7signal ABG-EYE-APU2 Sapphire User Manual Loupe User Guide
7signal Sapphire Loupe User Guide
7signal >
Contents
- 1. user manual
- 2. User Guide
- 3. Deployment Guide
- 4. Browser Application Guide
Browser Application Guide

7signal Ltd, Panuntie 6, FI-00620 HELSINKI, FINLAND, +358 40 777 7611, info@7signal.com, www.7signal.com
7signal Sapphire
Loupe User Guide
Release 3.0
Preface i
7signal Ltd, Panuntie 6, FI-00620 HELSINKI, FINLAND, +358 40 777 7611, info@7signal.com, www.7signal.com
7signal Sapphire Loupe User Guide Release 3.0
PREFACE
Document scope
This document is aimed for people familiarizing themselves with 7signal Sapphire
measurements and the use of 7signal Sapphire Loupe. Case studies are included to introduce
typical analysis paths of wlan network quality shortcomings.
This document does not describe how the software operates or how to configure testing. The
actual use of various 7signal Sapphire applications is explained in detail in 7signal Sapphire
Carat User Guide. Software and hardware insallation is explained in 7signal Sapphire
Deployment Guide.
FCC Warning
The radiated output power of the 7signal Sapphire Eye complies with the FCC RF exposure
limits. To avoid the possibility of exceeding the FCC radio frequency exposure limits, a distance
of at least 20 cm should be kept with the user and the device while operating.
The FCC ID for 7signal Sapphire Eye is YLF-2010-08-APU2 for
IEEE802.11a/b/g
PENDING - PENDING - PENDING - PENDING - PENDING - PENDING
The FCC ID for 7signal Sapphire Eye is YLF-EYE-ABGN-APU3 for
IEEE802.11a/b/g/n
NOTE TO THE USER
Any uninstructed modification to the 7signal products may result in violation of FCC
requirements.
CONTACT INFORMATION
Contact us at 7signal
by mail: Panuntie 6, FI-00620 Helsinki, Finland
by email: info@7signal.com
by phone: +358 40 777 7611 (exchange)
For handling of software defects, send email to: defect-report@7signal.com
In case of other requests, send email to: support@7signal.com

Table of Contents ii
7signal Ltd, Panuntie 6, FI-00620 HELSINKI, FINLAND, +358 40 777 7611, info@7signal.com, www.7signal.com
7signal Sapphire Loupe User Guide Release 3.0
TABLE OF CONTENTS
1 Loupe.................................................................................................................................... 1
1.1 Loupe login ................................................................................................................ 1
1.2 Loupe at a first-glance ................................................................................................ 1
2 Using Loupe .......................................................................................................................... 3
2.1 Channel aggregation and selection ............................................................................. 5
2.2 Saving the Charts........................................................................................................ 5
2.3 Advanced Chart Settings............................................................................................. 5
3 Tabs ...................................................................................................................................... 7
3.1 Tabs and analysis........................................................................................................ 7
3.2 Tab memory ............................................................................................................... 7
4 Summary .............................................................................................................................. 8
4.1 Elementary KPIs ......................................................................................................... 9
5 Service Level Agreement, SLA ..............................................................................................10
5.1 Three-basket principle ...............................................................................................10
5.2 SLA table active cells .................................................................................................11
6 TP/SNR ................................................................................................................................12
7 Network Performance Indicatros ........................................................................................13
8 Client Indicators ..................................................................................................................15
9 Codec Indicators ..................................................................................................................16
9.1 Codec and channel history ........................................................................................16
10 Spectrum ...........................................................................................................................17
10.1 Over period chart ....................................................................................................17
10.2 Time-axis chart ........................................................................................................17
11 Top ....................................................................................................................................18
12 Alarms ...............................................................................................................................19
13 Continuos And Automated Reporting................................................................................20
13.1 Subscription for a new report ..................................................................................20

Table of Contents iii
7signal Ltd, Panuntie 6, FI-00620 HELSINKI, FINLAND, +358 40 777 7611, info@7signal.com, www.7signal.com
7signal Sapphire Loupe User Guide Release 3.0
13.2 Adding Report Items................................................................................................21
13.3 Indicator Content Type ............................................................................................22
13.4 Service level content type, SLA ................................................................................23
13.5 Alarm Content Type ................................................................................................25
14 How To Troubleshoot Using Loupe ....................................................................................26
14.1 Typical pattern ........................................................................................................26
14.2 Troubleshooting: Use Cases .....................................................................................26
14.2.1 Accessibility Problem ....................................................................................26
14.3 Downlink Performance Problem ..............................................................................31
14.4 Downlink And Uplink Performance Problem ............................................................34
15 KPI Glossary .......................................................................................................................39
1 Loupe 1
7signal Ltd, Panuntie 6, FI-00620 HELSINKI, FINLAND, +358 40 777 7611, info@7signal.com, www.7signal.com
7signal Sapphire Loupe User Guide Release 3.0
1 LOUPE
Sapphire Loupe is a browser application for viewing test results and saving the test results.
Open Loupe in a browser. Type the Loupe server’s IP address into the Address field. Loupe
uses the same user database as Sapphire Carat. An encrypted connection is used to transmit
the username and password.
1.1 Loupe login
Login and authentication is similar to the management GUI, 7signal Sapphire Carat.
On top of typical username/password combination the user may have to select a group (access
context) as well. This is primarily for multi-organization environments where one user account
is able to manage numerous wlan networks otherwise separated by access rights. However,
only one administrative domain is accessed at one particular session. To manage another wlan
network or organization, the same user account has to do another login with another context.
1.2 Loupe at a first-glance
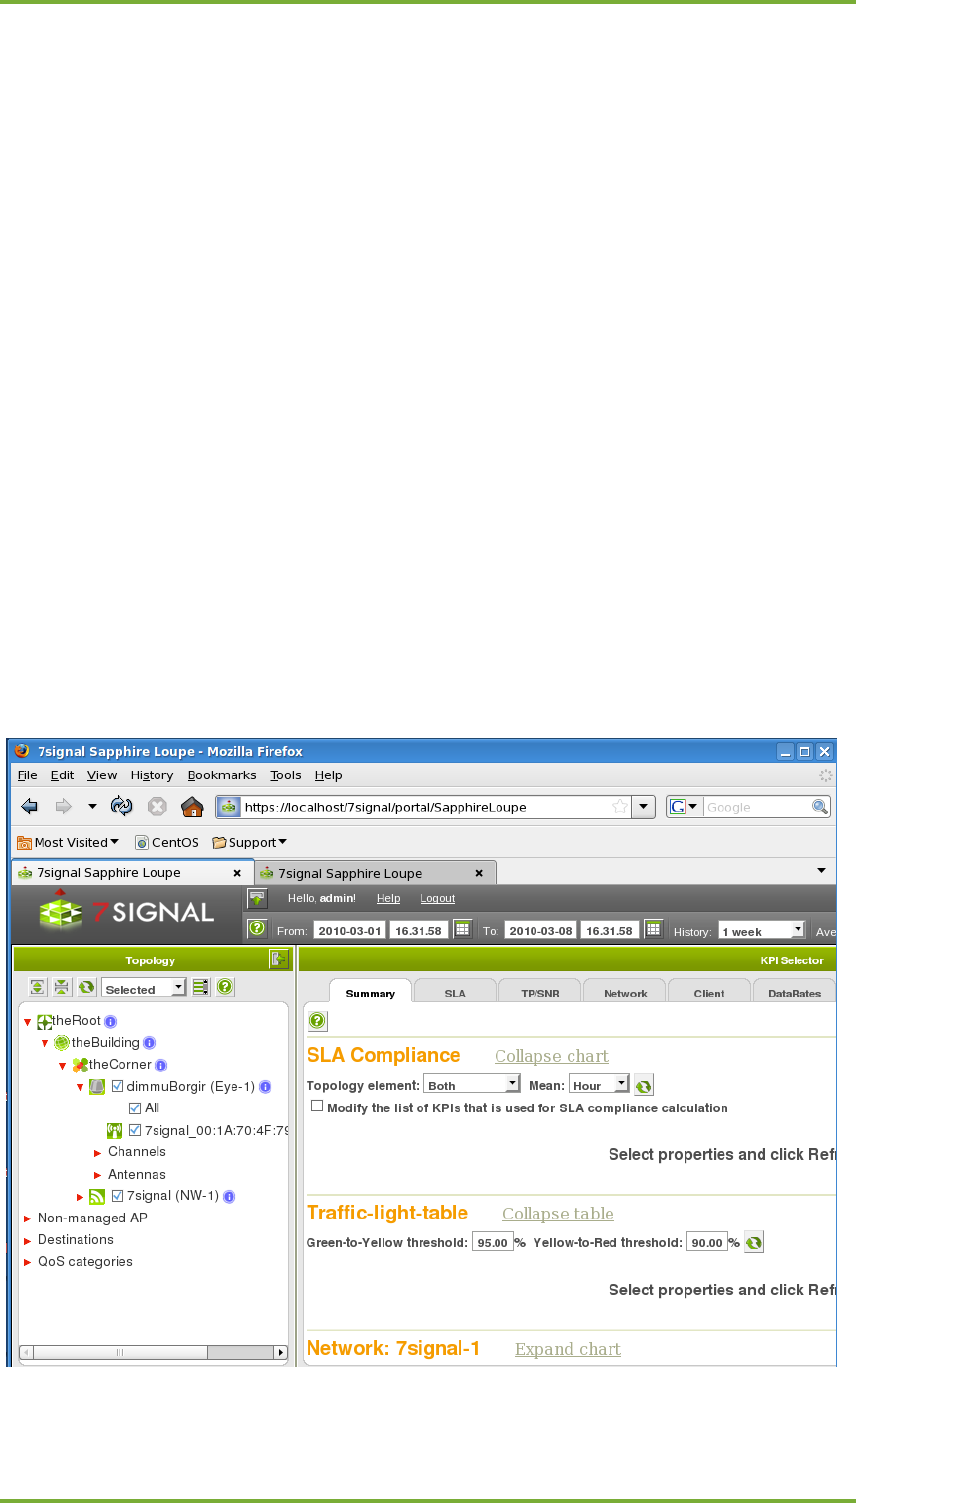
After a successful authentication, a typical Loupe screen is opened. The network topology
accessible to the current user is displayed on the left and on the right there is the Summary
pane. There are no default charts available to keep the start-up both responsive and relevant.
The Summary pane operations and options are explained below.

1 Loupe 2
7signal Ltd, Panuntie 6, FI-00620 HELSINKI, FINLAND, +358 40 777 7611, info@7signal.com, www.7signal.com
7signal Sapphire Loupe User Guide Release 3.0
A common central element between Loupe and Sapphire Carat is the hierarchical tree view in
the left pane, depicting the topology of the networks being monitored.
The main Key Performance Indicators (KPIs) are grouped in tabs as well as other relevant
report information such as visual tests and events. The tabs are following:
Summary SLA
TP/SNR Network
Client Data rates
Spectrum TOP
Alarm
2 Using Loupe 3
7signal Ltd, Panuntie 6, FI-00620 HELSINKI, FINLAND, +358 40 777 7611, info@7signal.com, www.7signal.com
7signal Sapphire Loupe User Guide Release 3.0
2 USING LOUPE
Sapphire Carat gathers and aggregates into a database the results obtained from running the
chosen test profiles. Loupe enables you to view the results and make comparisons between
different devices, tests, and time spans.
The charts displayed on startup give a simplified view to the status of the networks. Loupe
offers many features for getting more detailed views.
Building a Result View:
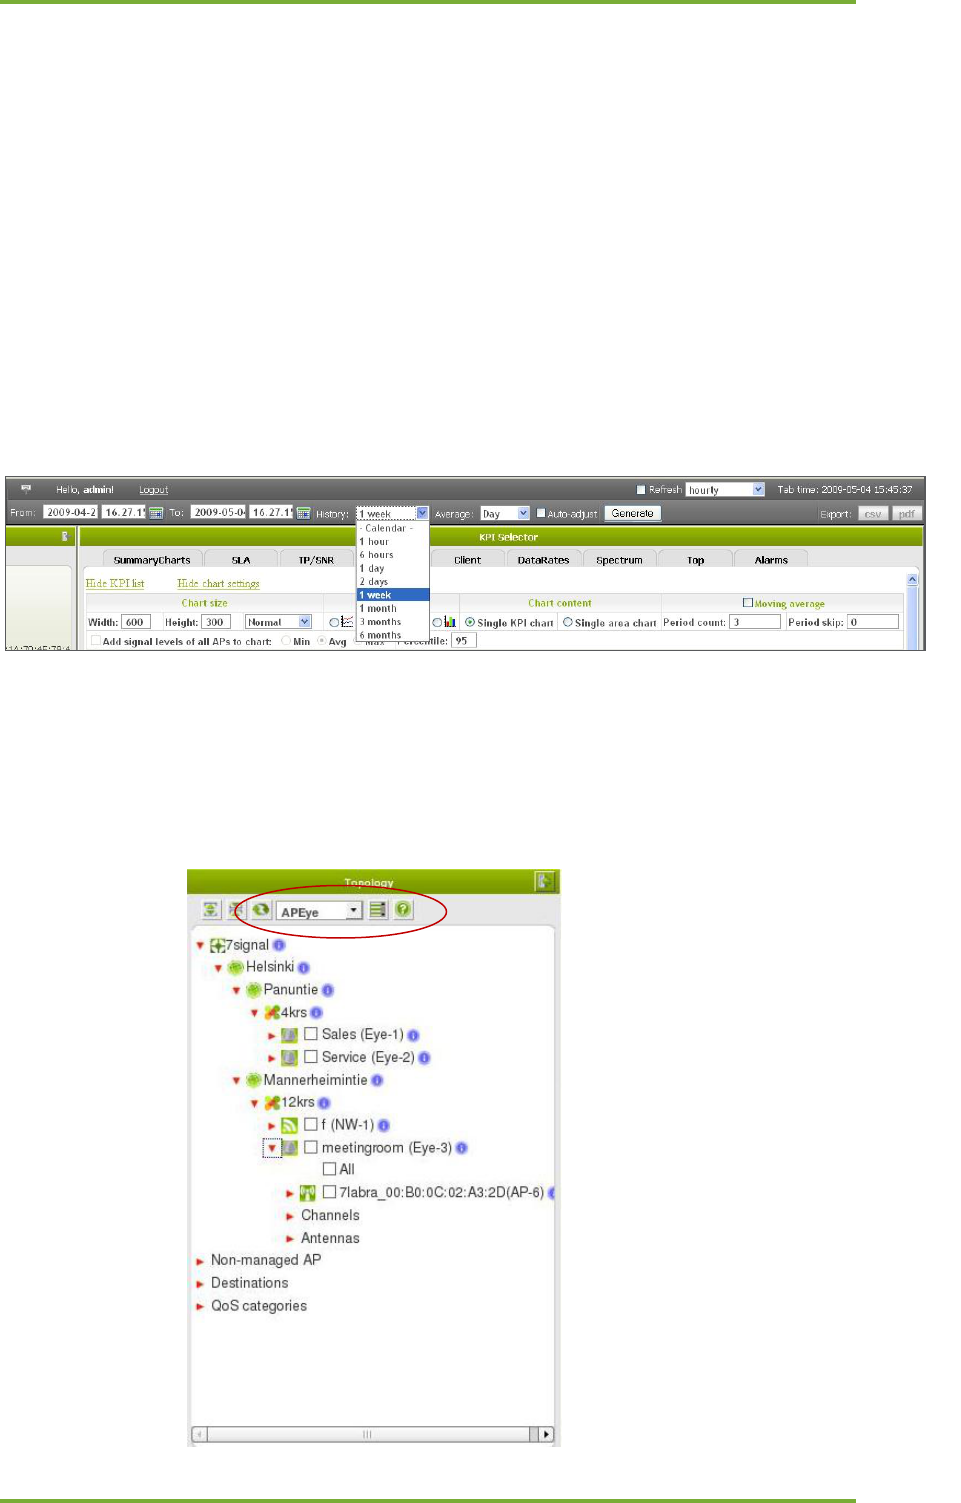
1. Decide which group of indicators you want to view, for example Network
2. From the list, select the indicators from which you want to generate charts
3. From the top bar, select the time span to include in the results
a. you can choose a time span by typing in the times and dates. You can either
type the date manually, or select it from a calendar.
b. you can also use the preconfigured values under History.
4. Under Average, select the averaging period
(The test results are based on samples, and you can use various averaging periods
within the time span chosen in step 3. Changing the averaging period may cause
changes in the test results, which is often exactly what is desired.)
5. From the Topology view, choose the level of aggregation
a. aggregation is a set of qualifiers that limit the result set
2 Using Loupe 4
7signal Ltd, Panuntie 6, FI-00620 HELSINKI, FINLAND, +358 40 777 7611, info@7signal.com, www.7signal.com
7signal Sapphire Loupe User Guide Release 3.0
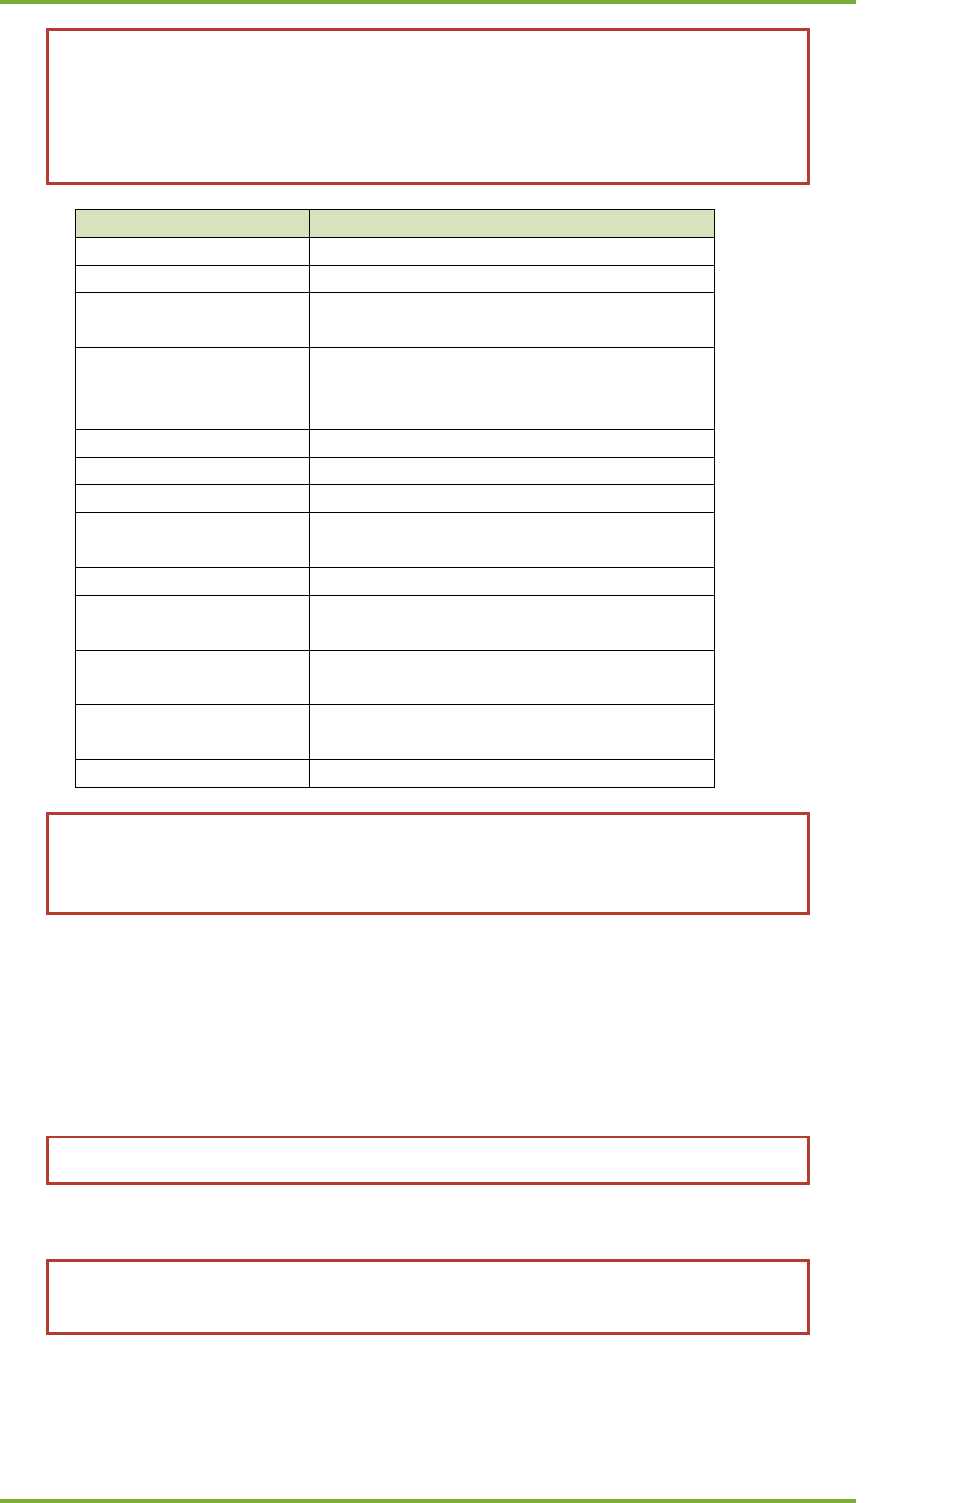
Note! The aggregation level can be chosen freely, but not all aggregation levels
can be used with all KPIs. In other words, when choosing the level of aggregation,
note the KPI being used. Loupe offers a default viewing level, but other viewing
levels might be just as suitable. If you change the level, Loupe uses that level
during the session.
Area
Description
NW
Network level
AP
Access point level
APEye
One single managed access point of a
single monitoring station
APEyeAnt
One single managed access point of a
single monitoring station in particular
antenna direction
Eye
Single Eye
EyeAnt
An individual antenna in a chosen Eye
Dest
The Sonar to be tested
DestAP
The access point to be tested with relation
to Sonars
ChEye
An individual channel in a chosen Eye
ChEyeAnt
An individual antenna and channel in a
chosen Eye
QoSAP
Traffic belonging to a particular QoS level
on a single access point
Link
Link consists of a chain Eye - Access Point
– Sonar
All
Selects all elements
Note! The more detailed the chosen aggregation is, the more input one must give
in the topology tree. For example, ChEyeAnt aggregation requires input on the
channel, antenna and monitoring station for the request to be valid.
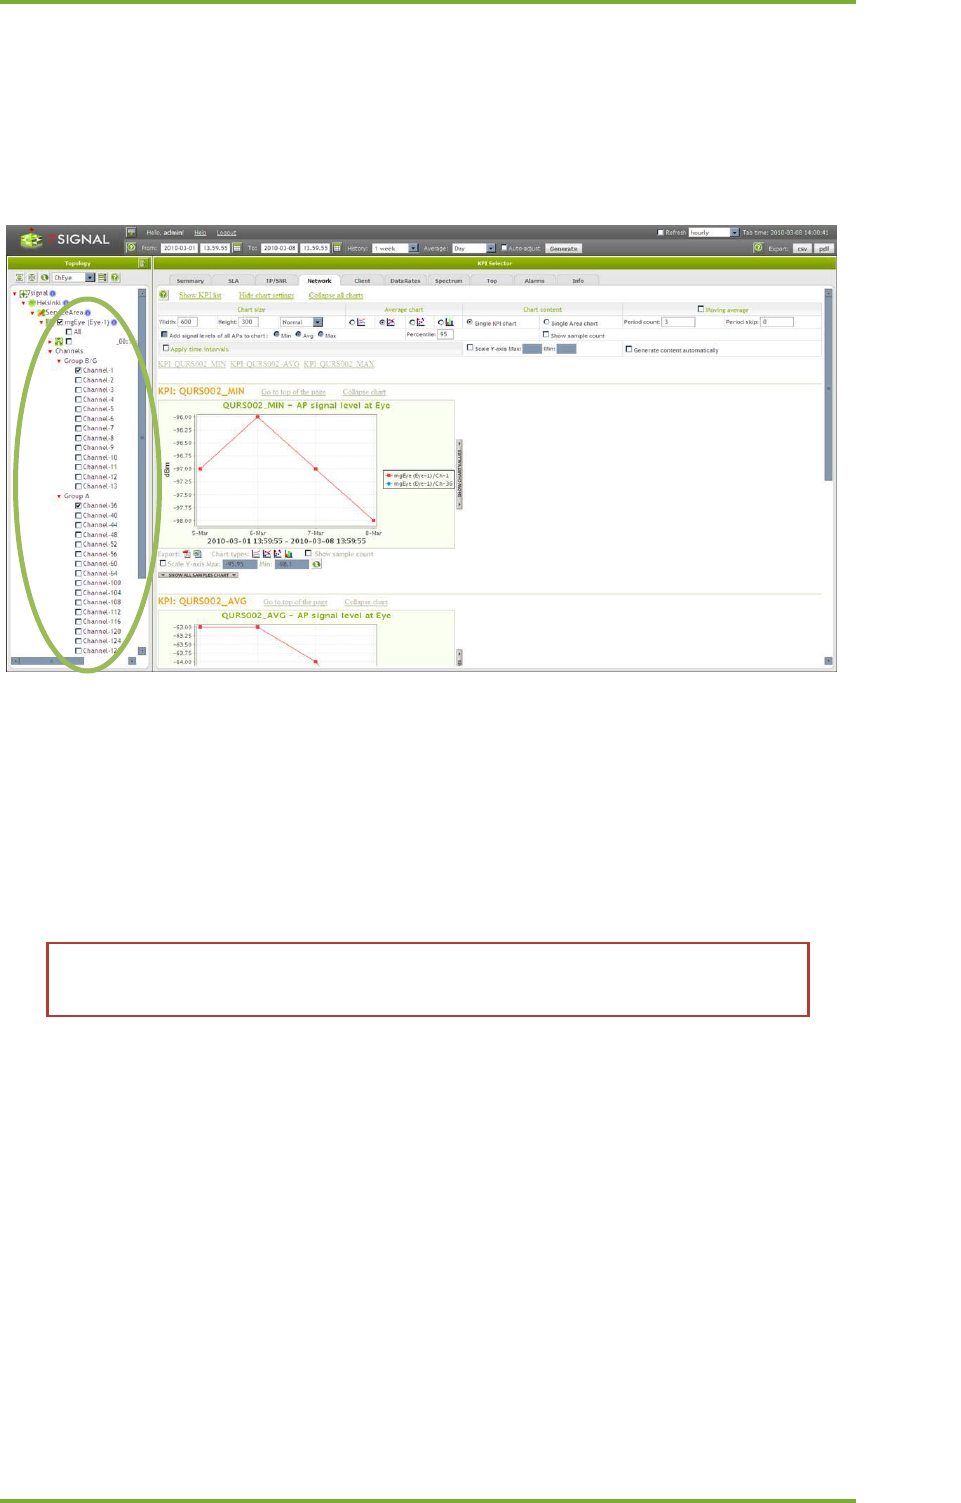
6. Alternatively, you can select Destinations from the tree hierarchy, and then select a
Sonar for which you want to display the results.
7. You can hide the KPI list by selecting Hide KPI
8. Click Generate to display the results.
The results open up in the same view / panel.
Note! Rendering the results may take a long time.
Note! If you choose an extremely large number of KPIs, the application may run
out of memory. Please use selections like “All KPIs” with caution.
2 Using Loupe 5
7signal Ltd, Panuntie 6, FI-00620 HELSINKI, FINLAND, +358 40 777 7611, info@7signal.com, www.7signal.com
7signal Sapphire Loupe User Guide Release 3.0
2.1 Channel aggregation and selection
For the convenience of the user, the channels are separated by the IEEE 802.11 standards. The
support is for IEEE 802.11b/g, IEEE 802.11a and IEEE 802.11n. The channel list is dynamic is
based on the monitoring station country code setting. For example, one monitoring station
located in Finland would show channel 13 while a monitoring station in the same organization
but located in USA would not show that channel.
2.2 Saving the Charts
You can save the charts either individually under each chart or all at once by choosing Export
from the top right corner. You have two saving options:
1. CSV: a comma-separated text file, suitable for importing data into a spreadsheet
program
2. PDF: A Portable Document Format file suitable for printing.
Note! The options displayed in the browser might not look exactly the same in the
PDF. Some changes are made to make the printed document easier to read.
2.3 Advanced Chart Settings
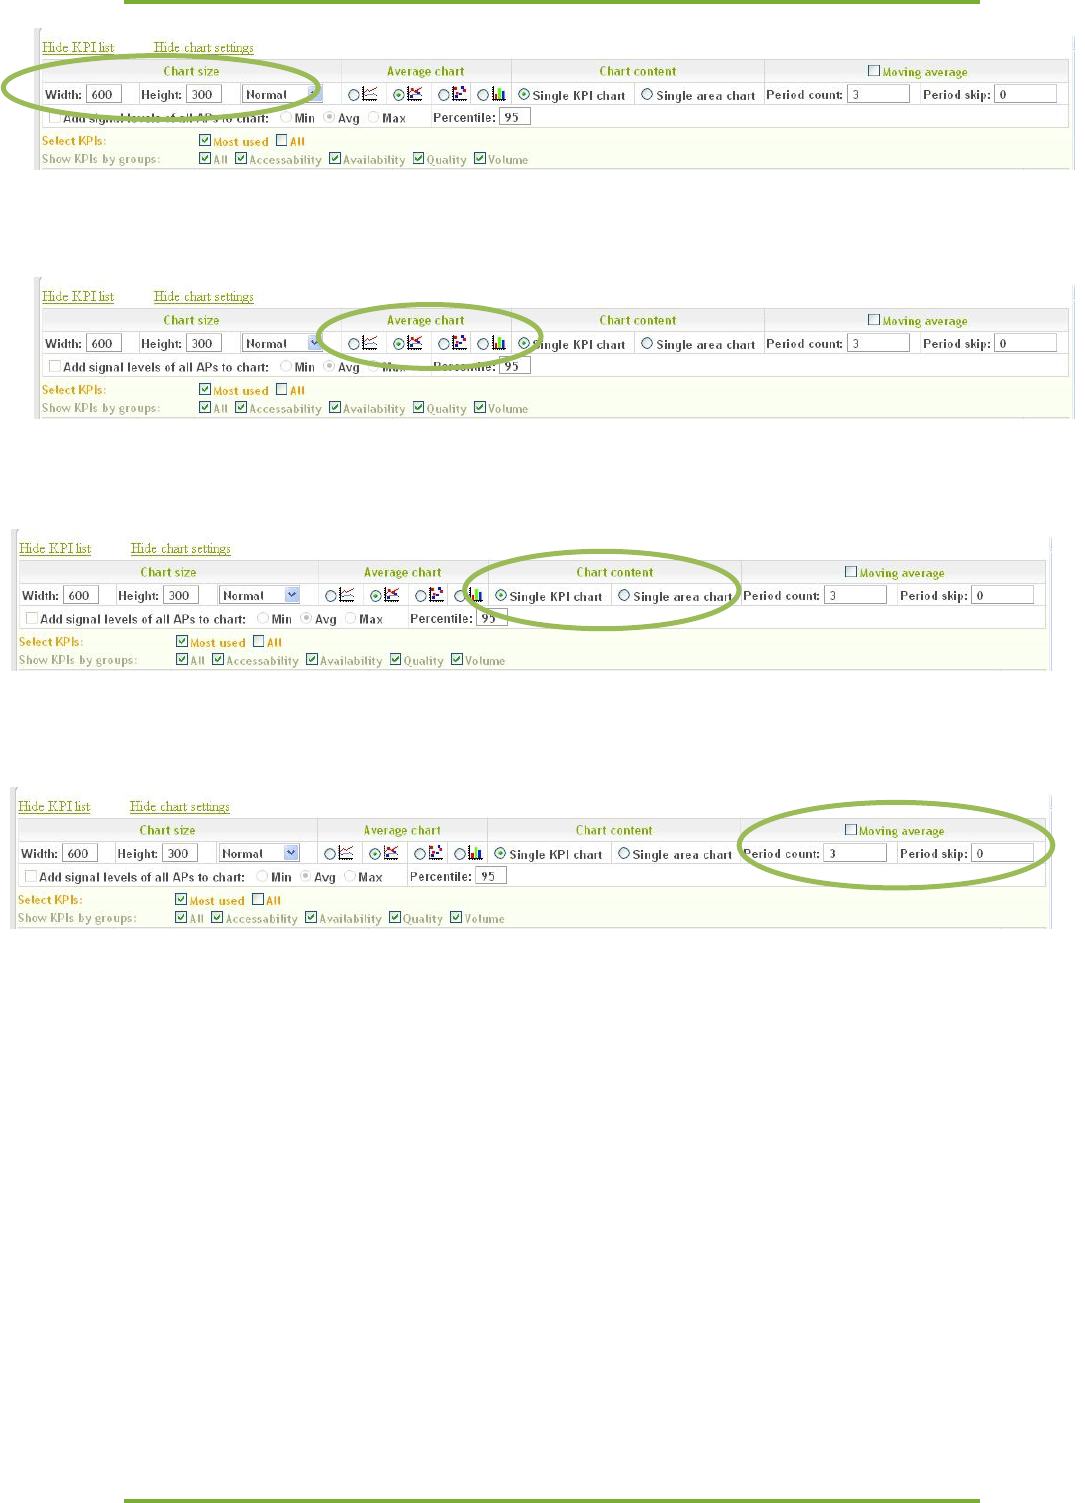
You can view the details of the results by selecting Show raw chart and Show chart data next
to the chart (raw = all data points and samples without averaging). You can modify the charts
by choosing or editing the values above the chart listing:
1. Chart size
a. Small, Normal, Large
b. User-defined size
2 Using Loupe 6
7signal Ltd, Panuntie 6, FI-00620 HELSINKI, FINLAND, +358 40 777 7611, info@7signal.com, www.7signal.com
7signal Sapphire Loupe User Guide Release 3.0
2. Chart type
a. Line, line with data points, scatter plot, bar chart
3. Display method of charts
a. Single KPI chart – Each KPI displayed as a separate chart
b. Single Area chart – All chosen KPIs in a single chart
Note! A “single area chart” should only contain measurements that have the same unit of
measurement, such as millisecond.
4. Moving average
a. Period count – the number of previous values to include into the calculation of
a moving average. F.ex. with value 3, the moving average at 8:00 is the
average of the values in 6:00, 7:00, and 8:00, when area-aggregation is hour.
b. Skip – the number of periods to skip from the start of the series. F.ex. for a
day’s serie, to ignore the night-time-values from 0:00 to 7:00, set skip to 8

3 Tabs 7
7signal Ltd, Panuntie 6, FI-00620 HELSINKI, FINLAND, +358 40 777 7611, info@7signal.com, www.7signal.com
7signal Sapphire Loupe User Guide Release 3.0
3 TABS
Below the time selectors there are numerous tabs. The tabs divide KPIs by category and to
some extent follow the principle that the more abstract, derived or calculated high-level
indicators are on the left and the detailed, accurate and raw-level indicators are on the right.
As the amount of information is enormous and the displays may be limited, many of the
elements in the user interface may be expanded / collapsed.
3.1 Tabs and analysis
The typical analysis flow is expected to progress from left to right. The outcome and results on
the left are more abstract, more compounded and more processed than on the right. On the
other hand, the level of detail grows the more the tab is on the right.
Please find the troubleshoot analysis at the end of this manual to see a few examples of typical
analysis cases and how the user-interface supports those.
3.2 Tab memory
The tabs remember the last successful query or other similar selection. There is variance per
tab on the items that are saved between sessions but in general all the essential information
for a proper query is kept.
Also, expansions and collapses of the dynamic elements are saved.
4 Summary 8
7signal Ltd, Panuntie 6, FI-00620 HELSINKI, FINLAND, +358 40 777 7611, info@7signal.com, www.7signal.com
7signal Sapphire Loupe User Guide Release 3.0
4 SUMMARY
SLA Compliance KPI
To summarize the health of the network element, Loupe analyses multiple KPIs and based on
that computes one single value that is called the ‘SLA Compliance KPI’. The network element
may be either an access point or a link. There has to be a SLA group defined and bound to the
network element.
The measurement value averages all the KPIs in the SLA group. As such, this KPI does not
provide any tools for analysis but it is rather to point out the need for analysis for the network
elements that do not fulfill the quality expectations.
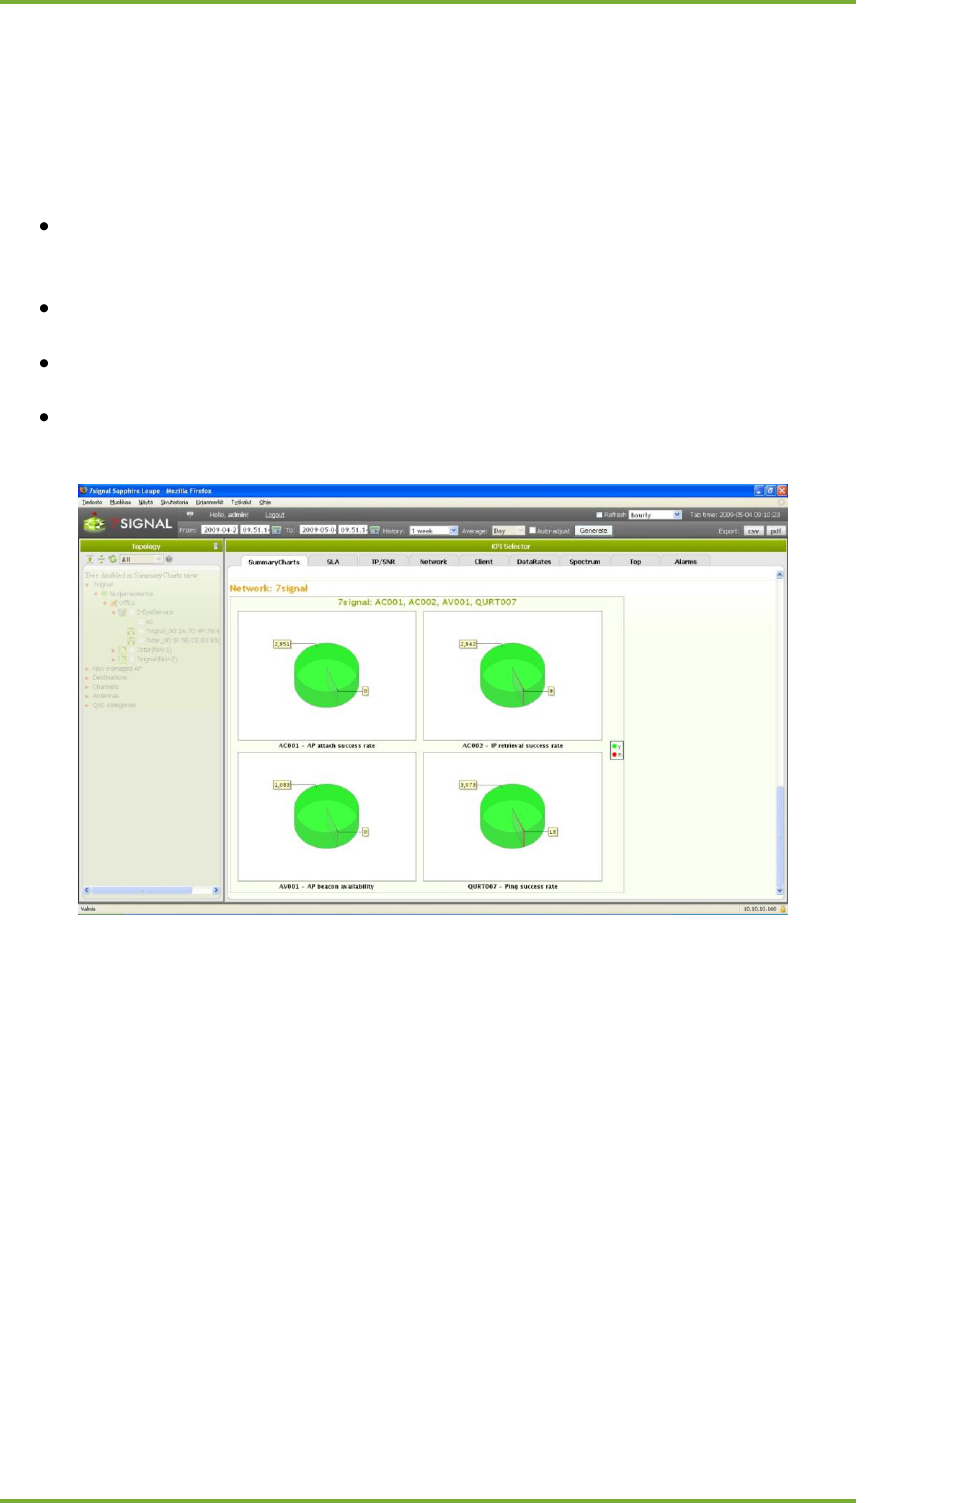
In the picture below, there are threenetwork elements, AP-10, AP-15 and AP-35. Based on the
chart one can assume that AP-15 is operating as expected with only one temporary quirk. On
the other hand, AP-35 seems to be continuously doing below any expectation. Note that AP-35
might be completely out or it may serve wlan clients but the overall quality is next to nothing,
the SLA compliance is non-existent. AP-10 has its moments but obviously it is
underperforming.
While all elements would benefit from some attention, it is obvious that AP-35 should have
the priority. This is elementary to the SLA compliance KPI: one glimpse tells whether some
element needs attention or not. The nature of the problem is available through investigating
lower-level KPIs.
The SLA group defines the threshold values for all individual KPIs. However, the resultant KPI
threshold values may and should be set in Loupe. The value setting is stored between the
sessions for each user.
Export for the charts is available both for each chart individually and the global export on the
top-menu buttons.
4 Summary 9
7signal Ltd, Panuntie 6, FI-00620 HELSINKI, FINLAND, +358 40 777 7611, info@7signal.com, www.7signal.com
7signal Sapphire Loupe User Guide Release 3.0
4.1 Elementary KPIs
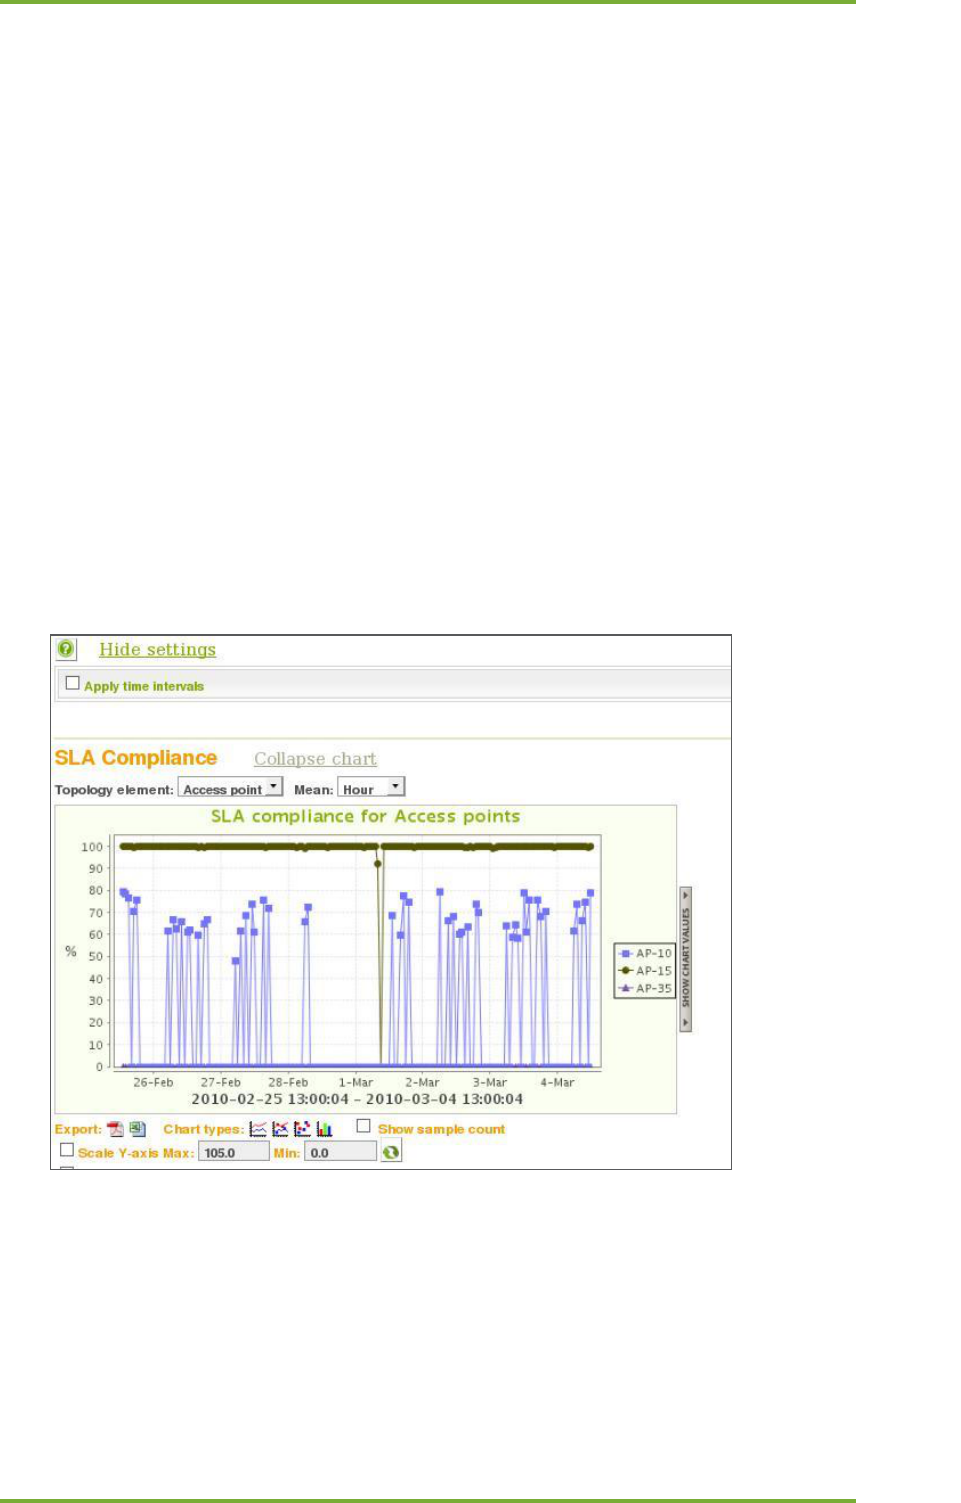
The Summary tab contains also pie charts on some elementary KPIs. By default, they are now
visible but the pie charts are available by selecting the wlan network name.
When expanded, Loupe displays a chart showing the general status of the monitored network
from the last 7 days. The view contains the following KPIs:
AP attach success rate
o the ratio of successful network attachments to the number of attachments
attempted
IP retrieval success rate
o the ratio of successful IP address retrievals to retrieval attempts
AP beacon availability
o heard beacon signal versus listening attempts
Ping success rate
o The ratio of successful reachability tests to the number of tests
The green area in the pie chart indicates successful measurements, and the red area indicates
failures. The number of measurements is displayed next to the chart.
5 Service Level Agreement, SLA 10
7signal Ltd, Panuntie 6, FI-00620 HELSINKI, FINLAND, +358 40 777 7611, info@7signal.com, www.7signal.com
7signal Sapphire Loupe User Guide Release 3.0
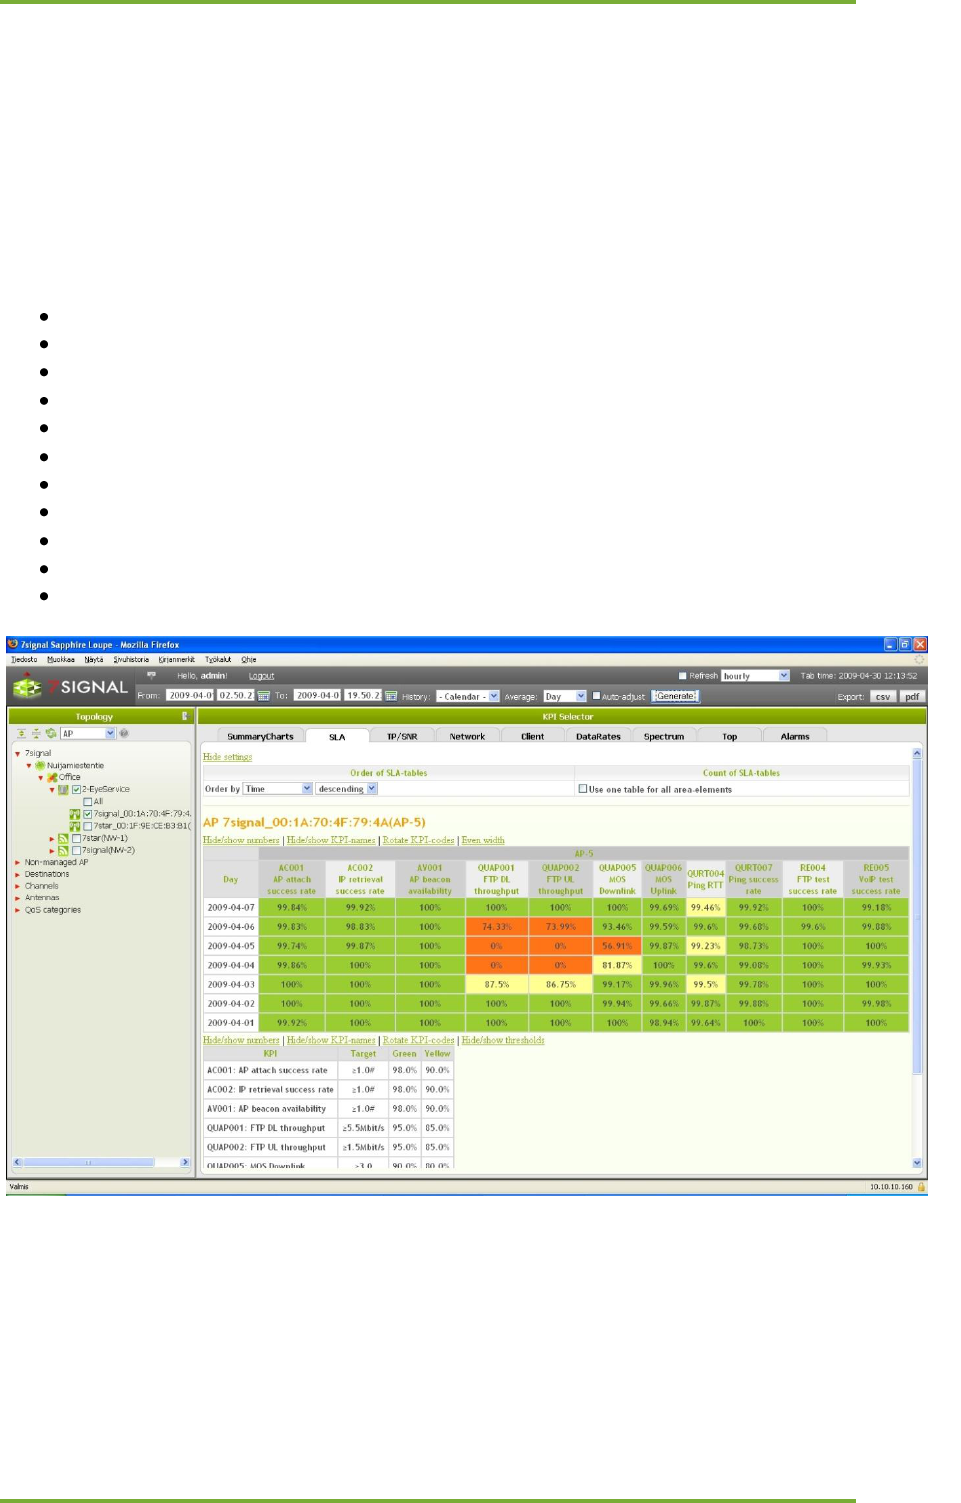
5 SERVICE LEVEL AGREEMENT, SLA
The service level agreement (SLA) view contains KPIs that display network functionality and
availability as traffic lights.
The default limits are set by 7signal, and the values are based on real-life situations. You can
modify the values to conform to the service level agreement currently being used. The values
can be modified in the Sapphire Carat’s management interface.
The SLA view contains by default the following KPIs:
AP attach success rate
IP retrieval success rate
AP beacon availability
Ping success rate
FTP downlink throughput
FTP uplink throughput
MOS downlink
MOS uplink
Ping RTT
FTP test success rate
VoIP test success rate
5.1 Three-basket principle
The color-coding indicates the SLA status, it may be either red, yellow or green. The wlan
network may be operational and any test and any user-action may be successful yet the color
in the SLA table is yellow or even red. This is because SLA view is highly derived data that is
compared to expected level of the service.
5 Service Level Agreement, SLA 11
7signal Ltd, Panuntie 6, FI-00620 HELSINKI, FINLAND, +358 40 777 7611, info@7signal.com, www.7signal.com
7signal Sapphire Loupe User Guide Release 3.0
For example, one may get 100% VoIP calls through but the SLA shows red. The interpretation
here is that while the wlan network provides the VoIP service continuously, the service level is
not met, thus the alarming color-code. There are not necessarily imminent problems with the
wlan network in case red or yellow color but further investigation is surely needed. And
obviously it is possible that in case of the red color, the service may be completely down.
5.2 SLA table active cells
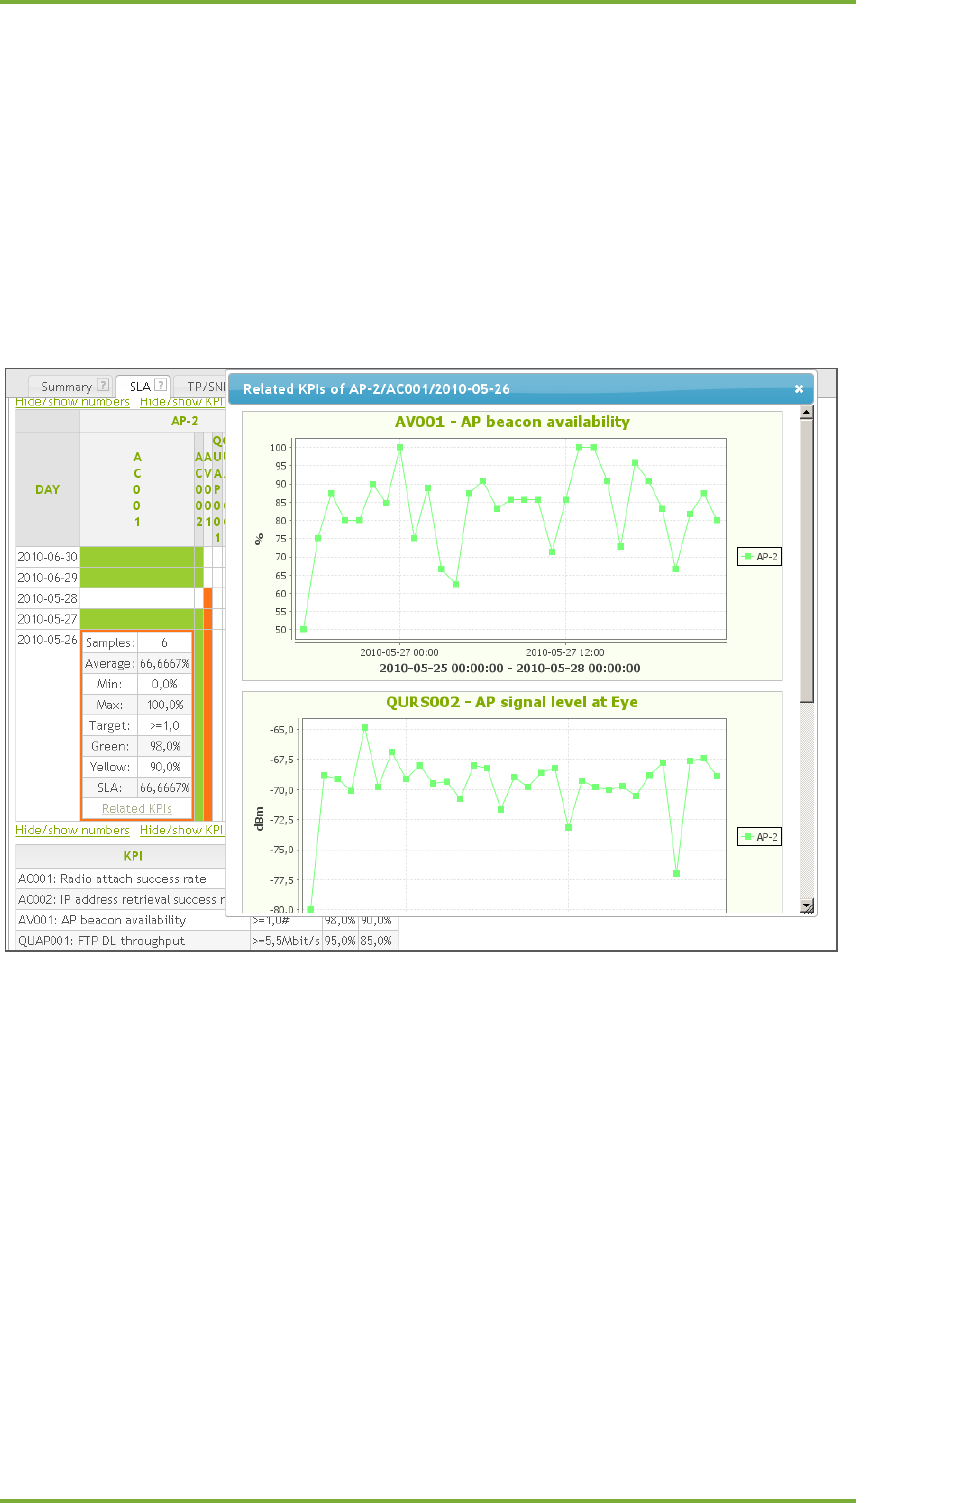
To better understand the resulting color-code the cells in the table are active. By clicking a cell
one gets immediate information on data that lead to the cell color.
In case further analysis is needed, the link “Related KPIs” pop additional KPI charts up. The
charts show a set of KPIs on time-interval that has shown on SLA table row expanded with one
unit earlier and later. If the SLA table row is for an hour, the KPI chart includes the preceding
and the following hour, too.
The set of KPIs either directly affect the SLA result or would be the KPIs that should be checked
in the next step of the analysis. The troubleshoot cases at the end of this manual elaborate on
the flow of analysis.
6 TP/SNR 12
7signal Ltd, Panuntie 6, FI-00620 HELSINKI, FINLAND, +358 40 777 7611, info@7signal.com, www.7signal.com
7signal Sapphire Loupe User Guide Release 3.0
6 TP/SNR
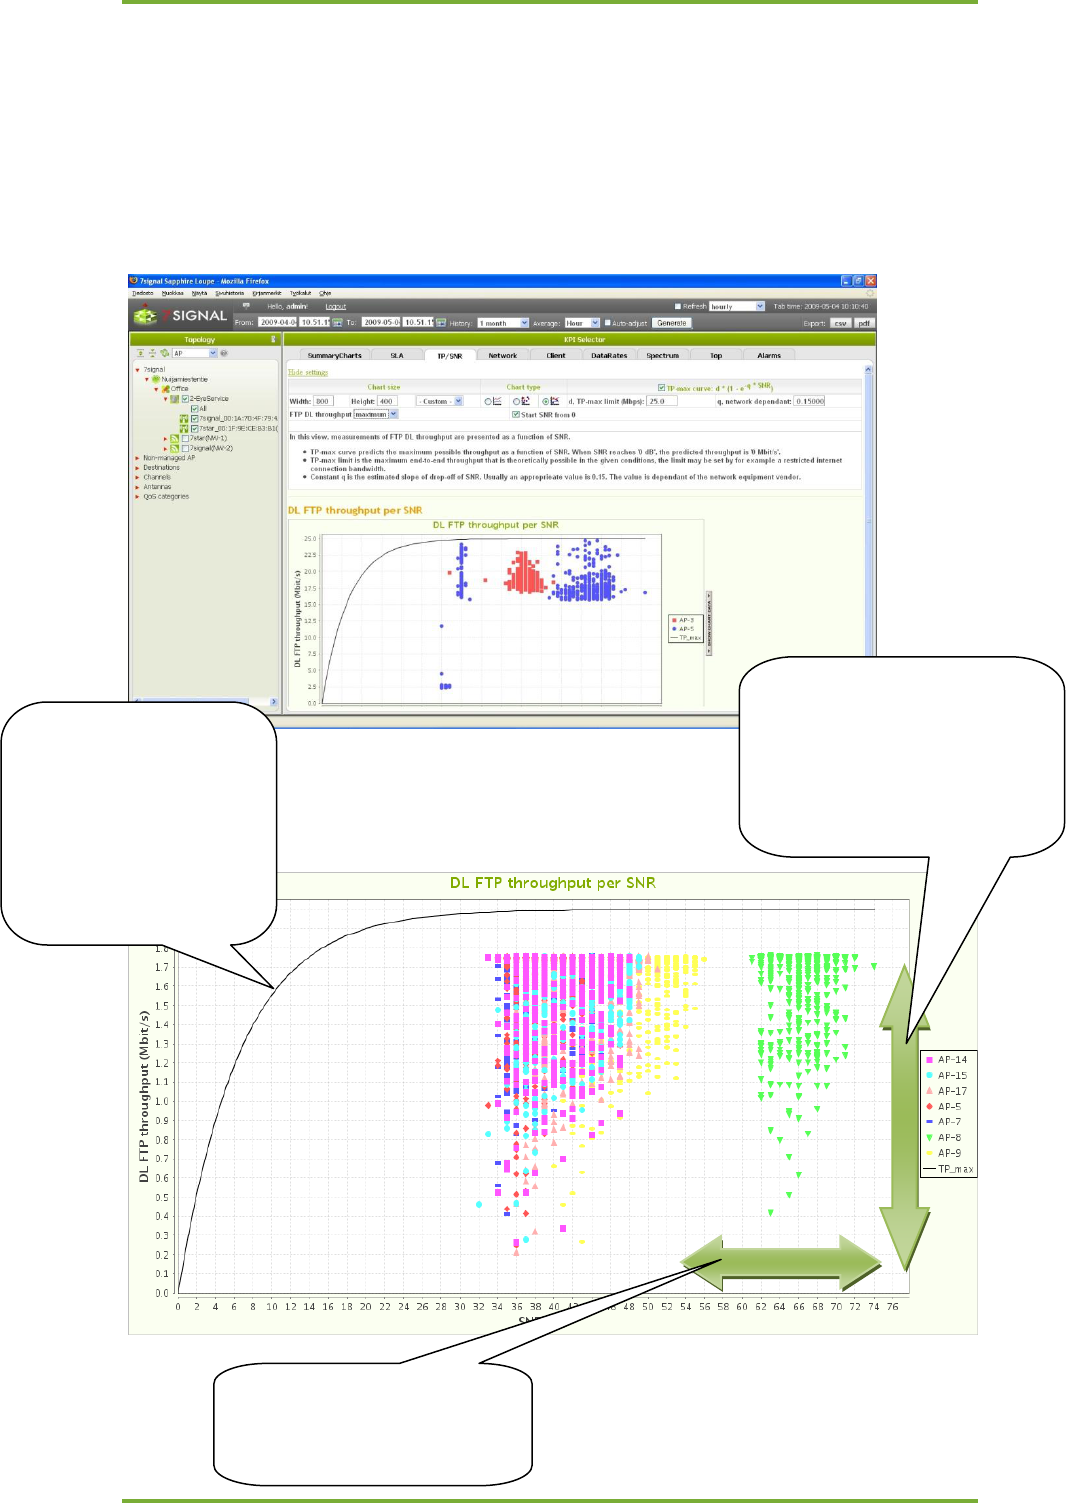
This view has a single chart, which displays the relationship between the measured throughput
speed and the signal to noise ratio of a given access point. Measurements usually take into
account only the theoretical maximum throughput speed. Since the measurements vary by
network and hardware, the view instructs the user to modify the parameters. Modify the
parameters directly in the view.
The picture below is an example on how to interpret the TP /SNR chart.
The maximum speed of
an end-to-end
connection is 2Mbps.
The theoretical TP/SNR
curve indicates the best
data throughput speed
for a given SNR value.
A large variation in
throughput rate when the
SNR value is good indicates
possible performance issues
in a wired network or a
severely loaded radio
Variation in the SNR indicates
variation in radio frequency
interference.
7 Network Performance Indicatros 13
7signal Ltd, Panuntie 6, FI-00620 HELSINKI, FINLAND, +358 40 777 7611, info@7signal.com, www.7signal.com
7signal Sapphire Loupe User Guide Release 3.0
7 NETWORK PERFORMANCE INDICATROS
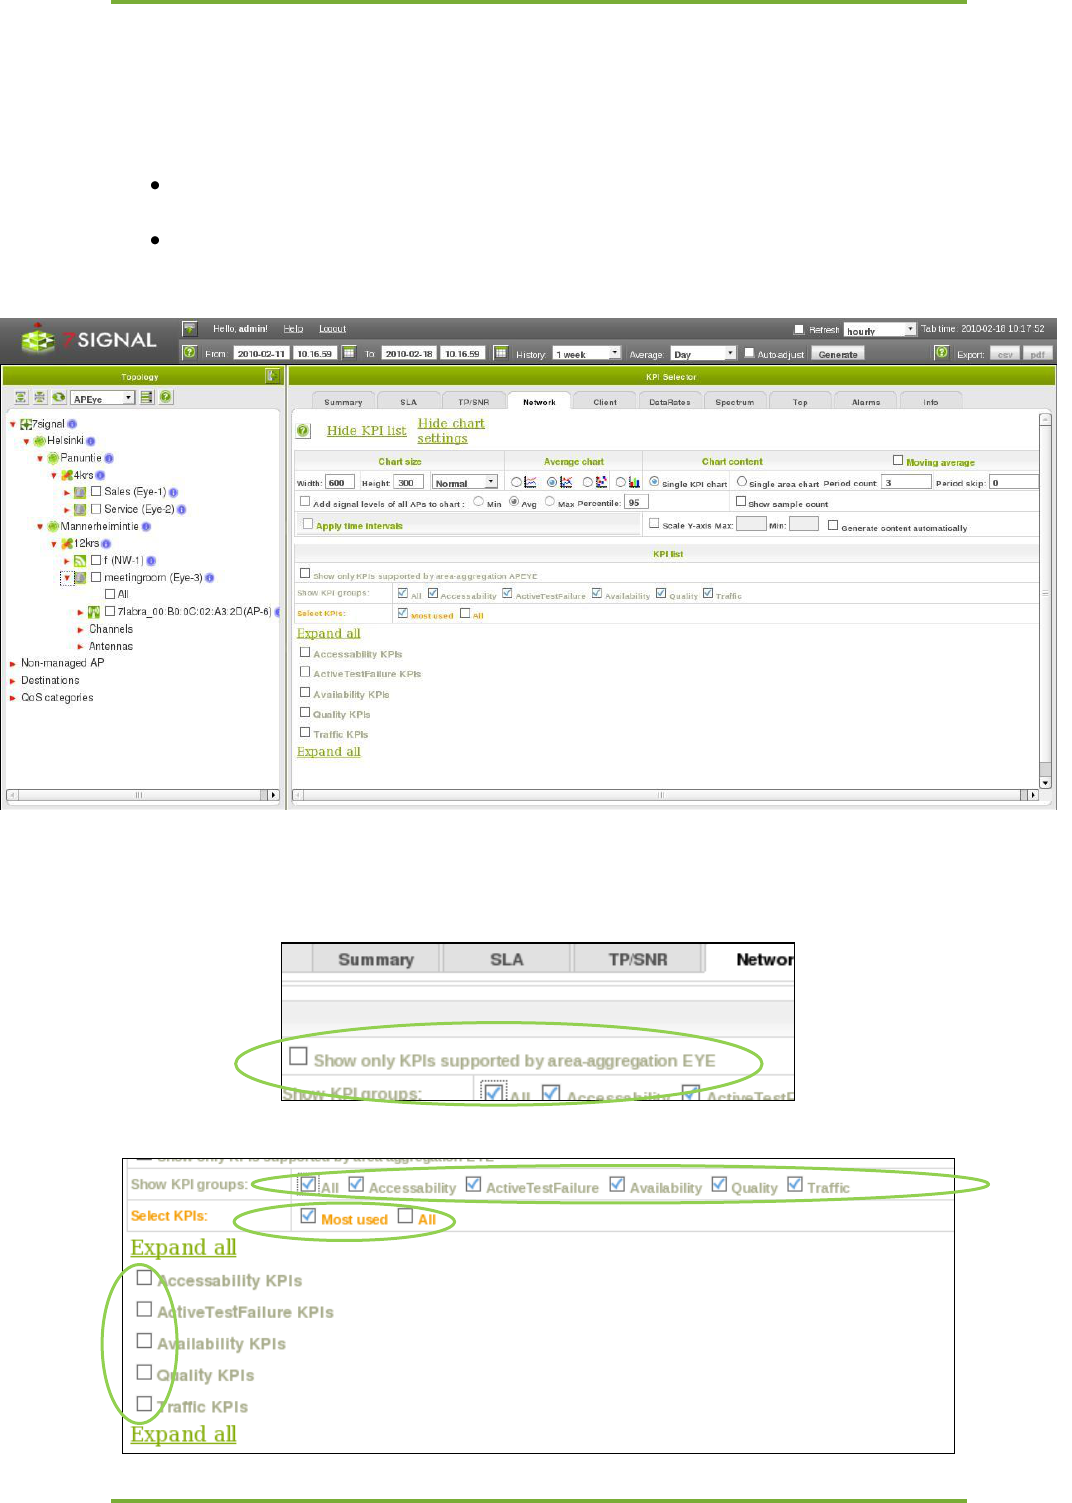
The KPIs in the Network tab are divided into four groups: Accessibility, Availability, Quality,
Volume and Active test failures.
Apply time intervals – You can limit the time of day, from which the measurements are
included. F.ex. set time interval to 7:00 - 18:00 to ignore the results from night time.
Scale Y-axis – You can set the minimum and maximum values of the y-axis to be the
same in all of the charts.
Active controls in the tab pane
Selections in other panes affect KPI lists and other elements in the tab pane.
Aggregation selection in the Topology pane changes the aggregation-based KPI listing function.

7 Network Performance Indicatros 14
7signal Ltd, Panuntie 6, FI-00620 HELSINKI, FINLAND, +358 40 777 7611, info@7signal.com, www.7signal.com
7signal Sapphire Loupe User Guide Release 3.0
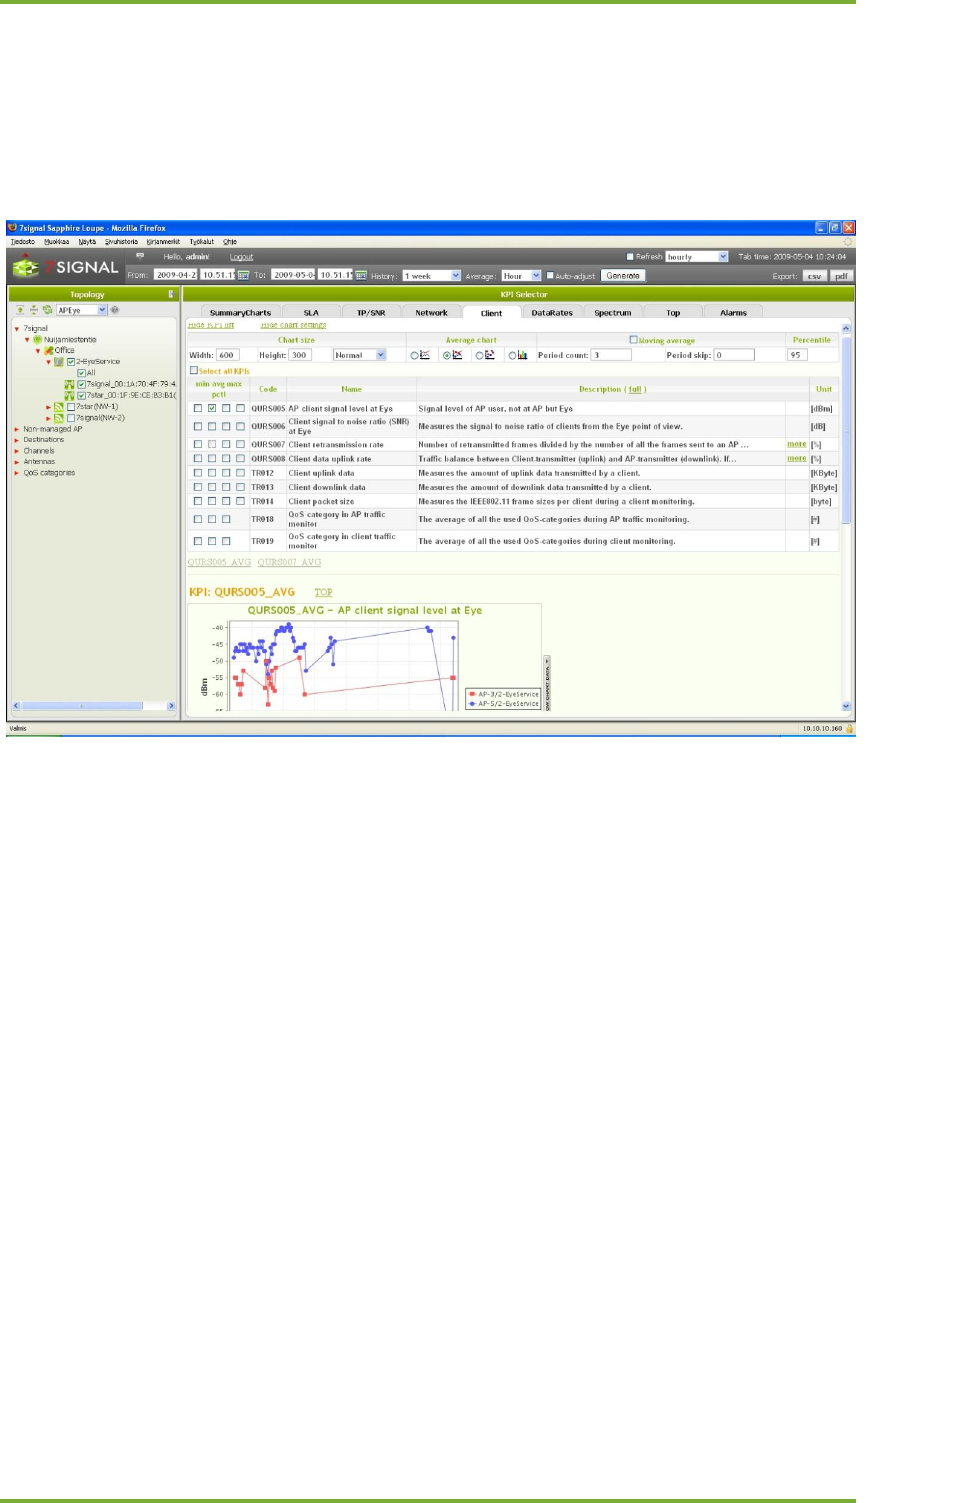
The Network tab contains the highest number of KPIs of all tabs. Therefore check-boxes are
added to enable control of visibility. Both top-horizontal and vertical check-boxes control the
same set of KPIs. Even when the horizontal selection limits the number of KPIs, the user
benefits from the vertical control as well.
“Expand all” is there to show all KPIs at once.
8 Client Indicators 15
7signal Ltd, Panuntie 6, FI-00620 HELSINKI, FINLAND, +358 40 777 7611, info@7signal.com, www.7signal.com
7signal Sapphire Loupe User Guide Release 3.0
8 CLIENT INDICATORS
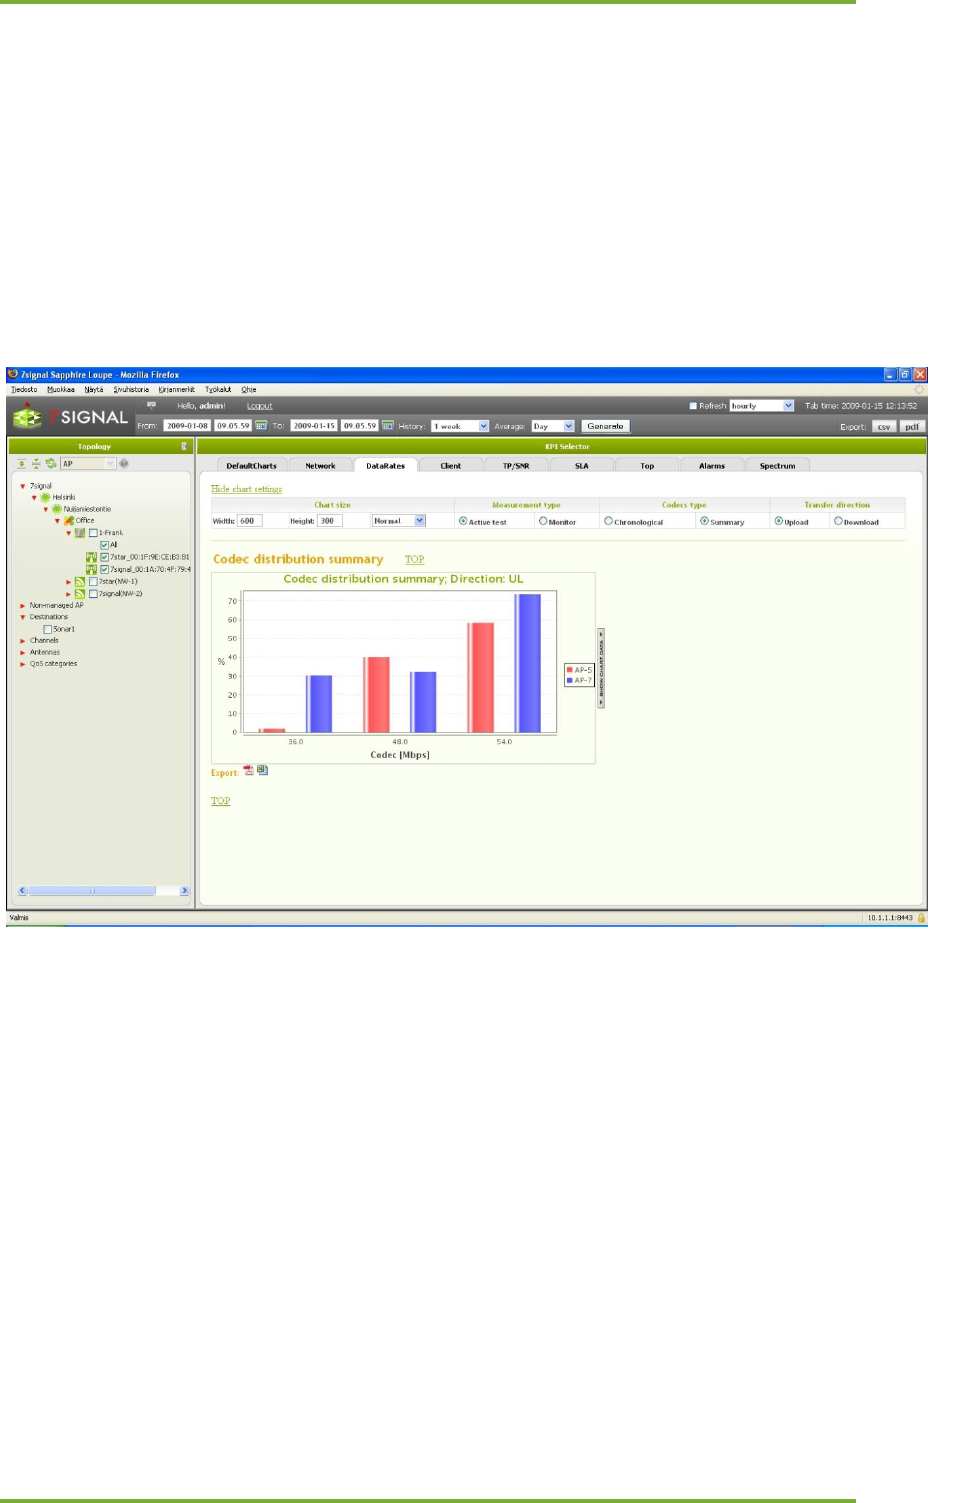
The Client tab contains charts that indicate network functionality and the network quality as
experienced by the user.
You can view the results by user (i.e. by client) by choosing the Client level from the Topology
view.
9 Codec Indicators 16
7signal Ltd, Panuntie 6, FI-00620 HELSINKI, FINLAND, +358 40 777 7611, info@7signal.com, www.7signal.com
7signal Sapphire Loupe User Guide Release 3.0
9 CODEC INDICATORS
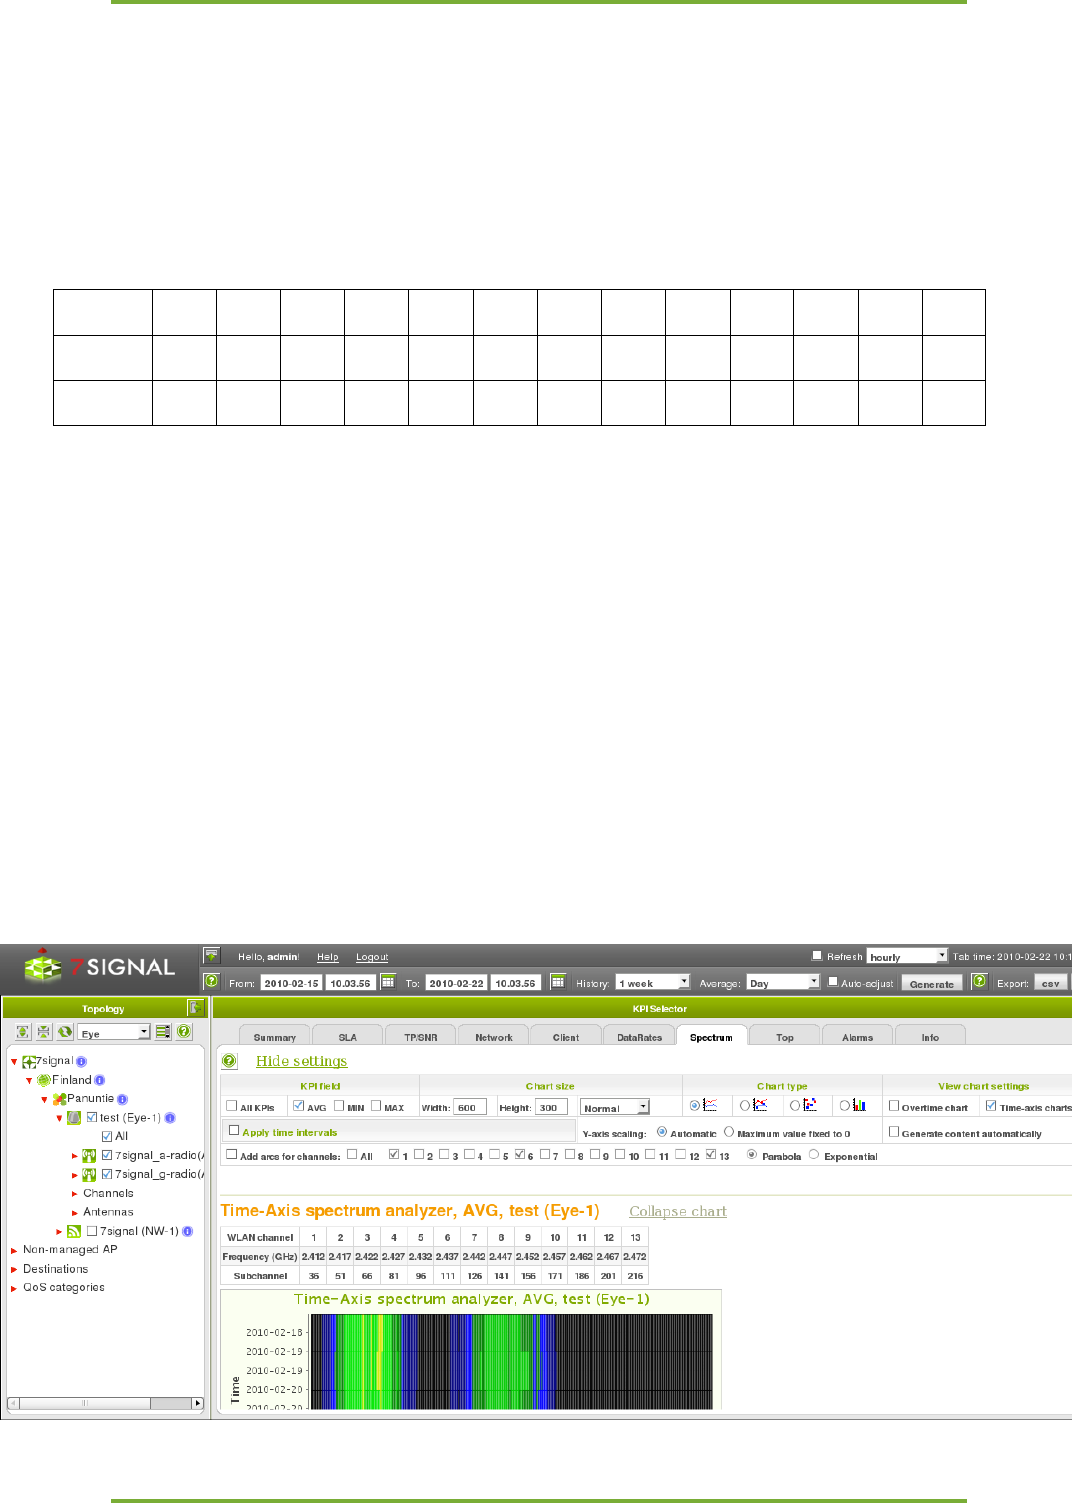
This view displays the distribution of codecs used during the active tests. The codec used
indicates the data transfer rate (Mbps). The use of small codecs is a sign of functionality
problems in the network. In a properly functioning network, the maximum data transfer rate is
used almost continuously.
When the Active test measurement type is used, the picture displays the codecs of each access
point selected in the Topology view. When the Monitor test measurement type is used, the
picture displays the codecs for each client selected in the Topology view.
You can view a summary or a chronological distribution of the codecs. In the summary, the
codecs are aggregated as an average over the time span entered in the top bar.
9.1 Codec and channel history
Loupe provides an alternative view on codecs i.e. bitrates used by access points. This view is
not based on a single active test but events that affect bitrates and channels used by the
managed access points are stored in the database and thus available to Loupe.
The topology-tree provides the history by right-click pop-up menu on access point icons. The
change history is the last item in the pop-up window. Alternatively the Info tab has the a link
called “Show AP history” among other access point information. By following the link the
change history is available.
10 Spectrum 17
7signal Ltd, Panuntie 6, FI-00620 HELSINKI, FINLAND, +358 40 777 7611, info@7signal.com, www.7signal.com
7signal Sapphire Loupe User Guide Release 3.0
10 SPECTRUM
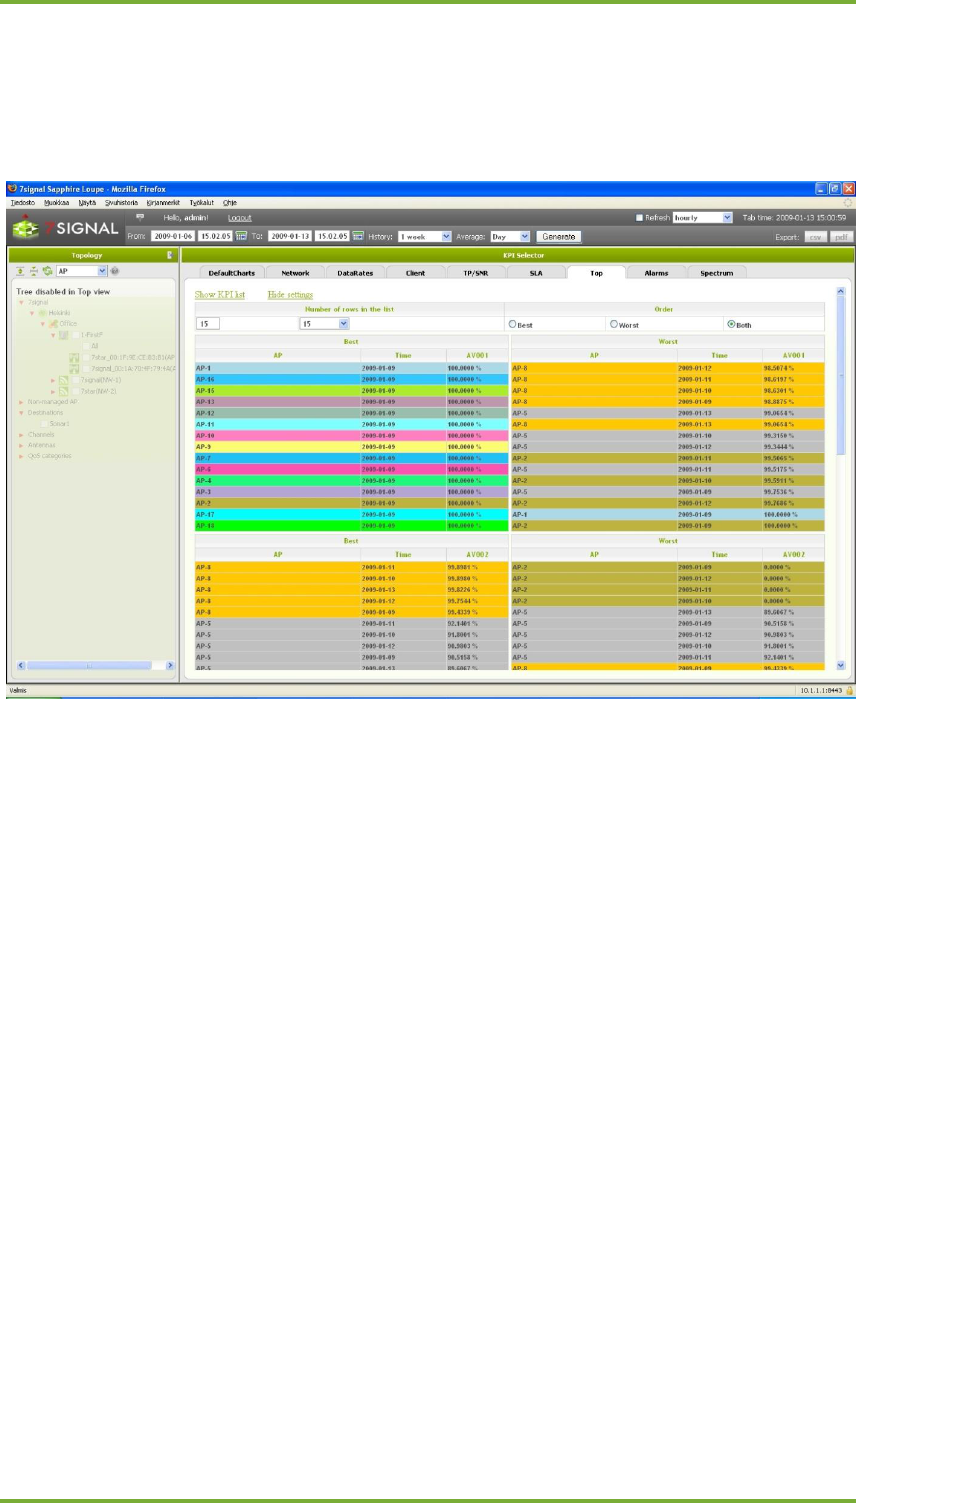
The spectrum analysis is an interactive troubleshooting tool in Sapphire, and is most useful
when used in Carat. Loupe displays the spectrum analysis results from the chosen time span to
assist you in continuous monitoring.
In all of the spectrum charts, the swept frequency band lays on the x-axis. The band
constitutes of the 256 WLAN subcarrier channels that are mapped to frequencies and WLAN
channels, as described in below table:
Subcarrier
36
51
66
81
96
111
126
141
156
171
186
201
216
Frequency
2.412
2.417
2.422
2.427
2.432
2.437
2.442
2.447
2.452
2.457
2.462
2.467
2.472
Channel
1
2
3
4
5
6
7
8
9
10
11
12
13
10.1 Over period chart
Loupe displays the spectrum analysis results from the chosen time span to assist you in
continuous monitoring. In the “over period chart”, Tthe signal level is plotted on the y- axis,.
and each antenna is represented by an individual chart. The swept frequency band is on the x
axis. If you select several Eyes, the results will be displayed individually for each Eye. To help to
plot signal levels to the actual WLAN channels (1-13), you can activate the “Add arcs for
channels”-checkbox. This selection adds parabolic lines to the chart to show the location of the
selected channel numbers.
10.2 Time-axis chart
Time-axis chart plots the measurement time to the y-axis. Each antenna is represented by an
individual time-axis chart. If you select several Eyes, the results will be displayed individually
for each Eye.
11 Top 18
7signal Ltd, Panuntie 6, FI-00620 HELSINKI, FINLAND, +358 40 777 7611, info@7signal.com, www.7signal.com
7signal Sapphire Loupe User Guide Release 3.0
11 TOP
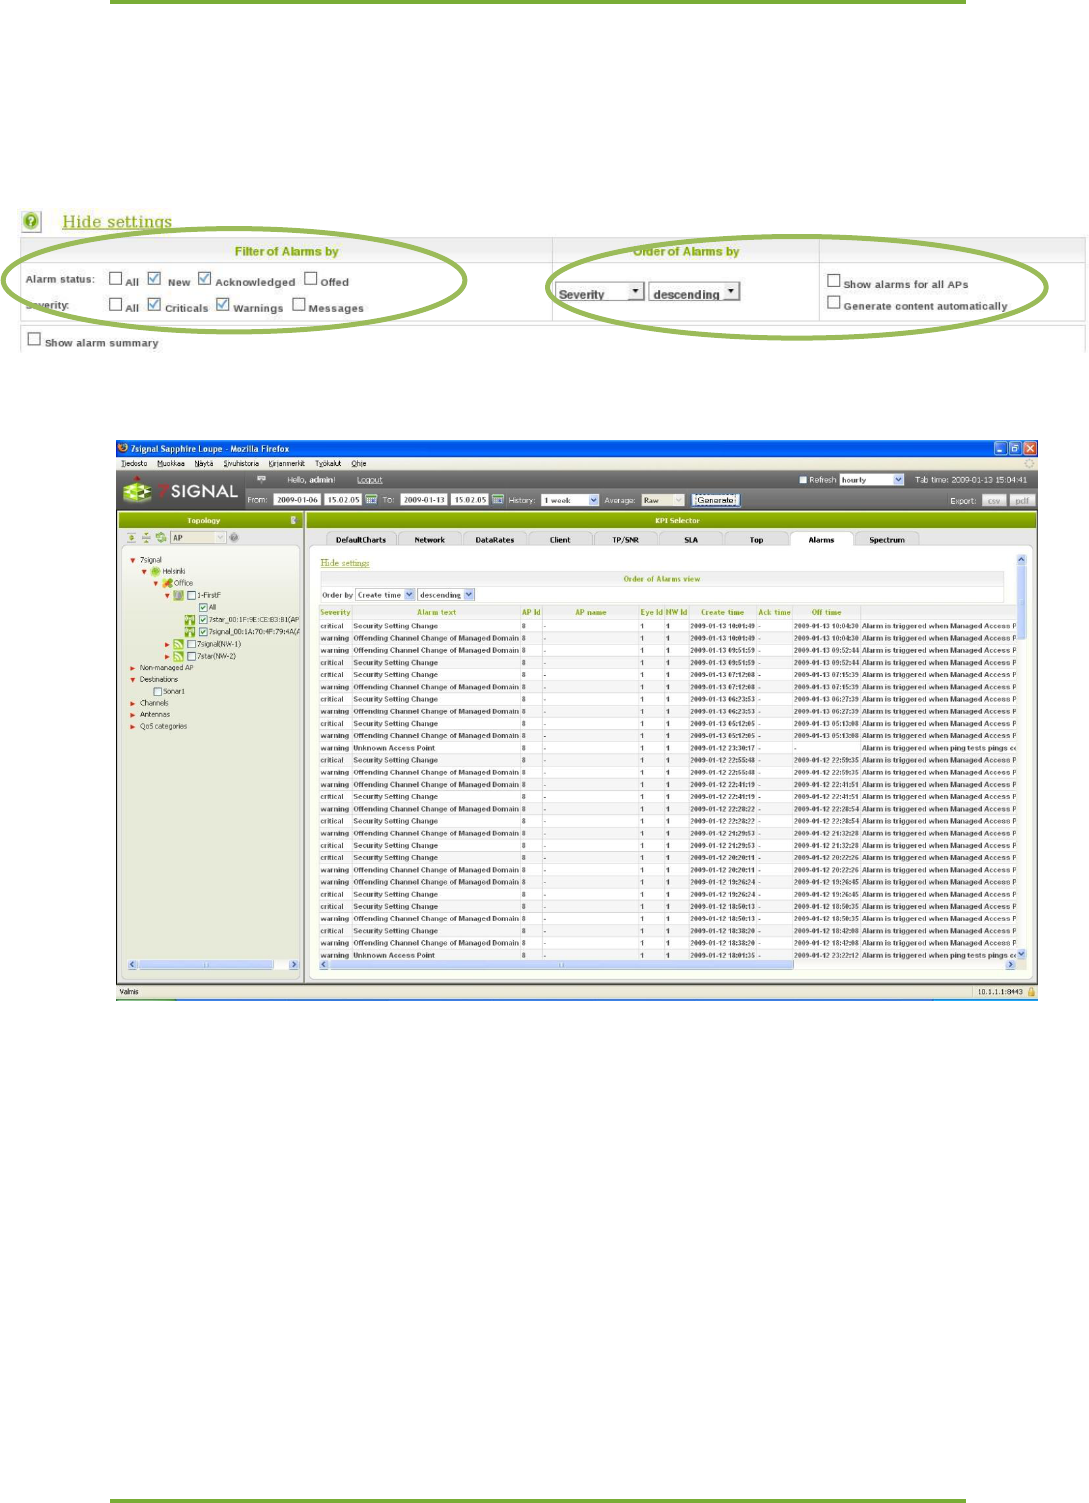
This view displays the extremes – the highest or lowest KPI values. The current value extremes
of a KPI can be seen in this view even when they are far from the alarm limits. This enables you
to react to worrying developments and trends before they cause actual problems.
12 Alarms 19
7signal Ltd, Panuntie 6, FI-00620 HELSINKI, FINLAND, +358 40 777 7611, info@7signal.com, www.7signal.com
7signal Sapphire Loupe User Guide Release 3.0
12 ALARMS
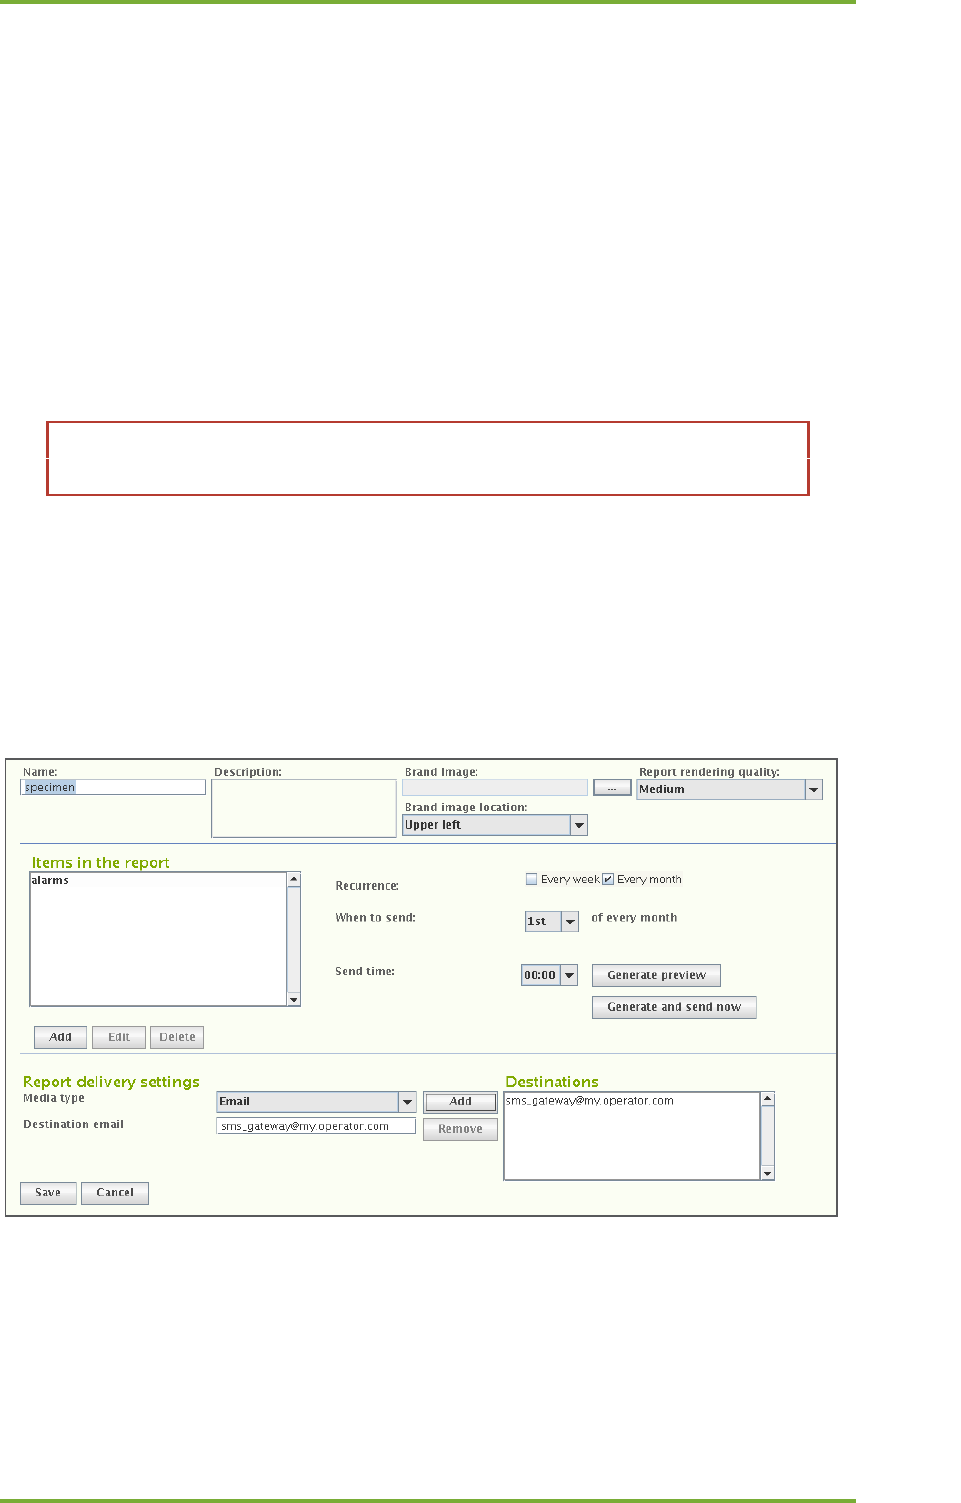
This view lists the alarms activated by Sapphire. Alarms are handled in Sapphire Carat. Loupe
simply offers an alternative view and reporting functionality.
13 Continuos And Automated Reporting 20
7signal Ltd, Panuntie 6, FI-00620 HELSINKI, FINLAND, +358 40 777 7611, info@7signal.com, www.7signal.com
7signal Sapphire Loupe User Guide Release 3.0
13 CONTINUOS AND AUTOMATED REPORTING
Loupe is an interactive tool for studying network phenomena of interest and for in-depth
investigation of problems. Reports in standard, easy-to-interpret formats are available to
support routine monitoring. The reports take almost the same form as the indicator view of
Loupe, and subscribing for a report is similar to using Loupe. Subscription must, however, be
done via the Carat management interface.
By using the report view in Carat, the user can configure reports from elements that are
familiar from Loupe. In addition to the user-selected indicators, a report configured here
contains the time of compilation and delivery and a list of the delivery addresses. At the
specified time, Carat generates the report and delivers it to the recipients, specified as either
e-mail addresses or directories in the Carat server file system. A report can include KPIs,
service level views, and alarms, referred to below as report items.
Note: Configuring the mail server settings found under “Edit | SMTP server”
enables the use of email in reporting.
13.1 Subscription for a new report
1. Select “Manage | Automated report configuration”
2. Select “New” to create a new subscription and open a report template
a. Use “Edit” for editing a subscription
b. The “Delete” option allows you to delete a subscription
c. When you select a report name, the description of this existing report is displayed
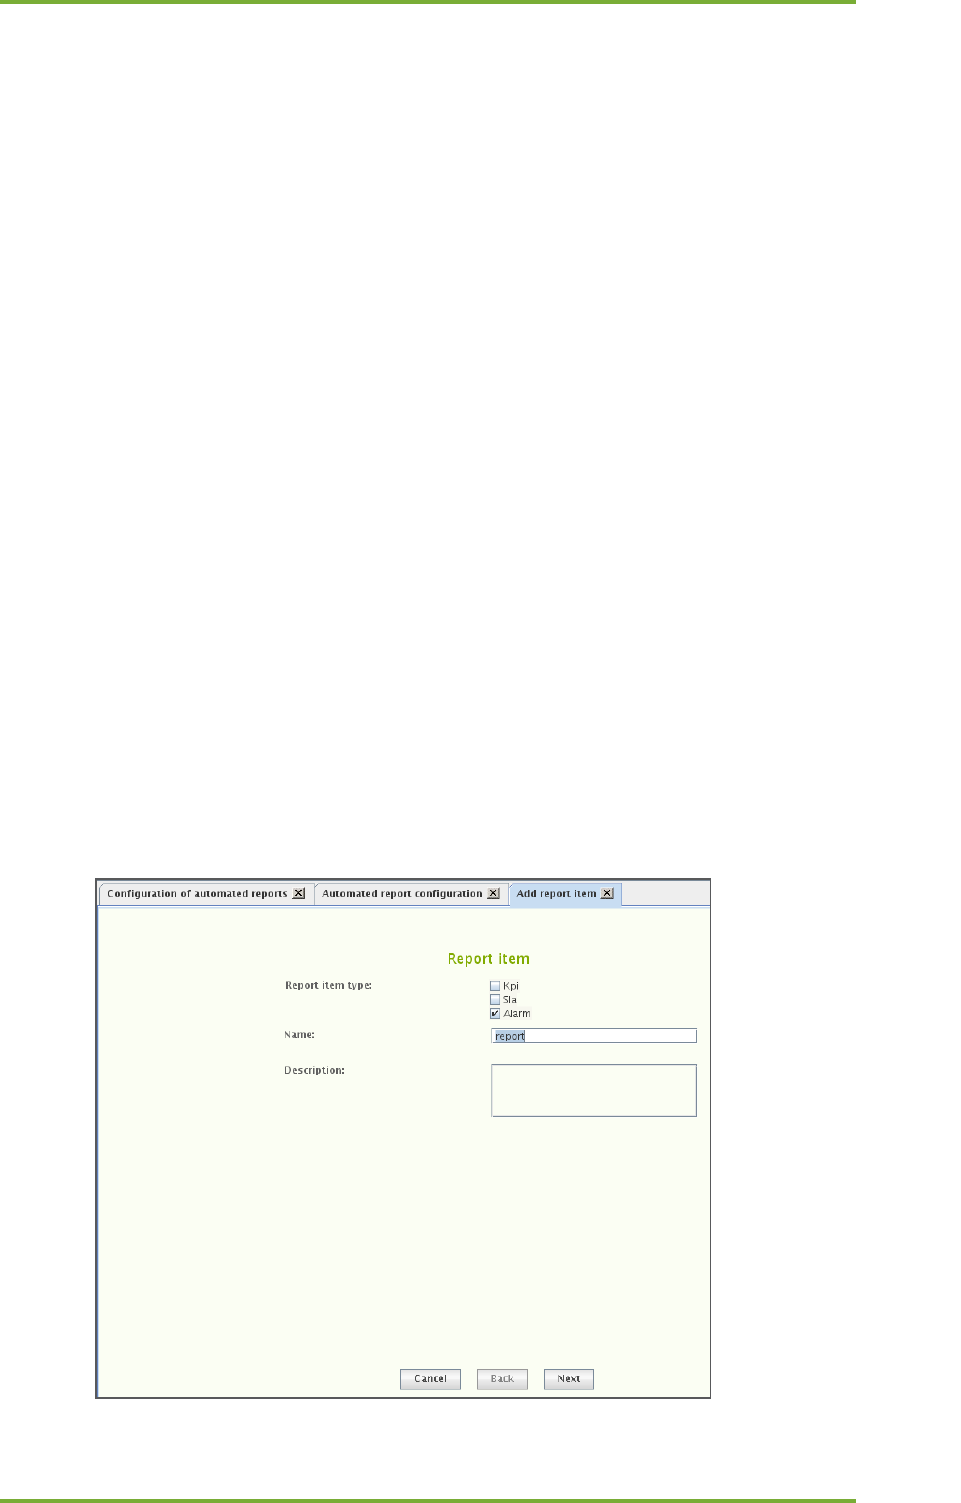
In the “Report Properties Configuration” area:
3. Enter a name for the subscription
4. Enter a description for the subscription (optional)
5. Select an image from the Carat server file system (optional)
6. Choose the location for the image on the page
The image will be repeated on each page of the report. It might represent, for example, a
company or a target network.
13 Continuos And Automated Reporting 21
7signal Ltd, Panuntie 6, FI-00620 HELSINKI, FINLAND, +358 40 777 7611, info@7signal.com, www.7signal.com
7signal Sapphire Loupe User Guide Release 3.0
7. Select the resolution (quality) to be used for the report graphics, mainly relevant to
charting.
In the “Report items” area:
8. Configure the items to be included in the report by selecting “Add”
a. this starts content-dependent workflows, instructions below
9. Specify the send time
a. recurrence is weekly or monthly
i. Field “When to send” is dynamic and let’s one choose either numerous
week days or a day in month
b. circadian time has 30 minutes resolution in a drop-down menu
10. “Generate preview” creates a report and opens it is a viewer tool
11. “Generate and send now” are available for subscriptions that have been saved.
In the “Report destination settings” area:
12. Choose the delivery format (Media type) of the PDF report
a. Email
b. save to File system
i. an absolute path gives the location in the Carat server file system
ii. relative paths are relative to the Carat startup directory (default:
/opt/7signal/Carat/7signal)
13. Add one or more formats in the “Destinations” field by clicking “New”
14. Save the subscription by clicking “Save”
13.2 Adding Report Items
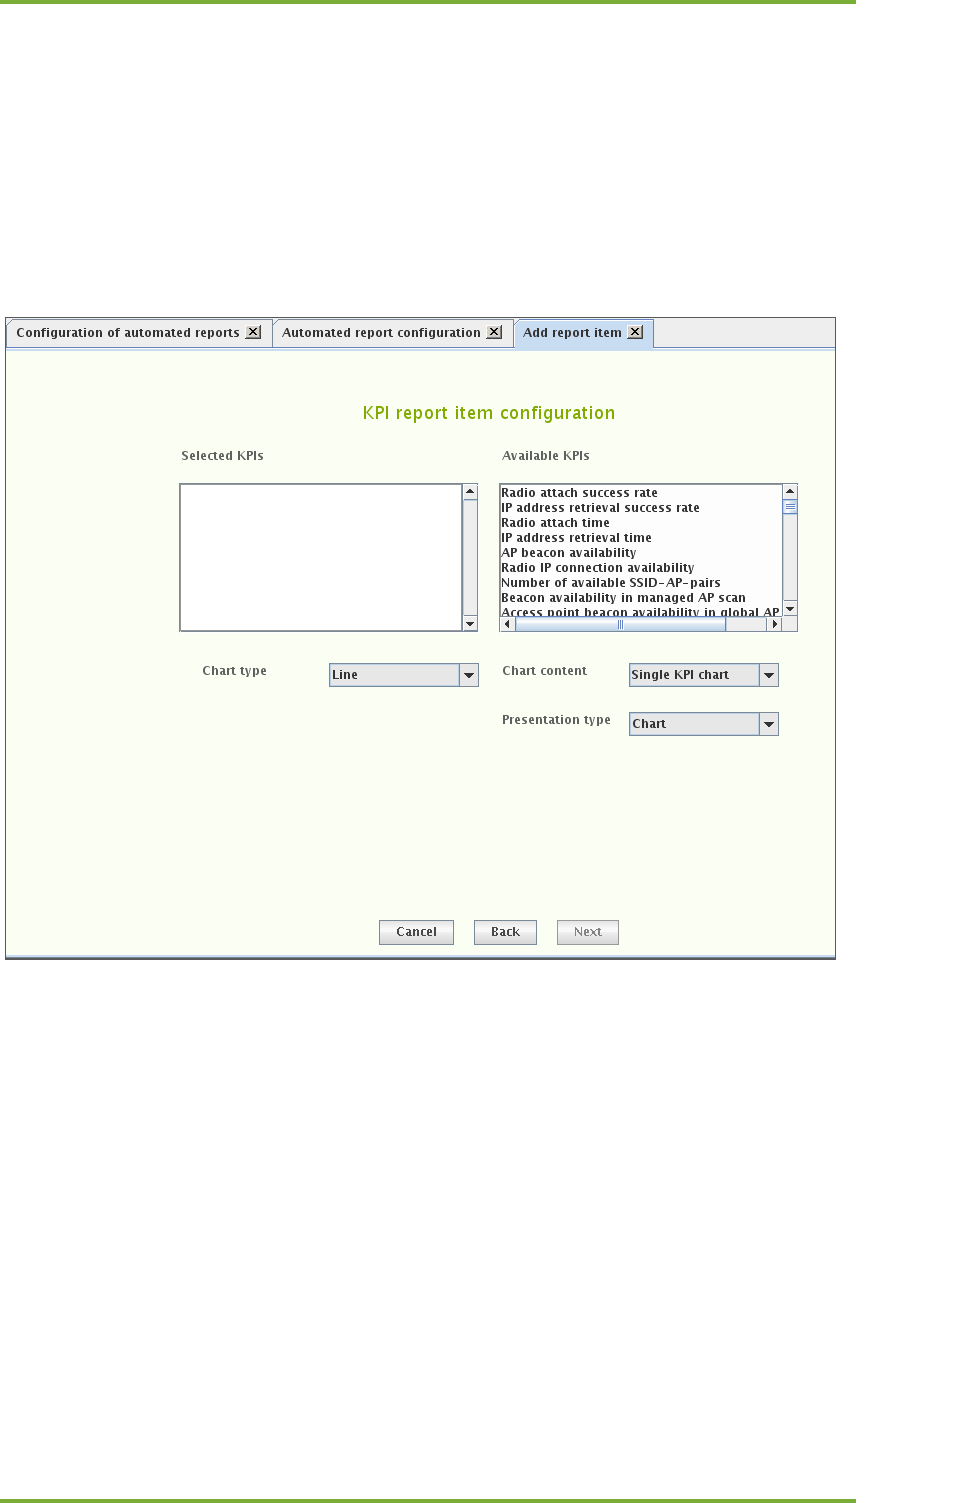
There are three report item types. A report item is an individual piece of information – a single
KPI chart or SLA table or a set of alarms – that is part of the report. A report is a series of
report items.
13 Continuos And Automated Reporting 22
7signal Ltd, Panuntie 6, FI-00620 HELSINKI, FINLAND, +358 40 777 7611, info@7signal.com, www.7signal.com
7signal Sapphire Loupe User Guide Release 3.0
To add a report item:
1. Choose the content type
2. Give a name to the report item
a. a descriptive name is good especially if the item content groups together
numerous pieces of information
3. Optionally write a description of the report item
4. Select “Next”
13.3 Indicator Content Type
1. Select the desired KPI by left-clicking it in the right-hand pane
2. Right-click and select “Add KPI” in the submenu
3. Repeat steps 2–3 until all desired KPIs are in the left pane
4. Select the Chart type
5. Select the method for displaying the measurement series in Chart content
6. Select the display method
a. Data Table, Aggregation Chart
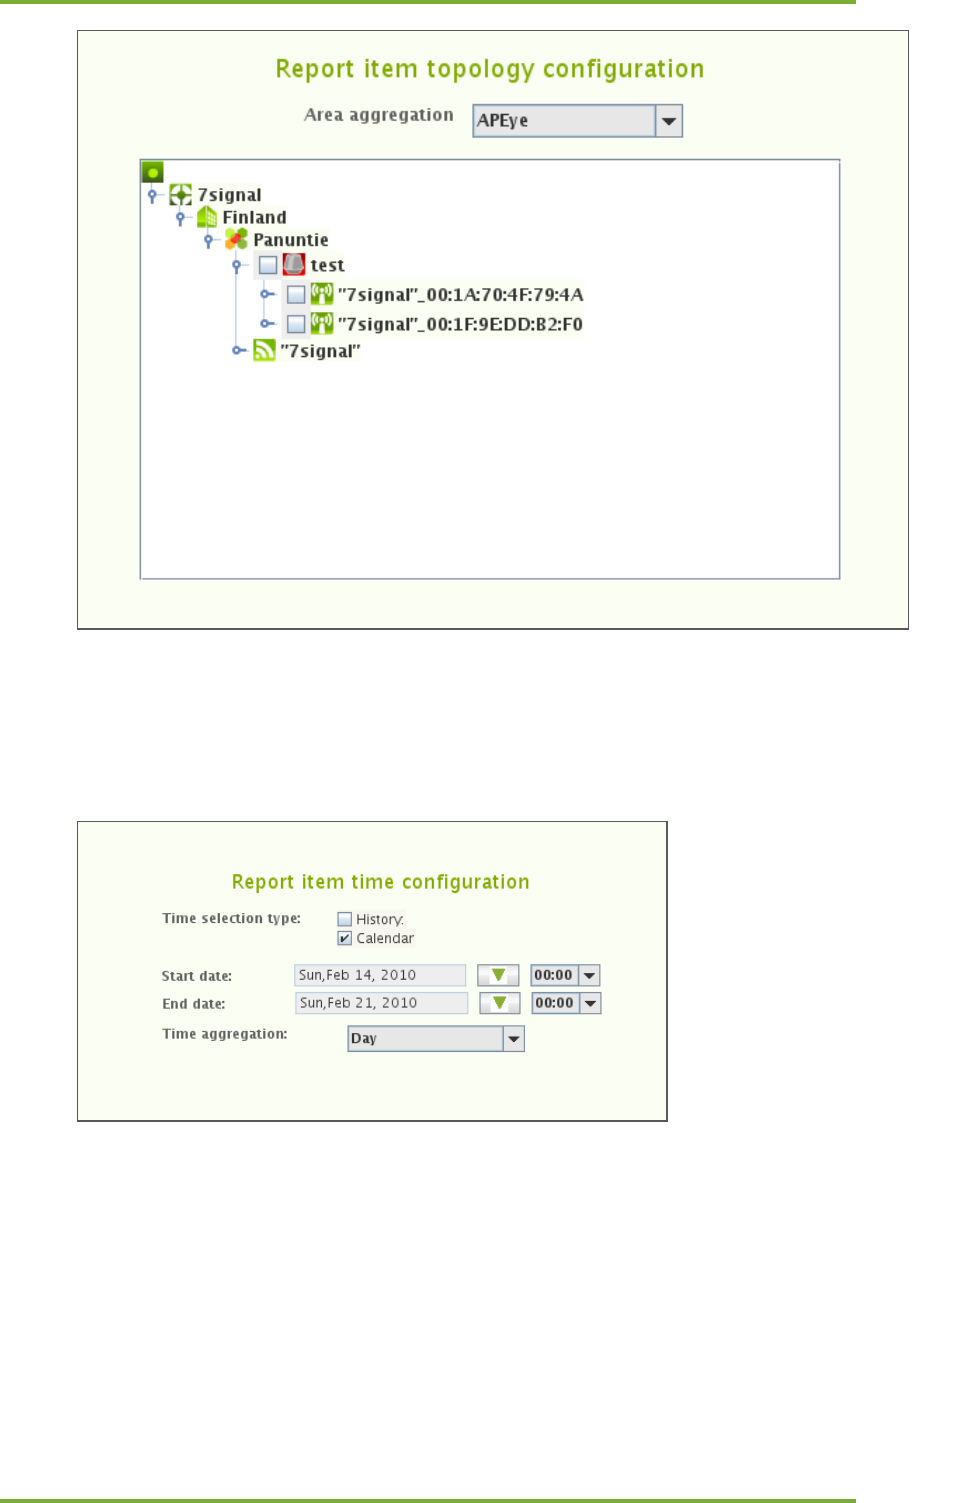
7. Click “Next” to continue to “Report item topology configuration”
13 Continuos And Automated Reporting 23
7signal Ltd, Panuntie 6, FI-00620 HELSINKI, FINLAND, +358 40 777 7611, info@7signal.com, www.7signal.com
7signal Sapphire Loupe User Guide Release 3.0
8. Select the method of aggregation in Area aggreation
a. Note that maybe not all Loupe aggregations are available in the report
9. From the hierarchical tree presented, select the access points or networks to be
included in the report by ticking the check-boxes
10. Click “Next” to continue to “Report item time configuration”
11. Select the time interval for the report
a. History uses pre-defined intervals from the generation time backwards
b. Calendar (in the picture above) allows free interval definition
12. Time aggregation defines the averaging period for the report item
13. Click “Finish” to return to first subscription page
13.4 Service level content type, SLA
The pre-requisite is that there has to be SLA groups defined in the system. SLA report an SLA
group to be bound to a topology element. KPI set and related threshold values are defined in
13 Continuos And Automated Reporting 24
7signal Ltd, Panuntie 6, FI-00620 HELSINKI, FINLAND, +358 40 777 7611, info@7signal.com, www.7signal.com
7signal Sapphire Loupe User Guide Release 3.0
SLA groups, in automated report only SLA group is combined with the elements that should
fulfill the SLA defined in the SLA group
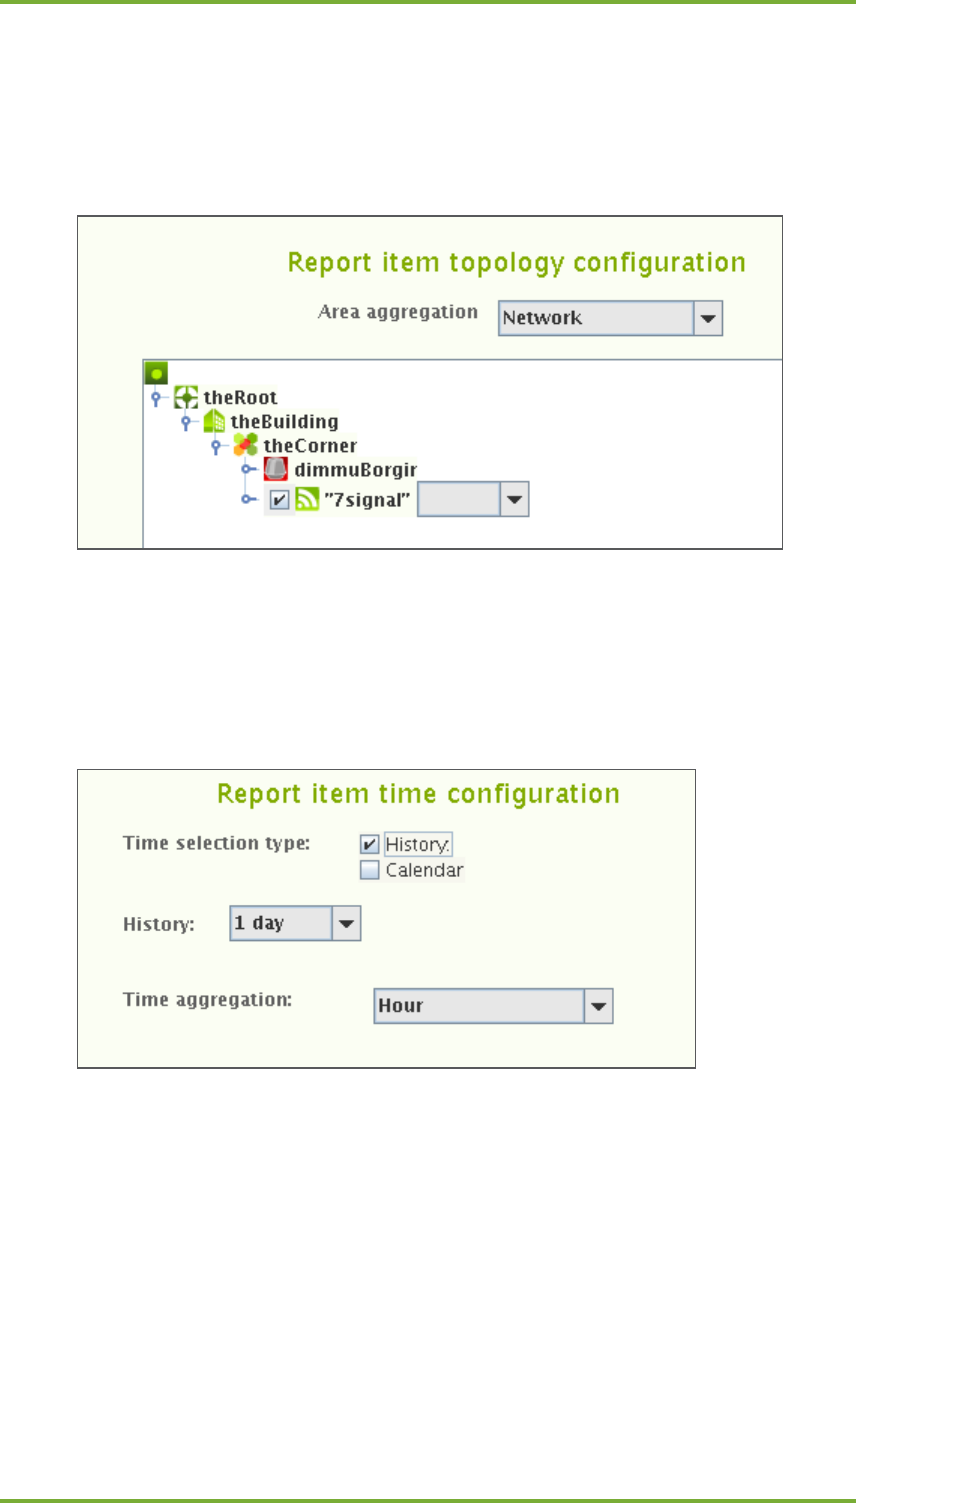
The following sequence happens in “Report item topology configuration” pane. It open after
choosing SLA type of report item in the previous dialog.
1. Choose the appropriate aggregation in the drop-down box.
2.
3. Select the elements in the topology tree
4. Select the SLA group to be applied. Available SLA groups are in a drop-down menu on
the right of the topology element name.
5. Repeat steps 2-3 until all desired elements are bound to SLA groups.
6. Click “Next” to continue to “Report item time configuration”
7. Select the time interval for the report
a. History (in the picture above)uses pre-defined intervals from the generation
time backwards
b. Calendar allows free interval definition
8. Time aggregation defines the averaging period for the report item
9. Click “Finish” to return to first subscription page
13 Continuos And Automated Reporting 25
7signal Ltd, Panuntie 6, FI-00620 HELSINKI, FINLAND, +358 40 777 7611, info@7signal.com, www.7signal.com
7signal Sapphire Loupe User Guide Release 3.0
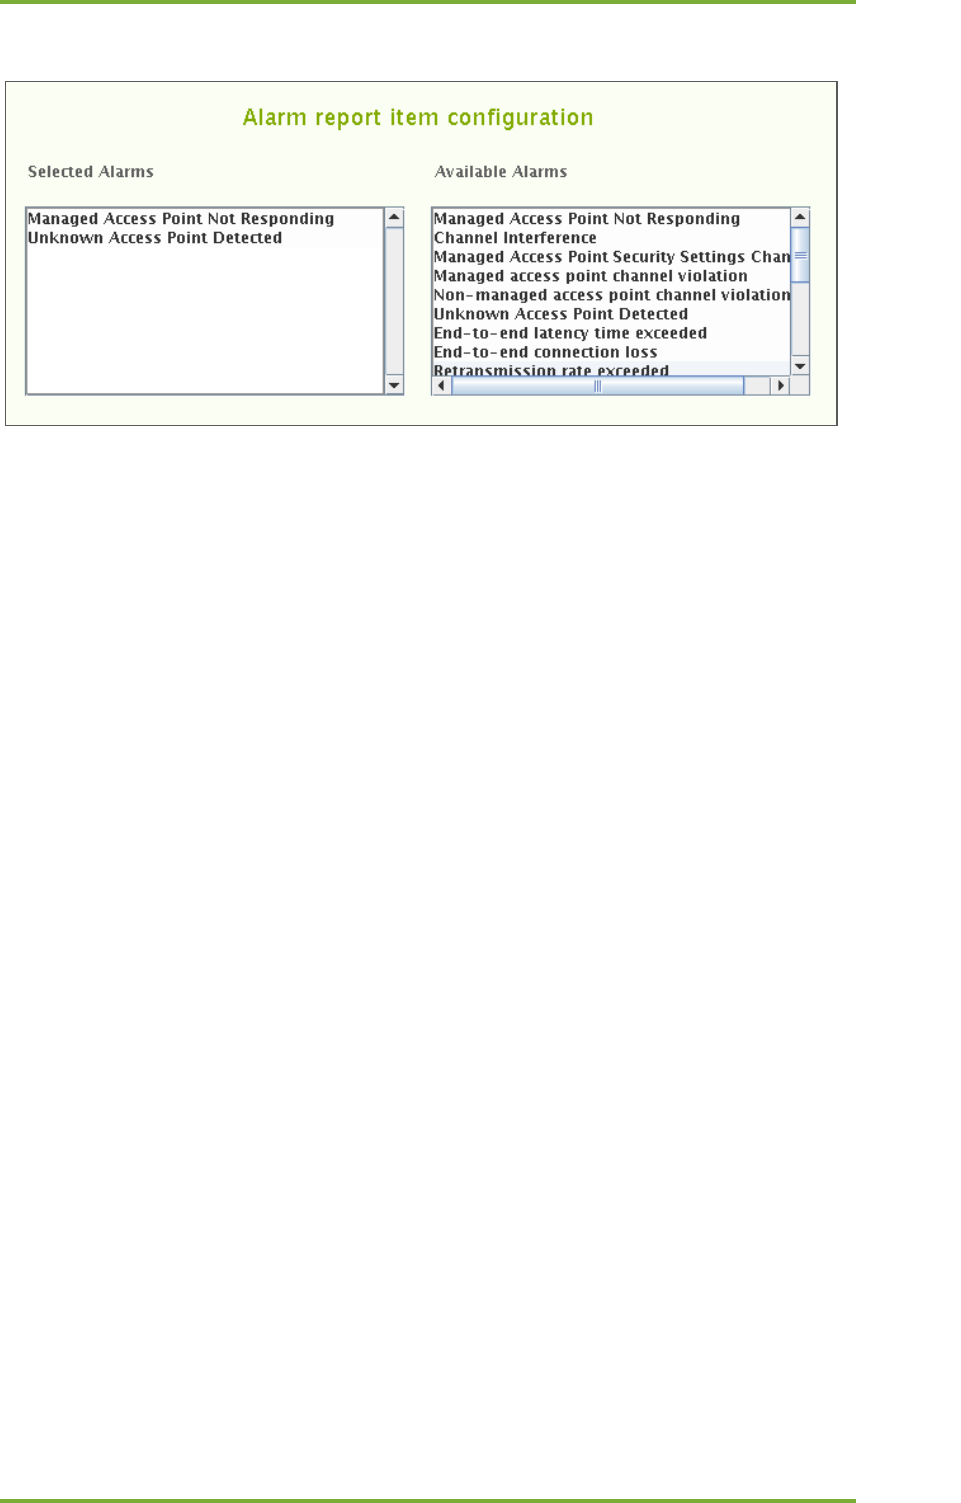
13.5 Alarm Content Type
1. Select the desired alarm by left-clicking it in the right-hand pane
2. Right-click the alarm and select “Add alarm” in the submenu
a. One may remind oneself about the alarm by selecting “Description”
3. Repeat steps 2–3 until all of the desired alarms are in the left pane
4. Select “Next” to continue to “Report item topology configuration” (pictured above)
5. Select the method of aggregation in Area aggregation
a. Note that maybe not all Loupe aggregations are available in the report
6. From the hierarchical tree presented, select the access points or networks to be
included in the report by ticking the check-boxes
7. Select “Next” to continue to “Report item time configuration”
8. Select the time interval for the report
a. History uses pre-defined intervals from the generation time backwards
b. Calendar allows free interval definition
9. Time aggregation defines the averaging period for the report item
10. Click “Finish” to return to first subscription page
14 How To Troubleshoot Using Loupe 26
7signal Ltd, Panuntie 6, FI-00620 HELSINKI, FINLAND, +358 40 777 7611, info@7signal.com, www.7signal.com
7signal Sapphire Loupe User Guide Release 3.0
14 HOW TO TROUBLESHOOT USING LOUPE
14.1 Typical pattern
A typical troubleshooting workflow is as follows:
1. When logging in, you discover that there is an unusually large amount of failed wireless
connection availability tests (AC001).
2. Go to the SLA tab and choose the access point or network where the problem has
occurred. From the pull-down menu, choose the last 7 days as the time span and set the
averaging period to 1 hour. These settings bring out the times of the failed tests in more
detail.
3. Go to the Network tab, set the time span to cover the problematic times detected in step
2, and use 1-hour averaging. Select the KPIs. The problem with the wireless connection
availability in this example is commonly caused by the following factors:
a. Increased load in the wireless network
i. TR003 (Client count per AP)
b. Changes in the interference levels
i. QURS002 (AP signal level at Eye)
ii. QURS003 (AP signal to noise ratio at Eye)
Additional factors can be:
c. Authentication or DHCP problems in a wired network
i. QURT004 (Ping RTT)
14.2 Troubleshooting: Use Cases
14.2.1 Accessibility Problem
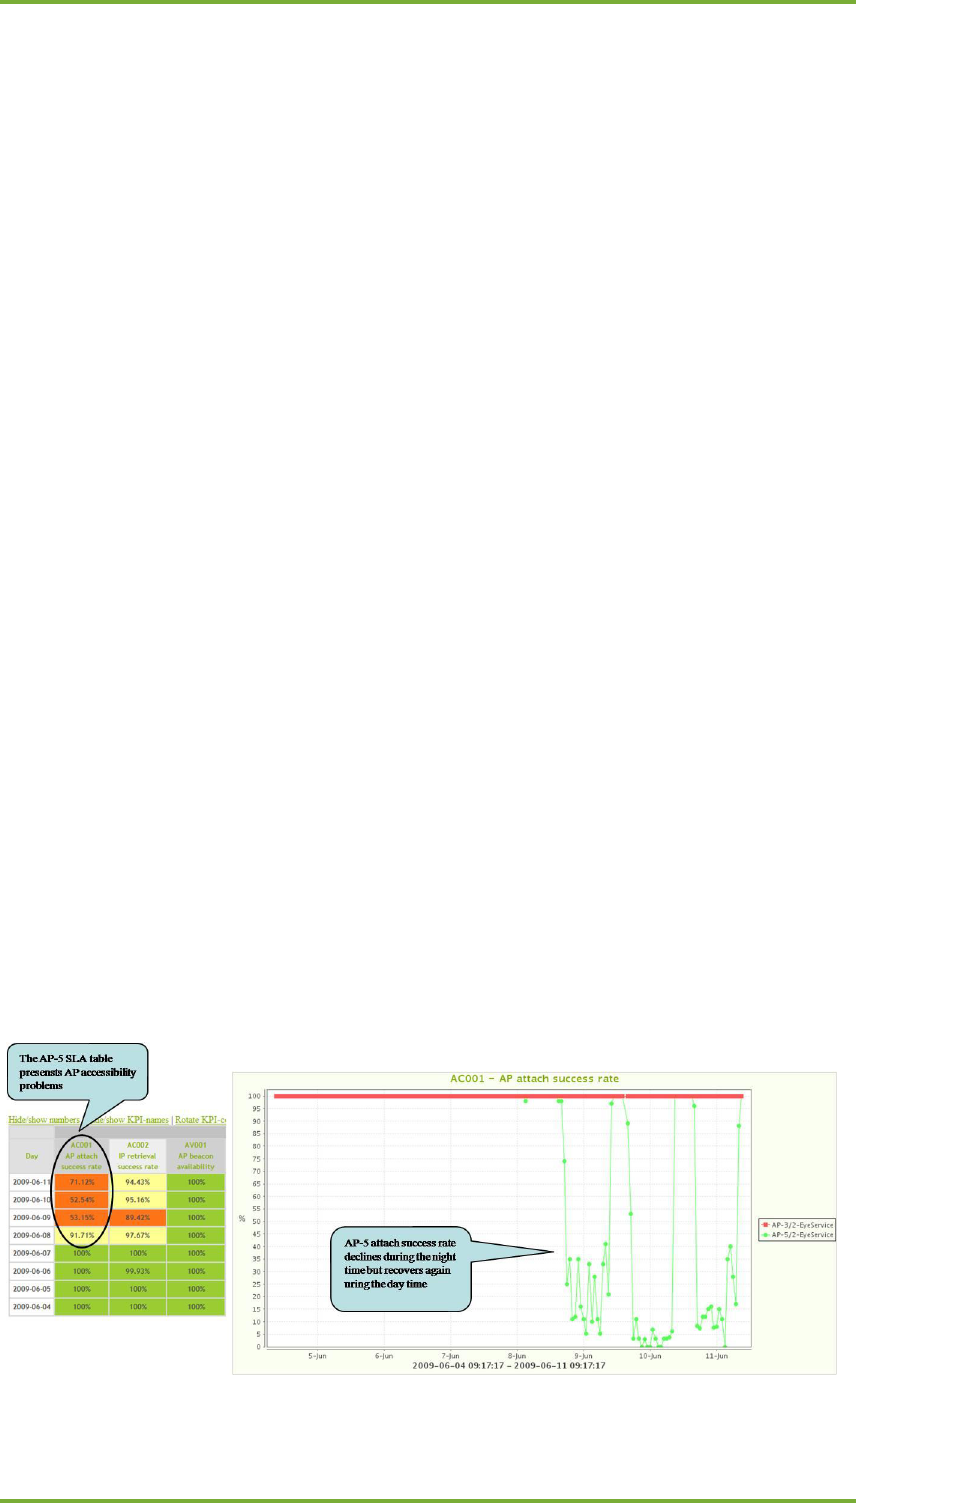
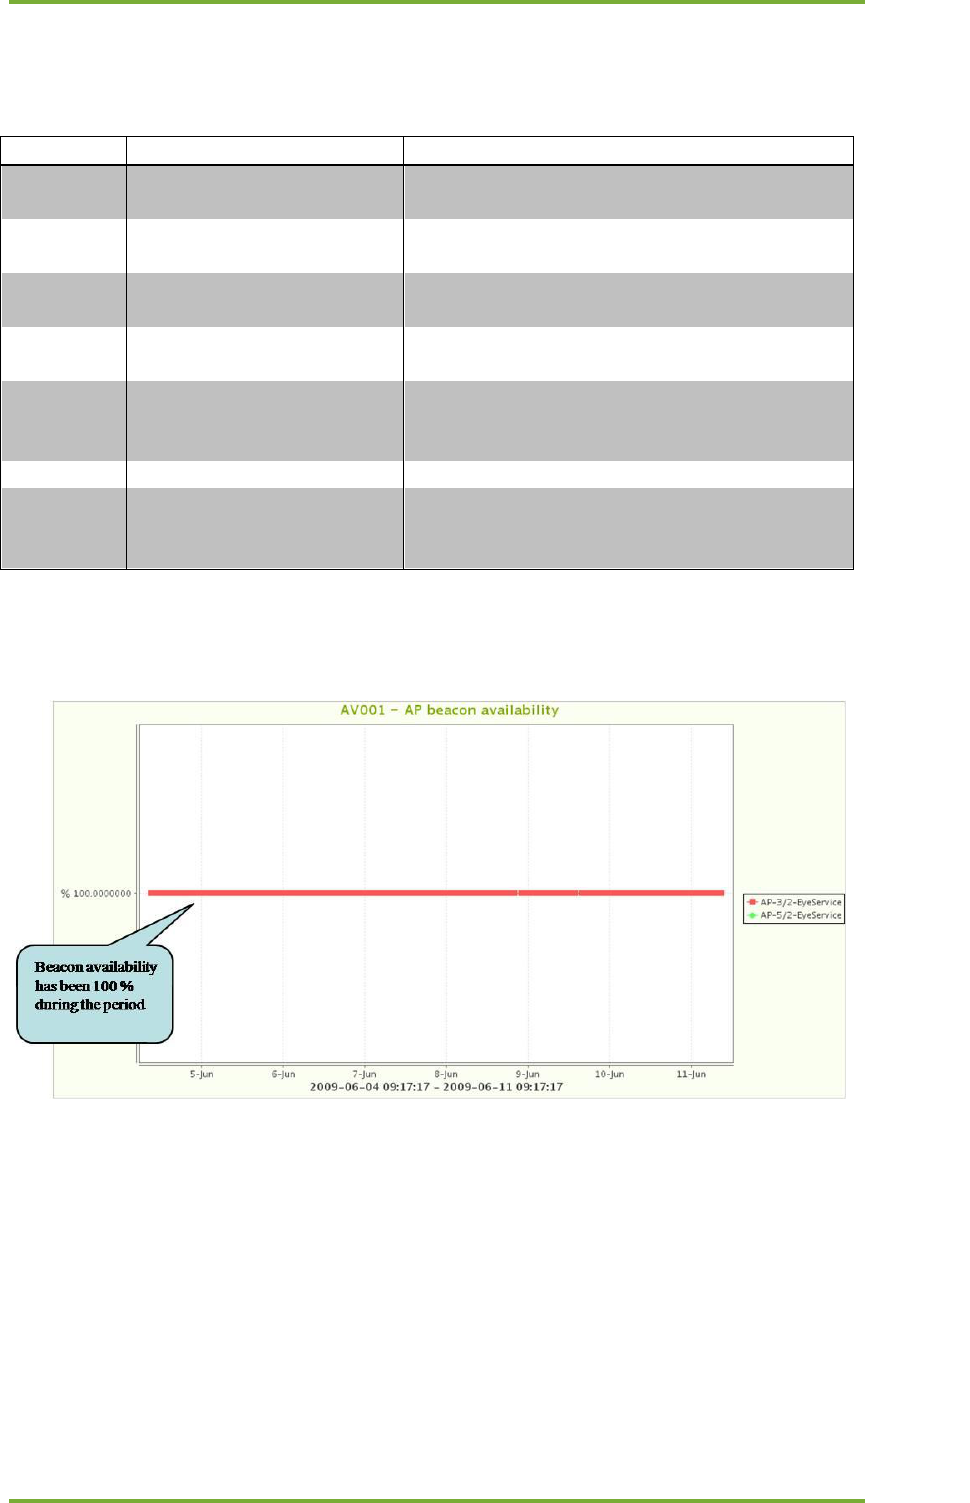
The "AP attach success rate" presents both radio attaching and authentication success rate.
14 How To Troubleshoot Using Loupe 27
7signal Ltd, Panuntie 6, FI-00620 HELSINKI, FINLAND, +358 40 777 7611, info@7signal.com, www.7signal.com
7signal Sapphire Loupe User Guide Release 3.0
Wireless or fixed network problem?
Check also these KPIs:
KPI ID
Name
Description
AV001
AP beacon availability
The beacon availability presents if AP has been
active and achievable
QURS002
AP signal level at Eye
The measured AP signal level and SNR presents
the radio environment variations
QURS003
AP SNR at Eye
The measured AP signal level and SNR presents
the radio environment variations
AV010
AP Channel information
The AP channel KPI presents the possible radio
channel changes of managed and neighbor APs
QURS004
AP retransmission rate
The AP retransmission rate presents the
possible radio problems between AP and
Clients
TR003
Client count per AP
The AP Client count presents radio load issues
QURS001
Channel noise level at Eye
and Spectrum-view
The channel noise level together with
Spectrum-view presents possible interference
issues and locations
AP beacon availability (AV001)
The beacon availability presents if AP has been active and achievable
AP radio transmission has been active
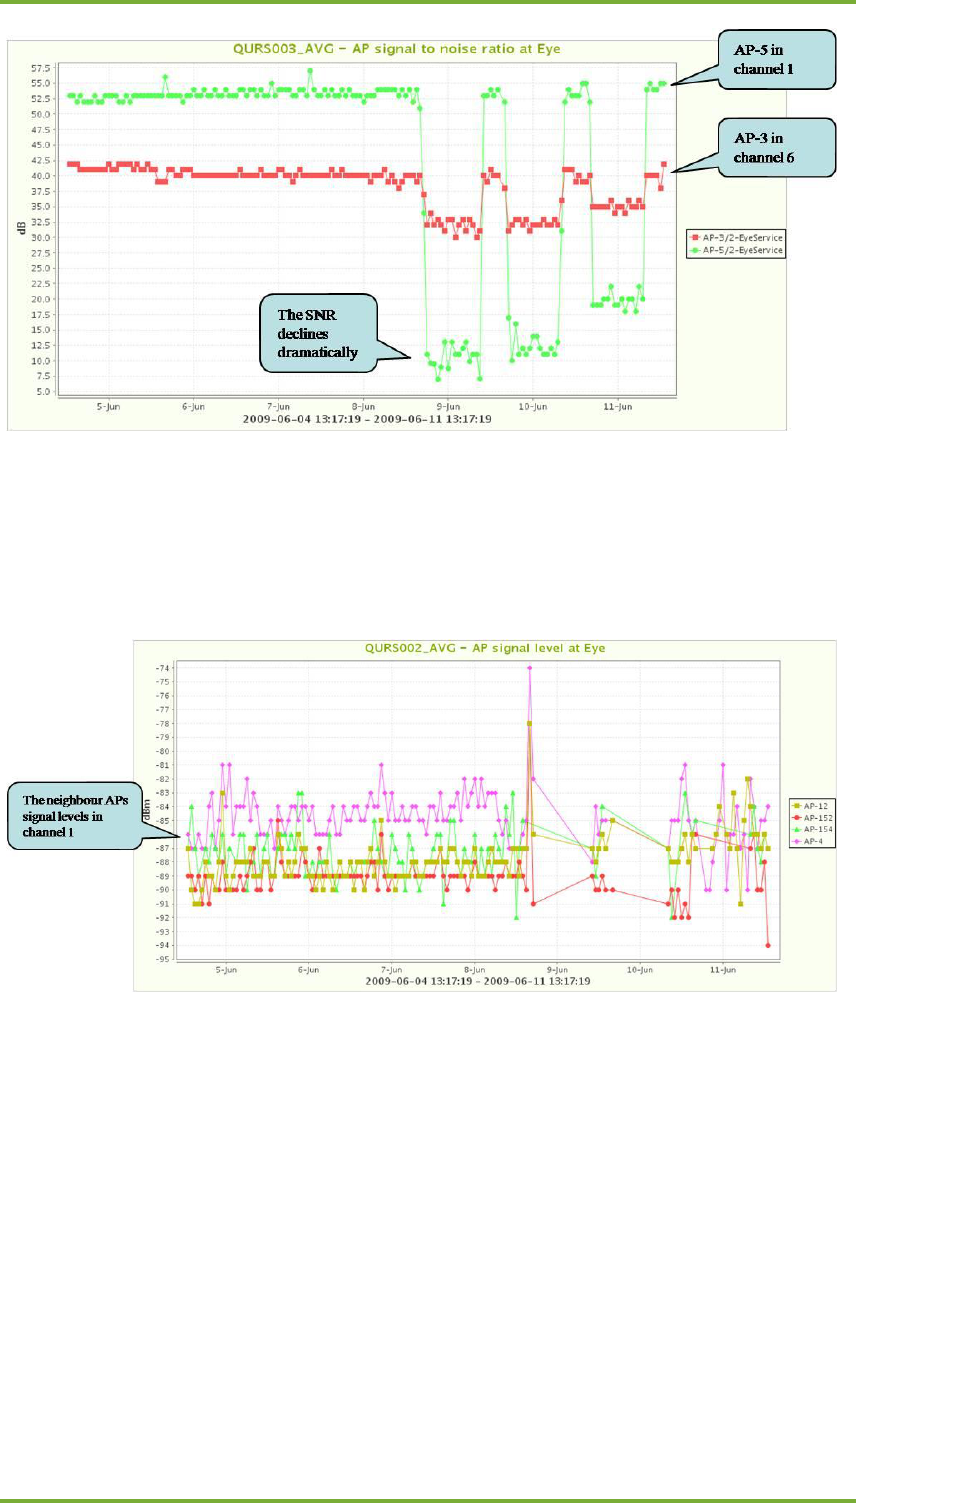
AP SNR at Eye (QURS003)
The measured AP signal level and SNR indicate variations in the radio environment
14 How To Troubleshoot Using Loupe 28
7signal Ltd, Panuntie 6, FI-00620 HELSINKI, FINLAND, +358 40 777 7611, info@7signal.com, www.7signal.com
7signal Sapphire Loupe User Guide Release 3.0
The SNR declines dramatically during the night-time
Wireless problem; Location and source ?
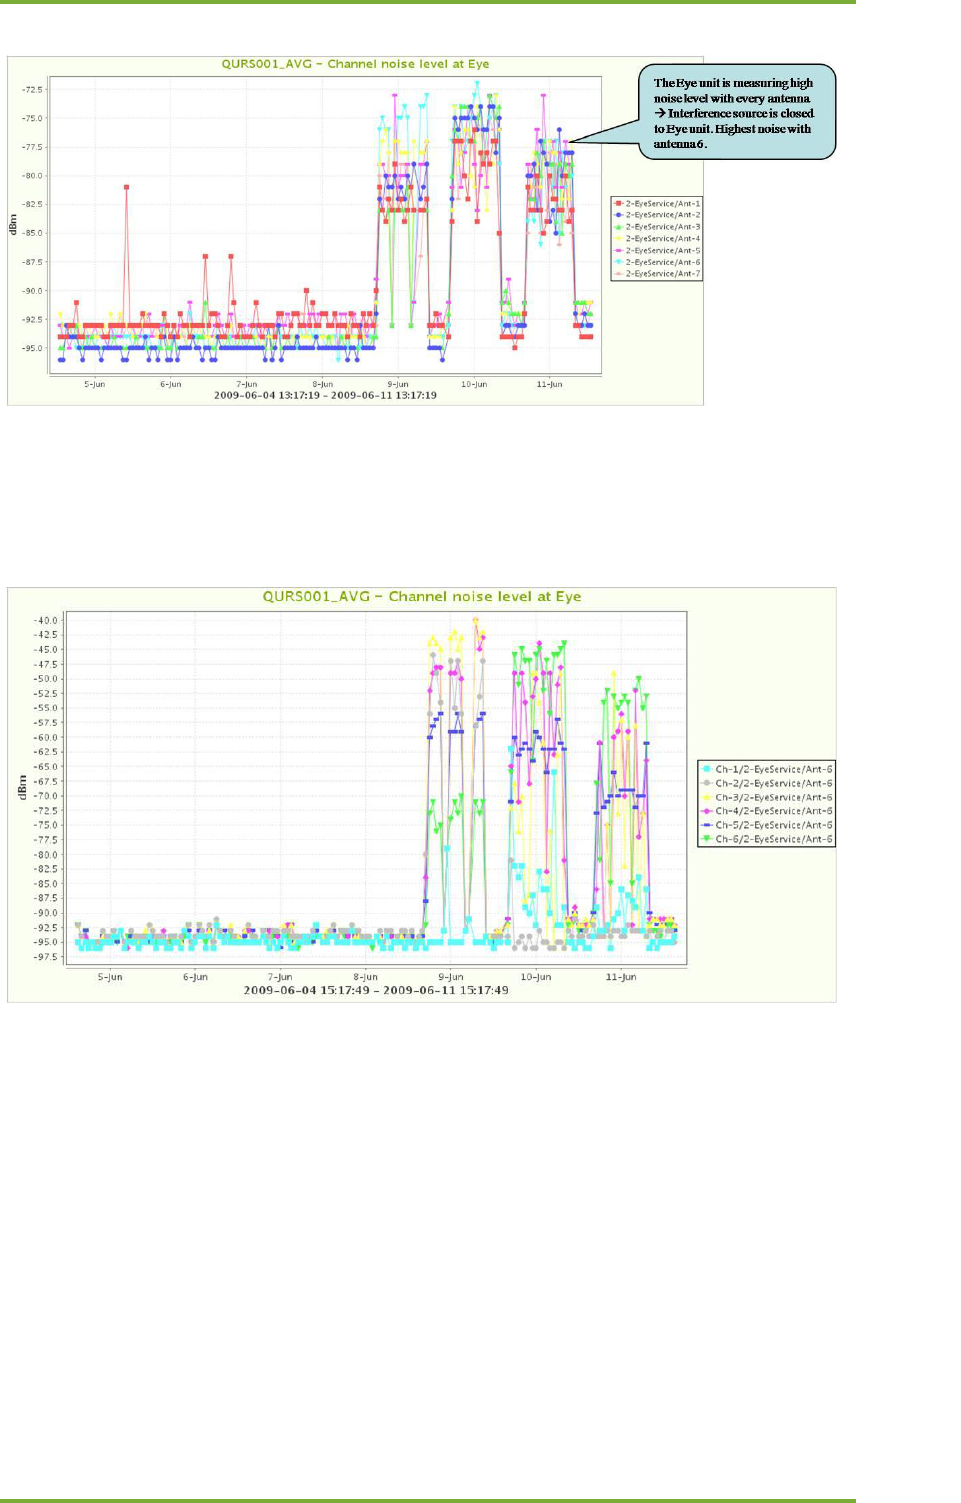
The signal levels of neighbor APs (QURS002)
The measured AP signal level and SNR indicate variations in the radio environment
Channel noise level / Antenna (QURS001)
The channel noise level together with Spectrum-view indicates possible interference issues
and locations.
14 How To Troubleshoot Using Loupe 29
7signal Ltd, Panuntie 6, FI-00620 HELSINKI, FINLAND, +358 40 777 7611, info@7signal.com, www.7signal.com
7signal Sapphire Loupe User Guide Release 3.0
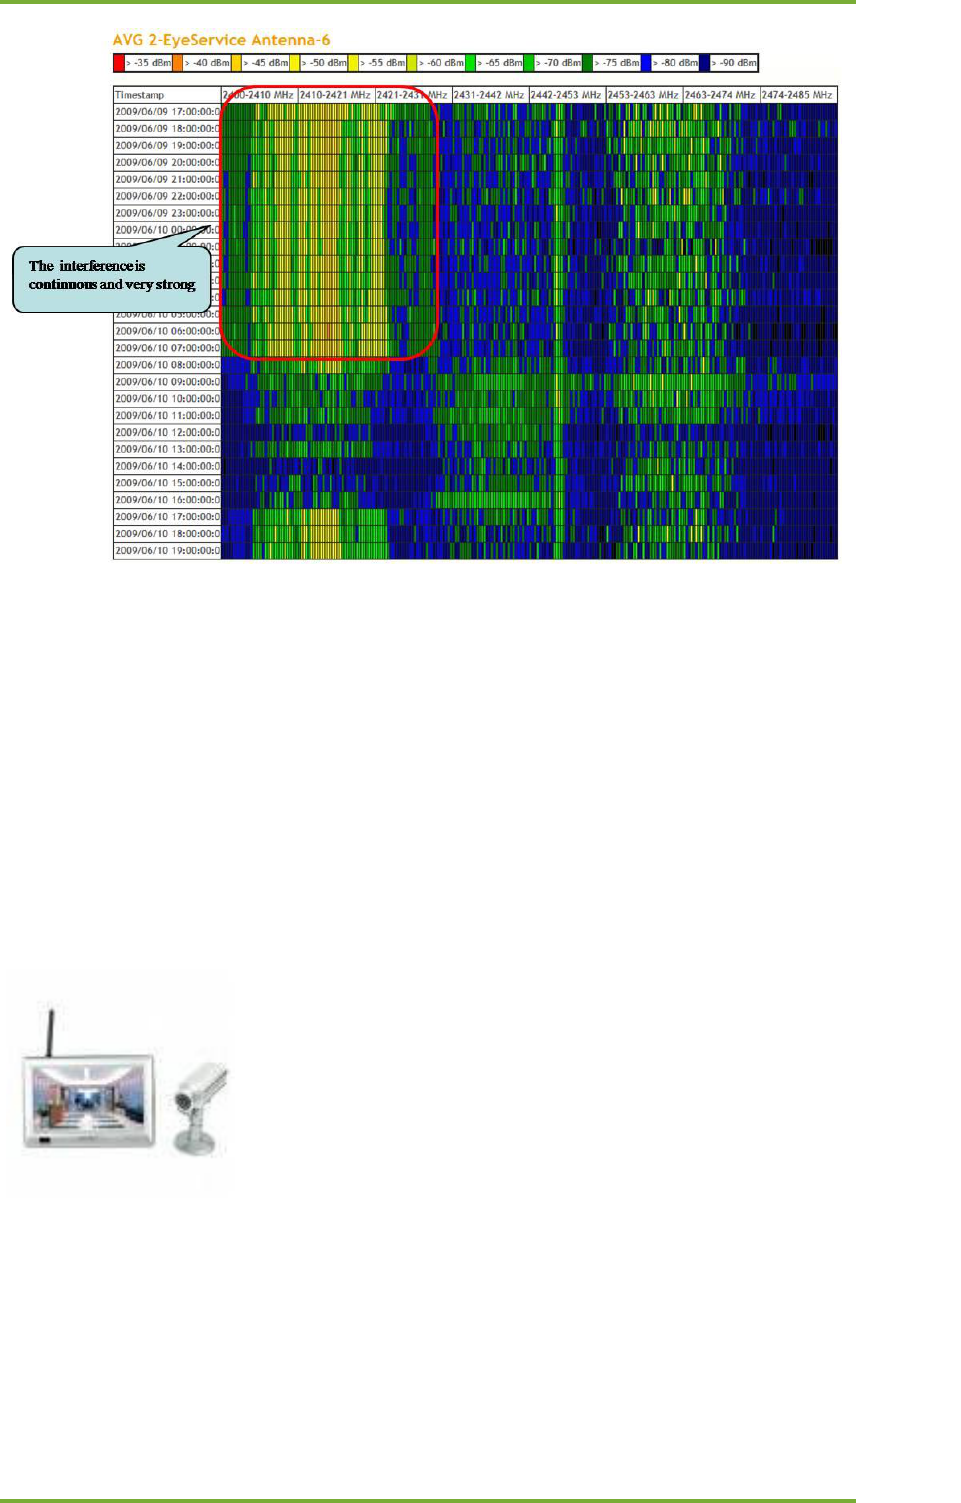
Channel noise level / Antenna 6, channels 1-6 (QURS001)
The channel noise level together with Spectrum-view indicates possible interference issues
and locations.
Spectrum-view / Antenna 6 (QURS001)
The channel noise level together with Spectrum-view indicates possible interference issues
and locations.
14 How To Troubleshoot Using Loupe 30
7signal Ltd, Panuntie 6, FI-00620 HELSINKI, FINLAND, +358 40 777 7611, info@7signal.com, www.7signal.com
7signal Sapphire Loupe User Guide Release 3.0
Case 1 summary
The attach success rate declination is also visible in other test results.
Attach times increase, the IP retrieval success rate declines, the FTP and VoIP test success rate
declines etc.
The strong SNR declination and noise level increase indicates wireless problems.
The problem is caused by strong interference which is active during the night-times. The
interference has a strong impact on Wi-Fi channels 1-6. The interference source is in Eye
antenna direction 6.
The extensive, strong and continuous interference is caused by FM-modulation
wireless observation system in 2.4GHz Wi-Fi band.
14 How To Troubleshoot Using Loupe 31
7signal Ltd, Panuntie 6, FI-00620 HELSINKI, FINLAND, +358 40 777 7611, info@7signal.com, www.7signal.com
7signal Sapphire Loupe User Guide Release 3.0
14.3 Downlink Performance Problem
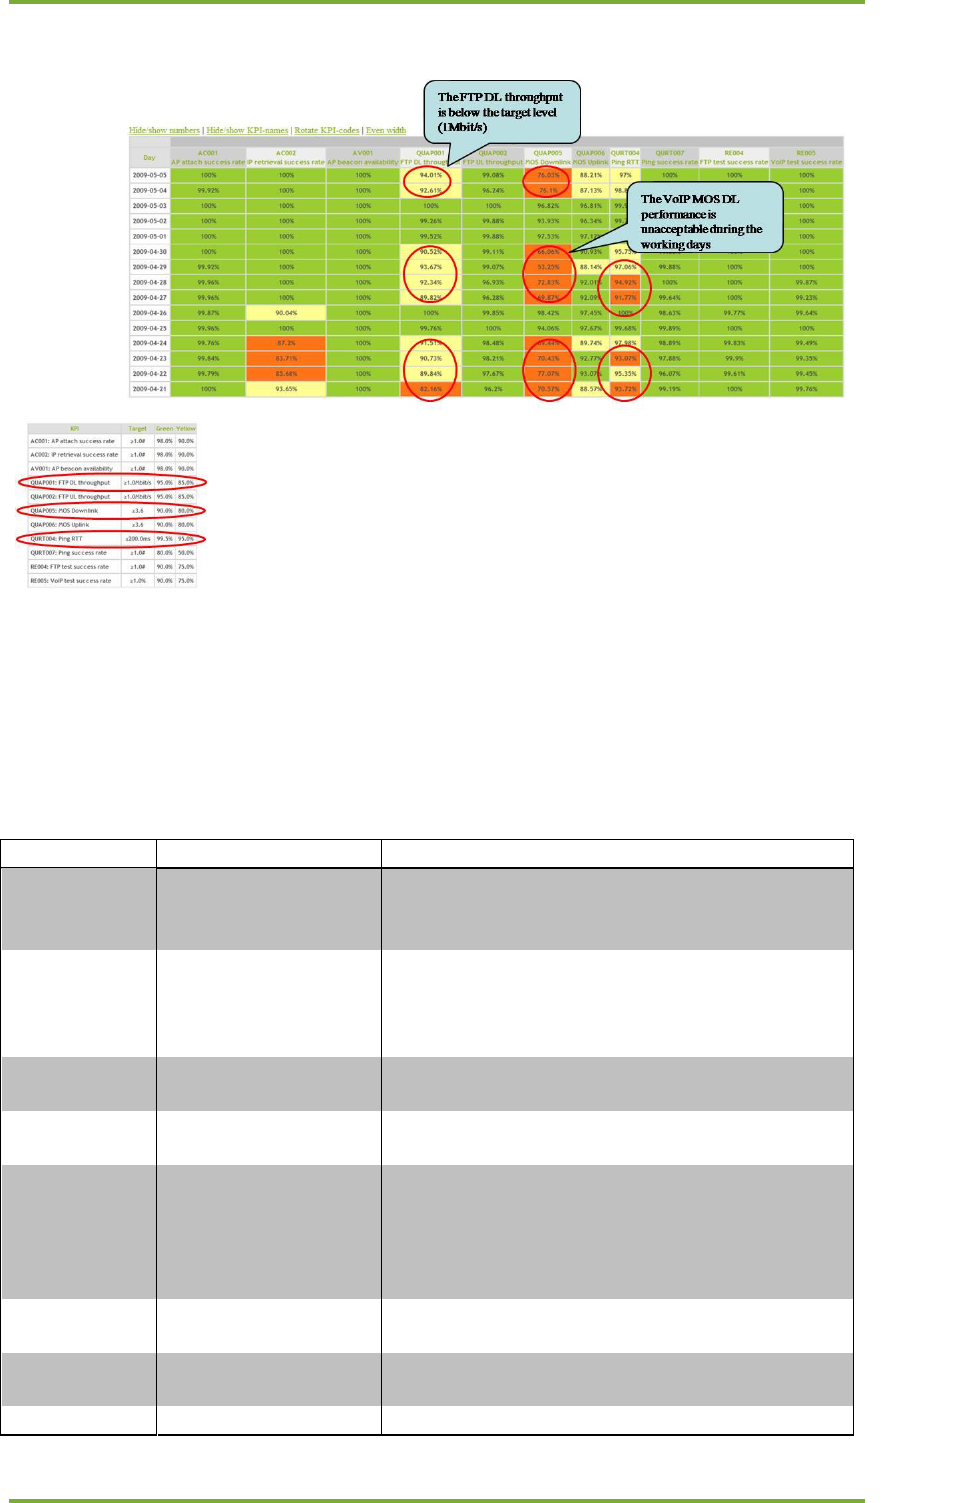
The network SLA table shows the performance situation of all the APs
The table presents downlink performance problems during the working days.
Wireless or fixed network problem?
Check also these KPIs:
KPI ID / tab
Name
Description
TP/SNR
FTP DL throughput
variation as a function
of SNR
The TP/SNR KPI presents if wireless and/or wired
side conditions change repeatedly
QUAP005
VoIP MOS downlink
(listen)
The VoIP MOS KPI presents detailed information
about VoIP MOS variation in the network. With 2
or more Sonar setup the VoIP MOS performance
can be observed in wireless and wired side.
QUAP015
VoIP MOS packet loss
The VoIP packet loss KPI presents the network
packet loss situation
QURT004
Ping RTT
The round trip time presents the e2e connection
delay variation
QUAP001
FTP DL throughput
The FTP DL throughput KPI presents detailed
information about throughput variation in the
network. With 2 or more Sonar setup the
throughput problem can be limit to wireless /
wired side.
QUIP005
FTP DL packet size
The radio packet size KPI presents the possible
packet size variation in the radio interface
QURS002
AP signal level at Eye
The measured AP signal level and SNR presents
the radio environment variations
QURS003
AP SNR at Eye
The measured AP signal level and SNR presents
14 How To Troubleshoot Using Loupe 32
7signal Ltd, Panuntie 6, FI-00620 HELSINKI, FINLAND, +358 40 777 7611, info@7signal.com, www.7signal.com
7signal Sapphire Loupe User Guide Release 3.0
the radio environment variations
Client
Client detailed
statistics
E.g. Client retransmission rate and client packet
size presents also the end-user performance
Data rates
DL codec distribution
The data rates codec distribution KPI presents the
downlink codec usage in the active tests
TR003
Client count per AP
The AP Client count presents radio load issues
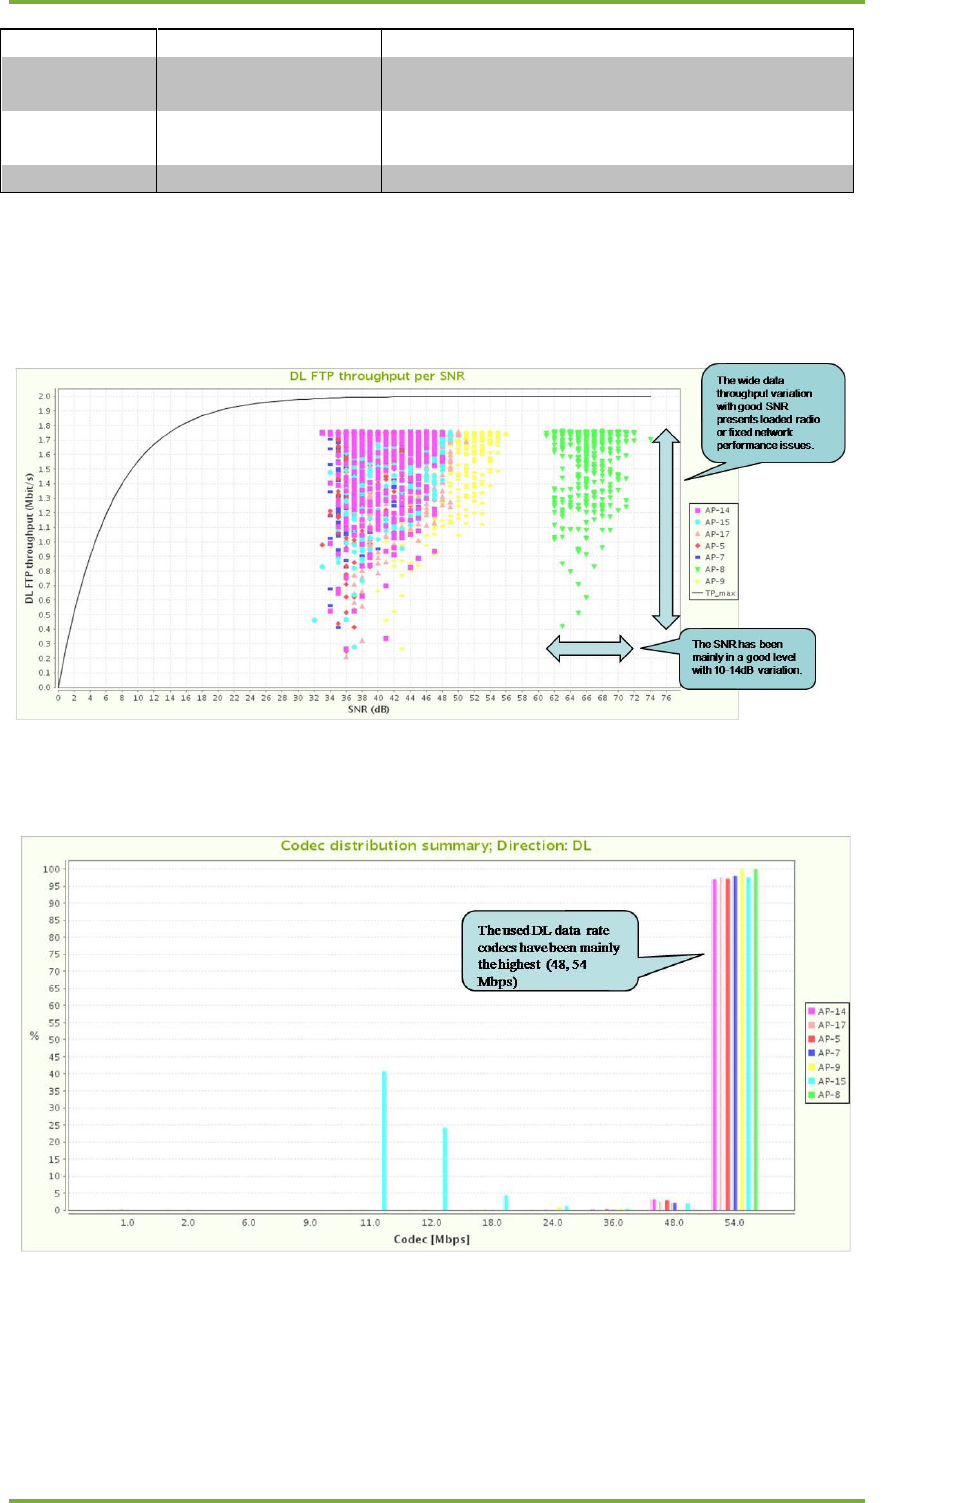
FTP DL throughput / SNR (TP/SNR)
The TP/SNR KPI can be used to determine if wireless and/or wired side conditions change
repeatedly.
DL codec distribution (Data rates)
The data rates codec distribution KPI presents the downlink codec usage in the active tests
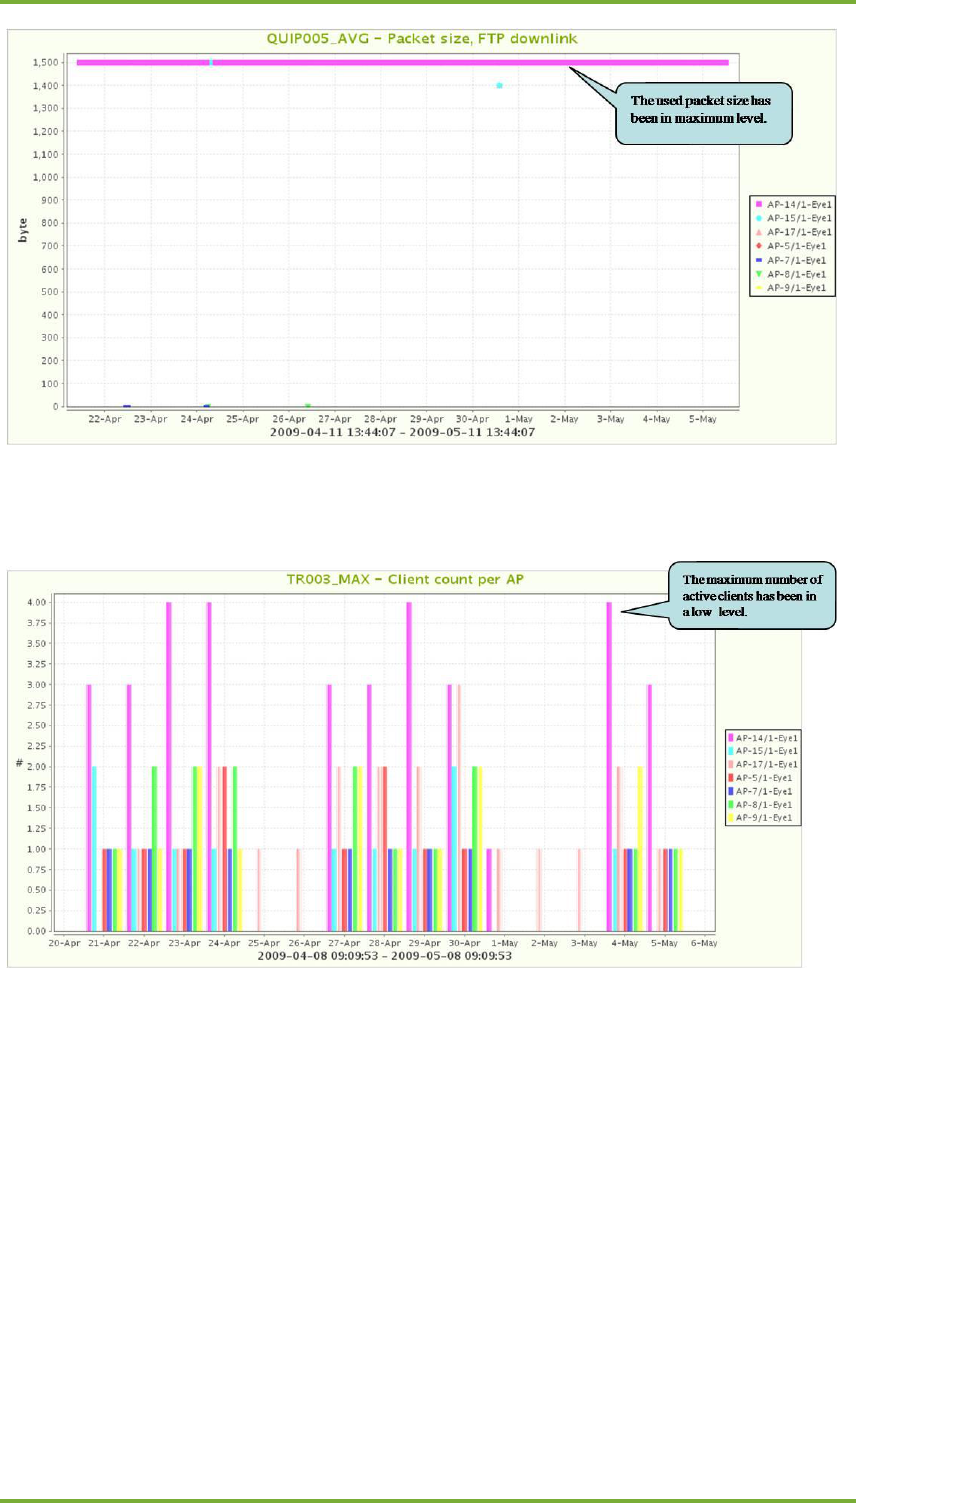
FTP DL packet size (QUIP005)
The radio packet size KPI presents the possible packet size variation in the radio interface.
14 How To Troubleshoot Using Loupe 33
7signal Ltd, Panuntie 6, FI-00620 HELSINKI, FINLAND, +358 40 777 7611, info@7signal.com, www.7signal.com
7signal Sapphire Loupe User Guide Release 3.0
Client count per AP (TR003)
The AP Client count presents radio load issues
Case 2 Summary
The downlink performance declines during the working days:
FTP downlink throughput is at a very low level
VoIP MOS downlink is not in an acceptable level
Ping round trip time is occasionally very high (>200ms)
The radio KPIs (data rate codecs, SNR, packet size, client count) demonstrate that the downlink
performance problem is not in the wireless interface.
The maximum e2e connection between Eye and Sonar end-point is only 1.8 Mbit/s.
The fixed interface load is too high during working days
14 How To Troubleshoot Using Loupe 34
7signal Ltd, Panuntie 6, FI-00620 HELSINKI, FINLAND, +358 40 777 7611, info@7signal.com, www.7signal.com
7signal Sapphire Loupe User Guide Release 3.0
14.4 Downlink And Uplink Performance Problem
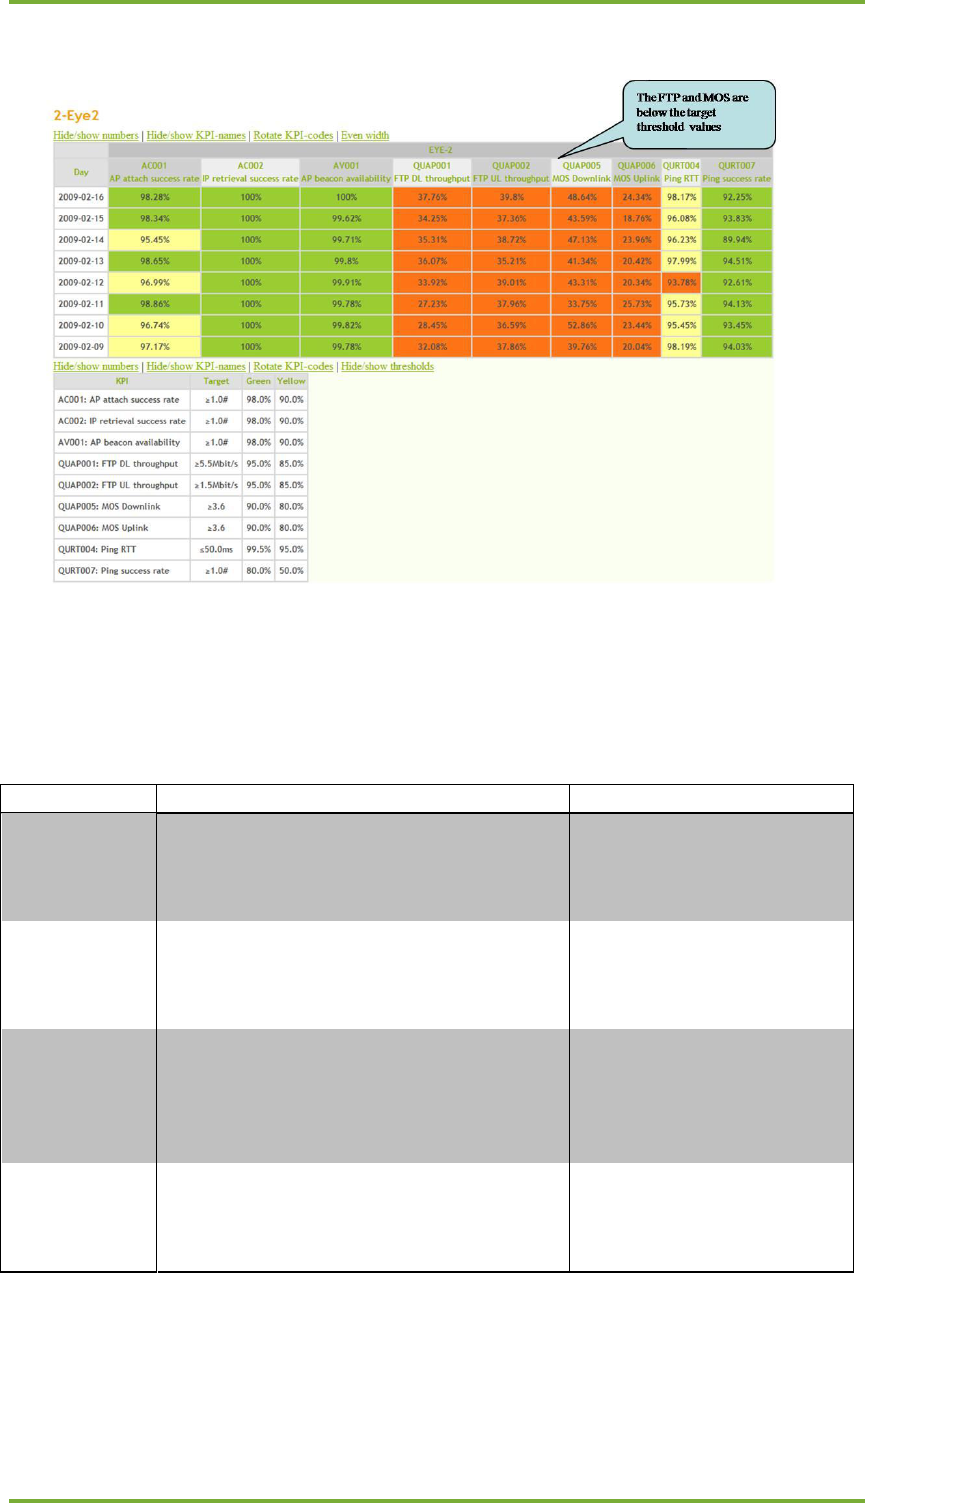
The network SLA table shows the performance situation of the 5 APs.
The table presents downlink & uplink performance problems during the measurement period.
Wireless or fixed network problem?
Check also these KPIs:
KPI ID / tab
Name
Description
TP/SNR
FTP DL throughput variation as a function
of SNR
The TP/SNR KPI presents if
wireless and/or wired side
conditions change
repeatedly.
AV010
AP Channel information
The AP channel KPI presents
the possible radio channel
changes of managed and
neighbor APs.
QURS001
Channel noise level at Eye and Spectrum-
view
The channel noise level
together with Spectrum-view
presents possible
interference issues and
locations
QURS004
AP retransmission rate
The AP retransmission rate
presents the possible radio
problems between AP and
Clients
14 How To Troubleshoot Using Loupe 35
7signal Ltd, Panuntie 6, FI-00620 HELSINKI, FINLAND, +358 40 777 7611, info@7signal.com, www.7signal.com
7signal Sapphire Loupe User Guide Release 3.0
QUAP005
&
QUAP006
VoIP MOS downlink (listen)
&
VoIP MOS uplink (talk)
The VoIP MOS KPI presents
detailed information about
VoIP MOS variation in the
network. With 2 or more
Sonar setup the VoIP MOS
performance can be
observed in wireless and
wired side.
QUAP015
VoIP MOS packet loss
The VoIP packet loss KPI
presents the network packet
loss situation.
QUAP001
&
QUAP002
FTP DL throughput
&
FTP UL throughput
The FTP throughput KPI
presents detailed
information about
throughput variation in the
network. With 2 or more
Sonar setup the throughput
problem can be limit to
wireless / wired side.
QUIP005
&
QUIP006
FTP DL packet size
&
FTP UL packet size
The radio packet size KPI
presents the possible packet
size variation in the radio
interface.
QURS002
&
QURS003
AP signal level at Eye
&
AP SNR at Eye
The measured AP signal level
and SNR presents the radio
environment variations
Client
Client detailed statistics
E.g. Client retransmission
rate and client packet size
presents also the end-user
performance.
Data rates
DL & UL codec distribution
The data rates codec
distribution KPI presents the
downlink codec usage in the
active tests.
TR003
Client count per AP
The AP Client count presents
radio load issues.
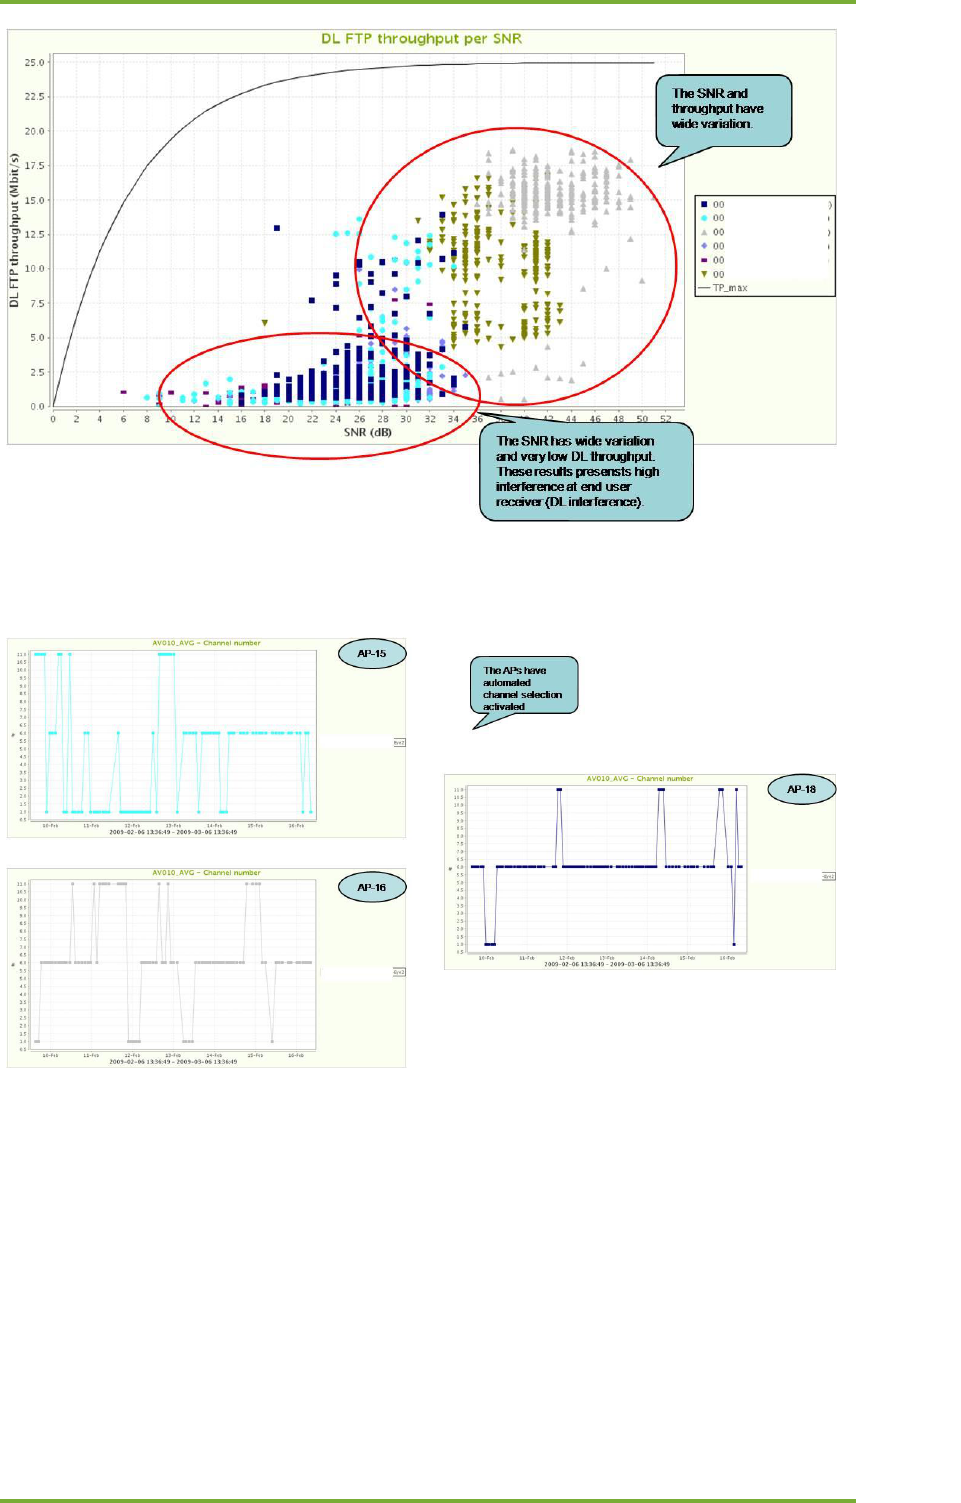
FTP DL throughput / SNR (TP/SNR)
The TP/SNR KPI can be used to determine if wireless and/or wired side conditions change
repeatedly.
14 How To Troubleshoot Using Loupe 36
7signal Ltd, Panuntie 6, FI-00620 HELSINKI, FINLAND, +358 40 777 7611, info@7signal.com, www.7signal.com
7signal Sapphire Loupe User Guide Release 3.0
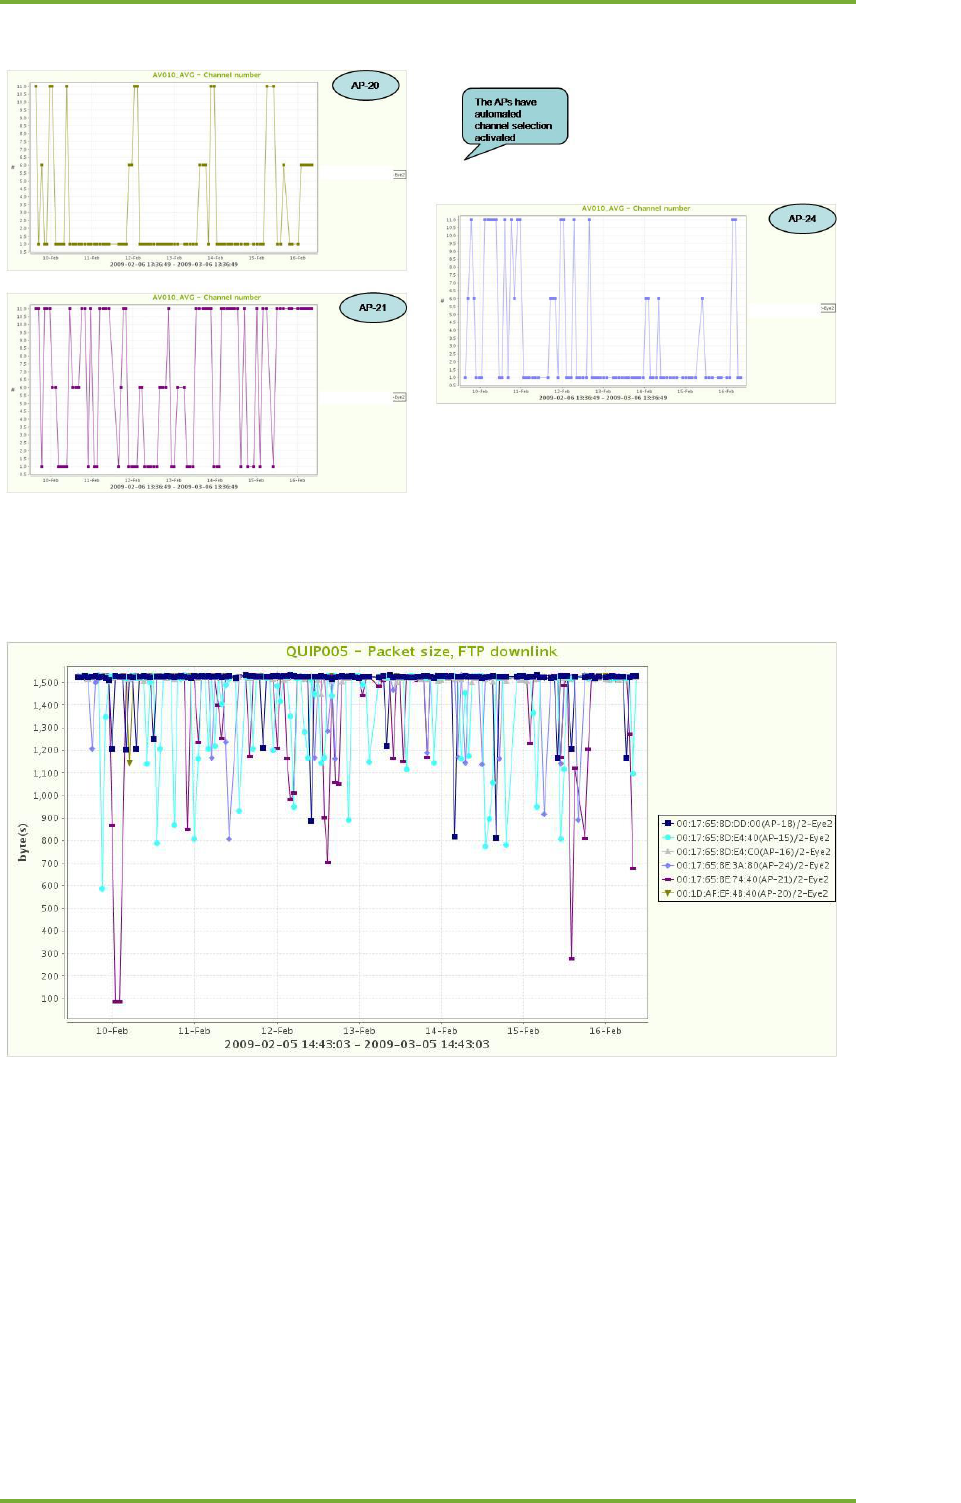
AP Channel information (AV010)
14 How To Troubleshoot Using Loupe 37
7signal Ltd, Panuntie 6, FI-00620 HELSINKI, FINLAND, +358 40 777 7611, info@7signal.com, www.7signal.com
7signal Sapphire Loupe User Guide Release 3.0
AP Channel information (AV010)
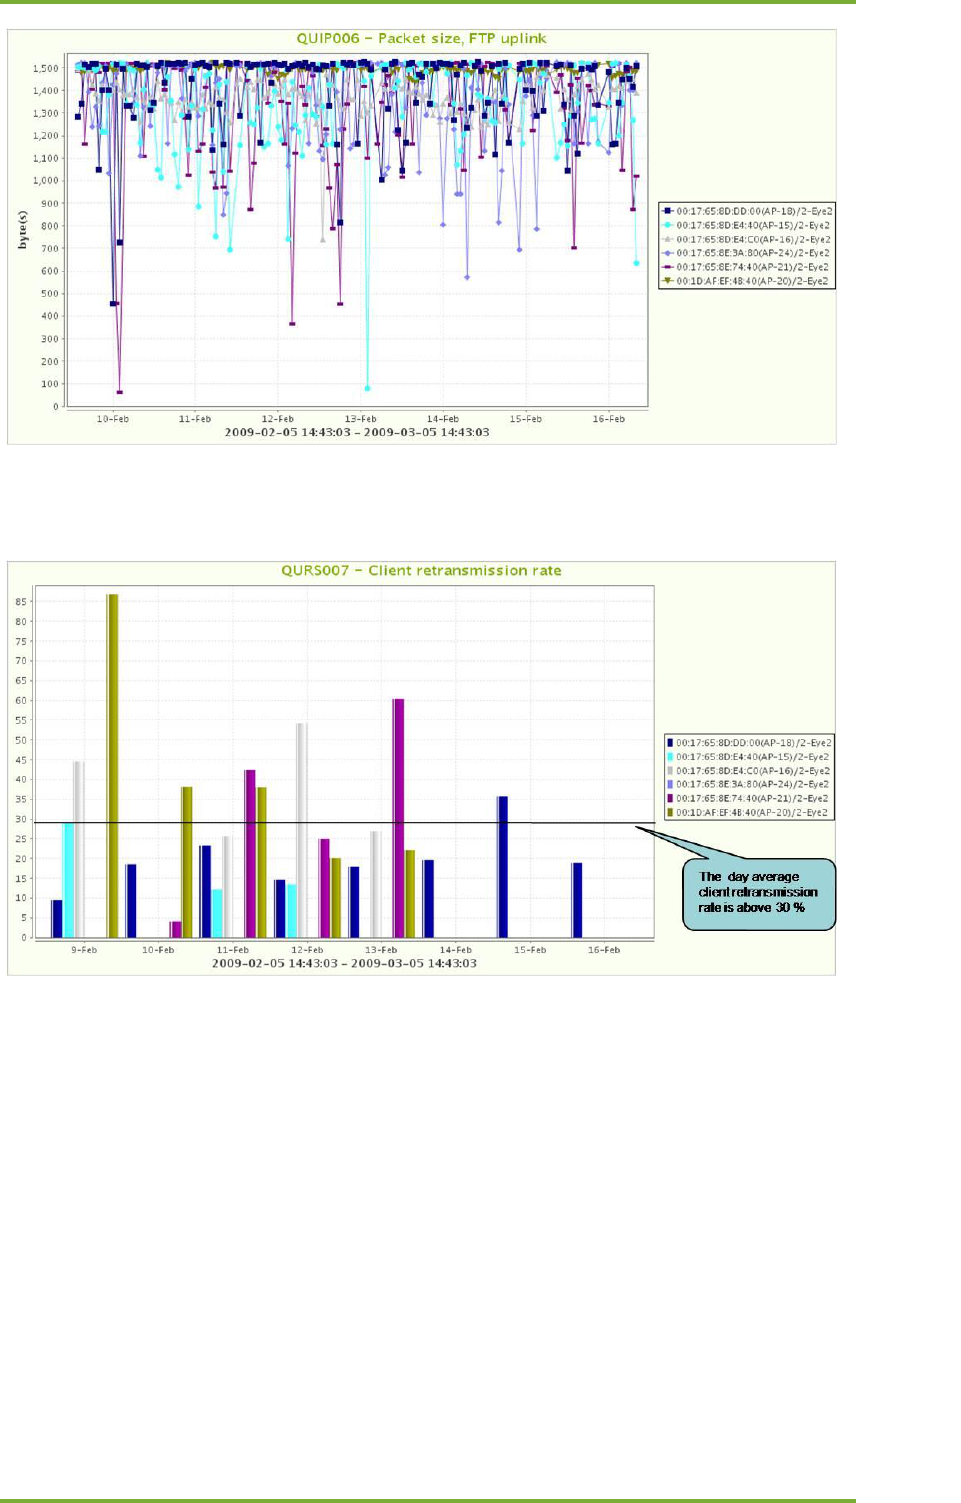
QUIP005 - FTP DL packet size
The FTP DL packet size is changing between 100 and1500 bytes.
FTP UL packet size (QUIP006)
The FTP DL packet size is changing between 80 and 1500 bytes.
14 How To Troubleshoot Using Loupe 38
7signal Ltd, Panuntie 6, FI-00620 HELSINKI, FINLAND, +358 40 777 7611, info@7signal.com, www.7signal.com
7signal Sapphire Loupe User Guide Release 3.0
Client detailed statistics (Client)
E.g. Client retransmission rate and client packet size presents also the end-user performance.
Summary
The end-user downlink performance problems are caused by other Wi-Fi APs. All the APs are
changing radio channel automatically, trying to avoid interference caused by using the same
channels.
The uplink performance problems are caused by high AP interference.
The packet sizes and used data rate codecs vary a lot because of radio interference.
The end-user retransmission rate is high and the data rate codecs vary considerably.
15 KPI Glossary 39
7signal Ltd, Panuntie 6, FI-00620 HELSINKI, FINLAND, +358 40 777 7611, info@7signal.com, www.7signal.com
7signal Sapphire Loupe User Guide Release 3.0
15 KPI GLOSSARY
KPI ID
Name
Description
Unit
Availability
AV001
Access point beacon availability
Measures beacon signal transmission
from each monitored AP. The KPI is the
relative amount of received and expected
beacons.
%
AV002
Internet connection availability
Measures internet connection availability
between a predefined server (Sonar) and
an Eye. The Eye pings (32B) the target
server three times. If all pings are
successful, internet is available. Otherwise
internet service is not available.
%
AV004
Number of available APs
Number of APs that have sent a beacon in
the selected area.Number of APs that have
sent a beacon in the selected area.
#
AV010
Channel number average of
selected element
Channel number average of selected
element
#
Accessability
AC001
Radio resource accessibility
Measures radio resource reservation
success rate. During the test, Eye attempts
to associate with the monitored AP. KPI is
calculated as the number of successful
associations divided by the number of all
the association attempts.
%
AC002
IP address retrieval success rate
Measures DHCP success rate. The KPI is
calculated as the amount of successful IP
address retrievals divided by all the
requests by Eye.
%
AC004
Radio attach time
Time between Eye starts radio attach to
an AP, and attach complete. Time between
Eye starts radio attach to an AP, and attach
complete.
Ms
AC005
IP address retrieval time
Time between Eye requests an IP
address, and IP address retrieved.
Ms
RE001
FTP download success rate
Measures FTP download completion rate.
%
RE002
FTP upload success rate
Measures FTP upload completion rate.
%
RE011
VoIP download test success rate
Measures VoIP (MOS) download
completion rate.
%

15 KPI Glossary 40
7signal Ltd, Panuntie 6, FI-00620 HELSINKI, FINLAND, +358 40 777 7611, info@7signal.com, www.7signal.com
7signal Sapphire Loupe User Guide Release 3.0
RE012
VoIP upload test success rate
Measures VoIP (MOS) upload completion
rate.
%
Quality
QUAP001
FTP downlink throughput
Measures downlink throughput in an
FTP file transfer. Measures downlink
throughput in an FTP file transfer.
Mbit/s
QUAP002
FTP uplink throughput
Measures uplink throughput in an
FTP file transfer. Measures uplink
throughput in an FTP file transfer.
Mbit/s
QUAP005
Listening voice quality (MOS),
downlink
MOS (Mean Opinion Score) value of a VoIP
downlink test.
MOS
QUAP006
Listening voice quality (MOS),
uplink
MOS (Mean Opinion Score) value of a VoIP
uplink test.
MOS
QUAP007
HTTP downlink throughput
Measures downlink throughput in an HTTP
document transfer. The test measures both
the time of the transfer and the size of the
document, from which the throughput in
Mbit/s is calculated.Measures downlink
throughput in an HTTP document transfer.
The test measures both the time of the
transfer and the size of the document, from
which the throughput in Mbit/s is
calculated.
Mbit/s
QUAP011
FTP downlink throughput of E2E
maximum
Measured throughput divided by the
theoretical maximum throughput that is a
function of measured SNR.
QUAP012
FTP uplink throughput of E2E
maximum
Measured throughput divided by the
theoretical maximum throughput that is a
function of measured SNR.
%
QUAP013
Jitter in VoIP test
The variation of delay (jitter) during a VoIP
test.
ms
QUAP015
Packet loss, VoIP test
Packet loss during a VoIP test.
%
QUAP019
Average of used QoS categories
in FTP
The average of all the used QoS-categories
during FTP transfer tests.
QUAP022
Average of requested QoS
category in VoIP
The average of all the requested QoS-
categories for VoIP test.
QUAP025
Average of used QoS categories
in VoIP
The average of all the used QoS-categories
during VoIP tests.
QUAP028
Average of requested QoS
category in HTTP
The average of all the requested QoS-
categories for HTTP transfer test.
QUAP031
Average of used QoS categories
in HTTP
The average of all the used QoS-categories
during HTTP transfer tests.

15 KPI Glossary 41
7signal Ltd, Panuntie 6, FI-00620 HELSINKI, FINLAND, +358 40 777 7611, info@7signal.com, www.7signal.com
7signal Sapphire Loupe User Guide Release 3.0
QUIP005
Packet size, FTP downlink
Packet size distribution in FTP downlink
transfer test. Packet size distribution in FTP
downlink transfer test.
byte(s)
QUIP006
Packet size, FTP uplink
Packet size distribution in FTP uplink
transfer test.
byte(s)
QUIP013
Packet size, HTTP downlink
Packet size distribution in FTP uplink
transfer test. Packet size distribution in FTP
uplink transfer test.
byte(s)
QURS001
Channel noise level at Eye
RF noise level in dBm, measured by Eye.
dBm
QURS002
AP signal level at Eye
Measures the AP transmitted power level
of radio signal from the Eye point of view.
Measures the AP transmitted power level
of radio signal from the Eye point of view.
dBm
QURS003
AP signal to noise ratio (SNR) at
Eye
Measures the AP transmitted power level
of radio signal relative to the power level of
noise received by an Eye. Measures the AP
transmitted power level of radio signal
relative to the power level of noise
received by an Eye.
dB
QURS004
AP retransmission rate
Number of retransmitted frames divided by
the number of all the frames sent to
downlink by an AP.
QURS026
Eye-AP signal level in FTP DL
Signal power level between AP and Eye,
during an FTP download test. Signal power
level between AP and Eye, during an FTP
download test.
dBm
QURS027
Eye-AP signal level in FTP UL
Signal power level between AP and Eye,
during an FTP upload tes.t Signal power
level between AP and Eye, during an FTP
upload tes.t
dBm
QURS028
Eye-AP SNR in FTP DL
Signal to noise ratio between AP and Eye,
during an FTP download test. Signal to
noise ratio between AP and Eye, during an
FTP download test.
dB
QURS029
Eye-AP SNR in FTP UL
Signal to noise ratio between AP and Eye,
during an FTP upload test. Signal to noise
ratio between AP and Eye, during an FTP
upload test.
dB
QURS030
Channel noise during FTP DL
Measures the average channel noise on
the channel where the FTP download test is
done. Calculated as Signal level minus SNR.
dBm

15 KPI Glossary 42
7signal Ltd, Panuntie 6, FI-00620 HELSINKI, FINLAND, +358 40 777 7611, info@7signal.com, www.7signal.com
7signal Sapphire Loupe User Guide Release 3.0
QURS031
Channel noise during FTP UL
Measures the average channel noise on
the channel where the FTP upload test is
done. Calculated as Signal level minus SNR.
dBm
QURT004
32B active RTT
Measures the round trip time between Eye
and Sonar server. The test uses a serie of
pings to ping server 20 times with zero wait
time between the pings. The calculation is
done internally in Eye and the output of the
test is average, 95% percentile, max and
min values of RTT. The objective is to
measure the ping quality, not ping
availability.
ms
QURT007
Ping success rate
Number of successful pings divided by the
total amount of ping attempts.
%
Volume
TR001
AP uplink throughput
Measures the amount of uplink data
transmitted to an AP during a
measurement period. During the test, an
Eye listens traffic for 15 sec per each
managed access point.
Kbit/s
TR002
AP downlink throughput
Measures the amount of downlink data
transmitted by an AP during a
measurement period. During the test, an
Eye listens traffic for 15 sec per each
managed access point. Measures the
amount of downlink data transmitted by an
AP during a measurement period. During
the test, an Eye listens traffic for 15 sec per
each managed access point.
Kbit/s
TR003
Number of clients per AP
Measures the number of concurrent clients
using the specified AP during the test. This
KPI is measured concurrently with the
TRV001 AP uplink throughput. Measures
the number of concurrent clients using the
specified AP during the test. This KPI is
measured concurrently with the TRV001 AP
uplink throughput.
TR015
AP packet size
Measures the IEEE802.11 frame sizes
during a monitoring per AP.
byte
15 KPI Glossary 43
7signal Ltd, Panuntie 6, FI-00620 HELSINKI, FINLAND, +358 40 777 7611, info@7signal.com, www.7signal.com
7signal Sapphire Loupe User Guide Release 3.0
TR0018
Average QoS category in AP
traffic monitor
The average of all the used QoS-categories
during AP traffic monitoring.
Client
QURS005
Client signal level at Eye
Measures the signal power level of clients
from the Eye point of view. Measures the
signal power level of clients from the Eye
point of view.
dBm
QURS006
Client signal to noise ratio (SNR)
at Eye
Measures the signal to noise ratio of clients
from the Eye point of view. Measures the
signal to noise ratio of clients from the Eye
point of view.
dB
QURS007
Client retransmission rate
Number of retransmitted frames divided by
the number of all the frames sent to an AP
uplink by a client. Number of retransmitted
frames divided by the number of all the
frames sent to an AP uplink by a client.
%
QURS008
Client-AP link balance
Traffic balance between Client-transmitter
(uplink) and AP-transmitter (downlink). If
value is 100%, then all traffic has been
uplink (from Client to AP). If value is 0%,
then all traffic has been downlink. If value
is null, then there has been no traffic in
either direction. Traffic balance between
Client-transmitter (uplink) and AP-
transmitter (downlink). If value is 100%,
then all traffic has been uplink (from Client
to AP). If value is 0%, then all traffic has
been downlink. If value is null, then there
has been no traffic in either direction.
%
TRO12
Client uplink data
Measures the amount of uplink data
transmitted by a client.
Kbit/s
TRO13
Client-downlind data
Measures the amount of downlink data
transmitted to a client.
Kbit/s
TR014
Client packet size
Measures the IEEE802.11 frame sizes
during a monitoring per client.
byte
TR018
QoS category in AP traffic
monitor
The average of all the used QoS-categories
during AP traffic monitoring.
TR0019
Average QoS category in client
traffic monitor
The average of all the used QoS-categories
during client monitoring.