Bird Technologies Group 5PI031202 SIGNAL BOOSTER TWO-WAY User Manual 61 89A 50 A18 G1 UserManV3
Bird Technologies Group SIGNAL BOOSTER TWO-WAY 61 89A 50 A18 G1 UserManV3
USERS MANUAL

61-89A-50-A18-G1-UserMan page 1 of 20
TX RX Systems Inc. Manual 7-9352 (version 4) 01/27/04 Page 1
7-9352-4
Installation and Setup Manual
for the Two-Way Signal Booster System
Model Number 61-89A-50-A18-G1
First Printing: December 2003
Version Number Version Date
1 12/11/00
2 01/15/04
3 01/26/04
4 01/27/04
Part No.
Copyright (c) 2003 TX RX Systems, Inc.
61-89A-50-A18-G1-UserMan page 2 of 20
TX RX Systems Inc. Manual 7-9352 (version 4) 01/27/04 Page 2
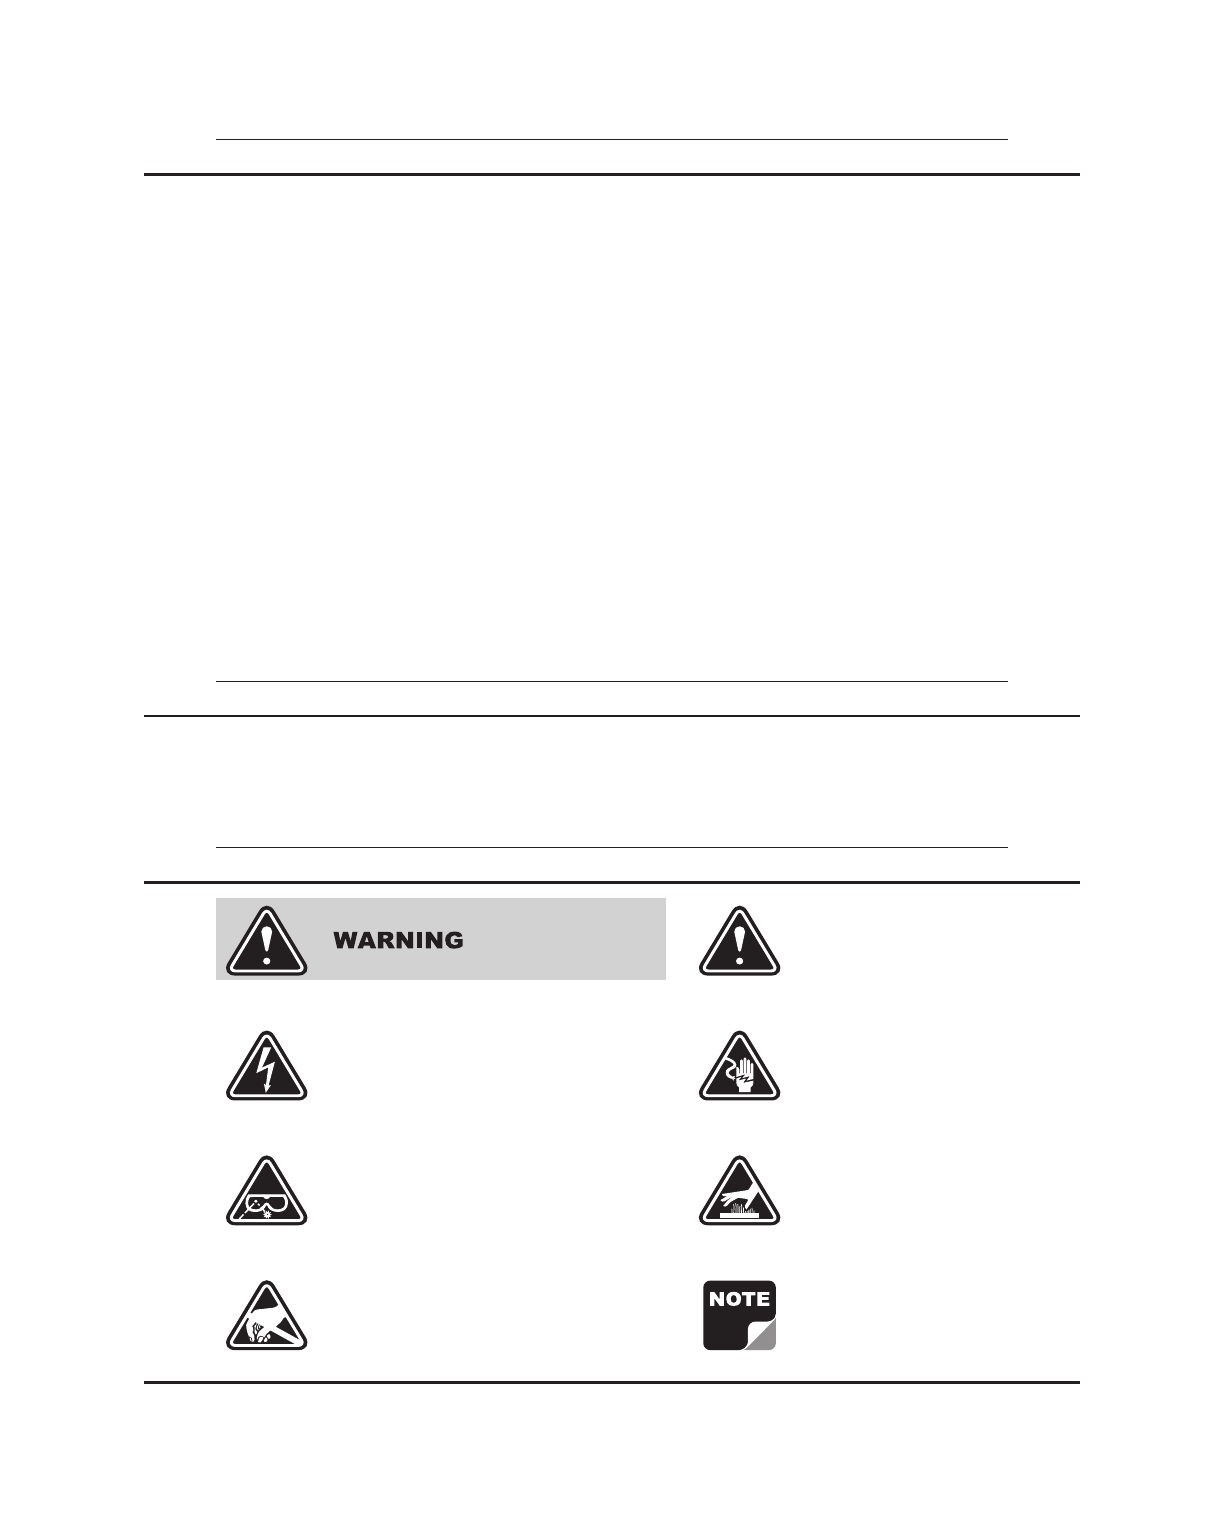
CAUTION or
ATTENTION
High Voltage Electrical Shock Hazard
Hot Surface
ESD Electrostatic Discharge
Use Safety Glasses
Important Information
Symbols Commonly Used
Warranty
Disclaimer
This warranty applies for one year from shipping date.
TX RX SYSTEMS INC. warrants its products to be free from defects in material and workmanship at the time of
shipment. Our obligation under warranty is limited to replacement or repair at our option, of any such products (with
the exception of tubes) which shall have been defective at the time of manufacture. TX RX SYSTEMS INC. reserves
the right to replace with merchandise of equal performance although not identical in every way to that originally sold.
TX RX SYSTEMS INC. is not liable for damage caused by lightning or other natural disasters. No product will be
accepted for repair or replacement without our prior written approval.
All Shipping charges on returned products must be prepaid by the purchaser. TX RX SYSTEMS INC. shall in no event
be liable for consequential damages, installation costs or expenses of any nature resulting from the purchase or use
of products, whether or not they are used in accordance with instructions. This warranty is in lieu of all other warran-
ties, either expressed or implied, including any implied warranty of merchantability or of fitness. No representative is
authorized to assume for TX RX SYSTEMS INC. any other liability or warranty than set forth above in connection with
our products or services.
Product part numbering in photographs and drawings is accurate at time of printing. Part number labels on
TX RX products supercede part numbers given within this manual.
61-89A-50-A18-G1-UserMan page 3 of 20
TX RX Systems Inc. Manual 7-9352 (version 4) 01/27/04 Page 3
For Class A Unintentional Radiators
This equipment has been tested and found to comply with the limits for a Class A digital device, pursuant to
part 15 of the FCC rules. These limits are designed to provide reasonable protection against harmful inter-
ference when the equipment is operated in a commercial environment. This equipment generates, uses,
and can radiate radio frequency energy and, if not installed and used in accordance with the instruction
manual, may cause harmful interference to radio communications. Operation of this equipment in a resi-
dential area is likely to cause harmful interference in which case the user will be required to correct the
interference at his own expense.
Changes or modifications not expressly approved by TX
RX System Inc. could void the user’s authority to operate
the equipment.
WARNING
This device complies with Part 15 of the FCC Rules. Operation is subject to the
following two conditions: (1) this device may not cause harmful interference and
(2) this device must accept any interference received, including interference
that may cause undesired operation.
To satisfy FCC RF exposure requirements for mobile trans-
mitting devices, a separation distance of 1.0 Meters or more
should be maintained between the UPLINK antenna of this
device and persons during device operation. To satisfy FCC
RF exposure requirements for mobile transmitting devices, a
separation distance of 0.2 Meters or more should be main-
tained between the DOWNLINK antenna of this device and
persons during device operation. To ensure compliance,
operations at closer than these distances is not recom-
mended.
The antenna used for this transmitter must not be co-located
in conjunction with any other antenna or transmitter.
WARNING
61-89A-50-A18-G1-UserMan page 4 of 20
TX RX Systems Inc. Manual 7-9352 (version 4) 01/27/04 Page 4
Antenna System Installation
The antenna or signal distribution system consists of two branches. An uplink
branch typically uses an outdoor mounted, unidirectional gain antenna such
as a yagi and a downlink signal radiating system consisting of a network of
zero-gain whip antennas or lengths of radiating cable usually mounted inside
of the structure.
Even though the antenna system may not be supplied or installed by TX RX
Systems. The following points need to be observed because both the safety
of the user and proper system performance depend on them.
1) Antenna system installation should only be performed by qualified techni-
cal personnel.
2) The following instructions for your safety describe antenna installation
guidelines based on FCC Maximum RF Exposure Compliance require-
ments.
3) The uplink antenna is usually mounted outside and exchanges signals
with the repeater base station or donor site. It is typically mounted perma-
nently-attached to the building wall or roof. The gain of this antenna should
NOT exceed 10 dB. Only qualified personnel should have access to the
antenna and under normal operating conditions, no one should be able to
touch or approach it within 1 meter (40 inches).
4) The downlink or in-building signal distribution system is connected to the
downlink booster port using coaxial cable. The distribution system may
use radiating coaxial cable or a network 1/4 wave whip antennas whose
gain does not exceed 0 dB for any radiator. These antennas should be
installed so that the user cannot approach any closer than 0.2 meters (8
inches) from the antenna.
61-89A-50-A18-G1-UserMan page 5 of 20
TX RX Systems Inc. Manual 7-9352 (version 4) 01/27/04 Page 5
Table of Contents
Specifications 6
General Description 6
Note About Output Power Rating 8
Installation 8
Cautionary Note 8
Pre-RF Connection Tests 9
Test Equipment 9
Antenna Isolation 9
Procedure for Measuring Antenna Isolation 10
Increasing Isolation 10
Input Signal Levels 10
Procedure for Measuring Input Signal Levels 13
Reduction of Incoming Signal Strength 13
Operation 13
Main Status Display Screen 13
Configuration Settings 14
Calibrate Currents 14
Set Gain 14
Set Output Level 14
Detailed Status Screens 14
Amplifiers 14
Power Supply 14
OLC 14
OLC Historical Info 14
Alarms 14
LED Indicators 14
Form-C Contacts 15
Performance Survey 15
Maintenance and Repair 17
illustrations & Tables
Figure 1 Front view of the Model 61-89A-50-A18-G1 7
Figure 2 Measuring Antenna Isolation 9
Figure 3 Measuring Input Signal Levels 11
Figure 4 Software flow chart 12
Figure 5 Boot-up display screen 13
Figure 6 Main status display screen 13
Figure 7 Measuring Signal Booster Gain 15
Figure 8 Surveying Performance 16

61-89A-50-A18-G1-UserMan page 6 of 20
TX RX Systems Inc. Manual 7-9352 (version 4) 01/27/04 Page 6
GENERAL DESCRIPTION
Signal boosters extend radio coverage into areas
where abrupt propagation losses prevent reliable
communication. This system receives an RF sig-
nal, raises its power level, and couples it to an
antenna or leaky (radiating) coaxial cable system
so that it can be re-radiated. No frequency transla-
tion (conversion) occurs with this device.
The two-way signal booster model 61-89A-50-A18-
G1 (shown in Figure 1) is a broadband, bidirec-
tional dual branch (uplink and downlink) system
with an 18 MHz passband. The booster passes
uplink signals from 806 to 824 MHz and downlink
signals from 851 to 869 MHz. Linear RF active
amplifiers, filters, and DC power sources are used
to adequately boost and re-radiate the passband
signals.
The system is hardware configurable to operate at
one of two coarse gain levels including medium
(+60 dB gain max) or high (+80 dB gain max). The
coarse gain adjustments is made by physically
removing the low level amplifier card (part# 3-
19575) from the branch. Without the low level card
in place the system gain will be +60 dB max. The
coarse gain of the uplink or downlink branch can be
adjusted independently of each others. In addition,
for fine adjustment the gain of a branch can be
reduced up to 30 dB in 0.5 dB increments via soft-
ware interface regardless of which coarse gain set-
ting the branch is configured for.
The output level of any signal passing through a
signal booster is determined by the systems gain
specification. All signals passing through a prop-
erly operating signal booster are amplified by the
same amount but will come out at power levels that
are related to their respective input level by the
gain specification. Signal leveling is not an
intended function of a signal booster. Amplifier
stages used in this signal booster system may be
damaged by excessively strong input signal levels.
The system is equipped with Output Leveling Cir-
cuitry (OLC) to protect the amplifiers and reduce
spurious signals. It is interesting to note that the
total power for the multicarrier condition is always
less than the maximum single carrier rating. As the
number of carriers increases, the difference
between the single carrier maximum and the total
power of all carriers grows even greater.
Linear power amplifiers (Class-A or Class-AB oper-
ation) are used in this application in contrast to the
El e c t r i c a l
Frequency Range: 806-869 MHz
FCC Identification Number: EZZ5PI031202
Number of Passbands: 2
Passband Frequencies: 806-824 / 851-869 MHz
Minimum Passband Separation: 45 MHz
Pass Bandw idth: 18 MHz
Gain: +80 dB
Guardband: 27 MHz
Output Level Control Range: 60 dB (less user programmed digital attenuation)
System Noise Figure at Maximum Gain: 3.5 dB maximum
Pow er Output 806-824 MHz ((total composite) 1.3 Watts
Pow er Output 851-869 MHz (total composite) 1.6 Watts
Third Order Output Intercept Point: +55 dBm minimum, w ith no attenuation
Primary Supply Voltage: 100-240 VAC; 50-60 Hz
Automatic Battery Backup Option: +24 to +30 VDC
M e chanical
Height: 24"
Width: 24"
Depth: 8"
Weight 85 lbs.
Housing Type: Painted Steel
Enclosure Type: NEMA 4 Standard
Model 61-89A-50-A18-G1 Specifications
61-89A-50-A18-G1-UserMan page 7 of 20
TX RX Systems Inc. Manual 7-9352 (version 4) 01/27/04 Page 7
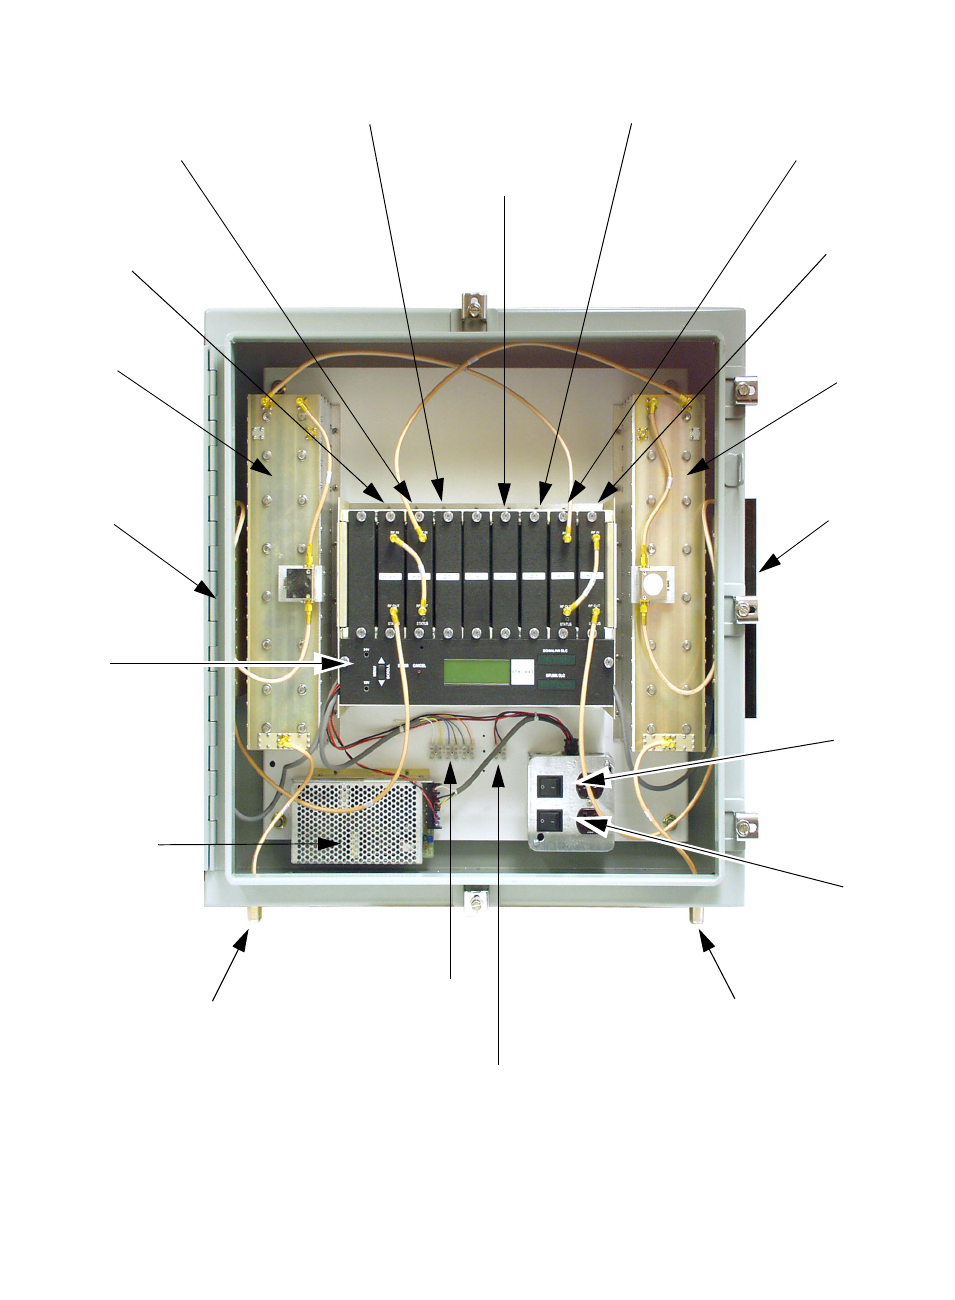
Figure 1: Front view of the model 61-89A-50-A18-G1 two-way signal booster system.
Power Supply
AC Power
Switch
Battery
Backup
Switch
Alarm Contact
Te r m i n al S t r i p
Connect
Backup
Battery
here
Uplink
Power
Amplifier
Duplexer
Downlink
Power
Amplifier
Duplexer
Menu
Select
Buttons
Uplink
Mid-Level
Amplifier
Uplink
Low-Level
Amplifier
(remove for coarse
gain adjustment)
Uplink
Power
Distribution
Downlink
Mid-Level
Amplifier
Downlink
Low-Level
Amplifier
(remove for coarse
gain adjustment)
Downlink
Power
Distribution
Controller
Downlink In
Uplink Out
Uplink Out
Downlink In
61-89A-50-A18-G1-UserMan page 8 of 20
TX RX Systems Inc. Manual 7-9352 (version 4) 01/27/04 Page 8
highly efficient Class-C power amplifiers used in
the output stages of most FM land mobile transmit-
ters. Linear amplifiers are biased for a relatively
high continuous DC current drain. Class-A amplifi-
ers generally have the lowest efficiency of the vari-
ous amplifier types, typically in the range of 25 -
33% and Class-AB amplifiers can reach 50% effi-
ciency. Their biggest advantage is faithful repro-
duction of the input waveform which results in the
lowest levels of intermodulation distortion products
(IM) of all the classes of amplifiers. The generation
of IM distortion is a serious design consideration
when two or more channels are simultaneously
present in the same amplifier stage.
Filtering is used at the input and output of the sig-
nal path to help suppress any IM products that may
be inadvertently generated. Signals that exceed
the maximum input rating may either damage the
signal booster or cause it to generate intermodula-
tion products that exceed the maximum allowed by
the FCC or other regulatory agency.
Note About Output Power Ratings
A single maximum output power rating does not
apply to broadband signal boosters because the
linear amplifiers used in them may have to process
multiple simultaneous signals. Under these condi-
tions, the questions of power rating becomes more
complex.
When more than one signal is amplified, a number
of spurious signals will also appear in the amplified
output. They are referred to as intermodulation dis-
tortion products, more commonly called IM. These
spurious products would not be present in a per-
fectly linear amplifier but as in all things, something
short of perfection is realized. Accepted industry
practice is to use the Third Order Intercept Point
specification of a signal booster to predict the level
of IM products. The intercept point is derived from
the measurement of an amplifiers 1 dB compres-
sion point.
INSTALLATION
The layout of the signal distribution system will be
the prime factor in determining the mounting loca-
tion of the signal booster enclosure. However,
safety and serviceability are also key consider-
ations. The unit should be located where it cannot
be tampered with by unauthorized personnel yet is
easily accessible to service personnel using trou-
ble shooting test equipment such as digital multim-
eters and spectrum analyzers. Also consider the
weight and size of the unit should it become
detached from its mounting surfaces for any rea-
son.
Very little is required to install this signal booster.
The unit should be bolted in its permanent position
using lag bolts or other suitable fasteners. Make
sure there is an unobstructed airflow over the
external heatsinks. Safety and serviceability are
key considerations. The signal booster cabinet will
stay warm during normal operation so in the inter-
est of equipment longevity, avoid locations that will
expose the cabinet to direct sun or areas where the
temperature is continually elevated.
Connection of RF to the unit is made via “N” female
connectors located on bottom of the cabinet.
These connectors are individually labeled “Down-
link In / Uplink Out” and “Downlink Out / Uplink In”.
Care should be used when making connections to
these ports to insure the correct antenna cable is
connected to its corresponding input / output port
or the system will not work. The use of high quality
connectors with gold center pins is advised. Flexi-
ble jumper cables made of high quality coax are
also acceptable for connecting to rigid cable sec-
tions.
The signal booster is designed to be powered from
120 VAC and a conduit entry box is provided at the
bottom of the enclosure for bringing the AC line into
the cabinet. AC line connections should be made in
accordance with local electrical and building codes.
In addition, the unit is capable of being operated
from a backup DC power source between +24 and
+30 VDC. A terminal screw connector is available
inside the bottom of the cabinet for connecting the
backup voltage. In addition, there are also terminal
screw connections inside the cabinet for alarm
monitoring that are designed for connection to a
customer supplied supervisory alarm system, see
figure 1.
CAUTIONARY NOTE
The following cautions are not intended to frighten
the user but have been added to make you aware
of and help you to avoid the areas where experi-
ence has shown us that trouble can occur.
1) Just like the feedback squeal that can occur
when the microphone and speaker get too close
to each other in a public address system, a sig-
nal booster can start to self oscillate. This will
occur when the isolation between the input
61-89A-50-A18-G1-UserMan page 9 of 20
TX RX Systems Inc. Manual 7-9352 (version 4) 01/27/04 Page 9
antenna or signal source and the output distri-
bution system does not exceed the signal
boosters gain by at least 15 dB. This condition
will reduce the effectiveness of the system and
may possibly damage the power amplifier
stages.
2) The major cause of damage to signal boosters
is the application of input RF power levels in
excess of the maximum safe input. This can
happen inadvertently when connecting a signal
generator with full power out to one of the inputs
or by a very strong signal that is far stronger
than expected. Following the pre-RF connection
checks listed next will help to avoid these two
problems.
PRE-RF CONNECTION TESTS
Certain characteristics of the signal distribution
system should be measured before connecting it to
the signal booster. This step is necessary to insure
that no conditions exist that could possibly damage
the signal booster and should not be skipped for
even the most thoroughly designed system. Two
characteristics need to be measured; antenna iso-
lation and input signal levels.
Test Equipment
The following equipment is required in order to per-
form the pre-installation measurements.
1) Signal generator for the frequencies of interest
capable of a 0 dBm output level. Modulation is
not necessary.
2) Spectrum analyzer that covers the frequencies
of interest and is capable of observing signal
levels down to -100 dBm.
3) Double shielded coaxial test cables made from
RG142 or RG55 coaxial cable.
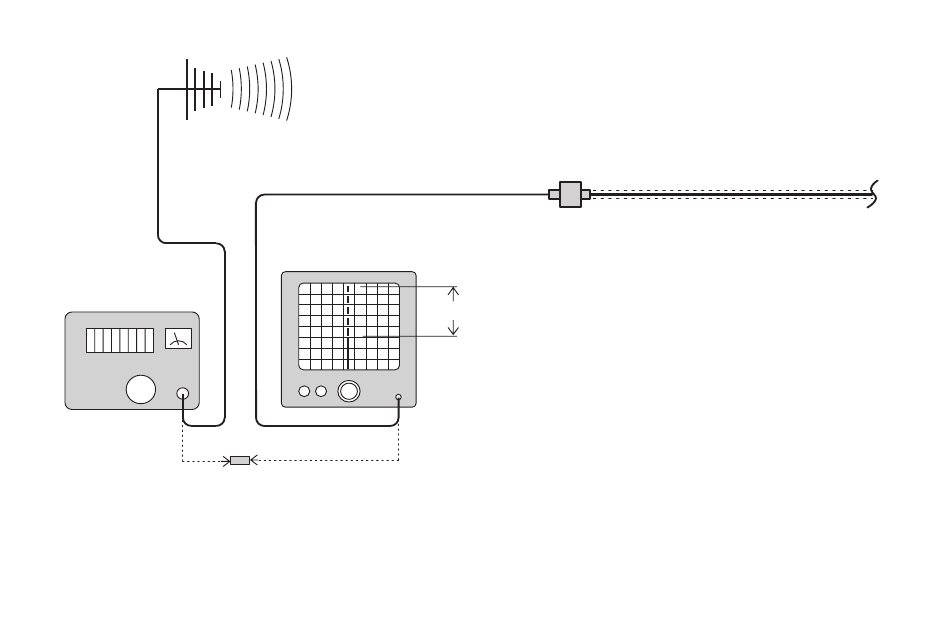
Antenna Isolation
Antenna isolation is the signal path isolation
between the two sections of the signal distribution
system that are to be connected to the signal
boosters antenna ports. Lack of isolation between
the input and output antennas can cause the
amplifiers in the system to oscillate. This can hap-
INTERNAL
SIGNAL DISTRIBUTION
SYSTEM
SPECTRUM
ANALYZER
EXTERNAL
ANTENNA
SIGNAL
GENERATOR
ZERO LOSS
REFERENCE
ISOLATION (dB)
Figure 2: Typical test equipment setup for measuring antenna isolation.

61-89A-50-A18-G1-UserMan page 10 of 20
TX RX Systems Inc. Manual 7-9352 (version 4) 01/27/04 Page 10
pen at a high enough level to damage the power
amplifier stages. In general, if one or both antenna
ports are connected to sections of radiating coaxial
cable (lossy cable) the isolation will be more than
adequate because of the high coupling loss values
that are encountered with this type of cable. When
a network of antennas are used for the input and
output, this problem is much more likely. Isolation
values are relatively easy to measure with a spec-
trum analyzer and signal generator.
Procedure for Measuring Antenna Isolation
1) Set the signal generator for a 0 dBm output
level at the center frequency of one of the signal
boosters passbands.
2) Set the spectrum analyzer for the same center
frequency and a sweep width equal to or just
slightly greater than the passband chosen in
step one.
3) Connect the test leads of the signal generator
and the spectrum analyzer together using a
female barrel connector, see Figure 2. Observe
the signal on the analyzer and adjust the input
attenuator of the spectrum analyzer for a signal
level that just reaches the 0 dBm level at the top
of the graticule.
4) Referring to figure 2, connect the generator test
lead to one side of the signal distribution system
(external antenna) and the spectrum analyzer
lead to the other (internal distribution system)
and observe the signal level. The difference
between this observed level and 0 dBm is the
isolation between the sections. If the signal is
too weak to observe, the spectrum analyzer's
bandwidth may have to be narrowed and its
input attenuation reduced. Record the isolation
value. The isolation value measured should
exceed the signal boosters gain figure by at
least 15 dB.
It is wise to repeat the procedure listed above for
measuring antenna isolation, with the signal gener-
ator set to frequencies at the passbands edges in
order to see if the isolation is remaining relatively
constant over the complete width of the passband.
Increasing Isolation
If the measured isolation does not exceed the sig-
nal boosters gain figure by at least 15 dB then
modification of the signal distribution system is
required. Alternately, the gain of the signal booster
can also be reduced to insure the 15 dB specifica-
tion is met. If the isolation cannot be increased
then the amount of gain reduction required is deter-
mined as shown in the following example.
Input Signal Levels
Excessive input signal levels can damage the sig-
nal booster. Although this problem is less severe in
OLC protected systems, strong signals may cause
sudden reductions in gain and an associated
decrease in the desired output signal strength.
Even in the most carefully designed signal distribu-
tion systems, unpredictable situations can arise
that can cause this trouble. A few of the more com-
mon causes are:
a) Unintended signals entering the system. Prima-
rily caused by radios operating on channels that
are within the operational bandwidth of the sig-
nal booster. Sometimes this will be a transient
problem caused by mobile units when they
transmit while in close proximity to your system.
b) Hand-held and mobile units that approach
much closer than expected to one of the anten-
nas in the signal distribution system.
c) Unexpected signal propagation anomalies.
Building geometry can cause signal ducting and
other phenomena that cause signal levels that
are much stronger (or lower) than expected.
d) Lower than estimated signal attenuation causes
signals to be unusually strong. Higher losses
can also occur giving weaker signals than
desired.
e) Signal booster model with excessive gain. In
systems that have an existing signal booster, it
is sometimes assumed that an identical unit
should be installed when expanding the system
EXAMPLE
Gain Reduction (dB) = Minimum Isolation (dB) -
Measured Isolation (dB)
If the measured isolation is -75dB and the mini-
mum isolation is -80dB then the amount of gain
reduction required is: -80dB - (-75) = -5 dB
61-89A-50-A18-G1-UserMan page 11 of 20
TX RX Systems Inc. Manual 7-9352 (version 4) 01/27/04 Page 11
to provide extended coverage. In most cases, a
signal booster with far less gain than the first is
required.
f) Improper installation or application of signal
splitters or directional couplers in the signal dis-
tribution system. This is usually the cause of too
low a signal level but deserves mentioning here.
Signal splitting needs to be done with constant
impedance signal splitters so that the proper
power splitting ratios and VSWR are main-
tained. Using tee connectors by themselves is
inviting trouble. Directional couplers must be
connected with regard to their directionality and
coupling levels or improper system signal levels
may result.
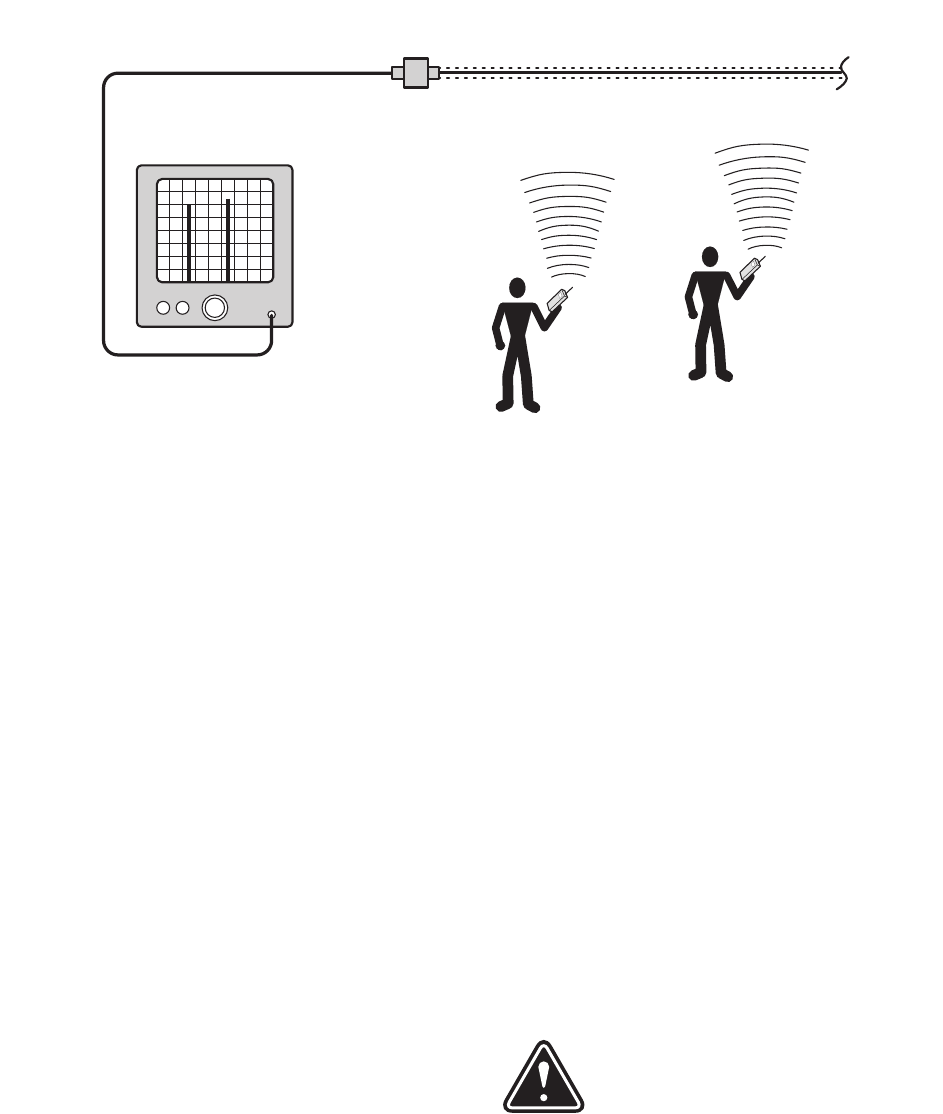
Procedure for Measuring Input Signal Levels
1) Set a spectrum analyzer for the center fre-
quency of one of the signal boosters pass-
bands.
2) Set the analyzers sweep width so that the entire
passband frequency range can be observed.
3) The analyzers input attenuator should be set in
order to observe input signal levels from
approximately -80 dBm to 0 dBm.
4) Connect the analyzer to the section of the sig-
nal distribution system that is going to serve as
the input (see Figure 3).
5) Record the power level (in dBm) of all carriers in
the passband frequency range that are signifi-
cantly greater than the noise floor displayed on
the analyzer.
6) To find the total power being applied the calcu-
lations listed below must be performed. The
conversion chart at the rear of the manual can
be used. Here are the steps:
a) Convert all values in dBm to Watts
b) Total the power for all carriers in Watts
c) Convert the total power in Watts to dBm
Example: suppose we have a signal
booster with a maximum gain of 70
dB. After checking the input signal
levels, it was determined that there
are three signals that are signifi-
cantly greater than the noise floor displayed on the
analyzer. These signals have strengths of -45
dBm, -43 dBm and -41 dBm.
First we use the conversion chart at the end of this
manual to convert the power levels in dBm to watts
S p e c t r u m A n a l y z e r
R a d i o 1
R a d i o 2
S I G N A L D I S T R I B U T I O N S Y S T E M
Figure 3: Typical test equipment setup for measuring input signal levels.
61-89A-50-A18-G1-UserMan page 12 of 20
TX RX Systems Inc. Manual 7-9352 (version 4) 01/27/04 Page 12
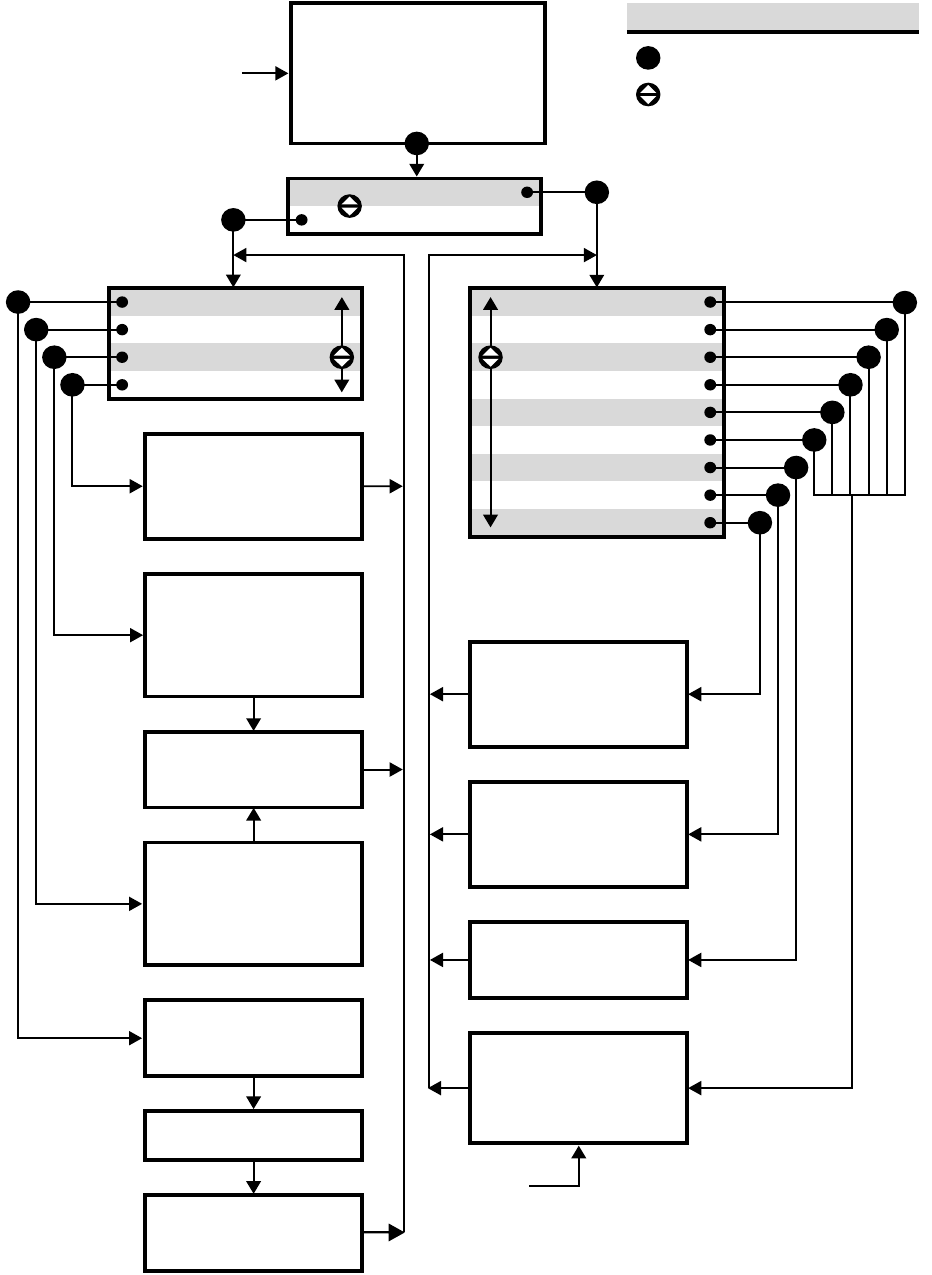
NOTE
Pressing CANCEL always returns
you to the previous menu without
saving changes
NOTE
If no button is pressed within
2 minutes, system returns to
Main Status Display Screen
NOTE
This menu screen will also give you
the option to place an amplifier into
Bypass or take one out of Bypass.
PA
## MA
## MA
MID
## MA
## MA
LOW
## MA
## MA
U
D
Status OK
Calibrate Currents
Set Gain
Set Output Level
Restore Orig Config
Uplink Low Level Amp
Uplink Mid Level Amp
Uplink Power Amp
Downlink Low Amp
Downlink Mid Amp
Downlink Power Amp
Power Supply
Current OLC Status
OLC Historical Info
OLC Historical Info
Avg
# dB
# %
Day
# dB
# %
UL
Current OLC Status
Uplink
# dB
# %
Downlink
# dB
# %
Name of Amp
Current # Temp #
Amp Is/Not
Bypassed/Connected
Power Supply Status
24v ### 12v ###
Set Desired Gain
Uplink
## dB
Downlink
## dB
Done
Save Changes?
Yes No
Uplink
## dBm
Downlink
## dBm
Done
Set Output Levels
Are you sure
you want to restore
the Factory Presets?
Yes No
Press Enter to
Calibrate Currents
Calibrating . . .
Done Calibrating
Press Enter to Save
Press ENTER key
KEY
Press Item Select arrow key
E
EE
E
E
E
E
E
E
E
E
E
E
E
E
E
E
Detailed Status
Configuration
Figure 4: Software flow chart.
61-89A-50-A18-G1-UserMan page 13 of 20
TX RX Systems Inc. Manual 7-9352 (version 4) 01/27/04 Page 13
so that we can add them together. The power in
watts is written in scientific notation but the chart
uses computer notation. For example, in the chart,
an exponent may be written as E-08. In conven-
tional mathematical notation E-08 is written 10-8.
The total power must be written as a number
between 0 and 10 to use the chart. Look up
1.611E-7 in the Watts column. This number falls
between -38 and -37 dBm so we chose -37
because it is the next higher value.
Reduction of Incoming Signal Strength
Reducing the strength of offending signals may
require some or all of the following steps:
a) The addition of extra filtering. Consult TX RX
System's sales engineers for help in this
respect.
b) Modification of the signal distribution layout by
changing the type or location of pickup anten-
nas. This has to be approached in an empirical
way, that is, change-and-try until you get the
desired results. Sometimes changing from omni
to directional antennas will correct the problem.
OPERATION
Power is applied to the signal booster by turning on
the AC power switch located on the junction box
inside the cabinet, refer to figure1. This will turn on
the power supply assembly and the LED indicator
on the power supply should come on indicating the
assembly is functioning normally.
The model 61-89A-50-A18-G1 signal booster sys-
tem is software controlled. Interface to the system
is done through the LCD display screen and the
menu select buttons located on the display panel,
see figure 1. A flow chart showing all of the possi-
ble user menu selections is shown in Figure 4.
Each menu selection will be discussed in detail
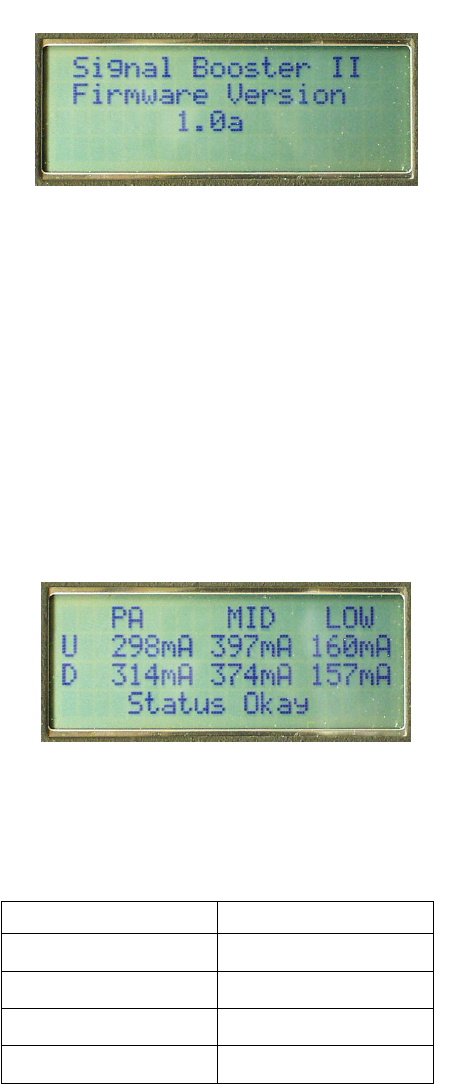
below. Upon power up the system will begin to
cycle through its normal boot-up sequence during
which time the LCD display will briefly show the
current software version, see Figure 5.
Main Status Display Screen
Once the boot-up sequence is completed (after
several seconds) the LCD display will switch to the
main status display screen as shown in Figure 6.
This is the normal display screen for the signal
booster. The system will return to this screen from
any other screen if no menu interface buttons are
pressed within 2 minutes.
The main status display screen shows the current
draw of all 6 amplifiers in the system. First the
uplink amplifiers, power (PA), mid-level (MID), and
low-level (LOW) then the three downlink amplifiers.
The current value will flash on and off for any
amplifier in error. The last line of the main display
screen gives a summary status message for the
entire signal booster. In this example “Status Okay”
is being displayed. Pressing the “ENTER” button
will move you from the main status display screen
into the menu selections and will permit interaction
with the system. There are two main functions
available within the software menus including con-
figuration settings and detailed status displays.
Power (dBm) Power (watts)
-45 dBm 3.16 x 10⁻⁸
-43 dBm 5.01 x 10⁻⁸
-41 dBm 7.94 x 10⁻⁸
TOTAL 16.11 x 10⁻⁸
Figure 6: Main Status Display Screen.
Figure 5: Software version is displayed briefly during
the boot-up sequence.

61-89A-50-A18-G1-UserMan page 14 of 20
TX RX Systems Inc. Manual 7-9352 (version 4) 01/27/04 Page 14
Configuration Settings
These items allow system configuration changes to
be made. The final selection in this group “Restore
Orig Config” will restore all configurable settings to
their original factory default values. Each config-
urable item is discussed below in detail.
CALIBRATE CURRENTS
Selecting this function automatically calibrates the
current alarm “trip” point of each amplifier in the
system. Due to manufacturing tolerances there are
small differences in current draw between amplifier
assemblies. This software function matches the
alarm sensing circuit to the respective amplifier
assembly and should be repeated whenever an
amplifier assembly is replaced for maintenance
purposes.
SET GAIN
This function allows the user to electronically
reduce the gain of the booster up to 30 dB in incre-
ments of 0.5 dB. Gain can be adjusted indepen-
dently for both the uplink and downlink channels.
SET OUTPUT LEVEL
Allows the output levels for the uplink and downlink
channels to be independently adjusted in 1 dB
increments up to +30 dBm. Note that the OLC cir-
cuitry will make every effort to maintain the sys-
tems output level at the values you have selected in
this menu.
Detailed Status Screens
These items allow a detailed examination of sys-
tem components including; all amplifiers, the power
supply, and the OLC function. Each item is dis-
cussed below in detail.
AMPLIFIERS
A separate status screen is available for each
amplifier in the system. When an amplifier is
selected this function will display the present cur-
rent draw of that amp as well as its present operat-
ing temperature in degrees Celsius. In addition, a
status message will indicate if the amplifier is con-
nected and whether the amplifier is bypassed or
not bypassed. This menu selection also provides
the option of placing an amplifier in bypass or tak-
ing an amplifier out of bypass.
POWER SUPPLY
This function displays the real time power supply
voltages for both 24 volt and 12 volt supplies.
OLC
This screen shows the amount of attenuation pres-
ently being used by the OLC for both the uplink and
downlink channels. In addition, the percentage of
OLC presently being used is also shown.
The amount of OLC currently being
used in either the uplink or downlink
channels is also indicated by LED bar
graph displays located on the display
panel.
OLC HISTORICAL INFO
This screen displays the OLC historical data over
the past 100 days for both uplink and downlink. The
average OLC attenuation used when the OLC was
active is given both for individual days and over the
entire past 100 days. The percentage of time the
OLC was active is also given for both individual
days and over the past 100 days. This archived
information will permit the creation of a user signal
profile to facilitate optimum system configuration
and performance.
Alarms
The system continuously monitors the current draw
and operating temperature of each amplifier as well
as the voltage level of the +12 and +24 VDC sup-
plies. If any of these parameters exceed normal
operating levels by a factory preset percentage the
system enters an alarm condition. Notification of an
alarm condition is provided by LED indicators and
Form-C contacts available via the alarm terminal
screws.
LED INDICATORS
There are LED indicators for each amplifier in the
system as well as the +12 and +24 VDC power
supply voltages. The LED indicators for the low and
mid level amplifiers are located on the individual
plug-in module. These are tri-color LED’s with
green representing NORMAL operation, orange
representing a WARNING condition, and red indi-
cating a FAULT condition. A warning condition
occurs when the current draw of the amplifier
exceeds nominal by +/- 20%. Fault conditions
occur when the current draw exceeds +/- 30% or
the amplifiers operating temperature exceeds 80°
Celsius.
The LED indicators for the power amplifiers are
located on the assembly next to the RF input con-
nector and are dual color LED’s. Green represents
NORMAL operation while red indicates a FAULT
NOTE
61-89A-50-A18-G1-UserMan page 15 of 20
TX RX Systems Inc. Manual 7-9352 (version 4) 01/27/04 Page 15
condition. Fault conditions occur when the current
draw exceeds +/- 30% or the amplifiers operating
temperature exceeds 80° Celsius. The power
amplifiers do not have a warning state.
The power supply LED indicators are located on
display panel next to the menu selection buttons
and are also dual color. Green representing normal
operation and red a fault condition. A fault condition
for the +24 VDC supply occurs whenever the volt-
age potential drops below +16 VDC (30% below
nominal). Likewise, a fault for the +12 VDC supply
occurs when the potential is below +8 VDC (30%
below nominal).
FORM-C CONTACTS
Form-C contacts are available inside the cabinet
next to the power supply assembly, see figure1.
These screw terminals are intended for connection
to the customers supervisory alarm or data acqui-
sition system. One set of terminals is notification of
any alarm condition occurring and the second set
of contacts indicate the system is operating on bat-
tery backup power.
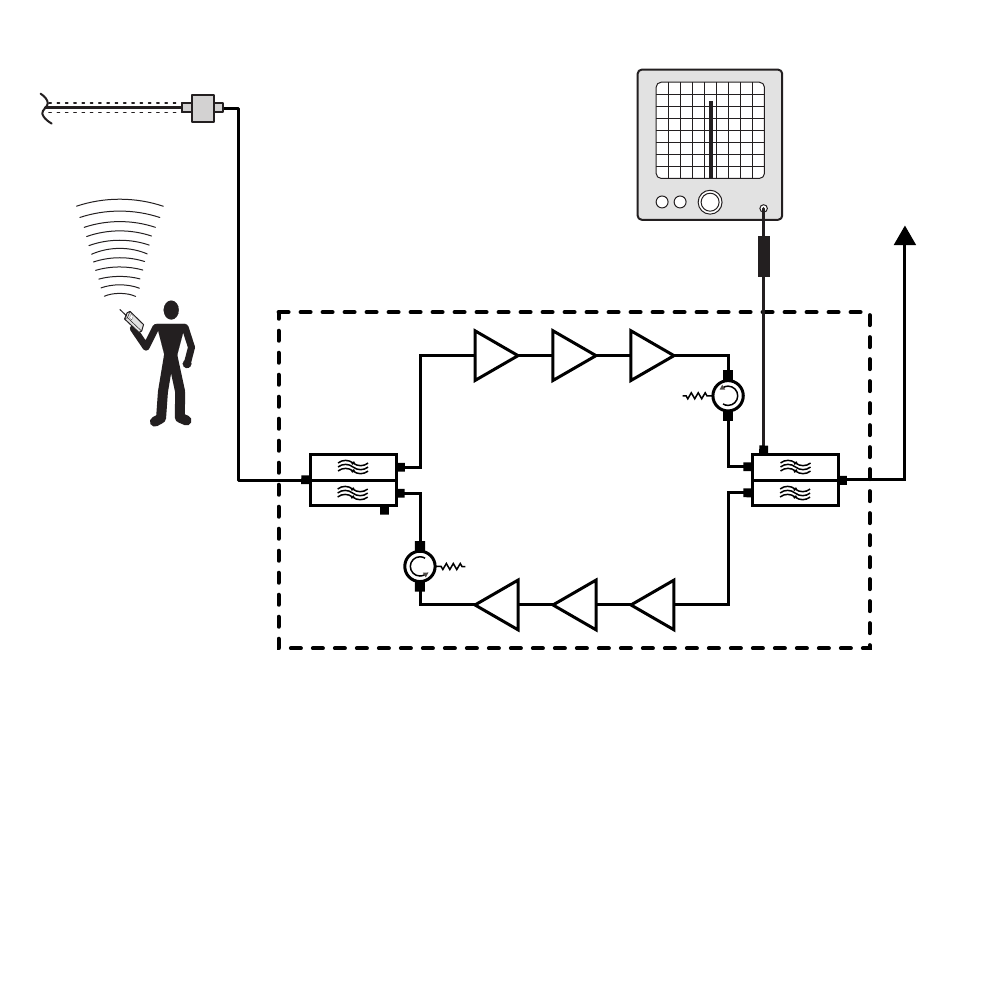
PERFORMANCE SURVEY
It is a good idea to document the performance of
the system after installation so that a reference
exists for future comparisons. This information can
make troubleshooting an interference problem or
investigation of a complaint about system perfor-
mance much easier. If there are coverage prob-
lems with a system, this survey will usually reveal
them allowing corrective measures to be taken
before the system is put into routine use. The fol-
lowing is an outline of how to do such a survey.
Because the nature of each installation can be
quite different, only a broad outline is given.
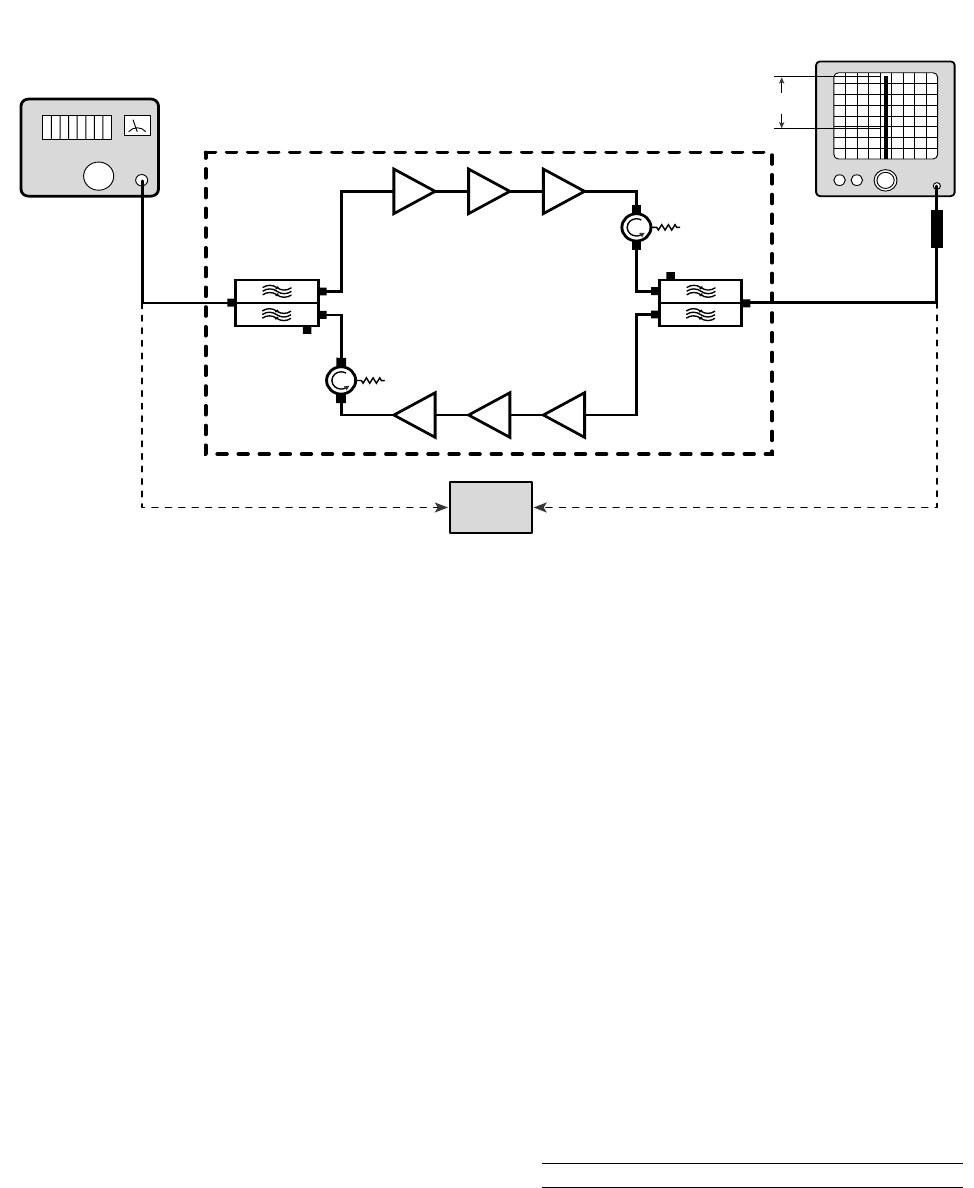
1) Measure the gain of the signal booster being
careful not to exceed the maximum input level.
Figure 7 shows this being done using a signal
generator and spectrum analyzer. This is basi-
cally a substitution measurement. Record the
measured values for each passband.
Test Port
Test Port
Signal
Generator
Zero
Reference
Spectrum
Analyzer
10 dB Pad
Gain
Figure 7: Test equipment interconnection for measuring signal booster gain.
61-89A-50-A18-G1-UserMan page 16 of 20
TX RX Systems Inc. Manual 7-9352 (version 4) 01/27/04 Page 16
2) The signal booster is equipped with a -30 dB
signal sampler port following the final output
amp (part of the Duplexer assembly). This port
is for the connection of test equipment such as
a spectrum analyzer and will allow the observa-
tion of the amplifier output at a considerably
reduced output level. This decoupling figure
needs to be added to a measured signal value
in order to arrive at the actual signal level.
3) With a spectrum analyzer connected to the sig-
nal sampler port (see Figure 8), have person-
nel with handheld radios move to several
predetermined points and key their radios.
Record the level of these signals as observed
on the analyzer and also record the location of
the person transmitting. In this way, a map of
the systems performance can be generated.
Test Port
Boosted
RF Signal
Signal Distribution System
Spectrum
Analyzer
10 dB Pad
Figure 8: Test equipment interconnection for surveying performance.
61-89A-50-A18-G1-UserMan page 17 of 20
TX RX Systems Inc. Manual 7-9352 (version 4) 01/27/04 Page 17
4) For signals coming from a fixed antenna or sta-
tion, record the level of all the desired incoming
signals for future reference.
MAINTENANCE AND REPAIR
Signal boosters manufactured by TX RX Systems,
Inc. can function reliably for 10 or more years with
little or no maintenance. However, if the amplifiers
are subjected to excessively high signal levels,
power surges or lightning strikes, failures may
occur. The following procedures may be followed
for detecting a malfunctioning unit or as part of a
periodic maintenance program.
1) The heatsink area should be cleared of dust
and debris.
2) Inspect the unit to see that the power supply
LED DC indicator is lit (remove any dust or
debris that may obscure the LED). This will ver-
ify that DC power is flowing properly. Check all
hardware for tightness.
3) Compare system performance to initial perfor-
mance levels measured when the system was
first installed. The lack of signal can be traced to
a malfunctioning amplifier by progressive signal
monitoring from the output (far end) to the input
end of the system noting the area where the
signal returns to normal level. The next amplifier
toward the output end of the system will proba-
bly be the one that failed.
or
Measure the gain at any convenient frequency
in the working frequency band to verify that the
gain specification is being met. If the gain val-
ues fall below that specified for the model check
the following:
A) Open the signal booster cabinet and inspect for
any loose or broken connections or cables, and
repair as necessary.
B) Measure the output of the power supply to see
that the proper operating voltage is being main-
tained.

61-89A-50-A18-G1-UserMan page 18 of 20
TX RX Systems Inc. Manual 7-9352 (version 4) 01/27/04 Page 18
dBm dBw Watts Volts (50Ω)
80 50 100000 2236.07
79 49 79432.82 1992.9
78 48 63095.74 1776.17
77 47 50118.72 1583.01
76 46 39810.72 1410.86
75 45 31622.78 1257.43
74 44 25118.86 1120.69
73 43 19952. 62 998.81
72 42 15848.93 890.19
71 41 12589.25 793.39
70 40 10000 707.11
69 39 7943.28 630.21
68 38 6309.57 561.67
67 37 5011.87 500.59
66 36 3981.07 446.15
65 35 3162.28 397.64
64 34 2511.89 354.39
63 33 1995.26 315.85
62 32 1584.89 281.5
61 31 1258.93 250.89
60 30 1000 223.61
59 29 794.33 199.29
58 28 630.96 177.62
57 27 501.19 158.3
56 26 398.11 141.09
55 25 316.23 125.74
54 24 251.19 112.07
53 23 199.53 99.88
52 22 158.49 89.02
51 21 125.89 79.34
50 20 100 70.71
49 19 79.43 63.02
48 18 63.1 56.17
47 17 50.12 50.06
46 16 39.81 44.62
45 15 31.62 39.76
44 14 25.12 35.44
43 13 19.95 31.59
42 12 15.85 28.15
41 11 12.59 25.09
dBm dBw Watts Volts (50Ω)
40 10 10 22.36
39 9 7.94 19.93
38 8 6.31 17.76
37 7 5.01 15.83
36 6 3.98 14.11
35 5 3.16 12.57
34 4 2.51 11.21
33 3 2 9.99
32 2 1.59 8.9
31 1 1.26 7.93
30 0 1 7.07
29 -1 0.79 6.3
28 -2 0.63 5.62
27 -3 0.5 5.01
26 -4 0.4 4.46
25 -5 0.32 3.98
24 -6 0.25 3.54
23 -7 0.2 3.16
22 -8 0.16 2.82
21 -9 0.13 2.51
20 -10 0.1 2.24
19 -11 0.08 1.99
18 -12 0.06 1.78
17 -13 0.05 1.58
16 -14 0.04 1.41
15 -15 0.03 1.26
14 -16 0.03 1.12
13 -17 0.02 1
12 -18 0.02 0.89
11 -19 0.01 0.79
10 -20 0.01 0.71
9 -21 0.01 0.63
8 -22 0.01 0.56
7 -23 0.01 0.5
6-24 00.45
5-25 0 0.4
4-26 00.35
3-27 00.32
2-28 00.28
1-29 00.25
Power Conversion Chart
dBm to dBw : Watts : Microvolts

61-89A-50-A18-G1-UserMan page 19 of 20
TX RX Systems Inc. Manual 7-9352 (version 4) 01/27/04 Page 19
dBm dBw Watts uVolts (50Ω)
0 -30 1.0000E-03 223606.8
-1 -31 7.9433E-04 199289.77
-2 -32 6.3096E-04 177617.19
-3 -33 5.0119E-04 158301.49
-4 -34 3.9811E-04 141086.35
-5 -35 3.1623E-04 125743.34
-6 -36 2.5119E-04 112068.87
-7 -37 1.9953E-04 99881.49
-8 -38 1.5849E-04 89019.47
-9 -39 1.2589E-04 79338.69
-10 -40 1.0000E-04 70710.68
-11 -41 7.9433E-05 63020.96
-12 -42 6.3096E-05 56167.49
-13 -43 5.0119E-05 50059.33
-14 -44 3.9811E-05 44615.42
-15 -45 3.1623E-05 39763.54
-16 -46 2.5119E-05 35439.29
-17 -47 1.9953E-05 31585.3
-18 -48 1.5849E-05 28150.43
-19 -49 1.2589E-05 25089.1
-20 -50 1.0000E-05 22360.68
-21 -51 7.9433E-06 19928.98
-22 -52 6.3096E-06 17761.72
-23 -53 5.0119E-06 15830.15
-24 -54 3.9811E-06 14108.64
-25 -55 3.1623E-06 12574.33
-26 -56 2.5119E-06 11206.89
-27 -57 1.9953E-06 9988.15
-28 -58 1.5849E-06 8901.95
-29 -59 1.2589E-06 7933.87
-30 -60 1.0000E-06 7071.07
-31 -61 7.9433E-07 6302.1
-32 -62 6.3096E-07 5616.75
-33 -63 5.0119E-07 5005.93
-34 -64 3.9811E-07 4461.54
-35 -65 3.1623E-07 3976.35
-36 -66 2.5119E-07 3543.93
-37 -67 1.9953E-07 3158.53
-38 -68 1.5849E-07 2815.04
-39 -69 1.2589E-07 2508.91
dBm dBw Watts uVolts (50Ω)
-40 -70 1.0000E-07 2236.07
-41 -71 7.9433E-08 1992.9
-42 -72 6.3096E-08 1776.17
-43 -73 5.0119E-08 1583.02
-44 -74 3.9811E-08 1410.86
-45 -75 3.1623E-08 1257.43
-46 -76 2.5119E-08 1120.69
-47 -77 1.9953E-08 998.82
-48 -78 1.5849E-08 890.2
-49 -79 1.2589E-08 793.39
-50 -80 1.0000E-08 707.11
-51 -81 7.9433E-09 630.21
-52 -82 6.3096E-09 561.68
-53 -83 5.0119E-09 500.59
-54 -84 3.9811E-09 446.15
-55 -85 3.1623E-09 397.64
-56 -86 2.5119E-09 354.39
-57 -87 1.9953E-09 315.85
-58 -88 1.5849E-09 281.5
-59 -89 1.2589E-09 250.89
-60 -90 1.0000E-09 223.61
-61 -91 7.9433E-10 199.29
-62 -92 6.3096E-10 177.62
-63 -93 5.0119E-10 158.3
-64 -94 3.9811E-10 141.09
-65 -95 3.1623E-10 125.74
-66 -96 2.5119E-10 112.07
-67 -97 1.9953E-10 99.88
-68 -98 1.5849E-10 89.02
-69 -99 1.2589E-10 79.34
-70 -100 1.0000E-10 70.71
-71 -101 7.9433E-11 63.02
-72 -102 6.3096E-11 56.17
-73 -103 5.0119E-11 50.06
-74 -104 3.9811E-11 44.62
-75 -105 3.1623E-11 39.76
-76 -106 2.5119E-11 35.44
-77 -107 1.9953E-11 31.59
-78 -108 1.5849E-11 28.15
-79 -109 1.2589E-11 25.09
Power Conversion Chart
dBm to dBw : Watts : Microvolts

61-89A-50-A18-G1-UserMan page 20 of 20
TX RX Systems Inc. Manual 7-9352 (version 4) 01/27/04 Page 20
dBm dBw Watts uVolts (50Ω)
-80 -110 1.0000E-11 22.36
-81 -111 7.9433E-12 19.93
-82 -112 6.3096E-12 17.76
-83 -113 5.0119E-12 15.83
-84 -114 3.9811E-12 14.11
-85 -115 3.1623E-12 12.57
-86 -116 2.5119E-12 11.21
-87 -117 1.9953E-12 9.99
-88 -118 1.5849E-12 8.9
-89 -119 1.2589E-12 7.93
-90 -120 1.0000E-12 7.07
-91 -121 7.9433E-13 6.3
-92 -122 6.3096E-13 5.62
-93 -123 5.0119E-13 5.01
-94 -124 3.9811E-13 4.46
-95 -125 3.1623E-13 3.98
-96 -126 2.5119E-13 3.54
-97 -127 1.9953E-13 3.16
-98 -128 1.5849E-13 2.82
-99 -129 1.2589E-13 2.51
-100 -130 1.0000E-13 2.24
-101 -131 7.9433E-14 1.99
-102 -132 6.3096E-14 1.78
-103 -133 5.0119E-14 1.58
-104 -134 3.9811E-14 1.41
-105 -135 3.1623E-14 1.26
-106 -136 2.5119E-14 1.12
-107 -137 1.9953E-14 1
-108 -138 1.5849E-14 0.89
-109 -139 1.2589E-14 0.79
-110 -140 1.0000E-14 0.71
-111 -141 7.9433E-15 0.63
-112 -142 6.3096E-15 0.56
-113 -143 5.0119E-15 0.5
-114 -144 3.9811E-15 0.45
-115 -145 3.1623E-15 0.4
-116 -146 2.5119E-15 0.35
-117 -147 1.9953E-15 0.32
-118 -148 1.5849E-15 0.28
-119 -149 1.2589E-15 0.25
dBm dBw Watts uVolts (50Ω)
-120 -150 1.0000E-15 0.22
-121 -151 7.9433E-16 0.2
-122 -152 6.3096E-16 0.18
-123 -153 5.0119E-16 0.16
-124 -154 3.9811E-16 0.14
-125 -155 3.1623E-16 0.13
-126 -156 2.5119E-16 0.11
-127 -157 1.9953E-16 0.1
-128 -158 1.5849E-16 0.09
-129 -159 1.2589E-16 0.08
-130 -160 1.0000E-16 0.07
-131 -161 7.9433E-17 0.06
-132 -162 6.3096E-17 0.06
-133 -163 5.0119E-17 0.05
-134 -164 3.9811E-17 0.05
-135 -165 3.1623E-17 0.04
-136 -166 2.5119E-17 0.04
-137 -167 1.9953E-17 0.03
-138 -168 1.5849E-17 0.03
-139 -169 1.2589E-17 0.03
-140 -170 1.0000E-17 0.02
-141 -171 7.9433E-18 0.02
-142 -172 6.3096E-18 0.02
-143 -173 5.0119E-18 0.02
-144 -174 3.9811E-18 0.01
-145 -175 3.1623E-18 0.01
-146 -176 2.5119E-18 0.01
-147 -177 1.9953E-18 0.01
-148 -178 1.5849E-18 0.01
-149 -179 1.2589E-18 0.01
-150 -180 1.0000E-18 0.01
Power Conversion Chart
dBm to dBw : Watts : Microvolts