Cadwell CADWELL-1 Wireless EEG Recorder User Manual Easy III Operators Manual
Cadwell Wireless EEG Recorder Easy III Operators Manual
Cadwell >
Contents
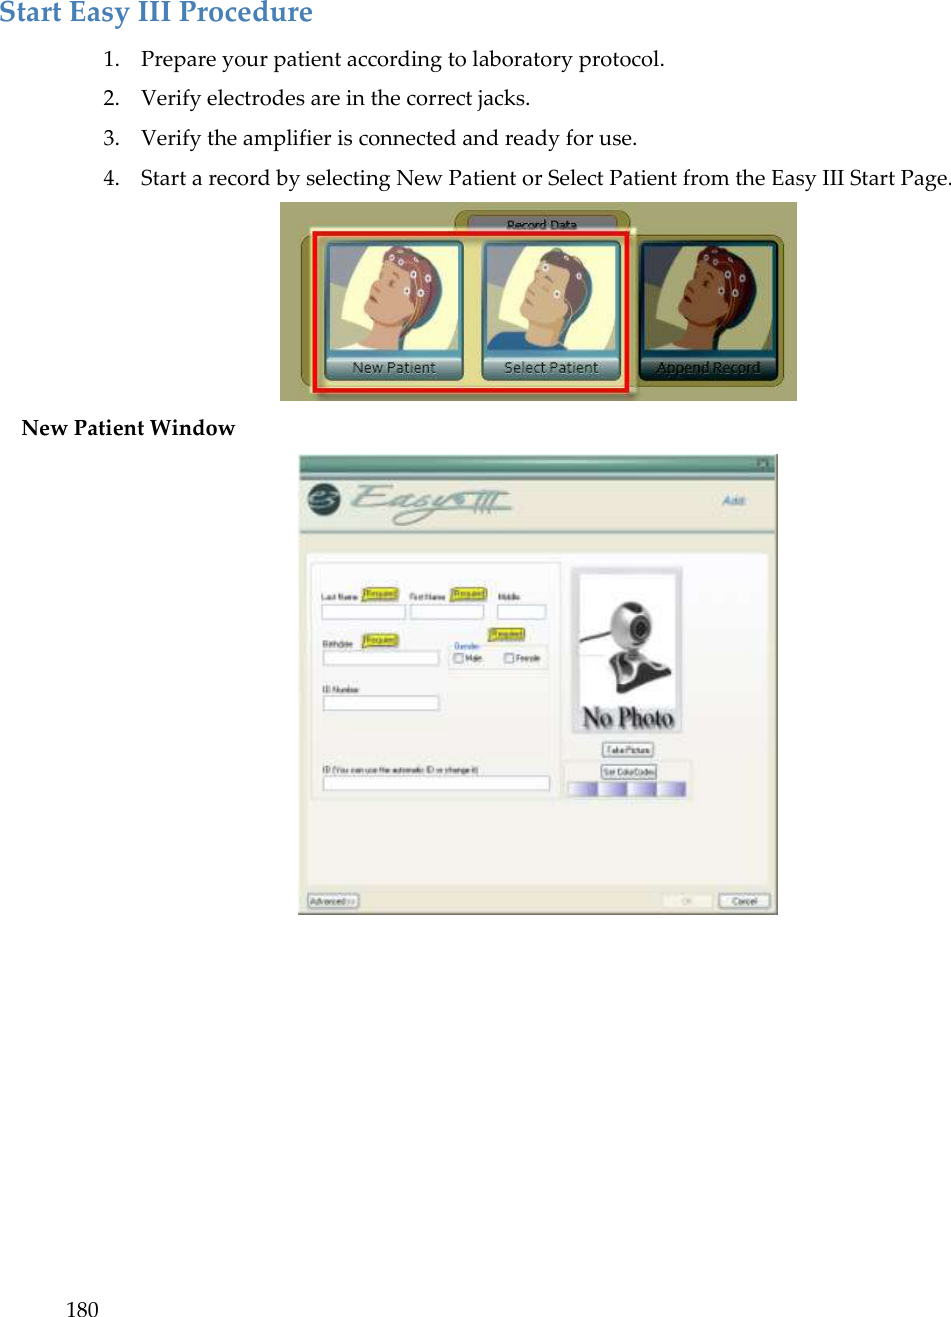
- 1. User Manual Excerpt
- 2. First half User Manual
- 3. Second half User Manual
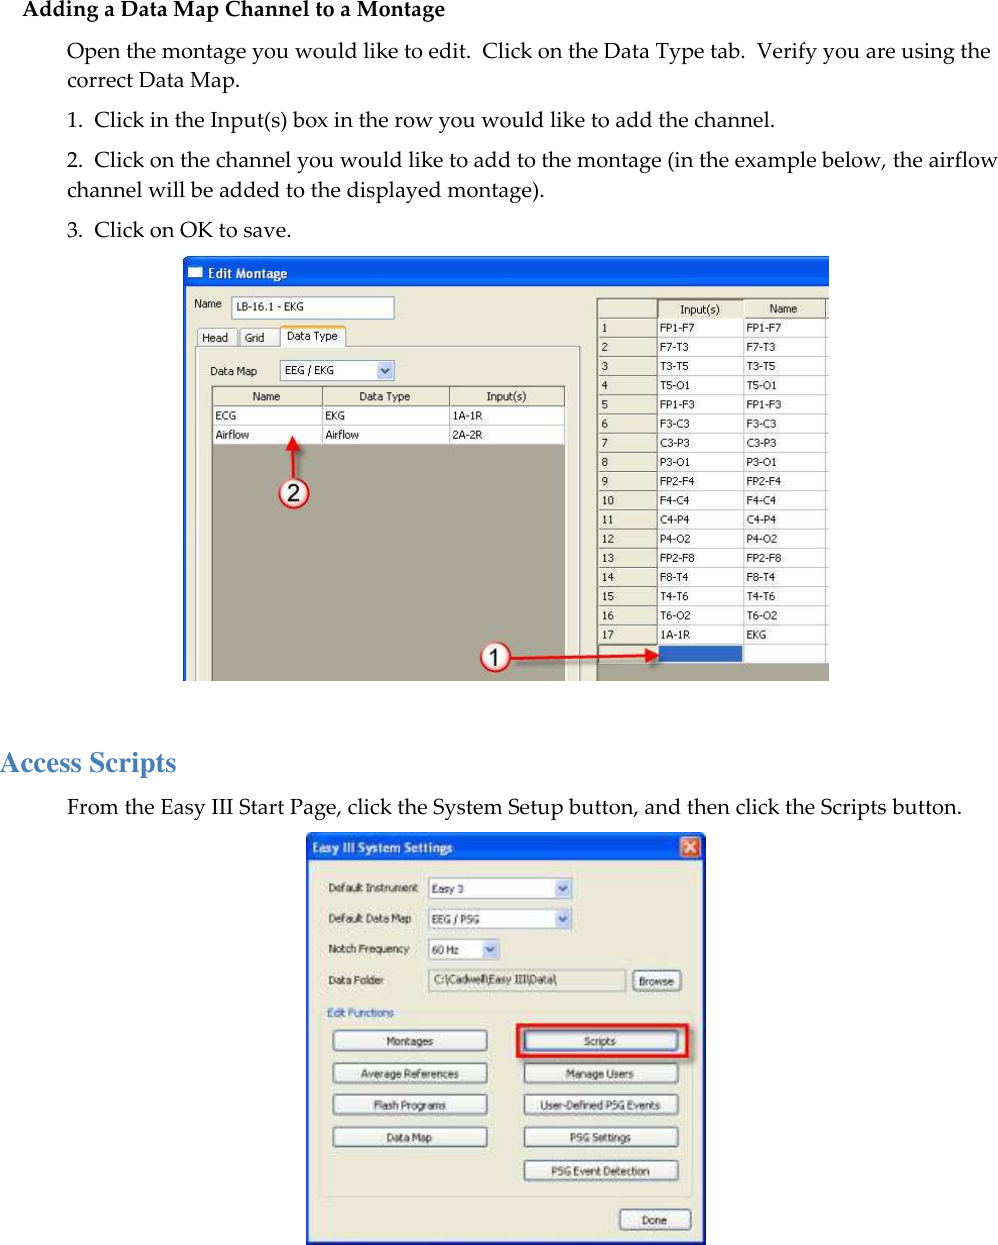
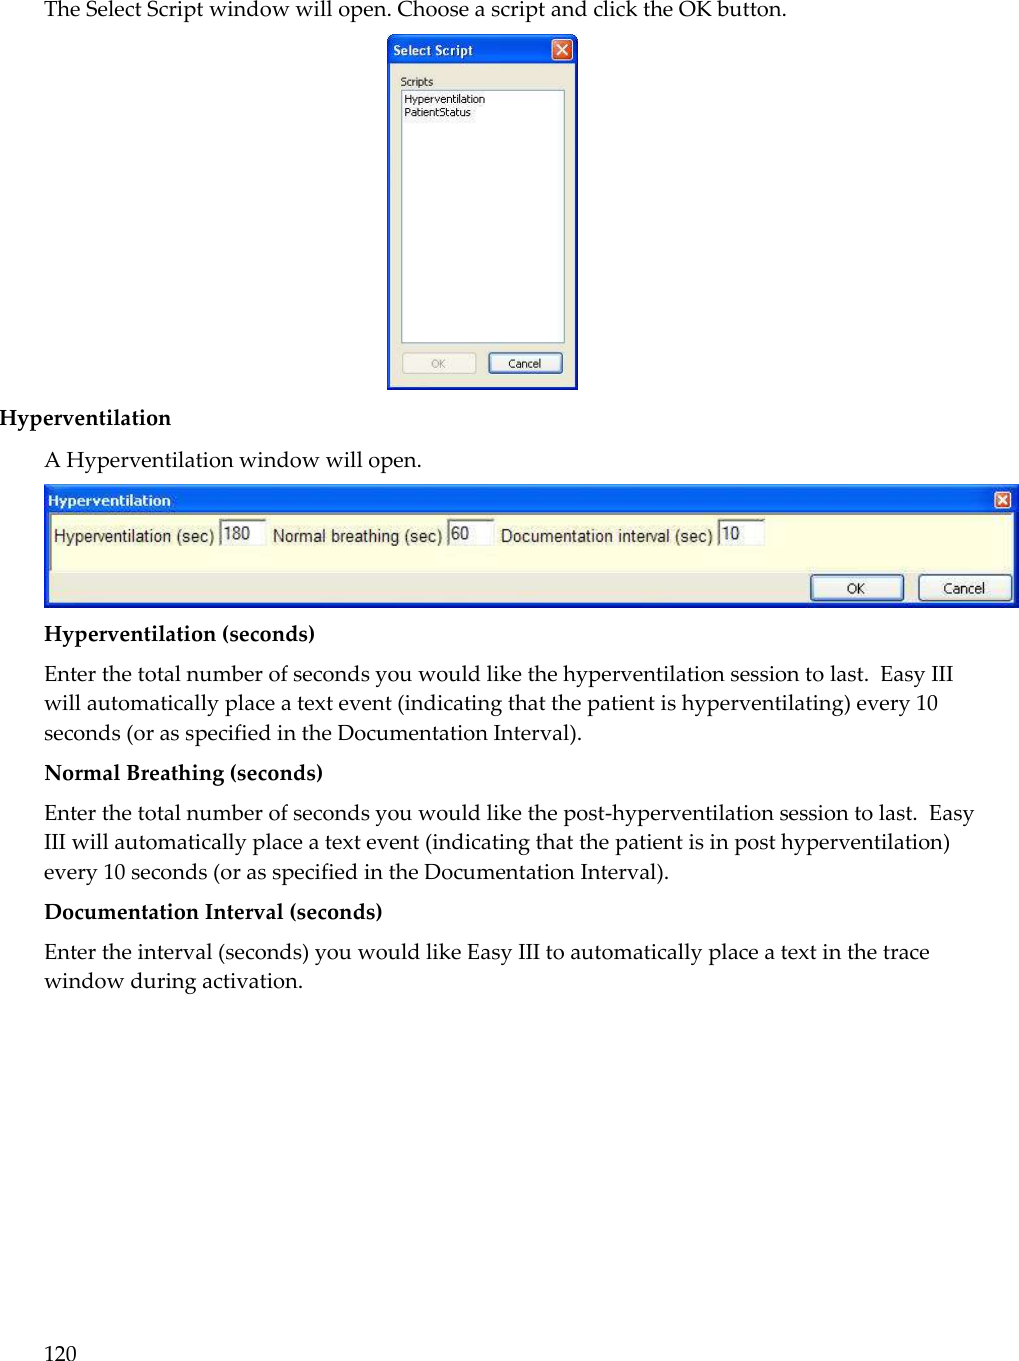
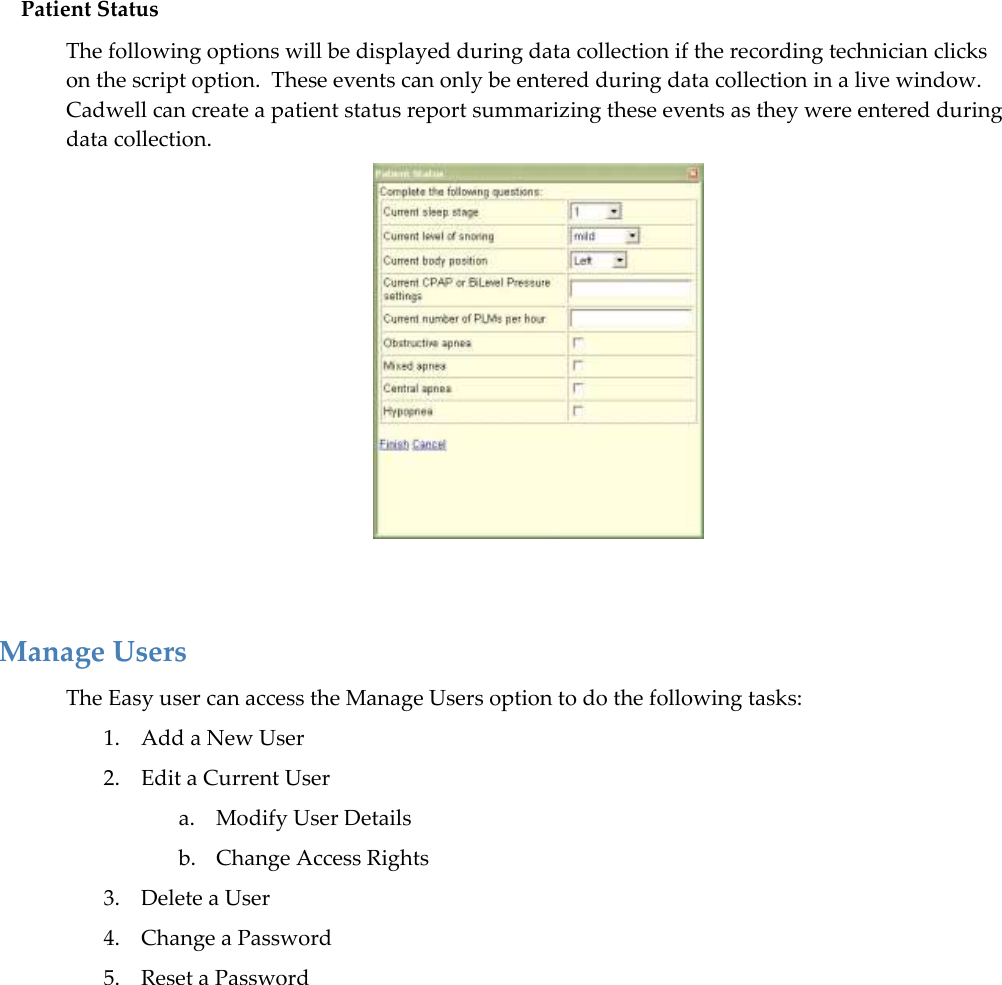
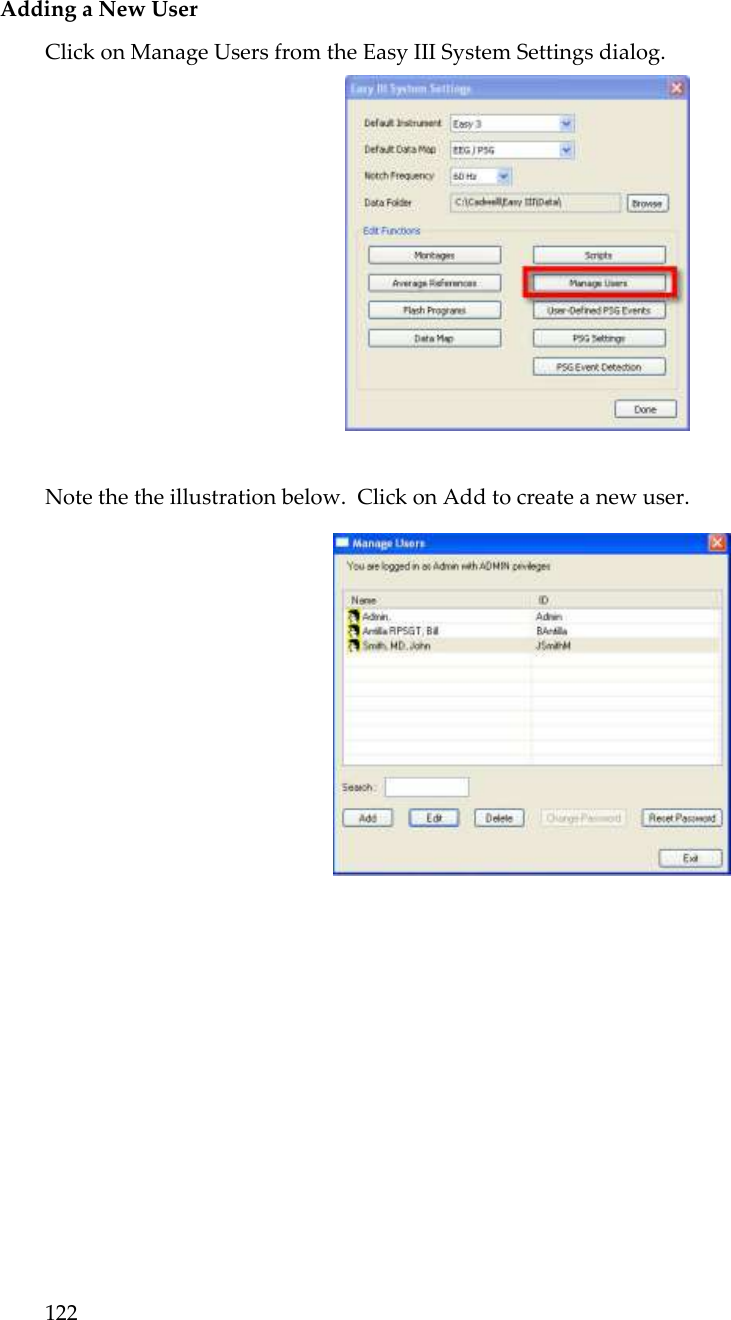
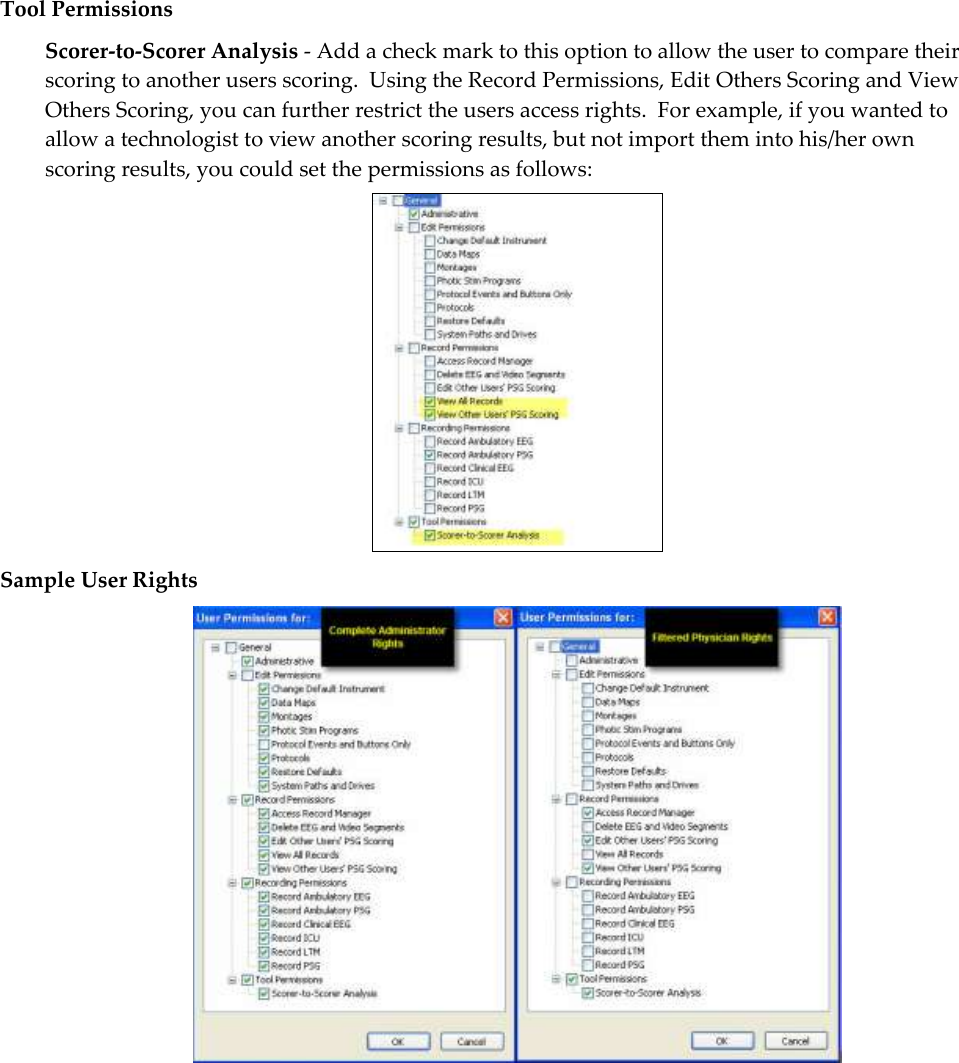
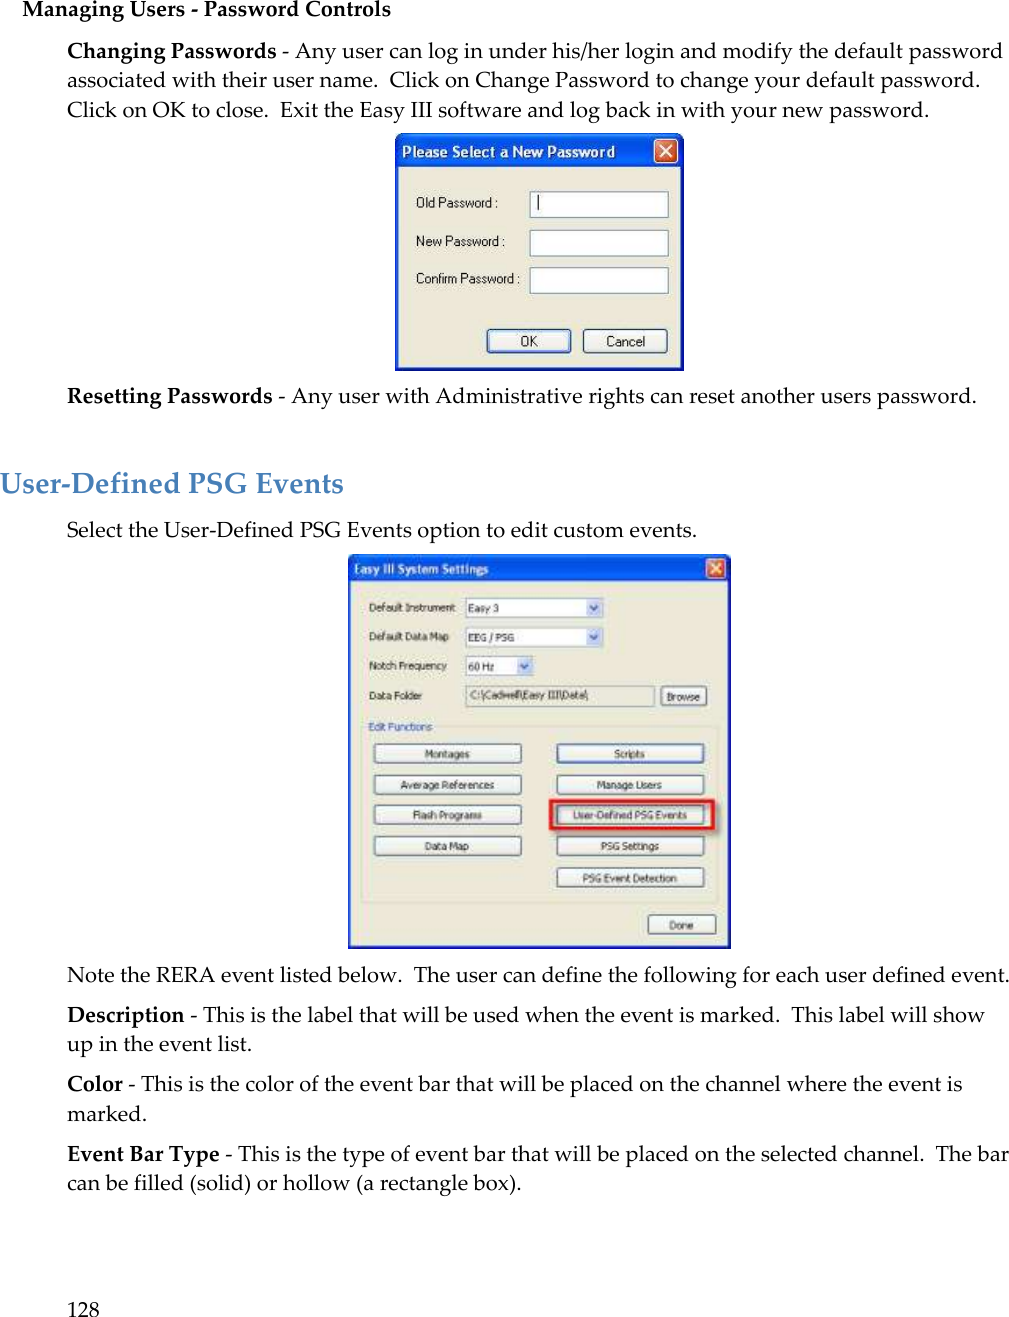
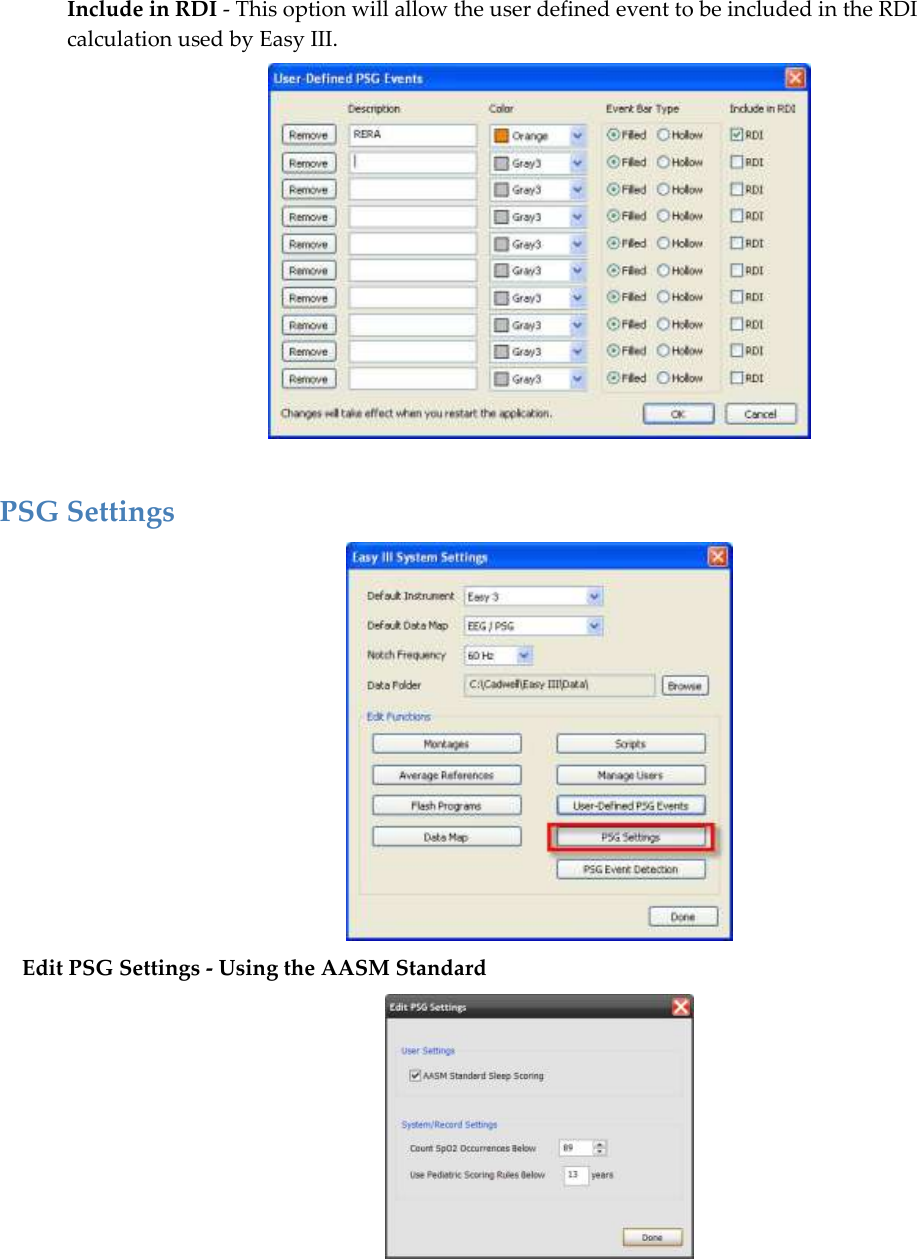
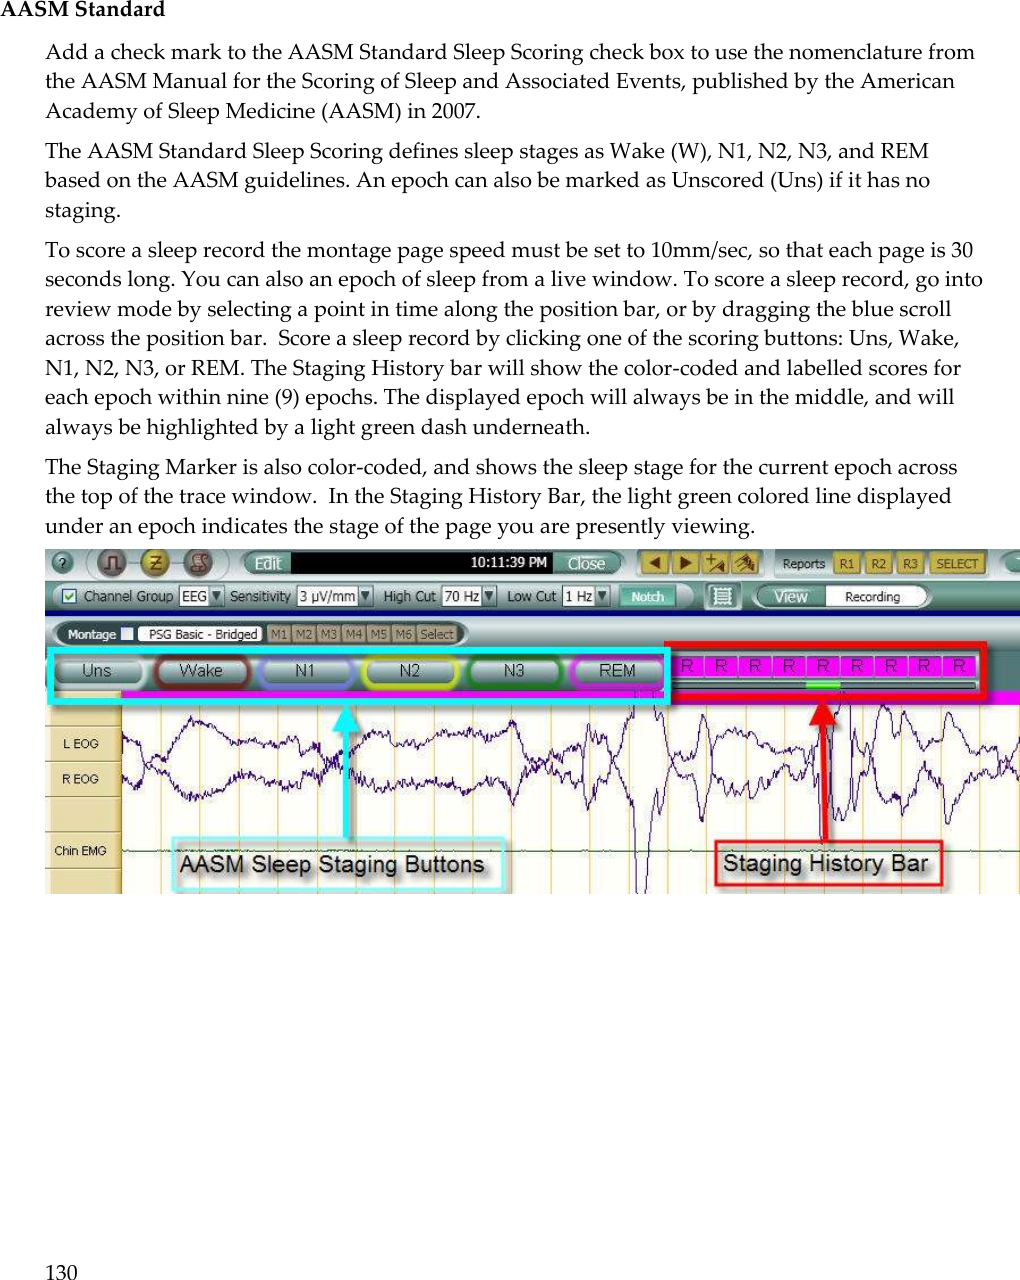
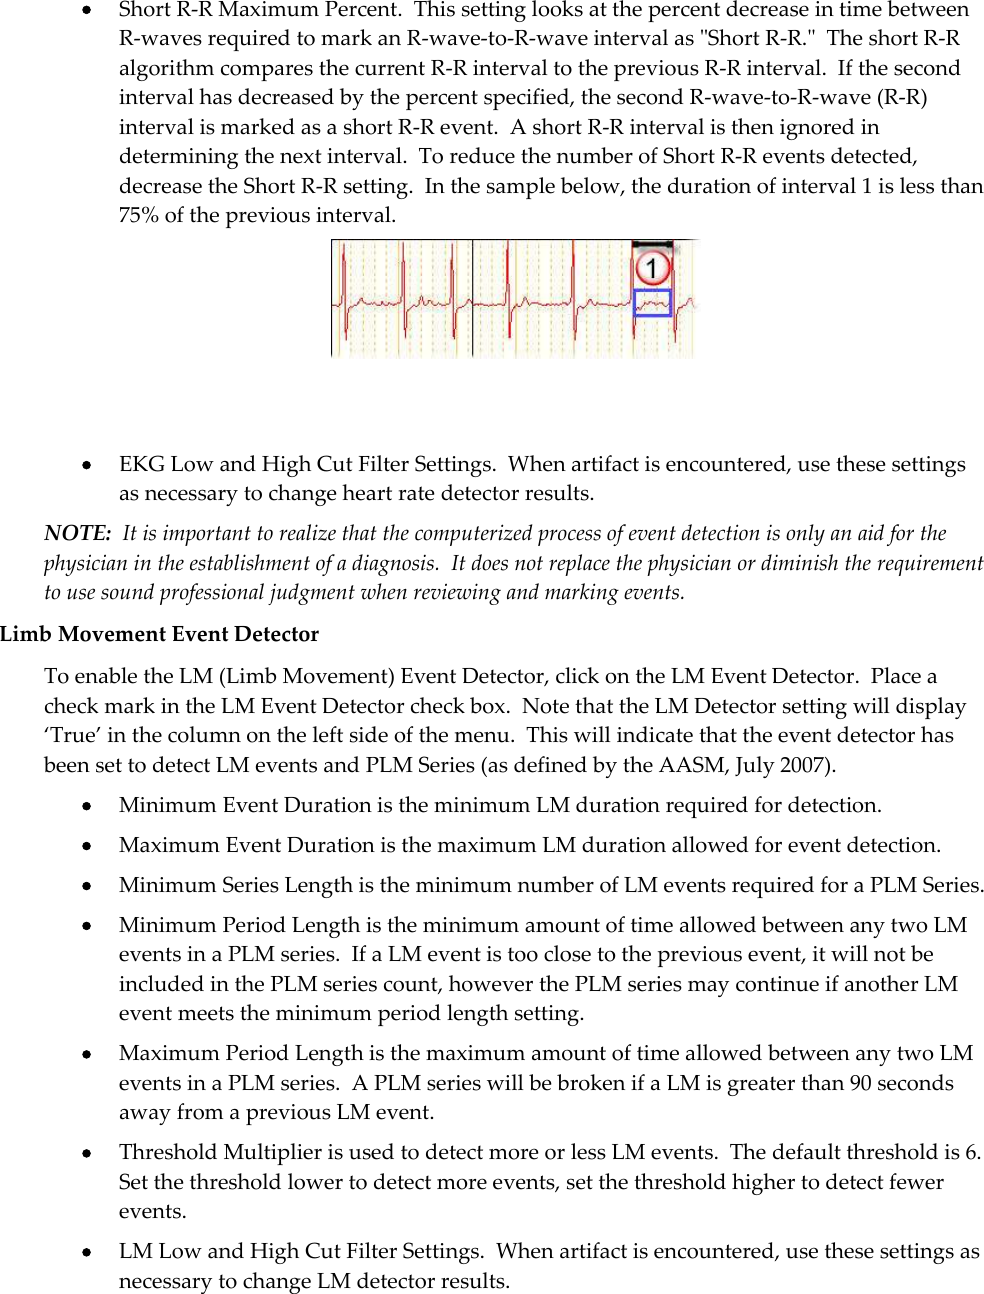
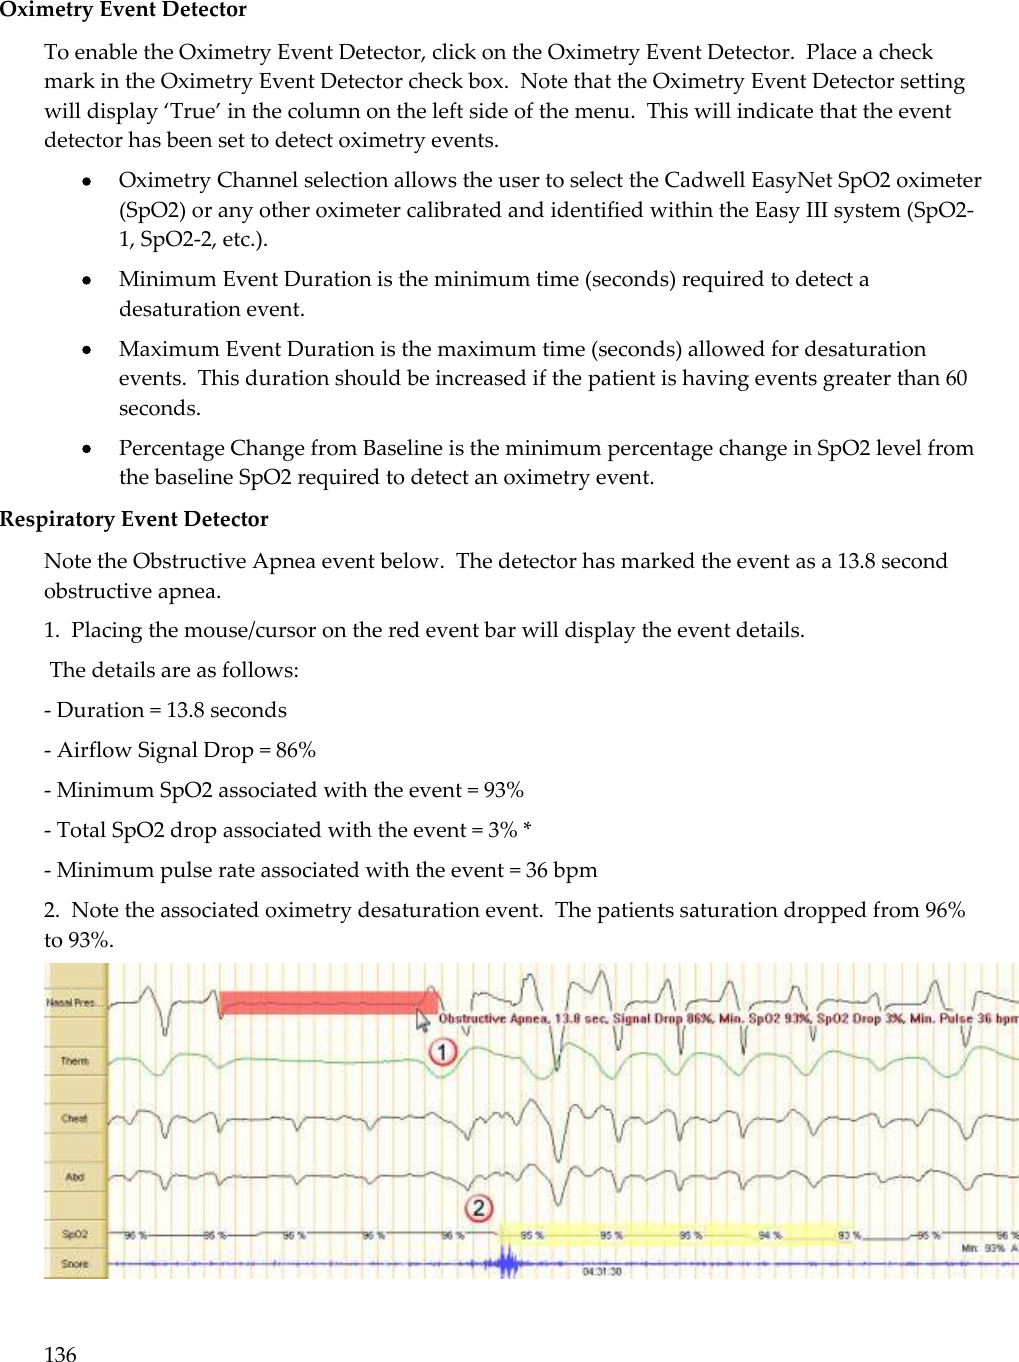
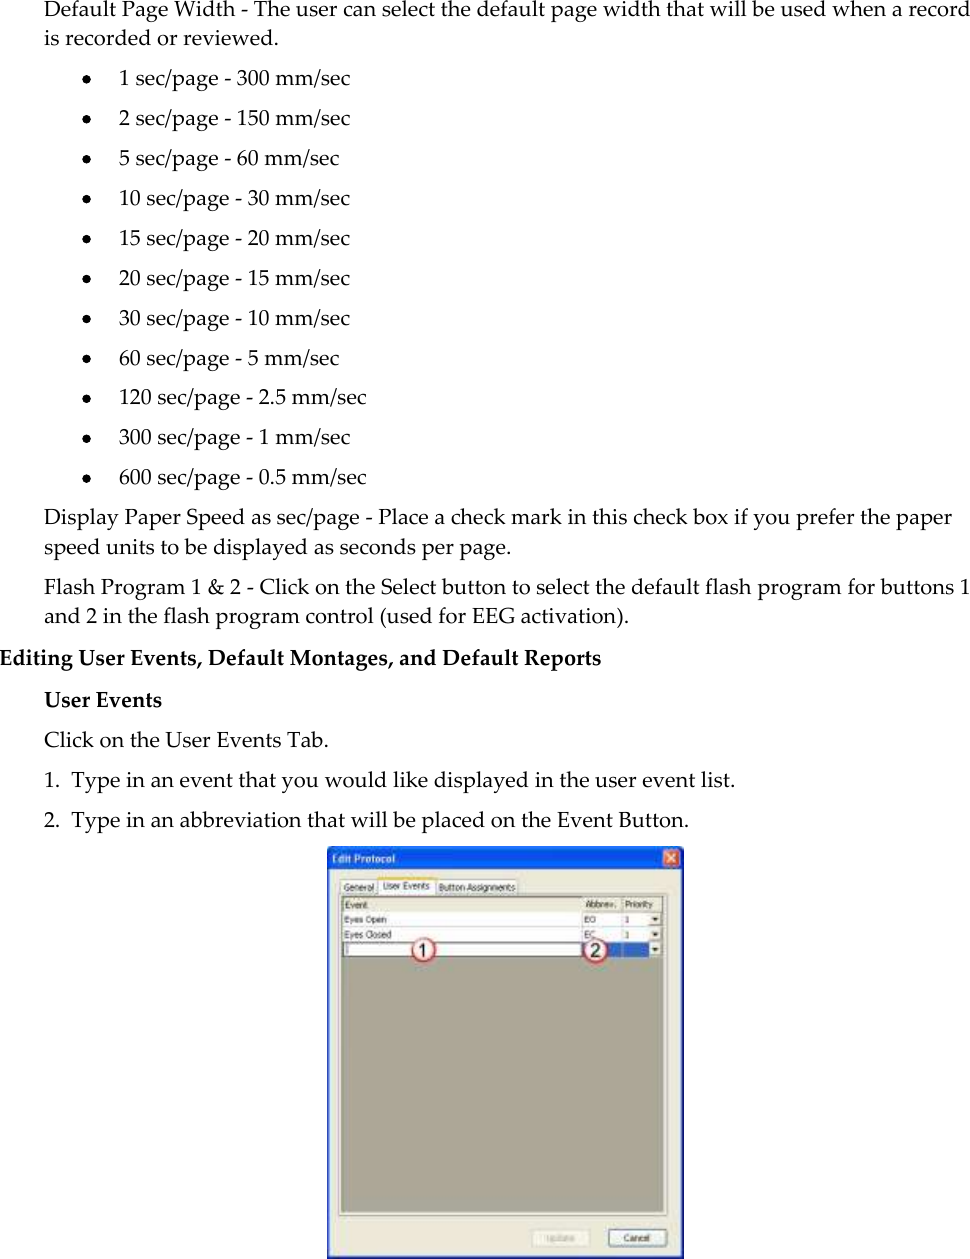
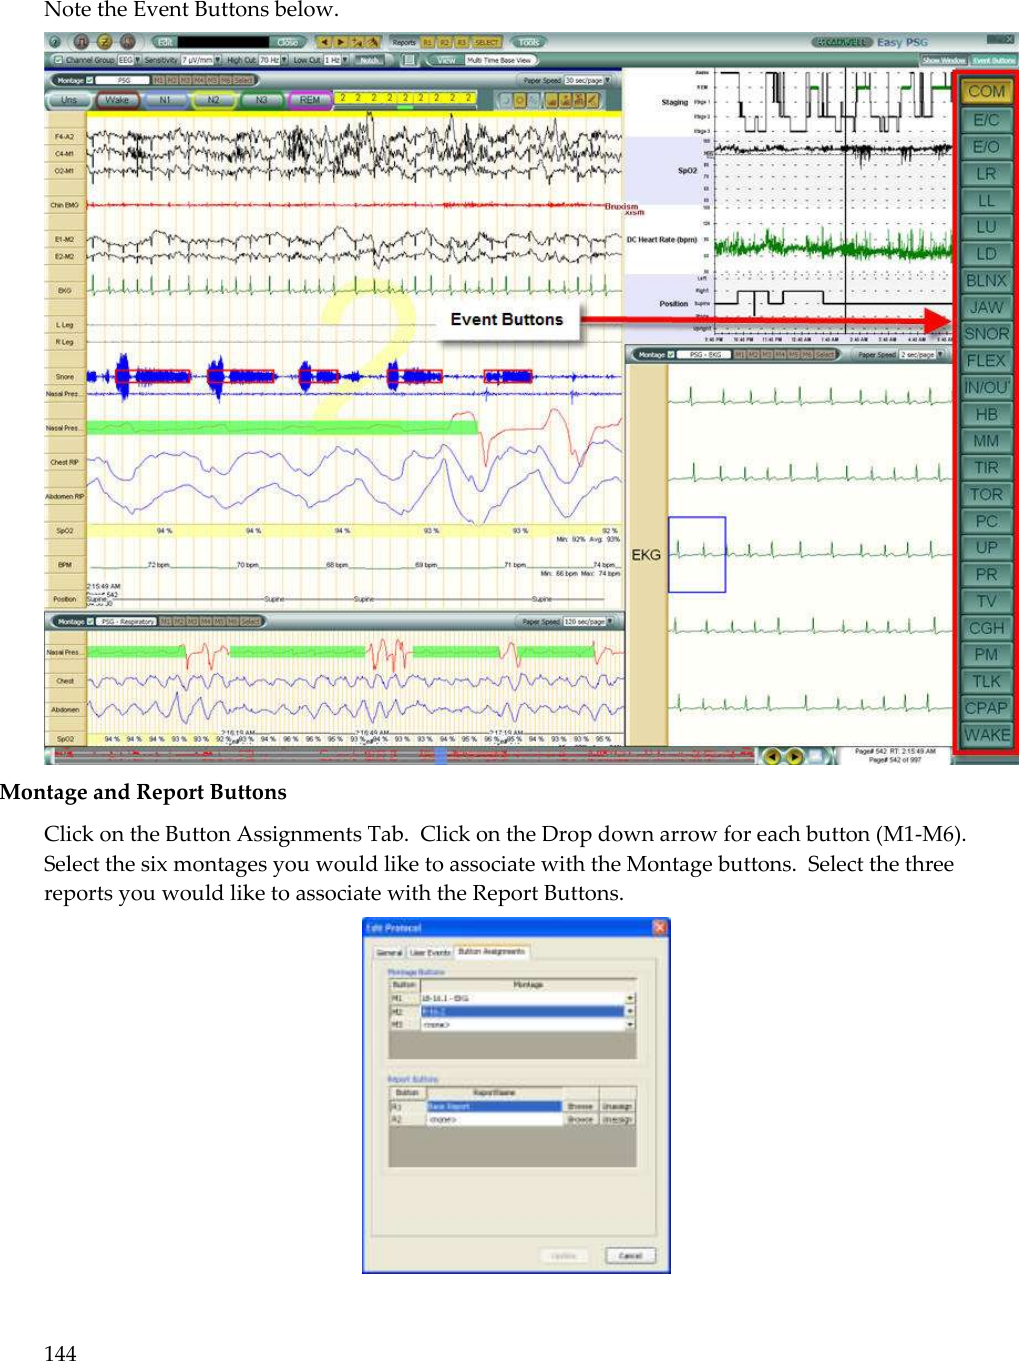
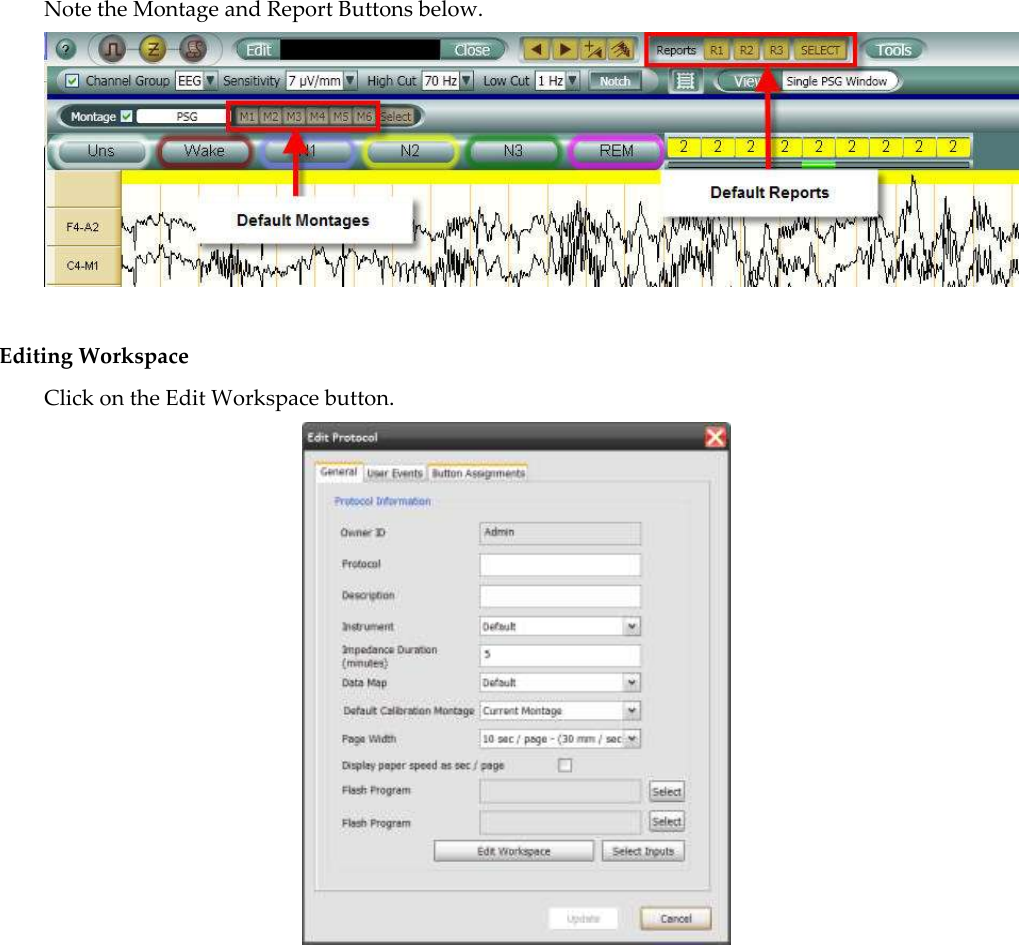
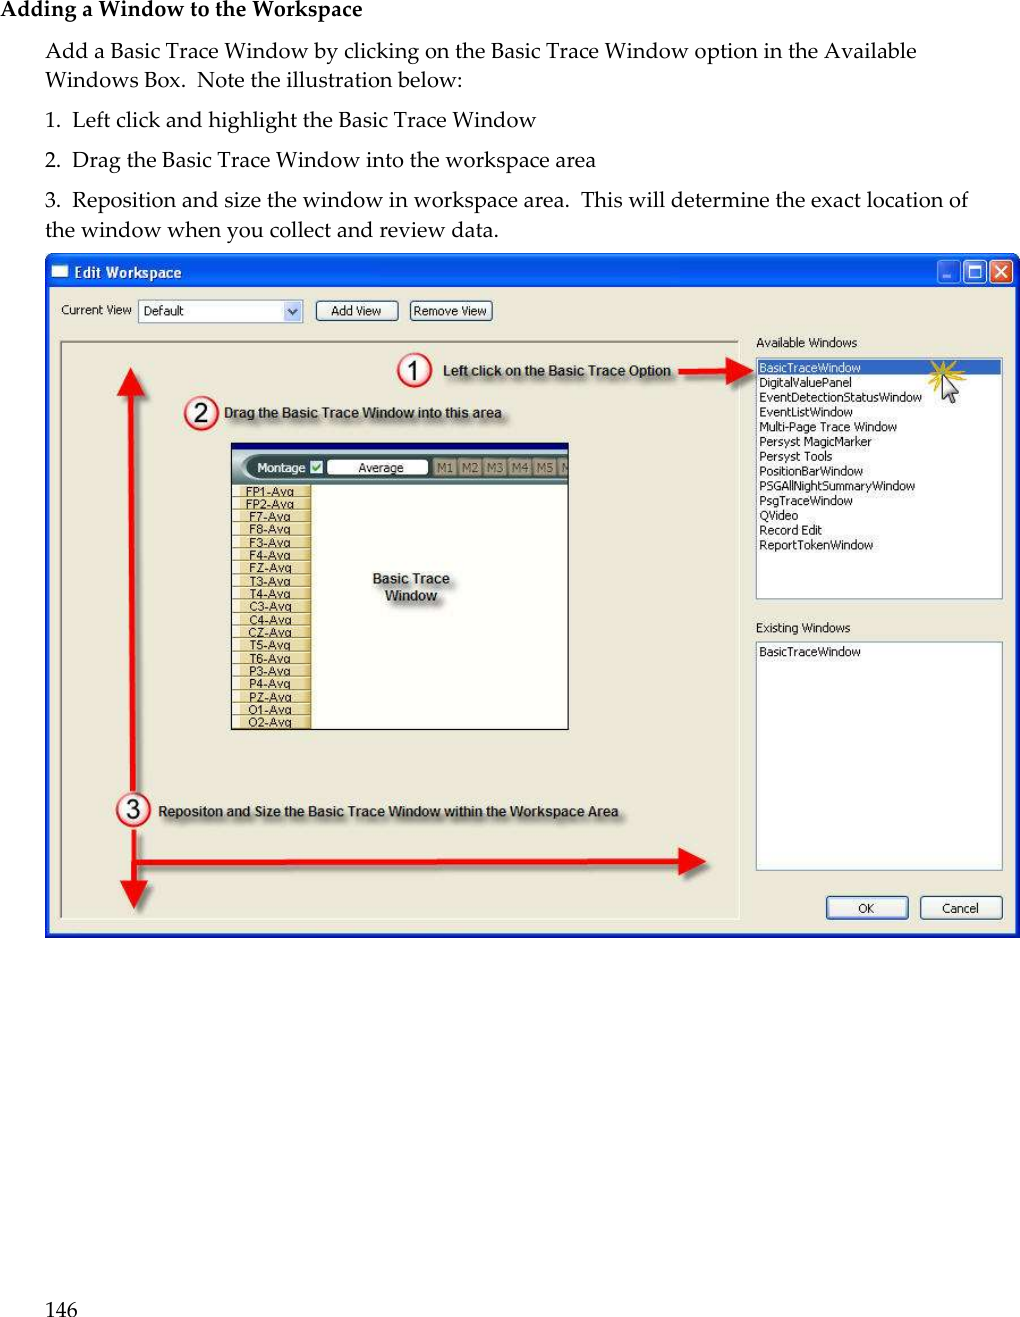
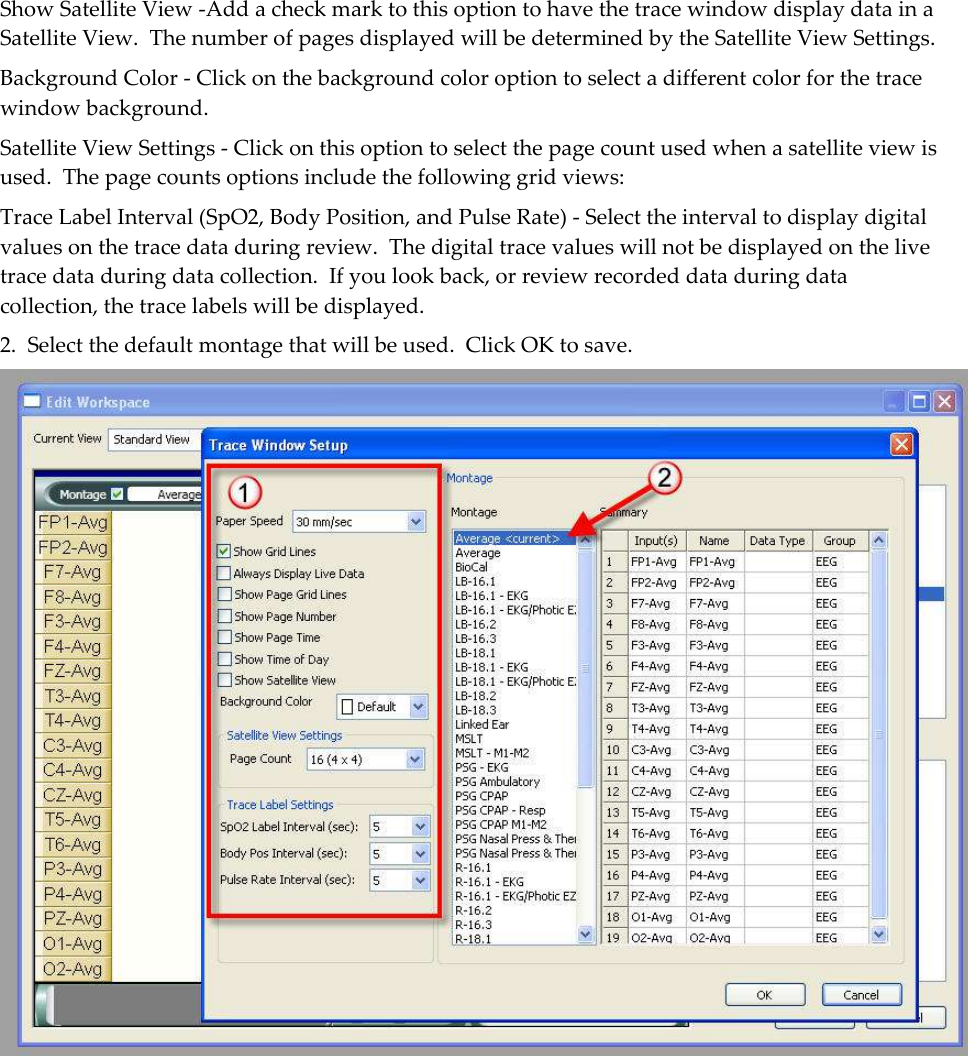
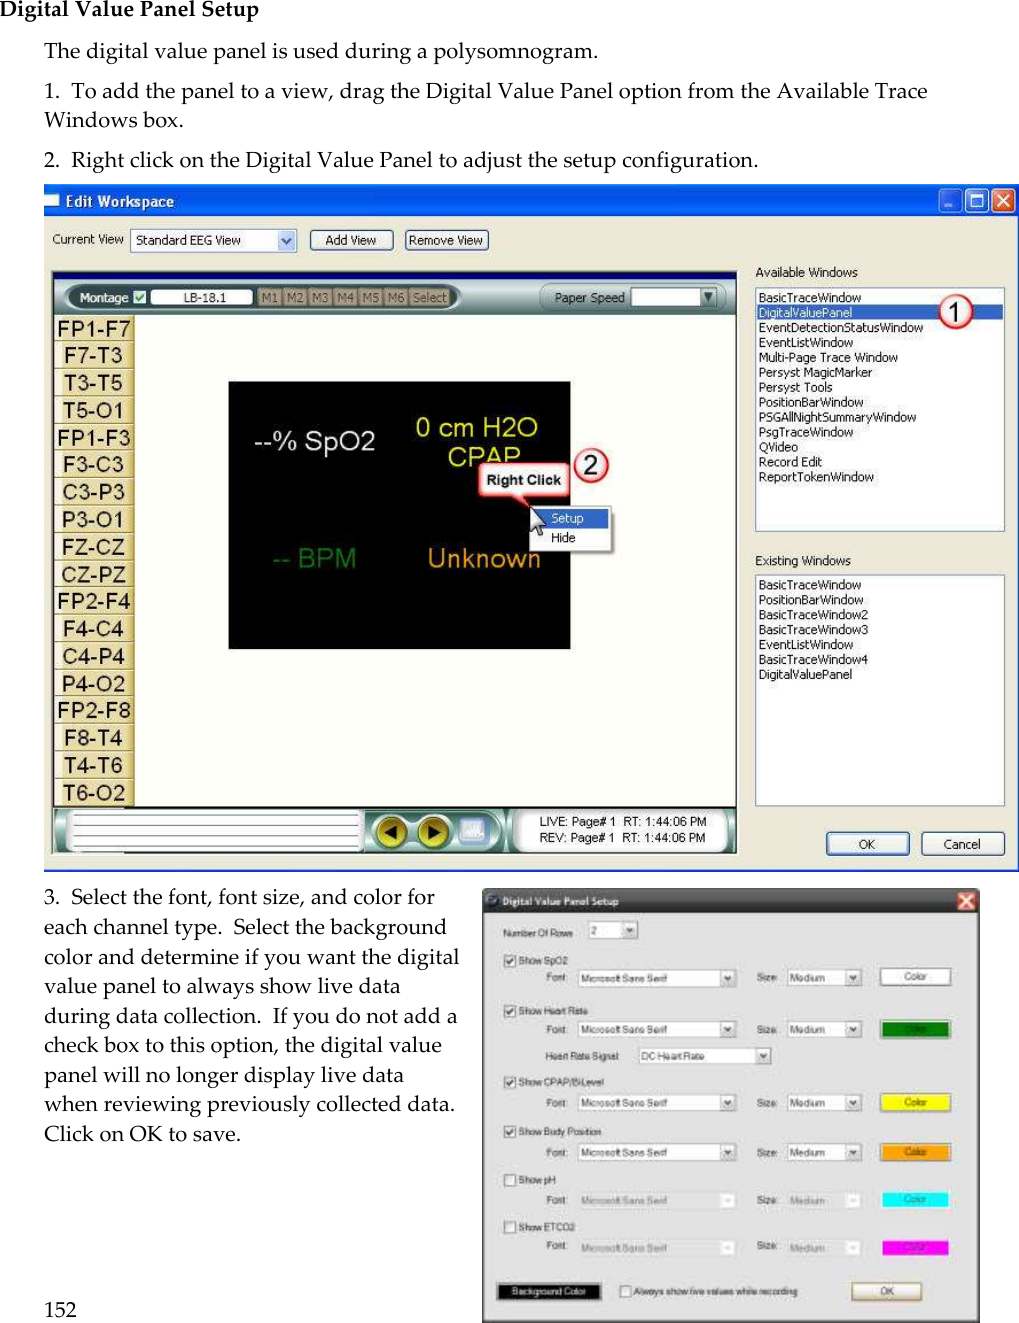
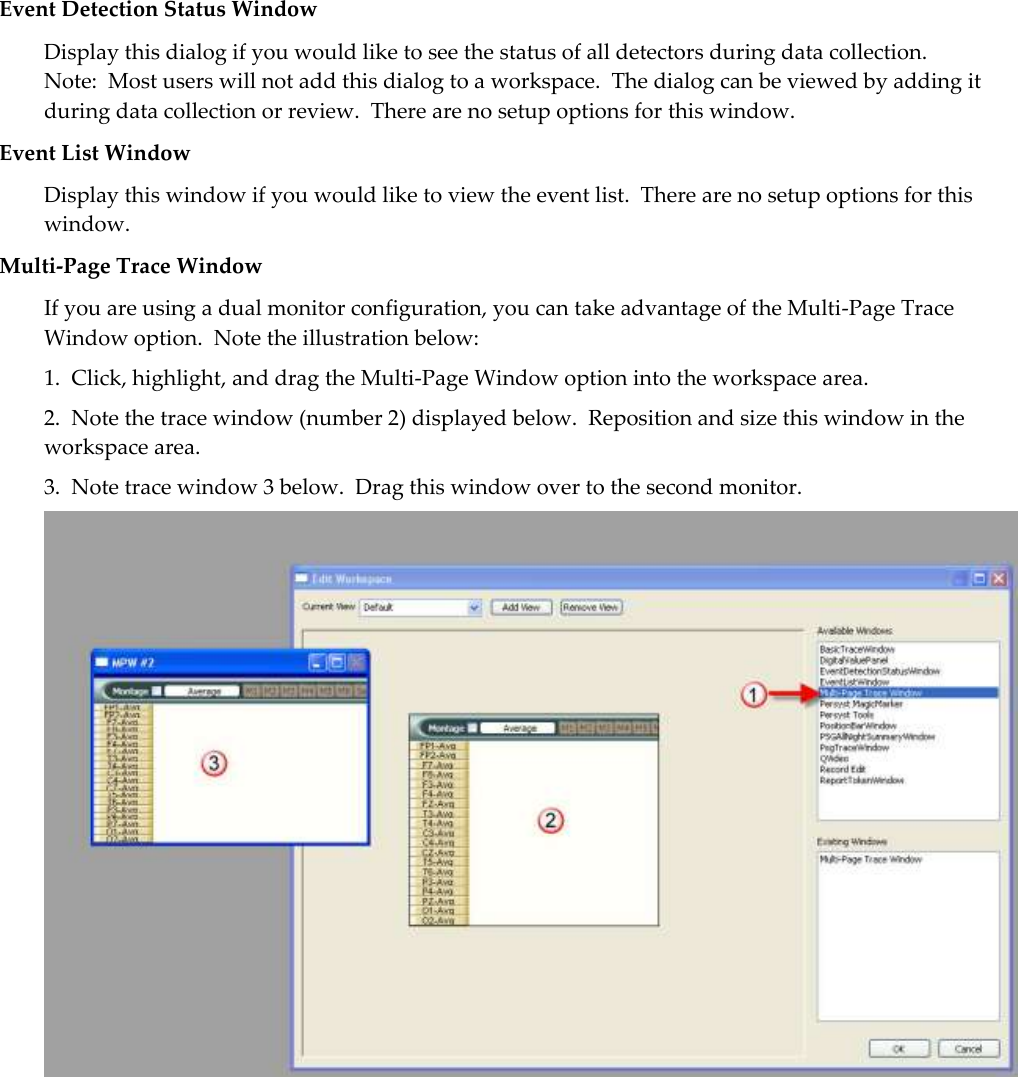
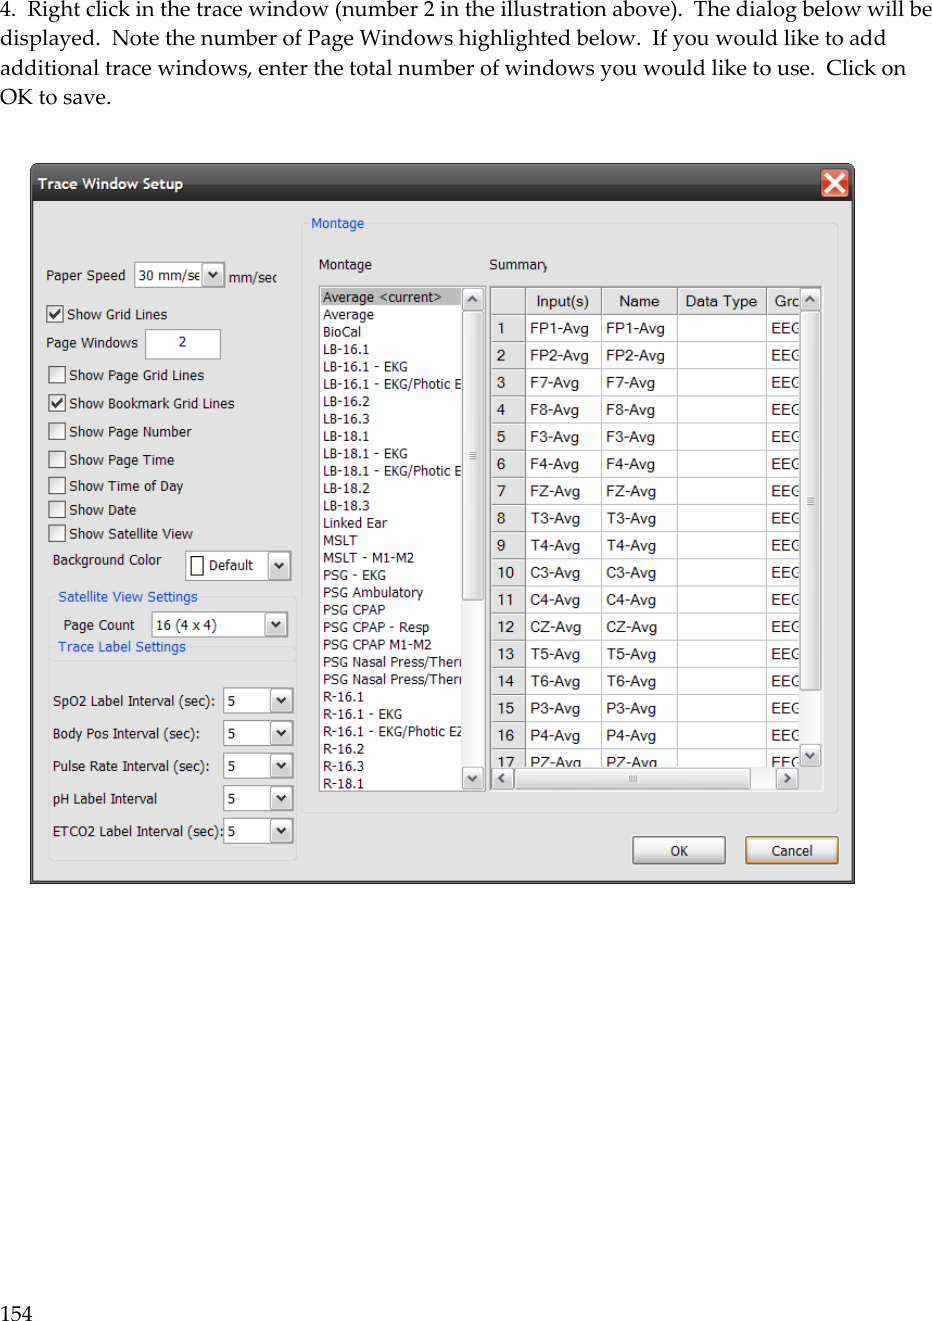
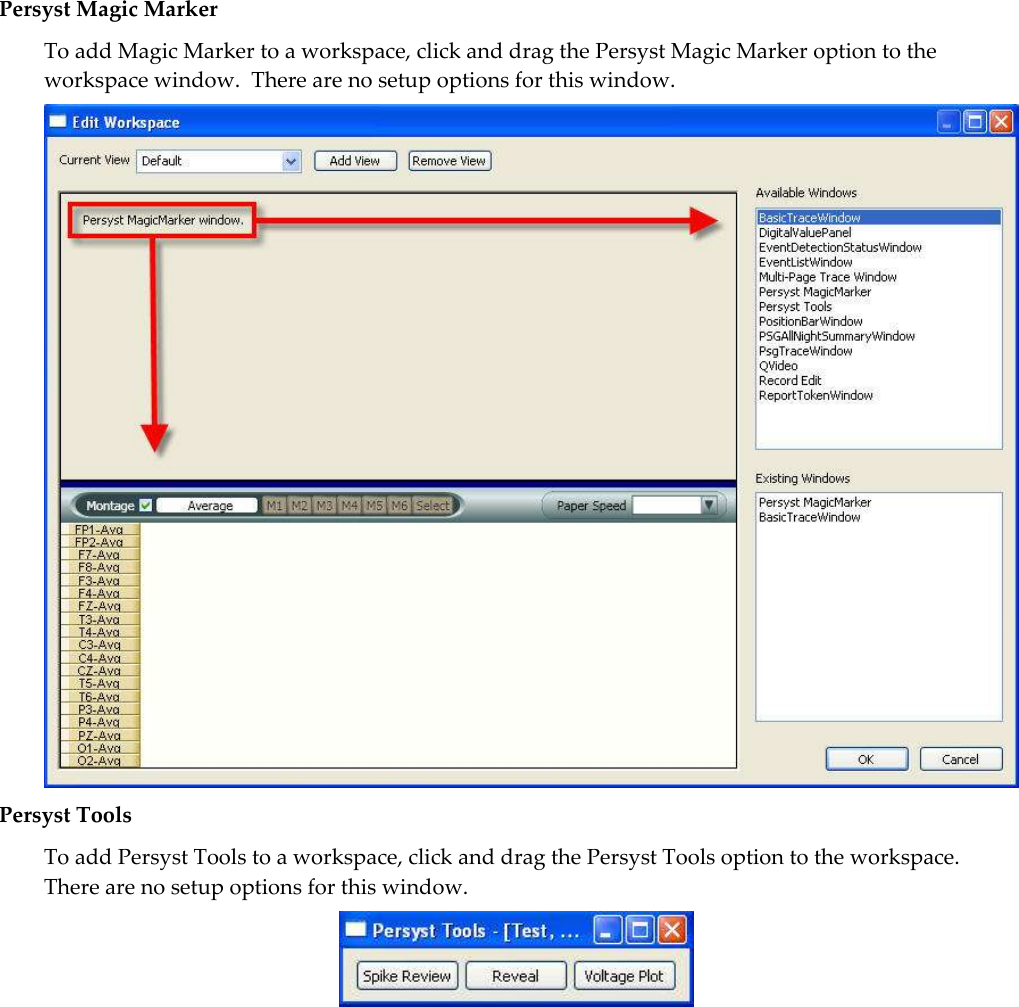
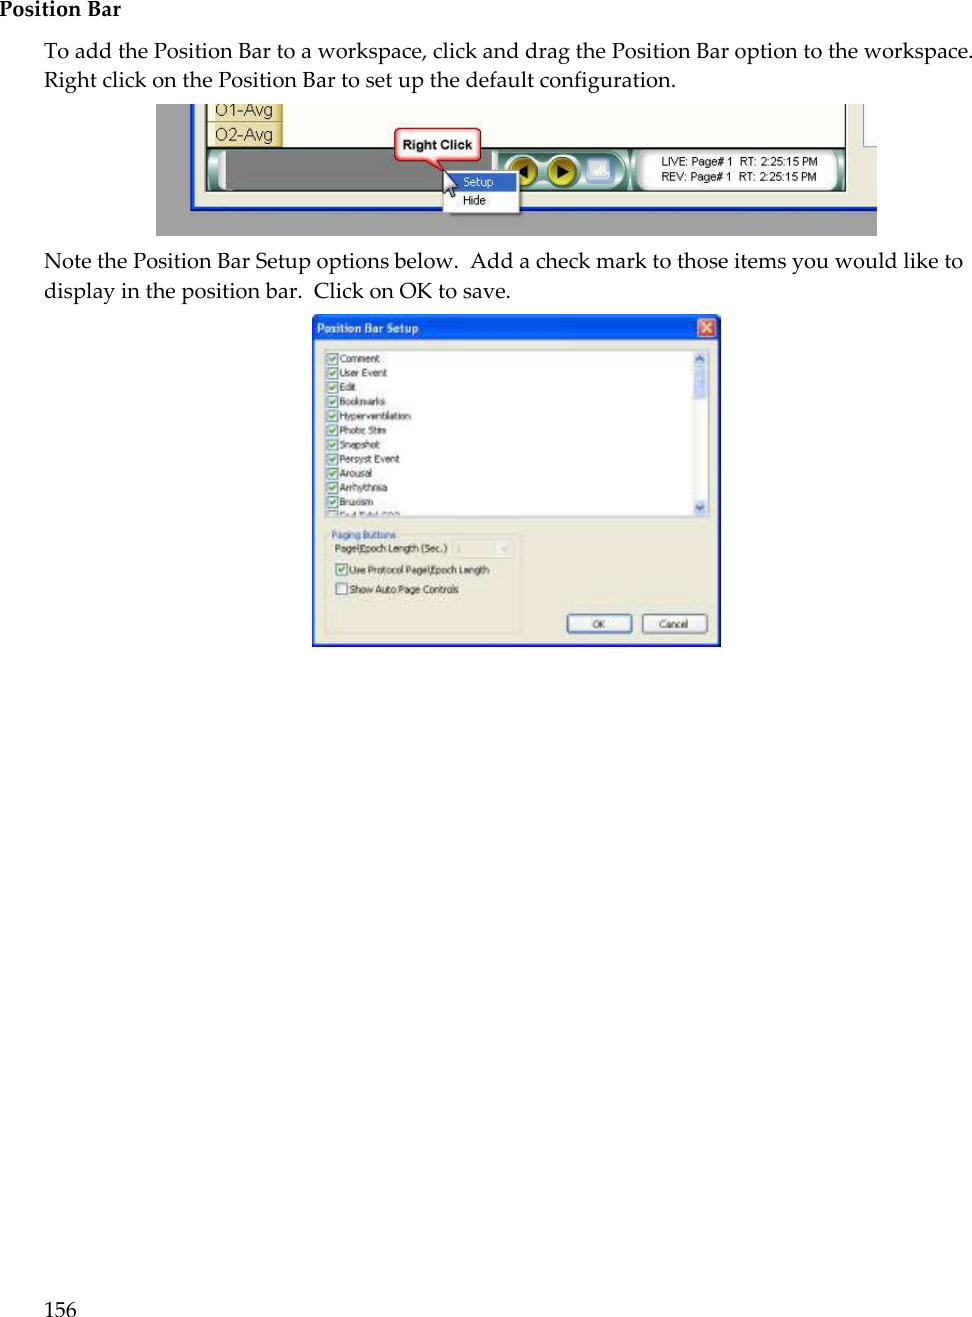
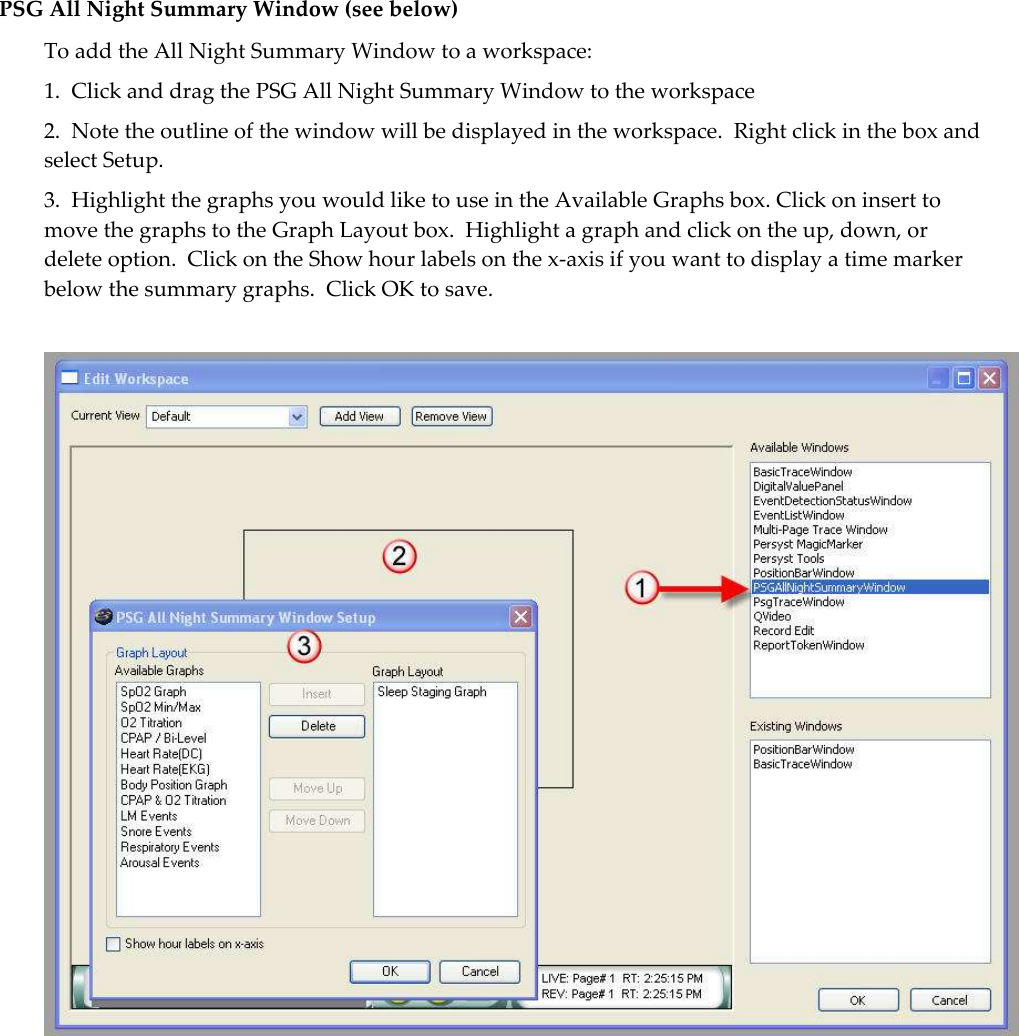
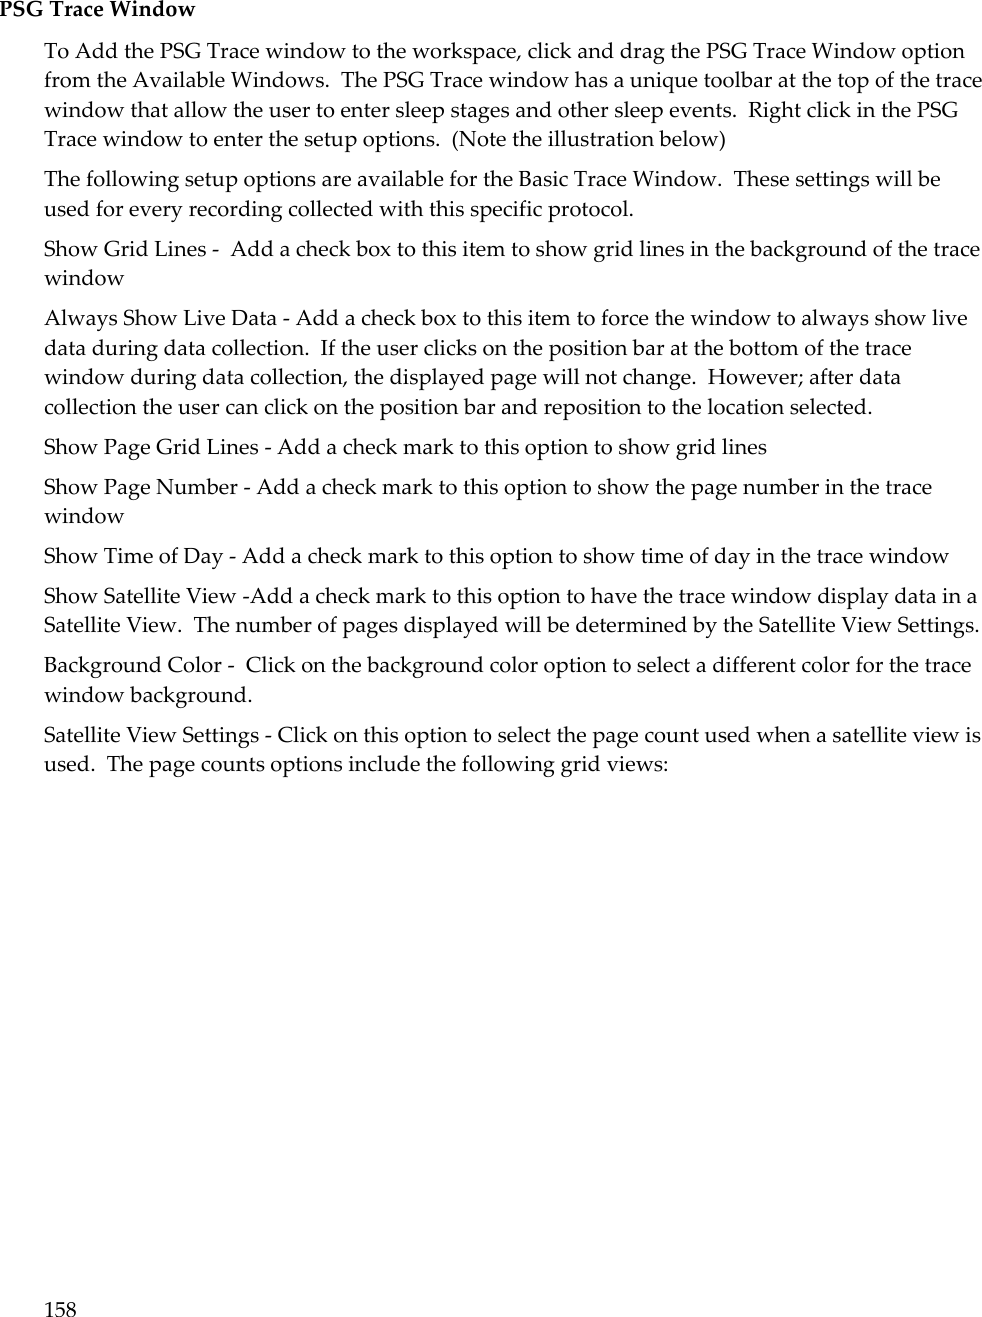
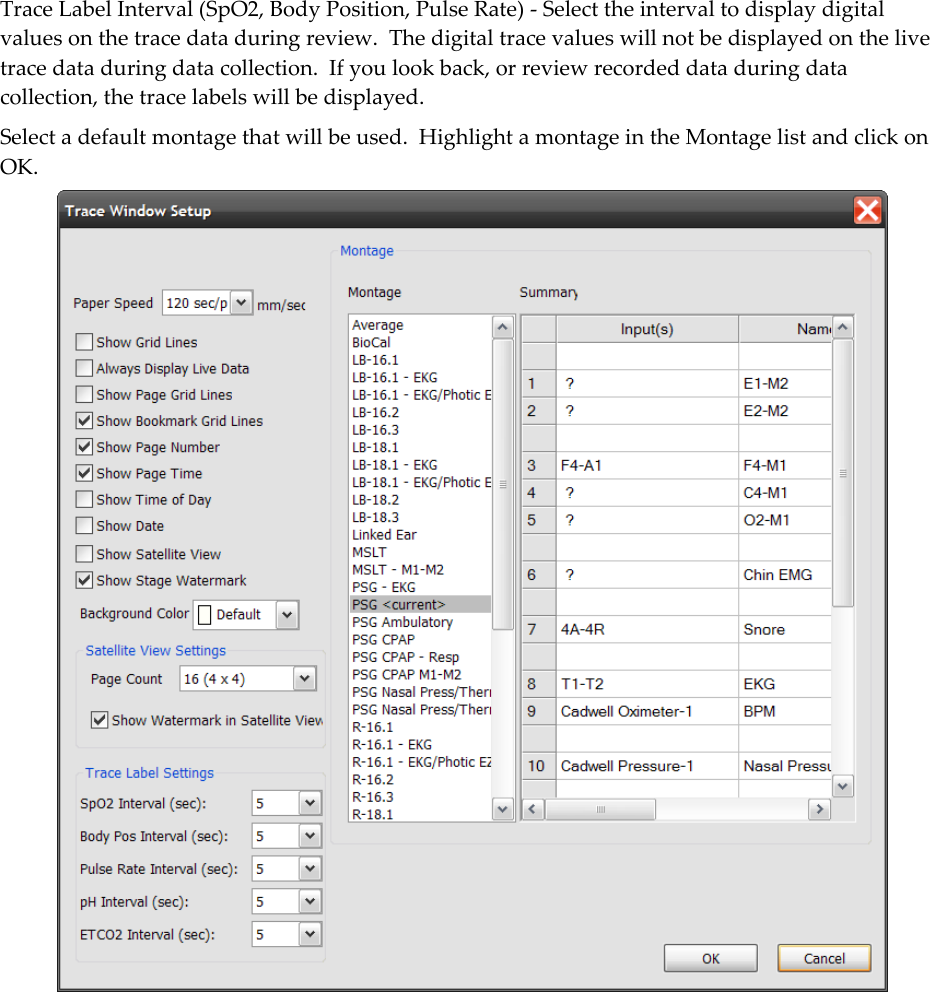
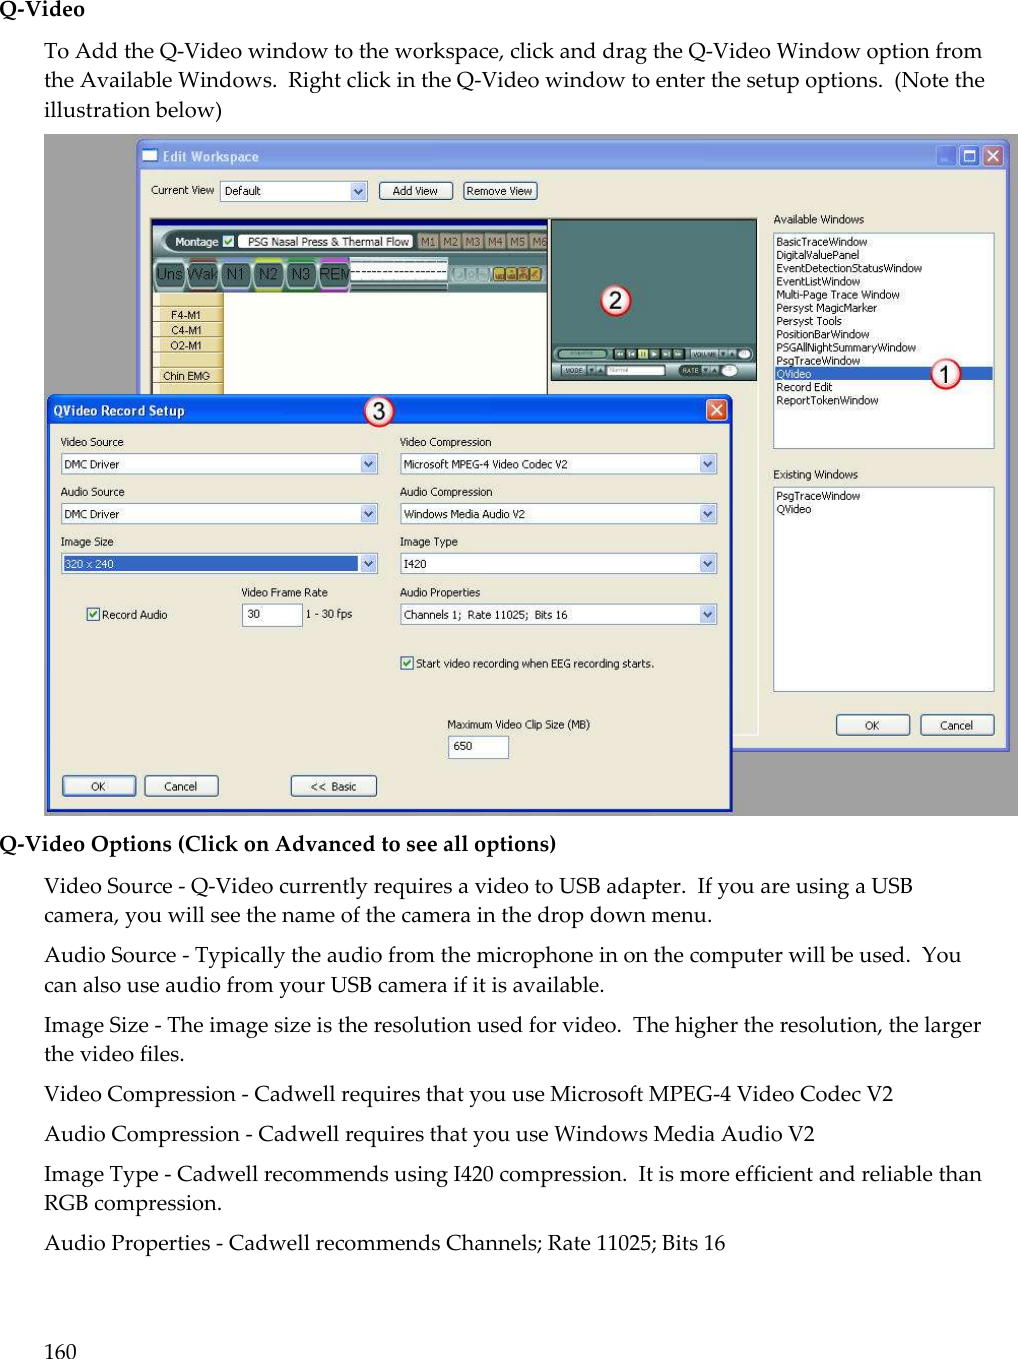
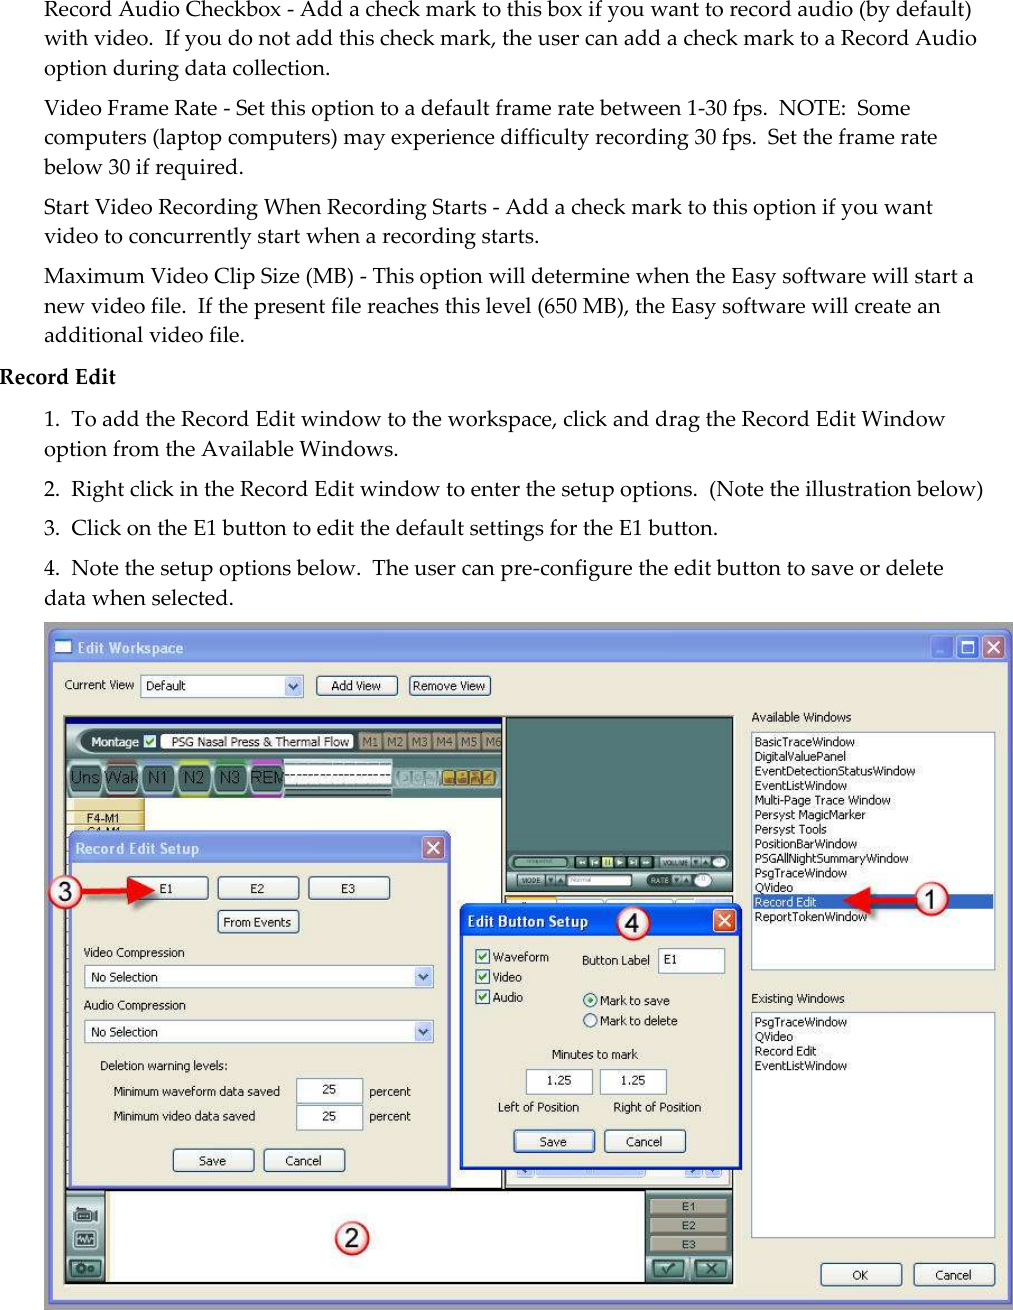
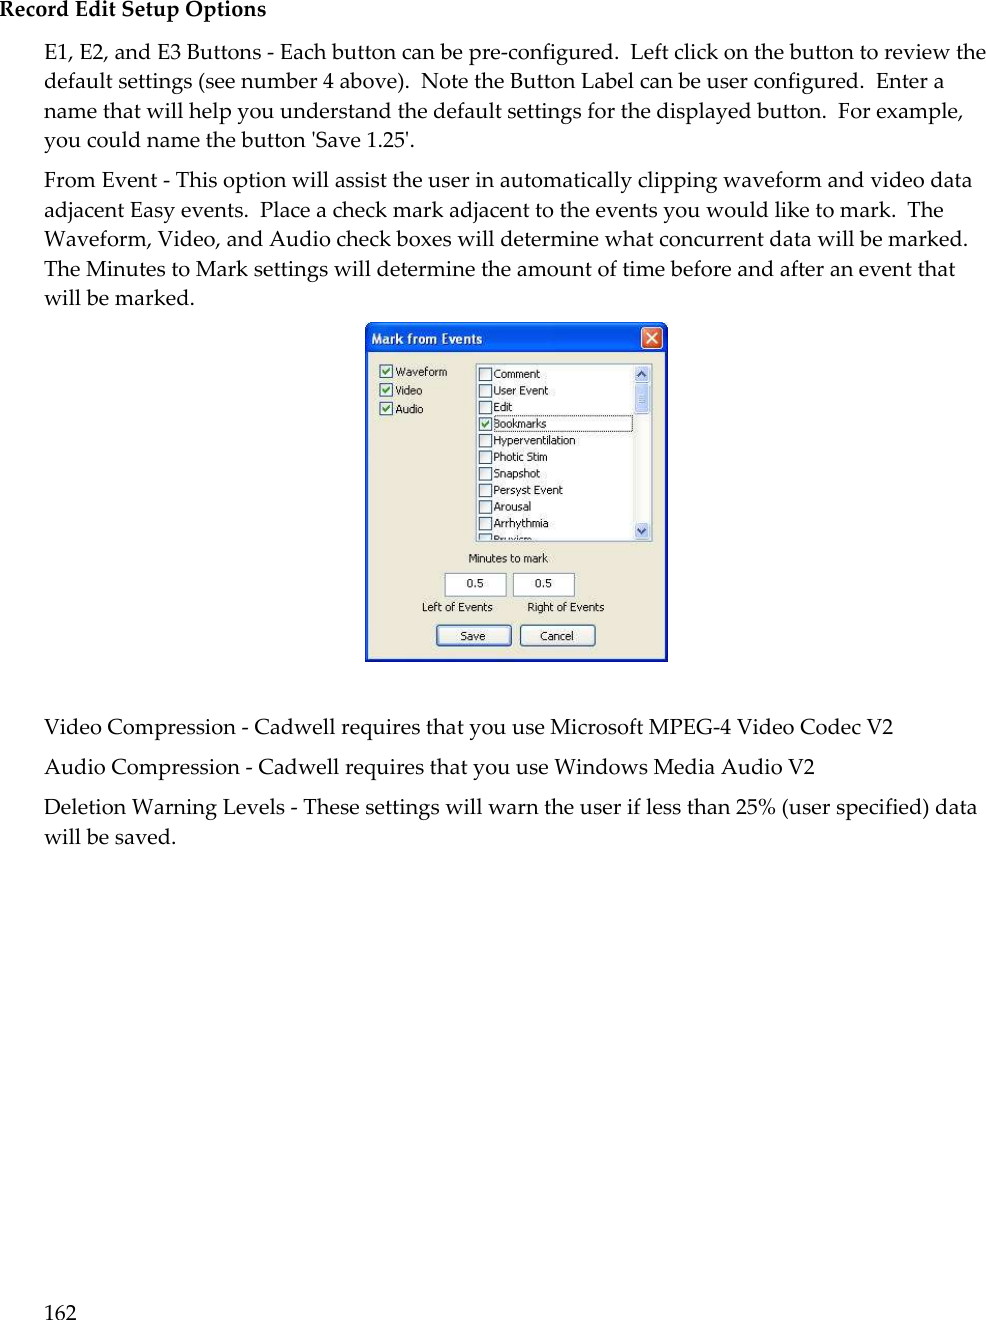
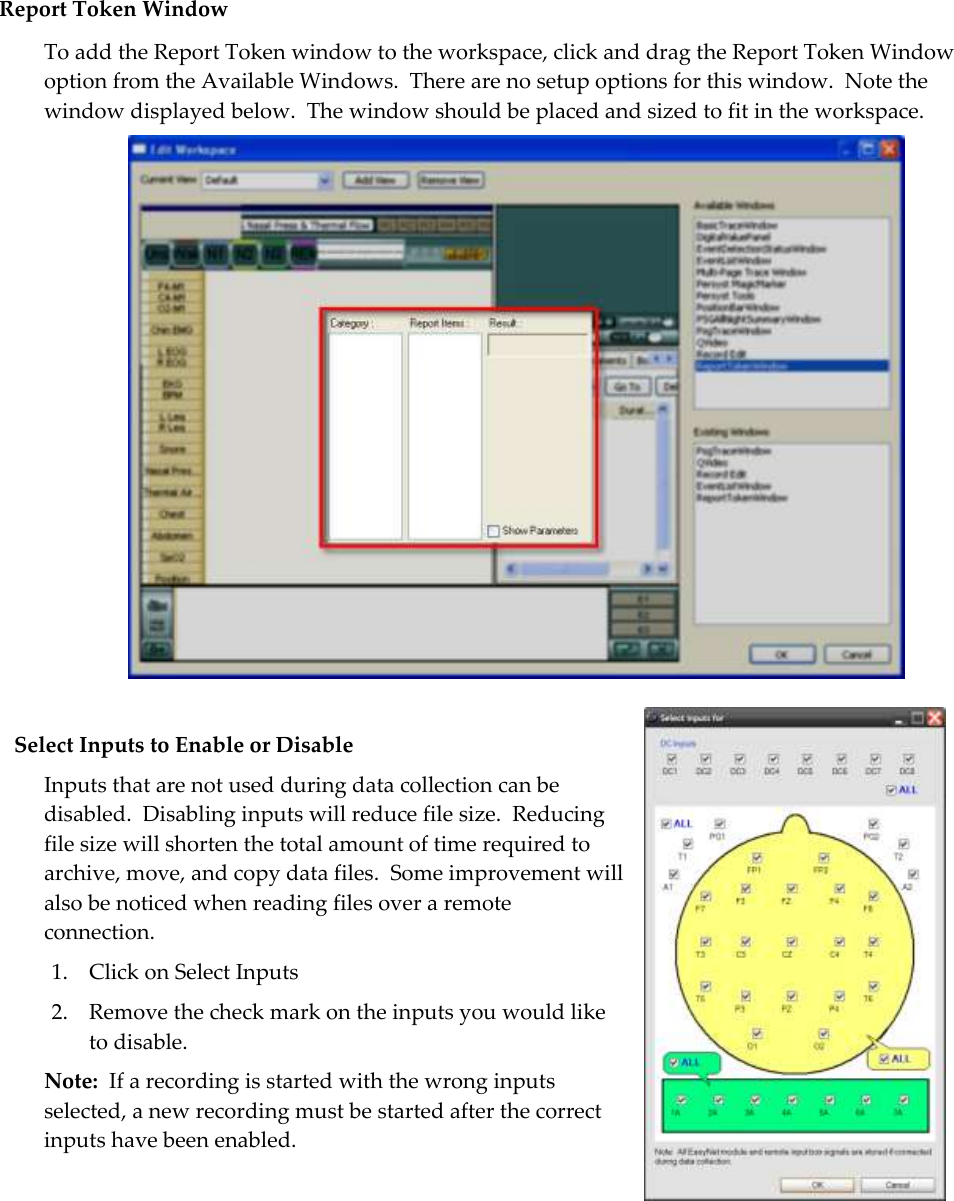
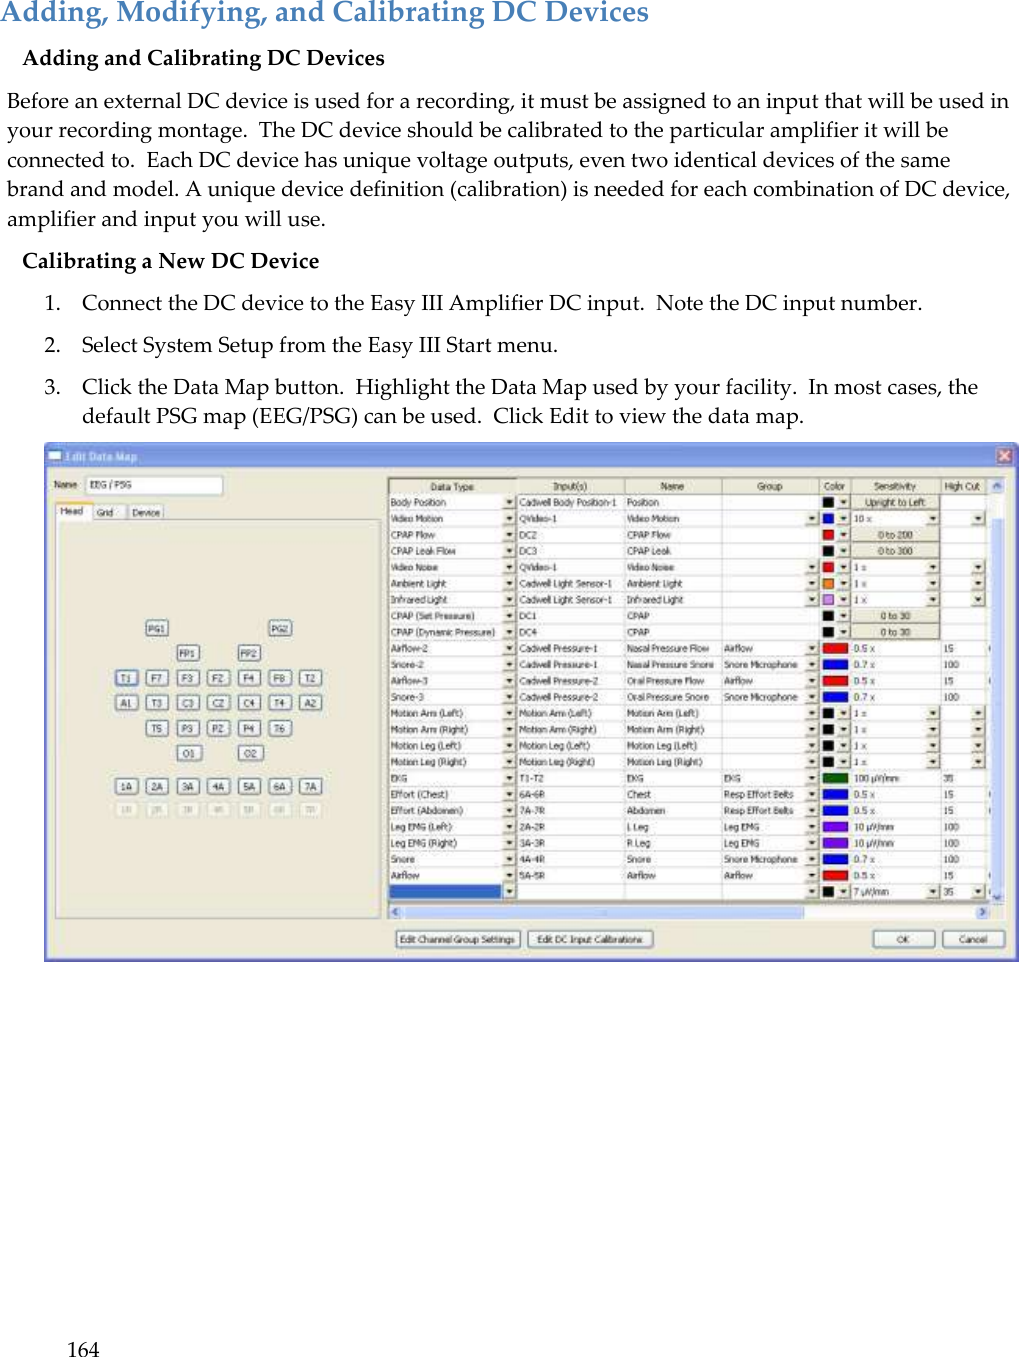
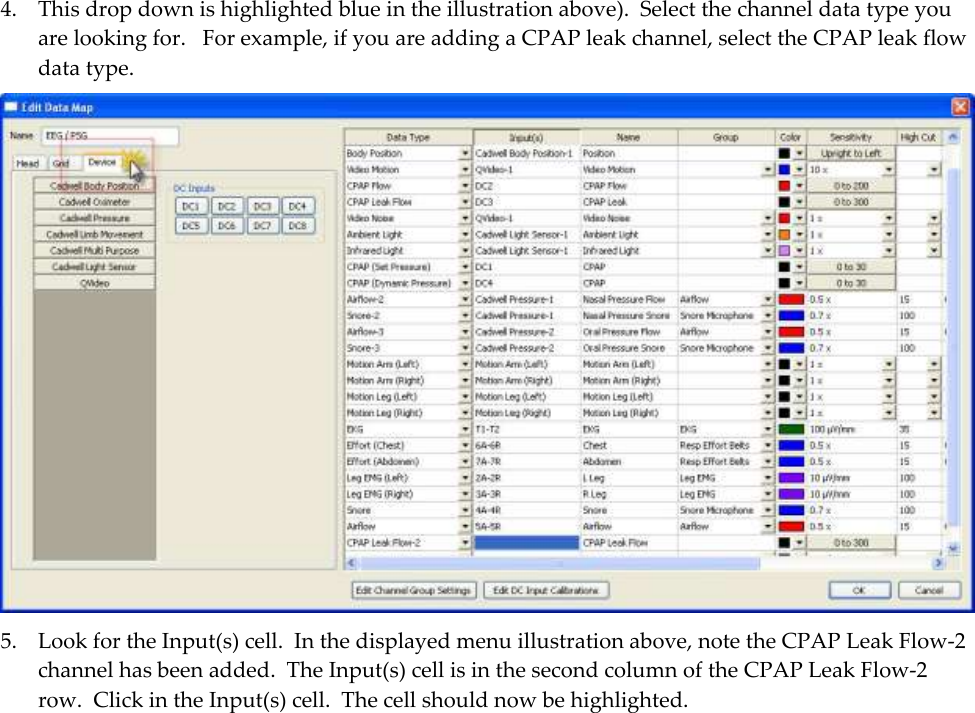
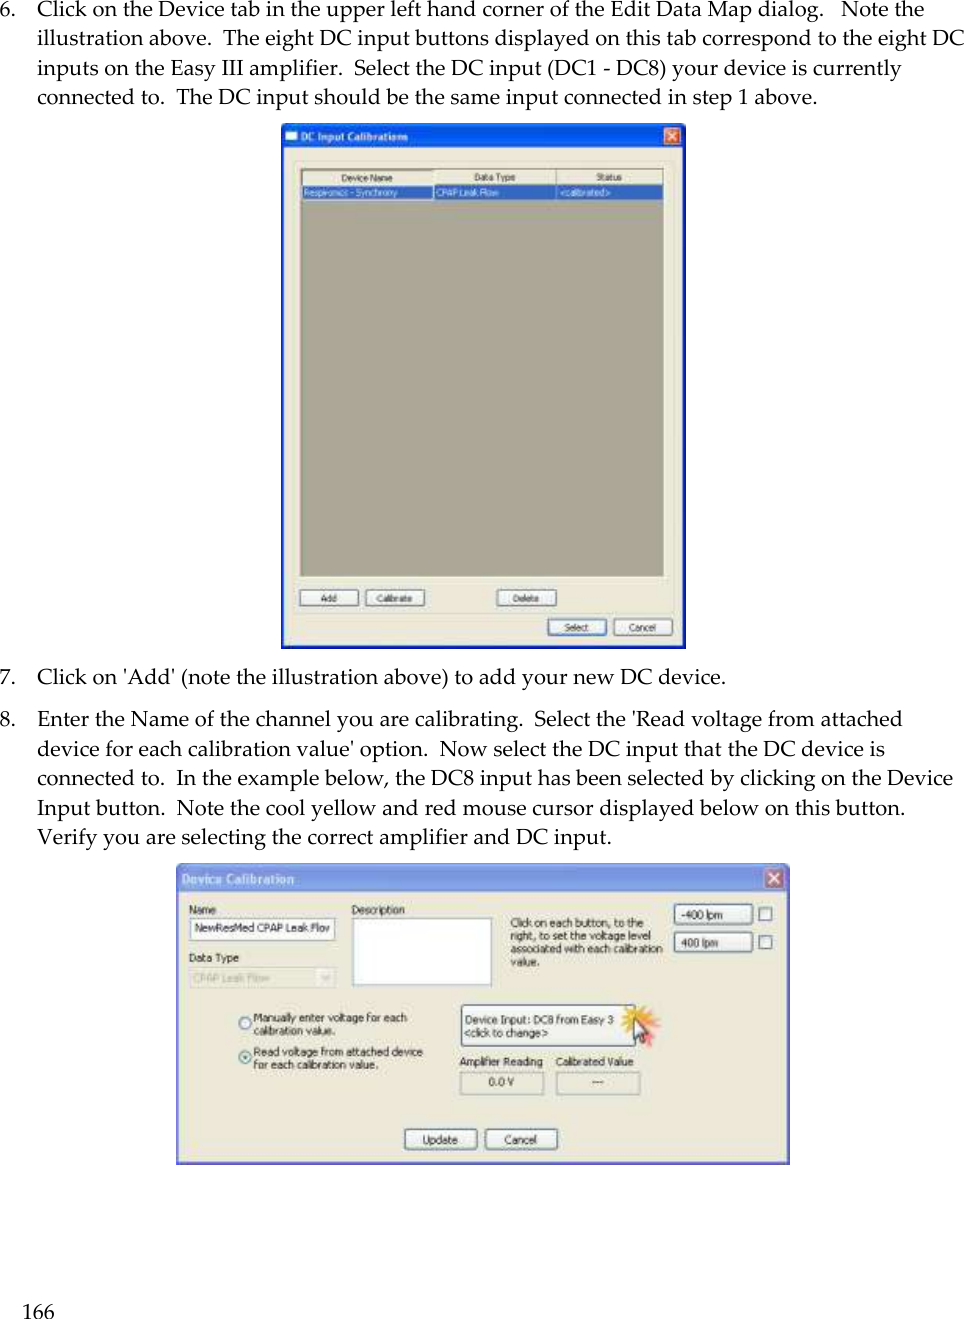
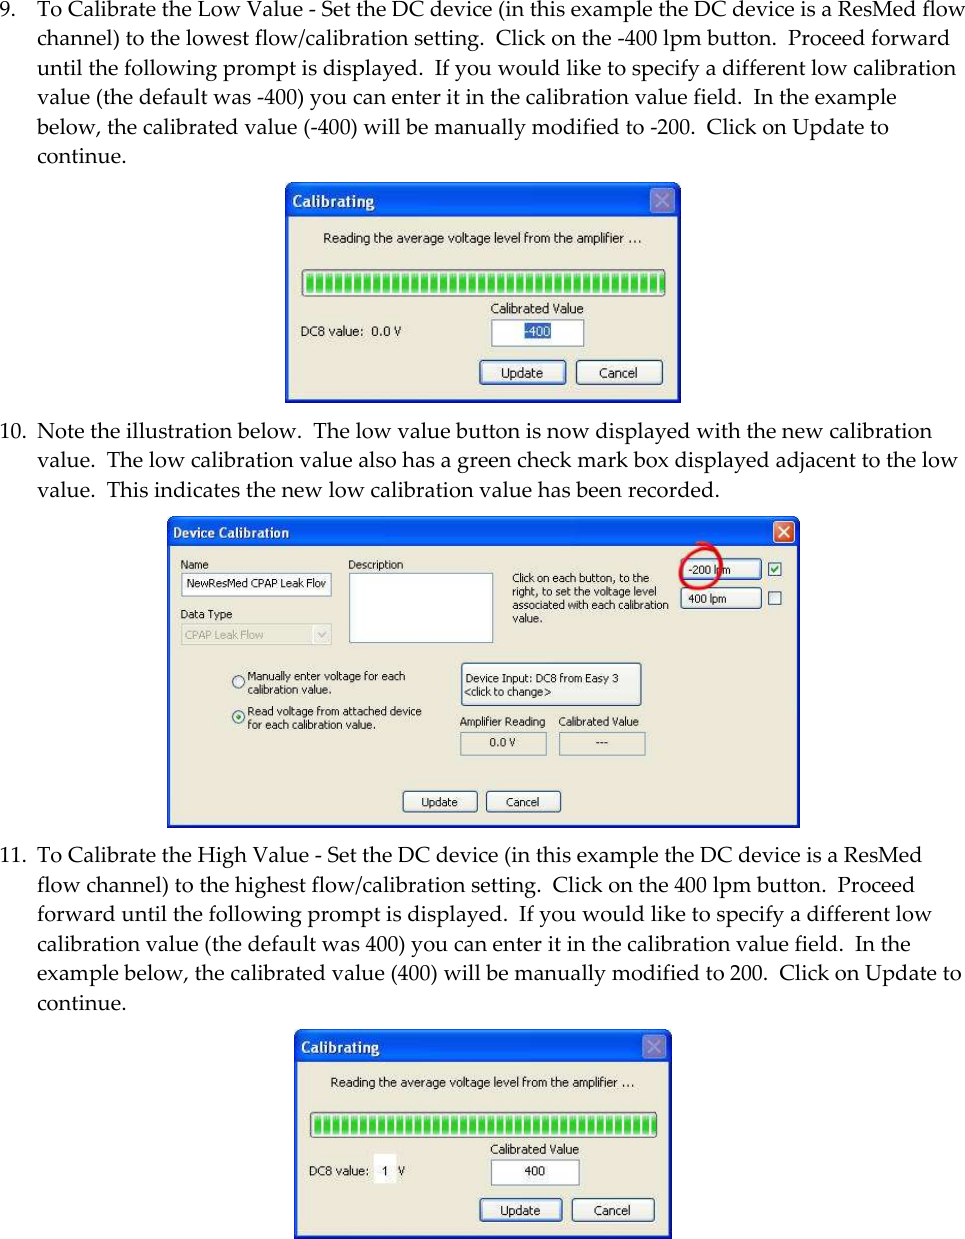
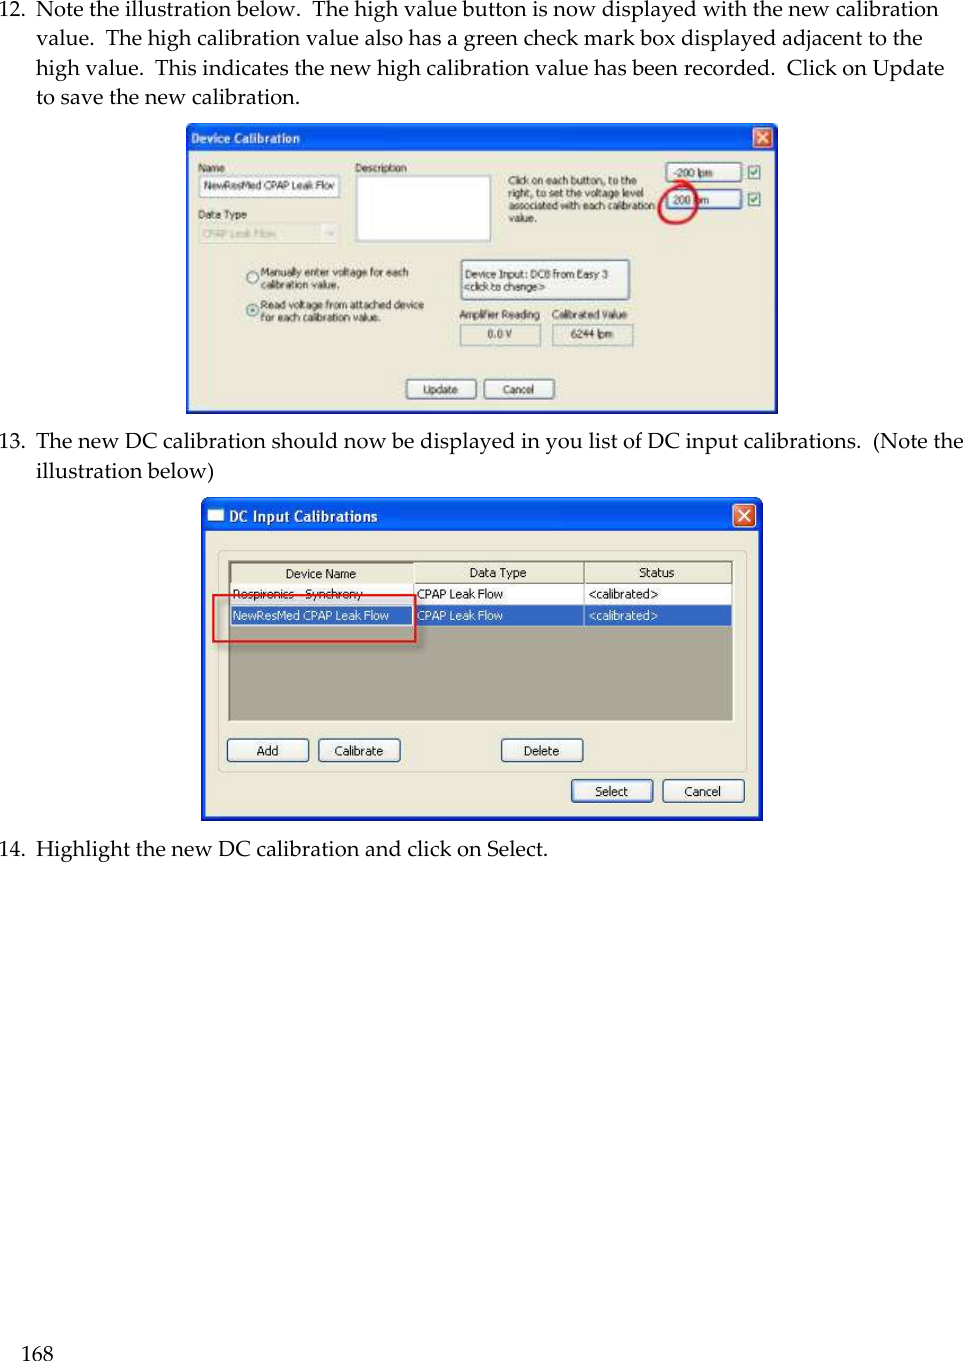
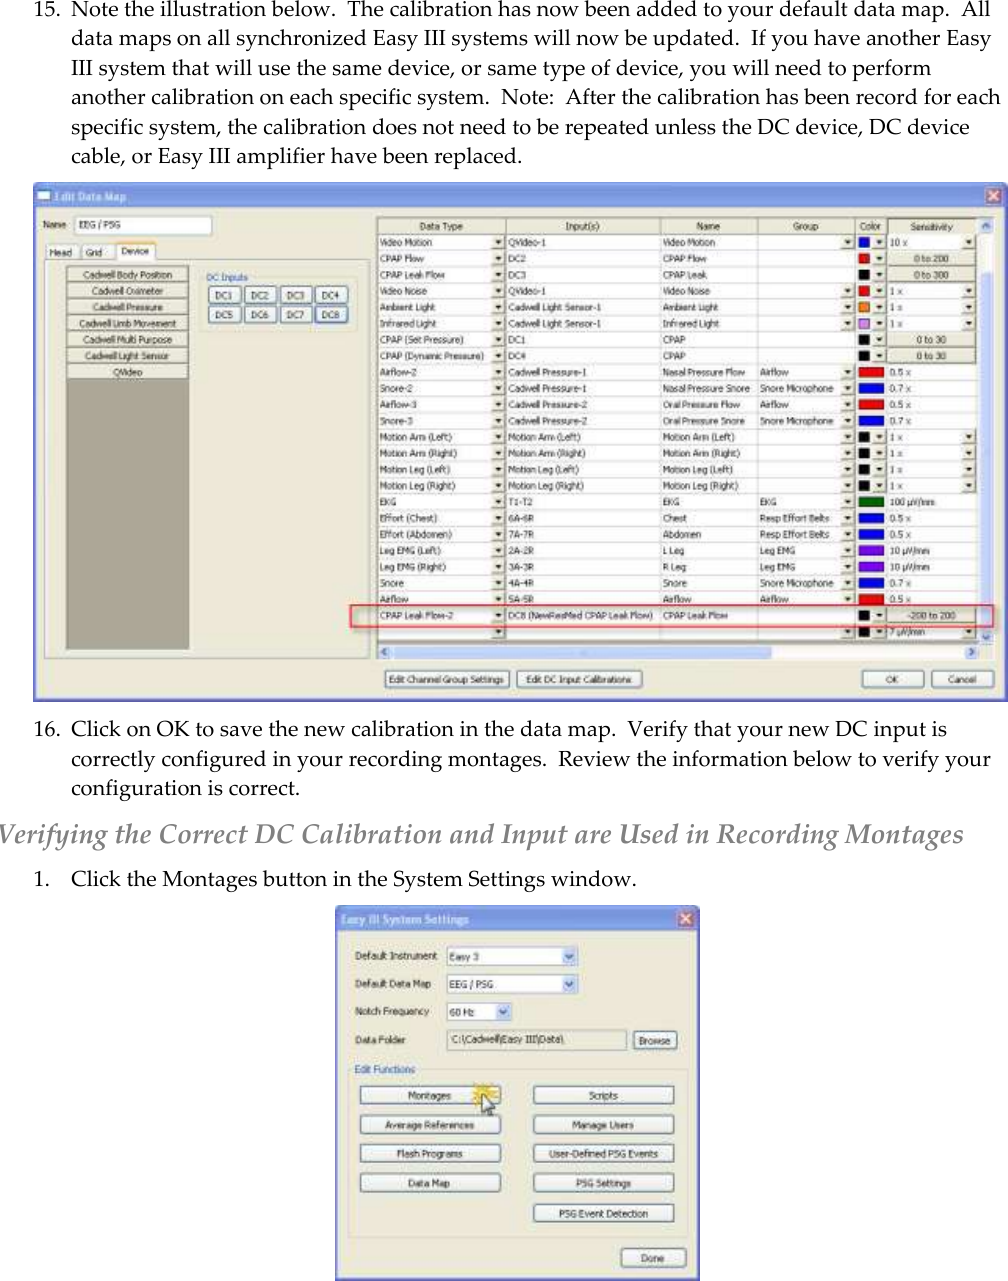
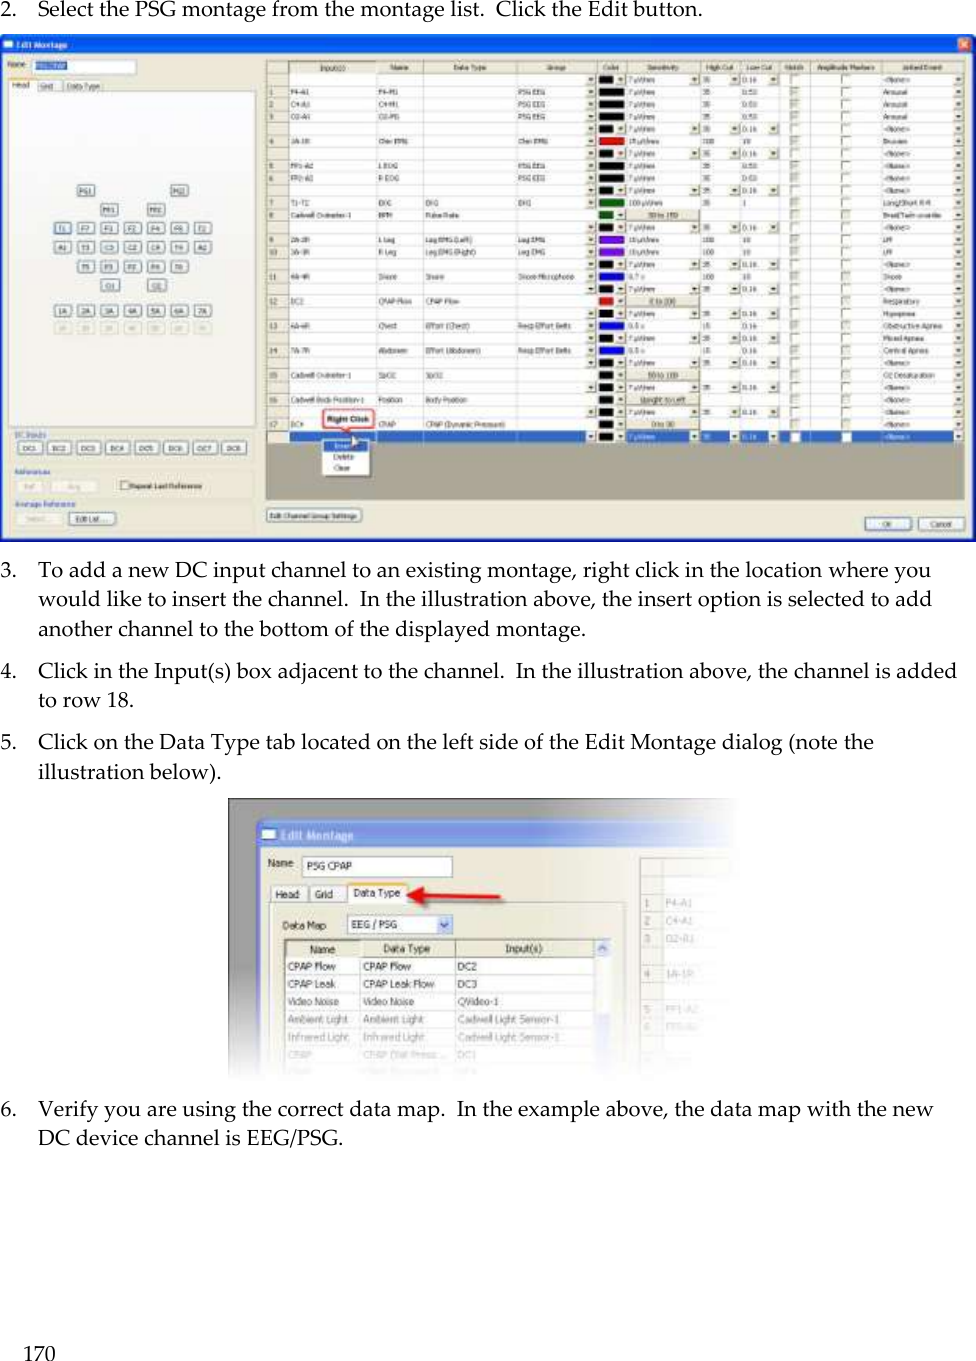
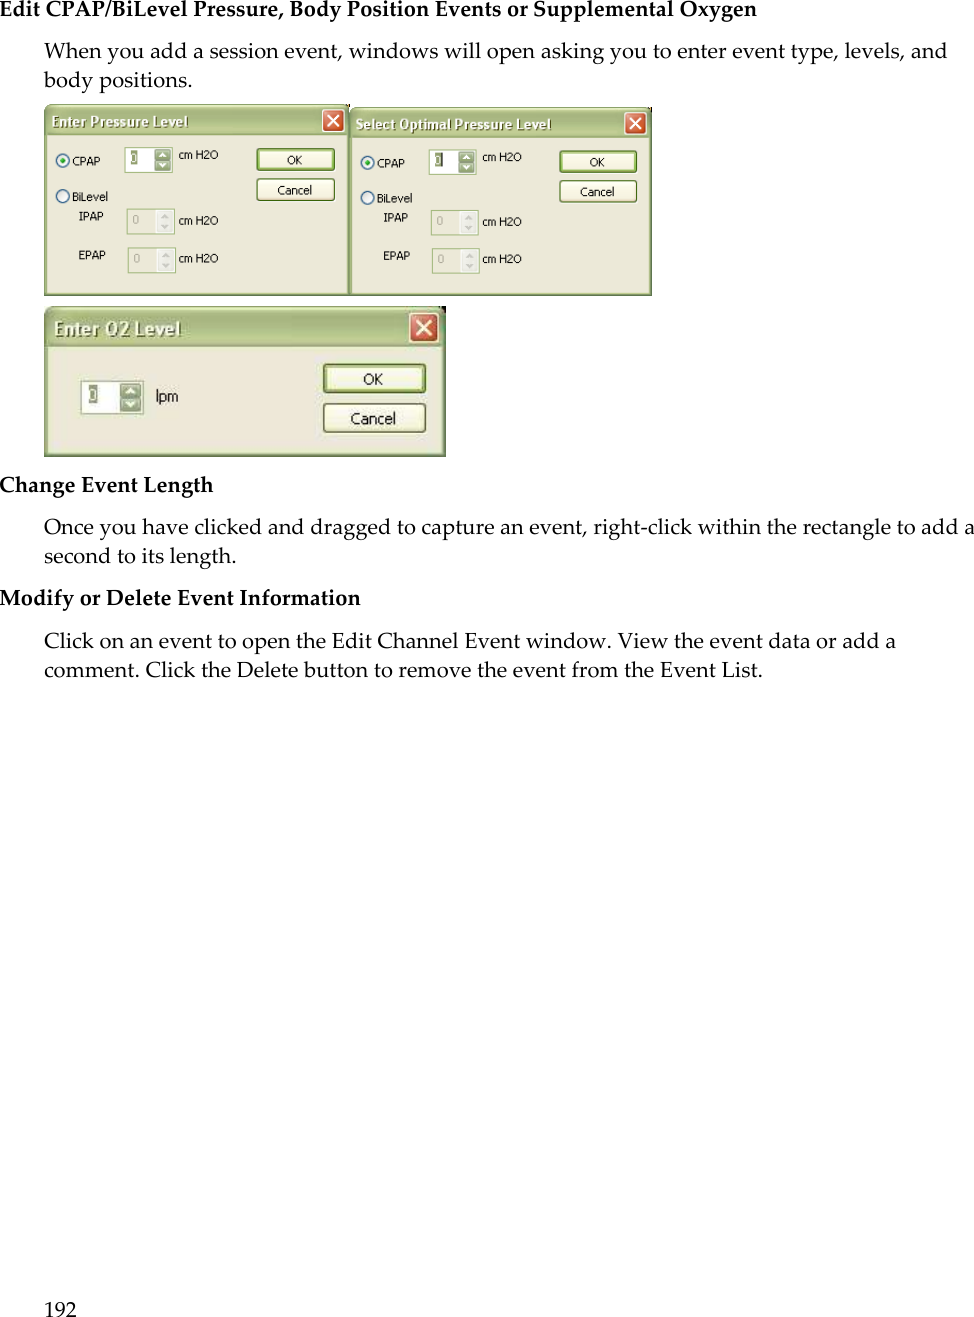
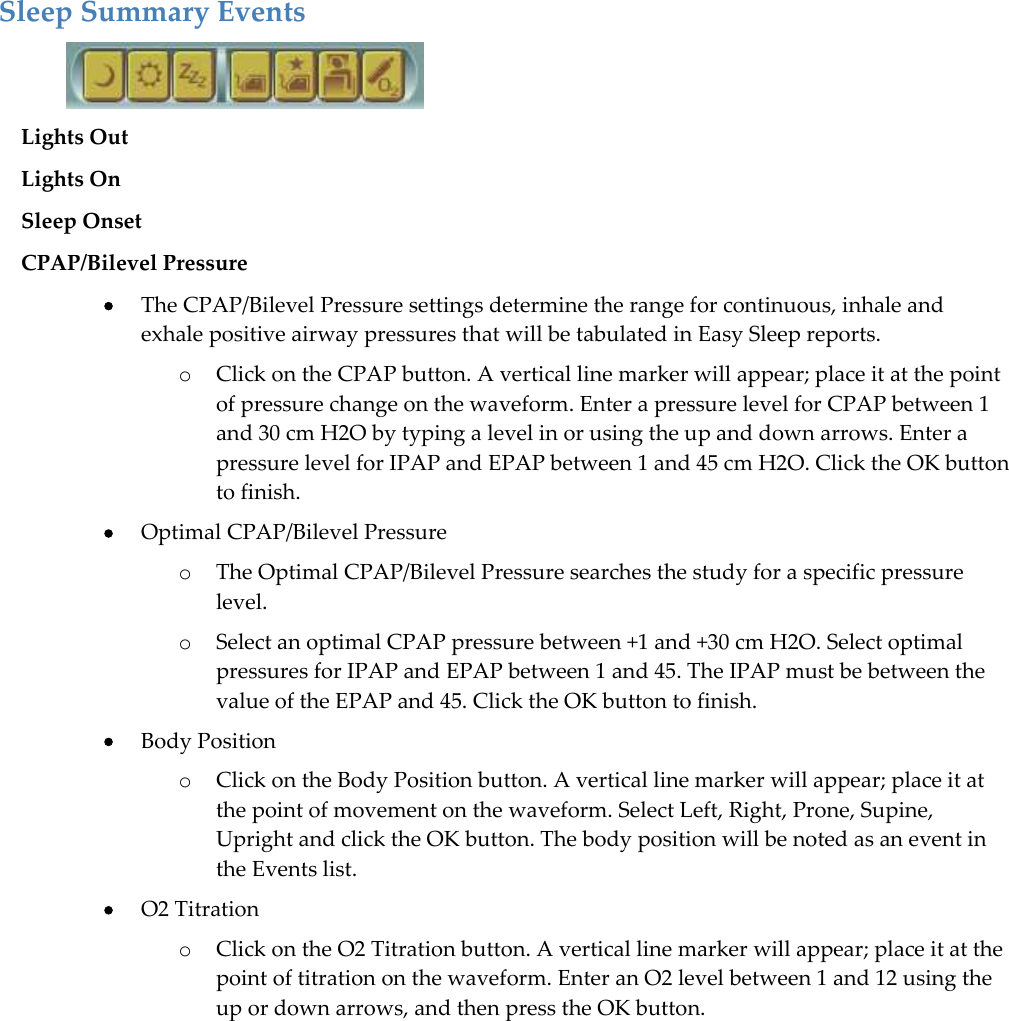
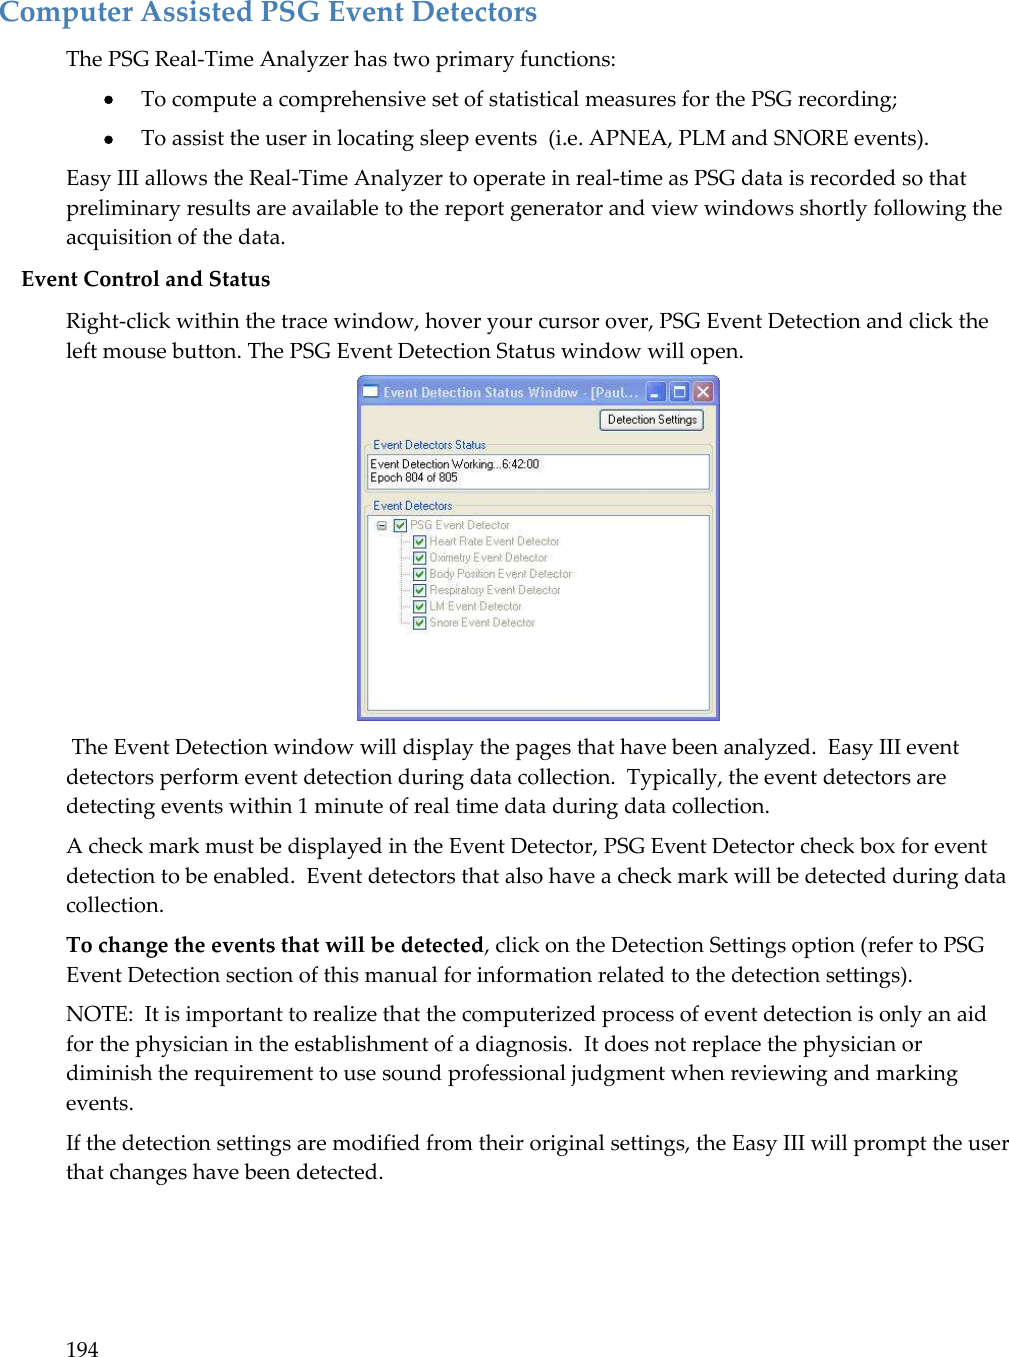
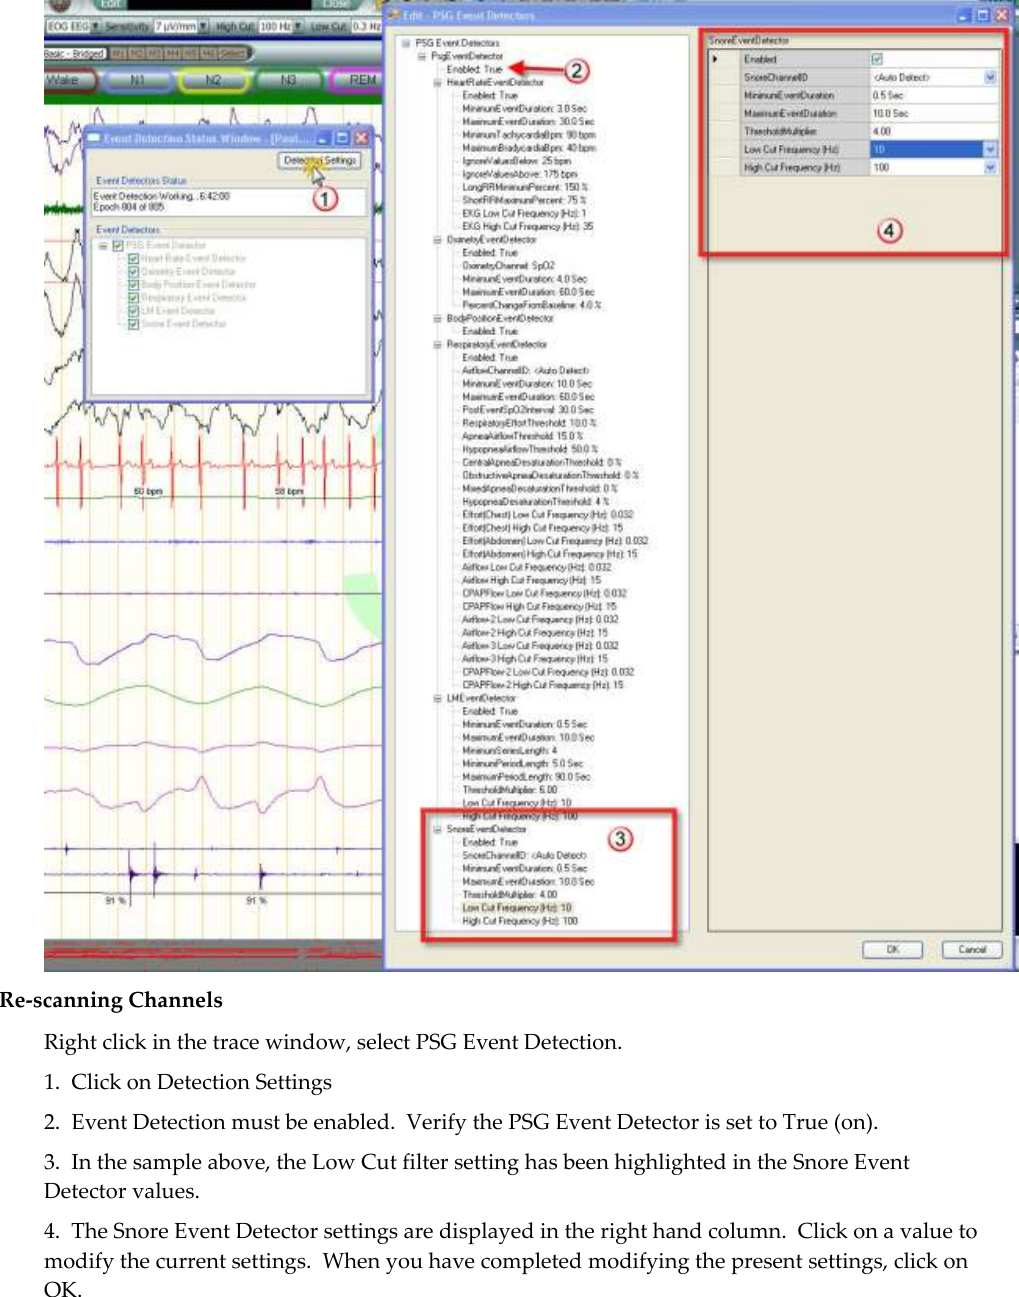
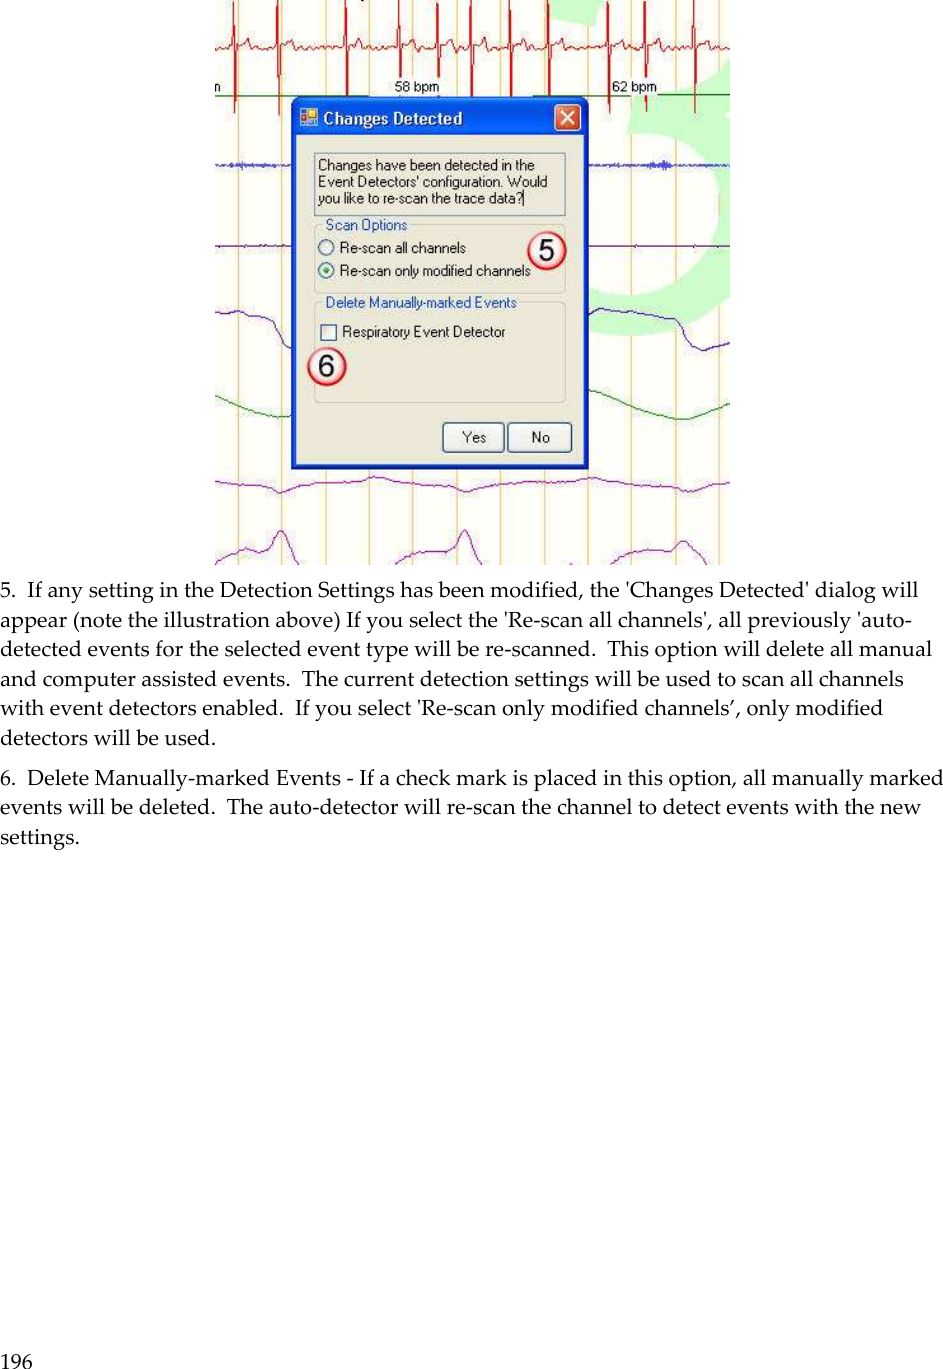
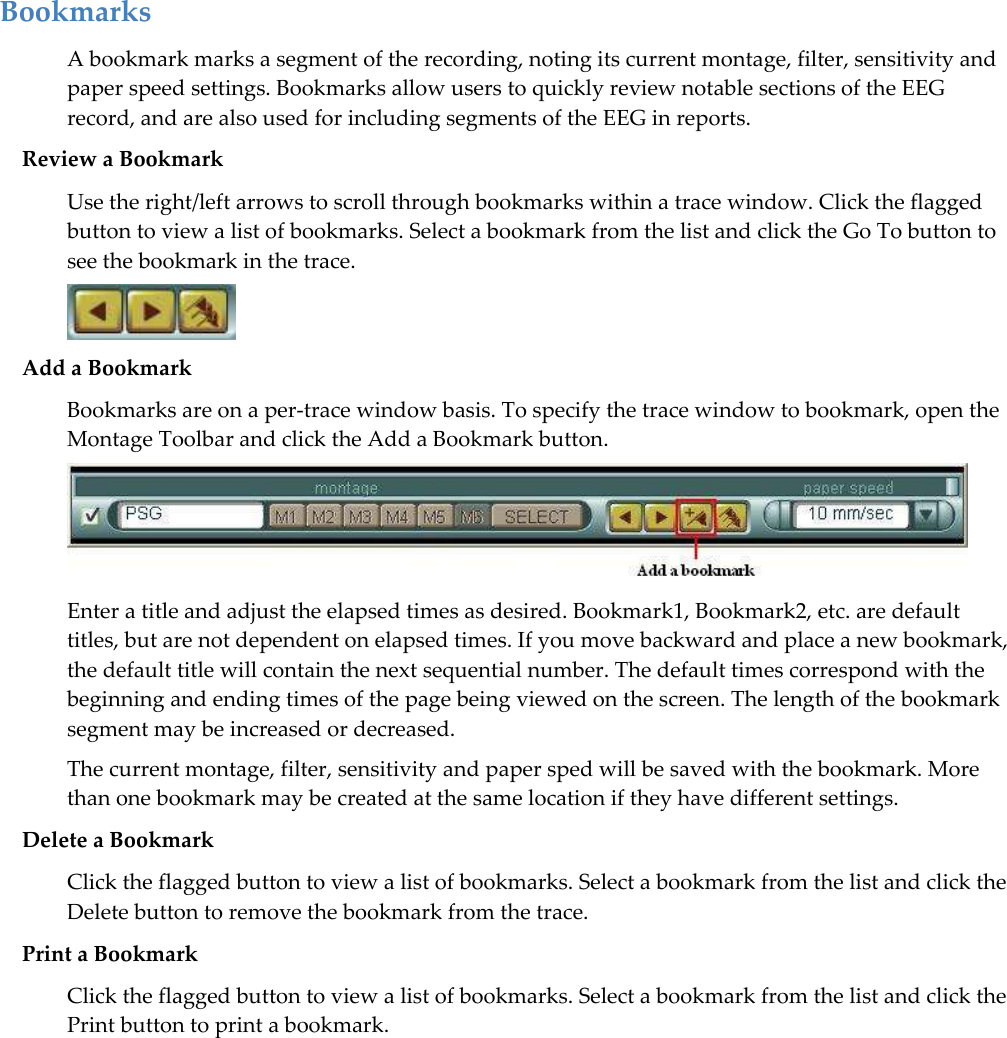
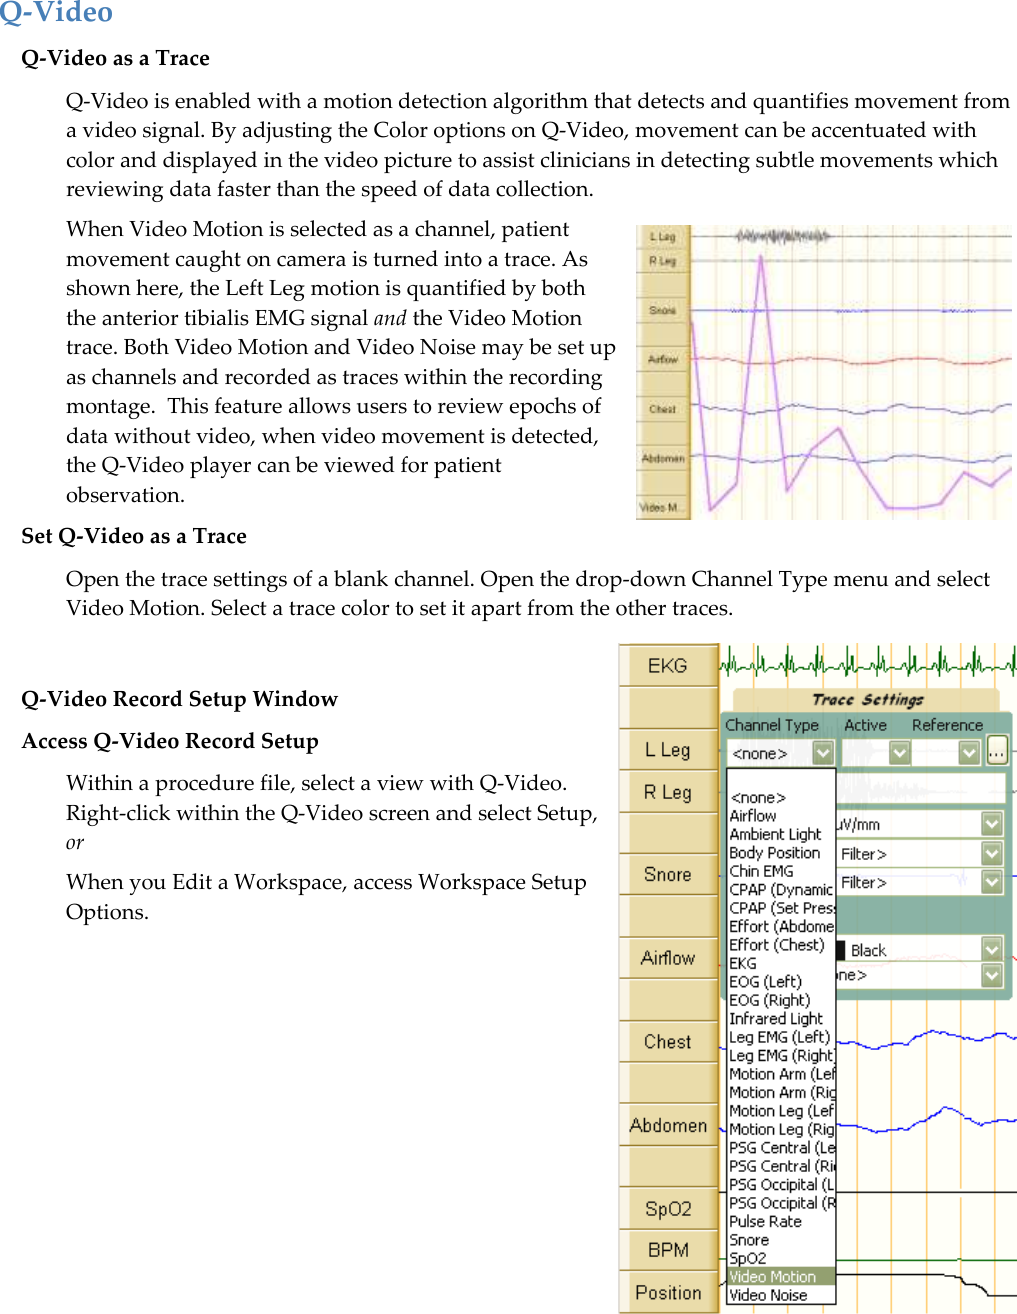
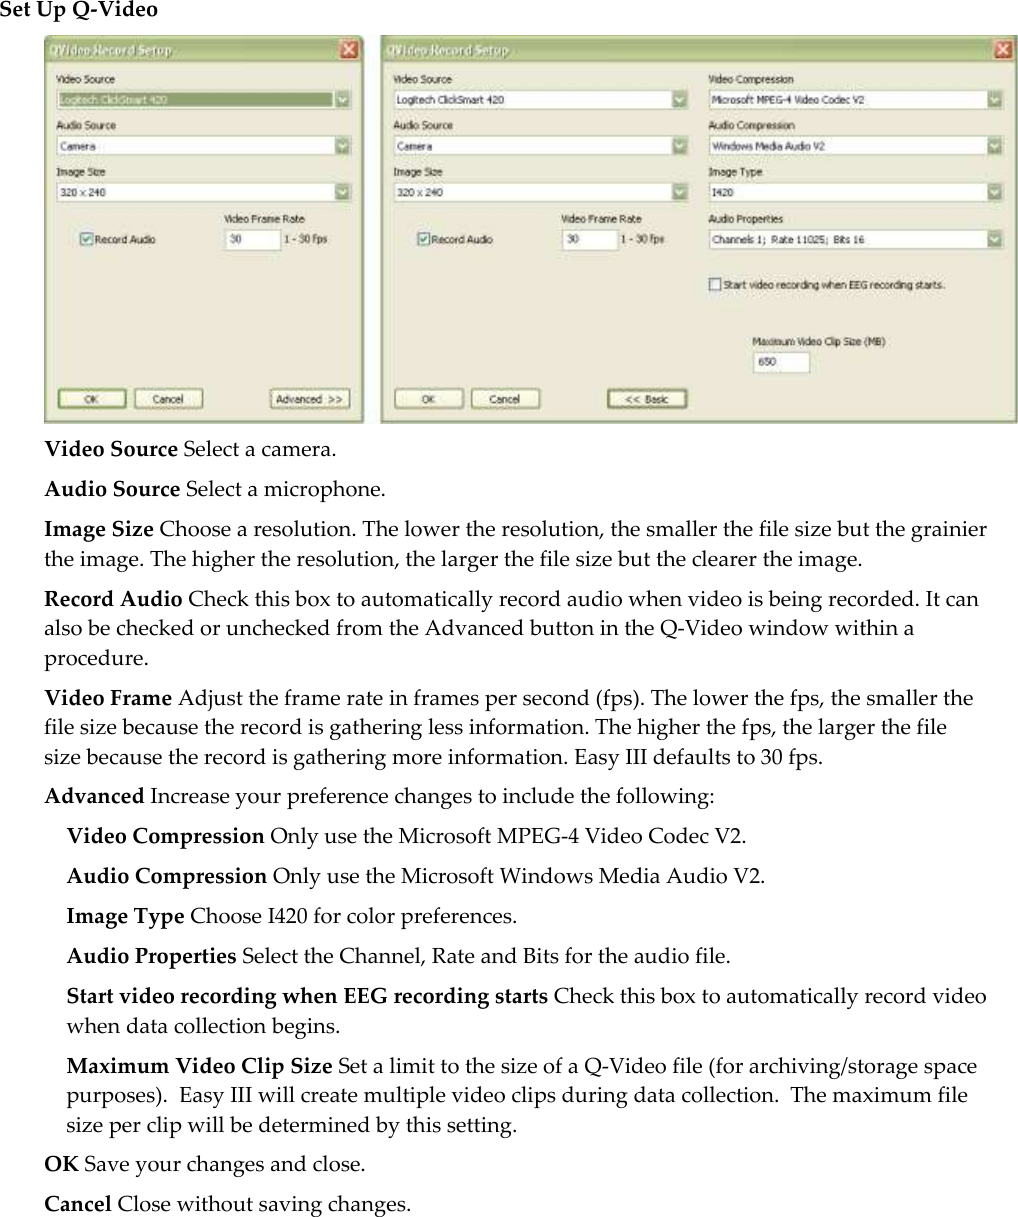
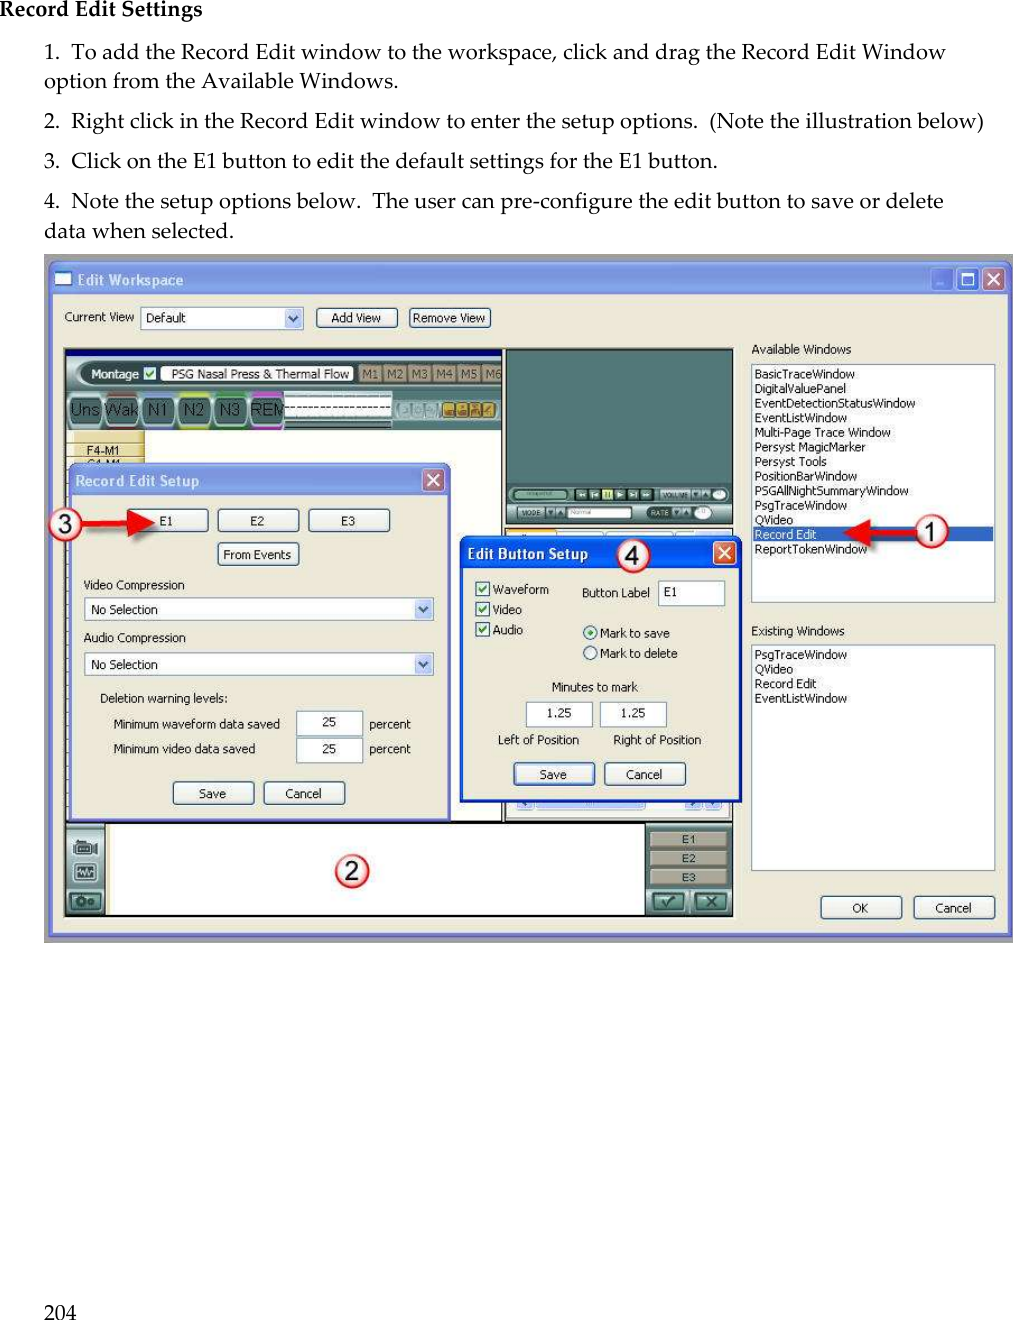
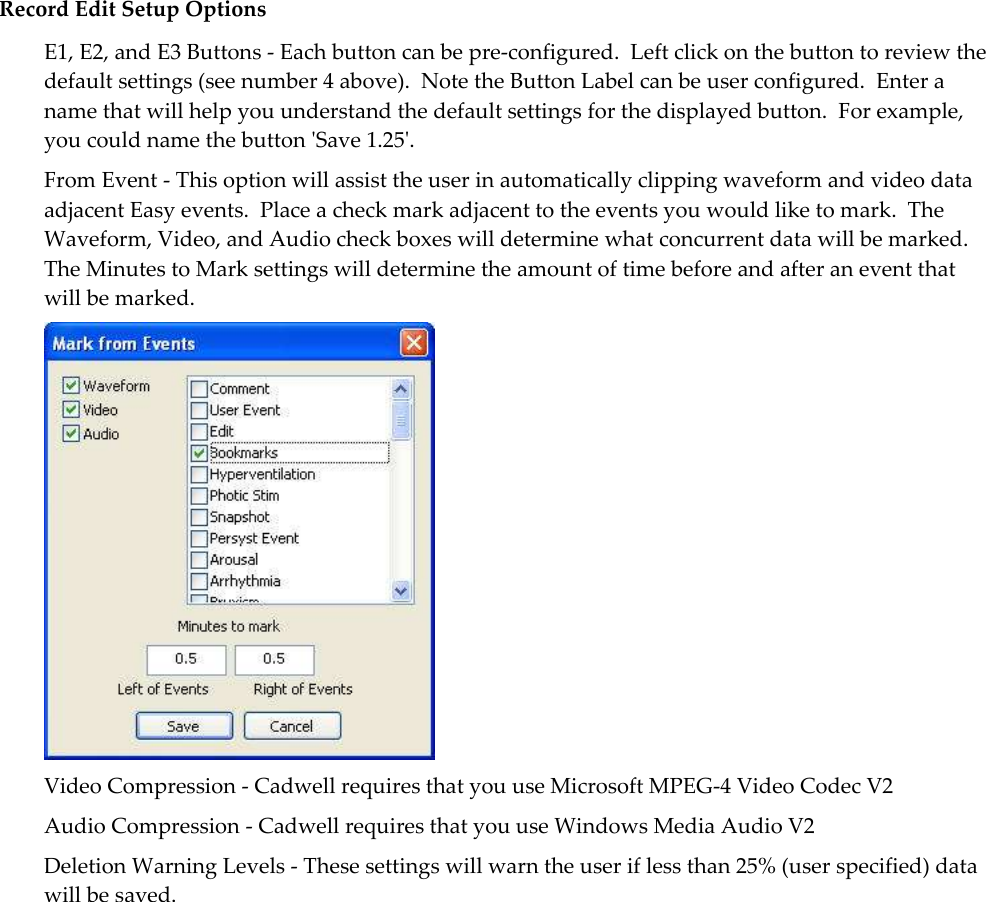
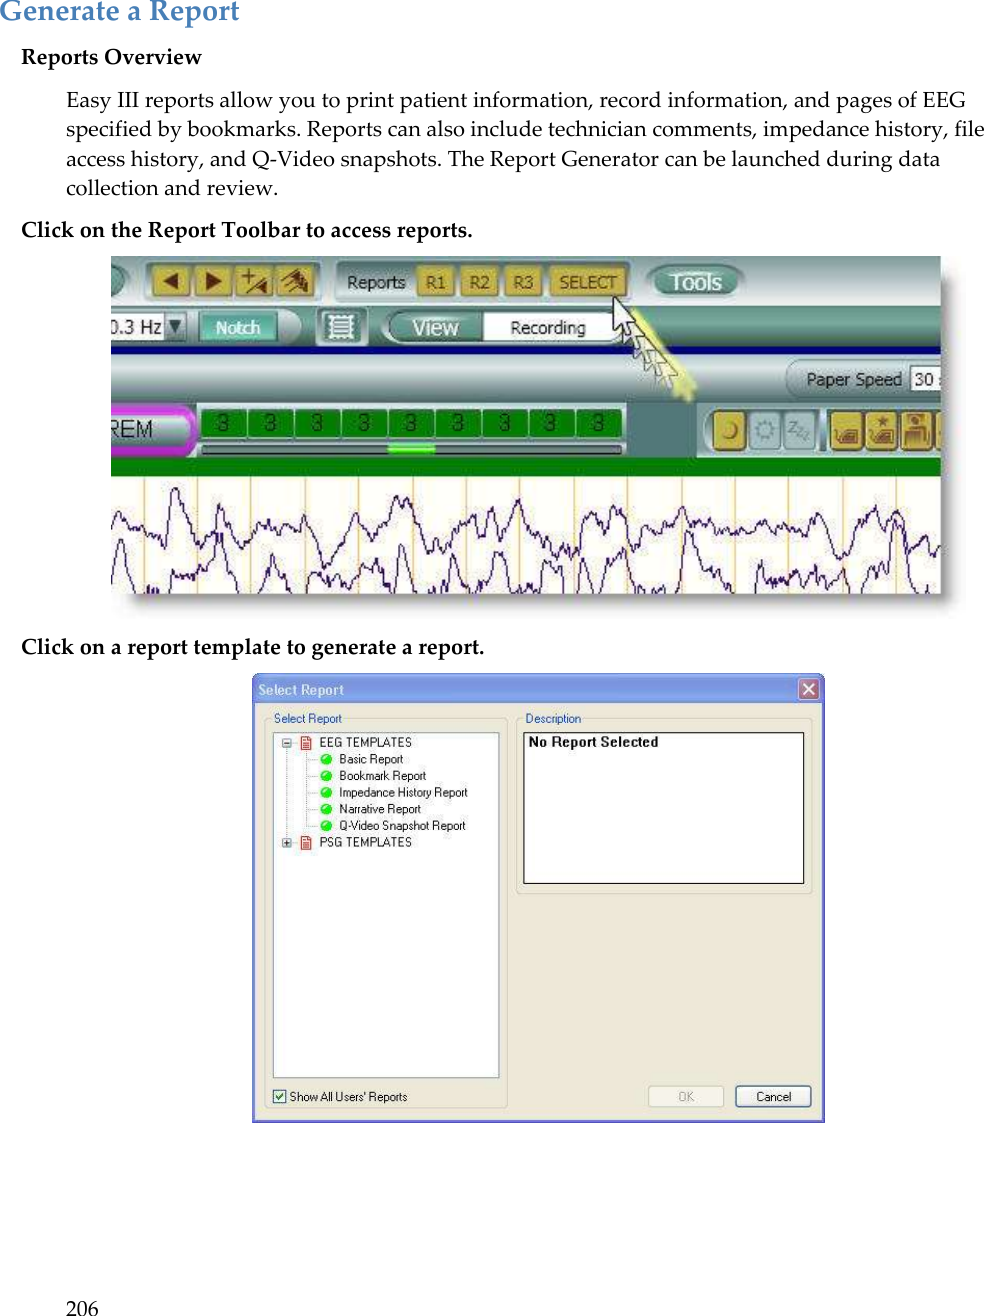
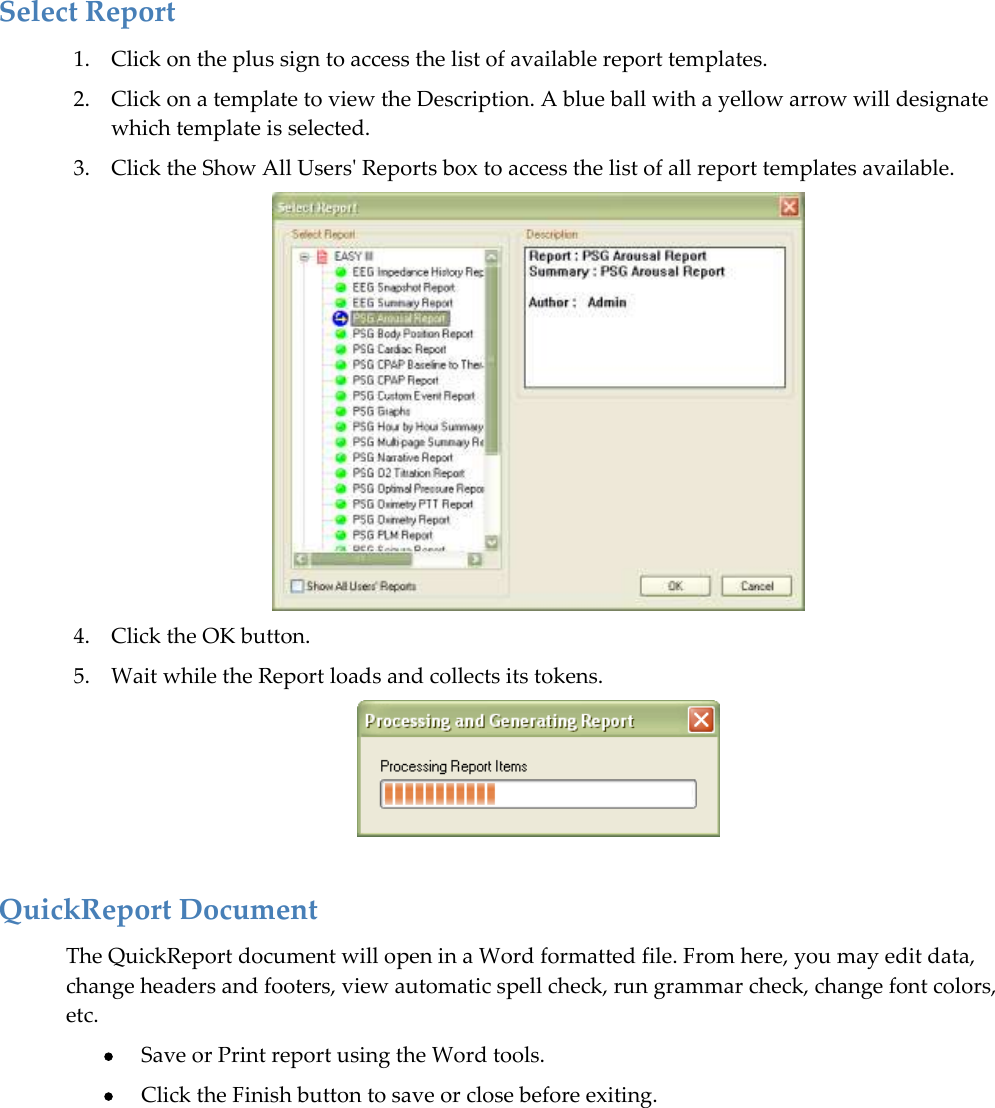
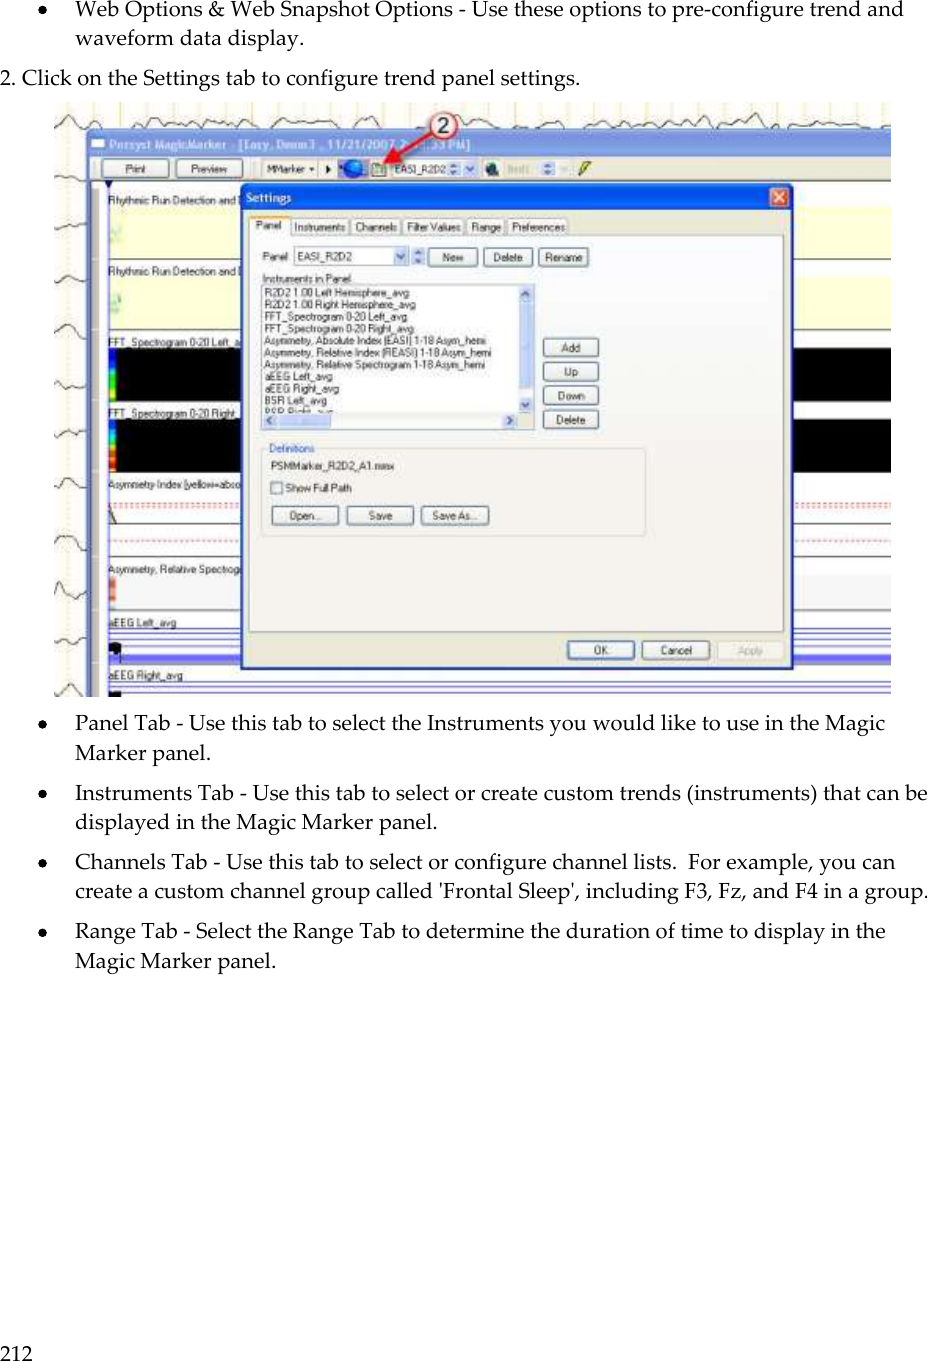
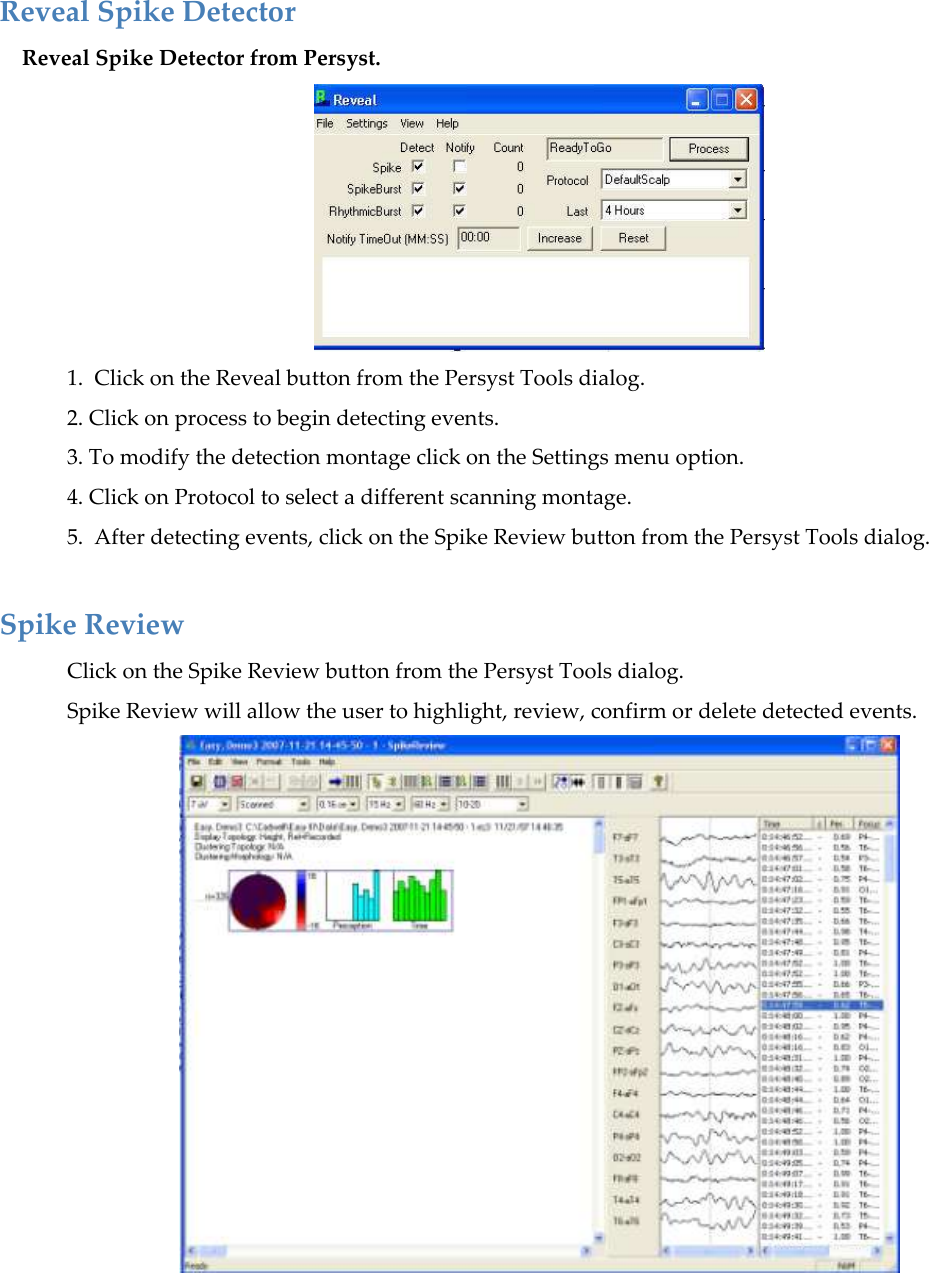
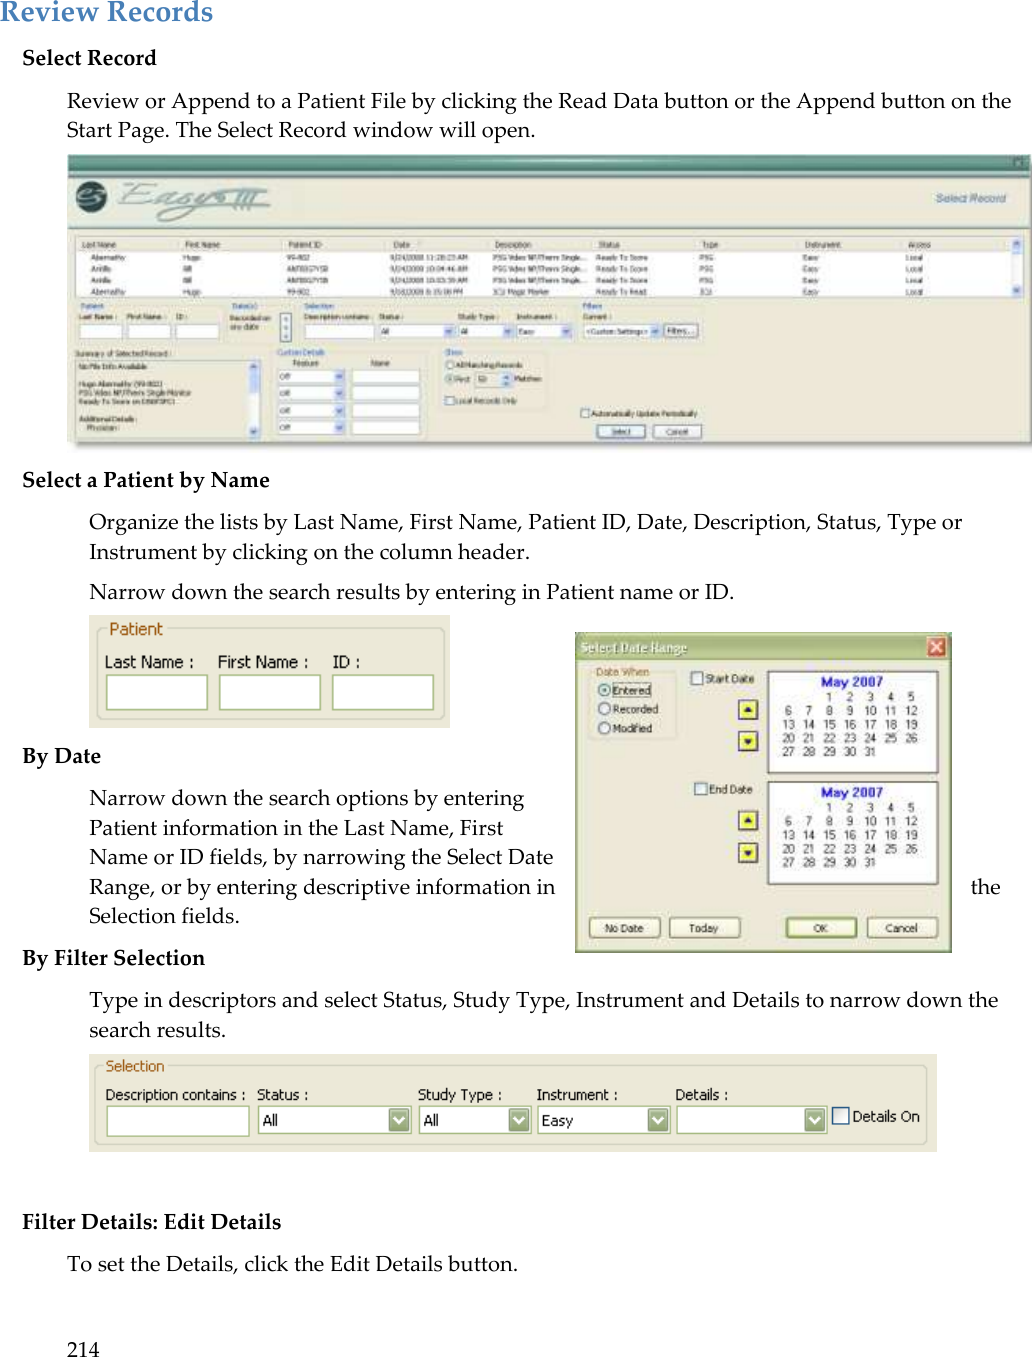
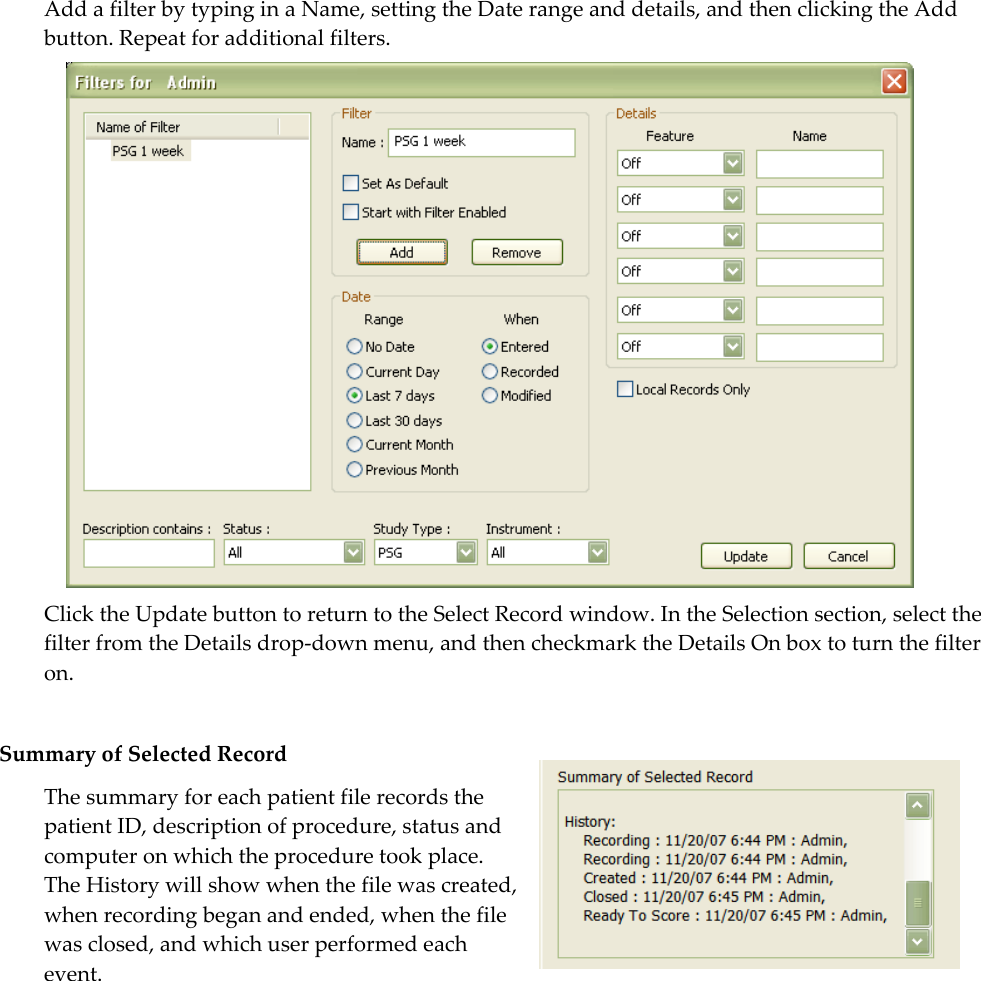
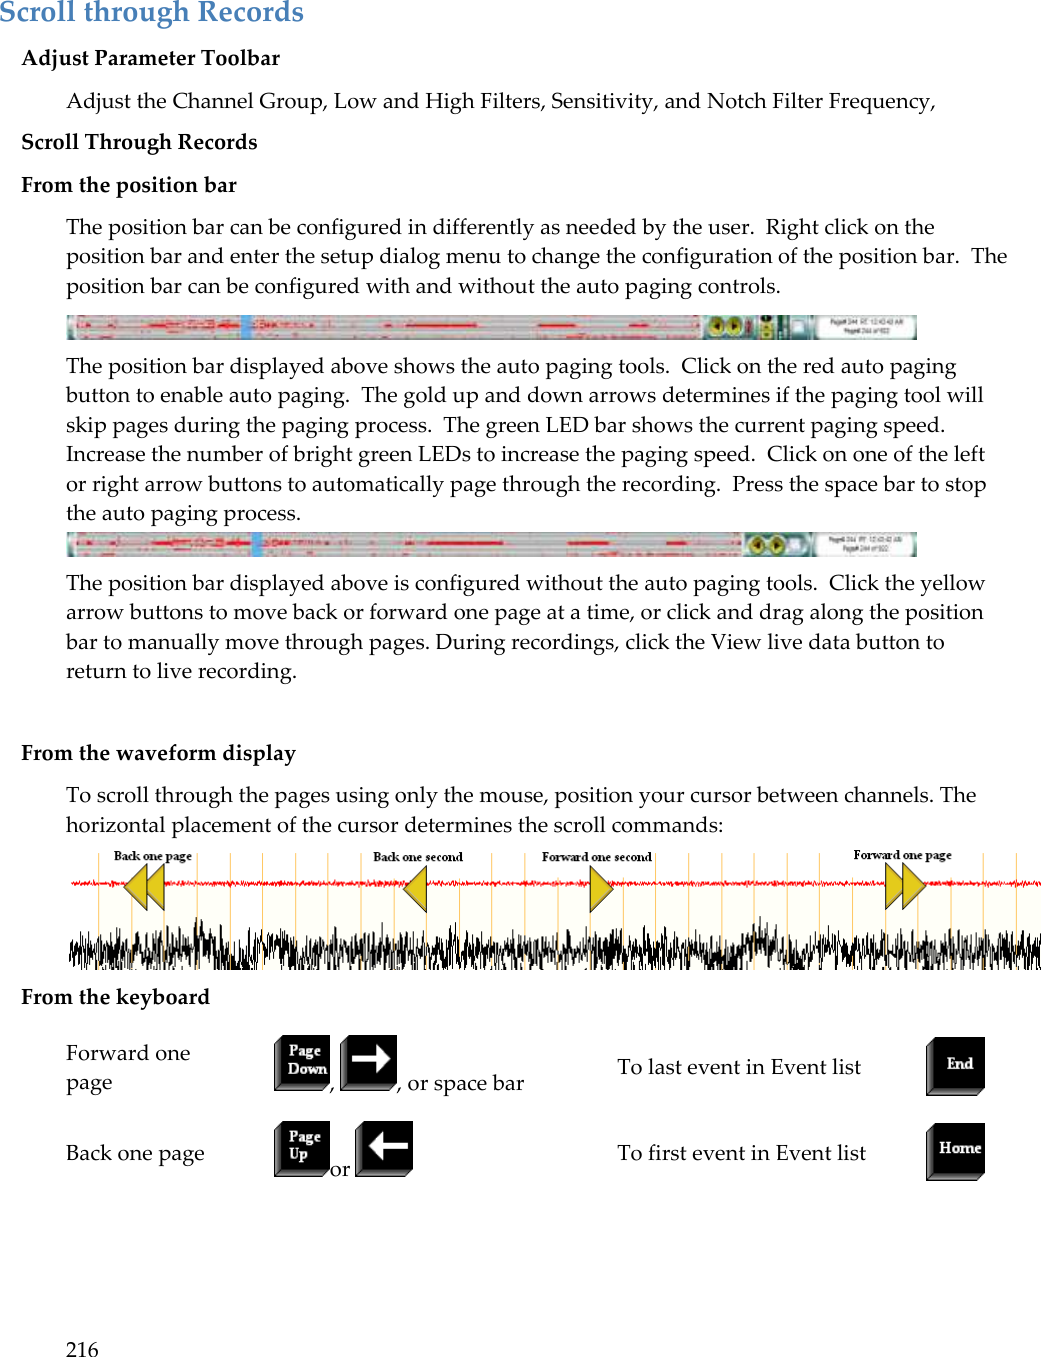
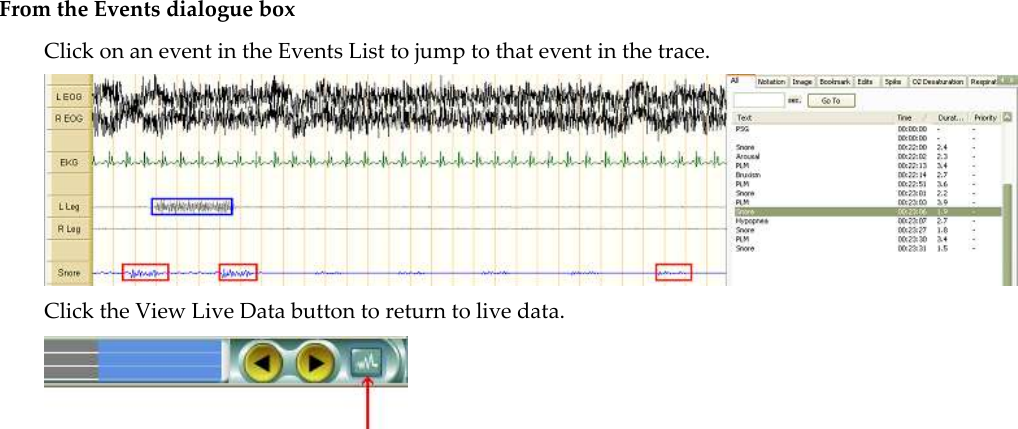
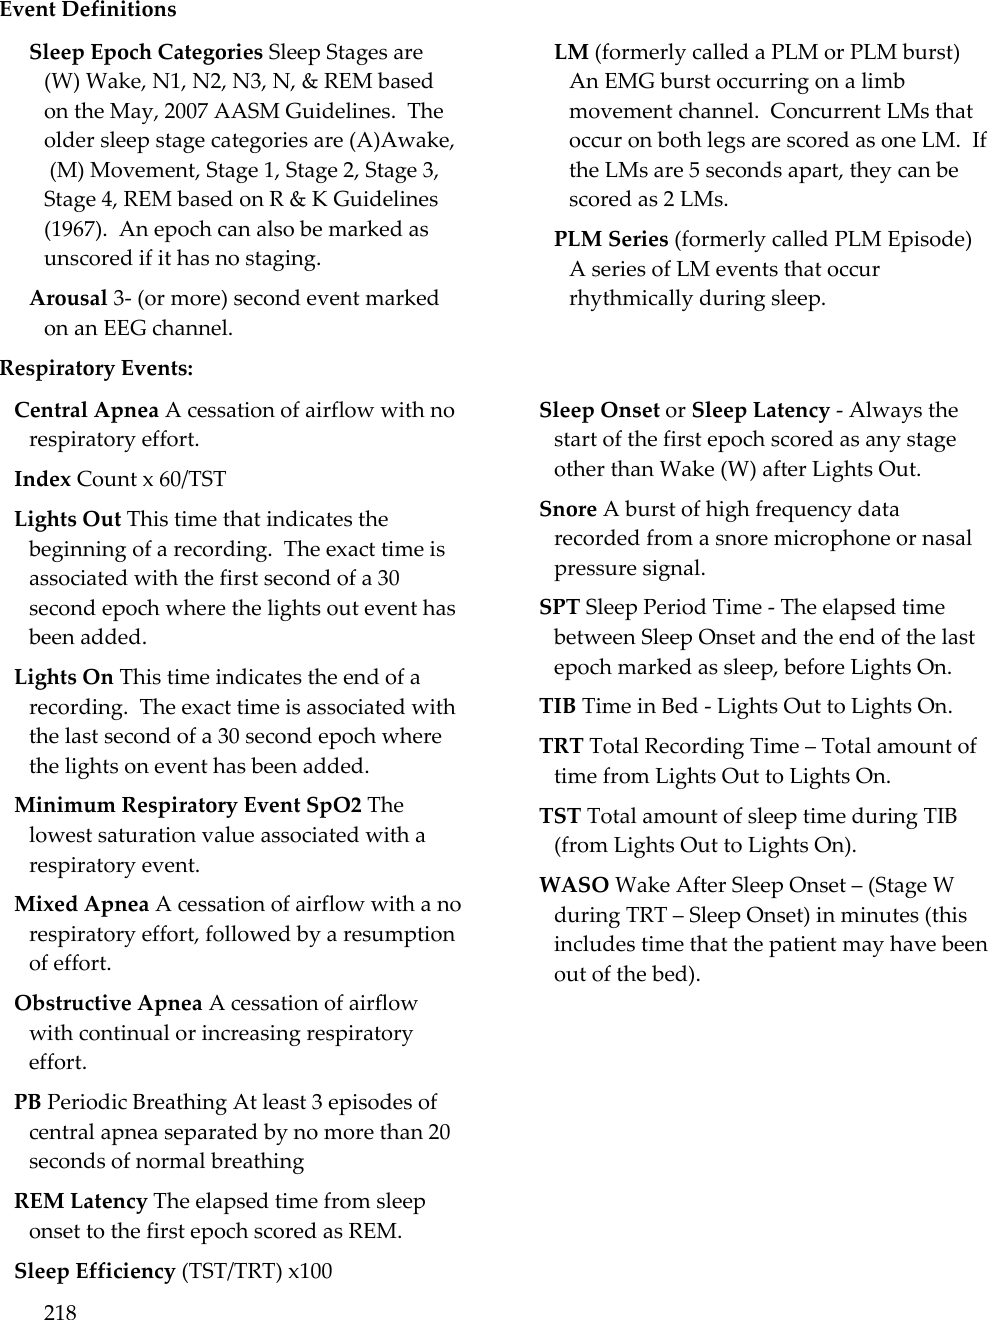
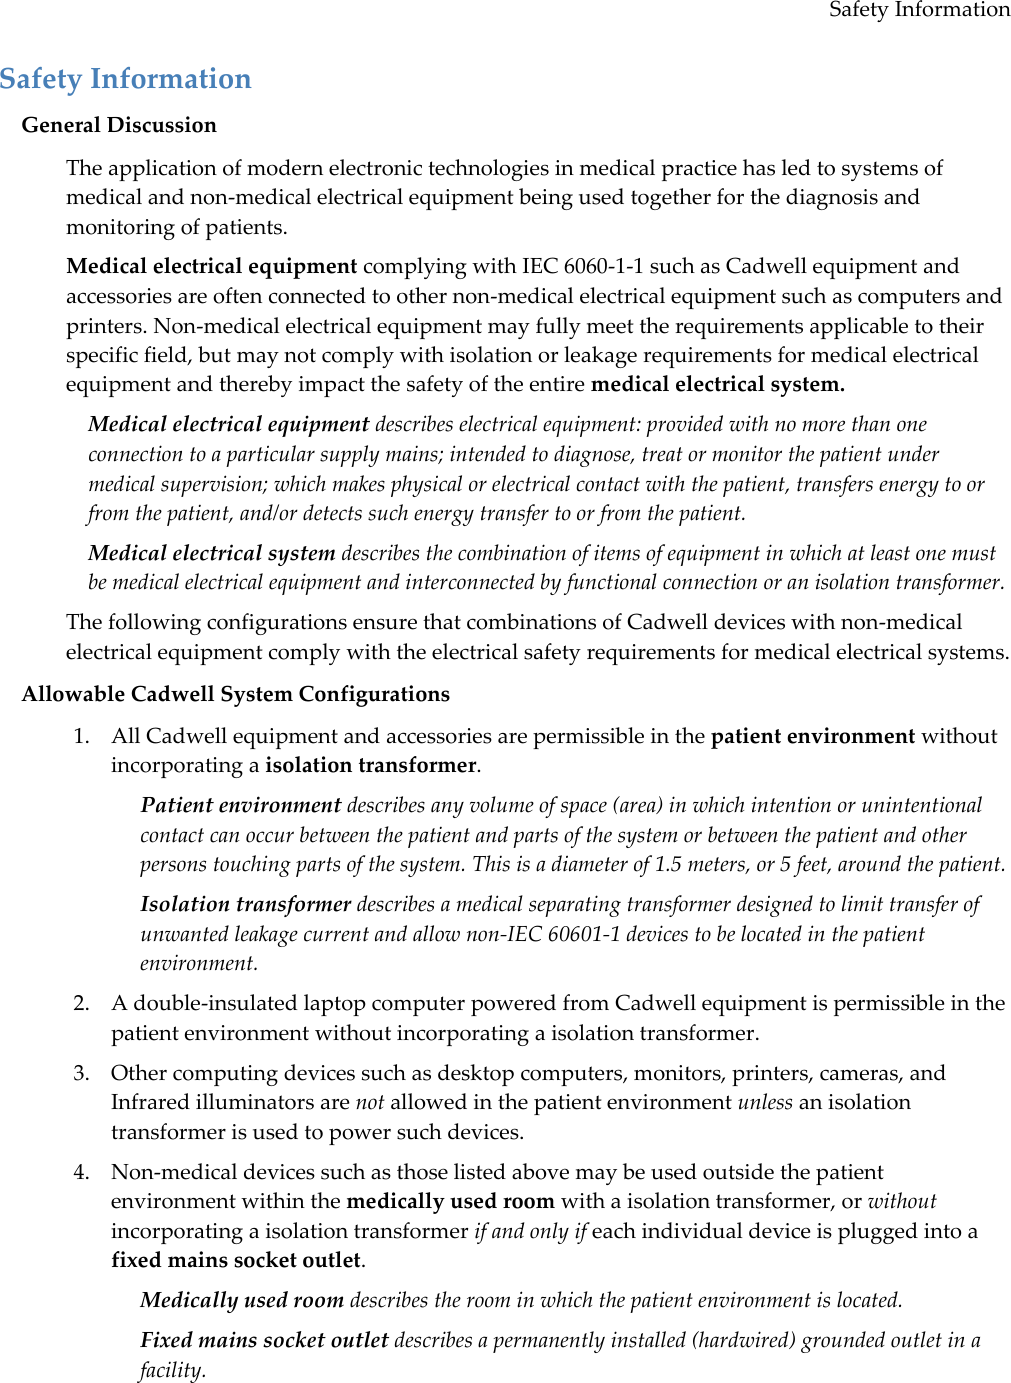
Second half User Manual