Cadwell CADWELL-1 Wireless EEG Recorder User Manual Easy III Operators Manual
Cadwell Wireless EEG Recorder Easy III Operators Manual
Cadwell >
Contents
- 1. User Manual Excerpt
- 2. First half User Manual
- 3. Second half User Manual
Second half User Manual
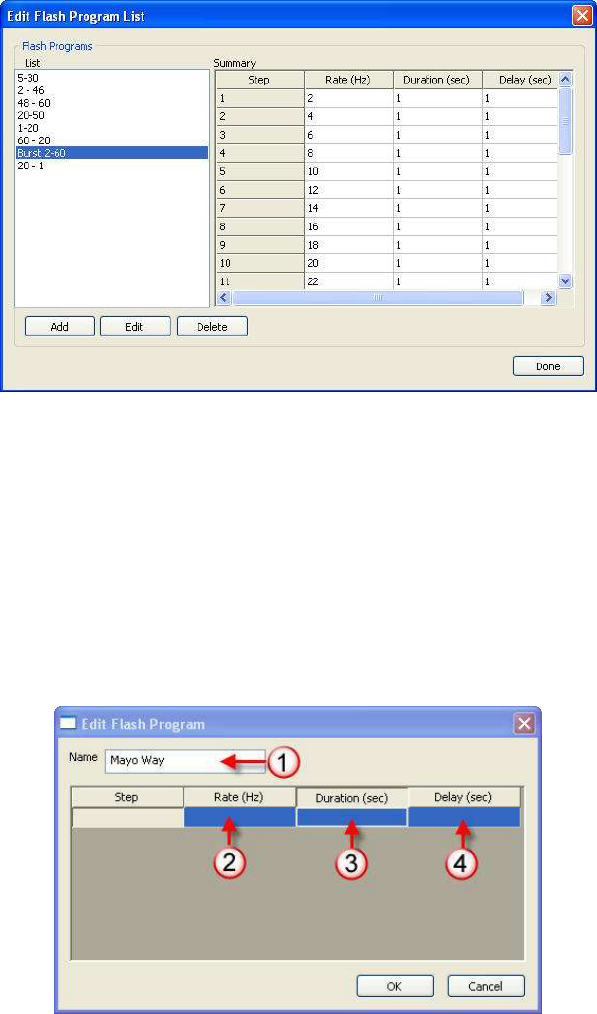
Note the Edit Flash Program dialog below.
1. Enter the name you would like to use for the photic program
2. Enter the Rate you would like to use for step number 1, press the tab button to advance to the
Duration box after you have entered the Rate.
3. Enter the Duration; press the tab button to advance to the Delay box after you have entered
the Duration.
4. Enter the Delay; press the tab button to advance to the next step. Enter the Rate for the next
step. Continue until all steps have been defined. Click on OK when you have completed all
steps.
To associate a flash program with the Program 1 or Program 2 button in the Photic Stimulator
control box during data collection, you must edit the recording protocol.
Refer to the Protocols section for information on how to configure the photic program for use
during data collection.
116
Data Maps
Data maps allow laboratories to standardize how channels will be displayed and defined. Easy
III system will refer to a data map to allow the system to collect data from multiple amplifier
types available from Cadwell.
Opening the Data Map Option
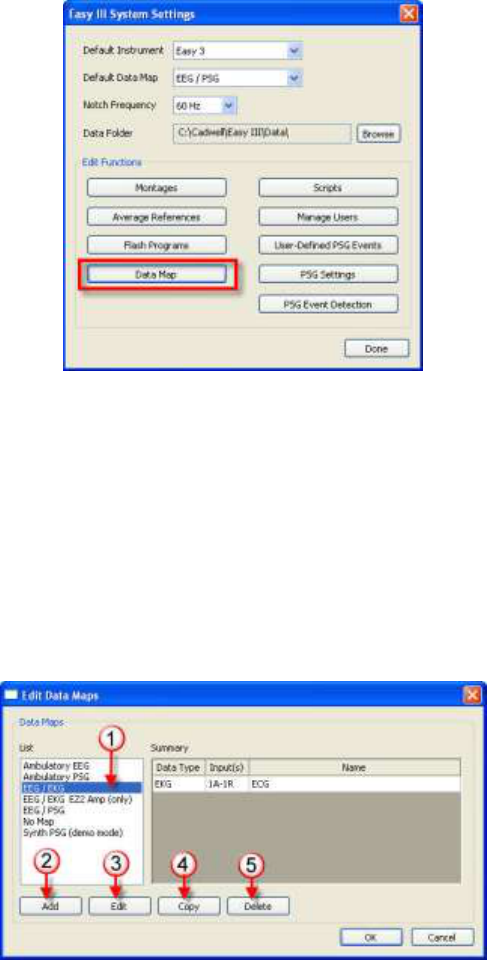
To open or create a Data Map, click on the Data Map option.
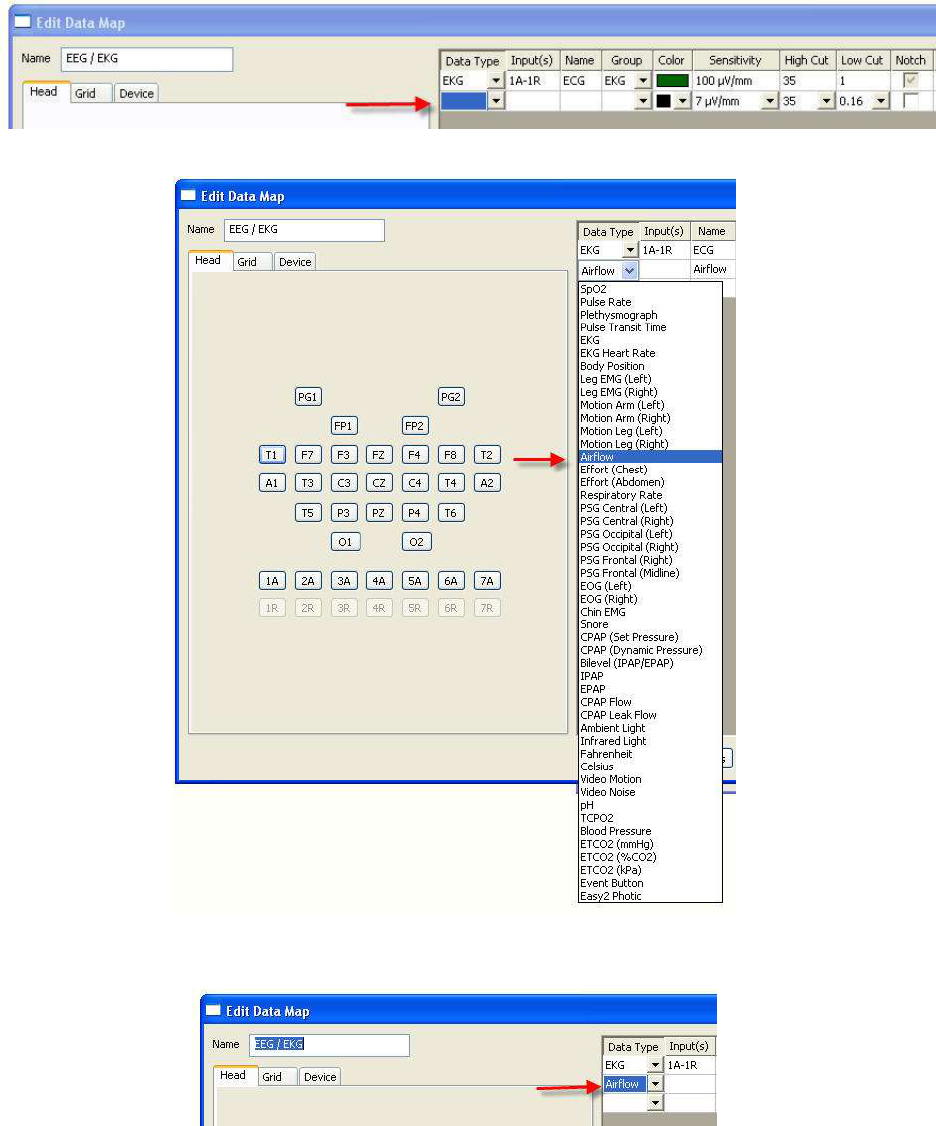
Editing or Selecting a Data Map (note the menu displayed below)
1. Select the Data Map you would like to review.
2. To add a new Data Map, click on the Add button.
3. To edit the selected Data Map, click on the Edit button.
4. To make a copy of the selected Data Map, click on the Copy button.
5. To delete the selected Data Map, click on the Delete button.
Note: All changes made to data maps will be automatically copied to all systems. Any Data
Maps deleted from this list will also be deleted from all systems.
Adding a Channel to a Data Map
Selecting a Data Map from the Data Map list and clicking on Edit will allow the user to edit the
selected map.
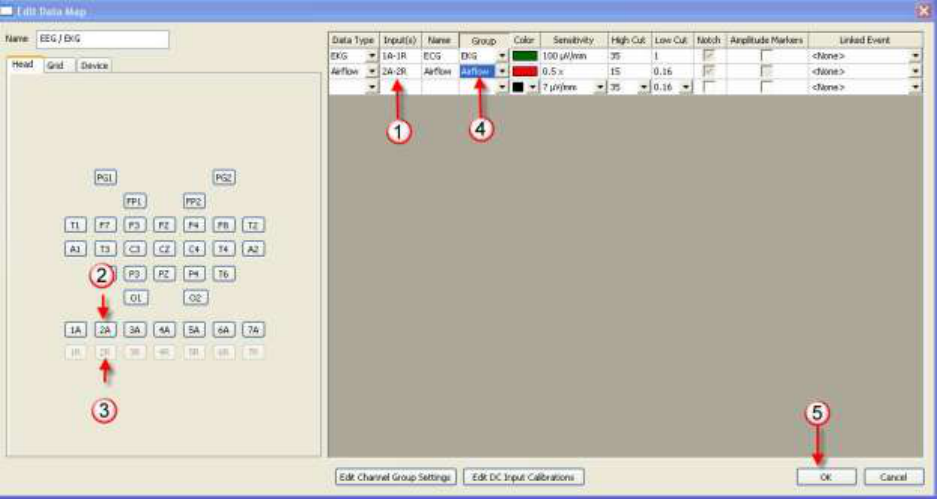
Click on the Data Type drop down, select a channel type.
In the example below, an airflow channel will be added to the EEG/EKG Data Map.
Note the Airflow channel is now automatically placed in the second row of the EEG/EKG Data
Map displayed below.
118
To select the inputs you would like to use:
1. Click in the Input(s) cell
2. Click in the Active input you would like to use (in this example 2A is used)
3. Click on the Reference input you would like to us (in this example 2R is used).
The Inputs box will now display 2A-2R.
4. Click on the Channel Group and select Airflow.
5. Click on OK to save the changes added to the data map. The 2A - 2R inputs will now be
configured for use for the Airflow channel.
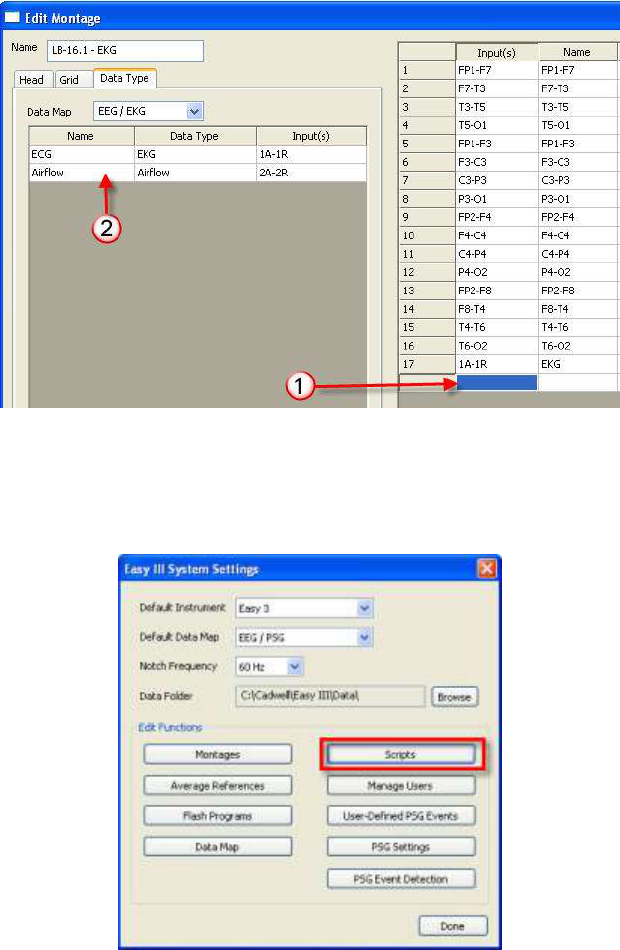
Adding a Data Map Channel to a Montage
Open the montage you would like to edit. Click on the Data Type tab. Verify you are using the
correct Data Map.
1. Click in the Input(s) box in the row you would like to add the channel.
2. Click on the channel you would like to add to the montage (in the example below, the airflow
channel will be added to the displayed montage).
3. Click on OK to save.
Access Scripts
From the Easy III Start Page, click the System Setup button, and then click the Scripts button.
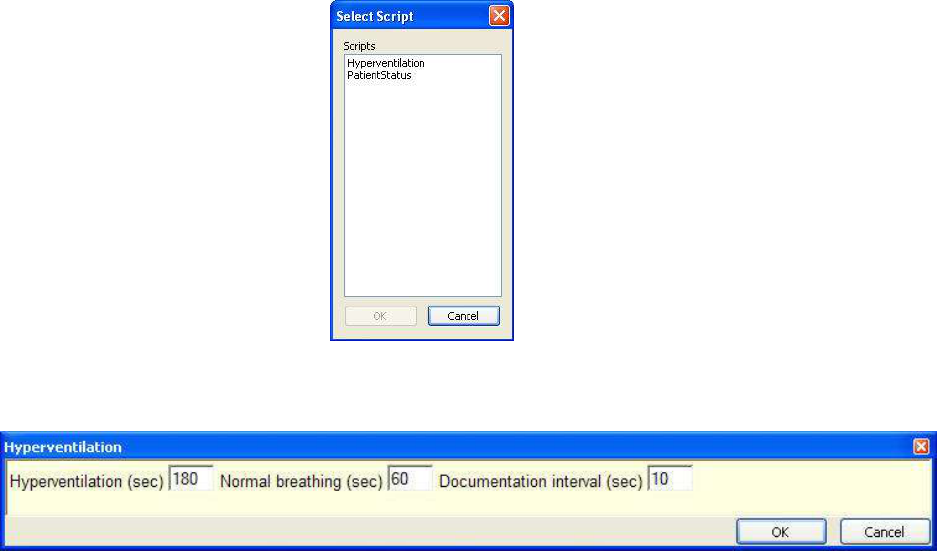
120
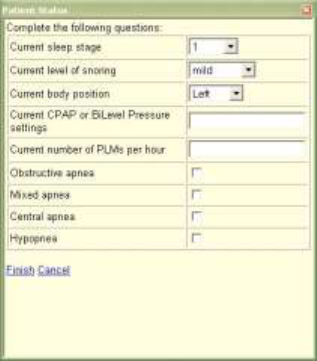
The Select Script window will open. Choose a script and click the OK button.
Hyperventilation
A Hyperventilation window will open.
Hyperventilation (seconds)
Enter the total number of seconds you would like the hyperventilation session to last. Easy III
will automatically place a text event (indicating that the patient is hyperventilating) every 10
seconds (or as specified in the Documentation Interval).
Normal Breathing (seconds)
Enter the total number of seconds you would like the post-hyperventilation session to last. Easy
III will automatically place a text event (indicating that the patient is in post hyperventilation)
every 10 seconds (or as specified in the Documentation Interval).
Documentation Interval (seconds)
Enter the interval (seconds) you would like Easy III to automatically place a text in the trace
window during activation.
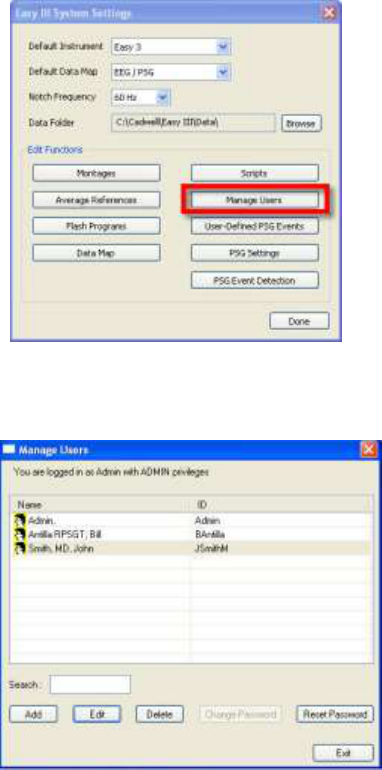
Patient Status
The following options will be displayed during data collection if the recording technician clicks
on the script option. These events can only be entered during data collection in a live window.
Cadwell can create a patient status report summarizing these events as they were entered during
data collection.
Manage Users
The Easy user can access the Manage Users option to do the following tasks:
1. Add a New User
2. Edit a Current User
a. Modify User Details
b. Change Access Rights
3. Delete a User
4. Change a Password
5. Reset a Password
122
Adding a New User
Click on Manage Users from the Easy III System Settings dialog.
Note the the illustration below. Click on Add to create a new user.
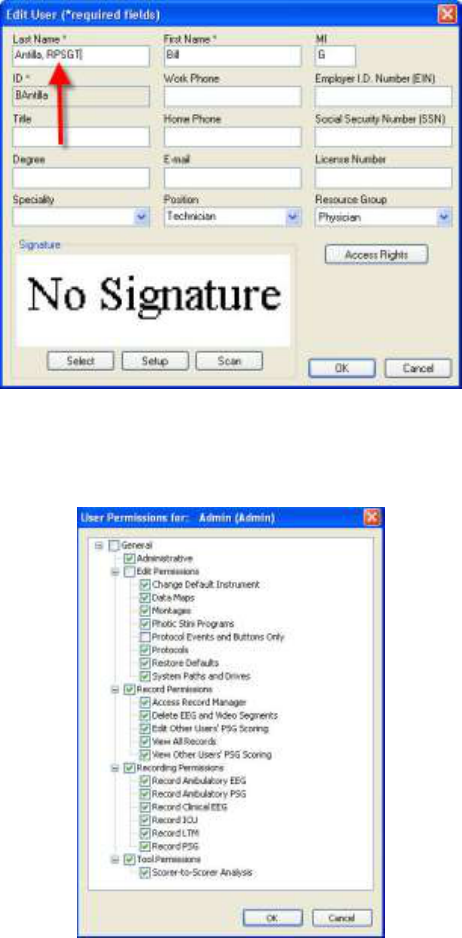
From the Edit User rights dialog, verify the following fields are correctly entered:
Last Name - Enter the last name of the user. If you would like to include the credentials
of the user, include them with the last name. For example, type in 'RPSGT' if you would
like to include the RPSGT credential with the users name (see example below)
First Name
Middle Initial (MI)
Position (physician, referring physician, technician)
Assigning Access Rights
Easy III provides powerful user rights options that allow laboratories to provide custom access
settings per user. The following User Rights Options are available within Easy III.
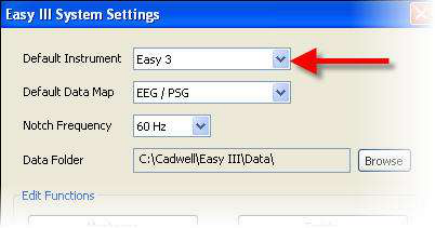
124
Easy III User Permissions - Description of Permissions
General
Administrative- Adding a check mark to the administrative check box will allow the user to reset
and access other users login data.
Edit Permissions
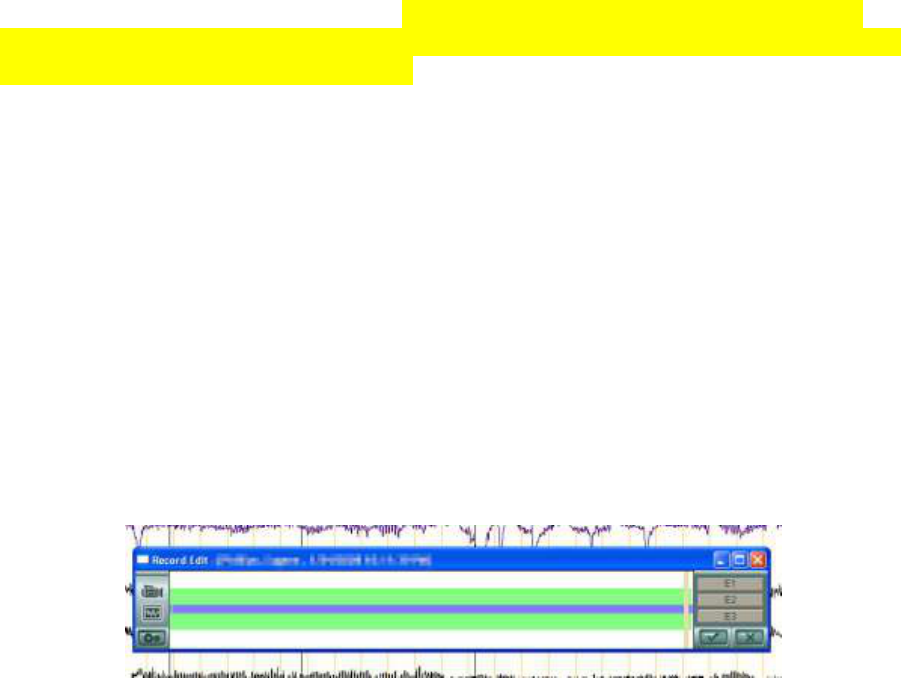
Change Default Instrument - Adding a check mark to the check box will allow the user to
change the default amplifier displayed in the System Settings dialog (note the illustration below).
If your laboratory uses multiple Easy amplifier types, you should add a check mark to this box to
allow users to swap hardware as necessary.
Data Maps - Removing a check mark from the check box will prohibit users from changing your
default channel configurations for your laboratory. If you place a check mark in this check box,
the user can add and remove default channel configurations. Data maps determine what inputs,
channel settings, colors, filters, etc will be used for each channel type used in recording montages.
Note: If a user deletes all data maps on a specific system, all data maps on all other networked
systems will be deleted also.
Montages - Removing a check mark from this check box will prohibit the user from adding,
modifying, or deleting saved montages. Removing this check mark does not prohibit the user
from modifying montages during data collection. The user will have the ability to modify
existing montages as necessary during data collection and review.
Photic Stim Programs - Removing a check mark from this check box will prohibit the user from
modifying, deleting, or creating new Photic Stimulation Programs.
Protocol Events and Buttons Only- Remove this check mark from the check box if you want to
prohibit the user from accessing protocols and buttons. If you want to provide the user limited
rights to default protocols, place a check mark in the check box. The user will not be able to
modify workspace layout (the layout of trace windows and menus); however they will be able to
create a new protocol using the existing workspace. The user can create their own custom events
and report buttons used while viewing data.
Protocols- Remove the check mark from this check box to prohibit the user from changing the
default configurations and views used for data collection. Cadwell recommends that only key
users, trained to alter the system configuration be granted access to this option. Default views
and configurations are tied directly to the data file. If a data file is collected with a specific
view/protocol, that view will always be used when the file is opened.
Restore Defaults - This feature is currently not supported.
System Paths and Drives - Remove the check mark from this check box to prohibit the user from
changing the default Data Folder location. Cadwell highly recommends that you remove the
check mark from this check box for most users. A possible loss of data can occur if acquiring data
on a machine that has a network data folder. If you allow users to change the default data path,
the Easy III will automatically move all data files to any new folder immediately after it is
selected by the user.
Record Permissions
Access Record Manager - Removing the check mark from the check box for this option will
prohibit the user from copying, deleting, archiving, moving, exporting, and importing patient
data.
Delete EEG and Video Segments - Removing the check mark from the check box will prohibit
the user from accessing the record editor. The record editor allows the user to select sections of a
recording for deletion. Note the record editor below. The blue bar represents the entire data file.
The green bar above and below the blue bar represents that data marked for saving. If you place
a check mark in the user rights for the Delete EEG and Video Segments option, the user will be
able to remove portions (or all) of the green line displayed in the record editor. Once segments
are marked for deletion, the user can proceed with deleting data. Data can not be recovered after
deletion.
Edit Other Users' PSG Scoring- If you are training a new user, you may want to prohibit the user
from importing another users scoring. If you place a check mark in the check box for this option,
the user will be able to login under their own name, access a record scored by another user, and
import their scoring and staging events.
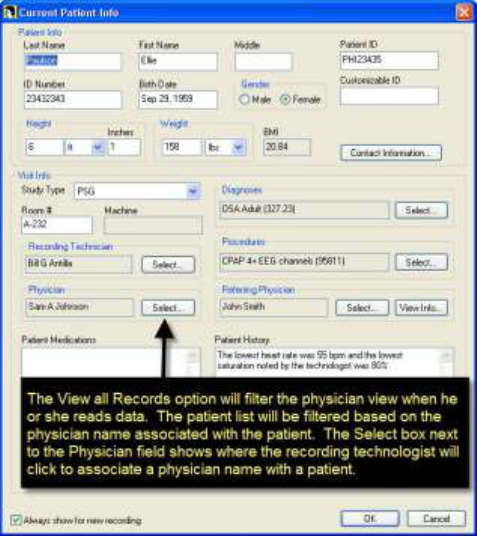
View All Records- This option will filter the Read Data/Select Record view for the physician.
This is a powerful option for filtering records. Removing this check mark from the check box will
only allow the physician to see his/her own patients. It is critical that the physician have a user
name in Easy III. The referring physician must also be selected from the patient information
dialog (see below).
126
View Other Users' PSG Scoring - If you are training a new user, you may want to allow the user
to view another users scoring. If you place a check mark in the check box for this option, the user
will be able to login under their own name, access a record scored by another user, and view their
scoring and staging events.
Recording Permissions
Removing the Recording Permissions check mark from the Check box will prohibit the user from
recording data from the selected recording modality.
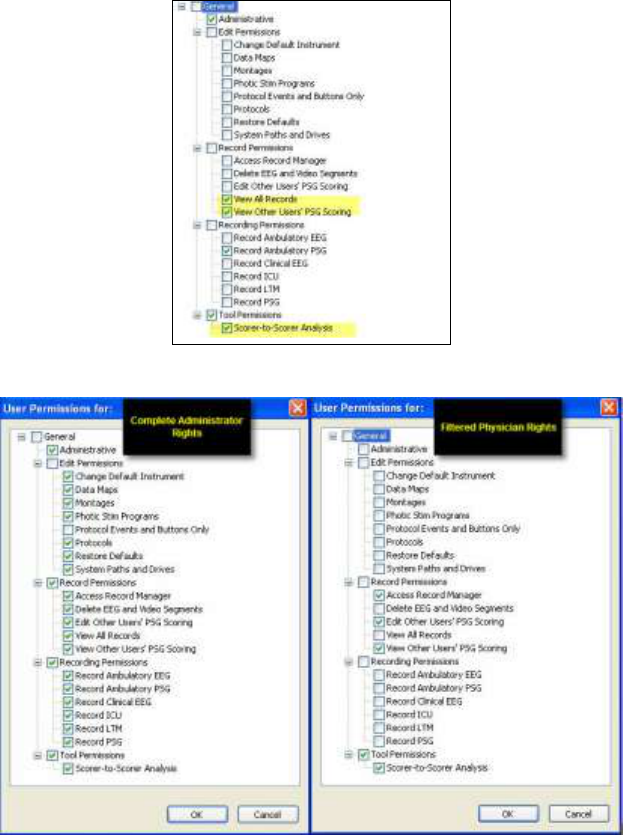
Tool Permissions
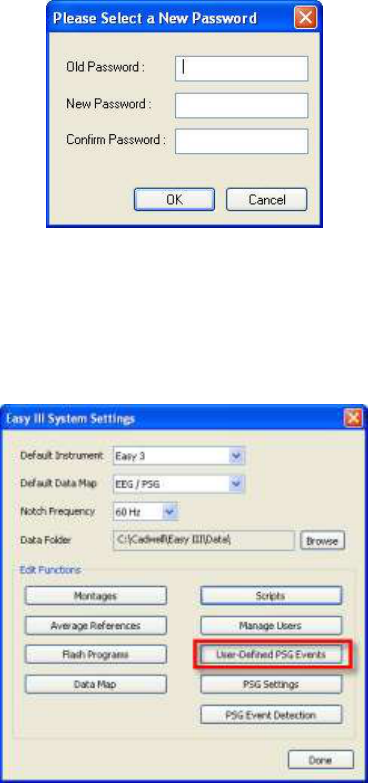
Scorer-to-Scorer Analysis - Add a check mark to this option to allow the user to compare their
scoring to another users scoring. Using the Record Permissions, Edit Others Scoring and View
Others Scoring, you can further restrict the users access rights. For example, if you wanted to
allow a technologist to view another scoring results, but not import them into his/her own
scoring results, you could set the permissions as follows:
Sample User Rights
128
Managing Users - Password Controls
Changing Passwords - Any user can log in under his/her login and modify the default password
associated with their user name. Click on Change Password to change your default password.
Click on OK to close. Exit the Easy III software and log back in with your new password.
Resetting Passwords - Any user with Administrative rights can reset another users password.
User-Defined PSG Events
Select the User-Defined PSG Events option to edit custom events.
Note the RERA event listed below. The user can define the following for each user defined event.
Description - This is the label that will be used when the event is marked. This label will show
up in the event list.
Color - This is the color of the event bar that will be placed on the channel where the event is
marked.
Event Bar Type - This is the type of event bar that will be placed on the selected channel. The bar
can be filled (solid) or hollow (a rectangle box).
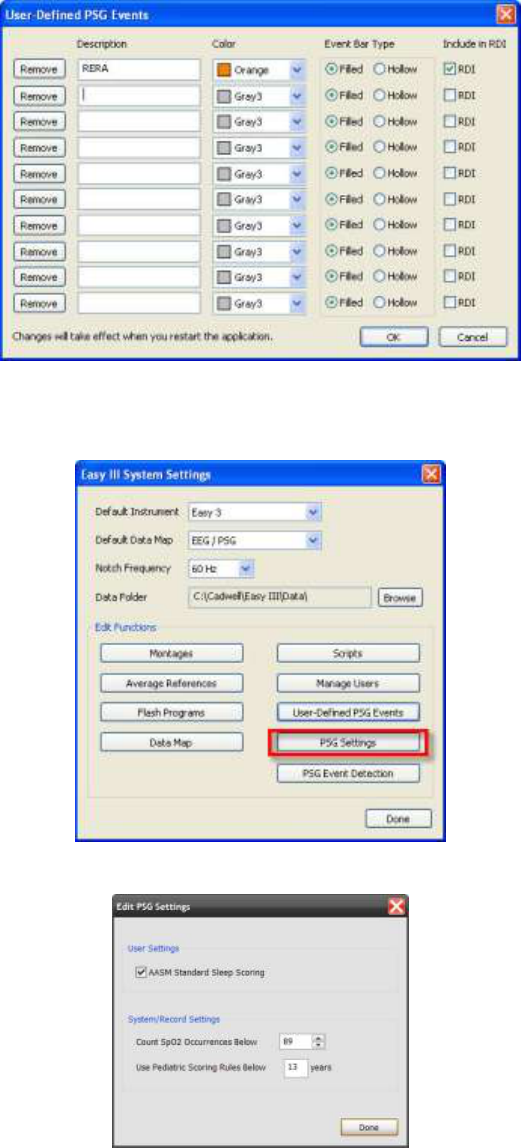
Include in RDI - This option will allow the user defined event to be included in the RDI
calculation used by Easy III.
PSG Settings
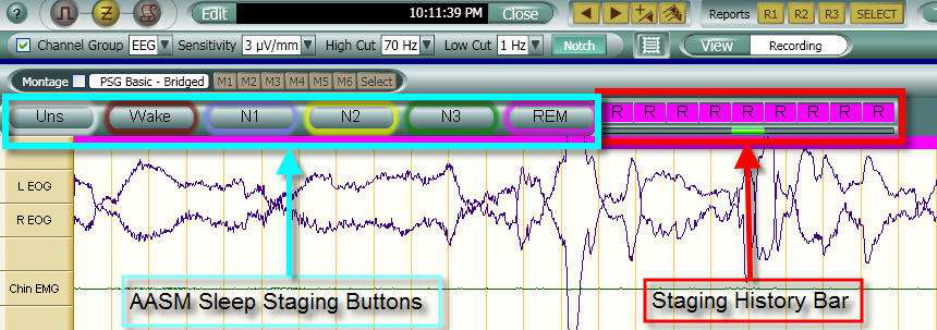
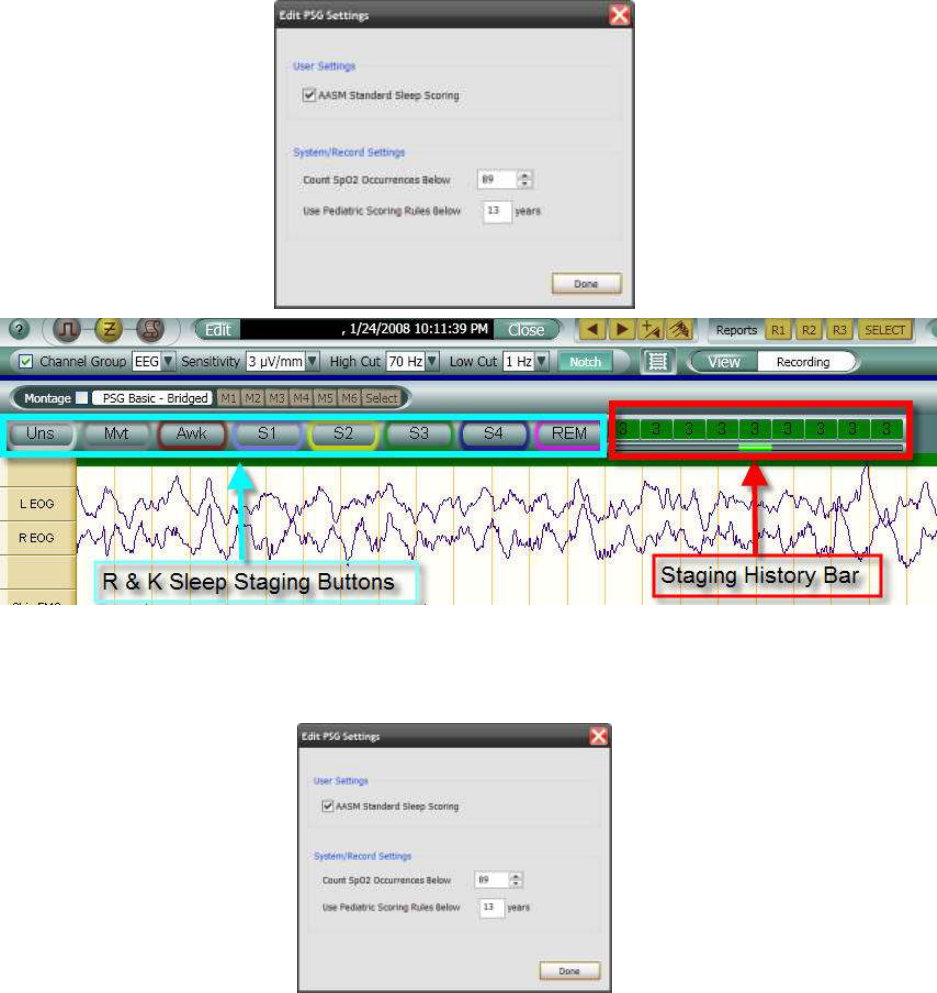
Edit PSG Settings - Using the AASM Standard
130
AASM Standard
Add a check mark to the AASM Standard Sleep Scoring check box to use the nomenclature from
the AASM Manual for the Scoring of Sleep and Associated Events, published by the American
Academy of Sleep Medicine (AASM) in 2007.
The AASM Standard Sleep Scoring defines sleep stages as Wake (W), N1, N2, N3, and REM
based on the AASM guidelines. An epoch can also be marked as Unscored (Uns) if it has no
staging.
To score a sleep record the montage page speed must be set to 10mm/sec, so that each page is 30
seconds long. You can also an epoch of sleep from a live window. To score a sleep record, go into
review mode by selecting a point in time along the position bar, or by dragging the blue scroll
across the position bar. Score a sleep record by clicking one of the scoring buttons: Uns, Wake,
N1, N2, N3, or REM. The Staging History bar will show the color-coded and labelled scores for
each epoch within nine (9) epochs. The displayed epoch will always be in the middle, and will
always be highlighted by a light green dash underneath.
The Staging Marker is also color-coded, and shows the sleep stage for the current epoch across
the top of the trace window. In the Staging History Bar, the light green colored line displayed
under an epoch indicates the stage of the page you are presently viewing.
Using the Older R&K Sleep Scoring Standard
The older sleep stage categories are Awake (Awk), Movement (Mvt), Stages 1-4 (S1, S2, S3, S4),
and REM based on R&K Guidelines (1967). An epoch can also be marked as Unscored (Uns) if it
has no staging.
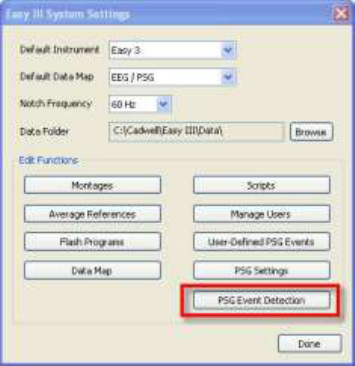
Count SpO2 Occurrences Below % Setting
This setting is used in the oximetry report. The total amount of time below this setting will be
used in the oximetry report.
Use Pediatric Scoring Rules
This setting is used to specify the age limit for pediatric respiratory event scoring. The patient
must be less than or equal to the age in this setting.
132
PSG Event Detection Settings
The Easy III system provides time saving tools to help the trained clinician detect events that
meet user defined criteria.
NOTE: It is important to realize that the computerized process of event detection is only an aid for the
physician in the establishment of a diagnosis. It does not replace the physician or diminish the requirement
to use sound professional judgment when reviewing and marking events.
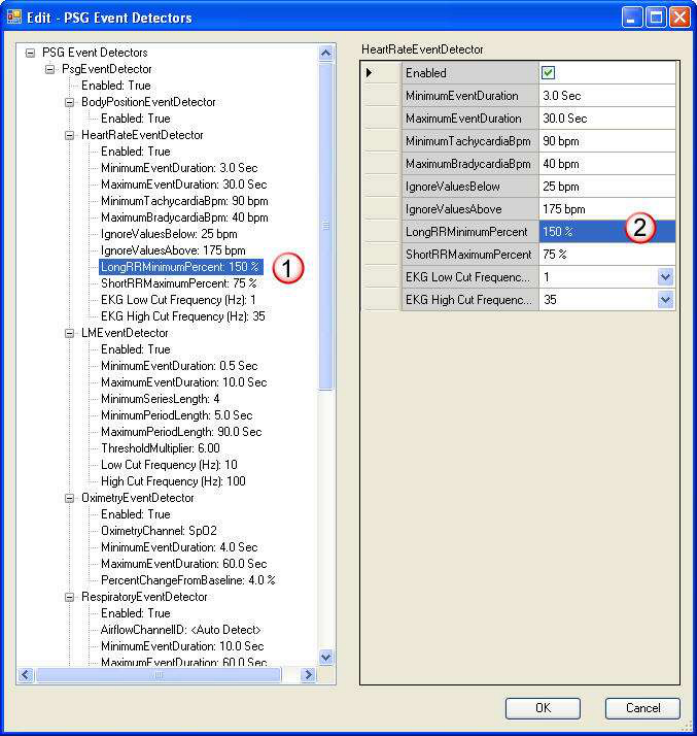
Easy III System Settings - PSG Event Detection
Click on the PSG Event Detection button to access PSG Event Detection settings.
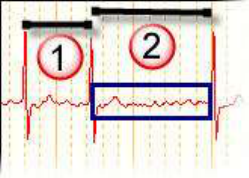
To review settings (note the illustration below) use the scroll bar in the PSG Event Detector
column to review detector settings.
1. Left click on a detector category you would like to review
2. To modify a specific user setting, left on the specific setting and type in a new value. In the
sample below, clicking in the blue area (where the number 2 is displayed) will allow the user to
type in a different Long R-R Minimum Percent. The user could type in 100 and then move on to
the next category, or simply click on OK to save the new default setting. The new default setting
will be synchronized across all Easy III systems. All PSG records will now use the new setting
during data collection and review. NOTE: Systems previously collected with the old RR settings
will not be automatically updated to the new settings. Auto-detection for RR to intervals must be
re-run to use the new settings.
PSG Event Detector
To enable PSG Event Detection, click on the PSG Event Detector Group. Place a check mark in
the PSG Event Detector check box. All event detectors that have been enabled (with a check box
setting of True) will be auto detected. Note: If the check mark is removed, no auto-detection of
events based on your settings will occur.
Body Position Event Detector
To enable Body Position Event Detection, click on the Body Position Event Detector. Place a check
mark in the Body Position Detector check box. Note that the Body Position Detector setting will
134
display ‘True’ in the column on the left side of the menu. This will indicate that the event
detector has been set to detect body position changes from a body position module.
Heart Rate Event Detector
To enable the Heart Rate Detector, click on the enable heart rate detector check box. Note the
heart rate detector will display ‘True’ on the column on the left side.
Minimum Event Duration is the minimum number of seconds required for a Tachycardia
or Bradycardia event.
Maximum Event Duration is the maximum number of seconds allowed for a Tachycardia
or Bradycardia event.
Minimum Tachycardia bpm is the minimum heart rate required to trigger a tachycardia
event. The default setting is set to 90 bpm as recommended by the AASM (July, 2007)
Maximum Bradycardia bpm must be at this level or lower for at least the minimum event
duration for a Bradycardia event to be detected. The default setting is set to 40 bpm as
recommended by the AASM (July, 2007).
Ignore Values Below. Values recorded below this level will be ignored by the event
detector.
Ignore Values Above. Values recorded above this level will be ignored the event
detector.
Long R-R Minimum Percent. This setting looks at the percent increase in time between R-
R waves required to mark an R-wave-to-R-wave interval as "Long R-R." The long R-R
algorithm compares the current R-R interval to the previous R-R interval. If the second
interval has increased by the percent specified, the second R-wave-to-R-wave (R-R)
interval is marked as a long R-R event. A long R-R interval is then ignored in
determining the next interval. To reduce the number of Long R-R events detected,
increase the Long R-R % setting. In the sample below, the duration of interval 2 is 150%
longer than the previous interval. As the detector examines interval 1 and interval 2, the
second interval is marked because 150% of the previous interval has been exceeded.

Short R-R Maximum Percent. This setting looks at the percent decrease in time between
R-waves required to mark an R-wave-to-R-wave interval as "Short R-R." The short R-R
algorithm compares the current R-R interval to the previous R-R interval. If the second
interval has decreased by the percent specified, the second R-wave-to-R-wave (R-R)
interval is marked as a short R-R event. A short R-R interval is then ignored in
determining the next interval. To reduce the number of Short R-R events detected,
decrease the Short R-R setting. In the sample below, the duration of interval 1 is less than
75% of the previous interval.
EKG Low and High Cut Filter Settings. When artifact is encountered, use these settings
as necessary to change heart rate detector results.
NOTE: It is important to realize that the computerized process of event detection is only an aid for the
physician in the establishment of a diagnosis. It does not replace the physician or diminish the requirement
to use sound professional judgment when reviewing and marking events.
Limb Movement Event Detector
To enable the LM (Limb Movement) Event Detector, click on the LM Event Detector. Place a
check mark in the LM Event Detector check box. Note that the LM Detector setting will display
‘True’ in the column on the left side of the menu. This will indicate that the event detector has
been set to detect LM events and PLM Series (as defined by the AASM, July 2007).
Minimum Event Duration is the minimum LM duration required for detection.
Maximum Event Duration is the maximum LM duration allowed for event detection.
Minimum Series Length is the minimum number of LM events required for a PLM Series.
Minimum Period Length is the minimum amount of time allowed between any two LM
events in a PLM series. If a LM event is too close to the previous event, it will not be
included in the PLM series count, however the PLM series may continue if another LM
event meets the minimum period length setting.
Maximum Period Length is the maximum amount of time allowed between any two LM
events in a PLM series. A PLM series will be broken if a LM is greater than 90 seconds
away from a previous LM event.
Threshold Multiplier is used to detect more or less LM events. The default threshold is 6.
Set the threshold lower to detect more events, set the threshold higher to detect fewer
events.
LM Low and High Cut Filter Settings. When artifact is encountered, use these settings as
necessary to change LM detector results.

136
Oximetry Event Detector
To enable the Oximetry Event Detector, click on the Oximetry Event Detector. Place a check
mark in the Oximetry Event Detector check box. Note that the Oximetry Event Detector setting
will display ‘True’ in the column on the left side of the menu. This will indicate that the event
detector has been set to detect oximetry events.
Oximetry Channel selection allows the user to select the Cadwell EasyNet SpO2 oximeter
(SpO2) or any other oximeter calibrated and identified within the Easy III system (SpO2-
1, SpO2-2, etc.).
Minimum Event Duration is the minimum time (seconds) required to detect a
desaturation event.
Maximum Event Duration is the maximum time (seconds) allowed for desaturation
events. This duration should be increased if the patient is having events greater than 60
seconds.
Percentage Change from Baseline is the minimum percentage change in SpO2 level from
the baseline SpO2 required to detect an oximetry event.
Respiratory Event Detector
Note the Obstructive Apnea event below. The detector has marked the event as a 13.8 second
obstructive apnea.
1. Placing the mouse/cursor on the red event bar will display the event details.
The details are as follows:
- Duration = 13.8 seconds
- Airflow Signal Drop = 86%
- Minimum SpO2 associated with the event = 93%
- Total SpO2 drop associated with the event = 3% *
- Minimum pulse rate associated with the event = 36 bpm
2. Note the associated oximetry desaturation event. The patients saturation dropped from 96%
to 93%.

Respiratory Event Bar Colors
Obstructive = Red
Central = Yellow
Mixed = Black
Hypopnea = Green
To enable the Respiratory Event Detector, click on the Respiratory Event Detector. Place a check
mark in the Respiratory Event Detector check box. Note that the Respiratory Event Detector
setting will display ‘True’ in the column on the left side of the menu. This will indicate that the
event detector has been set to detect respiratory events.
Airflow Channel ID. Set this to Auto-Detect to have Easy III automatically detect an
airflow sensor. Select a specific channel if you would like Easy III to use a specific
channel for respiratory event detection.
Minimum Event Duration. This is the minimum duration (seconds) for respiratory
events (apneas, hypopneas).
Maximum Event Duration. This is the maximum duration allowed for respiratory events.
Extend this duration if the patient is have events greater than one minute in duration.
Post Event SpO2 Interval. This is the period of time after a respiratory event that Easy III
will look for the lowest saturation associated with the respiratory event.
Respiratory Effort Threshold. This threshold will increase or decrease the types of apneas
detected. Lower this threshold to detect more central apneas, increase this threshold to
detect more central apneas.
Apnea Airflow Threshold. This setting will increase or decrease the number of apneas
detected. Decrease this setting to decrease the number of apneas events detected.
Hypopnea Airflow Threshold. This setting determines the airflow amplitude drop
required to detect a hypopnea.
Central, Obstructive, Mixed, and Hypopnea Desaturation Threshold. This setting
requires that the specified respiratory event have a corresponding desaturation event.
Airflow and Respiratory Effort Low and High Cut Filter Settings. When artifact is
encountered, use these settings as necessary to change respiratory event detector results.
NOTE: It is important to realize that the computerized process of event detection is only an aid for the
physician in the establishment of a diagnosis. It does not replace the physician or diminish the requirement
to use sound professional judgment when reviewing and marking events.
138
Snore Event Detector
To enable the Snore Event Detector, click on the Snore Event Detector. Place a check mark in the
Snore Event Detector check box. Note that the Snore Event Detector setting will display ‘True’ in
the column on the left side of the menu. This will indicate that the event detector has been set to
detect snore events.
Snore Channel ID. Use the Auto Detect setting to have Easy III detect the presence of a
snore channel. Select a specific snore channel if you want Easy III to detect events on a
specific channel.
Minimum Event Duration. This is the minimum duration required to detect a snore
event.
Maximum Event Duration. This is the maximum duration for a snore event. A snore
event will not be marked if it exceeds this duration.
Threshold Multiplier. The default threshold is 4. Set this threshold lower to detect more
events. Set this threshold higher to detect fewer events.
Snore Low and High Cut Filter Settings. When artifact is encountered, use these settings
as necessary to change snore event detector results.
NOTE: It is important to realize that the computerized process of event detection is only an aid for the
physician in the establishment of a diagnosis. It does not replace the physician or diminish the requirement
to use sound professional judgment when reviewing and marking events.
Selecting a Protocol
Protocols are used for data collection. A protocol is typically configured for specific modality or
recording type. Protocols define the default layout that will be used for data collection and
review.
Selecting a Protocol for use with the Record Data buttons
1. When the user clicks on New Patient or Select Patient, the default recording protocol will be
user.
2. To select a default protocol, click on the Protocols button.
140
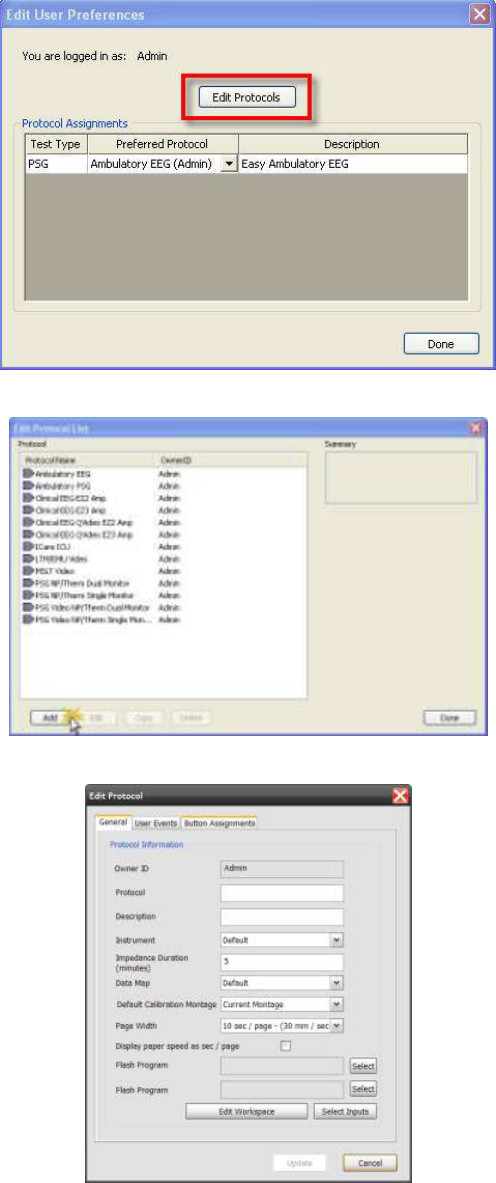
3. Click on the drop down arrow in the Preferred Protocol column. Select the protocol you
would like to use. Click on Done to save your setting. The selected protocol will now be used
when the user clicks on the New Patient or Select Patient button.
Note: The default protocol setting is specific to the User Name. Each user can select his/her
default recording protocol.
Editing Protocols
The Easy III software allows the user to define a laboratory specific layouts (workspaces) for data
recording and review. The workspace can consist of multiple views. For example, the first view
will contain a recording trace window only, however a second view will contain the same
recording trace window, a Q-Video patient window, and a event list.
A Recording Protocol Contains the following:
Default Screen Layout/Workspace (for recording and review)
Default Event Buttons (specified by the user)
Default Instrument (Easy III, Easy II, or Ambulatory Amplifier)
Default Impedance Measurement Time Out duration
Default Calibration Montage
Default Page Width
Default Flash Program
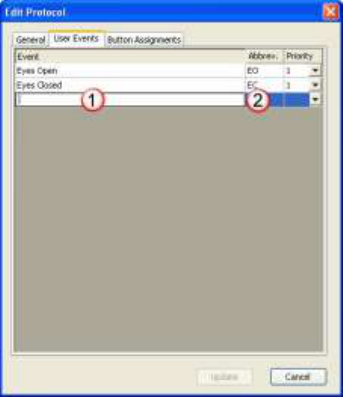
Creating a New Protocol
Click on Protocols
Click on Edit Protocols
Click on Add protocol
Note the Edit Protocol Dialog below.
142
General Tab Settings
Owner ID - This is the name of the user that created the protocol. If you are logged in under your
name, your Easy user name should be displayed in this window.
Protocol Name - This is the name of the protocol that will be displayed in the protocol list.
Description - The user can create a short description about the protocol. For example, the user
could enter 'Dual Monitor w/Q-Video'.
Default Instrument - Use this option to select the amplifier you would like to use with this
particular protocol. The options include:
Easy 3
Easy 2
Ambulatory
Default - Use this option if you are likely to use different amplifiers on multiple
Easy III computer systems
SynthHardware Server - Do not use. This is a configuration setting for system evaluation.
EEGSynthHardware Server - Do not use. This is a configuration setting for system
evaluation.
Impedance Duration (minutes) - This option determines the length of time the impedance
measurement will run. After the user specified duration has been met, the impedance
measurement process will stop.
Data Map - A default data map can be selected for the protocol. This allows the user to use
specific channel types, colors, and settings for the protocol selected.
Default Calibration Montage - This setting determines how the calibration montage will be
displayed with the protocol.
Current Montage - The trace window will show only those inputs used in the current
montage.
1 - 32 Channels - The trace window will show inputs 1 - 32.
1 - 64 Channels - The trace window will show inputs 1 - 64.
1 - 128 Channels - The trace window will show inputs 1 - 128.
10-20 + Active/Reference Pairs - The trace window will show all 10-20 inputs and the
Active Reference Inputs.
Default Page Width - The user can select the default page width that will be used when a record
is recorded or reviewed.
1 sec/page - 300 mm/sec
2 sec/page - 150 mm/sec
5 sec/page - 60 mm/sec
10 sec/page - 30 mm/sec
15 sec/page - 20 mm/sec
20 sec/page - 15 mm/sec
30 sec/page - 10 mm/sec
60 sec/page - 5 mm/sec
120 sec/page - 2.5 mm/sec
300 sec/page - 1 mm/sec
600 sec/page - 0.5 mm/sec
Display Paper Speed as sec/page - Place a check mark in this check box if you prefer the paper
speed units to be displayed as seconds per page.
Flash Program 1 & 2 - Click on the Select button to select the default flash program for buttons 1
and 2 in the flash program control (used for EEG activation).
Editing User Events, Default Montages, and Default Reports
User Events
Click on the User Events Tab.
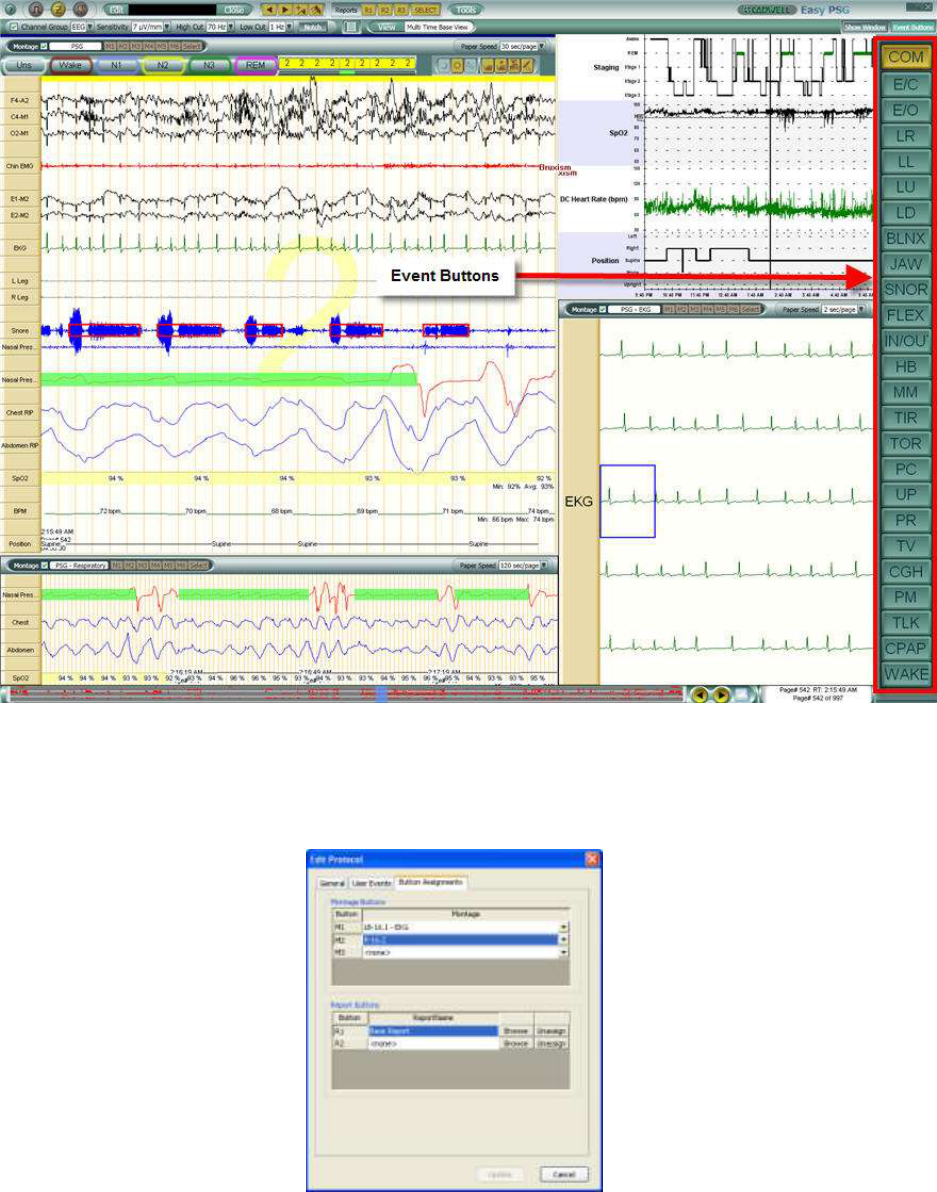
1. Type in an event that you would like displayed in the user event list.
2. Type in an abbreviation that will be placed on the Event Button.
144
Note the Event Buttons below.
Montage and Report Buttons
Click on the Button Assignments Tab. Click on the Drop down arrow for each button (M1-M6).
Select the six montages you would like to associate with the Montage buttons. Select the three
reports you would like to associate with the Report Buttons.
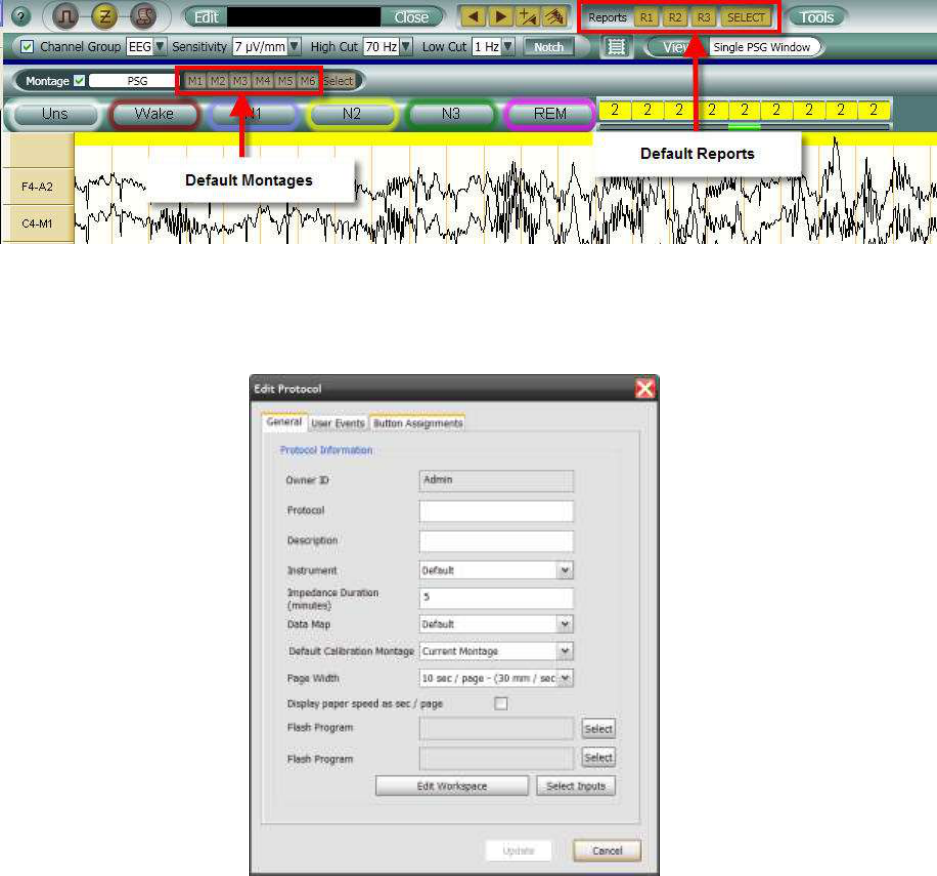
Note the Montage and Report Buttons below.
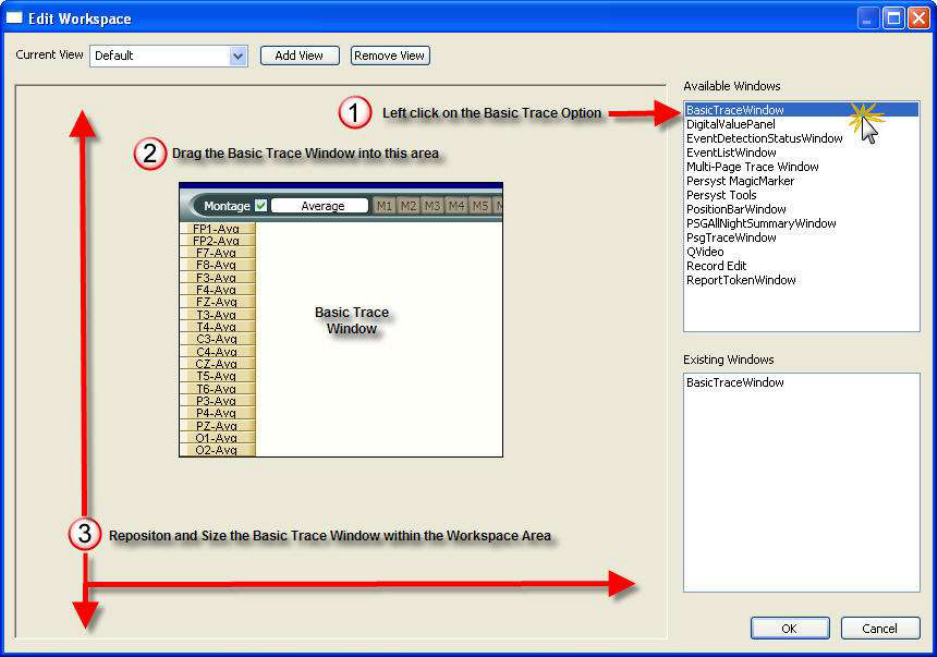
Editing Workspace
Click on the Edit Workspace button.
146
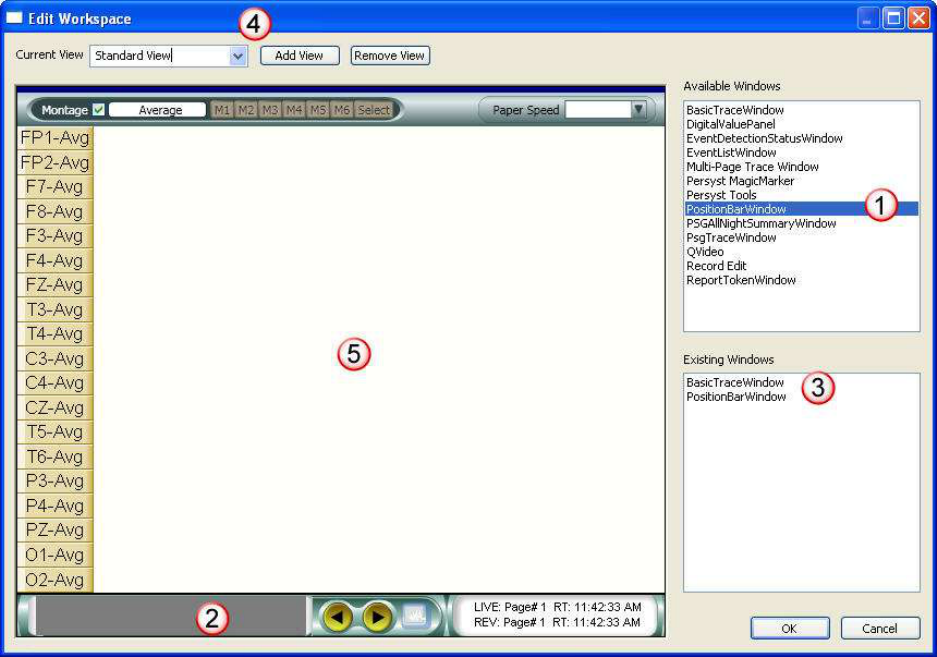
Adding a Window to the Workspace
Add a Basic Trace Window by clicking on the Basic Trace Window option in the Available
Windows Box. Note the illustration below:
1. Left click and highlight the Basic Trace Window
2. Drag the Basic Trace Window into the workspace area
3. Reposition and size the window in workspace area. This will determine the exact location of
the window when you collect and review data.
Configuring a Workspace View
Note the illustration below.
1. Drag the Position Bar option in the Available Windows Box into the workspace area
2. Position and size the Position Bar under the trace window
3. Note the Basic Trace windows that are now included in the workspace are listed in the
Existing Windows box
4. Add a custom name to the workspace view you have created. In the sample below 'Standard
View' has been entered.
5. Verify the Basic Trace Window is correctly aligned in the workspace.
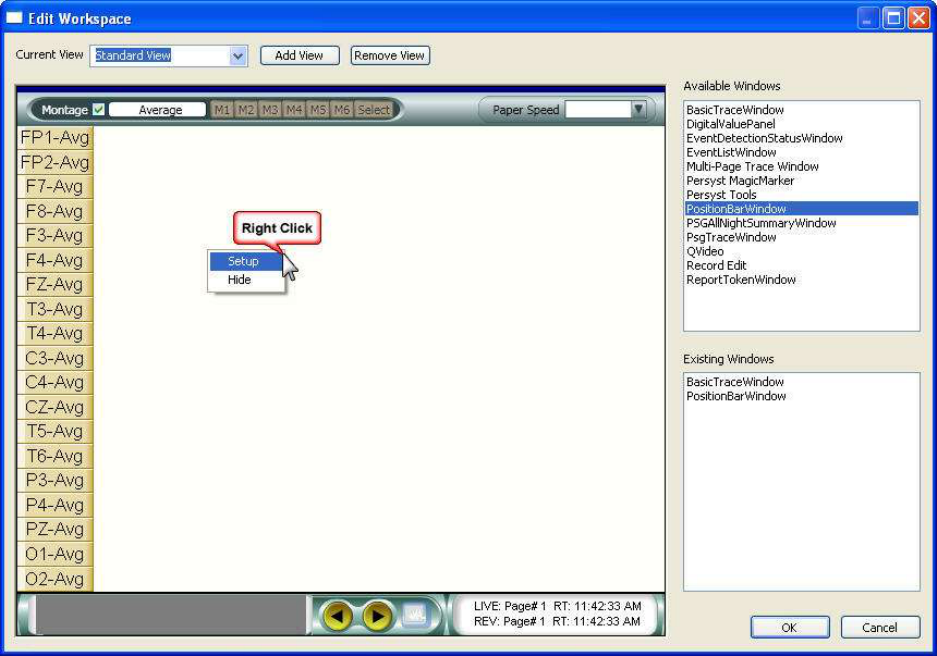
148
Setting Defaults for Windows Used in a Workspace
Each available window added to the workspace will need to be setup correctly. After a window
is added, right click on the window to determine if any default settings are available. Adjust the
settings as required.
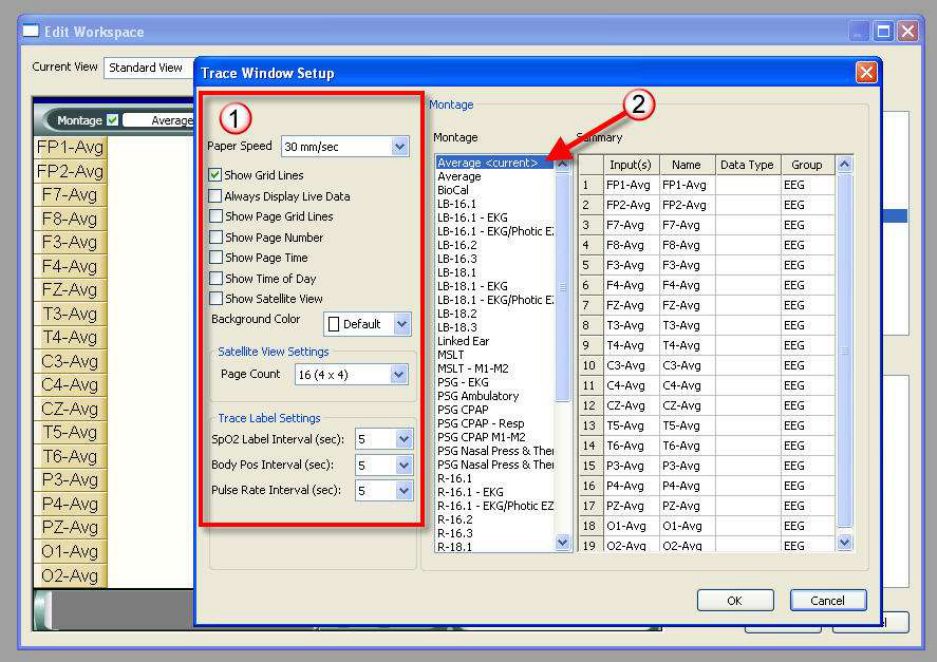
Right Click in the Basic Trace Window, Select Setup. (Note the illustration below)
The Trace Window Setup will be displayed. (Note the illustration below)
1. Select the default settings for this trace window. These settings will be used for every
recording collected with this specific protocol.
Show Grid Lines - Add a check box to this item to show grid lines in the background of the trace
window.
Always Show Live Data - Add a check box to this item to force the window to always show live
data during data collection. If the user clicks on the position bar at the bottom of the trace
window during data collection, the displayed page will not change. However; after data
collection the user can click on the position bar and reposition to the location selected.
Show Page Grid Lines - Add a check mark to this option to show grid lines
Show Page Number - Add a check mark to this option to show the page number in the trace
window

Show Time of Day - Add a check mark to this option to show time of day in the trace window
Show Satellite View -Add a check mark to this option to have the trace window display data in a
Satellite View. The number of pages displayed will be determined by the Satellite View Settings.
Background Color - Click on the background color option to select a different color for the trace
window background.
Satellite View Settings - Click on this option to select the page count used when a satellite view is
used. The page counts options include the following grid views:
Trace Label Interval (SpO2, Body Position, Pulse Rate) - Select the interval to display digital
values on the trace data during review. The digital trace values will not be displayed on the live
trace data during data collection. If you look back, or review recorded data during data
collection, the trace labels will be displayed.
2. Select the default montage that will be used with the protocol.
150
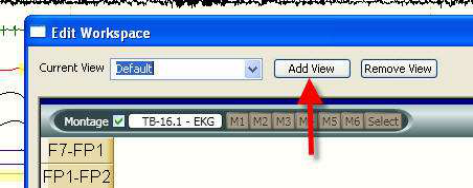
Adding another View
Click on the Add View button and repeat the steps listed above to customize your second view.
Important Details When Creating or Editing Views
1. When you are creating additional views, try to reuse windows from the Existing Windows
box.
2. If you are creating views for multiple monitors, drag the available window over to the
second monitor. The location you placed the window will be used when the protocol is
used.
3. Provide useful names when additional views are created. For example, Q-Video View, or
Satellite View.
4. When creating workspaces, maximize the edit workspace dialog to a full screen view to
more clearly view the workspace.
Setting up Workspace Windows
Basic Trace Window Setup
To Add the Basic Trace window to the workspace, click and drag the Basic Trace Window option
from the Available Windows. Right click in the Basic Trace window to enter the setup options.
(Note the illustration below)
1. The following setup options are available for the Basic Trace Window. These settings will be
used for every recording collected with this specific protocol.
Show Grid Lines - Add a check box to this item to show grid lines in the background of the trace
window
Always Show Live Data - Add a check box to this item to force the window to always show live
data during data collection. If the user clicks on the position bar at the bottom of the trace
window during data collection, the displayed page will not change. However; after data
collection the user can click on the position bar and reposition to the location selected.
Show Page Grid Lines - Add a check mark to this option to show grid lines
Show Page Number - Add a check mark to this option to show the page number in the trace
window
Show Time of Day - Add a check mark to this option to show time of day in the trace window
Show Satellite View -Add a check mark to this option to have the trace window display data in a
Satellite View. The number of pages displayed will be determined by the Satellite View Settings.
Background Color - Click on the background color option to select a different color for the trace
window background.
Satellite View Settings - Click on this option to select the page count used when a satellite view is
used. The page counts options include the following grid views:
Trace Label Interval (SpO2, Body Position, and Pulse Rate) - Select the interval to display digital
values on the trace data during review. The digital trace values will not be displayed on the live
trace data during data collection. If you look back, or review recorded data during data
collection, the trace labels will be displayed.
2. Select the default montage that will be used. Click OK to save.
152
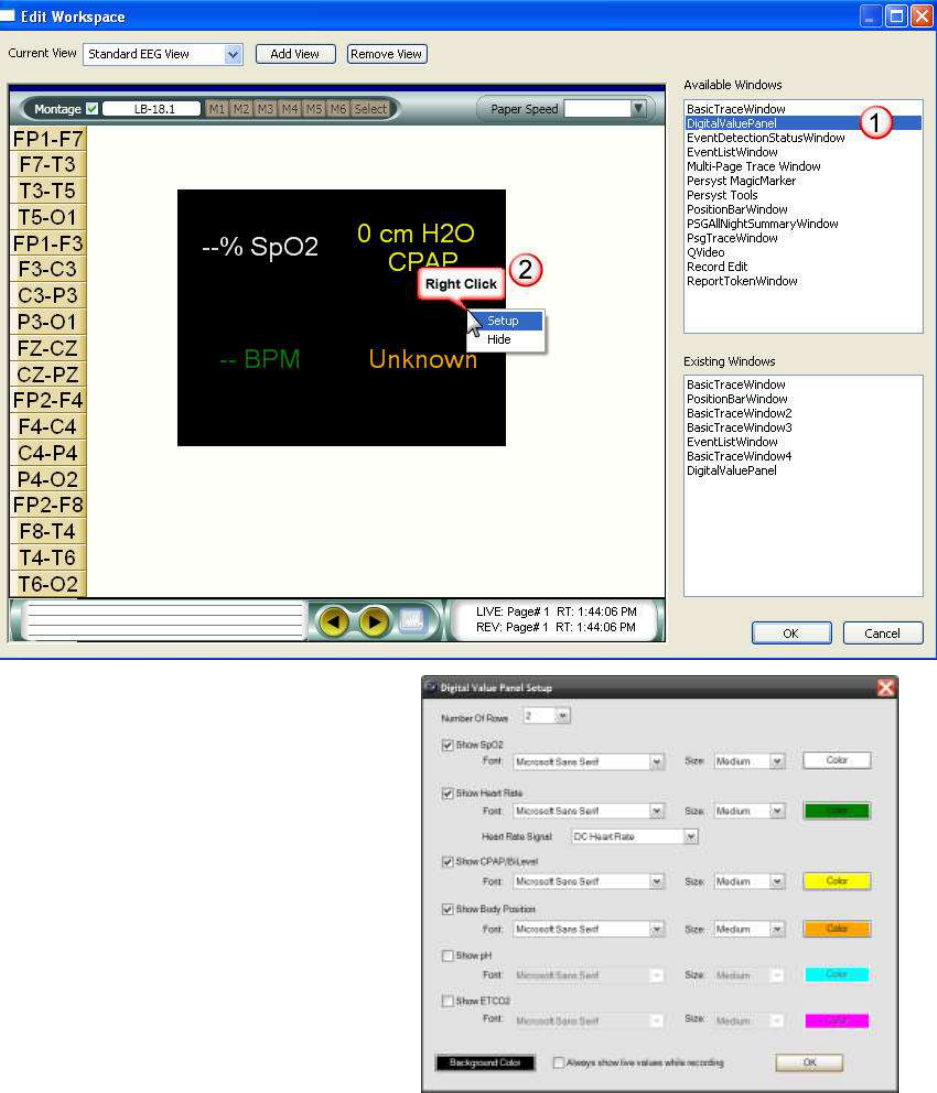
Digital Value Panel Setup
The digital value panel is used during a polysomnogram.
1. To add the panel to a view, drag the Digital Value Panel option from the Available Trace
Windows box.
2. Right click on the Digital Value Panel to adjust the setup configuration.
3. Select the font, font size, and color for
each channel type. Select the background
color and determine if you want the digital
value panel to always show live data
during data collection. If you do not add a
check box to this option, the digital value
panel will no longer display live data
when reviewing previously collected data.
Click on OK to save.
Event Detection Status Window
Display this dialog if you would like to see the status of all detectors during data collection.
Note: Most users will not add this dialog to a workspace. The dialog can be viewed by adding it
during data collection or review. There are no setup options for this window.
Event List Window
Display this window if you would like to view the event list. There are no setup options for this
window.
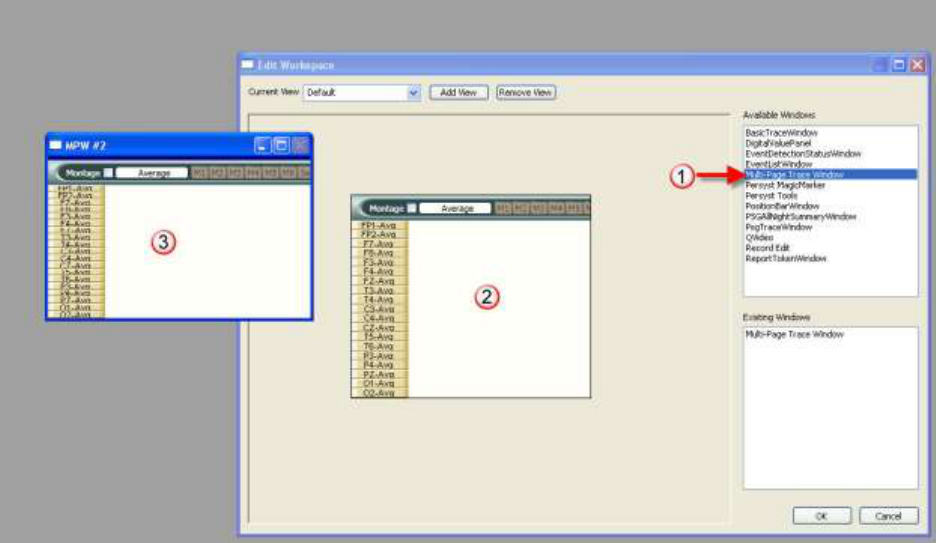
Multi-Page Trace Window
If you are using a dual monitor configuration, you can take advantage of the Multi-Page Trace
Window option. Note the illustration below:
1. Click, highlight, and drag the Multi-Page Window option into the workspace area.
2. Note the trace window (number 2) displayed below. Reposition and size this window in the
workspace area.
3. Note trace window 3 below. Drag this window over to the second monitor.
154
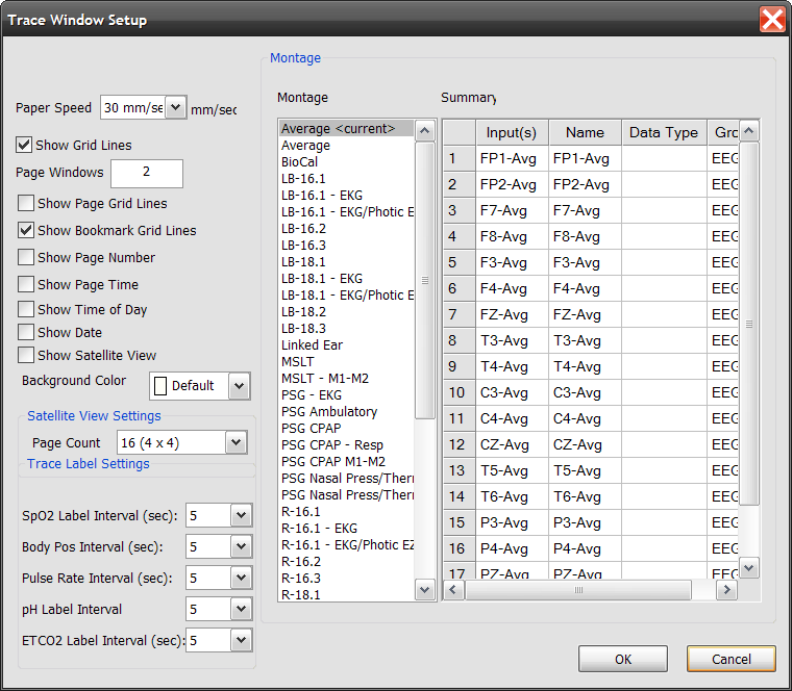
4. Right click in the trace window (number 2 in the illustration above). The dialog below will be
displayed. Note the number of Page Windows highlighted below. If you would like to add
additional trace windows, enter the total number of windows you would like to use. Click on
OK to save.
Persyst Magic Marker
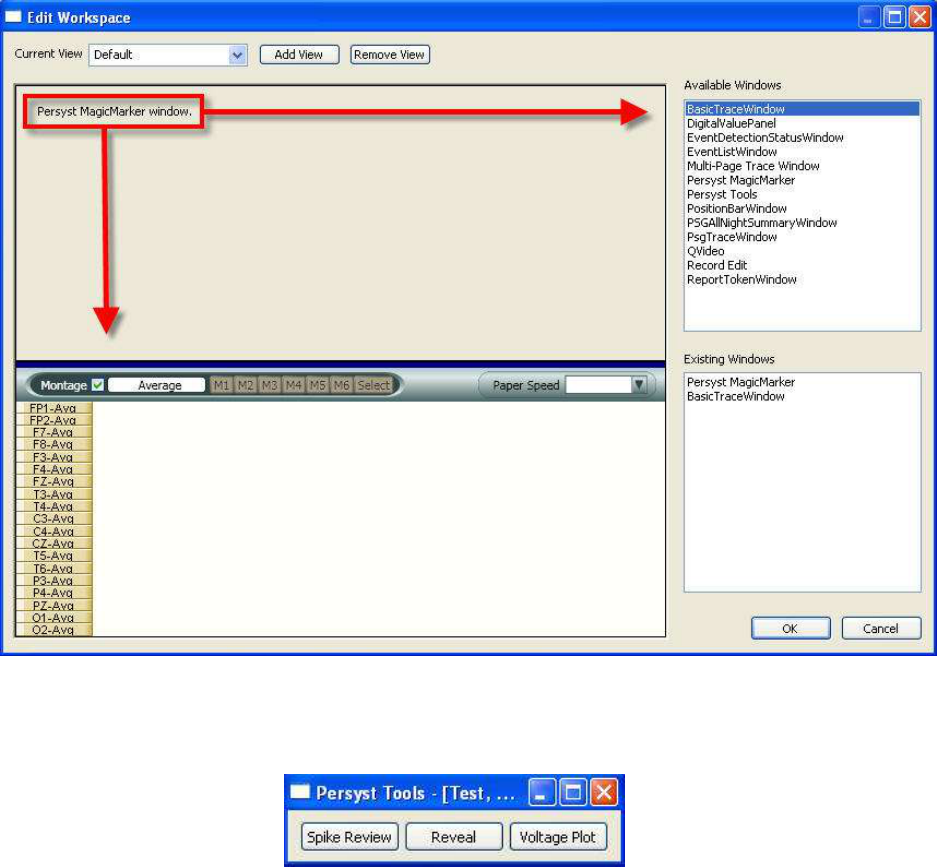
To add Magic Marker to a workspace, click and drag the Persyst Magic Marker option to the
workspace window. There are no setup options for this window.
Persyst Tools
To add Persyst Tools to a workspace, click and drag the Persyst Tools option to the workspace.
There are no setup options for this window.
156
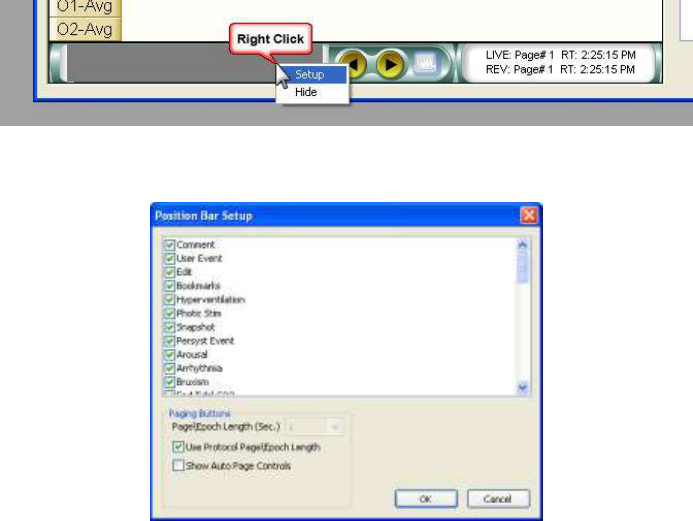
Position Bar
To add the Position Bar to a workspace, click and drag the Position Bar option to the workspace.
Right click on the Position Bar to set up the default configuration.
Note the Position Bar Setup options below. Add a check mark to those items you would like to
display in the position bar. Click on OK to save.
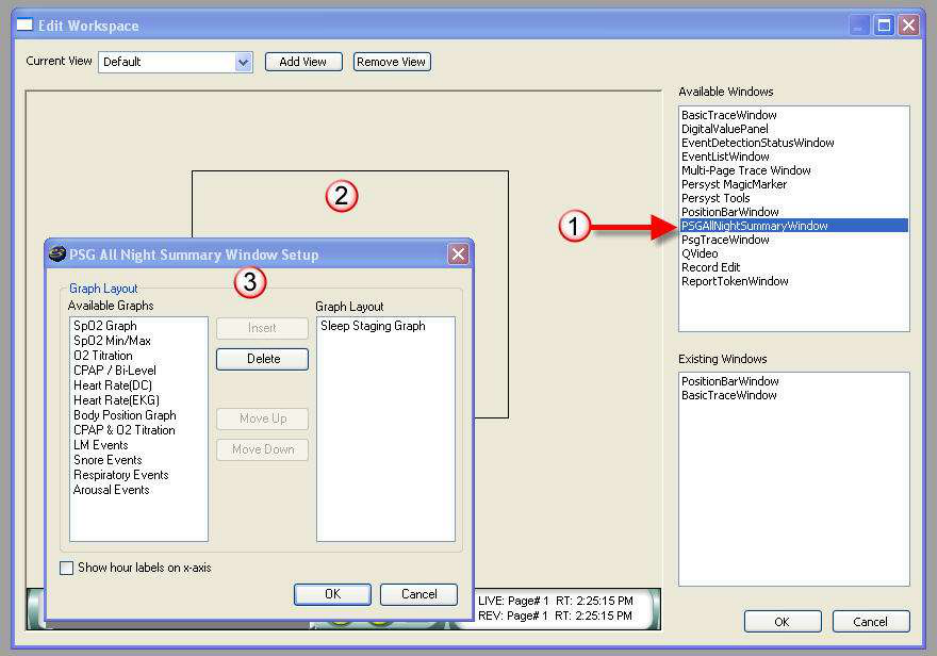
PSG All Night Summary Window (see below)
To add the All Night Summary Window to a workspace:
1. Click and drag the PSG All Night Summary Window to the workspace
2. Note the outline of the window will be displayed in the workspace. Right click in the box and
select Setup.
3. Highlight the graphs you would like to use in the Available Graphs box. Click on insert to
move the graphs to the Graph Layout box. Highlight a graph and click on the up, down, or
delete option. Click on the Show hour labels on the x-axis if you want to display a time marker
below the summary graphs. Click OK to save.
158
PSG Trace Window
To Add the PSG Trace window to the workspace, click and drag the PSG Trace Window option
from the Available Windows. The PSG Trace window has a unique toolbar at the top of the trace
window that allow the user to enter sleep stages and other sleep events. Right click in the PSG
Trace window to enter the setup options. (Note the illustration below)
The following setup options are available for the Basic Trace Window. These settings will be
used for every recording collected with this specific protocol.
Show Grid Lines - Add a check box to this item to show grid lines in the background of the trace
window
Always Show Live Data - Add a check box to this item to force the window to always show live
data during data collection. If the user clicks on the position bar at the bottom of the trace
window during data collection, the displayed page will not change. However; after data
collection the user can click on the position bar and reposition to the location selected.
Show Page Grid Lines - Add a check mark to this option to show grid lines
Show Page Number - Add a check mark to this option to show the page number in the trace
window
Show Time of Day - Add a check mark to this option to show time of day in the trace window
Show Satellite View -Add a check mark to this option to have the trace window display data in a
Satellite View. The number of pages displayed will be determined by the Satellite View Settings.
Background Color - Click on the background color option to select a different color for the trace
window background.
Satellite View Settings - Click on this option to select the page count used when a satellite view is
used. The page counts options include the following grid views:
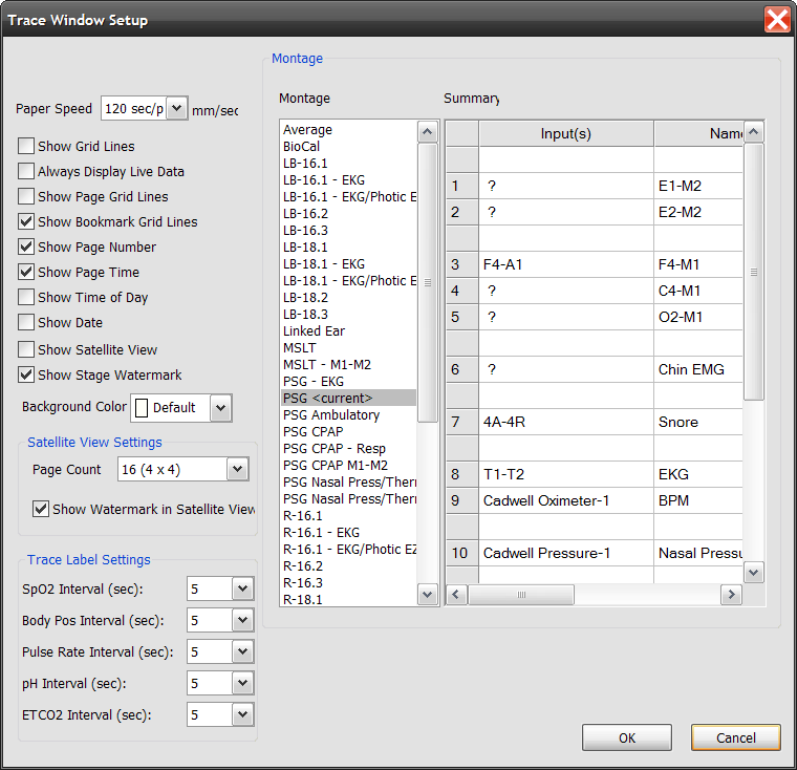
Trace Label Interval (SpO2, Body Position, Pulse Rate) - Select the interval to display digital
values on the trace data during review. The digital trace values will not be displayed on the live
trace data during data collection. If you look back, or review recorded data during data
collection, the trace labels will be displayed.
Select a default montage that will be used. Highlight a montage in the Montage list and click on
OK.

160
Q-Video
To Add the Q-Video window to the workspace, click and drag the Q-Video Window option from
the Available Windows. Right click in the Q-Video window to enter the setup options. (Note the
illustration below)
Q-Video Options (Click on Advanced to see all options)
Video Source - Q-Video currently requires a video to USB adapter. If you are using a USB
camera, you will see the name of the camera in the drop down menu.
Audio Source - Typically the audio from the microphone in on the computer will be used. You
can also use audio from your USB camera if it is available.
Image Size - The image size is the resolution used for video. The higher the resolution, the larger
the video files.
Video Compression - Cadwell requires that you use Microsoft MPEG-4 Video Codec V2
Audio Compression - Cadwell requires that you use Windows Media Audio V2
Image Type - Cadwell recommends using I420 compression. It is more efficient and reliable than
RGB compression.
Audio Properties - Cadwell recommends Channels; Rate 11025; Bits 16

Record Audio Checkbox - Add a check mark to this box if you want to record audio (by default)
with video. If you do not add this check mark, the user can add a check mark to a Record Audio
option during data collection.
Video Frame Rate - Set this option to a default frame rate between 1-30 fps. NOTE: Some
computers (laptop computers) may experience difficulty recording 30 fps. Set the frame rate
below 30 if required.
Start Video Recording When Recording Starts - Add a check mark to this option if you want
video to concurrently start when a recording starts.
Maximum Video Clip Size (MB) - This option will determine when the Easy software will start a
new video file. If the present file reaches this level (650 MB), the Easy software will create an
additional video file.
Record Edit
1. To add the Record Edit window to the workspace, click and drag the Record Edit Window
option from the Available Windows.
2. Right click in the Record Edit window to enter the setup options. (Note the illustration below)
3. Click on the E1 button to edit the default settings for the E1 button.
4. Note the setup options below. The user can pre-configure the edit button to save or delete
data when selected.

162
Record Edit Setup Options
E1, E2, and E3 Buttons - Each button can be pre-configured. Left click on the button to review the
default settings (see number 4 above). Note the Button Label can be user configured. Enter a
name that will help you understand the default settings for the displayed button. For example,
you could name the button 'Save 1.25'.
From Event - This option will assist the user in automatically clipping waveform and video data
adjacent Easy events. Place a check mark adjacent to the events you would like to mark. The
Waveform, Video, and Audio check boxes will determine what concurrent data will be marked.
The Minutes to Mark settings will determine the amount of time before and after an event that
will be marked.
Video Compression - Cadwell requires that you use Microsoft MPEG-4 Video Codec V2
Audio Compression - Cadwell requires that you use Windows Media Audio V2
Deletion Warning Levels - These settings will warn the user if less than 25% (user specified) data
will be saved.
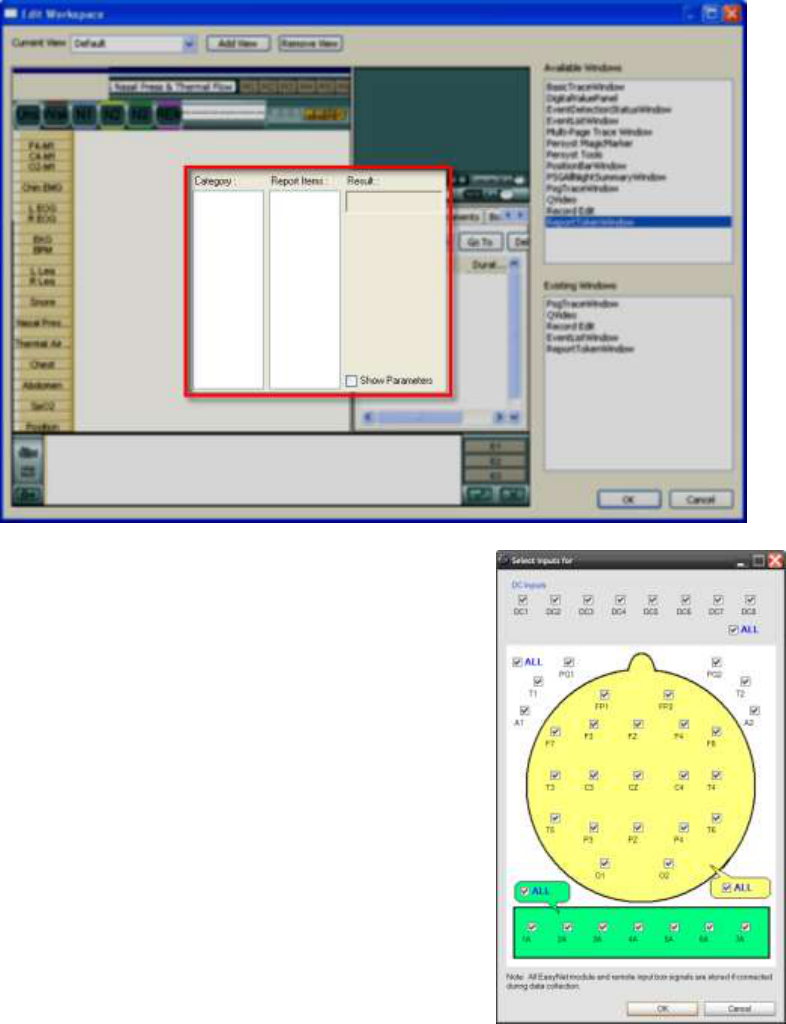
Report Token Window
To add the Report Token window to the workspace, click and drag the Report Token Window
option from the Available Windows. There are no setup options for this window. Note the
window displayed below. The window should be placed and sized to fit in the workspace.
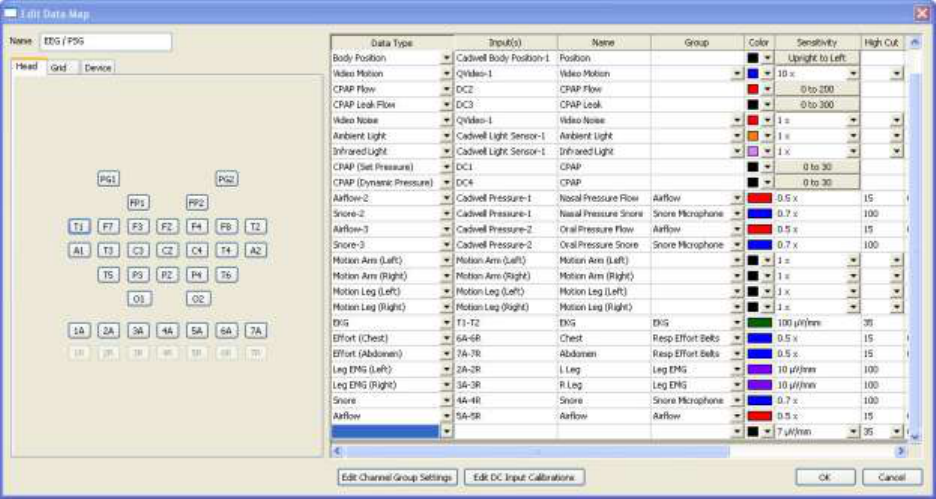
Select Inputs to Enable or Disable
Inputs that are not used during data collection can be
disabled. Disabling inputs will reduce file size. Reducing
file size will shorten the total amount of time required to
archive, move, and copy data files. Some improvement will
also be noticed when reading files over a remote
connection.
1. Click on Select Inputs
2. Remove the check mark on the inputs you would like
to disable.
Note: If a recording is started with the wrong inputs
selected, a new recording must be started after the correct
inputs have been enabled.
164
Adding, Modifying, and Calibrating DC Devices
Adding and Calibrating DC Devices
Before an external DC device is used for a recording, it must be assigned to an input that will be used in
your recording montage. The DC device should be calibrated to the particular amplifier it will be
connected to. Each DC device has unique voltage outputs, even two identical devices of the same
brand and model. A unique device definition (calibration) is needed for each combination of DC device,
amplifier and input you will use.
Calibrating a New DC Device
1. Connect the DC device to the Easy III Amplifier DC input. Note the DC input number.
2. Select System Setup from the Easy III Start menu.
3. Click the Data Map button. Highlight the Data Map used by your facility. In most cases, the
default PSG map (EEG/PSG) can be used. Click Edit to view the data map.
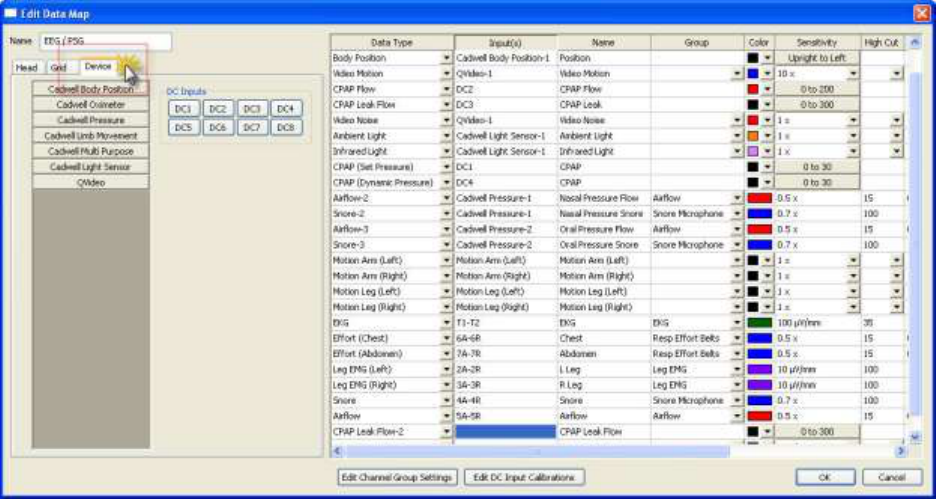
4. This drop down is highlighted blue in the illustration above). Select the channel data type you
are looking for. For example, if you are adding a CPAP leak channel, select the CPAP leak flow
data type.
5. Look for the Input(s) cell. In the displayed menu illustration above, note the CPAP Leak Flow-2
channel has been added. The Input(s) cell is in the second column of the CPAP Leak Flow-2
row. Click in the Input(s) cell. The cell should now be highlighted.
166
6. Click on the Device tab in the upper left hand corner of the Edit Data Map dialog. Note the
illustration above. The eight DC input buttons displayed on this tab correspond to the eight DC
inputs on the Easy III amplifier. Select the DC input (DC1 - DC8) your device is currently
connected to. The DC input should be the same input connected in step 1 above.
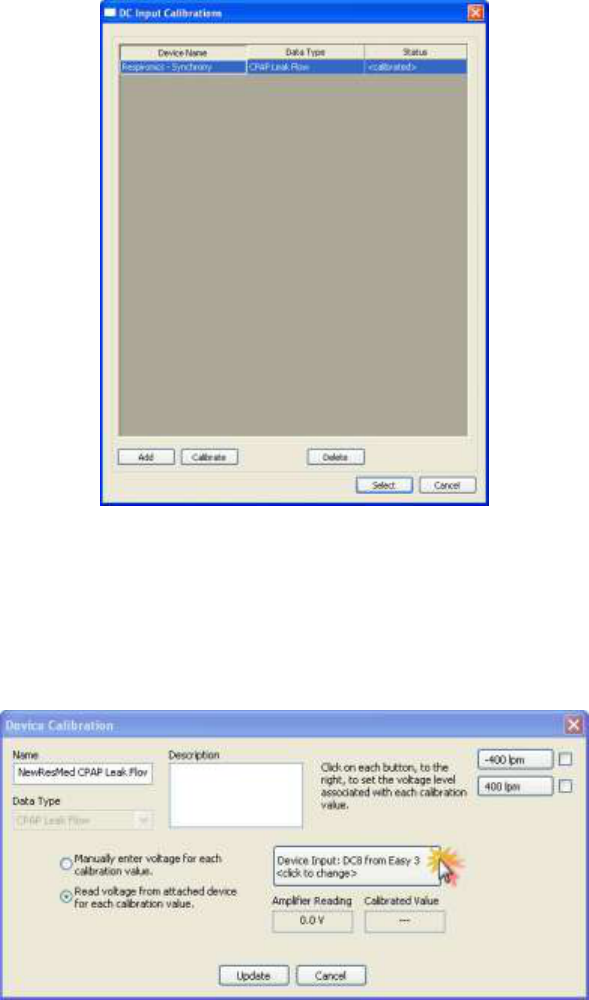
7. Click on 'Add' (note the illustration above) to add your new DC device.
8. Enter the Name of the channel you are calibrating. Select the 'Read voltage from attached
device for each calibration value' option. Now select the DC input that the DC device is
connected to. In the example below, the DC8 input has been selected by clicking on the Device
Input button. Note the cool yellow and red mouse cursor displayed below on this button.
Verify you are selecting the correct amplifier and DC input.
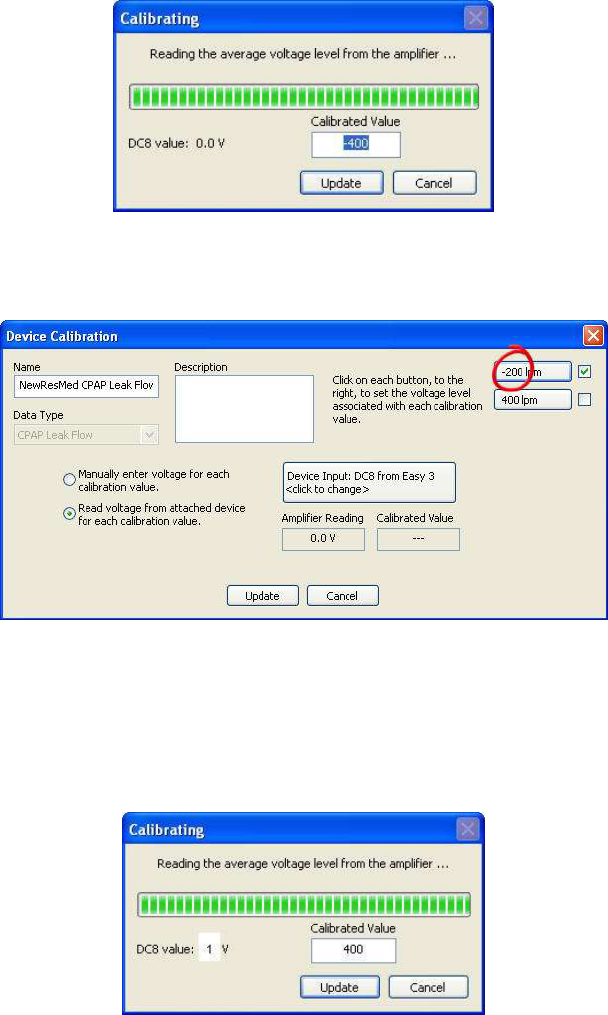
9. To Calibrate the Low Value - Set the DC device (in this example the DC device is a ResMed flow
channel) to the lowest flow/calibration setting. Click on the -400 lpm button. Proceed forward
until the following prompt is displayed. If you would like to specify a different low calibration
value (the default was -400) you can enter it in the calibration value field. In the example
below, the calibrated value (-400) will be manually modified to -200. Click on Update to
continue.
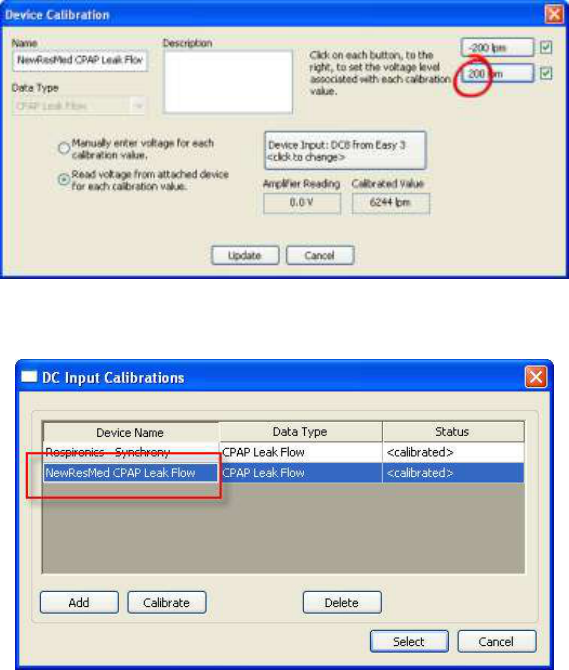
10. Note the illustration below. The low value button is now displayed with the new calibration
value. The low calibration value also has a green check mark box displayed adjacent to the low
value. This indicates the new low calibration value has been recorded.
11. To Calibrate the High Value - Set the DC device (in this example the DC device is a ResMed
flow channel) to the highest flow/calibration setting. Click on the 400 lpm button. Proceed
forward until the following prompt is displayed. If you would like to specify a different low
calibration value (the default was 400) you can enter it in the calibration value field. In the
example below, the calibrated value (400) will be manually modified to 200. Click on Update to
continue.
168
12. Note the illustration below. The high value button is now displayed with the new calibration
value. The high calibration value also has a green check mark box displayed adjacent to the
high value. This indicates the new high calibration value has been recorded. Click on Update
to save the new calibration.
13. The new DC calibration should now be displayed in you list of DC input calibrations. (Note the
illustration below)
14. Highlight the new DC calibration and click on Select.
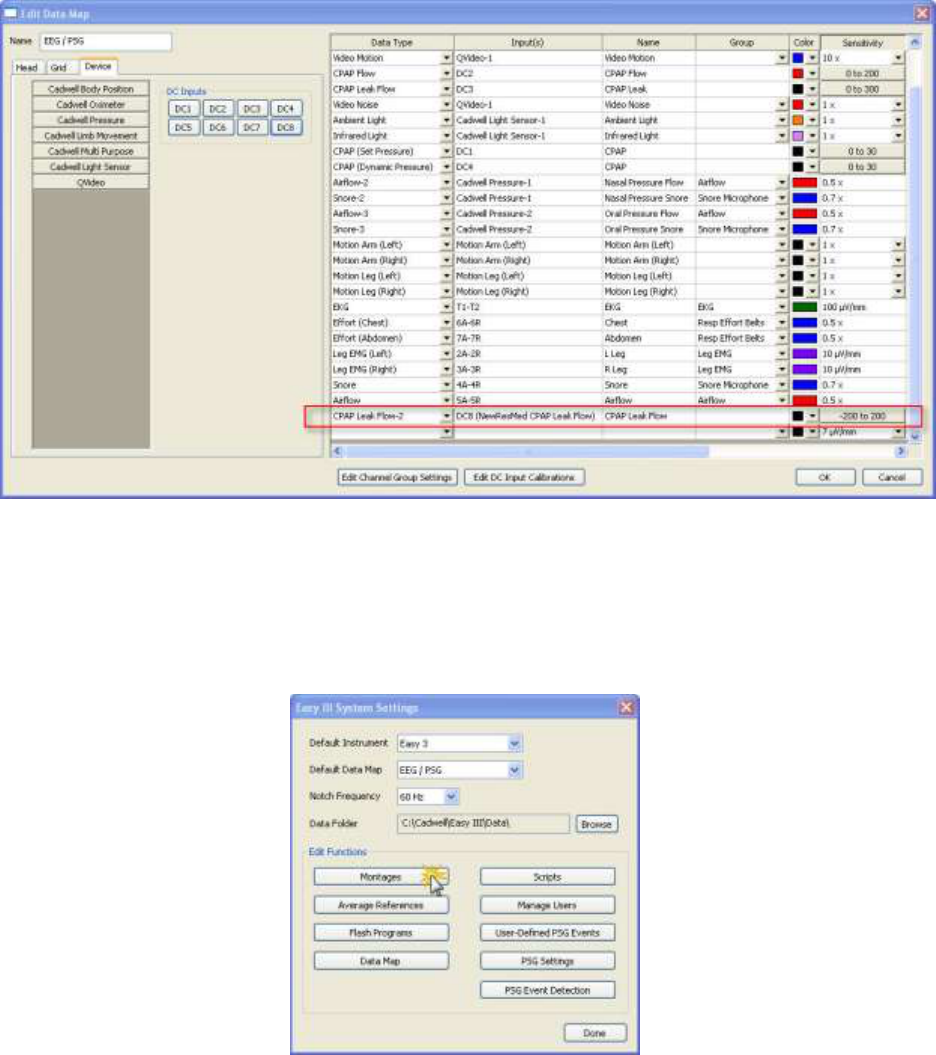
15. Note the illustration below. The calibration has now been added to your default data map. All
data maps on all synchronized Easy III systems will now be updated. If you have another Easy
III system that will use the same device, or same type of device, you will need to perform
another calibration on each specific system. Note: After the calibration has been record for each
specific system, the calibration does not need to be repeated unless the DC device, DC device
cable, or Easy III amplifier have been replaced.
16. Click on OK to save the new calibration in the data map. Verify that your new DC input is
correctly configured in your recording montages. Review the information below to verify your
configuration is correct.
Verifying the Correct DC Calibration and Input are Used in Recording Montages
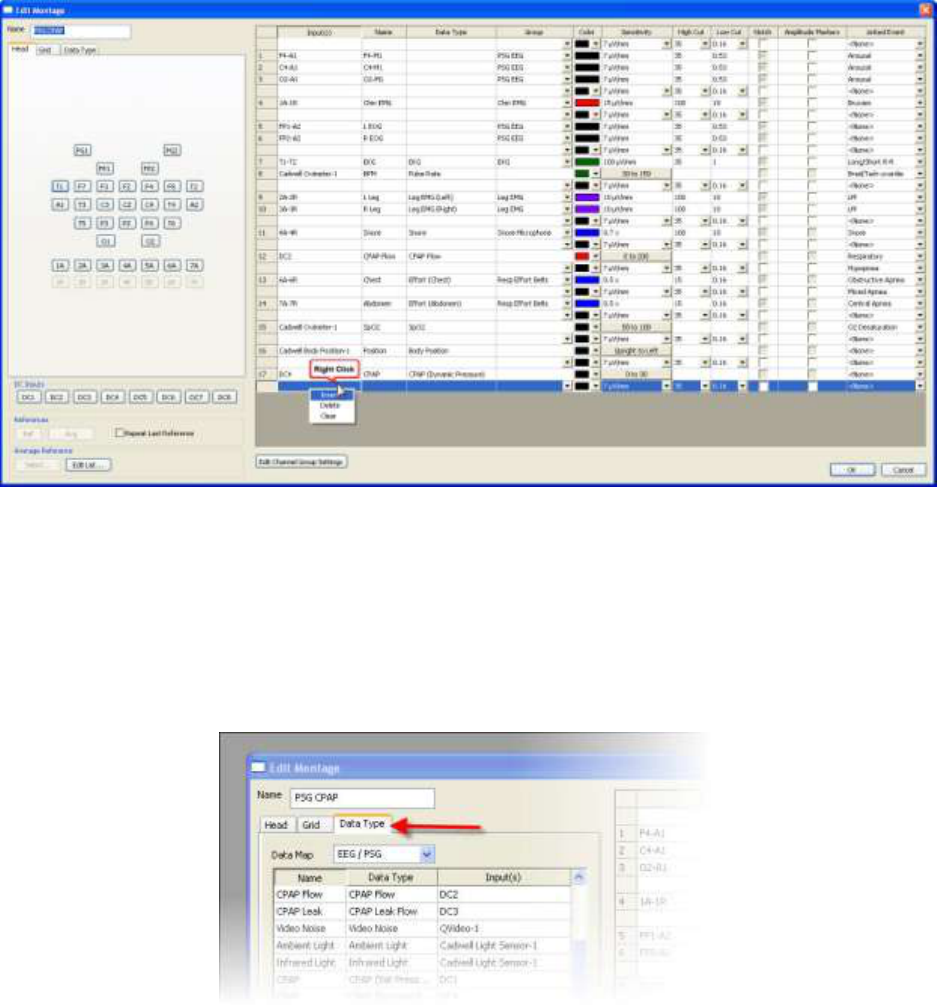
1. Click the Montages button in the System Settings window.
170
2. Select the PSG montage from the montage list. Click the Edit button.
3. To add a new DC input channel to an existing montage, right click in the location where you
would like to insert the channel. In the illustration above, the insert option is selected to add
another channel to the bottom of the displayed montage.
4. Click in the Input(s) box adjacent to the channel. In the illustration above, the channel is added
to row 18.
5. Click on the Data Type tab located on the left side of the Edit Montage dialog (note the
illustration below).
6. Verify you are using the correct data map. In the example above, the data map with the new
DC device channel is EEG/PSG.
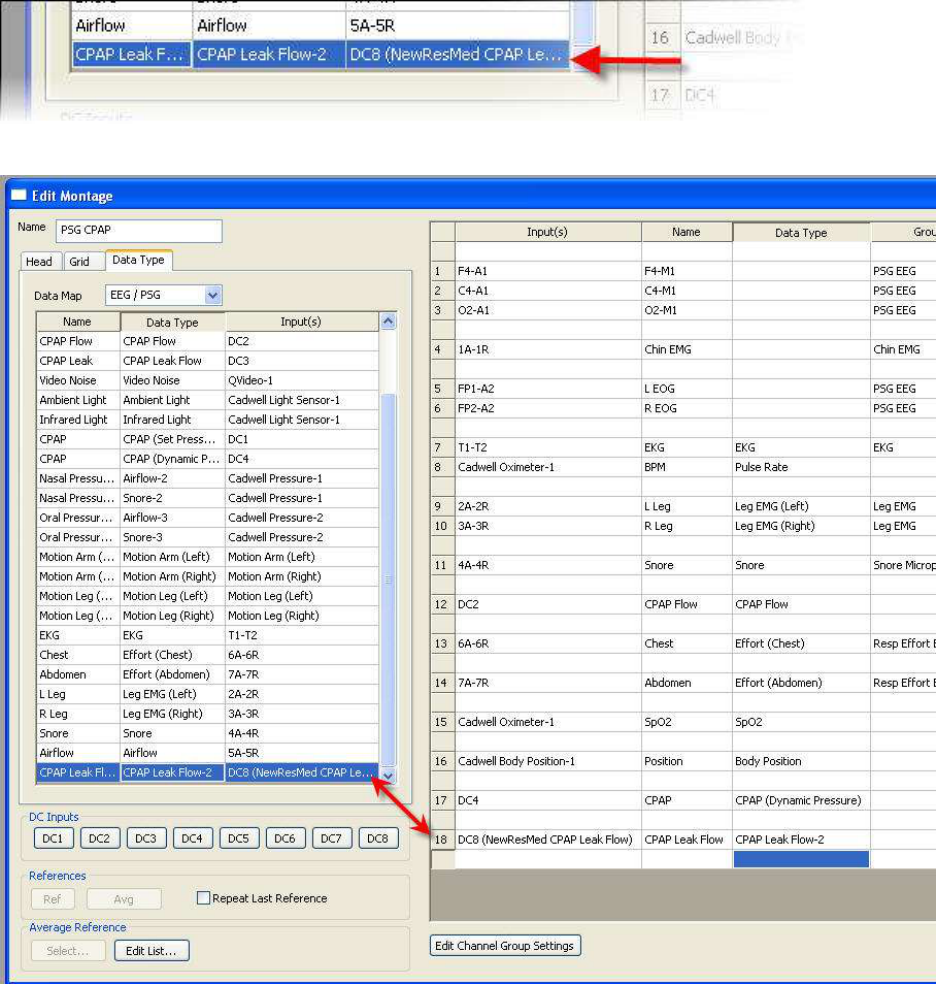
7. Look for the new DC device channel you would like to add to the montage. Click on the
channel.
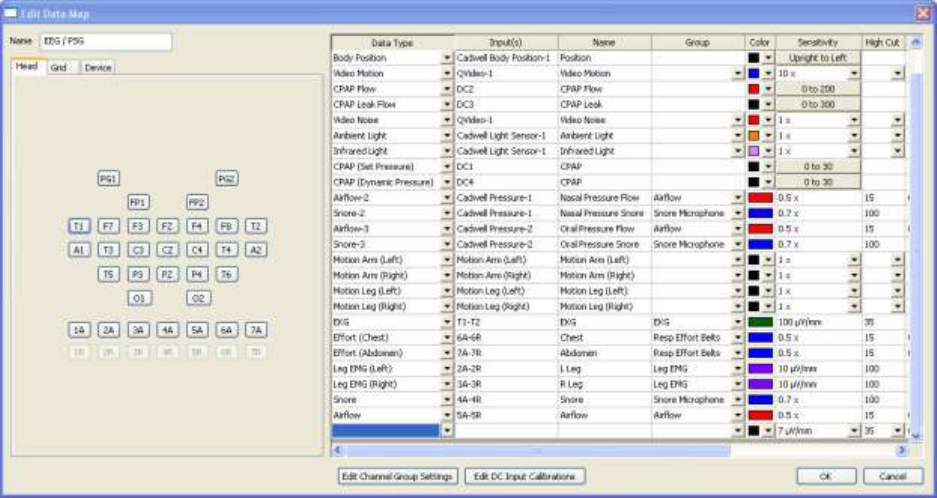
8. Note (below) that the new channel will be displayed in your montage.
9. Click on OK to save your changes. The edited montage will be synchronized with other Easy III
system
172
Re-calibrating DC Devices
Re-calibration needs to be performed when an existing hardware configuration has been
modified. Devices will need to be re-calibrated when the following occur:
An existing DC device is exchanged for another DC device of the same type.
An existing DC device is replaced with a different device that provides the same
data type (CPAP flow, CPAP pressure).
A new DC input cable from the DC device to the Easy III amplifier is used.
A new Easy III amplifier is used.
Re-calibration Steps
1. Verify the DC device is connected to the Easy III Amplifier DC input. Note the DC input
number.
2. Select System Setup from the Easy III Start menu.
3. Click the Data Map button. Highlight the Data Map used by your facility. In most cases, the
default PSG map (EEG/PSG) can be used. Click Edit to view the data map.
4. Look for the channel you would like to re-calibrate. If the channel is not in the data map, you
may be in the wrong data map. If the device needs to be added to the data map, proceed to
the Adding and Calibrating a New DC Device section of this Help File.
5. If the channel is in the data map, click on the Edit DC Input Calibrations button.
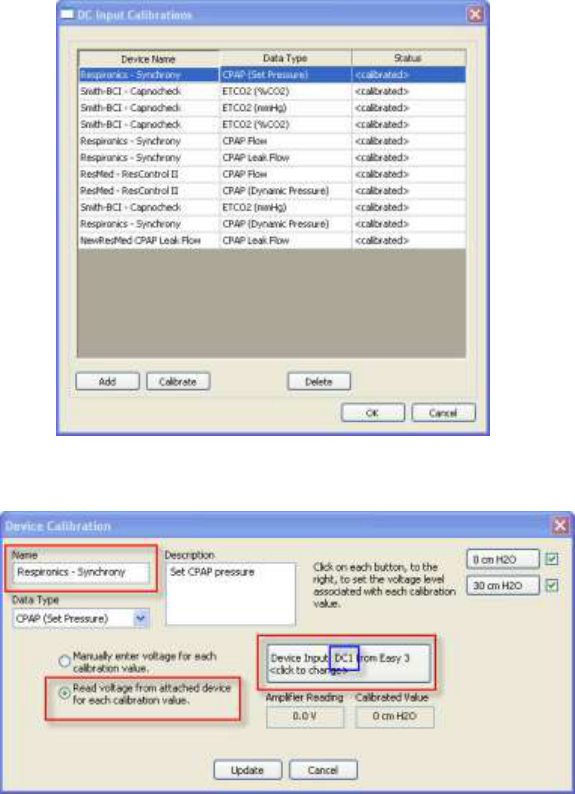
6. Look for the input you would like to re-calibrate in the DC Input Calibrations dialog.
Highlight the channel and click on Calibrate.
7. Verify the name of the channel you are calibrating is correct. Select the 'Read voltage from
attached device for each calibration value' option. Verify the correct DC input is being used.
8. To Calibrate the Low Value - Set the DC device (in this example the DC device is a
Respironics Synchrony pressure channel) via the PC Direct software to the minimum
pressure/calibration setting. Click on the O cm H20 button in the Device Calibration dialog.
Proceed through the calibration, clicking on Update to complete the minimum calibration.
9. To Calibrate the High Value - Set the DC device (in this example the DC device is a
Respironics Synchrony pressure channel) via the PC Direct software to the maximum
pressure/calibration setting. Click on the 30 cm H20 button in the Device Calibration dialog.
Proceed through the calibration, clicking on Update to complete the maximum calibration.
The calibration has now been updated with the new calibration.
174
Adding a Event Button to a Data Map
1. Select the Data Map you would like to edit. Click on Edit.
2. Click on the Data Type drop down. Select Event Button.
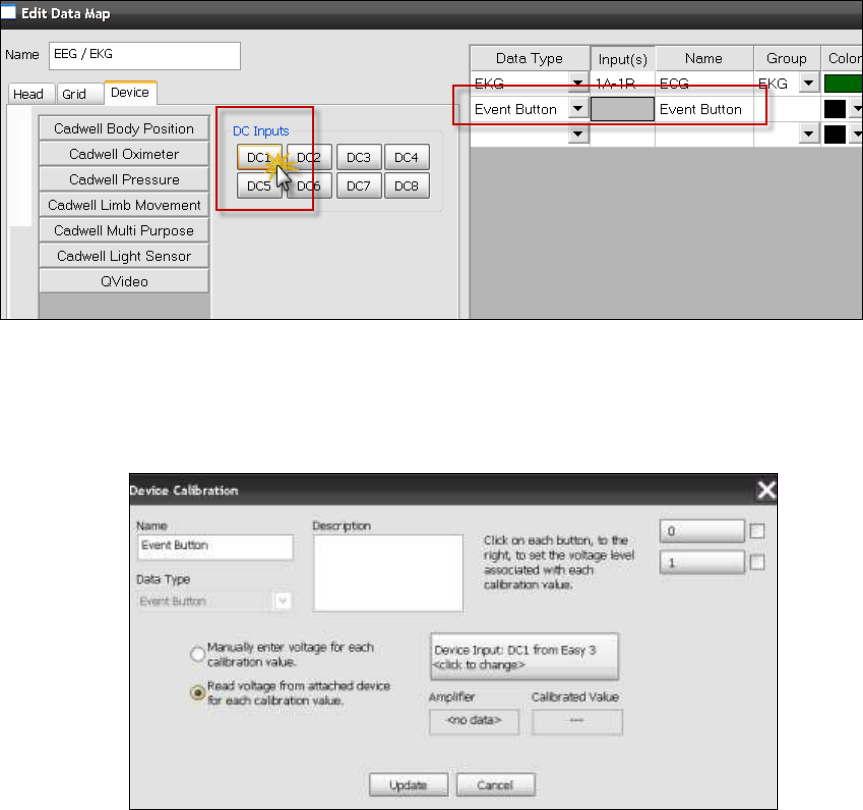
3. Click on the Device Tab. Click on the DC input you would like to use for the Event Button.
The DC Input Calibration dialog will be displayed.
4. Look for the Event Button in the list. If the event button is not displayed, click on Add.
5. Type in a name 'Event Button'.
6. Click on the Device Input button. Select the Amplifier and DC input you would like to use.
Click on Update.
7. Click on Read Voltages from the Attached Device.
8. Click on the '0' button in the upper right hand corner. Select OK when you are ready. The
input voltage should read 15V.
9. Hold the button down on the Event Button. Click on the '1' button in the upper right hand
corner. Select OK. The voltage should equal 0V. Click on Update.
10. The '0' button and the '1' button should now have a green check mark next to each button.
This indicates that both have been calibrated. Click on Update.
11. Edit the Event Button in the Data Map. Select a trace color. Add trace clipping if you want to
restrict the Event Button signal amplitude. Click on OK and close the System Setup dialog.
12. Edit Montages from the System Settings dialog. Add the Event Button channel to selected
montages by clicking on the Data Type tab. Verify that the correct Data Map is being used.
13. Click on the channel row in the montage where you would like to add the Event Button.
Click on the Event Button item in the list displayed on the left side. After clicking on the Event
Button, the channel should now be displayed in the selected montage displayed in the right hand
panel. Click on OK. Close the Montage Editor.
14. The Event Button is now ready for use. When the event button is depressed, the Easy III
software will detect the event. The event will be added to the trace window and the Event List.
176
Record Manager
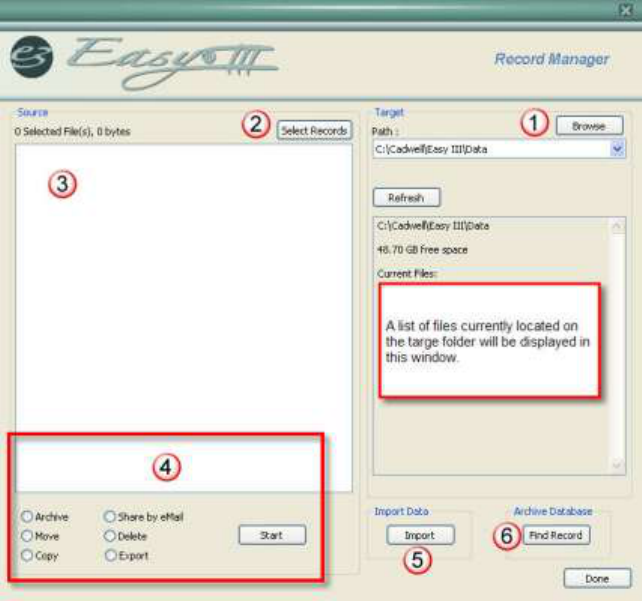
Record Manager Options (note illustration below)
1. Select a location to copy or move your selected files. Click on Browse button to select a
location. Click on the drop down arrow in the path to select previous paths used.
2. Select Records you would like to move or copy. Note: Several records can be selected at the
same time.
3. All records selected will be displayed in this window. File size will be displayed adjacent to
each record. Waveform data will be displayed with red checkmark adjacent to the waveform file.
If Q-Video data was recorded with patient data, each video file will be listed in this window.
Remove the check box from the video file segment(s) if you do not want to copy or move the file.
4. Record Manager Controls
Archive - The archive feature will move the selected file(s) to the specified target (number 1 in the
illustration above). After the file has been archived, the original file will be deleted from the data
folder. The file will be placed in the Windows Recycle Bin. Note: The Recycle Bin must
configured to save deleted data and have adequate space available. If you are archiving data
from a network location to an archive media, data will not be placed in the Recycle Bin. The
name of the selected patients will be placed in the Archive Database. Note: The date, time, and
user name that archived the file will remain in the record history file.
Move - This feature will move the selected files to another Easy III system selected in the Target
options (number 1 in the illustration above). Note: The file will be moved to the new target.
After the file is removed from the local machine, it will not be placed in the Recycle Bin. Note:
The date, time, and user name that moved the file will be placed in the record history file.
Copy - This feature will copy the selected files to another Easy III system selected in the Target
options (number 1 in the illustration above). Note: The date, time, and user name that copied the
file will be placed in the record history file.
Share by eMail - This feature will launch your local email client (if available). The selected
patient files will be placed as an attachment to the email. Note: The date, time, and user name
that emailed the patient files will be placed in the record history file.
Delete - This feature will delete the selected files. The files will be placed in the Windows Recycle
Bin. Note: The Recycle Bin must configured to save deleted data and have adequate space
available. If you are deleting data from a network location, data will not be placed in the Recycle
Bin. Note: The date, time, and user name that deleted the file will remain in the record history
file.
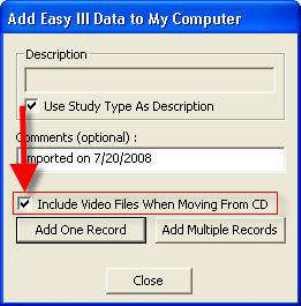
Export - This option will allow the user to copy the file to the selected target. If the target is a
DVD or CD, an autorun file (Add Easy III Data to My Computer) will be copied to the media
(note image below). When the media is placed in another computer with Easy III software, the
utility below will automatically run.
5. Click on the Import button to copy a file from another media to the local computer.
Remove the check mark from the 'Include Video Files When Moving From CD' if you do
not want to import video data along with waveform data.
Click on 'Add One Record' if you want to browse to one record to import.
Click on 'Add Multiple Records' to copy all records from the selected target.
Note: The utility will prompt you with a message with a message confirming all records have
been imported.
6. To review a list of archived records, click on the Find Record button for the Archive Database.
178
Record Manager Notes
Easy III does not support re-writable CD and DVD media. You must use CD-R and
DVD-R media.
Write the Media Label on the topside of the DVD/CD using a felt-tip pen.
International customers: The Easy DVD/CD Archiving does not support the use of large
extended language character sets, such as in Asian and Arabic languages, in the Patient
Information dialog.
Prepare a Patient for Data Collection
Required Equipment
To prepare for data collection, verify the following equipment is available:
Easy III PC
Easy Amplifier & Cables
Power/Com Module & Cables
Photic Stimulator & Cable (if required)
Setup Supplies: Skin Prep, Electrode Paste, Gauze
Verify System Hardware Setup
See Setup System Hardware for more information.
Place Electrodes and Sensors
Follow your laboratory protocols for applying electrodes to the patient.
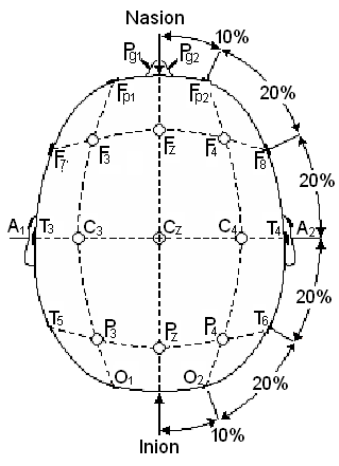
Cadwell recommends adherence to the International 10-20
standards for EEG electrode placement:
1. Attach electrodes to the patient.
2. Verify that the patient will be comfortable and not become
entangled in wires.
3. Route the electrode cables to the Remote Input Box.
4. Plug the electrodes into the Remote Input Box. (Do not pull
electrode wires when removing electrodes from the Remote
Input Box. Remove each electrode carefully to avoid
damaging the electrode connector).
5. Place respiratory, body position, snoring and SpO2 sensors
if required. See EasyNet Modules for more information.
180
Start Easy III Procedure
1. Prepare your patient according to laboratory protocol.
2. Verify electrodes are in the correct jacks.
3. Verify the amplifier is connected and ready for use.
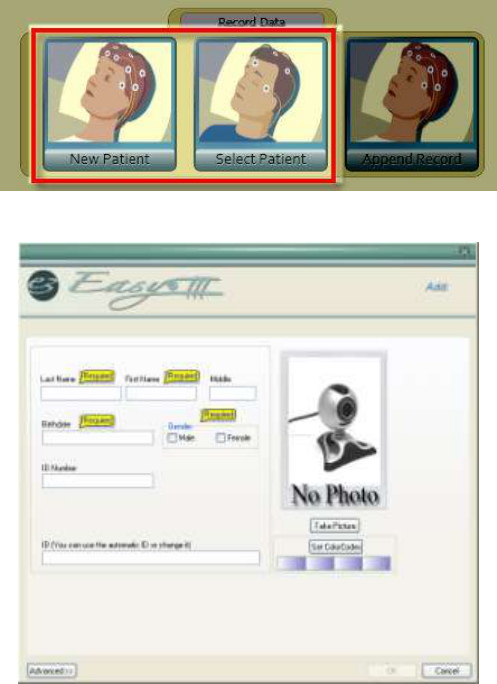
4. Start a record by selecting New Patient or Select Patient from the Easy III Start Page.
New Patient Window
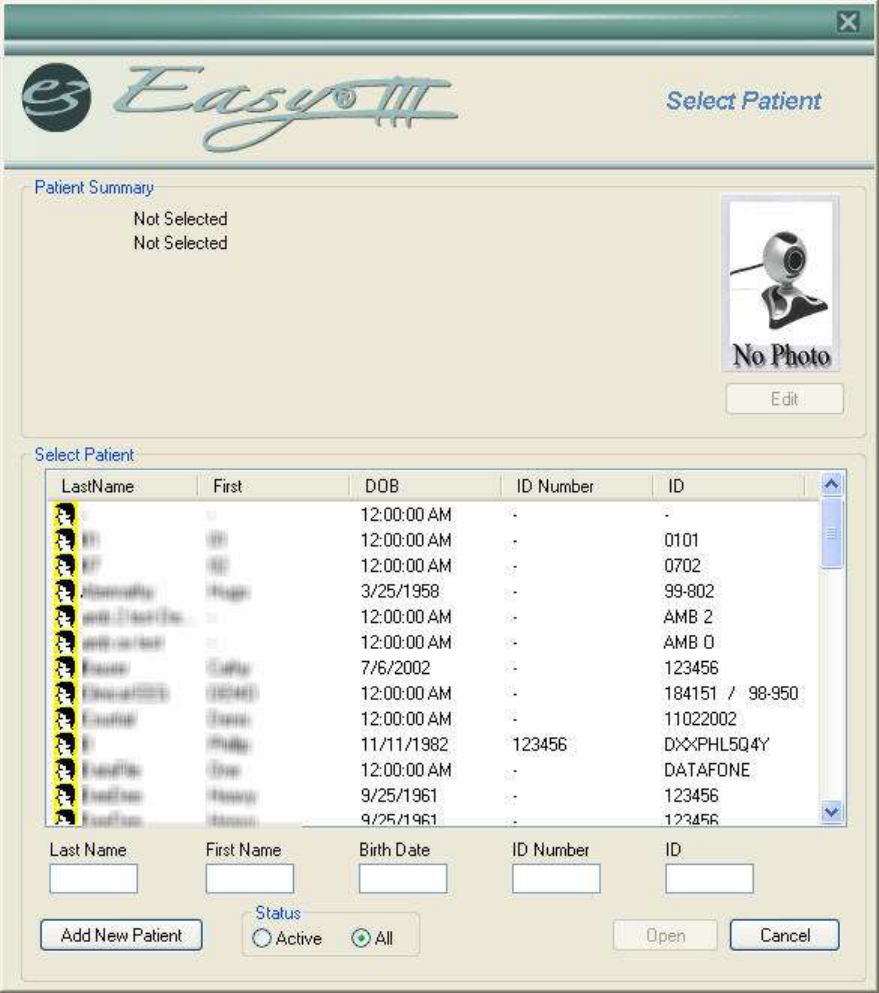
Select Patient
5. The patient information dialog will be displayed next. (see next page)
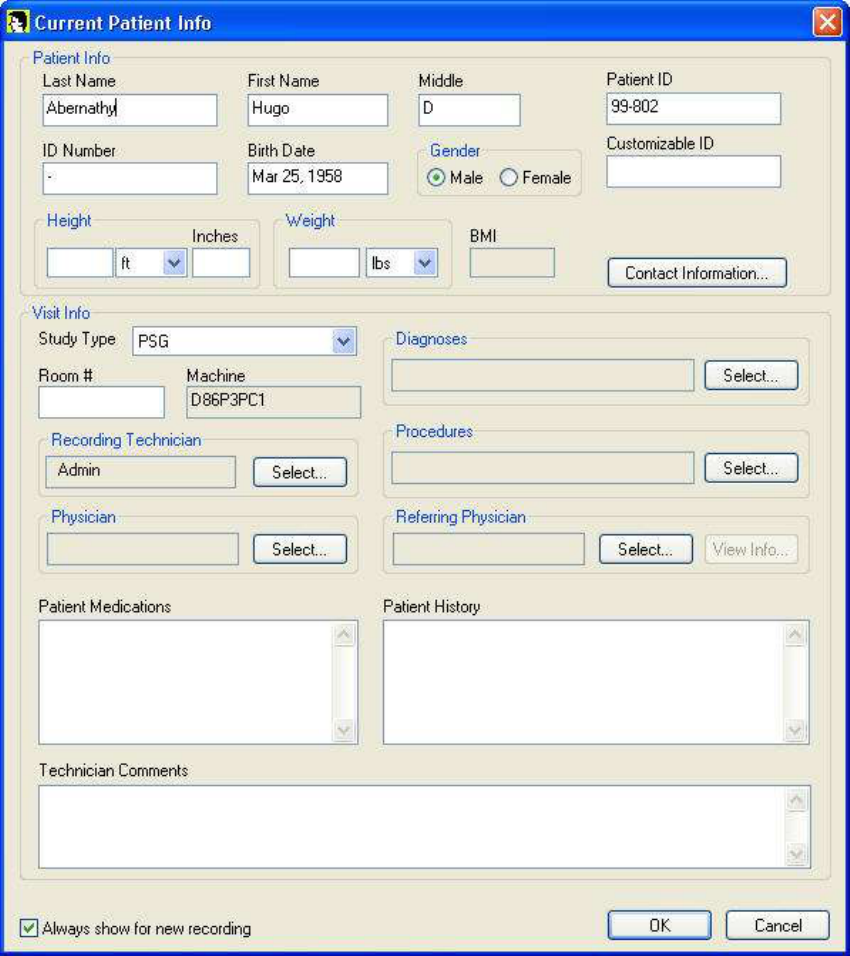
182
6. Click on OK to close the patient information dialog.
7. To start a recording, click on the start button (see next page).
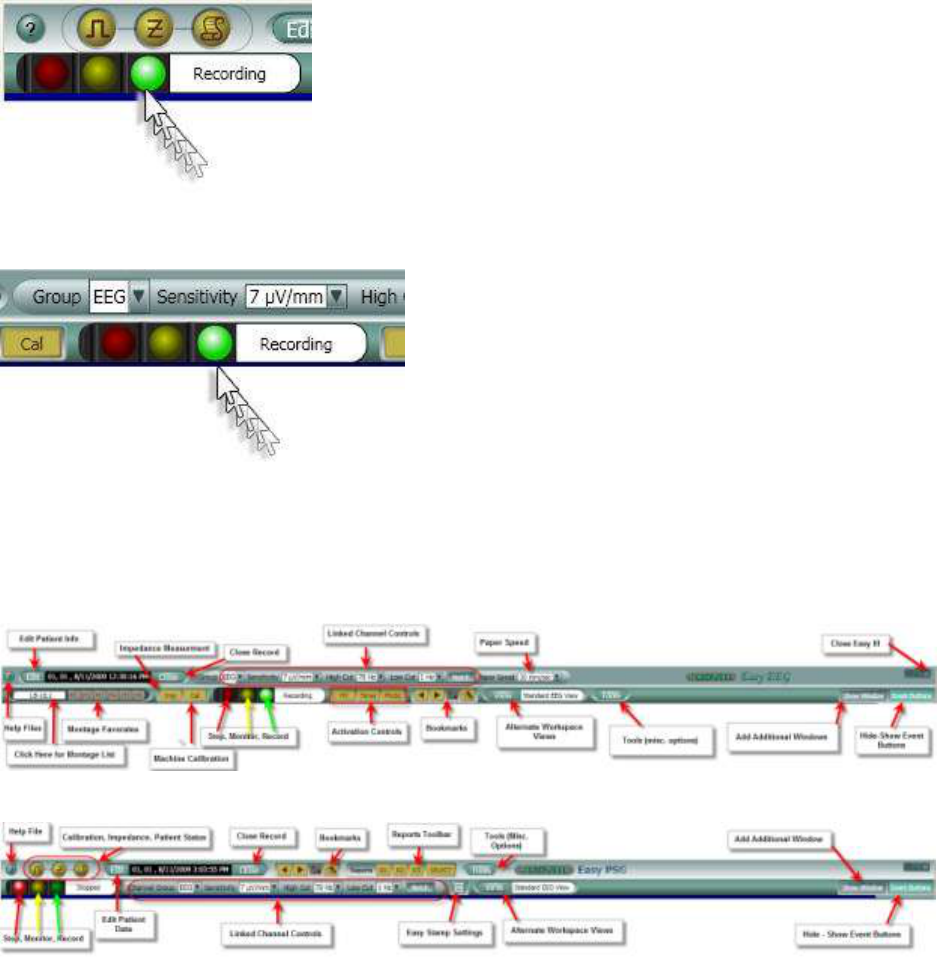
Start Button for PSG Recording
Start Button for EEG Recording
Easy III Toolbar Options
Record EEG
Record PSG
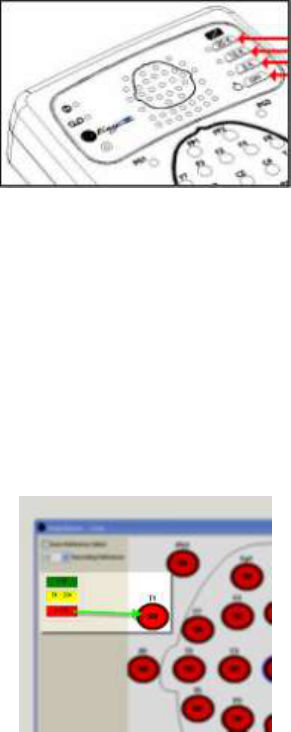
184
Checking Impedance during Data Collection
The Easy III software will evaluate all inputs displayed in the impedance dialog during
impedance measurement. When the impedance dialog is opened, Easy III will test the EEG
inputs, then the reference inputs, ground electrodes, and active reference pairs. NOTE: It is
important that the user wait at least 10 seconds when the impedance menu is opened. This will
allow the program to adequately check all inputs.
NOTE: Waveform data is not recorded during impedance measurement. Check impedance
and promptly return to data collection after evaluating impedance levels.
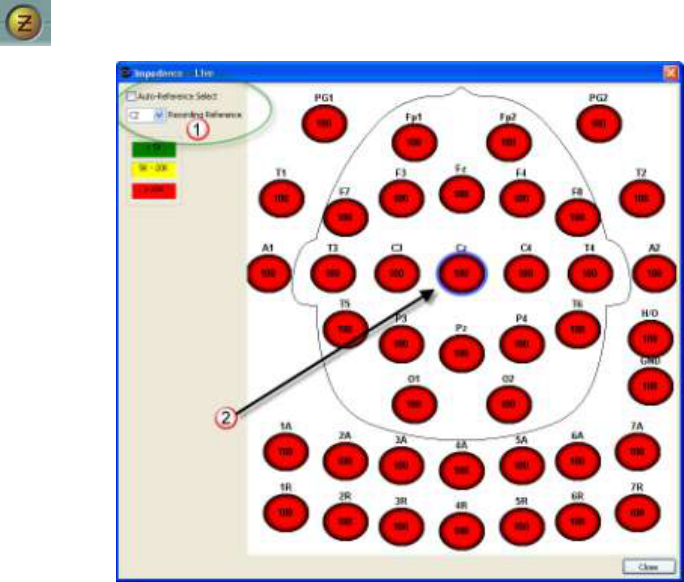
Checking Impedance from the Easy III Amplifier
On the amplifier, press the 20K button while recording to check impedances greater than
20 kilohms. Press the 10K button to check impedances between 5 and 20 kilohms. Press
the 5K button to check impedances below 5 kilohms. Each time an impedance button is
pressed, the impedance LEDS on the amplifier that correspond to the kilohm level of the
button pushed will light up.
The Impedance-Live window will open in the Easy III software.
Press the OFF button on the amplifier to stop impedance measurement. If the OFF button
is not pressed, the Easy III software will stop measuring impedance when the maximum
impedance measurement interval to obtained. The maximum impedance measurement
duration is set in the recording protocol.
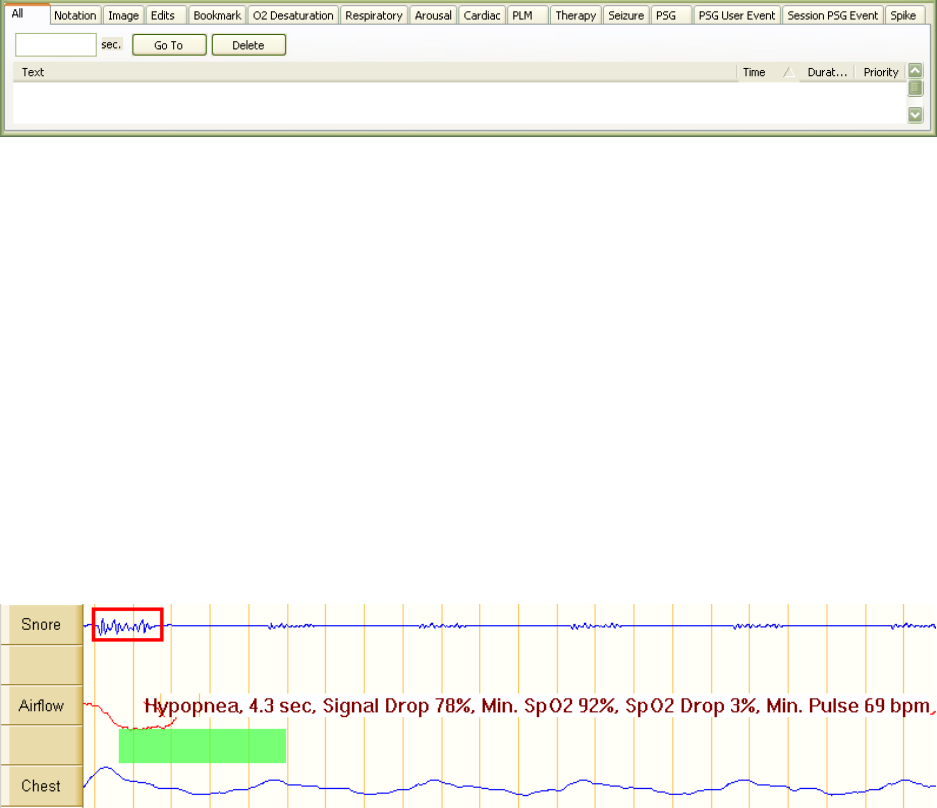
Checking Impedance from the Easy III Software
Note the illustration below. Impedance levels that are good will be displayed with green
background color in the input. In the sample below, the impedance is greater than 20K, therefor
the background color is red.
Click in the Easy III software toolbar.
1. Auto-Reference Select - Place a check mark in this box if you would like the Easy software to
find the lowest impedance reference electrode for use as a reference electrode. Note: The
evaluation and selection of the lowest impedance electrode is only done during impedance
measurement. After the reference electrode has been selected and the impedance measurement
option is closed, the reference electrode will not be changed unless the impedance measurement
option is opened again. The reference electrode can be manually selected by clicking on the drop
down Recording Reference option.
2. Note the reference electrode is marked with a blue oval ring around the input. Available
Reference Inputs: A1, T3, C3, Cz, C4, T4, or A2.
186
Marking Events
The Event List window summarizes all events associated with a recording. Click on a tab to
select a specific category. Click on a specific event to reposition to the selected event.
Click on an event and click the Delete button to remove it from the Event List.
See Event List Window Setup in Modify Window Settings for setup information.
Marking PSG Events
Hold the mouse cursor over any trace in a running procedure to show the option
Respiratory Events
Place the mouse over a respiratory channel, then click and drag across to mark a respiratory
event. As shown below, the Easy III software will instantaneously provide the event criteria:
Duration;
Percentage Drop in Signal Amplitude;
Minimum Sp02;
Percentage Drop in Sp02; and
Minimum Pulse Rate.
Marking Events by Event Type
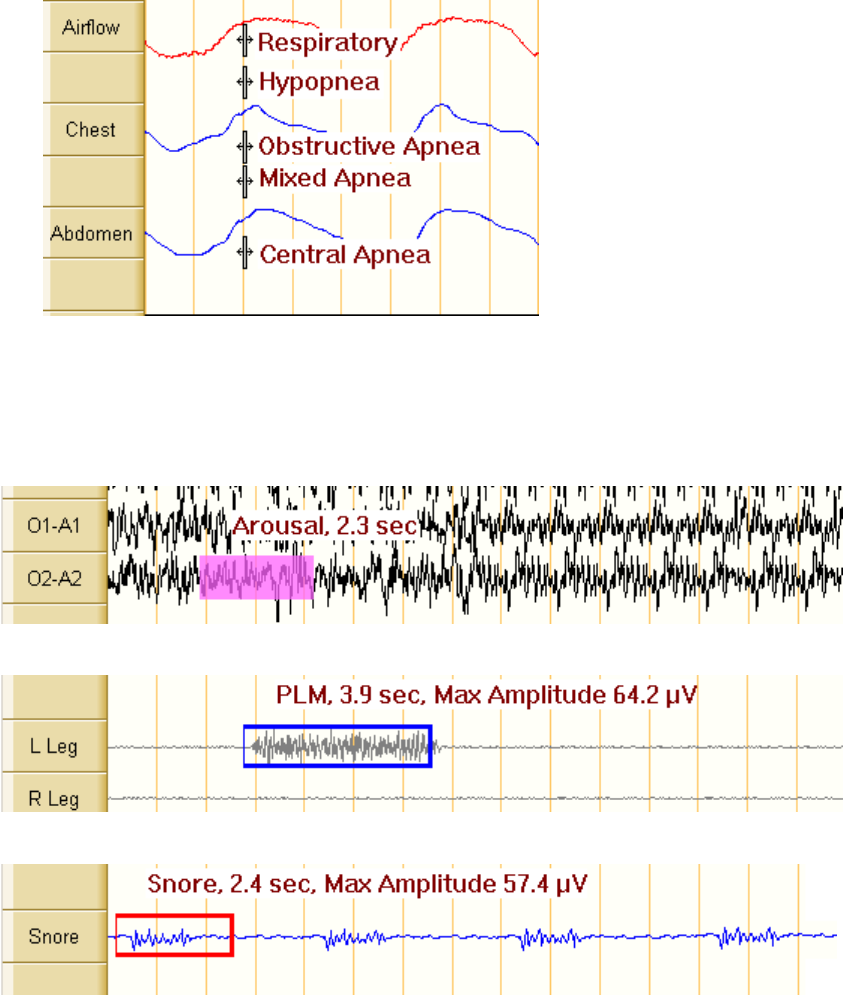
When you mark a respiratory event on the flow channel, a pop-up window will appear asking
you to select a respiratory event type. Moving the mouse below the airflow channel will allow the
user to select an event type before marking a respiratory event. This simulated image
demonstrates the different events that can be marked on a channel by moving your mouse up or
down:
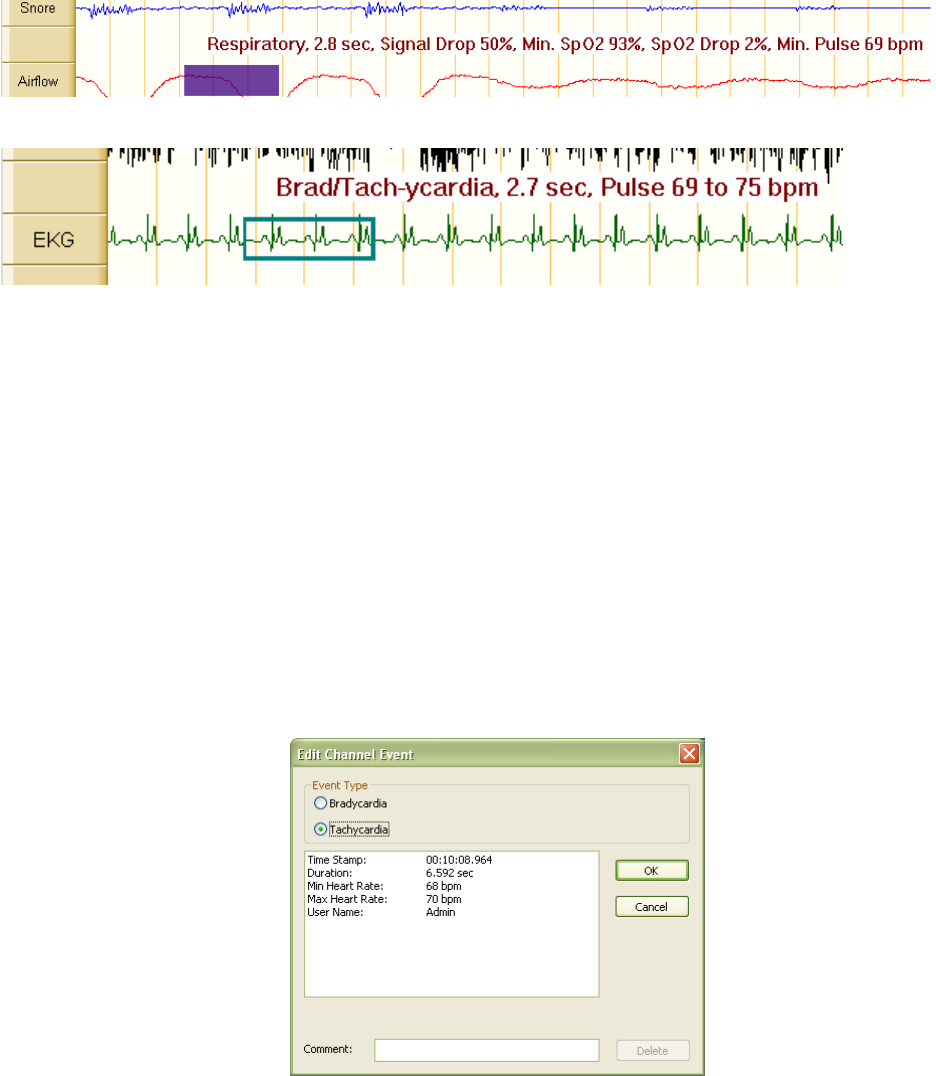
Real-Time Feedback Marking Events
Easy III will display duration and amplitude or range while marking events.
Arousal
PLM
Snore
188
Respiratory
EKG
Event Details
Clicking on any previously marked event will display the Edit Channel Event window, which
displays event type, event details, and the User's name. The event may be erased by clicking on
the Delete button.
Easy Stamp
Easy III allows users to mark any event, at any time, in any window. Quickly stamp a sleep
event on a particular channel in a trace window. Place the mouse over a sleep channel and right-
click to stamp an event start. To extend the duration of the stamped event, right-click on the
event bar again. The duration will increase each time you right-click the event.
Some events will automatically pull up an Edit Channel Event window, in which you can select a
more specific Event Type, review the event details, and add a comment. The Event will also
appear in the Event List window. Click on the Event to review the trace where it occurred.
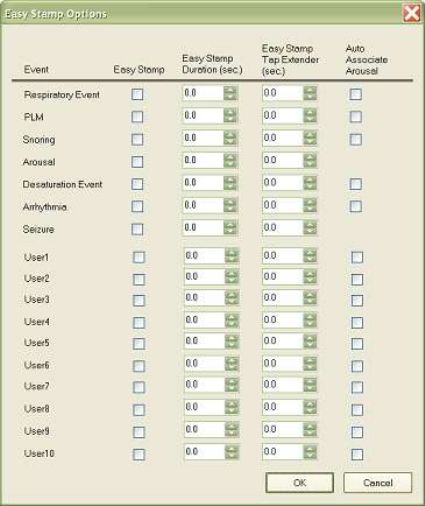
Easy Stamp Options Menu
Easy Stamp - Check mark to enable.
Easy Stamp Duration - Default duration of Easy Stamp event. Use arrows to adjust.
Easy Stamp Tap Extender - Determines additional duration added to an event when the
event bar is right-clicked.
Auto Associate Arousal - Check mark to automatically associate an EEG arousal with the
Easy Stamp Event.
User Events 1-10 - Configure custom user events assigned to specific channels in a
montage in the System Setup/User Defined PSG Events menu.
190
Sleep Events
Enter Sleep Events
The basic trace window and PSG trace window support marking and editing of PSG channel
events. You may mark the channel, start time and duration of the event.
When a new event is marked, the event type is set to the type specified in the Linked Event
attribute of the associated display channel. If the Linked Event is a group name, the event type
shall be set to a default event type which is a member of the specified group.
If a new event is marked that overlaps the time span of an existing event, the two will merge if
the types match, or if the two are of the same group. When events are merged, the time span of
the new event will be the union of the time span of the individual events. If they are not of the
same event type, the type of the merged event will match the type of the newly marked event.
Easy Stamp
Each user may set up their own EasyStamp data.
EasyStamp works for Respiratory, PLM, Snore, arousal, O2 Desaturation, Arrhythmia, Seizure,
and User 1-10 events.
Click on the EasyStamp button to initiate.
Manually Mark User-Defined Events
See EasyStamp to set User-Defined Events. See Mark Events for more information on the types of
events that are marked.
A separate set of PSG channel events exist for each scoring session in the PSG recording session.
Each PSG channel event is stored persistently with the PSG recording session data.
Manually Mark Session PSG Events
Click on a button in the PSG events toolbar to add a session event. See Lights, CPAP, O2 for more
information.
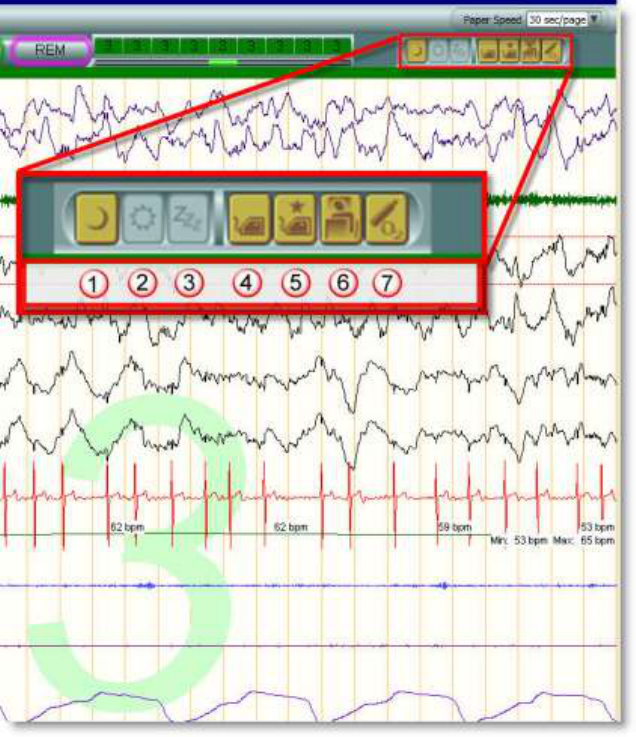
1. Lights Out - Click on this toolbar to enter a Lights Out event. Lights out will be placed at the
first second of the present epoch.
2. Light On - Click on this toolbar to enter Light On. Lights out will be placed at the last second
of present epoch.
3. Sleep Onset - Click on this toolbar to mark an epoch as sleep onset. Sleep onset will be placed
at the first second of the present epoch.
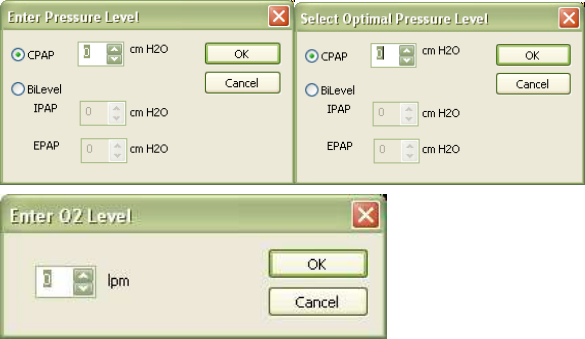
4. CPAP/BiLevel Pressure - Click on this toolbar to place a CPAP event in the trace window.
5. Optimal Pressure - Click on this toolbar to place an Optimal Pressure event in the trace
window.
6. Body Position - Click on this toolbar to enter a Body Position Change. If you are using a body
position sensor, you can use this option to over-ride or resume using the body position sensor.
7. Supplemental O2 - Click on this option to enter a supplemental O2 level.
192
Edit CPAP/BiLevel Pressure, Body Position Events or Supplemental Oxygen
When you add a session event, windows will open asking you to enter event type, levels, and
body positions.
Change Event Length
Once you have clicked and dragged to capture an event, right-click within the rectangle to add a
second to its length.
Modify or Delete Event Information
Click on an event to open the Edit Channel Event window. View the event data or add a
comment. Click the Delete button to remove the event from the Event List.

Sleep Summary Events
Lights Out
Lights On
Sleep Onset
CPAP/Bilevel Pressure
The CPAP/Bilevel Pressure settings determine the range for continuous, inhale and
exhale positive airway pressures that will be tabulated in Easy Sleep reports.
o Click on the CPAP button. A vertical line marker will appear; place it at the point
of pressure change on the waveform. Enter a pressure level for CPAP between 1
and 30 cm H2O by typing a level in or using the up and down arrows. Enter a
pressure level for IPAP and EPAP between 1 and 45 cm H2O. Click the OK button
to finish.
Optimal CPAP/Bilevel Pressure
o The Optimal CPAP/Bilevel Pressure searches the study for a specific pressure
level.
o Select an optimal CPAP pressure between +1 and +30 cm H2O. Select optimal
pressures for IPAP and EPAP between 1 and 45. The IPAP must be between the
value of the EPAP and 45. Click the OK button to finish.
Body Position
o Click on the Body Position button. A vertical line marker will appear; place it at
the point of movement on the waveform. Select Left, Right, Prone, Supine,
Upright and click the OK button. The body position will be noted as an event in
the Events list.
O2 Titration
o Click on the O2 Titration button. A vertical line marker will appear; place it at the
point of titration on the waveform. Enter an O2 level between 1 and 12 using the
up or down arrows, and then press the OK button.
194
Computer Assisted PSG Event Detectors
The PSG Real-Time Analyzer has two primary functions:
To compute a comprehensive set of statistical measures for the PSG recording;
To assist the user in locating sleep events (i.e. APNEA, PLM and SNORE events).
Easy III allows the Real-Time Analyzer to operate in real-time as PSG data is recorded so that
preliminary results are available to the report generator and view windows shortly following the
acquisition of the data.
Event Control and Status
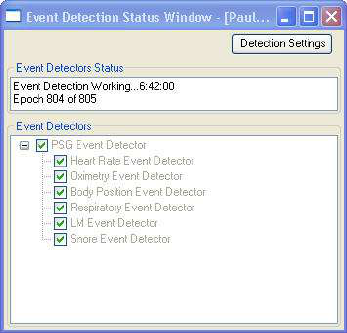
Right-click within the trace window, hover your cursor over, PSG Event Detection and click the
left mouse button. The PSG Event Detection Status window will open.
The Event Detection window will display the pages that have been analyzed. Easy III event
detectors perform event detection during data collection. Typically, the event detectors are
detecting events within 1 minute of real time data during data collection.
A check mark must be displayed in the Event Detector, PSG Event Detector check box for event
detection to be enabled. Event detectors that also have a check mark will be detected during data
collection.
To change the events that will be detected, click on the Detection Settings option (refer to PSG
Event Detection section of this manual for information related to the detection settings).
NOTE: It is important to realize that the computerized process of event detection is only an aid
for the physician in the establishment of a diagnosis. It does not replace the physician or
diminish the requirement to use sound professional judgment when reviewing and marking
events.
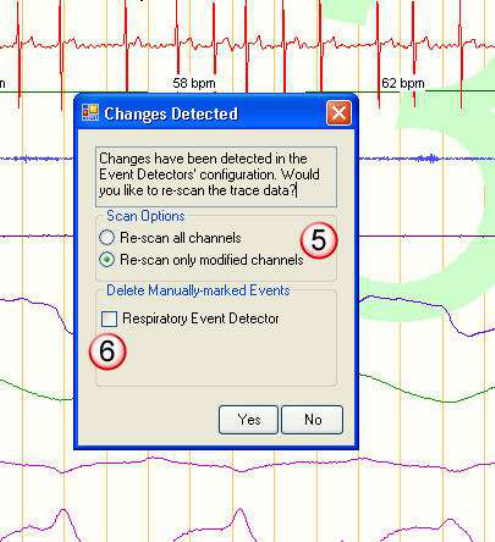
If the detection settings are modified from their original settings, the Easy III will prompt the user
that changes have been detected.
Re-scanning Channels
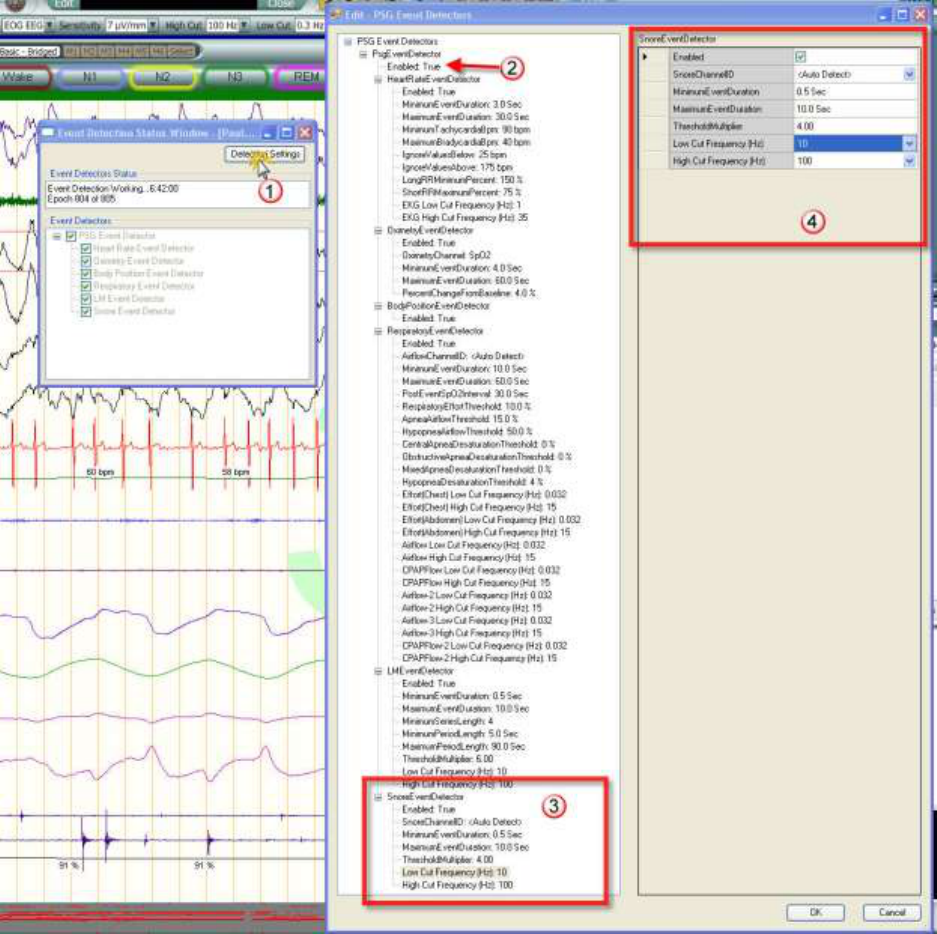
Right click in the trace window, select PSG Event Detection.
1. Click on Detection Settings
2. Event Detection must be enabled. Verify the PSG Event Detector is set to True (on).
3. In the sample above, the Low Cut filter setting has been highlighted in the Snore Event
Detector values.
4. The Snore Event Detector settings are displayed in the right hand column. Click on a value to
modify the current settings. When you have completed modifying the present settings, click on
OK.
196
5. If any setting in the Detection Settings has been modified, the 'Changes Detected' dialog will
appear (note the illustration above) If you select the 'Re-scan all channels', all previously 'auto-
detected events for the selected event type will be re-scanned. This option will delete all manual
and computer assisted events. The current detection settings will be used to scan all channels
with event detectors enabled. If you select 'Re-scan only modified channels’, only modified
detectors will be used.
6. Delete Manually-marked Events - If a check mark is placed in this option, all manually marked
events will be deleted. The auto-detector will re-scan the channel to detect events with the new
settings.
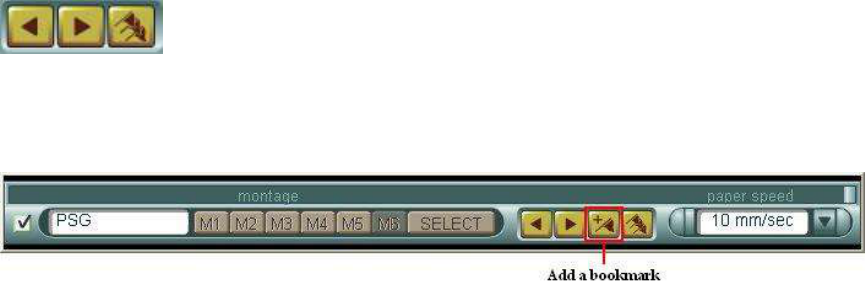
Bookmarks
A bookmark marks a segment of the recording, noting its current montage, filter, sensitivity and
paper speed settings. Bookmarks allow users to quickly review notable sections of the EEG
record, and are also used for including segments of the EEG in reports.
Review a Bookmark
Use the right/left arrows to scroll through bookmarks within a trace window. Click the flagged
button to view a list of bookmarks. Select a bookmark from the list and click the Go To button to
see the bookmark in the trace.
Add a Bookmark
Bookmarks are on a per-trace window basis. To specify the trace window to bookmark, open the
Montage Toolbar and click the Add a Bookmark button.
Enter a title and adjust the elapsed times as desired. Bookmark1, Bookmark2, etc. are default
titles, but are not dependent on elapsed times. If you move backward and place a new bookmark,
the default title will contain the next sequential number. The default times correspond with the
beginning and ending times of the page being viewed on the screen. The length of the bookmark
segment may be increased or decreased.
The current montage, filter, sensitivity and paper sped will be saved with the bookmark. More
than one bookmark may be created at the same location if they have different settings.
Delete a Bookmark
Click the flagged button to view a list of bookmarks. Select a bookmark from the list and click the
Delete button to remove the bookmark from the trace.
Print a Bookmark
Click the flagged button to view a list of bookmarks. Select a bookmark from the list and click the
Print button to print a bookmark.
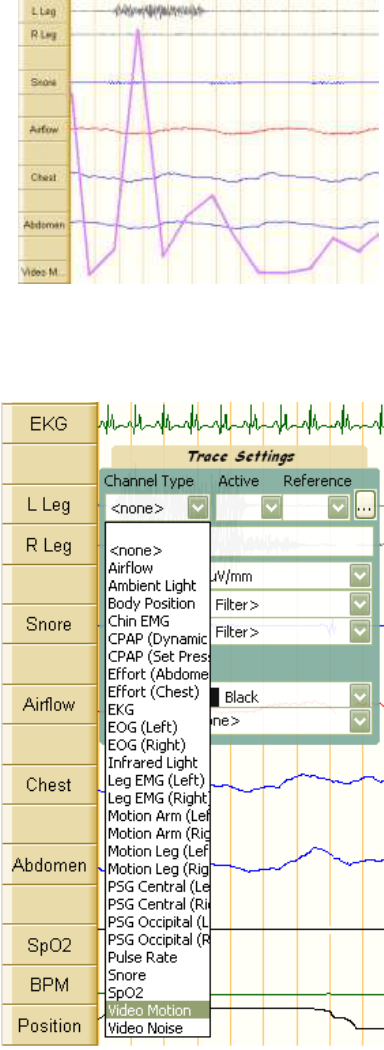
Q-Video
Q-Video as a Trace
Q-Video is enabled with a motion detection algorithm that detects and quantifies movement from
a video signal. By adjusting the Color options on Q-Video, movement can be accentuated with
color and displayed in the video picture to assist clinicians in detecting subtle movements which
reviewing data faster than the speed of data collection.
When Video Motion is selected as a channel, patient
movement caught on camera is turned into a trace. As
shown here, the Left Leg motion is quantified by both
the anterior tibialis EMG signal and the Video Motion
trace. Both Video Motion and Video Noise may be set up
as channels and recorded as traces within the recording
montage. This feature allows users to review epochs of
data without video, when video movement is detected,
the Q-Video player can be viewed for patient
observation.
Set Q-Video as a Trace
Open the trace settings of a blank channel. Open the drop-down Channel Type menu and select
Video Motion. Select a trace color to set it apart from the other traces.
Q-Video Record Setup Window
Access Q-Video Record Setup
Within a procedure file, select a view with Q-Video.
Right-click within the Q-Video screen and select Setup,
or
When you Edit a Workspace, access Workspace Setup
Options.
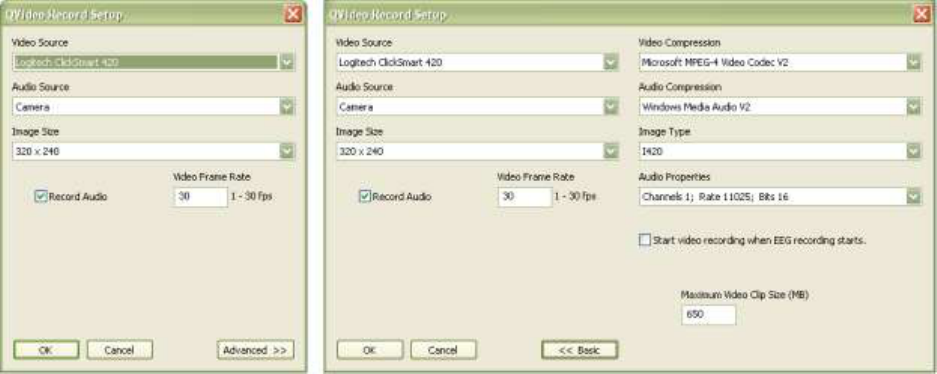
Set Up Q-Video
Video Source Select a camera.
Audio Source Select a microphone.
Image Size Choose a resolution. The lower the resolution, the smaller the file size but the grainier
the image. The higher the resolution, the larger the file size but the clearer the image.
Record Audio Check this box to automatically record audio when video is being recorded. It can
also be checked or unchecked from the Advanced button in the Q-Video window within a
procedure.
Video Frame Adjust the frame rate in frames per second (fps). The lower the fps, the smaller the
file size because the record is gathering less information. The higher the fps, the larger the file
size because the record is gathering more information. Easy III defaults to 30 fps.
Advanced Increase your preference changes to include the following:
Video Compression Only use the Microsoft MPEG-4 Video Codec V2.
Audio Compression Only use the Microsoft Windows Media Audio V2.
Image Type Choose I420 for color preferences.
Audio Properties Select the Channel, Rate and Bits for the audio file.
Start video recording when EEG recording starts Check this box to automatically record video
when data collection begins.
Maximum Video Clip Size Set a limit to the size of a Q-Video file (for archiving/storage space
purposes). Easy III will create multiple video clips during data collection. The maximum file
size per clip will be determined by this setting.
OK Save your changes and close.
Cancel Close without saving changes.
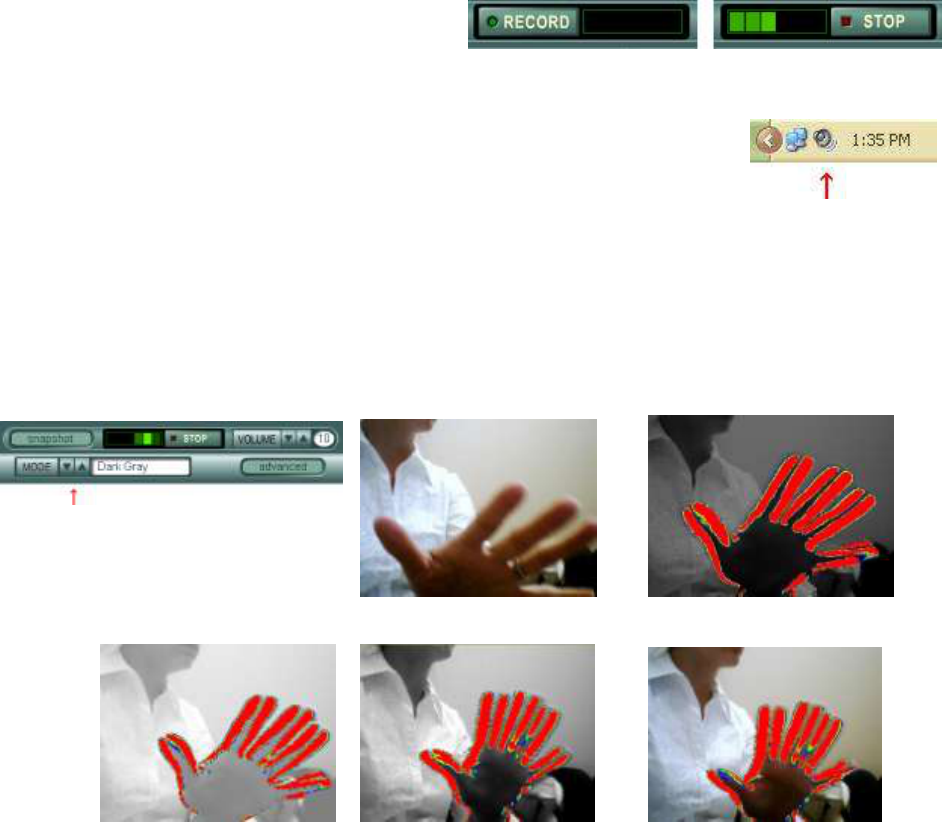
200
Use Q-Video
Setup Q-Video in Edit Workspace. Open a procedure, and select a view that includes Q-Video.
Zoom. Click and drag the mouse over the Q-Video image data subset that you wish to enlarge.
When you release the click, a floating Zoom window will appear. Move and resize the Zoom
window as necessary during a procedure or review.
Snapshot. Click Snapshot to capture a still photo from the video. Enter a comment, such as an
event associated with the action in the photo. The snapshot will appear as an event in the event
list.
Record/Stop. Press the Record button to
begin recording video feed. It will turn into a
Stop button. Press the Stop button to end
recording video feed.
Volume. Adjust the speaker output volume in a range of one (1) to ten (10)
using the up and down arrows. To further adjust speaker volume, double
click on the speaker icon in the system tray on your computer desktop.
To record video audio, click the Advanced button.
Modes. Q-Video collects and displays video data in a standard view. At any time during data
collection or review, enable motion controls to accentuate movement in the video. This assists
clinicians in quantifying movement during sleep studies or EEG recordings.
Click through the Mode up and down arrows to choose color accentuation.
Normal Dark Gray
Light Gray Black and White Motion Highlight
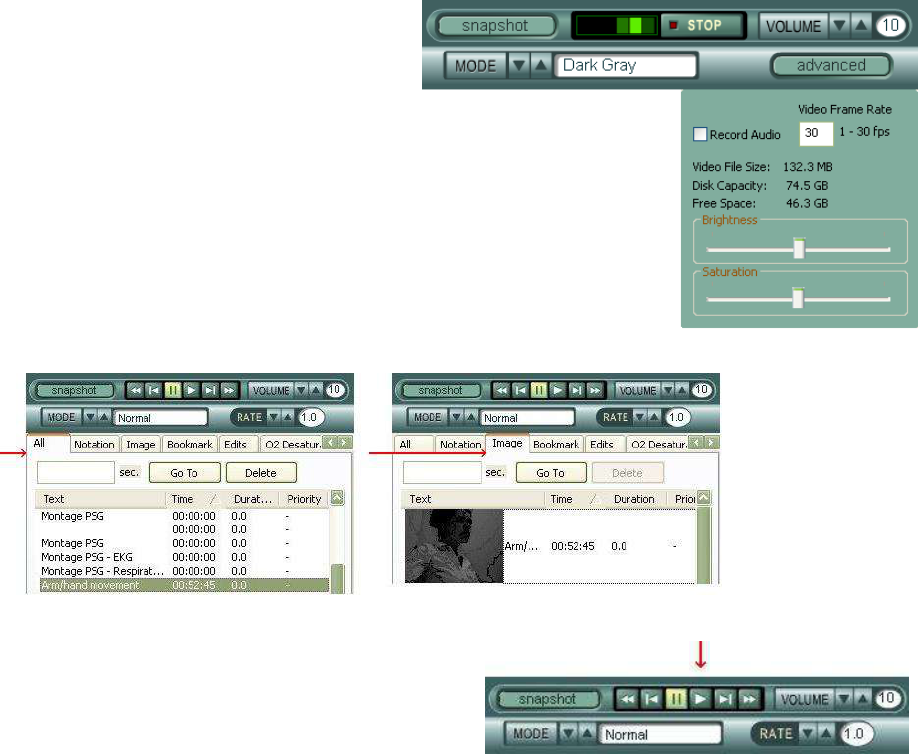
Advanced. Click the Advanced button to
select Record Audio, view or change the
video frame rate (in frames per second) at
any time during a recording, or use the
sliders to adjust the brightness and
saturation of the image. Advanced also displays disk status: real time
memory space used to store Q-Video files, the memory capacity of
the hard drive, and the remaining memory space.
Review Q-Video
In Read Data, you can access Q-Video data files in the Event List
Window under the All tab or the Image tab. Double-click on the file
to open.
Play
Press the Play button to watch the recorded Q-Video.
During the review, you may:
Take a snapshot,
Use the Volume control arrows to adjust speaker output from within Easy III software,
Adjust the Mode to change the color accentuation of movement within the Q-Video file,
Adjust the Rate of playback between 10 and 200% of real time, and
Use the Zoom feature to enlarge sections of the Q-Video file.
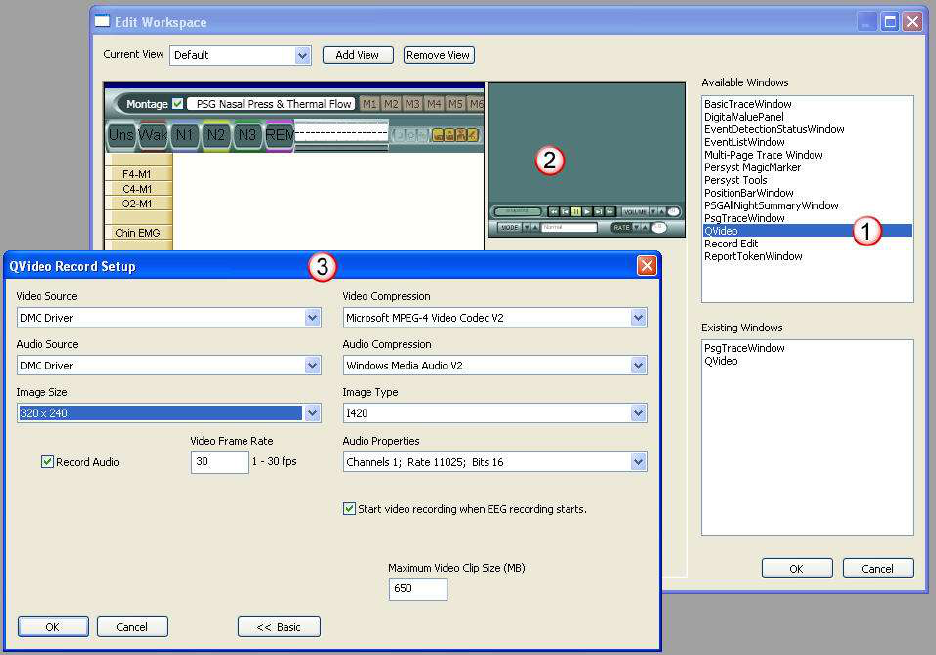
202
Q-Video Record Edit
To efficiently edit video data, you must add the Q-Video window and the editor to your
workspace. If you need to configure the Q-Video settings, enter the Protocol editor to configure
Q-Video settings.
1. Click and drag the Q-Video Window option from the Available Windows.
2. Right click in the Q-Video window to enter the setup options. (Note the illustration below)
3. Configure the Q-Video Record Setup Settings.
Q-Video Options (Click on Advanced to see all options)
Video Source - Q-Video currently requires a video to USB adapter. If you are using a USB
camera, you will see the name of the camera in the drop down menu.
Audio Source - Typically the audio from the microphone in on the computer will be used. You
can also use audio from your USB camera if it is available.
Image Size - The image size is the resolution used for video. The higher the resolution, the larger
the video files.
Video Compression - Cadwell requires that you use Microsoft MPEG-4 Video Codec V2
Audio Compression - Cadwell requires that you use Windows Media Audio V2
Image Type - Cadwell recommends using I420 compression. It is more efficient and reliable than
RGB compression.
Audio Properties - Cadwell recommends Channels; Rate 11025; Bits 16
Record Audio Checkbox - Add a check mark to this box if you want to record audio (by default)
with video. If you do not add this check mark, the user can add a check mark to a Record Audio
option during data collection.
Video Frame Rate - Set this option to a default frame rate between 1-30 fps. NOTE: Some
computers (laptop computers) may experience difficulty recording 30 fps. Set the frame rate
below 30 if required.
Start Video Recording When Recording Starts - Add a check mark to this option if you want
video to concurrently start when a recording starts.
Maximum Video Clip Size (MB) - This option will determine when the Easy software will start a
new video file. If the present file reaches this level (650 MB), the Easy software will create an
additional video file.
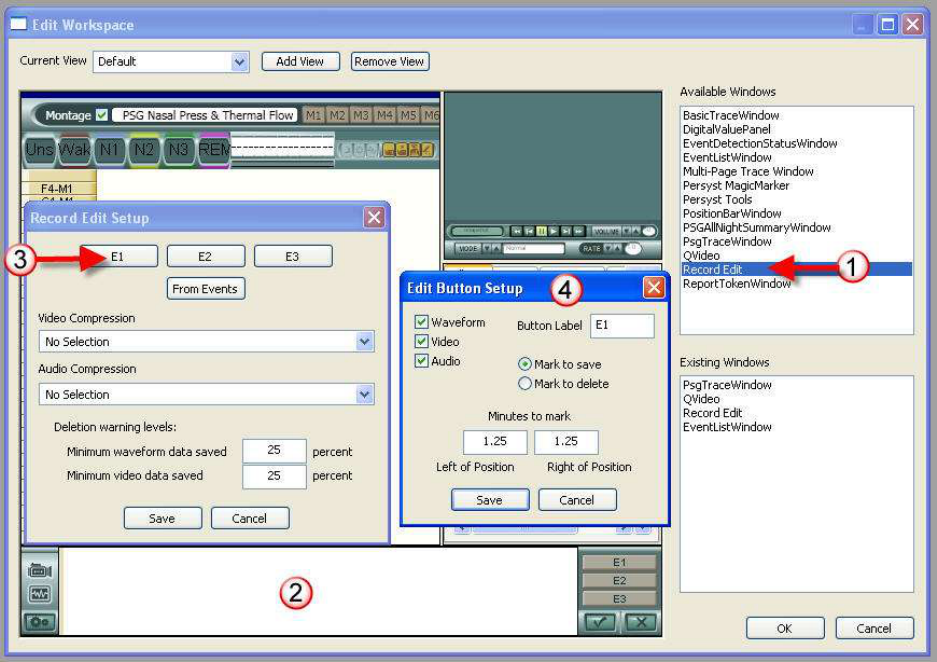
204
Record Edit Settings
1. To add the Record Edit window to the workspace, click and drag the Record Edit Window
option from the Available Windows.
2. Right click in the Record Edit window to enter the setup options. (Note the illustration below)
3. Click on the E1 button to edit the default settings for the E1 button.
4. Note the setup options below. The user can pre-configure the edit button to save or delete
data when selected.
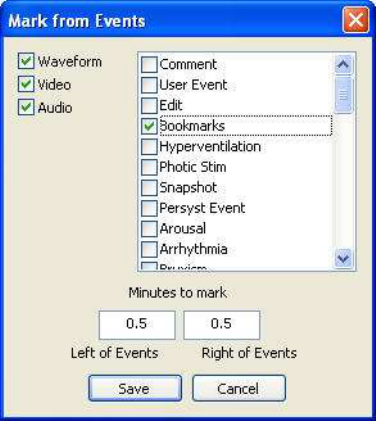
Record Edit Setup Options
E1, E2, and E3 Buttons - Each button can be pre-configured. Left click on the button to review the
default settings (see number 4 above). Note the Button Label can be user configured. Enter a
name that will help you understand the default settings for the displayed button. For example,
you could name the button 'Save 1.25'.
From Event - This option will assist the user in automatically clipping waveform and video data
adjacent Easy events. Place a check mark adjacent to the events you would like to mark. The
Waveform, Video, and Audio check boxes will determine what concurrent data will be marked.
The Minutes to Mark settings will determine the amount of time before and after an event that
will be marked.
Video Compression - Cadwell requires that you use Microsoft MPEG-4 Video Codec V2
Audio Compression - Cadwell requires that you use Windows Media Audio V2
Deletion Warning Levels - These settings will warn the user if less than 25% (user specified) data
will be saved.
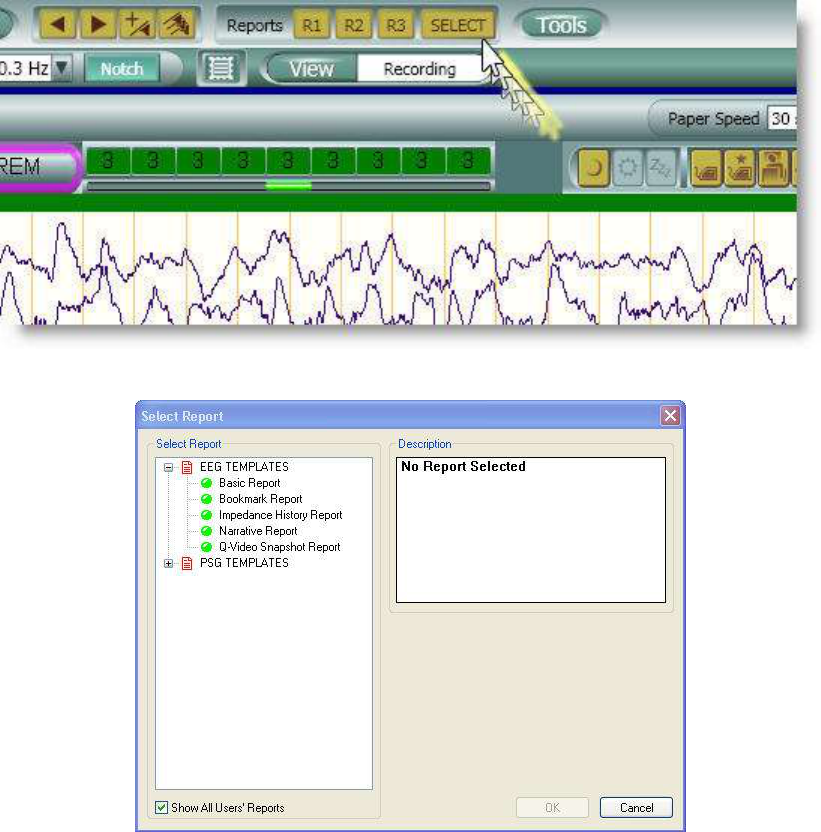
206
Generate a Report
Reports Overview
Easy III reports allow you to print patient information, record information, and pages of EEG
specified by bookmarks. Reports can also include technician comments, impedance history, file
access history, and Q-Video snapshots. The Report Generator can be launched during data
collection and review.
Click on the Report Toolbar to access reports.
Click on a report template to generate a report.
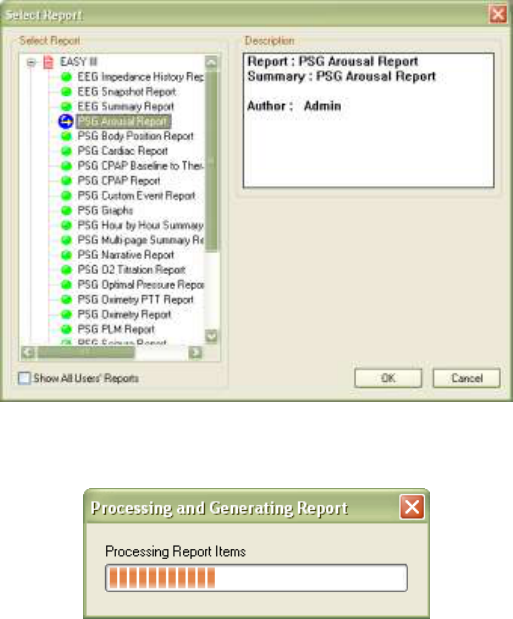
Select Report
1. Click on the plus sign to access the list of available report templates.
2. Click on a template to view the Description. A blue ball with a yellow arrow will designate
which template is selected.
3. Click the Show All Users' Reports box to access the list of all report templates available.
4. Click the OK button.
5. Wait while the Report loads and collects its tokens.
QuickReport Document
The QuickReport document will open in a Word formatted file. From here, you may edit data,
change headers and footers, view automatic spell check, run grammar check, change font colors,
etc.
Save or Print report using the Word tools.
Click the Finish button to save or close before exiting.
208
Save the Report
From the Document view, perform one of the following.
Click the diskette icon to save to the default location.
Select Save from the File menu to save to the default location.
Reports will be automatically saved to the following destination: C:\Cadwell\Easy
III\Reports
File Names
The filename of the report document is automatically created based on the patient's last name,
first name, the date of the exam, and the patient's birth date. The report will be saved to the
C:/Cadwell/Easy III/Reports. Save the reports to C:/Cadwell/Easy III/Data if you would like the
reports to be archived with the patient data. Note: Do not rename the report file names. When
reports are copied to the Data folder, the Easy III software will specifically look for system
generated (patient specific) report file names.
Close QuickReport
From the Document view, perform one of the following.
Select Exit from the File menu.
Click the Finish button at the bottom right of the screen.
Click the Red X in the top right-hand corner.
If the report has not been saved, you will be prompted to save the report before exiting.
Report Header
The Report Header is the information that appears at the top of the first page of the report
document. The report header is named Easy III Report Header.doc. The report can be found in
the C:\Cadwell\Easy III folder.
To modify the report header, open and edit the report. You must modify the report header on
each Easy III system.
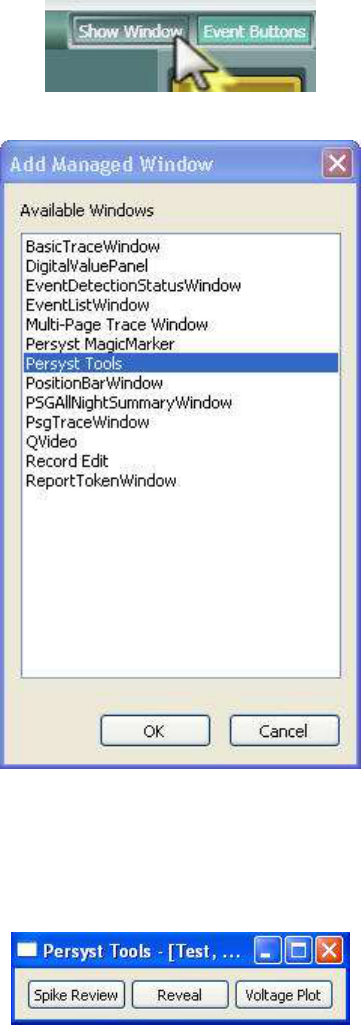
Persyst Tools
Click on Show Window
Click on Persyst Tools
Three separate programs are available from Persyst.
1. Spike Review
2. Reveal Spike Detector
3. Voltage Plot
210
Magic Marker
Magic Marker can trend physiological monitoring data simultaneously with EEG. A single trend
panel can be displayed concurrently with EEG data.
Magic Marker Trends
Rhythmic Run Detection and Display
EEG Asymmetry (absolute and relative)
Relative Alpha Variability
Alpha/Delta Ratio
Spectral edge trends
Power Ratio (any bands)
Power Difference (any bands)
Amplitude (amplitude-integrated, DC average, zero-crossing frequency)
Coherence
Event Density (e.g., spike density functions from Reveal on-line spike and seizure
detection)
Compressed Spectral Array (CSA), Coherence CSA, Peaks CSA
Trend relationships between EEG changes vs. physiological trends (MAP, HR, etc.)
Multi-Epoch—compare foreground to background with optional lag and apply Standard
Deviation, Maximum or Minimum, Average Ratio, TStat, and more…
Typical Magic Marker Trend
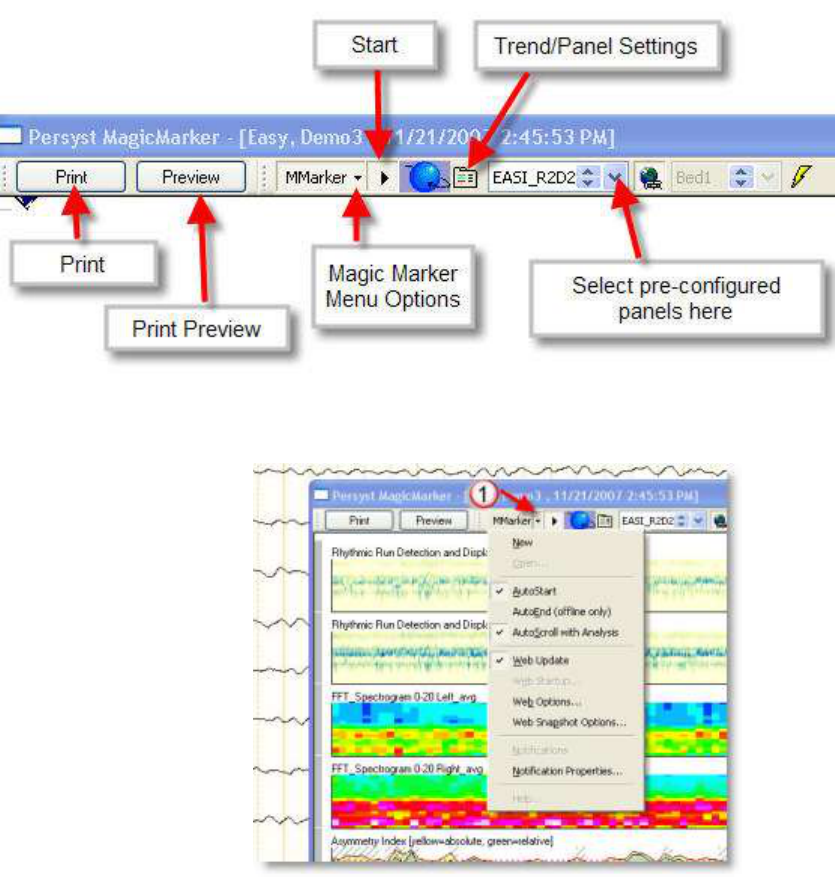
Magic Marker Menu Options
Configuring Magic Marker
1. Click one Magic Marker Menu to configure default settings.
The settings selected in the Magic Marker Menu will be retained the next time Magic Marker is
used.
AutoStart - Use this option to automatically start trending Magic Marker data when a
new recording is started.
Auto-Scroll with Analysis - Use this option to display trend analysis data during data
collection.
Web Update - Use this option to stream trend and waveform data to a folder. Remote
users can remotely access the web folder to review recorded data.
212
Web Options & Web Snapshot Options - Use these options to pre-configure trend and
waveform data display.
2. Click on the Settings tab to configure trend panel settings.
Panel Tab - Use this tab to select the Instruments you would like to use in the Magic
Marker panel.
Instruments Tab - Use this tab to select or create custom trends (instruments) that can be
displayed in the Magic Marker panel.
Channels Tab - Use this tab to select or configure channel lists. For example, you can
create a custom channel group called 'Frontal Sleep', including F3, Fz, and F4 in a group.
Range Tab - Select the Range Tab to determine the duration of time to display in the
Magic Marker panel.
Reveal Spike Detector
Reveal Spike Detector from Persyst.
1. Click on the Reveal button from the Persyst Tools dialog.
2. Click on process to begin detecting events.
3. To modify the detection montage click on the Settings menu option.
4. Click on Protocol to select a different scanning montage.
5. After detecting events, click on the Spike Review button from the Persyst Tools dialog.
Spike Review
Click on the Spike Review button from the Persyst Tools dialog.
Spike Review will allow the user to highlight, review, confirm or delete detected events.
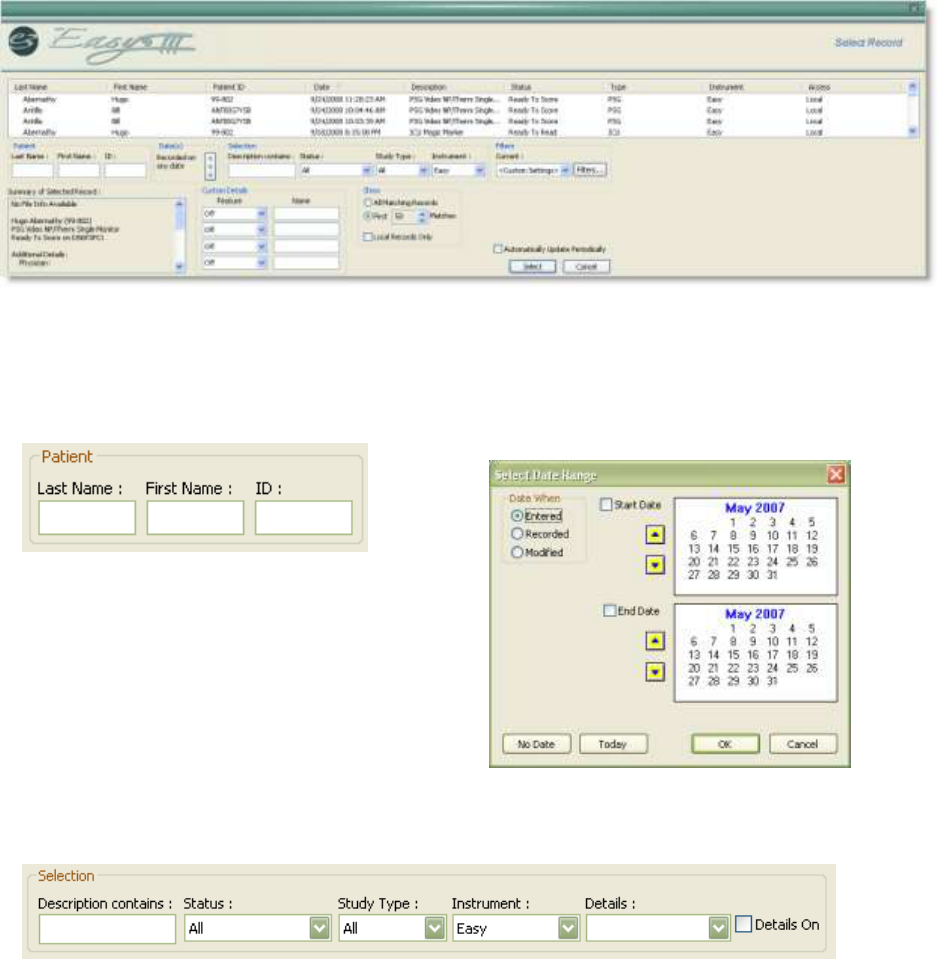
214
Review Records
Select Record
Review or Append to a Patient File by clicking the Read Data button or the Append button on the
Start Page. The Select Record window will open.
Select a Patient by Name
Organize the lists by Last Name, First Name, Patient ID, Date, Description, Status, Type or
Instrument by clicking on the column header.
Narrow down the search results by entering in Patient name or ID.
By Date
Narrow down the search options by entering
Patient information in the Last Name, First
Name or ID fields, by narrowing the Select Date
Range, or by entering descriptive information in the
Selection fields.
By Filter Selection
Type in descriptors and select Status, Study Type, Instrument and Details to narrow down the
search results.
Filter Details: Edit Details
To set the Details, click the Edit Details button.
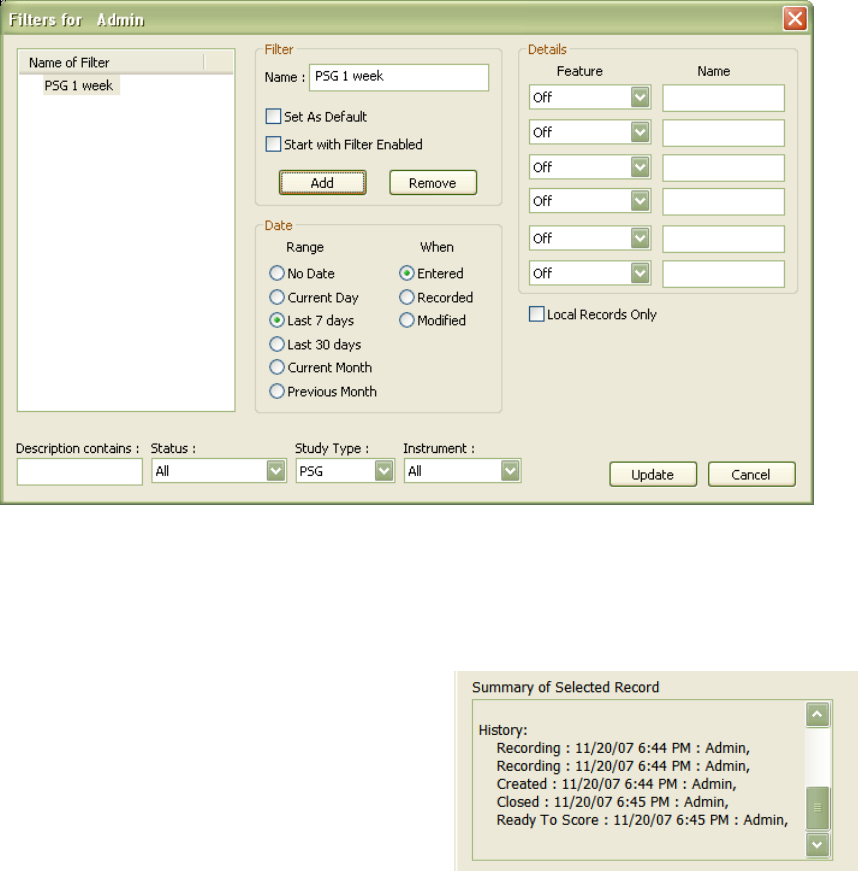
Add a filter by typing in a Name, setting the Date range and details, and then clicking the Add
button. Repeat for additional filters.
Click the Update button to return to the Select Record window. In the Selection section, select the
filter from the Details drop-down menu, and then checkmark the Details On box to turn the filter
on.
Summary of Selected Record
The summary for each patient file records the
patient ID, description of procedure, status and
computer on which the procedure took place.
The History will show when the file was created,
when recording began and ended, when the file
was closed, and which user performed each
event.
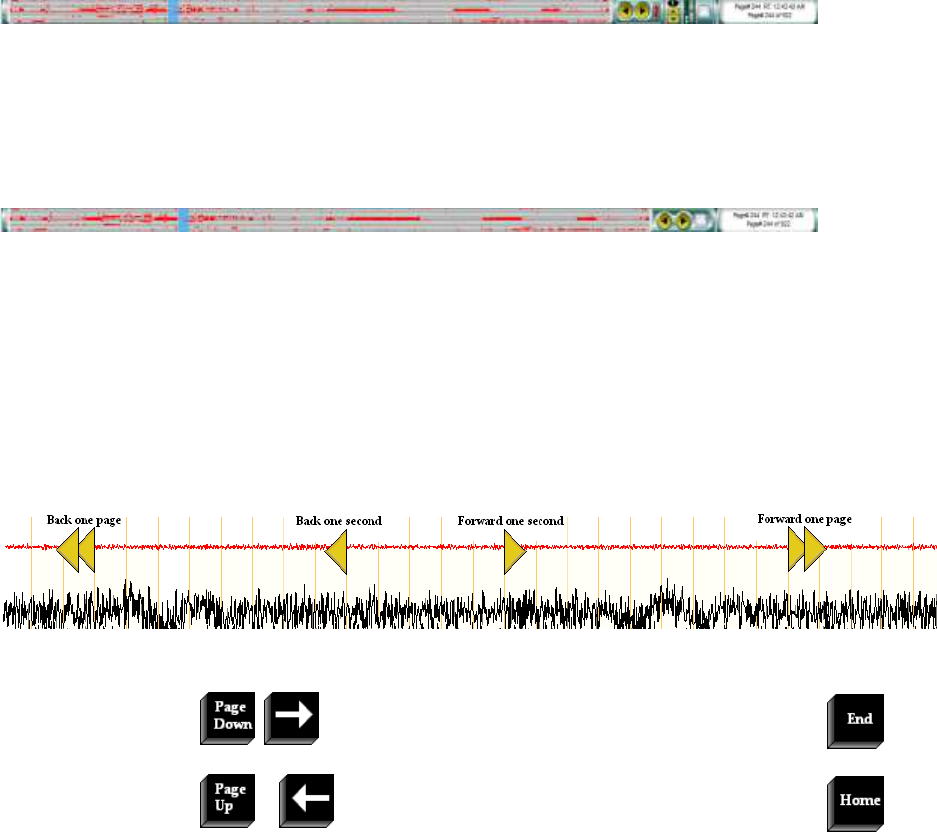
216
Scroll through Records
Adjust Parameter Toolbar
Adjust the Channel Group, Low and High Filters, Sensitivity, and Notch Filter Frequency,
Scroll Through Records
From the position bar
The position bar can be configured in differently as needed by the user. Right click on the
position bar and enter the setup dialog menu to change the configuration of the position bar. The
position bar can be configured with and without the auto paging controls.
The position bar displayed above shows the auto paging tools. Click on the red auto paging
button to enable auto paging. The gold up and down arrows determines if the paging tool will
skip pages during the paging process. The green LED bar shows the current paging speed.
Increase the number of bright green LEDs to increase the paging speed. Click on one of the left
or right arrow buttons to automatically page through the recording. Press the space bar to stop
the auto paging process.
The position bar displayed above is configured without the auto paging tools. Click the yellow
arrow buttons to move back or forward one page at a time, or click and drag along the position
bar to manually move through pages. During recordings, click the View live data button to
return to live recording.
From the waveform display
To scroll through the pages using only the mouse, position your cursor between channels. The
horizontal placement of the cursor determines the scroll commands:
From the keyboard
Forward one
page
, , or space bar
To last event in Event list
Back one page
or
To first event in Event list
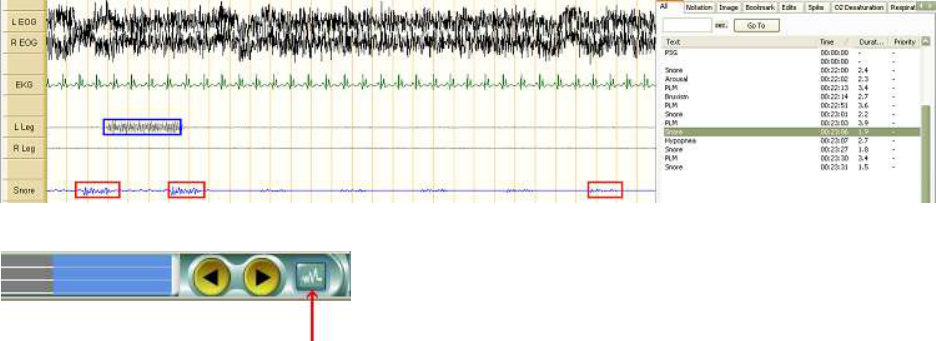
From the Events dialogue box
Click on an event in the Events List to jump to that event in the trace.
Click the View Live Data button to return to live data.
218
Event Definitions
Sleep Epoch Categories Sleep Stages are
(W) Wake, N1, N2, N3, N, & REM based
on the May, 2007 AASM Guidelines. The
older sleep stage categories are (A)Awake,
(M) Movement, Stage 1, Stage 2, Stage 3,
Stage 4, REM based on R & K Guidelines
(1967). An epoch can also be marked as
unscored if it has no staging.
Arousal 3- (or more) second event marked
on an EEG channel.
LM (formerly called a PLM or PLM burst)
An EMG burst occurring on a limb
movement channel. Concurrent LMs that
occur on both legs are scored as one LM. If
the LMs are 5 seconds apart, they can be
scored as 2 LMs.
PLM Series (formerly called PLM Episode)
A series of LM events that occur
rhythmically during sleep.
Respiratory Events:
Central Apnea A cessation of airflow with no
respiratory effort.
Index Count x 60/TST
Lights Out This time that indicates the
beginning of a recording. The exact time is
associated with the first second of a 30
second epoch where the lights out event has
been added.
Lights On This time indicates the end of a
recording. The exact time is associated with
the last second of a 30 second epoch where
the lights on event has been added.
Minimum Respiratory Event SpO2 The
lowest saturation value associated with a
respiratory event.
Mixed Apnea A cessation of airflow with a no
respiratory effort, followed by a resumption
of effort.
Obstructive Apnea A cessation of airflow
with continual or increasing respiratory
effort.
PB Periodic Breathing At least 3 episodes of
central apnea separated by no more than 20
seconds of normal breathing
REM Latency The elapsed time from sleep
onset to the first epoch scored as REM.
Sleep Efficiency (TST/TRT) x100
Sleep Onset or Sleep Latency - Always the
start of the first epoch scored as any stage
other than Wake (W) after Lights Out.
Snore A burst of high frequency data
recorded from a snore microphone or nasal
pressure signal.
SPT Sleep Period Time - The elapsed time
between Sleep Onset and the end of the last
epoch marked as sleep, before Lights On.
TIB Time in Bed - Lights Out to Lights On.
TRT Total Recording Time – Total amount of
time from Lights Out to Lights On.
TST Total amount of sleep time during TIB
(from Lights Out to Lights On).
WASO Wake After Sleep Onset – (Stage W
during TRT – Sleep Onset) in minutes (this
includes time that the patient may have been
out of the bed).
Safety Information
Safety Information
General Discussion
The application of modern electronic technologies in medical practice has led to systems of
medical and non-medical electrical equipment being used together for the diagnosis and
monitoring of patients.
Medical electrical equipment complying with IEC 6060-1-1 such as Cadwell equipment and
accessories are often connected to other non-medical electrical equipment such as computers and
printers. Non-medical electrical equipment may fully meet the requirements applicable to their
specific field, but may not comply with isolation or leakage requirements for medical electrical
equipment and thereby impact the safety of the entire medical electrical system.
Medical electrical equipment describes electrical equipment: provided with no more than one
connection to a particular supply mains; intended to diagnose, treat or monitor the patient under
medical supervision; which makes physical or electrical contact with the patient, transfers energy to or
from the patient, and/or detects such energy transfer to or from the patient.
Medical electrical system describes the combination of items of equipment in which at least one must
be medical electrical equipment and interconnected by functional connection or an isolation transformer.
The following configurations ensure that combinations of Cadwell devices with non-medical
electrical equipment comply with the electrical safety requirements for medical electrical systems.
Allowable Cadwell System Configurations
1. All Cadwell equipment and accessories are permissible in the patient environment without
incorporating a isolation transformer.
Patient environment describes any volume of space (area) in which intention or unintentional
contact can occur between the patient and parts of the system or between the patient and other
persons touching parts of the system. This is a diameter of 1.5 meters, or 5 feet, around the patient.
Isolation transformer describes a medical separating transformer designed to limit transfer of
unwanted leakage current and allow non-IEC 60601-1 devices to be located in the patient
environment.
2. A double-insulated laptop computer powered from Cadwell equipment is permissible in the
patient environment without incorporating a isolation transformer.
3. Other computing devices such as desktop computers, monitors, printers, cameras, and
Infrared illuminators are not allowed in the patient environment unless an isolation
transformer is used to power such devices.
4. Non-medical devices such as those listed above may be used outside the patient
environment within the medically used room with a isolation transformer, or without
incorporating a isolation transformer if and only if each individual device is plugged into a
fixed mains socket outlet.
Medically used room describes the room in which the patient environment is located.
Fixed mains socket outlet describes a permanently installed (hardwired) grounded outlet in a
facility.
220
5. Power strips and other multiple portable socket outlets are not permitted in a medically used
room unless connected to the output of a isolation transformer.
Power strips describe a combination of two or more socket outlets intended to be connected to, or
integral with, flexible cables or extension cords.
5. Connection to hospital networks is allowed without incorporating an isolation device if and
only if the network server and the medical electrical system are connected to circuits
powered from and grounded to the same electrical service entrance.
Isolation device describes a component or arrangement of components with input and output
parts that, for safety reasons, prevent a transfer of unwanted voltage or current between parts of
the medical electrical system.
System Requirements
1. Non-medical electrical equipment used in medical electrical systems must meet their
respective IEC electrical safety requirements, i.e. IEC 950 for computing devices.
2. Enclosure leakage must not exceed 500uA in any single fault condition within the patient
environment.
Enclosure leakage a potential electrical shock hazard from contact with the enclosure of a medical
device.
Single fault describes the condition in which a single means for protection against a safety hazard
in the system is defective, or a single external abnormal condition is present.
3. Enclosure leakage must not exceed 100uA in normal condition.
4. Earth leakage must not exceed 500uA in any single fault condition within the patient
environment.
Earth leakage describes the potential of an electrical shock hazard from the electrical current
flowing through the ground wire of a power cord of a medical electrical system.
5. The medical electrical system must provide a minimum of 1500 volts isolation between the
patient and earth.
6. The medical electrical system must provide a minimum of 4000 volts isolation between
patient applied parts and mains voltage.
7. The medical electrical system must provide a minimum of 1500 volts isolation between non-
patient contact parts of the system and mains voltage.
Contact the Cadwell Regulatory department at 1.800.245.3001 or 1.509.735.6481 with any
questions regarding these requirements.
Safety Information
General Warnings and Precautions
Federal law restricts sale of this system
to, or on the order of, a physician.
Do not try to service internal parts of
the Easy III system. Only service by
Cadwell, Inc. or authorized bodies.
The operator must be trained to
recognize the difference between
signal artifacts and valid bio-signals
caused by movements, interference, or
misplacement of sensors or electrodes.
Inspect all cables before and after each
use. Discard cable if insulation is
damaged or if the cable or connectors
are damaged in any manner.
This manual provides an operational
summary for the Easy III system. It
does not provide clinical training. It is
assumed that the user has adequate
clinical training.
The proper use of this device, for its
intended use, can only be assured once
all instructions have been read and
understood. Contact Cadwell with
questions about operation of Easy III.
The system is not defibrillator proof.
Do not use the system in an MRI
environment.
The system is not designed to operate
in an explosive environment.
Strictly adhere to cleaning instructions
in this manual.
Do not immerse the amplifier, remote
input box, power-communications
module, flash stimulator, and system
cables in liquid.
Do not use power strips with the
system unless they are connected
downstream of an isolation
transformer.
The system is designed to be used with
one patient at a time. Do not connect
multiple patients to one amplifier.
Do not connect items which are not
specified as part of or for use with the
Easy III system.
Never place an isolation transformer
on the ground.
Do not exceed the medical isolation
transformer placarded maximum load.
When attaching the Easy III system to
a patient, verify that the subject will
not become entangled in the wires. Do
not allow the electrode wires to wrap
around the patient's neck.
Do not use the system isolation
transformer to power non-system
components. This can overload the
transformer or defeat the separation by
providing additional leakage sources.
Do not plug non-medical electrical equipment in the patient environment directly into a
wall outlet. This may cause excessive leakage current in the patient environment.
222
Electromagnetic Compatibility
The Easy III system requires special precautions regarding Electromagnetic Compatibility (EMC)
and must be installed and put into service according to the EMC information provided here.
Portable and Mobile RF communications equipment can affect medical electrical equipment.
Easy III Cables and Accessories
Remote Input Box
Remote Input Box Cable
Photic Stimulator Cable
Isolation Transformer
Use of accessories and cabling other than these specified, excepting those sold by Cadwell as
replacement parts, may result in increased emissions or decreased immunity of the Easy III
system.
The Easy III system should not be used adjacent to or stacked with any other equipment. If such
use is necessary, performance of the Easy III system should be observed to verify normal
operation in the configuration in which it will be used.
Maintenance
Maintenance
Warranty and Service Information
Excerpted from Cadwell document Warranty & Service Information part number 829001-000 Rev 01.
What is covered
Cadwell Inc. guarantees this unit against
defects in materials and workmanship for
one year from the date shipped. During the
warranty period, we will repair or, at our
option, replace any unit that proves to be
defective. For complete warranty info, refer to
your sales contract.
What is not covered
This warranty does not apply if the
product has been damaged, abused, or
misused, or if unauthorized attempts have
been made to modify or repair the
equipment which may impair the
performance of the instrument. This
warranty is non-transferable and applied
to the original purchaser only.
Call for help
If you have a problem with your Cadwell
instrument, please follow these
instructions:
Have the unit, serial number and your
customer identification number with
you.
Call Cadwell, Inc at 1.800.245.3001 or
1.509.735.6481.
For applications or operational
support, ask for the Clinical
Applications Department.
For equipment repair, ask for the
Technical Service Department.
Service or Applications personnel may be
able to direct you through basic diagnostic
procedures on the unit.
After the problem is diagnosed
If a repair part must be sent or the unit
returned for repair, you will be issued a
return merchandise authorization (RMA)
number. You will need the RMA# when
requesting info about the repair. Repair
parts are shipped second-day air service.
Overnight and weekend services are
available for an additional charge.
Exchange the part
Turn the unit off and disconnect it from
AC power. Exchange the part with the
replacement supplied. Plug the
replacement unit into AC power and turn
the on to verify operation. Please return
the defective part promptly using the
original shipping carton. Shipping
materials and instructions will be included
with the replacement part.
Return the unit for repair
Return the unit in the original, or an
appropriate, shipping container with the
RMA number written on the box. Air-
freight is recommended. Second-day
return air-freight cost is included on a
warranty-covered repair. Repairs normally
require 2-3 business days to complete.
Service Warranty
Equipment not covered under the original
warranty or service contract will be
charged from a "flat rate" schedule for
repair. Billable repairs carry a 90-day
service warranty (covering only those
items repaired). For continued and
complete coverage of your entire system,
call Cadwell and ask about service
contracts.
Maintenance
Clean the Easy III System
Always disconnect all components from AC power before cleaning. Do not use acetone to clean
the surface of the system components.
Clean the amplifier, photic stimulator, power communications module, and remote input box
with a damp cloth. Ethanol may also be used for the exterior of the system units. Do not allow
direct contact of liquids to the inner parts of the Easy III system.
Part
Cleaning Instructions
Amplifier
Wipe down with a damp cloth with non-conductive distilled
water or electronically non-conductive inert surfactants.
Remote Input Box
Power/Com Module
Photic Stimulator
Amplifier Cables
Wipe down with a damp cloth with Isopropyl alcohol, non-
conductive distilled water or electronically non-conductive
inert surfactants.
Photic Stimulator Cables
Electrodes and Accessories
Rinse all surface electrodes with warm, soapy water or liquid
sterilizing agents; ensure all pastes and gels are cleaned from
the electrodes and their cables.
EasyNet Modules
Wipe down with a damp cloth with Isopropyl alcohol, non-
conductive distilled water, or electronically non-conductive
inert surfactants.
Cadwell recommends the following cleaning supplies:
Antiseptic Towelettes
Alcohol Pads
Envirocide™ Electrode Cleaner
Cotton Swabs
Sterile Cotton Balls
While the Easy III system has been carefully designed and manufactured to be reliable and
durable, regular cleaning and inspecting of the system will promote long-term trouble-free
operation of the system. Avoid extremes of physical stress such as dropping the unit or exposing
it to extreme temperatures.
Reusable Items
Clean reusable items after each use. The Easy III cables can be wiped down with a damp cloth or
ethanol. Do not allow direct contact of liquids to the connectors on the EasyNet cables.
The Cadwell EEG electrodes can be washed with a hospital grade cleaner such as Envirocide®.
Allow the electrodes to air dry prior to reuse.
Technical
Technical
Compliances
The Easy III amplifier inputs are type CF rated. CF rating ensures that no current higher than
50uA flows to or from the applied part if mains voltage is inadvertently connected to the patient.
All EasyNet modules are BF rated.
HIPPA Compliant access rights and auditing. Each time a patient file is accessed, the user ID is
added to the user channel events. Manually entered sleep events are stamped with the user ID.
Environment
The Easy III system should be stored in a clean, dry place. Handle the system with care.
Transport and Storage Limits (ambient conditions)
Temperature: -20º C (-4º F) to 65º C (149º F)
Relative Humidity: 10% - 90% non-condensing
Atmospheric Pressure: 500 hPa to 1060 hPa
Operational Limits (ambient conditions)
Temperature: +10º C (+50º F) to +40º C (+104º F)
Relative Humidity: 30% - 75%
Atmospheric Pressure: 700 hPa to 1060 hPa
Factory Calibration
Regular preventative maintenance never involves access to the interior of the Easy III system. It
involves regular inspection and cleaning of Easy III components.
Recommended Factory Service Interval
In general Cadwell recommends yearly factory service and calibration verification to help assure
continued top performance from the equipment. However, the service interval may be
lengthened or shortened as device performance history dictates. Refer to your facility’s in-house
equipment calibration policies and procedures for further guidance on this subject.
For service issues that require corrective maintenance and/or internal component service, contact
Cadwell Service Department at 1.800.245.3001.
Troubleshooting
If you are unable to solve a technical problem, contact Cadwell Service team. If yours is a clinical
or software-related call, contact Cadwell Clinical Support. Call Cadwell at 1.800.245.3001.
Please provide the following when you call:
Your account name.
Your account number.
The device serial number.
Detailed information about the issue.

Customer Support
Customer Support
www.cadwell.com
Domestic customers:
Phone: 800.245.3001 or 509.735.6481
Fax: 509-783-6503
International customers:
Please contact your distributor (listings available at www.cadwell.com) or email
International@cadwell.com
Support hours
Service department support: Monday through Friday from 6:30 A.M. to 5 P.M. PST.
Application support: Monday through Friday from 6:30 am. to 5 P.M. PST.
Contact Easy III Customer Support If:
o You continue to experience difficulty after troubleshooting a problem. Cadwell
Laboratories has a rapid, cost-effective method for troubleshooting and servicing
equipment. Most problems can be diagnosed over the telephone, and repairs can be
performed by sending in the defective part.
o You wish to order optional equipment.
To contact Cadwell for a problem
1. Have your customer identification number and serial number near the phone. Have a
person who runs the equipment be prepared to speak to a service technician. This person
should be able to provide an accurate description of the problem. It is best if the person
calling is in front of the equipment when they call.
2. Call the customer support number, and ask for the service department. The Cadwell
service technician will determine if an exchange or repair of parts is necessary and instruct
you on appropriate shipping arrangements.
Using Help Files
By accessing the Easy III help files, you can get the same information about the operation,
terminology, and capabilities of the Easy III as are found in the Operator's Manual.
Access
The help files can be accessed during operation of the Easy III software by clicking.
An electronic copy of the Operator's Manual is available on the software installation CD included
with your Easy III system. To access the file, insert the CD into the computer's CD-ROM . When
prompted "Do you want to run the Easy III Installer," click the No button. Go to the My
Computer file, right-click on the Easy III icon, and click Open.
Index
Index
A
AASM ................................................................... 208
Amplifier3, 10, 13, 14, 16, 18, 19, 20, 21, 22, 23, 24,
25, 26, 29, 31, 34, 46, 169, 211, 214, 215
Archive ................................................................... 84
B
Bookmark ..................................................... 187, 196
C
Cables .. 10, 13, 14, 16, 18, 23, 24, 26, 29, 31, 32, 49,
50, 51, 52, 169, 209, 211, 212, 214, 215
Calibration ........................................................... 215
Camera ....................................... 14, 16, 59, 188, 209
Cart ....................................................... 21, 25, 26, 29
Channel .......... 3, 19, 20, 23, 34, 46, 52, 53, 188, 208
Chest Belt ......................................................... 52, 53
Comments .............................................. 22, 190, 196
Compliance .......................................................... 215
Configurations .............. 13, 20, 25, 34, 46, 209, 212
Connections .. 18, 20, 22, 23, 25, 32, 34, 46, 83, 169,
209
Contact ......................................... 209, 210, 214, 215
CPN .......................................................... 14, 31, 169
Customer Service ........................................ 214, 215
D
DC ............................................... 3, 19, 20, 23, 34, 46
E
EasyNet 2, 14, 16, 19, 20, 23, 34, 46, 52, 53, 56, 214,
215
Electrodes ..................... 10, 16, 23, 50, 169, 211, 214
Events ................... 3, 19, 23, 190, 191, 204, 208, 215
F
Filters .......................................... 20, 34, 46, 187, 204
Flash Program ..................................... 29, 30, 31, 32
G
Ground ....... 10, 14, 20, 25, 26, 34, 46, 209, 210, 211
H
Hard Disk ............................................................... 14
Hardware 3, 13, 14, 16, 18, 22, 25, 26, 52, 169, 209,
214, 215
I
Impedance ............................. 20, 22, 23, 34, 46, 196
Install ............................................ 3, 16, 83, 209, 212
Intended Use ............................................. 3, 10, 211
International 10-20 ................................ 10, 169, 211
Isolation Transformer ...... 10, 25, 26, 169, 209, 211,
212
L
LED ............................. 14, 20, 22, 26, 30, 34, 46, 169
Log In................................................................ 85, 86
M
Memory .......................................................... 14, 190
Montage ............................................................... 187
N
Network ................................. 14, 22, 23, 26, 83, 209
Network Card ........................................... 23, 26, 83
O
Off ....................................................... 22, 23, 26, 213
On.............................. 3, 22, 26, 85, 86, 169, 188, 191
Operating System ................................................. 14
Oximeter .................................................... 16, 52, 53
P
Paper Speed ......................................................... 187
Password ................................................................ 85
Patient ....................................................... 10, 52, 211
PC ............................................................................ 14
Photic Stimulator ... 3, 14, 16, 20, 23, 25, 26, 29, 30,
31, 32, 34, 46, 169, 212, 214
Power/Com Module .. 14, 22, 23, 25, 26, 28, 29, 31,
169, 214
Preferences ..................................................... 86, 188
Protocol ................................................................ 169
PSG ....................................... 3, 16, 52, 53, 84, 86, 97
228
Q
QVideo ............... 14, 16, 59, 188, 190, 191, 192, 196
R
Read Data ............................................... 86, 191, 204
Record ... 3, 10, 19, 20, 22, 34, 46, 52, 53, 85, 86, 97,
188, 190, 191, 192, 196, 204, 208, 211
Record Edit .......................................................... 192
Regulations .............. 10, 14, 209, 210, 211, 212, 215
Remote Input Box .. 10, 16, 23, 49, 50, 51, 169, 211,
212, 214
Reports ..................................................... 3, 187, 196
Requirements ........................ 3, 14, 32, 59, 209, 210
Review ............................ 84, 188, 190, 191, 196, 204
Run/Stop button .................................................... 30
S
Safety ............................................................ 209, 210
Select Record ............................................... 190, 204
Sensitivity .................................................. 20, 34, 46
Settings ........................................................... 97, 188
Setup ............................... 3, 14, 16, 86, 169, 188, 190
Sleep Events ........................................................... 84
Software .... 2, 3, 16, 26, 59, 83, 84, 85, 86, 188, 191,
216
Support ............................................. 3, 213, 215, 216
T
Toolbars .................................................................. 85
Trace ............................................................. 187, 188
Trolley ........................................................ 21, 26, 29
U
USB ................................................................... 14, 59
Users ......................... 2, 3, 10, 32, 188, 204, 211, 215
V
Video ............................ 14, 16, 59, 84, 188, 190, 192
W
Warranty .............................................................. 213