Illuminant Influence On The Reconstruction Of NIR Spectra 3371 0deec5231f9b126b3b000000
User Manual: 3371
Open the PDF directly: View PDF ![]() .
.
Page Count: 6

Illuminant Influence on the Reconstruction of
NIR Spectra
Meritxell Vilasecaa, Jaume Pujola, Montserrat Arjonaa, and Francisco Martínez-Verdúb
aCenter for Sensors, Instrumentation and Systems Development (CD6),
Dept. of Optics and Optometry, Universitat Politècnica de Catalunya
Terrassa, Barcelona, Spain
bDept. Interuniversitari d’Òptica, Universitat d’Alacant
Alacant, Spain
Abstract
In order to recover spectral reflectances or transmittances
using a multispectral imaging based technique, it is
necessary to know the spectral radiance of the illuminant
used to light the samples in the acquisition process. In this
study, we analyzed the influence of the spectral
distribution of the illuminant on the reconstruction of
spectral reflectances in the near infrared region of the
spectrum (NIR). We considered a set of 30 textile samples
with different spectral reflectance in this region. We tested
the performance of a principal component analysis (PCA)
based method and a non-linear estimation method (NLE),
which allow us to obtain the spectral reflectance of
samples in the NIR region from a small number of
measurements performed with a CCD camera. Using
numerical simulation, we analyzed the number and shape
of the optimum filters that need to be used in the
acquisition channels in order to obtain good spectral
reconstructions under several lighting conditions. Finally,
we studied the quality of the reconstructions with a set of
commercially available filters which are similar to the
optimum filters obtained in the simulations. The results
obtained show that the reconstruction does not depend
heavily on the illuminant used. This indicates that, with the
same set of filters, we can obtain good reconstructions for
different types of illuminant.
Introduction
Conventional CCD cameras1,2 have maximum spectral
sensitivity in the visible region of the spectrum.
Nevertheless, CCD cameras with improved response in the
near infrared (NIR) are currently manufactured and their
spectral sensitivity is clearly significant up to 1000 nm.
Therefore, this standard instrumentation can be used in
order to obtain spectral information of samples in the NIR
region (800 – 1000 nm), which is not usually available
with conventional spectrophotometers. Standard
spectrophoto-meters normally have their response limited
to the visible range and require additional sensors to detect
energy coming from the NIR (for example, InGaAs), which
can significantly increase their cost. The spectral
information included in the NIR region is in general
directly related to the constituents of a material. Therefore,
it is used as an analytical tool in industry and research, and
is known as NIR technology.3 The applications include
agriculture, the food industry, medical applications,
military applications, the chemical industry etc.
Multispectral imaging4-7 allows us to obtain the
reflectance or transmittance spectra of samples using
conventional CCD camera measurements. This technique
uses different acquisition channels from which several
images of the analyzed sample are obtained. Because of
the different spectral response of the channels, the obtained
images hold spectral information of the acquired scene. It
is therefore possible to calculate the spectral reflectance or
transmittance of the original measured sample. The
multispectral imaging based methods need all the spectral
variables involved in the acquisition process to be known.
These variables are; the spectral radiance of the illuminant
used, the spectral transmittance of the filters which define
each of the acquisition channels and the spectral sensitivity
of the CCD camera. After selecting the CCD camera, we
can study which illuminants and filters may be used in
order to obtain the best reconstruction results of the set of
considered samples. Since the mathematical methods used
perform approximations, the factors mentioned may yield
different quality reconstructions.
In this work we studied the performance of two
different spectral reconstruction methods, principal
component analysis (PCA)6,8-10 and a non-linear estimation
method (NLE),11,12 under several lighting conditions. The
considered illuminants were of the blackbody type with
color temperatures between 1000 K and 16000 K. By
numerical simulation, we analyzed the shape of the
optimum filters which must be placed in front of the
camera in order to obtain good reconstructions of the
reflectance spectra of different samples for the tested
illuminants. After that, we studied the influence of the
illuminant on the quality of the reconstruction using
commercially available filters similar to the optimum
filters used in the simulations.
IS&T's 2003 PICS Conference
536
Spectral Reconstruction Methods
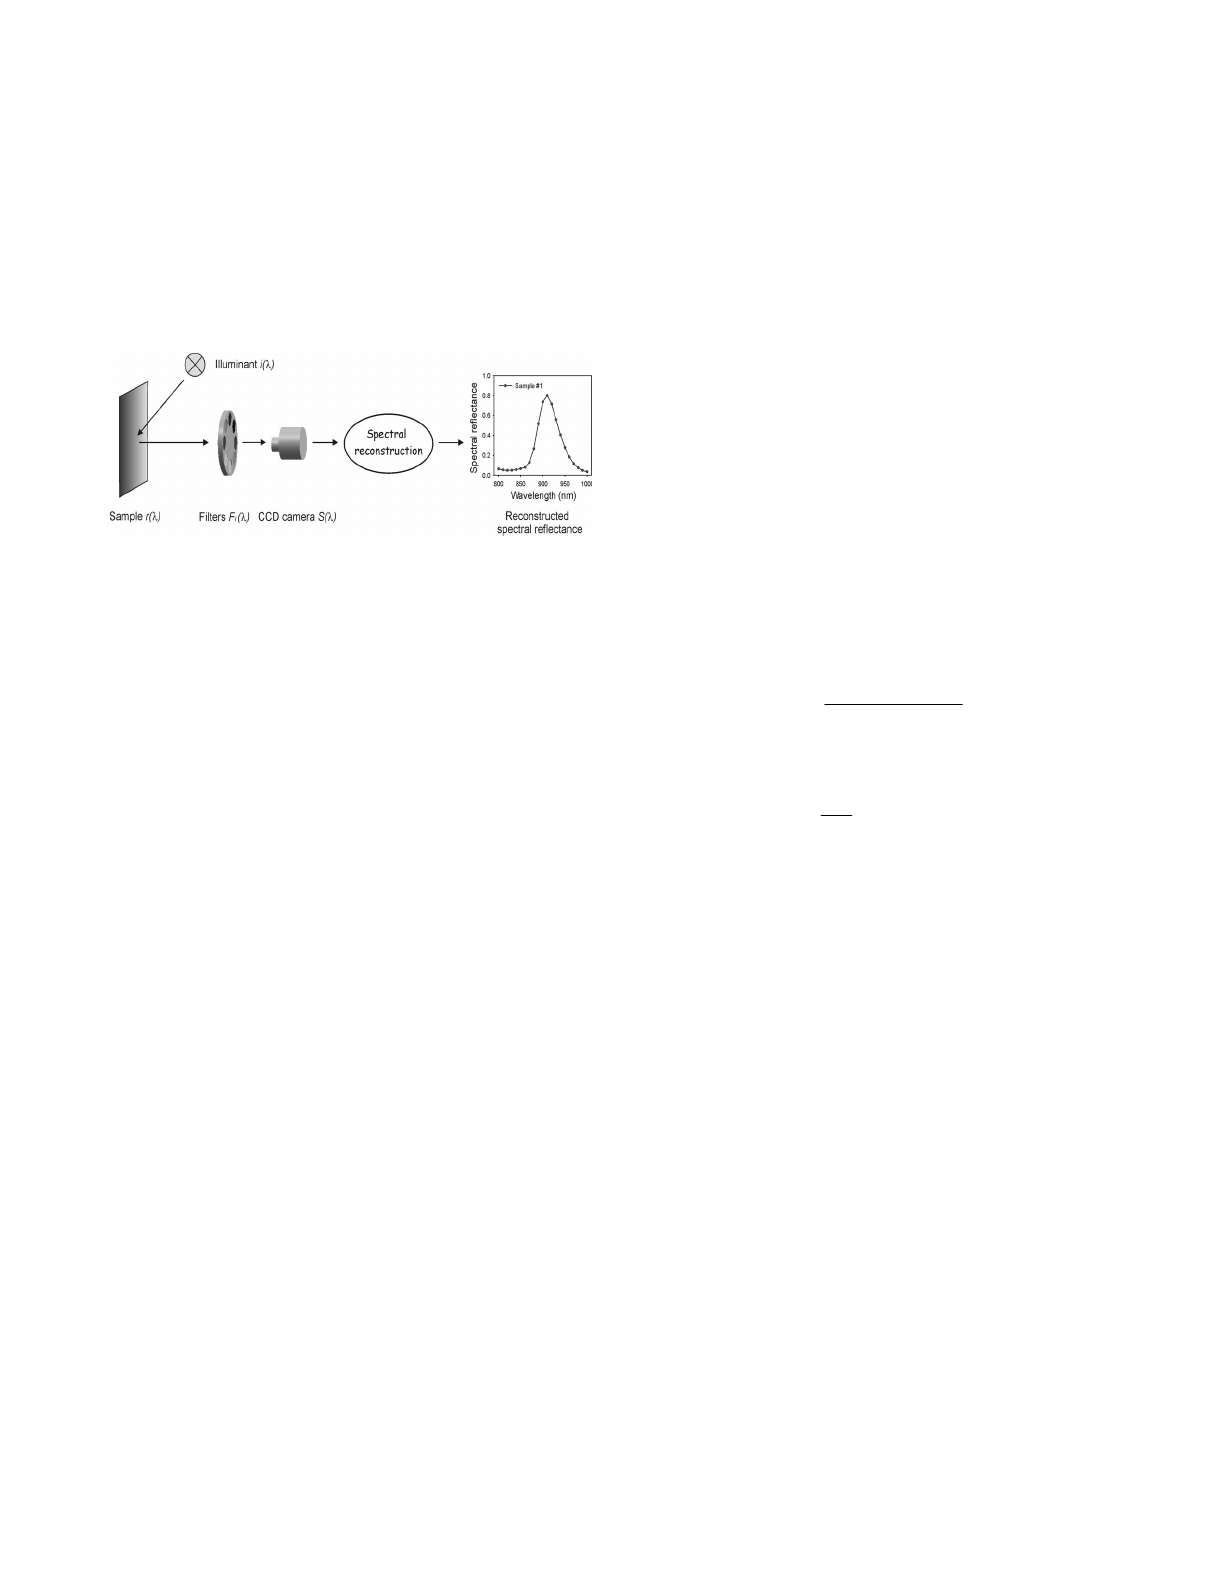
The reconstruction process used in multispectral imaging
based methods is summarized in Figure 1. A multi-channel
image of an original object is acquired by placing a
selected set of filters in front of the camera. After that, a
spectral reconstruction method is applied and the
reconstructed spectral reflectance of the sample is
obtained.
Figure 1. Schematic view of the acquisition system and the final
spectral reconstruction step.
There are several spectral reconstruction methods
based on interpolation or estimation methods.4-7 The latter
include linear methods, NLE or PCA methods. In this work
we analyzed the performance of a PCA and an NLE
method. In previous works10,15 we showed how these
methods yield the best spectral reconstruction results in the
NIR region.
In order to use these methods, it is necessary to know a
set of spectral reflectances similar to the curves that we
want to reconstruct. The set of n known spectral
reflectances is represented by a n x p matrix called Or.
The camera responses for the acquisition channels can
be expressed in matrix notation as follows:
Cr X = (1)
where X is a column vector which represents the m
responses of the camera to a sample, r is a column vector
(n components) representing the spectral reflectance of the
sample, and C is a m
×
n matrix in which each row is the
spectral sensitivity of a different acquisition channel, that
is, i(
λ
l)Fi(
λ
l)S(
λ
l) with i=1,.., m and l=1,...,n, i(
λ
l) being the
spectral radiance of the illuminant, Fi(
λ
l) the transmittance
of the filters used, and S(
λ
l) the sensitivity of the CCD
camera.
The PCA method associates the matrix Or to a vector
space and its characteristic vectors can be calculated. Thus,
each spectral reflectance curve can be obtained as a linear
combination of the largest characteristic vectors:
rqr2r1Mrec vvvrr
ξβα
++++≈ ... , q<n (2)
where rrec is the reconstructed spectral reflectance, rM is the
mean spectral reflectance of the curves belonging to Or,
vr1, vr2,..., vrq are the characteristic vectors and
α
,
β
,..,
ξ
are
scalar coefficients. They can be experimentally determined
relating the camera responses for each sample to the
characteristic vectors, that is, combining Eqs. (1) and (2):
rq
r2r1
MCvCvCvCrCrX
ξβα
++++≈= ... , q<n (3)
On the other hand, the NLE method used supposes that
a matrix DNL exists and that it provides the spectral
reflectances from:
NLNLrec XDr = (4)
where XNL is a column vector which represents a complete
second order polynomial calculated using the camera
responses, that is,
[]
T
322121
2
3
2
2
2
1321 X XX XX X X X X X X1 X=
NL
X (5)
The matrix DNL can be calculated using the
pseudoinverse technique,5,13,14 taking into account the
reflectance spectra belonging to the matrix Or:
1
)( −
=T
NLNL
T
NLrNL XXXOD (6)
In order to evaluate the quality of the reconstruction of
the analyzed spectra we use two different parameters :
Percentage of Reconstruction:
100
)(
)(
1
2
2
×
−
−= ∑
∑
max
min
max
min
r
rr
P
rec
rec
λ
λ
λ
λ
(7)
Root Mean Square Error:
2/1
2
)(
1
−= ∑max
min
rec
rr
N
RMSE
λ
λ
λ
(8)
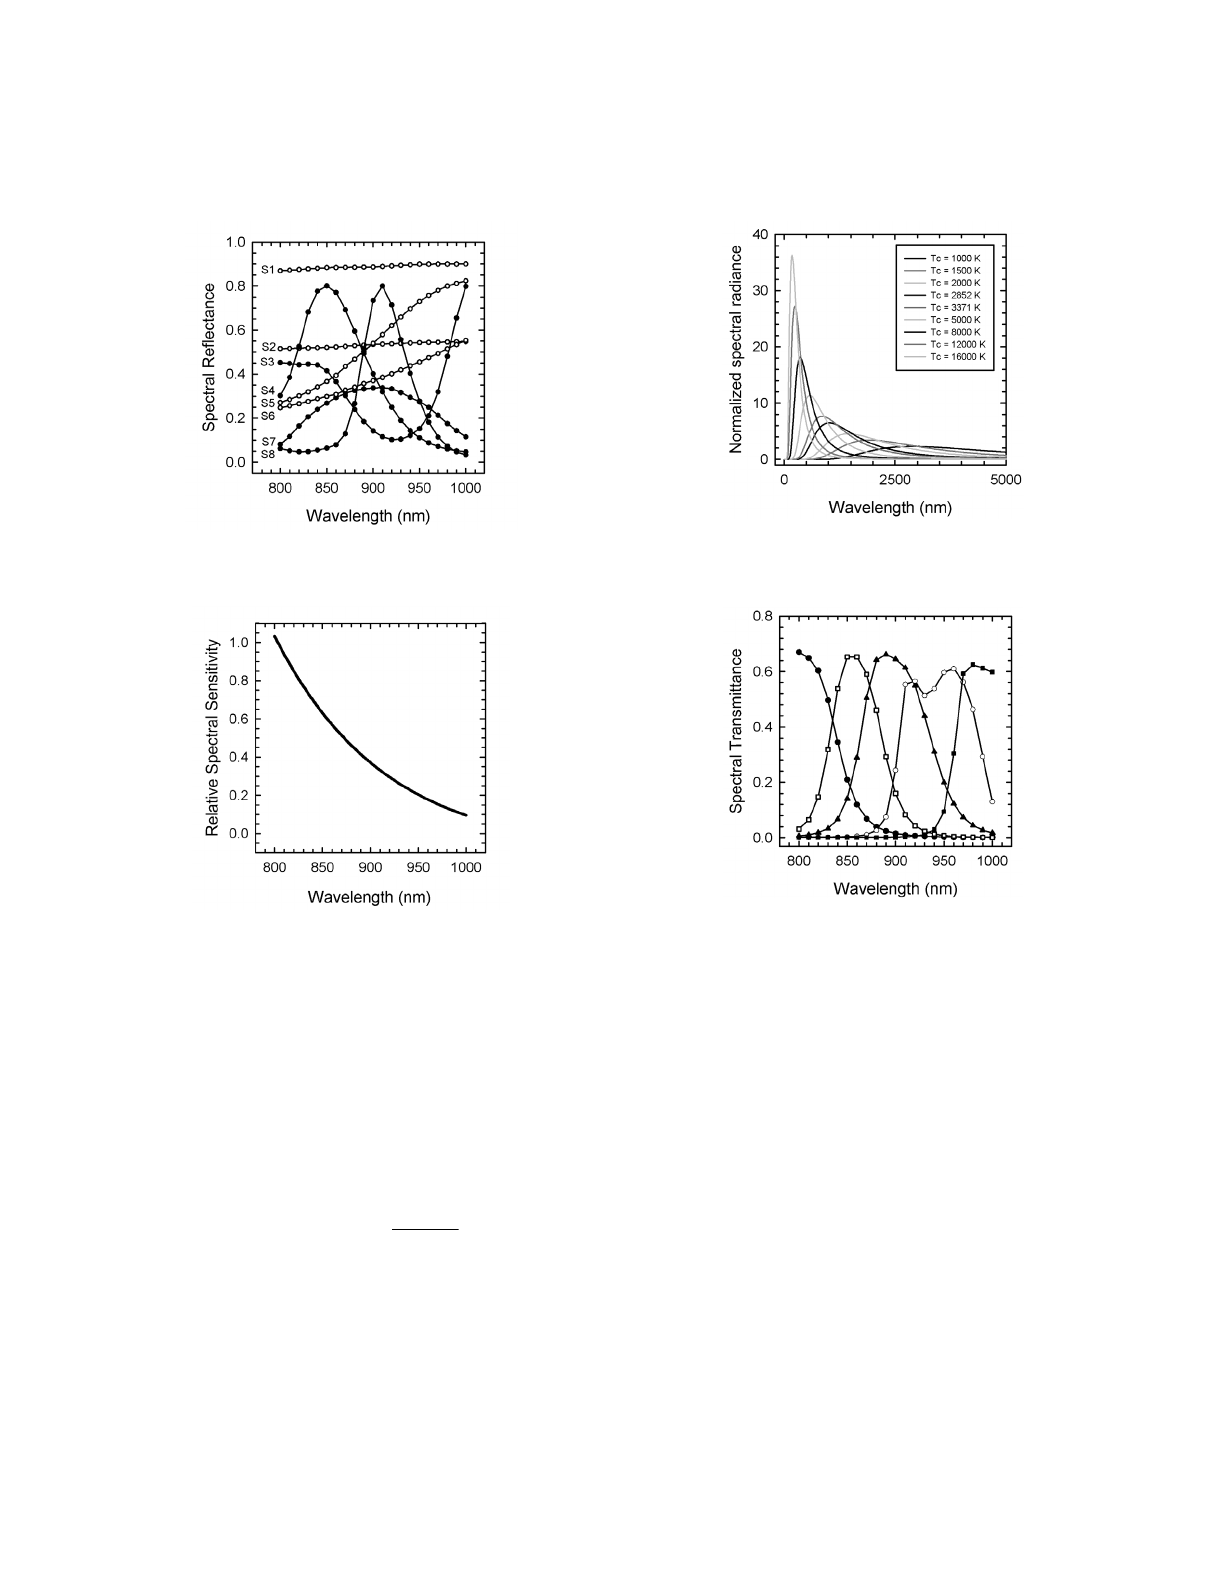
Data
In order to perform the simulations and the optimization
process we considered a matrix Or composed of 30 spectral
reflectance curves corresponding to textile samples (Figure
2). We considered the spectral data between 800 and 1000
nm in 10 nm steps. Therefore, each curve was made up of
21 components. The CCD camera used was a JAI CV-M10
progressive scan camera (Figure 3).
The analyzed illuminants were blackbody or Planckian
type (specifically graybody radiators) with the following
color temperatures: 1000, 1500, 1800, 1850, 1900, 2000,
2852, 3371, 4000, 5000, 6000, 7000, 8000, 9000, 12000,
13000, 14000 and 16000 K (Figure 4). 2852 and 3371 K
correspond to the color temperatures of commercial
available sources. The total emission of the illuminants
was normalized to a specific value of radiance (105
W/sr*m2) in order to obtain simulated lamps with the same
radiant flux. In the case of the PCA method, it can be seen
that the reconstruction results only depend on the relative
emission of the illuminant, that is, its color temperature.
Unlike PCA, the results provided by the NLE method have
a dependency on the absolute emission of the illuminant as
well as the color temperature. In order to take into account
this dependency we have also analyzed the NLE method
IS&T's 2003 PICS Conference
537
under the influence of some illuminants with color
temperature Tc = 3371 K but different radiance values
(specifically 103, 104, 106 and 107 W/sr*m2).
Figure 2. Spectral reflectance curves of 8 representative samples
belonging to the matrix Or.
Figure 3. Experimental relative spectral sensitivity of the camera
JAI CV-M10.
In the first part of the numerical simulation we used
five equi-spaced Gaussian filters in the 800-1000 nm
region with variable spectral bandwidth, in order to obtain
simple transmittance profiles and therefore available
commercial filters. In a previous work we demonstrated
that five filters were enough to achieve good
reconstructions in the NIR region10,15. The transmittance of
each simulated filter was:
−
−=
2
0
2ln4exp)( FWHM
TT MAX
λλ
λ
(9)
where TMAX (considered 1 in this study) is the maximum
height of the Gaussian peak,
λ
0 is the wavelength
corresponding to the maximum (center) of the Gaussian
and FWHM is the full width at half maximum of the
Gaussian. The parameter FWHM was considered the
optimization parameter. In order to determine the shape of
the optimum filters, it was increased progressively in the
same way for all the channels and the value providing the
best reconstruction for the spectral curves belonging to Or
was chosen.
Figure 4. Spectral radiance of the analyzed illuminants
normalized to 105 W/sr*m2.
Figure 5. Spectral transmittance of the real interference filters.
After the optimizations with simulated Gaussian
filters, we used real commercial filters (Thermo Corion
interference filters) in order to evaluate the influence of the
illuminants in the reconstructions. These filters were
chosen taking into account the shape of the optimum
Gaussian filters obtained. According to the results, the
FWHM of the filters should be approximately 70 nm. The
transmittance of the five real interference filters is shown
in Figure 5.
Results
1. Reconstructions with the Simulated Gaussian Filters
In order to determine the shape of the optimum equi-
spaced Gaussian filters and therefore to obtain the best
reconstruction results under all the analyzed lighting
conditions, we performed a numerical simulation using the
two proposed reconstruction methods. The best filters were
determined by searching for the minimum mean RMSE of
the curves belonging to the matrix Or. Table 1 and Table 2
IS&T's 2003 PICS Conference
538

show the obtained results for the PCA and the NLE
methods using illuminants with different color
temperatures and radiance 105 W/sr*m2. The obtained
reconstruction results using the NLE method and
illuminants of color temperature Tc = 3371 K with
different radiance values are shown in Table 3.
In the PCA method, the optimizations using
illuminants with higher temperature yield optimum filters
with smaller FHWM. The parameter Prec decreases with the
color temperature, and RMSE increases. Using the NLE
method, there is no clear relationship between the color
temperature and the FHWM of the optimum filters.
Similarly, the simulations performed with illuminants of
color temperature Tc = 3371K with different radiance
values provide results that do not bear any relationship to
the emitted radiance.
In both methods there is a stabilization of the optimum
spectral bandwidth of the filters for illuminants of color
temperature Tc = 5000 K – 6000 K or more. This can be
explained by the spectral emission of the illuminants in the
NIR region. Because the illuminants with large color
temperature have the maximum emission peak located at
short wavelengths, they have a similar decreasing spectral
distribution between 800 and 1000 nm.
The results obtained can be explained as follows. The
PCA method is a linear method whose simulation results
are described by equation (3). The explicit form of this
equation is:
...
1++= ∑∑∑
λλλ
λ
λλλλ
λ
λλλλ
λ
λ
α
vsFirsFirsFi iMii (10)
Table 1. Reconstruction results using the PCA method,
the simulated Gaussian filters and illuminants with
different color temperatures.
Tc (K) FWHM Mean Prec
Mean (RMSE*100)
1000 122 99.996 0.170
1500 97 99.996 0.183
1800 87 99.995 0.191
1850 85 99.995 0.193
1900 82 99.995 0.194
2000 80 99.995 0.197
2852 66 99.995 0.215
3371 61 99.994 0.223
4000 59 99.994 0.229
5000 56 99.994 0.237
6000 75 99.994 0.242
7000 54 99.994 0.245
8000 54 99.993 0.248
9000 54 99.993 0.250
12000 54 99.993 0.253
13000 54 99.993 0.254
14000 52 99.993 0.255
16000 52 99.993 0.256
Table 2. Reconstruction results using the NLE method,
the simulated Gaussian filters and illuminants with
different color temperatures.
Tc (K) FWHM Mean Prec
Mean (RMSE*100)
1000 66 100 0.032
1500 92 100 0.014
1800 38 100 0.014
1850 89 100 0.014
1900 38 100 0.013
2000 82 100 0.015
2852 80 100 0.016
3371 78 100 0.016
4000 80 100 0.016
5000 103 100 0.016
6000 103 100 0.017
7000 97 100 0.016
8000 99 100 0.016
9000 97 100 0.016
12000 101 100 0.016
13000 103 100 0.016
14000 99 100 0.016
16000 101 100 0.016
Table 3. Reconstruction results using the NLE method,
the simulated Gaussian filters and illuminants of Tc =
3371K with different radiance values.
Radiance
(W/sr*m2)
FWHM Mean Prec Mean (RMSE*100)
103 45 100 0.025
104 80 100 0.016
105 78 100 0.016
106 49 100 0.020
107 96 100 0.024
In order to obtain similar results in the optimization
process of the filters for any sample, it is necessary to have
similar values of the term i
λ
s
λ
r
λ
for the different analyzed
illuminants (or, by extension, the terms i
λ
s
λ
rM
λ
and i
λ
s
λ
v1
λ
,
i
λ
s
λ
v2
λ
etc.). Figure 6 shows these spectral products for a
particular sample belonging to the matrix Or. While
spectral products with different shape, corresponding to
specific illuminants, have different optimization results,
similarities in these spectral curves are translated to similar
spectral bandwidths of the obtained optimum filters.
On the other hand, the shape of these products does
not explain the behavior found in the NLE method. This
method uses the pseudoinverse technique which computes
the inverse of a nonsquare matrix and which, in general,
has singularities. The method searches for a least squares
solution. Therefore, the obtained results are very sensitive
to input variations and may present considerable
oscillations.
IS&T's 2003 PICS Conference
539

Figure 6. Spectral curve r
λ
s
λ
i
λ
of the sample S3 belonging to Or.
2. Reconstructions with the Real Filters
In the last section we have presented optimizations
performed with five simulated Gaussian filters. We have
seen that the spectral bandwidth of the optimum filters
depends on the considered illuminant for both analyzed
methods. Taking into account that incandescent or halogen
lamps, which are used in many devices, have color
temperatures within the 2800–3100 K range, we can
consider the results obtained for the illuminants with color
temperatures 2852 K and 3371 K as optimum. Using the
PCA method, the spectral bandwidth of the optimum filters
for these two illuminants are 66 nm and 78 nm
respectively. In the case of the NLE method, the FWHM
values are 80 nm and 78 nm. When ones uses the
illuminants of color temperature 3371 K with different
radiance values, the optimum filters have an FWHM of
between 45 nm and 96 nm. In conventional commercial
catalogues of various manufacturers we can find common
interference filters with the following spectral bandwidths
(FWHM): 1.5, 3, 10, 25, 40 and 70 nm. In almost all the
cases considered, the one most similar to those obtained in
the simulation process is the filter with a FWHM value of
70 nm. We acquired five filters with these spectral features
included in the analyzed range (Thermo Corion
interference filters), that is, the NIR region. The
transmittance of these filters is presented in the data
section (Figure 5). We can now consider how the
reconstructions use these filters under the influence of the
different illuminants. Table 4 shows the reconstruction
results obtained for the PCA method with some illuminants
of different color temperatures, and the results for the NLE
method are presented in Table 5. Table 6 shows the
reconstruction results for the NLE method under the
influence of the illuminants of color temperature 3371 K
with different radiance values.
While, with the PCA method, the RMSE parameter
increases when the color temperature is increased (as we
found in the case of the Gaussian filters), the results are
almost constant for the different illuminants analyzed with
the NLE method (except for the illuminant with color
temperature 1000 K). Using the NLE method and
illuminants of color temperature 3371 K with different
radiance values, the results obtained for the RMSE
parameter are almost the same in all the analyzed cases,
except for the illuminant with a radiance value of 107
W/sr*m2, for which a worse RMSE was found.
Table 4. Reconstruction results using the PCA method,
the five real interference filters and illuminants with
different color temperatures.
Tc Mean Prec Mean (RMSE*100)
1000 99.995 0.184
2000 99.992 0.238
2852 99.988 0.280
3371 99.985 0.302
5000 99.979 0.351
16000 99.966 0.443
Table 5. Reconstruction results using the NLE method,
the five real interference filters and illuminants with
different color temperatures.
Tc Mean Prec Mean (RMSE*100)
1000 100 0.044
2000 100 0.016
2852 100 0.016
3371 100 0.017
5000 100 0.017
16000 100 0.018
Table 6. Reconstruction results using the NLE method,
with five real interference filters and illuminants of Tc
= 3371K with different radiance values.
Radiance
(W/sr*m2)
Mean Prec Mean (RMSE*100)
103 100 0.018
104 100 0.017
105 100 0.017
106 100 0.017
107 100 0.024
In general, even when there are variations in the
results, they are not significant. All the performed
reconstructions have Prec > 99.9 % and RMSE < 1. In a
previous work it was demonstrated that these values
guarantee acceptable reconstructions of the samples in the
NIR region10,15. Therefore, the set of commercial analyzed
filters can be used to obtain spectral reflectance curves
under the influence of all the analyzed illuminants.
Conclusion
In this work, we studied the influence of the illuminant on
the reconstruction of NIR spectra using multispectral
imaging methods. We used principal component analysis
(PCA) and a non-linear method (NLE) based on a second
order polynomial in order to obtain reflectance spectra in
the NIR region using CCD camera measurements under
several lighting conditions. The analyzed illuminants were
IS&T's 2003 PICS Conference
540

graybody radiators with color temperatures between 1000
K and 16000 K with the same radiant flux for both
methods and illuminants with color temperature 3371 K
and different radiance values in the case of the NLE
method. In the first part of the study, we used five equi-
spaced Gaussian filters in order to reconstruct the spectral
reflectance of 30 textile samples. We determined the
optimum spectral bandwidth of the filters in order to obtain
the best possible reconstruction for each analyzed case,
that is, for each illuminant and tested method. According to
the results obtained, we analyzed a set of commercially
available interference filters (Thermo Corion) and analyzed
the quality of reconstruction achieved with these filters
under different lighting conditions. The results obtained
show that Prec > 99.9 % and RMSE < 1 in all the analyzed
cases. This indicates that, with the same set of filters, we
can obtain good reconstructions for all the considered
illuminants in the NIR region.
Acknowledgments
This research was supported by the Comisión
Interministerial de Ciencia y Tecnología (CICYT) (Spain)
under grants TAP-99-0856 and DPI2002-00118. M.
Vilaseca would like to thank the Generalitat (Government)
of Catalonia for the PhD grant she has received.
References
1. G. C. Holst, CCD Arrays, Cameras and Displays, SPIE
Press, Bellingham, WA, 1998.
2. G. C. Holst, Solid-state Cameras in Handbook of Optics III,
McGraw-Hill, NY, 2001, p. 4.1.
3. J. M. Pope, NIR Gains Continue in On-line Process
Applications, Chiltons I&CS, 67, 1994, p. 45.
4. F. König and W. Praefcke, The Practice of Multispectral
Image Acquisition, Proc. SPIE 3409, 1998, p. 34.
5. J. Y. Hardeberg, F. Schmitt, H. Brettel, J-P. Crettez and H.
Maître, Multispectral Image Acquisition and Simulation of
Illuminant Changes in Colour Imaging: Vision and
Technology, John Wiley & Sons, Chichester, England,
1999, p. 145.
6. J. Y. Hardeberg, F. Schmitt and H. Brettel, Multispectral
Image Capture Using a Tunable Filter, Proc. SPIE 3963,
2000, p. 77.
7. B. Hill, (R)evolution of Color Imaging Systems, Proc.
CGIV, 2002, p. 473.
8. J. L. Simonds, Application of Characteristic Vector Analysis
to Photographic and Optical Response Data, J. of the Optical
Soc. of America, 53, 1963, p. 968.
9. I.T. Jolliffe, Principal Component Analysis, Springer-
Verlag, NY, 1986.
10. M. Vilaseca, J. Pujol and M. Arjona, Spectral Reflectance
Reconstruction in the NIR Region Using Conventional CCD
Camera Measurements, Applied Optics (accepted),
December 2002.
11. P. G. Herzog, D. Knipp, H. Stiebig and F. König,
Colorimetric Characterization of Novel Multiple-channel
Sensors for Imaging and Metrology”, J. of Electronic
Imaging 8, 1999, p. 342.
12. G. Hong, M. R. Luo and P.A. Rhodes, A Study of Digital
Camera Colorimetric Characterization Based on Polynomial
Modeling, Color Research and application 26, 2001, p. 76.
13. A. Albert, Regression and the Moore-Penrose
Pseudoinverse, Academic Press, NY, 1972.
14. D. Hanselman and B. Littlefield, Matlab 5. A
Comprehensive Tutorial and Reference, Prentice Hall, New
Jersey, 1998.
15. M. Vilaseca, J. Pujol and M. Arjona, NIR
Spectrophotometric System Based on a Conventional CCD
Camera, Proc. Electronic Imaging: Machine Vision
Applications in Industrial Inspection XI, 2003.
Biography
Meritxell Vilaseca completed her BSc Degree in Physics
at the Autonomous University of Barcelona in 2000. She
completed her Degree in Optics and Optometry at the
Technical University of Catalonia in 1996. She is currently
enrolled on the PhD program in Optical Engineering at the
Technical University of Catalonia. Her work focuses on
camera calibration and characterization, industrial
colorimetry, color management and imaging.
e-mail: mvilasec@oo.upc.
IS&T's 2003 PICS Conference
541
