13480_Aqua Sorp_Web 13480 Aqua Sorp Web
User Manual: 13480_AquaSorp_Web
Open the PDF directly: View PDF ![]() .
.
Page Count: 124 [warning: Documents this large are best viewed by clicking the View PDF Link!]
Version 3.0
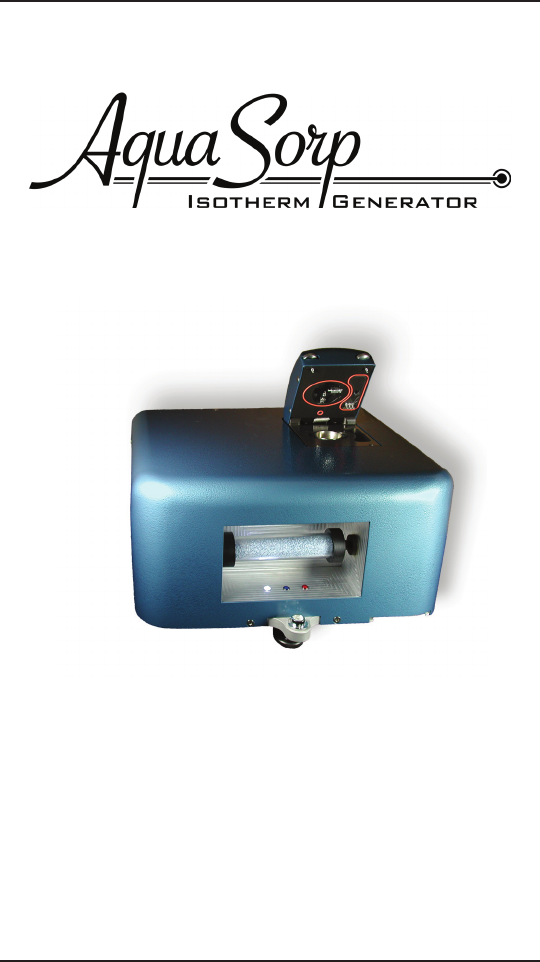
Moisture Sorption Isotherm Generator
Operator’s Manual

Copyright ©2007-2009
Decagon Devices, Inc.
2365 NE Hopkins Court
Pullman WA 99163
tel: (509) 332-2756
fax: (509) 332-5158
www.decagon.com/isotherm
aquasorp@decagon.com
Decagon Devices, Inc.
All rights reserved

Table of Contents
1. Introduction....................................5
About this Manual.........................................................5
Customer Service...........................................................5
Warranty........................................................................6
Note to Our AquaSorp Users.........................................6
Seller’s Liability..............................................................6
2. About the AquaSorp.................8
Moisture Sorption Isotherms..........................................8
Measurement Method..................................................10
Limitations...................................................................10
Specifications................................................................11
3. Theory............................................12
Hysteresis.....................................................................14
Non-equilibrium..........................................................17
Matrix changes.............................................................17
Working Isotherms.......................................................19
Uses for Moisture Sorption Isotherms..........................19
Isotherm Models..........................................................21
e DDI Isotherm Method Compared
to Other Methods.........................................................22
4. Getting Started.........................26
Components of your AquaSorp....................................26
e AquaSorp Isotherm Generator Essentials...............27
Preparing for Operation...............................................29
5. SorpTrac Software.................33
A Closer Look at SorpTrac...........................................34
6. Running a Test............................46
Connect to the AquaSorp.............................................46

2Index >>>..................................................12
Setting the AquaSorp Temperature...............................46
Starting a new Test.......................................................48
Data Collection............................................................61
Saving Data..................................................................62
Modify Test..................................................................63
7. Analysis Tools...........................64
Data Analysis...............................................................64
Multiple Isotherm Analysis..........................................73
Overview of Multiple Isotherm Analysis.......................74
Running a Multiple Isotherm Analysis.........................76
Creating a Working Isotherm Using the AquaSorp.......79
8. Instrument Verification..........85
Water Activity Verification...........................................85
Balance Verification.....................................................90
9. Maintenance and Cleaning..94
Cleaning the Sample Chamber.....................................94
Cleaning the Dew Point Sensor Block..........................95
Cleaning the Block.......................................................96
Reassemble the Block and Lid......................................97
10. Troubleshooting......................98
11. Further Reading.......................100
Declaration of Conformity.......120
Certificate of Traceability........121

5
1. Introduction
AquaSorp Users Manual
1. Introduction
Welcome to Decagon’s AquaSorp Isotherm Generator, an
automatic isotherm generator from the world leaders in
water activity measurement. e AquaSorp is the only au-
tomatic isotherm generator that utilizes the Dynamic Dew-
point Isotherm (DDI) method. is revolutionary method
makes it possible to generate complete isotherms with hun-
dreds of data points quickly and accurately. We hope you
find this manual informative and helpful in understanding
how to maximize the capabilities of your AquaSorp.
About this Manual
Included in this manual are instructions for setting up your
AquaSorp, setting up an isotherm test, running a test, col-
lecting data, and analyzing data. Please read these instruc-
tions before operating the AquaSorp to ensure your instru-
ment performs to its full potential.
Customer Service
If you ever need assistance with your AquaSorp, or if you
just have questions, there are several ways to contact us.
Phone/Fax
Toll-Free: (US, Canada Only) 1-800-755-2751
Tel: (509) 332-2756
Fax: (509) 332-5158
E-mail: support@decagon.com. Please include your serial
number, a contact name, phone number and address with
a description of your problem.

6
1. Introduction
AquaSorp Users Manual
Warranty
e AquaSorp has a 30-day satisfaction guarantee and a
one year warranty on parts and labor. To validate your war-
ranty, please complete and return your warranty card in-
cluded with this manual, or register online at http://www.
decagon.com/aw/aquasorp_registration. You can return
your warranty information by fax, e-mail, or phone. Please
include all of the requested information so we may better
assist you with future needs. It is important for Decagon to
have your current mailing address and telephone number
in case we need to send updated product information to
you.
Note to Our AquaSorp Users
is manual is written to aid the end user in understand-
ing the basic concepts of moisture sorption isotherms, en-
abling them to use our instruments with confidence. Every
effort has been made to ensure the content of this manual
is correct and scientifically sound.
Seller’s Liability
Seller warrants new equipment of its own manufacture
against defective workmanship and materials for a period
of one year from date of receipt of equipment (the results
of ordinary wear and tear, neglect, misuse, accident and
excessive deterioration due to corrosion from any cause
are not to be considered a defect); but Seller’s liability for
defective parts shall in no event exceed the furnishing of
replacement parts F.O.B. the factory where originally man-
ufactured. Material and equipment covered hereby which
is not manufactured by Seller shall be covered only by the
warranty of its manufacturer.

7
1. Introduction
AquaSorp Users Manual
Seller shall not be liable to Buyer for loss, damage or inju-
ries to persons (including death), or to property or things
of whatsoever kind (including, but not without limitation,
loss of anticipated profits), occasioned by or arising out of
the installation, operation, use, misuse, nonuse, repair, or
replacement of said material and equipment, or out of the
use of any method or process for which the same may be
employed. e use of this equipment constitutes Buyer’s
acceptance of the terms set forth in this warranty. ere
are no understandings, representations, or warranties of
any kind, express, implied, statutory or otherwise (includ-
ing, but without limitation, the implied warranties of mer-
chantability and fitness for a particular purpose), not ex-
pressly set forth herein.

8
2. About the AquaSorp
AquaSorp Users Manual
2. About the AquaSorp
e AquaSorp Isotherm Generator is an automatic mois-
ture sorption isotherm generator which rapidly creates de-
tailed adsorption and desorption isotherm curves.
Moisture Sorption Isotherms
e relationship between water activity (aw) and moisture
content at a given temperature is called the moisture sorp-
tion isotherm. is relationship is complex and unique for
each product due to different interactions (colligative, cap-
illary, and surface effects) between the water and the solid
components at different moisture contents. An increase in
aw is almost always accompanied by an increase in water
content, but in a non-linear fashion. Moisture sorption
isotherms are sigmoidal in shape for most foods, although
foods that contain large amounts of sugar or small soluble
molecules have a J-type isotherm curve shape.
Isotherms provide information about product quality and
safety. A few uses for isotherms include:
Monolayer moisture content determination•
Determine critical water activity or moisture content •
limits for crispness, hardness, and flow properties.
Optimize moisture contents at a safe water activity •
that maximizes moisture and avoids over drying.
Determine shelf-life and storage stability of a prod-•
uct.

9
2. About the AquaSorp
AquaSorp Users Manual
Predict packaging requirements based on sorption •
properties of a product.
Determine the equilibrium water activity of a mix-•
ture of dry ingredients.
Determine the degree of crystallinity of powders.•
Determine the level of amorphous material in a •
product.
Determine critical water activities for phase transi-•
tions.
Determine the relationship between water activity •
and glass transition temperature.
Determine the relationship between water activity •
and crystallization.
Determine hysteresis levels for a product.•
Determine the moisture sensitivity of a product.•
Determine the equilibrium moisture content at a •
given water activity.
Allow rapid moisture content determination from •
water activity analysis through isotherm curve.

10
2. About the AquaSorp
AquaSorp Users Manual
Measurement Method
e AquaSorp creates isotherms using a water activity and
gravimetric analysis method called Dynamic Dewpoint
Isotherm (DDI). e AquaSorp controls neither water
content nor water activity, but dries or wets the sample
and measures water activity and water content during the
wetting or drying process. Water content is determined by
weighing the sample using a high precision magnetic force
balance. Water activity is determined using Decagon’s pat-
ented chilled-mirror dewpoint sensor. Drying of the sample
is imposed by flowing dry air from a desiccant tube across
the sample. Wetting of the sample is imposed by saturating
the air with water before it enters the chamber and flows
across the sample. e water reservoir is an integral part
of the measurement chamber to ensure humidity satura-
tion and minimize temperature fluctuation. e AquaSorp
consists of a case which houses the power supply, air pump,
balance, temperature controlled sample chamber, sensor
block, sensor and temperature control electronics, water
reservoir, and desiccant supply. e integrated air pump
eliminates the need for gas cylinders. is allows the Aqua-
Sorp to generate robust isotherms with hundreds of data
points much faster than other isotherm methods because
the sample does not have to equilibrate to a known humid-
ity level.
Limitations
e AquaSorp may not be able to analyze samples with
high concentrations of certain volatiles like propylene gly-
col or ethanol. Specific volatile materials can interfere with
dewpoint measurements by chilled-mirror sensors. e
AquaSorp uses a chilled mirror sensor to measure water

11
2. About the AquaSorp
AquaSorp Users Manual
activity. Not all volatiles or concentrations will be a prob-
lem, but it is important to note that the presence of some
volatiles could influence the accuracy of the isotherm.
Finally, the AquaSorp sample chamber can have some hu-
midity memory and it may be a good idea to precondition
the chamber, especially when running low moisture capac-
ity samples (such as crystalline or glassy samples).
Specifications
Water Activity Range: 0.03 to 0.95 aw
Water Activity Accuracy: ±0.005 aw
Water Activity Repeatability: ±0.003 aw
Temperature Control Range: 15° to 40° C
Temperature Operating Range: 0° to 60° C
Humidity Operating Range: 10-90% non-condensing
Universal Power: 110 V to 220 V AC. 50/60Hz
Size (Footprint): 42.5 x 36.2 x 25.4cm
16.75 x 14.25 x 10in. (L x W x H)
Weight: 42 pounds
Weight Accuracy: ± 0.1mg

12
3. eory
AquaSorp Users Manual
3. Theory
Moisture sorption isotherms describe the relationship be-
tween water activity and moisture content at a specified
temperature. e nature of this relationship depends on the
interaction between water and other ingredients. Conse-
quently, the isotherm shape is unique to each product and
products with the same water activities may have different
moisture contents depending on capillary, surface, and col-
ligative effects. Products that lie in the low water activity,
<0.60 aw,, portion of the isotherm are often referred to as dry,
those in the range of 0.60 aw to 0.90 aw are intermediate
moisture products, and those having water activities higher
than 0.90 aw are high moisture products.
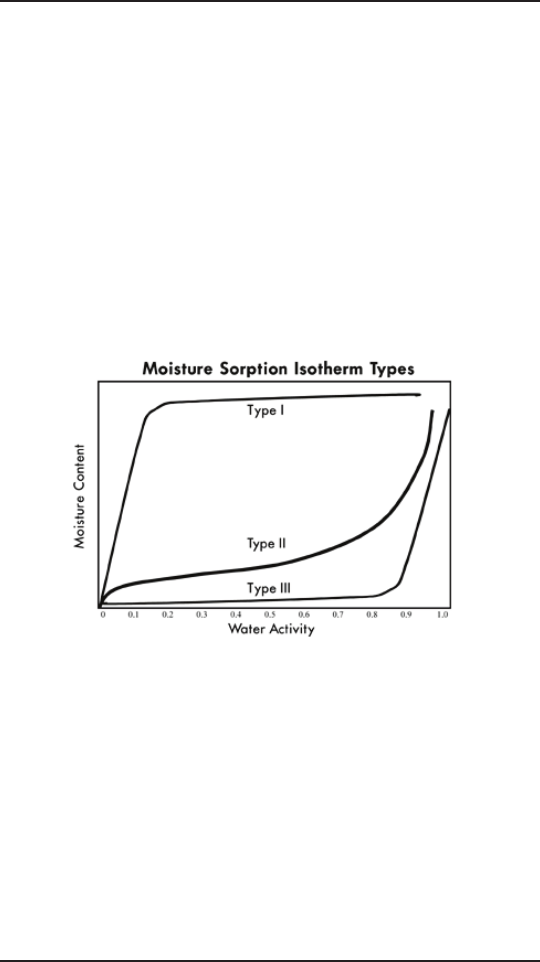
For ease of interpretation, isotherms are often classified as
one of three types (Figure 1).
• Type I isotherms are typical of anti-caking agents.
ese types of ingredients absorb water onto polar sites
and into non-swelling capillaries, which results in high
amounts of moisture being held at low water activities.
When all these sites are filled up, further increases in
moisture content results in large changes in water activ-
ity.
• Type II isotherms describes most types of products.
e isotherms shape for these types of products is sig-
moidal, characterized by sharp changes in moisture con-
tent at low and high water activities, but small changes in
moisture content over the intermediate moisture range.
13
3. eory
AquaSorp Users Manual
• Type III isotherms are typical of crystalline sub-
stances. For this type of isotherm, there is very little
moisture gain initially because water is only interacting
with the surface of the crystal through hydrogen bonds.
Increasing the surface area of the crystal will increase the
moisture content at low water activities. Eventually, as
water activity increases, the water will dissolve the crystal
(often called deliquescence). At this point, the moisture
content starts to increase dramatically as the material
goes into solution.
Figure 1. Brunauer classification of moisture sorption iso-
therms: Type I = anti-caking agents, Type II = most foods,
Type III = crystalline substances.
Constructing an isotherm consists of collecting water ac-
tivity and moisture content data at various points along
the water activity range. e range of water activities used
will depend on the situation, but normally run from 0.10
aw up to 0.90 aw. Most isotherm methods consist of con-
trolling water activity levels using saturated salt slurries,

14
3. eory
AquaSorp Users Manual
acid solutions, glycerol solutions, or mechanical humidifi-
ers. Equilibrium moisture contents are then determined at
each water activity level. Equilibrium is determined based
on when the weight of the sample stops changing. is
process is often accomplished using sealed chambers such
as desiccators and the equilibration process can take weeks.
Automatic isotherm generators use the same principle, but
track weight electronically and dynamically change the
water activity levels once equilibrium is achieved. Deca-
gon’s AquaSorp Isotherm Generator uses the DDI method,
which is discussed in detail below.
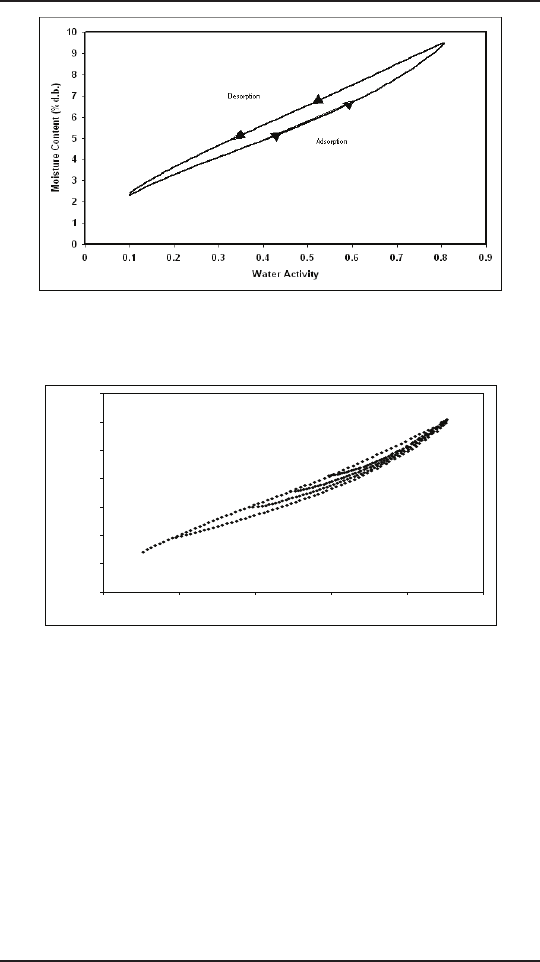
Hysteresis
Figure 2 shows two isotherms, one obtained by wetting
a sample from complete dryness and the other obtained
by drying a sample from saturation. e arrows show the
direction of the process. e water content at each water
activity is higher during desorption (drying from high wa-
ter content) than adsorption (wetting from low water con-
tent). is phenomena is called Hysteresis. e curves in
Fig. 2 represent limits or bounding isotherms since they
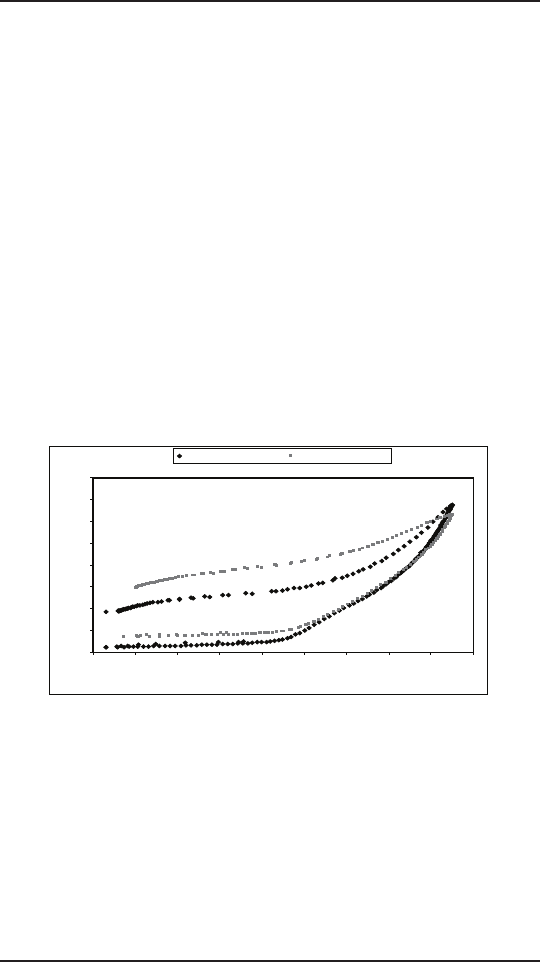
begin at water activities near zero and one. If a drying pro-
cess reduces the water activity of a sample only part way
to dryness, and the sample is then re-wet, it follows a path
between the wetting and drying boundary curves, as shown
in Fig. 3. ese curves are called scanning curves, and there
can be an infinite number of them depending on where
drying stops and starts.
15
3. eory
AquaSorp Users Manual
Figure 2. Full isotherm showing hysteresis.
0.00
2.00
4.00
6.00
8.00
10.00
12.00
14.00
00.2 0 .4 0.6 0.8 1
Water Activity
Moisture Content (%d.b.)
Figure 3. Scanning adsorption curves resulting from drying to
different water activities.
ese observations help clarify the point that an isotherm
is not a single valued function. e water content for any
given water activity value depends on the wetting and dry-
ing history of the sample.
It is possible to obtain isotherm data which appear to show
hysteresis by failing to allow a sample to equilibrate at each
step, or by inducing changes in the water binding proper-

16
3. eory
AquaSorp Users Manual
ties of the matrix by wetting or drying. We prefer to treat
these cases separately, and reserve the term hysteresis for
situations where equilibrium is reached, but water contents
of wetted and dried samples still differ because of their his-
tory.
Several plausible models exist for hysteresis. eories are
based on; capillary condensation of porous solids, phase
changes of non-porous solids, structural changes within
a solid matrix, and supersaturation of some solutes dur-
ing desorption. Depending on the composition of sample,
these theories explain why the water content of a desorp-
tion process is greater than that for a wetting process.
• Capillary condensation of porous solids theory is
illustrated by the ‘ink bottle’ model, in which pores and
capillaries fill and empty differently. Such a pore fills
when the water activity corresponding to the energy
state of the larger radius is exceeded, but will empty only
when the water activity drops below the energy state of
the narrow neck radius.
A phase change of non-porous solids is illustrated •
by the fact that desorption from rubbery state can reach
equilibrium faster due to increased molecular mobility,
while adsorption into a glassy material can be slow due
to restrictions in molecular mobility.
Structural changes within a solid matrix in which •
the material swells and polar sites once obscured are now
exposed to ‘bind’ with water. For example, hydrated pro-
tein contains many sites for water ‘binding’ before des-
orption while dehydrated protein have some polar sites
unavailable for water ‘binding’ prior to adsorption.
• Supersaturation. Some solutes may supersaturate
17
3. eory
AquaSorp Users Manual
below their crystallization water activity (non-equilibri-
um condition) and thus, hold more water as aw is low-
ered. Foods with high sugar content frequently exhibit
this phenomenon.
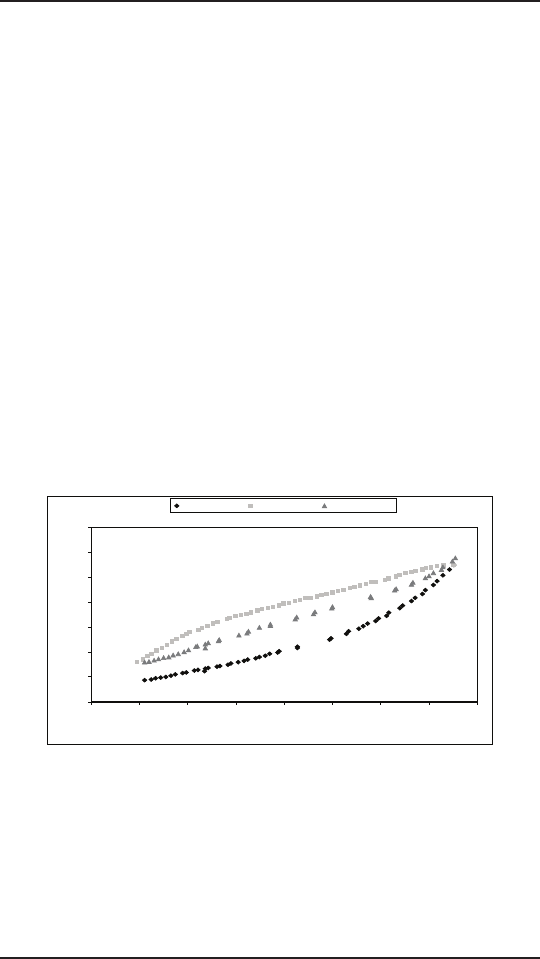
Non-equilibrium
It is possible to produce adsorption-desorption curves that
appear to show hysteresis, but are just the result of not
waiting long enough for equilibrium. Figure 4 shows two
AquaSorp runs, one with a high flow rate and one with a
low flow rate. Note that the apparent hysteresis is much
worse at the high flow rate. A flow rate needs to be chosen
such that further reductions in flow rate do not reduce the
size of the hysteresis loop.
0
5
10
15
20
25
30
35
40
00.1 0.2 0. 3 0.4 0.5 0.6 0.7 0.8 0.9
Wa te r Activity
Moisture Content (%d.b.)
100 ml/min Flow Rate 300 ml/min flow rate
Figure 4. Changes in hysteresis levels when flow rate of wet and
dry air is reduced from 300 ml/min to 100 ml/min.
Matrix changes
Figure 5 shows several cycles of an isotherm obtained on a
sample of rice cereal. Note that the first wetting branch is
substantially different from all subsequent branches. is
could be termed hysteresis, since the path depends on the
18
3. eory
AquaSorp Users Manual
wetting history of the sample, but the path can’t be repeat-
ed. Something about the sample changed during the first
wetting cycle, and is not changed back by drying, no mat-
ter how many drying cycles occur.
e water in the sample is “bound” to particle surfaces by
various bonding mechanisms. When the configuration of
the surface changes, possibly by conversion from glassy to
crystalline form, or rearrangement of molecular structures,
the binding sites change and the amount of water which
can be “bound” at a given energy changes. Once these
changes occur the wetting and drying paths coincide for as
many cycles as one wants to make. ese curves show what
should be more properly called hysteresis.
0
2
4
6
8
10
12
14
00.1 0.2 0.3 0.4 0. 5 0.6 0.7 0.8
Wa te r Activity
Moisture Content (%d.b.)
1st Adsorption 1st Desorption 2nd Adsorption
Figure 5. A moisture sorption isotherm curve showing a change
in hysteresis due to a phase change during the 1st adsorption
causing the 2nd adsorption curve to not match the 1st adsorp-
tion curve.

19
3. eory
AquaSorp Users Manual
Working Isotherms
In some cases, it is desirable to determine how a product
will adsorb or desorb water from its current condition. is
is referred to as the working isotherm and is determined by
wetting and drying the product from its current state. e
isotherm curve the product will initially follow depends on
whether the product was previously wetted or dried to its
current state. If a product was wetted to a certain water
activity and then is dried back down, there will be an ini-
tial transition period as the product moves from the ad-
sorption curve to the desorption curve. e same is true
for a product that was previously dried and then wetted
up. ere will be an initial transition period as the product
moves from the desorption curve to the adsorption curve.
is transition period can be observed at any point on the
isotherm if the direction of the sorption is changed and the
product exhibits hysteresis.
NOTE: Please refer to Chapter 7 for information about run-
ning a working Isotherm using the AquaSorp.
Uses for Moisture Sorption Iso-
therms
Moisture sorption isotherms provide valuable information.
For anyone who dries or wets their product, the sorption
isotherm serves as a drying and wetting curve and provides
information about the moisture content of a product when
dried or wetted to a specific water activity. It can be used
to assist in process control by determining drying rates and
optimal endpoints. It will also show if a product exhibits
hysteresis what impact that will have on the moisture con-
tent after drying to a given water activity.

20
3. eory
AquaSorp Users Manual
An additional function of the isotherm is moisture content
prediction. Although water activity is a much better predic-
tor of safety and quality than moisture content, there are
times when it is necessary to know both water activity and
moisture content as well as the relationship between the
two parameters for a given product. Water content mea-
surements can be inaccurate, time-consuming and require
a precision balance. As an alternative to moisture content
measurement methods, the sorption isotherm can be used
to determine moisture content based on water activity, usu-
ally with better accuracy than actually running a moisture
content analysis and in much less time.
Isotherms can be used to determine the effect of tempera-
ture on a product’s water activity and moisture content.
Isotherms conducted at several different temperatures will
show the temperature at which a product, in a sealed pack-
age (at constant moisture content), will be at unstable wa-
ter activity levels.
Isotherms can be very valuable for formulation and prod-
uct development. By comparing the isotherms of different
formulations, it is possible to determine if a product can be
adjusted to allow higher moisture content at a given water
activity or a lower water activity at a given moisture con-
tent. e result can be a moister product that is still shelf
stable. For those producing multi-component products,
it is possible using the isotherms of the two components
to determine what the final water activity will be of the
mixture without actually making the product. For dried
products, the isotherm will predict the moisture content of

21
3. eory
AquaSorp Users Manual
the product when it is dried to a shelf stable water activity
level.
Finally, sorption isotherms are valuable for shelf life predic-
tion. A product’s isotherm can be used to determine pack-
age requirements depending on the products sensitivity to
moisture. It can also be used to determine the monolayer
moisture content, which represents a products most stable
state. e shape of the isotherm can provide information
about the level of amorphous to crystalline material in a
product. Changes in the slope of the isotherm indicate
phase transitions and can provide information about criti-
cal water activities for maintaining texture properties and
preventing caking and clumping. e water activity value
where the glass transition temperature equals storage tem-
perature or the crystallization temperature equals storage
temperature can also be determined.
Isotherm Models
Several different isotherm models have been proposed and
compared in the literature. ese models are necessary to
predict the moisture content at a given water activity and
are used to evaluate thermodynamic functions of water in
foods. e most commonly used models are the GAB and
BET. Since the BET model is only applicable up to 0.50
aw, the GAB model is widely accepted as the most useful
for characterizing isotherms across the entire water activ-
ity range. A new model called the Double Log Polynomi-
al (DLP) has proven to be even better than the GAB at
characterizing complex isotherms. SorpTrac data analysis
provides the coefficients for the BET, GAB, and DLP. e
model equations are shown below.

22
3. eory
AquaSorp Users Manual
BET ) ]1(a1[
)a1(
ma
m
ww
ow
−+−
=c
c
Where m is the moisture in g/100 solids or g/g solids at
water activity aw and mo is the monolayer value in same
units. e constant (c) is calculated by:
T R
H
ec
D
=
Where
(DH) is the surface interaction energy cal/mole, R is the gas
constant and T is the Kelvin temperature .
GAB ( )( )
[ ]
w1ww
w1
aa1a1
a
m
bbb
bo
kCkk
Ckm
+−−
=
Where (m) is the moisture in g/100 solids or g/g solids, (kb)
is a constant in the range of 0.70 to 1 and (C1) is a constant
in the range of 1 to 2000. In addition, (mo) is the mono-
layer water content in the same units as (m) and (aw) is the
water activity at moisture (m).
DLP m = b3x3 + b2x2 + b1x + b0
Where (m) is the moisture in g/100 solids or g/g solids, x =
ln(-ln(aw)) and b0 – b3 are empirical constants.
The DDI Isotherm Method Compared
to Other Methods
e Dynamic Dewpoint Method(DDI) used by the Aqua-
Sorp is a unique way of obtaining isotherms. Tradition-
al isotherm methods depend on the equilibration of the
sample to known water activities and then measuring the

23
3. eory
AquaSorp Users Manual
equilibrium moisture content of the sample. is is most
easily done by placing the sample in a sealed chamber over
a saturated salt slurry in excess. Different water activity lev-
els are achieved by using different salts. Adjusting a mixture
of wet and dry air while monitoring the water activity with
a sensor can also be used to control water activity. Differ-
ent water activity levels are achieved by changing the levels
of dry or wet air. Some instruments are programmed to
automatically change the water activity in a dynamic step-
wise progression. e sample is held at each water activity
level until weight stops changing before moving to the next
water activity. Common to all these isotherm methods is
the dependence on equilibration to a known water activity
level to determine each data point’s water activity. Since
true equilibration between the sample and the vapor source
requires an infinitely long period of time, an apparent equi-
librium when weight stops changing by a tolerable level is
used. Increasing the tolerable weight change will speed up
the isotherm process but calls into question the validity of
the water activity values.
e DDI method directly measures water activity while
gravimetrically tracking weight, so there is no dependence
on equilibration to known water activity levels to deter-
mine water activity. Adsorption occurs as saturated wet air
is passed over the sample. Desorption is accomplished as
desiccated air is passed over the sample. After a short period
of time, airflow is stopped and a snapshot of the sorption
process is taken by directly measuring the water activity
and weight. e advantages of this method are increased
analysis speed since the sample does not have to wait for
equilibration to a known water activity and an unmatched

24
3. eory
AquaSorp Users Manual
level of resolution. In addition, only water and desiccant
are needed to run the isotherm.
e dynamic nature of the DDI method can present prob-
lems when trying to compare isotherms by DDI to iso-
therms created using other isotherm methods, especially
isopiestic methods where equilibration times can be weeks.
For most sample types, especially samples with fast va-
por diffusion, penetration by water vapor into the whole
sample is rapid and isotherms from DDI for these types of
products will be comparable to other methods. However,
for samples with slow diffusion rates, moisture movement
through the sample is slow and complete diffusion of mois-
ture into and out of the sample may be slow enough to
give the appearance of vapor equilibrium in the headspace
during water activity analysis. In reality, the moisture has
not had time to be completely adsorbed by the sample.
Isotherms for these types of samples developed using the
DDI method may have lower moisture contents during ad-
sorption and higher moisture contents during desorption
than isotherms constructed using other methods, resulting
in higher levels of apparent hysteresis. Better agreement
to other isotherms may be achieved, when using the DDI
method, by reducing the sample size and lowering the wet
or dry air flow rate to allow more moisture penetration into
slow diffusing samples.
Since the DDI method, other automated isotherm genera-
tors, and traditional isopiestic methods can achieve differ-
ent matrix states, none of which may be true equilibrium
states. It is impossible to say that one method is better
than another. e dynamic nature of the DDI method

25
3. eory
AquaSorp Users Manual
may actually give a more correct picture of the sorption
characteristics of a product in real conditions since sam-
ples are rarely exposed to changes in moisture in stepwise
progression but instead in a dynamic progression. In addi-
tion, time dependent physical changes that can occur as a
product equilibrates at different water activity levels over
weeks may not occur in production situations where expo-
sure to different moisture levels is dynamic. ese physical
changes may cause isotherms determined using traditional
methods to be much different than those made using the
DDI method.
e DDI method is the best method for tracking the sorp-
tion characteristics of a sample through the full isotherm
since the same sample can be subjected to multiple adsorp-
tion and desorption events in succession across any water
activity range. e resolution of the method eliminates the
need for extrapolation and gives a detailed view of sorption
events. A limitation of the DDI method is that it can not
be used to determine kinetics of sorption at different water
activity levels.

26
4. Getting Started
AquaSorp Users Manual
4. Getting Started
Components of your AquaSorp
e AquaSorp requires a computer and software to gener-
ate and analyze isotherm data. Once a test has begun, the
computer can be disconnected and re-connected without
losing any data. Your AquaSorp is shipped with the follow-
ing items:
e AquaSorp Isotherm Generator Main Unit•
PC Computer with Monitor•
e SorpTrac Software Installation Disc•
Operators Manual•
Calibration Certificate / MSDS Certificates•
Power Cord•
RS-232 Interface Cable•
5 Stainless Steel Sample Cups•
2 Refillable Desiccant Tubes•
1 Decagon Cleaning Kit•
1 Water Bottle•
3 Vials each of the following verification solution•
1.000 aw steam distilled water
0.760 aw 6.0 molal NaCl
0.500 aw 8.57 molal LiCl
0.250 aw 13.41 molal LiCl
1 Phillips Screwdriver.•
1 Flathead Screwdriver.•
1 2g NIST traceable weight.•
NOTE: Please keep the box your instrument arrives in. If it
ever needs to be returned, it must be shipped in the original
packaging.

27
4. Getting Started
AquaSorp Users Manual
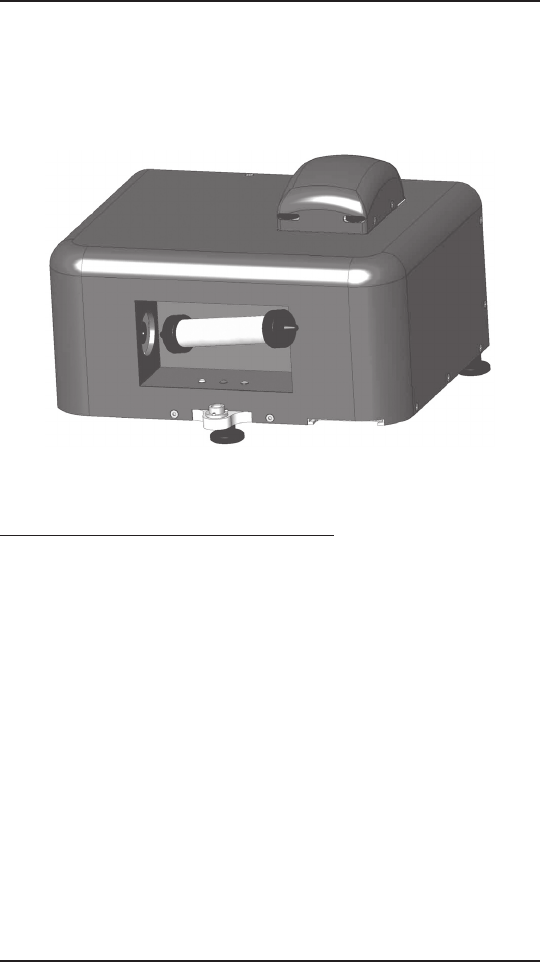
The AquaSorp Isotherm Generator
Essentials
Desiccant Tube
e desiccant tube provides dry air to the sample cham-
ber and is critical to correct operation of the instrument.
It needs to be maintained with blue desiccant to provide
dry air to the instrument. For instructions on changing the
desiccant or desiccant tube, see Step 2 of “Starting a new
Test” in Chapter 5.
Message Center
e message center on the front of the instrument consists
of three LED lights. Each light provides information about
the AquaSorp depending on which one is lit and if it is
solid or blinking.
COLOR STATE MESSAGE
White Solid Power is on but
the test is not
running
White Blinking e Instrument
and balance are
thermally equili-
brating.
Blue Solid A Test is running

28
4. Getting Started
AquaSorp Users Manual
Blue Blinking e Test is in
pause mode and
if not resumed
in 3 minutes the
Test will stop.
Red Solid A fatal error has
occurred and the
test was stopped.
Red Blinking An unusual
condition has oc-
curred and may
need attention.
White/Blue/Red Blinking in suc-
cession
Water Activity
verification in
process.
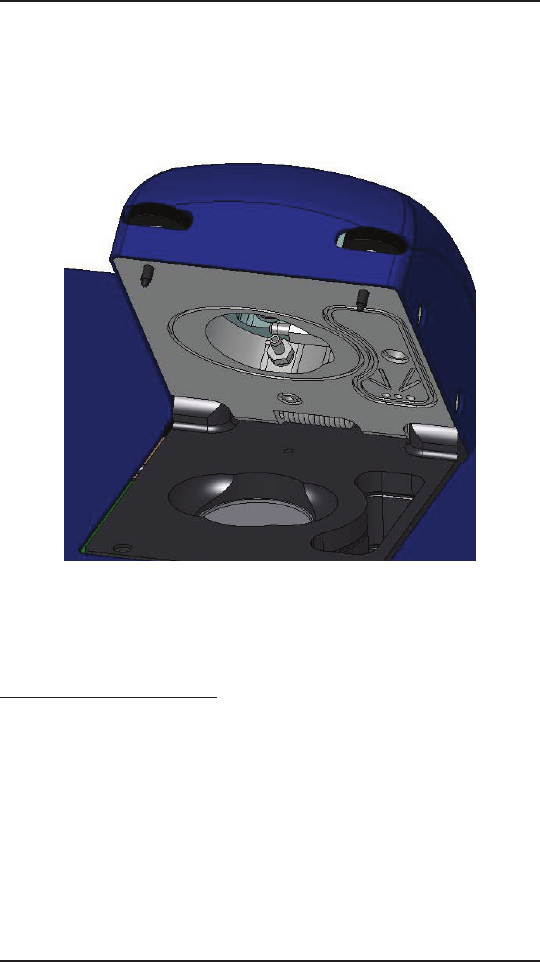
Sample Chamber
e sample chamber is located on top of the instrument
under the lid, which is opened and closed using two thumb-
screws. Turn both thumbscrews to the right to open and to
the left to tighten. When closing the lid, it is important to
tighten the screws down completely to ensure a good seal.
Make sure you tighten the screws evenly or the lid could
seat unevenly.
With the lid open and looking down at the instrument,
the sample chamber can be seen on the left and the wa-
ter chamber on the right. e water chamber provides
saturated air to the sample chamber and needs to be kept
filled between the two lines. Inside the sample chamber is
the weighing platform, which is connected to the
preci-sion balance. The chilled-mirror dew point sensor,
29
4. Getting Started
AquaSorp Users Manual
which is used to measure sample water activity, is in the
lid and can be viewed by looking under the lid when in
the open position.
Preparing for Operation
Choosing a Location
To ensure that your AquaSorp operates correctly and con-
sistently, place it on a level surface. ere must be adequate
room to house the AquaSorp and computer used to operate
the AquaSorp. e instrument must be completely level to
ensure that the precision balance works properly. To level
the instrument, adjust the three feet until the bubble on
the front of the instrument is centered. To protect the in-
ternal electrical components, and to avoid inaccurate read-

30
4. Getting Started
AquaSorp Users Manual
ings, place your AquaSorp in a location where the tempera-
ture remains stable. is location should be well away from
air conditioner and heater vents, open windows, outside
doors, refrigerator exhausts, or other items that may cause
rapid temperature fluctuation. After finding a good loca-
tion for the AquaSorp, plug the power cord into the back
of the unit.
Setting up and Connecting to the Computer
Set up the computer next to the AquaSorp according to
the Dell instructions. Connect the computer to the Aqua-
Sorp through the serial port on the back of the instrument
with the supplied RS232 serial cable. e use of an unin-
terrupted power supply, or UPS, is recommended to avoid
data loss.
e computer is pre-loaded with the SorpTrac software
used to operate the AquaSorp. Turn on both the comput-
er and the AquaSorp by pressing the power switches. e
power switch on the AquaSorp is located next to the power
cord on the back of the instrument. e AquaSorp requires
a 60 minute temperature equilibration period after turn-
ing it on or following a power outage. Although you can
still do data analysis during this equilibration, no test can
be started until after it has completed temperature equili-
bration. e AquaSorp can be left on continually without
harmful effects.
Setting up the Desiccant Tube
e desiccant tube must be loaded in the recessed area on
the front of the machine before testing can begin. To load
the tube, insert one black cone-shaped end into the left
31
4. Getting Started
AquaSorp Users Manual
inlet point on the front of the machine. is inlet is spring
loaded and pressing the tube to the left will allow room to
insert the right side of the tube into the right inlet. Make
sure that both ends are seated in the inlets snugly.
Preparing the Sample Chamber
e AquaSorp is shipped with a foam insert in the sample
chamber to protect the chamber and the balance. is foam
insert must be removed before a test can be performed. In
addition, the weighing pan must be inserted into the cham-
ber. To open the chamber and remove the insert, loosen the
thumbscrews to the right and open the lid. Remove the
foam insert and discard. Find the small round weighing
pan and insert it into the bottom of the sample chamber. It
should drop easily into the hole in the bottom of the cham-
ber. e weighing pan should be located with the other
components in the original packaging.

32
4. Getting Started
AquaSorp Users Manual
Water must be added to the water chamber before testing
can begin and the chamber should be refilled when the wa-
ter level falls below the bottom fill line. To fill the chamber,
find the water bottle that was shipped with the AquaSorp.
Fill the bottle with distilled or deionized water. Use the
bottle to fill the water chamber to the top fill line.
Setting up the Water Chamber

33
5. SorpTrac Software
AquaSorp Users Manual
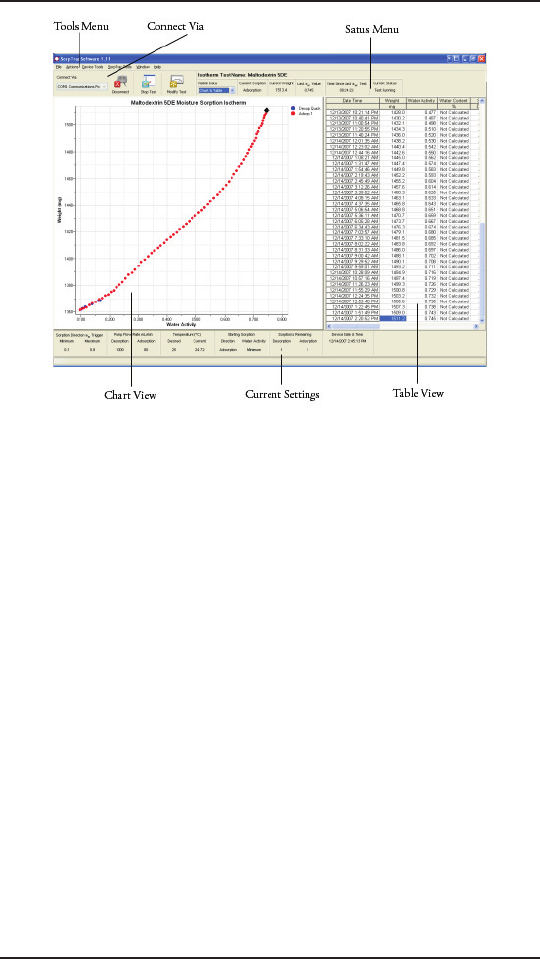
5. SorpTrac Software
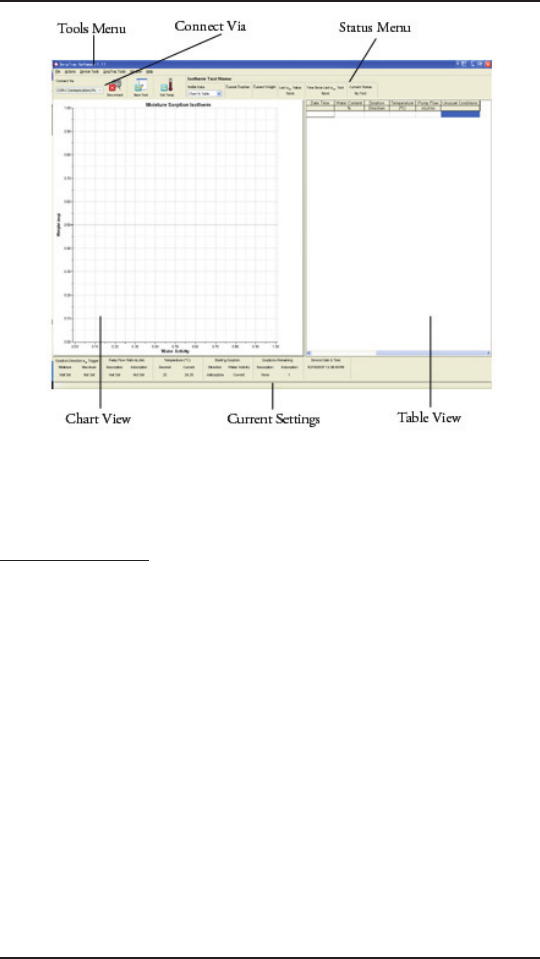
Overview
e AquaSorp uses the SorpTrac software to setup, col-
lect and analyze test data. To run the software, go to Start
> Programs > Decagon, and click on SorpTrac or double
click the SorpTrac icon on the desktop. At the top of the
screen are tools for connecting to the AquaSorp and for set-
ting SorpTrac preferences. e “Connect Via” drop down
box allows you to choose which communication port you
will use to connect to the AquaSorp and the “Visible Data”
drop down box allows you to change the current view from
chart alone, chart and table, or table alone. At the top right
of the screen is a current test status bar. In the center of the
screen you will see a blank chart on the left and a blank
table on the right.
As data is downloaded from the AquaSorp, the data points
will be loaded into the table and displayed in the chart. At
the bottom of the screen is a status bar that shows the iso-
therm settings for the current test.
34
5. SorpTrac Software
AquaSorp Users Manual
A Closer Look at SorpTrac
The File Menu
e File menu consists of Export, Save Experiment, and
Exit.
Export
e Export menu consists of two options for getting
data out of SorpTrac.
Chart to Graphic
SorpTrac allows you to export your chart as a
graphic bitmap (BMP) file. is can then be
placed in other programs that allow the use of
image files.

35
5. SorpTrac Software
AquaSorp Users Manual
Table
Exports the current table in the Excel format
(CSV). is file can be directly opened in Excel
for further analysis or additional graphing.
Save Experiment
Saves the current experiment. is file can be opened
in the Data Analysis Tool.
Exit
Closes the SorpTrac software.
The Actions Menu
e Actions menu consists of Connect/Disconnect (this
menu item/button will change depending on the status
of the instrument), New Test, Stop Test, Modify Test, Set
Temp., Equilibration Clock, Download, and AquaSorp In-
formation.
Connect/Disconnect
Selecting this will disconnect the AquaSorp from the
SorpTrac software. is can also be done using the
Connect/Disconnect button beneath the menus.
New Test
Starts a new test and opens up the test setup wizard.
Stop Test
Stops the current test.
Modify Test
is allows you to make changes to an experiment
36
5. SorpTrac Software
AquaSorp Users Manual
that is running. Further information on what can
be modified can be found in this chapter under the
Modify Test section.
Set Temp.
Sets the desired test temperature of the AquaSorp.
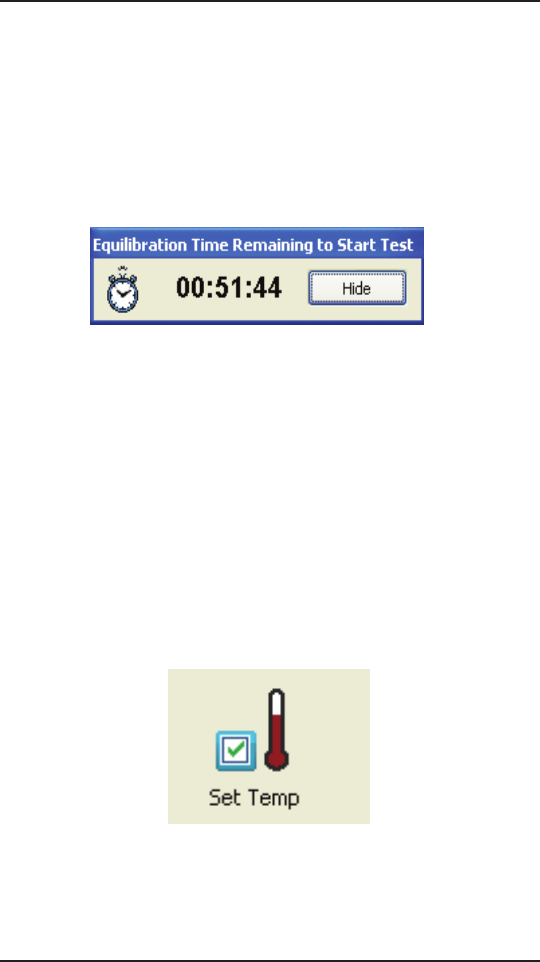
Equilibration Clock
Displays the amount of time until the temperature
equilibration is complete.
Download
Downloads the data points from the previous test.
NOTE: is option is only available before a new test is
started. Starting a new test will erase previously acquired data
points from the AquaSorp.
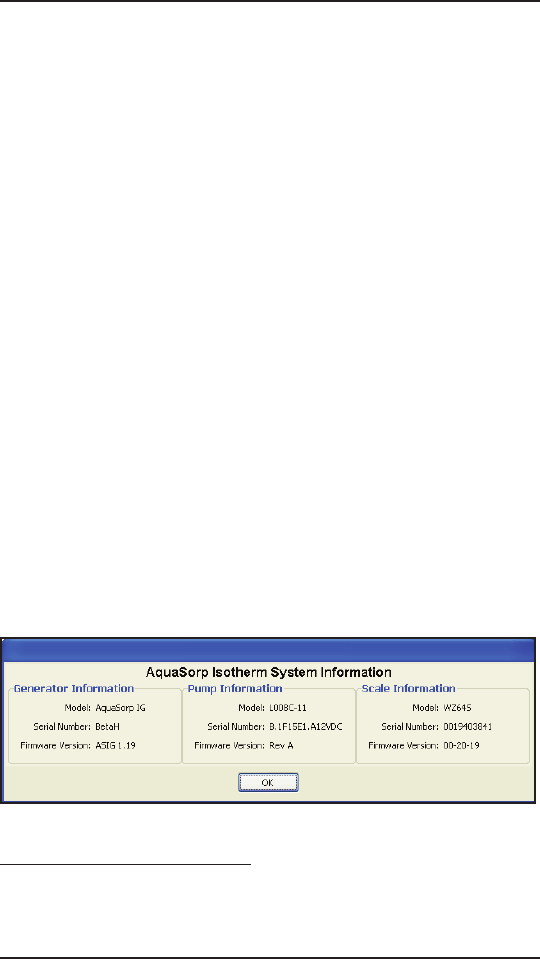
AquaSorp Information
Displays the Serial number, firmware version, etc. of the
AquaSorp.
The Device Tools Menu
e Device Tools menu consists of Sync Time, Verification
and Restore, and Erase Test.

37
5. SorpTrac Software
AquaSorp Users Manual
Sync Time
is option will synchronize the time between the
AquaSorp and your computer clock.
Verification and Restore
is menu option allows you to select the following
calibration options: Water Activity Verification, Re-
store Factory Water Activity Calibration, Balance Ver-
ification, and Restore Factory Balance Calibration.
Water Activity Verification
is is used to verify the calibration of the
chilled-mirror dewpoint sensor. Selecting this
option will start a verification wizard that will
guide you through the steps necessary to verify
the calibration of the sensor. See Chapter 8 for
more information about verifying the water ac-
tivity.
Restore Factory Water Activity Calibration
is option will set the aater activity calibration
back to the original factory settings.
NOTE: Clicking on “Yes” will restore the water activity cali-
bration values to factory settings and cannot be undone.
Balance Verification
is is used to verify the calibration of the mag-
netic force balance. You will need the supplied
2g NIST traceable weight. SorpTrac will check
the balance and ask if you want to offset the

38
5. SorpTrac Software
AquaSorp Users Manual
measured weight to the actual weight See Chap-
ter 8 for more information about verifying bal-
ance performance.
Restore Factory Balance Calibration
is resets the balance to the factory settings. A
window will open asking if you want to make
the change.
NOTE: Clicking on “Yes” will reset the balance to factory set-
tings and cannot be undone.
Erase Test
is option erases the current test and all associated
data. Make sure you save the data before selecting this
option or all data will be lost.
The SorpTrac Tools Menu
e SorpTrac Tools Menu provides three drop-down
menus: Data Analysis, Multiple Isotherm Analysis and
Preferences.
Data Analysis
is menu option opens a new window for analyzing
your data. A further description of Data Analysis is
found in Chapter 7.
Multiple Isotherm Analysis
is menu option opens a window for analyzing
multiple isotherms. is function is used to combine
isotherm curves for comparison or to analyze work-

39
5. SorpTrac Software
AquaSorp Users Manual
ing isotherms. More information about Multiple Iso-
therm Analysis is found in Chapter 7.
Preferences
e Preferences Menu opens a window with three tabs
to customize SorpTrac. e tabs are General Program
Options, Chart View Options, and Communications
Options.
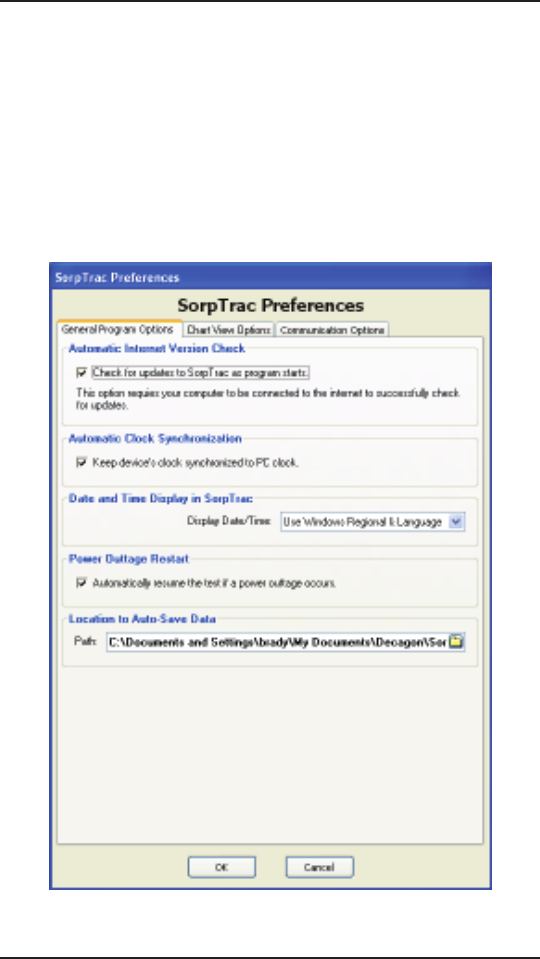
General Program Options
is menu option gives you general choices for custom-
izing SorpTrac such as update options, clock options, data
save locations, date/time format, etc.
Automatic Internet Version Check
is option allows SorpTrac to check Decagon’s web
site for updates to the SorpTrac program. You must
have an internet connection and be connected to the
web to use the automatic version checker.
Automatic Clock Synchronized to PC clock
is option synchronizes the AquaSorp’s clock to the
clock on your computer.
Date and Time Display in SorpTrac
Provides options for displaying the date and time.
Power Outage Restart
By default this box will not be checked and an iso-
therm test will stop if a power outage occurs. To make
an isotherm test automatically resume, check the
box.
40
5. SorpTrac Software
AquaSorp Users Manual
NOTE: It is recommended that restart delay be left unchecked
because power outages result in temperature fluctuation and
this invalidates the isotherm experiment.
Location to Auto-Save Data
is option tells the SorpTrac where you want the
data to be placed during an Auto-Save.

41
5. SorpTrac Software
AquaSorp Users Manual
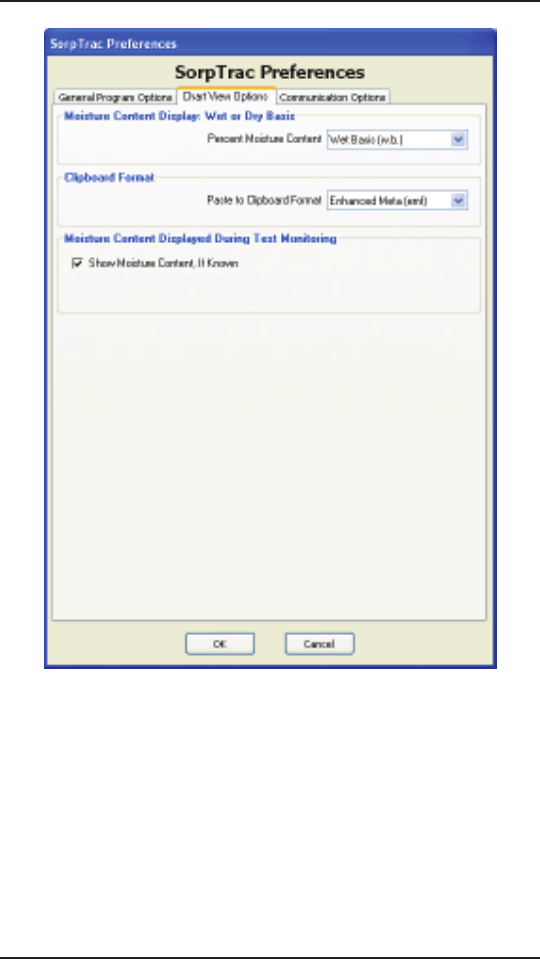
Chart View Options
is tab includes options for setting up the chart view in
SorpTrac. Click on the “Chart View Options” tab to open
this window.
Moisture Content Display: Wet or Dry Basis
is options allows you to set the method of dis-
play for the moisture content of the sample. Dry
basis (d.b.) is the amount of water in the sample
divided by the amount of dry material. Wet ba-
sis (w.b.) is the amount of water divided by the
amount of wet material.
Clipboard Format
is option sets the format for pasting data into
the Windows clipboard. You can choose between
the Enhanced Meta (emf) format or a Bitmap
(bmp) image format.
Moisture Content Displayed During Test
Monitoring
is option will be selected by default if a known
moisture content is entered during test setup. It
will enable moisture content values to be shown
during data collection instead of the weight
values. If a known moisture content is not en-
tered at setup, this option will not be selected
and weights will be shown on the data collection
screen.
42
5. SorpTrac Software
AquaSorp Users Manual
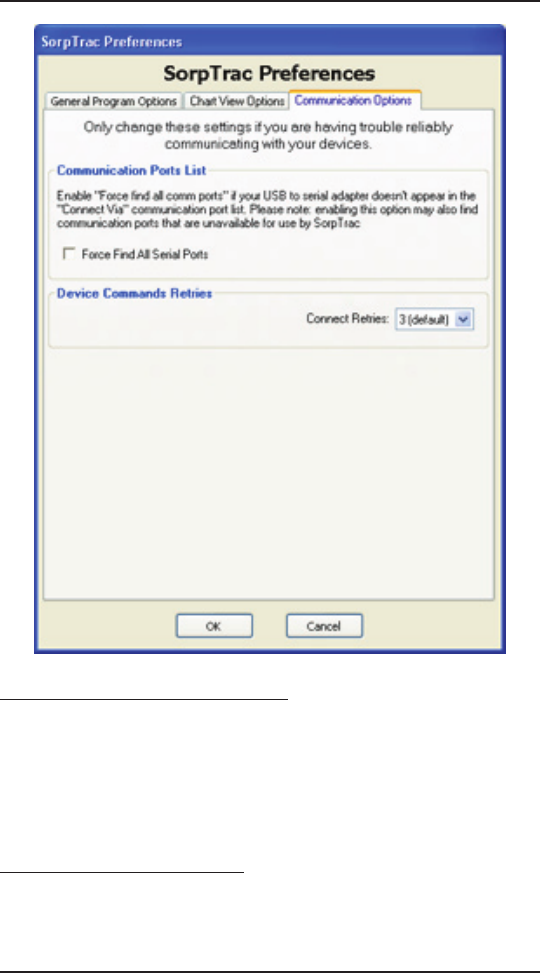
Communications Options
e communications tab gives you options for changing
the way SorpTrac communicates with the AquaSorp. Click
on the “Communication Option” tab to open this win-
dow.
NOTE: Only change these settings if you are having trouble
communicating with the AquaSorp.

43
5. SorpTrac Software
AquaSorp Users Manual
Communication Ports List
is option allows SorpTrac to force find all
comm ports. Activating this option may give
you ports that are unavailable to SorpTrac. is
is a useful option if your USB to serial adapter
doesn’t appear in the “Connect Via” communi-
cation port list.
Device Commands Retries
Sets the number of times SorpTrac will try to
connect to the AquaSorp. e default is 3 times
before a communication error dialog box will
appear.
44
5. SorpTrac Software
AquaSorp Users Manual
The Window Menu Option
is menu option is available after you have opened at least
one Data Analysis Window via the SorpTrac Tools menu.
You can open up to three Data Analysis Windows and this
allows you to quickly switch between them.
The Help Menu Option
e Help menu option has one menu called “About Sorp-
Trac” that will give you information about the SorpTrac
software. Click anywhere within the window to close.

45
5. SorpTrac Software
AquaSorp Users Manual

46
6. Running a Test
AquaSorp Users Manual
6. Running a Test
It is important to verify that the AquaSorp is performing
correctly before starting a test using Decagon’s Verification
Standards. Please refer to Chapter 8 for instructions on
how to verify your AquaSorp and adjust the calibrations
if necessary.
Connect to the AquaSorp
SorpTrac software must be connected to the Aqua-
Sorp to start a test. To connect, press the ‘Connect’
button at the top of the screen or go to Actions > Con-
nect. If a previous isotherm has been run on the Aqua-
Sorp and the data is still stored in the AquaSorp, a dia-
logue box will ask if the user wants to download the data.
If this data has not been previously saved, select “yes”
and save the data before proceeding with a new test.
NOTE: Make sure this data is saved before pressing the ‘New
Test’ button, as this data will be erased when the new test but-
ton is pressed.
Setting the AquaSorp Temperature
e AquaSorp must be thermally equilibrated to a desired
test temperature before a new test can be initiated. e
desired isotherm temperature and the current instrument
temperature can be found at the bottom of the data collec-
tion screen in the status bar. ese temperatures are updat-
ed real time. Anytime the current temperature is more than
±1°C different from the desired temperature, an equilibra-
tion time is needed. e length of this equilibration time
47
6. Running a Test
AquaSorp Users Manual
will vary depending how far away the current temperature
is from the desired temperature.
When the AquaSorp is turned on, an initial 60 minute
warmup time for the balance is needed. e AquaSorp
temperature is set to 25°C by default.
After the initial warmup, additional equilibration time
should only be needed if the isotherm temperature is
changed or the instrument is shutdown.
If an isotherm test temperature other than 25°C is desired,
the temperature should be set prior to starting a new test.
To change the desired isotherm temperature, press the “Set
Temp” icon at the top of the screen to open the “Set Iso-
therm Temperature” page.
Any change to the target temperature will require an equili-
bration time, even if the instrument had previously equili-
brated to a different temperature. e equilibration time

48
6. Running a Test
AquaSorp Users Manual
needed will be indicated in the text of the “Set Isotherm
Temperature Page.” Temperatures between 15°C and 40°C
may be chosen. Enter the new isotherm test temperature
using the up and down arrow buttons or by typing in the
desired temperature and press “OK”. e “Set Temp” icon
at the top of the SorpTrac data collection page will then
blink red, the white light on the front of the AquaSorp
will blink, and the “New Test” icon will not be active until
the temperature has equilibrated to the desired isothermal
temperature.
Starting a new Test
To begin a test, press the ‘New Test’ button or go to Ac-
tions > New Test to open the test setup wizard.
A warning box will tell you that starting a new test will erase
data on the instrument and ask if you want to proceed.
Make sure this data has been saved before pressing ‘OK’ as
this data will be erased when the new test wizard begins.
Pressing “cancel” stops the new test and does not erase the
data. e wizard will guide you through the steps neces-
sary to start an isotherm test. e steps of the wizard are
described below:

49
6. Running a Test
AquaSorp Users Manual
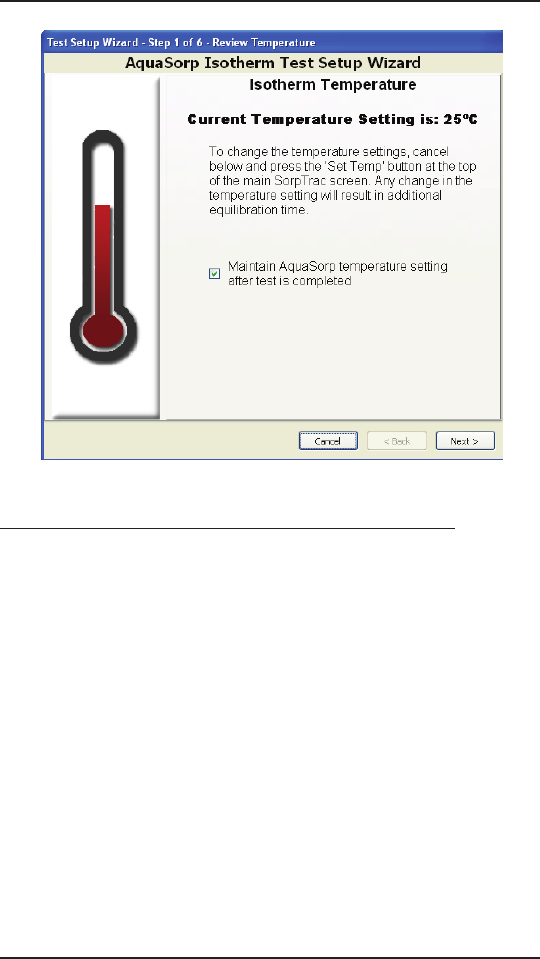
Step1. Isotherm Temperature
is page shows the currently set isotherm temperature to
allow the user to confirm it is correct. If a different temper-
ature is desired, the user must cancel out of the test startup
wizard and set the temperature using the “Set Temp” icon.
Additional equilibration time will be needed if a change is
made.
After a test is complete, the temperature of the AquaSorp
can be maintained at the current isotherm test temperature
or be allowed to return to the 25°C default temperature.
e default setting is to maintain the temperature of the
AquaSorp at the current test temperature. To change the
setting back to 25°C when the test is over, just un-check the
dialogue box at the bottom of the ‘Isotherm Temperature’
screen in Step 1 of the Test Setup Wizard called “Maintain
AquaSorp Temperature Setting after test is completed. If
subsequent isotherm tests are going to be run at the same
temperature, it is advantageous to maintain the AquaSorp
at this temperature to avoid equilibration time.
After verifying the isotherm temperature is correct and
choosing whether to maintain temperature after the iso-
therm test is complete, press “Next” to advance to Step 2
of the wizard.
50
6. Running a Test
AquaSorp Users Manual
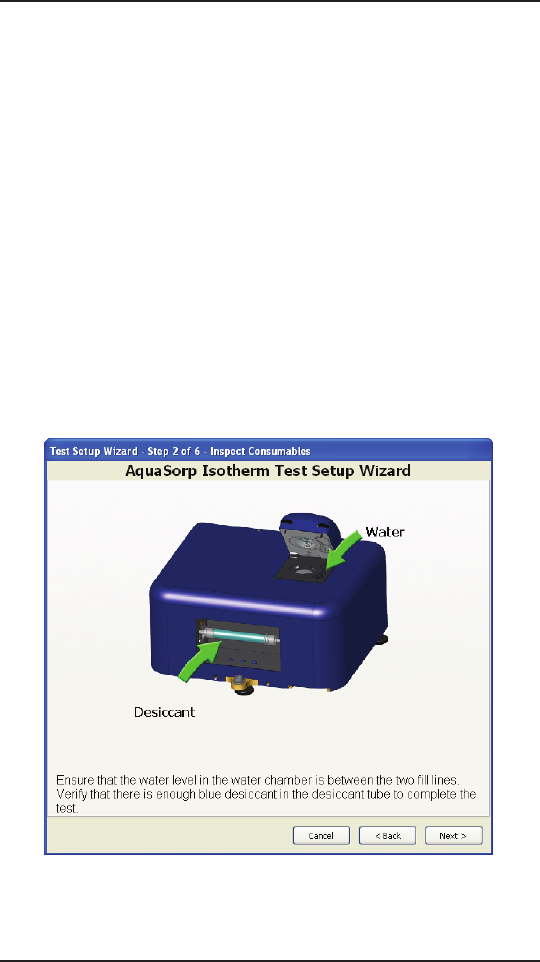
Step 2. Check Water and Desiccant Levels
Ensure the water level in the water chamber is between the
two fill lines. e water chamber is located to the right
of the sample chamber and should be filled with distilled
water using the supplied water dispenser. Care should be
taken to prevent spilling water into the sample chamber or
down the side of the lid.
Verify there is enough blue desiccant in the desiccant tube
to complete the experiment. If more than three quarters
of the tube is pink, the desiccant tube should be changed.
New desiccant tubes are available from Decagon or used
desiccant tubes can be recharged by returning the tube to
Decagon. Alternatively, the desiccant tube can be refilled
51
6. Running a Test
AquaSorp Users Manual
by removing one of the end caps, dumping out the pink
desiccant (any remaining blue desiccant in the tube can
still be used) and refilling with blue desiccant (additional
desiccant can be purchased from Decagon). Fill the tube
with desiccant and then lightly tap the tube on a hard sur-
face while holding the open end up to pack the desiccant.
If the tube is not full after tapping, add additional desic-
cant until full. When the water chamber and desiccant
tube are ready, press “Next”.
NOTE: Opening the chamber during a test will invalidate
and stop the test due to exposure of the sample to the room en-
vironment. Make sure both the desiccant and water level are
adequate before starting a test.
52
6. Running a Test
AquaSorp Users Manual
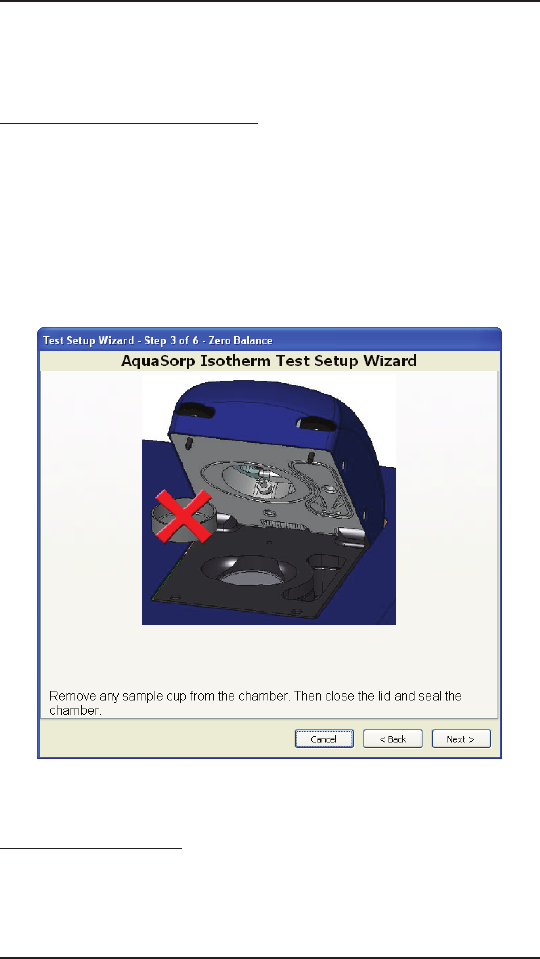
Step3. Zero the Balance
If there is a sample cup in the chamber, remove it. Close
the lid and seal the chamber. e lid does not need to be
sealed tight during this step, only closed. Press “Next.” e
balance will zero itself and the next step of the wizard will
appear.
Step 4. Tare Cup
Open the lid and place an empty stainless steel cup into the
sample chamber on the weighing platform. e platform
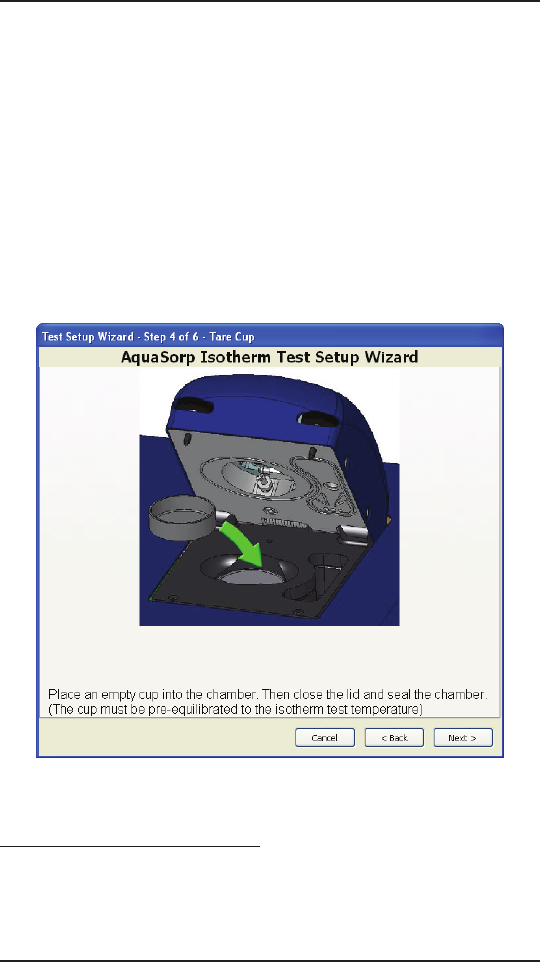
53
6. Running a Test
AquaSorp Users Manual
has a beveled rim and the cup should fit inside of the rim
and lie flat on top of the platform. When the cup is proper-
ly inserted, close the lid and seal the chamber as described
above. en press “Next.” e empty sample cup will be
tared and the wizard will advance to the next step.
NOTE: is cup should be close to the isotherm test tempera-
ture. If ambient humidity is high (above 40% RH) and there
is a large temperature divergence between the AquaSorp and
the sample cup (more than 15°C), condensation could occur.
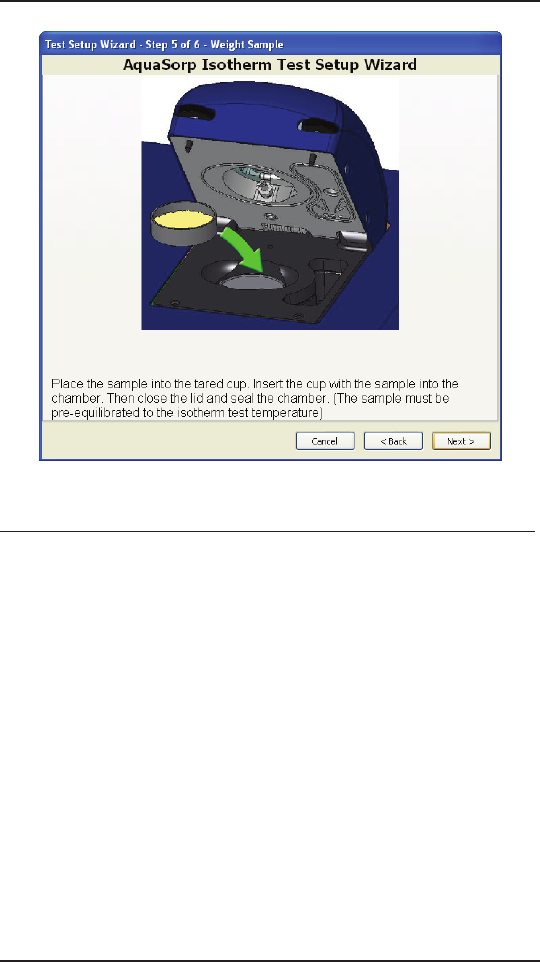
Step 5. Sample Insertion
Open the lid and remove the cup that was just tared. Place
the sample to be tested into this tared cup. e sample

54
6. Running a Test
AquaSorp Users Manual
should be uniform and representative of the material to be
tested. Avoid filling the sample cup more than half full and
make sure the outside of the sample cup is clean. For most
samples, adding just enough sample to cover the bottom of
the cup should be sufficient.
For samples with slow water diffusion rates, increasing the
surface area through grinding and keeping sample sizes
small may improve sorption testing. However, if surface
adsorption characteristics are desired, the sample should be
kept in native state. Tablets and other coated samples should
be crushed for analysis unless surface sorption characteris-
tics are of interest. Samples with high viscosity and slow
diffusion can potentially crust over so sample size should
be kept small. For slow diffusing samples and powders, the
optimal sample size is between 500 and 800 mg.
Use caution when placing the cup in the sample cham-
ber to avoid spilling the sample. Insert the cup with the
sample into the chamber, making sure the sample cup is
seated properly on the weighing platform. Close the lid
and seal the chamber by screwing down the thumbscrews
until tight. Make sure you tighten the screws evenly or the
lid could seat unevenly and cause a vapor leak. en press
“Next.” e wizard will advance to the test setup screen.
NOTE: Like the sample cup above, the sample temperature
should not be drastically different from the isotherm test to
avoid condensation problems.
55
6. Running a Test
AquaSorp Users Manual
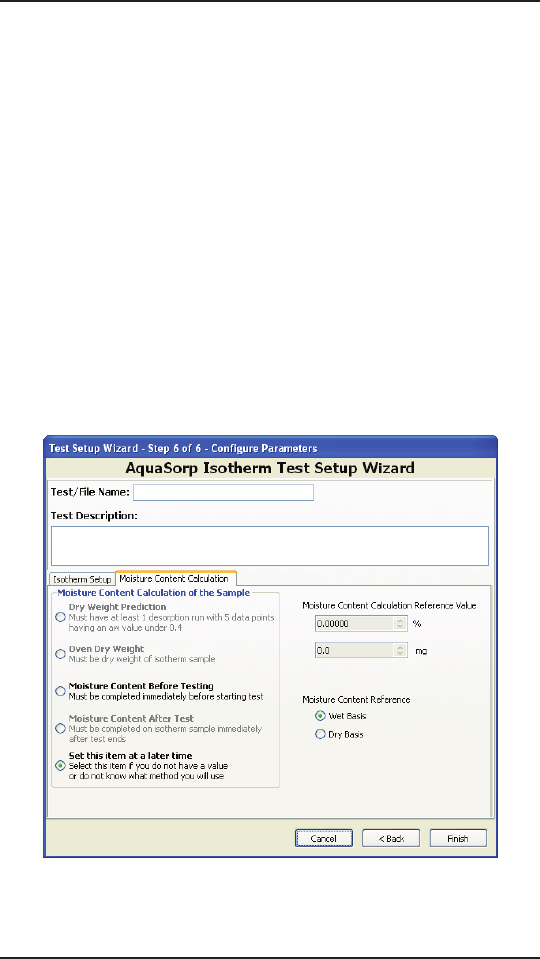
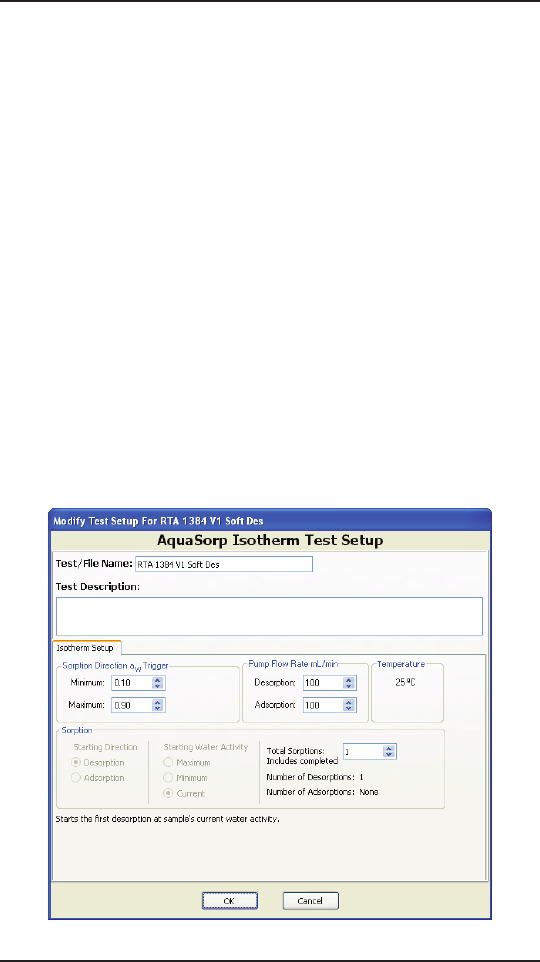
Step 6. The AquaSorp Isotherm Test Setup Screen
is screen sets the parameters for the isotherm analysis. It
has several important elements including:
Test or File Name: Each experiment requires a unique
name. is name will be used to identify the test as it
is being run and to identify the data set once testing
is complete. e name can be any combination of let-
ters and symbols including spaces and should provide
identifying information for the sample. A data file
will automatically be saved with the test or file name
in My Documents/Decagon/SorpTrac. If another
default save location is desired, it can be changed by
going to SorpTrac Tools > Preferences. is data file

56
6. Running a Test
AquaSorp Users Manual
will be updated with new data as it becomes available
whenever SorpTrac is connected to the AquaSorp or
if not connected, the data file will be updated with
new data upon re-connecting to the AquaSorp. Upon
completion of the isotherm test, this data file will
contain all the isotherm data and can be used for data
analysis (see Chapter 7 for instructions on using Data
Analysis).
Test Description: is space can be used to re-
cord any additional information about the ex-
periment that might be helpful to the user.
ere are two tabs on the lower portion of the Setup win-
dow. One is labeled “Isotherm Setup” and the other is la-
beled “Moisture Content Calculation”.
Isotherm Setup: e Isotherm Setup Tab is used to set the
parameters for the test.
Water Activity Limits: Use this section to set the up-
per and lower water activity limits for the isotherm.
e minimum setting can be any value above 0.03
aw, but it must always be lower than the maximum
setting. e upper limit is 0.95 aw. Default values are
0.10 aw minimum and 0.85 aw maximum. e lim-
its used will depend on the water activity range the
user wants to study. Some sample types can undergo
phase transitions and possibly go into solution during
adsorption. If these changes are not desired, the wa-
ter activity limit should be set at a value that is lower
than the critical water activity for the change. Keep

57
6. Running a Test
AquaSorp Users Manual
in mind that the critical water activity may not be
known until after an initial adsorption test has been
conducted.
Pump Flow Rate (ml/min): Use this section to set
the rate air will be pumped into the isotherm cham-
ber. Separate flow rates can be set for each direction.
e minimum flow rate is 10 ml/min and the maxi-
mum flow rate is 1000 ml/min. Default setting is 300
ml/min. Faster flow rates may make the isotherm
test faster, but may also result in fewer and less even-
ly spaced data points. For more information about
choosing the correct flow rate for your sample, please
contact Decagon Devices.
Sorption: Use this section to set the initial direction
of the isotherm, the starting water activity, and the
number of sorptions.
Starting Direction: In this box, choose if the
isotherm is to be started as desorption or adsorp-
tion.
Starting Water Activity: Use the next box to
determine if the isotherm will be started at the
sample’s current water activity level or if the
sample will be saturated to the maximum wa-
ter activity (desorption) or dried to minimum
water activity (adsorption) before beginning the
isotherm. If just full isotherms are desired, the
min and max starting water activity are the most
desirable. If the working adsorption or desorp-

58
6. Running a Test
AquaSorp Users Manual
tion isotherm data is desired from the current
state of the sample, current starting water activ-
ity should be chosen.
Number of Sorptions: e final box is used to
determine the number of sorption curves. Choos-
ing “1” for the number of sorptions means one
desorption or adsorption curve depending on
the starting sorption direction. Choosing “2” for
the number of sorptions will result in one des-
orption and one adsorption curve. Any number
of curves may be chosen to a maximum of 20.
Default setting is “2” sorptions. If current water
activity was chosen as the starting water activity,
the initial curve from the starting point to the
minimum or maximum water activity (depend-
ing on the chosen initial isotherm direction) will
count as one sorption. If maximum or mini-
mum is chosen as the starting water activity, the
first adsorption or desorption curve (depending
on the chosen initial isotherm direction) will be
identified as a quick adsorb or a quick desorb and
will not count as one of the sorption curves.
Moisture Content Calculation: is tab is used to determine
how moisture content will be calculated. e AquaSorp’s
balance tracks weight gravimetrically as the isotherm is
running. To have meaning, these weights must be convert-
ed into moisture contents. e method used to determine
moisture content when using the AquaSorp will depend on
the users preferred moisture content method. If moisture
content is available prior to the start of the test, it can be

59
6. Running a Test
AquaSorp Users Manual
entered at setup and data collected while the test is running
will be displayed as moisture content on the data collection
screen. If the moisture content information is not available
at startup and is entered after completion of the test, the
data collection screen will show the weight of the sample
and not the moisture content.
Dry Weight Prediction: is method has been devel-
oped by Decagon to eliminate the need to perform a
moisture analysis. It utilizes the desorption isotherm
data below 0.40 aw and oven dry water activity to pre-
dict the oven dry weight. is method cannot be used
if a desorption curve is not going to be generated. e
method works for most types of isotherms, but can-
not be used for materials with desorption curves that
flatten at low water activities and then rapidly lose
water at water activities below 0.1 aw.
Moisture Content Before Test: If the user knows the
moisture content of the sample prior to beginning the
isotherm test, select this button and enter the percent
moisture content. To be accurate, this must be the
moisture content of the sample at the time it is placed
in the AquaSorp.
Set is Item at a Later Time: If the dry weight or
moisture content of the sample is going to be deter-
mined after the analysis, select this button. is is the
default selection.
Moisture Content Reference
is function allows the user to select whether mois-
60
6. Running a Test
AquaSorp Users Manual
ture content should be reported on a wet or dry basis.
Alternating between the reporting methods will result
in changes to the data since they are calculated differ-
ently. For wet basis, the amount of water is divided by
the total weight of the sample (solids plus moisture)
while for dry basis, the amount of water is divided by
the dry weight (solids only). When using a known
moisture content, it is important to know its basis
and then select the right method on the setup screen
as this will impact the way all other moisture contents
are determined.
Finish: Pressing finish at the bottom of the page will start
the isotherm experiment you have just set up.

61
6. Running a Test
AquaSorp Users Manual
Data Collection
Once the test is started, data points will be loaded into the
chart and table as they are generated as long as the Sorp-
Trac software is connected to the AquaSorp. In addition,
the status bar at the top of the screen will show the current
status of the test and the status bar at the bottom of the
screen will show the current test settings.
Pressing “Disconnect” at the top of the screen stops
real time updating, but data will still be generated and
saved in the AquaSorp’s internal memory. is means
that once a test has been started, the SorpTrac soft-
ware can be disconnected and the computer can be
shutdown without affecting the test.
If the AquaSorp is turned off and automatic restart
is not selected or if the stop button is pressed during
the isotherm test, the data will not be lost and can be
saved; however the isotherm test cannot be continued.
If additional data points are needed, a new isotherm
test must be started.
62
6. Running a Test
AquaSorp Users Manual
Saving Data
Upon completion of a test, a data file is automatically saved
in the location described in preferences. If a different file
name and/or location are desired, the test can be saved by
going to File > Save Experiment and then entering a file
name and location for the test and pressing “Save.” e file
name can be the same or different from the test name se-
lected during test setup. In addition, both the chart and the
table can be exported from the data collection screen for
use in other programs. e graph is exported as an image
file and the table is exported as a .csv data file. is is done
by selecting File > Export and then selecting either “chart
to graphic” or “table.”
63
6. Running a Test
AquaSorp Users Manual
Modify Test
While the test is running, the aw limits flow rate for both
adsorption and desorption, and the number of sorptions
can be modified. To change these values, press the “Mod-
ify Test” button at the top of the screen or select Actions>
Modify Test from the menu options at the top of the
screen. (e modify test button will only be visible below
the menus after a test has started. When idle, the button
will be “Set. Temp”).
e isotherm setup screen will appear. e aw minimum &
maximum values, the flow rates and the number of sorp-
tions can be updated on this screen. e starting direction
and starting aw value settings cannot be changed and the
number of sorption curves cannot be reduced to a number
less than the number of curves already generated.

64
7. Analysis Tools
AquaSorp Users Manual
7. Analysis Tools
Data Analysis
SorpTrac software analyzes the completed test data using
the GAB, BET, and Decagon’s own polynomial equation
called the Double Log Polynomial. ree different file
types are used for data analysis in SorpTrac.
•SorptionExperimentDatale(.sxd). is file
contains the data collected for each isotherm test. It is
created automatically when an isotherm test is started
or can be saved manually be selecting File > Save Ex-
periment at the data collection screen. is file is then
opened in the Data Analysis Tool to be analyzed.
•AnalyzedExperimentDatale(.axd). is file
is created by saving the results from the Data Analysis
Tool. It contains the experimental data included in
the analysis plus the isotherm model information.
•MultipleExperimentDatale(.mxd). is file
is created by saving the results of the Multiple Iso-
therm Analysis Tool. It contains the data for all iso-
therms included in the analysis as well as the isotherm
model information if an analysis was done.
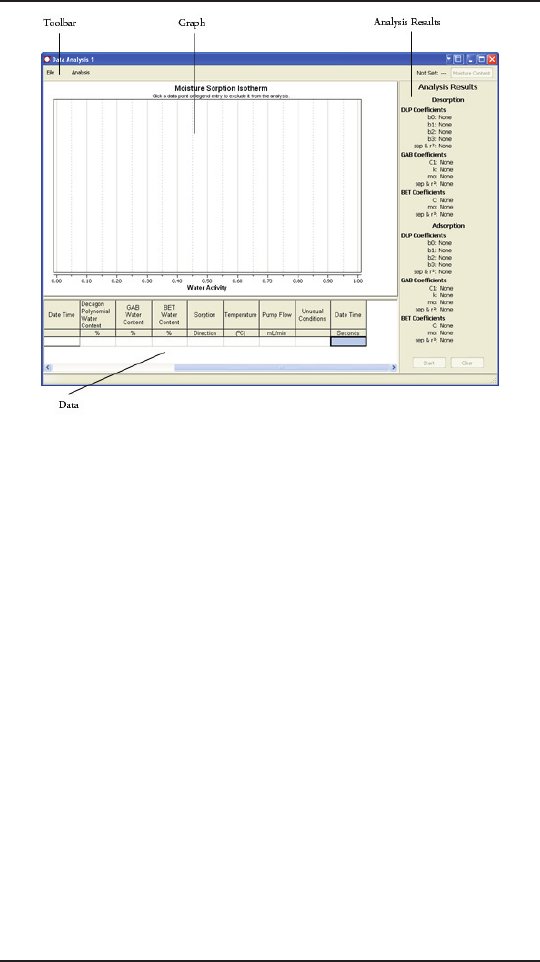
To begin Data Analysis, select Tools > Data Analysis, to
open the Data Analysis Window. e Data Analysis win-
dow consists of a chart area, a data table area, and an analy-
sis results area as seen below.
65
7. Analysis Tools
AquaSorp Users Manual
To open a test for analysis, select File > Open Test, select a
previously saved test data file, and press “OK”. e file ex-
tension for the test data file will be .sxd. e test data will
be displayed in the chart and table. e chart shows the test
name for the isotherm being analyzed.
66
7. Analysis Tools
AquaSorp Users Manual
Multiple data analysis pages can be open simultaneously
and more than one open data analysis page can use the
same data set. Additional data analysis pages are opened
by navigating to the data collection screen, selecting Tools
> Data Analysis, and then opening an experiment as out-
lined earlier. You can quickly switch between Data Analysis
Windows by selecting the Window menu item from the
data collection screen.
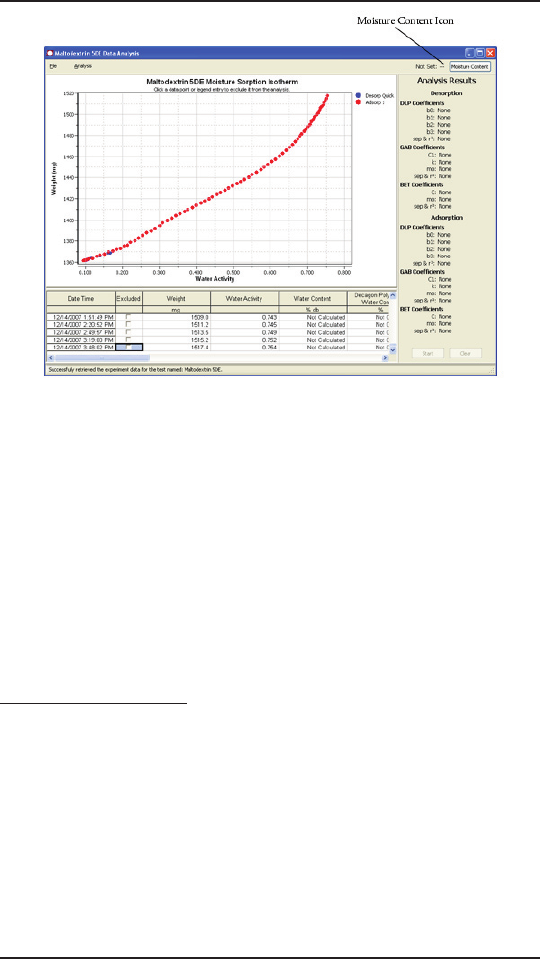
Moisture Content
Before the isotherm curves can be analyzed, the sample
weight data collected by the AquaSorp must be converted
to a moisture content. If moisture content information was
entered earlier during data collection, the moisture con-
tents should already be displayed in the data table. To enter
moisture content information, click the moisture content
icon in the top right corner of the data analysis page. is
brings up a moisture content window. is window con-

67
7. Analysis Tools
AquaSorp Users Manual
sists of several different sections including:
Test Name: e name of the test provided during
data collection will appear here by default.
Test Description: If a test description was provided
during data collection, it will appear here by default.
A test description can be added or edited anytime us-
ing this screen.
Moisture Content Calculation: is section is used to choose
the method to determine the moisture content of the iso-
therm data points. e possible methods include:
Dry Weight Prediction. is method has been devel-
oped by Decagon to eliminate the need to perform a
moisture analysis. It utilizes the desorption isotherm
data below 0.40 aw and oven dry water activity to pre-
dict the oven dry weight. is method cannot be used
if a desorption curve has not generated. e method
works for most types of isotherms, but cannot be
used for materials with desorption curves that flatten
at low water activities and then rapidly lose water at
water activities below 0.1 aw.
Oven dry weight. is method is used if loss-on-dry-
ing is used for moisture content analysis. It is impor-
tant that the dry weight be the weight of the actual
isotherm sample after drying in a convection or vacu-
um oven. is is done by taking the isotherm sample
from the instrument when the isotherm analysis is
complete, and putting it directly into the oven. e

68
7. Analysis Tools
AquaSorp Users Manual
stainless steel cup with the sample used for the iso-
therm analysis can be placed directly in an oven e
oven should be the oven routinely used for moisture
content analysis. Keep in mind that any loss in sample
or errors in weighing will result in errors in moisture
content values for all isotherm data points.
To obtain the oven dry weight of the sample, weigh
the cup and sample after removing from the oven and
cooling in a desiccator. Next remove the sample from
the stainless cup and clean the cup. Weigh the clean,
dry and empty stainless steel cup. e oven dry weight
of the sample is the weight of the cup and sample mi-
nus the weight of the empty cup. Enter this value in
milligrams in the dialog box to the right of the oven
dry weight button.
Moisture content before testing. Use this method
if a moisture content analysis was performed on a
sub-sample either before or during the isotherm test.
If this method is chosen, it is vital that the moisture
content be performed on a sub-sample that is in the
same moisture condition as the isotherm sample at
the time the test was started. is method will be the
most common choice for those who use moisture
analysis methods other than loss-on-drying i.e. Karl
Fischer titrations. Enter the % moisture content value
into the top box to the right of the buttons. Sorp-
Trac will assign this moisture content value to the first
data point collected and calculate all other data points
based on this value.

69
7. Analysis Tools
AquaSorp Users Manual
Moisture content After Test: Use this section to enter
a moisture content value from the sample determined
after completing the isotherm experiment. is mois-
ture content value can be determined by any appro-
priate method such as loss-on-drying or Karl Fisher.
Enter the percent moisture content value determined
on the sample at the end of the isotherm experiment
into the top right of the buttons. SorpTrac will assign
this moisture content value to the last data point col-
lected and calculate all other data points based on this
value.
Moisture Content Reference: is function allows
the user to select whether moisture content should be
reported on a wet or dry basis. Alternating between
the reporting methods will result in changes to the
data since they are calculated differently. For wet ba-
sis, the amount of water is divided by the total weight
of the sample (solids plus moisture) while for dry ba-
sis, the amount of water is divided by the dry weight
(solids only). When using a known moisture content,
it is important to know its reporting basis and then
select the right method on the setup screen as this
will impact the way all other moisture contents are
determined. Dry weight prediction is the default se-
lection.
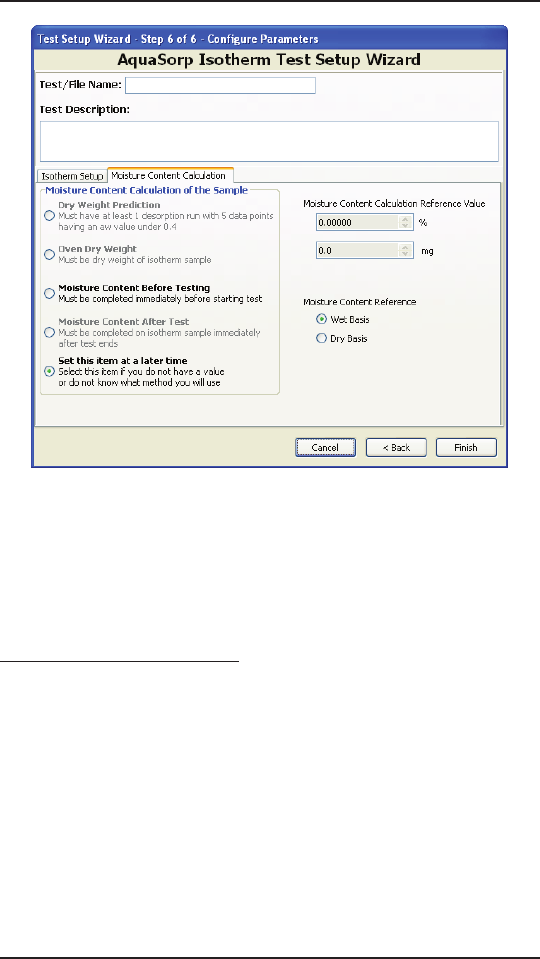
70
7. Analysis Tools
AquaSorp Users Manual
After selecting the appropriate Moisture Content determi-
nation, press “OK” at the bottom of the screen. e mois-
ture content window will close and return to the chart and
data table screen.
Running Data Analysis
With the moisture content data available, the isotherm
graphs can be analyzed to determine the isotherm equation
coefficients. If more than one adsorption or desorption
curves were generated, they will each be displayed on the
chart. Any of the curves can be excluded from the analysis
by clicking once on the curve name in the legend to the
right of the chart. e curve will then be removed from the
chart view. e word ‘excluded’ will now appear in paren-
theses next to the curve name in the legend at the right of
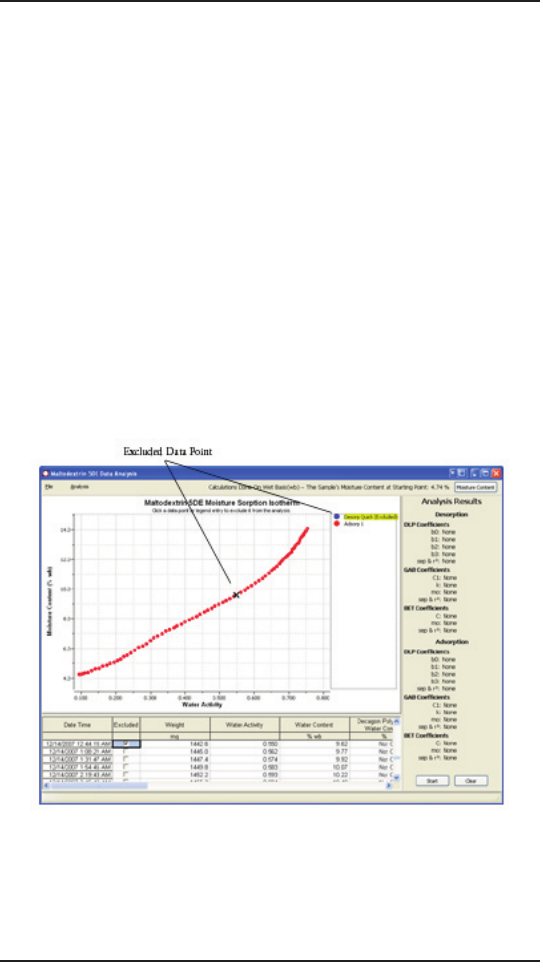
71
7. Analysis Tools
AquaSorp Users Manual
the chart indicating that the data for this curve will not be
included in the data analysis. e data for excluded curves
is not deleted and the curve can be re-included in the anal-
ysis by clicking the name in the legend again. If more than
one curve is included in the analysis, all adsorption points
from all included adsorption curves will be combined for
the adsorption analysis and all desorption data points from
all included desorption curves will be combined for des-
orption analysis. A single data point can also be eliminated
from the analysis by double clicking on the data point in
the chart view or by clicking on the excluded box in the
data table next to the data point. When the data point is
excluded, it will be replaced by an X in the chart view as
seen in the following picture.
When the data points and curves excluded from the analysis
have been selected, the analysis process is started by press-
ing the start button at the bottom right side of the data

72
7. Analysis Tools
AquaSorp Users Manual
analysis screen. When analysis is complete, the coefficient
results will be displayed on the right side of the screen. e
standard error of prediction (S.E.P.) and the R2 are also
displayed. e S.E.P. provides information about how well
the models predict the actual data. For example, an S.E.P.
of 0.05 means that the moisture content predicted by the
isotherm model at any water activity is ±0.05 of the actual
moisture content. e R2 is an indication of the goodness
of fit of the moisture content data generated by the models
to the actual moisture content data. An R2 value of 1.00
means the model perfectly matches the actual data.
e SorpTrac software provides separate analysis results for
adsorption and desorption curves using the Double Log
Polynomial (DLP equation), GAB, and BET isotherm
models (for the BET model, only data points between 0
and 0.50 aw are used for the analysis). e data points pre-
dicted by each equation are now displayed in the data table
and the predicted curve is displayed in the chart view. Any
of these curves can be hidden from view by clicking once
on their name in the legend to the right of the graph. e
word ‘hidden’ will appear after the model name.
e data table can be exported as a .csv file and the chart
can be exported as an image file before or after pressing
the start analysis button. However, if the table or chart is
exported before pressing start, the information generated
during analysis will not appear in the graphic or table. To
export the table select File> Export> Table. To export the
graph select File> Export> Chart to Graphic.
Once start has been pressed and analysis is complete, the

73
7. Analysis Tools
AquaSorp Users Manual
results can be saved. To save the results, select File> Save
Analysis and choose the name and location to save the file.
is file will be saved with an .axd file extension and will
save the moisture content information and GAB, BET, and
DLP information. To open a previously saved analysis file,
select File> Open Analysis File and choose any .axd file to
open. Once opened, new moisture content data can be
entered by pressing the moisture content icon or the data
set can be re-analyzed by pressing the clear button and the
start button again. Any graphs excluded from the analysis
originally will return when the clear button is pressed.
An isotherm report showing the isotherm graph and the
table of coefficients can also be saved as a pdf file. To gen-
erate an isotherm report, go to File> Generate Report and
choose a name and location for the isotherm report file.
Multiple Isotherm Analysis
e SorpTrac software includes a tool to view and analyze
multiple isotherm tests together in the same chart. is
function is used to compare isotherms as well as create and
analyze working isotherms. To begin Multiple Isotherm
Analysis, select SorpTrac Tools > Multiple Isotherm Analy-
sis. is will open a new Multiple Isotherm Data Analysis
page, which looks like the Data Analysis page, but with
only one set of coefficients under Analysis Results.
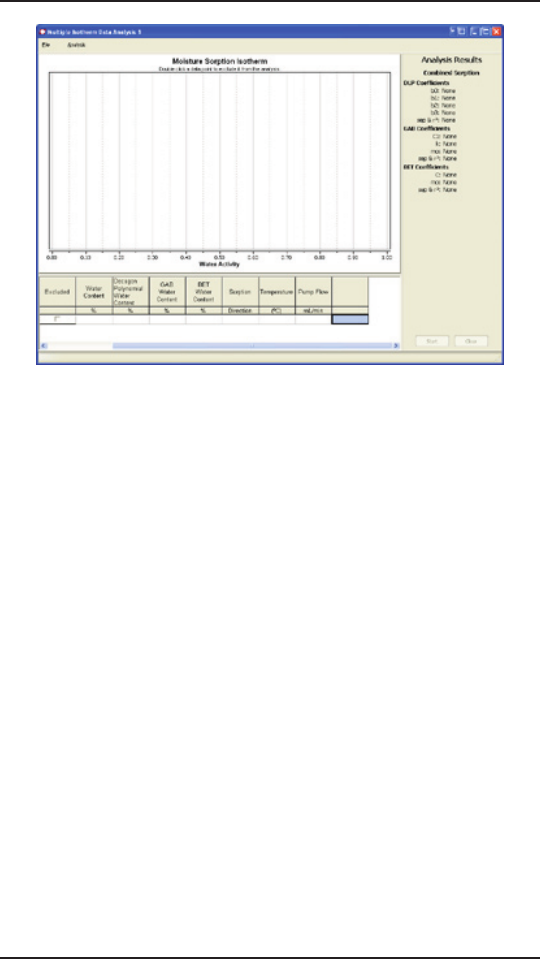
74
7. Analysis Tools
AquaSorp Users Manual
Overview of Multiple Isotherm
Analysis
Multiple Isotherm Analysis utilizes axd files created using
the Data Analysis Tool. It creates mxd files, which can be
re-opened for further analysis or opened with other mxd
or axd files for further comparisons and analysis. Since
axd and mxd files already contain moisture content infor-
mation, there is no need to enter moisture content infor-
mation for Multiple Isotherm Analysis. When axd files are
created, there is only one adsorption and one desorption
curve, even if the original sxd file had multiple adsorption
and desorption curves (Note: the adsorption and desorp-
tion curves in the axd files will include a combination of all
of the data from all of the curves included in the original
data analysis). e axd file can also have only an adsorp-
tion or desorption curve depending on what was included
when data analysis was conducted. When an axd file is
opened in Multiple Isotherm Analysis, all isotherm data

75
7. Analysis Tools
AquaSorp Users Manual
and curves in the axd file will be imported, (the isotherm
model information will not be imported). erefore, axd
files that are created to be merged with other axd files using
the Multiple Isotherm Analysis tool should only include
the data or curves that are to be merged. Any unwanted
data or curves should be excluded from the analysis before
the axd file is created.
Each curve from each axd file to be combined will be iden-
tified in the Multiple Isotherm Chart by its test name and
sorption direction allowing each curve to retain its original
identity. However, if the combined data is analyzed using
the start button at the bottom right corner of the Multiple
Isotherm Analysis page, all of the data will be treated as one
data set and one sorption curve. is means that for analy-
sis, the data will not be distinguished by sorption direction
or original axd file name. e analysis results will be one
sorption curve with one set of coefficients.
For example, consider there are two axd files whose adsorp-
tion curves are to be compared. e original sxd files con-
tain both an adsorption and desorption curve for both iso-
therm tests. To compare just the adsorption curves of the
two tests, the desorption curves should be excluded from
data analysis using the Data Analysis Tool. e results of
the data analysis of just the adsorption curves for both tests
should then be saved as axd files. ese axd files can then
be opened using the Multiple Isotherm Tool and compared
on the same chart without the desorption curves. If the
desorption curves were not excluded using the Data Analy-
sis Tool, they too would be imported and would appear in
the chart with the adsorption curves.
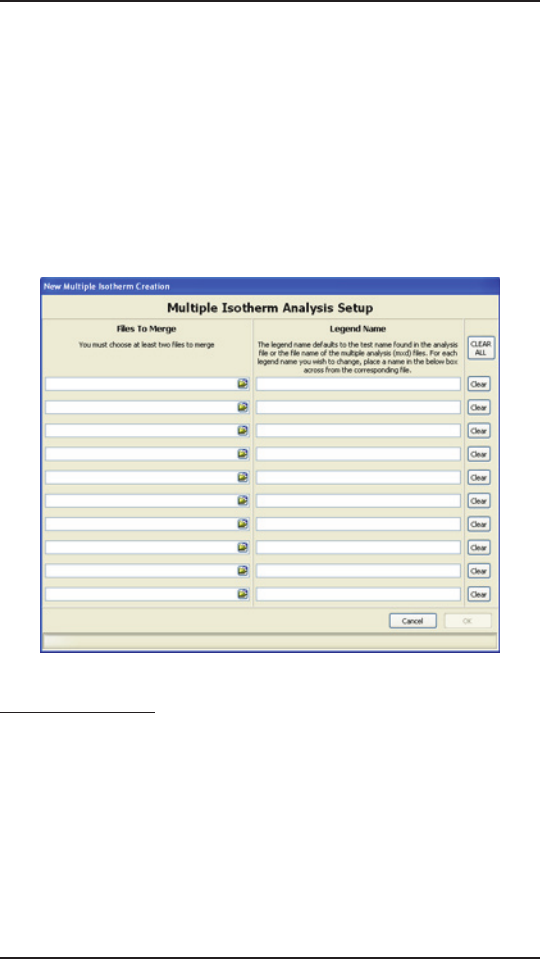
76
7. Analysis Tools
AquaSorp Users Manual
Running a Multiple Isotherm
Analysis
To begin a new multiple isotherm project, select File >
New. is will bring up the Multiple Isotherm Analysis
Setup page. is page consists of two parts, the Files to
Merge section and the Legend Name section.
Files to Merge
e Files to Merge section is used to select the isotherm
files to be combined. To select a file, click on the open
folder icon on the right side of the first blank space in the
Files to Merge section. is will bring up a browsing win-
dow to find the first file to merge. is must be either an
.axd file created during data analysis or an .mxd file created
previously using Multiple Isotherm Analysis. At least two
different files must be selected for merging and up to 10
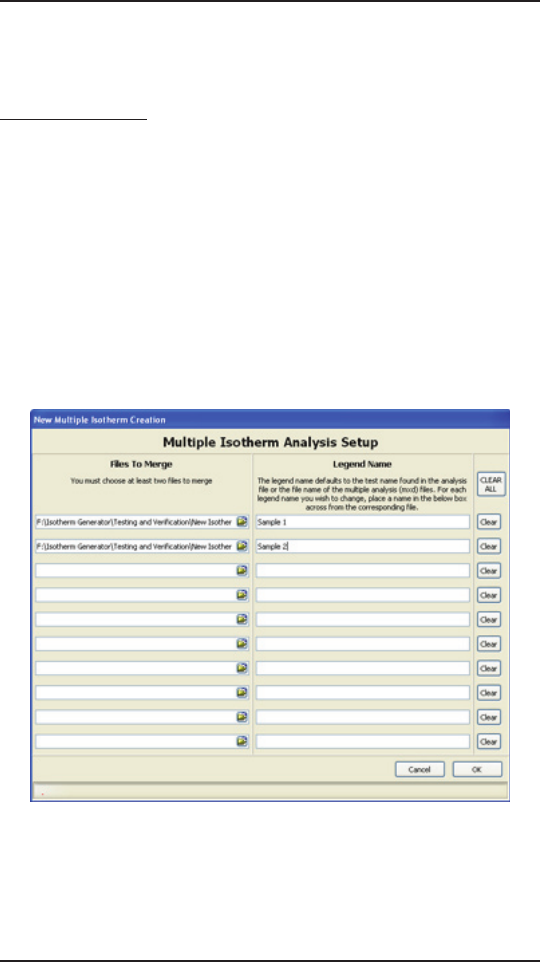
77
7. Analysis Tools
AquaSorp Users Manual
files can be selected. To open additional files, repeat the
process using the other blank lines.
Legend Name
By default, each curve from each file will be identified in
the chart by the test name and the sorption direction. Test
names that are too many characters will be shortened and
if more than one curve has the same test name, they will be
followed by ascending numbers (i.e. 1 then 2 and so forth).
If a legend name other than the test name is desired, it can
be entered in the corresponding blank line under Legend
Name. e curves imported for that file will now be iden-
tified by the new legend name and the sorption direction.
Pressing ‘OK’ after selecting the files to merge will import
the information and the combined isotherms will now
appear together in the Multiple Isotherm Analysis page.

78
7. Analysis Tools
AquaSorp Users Manual
Pressing “cancel” will return to the blank Multiple Iso-
therm Analysis screen. If the files included in the Multiple
Isotherm Analysis need to be changed, select File > Modify.
is will bring up the Multiple Isotherm Analysis Setup
Screen with the files and legend names (if any) chosen pre-
viously. e files can then be cleared, changed, additional
files can be included, or the legend names can be changed.
If a new Multiple Isotherm Analysis project is desired, se-
lecting File > New will bring up a blank Multiple Isotherm
Analysis Setup page.
Once the multiple isotherm files have been combined us-
ing the setup screen, the combined data will appear in the
chart and table on the Multiple Isotherm Analysis screen.
e legend names will be listed to the right of the chart.
Clicking on a legend name in the chart will hide that curve
from view and the word ‘Hidden” will appear next to the
legend name in parentheses. e chart and table of data
can be exported at any time by selecting File > Export >
Table or File > Export > Chart to Graphic. When a chart
is exported, it will appear as it does on the screen and any
curves that are hidden will be hidden in the image as well.
e Multiple Isotherm Analysis information can be saved
at any time as well (before or after clicking on the start but-
ton) by selecting File > Save. is will create an .mxd file.
is mxd file can then be re-opened anytime by selecting
File > Open. Only mxd files can be opened in this manner.
e mxd file can also be combined with other axd and mxd
files by selecting File > New and selecting the newly created
mxd file along with the other files to be combined.
In many cases, all that will be desired with the Multiple

79
7. Analysis Tools
AquaSorp Users Manual
Isotherm Analysis tool is to compare multiple curves but
not analyze them together. In these situations, it is not
necessary to click the start analysis tool at the bottom right
corner of the screen. However, if a combined analysis of
the curves is desired, pressing the start button will generate
the isotherm model values in the table and the coefficient
values under Analysis Results. Unlike the Data Analysis
Tool, clicking on a legend name in Multiple Isotherm
Analysis hides the curve from view, but does not exclude it
from the analysis. Individual data points can be eliminated
by double clicking on them or clicking on the excluded box
next to the data point in the data table.
e most obvious situation where analysis of the combined
isotherms will be of value is for working isotherms. More
information about working isotherms can be found below.
Since all of the data imported into the Multiple Isotherm
Analysis tool is considered one data set for analysis, only
one set of coefficients will appear under Analysis Results.
e results of the analysis can be cleared anytime by press-
ing the clear button. e results can also be saved by se-
lecting File > Save. is will create an .mxd file as above
but will now contain the isotherm model information. An
analysis report showing the graph and coefficients can also
be saved as a pdf file by selecting File > PDF Report.
Creating a Working Isotherm Us-
ing the AquaSorp
Working isotherms, as described in the eory section in
Chapter 3, can be generated using the AquaSorp, but it
requires several steps.
Step 1.

80
7. Analysis Tools
AquaSorp Users Manual
Generate two isotherm tests using the AquaSorp, one
for adsorption and one for desorption and both starting
at the “current” water activity value. A working isotherm
is an analysis of the sorption characteristics of a sample
starting from its native state. To generate this data requires
the analysis of two sub-samples in the same condition as
the original sample.
Adsorption Curve: One sub-sample is analyzed for
adsorption from its current state. When setting up the
test, any settings can be used for temperature, water
activity limits, and flow rate, but at the Isotherm Test
Setup screen of the Test Setup Wizard, Starting Sorp-
tion Direction must be Adsorption, Starting Water
Activity must be Current, and Number of Sorptions
must be 1. e Test Name should identify the sample
name and the sorption direction. Upon completion
of the isotherm, the sxd file should be saved with a file
name that identifies this isotherm as the adsorption
curve of the working isotherm.

81
7. Analysis Tools
AquaSorp Users Manual
Desorption Curve: One sub-sample is analyzed for
desorption from its current state. When setting up the
test, any settings can be used for temperature, water
activity limits, and flow rate, but at the Isotherm Test
Setup screen of the Test Setup Wizard, Starting Sorp-
tion Direction must be Desorption, Starting Water
Activity must be Current, and Number of Sorptions
must be 1. e Test Name should identify the sample
name and the sorption direction. Upon completion
of the isotherm, the sxd file should be saved with a file
name that identifies this isotherm as the desorption
curve of the working isotherm.
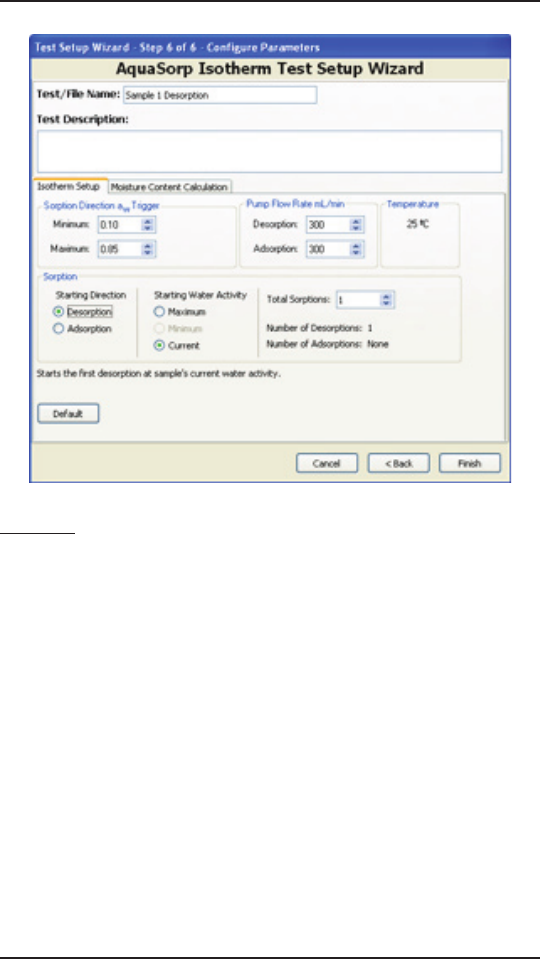
82
7. Analysis Tools
AquaSorp Users Manual
Step 2.
Analyze the adsorption and desorption curves separate-
ly using the Data Analysis Tool. Open the adsorption and
desorption sxd files of the working isotherm in separate
Data Analysis Tool windows. Enter the moisture content
information for each curve as detailed in the Data Analysis
section. Ideally, the same initial moisture content will be
used for both isotherm curves since the two sub-samples
used for isotherm analysis should have had the same ini-
tial moisture content. is also facilitates combining the
curves in Multiple Isotherm Analysis. Data analysis should
be then be conducted for each individual curve and the
analyses saved as axd files as outlined above.
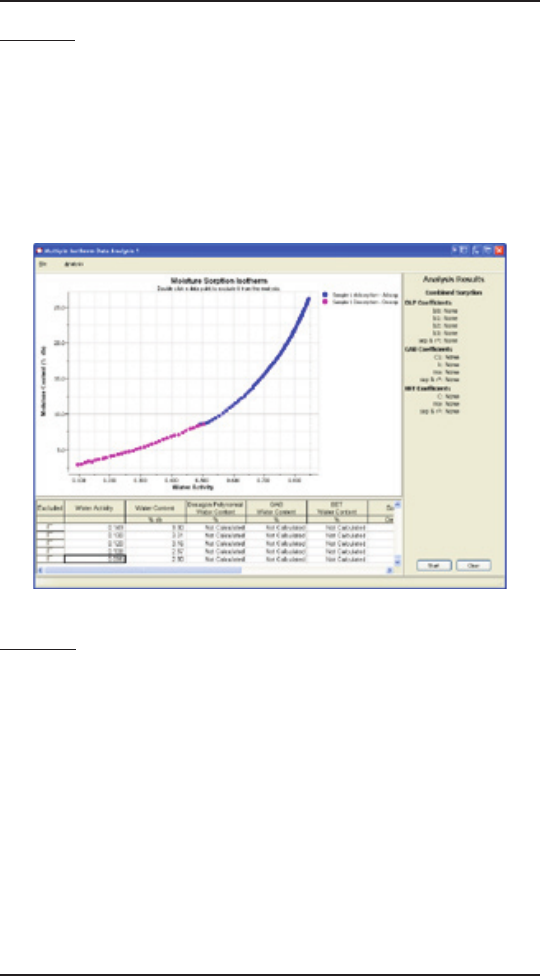
83
7. Analysis Tools
AquaSorp Users Manual
Step 3.
Combine the adsorption and desorption curves using
the Multiple Isotherm Analysis Tool. In the Multiple Iso-
therm Analysis Tool, select to merge the axd files for ad-
sorption and desorption as instructed above. Both curves
should now appear in the same chart, each identified by
their test name and sorption direction.
Step 4.
Analyze the combined curves as one working isotherm.
Press the Start button at the bottom right corner of the
page to analyze the two curves as a combined working iso-
therm. e results will show one working isotherm with
the isotherm model information for the working isotherm.
is working isotherm can now be saved as an .mxd file,
exported as a graphic, exported as a data table, or gener-
ated as a pdf report as outlined above. In addition, mul-
tiple working isotherms can be compared using the Mul-
tiple Isotherm Tool by merging the .mxd files from several
working isotherms.

84
7. Analysis Tools
AquaSorp Users Manual

85
8. Instrument Verification
AquaSorp Users Manual
8. Instrument Verification
To generate accurate isotherms, the AquaSorp must mea-
sure water activity and sample weight accurately. It is there-
fore important to verify the AquaSorp’s water activity and
weight measurements against known standards.
Water Activity Verification
e AquaSorp uses the chilled mirror dewpoint technique
to determine water activity as part of the isotherm anal-
ysis. Because this is a primary measurement method of
relative humidity, no calibration is necessary; however, it is
important to check for linear offset periodically. e com-
ponents that the instrument uses to measure aw are subject
to changes that may affect the AquaSorp’s performance.
ese changes are usually the result of chamber contami-
nation. When this occurs, it changes the accuracy of the
instrument. is is what is called a “linear offset.” ere-
fore, frequent linear offset verification can assure you that
your AquaSorp is performing correctly. Linear offset can be
checked by using a salt solution and distilled water.
Verification Standards
Verification standards are specially prepared salt solutions
that have a specific molality and water activity that is con-
stant and accurately measurable. e verification standards
that were sent with your initial shipment are very accurate
and readily available from Decagon Devices. ese par-
ticular standards are accurate and easy to use. Most im-
portantly, they greatly reduce preparation errors. Because
of these reasons, only standards provided by Decagon can
be used for verification of your AquaSorp’s performance.

86
8. Instrument Verification
AquaSorp Users Manual
Performance Verification Standards come in four water ac-
tivity levels: 1.000, 0.760, 0.500, and 0.250 aw. e stan-
dards are produced under a strict quality assurance regime.
e accuracy of the standards is verified and are shelf stable
for one year. Several verification vials are included with
the AquaSorp. Please contact Decagon Devices to order
additional standards.
Verification Standards
@25°C
Water Activity
Distilled Water 1.000 ±0.005
0.5m KCl 0.984 ±0.005
6.0m NaCl 0.760 ±0.005
8.57m LiCl 0.500 ±0.005
13.41m LiCl 0.250 ±0.005
To use a salt standard, remove the twist top and pour the
contents into an AquaSorp sample cup.
When to Verify for Linear Offset
Linear offset should be checked against a known verifica-
tion standard before beginning a new isotherm test. Linear
offset should never be verified solely against distilled wa-
ter, since it does not give an accurate representation of the
linear offset. Decagon recommends that the AquaSorp be
checked with a high and low salt standard, preferably the
0.760aw and 0.250aw verification solutions. Checking the
aw of a standard solution will alert you to the possibility of
contamination of the unit or shifts in the linear offset from
other causes.
How to Verify and Adjust for Linear Offset
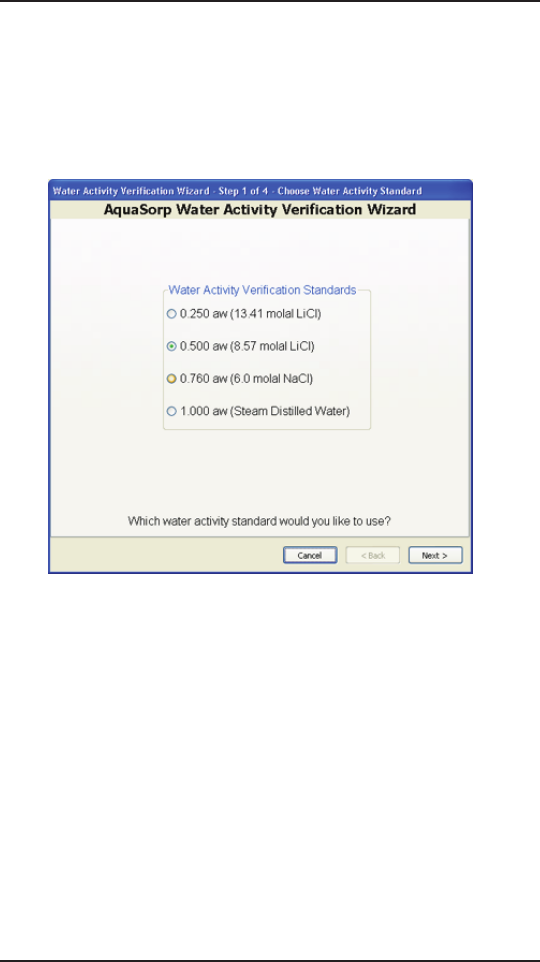
87
8. Instrument Verification
AquaSorp Users Manual
To verify for linear offset of your AquaLab, select Device
Tools > Verification and Restore > Water Activity Verifica-
tion. e water activity verification wizard will then ap-
pear. e steps of the wizard include:
Step 1: Choose Water Activity Standard
Use this step to choose which water activity standard
you will use to verify your AquaSorp. e most com-
mon choices will be 0.760aw and 0.250aw. e choic-
es include:
0.250 aw (13.41 molal LiCl)
0.500 aw (8.57 molal LiCl)
0.760 aw (6.0 molal NaCl)
1.000 aw (Steam Distilled Water)
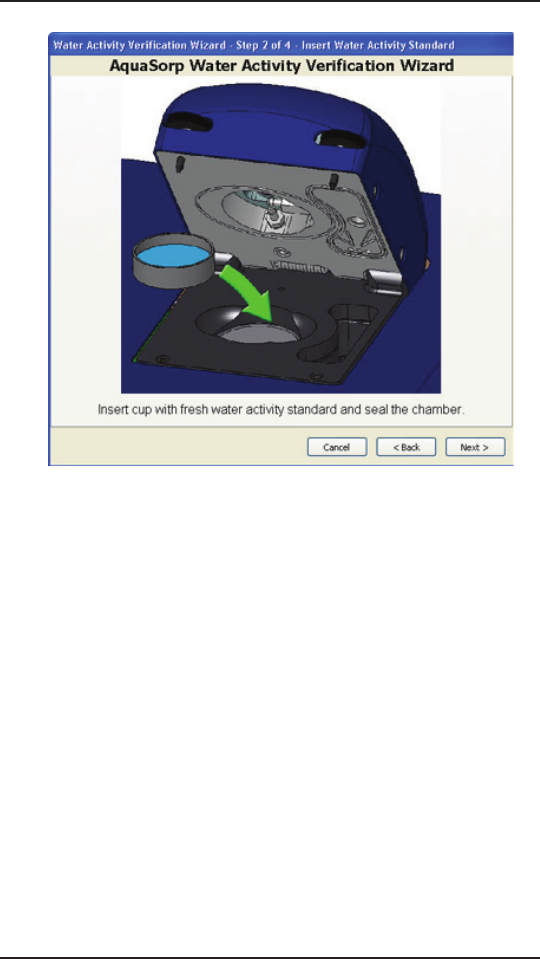
88
8. Instrument Verification
AquaSorp Users Manual
Step 2: Insert Water Activity Standard
For this step, insert a cup with a fresh water activity stan-
dard into the sample chamber and seal the chamber.
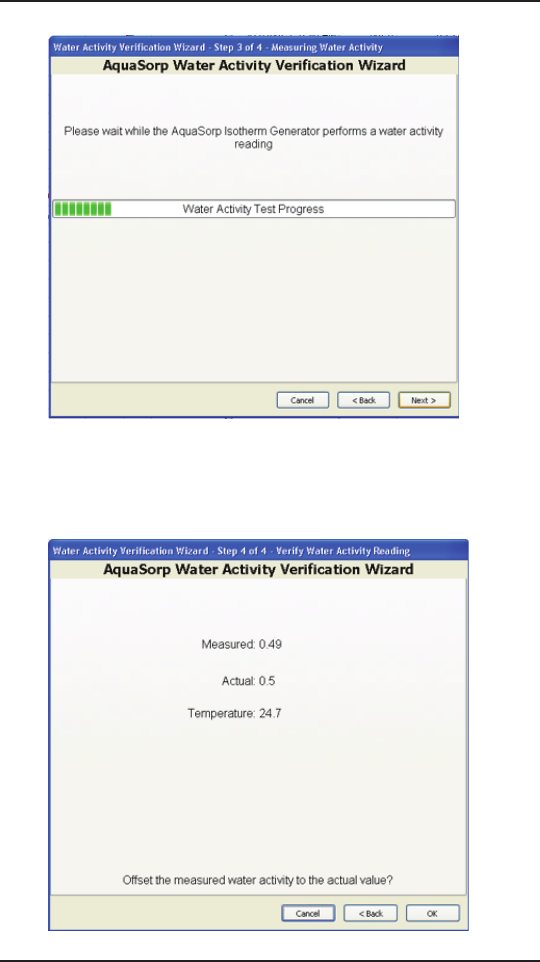
89
8. Instrument Verification
AquaSorp Users Manual
Step 3: Measuring Water Activity
During this step, the AquaSorp will perform a water
activity analysis on the water activity standard.
Step 4: Verify Water Activity Reading

90
8. Instrument Verification
AquaSorp Users Manual
When the water activity analysis in Step 3 is complete, the
analysis results will be displayed as the temperature and
measured aw. e actual aw will also be displayed. To adjust
the offset so the measured aw will match the actual aw, press
“OK” at the bottom of the screen. e offset adjustment
is done automatically and the verification wizard closes.
Pressing “Cancel” on any screen of the wizard closes the
verification wizard without saving the offset adjustment.
e verification process should be repeated for a second
water activity standard. If the second standard reads cor-
rectly, the AquaSorp is ready to begin a test. If the second
water activity standard requires a further offset, or if the
offset on the first standard was larger than ±0.05aw, the
AquaSorp’s testing chamber requires cleaning. For instruc-
tions on cleaning the instrument, please refer to Chapter 9.
e calibration settings can be restored to the factory set-
tings anytime by selecting Device Tools > Verification and
Restore > Restore Factory Aw Calibration.
Balance Verification
e AquaSorp uses a magnetic force balance to gravimetri-
cally track the weight of the sample during the isotherm
test. e performance of this balance is verified against
a NIST traceable 2 gram standard weight. is 2 gram
weight is included with the AquaSorp and should be han-
dled with tweezers and not bare skin. Balance performance
should be verified before starting a new isotherm test
Note: e oils from your skin will affect the accuracy of the
NIST traceable weight.
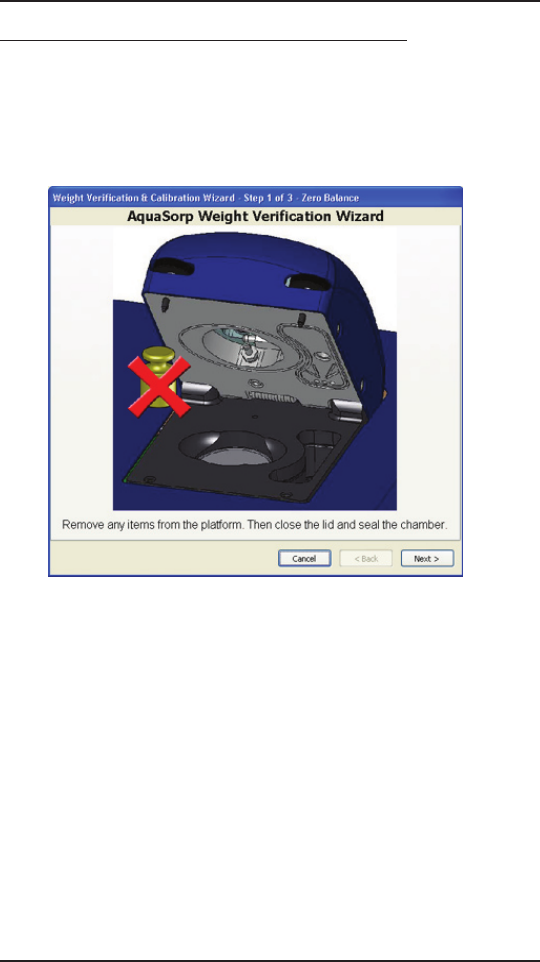
91
8. Instrument Verification
AquaSorp Users Manual
How to Verify and Adjust the Balance
To verify balance performance select Device Tools > Veri-
fication and Restore > Balance Verification. e balance
verification wizard will then appear.
Step 1: Zero the Balance
During this step, nothing should be on the balance.
Close the lid and press next to zero the balance.
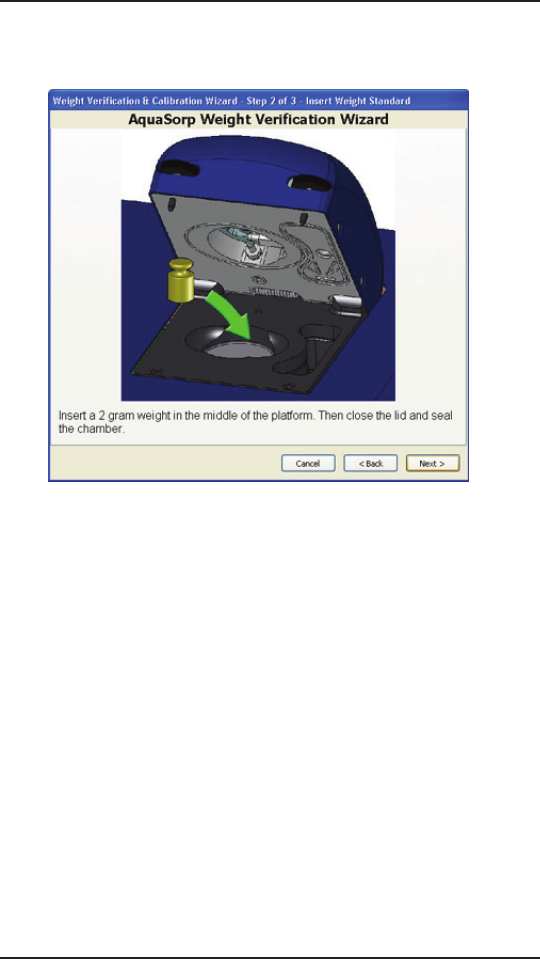
92
8. Instrument Verification
AquaSorp Users Manual
Step 2: Insert Weight Standard
e next screen will ask you to insert the 2 gram
NIST traceable weight standard included with the
AquaSorp. Remember not to handle the weight with
bare skin.
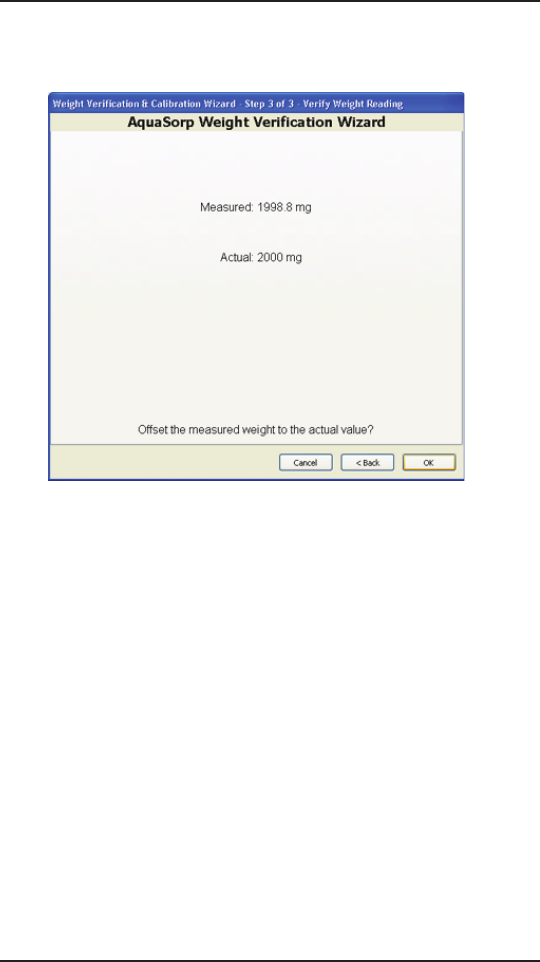
93
8. Instrument Verification
AquaSorp Users Manual
Step 3: Verify Weight Reading
e next screen will display the actual reading and
the measured reading. If the measured value is differ-
ent from the actual reading, press ‘OK’ to offset the
weight to the correct value. If no offset is needed,
press “Cancel”. e balance settings can be restored
back to the factory settings anytime by selecting De-
vice Tools > Verification and Restore > Restore Fac-
tory aw Calibration.

94
9. Maintenance and Cleaning
AquaSorp Users Manual
9. Maintenance and Cleaning.
e accuracy of the AquaSorp is vitally dependent on keep-
ing your instrument clean. Dust and sampling debris can
contaminate the sample chamber and must therefore be
regularly cleaned. To clean the AquaSorp, carefully follow
these instructions.
Tools Needed
Decagon Cleaning Kit which includes:•
A plastic rod.
Cleaning Solution
Lint-free or sizing-free tissues (Kimwipes ®)
Isopropyl Alcohol (Not Included).
NOTE: Kimwipes® are ideal because they don’t leave a lint
residue, like most tissues. ey also don’t have any other com-
pounds in the tissue that may contaminate the sensors in the
AquaSorp’s block. Also, never use cotton swabs to clean the
block sensors. Most cotton swabs contain adhesives and other
compounds that are released and transferred to the mirror and
other surfaces, contaminating them.
Cleaning the Sample Chamber
If the sample chamber becomes dirty, wipe down the in-
side of the chamber with a wet Kimwipe followed by a dry
Kimwipe. e lid containing the dewpoint block should be
cleaned in a separate step as outlined below.
Dust and debris can fall below the balance plate and should
be cleaned regularly. To remove the balance plate, gently
lift up simultaneously on both sides of the platform. It may
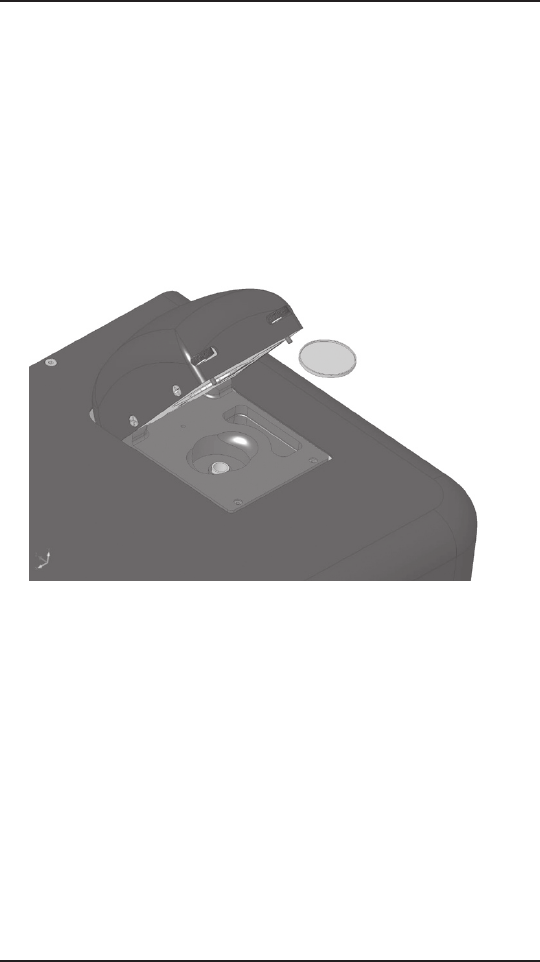
95
9. Maintenance and Cleaning
AquaSorp Users Manual
be necessary to use some tweezers to assist with the removal
of the plate. Avoid exerting any downward vertical force on
the plate or brass shaft that sits below it as this can damage
the precision balance. After wiping down the area under
the plate, gently replace it by inserting it into the top of the
brass shaft.
Cleaning the Dewpoint Sensor
Block
Accessing the Block
1. Turn off the power on your AquaSorp (switch on back).
2. To remove the sample chamber lid, loosen and remove
the 4 screws located on the left and right side of the sample
chamber lid using the Phillips head screwdriver. Carefully
lift the back of the lid and slide the lid forward past the
thumbscrews on the front and lift to remove.
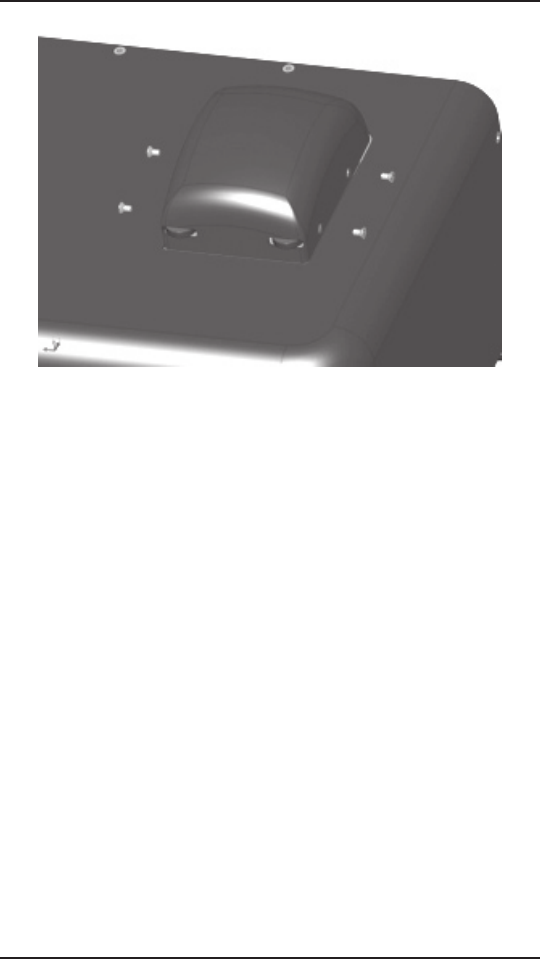
96
9. Maintenance and Cleaning
AquaSorp Users Manual
3. Removing the lid will expose the dew point sensor block.
Remove the foam insulation square and unscrew the two
thumbscrews that secure the sensor block. You need to use
the flat head screwdriver to loosen the thumb screws.
4. Unplug the cable with the 20-pin socket that attaches
the block to the main circuit board by releasing the two
locking levers that are on either side of the socket. Also,
unplug the lid sensor by pulling up on the small white plug
at the front of the block.
5. Carefully lift the block straight up from its mount. Turn
the block over to expose the chamber cavity.
Cleaning the Block
1. Wash your hands with soap and water to prevent oils
from contaminating the Kimwipe tissue and being trans-
ferred to the mirror.

97
9. Maintenance and Cleaning
AquaSorp Users Manual
2. Wrap a Kimwipe strip around the plastic rod from the
Decagon Cleaning Kit.
3. Cleaning your AquaSorp sensor block is a three-step
procedure. First clean the sensors and block using an iso-
propyl alcohol-moistened Kimwipe tissue. Clean the mir-
ror, optical sensor, infrared temperature sensor and cham-
ber surfaces.
4. Follow this with a Kimwipe tissue moistened with either
Decagon’s cleaning solution or distilled water.
5. Finally, wrap a new, dry Kimwipe around the plastic rod,
and use it to thoroughly wipe the water or cleaning so-
lution from the mirror, infra-red temperature sensors and
chamber surfaces.
Reassemble the Block and Lid
After cleaning, return the block to its position on top of the
lid and screw down the 2 thumbscrews. To ensure a good
seal, tighten them with the flat-head screwdriver. Plug the
20 pin socket cable back into the block making sure the
two locking levers lock back in place. Also, plug the small
white lid sensor plug back in at the front of the block. Re-
place the insulation on top of the block and place the sam-
ple chamber lid back on. For proper fitting, make sure the
2 thumbscrews that are used to seal the sample chamber fit
through the slots in the sample chamber lid. Secure with
the 4 screws using the Phillips screwdriver.
Verify the water activity calibration as described in Chap-
ter 8 after cleaning.

98
10. Troubleshooting
AquaSorp Users Manual
10. Troubleshooting
Problem Possible Solution
Wont Turn on Power cord discon-•
nected
Blown Fuse•
Can’t communicate with
the AquaSorp
RS232 cable not •
plugged in
Wrong Com port •
chosen
Weight is decreasing dur-
ing adsorption
Water tank has run dry•
Pump is not working•
Material is undergoing •
a phase change
Weight is increasing dur-
ing desorption
Desiccant tube has •
been used up
Pump is not working•
Water Activity is decreas-
ing during adsorption
Water tank has run dry•
Pump is not working•
Material is undergoing •
a phase change
Water activity is increasing
during desorption
Desiccant tube has •
been used up
Pump is not working•
Material is undergoing •
a phase change

tighten thumb screws
chamber) to further tighten
lid (as when cleaning
to remove sample chamber
to be tight. You may need
even if thumb screws seem
Lid is not closed tightly
sorption properties
Sample has very slow
flow rates
complete, even at high
unusually long time to
Isotherm test is taking
99
10. Troubleshooting
AquaSorp Users Manual
Isotherm test has stopped
premature
e lid has been •
opened
e AquaSorp experi-•
enced a power failure
•
•

100
11. Further Reading
AquaSorp Users Manual
11. Further Reading
Applications for Moisture Sorption Isotherms
Ahmed,J., H.S.Ramaswamy, and A.R.Khan. 2005. Effect
of water activity on glass transitions of date pastes. J Food
Eng 66:253-258.
Aktas,N. 2005. Moisture adsorption properties and adsorp-
tion isosteric heat of dehydrated slices of Pastirma (Turkish
dry meat product). Meat Science 71:571-576.
Amberg,C.H. 1959. Heats of adsorption of water vapor
on bovine albumin. Journal of American Chemical Society
79:3980.
Buckton,G., and P.Darcy. 1995. e use of gravimetric
studies to assess the degree of crystallinity of predominant-
ly crystalline powders. International Journal of Pharmaceu-
tics 123:265-271.
Burnett,D.J., F.ielmann, and J.Booth. 2004. Determin-
ing the critical relative humidity for moisture-induced
phase transitions. International Journal of Pharmaceutics
287:123-133.
Chou,H.E., K.M.Acott, and T.P.Labuza. 1973. Sorption
hysteresis and chemical reactivity: lipid oxidation. J Food
Sci 38:316-319.

101
11. Further Reading
AquaSorp Users Manual
Chuang,L., and R.T.Toledo. 1976. Predicting the water ac-
tivity of multicomponent systems from water sorption iso-
therms of individual components. J Food Sci 41:922-927.
Constantino,H.R., J.G.Curley, and C.C.HSU. 1997. De-
termining the Water Sorption Monolayer of Lyophilized
Pharmaceutical Proteins. J of Pharm Sci 86:1390-1393.
Diosady,L.L., S.S.H.Rizvi, W.CAI, and D.J.Jagdeo. 1996.
Moisture Sorption Isotherms of Canola Meals, and Appli-
cations to Packaging. J Food Sci 61:204-208.
Eckhoff,S.R., L.T.Black, and R.A.Anderson. 1982. Pre-
dicting the moisture isotherm for corn-soy milk from in-
dividual component moisture isotherms and their possible
effects on storage stability. Cereal Chem 59:289-290.
Emigg, and H.Hofmann. 1967. On the methods for esti-
mation of pore size distribution from isotherms. Journal of
Catalysis 9:303.
Gal,S., and D.Bankay. 1971. Hydration of sodium chlo-
ride bound by casein at medium water activities. J Food
Sci 36:800-803.
Harris,M., and M.Peleg. 1996. Patterns of textural changes
in brittle cellular cereal foods caused by moisture sorption.
Cereal Chem 73:225-231.
Iglesias,H.A., J.Chirife, and R.Boquet. 1980. Predicting of
water sorption isotherms of food models from knowledge
of components sorption behavior. J Food Sci 45:450-457.

102
11. Further Reading
AquaSorp Users Manual
Jouppila,K., and J.H.Roos. 1994a. Glass Transitions and
Crystallization in Milk Powder. Journal of Dairy Science
77:2907-2915.
Jouppila,K., and Y.H.Roos. 1994b. Water sorption and
time-dependent phenomena of milk powders. Journal of
Dairy Science 77:1798-1808.
Kapsalis,J.G. 1981. Moisture sorption hysteresis. p. 143-
177. In L.B.Rockland, and G.F.Stewart (ed.) Water Ac-
tivity: Influences on Food Quality. Academic Press, New
York.
Kingston,G.L., and P.S.Smith. 1964. ermodynam-
ics of adsorption of capillary systems. Trans. Farad. Soc.
60:705,721.
Konopacka,D., W.Plocharski, and T.Beveridge. 2002. Wa-
ter Sorption and Crispness of Fat-Free Apple Chips. J Food
Sci 67:87-92.
Labuza,T.P., and R.Contreras-Medellin. 1981. Predic-
tion of moisture protection requirements for foods. Cereal
Foods World 26:335-343.
Li,Y., K.M.Kloeppel, and F.Hsieh. 1998. Texture of glassy
corn cakes as a function of moisture content. J Food Sci
63:869-872.
Lima,J.R., S.D.S.Campos, and L.-A.G.Goncalves. 2000.
Relationship between water activity and texture of roast-

103
11. Further Reading
AquaSorp Users Manual
ed and salted cashew kernel. Journal of Food Science and
Technology 37(5):512-513.
Makower,B., and W.B.Dye. 1956. Equilibrium moisture
content and crystallization of amorphous sucrose and glu-
cose. Agriculture and Food Chemistry 4:72-77.
Mathlouthi,M., and B.Roge. 2004. Water vapour sorption
isotherms and the caking of food powders. Food Chem
82:61-71.
Oswin,C.R. 1946. e kinetics of package life. III. e iso-
therm. J. Chem. Ind. (London) 65:419.
Roos,Y.H. 1993. Water activity and physical state effects on
amorphous food stability. J Food Process Preserv 16:433-
447.
Ruckold,S., H.-D.Isengard, J.Hanss, and K.H.Grobecker.
2003. e energy of interaction between water and surfaces
of biological reference materials. Food Chem 82:51-59.
Sacchetti,M. 1998. ermodynamics Analysis of Moisture
Sorption Isotherms. Journal of Pharmaceutical Science
87:982-986.
Sapru,V., and T.Labuza. 1996. Moisture transfer simula-
tion in packaged cereal-fruit systems. J Food Eng 27:45-
61.
Telis,V.R.N., P.J.Sobral, and J.Telis-Romero. 2006. Sorp-
tion Isotherm, Glass Transitions and State Diagram for

104
11. Further Reading
AquaSorp Users Manual
Freeze-dried Plum Skin and Pulp. Food Science and Tech-
nology International 12:181-187.
Telis,V.R.N., and P.J.A.Sobral. 2001. Glass Transitions and
State Diagram for Freeze-dried Pineapple. Lebensmittel-
Wissenschaft und-Technologie 34:199-205.
Moisture Sorption Isotherms and Temperature
Alcala,M., R.Gómez, J.Espejo, M.A.Esteban, and A.Marcos.
1995. Moisture sorption isotherms at 30º Celsius of several
desiccated spices. Alimentaria 32:53-59.
Ayranci,E., G.Ayranci, and Z.Dogantan. 1990. Moisture
sorption isotherms of dried apricot, fig and raisin at 20°C
and 36°C. J Food Sci 55:1591-1593, 1625.
Bandyopadhyay,S.H., S.H.Weisser, and M.Loncin. 1980.
Water sorption isotherms at high temperatures. Lebensm
Wiss Technol 13:182.
Becker,H.A., and H.R.Sallans. 1956. A study of the des-
orption isotherms of wheat at 25ºC and 50ºC. Cereal
Chem 33:79-91.
Chen,C.S., and J.T.Clayton. 1971. e effect of tempera-
ture on sorption isotherms of biological materials. Transac-
tions of the ASAE 14:927-929.
Diamante,L.M., P.A.Munro, and M.G.Weeks. 1992. Mois-
ture sorption behaviour of mineral acid, lactic and rennet
caseins in the temperature range 27-80 C. J of Dairy Re-

105
11. Further Reading
AquaSorp Users Manual
search 59:307-319.
Kapsalis,J.G. 1987. Influences of hysteresis and tem-
perature on moisture sorption isotherms. p. 173-213. In
L.B.Rockland, and L.R.Beuchat (ed.) Water Activity: e-
ory and Applications to Food. Marcel Dekker, Inc., New
York.
Labuza,T.P., A.Kaanane, and J.Y.Chen. 1985. Effect of
temperature on the moisture sorption isotherms and water
activity shift of two dehydrated foods. J Food Sci 50:385-
391.
Lin,S.X.Q., X.D.Chen, and D.L.Pearce. 2005. Desorption
isotherm of milk powders at elevated temperatures and
over a wide range of relative humidity. J Food Eng 68:257-
264.
Pawar,V.S., D.K.Dev, V.D.Pawar, A.B.Rodge, V.D.Surve,
and D.R.More. 1992. Moisture adsorption isotherms of
ground turmeric at different temperatures. Journal of Food
Science and Technology 29:170-173.
Rasekh,J.G., B.R.Stillings, and D.L.Dubrow. 1971. Mois-
ture adsorption of fish protein concentrate at various rela-
tive humidities and temperatures. J Food Sci 36:705-707.
Sa,M.M., and A.M.Sereno. 1993. Effect of temperature on
sorption isotherms and heats of sorption of quince jam. In-
ternational Journal of Food Science & Technology 28:241-
248.

106
11. Further Reading
AquaSorp Users Manual
Moisture Sorption Isotherms of Various Products
Agrawal,K.K., B.L.Clary, and G.L.Nelson. 1971. Investi-
gation into the theories of desorption isotherms for rough
rice peanuts. J Food Sci 36:919-924.
Aguerre,R.J., C.Suarez, and P.Viollaz. 1983. Moisture
desoprtion isotherms of rough rice. J Food Technol 18:345-
351.
Ajisegiri,E.S., P.A.Sopade, and A.B.Abass. 1994. Moisture
Sorption study on Nigerian foods: Kuka. Journal of Stored
Products Research 30:331-338.
Aktas,N. 2005. Moisture adsorption properties and adsorp-
tion isosteric heat of dehydrated slices of Pastirma (Turkish
dry meat product). Meat-Science 71:571-576.
Alcala,M., R.Gómez, J.Espejo, M.A.Esteban, and A.Marcos.
1995. Moisture sorption isotherms at 30º Celsius of several
desiccated spices. Alimentaria 32:53-59.
Ayranci,E. 1996. Moisture sorption of cellulose based ed-
ible films. Nahrung 40:274-276.
Bakhit,R., and S.Schmidt. 1993. Sorption behavior of me-
chanically mixed and freeze-dried sucrose/casein mixtures.
J Food Sci 58:1162-1165.
Bakhit,R.M., and S.J.Schmidt. 1992. Sorption behavior
of mechanically mixed and freeze-dried sodium chloride/
casein mixtures. J Food Sci 57:493-496.

107
11. Further Reading
AquaSorp Users Manual
Bandyopadhyay,S.H., H.Das, and G.P.Sharma. 1987.
Moisture Adsorption Characteristics of Casein, Lactose,
Skim Milk and Chhana Powder. Journal of Food Science
and Technology 24:6-11.
Becker,H.A., and H.R.Sallans. 1956. A study of the des-
orption isotherms of wheat at 25ºC and 50ºC. Cereal
Chem 33:79-91.
Beuchat,L.R. 1978. Relationship of water activity to mois-
ture content in tree nuts. J Food Sci 43:754-755, 758.
Bushuk,W., and C.A.Winkler. 1957. Sorption of water
vapor on wheat flour, starch, and gluten. Cereal Chem
34:73-86.
Calzetta Resio,A., R.J.Aguerre, and C.Suarez. 1999. Analy-
sis of the sorptional characteristics of amaranth starch. J
Food Eng 42:51-57.
Cano-Chauca,M., A.M.Ramos, P.C.Stringheta,
J.A.Marques, and P.Ibrahim-Silva. 2004. Drying curves
and water activity evaluation of the banana-passes. Bo-
letim do Centro de Pesquisa e Processamento de Alimentos
22(1):121-132.
Cepeda,E., R.O.Latierro, M.J.San Jose, and M.Olazar.
1999. Water sorption isotherms of roasted coffee and cof-
fee roasted with sugar. International Journal of Food Sci-
ence & Technology 34:287-290.

108
11. Further Reading
AquaSorp Users Manual
Chau,K.V., J.J.Heinis, and M.Perez. 1982. Sorption iso-
therms and drying rate of Mullet fish and roe. J Food Sci
47:13-18.
Chen,C.C. 2002. Moisture sorption isotherms of pea seeds.
J Food Eng 58:45-51.
Cheng,L.H., A.A.Karim, and C.C.Seow. 2006. Effects of
Water-Glycerol and Water-Sorbitol Interactions on the
Physical Properties of Konjac Glucomannan Films. J Food
Sci 71:E062-E067.
Constantino,H.R., J.G.Curley, and C.C.HSU. 1997. De-
termining the Water Sorption Monolayer of Lyophilized
Pharmaceutical Proteins. Journal of Pharmaceutical Sci-
ences 86:1390-1393.
Diamante,L.M., and P.A.Munro. 1990. Water desorption
isotherms of two varieties of sweet potato. International
Journal of Food Science & Technology 25:140-147.
Diamante,L.M., P.A.Munro, and M.G.Weeks. 1992. Mois-
ture sorption behaviour of mineral acid, lactic and rennet
caseins in the temperature range 27-80 C. Journal of Dairy
Research 59:307-319.
Dole,M., andL.Faller. 1950. Water sorption by synthetic
high polymers. J Am Chem Soc 12:414-419.
Gal,S. 1968. e water vapor sorption isotherms of various
sorbents. Chimia 22:409.

109
11. Further Reading
AquaSorp Users Manual
Hardy,J., J.Scher, and S.Banon. 2002. Water activity and
hydration of dairy powders. Lait 82:441-452.
Huang,A.S., and D.S.Byerly. 1992. Sorption isotherms and
light stabilities of aluminum laked riboflavin 5’-phosphate.
J Food Sci 57:245-248.
Hubinger,M., F.C.Menegalli, R.J.Aguerre, and C.Suarez.
1992. Water vapor adsorption isotherms of guava, mango
and pineapple. J Food Sci 57:1405-1407.
Igbeka,J.C., and J.L.Blaisdel. 1982. Moisture isotherm of a
processed meat product - bologna. J Food Technol 17:37.
Karatas,S., and F.M.Battalbey. 1991. Determination of
moisture diffusivity of pistachio nut meat during drying.
Lebensm Wiss Technol 24:484-487.
Karathanos,V.T., A.E.Kostaropoulos, and G.D.Saravacos.
1995. Diffusion and equilibrium of water in dough/raisin
mixtures. J Food Eng 25:113-121.
Karoglou,M., A.Moropoulou, Z.B.Maroulis, and
M.K.Krokida. 2005. Water Sorption Isotherms of Some
Building Materials. Drying Technology 23:289-303.
Kaya,S., and M.D.Oner. 1995. Sorption characteristics of
fresh Gaziantep cheese. Turkish Journal of Engineering and
Environmental Sciences 19:263-267.
Khalloufi,S., J.Giasson, and C.Ratti. 2000. Water activity
of freeze dried mushrooms and berries. Canadian Agricul-

110
11. Further Reading
AquaSorp Users Manual
tural Engineering 42(1):51-56.
Kim,S.J., and Z.Ustunol. 2001. Solubility and Moisture
Sorption Isotherms of Whey-Protein-Based Edible Films as
Influenced by Lipid and Plasticizer Incorporation. Journal
of Agricultural Food Chemistry 49:4388-4391.
Kotwaliwale,N., G.P.Sharma, and S.K.Jain. 1993. Storage
stability of commercially available weaning foods. Journal
of Food Science and Technology 30:331-334.
Kouhila,M., A.Belghit, M.Daguenet, and B.C.Boutaleb.
2001. Experimental determination of the sorption iso-
therms of mint (Mentha viridis), sage (Salvia officinalis)
and verbena (Lippia citriodora). J Food Eng 47:281-287.
Kunze,O.R. 1977. Moisture adsorption influences on rice.
Journal of Food Processing and Engineering 1:167-181.
Kurkela,R., and K.Pääkkonen. 1983. Water sorption of
Northern Milk Cap mushroom (Lactarius trivialis). Leb-
ensm Wiss Technol 17:285-288.
Lagoudaki,M., P.G.Demertzis, and M.G.Kontominas.
1993. Moisture adsorption behaviour of pasta products.
Lebensm Wiss Technol 26:512-516.
Lim,L.T., J.Tang, and J.He. 1995. Moisture sorption char-
acteristics of freeze dried blueberries. J Food Sci 60:810-
814.
Lin,S.X.Q., X.D.Chen, and D.L.Pearce. 2005. Desorption

111
11. Further Reading
AquaSorp Users Manual
isotherm of milk powders at elevated temperatures and
over a wide range of relative humidity. J Food Eng 68:257-
264.
Mann,B., and R.C.Malik. 1996. Water vapour sorption
properties of buffalo milk whey protein concentrates. Jour-
nal of Food Science and Technology 33:403-406.
Mazza,G., and M.Lemageur. 1978. Water sorption prop-
erties of yellow globe onion. Canadian Institute of Food
Science and Technology Journal 11:189-193.
Mok,C., and J.W.Dick. 1991. Moisture adsorption of
damaged wheat starch. Cereal Chem 68:405-409.
Myhara,R.M., S.S.Sablani, and M.S.Taylor. 1998. Water
Sorption Isotherms of Dates: Modeling Using GAB Equa-
tion and Artificial Neural Network Approaches. Lebensm
Wiss Technol 31:699-706.
Pääkkonen,K. 1987a. Effects of different components of
the Northern Milk Cap mushroom (Lactarius trivialis) on
water sorption. Lebensm Wiss Technol 20:237-240.
Pääkkonen,K. 1987b. e water sorption of chitin isolated
from the Northern Milk Cap mushroom (Lactarius trivi-
alis). Lebensm Wiss Technol 20:259-262.
Palnitkar,M.P., and D.R.Heldman. 1971. Equilibrium
moisture characteristics of freeze-dried beef components. J
Food Sci 36:1015-1018.

112
11. Further Reading
AquaSorp Users Manual
Pauling,L. 1945. e adsorption of water by proteins. J
Am Chem Soc 67:655.
Pawar,V.S., D.K.Dev, V.D.Pawar, A.B.Rodge, V.D.Surve,
and D.R.More. 1992. Moisture adsorption isotherms of
ground turmeric at different temperatures. Journal of Food
Science and Technology 29:170-173.
Phoungchandang,S., and J.L.Woods. 2000. Moisture dif-
fusion and desorption isotherms for banana. J Food Sci
65:651-657.
Ramanathan,S., and S.Cenkowski. 1995. Sorption iso-
therms of flour and flow behaviour of dough as influenced
by flour compaction. Canadian Agricultural Engineering
37:119-124.
Rasekh,J.G., B.R.Stillings, and D.L.Dubrow. 1971. Mois-
ture adsorption of fish protein concentrate at various rela-
tive humidities and temperatures. J Food Sci 36:705-707.
Resio,A.C., R.J.Aguerre, and C.Suarez. 2004. Analysis of
the sorptional characteristics of amaranth starch. J Food
Eng 42:51-57.
Rovedo,C.O., R.J.Aguerre, and C.Suarez. 1993. Meauring
and modelling the water vapour desorption in sunflower
seeds. International J Food Sci & Tech 28:153-158.
Shreedhar,A., A.V.Deoskar, M.G.Bhotmange, B.Y.Rao,
and P.N.Shastri. 1996. Moisture sorption behaviour of
some flour-based traditional sweets. J Food Sci & Tech

113
11. Further Reading
AquaSorp Users Manual
33:516-519.
Singh,T. 1994. Malt concentrates and their mixtures with
sweetened condensed milk: Moisture sorption isotherms. J
Food Sci 59:1100-1103.
Sogi,D.S., U.S.Shivhare, S.K.Garg, and A.S.Bawa. 2003.
Water sorption isotherm and dying characteristics of to-
mato seeds. Biosystems-Engineering 84:297-301.
Togrul,H., and N.Arslan. 2007. Moisture sorption iso-
therms and thermodynamic properties of walnut kernels.
Journal of Stored Products Research 43:252-264.
Tsami,E., D.Marinos-Kouris, and Z.B.Maroulis. 1990.
Water sorption isotherms of raisins, currants, figs, prunes
and apricots. J Food Sci 55:1594-1597, 1625.
Valdez-Niebla,J.A., O.Paredes-Lopez, J.M.Vargas-Lopez,
and D.Hernandez-Lopez. 1993. Moisture sorption iso-
therms and other physicochemical properties of nixtamal-
ized amaranth flour. Food Chem 46:19-23.
Warburton,S., and S.W.Pixton. 1978. e Moisture Re-
lations of Spray Dried Skimmed Milk. Journal of Stored
Products Research 14:143-158.
Wolf,W., W.E.L.Spiess, and G.Jung. 1973. e water va-
por sorption isotherms of foodstuffs. Lebensm Wiss Tech-
nol 6:94-96.
Zhang,X.W., X.Liu, D.X.Gu, W.Zhou, R.L.Wang, and

114
11. Further Reading
AquaSorp Users Manual
P.Liu. 1996. Desorption isotherms of some vegetables.
Journal of the Science of Food and Agriculture 70:303-
306.
Moisture Sorption Isotherm Methods
Arlabosse,P., E.Rodier, J.H.Ferrasse, S.Chavez, and
D.Lecomte. 2003. Comparison Between Static and Dy-
namic Methods for Sorption Isotherm Measurements.
Drying Technology 21:479.
Bell,L.N., and T.P.Labuza. 2000. Moisture sorption: prac-
tical aspects of isotherm measurement and use. American
Association of Cereal Chemists, St. Paul, MN.
Caurie,M. 1970. A practical approach to water sorption
isotherms and the basis for the determination of optimum
moisture levels of dehydrated foods. J Food Technol 5:301-
308.
Gal,S. 1981. Recent development in techniques for ob-
taining complete sorption isotherms. p. 89-110. In
L.B.Rockland, and G.F.Stewart (ed.)Water Activity: Influ-
ences on Food Quality. Academic Press, New York.
Kuhn,I. 1964. New theoretical analysis of adsorption phe-
nomena. Journal of Colloid Science 19:685.
Kuhn,I. 1967. Generalized potential theory of adsorption.
Journal of Colloid Interface Science 23:563.
Laaksonen,T., Y.Roos, and T.Labuza. 2001. Comparisons

115
11. Further Reading
AquaSorp Users Manual
of the use of desiccators with or without vacuum for water
sorption and glass transition studies. International Journal
of Food Properties 4:545.
Spiess,W.E.L., and W.Wolf. 1987. Critical evaluation of
methods to determine moisture sorption isotherms. p.
215-233. In L.B.Rockland, and L.R.Beuchat (ed.) Water
Activity: eory and Applications to Food. Marcel Dekker,
Inc., New York.
Wolf,W., W.E.L.Spiess, and G.Jung. 1985. Standardization
of Isotherm Measurements (cost-project 90 and 90 BIS). p.
661-679. In D.Simatos, and J.L.Multon (ed.) Properties of
Water in Foods in Relation to Quality and Stability. Mar-
tinus Nijhoff, Boston.
Moisture Sorption Isotherm Models
Aguerre,R.J., C.Suarez, and P.E.Viollaz. 1989a. New BET
type multilayer sorption isotherms. Part I: eoretical deri-
vation of the model. Lebensm Wiss Technol 22:188-191.
Aguerre,R.J., C.Suarez, and P.E.Viollaz. 1984. Calculation
of the variation of the heat of desorption with moisture
content on the basis of the BET theory. J Food Technol
19:325-331.
Aguerre,R.J., C.Suarez, and P.E.Viollaz. 1989b. New BET
type multilayer sorption isotherms. Part II: Modelling wa-
ter sorption in foods. Lebensm Wiss Technol 22:192-195.
Asbi,B.A., and I.C.Baianu. 1986. An Equation for Fitting

116
11. Further Reading
AquaSorp Users Manual
Moisture Sorption Isotherms of Food Proteins. J Agric
Food Chem 34:494-496.
Basu,S., U.S.Shivhare, and A.S.Mujumdar. 2006. Models
for Sorption Isotherms for Foods: A Review. Drying Tech-
nology 24:917-930.
Bizot,H. 1983. Using G.A.B. model to construct sorption
isotherms. In R.Jowitt, F.Escher, M.Kent, B.McKenna,
and M.Roques (ed.) Physical properties of foods. Applied
Science Publishers, London.
Boente,G., H.H.L.Gonzalez, E.Martinez, M.L.Pollio, and
S.L.Resnik. 1996. Sorption isotherms of corn: Study of
mathematical models. J Food Eng 29:115-128.
Boente,G., A.Larumbe, J.Monserrat, M.L.Pollio, S.Resnik,
and S.Sanmartino. 1995. Multivariate statistical analysis
of water sorption data of Argentine sorghum. J Food Eng
25:73-84.
Boquet,R., J.Chirife, and H.A.Iglesias. 1978. Equations
for fitting water sorption isotherms of foods: Part II. Evalu-
ation of various two-parameter models. J Food Technol
13:319-327.
Boquet,R., J.Chirife, and H.Iglesias. 1979. Equations for
fitting water sorption isotherms of foods. III. Evaluation of
various three-parametet models. J Food Technol 14:527-
534.
Boquet,R., J.Chirife, and H.A.Iglesias. 1980. Technical

117
11. Further Reading
AquaSorp Users Manual
note: On the equivalence of isotherm equations. J Food
Technol 15:345-349.
Chinachoti,P. 1990. Isotherm Equations for Starch, Su-
crose and Salt for Calculation of High System Water Ac-
tivities. J Food Sci 55:265-266.
Chirife,J., and H.A.Iglesias. 1978. Equations for fitting
water sorption isotherms of foods: Part 1 - a review. J Food
Technol 13:159-174.
Iglesias,H.A., and J.Chirife. 1981. An equation for fitting
uncommon water sorption isotherms in foods. Lebensm
Wiss Technol 14:105-106.
Iglesias,H.A., and J.Chirife. 1976. A model for describing
the water sorption behavior of foods. J Food Sci 41:984-
992.
Iglesias,H.A., and J.Chirife. 1982. Handbook of food iso-
therms: water sorption parameters for food and food com-
ponents. Academic Press, New York.
Iglesias,H.A., and J.Chirife. 1995. An alternative to the
Guggenheim, Anderson and De Boer model for the math-
ematical description of moisture sorption isotherms of
foods. Food Res Intl 28:317-321.
Iglesias,O., and J.L.Bueno. 1999. Water agar-agar equilib-
rium: determination and correlation of sorption isotherms.
International J Food Sci & Tech 34:209-216.

118
11. Further Reading
AquaSorp Users Manual
Kaminski,W., and M.Al Bezweni. 1994. Calculation of
water sorption isotherms for multicomponent protein-
containing mixtures. Intl J Food Sci & Tech 29:129-136.
Lomauro,C.J., A.S.Bakshi, and T.P.Labuza. 1985a. Evalua-
tion of food moisture sorption isotherm equations. Part II:
Milk, coffee, tea, nuts, oilseeds, spices and starchy foods.
Lebensm Wiss Technol 18:118-124.
Lomauro,C.J., A.S.Bakshi, and T.P.Labuza. 1985b. Evalu-
ation of food moisture sorption isotherm equations. Part
I: Fruit, vegetable and meat products Lebensm Wiss Tech-
nol 18:111-117. Peleg,M.1988. An Empirical Model for
the Description of Moisture Sorption Curves. J Food Sci
53:1216-1217,1219.
Peng,G., X.Chen, W.Wu, and X.Jiang. 2007. Modeling
of water sorption isotherm for corn starch. J Food Eng
80:562-567.
Quirijns,E.J. 2005. An improved experimental and regres-
sion methodology for sorption isotherms. Journal of the
Science of Food and Agriculture 85:175-185.
Rovedo,C.O., R.J.Aguerre, and C.Suarez. 1993. Measur-
ing and modelling the water vapour desorption in sunflow-
er seeds. International J Food Sci & Tech 28:153-158.
Samaniego-Esguerra,C.M., I.F.Boag, and G.L.Robertson.
1991. Comparison of regression methods for fitting the
GAB model to the moisture isotherm of some dried fruit
and vegetables. J Food Eng 13:115.

119
11. Further Reading
AquaSorp Users Manual
Schuchmann,H., I.Roy, and M.Peleg. 1990. Empirical
models for moisture sorption isotherms at very high water
activities. J Food Sci 55:759-762.
Sopade,P.A., and J.A.Obekpa. 1990. Modelling Water
Absorption in Soybean, Cowpea and Peanuts at ree
Temperatures Using Peleg’s Equation. J Food Sci 55:1084-
1087.

120
Declaration of Conformity
AquaSorp Users Manual
Declaration of Conformity
Application of
Council Directive: 89/336/EEC
Standards to which EN500082-1
conformity is declared: EN81-1
Manufacturer’s Name: Decagon Devices,Inc.
2365 NE Hopkins Courtt
Pullman WA, 99163
USA
Type of equipment: AquaSorp Isotherm
Generator
Model Number: AquaSorp
Year of First Manufacture: 2007
is is to certify that the AquaSorp Isotherm Generator,
manufactured by Decagon Devices, Inc., a corporation
based in Pullman, Washington, USA meets or exceeds the
standards for CE compliance as per the Council Direc-
tives noted above. All instruments are built at the factory
at Decagon and pertinent testing documentation is freely
available for verification. is certification applies to all
AquaSorp Isotherm Generator models.

121
Certificate of Traceability
AquaSorp Users Manual
Certificate of Traceability
Decagon Devices, Inc.
2365 NE Hopkins Court
Pullman WA 99163
tel: (509) 332-2756
fax: (509) 332-5158
support@decagon.com
is is to certify that AquaSorp Isotherm Generators are
manufactured utilizing weight and temperature standards
with calibration traceable to the National Institute of Stan-
dards and Technology (NIST).

Formulation
Chilled-mirror dewpoint sensor
Index
122
AquaSorp Users Manual
Index
A
Applications 100
AquaSorp Information 36
B
Balance 52
BET 21
C
Capillary condensation 16
10
Cleaning 94
Communications Options 42
Components 26
Computer 30
Customer Service 5
D
Data Analysis 82
DDI 22
Desiccant 27
Desorption 23
Dewpoint 95
Double Log Polynomial 21
Dry Weight Prediction 59
F
Flow Rate 57
20
G
GAB 21

Shelf life prediction
Product development
Moisture Sorption Isotherms, Uses for
Limitation
Invalidate
Index
123
AquaSorp Users Manual
H
Humidity Operating Range 11
Hysteresis 14
I
Internet Version Check 39
51
Isotherm Models 21
L
Legend Name 77
25
Limitations 10
Linear Offset 86
Location 29
M
Matrix changes 17
Merge 76
Message Center 27
Modify Test 63
Moisture Content Reference 60
Moisture Sorption Isotherms 8
19
Multiple Isotherm Analysis 39, 74
P
Phone/Fax 5
Power Outage 39
20
S
Saving Data 62
Seller’s Liability 6
Setting up 30
21

Warmup time
Vapor equilibrium
Index
124
AquaSorp Users Manual
SorpTrac software 33
Specications 11
Standards 86
Supersaturation 16
T
Tare 52
Temperature 49
Temperature Control Range 11
Temperature Operating Range 11
Test Description 56, 67
Test Setup 55
Troubleshooting 99
Type III isotherms 13
Type II isotherms 12
Type I isotherms 12
V
24
Verication 85
Verication and Restore 37
W
47
Warranty 6
Water Activity Accuracy 11
Water Activity Range 11
Water Activity Repeatability 11
Water Chamber 32
Working Isotherms 19
