923 00010 00_Time_Stamp_Module_Mar88 00 Time Stamp Module Mar88
User Manual: 923-00010-00_Time_Stamp_Module_Mar88
Open the PDF directly: View PDF ![]() .
.
Page Count: 37
Illlmlll
Applied
Microsystems
Corporation
Time
Stamp
Module
for
ES
1800
Emulators:
User's
Manual
Addendum
rllmm~
1111111111
Applied
Microsystems
Corporation
Time
Stamp
Module
for
ES
1800
Emulators:
User's
Manual
Addendum
PIN
923-00010-00
March
1988
Copyright
©
1988
Applied
Microsystems
Corporation
All
rights
reserved.
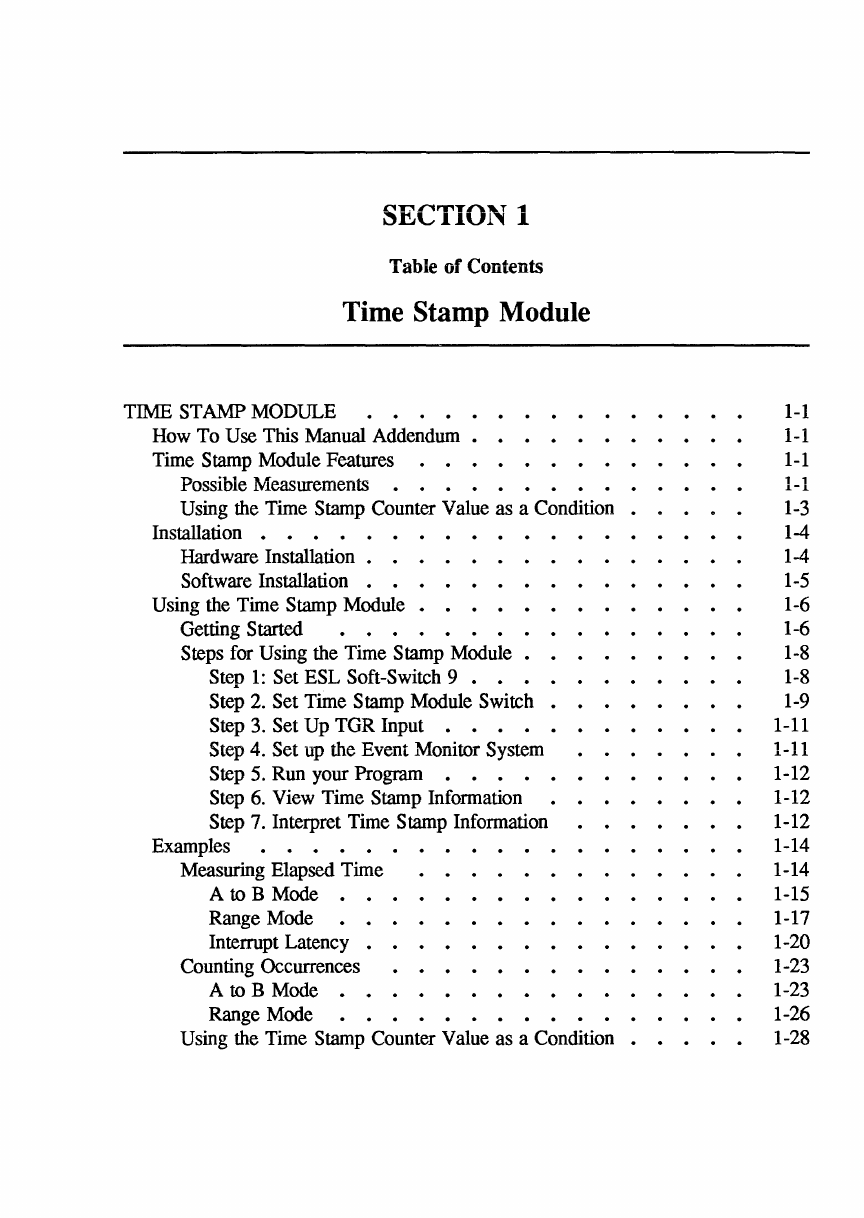
SECTION 1
Table
of
Contents
Time Stamp Module
TIME STAMP MODULE
How
To
Use This Manual Addendum
Time Stamp Module Features
Possible Measurements
Using the Time Stamp Counter Value as a Condition •
Installation • • • • • •
Hardware
Installation.
•
Software Installation • •
Using the Time Stamp Module • •
Getting Started
Steps for Using the Time Stamp
Module.
•
Step
1:
Set ESL Soft-Switch 9 • •
Step 2. Set Time Stamp Module Switch •
Step 3. Set Up TGR Input • • • • •
Step 4. Set up the Event Monitor System
Step 5. Run your Program • • • • • •
Step
6.
View Time Stamp Information
Step 7. Interpret Time Stamp Information
Examples • • • • • •
Measuring Elapsed Time
A to B Mode •
Range Mode
Interrupt Latency • •
Counting Occurrences
A to B Mode • • •
Range Mode
Using the Time Stamp Counter Value as a Condition •
1-1
1-1
1-1
1-1
1-3
1-4
1-4
1-5
1-6
1-6
1-8
1-8
1-9
1-11
1-11
1-12
1-12
1-12
1-14
1-14
1-15
1-17
1-20
1-23
1-23
1-26
1-28
Section
1
TIME
STAMP MODULE
How To Use This Manual Addendum
This addendum describes what the Time Stamp Module does, and how to install
and use the module. Complete examples are provided for using the module to do
each possible type
of
measurement.
Time Stamp Module Features
The Time Stamp Module adds performance analysis to the ES 1800 Series
emulators for
16
bit microprocessors. You can use this module when you use your
ES 1800 in stand-alone mode. or from your host computer, using
ES
Driver control
software. There are two ways the module can be used:
1.
To measure elapsed or absolute time.
2.
To trigger the Event Monitor System to cause an action such as breaking
emulation once a time stamp counter value is reached.
Possible Measurements
There are eight distinct measurements that can be made using the Time Stamp
Module:
Elapsed Time Measurements
-Measure time spent in a module
1-1
Time Stamp Module User's Manual Addendum
-Measure time spent between modules
-Measure duration
of
time when memory
is
accessed (opcode or data)
-Measure duration
of
time when code is accessed (opcode only)
-Measure interrupt response time directly
Count Occurrences
-Count number
of
times address or range
of
memory
is
accessed (opcode or
data)
-Count number
of
times code is accessed (opcode only)
-Count module linkage activity (the number
of
times one module calls
another)
Each time measurement can
be
based on one
of
five scales: .1uS, IuS, .01mS,
.1mS or 1mS, so you can collect your data using the appropriate time scale. The
maximum number
of
counts for any time base is 65,535 so you have a maximum
period
of
65 seconds without overflow.
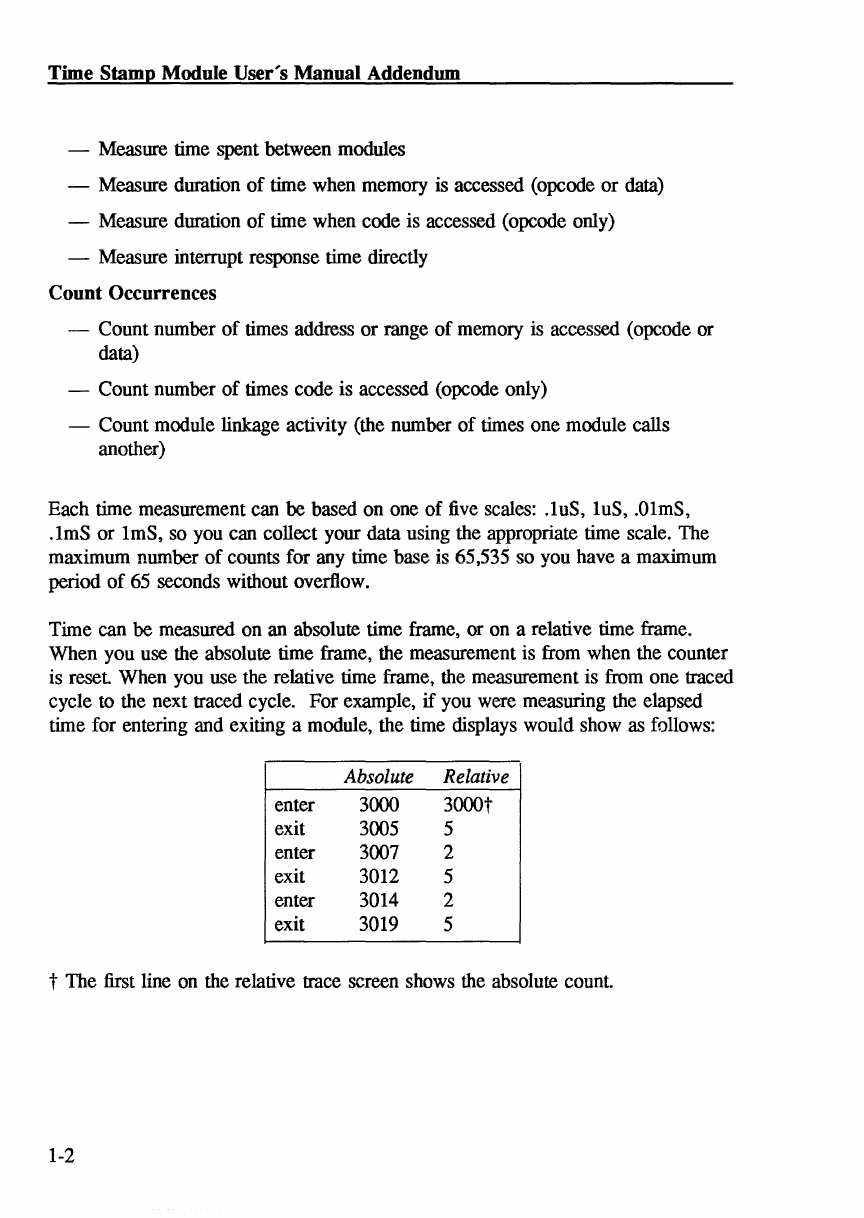
Time can be measured on an absolute time frame, or on a relative time frame.
When you use the absolute time frame, the measurement is from when the counter
is
reset
When you use the relative time frame, the measurement is from one traced
cycle
to
the next traced cycle. For example,
if
you were measuring the elapsed
time for entering and exiting a module, the time displays would show as follows:
Absolute Relative
enter 3000 3000t
exit 3005 5
enter 3007 2
exit 3012 5
enter 3014 2
exit 3019 5
t The first line on the relative trace screen shows the absolute
count
1-2
Time Stamp Module
Using the Time Stamp Counter VaIue as a Condition
The
ES
1800 Event Monitor System lets you specify complex program states,
using WHEN-THEN statements:
WHEN conditions THEN actions
You can use the absolute value
of
the time stamp counter as one condition. For
more details on using CTS, see the example on page 1-28.
1-3

Time Stamp Module User's
Manual
Addendum
Installation
Hardware Installation
The Time Stamp Module consists
of
the module and the cable
to
connect it to the
emulator.
There are three steps to hardware installation:
1.
Turn the emulator off.
CAUTION
The ES 1800 emulator must be
off
before plugging in the Time
Stamp Module, or the cable and module
may
be damaged. Do not
plug in or unplug the Time Stamp Module with power turned on.
2.
Connect the module
to
the LSA port on the front
of
the
ES
1800 emulator
as
shown in the following illustration. Note that you cannot use the Logic State
Analysis
pod
and the Time Stamp Module at the same time.
Figure 1-1. Connecting the Time Stamp Module
to
the ES 1800
1-4

Time Stamp Module
3. The Time Stamp Module requires a certain revision
of
ESL (the Emulator
Standard Language). To check your revision:
from stand-alone mode Type
REV
from the ES 1800 prompt.
from ES Driver Enter the Target Emulation menu, and type
REV
from the ES 1800 prompt.
If
you have an ESL equal to
or
greater than that shown in the chart below,
you can use your Time Stamp Module as is.
If
your ESL is below the
revision shown below, please contact your local sales office
or
representative, or call the Order Administration department at 1-800-426-
3925 for information on upgrading your ESL revision.
Product I Minimum Revision T evel
~
~
68000 ESL 3.3
68010 ESL 2.5
Z8000 ESL
3.1
80286 ESL 2.1
808x/18x ESL 3.2
808X Genesis ESL 3.2G
Software Installation
No software changes are required to operate the Time Stamp Module for any
of
the following software packages available from Applied Microsystems Corporation.
• ES Driver
• V ALIDA1E/XEL
• VALIDATE/Soft-Scope
• GeneProbe
1-5
Time
Stamp
Module User's
Manual
Addendum
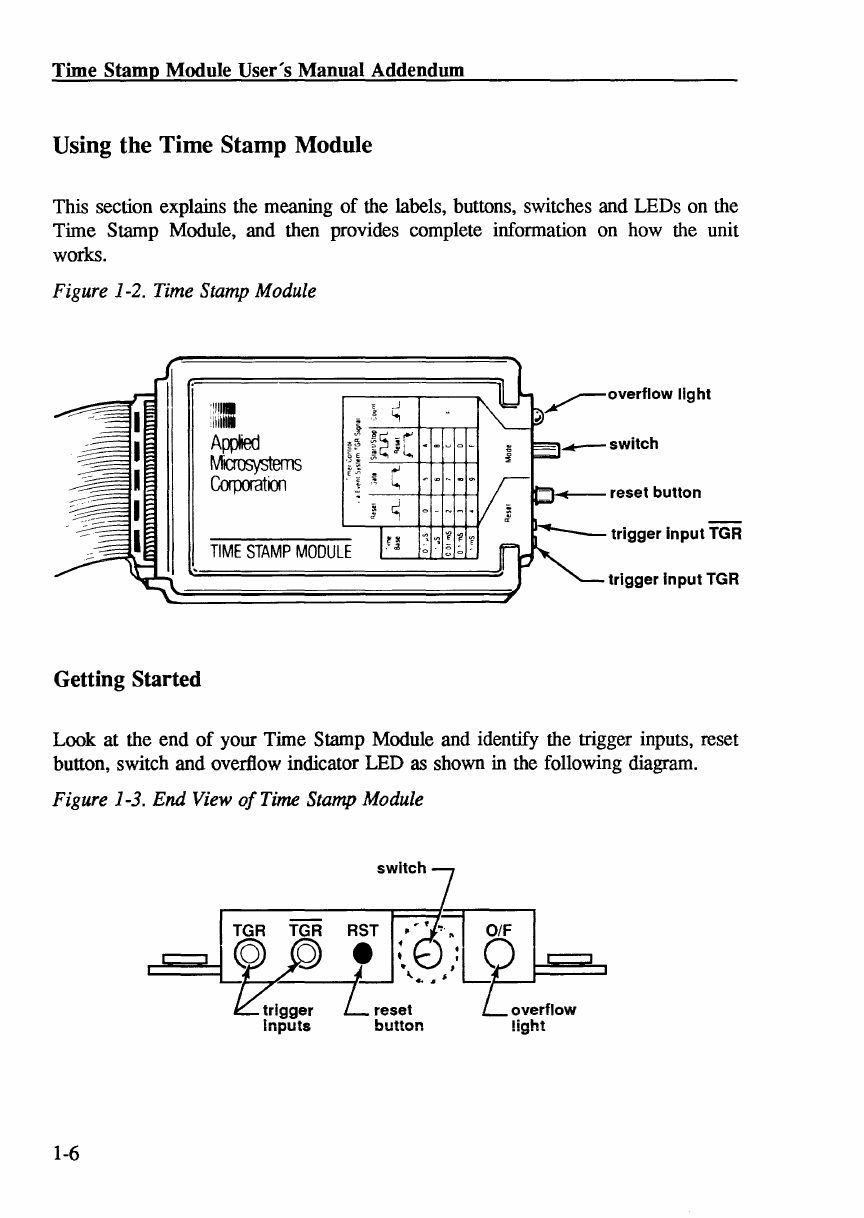
Using the Time Stamp Module
This section explains the meaning
of
the labels, buttons, switches and LEDs on the
Time Stamp Module, and then provides complete infonnation on how the unit
works.
Figure 1-2. Time Stamp Module
Getting Started
'11111
:iiU
I
A~
Microsystems
Corporatm
TIME
STAMP
MODULE
reset button
trigger
input
TGR
Look at the end
of
your Time Stamp Module and identify the trigger inputs, reset
button, switch and overflow indicator LED
as
shown in the following diagram.
Figure 1-3.
End
View
of
Time Stamp Module
TGR TGR
RST,
OIF
c:::=:~
~_
~
..
"I
L
~
.:"
,:It
trigger
L reset
Inputs
button
1-6
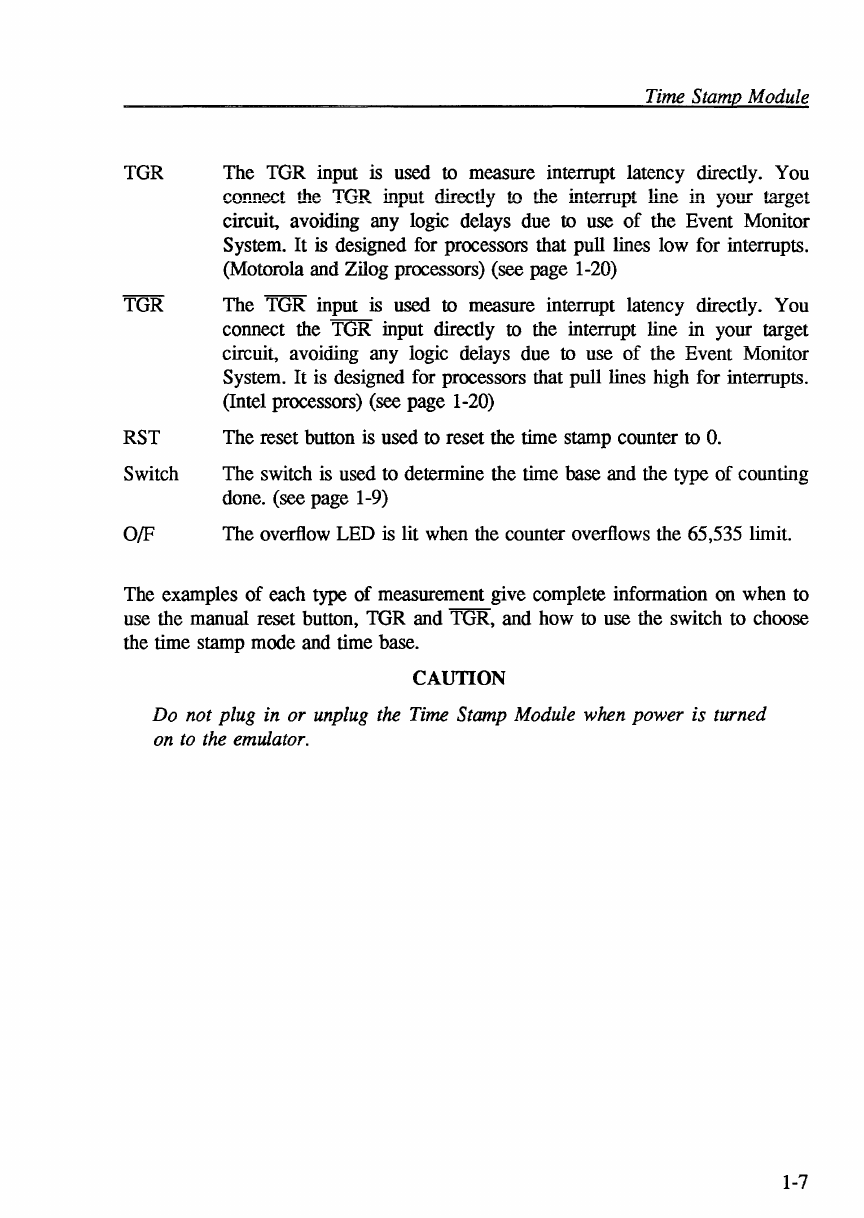
TGR
RST
Switch
OfF
Time Stamp Module
The TGR input is used to measure interrupt latency directly. You
connect the TGR input directly to the i.'1terrupt line
in
your target
circuit, avoiding any logic delays due to use
of
the Event Monitor
System. It is designed for processors that pull lines low for interrupts.
(Motorola and Zilog processors) (see page 1-20)
The TGR input is used to measure interrupt latency directly. You
connect the TOR input directly to the interrupt line
in
your target
circuit, avoiding any logic delays due to use
of
the Event Monitor
System. It is designed for processors that
pulllines
high for interrupts.
(Intel processors) (see page 1-20)
The reset button is used to reset the time stamp counter to
O.
The switch is used to determine the time base and the type
of
counting
done. (see page 1-9)
The overflow LED is lit when the counter overflows the 65,535 limit.
The examples
of
each type
of
measurement give complete information on when to
use the manual reset button, TGR and TGR, and how to use the switch to choose
the time stamp mode and time base.
CAUTION
Do not plug in or unplug the Time Stamp Module when power is turned
on
to
the emulator.
1-7
Time Stamp Module User's
Manual
Addendum
Steps for Using the Time Stamp Module
In order to make a measurement, there are seven steps you must follow:
1.
Set the ESL soft-switch 9 to the appropriate position for
the measurement you want to make.
2.
Choose a switch setting on the Time Stamp Module.
3.
Set up your trigger inputs.
4. Set up the Event Monitor System to trigger the Time Stamp Module
at the appropriate program states.
5.
Run your program.
6.
View the time stamp information.
7.
Interpret the time stamp information.
Each step is described in detail below.
Step 1: Set ESL Soft-Switch 9
ESL soft-switch 9 controls the LSA display
of
information coming in on the LSA
port. Settings 1 and 2 are used with the Time Stamp Module. Setting 0 is used
when you use the LSA pod.
o Default: LSA value shown as 16 bits
1 Display the absolute time value
2 Display the relative time value
Absolute time values are used when you want to measure the total amount
of
time
spent or the number
of
occurrences. Relative time values are used when you are
interested in the time spent between points A and B in your code. but are not
interested in how long it takes to get to point
A.
To get to ESL soft-switch
9:
1-8
from stand-alone mode Type SET 9, n, where n is 0, 1 or
2.
from ES Driver Select Target Emulation mode, and type SET 9, n,
where n is 0, 1 or
2.
Time Stamp Module
Step
20
Set Time Stamp Module Switch
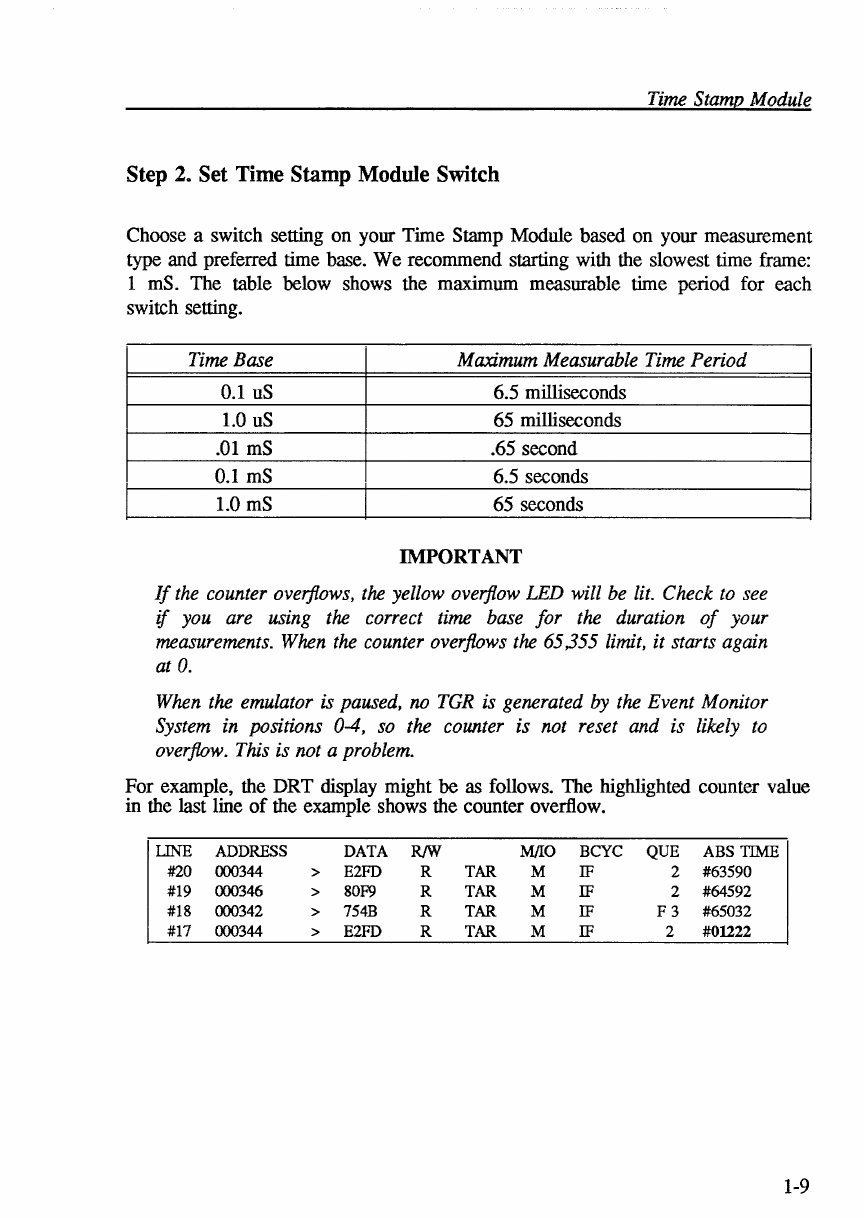
Choose a switch setting on your Time Stamp Module based on your measurement
type and preferred time base. We recommend starting with the slowest time frame:
1
mS.
The table below shows the maximum measurable time period for each
switch setting.
Time Base Maximum Measurable Time Period
0.1
uS
6.5 milliseconds
1.0
uS
65 milliseconds
.01
mS
.65 second
0.1
mS
6.5 seconds
1.0
mS
65 seconds
IMPORTANT
If
the counter overflows, the yellow overflow LED will be
lit.
Check
to
see
if
you are using the correct time base for the duration
of
your
measurements. When the counter overflows the
65,355
limit, it starts again
at
O.
When the emulator is paused, no
TGR
is generated
by
the Event Monitor
System in positions 0-4,
so
the counter is not reset and is likely
to
overflow. This is not a problem.
For example, the DRT display might be as follows. The highlighted counter value
in the last line
of
the example shows the counter overflow.
LINE
ADDRESS
DATA
R!W
MIlO
BCYC
QUE
ABS
TIME
#20
000344
>
E2FD
R
TAR
M
IF
2
#63590
#19
000346
>
80F9
R
TAR
M
IF
2
#64592
#18
000342
>
754B
R
TAR
M
IF
F3
#65032
#17
000344
>
E2FD
R
TAR
M
IF
2
#01222
1-9
Time
Stamp
Module
User's
Manual
Addendum
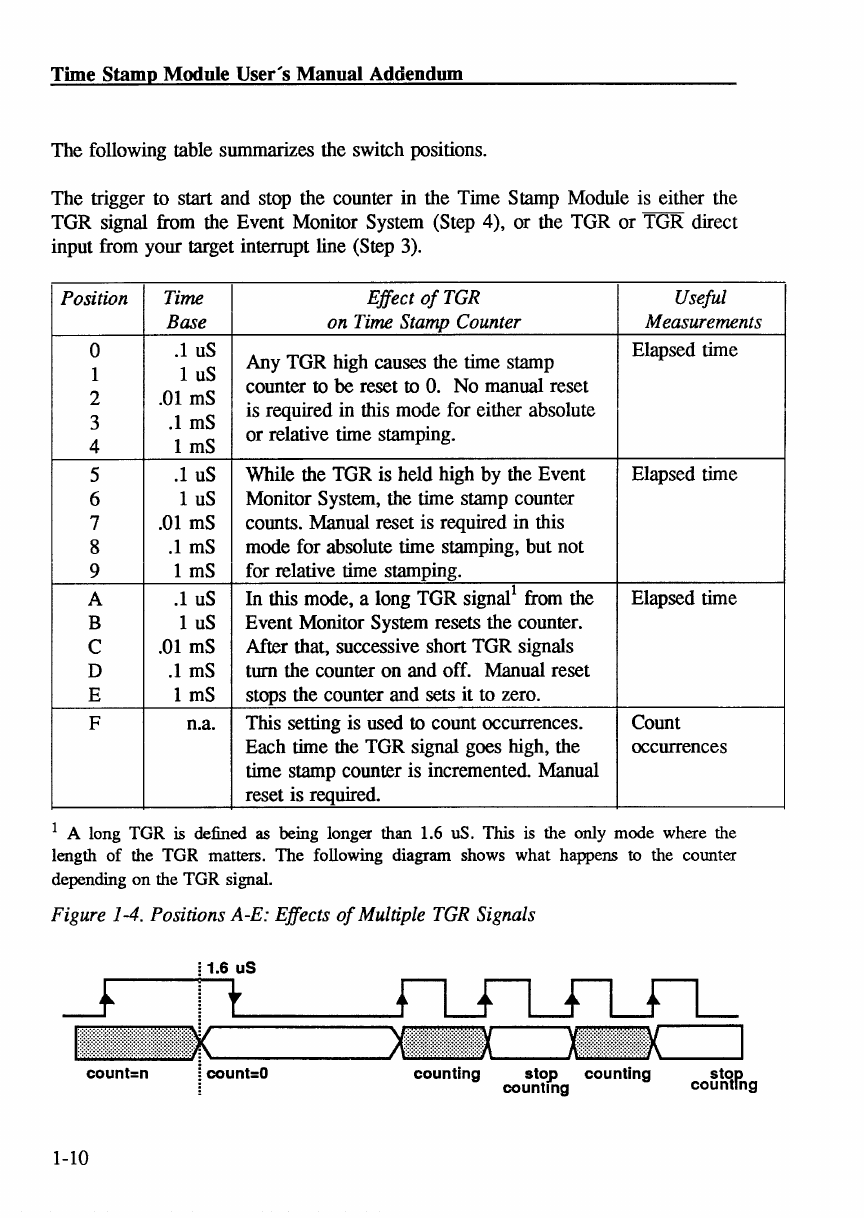
The following table summarizes the switch positions.
The trigger to start and stop the counter in the Time Stamp Module is either the
TGR signal from the Event Monitor System (Step 4), or the TGR or TGR direct
input from your target interrupt line (Step 3).
Position Time Effect
of
TGR Useful
Base on Time Stamp Counter Measurements
0
.1
uS
Any TGR high causes the time stamp Elapsed time
1 1
uS
2
.01
mS
counter to
be
reset to
O.
No manual reset
3
.1
mS
is required in this mode for either absolute
4 1
mS
or relative time stamping.
5
.1
uS
While the TGR is held high by the Event Elapsed time
6 1
uS
Monitor System, the time stamp counter
7
.01
mS
counts. Manual reset is required in this
8
.1
mS
mode for absolute time stamping, but not
9 1
mS
for relative time stamping.
A
.1
uS
In
this mode, a long TGR signal1 from the Elapsed time
B 1
uS
Event Monitor System resets the counter.
C
.01
mS
After that, successive short TGR signals
D
.1
mS
turn the counter on and off. Manual reset
E 1
mS
stops the counter and sets it to zero.
F n.a. This setting is used to count occurrences. Count
Each time the TGR signal goes high, the occurrences
time stamp counter is incremented. Manual
reset is required.
1 A long TOR is defined
as
being longer than 1.6 uS. This is the only mode where the
length
of
the TOR matters. The following diagram shows what happens
to
the counter
depending on the TOR signal.
Figure 1-4. Positions A-E: Effects
of
Multiple TGR Signals
! 1.6
uS
ItI~1t~III~~~~:~::::I~~::~I:~:~:~
_______
....
=~
'--_...J
'""'=~
'---_
......
count=n
1-10
~:
count=O
counting
stop
counting
counting
stop
counting
I
Time Stamp Module
Step 3. Set Up TGR Input
The counter in the Time Stamp Module can
be
controlled in one
of
three ways:
1.
The Event Monitor System TOR action.
2. The TOR
input
3. The TGR input.
The default is the Event Monitor System trigger
input
No additional wires are
necessary.
To use the TOR and TGR lines to measure interrupt latency, you must connect one
of
these lines to an interrupt line on your target. Use
of
the TGR and TGR external
inputs is described fully in the example on page 1-20.
Step
4.
Set up the Event Monitor System
In this step, you set up the Event Monitor System to selectively trace the memory,
program activity,
or
modules you are interested in time stamping. Setting up the
Event Monitor System can
be
done through ESL
or
through the Target Emulation
menu in ES Driver.
There are
three
steps to setting
up
the Event Monitor System:
1.
Decide what condition you want to look at, and what actions to
take when that condition is reached.
2. Set up the comparators to isolate that condition.
3.
Set up
WHEN/fHEN
statements using the appropriate
conditions and actions.
For more information on using the Event Monitor System, please see section 7 in
your ES 1800 manual. The examples beginning on page 1-14
of
this addendum
provide examples
of
using the Event Monitor System to specify conditions
appropriate for time stamping.
1-11
Time
Stamp
Module
User's
Manual
Addendum
Step
S.
Run your Program
from stand-alone mode Run the program using the RUN command, or run
to a breakpoint using RBK.
from ES Driver Select the Target Emulation menu, and the Run or
Run-to-Breakpoint command.
Step
6.
View Time Stamp Information
There are several ways to display the time stamp infonnation.
from stand-alone mode The first step is to display the trace by either:
-stopping emulation with the
STP
command
from ES Driver
-using the Event Monitor System to break emulation
-
if
you have Dynamic Trace available, you can
use the
OFF
TeE
command to view the trace
while your program is still running
Then view the trace, using the
DRT
command.
The last column shows the absolute or relative
time stamp, depending on the position you
specified with the SET command.
Enter the Target Emulation menu, and do the
same commands as listed in stand-alone mode.
Step 7. Interpret Time Stamp Information
The time stamp information is always given as a number
of
units: the units are the
ones you specify when you set the switch on the Time Stamp Module.
IMPORTANT
You must multiply this number
by
the time base you selected on the Time
Stamp Module switch in order
to
determine the elapsed time in seconds.
1-12
Time Stamp Module
Collecting Time
Stamp
Information
in a File
After setting up your Event Monitor System and Time Stamp Module to provide
just the information you need, you can use ES Driver to save the specific DRT
displays to an ASCII file. Once the information is stored in the file, you can use a
spreadsheet
or
data base management program to analyze the data.
While in Target Emulation mode,
1.
Press
<F3>
to open a file to save the session record in. You will
be
prompted to enter a file name. The default extension for this file is .rec.
2. Run the DRT command to print the trace. It will appear on the screen, and
also
be
stored in the file. Note the prompt on the bottom
of
the screen
"SA VEfile.rec <F8>=close."
3. Press
<F8>
to close the session record file.
1-13
EXAMPLES
Examples
There are two basic measurement modes: Elapsed Time and Counting Occurrences.
The examples are organized as follows:
Measuring elapsed time
-measuring the time
it
takes
to
go from event A
to
event B
-measuring the time the program is in the specified range
-meaSuring the time between an interrupt and interrupt servicing
Counting occurrences
-counting the number
of
times the program transitions
from event A
to
event B
-counting the number
of
accesses to a memory location
or
range
Measuring Elapsed Time
The
elapsed time measurement can
be
used to measure in-module time, out-of-
module time, inter-module time, and memory and program access time. These
measurements use switch positions 0 to E.
Conceptually, there are three types
of
elapsed time measurements:
1.
Measuring the time from event "A" to event "B"
-used for measuring program time, out-of-module execution time,
and inter-module execution time
2. Measuring the time spent in
an
address range
-used for measuring memory time and program time (excluding
calls to other modules)
3. Measuring the time between
an
interrupt and interrupt servicing
-used for measuring interrupt latency
1-14
ELAPSED TIME: A to B
A to B Mode
To measure the time it takes a program to get from event "A" to event "B," the
easiest way is to set
up
the Event Monitor System so only event "B" appears in the
trace display.
Step 1. Set LSA Display Type
SET
9,
t Set display format to absolute time stamp
Step 2. Select Time Stamp Module Switch Setting
Use positions 0-4, depending on your preferred time base. In positions 0-4, the
TGR from the Event Monitor System resets the time StllillP counter to
O.
If
you're not sure which time base to use, use position 4 for the slowest.
If
the
counter overflows, the yellow overflow LED will light. See page 1-9 for a chart
of
maximum time periods per setting.
Step 3. Set up the Trigger Input
To measure elapsed time, use the Event System Trigger input.
Step 4. Set up the Event Monitor System
ACt
=
'a
AC2 =
'b
WHEN
ACt
THEN
TGR
WHEN AC2 THEN TRC
Specify address comparator 1 in group 1
to
be
event A
Specify address comparator 2 in group 1 to be
event B
The TGR action resets the time stamp counter
to 0 at event A
Trace event B
1-15

ELAPSED
TIME:
A to B
Step
5.
Run
your Program
from stand-alone
mode
from
ES
Driver
RUN
Target
Emulation
Menu
Step
6.
View
Time
Stamp
Data
from stand-alone
mode
DRT
from
ES
Driver
Trace
Menu:
Step
7.
Interpret
Time
Stamp
Information
Run
program
Run
Display
the
trace
Display
the
trace
The
last
column
of
the
trace
display
gives
you
the
absolute
time
stamp
information.
Note
that
if
event
A
and
B
are
called
more
than
once,
you
will
get
the
time
between
events
for
each
occurrence.
IMPORTANT
You
must
multiply
this
number
by
the
time
base
you
selected
on
the
Time
Stamp
Module
switch
in
order
to
determine
the
elapsed
time
in
seconds.
The
following
screen
shows
the
raw
trace
display.
Since
the
Time
Stamp
Module
switch
was
set
to
position
#1
(1
uSee),
the
time
to
go
from
A
to
B
is
shown
to
vary
from
29
uSee
to
39
uSee.
Figure
1-5.
Sample
DRT
Screen
for
Measuring
Time
from A
to
B
>'JRT
LINE
ADDRESS
DATA
R/W
Fe
IPL
ASS TIME
ji20
001100>
4E71
R
OVL
SP
0
t3S
H9
001100>
4E71
R
OVL
SP
0
#32
HS
001100>
4E71
R
OVL
SP
0
t30
H7
001100>
4E71
R
OVL
SP
0
t30
H6
001100>
4E71
R
OVL
SP
0
#29
HS
001100>
4E71
R
OVL
SP
0
BO
H4
001100>
4E71
R
OVL
SP
0
#30
H3
001100>
4E71
R
OVL
SP
0
t31
H2
001100>
4E71
R
OVL
SP 0
t30
H1
001100>
4E71
R
OVL
SP
0
t3S
HO
001100>
4E71
R
OVL
SP 0
t31
jig
001100>
4E71
R
OVL
SP
0
*34
ts
001100>
4E71
R
OVL
SP 0
t34
n
001100>
4E71
R
OVL
SP 0
#36
ji6
001100>
4E71
R
OVL
SP
0
t32
!fS
001100>
4E71
R
OVL
SP 0
t30
!f4
001100>
4E71
R
OVL
SP 0
t31
t3
001100>
4E71
R
OVL
SP 0
t39
!f2
001100>
4E71
R
OVL
SP
0
#34
H
001100>
4E71
R
OVL
SP
0
t30
!f0
BREAK
1-16
ELAPSED TIME:
F~A~NGE
MODE
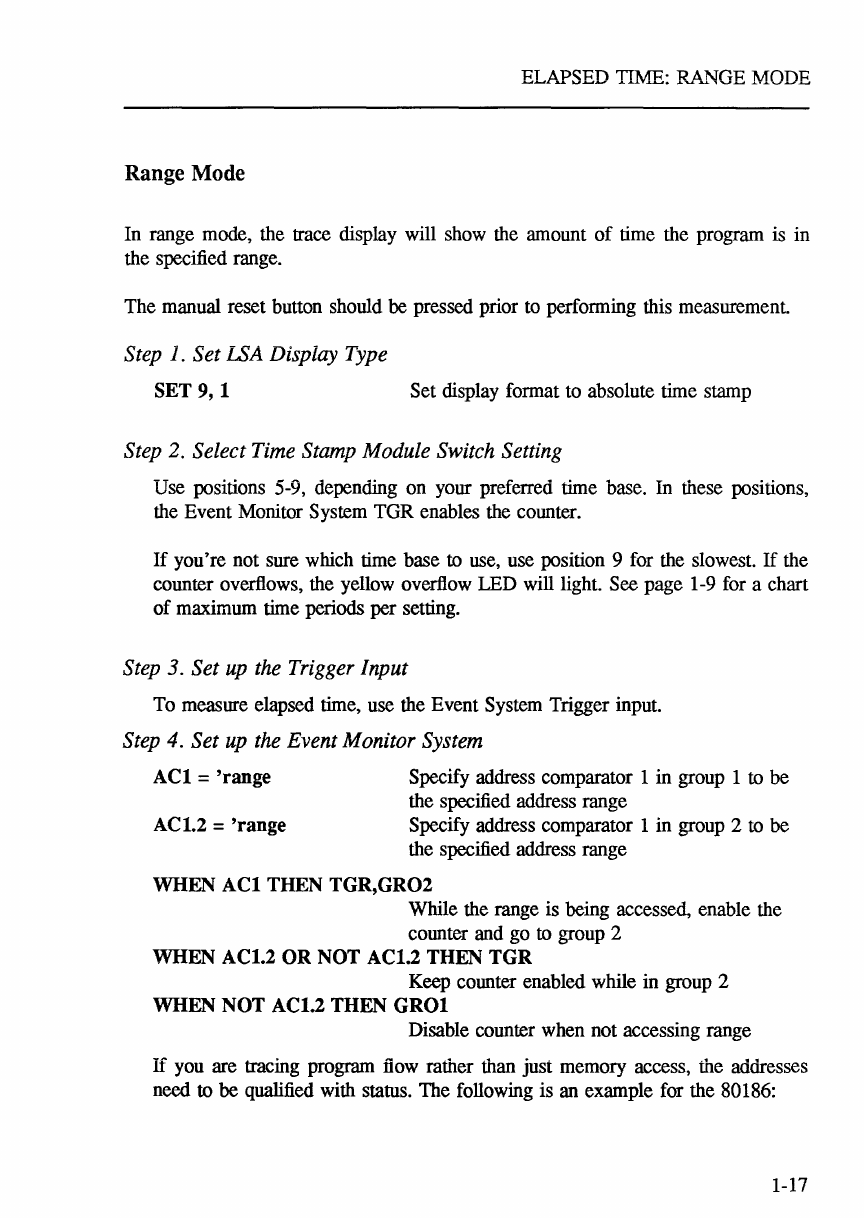
Range Mode
In range mode, the trace display will show the amount
of
time the program is in
the specified range.
The
manual reset button should be pressed prior to performing this measurement.
Step 1. Set LSA Display Type
SET 9, 1 Set display format to absolute time stamp
Step 2. Select Time Stamp Module Switch Setting
Use positions 5-9, depending on your preferred time base. In these positions,
the Event Monitor System
TGR
enables the counter.
If
you're
not sure which time base to use, use position 9 for the slowest.
If
the
counter overflows, the yellow overflow LED will light. See page 1-9 for a chart
of
maximum time periods per setting.
Step 3. Set up the Trigger Input
To measure elapsed time, use the Event System Trigger input.
Step 4. Set up the Event Monitor System
ACl
= 'range
ACl.2 = 'range
Specify address comparator 1
in
group 1 to
be
the specified address range
Specify address comparator 1 in group 2 to
be
the specified address range
WHEN
ACl
THEN
TGR,GR02
While the range is being accessed, enable the
counter and
go
to group 2
WHEN ACl.2 OR NOT ACl.2 THEN TGR
Keep counter enabled while
in
group 2
WHEN NOT ACl.2 THEN
GROl
Disable counter when not accessing range
If
you are tracing program flow rather than just memory access, the addresses
need to
be
qualified with status. The following
is
an example for the 80186:
1-17
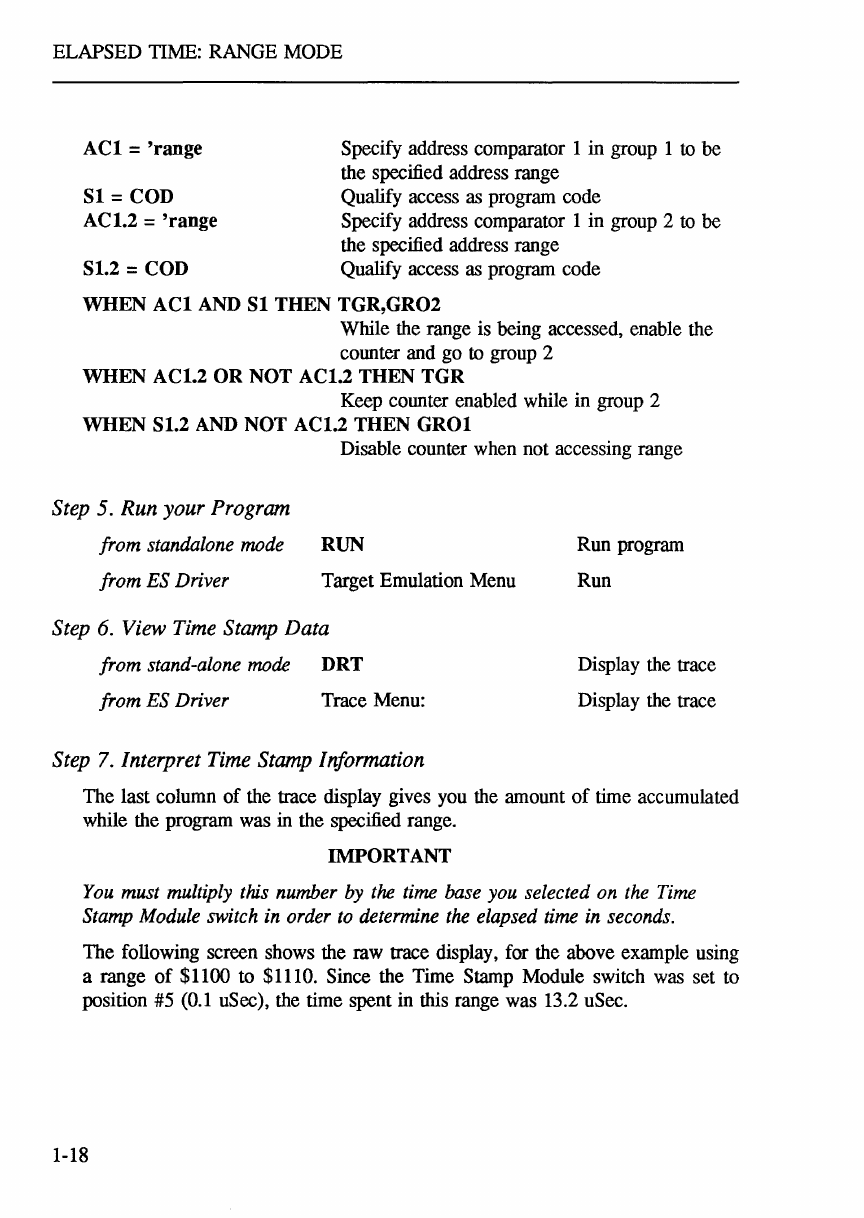
ELAPSED TIME: RANGE MODE
ACI
= 'range
SI
= COD
AC1.2 = 'range
SI.2 = COD
Specify address comparator 1 in group 1 to be
the specified address range
Qualify access
as
program code
Specify address comparator 1 in group 2 to be
the specified address range
Qualify access
as
program code
WHEN
ACI
AND
SI
THEN TGR,GR02
While the range is being accessed, enable the
counter and go to group 2
WHEN AC1.2 OR NOT AC1.2 THEN TGR
Keep counter enabled while in group 2
WHEN SI.2
AND
NOT AC1.2 THEN
GROI
Disable counter when not accessing range
Step 5. Run your Program
from standalone mode
from ES Driver
RUN
Target Emulation Menu
Step 6. View Time Stamp Data
from stand-alone mode DRT
from ES Driver Trace Menu:
Step
7.
Interpret Time Stamp Information
Run program
Run
Display the trace
Display the trace
The last column
of
the trace display gives you the amount
of
time accumulated
while the program was in the specified range.
IMPORTANT
You must multiply this number by the time base you selected on the Time
Stamp Module switch in order to determine the elapsed time in seconds.
The following screen shows the raw trace display, for the above example using
a range
of
$1100 to $1110. Since the Time Stamp Module switch was set to
position #5
(0.1
uSee), the time spent in this range was 13.2 uSec.
1-18
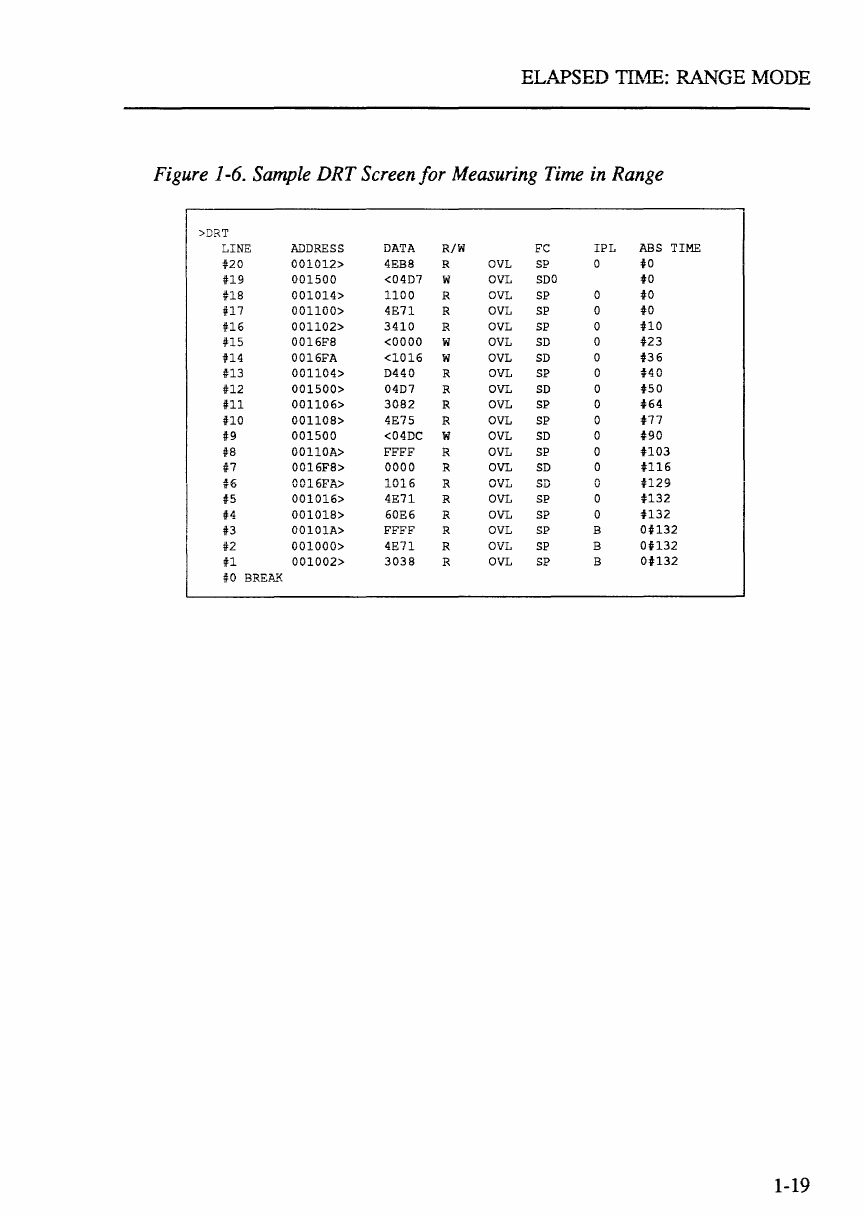
Figure
1-6.
Sample
DRT
Screen
for
Measuring
Time
in
Range
>DRT
LINE
ADDRESS
DATA
R/W
FC
IPL
ABS
TIME
no
001012>
4EBS R
OVL
SP
0
to
U9
001500
<0407
W
OVL
SOO
to
us
001014>
1100
R
OVL
SP
0
to
U7
001100>
4E71
R
OVL
SP
0
to
U6
001102>
3410
R
OVL
SP
0
HO
US
0016FS
<0000
W
OVL
SO
0
t23
n4
0016FA
<1016
W
OVL
SO
0
t36
n3
001104>
0440
R
OVL
SP
0
HO
#12
001500>
0407
R
OVL
SO
0
t50
U1
001106>
30S2
R
OVL
SP
0
t64
no
00110S>
4E75
R
OVL
SP
0
t77
I
jf9
001500
<040C
W
OVL
SO
0
t90
!fS
00110A>
FFFF
R
OVL
SP
0
H03
if7
0016FS>
0000
R
OVL
SO
0
H16
t6
0016FA>
1016
R
OVL
SD
0
H29
t5
001016>
4E71
R
OVL
SP
0
H32
t4
00101S>
60E6
R
OVL
SP
0
H32
113
00101A>
FFFF
R
OVL
SP
B
OH32
jf2
001000>
4E71
R
OVL
SP
B
OH32
n
001002>
303S
R
OVL
SP B
OH32
jlO
BREA.l{
1-19
INTERRUPT
LATENCY
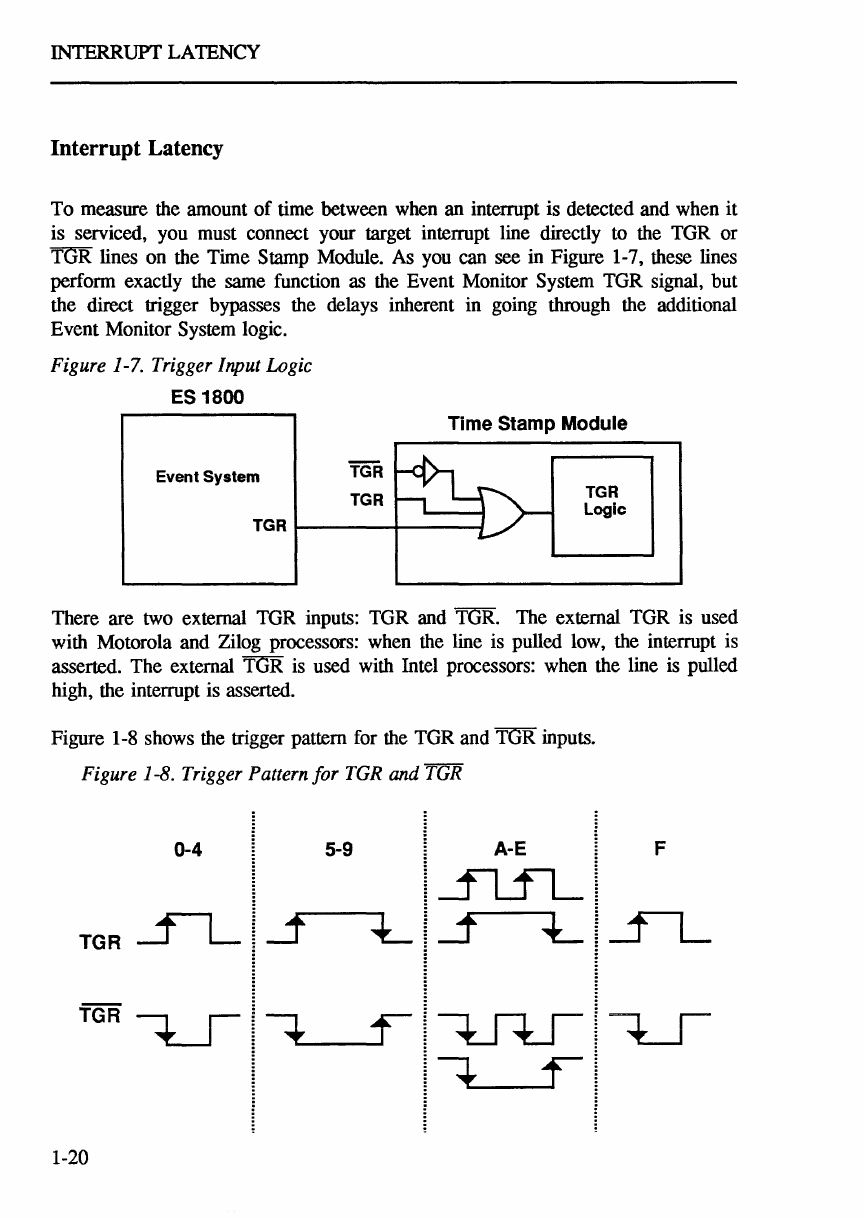
Interrupt Latency
To measure the amount
of
time between when an interrupt is detected and when it
is serviced, you must connect your target interrupt line directly to the TGR or
TGR lines on the Time Stamp Module. As you can see in Figure 1-7, these lines
perform exactly the same function as the Event Monitor System TGR signal, but
the direct trigger bypasses the delays inherent in going through the additional
Event Monitor System logic.
Figure 1-7. Trigger Input Logic
ES 1800
Event System
TGR
TGR
Time Stamp Module
TGR
Logic
TGR
t--------!t-----I
There are two external TGR inputs: TGR and TGR. The external TGR is used
with Motorola and Zilog processors: when the line is pulled low, the interrupt is
asserted. The external TGR is used with Intel processors: when the line is pulled
high, the interrupt is asserted.
Figure 1-8 shows the trigger pattern for the TGR and TGR inputs.
Figure 1-8.
Trigger
Pattern for
TGR
and
TGR
0-4 5-9 A-E F
TGR
1-20
INTERRUPT LATENCY
Step 1. Set LSA Display Type
SET
9,1
Set dispiay format to absoiute time stamp
Step 2. Select Time Stamp Module Switch Setting
Use positions 0-4, depending on your preferred time base. In positions 0-4, the
TGR from the external TGR, external TGR or Event Monitor System TGR
resets the time stamp counter to
O.
If
you're not sure which time base to use, use position 4 for the slowest.
If
the
counter overflows, the yellow overflow LED will light. See page 1-9 for a chart
of
maximum time periods per setting.
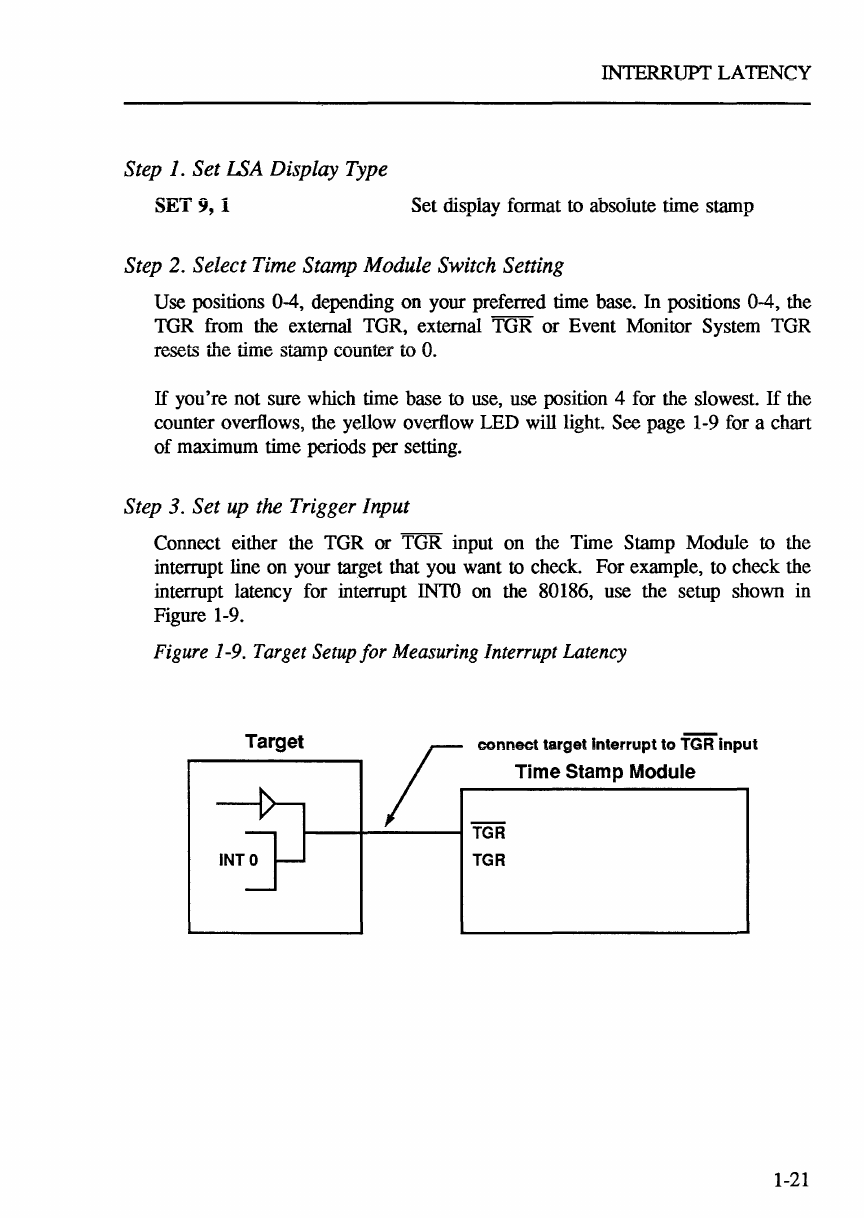
Step 3. Set
up
the Trigger Input
Connect either the TGR or TGR input on the Time Stamp Module to the
interrupt line on your target that you want to check. For example, to check the
interrupt latency for interrupt
INTO
on the 80186, use the setup shown in
Figure 1-9.
Figure
1-9.
Target
Setup
for
Measuring
Interrupt Latency
Target r
connect
targellnlerrupllo
TGRlnpul
/ I Time Stamp Module
1-21
INTERRUPT LATENCY
Step
4.
Set up the Event Monitor System
ACI
= 'intservice_start
WHEN
ACI
THEN TRC
Step 5. Run your Program
from standalone mode
from ES Driver
Specify address comparator 1 in group 1
to
be
the start
of
the interrupt service routine
Start tracing at the beginning
of
the interrupt
service routine
RUN
Target Emulation Menu
Run program
Run
Step
6.
View Time Stamp Data
from stand-alone mode DRT
from ES Driver Trace Menu:
Step
7.
Interpret Time Stamp Information
Display the trace
Display the trace
The Event Monitor System traces the first cycle
of
the interrupt service routine.
The last column
of
the the trace display shows the amount
of
time elapsed
between the start
of
the interrupt service routine and the actual interrupt
processing.
IMPORTANT
You must multiply this number by the time base you selected on the Time
Stamp Module switch in order
to
determine the elapsed time in seconds.
1-22
COUNTING OCCURRENCES: A to B
Counting Occurrences
The number
of
occurrences measurement can
be
used to measure memory
and
program activity, module linkage activity and program flow activity. Use switch
position F (count
TGR
pulses) for all counting measurements.
Conceptually, there are two types
of
counting occurrences measurements:
1. Counting the number
of
times the program transitions from event "A" to
event "B"
-used for measuring module linkage activity
2. Counting the number
of
accesses to some memory location(s).
-used for measuring memory program activity
A to B Mode
This mode records the number
of
times the transition from event "A" to event liB"
occurs. Trace is only recorded on exit from module A. The manual reset button
should
be
pressed prior to performing this measurement.
Step 1. Set LSA Display Type
SET
9,1
Set display format to absolute time stamp
Step 2. Select Time Stamp Module Switch Setting
Use position F.
For
counting occurrences, the time base is irrelevant. In
position F, when the
TGR
from the Event Monitor System goes high, the time
stamp counter increments.
1-23
COUNTING OCCURRENCES: A to B
Step 3. Set up the Trigger Input
To count occurrences, use the Event System Trigger input.
Step
4.
Set up the Event Monitor System
ACl.l
=
'start-a
Specify address comparator 1 in group 1 to
be
the start
of
module A
ACl.2 =
'start-b
Specify address comparator 1 in group 2 to
be
the start
of
module B
AC2.2 = 'end-a Specify address comparator 2 in group 2 to
be
the end
of
module A
WHEN
ACl
THEN
GR02
Go
to group 2 while in module A
WHEN
ACl.2
THEN
TGR
Increment counter when entering module B
from module A
WHEN AC2.2 THEN TRC,
GROl
Exit module A, record count in trace memory
Step 5. Run your Program
from stand-alone mode RUN
from ES Driver Target Emulation Menu
Step
6.
VielV
Time Stamp Data
from stand-alone mode DRT
from ES Driver Trace Menu:
Step
7.
Interpret Time Stamp Information
Run program
Run
Display the trace
Display the trace
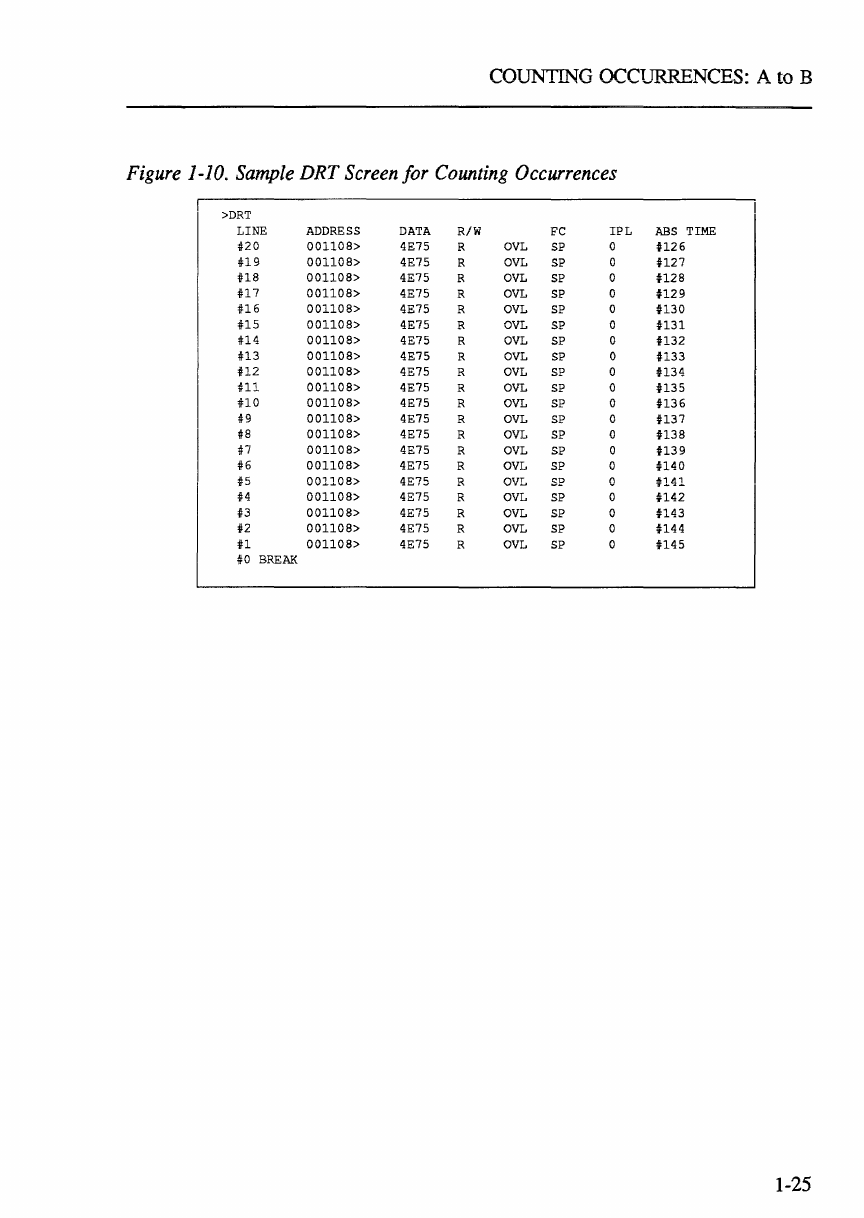
The last column gives you the number
of
times module B was entered from
module A. Note that only the location end-a is traced. In the following screen
we see that module B is called once each time from module A. The total
number
of
calls is 145.
1-24
COUNTING
OCCURFFNCES:
A to B
Figure
1-10.
Sample
DRT
Screen
for
Counting
Occurrences
>DRT
LINE
ADDRESS
DATA
R/W
Fe
IPL
ABS
TIME
#20
001108>
4E75 R
OVL
SP
a
U26
U9
001108>
4E75 R
OVL
SP
U27
U8
001108>
4E75 R
OVL
SP
U28
U7
001108>
4E75 R
OVL
SP
U29
U6
001108>
4E75 R
OVL
SP
U30
US
001108>
4E75 R
OVL
SP
U31
n4
001108>
4E75 R
OVL
SP
U32
U3
001108>
4E75 R
OVL
SP
H33
U2
001108>
4E75 R
OVL
SP
U34
HI
001108>
4E75 R
OVL
SP
U35
no
001108>
4E75 R
OVL
SP
0
U36
#9
001108>
4E75 R
OVL
SP
0
U37
#8
001108>
4E75 R
OVL
SP
U38
#7
001108>
4E75 R
OVL
SP
U39
#6
001108>
4E75 R
OVL
SP
U40
#5
001108>
4E75 R
OVL
SP
U41
H
001108>
4E75 R
OVL
SP
U42
#3
001108>
4E75 R
OVL
SP
0
U43
t2
001108>
4E75 R
OVL
SP
U44
U
001108>
4E75 R
OVL
SP
U45
#0
BREAK
1-25
COUNTING
OCCURRENCES:
RANGE
MODE
Range
Mode
This mode records the number
of
accesses to some memory location(s). Trace is
always recorded. The last trace cycles recorded show the accumulated access
counts. The manual reset button should be pressed prior
to
performing this
measurement
Step
1.
Set LSA Display Type
SET 9, 1 Set display format to absolute time stamp
Step 2. Select Time Stamp Module Switch Setting
Use position F. For counting occurrences, the time base is irrelevant. In this
position, when the TGR from the Event Monitor System goes high, the time
stamp counter increments.
Step 3. Set
up
the Trigger Input
To count accesses, use the Event System Trigger input.
Step 4. Set up the Event Monitor System
ACl.l
=
'here
TO
'there Specify the range to
be
monitored
WHEN
ACl
THEN TGR Increment counter whenever range is accessed
Step 5. Run your Program
from stand-alone mode RUN
from ES Driver Target Emulation Menu
Step
6.
View Time Stamp Data
from stand-alone mode DRT
from ES Driver Trace Menu
1-26
Run program
Run
Display the trace
Display the trace
COUNTING
OCCURRENCES:
R_A_NGE
MODE
Step
7.
Interpret
Time
Stamp
Information
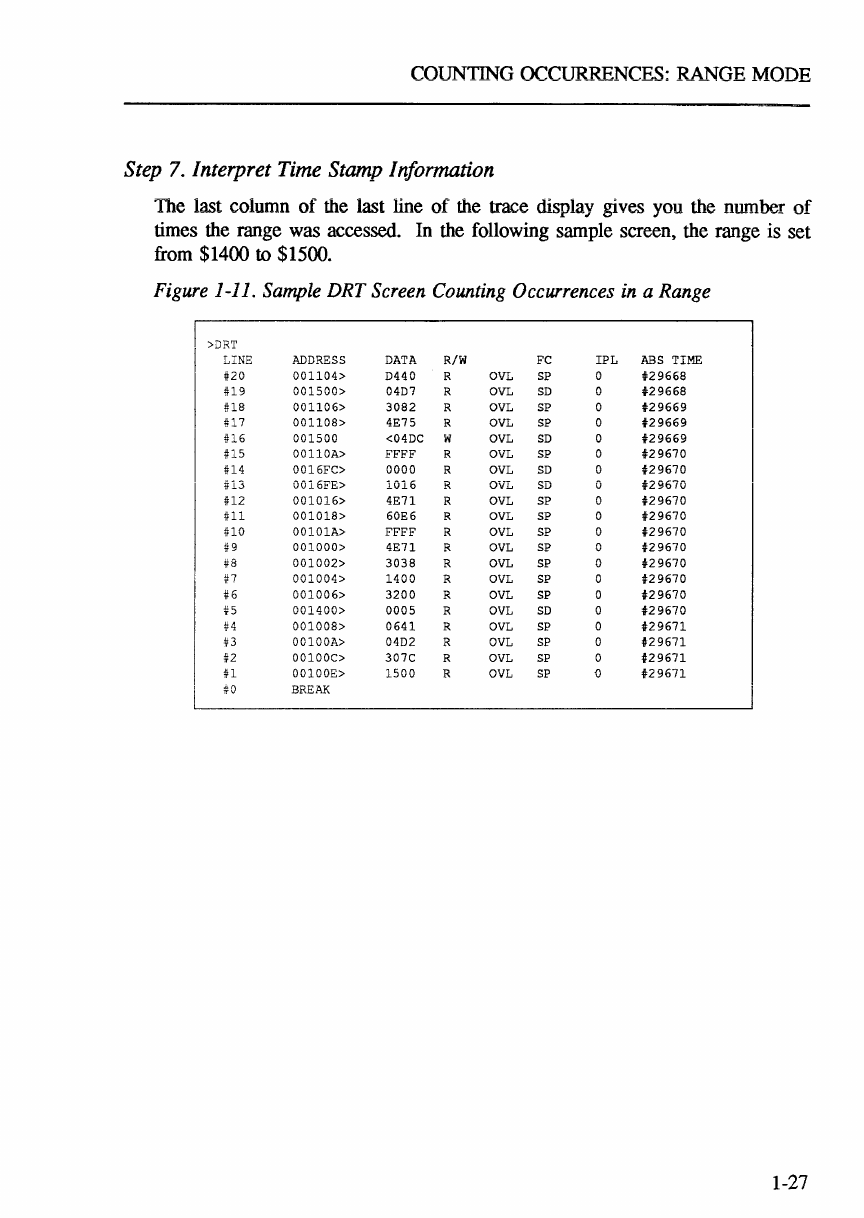
The last column
of
the
last line
of
the
trace
display gives you
the
number
of
times
the
range
was accessed.
In
the
following sample screen, the range is set
from
$1400 to $1500.
Figure
1-11.
Sample
DRT
Screen
Counting
Occurrences
in
a
Range
>ilRT
LINE
ADDRESS
DATA
R/W
FC
IPL
ABS
TIME
#20
001104>
D440
R
OVL
SP 0
t29668
U9
001500>
04D7 R
OVL
SD
t29668
U8
001106>
3082
R
OVL
SP
t29669
U7
001108>
4E75
R
OVL
SP
t29669
U6
001500
<04DC W
OVL
SD
t29669
U5
00110A>
FFFF
R
OVL
SP
t29670
U4
0016FC>
0000
R
OVL
SD
t29670
U3
0016FE>
1016
R
OVL
SD
t29670
U2
001016>
4E71
R
OVL
SP
t29670
U1
001018>
60E6
R
OVL
SP
t29670
UO
00101A>
FFFF
R
OVL
SP
t29670
#9
001000>
4E71
R
OVL
SP 0
t29670
#8
001002>
3038
R
OVL
SP 0
t29670
n
001004>
1400
R
OVL
SP
t29670
#6
001006>
3200
R
OVL
SP
t29670
#5
001400>
0005
R
OVL
SD
t29670
#4
001008>
0641
R
OVL
SP
t29671
#3
00100A>
04D2 R
OVL
SP
t29671
#2
00100C>
307C
R
OVL
SP
t29671
U
00100E>
1500
R
OVL
SP
Q
t29671
!f0
BREAK
1-27
USING COUNTER
AS
CONDmON
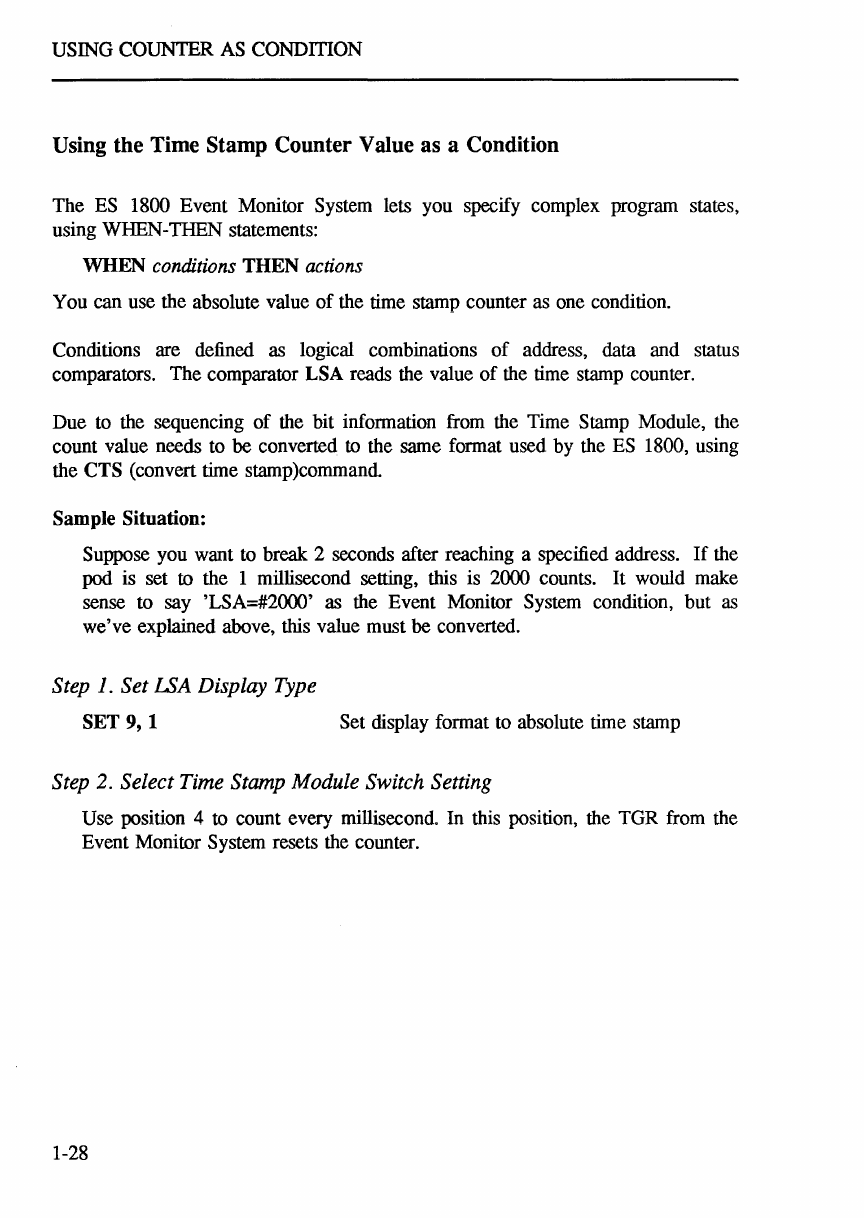
Using
the
Time
Stamp
Counter
Value
as
a Condition
The ES 1800 Event Monitor System lets you specify complex program states,
using WHEN-THEN statements:
WHEN
conditions
THEN
actions
You can use the absolute value
of
the time stamp counter as one condition.
Conditions are defined as logical combinations
of
address, data and status
comparators. The comparator LSA reads the value
of
the time stamp counter.
Due to the sequencing
of
the bit information from the Time Stamp Module, the
count value needs to
be
converted
to
the same format used by the ES 1800, using
the CTS (convert time stamp )command.
Sample Situation:
Suppose you want to break 2 seconds after reaching a specified address.
If
the
pod is set to the 1 millisecond setting, this is 2000 counts.
It
would make
sense to say 'LSA=#2000' as the Event Monitor System condition, but as
we've explained above, this value must
be
converted.
Step 1. Set LSA Display Type
SET
9,1
Set display format to absolute time stamp
Step 2. Select Time Stamp Module Switch Setting
Use position 4 to count every millisecond. In this position, the TGR from the
Event Monitor System resets the counter.
1-28
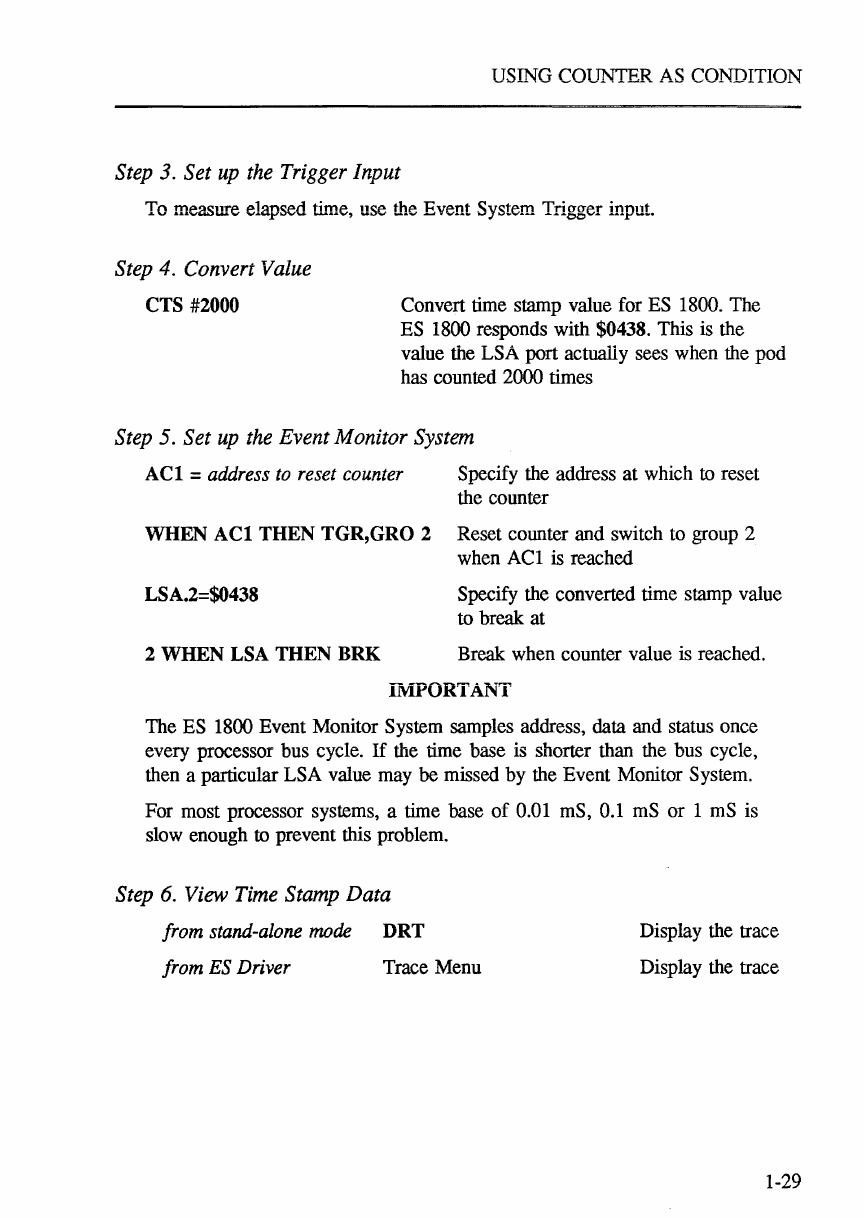
USING COUNTER AS CONDITION
Step 3. Set
up
the Trigger Input
To measure elapsed
ti.1Jle,
use the Event System Trigger input.
Step 4. Convert Value
CTS #2000 Convert time stamp value for ES 1800. The
ES 1800 responds with $0438. This is the
value the LSA port actually sees when the pod
has counted 2000 times
Step 5. Set
up
the Event Monitor System
ACI
=
address
to
reset
counter
Specify the address
at
which to reset
the counter
WHEN
ACI
THEN TGR,GRO 2 Reset counter and switch to group 2
when
ACl
is reached
LSA.2=$0438 Specify the converted time stamp value
to break at
2 WHEN LSA THEN BRK Break when counter value is reached.
iMPORTANT
The ES 1800 Event Monitor System samples address, data and status once
every processor bus cycle.
If
the time base is shorter than the bus cycle,
then a particular LSA value may
be
missed by the Event Monitor System.
For most processor systems, a time base
of
0.01 mS, 0.1 mS or 1 mS is
slow enough to prevent this problem.
Step
6.
View Time Stamp Data
from
stand-alone
mode
DRT
from
ES
Driver Trace Menu
Display the trace
Display the trace
1-29
USING
COUNTER
AS
CONDITION
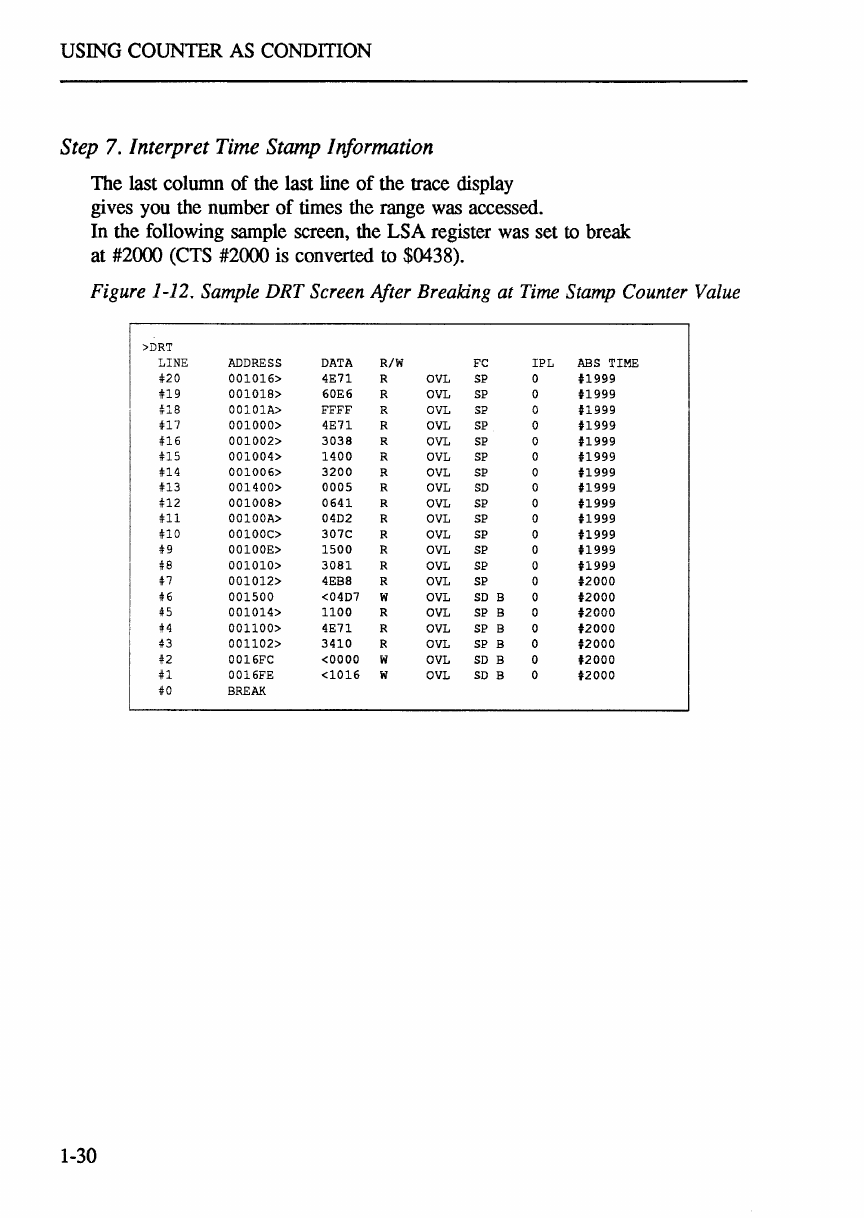
Step
7.
Interpret
Time
Stamp
Information
The
last
column
of
the
last
line
of
the
trace
display
gives
you
the
number
of
times
the
range
was
accessed.
In
the
following
sample
screen,
the
LSA
register
was
set
to
break
at
#2000
(CTS
#2000
is
converted
to
$0438).
Figure
1-12.
Sample
DRT
Screen
After
Breaking
at
Time
Stamp
Counter
Value
>DRT
LINE
ADDRESS
OATA
R/W
FC
IPL
ABS
TIME
#20
001016>
4E71
R
OVL
SP
0
U999
#19
001018>
60E6
R
OVL
SP
0
U999
#18
00101A>
FFFF
R
OVL
SP
0
U999
#17
001000>
4E71
R
OVL
SP 0
U999
#16
001002>
3038
R
OVL
SP
0
tl999
#15
001004>
1400
R
OVL
SP
0
tl999
U4
001006>
3200
R
OVL
SP
0
tl999
U3
001400>
0005
R
OVL
SO
0
tl999
U2
001008>
0641
R
OVL
SP 0
tl999
#11
00100A>
0402
R
OVL
SP
0
tl999
UO
00100C>
307C
R
OVL
SP
0
U999
119
00100E>
1500
R
OVL
SP
0
U999
#8
001010>
3081
R
OVL
SP
0
tl999
In
001012>
4EB8 R
OVL
SP
0
t2000
#6
001500
<0407
W
OVL
SO
B 0 nooo
#5
001014>
1100
R
OVL
SP
B 0
t2000
H
001100>
4E71
R
OVL
SP
B 0 nooo
1'13
001102>
3410
R
OVL
SP
B 0
t2000
n
0016FC
<0000
W
OVL
SO
B 0 nooo
#1
0016FE
<1016
W
OVL
SO
B 0 nooo
#0
BREAK
1-30

-
A-
Absolute time, 1-2
- B -
Break emulation, 1-28
- C -
Count occurrences
A
to
B, 1-23
code access, 1-2
memory
access,
1-1
memory and program activity, 1-23
module linkage activity, 1-2, 1-23
program flow activity, 1-23
range, 1-26
Counter overflow, 1-9
- E -
Elapsed time,
1-1
A to B, 1-14, 1-15
between module time, 1-1
code access, 1-1
in range, 1-14, 1-17
in-module time, 1-1
inter-module, 1-14
memory access, 1-1
memory time, 1-14
out-of-module, 1-14
program time, 1-14
units, 1-12
ESL
revisions, 1-5
Event monitor system
setup, 1-11
speed, 1-29
Examples, 1-14
Features,
1-1
File,
-
F-
INDEX
collecting time stamp info, 1-13
Time Stamp Module User's Manual Addendum
- I -
Installation, 1-4
hardware, 1-4
software, 1-5
Interrupt latency, 1-20
-
L-
Logic state analysis pod, 1-4
-
0-
Overflow LED, counter, 1-9
-
P-
Performance analysis
collecting data, 1-13
- R -
Relative time, 1-2
Reset button, 1-6
Run program, 1-12
- S -
SET
command, 1-8
Summary,
switch settings, 1-10
Switch positions, 1-10
Switch setting: ESL, 1-8
-
T-
TGR
choose input, 1-11
Event Monitor System, 1-10
external, 1-7, 1-10
Time base
maximum, 1-2
switch, 1-9
Time period
maximum, 1-9
Time stamp module
label, 1-6
Time units, 1-12
reset button, 1-6
-
U-
Units, 1-12
-
V-
View time stamp information, 1-12
[111111111
Applied
Microsystems
Corporation
5020
148th
Ave
N.
E.
P.O.
Box
97002
Redmond,
WA
98073-9702
(206)
882-2000
1-800-426-3925
TRT
TELEX
185196
FAX
(206)
883-3049
Applied
Microsystems
Corporation
marntains
a
worldwide
network
of
Direct
Sales
Offices
and
Representative
Organizations
committed
to
quality
service
and
support.
For
the
address
and
phone
number
of
the
Applied
Microsystems
Corporation
Sales
Office
nearest
you,
call
1-800-426-3925
(in
WA,
call
206-882-2000).
Applied
Microsystems'
products
are
available
throughout
Europe.
For
the
address
and
phone
number
of
your
nearest
distributor,
contact:
Applied
Microsystems
Corporation,
Ltd.
Chiltern
Court,
High
Street,
Wendover,
Aylesbury,
Bucks,
HP22
6EP,
England.
Tel
44(0)
296-625462

PIN
923-00010-00
March
1988
