120 Years Of American Education 93442
User Manual: 120
Open the PDF directly: View PDF ![]() .
.
Page Count: 115 [warning: Documents this large are best viewed by clicking the View PDF Link!]
- Cover
- Title Page
- Foreword
- Acknowledgments
- Introduction
- Contents
- Statistics in the U.S. Department of Education: Highlights from the Past 120 Years
- Chapter 1. Education Characteristics of the Population
- Figure 1.-- Percent of 5- to 19-year-olds enrolled in school, by race: 1850 to 1991
- Figure 2.--Percent of 20- to 24-year-olds and 25- to 34-year-olds enrolled in school, by sex: 1940 to 1991
- Figure 3.--Percent of persons 25 years old and over completing 4 years of high school, by sex and race: 1940 to 1991
- Figure 4.--Percent of persons 25 years old and over completing 4 years of college, by sex and race: 1940 to 1991
- Figure 5.--Annual average income of high school and college graduates, 25 years old and over, in constant 1991 dollars, by sex:
- Table 1.— Population, by age and race, live births, and birth rate: 1790 to 1991
- Table 1. (Cont'd)
- Table 1. (Cont'd)
- Table 2.—School enrollment of 5– to 19–year-olds per 100 persons, by sex and race: 1850 to 1991
- Table 3.— School enrollment and school enrollment rates, by age and sex: 1940 to 1991
- Table 3. (Cont'd)
- Table 3. (Cont'd)
- Table 4.— Years of school completed by persons 25 years old and over, by race and sex: April 1940 to March 1991
- Table 4. (Cont'd)
- Table 4. (Cont'd)
- Table 5.—Median years of school completed by persons age 25 and over and 25 to 29, by race and sex: 1910 to 1991
- Table 6.—Percentage of persons 14 years old and over who were illiterate, (1) by race and nativity: 1870 to 1979
- Table 7.—Annual mean income of males and females 25 years old and over, by years of school completed: 1939 to 1991
- Table 7. (Cont'd)
- Chapter 2. Elementary and Secondary Education
- Figure 6.--Enrollment in public elementary and secondary schools, by level: 1869-70 to 1992-93
- Figure 7.--Elementary and secondary enrollment as a percentage of 5- to 17-year-olds, by level: 1869-70 to fall 1991
- Figure 8.--Average number of days per year attended by public school students: 1869-70 to 1980-81
- Figure 9.--Pupil/teacher ratio in public elementary and secondary schools: 1869-70 to fall 1990
- Figure 10.--Percentage of elementary and secondary school teachers, by sex: 1869-70 to fall 1990
- Figure 11.--Number of public and private high school graduates per 100 17-year-olds: 1869-70 to 1991-92
- Figure 12.--Sources of revenues for public elementary and secondary schools: 1889-90 to 1989-90
- Figure 13.--Current expenditure per pupil in average daily attendance, in constant 1989-90 dollars: 1919-20 to 1989-90
- Table 8.— Historical summary of public elementary and secondary school statistics: 1869– 70 to 1989– 90
- Table 8. (Cont'd)
- Table 9.—Enrollment in regular public and private elementary and secondary schools, by grade level: 1869–70 to fall 1992
- Table 9. (Cont'd)
- Table 10.—Enrollment in regular public elementary and secondary schools, by grade: 1910–11 to fall 1990
- Table 10. (Cont'd)
- Table 10. (Cont'd)
- Table 10. (Cont'd)
- Table 11.— Enrollment in regular public elementary and secondary schools, by state: 1870– 71 to fall 1990
- Table 11. (Cont'd)
- Table 12.—Children served in special education programs, by type of disability: 1921–22 to 1989–90
- Table 13.—Public school pupils transported at public expense and current expenditures for transportation: 1929–30 to 1989–90
- Table 14.— Average daily attendance, instructional staff, and teachers in public elementary and secondary schools: 1869– 70 to 1
- Table 14. (Cont'd)
- Table 14. (Cont'd)
- Table 15.—Catholic elementary and secondary enrollment, teachers, and schools, by level: 1919–20 to 1990–91
- Table 16.— Public school enrollment in grades 9 to 12, by subject: 1889– 90 to fall 1981
- Table 17.— Student proficiency in reading, writing, mathematics, and science, by age and race/ethnicity: 1969-70 to 1989-90
- Table 18.— Percentage of students at or above selected reading, mathematics, and science proficiency levels, by age and race/ et
- Table 18. (Cont'd)
- Table 18. (Cont'd)
- Table 19.—High school graduates, by sex and control of institution: 1869–70 to 1991–92
- Table 20.—Public school districts and public and private elementary and secondary schools: 1929–30 to 1990–91
- Table 21.—Revenues for public elementary and secondary schools, by source of funds: 1889–90 to 1989–90
- Table 21. (Cont'd)
- Table 22.— Total and current expenditures and expenditure per pupil in public elementary and secondary schools, by purpose: 1869
- Table 22. (Cont'd)
- Table 22. (Cont'd)
- Chapter 3. Higher Education
- Figure 14.--Enrollment in institutions of higher education, by sex: 1869-70 to 1990-91
- Figure 15.--Percentage of students in institutions of higher education, by control, type, and attendance status: of 1931-32 to 1
- Figure 16.--Bachelor’s, master’s, and doctor’s degrees conferred by institutions of higher education: 1869-70 to 1989-90
- Figure 17.--Bachelor’s degrees per 1,000 23-year-olds: 1889-90 to 1989-90
- Figure 18.--Percentage of higher education degrees conferred to females, by level: 1869-70 to 1989-90
- Figure 19.--Bachelor’s degrees per 100 high school graduates 4 years earlier and master’s degrees per 100 bachelor’s degrees 2 y
- Figure 20.--Sources of current-fund revenue for institutions of higher education: 1909-10 to 1989-90
- Figure 21.--Expenditures of institutions of higher education per student in constant 1990-91 dollars: 1929-30 to 1989-90
- Table 23.— Historical summary of higher education statistics: education statistics: 1869– 70 to 1989– 90
- Table 24.— Enrollment in institutions of higher education, by sex, attendance status, and type and control of institution: 1869–
- Table 24. (Cont'd)
- Table 25.— Enrollment in institutions of higher education, by state: 1869– 70 to fall 1990
- Table 25. (Cont'd)
- Table 26.—Number and professional employees of institutions of higher education: 1869–70 to 1991–92
- Table 27.—Number of permanent colleges and universities founded before 1860, by decade of founding and by state
- Table 28.— Degrees conferred by institutions of higher education, by sex and level: 1869– 70 to 1989– 90
- Table 28. (Cont'd)
- Table 28. (Cont'd)
- Table 29.— Bachelor’s degrees conferred by institutions of higher education, by field of study: 1959–60 to 1989– 90
- Table 30.— Master’s degrees conferred by institutions of higher education, by field of study: 1959– 60 to 1989– 90
- Table 31.— Doctor’s degrees conferred by institutions of higher education, by field of study: 1959-60 to 1989-90
- Table 32.—First-professional degrees conferred by institutions of higher education in dentistry, medicine, and law, by sex: 1949
- Table 33.— Current- fund revenue of institutions of higher education, by source of funds: 1889-90 to 1989-90
- Table 34.—Current-fund expenditures and educational and general expenditure per student of institutions of higher education, by
- Table 34. (Cont'd)
- Table 35.—Value of property and endowment, and liabilities of institutions of higher education: 1899–1900 to 1989–90
- Table 36.—Gross domestic product, state and local expenditures, personal income, disposable personal income, and median family i
- Table 37.—Gross domestic product deflator, Consumer Price Index, education price indexes, and federal budget composite deflator:
- Methodology
120 Years of
American Education:
A Statistical Portrait
Editor
Thomas D. Snyder
Center for Education Statistics
U.S. Department of Education
Lamar Alexander
Secretary
Office of Educational Research and Improvement
Diane Ravitch
Assistant Secretary
National Center for Education Statistics
Emerson J. Elliott
Commissioner
National Center for Education Statistics
‘‘The purpose of the Center shall be to collect, analyze,
and disseminate statistics and other data related to edu-
cation in the United States and in other nations.’’—Sec-
tion 406(b) of the General Education Provisions Act,
as amended (20 U.S.C. 1221e–1).
January 1993
iii
Foreword
Emerson J. Elliott
Commissioner of Education Statistics
NCES statistics and reports are used for myriad
purposes. Congress, federal agencies, state and
local officials, business leaders, scholars and re-
searchers, the news media, and the general public
use our data to formulate programs, apportion re-
sources, monitor services, research issues, and in-
form and make decisions.
Since 1870, the federal government has collected
statistics on the condition and progress of American
education. In the beginning, data were collected on
very basic items, such as public elementary and sec-
ondary school enrollment, attendance, teachers and
their salaries, high school graduates, and expendi-
tures. Over the years, the level of detail has gradu-
ally increased. Today, the National Center for Edu-
cation Statistics has a staff of approximately 130 who
collect information through nearly 40 surveys and
studies and produce more than 175 publications per
year.
Statistics paint a portrait of our Nation. By looking
at changes in the data over time—like number of
schools, participation rates, completion rates, and ex-
penditures—we see how our Nation has progressed.
But the questions, too, have changed. Illiteracy, for
example, is defined differently today than it was in
earlier years. While we once looked only at whether
a person could read or write, today we are con-
cerned with how well a person can function in a
modern society. Recent additions to the long-term
data series contain more qualitative information, es-
pecially on student performance and classroom ac-
tivities.
During the period in which this report was pre-
pared, Diane Ravitch, an educational historian by
profession, was Assistant Secretary for Educational
Research and Improvement. Dr. Ravitch knows the
importance of the record that America’s education
data collections form, and it was her personal inter-
est and initiative that prompted preparation of this re-
port. Her support, both as Assistant Secretary and as
an historian of education, has been invaluable to the
production of this volume and in all other efforts of
NCES.
The Assistant Secretary’s Introduction to this vol-
ume states that an historical perspective is indispen-
sable for a full understanding of American education
and the changes it has undergone. Such a perspec-
tive will help supply that meaning, understanding,
and judgment needed to help improve education in
America.
I join her in thanking Vance Grant of OERI and
Tom Snyder of NCES for producing this work. We
will benefit from the better understanding of our past
that these education statistics bring to us.
This work supplements other major compilations of
education statistics, including the annual
Digest
and
the
Condition of Education
reports, and reaffirms the
mission of the National Center for Education Statis-
tics to provide the Nation with data on the condition
and progress of education. Our goal is to make edu-
cation data accessible, useful, and meaningful to our
many publics. I welcome comments for improve-
ments to our data collections and publications.
v
Acknowledgments
Many people have contributed in one way or an-
other to the development of
120 Years of American
Education
. Foremost among these contributors is W.
Vance Grant, who has served as an education statis-
tics expert since 1955. Thomas D. Snyder was re-
sponsible for the overall development and prepara-
tion of
120 Years of American Education,
which was
prepared under the general direction of Jeanne E.
Griffith, Associate Commissioner for Data Develop-
ment.
William Sonnenberg served as a statistical consult-
ant in all phases of
120 Years of American Education
and was responsible for chapter 2, ‘‘Elementary and
Secondary Education.’’ Irene Baden Harwarth devel-
oped a table on higher education enrollment and was
responsible for developing charts for the report.
Charlene Hoffman developed tables on degrees con-
ferred and managed the typesetting. Carol Sue
Fromboluti managed the review process of the publi-
cation. Celestine Davis provided statistical assist-
ance.
A number of people outside the Center also ex-
pended large amounts of time and effort on
120
Years of American Education.
James J. Corina and
Robert Craig of Pinkerton Computer Consultants,
Inc., provided computer support. Louise Woerner,
Barbara Robinson, Jeannette Bernardo, and Jeffrey
Sisson of HCR provided research assistance. Nancy
Floyd copyedited this book, and Margery Martin and
Wilma Greene provided editorial assistance. Annie
Lunsford designed the cover. Jerry Fairbanks and
Kim Stiles of the U.S. Government Printing Office
provided typesetting assistance.
120 Years of American Education
has received ex-
tensive reviews by individuals within and outside the
Department of Education. We wish to thank them for
their time and expert advice. In the Office of Edu-
cational Research and Improvement (OERI), Diane
Ravitch, Maris Vinovskis, Mary Frase, W. Vance
Grant, Fred Beamer, Frank Morgan, John Sietsema,
and Irene Baden Harwarth reviewed the entire manu-
script. Rosemary Clark and Dave Fleck of the Bu-
reau of the Census also reviewed the entire docu-
ment. Agency reviews were conducted by the Office
of Bilingual Education and Minority Languages Af-
fairs, Office of Management and Budget, Office of
Policy and Planning, Office of Private Education, and
Office of Vocational and Adult Education, U.S. De-
partment of Education.
OERI Deputy Assistant Secretary Francie Alexan-
der and NCES Chief of Staff Paul R. Hall provided
leadership and gave enthusiastic support to this
project.
vii
Introduction
Diane Ravitch
Assistant Secretary
As an historian of education, I have been a regular
consumer of education statistics from the U.S. De-
partment of Education. For many years, I kept the
Department’s telephone number in my address book
and computer directory. It did not take long to dis-
cover there was one person to whom I should ad-
dress all my queries: Vance Grant. In my many tele-
phone calls for information, I discovered he is the
man who knows what data and statistics have been
gathered over the years by the Department of Edu-
cation. No matter how exotic my question, Dr. Grant
could always tell me, without delay, whether the in-
formation existed; usually, he produced it himself.
When I asked a statistical question, I could often
hear the whir of an adding machine in the back-
ground, even after the advent of the electronic cal-
culator.
Imagine my surprise, therefore, to find myself in
the position of Assistant Secretary of the Office of
Educational Research and Improvement (OERI), the
very home of the National Center for Education Sta-
tistics (NCES). The latter agency is headed by Emer-
son Elliott, the first presidentially appointed Commis-
sioner of Education Statistics. And imagine my de-
light when I encountered Vance Grant, face to face,
for the first time. The voice on the telephone, always
cheerful and confident, belonged to a man employed
by the Department or Office of Education since 1955.
Vance Grant, a Senior Education Program Special-
ist, and Tom Snyder, NCES’ Chief of the Compila-
tions and Special Studies Branch in the Data Devel-
opment Division, prepared
120 Years of American
Education: A Statistical Portrait.
They did so enthu-
siastically, because—like me—they knew it was
needed. Historians of education customarily must
consult multiple, often disparate, sources to find and
collect the information in this one volume. They can
never be sure if the data they locate are consistent
and reliable. This compilation aggregates all relevant
statistics about the history of our educational system
in one convenient book. It will, I believe, become a
classic, an indispensable volume in every library and
on every education scholar’s bookshelf, one that will
be periodically updated. Vance Grant’s and Tom
Snyder’s careful preparation of this report substan-
tially enriches our knowledge of American education.
But collecting these historical data in one volume
not only benefits professional historians. As a Nation,
we need to develop an historical perspective in ana-
lyzing change. Too often, newspapers report impor-
tant political, economic, or social events without sup-
plying the necessary historical context. We are all
now accustomed to reading headlines about the lat-
est test scores. Whether up or down, they invariably
overstate the meaning of a single year’s change. And
the same short-sightedness often flaws journalistic
reports of other major educational trends.
Historical Context
One does not need to be an historian to recognize
the tremendous importance of historical context.
Each of us should be able to assess events, ideas,
and trends with reliable knowledge of what has hap-
pened in the past. If we cannot, our ability to under-
stand and make sense of events will be distorted.
This volume would become a reference for all who
wish to make informed judgments about American
education. We must struggle mightily against the
contemporary tendency towards presentism, the idea
inspired by television journalism that today’s news
has no precedent. As we struggle to preserve his-
tory, we preserve our human capacity to construct
meaning and to reach independent judgment.
In an age when we are awash with information and
instantaneous news, it is meaning, understanding,
and judgment that are in short supply. This collection
of historical statistics about American education pro-
vides its readers with the perspective they need to
understand how far we have come in our national
commitment to education and how far we must still
go in pursuit of our ideals.
I especially thank Vance Grant and Tom Snyder
for their untiring efforts in assembling this book. With-
out their dedication, and without Emerson Elliott’s
support for the importance of this work, it would
never have happened.
ix
Contents
Page
Foreword, by Emerson J. Elliott ............................................................................................... iii
Acknowledgments ..................................................................................................................... v
Introduction, by Diane Ravitch ................................................................................................. vii
Statistics in the U.S. Department of Education: Highlights from the Past 120 Years, by
W. Vance Grant. 1
Chapter 1. Education Characteristics of the Population, by Thomas D. Snyder ..................... 5
Chapter 2. Elementary and Secondary Education, by William C. Sonnenberg ...................... 25
Chapter 3. Higher Education, by Thomas D. Snyder .............................................................. 63
Methodology ............................................................................................................................. 95
Figures
1. Percent of 5- to 19-year-olds enrolled in school, by race: 1850 to 1991 ...................... 6
2. Percent of 20- to 24-year-olds and 25- to 34-year-olds enrolled in school, by sex:
1940 to 1991 .............................................................................................................. 7
3. Percent of persons 25 years old and over completing 4 years of high school, by sex
and race: 1940 to 1991 .............................................................................................. 8
4. Percent of persons 25 years old and over completing 4 years of college, by sex and
race: 1940 to 1991 ..................................................................................................... 8
5. Annual average income of high school and college graduates, 25 years old and
over, in constant 1991 dollars, by sex: 1959 to 1991 ................................................ 10
6. Enrollment in public elementary and secondary schools, by level: 1869–70 to
1992–93 ...................................................................................................................... 26
7. Elementary and secondary enrollment as a percentage of 5- to 17-year-olds, by
level: 1869–70 to fall 1991 ......................................................................................... 27
8. Average number of days per year attended by public school students: 1869–70 to
1980–81 ...................................................................................................................... 28
9. Pupil/teacher ratio in public elementary and secondary schools: 1869–70 to fall
1990 ............................................................................................................................ 29
10. Percentage of elementary and secondary school teachers, by sex: 1869–70 to fall
1990 ............................................................................................................................ 29
11. Number of public and private high school graduates per 100 17-year-olds: 1869–70
to 1991–92 .................................................................................................................. 31
12. Sources of revenues for public elementary and secondary schools: 1889–90 to
1989–90 ...................................................................................................................... 32
13. Current expenditure per pupil in average daily attendance, in constant 1989–90
dollars: 1919–20 to 1989–90 ...................................................................................... 33
x CONTENTS
14. Enrollment in institutions of higher education, by sex: 1869–70 to 1990–91 ................ 65
15. Percentage of students in institutions of higher education, by control, type, and
attendance status: 1931–32 to 1991–92 .................................................................... 66
16. Bachelor’s, master’s, and doctor’s degrees conferred by institutions of higher
education: 1869–70 to 1989–90 ................................................................................. 67
17. Bachelor’s degrees per 1,000 23-year-olds: 1889–90 to 1989–90 ............................... 68
18. Percentage of higher education degrees conferred to females, by level: 1869–70 to
1989–90 ...................................................................................................................... 69
19. Bachelor’s degrees per 100 high school graduates 4 years earlier and master’s
degrees per 100 bachelor’s degrees 2 years earlier: 1869–70 to 1989–90 .............. 69
20. Sources of current-fund revenue for institutions of higher education: 1909–10 to
1989–90 ...................................................................................................................... 71
21. Expenditures of institutions of higher education per student in constant 1990–91
dollars: 1929–30 to 1989–90 ...................................................................................... 73
Tables
Education Characteristics of the Population
1. Population, by age and race, live births, and birth rate: 1790 to 1991 ......................... 11
2. School enrollment of 5- to 19-year-olds per 100 persons, by sex and race: 1850 to
1991 ............................................................................................................................ 14
3. School enrollment and school enrollment rates, by age and sex: 1940 to 1991 .......... 15
4. Years of school completed by persons 25 years old and over, by race and sex: April
1940 to March 1991 ................................................................................................... 18
5. Median years of school completed by persons age 25 and over and 25 to 29, by
race and sex: 1910 to 1991 ....................................................................................... 21
6. Percentage of persons 14 years old and over who were illiterate, by race and
nativity: 1870 to 1979 ................................................................................................. 21
7. Annual mean income of males and females 25 years old and over, by years of
school completed: 1939 to 1991 ................................................................................ 22
Elementary and Secondary Education
8. Historical summary of public elementary and secondary school statistics: 1869–70
to 1989–90 .................................................................................................................. 34
9. Enrollment in regular public and private elementary and secondary schools, by grade
level: 1869–70 to fall 1992 ......................................................................................... 36
10. Enrollment in regular public elementary and secondary schools, by grade: 1910–11
to fall 1990 .................................................................................................................. 38
11. Enrollment in regular public elementary and secondary schools, by state: 1870–71
to fall 1990 .................................................................................................................. 42
12. Children served in special education programs, by type of disability: 1921–22 to
1989–90 ...................................................................................................................... 44
xiCONTENTS
13. Public school pupils transported at public expense and current expenditures for
transportation: 1929–30 to 1989–90 .......................................................................... 45
14. Average daily attendance, instructional staff, and teachers in public elementary and
secondary schools: 1869–70 to 1990–91 .................................................................. 46
15. Catholic elementary and secondary enrollment, teachers, and schools, by level:
1919–20 to 1990–91 .................................................................................................. 49
16. Public school enrollment in grades 9 to 12, by subject: 1889–90 to fall 1981 ............. 50
17. Student proficiency in reading, writing, mathematics, and science, by age and
race/ethnicity: 1969–70 to 1989–90 ........................................................................... 51
18. Percentage of students at or above selected reading, mathematics, and science pro-
ficiency levels, by age and race/ethnicity: 1970–71 to 1989–90 ............................... 52
19. High school graduates, by sex and control of institution: 1869–70 to 1991–92 ........... 55
20. Public school districts and public and private elementary and secondary schools:
1929–30 to 1990–91 .................................................................................................. 56
21. Revenues for public elementary and secondary schools, by source of funds:
1889–90 to 1989–90 .................................................................................................. 57
22. Total and current expenditures and expenditure per pupil in public elementary and
secondary schools, by purpose: 1869–70 to 1989–90 .............................................. 59
Higher Education
23. Historical summary of higher education statistics: 1869–70 to 1989–90 ...................... 75
24. Enrollment in institutions of higher education, by sex, attendance status, and type
and control of institution: 1869–70 to fall 1991 .......................................................... 76
25. Enrollment in institutions of higher education, by state: 1869–70 to fall 1990 .............. 78
26. Number and professional employees of institutions of higher education: 1869–70 to
1991–92 ...................................................................................................................... 80
27. Number of permanent colleges and universities founded before 1860, by decade of
founding and by state ................................................................................................. 81
28. Degrees conferred by institutions of higher education, by sex and level: 1869–70 to
1989–90 ...................................................................................................................... 82
29. Bachelor’s degrees conferred by institutions of higher education, by field of study:
1959–60 to 1989–90 .................................................................................................. 85
30. Master’s degrees conferred by institutions of higher education, by field of study:
1959–60 to 1989–90 .................................................................................................. 86
31. Doctor’s degrees conferred by institutions of higher education, by field of study:
1959–60 to 1989–90 .................................................................................................. 87
32. First-professional degrees conferred by institutions of higher education in dentistry,
medicine, and law, by sex: 1949–50 to 1989–90 ...................................................... 88
33. Current-fund revenue of institutions of higher education, by source of funds:
1889–90 to 1989–90 .................................................................................................. 89
34. Current-fund expenditures and educational and general expenditures per student of
institutions of higher education, by function: 1929–30 to 1989–90 ........................... 90
xii CONTENTS
35. Value of property and endowment, and liabilities of institutions of higher education:
1899–1900 to 1989–90 .............................................................................................. 92
Appendix
36. Gross domestic product, state and local expenditures, personal income, disposable
personal income, and median family income: 1940 to 1991 ..................................... 93
37. Gross domestic product deflator, Consumer Price Index, education price indexes,
and federal budget composite deflator: 1919 to 1992 ............................................... 94

1
1
The statistical component of the Department of Education has had
many names. A staff member who joined this office in 1955 recalls
that in the past 37 years it has been called the Research and Statis-
tical Services Branch, the Educational Statistics Branch, the Division
of Educational Statistics, the National Center for Educational Statis-
tics, the National Center for Education Statistics, the Center for Sta-
tistics, the Center for Education Statistics, and, once again, the Na-
tional Center for Education Statistics. For convenience it will be re-
ferred to in this paper as the National Center for Education Statistics
or simply National Center.
Statistics in the U.S. Department of Education:
Highlights from the Past 120 Years
W. Vance Grant
In 1867, the Congress of the United States passed
legislation providing ‘‘That there shall be established
at the City of Washington, a department of edu-
cation, for the purpose of collecting such statistics
and facts as shall show the condition and progress
of education in the several States and Territories,
and of diffusing such information respecting the orga-
nization and management of schools and school sys-
tems, and methods of teaching, as shall aid the peo-
ple of the United States in the establishment and
maintenance of efficient school systems, and other-
wise promote the cause of education throughout the
country.’’ The department was to be headed by a
Commissioner of Education. The Commissioner was
to be paid a salary of $4,000 a year, and he was au-
thorized to appoint three clerks, at annual salaries of
$2,000, $1,800, and $1,600, to help him carry out his
duties.
Two years later, the name of the new department
was changed to the Office of Education, its budget
was cut back, and the Commissioner’s support staff
was reduced from three to two clerks. The Office of
Education became one of the constituent agencies
within the Department of the Interior in 1869, and it
remained there for 70 years. During most of those
years, it was known as the Bureau of Education, but
in 1929 its name was restored to the Office of Edu-
cation. In 1939, it became part of the Federal Secu-
rity Agency, and in 1953, it was assigned to the
newly established Department of Health, Education,
and Welfare. In 1980, education was separated from
health and welfare, and a new cabinet-level Depart-
ment of Education came into existence.
Early in its history, the federal education agency
moved to fulfill its mandate to ‘‘collect’’ and ‘‘diffuse’’
statistics on education in the United States. The de-
velopment of a statistical program proved to be a for-
midable task. The country was large, its educational
system was decentralized, and the staff available to
collect statistics was almost nonexistent.
In the beginning, no effort was made to estimate
for nonresponding institutions (probably because
there were no bench marks from which to make rea-
sonable estimates). There were also some inconsist-
encies in the data obtained from the states and terri-
tories and from the various colleges and universities.
Early on, the compilers of education statistics learned
to look to the decennial censuses of population to fill
some of the gaps in the data reported to this office.
Some of the problems faced by the new agency,
along with some of the progress made in the early
years, are evident in a quotation from Commissioner
John Eaton, who wrote in the
Report of the Commis-
sioner of Education for the Year 1875:
‘‘When the
work of collecting educational statistics was begun by
the Office, it was found that there was no authentic
list of the colleges in the United States, or of acad-
emies, or normal schools, or schools of science, law,
or medicine, or of any other class of educational in-
stitutions. The lists of nearly all grades of schools are
now nearly complete. Information on all other matters
relating to educational systems was equally incom-
plete and difficult of access.’’
The statistical surveys of what is now the National
Center for Education Statistics
1
date from 1870. The
first statistics were apparently the responsibility of the
chief clerk, but in 1872, Congress authorized the
agency to hire its first statistician at a salary of
$1,800 a year. In the beginning, data were collected
on basic items, such as public elementary and sec-
ondary school enrollment, attendance, teachers and
their salaries, high school graduates, and expendi-
tures. At the higher education level, the data in the
early years included the number of colleges and uni-
versities, enrollment, faculty, and bachelor’s and
higher degrees conferred.
The level of detail obtained in the surveys of this
office gradually increased. By 1890, the data collec-
tion program had been expanded to include private

2 Highlights from the Past 120 Years
2
Earlier, surveys of enrollment in the ‘‘third week of fall term’’ had
been conducted biennially.
elementary and secondary school enrollment, teach-
ers, and graduates; enrollment by subject field in
public high schools; public school revenue receipts
by source; and income and value of physical plants
of institutions of higher education. By 1920, the sta-
tistical program included a detailed breakdown of
public school expenditures by purpose and of higher
education income by source of funds.
The statistical program of the National Center for
Education Statistics took a major step forward in
1923 when it was authorized to hire four new ‘‘Prin-
cipal Statistical Assistants.’’ A major responsibility of
these new employees was to make visits ‘‘to the
field’’ every two years. During these field visits, they
worked with the state departments of education and
with the institutions of higher education that had not
responded fully to the Center’s requests for statistical
information. The field staff brought back a great deal
of information that would not have been available
otherwise, thus enabling the Center to report national
totals that were virtually 100 percent complete.
These field visits were made biennially for many
years. The last extensive use of a field staff was
made in 1962 when representatives of the National
Center visited every state department of education in
connection with the
National Inventory of School Fa-
cilities and Personnel.
By 1930, the education data collected included the
number of public elementary and secondary schools,
the approximate number of private elementary and
secondary schools, the endowments of institutions of
higher education, and a breakdown of the expendi-
tures of colleges and universities by purpose. The
collection of education statistics was curtailed during
the early and middle 1940s, as the office assumed
various responsibilities related to the war effort.
Following the end of World War II, there was a fur-
ther expansion in the statistical information collected
by this office. College enrollment increased as many
war veterans took advantage of the G.I. Bill of Rights
to attend the Nation’s institutions of higher education.
The office responded with an annual survey of fall
enrollment in colleges and universities.
2
While there
have been some modifications in the coverage and
in the amount of detail requested over time, this sur-
vey continues in an unbroken series 47 years later.
A survey of earned degrees conferred by major
field of study was initiated in 1948, and it continues
today to provide annual data on the supply of trained
personnel coming out of colleges and universities
with bachelor’s, master’s, doctor’s, and first-profes-
sional degrees. This survey was extended to include
associate degrees and other awards below the bac-
calaureate in 1966. Data by sex have been collected
in the fall enrollment and earned degree surveys for
many years. Beginning in 1976, both surveys were
expanded to include the race/ethnicity of the students
and degree recipients. Statistics on the number of
foreign (nonresident alien) students and degree re-
cipients have also been collected periodically since
1976.
An annual survey of public school enrollment,
teachers, and schoolhousing was begun in 1954.
This survey has continued through the years, but the
amount of information collected has increased sub-
stantially over time. Today, it is our primary source
of state and national data on the enrollment, staff,
graduates, and finances of public elementary and
secondary schools.
The professional and clerical staff of the National
Center had grown gradually from 16 in 1948 to 26 in
1956. A major expansion of its staff and responsibil-
ities occurred in fiscal year 1957 when the Center
was authorized to increase its personnel to 76, in-
cluding 32 statisticians and education specialists.
The increase in staff enabled the Center to collect
more statistical information and to process it more
expeditiously. The period from the late 1950s through
the early 1960s was a productive time for the Center.
The quantity and quality of the statistical publications
coming out of the Center in those years were quite
high.
In the mid-1960s, the National Center’s education
statistics were put to a new use—that of supporting
the education proposals that were making their way
through the legislative process on Capitol Hill. It is no
exaggeration to say that the Center’s statistics
played an indispensable role in the passage of a
number of acts of Congress which provided support
to elementary, secondary, and higher education. For
those staff members of the Center who were in-
volved in preparing testimony and in supplying statis-
tical analyses to Capitol Hill for legislative purposes,
it was a very exciting time indeed.
For many years, the National Center for Education
Statistics has prepared a directory of public school
districts in the United States. Recent editions of this
directory provide the name, address, and telephone
number, as well as statistics on the number of
schools, enrollment, teachers, high school graduates,
and grade span of each public school district. In
1967, the Center assumed the responsibility for the
preparation of a directory of institutions of higher
education. Today, this publication has evolved into a
two-volume
Directory of Postsecondary Institutions:
Volume 1 provides data on 4-year and 2-year institu-
tions (primarily colleges and universities); Volume 2
contains information about institutions that offer less
than 2 years of postsecondary education (mainly vo-
cational schools).

3Highlights from the Past 120 Years
3
Early editions of the
Digest of Education Statistics
were called
Di-
gest of Educational Statistics.
4
Early editions of the
Projections of Education Statistics
were called
Projections of Educational Statistics.
Traditionally the information collected by the Na-
tional Center for Education Statistics emphasized in-
puts rather than outcomes. Recognizing the need to
provide data on the quality of education as well, the
Center in 1969 launched the National Assessment of
Educational Progress. For the past two decades, the
National Assessment surveys have measured the
achievement of a nationwide sample of students
aged 9, 13, and 17 in reading, writing, mathematics,
and science. Surveys of civics, history, and geog-
raphy achievement also have been conducted on a
periodic basis. The Center also has participated in
several international studies which provide compara-
tive data on student achievement in mathematics,
science, and reading.
The longitudinal surveys of the National Center for
Education Statistics date from 1972. In these sur-
veys, a nationwide sample of students is tracked
over a period of years. Their educational and occu-
pational experiences are recorded, and some infor-
mation is collected on their family lives and other ex-
periences and on their goals in life. The first series
began with a group of high school seniors in 1972,
and the second longitudinal series began with both
high school sophomores and seniors in 1980. A third
longitudinal study of students who were in the eighth
grade in the spring of 1988 will contribute to our
knowledge of when and why students drop out of
high school. Future longitudinal studies based on
other student levels are planned.
Among the new surveys added to the National
Center’s statistical program in recent years are the
National Postsecondary Student Aid Study, the Na-
tional Survey of Postsecondary Faculty, the Schools
and Staffing Survey, and the National Household
Education Survey. The Student Aid Study, first con-
ducted in 1986–87, provides data on the proportion
of postsecondary students who obtain financial as-
sistance, the kinds and sources of assistance they
receive, and the average amounts of aid awarded.
The National Survey of Postsecondary Faculty, first
conducted in 1987–88, collected information about
the characteristics of academic departments and col-
lege faculty members. The Schools and Staffing Sur-
vey, first conducted in 1987–88, provides a wealth of
information on elementary and secondary school
teachers, including their personal characteristics,
their teaching assignments, and their attitudes toward
the teaching profession. The data on teacher turn-
over and teacher characteristics, which are derived
from this study, make possible a variety of analyses,
such as a projection of the number of teachers that
will be needed in the years ahead. The National
Household Education Survey, first conducted in
1991, is used to collect data that are difficult to ob-
tain through surveys of institutions. For example, this
system was used to collect information about the
day-care experiences and preparation of children for
elementary school.
In addition to completely new survey systems,
other existing survey systems have been expanded
during the 1980s. For example, the new Integrated
Postsecondary Education Data System (IPEDS) was
designed to include all postsecondary education pro-
viders, rather than just colleges and universities.
A review of the statistical program of the Depart-
ment of Education would not be complete without
mentioning a few of the major publications that cover
the field of education from a broad perspective. From
1870 through 1917, the statistics collected by this of-
fice appeared in the Annual Report of the Commis-
sioner of Education. These impressive volumes, pro-
duced by a small but dedicated staff, provide the
framework for much of the National Center’s statis-
tical program today.
From 1918 through 1958, the major surveys of this
office were collected and published as chapters in
the
Biennial Survey of Education in the United
States.
The
Biennial Survey
usually contained chap-
ters on state school systems, city school systems,
and institutions of higher education, and a summary
chapter covering all levels of education. From time to
time, there were additional chapters covering a vari-
ety of subjects, including offerings and enrollments in
high school subjects, statistics of public secondary
schools, special education for exceptional children,
statistics of private elementary and secondary
schools, and library statistics.
After the demise of the
Biennial Survey,
a need
was felt for a publication that would bring together in
one convenient volume a summary of the different
kinds of data being collected by the National Center.
To fulfill this objective, the first
Digest of Education
Statistics
3
was prepared and published in 1962. Thir-
ty years later, a greatly expanded
Digest
continues to
meet the needs of thousands of users of education
statistics each year by providing numerous trend ta-
bles as well as the latest survey data.
In 1964, the National Center initiated a series enti-
tled
Projections of Education Statistics.
4
This report,
which is now prepared annually, provides projections
for each of the next 10 years of many key data items
collected by the National Center, including enroll-
ment, instructional staff, high school and college
graduates, and educational finances. In recent years,
the report has been expanded to include some fore-
casts at the state level.
Responding to a congressional mandate ex-
pressed in the Education Amendments of 1974, the
National Center has prepared a report on the ‘‘condi-
4 Highlights from the Past 120 Years
tion of education’’ each year since 1975.
The Condi-
tion of Education
provides timely data on the status
and progress of education in this country. It uses an
‘‘indicators’’ approach to highlight specific issues with
relevant information. Recent editions of this report
have added a new dimension by comparing the edu-
cational attainment, achievement, and expenditures
in the United States with those in other countries.
From humble beginnings 120 years ago, the Na-
tional Center for Education Statistics has emerged as
one of the major statistical agencies of the federal
government. Today, it is headed by a Commissioner
of Education Statistics and has a staff of approxi-
mately 130 people. It issues approximately 175 publi-
cations a year. These documents include early re-
leases, bulletins, statistical reports, directories, and
handbooks of standard terminology. Electronic for-
mats, including data tapes, diskettes, CD-ROMs, and
bulletin boards, are also used to make data available
to the public.
The demand for the National Center’s products
continues to grow. The number of requests for edu-
cation statistics and related information directed to
the information office now averages close to 1,000 a
week. The requests come from a variety of sources,
including Members of Congress and congressional
committees, government agencies, state and local
school officials, institutions of higher education, orga-
nizations representing the education community, the
news media, business organizations, students, and
the general public. As the 21st century approaches,
the National Center will be looking for additional
ways to serve its wide audience of users of edu-
cation statistics.
Bibliography
Annual Reports of the Commissioner of Education,
1870 to 1917.
Bureau of Education, Washington,
D.C.: various years.
Biennial Survey of Education in the United States,
1916–18 to 1956–58.
Office of Education, Washing-
ton, D.C.: various years.
Blauch, Lloyd E.
To Promote the Cause of Edu-
cation, A Review of Historic Background of Today’s
Office of Education.
Office of Education, Washington,
D.C.: 1953.
Grant, W. Vance. Specialist in Education Statistics,
personal reminiscences.
Kappel, Joseph W. (1957) and Henry G. Badger
(1962), unpublished staff papers.
Lykes, Richard Wayne.
Higher Education and the
United States Office of Education (1867–1953).
Of-
fice of Education, Washington, D.C.: 1975.
Smith, Darrell Hevenor.
The Bureau of Education,
Its History, Activities, and Organization.
The Johns
Hopkins Press, Baltimore: 1923.
Sniegoski, Stephen J.
The Department of Edu-
cation.
Chelsea House Publishers, New York: 1988.
U.S. Bureau of the Census.
Historical Statistics of
the United States, Colonial Times to 1957.
U.S. Gov-
ernment Printing Office, Washington, D.C.: 1960.
5
Chapter 1
Education Characteristics of the Population
‘‘. . . [I]t is believed that the most effectual means
of preventing [tyranny] would be, to illuminate, as far
as practicable, the minds of the people at large, and
more especially to give them knowledge of those
facts, which history exhibiteth, that . . . they may be
enabled to know . . .’’
Thomas Jefferson’s ‘‘Bill for
the more general diffusion of knowledge’’ (1779).
‘‘By the year 2000: . . .
Every adult American will be literate and will pos-
sess the knowledge and skills necessary to compete
in a global economy and exercise the rights and re-
sponsibilities of citizenship. . . .’’
Goal #5, The National Education Goals (1990).
We are unable to know the level of enthusiasm
that the founding fathers actually had for public edu-
cation. But it is clear that many Americans have
shared Mr. Jefferson’s vision of the need to have an
educated population in order to ‘‘exercise the rights
and responsibilities of citizenship.’’ Thus, even as
early as the Northwest Ordinance of 1787, the fed-
eral government set aside resources for education.
The creation of the federal Department of Education
in 1867, while not a cabinet level position, did rein-
force the importance of education.
The Act of 1867 directed the Department of Edu-
cation to collect and report the ‘‘condition and
progress of education’’ in annual reports to Con-
gress. In the first report of 1870, the Commissioner
proudly reported that nearly 7 million children were
enrolled in elementary schools and 80,000 were en-
rolled in secondary schools. Also, some 9,000 col-
lege degrees had been awarded. This contrasts with
1990, when 30 million were enrolled in public ele-
mentary schools and 11 million were enrolled in sec-
ondary schools. Over 1.5 million bachelor’s and high-
er degrees were awarded.
What path has American education taken from
such modest beginnings to such an impressive
present? These and other questions prompted the
Office of Educational Research and Improvement to
review historical data and report on historical edu-
cation statistics. This publication presents information
from the first Office of Education report for 1869–70
to current studies. It charts the development of the
U.S. education enterprise from its past to the
present, pointing toward its future.
One of the important determinants of the scope of
an education system is the size of the population
base. Changes in the birth rate and consequential
shifts in population profoundly influence society for
decades as larger or smaller groups (birth cohorts)
move through school, adulthood, work force, and fi-
nally into retirement. Larger birth cohorts can cause
pressure for building schools, hiring more teachers,
and expanding medical services; reduced cohorts
can have the opposite effect. During the historical
period covered by this publication, there have been
several of these population expansions and contrac-
tions that have impacted on public school systems.
The early years of the United States were marked
by very rapid population growth. Between 1790 and
1860, the U.S. population grew by about a third each
decade. This rate of growth is more than three times
the population growth that has occurred in the past
decade. These rises occurred despite the decline in
the birth rate during the 19th century. Increases in
immigration and in the number of women of child-
bearing age apparently compensated for the birth-
rate decline (table 1).
In the last decade of the 19th century, the popu-
lation growth rate fell to 22 percent and the drops
continued into the first two decades of the 20th cen-
tury. The 1920s marked a period of shifts in the pop-
ulation outlook. The birth rate continued to fall, drop-
ping from 118 per 1,000 women 15 to 44 years old
in 1920 to 89 in 1930. Also, the actual number of
births fell by 11 percent during the 1920s, marking a
divergence from the relative stability of the teens.
The decline in the birth rate stabilized during the
1930s, and then rose dramatically following World
War II, reaching a peak of 123 births per 1,000
women in 1957. This post-war birth rate was nearly
as high as those registered in the early teens. After
this peak of the ‘‘baby boom,’’ the birth rate resumed
its historical decline. The low points in birth rates so
far this century were in 1984 and in 1986, when
there were 65 births per 1,000 women. The United
States is now experiencing a surge in the number of
births caused by the large number of ‘‘baby
boomers’’ at child-bearing age. The 4.1 million births
6 Education Characteristics of the Population
in 1991 is nearly as high as the peak of 4.3 million
in 1957.
The number of births and the population size are
important determinants of the scope of the school
system. But the relative size of the school-age popu-
lation is also an important consideration when exam-
ining the impact of the cost of education on the adult
population. In 1870, about 35 percent of the popu-
lation was 5 to 17 years old. This proportion fell rap-
idly to 28 percent at the turn of the century, but fur-
ther changes in the beginning of the century were
very small. In the 1930s, the percentage of 5– to 17-
years-olds in the population began to decline, reach-
ing a low point of 20 percent in 1947. During the late
1960s, the proportion of 5– to 17-year-olds rose to
26 percent. However, this proportion has fallen in re-
cent years, hitting 18 percent in 1991. Thus, the pro-
portion of the population requiring elementary and
secondary school services is at or near a record low
level. Given the recent rises in births, significant de-
creases in this proportion are not anticipated for the
near future.
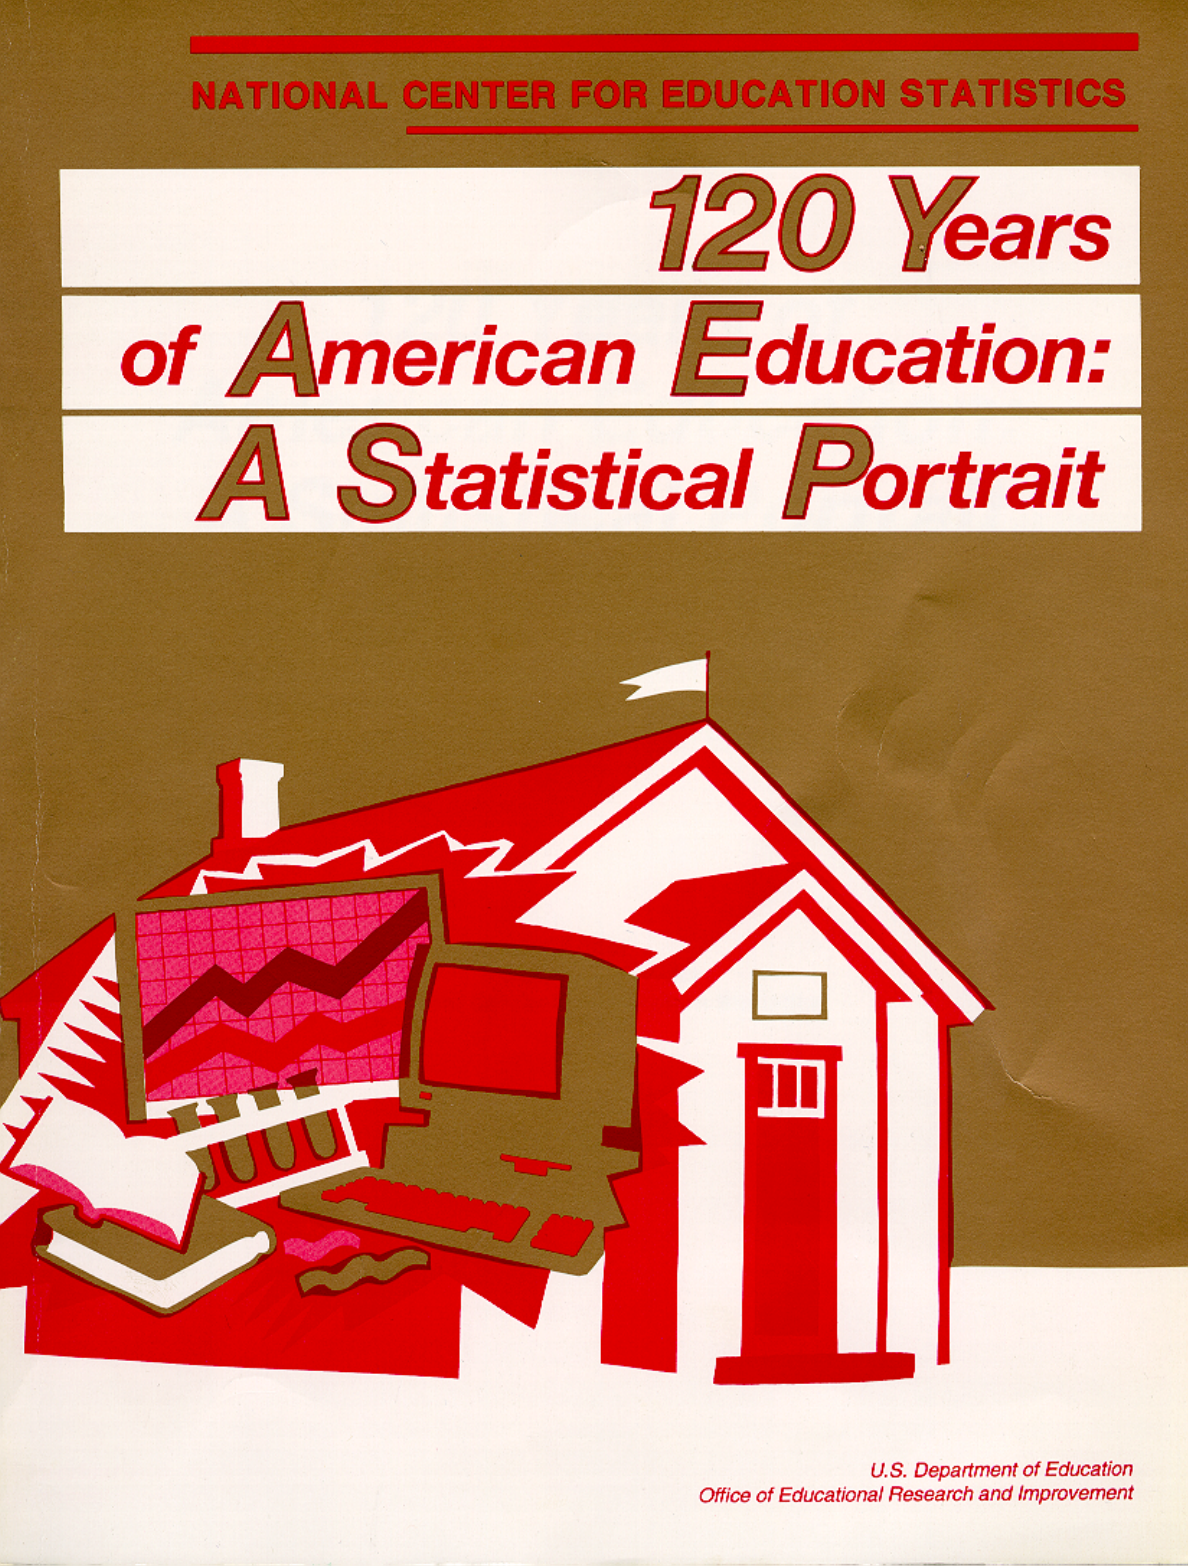
Enrollment Rates
The proportion of young people enrolled in school
remained relatively low in the last half of the 19th
century. Although enrollment rates fluctuated, roughly
half of all 5- to 19-year-olds were enrolled in school
(table 2). Rates for males and females were roughly
similar throughout the period, but rates for blacks
were much lower than for whites. Prior to the eman-
cipation of Southern blacks, school enrollment for
blacks largely was limited to only a small number in
Northern states. Following the Civil War, the enroll-
ment rate for blacks rose rapidly from 10 percent in
1870 to 34 percent in 1880. However, in the ensuing
20 years there was essentially no change in the en-
rollment rate for blacks and the rate for whites actu-
ally fell. The beginning of the 20th century brought
sustained increases in enrollment rates for both white
and minority children. The overall enrollment rates for
5- to 19-year-olds rose from 51 percent in 1900 to 75
percent in 1940. The difference in the white and
black enrollment rates narrowed from 23 points in
1900 to 7 points in 1940.
Enrollment rates continued to rise in the post-war
period for all race groups. By the early 1970s, enroll-
ment rates for both whites and blacks had risen to
about 90 percent, and these rates since have re-
mained relatively stable. In the most recent 1991
data, the enrollment rate for 5- to 19-year-olds was
93 percent for blacks, whites, males, and females.
Figure 1.-- Percent of 5- to 19-year-olds enrolled in school,
by race: 1850 to 1991
1850 1860 1870 1880 1890 1900 1910 1920 1930 1940 1950 1960 1970 1980
100
90
80
70
60
50
40
30
20
10
0
White
Black and other races
Percent
enrolled
Year
SOURCE: U.S. Department of Commerce, Bureau of the Census,
Current Population Reports, Series P-20,
Historical Statistics of the United States, Colonial Times to 1970;
Economic Characteristics of Students,
1991
and
School Enrollment - Social and
various issues.
7Education Characteristics of the Population
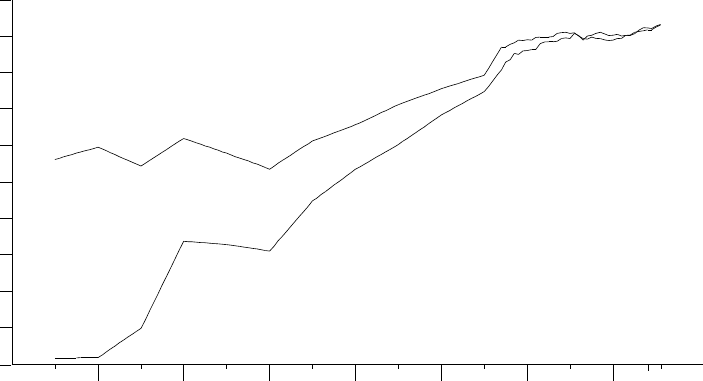
Figure 2.--Percent of 20- to 24-year-olds and 25- to 34-year-olds
enrolled in school, by sex: 1940 to 1991
1940 1950 1960 1970 1980
34
32
30
28
26
24
22
20
18
16
14
12
10
8
6
4
2
0
Percent
enrolled
Males, 20 to 24
Females, 20 to 24
Males, 25 to 34
Females, 25 to 34
Year
SOURCE: U.S. Department of Commerce, Bureau of the Census,
Current Population Reports, Series P-20,
Historical Statistics of the United States, Colonial Times to 1970; and
Economic Characteristics of Students,
1991
School Enrollment - Social and
various issues.
While the enrollment rates for children of elemen-
tary school age have not shown major changes dur-
ing the past 20 years, there have been some in-
creases for younger students as well as for those
persons attending high school and college (table 3).
The enrollment rate for 7- to 13-year-olds has been
99 percent or better since the late 1940s, but the
rate for the 14- to 17-year-olds has exhibited signifi-
cant increases since that period. During the 1950s,
the enrollment rate of 14- to 17-year-olds rose from
83 percent to 90 percent. Further increases during
the 1960s and 1980s brought the enrollment rate to
a high of 96 percent by the late 1980s. The rates for
5- and 6-year-olds also rose, from 58 percent in
1950 to 95 percent in 1991. Rates for those of col-
lege-age doubled or tripled throughout the 1950 to
1991 period, with much of the increase occurring
during the 1980s. In 1950, only 30 percent of 18-
and 19-year-olds were enrolled in school, compared
to 60 percent in 1991. The rate for 20- to 24-year-
olds rose from 9 percent in 1950 to 30 percent in
1990.
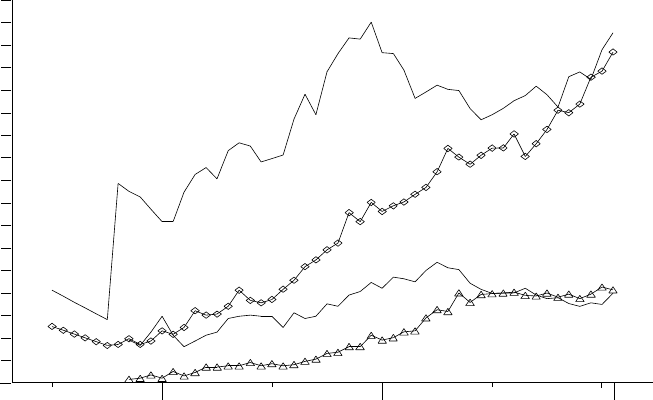
Educational Attainment
The increasing rates of school attendance have
been reflected in rising proportions of adults complet-
ing high school and college. Progressively fewer
adults have limited their education to completion of
the eighth grade which was typical in the early part
of the century. In 1940, more than half of the U.S.
population had completed no more than an eighth-
grade education. Only 6 percent of males and 4 per-
cent of females had completed 4 years of college
(table 4). The median years of school attained by the
adult population, 25 years old and over, had reg-
istered only a scant rise from 8.1 to 8.6 years over
a 30-year period from 1910 to 1940 (table 5).
During the 1940s and 1950s, the more highly edu-
cated younger cohorts began to make their mark on
the average for the entire adult population. More than
half of the young adults of the 1940s and 1950s
completed high school, and the median educational
attainment of 25- to 29-year-olds rose to 12.3 years.
By 1960, 42 percent of males, 25 years old and over,
still had completed no more than the eighth grade,
but 40 percent had completed high school and 10
percent had completed 4 years of college. The cor-
responding proportion for women completing high
school was about the same, but the proportion com-
pleting college was somewhat lower (table 4).
8 Education Characteristics of the Population
Figure 3.--Percent of persons 25 years old and over completing
4 years of high school, by sex and race: 1940 to 1991
1940 1950 1960 1970 1980
100
90
80
70
60
50
40
30
20
10
0
Percent
Year
White, females
White, males
Black and other races, males
Black and other races, females
SOURCE: U.S. Department of Commerce, Bureau of the Census,
Current Population Reports, Series P-20,
Historical Statistics of the United States, Colonial Times to 1970; and
the United States,
1991
Educational Attainment in
various issues.
Figure 4.--Percent of persons 25 years old and over completing
4 years of college, by sex and race: 1940 to 1991
1940 1950 1960 1970 1980 1991
40
35
30
25
20
15
10
5
0
Percent
White, males
White, females
Black and other races, females
Black and other races, males
Year
SOURCE: U.S. Department of Commerce, Bureau of the Census,
Current Population Reports, Series P-20,
Historical Statistics of the United States, Colonial Times to 1970; and
the United States,
Educational Attainment in
various years.

9Education Characteristics of the Population
1
Includes other races.
During the 1960s, there was a rise in the edu-
cational attainment of young adults, particularly for
blacks. Between 1960 and 1970, the median years of
school completed by black males, 25 to 29 years old,
rose from 10.5 to 12.2. From the middle 1970s to
1991, the educational attainment for all young adults
remained very stable, with virtually no change among
whites, blacks, males or females. The average edu-
cational attainment for the entire population contin-
ued to rise as the more highly educated younger co-
horts replaced older Americans who had fewer edu-
cational opportunities. In 1991, about 70 percent of
black males
1
and 69 percent of black females
1
had
completed high school. This is lower than the cor-
responding figures for white males and females (80
percent). However, the differences in these percent-
ages have narrowed appreciably in recent years.
Other data corroborate the rapid increase in the edu-
cation level of the minority population. The proportion
of black males
1
with 4 or more years of college rose
from 12 percent in 1980 to 18 percent in 1991, with
a similar rise for black females.
1
Illiteracy
Illiteracy statistics also give an important indication
of the education level of the adult population. Today,
illiteracy is a different issue than in earlier years. The
more recent focus on illiteracy has centered on func-
tional literacy, which addresses the issue of whether
a person’s reading and writing levels are sufficient to
function in a modern society. The earlier surveys of
illiteracy examined a very fundamental level of read-
ing and writing. (See Methodology for additional de-
tail.) The percent of illiteracy, according to earlier
measurement methods, was less than 1 percent of
persons 14 years old and over in 1979 (table 6).
Modern measurements have suggested somewhat
higher levels of functional illiteracy.
For the major part of this century, the illiteracy
rates have been relatively low, registering only about
4 percent as early as 1930. However, in the late 19th
century and early 20th century, illiteracy was very
common. In 1870, 20 percent of the entire adult pop-
ulation was illiterate, and 80 percent of the black
population was illiterate. By 1900, the situation had
improved somewhat, but still 44 percent of blacks re-
mained illiterate. The statistical data show significant
improvements for black and other races in the early
portion of the 20th century, as the former slaves who
had no educational opportunities in their youth were
replaced by younger individuals who grew up in the
post-Civil War period and often had some chance to
obtain a basic education. The gap in illiteracy be-
tween white and black adults continued to narrow
through the 20th century, and in 1979 the rates were
about the same.
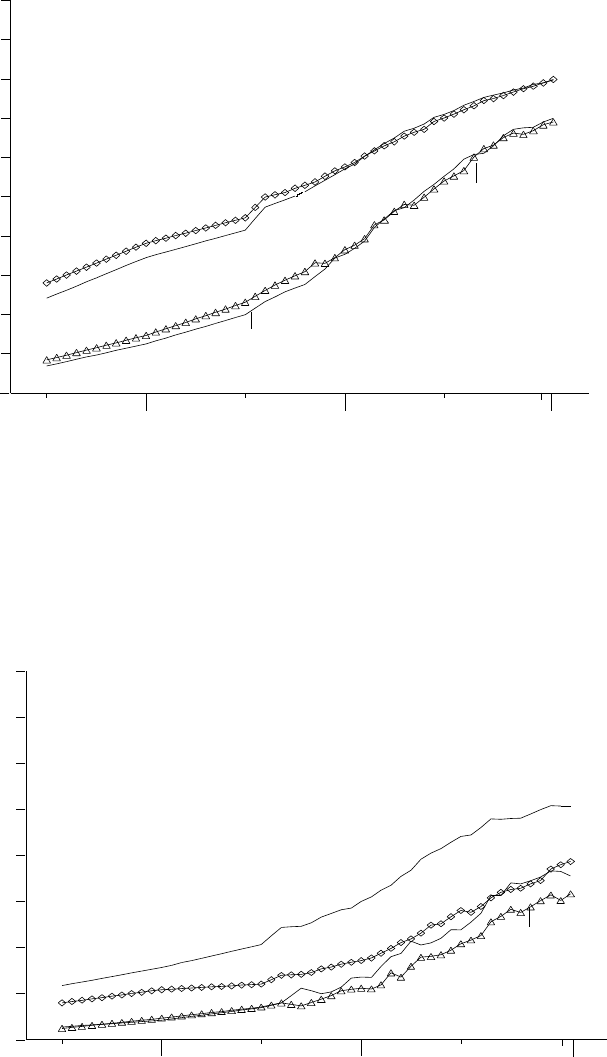
Income
Education is generally considered important to indi-
viduals to help them obtain good jobs with relatively
high pay. More highly educated individuals are paid
more, on average, than less well educated persons.
The historical changes that have occurred in the rel-
ative incomes for different levels of education are
less well known.
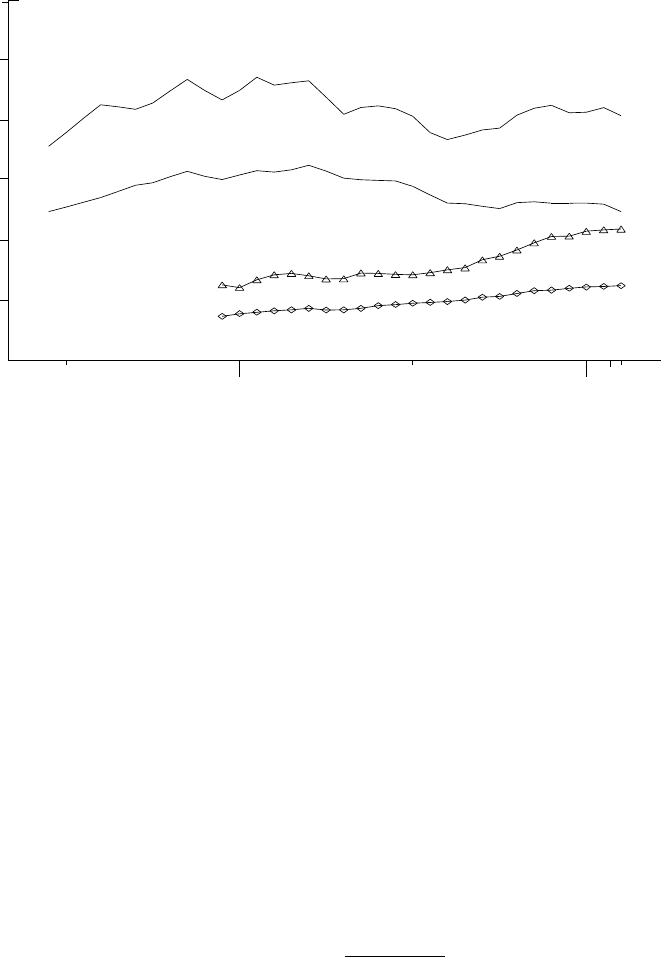
Most of the increases in incomes for males over
the past three decades may be attributed solely to in-
flation. After adjusting for inflation, incomes for males
at all education levels rose rapidly during the 1950s
and 1960s (table 7). Incomes for males with lower
levels of education maintained pace with those with
higher levels of education. Between 1961 and 1971,
the incomes for males who had only 1 to 3 years of
high school rose by 14 percent after adjustment for
inflation, while incomes for those who completed high
school rose by 16 percent. For males who had 4
years of college, the increase was only 8 percent.
After peaking in the early 1970s, incomes for
males of all education levels suffered during the rest
of the decade, especially during 1974 and 1975. Be-
tween 1971 and 1981, incomes for males who had
not finished high school fell by 24 percent, while in-
comes for those who had completed high school fell
by 16 percent. Incomes for males who had com-
pleted 4 years of college fell by 20 percent during the
same period.
The 1980s showed some recovery in income for
more educated groups; however, those with lower
levels of education continued to suffer. For males
with 1 to 3 years of high school, the average income
fell by 13 percent between 1981 and 1991, after ad-
justment for inflation. The incomes for those who had
completed only high school fell by 6 percent. In con-
trast, the average income for males with 4 years of
college rose by 11 percent and the income of those
with 5 or more years of college rose by 20 percent.
Thus, in the 1980s there was a widening of the in-
come gap between those with less education com-
pared to those with more education. From an histori-
cal perspective over these three decades of
changes, the income gap between males with 4
years of college and those with 4 years of high
school has widened only slightly.
10 Education Characteristics of the Population
2
For example, see
Youth Indicators, 1991.
The 1989 income for
male full-time year-round workers, 15 to 24 years of age was 13
percent higher than for females. Additional material appears in
Di-
gest of Education Statistics, 1992
and U.S. Department of Com-
merce, Bureau of the Census,
Money Income of Households, Fami-
lies and Persons in the United States.
1959 1969 1979 1989 1991
$60,000
50,000
40,000
30,000
20,000
10,000
0
Income
Year
SOURCE: U.S. Department of Commerce, Bureau of the Census,
Statistics of the United States, Colonial Times to 1970; and
Money Income of Families and Persons in the United States;
Figure 5.--Annual average income of high school and college
graduates, 25 years old and over, in constant 1991 dollars,
by sex: 1959 to 1991
Males, 4 years of college
Male high school graduates
Females, 4 years of college
Female high school graduates
Historical
Current Population Reports, unpublished data.
The patterns in salary increases for females have
been somewhat similar to those for males. However,
the incomes for females continued to rise during the
1970s. For example, between 1971 and 1981, the
average income for females with a high school di-
ploma rose by 19 percent compared to the 16 per-
cent decline for males. The incomes for women with
4 or more years of college increased by 6 percent
during the period. During the 1980s, the growth in in-
comes for females continued to outpace those for
males. The incomes for women with less than 4
years of high school increased by 17 percent and the
incomes for women completing 4 years of high
school rose by 27 percent. Incomes for women with
4 years of college rose by 45 percent.
Despite very large increases for females, salaries
for males continue to be significantly higher than
those for females with equivalent levels of education.
For example, the salary for males with 4 years of col-
lege is 86 percent higher than that for women with
equivalent education, and the salary for males with 4
years of high school is nearly double that of women
with a similar level of education. More detailed statis-
tics for specific age groups, and controlled for full-
time year-round workers, generally show smaller in-
come gaps, but substantial differences remain.
2
The historical data show large increases in enroll-
ment ratios and rates over the past 140 years, with
some significant rises even in more recent years.
The higher levels of education attained by young
adults in the most recent decades suggest that the
overall education level of the population will continue
to rise slowly into at least the early 21st century.

11Education Characteristics of the Population
Table 1.—Population, by age and race, live births, and birth rate: 1790 to 1991
[Population and births in thousands]
Year
Population, by age Population, by race
1
Live
births Birth
rate
2
Total Under
55 to 13 14 to
17 18 and
19 20 to
24 25 to
29 30 to 34 35 to
39 40 to
49 50 to
59 60 and
over Total White Black Other
races
1 2 3 4 5 6 7 8 9 10111213 14 15 16171819
1790 ..................................... 3,929 — ————— —————3,929 3,172 757———
1800 ..................................... 5,308 — ————— —————5,308 4,306 1,002 — —
3
278.0
1810 ..................................... 7,240 — ————— —————7,240 5,862 1,378 — —
3
274.0
1820 ..................................... 9,638 — ————— —————9,638 7,867 1,772 — —
3
260.0
1830 ..................................... 12,866 — ————— —————12,866 10,537 2,329 — —
3
240.0
1840 ..................................... 17,069 — ————— —————17,069 14,196 2,874 — —
3
222.0
1850
4
................................... 23,192 3,498
5
6,132
6
2,530 (
7
)
8
4,277 (
9
)
10
2,826 (
11
) 1,847 1,110 959 23,192 19,553 3,639 — —
3
194.0
1860
4
................................... 31,443 4,842
5
7,892
6
3,361 (
7
)
8
5,726 (
9
)
10
4,021 (
11
) 2,614 1,586 1,348 31,443 26,923 4,442 79 —
3
184.0
1870
4
................................... 38,558 5,515
5
9,601
6
4,041 (
7
) 3,748 3,075 2,563 2,315 3,519 2,245 1,933 38,558 33,589 4,880 89 —
3
167.0
1880 ..................................... 50,156 6,915
5
12,195
6
5,011 (
7
) 5,088 4,081 3,369 3,000 4,558 3,111 2,828 50,156 43,403 6,581 172 —
3
155.0
1890
12
................................. 62,622 7,635
5
14,608
6
6,558 (
7
) 6,197 5,228 4,579 3,866 5,917 3,999 3,875 62,622 54,984 7,470 168 —
3
137.0
1900 ..................................... 76,094 9,181 15,402 6,132 3,000 7,383 6,572 5,589 4,996 7,752 5,186 4,901 75,995 66,809 8,834 351 —
3
130.0
1901 ..................................... 77,584 9,336 15,572 6,228 3,056 7,544 6,729 5,713 5,126 7,939 5,324 5,017 — —————
1902 ..................................... 79,163 9,502 15,750 6,333 3,119 7,713 6,890 5,847 5,261 8,138 5,472 5,138 — —————
1903 ..................................... 80,632 9,645 15,893 6,433 3,180 7,876 7,048 5,971 5,394 8,324 5,610 5,258 — —————
1904 ..................................... 82,166 9,791 16,044 6,539 3,245 8,047 7,210 6,105 5,530 8,518 5,757 5,380 — —————
1905 ..................................... 83,822 9,944 16,210 6,654 3,313 8,237 7,382 6,249 5,677 8,724 5,914 5,518 — —————
1906 ..................................... 85,450 10,092 16,365 6,769 3,383 8,414 7,553 6,399 5,823 8,925 6,069 5,658 — —————
1907 ..................................... 87,008 10,220 16,513 6,878 3,448 8,584 7,715 6,542 5,967 9,124 6,224 5,793 — —————
1908 ..................................... 88,710 10,364 16,687 6,999 3,516 8,764 7,888 6,697 6,121 9,343 6,388 5,943 — —————
1909 ..................................... 90,490 10,509 16,888 7,123 3,587 8,943 8,063 6,860 6,281 9,571 6,564 6,101 — — — — 2,718 126.8
1910 ..................................... 92,407 10,671 17,138 7,252 3,655 9,117 8,243 7,031 6,453 9,822 6,751 6,274 91,972 81,732 9,828 413 2,777 126.8
1911 ..................................... 93,863 10,796 17,379 7,319 3,679 9,192 8,371 7,159 6,598 10,038 6,904 6,428 — — — — 2,809 126.3
1912 ..................................... 95,335 10,915 17,645 7,388 3,698 9,249 8,491 7,281 6,742 10,272 7,063 6,591 — — — — 2,840 125.8
1913 ..................................... 97,225 11,082 18,016 7,477 3,727 9,333 8,634 7,436 6,920 10,555 7,262 6,783 — — — — 2,869 124.7
1914 ..................................... 99,111 11,244 18,397 7,563 3,748 9,404 8,779 7,591 7,097 10,851 7,452 6,985 — — — — 2,966 126.6
1915 ..................................... 100,546 11,347 18,717 7,619 3,752 9,416 8,873 7,707 7,241 11,098 7,615 7,161 — — — — 2,965 125.0
1916 ..................................... 101,961 11,442 19,043 7,665 3,749 9,423 8,959 7,817 7,383 11,355 7,784 7,341 — — — — 2,964 123.4
1917 ..................................... 103,268 11,527 19,380 7,715 3,740 9,370 8,997 7,916 7,526 11,609 7,957 7,531 — — — — 2,944 121.0
1918 ..................................... 103,208 11,606 19,716 7,794 3,651 8,642 8,573 7,872 7,648 11,859 8,123 7,724 — — — — 2,948 119.8
1919 ..................................... 104,514 11,536 19,834 7,737 3,672 9,071 8,918 7,994 7,715 11,997 8,208 7,832 — — — — 2,740 111.2
1920 ..................................... 106,461 11,631 20,122 7,869 3,749 9,239 9,321 8,095 7,843 12,232 8,408 7,952 105,711 94,821 10,463 427 2,950 117.9
1921 ..................................... 108,538 11,879 20,426 8,079 3,827 9,323 9,505 8,242 7,942 12,492 8,662 8,161 — — — — 3,055 119.8
1922 ..................................... 110,049 12,031 20,656 8,260 3,901 9,373 9,502 8,422 7,914 12,738 8,927 8,325 — — — — 2,882 111.2
1923 ..................................... 111,947 12,119 20,913 8,454 3,996 9,524 9,458 8,773 7,929 13,078 9,172 8,531 — — — — 2,910 110.5
1924 ..................................... 114,109 12,269 21,136 8,669 4,116 9,751 9,415 9,142 7,992 13,456 9,388 8,775 — — — — 2,979 110.9
1925 ..................................... 115,829 12,316 21,364 8,825 4,209 9,907 9,350 9,370 8,076 13,804 9,579 9,029 — — — — 2,909 106.6
1926 ..................................... 117,397 12,189 21,633 8,956 4,290 10,064 9,387 9,480 8,195 14,118 9,793 9,292 — — — — 2,839 102.6
1927 ..................................... 119,035 12,111 21,853 9,093 4,378 10,258 9,473 9,475 8,424 14,397 9,997 9,576 — — — — 2,802 99.8
1928 ..................................... 120,509 11,978 21,995 9,213 4,451 10,472 9,584 9,369 8,732 14,643 10,195 9,877 — — — — 2,674 93.8

12 Education Characteristics of the Population
Table 1.—Population, by age and race, live births, and birth rate: 1790 to 1991—Continued
[Population and births in thousands]
Year
Population, by age Population, by race
1
Live
births Birth
rate
2
Total Under
55 to 13 14 to
17 18 and
19 20 to
24 25 to
29 30 to 34 35 to
39 40 to
49 50 to
59 60 and
over Total White Black Other
races
1 2 3 4 5 6 7 8 9 10111213 14 15 16171819
1929 ..................................... 121,767 11,734 22,131 9,283 4,513 10,694 9,729 9,212 9,032 14,865 10,410 10,164 — — — — 2,582 89.3
1930 ..................................... 123,077 11,372 22,266 9,370 4,567 10,915 9,894 9,145 9,218 15,128 10,718 10,484 122,775 110,287 11,891 597 2,618 89.2
1931 ..................................... 124,040 11,179 22,263 9,389 4,592 11,003 10,051 9,191 9,170 15,402 11,006 10,793 — — — — 2,506 84.6
1932 ..................................... 124,840 10,903 22,238 9,404 4,611 11,077 10,195 9,289 9,069 15,689 11,267 11,099 — — — — 2,440 81.7
1933 ..................................... 125,579 10,612 22,129 9,445 4,625 11,152 10,326 9,424 8,974 15,969 11,504 11,418 — — — — 2,307 76.3
1934 ..................................... 126,374 10,331 21,964 9,526 4,637 11,238 10,448 9,574 8,941 16,228 11,729 11,759 — — — — 2,396 78.5
1935 ..................................... 127,250 10,170 21,730 9,652 4,643 11,317 10,558 9,717 8,973 16,437 11,941 12,112 — — — — 2,377 77.2
1936 ..................................... 128,053 10,044 21,434 9,784 4,659 11,375 10,660 9,845 9,051 16,596 12,148 12,459 — — — — 2,355 75.8
1937 ..................................... 128,825 10,009 21,082 9,858 4,701 11,411 10,768 9,955 9,164 16,714 12,366 12,797 — — — — 2,413 77.1
1938 ..................................... 129,825 10,176 20,668 9,908 4,772 11,453 10,892 10,061 9,306 16,828 12,622 13,140 — — — — 2,496 79.1
1939 ..................................... 130,880 10,418 20,253 9,898 4,850 11,519 11,013 10,163 9,446 16,944 12,903 13,472 — — — — 2,466 77.6
1940 ..................................... 132,122 10,580 19,942 9,846 4,916 11,689 11,157 10,290 9,597 17,097 13,182 13,826 131,669 118,215 12,866 589 2,559 79.9
1941 ..................................... 133,412 10,851 19,697 9,753 4,909 11,810 11,280 10,413 9,741 17,326 13,425 14,207 — — — — 2,703 83.4
1942 ..................................... 134,865 11,300 19,460 9,618 4,883 11,953 11,374 10,536 9,869 17,562 13,668 14,642 — — — — 2,989 91.5
1943 ..................................... 136,755 12,020 19,378 9,477 4,850 12,065 11,511 10,684 10,012 17,806 13,902 15,050 — — — — 3,104 94.3
1944 ..................................... 138,398 12,525 19,302 9,361 4,846 12,061 11,670 10,838 10,157 18,049 14,134 15,455 — — — — 2,939 88.8
1945 ..................................... 139,924 12,979 19,378 9,133 4,754 12,036 11,796 10,938 10,312 18,282 14,376 15,940 — — — — 2,858 85.9
1946 ..................................... 141,392 13,246 19,664 8,915 4,645 12,003 11,893 11,060 10,459 18,509 14,600 16,398 — — — — 3,411 101.9
1947 ..................................... 144,122 14,405 20,094 8,868 4,604 11,812 12,038 11,193 10,657 18,714 14,846 16,891 — — — — 3,817 113.3
1948 ..................................... 146,634 14,919 20,949 8,705 4,510 11,795 12,156 11,336 10,873 18,920 15,089 17,382 — — — — 3,637 107.3
1949 ..................................... 149,199 15,609 21,631 8,592 4,420 11,700 12,254 11,475 11,099 19,141 15,361 17,917 — — — — 3,649 107.1
1950 ..................................... 151,689 16,328 22,266 8,445 4,392 11,614 12,314 11,614 11,301 19,385 15,597 18,435 150,697 134,942 15,042 713 3,632 106.2
1951 ..................................... 154,283 17,248 22,786 8,521 4,247 11,462 12,284 11,788 11,397 19,773 15,806 18,975 — — — — 3,823 111.5
1952 ..................................... 156,947 17,211 24,279 8,723 4,154 11,266 12,184 12,006 11,434 20,173 15,993 19,522 — — — — 3,913 113.9
1953 ..................................... 159,559 17,528 25,452 8,864 4,216 11,005 12,023 12,212 11,456 20,566 16,183 20,057 — — — — 3,965 115.2
1954 ..................................... 162,388 17,941 26,645 8,993 4,315 10,762 11,870 12,368 11,524 20,944 16,396 20,627 — — — — 4,078 118.1
1955 ..................................... 165,276 18,448 27,716 9,221 4,333 10,633 11,728 12,434 11,648 21,281 16,629 21,202 — — — — 4,104 118.5
1956 ..................................... 168,225 18,869 28,776 9,526 4,430 10,558 11,603 12,427 11,829 21,582 16,886 21,739 — — — — 4,218 121.2
1957 ..................................... 171,278 19,362 29,539 10,148 4,564 10,554 11,434 12,344 12,056 21,838 17,155 22,287 — — — — 4,308 122.9
1958 ..................................... 174,154 19,745 30,559 10,606 4,597 10,698 11,209 12,205 12,274 22,055 17,430 22,775 — — — — 4,255 120.2
1959 ..................................... 177,080 20,031 31,683 10,951 4,695 10,921 11,001 12,064 12,433 22,273 17,737 23,291 — — — — 4,245 118.8
1960 ..................................... 179,979 20,341 32,965 11,211 4,886 10,868 10,823 11,905 12,481 22,539 18,130 23,828 179,979 159,381 18,960 1,638 4,258 118.0
1961 ..................................... 182,992 20,522 33,217 12,046 5,411 11,222 10,756 11,738 12,481 22,792 18,518 24,290 182,992 161,891 19,385 1,716 4,268 117.1
1962 ..................................... 185,771 20,469 33,897 12,751 5,617 11,653 10,740 11,547 12,413 23,053 18,915 24,717 185,771 164,185 19,792 1,795 4,167 112.0
1963 ..................................... 188,483 20,342 34,578 13,492 5,461 12,397 10,848 11,348 12,294 23,322 19,295 25,108 188,483 166,413 20,194 1,876 4,098 108.3
1964 ..................................... 191,141 20,165 35,244 14,265 5,429 12,941 11,051 11,144 12,133 23,562 19,648 25,560 191,141 168,577 20,610 1,954 4,027 104.7
1965 ..................................... 193,526 19,824 35,754 14,145 6,450 13,404 11,226 11,040 11,952 23,751 19,957 26,023 193,526 170,499 20,999 2,028 3,760 96.3
1966 ..................................... 195,576 19,208 36,283 14,398 7,183 13,615 11,521 10,962 11,763 23,909 20,226 26,510 195,576 172,111 21,346 2,119 3,606 90.8
1967 ..................................... 197,457 18,563 36,629 14,729 6,928 14,566 11,943 10,953 11,569 24,061 20,458 27,058 197,457 173,562 21,671 2,224 3,521 87.2
1968 ..................................... 199,399 17,913 36,804 15,170 6,988 15,054 12,624 11,076 11,356 24,144 20,667 27,602 199,399 175,096 21,983 2,318 3,502 85.2

13Education Characteristics of the Population
Table 1.—Population, by age and race, live births, and birth rate: 1790 to 1991—Continued
[Population and births in thousands]
Year
Population, by age Population, by race
1
Live
births Birth
rate
2
Total Under
55 to 13 14 to
17 18 and
19 20 to
24 25 to
29 30 to 34 35 to
39 40 to
49 50 to
59 60 and
over Total White Black Other
races
1 2 3 4 5 6 7 8 9 10111213 14 15 16171819
1969 ..................................... 201,385 17,376 36,836 15,550 7,119 15,767 13,119 11,287 11,155 24,141 20,888 28,147 201,385 176,641 22,301 2,443 3,600 86.1
1970 ..................................... 203,984 17,166 36,672 15,921 7,410 16,579 13,604 11,505 11,079 24,099 21,167 28,783 203,984 178,703 22,687 2,593 3,731 87.9
1971 ..................................... 206,827 17,244 36,236 16,326 7,644 17,703 13,927 11,842 11,052 23,957 21,461 29,433 206,827 180,938 23,143 2,746 3,556 81.6
1972 ..................................... 209,284 17,101 35,679 16,637 7,854 17,865 15,142 12,321 11,105 23,700 21,803 30,077 209,284 182,799 23,572 2,913 3,258 73.1
1973 ..................................... 211,357 16,851 35,046 16,864 8,044 18,273 15,694 13,094 11,222 23,472 22,074 30,724 211,357 184,316 23,954 3,088 3,137 68.8
1974 ..................................... 213,342 16,487 34,465 17,033 8,196 18,758 16,428 13,644 11,400 23,197 22,344 31,388 213,342 185,745 24,326 3,271 3,160 67.8
1975 ..................................... 215,465 16,121 33,919 17,125 8,418 19,317 17,183 14,131 11,585 22,953 22,617 32,095 215,465 187,216 24,696 3,553 3,144 66.0
1976 ..................................... 217,563 15,617 33,516 17,117 8,604 19,794 18,177 14,428 11,883 22,793 22,853 32,780 217,563 188,693 25,079 3,791 3,168 65.0
1977 ..................................... 219,760 15,564 32,855 17,042 8,613 20,311 18,180 15,661 12,310 22,685 23,059 33,480 219,760 190,271 25,472 4,017 3,327 66.8
1978 ..................................... 222,095 15,735 32,094 16,944 8,617 20,748 18,585 16,218 13,052 22,673 23,239 34,189 222,095 191,960 25,886 4,249 3,333 65.5
1979 ..................................... 224,567 16,063 31,431 16,610 8,698 21,096 19,077 16,961 13,592 22,734 23,306 35,000 224,567 193,736 26,310 4,521 3,494 67.2
1980 ..................................... 227,255 16,458 31,095 16,140 8,713 21,380 19,697 17,754 14,080 22,774 23,314 35,849 227,255 195,208 26,784 5,263 3,612 68.4
1981 ..................................... 229,637 16,931 30,754 15,598 8,553 21,614 20,200 18,786 14,381 23,011 23,195 36,611 229,637 196,774 27,207 5,656 3,629 67.4
1982 ..................................... 231,996 17,298 30,614 15,041 8,425 21,587 20,753 18,808 15,599 23,478 22,965 37,429 231,996 198,321 27,636 6,039 3,681 67.3
1983 ..................................... 234,284 17,651 30,410 14,720 8,204 21,489 21,202 19,211 16,165 24,361 22,741 38,131 234,284 199,849 28,056 6,379 3,639 65.8
1984 ..................................... 236,477 17,830 30,238 14,704 7,818 21,328 21,535 19,696 16,932 25,077 22,476 38,843 236,477 201,290 28,457 6,730 3,669 65.4
1985 ..................................... 238,736 18,004 30,110 14,865 7,500 21,000 21,758 20,269 17,708 25,701 22,286 39,535 238,736 202,769 28,870 7,097 3,761 66.2
1986 ..................................... 241,107 18,154 30,351 14,797 7,322 20,411 22,005 20,773 18,722 26,274 22,162 40,136 241,107 204,326 29,303 7,478 3,757 65.4
1987 ..................................... 243,419 18,276 30,824 14,467 7,315 19,791 21,979 21,333 18,737 27,919 22,051 40,727 243,419 205,827 29,748 7,845 3,809 65.7
1988 ..................................... 245,807 18,456 31,406 13,982 7,480 19,184 21,877 21,798 19,140 29,150 22,033 41,301 245,807 207,377 30,202 8,228 3,910 67.3
1989 ..................................... 248,239 18,752 31,834 13,496 7,644 18,702 21,699 22,135 19,621 30,403 22,101 41,851 248,239 208,961 30,660 8,618 4,021 68.8
1990 ..................................... 249,415 18,874 32,000 13,312 7,697 19,131 21,229 21,907 19,976 31,608 21,840 41,842 — — — — 4,179 —
1991 ..................................... 252,177 19,222 32,500 13,423 7,191 19,194 20,718 22,159 20,518 32,848 22,068 42,336 — — — — 4,111 —
1
Data for 1790 through 1950 are from the decennial Census. These figures differ from the age data tabulated from
1900 to 1950 because of data calculation and timing differences.
2
Number of live births per 1,000 women, 15 to 44 years old.
3
Data are for white women only.
4
Total includes persons not identified by age.
5
Data for persons 5 to 14 years old.
6
Data for persons 15 to 19 years old.
7
Data included column in 5.
8
Includes persons 25 to 29 years old.
9
Data included in column 7.
10
Includes persons 35 to 39 years old.
11
Data included in column 9.
12
Excludes population (325,464) in the Indian Territory and on Indian reservations.
—Data not available.
NOTE.—Population data for 1790 through 1959 include U.S. population overseas; data for later years are for U.S.
resident population only. Population data for 1790 through 1890 are from decennial censuses. Age data for later years
are estimates of population for July 1, but race data are from decennial censuses through 1950. Population data for
1990 and 1991 are consistent with the 1990 Census, as enumerated. Data for early years are for continental popu-
lation. Excludes Indians living in Indian Territory or reservations until 1890. Beginning in 1960, data include Alaska
and Hawaii. Beginning in 1959, birth data include Alaska. Because of rounding, details may not add to totals.
SOURCE: U.S. Department of Commerce, Bureau of the Census, Current Population Reports, Series P-25,
United
States Population Estimates,
various years, and unpublished data;
Historical Statistics of the United States, Colonial
Times to 1970;
U.S. Department of Health and Human Services, National Center for Health Statistics,
Monthly Vital
Statistics Report
, various years. (This table was prepared October 1992.)

14 Education Characteristics of the Population
Table 2.—School enrollment of 5– to 19–year-olds per 100 persons, by sex and race: 1850 to 1991
Year
Both sexes Male Female
Total White Black and
other races
1
Total White Black and
other races
1
Total White Black and
other races
1
1 2345678910
1850 .......................... 47.2 56.2 1.8 49.6 59.0 2.0 44.8 53.3 1.8
1860 .......................... 50.6 59.6 1.9 52.6 62.0 1.9 48.5 57.2 1.8
1870 .......................... 48.4 54.4 9.9 49.8 56.0 9.6 46.9 52.7 10.0
1880 .......................... 57.8 62.0 33.8 59.2 63.5 34.1 56.5 60.5 33.5
1890 .......................... 54.3 57.9 32.9 54.7 58.5 31.8 53.8 57.2 33.9
1900
2
........................ 50.5 53.6 31.1 50.1 53.4 29.4 50.9 53.9 32.8
1910
2
........................ 59.2 61.3 44.8 59.1 61.4 43.1 59.4 61.3 46.6
1920
2
........................ 64.3 65.7 53.5 64.1 65.6 52.5 64.5 65.8 54.5
1930
2,3
...................... 69.9 71.2 60.3 70.2 71.4 59.7 69.7 70.9 60.8
1940 .......................... 74.8 75.6 68.4 74.9 75.9 67.5 74.7 75.4 69.2
1950 .......................... 78.7 79.3 74.8 79.1 79.7 74.7 78.4 78.9 74.9
1954 .......................... 86.2 87.0 80.8 87.5 88.4 80.9 84.8 85.4 80.7
1955 .......................... 86.5 87.0 82.9 88.4 88.9 84.6 84.5 85.0 81.2
1956 .......................... 87.2 87.8 83.6 88.6 89.4 83.6 85.8 86.1 83.5
1957 .......................... 87.8 88.2 85.3 89.4 90.0 85.6 86.2 86.4 85.0
1958 .......................... 88.4 88.9 85.1 90.1 90.5 87.2 86.7 87.2 82.9
1959 .......................... 88.5 88.8 85.9 89.7 90.2 86.8 87.1 87.5 85.0
1960
4
........................ 88.6 89.0 86.1 90.0 90.6 86.6 87.1 87.3 85.7
1961 .......................... 88.5 88.9 86.3 90.2 90.5 87.7 86.9 87.2 84.9
1962 .......................... 89.1 89.6 86.3 90.8 91.3 87.6 87.4 87.8 85.0
1963 .......................... 89.6 89.8 88.0 91.1 91.5 88.7 88.0 88.1 87.3
1964 .......................... 89.6 89.8 88.4 91.1 91.4 89.2 88.1 88.2 87.6
1965 .......................... 89.6 89.8 88.5 91.0 91.2 89.8 88.3 88.5 87.2
1966 .......................... 89.7 89.9 88.5 91.2 91.5 89.9 88.2 88.4 87.2
1967 .......................... 90.5 90.8 88.6 91.9 92.2 89.8 89.0 89.3 87.4
1968 .......................... 90.8 91.0 89.4 92.2 92.5 90.5 89.3 89.5 88.4
1969 .......................... 90.9 91.1 89.5 92.1 92.5 90.0 89.5 89.7 88.9
1970 .......................... 90.6 90.8 89.4 91.6 91.9 89.6 89.6 89.7 89.1
1971 .......................... 90.9 90.9 90.8 91.9 92.0 91.3 89.9 89.8 90.3
1972 .......................... 90.0 90.0 90.1 91.0 91.0 90.9 89.0 89.0 89.3
1973 .......................... 89.3 89.4 88.9 90.3 90.4 90.1 88.2 88.3 87.7
1974 .......................... 89.4 89.2 90.1 90.1 89.9 90.9 88.6 88.5 89.3
1975 .......................... 89.9 89.8 90.4 90.7 90.6 91.1 89.1 89.0 89.6
1976 .......................... 89.6 89.4 90.8 90.4 90.1 91.9 88.9 88.7 89.6
1977 .......................... 89.6 89.3 91.1 90.3 89.9 91.9 89.0 88.8 90.2
1978 .......................... 89.2 89.0 90.6 89.8 89.5 91.6 88.6 88.4 89.7
1979 .......................... 89.0 88.8 90.2 89.7 89.4 91.5 88.3 88.1 88.8
1980 .......................... 89.1 88.9 90.4 89.5 89.3 90.4 88.8 88.4 90.4
1981 .......................... 89.6 89.4 90.5 90.0 89.8 91.4 89.2 89.1 89.7
1982 .......................... 89.6 89.5 90.0 90.0 89.9 90.6 89.1 89.1 89.4
1983 .......................... 90.3 90.3 90.3 90.4 90.3 90.8 90.2 90.2 89.8
1984 .......................... 90.3 90.3 90.2 90.7 90.6 90.9 89.9 90.0 89.5
1985 .......................... 91.0 91.1 90.7 91.2 91.2 91.4 90.7 90.9 89.9
1986 .......................... 91.4 91.3 91.6 92.0 91.8 92.6 90.8 90.8 90.7
1987 .......................... 91.7 91.5 92.3 92.4 92.2 93.2 90.9 90.8 91.4
1988 .......................... 91.8 91.7 92.2 92.1 91.6 94.5 91.5 91.4 91.9
1989 .......................... 91.8 91.7 92.1 92.1 92.1 92.2 91.5 91.3 92.0
1990 .......................... 92.6 92.5 92.8 92.9 92.6 93.8 92.2 92.3 91.8
1991 .......................... 93.1 93.1 93.2 93.4 93.1 94.2 92.8 93.0 92.2
1
For 1971 to 1990, black and other races is calculated by subtracting whites from
total.
2
Enrollment rates are for 5– to 20–year-olds.
3
Revised to include Mexicans as white persons.
4
Denotes first year for which figures include Alaska and Hawaii.
NOTE.—Data for 1850 through 1950 are based on April 1 counts. Data for 1954 to
1991 are based on October counts.
SOURCE: U.S. Department of Commerce, Bureau of the Census,
Historical Statistics
of the United States, Colonial Times to 1970;
and Current Population Reports, Series
P-20,
School Enrollment - Social and Economic Characteristics of Students,
various
years. (This table was prepared September 1992.)

15Education Characteristics of the Population
Table 3.—School enrollment and school enrollment rates, by age and sex: 1940 to 1991
Year
Males and females, by age Males, by age Females, by age
Total, 5
to 34
1
5 and
67 to
13 14 to
17 18 and
19 20 to
24 25 to
34 Total, 5
to 34
1
5 and
67 to
13 14 to
17 18 and
19 20 to
24 25 to
34 Total, 5
to 34
1
5 and
67 to
13 14 to
17 18 and
19 20 to
24 25 to
34
1 2 3 4 5 6 7 8 9 101112131415 16 171819202122
Enrollment, in thousands
1940
2
......... 26,759 1,805 15,035 7,709 1,449 761 — 13,615 901 7,607 3,870 770 467 — 13,145 904 7,428 3,840 680 294 —
1945 ........... 25,515 2,833 14,747 6,956 668 311 — 12,660 1,423 7,456 3,475 192 114 — 12,855 1,410 7,291 3,481 476 197 —
1946 ........... 26,924 3,030 14,966 6,900 884 1,144 — 13,941 1,514 7,585 3,435 469 938 — 12,983 1,516 7,381 3,465 415 206 —
1947 ........... 27,746 3,069 15,302 6,737 1,007 1,183 448 14,635 1,549 7,781 3,364 587 947 407 13,111 1,520 7,521 3,373 420 236 41
1948 ........... 28,390 3,237 15,688 6,824 1,134 1,103 405 14,991 1,628 7,990 3,436 682 898 358 13,399 1,608 7,698 3,388 452 206 48
1949 ........... 29,283 3,487 16,374 6,778 1,028 1,041 576 15,489 1,807 8,330 3,447 593 827 487 13,794 1,679 8,045 3,331 435 215 89
1950 ........... 30,073 3,304 17,222 6,988 1,199 1,001
3
360 15,736 1,649 8,773 3,568 680 733
3
333 14,337 1,655 8,449 3,420 519 268
3
27
1951 ........... 30,466 3,196 17,946 7,216 974 846
3
288 15,774 1,648 9,148 3,614 534 602
3
228 14,692 1,548 8,798 3,602 440 244
3
60
1952 ........... 31,980 3,732 18,414 7,440 1,062 904 428 16,644 1,912 9,382 3,758 612 630 350 15,336 1,820 9,032 3,682 450 274 78
1953 ........... 32,796 4,038 18,525 7,538 1,180 981 534 16,974 2,035 9,405 3,844 642 636 414 15,822 2,003 9,120 3,695 538 346 120
1954 ........... 36,083 5,443 19,952 7,784 1,268 999 635 18,759 2,746 10,138 4,002 730 677 465 17,324 2,697 9,813 3,782 538 322 171
1955 ........... 37,426 5,520 21,028 7,970 1,232 1,010 667 19,573 2,821 10,725 4,096 752 686 494 17,853 2,700 10,304 3,873 480 324 173
1956 ........... 39,353 5,597 21,946 8,413 1,407 1,192 798 20,522 2,839 11,179 4,275 809 830 620 18,801 2,758 10,767 4,138 598 362 178
1957 ........... 41,166 5,829 22,705 9,067 1,409 1,336 820 21,509 2,963 11,584 4,646 780 897 639 19,657 2,866 11,121 4,421 629 439 181
1958 ........... 42,900 6,101 23,623 9,446 1,564 1,307 858 22,497 3,123 12,059 4,854 898 915 648 20,404 2,978 11,564 4,591 667 393 211
1959 ........... 44,370 6,222 24,626 9,839 1,601 1,283 799 23,192 3,158 12,556 5,041 918 892 627 21,178 3,064 12,070 4,798 683 391 172
1960 ........... 46,259 6,438 25,621 10,240 1,817 1,350 792 24,234 3,292 13,074 5,247 1,063 936 621 22,025 3,146 12,547 4,993 754 414 171
1961 ........... 47,708 6,638 25,801 11,163 1,952 1,468 686 24,944 3,402 13,167 5,705 1,170 989 511 22,764 3,236 12,634 5,458 782 479 175
1962 ........... 48,704 6,651 25,634 11,740 2,144 1,725 810 25,452 3,399 13,003 6,032 1,212 1,177 629 23,252 3,252 12,631 5,708 932 548 181
1963 ........... 50,356 6,768 26,203 12,517 2,061 2,014 793 26,243 3,440 13,280 6,402 1,180 1,365 576 24,113 3,328 12,923 6,115 881 649 217
1964 ........... 51,660 6,842 26,725 13,014 2,196 2,048 835 26,851 3,478 13,548 6,658 1,238 1,332 597 24,809 3,364 13,177 6,356 958 716 238
1965 ........... 53,769 6,995 27,450 13,033 2,930 2,360 1,001 28,059 3,555 13,932 6,613 1,689 1,559 711 25,710 3,440 13,518 6,420 1,241 801 290
1966 ........... 55,070 7,156 27,895 13,293 3,176 2,547 1,003 28,733 3,619 14,139 6,770 1,841 1,667 697 26,337 3,537 13,756 6,523 1,335 880 306
1967 ........... 56,511 7,352 28,286 13,638 3,026 3,002 1,207 29,368 3,719 14,342 6,975 1,637 1,862 832 27,144 3,632 13,944 6,662 1,390 1,139 375
1968 ........... 57,564 7,241 28,620 14,118 3,317 2,988 1,280 30,051 3,683 14,513 7,199 1,892 1,867 897 27,513 3,558 14,106 6,919 1,425 1,121 383
1969 ........... 58,718 7,155 28,844 14,452 3,351 3,380 1,536 30,583 3,623 14,620 7,374 1,886 2,070 1,011 28,135 3,532 14,223 7,078 1,465 1,310 526
1970 ........... 58,896 7,000 28,943 14,796 3,322 3,359 1,477 30,642 3,545 14,688 7,531 1,821 2,062 996 28,254 3,455 14,255 7,265 1,501 1,297 480
1971 ........... 59,630 6,818 28,823 15,144 3,557 3,606 1,682 31,114 3,450 14,633 7,720 1,939 2,217 1,155 28,515 3,368 14,190 7,424 1,617 1,389 527
1972 ........... 58,486 6,340 27,907 15,267 3,458 3,692 1,822 30,505 3,220 14,195 7,795 1,857 2,243 1,195 27,980 3,120 13,712 7,471 1,601 1,449 627
1973 ........... 57,703 6,228 27,289 15,354 3,284 3,659 1,889 30,012 3,162 13,884 7,845 1,783 2,118 1,220 27,689 3,066 13,405 7,509 1,500 1,540 669
1974 ........... 58,252 6,421 26,833 15,529 3,375 3,816 2,278 30,178 3,280 13,650 7,906 1,731 2,202 1,409 28,075 3,140 13,183 7,624 1,644 1,615 869
1975 ........... 58,867 6,590 26,104 15,698 3,765 4,121 2,589 30,502 3,346 13,267 8,042 1,940 2,334 1,573 28,365 3,244 12,837 7,657 1,825 1,786 1,016
1976 ........... 58,533 6,701 25,455 15,649 3,768 4,379 2,581 30,209 3,422 12,951 8,014 1,907 2,358 1,557 28,323 3,279 12,503 7,634 1,861 2,021 1,025
1977 ........... 58,078 6,433 25,052 15,529 3,762 4,390 2,912 29,831 3,246 12,751 7,934 1,919 2,401 1,580 28,246 3,187 12,301 7,594 1,844 1,988 1,332
1978 ........... 56,544 5,997 24,597 15,356 3,700 4,245 2,649 29,002 3,054 12,514 7,814 1,902 2,290 1,428 27,544 2,944 12,083 7,542 1,798 1,955 1,222
1979 ........... 55,717 5,846 24,145 14,970 3,693 4,290 2,773 28,459 3,003 12,285 7,680 1,874 2,229 1,388 27,258 2,843 11,860 7,290 1,819 2,061 1,385
1980 ........... 55,068 5,853 23,751 14,411 3,788 4,446 2,819 27,952 2,971 12,110 7,321 1,879 2,299 1,372 27,115 2,882 11,641 7,089 1,910 2,147 1,446
1981 ........... 56,057 5,955 24,025 14,373 3,976 4,700 3,028 28,577 3,051 12,253 7,309 2,018 2,467 1,479 27,482 2,904 11,771 7,065 1,958 2,234 1,550
1982 ........... 55,483 6,070 23,654 13,928 3,837 4,897 3,097 28,255 3,093 12,075 7,108 1,937 2,534 1,508 27,227 2,977 11,579 6,820 1,899 2,363 1,589
1983 ........... 55,120 6,214 23,278 13,791 3,938 4,720 3,179 28,230 3,166 11,887 7,021 1,956 2,582 1,618 26,891 3,048 11,391 6,770 1,983 2,138 1,561
1984 ........... 54,704 6,332 22,854 13,793 3,724 4,886 3,115 28,013 3,220 11,665 7,018 1,924 2,651 1,535 26,690 3,112 11,190 6,774 1,800 2,235 1,579

16 Education Characteristics of the Population
Table 3.—School enrollment and school enrollment rates, by age and sex: 1940 to 1991—Continued
Year
Males and females, by age Males, by age Females, by age
Total, 5
to 34
1
5 and
67 to
13 14 to
17 18 and
19 20 to
24 25 to
34 Total, 5
to 34
1
5 and
67 to
13 14 to
17 18 and
19 20 to
24 25 to
34 Total, 5
to 34
1
5 and
67 to
13 14 to
17 18 and
19 20 to
24 25 to
34
1 2 3 4 5 6 7 8 9 101112131415 16 171819202122
1985 ........... 55,214 6,697 22,849 14,016 3,716 4,776 3,160 28,087 3,422 11,666 7,186 1,852 2,467 1,494 27,125 3,274 11,182 6,830 1,864 2,309 1,666
1986 ........... 55,340 6,917 22,987 13,868 3,872 4,584 3,112 28,262 3,544 11,768 7,095 1,998 2,305 1,552 27,079 3,373 11,221 6,772 1,874 2,279 1,560
1987 ........... 55,943 6,956 23,521 13,532 3,982 4,792 3,160 28,547 3,580 12,057 6,928 2,047 2,469 1,466 27,396 3,376 11,463 6,603 1,936 2,324 1,694
1988 ........... 56,049 7,044 24,044 13,042 4,059 4,816 3,044 28,483 3,573 12,329 6,679 2,032 2,448 1,422 27,565 3,471 11,714 6,363 2,028 2,367 1,622
1989 ........... 56,338 6,990 24,431 12,747 4,125 4,837 3,208 28,539 3,551 12,509 6,583 2,061 2,339 1,496 27,798 3,439 11,922 6,164 2,063 2,498 1,712
1990 ........... 57,297 7,207 25,016 12,653 4,044 5,083 3,294 29,077 3,705 12,832 6,491 2,038 2,552 1,459 28,222 3,502 12,184 6,163 2,006 2,532 1,835
1991 ........... 58,208 7,178 25,445 12,789 3,969 5,406 3,422 29,612 3,655 13,033 6,584 1,976 2,710 1,653 28,596 3,522 12,412 6,205 1,993 2,695 1,769
Percent of population enrolled
1940
2
......... 57.7 43.0 95.0 79.3 28.9 6.6 — 58.6 42.3 94.8 78.9 30.8 8.2 — 56.9 43.7 95.2 79.7 26.9 5.0 —
1945 ........... 64.0 60.4 98.1 78.4 20.7 3.9 — 72.7 59.6 97.7 78.0 21.6 5.6 — 57.3 61.3 98.4 78.7 20.3 3.3 —
1946 ........... 61.1 62.0 98.3 79.6 22.5 10.1 — 64.9 60.8 98.0 79.2 29.0 17.7 — 57.5 63.3 98.5 80.1 18.0 3.4 —
1947 ........... 41.1 58.0 98.5 79.3 24.3 10.2 2.0 44.3 57.4 98.6 78.9 31.4 17.0 3.8 38.0 58.7 98.5 79.8 18.5 3.9 0.3
1948 ........... 41.5 56.0 98.1 81.8 26.9 9.7 1.8 44.8 55.1 98.3 81.9 34.3 16.5 3.3 38.4 56.8 98.0 81.7 20.3 3.4 0.4
1949 ........... 42.4 59.3 98.6 81.6 25.3 9.2 2.5 45.8 60.2 98.5 82.5 31.6 15.4 4.5 39.2 58.4 98.7 80.7 19.9 3.7 0.7
1950 ........... 51.6 58.2 98.7 83.4 29.7 9.2
3
3.0 54.8 56.8 98.7 84.4 35.7 14.3
3
5.9 48.4 59.5 98.7 82.3 24.3 4.6
3
0.4
1951 ........... 52.8 54.5 99.1 85.2 26.2 8.6
3
2.5 56.8 55.1 99.1 85.2 32.4 14.3
3
4.2 49.1 54.0 99.1 85.2 21.3 4.3
3
1.0
1952 ........... 45.4 54.7 98.8 85.2 28.8 9.7 1.8 49.4 54.8 98.7 85.4 37.2 16.9 3.2 41.9 54.6 98.9 85.0 22.1 4.9 0.6
1953 ........... 46.4 55.7 99.4 85.9 31.2 11.1 2.3 50.2 55.0 99.2 86.8 37.7 18.5 3.7 43.0 56.6 99.6 85.0 25.9 6.4 0.9
1954 ........... 50.0 77.3 99.4 87.1 32.4 11.2 2.7 54.0 76.3 99.2 88.7 40.6 19.1 4.2 46.3 78.3 99.6 85.4 25.4 6.0 1.4
1955 ........... 50.8 78.1 99.2 86.9 31.5 11.1 2.9 54.9 78.1 99.2 88.6 42.5 18.1 4.5 47.0 78.1 99.1 85.2 22.5 6.1 1.4
1956 ........... 52.3 77.6 99.3 88.2 35.4 12.8 3.5 56.3 77.1 99.1 89.1 45.1 20.6 5.7 48.7 78.2 99.4 87.3 27.4 6.8 1.5
1957 ........... 53.6 78.6 99.5 89.5 34.9 14.0 3.6 57.5 78.3 99.5 91.1 43.3 21.3 5.9 50.0 79.0 99.5 87.8 28.1 8.2 1.5
1958 ........... 54.8 80.4 99.5 89.2 37.6 13.4 3.8 58.7 80.6 99.5 90.7 47.5 21.0 6.0 51.0 80.2 99.4 87.6 29.4 7.3 1.8
1959 ........... 55.5 80.0 99.4 90.2 36.8 12.7 3.8 59.1 79.5 99.3 91.4 45.6 19.6 5.9 52.0 80.5 99.6 89.0 29.2 7.1 1.5
1960 ........... 56.4 80.7 99.5 90.3 38.4 13.1 3.6 60.0 80.8 99.5 91.3 47.8 19.9 5.9 52.8 80.6 99.6 89.2 30.0 7.4 1.7
1961 ........... 56.8 81.7 99.3 91.4 38.0 13.7 3.2 60.4 82.0 99.3 92.2 48.6 20.2 4.9 53.4 81.4 99.3 90.5 28.6 8.3 1.5
1962 ........... 57.8 82.2 99.3 92.0 41.8 15.6 3.8 61.7 82.6 99.2 93.7 51.2 23.4 6.2 54.0 81.7 99.4 90.3 33.7 9.1 1.6
1963 ........... 58.5 82.7 99.3 92.9 40.9 17.3 3.7 62.3 82.7 99.1 94.2 51.0 25.6 5.7 54.9 82.6 99.6 91.6 32.3 10.3 1.9
1964 ........... 58.7 83.3 99.0 93.1 41.6 16.8 3.9 62.3 83.4 98.8 94.4 50.9 23.8 5.9 55.3 83.2 99.2 91.8 33.7 10.9 2.1
1965 ........... 59.7 84.4 99.4 93.2 46.3 19.0 4.7 63.5 84.4 99.3 93.6 55.6 27.6 7.0 56.0 84.4 99.4 92.8 37.7 11.8 2.6
1966 ........... 60.0 85.1 99.3 93.7 47.2 19.9 4.6 64.1 84.5 99.2 94.4 57.8 29.2 6.8 56.1 85.7 99.5 92.9 37.7 12.4 2.7
1967 ........... 60.2 87.4 99.3 93.7 47.6 22.0 5.4 64.1 86.6 99.1 94.7 56.3 30.6 7.8 56.5 88.2 99.4 92.6 40.3 15.1 3.2
1968 ........... 60.1 87.6 99.1 94.2 50.4 21.4 5.5 64.3 87.3 98.9 95.0 60.4 30.5 8.1 56.1 88.0 99.3 93.4 41.3 14.3 3.2
1969 ........... 60.1 88.4 99.1 94.0 50.2 23.0 6.4 64.1 87.7 98.9 95.0 59.4 32.0 8.9 56.3 89.1 99.5 93.1 41.8 16.0 4.2
1970 ........... 59.0 89.5 99.2 94.1 47.7 21.5 6.0 62.6 88.9 99.0 94.8 54.4 29.3 8.4 55.5 90.2 99.4 93.4 41.6 15.2 3.8
1971 ........... 58.6 91.6 99.1 94.5 49.2 21.9 6.6 62.1 90.9 98.9 95.3 55.4 29.2 9.4 55.2 92.3 99.4 93.7 43.4 15.7 4.0
1972 ........... 56.9 91.9 99.2 93.3 46.3 21.6 6.8 60.1 91.7 99.1 94.0 51.2 27.8 9.2 53.8 92.2 99.3 92.6 41.8 16.0 4.5
1973 ........... 55.4 92.5 99.2 92.9 42.9 20.8 6.7 58.3 92.2 99.2 93.7 47.9 25.2 9.0 52.6 92.9 99.3 92.1 38.2 16.7 4.6
1974 ........... 55.3 94.2 99.3 92.9 43.1 21.4 7.8 57.9 94.4 99.2 93.3 45.8 25.8 10.0 52.7 93.9 99.5 92.5 40.7 17.3 5.8

17Education Characteristics of the Population
Table 3.—School enrollment and school enrollment rates, by age and sex: 1940 to 1991—Continued
Year
Males and females, by age Males, by age Females, by age
Total, 5
to 34
1
5 and
67 to
13 14 to
17 18 and
19 20 to
24 25 to
34 Total, 5
to 34
1
5 and
67 to
13 14 to
17 18 and
19 20 to
24 25 to
34 Total, 5
to 34
1
5 and
67 to
13 14 to
17 18 and
19 20 to
24 25 to
34
1 2 3 4 5 6 7 8 9 101112131415 16 171819202122
1975 ........... 55.1 94.7 99.3 93.6 46.9 22.4 8.5 57.7 94.4 99.0 94.6 49.9 26.4 10.7 52.6 95.1 99.6 92.6 44.2 18.7 6.5
1976 ........... 54.3 95.6 99.2 93.7 46.2 23.3 8.2 56.6 95.6 99.0 94.6 48.2 26.0 10.2 52.1 95.5 99.3 92.8 44.4 20.8 6.3
1977 ........... 53.6 95.8 99.4 93.6 46.2 22.9 9.0 55.6 94.7 99.3 94.3 48.4 25.9 10.0 51.7 96.9 99.5 93.0 44.0 20.0 8.0
1978 ........... 52.2 95.3 99.1 93.7 45.4 21.8 8.0 54.0 95.1 99.0 93.9 47.8 24.3 8.8 50.4 95.5 99.3 93.5 43.0 19.4 7.1
1979 ........... 51.2 95.8 99.2 93.6 45.0 21.7 8.1 52.8 96.3 99.0 94.5 46.6 23.3 8.3 49.7 95.2 99.4 92.6 43.4 20.2 7.8
1980 ........... 50.4 95.7 99.3 93.4 46.4 22.3 7.9 51.6 95.0 99.2 93.7 47.1 23.8 7.9 49.2 96.4 99.3 93.1 45.8 20.8 7.9
1981 ........... 49.7 94.0 99.2 94.1 49.0 22.5 8.0 51.0 94.2 99.1 94.3 50.5 24.4 8.0 48.4 93.8 99.4 93.9 47.5 20.8 8.0
1982 ........... 49.3 95.0 99.0 94.4 47.8 23.5 8.0 50.5 94.7 99.1 94.9 48.9 25.0 8.0 48.1 95.3 99.3 94.0 46.8 22.1 8.0
1983 ........... 49.0 95.5 99.2 95.0 50.4 22.7 8.1 50.4 95.1 99.1 95.1 50.5 25.5 8.4 47.6 95.8 99.3 94.9 50.3 20.1 7.8
1984 ........... 48.6 94.5 99.2 94.7 50.1 23.7 7.7 50.0 94.0 99.1 94.7 52.4 26.3 7.8 47.3 95.1 99.4 94.7 47.9 21.2 7.7
1985 ........... 48.9 96.1 99.2 94.9 51.6 24.0 7.7 50.1 95.3 99.2 95.4 52.2 25.6 7.5 47.8 97.0 99.3 94.5 51.0 22.5 8.0
1986 ........... 48.8 95.3 99.2 94.9 54.6 23.6 7.4 50.0 96.0 99.1 94.9 57.1 24.5 7.5 47.6 94.6 94.5 90.6 53.5 24.2 7.6
1987 ........... 49.3 95.2 99.5 95.0 55.6 25.5 7.5 50.5 95.7 99.7 95.3 57.9 27.2 7.0 48.1 94.6 99.4 94.5 53.4 24.0 7.9
1988 ........... 49.3 96.0 99.7 95.1 55.6 26.1 7.1 50.4 95.9 99.7 95.4 56.2 27.6 6.8 48.3 96.0 99.7 94.8 55.2 24.7 7.5
1989 ........... 49.7 95.2 99.3 95.7 56.0 27.0 7.5 50.4 95.1 99.2 96.1 56.6 26.9 7.1 48.9 95.2 99.4 95.3 55.4 27.1 7.9
1990 ........... 50.6 96.5 99.6 95.8 57.2 28.6 7.7 51.4 96.5 99.6 95.9 58.2 29.6 6.9 49.8 96.4 99.7 95.7 56.3 27.7 8.5
1991 ........... 51.4 95.4 99.6 96.0 59.6 30.2 8.1 52.3 95.0 99.8 96.4 59.8 31.0 7.9 50.5 95.8 99.5 95.6 59.4 29.4 8.3
1
Data for 1940 through 1946 are for ages 5–24. Data for 1950 and 1951 are for ages 5–29.
2
As of April 1.
3
25 to 29 years old.
—Data not available.
NOTE.—Unless otherwise noted, data are for October.
SOURCE: U.S. Department of Commerce, Bureau of the Census,
Historical Statistics of the United States, Colonial
Times to 1970;
and Current Population Reports, Series P-20,
School Enrollment - Social and Economic Characteristics
of Students,
various years. (This table was prepared September 1992.)

18 Education Characteristics of the Population
Table 4.—Years of school completed by persons 25 years old and over, by race and sex: April 1940 to March 1991
Year
1
and race
Percent of male population completing — Median
school
years
com-
pleted,
males
Percent of female population completing — Median
school
years
com-
pleted,
females
Elementary school High school College Elementary school High school College
0–4
years 5–7
years 8 years 1–3
years 4 years 1–3
years 4 years
or more 0–4
years 5–7
years 8 years 1–3
years 4 years 1–3
years 4 years
or more
1 2 3 4 5 6 7 8 9 10111213141516 17
Total
1940
2,3
........................... 15.1 19.0 28.8 14.5 12.2 4.9 5.5 8.6 12.4 18.0 27.5 15.9 16.4 6.1 3.8 8.7
1950
2,3
........................... 12.2 16.9 21.4 16.9 18.2 7.0 7.3 9.0 10.0 15.8 20.3 17.9 23.2 7.7 5.2 9.6
1960
3
............................. 9.4 14.6 17.8 18.7 21.2 8.6 9.7 10.3 7.4 13.1 17.3 19.7 27.8 9.0 5.8 10.7
1962 ................................ 8.7 12.2 16.7 17.4 24.7 8.9 11.4 11.1 6.9 11.2 16.5 17.9 31.6 9.3 6.7 11.6
1964 ................................ 8.1 11.4 16.1 17.4 26.3 9.0 11.7 11.5 6.3 10.8 15.6 18.5 33.4 8.8 6.8 11.8
1966 ................................ 7.3 10.7 15.6 17.4 27.7 8.8 12.5 11.8 5.7 10.2 14.6 18.8 34.4 9.0 7.4 12.0
1967 ................................ 6.8 10.5 15.1 17.0 28.2 9.6 12.8 12.0 5.4 9.8 14.5 18.5 34.8 9.4 7.6 12.0
1968 ................................ 6.5 10.3 14.3 16.9 28.9 9.8 13.3 12.1 5.3 9.4 13.9 18.1 35.7 9.5 8.0 12.1
1969 ................................ 6.1 9.9 14.0 16.4 29.7 10.3 13.5 12.1 5.1 9.0 13.5 17.9 36.9 9.4 8.2 12.1
1970 ................................ 5.9 9.5 13.6 16.1 30.1 10.8 14.1 12.2 4.7 8.7 13.1 17.9 37.5 9.7 8.2 12.1
1971 ................................ 5.6 8.9 13.4 15.8 30.6 11.1 14.6 12.2 4.5 8.5 12.7 17.7 37.8 10.3 8.5 12.2
1972 ................................ 5.0 8.6 12.1 16.1 31.4 11.4 15.4 12.3 4.2 8.1 11.8 17.8 38.7 10.5 9.0 12.2
1973 ................................ 4.9 8.2 11.5 15.3 32.1 12.0 16.0 12.3 4.2 7.7 11.3 17.2 39.2 10.8 9.6 12.2
1974 ................................ 4.9 7.7 11.1 14.7 32.3 12.5 16.9 12.4 4.1 7.4 10.7 16.9 39.4 11.4 10.1 12.3
1975 ................................ 4.7 7.5 10.2 14.5 32.3 13.2 17.6 12.4 3.8 7.2 10.4 16.6 39.7 11.7 10.6 12.3
1976 ................................ 4.2 7.4 9.5 14.2 32.3 13.8 18.6 12.5 3.5 6.8 9.8 16.3 39.9 12.4 11.3 12.3
1977 ................................ 4.0 7.0 9.4 14.0 32.1 14.2 19.2 12.5 3.5 6.8 9.2 16.2 39.6 12.7 12.0 12.4
1978 ................................ 3.9 6.9 9.0 13.5 32.1 14.9 19.7 12.5 3.4 6.5 9.1 15.9 39.6 13.4 12.2 12.4
1979 ................................ 3.7 6.3 8.6 12.9 32.6 15.4 20.4 12.6 3.2 6.1 8.6 15.0 40.2 14.0 12.9 12.4
1980 ................................ 3.6 6.0 8.1 13.1 32.7 15.6 20.9 12.6 3.2 6.0 8.2 14.5 40.4 14.2 13.6 12.4
1981 ................................ 3.4 5.8 7.5 12.9 33.6 15.6 21.1 12.6 3.1 5.8 7.8 14.1 41.1 14.6 13.4 12.5
1982 ................................ 3.3 5.6 6.9 12.5 34.1 15.7 21.9 12.6 2.8 5.5 7.3 14.0 41.4 14.9 14.0 12.5
1983 ................................ 3.2 5.2 6.7 12.1 33.9 15.9 23.0 12.7 2.8 5.3 7.0 13.4 41.1 15.4 15.1 12.5
1984 ................................ 2.9 5.1 6.5 11.8 34.6 16.1 22.9 12.7 2.6 4.9 6.6 12.9 41.8 15.6 15.7 12.6
1985 ................................ 2.9 5.0 6.3 11.5 34.8 16.5 23.1 12.7 2.5 4.5 6.5 12.9 41.3 16.2 16.0 12.6
1986 ................................ 2.8 4.7 6.0 11.3 34.9 17.1 23.2 12.7 2.5 4.6 6.0 12.5 41.6 16.7 16.1 12.6
1987 ................................ 2.5 4.6 5.7 11.2 35.4 17.1 23.6 12.7 2.4 4.4 5.8 12.1 41.6 17.1 16.5 12.6
1988 ................................ 2.6 4.5 5.0 11.5 35.7 16.8 24.0 12.7 2.3 4.2 5.5 12.0 41.8 17.2 17.0 12.6
1989 ................................ 2.7 4.3 4.8 11.0 35.4 17.4 24.5 12.8 2.4 4.0 5.2 11.9 41.3 17.2 18.1 12.6
1990 ................................ 2.7 4.2 4.6 10.7 35.5 17.8 24.4 12.8 2.2 3.9 4.9 11.5 41.0 18.0 18.4 12.7
1991 ................................ 2.7 3.9 4.5 10.4 36.0 18.2 24.3 12.8 2.1 3.7 4.4 11.4 41.0 18.6 18.8 12.7
White
1940
2,3
........................... 12.0 18.1 30.5 15.1 13.0 5.3 5.9 8.7 9.8 16.7 29.0 16.5 17.5 6.5 4.0 8.8
1950
2,3
........................... 9.8 15.9 22.4 17.4 19.3 7.4 7.9 9.3 8.1 14.4 21.1 18.2 24.6 8.1 5.4 10.0
1960
3
............................. 7.4 13.7 18.4 18.9 22.2 9.1 10.3 10.6 6.0 11.9 17.8 19.6 29.2 9.5 6.0 11.0
1962 ................................ 6.9 11.4 17.0 17.3 25.8 9.4 12.2 11.6 5.6 10.3 16.8 17.4 33.1 9.9 7.0 12.0
1964 ................................ 6.5 10.5 16.5 17.1 27.6 9.4 12.3 11.9 5.2 9.7 15.9 18.1 34.8 9.2 7.1 12.0
1965 ................................ 6.1 10.3 16.4 17.0 28.2 9.3 12.7 12.0 4.9 9.3 15.4 18.2 35.6 9.3 7.3 12.1
1966 ................................ 5.7 10.1 15.8 17.1 28.8 9.2 13.3 12.0 4.7 9.1 14.9 18.2 35.9 9.4 7.7 12.1
1967 ................................ 5.3 9.7 15.4 16.8 29.1 10.0 13.7 12.1 4.4 8.8 14.9 18.0 36.2 9.7 7.9 12.1
1968 ................................ 4.9 9.5 14.7 16.6 29.9 10.3 14.1 12.1 4.3 8.5 14.1 17.7 37.2 9.9 8.2 12.1
1969 ................................ 4.8 9.1 14.3 16.1 30.6 10.8 14.3 12.2 4.2 8.1 13.7 17.3 38.5 9.8 8.4 12.2
1970 ................................ 4.5 8.8 13.9 15.6 30.9 11.3 15.0 12.2 3.9 7.8 13.4 17.3 39.0 10.1 8.6 12.2

19Education Characteristics of the Population
Table 4.—Years of school completed by persons 25 years old and over, by race and sex: April 1940 to March 1991—Continued
Year
1
and race
Percent of male population completing — Median
school
years
com-
pleted,
males
Percent of female population completing — Median
school
years
com-
pleted,
females
Elementary school High school College Elementary school High school College
0–4
years 5–7
years 8 years 1–3
years 4 years 1–3
years 4 years
or more 0–4
years 5–7
years 8 years 1–3
years 4 years 1–3
years 4 years
or more
1 2 3 4 5 6 7 8 9 10111213141516 17
1971 ................................ 4.4 8.1 13.7 15.3 31.3 11.6 15.5 12.3 3.8 7.5 12.9 17.0 39.2 10.7 8.9 12.2
1972 ................................ 3.9 7.8 12.4 15.6 32.2 12.0 16.2 12.3 3.4 7.1 12.0 17.0 40.2 10.9 9.4 12.3
1973 ................................ 3.9 7.5 11.7 14.8 32.8 12.5 16.8 12.4 3.4 6.9 11.5 16.5 40.7 11.1 9.9 12.3
1974 ................................ 3.7 7.0 11.3 14.3 33.0 12.9 17.7 12.4 3.3 6.6 11.0 16.1 40.8 11.7 10.6 12.3
1975 ................................ 3.6 6.8 10.5 14.0 33.1 13.6 18.4 12.5 3.0 6.4 10.6 15.9 41.1 12.1 11.0 12.3
1976 ................................ 3.2 6.6 9.7 13.8 32.9 14.2 19.6 12.5 2.9 6.2 9.8 15.6 41.2 12.8 11.6 12.4
1977 ................................ 3.1 6.3 9.6 13.5 32.7 14.6 20.2 12.5 2.8 6.1 9.3 15.3 40.9 13.2 12.4 12.4
1978 ................................ 2.9 6.2 9.2 13.0 32.7 15.2 20.7 12.6 2.8 5.9 9.2 15.0 40.9 13.7 12.6 12.4
1979 ................................ 2.8 5.7 8.7 12.4 33.1 15.8 21.4 12.6 2.6 5.5 8.6 14.1 41.6 14.3 13.3 12.5
1980 ................................ 2.7 5.5 8.3 12.5 33.1 15.8 22.1 12.6 2.5 5.3 8.4 13.7 41.6 14.5 14.0 12.5
1981 ................................ 2.7 5.3 7.7 12.3 34.1 15.7 22.2 12.6 2.5 5.0 8.1 13.3 42.4 14.9 13.8 12.5
1982 ................................ 2.6 5.1 7.1 11.9 34.5 15.8 23.0 12.7 2.3 4.9 7.4 13.1 42.7 15.2 14.4 12.5
1983 ................................ 2.6 4.8 6.8 11.5 34.3 16.1 24.0 12.7 2.3 4.8 7.1 12.7 42.2 15.7 15.4 12.6
1984 ................................ 2.3 4.7 6.6 11.1 35.1 16.3 23.9 12.7 2.1 4.4 6.6 12.2 42.8 15.8 16.0 12.6
1985 ................................ 2.3 4.6 6.3 10.8 35.3 16.7 24.0 12.7 2.1 4.1 6.6 12.1 42.4 16.4 16.3 12.6
1986 ................................ 2.4 4.2 6.1 10.8 35.2 17.3 24.0 12.8 2.1 4.2 6.1 11.8 42.5 16.9 16.4 12.6
1987 ................................ 2.1 4.2 5.8 10.6 35.6 17.2 24.5 12.8 2.0 4.0 6.0 11.4 42.6 17.3 16.9 12.6
1988 ................................ 2.1 4.1 5.1 10.9 35.9 16.9 25.0 12.8 1.9 3.8 5.4 11.2 42.8 17.6 17.3 12.6
1989 ................................ 2.2 3.9 4.8 10.4 35.7 17.6 25.4 12.8 1.8 3.5 5.2 11.2 42.3 17.4 18.5 12.7
1990 ................................ 2.2 3.9 4.7 10.1 35.7 18.0 25.3 12.8 1.8 3.5 5.0 10.8 41.9 18.1 19.0 12.7
1991 ................................ 2.2 3.6 4.5 9.9 36.1 18.4 25.4 12.8 1.8 3.3 4.5 10.5 41.8 18.8 19.3 12.7
Black and other races
1940
2,3
........................... 46.2 28.1 11.4 7.4 3.8 1.7 1.4 5.4 37.5 31.8 12.4 9.9 5.1 2.1 1.2 6.1
1950
2,3
........................... 36.9 27.1 11.3 12.1 7.5 2.9 2.1 6.4 28.6 29.3 12.5 14.8 9.2 3.2 2.4 7.2
1960
3
............................. 27.7 23.0 12.3 17.0 12.1 4.4 3.5 7.9 19.7 23.7 13.3 20.2 15.2 4.4 3.6 8.5
1962 ................................ 26.1 19.3 13.2 18.2 14.5 4.8 4.0 8.3 18.5 19.3 13.9 22.1 18.2 4.0 4.0 8.9
1964 ................................ 22.2 19.7 12.2 20.1 15.3 4.9 5.6 8.7 15.4 20.7 12.9 22.0 20.2 4.9 3.7 9.1
1966 ................................ 22.5 16.6 13.1 20.1 17.4 5.3 5.0 8.8 14.0 19.4 11.5 24.0 21.2 5.4 4.4 9.6
1967 ................................ 21.2 18.2 12.0 18.9 19.3 5.2 5.2 8.9 14.1 18.5 11.7 22.7 22.3 6.1 4.8 9.8
1968 ................................ 20.4 17.3 10.6 20.2 20.3 5.6 5.7 9.2 14.6 17.5 12.6 22.0 22.5 5.3 5.3 9.7
1969 ................................ 17.5 17.5 10.8 19.8 21.8 6.0 6.7 9.7 13.3 17.4 11.8 23.0 23.5 5.6 5.5 10.0
1970 ................................ 17.9 15.3 10.9 20.6 22.4 6.2 6.8 9.9 11.9 16.7 11.3 23.5 24.6 6.4 5.6 10.3
1971 ................................ 16.3 16.3 10.3 20.2 23.8 6.3 6.8 10.2 10.7 16.7 10.8 24.1 25.9 6.3 5.5 10.4
1972 ................................ 15.3 15.9 9.4 20.6 24.3 6.5 8.0 10.3 10.8 15.9 9.5 24.4 26.5 6.9 6.0 10.6
1973 ................................ 13.8 14.3 9.7 20.0 25.3 7.9 9.0 10.7 10.5 14.0 9.3 23.4 27.4 8.2 7.3 11.0
1974 ................................ 14.6 14.0 8.8 18.2 25.9 9.1 9.4 11.0 10.1 13.8 8.2 23.8 28.7 8.7 6.8 11.1
1975 ................................ 14.1 13.4 7.4 18.6 25.5 10.2 10.7 11.3 9.7 13.1 8.6 22.2 29.3 9.0 8.0 11.5
1976 ................................ 13.1 13.8 8.1 17.6 27.1 9.9 10.3 11.5 8.7 11.9 9.6 21.7 30.0 9.1 9.0 11.7
1977 ................................ 11.4 13.0 7.9 18.4 27.2 11.5 10.5 11.9 8.2 12.4 8.7 22.8 29.6 9.3 9.0 11.7
1978 ................................ 11.3 12.4 7.1 17.7 27.7 12.7 11.0 12.1 8.2 11.0 8.4 22.5 29.8 10.9 9.2 12.0
1979 ................................ 11.0 11.7 7.1 17.1 28.8 12.4 12.0 12.1 7.8 10.2 8.3 21.7 30.4 11.9 9.7 12.1
1980 ................................ 10.3 9.7 6.8 17.9 29.3 14.1 11.9 12.2 7.6 11.0 6.9 20.4 31.6 12.1 10.4 12.1

20 Education Characteristics of the Population
Table 4.—Years of school completed by persons 25 years old and over, by race and sex: April 1940 to March 1991—Continued
Year
1
and race
Percent of male population completing — Median
school
years
com-
pleted,
males
Percent of female population completing — Median
school
years
com-
pleted,
females
Elementary school High school College Elementary school High school College
0–4
years 5–7
years 8 years 1–3
years 4 years 1–3
years 4 years
or more 0–4
years 5–7
years 8 years 1–3
years 4 years 1–3
years 4 years
or more
1 2 3 4 5 6 7 8 9 10111213141516 17
1981 ................................ 8.9 9.5 6.4 18.0 30.0 14.4 12.8 12.2 7.4 11.0 6.1 20.2 31.9 12.7 10.8 12.2
1982 ................................ 8.5 9.3 5.9 16.6 31.0 15.0 13.7 12.3 6.4 9.9 6.8 19.9 32.5 12.9 11.3 12.2
1983 ................................ 7.9 8.6 5.9 16.8 30.9 14.3 15.6 12.4 6.1 8.8 6.5 18.5 34.1 13.2 12.8 12.3
1984 ................................ 7.8 8.1 6.0 16.8 31.2 14.2 15.6 12.4 5.8 8.1 6.4 17.4 35.0 13.9 13.4 12.4
1985 ................................ 6.9 8.0 5.7 16.3 30.9 15.1 17.0 12.4 5.3 7.6 6.0 17.8 34.6 14.5 14.2 12.4
1986 ................................ 6.0 8.1 5.1 15.2 33.1 15.6 16.9 12.5 5.1 7.3 5.7 16.7 35.7 15.6 13.8 12.4
1987 ................................ 5.5 7.6 4.7 14.9 33.8 16.2 17.2 12.5 4.8 7.0 5.2 16.8 35.9 16.0 14.4 12.5
1988 ................................ 5.6 7.4 4.3 15.1 34.0 16.0 17.7 12.5 4.8 6.7 5.6 17.0 35.8 15.1 15.1 12.4
1989 ................................ 5.8 6.7 5.0 14.9 33.5 16.0 18.3 12.5 5.4 6.8 4.6 16.3 35.3 15.9 15.7 12.5
1990 ................................ 5.9 6.2 4.0 14.8 34.1 16.7 18.3 12.6 5.0 6.3 4.3 16.0 35.9 17.4 15.1 12.5
1991 ................................ 6.0 5.6 4.0 14.3 35.7 16.6 17.8 12.6 4.1 6.4 3.7 16.7 35.9 17.4 15.8 12.5
1
Unless otherwise indicated, surveys were conducted in March of the years shown.
2
Excludes population for whom school years were not reported.
3
As of April.
—Data not available.
SOURCE: U.S. Department of Commerce, Bureau of the Census,
Historical Statistics of the United States, Colonial
Times to 1970;
and Current Population Reports, Series P-20,
Educational Attainment in the United States,
various
years. (This table was prepared October 1992.)

21Education Characteristics of the Population
Table 5.—Median years of school completed by persons age 25 and over and 25 to 29, by race
and sex: 1910 to 1991
Year
Age 25 and over 25 to 29 years old
Total Male Female Total Male Female
White Black
1
White Black
1
White Black
1
White Black
1
1 234567891011
1910
2
........................ 8.1 —————————
1920
2
........................ 8.2 —————————
1930
2
........................ 8.4 —————————
1940 .......................... 8.6 8.7 5.4 8.8 6.1 10.3 10.5 6.5 10.9 7.5
1950 .......................... 9.3 9.3 6.4 10.0 7.2 12.1 12.4 7.4 12.2 8.9
1960
3
........................ 10.5 10.6 7.9 11.0 8.5 12.3 12.4 10.5 12.3 11.1
1969 .......................... 12.1 12.2 9.4 12.2 9.9 12.6 12.7 12.2 12.5 12.1
1970 .......................... 12.2 12.2 9.6 12.2 10.2 12.6 12.7 12.1 12.5 12.2
1971 .......................... 12.2 12.3 9.9 12.2 10.3 12.6 12.8 12.1 12.6 12.3
1972 .......................... 12.2 12.3 10.1 12.3 10.5 12.7 12.8 12.3 12.6 12.4
1973 .......................... 12.3 12.4 10.3 12.3 10.8 12.7 12.8 12.3 12.6 12.4
1974 .......................... 12.3 12.4 10.5 12.3 10.9 12.8 12.9 12.5 12.7 12.4
1975 .......................... 12.4 12.5 10.7 12.3 11.1 12.8 13.0 12.5 12.7 12.5
1976 .......................... 12.4 12.5 10.8 12.4 11.4 12.9 13.2 12.5 12.8 12.5
1977 .......................... 12.4 12.5 11.3 12.4 11.4 12.9 13.2 12.6 12.8 12.5
1978 .......................... 12.4 12.6 11.7 12.4 11.7 12.9 13.3 12.7 12.8 12.6
1979 .......................... 12.5 12.6 11.9 12.5 11.9 12.9 13.2 12.6 12.9 12.6
1980 .......................... 12.5 12.6 12.0 12.5 12.0 12.9 13.0 12.6 12.8 12.6
1981 .......................... 12.5 12.6 12.1 12.5 12.1 12.8 12.9 12.6 12.8 12.6
1982 .......................... 12.6 12.7 12.2 12.5 12.1 12.8 12.9 12.7 12.8 12.7
1983 .......................... 12.6 12.7 12.2 12.6 12.2 12.9 12.9 12.6 12.8 12.6
1984 .......................... 12.6 12.7 12.2 12.6 12.3 12.8 12.9 12.6 12.9 12.7
1985 .......................... 12.6 12.7 12.3 12.6 12.3 12.9 12.9 12.7 12.9 12.7
1986 .......................... 12.6 12.8 12.3 12.6 12.4 12.9 12.9 12.7 12.9 12.7
1987 .......................... 12.7 12.8 12.4 12.6 12.4 12.9 12.9 12.7 12.9 12.7
1988 .......................... 12.7 12.8 12.4 12.6 12.4 12.9 12.9 12.7 12.9 12.6
1989 .......................... 12.7 12.8 12.4 12.7 12.4 12.9 12.9 12.7 12.9 12.7
1990 .......................... 12.7 12.8 12.4 12.7 12.4 12.9 12.9 12.7 12.9 12.7
1991 .......................... 12.7 12.8 12.4 12.7 12.5 12.9 12.9 12.7 12.9 12.7
1
Data for years 1940 through 1960 include persons of ‘‘other’’ races.
2
Estimates based on retrojection, by the Bureau of the Census, of 1940 census data
on education by age.
3
Denotes first year in which figures include Alaska and Hawaii.
—Data not available.
NOTE.—Data for 1940, 1950, and 1960 are for April 1. Data for later years are as
of March.
SOURCE: U.S. Department of Commerce, Bureau of the Census,
Historical Statistics
of the United States, Colonial Times to 1970;
Current Population Series, P-20,
Edu-
cational Attainment of the United States Population,
various years; and ‘‘Education of the
American Population,’’ by John K. Folger and Charles B. Nam. (This table was prepared
February 1998.)
Table 6.—Percentage of persons 14 years old and over who were illiterate,
1
by race and nativity:
1870 to 1979
Year Total White Black and other
Total Native Foreign born
1 23456
1870 .............................. 20.0 11.5 — — 79.9
1880 .............................. 17.0 9.4 8.7 12.0 70.0
1890 .............................. 13.3 7.7 6.2 13.1 56.8
1900 .............................. 10.7 6.2 4.6 12.9 44.5
1910 .............................. 7.7 5.0 3.0 12.7 30.5
1920 .............................. 6.0 4.0 2.0 13.1 23.0
1930 .............................. 4.3 3.0 1.6 10.8 16.4
1940 .............................. 2.9 2.0 1.1 9.0 11.5
1947 .............................. 2.7 1.8 — — 11.0
1950 .............................. 3.2 ————
1952 .............................. 2.5 1.8 — — 10.2
1959 .............................. 2.2 1.6 — — 7.5
1969 .............................. 1.0 0.7 — —
2
3.6
1979 .............................. 0.6 0.4 — —
2
1.6
1
Persons are counted as illiterate if they cannot read or write in any language.
2
Based on black population only.
—Data not available.
SOURCE: U.S. Department of Commerce, Bureau of the Census,
Historical Statistics
of the United States, Colonial Times to 1970;
and Current Population Reports, Series
P-23,
Ancestry and Language in the United States: November 1979.
(This table was pre-
pared September 1992.)

22 Education Characteristics of the Population
Table 7.—Annual mean income of males and females 25 years old and over, by years of school
completed: 1939 to 1991
Year
Males
Elementary school High school College
Less than 8
years 8 years 1 to 3 years 4 years 1 to 3 years 4 or more years 4 years only 5 or more years
1 23456789
Current dollars
1939 ...................................... — — $1,379 $1,661 $1,931 $2,607 — —
1946 ...................................... $1,738 $2,327 2,449 2,939 3,654 4,527 — —
1949 ...................................... 2,062 2,829 3,226 3,784 4,423 6,179 — —
1956 ...................................... 2,574 3,631 4,367 5,183 5,997 7,877 — —
1958 ...................................... 2,530 3,677 4,452 5,257 6,272 8,643 $7,565 $9,178
1961 ...................................... 2,998 4,206 5,161 5,946 7,348 9,817 9,342 9,987
1963 ...................................... 3,078 4,410 5,348 6,557 7,633 9,811 9,392 10,353
1964 ...................................... 3,298 4,520 5,653 6,738 7,907 10,284 9,757 11,004
1966 ...................................... 3,520 4,867 6,294 7,494 8,783 11,739 11,135 12,563
1967 ...................................... 3,540 5,002 6,258 7,515 8,713 11,753 11,022 12,639
1968 ...................................... 4,135 5,689 6,454 7,688 8,890 11,851 11,086 12,794
1969 ...................................... 4,679 6,170 7,063 8,313 9,553 12,644 12,111 13,274
1970 ...................................... 4,948 6,674 7,575 8,998 10,554 14,018 13,434 14,727
1971 ...................................... 5,175 6,901 7,941 9,321 10,942 14,563 13,634 15,687
1972 ...................................... 5,436 7,088 8,273 9,741 11,205 15,017 14,192 15,983
1973 ...................................... 6,101 7,729 8,755 10,591 11,934 15,993 15,189 16,966
1974 ...................................... 6,422 8,559 9,526 11,408 12,640 16,769 15,859 17,817
1975 ...................................... 6,581 8,604 10,019 11,983 13,317 16,996 16,194 17,912
1976 ...................................... 6,673 8,957 9,920 12,559 14,104 18,750 17,599 20,141
1977 ...................................... 7,306 9,679 10,690 13,334 14,674 20,114 18,857 21,553
1978 ...................................... 7,841 10,131 11,400 14,312 15,728 21,464 20,056 23,103
1979 ...................................... 8,347 10,991 12,361 15,440 16,781 22,922 21,669 24,343
1980 ...................................... 8,757 12,050 12,956 16,657 18,232 24,417 22,949 26,065
1981 ...................................... 9,263 12,350 13,578 17,496 19,362 25,816 24,545 27,313
1982 ...................................... 10,151 13,214 14,362 18,468 20,889 28,896 26,612 31,434
1983 ...................................... 9,593 13,124 14,131 18,750 21,212 30,489 28,058 33,240
1984 ...................................... 9,944 13,451 14,529 19,289 22,219 31,969 29,530 34,731
1985 ...................................... 10,832 14,049 15,479 20,763 23,334 34,992 32,266 38,211
1986 ...................................... 10,401 14,193 15,722 21,265 25,046 36,883 33,793 40,732
1987 ...................................... 11,078 14,756 16,606 21,848 26,197 38,627 35,454 42,414
1988 ...................................... 12,184 14,787 17,350 22,747 27,383 39,241 35,800 43,487
1989 ...................................... 12,063 16,017 17,191 23,855 28,050 41,484 37,648 46,189
1990 ...................................... 12,446 15,754 17,331 24,940 29,792 44,257 40,384 49,085
1991 ...................................... 12,582 15,525 17,702 24,737 30,650 44,485 40,750 49,259
Constant 1991 dollars
1939 ...................................... — — $13,512 $16,275 $18,921 $25,545 — —
1946 ...................................... $12,139 $16,253 17,105 20,528 25,522 31,619 — —
1949 ...................................... 11,800 16,189 18,461 21,655 25,311 35,360 — —
1956 ...................................... 12,889 18,182 21,867 25,953 30,029 39,443 — —
1958 ...................................... 11,923 17,329 20,981 24,775 29,559 40,733 $35,652 $43,254
1961 ...................................... 13,656 19,159 23,509 27,085 33,471 44,718 42,555 45,493
1963 ...................................... 13,700 19,629 23,804 29,185 33,974 43,669 41,804 46,081
1964 ...................................... 14,490 19,859 24,837 29,604 34,740 45,183 42,868 48,347
1966 ...................................... 14,797 20,459 26,458 31,503 36,921 49,347 46,808 52,811
1967 ...................................... 14,436 20,397 25,519 30,645 35,530 47,927 44,946 51,540
1968 ...................................... 16,184 22,266 25,260 30,089 34,794 46,382 43,388 50,073
1969 ...................................... 17,365 22,898 26,212 30,851 35,453 46,924 44,946 49,262
1970 ...................................... 17,369 23,428 26,591 31,586 37,048 49,208 47,157 51,696
1971 ...................................... 17,403 23,208 26,705 31,346 36,798 48,975 45,851 52,755
1972 ...................................... 17,713 23,095 26,957 31,740 36,510 48,931 46,243 52,079
1973 ...................................... 18,715 23,709 26,857 32,489 36,608 49,060 46,593 52,044
1974 ...................................... 17,742 23,646 26,317 31,517 34,920 46,327 43,813 49,223
1975 ...................................... 16,660 21,782 25,364 30,336 33,713 43,027 40,997 45,346
1976 ...................................... 15,973 21,440 23,745 30,062 33,760 44,881 42,126 48,211
1977 ...................................... 16,420 21,754 24,026 29,968 32,980 45,207 42,382 48,441
1978 ...................................... 16,380 21,163 23,814 29,897 32,855 44,837 41,896 48,261
1979 ...................................... 15,659 20,619 23,190 28,966 31,482 43,002 40,652 45,668
1980 ...................................... 14,475 19,918 21,415 27,533 30,136 40,359 37,933 43,083
1981 ...................................... 13,879 18,505 20,345 26,215 29,011 38,681 36,777 40,924
1982 ...................................... 14,327 18,650 20,271 26,066 29,483 40,784 37,560 44,366
1983 ...................................... 13,118 17,947 19,324 25,640 29,007 41,693 38,368 45,455
1984 ...................................... 13,035 17,633 19,046 25,285 29,126 41,907 38,710 45,528
1985 ...................................... 13,711 17,783 19,593 26,282 29,536 44,293 40,842 48,367
1986 ...................................... 12,925 17,638 19,538 26,426 31,125 45,835 41,995 50,618
1987 ...................................... 13,282 17,692 19,910 26,195 31,409 46,312 42,507 50,852
1988 ...................................... 14,028 17,024 19,975 26,189 31,526 45,179 41,217 50,067
1989 ...................................... 13,250 17,593 18,882 26,202 30,810 45,565 41,352 50,733
1990 ...................................... 12,970 16,417 18,060 25,990 31,046 46,119 42,083 51,151
1991 ...................................... 12,582 15,525 17,702 24,737 30,650 44,485 40,750 49,259

23Education Characteristics of the Population
Table 7.—Annual mean income of males and females 25 years old and over, by years of school
completed: 1939 to 1991—Continued
Year
Females
Elementary school High school College
Less than 8
years 8 years 1 to 3 years 4 years 1 to 3 years 4 or more years 4 years only 5 or more years
1 1011121314151617
Current dollars
1939 ...................................... ————————
1946 ...................................... ————————
1949 ...................................... ————————
1956 ...................................... ————————
1958 ...................................... ————————
1961 ...................................... ————————
1963 ...................................... ————————
1964 ...................................... ————————
1966 ...................................... ————————
1967 ...................................... ————————
1968 ...................................... $1,039 $1,323 $1,550 $1,879 $2,297 $3,862 $3,210 $5,667
1969 ...................................... 1,205 1,515 1,701 2,099 2,468 4,063 3,266 5,977
1970 ...................................... 1,274 1,621 1,825 2,280 2,753 4,610 3,824 6,479
1971 ...................................... 1,406 1,731 1,905 2,452 3,006 5,056 4,241 6,900
1972 ...................................... 1,458 1,766 2,075 2,577 3,087 5,310 4,450 7,250
1973 ...................................... 1,559 1,916 2,219 2,819 3,285 5,502 4,587 7,544
1974 ...................................... 1,792 2,058 2,395 3,026 3,761 5,807 4,909 7,682
1975 ...................................... 1,999 2,315 2,709 3,314 4,133 6,313 5,371 8,175
1976 ...................................... 2,054 2,456 2,835 3,611 4,548 7,213 6,086 9,381
1977 ...................................... 2,225 2,725 3,057 4,044 4,858 7,616 6,449 9,894
1978 ...................................... 2,448 3,082 3,330 4,455 5,514 8,114 6,834 10,412
1979 ...................................... 2,840 3,250 3,718 5,063 6,181 9,007 7,601 11,389
1980 ...................................... 2,926 3,639 4,228 5,844 7,325 10,305 8,848 12,798
1981 ...................................... 3,314 4,025 4,562 6,535 8,389 11,500 10,066 14,013
1982 ...................................... 3,650 4,554 4,848 7,119 9,055 12,673 10,912 15,543
1983 ...................................... 3,610 4,662 5,090 7,682 9,707 14,113 12,243 17,061
1984 ...................................... 3,876 4,991 5,400 8,122 10,440 15,372 13,237 18,813
1985 ...................................... 4,278 5,408 5,991 8,788 11,394 16,743 14,517 20,366
1986 ...................................... 4,230 5,314 6,129 9,333 12,212 17,979 15,739 21,721
1987 ...................................... 4,526 5,268 6,380 9,751 12,746 19,365 17,197 22,939
1988 ...................................... 4,685 5,727 6,749 10,419 14,021 20,375 17,982 24,237
1989 ...................................... 5,026 5,577 6,952 11,114 15,159 21,827 19,570 25,462
1990 ...................................... 5,224 6,201 7,575 11,791 15,681 23,478 20,837 27,843
1991 ...................................... 5,583 6,298 7,987 12,429 16,310 24,684 21,859 29,466
Constant 1991 dollars
1939 ...................................... ————————
1946 ...................................... ————————
1949 ...................................... ————————
1956 ...................................... ————————
1958 ...................................... ————————
1961 ...................................... ————————
1963 ...................................... ————————
1964 ...................................... ————————
1966 ...................................... ————————
1967 ...................................... ————————
1968 ...................................... $4,066 $5,178 $6,066 $7,354 $8,990 $15,115 $12,563 $22,179
1969 ...................................... 4,472 5,622 6,313 7,790 9,159 15,078 12,121 22,182
1970 ...................................... 4,472 5,690 6,406 8,004 9,664 16,183 13,423 22,743
1971 ...................................... 4,728 5,821 6,406 8,246 10,109 17,003 14,262 23,204
1972 ...................................... 4,751 5,754 6,761 8,397 10,059 17,302 14,500 23,623
1973 ...................................... 4,782 5,877 6,807 8,647 10,077 16,878 14,071 23,142
1974 ...................................... 4,951 5,686 6,617 8,360 10,390 16,043 13,562 21,223
1975 ...................................... 5,061 5,861 6,858 8,390 10,463 15,982 13,597 20,696
1976 ...................................... 4,917 5,879 6,786 8,644 10,886 17,266 14,568 22,455
1977 ...................................... 5,001 6,125 6,871 9,089 10,918 17,117 14,494 22,237
1978 ...................................... 5,114 6,438 6,956 9,306 11,519 16,950 14,276 21,750
1979 ...................................... 5,328 6,097 6,975 9,498 11,596 16,897 14,260 21,366
1980 ...................................... 4,836 6,015 6,989 9,660 12,108 17,033 14,625 21,154
1981 ...................................... 4,966 6,031 6,835 9,792 12,570 17,231 15,082 20,996
1982 ...................................... 5,152 6,428 6,842 10,048 12,780 17,887 15,401 21,937
1983 ...................................... 4,937 6,375 6,960 10,505 13,274 19,299 16,742 23,330
1984 ...................................... 5,081 6,543 7,079 10,647 13,686 20,151 17,352 24,662
1985 ...................................... 5,415 6,845 7,583 11,124 14,423 21,193 18,376 25,779
1986 ...................................... 5,257 6,604 7,617 11,598 15,176 22,343 19,559 26,993
1987 ...................................... 5,426 6,316 7,649 11,691 15,282 23,218 20,618 27,503
1988 ...................................... 5,394 6,594 7,770 11,996 16,143 23,458 20,703 27,904
1989 ...................................... 5,520 6,126 7,636 12,207 16,650 23,974 21,495 27,967
1990 ...................................... 5,444 6,462 7,894 12,287 16,341 24,466 21,714 29,015
1991 ...................................... 5,583 6,298 7,987 12,429 16,310 24,684 21,859 29,466
—Data not available.
SOURCE: U.S. Department of Commerce, Bureau of the Census,
Historical Statistics
of the United States, Colonial Times to 1970;
Current Population Reports,
Money Income
of Families and Persons in the United States,
and unpublished data. (This table was pre-
pared September 1992.)
25
Chapter 2
Elementary and Secondary Education
William C. Sonnenberg
Several cities in the colonies, particularly in Massa-
chusetts, set up a variety of elementary schools.
These efforts were often modest, taught by house-
wives, clergy, or missionaries in their spare time, with
sparse resources. Boston, and several other large
cities, did provide some structure and some re-
sources for their schools. But no colony centralized
control of education. As towns prospered, the need
for public education standards became a concern of
colonial governments. Thus, in 1642, the General
Court of Massachusetts enacted into law a con-
demnation of parents and masters who did not take
steps to guarantee that their children could ‘‘read &
understand the principles of religion & the capitall
lawes of this country.’’ It is important to note that the
responsibility for providing education was placed on
parents rather than borne by the government.
Perhaps in response to a lack of direction in the
above legislation, albeit a clear expression of con-
cern, Massachusetts enacted provisions in 1647 for
the creation of grammar schools in any town which
attained a population level of 100 families or house-
holds. The stated aim of these schools was to ‘‘in-
struct youth so farr as they shall be fited for y univer-
sity Harvard.’’ These Massachusetts laws served as
models for other colonies.
Boston also took the lead in establishing the first
public secondary school, Latin Grammar School, in
1635. This institution focused primarily on college
preparatory studies, such as mathematics and an-
cient languages. In subsequent years, the concept
spread throughout the Massachusetts colony, espe-
cially with the acts of the legislature in 1647.
The Northwest Ordinances of 1787 represent a
significant federal step in providing education. This
legislation authorized grants of land for the establish-
ment of educational institutions. The Continental
Congress stated, ‘‘Religion, morality and knowledge
being necessary to good government and the happi-
ness of mankind, schools and the means of edu-
cation shall forever be encouraged.’’
Other governmental efforts also followed independ-
ence, as many local legislatures moved to establish
the concept of a uniform public system of elementary
education. This was necessary to guarantee such es-
sentials as a common language and technical and
agricultural training. In 1805, New York City adopted
a concept known as monitorial schools which were
designed to provide mass education to large num-
bers of children. However, success was limited when
teachers had to try to teach hundreds of children at
once using better students as helpers. But the stage
was set for what has been termed the ‘‘educational
awakening,’’ a movement strongly influenced by Hor-
ace Mann. As Secretary of the State Board of Edu-
cation of Massachusetts, he presided over the enact-
ment of the first compulsory elementary school at-
tendance law in 1852. Although significant progress
was made in providing formal education to residents
in some states, such as Massachusetts, there were
wide variations in the availability of education serv-
ices.
From colonial times, America has recognized the
value, both individually and collectively, of a basic
education. By the time of the first national surveys of
education statistics in 1869–70, millions of young
people were enrolled in public elementary schools.
Statistical Trends
Enrollment
The most fundamental measure of the scope of an
education system is a measure of enrollment. Over
the period covered in this report, total enrollment in
U.S. public elementary and secondary schools rose
from 7.6 million in 1870–71 to 41.2 million in 1990–
91. This increase may be attributed to growth in the
population, as well as to increases in the proportion
of young people attending school. Detailed informa-
tion on the increases in the enrollment rates can be
found in chapter 1. The pattern of the rise in public
school enrollment has not been consistent. Enroll-
ment increases have occurred at different rates, and
there have been two periods of enrollment declines:
the first, from the mid-1930s to the mid-1940s; and
the second, from the early 1970s to the mid-1980s
(table 9).
Public school enrollment expanded rapidly during
the late 19th century, with a particularly large in-
crease of 44 percent during the 1870s. The in-
creases of the 1870s and 1880s were fueled by in-
creases in the school-age population and increases
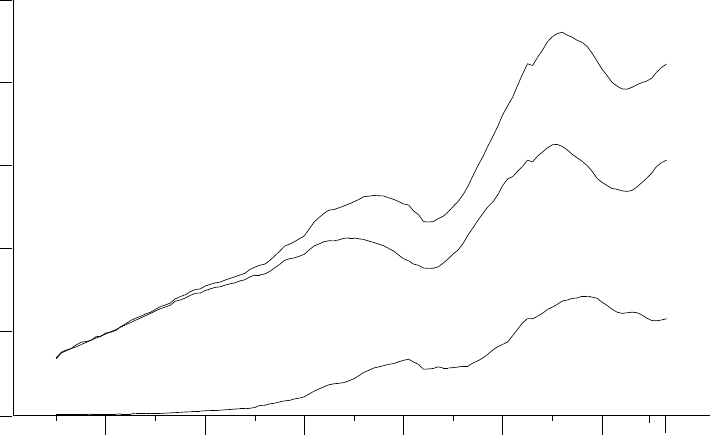
26 Elementary and Secondary Education
in the enrollment ratios. Some of the apparent in-
crease, particularly during the 1870s, may be due to
improvements in the relatively primitive data collec-
tion systems. Enrollment growth continued in the
1890s and the early 20th century, primarily driven by
population increases. Between 1889–90 and 1909–
10, the ratio of enrollment to the number of 5- to 17-
year-olds rose only slightly, from 77 percent to 81
percent. Enrollment growth accelerated again be-
tween 1909–10 and 1919–20, especially at the sec-
ondary level. Between 1909–10 and 1919–20, the
ratio of high school enrollment to the 14- to 17-year-
old population rose from 14 percent to 31 percent.
The enrollment ratio for the younger 5- to 13-year-old
children was over 100 percent, indicating both the
high enrollment rate for the age group and the num-
ber of older students attending below ninth grade.
Enrollment growth continued during the 1920s aided
by further increases in the high school enrollment ra-
tios. During the mid 1930s, changes in enrollment ra-
tios moderated and enrollments began to decline as
the number of 5- to 13-year-olds declined. Between
1933–34 and 1944–45, public school enrollment fell
by 12 percent.
After World War II, public school enrollment began
increasing again. The 1950s were a period of dy-
namic growth, with public school enrollment jumping
by 44 percent. The enrollment increase was driven
by the entry of the ‘‘baby boomers’’ into elementary
schools, as well as by the increase in the high school
enrollment ratio of 14- to 17-year-olds. During the
rush to accommodate the growing numbers of stu-
dents during this period, school buildings were con-
structed in expanding suburban areas, and teacher
demand rose dramatically. Enrollment increases con-
tinued through the 1960s and until 1971. Since 1971,
enrollment ratios have been relatively stable, show-
ing an increase only at the elementary level in the
1980s. The enrollment declines after 1971 were due
to a decline in births following the end of the ‘‘baby
boom.’’ Between 1971 and 1984, public school en-
rollment declined by 15 percent. The increase in en-
rollment from 1985 to 1992 has been driven by in-
creases in population and, to a smaller extent, by
rises in the enrollment rate of prekindergarten and
kindergarten pupils.
Figure 6.--Enrollment in public elementary and secondary schools,
by level: 1869-70 to 1992-93
Year ending
1870 1880 1890 1900 1910 1920 1930 1940 1950 1960 1970 1980
50
40
30
20
10
0
Millions
Total
Elementary
Secondary
1993
Source: U.S. Department of Commerce, Bureau of the Census,
Historical Statistics of the United States, Colonial Times to 1970;
U.S. Department of Education, National Center for Education Statistics,
Digest of Education Statistics,
various issues. and
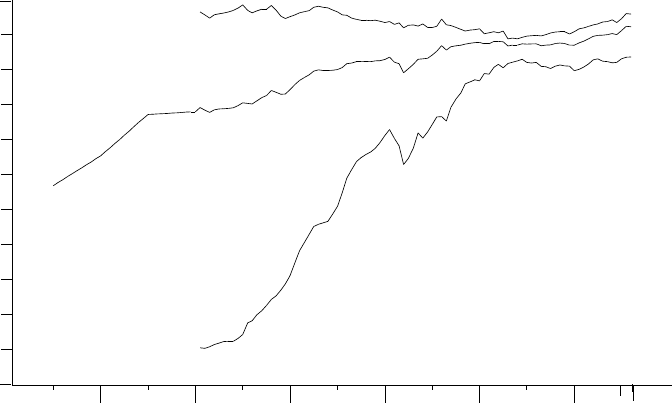
27Elementary and Secondary Education
Figure 7.--Elementary and secondary enrollment as a percentage of
5- to 17-year-olds, by level: 1869-70 to fall 1991
Year ending
1870 1880 1890 1900 1910 1920 1930 1940 1950 1960 1970 1980
110
100
90
80
70
60
50
40
30
20
10
0
1992
Elementary enrollment/5- to 13-year-olds
Secondary enrollment/
Percent
Source: U.S. Department of Commerce, Bureau of the Census,
Elementary and secondary
5- to 17-year-olds
enrollment/
14- to 17-year olds
Historical Statistics of the United States, Colonial Times to 1970;
U.S. Department of Education, National Center for Education Statistics,
Digest of Education Statistics,
various issues. and
School Attendance
Enrollment figures show the progress made in en-
couraging students to participate at the secondary
education level, but they do not fully illustrate the
progress that has been made in the amount of edu-
cation provided to students. The average number of
days that students attended school increased sub-
stantially during the late 19th century and early 20th
century (table 14).
In 1869–70, the school year was only about 132
days long compared to about 180 today. Not only
was the year much shorter, but the attendance rate
of 59 percent was much lower than the 90 percent
figure calculated for 1979–80. The net result of these
factors is that students in 1869–70 attended school
for an average of only 78 days compared to 161
days in 1979–80. In the early years, students were
likely to take time off to help with harvests or other
farm work. Also, the less advanced state of medicine
and hygiene left students more susceptible to long-
term illnesses that prevented school attendance. The
length of the school year and the average number of
days attended rose slowly during the late 19th cen-
tury, but rapid increases did not occur until the
1920s. Between 1919–20 and 1929–30, the average
number of days attended rose from 121 to 143. Dur-
ing the 1930s, the average number of days attended
increased to 152, and the school year lengthened to
175 days, almost as long as today. Since then the
changes have been relatively small. The increase in
the number of school days for the average student
during the early 20th century meant that a more ex-
tensive instructional program could be provided.
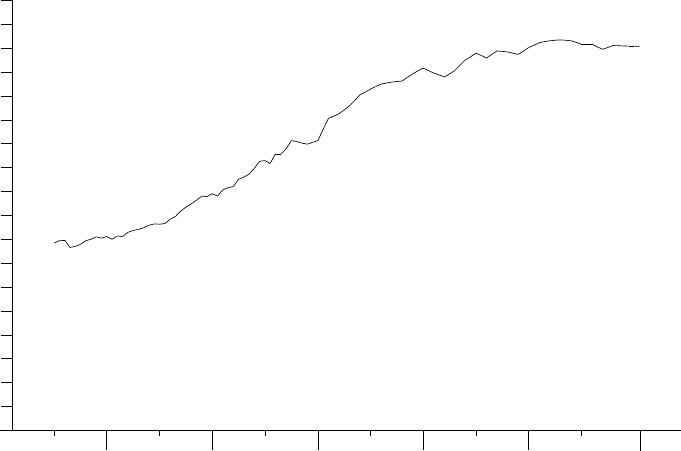
28 Elementary and Secondary Education
Figure 8.--Average number of days per year attended
by public school students: 1869-70 to 1980-81
Year ending
1870 1880 1890 1900 1910 1920 1930 1940 1950 1960 1970 1981
180
170
160
150
140
130
120
110
100
90
80
70
60
50
40
30
20
10
0
Source: U.S. Department of Commerce, Bureau of the Census,
Number of
days per
year
Historical Statistics of the United States, Colonial Times to 1970;
U.S. Department of Education, National Center for Education Statistics,
Digest of Education Statistics,
various issues. and
Pupil/Teacher Ratios
As might be expected, the increases in enrollment
were mirrored by rises in the number of teachers em-
ployed in public school systems. During the late 19th
and early 20th centuries, the number of teachers
rose at almost exactly the same rate as enrollment
(table 14). A steady pupil/teacher ratio of about 34 to
37 resulted. During the mid 1920s, a long-term pat-
tern developed of a slowly falling pupil/teacher ratio.
This slow movement picked up in the 1960s, when
the pupil/teacher ratio fell from 27 to 23. During the
1970s, the number of teachers remained relatively
steady during the enrollment decline, causing the
pupil/teacher ratio to drop to 18 in 1984-85. By 1990,
2.4 million Americans, an all-time high, were elemen-
tary-secondary teachers (nearly one percent of the
population). More complex and diverse school offer-
ings, including special education and enrichment pro-
grams, required increasing numbers of specialized
teachers.
Over the past 120 years, there have been several
shifts in the proportion of female teachers. During the
late 19th and early 20th centuries, the proportion of
female teachers increased steadily, from 57 percent
in 1879–80 to 86 percent in 1919–20. This shift in
the composition of the teacher force was brought
about by the extensive hiring of women teachers to
provide instruction for the rising enrollment and the
22 percent decline in the number of male teachers.
During the 1920s and 1930s, the proportion of fe-
male teachers dipped to a slightly lower level, before
returning to the 85 percent level during World War II,
when many young men left their positions to enter
the military. After the war, the proportion of female
teachers began falling, as the number of male teach-
ers increased more rapidly than the number of fe-
male teachers. In 1959–60, about 71 percent of the
teachers were women. After dipping to a slightly
lower proportion during the late 1960s and 1970s,
the proportion of women returned to the 1959–60
level during the late 1980s (table 14).
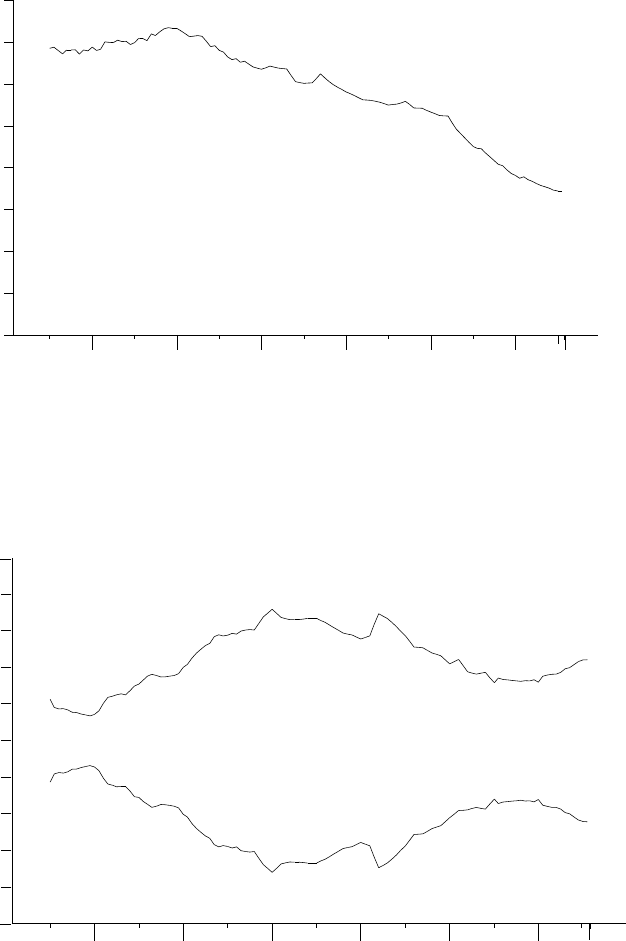
29Elementary and Secondary Education
Figure 9.--Pupil/teacher ratio in public elementary and secondary
schools: 1869-70 to fall 1990
Year ending
Pupil/teacher
1870 1880 1890 1900 1910 1920 1930 1940 1950 1960 1970 1980
40
35
30
25
20
15
10
5
0
ratio
Source: U.S. Department of Commerce, Bureau of the Census,
Statistics of the United States, Colonial Times to 1970;
of Education, National Center for Education Statistics,
Statistics,
1991
Historical
and U.S. Department
Digest of Education
various issues.
Figure 10.--Percentage of elementary and secondary school teachers,
by sex: 1869-70 to fall 1990
Year ending
1870 1880 1890 1900 1910 1920 1930 1940 1950 1960 1970 1980
100
90
80
70
60
50
40
30
20
10
0
Male
Female
Percent
1991
Source: U.S. Department of Commerce, Bureau of the Census,
Historical Statistics of the United States, Colonial Times to 1970;
U.S. Department of Education, National Center for Education Statistics,
Digest of Education Statistics,
various issues. and
30 Elementary and Secondary Education
Student Assessment
The overall trends in science, mathematics, and
reading suggest few changes in levels of educational
achievement across the two decades covered by the
National Assessment of Educational Progress
(NAEP). Although students appear to be mastering
the lower-level skills and virtually all students appear
to have grasped mathematics, science, and reading
fundamentals, few demonstrate competency with
more sophisticated materials and tasks.
In 1990, science achievement was no better at
ages 9 and 13 and somewhat worse at age 17 than
in 1969–70 (table 17). At all three ages, across the
20-year span, performance declined significantly in
the 1970s, but improved significantly during the
1980s. At ages 9 and 13, these recent gains re-
turned performance to levels observed two decades
earlier. However, at age 17, average proficiency in
1990 remained significantly below that in 1969. In
addition, science proficiency did not improve during
the 1980s for the lower-performing 25 percent of the
17-year-olds.
Average mathematics proficiency improved be-
tween 1973 and 1990 at ages 9 and 13. For 17-year-
olds, statistically significant declines in performance
between 1973 and 1982 were followed by recovery
during the 1980s to the original level of performance.
At all three ages, students’ average proficiency was
significantly higher in 1990 than in 1978.
The reading achievement of 9- and 13-year-olds in
1990 was unchanged from 1971, but 17-year-olds
were reading better. However, the pattern at age 9
is the reverse of that found for science and for math-
ematics at age 17. Significant improvement during
the 1970s has been all but eradicated by commensu-
rate declines during the 1980s. Little change oc-
curred for 13-year-olds. Seventeen-year-olds showed
relatively steady progress across the assessments.
The call for improved education and equal oppor-
tunity for all students is at the heart of many edu-
cation reform recommendations. Across the NAEP
assessments, both black and Hispanic students
have, on average, demonstrated significantly lower
proficiency than white students.
The 1990 results show that white students consist-
ently had higher average achievement than their
black and Hispanic counterparts at all three ages in
all three curriculum areas. The trends, however, do
indicate a lessening of the achievement gap. For ex-
ample, between 1969–70 and 1990, science pro-
ficiency has remained stable for white 9- and 13-
year-olds but decreased at age 17. In contrast, black
and Hispanic students showed gains at ages 9 and
13, and these students maintained their initial levels
of achievement at age 17.
In mathematics, the only significant progress by
white students since 1973 was at age 9. In compari-
son, black students showed significant improvements
at all three ages, as did Hispanic students at ages
9 and 13. The reading results show a similar pattern.
Although the proficiency of white 17-year-olds has
improved significantly since 1971, 9- and 13-year-
olds were reading at about the same level in 1990
as nearly two decades ago. Black students, however,
demonstrated significantly higher proficiency in 1990
at all three ages. Hispanic students also showed
gains at age 17, yet their reading performance did
not change significantly at the younger ages.
High School Graduates
The large enrollment in high schools is one of the
many success stories of American education during
the 20th century. Not surprisingly, the high enroll-
ment ratios have resulted in the growth in the num-
ber of high school graduates. An indicator of high
school graduation success can be measured by com-
paring the number of high school graduates to the
17-year-old population. This measurement does not
account for students receiving their diplomas through
GED programs, night schools, or other special pro-
grams; however, this ratio does allow rough historical
comparisons to be made over the past 120 years.
In 1869–70, there were only about two persons re-
ceiving high school diplomas per 100 17-year-olds
(table 19). While this ratio increased to 9 per 100
during the ensuing 40 years, high school graduation
remained an atypical occurrence, at least in most
areas of the country. It should be noted that gradua-
tion ratios for females have consistently been higher
than those for males. In 1909–10, about 60 percent
of the graduates were women. During the 1910s, the
1920s, and the 1930s, the graduation ratios in-
creased rapidly. In 1939–40, the ratio rose above 50
percent for the first time. In that year, about 53 per-
cent of the graduates were females. During World
War II, the graduation ratio dipped as some young
men left school to join the armed forces.
Immediately after the war, the graduation ratio re-
sumed its upward trend, reaching 70 percent in
1959–60. A peak ratio of 77 percent was attained at
the end of the 1960s. After falling to around 71 per-
cent in 1979–80, the ratio has returned to about the
same level as the late 1960s. More students now ob-
tain diplomas through non-traditional programs than
in the earlier years. If these graduates were included,
the total graduation ratio for young adults might now
be higher than ever.
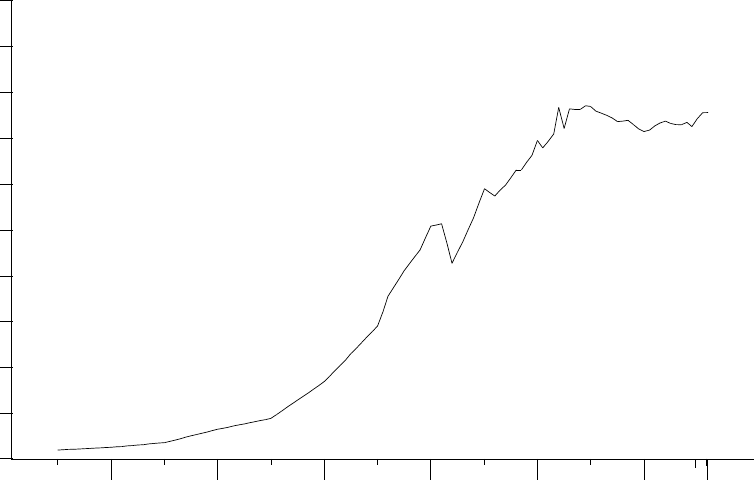
31Elementary and Secondary Education
Figure 11.--Number of public and private high school graduates
per 100 17-year-olds: 1869-70 to 1991-92
Year ending
1870 1880 1890 1900 1910 1920 1930 1940 1950 1960 1970 1980
100
90
80
70
60
50
40
30
20
10
0
Graduates
SOURCE: U.S. Department of Commerce, Bureau of the Census,
Current Population Reports, Series P-25; and U.S. Department of Education,
Historical Statistics of the United States, Colonial Times to 1970;
National Center for Education Statistics,
various issues.
per 100
1992
17-year-olds
and
Digest of Education
Statistics,
Public Elementary and Secondary School
Revenues
Today, public schools derive most of their funds
from state and local governments. Smaller amounts
of federal funds are directed to specific programs,
such as those for disabled or educationally disadvan-
taged children. Prior to the Great Depression of the
1930s, most of the funding came from local (county
and city) sources. From 1889–90 until the mid 1930s,
local governments provided over three-quarters of fi-
nancial support for elementary and secondary edu-
cation. In 1935–36, local governments provided 70
percent of the revenues for public schools and 29
percent came from state governments (table 21). The
federal government provided less than 1 percent.
During the post-war period, the proportions from
state and federal governments began to rise, while
the local proportion declined. By the early 1970s, the
federal government proportion had risen to 9 percent,
and it remained around this level until the early
1980s. The state proportion continued to rise in the
1970s and, in 1978–79, exceeded the local propor-
tion for the first time. During the 1980s, the propor-
tion from the federal government declined, while the
proportion from state governments continued to in-
crease, reaching a high of 50 percent in 1986–87.
During the late 1980s, the local proportion began
growing again, while the state proportions dipped
slightly.
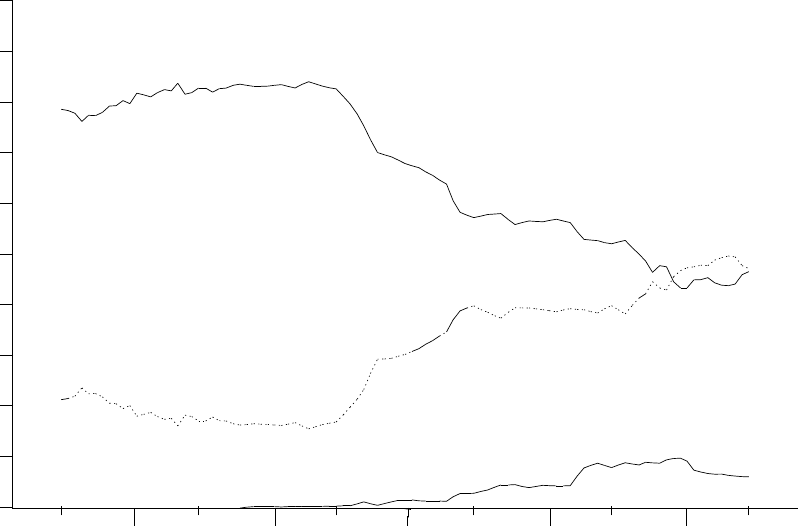
32 Elementary and Secondary Education
1890 1900 1910 1920 1930 1940 1950 1960 1970 1980 1990
100
90
80
70
60
50
40
30
20
10
0
Figure 12.--Sources of revenues for public elementary and
secondary schools: 1889-90 to 1989-90
Percent
State
Local
Federal
Year ending
SOURCE: U.S. Department of Education, National Center for Education Statistics,
Systems; Revenues and Expenditures for Public Elementary
Annual Report of the Commissioner of Education;
and Secondary Education;
and Common Core of Data survey.
Biennial Survey of Education in the United States; Statistics of State School
Public Elementary and Secondary School
Expenditures
Current expenditures are those costs associated
with providing educational services to children (e.g.,
instruction, transportation, and administration). Two
of the most important factors that affect school costs
are the relative number and pay of teachers. If there
is a drop in the pupil/teacher ratio, school expendi-
tures per student will rise if other factors are held
constant. Consistent price indexes to adjust older
historical education finance data are not available.
However, an examination of the 1869–70 to 1909–10
data indicates an increase in per student funding.
The total expenditure (including current expenditures,
plus capital outlay and interest on school debt) per
student rose from $16 to $33 during the 40-year pe-
riod (table 22). This increase in spending would not
indicate a real increase if even very modest levels of
inflation occurred during the 40 years. Also, the sta-
ble pupil/teacher ratio during this period suggests
that little additional resources on a per student basis
were devoted to education.
In 1919–20, current expenditure per student in av-
erage daily attendance stood at about $53, or about
$355 after adjusting to 1989–90 dollars. The expend-
iture per student jumped 81 percent in the 1920s,
after adjusting for inflation. The real value of teacher
salaries rose by 82 percent during this economic
boom period, while pupil/teacher ratios changed little
(table 14). During the Depression of the 1930s, ex-
penditures per student continued to increase, reg-
istering a rise of 24 percent by the end of the dec-
ade.
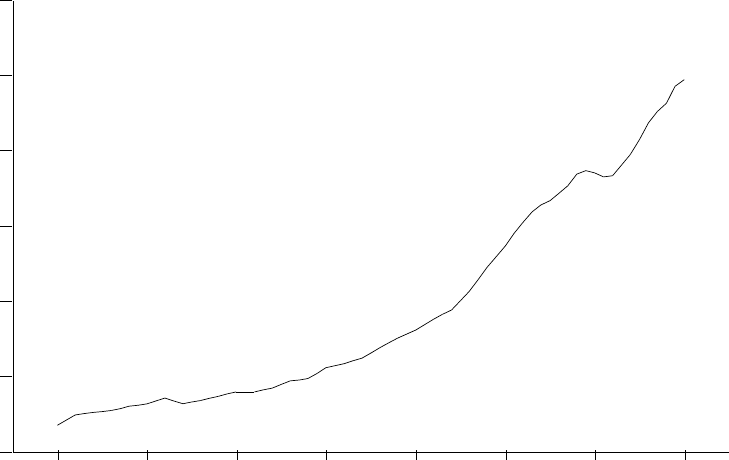
33Elementary and Secondary Education
Figure 13.--Current expenditure per pupil in average daily
Year ending
1920 1930 1940 1950 1960 1970 1980 1990
$6,000
5,000
4,000
3,000
2,000
1,000
0
attendance, in constant 1989-90 dollars: 1919-20 to 1989-90
SOURCE: U.S. Department of Commerce, Bureau of the Census,
Historical Statistics of the United States, Colonial Times to 1970;
Digest of Education Statistics,
U.S. Department of Education, National Center for Education Statistics,
Expenditure
per pupil
and
various years.
Large rises in current expenditure per pupil have
occurred in every decade since World War II, even
after adjusting for inflation. The 45 percent boost in
the 1950s and the 69 percent jump in the 1960s are
particularly impressive considering the rapidly rising
enrollment that occurred during these decades. Dur-
ing the 1970s and 1980s, the rate of increase in ex-
penditures per student slowed to a more moderate
rate of 35 percent and 33 percent, respectively. The
steady increase in expenditure per pupil has been in-
terrupted only twice during the past 70 years, during
the periods 1931–32 to 1933–34 and 1978–79 to
1980–81. In each case, the Nation was experiencing
economic difficulties. In 1989–90, the current ex-
penditure per student in the public schools was near-
ly $5,000.
These historical elementary and secondary edu-
cation statistics depict a great achievement during
the first half of the 20th century in the development
of high schools. Enrollment in high school, once lim-
ited to the elite, is now an opportunity that is shared
by nearly all America’s young people. A higher pro-
portion of students are graduating than ever, and
education funding and teacher salaries are at historic
highs.

34 Elementary and Secondary Education
Table 8.—Historical summary of public elementary and secondary school statistics: 1869–70 to 1989–90
Item 1869–70 1879–80 1889–90 1899–1900 1909–10 1919–20 1929–30 1939–40 1949–50 1959–60 1969–70 1979–80 1988–89 1989–90
1 2 3 4 5 6 7 8 9 101112 13 14 15
Population, pupils, and instructional staff
Total population,
1
in thousands .................................... 38,558 50,156 62,622 75,995 90,490 104,514 121,767 130,880 149,199 177,080 201,385 224,567 245,807 248,239
Population aged 5–17 years,
1
in thousands ................. 11,683 15,066 18,473 21,573 24,011 27,571 31,414 30,151 30,223 42,634 52,386 48,041 45,388 45,330
Percent of total population 5–17 .................................... 30.3 30.0 29.5 28.4 26.5 26.4 25.8 23.0 20.3 24.1 26.0 21.4 18.5 18.3
Total enrollment in elementary and secondary
schools, in thousands
2
..............................................
3
7,562 9,868 12,723 15,503 17,814 21,578 25,678 25,434 25,111 36,087 45,550 41,651 40,189 40,543
Kindergarten and grades 1–8, in thousands
2
........
3
7,481 9,757 12,520 14,984 16,899 19,378 21,279 18,832 19,387 27,602 32,513 28,034 28,499 29,152
Grades 9–12 and postgraduate, in thousands
2
.....
3
80 110 203 519 915 2,200 4,399 6,601 5,725 8,485 13,037 13,616 11,690 11,390
Enrollment as a percent of total population ................... 17.8 19.7 20.3 20.4 19.7 20.6 21.1 19.4 16.8 20.4 22.6 18.5 16.3 16.3
Enrollment as a percent of 5– to 17–year-olds ............. 57.0 65.5 68.9 71.9 74.2 78.3 81.7 84.4 83.1 84.6 87.0 86.7 88.5 89.4
Percent of total enrollment in high schools (grades 9–
12 and postgraduate) .................................................. 1.2 1.1 1.6 3.3 5.1 10.2 17.1 26.0 22.8 23.5 28.6 32.7 29.1 28.1
High school graduates, in thousands ............................ — — 22 62 111 231 592 1,143 1,063 1,627 2,589 2,748 2,459 2,320
Average daily attendance, in thousands ....................... 4,077 6,144 8,154 10,633 12,827 16,150 21,265 22,042 22,284 32,477 41,934 38,289 37,268 37,779
Total number of days attended by pupils enrolled, in
millions ......................................................................... 539 801 1,098 1,535 2,011 2,615 3,673 3,858 3,964 5,782 7,501
4
6,835 — —
Percent of enrolled pupils attending daily ..................... 59.3 62.3 64.1 68.6 72.0 74.8 82.8 86.7 88.7 90.0 90.4
4
90.1 — —
Average length of school term, in days ......................... 132.2 130.3 134.7 144.3 156.8 161.9 172.7 175.0 177.9 178.0 178.9
4
178.5 — —
Average number of days attended per pupil ................. 78.4 81.1 86.3 99.0 112.9 121.2 143.0 151.7 157.9 160.2 161.7
4
160.8 — —
Total instructional staff, in thousands ............................ — — — — — 700 892 912 962 1,464 2,253 2,441 — —
Supervisors, in thousands .......................................... — — — — — 77591432
4
35 — —
Principals, in thousands ............................................. — — — — — 14 31 32 39 64 91 106 — —
Teachers, librarians, and other nonsupervisory in-
structional staff,
5
in thousands ................................ 201 287 364 423 523 680 854 875 914 1,387 2,131 2,300 2,447 2,528
Men, in thousands ................................................ 78 123 126 127 110 96 142 195 195
4
402
4
691
4
782 — —
Women, in thousands .......................................... 123 164 238 296 413 584 712 681 719
4
985
4
1,440
4
1,518 — —
Percent men ......................................................... 38.7 42.8 34.5 29.9 21.1 14.1 16.6 22.2 21.3
4
29.0
4
32.4
4
34.0 — —
Amounts in millions of current dollars
Finance
Total revenue receipts ................................................... — — $143 $220 $433 $970 $2,089 $2,261 $5,437 $14,747 $40,267 $96,881 $192,016 $207,584
Federal government ................................................... — — — — — 2 7 40 156 652 3,220 9,504 11,902 12,751
State governments ..................................................... — — — — — 160 354 684 2,166 5,768 16,063 45,349 91,769 98,060
Local sources, including intermediate ........................ — — — — — 808 1,728 1,536 3,116 8,327 20,985 42,029 88,345 96,774
Percent of revenue receipts from
Federal government ................................................... — — — — — 0.3 0.4 1.8 2.9 4.4 8.0 9.8 6.2 6.1
State governments ..................................................... — — — — — 16.5 16.9 30.3 39.8 39.1 39.9 46.8 47.8 47.2
Local sources, including intermediate ........................ — — — — — 83.2 82.7 68.0 57.3 56.5 52.1 43.4 46.0 46.6
Total expenditures for public schools ............................ $63 $78 $141 $215 $426 $1,036 $2,317 $2,344 $5,838 $15,613 $40,683 $95,962 $192,977 $211,731
Current expenditures
6
................................................ — —
7
114
7
180
7
356 861 1,844 1,942 4,687
8
12,329
8
34,218
8
86,984
8
173,099
8
187,384
Capital outlay
9
........................................................... — — 26 35 70 154 371 258 1,014 2,662 4,659 6,506 14,101 17,685
Interest on school debt ............................................... — — — — — 18 93 131 101 490 1,171 1,874 3,213 3,693
Other expenditures
10
................................................. — — — — — 3 10 13 36 133 636
11
598
11
2,564
11
2,969
Percent of total expenditures devoted to
Current expenditures
6
................................................ — —
7
81.3
7
83.5
7
83.6 83.1 79.6 82.8 80.3
9
79.0
9
84.1
9
90.6
9
89.7
9
88.5
Capital outlay
8
........................................................... — — 18.7 16.5 16.4 14.8 16.0 11.0 17.4 17.0 11.5 6.8 7.3 8.4
Interest on school debt ............................................... — — — — — 1.8 4.0 5.6 1.7 3.1 2.9 2.0 1.7 1.7
Other expenditures
10
................................................. — — — — — 0.3 0.4 0.6 0.6 0.8 1.6
11
0.6
11
1.3
11
1.4

35Elementary and Secondary Education
Table 8.—Historical summary of public elementary and secondary school statistics: 1869–70 to 1989–90—Continued
Item 1869–70 1879–80 1889–90 1899–1900 1909–10 1919–20 1929–30 1939–40 1949–50 1959–60 1969–70 1979–80 1988–89 1989–90
1 2 3 4 5 6 7 8 9 101112 13 14 15
Amounts
Annual salary of instructional staff
12
.............................. $189 $195 $252 $325 $485 $871 $1,420 $1,441 $3,010 $5,174 $8,840
13
$16,715
13
$30,969
13
$32,723
Personal income per member of labor force
1
............... — — — — — — 1,634 1,356 3,400 5,413 8,750 19,087 33,036 34,886
Total school expenditures per capita of total population 1.59 1.56 2.23 2.83 4.71 9.91 19.03 17.91 39 88 202 427 785 853
National income
1
per capita .......................................... — — — — — — 667 587 1,520 2,272 3,829 9,117 16,284 17,099
Current expenditure
14
per pupil in A.D.A.
15
................. — —
7
13.99
7
16.67
7
27.85 53.32 86.70 88.09 209 375 816 2,272 4,645 4,960
Total expenditure
16
per pupil in A.D.A. ......................... 15.55 12.71 17.23 20.21 33.23 64.16 108.49 105.74 259 472 955 2,491 5,109 5,526
National income per pupil in A.D.A. .............................. — — — — — — 3,845 3,502 10,312 12,547 18,656 53,470 107,400 112,358
Current expenditure per day
17
per pupil in A.D.A. ....... — —
7
0.10
7
0.12
7
0.18 0.33 0.50 0.50 1.17 2.11 4.56 12.73 — —
Total expenditure per day per pupil in A.D.A. ............... 0.12 0.10 0.13 0.14 0.21 0.40 0.63 0.60 1.46 2.65 5.34 13.95 — —
Amounts in constant 1989–90 dollars
Annual salary of instructional staff
12
............................. — — — — — $5,803 $10,534 $13,093 $16,138 $22,359 $29,714
13
$27,339
13
$32,447
13
$32,723
Personal income per member of labor force
1
............... — — — — — — 12,121 12,320 18,229 23,392 29,412 31,218 34,612 34,886
Total school expenditures per capita of total population — — — — — 66 141 163 210 381 679 699 823 853
National income
1
per capita .......................................... — — — — — — 4,948 5,333 8,149 9,818 12,871 14,911 17,061 17,099
Current expenditure
14
per pupil in A.D.A.
15
................. — — — — — 355 643 800 1,120 1,621 2,743 3,716 4,866 4,960
Total expenditure
16
per pupil in A.D.A. ......................... — — — — — 427 805 961 1,388 2,040 3,210 4,074 5,353 5,526
National income per pupil in A.D.A. .............................. — — — — — — 28,522 31,819 55,287 54,220 62,709 87,454 112,525 112,358
Current expenditure per day
17
per pupil in A.D.A. ....... — — — — — 2.20 3.71 4.54 6.27 9.12 15.33 20.82 — —
Total expenditure per day per pupil in A.D.A. ............... — — — — — 2.67 4.67 5.45 7.83 11.45 17.95 22.82 — —
1
Data on population and labor force are from the Bureau of the Census, and data on personal income and national
income are from the Bureau of Economic Analysis, U.S. Department of Commerce. Population data through 1900 are
based on total population from the decennial census. From 1909–10 to 1959–60, population data are total population,
including armed forces overseas, as of July 1. Data for later years are for resident population, excluding armed forces
overseas.
2
Data for 1869–70 through 1959–60 are school year enrollment. Data for later years are fall enrollment.
3
Data for 1870–71.
4
Estimated by the National Center for Education Statistics.
5
Prior to 1919–20, data are for the number of different persons employed rather than number of positions.
6
Prior to 1919–20, includes expenditures for interest.
7
Includes interest on school debt.
8
Because of the modification of the scope of ‘‘current expenditures for elementary and secondary schools,’’ data
for 1959–60 and later years are not entirely comparable with prior years.
9
Beginning in 1969–70, includes capital outlay by state and local school building authorities.
10
Includes summer schools, community colleges, and adult education. Beginning in 1959–60, also includes commu-
nity services, formerly classified with ‘‘current expenditures for elementary and secondary schools.’’
11
Excludes community colleges and adult education.
12
Average includes supervisors, principals, teachers, and other nonsupervisory instructional staff.
13
Estimated by the National Education Association.
14
Excludes current expenditures not allocable to pupil costs.
15
‘‘A.D.A.’’ means average daily attendance in elementary and secondary schools.
16
The expenditure figure used here is the sum of current expenditures allocable to pupil costs, capital outlay, and
interest on school debt.
17
Per-day rates derived by dividing annual rates by average length of term.
—Data not collected.
NOTE.—Kindergarten enrollment includes a relatively small number of nursery school pupils. Because of rounding,
details may not add to totals. Some data have been revised from previously published figures. Beginning in 1959–
60, data include Alaska and Hawaii.
SOURCE: U.S. Department of Education, National Center for Education Statistics,
Statistics of State School Systems;
Statistics of Public Elementary and Secondary School Systems; Revenues and Expenditures for Public Elementary and
Secondary Education, FY 1980;
Common Core of Data survey; Council of Economic Advisers,
Economic Indicators;
and National Education Association,
Estimates of School Statistics
(copyright by the National Education Association.)
(This table was prepared October 1992.)

36 Elementary and Secondary Education
Table 9.—Enrollment in regular public and private elementary and secondary schools, by grade level:
1869–70 to fall 1992
[Enrollment in thousands]
Year
All schools Public schools Private schools
1
All public and private schools
Total Kinder-
garten to
grade 8
Grades 9
to 12 Total Kinder-
garten to
grade 8
Grades 9
to 12 Total Kinder-
garten to
grade 8
Grades 9
to 12
Ratio of
kinder-
garten to
grade 12
enrollment
to 5– to
17-year-
olds
Ratio of
kinder-
garten to
grade 8
enrollment
to 5– to
13-year-
olds
Ratio of
grades 9
to 12 en-
rollment to
14– to 17-
year-olds
1 2345678910111213
1869–70 .....................———6,872 —————
2
57.0 — —
1870–71 .....................———7,562 7,481 80 ——————
1871–72 .....................———7,815 ————————
1872–73 .....................———8,004 ————————
1873–74 .....................———8,444 ————————
1874–75 .....................———8,786 ————————
1875–76 .....................———8,869 ————————
1876–77 .....................———8,965 ————————
1877–78 .....................———9,439 ————————
1878–79 .....................———9,504 ————————
1879–80 .....................———9,868 9,757 110 — — —
2
65.5 — —
1880–81 .....................———10,001 ————————
1881–82 .....................———10,212 ————————
1882–83 .....................———10,652 ————————
1883–84 .....................———10,982 ————————
1884–85 .....................———11,398 ————————
1885–86 .....................———11,664 ————————
1886–87 .....................———11,885 ————————
1887–88 .....................———12,183 ————————
1888–89 ..................... 13,661 — — 12,392 — — 1,269 —————
1889–90 ..................... 14,334 14,036 298 12,723 12,520 203 1,611 1,516 95 77.3 — —
1890–91 ..................... 14,541 14,231 310 13,050 12,839 212 1,491 1,392 98 — — —
1891–92 ..................... 14,556 14,215 340 13,256 13,016 240 1,300 1,199 101 — — —
1892–93 ..................... 14,826 14,470 356 13,483 13,229 254 1,343 1,240 102 — — —
1893–94 ..................... 15,314 14,906 408 13,995 13,706 289 1,319 1,200 119 — — —
1894–95 ..................... 15,455 14,987 468 14,244 13,894 350 1,211 1,093 118 — — —
1895–96 ..................... 15,834 15,347 487 14,499 14,118 380 1,335 1,228 107 — — —
1896–97 ..................... 16,140 15,623 517 14,823 14,414 409 1,317 1,209 108 — — —
1897–98 ..................... 16,459 15,904 555 15,104 14,654 450 1,355 1,250 105 — — —
1898–99 ..................... 16,474 15,894 580 15,176 14,700 476 1,298 1,194 104 — — —
1899–1900 ................. 16,855 16,225 630 15,503 14,984 519 1,352 1,241 111 78.1 — —
1900–01 ..................... 17,072 16,422 650 15,703 15,161 542 1,370 1,262 108 79.3 106.6 10.6
1901–02 ..................... 17,126 16,471 655 15,917 15,367 551 1,209 1,104 105 78.6 105.8 10.5
1902–03 ..................... 17,205 16,511 694 16,009 15,417 592 1,196 1,094 102 77.9 104.8 11.0
1903–04 ..................... 17,560 16,821 739 16,256 15,620 636 1,304 1,201 103 78.7 105.8 11.5
1904–05 ..................... 17,806 17,019 787 16,468 15,789 680 1,338 1,231 107 78.8 106.1 12.0
1905–06 ..................... 18,056 17,231 824 16,642 15,919 723 1,414 1,312 102 79.0 106.3 12.4
1906–07 ..................... 18,292 17,444 848 16,891 16,140 751 1,402 1,305 97 79.1 106.6 12.5
1907–08 ..................... 18,537 17,675 862 17,062 16,292 770 1,475 1,383 92 79.2 107.0 12.5
1908–09 ..................... 18,917 17,982 935 17,506 16,665 841 1,411 1,317 94 79.9 107.8 13.4
1909–10 ..................... 19,372 18,340 1,032 17,814 16,899 915 1,558 1,441 117 80.7 108.6 14.5
1910–11 ..................... 19,636 18,349 1,288 18,035 16,878 1,157 1,601 1,471 131 80.5 107.1 17.8
1911–12 ..................... 19,830 18,488 1,342 18,183 16,982 1,201 1,647 1,506 141 80.3 106.4 18.3
1912–13 ..................... 20,348 18,866 1,482 18,609 17,276 1,333 1,739 1,591 148 81.3 106.9 20.1
1913–14 ..................... 20,935 19,348 1,587 19,154 17,722 1,432 1,781 1,626 155 82.1 107.4 21.2
1914–15 ..................... 21,474 19,758 1,717 19,704 18,143 1,562 1,770 1,615 155 82.7 107.4 22.7
1915–16 ..................... 22,172 20,306 1,866 20,352 18,641 1,711 1,820 1,665 155 84.2 108.5 24.5
1916–17
3
.................. 22,344 20,392 1,952 20,603 18,808 1,795 1,741 1,584 157 83.7 107.1 25.5
1917–18 ..................... 22,516 20,423 2,093 20,854 18,920 1,934 1,662 1,504 159 83.1 105.4 27.1
1918–19
3
.................. 22,897 20,643 2,253 21,216 19,149 2,067 1,681 1,495 186 83.2 104.7 28.9
1919–20 ..................... 23,278 20,863 2,414 21,578 19,378 2,200 1,699 1,486 214 84.4 105.2 31.2
1920–21
3
.................. 24,049 21,292 2,757 22,409 19,872 2,537 1,640 1,420 220 85.9 105.8 35.0
1921–22 ..................... 24,820 21,721 3,099 23,239 20,366 2,873 1,581 1,355 226 87.1 106.3 38.4
1922–23
3
.................. 25,418 22,047 3,371 23,764 20,633 3,131 1,654 1,414 240 87.9 106.7 40.8
1923–24 ..................... 26,016 22,372 3,644 24,289 20,899 3,390 1,727 1,473 254 88.6 107.0 43.1
1924–25
3
.................. 26,733 22,807 3,926 24,650 20,999 3,651 2,083 1,808 275 89.7 107.9 45.3
1925–26 ..................... 27,180 23,127 4,053 24,741 20,984 3,757 2,439 2,143 296 90.0 108.3 45.9
1926–27
3
.................. 27,495 23,342 4,153 24,961 21,126 3,834 2,535 2,216 318 89.9 107.9 46.4
1927–28 ..................... 27,810 23,558 4,252 25,180 21,268 3,911 2,631 2,289 341 89.9 107.8 46.8
1928–29
3
.................. 28,070 23,573 4,497 25,429 21,274 4,155 2,641 2,300 341 89.9 107.2 48.8
1929–30 ..................... 28,329 23,588 4,741 25,678 21,279 4,399 2,651 2,310 341 90.2 106.6 51.1
1930–31
3
.................. 28,695 23,553 5,142 25,977 21,207 4,770 2,719 2,346 372 90.7 105.8 54.9
1931–32 ..................... 29,061 23,518 5,543 26,275 21,135 5,140 2,786 2,383 403 91.8 105.6 59.0
1932–33
3
.................. 29,112 23,326 5,786 26,355 20,950 5,405 2,757 2,375 382 92.0 104.9 61.5
1933–34 ..................... 29,163 23,133 6,029 26,434 20,765 5,669 2,729 2,368 360 92.4 104.5 63.8
1934–35
3
.................. 29,084 22,889 6,196 26,401 20,579 5,822 2,684 2,310 374 92.4 104.2 65.0
1935–36 ..................... 29,006 22,644 6,362 26,367 20,393 5,975 2,639 2,251 387 92.4 104.2 65.9
1936–37
3
.................. 28,834 22,316 6,518 26,171 20,070 6,101 2,663 2,246 417 92.4 104.1 66.6
1937–38 ..................... 28,663 21,989 6,674 25,975 19,748 6,227 2,687 2,241 447 92.6 104.3 67.7
1938–39
3
.................. 28,354 21,487 6,866 25,704 19,290 6,414 2,649 2,197 452 92.7 104.0 69.3

37Elementary and Secondary Education
Table 9.—Enrollment in regular public and private elementary and secondary schools, by grade level:
1869–70 to fall 1992—Continued
[Enrollment in thousands]
Year
All schools Public schools Private schools
1
All public and private schools
Total Kinder-
garten to
grade 8
Grades 9
to 12 Total Kinder-
garten to
grade 8
Grades 9
to 12 Total Kinder-
garten to
grade 8
Grades 9
to 12
Ratio of
kinder-
garten to
grade 12
enrollment
to 5– to
17-year-
olds
Ratio of
kinder-
garten to
grade 8
enrollment
to 5– to
13-year-
olds
Ratio of
grades 9
to 12 en-
rollment to
14– to 17-
year-olds
1 2345678910111213
1939–40 ..................... 28,045 20,985 7,059 25,434 18,832 6,601 2,611 2,153 458 93.0 103.6 71.3
1940–41
3
.................. 27,910 20,726 7,184 25,296 18,582 6,714 2,614 2,143 470 93.7 103.9 73.0
1941–42 ..................... 27,179 20,308 6,871 24,562 18,175 6,388 2,617 2,133 483 92.3 103.1 70.5
1942–43
3
.................. 26,709 20,135 6,574 24,155 18,033 6,122 2,554 2,102 452 91.9 103.5 68.4
1943–44 ..................... 25,758 19,783 5,974 23,267 17,713 5,554 2,491 2,070 421 89.3 102.1 63.0
1944–45
3
.................. 25,884 19,830 6,053 23,226 17,666 5,560 2,658 2,165 493 90.3 102.7 64.7
1945–46 ..................... 26,124 19,937 6,187 23,300 17,678 5,622 2,825 2,259 565 91.6 102.9 67.7
1946–47
3
.................. 26,598 20,177 6,421 23,659 17,821 5,838 2,939 2,355 584 93.1 102.6 72.0
1947–48 ..................... 26,998 20,743 6,256 23,945 18,291 5,653 3,054 2,451 602 93.2 103.2 70.5
1948–49
3
.................. 27,694 21,398 6,296 24,477 18,818 5,658 3,217 2,580 637 93.4 102.1 72.3
1949–50 ..................... 28,492 22,095 6,397 25,111 19,387 5,725 3,380 2,708 672 94.3 102.1 74.5
1950–51
3
.................. 29,301 22,831 6,470 25,706 19,900 5,806 3,595 2,931 664 95.4 102.5 76.6
1951–52 ..................... 30,372 23,834 6,538 26,563 20,681 5,882 3,809 3,154 656 97.0 104.6 76.7
1952–53
3
.................. 31,581 24,997 6,584 27,507 21,625 5,882 4,074 3,373 702 95.7 103.0 75.5
1953–54 ..................... 33,175 26,138 7,038 28,836 22,546 6,290 4,339 3,592 747 96.7 102.7 79.4
1954–55
3
.................. 34,569 27,210 7,359 30,045 23,471 6,574 4,524 3,739 785 97.0 102.1 81.8
1955–56 ..................... 35,872 28,177 7,696 31,163 24,290 6,873 4,709 3,886 823 97.1 101.7 83.5
1956–57 ..................... 37,303 29,107 8,195 32,334 25,016 7,318 4,968 4,092 877 97.4 101.2 86.0
1957–58 ..................... 38,756 29,966 8,790 33,529 25,669 7,860 5,227 4,297 931 97.7 101.4 86.6
1958–59 ..................... 40,290 31,040 9,250 34,839 26,581 8,258 5,451 4,459 993 97.9 101.6 87.2
1959–60 ..................... 41,762 32,242 9,520 36,087 27,602 8,485 5,675 4,640 1,035 98.0 101.8 86.9
1960–61 ..................... 43,070 33,191 9,879 37,260 28,439 8,821 5,810 4,752 1,058 97.5 100.4 89.0
1961–62 ..................... 44,146 33,451 10,694 38,253 28,686 9,566 5,893 4,765 1,128 97.5 100.7 88.8
1962–63 ..................... 45,798 34,224 11,574 39,746 29,374 10,372 6,052 4,850 1,202 98.2 101.0 90.8
1963–64 ..................... 47,199 34,825 12,375 41,025 29,915 11,110 6,174 4,910 1,265 98.2 100.7 91.7
1964–65 ..................... 48,580 35,652 12,928 42,280 30,652 11,628 6,300 5,000 1,300 98.1 101.2 90.6
Fall 1965 .................... 48,368 35,366 13,002 42,068 30,466 11,602 6,300 4,900 1,400 96.9 98.9 91.9
Fall 1966 .................... 49,242 35,962 13,280 43,042 31,162 11,880 6,200 4,800 1,400 97.2 99.1 92.2
Fall 1967 .................... 49,890 36,243 13,647 43,890 31,643 12,247 6,000 4,600 1,400 97.1 98.9 92.7
Fall 1968 .................... 50,703 36,581 14,123 44,903 32,181 12,723 5,800 4,400 1,400 97.6 99.4 93.1
Fall 1969 .................... 51,050 36,713 14,337 45,550 32,513 13,037 5,500 4,200 1,300 97.5 99.7 92.2
Fall 1970 .................... 51,257 36,610 14,647 45,894 32,558 13,336 5,363 4,052 1,311 97.5 99.8 92.0
Fall 1971 .................... 51,271 36,218 15,053 46,071 32,318 13,753 5,200 3,900 1,300 97.5 100.0 92.2
Fall 1972 .................... 50,726 35,579 15,148 45,726 31,879 13,848 5,000 3,700 1,300 97.0 99.7 91.0
Fall 1973 .................... 50,445 35,101 15,344 45,445 31,401 14,044 5,000 3,700 1,300 97.2 100.2 91.0
Fall 1974 .................... 50,073 34,671 15,403 45,073 30,971 14,103 5,000 3,700 1,300 97.2 100.6 90.4
Fall 1975 .................... 49,819 34,215 15,604 44,819 30,515 14,304 5,000 3,700 1,300 97.6 100.9 91.1
Fall 1976 .................... 49,478 33,822 15,656 44,311 29,997 14,314 5,167 3,825 1,342 97.7 100.9 91.5
Fall 1977 .................... 48,717 33,172 15,546 43,577 29,375 14,203 5,140 3,797 1,343 97.6 101.0 91.2
Fall 1978 .................... 47,637 32,195 15,441 42,551 28,463 14,088 5,086 3,732 1,353 97.1 100.3 91.1
Fall 1979 .................... 46,651 31,734 14,916 41,651 28,034 13,616 5,000 3,700 1,300 97.1 101.0 89.8
Fall 1980 .................... 46,208 31,639 14,570 40,877 27,647 13,231 5,331 3,992 1,339 97.8 101.7 90.3
Fall 1981 .................... 45,544 31,380 14,164 40,044 27,280 12,764 5,500 4,100 1,400 98.3 102.0 90.8
Fall 1982 .................... 45,166 31,361 13,805 39,566 27,161 12,405 5,600 4,200 1,400 98.9 102.4 91.8
Fall 1983 .................... 44,967 31,296 13,671 39,252 26,981 12,271 5,715 4,315 1,400 99.6 102.9 92.9
Fall 1984 .................... 44,908 31,205 13,704 39,208 26,905 12,304 5,700 4,300 1,400 99.9 103.2 93.2
Fall 1985 .................... 44,979 31,229 13,750 39,422 27,034 12,388 5,557 4,195 1,362 100.0 103.7 92.5
Fall 1986 .................... 45,205 31,536 13,669 39,753 27,420 12,333 5,452 4,116 1,336 100.1 103.9 92.4
Fall 1987 .................... 45,486 32,162 13,324 40,007 27,930 12,077 5,479 4,232 1,247 100.4 104.3 92.1
Fall 1988 .................... 45,430 32,535 12,896 40,189 28,499 11,690 5,241 4,036 1,206 100.1 103.6 92.2
Fall 1989 .................... 45,898 33,314 12,583 40,543 29,152 11,390 5,355 4,162 1,193 101.3 104.6 93.2
Fall 1990 .................... 46,450 33,978 12,472 41,224 29,888 11,336 5,226 4,090 1,136 102.5 106.2 93.7
Fall 1991
3
................. 47,032 34,447 12,585 41,839 30,378 11,461 5,193 4,069 1,124 102.4 106.0 93.8
Fall 1992
3
................. 47,601 34,855 12,746 42,250 30,663 11,587 5,351 4,192 1,159 — — —
1
For 1958–59 and 1960–61 through 1963–64, numbers were estimated using linear
interpolation. Data for most years are at least partially estimated.
2
Data are for public elementary and secondary schools only.
3
Estimated.
—Data not available.
NOTE.—Prior to 1965, enrollment data include students who enrolled at any time dur-
ing the school year. Enrollment ratios based on cumulative enrollment figures tend to
be approximately 1 to 2 percentage points higher than counts based on fall enrollment.
In later years, data for grades kindergarten through 8 include a relatively small number
of prekindergarten students. Data for grades 9 to 12 contain a small number of post-
graduate students. Population data for 1870 through 1961 include U.S. population over-
seas; data for later years are for U.S. resident population only. Population data for 1870
to 1890 are from the decennial census. Data for later years are based on counts of pop-
ulation for July 1 preceding the school year. Because of rounding, details may not add
to totals.
SOURCE: U.S. Department of Education, National Center for Education Statistics,
An-
nual Report of the Commissioner of Education, Biennial Survey of Education in the Unit-
ed States; Statistics of State School Systems; Digest of Education Statistics;
and U.S.
Department of Commerce, Bureau of the Census, Current Population Reports, Series P-
20, and unpublished data. (This table was prepared September 1992.)

38 Elementary and Secondary Education
Table 10.—Enrollment in regular public elementary and secondary schools, by grade:
1910–11 to fall 1990
Year Total
Kindergarten through grade 8
Total Kinder-
garten
1
Grade 1 Grade 2 Grade 3 Grade 4 Grade 5 Grade 6
1 2345678910
1910–11 .......... 18,035,118 16,878,123 326,883 3,889,542 2,449,584 2,300,622 2,201,315 1,870,290 1,522,714
1911–12 .......... 18,182,937 16,982,139 348,303 3,875,684 2,445,174 2,295,469 2,212,300 1,879,624 1,546,947
1912–13 .......... 18,609,040 17,275,684 369,723 3,922,183 2,468,270 2,316,117 2,248,493 1,910,374 1,589,160
1913–14 .......... 19,153,786 17,721,691 391,143 3,986,026 2,495,599 2,374,285 2,287,632 1,975,683 1,663,733
1914–15 .......... 19,704,209 18,142,653 409,083 4,043,254 2,535,900 2,411,766 2,340,831 2,021,627 1,720,156
1915–16 .......... 20,351,687 18,640,815 434,022 4,114,735 2,585,365 2,476,124 2,403,297 2,075,574 1,784,266
1916–17
3
........ 20,602,602 18,807,710 433,700 4,224,907 2,600,418 2,503,813 2,425,708 2,104,986 1,814,236
1917–18 .......... 20,853,516 18,919,695 433,377 4,323,170 2,607,727 2,524,215 2,440,871 2,128,086 1,838,770
1918–19
3
........ 21,215,916 19,148,811 457,322 4,321,996 2,622,775 2,510,915 2,498,633 2,140,588 1,864,631
1919–20 .......... 21,578,316 19,377,927 481,266 4,320,823 2,637,822 2,497,615 2,556,395 2,153,091 1,890,492
1920–21
3
........ 22,408,773 19,872,124 505,252 4,248,745 2,743,417 2,606,922 2,558,036 2,221,331 1,974,256
1921–22 .......... 23,239,227 20,366,218 529,235 4,176,567 2,849,013 2,716,229 2,559,677 2,289,571 2,058,019
1922–23
3
........ 23,764,017 20,632,624 569,447 4,180,450 2,831,210 2,755,947 2,634,084 2,365,065 2,089,418
1923–24 .......... 24,288,808 20,898,930 609,659 4,184,232 2,813,409 2,795,665 2,708,491 2,440,558 2,120,817
1924–25
3
........ 24,650,291 20,999,078 599,684 4,048,598 2,799,520 2,730,383 2,696,479 2,514,493 2,186,346
1925–26 .......... 24,741,468 20,984,002 673,231 3,976,750 2,819,896 2,729,252 2,662,205 2,473,053 2,234,246
1926–27
3
........ 24,960,582 21,126,210 684,360 4,073,894 2,818,218 2,695,615 2,647,339 2,454,260 2,238,844
1927–28 .......... 25,179,696 21,268,417 695,490 4,171,037 2,816,540 2,661,977 2,632,474 2,435,466 2,243,443
1928–29
3
........ 25,428,856 21,273,505 709,467 4,160,978 2,809,727 2,697,108 2,615,851 2,408,979 2,249,846
1929–30 .......... 25,678,015 21,278,593 723,443 4,150,919 2,802,914 2,732,239 2,599,229 2,382,491 2,256,249
1930–31
3
........ 25,976,728 21,207,007 712,423 4,040,558 2,789,646 2,697,881 2,594,164 2,422,527 2,267,081
1931–32 .......... 26,275,441 21,135,420 701,403 3,930,196 2,776,378 2,663,524 2,589,098 2,462,563 2,277,913
1932–33
3
........ 26,354,817 20,950,229 649,001 3,826,112 2,704,053 2,637,885 2,581,054 2,448,002 2,282,982
1933–34 .......... 26,434,193 20,765,037 601,775 3,716,852 2,631,728 2,612,246 2,573,010 2,433,441 2,288,051
1934–35
3
........ 26,400,646 20,578,799 604,264 3,623,589 2,594,659 2,568,491 2,535,875 2,433,216 2,303,760
1935–36 .......... 26,367,098 20,392,561 606,753 3,530,325 2,557,589 2,524,736 2,498,741 2,432,991 2,319,470
1936–37
3
........ 26,171,103 20,070,368 606,893 3,423,735 2,522,070 2,484,558 2,450,679 2,387,710 2,286,096
1937–38 .......... 25,975,108 19,748,174 607,034 3,317,144 2,486,550 2,444,381 2,402,617 2,342,428 2,252,722
1938–39
3
........ 25,704,325 19,290,136 600,841 3,167,803 2,409,813 2,387,970 2,362,242 2,295,060 2,214,428
1939–40 .......... 25,433,542 18,832,098 594,647 3,018,463 2,333,076 2,331,559 2,321,867 2,247,692 2,176,133
1940–41
3
........ 25,296,138 18,582,225 613,213 2,991,738 2,285,614 2,263,315 2,270,749 2,211,285 2,155,538
1941–42 .......... 24,562,473 18,174,668 625,783 2,930,762 2,215,100 2,175,245 2,196,732 2,166,018 2,124,494
1942–43
3
........ 24,155,146 18,033,080 664,915 2,919,242 2,228,945 2,179,843 2,148,889 2,101,723 2,071,396
1943–44 .......... 23,266,616 17,713,096 697,468 2,878,843 2,220,739 2,162,878 2,079,788 2,016,635 1,997,806
1944–45
3
........ 23,225,784 17,665,594 733,974 2,881,849 2,265,796 2,173,078 2,083,552 2,007,988 1,950,624
1945–46 .......... 23,299,941 17,677,744 772,957 2,894,588 2,318,502 2,190,617 2,094,352 2,006,120 1,910,028
1946–47
3
........ 23,659,158 17,821,481 872,835 2,896,451 2,319,772 2,204,573 2,119,377 2,012,212 1,907,319
1947–48 .......... 23,944,532 18,291,227 988,680 2,951,300 2,363,477 2,258,858 2,183,171 2,055,115 1,939,500
1948–49
3
........ 24,476,658 18,818,254 1,016,186 3,067,375 2,502,828 2,314,645 2,220,554 2,088,826 1,994,735
1949–50 .......... 25,111,427 19,386,806 1,034,203 3,170,343 2,644,707 2,395,904 2,254,028 2,150,678 2,055,741
1950–51
3
........ 25,706,000 19,900,000 941,138 3,052,806 2,739,176 2,600,440 2,357,752 2,211,306 2,117,360
1951–52 .......... 26,562,664 20,680,867 1,272,127 2,957,485 2,670,162 2,717,947 2,559,115 2,320,132 2,165,741
1952–53
3
........ 27,506,630 21,624,682 1,399,064 3,357,598 2,638,816 2,633,457 2,684,145 2,520,163 2,275,680
1953–54 .......... 28,836,052 22,545,807 1,474,007 3,666,466 2,940,285 2,569,243 2,565,345 2,606,983 2,449,174
1954–55
3
........ 30,045,000 23,471,000 1,415,000 3,518,000 3,391,000 2,896,000 2,535,000 2,523,000 2,584,000

39Elementary and Secondary Education
Table 10.—Enrollment in regular public elementary and secondary schools, by grade:
1910–11 to fall 1990—Continued
Year
Kindergarten through grade 8 Grades 9 through 12 and postgraduate
Grade 7 Grade 8 Elementary
unclassi-
fied
2
Total Grade 9 Grade 10 Grade 11 Grade 12 Post-
graduate
Secondary
unclassi-
fied
2
1 11121314151617181920
1910–11 .......... 1,257,894 1,059,279 — 1,156,995 495,194 308,918 208,259 144,624 — —
1911–12 .......... 1,280,805 1,097,833 — 1,200,798 500,733 325,416 218,545 156,104 — —
1912–13 .......... 1,318,665 1,132,699 — 1,333,356 546,676 358,673 248,004 180,003 — —
1913–14 .......... 1,369,113 1,178,477 — 1,432,095 584,295 383,801 266,370 197,629 — —
1914–15 .......... 1,418,686 1,241,350 — 1,561,556 638,677 416,935 287,326 218,618 — —
1915–16 .......... 1,474,750 1,292,682 — 1,710,872 692,903 460,225 316,511 241,233 — —
1916–17
3
........ 1,481,027 1,218,915 — 1,794,892 743,064 476,406 324,163 251,259 — —
1917–18 .......... 1,482,675 1,140,804 — 1,933,821 816,396 506,974 341,534 268,917 — —
1918–19
3
........ 1,537,385 1,194,566 — 2,067,105 866,519 541,462 368,888 290,236 — —
1919–20 .......... 1,592,095 1,248,328 — 2,200,389 916,642 575,950 396,242 311,555 — —
1920–21
3
........ 1,668,158 1,346,007 — 2,536,649 1,065,177 678,752 455,842 336,878 — —
1921–22 .......... 1,744,222 1,443,685 — 2,873,009 1,213,713 781,553 515,542 362,201 — —
1922–23
3
........ 1,795,314 1,411,689 — 3,131,393 1,271,062 850,766 583,386 426,179 — —
1923–24 .......... 1,846,407 1,379,692 — 3,389,878 1,328,412 919,979 651,329 490,158 — —
1924–25
3
........ 1,930,732 1,492,843 — 3,651,213 1,424,304 970,415 715,978 540,516 — —
1925–26 .......... 1,927,265 1,488,104 — 3,757,466 1,425,204 1,004,503 736,254 591,505 — —
1926–27
3
........ 1,974,451 1,539,229 — 3,834,372 1,450,564 1,025,030 751,980 606,798 — —
1927–28 .......... 2,021,636 1,590,354 — 3,911,279 1,475,924 1,045,558 767,706 622,091 — —
1928–29
3
........ 2,025,686 1,595,863 — 4,155,351 1,551,374 1,118,871 823,616 661,490 — —
1929–30 .......... 2,029,736 1,601,373 — 4,399,422 1,626,823 1,192,185 879,525 700,889 — —
1930–31
3
........ 2,041,280 1,641,447 — 4,769,721 1,702,216 1,289,758 973,140 786,337 18,270 —
1931–32 .......... 2,052,825 1,681,520 — 5,140,021 1,777,608 1,387,331 1,066,755 871,786 36,541 —
1932–33
3
........ 2,119,972 1,701,168 — 5,404,588 1,816,317 1,463,793 1,137,967 938,580 47,931 —
1933–34 .......... 2,187,119 1,720,815 — 5,669,156 1,855,026 1,540,254 1,209,180 1,005,375 59,321 —
1934–35
3
........ 2,184,553 1,730,392 — 5,821,847 1,912,549 1,580,058 1,229,295 1,034,922 65,023 —
1935–36 .......... 2,181,987 1,739,969 — 5,974,537 1,970,072 1,619,862 1,249,409 1,064,469 70,725 —
1936–37
3
........ 2,177,580 1,731,047 — 6,100,735 1,974,726 1,644,571 1,314,404 1,107,487 59,547 —
1937–38 .......... 2,173,173 1,722,125 — 6,226,934 1,979,379 1,669,281 1,379,398 1,150,506 48,370 —
1938–39
3
........ 2,140,420 1,711,559 — 6,414,189 1,995,360 1,718,297 1,432,500 1,216,121 51,911 —
1939–40 .......... 2,107,667 1,700,994 — 6,601,444 2,011,341 1,767,312 1,485,603 1,281,735 55,453 —
1940–41
3
........ 2,049,791 1,690,982 — 6,713,913 2,034,316 1,792,615 1,517,344 1,322,641 46,997 —
1941–42 .......... 2,060,752 1,679,782 — 6,387,805 1,927,040 1,705,746 1,450,788 1,273,141 31,090 —
1942–43
3
........ 2,022,880 1,695,247 — 6,122,066 1,897,750 1,653,586 1,374,470 1,170,319 25,941 —
1943–44 .......... 1,964,997 1,693,942 — 5,553,520 1,774,593 1,519,638 1,230,168 1,009,611 19,510 —
1944–45
3
........ 1,897,743 1,670,990 — 5,560,190 1,742,873 1,529,857 1,236,883 1,015,959 34,618 —
1945–46 .......... 1,836,897 1,653,683 — 5,622,197 1,728,499 1,555,302 1,255,907 1,032,420 50,069 —
1946–47
3
........ 1,850,394 1,638,548 — 5,837,677 1,761,020 1,583,245 1,308,592 1,119,968 64,852 —
1947–48 .......... 1,897,740 1,653,386 — 5,653,305 1,672,920 1,502,743 1,271,645 1,130,805 75,192 —
1948–49
3
........ 1,919,462 1,693,643 — 5,658,404 1,708,838 1,499,477 1,267,483 1,126,022 56,584 —
1949–50 .......... 1,947,227 1,733,975 — 5,724,621 1,760,740 1,513,086 1,275,295 1,133,673 41,827 —
1950–51
3
........ 1,995,238 1,884,784 — 5,806,000 1,780,738 1,547,895 1,313,207 1,127,527 36,633 —
1951–52 .......... 2,082,533 1,935,625 — 5,881,797 1,819,732 1,582,142 1,337,930 1,110,638 31,355 —
1952–53
3
........ 2,143,106 1,972,653 — 5,881,948 1,861,411 1,579,177 1,306,615 1,107,884 26,861 —
1953–54 .......... 2,242,116 2,032,188 — 6,290,245 1,944,357 1,716,758 1,411,722 1,190,138 27,270 —
1954–55
3
........ 2,432,000 2,177,000 — 6,574,000 2,028,000 1,765,000 1,520,000 1,246,000 15,000 —

40 Elementary and Secondary Education
Table 10.—Enrollment in regular public elementary and secondary schools, by grade:
1910–11 to fall 1990—Continued
Year Total
Kindergarten through grade 8
Total Kinder-
garten
1
Grade 1 Grade 2 Grade 3 Grade 4 Grade 5 Grade 6
1 2345678910
1955–56 .......... 31,162,843 24,290,257 1,564,396 3,494,997 3,242,407 3,290,740 2,847,741 2,481,210 2,470,310
1956–57 .......... 32,334,333 25,015,873 1,675,373 3,491,387 3,240,771 3,183,406 3,237,852 2,808,290 2,442,701
1957–58 .......... 33,528,591 25,668,820 1,771,753 3,586,683 3,213,900 3,175,704 3,127,702 3,180,952 2,758,859
1958–59 .......... 34,838,641 26,580,774 1,834,014 3,678,772 3,345,722 3,179,087 3,141,825 3,099,426 3,135,641
1959–60 .......... 36,086,771 27,601,902 1,922,712 3,732,924 3,436,173 3,302,366 3,146,168 3,117,885 3,069,692
1960–61
3
........ 37,260,000 28,439,000 2,000,000 3,822,000 3,502,000 3,405,000 3,278,000 3,131,000 3,095,000
1961–62 .......... 38,252,673 28,686,420 2,064,852 3,857,075 3,567,852 3,428,206 3,342,980 3,218,277 3,064,577
1962–63
3
........ 39,746,000 29,374,000 2,162,000 3,928,000 3,630,000 3,518,000 3,391,000 3,332,000 3,190,000
1963–64
3
........ 41,025,000 29,915,000 2,177,000 4,023,000 3,705,000 3,560,000 3,467,000 3,366,000 3,299,000
1964–65
3
........ 42,280,000 30,652,000 2,250,000 4,014,000 3,800,000 3,662,000 3,523,000 3,465,000 3,362,000
Fall 1965 ......... 42,068,117 30,465,838 2,259,978 3,914,890 3,644,283 3,595,485 3,475,718 3,376,965 3,311,608
Fall 1966 ......... 43,042,127 31,162,189 2,370,462 3,954,328 3,696,457 3,615,340 3,580,280 3,462,525 3,369,162
Fall 1967 ......... 43,889,800 31,643,017 2,420,163 3,979,641 3,722,925 3,658,900 3,579,595 3,562,040 3,449,982
Fall 1968 ......... 44,903,166 32,180,510 2,510,856 3,926,204 3,758,260 3,692,353 3,628,751 3,572,609 3,555,465
Fall 1969 ......... 45,550,284 32,513,403 2,544,675 3,868,874 3,715,875 3,720,273 3,660,367 3,621,198 3,568,291
Fall 1970 ......... 45,893,960 32,558,308 2,563,579 3,816,598 3,654,267 3,662,935 3,675,187 3,635,354 3,597,730
Fall 1971 ......... 46,071,327 32,318,229 2,483,175 3,569,907 3,586,811 3,611,940 3,623,135 3,662,163 3,622,049
Fall 1972 ......... 45,726,408 31,878,600 2,503,475 3,351,551 3,381,182 3,532,508 3,553,633 3,596,637 3,638,617
Fall 1973 ......... 45,444,787 31,400,809 2,654,770 3,239,246 3,191,806 3,335,705 3,505,015 3,538,470 3,592,162
Fall 1974 ......... 45,073,441 30,970,723 2,800,625 3,198,255 3,106,126 3,169,434 3,344,721 3,510,207 3,558,679
Fall 1975 ......... 44,819,327 30,515,131 2,971,538 3,238,299 3,027,189 3,038,127 3,112,233 3,281,102 3,476,322
Fall 1976 ......... 44,310,966 29,996,835 2,918,189 3,332,225 3,086,214 2,986,432 3,024,788 3,116,272 3,298,200
Fall 1977 ......... 43,577,373 29,374,503 2,741,820 3,294,755 3,199,609 3,059,474 2,979,007 3,018,803 3,111,480
Fall 1978 ......... 42,550,893 28,463,348 2,652,467 3,062,180 3,148,000 3,158,000 3,046,000 2,980,000 3,036,000
Fall 1979 ......... 41,650,712 28,034,345 2,674,708 2,936,788 2,908,724 3,119,639 3,147,912 3,054,764 2,999,408
Fall 1980 ......... 40,877,481 27,646,536 2,689,243 2,894,473 2,799,593 2,893,007 3,107,126 3,129,864 3,037,601
Fall 1981 ......... 40,044,093 27,280,220 2,687,151 2,950,609 2,782,406 2,806,394 2,917,954 3,126,877 3,180,311
Fall 1982 ......... 39,565,610 27,160,518 2,845,402 2,937,054 2,790,497 2,763,006 2,797,859 2,911,721 3,141,580
Fall 1983 ......... 39,252,308 26,980,962 2,858,783 3,079,916 2,781,355 2,772,025 2,758,011 2,797,905 2,928,288
Fall 1984 ......... 39,208,252 26,904,517 3,009,630 3,112,800 2,904,385 2,764,966 2,771,972 2,760,549 2,830,629
Fall 1985 ......... 39,421,961 27,034,244 3,192,406 3,238,855 2,940,995 2,894,524 2,771,015 2,776,402 2,788,817
Fall 1986 ......... 39,753,172 27,420,063 3,309,782 3,357,949 3,054,039 2,933,018 2,895,932 2,774,856 2,805,770
Fall 1987 ......... 40,007,022 27,930,296 3,387,202 3,407,072 3,172,777 3,046,374 2,937,636 2,900,558 2,811,047
Fall 1988 ......... 40,188,690 28,499,136 3,433,124 3,460,049 3,223,428 3,167,036 3,050,506 2,945,065 2,936,696
Fall 1989 ......... 40,542,707 29,152,224 3,486,358 3,484,789 3,289,081 3,234,961 3,182,098 3,066,633 2,987,333
Fall 1990 ......... 41,223,804 29,887,650 3,611,561 3,499,091 3,328,109 3,298,633 3,249,437 3,197,495 3,111,713

41Elementary and Secondary Education
Table 10.—Enrollment in regular public elementary and secondary schools, by grade:
1910–11 to fall 1990—Continued
Year
Kindergarten through grade 8 Grades 9 through 12 and postgraduate
Grade 7 Grade 8 Elementary
unclassi-
fied
2
Total Grade 9 Grade 10 Grade 11 Grade 12 Post-
graduate
Secondary
unclassi-
fied
2
1 11121314151617181920
1955–56 .......... 2,541,719 2,356,737 — 6,872,586 2,142,573 1,848,570 1,542,646 1,325,726 13,071 —
1956–57 .......... 2,475,610 2,460,483 — 7,318,460 2,367,969 1,973,829 1,614,593 1,349,315 12,754 —
1957–58 .......... 2,457,872 2,395,395 — 7,859,771 2,479,588 2,193,739 1,736,180 1,431,302 18,962 —
1958–59 .......... 2,785,211 2,381,076 — 8,257,867 2,412,495 2,317,913 1,954,578 1,537,872 35,009 —
1959–60 .......... 3,172,798 2,701,184 — 8,484,869 2,412,413 2,258,010 2,063,322 1,747,311 3,813 —
1960–61
3
........ 3,123,000 3,083,000 — 8,821,000 2,750,000 2,252,000 1,997,000 1,820,000 2,000 —
1961–62 .......... 3,121,946 3,020,655 — 9,566,253 3,155,544 2,594,694 2,017,988 1,790,759 7,268 —
1962–63
3
........ 3,140,000 3,083,000 — 10,372,000 3,172,000 2,981,000 2,348,000 1,866,000 5,000 —
1963–64
3
........ 3,241,000 3,077,000 — 11,110,000 3,190,000 3,006,000 2,747,000 2,160,000 6,000 —
1964–65
3
........ 3,363,000 3,212,000 — 11,628,000 3,198,000 3,085,000 2,778,000 2,560,000 7,000 —
Fall 1965 ......... 3,296,830 3,185,613 404,468 11,602,279 3,215,090 2,993,191 2,740,889 2,477,142 6,563 169,404
Fall 1966 ......... 3,408,884 3,271,929 432,822 11,879,938 3,318,359 3,110,920 2,755,522 2,507,943 8,117 179,077
Fall 1967 ......... 3,454,124 3,356,821 458,826 12,246,783 3,395,030 3,221,364 2,879,107 2,525,408 16,266 209,608
Fall 1968 ......... 3,552,276 3,423,191 560,545 12,722,656 3,508,374 3,310,258 2,986,249 2,650,172 16,701 250,902
Fall 1969 ......... 3,666,623 3,519,625 627,602 13,036,881 3,567,783 3,404,835 3,047,342 2,731,777 20,680 264,464
Fall 1970 ......... 3,661,771 3,601,368 689,519 13,335,652 3,653,691 3,458,001 3,127,721 2,775,013 28,002 293,224
Fall 1971 ......... 3,710,030 3,635,020 813,999 13,753,098 3,781,001 3,571,024 3,200,171 2,863,832 9,037 328,033
Fall 1972 ......... 3,713,030 3,648,987 958,980 13,847,808 3,779,014 3,648,083 3,248,310 2,873,311 9,527 289,563
Fall 1973 ......... 3,741,103 3,675,682 926,850 14,043,978 3,800,743 3,650,445 3,323,148 2,917,920 3,695 348,027
Fall 1974 ......... 3,711,508 3,708,183 862,985 14,102,718 3,832,324 3,675,111 3,302,021 2,954,753 12,524 325,985
Fall 1975 ......... 3,618,952 3,635,697 1,115,672 14,304,196 3,878,760 3,723,241 3,353,888 2,986,296 22,598 339,413
Fall 1976 ......... 3,572,142 3,578,411 1,083,962 14,314,131 3,825,463 3,738,005 3,372,577 3,015,123 23,222 339,741
Fall 1977 ......... 3,384,593 3,533,583 1,051,379 14,202,870 3,779,103 3,686,352 3,387,650 3,026,115 12,732 310,918
Fall 1978 ......... 3,228,000 3,355,000 797,701 14,087,545 3,726,000 3,610,217 3,312,222 3,023,181 — 415,925
Fall 1979 ......... 3,127,695 3,170,749 893,958 13,616,367 3,526,450 3,531,995 3,240,825 2,968,747 — 348,350
Fall 1980 ......... 3,085,185 3,086,215 924,229 13,230,945 3,376,921 3,367,839 3,194,840 2,925,093 — 366,252
Fall 1981 ......... 3,182,613 3,058,995 586,910 12,763,873 3,286,288 3,217,564 3,038,979 2,907,276 — 313,766
Fall 1982 ......... 3,287,557 3,123,326 562,516 12,405,092 3,248,270 3,137,434 2,916,632 2,787,292 — 315,464
Fall 1983 ......... 3,247,425 3,222,136 535,118 12,271,346 3,330,074 3,102,912 2,860,892 2,678,093 — 299,375
Fall 1984 ......... 3,035,837 3,186,075 527,674 12,303,735 3,440,090 3,145,206 2,819,417 2,599,348 — 299,674
Fall 1985 ......... 2,938,307 2,981,883 511,040 12,387,717 3,438,951 3,230,130 2,866,025 2,549,614 — 302,997
Fall 1986 ......... 2,899,352 2,869,754 519,611 12,333,109 3,256,407 3,214,941 2,953,561 2,600,516 — 307,684
Fall 1987 ......... 2,910,432 2,838,513 518,685 12,076,726 3,143,179 3,020,018 2,935,626 2,680,825 — 297,078
Fall 1988 ......... 2,905,036 2,853,007 525,189 11,689,554 3,106,280 2,894,602 2,748,750 2,649,674 — 290,248
Fall 1989 ......... 3,027,491 2,853,464 540,016 11,390,483 3,141,456 2,867,522 2,629,483 2,473,278 — 278,744
Fall 1990 ......... 3,067,077 2,980,984 543,550 11,336,154 3,169,211 2,896,670 2,612,157 2,380,470 — 277,646
1
In later years, data contain a relatively small number of prekindergarten students.
2
Prior to fall 1965, enrollment in ungraded and special classes was prorated among
the regular grades.
3
Estimated.
—Data not available.
NOTE.—Prior to 1965 enrollment data include students who enrolled at any time dur-
ing the school year.
SOURCE: U.S. Department of Education, National Center for Education Statistics,
An-
nual Report of the Commissioner of Education, Biennial Survey of Education in the Unit-
ed States; Statistics of State School Systems; and Digest of Education Statistics.
(This
table was prepared February 1998.)

42 Elementary and Secondary Education
Table 11.—Enrollment in regular public elementary and secondary schools, by state: 1870–71 to fall 1990
State
Students enrolled at any time during the school year Fall enrollment
Estimated
1870–71 1879–80 1889–90 1899–1900 1909–10 1919–20 1929–30 1939–40 1949–50 1959–60 1969 1979 1989 1990
1 23456789101112131415
United States
1
................................................ 7,561,582 9,867,505 12,722,581 15,503,110 17,813,852 21,578,316 25,678,015 25,433,542 25,111,427 36,086,771 45,550,284 41,650,712 40,542,707 41,223,804
Alabama .................................................................. 141,312 179,400 301,615 376,423 424,611 569,940 622,988 686,767 680,066 787,269 826,237 754,181 723,743 721,806
Alaska
1
.................................................................... —————3,360 3,436 6,312 13,910 44,450 76,828 88,573 109,280 113,874
Arizona .................................................................... — 4,212 7,989 16,504 31,312 76,505 103,806 110,205 139,244 302,672 418,069 509,252 607,615 639,853
Arkansas ................................................................. 69,927 81,972 223,071 314,662 395,978 483,172 456,185 465,339 407,084 424,206 460,115 453,125 434,960 436,286
California ................................................................. 91,332 158,765 221,756 269,736 368,391 696,238 1,068,683 1,189,106 1,757,424
2
3,199,455 4,597,700 4,119,511 4,771,978 4,950,474
Colorado .................................................................. 4,357 22,119 65,490 117,555 168,798 220,232 240,482 221,409 229,196 393,690 538,175 550,527 562,755 574,213
Connecticut ............................................................. 113,588 119,694 126,505 155,228 190,353 261,463 319,453 281,032 273,015 476,828 646,393 566,634 461,560 469,123
Delaware ................................................................. 20,058 27,823 31,434 36,895 35,950 38,483 42,360 44,046 46,055
3
80,874 130,471 104,035 97,808 99,658
District of Columbia ................................................. 15,157 26,439 36,906 46,519 55,774 65,298 80,965 96,170 96,323 122,486 149,054 106,156 81,301 80,694
Florida ..................................................................... 14,000 39,315 92,472 108,874 148,089 225,160 346,434 369,214 449,836 993,496 1,408,095 1,508,337 1,789,925 1,861,592
Georgia .................................................................... 49,578 236,533 381,297 482,673 555,794 690,918 713,290 737,979 718,037 949,099 1,112,416 1,078,462 1,126,535 1,151,687
Hawaii
1
.................................................................... —————41,350 71,657 91,821 89,820
2
139,429 178,448 168,660 169,493 171,708
Idaho ....................................................................... 906 5,834 14,311 36,669 76,168 115,192 120,947 120,987 122,259 162,839 179,873 202,758 214,932 220,840
Illinois ...................................................................... 672,787 704,041 778,319 958,911 1,002,687 1,127,560 1,395,907 1,248,827 1,153,683 1,787,869 2,324,516 2,043,239 1,797,355 1,821,407
Indiana ..................................................................... 450,057 511,283 512,955 564,807 531,459 566,288 667,379 671,364 689,808 989,259 1,223,747 1,083,826 954,165 954,581
Iowa ......................................................................... 341,938 426,057 493,267 566,223 510,661 514,521 554,655 503,481 477,720 598,103 660,389 548,317 478,486 483,652
Kansas .................................................................... 89,777 231,434 399,322 389,582 398,746 406,880 431,166 376,349 347,626 478,630 518,867 422,924 430,864 437,034
Kentucky .................................................................. 178,457
4
276,000 399,660 500,294 494,863 535,332 588,354 604,064 562,883 631,412 703,720 677,123 630,688 636,401
Louisiana ................................................................. 57,639 77,642 120,253 196,169 263,617 354,079 434,557 473,020 483,363 693,202 853,766 800,435 783,025 784,757
Maine ....................................................................... 152,600 149,827 139,676 130,918 144,278 137,681 154,455 163,640 158,247 195,325 240,169 227,823 213,775 215,149
Maryland .................................................................. 115,683 162,431 184,251 222,373 238,393 241,618 277,459 287,225 335,018 596,375 891,981 777,725 698,806 715,176
Massachusetts ........................................................ 273,661 306,777 371,492 474,891 535,869 623,586 759,492 700,305 632,285
2
860,667 1,147,561 1,035,724 825,588 834,314
Michigan .................................................................. 292,466 362,556 427,032 504,985 541,501 691,674 970,582 970,188 1,069,435
2
1,625,247 2,138,979 1,860,498 1,576,785 1,581,925
Minnesota ................................................................ 113,983 180,248 280,960 399,207 440,083 503,597 551,741 512,224 481,612 681,938 913,915 778,056 739,553 756,374
Mississippi ............................................................... 117,000 236,654 334,158 386,507 469,137
4
412,670 595,449 594,799 527,440 566,421 575,284 482,039 502,020 502,417
Missouri ................................................................... 330,070 482,986 620,314 719,817 707,031 672,483 656,073 700,640 644,457 820,724 1,077,288 872,933 807,934 812,234
Montana .................................................................. 1,657 4,270 16,980 39,430 66,141 126,576 120,337 107,302 105,917 144,998 174,784 158,208 151,265 152,974
Nebraska ................................................................. 23,265 92,549 240,300 288,227
4
281,375 311,821 325,216 276,188 227,879 282,721 330,990 287,288 270,920 274,081
Nevada .................................................................... 3,106 9,045 7,387 6,676
4
10,200 14,114 18,041 20,746 25,144 66,415 123,663 147,734 186,834 201,316
New Hampshire ....................................................... 71,957 64,341 59,813 65,688 63,972 64,205 74,240 75,697 71,733 105,827 152,188 170,546 171,696 172,785
New Jersey ............................................................. 169,430 204,961 234,072 322,575 429,797 594,780 792,012 716,527 674,915 1,051,079 1,454,378 1,287,809 1,076,005 1,089,646
New Mexico ............................................................. 1,320 4,755 18,215 36,735 56,304 81,399 102,084 132,589 148,978 231,004 276,286 275,572 296,057 301,881
New York ................................................................. 1,028,110 1,031,593 1,042,160 1,209,574 1,422,969 1,719,841 2,141,479 2,227,870 1,998,129 2,828,853 3,442,809 2,969,216 2,565,841 2,598,337
North Carolina ......................................................... 115,000 252,612 322,533 400,452 520,404 691,249 866,939 886,484 884,733 1,105,412 1,185,592 1,150,053 1,080,744 1,086,871
North Dakota ........................................................... 1,660 13,718 35,543 77,686 139,802 168,283 169,277 140,126 114,661 136,766 147,782 117,688 117,816 117,825
Ohio ......................................................................... 719,372 729,499 797,439 829,160 838,080 1,020,663 1,277,636 1,213,978 1,202,967 1,905,995 2,423,831 2,025,256 1,764,410 1,771,516
Oklahoma ................................................................ — — — 99,602 422,399 589,282 682,650 611,818 441,263 533,928 612,374 583,458 578,580 579,087
Oregon .................................................................... 21,000 37,533 63,254 89,405 118,412 151,028 202,595 188,876 255,032 388,772 478,923 467,128 472,394 484,652
Pennsylvania ........................................................... 834,614 937,310 1,020,522 1,151,880 1,282,965 1,610,459 1,937,433 1,851,780 1,550,286 1,927,832 2,346,002 1,968,801 1,655,279 1,667,834
Rhode Island ........................................................... 34,000 40,604 52,774 67,231 80,061 93,501 118,704 114,161 96,305 133,317 180,285 154,699 135,729 138,813
South Carolina ........................................................ 66,056 134,072 201,260 281,891 340,415 478,045 469,370 481,750 494,185 610,099 648,182 624,795 616,177 622,112
South Dakota .......................................................... (
5
)(
5
) 78,043 98,822 126,253 146,955 165,624 136,447 117,675 153,596 166,693 133,840 127,329 129,164
Tennessee ............................................................... 140,000 300,217 447,950 485,354 521,753 619,852 627,747 648,131 659,785 810,300 891,414 866,117 819,660 824,595
Texas ....................................................................... 63,504
4
220,000 466,872 659,598 821,631 1,035,648 1,308,028 1,328,822 1,354,167 2,068,158 2,754,600 2,872,719 3,328,514 3,382,887
Utah ......................................................................... 16,992 24,326 37,279 73,042 91,611 117,406 138,046 136,519 153,648 235,934 302,394 333,049 438,554 447,891

43Elementary and Secondary Education
Table 11.—Enrollment in regular public elementary and secondary schools, by state: 1870–71 to fall 1990—Continued
State
Students enrolled at any time during the school year Fall enrollment
Estimated
1870–71 1879–80 1889–90 1899–1900 1909–10 1919–20 1929–30 1939–40 1949–50 1959–60 1969 1979 1989 1990
1 23456789101112131415
Vermont ................................................................... 65,384 75,328 65,608 65,964 66,615 61,785 65,976 64,911 61,143
2
72,822 99,957 98,338 94,779 95,762
Virginia .................................................................... 131,088 220,736 342,269 370,595 402,109 505,190 562,956 568,131 597,867 841,574 1,076,749 1,031,403 985,346 998,601
Washington ............................................................. 5,000 14,780 55,964 115,104 215,688 291,053 344,731 331,409 400,867
2
609,035 820,482 764,879 810,232 839,709
West Virginia ........................................................... 76,999 142,850 193,064 232,343 276,458 346,256 395,505 452,821 438,498 460,429 401,366 387,966 327,540 322,389
Wisconsin ................................................................ 265,285 299,457 351,723 445,142 464,311 465,243 564,022 535,880 493,949
2
698,509 980,064 857,855 782,905 797,621
Wyoming ................................................................. 450 2,907 7,052 14,512 24,584 43,112 54,505 56,199 59,585 81,431 86,440 95,422 97,172 98,226
1
National totals include data for Alaska and Hawaii beginning in 1959–60.
2
Includes only students enrolled on a specific date.
3
Includes an estimate for kindergarten.
4
Estimated.
5
Included in North Dakota.
—Data not available.
SOURCE: U.S. Department of Education, National Center for Education Statistics,
Annual Report of the Commis-
sioner of Education, Biennial Survey of Education in the United States; Statistics of State School Systems; Statistics
of Public Elementary and Secondary Day Schools; Digest of Education Statistics;
and
Historical Trends: State Edu-
cation Facts, 1969 to 1989.
(This table was prepared September 1992.)

44 Elementary and Secondary Education
Table 12.—Children served in special education programs, by type of disability: 1921–22 to 1989–90
[In thousands]
Year Total
Percent
of
public
school
enroll-
ment
Learning
disabled Speech
impaired Mentally
retarded
Seriously
emotion-
ally
disturbed
Hard-
of-
hear-
ing and
deaf
Ortho-
pedically
handi-
capped
Other
health
impaired
Visually
handi-
capped
Multi-
handi-
capped
Deaf-
blind
Pre-
school
handi-
capped
Other
handi-
capped
1 23 4 5 6 7 8 9 10 1112131415
1921–22 — — — — 23 — 4 — — — — — — —
1926–27 — — — — 52 — 4 — — 4 — — — —
1929–30 — — — — — 10 —
1
32 ——————
1931–32 161 0.6 — 23 75 14 4
1
40 — 5————
1935–36 294 1.1 — 117 100 13 9
1
48 — 7————
1939–40 310 1.2 — 126 98 10 13
1
53 — 9————
1947–48 356 1.5 — 182 87 15 14
1
50 — 8————
1952–53 475 1.7 — 307 114 — 16
1
29 — 9————
1957–58 838 2.5 — 490 223 29 20
1
52 — 12 — — — 12
1962–63 1,469 3.7 — 802 432 80 46
1
65 — 22 — — — 22
1965–66 1,794 4.3 — 990 540 88 51
1
69 — 23 — — — 33
1969–70 2,677 5.9 — 1,237 830 113 78
1
269 — 24 — — — 126
1976–77 3,692 8.3 796 1,302 959 283 87 87 141 38 — — (
2
)—
1977–78 3,751 8.6 964 1,223 933 288 85 87 135 35 — — (
2
)—
1978–79 3,889 9.1 1,130 1,214 901 300 85 70 105 32 50 2 (
2
)—
1979–80 4,005 9.6 1,276 1,186 869 329 80 66 106 31 60 2 (
2
)—
1980–81 4,142 10.1 1,462 1,168 829 346 79 58 98 31 68 3 (
2
)—
1981–82 4,198 10.5 1,622 1,135 786 339 75 58 79 29 71 2 (
2
)—
1982–83 4,255 10.8 1,741 1,131 757 352 73 57 50 28 63 2 (
2
)—
1983–84 4,298 10.9 1,806 1,128 727 361 72 56 53 29 65 2 (
2
)—
1984–85 4,315 11.0 1,832 1,126 694 372 69 56 68 28 69 2 (
2
)—
1985–86 4,317 11.0 1,862 1,125 660 375 66 57 57 27 86 2 (
2
)—
1986–87 4,374 11.0 1,914 1,136 643 383 65 57 52 26 97 2 (
2
)—
1987–88 4,447 11.1 1,928 953 582 373 56 47 45 22 77 1 363 —
1988–89 4,544 11.3 1,987 967 564 376 56 47 43 23 85 2 394 —
1989–90 4,641 11.4 2,050 973 548 381 57 48 52 22 86 2 422 —
1
Includes special health problems.
2
Prior to 1987–88, these students were included in the counts by handicapping condi-
tion. Beginning in 1987–88, states are no longer required to report preschool handi-
capped students (0 to 5 years) by handicapping condition.
—Data not available.
NOTE.—Data for years 1957–58 to 1969–70 are as of February. Data for other years
are for the school year. Data for 1976–77 and later years are for children participating
in federal programs. Increases since 1987–88 are due in part to new legislation enacted
fall 1986, which mandates public school special education services for all handicapped
children ages 3 through 5.
SOURCE: U.S. Department of Education, National Center for Education Statistics,
Bi-
ennial Survey of Education in the United States; Digest of Education Statistics;
Office
of Special Education and Rehabilitative Services,
Annual Report to Congress on the Im-
plementation of the Education of the Handicapped Act;
and unpublished tabulations.
(This table was prepared September 1992.)

45Elementary and Secondary Education
Table 13.—Public school pupils transported at public expense and current expenditures for transportation:
1929–30 to 1989–90
School year Average daily
attendance, all
students
Pupils transported at public expense Expenditures for transportation
(in current dollars) Expenditures for transportation
(in constant 1989–90 dollars)
Number Percent of total Total
1
(In thousands) Average per
pupil transported Total
1
(In thousands) Average per
pupil transported
1 2345678
1929–30 ................... 21,265,000 1,902,826 8.9 $54,823 $29 $406,681 $214
1931–32 ................... 22,245,000 2,419,173 10.9 58,078 24 511,511 211
1933–34 ................... 22,458,000 2,794,724 12.4 53,908 19 516,913 185
1935–36 ................... 22,299,000 3,250,658 14.6 62,653 19 578,909 178
1937–38 ................... 22,298,000 3,769,242 16.9 75,637 20 670,437 178
1939–40 ................... 22,042,000 4,144,161 18.8 83,283 20 756,698 183
1941–42 ................... 21,031,000 4,503,081 21.4 92,922 21 756,720 168
1943–44 ................... 19,603,000 4,512,412 23.0 107,754 24 785,197 174
1945–46 ................... 19,849,000 5,056,966 25.5 129,756 26 903,178 179
1947–48 ................... 20,910,000 5,854,041 28.0 176,265 30 960,569 164
1949–50 ................... 22,284,000 6,947,384 31.2 214,504 31 1,150,050 166
1951–52 ................... 23,257,000 7,697,130 33.1 268,827 35 1,298,722 169
1953–54 ................... 25,643,871 8,411,719 32.8 307,437 37 1,451,614 173
1955–56 ................... 27,740,149 9,695,819 35.0 353,972 37 1,671,897 172
1957–58 ................... 29,722,275 10,861,689 36.5 416,491 38 1,851,808 170
1959–60 ................... 32,477,440 12,225,142 37.6 486,338 40 2,101,650 172
1961–62 ................... 34,682,340 13,222,667 38.1 576,361 44 2,434,741 184
1963–64 ................... 37,405,058 14,475,778 38.7 673,845 47 2,774,187 192
1965–66 ................... 39,154,497 15,536,567 39.7 787,358 51 3,133,220 202
1967–68 ................... 40,827,965 17,130,873 42.0 981,006 57 3,662,763 214
1969–70 ................... 41,934,376 18,198,577 43.4 1,218,557 67 4,095,997 225
1971–72 ................... 42,254,272 19,474,355 46.1 1,507,830 77 4,652,654 239
1973–74 ................... 41,438,054 21,347,039 51.5 1,858,141 87 5,060,321 237
1975–76 ................... 41,269,720 21,772,483 52.8 2,377,313 109 5,443,026 250
1977–78 ................... 40,079,590
2
21,800,000 54.4 2,731,041 125 5,536,601 254
1979–80 ................... 38,288,911 21,713,515 56.7 3,833,145 177 6,269,416 289
1980–81 ................... 37,703,744
2
22,272,000 59.1
2
4,408,000 198
2
6,461,000 290
1981–82 ................... 37,094,652
2
22,246,000 60.0
2
4,793,000 215
2
6,467,000 291
1982–83 ................... 36,635,868
2
22,199,000 60.6
2
5,000,000 225
2
6,468,000 291
1983–84 ................... 36,362,978
2
22,031,000 60.6
2
5,284,000 240
2
6,592,000 299
1984–85 ................... 36,404,261
2
22,320,000 61.3
2
5,722,000 256
2
6,869,000 308
1985–86 ................... 36,523,103
2
22,041,000 60.3
2
6,123,000 278
2
7,145,000 324
1986–87 ................... 36,863,867
2
22,397,000 60.8
2
6,551,000 292
2
7,478,000 334
1987–88 ................... 37,050,707
2
22,158,000 59.8
2
6,888,000 311
2
7,550,000 341
1988–89 ................... 37,268,072
2
22,635,000 60.7
2
7,550,000 334
2
7,910,000 349
1989–90 ................... 37,778,512
2
22,459,000 59.4
2
8,304,000 370
2
8,304,000 370
1
Excludes capital outlay for years through 1979–80. Beginning in 1980–81, total trans-
portation figures include capital outlay.
2
Estimate based on data appearing in January issues of
School Bus Fleet.
NOTE.—Constant dollars are adjusted for inflation using the Consumer Price Index
computed on a school year basis. Some data have been revised from previously pub-
lished figures.
SOURCE: U.S. Department of Education, National Center for Education Statistics,
Sta-
tistics of State School Systems; Revenues and Expenditures for Public Elementary and
Secondary Education,
and unpublished data; and Bobbit Publishing Co.,
School Bus
Fleet,
January issues. (This table was prepared October 1992.)

46 Elementary and Secondary Education
Table 14.—Average daily attendance, instructional staff, and teachers in public elementary and secondary schools: 1869–70 to 1990–91
School year
School attendance Instructional staff
Average daily
attendance, in
thousands
Average
length of
school
term
(days)
Average
number of
days
attended
per pupil
enrolled
Total, in
thousands
Principals,
in
thousands
Other
supervisory
staff, in
thousands
Classroom teachers, in thousands
1
Average annual salary
of instructional staff
2
Average
annual salary of teach-
ers
3
Total Male Female Pupil-
teacher
ratio
In current
dollars
In constant
1990–91
dollars
In current
dollars
In constant
1990–91
dollars
1 2 3456 7 89101112131415
1869–70 ............ 4,077 132.2 78.4 — — — 201 78 123 34.3 $189 — — —
1870–71 ............ 4,545 132.1 79.4 — — — 220 90 130 34.4 — — — —
1871–72 ............ 4,659 133.4 79.5 — — — 230 95 135 34.0 — — — —
1872–73 ............ 4,745 129.1 76.5 — — — 238 98 140 33.6 — — — —
1873–74 ............ 5,051 128.8 77.0 — — — 248 103 145 34.0 — — — —
1874–75 ............ 5,248 134.4 77.9 — — — 258 109 149 34.1 — — — —
1875–76 ............ 5,291 133.1 79.4 — — — 260 110 150 34.1 — — — —
1876–77 ............ 5,427 132.1 80.0 — — — 267 114 153 33.6 — — — —
1877–78 ............ 5,783 132.0 80.9 — — — 277 119 158 34.1 — — — —
1878–79 ............ 5,876 130.2 80.5 — — — 280 121 159 33.9 — — — —
1879–80 ............ 6,144 130.3 81.1 — — — 287 123 164 34.4 195 — — —
1880–81 ............ 6,146 130.0 80.0 — — — 294 123 171 34.0 — — — —
1881–82 ............ 6,331 131.2 81.3 — — — 299 119 180 34.2 — — — —
1882–83 ............ 6,652 129.8 81.1 — — — 304 116 188 35.0 — — — —
1883–84 ............ 7,056 129.1 82.9 — — — 314 119 195 35.0 — — — —
1884–85 ............ 7,298 130.7 83.6 — — — 326 122 204 35.0 224 — — —
1885–86 ............ 7,526 130.4 84.1 — — — 331 124 208 35.2 — — — —
1886–87 ............ 7,682 131.3 84.9 — — — 339 127 212 35.1 — — — —
1887–88 ............ 7,907 132.3 85.9 — — — 347 126 221 35.1 — — — —
1888–89 ............ 8,006 133.7 86.4 — — — 357 124 232 34.7 — — — —
1889–90 ............ 8,154 134.7 86.3 — — — 364 126 238 35.0 252 — — —
1890–91 ............ 8,329 135.7 86.6 — — — 368 123 245 35.5 — — — —
1891–92 ............ 8,561 136.9 88.4 — — — 374 122 253 35.4 — — — —
1892–93 ............ 8,856 136.3 89.6 — — — 383 122 261 35.2 — — — —
1893–94 ............ 9,188 139.5 91.6 — — — 389 125 264 36.0 — — — —
1894–95 ............ 9,549 139.5 93.5 — — — 398 130 268 35.8 286 — — —
1895–96 ............ 9,781 140.5 94.8 — — — 400 130 270 36.2 — — — —
1896–97 ............ 10,053 142.0 96.3 — — — 405 131 274 36.6 — — — —
1897–98 ............ 10,356 143.0 98.0 — — — 411 132 279 36.7 — — — —
1898–99 ............ 10,389 143.0 97.9 — — — 414 131 283 36.7 — — — —
1899–1900 ........ 10,633 144.3 99.0 — — — 423 127 296 36.6 325 — — —
1900–01 ............ 10,716 143.7 98.0 — — — 432 126 306 36.3 — — — —
1901–02 ............ 11,064 144.7 100.6 — — — 442 121 321 36.0 — — — —
1903–03 ............ 11,055 147.2 101.7 — — — 449 117 332 35.7 — — — —
1903–04 ............ 11,318 146.7 102.1 — — — 455 114 341 35.7 — — — —
1904–05 ............ 11,482 150.9 105.2 — — — 460 111 350 35.8 386 — — —
1905–06 ............ 11,712 150.6 106.0 — — — 466 109 357 35.7 — — — —
1906–07 ............ 11,926 151.8 107.3 — — — 481 104 377 35.1 — — — —
1907–08 ............ 12,154 154.1 109.8 — — — 495 104 391 34.5 — — — —
1908–09 ............ 12,685 155.3 112.6 — — — 506 108 398 34.6 — — — —
1909–10 ............ 12,827 157.5 113.0 — — — 523 110 413 34.0 485 — — —

47Elementary and Secondary Education
Table 14.—Average daily attendance, instructional staff, and teachers in public elementary and secondary schools: 1869–70 to 1990–91—Continued
School year
School attendance Instructional staff
Average daily
attendance, in
thousands
Average
length of
school
term
(days)
Average
number of
days
attended
per pupil
enrolled
Total, in
thousands
Principals,
in
thousands
Other
supervisory
staff, in
thousands
Classroom teachers, in thousands
1
Average annual salary
of instructional staff
2
Average
annual salary of teach-
ers
3
Total Male Female Pupil-
teacher
ratio
In current
dollars
In constant
1990–91
dollars
In current
dollars
In constant
1990–91
dollars
1 2 3456 7 89101112131415
1910–11 ............ 12,872 156.8 111.8 — — — 534 110 423 33.8 466 — — —
1911–12 ............ 13,302 158.8 115.6 — — — 547 115 433 33.2 492 — — —
1912–13 ............ 13,614 158.1 115.6 — — — 565 113 452 32.9 512 — — —
1913–14 ............ 14,216 158.7 117.8 — — — 580 115 465 33.0 525 — — —
1914–15 ............ 14,986 159.4 121.2 — — — 604 118 486 32.6 543 — — —
1915–16 ............ 15,359 160.3 120.9 — — — 622 123 499 32.7 563 — — —
1917–18 ............ 15,549 160.7 119.8 — — — 651 105 546 32.0 635 — — —
1919–20 ............ 16,150 161.9 121.2 700 13.6 6.6 680 96 584 31.8 871 $6,120 — —
1921–22 ............ 18,432 164.0 130.6 756 18.6 14.1 723 118 605 32.1 1,166 9,109 — —
1923–24 ............ 19,132 168.3 132.5 787 17.9 7.9 761 129 633 31.9 1,227 9,572 — —
1925–26 ............ 19,856 169.3 135.9 850 26.9 8.4 778 131 647 31.8 1,277 9,603 — —
1927–28 ............ 20,608 171.5 140.4 868 28.8 7.7 832 138 694 30.3 1,364 10,605 — —
1929–30 ............ 21,265 172.7 143.0 892 30.9 6.9 854 142 712 30.1 1,420 11,110 — —
1931–32 ............ 22,245 171.2 144.9 901 23.9 5.7 872 154 718 30.1 1,417 13,162 — —
1933–34 ............ 22,458 171.6 145.8 880 28.1 5.0 847 162 685 31.2 1,227 12,409 — —
1935–36 ............ 22,299 173.0 146.3 906 29.6 5.8 871 179 692 30.3 1,283 12,503 — —
1937–38 ............ 22,298 173.9 149.3 919 36.4 5.0 877 185 692 29.6 1,374 12,845 — —
1939–40 ............ 22,042 175.0 151.7 912 31.5 4.8 875 195 681 29.1 1,441 13,809 — —
1941–42 ............ 21,031 174.7 149.6 898 33.1 6.1 859 183 676 28.6 1,507 12,943 — —
1943–44 ............ 19,603 175.5 147.9 865 31.6 5.5 828 127 701 28.1 1,728 13,280 — —
1945–46 ............ 19,849 176.8 150.6 867 29.4 6.8 831 138 693 28.0 1,995 14,646 — —
1947–48 ............ 20,910 177.6 155.1 907 37.1 9.2 861 162 699 27.8 2,639 15,168 — —
1949–50 ............ 22,284 177.9 157.9 962 39.3 9.2 914 195 719 27.5 3,010 17,020 — —
1951–52 ............ 23,257 178.2 156.0 1,012 39.7 9.8 963 235 728 27.6 3,450 17,578 — —
1953–54 ............ 25,644 178.6 158.9 1,098 45.7 10.3 1,032 254 779 27.9 3,825 19,048 — —
1955–56 ............ 27,740 178.0 158.5 1,213 51.0 13.3 1,149 299 850 27.1 4,156 20,703 $4,000 $19,926
1957–58 ............ 29,722 177.6 157.4 1,333 59.0 14.0 1,238 332 906 27.1 4,702 22,049 4,520 21,196
1959–60
4
.......... 32,477 178.0 160.2 1,464 63.6 13.8 1,355 393 962 26.6 5,174 23,581 4,995 22,765
1961–62 ............ 34,682 179.1 162.3 1,588 67.2 16.2 1,458 451 1,053 26.2 5,700 25,395 5,515 24,571
1963–64 ............ 37,405 179.0 163.2 1,717 72.6 18.7 1,568 488 1,080 26.2 6,240 27,094 5,995 26,030
1965–66 ............ 39,154 178.9 163.5 1,885 77.3 21.6 1,711 544 1,167 24.6 6,935 29,106 6,485 27,217
1967–68 ............ 40,828 178.8 163.2 2,071 85.5 29.0 1,864 584 1,280 23.5 7,885 31,050 7,423 29,230
1969–70 ............ 41,934 178.9 161.7 2,253 90.6 31.5 2,023 690 1,333 22.5 8,840 31,339 8,626 30,580
1970–71 ............ 42,428 ———— —2,059
5
676
5
1,383 22.3 9,698 32,693 9,268 31,243
1971–72 ............ 42,254 179.3 161.7 2,322 — — 2,070
5
688
5
1,382 22.3 10,213 33,237 9,705 31,584
1972–73 ............ 42,179 ———— —2,106
5
703
5
1,403 21.7 10,634 33,267 10,174 31,827
1973–74 ............ 41,438 178.7 159.5 2,338 100.0 38.0 2,136
5
715
5
1,421 21.3 11,254 32,324 10,770 30,934
1974–75 ............ 41,524 ———— —2,165
5
727
5
1,438 20.8 12,167 31,460 11,641 30,100

48 Elementary and Secondary Education
Table 14.—Average daily attendance, instructional staff, and teachers in public elementary and secondary schools: 1869–70 to 1990–91—Continued
School year
School attendance Instructional staff
Average daily
attendance, in
thousands
Average
length of
school
term
(days)
Average
number of
days
attended
per pupil
enrolled
Total, in
thousands
Principals,
in
thousands
Other
supervisory
staff, in
thousands
Classroom teachers, in thousands
1
Average annual salary
of instructional staff
2
Average
annual salary of teach-
ers
3
Total Male Female Pupil-
teacher
ratio
In current
dollars
In constant
1990–91
dollars
In current
dollars
In constant
1990–91
dollars
1 2 3456 7 89101112131415
1975–76 ............ 41,270 178.3 161.1 2,337 104.0 35.0 2,198
5
742
5
1,456 20.4 13,124 31,691 12,600 30,426
1976–77 ............ 40,832 ———— —2,189
5
734
5
1,455 20.2 13,840 31,579 13,354 30,470
1977–78 ............ 40,079 ———— —2,209
5
742
5
1,467 19.7 14,698 31,426 14,198 30,357
1978–79 ............ 39,075 — — 2,297 — — 2,207
5
735
5
1,472 19.3 15,764 30,819 15,032 29,387
1979–80 ............ 38,289 178.5 160.8 2,441 106.0 35.0 2,185
5
743
5
1,442 19.1
5
16,715 28,833 15,970 27,548
1980–81 ............ 37,704 178.2 160.7 2,452 107.0 20.6 2,184
5
708
5
1,476 18.7 18,404 28,451 17,644 27,277
1981–82 ............ 37,095 ———— —2,118
5
679
5
1,439 18.9 20,327 28,926 19,274 27,427
1982–83 ............ 36,636 ———— —2,133
5
679
5
1,454 18.6 21,641 29,527 20,695 28,236
1983–84 ............ 36,363 ———— —2,139
5
679
5
1,460 18.4 23,005 30,268 21,935 28,860
1984–85 ............ 36,404 — — 2,692 124.5 — 2,168
5
679
5
1,489 18.1 24,666 31,231 23,600 29,881
1985–86 ............ 36,523 — — 2,757 129.3 — 2,206
5
669
5
1,537 17.9 26,362 32,443 25,199 31,011
1986–87 ............ 36,864 — — 2,823 131.6 — 2,244
5
674
5
1,570 17.7 27,706 33,356 26,569 31,987
1987–88 ............ 37,051 — — 2,860 125.9 — 2,279
5
665
5
1,614 17.6 29,233 33,794 28,034 32,408
1988–89 ............ 37,268 — — 2,931 126.6 — 2,323
5
659
5
1,664 17.3 30,899 34,143 29,568 32,673
1989–90 ............ 37,779 — — 2,986 125.6 — 2,357
5
658
5
1,699 17.2 32,685 34,472 31,350 33,064
1990–91 ............ — — — 3,051 127.0 — 2,397
5
669
5
1,728 17.2 34,385 34,385 32,977 32,977
1
For select years prior to 1951–52, includes a small number of librarians and other non-supervisory instructional staff.
2
Prior to 1919–20, computed for teaching positions only; beginning 1919–20, also includes supervisors and prin-
cipals. Data for 1980–81 and subsequent years are estimates from the National Education Association.
3
Data for 1970–71 and subsequent years are estimated by the National Education Association.
4
Denotes first year for which figures include Alaska and Hawaii.
5
Estimated.
—Data not available.
SOURCE: U.S. Department of Commerce, Bureau of the Census,
Historical Statistics of the United States, Colonial
Times to 1970;
U.S. Department of Education, National Center for Education Statistics,
Annual Report of the Commis-
sioner of Education, Biennial Survey of Education in the United States, Digest of Education Statistics,
and unpublished
data: National Education Association,
Estimates of School Statistics.
(This table was prepared September 1992.)

49Elementary and Secondary Education
Table 15.—Catholic elementary and secondary enrollment, teachers, and schools, by level:
1919–20 to 1990–91
School year Number of schools Enrollment Instructional staff
1
Student-
instructional
staff ratioTotal Elementary Secondary Total Elementary Secondary Total Elementary Secondary
1 234567891011
1919–20 ........ 8,103 6,551 1,552 1,925,521 1,795,673 129,848 49,516 41,592 7,924 38.9
1929–30 ........ 10,046 7,923 2,123 2,464,467 2,222,598 241,869 72,552 58,245 14,307 34.0
1935–36 ........ 9,875 7,929 1,946 2,388,000 2,103,000 285,000 76,000 59,000 17,000 31.4
1939–40 ........ 10,049 7,944 2,105 2,396,305 2,035,182 361,123 81,057 60,081 20,976 29.6
1946–47 ........ — — 2,111 — — 467,000 — — 27,000 —
1947–48 ........ 10,435 8,285 2,150 2,788,000 2,305,000 483,000 89,000 62,000 27,000 31.3
1949–50 ........ 10,778 8,589 2,189 3,066,387 2,560,815 505,572 94,295 66,525 27,770 32.5
1951–52 ........ 11,060 8,880 2,180 3,391,000 2,842,000 549,000 101,000 72,000 29,000 33.6
1953–54 ........ 11,575 9,279 2,296 3,859,000 3,235,000 624,000 109,000 77,000 32,000 35.4
1955–56 ........ 11,926 9,615 2,311 4,276,000 3,571,000 705,000 120,000 85,000 35,000 35.6
1960–61 ........ 12,893 10,501 2,392 5,253,791 4,373,422 880,369 151,902 108,169 43,733 34.6
1961–62 ........ 13,007 10,631 2,376 5,383,000 4,445,000 938,000 158,000 111,000 47,000 34.1
1962–63 ........ 13,178 10,676 2,502 5,494,000 4,485,000 1,009,000 159,000 112,000 47,000 34.6
1963–64 ........ 13,205 10,775 2,430 5,590,000 4,546,000 1,044,000 166,000 115,000 51,000 33.7
1964–65 ........ 13,249 10,832 2,417 5,601,000 4,534,000 1,067,000 171,000 118,000 53,000 32.8
1965–66 ........ 13,292 10,879 2,413 5,574,000 4,492,000 1,082,000 177,000 120,000 57,000 31.5
1966–67 ........ 13,232 10,769 2,463 5,485,000 4,375,000 1,110,000 176,000 120,000 56,000 31.2
1967–68 ........ 12,627 10,350 2,277 5,199,000 4,106,000 1,093,000 179,000 124,000 55,000 29.0
1968–69 ........ 12,305 10,113 2,192 4,941,000 3,860,000 1,081,000 183,000 126,000 57,000 27.0
1969–70 ........ 11,771 9,695 2,076 4,658,098 3,607,168 1,050,930
2
195,400
2
133,200
2
62,200 23.8
1970–71 ........ 11,350 9,370 1,980 4,363,566 3,355,478 1,008,088 166,208 112,750 53,458 26.3
1971–72 ........ 10,841 8,982 1,859 4,034,785 3,075,785 959,000 159,083 106,686 52,397 25.4
1972–73 ........ 10,504 8,761 1,743 3,790,000 2,871,000 919,000 155,964 105,384 50,580 24.3
1973–74 ........ 10,297 8,569 1,728 3,621,000 2,714,000 907,000 153,883 102,785 51,098 23.5
1974–75 ........ 10,127 8,437 1,690 3,504,000 2,602,000 902,000 150,179 100,011 50,168 23.3
1975–76 ........ 9,993 8,340 1,653 3,415,000 2,525,000 890,000 149,276 99,319 49,957 22.9
1976–77 ........ 9,904 8,281 1,623 3,365,000 2,483,000 882,000 150,610 100,016 50,594 22.3
1977–78 ........ 9,797 8,204 1,593 3,289,000 2,421,000 868,000 150,648 99,739 50,909 21.8
1978–79 ........ 9,723 8,159 1,564 3,218,000 2,365,000 853,000 147,948 98,539 49,409 21.8
1979–80 ........ 9,640 8,100 1,540 3,139,000 2,293,000 846,000 147,294 97,724 49,570 21.3
1980–81 ........ 9,559 8,043 1,516 3,106,000 2,269,000 837,000 145,777 96,739 49,038 21.3
1981–82 ........ 9,494 7,996 1,498 3,094,000 2,266,000 828,000 146,172 96,847 49,325 21.2
1982–83 ........ 9,432 7,950 1,482 3,026,000 2,225,000 801,000 146,460 97,337 49,123 20.7
1983–84 ........ 9,380 7,917 1,463 2,969,000 2,179,000 790,000 146,913 98,591 48,322 20.2
1984–85 ........ 9,325 7,876 1,449 2,903,000 2,119,000 784,000 149,888 99,820 50,068 19.4
1985–86 ........ 9,220 7,790 1,430 2,821,000 2,061,000 760,000 146,594 96,741 49,853 19.2
1986–87 ........ 9,102 7,693 1,409 2,726,000 1,998,000 728,000 141,930 93,554 48,376 19.2
1987–88 ........ 8,992 7,601 1,391 2,623,000 1,942,000 681,000 139,887 93,199 46,688 18.8
1988–89 ........ 8,867 7,505 1,362 2,551,000 1,912,000 639,000 137,700 93,154 44,546 18.5
1989–90 ........ 8,719 7,395 1,324 2,499,000 1,894,000 606,000 136,900 94,197 42,703 18.3
1990–91 ........ 8,587 7,291 1,296 2,475,439 1,883,906 591,533 131,198 91,039 40,159 18.9
1
Beginning in 1970–71, includes full-time teaching staff only.
2
Includes estimates for the nonreporting schools.
—Data not available.
NOTE.—Data reported by the National Catholic Educational Association and data re-
ported by the National Center for Education Statistics are not directly comparable be-
cause survey procedures and definitions differ.
SOURCE: National Catholic Educational Association,
A Statistical Report on Catholic
Elementary and Secondary Schools for the Years 1967–68 to 1969–70,
as compiled
from the
Official Catholic Directory; United States Catholic Elementary and Secondary
Schools, 1989 and 1990-91;
and Franklin Press,
Catholic Schools in America
and
United
States Catholic Elementary and Secondary Schools, 1989–90 and 1990–91.
(This table
was prepared September 1992.)
50 Elementary and Secondary Education
Table 16.—Public school enrollment in grades 9 to 12, by subject: 1889–90 to fall 1981
Subject 1889–90 1899–
1900 1909–10 1914–15 1921–22 1927–28 1933–34 1948–49 1954–55 1958–59 1960–61 1962–63 1964–65 Fall 1972 Fall 1981
1 2 3 4 5 6 7 8 9 10111213141516
Total, in thousands ........ 203 519 915 1,562 2,873 3,911 5,669 5,658 6,574 8,258 8,821 10,372 11,628 13,848 12,764
Percentage of students taking specific subject
General science ................. ————18.3 17.5 17.8 20.8 — 19.6 22.2 17.6 18.7 11.3 23.0
Biology ................................ — — 1.1 6.9 8.8 13.6 14.6 18.4 20.0 20.8 21.7 24.0 23.2 19.6 23.2
Chemistry ........................... 10.1 7.7 6.9 7.4 7.4 7.1 7.6 7.6 7.5 8.1 9.1 8.3 9.3 8.7 9.8
Physics ............................... 22.8 19.0 14.6 14.2 8.9 6.8 6.3 5.4 4.7 4.7 4.9 3.8 4.5 2.9 1.0
Physiology .......................... — 27.4 15.3 9.5 5.1 2.7 1.8 1.0 — — 0.8 — — 0.9 1.2
Earth science ..................... — 29.8 21.0 15.3 4.5 2.8 1.7 0.4 — — 0.9 — — 3.6 0.2
Algebra ............................... 45.4 56.3 56.9 48.8 40.2 35.2 30.4 26.8 25.3 29.9 28.6 30.4 28.5 19.7 29.5
General mathematics ......... ————12.4 7.9 7.4 13.1 12.3 12.7 17.4 11.7 15.4 13.8 21.7
Geometry ............................ 21.3 27.4 30.9 26.5 22.7 19.8 17.1 12.8 12.5 13.4 13.8 14.7 13.9 11.6 11.4
Trignometry ........................ — 1.9 1.9 1.5 1.5 1.3 1.3 2.0 2.6 2.7 3.0 2.0 2.0 6.2 3.5
Spanish .............................. — — 0.7 2.7 11.3 9.4 6.2 8.2 — — 9.8 — 14.5 12.3 12.3
French ................................ 5.8 7.8 9.9 8.8 15.5 14.0 10.9 4.7 — — 8.0 — 12.4 7.6 6.6
German .............................. 10.5 14.3 23.7 24.4 0.6 1.8 2.4 0.8 — — 1.7 — 2.7 3.1 2.1
English ................................ — 38.5 57.1 58.4 76.7 93.1 90.5 92.9 — — 94.6 — — 89.8 86.5
Latin .................................... 34.7 50.6 49.0 37.3 27.5 22.0 16.0 7.8 — — 7.8 — — 1.5 1.1
U.S. and English history
1
.... 27.3 38.2 55.0 50.5 18.2 18.8 17.8 22.8 — — 24.3 — — 32.3 32.5
Civics and government ........ — 21.7 15.6 15.7 19.3 20.0 16.4 8.0 — — 9.5 — — 15.2 19.7
Industrial subjects .............. — — — 11.2 13.7 13.5 21.0 26.6 — — 28.0 — — 3.7 4.6
Bookkeeping ....................... — — — 3.4 12.6 10.7 9.9 8.7 — — 7.7 — — 5.8 3.2
Typewriting ......................... ————13.1 15.2 16.7 22.5 — — 23.1 — — 20.3 21.0
Shorthand ........................... ————8.98.79.07.8——6.7——4.63.1
Home economics ............... — — 3.8 12.9 14.3 16.5 16.7 24.2 — — 23.1 — — 20.4 23.9
Agriculture .......................... — — 4.7 7.2 5.1 3.7 3.6 6.7 — — 6.2 — — 2.7 3.3
Physical education ............. ————5.715.0 50.7 69.4 — — 73.7 — — 57.0 59.0
Music .................................. — — — 31.5 25.3 26.0 25.5 30.1 — — 28.0 — — 25.1 21.6
Art ....................................... — — — 22.9 14.7 11.7 8.7 9.0 — — 19.3 — — 17.9 24.2
1
For 1914–15 and earlier years, includes ancient, medieval, and modern history.
—Data not available.
SOURCE: U.S. Department of Education, National Center for Education Statistics,
Biennial Survey of Education in
the United States; A Trend Study of High School Offerings and Enrollments: 1972–73 and 1981–82;
and
Digest of
Education Statistics.
(This table was prepared October 1992.)

51Elementary and Secondary Education
Table 17.—Student proficiency in reading, writing, mathematics, and science, by age and race/ethnicity: 1969–70 to 1989–90
Year and
race/ethnicity
Reading Writing Mathematics Science
9-year-olds 13-year-olds 17-year-olds Grade 4 Grade 8 Grade 11 9-year-olds 13-year-olds 17-year-olds 9-year-olds 13-year-olds 17-year-olds
1 2 3 4 5 6 7 8 9 10111213
Total
1969–70 .................. —————————225255305
1970–71 .................. 208 255 285—————————
1972–73 .................. ——————219266304220250296
1974–75 .................. 210 256 286—————————
1976–77 .................. —————————220247290
1977–78 .................. ——————219264300———
1979–80 .................. 215 259 286—————————
1981–82 .................. ——————219269299221250283
1983–84 .................. 211 257 289 179 206 212——————
1985–86 .................. ——————222269302224251289
1987–88 .................. 212 258 290 186 203 214——————
1989–90 .................. 209 257 290 183 198 212 230 270 305 229 255 290
White
1969–70
1
................ —————————236263312
1970–71
1
................ 214 261 291—————————
1972–73 .................. ——————225274310231259304
1974–75 .................. 217 262 293—————————
1976–77 .................. —————————230256298
1977–78 .................. ——————224272306———
1979–80 .................. 221 264 293—————————
1981–82 .................. ——————224274304229257293
1983–84 .................. 218 263 295 186 210 218——————
1985–86 .................. ——————227274308232259298
1987–88 .................. 218 261 295 193 207 219——————
1989–90 .................. 217 262 297 191 202 217 235 276 310 238 264 301
Black
1969–70 .................. —————————179215258
1970–71 .................. 170 222 239—————————
1972–73 .................. ——————190228270177205250
1974–75 .................. 181 226 241—————————
1976–77 .................. —————————175208240
1977–78 .................. ——————192230268———
1979–80 .................. 189 233 243—————————
1981–82 .................. ——————195240272187217235
1983–84 .................. 186 236 264 154 190 195——————
1985–86 .................. ——————202249279196222253
1987–88 .................. 189 243 274 154 190 200——————
1989–90 .................. 182 242 267 155 182 194 208 249 289 196 226 253
Hispanic
1972–73 .................. ——————202239277———
1974–75 .................. 183 233 252—————————
1976–77 .................. —————————192213262
1977–78 .................. ——————203238276———
1979–80 .................. 190 237 261—————————
1981–82 .................. ——————204252277189226249
1983–84 .................. 187 240 268 163 191 188——————
1985–86 .................. ——————205254283199226259
1987–88 .................. 194 240 271 169 188 199——————
1989–90 .................. 189 238 275 168 189 198 214 255 284 206 232 262
1
Includes persons of Hispanic origin.
—Data not available.
SOURCE: U.S. Department of Education, National Center for Education Statistics, National Assessment of Edu-
cational Progress,
Trends in Academic Progress,
November 1991. (This table was prepared December 1992.)

52 Elementary and Secondary Education
Table 18.—Percentage of students at or above selected reading, mathematics, and science proficiency levels, by age and race/ethnicity:
1970–71 to 1989–90
Age, year
and
race/ethnicity
Reading Mathematics Science
Level
150
1
Level
200
2
Level
250
3
Level
300
4
Level
350
5
Level
150
6
Level
200
7
Level
250
8
Level
300
9
Level
350
10
Level
150
11
Level
200
12
Level
250
13
Level
300
14
Level
350
15
1 2 3 4 5 6 7 8 9 10111213141516
9-year-olds
16
Total
1970–71 ........................ 90.6 58.7 15.6 0.9 0.0 ——————————
1974–75 ....................... 93.1 62.1 14.6 0.6 0.0 ——————————
1976–77 ........................ ——————————93.5 68.0 25.7 3.2 0.1
1977–78 ........................ —————96.7 70.4 19.6 0.8 0.0 —————
1979–80 ........................ 94.6 67.7 17.7 0.6 0.0 ——————————
1981–82 ....................... —————97.1 71.4 18.8 0.6 0.0 95.2 70.7 24.3 2.3 0.0
1983–84 ....................... 92.3 61.5 17.2 1.0 0.0 ——————————
1985–86 ....................... —————97.9 74.1 20.7 0.6 0.0 96.2 72.0 27.5 3.0 0.1
1987–88 ........................ 92.7 62.6 17.5 1.4 0.0 ——————————
1989–90 ........................ 90.1 58.9 18.4 1.7 0.0 99.1 81.5 27.7 1.2 0.0 97.0 76.4 31.1 3.1 0.1
White
1970–71
17
..................... 94.0 65.0 18.0 1.1 0.0 ——————————
1974–75 ........................ 96.0 69.0 17.4 0.7 0.0 ——————————
1976–77 ........................ ——————————97.7 76.8 30.8 3.9 0.1
1977–78 ........................ —————98.3 76.3 22.9 0.9 0.0 —————
1979–80 ........................ 97.1 74.2 21.0 0.8 0.0 ——————————
1981–82 ....................... —————98.5 76.8 21.8 0.6 0.0 98.3 78.4 29.4 2.9 0.1
1983–84 ........................ 95.4 68.6 20.9 1.2 0.0 ——————————
1985–86 ........................ —————98.8 79.6 24.6 0.8 0.0 98.2 78.9 32.7 3.8 0.1
1987–88 ........................ 95.1 68.4 20.3 1.6 0.0 ——————————
1989–90 ........................ 93.5 66.0 22.6 2.2 0.0 99.6 86.9 32.7 1.5 0.0 99.2 84.4 37.5 3.9 0.1
Black
1970–71 ....................... 69.7 22.0 1.6 0.0 0.0 ——————————
1974–75 ........................ 80.7 31.6 2.0 0.0 0.0 ——————————
1976–77 ........................ ——————————72.4 27.2 3.5 0.2 0.0
1977–78 ........................ —————88.4 42.0 4.1 0.0 0.0 —————
1979–80 ........................ 84.9 41.3 4.1 0.0 0.0 ——————————
1981–82 ........................ —————90.2 46.1 4.4 0.0 0.0 82.1 38.9 3.9 0.1 0.0
1983–84 ........................ 81.3 36.6 4.5 0.1 0.0 ——————————
1985–86 ........................ —————93.9 53.4 5.6 0.1 0.0 88.6 46.2 8.3 0.3 0.0
1987–88 ........................ 83.2 39.4 5.6 0.2 0.0 ——————————
1989–90 ........................ 76.9 33.9 5.2 0.3 0.0 96.9 60.0 9.4 0.1 0.0 88.0 46.4 8.5 0.1 0.0
Hispanic
1974–75 ....................... 80.8 34.6 2.6 0.0 0.0 ——————————
1976–77 ........................ ——————————84.6 42.0 8.8 0.3 0.0
1977–78 ........................ —————93.0 54.2 9.2 0.2 0.0 —————
1979–80 ........................ 84.5 41.6 5.0 0.0 0.0 ——————————
1981–82 ........................ —————94.3 55.7 7.8 0.0 0.0 85.1 40.2 4.2 0.0 0.0
1983–84 ........................ 82.0 39.6 4.3 0.1 0.0 ——————————
1985–86 ........................ —————96.4 57.6 7.3 0.1 0.0 89.6 50.1 10.7 0.2 0.0
1987–88 ........................ 85.6 45.9 8.6 0.4 0.0 ——————————
1989–90 ........................ 83.7 40.9 5.8 0.2 0.0 98.0 68.4 11.3 0.2 0.0 93.6 56.3 11.6 0.4 0.0
13-year-olds
16
Total
1970–71 ....................... 99.8 93.0 57.8 9.8 0.1 ——————————
1974–75 ........................ 99.7 93.2 58.6 10.2 0.2 ——————————
1976–77 ........................ ——————————98.5 86.0 48.8 11.1 0.7
1977–78 ........................ —————99.8 94.6 64.9 18.0 1.0 —————
1979–80 ........................ 99.9 94.8 60.7 11.3 0.2 ——————————

53Elementary and Secondary Education
Table 18.—Percentage of students at or above selected reading, mathematics, and science proficiency levels, by age and race/ethnicity:
1970–71 to 1989–90—Continued
Age, year
and
race/ethnicity
Reading Mathematics Science
Level
150
1
Level
200
2
Level
250
3
Level
300
4
Level
350
5
Level
150
6
Level
200
7
Level
250
8
Level
300
9
Level
350
10
Level
150
11
Level
200
12
Level
250
13
Level
300
14
Level
350
15
1 2 3 4 5 6 7 8 9 10111213141516
1981–82 ........................ —————100.0 97.7 71.4 17.4 0.5 99.5 89.8 50.9 9.6 0.4
1983–84 ........................ 99.8 93.9 59.0 11.0 0.3 ——————————
1985–86 ........................ —————100.0 98.6 73.3 15.8 0.4 99.7 91.6 52.5 9.1 0.2
1987–88 ........................ 99.9 94.9 58.7 10.9 0.2 ——————————
1989–90 ........................ 99.8 93.8 58.7 11.0 0.4 100.0 98.5 74.7 17.3 0.4 99.7 92.3 56.5 11.2 0.4
White
1970–71
17
.................... 99.9 96.2 64.2 11.3 0.2 ——————————
1974–75 ........................ 99.9 96.4 65.5 12.1 0.3 ——————————
1976–77 ........................ ——————————99.6 92.2 56.5 13.4 0.8
1977–78 ........................ —————100.0 97.6 72.9 21.4 1.2 —————
1979–80 ........................ 100.0 97.1 67.8 13.6 0.3 ——————————
1981–82 ....................... —————100.0 99.1 78.3 20.5 0.6 99.9 94.4 58.3 11.5 0.4
1983–84 ........................ 99.9 96.2 65.3 13.1 0.4 ——————————
1985–86 ........................ —————100.0 99.3 78.9 18.6 0.4 99.9 96.1 61.0 11.3 0.3
1987–88 ........................ 99.9 96.0 63.7 12.4 0.3 ——————————
1989–90 ........................ 99.9 96.0 64.8 13.3 0.5 100.0 99.4 82.0 21.0 0.4 100.0 96.9 66.5 14.2 0.5
Black
1970–71 ....................... 98.6 74.2 21.1 0.8 0.0 ——————————
1974–75 ........................ 98.4 76.9 24.8 1.5 0.0 ——————————
1976–77 ........................ ——————————93.1 57.3 14.9 1.2 0.0
1977–78 ........................ —————98.6 79.7 28.7 2.3 0.0 —————
1979–80 ........................ 99.3 84.1 30.1 1.8 0.0 ——————————
1981–82 ....................... —————99.8 90.2 37.9 2.9 0.0 97.5 68.6 17.1 0.8 0.0
1983–84 ........................ 99.4 85.5 34.6 2.8 0.0 ——————————
1985–86 ........................ —————100.0 95.4 49.0 4.0 0.1 99.0 73.6 19.6 1.1 0.0
1987–88 ........................ 99.8 91.3 40.2 4.6 0.1 ——————————
1989–90 ........................ 99.4 87.7 41.7 4.6 0.1 100.0 95.4 48.7 3.9 0.1 98.8 77.6 24.3 1.5 0.1
Hispanic
1974–75 ....................... 99.6 81.3 32.0 2.2 0.0 ——————————
1976–77 ....................... ——————————94.3 62.2 18.1 1.8 0.0
1977–78 ........................ —————99.6 86.4 36.0 4.0 0.1 —————
1979–80 ........................ 99.7 86.8 35.4 2.3 0.0 ——————————
1981–82 ........................ —————99.9 95.9 52.2 6.3 0.0 98.0 75.5 24.1 2.4 0.0
1983–84 ....................... 99.5 86.7 39.0 4.1 0.1 ——————————
1985–86 ........................ —————100.0 96.9 56.0 5.5 0.2 99.0 76.7 24.9 1.5 0.0
1987–88 ........................ 99.2 87.4 38.0 4.4 0.0 ——————————
1989–90 ........................ 99.1 85.8 37.2 3.9 0.1 99.9 96.8 56.7 6.4 0.1 98.9 80.2 30.0 3.3 0.1
17-year-olds
16
Total
1970–71 ....................... 99.6 96.0 78.6 39.0 6.8 ——————————
1974–75 ........................ 99.7 96.4 80.1 38.7 6.2 ——————————
1976–77 ........................ ——————————99.8 97.1 81.6 41.7 8.5
1977–78 ........................ —————100.0 99.8 92.0 51.5 7.3 —————
1979–80 ........................ 99.9 97.2 80.7 37.8 5.3 ——————————
1981–82 ....................... —————100.0 99.9 93.0 48.5 5.5 99.7 95.7 76.6 37.3 7.1
1983–84 ........................ 100.0 98.3 83.1 40.3 5.7 ——————————
1985–86 ........................ —————100.0 99.9 95.6 51.7 6.5 99.9 97.1 80.7 41.3 7.9
1987–88 ........................ 100.0 98.9 85.7 40.9 4.6 ——————————
1989–90 ........................ 99.9 98.1 84.1 41.4 7.0 100.0 100.0 96.0 56.1 7.2 99.9 96.7 81.2 43.3 9.2
White
1970–71
17
.................... 99.9 97.9 83.7 43.2 7.7 ——————————
1974–75 ....................... 99.9 98.6 86.2 43.9 7.2 ——————————
1976–77 ........................ ——————————100.0 99.2 88.2 47.5 10.0
1977–78 ........................ —————100.0 100.0 95.6 57.6 8.5 —————

54 Elementary and Secondary Education
Table 18.—Percentage of students at or above selected reading, mathematics, and science proficiency levels, by age and race/ethnicity:
1970–71 to 1989–90—Continued
Age, year
and
race/ethnicity
Reading Mathematics Science
Level
150
1
Level
200
2
Level
250
3
Level
300
4
Level
350
5
Level
150
6
Level
200
7
Level
250
8
Level
300
9
Level
350
10
Level
150
11
Level
200
12
Level
250
13
Level
300
14
Level
350
15
1 2 3 4 5 6 7 8 9 10111213141516
1979–80 ........................ 100.0 99.1 86.9 43.3 6.2 ——————————
1981–82 ....................... —————100.0 100.0 96.2 54.7 6.4 100.0 98.6 84.9 43.9 8.6
1983–84 ........................ 100.0 99.0 88.0 46.3 6.9 ——————————
1985–86 ........................ —————100.0 100.0 98.0 59.1 7.9 100.0 98.8 87.8 48.7 9.6
1987–88 ........................ 100.0 99.3 88.7 45.4 5.5 ——————————
1989–90 ........................ 100.0 98.8 88.3 47.5 8.7 100.0 100.0 97.6 63.2 8.3 100.0 99.0 89.6 51.2 11.4
Black
1970–71 ....................... 97.6 81.9 40.1 7.7 0.4 ——————————
1974–75 ........................ 97.7 82.0 43.0 8.1 0.4 ——————————
1976–77 ........................ ——————————98.5 83.6 40.5 7.7 0.4
1977–78 ........................ —————100.0 98.8 70.7 16.8 0.5 —————
1979–80 ........................ 99.0 85.6 44.0 7.1 0.2 ——————————
1981–82 ........................ —————100.0 99.7 76.4 17.1 0.5 97.9 79.7 35.0 6.5 0.2
1983–84 ........................ 99.9 95.9 65.7 16.2 0.9 ——————————
1985–86 ........................ —————100.0 100.0 85.6 20.8 0.2 99.7 90.9 52.2 12.5 0.9
1987–88 ........................ 100.0 98.0 75.8 24.9 1.4 ——————————
1989–90 ........................ 99.6 95.7 69.1 19.7 1.5 100.0 99.9 92.4 32.8 2.0 99.4 88.3 51.4 15.7 1.5
Hispanic
1974–75 ....................... 99.3 88.7 52.9 12.6 1.2 ——————————
1976–77 ........................ ——————————99.7 93.1 61.5 18.5 1.8
1977–78 ........................ —————100.0 99.3 78.3 23.4 1.4 —————
1979–80 ........................ 99.8 93.3 62.2 16.5 1.3 ——————————
1981–82 ........................ —————100.0 99.8 81.4 21.6 0.7 98.9 86.9 48.0 11.1 1.4
1983–84 ........................ 99.8 95.6 68.3 21.2 2.0 ——————————
1985–86 ........................ —————100.0 99.4 89.3 26.5 1.1 99.8 93.3 60.0 14.8 1.1
1987–88 ........................ 99.9 96.3 71.5 23.3 1.3 ——————————
1989–90 ....................... 99.7 95.9 75.2 27.1 2.4 100.0 99.6 85.8 30.1 1.9 99.6 91.9 59.9 21.1 2.1
1
Able to follow brief written directions and select phrases to describe pictures.
2
Able to understand combined ideas and make references based on short uncomplicated passages about specific
or sequentially related information.
3
Able to search for specific information, interrelate ideas, and make generalizations about literature, science, and
social studies materials.
4
Able to find, understand, summarize, and explain relatively complicated literary and informational material.
5
Able to understand the links between ideas even when those links are not explicitly stated and to make appropriate
generalizations even when the text lacks clear introductions or explanations.
6
Able to perform elementary addition and subtraction.
7
Able to perform simple additive reasoning and problem solving.
8
Able to perform simple multiplicative reasoning and 2–step problem solving.
9
Able to perform reasoning and problem solving involving fractions, decimals, percents, elementary geometry, and
simple algebra.
10
Able to perform reasoning and problem solving involving geometry, algebra, and beginning statistics and prob-
ability.
11
Exhibit knowledge of some general scientific facts of the type that could be learned from everyday experiences.
12
Developing some understanding of simple scientific principles, particularly in the life sciences.
13
Able to interpret data from simple tables and make inferences about the outcomes of experimental procedures.
Exhibit knowledge and understanding of the life sciences, and also demonstrate some knowledge of basic information
from the physical sciences.
14
Able to evaluate the appropriateness of the design of an experiment and have the skill to apply scientific knowl-
edge in interpreting information from text and graphs. Exhibit a growing understanding of principles from the physical
sciences.
15
Able to infer relationships and draw conclusions using detailed scientific knowledge from the physical sciences,
particularly chemistry. Able to apply basic principles of genetics and interpret the societal implications of research in
this field.
16
All participants of this age were in school.
17
Includes persons of Hispanic origin.
—Data not available.
SOURCE: U.S. Department of Education, National Center for Education Statistics, National Assessment of Edu-
cational Progress,
Trends in Academic Progress,
November 1991. (This table was prepared December 1992.)

55Elementary and Secondary Education
Table 19.—High school graduates, by sex and control of institution: 1869–70 to 1991–92
[Numbers in thousands]
School year Population 17
years old
1
High school graduates Graduates per
100
17-year-oldsTotal Sex Control
Male Female Public
2
Private
3
1 2345678
1869–70 ........................................ 815 16 7 9 — — 2.0
1879–80 ........................................ 946 24 11 13 — — 2.5
1889–90 ........................................ 1,259 44 19 25 22 22 3.5
1899–1900 .................................... 1,489 95 38 57 62 33 6.4
1909–10 ........................................ 1,786 156 64 93 111 45 8.8
1919–20 ........................................ 1,855 311 124 188 231 80 16.8
1929–30 ........................................ 2,296 667 300 367 592 75 29.0
1930–31 ........................................ 2,327 747 337 409 — — 32.1
1931–32 ........................................ 2,330 827 375 452 — — 35.5
1932–33 ........................................ 2,335 871 403 468 — — 37.3
1933–34 ........................................ 2,334 915 432 483 — — 39.2
1934–35 ........................................ 2,348 965 459 506 — — 41.1
1935–36 ........................................ 2,377 1,015 486 530 — — 42.7
1936–37 ........................................ 2,416 1,068 505 563 — — 44.2
1937–38 ........................................ 2,456 1,120 524 596 — — 45.6
1939–40 ........................................ 2,403 1,221 579 643 1,143 78 50.8
1941–42 ........................................ 2,421 1,242 577 666 — — 51.3
1943–44 ........................................ 2,386 1,019 424 595 — — 42.7
1945–46 ........................................ 2,278 1,080 467 613 — — 47.4
1947–48 ........................................ 2,261 1,190 563 627 1,073 117 52.6
1949–50 ........................................ 2,034 1,200 571 629 1,063 136 59.0
1951–52 ........................................ 2,086 1,197 569 627 1,056 141 57.4
1953–54 ........................................ 2,135 1,276 613 664 1,129 147 59.8
1955–56 ........................................ 2,242 1,415 680 735 1,252 163 63.1
1956–57 ........................................ 2,272 1,434 690 744 1,270 164 63.1
1957–58 ........................................ 2,325 1,506 725 781 1,332 174 64.8
1958–59 ........................................ 2,458 1,627 784 843 1,435 192 66.2
1959–60 ........................................ 2,672 1,858 895 963 1,627 231 69.5
1960–61 ........................................ 2,892 1,964 955 1,009 1,725 239 67.9
1961–62 ........................................ 2,768 1,918 938 980 1,678 240 69.3
1962–63 ........................................ 2,740 1,943 956 987 1,710 233 70.9
1963–64 ........................................ 2,978 2,283 1,120 1,163 2,008 275 76.7
1964–65 ........................................ 2,684 2,658 1,311 1,347 2,360 298 72.1
1965–66 ........................................ 3,489 2,665 1,323 1,342 2,367 298 76.4
1966–67 ........................................ 3,500 2,672 1,328 1,344 2,374 298 76.3
1967–68 ........................................ 3,532 2,695 1,338 1,357 2,395 300 76.3
1968–69 ........................................ 3,659 2,822 1,399 1,423 2,522 300 77.1
1969–70 ........................................ 3,757 2,889 1,430 1,459 2,589 300 76.9
1970–71 ........................................ 3,872 2,937 1,454 1,483 2,637 300 75.9
1971–72 ........................................ 3,973 3,001 1,487 1,514 2,699 302 75.5
1972–73 ........................................ 4,049 3,036 1,500 1,536 2,730 306 75.0
1973–74 ........................................ 4,132 3,073 1,512 1,561 2,763 310 74.4
1974–75 ........................................ 4,256 3,133 1,542 1,591 2,823 310 73.6
1975–76 ........................................ 4,272 3,148 1,552 1,596 2,837 311 73.7
1976–77 ........................................ 4,272 3,155 1,548 1,607 2,840 315 73.9
1977–78 ........................................ 4,286 3,127 1,531 1,596 2,825 302 73.0
1978–79 ........................................ 4,327 3,117 1,523 1,594 2,817 300 72.0
1979–80 ........................................ 4,262 3,043 1,491 1,552 2,748 295 71.4
1980–81 ........................................ 4,207 3,020 1,483 1,537 2,725 295 71.8
1981–82 ........................................ 4,121 2,995 1,471 1,524 2,705 290 72.7
1982–83 ........................................ 3,939 2,888 1,437 1,451 2,598 290 73.3
1983–84 ........................................ 3,753 2,767
4
1,313
4
1,454 2,495 272 73.7
1984–85 ........................................ 3,658 2,677
4
1,291
4
1,386 2,414 263 73.2
1985–86 ........................................ 3,621 2,643
4
1,263
4
1,380 2,383 260 73.0
1986–87 ........................................ 3,697 2,694
4
1,301
4
1,393 2,429 265 72.9
1987–88 ........................................ 3,781 2,773
4
1,384
4
1,389 2,500 273 73.4
1988–89 ........................................ 3,761 2,727
4
1,343
4
1,384 2,459 268 72.5
1989–90 ........................................ 3,485 2,587
4
1,285
4
1,302 2,320 268 74.2
1990–91
5
...................................... 3,325 2,511
4
1,257
4
1,254 2,263 247 75.5
1991–92
5
...................................... 3,286 2,485 — — 2,251 234 75.6
1
Population as of July 1, derived from
Current Population Reports,
Series P-25. Ad-
justed to reflect October 17–year-old population.
2
Data for 1929–30 and preceding years are from
Statistics of Public High Schools
and
exclude graduates of high schools which failed to report to the Office of Education.
3
For most years, private school data have been estimated based on periodic private
school surveys. For years through 1957–58, private includes data for subcollegiate de-
partments of institutions of higher education and residential schools for exceptional chil-
dren.
4
Estimates based on data published by the Bureau of Labor Statistics.
5
Public high school graduates based on state estimates.
—Data not available.
SOURCE: U.S. Department of Commerce, Bureau of the Census,
Historical Statistics
of the United States, Colonial Times to 1970; Current Population Reports,
Series P-25:
U.S. Department of Education, National Center for Education Statistics,
Digest of Edu-
cation Statistics,
various years. (This table was prepared September 1992.)
56 Elementary and Secondary Education
Table 20.—Public school districts and public and private elementary and secondary schools:
1929–30 to 1990–91
School year Public
school
districts
1
Public schools
2
Private schools
2,3
Total, all
schools
4
Total,
regular
schools
5
Elementary schools Secondary
schools Total
4
Elementary Secondary
Total One-teacher
1 2345678910
1929–30 .......................... — — — 238,306 149,282 23,930 — 9,275 3,258
1937–38 .......................... 119,001 — — 221,660 121,178 25,467 — 9,992 3,327
1939–40 .......................... 117,108 — — — 113,600 — — 11,306 3,568
1945–46 .......................... 101,382 — — 160,227 86,563 24,314 — 9,863 3,294
1947–48 .......................... 94,926 — — 146,760 75,096 25,484 — 10,071 3,292
1949–50 .......................... 83,718 — — 128,225 59,652 24,542 — 10,375 3,331
1951–52 .......................... 71,094 — — 123,763 50,742 23,746 — 10,666 3,322
1953–54 .......................... 63,057 — — 110,875 42,865 25,637 — 11,739 3,913
1955–56 .......................... 54,859 — — 104,427 34,964 26,046 — 12,372 3,887
1957–58 .......................... 47,594 — — 95,446 25,341 25,507 — 13,065 3,994
1959–60 .......................... 40,520 — — 91,853 20,213 25,784 — 13,574 4,061
1961–62 .......................... 35,676 — — 81,910 13,333 25,350 — 14,762 4,129
1963–64 .......................... 31,705 — — 77,584 9,895 26,431 — — 4,451
1965–66 .......................... 26,983 — — 73,216 6,491 26,597 17,849 15,340 4,606
1967–68 .......................... 22,010 — 94,197 70,879 4,146 27,011 — — —
1970–71 .......................... 17,995 — 89,372 65,800 1,815 25,352 — 14,372 3,770
1973–74 .......................... 16,730 — 88,655 65,070 1,365 25,906 — — —
1975–76 .......................... 16,376 88,597 87,034 63,242 1,166 25,330 — — —
1976–77 .......................... 16,271 — 86,501 62,644 1,111 25,378 19,910 16,385 5,904
1978–79 .......................... 16,014 — 84,816 61,982 1,056 24,504 19,489 16,097 5,766
1980–81 .......................... 15,912 85,982 83,688 61,069 921 24,362 20,764 16,792 5,678
1982–83 .......................... 15,824 84,740 82,039 59,656 798 23,988 — — —
1983–84 .......................... 15,747 84,178 81,418 59,082 838 23,947
6
27,694
6
20,872
6
7,862
1984–85 .......................... — 84,007 81,147 58,827 825 23,916 — — —
1985–86 .......................... ——————
6
25,616
6
20,252
6
7,387
1986–87 ..........................
7
15,713 83,455 82,190 60,784 763 23,389 — — —
1987–88 ..........................
7
15,577 83,248 82,248 61,490 729 22,937
6
26,807
6
22,959
6
8,418
1988–89 ..........................
7
15,376 83,165 82,081 61,531 583 22,785 — — —
1989–90 ..........................
7
15,367 83,425 82,396 62,037 630 22,639 — — —
1990–91 ..........................
7
15,358 84,538 81,746 61,340 617 22,731 — — —
1
Includes operating and nonoperating districts.
2
Schools with both elementary and secondary programs are included under elemen-
tary schools and also under secondary schools.
3
Data for most years are partly estimated.
4
Includes regular schools and special schools not classified by grade span.
5
Includes elementary, secondary, and combined elementary/secondary schools.
6
These data are from sample surveys and should not be compared directly with the
data for earlier years.
7
Because of expanded survey coverage, data are not directly comparable with figures
for earlier years.
—Data not available.
SOURCE: U.S. Department of Education, National Center for Education Statistics,
Sta-
tistics of State School Systems; Statistics of Public Elementary and Secondary School
Systems; Statistics of Nonpublic Elementary and Secondary Schools; Private Schools in
American Education;
and Common Core of Data surveys. (This table was prepared April
1992.)

57Elementary and Secondary Education
Table 21.—Revenues for public elementary and secondary schools, by source of funds:
1889–90 to 1989–90
School year
In thousands Percentage distribution
Total Federal State
1
Local (including
intermediate)
2
Total Federal State
1
Local (including
intermediate)
2
123456789
1889–90
3
....... $143,195 — $26,345 $97,222 100.0 — 21.3 78.7
1890–91
3
....... 147,915 — 27,632 100,359 100.0 — 21.6 78.4
1891–92
3
....... 157,175 — 29,908 105,630 100.0 — 22.1 77.9
1892–93
3
....... 165,023 — 33,695 108,425 100.0 — 23.7 76.3
1893–94
3
....... 170,404 — 32,750 112,785 100.0 — 22.5 77.5
1894–95
3
....... 176,565 — 34,638 118,915 100.0 — 22.6 77.4
1895–96
3
....... 182,480 — 35,032 124,880 100.0 — 21.9 78.1
1896–97
3
....... 191,959 — 33,942 130,318 100.0 — 20.7 79.3
1897–98
3
....... 199,833 — 35,122 135,516 100.0 — 20.6 79.4
1898–99
3
....... 203,337 — 35,341 144,898 100.0 — 19.6 80.4
1899–1900
3
... 219,766 — 37,887 149,487 100.0 — 20.2 79.8
1900–01
3
....... 235,339 — 36,281 163,897 100.0 — 18.1 81.9
1901–02
3
....... 245,498 — 39,216 173,151 100.0 — 18.5 81.5
1902–03
3
....... 251,637 — 40,456 173,731 100.0 — 18.9 81.1
1903–04
3
....... 279,134 — 42,553 193,216 100.0 — 18.0 82.0
1904–05
3
....... 301,819 — 44,349 210,168 100.0 — 17.4 82.6
1905–06
3
....... 322,106 — 47,943 223,491 100.0 — 17.7 82.3
1906–07
3
....... 355,016 — 44,706 231,738 100.0 — 16.2 83.8
1907–08
3
....... 381,920 — 58,097 259,341 100.0 — 18.3 81.7
1908–09
3
....... 403,647 — 63,547 288,643 100.0 — 18.0 82.0
1909–10
3
....... 433,064 — 64,605 312,222 100.0 — 17.1 82.9
1910–11
3
....... 451,151 — 69,071 333,832 100.0 — 17.1 82.9
1911–12
3
....... 469,111 — 75,814 346,898 100.0 — 17.9 82.1
1912–13
3
....... 507,227 — 78,376 375,582 100.0 — 17.3 82.7
1913–14
3
....... 561,743 — 87,895 425,457 100.0 — 17.1 82.9
1914–15
3
....... 589,652 — 91,104 456,956 100.0 — 16.6 83.4
1915–16
3
....... 633,901 — 95,278 488,120 100.0 — 16.3 83.7
1917–18 ......... 736,876 $1,669 122,256 612,951 100.0 0.2 16.6 83.2
1919–20 ......... 970,121 2,475 160,085 807,561 100.0 0.3 16.5 83.2
1921–22
3
....... 1,444,242 2,891 230,517 1,184,530 100.0 0.2 16.3 83.5
1923–24
3
....... 1,618,438 3,986 261,997 1,290,239 100.0 0.3 16.8 82.9
1925–26 ......... 1,830,017 5,552 284,569 1,539,896 100.0 0.3 15.6 84.1
1927–28 ......... 2,025,750 6,174 333,279 1,686,297 100.0 0.3 16.5 83.2
1929–30 ......... 2,088,557 7,334 353,670 1,727,553 100.0 0.4 16.9 82.7
1931–32 ......... 2,068,029 8,262 410,550 1,649,218 100.0 0.4 19.9 79.7
1933–34 ......... 1,810,652 21,548 423,178 1,365,926 100.0 1.2 23.4 75.4
1935–36 .........
4
1,971,402
4
9,850 578,369 1,383,184 100.0 0.5 29.3 70.2
1937–38 ......... 2,222,885 26,535 655,996 1,540,353 100.0 1.2 29.5 69.3
1939–40 ......... 2,260,527 39,810 684,354 1,536,363 100.0 1.8 30.3 68.0
1941–42 ......... 2,416,580 34,305 759,993 1,622,281 100.0 1.4 31.4 67.1
1943–44 ......... 2,604,322 35,886 859,183 1,709,253 100.0 1.4 33.0 65.6
1945–46 ......... 3,059,845 41,378 1,062,057 1,956,409 100.0 1.4 34.7 63.9
1947–48 ......... 4,311,534 120,270 1,676,362 2,514,902 100.0 2.8 38.9 58.3
1949–50 ......... 5,437,044 155,848 2,165,689 3,115,507 100.0 2.9 39.8 57.3
1951–52 ......... 6,423,816 227,711 2,478,596 3,717,507 100.0 3.5 38.6 57.9
1953–54 ......... 7,866,852 355,237 2,944,103 4,567,512 100.0 4.5 37.4 58.1
1955–56 ......... 9,686,677 441,442 3,828,886 5,416,350 100.0 4.6 39.5 55.9
1957–58 ......... 12,181,513 486,484 4,800,368 6,894,661 100.0 4.0 39.4 56.6
1959–60 ......... 14,746,618 651,639 5,768,047 8,326,932 100.0 4.4 39.1 56.5
1961–62 ......... 17,527,707 760,975 6,789,190 9,977,542 100.0 4.3 38.7 56.9
1963–64 ......... 20,544,182 896,956 8,078,014 11,569,213 100.0 4.4 39.3 56.3
1965–66 ......... 25,356,858 1,996,954 9,920,219 13,439,686 100.0 7.9 39.1 53.0
1967–68 ......... 31,903,064 2,806,469 12,275,536 16,821,063 100.0 8.8 38.5 52.7
1969–70 ......... 40,266,923 3,219,557 16,062,776 20,984,589 100.0 8.0 39.9 52.1

58 Elementary and Secondary Education
Table 21.—Revenues for public elementary and secondary schools, by source of funds:
1889–90 to 1989–90—Continued
School year
In thousands Percentage distribution
Total Federal State
1
Local (including
intermediate)
2
Total Federal State
1
Local (including
intermediate)
2
123456789
1970–71 ......... 44,511,292 3,753,461 17,409,086 23,348,745 100.0 8.4 39.1 52.5
1971–72 ......... 50,003,645 4,467,969 19,133,256 26,402,420 100.0 8.9 38.3 52.8
1972–73 ......... 52,117,930 4,525,000 20,843,520 26,749,412 100.0 8.7 40.0 51.3
1973–74 ......... 58,230,892 4,930,351 24,113,409 29,187,132 100.0 8.5 41.4 50.1
1974–75 ......... 64,445,239 5,811,595 27,211,116 31,422,528 100.0 9.0 42.2 48.8
1975–76 ......... 71,206,073 6,318,345 31,776,101 33,111,627 100.0 8.9 44.6 46.5
1976–77 ......... 75,322,532 6,629,498 32,688,903 36,004,134 100.0 8.8 43.4 47.8
1977–78 ......... 81,443,160 7,694,194 35,013,266 38,735,700 100.0 9.4 43.0 47.6
1978–79 ......... 87,994,143 8,600,116 40,132,136 39,261,891 100.0 9.8 45.6 44.6
1979–80 ......... 96,881,165 9,503,537 45,348,814 42,028,813 100.0 9.8 46.8 43.4
1980–81 ......... 105,949,087 9,768,262 50,182,659 45,998,166 100.0 9.2 47.4 43.4
1981–82 ......... 110,191,257 8,186,466 52,436,435 49,568,356 100.0 7.4 47.6 45.0
1982–83 ......... 117,497,502 8,339,990 56,282,157 52,875,354 100.0 7.1 47.9 45.0
1983–84 ......... 126,055,419 8,576,547 60,232,981 57,245,892 100.0 6.8 47.8 45.4
1984–85 ......... 137,294,678 9,105,569 67,168,684 61,020,425 100.0 6.6 48.9 44.4
1985–86 ......... 149,127,779 9,975,622 73,619,575 65,532,582 100.0 6.7 49.4 43.9
1986–87 ......... 158,523,693 10,146,013 78,830,437 69,547,243 100.0 6.4 49.7 43.9
1987–88
2
....... 169,561,974 10,716,687 84,004,415 74,840,873 100.0 6.3 49.5 44.1
1988–89 ......... 192,016,374 11,902,001 91,768,911 88,345,462 100.0 6.2 47.8 46.0
1989–90 ......... 207,583,910 12,750,530 98,059,659 96,773,720 100.0 6.1 47.2 46.6
1
Prior to 1917–18, excludes receipts other than state taxes and appropriations.
2
Includes a relatively small amount from nongovernmental sources (gifts and tuition
and transportation fees from patrons). These sources accounted for 0.4 percent of total
revenues in 1967–68. Prior to 1917–18, excludes receipts from sources other than local
taxes and appropriations.
3
Total includes receipts not distributed by source. Percents based on funds reported
by source.
4
Excludes federal funds other than aid for vocational education.
—Data not available.
NOTE.—Beginning in 1980–81, revenues for state education agencies are excluded.
Data for 1988–89 reflect new survey collection procedures and may not be entirely com-
parable to figures for earlier years. Because of rounding, details may not add to totals.
SOURCE: U.S. Department of Education, National Center for Education Statistics,
An-
nual Report of the Commissioner of Education, 1890 to 1917; Biennial Survey of Edu-
cation in the United States, 1916–18 to 1956–58; Statistics of State School Systems,
1959–60 to 1969–70; Revenues and Expenditures for Public Elementary and Secondary
Education;
and Common Core of Data survey. (This table was prepared September
1992.)
59Elementary and Secondary Education
Table 22.—Total and current expenditures and expenditure per pupil in public elementary and secondary schools, by purpose:
1869–70 to 1989–90
School year
Total
expendi-
tures, in
millions
Current expenditures, day schools (in millions)
Capital
outlay,
4
in
millions
Interest
on school
debt, in
millions
Other ex-
pendi-
tures,
5
in
millions
Expenditures in current dollars Expenditures in constant 1989–90 dollars
Total
1
Adminis-
tration Instruc-
tion
2
Plant
oper-
ation
and
mainte-
nance
Other
3
Total Current,
per pupil
in aver-
age
daily
attend-
ance
Total Current
per pupil
in aver-
age
daily
attend-
ance
Per
capita
Per
pupil
enrolled
Per
pupil in
average
daily
attend-
ance
Per
capita
Per
pupil
enrolled
Per
pupil in
average
daily
attend-
ance
1 2 3 4 5 6 7 8 9 10 1112131415161718
1869–70 .............. $63 — — $38 — — — — — $2 $9 $16—————
1870–71 .............. 69 — — 43 — — — — — — 9 15 —————
1871–72 .............. 74 — — 46 — — — — — — 9 16 —————
1872–73 .............. 76 — — 48 — — — — — — 10 16 —————
1873–74 .............. 80 — — 51 — — — — — — 9 16 —————
1874–75 .............. 84 — — 55 — — — — — — 10 16 —————
1875–76 .............. 83 — — 55 — — — — — — 9 16 —————
1876–77 .............. 79 — — 55 — — — — — — 9 15 —————
1877–78 .............. 79 — — 56 — — — — — — 8 14 —————
1878–79 .............. 76 — — 55 — — — — — — 8 13 —————
1879–80 .............. 78 — — 56 — — — — — 2 8 13 —————
1880–81 .............. 84 — — 58 — — — — — — 8 14 —————
1881–82 .............. 89 — — 61 — — — — — — 9 14 —————
1882–83 .............. 97 — — 65 — — — — — — 9 15 —————
1883–84 .............. 103 — — 68 — — — — — — 9 15 —————
1884–85 .............. 110 — — 73 — — — — — — 10 15 —————
1885–86 .............. 113 — — 76 — — — — — — 10 15 —————
1886–87 .............. 116 — — 79 — — — — — — 10 15 —————
1887–88 .............. 124 — — 83 — — — — — — 10 16 —————
1888–89 .............. 133 $109 — 88 — $22 $23 — — — 11 17 $14————
1889–90 .............. 141 114 — 92 — 22 26 — — 2 11 17 14 ————
1890–91 .............. 147 121 — 96 — 25 26 — — — 11 18 15 ————
1891–92 .............. 156 126 — 100 — 26 29 — — — 12 18 15 ————
1892–93 .............. 164 134 — 105 — 29 30 — — — 12 19 15 ————
1893–94 .............. 173 142 — 109 — 33 30 — — — 12 19 16 ————
1894–95 .............. 176 146 — 114 — 33 29 — — — 12 18 15 ————
1895–96 .............. 183 151 — 117 — 34 33 — — — 13 19 15 ————
1896–97 .............. 188 155 — 119 — 36 32 — — — 13 19 15 ————
1897–98 .............. 194 163 — 124 — 39 31 — — — 13 19 16 ————
1898–99 .............. 200 169 — 129 — 40 31 — — — 13 19 16 ————
1899–1900 .......... 215 180 — 138 — 42 35 — — 3 14 20 17 ————
1900–01 .............. 228 188 — 143 — 44 40 — — 3 14 21 18 ————
1901–02 .............. 238 198 — 151 — 47 40 — — 3 15 22 18 ————
1902–03 .............. 251 205 — 157 — 48 46 — — 3 16 ——————
1903–04 .............. 273 224 — 168 — 56 49 — — 3 17 23 19 ————
1904–05 .............. 292 235 — 177 — 58 56 — — 4 18 24 20 ————
1905–06 .............. 308 247 — 186 — 61 61 — — 4 18 26 21 ————
1906–07 .............. 337 272 — 202 — 70 65 — — 4 20 28 23 ————
1907–08 .............. 371 298 — 220 — 78 74 — — 4 22 31 24 ————
1908–09 .............. 401 320 — 237 — 83 82 — — 5 23 32 25 ————
1909–10 .............. 426 356 $7 260 — 89 70 — — 5 24 33 28 ————

60 Elementary and Secondary Education
Table 22.—Total and current expenditures and expenditure per pupil in public elementary and secondary schools, by purpose:
1869–70 to 1989–90—Continued
School year
Total
expendi-
tures, in
millions
Current expenditures, day schools (in millions)
Capital
outlay,
4
in
millions
Interest
on school
debt, in
millions
Other ex-
pendi-
tures,
5
in
millions
Expenditures in current dollars Expenditures in constant 1989–90 dollars
Total
1
Adminis-
tration Instruc-
tion
2
Plant
oper-
ation
and
mainte-
nance
Other
3
Total Current,
per pupil
in aver-
age
daily
attend-
ance
Total Current
per pupil
in aver-
age
daily
attend-
ance
Per
capita
Per
pupil
enrolled
Per
pupil in
average
daily
attend-
ance
Per
capita
Per
pupil
enrolled
Per
pupil in
average
daily
attend-
ance
1 2 3 4 5 6 7 8 9 10 1112131415161718
1910–11 .............. 447 371 6 273 — 91 76 — — 5 25 35 29 ————
1911–12 .............. 483 405 9 295 — 101 78 — — 5 27 36 30 ————
1912–13 .............. 522 438 10 316 — 112 84 — — 5 28 38 32 ————
1913–14 .............. 555 463 12 335 — 116 92 — — 6 29 39 33 ————
1914–15 .............. 605 503 13 358 — 131 103 — — 6 31 40 34 ————
1915–16 .............. 641 537 15 378 — 144 104 — — 6 31 42 35 ————
1917–18 .............. 764 629 25 444 $133 27 119 $15 — 7 37 49 40 ————
1919–20 .............. 1,036 861 37 633 146 46 154 18 $3 10 48 64 53 $66 $320 $427 $355
1921–22 .............. 1,581 1,235 51 903 203 69 306 36 4 15 68 86 67 108 504 635 496
1923–24 .............. 1,821 1,369 55 1,001 221 92 388 59 5 16 75 95 72 120 555 704 529
1925–26 .............. 2,026 1,538 68 1,127 244 99 411 72 5 17 82 102 77 125 585 727 552
1927–28 .............. 2,184 1,706 77 1,220 278 130 383 92 4 18 87 106 83 135 641 781 610
1929–30 .............. 2,317 1,844 79 1,318 295 152 371 93 10 19 90 108 87 141 668 805 643
1931–32 .............. 2,175 1,810 75 1,333 257 144 211 140 13 18 83 98 81 154 731 861 717
1933–34 .............. 1,720 1,516 64 1,121 203 127 59 137 8 14 65 76 67 131 623 731 647
1935–36 .............. 1,969 1,657 67 1,214 233 142 171 133 8 15 75 88 74 143 693 816 687
1937–38 .............. 2,233 1,870 86 1,360 260 164 239 114 10 17 86 100 84 154 762 884 743
1939–40 .............. 2,344 1,942 92 1,403 268 179 258 131 13 18 92 106 88 163 836 961 800
1941–42 .............. 2,323 2,068 101 1,458 289 220 138 109 9 17 95 110 98 142 774 900 801
1943–44 .............. 2,453 2,293 111 1,591 316 276 54 97 9 18 105 125 117 131 765 908 852
1945–46 .............. 2,907 2,707 133 1,854 372 349 111 77 11 21 125 145 136 145 870 1,007 949
1947–48 .............. 4,311 3,795 170 2,572 526 527 412 76 28 30 180 203 179 163 981 1,105 978
1949–50 .............. 5,838 4,687 220 3,112 642 713 1,014 101 36 39 232 259 209 210 1,244 1,388 1,120
1951–52 .............. 7,344 5,722 266 3,782 757 917 1,477 114 30 48 276 313 244 230 1,333 1,511 1,180
1953–54 .............. 9,092 6,791 311 4,552 908 1,020 2,055 154 92 57 315 351 265 269 1,487 1,657 1,250
1955–56 .............. 10,955 8,251 373 5,502 1,072 1,304 2,387 216 101 66 352 388 294 313 1,663 1,833 1,390
1957–58 .............. 13,569 10,252 443 6,901 1,302 1,605 2,853 342 123 79 405 449 341 352 1,801 1,995 1,517
1959–60
6
............ 15,613 12,329 528 8,351 1,508 1,943 2,662 490 133 88 433 472 375 381 1,871 2,040 1,621
1961–62 .............. 18,373 14,729 648 10,016 1,760 2,304 2,862 588 194 100 480 530 419 424 2,028 2,238 1,770
1963–64 .............. 21,325 17,218 745 11,750 1,985 2,738 2,978 701 428 113 519 559 460 466 2,137 2,300 1,895
1965–66 .............. 26,248 21,053 938 14,445 2,386 3,284 3,755 792 648 136 613 654 537 540 2,439 2,602 2,138
1967–68 .............. 32,977 26,877 1,249 18,376 2,864 4,388 4,256 978 866 167 737 786 658 624 2,752 2,936 2,458
1969–70 .............. 40,683 34,218 1,607 23,270 3,512 5,829 4,659 1,171 636 202 877 955 816 679 2,948 3,210 2,743
1970–71 .............. 45,500 39,630 1,789 26,224 3,960 7,657 4,552 1,318 973 223 970 1,049 911 713 3,100 3,353 2,912
1971–72 .............. 48,050 41,818 1,876 28,148 4,325 7,469 4,459 1,378 396 232 1,034 1,128 990 717 3,191 3,481 3,055
1972–73 .............. 51,852 46,213 2,018 30,119 4,677 9,399 4,091 1,547 1,698 248 1,116 1,211 1,077 735 3,310 3,592 3,195
1973–74 .............. 56,970 50,025 2,276 32,609 5,291 9,849 4,978 1,514 453 270 1,244 1,364 1,207 734 3,388 3,715 3,287
1974–75 .............. 64,846 57,363 2,670 36,482 6,136 12,075 5,746 1,737 702 304 1,424 1,545 1,365 745 3,491 3,788 3,346

61Elementary and Secondary Education
Table 22.—Total and current expenditures and expenditure per pupil in public elementary and secondary schools, by purpose:
1869–70 to 1989–90—Continued
School year
Total
expendi-
tures, in
millions
Current expenditures, day schools (in millions)
Capital
outlay,
4
in
millions
Interest
on school
debt, in
millions
Other ex-
pendi-
tures,
5
in
millions
Expenditures in current dollars Expenditures in constant 1989–90 dollars
Total
1
Adminis-
tration Instruc-
tion
2
Plant
oper-
ation
and
mainte-
nance
Other
3
Total Current,
per pupil
in aver-
age
daily
attend-
ance
Total Current
per pupil
in aver-
age
daily
attend-
ance
Per
capita
Per
pupil
enrolled
Per
pupil in
average
daily
attend-
ance
Per
capita
Per
pupil
enrolled
Per
pupil in
average
daily
attend-
ance
1 2 3 4 5 6 7 8 9 10 1112131415161718
1975–76 .............. 70,601 62,054 2,808 39,687 6,675 12,884 6,146 1,846 553 328 1,564 1,697 1,504 750 3,581 3,885 3,444
1976–77 .............. 74,194 66,864 3,273 41,869 7,331 14,391 5,344 1,953 853 341 1,673 1,816 1,638 738 3,619 3,929 3,544
1977–78 .............. 80,844 73,058 3,867 45,024 8,096 16,071 5,245 1,952 589 368 1,842 2,002 1,823 746 3,734 4,059 3,696
1978–79 .............. 86,712 78,951 3,896 48,403 8,565 18,087 5,448 1,955 357 390 2,029 2,210 2,020 724 3,761 4,097 3,744
1979–80 .............. 95,962 86,984 4,264 53,258 9,745 — 6,506 1,874 598 427 2,290 2,491 2,272 699 3,745 4,074 3,716
1980–81 .............. 104,125 94,321 — — — — — — —
7
458
7
2,529
7
2,742 2,502
7
672
7
3,707
7
4,019 3,667
1981–82 .............. 111,186 101,109——— —— — —
7
484
7
2,754
7
2,973 2,726
7
653
7
3,716
7
4,011 3,678
1982–83 .............. 118,425 108,268——— —— — —
7
510
7
2,966
7
3,203 2,955
7
660
7
3,837
7
4,144 3,823
1983–84 .............. 127,500 115,392——— —— — —
7
544
7
3,216
7
3,471 3,173
7
679
7
4,012
7
4,330 3,958
1984–85 .............. 137,000 126,337——— —— — —
7
579
7
3,456
7
3,722 3,470
7
696
7
4,149
7
4,468 4,166
1985–86 .............. 148,600 137,165 — 83,463 — — — — —
7
622
7
3,724
7
4,020 3,756
7
726
7
4,345
7
4,691 4,383
1986–87 .............. 160,900 146,365 — 89,559 — — — — —
7
667
7
3,995
7
4,308 3,970
7
762
7
4,560
7
4,918 4,532
1987–88 .............. 172,400 157,098 — 96,967 — — — — —
7
708
7
4,310
7
4,654 4,240
7
776
7
4,724
7
5,101 4,647
1988–89 .............. 192,977 173,099 — 101,016 — — 14,101 3,213 2,564 785 4,738 5,109 4,645 823 4,964 5,353 4,866
1989–90 .............. 211,731 187,384 — 108,964 — — 17,685 3,693 2,969 853 5,149 5,526 4,960 853 5,149 5,526 4,960
1
Prior to 1917–18, includes expenditures for interest.
2
Prior to 1909–10, includes only expenditures for salaries of teachers and superintendents.
3
Prior to 1917–18, includes plant operation and maintenance; prior to 1909–10, includes all current expenditures ex-
cept salaries of teachers and superintendents.
4
Beginning in 1965–66, includes capital outlay by state and local school building authorities.
5
Beginning in 1953–54, includes expenditures for community services, previously included in ‘‘current expenditures,
day schools.’’
6
Denotes first year for which figures include Alaska and Hawaii.
7
Estimated.
—Data not available.
SOURCE: U.S. Department of Commerce, Bureau of the Census,
Historical Statistics of the United States, Colonial
Times to 1970;
U.S. Department of Education, National Center for Education Statistics,
Digest of Education Statistics;
and unpublished data. (This table was prepared September 1992.)

63
1
Donald G. Tewksbury,
The Founding of American Colleges and
Universities
, (New York: Columbia University Press, 1932; reprint
ed., New York: Archon Books, 1965), 90–91.
2
Adolphe E. Meyer,
Grandmasters of Educational Thought
(New
York: McGraw Hill, 1975), 146.
3
Richard Hofstadter and Wilson Smith, ed.,
American Higher Edu-
cation, A Documentary History, Vol. I
(Chicago: University of Chi-
cago Press, 1961), 157.
4
Tewksbury,
The Founding of American Colleges and Universities
,
167.
5
U.S. Department of Commerce, Bureau of the Census,
Historical
Statistics of the United States, Colonial Times to 1970
, 2 vols.
(Washington, D.C.: U.S. Government Printing Office, 1973), 1:8.
U.S. Department of Education, National Center for Education Statis-
tics, ‘‘Institutional Characteristics, 1980–81,’’ unpublished data.
6
Tewksbury,
The Founding of American Colleges and Universities
,
169.
7
Raphael M. Huber,
The Part Played by Religion in the History of
Education in the United States of America
(Trenton: MacCrillish &
Quigley & Co., 1951), 27.
Chapter 3
Higher Education
Development of American institutions of higher
education began early in the colonial period. Many of
the first European colonists left their homelands to
avoid religious persecution and were particularly in-
terested in literacy, as well as more advanced schol-
arship, to facilitate religious instruction. Thus, one of
the most important missions of colonial colleges was
to prepare men to be ministers or priests. The first
colonial college, now Harvard University, was found-
ed in 1636 to prepare ministers. The profusion of
small theological and religious colleges served the
expanding frontier by providing ministers to serve
local communities. The religious zeal which became
more pronounced after 1800 played an important role
in stimulating the growth of educational enterprises.
Prior to the Civil War, it has been estimated that per-
haps one-fourth of all college graduates became min-
isters.
1
Besides meeting the demand for religious
leaders, these religiously affiliated colleges assisted
in the general diffusion of knowledge.
Public colleges also expanded westward across
the United States as states made higher education
available to their citizens. Benjamin Franklin was
among the first prominent Americans to advocate
higher education without religious control. After the
Revolutionary War, considerable discussion was de-
voted to the thought of establishing a national or fed-
eral university.
2
Although all six of the first U.S.
presidents supported the concept of a national uni-
versity, such an institution was never approved by
Congress.
3
Despite Thomas Jefferson’s lack of suc-
cess with the national university concept, he was in-
fluential in the founding of the U.S. Military Academy
at West Point in 1802.
Another major development of the early 19th cen-
tury was the creation of normal schools. These insti-
tutions were designed to help prepare teachers for
the expanding school systems. The first of the nor-
mal schools was founded in 1823. Later in 1839,
Horace Mann established the first public normal
school in Massachusetts. These schools typically of-
fered a 2-year program.
Although national education statistics were not col-
lected prior to 1869-70, some inferences about the
number of colleges can be made by examining the
current colleges that have founding dates during the
late 18th and early 19th centuries. Some 37 of to-
day’s colleges were founded prior to 1800 (table 27).
Only four of these colleges were founded as public
institutions. The evidence suggests that the first of
the public colleges to obtain a charter was the Uni-
versity of Georgia, though the University of North
Carolina was the first to open.
4
Most of these 37 col-
leges had their beginning in the last two decades of
the 18th century. The growth of colleges accelerated
during the 19th century. During the first two decades
of the 1800s, 31 more colleges were founded, of
which 5 were publicly controlled (6, if the federally
controlled West Point is included). The next two dec-
ades brought 102 more colleges that still exist today,
and between 1840 and 1859, an additional 210 col-
leges were founded. Whether college enrollments
kept pace with the rise in population from 3.9 million
in 1790 to 31.5 million in 1860 is unknown, but at
least the increase in the number of colleges suggests
sharp rises in enrollment.
5
Public colleges also ex-
panded in the first half of the 19th century, and by
1860, there were 21 state colleges in 20 different
states.
6
Today, many of the 380 colleges founded
prior to 1860 are independent or public, but most
were originally controlled by religious groups.
7
Public
higher education was assisted through such pro-
grams as the First Morrill Act in 1862, which provided
land grants for the creation and maintenance of agri-
cultural and mechanical colleges.

64 Higher Education
8
For examples, see (
Exposition of the System of Instruction and
Discipline Pursued in the University of Vermont by the Faculty
[Bur-
lington: University of Vermont, 1829], 30) and (
Catalogue of the Offi-
cers and Students of the University in Cambridge, October 1825
[Cambridge: University Press, 1825], 19. These standards remained
in effect at many campuses well after the Civil War (
Catalogue of
the University of North Carolina, 1866–67
[Raleigh: Nichols, Gorman
& Neathery Printers, 1867], 15.)
9
Catalogue of the Officers and Students of the University of Virginia,
Session of 1839–40
(Charlottesville: Robert Noel, 1840), 1. and N.J.
Cabell, ed.,
Early History of the University of Virginia, as Contained
in the Letters of Thomas Jefferson and Joseph C. Cabell
(Richmond:
J.W. Randolph, 1856), 142–143.
10
Catalogue of the Officers and Students of Brown University, March
1824
(Providence: Carlile & Co., 1824), 5;
Catalogue of the Officers
and Students of Brown University, 1827–28
(Providence: Carlile &
Co., 1828), 13;
Catalogue of the Officers and Students of the Univer-
sity in Cambridge, October 1820 (Cambridge: University Press,
1820); and Catalogue of the Officers and Students of Harvard Uni-
versity for the Academical Year 1827–28
(Cambridge: University
Press, 1827).
11
This excludes the military science academy at West Point. Nich-
olas Butler, gen. ed.,
Education in the United States, Monographs
on Education in the United States
(New York: Arno Press & The
New York Times, 1969), ‘‘Scientific, Technical, and Engineering
Education,’’ by T.C. Mendenhall, 555.
12
U.S. Department of the Interior,
Annual Report of the Secretary
of the Interior for the Fiscal Year Ending June 30, 1890
, 5 vols.,
(Washington, D.C.: U.S. Government Printing Office, 1893), Part
2, 5:772–773.
13
U.S. Department of the Interior, Bureau of Education,
Report of
the Commissioner of Education for the Year 1878
(Washington,
D.C.: U.S. Government Printing Office, 1880), XCIV.
Higher education in the early 19th century was
characterized by heavy emphasis on the classics.
Higher education often began at 14 to 16 years of
age, though 17 to 20 was more common. Generally,
prospective students were expected to have an un-
derstanding of Greek and Latin and were frequently
tested on these before being allowed entrance.
Some knowledge of basic mathematics, such as al-
gebra, was assumed. The college curriculum gen-
erally comprised four years of study, and the typical
core of this instruction was equal parts of mathe-
matics, Greek, and Latin. Sometimes these were the
sole elements of freshman and sophomore edu-
cation. At more progressive and prestigious colleges,
juniors and seniors might delve into a variety of sci-
entific topics, perhaps including some medical lec-
tures, though physical sciences were more common.
Other common subjects for upperclassmen included
rhetoric, philosophy, and Christian studies.
8
Thomas
Jefferson in his founding of the University of Virginia
designed what was considered a progressive institu-
tion that provided electives for students to choose
particular courses of study. The courses of study at
the university included medicine, ancient and modern
languages, mathematics, philosophy, and sciences.
9
During the 1820s and 1830s, developments at other
colleges such as Harvard and Brown, reflected more
interest in science and mathematics instruction at the
expense of ancient studies.
10
Colleges reacted to
the changing times. The first exclusively scientific in-
stitution, Renssalaer Polytechnic University, opened
in 1824.
11
Higher education continued to maintain a strong
attachment to traditional studies through much of the
19th century. In 1886–87, 62 percent of college stu-
dents were enrolled in classical courses.
12
In 1878,
more than 10 percent of those students wishing to
enter colleges where entrance examinations were
given were rejected only because of their lack of pro-
ficiency with the Greek language. Altogether, about
one fourth of students were rejected because of defi-
ciencies in Latin, Greek, or sometimes mathe-
matics.
13
Enrollment
Higher education enrollment in the colonies was
largely limited to the well-to-do. This situation pre-
vailed through the late 19th and early 20th century.
When the federal Office of Education began collect-
ing education data in 1869–70, only 63,000 students
were attending higher education institutions through-
out the country, which amounted to only about 1 per-
cent of the 18- to 24-year-old population. This small
number of students was divided among 563 cam-
puses, giving an average enrollment size of only 112
students. About 21 percent of students were female.
Today, there are over 14,000,000 students in the
U.S. attending some 3,600 institutions, for an aver-
age enrollment of 3,931 students. More than half of
college students are women (table 23). About 33 per-
cent of all 18- to 24-year-olds are enrolled in college
today. Not only are many more students involved in
higher education today, but the system itself has
shown dynamic change over the past century, evolv-
ing from small institutions serving a relatively re-
stricted student body with instruction focussing on in-
struction in the classics and mathematics into today’s
large enterprises offering a vast array of courses.
During the latter part of the 1800s, enrollment grew
rapidly in higher education institutions, but much of
this growth was due to increases in the population.
Enrollment grew by 278 percent between 1869–70
and 1899–1900, but students as a percent of 18- to
24-year-olds rose from 1 percent to 2 percent. The
proportion of women students in colleges grew sig-
nificantly from 21 percent in 1869–70 to 36 percent
in 1899–1900. While the number of colleges grew
during this period, it did not rise as fast as the num-
ber of students. As a result, the average size of col-
leges grew as well, reaching 243 in 1899–1900
(table 24).

65Higher Education
Figure 14.--Enrollment in institutions of higher education, by sex:
Year ending
1870 1880 1890 1900 1910 1920 1930 1940 1950 1960 1970 1980
15
14
13
12
11
10
9
8
7
6
5
4
3
2
1
0
1991
Millions
Total
Female
Male
1869-70 to 1990-91
Source: U.S. Department of Commerce, Bureau of the Census,
Historical Statistics of the United States, Colonial Times to 1970;
U.S. Department of Education, National Center for Education Statistics,
Digest of Education Statistics,
various issues. and
Enrollment growth accelerated in the first 30 years
of the 20th century, driven by population growth and
continuing rises in participation rates. Between 1899–
1900 and 1909–10, enrollment rose by 50 percent. In
the following decade, enrollment rose by 68 percent,
and between 1919–20 and 1929–30, enrollment rose
by 84 percent. During these 30 years, the ratio of
college students to 18- to 24-year-olds rose from 2
to 7 per 100. However, the proportion of women stu-
dents in higher education dropped during the 1920s
from 47 percent to 44 percent. The depression of the
1930s may have contributed to slower growth in col-
lege enrollment and participation. By the end of the
decade, college enrollment had reached 1.5 million
with 9 college students per 100 18- to 24-year-olds.
The total was still 36 percent higher than 1929–30,
but the proportion of women students had fallen to
40 percent. By this time, enrollment in public colleges
had risen to the point where more than half of col-
lege students were enrolled in public institutions.
During the early 1940s, the enrollment of males
dropped precipitously as large numbers of young
men went to fight World War II. In 1943–44, about
half of the students in colleges were women. By the
end of the 1940s, college enrollment was surging.
Large numbers of World War II veterans entered col-
leges assisted by such programs as the Service-
men’s Readjustment Act which provided education
benefits. In fall 1949, about 2.4 million students en-
rolled in colleges, or about 15 per 100 18- to 24-
year-olds. The proportion of women on campus
dropped to 30 percent. The proportion of students
enrolled in public colleges was about half, the same
as in the 1929–30. Enrollment was still concentrated
at 4-year colleges, with less than 10 percent of stu-
dents at 2-year colleges.
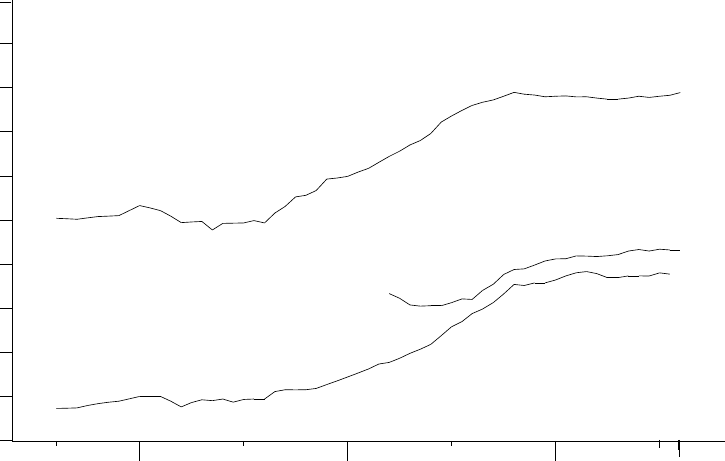
66 Higher Education
Figure 15.--Percentage of students in institutions of higher education,
by control, type, and attendance status:
1932 1940 1950 1960 1970 1980 1992
100
90
80
70
60
50
40
30
20
10
0
Public
Part-time
2-year
Percent
Year ending
of enroll-
ment
1931-32 to 1991-92
Source: U.S. Department of Commerce, Bureau of the Census,
Historical Statistics of the United States, Colonial Times to 1970;
U.S. Department of Education, National Center for Education Statistics,
Digest of Education Statistics,
various issues. and
The 1950s and 1960s marked two major develop-
ments. First, large numbers of young people entered
college and second, public colleges expanded dra-
matically to meet the demand. College enrollment
rose by 49 percent in the 1950s, partly because of
the rise in the enrollment/population ratio from 15
percent to 24 percent. During the 1960s, enrollment
rose by 120 percent. By 1969, college enrollment
was as large as 35 percent of the 18- to 24-year-old
population. About 41 percent of the college students
were women. Public institutions accounted for 74
percent of enrollment, and about one-fourth of all stu-
dents were enrolled at 2-year colleges.
The 1970s were a period of slower growth in col-
lege enrollment despite record numbers of young
people of college age and increasing participation of
older adults in college. During the 1970s, enrollment
rose by 45 percent, somewhat slower than the
1960s, but about the same as the 1950s. The pro-
portion of part-time students also increased, from 31
percent in 1969 to 41 percent in 1979. This rise was
partly due to increased participation rates of older
students and the expansion of 2-year college sys-
tems, whose enrollment more than doubled. By
1979, women constituted the majority on college
campuses. Enrollment growth slowed substantially
during the 1980s, with only a 17 percent increase be-
tween 1979 and 1989. Incremental increases have
continued during the early 1990s. The proportion of
part-time students has increased only slightly during
the 1980s as participation rates for older age groups
have remained stable. In contrast, enrollment rates
for younger, traditional college-age people rose sig-
nificantly, and college enrollment showed increases
during the 1980s, despite drops in the college-age
population.
Institutions and Professional Staff
Historical trends in numbers of institutions reflect
steady growth over the past 120 years, but the rate
of growth has been substantially slower than the rise
in enrollment. The result of these differing rates of in-
crease has been that the average size of colleges
has steadily increased. The average size of colleges
rose from only 112 students in 1869–70 to 243 at the
turn of the century. By 1929–30, average size had
risen to 781, and it more than doubled by 1960. In
1989–90, the average size of colleges was 3,830
students (table 23).
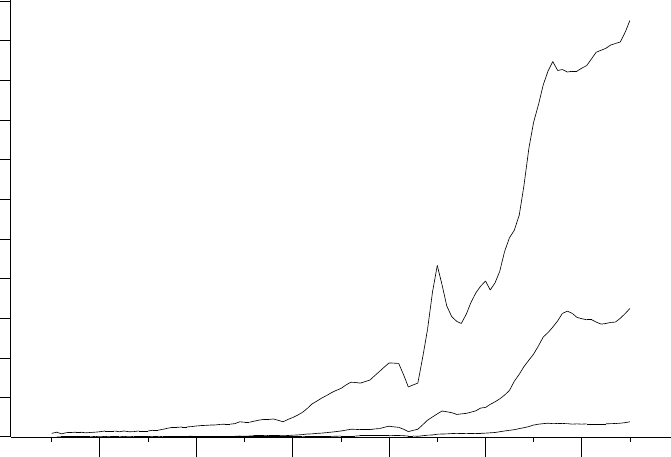
67Higher Education
The growth in the number of professional staff em-
ployed by colleges and universities has closely par-
alleled the rise in enrollment. The ratio of students to
staff has remained remarkably stable for more than
100 years. In 1869–70, there were 11 students for
every professional, and in 1989–90, there were 9
students for every professional (table 26). Although
the measure fluctuated somewhat over the time pe-
riod, the changes have not been dramatic, and some
of them are due to changes in survey procedures
and definitions. Full-time-equivalent data which might
be used to make more precise measurements of
staff resources are not available for the entire time
period.
Degrees Conferred
The number of bachelor’s degrees conferred ex-
hibited substantial increases during the 20th century.
The periods of most rapid growth were the 1920s,
the 1940s, and the 1960s (table 28). The increase in
the 1920s corresponds to rising proportions of young
people completing high school and consequently be-
coming eligible for college admission. The 1940s
surge was partly a result of the federal financial aid
program for veterans which encouraged huge num-
bers of returning servicemen to enter higher edu-
cation programs. In the 1960s, the ‘‘baby boom’’ gen-
eration entered college, and their large numbers re-
sulted in substantial increases in bachelor’s degrees
conferred. An additional factor in the increase in the
number of students and degrees was that over time
a higher proportion of young people sought access to
higher education. During the 1970s, interest in higher
education remained relatively steady, but the number
of bachelor’s degree recipients in relation to the 23-
year-old population was somewhat lower than the
peaks attained during the late 1960s and early
1970s. The number of bachelor’s degrees continued
to grow during the 1980s, despite declines in the tra-
ditional college-age population. This may be partly
attributed to rising proportions of high school grad-
uates attending college as well as to the graduation
of older students.
Figure 16.--Bachelor’s, master’s, and doctor’s degrees conferred
by institutions of higher education: 1869-70 to 1989-90
1870 1880 1890 1900 1910 1920 1930 1940 1950 1960 1970 1980 1990
1,100,000
1,000,000
900,000
800,000
700,000
600,000
500,000
400,000
300,000
200,000
100,000
0
Number
Year ending
Bachelor’s
Master’s
Doctor’s
Source: U.S. Department of Commerce, Bureau of the Census,
Historical Statistics of the United States, Colonial Times to 1970;
U.S. Department of Education, National Center for Education Statistics,
Digest of Education Statistics,
various issues. and
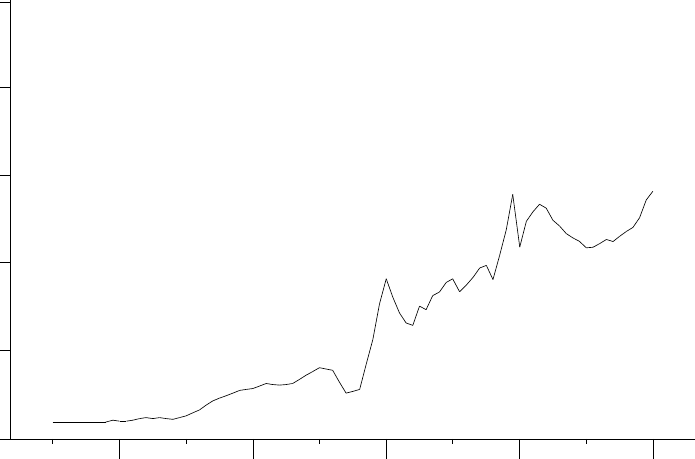
68 Higher Education
The proportion of women earning bachelor’s de-
grees rose slowly during the latter part of the 19th
and early 20th century. Between 1869–70 and 1909–
10, the proportion of bachelor’s degrees earned by
women rose from 15 percent to 23 percent. During
the teens and the twenties, the proportion received
by women grew more rapidly, reaching 40 percent in
1929–30. The proportion remained about the same
during the 1930s, but rose dramatically during the
early 1940s as large numbers of men left home to
fight in World War II. During some of the war years,
women constituted the majority of graduates. Follow-
ing the war, the number of male graduates surged as
large numbers of former soldiers took advantage of
financial assistance to complete their studies. In
1949–50, only 24 percent of the graduates were
women, but subsequently the proportion of women
began to grow again, reaching 43 percent in 1970.
By the early 1980s, the majority of bachelor’s degree
recipients were women, and in 1989–90, women
earned 53 percent of all bachelor’s degrees.
Figure 17.--Bachelor’s degrees per 1,000 23-year-olds:
1889-90 to 1989-90
1900 1910 1920 1930 1940 1950 1960 1970 1980 1990
500
400
300
200
100
0
Number per
23-year-olds
Year ending
1,000
SOURCE: U.S. Department of Commerce, Bureau of the Census,
Historical Statistics of the United States, Colonial Times to 1970;
Current Population Reports,
Population Estimates and Projections;
and U.S. Department of Education, National Center for Education
Statistics,
Digest of Education Statistics, 1992.
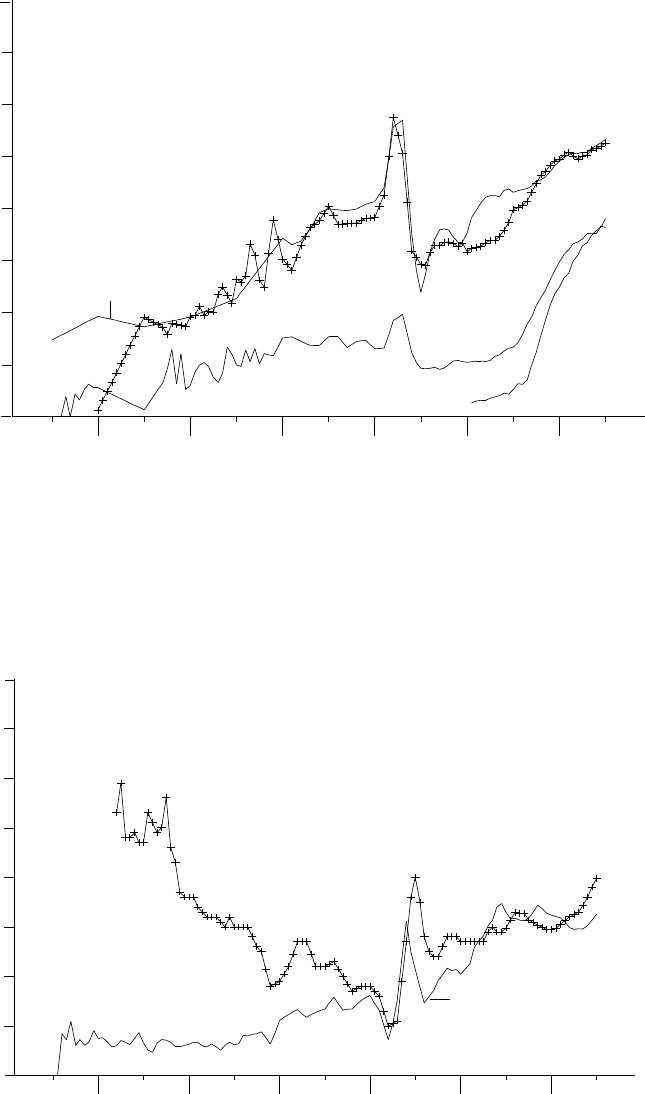
69Higher Education
Figure 18.--Percentage of higher education degrees conferred to
females, by level: 1869-70 to 1989-90
1870 1880 1890 1900 1910 1920 1930 1940 1950 1960 1970 1980 1990
80
70
60
50
40
30
20
10
0
Percentage
Bachelor’s
Master’s
Doctor’s
First-professional
Year ending
SOURCE: U.S. Department of Education, National Center for Education Statistics,
Biennial Survey of Education in the United States;
Earned Degrees Conferred;
and Integrated Postsecondary Education Data System (IPEDS) "Completions" survey.
Figure 19.--Bachelor’s degrees per 100 high school graduates
4 years earlier and master’s degrees per 100 bachelor’s degrees
1870 1880 1890 1900 1910 1920 1930 1940 1950 1960 1970 1980 1990
80
70
60
50
40
30
20
10
0
Master’s per
Bachelor’s per 100
high school graduates
100 bachelor’s
Number of
degrees
Year ending
2 years earlier: 1869-70 to 1989-90
SOURCE: U.S. Department of Commerce, Bureau of the Census,
Historical Statistics of the United States, Colonial Times to 1970;
Current Population Reports,
Population Estimates and Projections,
various years; and U.S. Department of Education, National Center for
Education Statistics,
Digest of Education Statistics, various years.
70 Higher Education
Master’s Degrees
The pattern of growth in the number of master’s
degrees conferred is similar to that displayed by
bachelor’s degrees. The number of master’s degrees
grew between 1871–72 and 1899–1900, but the rate
was erratic with year-to-year fluctuations, some of
which may have been caused by survey anomalies.
Still the number of master’s degrees per 100 bach-
elor’s degrees remained steady, generally remaining
between 6 and 8. This pattern shifted upward during
the 1920s as more bachelor’s degree recipients
sought master’s degrees, and the ratio rose to 16 in
1931–32. The ratio rose rapidly immediately after
World War II, especially compared to the relatively
small number of bachelor’s degrees awarded during
the war years. The rise in master’s degrees probably
was influenced by veterans returning to college to
complete their studies. The next period of dramatic
growth began in the early 1960s when both the num-
ber of bachelor’s degree recipients and the ratio of
master’s degrees per 100 bachelor’s degrees began
to rise. In 1969–70, there were 33 master’s degrees
per 100 bachelor’s degrees awarded 2 years earlier.
This ratio has remained fairly stable since that time
period.
The number of master’s degrees reached a peak
of 317,000 in 1976–77 and then declined for several
years. The former 1976–77 peak finally was ex-
ceeded in 1989–90 when 324,000 degrees were
awarded.
The proportion of master’s degrees awarded to
women rose significantly after the turn of the century,
reaching 26 percent in 1909–10. The proportion con-
tinued to increase during the teens and twenties, like
the bachelor’s degrees. However, there was little rise
in the proportion of women receiving master’s de-
grees during the 1930s. The proportion of degrees
awarded to women fell during the 1940s, and by
1949–50, the proportion had fallen to 29 percent,
partly as a result of the influx of veterans. Not until
1969–70 did the proportion of women reach 40 per-
cent again, about the same as 1929–30. During the
1970s and 1980s, the proportion of degrees awarded
to women continued to rise, reaching 53 percent in
1989–90.
Doctor’s Degrees
The number of doctor’s degrees conferred by U.S.
colleges remained very small until the 1920s. While
the number of doctor’s degrees in relation to the
number of bachelor’s degrees rose somewhat during
the late 1880s and 1890s, the doctor’s degrees grew
at a slower rate in the later years of the 19th century.
During the 1920s, the number of doctor’s degrees
per 1,000 bachelor’s degrees rose indicating that
more people were pursuing advanced degrees after
their bachelor’s degrees. Also, more people were re-
ceiving bachelor’s degrees which increased the size
of the pool for potential graduate school students. As
a function of these shifts, the number of doctor’s de-
grees conferred in 1929–30 showed an increase of
274 percent compared to 1919–20.
During the 1930s, the number of doctor’s degrees
continued to rise, but at a slower rate. The ratio of
doctor’s to bachelor’s degrees fell significantly during
the 1930s and continued to fall during World War II.
The lapse in time from bachelor’s to doctor’s degree
also lengthened significantly during the postwar
years, suggesting that many young people took time
from their studies to serve during the war. The num-
ber of doctor’s degrees continued to rise through the
1950s, but at much slower rate than the 1920s or
1940s. Also, the ratio of doctor’s degrees to bach-
elor’s degrees rose and then fell sharply. As in the
lower levels of degrees, the 1960s brought a surge
of interest in doctor’s degrees. Not only did the abso-
lute number of degrees rise by 204 percent between
1959–60 and 1969–70, but the ratio of doctor’s de-
grees to 1,000 bachelor’s degrees rose from 23 to
78. Also, the time-lapse from bachelor’s degree to
doctor’s degree hit a low of 7.9 years, as short as
any period measured except in 1919–20.
Through the 1970s, the number of doctor’s de-
grees conferred fluctuated within a narrow range.
The ratio of doctor’s degrees per 1,000 bachelor’s
degrees fell sharply, and the average length of time
to obtain the degree began to rise. The 1980s saw
the average time to complete the doctor’s degree
lengthen to a record 10.5 years in 1987–88, 1988–
89, and 1989–90. The number of these degrees per
1,000 bachelor’s degrees held steady during the
1980s and actually rose slightly at the end of the
decade. Because of the increases in the pool of
graduate students, the number of doctor’s degrees
rose somewhat during the 1980s from 32,600 in
1979–80 to 38,200 in 1989–90.
Women generally have obtained a lower proportion
of doctor’s degrees than master’s or bachelor’s. Only
a small number of doctor’s degrees were awarded to
women in the last 30 years of the 19th century, per-
haps fewer than might be awarded by a large univer-
sity in a single year today. The proportion of doctor’s
degrees awarded to women rose at an irregular rate
between 1899–1900 and 1939–40, from 6 percent to
13 percent. After the war years, the proportion
awarded to women fell. By 1970 the proportion of
doctor’s degrees awarded to women had reached 13
percent again. During the 1970s, more women began
graduating from doctor’s degree programs, and the
proportion reached 30 percent by 1979-80. In 1989-
90, about 36 percent of all doctor’s degrees were
earned by women.
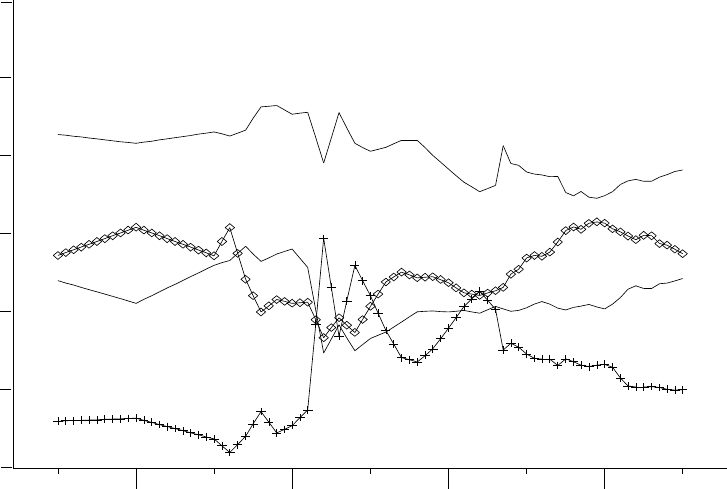
71Higher Education
First-Professional Degrees
Prior to 1960–61, separate figures on first-profes-
sional degrees did not exist because these programs
were tabulated with the bachelor’s degrees. In the
late 18th and early 19th century, professional de-
grees frequently did not require attainment of a bach-
elor’s degree before entrance into the programs.
Since 1960–61, first professional degrees, such as
degrees in law, medicine, and dentistry, have risen in
a different pattern than other types of degrees (table
31). For example, first-professional degrees grew
more rapidly during the 1970s than in the 1960s. In
contrast to the increases of bachelor’s, master’s, and
doctor’s degrees, the number of first-professional de-
grees fell during the latter half of the 1980s.
Over the past 30 years, the number of degrees
awarded in law has grown much more rapidly than
degrees conferred in medicine or dentistry. However,
the number of degrees conferred in each of the three
areas is down from peaks reached during the mid-
1980s. The number of degrees in dentistry grew by
72 percent between 1959–60 and 1982–83, before
falling dramatically by 27 percent between 1982–83
and 1989–90. The number of medical degrees rose
by 128 percent between 1959–60 and 1984–85, and
then fell 6 percent by 1989-90. The number of de-
grees conferred in law rose the most rapidly with an
increase of 306 percent between 1959–60 and
1984–85, but since then the number of law degrees
has fluctuated at a slightly lower level.
One of the most significant trends in first-profes-
sional degrees has been the dramatic increase in the
portion of degrees earned by women. In 1959–60,
women received 1 percent of the dentistry degrees,
6 percent of the medical degrees, and only 2 percent
of the law degrees. The number of women earning
degrees in these fields rose rapidly, particularly dur-
ing the 1970s. In 1989–90 women accounted for 31
percent of the dentistry degrees, 34 percent of the
degrees in medicine, and 42 percent of the degrees
in law.
Revenues for Higher Education
Although there have been huge increases in the
total revenues for higher education during the 20th
century, the sources of the funds have shown rel-
atively stable patterns. For example, the proportion of
revenues from tuition and fees was 24 percent in
1909–10 and in 1989–90. However, there have been
some significant shifts through the period, notably
during World War II (table 33).
Figure 20.--Sources of current-fund revenue for institutions of
higher education: 1909-10 to 1989-90
1910 1920 1930 1940 1950 1960 1970 1980 1990
60
50
40
30
20
10
0
Other
State
Tuition
Federal
Percent
Year ending
SOURCE: U.S. Department of Education, National Center for Education Statistics,
Annual Report of the Commissioner; Biennial Survey
Higher Education; Digest of Education Statistics, 1992;
unpublished data.
of Education in the United States; Financial Statistics of Institutions of
and
72 Higher Education
From 1909–10 to 1939–40, revenue sources
evolved slowly. The proportion of revenues from tui-
tion dropped slightly during the teens and then rose
to 26 percent in 1929–30 and 28 percent in 1939–
40. The proportion from federal sources fluctuated
between 4 and 7 percent during this 30-year period.
The proportion of revenues from state sources fluc-
tuated around 30 percent between 1909–10 and
1931–32, and then fell significantly during the Great
Depression of the 1930s. By the early 1940s, only 21
percent of revenues came from the state govern-
ments. The proportion of revenues from endowments
fell from 16 percent in 1909–10 to 10 percent in
1939–40. Part of this drop may have been due to the
rapidly rising number of institutions. The new schools
usually did not have the resources of some of the
older, well-established institutions. Also the stock
market crash of 1929 and the ensuing depression
dampened revenues from endowments. One signifi-
cant rise during the early part of the century was in
income from auxiliary enterprises, which rose from
12 percent of all revenues in 1909–10 to 20 percent
of all revenues in 1939–40.
The war years were marked by an increase in fed-
eral funding of higher education. Some of this fund-
ing was earmarked for research, and some was for
training programs specifically contracted by the fed-
eral government. After the war, the proportion of rev-
enues coming from the federal government began to
decline, dipping to 14 percent in 1955–56. After
some rises during the early 1960s, the proportion of
revenues from the federal government began a long,
slow slide to 10 percent in 1989–90. In contrast, the
proportion of revenues from state sources increased
in the 1950s, 1960s, and 1970s, but dipped slightly
in the 1980s. The percent of revenues from local
government has fluctuated between 2 and 4 percent
since World War II. Similarly, the proportions of reve-
nues from endowments and from private gifts, grants,
and contracts have shown only small fluctuations
during the postwar period. One significant shift in col-
lege finances of the postwar period has been the
steady increase in revenues from university hos-
pitals. Between 1949–50 and 1989–90, the propor-
tion of revenues rose from 5 percent in 1949–50 to
9 percent in 1989–90. This increase occurred during
the 1970s and 1980s, after falling in the early part of
the postwar period.
Expenditures
In the 60-year period between 1929–30 and 1989–
90, there were several significant developments in
the expenditure patterns of colleges and universities.
Although changes in definitions and data collection
procedures sometimes hamper direct comparisons,
there appears to have been some increase in the
proportion of expenditures for administration, re-
search, and university hospitals, and a decline in the
proportion of expenditures for instruction, auxiliary
enterprises, and plant operation and maintenance.
However, these shifts have not been consistent over
the 60-year period (table 24).
Administrative and general expenditures as a per-
cent of current-fund expenditures rose slowly
throughout the 1929–30 to 1989–90 period. In 1929–
30, administrative expenditures accounted for about
8 percent of college budgets, but they increased to
10 percent in 1959–60 and 14 percent in 1989–90.
The administrative costs rose most rapidly in the
1960s while changes in most of the other decades
amounted to about 1 percentage point or less.
One of the most rapidly growing areas of college
budgets in recent years has been university hos-
pitals. When data were first tabulated separately in
1966–67, university hospitals accounted for 2 percent
of the budget. Hospitals accounted for 8 percent of
the budget in 1979–80 and 9 percent in 1989–90.
The proportion of college budgets for instruction is
lower now than in 1929–30, but most of the change
occurred during the 1930s and 1940s. Between
1929–30 and 1949–50, the share of college budgets
for instruction fell from 44 percent to 35 percent. In
the following 40 years, the proportion dipped slightly,
reaching 31 percent in 1989–90.
Although there have been significant fluctuations,
the proportion of college budgets spent on plant op-
eration and maintenance has fallen over the 60-year
period. The share of college budgets for plant oper-
ation and maintenance fell from 12 percent in 1929–
30 to 10 percent in 1939–40. Between 1939–40 and
1943–44, there was a further drop to 8 percent, likely
caused by conservation policies prompted by the
war. After jumping to 10 percent again after the war,
the proportion of funds for plant operation and main-
tenance fell to 7 percent through the late 1960s. In
the early 1970s, partly due to the sharply higher
costs of energy, the plant operation share returned to
8 percent. In the latter part of the 1980s, the propor-
tion fell to 7 percent.
The part of the college budget that goes to auxil-
iary enterprises such as residence halls, food serv-
ice, and sports arenas has fallen through much of
the 60-year period. These auxiliary enterprises rose
from 17 percent of the budget in 1931–32 to 23 per-
cent in 1947–48. But during the 1950s and the
1960s, the proportion fell steadily. After stabilizing in
the 1970s, the proportion dipped slightly again to
about 10 percent in 1989–90. At least part of this
shift may be attributed to the increased popularity of
2-year colleges, which have lower spending on auxil-
iary enterprises compared to 4-year colleges with
larger numbers of students living on campus.
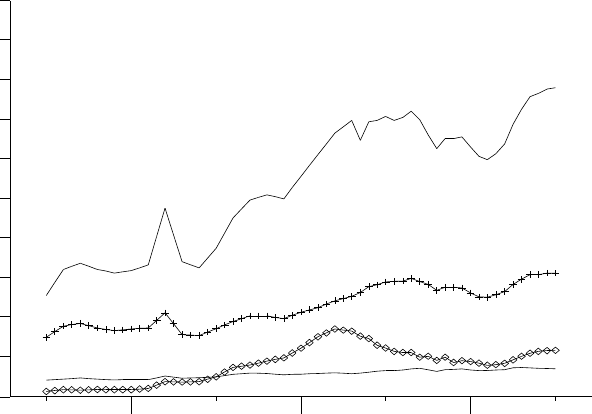
73Higher Education
Figure 21.--Expenditures of institutions of higher education per
student in constant 1990-91 dollars: 1929-30 to 1989-90
1930 1940 1950 1960 1970 1980 1990
$10,000
9,000
8,000
7,000
6,000
5,000
4,000
3,000
2,000
1,000
0
Total educational and general
Instruction
Research
Plant operation
Year ending
SOURCE: U.S. Department of Education, National Center for Education Statistics,
Annual Report of the Commissioner; Biennial Survey
Higher Education;
System (IPEDS) "Finance" survey.
Expenditure
per
student
and Integrated Postsecondary Education Data
of Education in the United States; Financial Statistics of Institutions of
Another way of examining college and university
expenditures is to look at per student spending. After
adjustment for inflation, expenditures per student
have risen in nearly every decade since 1929–30.
Because consistent data on full-time-equivalent en-
rollment were not available for this historical analysis,
data on total head-count enrollment were used in-
stead. Because of the rising proportion of students
attending college part-time, the use of total enroll-
ment makes the expenditure per student percentage
changes lower than they would have been if more
precise FTE enrollment data had been used.
Educational and general spending on a per student
basis held up remarkably well during the Great De-
pression of the 1930s, even registering a 25 percent
increase. Per student expenditures rose a further 18
percent during the 1940s. The 1950s saw the most
rapid growth. The large 49 percent increase in ex-
penditures per student may be partly attributed to the
enrollment drop during the early part of the decade
when the high expenditures of the immediate post-
war years remained steady. Expenditures per student
rose a further 27 percent during the 1960s, but
dropped 11 percent in the 1970s. The drops were
particularly notable during the years with the highest
inflation rates. During the 1980s, the expenditures
per student rose a further 24 percent reaching an all
time record of $7,799 per student in 1989–90.
Endowment and Physical Plant
Endowment funds and physical plant value are
long-term assets that can be used to analyze institu-
tional resources. Physical plant value measures the
book value of land, buildings, and equipment owned
by colleges and universities. Endowment funds are
economic resources that are acquired by colleges
through donations or deliberate transfers from current
operating funds. The principal of the endowment is
maintained in investments while the interest is di-
verted to fund special programs, such as faculty
members in specific disciplines, or student aid, or
scholarships for particular categories of students.
Endowments at colleges represent a sizeable eco-
nomic resource amounting to $68 billion in 1989–90.
Endowment funds are deposited in a variety of in-
vestments, including relatively volatile ones like
stocks. Thus, their value tends to fluctuate more over
time than other types of higher education finances.
When examined on a per student basis, there was a
drop in the book value of the endowments per stu-
dent between the mid-1930s and the early 1950s. A
more reliable indicator of market value of endowment
became available in the mid-1960s. Market value of
74 Higher Education
endowment takes into account unrealized losses and
gains in the value of the investments. The market
value data indicate a continuing drop in value per
student through the early 1980s. Some of this may
be attributed to the rapid growth of new public col-
leges, especially 2-year colleges, which generally
have either no or small endowments. During the
1980s, the market value of endowment per student
rose a dramatic 71 percent. Some of this may be
due to favorable stock market performances, as well
as to institutional drives to boost endowments even
at public colleges.
The plant value data must be interpreted with cau-
tion since the book value of buildings or land may
differ considerably from their replacement value.
After adjustment for student enrollment and inflation,
it appears that plant fund value per student generally
is lower now than in the late 1960s and early 1970s.
Some of this may be attributed to the growth in the
enrollment of 2-year colleges which accounted for 38
percent of students in 1989 compared to 26 percent
of students in 1969. Two-year colleges generally
have lower physical plant value per student than 4-
year colleges because relatively few students live on
campus, and equipment and land holdings are gen-
erally less extensive. Property value per student re-
mained stable during the 1980s after adjustment for
student enrollment and inflation. Like other expendi-
ture-per-student measures, the use of total enroll-
ment rather than FTE enrollment tends to depress
percentage changes.
The 20th century has been a period of dynamic
growth for higher education institutions. Colleges
have evolved from institutions largely limited to the
social elite to much more egalitarian institutions at-
tended today by nearly two out of three high school
graduates. Colleges showed particularly strong
growth during the late teens and in the twenties, fif-
ties, sixties and eighties. The missions of colleges
have evolved with the times as has the student com-
position. College enrollments, degrees, and finances
are now at record highs.

75Higher Education
Table 23.—Historical summary of higher education statistics: 1869–70 to 1989–90
Item 1869–70 1879–80 1889–90 1899–1900 1909–10 1919–20 1929–30 1939–40 1949–50 1959–60 1969–70 1979–80 1987–88 1988–89 1989–90
1 2345678 9 1011 12 13 14 15 16
Total institutions
1
.............................. 563 811 998 977 951 1,041 1,409 1,708 1,851 2,004 2,525 3,152 3,587 3,565 3,535
Professional staff
2
................................
3
5,553
3
11,522
3
15,809 23,868 36,480 48,615 — 146,929 246,722 380,554 — — 1,437,975 — 1,531,071
Male ..................................................
3
4,887
3
7,328
3
12,704 19,151 29,132 35,807 — 106,328 186,189 296,773 — — 850,451 — 880,766
Female ..............................................
3
666
3
4,194
3
3,105 4,717 7,348 12,808 — 40,601 60,533 83,781 — — 587,524 — 650,305
Instructional staff
4
................................ — — — — — — 82,386 110,885 190,353 281,506 551,000 — 954,534 — 987,518
Total fall enrollment
5
........................... 62,839 115,850 156,756 237,592 355,430 597,880 1,100,737 1,494,203 2,444,900 3,639,847 8,004,660 11,569,899 12,766,642 13,055,337 13,538,560
Male .................................................
3
49,467
3
77,994
3
100,453 152,254
3
214,779 314,938 619,935 893,250 1,721,572 2,332,617 4,746,201 5,682,877 5,932,056 6,001,896 6,190,015
Female ..............................................
3
13,372
3
37,856
3
56,303 85,338
3
140,651 282,942 480,802 600,953 723,328 1,307,230 3,258,459 5,887,022 6,834,586 7,053,441 7,348,545
Earned degrees conferred
Associate, total ................................ — — — — — — ————206,023 400,910 435,085 436,764
6
454,679
Male .............................................. — — — — — — ————117,432 183,737 190,047 186,316
6
191,072
Female ......................................... — — — — — — ————88,591 217,173 245,038 250,448
6
263,607
Bachelor’s,
7
total ............................. 9,371 12,896 15,539 27,410 37,199 48,622 122,484 186,500 432,058 392,440 792,317 929,417 994,829 1,018,755
6
1,049,657
Male .............................................. 7,993 10,411 12,857 22,173 28,762 31,980 73,615 109,546 328,841 254,063 451,097 473,611 477,203 483,346
6
491,488
Female ......................................... 1,378 2,485 2,682 5,237 8,437 16,642 48,869 76,954 103,217 138,377 341,220 455,806 517,626 535,409
6
558,169
Master’s,
8
total ................................ — 879 1,015 1,583 2,113 4,279 14,969 26,731 58,183 74,435 208,291 298,081 299,317 310,621
6
323,844
Male .............................................. — 868 821 1,280 1,555 2,985 8,925 16,508 41,220 50,898 125,624 150,749 145,163 149,354
6
153,643
Female ......................................... — 11 194 303 558 1,294 6,044 10,223 16,963 23,537 82,667 147,332 154,154 161,267
6
170,201
First-professional,
7
total .................. (
7
)(
7
)(
7
)(
7
)(
7
)(
7
)(
7
)(
7
)(
7
)(
7
) 34,578 70,131 70,735 70,856
6
70,980
Male .............................................. (
7
)(
7
)(
7
)(
7
)(
7
)(
7
)(
7
)(
7
)(
7
)(
7
) 32,794 52,716 45,484 45,046
6
44,002
Female ......................................... (
7
)(
7
)(
7
)(
7
)(
7
)(
7
)(
7
)(
7
)(
7
)(
7
) 1,784 17,415 25,251 25,810
6
26,978
Doctor’s, total ................................... 1 54 149 382 443 615 2,299 3,290 6,420 9,829 29,912 32,615 34,870 35,720
6
38,238
Male .............................................. 1 51 147 359 399 522 1,946 2,861 5,804 8,801 25,890 22,943 22,615 22,648
6
24,371
Female ......................................... 0 3 2 23 44 93 353 429 616 1,028 4,022 9,672 12,255 13,072
6
13,867
Finances, in thousands
Current-fund revenue
8
.................... — — — — $76,883 $199,922 $554,511 $715,211 $2,374,645 $5,785,537 $21,515,242 $58,519,982 $117,340,109 $128,501,638
6
139,635,477
Educational and general
income ....................................... — — $21,464 $35,084 67,917 172,929 494,092 538,511 1,751,393 4,593,485 17,144,194 46,534,023 91,863,743 100,598,033
6
109,241,902
Current-fund expenditures
8
............. — — — — — — 507,142 674,688 2,245,661 5,601,376 21,043,110 56,913,588 113,786,476 123,867,184
6
134,655,571
Educational and general
expenditures .............................. — — — — — — 377,903 521,990 1,706,444 4,685,258 16,845,210 44,542,843 89,157,430 96,803,377
6
105,585,076
Value of physical property ............... — — 95,426 253,599 457,954 747,333 2,065,049 2,753,780 4,799,964 13,548,548 42,093,580 83,733,387 133,228,717 142,425,392 155,401,508
Endowment funds
9
.......................... — — 78,788 194,998 323,661 569,071 1,372,068
10
1,686,283 2,601,223
10
5,322,080
10
10,837,343
10
18,561,472 — — —
1
Prior to 1979–80, excludes branch campuses.
2
Total number of different individuals (not reduced to full-time equivalent). Beginning in 1959–60, data are for the
first term of the academic year.
3
Estimated.
4
Includes all faculty, instructors and above, and research assistants.
5
Data for 1869–70 to 1939–40 are for resident degree-credit students who enrolled at any time during the academic
year.
6
Preliminary data.
7
From 1869–70 to 1959–60, first-professional degrees included under bachelor’s degrees.
8
Figures for years prior to 1969–70 are not precisely comparable with later data.
9
Book value. Includes annuity funds.
10
Endowment funds only.
—Data not available.
NOTE.—Beginning in 1959–60, includes Alaska and Hawaii. Some data have been revised from previously published
figures.
SOURCE: U.S. Department of Education, National Center for Education Statistics,
Biennial Survey of Education in
the United States; Education Directory, Colleges and Universities; Faculty and Other Professional Staff in Institutions
of Higher Education; Fall Enrollment in Colleges and Universities; Earned Degrees Conferred; Financial Statistics of
Institutions of Higher Education;
and ‘‘Fall Enrollment in Institutions of Higher Education,’’ ‘‘Degrees and Other Formal
Awards Conferred,’’ and ‘‘Financial Statistics of Institutions of Higher Education’’ surveys; and Integrated Postsecondary
Education Data System (IPEDS), ‘‘Fall Enrollment,’’ ‘‘Completions,’’ and ‘‘Finance’’ surveys. (This table was prepared
November 1992.)

76 Higher Education
Table 24.—Enrollment in institutions of higher education, by sex, attendance status, and type and control of institution:
1869–70 to fall 1991
[In thousands]
Year Total
enrollment
Enrollment as a
percent of 18– to
24–year-old popu-
lation
1
Male Female Full-time Part-time 4-year 2-year
Public institutions Private institutions
Total 4-year 2-year Total 4-year 2-year
1 2 3 45 6 7 8 9 101112131415
1869–70 .............. 63 1.3 49 13 — — ————————
1879–80 .............. 116 1.6 78 38 — — ————————
1889–90 .............. 157 1.8 100 56 — — ————————
1899–1900 .......... 238 2.3 152 85 — — ————————
1904–05 .............. 264 2.3 — — — — ————————
1909–10 .............. 355 2.8 215 141 — — ————————
1910–11 .............. 354 2.8 — — — — ————————
1911–12 .............. 356 2.8 — — — — ————————
1912–13 .............. 361 2.8 — — — — ————————
1913–14 .............. 379 2.9 — — — — ————————
1914–15 .............. 404 3.1 — — — — ————————
1915–16 .............. 441 3.3 — — — — ————————
1917–18 .............. 441 3.4 — — — — ———— 1—— 3
1919–20 .............. 598 4.7 315 283 — — ———— 3—— 5
1921–22 .............. 681 5.2 — — — — ———— 5—— 7
1923–24 ..............
2
823 6.1— — — — ———— 9——11
1925–26 .............. 941 6.7 — — — — ————14——13
1927–28 .............. 1,054 7.2 — — — — ————28——16
1929–30 .............. 1,101 7.2 620 481 — — — — 531 — 37 591 — 19
1931–32 .............. 1,154 7.4 667 487 — — 1,069 85 582 523 59 572 546 26
1933–34 .............. 1,055 6.7 616 440 — — 977 78 530 474 56 525 503 23
1935–36 .............. 1,208 7.6 710 499 — — 1,106 102 614 544 71 594 562 32
1937–38 .............. 1,351 8.4 804 547 — — 1,229 122 689 607 82 661 622 39
1939–40 .............. 1,494 9.1 893 601 — — 1,344 150 797 689 108 698 655 42
1941–42 .............. 1,404 8.4 819 585 — — 1,263 141 732 631 101 672 631 40
1943–44 .............. 1,155 6.8 579 576 — — 1,066 89 571 511 61 584 556 28
1945–46 .............. 1,677 10.0 928 749 — — 1,520 156 834 724 110 843 796 47
Fall 1946 ............. 2,078 12.5 1,418 661 — — ————————
Fall 1947 ............. 2,338 14.2 1,659 679 — — 2,116 222 1,152 989 163 1,186 1,127 59
Fall 1948 ............. 2,403 14.7 1,709 694 — — 2,192 211 1,186 1,032 154 1,218 1,161 57
Fall 1949 ............. 2,445 15.2 1,722 723 — — 2,216 229 1,207 1,036 171 1,238 1,179 58
Fall 1950 ............. 2,281 14.3 1,560 721 — — 2,064 217 1,140 972 168 1,142 1,092 50
Fall 1951 ............. 2,102 13.4 1,391 711 — — 1,902 200 1,038 882 156 1,064 1,020 44
Fall 1952 ............. 2,134 13.8 1,380 754 — — 1,896 238 1,101 910 192 1,033 986 47
Fall 1953 ............. 2,231 14.7 1,423 808 — — 1,973 258 1,186 976 210 1,045 997 48
Fall 1954 ............. 2,447 16.2 1,563 883 — — 2,164 282 1,354 1,112 241 1,093 1,052 41
Fall 1955 ............. 2,653 17.7 1,733 920 — — 2,345 308 1,476 1,211 265 1,177 1,134 43
Fall 1956 ............. 2,918 19.5 1,911 1,007 — — 2,571 347 1,656 1,359 298 1,262 1,212 50
Fall 1957 ............. 3,324 22.0 2,171 1,153 — — — — 1,973 — — 1,351 — —
Fall 1959 ............. 3,640 23.8 2,333 1,307 — — — — 2,181 — — 1,459 — —
Fall 1961 ............. 4,145 23.6 2,586 1,559 — — — — 2,561 — — 1,584 — —

77Higher Education
Table 24.—Enrollment in institutions of higher education, by sex, attendance status, and type and control of institution:—Continued
1869–70 to fall 1991
[In thousands]
Year Total
enrollment
Enrollment as a
percent of 18– to
24–year-old popu-
lation
1
Male Female Full-time Part-time 4-year 2-year
Public institutions Private institutions
Total 4-year 2-year Total 4-year 2-year
1 2 3 45 6 7 8 9 101112131415
Fall 1963 ............. 4,780 27.7 2,962 1,818 3,184 1,596 3,929 850 3,081 2,341 740 1,698 1,588 111
Fall 1964 ............. 5,280 28.7 3,249 2,031 3,573 1,707 4,291 989 3,468 2,593 875 1,812 1,698 114
Fall 1965 ............. 5,921 29.8 3,630 2,291 4,096 1,825 4,748 1,173 3,970 2,928 1,041 1,951 1,820 132
Fall 1966 ............. 6,390 30.7 3,856 2,534 4,439 1,951 5,064 1,326 4,349 3,160 1,189 2,041 1,904 137
Fall 1967 ............. 6,912 32.2 4,133 2,779 4,793 2,119 5,399 1,513 4,816 3,444 1,372 2,096 1,955 141
Fall 1968 ............. 7,513 34.1 4,478 3,035 5,210 2,303 5,721 1,792 5,431 3,784 1,646 2,082 1,937 146
Fall 1969 ............. 8,005 35.0 4,746 3,258 5,499 2,506 5,937 2,068 5,897 3,963 1,934 2,108 1,975 133
Fall 1970 ............. 8,581 35.8 5,044 3,537 5,816 2,765 6,262 2,319 6,428 4,233 2,195 2,153 2,029 124
Fall 1971 ............. 8,949 35.3 5,207 3,742 6,077 2,871 6,369 2,579 6,804 4,347 2,457 2,144 2,022 122
Fall 1972 ............. 9,215 35.8 5,239 3,976 6,072 3,142 6,459 2,756 7,071 4,430 2,641 2,144 2,029 115
Fall 1973 ............. 9,602 36.5 5,371 4,231 6,189 3,413 6,590 3,012 7,420 4,530 2,890 2,183 2,060 122
Fall 1974 ............. 10,224 37.9 5,622 4,601 6,370 3,853 6,820 3,404 7,989 4,703 3,285 2,235 2,117 119
Fall 1975 ............. 11,185 40.3 6,149 5,036 6,841 4,344 7,215 3,970 8,835 4,998 3,836 2,350 2,217 134
Fall 1976 ............. 11,012 38.8 5,811 5,201 6,717 4,295 7,129 3,883 8,653 4,902 3,752 2,359 2,227 132
Fall 1977 ............. 11,286 39.0 5,789 5,497 6,793 4,493 7,243 4,043 8,847 4,945 3,902 2,439 2,298 141
Fall 1978 ............. 11,260 38.3 5,641 5,619 6,668 4,592 7,232 4,028 8,786 4,912 3,874 2,474 2,319 155
Fall 1979 ............. 11,570 38.8 5,683 5,887 6,794 4,776 7,353 4,217 9,037 4,980 4,057 2,533 2,373 160
Fall 1980 ............. 12,097 40.2 5,874 6,223 7,098 4,999 7,571 4,526 9,457 5,129 4,329 2,640 2,442
3
198
Fall 1981 ............. 12,372 41.0 5,975 6,397 7,181 5,190 7,655 4,716 9,647 5,166 4,481 2,725 2,489
3
236
Fall 1982 ............. 12,426 41.4 6,031 6,394 7,221 5,205 7,654 4,772 9,696 5,176 4,520 2,730 2,478 252
Fall 1983 ............. 12,465 42.0 6,024 6,441 7,261 5,204 7,741 4,723 9,683 5,223 4,459 2,782 2,518 264
Fall 1984 ............. 12,242 42.0 5,864 6,378 7,098 5,144 7,711 4,531 9,477 5,198 4,279 2,765 2,513 252
Fall 1985 ............. 12,247 43.0 5,818 6,429 7,075 5,172 7,716 4,531 9,479 5,210 4,270 2,768 2,506 261
Fall 1986 ............. 12,504 45.1 5,885 6,619 7,120 5,384 7,824 4,680 9,714 5,300 4,414 2,790 2,524
4
266
Fall 1987 ............. 12,767 47.1 5,932 6,835 7,231 5,536 7,990 4,776 9,973 5,432 4,541 2,793 2,558
4
235
Fall 1988 ............. 13,055 49.0 6,002 7,053 7,437 5,619 8,180 4,875 10,161 5,546 4,615 2,894 2,634 260
Fall 1989 ............. 13,539 51.4 6,190 7,349 7,661 5,878 8,388 5,151 10,578 5,694 4,884 2,961 2,693 267
Fall 1990
5
........... 13,710 51.1 6,239 7,472 7,780 5,930 8,529 5,181 10,741 5,803 4,938 2,970 2,726 243
Fall 1991
6
........... 14,157 53.7 6,405 7,752 8,031 6,126 — — 11,174 — — 2,983 — —
1
Population ratio data are based on persons 18 to 24 years old, as of July 1 prior to the opening of school, except
for 1899–1900 which is based on July 1 population after the closing of school in June. Population data through 1959
are total population, including armed forces overseas. Data for 1960 to 1991 are resident population. Many students
are over age 24, particularly in the later years. In fall 1990, about 44 percent of college students were over age 24.
2
Data for 1923–24 and previous years based on U.S. Office of Education,
Education for Victory,
vol. 3, no. 6, 1944.
3
Large increases are due to the addition of schools accredited by the National Association of Trade and Technical
Schools in 1980 and 1981.
4
Because of imputation techniques, data are not consistent with figures for other years.
5
Preliminary data.
6
Preliminary estimate.
—Data not available.
NOTE.—Prior to 1970, data for 2–year branch campuses of 4–year institutions are included with the 4–year institu-
tions. Data for 1869–70 through fall 1956 are degree-credit enrollment. Data for later years include degree-credit and
non-degree-credit enrollment. Data for 1869–70 through 1945–46 are cumulative enrollment for the entire academic
year. Beginning in fall 1960, data include Alaska and Hawaii.
SOURCE: U.S. Department of Commerce, Bureau of the Census,
Historical Statistics of the United States, Colonial
Times to 1970;
and U.S. Department of Education, National Center for Education Statistics,
Digest of Education Statis-
tics.
(This table was prepared September 1992.)

78 Higher Education
Table 25.—Enrollment in institutions of higher education, by state: 1869–70 to fall 1990
State Academic year degree-credit enrollment Total enrollment
1869–70 1879–80 1889–90 1899–1900 1909–10 1919–20 1929–30 1939–40 1949–50 Fall 1959 Fall 1969 Fall 1979 Fall 1989 Fall 1990
1 234 5 678 9 101112131415
United States ......... 62,839 115,850 156,756 237,592 355,430 597,880 1,100,737 1,494,203 2,444,900 3,639,847 8,004,660 11,569,899 13,538,560 13,710,150
Alabama ........................ 560 2,250 3,003 — 4,802 6,421 15,290 19,987 31,760 46,397 97,816 159,784 208,562 217,550
Alaska ............................ 0 0 0 — 0 0 86 268 328 3,074 7,514 20,052 28,627 29,833
Arizona .......................... 0 0 31 — 407 1,357 3,742 5,969 13,144 33,121 97,692 188,976 252,625 264,735
Arkansas ....................... 80 709 454 — 2,343 2,900 6,445 10,928 19,445 24,371 51,530 74,453 88,572 90,425
California ....................... 1,790 2,155 3,209 — 11,394 24,257 69,087 120,290 200,447 507,302 1,149,148 1,698,788 1,802,884 1,769,997
Colorado ........................ 0 195 402 — 4,601 6,050 11,290 17,376 35,063 45,745 111,893 156,100 201,114 227,131
Connecticut ................... 1,173 1,775 2,688 — 4,917 5,403 9,183 12,860 32,105 49,082 114,419 156,067 169,438 168,530
Delaware ....................... 188 96 169 — 225 498 711 1,118 3,441 6,783 23,012 32,308 40,562 42,004
District of Columbia ....... 1,587 920 2,536 — 4,710 9,564 15,944 22,319 37,454 49,518 77,886 87,855 79,800 80,669
Florida ........................... 238 39 185 — 650 1,794 5,857 11,473 36,093 70,788 218,303 395,233 578,123 538,389
Georgia .......................... 957 2,990 3,366 — 6,283 9,442 15,838 23,229 39,094 49,054 117,198 178,017 242,289 251,810
Hawaii ............................ 0 0 0 — 0 198 1,005 2,730 4,822 9,769 33,586 48,994 54,188 53,772
Idaho ............................. 0 0 0 — 724 2,322 3,812 6,615 8,266 12,579 31,450 40,661 48,969 51,881
Illinois ............................ 3,992 7,075 11,512 — 29,069 48,649 81,701 107,074 151,622 193,680 425,002 613,874 709,952 729,246
Indiana ........................... 3,367 5,812 7,652 — 16,477 20,044 26,118 37,065 70,363 93,549 185,290 228,397 275,821 283,015
Iowa ............................... 1,644 3,269 4,863 — 11,146 19,994 23,688 29,753 44,045 54,253 106,063 132,599 169,901 170,515
Kansas .......................... 466 952 2,723 — 9,409 16,437 21,326 27,244 37,061 50,775 104,568 133,360 158,497 163,375
Kentucky ........................ 2,097 3,945 4,779 — 7,061 7,048 16,877 22,414 32,455 45,360 97,243 135,179 166,014 177,852
Louisiana ....................... 1,097 851 2,389 — 3,883 4,829 11,180 25,996 35,641 54,958 114,995 153,812 180,202 186,599
Maine ............................. 957 1,556 1,554 — 2,994 3,221 4,659 6,092 9,507 12,320 30,498 42,912 58,230 57,186
Maryland ........................ 1,715 3,601 3,162 — 5,211 7,430 13,084 18,557 36,570 59,267 135,712 218,447 254,533 259,700
Massachusetts .............. 3,007 6,256 10,255 — 19,792 33,138 54,424 57,772 102,351 134,589 285,709 396,267 426,476 418,874
Michigan ........................ 2,445 2,812 6,039 — 14,967 21,833 44,144 60,961 101,390 160,313 366,568 503,839 560,320 569,803
Minnesota ...................... 675 1,170 2,787 — 9,724 18,102 24,884 34,647 50,709 73,013 158,359 193,830 253,097 253,789
Mississippi ..................... 251 1,527 1,989 — 3,298 4,521 10,070 14,019 19,695 34,501 68,594 100,272 116,370 122,883
Missouri ......................... 2,668 5,657 7,606 — 14,844 21,031 31,458 40,393 65,183 80,564 174,486 221,088 278,505 289,407
Montana ........................ 0 0 37 — 612 2,048 3,897 6,685 8,622 12,408 28,868 31,906 37,660 35,876
Nebraska ....................... 102 411 1,305 — 7,630 10,565 15,685 16,579 22,024 31,776 65,239 86,446 108,844 112,831
Nevada .......................... 0 35 52 — 235 430 1,046 1,267 1,775 3,964 12,746 35,935 56,471 61,728
New Hampshire ............. 491 655 651 — 1,713 3,505 4,846 5,897 9,069 12,624 28,114 42,112 59,081 59,510
New Jersey ................... 1,449 1,711 2,314 — 4,731 5,596 14,662 20,515 45,562 84,579 188,810 312,460 314,091 323,947
New Mexico ................... 0 0 22 — 342 2,562 2,635 4,950 9,592 17,125 41,478 56,487 81,350 85,596
New York ....................... 7,869 16,767 19,482 — 31,482 64,727 156,730 195,596 312,971 376,508 728,379 970,286 1,029,518 1,035,323
North Carolina ............... 885 2,396 2,311 — 6,898 9,109 18,901 32,118 45,195 68,500 161,038 269,065 345,502 351,990
North Dakota ................. 0 0 60 — 1,382 4,161 6,891 8,332 8,673 14,448 29,830 31,904 40,404 37,878
Ohio ............................... 5,207 8,796 9,965 — 17,584 36,779 66,985 84,367 137,743 169,762 358,892 463,310 550,720 554,787
Oklahoma ...................... 0 0 0 — 4,942 11,671 22,770 32,908 45,401 57,836 106,269 152,683 175,855 173,221
Oregon .......................... 368 768 849 — 2,920 7,929 11,796 16,141 25,588 41,630 110,780 154,597 161,822 166,641
Pennsylvania ................. 8,085 12,845 15,562 — 32,813 44,098 78,086 83,401 151,218 193,967 393,518 481,347 610,479 604,060
Rhode Island ................. 217 392 500 — 1,604 2,189 4,262 5,425 13,841 19,915 42,788 64,435 76,503 78,273

79Higher Education
Table 25.—Enrollment in institutions of higher education, by state: 1869–70 to fall 1990—Continued
State Academic year degree-credit enrollment Total enrollment
1869–70 1879–80 1889–90 1899–1900 1909–10 1919–20 1929–30 1939–40 1949–50 Fall 1959 Fall 1969 Fall 1979 Fall 1989 Fall 1990
1 234 5 678 9 101112131415
South Carolina .............. 381 1,069 1,774 — 5,152 5,246 10,666 15,914 23,038 30,875 62,320 131,459 145,730 159,302
South Dakota ................ 0 0 677 — 1,763 4,676 6,113 6,583 8,157 14,621 30,908 31,294 32,666 34,208
Tennessee ..................... 1,663 4,872 5,531 — 8,134 9,219 20,496 25,253 39,748 59,887 127,568 199,902 218,866 226,238
Texas ............................. 421 1,929 2,441 — 8,344 23,490 46,703 74,552 129,477 185,518 407,918 676,047 879,335 901,437
Utah ............................... 296 55 141 — 1,102 2,313 7,127 13,043 22,380 34,903 81,540 88,608 114,815 121,303
Vermont ......................... 759 782 896 — 1,245 1,813 2,442 3,975 7,767 9,571 21,964 29,550 35,946 36,398
Virginia .......................... 2,408 3,178 4,273 — 6,540 10,738 19,316 26,156 37,393 57,511 138,561 270,599 344,284 353,442
Washington ................... 0 138 84 — 4,524 10,675 17,903 26,226 43,093 65,018 170,107 303,469 255,760 263,278
West Virginia ................. 325 973 1,174 — 2,708 4,334 11,632 14,444 22,834 28,838 62,052 81,335 82,455 84,790
Wisconsin ...................... 1,255 2,659 3,293 — 10,763 20,159 23,758 33,135 49,678 73,556 190,496 255,907 291,966 299,774
Wyoming ....................... 0 0 9 — 125 375 1,177 2,264 3,817 6,371 14,115 19,490 29,159 31,326
U.S. Service Schools .... — — — — 1,211 2,990 3,400 4,326 7,340 13,411 15,828 18,102 55,607 48,023
—Data not available.
NOTE.—National totals exclude data for Utah in 1869–70 and 1879–80, and Washington in 1879–80. Beginning in
1959–60, data include Alaska and Hawaii.
SOURCE: U.S. Department of Education, National Center for Education Statistics,
Report of the Commissioner of
Education, Biennial Survey of Education in the United States; Total Enrollment in Institutions of Higher Education, First
Term, 1959–60; Fall Enrollment in Institutions of Higher Education;
and Integrated Postsecondary Education Data Sys-
tem, ‘‘Fall Enrollment’’ survey. (This table was prepared September 1992.)
80 Higher Education
Table 26.—Number and professional employees of institutions of higher education: 1869–70 to 1991–92
Year
Number of institutions
1
Number
of
medical
schools
2
Number
of
dental
schools
2
Professional staff Instruc-
tional
staff
3
Total 4-year colleges 2-year colleges Total Male Female
Total Public Private Total Public Private
1 2345678 9 10 11 12 13 14
1869–70 .................................. 563 —————— 75 105,553 4,887 666 —
1879–80 .................................. 811 ——————100 1411,522 7,328 4,194 —
1889–90 .................................. 998 ——————133 3115,809 12,704 3,105 —
1899–1900 .............................. 977 ——————160 5723,868 19,151 4,717 —
1909–10 .................................. 951 ——————131 5436,480 29,132 7,348 —
1915–16 .................................. ——————— 95 49 ————
1917–18 .................................. 980 934 — — 46 14 32 90 46 ————
1919–20 .................................. 1,041 989 — — 52 10 42 85 46 48,615 35,807 12,808 —
1921–22 .................................. 1,162 1,082 — — 80 17 63 81 45 — — — 56,486
1923–24 .................................. 1,295 1,163 — — 132 39 93 79 43 — — — 63,999
1925–26 .................................. 1,377 1,224 — — 153 47 106 79 44 — — — 70,674
1927–28 .................................. 1,410 1,162 — — 248 114 134 80 40 — — — 76,080
1929–30 .................................. 1,409 1,132 — — 277 129 148 76 38 — — — 82,386
1931–32 .................................. 1,478 1,136 — — 342 159 183 76 38 100,789 71,680 29,109 88,172
1933–34 .................................. 1,418 1,096 — — 322 152 170 77 39 108,873 78,369 30,504 86,914
1935–36 .................................. 1,628 1,213 — — 415 187 228 77 39 121,036 86,567 34,469 92,580
1937–38 .................................. 1,690 1,237 — — 453 209 244 77 39 135,989 97,362 38,627 102,895
1939–40 .................................. 1,708 1,252 — — 456 217 239 77 39 146,929 106,328 40,601 110,885
1941–42 .................................. 1,769 1,308 — — 461 231 230 77 39 151,066 109,309 41,757 114,693
1943–44 .................................. 1,650 1,237 — — 413 210 203 77 39 150,980 106,254 44,726 105,841
1945–46 .................................. 1,768 1,304 — — 464 242 222 77 39 165,324 116,134 49,190 125,811
1947–48 .................................. 1,788 1,316 — — 472 242 230 77 40 223,660 164,616 59,044 174,204
1949–50 .................................. 1,851 1,327 344 983 524 297 227 72 40 246,722 186,189 60,533 190,353
1950–51 .................................. 1,852 1,312 341 971 540 295 245 72 40 ————
1951–52 .................................. 1,832 1,326 350 976 506 291 215 72 41 244,488 187,136 57,352 183,758
1952–53 .................................. 1,882 1,355 349 1,006 527 290 237 72 41 ————
1953–54 .................................. 1,863 1,345 369 976 518 293 225 73 42 265,911 204,871 61,040 207,365
1954–55 .................................. 1,849 1,333 353 980 516 295 221 72 42 ————
1955–56 .................................. 1,850 1,347 360 987 503 290 213 73 42 298,910 230,342 68,568 228,188
1956–57 .................................. 1,878 1,355 359 996 523 297 226 75 43 ————
1957–58 .................................. 1,930 1,390 366 1,024 540 300 240 75 43 344,525 267,482 77,043 258,184
1958–59 .................................. 1,947 1,394 366 1,028 553 307 246 76 43 ————
1959–60 .................................. 2,004 1,422 367 1,055 582 328 254 79 45 380,554 296,773 83,781 281,506
1960–61 .................................. 2,021 1,431 368 1,063 590 332 258 79 46 ————
1961–62 .................................. 2,033 1,443 374 1,069 590 344 246 81 46 424,862 332,006 92,856 310,772
1962–63 .................................. 2,093 1,468 376 1,092 625 364 261 81 46 ————
1963–64 .................................. 2,132 1,499 386 1,113 633 374 259 82 46 494,514 385,405 109,109 355,542
1964–65 .................................. 2,175 1,521 393 1,128 654 406 248 81 45 ————
1965–66 .................................. 2,230 1,551 401 1,150 679 420 259 84 47 ————
1966–67 .................................. 2,329 1,577 403 1,174 752 477 275 83 47 646,264 — — 445,484
1967–68 .................................. 2,374 1,588 414 1,174 786 520 266 85 48 709,811 — — 484,387
1968–69 .................................. 2,483 1,619 417 1,202 864 594 270 84 48 ————
1969–70 .................................. 2,525 1,639 426 1,213 886 634 252 86 48 — — — 551,000
1970–71 .................................. 2,556 1,665 435 1,230 891 654 237 89 48 — — — 574,592
1971–72 .................................. 2,606 1,675 440 1,235 931 697 234 92 48 ————
1972–73 .................................. 2,665 1,701 449 1,252 964 733 231 97 51 881,665 639,251 242,414 652,517
1973–74 .................................. 2,720 1,717 440 1,277 1,003 760 243 99 52 ————
Including branch campuses
1974–75 .................................. 3,004 1,866 537 1,329 1,138 896 242 104 52 ————
1975–76 .................................. 3,026 1,898 545 1,353 1,128 897 231 107 56 ————
1976–77 .................................. 3,046 1,913 550 1,363 1,133 905 228 109 57 1,073,119 729,169 343,950 793,296
1977–78 .................................. 3,095 1,938 552 1,386 1,157 921 236 109 57 ————
1978–79 .................................. 3,134 1,941 550 1,391 1,193 924 269 109 58 ————
1979–80 .................................. 3,152 1,957 549 1,408 1,195 926 269 112 58 ————
1980–81 .................................. 3,231 1,957 552 1,405 1,274 945 329 116 58 ————
1981–82 .................................. 3,253 1,979 558 1,421 1,274 940 334 119 59 ————
1982–83 .................................. 3,280 1,984 560 1,424 1,296 933 363 118 59 ————
1983–84 .................................. 3,284 2,013 565 1,448 1,271 916 355 119 60 ————
1984–85 .................................. 3,331 2,025 566 1,459 1,306 935 371 120 59 ————
1985–86 .................................. 3,340 2,029 566 1,463 1,311 932 379 120 59 ————
1986–87 .................................. 3,406 2,070 573 1,497 1,336 960 376 122 58 ————
1987–88 .................................. 3,587 2,135 599 1,536 1,452 992 460 122 57 1,437,975 850,451 587,524 954,534
1988–89 .................................. 3,565 2,129 598 1,531 1,436 984 452 124 58 ————
1989–90 .................................. 3,535 2,127 595 1,532 1,408 968 440 124 57 1,531,071 880,766 650,305 987,518
1990–91 .................................. 3,559 2,141 595 1,546 1,418 972 446 — —————
1991–92 .................................. 3,601 2,157 599 1,558 1,444 999 445 — —————
1
Data for 1869–70 through 1973–74 include main campuses only and exclude branch
campuses. Data for later years include both main and branch campuses.
2
Medical and dental schools are included, as appropriate, in columns 2 through 5.
3
Includes regular faculty, junior faculty, and research assistants.
—Data not available.
NOTE.—Beginning in 1959–60, data include Alaska and Hawaii.
SOURCE: U.S. Department of Education, National Center for Education Statistics,
An-
nual Report of the Commissioner; Biennial Survey of Education in the United States;
Numbers and Characteristics of Employees in Institutions of Higher Education;
and
Di-
gest of Education Statistics.
(This table was prepared October 1992.)

81Higher Education
Table 27.—Number of permanent colleges and universities founded before 1860, by decade of founding and by
state
State Total
before
1860
Before
1769 1770 to
1779 1780 to
1789 1790 to
1799 1800 to
1809 1810 to
1819 1820 to
1829 1830 to
1839 1840 to
1849 1850 to
1859
1 23456789101112
United States .... 381 11 4 14 9 10 21 36 66 79 131
Alabama ................... 10—————— 1 4 2 3
Alaska ...................... (
1
)——————————
Arizona ..................... (
1
)——————————
Arkansas .................. 1 ——————— 1——
California .................. 6 ————————— 6
Colorado .................. (
1
)——————————
Connecticut .............. 5 1 ————— 1 3——
Delaware .................. 1 ——————— 1——
District of Columbia 3 — — 1 — — — 1 — — 1
Florida ...................... 2 ————————— 2
Georgia .................... 10 — — 1 — — — 2 5 1 1
Hawaii ...................... (
1
)——————————
Idaho ........................ (
1
)——————————
Illinois ....................... 21—————— 3 1 512
Indiana ..................... 17———— 1 1 2 3 5 5
Iowa ......................... 13——————— 1 4 8
Kansas ..................... 3 ————————— 3
Kentucky .................. 9 — — 1 1 — 2 1 — 1 3
Louisiana ................. 3 —————— 1 1— 1
Maine ....................... 4 — — — 1 — 2 — 1 — —
Maryland .................. 11 — — 2 1 2 — 1 1 1 3
Massachusetts ......... 18 1 — 1 1 2 — 2 4 2 5
Michigan .................. 8 ————— 1— 2 3 2
Minnesota ................ 4 ————————— 4
Mississippi ............... 2 —————— 1— 1—
Missouri ................... 15————— 2 1 3 2 7
Montana ................... (
1
)——————————
Nebraska ................. (
1
)——————————
Nevada .................... (
1
)——————————
New Hampshire ....... 2 1 —————— 1——
New Jersey .............. 8 2 — 1 — — 1 — — — 4
New Mexico ............. (
1
)——————————
New York ................. 39 1 — 1 1 1 5 5 5 7 13
North Carolina ......... 16 — 1 2 ———— 5 2 6
North Dakota ........... (
1
)——————————
Ohio ......................... 30———— 2 1 3 6 810
Oklahoma ................ 1 ————————— 1
Oregon ..................... 5 ———————— 3 2
Pennsylvania ........... 44 2 1 3 1 — 3 6 6 9 13
Rhode Island ........... 2 1 ———————— 1
South Carolina ......... 11 — 1 — — 1 — 2 2 2 3
South Dakota ........... 1 ————————— 1
Tennessee ............... 12——— 2—— 1— 6 3
Texas ....................... 5 ———————— 4 1
Utah ......................... 1 ————————— 1
Vermont ................... 7 — — 1 1 1 1 1 2 — —
Virginia ..................... 16 2 1 — — — 2 1 6 3 1
Washington .............. 1 ————————— 1
West Virginia ........... 3 ——————— 2 1—
Wisconsin ................ 11 ———————— 7 4
Wyoming .................. (
1
)——————————
1
No permanent colleges founded prior to 1860.
—No permanent colleges reported.
SOURCE: U.S. Department of Education, National Center for Education Statistics, ‘‘In-
stitutional Characteristics of Colleges and Universities, 1980–81,’’ and unpublished data.
(This table was prepared November 1992.)

82 Higher Education
Table 28.—Degrees conferred by institutions of higher education, by sex and level: 1869–70 to 1989–90
Year
Bachelor’s degrees Master’s degrees (includes second-
professional for years prior to 1959–60) First-professional degrees Doctor’s degrees
Total Male Female
Per
1,000
persons
23
years
old
Per 100
high
school
grad-
uates
4 years
earlier
Total Male Female
Per 100
bach-
elor’s
degrees
2 years
earlier
Total Male Female Total Male Female
Total
lapse
time in
years,
bach-
elor’s to
doctor’s
Per
1,000
bach-
elor’s
degrees
x-years
earlier
1
1 2 3 4 5 6 7 8 9 1011121314151617 18
1869–70 .........
2
9,371
2
7,993
2
1,378 — — — — — — (
3
)(
3
)(
3
)110——
1870–71 .........
2
12,357
2
10,484
2
1,873 — — — — — — (
3
)(
3
)(
3
)13——— —
1871–72 .........
2
7,852
2
6,626
2
1,226 — — 794 — — 8 (
3
)(
3
)(
3
)14——— —
1872–73 .........
2
10,807
2
9,070
2
1,737 — — 890 — — 7 (
3
)(
3
)(
3
)26——— —
1873–74 .........
2
11,493
2
9,593
2
1,900 — — 860 — — 11 (
3
)(
3
)(
3
)13——— —
1874–75 .........
2
11,932
2
9,905
2
2,027 — — 661 — — 6 (
3
)(
3
)(
3
)23——— —
1875–76 .........
2
12,005
2
9,911
2
2,094 — — 835 — — 7 (
3
)(
3
)(
3
)31——— —
1876–77 .........
2
10,145
2
8,329
2
1,816 — — 731 — — 6 (
3
)(
3
)(
3
)39——— —
1877–78 .........
2
11,533
2
9,416
2
2,117 — — 816 — — 7 (
3
)(
3
)(
3
)32——— 3.4
1878–79 .........
2
12,081
2
9,808
2
2,273 — — 919 — — 9 (
3
)(
3
)(
3
)36——— 2.9
1879–80 .........
2
12,896
2
10,411
2
2,485 — — 879 868 11 8 (
3
)(
3
)(
3
) 54 51 3 — 5.7
1880–81 .........
2
14,871
2
12,035
2
2,836 — — 922 — — 8 (
3
)(
3
)(
3
)37——— 3.7
1881–82 .........
2
14,998
2
12,168
2
2,830 — — 884 — — 7 (
3
)(
3
)(
3
)46——— 3.7
1882–83 .........
2
15,116
2
12,294
2
2,822 — — 863 — — 6 (
3
)(
3
)(
3
)50——— 4.2
1883–84 .........
2
12,765
2
10,408
2
2,357 — 53 901 — — 6 (
3
)(
3
)(
3
)66——— 3.8
1884–85 .........
2
14,734
2
12,043
2
2,691 — 59 1,071 — — 7 (
3
)(
3
)(
3
)77——— 5.8
1885–86 .........
2
13,097
2
10,731
2
2,366 — 48 859 — — 7 (
3
)(
3
)(
3
)84——— 2.9
1886–87 .........
2
13,402
2
11,008
2
2,394 — 48 923 — — 6 (
3
)(
3
)(
3
)77——— 6.4
1887–88 .........
2
15,256
2
12,562
2
2,694 — 49 987 — — 8 (
3
)(
3
)(
3
) 140 — — — 6.1
1888–89 .........
2
15,020
2
12,397
2
2,623 — 47 1,161 — — 9 (
3
)(
3
)(
3
) 124 — — — 8.1
1889–90 .........
2
15,539
2
12,857
2
2,682 — 47 1,015 821 194 7 (
3
)(
3
)(
3
) 149 147 2 — 9.0
1890–91 .........
2
16,840
2
13,902
2
2,938 — 53 776 — — 5 (
3
)(
3
)(
3
) 187 — — — 9.2
1891–92 .........
2
16,802
2
13,840
2
2,962 — 51 730 — — 5 (
3
)(
3
)(
3
) 190 — — — 13.0
1892–93 .........
2
18,667
2
15,342
2
3,325 — 49 1,104 — — 7 (
3
)(
3
)(
3
) 218 — — — 13.2
1893–94 .........
2
21,850
2
17,917
2
3,933 — 50 1,223 1,013 210 7 (
3
)(
3
)(
3
) 279 261 18 — 18.5
1894–95 .........
2
24,106
2
19,723
2
4,383 — 56 1,334 1,124 210 7 (
3
)(
3
)(
3
) 272 247 25 — 18.3
1895–96 .........
2
24,593
2
20,076
2
4,517 — 46 1,478 1,213 265 7 (
3
)(
3
)(
3
) 271 236 35 — 16.0
1896–97 .........
2
25,231
2
20,550
2
4,681 — 43 1,413 1,163 250 6 (
3
)(
3
)(
3
) 319 299 20 — 19.8
1897–98 .........
2
25,052
2
20,358
2
4,694 — 37 1,440 1,188 252 6 (
3
)(
3
)(
3
) 324 285 39 — 15.2
1898–99 .........
2
25,980
2
21,064
2
4,916 — 36 1,542 1,275 267 6 (
3
)(
3
)(
3
) 345 327 18 — 13.3
1899–1900 .....
2
27,410
2
22,173
2
5,237
2
19
2
36 1,583 1,280 303 6 (
3
)(
3
)(
3
) 382 359 23 — 14.2
1900–01 .........
2
28,681
2
23,099
2
5,582
2
19
2
36 1,744 1,405 339 7 (
3
)(
3
)(
3
) 365 334 31 — 13.7
1901–02 .........
2
28,966
2
23,225
2
5,741
2
19
2
34 1,858 1,464 394 7 (
3
)(
3
)(
3
) 293 264 29 — 10.2
1902–03 .........
2
29,907
2
23,872
2
6,035
2
19
2
33 1,718 1,385 333 6 (
3
)(
3
)(
3
) 337 302 35 — 11.2
1903–04 .........
2
30,501
2
24,237
2
6,264
2
19
2
32 1,679 1,340 339 6 (
3
)(
3
)(
3
) 334 302 32 — 11.8
1904–05 .........
2
31,519
2
24,934
2
6,585
2
19
2
32 1,925 1,538 387 6 (
3
)(
3
)(
3
) 369 341 28 — 12.9
1905–06 .........
2
32,019
2
25,215
2
6,804
2
19
2
32 1,787 1,366 421 6 (
3
)(
3
)(
3
) 383 358 25 — 13.0
1906–07 .........
2
32,234
2
25,269
2
6,965
2
19
2
31 1,619 1,215 404 5 (
3
)(
3
)(
3
) 349 320 29 — 12.6
1907–08 .........
2
33,800
2
26,376
2
7,424
2
19
2
30 1,971 1,511 460 6 (
3
)(
3
)(
3
) 391 339 52 — 13.8
1908–09 .........
2
37,892
2
29,433
2
8,459
2
21
2
32 2,188 1,713 475 7 (
3
)(
3
)(
3
) 451 397 54 — 13.6
1909–10 .........
2
37,199
2
28,762
2
8,437
2
20
2
30 2,113 1,555 558 6 (
3
)(
3
)(
3
) 443 399 44 — 12.5

83Higher Education
Table 28.—Degrees conferred by institutions of higher education, by sex and level: 1869–70 to 1989–90—Continued
Year
Bachelor’s degrees Master’s degrees (includes second-
professional for years prior to 1959–60) First-professional degrees Doctor’s degrees
Total Male Female
Per
1,000
persons
23
years
old
Per 100
high
school
grad-
uates
4 years
earlier
Total Male Female
Per 100
bach-
elor’s
degrees
2 years
earlier
Total Male Female Total Male Female
Total
lapse
time in
years,
bach-
elor’s to
doctor’s
Per
1,000
bach-
elor’s
degrees
x-years
earlier
1
1 2 3 4 5 6 7 8 9 1011121314151617 18
1910–11 .........
2
37,481
2
28,547
2
8,934
2
20
2
30 2,456 1,821 635 6 (
3
)(
3
)(
3
) 497 449 48 — 14.9
1911–12 .........
2
39,408
2
29,560
2
9,848
2
21
2
30 3,035 2,215 820 8 (
3
)(
3
)(
3
) 500 436 64 — 15.9
1912–13 .........
2
42,396
2
31,312
2
11,084
2
23
2
30 3,025 2,021 1,004 8 (
3
)(
3
)(
3
) 538 481 57 — 14.9
1913–14 .........
2
44,268
2
32,183
2
12,085
2
24
2
28 3,270 2,256 1,014 8 (
3
)(
3
)(
3
) 559 486 73 — 15.7
1914–15 .........
2
43,912
2
31,417
2
12,495
2
23
2
26 3,577 2,638 939 8 (
3
)(
3
)(
3
) 611 549 62 — 17.2
1915–16 .........
2
45,250
2
31,852
2
13,398
2
24
2
25 3,906 2,934 972 9 (
3
)(
3
)(
3
) 667 586 81 — 18.1
1917–18 .........
2
38,585
2
26,269
2
12,316
2
22
2
18 2,900 1,806 1,094 6 (
3
)(
3
)(
3
) 556 491 65 — 15.0
1919–20 .........
2
48,622
2
31,980
2
16,642
2
26
2
19 4,279 2,985 1,294 11 (
3
)(
3
)(
3
) 615 522 93 7.7 15.6
1921–22 .........
2
61,668
2
41,306
2
20,362
2
33
2
22 5,984 4,304 1,680 12 (
3
)(
3
)(
3
) 836 708 128 7.8 18.9
1923–24 .........
2
82,783
2
54,908
2
27,875
2
43
2
27 8,216 5,515 2,701 13 (
3
)(
3
)(
3
) 1,098 939 159 8.4 24.3
1925–26 .........
2
97,263
2
62,218
2
35,045
2
49
2
27 9,735 6,202 3,533 12 (
3
)(
3
)(
3
) 1,409 1,216 193 8.6 33.6
1927–28 .........
2
111,161
2
67,659
2
43,502
2
55
2
22 12,387 7,727 4,660 13 (
3
)(
3
)(
3
) 1,447 1,249 198 8.4 29.8
1929–30 .........
2
122,484
2
73,615
2
48,869
2
57
2
22 14,969 8,925 6,044 13 (
3
)(
3
)(
3
) 2,299 1,946 353 8.7 41.7
1931–32 .........
2
138,063
2
83,271
2
54,792
2
63
2
23 19,367 12,210 7,157 16 (
3
)(
3
)(
3
) 2,654 2,247 407 9.1 36.7
1933–34 .........
2
136,156
2
82,341
2
53,815
2
61
2
20 18,293 11,516 6,777 13 (
3
)(
3
)(
3
) 2,830 2,456 374 8.5 29.1
1935–36 .........
2
143,125
2
86,067
2
57,058
2
63
2
17 18,302 11,503 6,799 13 (
3
)(
3
)(
3
) 2,770 2,370 400 9.2 26.6
1937–38 .........
2
164,943
2
97,678
2
67,265
2
72
2
18 21,628 13,400 8,228 15 (
3
)(
3
)(
3
) 2,932 2,502 430 9.5 26.4
1939–40 .........
2
186,500
2
109,546
2
76,954
2
81
2
18 26,731 16,508 10,223 16 (
3
)(
3
)(
3
) 3,290 2,861 429 9.4 25.3
1941–42 .........
2
185,346
2
103,889
2
81,457
2
78
2
16 24,648 14,179 10,469 13 (
3
)(
3
)(
3
) 3,497 3,036 461 8.8 25.5
1943–44 .........
2
125,863
2
55,865
2
69,998
2
52
2
10 13,414 5,711 7,703 7 (
3
)(
3
)(
3
) 2,305 1,880 425 9.4 16.5
1945–46 .........
2
136,174
2
58,664
2
77,510
2
56
2
11 19,209 9,484 9,725 15 (
3
)(
3
)(
3
) 1,966 1,580 386 11.0 14.1
1947–48 .........
2
271,186
2
175,615
2
95,571
2
113
2
27 42,432 28,931 13,501 31 (
3
)(
3
)(
3
) 3,989 3,496 493 10.8 25.9
1948–49 .........
2
365,492
2
263,608
2
101,884
2
154
2
36 50,741 35,212 15,529 25 (
3
)(
3
)(
3
) 5,049 4,527 522 10.2 28.7
1949–50 .........
2
432,058
2
328,841
2
103,217
2
182
2
40 58,183 41,220 16,963 21 (
3
)(
3
)(
3
) 6,420 5,804 616 10.2 34.4
1950–51 .........
2
382,546
2
278,240
2
104,306
2
161
2
35 65,077 46,196 18,881 18 (
3
)(
3
)(
3
) 7,337 6,663 674 9.8 39.5
1951–52 .........
2
329,986
2
225,981
2
104,005
2
143
2
28 63,534 43,557 19,977 15 (
3
)(
3
)(
3
) 7,683 6,969 714 9.8 41.5
1952–53 .........
2
303,049
2
199,793
2
103,256
2
132
2
25 60,959 40,946 20,013 16 (
3
)(
3
)(
3
) 8,307 7,515 792 9.7 53.4
1953–54 .........
2
291,508
2
186,884
2
104,624
2
129
2
24 56,823 38,147 18,676 17 (
3
)(
3
)(
3
) 8,996 8,181 815 9.7 71.5
1954–55 .........
2
285,841
2
182,839
2
103,002
2
151
2
24 58,200 38,739 19,461 19 (
3
)(
3
)(
3
) 8,840 8,014 826 9.9 67.5
1955–56 .........
2
309,514
2
198,615
2
110,899
2
147
2
26 59,281 39,393 19,888 20 (
3
)(
3
)(
3
) 8,903 8,018 885 10.3 65.4
1956–57 .........
2
338,436
2
221,650
2
116,786
2
163
2
28 61,940 41,329 20,611 22 (
3
)(
3
)(
3
) 8,756 7,817 939 10.2 43.0
1957–58 .........
2
363,502
2
241,560
2
121,942
2
167
2
28 65,586 44,229 21,357 21 (
3
)(
3
)(
3
) 8,942 7,978 964 10.3 33.0
1958–59 .........
2
379,931
2
252,517
2
127,414
2
178
2
28 72,532 48,360 24,172 21 (
3
)(
3
)(
3
) 9,360 8,371 989 10.3 25.6
1959–60
4
.......
2
392,440
2
254,063
2
138,377
2
182
2
27 74,435 50,898 23,537 20 (
3
)(
3
)(
3
) 9,829 8,801 1,028 10.4 22.7
1960–61 ......... 365,174 224,538 140,636 165 25 84,609 57,830 26,779 22 25,253 24,577 676 10,575 9,463 1,112 10.3 27.6
1961–62 ......... 383,961 230,456 153,505 173 25 91,418 62,603 28,815 23 25,607 24,836 771 11,622 10,377 1,245 10.2 35.2
1962–63 ......... 411,420 241,309 170,111 181 25 98,684 67,302 31,382 27 26,590 25,753 837 12,822 11,448 1,374 10.2 42.3
1963–64 ......... 461,266 265,349 195,917 192 25 109,183 73,850 35,333 28 27,209 26,357 852 14,490 12,955 1,535 10.0 49.7
1964–65 ......... 493,757 282,173 211,584 194 25 121,167 81,319 39,848 29 28,290 27,283 1,007 16,467 14,692 1,775 10.0 57.6

84 Higher Education
Table 28.—Degrees conferred by institutions of higher education, by sex and level: 1869–70 to 1989–90—Continued
Year
Bachelor’s degrees Master’s degrees (includes second-
professional for years prior to 1959–60) First-professional degrees Doctor’s degrees
Total Male Female
Per
1,000
persons
23
years
old
Per 100
high
school
grad-
uates
4 years
earlier
Total Male Female
Per 100
bach-
elor’s
degrees
2 years
earlier
Total Male Female Total Male Female
Total
lapse
time in
years,
bach-
elor’s to
doctor’s
Per
1,000
bach-
elor’s
degrees
x-years
earlier
1
1 2 3 4 5 6 7 8 9 1011121314151617 18
1965–66 ......... 520,115 299,287 220,828 181 27 140,602 93,081 47,521 30 30,124 28,982 1,142 18,237 16,121 2,116 10.0 58.9
1966–67 ......... 558,534 322,711 235,823 208 29 157,726 103,109 54,617 32 31,695 30,401 1,294 20,617 18,163 2,454 8.1 54.3
1967–68 ......... 632,289 357,682 274,607 238 28 176,749 113,552 63,197 34 33,939 32,402 1,537 23,089 20,183 2,906 8.1 58.8
1968–69 ......... 728,845 410,595 318,250 278 27 193,756 121,531 72,225 35 35,114 33,595 1,519 26,158 22,722 3,436 8.0 71.6
1969–70 ......... 792,317 451,097 341,220 218 30 208,291 125,624 82,667 33 34,578 32,794 1,784 29,912 25,890 4,022 7.9 77.9
1970–71 ......... 839,730 475,594 364,136 247 31 230,509 138,146 92,363 32 37,946 35,544 2,402 32,107 27,530 4,577 7.9 78.0
1971–72 ......... 887,273 500,590 386,683 258 33 251,633 149,550 102,083 32 43,411 40,723 2,688 33,363 28,090 5,273 8.2 72.3
1972–73 ......... 922,362 518,191 404,171 267 33 263,371 154,468 108,903 31 50,018 46,489 3,529 34,777 28,571 6,206 8.4 70.4
1973–74 ......... 945,776 527,313 418,463 262 33 277,033 157,842 119,191 31 53,816 48,530 5,286 33,816 27,365 6,451 8.5 65.0
1974–75 ......... 922,933 504,841 418,092 249 31 292,450 161,570 130,880 32 55,916 48,956 6,960 34,083 26,817 7,266 8.6 65.5
1975–76 ......... 925,746 504,925 420,821 242 31 311,771 167,248 144,523 33 62,649 52,892 9,757 34,064 26,267 7,797 8.6 61.0
1976–77 ......... 919,549 495,545 424,004 234 30 317,164 167,783 149,381 34 64,359 52,374 11,985 33,232 25,142 8,090 8.7 52.6
1977–78 ......... 921,204 487,347 433,857 229 30 311,620 161,212 150,408 34 66,581 52,270 14,311 32,131 23,658 8,473 8.9 44.1
1978–79 ......... 921,390 477,344 444,046 225 29 301,079 153,370 147,709 33 68,848 52,652 16,196 32,730 23,541 9,189 9.0 41.3
1979–80 ......... 929,417 473,611 455,806 218 30 298,081 150,749 147,332 32 70,131 52,716 17,415 32,615 22,943 9,672 9.3 38.8
1980–81 ......... 935,140 469,883 465,257 218 30 295,739 147,043 148,696 32 71,956 52,792 19,164 32,958 22,711 10,247 9.4 37.1
1981–82 ......... 952,998 473,364 479,634 222 30 295,546 145,532 150,014 32 72,032 52,223 19,809 32,707 22,224 10,483 9.6 36.9
1982–83 ......... 969,510 479,140 490,370 227 31 289,921 144,697 145,224 31 73,136 51,310 21,826 32,775 21,902 10,873 9.8 35.5
1983–84 ......... 974,309 482,319 491,990 225 32 284,263 143,595 140,668 30 74,407 51,334 23,073 33,209 22,064 11,145 10.0 35.1
1984–85 ......... 979,477 482,528 496,949 230 32 286,251 143,390 142,861 30 75,063 50,455 24,608 32,943 21,700 11,243 10.2 35.7
1985–86 ......... 987,823 485,923 501,900 236 33 288,567 143,508 145,059 30 73,910 49,261 24,649 33,653 21,819 11,834 10.4 36.4
1986–87 ......... 991,339 480,854 510,485 241 34 289,557 141,363 148,194 30 72,750 47,460 25,290 34,120 22,099 12,021 10.4 37.1
1987–88 ......... 994,829 477,203 517,626 252 36 299,317 145,163 154,154 30 70,735 45,484 25,251 34,870 22,615 12,255 10.5 37.9
1988–89 ......... 1,018,755 483,346 535,409 272 38 310,621 149,354 161,267 31 70,856 45,046 25,810 35,720 22,648 13,072 10.5 38.8
1989–90
5
....... 1,049,657 491,488 558,169 282 40 323,844 153,643 170,201 33 70,980 44,002 26,978 38,238 24,371 13,867 10.5 41.1
1
Represents the number of years from the receipt of the bachelor’s degree to the receipt of the doctorate degree.
See column 17.
2
Includes first-professional degrees.
3
First-professional degrees included with bachelor’s degrees.
4
Denotes the first year for which figures include Alaska and Hawaii.
5
Preliminary data.
—Data not available.
SOURCE: U.S. Department of Commerce, Bureau of the Census,
Historical Statistics of the United States, Colonial
Times to 1970;
Current Population Reports, Series P-25,
Population Estimates and Projectons;
U.S. Department of
Education, National Center for Education Statistics,
Digest of Education Statistics;
and National Academy of Sciences,
Doctorate Recipients from United States Universities.
(This table was prepared November 1992.)

85Higher Education
Table 29.—Bachelor’s degrees conferred by institutions of higher education, by field of study: 1959–60 to 1989–90
Year Total
Agriculture
and
natural
resources
Architec-
ture and
environ-
mental
design
Business
and
manage-
ment
Com-
muni-
cations
Computer
and
informa-
tion
sciences
Education Engi-
neering
For-
eign
lan-
guages
Health
sciences Letters Library
sciences Life
sciences Mathe-
matics Physical
sciences
Psy-
cholo-
gy
Public
affairs Social
sciences
Visual
and
per-
forming
arts
Other
1
1 2 3 4 5 6 7 8 910111213 1415161718192021
1959–60
2
........... 392,440 6,241 1,801 51,076 1,548 0 89,002 37,679 5,405 24,455 22,457 1,938 15,576 11,399 16,007 8,061 3,714 48,002 13,163 34,916
1960–61 ............. 365,174 5,649 1,674 48,074 1,830 0 91,028 35,698 6,364 11,314 24,003 439 16,060 13,097 15,452 8,460 1,688 50,221 12,942 21,181
1961–62 ............. 383,961 5,841 1,774 49,017 1,519 0 96,280 34,735 7,906 11,366 26,609 423 16,915 14,570 15,851 9,578 1,560 55,296 13,609 21,112
1962–63 ............. 411,420 6,013 2,028 50,639 1,687 0 101,338 33,458 9,707 11,854 30,225 462 19,114 16,078 16,215 10,993 1,957 63,104 14,518 22,030
1963–64 ............. 461,266 6,169 2,059 55,474 2,001 0 111,215 35,226 12,160 11,527 35,146 510 22,723 18,624 17,456 13,258 2,032 74,729 16,159 24,798
1964–65 ............. 493,757 6,734 2,333 59,288 1,928 87 117,137 36,795 13,859 11,611 38,836 623 25,166 19,460 17,861 14,626 2,320 81,919 17,391 25,783
1965–66 ............. 520,115 7,178 2,663 62,721 2,357 89 116,448 35,615 15,186 14,965 42,262 619 26,916 19,977 17,129 16,897 2,960 90,632 18,679 26,822
1966–67 ............. 558,534 7,866 2,937 69,032 2,741 222 118,955 35,954 16,706 15,908 45,900 701 28,849 21,207 17,739 19,364 3,242 101,550 21,548 28,113
1967–68 ............. 632,289 8,308 3,057 79,074 3,173 459 133,965 37,368 19,128 17,429 52,467 814 31,826 23,513 19,380 23,819 4,912 117,093 25,521 30,983
1968–69 ............. 728,845 9,965 3,477 93,094 4,269 933 150,985 41,248 21,493 19,825 59,674 1,000 35,308 27,209 21,480 29,332 5,282 137,517 31,588 35,166
1969–70 ............. 792,317 11,321 4,105 104,706 5,199 1,544 164,080 44,479 20,895 21,674 62,583 1,054 37,389 27,442 21,439 33,606 5,762 150,331 35,901 38,807
1970–71 ............. 839,730 12,672 5,570 114,865 10,802 2,388 176,614 50,046 19,945 25,190 64,933 1,013 35,743 24,801 21,412 37,880 6,252 155,236 30,394 43,974
1971–72 ............. 887,273 13,516 6,440 121,360 12,340 3,402 191,220 51,164 18,849 28,570 64,670 989 37,293 23,713 20,745 43,093 8,221 158,037 33,831 49,820
1972–73 ............. 922,362 14,756 6,962 126,263 14,317 4,304 194,229 51,265 18,964 33,523 61,799 1,159 42,233 23,067 20,696 47,695 11,346 155,922 36,017 57,845
1973–74 ............. 945,776 16,253 7,822 131,766 17,096 4,756 185,225 50,286 18,840 41,394 55,469 1,164 48,340 21,635 21,178 51,821 12,671 150,298 39,730 70,032
1974–75 ............. 922,933 17,528 8,226 133,010 19,248 5,033 167,015 46,852 17,606 48,858 48,534 1,069 51,741 18,181 20,778 50,988 14,730 135,165 40,782 77,589
1975–76 ............. 925,746 19,402 9,146 142,379 21,282 5,652 154,807 46,331 15,471 53,813 43,019 843 54,275 15,984 21,465 49,908 16,751 126,287 42,138 86,793
1976–77 ............. 919,549 21,467 9,222 150,964 23,214 6,407 143,722 49,283 13,944 57,122 38,849 781 53,605 14,196 22,497 47,373 17,627 116,879 41,793 90,604
1977–78 ............. 921,204 22,650 9,250 160,187 25,400 7,201 136,141 55,654 12,730 59,168 36,365 693 51,502 12,569 22,986 44,559 18,078 112,827 40,951 92,293
1978–79 ............. 921,390 23,134 9,273 171,764 26,457 8,719 126,109 62,375 11,825 61,819 34,557 558 48,846 11,806 23,207 42,461 18,882 107,922 40,969 90,707
1979–80 ............. 929,417 22,802 9,132 185,361 28,616 11,154 118,169 68,893 11,133 63,607 33,497 398 46,370 11,378 23,410 41,962 18,422 103,519 40,892 90,702
1980–81 ............. 935,140 21,886 9,455 199,338 31,282 15,121 108,309 75,000 10,319 63,348 33,208 375 43,216 11,078 23,952 40,833 18,714 100,345 40,479 88,882
1981–82 ............. 952,998 21,029 9,728 214,001 34,222 20,267 101,113 80,005 9,841 63,385 34,334 307 41,639 11,599 24,052 41,031 18,739 99,545 40,422 87,739
1982–83 ............. 969,510 20,909 9,823 226,893 38,602 24,510 97,991 89,270 9,685 64,614 32,743 258 39,982 12,453 23,405 40,364 16,290 95,088 39,469 87,161
1983–84 ............. 974,309 19,317 9,186 230,031 40,165 32,172 92,382 94,444 9,479 64,338 33,739 255 38,640 13,211 23,671 39,872 14,396 93,212 39,833 85,966
1984–85 ............. 979,477 18,107 9,325 233,351 42,083 38,878 88,161 96,105 9,954 64,513 34,091 202 38,445 15,146 23,732 39,811 13,838 91,461 37,936 84,338
1985–86 ............. 987,823 16,823 9,119 238,160 43,091 41,889 87,221 95,953 10,102 64,535 35,434 157 38,524 16,306 21,731 40,521 13,878 93,703 36,949 83,727
1986–87 ............. 991,339 14,991 8,922 241,156 45,408 39,664 87,115 93,074 10,184 63,206 37,133 139 38,114 16,489 19,974 42,868 14,161 96,185 36,223 86,333
1987–88 ............. 994,829 14,222 8,603 243,725 46,726 34,523 91,287 88,706 10,045 60,754 39,551 123 36,755 15,904 17,806 45,003 14,294 100,288 36,638 89,876
1988–89 ............. 1,018,755 13,492 9,150 247,175 48,645 30,454 97,082 85,225 10,780 59,138 43,387 122 36,059 15,218 17,186 48,737 15,270 107,914 37,925 95,796
1989–90 ............. 1,049,657 13,070 9,261 249,081 51,283 27,434 104,715 82,110 11,326 58,816 48,075 84 37,170 14,597 16,131 53,586 16,241 116,925 39,695 100,057
1
‘‘Other’’ includes degrees in area and ethnic studies, home economics, law, liberal/general studies, military sciences,
multi/interdisciplinary studies, parks and recreation, philosophy and religion, protective services, theology, and degrees
not classified by field of study.
2
All of the first-professional degrees and some master degrees are included. The degrees that are affected are busi-
ness and management, education, health sciences, letters, library sciences, public affairs, and other categories.
SOURCE: U.S. Department of Education, National Center for Education Statistics,
Earned Degrees Conferred
and
‘‘Degrees and Other Formal Awards Conferred’’ surveys; and Integrated Postsecondary Education Data System
(IPEDS), ‘‘Completions’’ surveys.

86 Higher Education
Table 30.—Master’s degrees conferred by institutions of higher education, by field of study: 1959–60 to 1989–90
Year Total
Agriculture
and
natural
resources
Architec-
ture and
environ-
mental
design
Business
and
manage-
ment
Com-
muni-
cations
Computer
and
informa-
tion
sciences
Education Engi-
neering
For-
eign
lan-
guages
Health
sciences Letters Library
sciences Life
sciences Mathe-
matics Physical
sciences
Psy-
cholo-
gy
Public
affairs Social
sciences
Visual
and
per-
forming
arts
Other
1
1 2 3 4 5 6 7 8 910111213 1415161718192021
1959–60
2
........... 74,435 1,203 319 4,643 0 0 33,433 7,159 1,055 1,838 3,262 305 2,154 1,757 3,376 1,406 568 5,448 2,892 3,617
1960–61 ............. 84,609 1,241 378 6,723 37 0 34,368 8,178 1,274 1,632 3,556 1,931 2,358 2,231 3,790 1,719 2,706 5,825 2,910 3,752
1961–62 ............. 91,420 1,357 311 7,691 44 0 36,182 8,909 1,480 1,632 3,947 2,140 2,642 2,680 3,925 1,832 2,841 6,678 3,151 3,978
1962–63 ............. 98,684 1,261 356 8,334 32 0 37,878 9,635 1,849 2,011 4,490 2,363 2,921 3,313 4,123 1,918 3,180 7,637 3,363 4,020
1963–64 ............. 109,183 1,344 383 9,251 32 0 41,091 10,827 2,196 2,279 5,006 2,717 3,296 3,597 4,561 2,059 3,651 8,493 3,673 4,727
1964–65 ............. 121,167 1,366 373 10,602 38 146 44,314 12,055 2,690 2,493 5,745 3,211 3,598 4,141 4,914 2,241 4,085 9,565 4,244 5,346
1965–66 ............. 140,602 1,661 702 12,959 44 238 50,397 13,675 3,393 2,833 7,033 3,939 4,232 4,769 4,987 2,530 4,769 11,477 5,019 5,945
1966–67 ............. 157,726 1,750 812 14,892 107 449 55,760 13,880 4,017 3,398 8,231 4,489 4,996 5,278 5,405 3,138 5,087 13,460 5,812 6,765
1967–68 ............. 176,749 1,797 1,021 17,795 65 548 63,399 15,182 4,511 3,677 9,021 5,165 5,506 5,527 5,499 3,479 5,858 14,539 6,563 7,597
1968–69 ............. 193,756 2,070 1,143 19,281 129 1,012 70,967 15,240 4,691 4,067 9,684 5,932 5,743 5,713 5,895 4,011 6,318 16,068 7,413 8,379
1969–70 ............. 208,291 1,793 1,427 21,287 130 1,459 79,293 15,593 4,803 4,488 9,713 6,511 5,800 5,636 5,935 4,111 7,067 16,281 7,849 9,115
1970–71 ............. 230,509 2,457 1,705 26,481 1,856 1,588 88,952 16,443 4,755 5,445 11,148 7,001 5,728 5,191 6,367 4,431 8,215 16,476 6,675 9,595
1971–72 ............. 251,633 2,680 1,899 30,367 2,200 1,977 98,143 16,960 4,616 6,875 11,074 7,383 6,101 5,198 6,287 5,289 9,183 17,416 7,537 10,448
1972–73 ............. 263,371 2,807 2,307 31,007 2,406 2,113 105,565 16,619 4,289 7,879 10,808 7,696 6,263 5,028 6,257 5,831 10,899 17,288 7,254 11,055
1973–74 ............. 277,033 2,928 2,702 32,644 2,640 2,276 112,610 15,379 3,964 9,090 10,384 8,134 6,552 4,834 6,062 6,588 12,077 17,249 8,001 12,919
1974–75 ............. 292,450 3,067 2,938 36,247 2,794 2,299 120,169 15,348 3,807 9,901 10,068 8,091 6,550 4,327 5,807 7,066 14,610 16,892 8,362 14,107
1975–76 ............. 311,771 3,340 3,215 42,512 3,126 2,603 128,417 16,342 3,531 11,885 9,468 8,037 6,582 3,857 5,466 7,811 16,117 15,824 8,817 14,821
1976–77 ............. 317,164 3,724 3,213 46,420 3,091 2,798 126,825 16,245 3,147 12,323 8,701 7,572 7,114 3,695 5,331 8,301 17,917 15,395 8,636 16,716
1977–78 ............. 311,620 4,023 3,115 48,326 3,296 3,038 119,038 16,398 2,726 13,619 8,306 6,914 6,806 3,373 5,561 8,160 18,341 14,578 9,036 16,966
1978–79 ............. 301,079 3,994 3,113 50,372 2,882 3,055 111,995 15,495 2,426 14,781 7,289 5,906 6,831 3,036 5,451 8,003 18,300 12,807 8,524 16,819
1979–80 ............. 298,081 3,976 3,139 55,006 3,082 3,647 103,951 16,243 2,236 15,068 6,807 5,374 6,510 2,860 5,219 7,806 18,413 12,101 8,708 17,935
1980–81 ............. 295,739 4,003 3,153 57,898 3,105 4,218 98,938 16,709 2,104 16,004 6,515 4,859 5,978 2,567 5,284 7,998 18,524 11,855 8,629 17,398
1981–82 ............. 295,546 4,163 3,327 61,299 3,327 4,935 93,757 17,939 2,008 15,942 6,421 4,506 5,874 2,727 5,514 7,791 18,216 11,892 8,746 17,162
1982–83 ............. 289,921 4,254 3,357 65,319 3,604 5,321 84,853 19,350 1,759 17,068 5,767 3,979 5,696 2,837 5,290 8,378 16,245 11,112 8,742 16,990
1983–84 ............. 284,263 4,178 3,223 66,653 3,656 6,190 77,187 20,661 1,773 17,443 5,818 3,805 5,406 2,741 5,576 8,002 15,373 10,465 8,520 17,593
1984–85 ............. 286,251 3,928 3,275 67,527 3,669 7,101 76,137 21,557 1,724 17,383 5,934 3,893 5,059 2,882 5,796 8,408 16,045 10,380 8,714 16,839
1985–86 ............. 288,567 3,801 3,260 67,137 3,823 8,070 76,353 21,661 1,721 18,624 6,291 3,626 5,013 3,159 5,902 8,293 16,300 10,428 8,416 16,689
1986–87 ............. 289,557 3,523 3,142 67,496 3,937 8,491 75,501 22,693 1,746 18,426 6,123 3,815 4,954 3,321 5,652 8,204 17,032 10,397 8,506 16,598
1987–88 ............. 299,317 3,479 3,159 69,655 3,925 9,197 77,867 23,388 1,844 18,665 6,194 3,713 4,784 3,442 5,733 7,872 17,290 10,294 7,937 20,879
1988–89 ............. 310,621 3,245 3,383 73,521 4,257 9,414 82,533 24,572 1,898 19,293 6,676 3,953 4,961 3,447 5,723 8,552 17,918 10,867 8,265 18,143
1989–90 ............. 323,844 3,373 3,492 77,203 4,369 9,643 86,057 24,848 1,995 20,354 7,223 4,349 4,861 3,677 5,447 9,231 17,993 11,419 8,546 19,764
1
‘‘Other’’ includes degrees in area and ethnic studies, home economics, law, liberal/general studies, military sciences,
multi/interdisciplinary studies, parks and recreation, philosophy and religion, protective services, theology, and degrees
not classified by field of study.
2
Some master degrees are included in bachelor’s degrees.
SOURCE: U.S. Department of Education, National Center for Education Statistics,
Earned Degrees Conferred
and
‘‘Degrees and Other Formal Awards Conferred’’ surveys; and Integrated Postsecondary Education Data System
(IPEDS), ‘‘Completions’’ surveys.

87Higher Education
Table 31.—Doctor’s degrees conferred by institutions of higher education, by field of study: 1959–60 to 1989–90
Year Total
Agriculture
and
natural
resources
Architec-
ture and
environ-
mental
design
Business
and
manage-
ment
Com-
muni-
cations
Computer
and
informa-
tion
sciences
Education Engi-
neering
For-
eign
lan-
guages
Health
sciences Letters Library
sciences Life
sciences Mathe-
matics Physical
sciences
Psy-
cholo-
gy
Public
affairs Social
sciences
Visual
and
per-
forming
arts
Other
1
1 2 3 4 5 6 7 8 910111213 1415161718192021
1959–60 ............. 9,829 440 17 135 0 0 1,591 786 203 107 431 19 1,205 303 1,838 641 43 1,211 292 567
1960–61 ............. 10,575 450 3 172 16 0 1,742 943 232 133 439 14 1,193 344 1,991 703 66 1,302 303 529
1961–62 ............. 11,622 465 1 226 9 0 1,898 1,207 228 148 526 10 1,338 396 2,122 781 67 1,309 311 580
1962–63 ............. 12,822 449 3 250 7 0 2,075 1,378 237 157 565 17 1,455 490 2,380 844 77 1,461 379 598
1963–64 ............. 14,490 555 3 275 12 0 2,348 1,693 326 192 618 13 1,625 596 2,455 939 72 1,719 422 627
1964–65 ............. 16,467 529 10 321 9 6 2,705 2,124 376 173 766 12 1,928 682 2,829 847 87 1,913 428 722
1965–66 ............. 18,237 588 12 387 11 19 3,065 2,304 426 251 801 19 2,097 782 3,045 1,046 108 2,033 476 767
1966–67 ............. 20,617 637 18 437 5 38 3,529 2,614 478 250 972 16 2,255 832 3,462 1,231 123 2,388 504 828
1967–68 ............. 23,089 648 15 441 1 36 4,078 2,932 610 243 1,116 22 2,784 947 3,593 1,268 129 2,684 528 1,014
1968–69 ............. 26,158 699 32 530 14 64 4,830 3,377 659 283 1,275 17 3,051 1,097 3,859 1,551 137 3,016 684 983
1969–70 ............. 29,866 823 35 601 10 107 5,895 3,681 760 357 1,339 40 3,289 1,236 4,312 1,668 152 3,638 734 1,189
1970–71 ............. 32,107 1,086 36 807 145 128 6,403 3,638 781 459 1,857 39 3,645 1,199 4,390 1,782 185 3,659 621 1,247
1971–72 ............. 33,363 971 50 896 111 167 7,044 3,671 841 425 2,023 64 3,653 1,128 4,103 1,881 219 4,078 572 1,466
1972–73 ............. 34,777 1,059 58 923 139 196 7,318 3,492 991 643 2,170 102 3,636 1,068 4,006 2,089 214 4,230 616 1,827
1973–74 ............. 33,816 930 69 981 175 198 7,293 3,312 923 568 2,076 60 3,439 1,031 3,626 2,336 214 4,123 585 1,877
1974–75 ............. 34,083 991 69 1,009 165 213 7,446 3,108 857 609 1,951 56 3,384 975 3,626 2,442 271 4,209 649 2,053
1975–76 ............. 34,064 928 82 953 204 244 7,778 2,821 864 577 1,884 71 3,392 856 3,431 2,581 298 4,154 620 2,326
1976–77 ............. 33,232 893 73 863 171 216 7,963 2,586 752 538 1,723 75 3,397 823 3,341 2,761 316 3,784 662 2,295
1977–78 ............. 32,131 971 73 866 191 196 7,595 2,440 649 638 1,616 67 3,309 805 3,133 2,587 385 3,583 708 2,319
1978–79 ............. 32,730 950 96 860 192 236 7,736 2,506 641 705 1,504 70 3,542 730 3,102 2,662 344 3,358 700 2,796
1979–80 ............. 32,615 991 79 792 193 240 7,941 2,507 549 771 1,500 73 3,636 724 3,089 2,768 372 3,219 655 2,516
1980–81 ............. 32,958 1,067 93 842 182 252 7,900 2,561 588 827 1,380 71 3,718 728 3,141 2,955 388 3,114 654 2,497
1981–82 ............. 32,707 1,079 80 855 200 251 7,680 2,636 536 910 1,313 84 3,743 681 3,286 2,780 389 3,061 670 2,473
1982–83 ............. 32,775 1,149 97 809 214 262 7,551 2,831 488 1,155 1,176 52 3,341 698 3,269 3,108 347 2,931 692 2,605
1983–84 ............. 33,209 1,172 84 977 219 251 7,473 2,981 462 1,163 1,215 74 3,437 695 3,306 2,973 421 2,911 728 2,667
1984–85 ............. 32,943 1,213 89 866 234 248 7,151 3,230 437 1,199 1,239 87 3,432 699 3,403 2,908 431 2,851 693 2,533
1985–86 ............. 33,653 1,158 73 969 223 344 7,110 3,410 448 1,241 1,215 62 3,358 742 3,551 3,088 385 2,955 722 2,599
1986–87 ............. 34,120 1,049 92 1,098 275 374 6,909 3,820 441 1,213 1,181 57 3,423 725 3,672 3,123 398 2,916 792 2,562
1987–88 ............. 34,870 1,142 98 1,109 234 428 6,553 4,191 411 1,261 1,172 46 3,629 750 3,809 2,987 470 2,781 725 3,074
1988–89 ............. 35,720 1,183 86 1,149 253 551 6,800 4,523 420 1,436 1,234 61 3,520 866 3,858 3,222 429 2,885 752 2,492
1989–90 ............. 38,238 1,272 97 1,142 269 623 6,922 4,965 512 1,543 1,266 41 3,844 915 4,168 3,353 495 3,023 842 2,946
1
‘‘Other’’ includes degrees in area and ethnic studies, home economics, law, liberal/general studies, military sciences,
multi/interdisciplinary studies, parks and recreation, philosophy and religion, protective services, theology, and degrees
not classified by field of study.
SOURCE: U.S. Department of Education, National Center for Education Statistics,
Earned Degrees Conferred
and
‘‘Degrees and Other Formal Awards Conferred’’ surveys; and Integrated Postsecondary Education Data System
(IPEDS), ‘‘Completions’’ surveys.
88 Higher Education
Table 32.—First-professional degrees conferred by institutions of higher education in dentistry, medicine, and law,
by sex: 1949–50 to 1989–90
Year
Dentistry (D.D.S. or D.M.D.) Medicine (M.D.) Law (LL.B. or J.D.)
Number of
institutions
conferring
degrees
Degrees conferred Number of
institutions
conferring
degrees
Degrees conferred Number of
institutions
conferring
degrees
Degrees conferred
Total Male Female Total Male Female Total Male Female
1 2 3 4 5 6 7 8 9 10 111213
1949–50 .... 40 2,579 2,561 18 72 5,612 5,028 584 (
1
)(
1
)(
1
)(
1
)
1951–52 .... 41 2,918 2,895 23 72 6,201 5,871 330 (
1
)(
1
)(
1
)(
1
)
1953–54 .... 42 3,102 3,063 39 73 6,712 6,377 335 (
1
)(
1
)(
1
)(
1
)
1955–56 .... 42 3,009 2,975 34 73 6,810 6,464 346 131 8,262 7,974 288
1957–58 .... 43 3,065 3,031 34 75 6,816 6,469 347 131 9,394 9,122 272
1959–60 .... 45 3,247 3,221 26 79 7,032 6,645 387 134 9,240 9,010 230
1961–62 .... 46 3,183 3,166 17 81 7,138 6,749 389 134 9,364 9,091 273
1963–64 .... 46 3,180 3,168 12 82 7,303 6,878 425 133 10,679 10,372 307
1965–66 .... 47 3,178 3,146 32 84 7,673 7,170 503 136 13,246 12,776 470
1967–68 .... 48 3,422 3,375 47 85 7,944 7,318 626 138 16,454 15,805 649
1969–70 .... 48 3,718 3,684 34 86 8,314 7,615 699 145 14,916 14,115 801
1970–71 .... 48 3,745 3,703 42 89 8,919 8,110 809 147 17,421 16,181 1,240
1971–72 .... 48 3,862 3,819 43 92 9,253 8,423 830 147 21,764 20,266 1,498
1972–73 .... 51 4,047 3,992 55 97 10,307 9,388 919 152 27,205 25,037 2,168
1973–74 .... 52 4,440 4,355 85 99 11,356 10,093 1,263 151 29,326 25,986 3,340
1974–75 .... 52 4,773 4,627 146 104 12,447 10,818 1,629 154 29,296 24,881 4,415
1975–76 .... 56 5,425 5,187 238 107 13,426 11,252 2,174 166 32,293 26,085 6,208
1976–77 .... 57 5,138 4,764 374 109 13,461 10,891 2,570 169 34,104 26,447 7,657
1977–78 .... 57 5,189 4,623 566 109 14,279 11,210 3,069 169 34,402 25,457 8,945
1978–79 .... 58 5,434 4,794 640 109 14,786 11,381 3,405 175 35,206 25,180 10,026
1979–80 .... 58 5,258 4,558 700 112 14,902 11,416 3,486 179 35,647 24,893 10,754
1980–81 .... 58 5,460 4,672 788 116 15,505 11,672 3,833 176 36,331 24,563 11,768
1981–82 .... 59 5,282 4,467 815 119 15,814 11,867 3,947 180 35,991 23,965 12,026
1982–83 .... 59 5,585 4,631 954 118 15,484 11,350 4,134 177 36,853 23,550 13,303
1983–84 .... 60 5,353 4,302 1,051 119 15,813 11,359 4,454 179 37,012 23,382 13,630
1984–85 .... 59 5,339 4,233 1,106 120 16,041 11,167 4,874 181 37,491 23,070 14,421
1985–86 .... 59 5,046 3,907 1,139 120 15,938 11,022 4,916 181 35,844 21,874 13,970
1986–87 .... 58 4,741 3,603 1,138 122 15,620 10,566 5,054 180 36,172 21,643 14,529
1987–88 .... 57 4,477 3,300 1,177 122 15,358 10,278 5,080 180 35,397 21,067 14,330
1988–89
2
.. 58 4,265 3,124 1,141 124 15,460 10,310 5,150 182 35,634 21,069 14,565
1989–90
3
.. 57 4,093 2,830 1,263 124 15,115 9,977 5,138 182 36,437 21,059 15,378
1
Data prior to 1955–56 are not shown because they lack comparability with the figures
for subsequent years.
2
Revised from previously published data.
3
Preliminary data.
SOURCE: U.S. Department of Education, National Center for Education Statistics,
‘‘Degrees and Other Formal Awards Conferred’’ surveys, and Integrated Postsecondary
Education Data System (IPEDS), ‘‘Completions’’ surveys. (This table was prepared No-
vember 1991.)
89Higher Education
Table 33.—Current-fund revenue of institutions of higher education, by source of funds: 1889–90 to 1989–90
[In thousands]
Year Total
current-fund
revenue
Educational and general revenue Other revenue
Total Student tuition
and fees
Government Endowment
income Private gifts
and grants
Organized
activities
related to
educational
depart-
ments
Sales and
services of
educational
activities
Student aid Other Hospitals Independ-
ent
operations
2
Auxiliary
enterprises
Federal
1
State Local
1 2 3 4 5 6 7 8 9 10 11 12 13 14 15 16
1889–90 ........ — $21,464 — — ———————— —— —
1899–1900 .... — 35,084 — — ———————— —— —
1909–10 ........ $76,883 67,917 $18,463 $4,607 $20,937 — $12,584 $3,551 — — — $7,775 — — $8,966
1919–20 ........ 199,922 172,929 42,254
3
12,783 61,690 (
4
) 26,482 7,584 — — — 22,135 — — 26,993
1929–30 ........ 554,511 494,092 144,126 20,658 150,847 (
4
) 68,605 26,172 — — $11,027 72,657 — — 60,419
1931–32 ........ 566,264 441,987 150,649 (
4
) 174,663 (
4
) 60,903 29,948 — — 10,998 14,826
5
$21,008 — 103,269
1933–34 ........ 486,362 380,620 138,257 19,827 117,551 (
4
) 55,534 27,468 — — 9,653 12,330
5
17,759 — 87,983
1935–36 ........ 597,585 466,163 158,134 43,234 119,585 $21,050 60,090 37,115 — — — 26,955
5
24,943 — 106,479
1937–38 ........ 652,631 494,161 178,996 29,345 140,959 22,091 70,654 36,908 — — — 15,208
5
27,947 — 130,523
1939–40 ........ 715,211 538,511 200,897 38,860 151,222 24,392 71,304 40,453 — — — 11,383
5
32,777 — 143,923
1941–42 ........ 783,720 585,988 201,365 58,232 166,532 27,057 74,075 45,916 — — — 12,811
5
40,308 — 157,424
1943–44 ........ 1,047,298 810,077 154,485 308,162 175,169 26,449 75,196 50,449 — — — 20,167
5
53,577 — 183,644
1945–46 ........ 1,169,394 857,874 214,345 197,250 225,161 31,005 89,763 77,572 — — — 22,779
5
67,084 — 244,436
1947–48 ........ 2,027,051 1,469,172 304,601 526,476 352,281 47,521 86,680 91,468 — — 23,821 36,324
5
92,725 — 465,154
1949–50 ........ 2,374,645 1,751,393 394,610 524,319 491,958 61,378 96,341 118,627 — — 29,535 34,625
5
111,987 — 511,265
1951–52 ........ 2,562,451 1,916,463 446,591 451,011 611,302 72,013 112,859 149,826 — — 32,027 40,834
5
136,442 — 509,546
1953–54 ........ 2,945,550 2,205,901 551,424 417,097 740,043 88,198 127,475 190,899 — — 32,212 58,553
5
164,880 — 574,769
1955–56 ........ 3,603,370 2,719,804 722,215 489,800 878,349 106,857 145,000 245,085 — — 52,364 80,133
5
191,829 — 691,737
1957–58 ........ 4,641,387 3,650,492 934,203 707,048 1,138,454 129,324 181,585 324,426 $46,877 $47,302 70,058 71,214 152,078 — 838,817
1959–60 ........ 5,785,537 4,593,485 1,157,481 1,036,988 1,374,476 151,715 206,619 382,570 57,102 45,423 92,902 88,208 187,769 — 1,004,283
1961–62 ........ 7,429,379 5,919,927 1,499,924 1,537,697 1,668,289 191,188 232,289 450,145 65,533 52,252 118,073 104,537 238,567 — 1,270,885
1963–64 ........ 9,543,514 7,642,763 1,892,839 2,160,889 2,110,981 239,851 266,157 550,684 69,443 64,742 148,093 139,082 293,777 — 1,606,974
1965–66 ........ 12,734,225 10,345,108 2,640,641 2,587,893 2,894,893 303,401 288,833 613,718 373,573 34,680 309,855 297,621
6
250,000 — 2,139,117
1966–67 ........ 14,561,039 11,111,063 2,972,050 2,200,276 3,371,986 405,561 328,068 765,927 317,627 116,862 394,386 238,320 253,790 $951,668 2,244,518
1967–68 ........ 16,825,199 13,288,034 3,380,294 2,695,681 4,181,070 503,661 363,990 848,450 399,821 118,618 497,930 298,519 290,000 765,495 2,481,670
1968–69 ........ 18,874,602 14,901,466 3,814,160 2,924,547 4,812,482 614,462 413,276 915,909 421,301 127,461 571,536 286,332 497,280 708,542 2,767,314
1969–70 ........ 21,515,242 17,144,194 4,419,845 3,146,869 5,787,910 774,803 447,275 1,001,454 484,977 127,800 658,016 295,245 619,578 768,498 2,982,973
1970–71 ........ 23,879,188 19,101,148 5,021,211 3,359,027 6,502,813 907,274 470,655 1,091,654 524,697 137,775 709,101 376,941 821,478 831,324 3,125,238
1971–72 ........ 26,234,258 20,964,859 5,594,095 3,659,506 7,120,982 991,034 480,806 1,208,070 590,448 148,711 764,590 406,616 1,006,865 953,577 3,308,957
1972–73 ........ 28,606,217 22,927,142 6,010,926 3,994,490 7,917,825 1,143,529 515,041 1,300,343 610,342 163,482 800,075 471,090 1,181,390 1,030,751 3,466,934
1973–74 ........ 31,712,452 25,510,428 6,500,101 4,176,226 9,182,189 1,263,145 576,915 1,430,982
7
611,678 222,382 882,585 664,227 1,436,481 1,031,314 3,734,229
1974–75 ........ 35,686,902 28,373,036 7,232,908 4,990,969 10,857,376 1,424,392 717,915 1,744,967 — 554,882 (
8
) 849,625 2,152,079 1,081,585 4,080,202
1975–76 ........ 39,703,166 31,597,873 8,171,942 5,413,847 12,260,885 1,616,975 687,470 1,917,036 — 645,420 (
8
) 884,298 2,494,340 1,063,331 4,547,622
1976–77 ........ 43,436,827 34,218,636 9,024,932 5,729,818 13,285,684 1,626,908 764,788 2,105,070 — 779,058 (
8
) 902,377 2,859,376 1,439,213 4,919,602
1977–78 ........ 47,034,032 37,581,559 9,855,270 6,112,805 14,746,166 1,744,230 832,286 2,320,368 — 882,715 (
8
) 1,087,719 3,268,956
9
855,696 5,327,821
1978–79 ........ 51,837,789 41,325,437 10,704,171 6,843,736 16,363,784 1,573,018 985,242 2,489,366 — 1,037,130 (
8
) 1,328,991 3,763,453 1,007,590 5,741,309
1979–80 ........ 58,519,982 46,534,023 11,930,340 7,771,726 18,378,299 1,587,552 1,176,627 2,808,075 — 1,239,439 (
8
) 1,641,965 4,373,384 1,131,117 6,481,458
1980–81 ........ 65,584,789 52,048,276 13,773,259 8,478,709 20,106,222 1,790,740 1,364,443 3,176,670 — 1,409,730 (
8
) 1,948,503 4,980,346 1,268,877 7,287,290
1981–82 ........ 72,190,856 56,958,692 15,774,038 8,319,817 21,848,791 1,937,669 1,596,813 3,563,558 — 1,582,922 (
8
) 2,335,084 5,838,565 1,271,988 8,121,611
1982–83 ........ 77,595,726 60,844,948 17,776,041 8,181,402 23,065,636 2,031,353 1,720,677 4,052,649 — 1,723,484 (
8
) 2,293,706 6,531,562 1,449,695 8,769,521
1983–84 ........ 84,417,287 66,296,893 19,714,884 8,782,803 24,706,990 2,192,275 1,873,945 4,415,275 — 1,970,747 (
8
) 2,639,973 7,040,662 1,623,363 9,456,369
1984–85 ........ 92,472,694 73,003,805 21,283,329 9,615,221 27,583,011 2,387,212 2,096,298 4,896,325 — 2,126,927 (
8
) 3,015,483 7,474,575 1,893,904 10,100,410
1985–86 ........ 100,437,616 79,298,586 23,116,605 10,466,491 29,911,500 2,544,506 2,275,898 5,410,905 — 2,373,494 (
8
) 3,199,186 8,226,635 2,238,259 10,674,136
1986–87 ........ 108,809,827 85,488,436 25,705,827 11,224,680 31,309,303 2,799,321 2,377,958 5,952,682 — 2,641,906 (
8
) 3,476,760 9,277,834 2,679,369 11,364,188
1987–88 ........ 117,340,109 91,863,743 27,836,781 11,869,932 33,517,166 3,006,263 2,586,441 6,359,282 — 2,918,090 (
8
) 3,769,787 10,626,566 2,902,022 11,947,778
1988–89 ........ 128,501,638 100,598,033 30,806,566 12,837,218 36,031,208 3,363,676 2,914,396 7,060,730 — 3,315,620 (
8
) 4,268,618 11,991,265 3,056,760 12,855,580
1989–90
10
.... 139,635,477 109,241,902 33,926,060 14,016,432 38,349,239 3,639,902 3,143,696 7,781,422 — 3,632,100 (
8
) 4,753,051 13,216,664 3,238,442 13,938,469
1
Excludes federally funded research and development centers (FFRDCs) from 1966–67 to 1989–90.
2
Primarily limited to federally funded research and development centers (FFRDCs). Where separate data are not
shown, they are included under federal.
3
Universities, colleges, and professional schools only; teachers and normal colleges included under state.
4
Included under state governments.
5
Includes organized activities related to educational departments.
6
Estimated.
7
In later years, data are included primarily under sales and services and hospitals.
8
Data are included under source of student aid money.
9
Drop from previous year caused by a change in jurisdiction of one of the centers.
10
Preliminary data.
—Data not available.
NOTE.—Beginning in 1959–60, data include Alaska and Hawaii. Because of changes in data collection instruments
and definitions, a number of data comparability problems exist in this table. See methodology for more details. Data
for years prior to 1929–30 give only a rough indication of the scope of the higher education enterprise at that time.
Because of rounding, details may not add to totals.
SOURCE: U.S. Department of Education, National Center for Education Statistics,
Annual Report of the Commis-
sioner; Biennial Survey of Education in the United States; Financial Statistics of Institutions of Higher Education; Digest
of Education Statistics;
and unpublished data. (This table was prepared September 1992.)

90 Higher Education
Table 34.—Current-fund expenditures and educational and general expenditure per student of institutions
of higher education, by function: 1929–30 to 1989–90
[In thousands]
Year Current-fund
expenditures
Educational and general expenditures
Total
Administra-
tion and
general
expense
Instruction
and
depart-
mental
research
Organized
research Libraries
Plant
operation
and
maintenance
Organized
activities
related to
instructional
departments
Other
sponsored
programs
1
1 2345678910
1929–30 .................... $507,142 $377,903 $42,633 $221,598
5
$18,007 $9,622 $61,061 (
6
)—
1931–32 .................... 536,523 420,633 47,232 232,645
5
21,978 11,379 56,797
7
$21,297 —
1933–34 .................... 469,329 369,661 43,155 203,332
5
17,064 13,387 51,046
7
14,155 —
1935–36 .................... 541,391 419,883 48,069 225,143
5
22,091 15,531 56,802
7
20,241 —
1937–38 .................... 614,385 475,191 56,406 253,006
5
25,213 17,588 62,738
7
24,031 —
1939–40 .................... 674,688 521,990 62,827 280,248
5
27,266 19,487 69,612
7
27,225 —
1941–42 .................... 738,169 572,465 66,968 298,558
5
34,287 19,763 72,594
7
37,771 —
1943–44 .................... 974,118 753,846 69,668 334,189
5
58,456 20,452 81,201
7
48,415
8
$97,044
1945–46 .................... 1,088,422 820,326 104,808 375,122
5
86,812 26,560 110,947
7
60,604 —
1947–48 .................... 1,883,269 1,391,594 171,829 657,945
5
159,090 44,208 201,996
7
85,346 —
1949–50 .................... 2,245,661 1,706,444 213,070 780,994
5
225,341 56,147 225,110
7
119,108 —
1951–52 .................... 2,471,008 1,960,481 233,844 823,117
5
317,928 60,612 240,446
7
147,854 —
1953–54 .................... 2,882,864 2,345,331 288,147 960,556
5
372,643 72,944 277,874
7
186,905 —
1955–56 .................... 3,499,463 2,861,858 355,207 1,140,655
5
500,793 85,563 324,229
7
222,007 —
1957–58 .................... 4,509,666 3,734,350 473,945 1,465,603
5
727,776 109,715 406,226
7
238,455 —
1959–60 .................... 5,601,376 4,685,258 583,224 1,793,320
5
1,022,353 135,384 469,943
7
294,255 —
1961–62 .................... 7,154,526 5,997,007 730,429 2,202,443
5
1,474,406 177,362 564,225
7
375,040 —
1963–64 .................... 9,177,677 7,725,433 957,512 2,801,707
5
1,973,383 236,718 686,054
7
458,507 —
1965–66 .................... 12,509,489 10,376,630 1,251,107 3,756,175
5
2,448,300 346,248 844,506
7
558,170 155,202
1966–67 .................... 14,230,341 10,724,974 1,445,074 4,356,413 1,565,102 415,903 969,275 591,848 350,950
1967–68 .................... 16,480,786 12,847,350 1,738,946 5,139,179 1,933,473 493,266 1,127,290 350,711 514,294
1968–69 .................... 18,481,583 14,718,140 2,277,585 5,941,972 2,034,074 571,572 1,337,903 535,269 668,483
1969–70 .................... 21,043,110 16,845,210 2,627,993 6,883,844 2,144,076 652,596 1,541,698 648,089 769,253
1970–71 .................... 23,375,197 18,714,642 2,983,911 7,804,410 2,209,338 716,212 1,730,664 693,011 890,507
1971–72 .................... 25,559,560 20,441,878 3,344,215 8,443,261 2,265,282 764,481 1,927,553 779,728 1,059,989
1972–73 .................... 27,955,624 22,400,379 3,713,068 9,243,641 2,394,261 840,727 2,141,162 791,290 1,284,085
1973–74 .................... 30,713,581 24,653,849 4,200,955 10,219,118 2,480,450 939,023 2,494,057 838,170 1,355,027
1974–75 .................... 35,057,563 27,547,620 4,495,391 11,797,823 3,132,132 1,001,868 2,786,768 1,253,824 —
1975–76 .................... 38,903,177 30,598,685 5,240,066 13,094,943 3,287,364 1,223,723 3,082,959 1,248,670 —
1976–77 .................... 42,599,816 33,151,681 5,590,669 14,031,145 3,600,067 1,250,314 3,436,705 1,544,646 —
1977–78 .................... 45,970,790 36,256,604 6,177,029 15,336,229 3,919,830 1,348,747 3,795,043 1,781,160 —
1978–79 .................... 50,720,984 39,833,116 6,832,004 16,662,820 4,447,760 1,426,614 4,178,574 2,044,386 —
1979–80 .................... 56,913,588 44,542,843 7,621,143 18,496,717 5,099,151 1,623,811 4,700,070 2,252,577 —
1980–81 .................... 64,052,938 50,073,805 8,681,513 20,733,166 5,657,719 1,759,784 5,350,310 2,513,502 —
1981–82 .................... 70,339,448 54,848,752 9,648,069 22,962,527 5,929,894 1,922,416 5,979,281 2,734,038 —
1982–83 .................... 75,935,749 58,929,218 10,412,233 24,673,293 6,265,280 2,039,671 6,391,596 3,047,220 —
1983–84 .................... 81,993,360 63,741,276 11,561,260 26,436,308 6,723,534 2,231,149 6,729,825 3,300,003 —
1984–85 .................... 89,951,263 70,061,324 12,765,452 28,777,183 7,551,892 2,361,793 7,345,482 3,712,460 —
1985–86 .................... 97,535,742 76,127,965 13,913,724 31,032,099 8,437,367 2,551,331 7,605,226 4,116,061 —
1986–87 .................... 105,763,557 82,955,555 15,060,576 33,711,146 9,352,309 2,441,184 7,819,032 5,134,267 —
1987–88 .................... 113,786,476 89,157,430 16,171,015 35,833,563 10,350,931 2,836,498 8,230,986 5,305,083 —
1988–89 .................... 123,867,184 96,803,377 17,309,956 38,812,690 11,432,170 3,009,870 8,739,895 5,894,409 —
1989–90
10
................. 134,655,571 105,585,076 19,062,179 42,145,987 12,505,961 3,254,239 9,458,262 6,183,405 —

91Higher Education
Table 34.—Current-fund expenditures and educational and general expenditure per student of institutions
of higher education, by function: 1929–30 to 1989–90—Continued
[In thousands]
Year
Educational and general expenditures
Auxiliary
enterprises Independent
operations
2
Hospitals Other
current
expenditures
Educational and general
expenditures per student
in fall
enrollment
3
Extension
and public
service
Scholarships
and
fellowships
Other
general
expenditures Current
dollars
Constant
1989–90
dollars
4
1 111213141516171819
1929–30 .................... $24,982 (
6
) — $3,127 (
5
)(
7
) $126,112 343 2,547
1931–32 .................... 24,066 (
6
) $5,239 90,897 (
5
)(
7
) 24,993 364 3,210
1933–34 .................... 20,020 (
6
) 7,502 78,730 (
5
)(
7
) 20,938 350 3,359
1935–36 .................... 29,426 (
6
) 2,580 95,332 (
5
)(
7
) 26,176 348 3,211
1937–38 .................... 34,189 (
6
) 2,020 115,620 (
5
)(
7
) 23,574 352 3,118
1939–40 .................... 35,325 (
6
) — 124,184 (
5
)(
7
) 28,514 349 3,174
1941–42 .................... 42,525 (
6
) — 137,328 (
5
)(
7
) 28,375 408 3,320
1943–44 .................... 44,421 (
6
) — 199,344 (
5
)(
7
) 20,928 653 4,755
1945–46 .................... 55,473 (
6
) — 242,028 (
5
)(
7
) 26,068 489 3,405
1947–48 .................... 71,180 (
6
) — 438,988 (
5
)(
7
) 52,687 595 3,243
1949–50 .................... 86,674 (
6
) — 476,401 (
5
)(
7
) 62,816 698 3,742
1951–52 .................... 97,408 $39,272 — 477,672 (
5
)(
7
) 32,855 933 4,506
1953–54 .................... 112,227 74,035 — 537,533 (
5
)(
7
) — 1,051 4,964
1955–56 .................... 137,914 95,490 — 637,605 (
5
)(
7
) — 1,079 5,095
1957–58 .................... 175,256 129,935 7,439 775,316 (
5
)(
7
) — 1,124 4,995
1959–60 .................... 205,595 172,050 9,134 916,117 (
5
)(
7
) — 1,287 5,563
1961–62 .................... 244,337 228,765 — 1,157,517 (
5
)(
7
) — 1,447 6,112
1963–64 .................... 297,350 300,370 13,832 1,452,244 (
5
)(
7
) — 1,616 6,654
1965–66 .................... 438,385 425,524 153,013 1,887,744 (
5
)(
7
)
9
245,115 1,753 6,974
1966–67 .................... 226,566 583,390 220,453 2,060,130 $951,668 $253,790
9
239,780 1,678 6,474
1967–68 .................... 597,544 712,425 240,222 2,302,419 765,495 290,000
9
275,523 1,859 6,940
1968–69 .................... 536,527 814,755 — 2,539,183 697,317 526,943 — 1,959 6,974
1969–70 .................... 593,067 984,594 — 2,769,276 757,388 671,236 — 2,104 7,074
1970–71 .................... 588,390 1,098,198 — 2,988,407 829,596 842,552 — 2,181 6,971
1971–72 .................... 615,997 1,241,372 — 3,178,272 940,825 998,585 — 2,284 7,049
1972–73 .................... 669,735 1,322,411 — 3,337,789 1,033,746 1,183,709 — 2,431 7,210
1973–74 .................... 730,560 1,396,488 — 3,613,256 1,014,872 1,431,604 — 2,568 6,992
1974–75 .................... 1,097,788 1,449,542 532,485 4,073,590 1,085,590 2,350,763 — 2,694 6,606
1975–76 .................... 1,238,603 1,635,859 546,498 4,476,841 1,132,016 2,695,635 — 2,736 6,264
1976–77 .................... 1,343,404 1,770,214 584,515 4,858,328 1,434,738 3,155,069 — 3,010 6,513
1977–78 .................... 1,425,294 1,839,298 633,973 5,261,477 855,054 3,597,655 — 3,213 6,513
1978–79 .................... 1,593,097 1,944,599 703,262 5,749,974 1,007,119 4,130,775 — 3,538 6,557
1979–80 .................... 1,816,521 2,200,468 732,385 6,485,608 1,127,728 4,757,409 — 3,850 6,297
1980–81 .................... 2,057,770 2,504,525 815,516 7,288,089 1,257,934 5,433,111 — 4,139 6,068
1981–82 .................... 2,203,726 2,684,945 783,854 7,997,632 1,258,777 6,234,287 — 4,433 5,982
1982–83 .................... 2,320,478 2,922,897 856,548 8,614,316 1,406,126 6,986,089 — 4,742 6,135
1983–84 .................... 2,499,203 3,301,673 958,321 9,250,196 1,622,233 7,379,654 — 5,114 6,379
1984–85 .................... 2,861,095 3,670,355 1,015,613 10,012,248 1,867,550 8,010,141 — 5,723 6,871
1985–86 .................... 3,119,533 4,160,174 1,192,449 10,528,303 2,187,361 8,692,113 — 6,216 7,253
1986–87 .................... 3,448,453 4,776,100 1,212,488 11,037,333 2,597,655 9,173,014 — 6,635 7,574
1987–88 .................... 3,786,362 5,325,358 1,317,633 11,399,953 2,822,632 10,406,461 — 6,984 7,655
1988–89 .................... 4,227,323 5,918,666 1,458,397 12,280,063 2,958,962 11,824,782 — 7,415 7,769
1989–90
10
................. 4,689,758 6,655,544 1,629,742 13,203,984 3,187,224 12,679,286 — 7,799 7,799
1
Includes all separately budgeted programs, other than research, which are supported
by sponsors outside the institution. Examples are training programs, workshops, and
training and instructional institutes. For years not shown, most expenditures for these
programs are included under ‘‘Extension and public service.’’
2
Generally includes only those expenditures associated with federally funded research
and development centers (FFRDCs).
3
Data for 1929–30 to 1945–56 are based on school year enrollment.
4
Data adjusted by the Consumer Price Index computed on a school year basis.
5
Expenditures for federally funded research and development centers are included
under ‘‘Research.’’
6
Included under ‘‘Other current expenditures.’’
7
Expenditures for hospitals and independent operations included under ‘‘Organized
activities related to instructional departments.’’
8
Expenditures were for federal contract courses.
9
Includes current expenditures for physical plant assets. In later years, the educational
and general expenditures for physical plant assets are included under ‘‘Other educational
and general expenditures.’’
10
Preliminary data.
—Data not available.
NOTE.—The data in this table reflect limitations of data availability and comparability.
Major changes in data collection forms in 1965–66 and 1974–75 cause significant data
comparability problems among the three mostly consistent time periods, 1929–30 to
1963–64, 1965–66 to 1973–74, and 1974–75 to 1989–90. The largest problems affect
Hospitals, Independent operations, Organized research, Other sponsored programs, Ex-
tension and public service, and Scholarships and fellowships.
SOURCE: U.S. Department of Education, National Center for Education Statistics,
Bi-
ennial Survey of Education in the United States, Financial Statistics of Institutions of
Higher Education;
and Integrated Postsecondary Education Data System, ‘‘Finance’’ sur-
vey. (This table was prepared September 1992.)

92 Higher Education
Table 35.—Value of property and endowment, and liabilities of institutions of higher education:
1899–1900 to 1989–90
[In thousands]
Year
Property value at end of year Endowment
(end of year
market
value)
1
Liabilities of
plant funds
Total Physical plant value Endowment
(book value)
1
Total Land Buildings Equipment
1 23456789
1899–1900 ............... $448,597 $253,599 — — —
2
$194,998 — —
1909–10 ................... 781,255 457,594 $92,359 $297,153 $68,082
2
323,661 — —
1919–20 ................... 1,316,404 747,333 128,922 495,920 122,491
2
569,071 — —
1929–30 ................... 3,437,117 2,065,049 304,114 1,490,014 270,921
2
1,372,068 — —
1935–36 ................... 3,913,028 2,359,418 334,085 1,636,722 388,611
2
1,553,610 — —
1937–38 ................... 4,208,695 2,556,075 313,665 1,811,309 431,101 1,652,620 — —
1939–40 ................... 4,440,063 2,753,780 — — — 1,686,283 — —
1941–42 ................... 4,525,925 2,759,261 — — —
2
1,766,664 — —
1947–48 ................... 6,076,212 3,691,725 — — — 2,384,487 — —
1949–50 ................... 7,401,187 4,799,964 — — —
2
2,601,223 — —
1951–52 ................... 9,241,725 6,373,195 — — — 2,868,530 — —
1953–54 ................... 10,717,082 7,523,193 — — — 3,193,889 — —
1955–56 ................... 12,561,046 8,858,907 624,467
3
6,697,648 1,536,792 3,702,139 — $894,383
1957–58 ................... 15,770,197 11,124,489 733,182
3
8,540,429 1,850,878 4,645,708 — 1,444,602
1959–60 ................... 18,870,628 13,548,548 842,664
3
10,472,478 2,233,407 5,322,080 — 1,964,306
1961–62 ................... 22,761,193 16,681,844 1,009,294
3
12,900,093 2,772,457 6,079,349 — 2,806,868
1963–64 ................... 28,232,362 21,279,346 1,292,691
3
16,460,867 3,525,788 6,953,016 — 4,190,189
1965–66 ................... 35,274,597 26,851,273 1,758,901
3
20,653,028 4,439,344 8,423,324 $11,126,831 6,071,750
1967–68 ................... — 34,506,348 2,062,545
3
26,673,826 5,769,977 — — —
1969–70 ................... 52,930,923 42,093,580 3,076,751 31,865,179 7,151,649 10,837,343 11,206,632 9,384,731
1970–71 ................... 57,394,951 46,053,585 3,117,895 35,042,590 7,893,100 11,341,366 13,714,330 9,786,240
1971–72 ................... 62,136,459 50,153,251 3,287,326 38,131,339 8,734,586 11,983,208 15,180,934 10,291,095
1972–73 ................... 66,814,103 53,814,596 3,492,611 40,808,481 9,513,503 12,999,507 15,099,840 10,823,595
1973–74 ................... 71,305,817 58,002,777 3,888,372 43,701,491 10,412,914 13,303,040 13,168,076 11,400,916
1974–75 ................... 75,585,674 62,183,078 4,210,901 46,453,642 11,518,536 13,402,596 14,364,545 12,413,420
1975–76 ................... 80,300,595 66,348,304 4,345,232 49,349,224 12,653,847 13,952,291 15,488,265 12,687,015
1976–77 ................... 85,486,550 70,739,427 4,444,927 52,384,393 13,910,107 14,747,123 16,304,553 13,068,341
1977–78 ................... 90,337,044 74,770,804 4,621,071 55,188,603 14,961,131 15,566,240 16,840,129 13,437,861
1978–79 ................... 95,442,468 78,637,991 4,824,250 57,563,005 16,250,737 16,804,477 18,158,634 13,712,648
1979–80 ................... 102,294,859 83,733,387 5,037,172 60,847,097 17,849,119 18,561,472 20,743,045 14,181,991
1980–81 ................... 109,701,242 88,760,567 5,212,453 64,158,017 19,390,097 20,940,675 23,465,001 14,794,669
1981–82 ................... 117,601,954 94,516,512 5,402,339 67,794,877 21,319,297 23,085,442 24,415,245 15,487,618
1982–83 ................... 127,345,302 100,992,841 5,889,080 71,519,718 23,584,042 26,352,461 32,691,133 16,749,900
1983–84 ................... 137,141,741 107,640,113 6,109,746 75,220,765 26,309,602 29,501,629 32,975,610 18,277,315
1984–85 ................... 148,163,096 114,763,986 6,236,159 79,133,998 29,393,829 33,399,110 39,916,361 22,105,712
1985–86 ................... 160,959,517 122,261,355 6,573,923 82,886,012 32,801,419 38,698,162 50,280,775 25,699,408
1986–87 ................... — 126,996,079 7,220,353 85,176,226 34,599,500 — 56,470,724 —
1987–88 ................... — 133,228,717 7,827,226 88,356,303 37,045,188 — 57,338,768 —
1988–89 ................... — 142,425,392 8,403,922 93,983,463 40,038,007 — 64,096,719 —
1989–90 ................... — 155,401,508 8,969,805 101,909,833 44,521,870 — 67,927,188 —
1
Includes funds functioning as endowment.
2
Includes annuity funds.
3
Includes improvements to land and equipment. These funds are included under ap-
propriate categories after 1967–68.
—Data not available.
NOTE.—Because of rounding, details may not add to totals.
SOURCE: U.S. Department of Education, National Center for Education Statistics,
Bi-
ennial Survey of Education in the United States;
and Financial Statistics of Institutions
of Higher Education survey. (This table was prepared September 1992.)

93Appendix
Table 36.—Gross domestic product, state and local expenditures, personal income, disposable personal income,
and median family income: 1940 to 1991
Year
Gross domestic product,
in billions State and local
expenditures,
1
in millions Personal
income,
in billions
Disposable
personal
income,
in billions of
1987 dollars
Disposable personal income
per capita Median
family in-
comeCurrent
dollars Constant
1987 dollars All general
expenditures Education
expenditures Current
dollars Constant
1987 dollars
1 2345678910
1940 ......................... — — $9,229 $2,638 —————
1941 ......................... —————————
1942 ......................... — — 9,190 2,586 —————
1943 ......................... —————————
1944 ......................... — — 8,863 2,793 —————
1945 ......................... —————————
1946 ......................... — — 11,028 3,356 —————
1947 ......................... ————————$3,031
1948 ......................... — — 17,684 5,379 ————3,187
1949 ......................... ————————3,107
1950 ......................... — — 22,787 7,177 ————3,319
1951 ......................... ————————3,709
1952 ......................... — — 26,098 8,318 ————3,890
1953 ......................... — — 27,910 9,390 ————4,242
1954 ......................... — — 30,701 10,557 ————4,167
1955 ......................... — — 33,724 11,907 ————4,418
1956 ......................... — — 36,711 13,220 ————4,780
1957 ......................... — — 40,375 14,134 ————4,966
1958 ......................... — — 44,851 15,919 ————5,087
1959 ......................... $494.2 $1,931.3 48,887 17,283 $391.2 $1,284.9 $1,958 $7,256 5,417
1960 ......................... 513.4 1,973.2 51,876 18,719 409.2 1,313.0 1,994 7,264 5,620
1961 ......................... 531.8 2,025.6 56,201 20,574 426.5 1,356.4 2,048 7,382 5,735
1962 ......................... 571.6 2,129.8 60,206 22,216 453.4 1,414.8 2,137 7,583 5,956
1963 ......................... 603.1 2,218.0 63,977 23,729 476.4 1,461.1 2,210 7,718 6,249
1964 ......................... 648.0 2,343.3 69,302 26,286 510.7 1,562.2 2,369 8,140 6,569
1965 ......................... 702.7 2,473.5 74,678 28,563 552.9 1,653.5 2,527 8,508 6,957
1966 ......................... 769.8 2,622.3 82,843 33,287 601.7 1,734.3 2,699 8,822 7,532
1967 ......................... 814.3 2,690.3 93,350 37,919 646.5 1,811.4 2,861 9,114 7,933
1968 ......................... 889.3 2,801.0 102,411 41,158 709.9 1,886.8 3,077 9,399 8,632
1969 ......................... 959.5 2,877.1 116,728 47,238 773.7 1,947.4 3,274 9,606 9,433
1970 ......................... 1,010.7 2,875.8 131,332 52,718 831.0 2,025.3 3,521 9,875 9,867
1971 ......................... 1,097.2 2,965.1 150,674 59,413 893.5 2,099.9 3,779 10,111 10,285
1972 ......................... 1,207.0 3,107.1 168,550 65,814 980.5 2,186.2 4,042 10,414 11,116
1973 ......................... 1,349.6 3,268.6 181,357 69,714 1,098.7 2,334.1 4,521 11,013 12,051
1974 ......................... 1,458.6 3,248.1 198,959 75,833 1,205.7 2,317.0 4,893 10,832 12,902
1975 ......................... 1,585.9 3,221.7 230,721 87,858 1,307.3 2,355.4 5,329 10,906 13,719
1976 ......................... 1,768.4 3,380.8 256,731 97,216 1,446.3 2,440.9 5,796 11,192 14,958
1977 ......................... 1,974.1 3,533.2 274,215 102,780 1,601.3 2,512.6 6,316 11,406 16,009
1978 ......................... 2,232.7 3,703.5 296,983 110,758 1,807.9 2,638.4 7,042 11,851 17,640
1979 ......................... 2,488.6 3,796.8 327,517 119,448 2,033.1 2,710.1 7,787 12,039 19,587
1980 ......................... 2,708.0 3,776.3 369,086 133,211 2,265.4 2,733.6 8,576 12,005 21,023
1981 ......................... 3,030.6 3,843.1 407,449 145,784 2,534.7 2,795.8 9,455 12,156 22,388
1982 ......................... 3,149.6 3,760.3 436,896 154,282 2,690.9 2,820.4 9,989 12,146 23,433
1983 ......................... 3,405.0 3,906.6 466,421 163,876 2,862.5 2,893.6 10,642 12,349 24,674
1984 ......................... 3,777.2 4,148.5 505,008 176,108 3,154.6 3,080.1 11,673 13,029 26,433
1985 ......................... 4,038.7 4,279.8 553,899 192,686 3,379.8 3,162.1 12,339 13,258 27,735
1986 ......................... 4,268.6 4,404.5 605,623 210,819 3,590.4 3,261.9 13,010 13,552 29,458
1987 ......................... 4,539.9 4,540.0 657,134 226,619 3,802.0 3,289.6 13,545 13,545
2
30,970
1988 ......................... 4,900.4 4,718.6 704,921 242,683 4,075.9 3,404.3 14,477 13,890
2
32,191
1989 ......................... 5,244.0 4,836.9 762,360 263,898 4,380.2 3,471.2 15,313 14,030
2
34,213
1990 ......................... 5,513.8 4,884.9 834,786 288,148 4,679.8 3,538.3 16,236 14,154
2
35,353
1991 ......................... 5,671.8 4,848.4 — — 4,833.9 3,534.1 16,693 13,987 —
1
Data for years prior to 1963 include expenditures for government fiscal years ending
during that particular calendar year. Data for 1963 and later years are the aggregations
of expenditures for government fiscal years which ended on June 30 of the stated year.
General expenditures exclude expenditures of publicly owned utilities and liquor stores,
and of insurance-trust activities. Intergovernmental payments between state and local
governments are excluded. Payments to the federal government are included.
2
Revised methodology.
—Data not available.
NOTE.—Gross Domestic Product (GDP) data are adjusted by the GDP implicit price
deflator. Personal income data are adjusted by the personal consumption deflator. Some
data have been revised from previously published figures.
SOURCE: Executive Office of the President,
Economic Report of the President
, Feb-
ruary 1992: U.S. Department of Commerce, Bureau of the Census,
Consumer Income,
Series P-60, No. 174: U.S. Census Bureau, news release, December 30, 1991. (This
table was prepared May 1992.)

94 Appendix
Table 37.—Gross domestic product deflator, Consumer Price Index, education price indexes, and federal budget
composite deflator: 1919 to 1992
Calendar year School year Federal fiscal year
Year
Gross
domestic
product
deflator
Consumer
Price Index
1
Year Consumer
Price Index
2
Elementary/
Secondary
Price Index
Higher
Education
Price Index Year
Federal
budget
composite
deflator
1 23456789
1919 ..................................... — 17.3 1919–20 ..... 19.1 — — 1919 ........... —
1929 ..................................... — 17.1 1929–30 ..... 17.1 — — 1929 ........... —
1934 ..................................... — 13.4 1934–35 ..... 13.6 — — 1934 ........... —
1939 ..................................... — 13.9 1939–40 ..... 14.0 — — 1939 ........... —
1940 ..................................... — 14.0 1940–41 ..... 14.2 — — 1940 ........... 0.0988
1941 ..................................... — 14.7 1941–42 ..... 15.6 — — 1941 ........... 0.1036
1942 ..................................... — 16.3 1942–43 ..... 16.9 — — 1942 ........... 0.1136
1943 ..................................... — 17.3 1943–44 ..... 17.4 — — 1943 ........... 0.1234
1944 ..................................... — 17.6 1944–45 ..... 17.8 — — 1944 ........... 0.1198
1945 ..................................... — 18.0 1945–46 ..... 18.2 — — 1945 ........... 0.1157
1946 ..................................... — 19.5 1946–47 ..... 21.2 — — 1946 ........... 0.1129
1947 ..................................... — 22.3 1947–48 ..... 23.3 — — 1947 ........... 0.1419
1948 ..................................... — 24.1 1948–49 ..... 24.1 — — 1948 ........... 0.1637
1949 ..................................... — 23.8 1949–50 ..... 23.7 — — 1949 ........... 0.1701
1950 ..................................... — 24.1 1950–51 ..... 25.1 — — 1950 ........... 0.1702
1951 ..................................... — 26.0 1951–52 ..... 26.3 — — 1951 ........... 0.1597
1952 ..................................... — 26.5 1952–53 ..... 26.7 — — 1952 ........... 0.1683
1953 ..................................... — 26.7 1953–54 ..... 26.9 — — 1953 ........... 0.1787
1954 ..................................... — 26.9 1954–55 ..... 26.8 — — 1954 ........... 0.1835
1955 ..................................... — 26.8 1955–56 ..... 26.9 — — 1955 ........... 0.1897
1956 ..................................... — 27.2 1956–57 ..... 27.7 — — 1956 ........... 0.1995
1957 ..................................... — 28.1 1957–58 ..... 28.6 — — 1957 ........... 0.2081
1958 ..................................... — 28.9 1958–59 ..... 29.0 — — 1958 ........... 0.2205
1959 ..................................... 25.6 29.1 1959–60 ..... 29.4 — — 1959 ........... 0.2317
1960 ..................................... 26.0 29.6 1960–61 ..... 29.8 — 25.1 1960 ........... 0.2367
1961 ..................................... 26.3 29.9 1961–62 ..... 30.1 — 26.1 1961 ........... 0.2392
1962 ..................................... 26.8 30.2 1962–63 ..... 30.4 — 27.1 1962 ........... 0.2435
1963 ..................................... 27.2 30.6 1963–64 ..... 30.8 — 28.1 1963 ........... 0.2539
1964 ..................................... 27.7 31.0 1964–65 ..... 31.2 — 29.3 1964 ........... 0.2586
1965 ..................................... 28.4 31.5 1965–66 ..... 31.9 — 30.8 1965 ........... 0.2641
1966 ..................................... 29.4 32.4 1966–67 ..... 32.9 — 32.4 1966 ........... 0.2705
1967 ..................................... 30.3 33.4 1967–68 ..... 34.0 — 34.3 1967 ........... 0.2780
1968 ..................................... 31.7 34.8 1968–69 ..... 35.7 — 36.7 1968 ........... 0.2903
1969 ..................................... 33.3 36.7 1969–70 ..... 37.8 — 39.2 1969 ........... 0.3086
1970 ..................................... 35.1 38.8 1970–71 ..... 39.7 — 41.6 1970 ........... 0.3273
1971 ..................................... 37.0 40.5 1971–72 ..... 41.2 — 44.0 1971 ........... 0.3497
1972 ..................................... 38.8 41.8 1972–73 ..... 42.8 — 46.3 1972 ........... 0.3731
1973 ..................................... 41.3 44.4 1973–74 ..... 46.6 — 49.6 1973 ........... 0.3961
1974 ..................................... 44.9 49.3 1974–75 ..... 51.8 52.7 53.8 1974 ........... 0.4307
1975 ..................................... 49.2 53.8 1975–76 ..... 55.5 57.1 57.9 1975 ........... 0.4758
1976 ..................................... 52.3 56.9 1976–77 ..... 58.7 60.8 61.7 1976 ........... 0.5098
1977 ..................................... 55.9 60.6 1977–78 ..... 62.6 64.6 65.8 1977 ........... 0.5623
1978 ..................................... 60.3 65.2 1978–79 ..... 68.5 70.3 70.6 1978 ........... 0.5928
1979 ..................................... 65.5 72.6 1979–80 ..... 77.6 76.5 77.5 1979 ........... 0.6441
1980 ..................................... 71.7 82.4 1980–81 ..... 86.6 85.7 85.9 1980 ........... 0.7102
1981 ..................................... 78.9 90.9 1981–82 ..... 94.1 93.7 94.0 1981 ........... 0.7817
1982 ..................................... 83.8 96.5 1982–83 ..... 98.2 100.0 100.0 1982 ........... 0.8369
1983 ..................................... 87.2 99.6 1983–84 ..... 101.8 105.6 104.7 1983 ........... 0.8776
1984 ..................................... 91.0 103.9 1984–85 ..... 105.8 112.6 110.5 1984 ........... 0.9125
1985 ..................................... 94.4 107.6 1985–86 ..... 108.8 119.6 115.6 1985 ........... 0.9452
1986 ..................................... 96.9 109.6 1986–87 ..... 111.2 125.7 120.3 1986 ........... 0.9735
1987 ..................................... 100.0 113.6 1987–88 ..... 115.8 132.7 125.8 1987 ........... 1.0000
1988 ..................................... 103.9 118.3 1988–89 ..... 121.2 139.7 133.1 1988 ........... 1.0361
1989 ..................................... 108.4 124.0 1989–90 ..... 127.0 147.6 140.8 1989 ........... 1.0815
1990 ..................................... 112.9 130.7 1990–91 ..... 133.9 — — 1990 ........... 1.1283
1991 ..................................... 117.0 136.2 1991–92 ..... 138.2 — — 1991 ........... 1.1782
1992 ..................................... — — 1992–93 ..... — — — 1992 ........... 1.2147
1
Index for urban wage earners and clerical workers through 1977; 1978 and later fig-
ures are for all urban consumers.
2
Consumer Price Index adjusted to a school-year basis (July through June).
—Data not available.
NOTE.—Some data have been revised from previously published figures.
SOURCE: Council of Economic Advisers,
Economic Indicators,
February 1991, and
Economic Report of the President,
February 1992; U.S. Department of Education, Na-
tional Institute of Education,
Inflation Measures for Schools and Colleges;
U.S. Depart-
ment of Labor, Bureau of Labor Statistics,
Consumer Price Index; Research Associates
of Washington
, ‘‘Inflation Measures for Schools and Colleges, 1990 Update;’’ U.S. Office
of Management and Budget,
Budget of the U.S. Government, Fiscal Year 1993.
(This
table was prepared July 1992.)
95
Methodology
General Note
Nationwide statistics on education have been col-
lected and published primarily by the U.S. Depart-
ment of Education (formerly the Office of Education)
and the U.S. Bureau of the Census. Data on edu-
cation have also been collected and published by
other federal, state and local governmental agencies,
and by independent research organizations.
The Department of Education obtained the data for
this publication from reports of state and local school
systems and institutions of higher education. These
data relate to school enrollment and attendance,
graduates, instructional staff, curricula, school district
organization, and receipts and expenditures for ele-
mentary and secondary schools, and enrollment, fac-
ulty, degrees conferred, income, expenditures, prop-
erty, and plant fund operations for institutions of high-
er education.
Data in this report from the Bureau of the Census
were obtained from households in the decennial cen-
suses and monthly sample surveys, and relate pri-
marily to school enrollment, literacy, and educational
attainment of the general population.
The Department of Education has issued statistical
reports on elementary, secondary, and higher edu-
cation since 1870. From 1869–70 to 1916–17, statis-
tics were included as part of the
Annual Report of
the Commissioner of Education.
From 1917–18 to
1957–58, a report was issued for each even-num-
bered school year under the title,
Biennial Survey of
Education in the United States.
Chapter 1 of the
Bi-
ennial Survey,
‘‘Statistical Summary of Education,’’
and chapter 2, ‘‘Statistics of State School Systems,’’
are primary sources for some derived measures re-
lating to education. Beginning with 1940–41 and end-
ing with 1950–51, chapter 2 was supplemented by
an abridged report issued as a circular for each odd-
numbered school year. Biennial survey data were
based on report forms completed by state depart-
ments of education (a copy of the report form ap-
pears in the
Biennial Survey
of 1951–52 and 1953–
54). Beginning with the
Biennial Survey
of 1951–52
and 1953–54, these forms have been completed by
education officials in accordance with detailed in-
structions contained in the Office of Education,
Hand-
book I, the Common Core of State Educational Infor-
mation.
Prior to that date, the forms were completed
in accordance with various circulars of information
distributed by the Office of Education.
Since 1962, the annual publication,
Digest of Edu-
cation Statistics,
has provided an abstract of statis-
tical information covering the broad field of American
education from kindergarten through graduate
school. The
Digest
utilizes materials from numerous
sources, including the statistical surveys and esti-
mates of the Department of Education and other ap-
propriate agencies, both governmental and non-
governmental. It is divided into seven chapters: (1)
all levels of education; (2) elementary and secondary
education; (3) postsecondary education; (4) federal
programs for education; (5) outcomes of education;
(6) international comparisons of education; and (7)
learning resources and technology.
A major issue in presenting accurate statistical
data on a national basis is the uniformity with which
all recording units use standard terms, definitions,
and procedures. Prior to 1908–09, this was con-
trolled only by definitions on the questionnaires re-
questing information. Since 1908–09, the Office of
Education in cooperation with other national and
state organizations has improved uniform recording
and reporting through the means of national commit-
tees, publications, and national and regional con-
ferences.
A major problem in the collection and processing
of comprehensive nationwide school statistics is get-
ting all the schools to respond within reasonable time
limits. School authorities are not compelled to report
to the Department of Education. There is some evi-
dence that the proportion of schools reporting has in-
creased through the years. This increase is most evi-
dent in the data for secondary schools. Prior to
1929–30, a complete list of public secondary day
schools had not been compiled, and consequently
there is no way to measure the degree of response
in the earlier years. Since there was no attempt to
estimate data for the nonrespondents in the early
years, the secondary school data are undercounted.
This was especially problematic for high school en-
rollment and graduate data of the 1870s and 1880s.
In 1929–30, there were 23,930 public secondary day
schools on file, and reports were received from
22,237. In 1937–38, the number of schools on file in-
creased to 35,308, and the number reporting was
96 Methodology
25,091. In 1951–52, there were 23,757 schools, and
replies were received from all but 12 schools. The
data for the missing schools were estimated, and the
published totals for 1951–52 cover all public second-
ary day schools.
Since 1869–70, there have been both major and
minor changes in the collection patterns with
changes in the administration of the program. Some
patterns lasted for many years. With voluntary re-
sponse and no field service (until 1924), response
rates varied in their completeness for both reporting
in general and for specific items. The completeness
of the coverage is not always made evident in the
publications. For example, field service supple-
mented returns by mail for the 1923–24 biennial
chapters. From 1923 to 1963, visits were made to
state departments of education and colleges and uni-
versities to complete the coverage from basic or sec-
ondary records available in the state departments of
education or at individual schools and institutions.
The introduction of sampling in recent years has also
insured adequate coverage.
The data in these historical tables will not always
agree with similar data in the publications cited as
sources for a specific year because tabulations were
‘‘kept open’’ for many years, and as data came in,
they were added and reflected in future historical ta-
bles. In addition, when feasible, missing data have
been imputed to produce consistent national informa-
tion.
Table 1.—Population, by age and race, live
births, and birth rate: 1970 to 1991
Source: U.S. Department of Commerce, Bureau of
the Census, Current Population Reports, Series P-
25, and unpublished data;
Historical Statistics of the
United States, Colonial Times to 1970.
U.S. Depart-
ment of Health and Human Services, National Center
for Health Statistics,
Monthly Vital Statistics Report,
various issues.
The annual population estimates are as of July 1
and, thus, differ from decennial census population
estimates. Annual estimates prior to 1900 are based
on linear interpolation between decennial years. Esti-
mates between 1900 and 1919 are based on inter-
polation applied to decennial age data. Subsequent
data are based on decennial data augmented by in-
formation on births, deaths, and international migra-
tion. Population data for the period from 1980 to
1989 are likely to be revised when they are con-
trolled to the 1990 census. However, experience
from past decennial census changes indicates that
these changes will be small.
Births and deaths are classified in the category of
information known as vital statistics. These data are
compiled by the National Center for Health Statistics
(originally by the National Office of Vital Statistics).
Since 1900, these have been collected by the Bu-
reau of the Census from various state offices. Since
1951, birth statistics have been estimated based on
a 50 percent sample of all registered births. Data on
death registrations are compiled in a similar manner.
However, each of these relies on the purported reli-
ability of registrations at state and local levels.
Table 2.—School enrollment of 5- to 19-year-
olds per 100 persons, by sex and race: 1850 to
1991
Source: U.S. Bureau of the Census. Decennial
data, 1850 to 1930, Fifteenth Census Reports, Popu-
lation, vol. II; 1940 to 1950, U.S. Census of Popu-
lation: 1950, vol. II, part 1; U.S. Census of Popu-
lation: 1960, PC(1)-ID. Other data, Current Popu-
lation Reports, series P-20, Nos. 54, 66, 74, 80, 93,
101, 110, 117, 126, 129, 148, 162, 167, 206, and
222; 1970 to 1991, Current Population Survey, sur-
vey data files.
For decennial census years, the statistics refer to
the total population within the specified age group;
figures from the Current Population Survey (CPS)
refer to the civilian noninstitutional population. Per-
sons not covered in the CPS (Armed Forces and in-
stitutional population) are known to have low enroll-
ment rates.
In the Census of Population for 1940 and 1950,
and in the CPS, 1954 to 1991, enrollment was de-
fined as enrollment in ‘‘regular’’ schools only—that is,
schools where enrollment may lead toward an ele-
mentary or high school diploma, or to a college, uni-
versity, or professional school degree. Such schools
included public and private nursery schools, kinder-
gartens, elementary and secondary schools, col-
leges, universities, and professional schools. Enroll-
ment could be either full-time or part-time, day or
night.
If a person was receiving regular instruction at
home from a tutor and if the instruction was consid-
ered comparable to that of a regular school or col-
lege, the person was counted as enrolled. Enrollment
in a correspondence course was counted only if the
person received credit in the regular school system.
Enrollments in business and trade schools at the
postsecondary level were excluded if the coursework
did not lead to a degree.
Children enrolled in kindergarten were included in
the ‘‘regular’’ school enrollment figures in the Current
Population Survey beginning in 1950; children en-
rolled in nursery school were included beginning in
1967. Children enrolled in kindergarten were not in-
cluded in the ‘‘regular’’ school enrollment figures in
the 1950 Census of Population; however, they have
been included here to make the data comparable
97Methodology
with earlier years and with current practice. In cen-
suses prior to 1950, no attempt was made to exclude
children in kindergarten so that the statistics for
those years include varying proportions attending kin-
dergarten. Also, in censuses prior to 1940, the data
were not restricted as to type of school or college the
person was attending.
In addition to differences in definitions of school
enrollment and in population coverage, the enroll-
ment data for different years may differ because of
variations in the dates when the questions were
asked and the time periods to which enrollment re-
ferred. Data from the Current Population Survey
were obtained in October and refer to enrollment in
the current school term. In 1940, 1950, and 1960,
the censuses were taken as of April 1, but enrollment
related to any time after March 1 in 1940 and any
time after February 1 in 1950 and 1960. The cor-
responding question in the censuses from 1850 to
1930 applied to a somewhat longer period: in 1850
to 1900, to the 12 months preceding the census
date; and in 1910, 1920, and 1930, to the period be-
tween the preceding September 1 and the census
date (April 15 in 1910, January 1 in 1920, and April
1 in 1930).
Information on school enrollment is also collected
and published by the Department of Education.
These data are obtained from reports of school sur-
veys and censuses. They are, however, only roughly
comparable with data collected by the Bureau of the
Census from households, because of differences in
definitions, time references, population coverage, and
enumeration methods.
Table 3.—School enrollment and school enroll-
ment rates, by age and sex: 1940 to 1991
Source: U.S. Bureau of the Census, 1940, U.S.
Census of Population: 1950, vol. II, part 1; 1945 to
1969, Current Population Reports, series P-20, Nos.
19, 24, 30, 34, 45, 52, 54, 66, 74, 80, 93, 101, 110,
117, 126, 129, 148, 162, 167, 190, 206, and 222;
1970 to 1991, Current Population Survey, survey
data files.
The estimates are based on data obtained in Octo-
ber in the Current Population Survey of the Bureau
of the Census, except that data shown for 1940 are
based on complete enumeration of the population
and were published in volume II of the 1950 census
reports on population. Except for 1940, data are for
the civilian population excluding the relatively small
number in institutions. Data shown for 1940 relate to
the total population, including those in institutions
and all members of the Armed Forces (about
267,000) enumerated on April 1.
The school enrollment statistics from the Current
Population Survey are based on replies to the enu-
merator’s inquiry as to whether the person was en-
rolled in school. See description of CPS procedures
under previous table.
Table 4.—Years of school completed by per-
sons 25 years old and over, by race and sex:
April 1940 to March 1991
Table 5.—Median years of school completed by
persons age 25 and over and 25 to 29, by race
and sex: 1910 to 1991
Source: U.S. Bureau of the Census, 1940 and
1950, U.S. Census of Population, 1950, vol. II; 1960,
U.S. Census of Population: 1960, series PC-l; 1970
to 1991, Current Population Survey, survey data
files.
The median years of school completed is defined
as the value which divides the population into two
equal parts—one-half having completed more and
the other half less schooling than the median. The
median was computed after the statistics on years of
school completed had been converted to a continu-
ous series of numbers (e.g., completion of the 1st
year of high school was treated as completion of the
9th year and completion of the 1st year of college as
completion of the 13th year). The persons completing
a given school year were assumed to be distributed
evenly within the interval from .0 to .9 of the year
(e.g., persons completing the 12th year were as-
sumed to be distributed evenly between 12.0 and
12.9). The effect of the assumption is to place the
median for younger persons slightly below, and for
older persons slightly above, the true median. Be-
cause of the inexact assumption as to the distribution
within an interval, this median is more appropriately
used for comparing groups and the same group at
different dates than as an absolute measure of edu-
cational attainment.
The data for 1940, 1950, and 1960 are based on
the decennial censuses: complete count in 1940, 20
percent sample in 1950, and 25 percent sample in
1960. The data for 1970 through 1991 are based on
the March Current Population Survey and may differ
from decennial census data for the following reasons:
(1) only those members of the Armed Forces in the
United States living off post or with their families on
post are included in the CPS whereas all members
of the Armed Forces in the United States are in-
cluded in the census data and (2) there are dif-
ferences between the CPS and the censuses in cov-
erage, enumeration techniques, and methods of allo-
cating responses.
The procedure used both in 1940 and 1950 for cal-
culating the median years of school completed made
allowance for the fact that many persons reported as
having completed a given full school year had also
completed a part of the next higher grade. Thus, it
98 Methodology
is assumed that persons who reported 12 full years
of school completed had actually completed 12.5
years, on the average.
Although the statistics on median years of school
completed have been available only since 1940, the
data by age give further indication of time trends.
The 1910 to 1930 data cited in the table are based
on a retrojection of educational attainment of older
age groups.
Differences in the quality of education data for the
three censuses may have resulted in part from
changes in the way the information was requested.
In 1940, a single question was asked on highest
grade of school completed. In the 1950 and 1960
censuses and the various CPS surveys, data on
years of school completed were obtained from a
combination of responses to two questions, one ask-
ing for the highest grade of school attended and an-
other whether that grade was finished. Analysis of
data from the 1940 census returns and from surveys
conducted by the Bureau of the Census based on
the same question wording as in 1940 indicated that
respondents frequently reported the year or grade
they had last attended, instead of the one completed.
There is evidence that, as a result of the change in
the questions in 1950, there was relatively less exag-
geration in reporting educational attainment than in
1940. Hence, the indicated increases in attainment
between 1940 and 1950 tend slightly to understate
the true increase.
The 1970 to 1991 data are based on sample sur-
veys and relate to the resident population, including
inmates of institutions and members of the Armed
Forces living off post or with their families on post;
all other members of the Armed Forces are ex-
cluded. Except for 1940, the data were derived from
the combination of answers to two questions: (a)
‘‘What is the highest grade of school he has ever at-
tended?’’ and (b) ‘‘Did he finish the grade?’’ In 1940,
a single question was asked on highest grade of
school completed. The questions on educational at-
tainment apply only to progress in ‘‘regular’’ schools.
Table 6.—Percentage of persons 14 years old
and over who are illiterate, by race and nativity:
1870 to 1979
Source: U.S. Bureau of the Census, 1870 to 1930,
Fifteenth Census Reports, Population, vol. II; 1940 to
1979, Current Population Reports, series P-20, Nos.
20, 45, and 217; and series P-23, No. 116.
Persons were regarded as illiterate if they could
not read and write, either in English or some other
language. Information on illiteracy of the population
was obtained from direct questions in the censuses
of 1870 to 1930. The data for 1947, 1952, 1959,
1969, and 1979 were obtained from sample surveys;
they exclude the Armed Forces and inmates of insti-
tutions. The statistics for the census years 1940 and
1950 were derived by estimating procedures. In
1947, the literacy question was asked only of per-
sons who had completed less than 5 years of school;
in 1952, 1959, 1969, and 1979, the same general
procedure was used, but the question was asked of
those who had completed less than 6 years of
school.
These surveys examined a very fundamental level
of reading and writing. More recent studies on this
issue have analyzed functional illiteracy. Functional
illiteracy indicates a lack of ability to function effec-
tively in a modern society. These functional illiteracy
percentages are substantially higher than earlier
studies based on fundamental illiteracy.
Some variation has existed over the years in the
way the question on illiteracy was asked. Since
1930, reference has been made as to whether or not
the person was able to read and write. In the cen-
suses of 1870 to 1930, two questions were asked;
one on whether the person was able to read and one
on whether he could write. Illiteracy was defined as
inability to write ‘‘regardless of ability to read.’’ Since
the data showed that nearly all persons who were
able to write could also read, the earlier statistics
should be generally comparable with data obtained
through the consolidated question used in later
years.
Ability to read and write cannot be defined so pre-
cisely in a census to cover all cases with certainty.
No specific test of ability to read and write was used,
but enumerators were instructed not to classify a per-
son as literate simply because he was able to write
his name. Analysts of earlier census data assumed
that the illiterate population comprised only those
persons who had no education whatever. Information
on the educational attainment of illiterates obtained in
recent sample surveys indicates, however, that some
persons cannot read and write even though they
have had some formal schooling. For example, data
from the Current Population Survey of October 1952
show that among persons 14 years old and over the
proportion reported as illiterate ranged from 77.8 per-
cent of those who had not completed a year of
school to 1.3 percent of those who had completed 5
years. Comparable figures from the November 1969
survey were 57.4 percent and 2.3 percent, respec-
tively.
Data on illiteracy were also collected in the cen-
suses of 1840, 1850, and 1860, but are not included
here because they are not comparable with statistics
for subsequent years and because of limitations in
the quality of data for those early years. In 1840, the
head of the family was asked for the total number of
illiterates in each family, a method which undoubtedly
led to some understatement. Beginning with 1850,
99Methodology
the individual entry system was used, the question
being asked regarding each member of the family.
By 1870, another change in census methods was in-
troduced, separate questions being asked on ability
to read and ability to write. In addition to changes in
the form of the inquiry, the statistics on illiteracy for
1840, 1850, and 1860 related to the population 20
years old and over, whereas in the 1870 and later
censuses, they referred to the population 10 years
old and over.
The percentages of illiterates in the total population
20 years old and over, as recorded in those earlier
censuses, were as follows: 1840, 22.0 percent; 1850,
22.6 percent; and 1860, 19.7 percent. The com-
parable percentages for the white population 20
years old and over in those years were 9.0, 10.7 and
8.9 percent, respectively. The apparent increases in
illiteracy of white persons in 1850 and 1870 may be
due, in part, to the large influx of immigrants during
those periods, many of whom could not read and
write in any language. It is more likely, however, that
the apparent increases resulted from improvements
in the way the information was obtained at those
census dates.
Table 7.—Annual mean income of males and
females 25 years old and over, by years of
school completed: 1939 to 1991
Source: 1939 to 1949, Herman P. Miller, ‘‘Annual
and Lifetime Income in Relation to Education’’; 1939
to 1959, American Economic Association,
The Amer-
ican Economic Review,
December 1960 (copyright);
1956 to 1969, U.S. Bureau of the Census, Current
Population Reports, series P-60, No. 74; and 1970 to
1991, Current Population Survey, survey data files.
Data for 1939 were derived from 1940 Census of
Population,
Education: Educational Attainment by
Economic Characteristics and Marital Status
; for
1946, from Current Population Reports, series P-60,
No. 5; and for 1949, from 1950 Census of Popu-
lation, series P-E, No. 5B,
Education.
For details of
methodology, see the source.
Neither the income concept nor the universe cov-
ered is directly comparable for all years shown. Most
of the differences, however, are relatively small and
are not believed to seriously distort the relationships.
The figures for 1939 are based on the 1940 census
and are restricted to males 25 to 64 years of age
with $1 or more of wage or salary income and less
than $50 of nonwage income. For this group the
averages represent total money income; however,
this group includes only about three-fifths of all men
25 to 64 years old in 1940. The effects of this restric-
tion cannot be measured, but it is undoubtedly more
important than restrictions cited for other years. It is
also possible that this restriction affects college grad-
uates more than persons with less schooling and for
them tends to create a biased sample since college
graduates are more likely to have income other than
earnings.
The 1946 figures are based on the Current Popu-
lation Survey and represent the total money earnings
(not total income) of the civilian noninstitutional male
population 25 years old and over. Although the con-
ceptual differences between income and earnings
are substantial, the actual differences in the aver-
ages are quite small, primarily because the amount
of nonearned income is small relative to the total,
and this type of income tends to be seriously under-
reported in household surveys of income. The 1949
figures are based on the 1950 census and also rep-
resent the total money income of all males 25 years
old and over, including a relatively small number of
institutional inmates.
The 1956 to 1991 figures are entirely comparable
since they are based on the Current Population Sur-
vey and represent the total money income of the ci-
vilian noninstitutional population of the United States
and members of the Armed Forces in the United
States living off post or with their families on post,
but excluding all other members of the Armed
Forces. For each person in the sample, 14 years old
and over, questions were asked on the amount of
money income received during the preceding cal-
endar year from each of the following sources: (1)
money wages or salary; (2) net income from nonfarm
self-employment; (3) net income from farm self-em-
ployment; (4) social security; (5) dividends, interest
(on savings or bonds), income from estates or trusts
or net rental income; (6) public assistance or welfare
payments; (7) unemployment compensation, govern-
ment employee pensions, or veterans’ payments; (8)
private pensions, annuities, alimony, regular contribu-
tions from persons not living in this household, royal-
ties, and other periodic income. The amounts re-
ceived represent income before deductions for per-
sonal taxes, social security, bonds, etc.
Table 8.—Historical summary of public elemen-
tary and secondary school statistics: 1869–70 to
1989–90
Table 9.—Enrollment in regular public and pri-
vate elementary and secondary schools, by grade
level: 1869–70 to fall 1992
Table 10.—Enrollment in regular public elemen-
tary and secondary schools, by grade: 1910–11
to fall 1990
Table 11.—Enrollment in regular public elemen-
tary and secondary schools, by state: 1870–71 to
fall 1990
100 Methodology
Source: U.S. Department of Education (Office of
Education), 1869–70 to 1915–16,
Annual Report of
the United States Commissioner of Education,
var-
ious issues; 1916–17 to 1955–56,
Biennial Survey of
Education in the United States, Statistics of State
School Systems,
various issues; 1957–58 to 1991–
92, National Center for Education Statistics,
Digest of
Education Statistics,
various issues, and unpublished
tabulations. U.S. Bureau of the Census,
Historical
Statistics of the United States, Colonial Times to
1970.
A school is defined as a division of the school sys-
tem consisting of a group of pupils composed of one
or more grade groups, organized as one unit with
one or more teachers to give instruction of a defined
type and housed in a school plant of one or more
buildings. More than one school may be housed in
one school plant, as is the case when the elementary
and secondary programs are housed in the same
school plant. The actual operation of public schools
is generally the sole responsibility of local school
systems in the various states. The local basic admin-
istrative unit or school district is an area organized as
a quasi-corporation under the jurisdiction of a board
of education responsible for the administration of all
public schools in the area. School districts provide
the machinery through which local control of schools
is exercised and are largely responsible for the loca-
tion and size of schools, the types of educational
programs and services offered, and the amount of fi-
nancial support to be provided locally.
A public school is defined as one operated by pub-
licly elected or appointed school officials in which the
program and activities are under the control of these
officials and which is supported by public funds.
Enrollment and other figures prior to 1959–60 for
public elementary and secondary day schools only
include the coterminous United States. Excluded are
public schools in the outlying areas of the United
States, public schools operated directly by the fed-
eral government on military reservations and schools
for Indians, public residential schools for exceptional
children, and subcollegiate departments of institu-
tions of higher education. Only regular day school
pupils are included; pupils enrolled in night schools
and summer schools are excluded.
Private schools, while subject to certain regulatory
controls of the state, are under the operational con-
trol of private individuals or religiously affiliated or
nonsectarian institutions. Whether operated on a
profit or nonprofit basis, private schools are generally
supported by private funds as distinguished from
public funds.
Private school figures are not strictly comparable.
For example, in some of the earlier years, the figures
include enrollment of secondary pupils in subcolle-
giate departments of institutions of higher education,
normal schools, etc. Enrollment figures prior to 1976
do not include private schools for exceptional chil-
dren or private vocational or trade schools. They
cover only regular day school pupils. Summer school
pupils are excluded in all years.
It should be noted that the annual public enroll-
ment information such as that tabulated in the Bien-
nial Survey of Education was collected on a state-by-
state basis and represented a cumulative count of
the total number of different pupils registered at any
time during the school year in each state. Pupils en-
rolled in two or more states at any time during the
school year are, therefore, counted more than once,
resulting in a tendency to increase the total enroll-
ment figure for the Nation.
The number of pupils per classroom teacher, oth-
erwise known as the ‘‘pupil/teacher ratio,’’ has often
been used as a measure of teacher workload. For
years prior to the 1940s, the available figures on
‘‘teachers’’ sometimes included librarians and guid-
ance and psychological personnel as well as class-
room teachers.
Table 12.—Children served in special education
programs, by type of disability: 1921–22 to 1989–
90
Source: U.S. Department of Education (Office of
Education), 1921–22 to 1947–48,
Biennial Survey of
Education in the United States;
1951–52 and 1952–
53,
Statistics of Special Schools and Classes for Ex-
ceptional Children;
and 1957–58 to 1989–90, Na-
tional Center for Education Statistics,
Digest of Edu-
cation Statistics,
various issues.
Children served in these programs include ‘‘excep-
tional children’’ in years prior to 1970. This term ap-
plies to pupils who need additional education serv-
ices, referred to as ‘‘special education,’’ because of
their physical, intellectual, or personal-social dif-
ferences from other children. Included are the unusu-
ally bright or gifted children; the mentally retarded;
the disabled, including the physically handicapped,
learning disabled, and cerebral-palsied; those with
special health problems such as cardiac involvement,
epilepsy, and other debilitating conditions; the blind
and partially seeing; the deaf and hard-of-hearing;
those with speech impairments; and the emotionally
disturbed. Pupils are reported according to the major
type of exceptionality for which they were receiving
special education.
Data for years after 1970 are based on counts of
students participating in PL 94–142, Education of the
Handicapped Act, and the successor, Individuals with
Disabilities Education Act (IDEA) programs.
101Methodology
Table 13.—Public school pupils transported at
public expense and current expenditures for
transportation: 1929–30 to 1989–90
Source: 1929–30 to 1989–90, U.S. Department of
Education, National Center for Education Statistics,
Digest of Education Statistics, 1992.
1979–80 to
1989–90, Bobbit Publishing Co.,
School Bus Fleet,
January issues.
More than half of U.S. public school children ride
buses to school, frequently because walking to
school would be inconvenient or unsafe. Pupil trans-
portation services may also be provided as a result
of state or local legislation for reorganizing school
systems, consolidating widely scattered school at-
tendance areas, or achieving equalization of edu-
cational opportunity.
Expenditures of public funds for transportation in-
clude salaries, vehicle replacement, supplies and
maintenance for vehicles and garages, transportation
insurance, contracted services, fares for public trans-
portation, and payments in lieu of transportation.
Data through 1979–80 are based on reports by state
education agencies to the National Center for Edu-
cation Statistics. Data for later years are estimates
based on data reported by
School Bus Fleet.
Table 14.—Average daily attendance, instruc-
tional staff, and teachers in public elementary
and secondary schools: 1869–70 to 1990–91
Source: U.S. Department of Education (Office of
Education), 1869–70 to 1915–16,
Annual Report of
the United States Commissioner of Education,
var-
ious issues; 1917–18 to 1957–58,
Biennial Survey of
Education in the United States,
various issues;
1959–60 to 1989–90, National Center for Education
Statistics,
Digest of Education Statistics,
various is-
sues. 1969–70 to 1980–91, National Education Asso-
ciation,
Estimates of School Statistics,
various is-
sues.
Figures for average daily attendance in public
schools were computed by dividing the total number
of days attended by all pupils enrolled by the number
of days school was actually in session. Only days
when the pupils were under the guidance and direc-
tion of teachers are considered as days in session.
‘‘Instructional staff’’ refers to personnel who render
direct and personal services which are in the nature
of teaching or the improvement of the teacher-learn-
ing situation. Included, therefore, are supervisors of
instruction, principals, teachers, guidance personnel,
librarians, and psychological personnel. The duty of
supervisors of instruction, including consultants, is to
assist teachers in improving the learning situation
and instructional methods at a particular level or in
a particular subject. Principals are the administrative
heads of schools. They usually administer a building
or a group of buildings with or without the aid of su-
pervisors.
The term ‘‘teacher’’ is defined as a person em-
ployed to instruct pupils or students. At the elemen-
tary and secondary levels, it does not include super-
visors and principals, or librarians and guidance and
psychological personnel when separately reported.
Beginning with 1919–20, the Department of Edu-
cation has collected data on salaries of total instruc-
tional staff (supervisors, principals, teachers, librar-
ians, and guidance and psychological personnel).
Salary information for prior years is available for
teachers only. Average annual salaries of instruc-
tional staff members were obtained by dividing total
expenditures for salaries by the number of such per-
sonnel.
Table 15.—Catholic elementary and secondary
enrollment, teachers, and schools, by level:
1919–20 to 1990–91
Source: National Catholic Educational Association,
A Statistical Report on Catholic Elementary and Sec-
ondary Schools for the Years 1967–68 and 1969–70,
as compiled from the Official Catholic Directory, and
United States Catholic Elementary and Secondary
Schools, 1989–90 and 1990–91.
Franklin Press,
Catholic Schools in America
(1978 edition). U.S. Bu-
reau of the Census, 1919–20 to 1959–60,
Historical
Statistics of the United States, Colonial Times to
1970.
The elementary division of the Catholic school sys-
tem includes five types of schools: (1) parochial
schools are operated in connection with parishes; (2)
inter-parochial schools are under the administrative
control of two or more parishes; (3) archdiocesan or
diocesan schools are under the direct administration
of an ordinary and serve the parishes designated by
him; (4) private schools are conducted independently
of parishes by religious communities; and (5) institu-
tional schools include industrial schools; schools for
blind, deaf, delinquent, or other disadvantaged chil-
dren; and schools conducted in orphanages.
In Catholic secondary education, there are, broad-
ly, three types of administrative control, defined gen-
erally as for the elementary above: (1) central or di-
ocesan; (2) parochial; and (3) private. However,
many parochial and private schools really function as
diocesan schools. The data for elementary school
teachers exclude priests serving as part-time teach-
ers of religion.
Table 16.—Public school enrollment in grades
9 to 12, by subject: 1889–90 to fall 1981
Source: U.S. Department of Education (Office of
Education), 1889–90 to 1948–49,
Biennial Survey of
Education in the United States, 1947–48 to 1949–50;
1954–55 to 1964–65, National Center for Education
102 Methodology
Statistics,
Digest of Educational Statistics;
fall 1972
and fall 1981,
A Trend Study of High School Offer-
ings and Enrollments;
and unpublished data.
For 1919–10 to 1933–34, the percentages are
based on the number of pupils enrolled in the last 4
years of all schools that returned usable question-
naires. For 1889–90, 1899–1900, and 1948–49 to
1964–65, the figures are based on the total number
of pupils enrolled in the last 4 years of all schools.
The source for 1889–90 to 1948–49 states that
‘‘when necessary, the subjects reported in previous
surveys were analyzed, and appropriate components
were either recombined, separately listed, or elimi-
nated (with corresponding changes in the number
and percentage enrolled) in a manner to yield as
close comparability as possible with the data in the
current (1948–49) survey.’’
Table 17.—Student proficiency in reading, writ-
ing, mathematics, and science, by age and race/
ethnicity: 1969–70 to 1989–90
Table 18.—Percentage of students at or above
selected reading, mathematics, and science pro-
ficiency levels, by age and race/ethnicity: 1970–
71 to 1989–90
Source: U.S. Department of Education, National
Center for Education Statistics, National Assessment
of Educational Progress,
Trends in Academic
Progress.
The idea of an indicator of student achievement at
the national level first emerged in 1963 when then
Commissioner of Education Frank Keppel decided to
collect information on how well the Nation’s schools
were doing. In 1969, a National Assessment of Edu-
cational Progress (NAEP) was designed as a vol-
untary, cooperative program to monitor the scholastic
achievement of our Nation’s 9-, 13-, and 17-year-
olds. NAEP is a congressionally mandated project of
the U.S. Department of Education’s National Center
for Education Statistics.
Over the past 20 years, NAEP has generated
more than 200 reports spanning 11 instructional
areas. Commonly known as the ‘‘Nation’s report
card,’’ it is the only ongoing, comparable, and rep-
resentative assessment of what U.S. students know
and can do. The NAEP trend data in this report are
based on four science assessments (1976–77,
1981–82, 1985–86, and 1989–90), four mathematics
assessments (1977–78, 1981–82, 1985–86, and
1989–90), and six reading assessments (1970–71,
1974–75, 1979–80, 1983–84, 1987–88, and 1989–
90).
Students are randomly selected based on a strati-
fied, three-stage sampling plan designed to yield na-
tionally representative results as well as results for
particular subpopulations of students, as defined by
sex, race/ethnicity, region of the country, and size/
type of community. NAEP samples about 40,000 stu-
dents per subject, per assessment. For the trend as-
sessments, NAEP assesses 9-, 13-, and 17-year-old
students. To reduce the burden for students, NAEP
uses a variant of matrix sampling called Focused-
Balanced Incomplete Block (BIB) Spiraling. Thus, not
all students are asked to answer all questions. This
system provides broad coverage of the subject being
assessed while minimizing the classroom time re-
quired of any one student.
Table 19.—High school graduates, by sex and
control of institution: 1869–70 to 1991–92
Source: U.S. Department of Education (Office of
Education), 1869–70 to 1937–38,
Statistical Sum-
mary of Education, 1937–38
; 1939–40 to 1951–52,
Biennial Survey of Education in the United States,
various issues; 1953–54 to 1991–92, National Center
for Education Statistics,
Digest of Education Statis-
tics, 1992.
Seventeen-year-olds computed on the
basis of U.S. Bureau of the Census, Current Popu-
lation Reports, series P-25, Nos. 310, 311, and 511,
and unpublished tabulations.
Figures for high school graduates include grad-
uates from public and private schools and exclude
persons granted equivalency certificates.
Table 20.—Public school districts and public
and private elementary and secondary schools:
1929–30 to 1990–91
Source: U.S. Department of Education, National
Center for Education Statistics,
Digest of Education
Statistics, 1992.
These data are fall counts of local education agen-
cies and public schools. Since schools are organiza-
tional units and not counts of physical plants, there
may be more schools than school buildings (see ad-
ditional notes for tables 9, 10, and 11). In addition,
school districts include various entities which provide
specialized instruction and administrative and other
student-related assistance to schools. These entities
include various kinds of units such as vocational and
special education districts and supervisory unions.
Counts of private schools are estimated from var-
ious sources. Specifically, key elements of the pri-
vate school universe, such as the Catholic schools
and other private schools, are located with the assist-
ance of private school associations. In addition, sam-
pling techniques are used to discover the existence
of other religious and non-affiliated schools. After
1980, estimates of the number of these schools and
other data were obtained from sample surveys.
103Methodology
Table 21.—Revenues for public elementary and
secondary schools, by source of funds: 1889–90
to 1989–90
Source: U.S. Department of Education (Office of
Education), 1889–90 to 1915–16,
Annual Report of
the United States Commissioner of Education,
var-
ious issues; 1917–18 to 1957–58,
Biennial Survey of
Education in the United States,
various issues;
1959–60 to 1989–90, National Center for Education
Statistics,
Digest of Education Statistics, 1992.
Revenue receipts represent additions to assets
(cash) from taxes, appropriations, and other funds
which do not incur an obligation that must be met at
some future date and do not represent exchanges of
property for money. Receipts from county and other
intermediate sources are included with local receipts.
Other sources of revenue include gifts, tuition, and
transportation fees from patrons.
Nonrevenue receipts represent amounts which ei-
ther incur an obligation that must be met at some fu-
ture date or change the form of an asset from prop-
erty to cash and therefore decrease the amount and
the value of school property. Money received from
loans, sale of bonds, sale of property purchased from
capital funds, and proceeds from insurance adjust-
ments constitute most of the nonrevenue receipts.
Nonrevenue receipts are not included in the table.
Table 22.—Total and current expenditures and
expenditure per pupil in public elementary and
secondary schools, by purpose: 1869–70 to
1989–90
Source: U.S. Department of Education (Office of
Education), 1869–70 to 1915–16,
Annual Report of
the United States Commissioner of Education,
var-
ious issues; 1917–18 to 1955–56,
Biennial Survey of
Education in the United States,
various issues;
1957–58 to 1989–90, National Center for Education
Statistics,
Digest of Education Statistics,
various is-
sues.
Expenditures for administration include those for
the central office staff for administrative functions and
all general control which is system wide and not con-
fined to one school, subject, or narrow phase of
school services. Instruction expenditures include sal-
aries of instructional staff and clerical assistants, ex-
penditures for free textbooks, school library books,
supplies, and other expenditures for instruction. Plant
operation and maintenance expenditures include sal-
aries of custodians, engineers, carpenters, painters,
etc.; fuel, light, water, and power; and supplies, ex-
penses, and contractual service. Other current ex-
penditures include those for fixed charges and for at-
tendance, health, transportation, food, and mis-
cellaneous services.
Capital outlay includes expenditures for the acqui-
sition of fixed assets or additions to fixed assets
(such as land or existing buildings, improvement of
grounds, construction of buildings, additions to build-
ings, remodeling of buildings, and initial or additional
equipment). Interest includes interest payments on
short-term and current loans from current funds and
on bonds from current and sinking funds. Other ex-
penditures include those separately reported for sum-
mer schools, community colleges, and adult edu-
cation.
Table 23.—Historical summary of higher edu-
cation statistics: 1869–70 to 1989–90
Source: U.S. Department of Education (Office of
Education), 1869–70 to 1915–16,
Annual Report of
the United States Commissioner of Education,
var-
ious issues; 1917–18 to 1955–56,
Biennial Survey of
Education in the United States,
various issues;
1957–58 to 1979–80, National Center for Education
Statistics,
Education Directory, Colleges and Univer-
sities; Faculty and Other Professional Staff in Institu-
tions of Higher Education; Fall Enrollment in Colleges
and Universities; Earned Degrees Conferred; Finan-
cial Statistics of Institutions of Higher Education;
and
‘‘Fall Enrollment in Institutions of Higher Education,’’
‘‘Degrees and Other Formal Awards Conferred,’’ and
‘‘Financial Statistics of Institutions of Higher Edu-
cation’’ surveys; and 1989–90,
Digest of Education
Statistics, 1992.
The Office of Education has issued statistical re-
ports on higher education on a periodic basis since
1869–70. Until 1915–16, these statistics appeared in
the
Annual Report of the United States Commis-
sioner of Education.
For 1917–18 through 1957–58,
statistical reports were issued biennially, as chapters
of the
Biennial Survey of Education in the United
States.
Since 1962, data have appeared in the an-
nual
Digest of Education Statistics.
In addition, an
annual report on conferral of earned degrees has
been issued since 1948 and one on fall enrollments
since 1946. An annual report on current income and
expenditures and other finance items was also is-
sued from 1933 to 1940, first under the title
The Eco-
nomic Outlook in Higher Education
and later under
the title
College Income and Expenditures.
Among the major problems involved in the collect-
ing and processing of nationwide statistics of higher
education have been those of uniformity and prompt-
ness of reporting and completeness of coverage of
the field. The problem of uniformity of reporting was
attacked in 1930 with the formation of the National
Committee on Standard Reports for Institutions of
Higher Education; this committee was disbanded in
1935. Its successor, the Financial Advisory Service
of the American Council on Education, carried on the
104 Methodology
work until 1940, when it, too, was discontinued.
These two organizations, voluntary in character and
operating with no official status, did much to conven-
tionalize finance accounting and reporting procedures
in universities and colleges.
The problems of promptness of reporting and com-
pleteness of coverage stem from the fact that only
the land-grant institutions (fewer than 4 percent of all
the institutions in the Nation) are under legal obliga-
tion to submit financial or statistical reports to the Of-
fice of Education. The percent of institutions supply-
ing usable reports within a reasonable time, however,
has increased materially in the last two or three dec-
ades, in spite of the fact that inquiries emanating
from the Office of Education have increased in num-
ber and scope. Since 1966, data have been collected
from individual colleges and universities by the High-
er Education General Information Survey and the
successor, Integrated Postsecondary Education Data
System. These survey systems allow for extensive
data checks and imputations for nonrespondents.
Response rates are generally quite high, over 90
percent, for most survey components. All of the data
in this report are for institutions of higher education
only. Institutions which do not offer a program cred-
itable towards an associate or higher level degree
are excluded.
Another problem in the compilation of historical
statistics of higher education is the double counting
of data for some institutions. Until 1916, the tabula-
tions of the Office of Education were built largely
around the various professional curricula, with the re-
sult that in many instances the data of a professional
school within a university were included both in the
overall tabulations of universities and colleges and in
those of the profession involved. With the inception
of the
Biennial Survey of Education
in 1918, the em-
phasis in tabulation was shifted to the administrative
organization, and the data relating to certain profes-
sional schools were so tabulated that any possible
duplication was identifiable without too much dif-
ficulty. Since 1932, the Office of Education has main-
tained a master list of all institutions in the Nation;
thus, the problem of duplicate tabulation is no longer
important.
Institutions reporting include universities, colleges,
professional schools, junior colleges, teachers col-
leges, and normal schools, both privately and pub-
licly controlled, regular session. The figures for insti-
tutions represent administrative organizations rather
than individual campuses, i.e., a university operating
one or more branches away from the main campus
is counted as one institution. Beginning in 1969–70,
or as noted, figures for institutions represent individ-
ual campuses. The branch campuses are counted as
individual units according to their length of program.
There is some (undeterminable) underreporting in the
earlier years. Since 1946, this underreporting has
been corrected by the use of estimated reports pre-
pared from secondary sources for nonrespondent in-
stitutions.
The term ‘‘junior college’’ is used comprehensively
to designate all institutions, of whatever curricular or-
ganization, which offer at least 2 but fewer than 4
years of college-level work immediately beyond high
school.
Faculty figures include full-time and part-time fac-
ulty members. No attempt has been made to system-
atically evaluate these services on a full-time equiva-
lent basis. Faculty figures also include the adminis-
trative, instructional, research, and other professional
personnel. Resident instructional staff, however, ex-
cluded administrative and other professional person-
nel not engaged in instructional activities.
Table 24.—Enrollment in institutions of higher
education, by sex, attendance status, and type
and control of institution: 1869–70 to fall 1991
Table 25.—Enrollment in institutions of higher
education, by state: 1869–70 to fall 1990
Source: U.S. Department of Education (Office of
Education), 1869–70 to 1915–16,
Annual Report of
the United States Commissioner of Education,
var-
ious issues; 1917–18 to 1945–46,
Biennial Survey of
Education in the United States,
various issues; and
Fall 1946 to 1990, National Center for Education Sta-
tistics,
Digest of Education Statistics,
various edi-
tions.
The term ‘‘degree-credit enrollment’’ refers to stu-
dents whose current program in an institution of high-
er education consisted wholly or principally of work
which was creditable toward a bachelor’s or higher
degree, either in the student’s own institution or by
transfer to another institution.
Table 26.—Number and professional employees
of institutions of higher education: 1869–70 to
1991–92
Source: U.S. Department of Education (Office of
Education), 1869–70 to 1915–16,
Annual Report of
the United States Commissioner of Education,
var-
ious issues; 1917–18 to 1943–44,
Biennial Survey of
Education in the United States,
various issues; and
1961–62 to 1990, National Center for Education Sta-
tistics,
Digest of Education Statistics,
various edi-
tions.
An institution of higher education is authorized and
currently offering either a 2-year or 4-year degree or
credit transferable to such an institution leading to
such a degree. In addition, such an institution must
be accredited by an agency recognized as a valid
accrediting agency by the Secretary of Education.
105Methodology
Table 27.—Number of permanent colleges and
universities founded before 1860, by decade of
founding and by state
Source: U.S. Department of Education, Higher
Education General Information Survey (HEGIS), ‘‘In-
stitutional Characteristics of Colleges and Univer-
sities,’’ unpublished tabulation.
The Department of Education has maintained a
data file on the characteristics of colleges and univer-
sities, which includes a founding date for each higher
education institution in the country. An analysis was
conducted based on the 1980–81 data file to find the
number of colleges founded prior to the Civil War.
According to the tabulation, some 381 of today’s col-
leges existed prior to 1860; however, some were
probably not providing college-level education during
that time period. This estimate seems to give a rea-
sonable measure of the number of institutions that
existed prior to 1860. The 1860 census reported that
there were 467 colleges which, after allowing for clo-
sures gives some credibility to the figure of 381 per-
manent colleges.
Table 28.—Degrees conferred by institutions of
higher education, by sex and level: 1869–70 to
1989–90
Table 29.—Bachelor’s degrees conferred by in-
stitutions of higher education, by field of study:
1959–60 to 1989–90
Table 30.—Master’s degrees conferred by insti-
tutions of higher education, by field of study:
1959–60 to 1989–90
Table 31.—Doctor’s degrees conferred by insti-
tutions of higher education, by field of study:
1959–60 to 1989–90
Table 32.—First-professional degrees conferred
by institutions of higher education in dentistry,
medicine, and law, by sex: 1949–50 to 1989–90
Source: U.S. Department of Education (Office of
Education), 1869–70 to 1952–53,
Biennial Survey of
Education in the United States, Statistics of Higher
Education,
biennial issues, and unpublished data;
1953–54 to 1989–90,
Digest of Education Statistics,
annual issues. National Research Council, Commis-
sion on Human Resources, Washington, D.C., Doc-
torate Records File.
The first-level degree (designated as ‘‘bachelor’s or
first professional’’) is defined as the first degree
granted upon completion of a course of study in a
given academic field. The degree must be based on
at least 4 years of college work or the equivalent
thereof. The same classification (namely, ‘‘first level’’)
is given to a degree, e.g., LL.B., regardless of wheth-
er the degree is based on 7 years’ preparation or
less; and regardless of whether the student had pre-
viously earned a degree in another field. The first-
level degree is ordinarily a bachelor’s degree, but im-
portant exceptions occur in certain of the profes-
sional fields. The second-level degree is a degree
beyond the first level but below the doctorate; ordi-
narily, a master’s degree. The doctorate (the highest
level of earned degrees) includes such advanced de-
grees as Ph.D., Ed.D., D.Eng., and Dr. P.H.; it in-
cludes only earned degrees, not honorary.
Although the first medical school in the United
States was established in 1765, the accuracy of data
recorded for years prior to 1900 is questionable. In-
spection and classification of medical schools was
initiated by the American Medical Association Council
on Medical Education in 1904; by 1929, there was
only one unapproved school. As far as the data per-
mit, only approved medical and basic science
schools are included. Before the founding of the first
dental school in 1840, dental work was done by
medical doctors or by persons who were self-taught
or apprentice-trained. By 1880, most states required
dental practitioners to be dental school graduates.
The Doctorate Records File is a virtually complete
source of data about persons receiving doctorates
since 1920. This survey was used as a source of
data on the average length of time required to earn
a doctor’s degree. The doctoral degrees reported are
those earned at regionally accredited U.S. univer-
sities and include such degree titles as Doctor of Phi-
losophy (Ph.D.), Doctor of Education (Ed.D.), Doctor
of Engineering (D.Eng.), etc. Professional degrees
such as Doctor of Medicine (M.D.), Doctor of Dental
Surgery (D.D.S.), and Doctor of Veterinary Medicine
(D.V.M.) are excluded.
Table 33.—Current-fund revenue of institutions
of higher education, by source of funds: 1889–90
to 1989–90
Source: U.S. Department of Education (Office of
Education), 1889–90 to 1919–10,
Annual Report of
the United States Commissioner of Education,
var-
ious issues; 1919–20 to 1959–60,
Biennial Survey of
Education in the United States,
various issues;
1961–62 to 1963–64, National Center for Education
Statistics,
Higher Education Finances,
and
unpublished data; 1965–66 to 1979–80,
Financial
Statistics of Institutions of Higher Education,
various
issues; and 1980–81 to 1989–90,
Digest of Edu-
cation Statistics,
various issues.
Total current-fund revenue represents funds accru-
ing to, or received by, higher education institutions,
usable for their recurring day-to-day activities.
Educational and general revenue are those avail-
able for the regular or customary activities of an insti-
tution which are part of, contributory to, or necessary
106 Methodology
to its instructional or research program. These in-
clude salaries and travel of faculty and administrative
or other employees; purchase of supplies or mate-
rials for current use in classrooms, libraries, labora-
tories, or offices; and operation and maintenance of
the educational plant.
Income from students’ tuition and fees represents
funds (matriculation, tuition, laboratory, library,
health, and other fees, but not charges for rooms or
meals) regularly paid by students themselves or for
them by their relatives or philanthropic groups.
Endowment income is derived from invested funds.
Only the income of the endowment funds is to be
used for the current purposes of the institution. If
funds are merely temporarily placed in the endow-
ment fund, the right to withdraw them being reserved
by the donor or the governing board of the institution
concerned, they are known as ‘‘funds functioning as
endowment’’ and are not subject to the principal of
‘‘once endowment, always endowment.’’
Private gifts and grants are voluntary contributions
from philanthropically minded individuals and organi-
zations to the various institutions of higher education.
Sales and services of educational activities and of
organized activities related to them are frequently re-
ferred to briefly as ‘‘related activities.’’ The term in-
cludes all the incidental earnings of an institution,
such as sales of livestock or dairy products of an ag-
ricultural school; tuition and other income of a labora-
tory school, a demonstration school, or a museum;
fees for care at a medical or dental clinic; and other
income of this nature derived from services directly
connected with the instructional program of the insti-
tution.
Student-aid funds are funds having to do with the
provision of scholarships, fellowships, prizes, and
student-financed aid of any type not involving em-
ployment by or repayment to the institution. Student-
aid funds may be lent to students to help them de-
fray their expenses while in school.
Other sources of income include annuity and plant
funds. Annuity funds are funds acquired subject to
the condition that the recipient institution pay a stipu-
lated sum of money annually or at other regular inter-
vals to a designated beneficiary or beneficiaries, not
necessarily the same person as the donor. These
payments continue until the death of the beneficiary
(the last beneficiary, if more than one), at which time
the principal of the fund becomes the property of the
institution. Plant funds are funds which have been or
are to be invested in buildings, grounds, furniture,
scientific equipment, or other permanent physical
property of the institution. Real estate held for direct
educational or auxiliary use by the institution is thus
part of the plant-fund group.
Income from auxiliary enterprises and activities in-
cludes income of dormitories, dining halls, cafeterias,
union buildings, college bookstores, university press-
es, student hospitals, faculty housing, intercollegiate
athletic programs, concerts, industrial plants operated
on a student self-help basis, and other enterprises
conducted primarily for students and staff and in-
tended to be self-supporting without competing with
the industries of the community in which the institu-
tion is located.
The other account of an institution of higher edu-
cation includes income which is either so incidental
in its nature, so irregular in its frequency, or so minor
in its amount as to make its classification difficult or
impractical. The most common types of other income
are probably (1) interest on current funds; (2) rent of
institutional property for noninstitutional purposes; (3)
transcript fees of students; (4) library fines; and pos-
sibly other minor items.
Table 34.—Current-fund expenditures and edu-
cational and general expenditure per student of
institutions of higher education, by function:
1929–30 to 1989–90
Source: U.S. Department of Education (Office of
Education), 1929–30 to 1959–60,
Biennial Survey of
Education in the United States,
various issues;
1961–62 to 1963–64,
Higher Education Finances,
and unpublished tabulations; 1965–66 to 1989–90,
National Center for Education Statistics,
Digest of
Education Statistics,
various issues.
Expenditure data were not tabulated for all institu-
tions of higher education until 1930. Prior to that
time, they were collected from land-grant institutions
and teacher-education institutions only. Other profes-
sional schools and non-land-grant institutions were
omitted from the surveys.
Organized research expenditures cover research
programs of sufficient magnitude to warrant carrying
them separately in the finance budget.
Plant operation and maintenance expenditures in-
clude wages of janitors and other caretakers; cost of
fuel, light, trucking of materials about the campuses,
and repairs to buildings; and other costs connected
with keeping the physical plant in good order.
Expenditures for conducting laboratory or dem-
onstration schools, medical-school hospitals, dental
clinics, home-economics cafeterias, agricultural-col-
lege creameries, college-operated industries, and
other activities closely connected with the instruc-
tional program but not actually integral parts of it are
frequently referred to briefly as ‘‘related activities.’’
Extension and public service expenditures cover
correspondence courses, radio and television
courses, adult study courses and other non-degree-
credit courses, institutes, public lectures, cooperative
extension in land-grant institutions, radio and tele-
vision stations, and similar media for carrying the
107Methodology
work of an institution beyond its traditional and cus-
tomary campus activities.
Table 35.—Value of property and endowment,
and liabilities of institutions of higher education:
1899–1900 to 1989–90
Source: U.S. Department of Education (Office of
Education), 1919–20 to 1957–58,
Biennial Survey of
Education in the United States,
various issues;
1959–60,
Statistics of Higher Education-Receipts,
Expenditures, and Property, 1959-60;
1961–62 to
1963–64,
Higher Education Finances;
1965–66 to
1985–86,
Digest of Education Statistics, 1992;
and
1986–87 to 1989–90, Integrated Postsecondary Edu-
cation Data System (IPEDS), ‘‘Finance’’ survey, sur-
vey data files.
Data represent moneys received and spent by
higher education institutions for expanding their phys-
ical holdings (land, buildings, equipment of various
sorts) held or utilized primarily for instructional, rec-
reational, or student residence purposes. Real estate
held and operated for investment purposes is not in-
cluded.
Property data represent value of all permanent or
quasi-permanent assets which include lands, build-
ings, and equipment; funds held for investment pur-
poses only (the income from such funds being avail-
able for current use); funds subject to annuity or liv-
ing trust agreements; and funds the principal of
which may be lent to students to help defray their liv-
ing expenses or tuition bills. The term ‘‘fund’’ is used
in its accounting sense of cash or other valuable as-
sets (real estate, bonds, stock certificates, and other
evidences of ownership or equity).
Table 36.—Gross domestic product, state and
local expenditures, personal income, disposable
personal income, and median family income:
1940 to 1991
Source: Gross domestic product, state and local
expenditures, personal income and disposable per-
sonal income, 1940 to 1991, Executive Office of the
President,
Economic Report of the President, Feb-
ruary 1992.
Median family income, 1947 to 1989,
U.S. Department of Commerce, Bureau of the Cen-
sus, Current Population Reports, series P-60, No.
174; and 1990, Bureau of the Census, News Re-
lease, December 30, 1991.
Table 37.—Gross domestic product deflator,
Consumer Price Index, education price indexes,
and federal budget composite deflator: 1919 to
1992
Source: Gross domestic product deflator,
Consumer Price Index, and federal budget composite
deflator, 1919 to 1992, Executive Office of the Presi-
dent,
Economic Report of the President, February
1992.
Education price indexes, Research Associates
of Washington,
Inflation Measures for Schools and
Colleges,
various issues.
