PBF206 Annual Report 2010
User Manual: PBF206
Open the PDF directly: View PDF ![]() .
.
Page Count: 156 [warning: Documents this large are best viewed by clicking the View PDF Link!]
Petroplus
Annual Report 2010
Petroplus Annual Report 2010
Financial Highlights
2010 2009 20081)2) 20071)2) 20061)2)
Selected Operating Data
Revenue inmillionsofUSD 20,735.0 14,797.8 24,302.0 10,581.0 3,797.5
Gross margin inmillionsofUSD 1,328.6 1,205.4 948.6 913.0 405.7
Net (loss)/income
from continuing operations
inmillionsofUSD (106.9) (108.8) (333.0) 206.2 104.6
Net (loss)/income inmillionsofUSD (112.3) (249.9) (516.6) 303.3 443.6
Basic earnings per shareinUSD (1.22) (3.20) (6.94) 4.22 10.06
Diluted earnings per shareinUSD (1.22) (3.20) (6.94) 4.09 9.71
EmployeesNumber 2,575 2,845 2,882 1,827 925
Total throughputinthousandsofbpd3) 596.2 529.1 4) 569.4 4) 384.8 201.0
Total productioninthousandsofbpd3) 608.3 539.6 4) 580.6 4) 391.0 202.1
Selected Statement of Financial Position
Cash and short-term
deposits
inmillionsofUSD 179.0 11.2 209.8 62.5 91.6
Current ratio5) 1.26 1.18 1.13 1.26 1.57
Net current assets6) inmillionsofUSD 656.1 397.8 341.1 832.2 648.6
Total assets inmillionsofUSD 6,769.6 6,678.3 6,914.9 7,466.8 3,014.8
Total debt inmillionsofUSD 1,692.0 1,833.4 1,881.9 1,333.1 –
Total equity inmillionsofUSD 2,003.9 1,988.0 1,987.6 2,501.5 1,555.1
Selected Share Data7)
(ISIN: CH0027752242;
Symbol: PPHN)
Issued shares at
December 31
Number 95,230,953 86,325,289 69,060,231 68,641,599 61,036,600
Nominal value inCHF 7.48 7.58 8.18 9.18 9.18
Share price: high
low
inCHF
inCHF
22.58
9.12
28.24
13.78
84.15
18.05
133.00
70.00
79.90
66.90
Share price at December 31 inCHF 12.32 19.03 20.96 87.70 74.00
Market capitalization at
December 31
inmillionsofCHF 1,173.2 1,642.8 1,447.5 6,019.9 4,516.7
1)IncludesthePetitCouronneandReichstettrefineries(acquiredonMarch31,2008),theCorytonrefinery(acquiredonMay31,2007),theIngolstadt
refinery(acquiredonMarch31,2007),theAntwerprefinery(acquiredonMay31,2006)andtheCressierrefinery.
2)The2008,2007and2006financialshavebeenre-presentedtoreflecttheimpactofdiscontinuedoperationsrelatedtotheTeessiderefiningoperations
andtheAntwerpProcessingfacility.
3)Barrelsperday(“bpd”)
4)ExcludesthroughputandproductionoftheTeessiderefinery.
5)Currentassetsdividedbycurrentliabilities.
6)Currentassetsminuscurrentliabilities(excludesnetassets/liabilitiesheldforsaleofUSD57.6millionin2009andUSD41.8millionin2006).
7)ThesharesofPetroplusHoldingsAGweretradedontheSIXSwissStockExchangeonNovember30,2006forthefirsttime.

Petroplus Holdings AG | Annual Report 2010 | 3
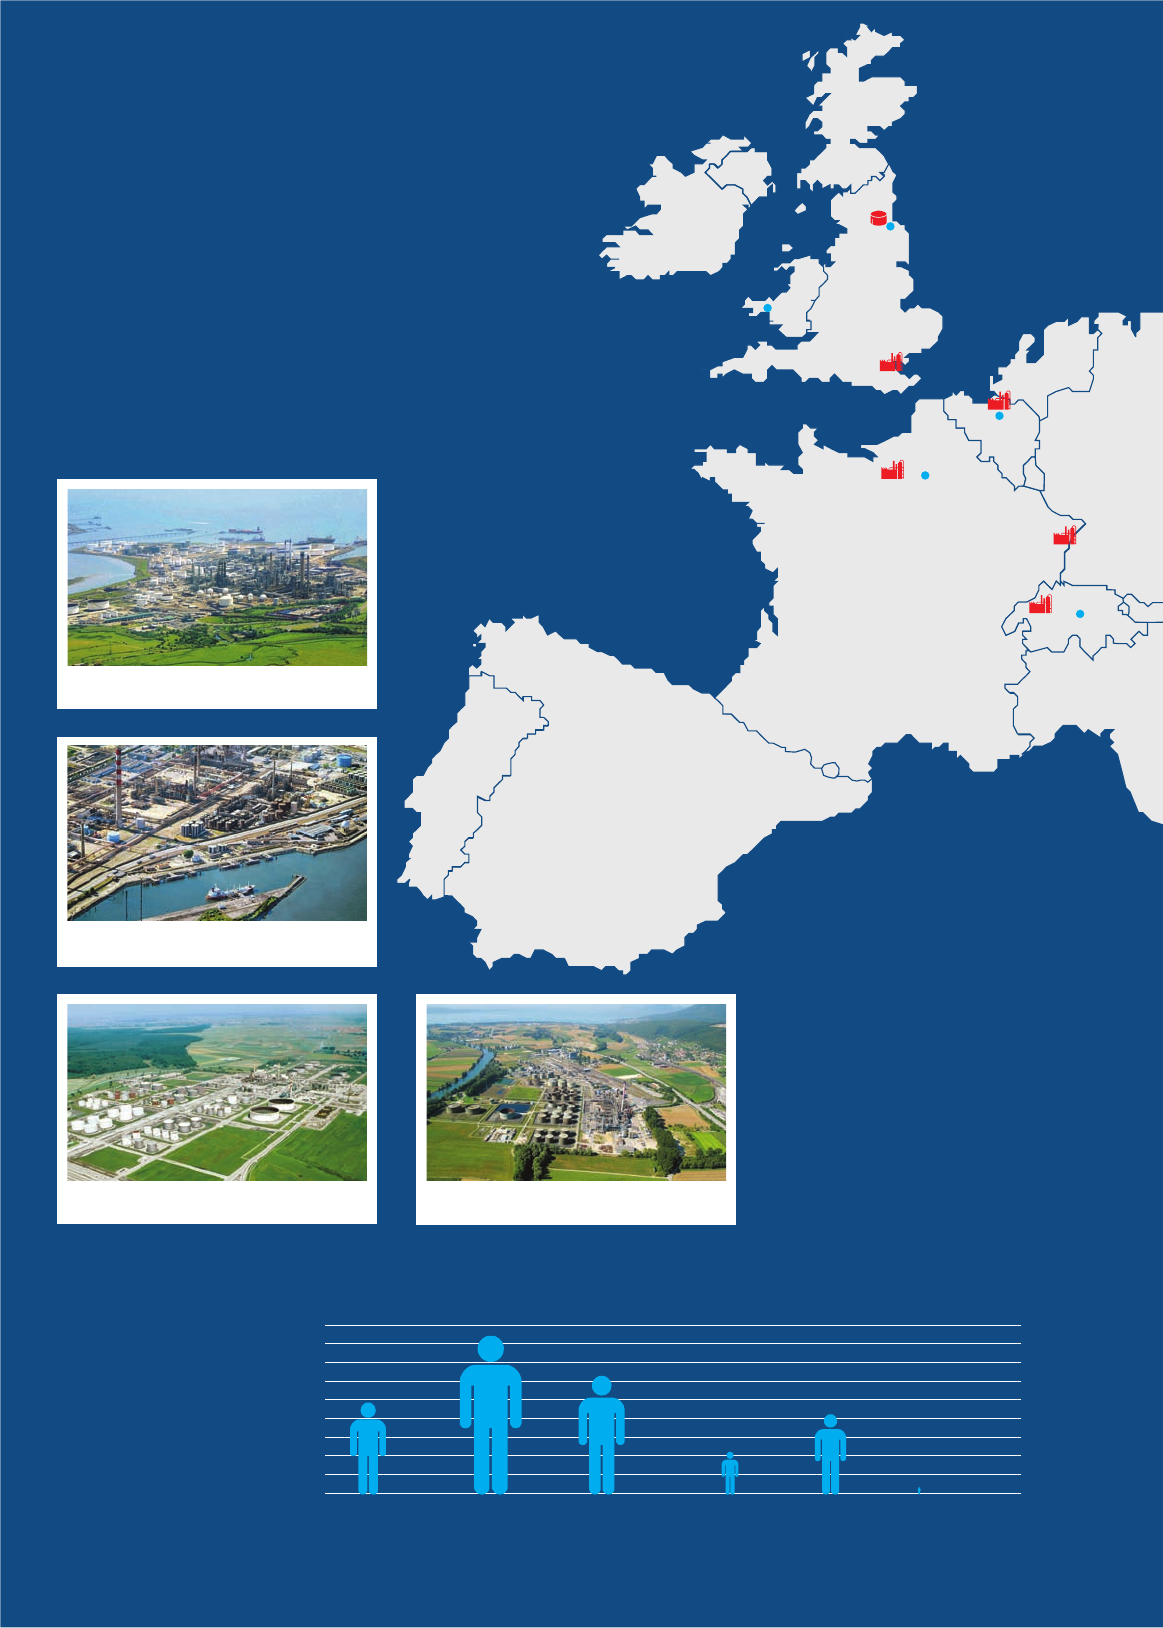
The Petroplus Company
Listed on the SIX Swiss Exchange, Petroplus Holdings AG,
together with its subsidiaries (“Petro plus”, the “Company”, the
“Group”, “we”, “our”, or “us”) focuses on refining and currently
owns and operates six refineries across Europe: The Coryton
refinery on the Thames Estuary in the United Kingdom, the
Antwerp refinery in Antwerp, Belgium, the Petit Couronne
refinery in Petit Couronne, France, the Ingolstadt refinery in
Ingolstadt, Germany, the Reichstett refinery near Strasbourg,
France, and the Cressier refinery in the canton of Neuchâtel,
Switzerland. The refineries have a combined throughput ca-
pacity of approximately 752,000 barrels per day. The Company
also owns the Teesside facility in Teesside, United Kingdom,
which operates as a marketing and storage facility.
Petroplus produces a variety of finished products including
diesel, heating oil, gasoline, aviation fuels, light and heavy fuel
oils, gasoline components and other petroleum products. We
sell our refined products on an unbranded basis to distributors
and end customers, primarily in the United Kingdom, France,
Switzerland, Germany and the Benelux countries, as well as
on the global spot market.
Our supply and distribution group, centrally based in Zug, Swit-
zerland, is responsible for all physical supply and commercial
optimization activities for our refineries. The group’s primary
goal is to optimize both the supply of crude oil and feedstocks
for each refinery and the off-take of each refinery’s petroleum
products. We source our crude oil on a global basis through
a combination of spot market purchases and short-term pur-
chase contracts. We believe purchasing based on spot mar-
ket pricing provides us flexibility in obtaining crude oil at lower
prices and on a “as needed” basis. Since all of our refineries
have access, either directly or through pipeline connections to
deepwater terminals, we have the flexibility to purchase crude
oil originating from a number of different countries.
Petroplus employs approximately 2,600 employees through-
out Europe and we consider good corporate citizenship to be
a core responsibility of our business.
Our Strategy
We are a “pure play” refiner able to source crude on a global
basis not integrated with retail outlets. As a result, we are free
to supply our products into the distribution channel or market
that we believe will maximize profit. Petroplus strives for safe
and reliable business operations and searches for opportun-
ities to expand our key business area – the refining of crude oil
and wholesale marketing of refined petroleum products.
Our Key Values
Above all else, our focus is to operate our refineries in a safe
and reliable manner. We devote significant time and resources
to improving the safety, reliability and environmental compli-
ance of our operations. We are also determined to improve
our competitiveness in the marketplace. We highly value our
employees and we are dedicated to providing them with devel-
opment opportunities throughout our organization. With these
priorities in place, our management team remains committed
to creating value for our shareholders.
Building
Shareholder
Value
Enabling
Employees
to Excel
Improving
Competi-
tiveness
Safety is
our Number 1
Priority
Welcome to Petroplus

Forward-Looking Statement
Certain portions of this document contain forward-looking statements that reflect our current judgment
regarding conditions we expect to exist and the course of action we expect to take in the future. Even though
we believe our expectations regarding future events are based on reasonable assumptions, forward-looking
statements are not guarantees of future performance. In some cases, these forward-looking statements can
be identified by the use of forward-looking terminology, including the words “aims”, “believes”, “estimates”,
“anticipates”, “expects”, “intends”, “may”, “will”, “plans”, “continue” or “should” and in each case, their nega-
tive or other variations or comparable ter mi nology or by discussions of strategies, plans, objectives, targets,
goals, future events or intentions. These forward-looking statements include all matters that are not historical
facts. Our assumptions rely on our operational analysis and expectations for the operating performance of our
assets based on their historical operating performance, management expectations as described in this report
and historical costs associated with the operations of those assets. Factors beyond our control could cause
our actual results to vary materially from our expectations and are discussed in “Outlook” and elsewhere in
this document. Any prospective financial information included in this document is not fact and should not be
relied upon as being necessarily indicative of future results, and you are cautioned not to place undue reliance
on this prospective financial information. We undertake no obligation to update any forward-looking state-
ments contained in this document as a result of new information, future events or subsequent developments,
or otherwise.
Content
6 I Letter to the Shareholders
8 I Company Overview
8 I Executive Committee
9 I Organizational Structure
10 I Petroplus at a Glance
12 I Operating and Financial Review
12 I Management Discussion and Analysis
29 I Outlook
39 I Corporate Responsibility
45 I Corporate Governance
67 I Financial Reporting
67 I Consolidated Financial Statements of Petroplus Holdings AG
135 I Statutory Financial Statements of Petroplus Holdings AG
6 | Petroplus Holdings AG | Annual Report 2010
Letter to the Shareholders
Dear Shareholders,
2010 was a better year for the refining industry and for Petroplus.
As we look back over 2010, refining margins were better as compared to 2009. Economic activity increased
throughout the year, and global oil demand recovered. The momentum from 2010 should continue into
2011. Global oil demand is expected to be up by another 1.4 million barrels per day, led by China and other
developing nations, but also with stable recovery from North America and Northwest Europe. Specifically,
the market for 2010 was different from 2009 as we saw petrochemical demand for naphtha increase both
in Europe and the Far East, thereby improving margins to make naphtha and gasoline. Distillates, which
spent most of 2009 in a very deep contango, started to improve in the second quarter as margins for gasoil
increased to over US-Dollar 10 per barrel and contango disappeared, alleviating the barrels stored both
in tank and in vessels on the water. Not as positively, in our niche inland markets, we saw a weaker Rhine
freight in 2010 versus 2009, impacting overall premiums for the gasoline and distillates sold in those markets.
Petroplus’ 2010 results strengthened over 2009. Our operating profit more than doubled, and we ended
the year in a stronger financial position with higher cash and no short-term cash borrowings. Our net
debt-to-net capitalization ratio improved from 48 % to 43 % year-over-year, and as of December 31, 2010,
we are in compliance with all financial covenants under our credit facility and bond indentures. From
an
operational perspective, we processed 25 million more barrels of crude in 2010 than in 2009, primarily
due to increased reliability across our system. While our throughput levels improved significantly, we
did face some operating challenges during the year. Our Antwerp and Cressier sites experienced major
turnarounds, and the labor strikes in France during September and October forced the shutdown of
three of our refineries due to a shortage of crude supply. Management continues to focus on increasing
the reliability of our assets as this is the key to better performance. Despite our improved financial
position and better reliability of our assets, we ended the year with a net loss on an IFRS basis.
However, these tough times give us the chance to rise to the challenge of turning Petroplus back into
a profitable company. During 2010, we have made three significant changes throughout our organization
that will enable us to move the Company forward:
First of all, we re-designed the operating structure of the Company. The new structure is designed both
to be more reactive to market opportunities and to streamline processes and reduce inefficiencies by
centralizing decision-making, optimizing our supply-chain management, and strengthening the support
functions across the organization.
Secondly, we conducted a thorough review of our portfolio of assets, resulting in some tough decisions.
We sold our interest in the investment vehicle, PBF Energy Company LLC, based in the United States.
Further, we entered into a consultation process to propose terms for a project to cease refining operations
at our Reichstett refinery. These actions are driven to free up some liquidity and focus our attention and
resources on our core business of European oil refining.
Thirdly, we have implemented our Three-Year Improvement Plan, a comprehensive program designed
to increase gross margin capture, lower operating costs, increase energy efficiency, and improve opera-
tional reliability.

Petroplus Holdings AG | Annual Report 2010 | 7
Together, these changes enable us to focus on unlocking the hidden value in our refineries. With our new,
lean organization, a streamlined asset portfolio and operational improvement program in place, we are
well-positioned to capture better results. 2010, the first year of this plan, demonstrated an overall improve-
ment of USD 1 per barrel, largely ahead of our 2012 target of USD 1.25 per barrel.
We have also made a lot of progress in the area of safety, health and environmental compliance, reducing
the number of incidents significantly over the past year. These areas continue to be a top priority for
Petroplus, and we strive to operate our refineries at the highest standards of safety. In addition, we
successfully launched our REACH compliance program, ensuring that all requirements were met at
December 1, 2010, the effective date of this new European Union legislation.
Our Board of Directors and our Executive Committee also experienced some changes during the year.
Thomas D. O’Malley, our Chairman, announced his retirement from Petroplus, effective from February 2,
2011, and is succeeded by Patrick Monteiro de Barros. Mr. de Barros has been a member of our Board
of Directors since 2006 and, during these years, served as our Vice Chairman. He brings along a proven
track record of leadership within the refining industry. We are pleased to have had Joseph D. Watson,
our new Chief Financial Officer, join us in 2010, as he brings a wealth of knowledge and background in the
refining industry. In addition, Peter F. Senkbeil joined our executive team as General Manager, Refining.
Mr. Senkbeil has an established career in the oil refining industry, including serving for many years as the
Refinery Manager at our Ingolstadt site.
As we look to 2011 and beyond, we believe that the global economy will continue to recover, led by
emerging markets but also with solid improvement from North America and Northwest Europe. We have
ambitious targets to strengthen Petroplus’ performance through our Three-Year Improvement Plan,
focusing on organic improvements that will produce measurable financial results in four key areas: Gross
Margin Capture, Energy Efficiency, Operating Expenses, and General and Administrative Costs. The
Three-Year Improvement Plan is the cornerstone for our success in the next years. Our efforts in 2010
have already provided enough improvement that we can hope we will have to increase our targets before
the end of the plan! Our management team is focused on these initiatives, and we will continue to report
the results of our efforts to our shareholders.
I thank you, our shareholders, for your loyalty and continued confidence in Petroplus. I also thank all of
the Directors for their continuing support and employees for their hard work and dedication.
I look forward to facing the challenges to come and I am confident that better times are ahead.
Kindest regards,
Jean-Paul Vettier
Chief Executive Officer
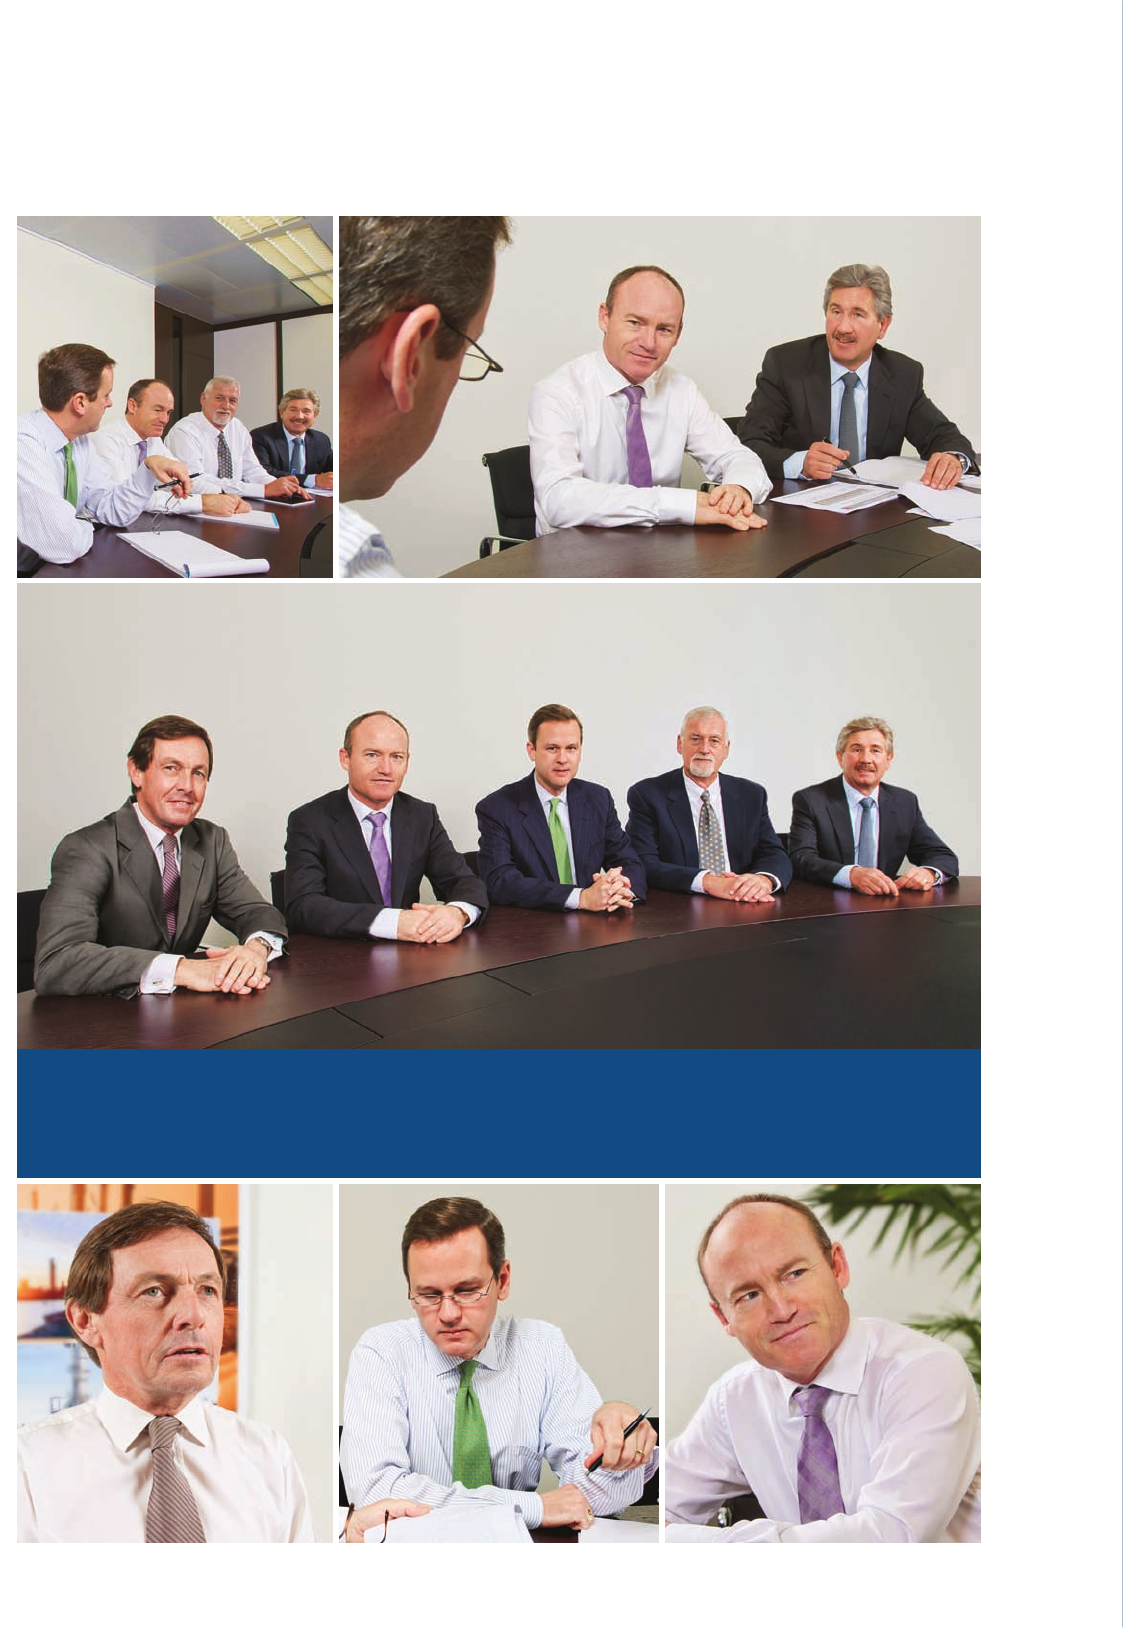
Executive Committee
Jean-Paul Vettier
Chief Executive Officer
Chester J. Kuchta
Chief Operating Officer
Joseph D. Watson
Chief Financial Officer
W. Thomas Skok
General Counsel and
Corporate Secretary
Peter F. Senkbeil
General Manager Refining
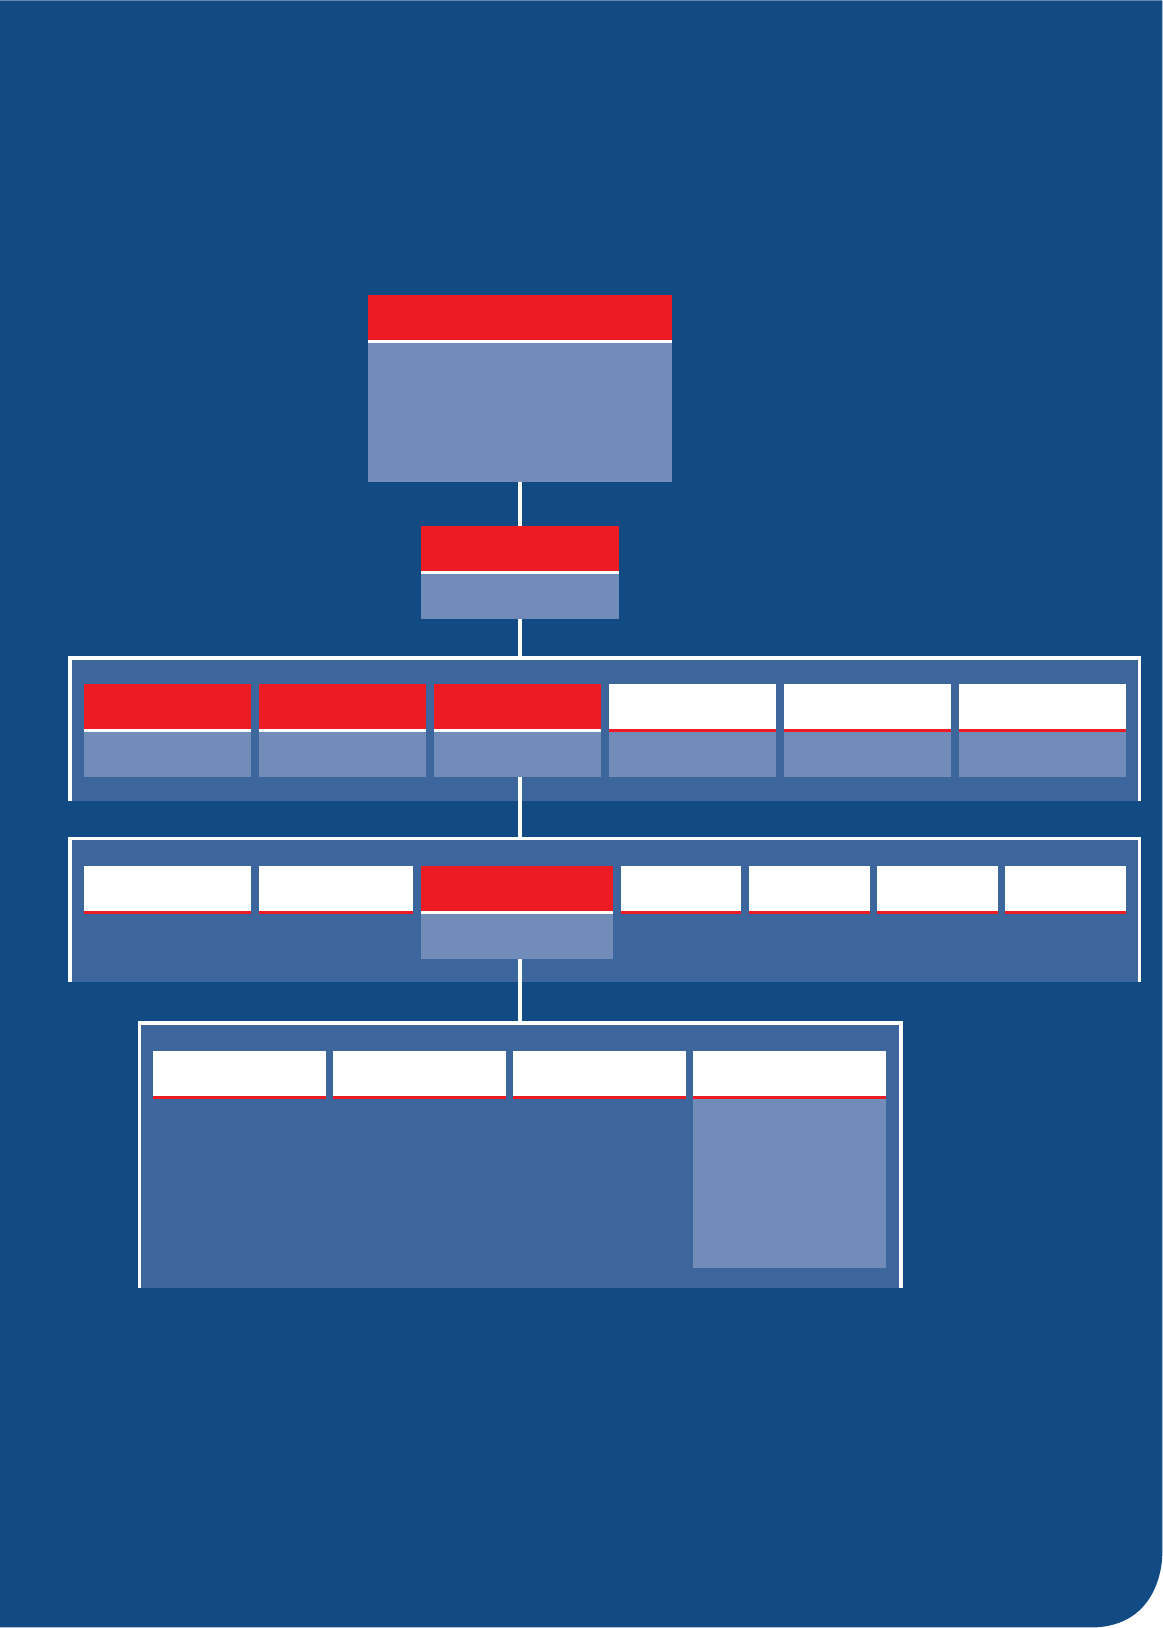
Organizational Structure
Jean-Paul Vettier*
Chief Executive Officer
Chairman:
Patrick Monteiro de Barros
(effective as of February 3, 2011)
Thomas D. O’Malley
(retired as of February 2, 2011)
Board of Directors
Joseph D. Watson*
Chief
Financial Officer
W. Thomas Skok*
General Counsel and
Corporate Secretary
Jim McCoy
Strategy & Business
Development
Crude Supply
Logistics, Quality &
Corporate Projects Procurement Wholesale
Marketing Shipping &
Scheduling Business Unit
Management
*Member of the Executive Committee
Chester J. Kuchta*
Chief
Operating Officer
Jack McDermott
Human Resources
Christophe Henrat
Risk Management
Peter F. Senkbeil*
General Manager
Refining
Safety, Health &
Environment Capital Projects Refineries
– Coryton
– Antwerp
– Petit Couronne
– Ingolstadt
– Reichstett
– Cressier
– Teesside Marketing
& Storage Facility
Technical Assistance
People
Employees
Total
2 575
Employees 2010
France
836
United Kingdom
615
Belgium
217
0
100
200
300
400
500
600
700
800
900
Switzerland
494
Germany
411
Czech Republic
2
Petroplus
at a Glance
1 Coryton Refinery
2 Petit Couronne Refinery
3 Reichstett Refinery 4 Cressier Refinery
Marketing & Sales Offices
1 Zug, Switzerland
2 Paris, France
3 Middlesbrough, United Kingdom
4 Swansea, United Kingdom
5 Antwerp, Belgium
6 Ingolstadt, Germany
7 Prague, Czech Republic
1
7
4
3
2
6
1
2
5
3
4

Results
EBIT from
continuing
operations
(in millions of USD)
Production 2010
(in percent)
2010
50 %
Middle distillates
5 % Naphtha/Petrochemicals
5 %
Solid by-products/fuel & loss
5 % LPG
10 % Fuel oil/Bitumen
27 % Gasoline
50 % Middle distillates
Throughput
(in thousands of bpd)
2010
596 200
bpd
0
150
300
450
600
569.4 529.1
2008 2009 2010
Total capital expenditures
(in millions of USD)
2010
226.9
millions of USD
0
100
200
300
400
2008 2009 2010
2010
161.7
millions of USD
0
–150
50
–100
100
–50
–200
–250
150
200
2010
2009
2008
0
1
2
3
4
5
6
2008 2009 2010
2010
3.48
USD per barrel
Petroplus Market Indicator (PMI)
(in USD per barrel)
Market
Operations
5 Ingolstadt Refinery
6 Antwerp Refinery
7 Teesside Marketing &
Storage Facility
596.2
321.5 347.7 226.9
5.17 3.482.53
–232.2
161.766.2
Excludes throughput of the Teesside refinery
5
7
6
12 | Petroplus Holdings AG | Annual Report 2010 | Operating and Financial Review
Operating and Financial Review
Management Discussion and Analysis of the Financial Condition and the Results of Operations
New Chief Financial Officer
Effective August 5, 2010, Joseph D. Watson was appointed
Chief Financial Officer (“CFO”), replacing Karyn F. Ovelmen
who resigned as CFO effective August 4, 2010.
New General Manager Refining
Effective February 2, 2010, Peter F. Senkbeil was appointed
General Manager Refining.
Main Activities during 2010
Reichstett Refinery
In the beginning of 2010, the Company launched a strategic
review of its Reichstett refinery in France to evaluate alterna-
tives for the site. The Company considered several possibili-
ties, including a potential sale, further investments to improve
its competitiveness, as well as a shutdown of refining opera-
tions and conversion to a terminal.
The process for a possible sale of the refinery concluded without
presenting any ultimate buyers, and the Company determined
that, in the current challenging refining market and capital-con-
strained environment, the Company cannot justify further size-
able capital investments in the plant. As a consequence, on Oc-
tober 21, 2010, the Company informed the Works Council of the
Reichstett refinery that it intended to commence a formal infor-
mation and consultation process to propose terms for a project
to cease refining operations and convert the site to a terminal.
The information and consultation process formally commenced
on November 24, 2010. A decision with respect to the future of
the site can and will only be made when Petroplus has received
the opinion of the Works Council which is expected around the
end of the first quarter of 2011, until which time, the refinery will
continue to operate.
Shutdowns at Refineries due to Strike Actions
During October 2010, throughput at the Petit Couronne,
Reichstett and Cressier refineries was impacted due to labor
strike actions in France.
Petroplus’ Share in Investment Vehicle PBF Energy
Company LLC
Acquisition of Delaware City Refinery Assets
On June 1, 2010, the Company’s investment vehicle, PBF En-
ergy Company LLC (“PBF”), a partnership entered into with
The Blackstone Group and First Reserve Corporation, com-
pleted its purchase of the Delaware City refinery in Delaware
City, Delaware from Valero Energy Corporation. On May 28,
2010, the Company contributed
US-Dollar (“USD”)
76.4 million
to PBF related to the purchase of the Delaware City refinery.
The following discussion and analysis is derived from, and
should be read in conjunction with, the Petroplus Holdings AG
Consolidated Financial Statements and the related notes to
those financial statements included elsewhere in this 2010 An-
nual Report. The following discussion of our financial condition
and results of operations contains forward-looking statements
that are based on assumptions about future business develop-
ments. As a result of many factors, including the risks set forth
under the caption “Risks Relating to Our Business and Our
Industry” in this 2010 Annual Report, our actual results may
differ materially from those anticipated by these forward-look-
ing statements.
Company Overview
We are the largest independent refiner and wholesaler of pe-
troleum products in Europe. We are focused on refining and
currently own and operate six refineries across Europe, spe-
cifically in the United Kingdom, Belgium, France, Germany and
Switzerland. The six refineries have a combined throughput
capacity of approximately 752,000 barrels per day (“bpd”). We
also own a marketing and storage facility, located in the United
Kingdom. We sell our refined petroleum products to distribu-
tors and end customers, primarily in the United Kingdom,
France, Switzerland, Germany and the Benelux countries, as
well as on the global spot market.
Change in Board of Directors and
Executive Committee
New Chairman of the Board of Directors
Thomas D. O’Malley’s retirement as Chairman and Member
of the Board of Directors, originally announced on December
8, 2010 and effective May 5, 2011, was brought forward to
the Petroplus Board meeting on February 2, 2011, due to the
continuing rapid development of PBF Energy Company LLC,
of which he is Chairman of the Board of Directors. Patrick
Monteiro de Barros, formerly Vice Chairman of the Board, has
succeeded Mr. O’Malley as Chairman.
With the recent sale of Petroplus’ interest in PBF Energy Com-
pany LLC and the pending development of PBF into an op-
erating Atlantic Basin oil refiner, the Petroplus Board and Mr.
O’Malley decided that, from a corporate governance perspec-
tive, it would not be advisable for him to remain as Chairman of
both organizations.

Petroplus Holdings AG | Annual Report 2010 | Operating and Financial Review | 13
Sale of Petroplus’ Share in Investment Vehicle PBF
On September 26, 2010, the Company reached an agreement
in principle with the Blackstone Group and First Reserve, its
partners in PBF, for the sale of Petroplus’ 32.62 % share of PBF
in the amount of USD 91.0 million. Cash proceeds received on
October 18, 2010, amounted to USD 81.9 million after with-
holding tax.
This transaction represents a strategic shift for the Company
mainly caused by the expected rapid expansion rate of PBF in
the United States, which would require large investments by
the Company to maintain a meaningful position in PBF and the
amount and timing of such investments would not be entirely
within the Company’s control.
Management believes it is most important to focus the Com-
pany’s resources on our core European operations and to pur-
sue strategies to improve the competitiveness of the existing
asset base.
Repayment of Nominal Share Capital
At the ordinary shareholders’ meeting of the Company which
took place on May 5, 2010, the shareholders resolved to re-
duce the share capital by CHF 0.10 per share. The entry of the
share capital reduction in the commercial register took place
on July 15, 2010, and the repayment of CHF 0.10 per regis-
tered share was paid to shareholders on July 26, 2010.
Issuance of Shares
During May 2010, the Company completed a private place-
ment whereby the Company issued 8,650,000 new registered
shares from existing authorized capital. The shares were sold
at a price of CHF 17.50. The first trading day of the new shares
was May 7, 2010. The gross proceeds amounted to USD 136.4
million, excluding share issue costs of USD 5.6 million.
Sale of PBF generates
USD 81.9 million in cash
in 2010
Discontinued Operations
Sale of the Antwerp Processing Facility
On October 23, 2009, the Company entered into a definitive
agreement
with Eurotank Belgium B.V., a wholly-owned sub-
sidiary of
Vitol Tank Terminals International B.V., part of the
Vitol Group of companies (“Vitol”) for the sale of Petroplus Re-
fining Ant werp N.V. and Petroplus Refining Antwerp Bitumen
N.V. (the “Antwerp Processing facility”). The sale was closed
on January 12, 2010. The proceeds received were USD 56.3
million, including hydrocarbon inventory on site.
Operations of the Teesside Refinery
Due to the low complexity configuration of the facility, the un-
favorable market environment and the significant regulatory
capital expenditures required to maintain refinery operations,
we suspended the Teesside facility’s refining operations in No-
vember 2009. The refinery had been shut down for economic
reasons since the second quarter of 2009. During 2010, the
refinery was converted to a marketing and storage facility. The
refinery’s 117,000 bpd throughput capacity had represented
approximately 14 % of our combined throughput capacity.
The results of the above operations, including impairment
charges recorded in 2009, have been reclassified to the sepa-
rate line item “Discontinued operations” in our Consolidated
Statement of Comprehensive Income for the years ended De-
cember 31, 2010 and 2009.
Successful Sale
of Antwerp Processing
Facility completed in
January 2010
14 | Petroplus Holdings AG | Annual Report 2010 | Operating and Financial Review
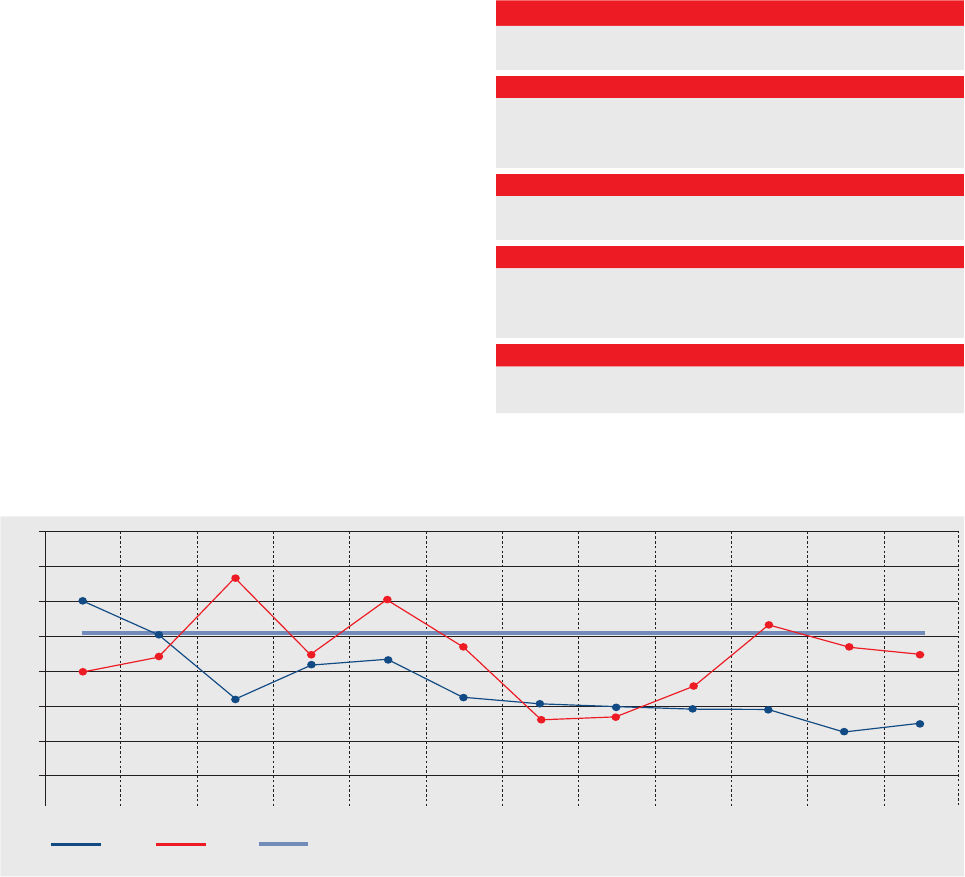
Market and Benchmark Indicators
PMI – An Indicator of the Market
At the beginning of 2010, Petroplus developed a tool, the
Petroplus Market Indicator (“PMI”), which gives a “flavor” of
the refining margin environment. The PMI is a daily indicator
and is structured on a typical refinery in Northwest Europe
(“NWE”). It simulates the possible refining margin for a hypo-
thetical Topping/Reforming/Cracking/Visbreaking refinery lo-
cated on the sea with an average crude distillation capacity
of 100,000 bpd. The model uses a crude basket consisting of
four crude oils (13 % Bonny Light, 40 % Urals, 12 % CPC, 35 %
Forties) typically processed by NWE refiners. The PMI index
is calculated and reported after variable costs. While the PMI
does not reflect the Company’s actual refining margin, it does
give an indication of the current market condition. Petroplus
refinery margins may be better or worse than the PMI depend-
ing on, among other factors, location, configuration, crude diet
and specialties. The PMI for 2010 was USD 3.48 per barrel
versus USD 2.53 per barrel for 2009. The market in 2010 has
improved but is still below historical crack levels.
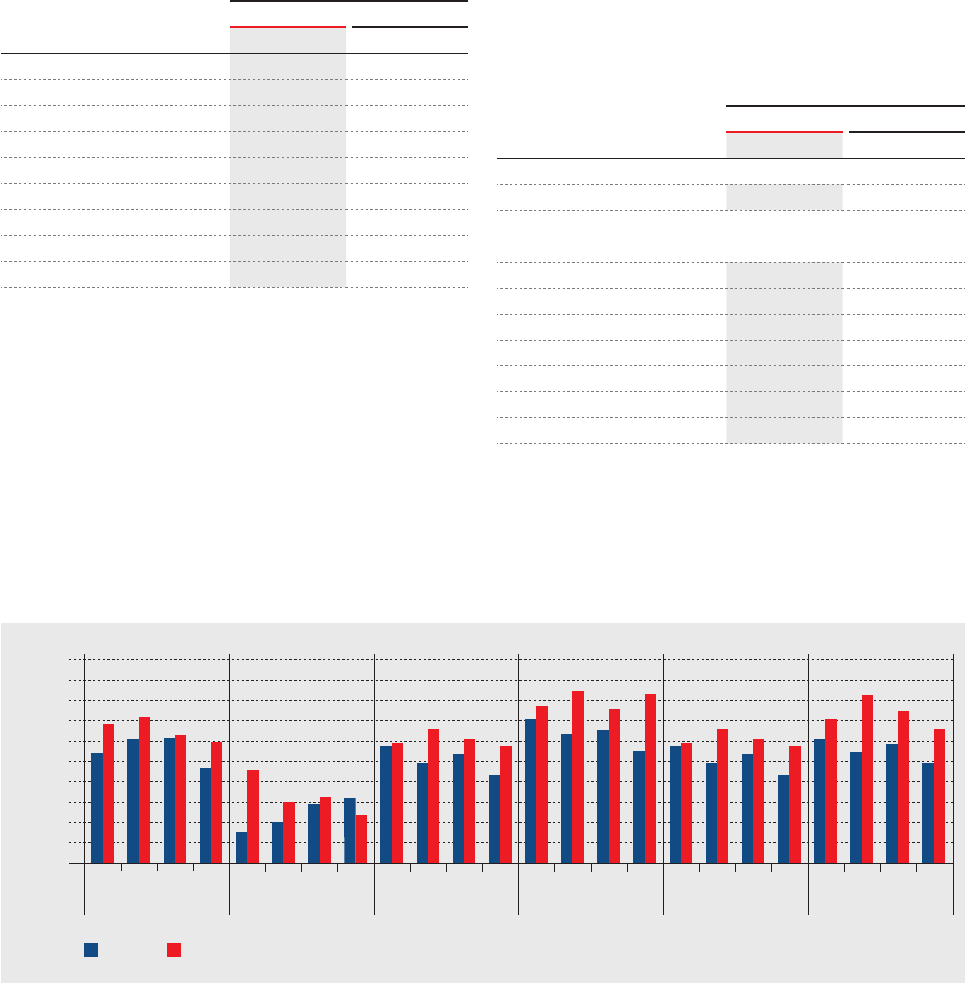
Benchmark Refining Margin Indicators
In addition to utilizing the PMI as an indicator of the current
market, we assess our operating performance by comparing
the refining margins (revenue less materials cost) of each of
our refineries against a specific benchmark industry refining
margin based on crack spreads. Benchmark refining margins
take into account both crude and refined petroleum product
prices. When these prices are combined in a formula, they
provide a single value – a gross margin per barrel – that, when
multiplied by a throughput number, provides an approximation
of the gross margin generated by refining activities.
As the performance of our refineries does not closely follow
any of the currently published industry benchmark refining
margins, we have created benchmark refinery margins, based
upon publicly available pricing information, for each of our re-
fi neries that more closely reflect each of our refineries’ actual
performance.
The benchmark refining margins for the six refineries we oper-
ated during the year 2010 are set forth in the following table:
Coryton Refinery 5/2/2/1
five Dated Brent/two gasoline/two ULSD/one 3.5 % fuel oil
Antwerp Refinery 6/1/2/2/1
six Dated Brent/one gasoline/two gasoil/two VGO/
one 3.5 % fuel oil
Petit Couronne and Reichstett refineries 4/1/2/1
four Dated Brent/one gasoline/two ULSD/one 3.5 % fuel oil
Ingolstadt Refinery 10/1/3/5/1
ten Dated Brent/one naphtha/three gasoline/five ULSD/one
3.5 % fuel oil
Cressier Refinery 7/2/4/1
seven Dated Brent/two gasoline/four gasoil/one 1 % fuel oil
7
6
5
4
3
2
1
0
DecNov
Petroplus Market Indicator (“PMI”) – On a Monthly Basis1)
2009 2010 Avg 2006–2010 Monthly average of daily prices during the relevant month
Jan Feb Mar Apr May Jun Jul Aug Sep Oct
USD/bbl
1)The PMI is NOT the Petroplus Margin. Petroplus margin may be better or worse depending on location configuration, crude diet, specialties, etc.
Petroplus Holdings AG | Annual Report 2010 | Operating and Financial Review | 15
The following table provides the average price of Dated Brent,
PMI and benchmark refining margin indicators by refinery for
the years ended December 31, 2010 and 2009. The bench-
mark refining margins are expressed in USD per barrel and
serve as proxy for the per barrel margin that a Dated Brent
crude oil refinery situated in NWE would earn assuming it sold
the benchmark production for the relevant refinery margin:
Benchmark Refining Margin Indicators
While the benchmark refinery margins presented in the table
above are representative of the results of our refineries, each
refinery’s realized gross margin on a per barrel basis will
differ from the benchmark due to a variety of factors affecting
the performance of the relevant refinery to its corresponding
benchmark. These factors include the refinery’s actual type of
For the year ended December 31,
(in USD per barrel) 2010 2009
Dated Brent 79.73 62.04
Petroplus Market Indicator1) 3.48 2.53
Benchmark refining margins
5/2/2/1 Coryton6.43 5.50
6/1/2/2/1 Antwerp 3.25 2.36
4/1/2/1 Petit Couronne5.96 4.99
10/1/3/5/1 Ingolstadt7.88 6.28
4/1/2/1 Reichstett5.96 4.99
7/2/4/1 Cressier 7.21 5.50
1)Net of variable operating costs.
crude oil throughput, product yield differentials and any other
factors not reflected in the benchmark refining margins, such
as transportation costs, fuel consumed during production
and any product premiums or discounts, as well as inventory
fluctuations, timing of crude oil and other feedstock purchases,
a rising or declining crude and product pricing environment
and commodity price management activities.
The following table sets forth historical benchmark crude and
refined petroleum product pricing information used in calcu-
lating each of our refineries’ benchmark refining margins:
Reference Benchmark Crude and Product Prices
For the year ended December 31,
(in USD per barrel) 2010 2009
Crude Oil1)
Dated Brent 79.73 62.04
Products Differential to Dated Brent1)
Naphtha 0.23 (2.05)
95 RON gasoline 8.33 7.55
ULSD 12.68 9.93
Gasoil2) 10.07 7.33
VGO 0.44 (0.30)
1 % Fuel Oil (6.44) (5.89)
3.5 % Fuel Oil (9.85) (7.44)
Source: Bloomberg
1)Average of daily prices for trading days during the relevant period.
2)Based on the quoted price for heating oil.
Benchmark Refining Margin Indicators by Petroplus Refineries – On a Quarterly Basis
$10.00
$ 8.00
$ 6.00
$ 4.00
$ 2.00
Sources: Bloomberg, Platt’s
Coryton Antwerp Petit Couronne Ingolstadt Reichstett Cressier
Q1 Q2 Q3 Q4 Q1 Q2 Q3 Q4 Q1 Q2 Q3 Q4 Q1 Q2 Q3 Q4 Q1 Q2 Q3 Q4 Q1 Q2 Q3 Q4
2009 2010
16 | Petroplus Holdings AG | Annual Report 2010 | Operating and Financial Review
Commodity Price Management
The nature of our business requires us to maintain a sub-
stantial investment in petroleum inventories. Since petroleum
feedstocks and products are global commodities, we have no
control over the changing market value of these inventories.
To supply our refineries with crude oil on a timely basis, we
enter into purchase contracts that fix the price of crude oil from
one to several weeks in advance of receiving and processing
that crude oil. In addition, as part of our marketing activities
we may enter into fixed price contracts for sales of our refined
petroleum products in advance of producing and delivering
the products. Prior to delivery of the crude oil and sale of
the related refined petroleum products, the market value of
the crude oil and products may change as prices related to
the fixed purchase and sale commitments rise and fall.
On average, throughout 2010, we have held approximately
21 million barrels of crude and product inventory on hand.
This level fluctuates on a daily basis, depending on timing
of crude purchases and product sales, operations and op-
timization of crude and product pricing. We are exposed to
the fluctuation in crude and product pricing on the inventory
we hold. Currently, we primarily use a commodity price
management program to manage the fluctuation associated
with commodity pricing on a defined volume of inventory.
Under this program we enter into commodity Intercontinental
Exchange (“ICE”) futures contracts and counterparty swaps
to lock in the price of certain commodities.
Most derivative transactions are not designated as effective
hedges, therefore any gains or losses arising from changes in
the fair value of these instruments are recorded in our Consoli-
dated Statement of Comprehensive Income in the line item “Ma-
terials cost”. Our derivative contracts are classified as derivative
instruments and are recorded in our Consolidated State-
ment of Financial Position at fair market value. We currently
do not enter into material derivative financial instruments for
speculative transactions and do not hedge our Group refining
margin. This strategy is continually reviewed and adapted
for current economic and market conditions.
As noted above, our refineries’ results will differ from the
reference benchmarks due to our hedging or commodity price
management activities.
Factors Affecting Operating Results
Overview
Our earnings and cash flows from operations are primarily
affected by the relationship between refined product prices
and the prices for crude oil and other feedstocks. The cost to
acquire crude oil and other feedstocks and the price of refined
petroleum products ultimately sold depend on numerous fac-
tors beyond our control, including the supply of, and demand
for, crude oil, gasoline, diesel and other refined petroleum pro-
ducts, which, in turn, depend on, among other factors, changes
in global and regional economies, weather conditions, global
and regional political affairs, production levels, the availability
of imports, the marketing of competitive fuels, pipeline capac-
ity and availability, prevailing exchange rates and the extent of
government regulation. Our revenue and operating income fluc-
tuate significantly with movements in refined petroleum product
prices; our materials costs fluctuate significantly with move-
ments in crude oil prices and our other operating expenses
fluctuate with movements in the price of energy to meet the
power needs of our refineries. In addition, the effect of changes
in crude oil prices on our operating results is influenced by how
the prices of refined products adjust to reflect such changes.
Crude oil and other feedstock costs and the prices of refined pe-
t roleum products have historically been subject to wide fluctua-
tions. Expansion and upgrading of existing facilities and installa-
tion of additional refinery distillation or conversion capacity, price
volatility, international political and economic developments and
other factors beyond our control are likely to continue to play
an important role in refining industry economics. These factors
can impact, among other things, the level of inventories in the
market, resulting in price volatility and a reduction or increase in
product margins. Moreover, the industry typically experiences
seasonal fluctuations in demand for refined petroleum products,
such as for gasoline and diesel, during the summer driving sea-
son and for home heating oil during the winter.
There is a lag between the time we purchase crude oil to the
time we process and sell finished refined products. Timing
of purchases depends on a number of factors, including the
relevant refinery’s planned throughput, unit disruptions which
may cause usage of lighter and sweeter crude oil and avail-
ability of crude oil. Unplanned downtime has a more economic
impact due to the disruption to the refinery’s normal operating
throughput, which results in a longer time lag between pur-
chases and processing of crude oil. In addition, during un-
planned downtime the timing of crude purchases is disrupted;
which may cause a significant impact on realized gross margin.
Petroplus Holdings AG | Annual Report 2010 | Operating and Financial Review | 17
Our operating results are also affected by safety, reliability and
the environmental performance of our refinery operations. Un-
planned downtime of our refinery assets generally results in
lost margin opportunity and increased maintenance expense.
The financial impact of planned downtime, such as major turn-
around maintenance, is managed through a planning process
that considers such things as, but not limited to, the margin
environment, the availability of resources to perform the need-
ed maintenance and feedstock logistics.
Foreign Currency Fluctuation Management
We are a USD functional currency Company as the majority of
our financing activities and costs of sales are incurred in USD.
We are primarily exposed to the fluctuation in the USD versus
the Swiss Franc (“CHF”), Euro (“EUR”) and the British Pound
(“GBP”) as our local marketing sales are invoiced in local cur-
rencies, and a portion of our local capital expenditures, oper-
ating and personnel costs are incurred in local currencies. We
are also exposed to foreign currency risk because certain of our
assets and liabilities are denominated in currencies other than
USD. To manage foreign currency exposure risk, we enter into
both swaps and forward derivative contracts. As we have not
currently designated our derivative financial instruments as ef-
fective hedges, any gains or losses arising from changes in the
fair value of these instruments are recorded in our Consolidated
Statement of Comprehensive
Income. The Company does not
use derivative contracts to
manage fluctuations on personnel
and operating costs.
Credit Risk Management
Credit risk refers to the risk that a counterparty will default
on its contractual obligations resulting in financial loss to the
Company. Our exposure to credit risk is represented by the
carrying amount of cash and receivables that are presented
in the Consolidated Statement of Financial Position, including
derivatives with positive market values. To minimize credit risk,
all customers are subject to credit verification procedures and
extensions of credit above defined thresholds are subject to
an approval process. We also maintain relationship with sev-
eral different banks in order to minimize our concentration of
risk. Our intention is to grant trade credit only to recognized
creditworthy third parties. In addition, receivable balances are
monitored on an ongoing basis. We also limit the risk of bad
debts by obtaining bank securities such as guarantees or let-
ters of credit and credit insurance.
Other Factors
Our operating cost structure is also important to our profitabil-
ity. Major operating costs include costs relating to employees
and contract labor, energy, maintenance and environmental
compliance. The predominant variable costs are energy re-
lated, in particular, the price of electricity and natural gas. In
addition, operating costs will vary with movements in foreign
currency.
18 | Petroplus Holdings AG | Annual Report 2010 | Operating and Financial Review
2010 Compared to 2009
The following table provides the Consolidated Financial Income
data of Petroplus Holdings AG.
Financial income data
For the year ended December 31,
(in millions of USD) 2010 2009
Revenue 20,735.0 14,797.8
Materials cost (19,406.4) (13,592.4)
Gross margin 1,328.6 1,205.4
Personnel expenses (351.9) (351.1)
Operating expenses (439.8) (451.2)
Depreciation and
amortization
(338.8) (282.1)
Other administrative
expenses
(42.7) (55.7)
Operating profit 155.4 65.3
Financial expense, net (186.5) (164.6)
Foreign currency exchange
(loss)/gain
(2.2) 2.5
Share of income/(loss)
from associates
8.5 (1.6)
Loss before income taxes (24.8) (98.4)
Income tax expense (82.1) (10.4)
Net loss from continuing
operations
(106.9) (108.8)
Loss from discontinued
operations, net of tax
(5.4) (141.1)
Net loss (112.3) (249.9)
Other financial data
EBITDA1) 500.5 348.3
Net loss per share available to shareholders(in USD):
Basic (1.22) (3.20)
Diluted (1.22) (3.20)
1)Earnings before Interest, Tax, Depreciation and Amortization (“EBITDA”)
from Continuing Operations.
Overview
Our operating profit from continuing operations was USD
155.4 million for the year ended December 31, 2010 as com-
pared to an operating profit of USD 65.3 million for the same
period in 2009. Our net loss from continuing operations for
the year ended December 31, 2010 was USD 106.9 million
as compared to a net loss from continuing operations of
USD 108.8 million for the same period in 2009. Our net loss
after discontinued operations attributable to shareholders was
USD 112.3 million (USD 1.22 per share) for the year ended De -
cember 31, 2010 as compared to a net loss of USD 249.9 mil-
lion (USD 3.20 per share) for the same period in 2009. The
net loss in 2010 is mainly attributable to the low, but improved
refining margin environment compared to 2009, and tax im-
pacts resulting from the movement in foreign exchange rates.
Additionally, tax expense was impacted by derecognized and
unrecognized tax losses.
The loss from discontinued operations of USD 5.4 million for
the year ended December 31, 2010 related mainly to the sale
of the Antwerp Processing facility in January 2010, whereas
the loss of USD 141.1 million in 2009 related to discontinued
operations related to the Antwerp Processing facility and the
Teesside refinery.
Revenue
Our revenue increased by USD 5,937.2 million, or 40.1 %, to
USD 20,735.0 million for the year ended December 31, 2010
from USD 14,797.8 million for the year ended December 31,
2009. The increase in revenue is mainly attributable to higher
refined petroleum product prices and increased volumes sold
during 2010 compared to the same period in 2009.
Gross Margin
Our gross margin from continuing operations increased by
USD 123.2 million, or 10.2 %, to USD 1,328.6 million for the
year ended December 31, 2010 from USD 1,205.4 million for
the year ended December 31, 2009. Market conditions im-
proved significantly in 2010 compared to 2009, as reflected in
the PMI which increased by 38 % from USD 2.53 per barrel in
2009 to USD 3.48 per barrel in 2010. This market improvement
is reflected in our gross margin in 2010 which was marked by
positive impacts from increasing global oil demand, improved
refining margin cracks for gasoline and middle distillates, in-
creased throughput and rising oil prices. These impacts were
partially offset by higher cost of fuel consumed by our refiner-
ies due to the increased crude oil price environment. Addition-
ally, gross margin in 2010 was further impacted by the turn-
arounds at the Cressier and Antwerp refineries. Gross margin
in 2009 was impacted by lower refining cracks and reduced
Petroplus Holdings AG | Annual Report 2010 | Operating and Financial Review | 19
throughput at the Cressier and Reichstett refineries due to the
August 2009 incident at the Société du Pipeline Sud-Européen
(“SPSE”) pipeline. Gross margin in 2009 was further impacted
by reduced throughput at the Coryton refinery due to a major
turnaround and a turnaround at the Reichstett refinery.
The 5/2/2/1 benchmark refining margin for the Coryton refin-
ery increased 17 % for the year ended December 31, 2010 as
compared to the same period in 2009 as a result of increased
ULSD and gasoline cracks partially offset by decreased fuel oil
cracks to Dated Brent. The 6/1/2/2/1 benchmark refining mar-
gin for the Antwerp refinery increased 38 % for the year ended
December 31, 2010 as compared to the same period in 2009
as a result of improved gasoil, gasoline and VGO cracks partial-
ly offset by a decline in fuel oil cracks. The 4/1/2/1 benchmark
refining margin for the Petit Couronne and Reichstett refiner-
ies increased 19 % for the year ended December 31, 2010 as
compared to the same period in 2009 as a result of increased
ULSD and gasoline cracks partially offset by decreased fuel
oil cracks to Dated Brent. The 10/1/3/5/1 benchmark refining
margin for the Ingolstadt refinery increased 25 % for the year
ended December 31, 2010 as compared to the same period in
2009. The increase was primarily due to improved ULSD and
gasoline cracks. The 7/2/4/1 benchmark refining margin for the
Cressier refinery increased 31 % for the year ended December
31, 2010 as compared to the same period in 2009 as a result
of higher gasoil and gasoline cracks.
Inland market premiums during 2010 declined compared to
2009. The Cressier refinery earns premiums to market prices,
in part based on the freight rates on the Rhine river, which
is the means of transport for Swiss customers purchasing
refined product from the ARA region. In 2010, Rhine Freight
averaged approximately CHF 18 per ton as compared to
CHF 31 per ton in 2009. In Germany, many of our refined prod-
ucts are based on an Oil Market Report (“OMR”) price. The
average OMR price premium to Platt’s middle distillates dur-
ing 2010 was USD 6 per barrel as compared to an average of
USD 7 per barrel during 2009.
Fuel consumed in the production process has a negative im-
pact on our realization of the benchmark refining margin, fluc-
tuating with the absolute crude price. Dated Brent increased
from approximately USD 62 per barrel on average in the year
ended December 31, 2009 to approximately USD 80 per barrel
in the year ended December 31, 2010. The increase of about
USD 18 per barrel resulted in higher cost of fuel consumed by
the refineries (representing approximately 5 % across our refin-
ing system) which negatively impacted our realized margin by
approximately USD 0.90 per barrel.
We use a commodity price management program to man-
age a small portion of our exposure to fluctuations in com-
modity pricing. Under this program, we enter into commodity
ICE futures contracts and counterparty swaps to lock in the
price of certain commodities. Any gains or losses arising from
changes in the fair value of these instruments are recorded in
our Consolidated Statement of Comprehensive Income in the
line item “Materials cost”. Materials cost included a derivative
gain of USD 21.9 million in 2010 and a loss of USD 5.7 million
in 2009.
Personnel Expenses
Our personnel expenses increased by USD 0.8 million to
USD 351.9 million for the year ended December 31, 2010 from
USD 351.1 million for the same period in 2009. Personnel
costs for the year ended December 31, 2010 were positively
impacted by the strengthening of the USD as personnel costs
are paid in various local currencies, such as the EUR and GBP.
However, this impact was more than offset by higher incen-
tive compensation accrued due to improved Company perfor-
mance in 2010 and termination benefits paid.
Operating Expenses
Our operating expenses decreased by USD 11.4 million to
USD 439.8 million for the year ended December 31, 2010 from
USD 451.2 million for the same period in 2009. The decrease
is mainly attributable to lower maintenance expenses in 2010
due to reduced use of contractors and lower levels of un-
planned maintenance activities than 2009. In addition, operat-
ing expenses were positively impacted by the strengthening
of the USD versus the EUR and GBP in 2010 as compared to
2009, as a significant portion of variable costs such as chemi-
cals and energy, are paid in local currencies. The decrease
was partially offset by higher consumption of natural gas dur-
ing 2010 as the Coryton refinery faced a major turnaround in
2009. Additionally, for economic reasons, we purchased more
natural gas to fuel refinery operations which allowed us to re-
cover and sell our higher-valued, internally produced Liquefied
Petroleum Gas (“LPG”).
Depreciation and Amortization
Our depreciation and amortization expenses increased by
USD 56.7 million, to USD 338.8 million for the year ended De-
cember 31, 2010 from USD 282.1 million for the same period in
2009. The increase in depreciation is mainly attributable to ad-
ditional capital expenditures associated with the turnarounds
at the Coryton and Reichstett refineries in the fourth quarter
of 2009.
20 | Petroplus Holdings AG | Annual Report 2010 | Operating and Financial Review
Other Administrative Expenses
Our other administrative expenses decreased by USD 13.0
million to USD 42.7 million for the year ended December 31,
2010 from USD 55.7 million for the same period in 2009. This
decrease is mainly attributable to a reduction in third party
service fees, including external legal expenses, and reduced
insurance premiums.
Financial Expense, Net
Our net financial expense increased by USD 21.9 million to
USD 186.5 million for the year ended December 31, 2010 from
USD 164.6 million for the same period in 2009. The increase in
2010 is mainly attribut able to higher interest expenses result-
ing from the Company’s refinancing activities which were com-
pleted in October 2009 and partly offset by lower bond accre-
tion expenses during 2010. In addition, expenses increased
related to letter of credit fees due to the higher crude oil price
environment and a one-time fee payment of USD 5.3 million in
the first quarter of 2010 for the Revolving Credit Facility (“RCF”)
covenant waiver.
Foreign Currency Exchange Loss/Gain
Our foreign currency exchange results show a loss of USD 2.2
million for the year ended December 31, 2010 as compared to
a gain of USD 2.5 million for the same period in 2009. The loss
mainly represents the revaluation of certain CHF, GBP and
EUR monetary items against the USD.
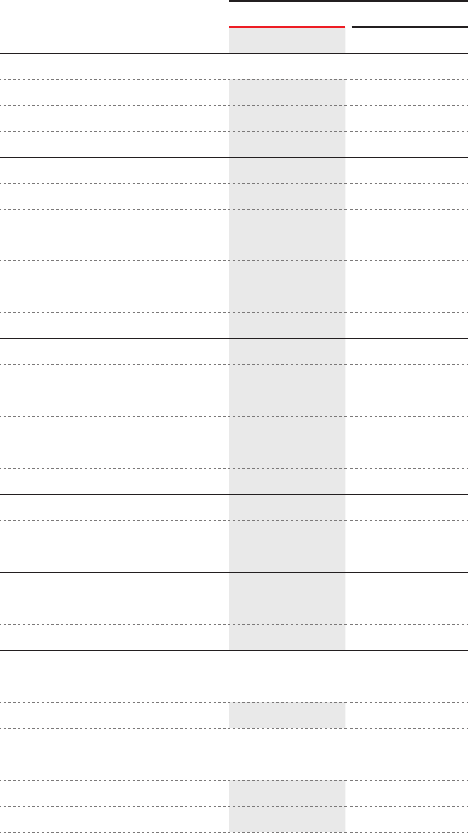
Coryton
Throughput in 2010 was impacted by a
planned catalyst change at the naph-
tha desulfurization unit and unplanned
maintenance at the reformer.
Throughput in 2009 was mainly impact-
ed by the fourth quarter planned major
turnaround, which lasted 72 days.
Antwerp
Throughput in 2010 was impacted by a
planned refinery-wide turnaround during
the second quarter. The restart was de-
layed and carried over into July. During
the last quarter, run rates were impacted
by an unplanned shutdown of the hydro-
desulfurization unit.
Throughput in 2009 was impacted by
planned and unplanned maintenance
throughout the year.
Petit Couronne
Throughput in 2010 was impacted by
planned and unplanned shutdowns of
the hydrodesulfurization and lube unit
and by unplanned maintenance at the
vacuum tower in the second quarter.
During the third and fourth quarter, run
rates were reduced as a result of strike
actions in France.
Throughput in 2009 was reduced as a
result of planned maintenance activities
and an unplanned shutdown of the fluid
catalytic cracking unit late in the year.
Refinery Operations – Throughput by Refinery
(in thousands of bpd)
2009 20092010 2010
81.2 111.7
2009
145.7 88.8 122.3
2010
181.2
Petroplus Holdings AG | Annual Report 2010 | Operating and Financial Review | 21
Income Tax Expense
Our income tax expense increased by USD 71.7 million to USD
82.1 million for 2010 as compared to an expense of USD 10.4
million for 2009. The tax rate was impacted by non-cash tax
effects resulting from the movement in foreign exchange rates
and lower realized refining margins. Additionally, the tax rate
was impacted by derecognized and unrecognized tax losses.
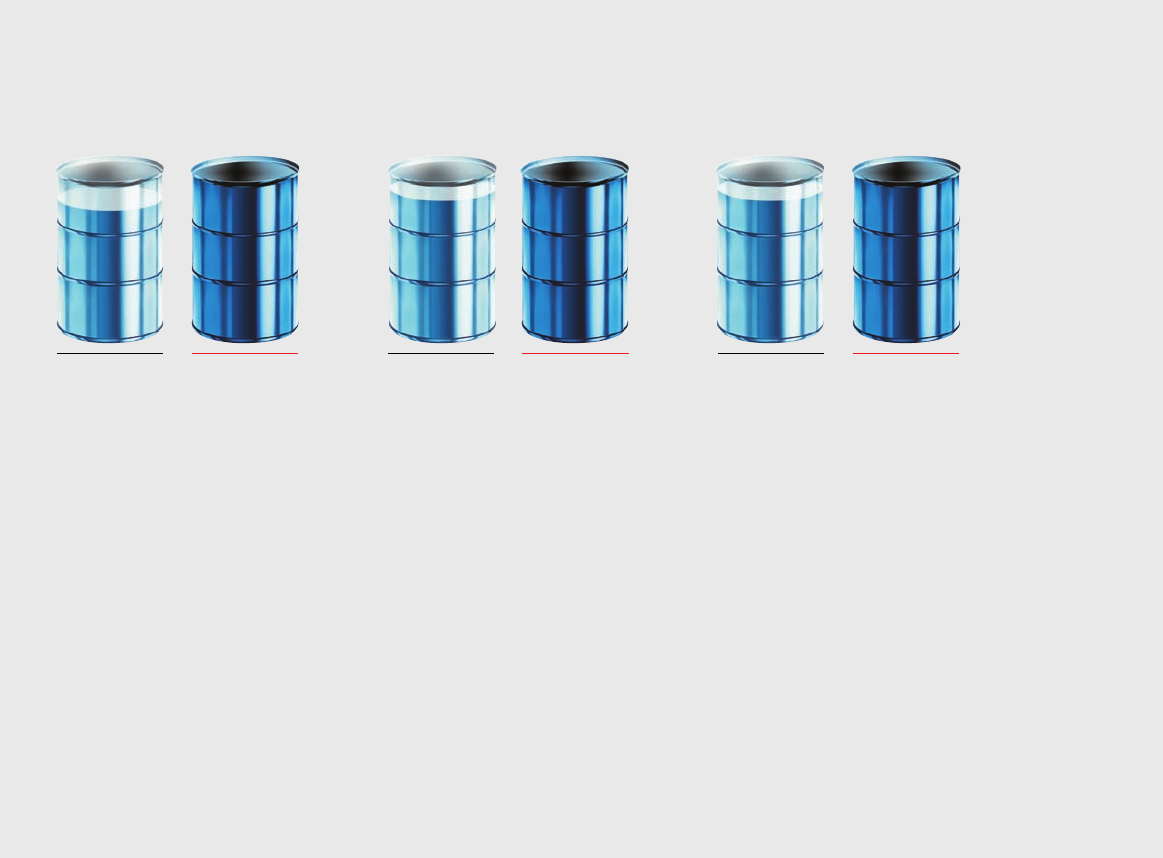
Ingolstadt
Throughput in 2010 was impacted by a
planned reformer catalyst regeneration
and planned catalyst changes at hydro-
desulfurization units.
Throughput in 2009 was reduced as a
result of planned downtime on the re-
former unit and minor unplanned down-
time.
Reichstett
Throughput in 2010 was impacted
by a planned fluid catalytic cracking
unit turnaround followed by a delayed
start-up. Furthermore, operations were
affected during the first quarter by un-
planned repairs on the debutanizer col-
umn. During the third and fourth quar-
ter, run rates were reduced as a result of
strike actions in France.
T
hroughput in 2009 was impacted by the
incident at the SPSE pipeline, which lim-
ited crude supply causing downtime and
the acceleration of the turnaround of cer-
tain units originally scheduled for 2010.
Cressier
Throughput in 2010 was impacted by a
planned turnaround in the second quar-
ter of 2010.
Furthermore, throughput was
impacted due to the
labor strike at the
port in Fos Sur Mer, France.
Throughput in 2009 was impacted by
the SPSE pipeline incident in August
2009.
2009
44.1
2009
53.3
2009
93.1
2010
55.2
2010
50.5
2010
98.2
22 | Petroplus Holdings AG | Annual Report 2010 | Operating and Financial Review
Refinery Operations – Throughput and Production Data
The following table provides a summary of total throughput and crude types processed, total production and refined petroleum
products produced by our six refineries for the years ended December 31, 2010 and 2009:
For the year ended December 31,
(in thousands of bpd) 2010 2009
Throughput
Crude Unit Throughput
Light sweet 260.3 44 % 200.3 38 %
Medium sweet 31.3 5 % 17.0 3 %
Heavy sweet – – 1.4 0 %
Light sour 107.4 18 % 128.1 24 %
Medium sour 114.0 19 % 84.6 16 %
Heavy sour 18.3 3 % 25.9 5 %
Total Crude Unit Throughput 531.3 89 % 457.3 86 %
Other throughput 64.9 11 % 71.8 14 %
Total Throughput 596.2 100 % 529.1 100 %
For the year ended December 31,
(in thousands of bpd) 2010 2009
Production
Light Products
Gasoline 161.4 27 % 145.6 28 %
Diesels and gasoils 261.5 44 % 228.0 43 %
Jet fuel 35.0 6 % 29.1 5 %
Petrochemicals 11.9 2 % 11.0 2 %
Naphtha 20.1 3 % 17.5 3 %
Liquefied petroleum gas (LPG) 29.9 5 % 29.8 6 %
Total Light Products 519.8 87 % 461.0 87 %
Fuel oil/Bitumen 60.2 10 % 52.3 10 %
Solid by-products/fuel consumed in process/fuel & loss1) 28.3 5 % 26.3 5 %
Total Production 608.3 102 % 539.6 102 %
1)The fuel consumed in-process is a percentage of the total crude, feedstock and gasoline/diesel blending additives used.

Petroplus Holdings AG | Annual Report 2010 | Operating and Financial Review | 23
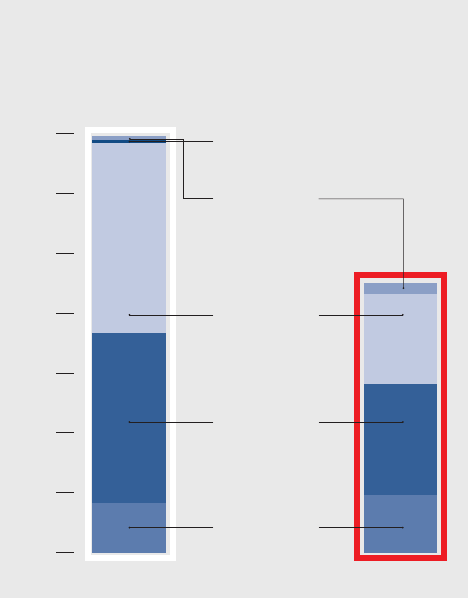
Petroplus Throughput
Petroplus Production
2010
2010
2009
2009
Sweet 41 %49 %
Other throughput
Light sour 24 %18 %
Medium sour
11 % 14 %
Heavy sour
19 % 16 %
5 %
3 %
Gasoline 28 %27 %
6 %
5 %
Middle distillates 48 %50 %
Fuel oil/Bitumen10 % 10 %
LPG
Naphtha/Petrochemicals
Solid by-products/fuel & loss
5 % 5 %
5 %
5 %
24 | Petroplus Holdings AG | Annual Report 2010 | Operating and Financial Review
Liquidity and Capital Resources
Cash Flows
The following table summarizes the cash flow activity for the periods indicated, including cash flows from discontinued operations:
For the year ended December 31,
(in millions of USD) 2010 2009
Cash flows from operating activities 429.7 (97.1)
Cash flows from investing activities (230.8) (272.6)
Cash flows from financing activities (40.4) 159.3
Net increase/(decrease) in cash and short-term deposits 158.5 (210.4)
Net foreign exchange differences 9.3 11.8
Cash and short-term deposits at beginning of period 11.2 209.8
Cash and short-term deposits at end of period 179.0 11.2
Cash Flows from Operating Activities
Net cash flows provided by operating activities were USD
429.7 million for the year ended December 31, 2010 as com-
pared to net cash used in operating activities of USD 97.1 mil-
lion for the same period in 2009. Net result, after excluding
non-cash depreciation and amortization and income tax ex-
penses, contributed USD 309.5 million for 2010 versus USD
162.8 million for 2009. Cash flows from operating activities
were positively impacted by higher oil prices and improved re-
fining margin cracks for middle distillates and gasoline in 2010
compared to 2009. Net changes in working capital provided
an additional USD 163.0 million in cash flow for the year ended
December 31, 2010 as compared to USD 248.4 million used
for the same period in 2009.
Cash Flows from Investing Activities
Net cash flows used in investing activities were USD 230.8
million for the year ended December 31, 2010 as compared
to net cash used in investing activities of USD 272.6 mil-
lion for the same period in 2009. The cash used in investing
activities in 2010 resulted primarily from planned capital ex-
penditures and turnaround activity in the fourth quarter 2009
and during 2010. The disposal of PBF generated a net cash
inflow of USD 5.5 million after the cash contribution of USD
76.4 million in May 2010 and the subsequent disposal in Octo-
ber 2010 which resulted in cash proceeds of USD 81.9 million.
On January 12, 2010, the Company completed the sale of the
Antwerp Processing facility and associated working capital,
which resulted in net cash proceeds of USD 56.2 million.
Net cash used in investing activities in 2009 resulted primarily
from capital expenditures in addition to turnaround activities
at the Coryton, Petit Couronne, Reichstett and Ingolstadt re-
fineries.
Cash Flows from Financing Activities
Net cash flows used in financing activities were USD 40.4 mil-
lion for the year ended December 31, 2010 as compared to net
cash provided by financing activities of USD 159.3 million for
the same period in 2009. Financing activities in 2010 primar-
ily represent net cash repayments on the RCF. Additionally,
in May 2010, the Company completed a private placement of
shares which resulted in gross proceeds of USD 136.4 million.
In September 2009, the Company issued Senior Notes,
9.375 % due 2019, resulting in net proceeds of USD 385.5 mil-
lion which were used to repurchase a portion of the Convert-
ible Bond, 3.375 % due 2013, in October 2009. Additionally,
the Company issued a USD 150.0 million Convertible Bond,
4.0 % due 2015, and completed a rights offering which result-
ed in net proceeds of USD 272.0 million. Additional financing
activities represent repayment of borrowings under the work-
ing capital facility.
Petroplus Holdings AG | Annual Report 2010 | Operating and Financial Review | 25
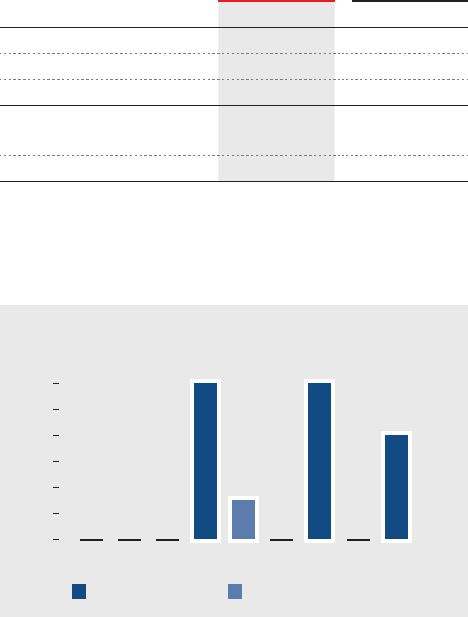
Capital Spending
We classify our capital expenditures, excluding acquisition
expenditures, into five major categories:
Permit-related capital expenditures include capital expen-
ditures for improvements and upgrades to our production
facilities required by local authorities as a condition of the
granting or renewal of the operating permits for our facilities.
These include process safety improvements and installation of
equipment to reduce emissions to the environment.
Sustaining capital expenditures include regular, non-permit
related capital expenditures we incur to maintain our produc-
tion facilities and to facilitate reliable operations.
Turnaround capital expenditures include capital expenditures
incurred in connection with planned shutdowns to make ne-
cessary repairs, perform preventative maintenance, replace
catalysts and implement improvements. We perform major
scheduled turnarounds on each of our refineries generally
every four to five years, with an intermediate, minor turnaround
generally two years following each scheduled major mainten-
ance turnaround.
Project-related capital expenditures include capital expendi-
tures for improvements or upgrades to our production facilities
that have been identified to provide significant gross margin
returns. These projects are expected to either add capacity
or increase product yields in higher value petroleum products.
Information technology (“IT”)/Intangibles capital expenditures
include costs associated with software integration primarily
from acquisitions and system upgrades. This category also in-
cludes other hardware and capital expenditures for intangible
assets.
Our total capital expenditures are summarized in the follow-
ing table by major category for the years ended December 31
2009 and 2010:
Information about our 2011 planned capital expenditures is
discussed in the “Outlook” section.
Turnaround
Total
347.7
Total
226.9
3.7
1.9
158.8
41.7
9.9
–
75.7
92.9
48.4
Sustaining
Permit-
related
0
50
100
150
200
250
300
350
2009 2010
Projects
IT/
Intangibles
Actual Capital Expenditures
(in millions of USD)
141.6
26 | Petroplus Holdings AG | Annual Report 2010 | Operating and Financial Review
Summary of Indebtedness
Overview
The following table sets forth our financial indebtedness and
cash balances as of December 31:
The following table illustrates the Company’s maturity profile
for long-term interest-bearing loans and borrowings:
The following description is a summary of our credit facilities
and other financing arrangements, including a description of
the usage of such facilities and arrangements.
(in millions of USD) 2010 2009
Long-term debt 1,692.0 1,683.8
Working capital facilities – 149.6
Total financial debt 1,692.0 1,833.4
Cash and short-term
deposits
179.0 11.2
Net financial debt 1,513.0 1,822.2
Maturity Profile
(in millions of USD)
600
500
400
300
200
100
Senior Notes Convertible Bonds
0
2014
600
2015
150
2011 20162012 2017
600
2013 2018 2019
400
Working Capital Facilities
Revolving Credit Facility (“RCF”)
Certain of our subsidiaries are party to a USD 1.05 billion com-
mitted multicurrency secured RCF agreement dated October
16, 2009, which replaced our former revolving credit facility.
The RCF includes an option to increase the committed facil-
ity amount up to USD 2.0 billion on a pre-approved but not
pre-committed basis in the event of increased working capital
needs or future acquisitions. The Company also has access to
significant uncommitted lines from committed banks, providing
increased liquidity on an as needed basis. As of December 31,
2010, the Company had additional uncommitted lines under the
RCF of USD 1.07 billion, bringing the total size of the RCF to
USD 2.12 billion.
The RCF is available, subject to a current asset borrowing
base, primarily in the form of letters of credit and short-term
loan advances. Not more than 60 % of the committed line util-
izations may be in the form of short-term cash borrowings.
The rate of interest on cash borrowings is the aggregate of
LIBOR plus a margin plus mandatory costs, if any. The mar-
gin is subject to a pricing grid determined by reference to the
Company’s ratio of Net Debt to Net Capitalization and ranges
from 2.75 % to 4.00 % for a ratio below 25 % or above 60 %,
respectively. Commissions on payment instruments are also
subject to a pricing grid determined by reference to the Com-
pany’s ratio of Net Debt to Net Capitalization.
Borrowings under the RCF are jointly and severally guaranteed
by certain of our subsidiaries. Such borrowings are secured
by certain assets of the borrowers and of the guarantors.
The form of such security includes certain pledges of bank
accounts held at participating banks, oil inventory, trade re-
ceivables and other assets. In certain conditions related to
an event of default as defined in the RCF, the RCF Security
Agent can enforce the pledge over the pledged assets. These
pledges will expire together with the RCF on October 16, 2012.
As of December 31, 2010, we have no cash borrowings under
the RCF. The related financing costs of USD 15.1 million are
capitalized and amortized over the three-year term of the RCF.
The carrying amount of these costs under the RCF amounts to
USD 9.0 million as of December 31, 2010.
Other Working Capital Facilities
One of our subsidiaries has a smaller working capital facility
available in relation to Swiss compulsory stocks of which USD
nil (2009: USD 24.3 million) was drawn upon as of December
31, 2010.
Petroplus Holdings AG | Annual Report 2010 | Operating and Financial Review | 27
Covenants
The RCF contains covenants that could restrict certain of
our activities, including restrictions on creating or permitting
to subsist certain securities, engaging in certain mergers or
consolidations, sales or other disposals of certain assets, giv-
ing certain guarantees, making certain loans, making certain
investments, incurring certain additional indebtedness, en-
gaging in different businesses, making certain debt or other
restricted payments, and amending or waiving certain material
agreements.
The RCF also includes three financial covenants, calculated on
a quarterly basis, requiring us to maintain:
–
a minimum Consolidated Tangible Net Worth of USD 1.5 billion;
– a minimum ratio of Group Clean EBITDA (as defined in the
RCF documentation) to Net Interest Expense of 2.5 to 1.0 for
the four prior rolling consecutive quarters; and
–
a minimum ratio of Current Assets to Current Liabilities of 1.05:1.
Compliance with these covenants is determined in the manner
specified in the documentation governing the RCF.
At December 31, 2009, the Clean EBITDA to Net Interest Ex-
pense ratio was below 2.5 to 1.0. On January 27, 2010, the
Company received a waiver for the fourth quarter 2009 through
the third quarter 2010. During the waiver period, and, as long
as the ratio of the Clean EBITDA to Net Interest Expense ratio
covenant was below 2.5 to 1.0, the interest rate margin on cash
borrowings was increased by 0.25 % and the Company was
required to meet an additional covenant. The Company’s Free
Cash Flow before working capital changes, as defined in the
waiver documentation, could not be more negative than minus
USD 250 million for the period starting from January 1, 2010
to each quarter end during the waiver period. The Company
fulfilled this temporary covenant throughout the year 2010. The
Company is in compliance with all financial covenants based
on year-end 2010 financial figures, and has, therefore, exited
the waiver period.
Long-Term Debt
Convertible Bond USD 150 million, 4.0 % due 2015
(the “2015 CB”)
On October 16, 2009, Petroplus Finance Ltd., a subsidiary of
the Company, issued USD 150.0 million in guaranteed senior
secured convertible bonds due 2015. The debt is guaranteed
by the Company as well as by certain of its subsidiaries. Each
bond in the principal amount of USD 100,000 is convertible
into common shares of the Company at a conversion price of
CHF 30.42 (subsequent to a reduction of CHF 0.19 due to the
nominal value repayment on July 26, 2010) per share with a
fixed exchange rate on conversion of USD/CHF 1.0469. The
2015 CB bears interest at the rate of 4.0 % per annum, with the
interest payable semi-annually in arrears on October 16 and
April 16 of each year the debt is outstanding, commencing on
April 16, 2010. The financing costs related to the issuance of
the 2015 CB have been capitalized in the aggregate amount of
USD 2.6 million and are amortized over six years.
Convertible Bond USD 500 million, 3.375 % due 2013
(the “2013 CB”) redeemed on October 16, 2009
On October 12, 2009, Petroplus announced the successful re-
sult of the tender offer to repurchase all of its outstanding USD
500.0 million in guaranteed, convertible bonds due in 2013.
The 2013 CB was redeemed on October 16, 2009 at the ag-
gregate principal amount of USD 500.0 million, plus accrued
interest calculated from September 26, 2009 until October 16,
2009 (20 days). The related remaining capitalized financing
costs of USD 6.0 million and the difference between the carry-
ing amount and the fair value of the liability portion of USD 2.1
million were written off and included in the line item “Financial
expenses” in the Consolidated Statement of Comprehensive
Income. The remaining difference of USD 35.0 million between
the repurchase price of the bond and the fair value of the liabil-
ity portion was recorded as a reduction of equity. The costs of
the tender offer amounted to USD 2.6 million and were includ-
ed in the line item “Financial expenses” in the Consolidated
Statement of Comprehensive Income.
Senior Notes USD 400 million, 9.375 % due 2019
(the “2019 SN”)
On September 17, 2009, Petroplus Finance 3 Limited, Ber-
muda, an unrestricted subsidiary of the Company, issued USD
400.0 million aggregate principal amount of 9.375 % senior
notes due 2019 at an issue price of 98.42 % giving a yield of
9.625 %. The coupon is payable semi-annually in arrears on
March 15 and September 15, beginning March 15, 2010. The
2019 SN are presented net of capitalized financing costs of
USD 8.7 million which are amortized over ten years. The pro-
ceeds from the 2019 SN were used to repurchase or redeem
a portion of the 2013 CB on October 16, 2009.
Upon successful completion of the tender offer and subse-
quent repayment of the 2013 CB, Petroplus Finance Limited
assumed the obligations of Petroplus Finance 3 Limited un-
der the 2019 SN, the Company and certain of its subsidiaries
became guarantors of the 2019 SN and Petroplus Finance 3
Limited was released of all obligations under the 2019 SN.
28 | Petroplus Holdings AG | Annual Report 2010 | Operating and Financial Review
Liquidity
Our ability to pay interest and principal on our indebtedness
and to satisfy our other debt obligations will depend upon our
future operating performance and the availability of new and
refinancing indebtedness, which can be affected by prevailing
economic conditions and financial, business and other fac-
tors, some of which are beyond our control.
We believe that our cash flows from operations, borrowings
under our existing credit facilities and other capital resources
will be sufficient to satisfy the anticipated cash requirements
associated with our existing operations during the next twelve
months. Our ability to generate sufficient cash from our oper-
ating activities depends on our future performance and global
oil market pricing, which are subject to general economic,
political, financial, competitive and other factors beyond our
control. The Company could, during periods of economic
downturn, access the capital markets and/or other available
financial resources to strengthen its financial position. In ad-
dition, our future capital expenditures and other cash require-
ments could be higher than we currently expect as a result of
various factors, including any acquisitions that we may complete.
Contractual Obligations
The following table summarizes our material contractual obli-
gations and commitments as of December 31, 2010:
Payment due by Period
(in millions of USD) Total < 1 year 1 – 5 years > 5 Years
Interest-bearing loans and borrowings1) 2,506.5 126.0 1,185.3 1,195.2
Finance lease commitments 30.2 3.4 13.4 13.4
Operating lease commitments 66.9 17.6 26.6 22.7
Purchase commitments2) 40.8 40.8 – –
Total 2,644.4 187.8 1,225.3 1,231.3
1)Represents nominal values of contractual obligations and undiscounted interest payments, excluding capitalized financing fees.
2)Represents contractual obligations for future capital expenditure purchase obligations.
Senior Note USD 600 million, 6.75 % due 2014 (the “2014 SN”)
& Senior Note USD 600 million, 7 % due 2017 (the “2017 SN”)
On May 1, 2007, Petroplus Finance Ltd., a subsidiary of the
Company, issued USD 600.0 million, 6.75 % senior notes due
2014 and USD 600.0 million, 7 % senior notes due 2017 (to-
gether the “Notes”). The Company used the proceeds from the
Notes primarily to fund the acquisition of the Coryton refinery.
The Senior Notes are presented net of total capitalized finan-
cing costs of USD 18.1 million which are amortized over seven
and ten years, respectively.
Financial Covenants
The main financial covenant under the 2015 CB, the 2014 SN,
2017 SN and 2019 SN is an EBITDA to gross interest expense
coverage ratio which is required to exceed 2.0 to 1.0. This cov-
enant is not a maintenance covenant and, therefore, when the
ratio is not met, the Company is not in breach but only limited
in incurring certain debt or making certain payments outside
of the ordinary course of business as long as the ratio does not
exceed 2.0 to 1.0.
As of December 31, 2010 we are in compliance with this
covenant.

Petroplus Holdings AG | Annual Report 2010 | Operating and Financial Review | 29
Outlook
The discussion below contains forward-looking statements that
reflect our current judgment regarding conditions we expect to
exist and the course of action we expect to take in the future.
Even though we believe our expectations regarding future events
are based on reasonable assumptions, forward-looking state-
ments are not guarantees of future performance. Our assump-
tions rely on our operational analysis and expectations for the
operating performance of our assets based on their historical
operating performance, management expectations as described
below and historical costs associated with the operations of
those assets. Factors beyond our control could cause our ac-
tual results to vary materially from our expectations, which are
discussed in the “Forward-Looking Statement” and elsewhere in
this document. The prospective financial information below is our
current judgment and should not be relied upon as being neces-
sarily indicative of future results, and the reader is cautioned not
to place undue reliance on this prospective financial information.
We undertake no obligation to update any forward-looking state-
ments contained in this document as a result of new information,
future events or subsequent developments, or otherwise.
Market
We expect the market outlook for 2011 to remain challenging,
but to improve over 2010 for the European refining industry as
we see signs of an economic revival in the Atlantic Basin and
a corresponding gradual increase in consumption, which we
believe will drive improved refining margins. While we expect
refining margins will continue to fluctuate, we believe that we
are adequately positioned in the industry to perform and fund
our operations under current and expected market conditions.
Budget 2011
Summary of Estimated Costs 2011
(in millions of USD) 2011
Refining and marketing operating expenses 665
Other administrative and non-refinery
personnel expenses1)
120
Depreciation and amortization 335
Interest rate on indebtedness 7.2 %
Approximate effective income tax rate 10 %
Capital expenditures 315
1)Excludes incentive compensation.
Foreign Exchange Rates
Various factors beyond our control, such as unplanned down-
time and changes in the value of the USD against the EUR,
GBP and CHF, can cause actual results to differ from our ex-
pectations. The 2011 outlook is based on the following ex-
change rate assumptions:
Refining and Marketing Operating Expenses
We expect refining and marketing operating expenses, de-
fined as refining personnel, operating and other administra-
tive expenses that pertain to the processing of crude oil and
feed/blendstock into refined products, to be approximately
USD 665 million for 2011. Natural gas and electricity will be
the largest components of our variable operating expenses.
Other significant components of operating expenses are our
employee costs, ongoing repair and maintenance, catalysts
and chemicals. As a significant portion of refining and mar-
keting operating expenses is incurred in local currency, actual
results will be impacted by changes in the value of the USD.
Other Administrative and Non-Refinery Personnel Expenses
We expect our other expenses, comprised of non-refining and
marketing personnel and other administrative expenses, ex-
cluding incentive compensation, to be approximately USD 120
million for 2011. As a significant portion of personnel and other
administrative expenses is incurred in local currency, actual
results will be impacted by changes in the value of the USD.
Depreciation and Amortization
We expect depreciation and amortization expenses to be
approximately USD 335 million for 2011. Our depreciation
expenses will vary in future periods based on completion
and placing into service of our capital expenditure activity.
Interest Expense
We expect that our net interest for borrowings under the work-
ing capital facilities will have a blended rate of the published
LIBOR rate plus approximately 3 %. Additionally, we expect to
incur interest expense at a blended rate of 7.2 % on our long-
term debt. We will also incur non-cash accretion expense in
relation to the USD 150.0 million CB and the USD 400.0 million
Senior Note of approximately USD 6 million for 2011. Interest
Foreign Exchange Rates Applied for 2011 Outlook
2011
EUR/USD 1.25
GBP/USD 1.50
CHF/USD 0.95
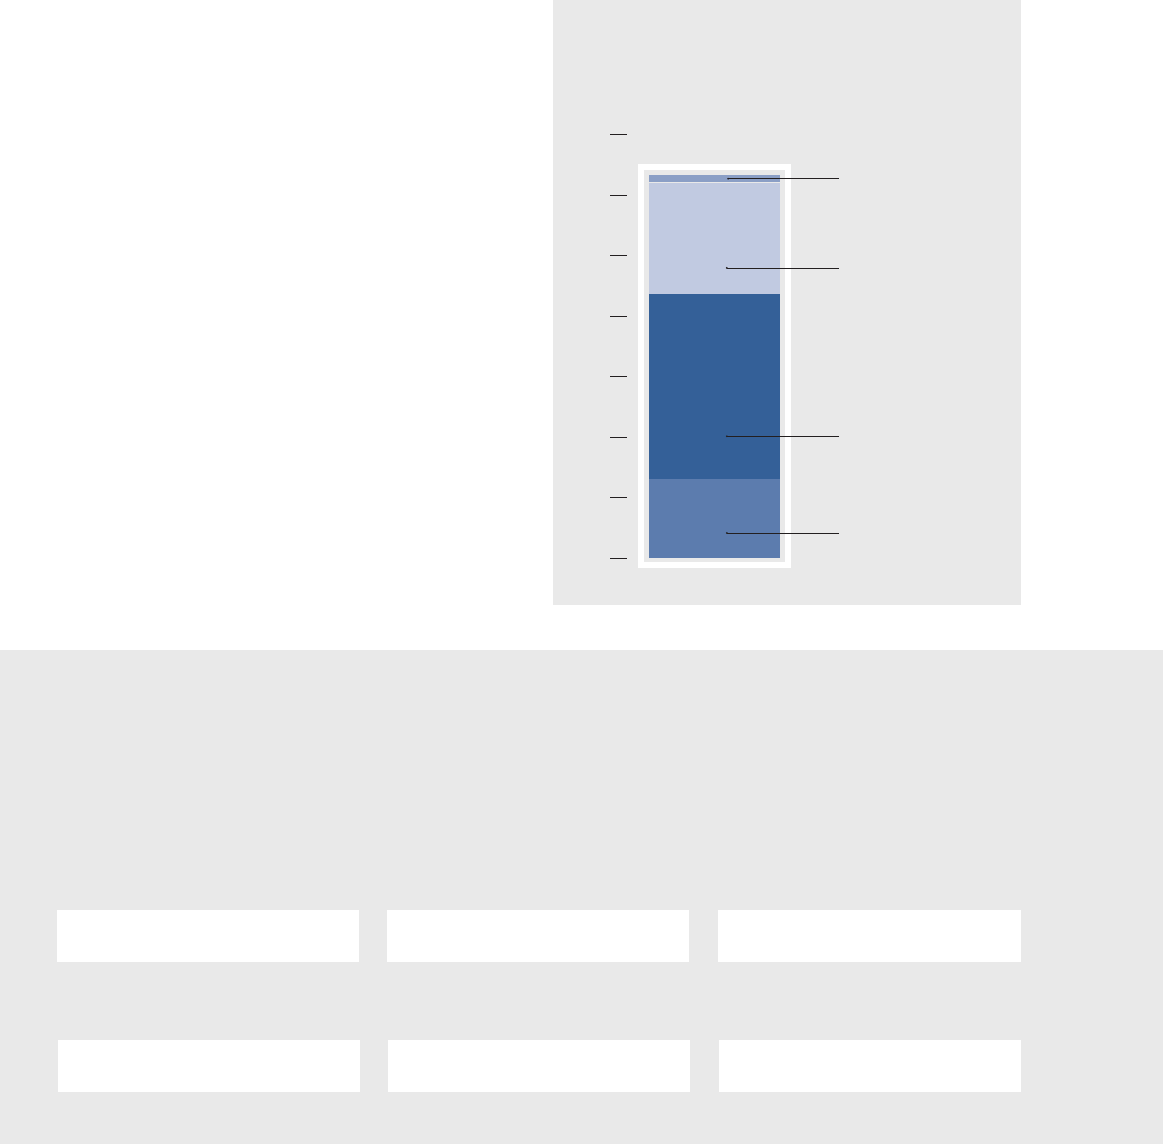
30 | Petroplus Holdings AG | Annual Report 2010 | Operating and Financial Review
expense will also include letter of credit fees and non-cash
deferred financing charges of approximately USD 7 million per
quarter.
Income Taxes
We expect our effective tax rate for 2011 to be approximately
10 % of our net income before income taxes, excluding any
non-recurring events. Our effective income tax rate will vary as
realized refining margins and foreign currency rates fluctuate.
Additionally, our effective income tax rate will also vary in con-
nection with any acquisitions or disposals.
Capital Expenditures
We expect capital expenditures to be approximately USD 315
million for 2011. The following table summarizes our budgeted
capital expenditures, excluding future acquisitions, for the year
ending December 31, 2011, by major category:
Turnaround
6
91
66
Sustaining
Permit-related
0
50
100
150
200
250
300
350
2011
Non-refining
and IT
Planned Capital Expenditures for 2011
(in millions of USD)
152
Total
315
Refinery Operations – Throughput Estimates for 2011
The throughput estimates set forth below assume that our refinery operations will experience no operating disruptions or eco-
nomic run cuts in 2011 other than scheduled maintenance shutdowns:
(in thousands of bpd)
175 to 185
85 to 95
95 to 105
55 to 65
115 to 125
55 to 65
Coryton Antwerp Petit Couronne
Ingolstadt Reichstett Cressier
Petroplus Holdings AG | Annual Report 2010 | Operating and Financial Review | 31
which can also be affected by prevailing economic conditions
and financial, business and other factors. If current financial
market conditions were to continue or become worse, we may
have to seek alternative sources of potentially less attractive
financing, which may have a material adverse effect on our
financial condition.
Refining margins significantly impact our profitabi l-
ity and cash flow. Crude oil prices, refined petroleum
product prices, refining margins and our results of
operations have fluctuated significantly in the past.
As an oil refiner, our results are primarily affected by the dif-
ferential between refined petroleum product prices and the
prices of crude oil used for refining. This price differential, once
direct costs are subtracted, constitutes our refining margin.
This means we will not generate operating profit or positive
cash flow from our refining operations unless we are able to
sell refined petroleum products at margins sufficient to cover
the fixed and variable costs of our refineries. Refining margins
have declined since their highs in the middle of 2008. Refin-
ing margins could decline further in the future due to factors
beyond our control. A decrease in refining margins could have
a material adverse effect on our business, results of operations
and financial condition.
Historically, refining margins have fluctuated substantially.
Refining margins are influenced principally by supply and de-
mand for crude oil and refined petroleum products, which in
turn determine their market prices. Other factors (although the
list below is non-exhaustive), in no particular order, that may
have an impact on prices and refining margins include:
– changes in global economic conditions, including exchange
rate fluctuations;
– changes in global and regional demand for refined petroleum
products;
– market conditions in countries in which we refine or sell our
refined petroleum products and the level of operations of
other refineries in Europe;
– aggregate refining capacity in the global refining industry to
convert crude oil into refined petroleum products, including
additional export refining capacity in developing countries,
particularly India and China, which could reduce the market
share of European refiners;
– changes in the cost or availability of transportation for crude
oil, feedstocks and refined petroleum products;
– availability of price arbitrage for refined petroleum products
between different geographical markets;
Risks Relating to Our Business
and Our Industry
We are subject to various risks relating to changing economic,
political, legal, social, competitive, industry, business and finan-
cial conditions. The main risks we face are described below.
Unfavorable general economic conditions have had
and may continue to have a negative effect on our
business, results of operations, financial condition,
and future growth prospects.
Over the past two years, a worldwide financial and economic
crisis has affected essentially all regions of the world and all
business sectors. While there are currently indications that
some of the world’s major economies have started to recover
from the crisis, there can be no assurance that this trend will
continue or that the financial and economic conditions will not
worsen again. Lower levels of economic activity during periods
of recession often result in declines in energy consumption,
including declines in the demand for and consumption of our
refined products. This could cause our revenues and refining
margins to decline and, in turn, have a material negative effect
on our business, results of operations, financial condition, and
future growth prospects.
Ongoing disruptions in the financial markets may
adversely affect our ability to obtain credit and
financing on reasonable terms, which may have a
material adverse effect on our financial condition.
Current global credit market conditions have a material impact
on the availability of financing, making terms for certain financ-
ing less attractive and, in some cases, resulting in a lack of
availability of certain types of financing. We have historically
accessed the capital markets for financing to fund acquisitions
and may seek to do so in the future. We also rely on the re-
volving credit facility to finance crude oil purchases and other
operational expenditures. Continued uncertainty in the credit
markets and capital markets may negatively impact our ability
to renew this financing or to access other financing on reason-
able terms or at all, which may have an adverse impact on
our financial condition if our cash needs exceed our internally
generated cash flow. In addition, our ability to pay interest and
principal on our indebtedness and to satisfy our other debt ob-
ligations will depend upon our future operating performance
and the availability of new and refinancing indebtedness,
32 | Petroplus Holdings AG | Annual Report 2010 | Operating and Financial Review
– political developments and instability in petroleum producing
regions such as the Middle East, Russia, Africa and South
America;
– the ability of the Organization of Petroleum Exporting Coun-
tries (“OPEC”) and other petroleum producing nations to set
and maintain oil price and production controls;
– seasonal demand fluctuations;
– expected and actual weather conditions;
– to the extent unhedged, changes in prices from the time
crude feedstocks are purchased and refined petroleum
products are sold;
– the extent of government regulation, in particular as it relates
to environmental policy, fuel specifications and energy taxes;
– the ability of suppliers, transporters and purchasers to per-
form on a timely basis, or at all, under their agreements (in-
cluding risks associated with physical delivery);
– the development, availability, price and acceptance of alter-
native fuels; and
– terrorism or the threat of terrorism that may affect supply,
transportation or demand for crude oil and refined petroleum
products.
Disruption of our ability to obtain crude oil and
other feedstocks could reduce our margins and
materially affect our results of operations.
We require crude oil and other feedstocks to produce refined
petroleum products. We purchase our crude oil primarily on
the spot and forward markets from, among others, oil majors,
crude oil marketing companies and independent producers.
Crude oil supply contracts are generally short-term contracts
with market responsive price provisions. In addition, a signifi-
cant portion of our crude oil is supplied from the North Sea, Af-
rica, Russia and Kazakhstan making us subject to the political,
geographic and economic risks attendant to doing business
with suppliers located in those regions, such as labor strikes,
regional hostilities and unilateral announcements by any of the
countries within these regions that some or all oil exports for
a specified period of time will be halted. In the event that one
or more of our supply contracts are terminated or not fulfilled,
we may not be able to find alternative sources of supply. More-
over, unlike certain of our competitors that have their own oil
exploration and production operations, we are dependent on
third parties for continued access to crude oil and other raw
materials and supplies at appropriate prices. Further, we may
be subject to governmental restrictions on our purchases of
certain crude oil because of economic sanctions against the
government of the country that is the source of the crude oil,
which may result in higher costs or the unavailability of crude
oil. If we are unable to obtain adequate crude oil volumes or
are only able to obtain such volumes at unfavorable prices, our
margins and our other results of operations could be materially
adversely affected.
We are dependent on certain third party suppliers
for the provision of services that are necessary for
our refineries’ operations, including the supply of
crude oil feedstocks. If third parties are unable to
perform under our contracts with them or cancel
these contracts, we may be unable to operate our
refineries or deliver refined products to customers.
Each of our refineries is partially or wholly dependent on re-
ceiving a steady and adequate supply of utilities such as elec-
tricity, natural gas and water provided by local companies. Any
disruptions in these utilities, such as a power grid failure, could
force us to shut down the affected refinery and have a material
adverse effect on our results of operations, financial condition
and cash flows.
If any of our service, transport or storage arrangements are
terminated or disrupted, this could have a material adverse
effect on our business, results of operations, financial condi-
tion, and cash flows. Moreover, to the extent our customers
require us to deliver our products by specified delivery dates
and we fail to do so because we are not able to make alterna-
tive service arrangements, we may incur penalties and suffer
reputational damage.
Our business is subject to significant environmental
regulations and environmental risks.
Like those of other oil refiners, our operations are subject to
numerous national, regional and local environmental laws and
regulations, including legislation that implements international
conventions or protocols. In particular, these laws and regula-
tions restrict the types, quantities and concentration of various
substances that can be released into the environment in con-
nection with production activities and impose administrative
sanctions and criminal and civil lia bilities for pollution. These
laws and regulations also restrict air emissions and waste-
water discharge resulting from the operation of refineries and
other facilities as well as establish standards for the composi-
tion of gasoline, diesel fuel and other petroleum products. In
addition, our operations are subject to laws and regulations
Petroplus Holdings AG | Annual Report 2010 | Operating and Financial Review | 33
relating to the generation, handling, transportation, sale, stor-
age, disposal and treatment of materials that may be con-
sidered to be contaminants when released into the environment.
Environmental laws and regulations that affect our operations,
processes and margins have become and are becoming in-
creasingly stringent. If we violate or fail to comply with these
laws and regulations, we could be fined or become liable for
remediation costs or subject to other sanctions. In addition,
regulatory authorities could suspend our operations or refuse
to renew the permits and authorizations we require to operate.
They could also mandate upgrades or changes to our pro-
cesses that could have a significant impact on our costs.
We need a variety of permits to conduct our facilities. We must
comply with and renew these permits. Failure to comply with
our permits could subject us to civil penalties, criminal sanc-
tions and closures of our facilities.
Sites at which we operate have a long history of industrial ac-
tivities and may be, or may have been in the past, engaged
in activities involving the use of materials and processes that
could give rise to potential remediation liabilities. Potential li-
abilities can also arise in relation to land previously owned by
companies or refineries that we have acquired but where such
land was sold prior to our acquisition of those companies or
refineries. With respect to our acquisitions, we cannot assure
that our due diligence investigations identified or accurately
quantified all material environmental matters and contingen-
cies relating to acquired facilities. In addition, environmental
indemnities given to us by sellers typically contain thresholds
and other limitations as to the aggregate amount of the sellers’
obligations. Consequently, we may incur significant costs to
remediate pre-existing environmental contamination or condi-
tions at sites we have acquired.
We have identified soil and groundwater contamination at
certain of our sites, are undertaking measures to address the
contamination and are in consultation with regulatory auth-
orities where necessary. We have budgeted expenditures at
three of our refineries relating to known contamination, and
we may need to make additional expenditures, which could be
significant, to comply with environmental laws and regulations.
The risk of significant environmental remedial liability is inher-
ent to our business. No assurance can be given that such li-
ability will not arise in the future as a result of the application of
present or future laws and regulations to existing contamina-
tion, whether presently detected or otherwise, or misinterpre-
tation of data regarding such contamination, or future con-
tamination of any of our sites or otherwise arising out of our
activities and operations.
We are subject to European Union (“EU“) regulations on car-
bon dioxide emission. In 2010 and in prior years, we have op-
erated within the allowable limits of carbon dioxide emissions.
There is no assurance that we will not be required to purchase
carbon dioxide credits in the market, be levied any fines or
experience any operational disruption due to our facilities’ car-
bon dioxide emissions.
In addition to potential liability for remediation costs and regu-
latory non-compliance, we may be liable for the environmental
impact of our operations on third parties. We could also be
liable to third parties, without limitation, for crude oil or refined
petroleum product spills, discharges of hazardous materials
into the soil, air and water and other environmental liabilities.
Compensation to third parties, as well as other liabilities men-
tioned, may involve significant costs. Any such costs could
reduce or eliminate the funds available for financing our normal
operations and planned development or result in the loss of
our properties. We cannot assure you that discharges of haz-
ardous materials will not occur in the future or that third parties
will not assert claims against us for damages allegedly arising
out of any past or future contamination.
Stricter environmental, health and safety laws and enforcement
policies could result in substantial costs and liabilities for us
and could result in our handling, manufacture, use, reuse or
disposal of substances or pollutants being subjected to more
rigorous scrutiny by regulatory authorities than is currently the
case. Compliance with these laws could result in significant
capital expenditures as well as other costs and liabilities, there-
by harming our business.
In addition, we cannot assure that we will be able to meet future
refined product standards that may be introduced in the EU or
other relevant jurisdictions or that we will have sufficient funds
to make the necessary capital expenditures to produce prod-
ucts that comply with future specifications and regulations.
We may be liable for significant environmental costs
relating to past and/or future transactions.
In connection with acquisitions of certain of our refineries, we
may become responsible for certain environmental clean-up
liabilities or costs. Some of the acquisition agreements for our
34 | Petroplus Holdings AG | Annual Report 2010 | Operating and Financial Review
refineries provide that, subject to certain limitations, the sellers
will indemnify us only against a certain percentage, on a slid-
ing scale basis for a specified period and with certain limita-
tions. We have also agreed to indemnify certain of the sellers
against environmental liabilities and costs to the extent these
liabilities and costs are not covered by the sellers’ indemnities.
There is no assurance that the sellers will satisfy their obliga-
tions under their agreements or that the liabilities and costs
in excess of those that the sellers have agreed to reimburse
us for will not be significant or that significant liabilities will not
arise with respect to the other matters we have assumed or for
which we are indemnifying the sellers. Moreover, if any of the
sellers were to become insolvent, such seller would be unable
to reimburse us for any environmental liabilities. In addition,
we may agree to be responsible for these or other types of
environmental liabilities in connection with future acquisitions.
We cannot assure that these environmental liabil ities and/or
costs or expenditures to comply with environmental laws will
not have a material adverse effect on our current or future re-
sults of operations and financial condition. In connection with
divestitures of refineries, liabilities may be left with us under the
sale agreements.
We must comply with health and safety regulations
at our facilities and failure to do so could result in
significant liabilities, fines and/or penalties.
Our activities are subject to a wide range of EU, national, pro-
vincial and local occupational health and safety laws and regu-
lations in each jurisdiction in which we operate. These health
and safety laws are constantly changing. Failure to comply
with these health and safety laws could lead to criminal viola-
tions, civil fines and changes in the way we operate our facili-
ties, which could increase the costs of operating our business.
A significant interruption or casualty loss at any of
our refineries could reduce our production, particu-
larly if not fully covered by our insurance.
Our operations could be subject to significant interruption if
any of our refineries were to experience a major accident, be
damaged by severe weather or other natural disaster or other -
wise be forced to shut down or curtail production due to
unforeseen events, such as acts of nature, power outages,
fires or acts of terrorism. Any such shutdown would reduce the
production from that refinery. There is also risk of mechanical
failure and equipment shutdowns, both in general and follow-
ing unforeseen events. Further, in such situations, undamaged
refinery processing units may be dependent on or interact
with damaged sections of our refineries and, accordingly, are
also subject to being shut down. In addition, damage to the
pipelines transporting product to and from our refineries could
cause an interruption in production at those facilities. In the
event any of our refineries are forced to shut down for a signifi-
cant period of time, or if any of the above events are not fully
covered by our insurance, this would have a material adverse
effect on our results of operations and financial condition.
We may be exposed to economic disruptions in the
various countries in which we operate and in which
our suppliers and customers are located. These
disruptions could adversely affect our operations,
tax treatment under foreign laws and our financial
results.
Although we operate primarily in the United Kingdom, Germa-
ny, France, Belgium, and Switzerland, our operations extend
beyond these countries. We export refined petroleum products
to certain other areas, including the Netherlands and North
America. In addition, we purchase the crude oil that we refine
predominantly from the North Sea, Africa, Russia and Kazakh-
stan. Accordingly, we are subject to legal, economic and mar-
ket risks associated with operating internationally, purchasing
crude oil and supplies from other countries and selling refined
petroleum products to them. These risks include:
– interruption of crude oil supply;
– devaluations and fluctuations in currency exchange rates;
– imposition or increase of withholding and other taxes on re-
mittances by foreign subsidiaries;
– imposition of trade restrictions or embargoes against certain
states, preventing us from buying crude oil and other feed-
stock from, or selling products to, these states;
– imposition or increase of investment and other restrictions by
foreign governments;
– failure to comply with a wide variety of foreign laws; and
– unexpected changes in regulatory environments and gov-
ernment policies.
Our international operations also expose us to different social,
political and business risks in each jurisdiction, including:
– compliance with union and collective bargaining agreements
in a number of locations;
– implementation of local solutions to manage credit risks of
local customers;
– fluctuations in currency exchange rates; and
– impacts arising from political, social and labor instability that
could disrupt or increase the cost of our operations.
Petroplus Holdings AG | Annual Report 2010 | Operating and Financial Review | 35
We cannot assure that we will develop and implement systems
and policies that enable us to operate profitably, or at all, in all
of the locations where we do business.
As we operate in multiple jurisdictions, we may be
subjected to changes in tax law or practice, which
potentially represent a risk to our tax planning.
We are subject to taxation in multiple jurisdictions and are
faced with increasingly complex tax laws. The tax laws in these
jurisdictions may change or be subject to differing interpreta-
tions, possibly with retroactive effect, including the imposition
of substantially higher tax or interest payments, which could
have a material adverse effect on our liquidity and results of
operations. Any changes in laws or regulations, or a failure
to comply with any such laws or regulations, may adversely
affect our performance. In addition, taxing authorities could
review and question our tax returns, leading to additional taxes
and penalties that could be material.
We face significant competition. Increases in global
refining and conversion capacity could further
increase the competition we face and harm our
business.
We face domestic and international competition in the markets
in which we participate. The refining and marketing industry is
highly competitive with respect to both feedstock supply and
refined product markets. We compete with many companies
for available supplies of crude oil and other feedstocks and for
outlets for our refined products.
We do not produce any of our crude oil feedstocks. Many
of our competitors, including, but not limited to, BP, Exxon
Mobil, Shell and Total, obtain a significant portion of their
feedstocks from company-owned production, and some
have retail outlets. Competitors that have their own produc-
tion, more complex refineries or more diverse operations may
be better able than us to withstand volatile industry condi-
tions, including shortages of crude oil or refined petroleum
products, volatility in prices for crude oil or refined petroleum
products or intense price competition at the wholesale level.
Further, with the adoption of stricter environmental standards
in Europe and the US and the historically high level of refining
margins, many of our competitors are expected to upgrade
their refining facilities, which would increase the competition
faced by us in the markets for our particular slate of refined
petroleum products. In addition, oil majors have financial and
other resources substantially greater than ours. Competition
could cause price reductions, reduce our margins or result in
loss of market share for our products and services. This may
adversely affect our results of operations.
In recent years, several companies have announced projects
that would increase refining capacity. These projects are pri-
marily located in regions that are expecting growth in popula-
tion and demand for oil, especially in the Asia-Pacific region.
Many of these projects were announced in response to high
refining margins enjoyed during 2007 and 2008. Although
these projects have long lead times and some of them may be
delayed or cancelled, many or all of them are likely to be com-
pleted in the future, thereby leading to an increase in global
refining capacity. Developing countries, particularly India and
China, among other emerging economies, have built and are
continuing to build refining capacity. Refineries in these coun-
tries, which operate on very low wages and with different en-
vironmental and safety standards, are expected to continue
to capture market share in Europe and the US. This increase
in capacity could lead to a decrease in our refining margins
and have a material adverse effect on our business and results
from operations.
Changes in oil prices affect our inventory and influ-
ence our commercial and operational decisions,
which in turn may impact our financial and operat-
ing results.
Over the twelve months ended December 31, 2010, on aver-
age, we held approximately 21 million barrels of crude and
product inventory on hand, representing the level of inven-
tory we hold on average in order to maintain our daily refinery
operations and sales requirements. This level fluctuates on a
daily basis, depending on the timing of crude purchases and
product sales, our operations and optimization of crude and
product pricing. We are exposed to the fluctuation in crude
and product pricing on the inventory we hold. If crude prices
rise or decline by USD 10 per barrel, the impact on our margin,
using the 21 million barrels we hold on average, could result
in a gain or loss of approximately USD 210 million. Currently,
we use a commodity price management program to manage
a small portion of our exposure to fluctuations in commod-
ity pricing. Under this program, we enter into commodity In-
tercontinental Exchange futures contracts and counterparty
swaps to lock in the price of certain commodities. Our inability
to manage inventory levels or acquire inventory at attractive
prices could have a material adverse effect on our business
and results from operations.
36 | Petroplus Holdings AG | Annual Report 2010 | Operating and Financial Review
Additionally, we are exposed to the refining margin crack,
which is defined as the net result of the purchase of crude
and the corresponding sale of the refined product. If the refin-
ing margin crack, based on fluctuations in crude and product
pricing, were to rise or decline by USD 1 per barrel against
actual prices over the relevant periods, the effect on our profit
before income taxes would have been a gain or loss of approx-
imately USD 218 million in 2010 and USD 193 million in 2009.
This analysis does not take into consideration any changes in
commercial or operating decisions that might be made given
the change in the environment, changes in the inventory held,
or other factors that might be present in a volatile crude and
product pricing environment. We do not currently have any
material refining margin hedging transactions in place. A de-
cline in the refining margin crack could have a material adverse
effect on our results from operations.
We need significant capital to fund our working
capital and any potential future acquisitions.
We will require significant amounts of capital to fund our work-
ing capital and future acquisitions.
We purchase crude oil mostly on the spot and forward mar-
kets, and we primarily finance those purchases via letters of
credit through our working capital facilities. Because prices
of crude oil can be volatile, it is crucial for us to have access
to these facilities. The availability of funds under our working
capital facilities is conditional upon, among other things, our
continued compliance with the covenants contained therein. If
we fail to meet these conditions and are unable to obtain let-
ters of credit or draw funds under our working capital facilities,
our financial condition would be severely impacted.
In addition, because most of our working capital facilities ac-
crue interest on a floating-rate basis, increases in base interest
rates may negatively impact our financial condition.
We will also be required to make expenditures on a regular
basis to repair, maintain and upgrade our facilities. We must
continue to make sustaining and turnaround capital expendi-
tures at our six refineries. If we are unable to fund these capi-
tal expenditures, production capacity at our refineries may fall
and our refineries might be unable to produce products that
comply with future regulations, have their operating permits
revoked or otherwise be adversely affected.
We continually assess potential acquisitions of refining assets
that would complement our businesses and expand our refin-
ery and storage capacity. We may elect to fund future acquisi-
tions with equity and/or debt financing and/or cash on hand.
We cannot assure you, however, that our cash on hand and
available debt and equity funding will be sufficient to fund any
future acquisitions or investments and, in such an event, we
might be required to forego attractive acquisition candidates
or investment opportunities.
Unscheduled or unexpectedly long scheduled re-
pair, maintenance and turnarounds at our refineries
could affect our results of operations. In addition, as
refining margins are volatile, it is possible that peri-
ods of expected low refining margins during which
we undertake scheduled turnarounds could turn out
to be high margin periods.
We need to carry out regular maintenance at our refineries.
Our refineries are typically shut down every four to five years
for major turnarounds to make necessary repairs, perform
preventative maintenance, replace catalysts and implement
capital improvements. These shutdowns vary in duration de-
pending on the complexity of the refinery and the work to be
performed, but typically last between four and five weeks. We
also shut down each refinery two years after each major turn-
around in order to perform an intermediate turnaround, which
typically lasts between three and four weeks. In addition, por-
tions of our refineries may be shut down for shorter periods to
perform more limited maintenance, catalyst replacement and
capital improvements. Although we attempt to schedule shut-
downs during periods of low refining margins, it is possible
that our refineries may be shut down during periods of high
margins as a result of, for example, the volatility and unpre-
dictability of refining margins or scheduled shutdowns taking
longer to complete than expected.
A substantial portion of our workforce is unionized,
and we may face labor disruptions that would inter-
fere with our refinery operations.
Our operations have been in the past and may in the future
be affected by labor disruptions involving our employees and
employees of third parties. Over half of our refinery employ-
ees are represented by trade unions under collective bargain-
ing agreements, which are generally renegotiated every year.
Negotiations with these unions have, at times, been difficult.
Petroplus Holdings AG | Annual Report 2010 | Operating and Financial Review | 37
We have been in the past and may in the future be affected
by strikes, lockouts or other significant work stoppages, any
of which could adversely affect our business, results of oper-
ations or financial condition.
In addition, employee rights in certain jurisdictions in which we
operate, including France and the United Kingdom, may make
it more challenging and costly to restructure or terminate the
operations of refineries in those jurisdictions.
Loss of key executives and failure to attract quali-
fied management could limit our growth and nega-
tively impact our operations.
We depend highly upon our Board of Directors and Execu-
tive Committee team. We will continue to require operations
management personnel and other key employees with refinery
industry experience. We do not know the availability of such
experienced management personnel or how much it may cost
to attract and retain such personnel. The loss of the services
of any member of the Executive Committee or the inability to
hire experienced management personnel or other key execu-
tives could materially adversely affect our operations and fi-
nancial condition.
Any military strikes, sustained military campaigns
or terrorist activity in the areas or regions where we
do business could have a material adverse effect
on our business, results of operations and financial
condition.
Any military strikes or sustained military campaigns in areas
or regions of the world where we acquire crude oil and other
raw materials or sell our refined petroleum products may
affect our business in unpredictable ways, including forcing
us to increase security measures and causing disruptions of
supplies and distribution markets. Further, like other industrial
companies, our facilities may be the target of terrorist activi-
ties. Any act of war or terrorism that resulted in damage to
any of our refineries or third party facilities upon which we are
dependent for our business operations could have a ma terial
adverse effect on our business, results of operations and
financial condition.
Our indebtedness could have a material adverse ef -
fect on our financial position and may limit our
financial flexibility.
Subject to certain restrictions in our bank working capital facil-
ities and other existing and planned debt agreements, we may
incur significant additional debt in the future to fund our work-
ing capital needs and for other purposes, including possible
future acquisitions. We have incurred and will continue to incur
substantial short-term debt to fund our working capital needs.
Our substantial debt could have important consequences for
us. For example, it could:
– make it more difficult for us to satisfy our debt-service obli-
gations;
– increase our vulnerability to adverse general economic and
industry conditions;
– limit our ability to obtain additional financing to fund our
capital expenditures, working capital, acquisitions and other
general corporate requirements;
– limit our flexibility in planning for, or reacting to, changes in
our business and the industry in which we operate;
– limit our ability to take advantage of significant business op-
portunities;
– place us at a competitive disadvantage compared to our
competitors that have lower leverage and/or greater access
to capital resources than we have;
– limit our ability to distribute dividends;
– negatively impact payment terms with our creditors; and
– require us to dedicate a substantial portion of our cash flow
from operations to payment of our debt.
In addition, our failure to comply with the covenants and re-
strictions contained in the agreements governing our indebted-
ness could trigger defaults under those agreements.
Critical Accounting Judgments and Estimates
For discussion on our critical accounting judgments and es-
timates, see Note 2 “Summary of Significant Judgments and
Estimates” in the Consolidated Financial Statements in this
Annual Report.


Corporate
Responsibility
40 I Principles
40 I Strategy
40 I Safety and Health
41 I Environment
42 I Social Performance, Community
and Public Affairs
43 I Employees
43 I Business Integrity and Transparency

40 | Petroplus Holdings AG | Annual Report 2010 | Corporate Responsibility
Corporate Responsibility
Principles
Our Company regards the effective management of Safety,
Health and Environmental (“SHE”) risks and good corporate
citizenship as core responsibilities of our industry. The main
purpose of our initiatives, as outlined below, is to prevent ma-
jor incidents, occupational injuries, environmental harm and to
provide transparency and business integrity.
Strategy
Promoting Understanding and Effective Manage-
ment of Safety, Health and Environmental Risks
Our operating approach is based on open discussion of SHE
risks and the ways in which these can be mitigated to a level
that is as low as reasonably practicable. We believe that it is
only by maintaining a strong focus on the SHE performance of
our assets that we can deliver sustainable profitability for our
stakeholders.
Promoting Operational Excellence in Safety
and Reliability
We devote significant time and resources to improving the
safety, reliability and environmental compliance of our oper-
ations and continue to emphasize SHE in all aspects of our
operations.
Employing Highly Skilled Refining Professionals to
operate Refining Assets
Our strategy is to employ highly skilled refining sector profes-
sionals and to create a working environment that encourages
our employees to use recognized industry good practices to
improve the safety and efficiency of our refineries.
Safety and Health
Petroplus employs approximately 2,600 employees throughout
Northwest Europe. We encourage a culture which fosters open
discussion of SHE matters, effective reporting and thorough in-
vestigation of incidents and near-misses to prevent recurrence.
We train employees in safe work practices and involve employ-
ees in establishing safety standards and operating practices.
There is a need to plan for and manage both high conse-
quence but low likelihood events – “Process Safety” and lower
consequence but higher likelihood events – “Occupational
Safety” effectively.
In 2010, we improved Process Safety by 18 %, as measured
by our key indicators, compared to 2009. Process Safety is
about managing the risks associated with our day to day plant
operations.
During 2010, Lost Work Incidents (“LWI”) were reduced by
17 % and Restricted Work Incidents (“RWI”) by 24 % compared
to 2009. LWI is defined as a work-related injury that causes the
injured person to be away from work for at least one normal
shift because he/she is unfit to perform any duties. RWI is de-
fined as a work-related injury which causes the injured person
to be assigned to other work on a temporary basis or to work
his/her normal job less than full time or without undertaking all
the normal duties.
Our key performance indicators in both of these areas are re-
viewed regularly and updated to ensure that they reflect recog-
nized industry good practice and continue to help us to focus
on the highest priority issues.
As an improving continuum, our SHE Management system is
constantly under review. As a matter of course, the Company
integrates learning from our incidents as well as other inci-
dents within the industry and ensures that its processes and
procedures are reviewed and adapted if necessary. In order to
assist in this, Petroplus participates in relevant industry health
and safety groups.
SHE performance is reviewed on a quarterly basis and all find-
ings are reported to the Executive Committee and the Board
of Directors.
Chemicals Regulation – REACH
Since the introduction of a new regulatory framework for
chemicals called REACH (registration, evaluation and auth-
orization of chemicals) in 2007, all manufacturers and import-
ers of chemicals must identify and manage risks linked to the
substances they manufacture and market. For substances
manufactured or imported, companies are required to sub-
18 %
In 2010, we improved Process Safety by 18 %, as
measured by our key indicators, compared to 2009.

Petroplus Holdings AG | Annual Report 2010 | Corporate Responsibility | 41
mit a registration dossier to the European Chemicals Agency
(“ECHA”). The ECHA then assesses whether the registration
dossier complies with the regulations and evaluates test-
ing proposals. As a manufacturer of oil products, Petroplus
pre-registered all relevant substances which are produced or
imported with the ECHA. Petroplus completed all necessary
steps for the full registration in December 2010.
Petroplus has not altered its existing product portfolio and
therefore all substances that are currently manufactured or
are imported by Petroplus into the European Union (“EU”)
have been registered. Additionally, we have reviewed the sub-
stances that are supplied to Petroplus to ensure that they are
registered by the suppliers.
Petroplus is a member of CONCAWE, the oil companies’ Euro-
pean association for environment, health and safety in refining
and distribution, which supports the registration process for
its member companies. Petroplus plays an active role in CON-
CAWE’s management groups that deal with the implementa-
tion of REACH.
Support and Compliance with EU Regulations
Petroplus is also a member of European Petroleum Industry As-
sociation (“EUROPIA”) that represents the oil refining and mar-
keting industry in Europe. EUROPIA contributes in a constructive
and proactive way to the development of EU policies, while pro-
moting and enhancing the reputation of the oil industry.
Petroplus is also a member of the National Oil Industry Associ-
ations (NOIA) in member EU countries. Through these groups,
Petroplus is able to participate in local policy development in a
productive manner.
Environment
Laws and Regulations
Our operations are subject to numerous EU, national, regional
and local environmental laws and regulations, including legis-
lation that implements international conventions or protocols.
In particular, these laws and regulations control the types,
quantities and concentration of various substances that can
be released into the environment in connection with produc-
tion activities and may impose administrative sanctions and
criminal and civil liabilities for excess pollution. These laws and
regulations establish standards for the composition of trans-
portation fuels and other petroleum products. In addition, our
operations are subject to laws and regulations relating to the
generation, handling, transportation, sale, storage, disposal
and treatment of materials that may be considered to be con-
taminants if released into the environment.
Carbon Dioxide (CO2) and Emissions
Trading Directive
To help meet the greenhouse gas emissions reduction targets
identified in the Kyoto Protocol, the EU adopted the Emissions
Trading Directive which established a scheme for trading green-
house gas emissions allowances (the ‘‘EU-ETS’’).
Oil refineries are included within the mandatory scope of ap-
plication of the EU-ETS which requires EU Member States to
set a cap on the amount of greenhouse gas emissions from
certain facilities. There are mandatory caps on carbon di-
oxide emissions from combustion plants and certain specific
industry sectors. Based on these caps, facilities are allocated
allowances in the form of credits to an account held at the
central registry of each EU Member State. Each Member State
is required to prepare and publish a National Allocation Plan
to specify the total quantity of CO2 emission allowances that
Member States would grant to companies. All of our refineries
hold permits as required by the EU-ETS Directive. Petroplus
operated within its allocated CO2 allowances for 2008, 2009
and 2010 and expects this to be the case for 2011.
Other Emissions Monitoring and Regulations
Our refineries monitor their emissions to ensure compliance
with limits set by the relevant national environmental author-
ities and other local authorities. The majority of our air emis-
sions come from our stacks and are due to the burning of fuel
and gas in the refineries’ boilers and process heaters. Volatile
Organic Compounds (“VOCs”) typically come from our storage
tanks and process equipment.
Emissions to air such as sulfur dioxide and nitrogen oxides
and emissions to the water are limited at each refinery by the
local environmental authorities. Refinery emissions limits are
permit-related and regularly controlled. Our refineries, whose
emissions are also independently verified, report their emis-
sions directly to local and environmental authorities.
CO2
Petroplus operated within its allocated CO2 allowances
for 2008, 2009 and 2010 and expects this to be the
case for 2011.

42 | Petroplus Holdings AG | Annual Report 2010 | Corporate Responsibility
The Ingolstadt refinery signed an agreement in 2009 with the
local utility company to supply the city with energy from what
would otherwise be waste heat.
Shipping
Petroplus is active in the shipping market on a global basis,
chartering vessels for both the supply of feedstocks for each
of our refinery locations as well as for the transportation of
petroleum products we produce from each refinery location.
Petroplus strictly adheres to Marine Vetting Acceptance Crite-
ria, the purpose of which is to provide a managed risk assess-
ment service ensuring the safe sea transportation, and safe
turn-around in port, of our marine activity. We maintain strict
criteria in order to assess the suitability of a vessel prior to it
being considered for our business. This process applies to all
seagoing vessels proposed for use by Petroplus or attending
Petroplus-operated facilities.
We are a member of the Oil Companies International Marine
Forum (“OCIMF”). The primary objectives of OCIMF are pro-
moting safety and preventing pollution from tankers and oil
terminals.
Oil Spills
We are a member of Oil Spill Response Ltd. (“OSRL”) whose
mission is to provide resources and expertise to respond to oil
spills efficiently and effectively on a global basis.
Social Performance, Community
and Public Affairs
Petroplus aims to be a good neighbor in our communities. This
is more than operating safely and cleanly; it also includes the
integration of goals for the safety of our people and the envi-
ronment. We understand the need to actively communicate
with the community and all stakeholders so that concerns are
addressed.
Energy
We set aggressive targets to drive improvements in
energy efficiency.
Our refineries also support local initiatives dedicated to the
environment. For example, the Petit Couronne refinery is a
member of the Board of Air Normand, a regional association
which undertakes independent monitoring of local air pollu-
tion. The Reichstett refinery is one of the founding members
of “l’Association pour la Surveillance et l’étude de la Pollution
Atmosphérique en Alsace” (“ASPA”) which is the local air pol-
lution monitoring organization for the Strasbourg area. Since
2004, the Cressier refinery has been a member of the Ecoparc
Association whose purpose is to improve synergies between
the industries and their environment.
Low-sulfur/Biofuels
More than 50 % of our final products are in the transport fuels
sector. The Company is in compliance with the national and
European standards for cleaner transportation fuels in all coun-
tries. Additionally, we continue various biofuel initiatives as de-
scribed below:
– The blending of Ethanol and FAME (Fatty Acid Methyl Esters)
to produce bio-blended fuels across all refineries is in line
with national recommendations and obligations.
– Preparation and engagement for the Renewable Energy Di-
rective (RED) and the Fuels Quality Directive (FQD) require-
ments have been given priority in the latter part of the year
and it is anticipated that the groundwork laid down will see
compliance during the course of the next year. The purpose
of these directives introduced by the EU is to reduce green-
house gases and to provide for sustainable bio fuels. The
Company is committed to meeting the requirements of both
directives.
Environmental and Quality Management
Environmental and quality management are keys to delivering
sustainable and reliable performance. We have set up environ-
mental management and auditing systems aimed at monitor-
ing and improving the environmental performance of our op-
erations. The Coryton, Petit Couronne, Ingolstadt, Reichstett
and Cressier refineries are successfully accredited with both
ISO 14001 and ISO 9001 certifications for their environmental
and quality management systems.
Energy Consumption
We set aggressive targets to drive improvements in energy ef-
ficiency. Each refinery has an appointed energy manager to
evaluate new opportunities to improve energy consumption.
In many locations, both heat and electrical power are gener-
ated internally as part of the refining processes. For example,
the Antwerp refinery has completed the construction of a co-
generator plant which is able to produce steam and electricity.
Petroplus Holdings AG | Annual Report 2010 | Corporate Responsibility | 43
Our refineries and operating sites are key members of our local
communities. As a result, we aim to support and strengthen
our ties with these communities. We support local projects,
initiatives and funding of charitable organizations through do-
nations. Petroplus supports charitable programs and activities
that promote the well-being and quality of life of our employees
and their families, and invests in the communities where our
employees live and work.
Each of our local management teams has the flexibility to de-
velop public affairs and community support programs that are
tailored to each community.
Activities at our refineries currently include:
– support of local fire brigades and safety organizations;
– support of local air quality initiatives;
– support of local bio diversity;
– support of local community initiatives for well-being;
– close cooperation programs with local authorities; and
–
proactive communications programs with local communities,
authorities and organizations.
Employees
Petroplus is dedicated to promoting the career development
of its employees and to preparing them to fill their future
responsibil ities. Petroplus also strives to offer its employees an
interesting, flexible and challenging work environment, with the
opportunity to learn and develop. There is a strong emphasis
on competent leadership and on high quality education and
training both on the job by mentoring and coaching and by
specific training courses.
Business Integrity and Transparency
Petroplus is focused on providing transparent and honest
corporate management. Other than those disclosed in the
Corporate Governance section, none of the members of the
Executive Committee are members of governing and super-
visory bodies of Swiss or foreign organizations outside of the
Petroplus group. None of the members have official functions
or hold political posts.
– Our Code of Business Conduct provides guidelines on legal
and ethical conduct, conflicts of interest and protection and
use of Company assets. The policy is distributed throughout
the Company. Additionally, the Company has strict delega-
tion of authority guidelines which govern the approval pro-
cess of all business transactions.
– Our Corporate Risk Management Framework establishes
corporate risk management policies pertaining to financial
liquidity, SHE, counterparty credit, foreign exchange deriva-
tives, commodity derivatives, physical inventory and entity
management. The objective of these policies is to ensure
that key Company risks and their impacts are identified and
evaluated timely and that strategies and policies are defined
to mitigate such risks. Each of these policies is reviewed
and approved annually by the Executive Committee and the
Board of Directors.
– Our Investor Relations Policy provides guidelines and com-
mitments to our shareholders and investors with regards to
communications. Petroplus is committed to providing timely,
consistent and credible dissemination of information, con-
sistent with legal and regulatory requirements, to enable or-
derly behavior in the market and maintain realistic investor
expectations. The ultimate goal of communication with the
financial community is to ensure that Petroplus shareholders
and the market are receiving accurate and timely informa-
tion and that the same information is being provided to all
stakeholders.
– Our Corporate Procurement Guiding Principles & Practices
provides guidelines that are designed to ensure that each
Petroplus business unit secures maximum benefits from our
expenditures for the procurement of goods and services and
minimizes the risks from any of our relationships with ma-
terial suppliers and service providers.
– Our Insider Trading Guideline is designed to prevent and de-
tect insider trading in order to sustain the Company’s reputa-
tion for integrity and ethical conduct.
As part of our compliance with the Swiss Code of Obligations,
we implemented an extensive controls review process in all
areas of our business, including entity level controls and process
level controls. As part of this process, the Company identi-
fied potential risks and implemented processes and controls
designed to prevent and detect any material errors that may
arise. The Company also has extensive procedures in place
to ensure the integrity and transparency of financial statement
disclosures, including reviews at all levels of management and
the Board of Directors. The Company is compliant with the fi-
nancial control requirements of the Swiss Code of Obligations.

Corporate
Governance
46 I Introduction and Principles
46 I Group Structure and Shareholders
47 I Capital Structure
51 I Board of Directors
58 I Executive Committee
61 I Compensation, Shareholdings and Loans
63 I Shareholders’ Participation
64 I Changes of Control and Defense Measures
64 I Auditors
65 I Information Policy
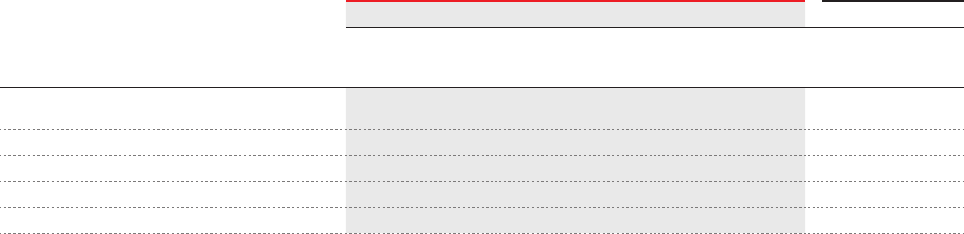
46 | Petroplus Holdings AG | Annual Report 2010 | Corporate Governance
Introduction and Principles
Petroplus is fully committed to meeting high standards of cor-
porate governance. We comply with the standards and report-
ing structure established in the “Swiss Code of Best Practice
for Corporate Governance”, effective July 1, 2002 (updated in
2007), and the SIX Swiss Exchange “Directive on Information
Relating to Corporate Governance” (“DCG”), amended on Oc-
tober 29, 2008 and effective July 1, 2009.
1 Group Structure and Shareholders
1.1 Group Structure
Petroplus Holdings AG (“Petroplus”, “Group”, “us”, “our”, “we” or
the “Company”) is a holding company organized under Swiss
Law with its legal domicile at Industriestrasse 24 in Zug, Switzer-
land. The Company concentrates its business activities solely on
refining crude oil and the wholesale marketing of those refined
products. For detailed segment information, see Note 4 “Seg-
ment Information” of the Consolidated Financial Statements.
The organizational structure is illustrated in the diagram on
page 9. All major group companies are set out in the list of sub-
sidiaries in Note 32 “Subsidiaries” of the Consolidated Finan-
cial Statements. None of the subsidiaries of Petroplus Hold-
ings AG have their shares listed on the SIX Swiss Exchange
or any other stock exchange worldwide. However, Petroplus
Corporate Governance
Finance Ltd., Bermuda, a subsidiary of Petroplus, has issued
USD 600.0 million 6.75 % Senior Notes due 2014 (ISIN: US-
G7053RAA26), USD 600.0 million 7 % Senior Notes due 2017
(ISIN: USG7053RAB09) and USD 400.0 million 9.375 % Senior
Notes due 2019 (ISIN: USG7053TAA81). These debt securities
are listed on the Irish Stock Exchange in the Debt Securities
Segment. The same subsidiary has issued USD 150.0 million
guaranteed, convertible bonds due in 2015. These bonds are
listed on the SIX Swiss Exchange (ISIN: CH0105325853) in the
Debt Securities Segment (International Bonds).
Petroplus registered shares (Symbol: PPHN) are traded in the
main market (clearing via SWX Europe) of the SIX Swiss Exchange
(ISIN: CH0027752242). The market capitalization at December
31, 2010 was approximately CHF 1.2 billion (USD 1.3 billion).
Neither Petroplus Holdings AG nor any of its subsidiaries held
treasury shares at December 31, 2010.
1.2 Significant Shareholders
Based on the notifications that we have received, our signifi-
cant shareholders as of December 31, 2010 include:
Footnotes are outlined on page 47.
December 31, 2010 December 31, 2009
Shareholder
Ownership in % of
registered shares
(Voting rights)
Ownership in % of
potential shares1)
Total
Ownership
Total
Ownership
Janus Capital Group, USA2) 10.13 % – 10.13 % n.a.
FMR Corp., USA3) 4.92 % – 4.92 % 4.92 %
Thomas D. O’Malley, USA4) 2.14 % 1.83 % 3.97 % 4.71 %
UBS AG, Switzerland5) 3.45 % – 3.45 % < 3 %
JGD Management Corporation, USA6) – – < 3 % 3.82 %
Footnotes for the table on page 46
1)Represents the potential ownership, held through financial instruments other than registered shares of Petroplus Holdings AG and calculated based on
the requirements set out in Article 15 of the Ordinance of the Financial Market Supervisory Authority on Stock Exchanges and Securities Trading.
2)Janus Capital Group, located at 151 Detroit Street, Denver, CO 80209, USA, is the parent company of Janus Capital Management LLC. Janus Capital
Management LLC is an investment company and manages US and global portfolios. Janus Capital Group has reported on August 9, 2010 their owner-
ship of 10.13 % (after a reported ownership of 5.56 % on April 21, 2010 and 3.66 % on April 19, 2010).
3)FMR Corp., located at 82 Devonshire Street, Boston, MA 02109, USA, is the parent company of Fidelity Management & Research Company, an
investment manager for US mutual funds, and Fidelity Management Trust Company, a US state chartered bank which acts as a trustee or investment
manager for various pension and trust accounts. FMR Corp. has reported on August 31, 2010 their ownership of 4.92 % (after a reported ownership of
6.53 % on February 3, 2010, 4.92 % on October 29, 2009, 5.07 % on September 28, 2009 and 4.53 % on September 17, 2009).
4)Mr. Thomas D. O’Malley served as our Chairman until his retirement on February 2, 2011 and lives in Stuart, Florida, USA. The ownership of 3.97 %
represents the status as of December 31, 2010 (includes ownership by Horse Island Partners and The T.D. & M.A. O’Malley Foundation, a charitable
organization) after a reported ownership of 4.56 % on September 21, 2009 with SIX.
5)UBS AG, located at Bahnhofstrasse 45, P.O. Box 8090, Zurich, Switzerland, is an international investment bank and provider of financial services.
UBS AG has reported on December 14, 2010 their ownership of 3.45 % (after a reported ownership below 3 % on November 14, 2009 and 3.15 % on
November 14, 2008).
6)JGD Management Corporation, located at 767 Fifth Avenue, New York, NY 10153, USA, is an international investment group and institutional invest-
ment manager. On February 24, 2011, JGD Management Corporation reported that it has sold their ownership on October 6, 2008 (after a reported
ownership of 3.82 % on October 2, 2008). For consistency purposes, the ownership disclosed as of December 31, 2009 has not been adjusted.

Petroplus Holdings AG | Annual Report 2010 | Corporate Governance | 47
BlackRock, Inc., located at 40 East 52nd Street, New York,
NY 10022, USA has reported on April 26, 2010 their owner-
ship below 3 % after a reported ownership of 3.14 % on April
15, 2010.
Credit Suisse Asset Management Funds AG, located in Zurich,
Switzerland has reported on December 16, 2009 their owner-
ship below 3 % after a reported ownership of 3.05 % on July
6, 2009 and Invesco Limited, located in Atlanta, Georgia, has
reported on September 24, 2009 their ownership below 3 %
after a reported ownership of 3.47 % on September 21, 2009.
For specific information on the notifications that we received,
we refer to the SIX Swiss Exchange website:
www.six-exchange-regulation.com, under the section “Obliga-
tions – Disclosure of Shareholdings – Significant Shareholders”.
To the best of our knowledge, no other shareholder holds 3 %
or more of Petroplus Holdings AG voting and potential voting
rights as at December 31, 2010. Additionally, we are not aware
of any shareholder agreements.
Subsequent to December 31, 2010 and prior to the author-
ization of the Annual Report 2010 on February 28, 2011, FMR
Corp. reported an increase in their ownership from 4.92 %
to 5.04 % on January 31, 2011, and subsequently reported a
decrease in their ownership to 4.95 % on February 15, 2011.
1.3 Cross-Shareholdings
There are no cross-shareholdings of Petroplus with another
company or group of companies outside of the Petroplus
group.
2 Capital Structure
2.1 Capital
The Company’s share capital at December 31, 2010 was CHF
712,327,528 and is divided into 95,230,953 registered shares
with a par value of CHF 7.48 each. The share capital is fully paid.
2.2 Authorized and Conditional Share Capital
Authorized Share Capital
As of December 31, 2010, the Board of Directors (“BoD”) is
authorized, according to
article 5 of the Articles of Asso-
ciation,
to increase the share capital, at any time until May 5,
2012, by a maximum amount of CHF 251,440,626 by issuing
a maximum of 33,615,057 fully paid-up registered shares with
a nominal value of CHF 7.48 each. The BoD is entitled to issue
these shares by means of a firm underwriting by a banking insti-
tute or syndicate or by third parties and, subject to an exclusion
of pre-emptive rights, subsequent offer to the shareholders, or
in partial amounts.
Footnotes are outlined on page 47.
December 31, 2010 December 31, 2009
Shareholder
Ownership in % of
registered shares
(Voting rights)
Ownership in % of
potential shares1)
Total
Ownership
Total
Ownership
Janus Capital Group, USA2) 10.13 % – 10.13 % n.a.
FMR Corp., USA3) 4.92 % – 4.92 % 4.92 %
Thomas D. O’Malley, USA4) 2.14 % 1.83 % 3.97 % 4.71 %
UBS AG, Switzerland5) 3.45 % – 3.45 % < 3 %
JGD Management Corporation, USA6) – – < 3 % 3.82 %
Footnotes for the table on page 46
1)Represents the potential ownership, held through financial instruments other than registered shares of Petroplus Holdings AG and calculated based on
the requirements set out in Article 15 of the Ordinance of the Financial Market Supervisory Authority on Stock Exchanges and Securities Trading.
2)Janus Capital Group, located at 151 Detroit Street, Denver, CO 80209, USA, is the parent company of Janus Capital Management LLC. Janus Capital
Management LLC is an investment company and manages US and global portfolios. Janus Capital Group has reported on August 9, 2010 their owner-
ship of 10.13 % (after a reported ownership of 5.56 % on April 21, 2010 and 3.66 % on April 19, 2010).
3)FMR Corp., located at 82 Devonshire Street, Boston, MA 02109, USA, is the parent company of Fidelity Management & Research Company, an
investment manager for US mutual funds, and Fidelity Management Trust Company, a US state chartered bank which acts as a trustee or investment
manager for various pension and trust accounts. FMR Corp. has reported on August 31, 2010 their ownership of 4.92 % (after a reported ownership of
6.53 % on February 3, 2010, 4.92 % on October 29, 2009, 5.07 % on September 28, 2009 and 4.53 % on September 17, 2009).
4)Mr. Thomas D. O’Malley served as our Chairman until his retirement on February 2, 2011 and lives in Stuart, Florida, USA. The ownership of 3.97 %
represents the status as of December 31, 2010 (includes ownership by Horse Island Partners and The T.D. & M.A. O’Malley Foundation, a charitable
organization) after a reported ownership of 4.56 % on September 21, 2009 with SIX.
5)UBS AG, located at Bahnhofstrasse 45, P.O. Box 8090, Zurich, Switzerland, is an international investment bank and provider of financial services.
UBS AG has reported on December 14, 2010 their ownership of 3.45 % (after a reported ownership below 3 % on November 14, 2009 and 3.15 % on
November 14, 2008).
6)JGD Management Corporation, located at 767 Fifth Avenue, New York, NY 10153, USA, is an international investment group and institutional invest-
ment manager. On February 24, 2011, JGD Management Corporation reported that it has sold their ownership on October 6, 2008 (after a reported
ownership of 3.82 % on October 2, 2008). For consistency purposes, the ownership disclosed as of December 31, 2009 has not been adjusted.
48 | Petroplus Holdings AG | Annual Report 2010 | Corporate Governance
The BoD is authorized to determine the issue date, the issue
price, the manner in which the new shares have to be paid-
up, the date from which they carry the right to dividends and
the allocation of unexercised pre-emptive rights. The BoD is
authorized to either forfeit pre-emptive rights which are not
exercised, or to place those or the shares, respectively, for
which the pre-emptive rights were granted but not exercised,
at market conditions or to use them otherwise in the interest of
Petroplus Holdings AG.
The BoD is authorized to exclude or to restrict the pre-emptive
rights of the shareholders provided that the new shares are to
be used for the takeover of enterprises by way of exchange
of shares or for the financing of the takeover of enterprises,
of parts of enterprises or of participations or the financing of
new investment projects of the Company, or in the case of a
national or international private or public placement of shares
in order to finance such transactions, and for granting an over-
allotment option (greenshoe) of up to 20 % of the new shares
to the joint lead managers in connection with a placement of
shares at market price.
Conditional Share Capital
As of December 31, 2010, Petroplus Holdings AG’s share
capital may be increased by a maximum amount of CHF
217,638,117 by issuing up to 29,096,005 fully paid-up regis-
tered shares with a nominal value of CHF 7.48 each. A maxi-
mum of 4,227,705 of these registered shares are available for
issuance to directors, employees and consultants of Petroplus
Holdings AG and its subsidiaries by exercising option rights
granted to them or investors in connection with the purchase
of shares (see article 6 of the Articles of Association and sec-
tion 2.6 “Convertible Bonds, Warrants and Options”). The right
of the shareholders to exercise their statutory pre-emptive
rights is excluded. Up to 24,868,300 registered shares are
available for issuance through the exercise of conversion and/
or option rights, granted in connection with the issuance of
new or existing convertible bonds, convertible loans and/or
bonds with option rights (subsequently called “Equity Related
Financing Instruments”) or other equity related financing in-
struments of Petroplus Holdings AG or one of its subsidiaries
in one or more issues (see article 6a of the Articles of the Asso-
ciation). The holders of conversion or option rights are entitled
to new shares.
In connection with the issuance of Equity Related Financing
Instruments of Petroplus Holdings AG or its subsidiaries, the
BoD is auth orized to restrict or exclude the rights of advanced
subscription of existing shareholders and to allocate such
rights to third parties for the financing or refinancing of the
acquisitions of enterprises or divisions thereof, or of participa-
tions, or of new investment plans of Petroplus Holdings AG or
its subsidiaries, or the issuance of Equity Related Financing
Instruments on national or international capital markets, the re-
financing of existing convertible bonds or other Equity Related
Financing Instruments and the securing of optimal issuance
conditions of Equity Related Financing Instruments.
To the extent the pre-emptive subscription rights are excluded,
the Equity Related Financing Instruments have to be offered
at market conditions, the conversion rights may be exercised
only for up to 10 years and option rights only during a period
of up to 7 years from the date of issue of the relevant Equity
Related Financing Instruments, and the issue price for new
shares (including possible premiums on options and benefits)
has to be in accordance with the market conditions at the time
of issuance of the relevant Equity Related Financing Instruments.
2.3 Changes of Share Capital
The changes to Petroplus Holdings AG’s share capital over the
last three years are described as follows:
Year Ended December 31, 2008
At the ordinary shareholders’ meeting held on May 7, 2008,
the shareholders resolved to reduce the share capital by CHF
68,641,599 to CHF 561,488,280 or CHF 1.00 per registered
share. The entry of the share capital reduction in the commer-
cial register took place on July 22, 2008 and the repayment of
CHF 1.00 per registered share was paid to the shareholders
on July 29, 2008.
During 2008, employees, members of the Executive Commit-
tee and BoD exercised 418,632 options granted under the
Equity Participation Plan and the Equity Incentive Plan. Accord-
ingly 418,632 new shares with a nominal amount of CHF 8.18
each were issued out of the conditional capital according to
article 6 of the Articles of Association. The share capital was
increased accordingly by CHF 3,424,410 and amounted to
CHF 564,912,690 divided into 69,060,231 shares with a nomi-
nal value of CHF 8.18 each as of December 31, 2008.
Year Ended December 31, 2009
At the ordinary shareholders’ meeting held on May 6, 2009,
the shareholders resolved to reduce the share capital by CHF
41,436,138 to CHF 523,476,550 or CHF 0.60 per registered
share. The entry of the share capital reduction in the commer-
Petroplus Holdings AG | Annual Report 2010 | Corporate Governance | 49
cial register took place on July 21, 2009 and the repayment of
CHF 0.60 per registered share was paid to the shareholders on
July 28, 2009.
During September 2009, the Company completed a rights is-
sue and international offering whereby the Company issued
17,265,058 new registered shares from existing authorized
share capital. Existing shareholders were entitled to subscribe
for one new share at a subscription price of CHF 16.90 per
share for every four existing shares held. The new shares began
trading on September 22, 2009. Accordingly, the share capital
amounted to CHF
654,345,690 and was divided into 86,325,289
registered shares with a par value of CHF 7.58 each
as of De-
cember 31, 2009.
Year Ended December 31, 2010
During May 2010, Petroplus completed a private placement
whereby it issued 8,650,000 new registered shares with a
nominal value of CHF 7.58 each out of its authorized capi-
tal according to article 5 of the Articles of Association. The
shares were sold at a price of CHF 17.50. The first trading day
of the new shares was May 7, 2010. This additional offering
increased the share capital by CHF 65,567,000.
At the ordinary shareholders’ meeting held on May 5, 2010, the
shareholders resolved to reduce the share capital by CHF 0.10
per registered share. The entry of the share capital reduction
in the commercial register took place on July 15, 2010 and the
repayment of CHF 0.10 per registered share amounting to
CHF 9,519,456 was paid to shareholders on July 26, 2010.
During 2010, members and former members of the Executive
Committee exercised 255,664 Restricted Share Units (“RSUs”)
and options granted under the Equity Participation Plan and the
Equity Incentive Plan. Accordingly, 255,664 new shares were
issued out of the conditional capital according to article 6 of
the Articles of Association. Consequently, the share capital
was increased by CHF 1,934,294. Accordingly, the share capi-
tal amounts to CHF
712,327,528 and is divided into 95,230,953
registered shares with a par value of CHF 7.48 each
as of De-
cember 31, 2010.
2.4 Shares, Participation
and Profit Sharing Certificates
Registered Shares
As of December 31, 2010, Petroplus Holdings AG has
95,230,953
fully paid registered shares in issue, each with a
nominal amount of CHF 7.48. Each registered share is entitled
to one vote at the annual general meeting of shareholders. Vot-
ing rights may only be exercised after the shareholder has been
registered in the share register. All shares participate equally
in and are entitled to full dividends declared by the Company.
According to the Articles of Association, shareholders are not
entitled to request the printing and delivery of certificates for
registered shares. However, the shareholder may at any time
request a confirmation of the number of his or her registered
shares, which is to be issued by Petroplus Holdings AG.
Participation and Profit Sharing Certificates
Petroplus Holdings AG did not have any participation certifi-
cates or profit sharing certificates outstanding at December 31,
2010 or at any time within the periods presented in this Annual
Report.
2.5 Limitations on Transferability
and Nominee Registrations
There are no restrictions for Swiss or foreign investors with
regard to registration in the share register, insofar as they de-
clare to have acquired shares for their own account. See also
articles 7 and 8 of the Articles of Association.
Persons not expressly declaring themselves to be holding
shares for their own account in their application for entry in
the register of shares (a “Nominee”) will be entered for a maxi-
mum of 5 % of the outstanding share capital. Above this limit,
registered shares held by Nominees will be entered in the
share register with voting rights only if the Nominee in ques-
tion makes known the names, addresses and shareholdings
of the persons for whose account such Nominee is holding
0.5 % or more of the outstanding share capital according to
the commercial register. The BoD has the right to conclude
agreements with such Nominees regulating the representation
of shareholders and of the voting rights.
Legal entities and associations that are linked through capital
ownership or voting rights, through common management or
in like manner, as well as individuals, legal entities or partner-
ships that act in concert with the intent to evade the entry
restriction, are considered as one shareholder or Nominee.
50 | Petroplus Holdings AG | Annual Report 2010 | Corporate Governance
2.6 Convertible Bonds, Warrants and Options
Convertible Bonds
On October 16, 2009, Petroplus Finance Ltd., a subsidiary of
the Company, issued USD 150.0 million in guaranteed senior
secured convertible bonds due 2015. Additional information
on the convertible bonds can be found in Note 18 “Interest-
Bearing Loans and Borrowings” to the Consolidated Financial
Statements of Petroplus Holdings AG.
Warrants, Options and Restricted Stock Units
At December 31, 2010, Petroplus has 3,504,564 options and
RSUs outstanding that were granted through two plans: the
Equity Incentive Plan and the Equity Participation Plan.
Under the Equity Incentive Plan, options were granted to in-
vestors (some of whom are Directors or members of the Ex-
ecutive Committee) in connection with the Company’s shares
and are not dependent upon employment or service. At De-
cember 31, 2010 a total of 2,013,751 options are outstanding
under this plan.
Under the Equity Participation Plan, options and RSUs were
granted to employees, members of the Executive Committee
and members of the BoD:
− At December 31, 2010, a total of 1,119,824 options are out-
standing which were granted between November 30, 2006
and December 31, 2010.
− At December 31, 2010, a total of 370,989 RSUs are out-
standing which were granted between February 4, 2009 and
December 31, 2010.
See Note 22 “Shareholders’ Equity” and Note 24 “Share-
based Payments” in the Consolidated Financial Statements
and Note 6 “Compensation, Shareholdings and Loans” of the
Statutory Financial Statements of Petroplus Holdings AG for
further information regarding these plans.
Petroplus Holdings AG | Annual Report 2010 | Corporate Governance | 51
3 Board of Directors
3.1 Members of the Board of Directors
Petroplus Holdings AG’s Articles of Association stipulate that
the BoD consists of a minimum of three members. At December
31, 2010, the BoD has ten members and is composed as follows:
Markus Dennler (Chairperson)
Walter Grüebler
Werner G. Müller
* Thomas D. O’Malley retired as Chairman and member of the BoD on February 2, 2011. Patrick Monteiro de Barros, formerly Vice Chairman of the
Board, has succeeded Mr. O’Malley as Chairman.
Audit Committee
Patrick Monteiro de Barros (Chairperson)
Eija Malmivirta
Patrick Power
Compensation Committee
Eija Malmivirta (Chairperson)
Maria Livanos Cattaui
Robert J. Lavinia
Werner G. Müller
Nominating and Corporate
Governance Committee
Chairman:
Thomas D. O’Malley*
Vice Chairman:
Patrick Monteiro de Barros*
Board of Directors
Markus Dennler
Walter Grüebler
Robert J. Lavinia
Maria Livanos
Cattaui
Eija Malmivirta
Werner G. Müller
Patrick Power
Jean-Paul Vettier
Name Nationality Position Date of first appointment Term expires
Thomas D. O’Malley American Chairman, non-executive member February 20061) 20112)
Patrick Monteiro de Barros2)3) Portuguese Vice Chairman, Committee Chair-
person, non-executive member
November 20062012
Markus Dennler Swiss Committee Chairperson,
non-executive member
November 20062012
Walter Grüebler Swiss Non-executive member November 20062011
Robert J. Lavinia4) American Non-executive member May 20072013
Maria Livanos Cattaui Swiss Non-executive member November 20062011
Eija Malmivirta Finnish Committee Chairperson,
non-executive member
November 20062012
Werner G. Müller4) Swiss Non-executive member May 20072013
Patrick Power Irish Non-executive member November 20062011
Jean-Paul Vettier4) French Executive member and Chief
Executive Officer
May 20102013
1)Includes Thomas D. O’Malley’s term as Chairman of Argus.
2)Thomas D. O’Malley’s retirement as Chairman and member of the BoD, originally announced on December 8, 2010 and effective May 5, 2011, was
brought forward to the Petroplus Board meeting on February 2, 2011, due to the continuing rapid development of PBF Energy Company LLC, of which
he is Chairman of the BoD. Patrick Monteiro de Barros, formerly Vice Chairman of the Board, has now succeeded Mr. O’Malley as Chairman.
3)Patrick Monteiro de Barros was a founder of and a member of the BoD of Argus from February 2006 to August 2006.
4)At the fourth Annual General Meeting of Petroplus Holdings AG on May 5, 2010, Robert J. Lavinia and Werner G. Müller were re-elected members of
the BoD and Jean-Paul Vettier was elected member of the BoD, all for a tenure of three years.
Composition of the Board of Directors and its Committees at December 31, 2010

52 | Petroplus Holdings AG | Annual Report 2010 | Corporate Governance
3.2 Education, Professional Background,
Other Activities and Functions
With the exception of Mr. O’Malley, our Chairman, who served
as our CEO from May 2006 to March 2008, Mr. Lavinia, who
served as our CEO from March 2008 until August 2009, and
Mr. Vettier, our CEO, who succeeded Mr. Lavinia, none of the
other members of the BoD has or had any management re-
sponsibility within Petroplus. With the exception of their own-
ership interest, none of the other members of the BoD has or
have had any significant business connection with Petroplus
or its affiliated companies other than those disclosed below.
None of the members of the BoD have official functions or hold
political posts.
Thomas D. O’Malley
(Chairman, non-executive member)
Education
Bachelor of Science in Economics from Man-
hattan College, USA.
Professional background
Thomas D. O’Malley has served as Chairman of
the BoD since May 2006. Mr. O’Malley was CEO
of Petroplus from May 2006 to March 2008. Mr.
O’Malley also serves as Chairman and CEO of
PBF Investments LLC, the managing entity of a
US partnership of which Petroplus was an ap-
proximate one-third owner until October 2010.
Prior to his involvement with Petroplus, Mr.
O’Malley was Chairman of the BoD of Prem-
cor Inc., a US domestic oil refiner and Fortune
250 company listed on the New York Stock Ex-
change until its sale to Valero in August 2005.
Before joining Premcor, Mr. O’Malley was Chair-
man and CEO of Tosco Corpor ation. This For-
tune 100 Company was the largest indepen-
dent oil refiner and marketer of oil products in
the United States. Prior to his involvement with
Premcor and Tosco, Mr. O’Malley was Vice
Chairman of Salomon Inc.
Activities in governing and supervisory bodies
Mr. O’Malley is Chairman of the Board of Trust-
ees of Manhattan College and is a member of
the Board of the National Petrochemical & Re-
finers Association (“NPRA”), Washington, D.C.,
the trade association representing the US Re-
fining and Petrochemical Industry. Mr. O’Malley
also serves as Chairman and CEO of PBF In-
vestments LLC, USA.
Permanent management and consultancy func-
tions for Swiss and foreign interest groups
None.
Patrick Monteiro de Barros
(Vice Chairman and Chair person of the Compensation Committee, non-executive member)
Education
BA from the University of Paris and Ecole Supé-
rieur de Commerce de Paris, France.
Professional background
Patrick Monteiro de Barros has served as
Chairman and CEO of Argus Resources Ltd.
(U.K.) since 1988. He was president and CEO
of Sigmoil Resources from 1987 to 1988 and
Senior Vice President of Philipp Brothers from
1975 to 1987.
Activities in governing and supervisory bodies
Mr. de Barros serves as a Chairman of the Mon-
teiro de Barros Foundation, Lisbon, Portugal,
Chairman of Protea Holdings, NY, USA and is a
non-executive member of the Board of the Es-
pirito Santo Financial Group.
Permanent management and consultancy func-
tions for Swiss and foreign interest groups
None.

Petroplus Holdings AG | Annual Report 2010 | Corporate Governance | 53
Markus Dennler, Dr.
(Chairperson of the Audit Committee, non-executive member)
Education
Juris Doctor from the University of Zurich and
admitted to the Bar. Further he attended the In-
ternational Bankers School in New York and the
Harvard Business School (AMP), USA.
Professional background
Markus Dennler served in a series of positions
within the Credit Suisse Group, ultimately as
a member of the Executive Board of Credit
Suisse Financial Services and as CEO respon-
sible for the global operational life and pensions
business. Prior to that, he was a member of the
Corporate Executive Board of Winterthur Insur-
ance, at that time a subsidiary of Credit Suisse
Group.
Activities in governing and supervisory bodies
Dr. Dennler currently serves as Vice Chairman
of Implenia and Allianz Suisse and as a member
of the Board of Swissquote.
Permanent management and consultancy func-
tions for Swiss and foreign interest groups.
Council member of the British Swiss Chamber
of Commerce.
Walter Grüebler, Dr.
(Non-executive member)
Education
Dr. oec. HSG and Master of Business Adminis-
tration (lic. oec. HSG) from the University of St.
Gallen, Switzerland.
Professional background
Walter Grüebler served as CEO of Sika AG from
2000 to 2004. From 1990 to 1999, Mr. Grüebler
was a member of Group Management of Alu-
suisse AG and from 1974 to 1990 was CEO and
Vice Chairman of the BoD of Airex AG.
Activities in governing and supervisory bodies
Dr. Grüeb ler serves as Chairman of the BoD of
Sika AG, Chairman of Adval Tech AG and Na-
tional Versicherungen. Dr. Grüebler is a Board
member of ETH Foundation, Zurich, Switzer-
land.
Permanent management and consultancy func-
tions for Swiss and foreign interest groups
None.
Robert J. Lavinia
(Non-executive member)
Education
Graduated from the US Merchant Marine Acad-
emy and the Harvard Business School (AMP),
USA.
Professional background
Robert J. Lavinia has served on the BoD since
May 2007. He was President of Petroplus from
July 5, 2007 until March 1, 2008, and CEO of
Petroplus from March 1, 2008 until August 31,
2009. Prior to joining Petroplus, he worked for
a number of large energy companies including
Gulf Oil Corporation (1970 – 1980), Phibro Ener-
gy Corporation (1980 – 1991) and Tosco Corpor-
ation (1992 – 2001). Mr. Lavinia served on the
BoD of Transcor SA, a Belgium based trading
company from 2002 to 2006 and as Chairman
of the Board of the Pasadena Refining Com-
pany from 2005 to 2006.
Activities in governing and supervisory bodies
None.
Permanent management and consultancy func-
tions for Swiss and foreign interest groups
None.

54 | Petroplus Holdings AG | Annual Report 2010 | Corporate Governance
Maria Livanos Cattaui
(Non-executive member)
Education
BA with Honors from Harvard University, USA,
and an honorary Doctor of Laws degree from
York University, Canada.
Professional background
Maria Livanos Cattaui was Secretary-General of
the International Chamber of Commerce from
1996 through June 2005. Prior to this position,
Mrs. Cattaui was with the World Economic Fo-
rum in Geneva for nearly two decades, rising to
become Managing Director, responsible for the
forum’s annual meeting in Davos.
Activities in governing and supervisory bodies
Mrs. Cattaui serves on various non-profit boards
around the world: Chairman of the Balkan Chil-
dren and Youth Foundation, Skopje, member
of the Executive Committee of the International
Crisis Group, Brussels, member of the Board
and Advisory Board of ICT for Peace Found-
ation, Geneva, East-West Institute, New York,
the Institute of International Education, New
York, the National Bureau of Asian Research
(NBR), the Schulich School of Business at the
York University, Toronto, and the Elliott School
of International Affairs at the George Washington
University, Washington D.C.
Permanent management and consultancy func-
tions for Swiss and foreign interest groups
None.
Eija Malmivirta (Chairperson of the Nominating and Corporate Governance Committee,
non-executive member)
Education
Master of Sciences from Helsinki University of
Technology in Finland.
Professional background
Eija Malmivirta served as Chairman and principal
owner of Merei Oy Ltd. from 1996 to 2002. From
1969 to 1996, she served in various positions
with Neste Oyj, most recently as Executive Vice
President, Head of Neste Oil Trading and Supply.
Activities in governing and supervisory bodies
Ms. Malmivirta serves as a member of the BoD
of Kotimaa Yhtiöt Oy, Helsinki, and Miinan Hoi-
tolat Oy, Helsinki.
Permanent management and consultancy func-
tions for Swiss and foreign interest groups
None.
Werner G. Müller, Dr.
(Non-executive member)
Education
PhD in geology from the University of Basel,
Switzerland.
Professional background
Werner G. Müller has more than 40 years of pro-
fessional experience in technical and economic
aspects of the mining, metallurgical and oil and
gas businesses. Dr. Müller has worked for the
world’s leading commodity trading firms, includ-
ing Philipp Brothers (1971 – 1985), Glencore and
its predecessor Marc Rich (1989 – 2000). Since
2000, Dr. Müller has been an independent min-
erals industry consultant. He is also a Senior As-
sociate of Behre Dolbear, a US-based consulting
group specialized in evaluating minerals industry
assets and providing mining financial services.
Activities in governing and supervisory bodies
None.
Permanent management and consultancy func-
tions for Swiss and foreign interest groups
None.

Petroplus Holdings AG | Annual Report 2010 | Corporate Governance | 55
3.3 Elections and Terms of Office
The members of the BoD are generally elected for terms with
a maximum of three years at the annual general shareholders’
meeting. A year is defined as the period between two ordi-
nary shareholders’ meetings. The individual terms of office of
the members are coordinated in such a way that every year
Patrick Power
(Non-executive member)
Education
Bachelor of Sciences in Experimental Physics
from University College Dublin, Ireland; Master
of Sciences in Geophysics from Imperial Col-
lege London, UK; MBA from University College,
Cork, Ireland. Patrick Power is also a chartered
engineer and a fellow of the Institution of Engin-
eers of Ireland.
Professional background
Patrick Power has served as founder and Man-
aging Director of Shannon LNG Limited since
2003. Prior to that, he served as director and
CEO of the Irish National Petroleum Corpor-
ation from 1998 to 2001 and the Irish Petroleum
Company from 2001 to 2002. From 1973 to
1993, Mr. Power held various positions with
Marathon Oil Company, including President of
Marathon International Petroleum – Worldwide
Business Development.
Activities in governing and supervisory bodies
Mr. Power serves as a Managing Director and
member of the BoD of Shannon LNG Ltd.
Permanent management and consultancy func-
tions for Swiss and foreign interest groups
None.
Jean-Paul Vettier
(Chief Executive Officer and executive member)
Education
Undergraduate degree in Economic Sciences
and Law from the University of Paris, France.
Professional background
Jean-Paul Vettier was appointed CEO in Sep-
tember 2009. Prior to joining Petroplus, he was
active in advising investment and management
firms on energy matters and he has also served
as a Board Member for companies based in the
US, Europe and Canada. From 1993 to March
2006, he was Chairman and CEO and member
of the Executive Committee of Total Refining
& Marketing, a multinational energy company.
Between 1992 and 1996, he was non-executive
Chairman of Total Petroleum North America.
Prior to joining Total in 1990, he served as the
General Manager of the Petrochemical Division
and as a member of the Executive Committee at
Orkem from 1987 to 1989. From 1970 to 1986,
Mr. Vettier was employed by Rhône-Poulenc, a
chemical and petrochemical firm where he held
operational responsibilities.
Activities in governing and supervisory bodies
Director of Overseas Shipholding Group, a New
York based shipping company and DOMO NV,
a Belgian chemical company.
Permanent management and consultancy func-
tions for Swiss and foreign interest groups
None.
approximately one-third of the members are subject to reelec-
tion or election. Each year, the members were elected indi-
vidually. The expiry dates of the elected terms of all members
of the BoD are disclosed in the table on page 51.
The BoD appoints its own Chairman and Vice Chairman.
56 | Petroplus Holdings AG | Annual Report 2010 | Corporate Governance
3.4 Internal Organizational Structure
The BoD is the supreme management body of Petroplus and
consists of the Chairman, the Vice Chairman and the other
members. In accordance with the Organizational Regulations
of Petroplus Holdings AG, our BoD has established three com-
mittees: the Audit Committee, the Nominating and Corporate
Governance Committee and the Compensation Committee.
Each committee advises the BoD on the matters specified be-
low, often with the assistance of the Executive Committee and
others involved in the management of Petroplus Holdings AG.
The chairperson of each of the committees informs the BoD of
all significant issues discussed at the committee meetings and
provides recommendations for decisions required to be made
by the BoD. Members of the committees are non-executive
members of the BoD and are independent of Petroplus. For
purposes of committee membership, independent means a
non-executive member of the BoD who was not a member of
the Executive Committee during the past three years and who
has had no or comparatively minor business relations with
Petroplus Holdings AG. This restriction can be waived by the
BoD depending on the individual circumstances. No member
of any committee may have any relationship that, in the opinion
of the BoD, would interfere with the exercise of his or her in-
dependent judgment as a member of the relevant committee.
There have been eight BoD meetings held during the year,
typically lasting approximately two to five hours each, or the
time necessary to fulfill their purpose.
The BoD and the committees have invited members of the
Executive Committee and external consultants to deal with
specific issues as necessary.
Audit Committee
Members: Markus Dennler (Chairperson), Walter Grüeb ler
and Werner G. Müller.
The Audit Committee supports the BoD as a consulting, con-
trolling and initiating body in the areas of communicating with
internal and external auditors, supervising the independence
and objectivity of the internal audit function, reviewing and as-
sessing the independence of external auditors, reviewing and
assessing financial reporting as well as assessing the adequa-
cy of internal control systems. The Audit Committee encour-
ages continuous improvement of, and adherence to Petroplus
Holdings AG’s policies, procedures and practices at all levels.
The Audit Committee is composed of at least two members of
the BoD as determined by the BoD. Each member of the Audit
Committee must be a non-executive and independent direc-
tor. The committee normally meets at least four times a year
for the time necessary to fulfill its purpose, which is estimated
to be no less than one hour, or more frequently as circum-
stances dictate. In 2010, the committee held four meetings,
lasting approximately three to five hours each.
Nominating and Corporate Governance Committee
Members: Eija Malmivirta (Chairperson), Maria Livanos Cattaui,
Robert J. Lavinia and Werner G. Müller.
The Nominating and Corporate Governance Committee es-
tablishes principles for the selection of nominees for election
or re-election to the BoD, suggests nominees for election to
the BoD and makes recommendations to the BoD concerning
corporate governance matters and practices.
The Nominating and Corporate Governance Committee is
composed of at least two members of the BoD as determined
by the BoD. The majority of them must be non-executive and
independent directors. The committee normally meets ap-
proximately two to four times a year for the time necessary
to fulfill its purpose, which is estimated to be no less than one
hour, or more frequently as circumstances dictate. In 2010,
the committee held five meetings, lasting approximately one
to three hours each.
Compensation Committee
Members: Patrick Monteiro de Barros (Chairperson),
Eija Malmivirta
and Patrick Power.
The Compensation Committee supports the BoD to assure that
the executive officers and the members of the BoD are com-
pensated in a manner consistent with our stated compensation
strategy, internal equity considerations, competitive practice,
regulatory requirements and our shareholders’ interests.
The Compensation Committee is composed of at least two
members of the BoD as determined by the BoD. The major-
ity of them must be non-executive and independent directors.
The committee normally meets approximately two to four
times a year for the time necessary to fulfill its purpose, which
is estimated to be no less than one hour, or more frequently as
circumstances dictate. In 2010, the committee held four meet-
ings, lasting approximately one to three hours each.
Petroplus Holdings AG | Annual Report 2010 | Corporate Governance | 57
3.5 Definition of Areas of Responsibility
While the BoD has delegated the executive management of
Petroplus to the CEO and the Executive Committee, the fol-
lowing responsibilities remain with the Board:
− election of the Chairman, Vice Chairman, Chairperson and
members of the Audit Committee, Nominating and Corpor-
ate Governance Committee and the Compensation Com-
mittee;
− definition of the ultimate direction of the Company and the
handing out of necessary instructions;
− definition and modification of the strategy of the Company
as well as the passing of resolutions about taking up or sus-
pending of business activities;
− establishment of the organization;
− appointment and dismissal of members of the Executive
Committee and of other signatories of the Company;
− approval of the annual budget and deviations from it;
− approval of the financial planning and establishment of prin-
ciples of accounting and financial control;
– determination of the fiscal year of the Company;
− supervision and control of the members of the Executive Com-
mittee, especially with respect to compliance with laws, the Ar-
ticles of Association, internal directives and instructions;
− preparation of the annual report and general meetings, as
well as the execution of its decisions;
− notification of the judge in case of over-indebtedness or
bankruptcy based on Article 725 of the Swiss Code of Ob-
ligation (“CO”);
− decisions about contributions on shares not fully paid and
in connection with the increase of share capital out of the
authorized capital, including decisions to delete outdated
provisions;
− approval of mass redundancies as set out in Article 335d of
the CO or similar foreign regulations; and
− purchases and sales of real estate, subsidiaries or busi-
nesses if the consideration exceeds CHF 80 million, bor-
rowings that exceed CHF 500 million, petroleum contracts
that exceed 600,000 barrels per month and extend more
than one year and other contracts that exceed CHF 200 mil-
lion per year and all transactions between the Company and
the CEO or the other members of management or persons
closely related to them.
3.6 Information and Control Instruments
vis-à-vis the Executive Committee
Petroplus’ reporting system uses professional reporting and
consolidation software. Comprehensive Income and Finan-
cial Position Statements are consolidated and reported on a
monthly basis, including other information pertinent to an up-
to-date controlling system, such as sales and operating profit
details. On a monthly basis, each refinery, marketing and other
business controller reports a detailed analysis on the changes
in financial information. This analysis incorporates changes in
the market, operations, and other relevant areas. Additionally,
this analysis is compared to the budget that was approved by
the BoD in the fourth quarter of the previous year. The Chief
Financial Officer (“CFO”) provides the BoD a summary analysis
on the financial and operational results on a monthly basis.
The members of the Executive Committee are regularly in-
volved in the meetings of the BoD and the Audit Committee.
The CFO presents the financial information of the Company to
the Audit Committee and the BoD on a quarterly and annual
basis.
The Internal Audit function assists the BoD in the execution
of its oversight responsibilities by providing independent and
objective assessments of the effectiveness of the Company’s
risk management, internal control and governance processes.
Internal Audit activities are based on an annual audit plan de-
veloped using an appropriate risk-based methodology that
covers all operations of the Company. This audit plan is ap-
proved by the BoD after review by the Audit Committee. The
results of internal audits are communicated directly to the
Executive Committee, the Audit Committee, the Chairman of
the Board and the External Auditors through formal Internal
Audit reports. Regular follow-up is performed to ensure that
risk miti gation and control improvement measures are imple-
mented on a timely basis.
The Director of Internal Audit reports directly to the Audit Com-
mittee to ensure independence from management.
The Internal Audit function is committed to abiding by the Stan-
dards for Professional Practice of Internal Auditing set out by
the Institute of Internal Auditors.
58 | Petroplus Holdings AG | Annual Report 2010 | Corporate Governance
4 Executive Committee
4.1 Members of the Executive Committee
The five members of the Executive Committee are as follows:
4.2 Education, Professional Background, Other
Activities and Functions
None of the members of the Executive Committee are mem-
bers of governing or supervisory bodies of Swiss or foreign
organ izations outside of the Petroplus group, other than
those disclosed for Jean-Paul Vettier. None of the mem-
bers hold permanent management or consultancy functions
for Swiss or foreign interest groups, and none of the members
have official functions or hold political posts.
Name Nationality Position
Jean-Paul VettierFrench Chief Executive Officer and member of the Board of
Directors
Chester J. KuchtaAmerican Executive Vice President and Chief Operating Officer
Peter F. Senkbeil1) German General Manager Refining
W. Thomas SkokAmerican General Counsel and Corporate Secretary
Joseph D. Watson2) American Executive Vice President and Chief Financial Officer
1)Effective February 2, 2010, Peter F. Senkbeil was appointed General Manager Refining.
2)Effective August 5, 2010, Joseph D. Watson was appointed CFO, replacing Karyn F. Ovelmen. Ms. Ovelmen continued to serve as an employee in a
transition position until the end of August 2010.
Jean-Paul Vettier
(Chief Executive Officer and executive member of the Board of Directors)
See section “Board of Directors” on page 55.
Tasks previously carried out for Petroplus
None.

Petroplus Holdings AG | Annual Report 2010 | Corporate Governance | 59
Chester J. Kuchta
(Executive Vice President and Chief Operating Officer)
Education
Bachelor of Sciences in Chemical Engineering
from Brown University, USA.
Professional background
Chester J. Kuchta has served as our Chief Op-
erating Officer since November 2009. He joined
Petroplus in June 2006 as Chief Commercial
Officer. Prior to this position, he served as Vice
President of Crude Oil Supply and Trading at
the Premcor Refining Group Inc. from April
2002 until September 2005, when Premcor
was acquired by Valero Energy. Prior to join-
ing Premcor, Mr. Kuchta served as the Crude
Oil Supply Manager for Phillips 66 Company’s
East Coast and Gulf Coast Systems, follow-
ing Phillips’ acquisition of Tosco Corporation in
2001. Prior to joining Phillips, Mr. Kuchta served
in various commercial and refining positions at
Tosco from 1996 to 2001. Prior to joining Tosco,
Mr. Kuchta spent six years at the Exxon Cor-
poration in various refining, economic and envi-
ronmental engineering positions.
Tasks previously carried out for Petroplus
Served as Chief Commercial Officer from 2006
to 2009.
Peter F. Senkbeil
(General Manager Refining)
Education
Diploma in Mechanical Engineering from Uni-
versity of Applied Sciences Hannover, Ger-
many.
Professional background
Peter F. Senkbeil has served as our General
Manager Refining since November 2009 and
as a member of the Executive Committee since
February 2010. He was the General Manager for
the Inland Refining System from 2007 to 2009.
Mr. Senkbeil has 30 years of experience in the
refining industry. He was the refinery manager
at the Exxon Ingolstadt refinery from 1997 until
2007, when Ingolstadt was acquired by Petro-
plus. Mr. Senkbeil holds a degree in mechani-
cal engineering and joined Exxon in 1980 where
he progressed through management positions
in maintenance, engineering and operations in
the former German Exxon refineries. He also
held several non-refinery assignments includ-
ing Supply Manager for Exxon Central and East
Europe as well as foreign assignments to the
US with Exxon Research and Engineering.
Effective February 2, 2010, Mr. Senkbeil was
appointed as a member of the Executive Com-
mittee.
Tasks previously carried out for Petroplus
Served as General Manager for the Inland Refin-
ing System from 2007 to 2009.

60 | Petroplus Holdings AG | Annual Report 2010 | Corporate Governance
4.3 Management contracts
Petroplus does not have management contracts with third parties.
W. Thomas Skok
(General Counsel and Corporate Secretary)
Education
Bachelor of Arts Degree from Lycoming College,
Pennsylvania, USA, and Juris Doctor from West-
ern State University, College of Law, USA.
Professional background
W. Thomas Skok has served as our General
Counsel and Corporate Secretary since De-
cember 2009. He previously served as Asso-
ciate General Counsel of Petroplus from 2007
to 2009. Prior to joining Petroplus, Mr. Skok
served as Senior Counsel supporting Conoco
Phillips’ downstream businesses from 2001
until February 2007. From 1997 to 2001, he was
Associate General Counsel at Tosco Corpor-
ation. Prior to joining Tosco, Mr. Skok served as
Deputy General Counsel at Unocal Corporation
from 1984 to 1997. Prior to earning his license
to practice law, he served in various financial
management positions for Unocal’s Industrial
Chemicals businesses.
Tasks previously carried out for Petroplus
Served as Associate General Counsel of
Petroplus Marketing AG from 2007 to 2009.
Joseph D. Watson
(Executive Vice President and Chief Financial Officer)
Education
Bachelor of Arts Degree from Princeton Univer-
sity, USA, and Program for Management Devel-
opment at Harvard Business School, USA.
Professional background
Joseph D. Watson has served as our CFO since
August 2010. Mr. Watson has thirteen years of
executive experience in the independent refin-
ing sector. He served as Senior Vice President
and CFO of Premcor Inc. from January to Sep-
tember 2005 after spending several years at
various management levels in the company.
Prior to joining Premcor, he spent nine years
with Tosco Corporation, serving as president of
The e-Place.com, Ltd., a wholly owned subsidi-
ary of Tosco, and as Vice President of Tosco
Shared Services from November 2000 to Feb-
ruary 2002. From 1993 to 2000, Mr. Watson
served in various financial management posi-
tions at Tosco. From 1991 to 1993, he served
as Vice President of Argus Investments, Inc., a
private investment company. More recently, Mr.
Watson has been involved at the executive level
in the alternative energy industry, serving as the
CFO of Process Energy Solutions LLC, and has
consulted for various energy companies, in-
cluding PBF Energy Company.
Effective August 5, 2010, Mr. Watson suc-
ceeded Ms. Karyn F. Ovelmen as the CFO of
the Company.
Tasks previously carried out for Petroplus
None.
Petroplus Holdings AG | Annual Report 2010 | Corporate Governance | 61
5 Compensation, Shareholdings
and Loans
5.1 Content and Method of Determining the
Compensation and the Share-Ownership
Programs
Compensation for the BoD and for the Executive Committee
is determined by the Compensation Committee and is subject
to approval by the BoD. The remunerations paid in 2010 are
in accordance with this authorization procedure and are con-
sistent with the Company’s rewards policy. The information in-
cluded here follows the guidelines of the SIX Swiss Exchange.
Compensation Policy
Petroplus’ human resources philosophy centers on valuing
employees and their contributions to the success of the Com-
pany. These principles also apply to members of the BoD and
the Executive Committee. Wherever possible, Petroplus uses
results- and performance-driven compensation programs that
are based on relevant market practices. Our rewards policy
focuses on total compensation which is comprised of three
elements:
− Base salaries;
− Short-term incentive awards; and
− Long-term equity incentives.
Compensation decisions are guided by clearly defined pro-
gram structures that ensure fair and transparent treatment.
Compensation Committee
The Compensation Committee of the BoD has established
policies to ensure that management and employees are re-
warded appropriately for their contributions to the Company’s
growth and profitability, that the executive compensation
strategy supports organizational objectives and shareholder
interests and that compensation is demonstrably contingent
upon sustainable Company success and the individual con-
tribution by each person. The Committee regularly monitors
market data and industry practices and has established pro-
grams to provide a framework for compensation at all levels of
the Company.
Petroplus uses a variety of information to obtain insight to
market practices. Several external advisors, including leading
compensation consulting groups, are regularly consulted. The
relevant market data is derived from the Swiss Leader Index
(SLI) and the index STOXX Europe – TMI Oil & Gas Producers
as well as from specially commissioned refining industry studies.
Principle initiatives of the Compensation Committee in 2010
include the standardization of executive employment agree-
ments, industry benchmarking studies, introduction of a newly
designed Corporate Bonus Program and implementation
guidelines for the Petroplus Equity Participation Plan.
In 2010, the Compensation Committee supported the intro-
duction of a new short-term variable reward program: The
Corporate Bonus Program. This is a key element of the Com-
pany’s total compensation approach and applies to all eligible
employees, including the Executive Committee. The new pro-
gram acknowledges and rewards contributions at three levels:
− Total Company performance;
− Business unit or team accomplishment; and
− Individual performance.
Metrics are established for each of these components with the
main purpose of rewarding annual performance.
The BoD approves the available funding for compensation
programs and the individual awards to the non-executive Di-
rectors and the Executive Committee.
Non-Executive Members of the Board of Directors
The BoD determines the compensation to non-executive
members of the BoD. For 2010, the following forms of com-
pensation were received by non-executive members of the
BoD:
− Board of Directors fees – With the exception of our Chair-
man, Thomas D. O’Malley, each non-executive member of
the BoD was paid an annual compensation of CHF 202,500
for services provided. This represented a 10 % reduction
from 2009. In addition, the chairperson of the Audit Com-
mittee received additional annual compensation of CHF
100,000, and the committee chairpersons of the Compen-
sation Committee and the Nominating and Corporate Gov-
ernance Committee each received additional annual com-
pensation of CHF 20,000.
− Other cash compensation – Each non-executive member
of the BoD received compensation of CHF 5,500 for each
board and/or committee meeting attended and reimburse-
ment of out-of-pocket expenses incurred for attending
Committee and Board meetings.
− Equity Participation Plan – The non-executive members of
the BoD are eligible to participate in the Petroplus Equity
Participation Plan. The equity compensation granted is ap-
proved by the BoD. No such equity awards were granted to
non-executive members of the BoD in 2010.
− The agreement for Thomas D. O’Malley provides for an an-
nual base salary in the amount of CHF 600,000.
62 | Petroplus Holdings AG | Annual Report 2010 | Corporate Governance
Executive Committee
Changes in the Executive Committee
During 2010, the Company experienced changes in the Ex-
ecutive Committee. Mr. Michael D. Gayda retired from the
Company while Mr. Bruce A. Jones and Ms. Karyn F. Ovelmen
resigned their positions. New senior managers were elected
by the BoD as members of the Executive Committee. These
include Mr. Peter F. Senkbeil (General Manager Refining as of
February 2, 2010) and Mr. Joseph D. Watson (Chief Financial
Officer as of August 5, 2010).
Employment Agreements
The Company has entered into employment agreements with
members of the Executive Committee. Each agreement has
been approved by the BoD. The agreements, as amended,
have an indefinite term and may be terminated by either the
Company or the relevant Executive with at least three months’
notice period, except that Mr. Vettier’s employment agreement
is for a two-year term with a provision that permits an exten-
sion of the agreement for additional one-year periods at the
end of the term or any renewal thereof.
Termination benefits are contained in executive agreements
should employment be terminated by the Company without
cause or by the Executive for good reason. These include a
payment equal to 1.5 times the sum of the annual base salary
and previous year’s bonus for Mr. Vettier, 1.5 times the annual
base salary for Mr. Kuchta and 1.0 times the annual base sal-
ary for both Mr. Skok and Mr. Senkbeil. In 2010, former mem-
bers of the Executive Committee, Bruce A. Jones and Karyn
F. Ovelmen, received termination benefits per the provisions of
their employment agreements.
Compensation
The total compensation of Executives, including base salary,
short-term and long-term incentive components, is determined by
the BoD. In determining Executive compensation, the BoD con-
siders, among other factors, the Company’s performance and rel-
ative shareholder return, the value of similar incentive awards for
executive officers at comparable companies in the refining indus-
try and the awards given to the respective persons in past years.
– Base Salary: The Executive Employment Agreements pro-
vide for annual base salaries in the following amounts as of
December 31, 2010:
– CHF 2,400,000 for Jean-Paul Vettier;
– CHF 1,200,000 for Chester J. Kuchta;
– CHF 1,000,000 for Joseph D. Watson (effective July 1, 2010);
– CHF 675,000 for W. Thomas Skok; and
– CHF 500,000 for Peter F. Senkbeil (effective February 2, 2010).
– Short-term Incentive Awards: The employment agreements
provide that the members of the Executive Committee are
eligible to earn an annual bonus in accordance with the
Company’s incentive compensation plan. For 2010, the ap-
plication of Executive Committee bonus awards followed
the structure of the Corporate Bonus Program in which a
target bonus amount of 60 % of base salary has been mea-
sured against Company financial results and individual per-
formance. These award components were given weightings
of 50 % each and included assessment of the Company’s
success as measured by “clean” earnings-per-share (which
excludes the impact of the change in the oil price environ-
ment and one-time items) and evaluation of achievements
versus individual performance objectives. The maximum bo-
nus for the members of the Executive Committee under the
Corporate Bonus Program may not exceed 120 % of base
salary. Actual awards are determined by the BoD. Outside of
the Corporate Bonus Program, Executives may also receive
additional bonus awards at any time at the discretion of the
BoD.
– Long-term Equity Incentives: Members of the Executive
Committee are also eligible to participate in the Petroplus
Equity Participation Plan, under which certain stock options
and RSUs are granted at the discretion of the BoD. These
incentives are intended to reward the members of the Ex-
ecutive Committee based on the long-term success of the
Company. In 2010, Mr. Vettier, Mr. Kuchta, Mr. Senkbeil and
Mr. Skok received RSUs with a three-year graded vesting
scheme, with one-third of the shares vesting each year. Ad-
ditionally, Mr. Senkbeil, Mr. Skok and Mr. Watson received
share options with a four-year vesting schedule. The awards
for Mr. Vettier, Mr. Kuchta and Mr. Watson are contractually
agreed amounts, based on the provisions of their respective
agreements. Mr. Vettier receives equity incentives annually
with a fair value calculated under International Financial Re-
porting Standards (“IFRS”) representing 20 % of his annual
base salary. Mr. Kuchta receives equity incentives annually
representing 0.05 % of the number of outstanding shares of
Petroplus Holdings AG. Mr. Watson receives equity incen-
tives of 50,000 options annually for a two year period. The
number of stock options and RSUs awarded to Mr. Senkbeil
and Mr. Skok is based on the role of each individual.
Loans to Acting Members of Governing Bodies
No loans have been granted to members of the BoD or mem-
bers of the Executive Committee during 2010.
Petroplus Holdings AG | Annual Report 2010 | Corporate Governance | 63
5.2 Compensation and Shareholdings
For the disclosure of the compensation of the BoD and Ex-
ecutive Committee and details of shareholdings refer to Note
6 “Compensation, Shareholdings and Loans” of the Statutory
Financial Statements of Petroplus Holdings AG at December
31, 2010.
6 Shareholders’ Participation
6.1 Voting Rights and Representation Restrictions
Each share carries one vote. All shares have equal rights. Voting
rights and certain other non-economic rights attached to the
shares, including the right, subject to certain conditions, to call
and to attend shareholders’ meetings, may be exercised only
after a shareholder has been registered in the share register
of Petroplus Holdings AG as a shareholder or beneficiary with
voting rights.
Persons who have acquired registered shares will, upon ap-
plication, be entered into the share register as shareholders
with voting power, provided they expressly declare themselves
to have acquired the shares concerned in their own name and
for their own account. For further information see section 2.5
“Limitations on Transferability and Nominee Registrations”.
The transfer of uncertificated shares is completed upon the
assignment in writing by the shareholder selling the shares
and notification to Petroplus Holdings AG. Shares held in a
custody or portfolio account with a bank may be transferred
only with the cooperation of that bank. Uncertificated shares
may be pledged only by a written pledge agreement in favor
of the bank in whose accounts the shareholder keeps the
relevant shares.
If the registration of shareholdings with voting rights was ef-
fected based on false information, the BoD may cancel such
registration with retroactive effect.
6.2 Statutory Quorums
There is no provision in our articles of association requiring
a quorum to be present for our shareholders’ meetings. Ex-
cept as otherwise stipulated by law, the shareholders’ meeting
passes resolutions and carries out elections by the majority of
the votes represented at a meeting. A resolution passed at the
shareholders’ meeting with a qualified majority of at least two-
thirds of the shares and the absolute majority of the nominal
capital represented at such meeting is required by law for:
− changes in the Company’s purpose;
− the creation of shares with privileged voting rights;
− restrictions on the transferability of registered shares;
− an authorized or conditional increase in the Company’s
share capital;
− an increase in the Company’s share capital by way of capi-
talization of reserves, against contributions in kind, for the
acquisition of assets or involving the grant of special bene-
fits;
− the restriction or elimination of pre-emptive rights of share-
holders;
− a relocation of domicile; or
− dissolution of the Company.
The Chairman of the shareholders’ meeting decides on the
voting procedure at each meeting.
6.3 Convocation of the Annual General Meeting
of Shareholders
The rules regarding the convocation of the Annual General
Meeting of the Shareholders do not deviate from Swiss Com-
pany Law.
6.4 Agenda
The agenda of the Annual General Shareholders’ Meet-
ing is set by the BoD and mentions the business to be dis-
cussed as well as motions of the BoD or of shareholders who
have asked for an item to be placed on the agenda. One or
more shareholders representing shares with a par value of
CHF 1,000,000 may request that an item be included in the
agenda of the shareholders’ meeting. Any request to include
an item must be submitted in writing at least 45 days prior to
the shareholders’ meeting, stating the item to be included and
the motions.
6.5 Registrations in the Share Register
The Company maintains a share register in which the details
of the owners and beneficiaries of the registered shares are
recorded. Nominees will be registered up to 5 %. For further
information see section 2.5 “Limitations on Transferability and
Nominee Registrations”.
64 | Petroplus Holdings AG | Annual Report 2010 | Corporate Governance
7 Changes of Control and Defense
Measures
7.1 Duty to Make an Offer
A person who acquires equity securities of Petroplus, whether
directly, indirectly or acting in concert with third parties, which
exceed the threshold of 331⁄3 % of the Company’s voting rights
(whether exercisable or not), must make an offer to acquire all
shares. A waiver of the mandatory rules may be granted by the
Swiss Takeover Board or the Swiss Federal Banking Commis-
sion under certain circumstances.
Swiss law provides for the possibility to have the articles of
association contain a provision which would eliminate the ob-
ligation of an acquirer of shares exceeding the threshold of
331⁄3 % of the voting rights to proceed with a public purchase
offer (“opting-out”) or which would increase such threshold to
49 % of the voting rights (“opting-up”). The articles of associa-
tion of Petroplus do not contain such opting-out or opting-up
provisions.
7.2 Clauses on Changes of Control
All outstanding options, including those granted to the members
of the BoD and members of the Executive Committee, become
fully vested and the non-compete clause in the employment
agreements with the members of the Executive Committee
become null and void upon a change of control of Petroplus
Holdings AG. The agreements of Mr. O’Malley and Mr. Kuchta
include a provision for a payment equal to 2.99 times annual
base salary upon a change of control. Mr. O’Malley retired from
Petroplus effective February 2, 2011. The change of control
rights in Mr. O’Malley’s agreement expire six months after his
termination date. The agreement of Mr. Vettier includes a provi-
sion for payment of 2.0 times the sum of: annual base salary,
previous year’s bonus and the total amount of equity awarded
during the term of the employment agreement. The agreement
of Mr. Watson includes a provision for payment equal to 1.5
times the sum of: annual base salary, previous year’s bonus and
previous year’s equity awards.
8 Auditors
8.1 Duration of the Mandate and Term of Office of
the Lead Auditor
In 2006, Ernst & Young Ltd., Zurich were appointed as Statuto-
ry Auditors of Petroplus for the first time. They were re-elected
for a term of one year at the Fourth Annual General Sharehold-
ers’ meeting held on May 5, 2010. Mr. Reto Hofer, Partner, is
acting as the Auditor-In-Charge since 2009.
8.2 Auditing and Additional Fees
The following fees were charged for professional services ren-
dered to the Company by Ernst & Young in 2010 and 2009:
8.3 Supervisory and Control Instruments
The supervision and assessment of the external auditor’s ser-
vices has been delegated by the BoD to the Audit Committee.
The Audit Committee meets with the external auditors at least
four times per year to discuss the quarterly review or audit
procedures performed, significant accounting transactions,
progression of fees, any non-audit procedures performed
and independence. Additionally, once per year, the external
auditors present the detailed audit plan to the Audit Commit-
tee. The plan includes the timing, scope and fees for the audit
services which will be performed for the upcoming year. The
Audit Committee provides summarized information to the BoD
and, based on the information provided and the recommen-
dation of the Audit Committee, the Board approves the audit
plan and associated fees. In 2010, the Audit Committee met
independently four times with the external auditors. In addi-
tion, the Internal Auditor and representatives of the external
auditors attended each of the Audit Committee meetings held
throughout the year.
(in millions of USD) 2010 2009
Audit fees1) 2.3 2.4
Tax compliance 0.2 0.2
Transaction services2) 0.1 0.4
Total 2.6 3.0
1)This amount includes the fees for the individual audits of Petroplus com-
panies carried out by Ernst & Young as well as their fees for auditing the
Consolidated Financial Statements of the Company.
2)Transaction related services comprise, among other things, fees for
capital market transactions, acquisitions and related comfort letters.
Petroplus Holdings AG | Annual Report 2010 | Corporate Governance | 65
9 Information Policy
In addition to the annual report, Petroplus publishes con-
densed interim financial information quarterly.
Petroplus provides stock-price-sensitive information in accor-
dance with the ad hoc publicity requirements of the Listing
Rules of the Swiss Exchange. All information is distributed
through third-party electronic and print media resources.
Additionally, all interested parties have the possibility to di-
rectly receive from Petroplus, via an e-mail distribution list,
free and timely notification of publicly released information.
All of this information, as well as the registration form for the
e-mail distribution service, general corporate information,
corporate calendar and Company publications can be found
in the Investors section of the Company website located at
www.petroplusholdings.com.
Contact information
Petroplus Holdings AG
Investor Relations
Industriestrasse 24
6300 Zug, Switzerland
Phone +41 58 580 12 44
Fax +41 58 580 13 87
E-Mail ir@petroplus.biz
Internet www.petroplusholdings.com
Financial
Reporting
Consolidated Financial
Statements of
Petroplus Holdings AG
68 I Consolidated Statement of
Comprehensive Income
for the year ended December 31, 2010
69 I Consolidated Statement of Financial
Position at December 31, 2010
70 I Consolidated Statement of Cash Flows
for the year ended December 31, 2010
71 I Consolidated Statement of Changes in
Equity for the year ended December 31, 2010
72 I Notes to the Consolidated Financial
Statements for the year 2010
131 I Report of the Statutory Auditor

68 | Petroplus Holdings AG | Annual Report 2010 | Consolidated Financial Statements
Consolidated Statement of Comprehensive Income
for the year ended December 31, 2010
(in millions of USD) Notes 2010 2009
Continuing operations
Revenue 3, 4 20,735.0 14,797.8
Materials cost 3 (19,406.4) (13,592.4)
Gross margin 1,328.6 1,205.4
Personnel expenses5 (351.9) (351.1)
Operating expenses 5 (439.8) (451.2)
Depreciation and amortization 13, 14 (338.8) (282.1)
Other administrative expenses 5 (42.7) (55.7)
Operating profit 155.4 65.3
Financial income 5 3.1 2.6
Financial expenses 5 (189.6) (167.2)
Foreign currency exchange (loss)/gain (2.2) 2.5
Share of income/(loss) from associates 15 8.5 (1.6)
Loss before income taxes (24.8) (98.4)
Income tax expense 6 (82.1) (10.4)
Net loss from continuing operations (106.9) (108.8)
Discontinued operations
Loss from discontinued operations, net of tax 7 (5.4) (141.1)
Net loss (112.3) (249.9)
Other comprehensive (loss)/income
Net loss on available-for-sale financial assets 16 (1.2) –
Exchange difference on disposal/liquidation of subsidiary1) 0.4 –
Income tax2) 6 – 12.0
Other comprehensive (loss)/income (0.8) 12.0
Total comprehensive loss (113.1) (237.9)
Net loss attributable to shareholders of the parent for
continuing operations (106.9) (108.8)
discontinued operations (5.4) (141.1)
Net loss (112.3) (249.9)
Total comprehensive loss attributable to shareholders of the parent for
continuing operations (108.5) (96.8)
discontinued operations (4.6) (141.1)
Total comprehensive loss (113.1) (237.9)
Earnings per share(in USD)
Earnings per share – basic 23 (1.22) (3.20)
Earnings per share – diluted 23 (1.22) (3.20)
calculated on continuing operations
Earnings per share – basic 23 (1.16) (1.39)
Earnings per share – diluted 23 (1.16) (1.39)
1)Recognition of the cumulative exchange differences in respect of the disposal of the Antwerp Processing facility reclassified to the line item “Dis-
continued operations” in the Consolidated Statement of Comprehensive Income (further information is disclosed in Note 8 “Disposal of the Antwerp
Processing Facility”) resulting in an other comprehensive income of USD 0.8 million and the liquidation of Refinaria Vasco da Gama, Lisboa, resulting
in an other comprehensive loss of USD 0.4 million.
2)Relates mainly to fluctuations in foreign exchange gains and related taxes regarding loans classified as net investments.

Petroplus Holdings AG | Annual Report 2010 | Consolidated Financial Statements | 69
Consolidated Statement of Financial Position
at December 31, 2010
(in millions of USD) Notes 2010 2009
Current assets
Cash and short-term deposits 10 179.0 11.2
Trade receivables, net 12 1,154.7 1,051.4
Other receivables and prepayments 12 109.3 99.8
Derivative financial instruments 28 6.0 7.7
Inventories 11 1,707.9 1,684.5
Other financial assets 28 2.2 2.4
Current tax assets 12.8 8.4
Assets classified as held for sale 9 – 88.2
Total current assets 3,171.9 2,953.6
Non-current assets
Intangible assets 13 81.3 99.3
Property, plant and equipment 14 3,415.5 3,523.1
Investments in associates 15 14.6 21.2
Financial assets available-for-sale 16, 28 34.6 28.6
Retirement benefit asset 20 26.2 9.3
Other financial assets 28 11.8 3.2
Deferred tax assets 6 13.7 40.0
Total non-current assets 3,597.7 3,724.7
Total assets 6,769.6 6,678.3
Current liabilities
Interest-bearing loans and borrowings 18 – 149.6
Finance lease commitments 25, 28 2.2 2.9
Trade payables 17 1,406.6 1,463.4
Other payables and accrued expenses 17 1,102.2 822.7
Derivative financial instruments 28 1.2 4.0
Provisions 19 1.8 13.9
Current tax liabilities 1.8 11.1
Liabilities classified as held for sale 9 – 30.6
Total current liabilities 2,515.8 2,498.2
Non-current liabilities
Interest-bearing loans and borrowings 18 1,692.0 1,683.8
Finance lease commitments 25, 28 21.6 25.6
Provisions 19 11.6 12.5
Retirement benefit obligation 20 118.4 123.0
Other liabilities 9.7 4.6
Deferred tax liabilities 6 396.6 342.6
Total non-current liabilities 2,249.9 2,192.1
Total liabilities 4,765.7 4,690.3
Shareholders’ equity
Share capital 22 608.1 555.2
Share premium 22 1,542.9 1,463.4
Other reserves 20.9 22.1
Retained earnings (168.3) (53.0)
Equity attributable to shareholders of the parent 2,003.6 1,987.7
Non-controlling interest 21 0.3 0.3
Total shareholders’ equity 2,003.9 1,988.0
Total liabilities and shareholders’ equity 6,769.6 6,678.3

70 | Petroplus Holdings AG | Annual Report 2010 | Consolidated Financial Statements
Consolidated Statement of Cash Flows
for the year ended December 31, 2010
(in millions of USD) Notes 2010 2009
Cash flows from operating activities1)
Net loss (112.3) (249.9)
Adjustment for:
Depreciation, amortization and impairment 7, 13, 14 339.4 426.6
Amortization of capitalized financing costs/accretion expenses 5 13.3 25.4
Income tax expense/(benefit) 82.4 (13.9)
Interest expense, net of interest income 136.6 115.7
Share-based payments5, 24 5.0 6.1
Impairment of financial assets available-for-sale and related loans – 2.3
Net loss on disposals of subsidiaries and other assets 5.9 1.1
Share of (gain)/loss from associates (6.9) 1.6
Foreign exchange and other items (9.3) (17.5)
Change in provisions and pensions (34.4) (9.6)
Changes in working capital
Change in trade and other receivables (118.8) 255.3
Change in inventories (20.5) (378.3)
Change in derivative financial instruments (1.1) (29.2)
Change in trade and other payables and accrued expenses 303.4 (96.2)
Cash generated from operations 582.7 39.5
Interest paid (137.0) (108.8)
Interest received 0.6 0.6
Income tax paid, net of tax received (18.0) (28.4)
Dividends received from associates and available-for-sale investments 1.4 –
Cash flows from operating activities 429.7 (97.1)
Cash flows from investing activities1)
Investment in property, plant and equipment/intangible assets2) (293.3) (295.0)
Investment in associate 15 (76.4) –
Acquisition of businesses, cash collected from final purchase price settlement
31 – 9.0
Disposals of subsidiaries, net of cash sold 8 56.2 –
Disposal of associate, net of cash sold 15 81.9 –
Disposals of assets, net of cash sold 0.8 1.7
Cash flows from prior years disposals – 11.7
Cash flows from investing activities (230.8) (272.6)
Cash flows from financing activities1)
Proceeds from issuance of share capital3) 22 138.0 284.2
Proceeds from issuance of senior notes/convertible bond 18 – 543.7
Repayment of convertible bond 18 – (500.0)
Repayment of nominal share capital 22 (9.0) (38.2)
Decrease on working capital facilities 18 (163.1) (90.3)
Financing costs (6.3) (40.1)
Cash flows from financing activities (40.4) 159.3
Net cash flow 158.5 (210.4)
Net foreign exchange differences 9.3 11.8
Movement in cash and short-term deposits 167.8 (198.6)
Cash and short-term deposits as per January 1 11.2 209.8
Cash and short-term deposits as per December 31 179.0 11.2
1)The Consolidated Cash Flow Statement includes cash flows from discontinued operations. Cash flow information related to discontinued operations is
disclosed in Note 7 “Discontinued Operations”.
2)Net of non-cash accruals.
3)Includes proceeds from private placement of shares and options exercised under the Equity Incentive Plan during 2010.
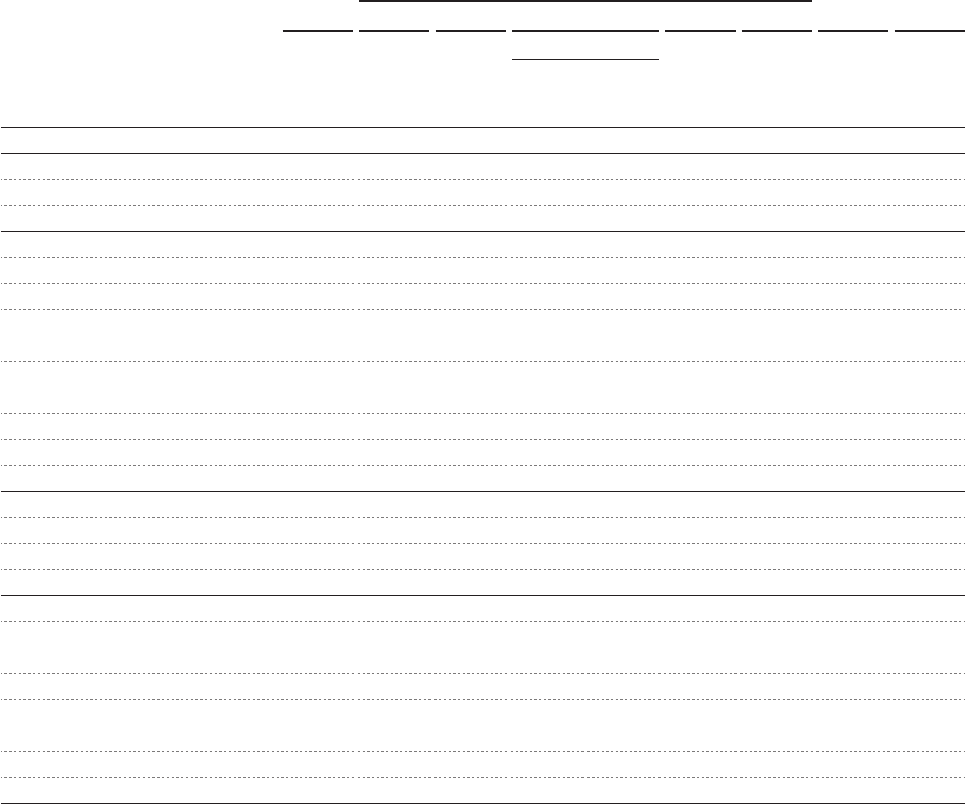
Petroplus Holdings AG | Annual Report 2010 | Consolidated Financial Statements | 71
Consolidated Statement of Changes in Equity
for the year ended December 31, 2010
Attributable to equity holders of the parent
(in millions of USD)
Notes Share
capital
Share
premium
Other reserves Retained
earnings
Total Non-
controlling
interest
Total
equity
Available-
for-sale
reserve
Trans-
lation
reserve
Balance as at January 1, 2009 464.0 1,306.3 – 12.9 204.1 1,987.3 0.3 1,987.6
Net loss for the period – – – – (249.9) (249.9) – (249.9)
Other comprehensive income 6 – – – 12.0 – 12.0 – 12.0
Total comprehensive loss – – – 12.0 (249.9) (237.9) – (237.9)
Repayment of nominal share capital 22 (34.0) – – (2.8) – (36.8) – (36.8)
Issuance of shares (public offering) 22 125.2 154.6 – – – 279.8 – 279.8
Share issue costs 22 – – – – (12.2) (12.2) – (12.2)
Equity component convertible bond
“2013 CB” (reversal)
18, 22 – (35.0) – – – (35.0) – (35.0)
Equity component convertible bond
“2015 CB”
18, 22 – 36.4 – – – 36.4 – 36.4
Related income tax – 1.1 – – (1.1) – ––
Share-based payments 24 – – – – 6.1 6.1 – 6.1
Balance as at December 31, 2009 555.2 1,463.4 – 22.1 (53.0) 1,987.7 0.3 1,988.0
Net loss for the period – – – – (112.3) (112.3) – (112.3)
Other comprehensive loss – – (1.2) 0.4 – (0.8) – (0.8)
Total comprehensive loss – – (1.2) 0.4 (112.3) (113.1) – (113.1)
Repayment of nominal share capital 22 (8.1) – – (0.4) – (8.5) – (8.5)
Issuance of shares
(private placement)
22 59.2 77.4 – – – 136.6 – 136.6
Share issue costs 22 – – – – (5.6) (5.6) – (5.6)
Issuance of shares under
share option plan
22 1.8 2.1 – – (2.4) 1.5 – 1.5
Share-based payments 24 – – – – 5.0 5.0 – 5.0
Balance as at December 31, 2010 608.1 1,542.9 (1.2) 22.1 (168.3) 2,003.6 0.3 2,003.9
72 | Petroplus Holdings AG | Annual Report 2010 | Consolidated Financial Statements
The process for a possible sale of the refinery concluded without
presenting any ultimate buyers, and the Company determined
that, in the current challenging refining market and capital-con-
strained environment, the Company cannot justify further size-
able capital investments in the plant. As a consequence, on Oc-
tober 21, 2010, the Company informed the Works Council of the
Reichstett refinery that it intended to commence a formal infor-
mation and consultation process to propose terms for a project
to cease refining operations and convert the site to a terminal.
The information and consultation process formally commenced
on November 24, 2010. A decision with respect to the future of
the site can and will only be made when Petroplus has received
the opinion of the Works Council which is expected around the
end of the first quarter of 2011, until which time, the refinery will
continue to operate.
Shutdowns at Refineries due to Strike Actions
During October 2010, throughput at the Petit Couronne,
Reichstett and Cressier refineries was impacted due to labor
strike actions in France.
Petroplus’ Share in Investment Vehicle PBF Energy
Company LLC
Acquisition of Delaware City Refinery Assets
On June 1, 2010, the Company’s investment vehicle, PBF En-
ergy Company LLC (“PBF”), a partnership entered into with
The Blackstone Group and First Reserve Corporation, com-
pleted its purchase of the Delaware City refinery in Delaware
City, Delaware from Valero Energy Corporation. On May 28,
2010, the Company contributed USD 76.4 million to PBF re-
lated to the purchase of the Delaware City refinery.
Sale of Petroplus’ Share in Investment Vehicle PBF
On September 26, 2010, the Company reached an agreement
in principle with the Blackstone Group and First Reserve, its
partners in PBF, for the sale of Petroplus’ 32.62 % share of PBF
in the amount of USD 91.0 million. Cash proceeds received on
October 18, 2010, amounted to USD 81.9 million after with-
holding tax. For further details, see Note 15 “Investments in
Associates”.
Repayment of Nominal Share Capital
At the ordinary shareholders’ meeting of the Company which
took place on May 5, 2010, the shareholders resolved to re-
duce the share capital by CHF 0.10 per share. The entry of the
share capital reduction in the commercial register took place
on July 15, 2010, and the repayment of CHF 0.10 per regis-
tered share was paid to shareholders on July 26, 2010. For
further details, see Note 22 “Shareholders’ Equity”.
Notes to the Consolidated Financial Statements
for the year 2010
1 General Information
General
Petroplus Holdings AG and its subsidiaries (the “Company”,
“Group”, “we”, “us” or “Petroplus”) is a publicly traded com-
pany listed in the main segment of the SIX Swiss Exchange
(“SIX”). The initial listing of the Company took place on No-
vember 30, 2006. Petroplus Holdings AG was incorporated on
February 20, 2006 under the name of Argus Atlantic Energy
Limited (“Argus”) in Bermuda. On August 22, 2006, the share-
holders of Argus Atlantic Energy Limited resolved to transfer its
registered office to Zug, Switzerland and to change its name
to Petroplus Holdings AG. The address of its registered office
and domicile is Petroplus Holdings AG, Industriestrasse 24,
6300 Zug, Switzerland.
Petroplus is the largest independent refiner and wholesaler of
petroleum products in Europe. The Company is focused on
refining and currently owns and operates six refineries across
Europe: The Coryton refinery on the Thames Estuary in the
United Kingdom, the Antwerp refinery in Antwerp, Belgium,
the Petit Couronne refinery in Petit Couronne, France, the In-
golstadt refinery in Ingolstadt, Germany, the Reichstett refinery
near Strasbourg, France, and the Cressier refinery in the can-
ton of Neuchâtel, Switzerland. The six refineries have a com-
bined throughput capacity of approximately 752,000 barrels
per day (“bpd”). The Company also owns the Teesside facility
in Teesside, United Kingdom, which operates as a market-
ing and storage facility. The Company sells refined petroleum
products on an unbranded basis to distributors and end cus-
tomers, primarily in the United Kingdom, France, Switzerland,
Germany and the Benelux Countries, as well as on the global
spot market.
Development of the Company
Activities in 2010
Reichstett Refinery
In the beginning of 2010, the Company launched a strategic
review of its Reichstett refinery in France to evaluate alterna-
tives for the site. The Company considered several possibili-
ties, including a potential sale, further investments to improve
its competitiveness, as well as a shutdown of refining oper-
ations and conversion to a terminal.
Petroplus Holdings AG | Annual Report 2010 | Consolidated Financial Statements | 73
Issuance of Shares
During May 2010, the Company completed a private place-
ment whereby the Company issued 8,650,000 new registered
shares from existing authorized capital. The shares were sold
at a price of CHF 17.50. The first trading day of the new shares
was May 7, 2010. The gross proceeds amounted to USD 136.4
million, excluding share issue costs of USD 5.6 million. For fur-
ther details, see Note 22 “Shareholders’ Equity”.
Activities in 2009
Discontinued Operations
Sale of the Antwerp Processing Facility
On October 23, 2009, the Company entered into a definitive
agreement
with Eurotank Belgium B.V., a wholly-owned sub-
sidiary of
Vitol Tank Terminals International B.V., part of the
Vitol Group of companies (“Vitol”) for the sale of Petroplus Re-
fining Ant werp N.V. and Petroplus Refining Antwerp Bitumen
N.V. (the “Antwerp Processing facility”). The sale was closed
on January 12, 2010. The proceeds received were USD 56.3
million, including hydrocarbon inventory on site. For further de-
tails, see Note 7 “Discontinued Operations”.
Operations of the Teesside Refinery
Due to the low complexity configuration of the facility, the un-
favorable market environment and the significant regulatory
capital expenditures required to maintain refinery operations,
we suspended the Teesside facility’s refining operations in No-
vember 2009. The refinery had been shut down for economic
reasons since the second quarter of 2009. During 2010, the
refinery was converted to a marketing and storage facility. The
refinery’s 117,000 bpd throughput capacity had represented
approximately 14 % of our combined throughput capacity.
The results of the above operations, including impairment
charges recorded in 2009, have been reclassified to the sepa-
rate line item “Discontinued operations” in our Consolidated
Statement of Comprehensive Income for the years ended De-
cember 31, 2010 and 2009. For further details, see Note 7
“Discontinued Operations”.
Revolving Credit Facility
On October 16, 2009 the Company successfully completed a
new three-year committed Revolving Credit Facility (“RCF”) of
USD 1.05 billion. The RCF includes an option to increase the
committed facility amount up to USD 2.0 billion on a preap-
proved but not precommitted basis in the event of increased
working capital needs or future acquisitions. The RCF termi-
nates October 16, 2012. For further details, see Note 18 “Inter-
est-Bearing Loans and Borrowings”.
Convertible Bond
Convertible Bond USD 150 million, 4.0 % due 2015
(the “2015 CB”)
On October 16, 2009, Petroplus Finance Ltd., a subsidiary of
the Company issued USD 150.0 million in guaranteed senior
secured convertible bonds due 2015. The debt is guaranteed
by the Company as well as by certain of its subsidiaries. The
specified conversion price into common shares of the Com-
pany is CHF 30.42 per share. The 2015 CB bears interest at
4.0 % per annum. For further details, see Note 18 “Interest-
Bearing Loans and Borrowings”.
Convertible Bond USD 500 million, 3.375 % due 2013
(the “2013 CB”) redeemed on October 16, 2009
In October 2009, we successfully completed a tender offer
to repurchase our 2013 CB of USD 500.0 million 3.375 % due
in 2013. The 2013 CB was redeemed on October 16, 2009
at the principal amount of USD 500.0 million, plus aggregate
accrued interest. For further details, see Note 18 “Interest-
Bearing Loans and Borrowings”.
Senior Notes
Senior Notes USD 400 million, 9.375 % due 2019
(the “2019 SN”)
On September 17, 2009, Petroplus Finance 3 Limited, Ber-
muda, an unrestricted subsidiary of the Company, issued USD
400.0 million aggregate principal amount of 9.375 % senior
notes due 2019 at an issue price of 98.42 % giving a yield of
9.625 %. For further details, see Note 18 “Interest-Bearing
Loans and Borrowings”.
Upon successful completion of the tender offer and subse-
quent repayment of the 2013 CB, Petroplus Finance Limited
assumed the obligations of Petroplus Finance 3 Limited un-
der the 2019 SN, the Company and certain of its subsidiaries
became guarantors of the 2019 SN and Petroplus Finance 3
Limited was released of all obligations under the 2019 SN.
Rights Issue and International Offering
During September 2009, we completed a rights issue and in-
ternational offering whereby the Company issued 17,265,058
new registered shares from existing authorized share capital.
Existing shareholders were entitled to subscribe for one new
share at a subscription price of CHF 16.90 per share for every
four existing shares held. The new shares began trading on
September 22, 2009. The gross proceeds amounted to USD
284.2 million, excluding share issue costs of USD 12.2 million.
For further details, see Note 22 “Shareholders’ Equity”.
74 | Petroplus Holdings AG | Annual Report 2010 | Consolidated Financial Statements
2 Accounting Policies
Basis of Preparation
Statement of Compliance
The Consolidated Financial Statements of Petroplus have been
prepared in accordance with International Financial Reporting
Standards (“IFRS”) as issued by the International Accounting
Standards Board (“IASB”) and comply with Swiss Law.
All amounts included in the Consolidated Financial Statements
and notes are presented in USD and rounded to the nearest USD
in hundreds of thousands except where otherwise indicated.
Basis of Measurement
The Consolidated Financial Statements have been prepared on
the historical cost basis except for the following Statement of
Financial Position items that are measured at fair value:
− Financial assets available-for-sale;
− Derivative financial instruments; and
− Assets/liabilities held for sale.
The methods used to measure fair values are further discussed
below.
Summary of Significant Accounting Policies
Scope of Consolidation
These Financial Statements are the Consolidated Financial
Statements of Petroplus Holdings AG and its subsidiaries. Sub-
sidiaries are those companies directly or indirectly controlled by
Petroplus Holdings AG (generally over 50 % of voting interest,
or potential voting rights, of the relevant company’s share capi-
tal). Control is defined as the power to govern the financial and
operating policies of an enterprise so as to obtain benefits from
its activities. Special purpose entities, irrespective of their legal
structure, are consolidated in instances where the Company
has the power to govern the financial and operating policies of
an entity so as to obtain benefits from its activities.
Investments in associated companies (where Petroplus gen-
erally holds between 20 % and 50 % of a company’s voting
shares, or over which it otherwise has significant influence) and
joint ventures are accounted for using the equity method as de-
scribed in the paragraph “Investments in associates”.
Other investments, where the Company holds less than 20 %
and does not have significant influence, are valued at fair value
and classified as financial assets available-for-sale.
Companies acquired or disposed of during the year are includ-
ed in the Consolidated Financial Statements from the date of
acquisition or up to the date of disposal. Intercompany transac-
tions, balances and unrealized gains are eliminated in full.
Business Combinations
Acquisitions of subsidiaries and businesses are accounted for
using the acquisition method. The cost of the business com-
bination is measured as the aggregate of the fair values (at
the date of exchange) of assets given, liabilities incurred or
assumed, and equity instruments issued by the Company in
exchange for control of the acquiree. All acquisition-related
costs are accounted for as expenses in the periods in which
the costs are incurred and the services are received. The ac-
quiree’s identifiable assets, liabilities and contingent liabilities
that meet the conditions for recognition under IFRS 3 Busi-
ness Combinations are recognized at their fair values at the
acquisition date, except for non-current assets (or disposal
groups) that are classified as held for sale in accordance with
IFRS 5 Non-current Assets Held for Sale and Discontinued
Operations, which are recognized and measured at fair value
less costs to sell.
Goodwill arising on acquisition is recognized as an asset and
initially measured at cost, being the excess of the cost of the
business combination over the Company’s interest in the net
fair value of the identifiable assets, liabilities and contingent
liabilities recognized. If, after reassessment, the Company’s in-
terest in the net fair value of the acquiree’s identifiable assets,
liabilities and contingent liabilities exceeds the cost of the busi-
ness combination, the excess is recognized immediately in the
Consolidated Statement of Comprehensive Income.
The interest of non-controlling shareholders in the acquiree is
initially measured at the non-controlling shareholders’ propor-
tion of the net fair value of the assets and liabilities recognized.
Discontinued Operations
A discontinued operation is a component of the Company’s busi-
ness that represents a separate major line of business or geo-
graphical area of operations that has been disposed of, is held
for sale, or is a subsidiary acquired exclusively with the intent to
sell. Classification as a discontinued operation occurs when the
operation meets the criteria to be classified as held for sale or
upon disposal. When an operation is classified as a discontinued
operation, the comparative Consolidated Statement of Compre-
hensive Income is re-presented as if the operation had been dis-
continued from the start of the comparative period.
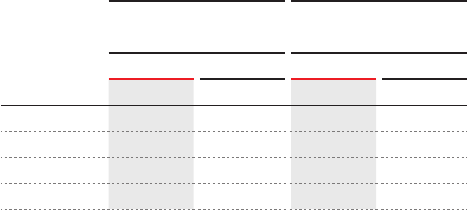
Petroplus Holdings AG | Annual Report 2010 | Consolidated Financial Statements | 75
The Company has outstanding intercompany loans in USD
that are classified as net investments. Until December 31,
2007, before the Company changed its functional currency
from various local currencies into the USD, certain subsidiaries
with functional currencies other than USD have directly rec-
ognized the gain or loss arising from the revaluation of these
loans in other comprehensive income. Exchange differences
arising from the translation of these net investments previously
classified in other comprehensive income are not recognized
in profit and loss until repayment of these loans.
Cash and Short-Term Deposits
Cash and short-term deposits are comprised of cash on hand,
current balances with banks and similar institutions, and
short-term, low risk, highly liquid investments that are readily
convertible to known amounts of cash and have a maturity of
up to three months.
For the purpose of the Consolidated Cash Flow Statement,
cash and short-term cash equivalents consist of cash and
short-term deposits as defined above, net of outstanding bank
overdrafts.
Trade Receivables, Net
The reported values of trade receivables, net represent
amounts invoiced to customers, less adjustments for doubt-
ful receivables. Doubtful receivable provisions are established
based upon the difference between the receivable value and
the estimated net collectible amount. The amount of the re-
spective estimated loss is recognized in the Consolidated
Statement of Comprehensive Income within gross margin.
The following exchange rates were used for translation of for-
eign currencies into USD:
Consolidated Statement of
Comprehensive Income
Consolidated Statement of
Financial Position
Average rates Period-end rates
2010 2009 2010 2009
1 EUR/USD 1.33 1.40 1.34 1.44
1 CHF/USD 0.96 0.92 1.07 0.97
1 GBP/USD 1.55 1.56 1.55 1.62
1 CZK/USD 0.05 0.05 0.05 0.05
Assets and Liabilities Classified as Held for Sale
Disposal groups comprised of assets and liabilities (or non-
current assets) that are expected to be recovered primarily
through sale rather than through continuing use are classified
as held for sale. Immediately before classification as held for
sale, the components of the disposal group (or non-current as-
sets) are re-measured in accordance with the Company’s ac-
counting policies. Thereafter, the assets or the disposal group
are measured at the lower of their carrying amount and fair val-
ue less cost to sell. Any impairment loss on a disposal group
is first allocated to goodwill, and then to remaining assets and
liabilities on a pro rata basis. No loss is allocated to inventory,
financial assets or deferred tax assets, which continue to be
measured in accordance with the Company’s accounting poli-
cies. Impairment losses on initial classification as held for sale
and subsequent gains or losses on re-measurement are rec-
ognized in profit and loss. Gains are not recognized in excess
of any cumulative impairment loss.
Functional Currency
Petroplus Holdings AG and its subsidiaries have determined
that their functional currency is the USD as the majority of the
Company’s revenues are related to the sale of refined prod-
ucts for which the sales prices are primarily influenced by the
USD. In addition, the Company’s costs are primarily associ-
ated with the purchase of crude oil, which, on a worldwide
basis, is priced in USD.
Transactions in foreign currencies are initially recorded at their
respective currency rates prevailing at the date of the transac-
tion. All foreign exchange results related to our daily refining
and marketing activities and the associated hedging activities
are classified in “Materials cost”; all results related to expo-
sure from operating, personnel and other administrative costs,
which are incurred in local currencies, are classified in the as-
sociated line item in the Consolidated Statement of Compre-
hensive Income.
Monetary assets and liabilities denominated in a currency
that differs from the functional currency of the Company are
translated into the functional currency at year-end exchange
rates. All differences are taken to the Consolidated State-
ment of Comprehensive Income. Non-monetary items that are
measured in terms of historical cost in a foreign currency are
translated using the exchange rates at the dates of the initial
transactions. Non-monetary items measured at fair value in a
foreign currency are translated using the exchange rates at the
date when the fair value was determined.
76 | Petroplus Holdings AG | Annual Report 2010 | Consolidated Financial Statements
Derivative Financial Instruments
The Company uses derivative financial instruments, such as
commodity derivatives and forward currency contracts, to
manage a portion of its risk associated with commodity price
and foreign currency fluctuation. Such derivative financial
instruments are initially recognized at fair value on the date
on which a derivative contract is entered into and are subse-
quently re-measured at fair value. Derivatives are carried as
assets when the fair value is positive and as liabilities when the
fair value is negative. The fair value of the derivative financial
instruments is either derived from market quotes or is based
on recent arm’s length transactions.
The Company applies hedge accounting, in accordance with
IAS 39 Financial Instruments: Recognition and Measurement
and IFRS 7 Financial Instruments: Disclosures, to certain
transactions, including fixed price contracts to sell bitumen in
the UK. On the date a derivative contract is entered into, the
Company designates certain derivatives as a hedge of a par-
ticular risk associated with a recognized asset or liability (fair
value hedge). At the inception of the transaction, the Company
documents the relationship between the hedging instruments
and the hedged items, as well as its risk management ob-
jective and strategy for undertaking various hedge transac-
tions. This process includes linking all derivatives designated
as hedges to specific assets and liabilities. The Company also
documents its assessment, both at hedge inception and on an
ongoing basis at each quarter end, of whether the derivatives
that are used in hedging transactions are highly effective in off-
setting changes in fair values of hedged items. In accordance
with IAS 39, changes in the fair value of derivatives that are
designated and qualify as fair value hedges and that are highly
effective are recorded in the Consolidated Statement of Com-
prehensive Income in the line item “Materials cost”, along with
any changes in the fair value of the hedged asset or liability
that are attributable to the hedged risk.
Other than those disclosed above, the Company has not cur-
rently designated any of its derivative financial instruments as
effective hedges in line with IAS 39 Financial Instruments: Rec-
ognition and Measurement and IFRS 7 Financial Instruments:
Disclosures. Changes in the fair value of any derivative finan-
cial instruments not designated as effective hedges are recog-
nized directly in profit and loss for the year. Such derivatives
are primarily commodity instruments and currency contracts.
Commodity instruments are used by the Company to man-
age commodity price fluctuation for a portion of our inventory
and certain sales contracts. Gains and losses related to these
commodity instruments are recorded in the line item “Mat-
erials cost” in the Consolidated Statement of Comprehensive
Income. The Company uses currency contracts to manage the
foreign currency risk associated with non USD sales, assets
and liabilities. Gains and losses related to these currency con-
tracts are taken directly to profit and loss for the year.
Financial Assets
Financial assets within the scope of IAS 39 Financial Instruments:
Recognition and Measurement are classified as either financial
assets at fair value through profit or loss, loans and receivables,
held-to-maturity investments, or available-for-sale financial as-
sets, as appropriate. When financial assets are initially recognized,
they are measured at fair value, plus, in the case of financial assets
not measured at fair value through profit or loss, directly attribut-
able financing costs. The Company determines the classification
of the financial assets at initial recognition and, where appropriate,
evaluates this designation at each financial year end.
All regular purchases and sales of financial assets are recognized
on the transaction date, the date the Company commits to pur-
chase the asset. Regular purchases and sales are purchases or
sales of financial assets that require delivery of those assets with-
in the period generally established by regulation or marketplace
convention.
Financial Assets at Fair Value through Profit or Loss
Financial assets classified as held for trading are included in the
category financial assets at fair value through profit or loss. Finan-
cial assets are classified as held for trading if they are acquired
for the purpose of being sold in the near term. Derivatives are
also classified as held for trading unless they are designated as
effective hedging instruments. Gains and losses on investments
held for trading are recognized in the Consolidated Statement of
Comprehensive Income.
Loans and Receivables
Loans and receivables are non-derivative financial assets with
fixed or determinable payments that are not quoted in an active
market. Such assets are carried at amortized cost using the ef-
fective interest method. Gains and losses are recognized in the
Statement of Comprehensive Income when the loans and receiv-
ables are de-recognized or impaired, as well as through the amor-
tization process.
Financial Assets Available-for-Sale
Available-for-sale financial assets are those non-derivative finan-
cial assets that are designated as available-for-sale financial as-
sets or are not classified in any of the preceding two categories.
After initial recognition, available-for-sale financial assets are mea-
Petroplus Holdings AG | Annual Report 2010 | Consolidated Financial Statements | 77
sured at fair value with gains or losses being recognized in other
comprehensive income until the investment is de-recognized or
the investment is determined as being impaired, at which time the
cumulative gain or loss previously recorded in other comprehen-
sive income is reclassified from equity to profit and loss.
The fair value of the investments that are actively traded in or-
ganized financial markets is determined by reference to quoted
market bid prices at the close of business on the Statement of
Financial Position date. For investments where there is no ac-
tive market, fair value is determined using valuation techniques.
Such techniques include using recent arm’s length transactions,
reference to the current market value of another instrument that is
substantially the same, discounted cash flow analysis and option
pricing models.
Other available-for-sale financial assets, such as investments over
which the Company has no significant influence, and whose fair
value cannot be reliably measured are stated at cost, less a provi-
sion for any prolonged diminution in value. Dividends are record-
ed when declared.
Impairment of Financial Assets
A financial asset is considered to be impaired if objective evidence
indicates that events have had a negative effect on the estimated
future cash flows of that asset. An impairment loss in respect of
a financial asset measured at amortized cost is calculated as the
difference between its carrying amount and the present value of
the estimated future cash flows discounted at the original effective
interest rate. An impairment loss on an available-for-sale financial
asset is calculated by reference to its current fair value. Significant
financial assets are tested for impairment on an individual basis.
The remaining financial assets are assessed in groups that share
similar risk characteristics.
In relation to trade receivables, a provision for impairment is re-
corded when there is objective evidence (such as the probability
of insolvency or significant financial difficulties of the debtor) that
the Company will not be able to collect all of the amounts due
under the original terms of the invoice. The carrying amount of the
receivable is reduced through a provision for doubtful accounts.
Impaired receivables are de-recognized when they are assessed
as uncollectible.
All impairment losses are recognized in profit and loss. Any cumu-
lative loss in respect of an available-for-sale financial asset recog-
nized previously in other comprehensive income is transferred to
profit and loss upon recognition of an impairment charge. If, in a
subsequent period, the amount of the impairment loss decreases
and the decrease can be related objectively to an event occurring
after the impairment was recognized, the previously recognized
impairment loss is reversed through profit and loss to the extent
that the carrying amount of the investment at the date the im-
pairment is reversed does not exceed what the amortized cost
would have been, had the impairment not been recognized. For
available-for-sale financial assets that are equity instruments, the
reversal is recognized directly in other comprehensive income.
Inventories
Inventories are valued at the lower of cost and net realizable
value. Cost is determined using the first-in, first-out (“FIFO”)
method and is accounted for as follows:
Crude oil and feedstock
– purchase cost on a FIFO basis including freight.
Finished goods and intermediates
– cost of direct materials and labor and a proportion of manu-
facturing overhead based on normal operating capacity, but
excluding borrowing costs.
For determination of the cost of raw materials, the relevant pur-
chase contract and the attributable freight costs are included.
The costs of the refined products are built up by identifying the
appropriate crude oil and feedstock cost based on the crude
oil and feedstock processed in the refinery for the last month
of the reporting period. Additional factors considered include
the charge and yield of the refinery, average product prices to
guide allocation of raw material cost and the relevant variable
and fixed overhead for the stated month of production. When-
ever the net realizable value (“NRV”) of inventory is lower than
its cost value, the stock is re-measured at its NRV. The NRV is
the estimated selling price in the ordinary course of business,
less the estimated costs necessary to make the sale.
Intangible Assets
Intangible assets, including software, that are acquired by the
Company are stated at cost less accumulated amortization
and impairment losses. Where acquired in a business combi-
nation, the fair value is allocated in accordance with acquisi-
tion accounting.
Subsequent expenditure on intangible assets is capitalized
only when it increases the future economic benefits embodied
in the specific asset to which it relates. All other expenditures
are expensed as incurred.

78 | Petroplus Holdings AG | Annual Report 2010 | Consolidated Financial Statements
Amortization is charged to the Consolidated Statement of
Comprehensive Income on a straight-line basis over the es-
timated useful lives of intangible assets, from the time the as-
sets are available for use. The estimated useful lives are as
follows:
Property, Plant and Equipment
Property, plant and equipment (“PP&E”) is stated at cost,
less accumulated depreciation and impairment losses. Cost
includes the cost of restoring part of the relevant plant and
equipment when the recognition criteria are met. Depreciation
is calculated on a straight-line basis over the estimated useful
life of the assets. The useful lives are estimated as follows:
The carrying value of PP&E is reviewed for impairment when
events or changes in circumstances indicate that the carrying
value may not be recoverable.
Where parts of an item of PP&E have different useful lives, they
are accounted for as separate items. Routine maintenance
costs are expensed as incurred.
PP&E is de-recognized upon disposal of the asset or when no
future economic benefits are expected from its use. Any gain
or loss arising upon de-recognition of the assets (calculated
as the difference between the net disposal proceeds and the
carrying amount of the asset) is included in the Consolidated
Statement of Comprehensive Income in the year the asset is
de-recognized. Asset residual values and useful lives are re-
viewed and adjusted if appropriate at each financial year end.
Amortization periods
Software 3 – 5 years
Leasehold 41 years
Other intangible assets 5 – 20 years
Intangible assets under construction Not amortized
Depreciation periods
Land Not depreciated
Buildings 30 – 40 years
Machinery and equipment 2 – 40 years
Other assets 3 – 25 years
Assets under construction Not depreciated
Capitalized Turnaround Costs
A turnaround is a required standard procedure for mainte-
nance of a refinery that involves the shutdown and inspection
of major processing units, which occurs approximately every
two to five years. Turnaround costs include actual direct and
contract labor, materials costs incurred for the overhaul, in-
spection and the replacement of major components of pro-
cessing and support units performed during the turnaround.
Turnaround costs, which are included in the Company’s
Consolidated Statement of Financial Position in PP&E, are
depreciated on a straight-line basis over the period until the
next scheduled turnaround, beginning the month following
completion. The depreciation of the turnaround costs is pre-
sented in the line item “Depreciation and amortization” in the
Consolidated Statement of Comprehensive Income.
Impairment of Non-Financial Assets
The Company assesses, at each reporting date, whether there
is an indication that an asset may be impaired. If any such indi-
cation exists, or, when annual impairment testing for an asset is
required, the Company makes an estimate of the asset’s recov-
erable amount. An asset’s recoverable amount is the higher of
an asset’s, or cash-generating unit’s, fair value less costs to sell
and its value in use. The recoverable amount is determined for an
individual asset, unless the asset does not generate cash inflows
that are largely independent of those from other assets or groups
of assets. Where the carrying amount of an asset exceeds its re-
coverable amount, the asset is considered impaired and is written
down to its recoverable amount. In assessing value in use, the
estimated future cash flows are discounted to their present value
using a discount rate that reflects current market assessments
of the time value of money and the risks specific to the asset.
Impairment losses from continuing operations are recognized in
the Consolidated Statement of Comprehensive Income in the line
item “Depreciation and amortization”.
Investments in Associates
The Company’s investments in associates are accounted for
using the equity method. An associate is an entity in which the
Company has determined it has significant influence but is not
considered a subsidiary.
Under the equity method, an investment in an associate is car-
ried in the Consolidated Statement of Financial Position at cost
plus post acquisition changes in the Company’s share of net
assets of the associate. After application of the equity method,
the Company determines whether it is necessary to recog-
nize any impairment loss with respect to the net investment in
the associate. The Consolidated Statement of Comprehensive
Petroplus Holdings AG | Annual Report 2010 | Consolidated Financial Statements | 79
Income reflects the Company’s share of the results of oper-
ations of the associate. Where there has been a change rec-
ognized directly in the equity of the associate, the Company
recognizes its share of any changes and reflects this, or major
transactions, when applicable, in the Consolidated Statement
of Changes in Equity.
The reporting dates of the associates are the same as the re-
porting date of the Company.
Debt Instruments
Debt instruments are initially recognized at fair value, which is the
proceeds received, less attributable financing costs. Subsequent
to initial recognition, debt instruments are stated at amortized
cost with any difference between cost and redemption value be-
ing recognized in the Consolidated Statement of Comprehensive
Income over the period of the debt instrument using the effec-
tive interest method. Any discount between the net proceeds re-
ceived and the principal value due on redemption is amortized
over the duration of the debt instrument and is recognized as part
of financing costs using the effective interest method.
Compound financial instruments issued by the Company com-
prise convertible bonds that can be converted into share capi-
tal. The liability component of a compound financial instrument
is initially recognized at the fair value of a similar liability that does
not have an equity conversion option. The equity component is
initially recognized as the difference between the fair value of the
compound financial instrument as a whole and the fair value of the
liability component. Any directly attributable financing costs are
allocated to the liability and equity components in proportion to
their initial carrying amounts. Subsequent to initial recognition, the
liability component of a compound financial instrument is mea-
sured at amortized cost using the effective interest method. The
equity component of a compound financial instrument is not re-
measured subsequent to initial recognition.
Financial Liabilities
Interest-Bearing Loans and Borrowings
All loans and borrowings are initially recognized at fair value less
directly attributable financing costs.
The Company capitalizes financing costs which are netted against
proceeds received. If new debt securities and credit facilities are
issued but not drawn, the capitalized financing costs are pre-
sented within “Other financial assets”. The Company amortizes
these costs over the maturity period of the debt or over the life of
the credit facility. The amortization of these costs is included in
“Financial expenses” in the Consolidated Statement of Compre-
hensive Income.
After initial recognition, interest-bearing loans and borrowings are
subsequently measured at amortized cost using the effective in-
terest method.
Gains and losses are recognized in profit and loss when the li-
abilities are de-recognized as well as through the amortization
process.
Financial Liabilities at Fair value through Profit and Loss
Financial liabilities at fair value through profit and loss include fi-
nancial liabilities held for trading and financial liabilities designated
upon initial recognition as at fair value through profit and loss.
Derivatives are classified as held for trading. Gains and losses on
liabilities held for trading are recognized in profit and loss.
Leases
The determination of whether an arrangement is, or contains, a
lease is based on the substance of the arrangement and requires
an assessment of whether the fulfillment of the arrangement is
dependent on the use of a specific asset, or assets, and the ar-
rangement conveys a right to use the asset.
Company as a Lessee
Finance leases, which transfer to the Company substantially all
the risks and benefits incidental to ownership of the leased item,
are capitalized at the inception of the lease at the fair value of the
leased property or, if lower, at the present value of the minimum
lease payments. Lease payments are apportioned between fi-
nance charges and reduction of the lease liability so as to achieve
a constant rate of interest on the remaining balance of the liability.
Finance charges are expensed.
Capitalized leased assets are depreciated over the shorter of the
estimated useful life of the asset and the lease term if there is no
reasonable certainty that the Company will obtain ownership at
the end of the lease term.
Leases which do not meet the requirements of a finance lease
are classified as operating leases. Operating lease payments are
recognized as an expense in the Consolidated Statement of Com-
prehensive Income on a straight-line basis over the lease term.
Company as a Lessor
Leases where the Company does not transfer substantially all the
risks and benefits of ownership of the asset to the lessee are clas-
sified as operating leases. Initial direct costs incurred in negotiat-
ing an operating lease are added to the carrying amount of the
leased asset and recognized over the lease term on the same
basis as rental income.
80 | Petroplus Holdings AG | Annual Report 2010 | Consolidated Financial Statements
Provisions for Liabilities and Charges
Provisions are recognized only when the Company has a pre-
sent obligation (legal or constructive) as a result of a past event
whereby it is probable that an outflow of resources embodying
economic benefits will be required to settle the obligation and a
reliable estimate can be made as to the amount of the obligation.
Where the Company expects some or all of a provision to be reim-
bursed, the reimbursement is recognized as a separate asset on
condition that the reimbursement is virtually certain. The expense
relating to any provision is presented in the Consolidated State-
ment of Comprehensive Income net of any reimbursement. If the
effect of time value of money is material, provisions are discount-
ed using a current pre-tax rate which reflects, where appropriate,
the risks specific to the liability. Where discounting is used, the
increase in the provision due to the passage of time is recognized
as a financial expense.
Provisions and liabilities for environmental remediation, resulting
from past operations or events, are accounted for in the period in
which a legal or constructive obligation arises and the amount can
be estimated reasonably. Obligations and liabilities are measured
on the basis of current legal requirements and existing technol-
ogy. Environmental expenditures relating to current operations are
expensed, or capitalized where such expenditures provide future
economic benefits. Obligations and expected insurance pay-outs
are accounted for separately.
Emission Rights
Emission rights that are granted to the Company at no cost are not
recorded in the Consolidated Statement of Financial Position and
a provision is only recognized when the total of actual emissions
at the Statement of Financial Position date exceeds the number
of granted emission rights held. The provision for such a shortfall
is based on the fair value of emission rights at the Statement of
Financial Position date. Sales of emission rights are reflected in
gross margin under “Revenue”.
Retirement Benefit Obligation
The Company operates several different defined benefit plans in
the United Kingdom, Switzerland, Germany, France and Belgium.
The cost of providing benefits under the defined benefit plans is
determined separately for each plan using an actuarial valuation.
The liability recognized in the Consolidated Statement of Financial
Position is the present value of the defined benefit obligation at the
Statement of Financial Position date less the fair value of plan as-
sets, together with adjustments for unrecognized actuarial gains
or losses and unrecognized past service costs. The present value
of the defined benefit obligation is determined by discounting the
estimated future cash outflows using a discount rate that is similar
to the interest rate on high quality corporate bonds where the cur-
rency and terms of the corporate bonds are consistent with the
currency and estimated terms of the defined benefit obligation.
Actuarial gains or losses are amortized over the expected average
remaining working lives of the participating employees, but only
to the extent that the net cumulative unrecognized amount at the
start of the year exceeds 10 % of the greater of the present value
of the defined benefit obligation and the fair value of plan assets
at the same date.
Past service costs are recognized on a straight-line basis over the
average period until the benefits become vested. If the benefits
vest immediately following the introduction of, or changes to, a
pension plan, past service cost is recognized immediately. Gains
or losses on the curtailment or settlement of pension benefits are
recognized when the curtailment or settlement occurs.
A net pension asset is recorded only to the extent that it does not
exceed the present value of any economic benefits available in the
form of refunds from the plan or reductions in future contributions
to the plan and any unrecognized net actuarial losses and past
service costs.
Taxes
Current Taxes
Current tax assets and liabilities for the current and prior periods
are measured at the amount expected to be recovered from, or
paid to, the tax authorities. The tax rates and tax laws applied in
the computation of the amount are those enacted at the State-
ment of Financial Position date.
Deferred Taxes
Deferred income tax is provided using the liability method on tem-
porary differences, at the Statement of Financial Position date,
between the tax basis of assets and liabilities and their carrying
amounts for financial reporting purposes.
Deferred tax liabilities are recognized for all taxable temporary dif-
ferences, except:
– where the deferred tax liability arises from the initial recogni-
tion of goodwill;
– where the deferred tax liability arises from the initial recogni-
tion of an asset or liability in a transaction that is not a busi-
ness combination and, at the time of the transaction, affects
neither the accounting profit nor taxable profit or loss; and
Petroplus Holdings AG | Annual Report 2010 | Consolidated Financial Statements | 81
– in respect of taxable temporary differences associated with
investments in subsidiaries, branches, associates and inter-
ests in joint ventures, where the timing of the reversal of the
temporary differences can be controlled and it is probable
that the temporary differences will not reverse in the foresee-
able future.
Deferred tax assets are recognized for all deductible temporary
differences and carry-forwards of unused tax credits and unused
tax losses, to the extent that it is probable that taxable profit will
be available against which the deductible temporary differences
and the carry-forward of unused tax credits and unused tax loss-
es can be utilized, except:
– where the deferred tax asset relating to the deductible tem-
porary difference arises from the initial recognition of an as-
set or liability in a transaction that is not a business combina-
tion and, at the time of the transaction, affects neither the
accounting profit nor taxable profit or loss; and
– in respect of deductible temporary differences associated
with investments in subsidiaries, branches, associates and
interests in joint ventures, deferred tax assets are recognized
only to the extent that it is probable that the temporary differ-
ences will reverse in the foreseeable future and taxable profit
will be available against which the temporary differences can
be utilized.
The carrying amount of deferred tax assets is reviewed at each
Statement of Financial Position date and reduced to the extent
that it is no longer probable that sufficient taxable profit will be
available to allow all or part of the deferred tax asset to be utilized.
Unrecognized deferred tax assets are reassessed at each State-
ment of Financial Position date and are recognized to the extent
that it has become probable that future taxable profit will allow the
deferred tax asset to be recovered.
Deferred tax assets and liabilities are measured at the tax rates
that are expected to apply in the year when the asset is realized
or the liability is settled, based on tax rates (and tax laws) that
have been enacted, or substantively enacted, at the Statement of
Financial Position date.
Deferred tax assets and deferred tax liabilities are offset if a legally
enforceable right to offset exists and the deferred taxes relate to
the same taxable entity and same taxation authority.
Current and Deferred Taxes for the Period
Current and deferred taxes are recognized as an expense or in-
come in profit and loss, except when they relate to items that are
recognized outside of profit and loss (whether in other compre-
hensive income or directly in equity), in which case the tax is also
recognized outside profit and loss.
Related Party Transactions
Transactions between the Company and related parties are dis-
closed in Note 29 “Related Parties”, specifying the nature, types
and details of the transactions and the relationships.
Revenue Recognition
Revenue is recognized to the extent that it is probable that the
economic benefits will flow to the Company and the revenue can
be reliably measured. The following specific recognition criteria
must also be met before revenue is recognized:
Sale of Goods
Revenue is recognized when the significant risks and rewards of
ownership of the goods have passed to the buyer. Amounts col-
lected on behalf of third parties such as mineral oil taxes, sales
taxes and value added taxes are not included in revenue.
Sale of Crude
In certain circumstances the Company enters into transactions for
the sale of surplus crude oil that cannot be utilized due to oper-
ational circumstances or unplanned refinery shutdowns. As these
transactions are incidental to the Company’s main revenue gen-
erating activities, the results of such transactions are presented
by netting any income with related expenses arising on the same
transaction. The net amount realized is included in “Materials
cost” in the Consolidated Statement of Comprehensive Income.
Cross Sales and Purchases
A cross sale is a sale to an entity outside of the Company under a
cross sale/purchase agreement, where a sale of petroleum prod-
ucts is made on the understanding that a specified quantity of
products, including that of a different grade, is bought back. The
purpose of such arrangements is to allow the parties to achieve
savings in their distribution costs in the selling of petroleum prod-
ucts. Cross sale and purchase transactions are presented net in
“Materials cost” in the Consolidated Statement of Comprehensive
Income.
Interest Income
Interest income is recognized using the effective interest meth-
od which exactly discounts the estimated future cash receipts
through the expected life of the financial instrument to the net car-
rying amount of the financial asset.
82 | Petroplus Holdings AG | Annual Report 2010 | Consolidated Financial Statements
Segment Reporting
The Company has determined that we operate as one segment
“Refining”.
Share-Based Payment Transactions
Employees of the Company, including members of the Executive
Committee, and members of the Board of Directors receive com-
pensation in the form of share-based payments, whereby em-
ployees render services as consideration for equity instruments
(“equity-settled transactions”). Equity-settled transactions are
share options which can only be settled through the issuance of
shares or other equity instruments. Share options which can only
be settled in cash are cash-settled transactions. The Company
only has equity-settled transactions.
The cost of equity-settled transactions is measured by reference
to the fair value at the date on which they are granted. The fair val-
ue of share options is determined using the Black-Scholes model,
further details of which are provided in Note 24 “Share-based
Payments”. In determining the fair value of the share options, the
service condition is not taken into account.
The cost of equity-settled transactions is recognized, together
with a corresponding increase in equity, on a straight-line basis
over the period in which service conditions are fulfilled. At each
reporting date, based on the Company’s best estimate, the ex-
pense recognized is adjusted to reflect the actual number of share
options that vest.
Where an equity-settled award is cancelled, it is treated as if it
had vested on the date of cancellation, and any expense not yet
recognized for the award is recognized immediately. This includes
any award where non-vesting conditions within the control of ei-
ther the entity or the employee are not met. However, if a new
award is substituted for the cancelled award, and designated as a
replacement award on the date that it is granted, the new awards
are treated as if they were a modification of the original award.
All cancellations of equity-settled transaction awards are treated
equally.
If an equity-settled award is repurchased during the vesting
period for fully vested equity instruments, the payment is treated
as a deduction from equity, except to the extent that the payment
exceeds the fair value of the equity instrument granted, measured
at the repurchase date. Such excess is recognized as an expense
in the Consolidated Statement of Comprehensive Income in the
line item “Personnel expenses”.
Earnings per Share
The Company presents basic and diluted earnings per share
(“EPS”) data for its ordinary shares. Basic EPS is calculated by
dividing the profit or loss attributable to ordinary shareholders of
the Company by the weighted average number of ordinary shares
outstanding during the period. Diluted EPS is determined by ad-
justing the profit or loss attributable to ordinary shareholders and
the weighted average number of ordinary shares outstanding for
the effects of all potential dilutive ordinary shares, which comprise
share options and Restricted Share Units (“RSUs”) granted to em-
ployees and the dilutive effect of the convertible bond.
Cash Flow Presentation
The Consolidated Statement of Cash Flows is presented using
the indirect method. The activity presented in the Consolidated
Statement of Cash Flows is divided between operating, investing
and financing activities and includes cash flows from discontinued
operations.
Receipts relating to interest, dividends received and income taxes
and payments relating to interest expense and income taxes are
included within net cash flows from operating activities.
Net cash flows from acquisitions and disposals of subsidiaries
and equity participations are included within cash flows from in-
vesting activities.
Dividend distributions are included within net cash flows from fi-
nancing activities.
Summary of Significant Judgments
and Estimates
Use of Estimates
The preparation of Financial Statements in conformity with IFRS
requires the use of certain critical accounting estimates. It also re-
quires management to exercise its judgment in the process of ap-
plying the Company’s accounting policies. The Company makes
estimates and assumptions concerning the future. The resulting
accounting will not necessarily equal the actual results. The
areas involving a higher degree of judgment or complexity, or
areas where assumptions and estimates are significant to the
Consolidated Financial Statements are discussed below.
Judgments
In the process of applying the Company’s accounting policies,
management has made the following judgments, apart from those
involving estimates, which have the most significant impact on the
amounts recognized in the consolidated financial information:
Petroplus Holdings AG | Annual Report 2010 | Consolidated Financial Statements | 83
Finance Lease Commitments – The Company has a contract
with a third party to provide hydrogen to its Cressier refinery; in
the course of evaluating that contract under IFRIC 4 (Interna-
tional Financial Reporting Interpretations Committee) Determin-
ing whether an arrangement contains a lease, the Company has
determined the contract to be a finance lease.
Forward Purchase and Sale Commitments – The Company en-
ters into physical forward sales and purchase contracts for crude
oil procurement to deliver refined products to distributors and end
customers. The Company has determined that these contracts
do not meet the criteria of a derivative financial instrument ac-
cording to IAS 39 Financial Instruments: Recognition and Mea-
surement. This is due to management’s determination that the
function of the activities is to supply crude oil to the refineries and
to deliver refined products to distributors and end customers.
Impairment of Assets – In accordance with IAS 36 Impairment of
Assets, at each Statement of Financial Position date, the Com-
pany performs an assessment to determine whether there are any
indications of impairment. If indications of impairment exist, an
impairment test is performed to assess the recoverable amount
of the assets.
Deferred Tax Assets – Deferred tax assets are recognized to the
extent that it is probable that there will be future taxable income
against which the temporary differences can be utilized. The valu-
ation of future taxable income depends on assumptions that can
change through time, with the possibility of significant differences
in management’s final valuation of deferred income tax. Judgment
is required when determining the key assumptions used in the as-
sessment and changes to the assumptions can significantly affect
the outcome of the assessment.
Estimates
The key assumptions concerning the future and other key sources
of estimation uncertainty at the Statement of Financial Position
date, that have a significant risk of causing a material adjustment
to the carrying amounts of assets and liabilities within the next
financial year are disclosed below:
Useful Lives of Property, Plant and Equipment – PP&E is depreci-
ated on a straight-line basis over the estimated useful lives of the
assets. The useful lives are estimated by management at the time
the assets are acquired and are reassessed annually, with the
estimated useful lives being based on historical experience with
similar assets, market conditions and future anticipated events.
The actual useful life might be different from the estimated use-
ful life. The related carrying amount as of December 31, 2010 is
disclosed in Note 14 “Property, Plant & Equipment”.
Valuation of Costs in Determining FIFO Inventory – In determining
the costs of our crude oil and refined petroleum products in inven-
tory, management must make certain assumptions and estimates
in order to develop the production cost of our refined petroleum
products. While crude and feedstock oil valuation is directly attrib-
uted to relevant purchase contracts and freight costs, the value of
the refined products cost is built up by identifying the appropriate
crude and feedstock cost. Additional factors considered include
charge and yield of the refinery, average product prices to guide
allocation of cost of crude and feedstock processed and the rel-
evant operating and fixed overheads for the stated month of pro-
duction. Whenever net realizable value (“NRV”) is lower than FIFO
cost, the NRV is considered for valuation purposes. Management
periodically reassesses its assumptions and estimates, and judg-
ment is required when determining the assumptions. Changes to
these assumptions and estimates can significantly affect the out-
come of the value of the oil products. The related carrying amount
as of December 31, 2010 is disclosed in Note 11 “Inventories”.
Environmental Costs – We provide for costs associated with
environmental remediation obligations when the Company has
a present obligation and the provision can be reasonably esti-
mated. Such provisions are adjusted as further information devel-
ops or circumstances change. The related carrying amount as of
December 31, 2010 is disclosed in Note 19 “Provisions”.
New and Amended Standards Adopted by the
Company
The Company has adopted the following relevant new, revised
and amended IFRSs as of January 1, 2010:
IFRS 2 (Amended) Group cash-settled and share-based payment
transactions – The amendments are effective for annual periods
beginning on or after January 1, 2010. IFRS 2 has been amended
to clarify the accounting for group cash-settled share-based pay-
ment transactions, where a subsidiary receives goods or services
from employees or suppliers but the parent or another entity in the
group pays for those goods or services. The amendments clarify
that the scope of IFRS 2 includes such transactions. The amend-
ment incorporates the guidance from IFRIC 8 Scope of IFRS 2
and IFRIC 11 Group and Treasury Share Transactions and hence
both IFRIC 8 and IFRIC 11 have been withdrawn. As the Company
currently does not have any cash-settled share-based payment
transactions, this amended standard has no impact on the Com-
pany’s Consolidated Financial Statements.
84 | Petroplus Holdings AG | Annual Report 2010 | Consolidated Financial Statements
IFRS 3 (Revised) Business Combinations – The revised standard
is effective for annual periods beginning on or after July 1, 2009.
The revised standard introduces several changes such as the
choice to measure the non-controlling interest in the acquiree ei-
ther at fair value or at its proportionate interest in the acquiree’s
net assets, the re-measurement of previously held interests to fair
value at the date of the subsequent acquisition and including this
value in calculating goodwill, the measurement of contingent con-
siderations at fair value at the date of acquisition as well as the
expense of all acquisition-related costs. The changes from IFRS 3
(revised) will affect future acquisitions, but will have no impact on
the current Consolidated Financial Statements of the Company.
IAS 27 (Amended) Consolidated and Separate Financial State-
ments – According to the amended standard, effective July 1,
2009, changes in the ownership of a non-controlling interest
that do not result in a loss of control shall be accounted for as
an equity transaction. Upon loss of control of a subsidiary, any
retained interest is re-measured to fair value and a gain or loss
is recognized in profit and loss. The standard also clarifies that
losses incurred by the subsidiary are allocated between control-
ling and non-controlling interests even if the losses exceed the
non-controlling equity investment in the subsidiary. The revised
standard has no impact on the Consolidated Financial State-
ments of the Company.
IAS 39 (Amended) Financial Instruments: Recognition and Mea-
surement – Eligible Hedged Items – The amended standard is
effective for annual periods beginning on or after July 1, 2009.
The amended standard addresses the designation of a one-sided
risk in a hedged item, and the designation of inflation as a hedged
risk or portion in particular situations. It clarifies that an entity
is permitted to designate a portion of the fair value changes or
cash flow variability of a financial instrument as a hedged item.
The amendment has no impact on the financial position or perfor-
mance of the Company as the Company currently does not enter
into such hedges.
IFRIC 17 Distributions of non-cash assets to owners – This IFRIC
is effective for annual periods beginning on or after July 1, 2009.
This interpretation provides guidance on accounting for arrange-
ments whereby an entity distributes non-cash assets to share-
holders either as a distribution of reserves or as dividends. IFRS
5 Non-current Assets Held for Sale and Discontinued Operations
has also been amended to require that assets are classified as
held for distribution only when they are available for distribution
in their present condition and the distribution is highly probable.
This interpretation does not have an impact on the Company’s
Consolidated Financial Statements.
IFRIC 18 Transfers of Assets from Customers – This IFRIC is ef-
fective for annual periods beginning on or after July 1, 2009. This
interpretation provides guidance on how to account for items of
property, plant and equipment received from customers or cash
that is received and used to acquire or construct specific assets
in return for connection to a network or ongoing access to goods
or services. The interpretation requires an entity to initially deter-
mine whether the transferred item meets the definition of an asset
as set out in the Framework. A key element in the definition is
whether the entity has control of the item. Additionally, the inter-
pretation requires the transferred assets to be recognized initially
at fair value and the related revenue to be recognized immediately.
This interpretation has no impact on the Company’s Consolidated
Financial Statements.
Amendments resulting from annual improvements to IFRS do not
have a material impact on the Company’s Consolidated Financial
Statements.
Early Adoption of Standards and Interpretations
The Company has early adopted the following standard:
IAS 32 (Amended) Financial Instruments: Presentation – In 2009,
the International Accounting Standards Board (IASB) issued
“Classification of Rights Issues – an amendment to IAS 32”, be-
coming effective for annual periods beginning on or after Febru-
ary 1, 2010, with early application permitted. The amendment ad-
dresses the accounting for rights issues that are denominated in
a currency other than the functional currency of the issuer. Previ-
ously, such rights issues were accounted for as a derivative trans-
action. The amendment requires that, provided certain conditions
are met, such rights issues are classified as equity regardless
of the currency in which the exercise price is denominated. The
Company has early adopted the amendment and have appro-
priately classified the September 2009 rights issue as an equity
transaction.
Standards, Amendments and Interpretations to
Existing Standards that are not yet Effective and
have not been Early Adopted by the Company
At the date of authorization of these Consolidated Financial State-
ments, other than the Standards and Interpretations adopted by
the Company, the following amended Standards and new Inter-
pretations, which could have an impact on the Company, were
issued but are not yet effective:
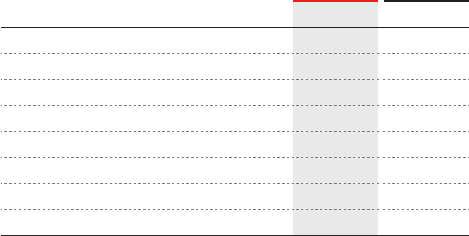
Petroplus Holdings AG | Annual Report 2010 | Consolidated Financial Statements | 85
IFRS 9 Financial Instruments – The new standard is effective for
annual periods beginning on or after January 1, 2013. IFRS 9 is
the wider project to replace IAS 39. IFRS 9 retains but simplifies
the mixed measurement model and establishes two primary mea-
surement categories for financial assets: amortized cost and fair
value. The basis of classification depends on the entity’s business
model and the contractual cash flow characteristics of the finan-
cial asset. The Company intends to apply IFRS 9 at January 1,
2013. This revised Standard is not expected to have a significant
impact on the Company’s Consolidated Financial Statements.
IFRIC 14 (Amended) IAS 19 The Limit on Defined Benefit Assets,
Minimum Funding Requirements and their Interaction – The
amendment is effective for annual periods beginning on or after
January 1, 2011. This amendment removes unintended conse-
quences arising from the treatment of prepayments where there
is a minimum funding requirement. The amendment results in pre-
payments of contributions in certain circumstances being recog-
nized as an asset rather than an expense. The Company intends
to adopt IFRIC 14 (amended) at January 1, 2011. This amended
standard is not expected to have a material impact on the Com-
pany’s Consolidated Financial Statements.
IFRIC 19 Extinguishing financial liabilities with equity instruments
(
“
debt for equity swaps
”
) – The new interpretation is effective for
annual periods beginning on or after July 1, 2010. IFRIC 19 clari-
fies the accounting when an entity renegotiates the terms of its
debt with the result that the liability is extinguished by the debtor
issuing its own equity instruments to the creditor (referred to as
a
“
debt for equity swap
”
). These equity instruments issued are
measured at their fair value and any gain or loss is recognized im-
mediately in profit and loss. The Company intends to adopt IFRIC
19 at January 1, 2011. This new interpretation is not expected to
have a material impact on the Company’s Consolidated Financial
Statements.
Amendments resulting from annual improvements to IFRS that
are not yet applicable are not expected to have a material impact
on the Company’s Consolidated Financial Statements.
In the Company’s view, other issued amendments to the account-
ing standards and interpretations that are not yet applicable do
not have a material impact on the accounting policies, financial
position or performance of the Group.
3 Revenue and Materials Cost
Revenue represents the revenues earned from the sale of re-
fined products and other revenues from sale of biofuel cer-
tificates at the French refineries, sale of CO2 emission rights,
tank rental, compulsory stock storage and handling fees. The
increase in revenue is mainly attributable to higher refined pe-
troleum product prices and increased volumes sold during
2010 compared to the same period in 2009.
Excise duties are not included in revenues but they are levied
on part of the revenues. The excise duties invoiced during the
year 2010 amounted to USD 4.3 billion (2009: USD 4.3 billion).
Materials Cost
Materials cost represents the cost to purchase crude oil and
gains and losses on commodity instruments. Materials cost
included a gain of USD 21.9 million for the year ended De-
cember 31, 2010 (2009: loss of USD 5.7 million) related to our
commodity price management program.
Included in “Materials cost” are sales of crude oil. These sales
are executed to avoid failures of timely deliveries, delivery
shortages of crude oil, and, at times, are a result of operational
optimization decisions. These sales occur mainly with refiner-
ies that are dependent on crude oil supply by vessels. The
related primary crude oil purchase is sold at the current market
price. The crude oil sales revenue offset against materials cost
in 2010 is USD 304.0 million (2009: USD 109.5 million).
Revenue
(in millions of USD) 2010 2009
Sale of products 20,626.7 14,714.8
Sale of biofuel certificates 44.5 51.3
Sale of CO2 emission rights 36.8 –
Tank rental 8.9 17.0
Compulsory stock storage 4.5 3.6
Handling fee 1.4 1.3
Other 12.2 9.8
Total revenue 20,735.0 14,797.8
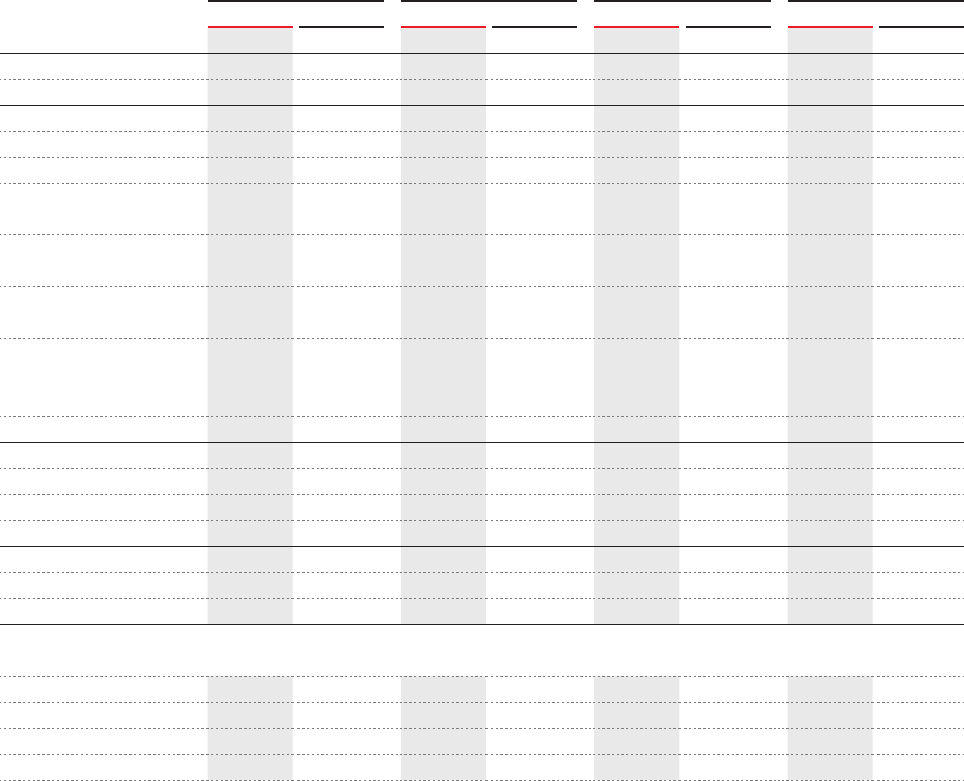
86 | Petroplus Holdings AG | Annual Report 2010 | Consolidated Financial Statements
4 Segment Information
Segment information is presented with respect to the Com-
pany’s operating segment, together with selected geographical
and other information.
Segment results, assets and liabilities include items directly at-
tributable to a segment as well as those that can be allocated
on a reasonable basis.
We have one reportable operating segment, refining. Our
refining segment includes refining and wholesale marke ting
operations. Petroplus is an independent refining company with
no other operating activities. As such, we manage operations
on a consolidated basis. Additionally,
the Company does not
generate financial information down to the net income level for
its refineries.
Operating Segment
Refining Total Continuing Operations Discontinued Operations Total Company
(in millions of USD) 2010 2009 2010 2009 2010 2009 2010 2009
Total external revenue 20,735.0 14,797.8 20,735.0 14,797.8 12.2 1,413.1 20,747.2 16,210.9
Total revenue 20,735.0 14,797.8 20,735.0 14,797.8 12.2 1,413.1 20,747.2 16,210.9
Operating profit/(loss) 155.4 65.3 155.4 65.3 (0.8) (165.3) 154.6 (100.0)
Financial income 3.1 2.6 – 0.2 3.1 2.8
Financial expenses (189.6) (167.2) – (0.3) (189.6) (167.5)
Foreign currency
exchange (loss)/gain
(2.2) 2.5 – – (2.2) 2.5
Share of income/(loss)
from associates
8.5 (1.6) – – 8.5 (1.6)
Income tax (expense)/
benefit
(82.1) (10.4) (0.3) 24.3 (82.4) 13.9
Loss on sale of
discontinued operations,
net of income tax
– – (4.3) – (4.3) –
Net loss (106.9) (108.8) (5.4) (141.1) (112.3) (249.9)
Segment assets 6,755.0 6,568.9 6,755.0 6,568.9 – 88.2 6,755.0 6,657.1
Investments in associates 14.6 21.2 14.6 21.2 – – 14.6 21.2
Total assets 6,769.6 6,590.1 6,769.6 6,590.1 – 88.2 6,769.6 6,678.3
Segment liabilities 4,765.7 4,659.7 4,765.7 4,659.7 – 30.6 4,765.7 4,690.3
Total liabilities 4,765.7 4,659.7 4,765.7 4,659.7 – 30.6 4,765.7 4,690.3
Other information
Capital expenditures 226.7 342.3 226.7 342.3 0.2 5.4 226.9 347.7
Depreciation (309.5) (252.5) (309.5) (252.5) – (18.6) (309.5) (271.1)
Amortization (21.1) (23.0) (21.1) (23.0) – (0.6) (21.1) (23.6)
Impairment (8.2) (6.6) (8.2) (6.6) (0.6) (125.3) (8.8) (131.9)
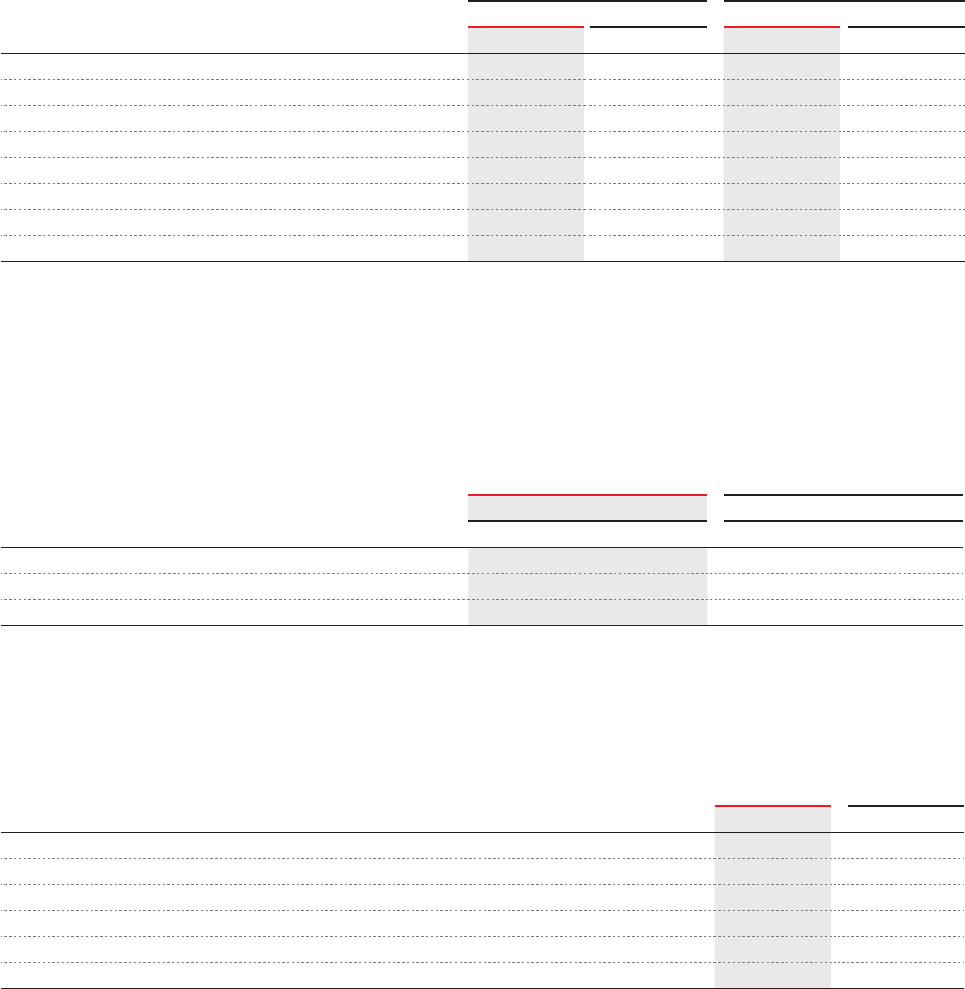
Petroplus Holdings AG | Annual Report 2010 | Consolidated Financial Statements | 87
Geographical Information
The following table provides details of total external revenues by geographic market area for the years ended December 31, 2010
and 2009 and the non-current assets by location as of December 31, 2010 and 2009.
The revenue information is based on the location of the customer. Non-current assets for this purpose consist of property, plant
and equipment and intangible assets:
Major Customers
The following table provides information about major customers. The total sales to each customer are compared with total sales
from continuing operations of USD 20,735.0 million (2009: USD 14,797.8 million). If the Company sells products to different cus-
tomers that form a group of companies, these sales are shown as sales to one customer.
5 Additional Statement of Comprehensive Income Disclosures
External revenue1) Non-current assets1)
(in millions of USD) 2010 2009 2010 2009
United Kingdom 7,207.5 4,342.0 1,393.8 1,506.4
France 4,709.3 3,492.4 466.7 445.7
Switzerland 3,768.6 2,502.1 329.6 335.4
Germany 2,594.9 2,656.6 674.1 695.2
Belgium 770.9 585.3 632.6 639.7
The Netherlands 523.7 302.0 – –
Rest of the world 1,160.1 917.4 – –
Total 20,735.0 14,797.8 3,496.8 3,622.4
1)
Excludes external revenue relating to the Antwerp Processing facility and the Teesside refining operations and non-current assets relating to the Antwerp
Processing facility.
2010 2009
(in millions of USD) Sales in % of total sales Sales in % of total sales
Customer 1 4,972.6 24.0 % 4,213.3 28.5 %
Customer 2 1,415.4 6.8 % 1,216.3 8.2 %
Total 6,388.0 30.8 % 5,429.6 36.7 %
Personnel expenses
(in millions of USD) 2010 2009
Wages, salaries and bonuses (232.8) (228.9)
Social security and pension expenses (82.9) (80.9)
Contract labor (15.9) (12.4)
Expense of share-based payments (5.0) (6.1)
Other personnel expenses1) (15.3) (22.8)
Total personnel expenses (351.9) (351.1)
1)Other personnel expenses include mainly recruitment, education and health and staff insurance expenses.
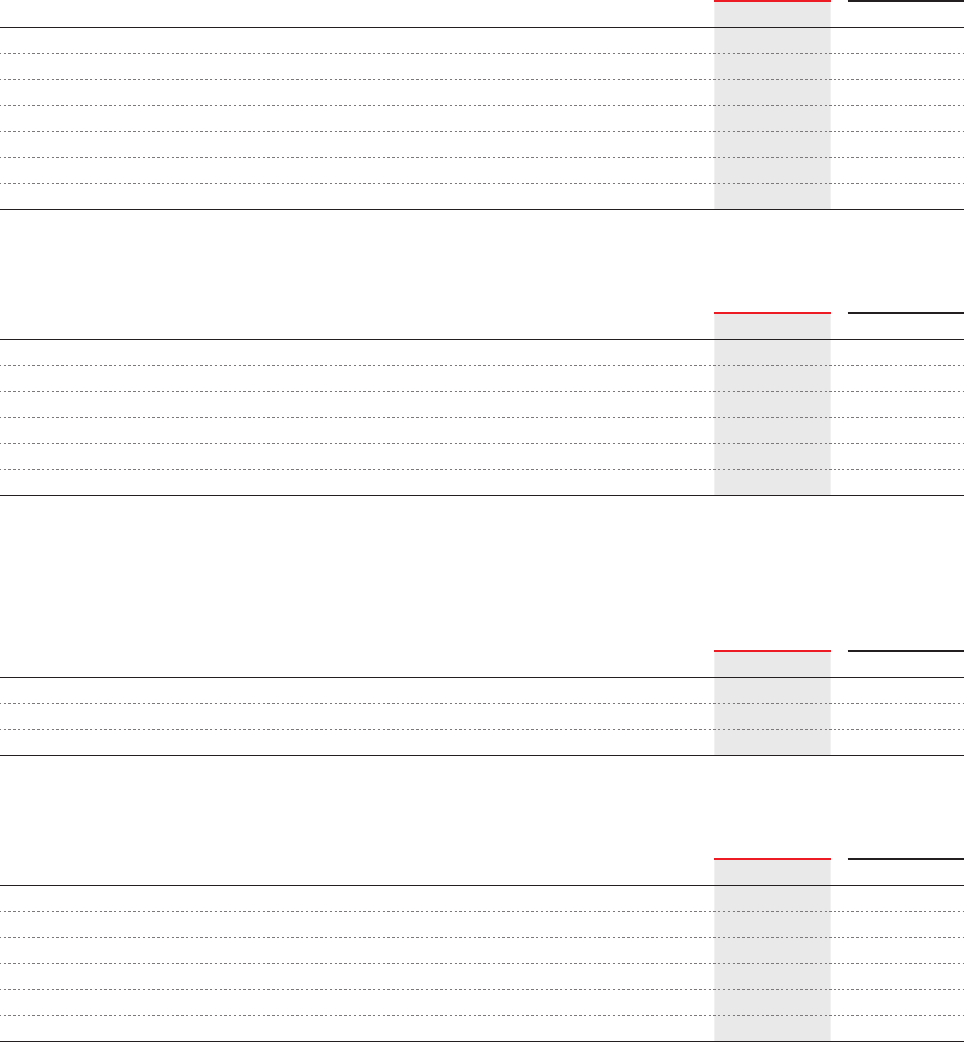
88 | Petroplus Holdings AG | Annual Report 2010 | Consolidated Financial Statements
Operating expenses
(in millions of USD) 2010 2009
Maintenance (145.1) (162.6)
Energy expenses (115.6) (104.0)
Chemical expenses (65.2) (57.4)
Other selling, general and administrative expenses (91.1) (102.3)
Utilities (0.7) (0.4)
Safety, health and environmental costs (22.1) (24.5)
Total operating expenses (439.8) (451.2)
Other administrative expenses
(in millions of USD) 2010 2009
Consultancy fees (13.0) (17.0)
Information technology (11.4) (16.3)
Insurance (9.0) (10.8)
Travel and accommodation (4.2) (4.2)
Other1) (5.1) (7.4)
Total other administrative expenses (42.7) (55.7)
1)Other includes leasing, postage and telecom, printing and office supplies, canteen, public relations, property and other indirect taxes and other miscel-
laneous administrative expenses.
Financial income
(in millions of USD) 2010 2009
Interest income 0.6 0.4
Other financial income 2.5 2.2
Total financial income 3.1 2.6
Financial expenses
(in millions of USD) 2010 2009
Interest expense (137.2) (116.0)
Refinancing costs and bond accretion (13.3) (25.4)
Letter of credit expense (26.9) (14.1)
Bank and commission fees (12.1) (9.3)
Other financial expenses (0.1) (2.4)
Total financial expenses (189.6) (167.2)
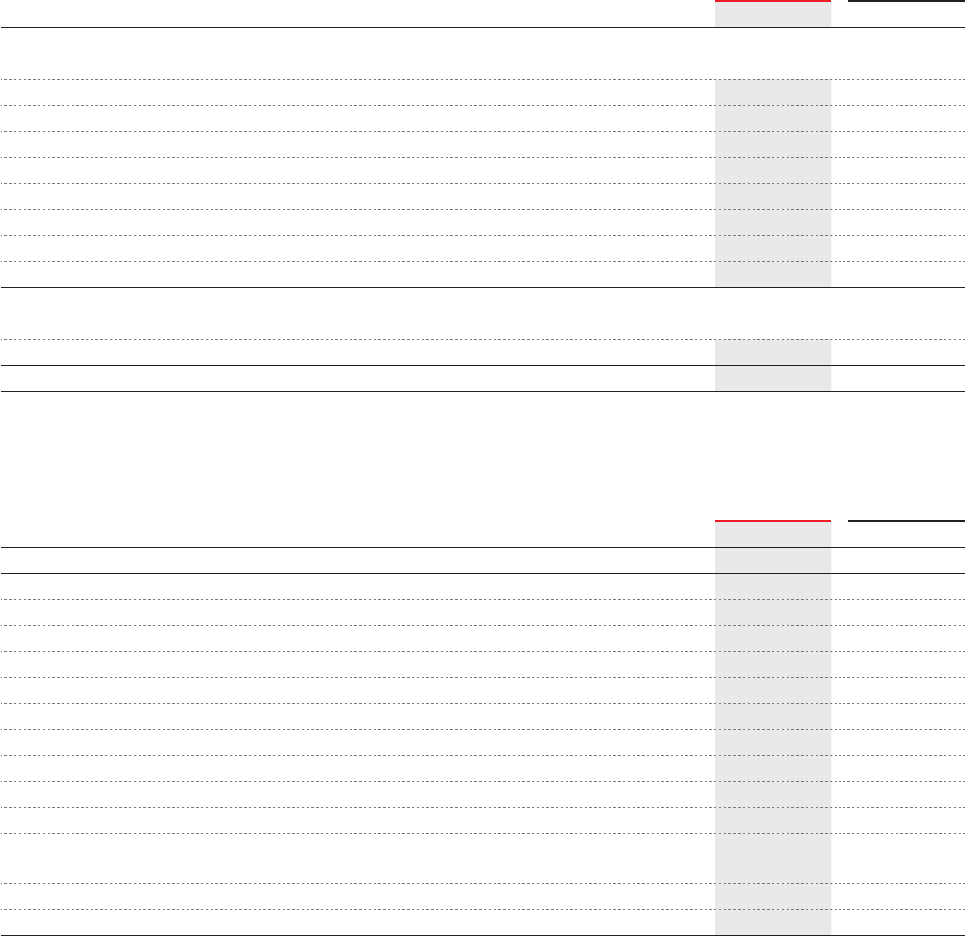
Petroplus Holdings AG | Annual Report 2010 | Consolidated Financial Statements | 89
6 Taxes
Current Tax
The major components of income tax expense for the years ended December 31, 2010 and 2009 are as follows:
The reconciliations between the actual tax charge and the expected tax charge for the years ended December 31, 2010 and
2009 are as follows:
(in millions of USD) 2010 2009
Consolidated Statement of Comprehensive Income
Current income tax
Current income tax charge (2.0) (10.7)
Charges in respect to current tax of previous years (0.7) (5.7)
Deferred income tax
Related to origin and reversal of temporary differences (80.7) 5.3
Related to changes in tax rates 1.3 0.7
Total income tax expense from continuing operations (82.1) (10.4)
Aggregate current and deferred tax relating to items charged or credited to equity
Total income tax recognized in other comprehensive income – 12.0
Total income tax recognized in equity – –
(in millions of USD) 2010 2009
Total loss from continuing operations before income taxes (24.8) (98.4)
Expected tax benefit at head office rate (2010: 10 %; 2009: 10 %) 2.5 9.8
Income taxed at different rates 19.9 41.8
Foreign currency impact (55.9) (27.5)
Tax effect of expenses not deductible in determining taxable profit (9.5) (20.4)
Tax effect of non-taxable income 10.2 17.3
Change in tax rate 1.3 0.7
Adjustment in respect of prior periods (1.4) (1.5)
Utilization of tax losses not previously recognized 4.1 2.4
Unrecognized deferred tax assets relating to current year (18.1) (32.5)
Deferred tax expense arising from the write-down of previously
recognized deferred tax assets
(35.2) –
Other – (0.5)
Income tax expense from continuing operations (82.1) (10.4)
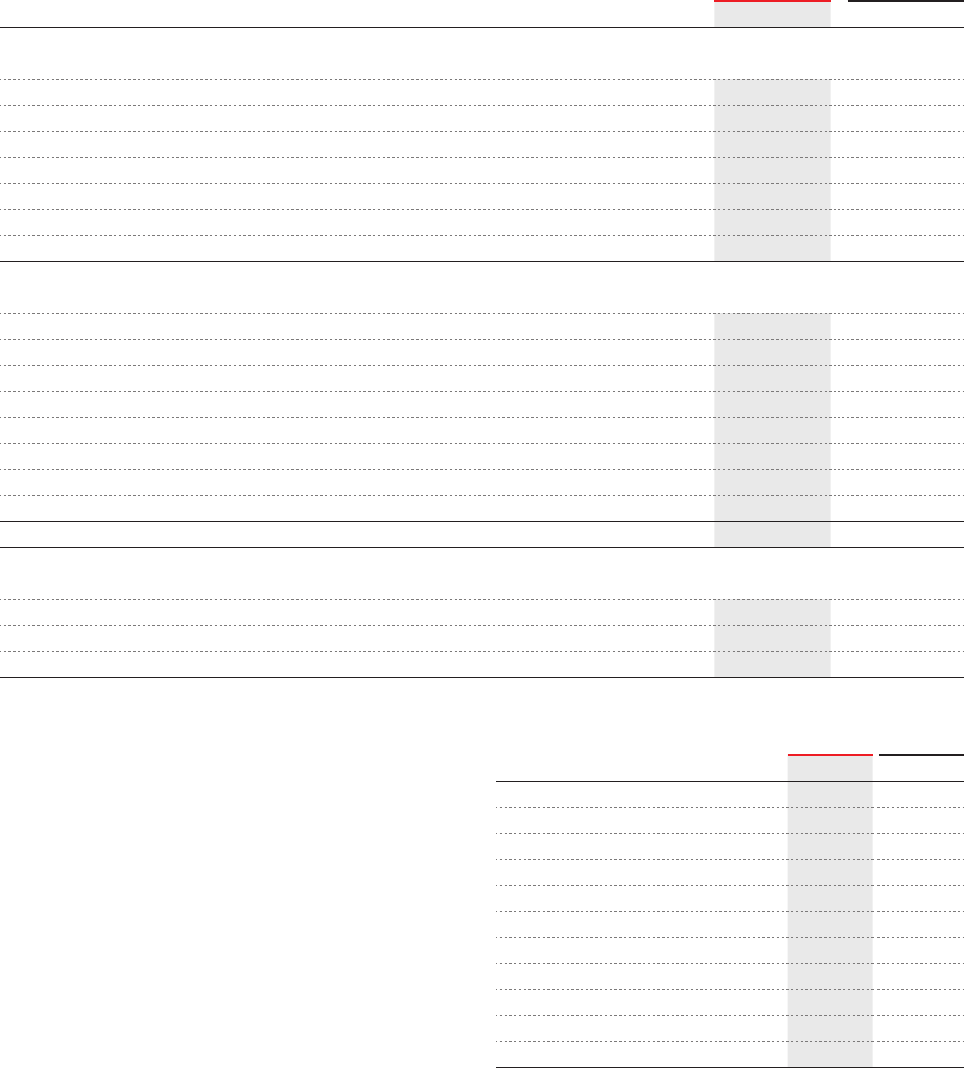
90 | Petroplus Holdings AG | Annual Report 2010 | Consolidated Financial Statements
Tax Losses Carried Forward
The deferred tax assets on the loss carry forwards which have
been recognized as of December 31, 2010 relate to Switzer-
land, Germany and Belgium. The realization of tax assets is
dependent upon the generation of future taxable income dur-
ing the periods in which those temporary differences become
deductible or in which tax losses can be utilized.
Tax losses on which no deferred tax assets were recognized
as their utilization is not probable, are described in the table
to the right.
Dividend Distributions
Any intragroup dividend distributions would have no or limited
tax consequences to the Company due to the expected ap-
plication of relevant European Union Directives, Double Tax
Treaties and participation exemption rules.
Deferred Tax
Deferred tax at December 31, 2010 and 2009 relates to the following:
(in millions of USD) 2010 2009
Deferred tax assets
Temporary differences:
Intangible assets 4.6 4.5
Trade and other receivables 4.2 6.6
Retirement benefit obligation 37.0 39.7
Other assets 10.0 12.0
Tax losses and tax credits available for offset against future taxable income 46.0 78.9
Total deferred tax assets 101.8 141.7
Deferred tax liabilities
Temporary differences:
Property, plant and equipment 366.0 351.3
Intangible assets 15.9 20.7
Derivative financial instruments 2.3 12.2
Inventories 3.7 4.4
Trade and other payables 10.0 4.4
Provisions and other liabilities 86.8 51.3
Total deferred tax liabilities 484.7 444.3
Deferred tax liabilities, net (382.9) (302.6)
Presented in the Consolidated Statement of Financial Position as:
Deferred tax assets 13.7 40.0
Deferred tax liabilities (396.6) (342.6)
Deferred tax liabilities, net (382.9) (302.6)
(in millions of USD) 2010 2009
Unrecognized tax losses expiry
Switzerland
From 4 to 7 years 743.1 309.5
Belgium
Never expire 0.9 78.2
The Netherlands
From 7 to 9 years 83.1 75.9
Others
From 3 to 6 years 34.1 3.3
Never expire 5.5 0.8
Total unrecognized tax losses 866.7 467.7
Petroplus Holdings AG | Annual Report 2010 | Consolidated Financial Statements | 91
7 Discontinued Operations
Disposal of the Antwerp Processing Facility
On October 23, 2009, the Company, through certain of its
subsidiaries, entered into a definitive agreement with Eurotank
Belgium B.V., a wholly-owned subsidiary of Vitol Tank Termi-
nals International B.V., part of the Vitol Group of companies
(“Vitol”), for the sale of Petroplus Refining Ant werp N.V. and
Petroplus Refining Antwerp Bitumen N.V. (the “Antwerp Pro-
cessing facility”). The disposal of the Antwerp Processing facil-
ity is consistent with the Company’s long-term policy to focus
on its core refining business. The gross sales price for the net
asset value of the facility, excluding hydrocarbon inventory,
was USD 25.0 million in cash. The disposal was completed
on January 12, 2010, on which date control of the Antwerp
Processing facility passed over to the acquirer for total cash
consideration of USD 56.3 million. Details of the assets and li-
abilities disposed of and the calculation of the loss on disposal
are disclosed in Note 8 “Disposal of the Antwerp Processing
Facility”. Total loss from discontinued operations in 2010
related to the Antwerp Processing facility amounted to USD
4.7 million.
During 2009, the Company recorded an impairment loss of
USD 15.0 million to reflect the fair value of the facility which
was included within discontinued operations in the line item
“Depreciation, amortization and impairment” for the year end-
ed December 31, 2009. The related income tax impact was
a USD 2.0 million tax benefit. The results of the Antwerp Pro-
cessing facility, including selling costs of USD 4.5 million, have
been included in the line item “Discontinued operations” in our
Consolidated Statement of Comprehensive Income for the
year ended December 31, 2009. As at December 31, 2009,
the Antwerp Processing facility was classified as a disposal
group held for sale. The major classes of assets and liabilities
classified as held for sale are disclosed in Note 9 “Net Assets
Held for Sale”.
Suspension of the Teesside Refinery Operations
In November 2009, the Company suspended the Teesside re-
fining operations due to the unfavorable market environment
and capital expenditures required to maintain refinery oper-
ations. During 2010, the site was converted into a marketing and
storage facility. In addition to the charges recorded in 2009,
additional transition costs of USD 0.7 million were recorded
in the line item “Discontinued operations” in our Consolidated
Statement of Comprehensive Income for the year ended 2010.
Further details regarding restructuring expenses are disclosed
in Note 19 “Provisions”.
As a result of the suspension of the Teesside refinery oper-
ations in 2009, an impairment test was performed on the fixed
asset value in 2009 based on value in use by using a discount
factor of 8 %. As the estimated recoverable amount deter-
mined under value in use was less than the net book value,
an impairment charge of USD 110.0 million was recorded. Re-
lated to the transition, the Company recognized a provision of
USD 19.0 million for expected restructuring costs, including
contract termination costs, consulting fees, employee termi-
nation benefits and related incremental costs. The results of
the Teesside refining and marketing operations were included
in the line item “Discontinued operations” in our Consolidated
Statement of Comprehensive Income for the year ended De-
cember 31, 2009.
Analysis of Loss for the Year from Discontinued Operations
The combined results of the discontinued operations (i.e. Ant-
werp Processing facility and Teesside refining operations) are
set forth on the next page.
92 | Petroplus Holdings AG | Annual Report 2010 | Consolidated Financial Statements
The loss for the year from discontinued operations is analyzed
as follows:
(in millions of USD) 2010 2009
Loss from discontinued
operations
Revenue 12.2 1,413.1
Materials cost (10.3) (1,311.7)
Gross margin 1.9 101.4
Personnel expenses (0.3) (35.5)
Operating expenses (1.3) (61.1)
Depreciation, amortization and
impairment
(0.6) (144.5)
Restructuring expenses (0.1) (19.0)
Other administrative expenses (0.4) (6.6)
Operating loss (0.8) (165.3)
Financial income – 0.2
Financial expenses – (0.3)
Loss before income taxes (0.8) (165.4)
Income tax (expense)/benefit (0.3) 24.3
Results from discontinued
operations
(1.1) (141.1)
Loss on disposal of discontinued
operations
(4.3) –
Total loss from discontinued
operations
(5.4) (141.1)
(in USD) 2010 2009
Earnings per share from
discontinued operations
Earnings per share – basic (0.06) (1.81)
Earnings per share – diluted (0.06) (1.81)
The net cash flows from discontinued operations are as fol-
lows:
(in millions of USD) 2010 2009
Cash flows from operating activities (25.2) 19.5
Cash flows from investing activities 56.1 1) (10.5)
Cash flows from financing activities – –
Net cash flows 30.9 9.0
1)Includes USD 0.2 million for capital expenditures.
8 Disposal of the Antwerp
Processing Facility
On January 12, 2010, the Company disposed of the Antwerp
Processing facility. Cash proceeds of USD 56.3 million were
received during 2010.
The loss on disposal amounting to USD 4.3 million is included
in the line item “Discontinued operations” in our Consolidated
Statement of Comprehensive Income for the year ended
December 31, 2010. Further details are disclosed in Note 7
“Discontinued Operations”.
Consideration:
(in millions of USD) 2010
Consideration received in cash 56.3
Total consideration 56.3
Effect of disposal on the financial position of the Group as per
January 12, 2010:
(in millions of USD) 2010
Cash 0.1
Other receivables and prepayments 2.6
Inventories 31.9
Property, plant and equipment 41.8
Other financial assets 13.3
Total assets disposed of 89.7
Other payables and accrued expenses (15.3)
Current tax liabilities (0.2)
Retirement benefit obligation (8.3)
Provisions (5.5)
Other financial liabilities (0.6)
Total liabilities disposed of (29.9)
Net assets disposed of 59.8
Loss on disposal of Antwerp Processing facility:
(in millions of USD) 2010
Consideration 56.3
Net assets disposed of (59.8)
Loss on disposal (3.5)
Cumulative exchange differences
reclassified from equity
(0.8)
Total loss on disposal of
Antwerp Processing facility
(4.3)
Petroplus Holdings AG | Annual Report 2010 | Consolidated Financial Statements | 93
9 Net Assets Held for Sale
During 2009, the Company, through certain of its subsidiaries,
entered into a definitive agreement with Eurotank Belgium B.V.,
a wholly-owned subsidiary of the Vitol Group of Companies,
for the sale of its Antwerp Processing facility. The sale was
completed on January 12, 2010.
The major classes of assets and liabilities of the Antwerp Pro-
cessing facility were classified as held for sale as of December
31, 2009:
Net cash inflow on disposal of the Antwerp Processing facility:
(in millions of USD) 2010
Consideration received in cash 56.3
Less: Cash balances disposed of (0.1)
Net cash inflow 56.2
(in millions of USD) 2009
Cash 0.1
Other receivables and prepayments 2.6
Inventories 34.0
Property, plant and equipment 41.6
Other financial assets 9.9
Total assets classified as held for sale 88.2
Other payables and accrued expenses (16.0)
Current tax liabilities (0.2)
Retirement benefit obligation (8.3)
Provisions (5.5)
Other financial liabilities (0.6)
Total liabilities classified as held for sale (30.6)
Net assets held for sale 57.6
10 Cash and Short-Term Deposits
Cash held at banks earns interest at floating rates based on
bank deposit rates. Short-term deposits are made for vary-
ing periods between one day and three months depending on
the immediate cash requirements of the Company. Interest is
earned at the respective short-term deposit rates. See Note
28 “Financial Instruments” for the fair value of cash and short-
term deposits.
Of the total amount included in cash and short-term deposits
at December 31, 2010, USD 166.7 million was pledged under
the Company’s borrowing agreements (2009: USD nil).
Cash and short-term deposits are composed of the following
currencies:
11 Inventories
There were no write-downs for obsolete or slow-moving items
related to raw materials and finished goods in 2010 and 2009.
Of the total amount included in inventories at December 31,
2010, USD 1,322.8 million (2009: USD 1,213.1 million) was
pledged as security for the Company’s credit facilities.
Cash and short-term deposits for the years ended December
31, 2010 and 2009 are as follows:
(in millions of USD) 2010 2009
Cash 111.7 10.5
Short-term deposits 67.3 0.7
Total cash and short-term deposits 179.0 11.2
(in millions of USD) 2010 2009
USD 123.1 4.5
EUR 33.6 4.8
GBP 16.0 0.1
CZK 4.1 1.4
CHF 2.2 0.4
Total cash and short-term deposits 179.0 11.2
(in millions of USD) 2010 2009
Crude oil 717.6 825.5
Finished goods & feedstock 933.4 808.1
Other materials 56.9 50.9
Total inventories 1,707.9 1,684.5
94 | Petroplus Holdings AG | Annual Report 2010 | Consolidated Financial Statements
12 Trade and Other Receivables
Trade receivables are non-interest-bearing and are generally
on 5 to 35 day terms.
At December 31, the aging analysis of trade receivables is as
follows:
At December 31, trade receivables are composed of the fol-
lowing currencies:
At December 31, 2010, trade receivables at a nominal value of
USD 0.1 million (2009: USD 0.8 million) were impaired and fully
provided for. The movements in the provision for impairment of
receivables were as follows:
Trade receivables
(in millions of USD) 2010 2009
Trade receivables 1,154.8 1,052.2
Provision for doubtful debt (0.1) (0.8)
Total trade receivables, net 1,154.7 1,051.4
(in millions of USD) 2010 2009
Neither past due nor impaired 1,133.9 1,025.4
Past due
less than 30 days 17.5 23.0
between 31 and 60 days 0.3 0.1
between 61 and 90 days 0.2 1.1
between 91 and 180 days 2.4 1.0
between 181 and 360 days 0.4 0.8
more than 360 days – –
Total trade receivables, net 1,154.7 1,051.4
(in millions of USD) 2010 2009
EUR 623.6 632.8
USD 222.4 103.6
GBP 222.0 198.0
CHF 79.7 73.2
CZK 7.0 43.8
Total trade receivables, net 1,154.7 1,051.4
Of the total amount included in trade receivables at December
31, 2010, USD 1,004.0 million (2009: USD 962.6 million) was
pledged as security for the Company’s credit facilities.
Factoring Agreement
On June 8, 2009, one of the Company’s subsidiaries conclud-
ed an uncommitted factoring agreement of up to approximate-
ly USD 250 million resulting in the sale of some of the Com-
pany’s oil major receivables (the “Factoring Agreement”). The
Factoring Agreement is available, subject to certain oil major
receivables being eligible for sale. The eligible receivables are
sold at their nominal value less the bank’s funding rate plus a
margin below that of the RCF. As of December 31, 2010, the
Company utilized USD 178.7 million against this facility.
Other receivables and prepayments consist mainly of receiv-
ables in connection with compulsory stock obligations in the
amount of USD 30.8 million (2009: USD 26.5 million), prepaid
biotax allowances of USD 9.7 million and prepaid insurance of
USD 4.0 million.
(in millions of USD)
Individually
impaired
Balance at January 1, 2009 (1.2)
Charge for the year (0.4)
Utilized 0.1
Unused amount reversed 0.7
Balance at December 31, 2009 (0.8)
Charge for the year (0.1)
Utilized 0.3
Unused amount reversed 0.5
Balance at December 31, 2010 (0.1)
Other Receivables and Prepayments
(in millions of USD) 2010 2009
Receivables from associates 0.8 1.2
Taxes other than income taxes 30.6 31.6
Other receivables and prepayments 77.9 67.0
Total other receivables
and prepayments
109.3 99.8

Petroplus Holdings AG | Annual Report 2010 | Consolidated Financial Statements | 95
13 Intangible Assets
Changes in intangible assets for the years ended December 31, 2010 and 2009 were as follows:
(in millions of USD)
Notes Software Leasehold Other intangible
assets
Intangible assets
under construction
Total
Cost
Balance at January 1, 2009 52.0 26.8 54.1 5.8 138.7
Additions – – – 1.9 1.9
Disposals – – (0.8) – (0.8)
Reclassification 8.4 – 7.7 (6.6) 9.5
Balance at December 31, 2009 60.4 26.8 61.0 1.1 149.3
Additions 0.1 – 0.2 4.9 5.2
Reclassification 1.8 – 4.4 (5.3) 0.9
Balance at December 31, 2010 62.3 26.8 65.6 0.7 155.4
Accumulated amortization
Balance at January 1, 2009 10.8 1.3 13.2 – 25.3
Amortization – continued 15.1 0.7 7.2 – 23.0
Amortization – discontinued1) 7 0.6 – – – 0.6
Disposals – – (0.2) – (0.2)
Reclassification (1.8) – 3.1 – 1.3
Balance at December 31, 2009 24.7 2.0 23.3 – 50.0
Amortization – continued 17.9 0.7 2.5 – 21.1
Reclassification 0.4 – 2.6 – 3.0
Balance at December 31, 2010 43.0 2.7 28.4 – 74.1
Net carrying amount at
January 1, 2009 41.2 25.5 40.9 5.8 113.4
December 31, 2009 35.7 24.8 37.7 1.1 99.3
December 31, 2010 19.3 24.1 37.2 0.7 81.3
1)Attributable to the Teesside refining operations.

96 | Petroplus Holdings AG | Annual Report 2010 | Consolidated Financial Statements
14 Property, Plant and Equipment
Changes in property, plant and equipment for the years ended December 31, 2010 and 2009 were as follows:
(in millions of USD)
Notes Land & Buildings Machinery &
Equipment
Other
assets
Assets under
construction
Total
Cost
Balance at January 1, 2009 453.3 3,541.2 26.9 225.8 4,247.2
Final purchase price allocation
and reclassification adjustment
31 (16.5) (12.8) – – (29.3)
Additions – – 2.0 343.8 345.8
Disposals – (19.4) (1.9) – (21.3)
Reclassification 21.5 268.0 15.8 (343.9) (38.6)
Classified as held for sale1) 9 (4.1) (151.4) (1.3) (5.2) (162.0)
Balance at December 31, 2009 454.2 3,625.6 41.5 220.5 4,341.8
Additions – – 0.3 221.4 221.7
Disposals (0.4) (200.8) (0.1) (1.8) (203.1)
Reclassification 10.7 284.5 3.9 (296.9) 2.2
Balance at December 31, 2010 464.5 3,709.3 45.6 143.2 4,362.6
Accumulated depreciation
Balance at January 1, 2009 12.6 559.0 14.8 – 586.4
Depreciation – continued 4.2 243.9 4.4 – 252.5
Depreciation – discontinued2) 7 0.3 18.1 0.2 – 18.6
Impairment – continued 4.1 2.5 – – 6.6
Impairment – discontinued2) 7 – 125.3 – – 125.3
Disposals – (18.0) (1.1) – (19.1)
Reclassification 2.2 (33.1) (0.3) – (31.2)
Classified as held for sale1) 9 (0.8) (118.6) (1.0) – (120.4)
Balance at December 31, 2009 22.6 779.1 17.0 – 818.7
Depreciation – continued 5.4 300.1 4.0 – 309.5
Impairment – continued 2.2 6.0 – – 8.2
Impairment – discontinued2) 7 – 0.6 – – 0.6
Disposals – (199.3) – – (199.3)
Reclassification 18.5 (9.3) 0.2 – 9.4
Balance at December 31, 2010 48.7 877.2 21.2 – 947.1
Net carrying amount at
January 1, 2009 440.7 2,982.2 12.1 225.8 3,660.8
December 31, 2009 431.6 2,846.5 24.5 220.5 3,523.1
December 31, 2010 415.8 2,832.1 24.4 143.2 3,415.5
1)Attributable to the Antwerp Processing facility.
2)Attributable to the Antwerp Processing facility and the Teesside refining operations.
Petroplus Holdings AG | Annual Report 2010 | Consolidated Financial Statements | 97
The carrying amount of finance leases included in Machinery &
Equipment as of December 31, 2010 is USD 22.2 million (2009:
USD 29.8 million). Of the total amount included in Property,
Plant and Equipment at December 31, 2010, USD 8.5 million
(2009: USD 11.4 million) was pledged as security for the Com-
pany’s credit facilities.
The Company has purchase commitments at December 31,
2010 of USD 40.8 million (2009: USD 19.7 million) for property,
plant and equipment.
15 Investments in Associates
The following table illustrates the summarized financial infor-
mation of the Company’s investments in associates for De-
cember 31, 2010 and 2009:
A complete list of the Company’s associated entities, coun-
tries of incorporation, and interest held is disclosed in Note 32
“Subsidiaries”.
December 31,
(in millions of USD) 2010 2009
Current assets 62.6 78.9
Non-current assets 81.2 80.1
Total assets 143.8 159.0
Current liabilities (67.5) (66.4)
Non-current liabilities (26.8) (25.0)
Total liabilities (94.3) (91.4)
Net assets 49.5 67.6
Company’s share of
associates’ net assets
14.6 21.2
For the year ended December 31,
(in millions of USD) 2010 2009
Revenue 38.6 40.0
Income/(loss) 1.2 (2.4)
Company’s share of
associates’ revenue
11.9 12.3
Company’s share of
associates’ income/(loss)
8.5 1) (1.6)
1)Includes gain on sale of PBF.
Acquisitions/Disposals
During 2010 and 2009, there were no other acquisitions or
disposals of investments in associates, except as noted below.
Acquisition of Delaware City Refinery Assets
On June 1, 2010, the Company’s investment vehicle, PBF En-
ergy Company LLC (“PBF”), a partnership entered into with
The Blackstone Group and First Reserve Corporation, com-
pleted its purchase of the Delaware City refinery in Delaware
City, Delaware from Valero Energy Corporation. On May 28,
2010, the Company contributed USD 76.4 million to PBF re-
lated to the purchase of the Delaware City refinery.
Sale of Petroplus’ Share in Investment Vehicle PBF
On September 26, 2010, the Company reached an agreement
in principle with The Blackstone Group and First Reserve, its
partners in PBF, for the sale of Petroplus’ 32.62 % share of PBF
in the amount of USD 91.0 million. Cash proceeds received on
October 18, 2010, amounted to USD 81.9 million after with-
holding tax. The sale transaction resulted in a gain of USD
8.3 million in 2010. During 2009, PBF reported a loss in the
amount of USD 2.1 million.
This transaction represents a strategic shift for the Company
mainly caused by the expected rapid expansion rate of PBF in
the United States, which would require large investments by
the Company to maintain a meaningful position in PBF and the
amount and timing of such investments would not be entirely
within the Company’s control.
Management believes it is most important to focus the Com-
pany’s resources on our core European operations and to pur-
sue strategies to improve the competitiveness of the existing
asset base.
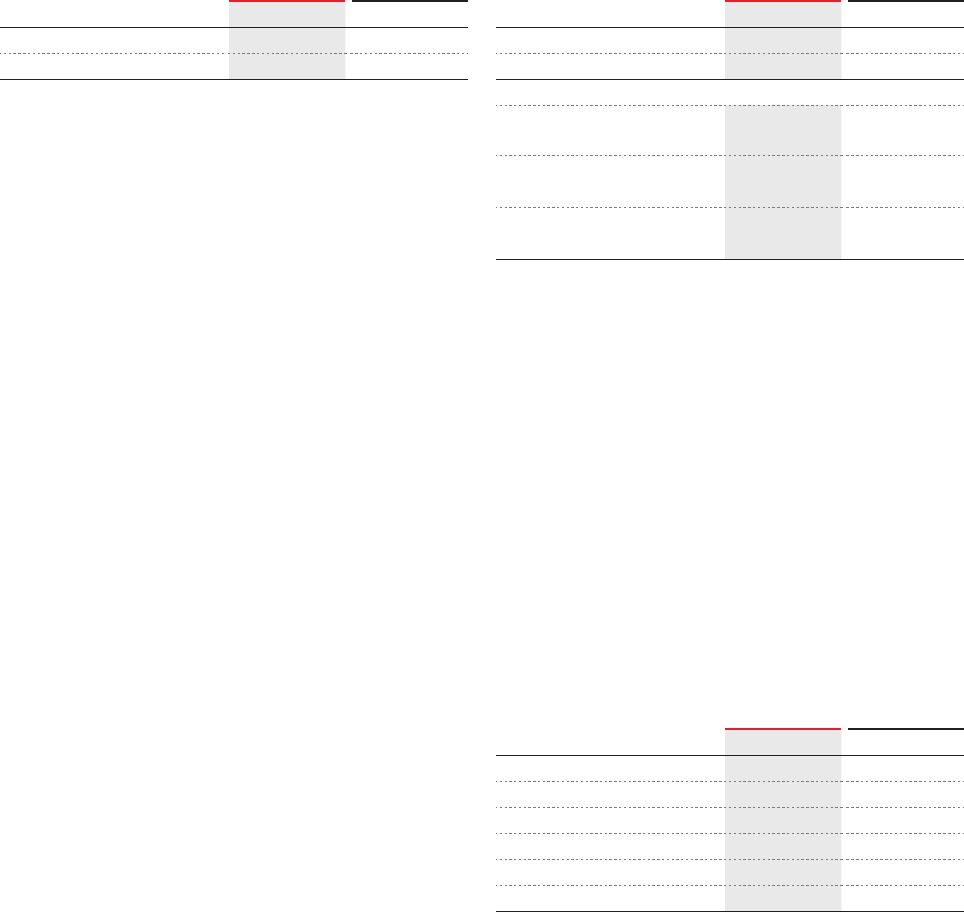
98 | Petroplus Holdings AG | Annual Report 2010 | Consolidated Financial Statements
16 Financial Assets Available-for-Sale
Financial assets available-for-sale consist of investments in
unlisted ordinary shares that have no fixed maturity date or
coupon rate. These investments, held for strategic purposes,
relate to pipeline and tankstorage companies and are carried
at fair value.
The Company recognizes dividend income from investments
when declared.
With the acquisition of the Ingolstadt refinery in March 2007,
the Company acquired, as part of the acquisition agreement,
a 10 % ownership in each of the pipeline entities Deutsche
Transalpine Ölleitung GmbH, Munich in Germany, Trans alpine
Ölleitung in Österreich Gesellschaft m.b.H., Innsbruck in Aus-
tria and Società Italiana per l’Oleodotto Transalpino S.p.A.,
Trieste in Italy (“TAL”). Due to formal legal requirements, the
ownership rights were transferred to the Company in Decem-
ber 2010. The fair value of the Company’s investment in TAL
amounts to USD 7.2 million as of December 31, 2010.
The change in fair value of financial assets available-for-sale
as of December 31, 2010 recorded in other comprehensive
income resulted in a loss of USD 1.2 million.
(in millions of USD) 2010 2009
At fair value:
Shares – unlisted 34.6 28.6
17 Trade and Other Payables
At December 31, 2010, USD 299.2 million (2009: USD 337.4
million) of other payables and accrued expenses primarily
relate to capital expenditures accruals, personnel expenses,
general expenses, accrued interest and invoices to be re-
ceived.
Taxes other than income taxes consist of excise duties, value
added taxes, withholding taxes and wage taxes.
Trade payables are non-interest-bearing and normally settled
between 5 and 30 days. Other payables are non-interest-bear-
ing and have an average term of one to three months.
At December 31, trade payables are composed of the follow-
ing currencies:
Other payables are mainly composed of amounts denominated
in USD, EUR, CHF, GBP and CZK.
(in millions of USD) 2010 2009
Trade payables 1,406.6 1,463.4
Total trade payables 1,406.6 1,463.4
Taxes other than
income taxes
803.0 485.3
Other payables and
accrued expenses
299.2 337.4
Total other payables and
accrued expenses
1,102.2 822.7
(in millions of USD) 2010 2009
USD 1,272.9 1,123.7
EUR 109.7 186.1
CHF 14.3 106.8
GBP 8.6 20.2
CZK 1.1 26.6
Total trade payables 1,406.6 1,463.4
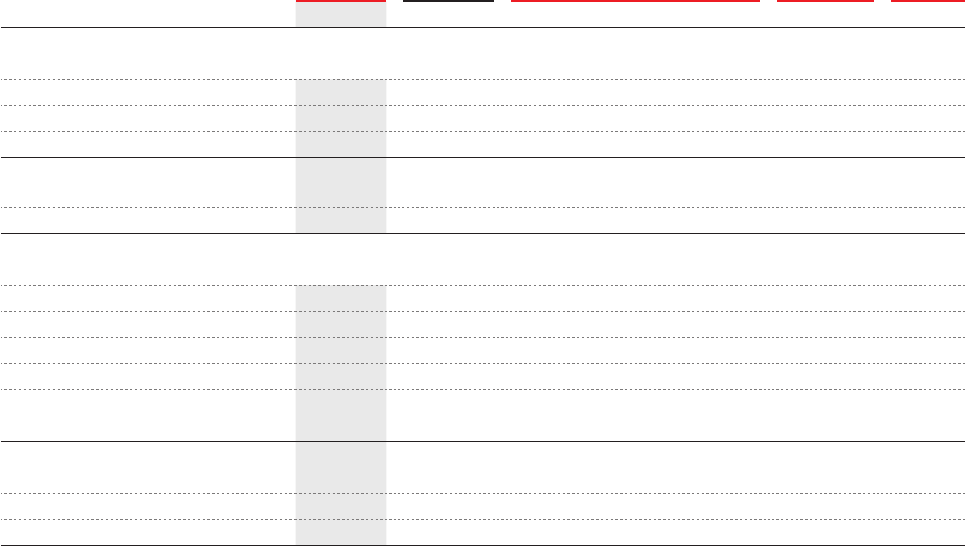
Petroplus Holdings AG | Annual Report 2010 | Consolidated Financial Statements | 99
gin is subject to a pricing grid determined by reference to the
Company’s ratio of Net Debt to Net Capitalization and ranges
from 2.75 % to 4.00 % for a ratio below 25 % or above 60 %,
respectively. Commissions on payment instruments are also
subject to a pricing grid determined by reference to the Com-
pany’s ratio of Net Debt to Net Capitalization.
Borrowings under the RCF are jointly and severally guaranteed
by certain of our subsidiaries. Such borrowings are secured
by certain assets of the borrowers and of the guarantors.
The form of such security includes certain pledges of bank
accounts held at participating banks, oil inventory, trade re-
ceivables and other assets. In certain conditions related to an
event of default as defined in the RCF, the RCF Security Agent
can enforce the pledge over the pledged assets. The amounts
pledged are indicated in Note 10 “Cash and Short-Term De-
posits”, in Note 11 “Inventories” and Note 12 “Trade and Other
Receivables”. These pledges will expire together with the RCF
on October 16, 2012.
As of December 31, 2010, we have no cash borrowings under
the RCF. The related financing costs of USD 15.1 million are
Current
Working Capital Facilities
Revolving Credit Facility (“RCF”)
Certain of our subsidiaries are party to a USD 1.05 billion com-
mitted multicurrency secured RCF agreement dated October 16,
2009, which replaced our former revolving credit facility. The RCF
includes an option to increase the committed facility amount up
to USD 2.0 billion on a pre-approved but not pre-committed ba-
sis in the event of increased working capital needs or future ac-
quisitions. The Company also has access to significant uncom-
mitted lines from committed banks, providing increased liquidity
on an as needed basis. As of December 31, 2010, the Company
had additional uncommitted lines under the RCF of USD 1.07 bil-
lion, bringing the total size of the RCF to USD 2.12 billion.
The RCF is available, subject to a current asset borrowing
base, primarily in the form of letters of credit and short-term
loan advances. Not more than 60 % of the committed line uti-
lizations may be in the form of short-term cash borrowings.
The rate of interest on cash borrowings is the aggregate of
LIBOR plus a margin plus mandatory costs, if any. The mar-
18 Interest-Bearing Loans and Borrowings
(in millions of USD) 2010 2009 Interest rate Maturity Currency
Current
Revolving Credit Facility – 138.8 LIBOR + (range of 2.75 % – 4 %) On demand USD
Credit facilities1) – 24.3 LIBOR On demand CHF
Total current (at nominal value) – 163.1
Current loans and borrowings
(at amortized cost)
– 149.6
Total current – 149.6
Non-current
Convertible Bond 2015 150.0 150.0 4.000 % Oct. 2015 USD
Senior Note 2019 400.0 400.0 9.375 % Sept. 2019 USD
Senior Note 2017 600.0 600.0 7.000 % May 2017 USD
Senior Note 2014 600.0 600.0 6.750 % May 2014 USD
Convertible Bond/Senior Notes
(at nominal value)
1,750.0 1,750.0
Convertible Bond
(liability component at amortized cost)
117.2 111.9
Senior Notes (at amortized cost) 1,574.8 1,571.9
Total non-current 1,692.0 1,683.8
1)Credit facility for Swiss compulsory stocks.
100 | Petroplus Holdings AG | Annual Report 2010 | Consolidated Financial Statements
capitalized and amortized over the three-year term of the RCF.
The carrying amount of these costs under the RCF amounts to
USD 9.0 million as of December 31, 2010 and is presented with-
in “Other financial assets” in the Statement of Financial Position.
Old Revolving Credit Facility (“Old RCF”)
Certain of our subsidiaries were party to a USD 1.2 billion
committed multicurrency, secured, revolving credit facility
which was terminated and replaced by the RCF on October
16, 2009. Moreover, the Company was able to obtain addition-
al availability on an uncommitted basis under the same facility.
The Old RCF was available, subject to a current asset bor-
rowing base, primarily in the form of letters of credit, short-
term loan advances, and bank overdrafts. For the committed
part, cash borrowings and revolving loans together could not
exceed more than 60 % of the committed amount of the Old
RCF. Bank overdrafts were limited to USD 100 million. Revolv-
ing loans and bank overdrafts under the Old RCF incurred in-
terest at a rate that was the aggregate of a margin of cost of
funds plus 1.0 % in 2008 and up to February 3, 2009, and cost
of funds plus 1.75 % from February 3, 2009 until its termina-
tion in October 2009. Commissions on payment instruments
varied depending upon the instrument type.
Other Working Capital Facilities
One of our subsidiaries has a smaller working capital facility
available in relation to Swiss compulsory stocks of which USD
nil (2009: USD 24.3 million) was drawn upon as of December
31, 2010.
Covenants
The RCF contains covenants that could restrict certain of
our activities, including restrictions on creating or permitting
to subsist certain securities, engaging in certain mergers or
consolidations, sales or other disposals of certain assets, giv-
ing certain guarantees, making certain loans, making certain
investments, incurring certain additional indebtedness, en-
gaging in different businesses, making certain debt or other
restricted payments, and amending or waiving certain material
agreements.
The RCF also includes three financial covenants, calculated on
a quarterly basis, requiring us to maintain:
–
a minimum Consolidated Tangible Net Worth of USD 1.5 billion;
– a minimum ratio of Group Clean EBITDA (as defined in the
RCF documentation) to Net Interest Expense of 2.5 to 1.0 for
the four prior rolling consecutive quarters; and
–
a minimum ratio of Current Assets to Current Liabilities of 1.05:1.
Compliance with these covenants is determined in the manner
specified in the documentation governing the RCF.
At December 31, 2009, the Clean EBITDA to Net Interest Ex-
pense ratio was below 2.5 to 1.0. On January 27, 2010, the
Company received a waiver for the fourth quarter 2009 through
the third quarter 2010. During the waiver period, and, as long
as the ratio of the Clean EBITDA to Net Interest Expense ratio
covenant was below 2.5 to 1.0, the interest rate margin on cash
borrowings was increased by 0.25 % and the Company was
required to meet an additional covenant. The Company’s Free
Cash Flow before working capital changes, as defined in the
waiver documentation, could not be more negative than minus
USD 250 million for the period starting from January 1, 2010,
to each quarter end during the waiver period. The Company
fulfilled this temporary covenant throughout the year 2010. The
Company is in compliance with all financial covenants based
on year-end 2010 financial figures, and has, therefore, exited
the waiver period.
Non-Current
Convertible Bonds
Convertible Bond USD 150 million, 4.0 % due 2015
(the “2015 CB”)
On October 16, 2009, Petroplus Finance Ltd., a subsidiary of
the Company, issued USD 150.0 million in guaranteed senior
secured convertible bonds due 2015. The debt is guaranteed
by the Company as well as by certain of its subsidiaries. Each
bond in the principal amount of USD 100,000 is convertible
into common shares of the Company at a conversion price of
CHF 30.42 (subsequent to a reduction of CHF 0.19 due to the
nominal value repayment on July 26, 2010) per share with a
fixed exchange rate on conversion of USD/CHF 1.0469 at the
option of the bondholder at any time on or after November 26,
2009 until October 9, 2015.
The bond is a “hybrid instrument” which requires that an “equi-
ty portion” and the financing costs related thereto must be ac-
counted for in the equity section of the Statement of Financial
Position. The equity portion, net of allocated financing costs,
amounted to USD 36.4 million. The 2015 CB bears interest at
the rate of 4.0 % per annum, with the interest payable semi-
annually in arrears on October 16 and April 16 of each year
the debt is outstanding, commencing on April 16, 2010. The
financing costs related to the issuance of the 2015 CB have
been capitalized in the aggregate amount of USD 2.6 million
and are amortized over six years.
Petroplus Holdings AG | Annual Report 2010 | Consolidated Financial Statements | 101
Convertible Bond USD 500 million, 3.375 % due 2013
(the “2013 CB”) redeemed on October 16, 2009
On March 26, 2008, Petroplus Finance Ltd., a subsidiary of the
Company, issued USD 500.0 million in guaranteed convertible
bonds due in 2013. The debt was guaranteed by the Company
as well as by certain of its subsidiaries. Each bond in the prin-
cipal amount of USD 100,000 was convertible into common
shares of the Company at an initial conversion price of CHF
85.18 per share with a fixed exchange rate on conversion of
USD/CHF 1.0203 at the option of the bondholder at any time
on or after May 6, 2008 until March 19, 2013.
The bonds were “hybrid instruments”, which required that an
“equity portion”, and the financing costs related thereto, must
be accounted for in the equity section of the Statement of Fi-
nancial Position. The equity portion, net of allocated financing
costs, amounted to USD 51.6 million. The bonds were interest-
bearing at the rate of 3.375 %, with the interest payable semi-
annually in arrears on March 26 and September 26 of each
year the debt was outstanding, and commenced on Septem-
ber 26, 2008. The financing costs related to the issuance of
the convertible bond were capitalized in the aggregate amount
of USD 8.4 million and amortized over the expected life of the
bond. In 2009 and 2008, no bonds were converted. The terms
and conditions included an investor put option on March 28,
2011 for principal plus accrued interest.
On October 12, 2009, Petroplus announced the successful re-
sult of the tender offer to repurchase all of its outstanding USD
500.0 million in guaranteed, convertible bonds due in 2013.
The last day the 2013 CB was traded on the SIX Swiss Ex-
change was October 13, 2009. The 2013 CB was redeemed
on October 16, 2009 at the principal amount of USD 500.0
million, plus aggregate accrued interest calculated from Sep-
tember 26, 2009 until October 16, 2009 (20 days). The related
remaining capitalized financing costs of USD 6.0 million and
the difference between the carrying amount and the fair value
of the liability portion of USD 2.1 million were written off and
included in the line item “Financial expenses” in the Consoli-
dated Statement of Comprehensive Income. The remaining
difference of USD 35.0 million between the repurchase price
of the bond and the fair value of the liability portion was re-
corded as a reduction of equity. The costs of the tender offer
amounted to USD 2.6 million and were included in the line item
“Financial expenses” in the Consolidated Statement of Com-
prehensive Income.
Senior Notes
Senior Notes USD 400 million, 9.375 % due 2019
(the “2019 SN”)
On September 17, 2009, Petroplus Finance 3 Limited, Ber-
muda, an unrestricted subsidiary of the Company, issued USD
400.0 million aggregate principal amount of 9.375 % senior
notes due 2019 at an issue price of 98.42 % giving a yield of
9.625 %. The coupon is payable semi-annually in arrears on
March 15 and September 15, beginning March 15, 2010. The
2019 SN are presented net of capitalized financing costs of
USD 8.7 million which are amortized over ten years. The pro-
ceeds from the 2019 SN were used to repurchase or redeem
a portion of the 2013 CB on October 16, 2009.
Upon successful completion of the tender offer and subse-
quent repayment of the 2013 CB, Petroplus Finance Limited
assumed the obligations of Petroplus Finance 3 Limited un-
der the 2019 SN, the Company and certain of its subsidiaries
became guarantors of the 2019 SN and Petroplus Finance 3
Limited was released of all obligations under the 2019 SN.
Senior Note USD 600 million, 6.75 % due 2014 (the “2014 SN”)
& Senior Note USD 600 million, 7 % due 2017 (the “2017 SN”)
On May 1, 2007, Petroplus Finance Ltd., a subsidiary of the
Company, issued USD 600.0 million, 6.75 % senior notes due
2014 and USD 600.0 million, 7 % senior notes due 2017 (to-
gether the “Notes”). The Company used the proceeds from
the Notes primarily to fund the acquisition of the Coryton refin-
ery. The Notes are presented net of total capitalized financing
costs of USD 18.1 million which are amortized over seven and
ten years, respectively.
Financial Covenants
The main financial covenant under the 2015 CB, the 2014 SN,
2017 SN and 2019 SN is an EBITDA to gross interest expense
coverage ratio which is required to exceed 2.0 to 1.0. This cov-
enant is not a maintenance covenant and, therefore, when the
ratio is not met, the Company is not in breach but only limited
in incurring certain debt or making certain payments outside
of the ordinary course of business as long as the ratio does not
exceed 2.0 to 1.0.
As of December 31, 2010 we are in compliance with this cov-
enant.
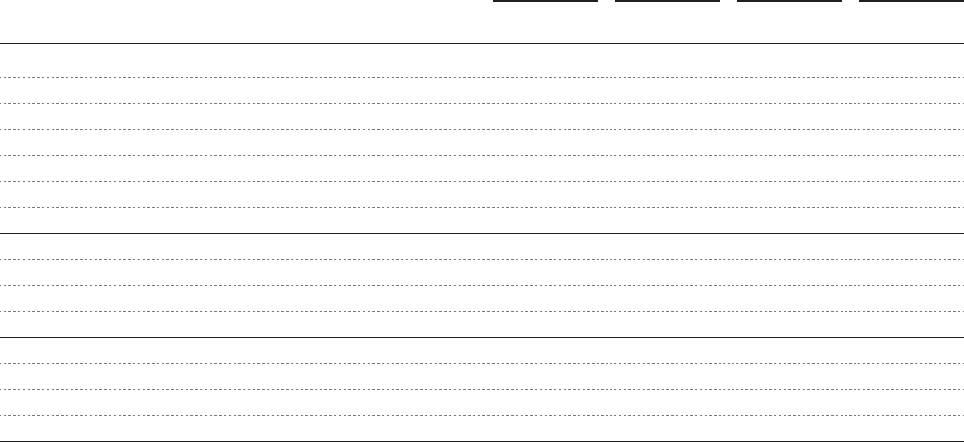
102 | Petroplus Holdings AG | Annual Report 2010 | Consolidated Financial Statements
19 Provisions
Litigation
The litigation provision relates primarily to two claims recorded
in 2008 and 2010 where tax authorities have challenged, in
one case, certain biofuel credits claimed by arguing that not all
biofuels are blended with diesel which could give rise to a re-
duction of excise duties and, in a second case, tax authorities
could challenge a potential error in the Company’s reporting of
its customs duties obligations. The outcomes of these cases
are expected by year-end 2011.
A provision was recorded in June 2007, in conjunction with a
claim filed against the Company, arising out of what is alleged
to be an unfit cargo of gasoil. The cargo supplied was tested
and found to be on specification at loadport, however, the de-
fendant has claimed that the cargo was not able to withstand
an ordinary voyage so as to arrive at the discharge port still
meeting the specification for sediment.
The Company has provided for USD 3.1 million associated
with potential costs of the cases described above and minor
other legal cases.
During 2010, the Company reached a settlement with a former
employee for circumstances surrounding termination of the
employee’s employment contract dating back to September
2004 resulting in a payment of USD 0.1 million. The remaining
unused provision was reversed.
(in millions of USD)
Litigation Environmental
remediation
Restructuring Total
Balance at January 1, 2010 2.7 11.1 12.6 26.4
Additions 0.8 0.3 6.4 7.5
Utilized arising from payments (0.1) (0.3) (11.2) (11.6)
Unused provision reversed (0.9) (0.7) (1.2) (2.8)
Reclassification 0.4 (0.4) (5.1) (5.1)
Currency translation 0.2 (0.8) (0.4) (1.0)
Balance at December 31, 2010 3.1 9.2 1.1 13.4
Non-current 2.7 8.9 – 11.6
Current 0.4 0.3 1.1 1.8
Balance at December 31, 2010 3.1 9.2 1.1 13.4
Non-current 2.2 10.3 – 12.5
Current 0.5 0.8 12.6 13.9
Balance at December 31, 2009 2.7 11.1 12.6 26.4
Environmental Remediation
The provisions for environmental matters are recorded on a
site-by-site basis when the Company has a present obligation
to remediate the environmental disturbance and the amount of
the liability can be reasonably estimated.
Antwerp Refinery
Soil and groundwater contamination has been identified on
various areas throughout the site. Cost estimates obtained for
remediation are based on different scenarios, the most rea-
sonable scenario being estimated at USD 6.3 million. Current-
ly, neither the remediation plan nor an agreed upon timeline
has been approved by the local authorities.
Ingolstadt Refinery
In 2006, an environmental due diligence assessment was per-
formed on a portion of the land in Ingolstadt. Based on the
results of this assessment, the Company provided for possible
contaminated land and cropland next to the site. As part of
the related ongoing remediation, the Company paid USD 0.3
million during 2010. Total remaining estimated costs of moni-
toring for this site are USD 1.4 million.
Teesside Marketing and Storage Facility
Soil contamination has been detected on site. According to
a pollution prevention and control permit, the operator is re-
quired to remediate any contamination that results from the
permitted activities. Therefore, contamination detected as a
Petroplus Holdings AG | Annual Report 2010 | Consolidated Financial Statements | 103
result of obligatory monitoring that cannot be related to the
period before the permit was issued becomes the responsibil-
ity of the Company. The estimated costs to demolish an old oil
pump bay and remediate the contaminated soil are estimated
to be USD 1.5 million.
Other Sites
The Company is currently not responsible for material re-
medial
action at any other sites. For further information related
to environmental contingencies refer to Note 26 “Other Com-
mitments and Contingencies”.
Restructuring
Teesside Marketing and Storage Facility
On November 5, 2009, the Company suspended the Teesside
refining operations and began to convert the site into a mar-
keting and storage facility. In conjunction with this decision,
the Company recognized a provision of USD 12.6 million for
expected restructuring costs, including contract termination
costs, consulting fees, employee termination benefits and re-
lated incremental costs as of December 31, 2009. Estimated
costs were based on the terms of the relevant contracts and
management’s best estimates.
During 2010, the site was converted into a marketing and stor-
age facility. In conjunction with the transition, an additional
provision of USD 6.4 million for expected restructuring costs,
primarily further employee redundancies and contract cancel-
lation costs, was recorded in 2010. During 2010, total sever-
ance payments of USD 11.2 million were made. Subsequently,
USD 5.1 million of the total provision which relates to pension
costs was reclassified to Retirement Benefit Obligation. Based
on final valuations of the Company’s pension liability, the USD
5.1 million was released in 2010 and recorded in the line item
“Discontinued Operations” in the Consolidated Statement of
Comprehensive Income. As of December 31, 2010, the Com-
pany has a remaining provision of USD 1.1 million related to its
obligation under this restructuring plan.
Coryton Refinery
During 2010, the Company commenced a plan to reduce op-
erating expenses by reorganizing and streamlining its Coryton
refinery operations. The plan involved the reduction of certain
third party contractors and own employee positions, on a vol-
untary basis. The plan will be finalized during the beginning of
2011. As of December 31, 2010, the Company has recorded
an accrual of USD 0.5 million related to its obligation under this
plan. This amount is included in the line item “Other payables
and accrued expenses” in the Consolidated Statement of Fi-
nancial Position.
Emission Rights
For the years ended December 31, 2010 and 2009 the total of
the Company’s actual emissions did not exceed the number
of granted emission credits held. As there was a surplus, no
provisions were recorded for the years ended December 31,
2010 and 2009.

104 | Petroplus Holdings AG | Annual Report 2010 | Consolidated Financial Statements
20 Employee Benefits
The Company has several different defined benefit pension plans
(in the United Kingdom, Switzerland, Germany, France and Bel-
gium) which cover substantially all of its employees and require
contributions to be made to separately administered funds.
The principal assumptions used at the year end are shown
below and are based on weighted averages:
The assumptions, other than expected investment yield, are
used in determining the employee benefit obligations and
are weighted on the present value of the respective defined
benefit obligations. The overall expected investment yield is
a weighted average of the expected returns of the different as-
set categories at December 31, 2010. The assessment of the
expected returns on investments by the Company is based on
historical return trends and analysts’ predictions of the market
for the respective categories.
Demographic assumptions (including mortality) are based on
the advice of local independent actuaries. Mortality assump-
tions are based on the latest available standard mortality tables
for the individual countries concerned, adjusted where appro-
priate to reflect the experience of the Company’s employees.
Defined Benefit Obligation
Changes in the present value of the defined benefit obligation
are as follows:
Assumptions (weighted averages) 2010 2009
Discount factor 4.4 % 5.3 %
Expected investment yield 5.3 % 5.6 %
Future pay increases 3.7 % 3.8 %
Future price inflation 2.4 % 2.4 %
(in millions of USD) 2010 2009
Defined benefit obligation at January 1, 486.9 396.1
Interest cost 24.6 22.4
Current service costs 26.9 28.6
Past service cost 0.7 29.0
Contributions by plan participants 5.6 5.9
Benefits paid (28.4) (17.8)
Actuarial loss/(gain) on obligation 40.8 (2.6)
Plan curtailments – (0.9)
Plan settlements (3.4) –
Disposal of businesses (9.5) –
Exchange differences (3.8) 26.2
Defined benefit obligation at
December 31,
540.4 486.9
During 2010 the yields on long-dated AA Corporate bonds
(and hence IAS 19 discount rates) reduced considerably. As
a result, large actuarial losses on plan obligations were gen-
erated. The actuarial losses will be amortized through the
Consolidated Statement of Comprehensive Income in future
years using the 10 % corridor methodology outlined in IAS 19
Employee Benefits.
The past service costs recognized in 2009 related to changes
in French legislation which resulted in additional social charges
on early retirement payments. As a result of this new legisla-
tion, the Company included past service costs of USD 22.6
million in the defined benefit obligation at January 1, 2009.
These costs are recognized in the Consolidated Statement of
Comprehensive Income over the vesting period of 13 to 17
years. In addition, past service cost included USD 6.4 million
related to a restructuring plan at the Teesside facility which
was announced in November 2009, resulting in a plan curtail-
ment under IAS 19 for affected pension plan members. Be-
cause the benefit enhancements were immediately vested, the
full amount was recognized in the Consolidated Statement of
Comprehensive Income in 2009.
On January 12, 2010, the Company sold the Antwerp Process-
ing facility which resulted in a decrease in the net retirement
benefit obligation of USD 8.3 million, including a net actuarial
gain of USD 2.9 million.
Fair Value of the Plan Assets
Changes in the fair value of plan assets are as follows:
Employer contributions are lower in 2010 than in 2009 due to
the sizeable contribution in 2009 made to fund the German
Pension Plan.
(in millions of USD) 2010 2009
Fair value of plan assets at January 1, 342.1 221.8
Expected return on assets 19.0 14.1
Contributions by employers 48.0 71.1
Contributions by plan participants 5.6 5.9
Benefits paid (28.4) (17.8)
Plan settlements (1.6) –
Transfers – 0.7
Disposal of businesses (4.1) –
Actuarial gain 9.3 25.8
Exchange differences 2.0 20.5
Fair value of the plan assets at
December 31,
391.9 342.1
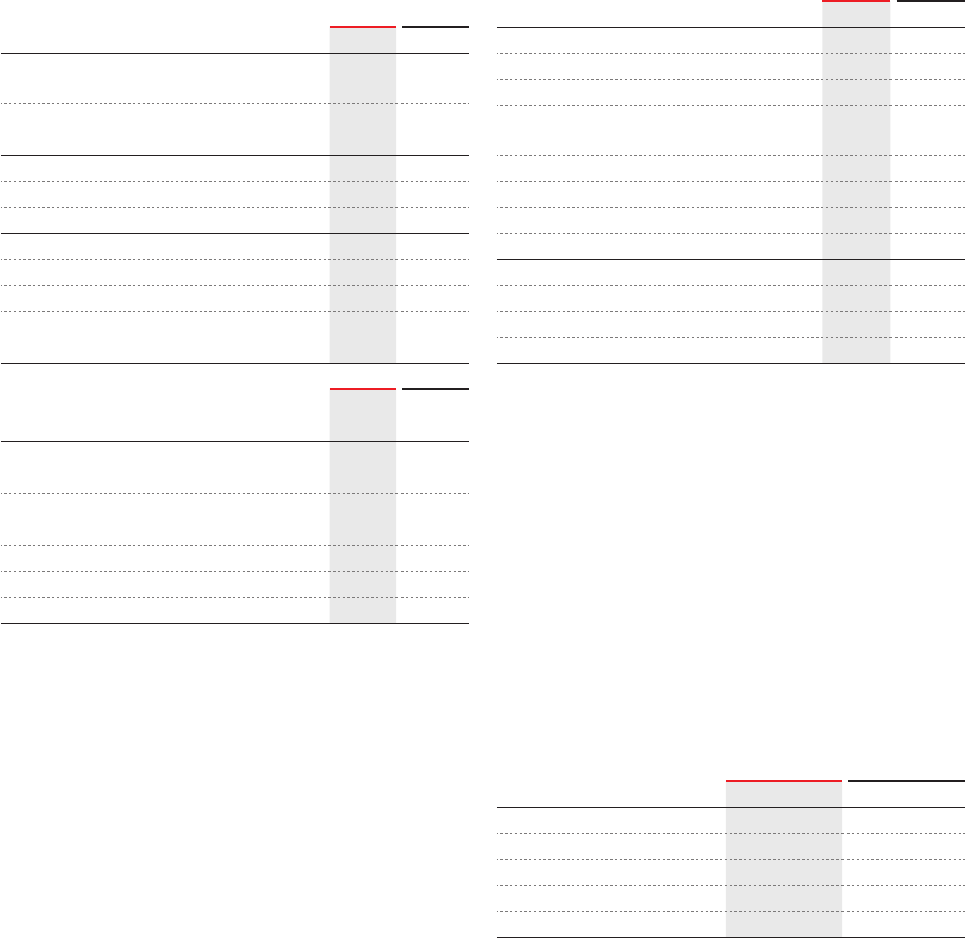
Petroplus Holdings AG | Annual Report 2010 | Consolidated Financial Statements | 105
Net Retirement Benefit Obligation
The following tables summarize the funded and unfunded net
retirement benefit obligation presented in the Consolidated
Statement of Financial Position for the respective employee
benefit plans.
(in millions of USD) 2010 2009
Total funded defined benefit obligation at
December 31,
(439.7) (371.8)
Total unfunded defined benefit obligation
at December 31,
(100.7) (115.1)
Defined benefit obligation at December 31, (540.4) (486.9)
Fair value of plan assets at December 31, 391.9 342.1
Deficit (148.5) (144.8)
Unrecognized net actuarial loss 37.8 1.7
Unrecognized past service cost 18.5 21.6
Other benefit obligations – (0.5)
Net retirement benefit obligation at
December 31,
(92.2) (122.0)
As Presented in the Statement of
Financial Position at December 31,
2010 2009
Retirement benefit obligation classified as
held for sale
– (8.3)
Retirement benefit obligation from
continuing operations:
Retirement benefit asset 26.2 9.3
Retirement benefit obligation (118.4) (123.0)
Net retirement benefit obligation (92.2) (122.0)
Net Benefit (Expense)
The net benefit (expense) is recognized in the line item “Per-
sonnel expenses” in the Consolidated Statement of Compre-
hensive Income.
The Company recognizes as net benefit (expense) the por-
tion of actuarial gains and losses for each defined benefit plan
which exceeds a 10 % corridor (determined as 10 % of the
greater of the plan assets or defined benefit obligations), di-
vided by the expected average remaining working lives of the
employees participating in that plan.
Total employer contributions to the defined benefit pension
plans in 2011 are expected to be USD 30 million.
Major categories of Plan Assets
The major categories of plan assets for the years ended De-
cember 31, 2010 and 2009 are as follows:
The actual return on plan assets was USD 28.3 million for 2010
and USD 39.9 million for 2009.
(in millions of USD) 2010 2009
Current service costs (26.9) (28.6)
Interest cost on benefit obligation (24.6) (22.4)
Expected return on plan assets 19.0 14.1
Net actuarial gain/(loss) recognized in the
year
1.9 (1.5)
Past service costs recognized in the year (2.3) (8.1)
Plan curtailments – 0.9
Plan settlements 1.8 –
Net benefit (expense) (31.1) (45.6)
Net benefit (expense) included in:
Continued operations (31.1) (38.0)
Discontinued operations – (7.6)
Net benefit (expense) (31.1) (45.6)
(in %) 2010 2009
Equity instruments 43.4 40.6
Debt instruments 36.3 37.7
Property 7.1 7.6
Other assets 13.2 14.1
Total 100.0 100.0
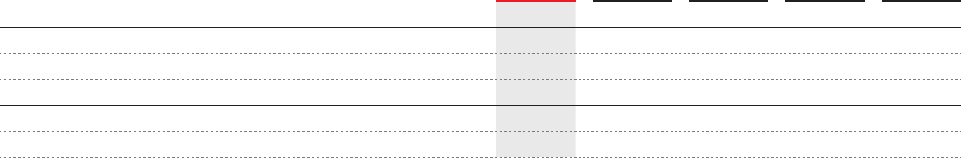
106 | Petroplus Holdings AG | Annual Report 2010 | Consolidated Financial Statements
The plan assets do not include any of the Company’s own
financial instruments, nor any property occupied by, or other
assets used by the Company.
The history of experience adjustments is as follows:
21 Non-controlling Interest
Non-controlling interest represents the portion of profit or loss
and net assets in subsidiaries that are not held by the Com-
pany and are presented separately within the Consolidated
Statement of Comprehensive Income and within equity in the
Consolidated Statement of Financial Position.
(in millions of USD) 2010 2009 2008 2007 2006
Defined benefit obligation at December 31, (540.4) (486.9) (396.1) (325.2) (156.5)
Fair value of plan assets at December 31, 391.9 342.1 221.8 271.1 142.2
Deficit at December 31, (148.5) (144.8) (174.3) (54.1) (14.3)
Experience adjustment (gain)/loss on plan liabilities (1.6) (1.8) 11.9 3.1 (5.2)
Experience adjustment gain/(loss) on plan assets 9.3 25.8 (56.1) (2.5) 4.1
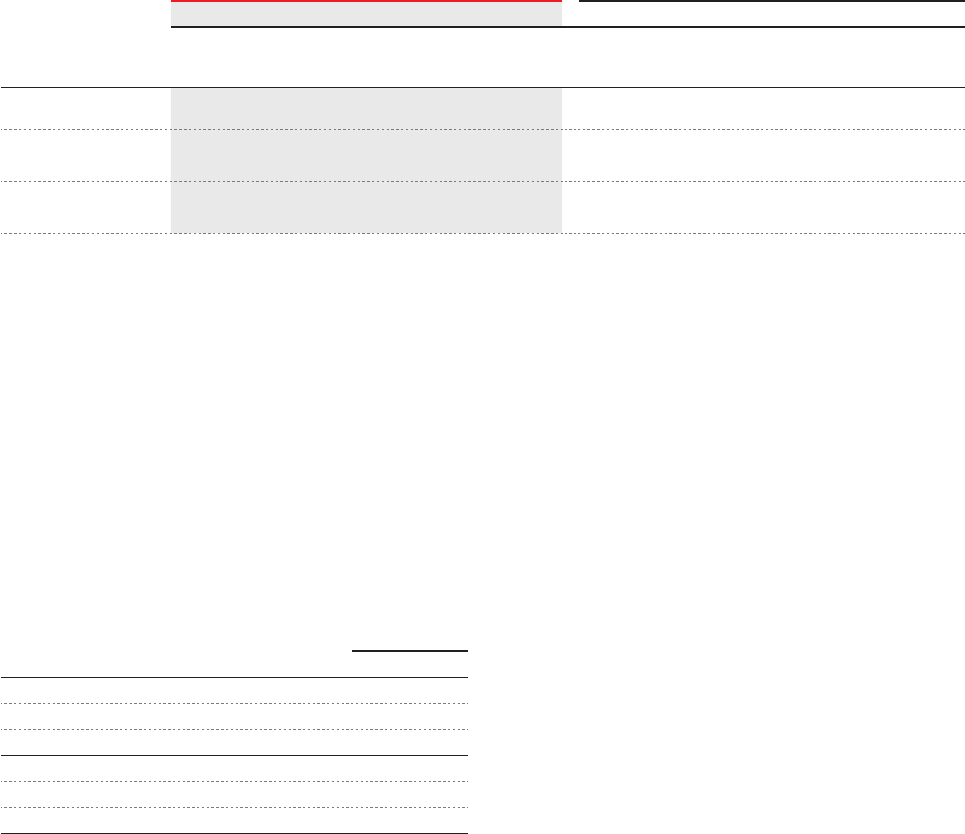
Petroplus Holdings AG | Annual Report 2010 | Consolidated Financial Statements | 107
22 Shareholders’ Equity
Share Capital
Issued Share Capital
The outstanding share capital as of December 31, 2010
amounts to USD 608.1 million (CHF 712.3 million), comprised
of 95,230,953 shares which are fully paid and include new
shares issued out of authorized share capital in May 2010
from a private placement as well as new shares created out
of conditional share capital during 2010 due to the exercise of
options and Restricted Share Units (“RSUs”) granted under the
Equity Incentive Plan and the Equity Participation Plan.
The movements in the share capital over the last two years,
expressed in number of shares, are as follows:
Authorized Share Capital
At the annual ordinary shareholders’ meeting held on May 5,
2010, the Board of Directors (“BoD”) received shareholder auth-
orization to increase the share capital of the Company. Addi-
tional authorized capital may be raised at any time until May 5,
2012, by a maximum amount of CHF 187.0 million by issuing a
maximum of 25,000,000 fully paid shares with a nominal value
2010 2009
Nominal value
per share in
CHF
Share Capital
in millions of
USD
Share Capital
in millions of
CHF
Number
of shares
Nominal value
per share in
CHF
Share Capital
in millions of
USD
Share Capital
in millions of
CHF
Number
of shares
Issued share capital 7.48 608.1 712.3 95,230,953 7.58 555.2 654.3 86,325,289
Authorized share
capital
7.48 214.6 251.4 33,615,057 7.58 111.0 130.9 17,265,057
Conditional share
capital
7.48 185.8 217.6 29,096,005 7.58 92.3 108.8 14,351,669
Number of shares
January 1, 2009 69,060,231
September 21, 20091) 17,265,058
December 31, 2009 86,325,289
May 7, 20102) 8,650,000
During the period3) 255,664
December 31, 2010 95,230,953
1)During September 2009, the Company completed a rights issue and
international offering whereby the Company issued 17,265,058 new
registered shares from existing authorized share capital.
2)During May 2010, the Company completed a private placement
whereby the Company issued 8,650,000 new registered shares from
existing authorized share capital.
3)During 2010, a total of 255,664 new shares were created out of the
conditional share capital due to the exercise of options granted under
the Equity Participation Plan (157,762 RSUs) and the Equity Incentive
Plan (97,902 options).
of CHF 7.48 each. The BoD is entitled to issue these shares
by means of a firm underwriting or in partial amounts. The
outstanding authorized share capital as of December 31, 2010
amounts to USD 214.6 million (CHF 251.4 million), comprising
33,615,057 shares.
Conditional Share Capital
At the annual ordinary shareholders’ meeting held on May 5,
2010, the BoD received shareholder authorization to increase
the share capital of the Company. Additional conditional capi-
tal may be raised at any time by a maximum amount of CHF
112.2 million by issuing up to 15,000,000 fully paid registered
shares with a nominal value of CHF 7.48 each in connection
with further issuance of convertible bonds, bonds with war-
rants or other financial market instruments with conversion or
warrant rights.
The conditional share capital is reduced by the amount used
by the BoD regarding share capital increases through the ex-
ercise of options and RSUs granted under our Equity Partici-
pation Plan and the Equity Incentive Plan. During 2010, a total
of 255,664 shares were created out of the conditional share
capital due to options and RSUs exercised.
The outstanding conditional share capital at December 31,
2010, amounts to USD 185.8 million (CHF 217.6 million), com-
prising of 29,096,005 shares.
Repayment of Nominal Share Capital
At the annual ordinary shareholders’ meeting of the Company
which took place on May 5, 2010, the shareholders resolved
to reduce the share capital by CHF 0.10 per share. The en-
try of the share capital reduction in the commercial register
took place on July 15, 2010, and the repayment of CHF 0.10
per registered share was paid to the shareholders on July 26,
2010, amounting to USD 9.0 million. The foreign currency im-
pact of USD 0.9 million resulting from the historical rate of the
108 | Petroplus Holdings AG | Annual Report 2010 | Consolidated Financial Statements
share capital has been partly allocated to translation reserve
within shareholders’ equity (USD 0.4 million) and to the line
item “Foreign currency exchange loss” within the Consolidated
Statement of Comprehensive Income (USD 0.5 million).
At the annual ordinary shareholders’ meeting of the Company
which took place on May 6, 2009, the shareholders resolved
to reduce the share capital by CHF 0.60 per share. The en-
try of the share capital reduction in the commercial register
took place on July 21, 2009 and the repayment of CHF 0.60
per registered share was paid to the shareholders on July 28,
2009, amounting to USD 38.2 million. The foreign currency
impact of USD 4.2 million resulting from the historical rate of
the share capital has been partly allocated to translation re-
serve within shareholders’ equity (USD 2.8 million) and to the
line item “Foreign currency exchange gain” within the Consoli-
dated Statement of Comprehensive Income (USD 1.4 million).
Issuance of Shares
Private Placement in 2010
During May 2010, the Company completed a private place-
ment whereby the Company issued 8,650,000 new registered
shares from existing authorized capital. The shares were sold
at a price of CHF 17.50. The first trading day of the new shares
was May 7, 2010. The gross proceeds amounted to USD 136.4
million (after a realized foreign exchange loss of USD 0.2 mil-
lion) excluding share issue costs of USD 5.6 million.
Rights Issue and International Offering in 2009
During September 2009, the Company completed a rights is-
sue and international offering whereby the Company issued
17,265,058 new registered shares from existing authorized
share capital. Existing shareholders were entitled to subscribe
for one new share at a subscription price of CHF 16.90 per
share for every four existing shares held. The new shares
began trading on September 22, 2009. The gross proceeds
amounted to USD 284.2 million (after a realized foreign ex-
change gain of USD 4.4 million) excluding share issue costs of
USD 12.2 million.
Equity Instruments
At December 31, 2010, Petroplus has 3,504,564 options and
RSUs outstanding that were granted through two plans: the
Equity Incentive Plan and the Equity Participation Plan.
Under the Equity Incentive Plan, options were granted to inves-
tors (some of which are Directors or members of the Executive
Committee) in connection with purchases of the Company’s
shares and are not dependent upon employment or service
and therefore do not qualify as share-based payment trans-
actions under IFRS 2 Share-based Payment. Each of these
options, granted in an investment capacity, provides the hold-
er the right to purchase one share at a price of USD 14.58.
The options have to be exercised according to the following
schedule: 537,322 options during 2014, 652,668 options dur-
ing 2015, 498,623 options during 2016 and 325,138 by end
of July 2016. The time of exercise can be accelerated in the
event of a change of control of Petroplus Holdings AG, death,
disability or separation from employment and the options are
subject to further terms and conditions of the Equity Incentive
Plan. In 2010, a total of 97,902 (2009: nil) options were exer-
cised and 43,707 (2009: nil) options expired as of December
31, 2010. At December 31, 2010 a total of 2,013,751 options
are outstanding under this plan.
Under the Equity Participation Plan, options and RSUs were
granted to employees, members of the Executive Committee
and members of the BoD:
− Options were granted between November 30, 2006 and De-
cember 31, 2010. Each of these options provides the holder
with the right to purchase one share at an exercise price with
a range between CHF 11.92 and CHF 119.98, depending on
the grant date. At December 31, 2010, a total of 1,119,824
options are outstanding under this plan.
− RSUs were granted between February 4, 2009 and Decem-
ber 31, 2010. Each RSU granted entitles the participant to
receive one share upon vesting. At December 31, 2010, a
total of 370,989 RSUs are outstanding under this plan.
Further details of these options and RSUs granted under the
Equity Participation Plan are described in Note 24 “Share-
based Payments”.
Equity Component of Convertible Bonds
On October 16, 2009, Petroplus Finance Ltd., a subsidiary of
the Company, issued the 2015 CB in the amount of USD 150.0
million. The 2015 CB is a “hybrid instrument” which requires
that an “equity portion” and the financing costs related thereto
must be accounted for in the equity section of the Consoli-
dated Statement of Financial Position. The equity portion, net
of allocated financing costs, amounted to USD 36.4 million.
On October 16, 2009, Petroplus redeemed the 2013 CB. The
remaining equity component of USD 35.0 million was re-
corded
as a reduction of equity.
Further details of the issuance of the 2015 CB and the repur-
chase of the 2013 CB are disclosed in Note 18 “Interest-Bear-
ing Loans and Borrowings”.
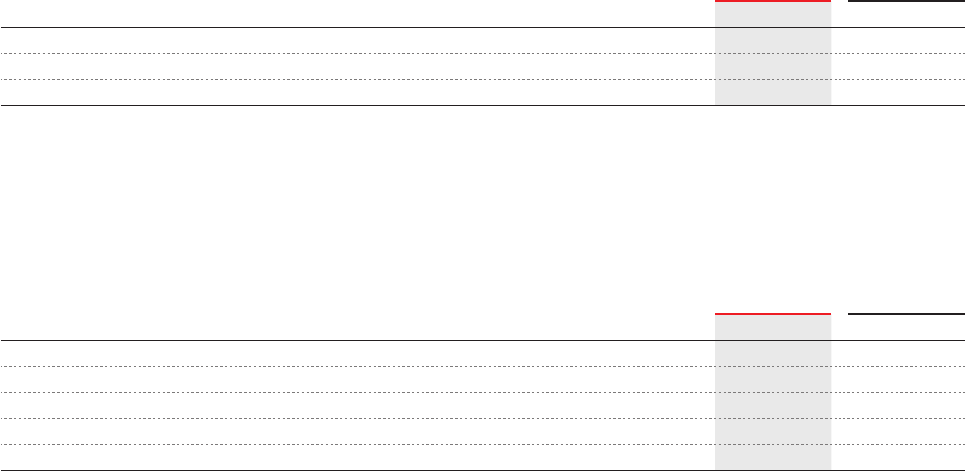
Petroplus Holdings AG | Annual Report 2010 | Consolidated Financial Statements | 109
23 Earnings per Share
The following table shows the basis used for the calculation of basic and diluted earnings per share (“EPS”):
Basic EPS is calculated by dividing the net loss attributable to shareholders of Petroplus Holdings AG by the weighted average
number of shares outstanding. To calculate diluted EPS, the weighted average number of shares outstanding is adjusted to as-
sume conversion of all potentially dilutive shares arising from RSUs/options/convertible bonds into Petroplus Holdings AG shares.
As the conversion of these potential equity instruments would decrease the loss per share, the instruments are antidilutive for the
years ended December 31, 2010 and 2009:
A weighted average number of RSUs/options/convertible bonds equivalent to 8,903,457 shares (2009: 8,453,928 shares) were
antidilutive. There have been no material transactions involving ordinary shares or potential ordinary shares between the report-
ing date and the date of completion of the Consolidated Financial Statements.
Net loss
(in millions of USD) 2010 2009
Net loss from continuing operations attributable to ordinary shareholders of the parent (106.9) (108.8)
Net loss from discontinued operations (5.4) (141.1)
Net loss attributable to ordinary shareholders of the parent (112.3) (249.9)
Basic and diluted earnings per share 2010 2009
Weighted average number of shares outstanding (in shares) 92,162,578 78,010,060
Basic and diluted earnings per share calculated on:
Net loss from continuing operations(in USD) (1.16) (1.39)
Net loss from discontinued operations(in USD) (0.06) (1.81)
Net loss attributable to ordinary shareholders of the parent(in USD) (1.22) (3.20)
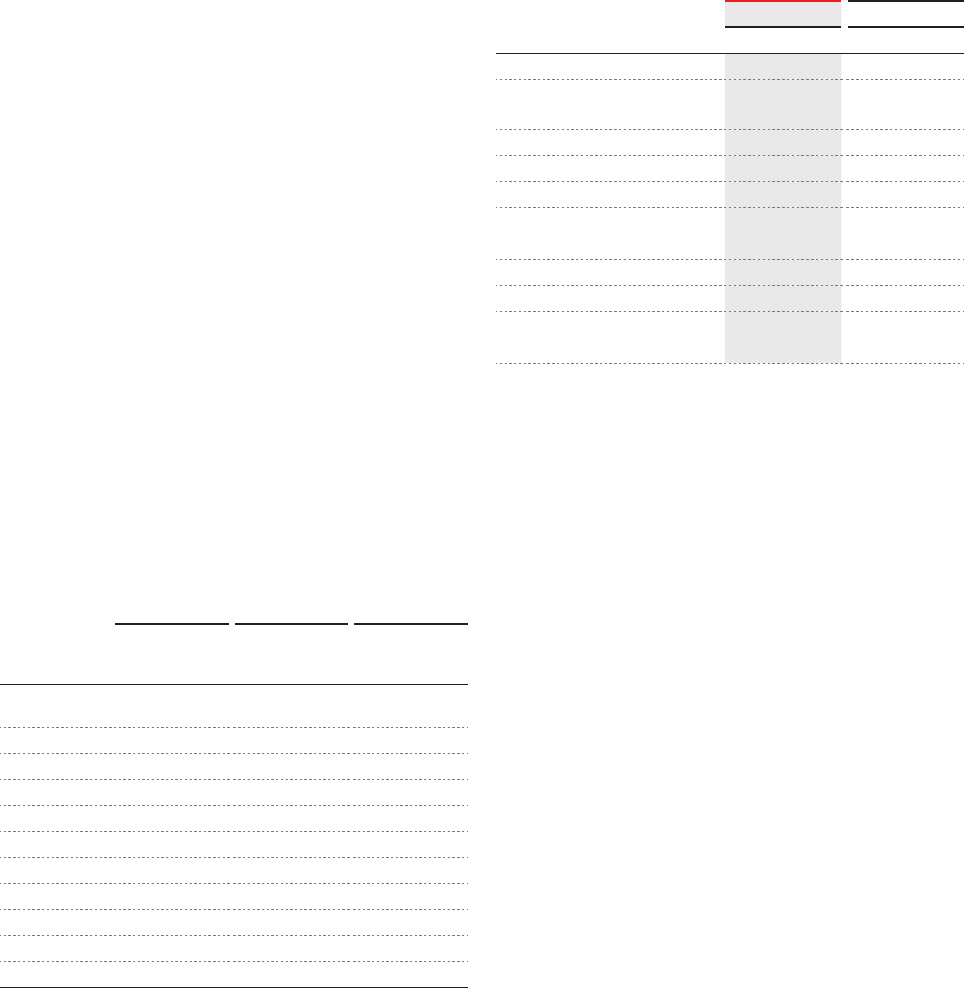
110 | Petroplus Holdings AG | Annual Report 2010 | Consolidated Financial Statements
24 Share-based Payments
The share option and RSU scheme of the Company, the Equity
Participation Plan, is an equity-settled share-based payment
plan. The services the Company receives from management
and personnel in exchange for the options or other equity
awards being granted do not qualify for recognition as assets
and are therefore recognized as expenses.
The BoD has granted stock options and RSUs under the
Equity Participation Plan as described below.
Stock Options
Each option converts into one ordinary share of Petroplus
Holdings AG upon exercise. No amounts are paid or payable
by the recipient upon receipt of the option. The options carry
neither rights to dividends nor voting rights. The options may
be exercised at any time from the date of vesting to the date of
expiry. The options can only be exercised when the employee
remains in the Company’s employ or service, unless otherwise
agreed.
Depending on the grant date, the options have a
− three-year graded vesting scheme, with one third of the op-
tions vesting each year; or
− a vesting period of four years.
The options will be fully vested on the third or fourth anniver-
sary of the grant date.
The following table summarizes the number of outstanding op-
tions at the end of December 31, 2010, the exercise price per
grant and the weighted average remaining contractual life:
Grant
Exercise price
(in CHF)
Number of
options
outstanding
Remaining
contractual life
(years)
Nov. 20061) 58.14 128,228 5.9
Jan. 20071) 68.25 287,138 6.0
Feb. 20071) 87.91 16,253 6.1
May 20071) 91.69 162,539 6.3
Jul. 20071) 119.98 10,836 6.6
Aug. 20071) 112.69 27,090 6.7
Nov. 20071) 89.06 75,853 6.8
May 20081) 55.47 8,127 7.3
Jan. 20091) 21.41 204,530 8.0
Oct. 2010 11.92 199,230 9.8
55.10 1,119,824 7.2
1)Adjusted to reflect the September 2009 rights issue.
In 2010, the BoD granted a total of 199,230 options (2009:
204,530) to members of the Executive Committee and em-
ployees. The weighted average fair value of the share options
granted during 2010 is CHF 4.08 per option (2009: CHF 8.27).
Consistent with the provisions of IFRS 2 Share-based Pay-
ment, we estimated the fair value of stock options on the date
of grant with the Black-Scholes Option Valuation Model using
the following assumptions:
The risk-free interest rate is based on yields of the Swiss Con-
federation bonds on the date of grant with the maturity date
approximately equal to the expected life at the grant date. The
expected life of the options is six years compared to the op-
tions’ contractual life of ten years. The Company derives its
expected volatility based on the average volatility of our main
competitors’ share prices over the past four years.
2010 2009
Assumptions October January1)
Number of options granted 199,230 204,530
Closing price at grant date
(in CHF)
11.92 21.41
Exercise price(in CHF) 11.92 21.41
Expected volatility 60.0 % 60.0 %
Vesting(in years) 4 1, 2, 3
Expected average
option life(in years)
6 6
Dividend yield 5.5 % 4.7 %
Risk-free interest rate 1.0 % 1.6 %
Market value of option
at grant date(in CHF)
4.08 8.27
1)Adjusted to reflect the September 2009 rights issue.
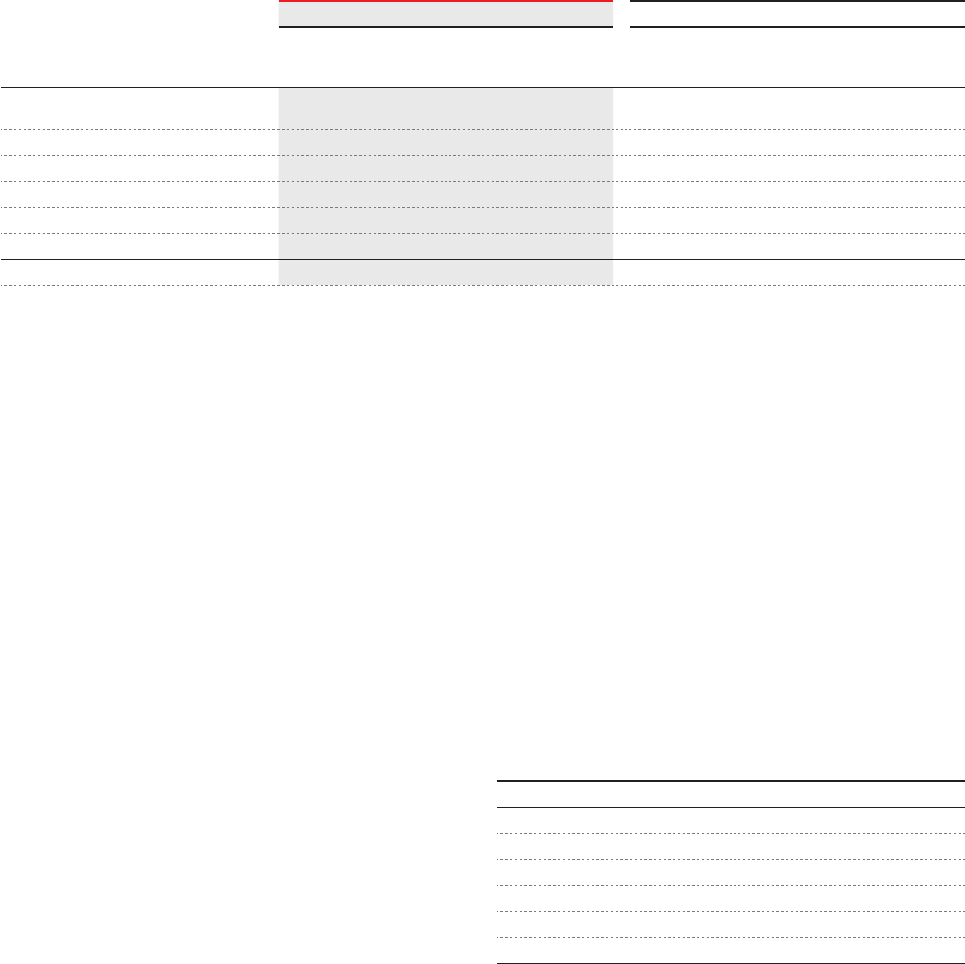
Petroplus Holdings AG | Annual Report 2010 | Consolidated Financial Statements | 111
During 2010 and 2009, no options were exercised. The share
options outstanding at the end of 2010 have a weighted av-
erage exercise price of CHF 55.10 (2009: CHF 65.22) and
a weighted average remaining contractual life of 7.2 years
(2009: 7.7 years).
Total expense for stock options granted under the Equity Par-
ticipation Plan for the year ended December 31, 2010 was
USD 1.1 million (2009: USD 4.7 million).
Restricted Stock Units (“RSUs”)
Each RSU granted entitles the participant to receive one share
upon vesting. Shareholders’ rights (including rights to receive
distributions) can only be exercised once the shares are deliv-
ered and voting rights can be exercised as soon as the partici-
pant is registered in the share register of Petroplus Holdings
AG as shareholder with voting rights.
RSUs have a three-year graded vesting scheme, with one third
of the RSUs vesting each year. Unless otherwise agreed, the
RSUs will be fully vested on the third anniversary of the grant
date.
The following table summarizes the number of outstanding
RSUs at the end of December 31, 2010:
Grant Number of RSUs outstanding
Feb. 20091) 17,336
Sep. 20091) 3,429
Jan. 2010 44,554
Feb. 2010 200,000
Oct. 2010 105,670
370,989
1)Adjusted to reflect the September 2009 rights issue.
The following table shows stock option activity for the years
ended December 31, 2010 and 2009:
2010 2009
Number of optionsWeighted average
exercise price
CHF
Number of options1) Weighted average
exercise price1)
CHF
Balance at January 1, 996,445 65.22 898,463 77.56
Granted during the year 199,230 11.92 204,530 21.41
Forfeited during the year (75,851) 74.64 (106,548) 85.17
Exercised during the year – – – –
Expired during the year – – – –
Balance at December 31, 1,119,824 55.10 996,445 65.22
Exercisable at December 31, 893,095 65.66 578,786 74.89
1)Adjusted to reflect the September 2009 rights issue.
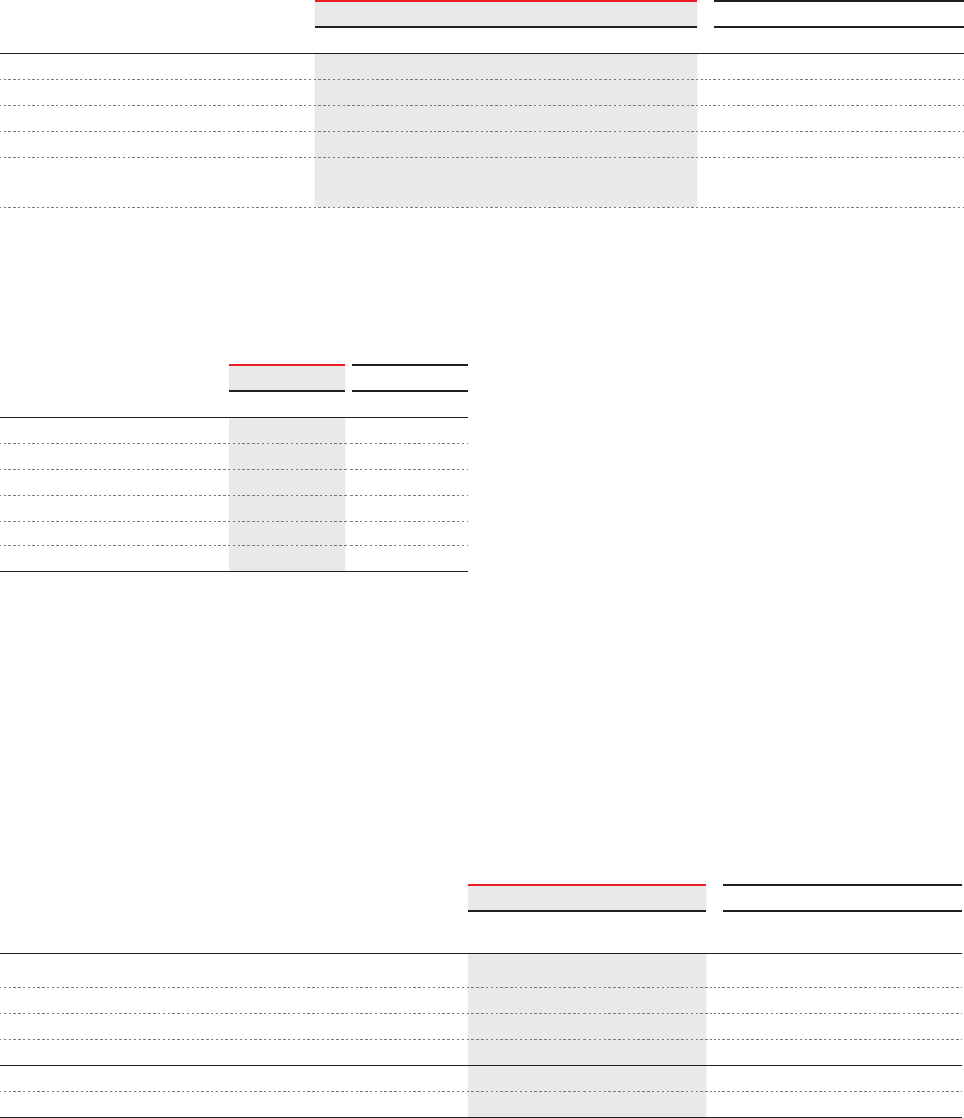
112 | Petroplus Holdings AG | Annual Report 2010 | Consolidated Financial Statements
In 2010, pursuant to the Equity Participation Plan, the BoD
granted a total of 396,914 RSUs (2009: 143,837 RSUs) to
members of the Executive Committee and employees. The
weighted average fair value of the RSUs granted during 2010
is CHF 15.42 (2009: CHF 19.28) based on the following as-
sumptions:
The following table shows RSU activity for the years ended
December 31, 2010 and 2009:
2010 2009
Assumptions October February January September1) February1)
Number of RSUs granted105,670 212,000 79,244 5,144 138,693
Closing price at grant date(in CHF)11.92 18.30 18.89 21.53 20.82
RSU life(in years) 1, 2, 3 1, 2, 3 1, 2, 3 1, 2, 3 1, 2, 3
Dividend yield4.5 % 2.9 % 2.8 % 4.6 % 4.8 %
Average market value of RSUs at
grant date(in CHF)
10.64 16.99 17.61 19.80 19.26
1)Adjusted to reflect the September 2009 rights issue.
2010 2009
Number of RSUsNumber of RSUs
Balance at January 1, 143,837 –
Granted during the year 396,914 143,837
Forfeited during the year (12,000) –
Exercised during the year (157,762) –
Expired during the year – –
Balance at December 31, 370,989 143,837
During 2010, a total of 157,762 (2009: nil) RSUs were exer-
cised. The weighted average share price at the date of exer-
cise for 2010 was CHF 16.26.
Total expense for the RSUs under the Equity Participation Plan
for the year ended December 31, 2010 was USD 3.9 million
(2009: USD 1.4 million).
25 Leases
Finance Lease Commitments –
Company is Lessee
The Company has one major contract which contains a finance
lease for a hydrogen unit with the supplier Air Product. Future
minimum lease payments under finance leases, together with
the present value of the lease payments, are as follows:
2010 2009
(in millions of USD)
Minimum lease
payments
Present value of
payments
Minimum lease
payments
Present value of
payments
Within one year 3.4 2.2 4.3 2.9
After one year but not more than five years 13.4 9.7 14.5 10.0
More than five years 13.4 11.9 18.1 15.6
Total 30.2 23.8 36.9 28.5
Less amounts for finance charge (6.4) (8.4)
Present value of the minimum payments 23.8 23.8 28.5 28.5
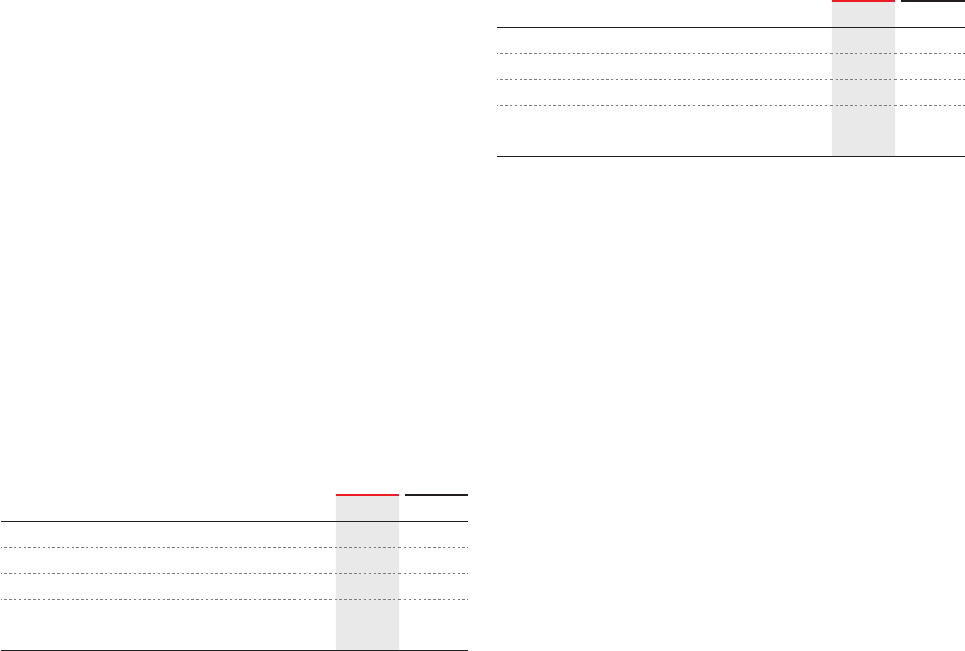
Petroplus Holdings AG | Annual Report 2010 | Consolidated Financial Statements | 113
Under the hydrogen supply contract, Air Product supplies the
Company with hydrogen whereby the supplier legally owns
and operates the hydrogen unit on the site of the Cressier
refinery. Petroplus effectively purchases all of the hydrogen
produced for a fee of USD 4.7 million per year. This fee also
includes payments for non-lease elements in the arrangement.
The contract has a duration of 15 years as from the end of
2004 and does not contain any option for the Company to
purchase the asset.
Total contingent rent recognized as an expense for the finance
lease for the year ended December 31, 2010 was USD 1.5 mil-
lion (2009: USD 1.5 million) and is dependent on the Swiss
Index of Consumer Prices.
Operating Lease Commitments –
Company is Lessee
The Company has entered into rental agreements, hire pur-
chases and commercial leases on machinery, motor vehicles
and office equipment. There are no restrictions placed upon
the lessee by entering into these leases.
The decrease in future minimum rentals payable under non-
cancellable operating leases is mainly related to contracts
which were terminated in connection with the suspension of
the Teesside refining operations and the sale of the Antwerp
Processing facility.
Total expense associated with operating leases was USD
24.9 million in 2010 (2009: USD 18.2 million).
Future minimum rentals payable under non-cancellable oper-
ating leases at December 31, are as follows:
(in millions of USD) 2010 2009
Within one year 17.6 20.7
After one year but not more than five years 26.6 40.8
More than five years 22.7 37.3
Total operating lease commitments –
Company is lessee
66.9 98.8
Operating Lease Commitments –
Company is Lessor
The Company has entered into lessor agreements for use of
land and buildings.
Bitumen Supply Contracts
Under the bitumen supply contract, the Antwerp Processing
facility was supplied with crude oil feedstock and converted
the crude into bitumen and distillates. This contract contained
a lease whereby the Company was the lessor. The supplier
of the feedstock purchased all of the bitumen production
and paid a processing fee consisting of fixed elements (USD
2.2 million per month) and variable elements. The fixed fee also
included payments for non-lease elements in the arrangement.
This contract was part of the sale of the Antwerp Processing
facility as per January 12, 2010. Since this date, the Company
has no further obligation to purchase feedstock or to deliver
bitumen.
The receivables under non-cancellable operating leases at
December 31, are as follows:
(in millions of USD) 2010 2009
Within one year 8.6 30.1
After one year but not more than five years 0.3 60.3
More than five years – 1.2
Total operating lease commitments –
Company is lessor
8.9 91.6
114 | Petroplus Holdings AG | Annual Report 2010 | Consolidated Financial Statements
Commercial Commitments
In connection with the acquisition of the Petit Couronne and
Reichstett refineries in 2008, we entered into four to five year
processing agreements with Shell for approximately half of
the Petit Couronne refinery’s total crude oil throughput. The
processing agreement related to refined products expired
on December 31, 2008, while the processing arrangements
to produce Shell lube oil base stocks will continue until 2011.
Additionally, Petroplus has entered into off-take agreements
with Shell, at market prices, which are estimated to account
for approximately 90 % of bitumen produced at the Petit Cou-
ronne and Reichstett refineries in 2011.
In connection with the acquisition of the Coryton refinery in
2007, we entered into an off-take agreement with BP that is
estimated to account for approximately 70 % of the refinery’s
gasoline production, approximately 90 % of its jet fuel and
ULSD production and approximately 30 % of its gasoil produc-
tion in 2011. The initial term of the agreement lasts until 2012.
In connection with the acquisition of the Ingolstadt refinery in
2007, we entered into a five year off-take agreement with Esso
to supply its retail chain in Bavaria with substantial amounts
of gasoline and diesel fuel and to supply Esso with significant
amounts of jet fuel. In 2010, this agreement was transferred to
ENI (an integrated energy company based in Italy) as part of
their purchase of Esso’s Austrian business and is estimated to
account for approximately 15-20 % of the Ingolstadt refinery’s
gasoline and diesel fuel production and approximately 90 % of
its jet fuel production in 2011. The off-take agreement termi-
nates on December 31, 2011.
On May 1, 2007, under the terms of a distribution agreement,
Petroplus Deutschland GmbH entered into an agreement with
Nynas for the right of distribution of bitumen produced at the
Ingolstadt refinery in Germany. The agreed upon term of this
contract is ten years, with yearly pricing negotiations, begin-
ning January 1, 2008.
26 Other Commitments
and Contingencies
Legal Contingencies
We have extensive operations and are both a defendant and
a plaintiff in a number of arbitration and legal proceedings in
connection with our operations. While we are currently in-
volved in several legal proceedings, we believe that, other than
as discussed below, the results of these proceedings will not
have a material adverse effect on our business, results of op-
erations or financial condition.
In 1989, certain Belgian subsidiaries of the Company sold
products to a customer without collecting excise taxes be-
cause the customer had provided documents that the prod-
ucts were to be exported and, therefore, no taxes were due.
The customer neither exported the product nor paid the ex-
cise tax liability. The Belgian authorities have brought a claim
against these entities for the taxes owed. The case has been
suspended until the criminal case against the customer is re-
solved. If a court determines that the Company is liable for
the taxes, the amount due, including interest, is expected to
be USD 2.6 million. The timing of the resolution of this case is
uncertain.
Environmental Commitments
In connection with the sale of the Antwerp Processing facility,
we have agreed to reimburse Vitol for certain specific environ-
mental liabilities, subject to a maximum liability cap of EUR
7.5 million (USD 10.0 million), and for certain other liabilities
subject to a liability cap of USD 25.0 million. These indemnities
are limited to a period of ten years and are subject to various
thresholds and conditions.
In connection with the acquisition of the Petit Couronne and
Reichstett refineries, we entered an agreement with Shell con-
cerning environmental liabilities. Under the agreement, gener-
ally, Shell is to indemnify us for certain losses we may incur
related to environmental contamination for eight years, for off-
site contamination associated with the Petit Couronne refinery
for 20 years and for rectifying possible non-compliance, if any,
with environmental laws for five years. In turn, we indemnify
Shell for certain losses Shell may incur from post completion
environmental matters and for certain pre-completion environ-
mental matters as Shell indemnity expires. These indemnities
are limited by various thresholds, caps and conditions and in-
clude a sharing mechanism under which our liability generally
increases in steps during the indemnity periods.
Petroplus Holdings AG | Annual Report 2010 | Consolidated Financial Statements | 115
Commodity Price Risk Management
Due to the nature of our business, the Company has significant
exposure to the fluctuation of crude and oil product prices as
part of its normal operations. There are many factors of our
business which are impacted by prevailing market conditions.
Specifically, a change in the crude and product pricing en-
vironment, rise or decline, will influence our inventory levels,
purchasing decisions and commodity price management ac-
tivities and will ultimately have an impact on our realized gross
margin. Our commercial and operational decisions are a direct
response to the market and, as such, will change as market
conditions change.
On average, throughout 2010, we have held approximately
21 million barrels of crude and product inventory on hand. The
21 million barrels represent the level of inventory we will hold
on average in order to maintain our daily refinery operations
and sales requirements. This level fluctuates on a daily basis,
depending on timing of crude purchases and product sales,
operations and optimization of crude and product pricing. We
are exposed to the fluctuation in crude and product pricing on
the inventory we hold. Currently, we primarily use a commodity
price management program to manage the fluctuation associ-
ated with commodity pricing on a defined volume of inventory.
Under this program, we enter into commodity Intercontinental
Exchange (“ICE”) futures contracts and counterparty swaps to
lock in the price of certain commodities.
Our earnings, as under the FIFO inventory accounting method-
ology, will be impacted by crude and product pricing volatility.
The FIFO accounting methodology, in times of extreme pricing
volatility, creates a lag between the cost of crude applied to
current market sales. This lag can, at times, be greater than
the natural lag from the processing of crude oil into refined
products. If crude prices rise or decline by USD 10 per bar-
rel, the impact on our margin, using the 21 million barrels we
hold on average, could result in a gain or loss of approximately
USD 210 million.
27 Financial Risk Management
Objectives and Policies
Risk Assessment
The Company has established an organizational framework for
risk assessment and management which includes risk identi-
fication and appraisal, development of acceptable exposure
limits, implementation of strategies, policies and procedures
to mitigate identified financial risks, and the monitoring of com-
pliance with such strategies, policies and procedures.
The BoD of Petroplus Holdings AG and the Executive Commit-
tee have overall responsibility for the Company’s risk manage-
ment strategies. Risk Owners, comprised of key members of
senior management, are responsible for the day-to-day execu-
tion of corporate risk strategies and policies, while Risk Com-
mittees, comprised of financial disclosure experts, procedures
and controls experts and appropriate subject matter experts
evaluate the adequacy of the implementation and execution of
the strategies and policies by the Risk Owners.
The Company’s internal risk assessment process consists of
regular reporting to the BoD on identified risks and manage-
ment’s reaction to them. The BoD has performed the risk as-
sessment based on the Company’s internal risk assessment
process and monitors management’s response to the risks
identified.
The Company’s principal financial liabilities, other than deriva-
tives, are comprised of interest-bearing loans and borrowings,
finance leases and trade and other payables. The main pur-
pose of these financial liabilities is financing for the Company’s
operations and acquisitions. The Company has various finan-
cial assets, other than derivatives, such as cash and short-
term deposits and trade and other receivables which arise
directly from our operations.
The main risks which influence the Company’s financial in-
struments and, ultimately, the financial results are commodity
price risk, credit risk, foreign currency exchange rate risk, in-
terest rate risk and financial liquidity risk. The Company seeks
to minimize the effects of some of these risks by using de-
rivative financial instruments. The use of financial derivatives is
governed by the Company’s risk policies which provide written
principles on risk management.
116 | Petroplus Holdings AG | Annual Report 2010 | Consolidated Financial Statements
Additionally, the Company is exposed to the refining margin
crack, which is defined as the net result of the purchase of
crude and the corresponding sale of the refined product. If
the refining margin crack, based on fluctuations in crude and
product pricing, was to rise or decline by USD 1 per barrel, the
effect on the Company’s profit before income taxes would be
a gain or loss of approximately USD 218 million in 2010 and
approximately USD 193 million in 2009. This analysis does not
take into consideration any changes in commercial or operat-
ing decisions which would be made given the change in the
environment, changes in the inventory held, or other factors
which could be present in a volatile crude and product pricing
environment.
The Company currently does not enter into material derivative
financial instruments for speculative transactions and does not
hedge the Group refining margin. This strategy is continually
reviewed and adapted for current economic and market con-
ditions.
Credit Risk Management
Credit risk arises from the potential failure of a counterparty
to meet its contractual obligations resulting in financial loss
to the Company. The Company is exposed to credit risk from
granting trade credit to customers and from placing deposits
with banks and financial institutions. To minimize credit risk,
all customers are subject to credit verification procedures and
extensions of credit above defined thresholds are subject to
an approval process. We also maintain relationships with sev-
eral different banks in order to minimize our concentration of
risk. The Company’s intention is to grant trade credit only to
recognized creditworthy third parties. In addition, receivable
balances are monitored on an ongoing basis. The Company
also limits the risk of bad debts by obtaining bank securities
such as guarantees or letters of credit and credit insurance.
The maximum exposure to credit risk is represented by the
carrying amounts of cash and receivables that are presented
in the Consolidated Statement of Financial Position, includ-
ing derivatives with positive market values. Trade credit risk is
minimized as the Company’s trade debtor portfolio consists
primarily of large, financially strong players in world markets
such as the major oil companies. In addition, the majority of
receivables from non-investment grade companies are credit
insured or covered by letters of credit.
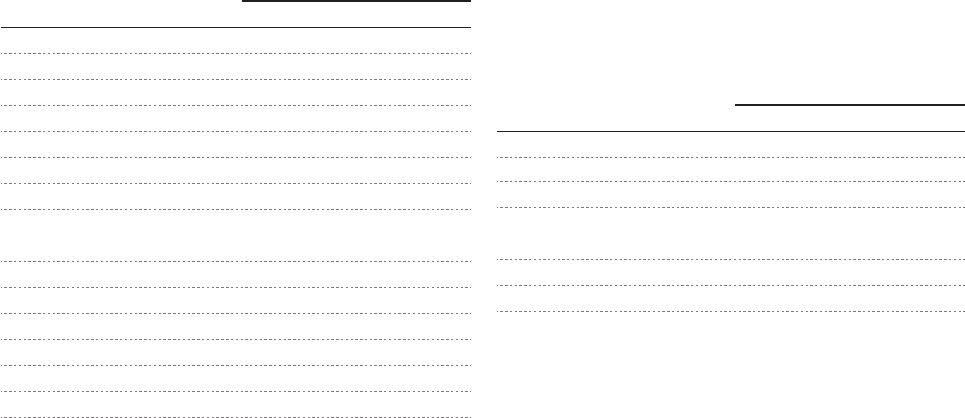
Petroplus Holdings AG | Annual Report 2010 | Consolidated Financial Statements | 117
Foreign Currency Exchange Rate Risk Management
The Company is exposed to foreign currency risk as a signifi-
cant percentage of our revenues and some of our expenses
are recorded in EUR, CHF and GBP and then translated into
USD. In order to keep the currency risk at an acceptable level,
the Company uses financial instruments (swaps, spot and for-
ward foreign currency derivatives contracts) to manage certain
foreign currency risk associated with non-USD sales, assets
and liabilities. The Company is exposed to foreign currency
movement on non-USD operating and personnel costs as we
currently do not hedge these costs.
The following table details the Company’s sensitivity to a 5 %
increase and decrease in the USD against the relevant foreign
currencies. 5 % is the sensitivity rate used when reporting for-
eign currency risk internally to management. The sensitivity
analysis below includes the effect of changes in foreign cur-
rency rates on income, expenses, assets and liabilities that are
subject to foreign currency risks in profit before income taxes.
There is no material impact on the Company’s equity.
(in millions of USD) Effect on profit before income taxes
2010
5 % increase in EUR/USD rate (20.9)
5 % increase in CHF/USD rate (8.6)
5 % increase in GBP/USD rate (12.5)
5 % decrease in EUR/USD rate 20.9
5 % decrease in CHF/USD rate 8.6
5 % decrease in GBP/USD rate 12.5
2009
5 % increase in EUR/USD rate (13.1)
5 % increase in CHF/USD rate (3.6)
5 % increase in GBP/USD rate (6.7)
5 % decrease in EUR/USD rate 13.1
5 % decrease in CHF/USD rate 3.6
5 % decrease in GBP/USD rate 6.7
Interest Rate Risk Management
The Company is exposed to interest rate risk mainly through
interest-bearing net debt. The Company’s interest rate risk
management aims to reduce the volatility of interest costs in
the Consolidated Statement of Comprehensive Income. Long-
term debt raised to finance our acquisitions is, therefore, kept
at fixed interest rates while only cash, short-term deposits and
short-term borrowings raised through our working capital fa-
cilities are exposed to changes in market conditions. At De-
cember 31, 2010, none of our Net Debt was exposed to inter-
est rate risk. As of December 31, 2009, approximately 8 % or
USD 151.9 million of our Net Debt (excluding capitalized fees)
was exposed to interest rate risk. In addition, proceeds from
the sale of the Company’s eligible receivables under our Fac-
toring Agreement are exposed to interest rate risk. As of De-
cember 31, 2010, USD 178.7 million (2009: USD 159.3 million)
was exposed to interest rate risk with respect to the Factoring
Agreement. For additional details of the Factoring Agreement,
refer to Note 12 “Trade and Other Receivables”.
The following table demonstrates the sensitivity to a reason-
able change in interest rates, with all other variables held con-
stant, of the Company’s profit before income tax. There is no
material impact on the Company’s equity.
As the average 1-week LIBOR rate for 2010 and 2009 was
below 1 %, a 2 % decrease would not have a material impact
on the Company’s profit before income tax.
(in millions of USD) Effect on profit before income taxes
2010
Increase of 2 % in LIBOR (6.3)
Decrease of 2 % in LIBOR –
2009
Increase of 2 % in LIBOR (5.7)
Decrease of 2 % in LIBOR –

118 | Petroplus Holdings AG | Annual Report 2010 | Consolidated Financial Statements
The decrease in net debt to net capital in 2010 is primarily re-
lated to the reduction in short-term borrowings, as compared
to 2009.
Ultimate responsibility for financial liquidity risk management
rests with the BoD, which has developed an appropriate finan-
cial liquidity risk management framework for the Company’s
short, medium and long-term funding and financial liquidity
management requirements. The Company manages the finan-
cial liquidity risk by maintaining adequate reserves, available
revolving credit facilities, continuously monitoring forecasted
and actual cash flows, and matching the maturity profiles of
financial assets and liabilities. Included in Note 18 “Interest-
Bearing Loans and Borrowings” is a listing of our existing fa-
cilities and available limits the Company has at its disposal to
further reduce financial liquidity risk.
Financial Liquidity Risk Management
The primary objective of the Company’s financial liquidity
risk management is to ensure that the Company maintains a
strong credit rating and healthy capital ratios to support our
daily business activities, reduce financing costs and maximize
shareholder value.
Management is committed to maintaining a healthy finan-
cial position while executing the Company’s growth strategy.
Through the acquisition process, we carefully evaluate the
price paid and financing options available for every asset ac-
quired. The assets acquired by the Company are long-term
assets for which we maintain a portion of long-term debt. The
capital structure of the Group consists of debt, which includes
the borrowings disclosed in Note 18 “Interest-Bearing Loans
and Borrowings”, cash and cash equivalents and equity at-
tributable to equity holders of the parent, comprising issued
capital, reserves and retained earnings as disclosed in Note
22 “Shareholders’ Equity”.
Management reviews the capital structure on a continual ba-
sis. As part of this review, management considers the cost
of capital and the risks associated with each class of capital.
While the Company’s leverage may temporarily change with
acquisitions and material oil price risks, the target is to main-
tain a gearing ratio below 40 %, determined as the proportion
of net debt to net capital. The gearing ratio at December 31
was as follows:
(in millions of USD) 2010 2009
Interest-bearing loans and
borrowings
1,692.0 1,833.4
Cash and short-term
deposits
(179.0) (11.2)
Net Debt 1,513.0 1,822.2
Equity 2,003.9 1,988.0
Ratio
Net Debt to Net Capital 43.0 % 47.8 %

Petroplus Holdings AG | Annual Report 2010 | Consolidated Financial Statements | 119
The table below summarizes the maturity profile of the Company’s financial liabilities at December 31, 2010 and 2009 based on
contractual, undiscounted payments:
(in millions of USD)
Total On demand Less than
3 months
3 to 12 months 1 to 5 years over 5 years
December 31, 2010
Interest-bearing loans and borrowings1) 2,506.5 – 31.5 94.5 1,185.3 1,195.2
Finance lease commitments 30.2 – 0.9 2.5 13.4 13.4
Trade payables 1,406.6 – 1,405.4 1.2 – –
Other payables2) 238.5 – 226.9 11.6 – –
Derivative financial instruments 1.2 – 1.2 – – –
Total 4,183.0 – 1,665.9 109.8 1,198.7 1,208.6
(in millions of USD)
Total On demand Less than
3 months
3 to 12 months 1 to 5 years over 5 years
December 31, 2009
Interest-bearing loans and borrowings1) 2,795.5 163.1 31.5 94.5 1,077.0 1,429.4
Finance lease commitments 36.9 – 1.0 3.3 14.5 18.1
Trade payables 1,463.4 – 1,417.2 46.2 – –
Other payables2) 277.0 – 277.0 – – –
Derivative financial instruments 4.0 – 4.0 – – –
Total 4,576.8 163.1 1,730.7 144.0 1,091.5 1,447.5
1)Includes expected interest payments.
2)Excluding USD 863.7 million at December 31, 2010 and USD 545.7 million at December 31, 2009, of other payables and accrued expenses which do
not qualify as financial liabilities.
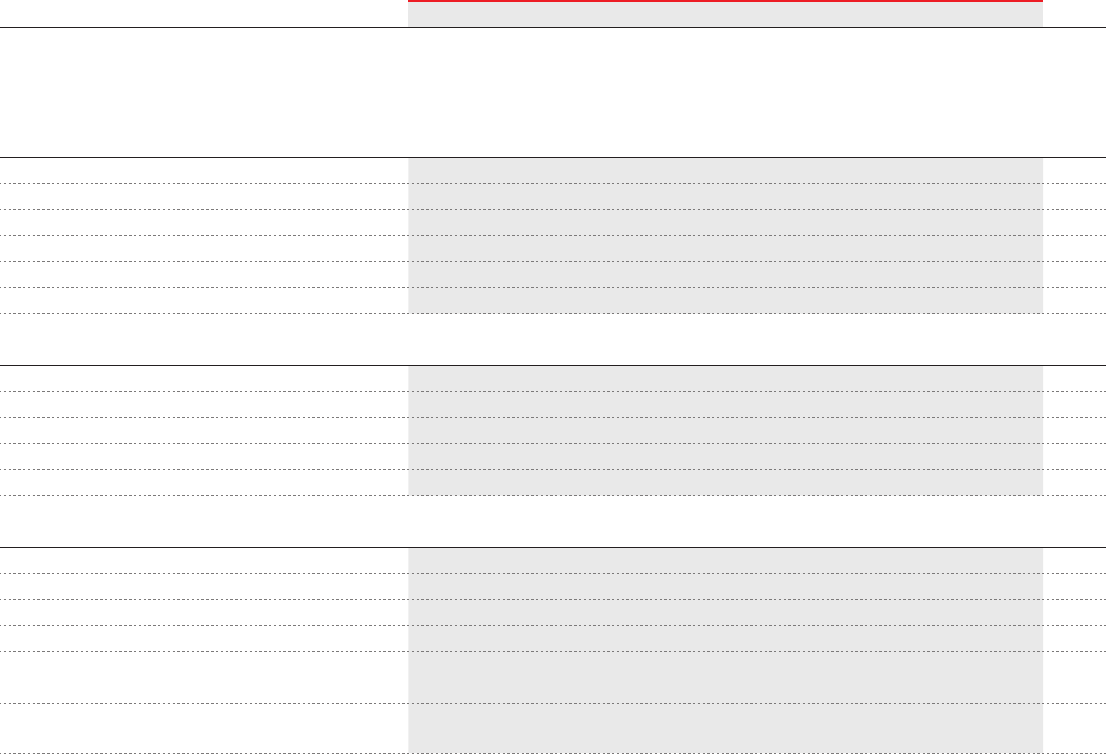
120 | Petroplus Holdings AG | Annual Report 2010 | Consolidated Financial Statements
28 Financial Instruments
The nominal value of financial instruments, other than long-
term interest-bearing loans and borrowings, approximate fair
value. Long-term interest-bearing loans and borrowings are
initially recognized at fair value, net of transaction costs in-
curred, and are subsequently stated at amortized cost. The
fair values reported for long-term interest-bearing loans and
borrowings are based on quoted market prices of the Com-
pany’s Senior Notes and Convertible Bonds. The Company’s
financial instruments included in the Consolidated Financial
Statements are listed below:
(in millions of USD) December 31, 2010 December 31, 2009
Financial assets
Category in
accordance
with IAS 39
Carrying
amount
Amortized
cost
Cost Fair value
through
profit or loss
Fair value
through
other com-
prehensive
income
Amounts recog-
nized in Consoli-
dated Statement
of Financial Posi-
tion according to
IAS 17
Fair
value
Carrying
amount
Amortized
cost
Cost Fair value
through
profit or loss
Fair value
through
other com-
prehensive
income
Amounts recog-
nized in Consoli-
dated Statement
of Financial Posi-
tion according to
IAS 17
Fair
value
Cash and short-term deposits C 179.0 – – 179.0 – – 179.0 11.2 – – 11.2 – – 11.2
Trade receivables, net LaR 1,154.7 1,154.7 – – – – 1,154.7 1,051.4 1,051.4 – – – – 1,051.4
Other receivables1) LaR 15.2 15.2 – – – – 15.2 18.1 18.1 – – – – 18.1
Financial assets available-for-sale AfS 34.6 – – – 34.6 – 34.6 28.6 – 0.9 – 27.7 – 28.6
Other financial assets2) LaR 4.9 4.9 – – – – 4.9 5.6 5.6 – – – – 5.6
Derivative financial instruments3) FAHfT 4.2 – – 4.2 – – 4.2 0.6 – – 0.6 – – 0.6
Financial liabilities
Interest-bearing loans and borrowings FLAC 1,692.0 1,692.0 – – – – 1,598.7 1,833.4 1,833.4 – – – – 1,773.6
Finance lease commitments n.a. 23.8 – – – – 23.8 23.8 28.5 – – – – 28.5 28.5
Trade payables FLAC 1,406.6 1,406.6 – – – – 1,406.6 1,463.4 1,463.4 – – – – 1,463.4
Other payables4) FLAC 238.5 238.5 – – – – 238.5 277.0 277.0 – – – – 277.0
Derivative financial instruments FLHfT 1.2 – – 1.2 – – 1.2 4.0 – – 4.0 – – 4.0
Aggregated by category
Cash (C) 179.0 – – 179.0 – – 179.0 11.2 – – 11.2 – – 11.2
Loans and Receivables (LaR) 1,174.8 1,174.8 – – – – 1,174.8 1,075.1 1,075.1 – – – – 1,075.1
Available-for-Sale financial assets (AfS) 34.6 – – – 34.6 – 34.6 28.6 – 0.9 – 27.7 – 28.6
Financial Assets Held for Trading (FAHfT) 4.2 – – 4.2 – – 4.2 0.6 – – 0.6 – – 0.6
Financial Liabilities measured at
Amortized Costs (FLAC)
3,337.1 3,337.1 – – – – 3,243.8 3,573.8 3,573.8 – – – – 3,514.0
Financial Liabilities Held for Trading
(FLHfT)
1.2 – – 1.2 – – 1.2 4.0 – – 4.0 – – 4.0
1)Excluding USD 94.1 million at December 31, 2010 and USD 81.7 million at December 31, 2009, of other receivables and prepayments which do not qualify
as financial assets.
2)Excluding capitalized financing costs of USD 9.1 million at December 31, 2010 and USD nil at December 31, 2009.
3)Excluding a hedge accounting portion amounting to an asset of USD 1.8 million at December 31, 2010 and an asset of USD 7.1 million at December 31, 2009.
4)Excluding USD 863.7 million at December 31, 2010 and USD 545.7 million at December 31, 2009, of other payables and accrued expenses which do not qualify
as financial liabilities.

Petroplus Holdings AG | Annual Report 2010 | Consolidated Financial Statements | 121
28 Financial Instruments
The nominal value of financial instruments, other than long-
term interest-bearing loans and borrowings, approximate fair
value. Long-term interest-bearing loans and borrowings are
initially recognized at fair value, net of transaction costs in-
curred, and are subsequently stated at amortized cost. The
fair values reported for long-term interest-bearing loans and
borrowings are based on quoted market prices of the Com-
pany’s Senior Notes and Convertible Bonds. The Company’s
financial instruments included in the Consolidated Financial
Statements are listed below:
(in millions of USD) December 31, 2010 December 31, 2009
Financial assets
Category in
accordance
with IAS 39
Carrying
amount
Amortized
cost
Cost Fair value
through
profit or loss
Fair value
through
other com-
prehensive
income
Amounts recog-
nized in Consoli-
dated Statement
of Financial Posi-
tion according to
IAS 17
Fair
value
Carrying
amount
Amortized
cost
Cost Fair value
through
profit or loss
Fair value
through
other com-
prehensive
income
Amounts recog-
nized in Consoli-
dated Statement
of Financial Posi-
tion according to
IAS 17
Fair
value
Cash and short-term deposits C 179.0 – – 179.0 – – 179.0 11.2 – – 11.2 – – 11.2
Trade receivables, net LaR 1,154.7 1,154.7 – – – – 1,154.7 1,051.4 1,051.4 – – – – 1,051.4
Other receivables1) LaR 15.2 15.2 – – – – 15.2 18.1 18.1 – – – – 18.1
Financial assets available-for-sale AfS 34.6 – – – 34.6 – 34.6 28.6 – 0.9 – 27.7 – 28.6
Other financial assets2) LaR 4.9 4.9 – – – – 4.9 5.6 5.6 – – – – 5.6
Derivative financial instruments3) FAHfT 4.2 – – 4.2 – – 4.2 0.6 – – 0.6 – – 0.6
Financial liabilities
Interest-bearing loans and borrowings FLAC 1,692.0 1,692.0 – – – – 1,598.7 1,833.4 1,833.4 – – – – 1,773.6
Finance lease commitments n.a. 23.8 – – – – 23.8 23.8 28.5 – – – – 28.5 28.5
Trade payables FLAC 1,406.6 1,406.6 – – – – 1,406.6 1,463.4 1,463.4 – – – – 1,463.4
Other payables4) FLAC 238.5 238.5 – – – – 238.5 277.0 277.0 – – – – 277.0
Derivative financial instruments FLHfT 1.2 – – 1.2 – – 1.2 4.0 – – 4.0 – – 4.0
Aggregated by category
Cash (C) 179.0 – – 179.0 – – 179.0 11.2 – – 11.2 – – 11.2
Loans and Receivables (LaR) 1,174.8 1,174.8 – – – – 1,174.8 1,075.1 1,075.1 – – – – 1,075.1
Available-for-Sale financial assets (AfS) 34.6 – – – 34.6 – 34.6 28.6 – 0.9 – 27.7 – 28.6
Financial Assets Held for Trading (FAHfT) 4.2 – – 4.2 – – 4.2 0.6 – – 0.6 – – 0.6
Financial Liabilities measured at
Amortized Costs (FLAC)
3,337.1 3,337.1 – – – – 3,243.8 3,573.8 3,573.8 – – – – 3,514.0
Financial Liabilities Held for Trading
(FLHfT)
1.2 – – 1.2 – – 1.2 4.0 – – 4.0 – – 4.0
1)Excluding USD 94.1 million at December 31, 2010 and USD 81.7 million at December 31, 2009, of other receivables and prepayments which do not qualify
as financial assets.
2)Excluding capitalized financing costs of USD 9.1 million at December 31, 2010 and USD nil at December 31, 2009.
3)Excluding a hedge accounting portion amounting to an asset of USD 1.8 million at December 31, 2010 and an asset of USD 7.1 million at December 31, 2009.
4)Excluding USD 863.7 million at December 31, 2010 and USD 545.7 million at December 31, 2009, of other payables and accrued expenses which do not qualify
as financial liabilities.
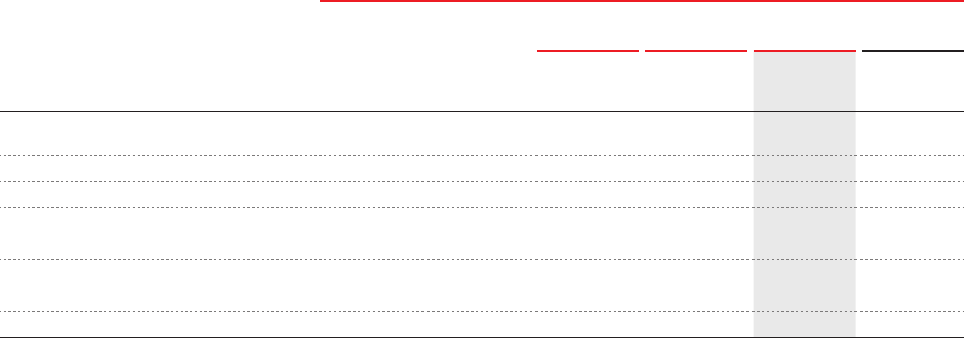
122 | Petroplus Holdings AG | Annual Report 2010 | Consolidated Financial Statements
Derivatives not Designated as Hedging
Instruments
The Company enters into commodity instruments to manage
the fluctuation associated with commodity pricing on a defined
volume of inventory
. The Company also uses
financial instru-
ments (swaps and forward exchange contracts) to manage
certain of its foreign currency risk. These derivative transac-
tions have not been designated as effective hedges, therefore,
any gains or losses arising from the changes in the fair value of
these instruments is recorded in our Consolidated Statement
of Comprehensive Income.
Net (loss)/gain
by measurement category
From
interest
Bond
accretion/
amortized
financing
costs
From subsequent measurement Net (loss)/gain
(in millions of USD)
At fair value Impairment/
reversal of
impairment
2010 2009
Loans and Receivables (LaR) – – – 0.4 0.4 (0.7)
Available-for-Sale financial assets (AfS)1) – – (1.2) – (1.2) (2.3)
Financial Assets held for Trading (FAHfT) – – 33.6 – 33.6 –
Financial Liabilities measured at
Amortized Costs (FLAC)
(137.2) (13.3) – – (150.5) (141.4)
Financial Liabilities Held for Trading
(FLHfT)
– – – – – (32.6)
Net (loss)/gain (137.2) (13.3) 32.4 0.4 (117.7) (177.0)
1)Recognised in other comprehensive income.
Derivatives Designated as Hedging
Instruments
In connection with a German governmental stock-piling re-
quirement and with fixed price contracts for the sale of bitumen
in the UK, the Company enters into fixed price contracts to buy
and sell specified volumes of gasoline, gasoil and bitumen.
As a result, we enter into gasoline and fuel swaps and gasoil
futures to manage the price risk associated with such fixed
price contracts. There were no outstanding amounts related
to hedges of German stock-piling requirements at December
31, 2010 and 2009. The fair value for fuel swaps included as
an asset in the Consolidated Statement of Financial Position
at December 31, 2010 is USD 1.8 million (2009: USD 7.1 mil-
lion). In 2010, the Company realized a gain of USD 1.1 million
(2009: USD 10.6 million) related to the hedging instruments
and a loss of USD 2.2 million (2009: USD 13.5 million) related
to the hedged items. During the year, the fair value of the gaso-
line and fuel swaps was determined through broker forward
curve quotations, whereas the fair value of gasoil futures was
obtained from published settlement quotes on the ICE.
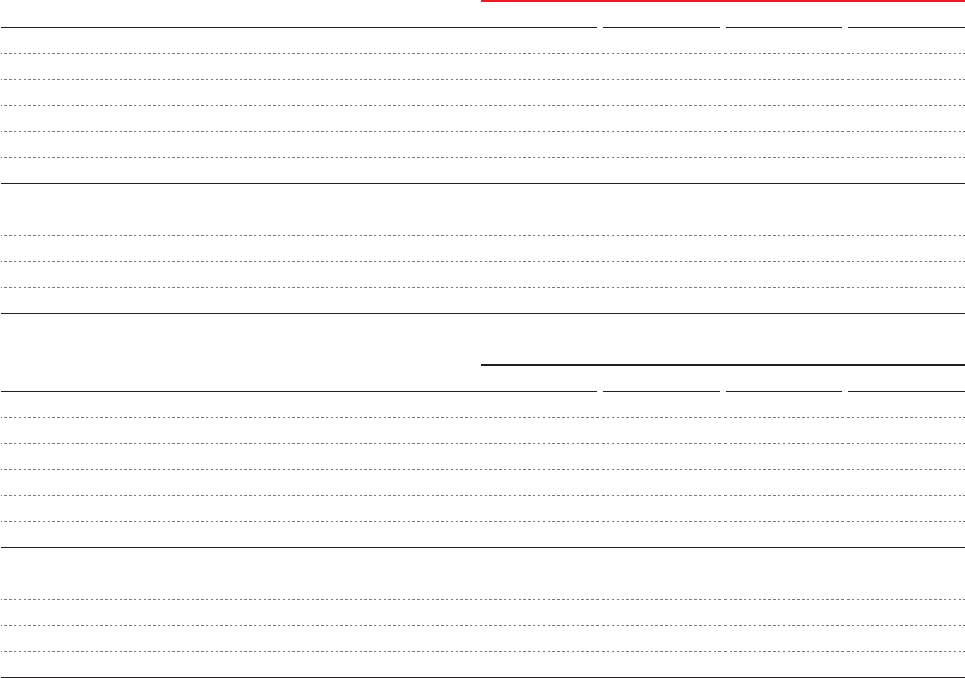
Petroplus Holdings AG | Annual Report 2010 | Consolidated Financial Statements | 123
Fair Value Hierarchy
The Company uses the following hierarchy for determining and
disclosing the fair value of financial instruments by valuation
technique:
Level 1: Quoted (unadjusted) prices in active markets for iden-
tical assets or liabilities.
Level 2: Other techniques for which all inputs which have a
significant effect on the recorded fair value are observable,
either directly or indirectly.
Level 3: Techniques which use inputs which have a significant
effect on the recorded fair value that are not based on observ-
able market data.
The following table presents the Company’s assets and liabil-
ities that are measured at fair value at December 31, 2010 and
2009:
(in millions of USD) December 31, 2010
Financial assets measured at fair value Level 1 Level 2 Level 3 Total
Financial assets at fair value through profit or loss
Derivative financial instruments – held for trading 1.7 2.5 – 4.2
Derivative financial instruments – hedge accounting applied 1.8 – – 1.8
Available-for-sale financial assets – – 34.6 34.6
Total assets measured at fair value 3.5 2.5 34.6 40.6
Financial liabilities measured at fair value
Financial liabilities at fair value through profit or loss
Derivative financial instruments – held for trading – 1.2 – 1.2
Total liabilities measured at fair value – 1.2 – 1.2
(in millions of USD) December 31, 2009
Financial assets measured at fair value Level 1 Level 2 Level 3 Total
Financial assets at fair value through profit or loss
Derivative financial instruments – held for trading 0.6 – – 0.6
Derivative financial instruments – hedge accounting applied 7.1 – – 7.1
Available-for-sale financial assets – – 27.7 27.7
Total assets measured at fair value 7.7 – 27.7 35.4
Financial liabilities measured at fair value
Financial liabilities at fair value through profit or loss
Derivative financial instruments – held for trading – 4.0 – 4.0
Total liabilities measured at fair value – 4.0 – 4.0
There were no transfers between Level 1 and Level 2 or into or
out of Level 3 during 2010 or 2009.
The Company carries unquoted equity shares as available-for-
sale financial assets classified as Level 3 within the fair value
hierarchy. For further details, including the impact of changes
during 2010, refer to Note 16 “Financial Assets Available-for-
Sale”.
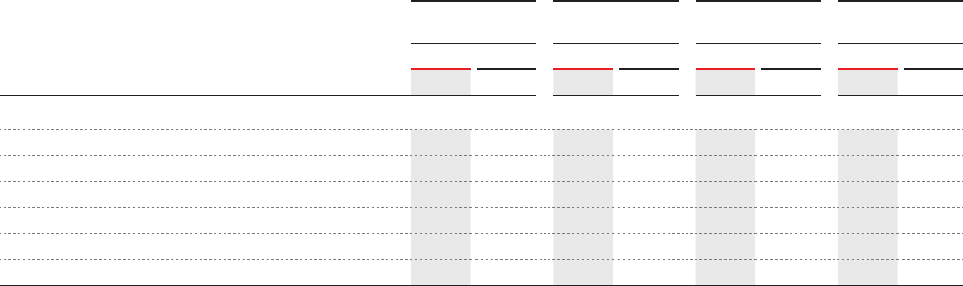
124 | Petroplus Holdings AG | Annual Report 2010 | Consolidated Financial Statements
29 Related Parties
The Company maintains business relationships with related
parties, including its subsidiaries, its associated companies,
other investments, and its key management personnel.
All related party transactions between the Company and its
subsidiaries are eliminated on consolidation and are not dis-
closed in this note. Details of transactions between the Com-
pany and other related parties are disclosed below.
Sales to and purchases from related parties are made at normal
market prices. In general, outstanding balances at year-end are
unsecured, interest free and settlement typically occurs in cash.
There have been no guarantees provided or received for any re-
lated party receivables or payables. Additionally, no provisions
have been made for doubtful debts relating to amounts owed
by related parties. This assessment is undertaken each financial
year through examination of the financial position of the related
party and the market in which the related party operates.
Guarantees
Petroplus Holdings AG guarantees certain obligations of sub-
sidiaries to third parties. For further information, see Note 7
“Contingent Liabilities/Guarantees and Pledges” in the Statu-
tory Financial Statements of Petroplus Holdings AG.
Sales of goods Purchases of
goods
Other transactions Amounts owed by
related parties
December 31,
(in millions of USD) 2010 2009 2010 2009 2010 2009 2010 2009
Associates
Raffinerie du Midi – – – – 1.7 2.0 – –
Groupement Pétrolier de Saint Pierre des Corps – – – – 0.6 – – –
Sempachtank AG – – – (0.1) – – – –
Société Genevoise des Pétroles SA – – – (0.1) (0.2) – – 0.1
Pflichtlagergesellschaft für Mineralöle 0.4 – – – 5.5 – – –
Total 0.4 – – (0.2) 7.6 2.0 – 0.1

Petroplus Holdings AG | Annual Report 2010 | Consolidated Financial Statements | 125
Compensation of Key Management Personnel
Effective September 1, 2009, Mr. Jean-Paul Vettier succeeded
Mr. Robert J. Lavinia as the CEO of the Company.
At the end of 2010, key management personnel includes four-
teen members (2009: fourteen), including nine non-executive
members of the BoD, the CEO of the Company, who is also a
member of the BoD, and four members of the Executive Com-
mittee.
The compensation for key management personnel as de-
scribed above, including one former member of BoD and three
former members of the Executive Committee, was as follows:
The compensation of key management personnel is deter-
mined by the Compensation Committee after considering the
performance of the individual and market trends.
Other
In March 2008, we entered into a partnership (“PBF”) with The
Blackstone Group and First Reserve, to evaluate acquisitions
of crude oil refineries in the United States, its possessions
and Eastern Canada. Mr. O’Malley serves as Chairman of the
BoD and CEO of PBF. On September 26, 2010, the Company
reached an agreement in principle with the Blackstone Group
and First Reserve, its partners in PBF, for the sale of Petroplus’
32.62 % share of PBF. The Company’s proportionate contribu-
tion for Mr. O’Malley’s compensation from PBF amounted to
USD 0.4 million for the time we held an interest in PBF in 2010
(2009: USD 0.5 million).
(in millions of USD) 2010 2009
Short-term employee benefits 11.6 10.7
Post-employment benefits 0.5 0.6
Other long-term benefits 0.1 –
Termination benefits 3.1 –
Share-based payments1) 3.3 3.7
Total compensation of key
management personnel
18.6 15.0
1)
The fair value of options/RSUs granted have been calculated in accor-
dance with IFRS 2 Share-based Payment. In comparison to the treatment
under IFRS 2, where the fair value of the options/RSUs are recorded as an
expense over the vesting period, Swiss Code of Obligation requires the
presentation of the total fair value of the options/RSUs at the date of grant
and are based on the valuation principles contained in a tax ruling from
the Swiss tax authorities. The share-based payment expense above does
therefore not reconcile with the amount disclosed in Note 6 “Compensa-
tion, Shareholdings and Loans” in the Statutory Financial Statements of
Petroplus Holdings AG.
30 Number of Employees
The following table sets out information on the number of full-
time equivalent employees we employed in the periods indi-
cated:
Number of employees December 31, 2010 December 31, 20091)
Switzerland 494 500
France 836 855
United Kingdom 615 742
Germany 411 391
Belgium 217 353
Czech Republic 2 4
Total 2,575 2,845
1)Includes employees of the Antwerp Processing facility which had not
been sold during the period indicated.
126 | Petroplus Holdings AG | Annual Report 2010 | Consolidated Financial Statements
31 Acquisitions
In 2010 and 2009, Petroplus did not acquire any new busi-
nesses.
Purchase Price Allocation Finalized in 2009 Regarding
the Acquisitions of the Petit Couronne and Reichstett
Refineries in 2008
Pursuant to an Asset Purchase Agreement dated March 31,
2008, the Company completed the acquisition of refineries lo-
cated in Petit Couronne and Reichstett, France. The aggregate
purchase consideration was USD 810.9 million.
During 2008, the Company’s purchase price allocation was
calculated on a provisional basis. The allocation was finalized in
March 2009 upon final agreement with Shell as to the value of
inventory, receivables and pension liabilities transferred to the
Company, resulting in the following updates as detailed below:
Purchase Consideration
(in millions of USD)
Purchase price 784.1
Fees 26.8
Total purchase consideration 810.9
Purchase Price Allocation
(in millions of USD)
Preliminary purchase
price allocation
Changes as
at acquisition date
Fair value
Assets acquired
Inventories 632.7 (1.4) 631.3
Other receivables and prepayments 55.1 25.8 80.9
Intangible assets 1.9 – 1.9
Property, plant and equipment 373.8 (29.3) 344.5
Investment in associates 13.4 – 13.4
Financial assets available-for-sale 27.7 – 27.7
Deferred tax assets 38.5 10.3 48.8
Total assets 1,143.1 5.4 1,148.5
Liabilities acquired
Trade payables 203.6 – 203.6
Other payables 35.4 26.0 61.4
Other financial liabilities 72.6 – 72.6
Total liabilities 311.6 26.0 337.6
Net assets acquired 831.5 (20.6) 810.9
Total purchase consideration 831.5 (20.6) 810.9
Net cash outflow from transaction 831.5 (20.6) 810.9
As the finalization of the purchase price allocation did not
result in material changes in assets, liabilities or net income,
prior period balances were not adjusted. If the Company had
restated the Consolidated Statement of Comprehensive In-
come based on the updated asset balance, net loss for the
twelve months ended December 31, 2008 would have been
approximately USD 3.2 million lower and the net loss for the
twelve months ended December 31, 2009 would have been
approximately USD 3.2 million higher. During 2009, the Com-
pany collected USD 9.0 million in regards to the final purchase
price adjustment.
The Company did not have access to sufficient information to
calculate a reliable estimate of the carrying amount of net as-
sets prior to the acquisition.
The presentation of pro-forma financial information would re-
quire significant estimates and assumptions on behalf of the
Company and, therefore, cannot be presented. Additionally,
the Company does not generate financial information down to
the net income level for its refineries.
Petroplus Holdings AG | Annual Report 2010 | Consolidated Financial Statements | 127
32 Subsidiaries
Subsidiary
Share capital
(in millions local currency)
2010 2009 Activities*
Switzerland
Petroplus Marketing AG, Zug CHF 51.400 100.0 % 100.0 % H/F, M
Petroplus Tankstorage AG, Zug CHF 5.000 100.0 % 100.0 % P/T
Petroplus Switzerland Investment GmbH, Zug CHF 1.000 100.0 % 100.0 % H/F
Petroplus Refining Cressier SA, Cressier CHF 5.000 100.0 % 100.0 % R
Société Immobilière Les Planches Vallier SA, Cressier CHF 0.050 80.0 % 80.0 % O
Oléoduc du Jura Neuchâtelois S.A., Cornaux CHF 1.000 80.0 % 80.0 % P/T
Belgium
Belgian Refining Corporation N.V., Antwerp EUR 51.150 100.0 % 100.0 % R
Petroplus Refining Antwerp Bitumen N.V., Antwerp1) USD – – 100.0 % R
Petroplus Refining Antwerp N.V., Antwerp1) USD – – 100.0 % R
Universal Holding N.V., Antwerp USD 11.568 100.0 % 100.0 % H/F
Petrobel N.V., Kontich EUR 0.372 100.0 % 100.0 % M
Bermuda
Argus International Ltd., Hamilton USD 1,500.000 100.0 % 100.0 % H/F
Petroplus Finance Ltd., Hamilton USD 0.010 100.0 % 100.0 % H/F
Petroplus Finance 2 Ltd., Hamilton USD 1,450.000 100.0 % 100.0 % H/F
Petroplus Finance 3 Ltd., Hamilton2) USD – – 100.0 % H/F
Cyprus
Rivermill Investments Ltd., Nicosia EUR 0.002 99.9 % 99.9 % H/F
Czech Republic
Marimpex Prague (branch office), Prague2) – – 100.0 % M
Petroplus Czech Republic s.r.o., Prague3) CZK 148.489 100.0 % 100.0 % M
France
SKI Participations SA, Villeneuve d’Ascq EUR 0.045 100.0 % 100.0 % H/F
Société Française du Pipeline du Jura, Paris EUR 3.114 100.0 % 100.0 % P/T
Petroplus Holdings France SAS, Paris la Défense CedexEUR 76.561 100.0 % 100.0 % H/F
Petroplus Marketing France SAS, Paris la Défense CedexEUR 20.731 100.0 % 100.0 % M
Petroplus Raffinage Petit-Couronne SAS, Petit CouronneEUR 89.724 100.0 % 100.0 % R
Petroplus Pipelines Petit-Couronne SAS, Petit CouronneEUR 1.370 100.0 % 100.0 % P/T
Petroplus Raffinage Reichstett SAS, ReichstettEUR 40.854 100.0 % 100.0 % R
Petroplus Pipelines Reichstett SAS, ReichstettEUR 0.388 100.0 % 100.0 % P/T
* Activities:
H/F = Holding/Finance: This entity is a holding company and/or performs finance functions for the Group.
M = Marketing: This entity performs marketing and sales activities for the Group.
R = Refining: This entity performs refining activities for the Group.
P/T = Pipeline/Tankstorage: This entity is either a pipeline or a tankstorage.
O = Other: Includes property and waste disposal.
128 | Petroplus Holdings AG | Annual Report 2010 | Consolidated Financial Statements
Subsidiary
Share capital
(in millions local currency)
2010 2009 Activities
Germany
Marimpex Mineralöl-Handelsgesellschaft mbH, Hamburg EUR 6.647 100.0 % 100.0 % H/F
Petroplus Deutschland GmbH, IngolstadtEUR 2.960 100.0 % 100.0 % M
Petroplus Raffinerie Ingolstadt GmbH, Kösching EUR 10.000 100.0 % 100.0 % R
Petroplus Bayern GmbH, Kösching EUR 0.170 100.0 % 100.0 % M
Petroplus Tankstorage Holding GmbH, Ingolstadt4) EUR – – 100.0 % H/F
Petroplus Tankstorage Holding Deutschland GmbH,
Ingolstadt
EUR 0.025 100.0 % 100.0 % H/F
The Netherlands
Petroplus Holdings B.V., Rotterdam EUR 0.113 100.0 % 100.0 % H/F
Petroplus International B.V., Rotterdam EUR 1.235 100.0 % 100.0 % H/F
United Kingdom
Petroplus Marketing Ltd., Teesside, Middlesbrough GBP 0.010 100.0 % 100.0 % M
Petroplus Refining & Marketing Ltd., Stanford-Le-Hope GBP 79.790 100.0 % 100.0 % R
Petroplus Refining Teesside Ltd., Middlesbrough GBP 0.020 100.0 % 100.0 % M
Luxemburg
Argus International S. à r. l., Munsbach EUR 0.040 100.0 % 100.0 % H/F
Argus Energy S. à r. l., Munsbach EUR 0.040 100.0 % 100.0 % H/F
Portugal
Refinaria Vasco da Gama, Lisboa2) EUR – – 100.0 % H/F
USA
Argus Services Corporation, Delaware2) USD – – 100.0 % H/F
1)Sold in 2010.
2)Liquidated in 2010.
3)Contribution in kind from parent company Marimpex Mineralöl-Handelsgesellschaft mbH, Hamburg to Petroplus Czech Republic s.r.o., Prague,
in 2010.
4)Merged with Marimpex Mineralöl-Handelsgesellschaft mbH, Hamburg, in 2010.
Petroplus Holdings AG | Annual Report 2010 | Consolidated Financial Statements | 129
Investments in associates
Share capital
(in millions local currency)
2010 2009 Activities
Switzerland
Pflichtlagergesellschaft für Mineralöle, Zug CHF 1.000 35.0 % 35.0 % P/T
SOGEP Société Genevoise des Pétroles, Vernier CHF 0.100 32.0 % 32.0 % P/T
Sempachtank AG, Neuenkirch CHF 0.113 22.0 % 22.0 % P/T
France
Raffinerie du Midi, ParisEUR 3.432 33.3 % 33.3 % P/T
Groupement Pétrolier de Saint Pierre des Corps, CergyEUR 0.330 20.0 % 20.0 % P/T
USA
PBF Investments LLC and Affiliates, Greenwich, CT1) USD – – 35.4 % H/F
Investments available-for-sale
Share capital
(in millions local currency)
2010 2009 Activities
France
Entrepôt Pétrolier de Valenciennes, HaulchinEUR 0.480 16.0 % 16.0 % P/T
Entrepôt Pétrolier de Mulhouse, IllzachEUR 0.287 14.3 % 14.3 % P/T
Société des Transports Pétroliers par Pipeline (Trapil), ParisEUR 13.160 5.5 % 5.5 % P/T
Société Anonyme de Gestion des Stocks de Sécurité
(SAGESS), Cedex
EUR 0.240 1.1 % 1.1 % O
Germany
RBE-Rheinische Bio Ester GmbH & Co. KG, Neuss1) EUR – – 15.0 % R
GSB Sonderabfallentsorgung Bayern GmbH, Bayern EUR 42.260 0.3 % 0.3 % O
Deutsche Transalpine Ölleitung GmbH, Munich2) EUR 5.150 10.0 % – P/T
Austria
Transalpine Ölleitung in Österreich Gesellschaft m.b.H.,
Innsbruck2)
EUR 18.200 10.0 % – P/T
Italy
Società Italiana per l’Oleodotto Transalpino S.p.A., Trieste2) EUR 4.900 10.0 % – P/T
Switzerland
SAPPRO SA (Société du Pipeline à Produits
Pétroliers sur Territoire Genevois), Vernier
CHF 0.653 12.3 % 12.3 % P/T
1)Sold in 2010.
2)Transfer of legal ownership in 2010.
None of the above listed subsidiaries, associates or investments available-for-sale are listed on SIX or any other stock
exchange.

130 | Petroplus Holdings AG | Annual Report 2010 | Consolidated Financial Statements
33 Subsequent Events
New Chairman of the Board of Directors
On February 3, 2011, Petroplus announced that Thomas
D. O’Malley’s retirement as Chairman and member of the
BoD, originally announced on December 8, 2010 and effective
May 5, 2011, was brought forward to the Petroplus Board
meeting on February 2, 2011, due to the continuing rapid de-
velopment of PBF Energy Company LLC, of which he is Chair-
man of the BoD. Patrick Monteiro de Barros, formerly Vice
Chairman of the Board, has succeeded Mr. O’Malley as Chair-
man.
With the recent sale of Petroplus’ interest in PBF Energy Com-
pany LLC, of which Mr. O’Malley was also Chairman of the BoD,
and the pending development of PBF into an operating Atlantic
Basin oil refiner, the Petroplus Board and Mr. O’Malley decided
that, from a corporate governance perspective, it would not be
advisable for him to remain as Chairman of both organizations.
There are no events to report that had an influence on the
Consolidated Statement of Financial Position or the Consoli-
dated Statement of Comprehensive Income for the year ended
December 31, 2010.
34 Authorization of Consolidated
Financial Statements
These Consolidated Financial Statements have been auth-
orized for issue by the Board of Directors on February 28, 2011
and will be recommended for approval at the Annual Share-
holders’ Meeting on May 5, 2011.
Zug, February 28, 2011
Petroplus Holdings AG
For the Board of Directors
Patrick Monteiro de Barros
Chairman of the Board of Directors
Petroplus Holdings AG | Annual Report 2010 | Consolidated Financial Statements | 131
Report of the Statutory Auditor
132 | Petroplus Holdings AG | Annual Report 2010 | Consolidated Financial Statements
Petroplus Holdings AG | Annual Report 2010 | Consolidated Financial Statements | 133
(This page has been left blank intentionally.)


Statutory
Financial
Statements
136 I Income Statements for the years ended
December 31, 2010 and 2009
137 I Balance Sheets at December 31,
2010 and 2009
138 I Notes to the Statutory Financial
Statements 2010 and 2009
150 I Report of the Statutory Auditor

136 | Petroplus Holdings AG | Annual Report 2010 | Statutory Financial Statements
Income Statements for the years ended December 31,
2010 and 2009
(in millions of CHF) 2010 2009
Financial income 26.7 21.8
Total income 26.7 21.8
Financial expenses (29.0) (8.1)
Capital issue expenses (6.0) (12.7)
Administrative expenses (6.5) (9.5)
Total expenses (41.5) (30.3)
Loss before taxes (14.8) (8.5)
Income taxes – –
Net loss (14.8) (8.5)

Petroplus Holdings AG | Annual Report 2010 | Statutory Financial Statements | 137
Balance Sheets at December 31, 2010 and 2009
(in millions of CHF) Notes 2010 2009
Current assets
Cash and short-term deposits 0.2 0.3
Other receivables from subsidiaries 203.3 68.2
Other receivables and prepayments 0.1 0.3
Total current assets 203.6 68.8
Non-current assets
Investments 3 2,824.1 2,824.1
Total non-current assets 2,824.1 2,824.1
Total assets 3,027.7 2,892.9
Current liabilities
Other payables to subsidiaries 5.2 6.4
Other payables and accrued expenses 1.8 1.3
Total current liabilities 7.0 7.7
Non-current liabilities
Long-term deferred income 9.3 4.9
Total non-current liabilities 9.3 4.9
Total liabilities 16.3 12.6
Shareholders’ equity
Share capital 5 712.3 654.3
Share premium 5 87.9 161.7
Legal reserves 5 131.0 113.0
Free reserves 5 2,095.0 1,959.8
Net loss 5 (14.8) (8.5)
Total shareholders’ equity 3,011.4 2,880.3
Total liabilities and shareholders’ equity 3,027.7 2,892.9
138 | Petroplus Holdings AG | Annual Report 2010 | Statutory Financial Statements
4 Major Shareholders
The following shareholders of Petroplus Holdings AG own
more than 5 % of the voting rights as at December 31, 2010
and 2009 according to the requirements of Art. 663c of the
Swiss Code of Obligation (“CO”):
To the best of the Company’s knowledge, no other share-
holder holds 5 % or more of Petroplus Holdings AG shares at
December 31, 2010 and 2009.
Subsequent to December 31, 2010 and prior to the author-
ization of the Annual Report 2010 on February 28, 2011, FMR
Corp. reported an increase in their ownership from 4.92 %
to 5.04 % on January 31, 2011, and subsequently reported a
decrease in their ownership to 4.95 % on February 15, 2011.
FMR Corp., located at 82 Devonshire Street, Boston, MA
02109, USA, is the parent company of Fidelity Management
& Research Company, an investment manager for US mutual
funds, and Fidelity Management Trust Company, a US state
chartered bank which acts as a trustee or investment manager
for various pension and trust accounts.
Significant Shareholders 2010 2009
Janus Capital Group, USA1) 10.1 % n.a.
1)Janus Capital Group, located at 151 Detroit Street, Denver, CO 80209,
USA, is the parent company of Janus Capital Management LLC. Janus
Capital Management LLC is an investment company and manages US
and global portfolios. Janus Capital Group has reported on August 9,
2010 their ownership of 10.13 % (after a reported ownership of 5.56 %
on April 21, 2010 and 3.66 % on April 19, 2010).
Notes to the Statutory Financial Statements
2010 and 2009
1 General
Petroplus Holdings AG (the “Company” or “Petroplus”), Zug,
Switzerland is a publicly traded company listed in the main
segment of the SIX Swiss Exchange (“SIX”). The address of its
registered office is Petroplus Holdings AG, Industriestrasse 24,
6300 Zug, Switzerland.
2 Accounting Policies
These Statutory Financial Statements of Petroplus comply
with the requirements of Swiss law.
Presentation
All amounts included in these Statutory Financial Statements
are presented in millions of Swiss Francs (“CHF”) except where
otherwise indicated.
Foreign Exchange Rate Differences
Assets and liabilities denominated in foreign currencies are
translated into CHF using year-end rates. Transactions dur-
ing the year which are denominated in foreign currencies are
translated at exchange rates effective at the relevant transac-
tion dates. Resulting exchange gains and losses are recog-
nized in the Income Statement with the exception of net unre-
alized gains which are deferred.
Investments
Investments are valued at acquisition cost less adjustments for
impairment of value.
3 Investments
As at December 31, 2010 and 2009 Petroplus Holdings AG
holds direct interests in the following companies:
20101) 2009
Argus International Ltd., Bermuda 100 % 100 %
Petroplus Finance Ltd., Bermuda100 % 100 %
Petroplus Finance 3 Ltd., Bermuda2) – 100 %
Petroplus International B.V.,
The Netherlands
100 % 100 %
1)Details of the individual share capitals in local currency and purpose of
the entities are disclosed in Note 32 “Subsidiaries” of the Consolidated
Financial Statements.
2)Liquidated in 2010.
Petroplus Holdings AG | Annual Report 2010 | Statutory Financial Statements | 139
5 Share Capital of Petroplus Holdings AG
At December 31, 2010 and 2009, the Company had the follow-
ing issued, authorized and conditional share capital:
The following table shows the changes in Equity for the years
ended December 31, 2010 and 2009:
2010 2009
Nominal value
per share in
CHF
Share Capital
in millions of
CHF
Number
of shares
Nominal value
per share in
CHF
Share Capital
in millions of
CHF
Number
of shares
Issued share capital 7.48 712.3 95,230,953 7.58 654.3 86,325,289
Authorized share capital 7.48 251.4 33,615,057 7.58 130.9 17,265,057
Conditional share capital 7.48 217.6 29,096,005 7.58 108.8 14,351,669
(in millions of CHF)
Share
capital
Share
premium
Legal
reserves
Free
reserves
Accumu-
lated loss
Net loss Total
Equity
Balance as at January 1, 2009 564.9 2,179.0 – – (85.6) (20.6) 2,637.7
Issuance of shares (public offering) 130.9 161.7 – – – – 292.6
Repayment of nominal share capital (41.5) – – – – – (41.5)
Allocation of share premium to reserves1) – (2,179.0) 113.0 2,066.0 – – –
Allocation to accumulated loss – – – – (20.6) 20.6 –
Allocation to free reserves1) – – – (106.2) 106.2 – –
Net loss 2009 – – – – – (8.5) (8.5)
Balance as at December 31, 2009 654.3 161.7 113.0 1,959.8 – (8.5) 2,880.3
Issuance of shares (private placement) 65.6 85.8 – – – – 151.4
Issuance of shares under stock option plan 1.9 2.1 – – – – 4.0
Repayment of nominal share capital (9.5) – – – – – (9.5)
Allocation of share premium to reserves2) – (161.7) 18.0 143.7 – – –
Allocation to accumulated loss – – – – (8.5) 8.5 –
Allocation to free reserves2) – – – (8.5) 8.5 – –
Net loss 2010 – – – – – (14.8) (14.8)
Balance as at December 31, 2010 712.3 87.9 131.0 2,095.0 – (14.8) 3,011.4
1)Allocation of share capital to legal reserves and free reserves in accordance with the Board of Directors proposal for the year ended
December 31, 2008 which was approved at the Annual General Meeting on May 6, 2009.
2)Allocation of share capital to legal reserves and free reserves in accordance with the Board of Directors proposal for the year ended
December 31, 2009 which was approved at the Annual General Meeting on May 5, 2010.
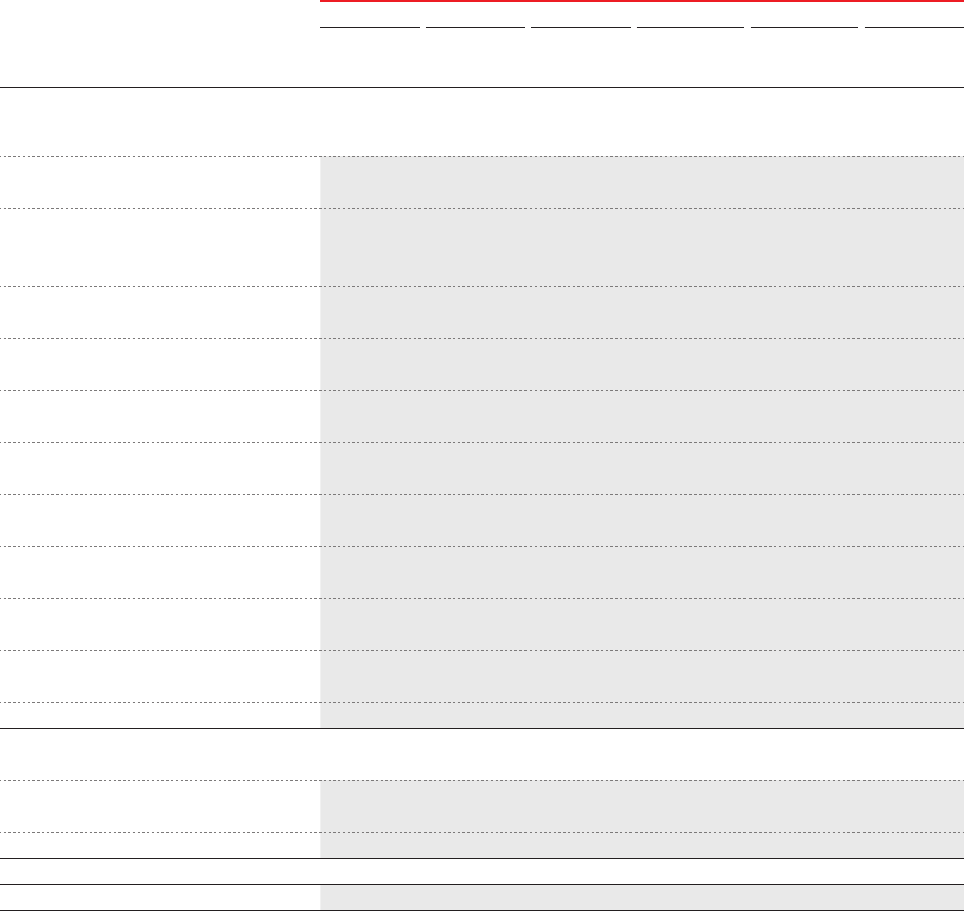
140 | Petroplus Holdings AG | Annual Report 2010 | Statutory Financial Statements
6 Compensation, Shareholdings and Loans
Compensation for Acting Members of Governing Bodies for 2010
The following tables illustrate the compensation earned by the members of the Board of Directors and the Executive Committee for 2010
based on the requirements of Article 663bbis CO:
Compensation for the Members of the Board of Directors1)
2010
(in thousands of CHF)
Salary BoD fees2) Other3) Pension, health
and fringe
benefits4)
Fair value of
RSUs
granted5)
Total com-
pensation
Board of Directors
Thomas D. O’Malley
(Chairman, non-executive member)
600.0 – – 35.5 – 635.5
Patrick Monteiro de Barros
(Vice Chairman and Chairperson,
non-executive member)
– 277.5 – – – 277.5
Markus Dennler
(Non-executive member and Chairperson)
– 368.5 – 19.9 – 388.4
Walter Grüebler
(Non-executive member)
– 268.5 – 12.7 – 281.2
Robert J. Lavinia
(Non-executive member and former CEO)
– 252.0 – – – 252.0
Maria Livanos Cattaui
(Non-executive member)
– 263.0 – 12.4 – 275.4
Eija Malmivirta
(Non-executive member and Chairperson)
– 288.5 – – – 288.5
Werner G. Müller
(Non-executive member)
– 274.0 – 13.0 – 287.0
Patrick Power
(Non-executive member)
– 257.5 – – – 257.5
Jean-Paul Vettier6)
(Executive member and CEO)
2,400.0 – 90.0 135.4 428.1 3,053.5
Total Board of Directors 3,000.0 2,249.5 90.0 228.9 428.1 5,996.5
Former Member of Board of Directors
Ernst Weil7)
(Non-executive member)
– 140.0 – 6.6 – 146.6
Total Former Board of Directors – 140.0 – 6.6 – 146.6
Total 3,000.0 2,389.5 90.0 235.5 428.1 6,143.1
Footnotes for the table above are outlined on page 142.
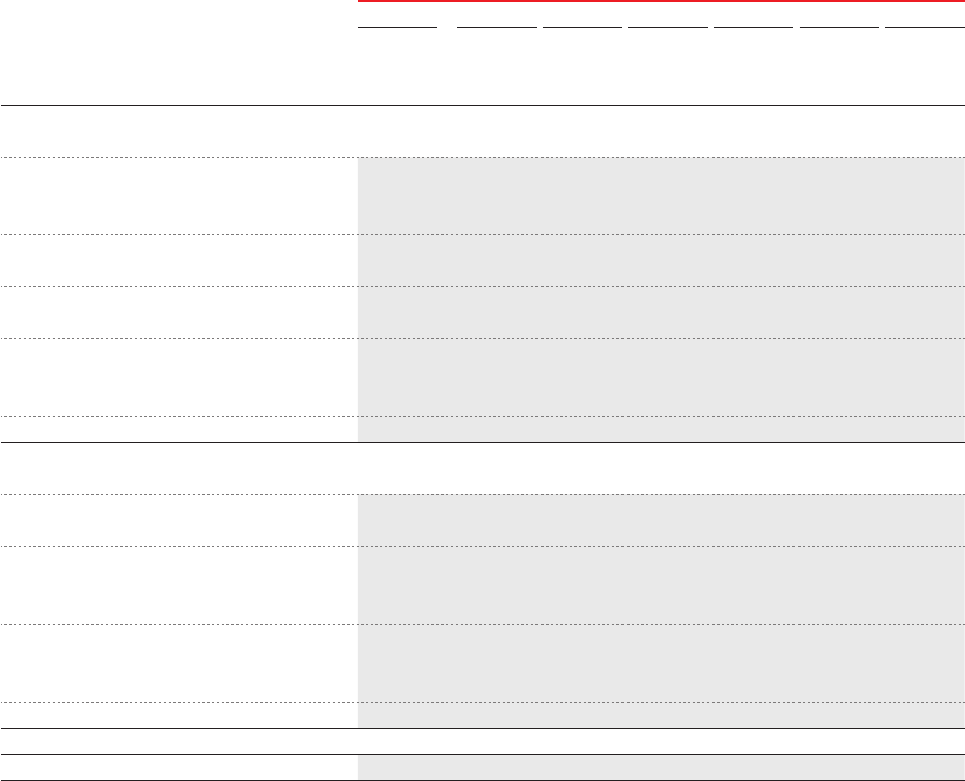
Petroplus Holdings AG | Annual Report 2010 | Statutory Financial Statements | 141
Compensation for the Members of the Executive Committee1)
2010
(in thousands of CHF)
Salary Bonuses8) Termi-
nation
benefits
Other3) Pension,
health
and fringe
benefits4)
Fair value
of options/
RSUs
granted5)
Total com-
pensation
Executive Committee
Chester J. Kuchta
(Executive Vice President and
Chief Operating Officer)
1,216.7 180.0 – – 204.6 272.9 1,874.2
Peter F. Senkbeil9)
(General Manager Refining)
456.8 180.0 – 62.5 125.9 209.7 1,034.9
W. Thomas Skok
(General Counsel and Corporate Secretary)
675.0 240.0 – – 174.5 166.6 1,256.1
Joseph D. Watson10)
(Executive Vice President and
Chief Financial Officer)
405.9 180.0 – 48.5 100.7 161.5 896.6
Total Executive Committee 2,754.4 780.0 – 111.0 605.7 810.7 5,061.8
Former Members of the Executive Committee
Michael D. Gayda11)
(Executive Vice President and General Counsel)
205.9 14) – – 16.9 23.2 – 246.0
Bruce A. Jones12)
(Executive Vice President and
Chief Operating Officer)
185.8 14) – 1,522.5 14.6 111.2 272.9 2,107.0
Karyn F. Ovelmen13)
(Executive Vice President and
Chief Financial Officer)
957.9 14) – 1,500.0 43.1 243.8 272.9 3,017.7
Total Former Executive Committee 1,349.6 – 3,022.5 74.6 378.2 545.8 5,370.7
Total 4,104.0 780.0 3,022.5 185.6 983.9 1,356.5 10,432.5
Footnotes for the table above are outlined on page 142.

142 | Petroplus Holdings AG | Annual Report 2010 | Statutory Financial Statements
Footnotes for the tables on page 140 & 141
1) Compensation is disclosed gross of withholding tax and employee social security contributions. The compensation does not include reimbursements
for travel and other necessary business expenses incurred in the performance of their services as these are not considered compensation. Compen-
sation for members of the Board of Directors with executive functions (Mr. Vettier) is disclosed within the compensation for the members of the Board
of Directors.
2) Includes the annual compensation of the Board of Directors fees and the compensation fee for each board or committee meeting attended.
3) Represents housing and personal transportation costs for Mr. Vettier, long-term service benefits for Mr. Senkbeil, relocation and settling in allowance
for Mr. Watson and relocation allowance for Mr. Gayda, Mr. Jones and Ms. Ovelmen.
4) Includes the employer pension contribution (if applicable; state old age and survivors insurance {AHV}, disability insurance {IV}, pension fund), health/
accident insurance and other fringe benefits.
5) Details regarding options and RSUs granted during 2010:
Name
Type* Grant date Number Exercise
price
(in CHF)
Fair value
(CO)**
Vesting
(in years)
Life time
(in years)
Jean-Paul Vettier RSU 04.01.2010 27,209 – 15.73 1, 2, 3 1, 2, 3
Chester J. Kuchta RSU 04.01.2010 17,345 – 15.73 1, 2, 3 1, 2, 3
Peter F. Senkbeil RSU 02.02.2010 10,000 – 15.21 1, 2, 3 1, 2, 3
RSU 01.10.2010 4,000 – 9.57 1, 2, 3 1, 2, 3
Call-Option 01.10.2010 6,000 11.92 3.23 4 10
W. Thomas Skok RSU 02.02.2010 8,000 – 15.21 1, 2, 3 1, 2, 3
RSU 01.10.2010 3,000 – 9.57 1, 2, 3 1, 2, 3
Call-Option 01.10.2010 5,000 11.92 3.23 4 10
Joseph D. Watson Call-Option 01.10.2010 50,000 11.92 3.23 4 10
Bruce A. Jones RSU 04.01.2010 17,345 – 15.73 Exit date n/a
Karyn F. Ovelmen RSU 04.01.2010 17,345 – 15.73 Exit date n/a
*) Further details of options and RSUs are disclosed in Note 22 “Shareholders’ Equity” and Note 24 “Share-based Payments” of the Consolidated
Financial Statements.
**)The fair value of options/RSUs granted have been calculated in accordance with IFRS 2 Share-based Payment, using the Black-Scholes Model
(see Note 24 “Share-based Payments” of the Consolidated Financial Statements for details on calculation of the fair value and assumptions made).
In comparison to the treatment under IFRS 2, where the fair value of the options/RSUs are recorded as an expense over the vesting period,
Swiss Code of Obligation (“CO”) requires the presentation of the total fair value of the options/RSUs at the date of grant. The values of options/
RSUs granted are reported based on the valuation principles contained in a tax ruling from the Swiss Tax Authorities, reflecting the principles
as disclosed in the Kreisschreiben Nr. 5. Values of options/RSUs granted are discounted by 6 % per year depending on the length of the vesting
period. For example, the value of an option award subject to a two-year vesting period calculated in accordance with the methodology described
in the Kreisschreiben Nr. 5 equals 89 % of its market value at the grant date. However, the future compensation out of these options/RSUs granted
will depend on the individual person’s employment with the Company, on the future development of the Company’s share price and the timing of
exercise.
6) At the fourth Annual General Meeting of Petroplus Holdings AG on May 5, 2010, Jean-Paul Vettier was elected member of the Board of Directors for
a tenure of three years.
7) At the fourth Annual General Meeting of Petroplus Holdings AG on May 5, 2010, Ernst Weil retired as member of the Board of Directors, effective
May 6, 2010. The compensation covers the period from January 1, 2010, until June 30, 2010.
8) Bonus for the financial year 2010. Accrued as of December 31, 2010 and will be paid in March 2011. Bonus relates to individual performance targets
achieved. No bonus has been awarded related to financial results as goals were not met.
9) Effective February 2, 2010, Peter F. Senkbeil was appointed General Manager Refining. The compensation covers the period from February 2, 2010,
until December 31, 2010.
10)Effective August 5, 2010, Joseph D. Watson was appointed Executive Vice President and CFO. The compensation covers the period from August 5,
2010, until December 31, 2010.
11)Effective December 15, 2009, Michael D. Gayda resigned as General Counsel. Mr. Gayda continued to serve as an employee in a transition position
until his retirement on January 31, 2010. The compensation covers the period from January 1, 2010, until January 31, 2010.
12)Effective November 23, 2009, the Company’s commercial and refinery operations were combined and Bruce A. Jones’ position was eliminated.
Mr. Jones continued to serve as an employee in a transition position until February 28, 2010. The compensation covers the period from January 1, 2010,
until February 28, 2010.
13)
Effective August 4, 2010, Karyn F. Ovelmen resigned as Executive Vice President and CFO. The compensation covers the period from January 1, 2010,
until August 31, 2010.
14)Includes payments for vacation not taken.

Petroplus Holdings AG | Annual Report 2010 | Statutory Financial Statements | 143
Compensation for Acting Members of Governing Bodies for 2009
The following tables illustrate the compensation earned by the members of the Board of Directors and the Executive Committee for
2009 based on the requirements of Article 663bbis CO:
Compensation for the Members of the Board of Directors1)
2009
(in thousands of CHF)
Salary BoD fees2) Bonuses3) Pension, health
and fringe
benefits4)
Fair value of
options/RSUs
granted5)
Total compen-
sation
Thomas D. O’Malley
(Chairman, non-executive member)
500.0 – 400.0 50.1 – 950.1
Patrick Monteiro de Barros
(Vice Chairman and Chairperson,
non-executive member)
– 293.0 – – – 293.0
Markus Dennler
(Non-executive member and Chairperson)
– 378.6 – 20.3 – 398.9
Walter Grüebler
(Non-executive member)
– 278.6 – 13.2 – 291.8
Robert J. Lavinia6)
(Non-executive member and former CEO)
900.0 – 700.0 242.4 983.7 2,826.1
Maria Livanos Cattaui
(Non-executive member)
– 256.6 – 12.1 – 268.7
Eija Malmivirta
(Non-executive member and Chairperson)
– 293.0 – – – 293.0
Werner G. Müller
(Non-executive member)
– 262.0 – 12.4 – 274.4
Patrick Power
(Non-executive member)
– 273.0 – – – 273.0
Ernst Weil
(Non-executive member)
– 273.0 – 13.0 – 286.0
Total 1,400.0 2,307.8 1,100.0 363.5 983.7 6,155.0
1)Compensation is disclosed gross of withholding tax and employee social security contributions. The compensation does not include reimbursements
for travel and other necessary business expenses incurred in the performance of their services as these are not considered compensation.
2)Includes the annual compensation of the Board of Directors fees and the compensation fee for each board or committee meeting attended.
3)Bonus for the financial year 2009. Paid in December 2009.
4)Includes the employer pension contribution (if applicable; state old age and survivors’ insurance {AHV}, disability insurance {IV}, pension fund
{only for Mr. Lavinia}), health/accident insurance and other fringe benefits.
5)Options of 55,782 granted during 2009 have a life of ten years and will vest in equal amounts on the first, second and third anniversary of the respec-
tive grant date. The options provide Mr. Lavinia with the right to purchase one share at the offer price of CHF 21.41. RSUs of 34,673 granted during
2009 will vest in equal amounts on the first, second and third anniversary of the respective grant date. The RSUs provide Mr. Lavinia with the right to
receive one share upon vesting. The fair value of options/RSUs granted have been calculated in accordance with IFRS 2 Share-based Payment, using
the Black-Scholes Model (see Note 24 “Share-based Payments” of the Consolidated Financial Statements for details on calculation of the fair value
and assumptions made). In comparison to the treatment under IFRS 2, where the fair value of the options/RSUs are recorded as an expense over the
vesting period, CO requires the presentation of the total fair value of the options/RSUs at the date of grant. The values of options/RSUs granted are
reported based on the valuation principles contained in a tax ruling from the Swiss Tax Authorities, reflecting the principles as disclosed in the Kreis-
schreiben Nr. 5. Values of options/RSUs granted are discounted by 6 % per year depending on the length of the vesting period. For example, the value
of an option award subject to a two-year vesting period calculated in accordance with the methodology described in the Kreisschreiben Nr. 5 equals
89 % of its market value at the grant date. According to this methodology, the options/RSUs granted with a vesting period of 1, 2 and 3 years had an
average value of CHF 6.99 per option and CHF 17.24 per RSU at grant date. However, the future compensation out of these options/RSUs granted will
depend on the individual person’s employment with the Company, on the future development of the Company’s share price and the timing of exercise.
6)Mr. Lavinia retired as CEO effective September 1, 2009. Mr. Lavinia continued to serve as an employee in a transition position until the end of 2009.
He will remain as a non-executive member of the Board of Directors. The compensation covers the period from January 1, 2009 until December 31,
2009.
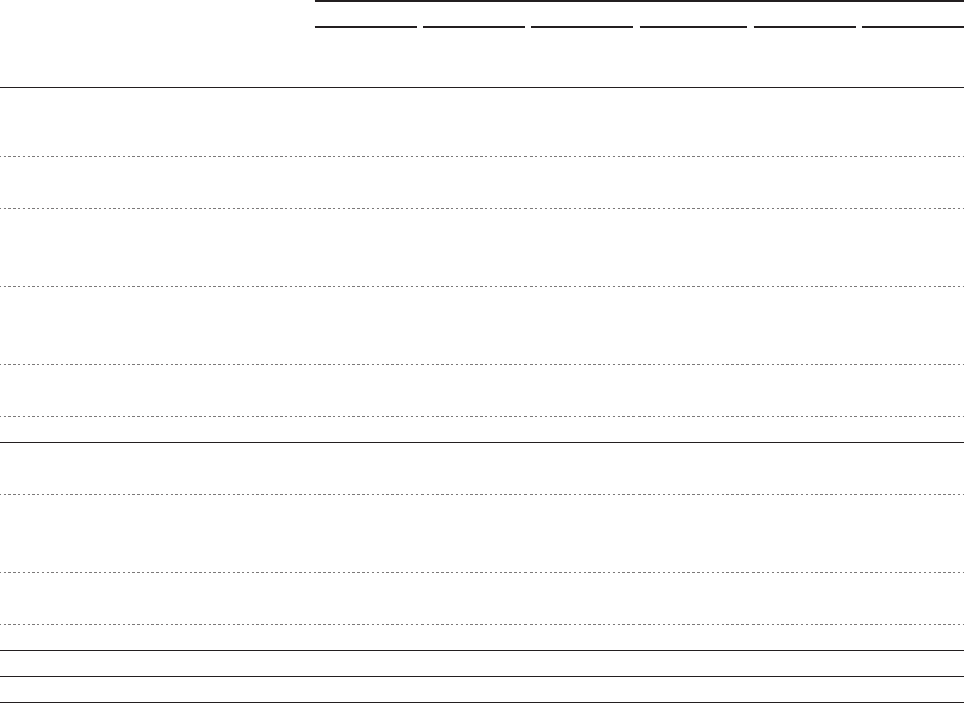
144 | Petroplus Holdings AG | Annual Report 2010 | Statutory Financial Statements
Compensation for the Members of the Executive Committee1)
2009
(in thousands of CHF)
Salary Bonuses2) Other3) Pension, health
and fringe
benefits4)
Fair value of
options/RSUs
granted5)
Total compen-
sation
Executive Committee
Jean-Paul Vettier6)
(Chief Executive Officer)
400.0 400.0 35.2 52.0 90.8 978.0
Chester J. Kuchta
(Executive Vice President and
Chief Operating Officer)
783.3 – 550.0 184.2 705.4 2,222.9
Karyn F. Ovelmen
(Executive Vice President and
Chief Financial Officer)
783.3 – 550.0 233.5 705.4 2,272.2
W. Thomas Skok7)
(General Counsel and Corporate Secretary)
30.8 – – 3.9 – 34.7
Total Executive Committee 1,997.4 400.0 1,135.2 473.6 1,501.6 5,507.8
Former Members of the Executive Committee
Bruce A. Jones8)
(Executive Vice President and
Chief Operating Officer)
783.3 – 550.0 196.7 705.4 2,235.4
Michael D. Gayda9)
(Executive Vice President and General Counsel)
783.3 – 550.0 195.9 705.4 2,234.6
Total Former Executive Committee 1,566.6 – 1,100.0 392.6 1,410.8 4,470.0
Total 3,564.0 400.0 2,235.2 866.2 2,912.4 9,977.8
1)Compensation is disclosed gross of withholding tax and employee social security contributions. The compensation does not include reimbursements
for travel and other necessary business expenses incurred in the performance of their services as these are not considered compensation and does
not include compensation for members of the Board of Directors with executive functions (Mr. Lavinia).
2)Represents the prorated portion of Mr. Vettier’s annual minimum bonus accrued as at December 31, 2009 which was paid in March 2010.
3)Represents housing and personal transportation costs for Mr. Vettier. Payments to Mr. Kuchta, Mrs. Ovelmen, Mr. Jones and Mr. Gayda represent
retention payments paid in December 2009.
4)Includes the employer pension contribution (state old age and survivors insurance {AHV}, disability insurance {IV}, pension fund), health/accident in-
surance and other fringe benefits.
5)Total options of 148,748 (37,187 each for Mr. Kuchta, Mrs. Ovelmen, Mr. Jones and Mr. Gayda) granted during 2009 have a life of ten years and will
vest in equal amounts on the first, second and third anniversary of the respective grant date. The options provide the holder with the right to purchase
one share at the offer price of CHF 21.41. RSUs of 109,164 (whereof 5,144 RSUs granted to Mr. Vettier and 26,005 RSUs each for Mr. Kuchta, Mrs.
Ovelmen, Mr. Jones and Mr. Gayda) granted during 2009 will vest in equal amounts on the first, second and third anniversary of the respective grant
date. The RSUs provide the holder with the right to receive one share upon vesting. The fair value of options/RSUs granted have been calculated in
accordance with IFRS 2 Share-based Payment, using the Black-Scholes Model (see Note 24 “Share-based Payments” of the Consolidated Financial
Statements for details on calculation of the fair value and assumptions made). In comparison to the treatment under IFRS 2, where the fair value of the
options/RSUs are recorded as an expense over the vesting period, CO requires the presentation of the total fair value of the options/RSUs at the date
of grant. The values of options/RSUs granted are reported based on the valuation principles contained in a tax ruling from the Swiss Tax Authori-
ties, reflecting the principles as disclosed in the Kreisschreiben Nr. 5. Values of options/RSUs granted are discounted by 6 % per year depending on
the length of the vesting period. For example, the value of an option award subject to a two-year vesting period calculated in accordance with the
methodology described in the Kreisschreiben Nr. 5 equals 89 % of its market value at the grant date. According to this methodology, the options/RSUs
granted with a vesting period of 1, 2 and 3 years had an average value of CHF 6.99 per option and CHF 17.24 per RSU at grant date. However, the
future compensation out of these options/RSUs granted will depend on the individual person’s employment with the Company, on the future develop-
ment of the Company’s share price and the timing of exercise.
6)Effective September 1, 2009, Mr. Vettier was appointed CEO, replacing Mr. Lavinia. The compensation covers the period from September 1, 2009, until
December 31, 2009.
7)Effective December 15, 2009, Mr. Skok was appointed General Counsel, replacing Mr. Gayda. Compensation for Mr. Skok covers the period from
December 15, 2009, until December 31, 2009.
8)Effective November 23, 2009, the Company’s commercial and refinery operations were combined and Mr. Jones’ position was eliminated. Mr. Jones
will continue to serve as an employee in a transition position until February 28, 2010. The compensation covers the period from January 1, 2009, until
December 31, 2009.
9)Effective December 15, 2009, Mr. Gayda resigned as General Counsel. Mr. Gayda continued to serve as an employee in a transition position until his
retirement on January 31, 2010. The compensation covers the period from January 1, 2009, until December 31, 2009.

Petroplus Holdings AG | Annual Report 2010 | Statutory Financial Statements | 145
Shares, RSUs and Options Ownership
The following table shows the total of shares, RSUs and options held by each member of the Board of Directors and members
of the Executive Committee based on the requirements of Article 663c, par 3 of the CO:
Board of Directors1)
Shares2) RSUs2, 3) Options2, 4) Total holdings2)
(in shares) 2010 2009 2010 2009 2010 2009 2010 2009
Thomas D. O’Malley 2,037,168 2,327,168 – – 1,739,638 1,739,638 3,776,806 4,066,806
(Chairman,
non-executive member)
2.14 % 2.70 % 1.83 % 2.01 % 3.97 % 4.71 %
Patrick Monteiro de Barros 325,350 325,350 – – 98,212 98,212 423,562 423,562
(Vice Chairman and Chairperson,
non-executive member)
0.34 % 0.38 % 0.10 % 0.11 % 0.44 % 0.49 %
Markus Dennler 20,758 20,758 – – 9,934 9,934 30,692 30,692
(Non-executive member and
Chairperson)
0.02 % 0.02 % 0.01 % 0.01 % 0.03 % 0.04 %
Walter Grüebler 19,632 19,632 – – 9,934 9,934 29,566 29,566
(Non-executive member) 0.02 % 0.02 % 0.01 % 0.01 % 0.03 % 0.03 %
Robert J. Lavinia 42,673 8,000 – 34,673 66,618 66,618 109,291 109,291
(Non-executive member and
former CEO)
0.04 % 0.01 % 0.04 % 0.07 % 0.08 % 0.11 % 0.13 %
Maria Livanos Cattaui 4,375 4,375 – – 10,836 10,836 15,211 15,211
(Non-executive member) 0.01 % 0.01 % 0.01 % 0.01 % 0.02 % 0.02 %
Eija Malmivirta 1,093 1,093 – – 10,836 10,836 11,929 11,929
(Non-executive member and
Chairperson)
0.00 % 0.00 % 0.01 % 0.01 % 0.01 % 0.01 %
Werner G. Müller 3,000 3,000 – – 10,836 10,836 13,836 13,836
(Non-executive member) 0.00 % 0.00 % 0.01 % 0.01 % 0.01 % 0.02 %
Patrick Power 2,340 2,340 – – 10,836 10,836 13,176 13,176
(Non-executive member) 0.00 % 0.00 % 0.01 % 0.01 % 0.01 % 0.02 %
Jean-Paul Vettier 1,715 – 30,638 5,144 – – 32,353 5,144
(Executive member and CEO) 0.00 % 0.03 % 0.01 % 0.03 % 0.01 %
Total 2,458,104 2,711,716 30,638 39,817 1,967,680 1,967,680 4,456,422 4,719,213
Total in % 2.58 % 3.14 % 0.03 % 0.05 % 2.07 % 2.28 % 4.68 % 5.47 %
Former Member of Board of Directors1)
Ernst Weil n/a 12,500 n/a – n/a 10,836 n/a 23,336
(Non-executive member) 0.01 % 0.01 % 0.02 %
Total n/a 12,500 n/a – n/a 10,836 n/a 23,336
Total in % 0.01 % 0.01 % 0.02 %
Footnotes for the table above are outlined on page 147.
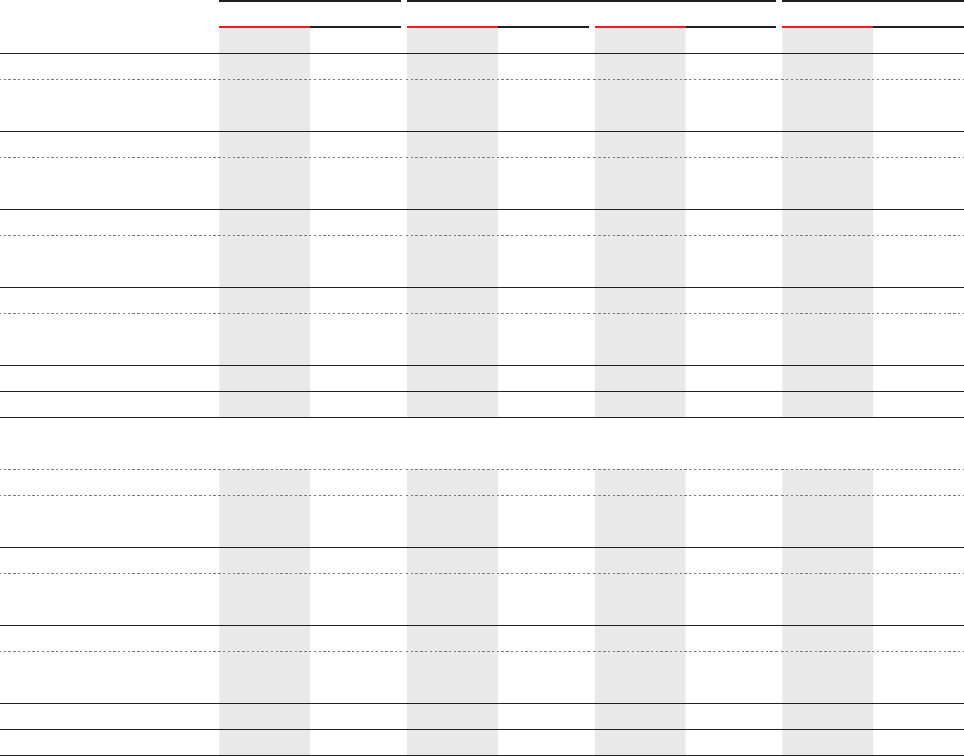
146 | Petroplus Holdings AG | Annual Report 2010 | Statutory Financial Statements
Loans to Acting Members of Governing Bodies
No loans have been granted to members of the Board of
Di
rectors or members of the Executive Committee during 2010
and 2009.
Executive Committee1)
Shares2) RSUs2, 3) Options2, 4) Total holdings2)
(in shares) 2010 2009 2010 2009 2010 2009 2010 2009
Chester J. Kuchta 21,906 20,237 34,681 26,005 91,364 135,071 147,951 181,313
(Executive Vice President and
Chief Operating Officer)
0.02 % 0.02 % 0.04 % 0.03 % 0.10 % 0.16 % 0.16 % 0.21 %
Peter F. Senkbeil 1,000 n/a 14,000 n/a 33,089 n/a 48,089 n/a
(General Manager Refining) 0.00 % 0.02 % 0.03 % 0.05 %
W. Thomas Skok – – 11,000 – 32,089 27,089 43,089 27,089
(General Counsel and
Corporate Secretary)
0.02 % 0.03 % 0.03 % 0.05 % 0.03 %
Joseph D. Watson – n/a – n/a 50,000 n/a 50,000 n/a
(Executive Vice President and
Chief Financial Officer)
0.05 % 0.05 %
Total 22,906 20,237 59,681 26,005 206,542 162,160 289,129 208,402
Total in % 0.02 % 0.02 % 0.08 % 0.03 % 0.22 % 0.19 % 0.32 % 0.24 %
Former Members of the Executive Committee1)
Karyn F. Ovelmen n/a 56,434 n/a 26,005 n/a 189,266 n/a 271,705
(Executive Vice President and
Chief Financial Officer)
0.07 % 0.03 % 0.23 % 0.31 %
Bruce A. Jones n/a 33,228 n/a 26,005 n/a 189,266 n/a 248,499
(Executive Vice President and
Chief Operating Officer)
0.04 % 0.03 % 0.22 % 0.29 %
Michael D. Gayda n/a 56,439 n/a 26,005 n/a 231,224 n/a 313,668
(Executive Vice President and
General Counsel)
0.07 % 0.03 % 0.27 % 0.37 %
Total n/a 146,101 n/a 78,015 n/a 609,756 n/a 833,872
Total in % 0.18 % 0.09 % 0.71 % 0.98 %
Footnotes for the table above are outlined on page 147.

Petroplus Holdings AG | Annual Report 2010 | Statutory Financial Statements | 147
Footnotes for the tables on page 145 & 146
1) Due to changes in the composition of the Board of Directors and the Executive Committee during 2010, the prior year ownership has been represented
to reflect the current composition of the Board of Directors and the Executive Committee.
2) Ownership of the Company’s outstanding share capital as of December 31, 2010 (95,230,953) and December 31, 2009 (86,325,289)
3) RSUs granted under the Equity Participation Plan entitle the participant to receive one share upon vesting. The RSUs are subject to a vesting period
of up to three years. Further information is disclosed in Note 22 “Shareholders’ Equity” and Note 24 “Share-based Payments” of the Consolidated
Financial Statements.
4) Options granted under the Equity Participation Plan (strike prices range from CHF 11.92 to CHF 119.98) and the Equity Incentive Plan (strike price
USD 14.58) with the right to purchase one share for one option upon vesting. The options under the Equity Participation Plan are subject to a three-year
graded vesting period or a vesting period of up to four years, depending on the grant date; the options under the Equity Incentive Plan are exercis-
able at predefined dates (further information is disclosed in Note 22 “Shareholders’ Equity” and Note 24 “Share-based Payments” of the Consolidated
Financial Statements). Details regarding call-options allocated to members of the Board of Directors and the Executive Committee are outlined below:
Name
Number Exercise price Vesting date Expiry date or
exercisable
Board of Directors
Thomas D. O’Malley 537,322 14.58 USD vested 2014
645,675 14.58 USD vested 2015
491,629 14.58 USD vested 31.07.2016
65,012 68.25 CHF vested 03.01.2017
Patrick Monteiro de Barros 87,376 14.58 USD vested 31.07.2016
2,709 58.14 CHF vested 29.11.2016
8,127 91.69 CHF vested 09.05.2017
Markus Dennler 1,807 58.14 CHF vested 29.11.2016
8,127 91.69 CHF vested 09.05.2017
Walter Grüebler 1,807 58.14 CHF vested 29.11.2016
8,127 91.69 CHF vested 09.05.2017
Robert J. Lavinia 10,836 91.69 CHF vested 09.05.2017
55,782 21.41 CHF vested 05.01.2019
Maria Livanos Cattaui 2,709 58.14 CHF vested 29.11.2016
8,127 91.69 CHF vested 09.05.2017
Eija Malmivirta 2,709 58.14 CHF vested 29.11.2016
8,127 91.69 CHF vested 09.05.2017
Werner G. Müller 10,836 91.69 CHF vested 09.05.2017
Patrick Power 2,709 58.14 CHF vested 29.11.2016
8,127 91.69 CHF vested 09.05.2017
Executive Committee
Chester J. Kuchta 54,177 68.25 CHF vested 03.01.2017
37,187 21.41 CHF 05.01.2012 05.01.2019
Peter F. Senkbeil 27,089 91.69 CHF vested 09.05.2017
6,000 11.92 CHF 01.10.2014 01.10.2020
W. Thomas Skok 16,253 87.91 CHF vested 07.02.2017
10,836 119.98 CHF vested 05.07.2017
5,000 11.92 CHF 01.10.2014 01.10.2020
Joseph D. Watson 50,000 11.92 CHF 01.10.2014 01.10.2020
148 | Petroplus Holdings AG | Annual Report 2010 | Statutory Financial Statements
7 Contingent Liabilities/Guarantees
and Pledges
The Company is part of a value added tax (“VAT”) group and,
therefore, jointly liable to the Swiss Federal Tax Department for
the VAT liability of the other members.
The Company guarantees certain obligations of its subsidiar-
ies to third parties. The guarantees are denominated in USD,
CZK and EUR. At December 31, 2010, Petroplus Holdings AG
had guarantees outstanding for a maximum amount of ap-
proximately CHF 0.3 billion (2009: CHF 0.5 billion).
Certain of Petroplus Holdings AG’s subsidiaries are party to a
committed USD 1.05 billion (CHF 0.98 billion) multi-currency
secured revolving credit facility agreement (2009: USD 1.05
billion/CHF 1.1 billion) with an additional uncommitted credit
facility of USD 1.07 billion (CHF 1.0 billion) as of December 31,
2010 and USD 1.06 billion (CHF 1.1 billion) as of December 31,
2009. Petroplus Holdings AG is a guarantor of these facilities.
As of December 31, 2010, no bank borrowings and short-term
loans (2009: USD 138.8 million or CHF 142.9 million) were out-
standing. Letters of credit and guarantees of approximately
USD 1.7 billion (CHF 1.6 billion) were drawn as of December
31, 2010 (2009: USD 1.7 billion or CHF 1.7 billion). Additionally,
the Company is guarantor for foreign currency mark to market
limits in the amount of USD 30 million to an indirectly owned
subsidiary.
The Company does, together with certain subsidiaries, jointly
and severally guarantee Petroplus Finance Limited’s obliga-
tions under the USD 1.2 billion notes issued on May 1, 2007
and USD 0.4 billion notes issued on September 17, 2009, both
listed on the Irish Stock Exchange. In addition, the shares held
in Petroplus Finance Ltd., Bermuda, have been pledged to
secure the Senior Notes in the carrying amount of CHF 12,200.
On October 16, 2009, Petroplus Finance Ltd. issued USD
150.0 million in guaranteed senior secured convertible bonds
due 2015 (“2015 CB”). The debt is guaranteed by the Company
as well as by certain of its subsidiaries. In addition, Petroplus
Holdings AG will grant to Petroplus Finance Ltd. 5,162,229 call
options whereby each call option relates to, and gives Petro-
plus Finance Ltd. the right to acquire from Petroplus Holdings
AG, one share at a price per share equal to the conversion
price applicable on the relevant conversion date. In 2010 and
2009, no bonds were converted. Further information on the
2015 CB can be found in Note 18 “Interest-Bearing Loans
and Borrowings” to the Consolidated Financial Statements of
Petroplus Holdings AG.
On March 26, 2008, Petroplus Finance Ltd. issued USD 500.0
million in guaranteed convertible bonds due in 2013 (“2013 CB”).
The debt was guaranteed by Petroplus Holdings AG as well as
by certain of its subsidiaries. During 2009 and 2008, no bonds
were converted. The terms and conditions included an investor
put option on March 28, 2011 for principal plus accrued interest.
On October 12, 2009, Petroplus announced the successful result
of the tender offer to repurchase the 2013 CB. The last day the
2013 CB was traded on the SIX Swiss Exchange was October
13, 2009. The 2013 CB was redeemed on October 16, 2009 at
the principal amount of USD 100,000 per bond, plus accrued
interest calculated from September 26, 2009 until October 16,
2009 (20 days).
8 Risk Assessment Disclosures
Petroplus Holdings AG, as the ultimate parent Company, is fully
integrated into the group-wide internal risk assessment process.
The Company has established an organizational framework for
risk assessment and management which includes risk identi-
fication and appraisal, development of acceptable exposure
limits, implementation of strategies, policies and procedures
to mitigate identified financial risks, and the monitoring of com-
pliance with such strategies, policies and procedures.
The Board of Directors of Petroplus Holdings AG and the Ex-
ecutive Committee have overall responsibility for the Compa-
ny’s risk management strategies. Risk Owners, comprised of
key members of senior management, are responsible for the
day-to-day execution of corporate risk strategies and policies,
while Risk Committees, comprised of financial disclosure ex-
perts, procedures and controls experts and appropriate sub-
ject matter experts evaluate the adequacy of the implementa-
tion and execution of the strategies and policies by the Risk
Owners.
The Company’s internal risk assessment process consists of
regular reporting to the
Board of Directors
on identified risks
and management’s reaction to them. The
Board of Directors
has
performed the risk assessment based on the Company’s internal
risk assessment process and monitors management’s response
to the risks identified.
Further disclosures regarding risk management are included
in the Petroplus Group Consolidated Financial Statements in
Note 27 “Financial Risk Management Objectives and Policies”.

Petroplus Holdings AG | Annual Report 2010 | Statutory Financial Statements | 149
9 Authorization of Statutory
Financial Statements
These Statutory Financial Statements have been authorized
for issue by the Board of Directors on February 28, 2011 and
will be recommended for approval at the Annual Shareholders’
Meeting on May 5, 2011.
Zug, February 28, 2011
Petroplus Holdings AG
For the Board of Directors
Patrick Monteiro de Barros
Chairman of the Board of Directors
150 | Petroplus Holdings AG | Annual Report 2010 | Statutory Financial Statements
Report of the Statutory Auditor
Petroplus Holdings AG | Annual Report 2010 | Statutory Financial Statements | 151

152 | Petroplus Holdings AG | Annual Report 2010 | Glossary
The following explanations are not intended as technical definitions, but to assist the general reader to understand
certain terms as used in the annual report.
API gravity The API gravity illustrates the density of crude oil classified by the American
Petroleum Institute. The API gravity is defined as:
141.5 –131.5
Gravity of specific crude oil at 15.6°C
Thus, the higher the API gravity is, the lighter is the crude oil.
ARA Antwerp–Rotterdam–Amsterdam.
Barrel (bbl) Barrel of crude oil, 159 liters by volume.
Biofuel Gasoline or diesel fuel that contains components derived from plants, such as sugar
cane, sugar beet, rapeseed and Soya.
Bitumen A residual product of crude-oil vacuum distillation, which is primarily used for asphalt
coating of roads and roofing materials.
bpd Barrels per day.
Brent A light North Sea crude oil with API gravity of approximately 39° and a sulfur content of
approximately 0.4 %.
C.I.F. Cost, insurance and freight. A delivery term that includes the costs as well as freight and
insurance charges of the delivery of goods to a named destination as defined in the ICC
(International Chamber of Commerce) Incoterms 2000.
CO2 Carbon dioxide, a significant greenhouse gas.
Complexity A key industry measure referring to an oil refinery’s ability to process feedstocks, such
as heavier and higher sulfur content crude oils, into value-added products. Generally,
the higher the complexity and more flexible the feedstock slate, the better positioned the
refinery is to take advantage of the more cost effective crude oils, resulting in incremental
gross margin opportunities for the refinery.
Cracking The conversion of large hydrocarbon molecules into smaller ones. Cracking is carried
out either at high temperatures (thermal cracking), or with the aid of a catalyst and high
pressure (catalytic cracking and hydrocracking). The cracking process enables greater
quantities of saturated hydrocarbons suitable for gasoline and other light fractions to be
recovered from crude oil.
Crack Spread A proxy, or a benchmark, for refining margins referring to the margin that would
accrue from the simultaneous purchase of crude oil and the sale of refined petroleum
products, in each case at then prevailing price. For example, 3/2/1 crack spread is often
referenced and represents the approximate gross margin resulting from processing one
barrel of crude oil, assuming that three barrels of a benchmark crude oil are converted,
or cracked, into two barrels of gasoline and one barrel of diesel.
Dated Brent The price for prompt shipments of Brent crude as reported by price agencies. It is the
price benchmark for the vast majority of crude oils sold in Europe, Africa and the Middle
East, and one of the most important benchmarks for spot-market prices.
Desulfurization or Hydrotreating A process to remove sulfur from petroleum products.
Distillates Any of wide range petroleum of products produced generally by distillation, the primary
refining step in which crude oil is separated into fractions or components. These com-
monly include diesel, heating oil and jet kerosene but exclude gasoline and naphthas.
FAME Fatty Acid Methyl Ester; primarily obtained from vegetable oils used for diesel blending
to comply with biofuels regulations.
Feedstocks Crude oil and other hydrocarbons used as basic materials in a refining or manufacturing
process.
Glossary

Petroplus Holdings AG | Annual Report 2010 | Glossary | 153
Fluid catalytic cracking (FCC) The refining process of breaking down the larger, heavier, and more complex hydro-
carbon molecules into simpler and lighter molecules. Fluid catalytic cracking is accom-
plished by the use of a catalytic agent, which is continuously re-generated and is an
effective process for increasing the yield of gasoline from crude oil. Catalytic cracking
processes fresh feedstocks as well as recycled feedstocks.
Gasoil A liquid petroleum product with a boiling range temperature of 200°–370°C and an ig-
nition temperature over 55°C that is typically used as a fuel for boilers, furnaces and
internal combustion engines. The type of gasoil suitable for use in oil-fired heating plants
and boilers is called heating oil, while the type suitable for internal combustion engines is
called diesel.
Gasoline A light liquid petroleum product that is typically used as a fuel for internal combustion
engines.
Heating oil A gasoil with properties that generally make it suitable as a fuel for oil-fired heating and
boilers.
Heavy fuel oil Fuel oil with a distillation range of over 350°C. Heavy fuel oil is used in heat plants, power
stations and industrial furnaces.
Heavy sour Crude oils with a sulfur content greater than 2.0 % and a density less than 30° API.
Heavy sweet Crude oils with a sulfur content less than 0.5 % and a density less than 30° API.
Hydrocracking The conversion and desulfurization process (typically of vacuum gasoil) into lighter prod-
ucts such as diesel that takes place at high pressure and temperature in the presence of
hydrogen and a fixed catalyst.
Light sour Crude oils with a sulfur content between 0.5 % and 1.0 % and a density greater than 30°
API.
Light sweet Crude oils with a sulfur content less than 0.5 % and a density greater than 30° API.
LPG Liquefied Petroleum Gas; a gas mixture used for fuel purposes, containing propane, pro-
pylene, butane, or butylenes as its main components that has been liquefied to enable it
to be transported and stored under pressure.
Medium sour Crude oils with a sulfur content between 1.0 % and 2.0 % and a density between 30° to
35° API.
Medium sweet Crude oils with a sulfur content less than 0.5 % and a density between 30° to 35° API.
Naphtha A liquid petroleum product that is typically used as a feedstock for other petrochemical
processes, generally in a reformer, producing high octane gasoline and hydrogen or
other petrochemical products. Naphtha is also used as a chemical feedstock.
Natural gas Any hydrocarbons or mixture of hydrocarbons and other gases consisting primarily of
methane which at normal operating conditions is in a gaseous state.
Petrochemicals Many products derived from crude oil refining, such as ethylene, propylene, butylenes
and isobutylene, primarily intended for use as petrochemical feedstock in the production
of plastics, synthetic fibers, synthetic rubbers and other products. A variety of products
are produced for use as solvents, including benzene, toluene and xylene.
Refinery A facility used to process crude oil. The basic process unit in a refinery is a crude oil distil-
lation unit, which splits crude oil into various fractions through a process of heating and
condensing. Simple, or hydroskimming, refineries normally have crude oil distillation, cata-
lytic reforming, and hydrotreating units. The demand for lighter petroleum products, such
as motor gasoline and diesel fuel, has increased the need for more sophisticated process-
ing. More complex refineries have vacuum distillation, catalytic cracking, or hydrocracking
units. Cracking units process vacuum oil into gasoline, gasoil, and heavy fuel oil.
Refining margin The difference, for any particular quantity of crude oil, between the value of all the refined
petroleum products a refinery is able to produce from such crude oil minus the cost of
the crude oil (including associated costs such as transport, insurance, etc.).

154 | Petroplus Holdings AG | Annual Report 2010 | Glossary
Rhine Freight Premium The Rhine freight premium is a price reflected in the oil products sold within Switzerland.
It represents the additional alternative cost to an importer when bringing the same prod-
uct into the Switzerland area from ARA or Germany along the River Rhine.
Solvent A liquid that is used for diluting or thinning a solution. A liquid that absorbs another liquid,
gas, or solid in order to form a homogeneous mixture.
Spot market A term used to describe the international trade in one-off cargoes or shipments of com-
modities, such as crude oil, in which prices closely follow demand and availability.
Ton One ton represents 1,000 kilograms or approximately 2,205 pounds.
ULSD Ultra low sulfur diesel.
Urals Russian benchmark crude oil which is a medium sour crude oil with API gravity of ap-
proximately 31° and a sulfur content of approximately 13 %.
Vacuum gasoil or VGO Also known as cat feed. Feedstock for fluid catalytic cracker used to make gasoline,
No. 2 and other by-products.
Key Date
Annual General Meeting
May 5, 2011, Casino Zug
Contact Information
Registered office
Petroplus Holdings AG
Industriestrasse 24
6300 Zug
Switzerland
Phone +41 58 580 11 00
Fax +41 58 580 13 99
For further information regarding
Petroplus please contact
Petroplus Holdings AG
Investor Relations
Phone +41 58 580 12 44
Fax +41 58 580 13 87
E-mail ir@petroplus.biz
Petroplus on the Internet
www.petroplusholdings.com
The Petroplus Annual Report 2010 is originally published in English
and is translated into German. Only the printed version in English is
considered to be legally binding.
The reports are available online at www.petroplusholdings.com.
Publisher: Petroplus Holdings AG, Zug, Switzerland
Realization, production and print:
Victor Hotz AG, Corporate Publishing & Print,
Steinhausen, Switzerland
Pictures on page 8: fotoARION, Zurich, Switzerland
© Petroplus Holdings AG, 2011

