Microsoft C3 Workshop_Track 2_Sizing Calcs_6 5 12 [Compatibility Mode] 000 Gpd To 288 Workshop Track 2 Sizing Calcs 6
User Manual: 000 gpd to 288
Open the PDF directly: View PDF ![]() .
.
Page Count: 38

C.3 Workshop – Track 2:
Sizing Calculations and
Design Considerations for
LID Treatment Measures
Jill Bicknell, P.E., EOA, Inc.
Santa Clara Valley Urban Runoff Pollution Prevention Program

Presentation Overview
Determining Water Quality Design Flow
and Volume (“QBMP” and “VBMP”)
Sizing Bioretention and Flow-Through
Planters
Sizing Pervious Paving and Infiltration
Trenches
Sizing Rainwater Harvesting Cisterns
Sizing Non-LID Components
C.3.d Sizing Criteria
Volume-based sizing criteria:
• URQM Method - use formula and volume capture
coefficients in “Urban Runoff Quality Management”,
WEF/ASCE MOP No. 23 (1998), pages 175-178
• CASQA BMP Handbook Method - Determine
volume equal to 80% of the annual runoff, using
methodology in Appendix D of the CASQA BMP
Handbook (2003) using local rainfall data
–Sizing curves specific to Santa Clara Valley
provided in Appendix B of C.3 Handbook
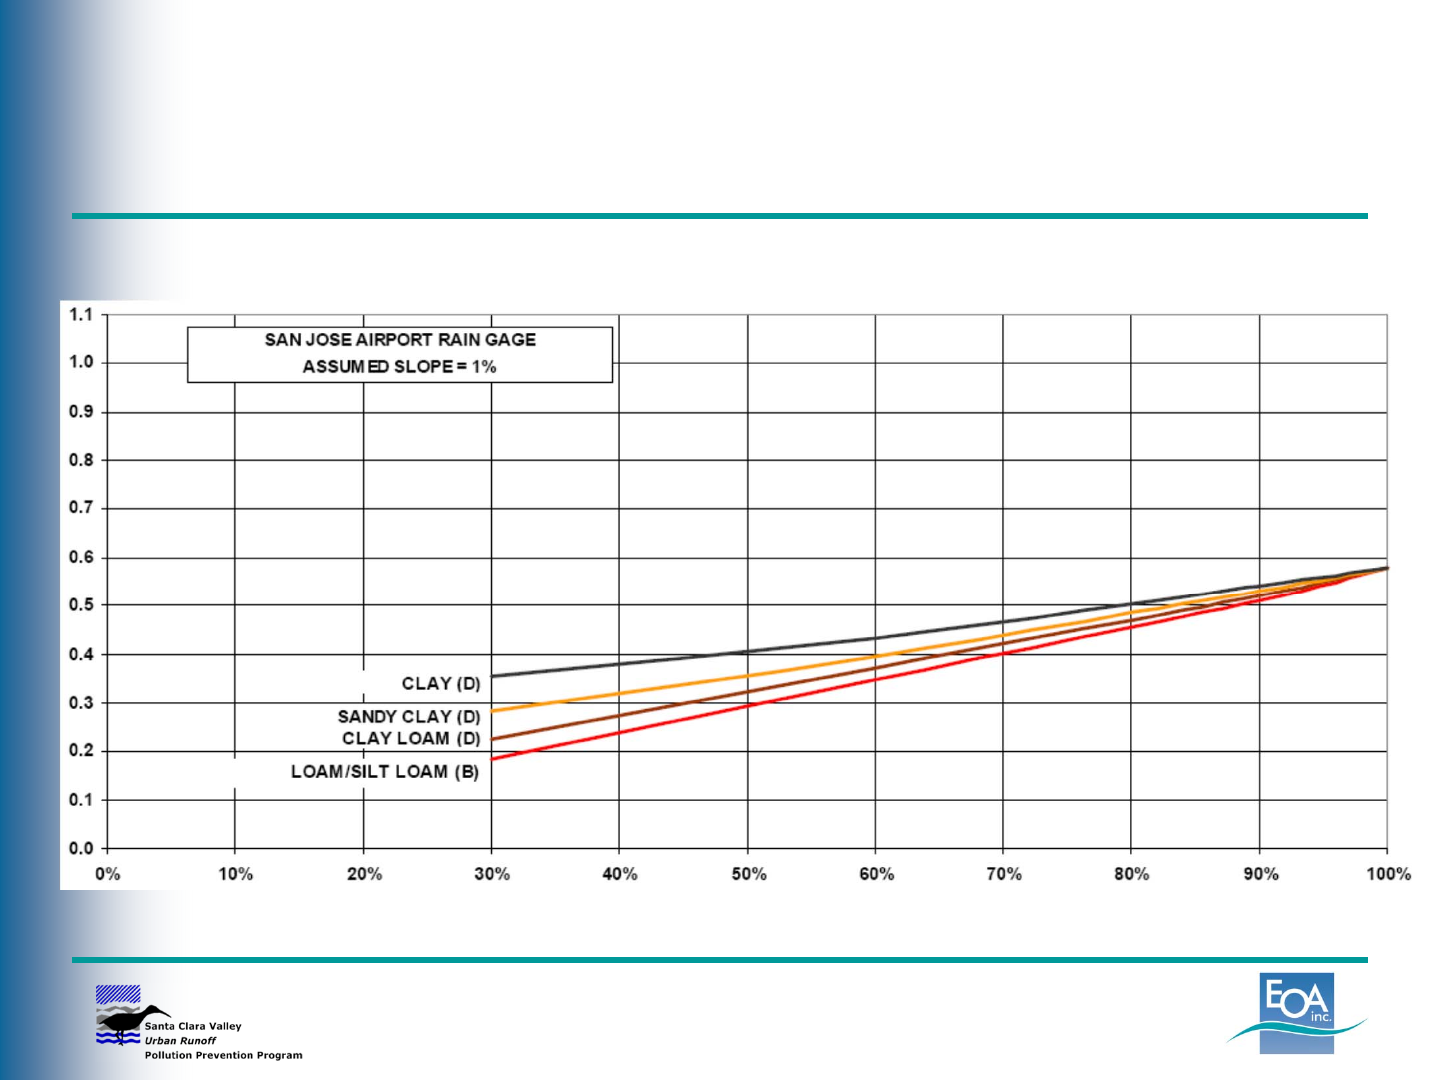
Unit Basin Storage Volume
for 80% Capture (inches)
San Jose Rain Gage, 1% Slope
Percent Imperviousness

C.3.d Sizing Criteria
Flow-based sizing criteria:
• Factored Flood Flow - 10% of the 50-year peak flow
rate, determined using Intensity-Duration-Frequency
curves published by the local flood control agency
• Percentile Rainfall Intensity - Flow of runoff
produced by a rain event equal to two times the 85th
percentile hourly rainfall intensity
–Data for Santa Clara Valley rain gages in Sizing
Worksheets (Appendix B of C.3 Handbook)
•Uniform Intensity - Flow of runoff resulting from
a rain event equal to 0.2 inches per hour intensity
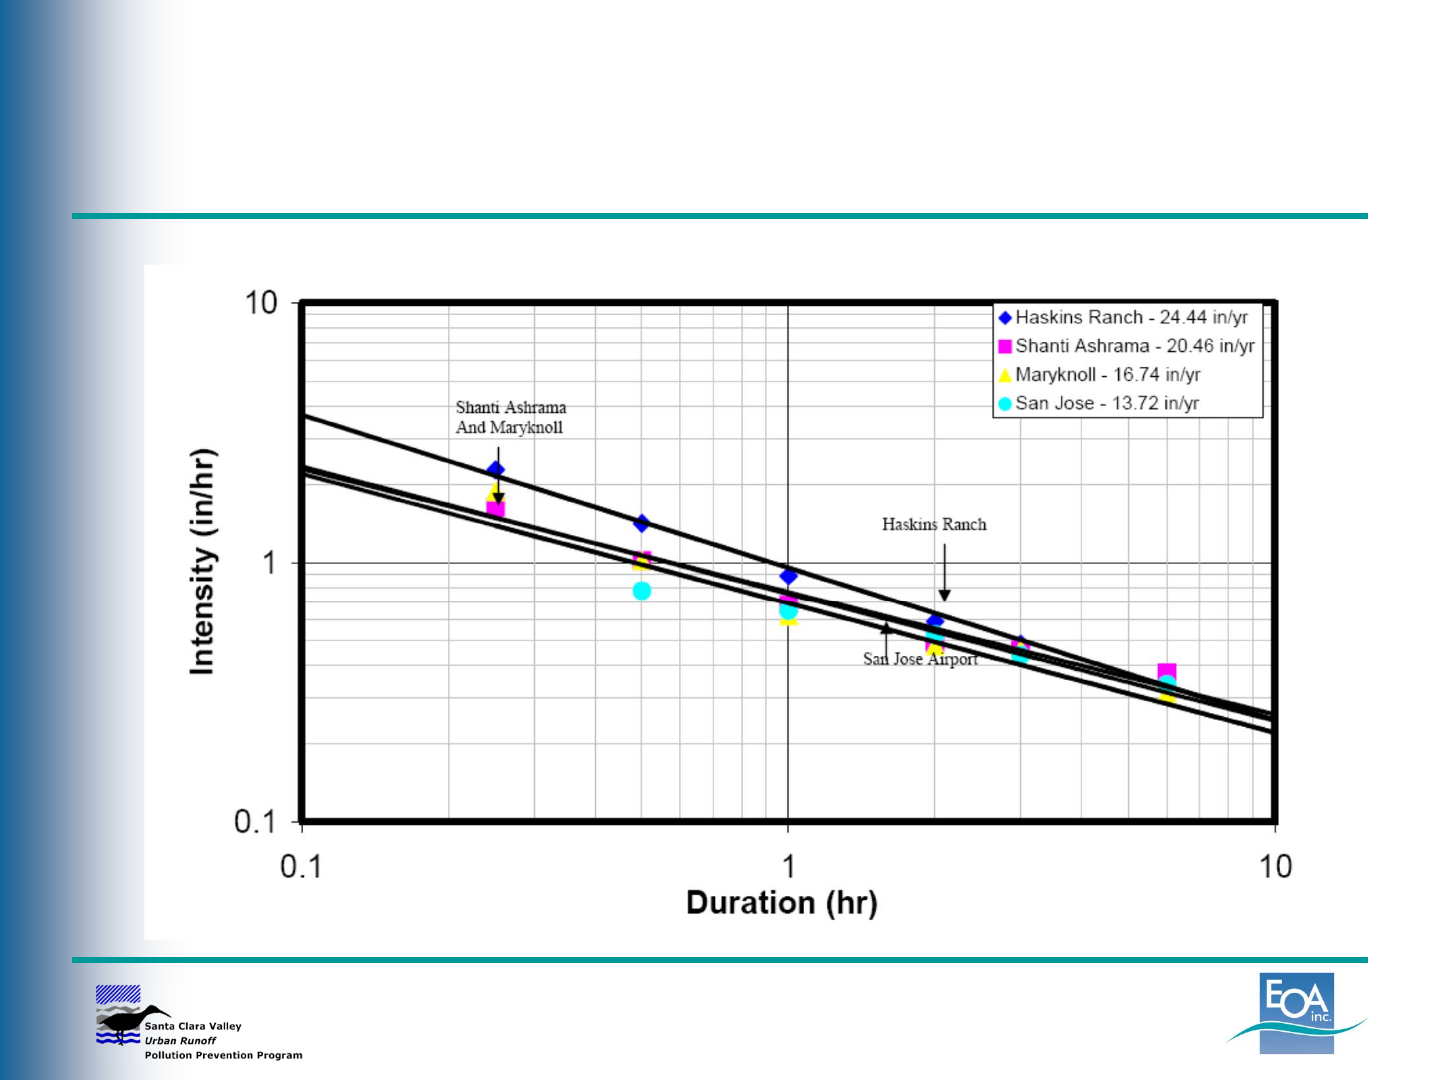
Intensity-Duration-Frequency Curve
(50-Year Return Period)
C.3.d Sizing Criteria
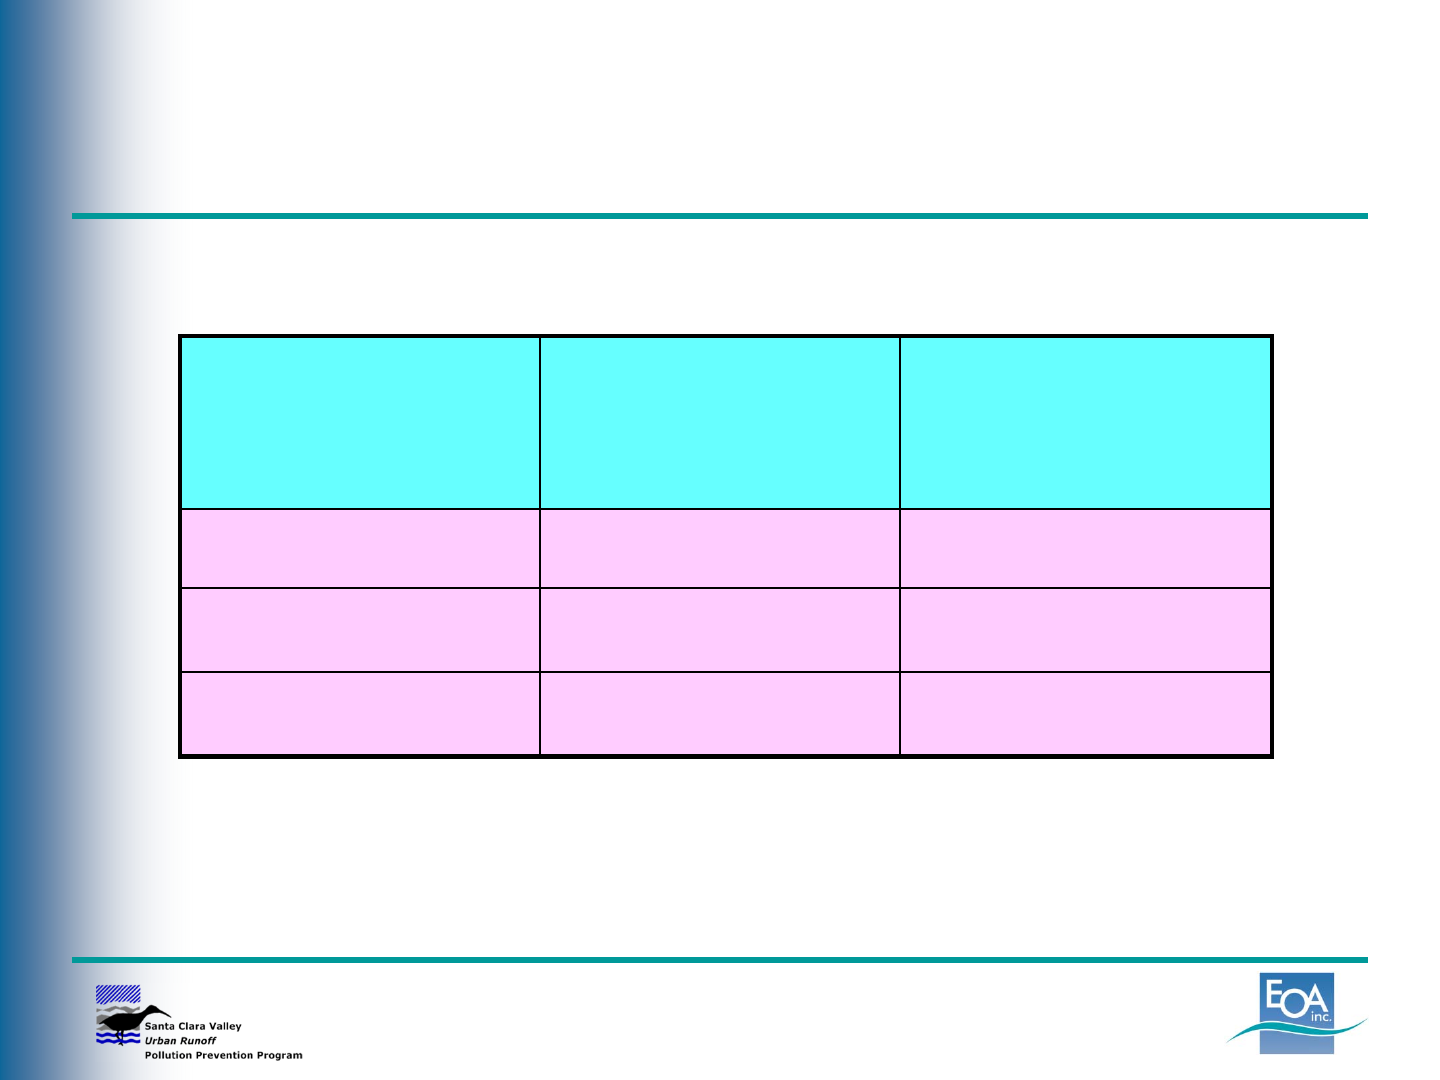
85th Percentile Rainfall Intensity Data:
Reference Rain
Gages 85th Percentile
Hourly Rainfall
Intensity (in/hr)
Design Rainfall
Intensity (in/hr)*
San Jose Airport 0.087 0.17
Palo Alto 0.096 0.19
Morgan Hill 0.12 0.24
*Design rainfall intensity = 2 X 85th percentile hourly rainfall intensity
By comparison, Uniform Intensity = 0.2 in/hr

C.3.d Sizing Criteria
Flow-based sizing criteria:
• Simplified Sizing Approach – Variation of Uniform
Intensity Method (0.2 in/hr)
– The surface area of a biotreatment measure is sized to be
4% of the contributing impervious area
– Based on a runoff inflow of 0.2 in/hr (assume equal to the
rainfall intensity), with an infiltration rate through the
biotreatment soil of 5 in/hr
(0.2 in/hr ÷5 in/hr = 0.04)
– Conservative approach because does not account for
surface ponding – good for planning purposes

C.3.d Sizing Criteria
Combination Flow & Volume Design Basis:
• Treatment systems can be sized to treat “at least
80% of total runoff over the life of the project”
• Option 1: Use a continuous simulation hydrologic
model (typically not done for treatment measures)
• Option 2: Show how treatment measure sizing
meets both flow and volume-based criteria
– Used for bioretention and flow-through planters
– Appropriate where drainage area is mostly impervious
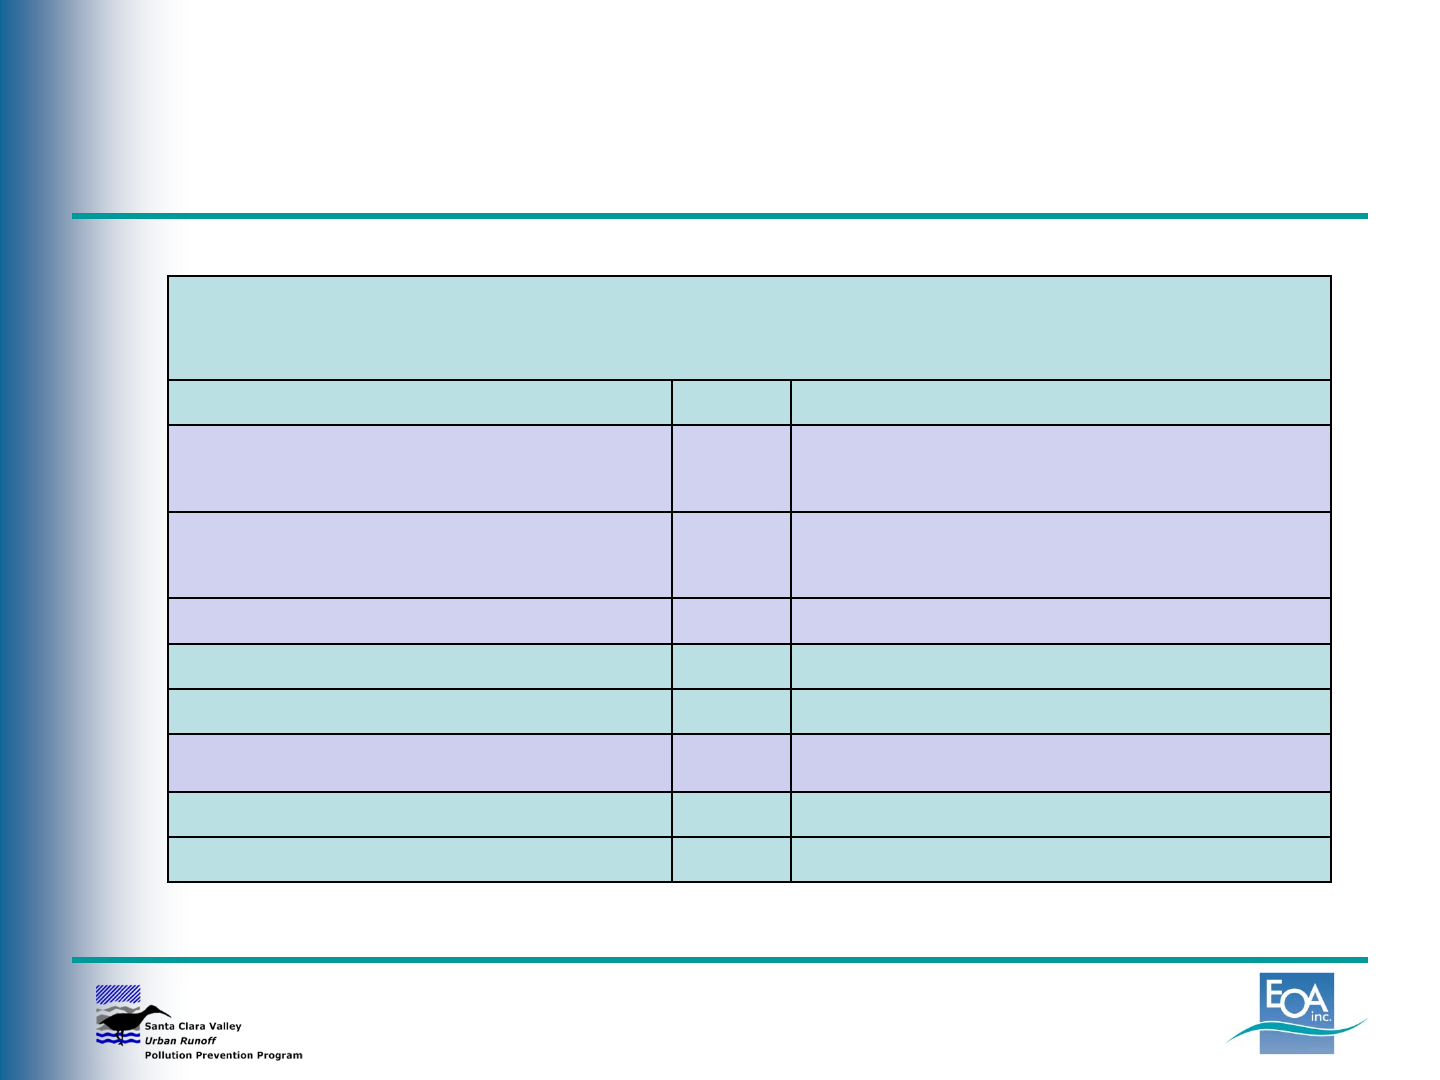
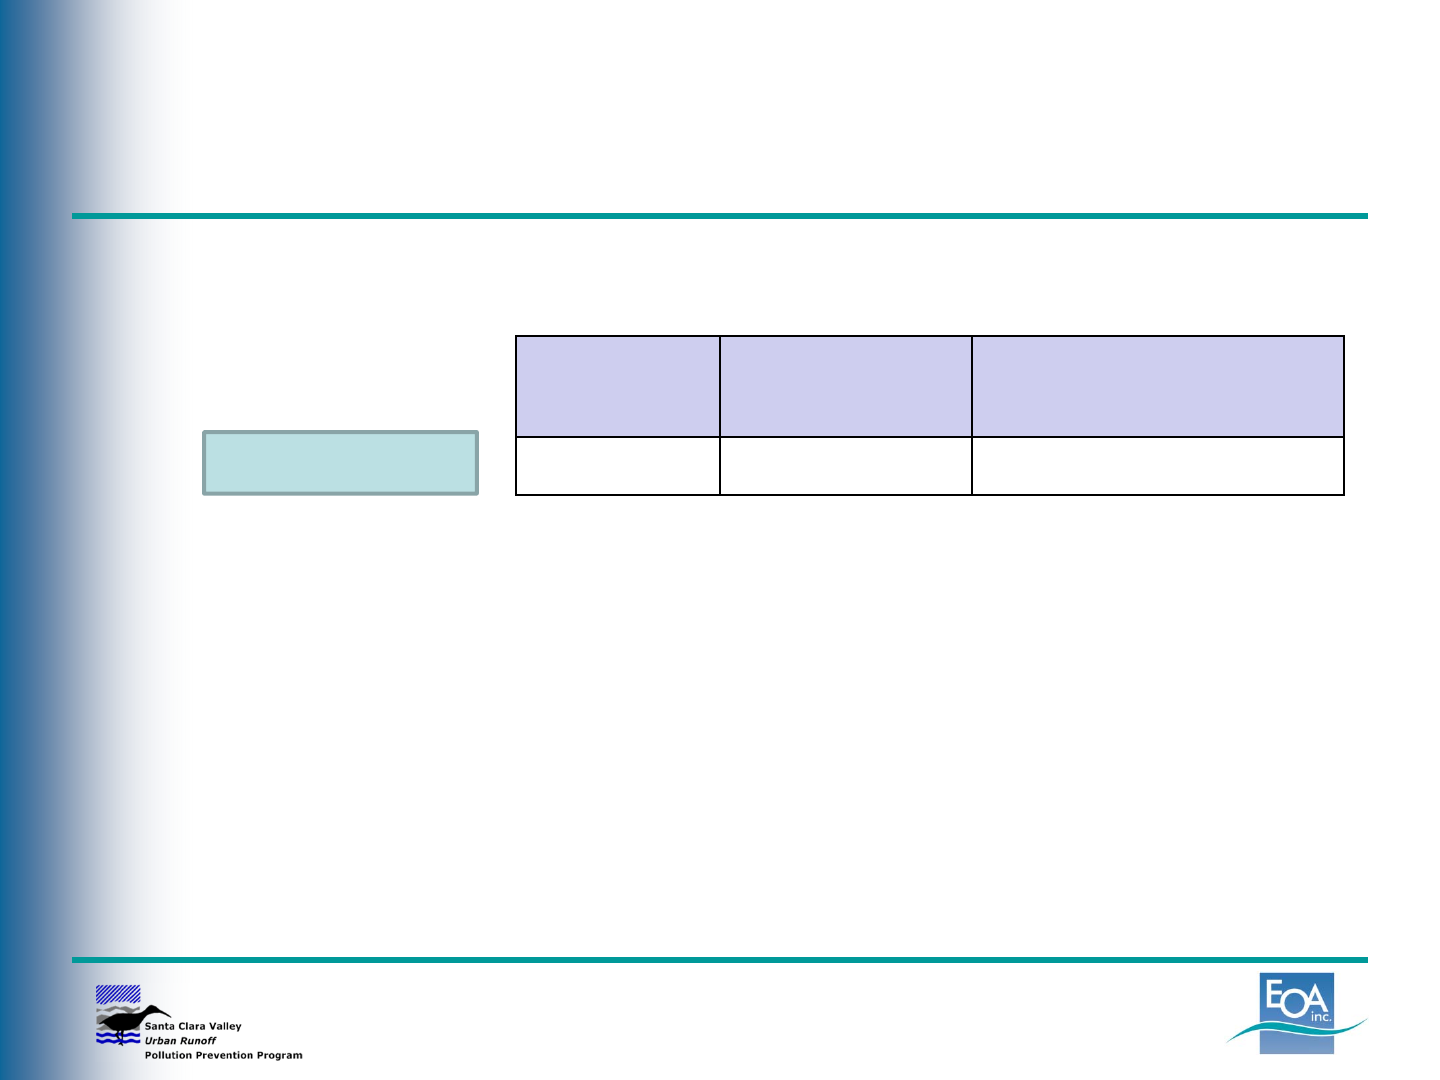
Flow- or Volume-Based Sizing
for Treatment Measures?
Table 5-1
Flow and Volume Based Treatment Measure Sizing Criteria
Type of Treatment Measure LID? Hydraulic Sizing Criteria
Bioretention area Yes Flow- or volume-based or
combination
Flow-through planter box Yes Flow- or volume-based or
combination
Tree well filter Yes Flow-based
Infiltration trench Yes Volume-based
Subsurface infiltration system Yes Volume-based
Rainwater harvesting and use Yes Volume-based
Media filter No Flow-based
Extended detention basin No Volume-based

Sizing Criteria Worksheets
Appendix B of SCVURPPP C.3 Handbook
• Worksheets for determining water quality design
flow and volume
• Figure B-1: Soil Texture and Mean Annual
Precipitation (MAP) Depths
• Figures B-2 – B-7: Unit Basin Storage Volume for
80% Capture (3 gages, 1% and 15% slopes)
• Figure B-8: Intensity-Duration-Frequency Curves for
50-year Return Period (4 gages)
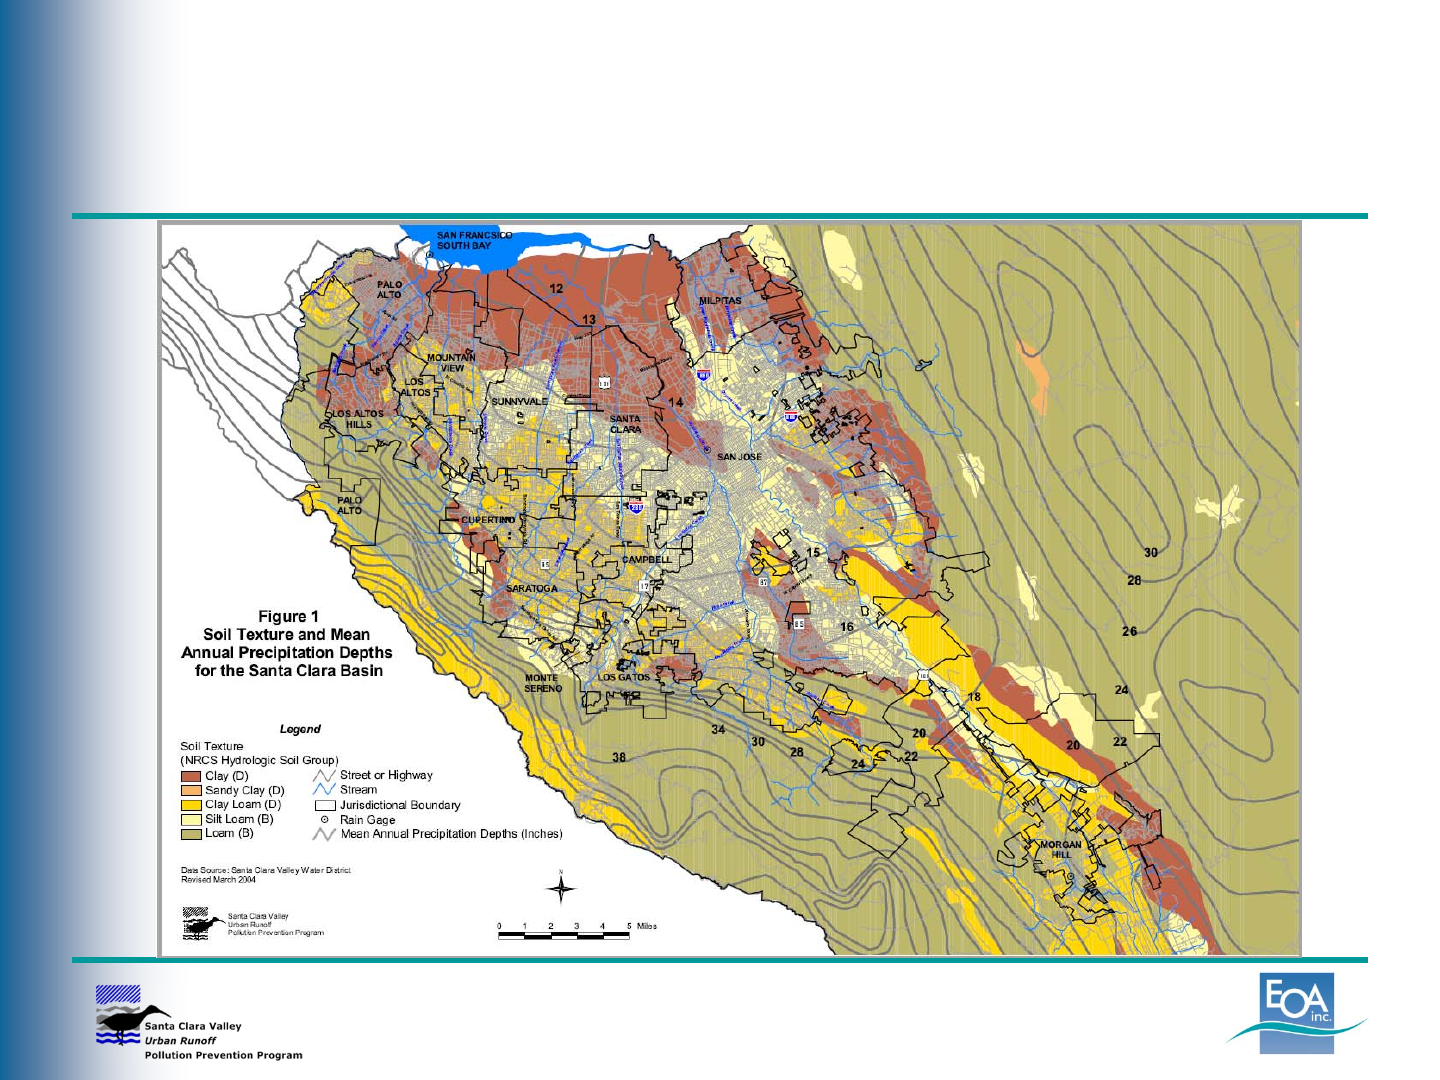
Figure B-1: Soil Texture and Mean
Annual Precipitation (MAP) Depth
Sizing Example #1
Parking lot in Santa Clara
• Area = 35,000 sq. ft.
(0.80 acres)
• 100% impervious
• Slope = 1%
• Mean annual precipitation
(MAP) = 15 inches
Use the sizing worksheets
to determine QBMP and VBMP
Answer: VBMP = 1,819 cu. ft.; QBMP = 0.103 cfs
35,000 sq. ft.

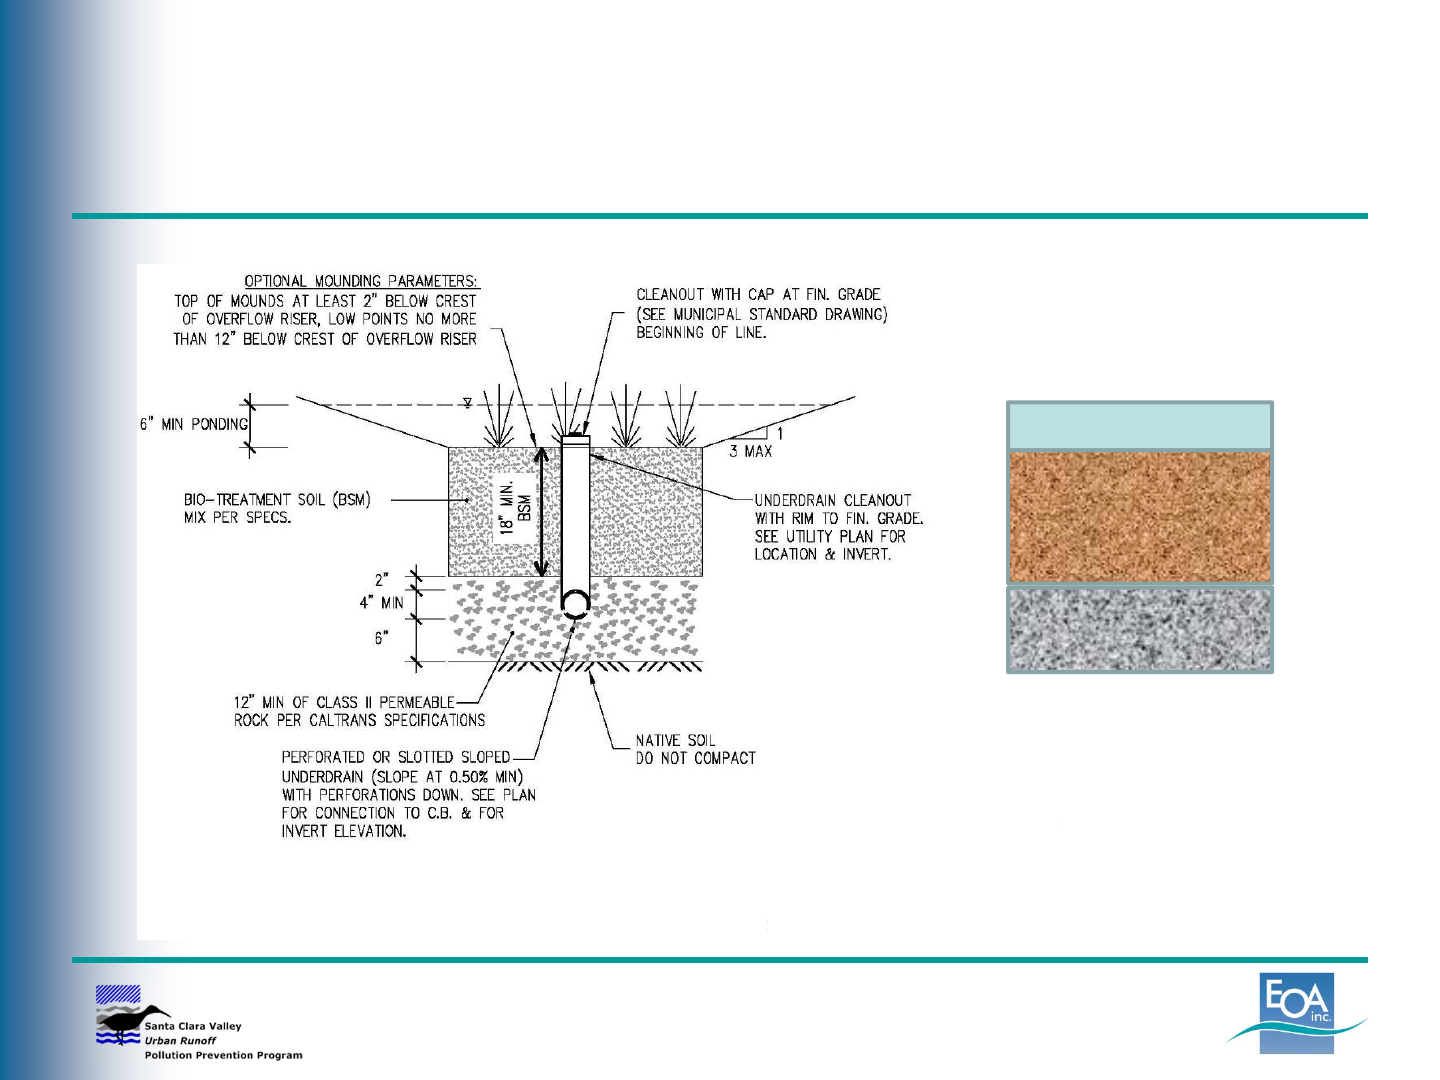
Sizing Bioretention Facilities
Simplified Sizing Approach
• Surface area is 4% of contributing impervious area
• Does not consider storage in surface ponding area
Volume Based Approach
•Store VBMP in just surface ponding area
•Store
VBMP in ponding area, soil media & drain rock
Combination Flow and Volume Approach
• Compute both QBMP and VBMP
• Route through facility, allowing ponding
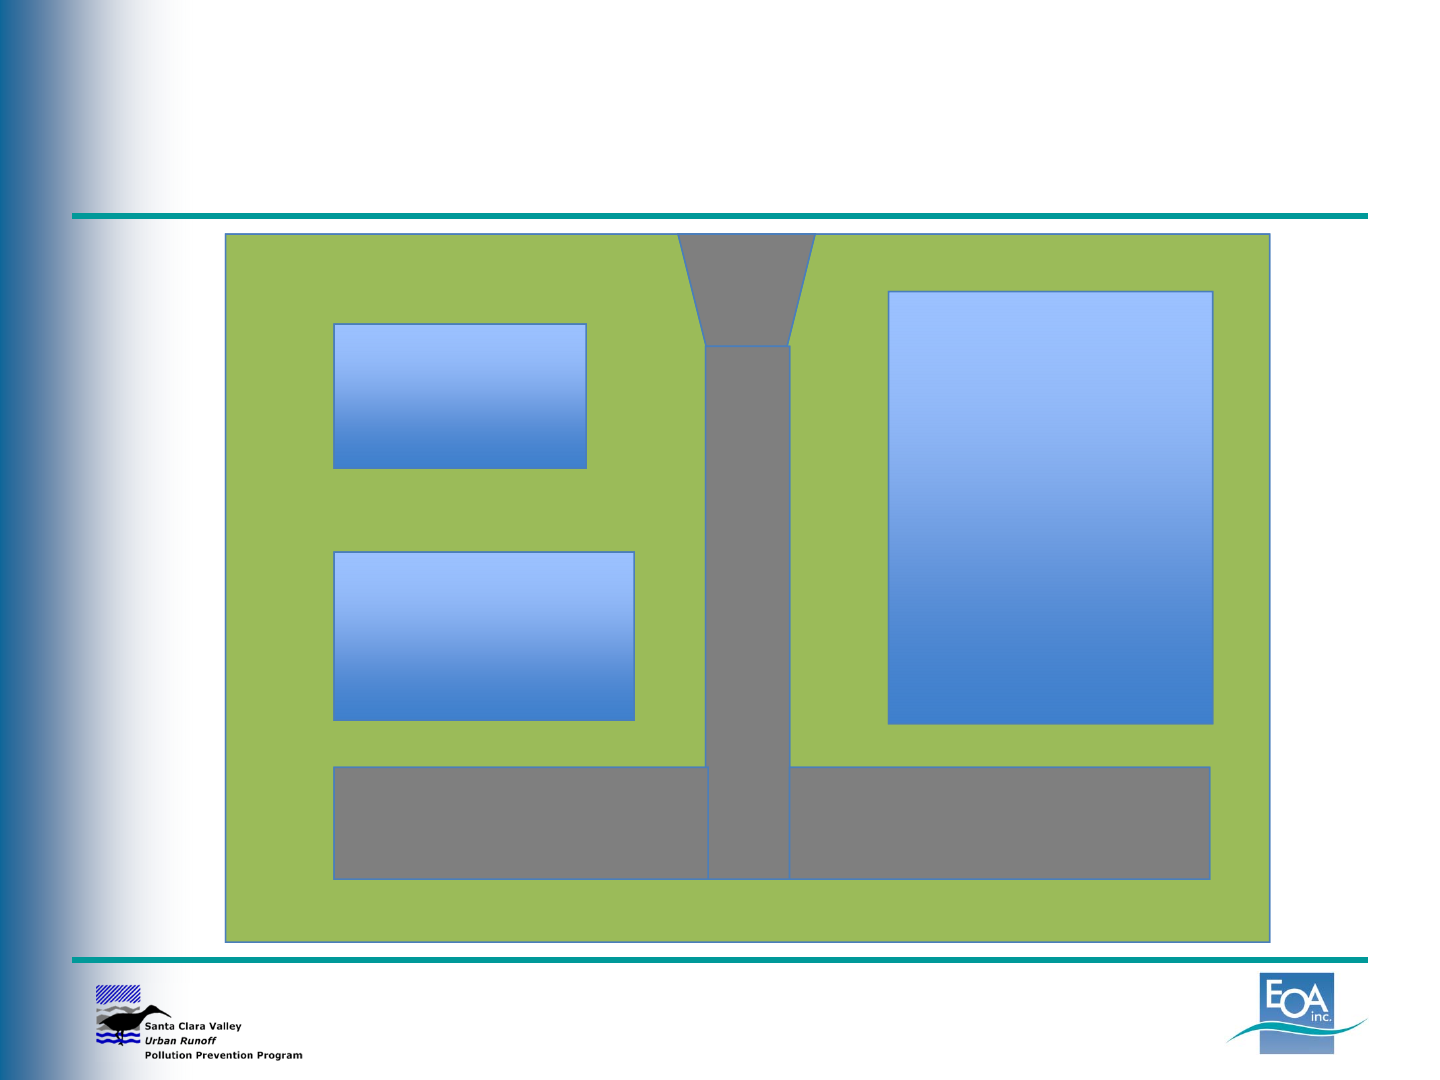
Sizing Bioretention Facilities:
Volume-Based Approach
V1
V2
V3
Sizing Bioretention Facilities:
Volume-Based Approach
V1
Depth
(ft) Porosity Volume per sq. ft.
(cubic feet)
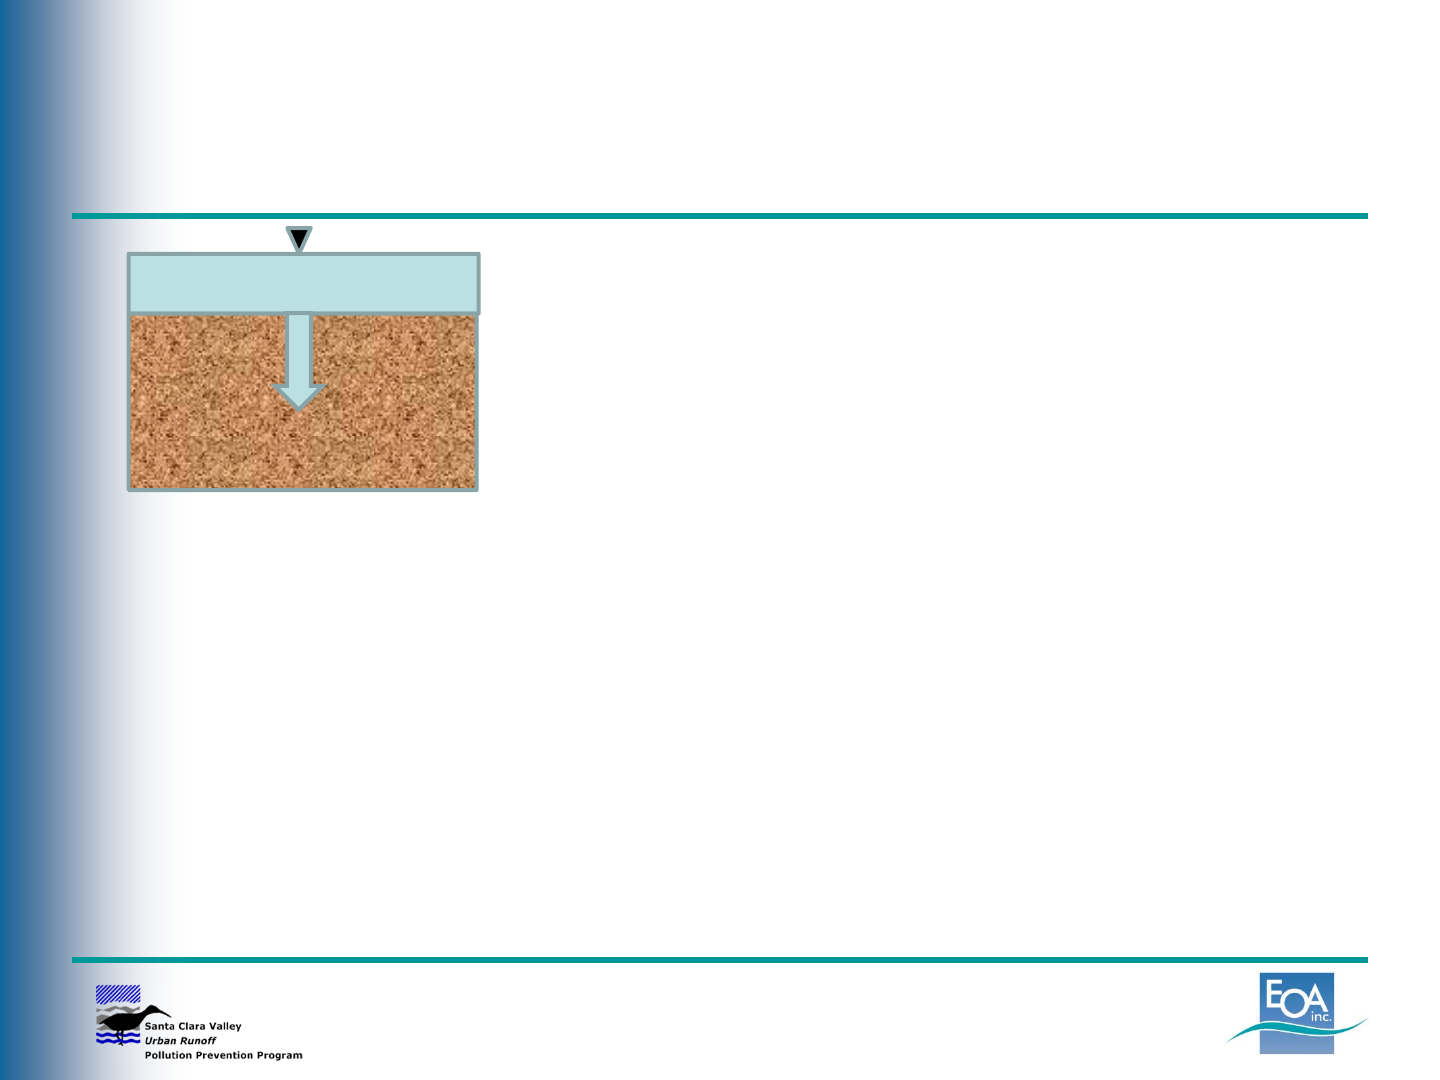
0.5 1.0 0.5
Surface Area = VBMP (cu.ft.) ÷0.5 cu.ft./sq.ft.
Method 1: Store entire volume in surface ponding area
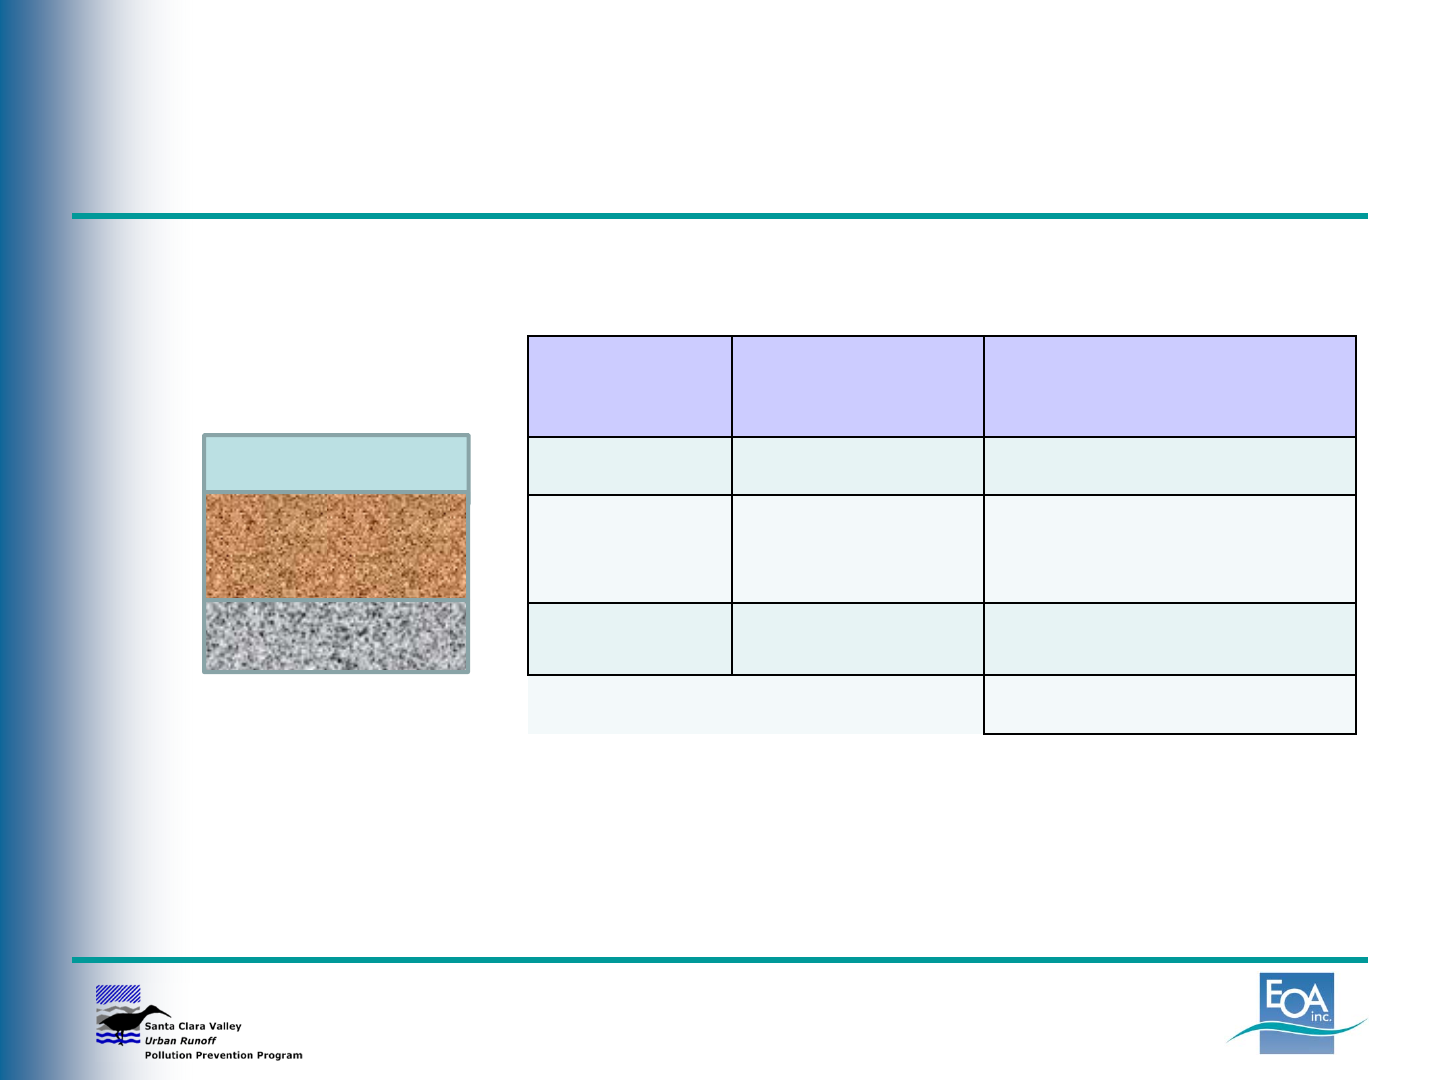
Sizing Bioretention Facilities:
Volume-Based Approach
V1
V2
V3
Depth
(ft) Porosity Volume per sq. ft.
(cubic feet)
0.5 1.0 0.5
1.5 0.30 0.45
0.5* 0.40 0.20
Total 1.15
Surface Area = VBMP (cu.ft.) ÷1.15 cu.ft./sq.ft.
*Depth below bottom of underdrain
Method 2: Store volume in ponding area and media
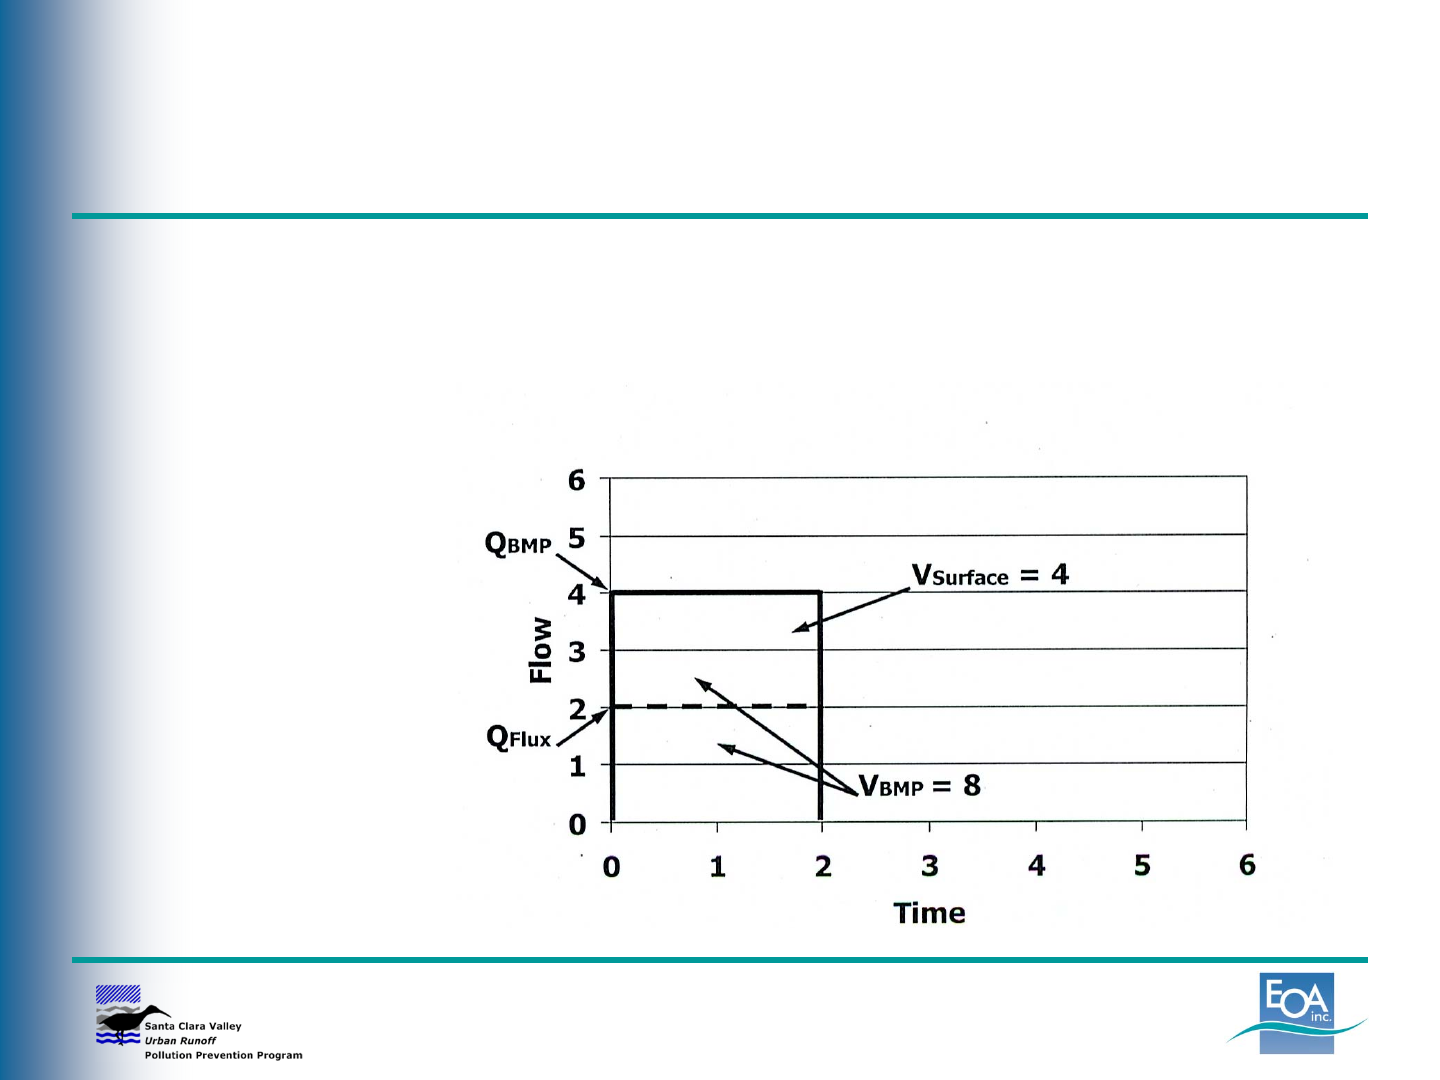
Sizing Bioretention Facilities:
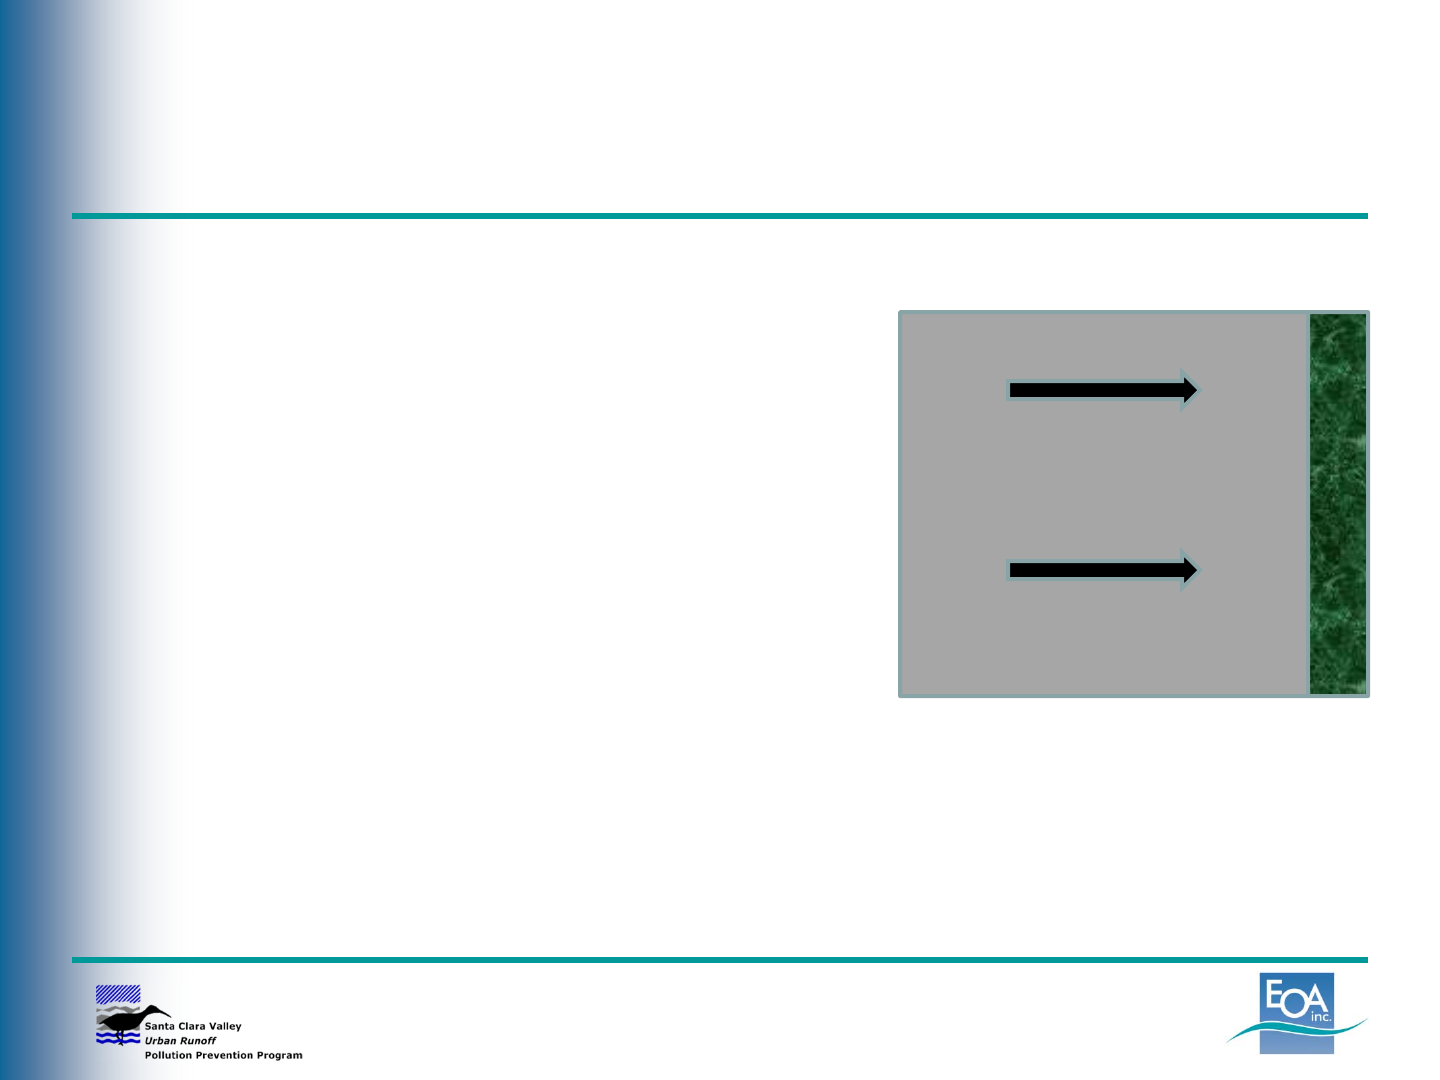
Flow & Volume Approach
“Hydrograph Approach”
• Runoff is routed through the treatment measure
• Assume rectangular hydrograph that meets both flow and
volume criteria
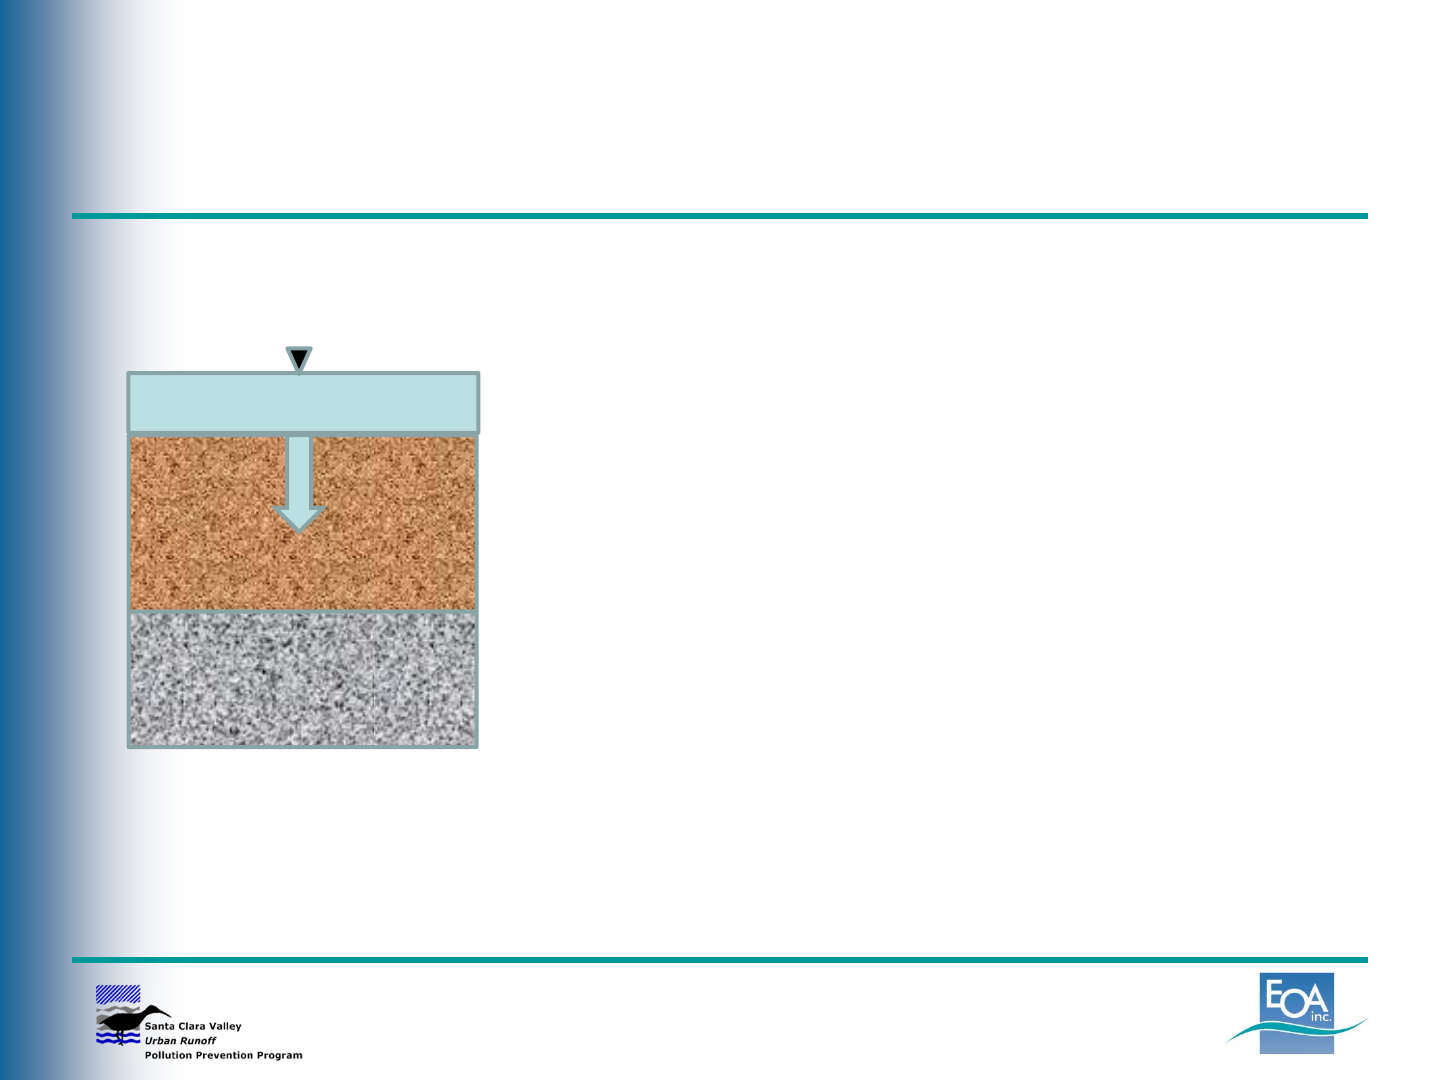
Sizing Bioretention Facilities:
Flow & Volume Approach
5 in/hr
Determine VBMP
Assume constant rainfall intensity of
0.2 in/hr continues throughout the
storm (rectangular hydrograph)
Calculate the duration of the storm
by dividing the Unit Basin Storage
by the rainfall intensity
Calculate the volume of runoff that
filters through the biotreatment soil
at a rate of 5 in/hr over the duration
of the storm and the volume that
remains on the surface
Sizing Bioretention Facilities:
Flow & Volume Approach
5 in/hr
To start the calculation, you have to
assume a surface area “AS” -- use
3% of the contributing impervious
area as a first guess
Determine volume of treated water “VT” during storm:
VT= AS x 5 in/hr x duration (hrs) x 1 in/12 ft
Determine volume remaining on the surface “VS”:
VS = VBMP –V
T
Determine depth “D” of ponding on the surface:
D =VS ÷AS
Repeat until depth is approximately 6 inches
Sizing Example #1, continued
Parking lot in Santa Clara
• Area = 35,000 sq. ft. (0.8 acres)
• 100% impervious
•VBMP = 1,819 cu. ft.
• UBS Volume = 0.63 in.
Use the combination flow
and volume sizing worksheet
to determine the bioretention surface area
Answer: 1,000 sq. ft. (depth of 0.5 ft.)
35,000 sq. ft.
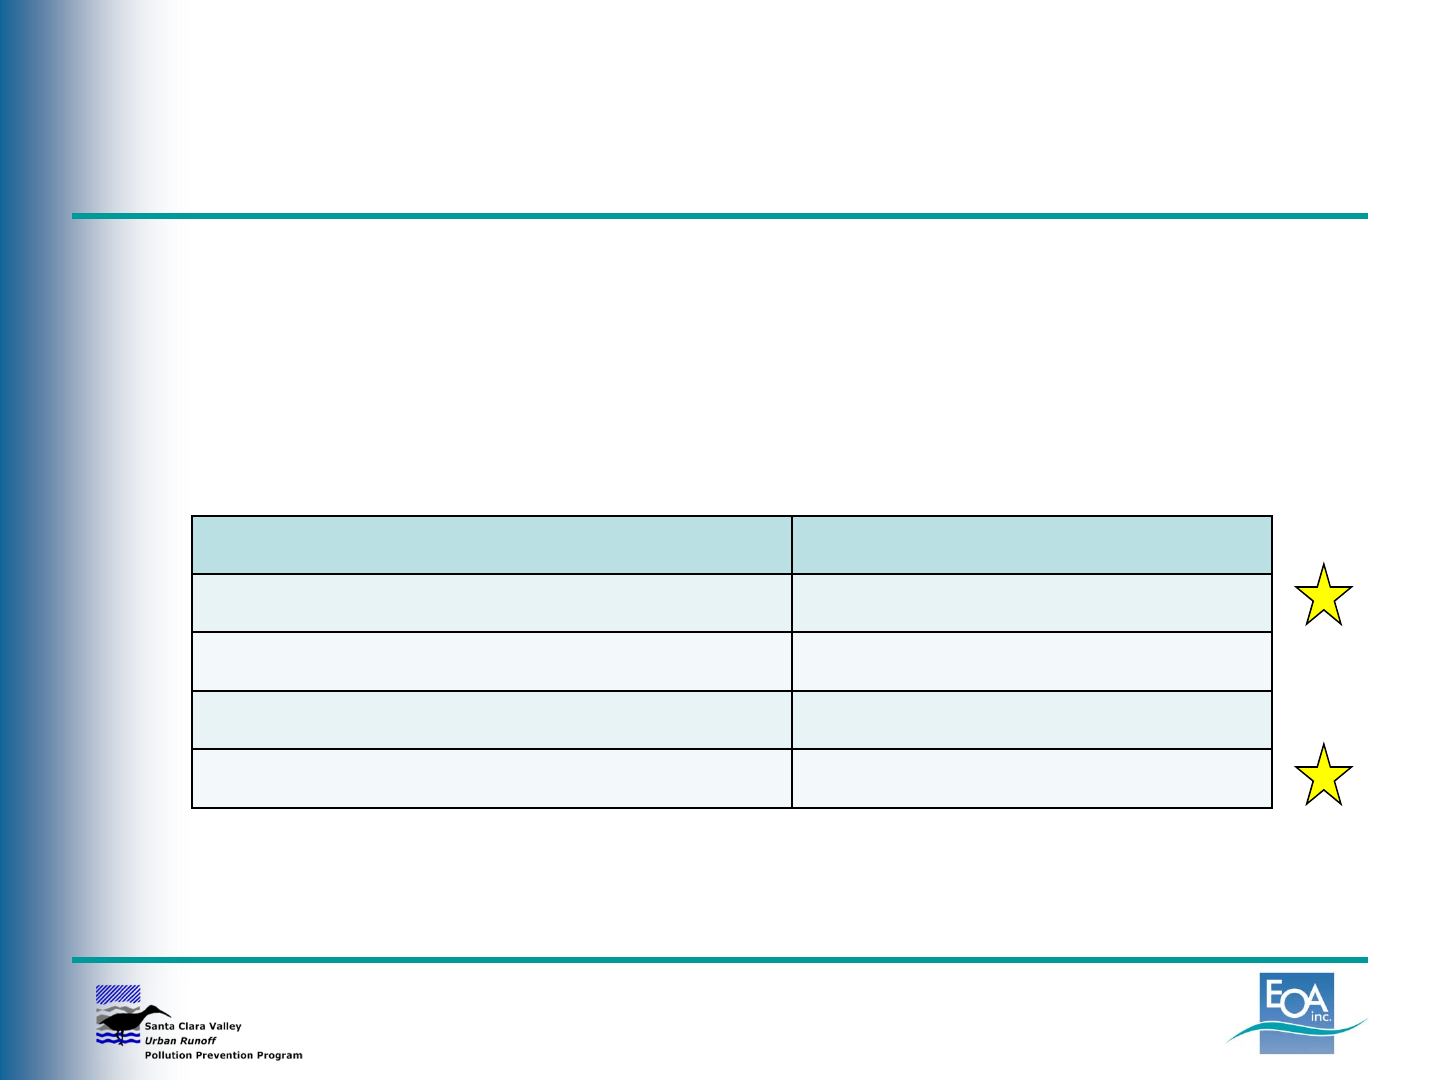
Sizing Bioretention Facilities:
Comparison of Methods
Example: 35,000 sq. ft. parking lot in Santa Clara
MAP= 15 inches, 100% impervious
VBMP = 1,819 cu. ft. (80% of annual runoff)
Sizing Method Surface Area (sq. ft.)
Simplified Method (flow-based) 1,400
Volume ponded on surface 3,638
Volume stored in unit (V1+V2+V3) 1,580
Combination flow & volume 1,000
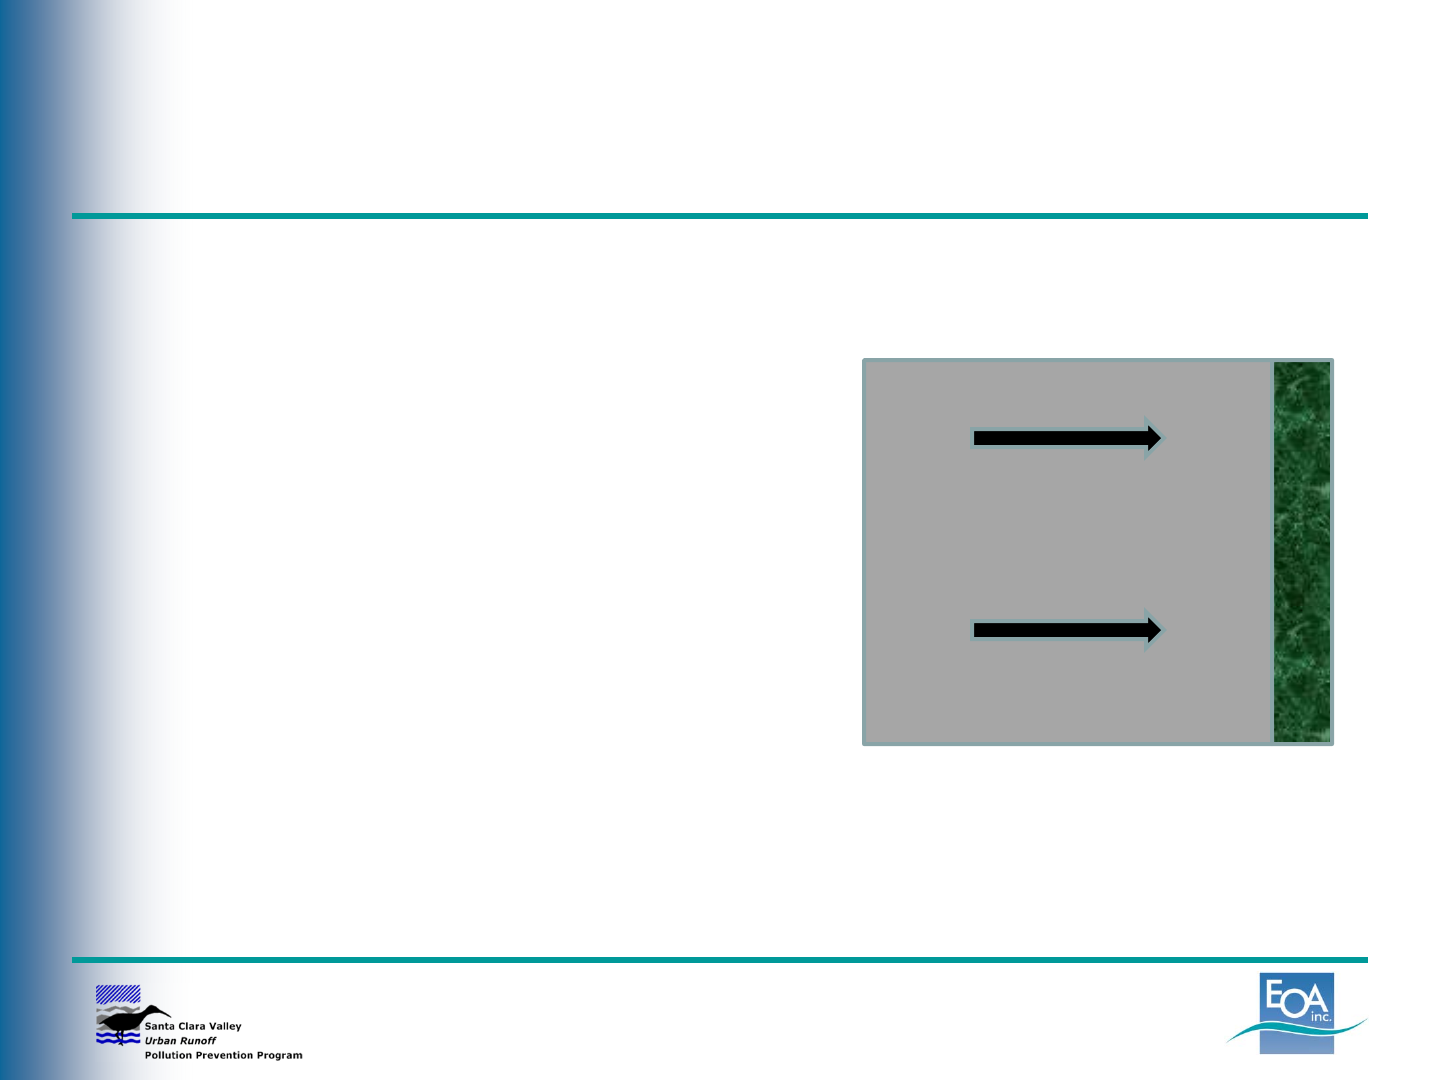
Sizing Pervious Paving and
Infiltration Trenches
General Principles
• Store the WQD Volume in void
space of stone base/subbase and
infiltrate into subgrade
• Surface allows water to infiltrate at a
high rate
• Any underdrains must be placed
above the void space needed to
store and infiltrate the WQD volume

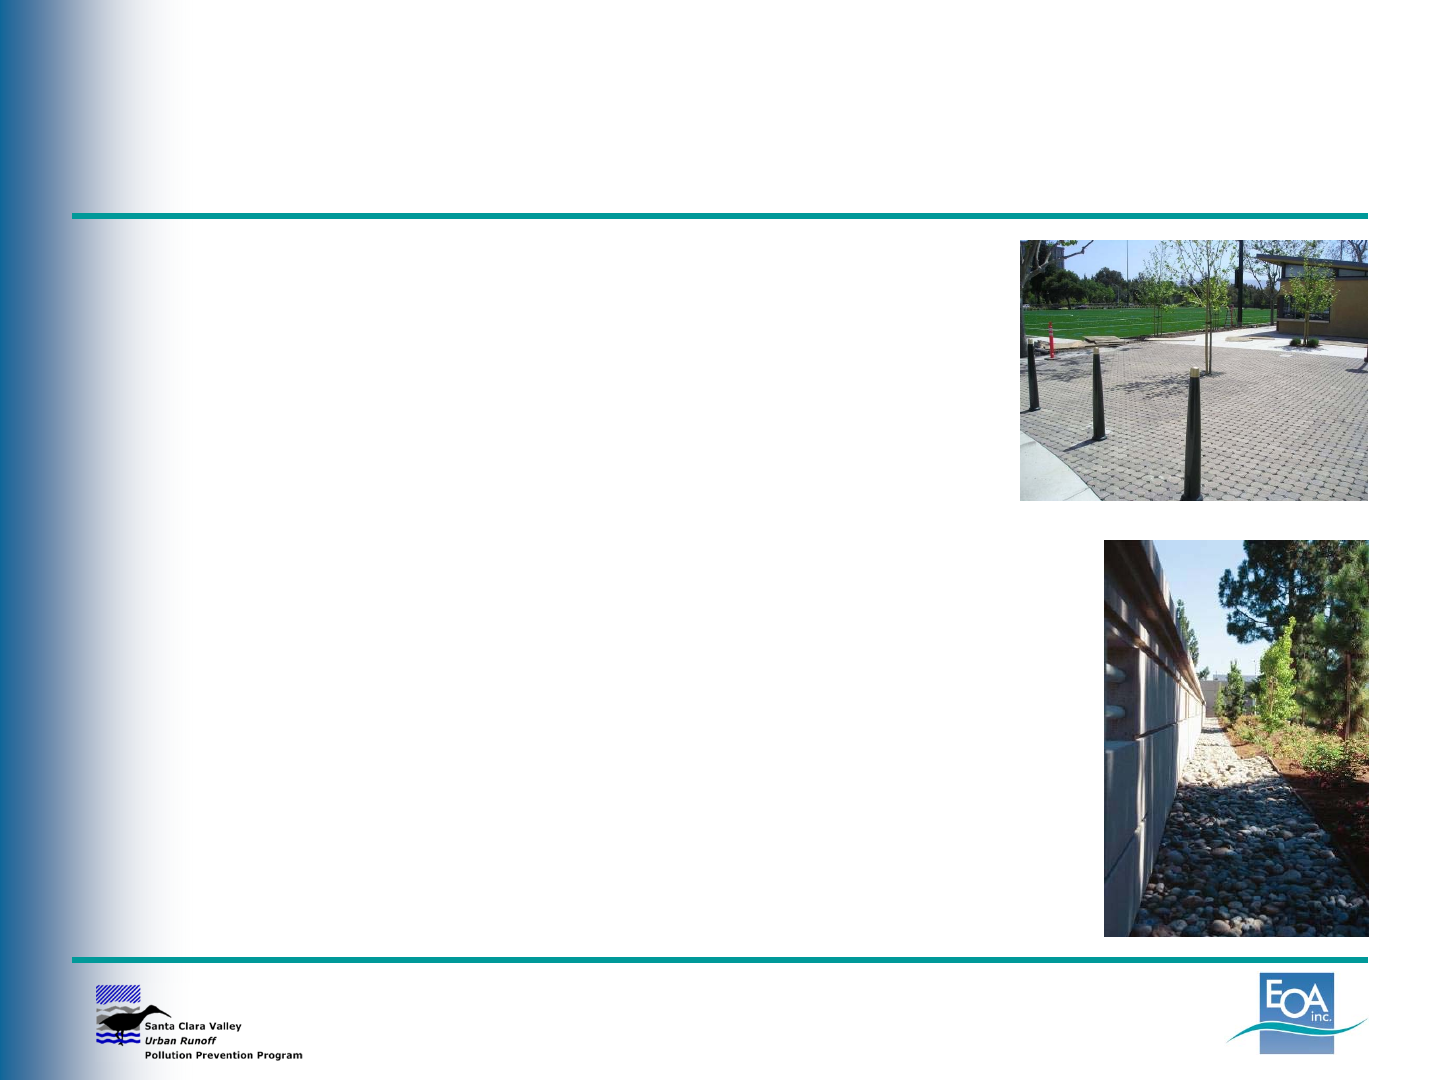
Sizing Pervious Paving and
Infiltration Trenches
Pervious Paving
• May be self-treating area or self-retaining area (accept
runoff from other areas)
• Can only be considered a “pervious area” if stone
base/subbase sized to store the WQD volume
• Can work where native soils have low infiltration rates
(stored water depths are relatively small)
• Surface area is usually predetermined
• Base and subbase thickness usually determined by
expected traffic load and saturated soil strength
• Slope should be ≤1% (or use cutoff trenches)
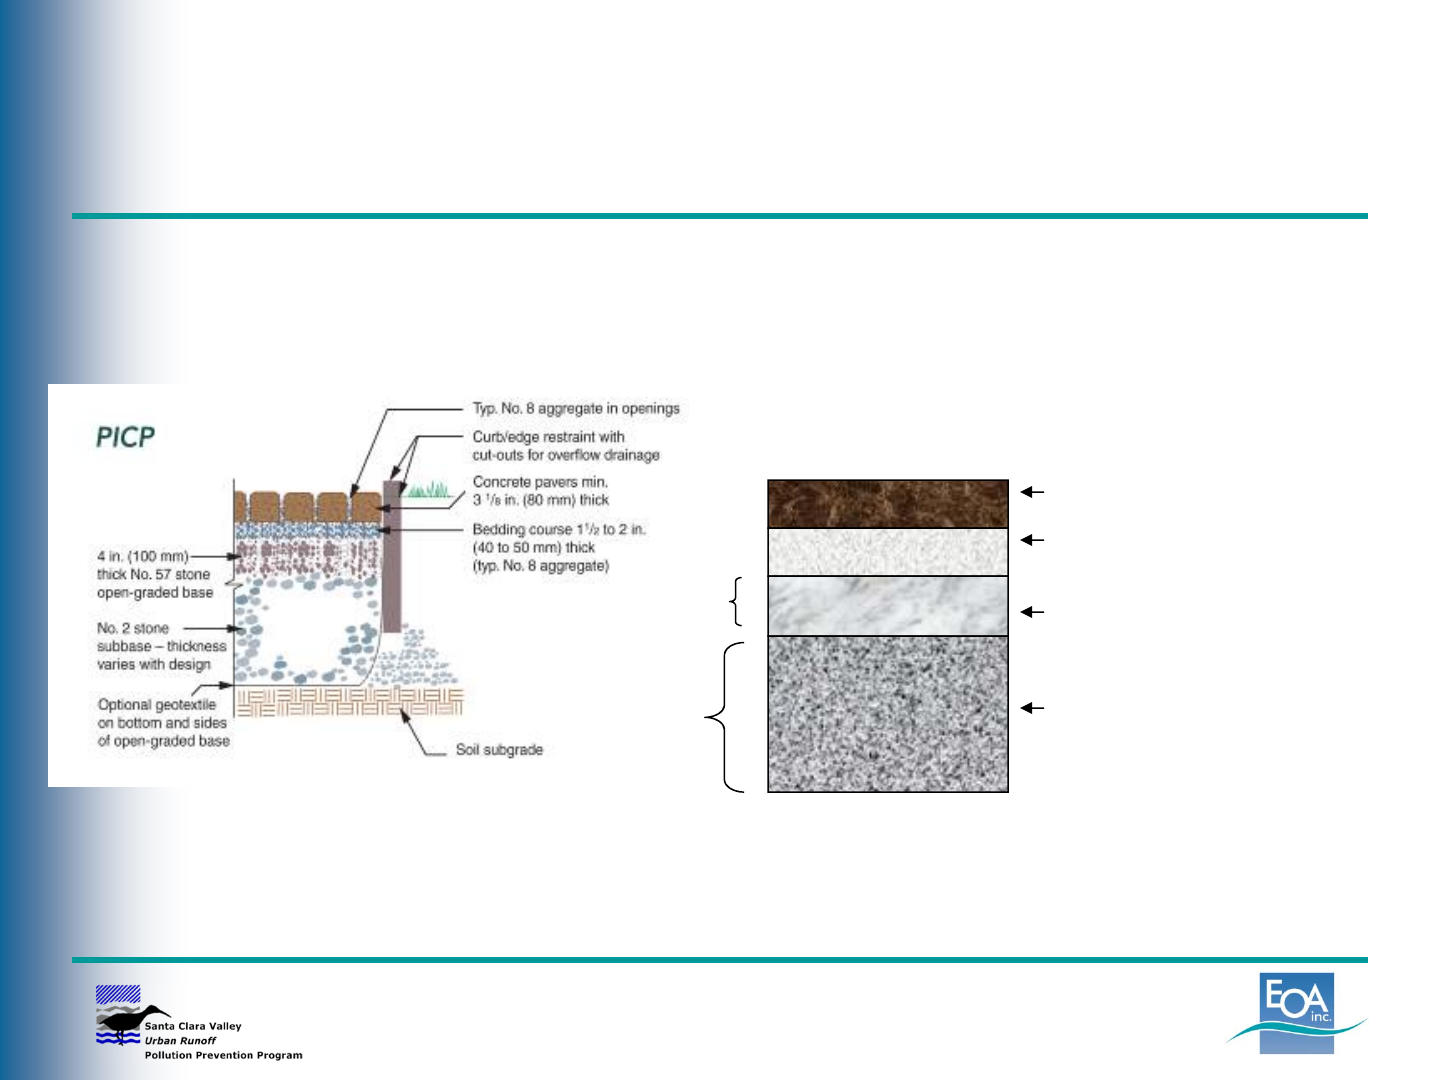
Pervious Paving
Paving surface
Bedding No. 8 stone
Base No. 57 stone
Subbase No. 2 stone
Thickness
varies
4 in.
Base and subbase layers available for water storage
Both typically have 40% void space
Typical Section

Pervious Paving
Approach to Sizing Pervious Paving
• Self-Treating
– Check the depth of the WQD volume in base/subbase:
UBS volume (in.) ÷0.40 = Depth (in.)
Example: UBS volume = 1.0 in., depth = 2.5 in.
(Minimum depth for vehicular traffic is 10 in.)
– Check the time required for stored water to drain:
UBS Vol. (in.) ÷Infiltration rate (in/hr) = Drain time (hrs)
( recommend < 48 hrs)

Pervious Paving
Approach to Sizing Pervious Paving
• Self-Retaining
– Check the depth of the WQD volume in base/subbase:
UBS volume (in.) ÷0.40 = Depth (in.)
Example: UBS volume = 1.0 in., depth = 2.5 in.
(Minimum depth for vehicular traffic is 10 in.)
– Check the time required for stored water to drain:
UBS Vol. (in.) ÷Infiltration rate (in/hr) = Drain time (hrs)
( recommend < 48 hrs)
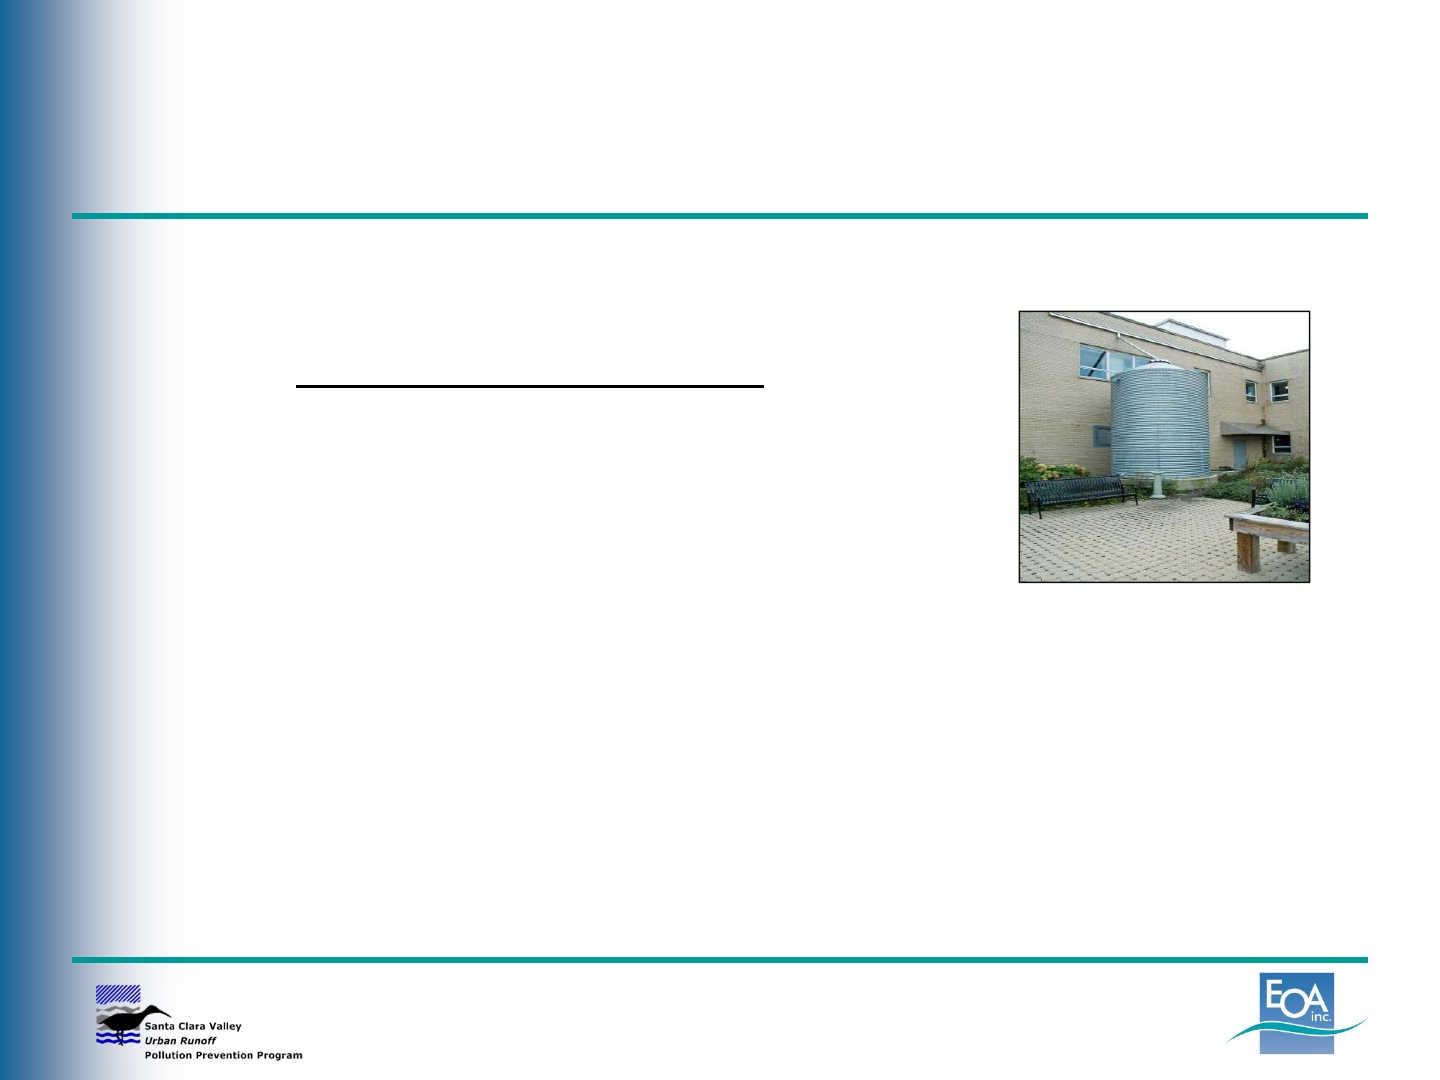
Sizing Rainwater Harvesting
Cisterns
Rainwater Harvesting and Use
• Types of Demands
– Irrigation
– Toilet flushing
– Other non-potable
• Volume based sized criteria in C.3.d is 80%
capture of the annual runoff
• Key concept is drawdown time
• Barriers: lack of plumbing codes, treatment,
recycled water preference
Storage values are
per one acre of
impervious surface
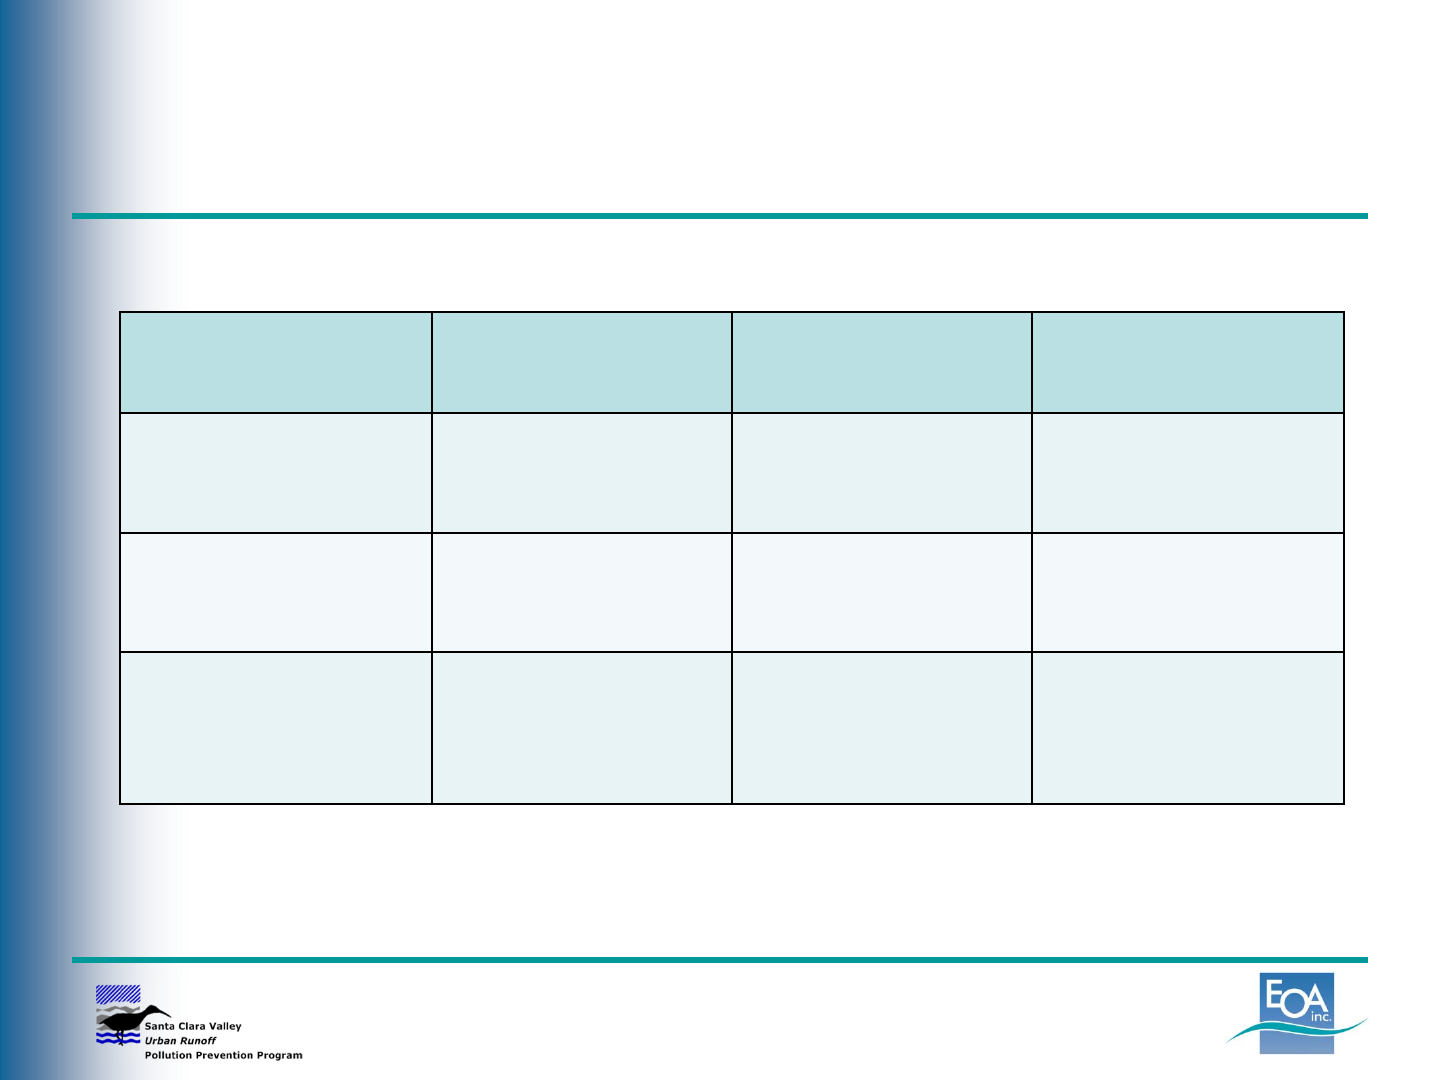
Estimate Actual Demand
Land Use Type User Unit User Unit
Factor2Daily Use/Unit
(gal/day/unit)
Residential Resident 2.9 residents per
dwelling unit
8.6
Office or Retail Employee
(non-visitor)
200 SF per
employee
6.9
Schools Employee
(not including
students)
50 SF per
employee
33.9
1References: CCCWP Stormwater C.3 Guidebook, 6th edition, 2012; BASMAA
LID Feasibility Report, 2011; California Plumbing Code, 2010.
2Use project-specific data if available
Daily Use Rates for Toilets and Urinals1
Example:
2-story Office Building
3,000SF
4,000SF
10,000SF
(Interiorfloorarea
=20,000SF)

Screening Worksheet Results
Potential rainwater capture area = area of one
building roof = 10,000 SF
Convert to acres:
10,000 SF ÷43,560 SF/acre = 0.23 acres
Demand for commercial building:
Interior floor area = 20,000 SF
Minimum floor area to meet toilet flushing demand =
70,000 SF per acre of impervious surface
Minimum floor area for this project to meet demand =
70,000 SF/ac X 0.23 acres = 16,100 SF
20,000 SF > 16,100 SF BBuilding will have minimum
toilet flushing demand

Determine Building Toilet
Flushing Demand
Building interior floor area = 20,000 SF
Estimate no. of employees:
• 200,000 SF ÷200 SF/employee = 100 employees
• 100 employees ×6.9 gpd/employee = 690 gpd
Convert to equivalent demand per impervious acre
(to allow use of sizing curves):
• 10,000 SF roof area ÷43,560 SF/ac = 0.23 ac.
• 690 gpd ÷0.23 = 3,000 gpd per impervious acre

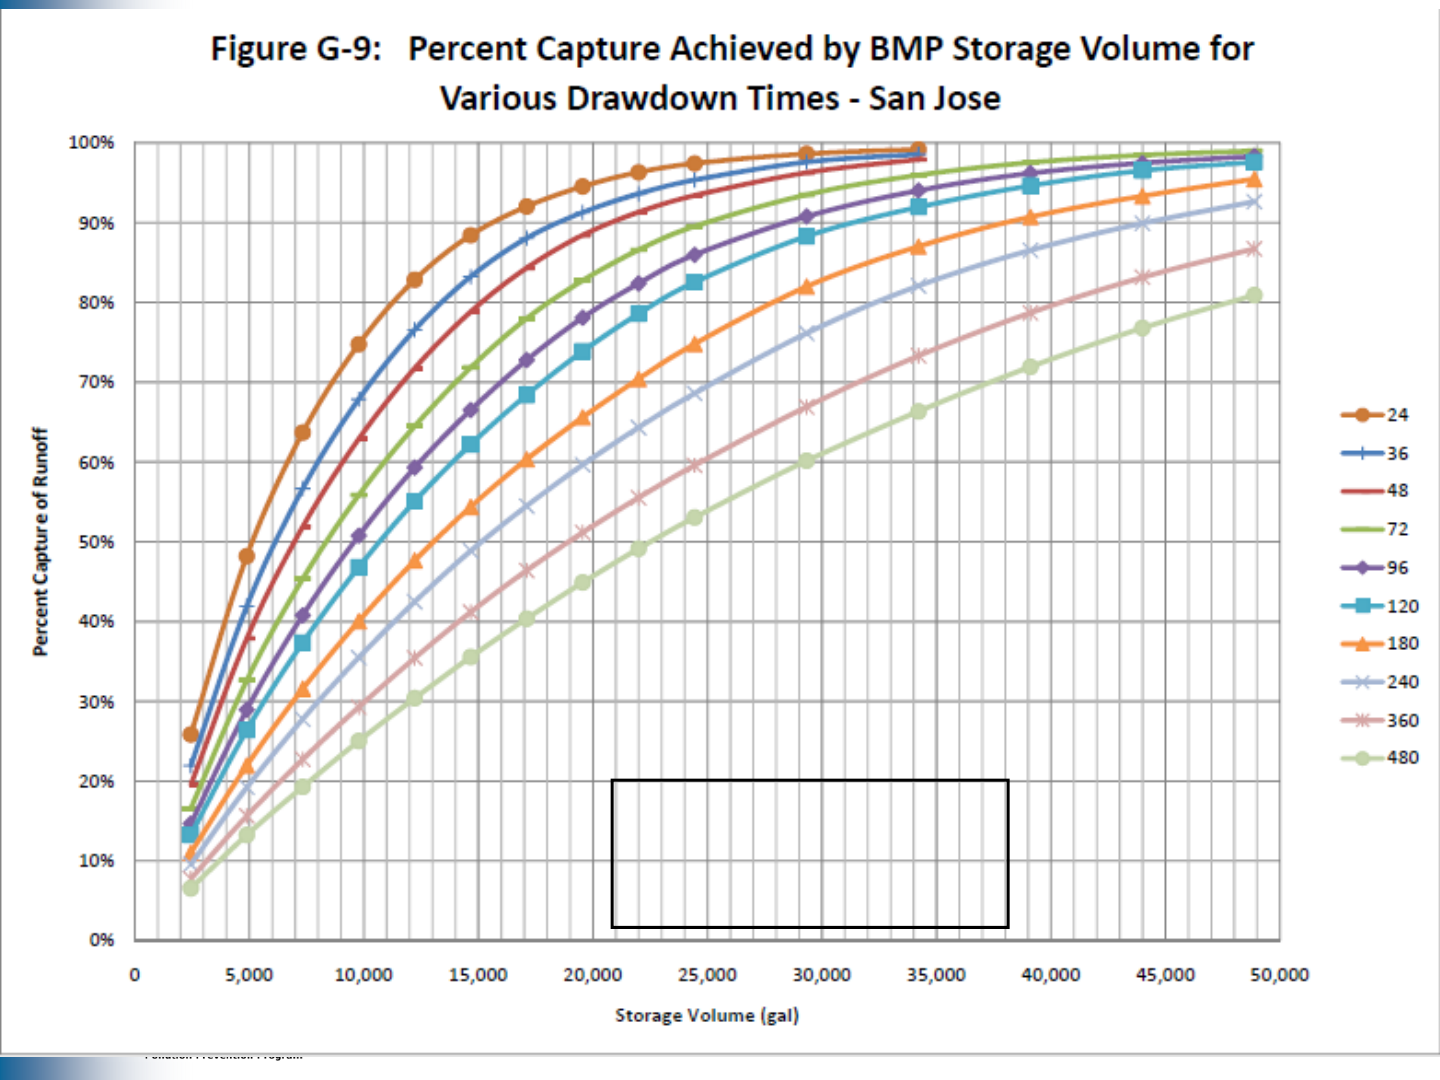
Determine Required Cistern Size
From sizing curves, find right combination of
drawdown time, tank size and required demand:
• 480-hr (20-day) drawdown B49,000 gallon tank B2,450 gpd
• 360-hr (15-day) drawdown B40,000 gallon tank B2,667 gpd
• 240-hr (10-day) drawdown B32,000 gallon tank B3,200 gpd
• 288-hr (12-day) drawdown B36,000 gallon tank B3,000 gpd √
Adjust tank size back to actual impervious area:
• 36,000-gallon tank per 1 acre impervious area
• 36,000 ×0.23 acres = 8,300-gallon tank
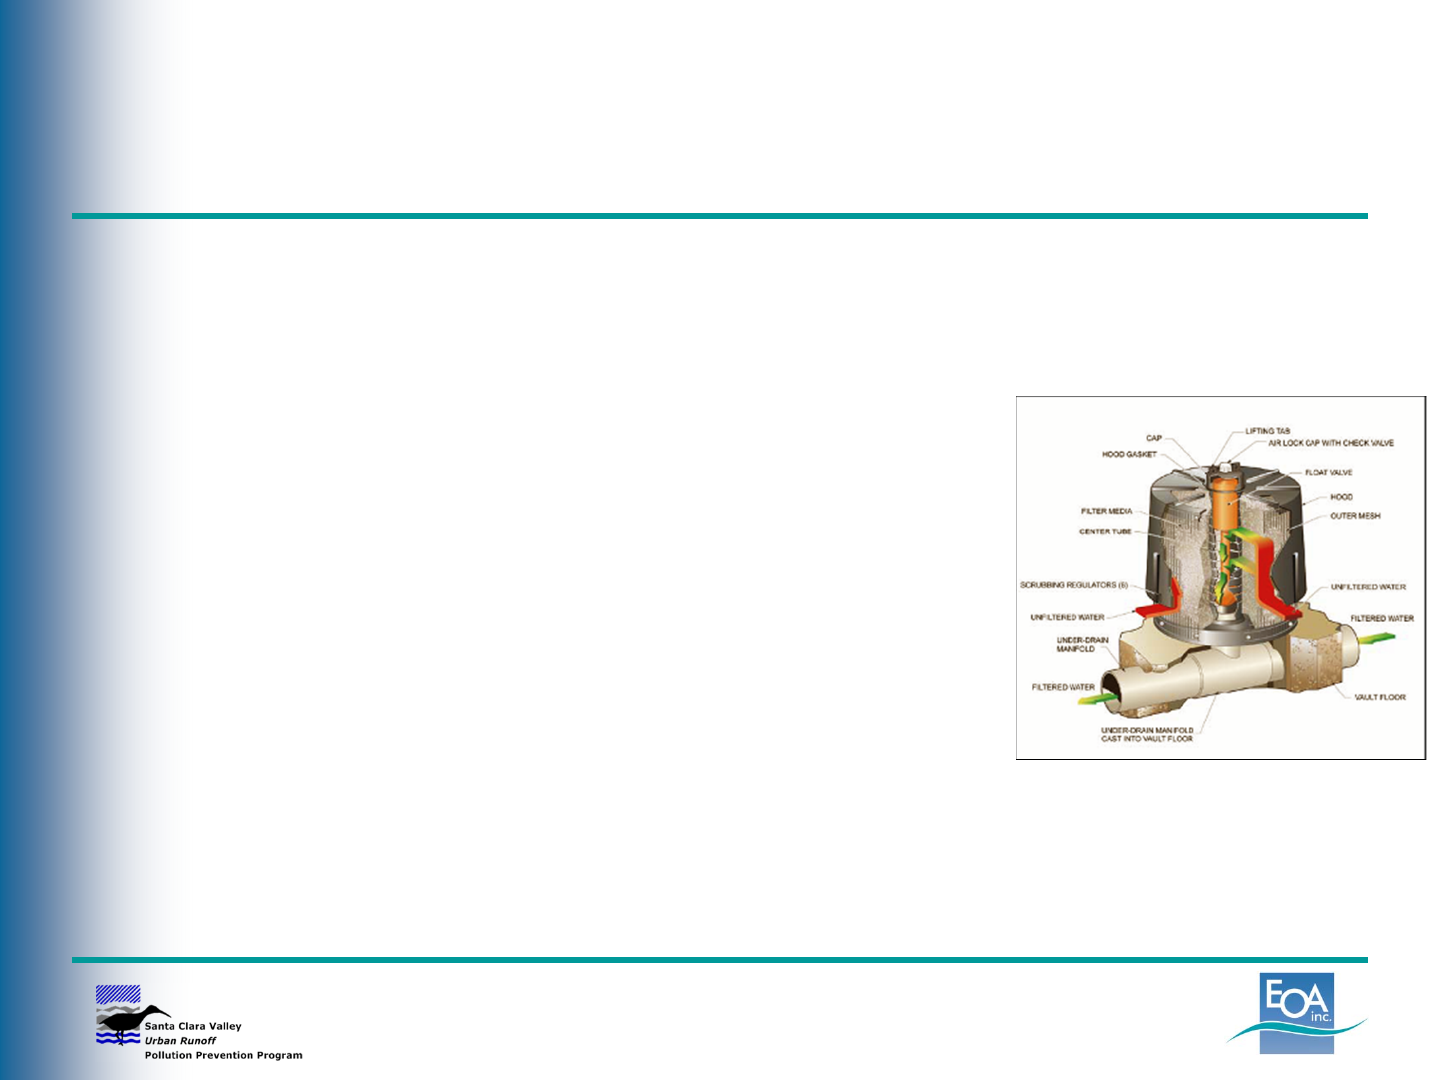
Sizing Non-LID Components
Media Filters (cartridge type)
Flow-based Treatment Measure
Determine QBMP
From manufacturer’s specifications,
determine the design flow rate per
cartridge
Divide QBMP by the cartridge flow
rate to calculate the number of
cartridges required (round up)
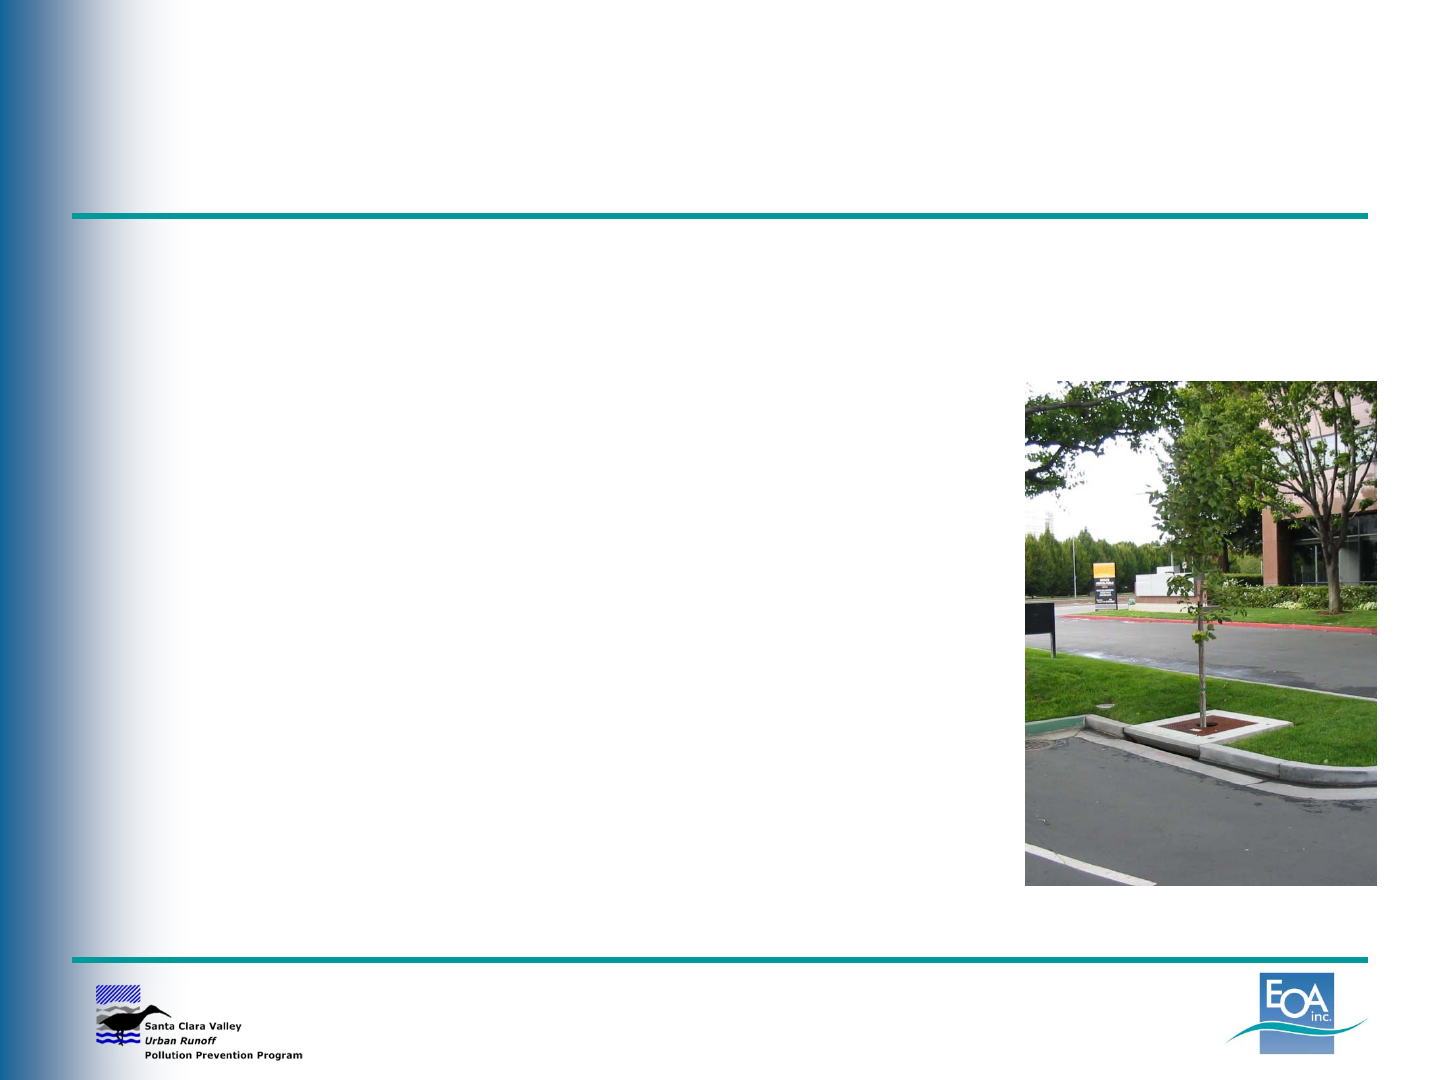
Sizing Non-LID Components
High Flow Rate Tree Box Filters
Flow-based Treatment Measure
Determine QBMP
From manufacturer’s specifications,
determine the appropriate size of
unit or combination of units
A tree box filter that uses bio-
treatment soil can be sized like
a bioretention area or flow-through
planter
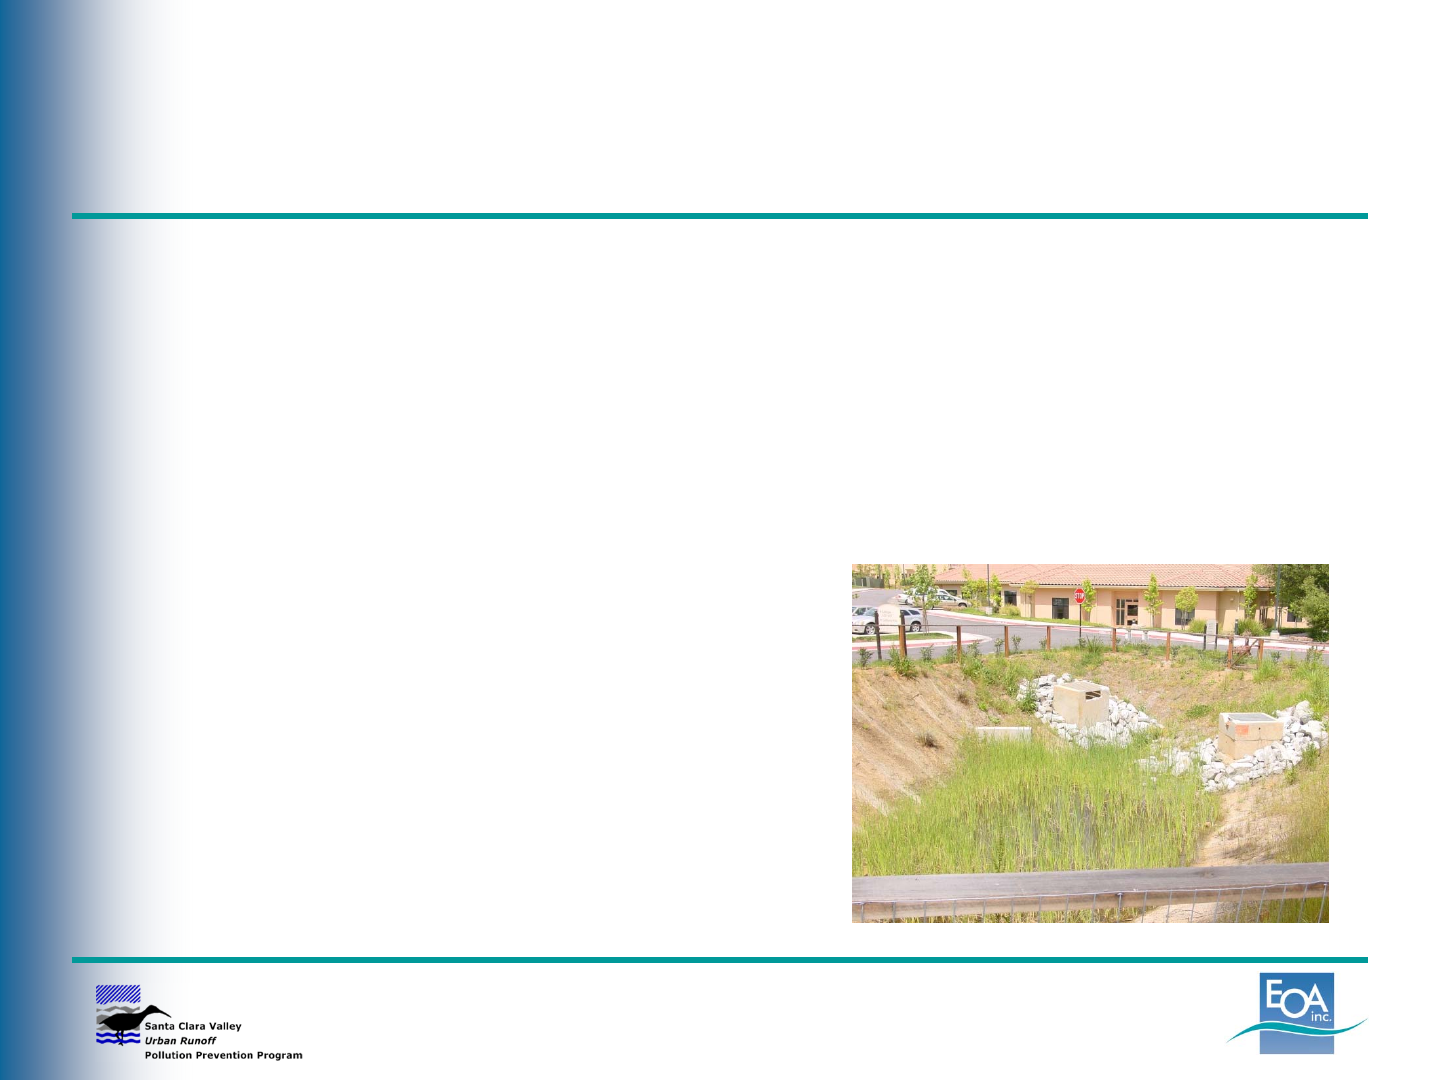
Sizing Non-LID Components
Detention Basin
Volume-based Treatment Measure (can only be
used in treatment train)
Determine VBMP
Design outlet for 48-hour
detention time
If sizing for hydromodification
management, use Bay Area
Hydrology Model to determine
size to meet HM standards
??? Questions ???
Contact Information:
Jill Bicknell
408-720-8811, X 1
jcbicknell@eoainc.com
www.scvurppp.org
