Microsoft Combinedppt Sansa E200 Combinedppt2
User Manual: Sansa e200
Open the PDF directly: View PDF ![]() .
.
Page Count: 94

Nelson Chan
EVP, Consumer
Products Business
and Corporate
Marketing

2 February 23, 2006
Agenda
Global Market Share Opportunities
Global Sales Expansion
Key Market Segments and Product Strategies
Branding and Advertising
3 February 23, 2006
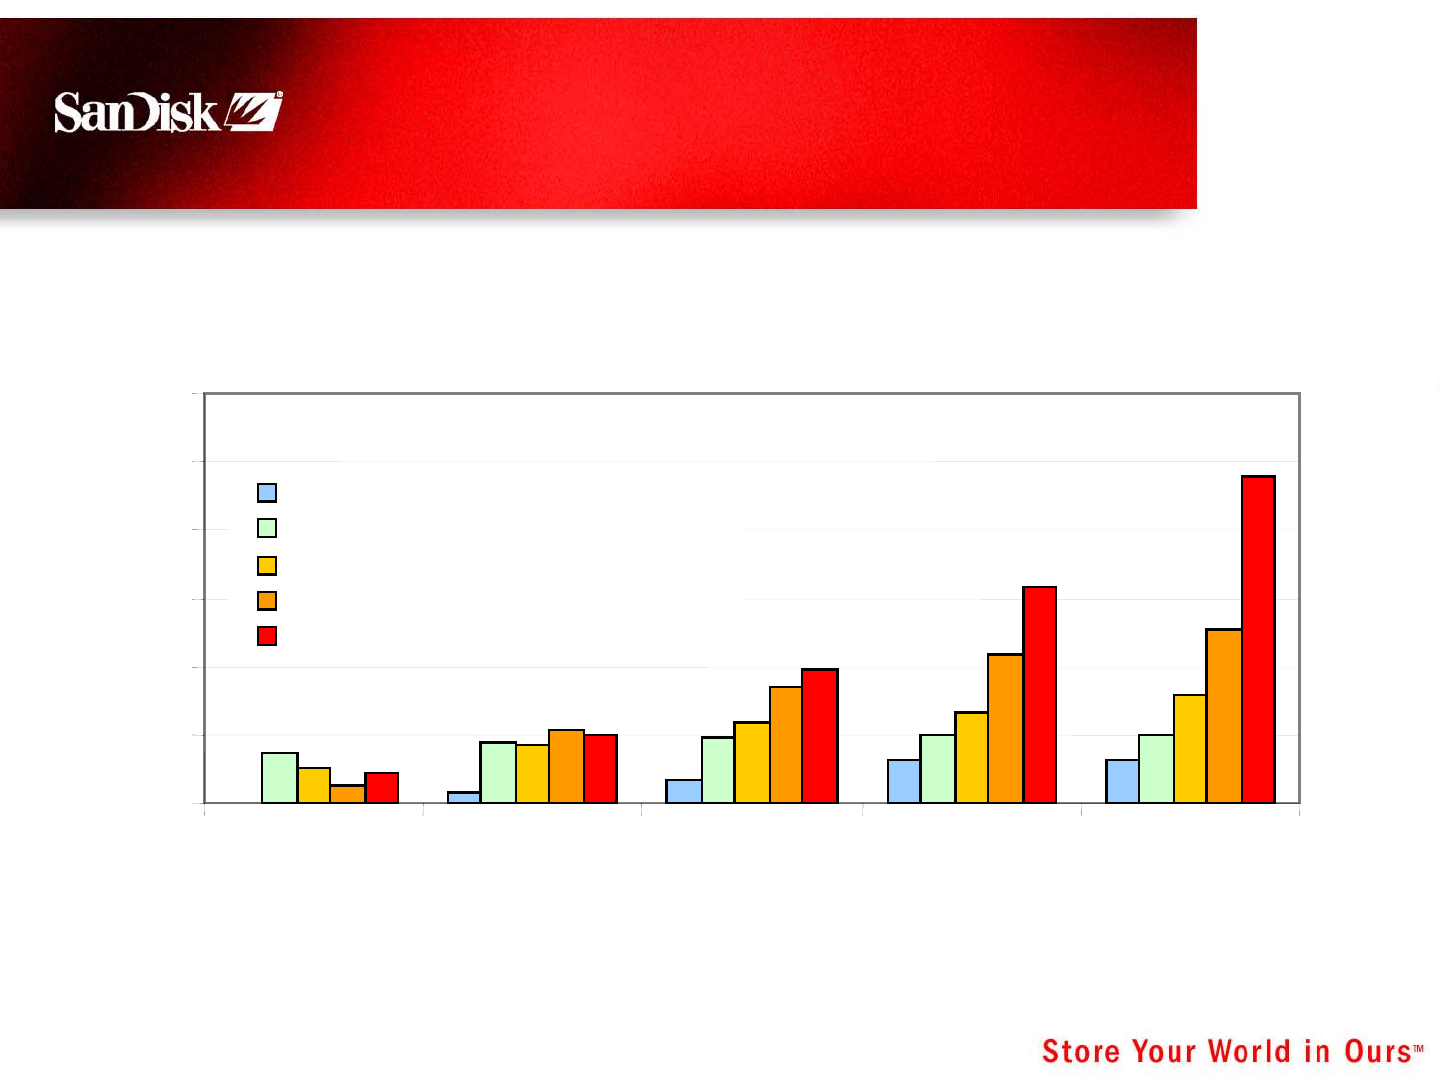
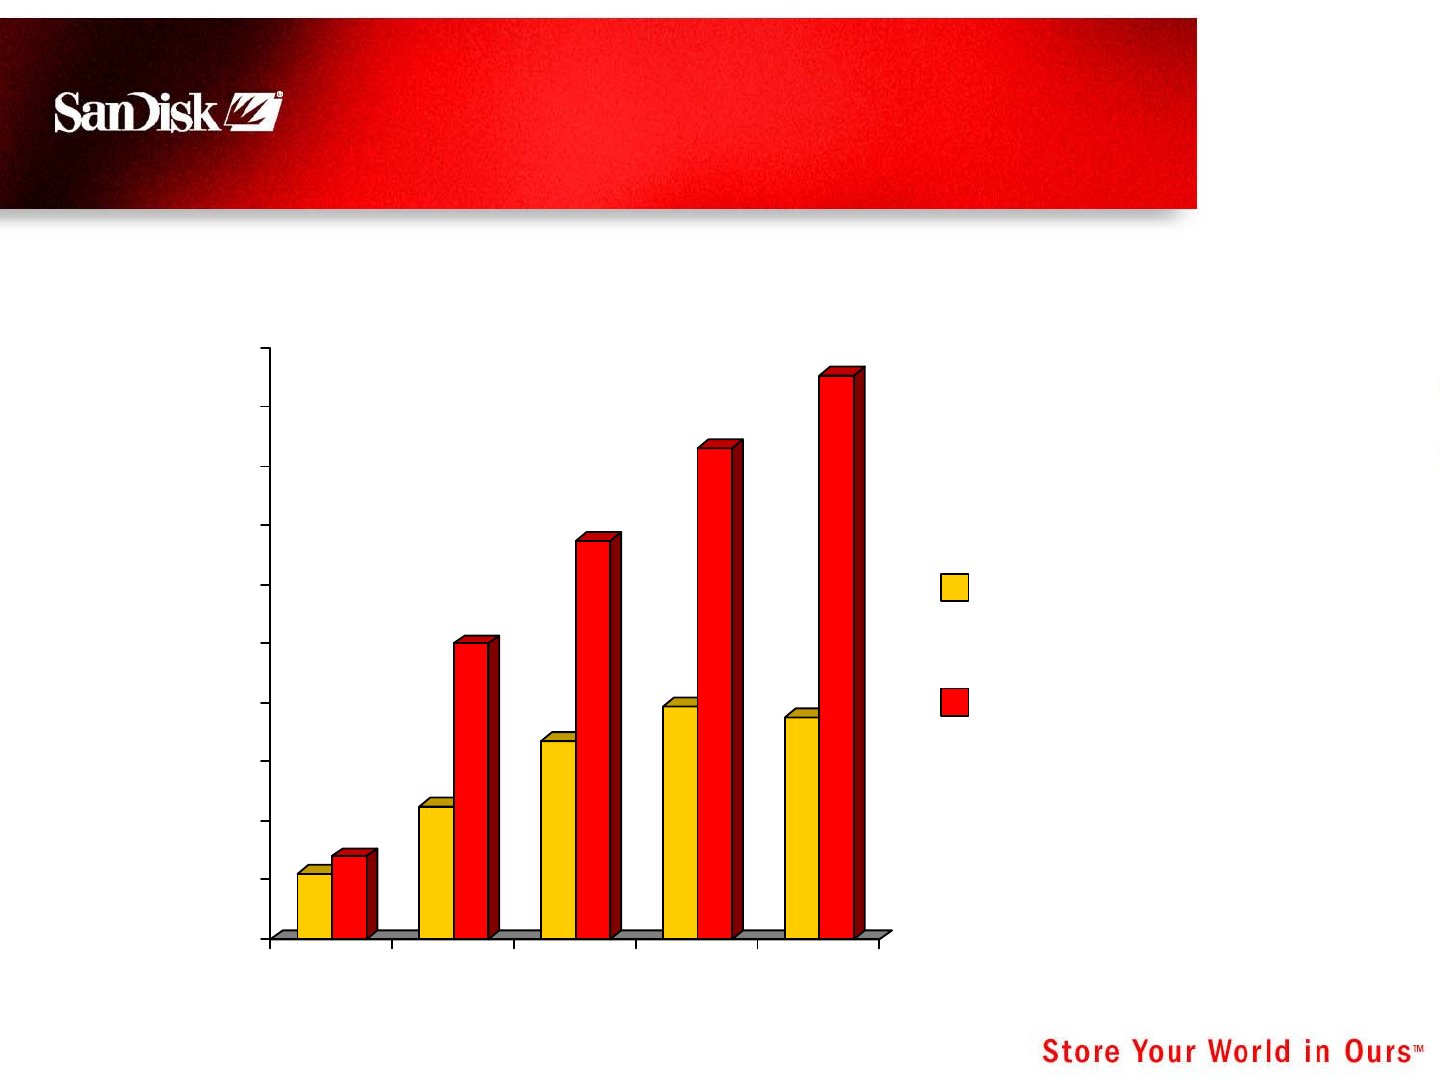
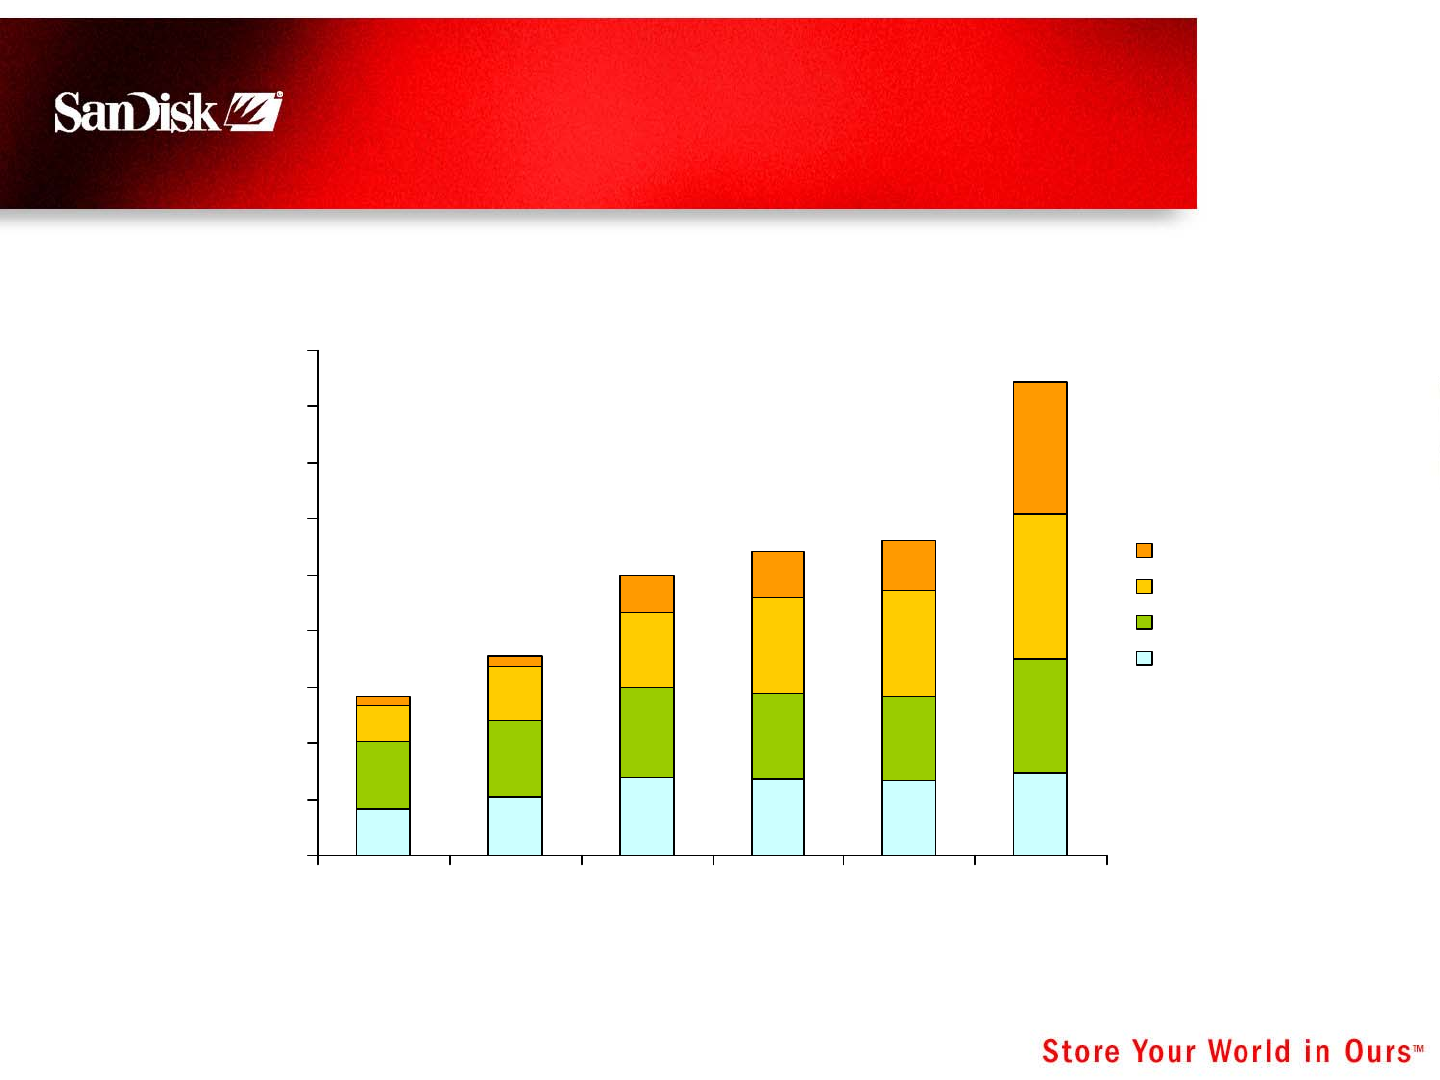
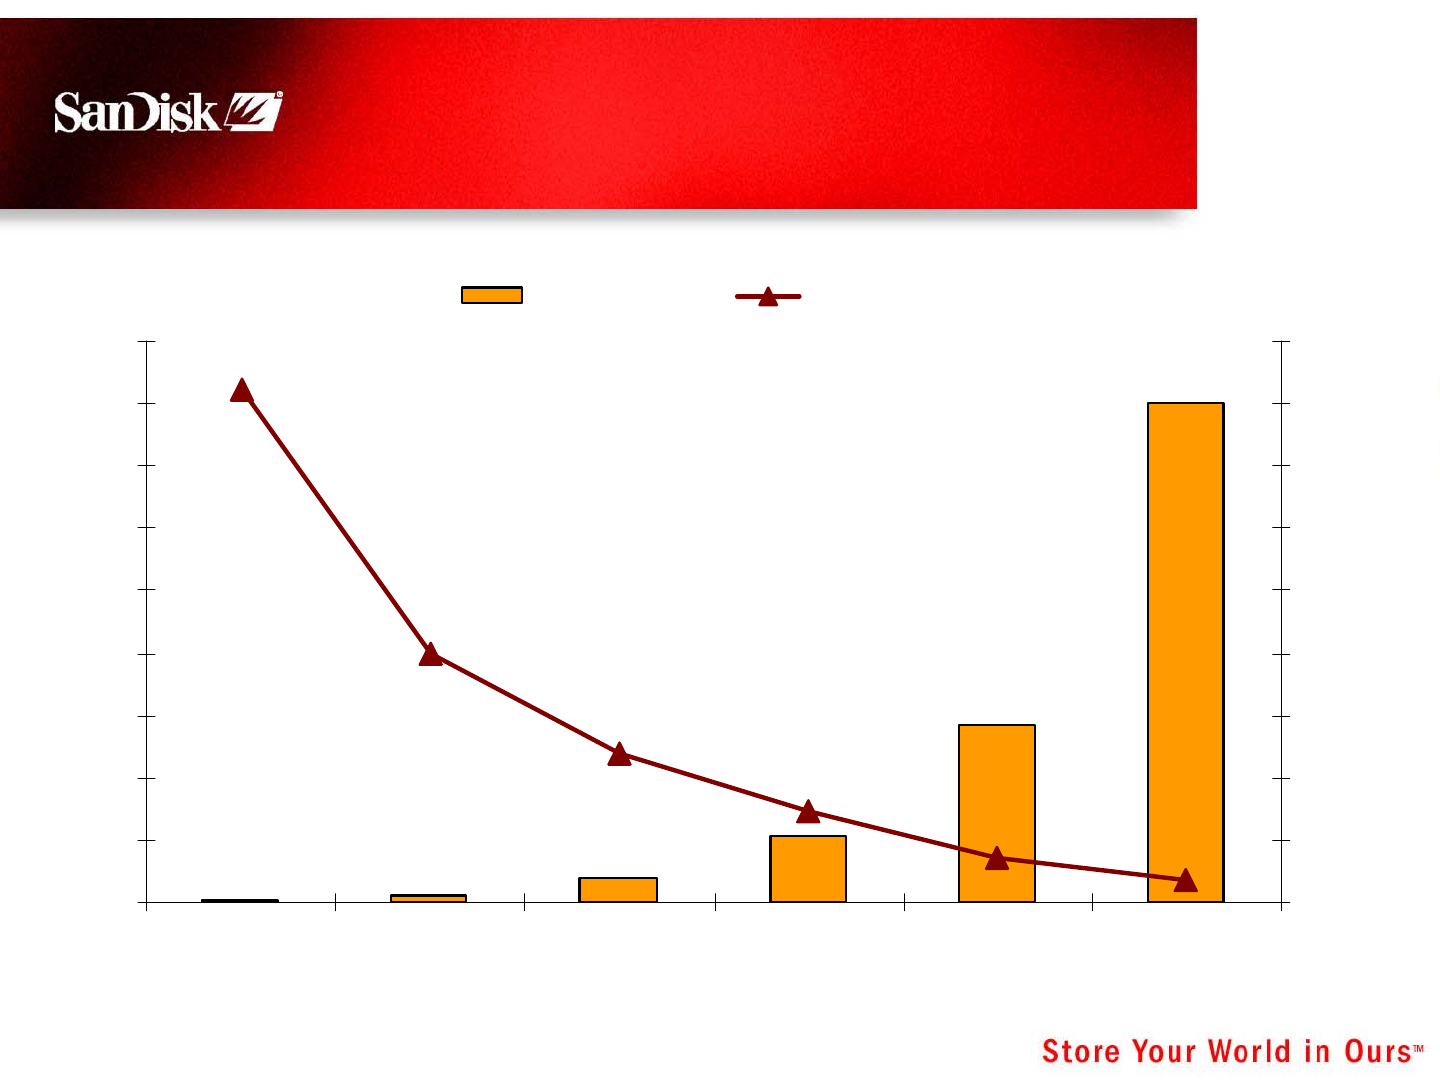
Key Markets
Sources: Gaming - IDC Jan06 / SanDisk, Flash Audio - Gartner Feb06 , DSCs - IDC Aug05/Feb06,
UFDs - Gartner Feb06, Phone Slots - Strategy Analytics Feb06
Million Units
CAGR 2005-08
0
100
200
300
400
500
600
2004 2005 2006 2007 2008
Gaming w. slot or USB 62%
Digital Cameras 3%
USB Drives 24%
Flash Audio Players 33%
Phone Slots 68%
4 February 23, 2006
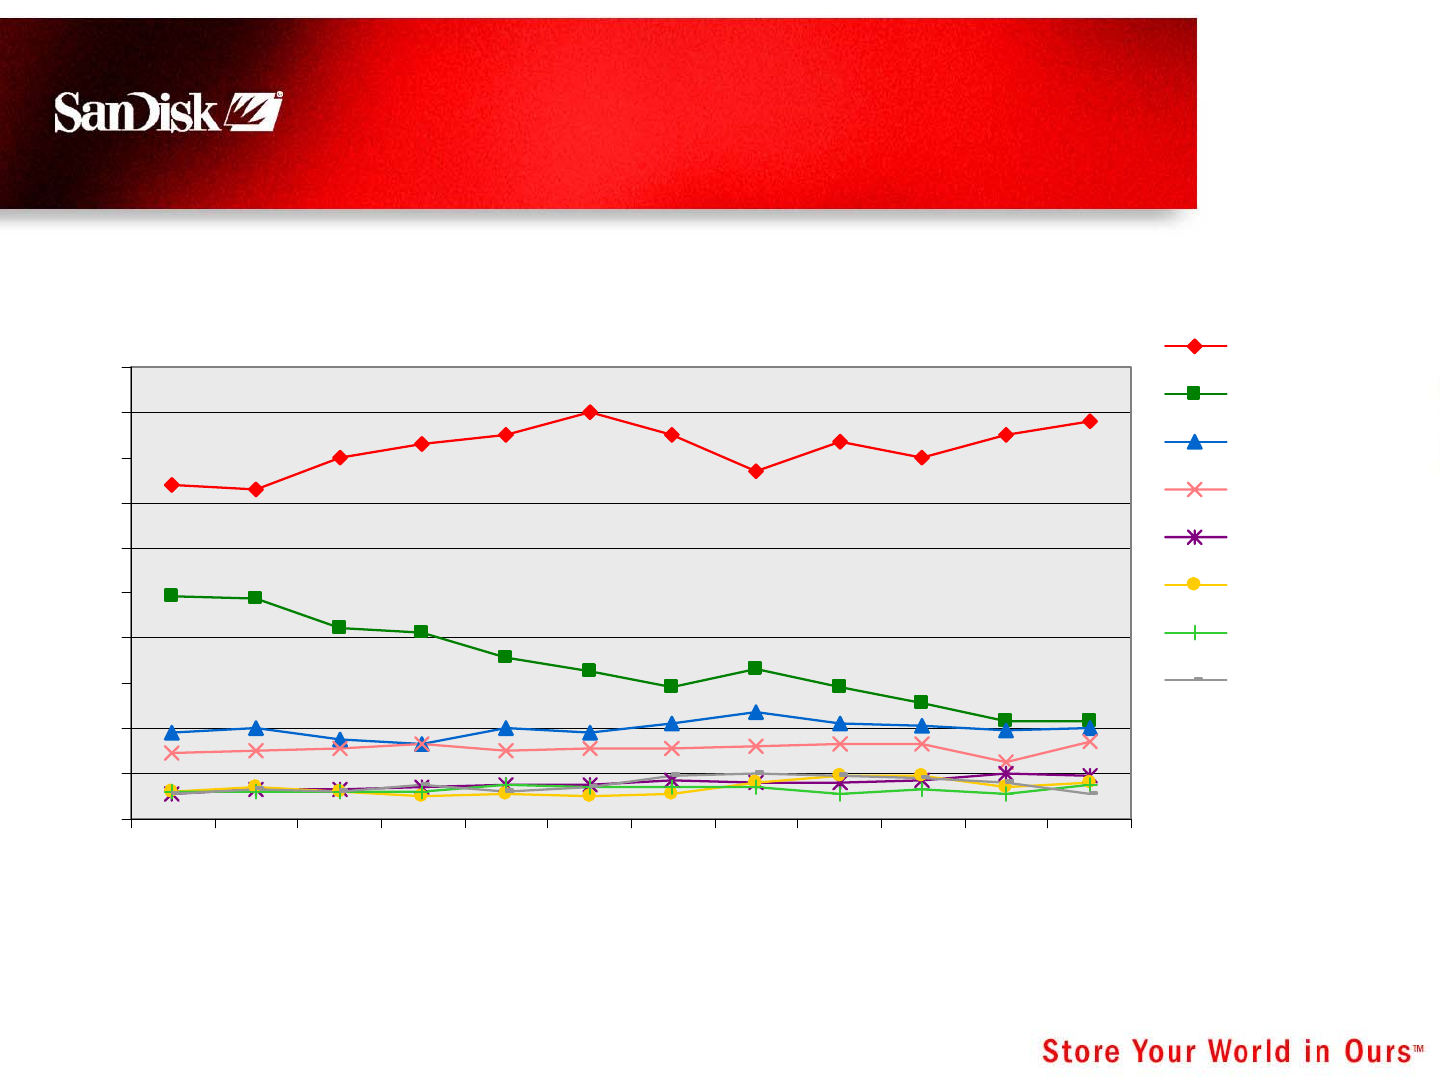
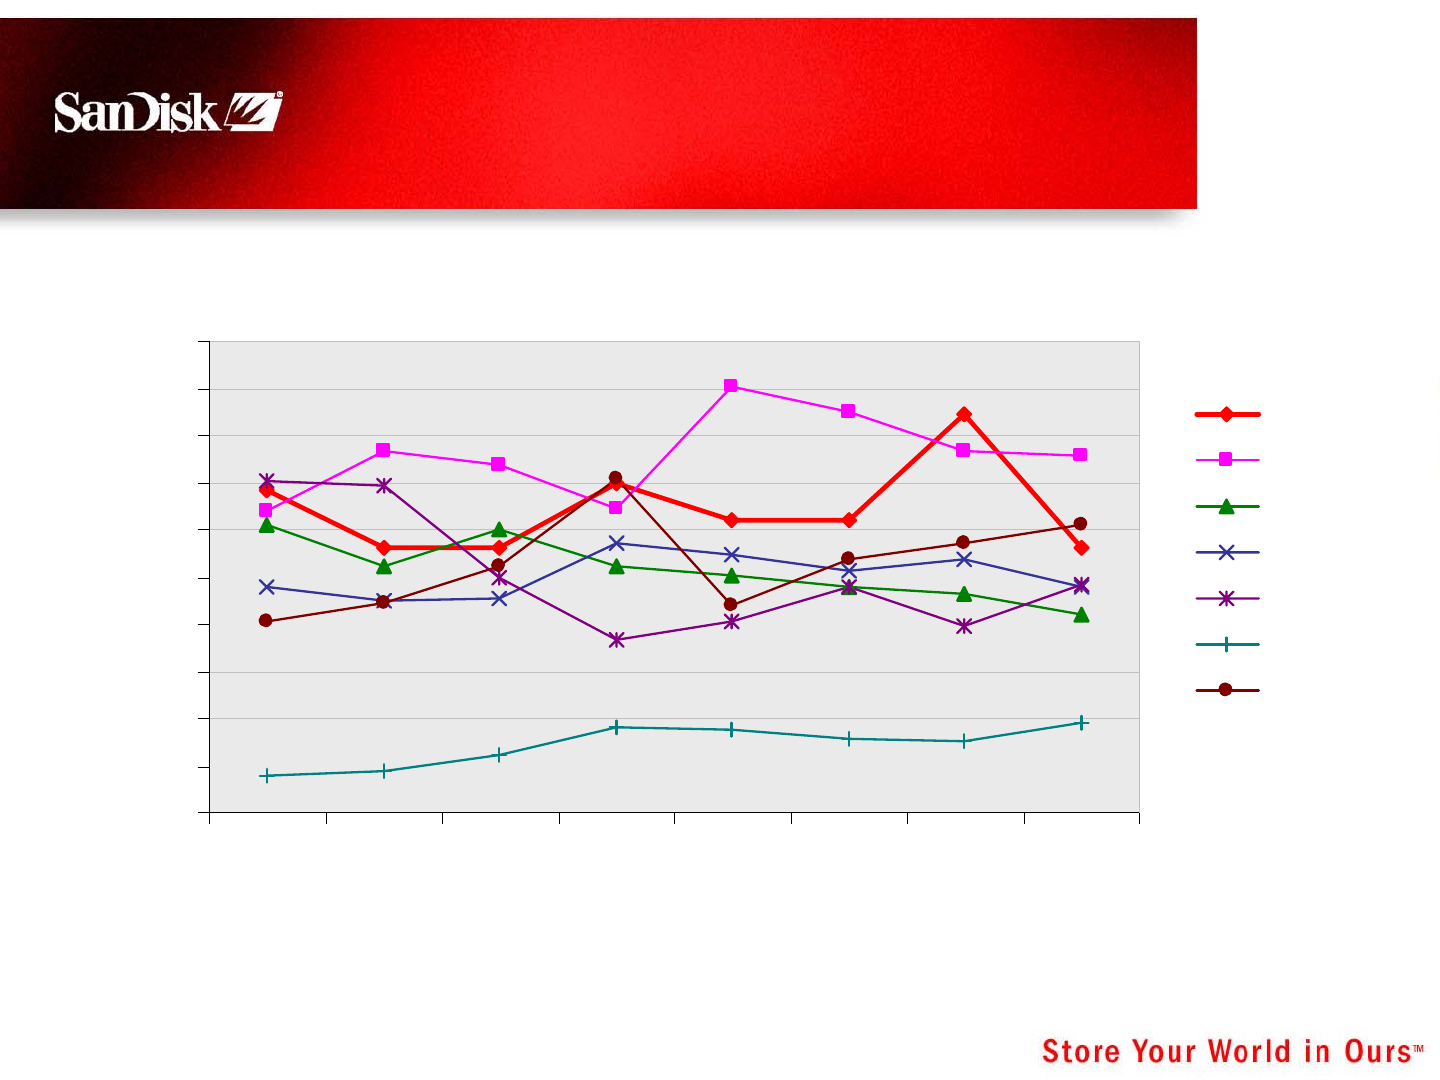
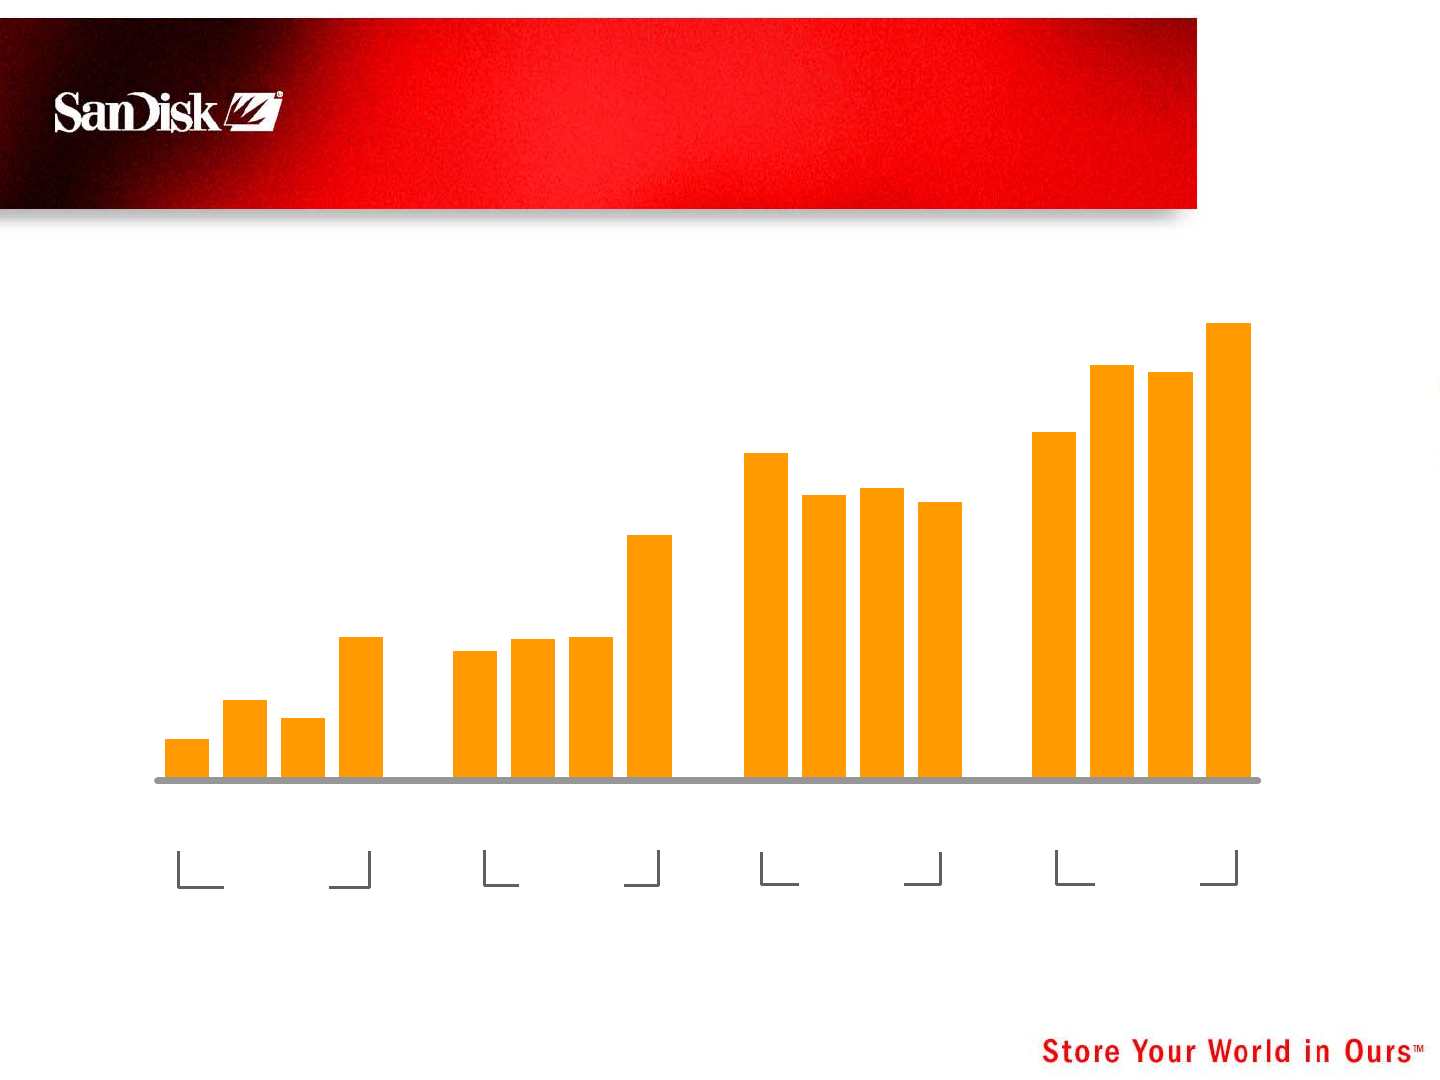
Growing Market Share: Leader in U.S.
0%
5%
10%
15%
20%
25%
30%
35%
40%
45%
50%
2005-01
2005-02
2005-03
2005-04
2005-05
2005-06
2005-07
2005-08
2005-09
2005-10
2005-11
2005-12
SanDisk
Lexar
PNY
Sony
Kodak
Memorex
Fujifilm
Kingston
Source: NPD Group
Retail Revenue Shares – Cards & UFDs
5 February 23, 2006
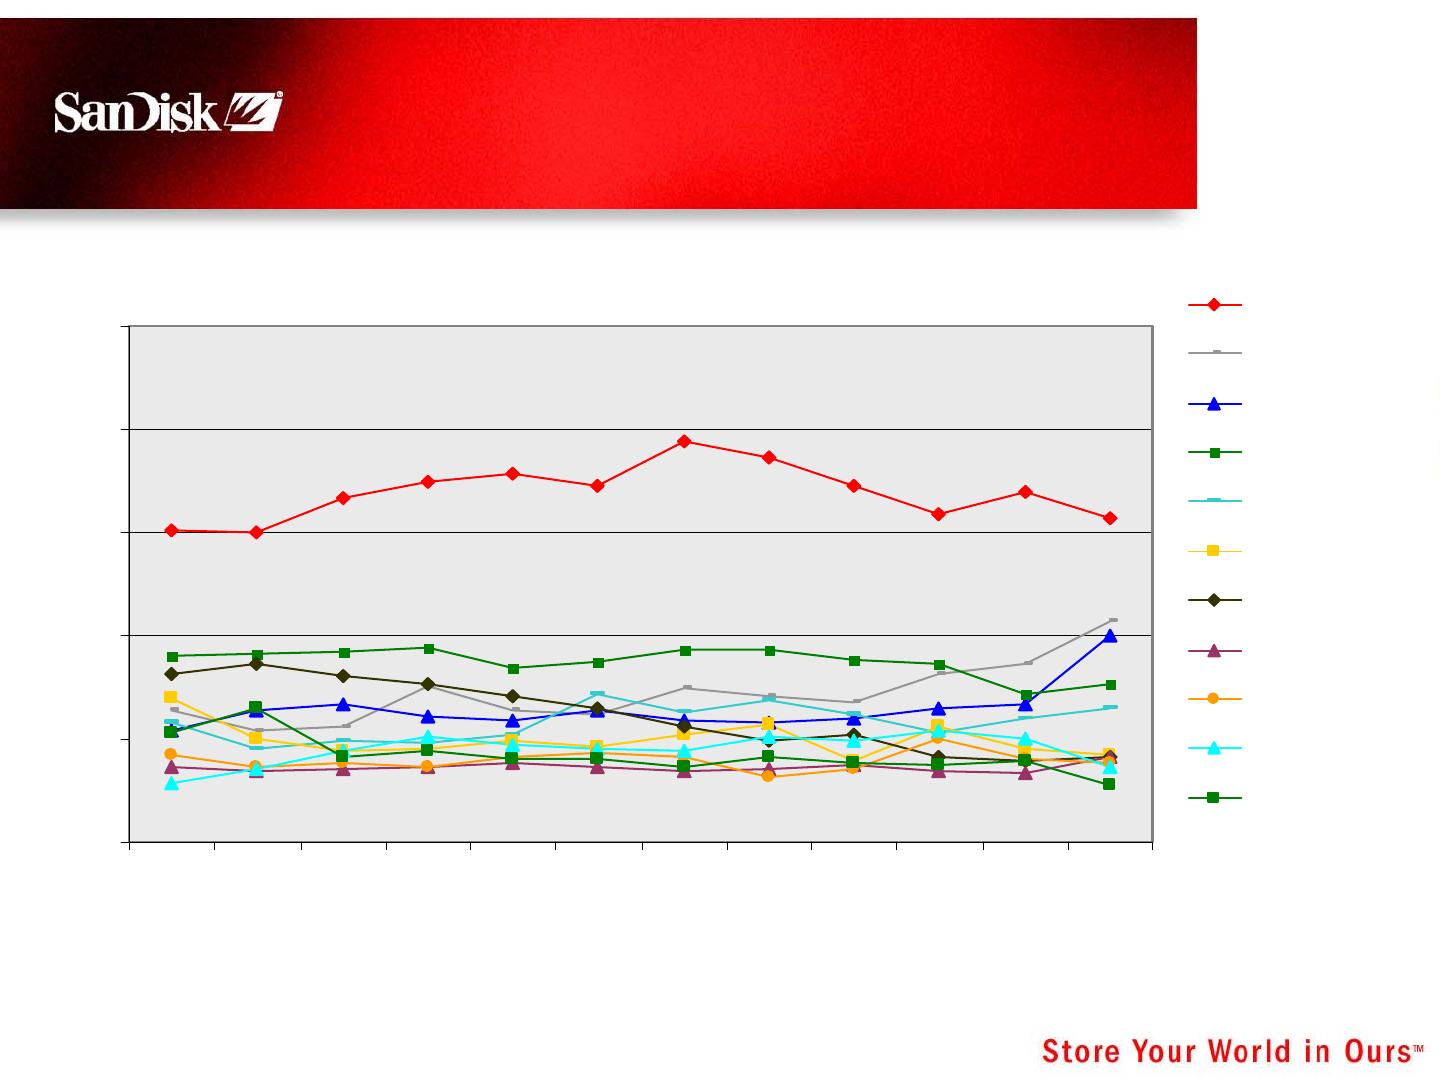
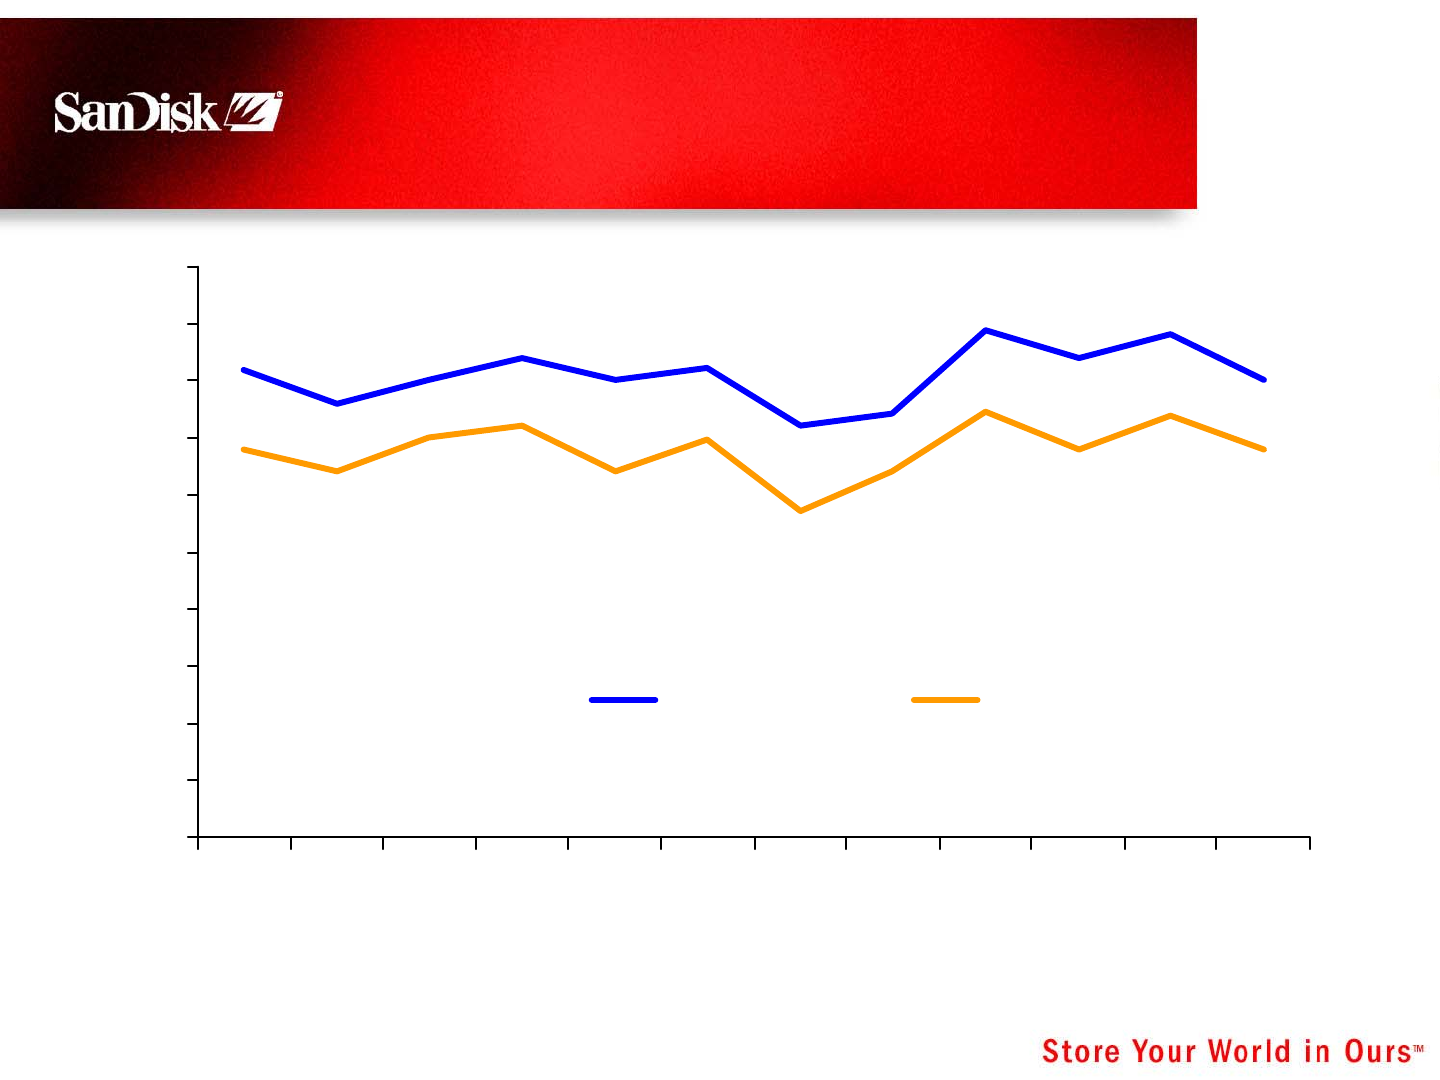
Europe: Opportunity for Growth in
2006
0%
5%
10%
15%
20%
25%
2005-01
2005-02
2005-03
2005-04
2005-05
2005-06
2005-07
2005-08
2005-09
2005-10
2005-11
2005-12
Source: GfK (France, Germany, UK)
Retail Revenue Shares – Cards + UFDs
SANDISK
PNY TECH
TRADEBRAND
SONY
FUJIFILM
HAMA
LEXAR
OLYMPUS
DANE ELEC
KINGSTON
UNBRANDED
6 February 23, 2006
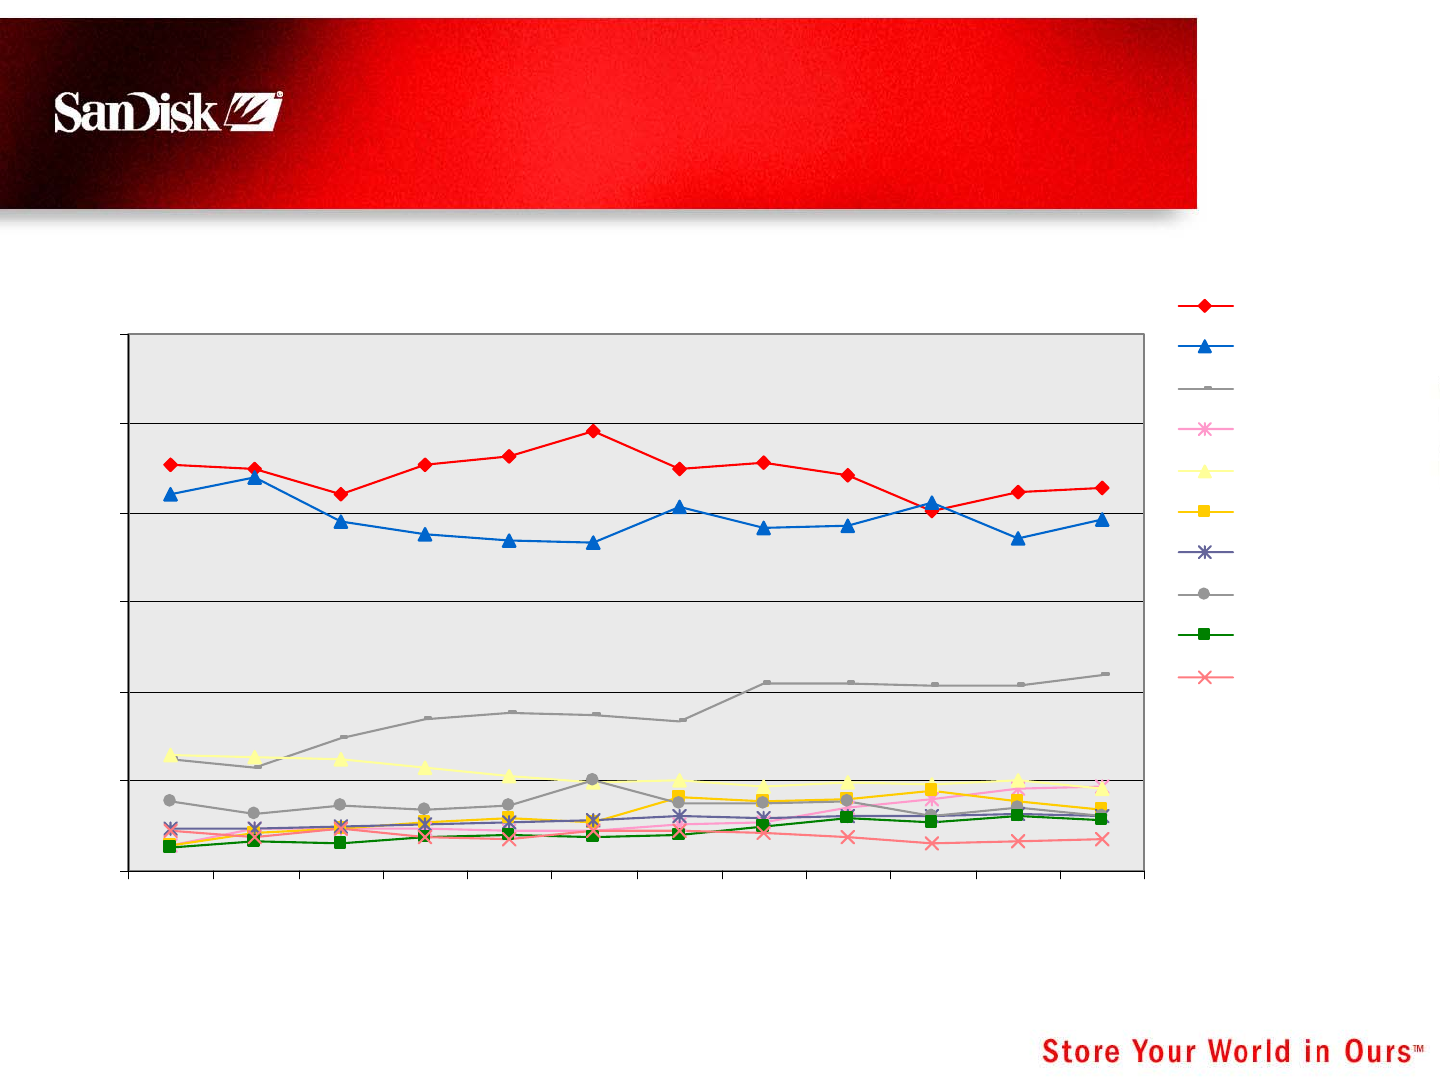
APAC: Opportunity for Growth
in 2006
0%
5%
10%
15%
20%
25%
30%
2005-01
2005-02
2005-03
2005-04
2005-05
2005-06
2005-07
2005-08
2005-09
2005-10
2005-11
2005-12
Source: GfK (China, Korea, Hong Kong, Taiwan, Singapore)
All Formats per Brand −Revenue
SANDISK
SONY
KINGSTON
TOSHIBA
OLYMPUS
ADATA
FUJIFILM
TRANSCEND
LG
AIGO
7 February 23, 2006
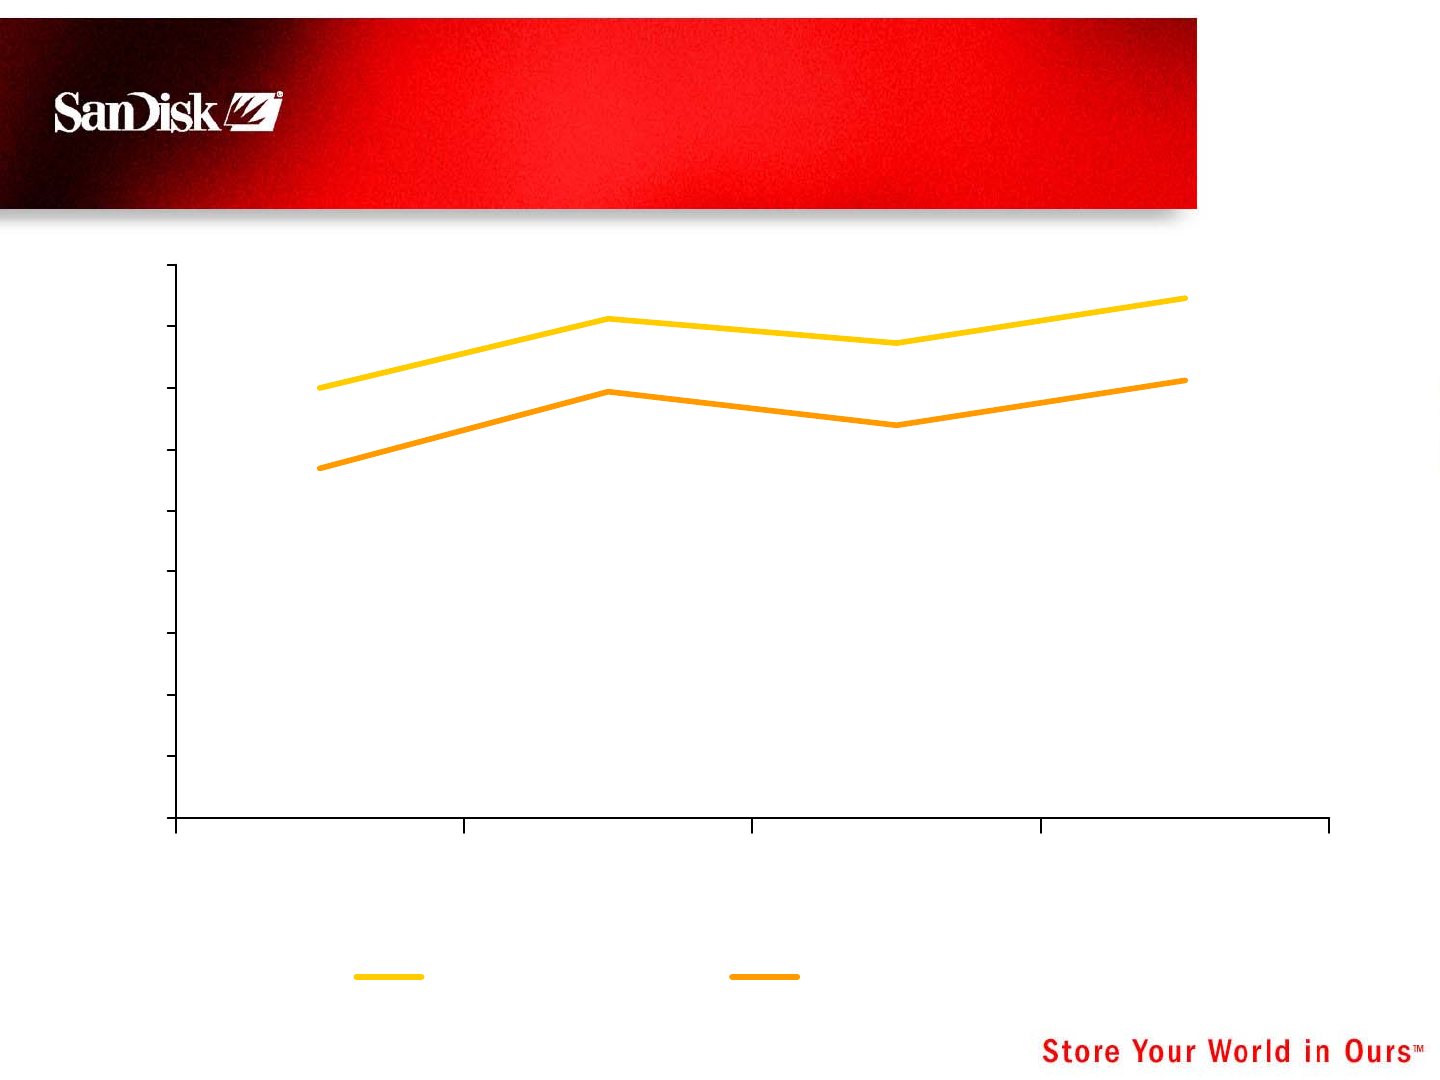
Japan: Opportunity to Lead
In Highly Fragmented Market
0%
2%
4%
6%
8%
10%
12%
14%
16%
18%
20%
2004 Q1
Q2
Q3
Q4
2005Q1
Q2
Q3
Q4
SanDisk
Buffalo
Hagiwara
Panasonic
I-O Data
Lexar
Sony
All Formats per Brand −Shipments
Source: TSR
8 February 23, 2006
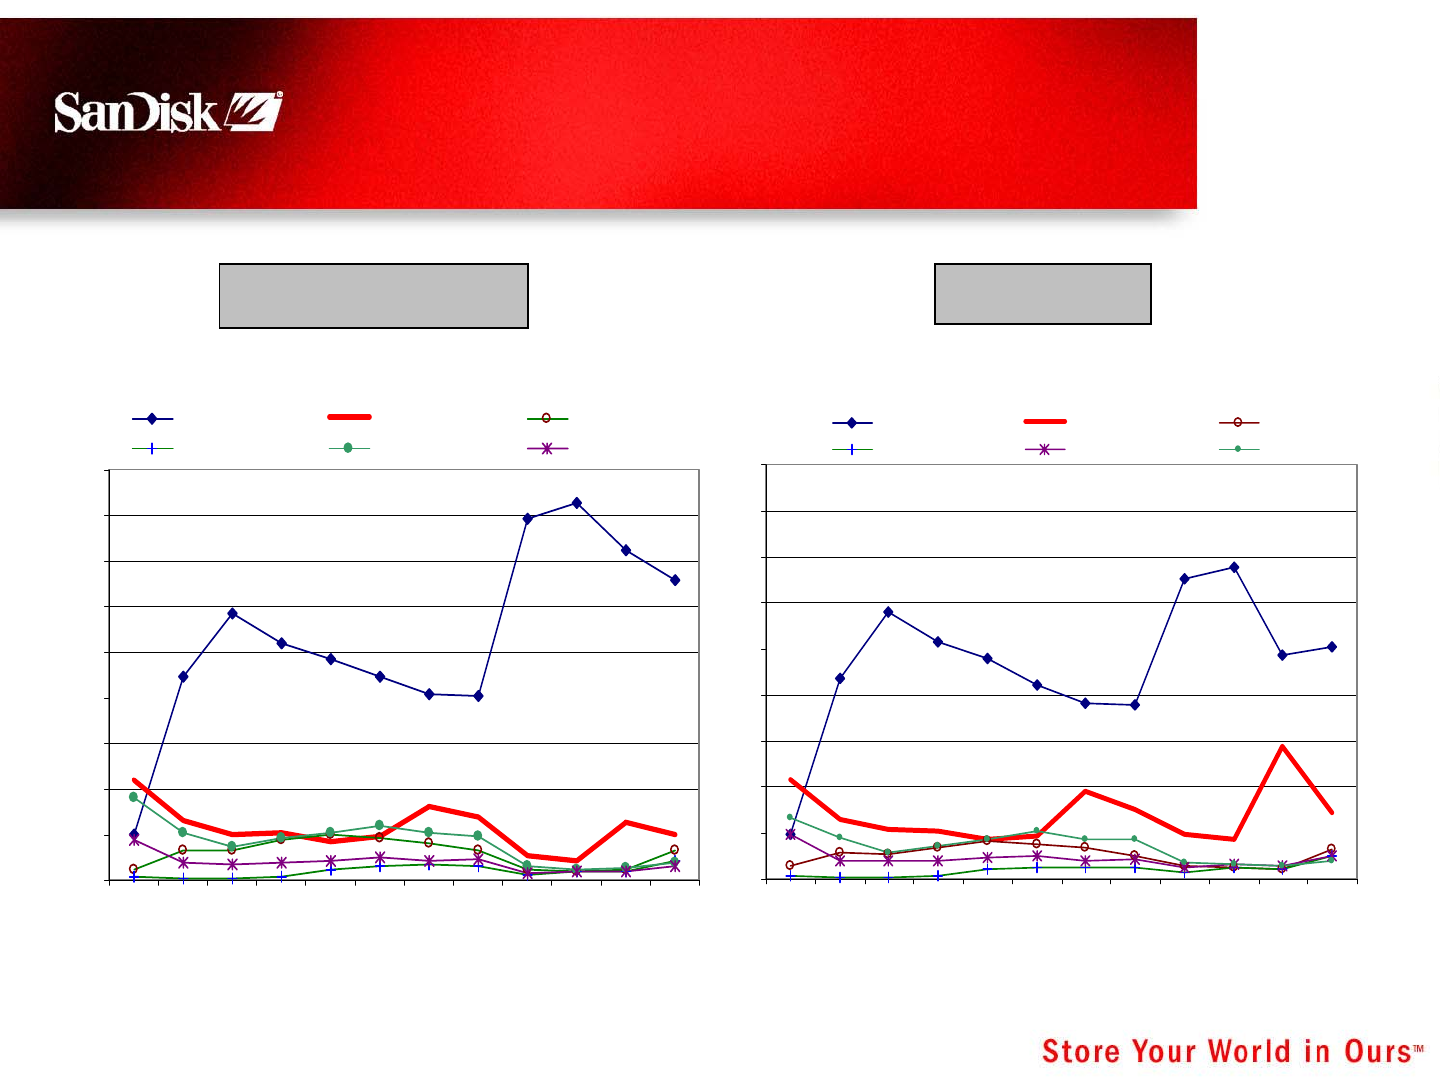
Flash Digital Audio Players: US
Market Shares
0
10
20
30
40
50
60
70
80
90
Jan-05
Feb-05
Mar-05
Apr-05
May-05
Jun-05
Jul-05
Aug-05
Sep-05
Oct-05
Nov-05
Dec-05
Apple SanDisk Samsung
Sony Creative Labs iRiver
Source: NPD Group
Revenue Share Unit Share
0
10
20
30
40
50
60
70
80
90
Jan-05
Feb-05
Mar-05
Apr-05
May-05
Jun-05
Jul-05
Aug-05
Sep-05
Oct-05
Nov-05
Dec-05
Apple SanDisk Samsung
Sony iRiver Creative Labs
9 February 23, 2006
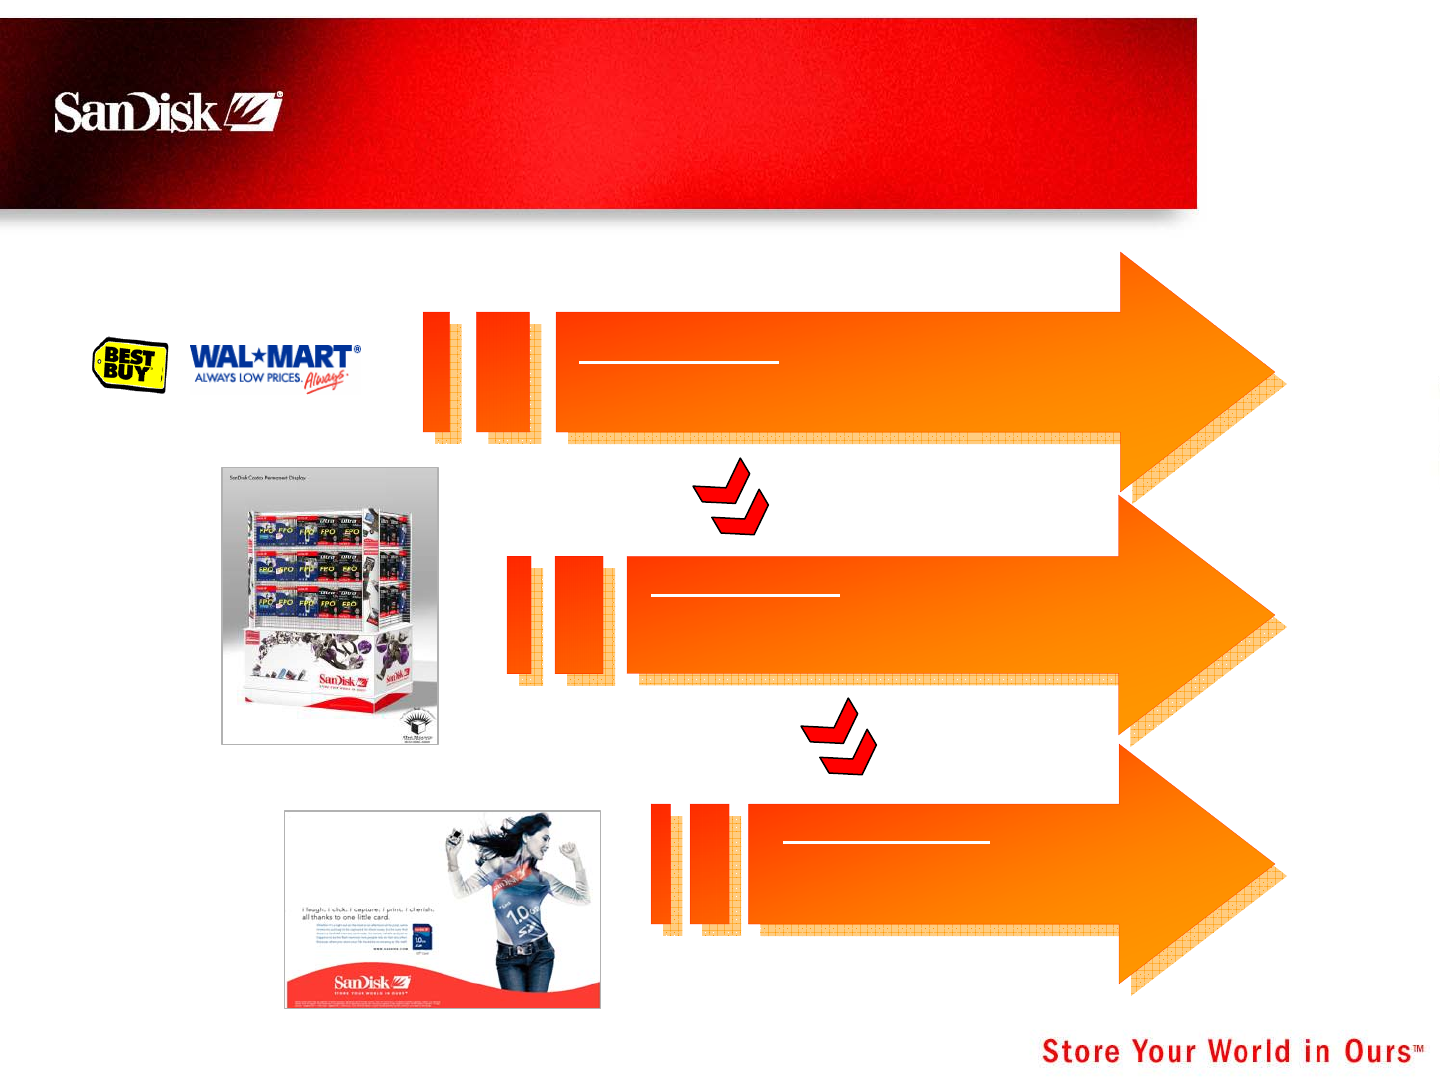
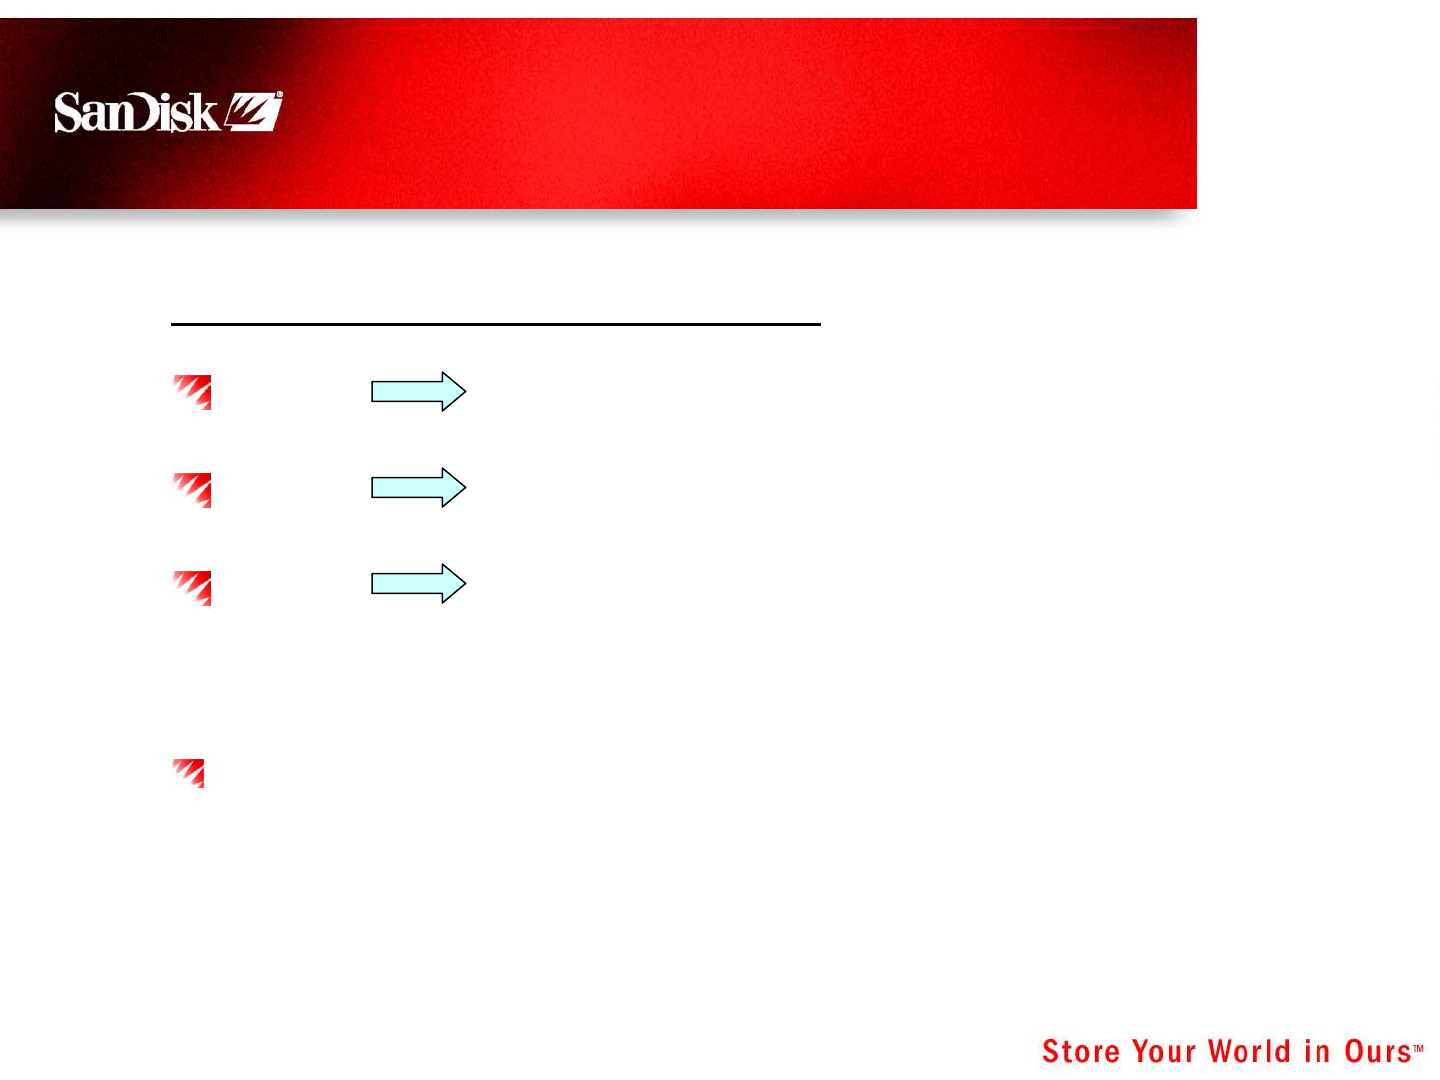
Be Everywhere where people will purchase
…with the broadest product offering
Retail Sales and Marketing Strategy
1
2
3Build the Brand –
Predispose the Customer
to choose SanDisk
Own the Store – “Store in Store”
Segment, Differentiate, Promote, Train,
Merchandise
10 February 23, 2006
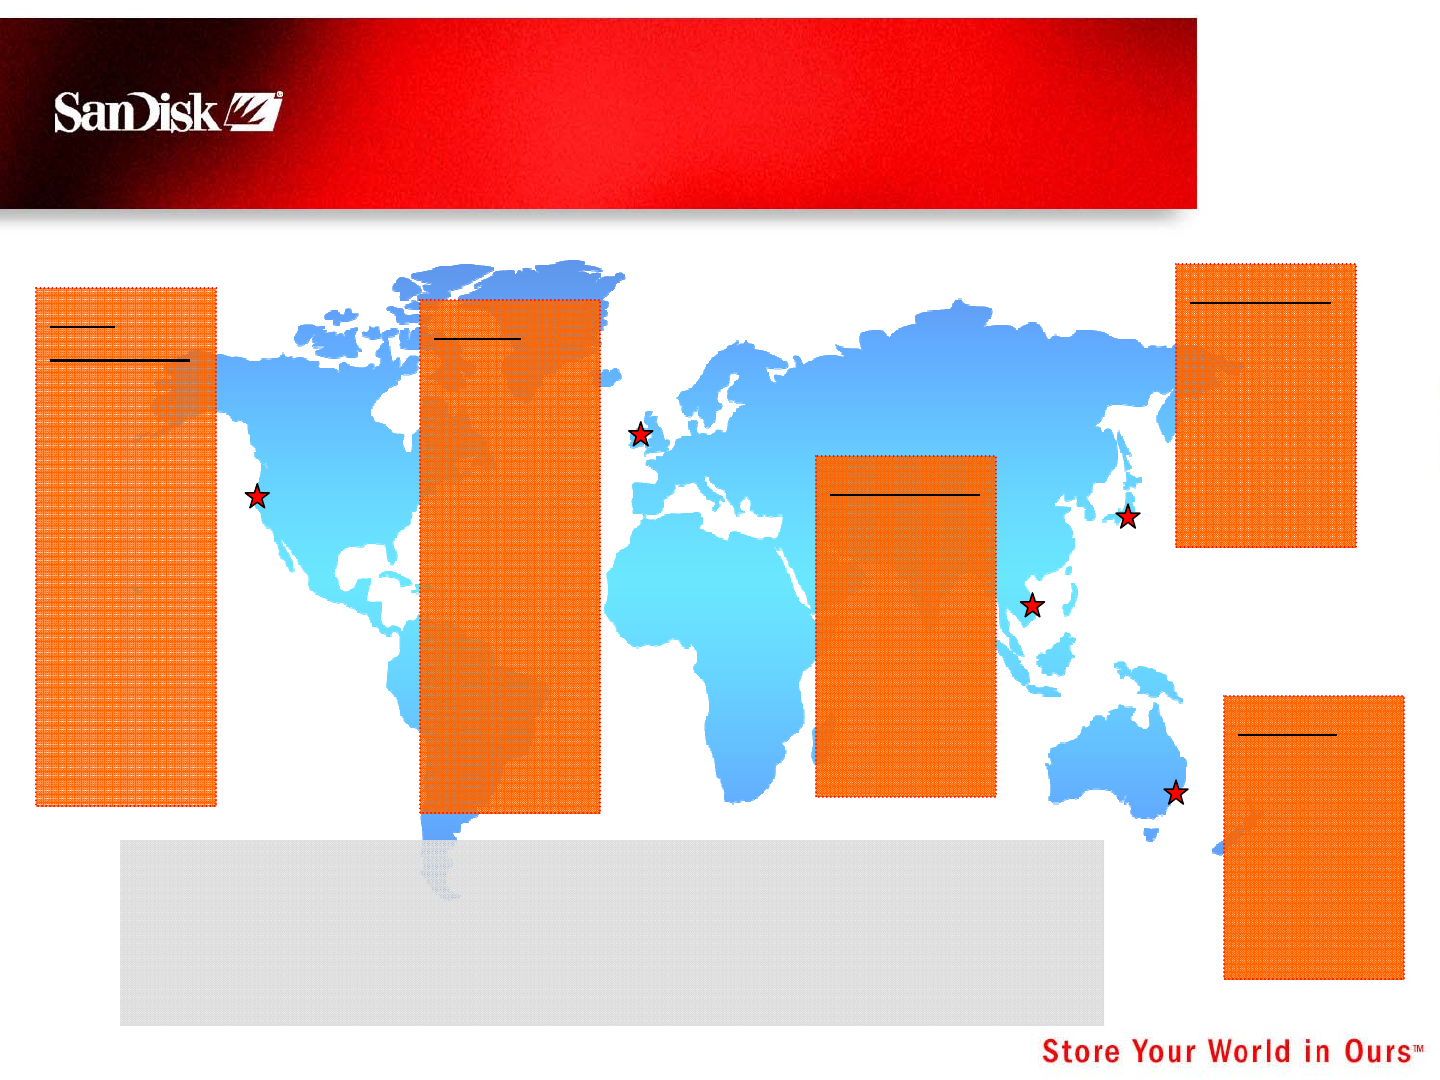
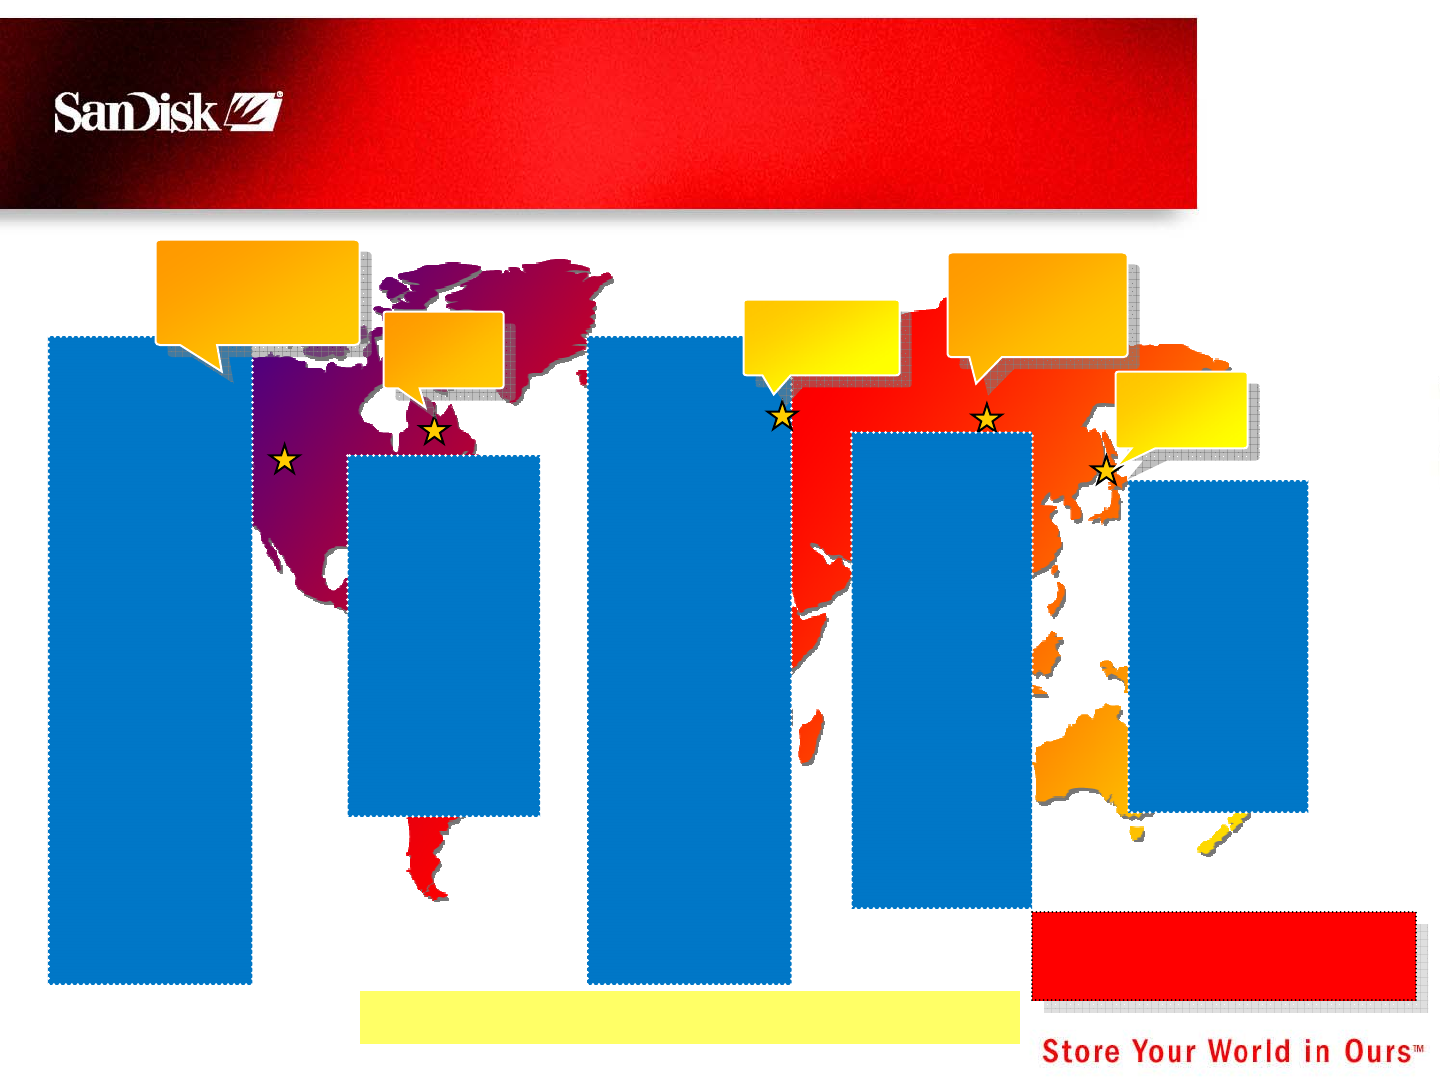
HQ –
Sunnyvale
Retail/OEM
Direct/
Distribution
CE/Mobile
Photo
Food/Drug
US
Canada
Mexico
Sales Ops
Doubling direct sales in EMEA and APAC
(with focus on China)
Added new sales team in Australia
Regional marketing staff in EMEA, APAC and Japan
Worldwide Sales Structure:
Aggressive Expansion Outside
the US
Dublin
Retail/OEM
CE/Mobile/
Photo
Germany
UK, France
Nordic
S Europe
E Europe
Middle East
Africa
Sales Ops
Field Eng
Hong Kong
Retail/OEM
CE/Mobile
China
Taiwan
Korea
S Asia
India
Yokohama
Retail/OEM
CE/Mobile/
Photo
Sales Ops
Field Eng
Sydney
Retail
CE/Mobile/
Photo
Australia
New Zealand
11 February 23, 2006
Global Reach: Over 150,000
Storefronts Worldwide
AAFES
Best Buy
Brooks/Eckerd
Circuit City
CompUSA
Wal-Mart
Costco
K-Mart
Musicland
Office Depot
Staples
Sears
Rite Aid
Radio Shack
Meijer/Food
Safeway
Kroger
HEB
MDI
GameStop
Sprint
Verizon
Bell World
Best Buy
Blacks
Costco
London
Drugs
Radio Shack
Sears
Shoppers
Drug Mart
West Fair
Canada Tire
T Mobile
Carphone
Warehouse
Woolworths
Dixons
Orange
Wal-Mart
Camara
Euronix
FotoSistema
Fotoco
FNAC
Foto Service
Germanos
Internet shops
Knut Leclerc
MakroMarkt
PhotoStation
Pulsat
RIC
Ringfoto
Schlecker
Aeon
BIC
Best
Edion
K’s
Kitamura
Kojima
Lawsons
Matsukiyo
Yamada
Yodobashi
Canada
5,000+
Canada
5,000+
Japan
14,000+
Japan
14,000+
Asia/
Pac Rim
27,000+
Asia/
Pac Rim
27,000+
USA, Mexico &
So. America
51,000+
USA, Mexico &
So. America
51,000+ Europe
51,000+
Europe
51,000+
20,000+ Food & Drug Stores
30,000+ Mobile Stores
20,000+ Food & Drug Stores
30,000+ Mobile Stores
Best
Coles
Fortress
Broadway
Lotte
Costco
Sunfar
GoMe
SuNing
DahZong
Officeworks
Big W
Harris Tech.
Good Guys
H Norman
Woolworths
48,000 store fronts added in 2005!
12 February 23, 2006
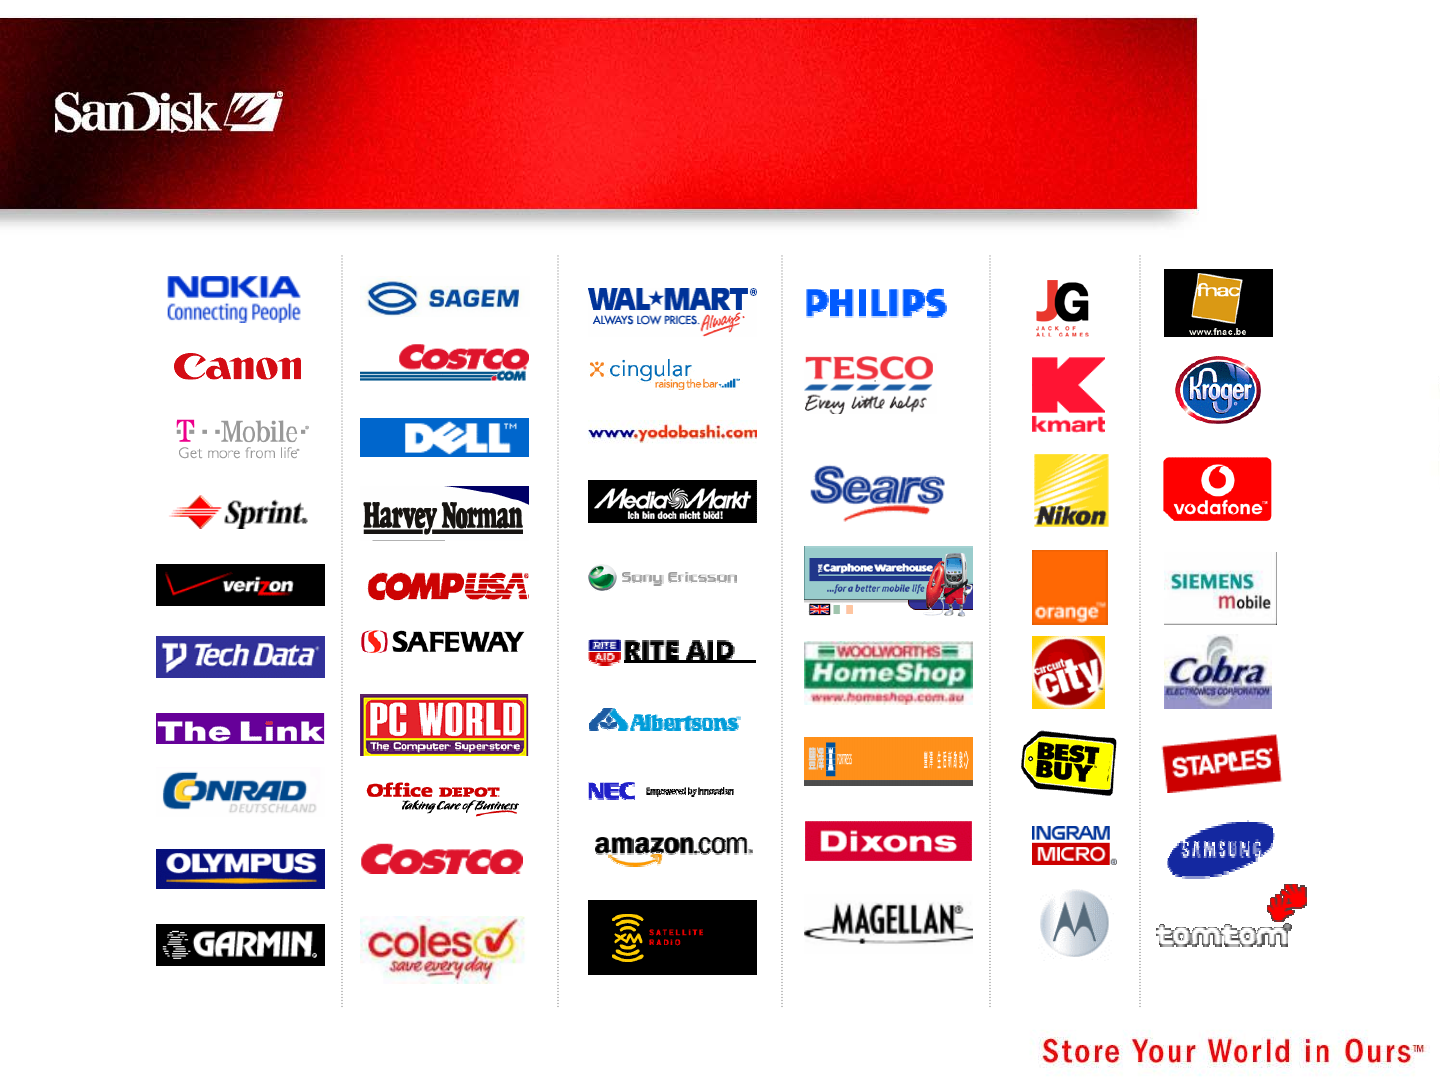
World Class Customers
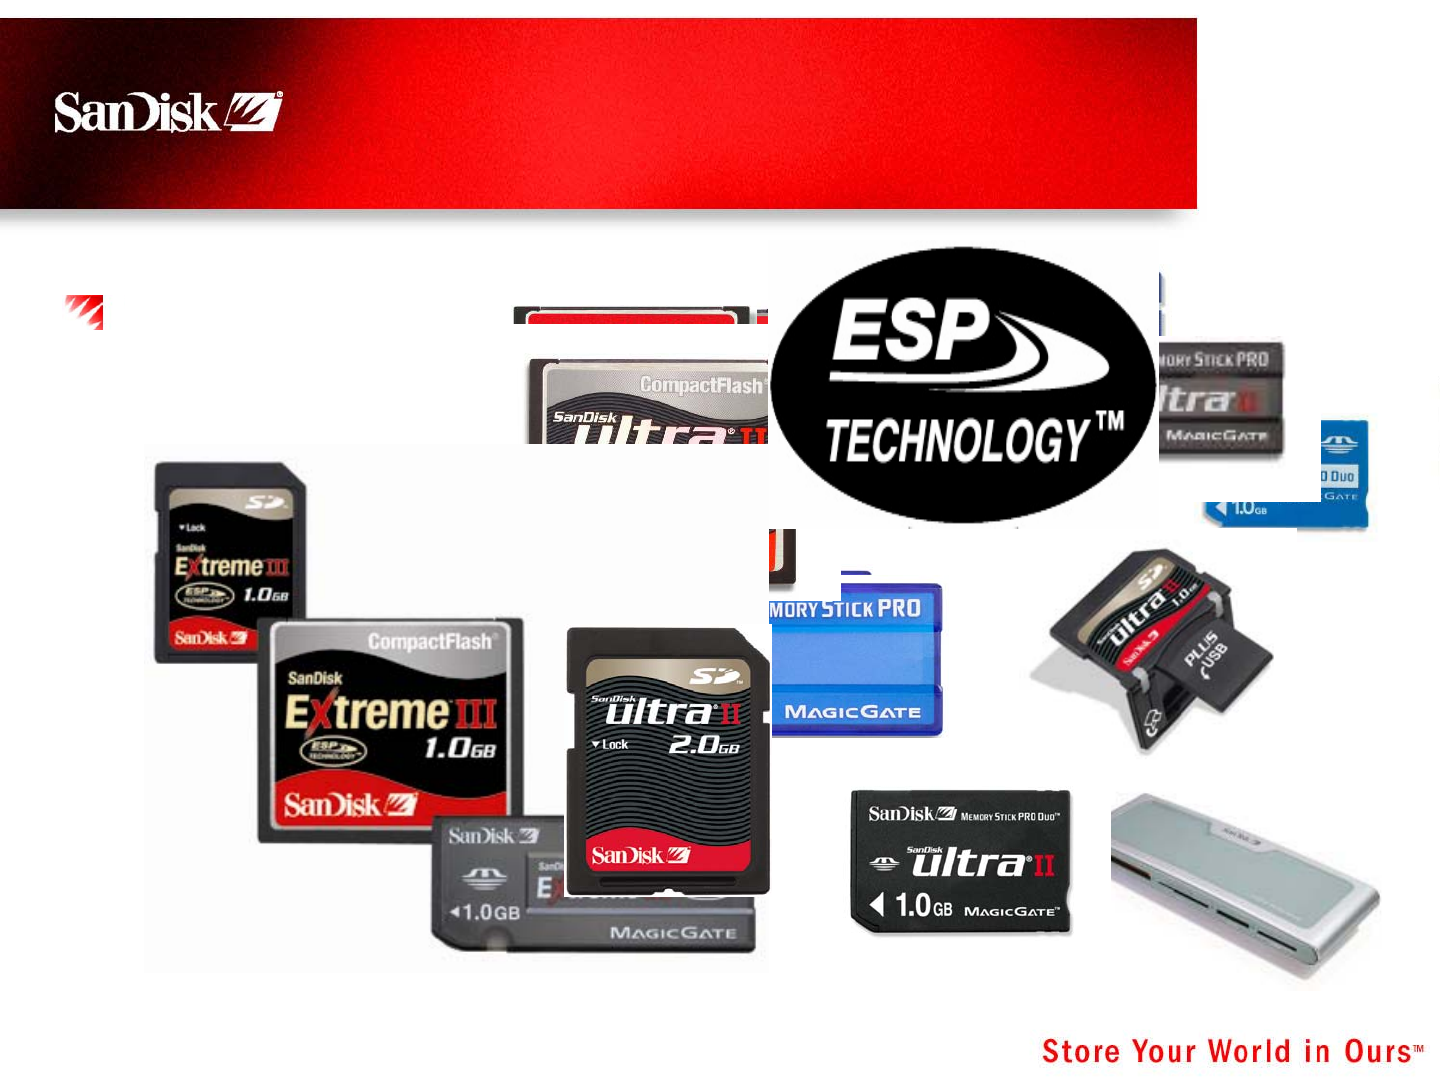
13 February 23, 2006
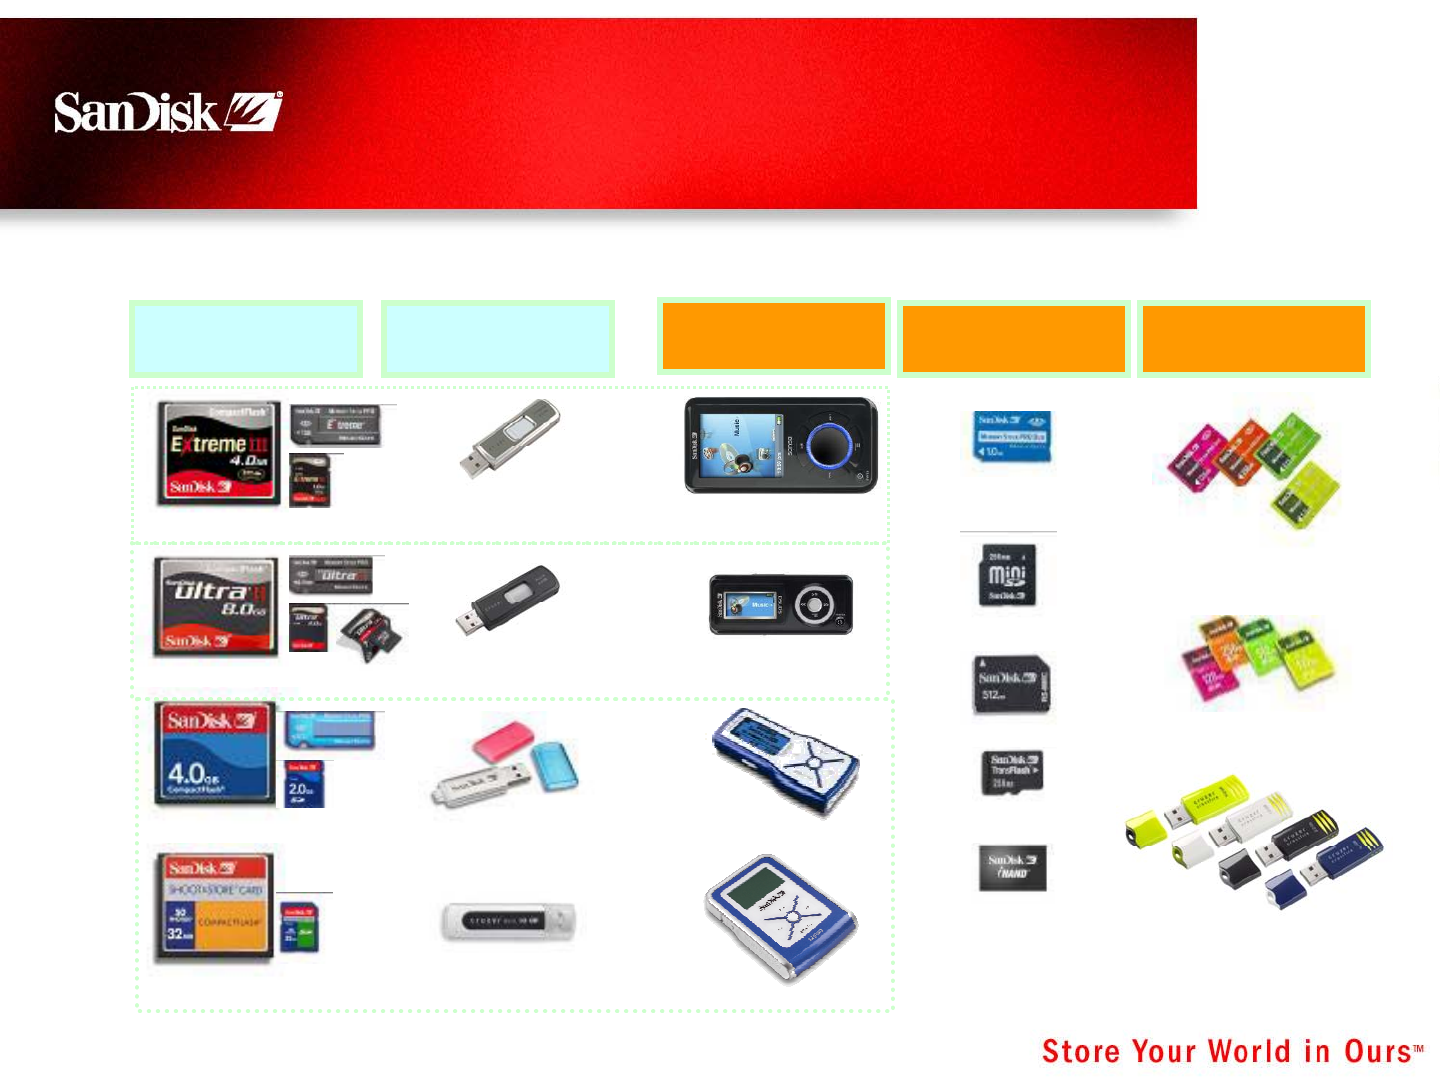
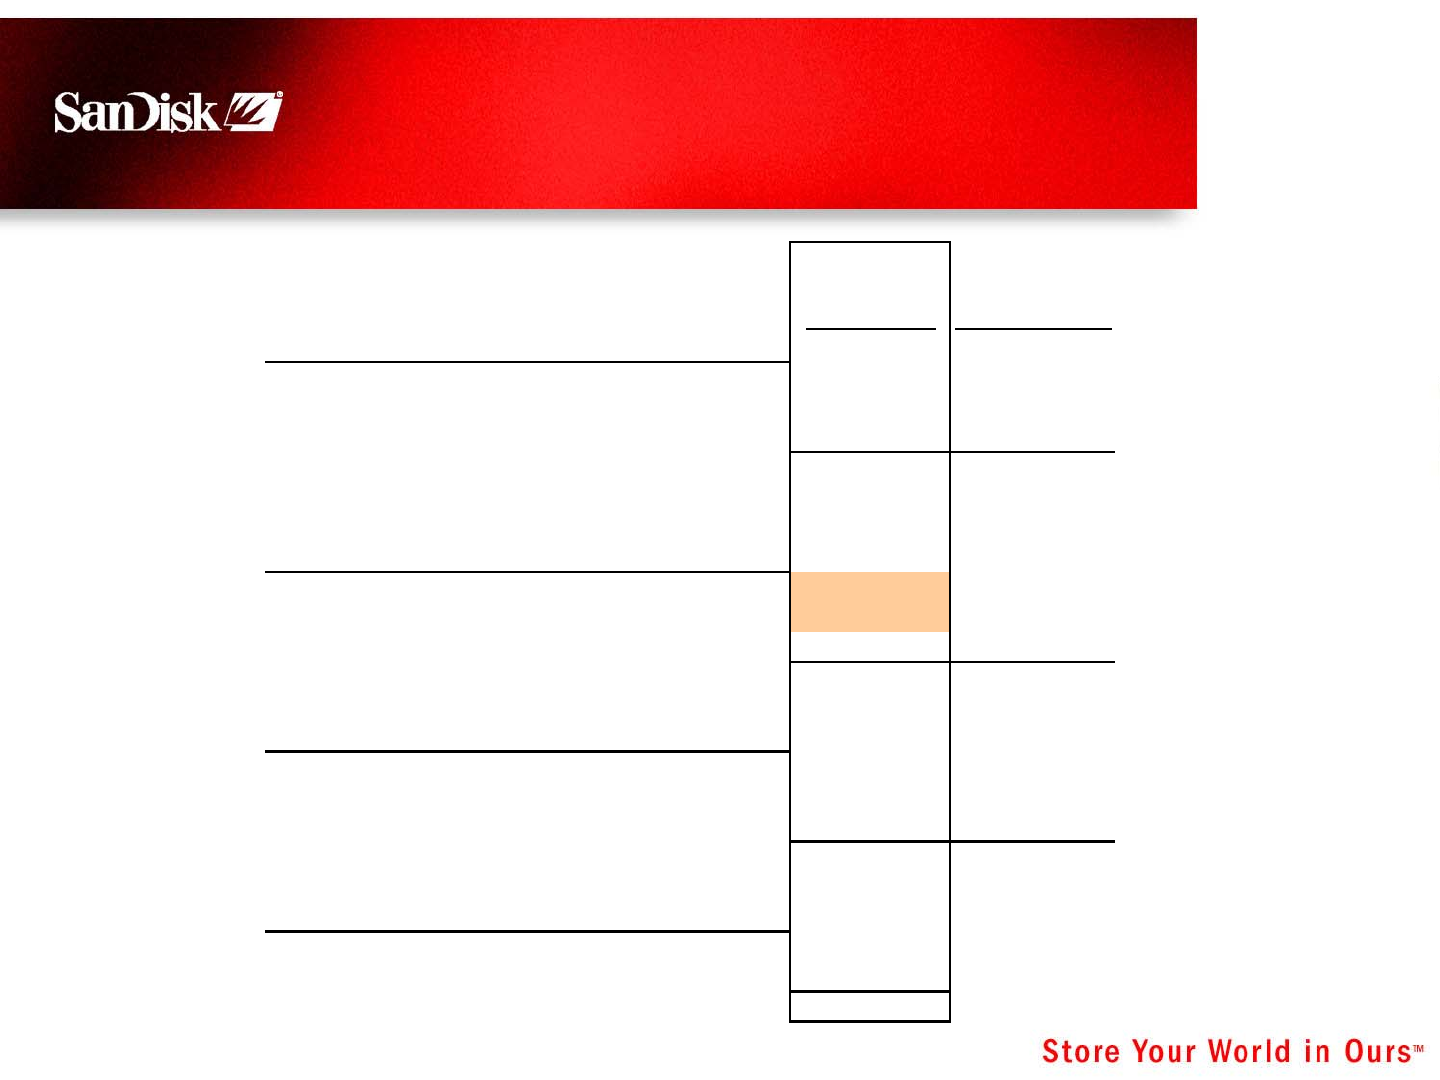
Personal
Data Storage
Core
Digital
Imaging
Shoot & Store™ Family
Blue Family
SanDisk Ultra®Family
SanDisk Extreme®Family
Best
Good
Better
Emerging High Growth
Mobile
Phones
Memory Stick
PRO Duo™
miniSD™
MMCmobile™
microSD™
iNAND™
Digital
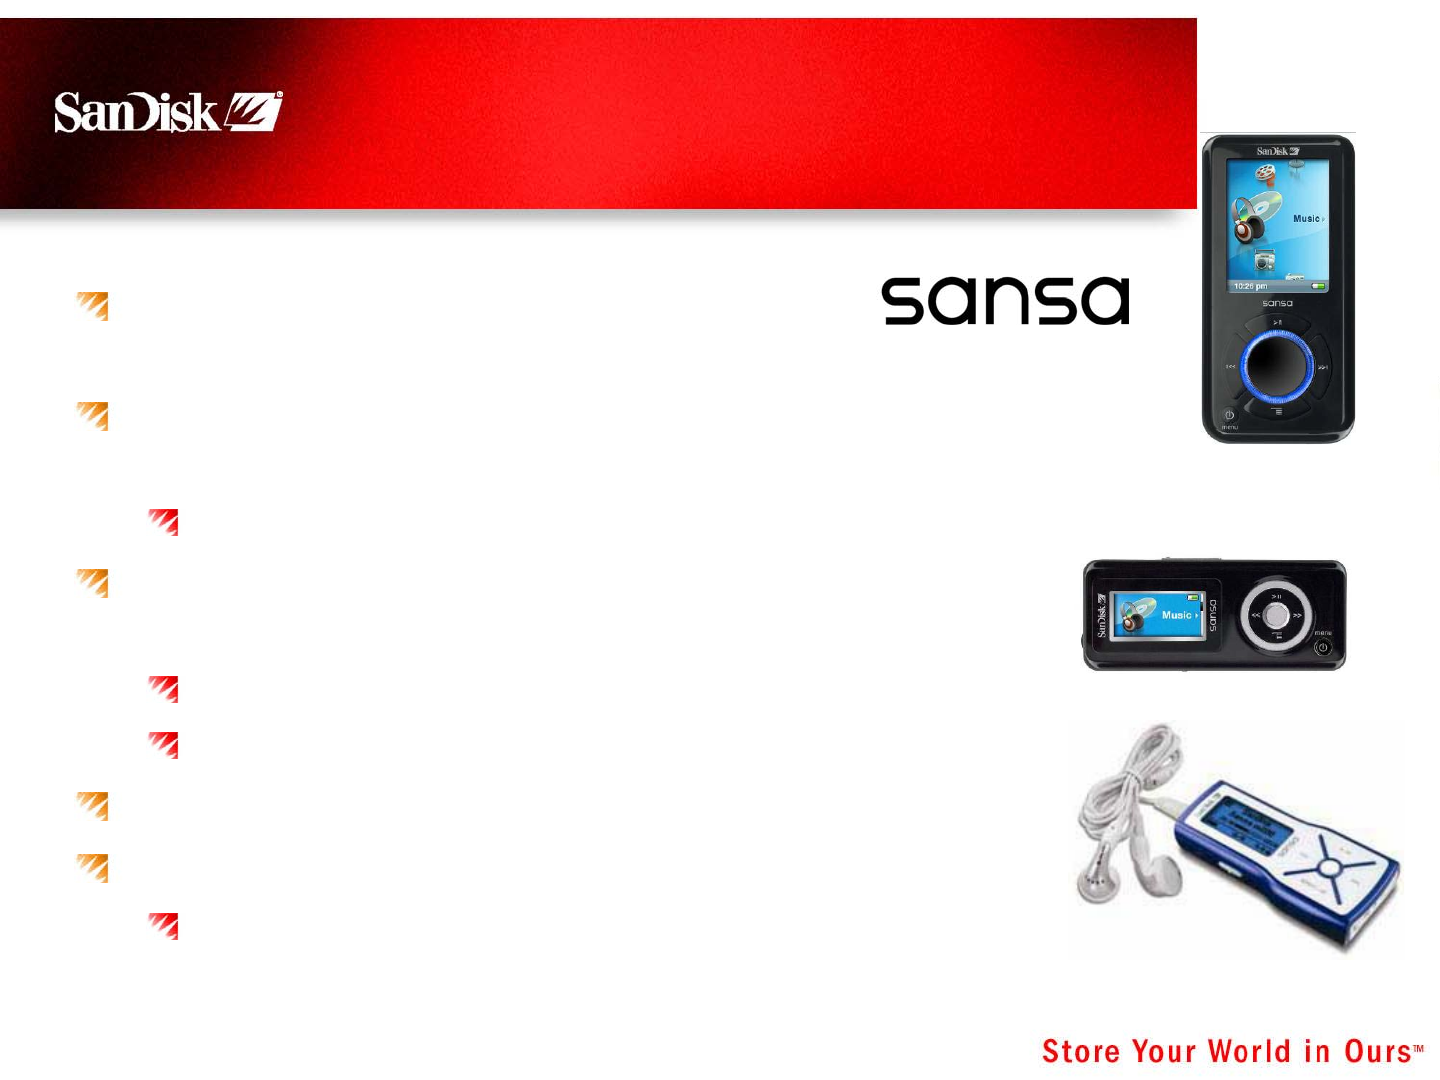
Audio
Sansa®e100
SansaTM m200
SansaTM c100
SansaTMe200
Gaming
SD™
Memory Stick
PRO Duo™
Cruzer Crossfire™
Cruzer®Mini
Cruzer®Micro Skins
Cruzer®Titanium II
Cruzer®Micro II
Differentiated and Segmented
Strategy
14 February 23, 2006
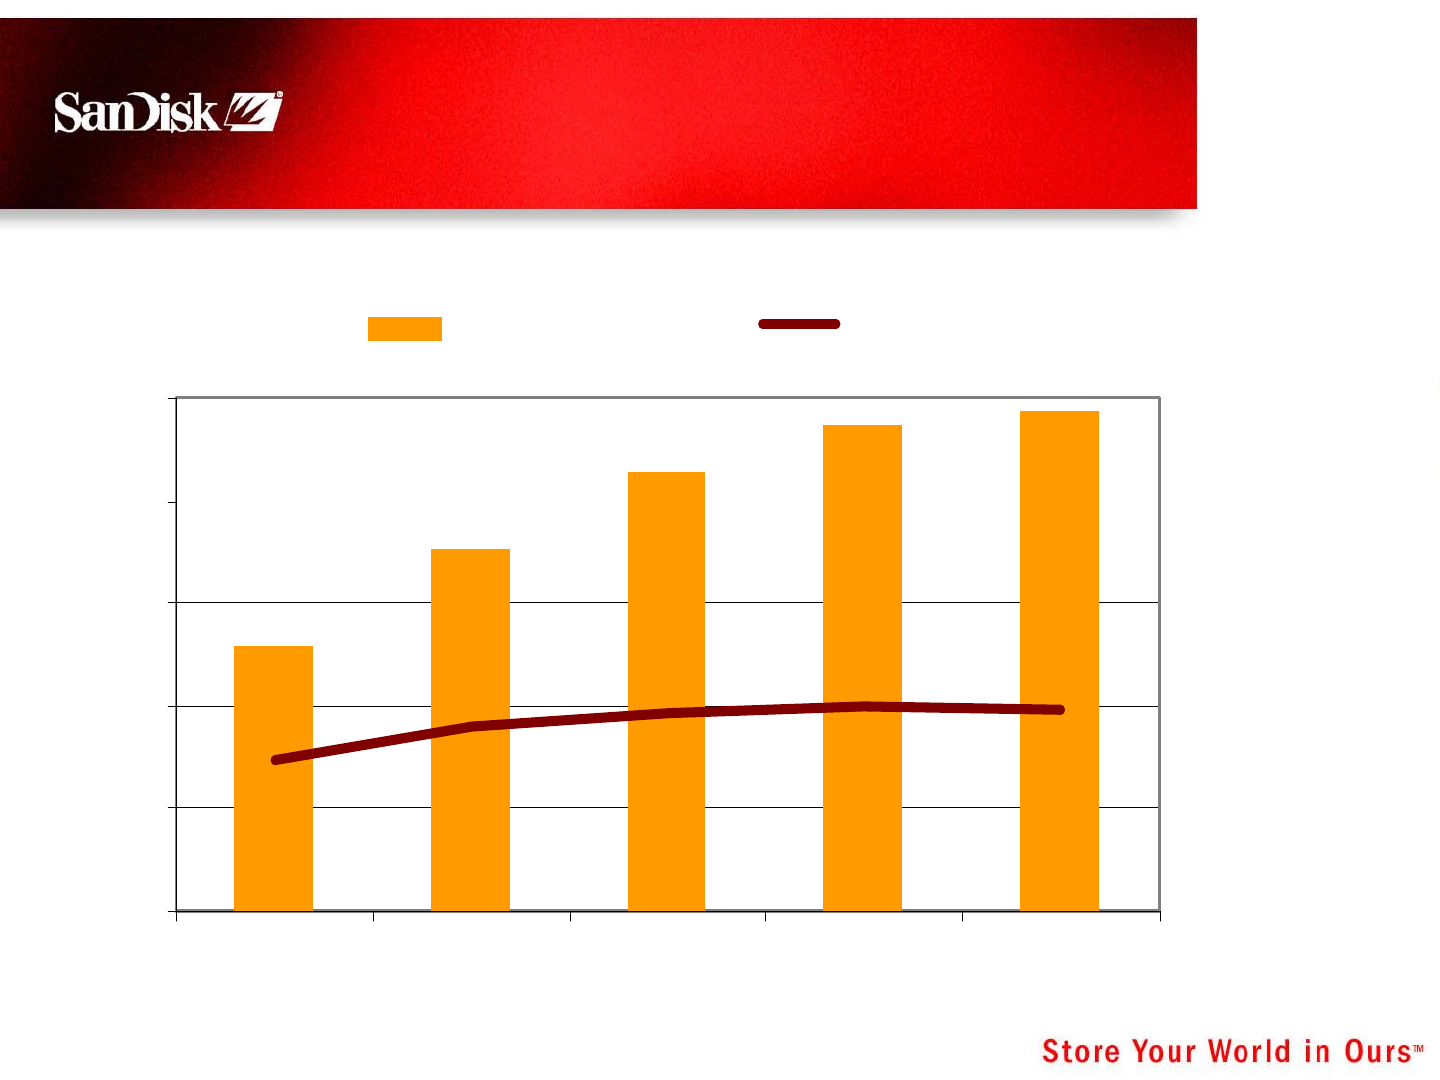
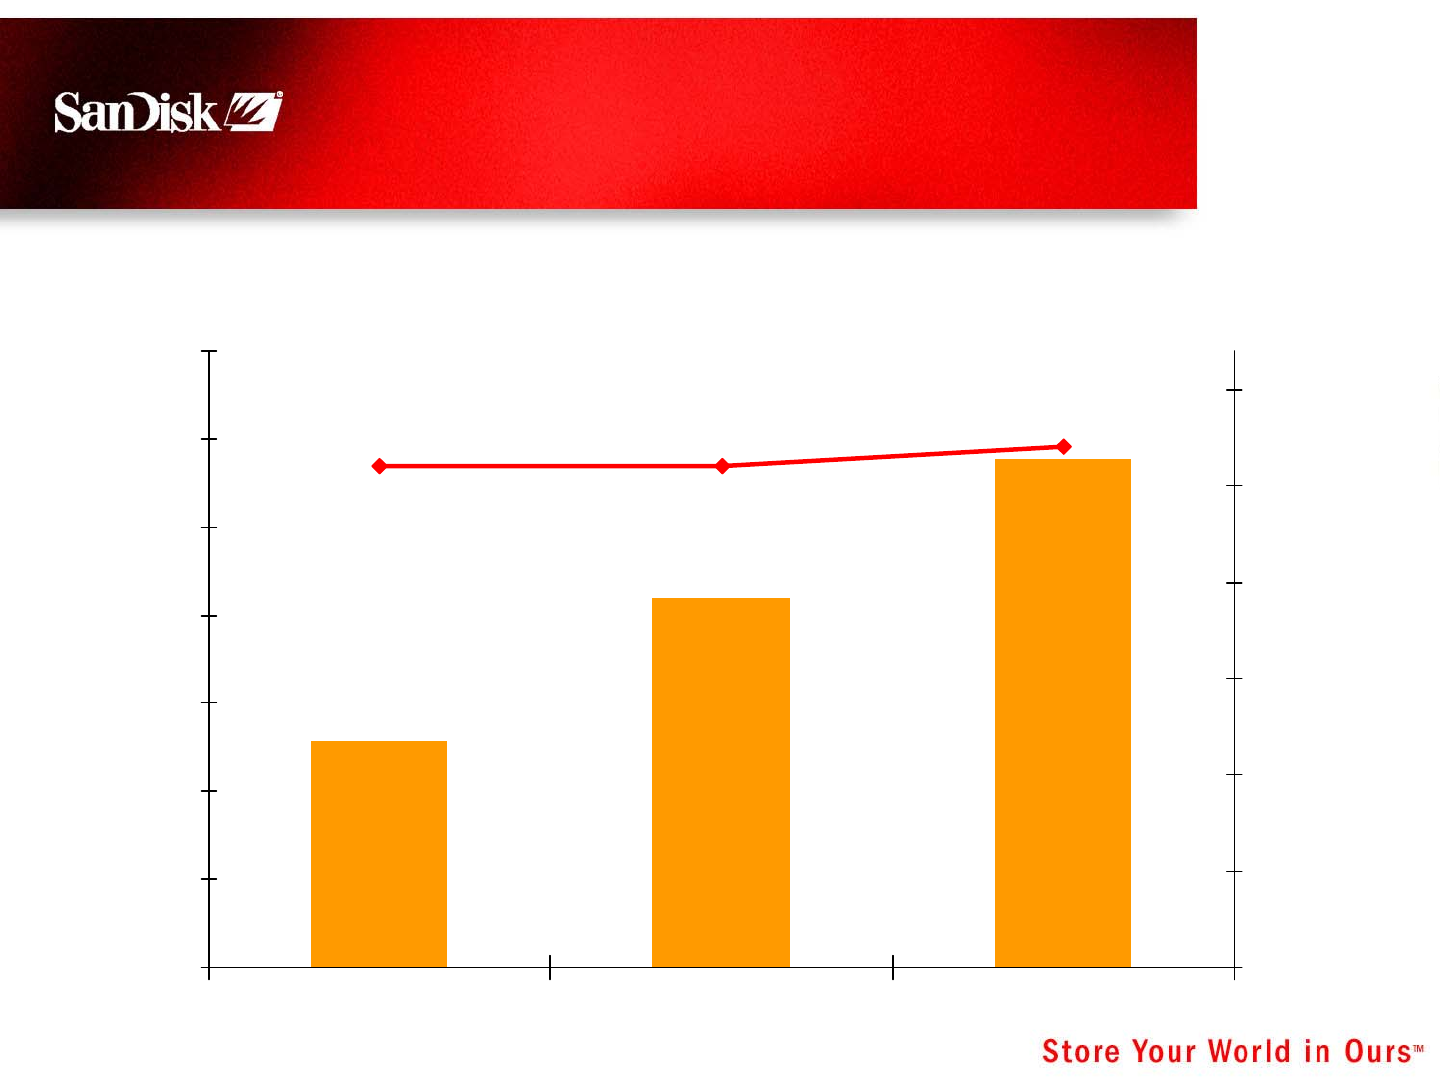
Source: DSCs-IDC Aug ’05/Feb ‘06, Installed Base-SanDisk Estimates
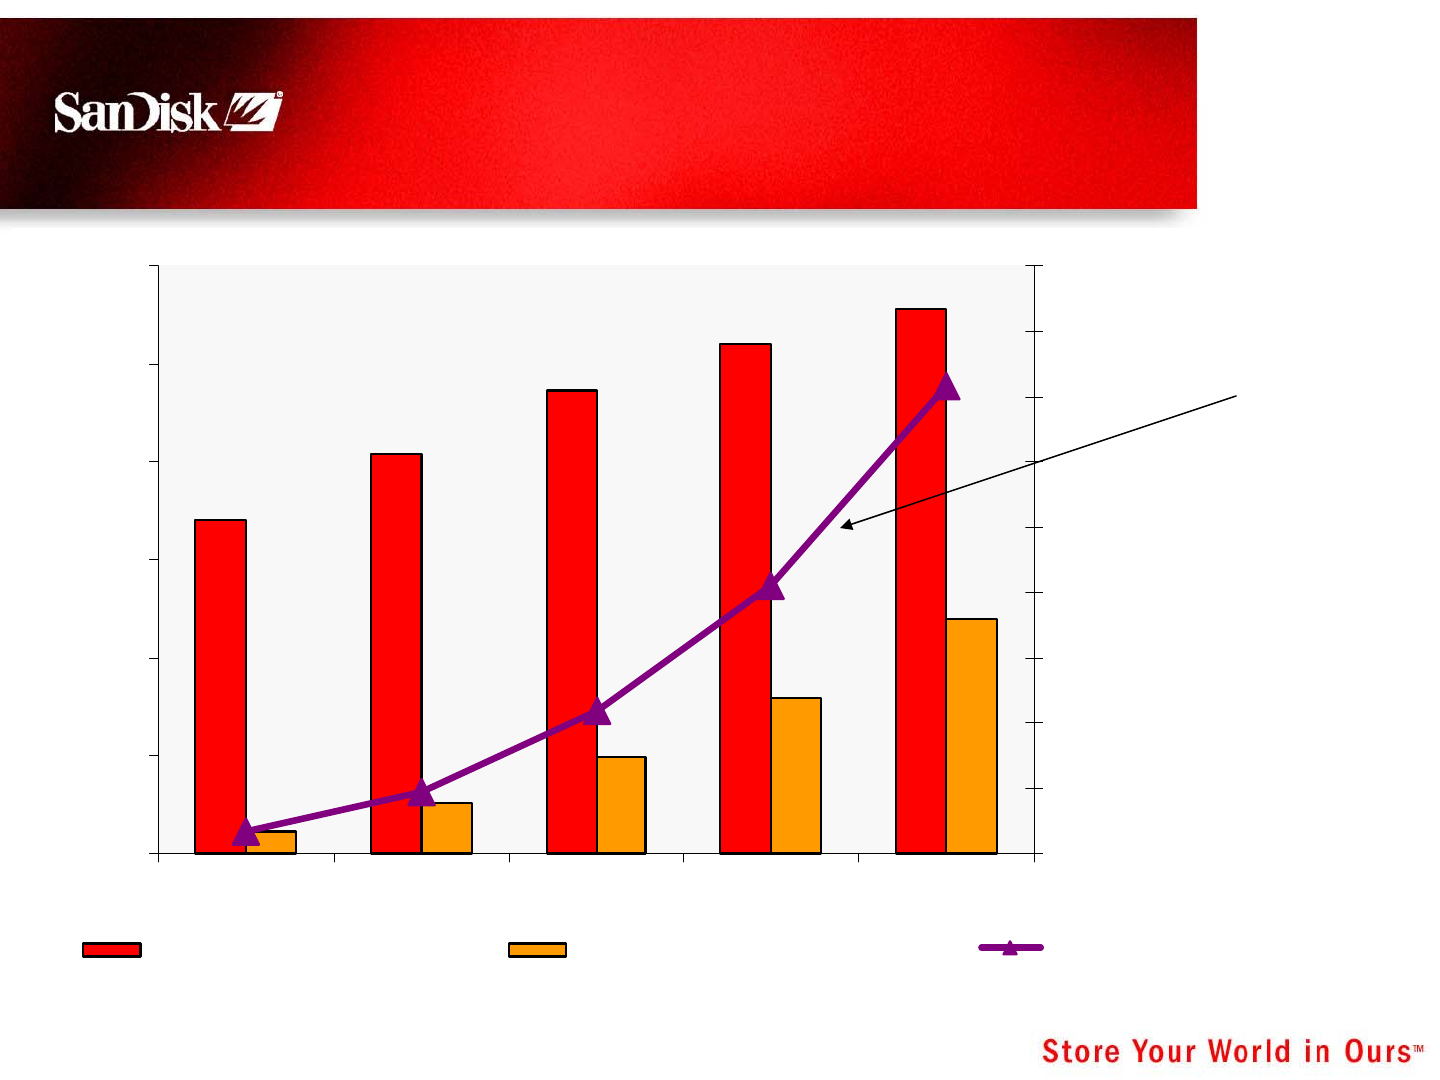
Digital Still Camera Market:
Growing Installed Base
-
50
100
150
200
250
2004 2005 2006 2007 2008
Installed Base 4 Years shipments
DSC Shipments & Installed Base
Life Span 4 Years
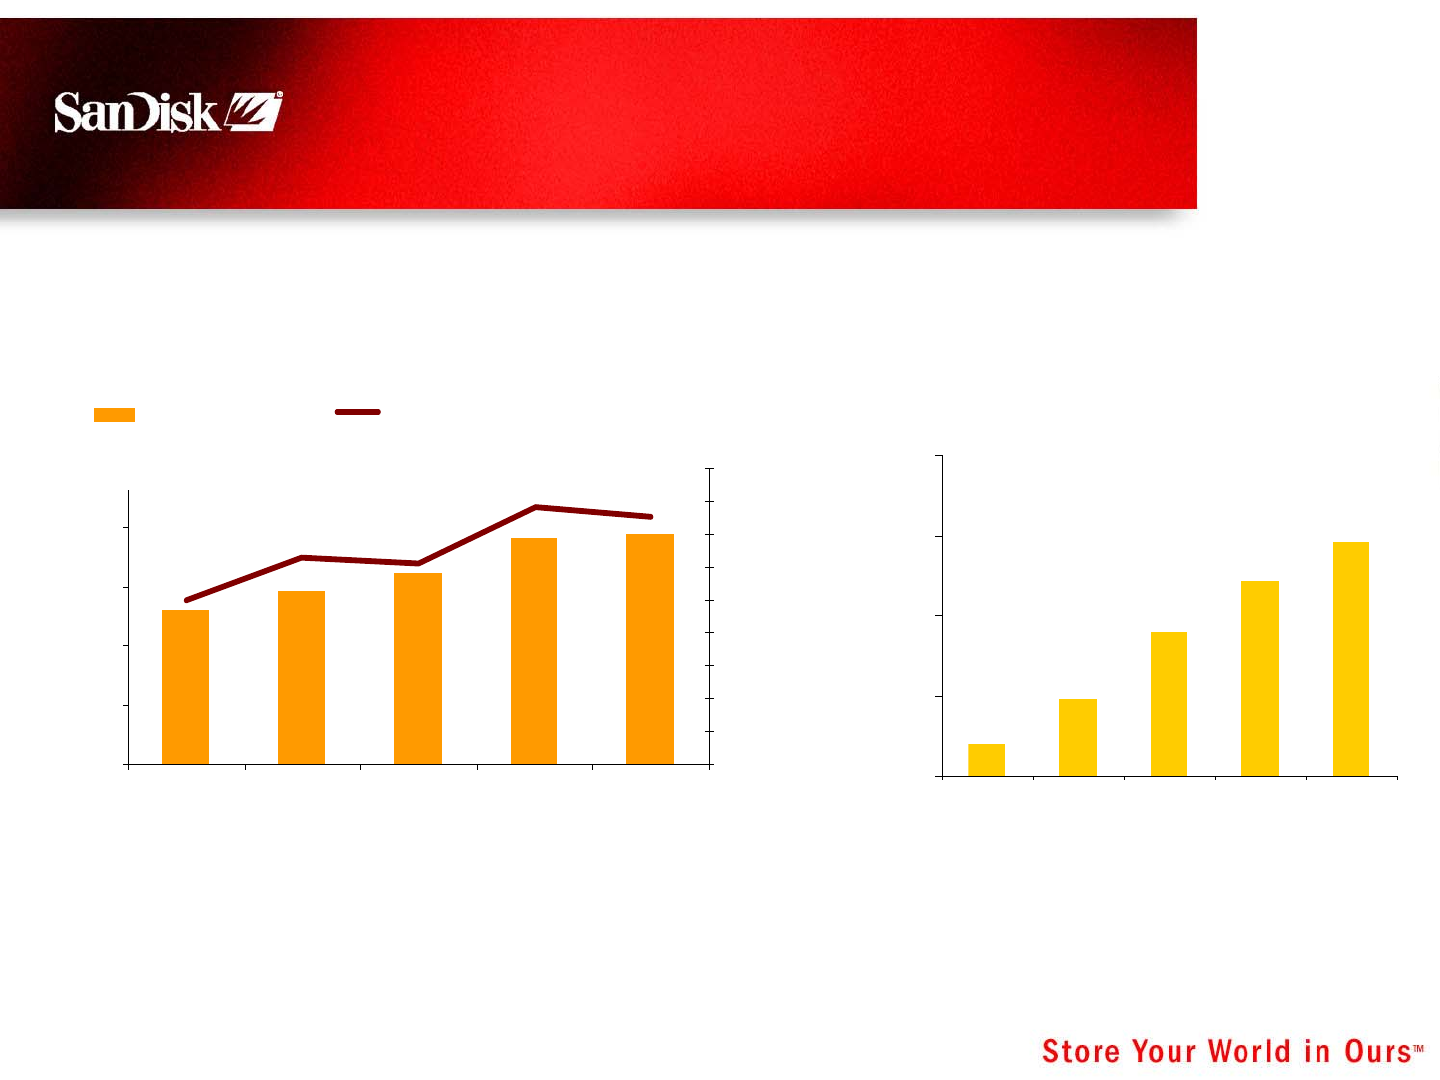
15 February 23, 2006
Card Capacities Increasing
Source: Web-Feet Research, Feb ‘06
0
500
1,000
1,500
2,000
2004 2005 2006 2007 2008
Digital Camera Market Average Capacities
0
50
100
150
200
250
2004 2005 2006 2007 2008
M Units
0
500
1,000
1,500
2,000
2,500
3,000
3,500
4,000
4,500
M $
Cards for DSCs Units Car ds f or DSCs $ TA M
NAND Units for DSCs DSC NAND $ TAM
MB
16 February 23, 2006
Digital Imaging Segments
MainstreamProsumerProfessionalValue-Conscious
17 February 23, 2006
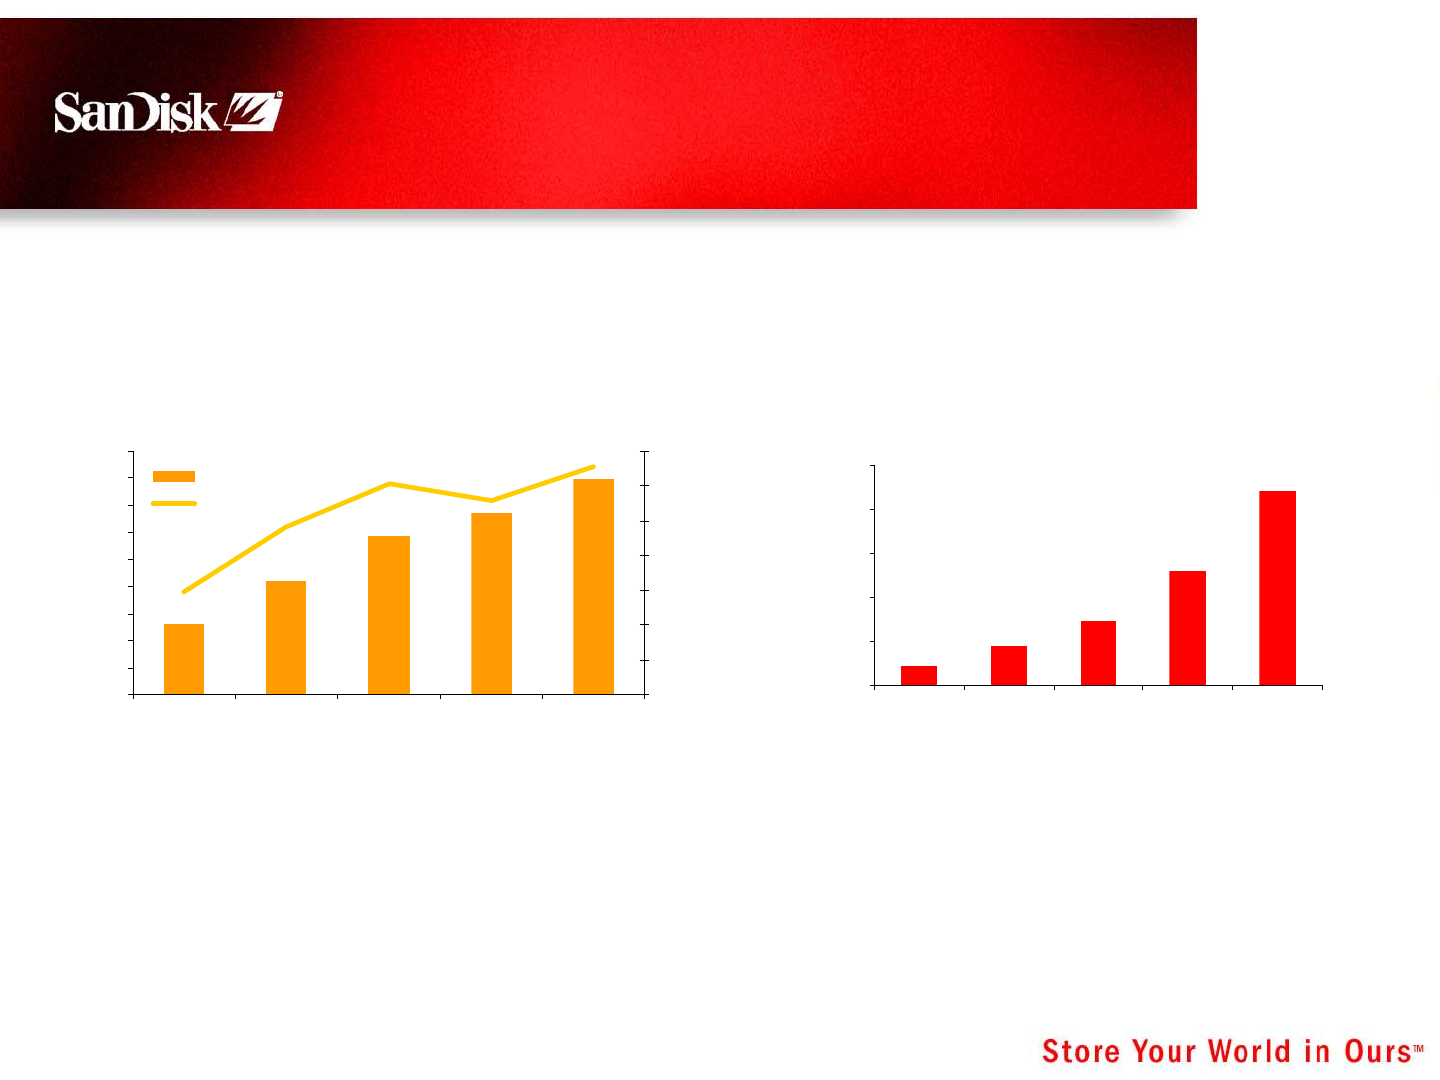
USB Flash Drive Market
0
20
40
60
80
100
120
140
160
180
2004 2005 2006 2007 2008
M Units
0
500
1,000
1,500
2,000
2,500
3,000
3,500
M $
UFD Units
UFD $ TA M
0
500
1,000
1,500
2,000
2,500
2004 2005 2006 2007 2008
M B
USB Drive Market Average Capacities
Source: Gartner Feb ‘06
18 February 23, 2006
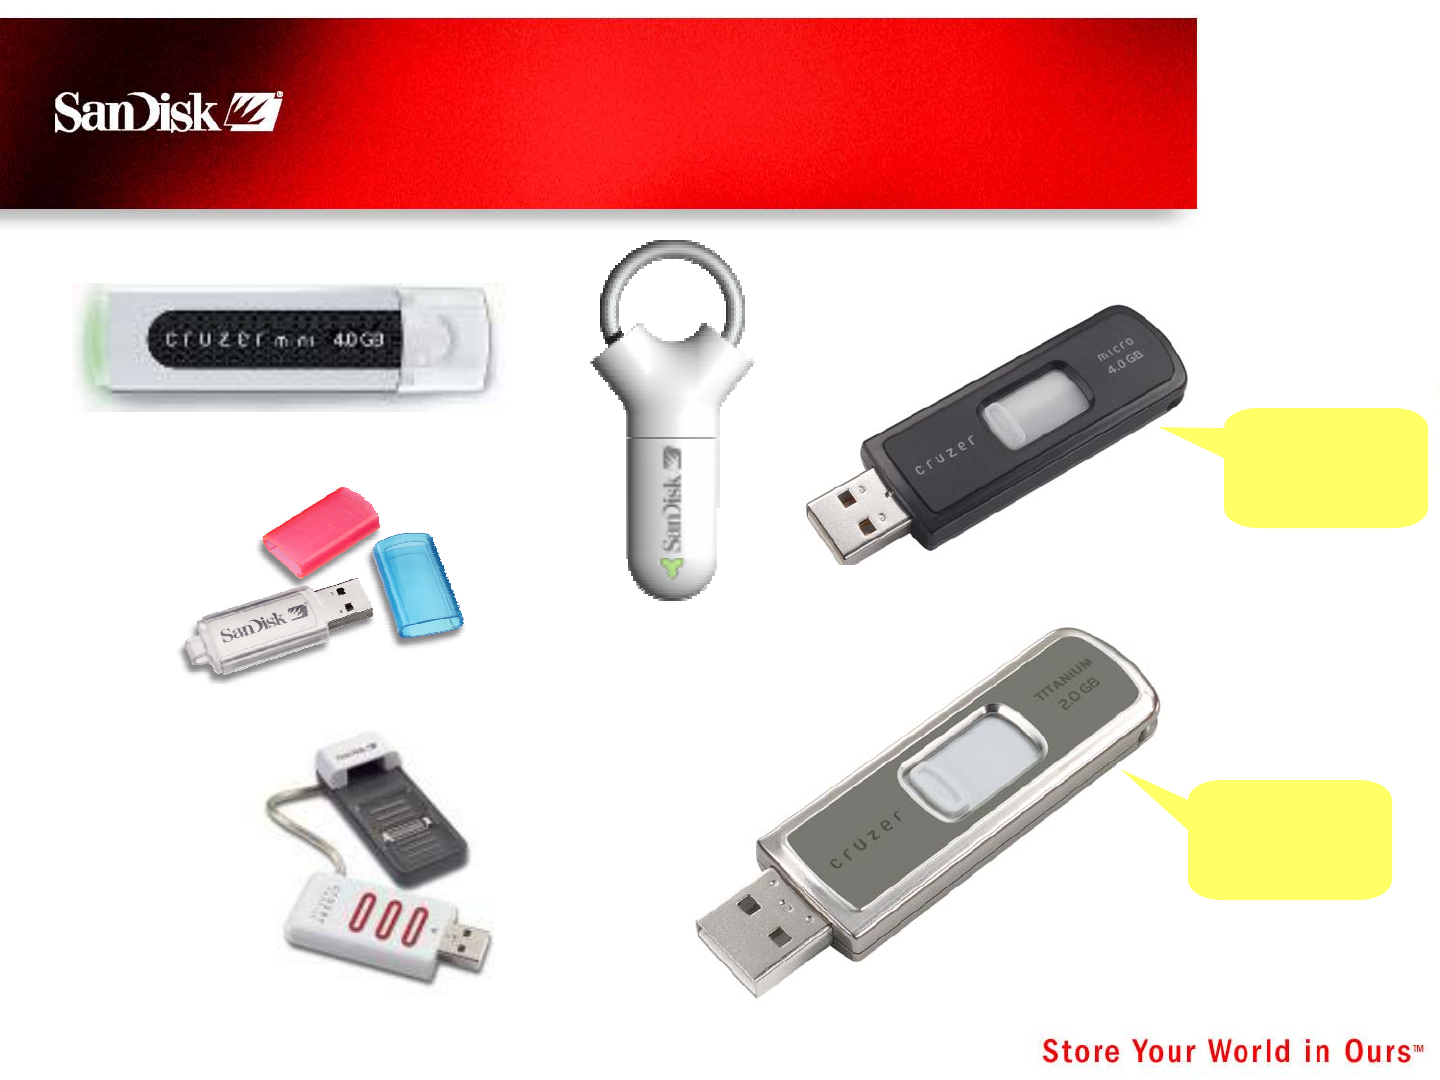
USB Flash Drive Products
New
Product
New
Product
19 February 23, 2006
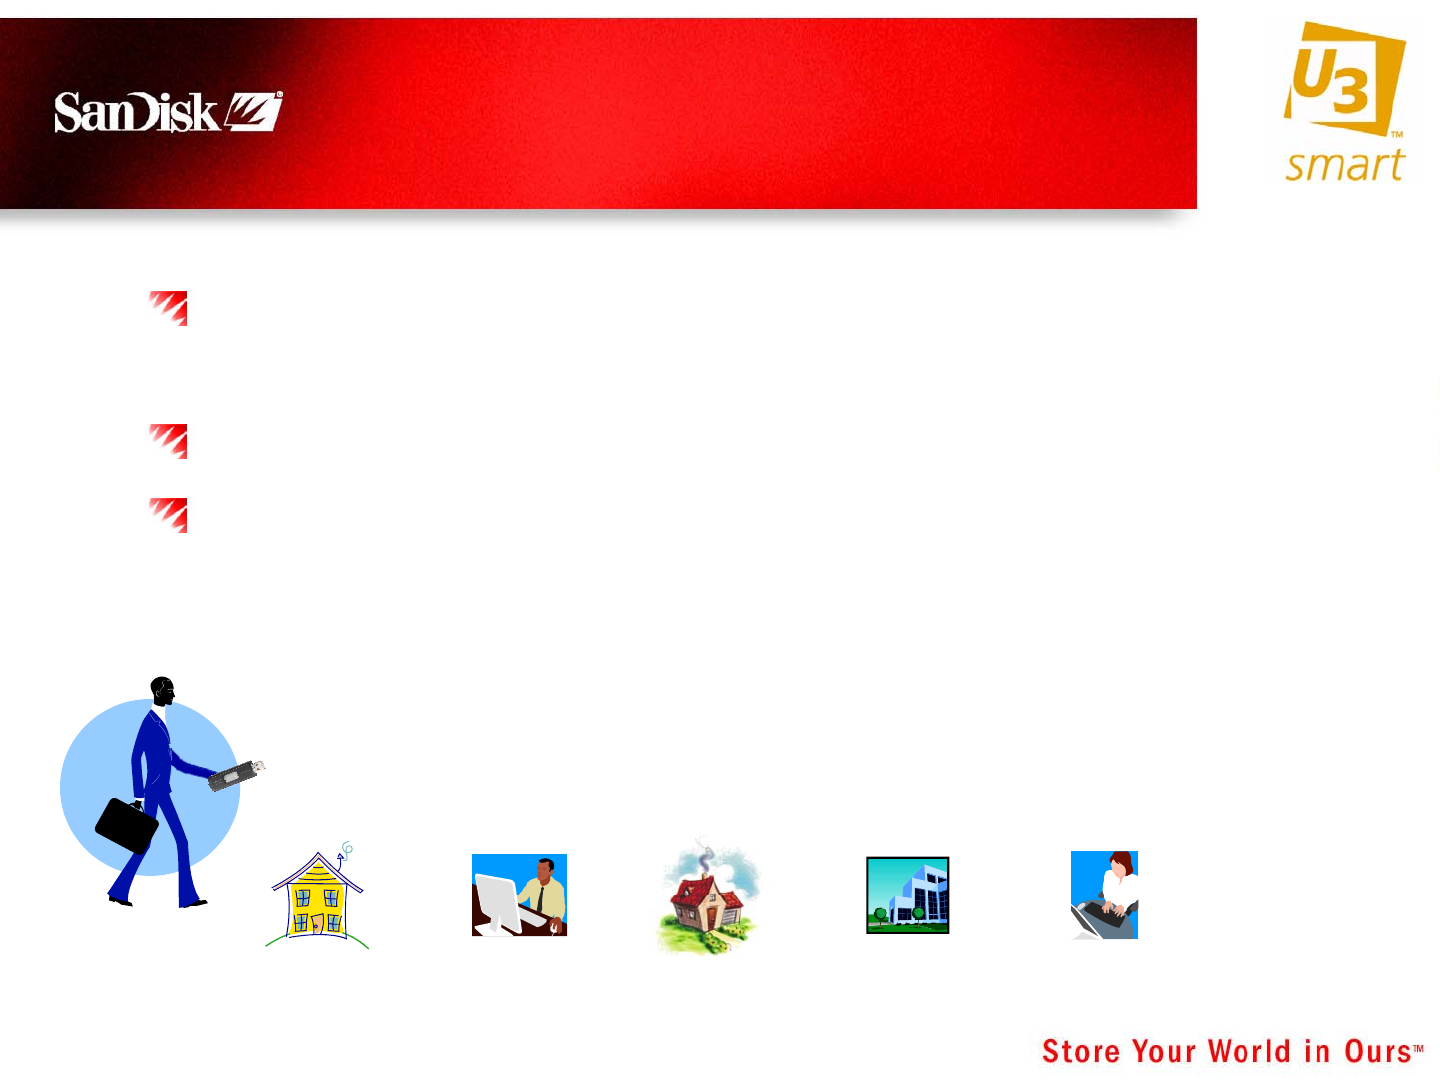
U3TM – Transforming the USB Market
Transform USB Drives from Today’s ‘Floppy Drive
Replacement’ into a Portable Personal Workspace
Enable a Continuum of Online and Offline Activity
Participate in the Shift from The PC-Centric
Paradigm to Access of Data “Anytime, Anywhere”
Home Office Friend’s
House
Business
Center
Internet
Cafe
20 February 23, 2006
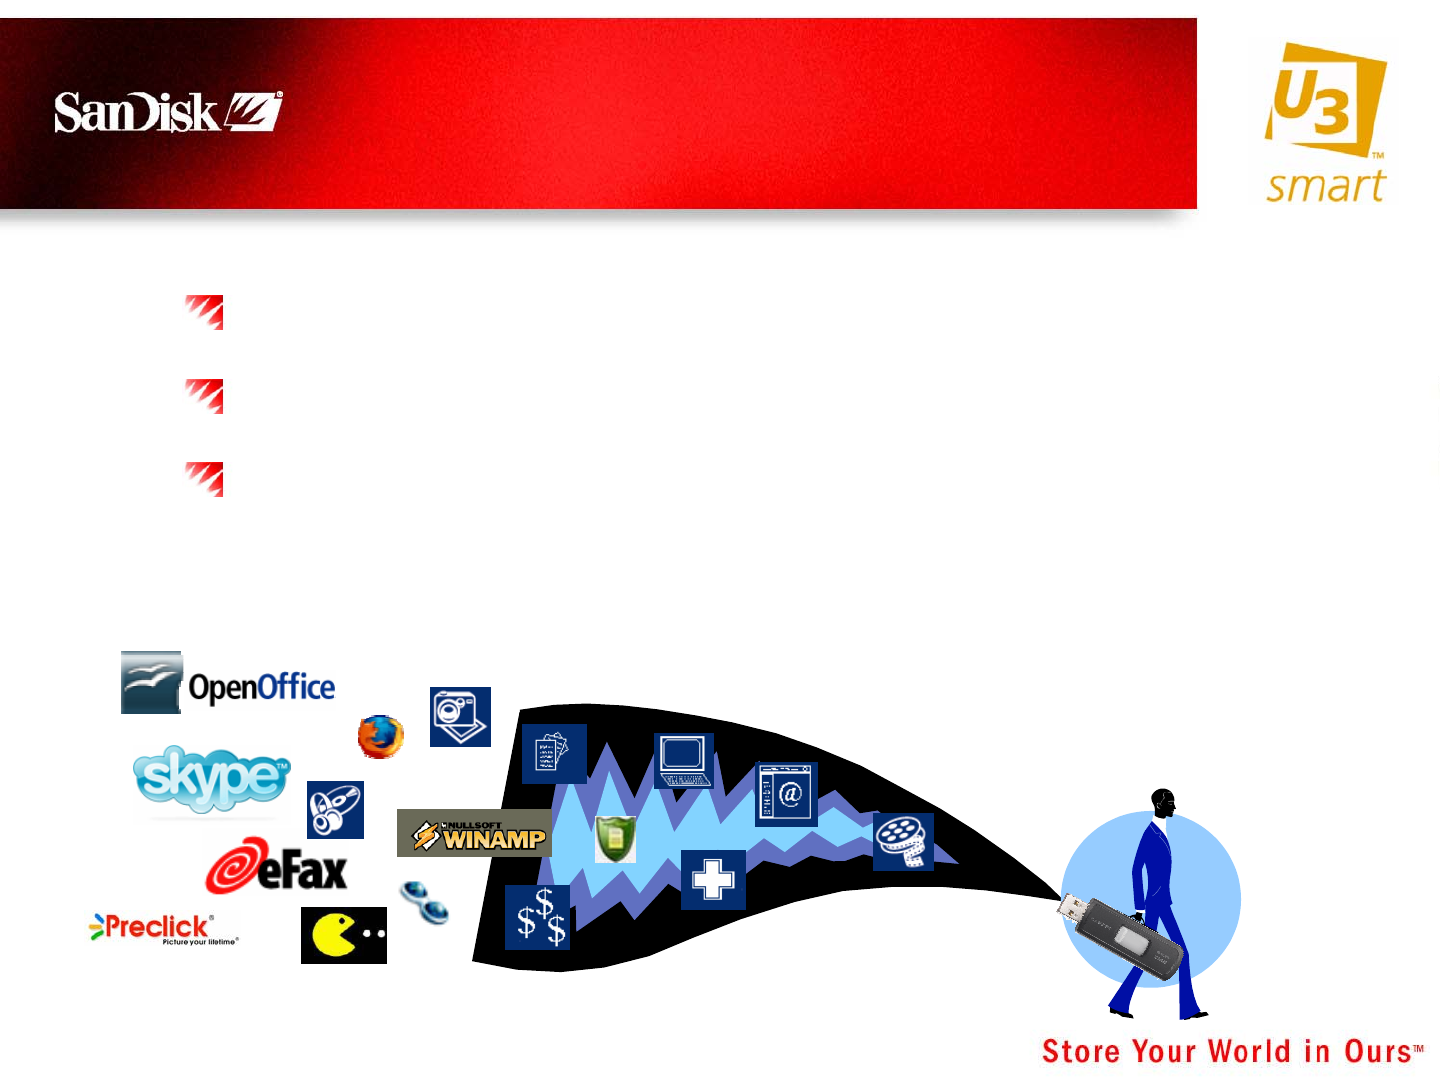
U3 Fuels Demand for Flash
Increases Average Drive Capacity Usage
Expands the Market Through New Uses
Meets Individual Needs Through Software
Personalization
21 February 23, 2006
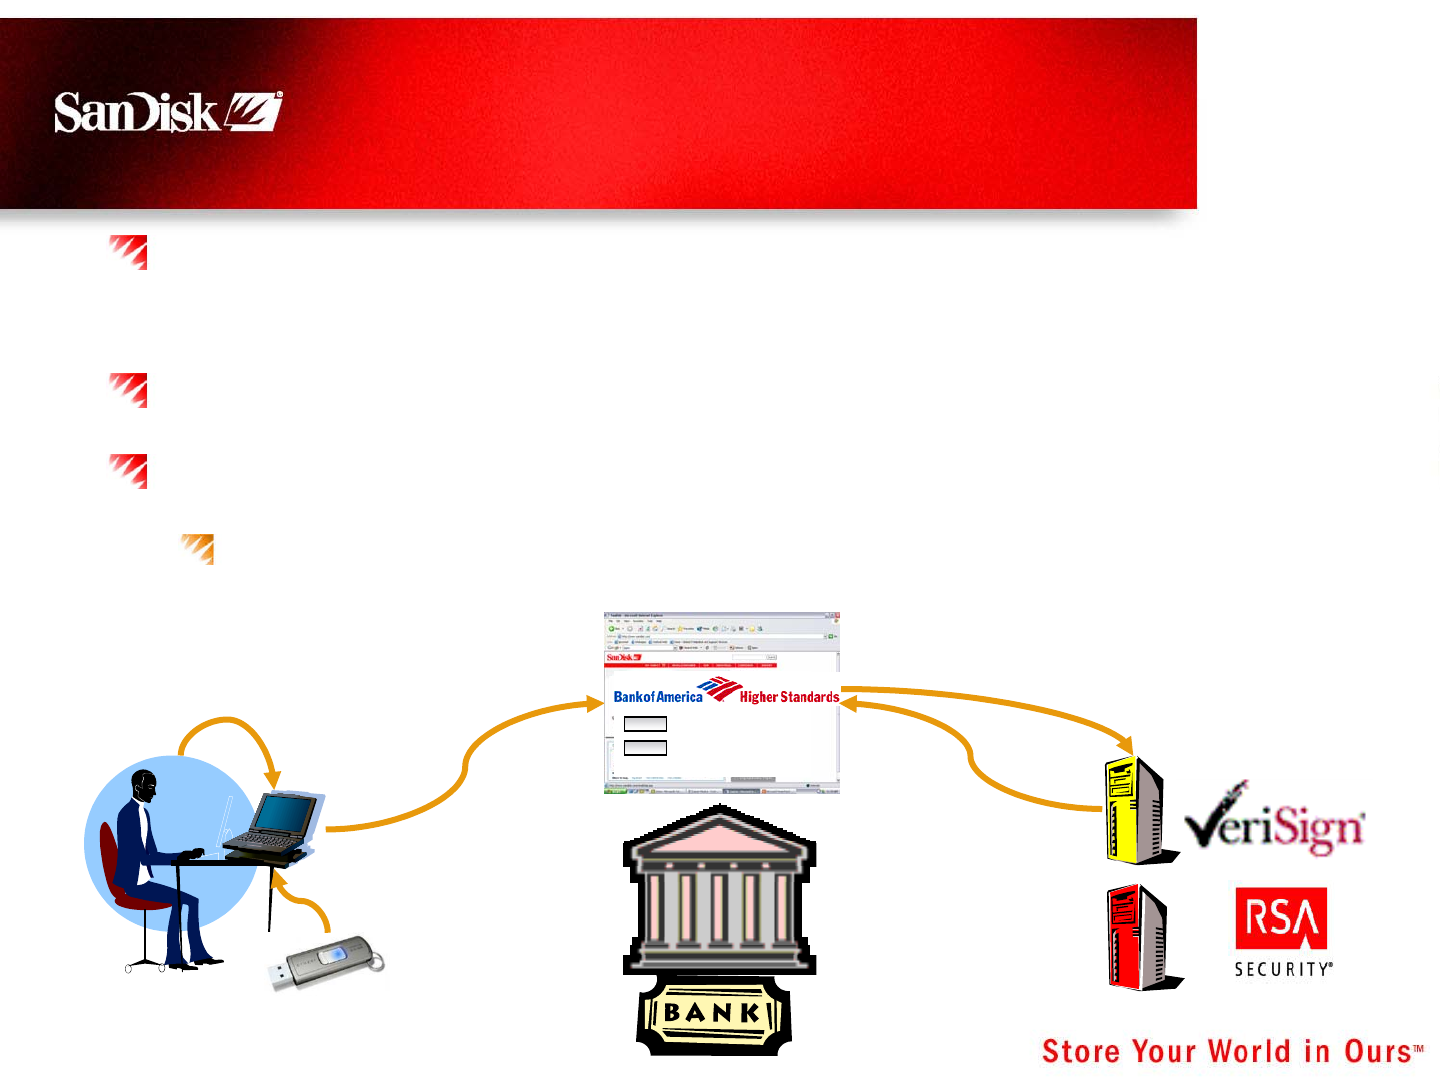
Growing the Market and Increasing
Differentiation: Protection Against
Online Fraud
Ideal for Many Online Applications (Banking, Trading,
E-Commerce, etc.)
Uses Highly Secure, Dual-Factor Authentication
Partnering with the Security Industry’s Leaders
RSA & Verisign
Password
Crypto-Secret
Password
+
Crypto-Secret
Request
Authentication
Username
Password
Authenticate
22 February 23, 2006
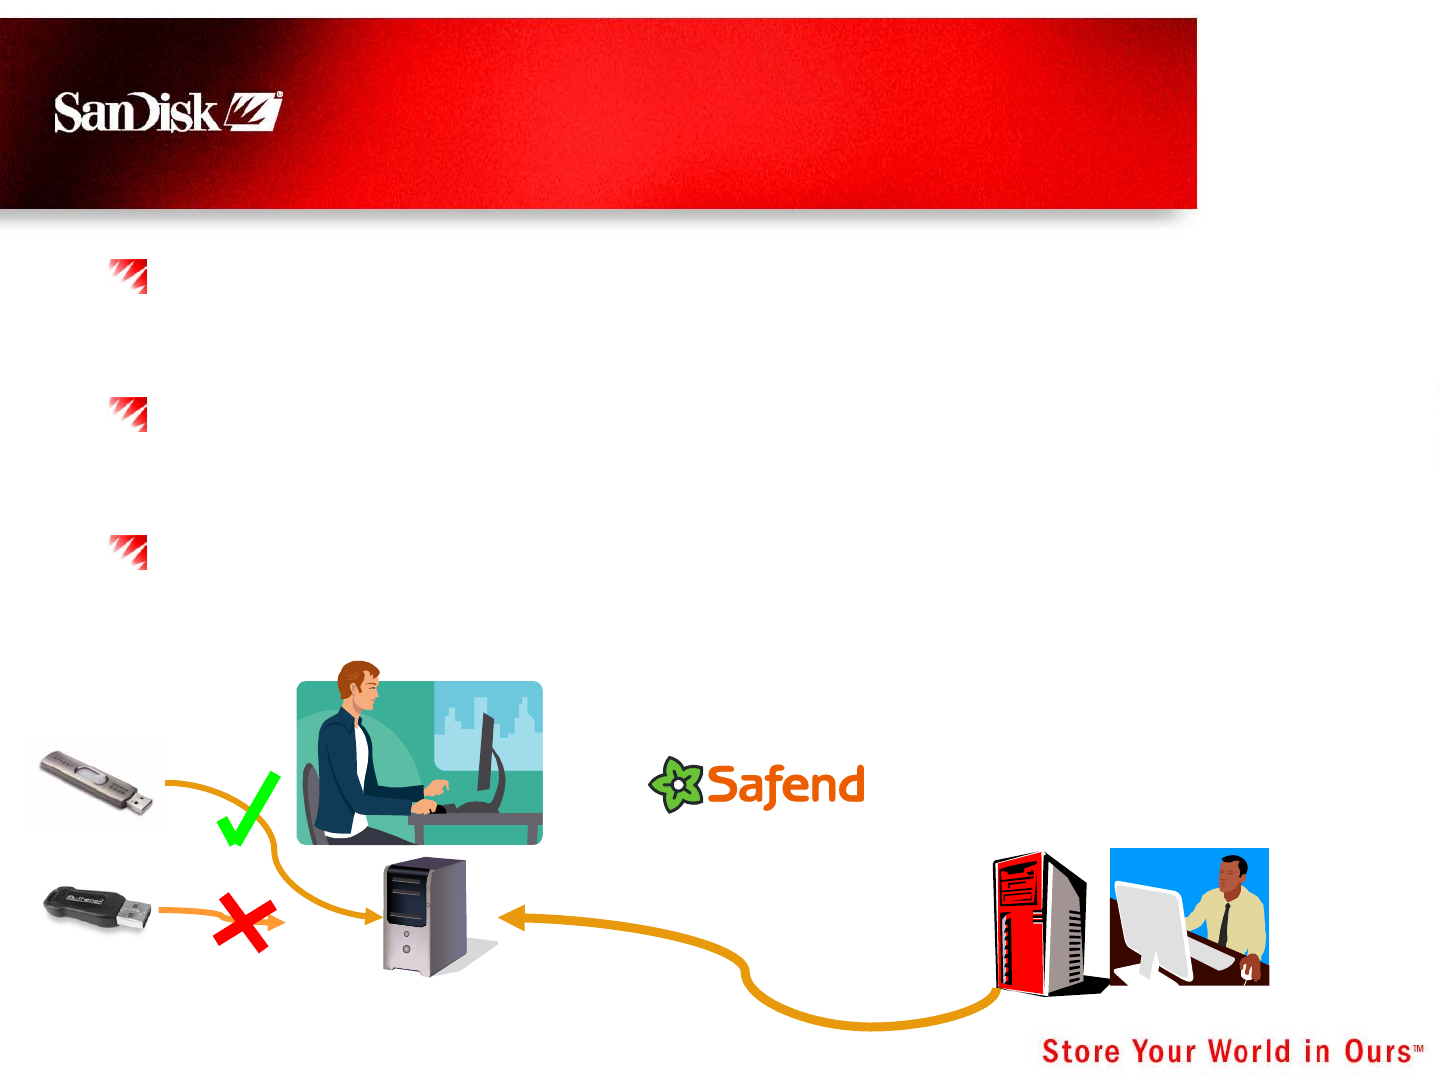
Growing the Market and
Increasing Differentiation:
Protection for the Enterprise
SanDisk is Partnering with Key Companies to Provide
Highly Secure Enterprise Solutions
Goal −Ensure Sensitive Data Doesn’t “Walk Out the
Door” via an Unsecured USB Drive
Working to Create the Right Solutions PLUS Provide
Methods for Managing Fleets of Devices
Authorized UFD
IT Manager
Remote Device
Administration
Personal UFD
23 February 23, 2006
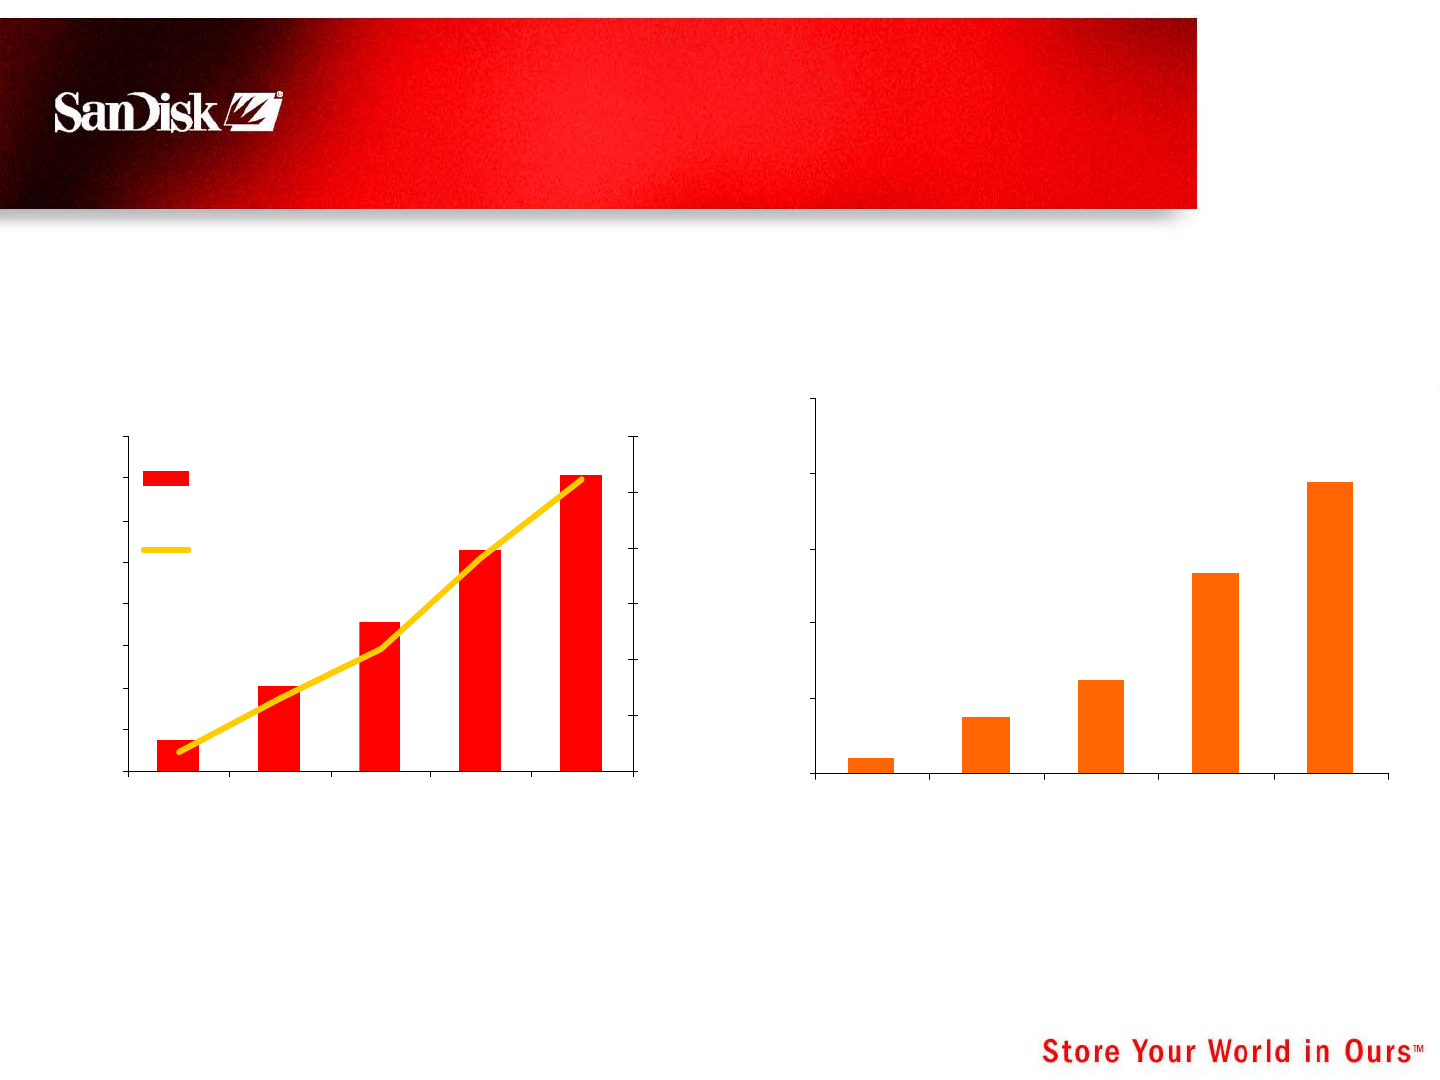
Gaming Card Market
0
10
20
30
40
50
60
70
80
2004 2005 2006 2007 2008
M Units
0
200
400
600
800
1,000
1,200
M $
Gaming Card Units
Gaming Card $
0
200
400
600
800
1,000
2004 2005 2006 2007 2008
Gaming Card Market Average Capacities
Source: Web-Feet May ‘05
MB
24 February 23, 2006
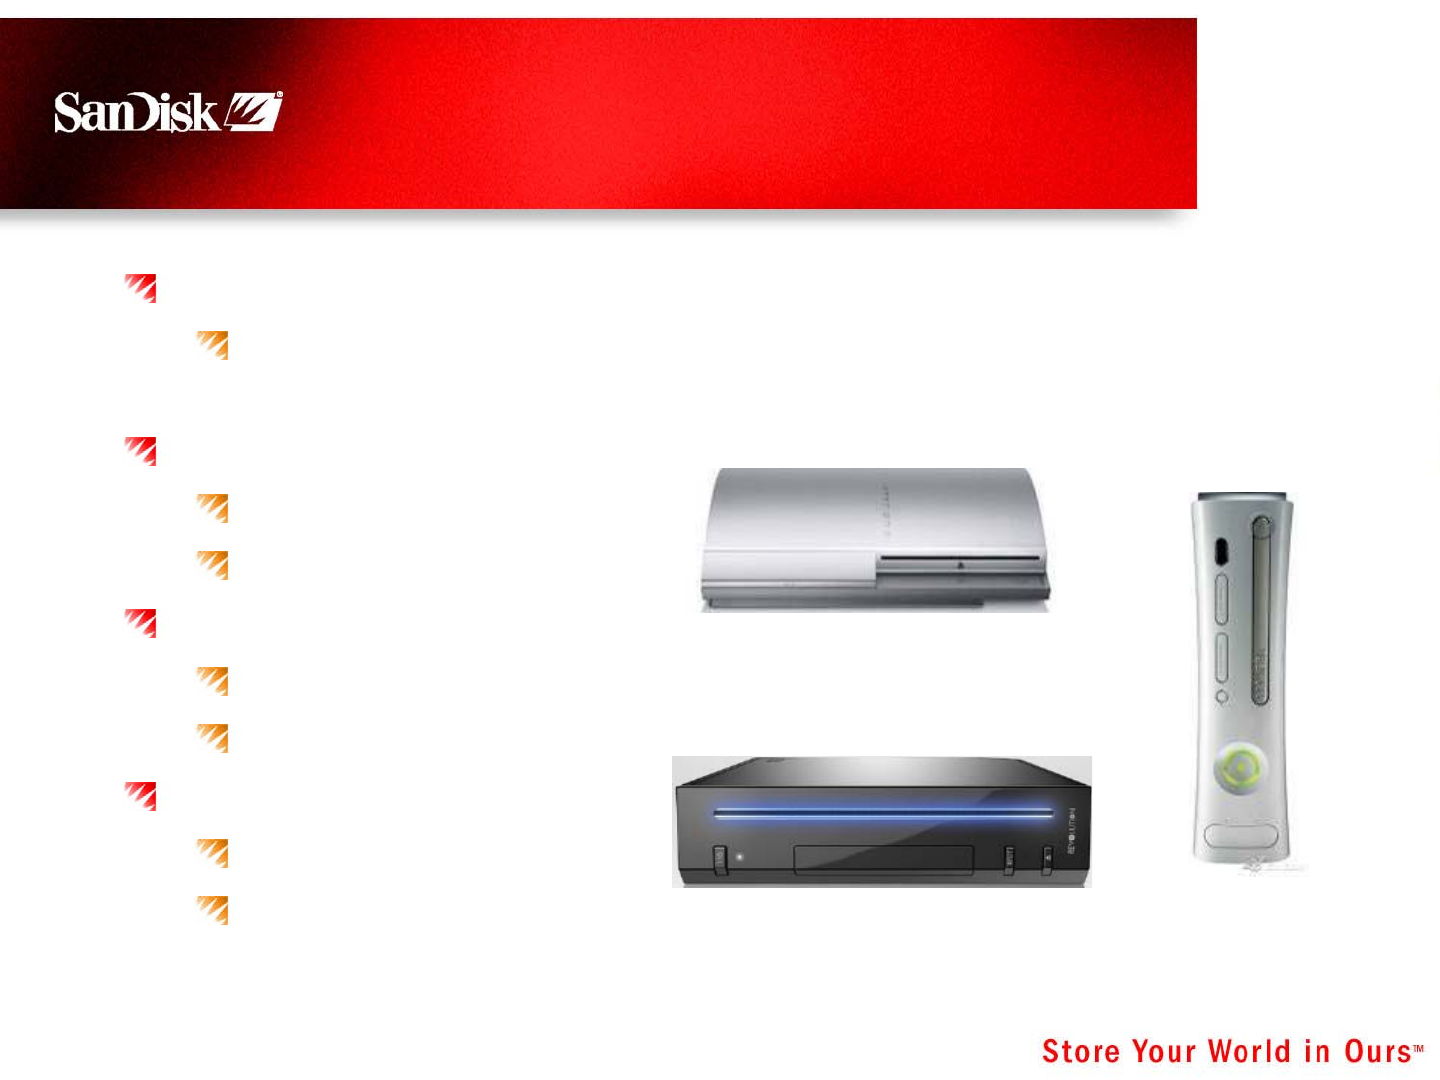
New Gaming Consoles
All Major New In-Home Consoles are USB/Card Enabled
Content import, downloads and game saves are primary
drivers
Sony®PS3™
CF, SD, and MS slot
6 USB ports
Microsoft®Xbox 360™
Proprietary memory unit with USB interface
3 USB ports
Nintendo®Revolution
SD slot
2 USB ports
25 February 23, 2006
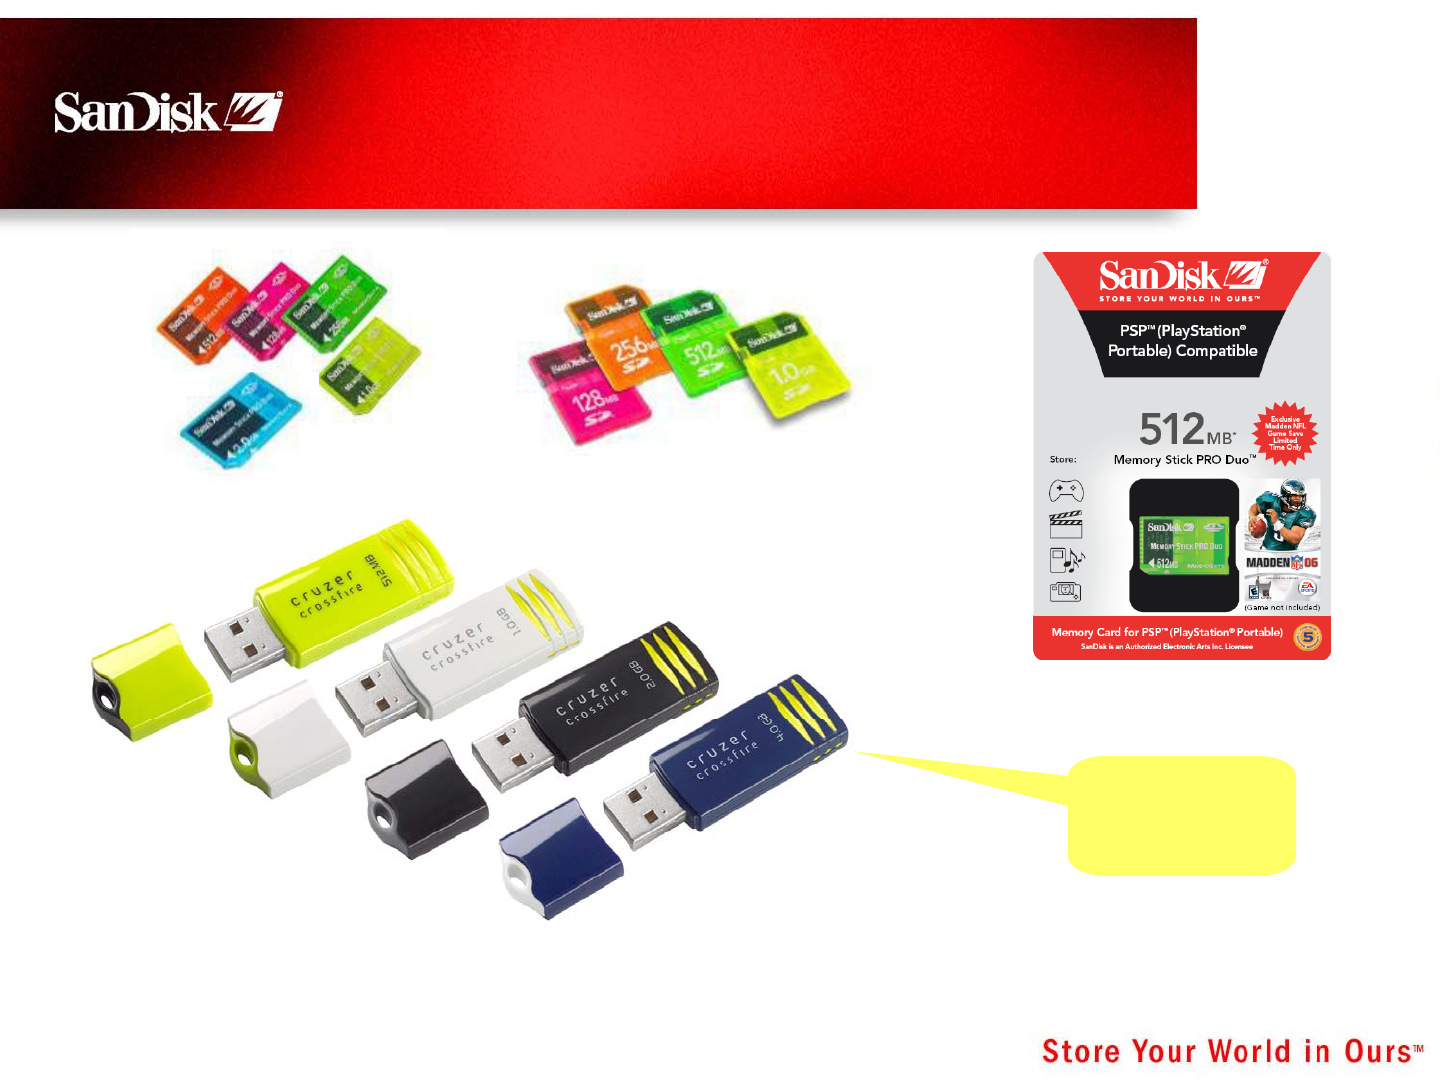
Gaming – Incremental Store
Fronts and Shelf Space
New
Products
26 February 23, 2006
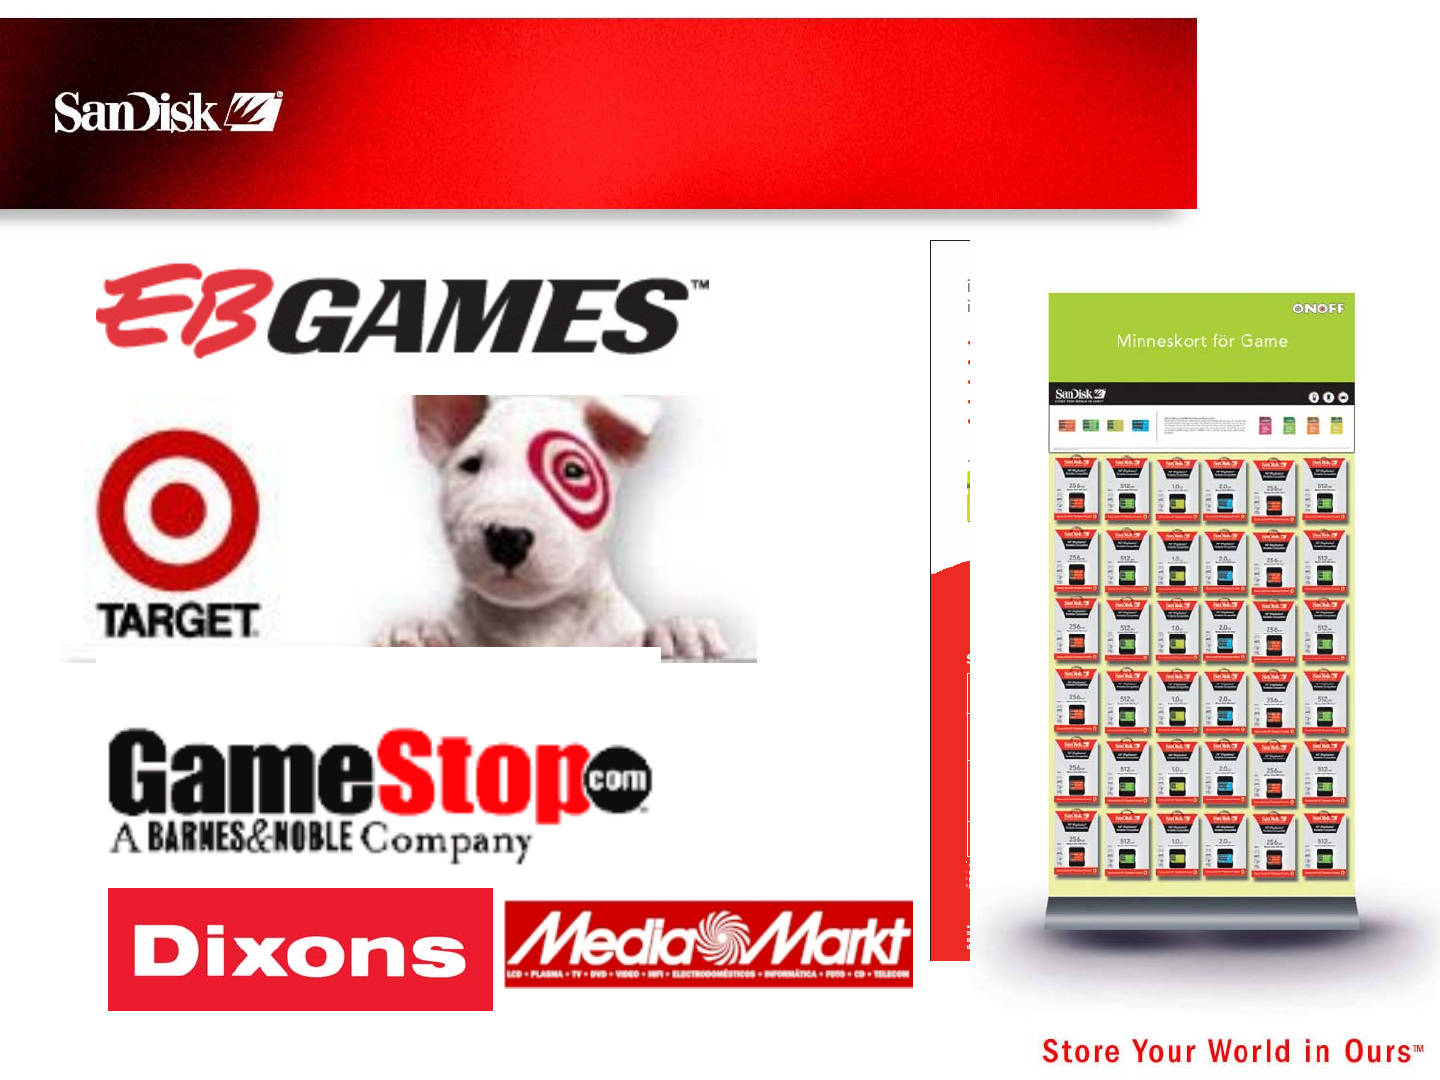
Gaming In Retail
27 February 23, 2006
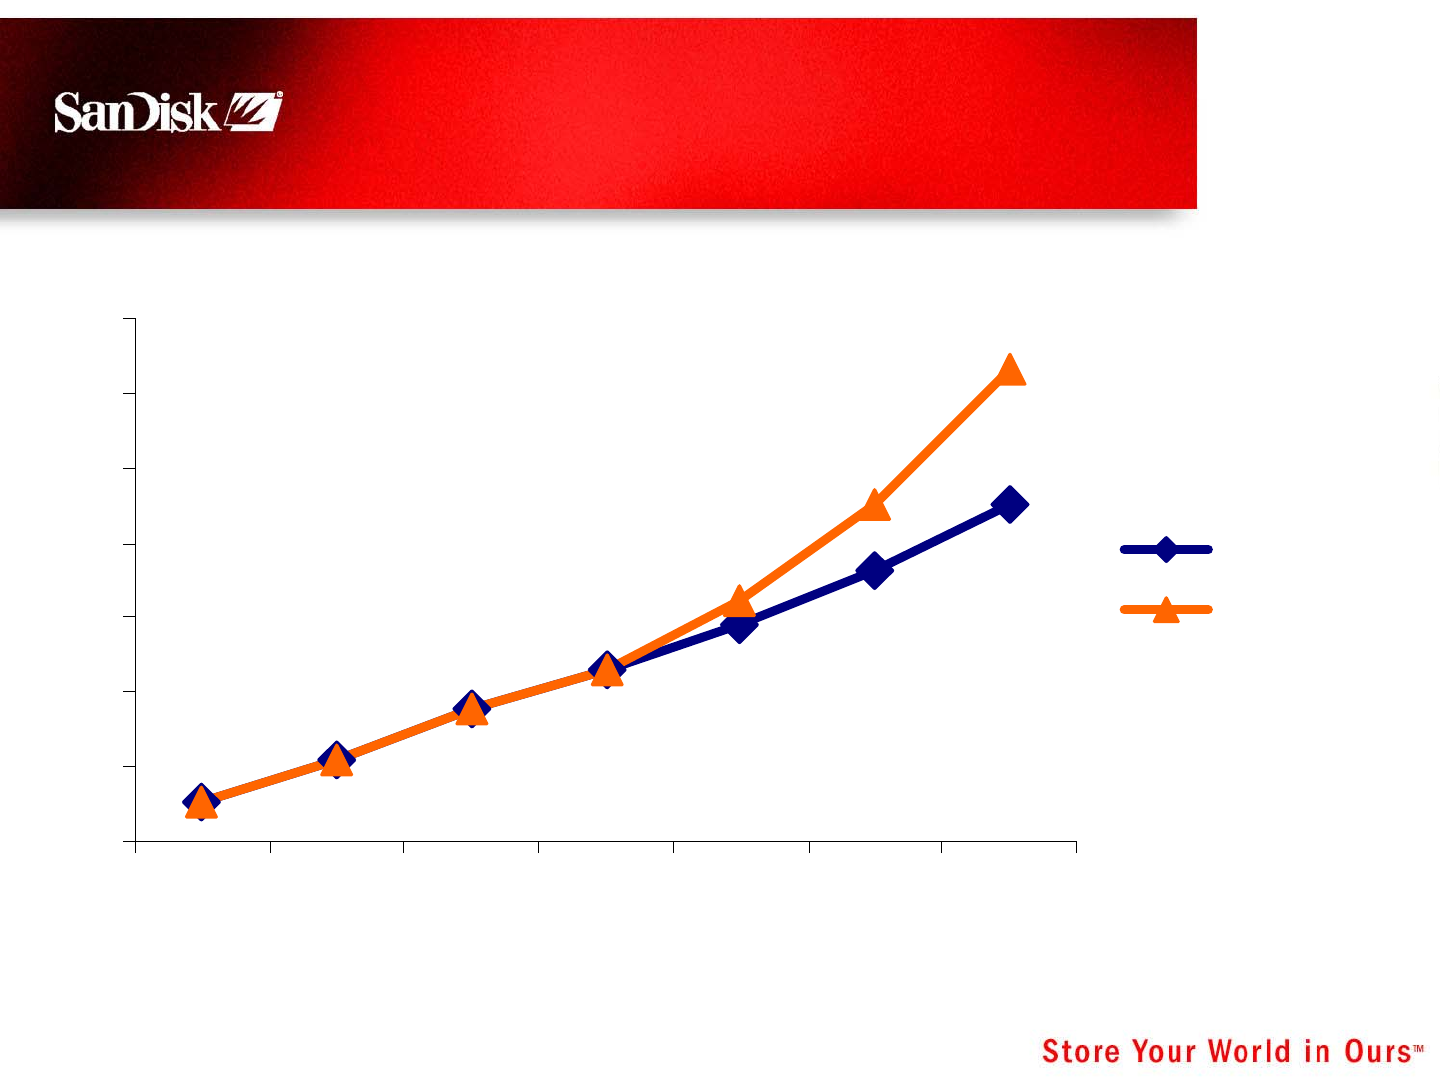
Flash-Based Digital Audio Players
$0
$2
$4
$6
$8
$10
$12
$14
$16
$18
$20
2004 2005 2006 2007 2008
IDC Sept 2005
Gartner Feb
2006
Billions
28 February 23, 2006
Significant Cost Advantage Due to
Vertical Integration
Leverage Established Global Retail Sales
Channels
Rapid global expansion – Europe and Asia
Develop “Cool” Products at Very Attractive Price
Points
“Good, Better, Best” product portfolio
Cards slots for expandability and portability
Own the Market Sweet Spot: $49-$149
Allow Customer Choice
Support of Microsoft PlaysForSure DRM
(RealNetworks, Napster and Yahoo Music)
Flash Audio Player Strategy
TM
29 February 23, 2006
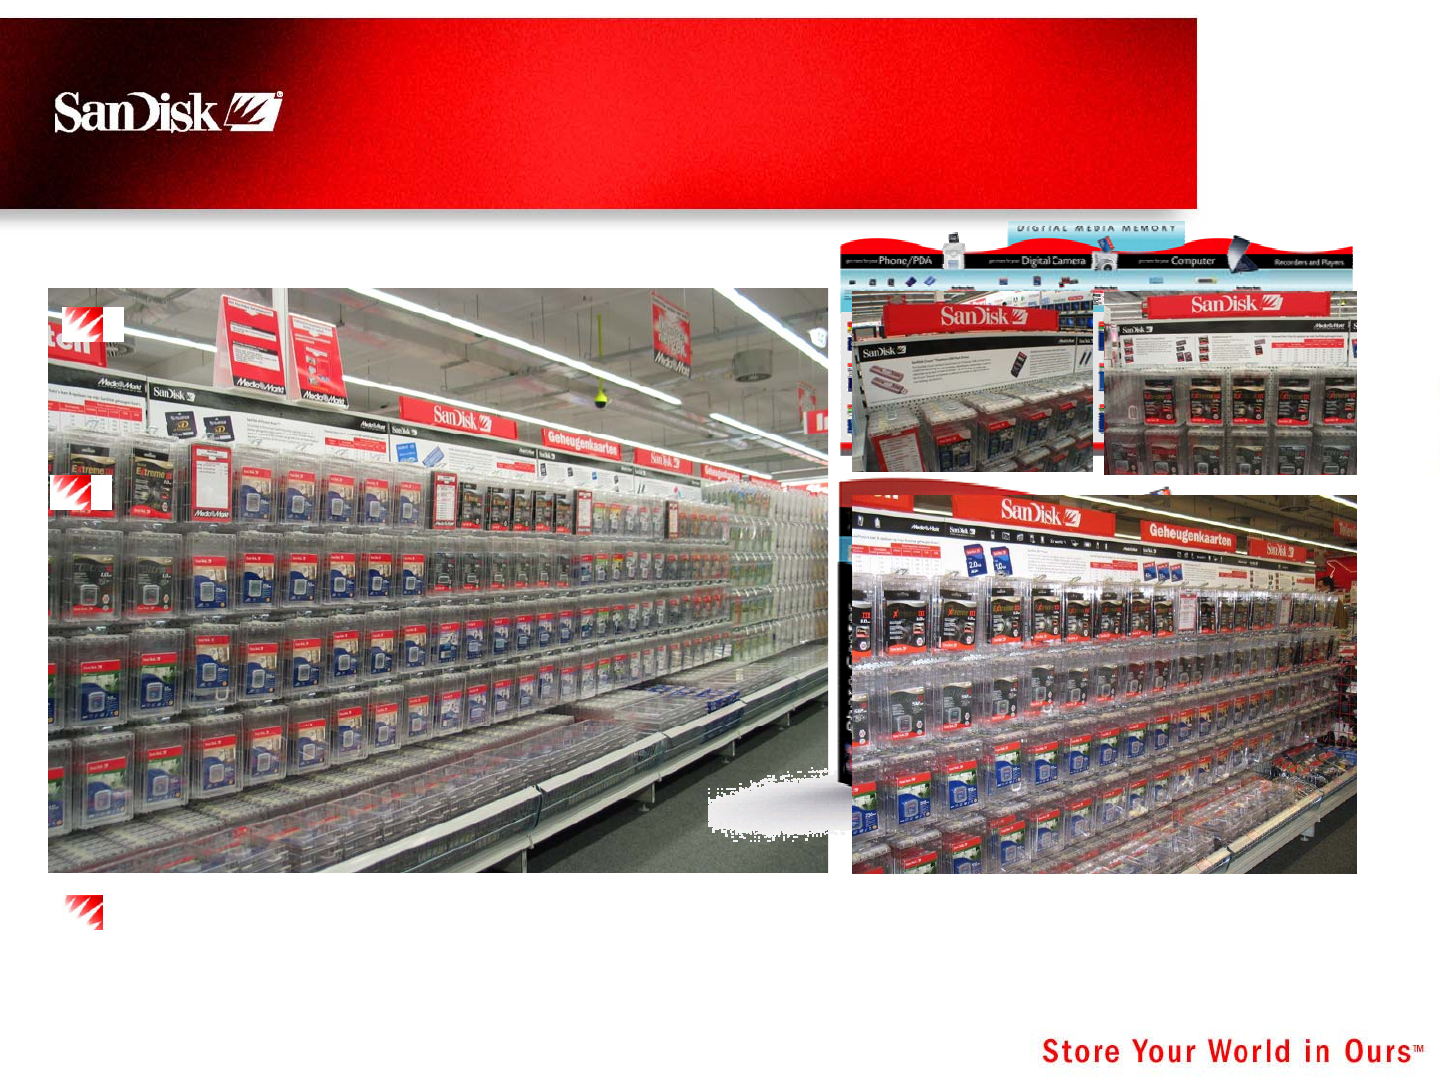
Strong Channel Presence
“Own the store” −Educate,
Promote and Merchandise
Promote Media Centers
and “Store Within a Store”
Concepts
“Dramatically Increase In-Store
Adjacencies”
30 February 23, 2006
Building the Brand
Increase Sales in Established and New Markets
~2% of revenues for branding and merchandising
Building Global Brand Awareness
Engaging Grey San Francisco for global advertising and
MetaDesign for brand identity communication
Predispose Consumers to Buy SanDisk
Premium brand at everyday price
31 February 23, 2006
Drive the Brand Globally
Focus on high growth
geographies (EMEA, China, etc.)
Focus Global Marketing Campaigns
on Key Areas
SanDisk brand and products
Digital audio
Mobile (handsets)
High-performance card line (digital
imaging)
Promote Usage of Flash Cards in
Mobile Phones and Drive Retail
Attach Rates
Establish SanDisk Brand in Digital
Audio and Solidify #2 Position
Marketing Objectives

33 February 23, 2006
Summary
Focusing on Multiple High-Growth Markets
Unrivaled Product Lines
Both breadth and depth
Highly segmented and differentiated
Strong new product pipeline and innovation
Drive Global Expansion and Market Share Gain
Exceptional Channel Strength and Coverage
Leveraging Key OEM and Retail Partnerships
Slots ÆBundles ÆAftermarket
Investing to Build a Global Consumer Brand

Yoram Cedar
EVP of Handset
Business and
Corporate
Engineering
35 February 23, 2006
-
200
400
600
800
1,000
1,200
2004 2005 2006 2007 2008
Million Units
$0
$1,000
$2,000
$3,000
$4,000
$5,000
$6,000
$7,000
$8,000
$9,000
Mobile Flash Card
Revenue, $K
Total Mobile Phones (000)'s Units Mobile Phone Card Slots (000)'s Units Total Mobile Card Revenue, $K
Worldwide Mobile Phone Card TAM
Sources: Phones - Strategy Analytics,
Mobile Revenue - SanDisk, 2006
36 February 23, 2006
Primary Mobile Card Usages
Memory Expansion
Digital audio
Personal images and video recording
Personal data backup
Variety of files (email, presentations…)
Protected Content Storage
Pre-loaded
Downloaded
Mobile User Authentication (Dual Factor
Authentication)
Securely access the enterprise, banking and other
sensitive services
37 February 23, 2006
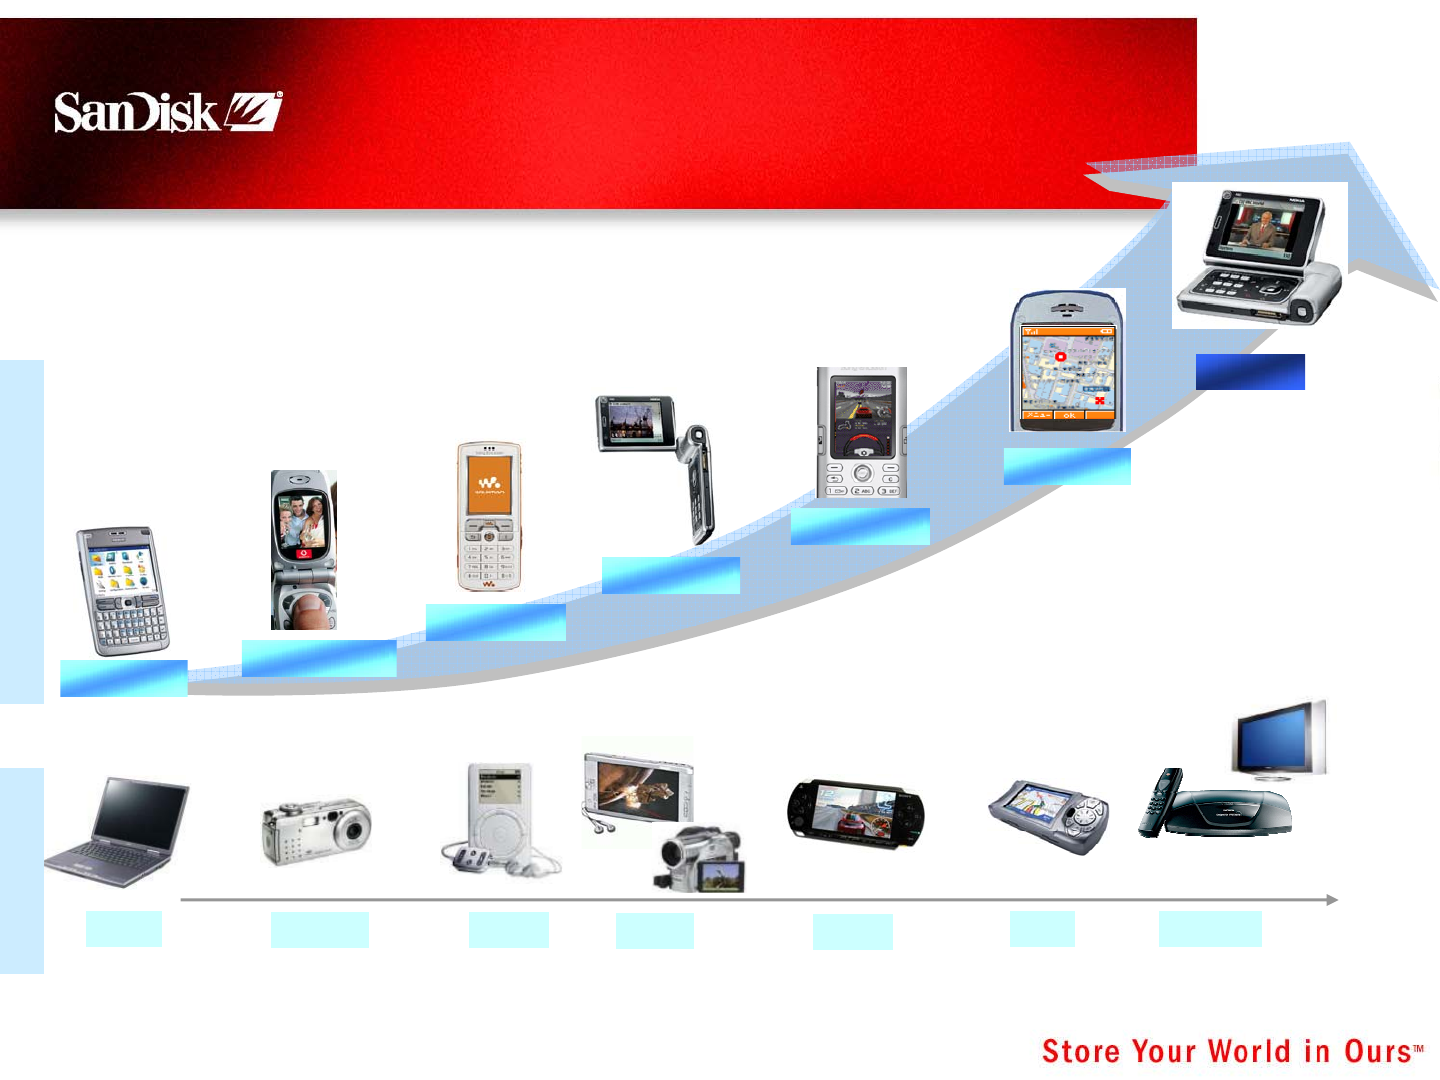
Applications Are Storage Intensive
Content will follow successful CE Applications
Music Phone
Camera Phone
PDA Phone
Game Phone
Video Phone
GPS Phone
MobileTV
PC, CE Markets Mobile Market
Email Imaging Music Game
Video Map TV / STB Application
38 February 23, 2006
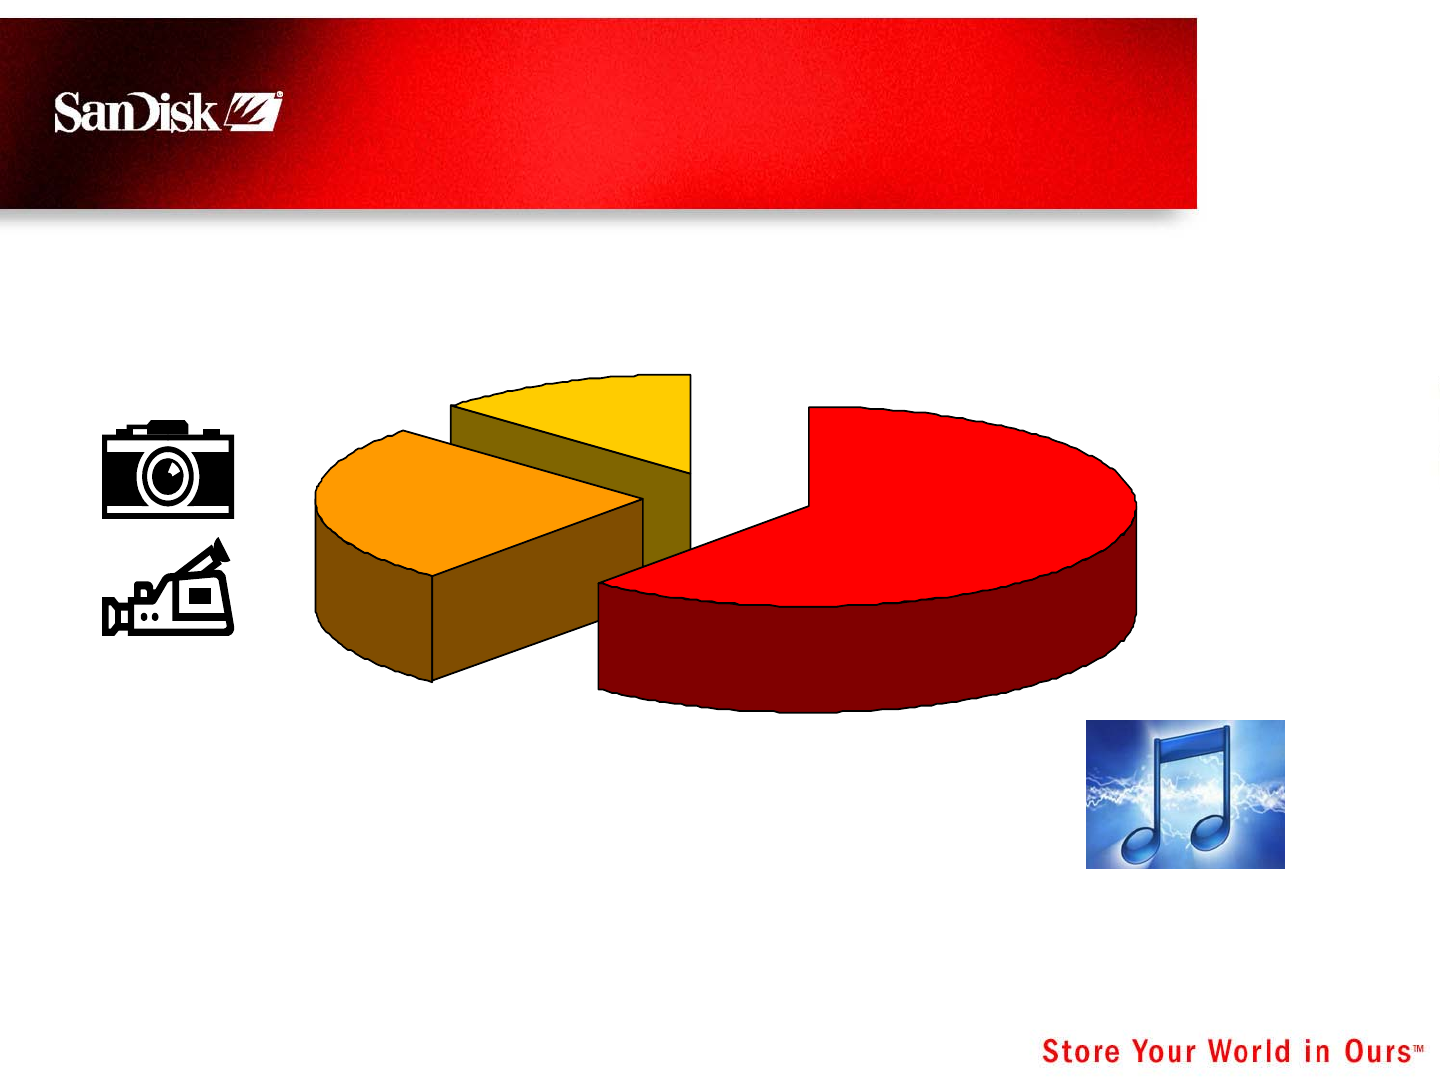
Source: SanDisk, 2006
Worldwide Mobile Card Usage
2005 Retail
Others
13%
Picture
26% Music
61%
39 February 23, 2006
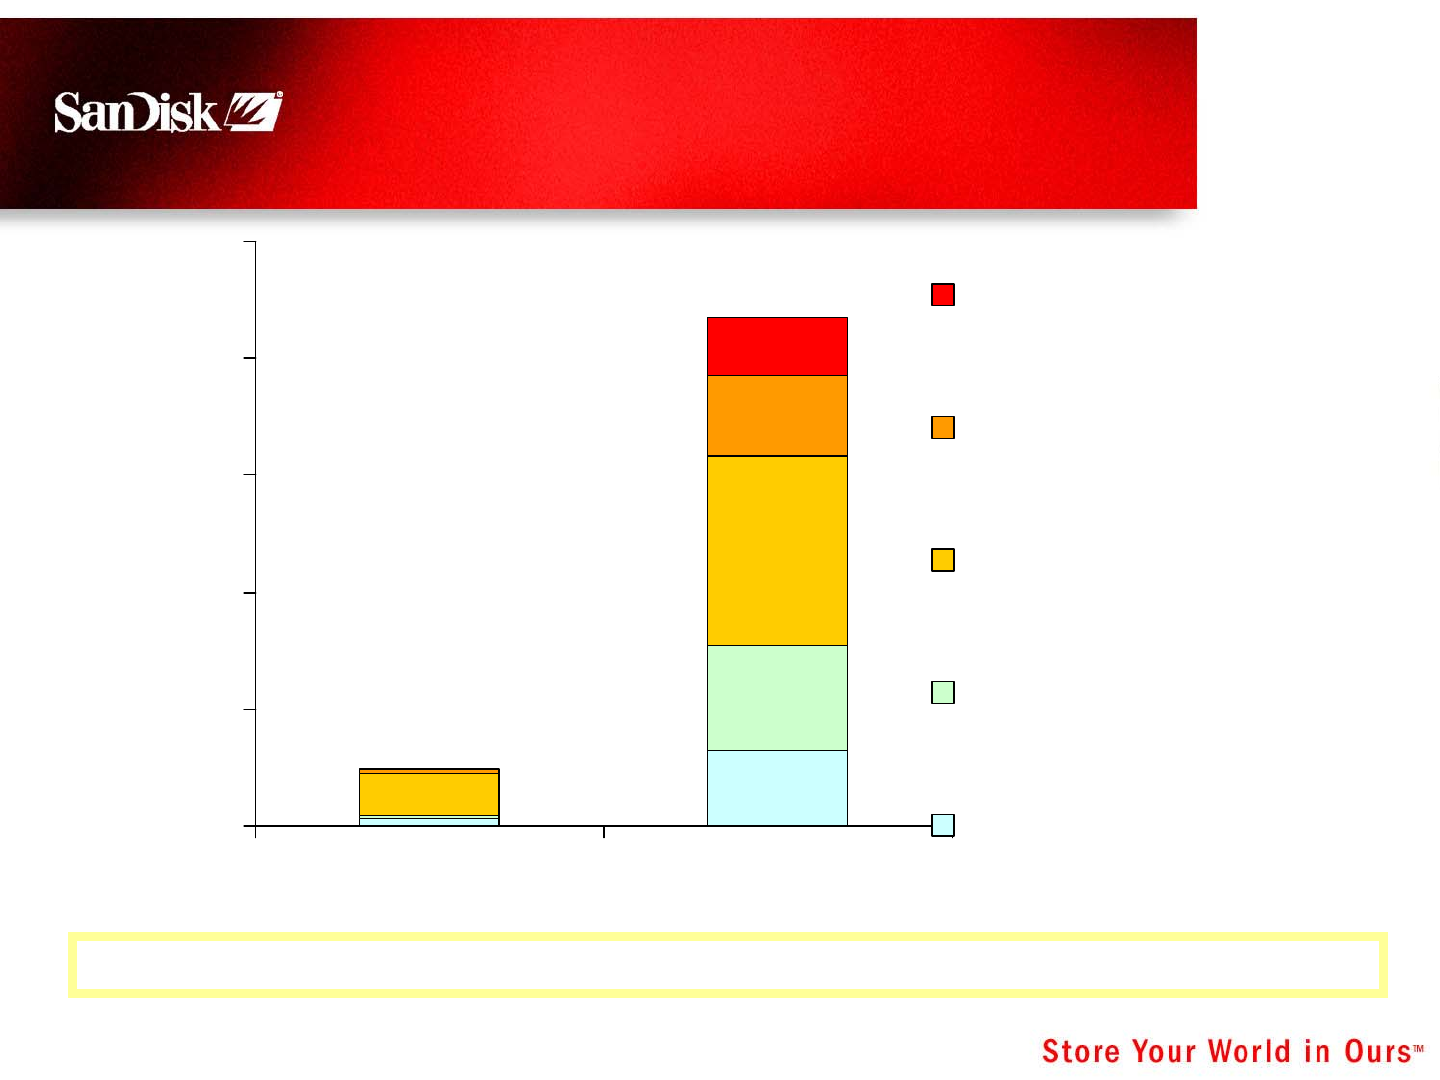
0
500
1000
1500
2000
2500
2005 2008
Others (Games, Maps, …)
Video Clip (Sports,
MusicTV, Comedy, Films)
Digital Music
Personal Picture
Personal Video
Applications Drive Retail Card
Capacity
Source: Usage from SanDisk Estimates, Q1’06
Digital Rights Management (DRM) Solutions Expected to Accelerate Consumption

40 February 23, 2006
Evangelize to Grow Mobile TAM
Leverage Relationships with Mobile Phone
Ecosystem
Provide Leading Technical Expertise for Rapid
Adoption and Time-to-Market
Drive Content Security Solutions
Support OEM ÆSupport Retail
41 February 23, 2006
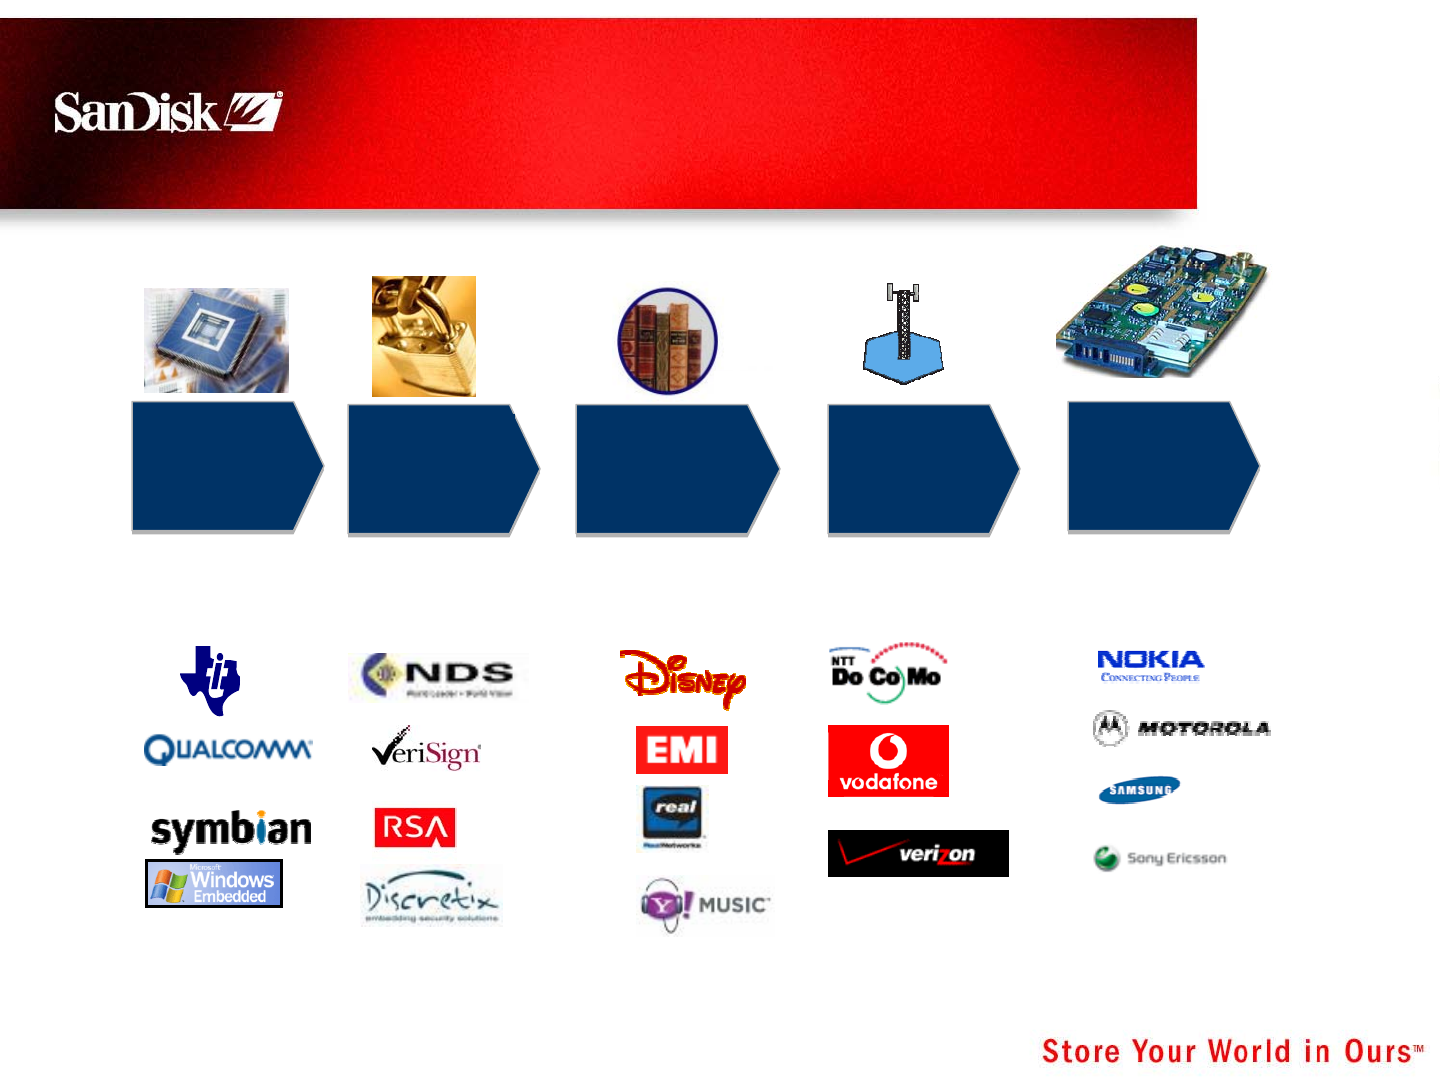
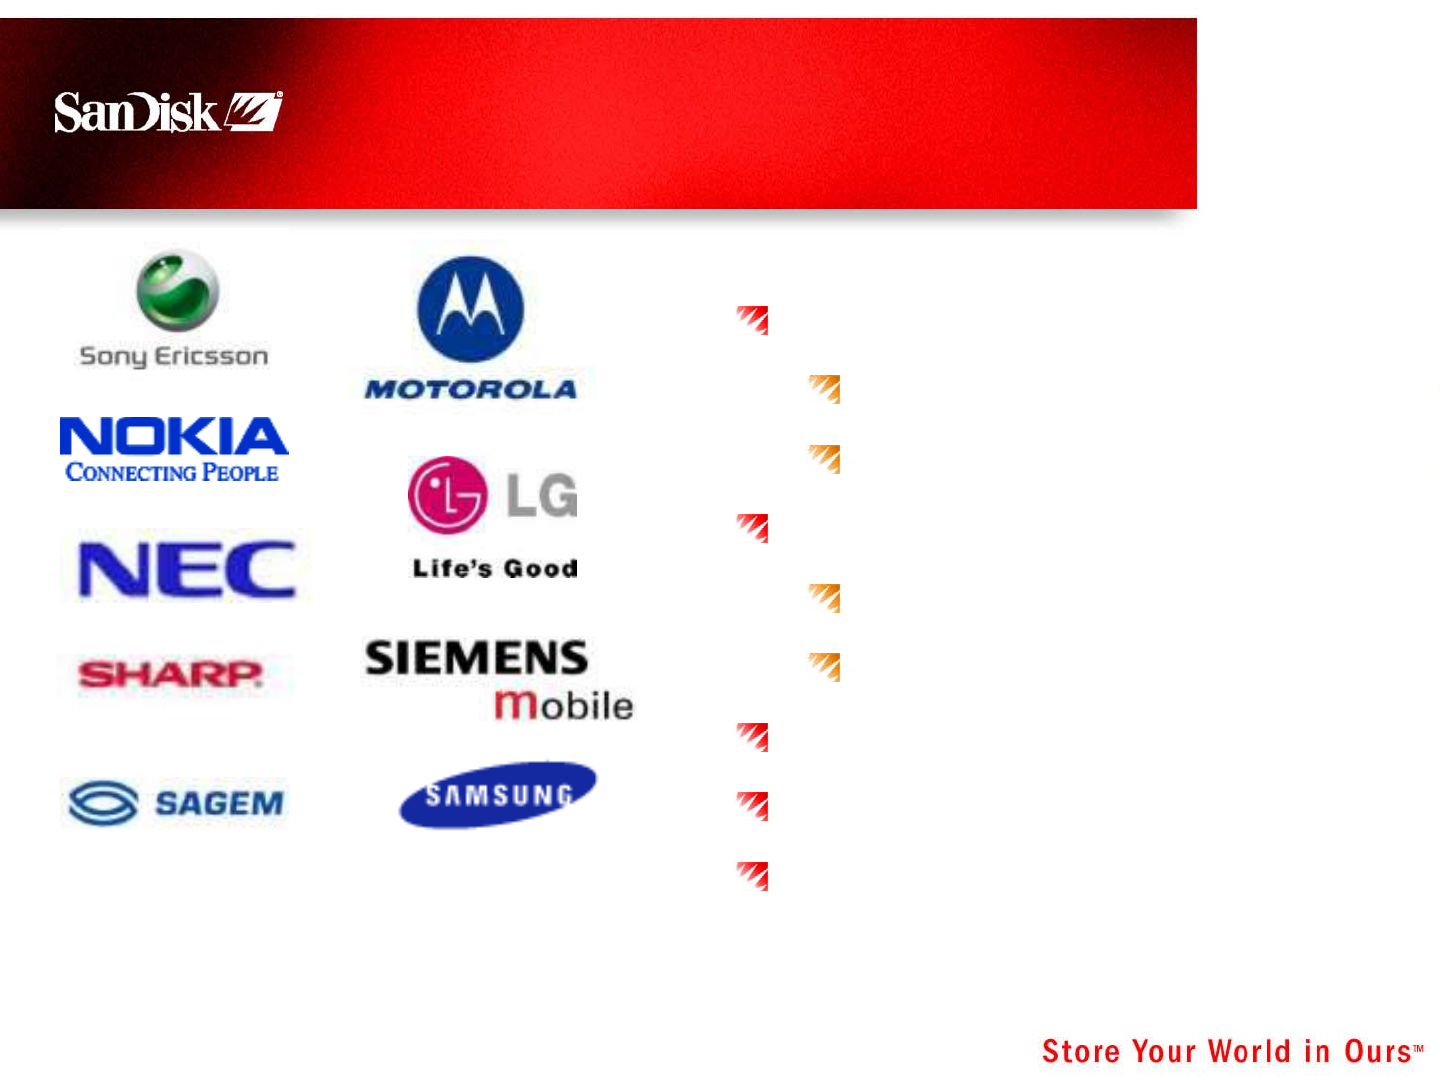
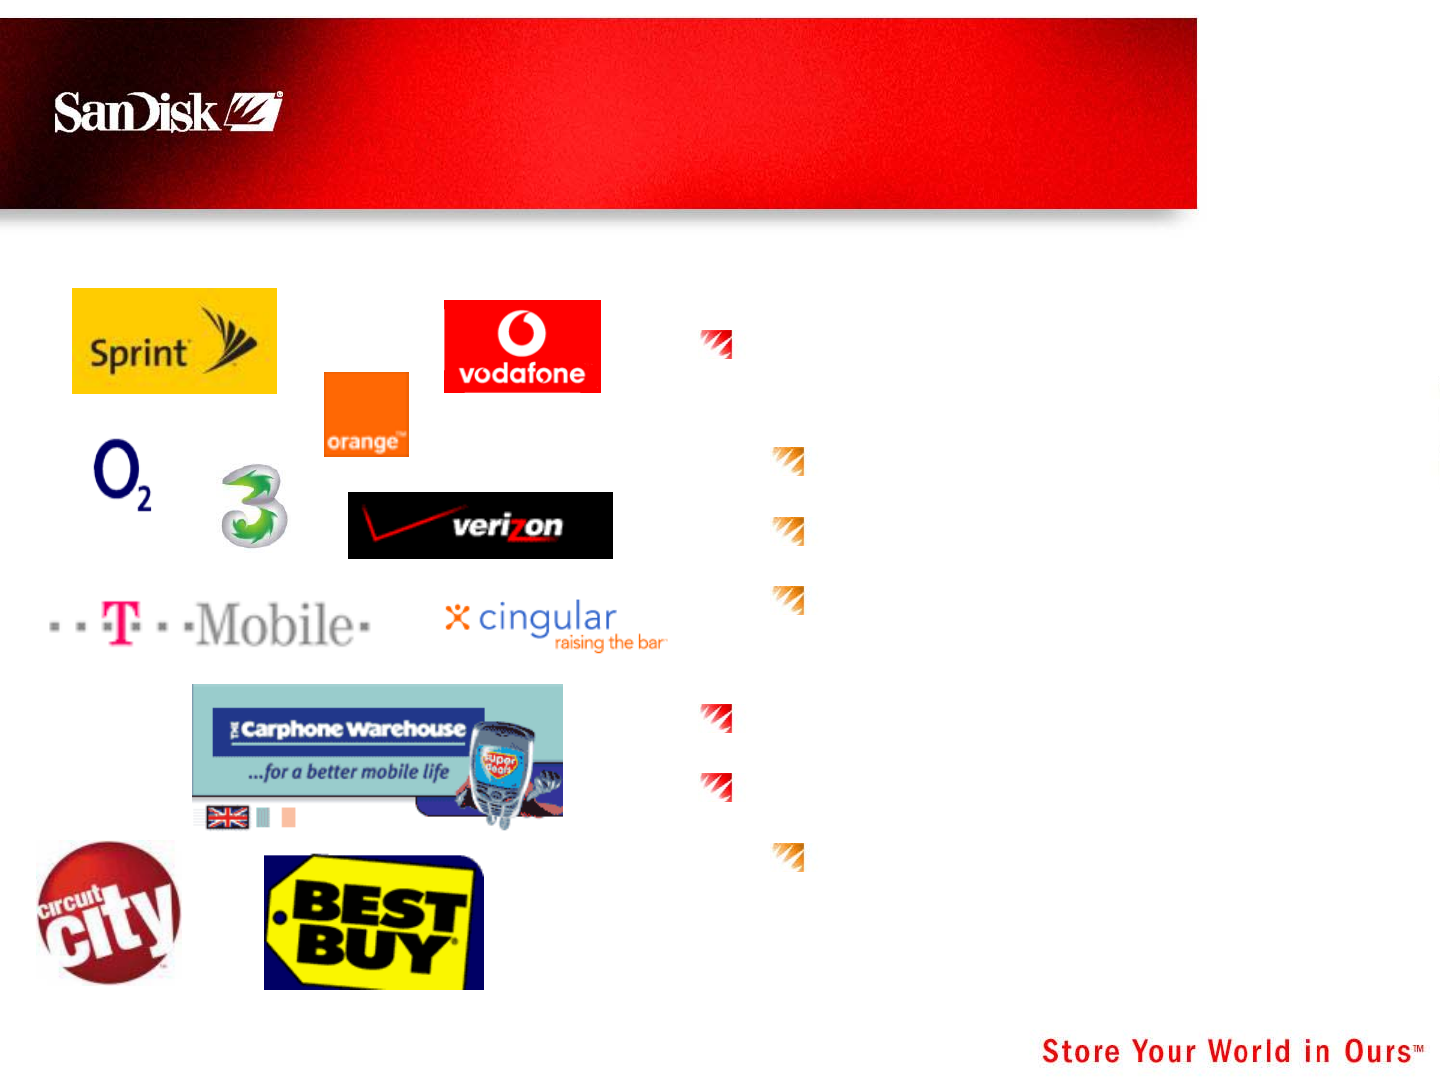
Mobile Phone Ecosystem
Partnership to Drive Market Adoption
ASSP,
OS
Security Content and
Service
Providers
Content and
Service
Providers
Mobile
Operators
Mobile
Operators
Handset
Vendors
Handset
Vendors
42 February 23, 2006
microSD Adoption Accelerating
Source: SanDisk, 2006
0
50
100
150
200
250
300
350
400
450
Q304 Q404 Q105 Q205 Q305 Q405
microSD
miniSD
SD
All Others
Number of Models
Flash Card Adoption in Handsets
43 February 23, 2006
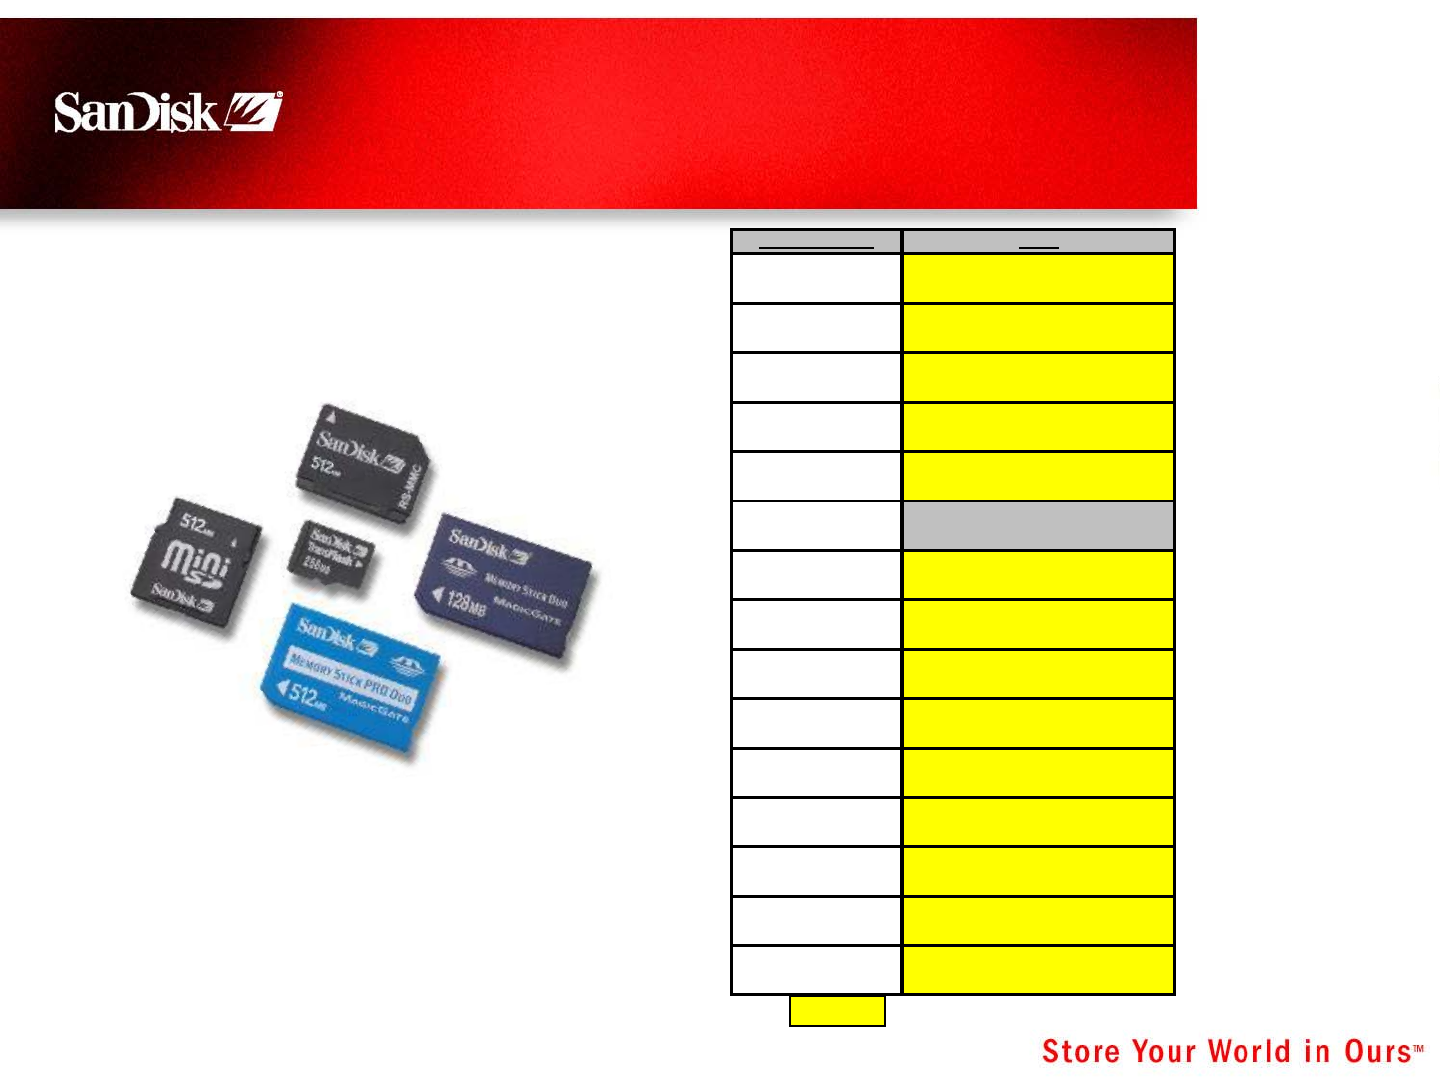
Overwhelming Adoption of SDTM
Formats
SD format adopter
Source: SanDisk, 2006
Manufacturer 2005
Nokia RSMMC, miniSD, microSD
Motorola SD, miniSD, microSD
Samsung RSMMC,SD, miniSD,
microSD
Siemens/BenQ RSMMC, SD, microSD
LG miniSD, microSD
SEMC MS Pro Duo
PMC miniSD
Alcatel miniSD
NEC miniSD, microSD
Kyocera miniSD, microSD
Sharp SD, miniSD
Sagem miniSD, microSD
Philips SD
Mitsubishi MS Duo, miniSD
Sanyo miniSD
44 February 23, 2006
OEM Business
Customers and Strategy for Growth
Added Value and Functionality
Customization
Security and DRM
Collaboration on Future Designs
Design know-how
Custom solutions
All Relevant Form Factors
Embedded Solutions as Needed
Retail Strength
45 February 23, 2006
Retail Business
Most Comprehensive Mobile Card Line Up
Partner with Retailers and Market
Drivers to Increase Adoption Rates
In-Store education
Joint promotion
Customized content (e.g.,
Verizon VCast)
35k Storefronts and Growing
Broad Product Offering
All major form factors
46 February 23, 2006
Poised for Mobile Growth
Huge Addressable Market
Projected $7B TAM in 2008
Technology and Product Leadership
Pioneer of mobile cards
Right solutions to satisfy and grow market
Channel Strength
Right customers; Right channels
New Technologies for
Emerging Markets
48 February 23, 2006
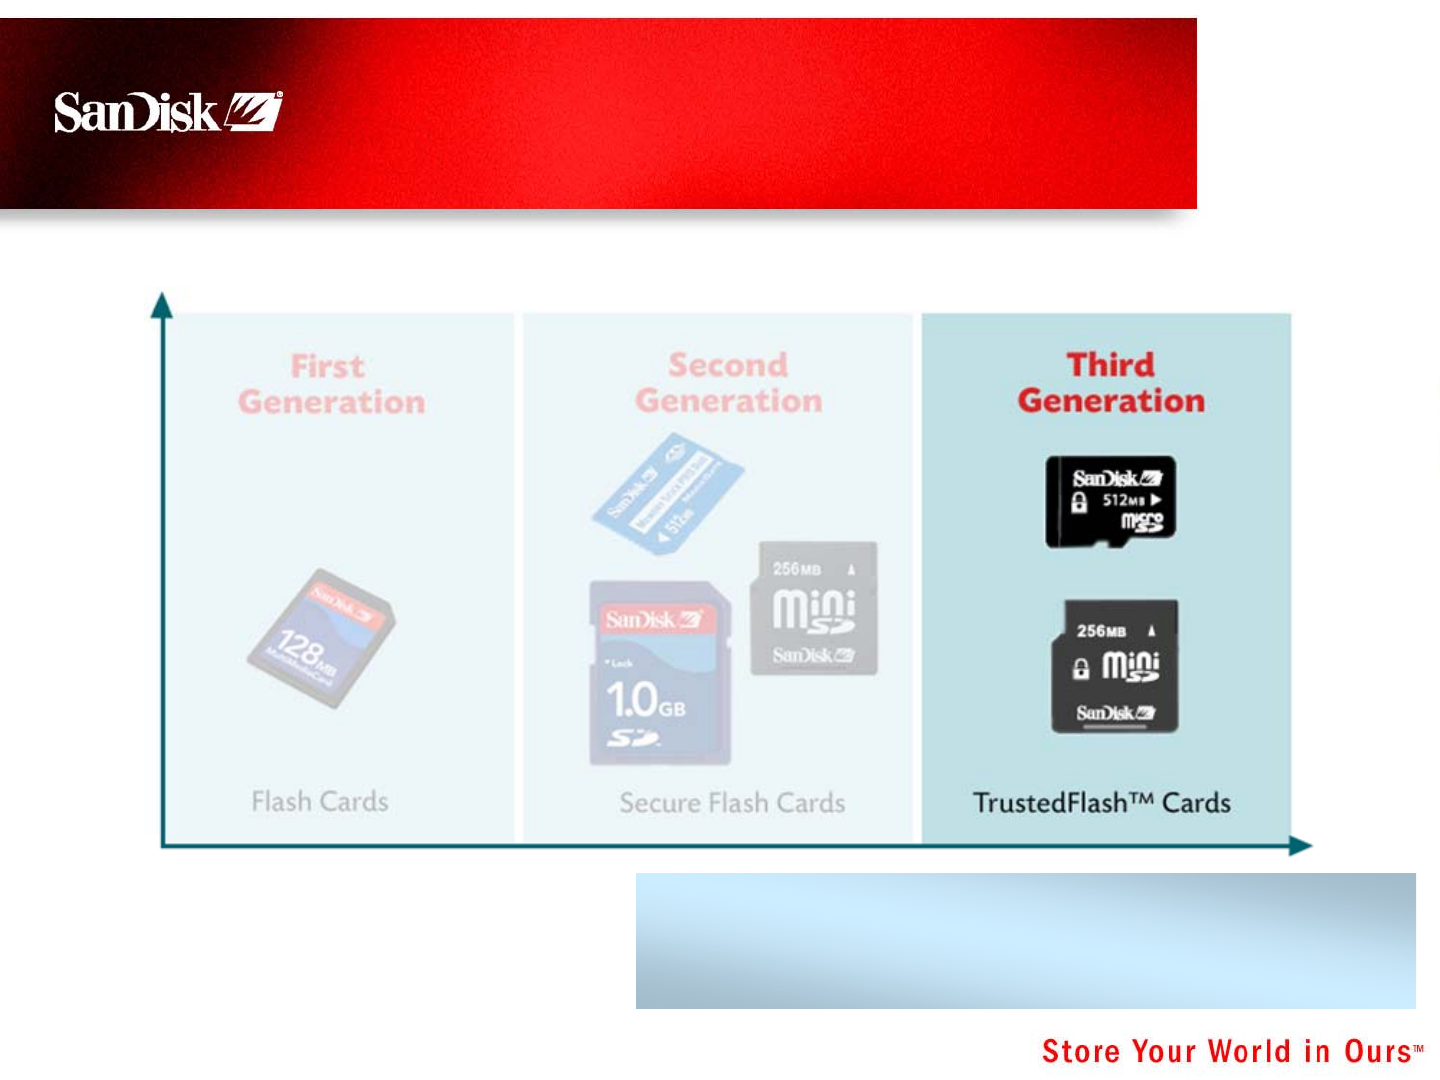
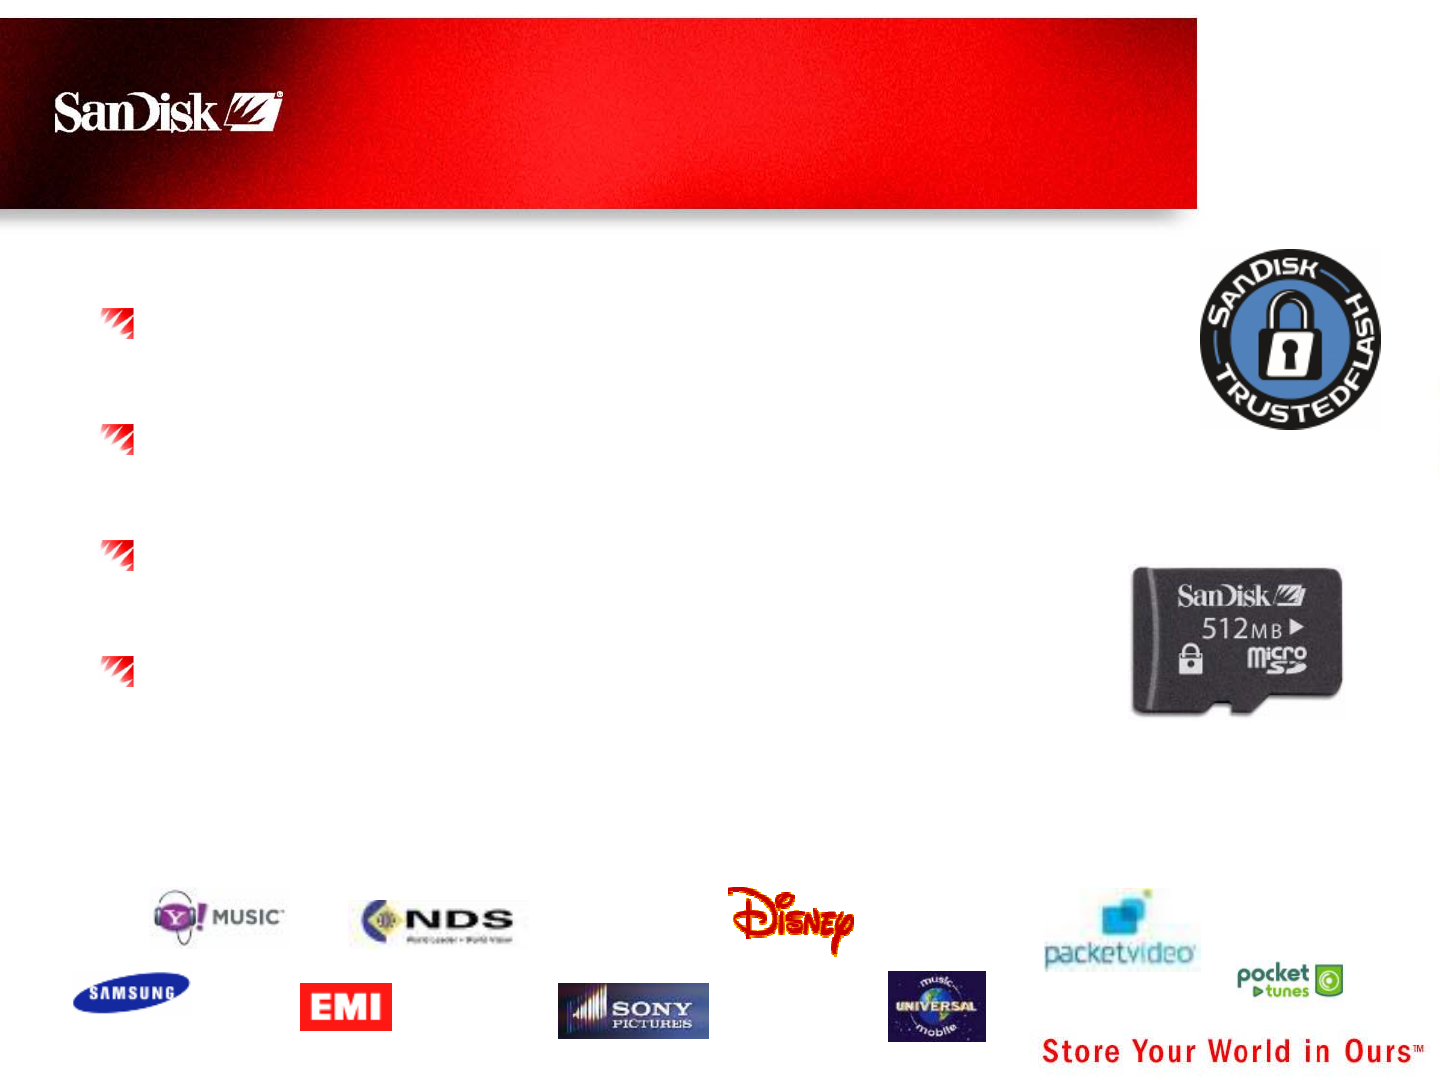
Third Generation Flash Cards
TrustedFlashTM Technology
Accelerating Consumption of Storage/Capacity
9Card-Based Content Protection and
Digital Rights Management (DRM) Solution
9State-of-Art Security Architecture

49 February 23, 2006
Mobile Content TAM
Projected for 2007
Source: Arc Group, IDC, iSuppli, Strategy Analytics, Gartner
Content Goes Mobile
TrustedFlash Technology
Portability
Ease of Use
Flexibility
Increased Security
Music – $ 9B
Games – $ 5B
Video – $ 10B
50 February 23, 2006
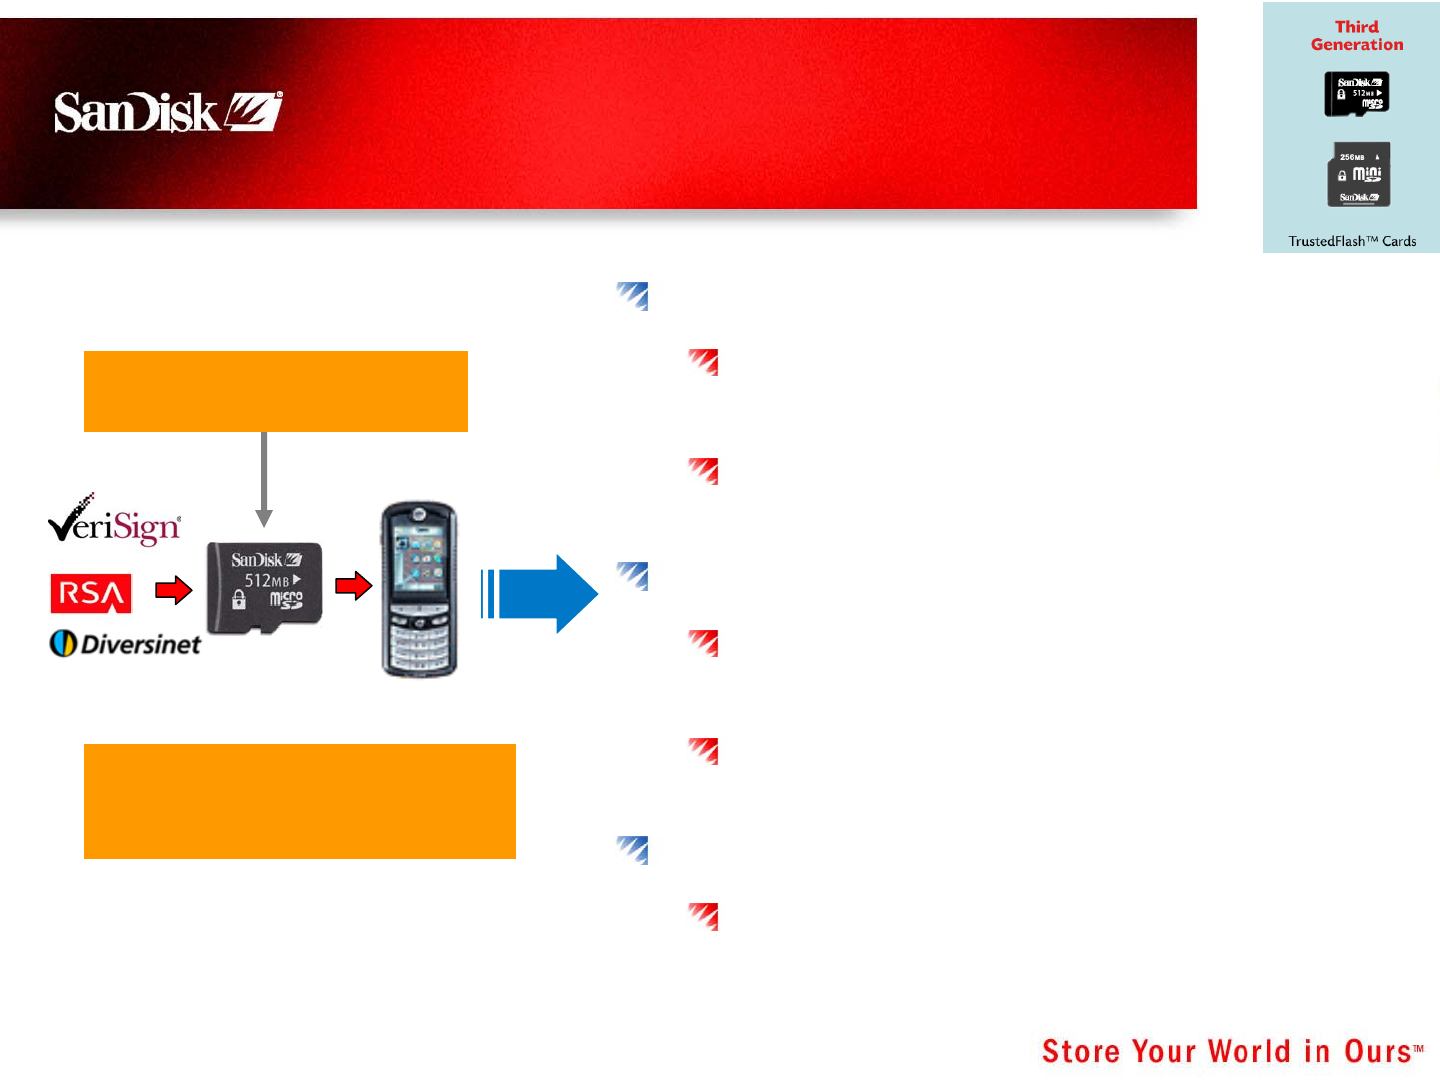
Mobile User Authentication
(Dual-Factor Authentication)
TrustedFlash Technology
Mobile Enterprise
Authenticate employees to provide
VPN access
No key fob required
Mobile and PC Banking
Authenticate users to banks for
secure access through PC and mobile
No dedicated token required
e-Commerce
Authenticate buyers to merchants for
both mobile and PC e-commerce
Credentials are stored in
card tamper-resistant area
* Source: Diversinet, 2005
On-Line Users:*
2005 270M
2010 1B
51 February 23, 2006
TrustedFlash Value
Proposition
Consumer: Can Own Content and Play on Multiple
Devices
Content Owner/Distributor: Content Safely Stored
on Card
MNO: Consumers can Seamlessly Upgrade
Handsets
Handset Manufacturer: No Need to Design-in
Costly Security and Tamper Resistance – Zero
Liability for Content Protection
TM
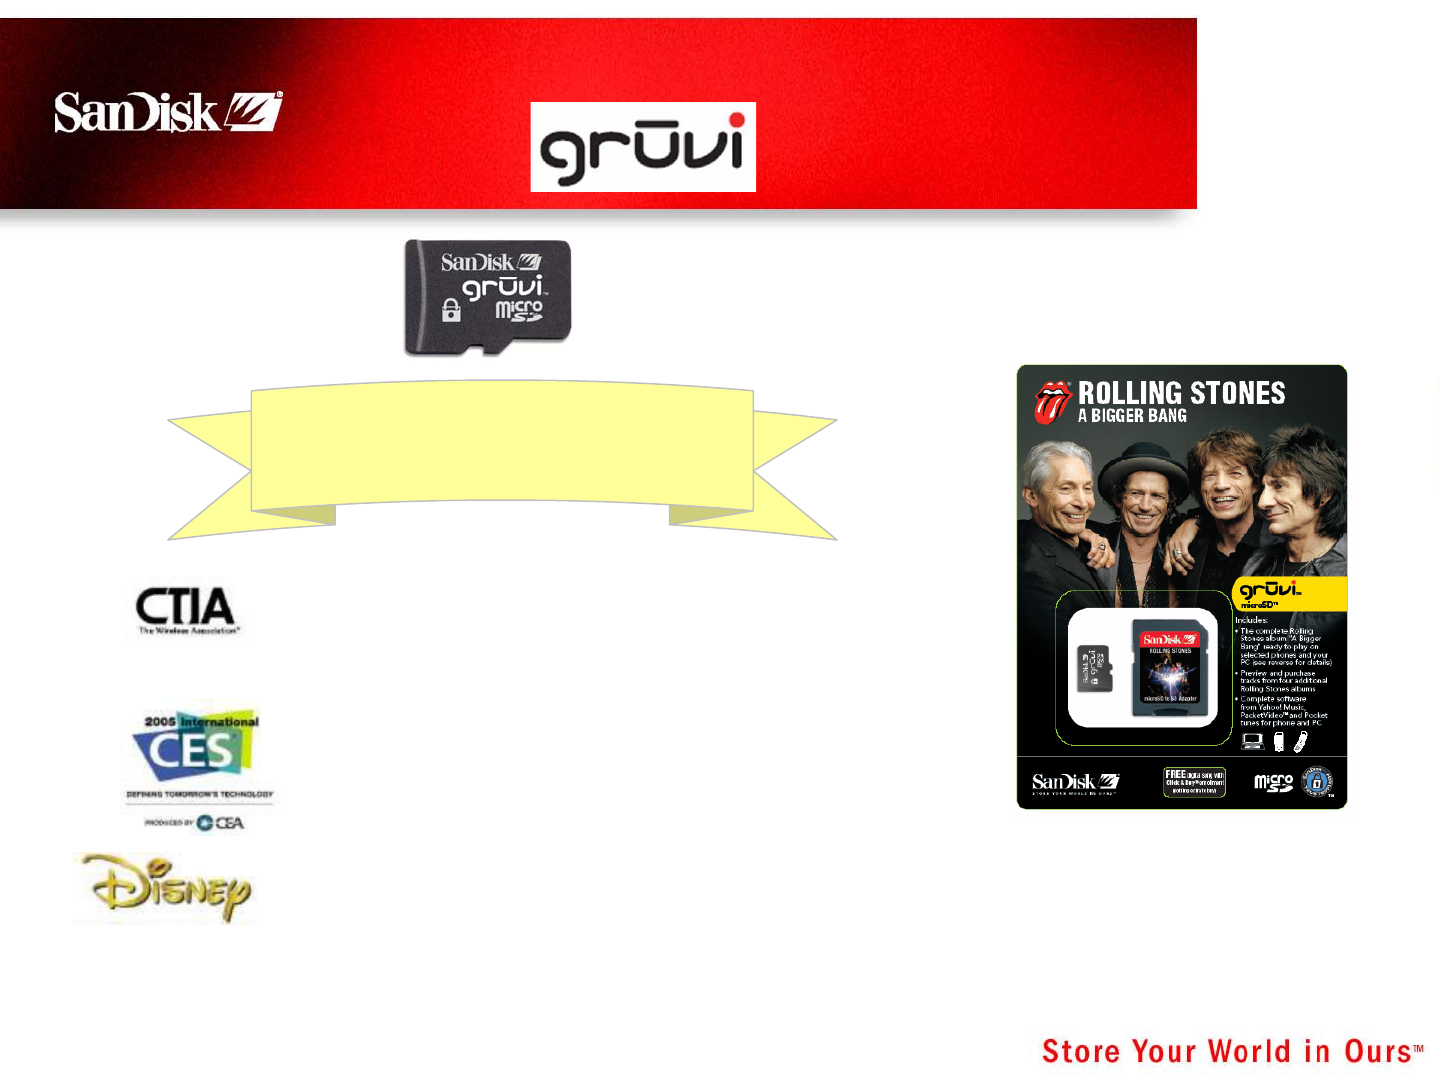
52 February 23, 2006
CTIA Innovative Product 2005
CES Innovations 2006
Disney’s Best of CES 2006
Demonstrating power
of TrustedFlash technology
TrustedFlash Technology in a Card
TM

53 February 23, 2006
54 million K-12 Students in
the US
17 Million College Students
Need for Simple, Portable
Distribution of Textbooks and
Classroom Materials
Positive Feedback from
Several Beta Sites
Evaluating Cruzer Freedom
Education
TrustedFlash Technology


Judy Bruner
EVP and CFO
56 February 23, 2006
Agenda
Financial Review
Modeling our Future Success
Revenue drivers
Fab capacity and investments
Gross margin factors
Target Financial Model
57 February 23, 2006
Q1 Q2 Q3 Q4 Q1 Q2 Q3 Q4 Q1 Q2 Q3 Q4 Q1 Q2 Q3 Q4
Revenue Growth
2002 2003
----$1.08B----
----$541M----
----$1.78B----
2004
License/
Royalty
Product
2005
-----$2.3B-----
58 February 23, 2006
Q1 Q2 Q3 Q4 Q1 Q2 Q3 Q4 Q1 Q2 Q3 Q4 Q1 Q2 Q3 Q4
2002 2003
$ in Millions
-----$97M-----
----$48M------
-----$174M-----
2004 2005
IP Leadership: License
and Royalty Revenue
-----$239M-----
59 February 23, 2006
Consistent Gross Margins
44%
40%
37%
34%
42%
40%
38% 40%
36%
41%
37%
41%
44%
42%
34%
32%
35%
32%
34%
29%
32% 35%
37%
36%
0%
5%
10%
15%
20%
25%
30%
35%
40%
45%
50%
Q103
Q203
Q303
Q403
Q104
Q204
Q304
Q404
Q105
Q205
Q305
Q405
Total GM% Product GM%
60 February 23, 2006
Excellent Gross Margin in 2005
Reflects 90nm Cost Structure & Effective Fab 3
Transition
42.2%
35.5%
38.6%
40.6%
34.9%
31.9%
34.7%
28.5%
0%
5%
10%
15%
20%
25%
30%
35%
40%
45%
2002 2003 2004 2005
Total GM% Product GM%
61 February 23, 2006
2005 Record Operating
Income and Margin
13 Consecutive Quarters 20%+
$0
$100
$200
$300
$400
$500
$600
$700
2003 2004 2005
-2%
3%
8%
13%
18%
23%
28%
$ in
Millions % of
Revenue
$257
$419
24% 24%
25%
$577
62 February 23, 2006
EPS $2.00, Up 39% Y/Y
$0.00
$1.00
$2.00
$ per
Share
2003 2004 2005
$1.02
$1.44
$2.00
63 February 23, 2006
Strong Balance Sheet
Focus area for reduced
cycle time & increased
flexibility
Cash up $375M Y/Y
January 1, 2006
$ millions
Cash & Short-term investments 1,698
Accounts Receivable (DSO = 44) 329
Inventory (Turns = 5.4) 332
Other current assets 217
Total Current Assets 2,576
PP&E 211
Note Receivable, FlashVision 62
Investment in FlashVision 161
Investment in Flash Partners 42
Other non-current assets 68
Total Assets 3,120
Current Liabilities 571
Non-current Liabilities 25
Total Liabilities 596
Stockholders' Equity 2,524
Total Liabilities & Stockholders' Equity 3,120
Operating Lease Guarantees - Fabs 278
64 February 23, 2006
Significant Cash Flow
From Operations
$0
$100
$200
$300
$400
$500
$600
$ Millions
2003 2004 2005
$273
$228
$481
65 February 23, 2006
Revenue per Employee
Increasing Productivity
599
751
876
1083
0
200
400
600
800
1000
1200
2002 2003 2004 2005
Headcount
0
0.5
1
1.5
2
2.5
3
3.5
$ millions
Ending headcount Revenue $ per Employee
$1.6M
$2.2M
$2.4M
66 February 23, 2006
Modeling our Future Success
Revenue Drivers
Markets
Elasticity
TB growth and pricing
Fab Capacity and Investment
Gross Margin Factors
67 February 23, 2006
Revenue Base Diversifying
End Markets as a % of Revenue
2003 2004 2005
Imaging 75% 65% 52%
USB 3% 13% 12%
Mobile Handset 4% 6% 13%
Digital Audio - 1% 6%
Gaming - - 3%
Other Products 9% 5% 4%
License and Royalty 9% 10% 10%

68 February 23, 2006
Portfolio of Markets at Different Stages
Terabyte Growth by End Market
2003 2004 2005
Imaging 226% 130% 119%
USB 1178% 909% 142%
Mobile Handset Year 1 316% 916%
Digital Audio Year 1 791%
Gaming Year 1
Industrial/Other 146% 24% -16%
Total 238% 167% 166%
69 February 23, 2006
Strong Elasticity
Retail Capacity vs. Price per MB
(40%)
(30%)
(20%)
(10%)
0%
10%
20%
30%
40%
Q1 Q2 Q3 Q4 Q1 Q2 Q3 Q4 Q1 Q2 Q3 Q4 Q1 Q2 Q3 Q4
% Quarterly
Change Average Retail Capacity per Card
Price per MB
Retail Channel Only
2002 2003 2004
+8%
-13%
2005
70 February 23, 2006
Elasticity
Capacity & Unit Growth ÆMB’s Sold
(40%)
(20%)
0%
20%
40%
60%
80%
100%
120%
Q1 Q2 Q3 Q4 Q1 Q2 Q3 Q4 Q1 Q2 Q3 Q4 Q1 Q2 Q3 Q4
Megabytes Sold
Price per MB
2002 2003
% Quarterly
Change
2004 2005
All Channels
Seasonality also a factor
71 February 23, 2006
TB Growth Forecasted to Accelerate in 2006
Fueled by Fab 3 Supply, Market Demand
2001 2002 2003 2004 2005 2006
Terabytes Sold
ASP per MB
Terabytes Sold ASP per MB
+233% +238%
+167%
+166%
+180-190%
72 February 23, 2006
Revenue Growth Forecast
Actual Actual Projected What we said last year
2002 - 2005 2005 2005 - 2008 for 2004 - 2007
CAGR Growth CAGR CAGR
Terabyte Growth 189% 166% 130 - 170% 100 - 150%
ASP per MB Decline 44% 52% 40 - 50% 35 - 45%
Total SNDK Revenue Growth * 62% 30% 25 - 40% 25 - 35%
* Projected Revenue CAGR includes NAND Products, License & Royalty and 3D Products

73 February 23, 2006
More on Revenue Growth
Revenue Revenue Revenue
2005 2006 CAGR
Nand Products $2067M MB +180-190% ~ 25% - 40% 2005 - 2008
ASP/MB -(50-55%)
3D Products * $60 - 90M ~ 50% - 75% 2006 - 2008
License & Royalty $239M ~$350M ~ 30% - 40% 2005 - 2008
Total $2306M ~ 25% - 40% 2005 - 2008
* 2005 3D Revenue not included in SNDK
74 February 23, 2006
Planning for Fab Capacity and
Capital Investment
TB Growth CAGR 2005 - 2008
130% Fab “4” needed 1st H 2009
150% Fab “4” needed 2nd H 2008
170% Fab “4” needed 1st H 2008
All Scenarios Assume 70% Captive/30% Non-captive Model
75 February 23, 2006
2005 SanDisk Fab Investment
Significant Funding from FP Working Capital
Analyst Day
($ in millions) Last Year
Actual 2005 Forecast 2005
Capital Investment
Flash Partners 519 470
FlashVision 90 80
SNDK owned Equipment at FlashVision 39 50
Total Capital Investment 648 600
Payment
SNDK Cash 95 360
FP/FV Working Capital 328
Operating Leases - Flash Partners 225 240
648 600
Impact on SNDK Balance Sheet
Investment & Notes Receivable - Flash Partners 22 230
Investment & Notes Receivable - FlashVision 34 80
Capital Equipment 39 50
95 360
End of Year Operating Lease Guarantee
Flash Partners 203
FlashVision 75
Total Operating Lease Guarantee 278
76 February 23, 2006
Fab 3 Investment
2006 Investment Reflects Accelerated Ramp
Cumulative Last Years'
Forecast Forecast
($ in millions) Actual Actual Committed thru thru
2004 2005 2006 2006 2006
Gross SNDK Capital Investment 23 519 1,200 1,742 (1) 1,253
Less: Flash Partners Working Capital 0 (272) (200) (472) (2) (100)
Net SNDK Investment 23 247 1,000 1,270 1,153
Source of Funding - Net Investment Forecast
SNDK Cash Investment in FP 23 22 500 545 563
Operating Leases/Other Financing 0 225 500 725 590
23 247 1,000 1,270 1,153
Source of Funding - Total Investment
Funding by SNDK Cash or FP Working Capital 23 294 700 1,017 58% 663 53%
Funding by Leases or Other Financing 0 225 500 725 42% 590 47%
Total SNDK Capital Investment 23 519 1,200 1,742 1,253
(1) Capital Investment by SNDK up from last year's forecast due to acceleration of Fab 3 expansion
to 70,000 wafers/month (SNDK's share 50%) expected by March 2007, up from 48,750 w/m
(2) Flash Partners working capital contributions greater than previously forecasted
This is SanDisk's share of FP working capital
77 February 23, 2006
Potential Future Fab & Capex Investment
($ in millions) Actual Actual Forecast
Capital Investments 2004 2005 2006 2007 2008 5 YrTotal
FlashVision Investment 33 91 124
Fab 3 Investment 23 519 1,200 1,100 700 3,542
Potential Fab "4" Investment 400 1,200 1,600
Total Gross SNDK Fab Venture Investment 56 610 1,200 1,500 1,900 5,266
SNDK owned fab equipment- FV 63 39 102
Non-Fab Capex Investment 63 95 200 300 500 1,158
Total SNDK Capex Investments 126 134 200 300 500 1,260
Total SNDK Capital Investments (Fab & Capex) 182 744 1,400 1,800 2,400 6,526
Funding
Fab Ventures Working Capital 328 200 350 450 1,328
Committed Operating Leases * 225 150 375
SanDisk Cash spent 182 191
Remaining Funding Required 0 0 1,050 1,450 1,950 4,823
* Committed Operating Leases = SanDisk's 50% share of 85B Yen
Potential
Assumes Fab 3 at capacity of 100K w/m by end of 2007

78 February 23, 2006
Fab and Capex Financing Strategy
Potential Expansion Suggests Funding Requirement of
Approximately $4.8B for 2006-2008
Strategy Remains 50% Cash and 50% Other Financing
50% Cash Funding
Cash flow from operations a significant source
Maintain minimum cash balance of $1B
50% Other Financing
Diversification of funding sources & maturities
Operating lease financing remains high priority −attractive
cost of capital
79 February 23, 2006
Fab 3 ROI
Return = Gross Margin Delta of Captive vs. Non-captive,
After Tax
Investment = Capital Provided to Flash Partners
Projections Analyzed Through 2010
Pricing Assumed to Follow Forecasted Cost Reduction
No Industry Downturn Factored In
ROI
0% operating leases ~35% ROI
25% operating leases ~50% ROI
50% operating leases ~90% ROI
80 February 23, 2006
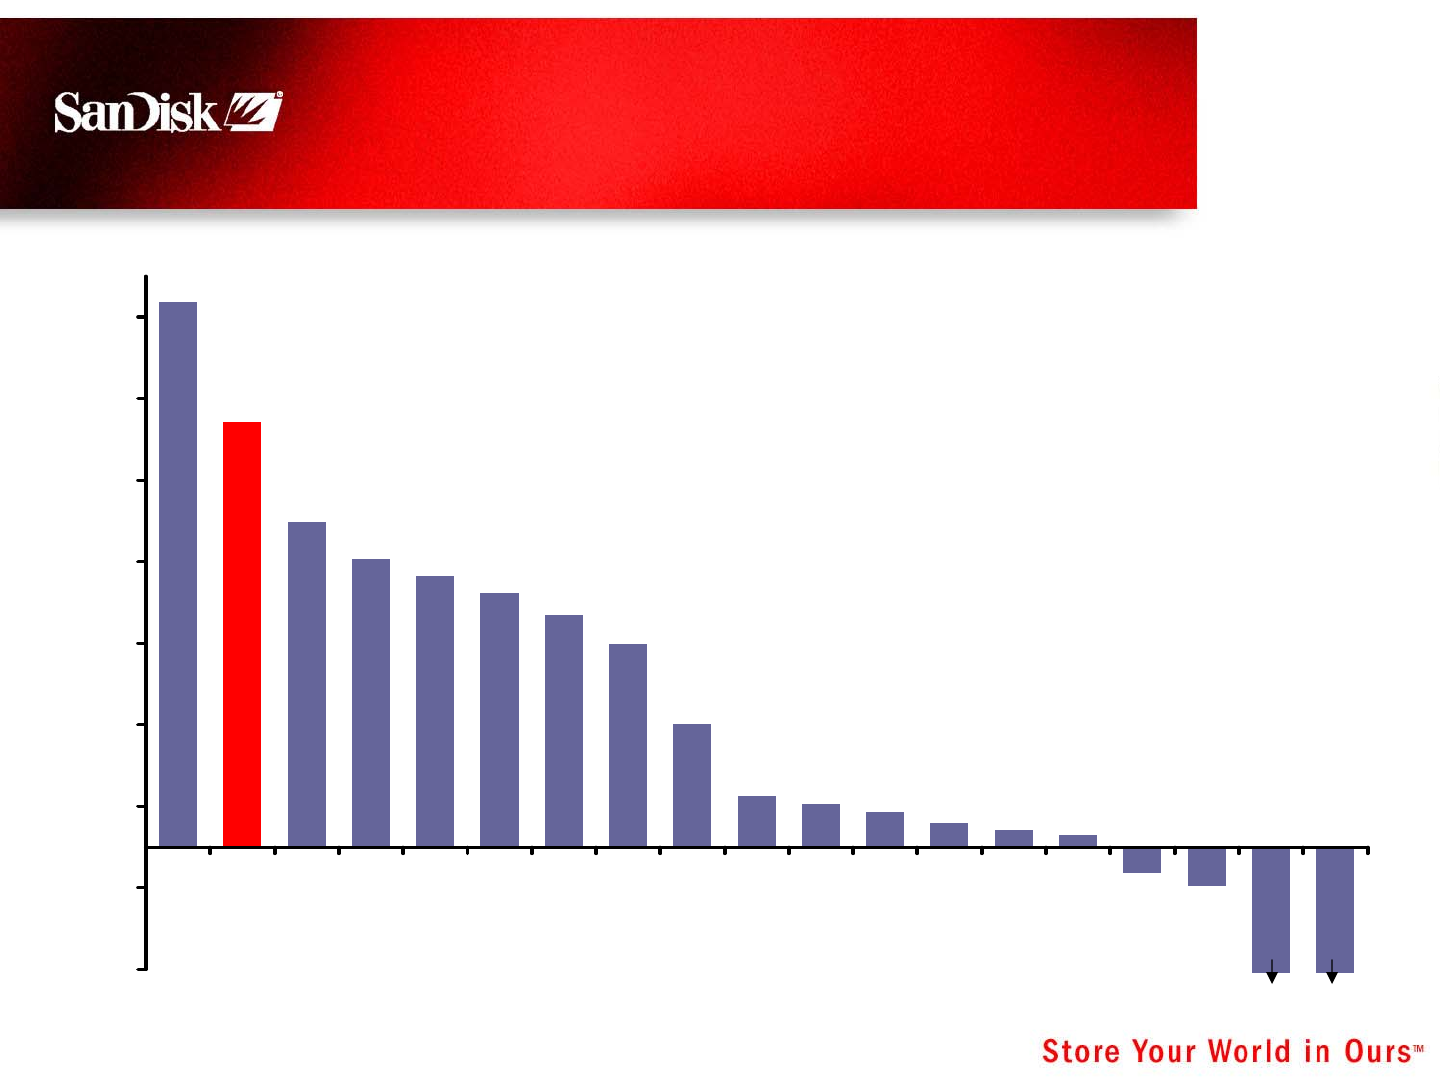
SanDisk Producing Strong ROIC
-15%
-5%
5%
15%
25%
35%
45%
55%
65%
NVIDIA
SanDisk
QualComm
M-Systems
Motorola
Broadcom
TI
Intel
Xilinx
AMD
Rambus
ARM
ST-Micro
Kodak
Micron
Infineon
Cypress
Silicon Storage
Lexar
ROIC
ROIC Last Four Quarters
81 February 23, 2006
Key Gross Margin Drivers
Technology Transitions
300mm vs. 200mm Wafer Mix
Captive vs. Non-Captive Mix
Fab Start-up Costs & Fab Ramp-Up
Non-memory Cost Reduction
Average Capacity of Card Sales
Product Line Mix
ASP/MB converging for leading form factors
Flash memory as % of BOM
MP3 devices – lower margin %, higher margin $

82 February 23, 2006
Captive & Non-Captive Gross Margins
2003 2004 2005
Captive Gross Margin ~40% ~42% ~45%
Non-Captive Gross Margin ~19% ~13% ~18%
Non-Captive Mix 26% 35% 35%
License/Royalty GM Contribution 6% 7% 7%
Total Gross Margin 41% 39% 42%
83 February 23, 2006
Planning for Strong Growth
No Industry Downturn Assumed
0
1
2
3
4
5
6
7
2002 2003 2004 2005 2006 2007 2008
Revenue $ in billions
25% CAGR
40% CAGR

84 February 23, 2006
Scaling the Infrastructure
Requires Targeted Investments
Investing in Systems
Application upgrades/replacements
Automation of manual processes
Network speed, redundancy, security
Organization
Raising the bar
International
Design centers, fab operations, local sales support
Process Re-engineering & Cycle Time Reduction
Supply chain – assembly & test
Customer fulfillment
Etc.
85 February 23, 2006
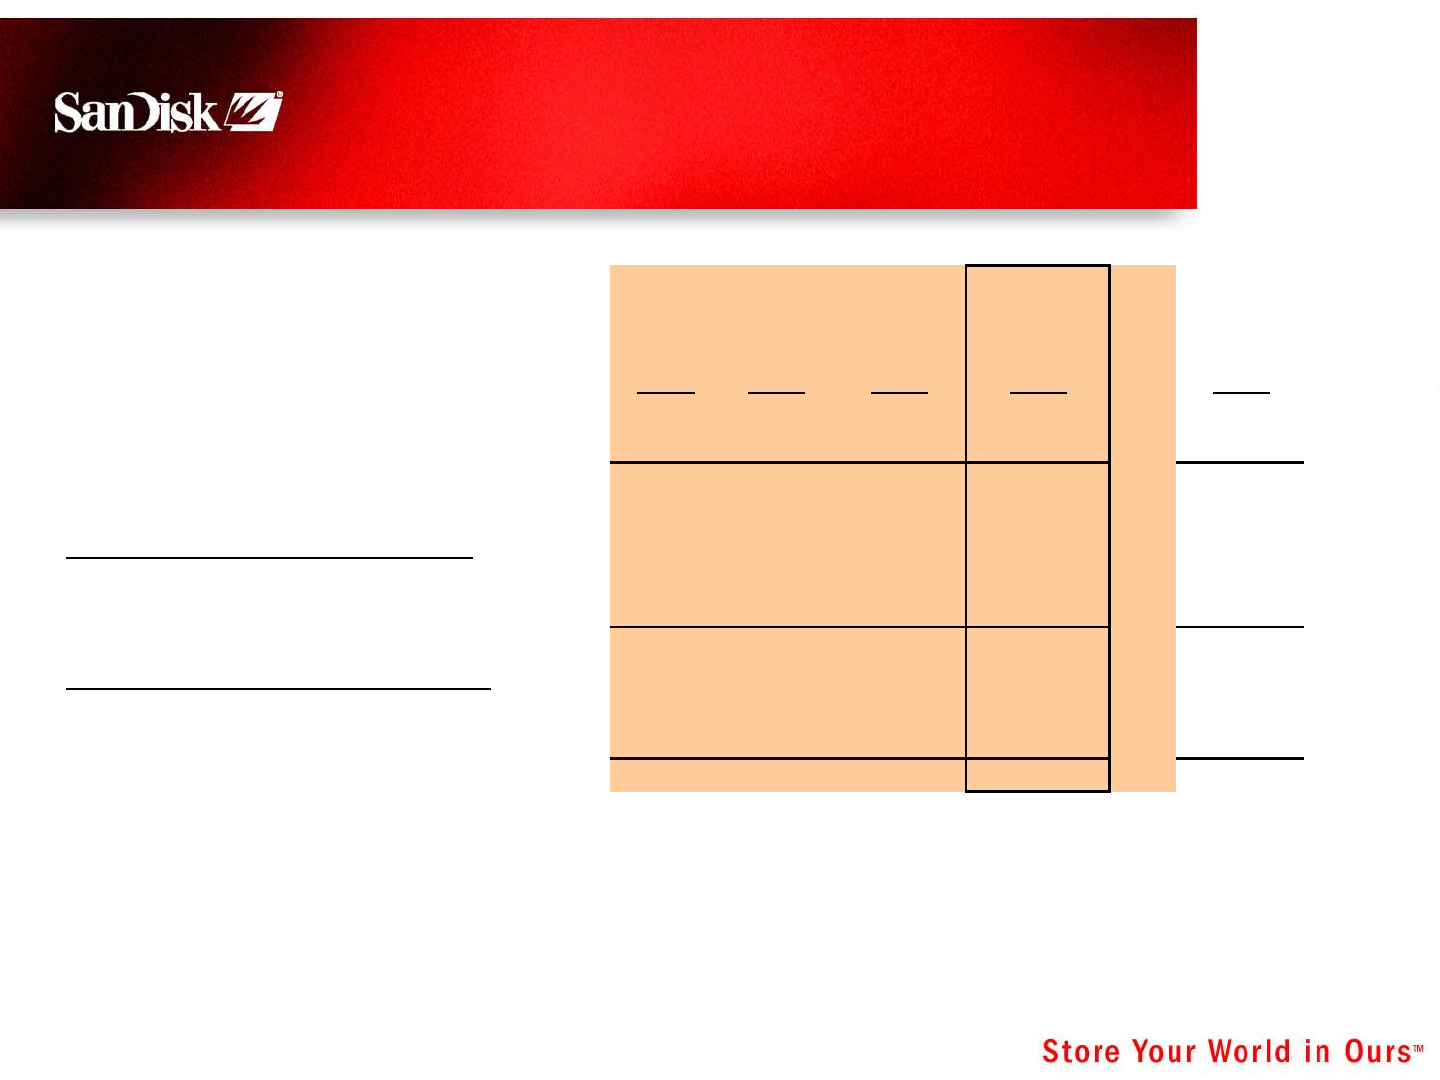
Target Financial Model – Non-GAAP
Non-GAAP excludes: stock compensation and acquisition related charges for in-process R&D and amortization of intangibles
Reconciliation to ‘GAAP Target Model for 2006-2008’ and ‘GAAP Guidance for 2006’ included in Appendix
Non-GAAP Non-GAAP Last Years'
A
nnual
A
nnual Target
Target Model Guidance Model
2004 2005 2006 - 2008 2006 2005 - 2007
Revenue $1,777M $2,306M
Revenue Growth 65% 30% 25 - 40% CAGR 25 - 35% CAGR
Total Gross Margin 38.6% 42.2% 35 - 42% 39 - 42% 35 - 40%
R&D 7.0% 8.4% 7 - 9% 7 - 9%
S&M 5.1% 5.3% 5 - 6% 5 - 6%
G&A 2.9% 3.4% 3 - 4% 3%
Oper Expenses 15.0% 17.2% 15 - 18% 17 - 18% 15 - 18%
Oper Income 23.6% 25.0% 20 - 24% 22 - 24% 20 - 24%
Tax Rate 37% 37% 35%

86 February 23, 2006
Stock Compensation Strategy
End of % of Shares
(in millions)
2005 Outstanding
Shares Outstanding 188.2
Incentives Issued 2005 - gross 6.5 3.4%
Incentives Issued 2005 - net 5.7 3.0%
Stock Incentives Outstanding 20.4 11%
2006
Reduced size of new hire and annual grants; believe
market is doing the same
Given significant growth in new hires, including
Matrix, expect incentive issuance to remain at
approximately 3-3.5%
See Appendix for estimated impact on GAAP results

87 February 23, 2006
Growth & Profitability
Last Four Quarters
QCOM
INTC
XLNX
ALTR
TXN
MU
BRCM
STM
RMBS
ARM
EK
SNDK
AMD
CY
IFX
SSTI
NVDA
FLSH
-20%
-10%
0%
10%
20%
30%
40%
50%
-20% -10% 0% 10% 20% 30% 40% 50% 60%
Y-o-Y Revenue Growth
Operating Margin
88 February 23, 2006
Summary
Attractive and Consistent Business Model
Fab Investments Providing Strong Returns
Planning for Projected Growth
Diversifying revenue base
Diversification of funding sources
Scaling the infrastructure

Appendix
90 February 23, 2006
GAAP Financial Guidance −2006
Non-GAAP
A
djustments GAAP
Total Gross Margin 39% - 42% 1%
(1)
38% - 41%
Operating Expenses 17% - 18% $145 - $175
(2)
21% - 24%
Operating Margin 22% - 24% 5% - 7%
(3)
15% - 19%
Tax Rate 35% >35%
(4)
(4)
Effective GAAP tax rate will reflect the non-deductibility of in-process R&D and incentive stock option expense
2006
(1)
Estimate of stock compensation & acquisition related intangible amortization to be included in cost of sales
(2)
Includes stock compensation of approximately $100 million, in-process research and development of $30 to $50
million related to the Matrix acquisition and amortizaton of acquisition related intangibles of $15 - 25 million
(3)
Reflects estimate of impact on operating margin of stock compensation, in-process R&D and amortization of
acquisition related intangibles expected in cost of sales and operating expenses
91 February 23, 2006
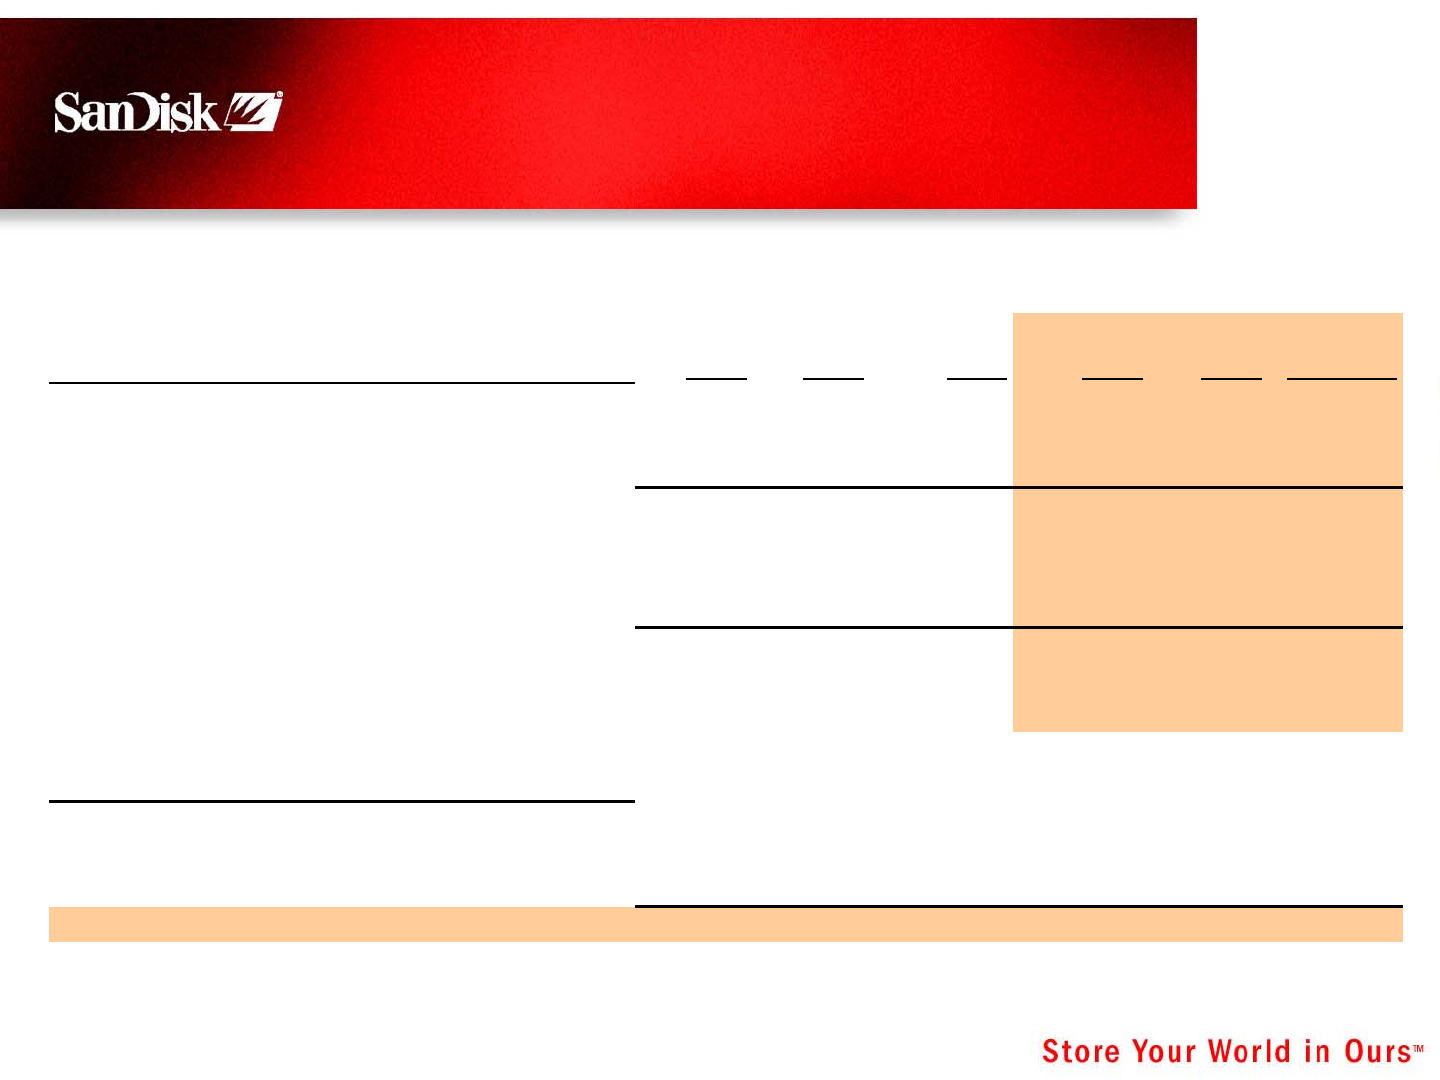
GAAP Target Model
Non-GAAP
A
djustments GAAP
Total Gross Margin 35% - 42% 1%
(1)
34% - 41%
Operating Expenses 15% - 18% 4% - 6%
(2)
19% - 24%
Operating Margin 20% - 24% 5% - 7%
(3)
13% - 19%
Annual Target Model 2006 - 2008
(1)
Estimate of stock compensation & acquisition related intangible amortization to be included in cost of
sales
(2)
Includes stock compensation, acquisition related in-process research and development, and
amortizaton of acquisition related intangibles
(3)
Reflects estimate of impact on operating margin of stock compensation, in-process R&D and
amortization of acquisition related intangibles expected in cost of sales and operating expenses

Q&A
93 February 23, 2006
3-5 Year Outlook
Flash Markets Expected to Grow
3X-4X (>$30B). In Five Years,
Primarily Handsets and CE
Investing to Meet Market
Challenges and Growth
Opportunities to Become
Consumer Branded Powerhouse
in Next Five Years
Uniquely Positioned to Meet
Competition Challenges and
Capitalize on Massive Global
Consumerism in Coming Decade
Creating Shareholder Value

SanDisk, the SanDisk logo, Store Your World in Ours, Cruzer,
SanDisk Extreme and SanDisk Ultra are trademarks of
SanDisk Corporation, registered in the United States and other
countries. Cruzer Crossfire, gruvi, the gruvi logo, Sansa, and
Shoot & Store are trademarks of SanDisk Corporation.
SanDisk Corporation is an authorized licensee of SD. The
PlaysForSure logo is a trademark or registered trademark of
Microsoft Corporation in the United States and/or other
countries. Memory Stick PRO Duo is a trademark of Sony
Corporation. PSP and PlayStation are registered trademarks
or trademarks of Sony Computer Entertainment, Inc. (SCEI).
Skype and the Skype logo are trademarks of Skype
Technologies S.A. U3 and the U3 smart logo are trademarks
of U3, LLC.
Other brand names mentioned herein are for identification
purposes only and may be trademarks of their respective
holder(s).
© 2006 SanDisk Corporation. All rights reserved.
