Logging And Log Management: The Authoritative Guide To Understanding Concepts Surrounding Management Undeanagement Anton Chuvakin & Kevin Schm
User Manual:
Open the PDF directly: View PDF ![]() .
.
Page Count: 463 [warning: Documents this large are best viewed by clicking the View PDF Link!]
- Front Cover
- Half Title
- Logging and Log Management
- Copyright
- Contents
- Acknowledgments
- About the Authors
- About the Technical Editor
- Foreword
- Preface
- 1 Logs, Trees, Forest: The Big Picture
- 2 What is a Log?
- 3 Log Data Sources
- 4 Log Storage Technologies
- 5 syslog-ng Case Study
- 6 Covert Logging
- 7 Analysis Goals, Planning, and Preparation: What Are We Looking for?
- 8 Simple Analysis Techniques
- 9 Filtering, Normalization, and Correlation
- 10 Statistical Analysis
- 11 Log Data Mining
- 12 Reporting and Summarization
- 13 Visualizing Log Data
- 14 Logging Laws and Logging Mistakes
- 15 Tools for Log Analysis and Collection
- 16 Log Management Procedures: Log Review, Response, and Escalation
- Introduction
- Assumptions, Requirements, and Precautions
- Common Roles and Responsibilities
- PCI and Log Data
- Logging Policy
- Review, Response, and Escalation Procedures and Workflows
- Validation of Log Review
- Logbook—Evidence of Exception of Investigations
- PCI Compliance Evidence Package
- Management Reporting
- Periodic Operational Tasks
- Additional Resources
- Summary
- References
- 17 Attacks Against Logging Systems
- 18 Logging for Programmers
- 19 Logs and Compliance
- 20 Planning Your Own Log Analysis System
- 21 Cloud Logging
- 22 Log Standards and Future Trends
- Index

Logging and Log
Management

This page is intentionally left blank

AMSTERDAM • BOSTON • HEIDELBERG • LONDON
NEW YORK • OXFORD • PARIS • SAN DIEGO
SAN FRANCISCO • SINGAPORE • SYDNEY • TOKYO
Syngress is an Imprint of Elsevier
Dr. Anton A. Chuvakin
Kevin J. Schmidt
Christopher Phillips
Partricia Moulder, Technical Editor
Logging and Log
Management
The Authoritative Guide to
Understanding the Concepts
Surrounding Logging and
Log Management

Acquiring Editor: Chris Katsaropoulos
Editorial Project Manager: Heather Scherer
Project Manager: Priya Kumaraguruparan
Designer: Alan Studholme
Syngress is an imprint of Elsevier
225 Wyman Street, Waltham, MA 02451, USA
Copyright © 2013 Elsevier, Inc. All rights reserved.
No part of this publication may be reproduced or transmitted in any form or by any means,
electronic or mechanical, including photocopying, recording, or any information storage and
retrieval system, without permission in writing from the publisher. Details on how to seek
permission, further information about the Publisher’s permissions policies and our arrange-
ments with organizations such as the Copyright Clearance Center and the Copyright Licensing
Agency, can be found at our website: www.elsevier.com/permissions.
This book and the individual contributions contained in it are protected under copyright by the
Publisher (other than as may be noted herein).
Notices
Knowledge and best practice in this eld are constantly changing. As new research and experi-
ence broaden our understanding, changes in research methods or professional practices, may
become necessary. Practitioners and researchers must always rely on their own experience and
knowledge in evaluating and using any information or methods described herein. In using such
information or methods they should be mindful of their own safety and the safety of others,
including parties for whom they have a professional responsibility.
To the fullest extent of the law, neither the Publisher nor the authors, contributors, or editors,
assume any liability for any injury and/or damage to persons or property as a matter of products
liability, negligence or otherwise, or from any use or operation of any methods, products,
instructions, or ideas contained in the material herein.
Library of Congress Cataloging-in-Publication Data
Application submitted.
British Library Cataloguing-in-Publication Data
A catalogue record for this book is available from the British Library.
ISBN: 978-1-59749-635-3
Printed in the United States of America
13 14 15 10 9 8 7 6 5 4 3 2 1
For information on all Syngress publications, visit our website at www.syngress.com

v
Contents
ACKNOWLEDGMENTS ............................................................................ xv
ABOUT THE AUTHORS .........................................................................xvii
ABOUT THE TECHNICAL EDITOR ....................................................... xix
FOREWORD .......................................................................................... xxi
PREFACE ......................................................................................... xxv
CHAPTER 1 Logs, Trees, Forest: The Big Picture ................................ 1
Introduction .................................................................................. 1
Log Data Basics ............................................................................ 2
What Is Log Data? ................................................................... 2
How is Log Data Transmitted and Collected? ...................... 4
What is a Log Message? ......................................................... 6
The Logging Ecosystem ......................................................... 7
A Look at Things to Come ......................................................... 15
Logs Are Underrated ................................................................. 16
Logs Can Be Useful .................................................................... 17
Resource Management ......................................................... 17
Intrusion Detection ............................................................... 18
Troubleshooting .................................................................... 21
Forensics ................................................................................ 21
Boring Audit, Fun Discovery ................................................ 22
People, Process, Technology ..................................................... 23
Security Information and Event Management
(SIEM) .......................................................................................... 24
Summary ..................................................................................... 27
CHAPTER 2 What is a Log?.................................................................. 29
Introduction ................................................................................ 29
Definitions .............................................................................. 29
Logs? What logs? ....................................................................... 32
Log Formats and Types ........................................................ 34
Log Syntax ............................................................................. 40
Log Content ........................................................................... 44

Contents
vi Contents
Criteria of Good Logging ........................................................... 46
Ideal Logging Scenario ......................................................... 47
Summary ..................................................................................... 48
CHAPTER 3 Log Data Sources ............................................................. 51
Introduction ................................................................................ 51
Logging Sources ......................................................................... 51
Syslog ..................................................................................... 52
SNMP ...................................................................................... 58
The Windows Event Log ...................................................... 62
Log Source Classification .......................................................... 63
Security-Related Host Logs .................................................. 64
Security-Related Network Logs ........................................... 68
Security Host Logs ................................................................ 68
Summary ..................................................................................... 70
CHAPTER 4 Log Storage Technologies ............................................... 71
Introduction ................................................................................ 71
Log Retention Policy .................................................................. 71
Log Storage Formats .................................................................. 73
Text-Based Log Files............................................................. 73
Binary Files ............................................................................ 76
Compressed Files .................................................................. 76
Database Storage of Log Data ................................................... 78
Advantages ............................................................................ 78
Disadvantages ....................................................................... 78
Defining Database Storage Goals ........................................ 79
Hadoop Log Storage .................................................................. 81
Advantages ............................................................................ 82
Disadvantages ....................................................................... 82
The Cloud and Hadoop .............................................................. 82
Getting Started with Amazon Elastic
MapReduce ............................................................................ 83
Navigating the Amazon ........................................................ 83
Uploading Logs to Amazon Simple Storage
Services (S3) ........................................................................... 84
Create a Pig Script to Analyze an Apache
Access Log ............................................................................. 86
Processing Log Data in Amazon Elastic MapReduce
(EMR) ...................................................................................... 87
Log Data Retrieval and Archiving ............................................ 89
Online ..................................................................................... 90

Contents vii
Near-line ................................................................................. 90
Offline ..................................................................................... 90
Summary ..................................................................................... 90
CHAPTER 5 syslog-ng Case Study ...................................................... 93
Introduction ................................................................................ 93
Obtaining syslog-ng................................................................... 93
What Is syslog-ngsyslog-ng? .................................................... 94
Example Deployment ................................................................. 95
Configurations ....................................................................... 96
Troubleshooting syslog-ng ........................................................ 99
Summary ................................................................................... 101
CHAPTER 6 Covert Logging .............................................................. 103
Introduction .............................................................................. 103
Complete Stealthy Log Setup .................................................. 105
Stealthy Log Generation ..................................................... 105
Stealthy Pickup of Logs ...................................................... 106
IDS Log Source ..................................................................... 106
Log Collection Server .......................................................... 107
“Fake” Server or Honeypot ................................................ 109
Logging in Honeypots ............................................................. 110
Honeynet’s Shell Covert Keystroke Logger ...................... 111
Honeynet’s Sebek2 Case Study .......................................... 112
Covert Channels for Logging Brief ......................................... 113
Summary ................................................................................... 114
CHAPTER 7 Analysis Goals, Planning, and Preparation:
What Are We Looking For? ........................................... 115
Introduction .............................................................................. 115
Goals ......................................................................................... 115
Past Bad Things .................................................................. 115
Future Bad Things, Never Before Seen Things,
and All But the Known Good Things ................................. 117
Planning .................................................................................... 117
Accuracy .............................................................................. 117
Integrity ............................................................................... 118
Confidence ........................................................................... 119
Preservation ......................................................................... 119
Sanitization .......................................................................... 120
Normalization ...................................................................... 120
Challenges with Time ......................................................... 121

Contents
viii Contents
Preparation ............................................................................... 122
Separating Log Messages .................................................. 122
Parsing ................................................................................. 122
Data Reduction .................................................................... 122
Summary ................................................................................... 125
CHAPTER 8 Simple Analysis Techniques ......................................... 127
Introduction .............................................................................. 127
Line by Line: Road to Despair ................................................ 127
Simple Log Viewers ................................................................. 129
Real-Time Review ............................................................... 129
Historical Log Review ......................................................... 130
Simple Log Manipulation .................................................... 131
Limitations of Manual Log Review ......................................... 134
Responding to the Results of Analysis .................................. 135
Acting on Critical Logs ....................................................... 135
Acting on Summaries of Non-Critical Logs ....................... 137
Developing an Action Plan ................................................. 138
Automated Actions ............................................................. 140
Examples .................................................................................. 140
Incident Response Scenario ............................................... 140
Routine Log Review ............................................................ 141
Summary ................................................................................... 142
CHAPTER 9 Filtering, Normalization, and Correlation .................... 145
Introduction .............................................................................. 145
Filtering..................................................................................... 147
Artificial Ignorance.............................................................. 147
Normalization ........................................................................... 148
IP Address Validation ......................................................... 150
Snort ..................................................................................... 150
Windows Snare .................................................................... 150
Generic Cisco IOS Messages .............................................. 151
Regular Expression Performance Concerns ...................... 152
Correlation ................................................................................ 154
Micro-Level Correlation ...................................................... 155
Macro-Level Correlation ..................................................... 157
Using Data in Your Environment ....................................... 161
Simple Event Correlator (SEC) ........................................... 161
Stateful Rule Example ......................................................... 163
Building Your Own Rules Engine ...................................... 169
Common Patterns to Look For ................................................ 178

Contents ix
The Future ................................................................................ 178
Summary ................................................................................... 180
CHAPTER 10 Statistical Analysis ........................................................ 181
Introduction .............................................................................. 181
Frequency ................................................................................. 181
Baseline..................................................................................... 182
Thresholds ........................................................................... 186
Anomaly Detection .............................................................. 186
Windowing........................................................................... 187
Machine Learning .................................................................... 187
k-Nearest Neighbor (kNN) .................................................. 188
Applying the k-NN Algorithm to Logs .............................. 188
Combining Statistical Analysis with Rules-Based
Correlation ................................................................................ 190
Summary ................................................................................... 191
CHAPTER 11 Log Data Mining ............................................................ 193
Introduction .............................................................................. 193
Data Mining Intro ..................................................................... 194
Log Mining Intro ...................................................................... 198
Log Mining Requirements ....................................................... 200
What We Mine For? ................................................................. 201
Deeper into Interesting ........................................................... 203
Summary ................................................................................... 205
CHAPTER 12 Reporting and Summarization ...................................... 207
Introduction .............................................................................. 207
Defining the Best Reports ....................................................... 208
Authentication and Authorization Reports ....................... 208
Network Activity Reports ........................................................ 211
Why They Are Important .................................................... 211
Specifics Reports ................................................................. 212
Who Can Use These Reports .............................................. 213
Resource Access Reports ........................................................ 213
Why They Are Important .................................................... 213
Specifics Reports ................................................................. 213
Who Can Use These Reports .............................................. 214
Malware Activity Reports ....................................................... 215
Why They Are Important .................................................... 215
Specific Reports ................................................................... 215
Who Can Use These Reports .............................................. 216

Contents
x
Critical Errors and Failures Reports ....................................... 216
Why They Are Important .................................................... 216
Specifics Reports ................................................................. 216
Who Can Use These Reports .............................................. 217
Summary ................................................................................... 217
CHAPTER 13 Visualizing Log Data ..................................................... 219
Introduction .............................................................................. 219
Visual Correlation .................................................................... 219
Real-Time Visualization ........................................................... 220
Treemaps .................................................................................. 221
Log Data Constellations .......................................................... 222
Traditional Log Data Graphing ............................................... 227
Summary ................................................................................... 229
CHAPTER 14 Logging Laws and Logging Mistakes .......................... 231
Introduction .............................................................................. 231
Logging Laws ........................................................................... 231
Law 1—Law of Collection ................................................... 232
Law 2—Law of Retention ................................................... 232
Law 3—Law of Monitoring ................................................. 233
Law 3—Law of Availability ................................................ 233
Law 4—Law of Security ...................................................... 233
Law 5—Law of Constant Changes .................................... 234
Logging Mistakes..................................................................... 234
Not Logging at All ............................................................... 235
Not Looking at Log Data ..................................................... 236
Storing for Too Short a Time .............................................. 237
Prioritizing Before Collection ............................................. 239
Ignoring Application Logs .................................................. 240
Only Looking for Known Bad Entries ................................ 241
Summary ................................................................................... 241
CHAPTER 15 Tools for Log Analysis and Collection .......................... 243
Introduction .............................................................................. 243
Outsource, Build, or Buy .......................................................... 243
Building a Solution .............................................................. 244
Buy ........................................................................................ 245
Outsource ............................................................................. 246
Questions for You, Your Organization, and Vendors ........ 246
Basic Tools for Log Analysis ................................................... 247
Grep ...................................................................................... 247
Awk ...................................................................................... 249
Contents

xi
Microsoft Log Parser ........................................................... 251
Other Basic Tools to Consider ............................................ 252
The Role of the Basic Tools in Log Analysis ..................... 254
Utilities for Centralizing Log Information .............................. 254
Syslog ................................................................................... 254
Rsyslog ................................................................................. 256
Snare ..................................................................................... 256
Log Analysis Tools—Beyond the Basics ................................ 257
OSSEC .................................................................................. 257
OSSIM ................................................................................... 261
Other Analysis Tools to Consider ...................................... 261
Commercial Vendors ................................................................ 262
Splunk ................................................................................... 263
NetIQ Sentinel ..................................................................... 264
IBM q1Labs .......................................................................... 264
Loggly ................................................................................... 265
Summary ................................................................................... 265
CHAPTER 16 Log Management Procedures:
Log Review, Response, and Escalation ....................... 267
Introduction .............................................................................. 267
Assumptions, Requirements, and Precautions ..................... 268
Requirements ...................................................................... 269
Precautions .......................................................................... 269
Common Roles and Responsibilities ...................................... 269
PCI and Log Data ..................................................................... 270
Key Requirement 10 ............................................................ 271
Other Requirements Related to Logging .......................... 275
Logging Policy .......................................................................... 277
Review, Response, and Escalation Procedures
and Workflows .......................................................................... 278
Periodic Log Review Practices and Patterns .................... 279
Building an Initial Baseline Using a Log
Management Tool ............................................................... 283
Building an Initial Baseline Manually ................................ 285
Main Workflow: Daily Log Review .................................... 286
Exception Investigation and Analysis ............................... 289
Incident Response and Escalation ..................................... 291
Validation of Log Review ........................................................ 293
Proof of Logging .................................................................. 294
Proof of Log Review ............................................................ 294
Proof of Exception Handling............................................... 294
Contents

Contents
xii Contents
Logbook—Evidence of Exception of Investigations .............. 296
Recommended Logbook Format ........................................ 296
Example Logbook Entry ..................................................... 297
PCI Compliance Evidence Package ........................................ 299
Management Reporting ........................................................... 300
Periodic Operational Tasks ..................................................... 300
Daily Tasks ........................................................................... 300
Weekly Tasks ....................................................................... 300
Monthly Tasks ..................................................................... 301
Quarterly Tasks ................................................................... 302
Annual Tasks ....................................................................... 303
Additional Resources ............................................................... 303
Summary ................................................................................... 303
CHAPTER 17 Attacks Against Logging Systems ............................... 305
Introduction .............................................................................. 305
Attacks ...................................................................................... 305
What to Attack? ................................................................... 306
Attacks on Confidentiality .................................................. 307
Attacks on Integrity ............................................................ 313
Attacks on Availability ........................................................ 318
Summary ................................................................................... 327
CHAPTER 18 Logging for Programmers ............................................. 329
Introduction .............................................................................. 329
Roles and Responsibilities ...................................................... 329
Logging for Programmers........................................................ 331
What Should Be Logged? ................................................... 332
Logging APIs for Programmers .......................................... 333
Log Rotation ........................................................................ 335
Bad Log Messages .............................................................. 336
Log Message Formatting .................................................... 337
Security Considerations........................................................... 340
Performance Considerations ................................................... 341
Summary ................................................................................... 342
CHAPTER 19 Logs and Compliance .................................................... 343
Introduction .............................................................................. 343
PCI DSS ..................................................................................... 344
Key Requirement 10 ............................................................ 345
ISO2700x Series ........................................................................ 350
HIPAA ....................................................................................... 353

Contents xiii
FISMA ....................................................................................... 360
NIST 800-53 Logging Guidance ......................................... 361
Summary ................................................................................... 366
CHAPTER 20 Planning Your Own Log Analysis System ................... 367
Introduction .............................................................................. 367
Planning .................................................................................... 367
Roles and Responsibilities .................................................. 368
Resources ............................................................................. 368
Goals ..................................................................................... 370
Selecting Systems and Devices for Logging ..................... 371
Software Selection ................................................................... 371
Open Source ......................................................................... 371
Commercial .......................................................................... 372
Policy Definition ....................................................................... 374
Logging Policy ..................................................................... 374
Log File Rotation ................................................................. 375
Log Data Collection ............................................................. 375
Retention/Storage ............................................................... 375
Response .............................................................................. 376
Architecture .............................................................................. 376
Basic ..................................................................................... 376
Log Server and Log Collector ............................................. 377
Log Server and Log Collector with Long-Term
Storage ................................................................................. 378
Distributed ........................................................................... 378
Scaling ....................................................................................... 378
Summary ................................................................................... 379
CHAPTER 21 Cloud Logging ................................................................ 381
Introduction .............................................................................. 381
Cloud Computing ..................................................................... 381
Service Delivery Models ..................................................... 382
Cloud Deployment Models ................................................. 383
Characteristics of a Cloud Infrastructure .......................... 384
Standards? We Don’t Need No Stinking Standards! ........ 385
Cloud Logging .......................................................................... 386
A Quick Example: Loggly ................................................... 388
Regulatory, Compliance, and Security Issues ........................ 390
Big Data in the Cloud ............................................................... 392
A Quick Example: Hadoop ................................................. 394
SIEM in the Cloud .................................................................... 395

Contents
xiv
Pros and Cons of Cloud Logging ............................................ 396
Cloud Logging Provider Inventory ......................................... 396
Additional Resources ............................................................... 396
Summary ................................................................................... 398
CHAPTER 22 Log Standards and Future Trends................................ 401
Introduction .............................................................................. 401
Extrapolations of Today to the Future ................................... 402
More Log Data ..................................................................... 402
More Motivations ................................................................ 404
More Analysis ...................................................................... 405
Log Future and Standards ....................................................... 406
Adoption Trends ................................................................. 410
Desired Future .......................................................................... 410
Summary ................................................................................... 411
INDEX ...................................................................................................... 413

FM Header
xv
Acknowledgments
Dr. Anton A. Chuvakin
First, the most important part: I’d like to thank my wife Olga for being my
eternal inspiration for all my writing, for providing invaluable project manage-
ment advice, and for tolerating (well, almost always tolerating…) my work on
the book during those evening hours that we could have spent together.
Next, I’d like to specially thank Marcus Ranum for writing a foreword for
our book.
Finally, I wanted to thank the Syngress/Elsevier crew for their tolerance of our
delays and broken promises to deliver the content by a specic date.
Kevin J. Schmidt
First off I would like to thank my beautiful wife, Michelle. She gave me the
encouragement and support to get this book over the nish line. Of course my
employer, Dell, deserves an acknowledgment. They provided me with support
to do this project. I next need to thank my co-workers who provided me with
valuable input: Rob Scudiere, Wayne Haber, Raj Bandyopadhyay, Emily Friese,
Rafael Guerrero-Platero, and Maro Arguedas. Robert Fekete from BalaBit IT
Security provided great input on the syslog-ng chapter. Ernest Friedman-Hill
provided valuable suggestions for the section on Jess in Chapter 9. Jimmy
Alderson, a past colleague of mine, graciously provided code samples for
Chapter 13. Finally, I would like to thank my co-authors, Anton and Chris, for
providing great content for a great book.
Christopher Phillips
I would like to thank my beautiful wife, Inna, and my lovely children,
Jacqueline and Josephine. Their kindness, humor, and love gave me inspi-
ration and support while writing this book and through all of life’s many

ACQUIRING EDITOR: CHRIS KATSAROPOULOS
Acknowledgments
endeavors and adventures. I would also like to thank my father for always
supporting and encouraging me to pursue a life in engineering and science.
Rob Scudiere, Wayne Haber, and my employer Dell deserve acknowledgment
for the valuable input they provided for this book. I would especially like to
thank my co-author Kevin Schmidt for giving me the opportunity to be part
of this great book. Kevin has provided tremendous guidance and encourage-
ment to me over our many years together at Dell Secureworks and has helped
me grow professionally in my career. His leadership and security knowledge
have been inspiration to me, our customers, and to the many people he works
with everyday.
xvi

FM Header
xvii
About the Authors
Dr. Anton A. Chuvakin is a recognized security expert in the eld of log
management, SIEM, and PCI DSS compliance. Anton is the co-author of
Security Warrior (ISBN: 978-0-596-00545-0) and a contributing author to Know
Your Enemy: Learning About Security Threats, Second Edition (ISBN: 978-0-321-
16646-3); Information Security Management Handbook, Sixth Edition (ISBN:
978-0-8493-7495-1); Hacker’s Challenge 3: 20 Brand-New Forensic Scenarios &
Solutions (ISBN: 978-0-072-26304-6); OSSEC Host-Based Intrusion Detection
Guide ( Syngress , ISBN: 978-1-59749-240-9); and others.
He has published dozens of papers on log management, correlation, data
analysis, PCI DSS, security management, and other security subjects. His blog,
www.securitywarrior.org, is one of the most popular in the industry. In addi-
tion, Anton has taught classes and presented at many security conferences
around the world; he recently addressed audiences in the United States, United
Kingdom, Singapore, Spain, Russia, and other countries. He has worked on
emerging security standards and served on the advisory boards of several
security start-ups.
Until recently, he ran his own consulting rm, Security Warrior. Prior to that,
he was a Director of PCI Compliance Solutions at Qualys and a Chief Logging
Evangelist at LogLogic, tasked with educating the world about the importance
of logging for security, compliance, and operations. Before LogLogic, he was
employed by a security vendor in a strategic product management role. Anton
earned his Ph.D. from Stony Brook University.
Kevin J. Schmidt is a senior manager at Dell SecureWorks, Inc., an
industry leading MSSP, which is part of Dell. He is responsible for the
design and development of a major part of the company’s SIEM platform.
This includes data acquisition, correlation, and analysis of log data.
Prior to SecureWorks, Kevin worked for Reex Security, where he worked on an
IPS engine and anti-virus software. And prior to this, he was a lead developer and
architect at GuardedNet, Inc., which built one of the industry’s rst SIEM platforms.
He is also a commissioned ofcer in the United States Navy Reserve (USNR).
He has over 19 years of experience in software development and design, 11
of which have been in the network security space. He holds a Bachelor of
Science in Computer Science.

Contents
xviiixviii About the Authors
Christopher Phillips is a manager and senior software developer at Dell
SecureWorks, Inc. He is responsible for the design and development of the
company’s Threat Intelligence service platform. He also has responsibility for
a team involved in integrating log and event information from many third-
party providers so that customers can have their information analyzed by
the Dell SecureWorks systems and security professionals. Prior to Dell
SecureWorks, Chris worked for McKesson and Allscripts, where he worked
with clients on HIPAA compliance, security, and healthcare systems integration.
He has over 18 years of experience in software development and design.
He holds a Bachelor of Science in Computer Science and an MBA.

FM Header
xix
About the Technical Editor
Patricia Moulder, CISSP, CISM, NSA-IAM, is a Senior Security Subject Matter
Expert and consultant. She holds a Master of Science in Technology from East
Carolina University. She has over 19 years’ experience in assessing network
security, auditing web applications, and wireless networks for commercial and
US government clients. Patricia served for ve years as an adjunct professor in
network security for Sinclair Community College. She also has extensive cross
platform experience in SDLC application security auditing and data privacy
compliance standards.

This page is intentionally left blank

FM Header
xxi
Foreword
It’s been 25 years since I rst encountered syslog. I was a newly minted system
administrator with a little cluster of Sun-2s surrounding a Sun-3, trying to
debug a UUCP connection over the phone with a friend, who told me “check
the log” and talked me through it. There was something that practically
hypnotized me about watching the syslog; I saw in retrospect that it was the
best way to see that my computer was actually doing something. Windowing
systems rst showed me their value when they allowed me to have a window
open in the upper corner of my screen, with ‘tail –f /usr/spool/messages’
running; I could watch the emails work, the USENET news ow, processes
start and stop—I could see that my computer was actually doing something!
It wasn’t until years later when I experienced my rst security incident, that I
discovered that logs were useful for looking at the past as well as function in the
present. By then it was already far past the time where a system administrator
could watch their logs in the corner of the screen. Nowadays it’d just be a blur.
Why are some of us fascinated with logs, while others could not care less about
them? I think it’s the association that system administrators make in their
minds between “the log is doing something” therefore “the computer is doing
something” and “it’s working so I am therefore happy.” My rst log analysis
algorithm was simply:
If the syslog stops, the Pyramid’s I/O processor is wedged again
Any tool that saves you headaches time and time again becomes one that you
turn to time and time again. In the 25 years since I started working with syslogs
I have used them to:
n Ferret out traces of a “shopping cart exhaustion attack” against a major
E-tailer
n Extract where a piece of malware was dropped automatically in 1,000+
systems

xxii Foreword
n Spend some of my summer vacation analyzing 10 years of a supercom-
puter center’s logs and accidentally discovering I could detect major Linux
releases through log-volume alone
n Build a data-replication system for a website, using syslogs as atomic
transaction records
n Identify who had sent a threatening email to President Clinton @white-
house.gov
n Calculate how much time one of my software engineers was spending
playing Diablo II
n Reconstruct a mangled database by parsing and replaying transactions
from 6 months of logs
And that’s in addition to the “usual stuff” like making sure things are working,
looking for unusual activity, and trying to gure out what failed and why.
Unlike virtually everything else about our computers, system logs allow us a
limited look back into the past—limited by what we collected, and how long
we kept it—but it’s a view, it’s something useful. This is why I’ve always said
that if you see a system with the logs turned off, it’s the system administrator’s
way of showing they don’t care to do their job. I don’t want to think about how
many times I’ve heard of an incident response in which critical systems had
their logs turned off “for performance reasons.” To someone like me, who is
fascinated with logs, that simply doesn’t compute: performance is easy to x
with a faster processor or a ash disk. Without your logs, you’re ying blind.
Strangely, there aren’t a lot of good books about system logs. You would expect
there to be lots of them, given how generally useful logging can be, but there
aren’t. Perhaps it’s because the topic can be a little bit dry and utilitarian, and
it’s so—huge—you have to cover everything from the nuts and bolts of getting
the data back and forth to what to do with it once you’ve got it. And therein
lies one of the big problems: there’s no simple prescription for what to do with
your logs. There’s no useful “top 10 things to do with your syslog on Sunday”
because everyone’s logs are different and so are their needs. It’s hard to write
a book that basically says, “engage your brain, then go look at your logs and
think about what you see.” A security guy is going to see intrusion attempts.
A system administrator will see signatures indicating a correctly functioning
system. A CIO will see usage metrics and business justication. An auditor will
see a check-box that can be lled in. And so it goes. The trick is to explain to
all of those people that system logs are a general-purpose oor wax, dessert
topping, and foot-massager all rolled up in one—oh, and, by the way: do-it-
yourselfers only.
Perhaps it’s the do-it-yourself requirement of logging that makes it hard for
people to get excited about. This book that you’re holding is as close to a
cookbook for logging as you’re going to nd, but there are no simple turn-key
Foreword

xxiii
Foreword
recipes. Every idea is one that you have to think about, then adapt and apply
to your specc situation. When I used to teach classes in system log analysis
(embarrassingly long ago!) I always knew that a certain number of people in
my class were going to go away unhappy: they had come with the expectation
that they’d leave with the One True Pie-chart That Reveals Everything or perhaps
the Mystical +5 Log Analysis Perl-script of Great Finding of Stuff. Instead, you get
frameworks for how to think about analyzing and sorting through data. I used
to put on the class prerequisites “must know how to program, in something”
and I fondly remember one guy whose preferred log analysis programming
language was MATLAB. Whatever gets you the data you’re looking for is the
best tool for the job.
It’s probably not appropriate to try to add my own advice in a foreword but I
will, anyway. The best way you can do something useful with your logs is to get
three or four smart people into a meeting room with some pizza and beer and
spend a couple hours just looking at your logs. Project them on a big screen so
everyone can see them, and just scroll back and forth and see what you’ve got.
Then, when you get bored, start asking yourself what you’ve got in there that
you want to know about, what you’d like to generate summaries about, what
might make a useful metric for system work accomplished, and what might
indicate a critical error. This book has more of the useful details for exactly how
to do that; but trust me, I’m right about the pizza and the beer.
I’ve probably already said too many things that you already know, and it’s time
for me to stop. Now, turn the page and read this book!
Marcus J. Ranum, CSO, Tenable Network Security, Inc.

This page is intentionally left blank

FM Header
xxv
Preface
Welcome to Logging and Log Management: The Authoritative Guide to Understand-
ing the Concepts Surrounding Logging and Log Management. The goal of this book
is to provide you, the Information Technology (IT) Professional, with an intro-
duction to understanding and dealing with log data. Log data comes in many
forms and is generated by many types of systems. A long-running problem is
what one should do with all this log data and how to analyze it. This book
presents techniques and tools that can help you analyze your log data and nd
malicious activity.
It used to be that system administrators perused log les to look for disk errors
or kernel panics. Today system administrators often do double duty as security
administrators. The need to better understand what to do with security log
data has never been more important. Security analysts are among the group
of IT professionals who must also keep up with log analysis techniques. Many
seasoned veterans have learned under “trial by re” mode. This book aims to
distill what many people have taken years to learn by presenting material in a
manner that will allow you to understand the concepts quickly.
Let’s talk about an issue that has recently come to the forefront: regulatory
compliance. With the corporate oversight debacle that was Enron and others,
regulatory compliance is now a central theme for many corporate entities. The
focus is now on policy and procedure. Can you, as an IT engineer, show that
Bob was unable to access his corporate email account after he was let go? These
are the sorts of things that companies are being asked to prove. The system and
network logging landscape is changing in these and many other ways.
INTENDED AUDIENCE
The audience for this book is anyone who is interested in learning more about
logging and log management. Here are some proles of individuals who
should read this book.

xxvi
System Administrator: You may be a system administrator who just inherited
the task of monitoring log data for your enterprise.
Junior Security Engineer: Maybe you’re a newcomer to network security and
want to learn about log analysis techniques.
Application Developer: Maybe you are interested in building a log analysis
system from the ground up. This book provides example code for doing just
that. The entire book, however, provides excellent background for why log
analysis is important. These areas should not be skipped.
Manager: Managers can gain great insights into topics such as log data collec-
tion, storage, analysis, and regulatory compliance. As previously mentioned,
these issues are ever more present in the corporate landscape and will continue
to be where IT professionals focus much of their time.
PREREQUISITES
It is assumed that you have a basic understanding of concepts like network-
ing, operating systems, and network security. However, you don’t need to
be a computer scientist or networking guru to understand the material in
this book. Topics that require background information are presented with
necessary detail. The Perl and Java programming languages are used to present
most code examples. You don’t have to be a Java guru to understand or follow
the code samples, so I encourage everyone to at least look over the examples
when they come up.
ORGANIZATION OF THE BOOK
The format of this book is one that builds upon each previous chapter. Having
said this, many of the chapters can be read as one-offs. There are 22 chapters
in this book.
Chapter 1: Logs, Trees, Forest: The Big Picture
Chapter 1 provides background information on logging systems. If you are
familiar with concepts like Syslog, SNMP, secure logging, log data collection,
storage, etc., then you can safely skip this chapter.
Chapter 2: What is a Log?
Chapter 2 takes time to describe what a log message is. Discussions include
why logs are important.
Preface
Preface

xxvii
Chapter 3: Log Data Sources
Chapter 3 describes the Syslog protocol, SNMP, and the Windows Event Log.
Additionally, classes of log data sources are presented.
Chapter 4: Log Storage Technologies
This is a great chapter if you want to learn more about log retention, storage
formats, and storing logs in a relational database management system (RDBM).
We even present examples of how Hadoop can be used for this endeavor.
Chapter 5: Case Study: syslog-ng
This chapter provides insight into how syslog-ng is deployed in a real environ-
ment for log collection. We also discuss some of the more advanced features
of syslog-ng.
Chapter 6: Covert Logging
If you have the need to use collection logs in a covert manner, this chapter
provides lots of details on how to accomplish this task.
Chapter 7: Analysis Goals, Planning, and Preparation:
What Are We Looking for?
Before you begin analyzing log data, you rst need to set goal, plan, and pre-
pare for the task at hand. Topics covered in this chapter include looking for
past bad things, future bad things, and never before seen things.
Chapter 8: Simple Analysis Techniques
Before discussing advanced analysis techniques, the basics need to be covered.
This includes manual log analysis and the tools that enable this. In addition to
this, we discuss an advanced tool that can make reading Windows Event Logs
much easier. And of course we discuss the process of responding to the results
of log analysis.
Chapter 9: Filtering, Normalization, and Correlation
This is an action-packed chapter. Chapter 9 presents techniques and tools that
can help you perform correlation in order to help nd issues that simple man-
ual log analysis may overlook. Topics covered include ltering, normalization,
taxonomy, correlation, and some common patterns to look for. Two valuable
Preface

xxviii
sections in this chapter are for developers who are interested in building their
own correlation engine. Jess and Esper are covered to show how to build a
rules-based and stream-based engine.
Chapter 10: Statistical Analysis
Chapter 10 discusses how statistics can be used to perform analysis. Frequency
counting, baselines, thresholds, and anomaly detection are covered. We even
present the ways in which machine learning can be used for analysis.
Chapter 11: Log Data Mining
This chapter is devoted to log mining or log knowledge discovery—a different
type of log analysis, which does not rely on knowing what to look for. This
takes the “high art” of log analysis to the next level by breaking the dependence
on the lists of strings or patterns to look for in the logs.
Chapter 12: Reporting and Summarization
Chapter 12 looks at reporting as a way of log analysis. We specically focus on
trying to dene what the best reports are for log data.
Chapter 13: Visualizing Log Data
It is often useful to visualize log data. By visualize we don’t mean viewing alerts,
emails, or whatever your particular log analysis system may emit. What we are
more interested in discussing is viewing log data in the context of directed
graphs and other visual tools.
Chapter 14: Logging Laws and Logging Mistakes
This chapter covers common mistakes organizations have made (and, in fact, are
making) with logs. It also covers some of the general rules and dependencies—
perhaps too ambitiously labeled “laws”—that govern how organizations deal
with logs.
Chapter 15: Tools for Log Analysis and Collection
This chapter provides a review of open source and commercial toolsets
available for the analysis and collection of log data. The review will provide
the reader many options to choose from when choosing a toolset to manage
log data on a daily basis. Examples of using the tools for log analysis are
interspersed within the contents of the chapter with real-world examples of
Preface
Preface

xxix
using the tools to review common logging tasks and scenarios. The chapter
will help the reader review the set of tools available and nd the right tool
for analyzing logs in their organization today.
Chapter 16: Log Management Procedures:
Log Review, Response, and Escalation
This chapter provides an introduction to log review, response, and escalation
for log management. Examples using Payment Card Industry (PCI) Data
Security Standard (DSS) will be a running theme throughout this chapter.
The idea is to illustrate how to apply the concepts in the real world. This
means examples are geared toward PCI standards, but they can easily be
adapted and extended to t any environment. In essence, this chapter devel-
ops a set of steps and procedures you can begin using today. An added side
benet of this chapter is insight into interpreting and applying standards to
log management.
Chapter 17: Attacks Against Logging Systems
This chapter covers attacks against logging, log analysis systems, and even
log analysts that can disrupt the use of logs for security, operation, and
compliance.
Chapter 18: Logging for Programmers
This chapter will be useful for programmers of all kinds. This includes sys-
tem administrators, Perl programmers, C/C++ programmers, Java program-
mers, and others. Basically, anyone who writes scripts, programs, or software
systems will benet from the content in this chapter. It has often been said
that bad log messages are the result of bad programmers. While this is not
entirely true, this chapter aims to change this notion by providing concepts
and guidance to programmers and others on how better log messages can be
produced. More ultimately, this will help with debugging, information gath-
ering, parse-ability, and increase overall usefulness of the log messages their
software generates.
Chapter 19: Logs and Compliance
This chapter is about logging and compliance with regulations and policies.
Chapter 19 will be a value to anyone who has to contend with regulatory
compliance.
Preface

xxx
Chapter 20: Planning Your Own Log Analysis System
This chapter will provide practical guidance on how to plan for the deploy-
ment of a log analysis system. The chapter is not meant to provide a detailed
blueprint of how to install any particular log analysis system. Instead, material
is presented so that you can apply the concepts to any log analysis deploy-
ment situation in which you nd yourself. This chapter will arm you with
questions to ask and items to consider during any such undertaking.
Chapter 21: Cloud Logging
Cloud computing is a hot topic right now. And it’s only getting hotter. As we
see traditional shrink-wrapped software migrate from company-owned data
centers to the cloud (it’s already happening), the opportunity for IT manag-
ers to spend less capital expenditure (CAPEX) on hardware, switches, racks,
software, etc., to cover things like log data collection, centralization, and stor-
age, and even Security Information and Event Management (SIEM) will be
greatly reduced. This chapter introduces cloud computing and logging and also
touches on regulatory and security issues related to cloud environments, big
data in the cloud, SIEM in the cloud, pros and cons, and an inventory of a few
key cloud logging providers.
Chapter 22: Log Standards and Future Trends
This chapter provides an expert opinion on the future of log standards and
future developments in logging and log analysis.
Preface

Logging and Log Management.
© 2013 Elseiver Inc. All rights reserved.
http://dx.doi.org/10.1016/B978-1-59-749635-3.00001-4
1
CHAPTER 1
Logs, Trees, Forest: The Big Picture
CONTENTS
Introduction .................1
Log Data Basics ..........2
What Is Log Data? .............2
How is Log Data Transmitted
and Collected? .......................4
What is a Log Message? ...6
The Logging Ecosystem ....7
First Things First: Ask
Questions, Have a Plan ............. 8
Log Message Generation .......... 8
Log Message Filtering and
Normalization ............................ 9
Log Message Collection ......... 11
Logging in the Cloud .............. 13
Log Analysis ............................. 14
Log Message Long-Term
Storage...................................... 14
A Look at Things to
Come ..........................15
Logs Are Underrated 16
Logs Can Be Useful ..17
Resource Management ...17
Intrusion Detection ..........18
Troubleshooting ...............21
Forensics ..........................21
Boring Audit, Fun
Discovery ..........................22
People, Process,
Technology ................23
n Log Data Basics
n A Look at Things to Come
n Logs Are Underrated
n Logs Can Be Useful
n People, Process, Technology
n Security Information and Event Management (SIEM)
n Case Studies
INFORMATION IN THIS CHAPTER:
INTRODUCTION
This book is about how to get a handle on systems logs. More precisely, it is
about how to get useful information out of your logs of all kinds. Logs, while
often under-appreciated, are a very useful source of information for computer
system resource management (printers, disk systems, battery backup systems,
operating systems, etc.), user and application management (login and logout,
application access, etc.), and security. It should be noted that sometimes the
type of information can be categorized into more than one bucket. User login
and logout messages are both relevant for both user management and security.
A few examples are now presented to show how useful log data can be.
Various disk storage products will log messages when hardware errors occur.
Having access to this information can often times mean small problems are
resolved before they become really big nightmares.
As a second example, let’s briefly consider how user management and security
logs can be used together to shed light on a user activity. When a user logs
onto a Windows environment, this action is logged in some place as a logon
record. We will call this a user management log data. Anytime this user accesses

CHAPTER 1: Logs, Trees, Forest: The Big Picture
2
various parts of the network, a firewall is more than likely in use. This firewall
also records network access in the form of whether or not it allowed network
packets to flow from the source, a user’s workstation, to a particular part of the
network. We will call this as security log data. Now, let’s say your company is
developing some new product and you want to know who attempts to access
your R&D server. Of course, you can use firewall access control lists (ACLs) to
control this, but you want to take it a step further. The logon data for a user
can be matched up with the firewall record showing that the user attempted
to access the server. And if this occurred outside of normal business hours,
you might have reason to speak with the employee to better understand their
intent. While this example is a little bit out there, it does drive home an impor-
tant point. If you have access to the right information, you are able to do some
sophisticated things.
But getting that information takes some time and some work. At first glance
(and maybe the second one too) it can seem an overwhelming task—the sheer
volume of data can alone be daunting. But we think we can help “de-whelm”
you. We’ll present an overall strategy for handling your logs. We’ll show you
some different log types and formats. The point of using different log types
and formats is twofold. First, it will get you accustomed to looking at log mes-
sages and data so you become more familiar with them. But, second it will
help you establish a mindset of understanding basic logging formats so you
can more easily identify and deal with new or previously unseen log data in
your environment. It’s a fact of life that different vendors will implement log
messages in different formats, but at the end of the day it’s all about how you
deal with and manage log data. The faster you can understand and integrate
new log data into your overall logging system, the faster you will begin to gain
value from it.
The remainder of this chapter is geared toward providing a foundation for the
concepts that will be presented throughout the rest of this book. The ideas
around log data, people, process, and technology will be explored, with some
real-world examples sprinkled in to ensure you see the real value in log data.
LOG DATA BASICS
So far we have been making reference to logging and log data without provid-
ing a real concrete description of what these things are. Let’s define these now
in no uncertain terms the basics around logging and log data.
What Is Log Data?
At the heart of log data are, simply, log messages, or logs. A log message is what a
computer system, device, software, etc. generates in response to some sort of stimuli.
Security Information
and Event Management
(SIEM) ........................ 24
Summary ...................27
References .................27

Log Data Basics 3
What exactly the stimuli are greatly depends on the source of the log message. For
example, Unix systems will have user login and logout messages, firewalls will have
ACL accept and deny messages, disk storage systems will generate log messages
when failures occur or, in some cases, when the system perceives an impending
failure.
Log data is the intrinsic meaning that a log message has. Or put another way,
log data is the information pulled out of a log message to tell you why the log
message generated. For example, a Web server will often log whenever some-
one accesses a resource (image, file, etc.) on a Web page. If the user accessing
the page had to authenticate herself, the log message would contain the user’s
name. This is an example of log data: you can use the username to determine
who accessed a resource.
The term logs is really used to indicate a collection of log messages that will be
used collectively to paint a picture of some occurrence.
Log messages can be classified into the following general categories:
n Informational: Messages of this type are designed to let users and
administrators know that something benign has occurred. For example,
Cisco IOS will generate messages when the system is rebooted. Care
must be taken, however. If a reboot, for example, occurs out of normal
maintenance or business hours, you might have reason to be alarmed.
Subsequent chapters in this book will provide you with the skills and
techniques to be able to detect when something like this occurs.
n Debug: Debug messages are generally generated from software systems in
order to aid software developers troubleshoot and identify problems with
running application code.
n Warning: Warning messages are concerned with situations where things
may be missing or needed for a system, but the absence of which will
not impact system operation. For example, if a program isn’t given the
proper number of command line arguments, but yet it can run without
them, is something the program might log just as a warning to the user or
operator.
n Error: Error log messages are used to relay errors that occur at various levels
in a computer system. For example, an operating system might generate an
error log when it cannot synchronize buffers to disk. Unfortunately, many
error messages only give you a starting point as to why they occurred.
Further investigation is often required in order to get at the root cause
of the error. Chapters 7, 8, 9, 10, 11, 12, 13, 15, and 16 in this book will
provide you with ways to deal with this.
n Alert: An alert is meant to indicate that something interesting has happened.
Alerts, in general, are the domain of security devices and security-related
systems, but this is not a hard and fast rule. An Intrusion Prevention System

CHAPTER 1: Logs, Trees, Forest: The Big Picture
4
(IPS) may sit in-line on a computer network, examining all inbound traffic.
It will make a determination on whether or not a given network connec-
tion is allowed through based on the contents of the packet data. If the IPS
encounters a connection that might be malicious it can take any number of
pre-configured actions. The determination, along with the action taken, will
be logged.
We will now turn to a brief discussion of how log data is transmitted and col-
lected. Then we will discuss what constitutes a log message.
How is Log Data Transmitted and Collected?
Log data transmission and collection is conceptually simple. A computer or
device implements a logging subsystem whereby it can generate a message
anytime it determines it needs to. The exact way the determination is made
depends on the device. For example, you may have the option to configure the
device or the device may be hard coded to generate a pre-set list of messages.
On the flip side, you have to have a place where the log message is sent and col-
lected. This place is generally referred to as a loghost. A loghost is a computer
system, generally a Unix system or Windows server, where log messages are
collected in a central location. The advantages to using a central log collector
are as follows:
n It’s a centralized place to store log messages from multiple locations.
n It’s a place to store backup copies of your logs.
n It’s a place where analysis can be performed on you log data.
While this is all well and good, how are log messages transmitted in the first
place? The most common way is via the Syslog protocol. The Syslog proto-
col is a standard for log message interchange. It is commonly found on Unix
systems, but it exists for Windows and other non-Unix based platforms. But
basically there is a client and server component implemented over the User
Datagram Protocol (UDP), although many open source and commercial Sys-
log implementations also support the Transmission Control Protocol (TCP)
for guaranteed delivery. The client portion is the actual device or computer sys-
tem that generates and sends log messages. The server side would typically be
found on a log collection server. Its main job is to take receipt of Syslog-based
log messages and store them to local disk storage where they can be analyzed,
backed up and stored for long-term use.
Syslog is not the only mechanism for log data transmission and collection. For
example, Microsoft implements their own logging system for Windows. It is
called the Windows Event Log. Things like user login and logoffs, application
messages, and so on are stored in a proprietary storage format. There are open
source and commercial applications that run on top of the Event Log which will

Log Data Basics 5
convert event log entries to Syslog, where they are forwarded to a Syslog server. We
will discuss the Windows Event Log in a little more detail in Chapters 3 and 16.
The Simple Network Management Protocol (SNMP) is a standards based pro-
tocol for managing networked devices. The protocol is based on two concepts:
traps and polling. A trap is merely a form of log message that a device or com-
puter system emits whenever something has happened. A trap is sent to a man-
agement station, which is analogous to a loghost. A management station is used
to manage SNMP-based systems. Polling is where the management station is
able use SNMP to query a device for pre-defined variables such as interface statis-
tics, bytes transferred in and out on an interface, etc. A key differentiator between
SNMP and Syslog is that SNMP is supposed to be structured with respect to data
format. But this not always found in practice. If you would like to learn more
about SNMP, see Essential SNMP (Mauro & Schmidt, 2005).
Databases have become a convenient way for applications to store log mes-
sages. Instead of generating a Syslog message, an application can write its log
messages to a database schema. Or in some cases, the Syslog server itself can
write directly a relational database. This has great advantages, especially around
providing a structured way to store, analyze and report on log messages.
Finally, there are proprietary logging formats. These are third-party devices and
applications which implement their own proprietary mechanisms for generat-
ing and retrieving log messages. In this realm the vendor either provides you
with an Application Programming Interface (API) in the form of C or Java
libraries, or you are left to implement the protocol on your own. The Windows
Event Log can be seen as a proprietary format, but it is often times viewed as an
unofficial logging standard, similar to Syslog, because it is so prevalent.
Some of the more common protocols we have discussed in this section:
n Syslog: UDP-based client/server protocol. This is the most common and
prevalent mechanism for logging.
n SNMP: SNMP was originally created for use in managing networked
devices. However, over the years, many non-networked systems have
adopted SNMP as a way to emit log message and other status type data.
n Windows Event Log: Microsoft’s proprietary logging format.
n Database: Structured way to store and retrieve log messages.
n Common Proprietary Protocols:
n LEA: The Log Extraction API (LEA) is Checkpoint’s API for gathering
logs from its line of firewall and security products.
n SDEE: The Security Device Event Exchange (SDEE) is Cisco’s eXten-
sible Markup Language (XML)-based protocol for gathering log mes-
sages from its line of IPS products.
n E-Streamer: E-Streamer is Sourcefire’s proprietary protocol for its IPS.

CHAPTER 1: Logs, Trees, Forest: The Big Picture
6
What is a Log Message?
As we have already discussed, a log message is something generated by some
device or system to denote that something has happened. But what does a log
message look like? Let’s take a brief look at the answer to this question. This
will be covered in great detail throughout the book.
Understanding the answer to this question will set the stage for the remainder
of the book.
First off, the typical basic contents for a log message are the following:
n Timestamp.
n Source.
n Data.
It doesn’t matter if the message is sent via Syslog, written to Microsoft’s Event
Log or stored in a database. These basic items are always part of the message.
The timestamp denotes the time at which the log message was generated. The
source is the system that generated the log message. This is typically repre-
sented in IP address or hostname format. Finally, the data is the meat of a log
message. There is unfortunately no standard format for how data is represented
in a log message. Some of the more common data items you will find in a log
message include source and destination IP addresses, source and destination
ports, user names, program names, resource object (like file, directory, etc.),
bytes transferred in or out, etc.
The exact way a log message is represented depends on how the source of the
log message has implemented its log data system. As we mentioned previously,
Syslog is the most common format used by devices and computer systems. As
such, let’s look at a sample Syslog message. Figure 1.1 provides a sample for us
to consider.
TIP
Beware of Supported Logging Methods
Some devices will support multiple logging methods. For example, an IPS device might support
logging to a Syslog server and to a database system. The problem is that the Sylog version of
the log message may only be a summary of the real alert generated by the IPS and is missing
vital information. You might need to actually go to the database to get the full set of data. For
example, packet captures (PCAPs). A PCAP contains the parts of the network connection that
trigged the IPS to generate an alert or log message. This can be a critical piece of information
for analysis, reporting, etc.

Log Data Basics 7
The sample from Figure 1.1 is a Syslog message generated from a Cisco router
and received on a loghost running a Syslog server. Note that the numbers 1, 2,
and 3 above the log message are not part of the log message, but are used as ref-
erence points for this discussion. Reference point 1 is the timestamp of when
the loghost received the log message. The timestamp includes the month, day,
hour, minute, and second of receipt. Reference point 2 is the IP address of the
Cisco router. Note that there is a colon after the IP address, which leads us to
reference point 3. Everything after the IP address and colon is the log message
data. It is a free form and contains a wealth of information. For example, one
of the primary pieces of information that can be relayed in a log message is
the priority of the log message. This is the vendor’s interpretation of what the
priority (sometimes called severity) of the log message is. In the case of Figure
1.1, the priority is embedded in this string: %LINEPROTO-5-UPDOWN. The
number 5 denotes the severity. But what does a 5 mean? In cases like this you
will need to consult the vendor’s documentation in order to understand the
log message format and any associated meaning the data in the message can
relay. It should also be noted that the Syslog protocol has an inherit priority
scheme as well. This concept will be discussed in Chapter 2.
Now notice that the router message data contains a timestamp, which differs
from that of the one at reference point 1. This timestamp is from the router and
it indicates a possible date and time issue. Either the Syslog server’s system clock
is not correct or the router’s clock is wrong. At any rate, time synchronization
is something to take seriously, and you should be aware of system clocks that
are off, skewed, etc. At a minimum, clock skew can cause issues with log data
consistency and call into questioning any sort of analysis you may wish to do.
You may be wondering how in the world do we deal with the fact that log mes-
sages can have free-form text? Well, the next section discusses the notion of a
logging system and briefly discusses this and other topics.
The Logging Ecosystem
Now that we have discussed what a log data and log messages are at a high
level, let’s now look at how logs are used in an overall logging ecosystem. The
logging ecosystem, sometimes referred to as a logging infrastructure, are all the
FIGURE 1.1 Example Syslog Message

CHAPTER 1: Logs, Trees, Forest: The Big Picture
8
components and piece parts that come together to allow for the generation,
filtering, normalization, analysis, and long-term storage of log data. Ultimately
our goal with such a system is to be able to use logs in ways that allow you to
solve problems. The exact problems you may need to solve depend on your
environment. For example, if you are a retail organization which processes
credit card transactions, there are various regulatory and compliance require-
ments you must adhere to. The remaining chapters in this book will expand on
the material presented in the rest of this section.
Let’s begin our discussion with some of the things you might have to think
about when you begin planning your logging infrastructure.
First Things First: Ask Questions, Have a Plan
Most organizations have a reason or set of reasons why logging must be
employed. It is rarely the case that it is done for fun. The following questions
are examples:
n What regulatory and compliance requirements might we have to adhere to?
Certain regulations may require you to actually prove that you are in compli-
ance. This can be in the form of reports which show you are logging things
like access to critical assets like accounting systems, credit card processing
systems, etc. Other proof comes in the form of auditors crawling through
various parts of your environment like device configuration repositories, bug
tracking systems, source code control systems, and so on. Chapters 12 and
16 will provide some detail on regulatory requirements and how it’s applied
to logging.
n What long-term storage requirements might we need, i.e. how long might
we need to keep around log data? This can greatly affect the amount of
disk storage you will need to store your log data.
n Will we be gathering log data from devices on a local area network (LAN)
or wide area network (WAN)? This might impact network connectivity or
throughput from log clients to the log server.
n What exactly are we interested in collecting? If you are only interested
in gathering CPU performance information, then the exact way you go
about this is different from monitoring your firewall. Although monitor-
ing CPU consumption on your firewall might also be a something you
care about, too.
Log Message Generation
We have discussed this before. Logs come from many sources such as:
n Unix and Windows Systems.
n Routers.
n Switches.

Log Data Basics 9
n Firewalls.
n Wireless Access Points.
n Virtual Private Network (VPN) Server.
n AntiVirus (AV) Systems
n Printers.
The list goes on and on. The take-away here is that just about every device,
computer system, and application in your network is capable of logging. You
just need to know where to look. But beyond looking, you will need to con-
figure your source system to actually log. The following three steps outline the
basic steps for enabling logging on most devices and systems:
1. Enable logging for your device. You will often find that you can turn on
and off logging.
2. Configure it to send log messages. Some systems are either on or off with
respect to what they log. In this case this step doesn’t apply. Other systems
allow you to tweak exactly what is logged in an effort not to impact resources
on the source system, for example.
3. Configure it to send a loghost for further collection and analysis. This is
pretty self explanatory.
Log Message Filtering and Normalization
Once a device or computer system is configured to generate log messages,
the next step is to filter and normalize the messages. Filtering deals with
including or excluding (exclusion is sometimes referred to as “dropping
on the floor” or drop) log messages based on the content in the log mes-
sage. Some sources support this natively, or, in some cases, you might have
to employ the use of an agent, which effectively intercepts log messages
and filters them based on user defined rules. Deciding what to filter greatly
depends on your organization’s needs. For example, it might be perfectly
legitimate to drop Cisco router reboot messages during normal mainte-
nance windows.
Normalization is the act of taking disparately formatted log messages and
converting them to a common format. The term event is typically used to
denote a normalized log message. Events are typically an intermediate state
for a log message. Think of an event as the currency of exchange in a logging
system. Typically, though, an event’s final resting place is a relational data-
base, where analysis and reporting can be performed. When your log data is
in a common format it makes it much easier to manipulate the data so that
meaning can be derived from it. It should be noted that normalization typi-
cally takes place regardless of the source and protocol used (i.e. Syslog, SNMP,
database, etc.).

CHAPTER 1: Logs, Trees, Forest: The Big Picture
10
Before we look at some simple examples, let’s discuss priorities. As we men-
tioned before, some log messages have a priority in the data itself, while
other log messages may have the priority missing. The notion of a priority
is something that you will need to normalize as well. A basic scheme is to
take a log message’s explicit and implicit priority and map it to some com-
mon scheme. An example is low, medium, and high scale. Descriptions of
each follow, but these are just meant as examples and to provide you with a
starting point:
n Low: Low events are ones that are informational and do not need to be
addressed as they happen.
n Medium: Medium events tend to be things that may need to be looked at
in a timely manner, but not necessarily immediately. For example, IPSs
tend to have the ability to block network traffic when the engine detects
malicious intent. This blocking of traffic is referred to as an action. If your
IPS emits a log message to this affect, then you know that the traffic was
blocked and you can investigate it at your leisure.
n High: High priority events are ones that require immediate intervention.
Examples of high priority events include router reboots outside of sanc-
tioned maintenance windows, IPS engine alerting of possible information
leakage, a network device dropping off the network for an extended period
of time, and so on.
But how is normalization accomplished? Normalization is covered in Chapter 9
in detail, but let’s look at a simple example. The following is a Sourcefire IPS
Syslog message:
Jul 16 10:54:39 SourceFire SFIMS: [1:469:1] ICMP PING NMAP
[Classification: Attempted Information Leak] [Priority: 2] {ICMP}
210.22.215.77 -> 67.126.151.137
There is a wealth of information in this message. In order to normalize it, we
use a technique called parsing. Parsing entails scanning the log message from
start to finish to pull out information we are interested in and place them into
normalized fields in the event. The following is an example set of more com-
mon fields used for normalization:
Type: Attempted Information Leak
Timestamp: July 16 2010, 10:54:39
Priority: High
Protocol: ICMP
Source IP Address: 210.22.215.77
Destination IP address: 67.126.151.137
Source Port: NULL

Log Data Basics 11
Destination Port: NULL
Raw log: Jul 16 10:54:39 SourceFire SFIMS: [1:469:1] ICMP PING NMAP
[Classification: Attempted Information Leak] [Priority: 2] {ICMP}
210.22.215.77 -> 67.126.151.137
A few notes are in order:
n Source and Destination IP addresses were easy to identify, since an arrow
(->) is used to denote directionality of the possible leakage.
n We decided to make the priority of the event High since it is unlikely
that that traffic was blocked, so we will need to look at this attempt
immediately.
n Source and Destination ports are not part of the log message, so they are
both set to NULL.
n Raw log contains the actual raw log message. This has the advantage of
preserving the raw log message.
Let’s look at another message from Snort:
Mar 12 18:02:22 snort: [ID 702911 local4.alert] [119:2:1]
(http_inspect) DOUBLE DECODING ATTACK {TCP} 10.1.1.21:60312 ->
10.1.1.69:80
We are fortunate in that the format is similar to the Sourcefire one. And, with
good reason. Snort is the open source version of Sourcefire. Now, note that
the source and destination IP address have a colon at the end of each as well
as a number. These numbers represent the source port and destination port
respectively. Also, this log message has no priority field, unlike the Sourcefire
message. This makes mapping to our priority scale a little harder. We have to
have intimate knowledge of this message, which means we will need to consult
the documentation for this alert.
Now let’s move on to look at what it means to collect log messages.
Log Message Collection
Figure 1.2 shows the basic concept behind log collection.
We have several different types of devices and systems all forwarding their
log messages to a log server. This log server might reside at a particular loca-
tion and serve as the only server for the organization. This is fine if the
organization is small or isn’t geographically spread out. But in the case of
multiple sites that can span states or event countries, you might have the
need to have a distributed set of servers. Figure 1.3 shows this particular
configuration.
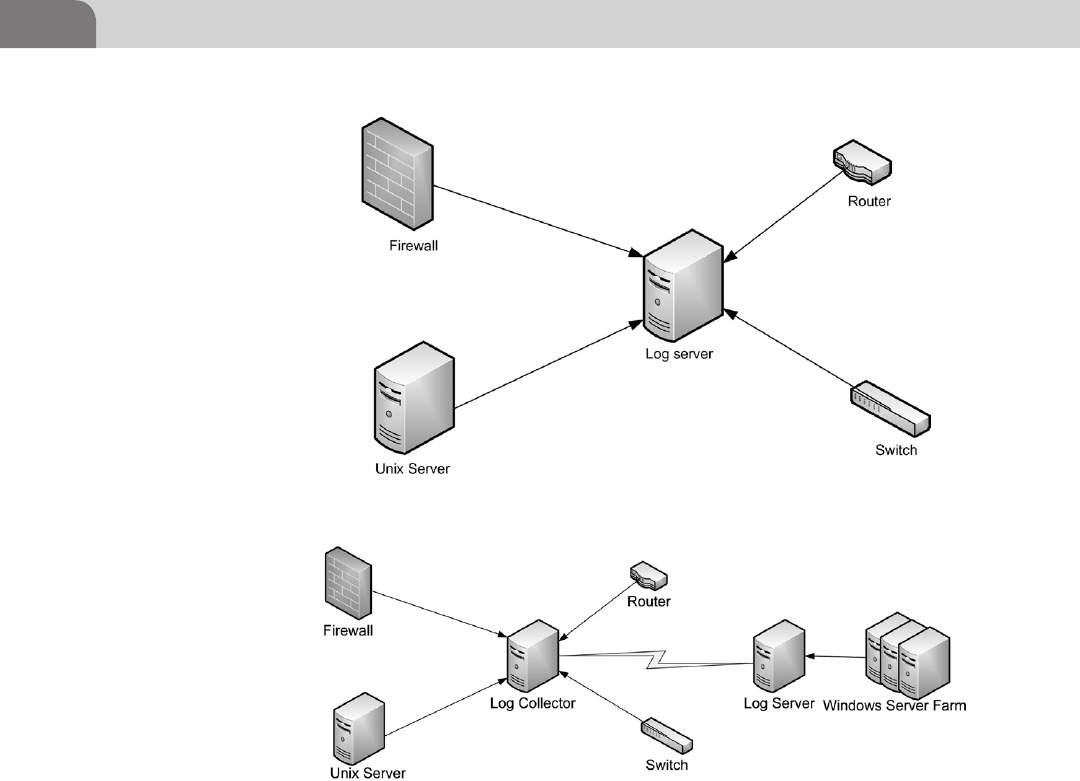
CHAPTER 1: Logs, Trees, Forest: The Big Picture
12
Here we have our site specific log collector forwarding to a central log server.
Since the log collector resides in a different location from the log server, the
communication between the two is typically encrypted to prevent eavesdrop-
ping. While the log server is a central collection point, it too can take feeds of
log messages, as depicted by the Windows Server Farm in Figure 1.3.
This sort of setup has several advantages:
n Redundancy: Your log data is stored in multiple places.
n Store and forward: The log collector, if it ever loses connection to the log
server, can store up the logs and transmit them when the link comes back
up. This mitigates possible data loss.
n Authentication: It is critical not only that the log collector can verify the
sender as a trusted source, the sender also needs to be able to trust the
system when it is sending logs.
FIGURE 1.3 Logical Layout of a Distributed Logging Setup
FIGURE 1.2 Logical Layout of Device Logging to a Log Server for Collection
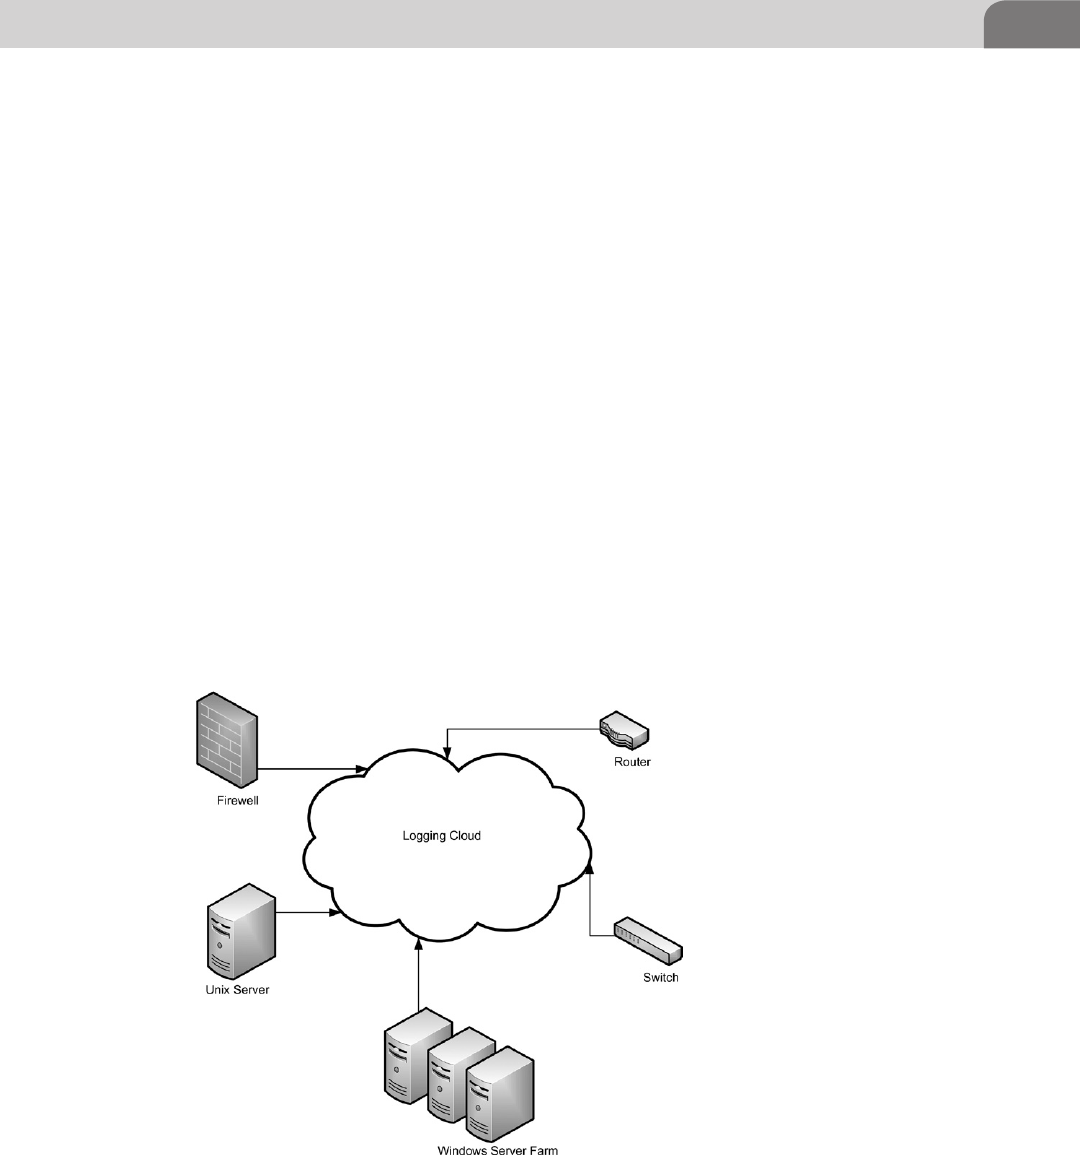
Log Data Basics 13
n Privacy: It is often the case that devices and systems that log do so without
the ability to encrypt their log messages. Since the log collector is on the
local network, the unencrypted data is sent to the local collector where it
is capable of sending the data upstream in a secure manner.
Now that we have presented the basics surrounding log data collection, let’s
now briefly discuss logging in the cloud.
Logging in the Cloud
Cloud computing has received a lot of press lately. Google lets you edit and
share documents in their cloud. Microsoft has similar initiatives as well. But
what about logging in the cloud? There are organizations such as Managed
Security Service Providers (MSSP) and cloud logging companies that effectively
allow you to point your log at them and they do the rest. Figure 1.4 shows the
conceptual view of logging in the cloud.
What exactly happens in the logging cloud? Things like filtering, normaliza-
tion, analysis, and long-term storage. Cloud logging vendors offer their ser-
vices for varying price points. They manage the complexity associated with a
traditional log collection system. Cloud logging is covered in more detail in
Chapter 21.
FIGURE 1.4 Logical Layout of Logging in the Cloud
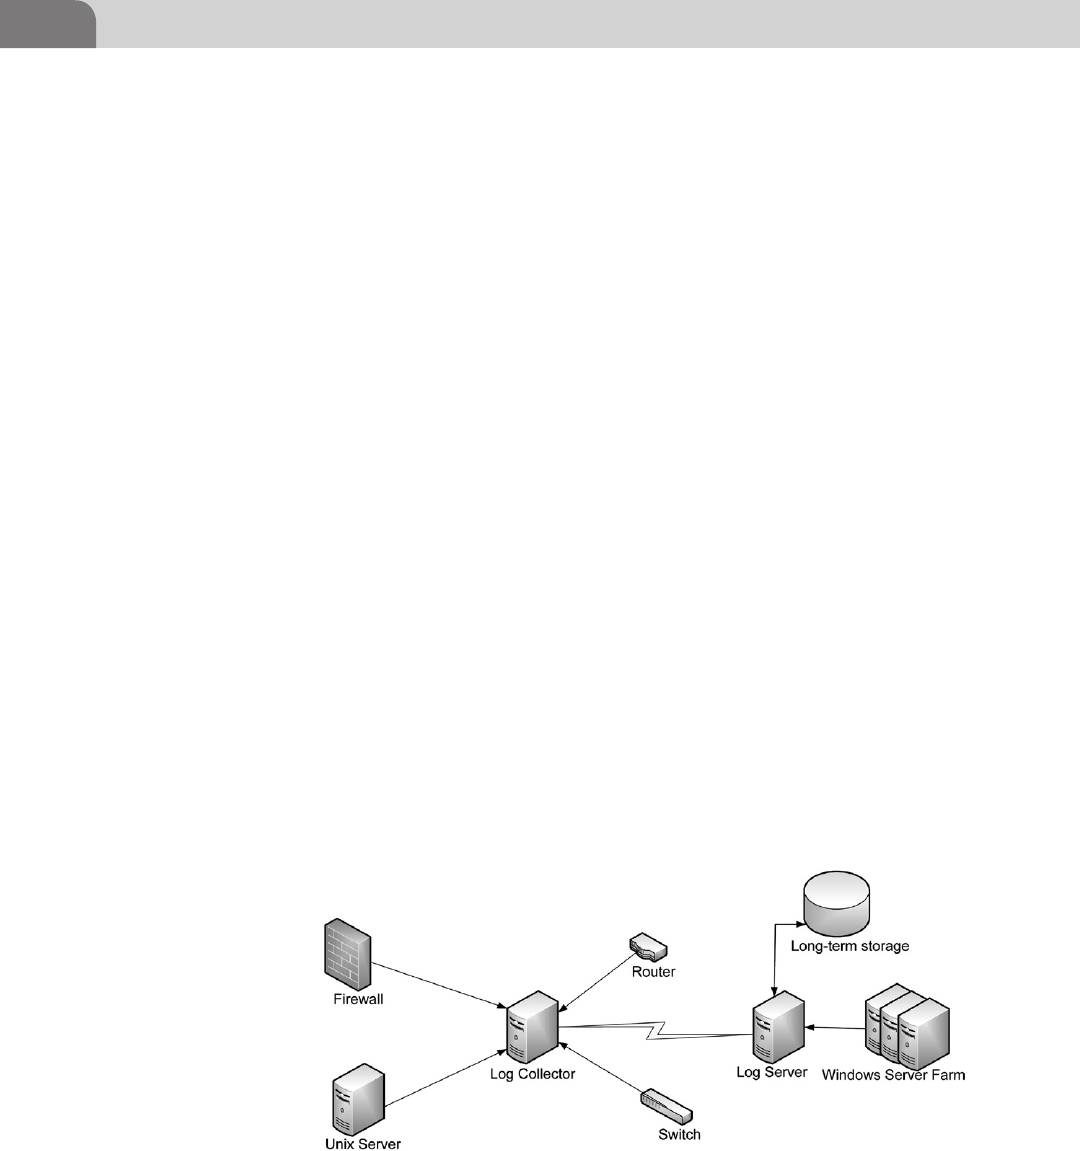
CHAPTER 1: Logs, Trees, Forest: The Big Picture
14
Log Analysis
Log message analysis, or simply log analysis, deals with analyzing log data
to derive meaning from it. Recall Figure 1.3 and its centralized collection
server. This is a central collection point and is crucial to analysis. Having
your data in a single place allows you to pull together or correlate log mes-
sage together in order to derive meaning. This is especially crucial in a highly
distributed environment where you may have multiple remote log collectors
and you need to correlate log message received at one collector with those
received at another. Chapter 9 goes into more detail surround correlation
and analysis.
Log Message Long-Term Storage
The final topic of discussion is long-term storage. Figure 1.5 shows the addition
of a database to the log server.
The long-term data store is typically accomplished by using a relational data-
base. It is also not uncommon to find small databases in use at remote log
collectors, too:
n Reporting: Creation of reports which summarize log data for manager or
for compliance audits.
n Forensic analysis: You might have the need to find out what a particular
user was doing a month ago on your network.
n Backup: This is self-explanatory, but if keeping your log data, due to regu-
latory compliance, etc. you can never have too few copies of your data.
You are now up to speed on the components of a logging ecosystem. This
information will be revisited in Chapters 7, 15, and 20 as we tackle in more
detail the concepts presented in this section.
FIGURE 1.5 Addition of a Database for Long-Term Storage

A Look at Things to Come 15
A LOOK AT THINGS TO COME
Now let’s briefly look at what sort of things you will encounter in the rest of
this book. Since you can only extract good information from your logs if it’s
there to begin with, we’ll look at the things that generate log information, and
how to make them give you what you need. We’ll show you how to build an
infrastructure to collect, archive, and analyze log data. And along the way we’ll
try to present real-world examples and case studies.
We’re going to talk in detail about Unix and Syslog data, because a lot of appli-
cations use Syslog automatically, and many others have the capability to use it
(for example, most Cisco and Juniper devices speak Syslog). And, Syslog is the
only cross-platform logging utility with a built-in mechanism for forwarding
log messages to a central collection system. But we will talk about other types
of logs that you can find on your systems. And we’ll definitely talk about Win-
dows logging, mostly in the context of getting your windows log data into your
centralized infrastructure.
If you are a programmer, we have a whole chapter just for you. One of the
biggest problems in analyzing log messages is that many of them are, frankly,
poorly written, and don’t have the information necessary to do anything useful
with them. Logs would be much easier to work with if they were better written
to begin with. For example, take a look at this log message:
Jun 21 14:38:25 10.2.2.1 rlogin: connection refused
What’s wrong with that message? It’s nice and explanatory, right? It informs us
that a connection to the rlogin service was refused. Aside from some annoy-
ing things like the fact that there’s no year or time zone, wouldn’t it be nice to
know where the connection was coming from that was refused? Wouldn’t it
be nice to know why it was refused? Maybe if you are diagnosing a problem,
and testing as you watch the log messages it isn’t so bad. But if you are looking
at the logs because someone is attacking your system, it really helps to know
where they’re coming from.
Now consider this log message:
Jun 21 14:38:25 somehost rlogin: connection refused from 1.2.3.4
because the address matches deny rule in hosts.allow: rlogind: all:
deny
Isn’t that a lot better?
And here’s a virtually useless message (and no, we did not make it up):
May 21 00:00:07 baz.example.com kernel: "00 00 00 00 00 00 00 00 00 00
00 00"

CHAPTER 1: Logs, Trees, Forest: The Big Picture
16
Maybe it means something to the kernel developers for that system, but not
much help otherwise. It might as well say this:
May 21 00:00:07 baz.example.com kernel: something happened
Rather than just complain about lousy log messages, in our chapter for pro-
grammers we offer helpful suggestions on how to improve the quality of the
logs that your applications generate.
LOGS ARE UNDERRATED
Logs are under-appreciated in many enterprise environments. Often logs are
completely ignored, and only noticed when disk space runs low. At that point
they are usually deleted without review. And in some cases, some of the mes-
sages in the logs might have indicated why the disk was full. We have certainly
had the experience of being asked to look at a compromised machine, and
upon inquiring as to where the logs were, we’re told “oh, they were just taking
up space so we deleted them.” In most of those cases, there wasn’t much we
could do for them.
Why are logs under-appreciated? Well, for a number of reasons. Vendors don’t
want you to use them. Vendors of intrusion detection systems are going to
tell you that you need the latest piece of technology (theirs being the best)
otherwise you’re toast. Vendors of IT management tools are going to tell you
that you need their expensive products, with little agents on every host that go
about reporting much of the same information that you find in your logs. But
of course, if you can get the information from your logs, you don’t need their
products.
Logs aren’t “sexy” even to system administrators. It’s much cooler to get
the Gigawombat-3000 Network Intrusion Detection System (NIDS) which
includes Extra Sensory Perception that tells you about attacks before they hap-
pen. Especially when your favorite mailing list is going on nonstop about how
that is the latest thing in intrusion detection/prevention/anticipation/what-
ever. By the way, that Gigawombat you just bought also requires somebody to
analyze its logs…
Log analysis isn’t easy, and can be messy. As opposed to the “plug-and-pray”
approach, effective log analysis takes some work. Logs come in a variety of
shapes and sizes, and at times it can be difficult to extract information from
them. Syslog data can be especially bad, as much of the data is free-form text
(as we discussed earlier). As we’ll show you throughout this book, it takes
some energy just to get the good bits of data out of Syslog. Plus there can be
a lot of data to work with. For instance, some sites collect several gigabytes

Logs Can Be Useful 17
per week of log data, others that much in a day. Such volume can seem quite
overwhelming to begin with—and the administrator often ends up cobbling
together some scripts that look for a random set of things based on what they
saw in the logs at a particular time.
Effective log analysis also requires knowledge of your environment; you have
to know what’s good and bad for your network, what’s suspicious and what’s
normal. What’s bad or strange for you may be perfectly normal for someone
else. For instance, a user logging from foreign countries may be suspicious to
you, especially if all of your users are local. However, another site may have
users all over the place, so it’s difficult for them to determine what would be
considered unusual.
That’s part of the reason there are no true plug-in log analysis tools, because it’s
your environment and policies that dictate what you want to get out of your logs.
And finally, there’s not a lot of good information available on how to do log
analysis. Gee, maybe someone should write a book about it…
LOGS CAN BE USEFUL
Beyond the many examples presented so far in this chapter, logs can tell you
a lot of things about what is happening on your network, from performance
information to fault detection to intrusion detection. Logs can be a good
source of “forensic” information for determining “what happened” after an
incident. And logs can make an audit trail for (what else?) auditing purposes.
The following sections are a list of use-cases that logs enable.
Resource Management
Logs contain a wealth of hidden riches. For example, a typical way to monitor
if a host is up or down is to use the Internet Control Message Protocol (ICMP)
to “ping” a host. But this is not foolproof. Successfully pinging a host tells you
that its network interface is configured. But sometimes a host can be crashed,
yet the interface still responds as long as it’s configured and has power. But see-
ing a message like:
May 24 02:00:36 somehost -- MARK --
May 24 02:20:36 somehost -- MARK --
May 24 02:40:36 somehost -- MARK --
May 24 03:00:36 somehost -- MARK --
tells you that the system is operating enough so that Syslog can write messages.
(MARK messages are a special status message generated by the UNIX Syslog
daemon at regular intervals).

CHAPTER 1: Logs, Trees, Forest: The Big Picture
18
Logs can not only tell you that a host is up, but also what the applications run-
ning on the host are doing. Failures, both hardware and software, often show
up in logs before the system actually fails. And when recovering from a failure,
logs often provide clues as to the cause.
Here’s a classic example of a failure that you can find in your logs:
May 21 08:33:00 foo.example.com kernel: pid 1427 (dd), uid 2 inumber
8329 on /var: filesystem full
Pretty informative! It shows that the var filesystem on the host has filled up.
The other information in the message shows the name and process-id of the
process that caused the error to occur. It even shows the i-node of the file being
written to. Now in this case, the process shown may not be the one that filled
up the disk, it may just be trying to write data after the partition had already
filled up. But it’s a starting point.
Intrusion Detection
Host logs (as opposed to NIDS logs) of course are very useful for intrusion
detection. For example:
Sep 17 07:00:02 host.example.com: sshd[721038]: Failed password for
illegal user erin from 192.168.2.4 port 44670 ssh2
This log message shows a failed login attempt, using the username erin.
The words illegal user appear because there is no such account on the sys-
tem. This message was the result of an attacker using an ssh-scanner which
attempts to log into a host via ssh, using a set of well-known commonly used
usernames and passwords. This example was selected from a set of several
thousand attempts done in a very short amount of time.
Host logs can be a better indicator of an intrusion than a NIDS. A NIDS can
tell you that an attack was attempted against a host, but usually cannot tell you
whether the exploit was successful. In our example above, a NIDS could only
detect that there had been a short ssh session, possibly that there were a very
large number of sessions in a short amount of time, but would be unable to
detect that authentication had failed, because a NIDS can only see what is hap-
pening on the wire. A host, if configured to log, can provide detail on what hap-
pened on the system. Of course this is not foolproof. You might log the wrong
things or disks could fill up. Or the attacker could erase the log files. This is
why it is critical to have your logs sent to a remote collection point. Even when
the attacker covers his tracks we will have the initial log messages on the col-
lection point which will help shed some light on what might have happened.
In a more subtle example, here’s a message from Snort, an open source NIDS:

Logs Can Be Useful 19
Jan 2 16:19:23 host.example.com snort[1260]: RPC Info Query: 10.2.3.4
-> host.example.com:111
Jan 2 16:19:31 host.example.com snort[1260]: spp_portscan: portscan
status from 10.2.3.4: 2 connections across 1 hosts: TCP(2), UDP(0)
These messages show that an attacker did a port scan of the network looking
for hosts running rcp.statd, which has had a number of vulnerabilities over the
years. The messages also show that the scanner was successful in connecting to
two hosts. But was the attack successful in gaining access to the machine? Was
the connection dropped by TCP-Wrappers? Snort doesn’t know. But more than
likely the system on which TCP-Wrappers is running did log if the connection
was dropped or not. If this system is set up to log, then you can correlate both
the Snort log message and the TCP-Wrappers log message to come up with
a better, more complementary picture of what is actually happening. Never
underestimate the ability to combine log messages from multiple sources to
paint a single, more informative picture.
Now look at this message found on one of the hosts:
Jan 02 16:19:45 host.example.com rpc.statd[351]: gethostbyname
error for ^X÷ÿ¿^X÷ÿ¿^Y÷ÿ¿^Y÷ÿ¿^Z÷ÿ¿^Z÷ÿ¿^[÷ÿ¿^[÷ÿ¿bffff750
804971090909090687465676274736f6d616e797265206520726f7220726f66
bffff718 bffff719 bffff71a bffff71b_________________________
__________________________________________________________
__________________________________________________________
__________________________________________________________!
__!
______________________________________________________________________
__________
Well, it certainly looks like a buffer overflow was attempted or at the very least,
some sort of error has occurred. We know this because of the gibberish that
starts on the second line. This indicates that binary data is present, i.e. is non-
printable characters, in the log message, which is usually a bad indicator.
But was it successful? The next message gives us a clue:
Jan 02 16:20:25 host.example.com adduser[12152]: new user: name=cgi,
uid=0, gid=0, home=/home/cgi, shell=/bin/bash
This message shows an account being added to the system. The account has
the username cgi but has a user ID of 0 (the root uid). This is generally a bad
sign. Attackers like to create accounts that they can use to log back into the
machine, and they like to pick benign names that might go unnoticed on the

CHAPTER 1: Logs, Trees, Forest: The Big Picture
20
system—names that look like they belong there. But the intruder wants to keep
his privileged access, so the account has to have the same uid (0) as root.
Now, the next message reads:
Jan 02 16:22:02 host.example.com PAM_pwdb[12154]: password for (cgi/0)
changed by ((null)/0)
The interesting part about this line is that it shows that the account password
was changed by a user with a null username, which is also a pretty bad sign, as
a user who had logged in using normal methods would have an actual user-
name (“root” in this case).
So, in the example above, the NIDS was not able to tell us whether the attack was
successful, only that maybe an attack was attempted. The real information on
the attack was logged on the host. The NIDS can be good for telling you about
especially good times to look at your logs, but by itself does not give you a com-
plete picture. Now it’s certainly the case that host logs won’t always indicate what
happened, but it’s pretty clear that NIDS and logs combined can be better than
NIDS alone. Recall the example from the introduction? Never underestimate the
power in combing log data together to find the proverbial needle in the haystack.
Logs tell you what is actually happening on your system(s). NIDS usually can’t
tell you about users attempting local exploits on a host, or users merely violat-
ing policy or committing some other undesirable activity. This is where host
intrusion detection systems (HIDS) fill the gap. HIDS monitor the running state
of a computer system. Things like users, directories, binaries, log files them-
selves, and other objects are monitored via checksums and other techniques to
detect when they have been altered by malicious users or compromised and/
or altered applications. As you may have guessed, HIDS systems emit log data
whenever suspected alteration of system resources may have occurred.
And with the increasing use of encrypted transport protocols, such as Secure
Sockets Layer (SSL), Internet Protocol Security (IPSEC), and other VPN tech-
nologies, it is becoming harder and harder for a NIDS to see the “interesting”
parts of network traffic.
WARNING
Buffer Overflow
A buffer overflow is a type of attack that exploits a flaw in an application. The person exploits
the flaw by entering more data than the application can handle. This extra data injection can
have unwanted side effects like a crash or even, in extreme cases, where the perpetrator gains
control of the systems processor for arbitrary code execution (Peikari & Chuvakin, 2004).

Logs Can Be Useful 21
As alluded to above, user behavior is also contained in system logs. When a
user logs in and out, where from, etc. some logs such as process accounting
logs, tell you something about what the user did. And system “auditing” tools
such as the BSM can provide even more fine-grained detail as to user and sys-
tem activity.
Troubleshooting
Logs are also invaluable for troubleshooting. Syslog was actually designed for
just that purpose. Diagnosing problems with daemons which are not con-
nected to a console or tty can be quite difficult without logfiles to examine.
Plus Syslog is often where the kernel provides information about what it’s
doing.
Forensics
Forensics is the process of building a picture of “what happened” after the
event is over. The picture is often built off of incomplete information, but the
credibility of the information available is critical. Logs can be an essential part
of the forensic process.
Logs, once recorded, are not altered through the course of normal use of the
system, meaning that they are a sort of “permanent” record. As such, they can
provide a somewhat accurate complement to other data on the system which
may be more susceptible to alteration or corruption.
Since logs usually have timestamps on each record, they provide a chrono-
logical sequence of events, not only showing what happened, but when it hap-
pened and in what order.
And logs forward to another host (usually a central log collector), also pro-
vide a source of evidence that is separate from the originating source. If the
accuracy of the information on the original source is called into question
(such as the issue of an intruder who may have altered or deleted logs), the
separate source of information may be considered an additional, more reli-
able source.
Likewise, logs from different sources, even different sites, can corroborate other
evidence and reinforce the accuracy of each source.
Logs serve to reinforce other evidence that is collected. Often, recreating the
picture of an event is not based on one piece or source of information, but data
from a variety of sources: files and their respective timestamps on the system,
user command history, network data, and logs. Occasionally logs may refute
other evidence, which in itself may indicate that other sources have been cor-
rupted (e.g. by an intruder).

CHAPTER 1: Logs, Trees, Forest: The Big Picture
22
The evidence shown in logs is at times indirect or incomplete. For example, a
log entry might show a particular activity, but not who did it. Or, as an exam-
ple, process accounting logs show what commands a user has run, but not
the arguments to those commands. So logs can’t always be relied on as a sole
source of information. Although, when a host is compromised, the logs may
be the only source of reliable information, provided the host has been for-
warding logs to a central log server. The logs up to the point when the host was
compromised can be trusted, but logs after the compromise are suspect at best.
But the logs you collected up to the event might help shed light on what hap-
pened or point you in the right direction.
Boring Audit, Fun Discovery
Auditing is a process that verifies a system or process is working as expected.
Logs are a part of any audit process, forming a part of the audit trail used.
Auditing is often done for policy or regulatory compliance. For instance, com-
panies routinely have to do financial audits to make sure that what their finan-
cial statements say match what their books say, and that the numbers all add
up. In the US laws such as Sarbanes-Oxley and HIPAA essentially require cer-
tain types of transaction logging, and an audit trail that can be used to verify
user access to financial, respectively, patient data. Another example is the Pay-
ment Card Industry Data Security Standard (PCI DSS), a mandate that covers
logging around credit card transactions and cardholder data access. We will
discuss PCI in Chapter 16.
HOW LOGS CAUGHT AN INTRUDER
Several years ago, a company had their Web server crash. The Web server logs showed what
looked like an attack that exploited a then-recently-announced Denial of Service (DoS) vulner-
ability. The incoming connection was from another company in town. Someone in the IT group
remembered that a recently departed employee had started working for that company, and
the employee had not left on the best of terms. Now, their logs only showed the attack coming
from that company, but the accused attacker could have claimed that the logs were forged to
“frame” him. But in addition to the Web server logs, firewall logs at both companies showed the
same connections happening at the identical time, corroborating the logs. And the logs from
the attacker’s new company showed that it came from his desk computer. The final nail in the
coffin was that one of the people at the victim company called the ex-employee at his new job,
and he answered the phone, which placed him in front of his computer at the time of the attack.
The attacker eventually pled guilty to a misdemeanor.
Had the victim company only had their Web server logs, they might not have had enough
evidence to prove their case. Having supporting data from multiple sources, especially those
under control of different groups, makes it much harder to claim the evidence is incorrect or
fabricated.

People, Process, Technology 23
Logs can also be used for compliance to technical policies, such as a security
policy. For example, if you have policies about what services are allowed on
your network, an audit of various logs can be used to verify that only those ser-
vices are running. For example, Windows has an Application event log which
contains log messages of services that are started and stopped by the operating
system.
Audit trails are also used for accountability, as such, logs can be used for non-
repudiation. For instance, if someone claims that they never received a par-
ticular email, mail logs can be used to verify that claim and show the message
was either delivered or not, much like having a signed receipt from a mail
carrier. Or, in another example, if a user claims that they were not logged in
when a certain event occurred, logs can show whether or not that statement
was true.
Having an organized approach to log analysis can also turn a boring audit into
“fun discovery.” What does that mean? Well, for example, we’ll show you tools
you can use to extract from your logs a list of all the services running on a host.
You might be surprised to find out some of the things that you are running
(didn’t know you had an IRC server on your network, eh?). Sometimes such
discoveries show policy violations and on occasion, they show an intruder
who’s silly enough to start a service that leaves log records behind.
Auditing user activity can show you things you didn’t know about. In the Unix
environment, there is a utility called sudo. It allows you, as a regular user, to
execute administrator commands without needing to know the administrator
password. Looking at sudo, logs can show you who has been running admin-
istrator commands. That information can be invaluable when someone acci-
dentally erases an entire filesystem and you’re trying to figure out who did it.
If you allow users to log in remotely, you might find it quite interesting to see
where they’re logging in from. If you see a user logging in from two places at
the same time that are geographically distant from each other, that might be
something you want to investigate. (We’ve heard that cell phone companies do
exactly that to detect cloned cell phones.)
Let’s shift gears away from how useful logs are to how effective people, process
and technology are in the overall log analysis picture.
PEOPLE, PROCESS, TECHNOLOGY
An effective log analysis strategy is not just a set of tools but a combination of
people, process, and technology.
The technology is the combination of tools you use. But it’s not enough to have
a collection of the latest hip tools, you need to know what to do with them.

CHAPTER 1: Logs, Trees, Forest: The Big Picture
24
Process determines what you do with those tools. How are you going to man-
age the log data, make sure it contains the information you want, and be able to
extract the information you need? A process is required for doing those things.
A documented process for handling log data can be essential for using logs as
evidence in court. Being able to show how you regularly collect and preserve
log data may make the difference as to whether your log data is admissible as
evidence. Reporting can aid in this and Chapter 12 touches on this.
And it takes people to drive and execute on the process. Human intelligence is
also required to decide what particular log messages mean in the context of a
particular situation.
In the intrusion example, is an example of the human involvement required.
The computer doesn’t know that those log records indicate an intrusion. It
takes a person to look at them and say “Wait, that’s not quite right, why is an
account being created with a uid of 0?” Another example of such a situation
is when a host suddenly becomes unreachable. Since you were in a morning
meeting where it was announced that network maintenance was going to occur
at 3pm, you use that information to determine if the outage is related to this
work or not.
SECURITY INFORMATION AND EVENT
MANAGEMENT (SIEM)
No book on log management would be complete without a discussion on
SIEM. SIEM is an industry in its own. SIEM tools provide a means to analyze,
in real time, security events. It also provides mechanism for reporting, visual-
ization, long-term storage, etc. We will not spend a lot of time on SIEM in this
book. But Chapter 15 discusses some open source SIEM tools.
The following two case studies explain how log data helped solve to real-world
problems.
TRACKING AN ATTACKER THROUGH
FIREWALL LOGS
In a recent investigation, one of the authors had to look at a compromised server that was
running at a small internet service provider (ISP). The system was apparently destroyed by the
attacker, possibly due to frustration stemming from his inability to penetrate further into the
network, or out of sheer malevolence.
One morning, company support team was alerted by a customer who was trying to down-
load a driver update. He reported that the FTP server “was not responding” to his connection
attempts. Upon failing to login to the FTP server remotely via secure shell, the support team

Security Information and Event Management (SIEM) 25
member walked to a server room only to discover that the machine crashed and would not
reboot. The reason was simple—no operating system was found on the disk.
While the machine itself was apparently compromised and all host-side evidence, includ-
ing logs, were gone (yes, the logs may have been recoverable using “forensic” tools, but that’s
outside the scope of this book). But the network segment on which the server was located was
behind a firewall, and the firewall was set to log at maximum level.
The firewall logs were searched for any messages occurring over the previous 24 h which
contained the IP address of the compromised server, providing a record of all connections to
and from the server for the previous day. From those logs, they were able to establish that:
n Several hours prior to the time of the crash, someone probed the IP addresses of the FTP
server from the outside. There were several connection attempts to various ports on the
server, some not successful (such as TCP port 25) and some successful (port TCP 21—FTP).
n The attacker connected several times to the FTP port, with TCP session times ranging
from several seconds up to ten minutes.
n The attacker uploaded a file to the FTP server.
n It appeared that the attacker managed to establish an interactive command session with
the server. The firewall logs did not give any detail about the contents of the TCP session,
so it was impossible to determine exactly what the attacker did. But it appears highly
likely that he managed to exploit the FTP server and install his own software on it.
n The logs then showed connection attempts from the FTP server to outside hosts, which
were blocked by the firewall as a result of rules on the firewall restricting outbound traffic.
These failed attempts were most likely the intruder unsuccessfully attempting to access
other machines from the compromised server.
So, even simple firewall logs can shed significant light on an incident where there would
otherwise be no useful information. This example would have benefitted from a central loghost
as well. The logs would have been stored off host and could have been retrieved.
Virus Tracking Through Antivirus Logs
Antivirus logs are often seen as mundane and useless. However, AV logs can prove invalu-
able as a piece of evidence to prove that the system is infected or compromised. Different AV
vendors log their messages in different ways. In the case of the AV data used in this example,
the AV system logged to the Windows Event Log.
In one case, a Windows system was showing unusual behavior:
n Slow system response for local programs.
n Slow networking on the same LAN segment as the system in question.
n Extraneous processes running even when no user is using the systems.
Logs from a network security monitoring tool also revealed that the system was a source of
significant scanning activity. At that stage the machine was disconnected from the network.
The system administrators suspected some sort of malware (e.g. virus, worm, etc.), but the
system was running an antivirus program that was believed to be up to date.
A review of antivirus logs on the system revealed a number of interesting things. First, there
were a number of messages indicating failed updates due to low disk space. That explained
why the system was not fully protected.
Then there were some messages showing the AV software responding to viruses:

CHAPTER 1: Logs, Trees, Forest: The Big Picture
26
The interesting thing about the above message is that while the first two mal-
ware instances were dealt with, the last was only detected but not cleaned out.
The malware (an IRC backdoor bot) enabled the attackers to gain control over
the system and to use it to scan other hosts for vulnerabilities.
Figure 1.6 shows a subset of the antivirus logs imported into Excel, showing
just the actions taken with regard to Backdoor.IRC.Bot. Excel is being used here
to more easily show the AV log messages.
The example indicates that the backdoor may have been on the system since
at least May. It also confirms that the backdoor was not quarantined by the
antivirus software.
The highlighted messages in Figure 1.7 show that around the time the back-
door appeared in May, the system was infected by both the Welchia and W32.
Randex.gen worms, either of which could have installed the backdoor. In fact,
FIGURE 1.6 Sample Antivirus Logs
NOTE
Backdoor
A backdoor is a piece of software or application program that allows a user to gain access to a
computer system without being noticed. It is often the case that backdoors are used for mali-
cious purposes (Skoudis & Zeltser, 2004)
Virus Found!Virus name: W32.Welchia.B.Worm in File: C:\WINNT\
system32\drivers\svchost.exe by: Manual scan. Action: Quarantine
succeeded:
Virus Found!Virus name: W32.Randex.gen in File: C:\WINNT\system32\
wumgrd.exe by: Manual scan. Action: Quarantine succeeded:
These messages indicate viruses which were found and “quarantined” or stopped:
Virus Found!Virus name: Backdoor.IRC.Bot in File: C:\WINNT\system32\
mfm\msrll.exe by: Manual scan. Action: Clean failed: Quarantine
failed:
But this message shows a “backdoor” called “Backdoor.IRC.Bot” was detected, but not stopped.
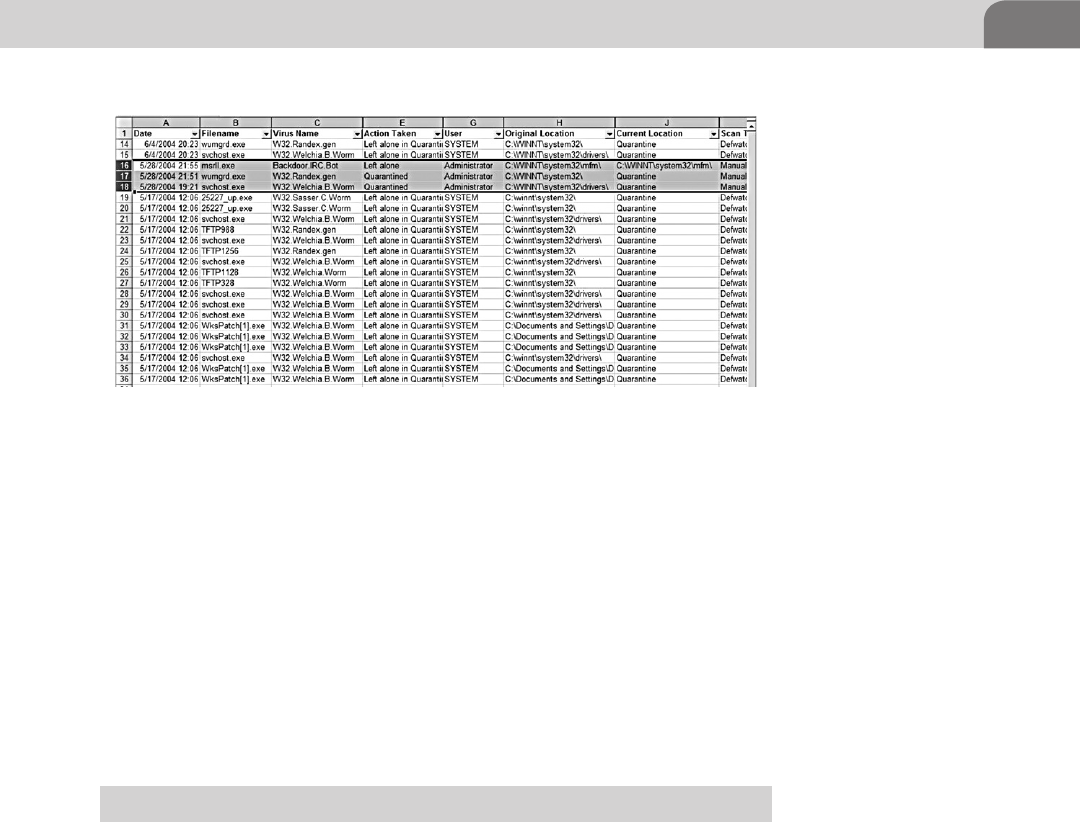
References 27
the reference for W32.Randex.gen (http://securityresponse.symantec.com/
avcenter/venc/data/w32.randex.gen.html#technicaldetails) says that the worm
is known to “open backdoor ports and open connections to predetermined
IRC servers and wait for commands from an attacker.”
The log entries above also show that the system was a “rats nest” of malware,
only some of which was successfully cleaned (albeit often after the successful
infection and system modification).
So, in this situation, without the antivirus logs, it would have been difficult or
impossible to determine when the infection happened, or that the antivirus
software had failed to update itself.
SUMMARY
This chapter presented concepts surrounding logging, logs, log messages, and
log data. The piece parts of a logging ecosystem were discussed including log
message generation, filtering and normalization, collection, analysis, and
long-term storage. These concepts set the ground work for what is to come in
the rest of the book. Additionally examples of how useful log data can be were
presented, along with ways logs helped solve two real-world problems.
REFERENCES
Mauro, D. R., & Schmidt, K. J. (2005). Essential SNMP (2nd ed.) Beijing: O’Reilly.
Peikari, C., & Chuvakin, A. (2004). Overflow attacks. In Security warrior (p. 161). Beijing: O’Reilly
& Associates, Inc.
Skoudis, Ed., & Zeltser, L. (2004). Backdoors. In Malware: Fighting malicious code (p. 124). Upper
Saddle River, NJ: Prentice Hall PTR, 2004.
FIGURE 1.7 Sample Antivirus Logs for a Specific Time Period

This page is intentionally left blank

Logging and Log Management.
© 2013 Elsevier, Inc. All rights reserved.
http://dx.doi.org/10.1016/B978-1-59-749635-3.00002-6
29
CHAPTER 2
What is a Log?
CONTENTS
Introduction ...............29
Definitions ........................29
Logs? What logs? ......32
Log Formats and Types ..34
Log Syntax ........................40
Log Content......................44
Criteria of Good
Logging .....................46
Ideal Logging Scenario ....47
Summary ...................48
References .................49
n Logs? What logs?
n Criteria of Good Logging
INFORMATION IN THIS CHAPTER:
What is a log? A secret
Let’s crack it now!
Resist it will furiously
Haiku 2: Anton
INTRODUCTION
In Chapter 1 we talked about logs, but what are we actually talking about?
We’re not talking about trees, mathematics, nor ship’s logs...so let’s start from
the definitions. Having a clear definitions around logging data is important
because so many discussions in this area and that being high level and fuzzy,
thus not useful for security analysts and network engineers.
Definitions
Many of the terms used in logging, log analysis, and log management—
including these very terms we just used—have vague, misleading, or multiple
meanings. In some cases, the terms are “borrowed” from other disciplines (and
we use that word loosely), in some cases, they’re just used differently by differ-
ent people. In other cases, they used to be specific, but then got corrupted by
tool vendor marketing departments. This vagueness only muddies the waters
of what is already a difficult sea to navigate.

CHAPTER 2: What is a Log?
30
So, what should the logs convey? Are logs here to warn us or to be ignored?
If logs are so important, how can it happen that they are ignored so often
(and they are!)? The blatant cases of organizations that were compromised
by hackers and never knew it, despite having all the evidence in their logs
for months and occasionally years after the breach. Do we have to look at
logs if everything is seemingly going fine with our computers, related software
running on them as well as network devices?
Ideally, logs should not only serve for answering the ever-important “what’s
wrong” question. They are also useful for answering many other questions,
including “how well we are doing?” “will anything be wrong in the near
future?,” “did we do enough to protect something?” as well as they whole slew
of audit-related questions such as “who did what.” Note that the latter are
useful not only when we know that something wrong has happened.
Thus, logs analysis tools should not be broken out of their shrink wraps only when
something goes wrong. Ongoing log review must eventually become a habit, a daily
routine—something akin to brushing one’s teeth. Regulations today compel orga-
nization to adopt such good hygiene habits, while many organization are resisting.
So, is it OK to only look at logs when all hell breaks loose? The best answer to
that is “that is the least you should do” but there are lots of other ways of using
the log contents beyond that.
Here are the definitions of the terms that we will be using them throughout
this book.
“An event is a single occurrence within an environment, usually involving an
attempted state change. An event usually includes a notion of time, the occurrence,
and any details the explicitly pertain to the event or environment that may help
explain or understand the event’s causes or effects” (source: http:/cee.mitre.org
and specifically http://cee.mitre.org/docs/CEE_Architecture_ Overview-v0.5.pdf).
Event categories group events based upon one or more event categorization meth-
odologies. Example methodologies include organization based upon what hap-
pened during the event, the involved parties, device types impacted, etc.
“An event field describes one characteristic of an event. Examples of an event
field include date, time, source IP, user identification, and host identification.”
(source: http://cee.mitre.org/docs/CEE_Architecture_Overview-v0.5.pdf)
“An event record is a collection of event fields that, together, describe a single
event. Terms synonymous to event record include “audit record” and “log entry””
(source: http://cee.mitre.org/docs/CEE_Architecture_Overview-v0.5.pdf)
A log is a collection of event records. Terms such as “data log,” “activity
log,” “audit log,” “audit trail,” “log file,” and “event log” are often used

31
Introduction
to mean the same thing as log. (source: http://cee.mitre.org/docs/
CEE_Architecture_Overview-v0.5.pdf)
An audit is the process of evaluating logs within an environment (e.g. within
an electronic system). The typical goal of an audit is to assess the overall status
or identify any notable or problematic activity. (source: http://cee.mitre.org/
docs/CEE_Architecture_Overview-v0.5.pdf)
Recording is the act of saving the event fields associated with a single event as an
event record. (source: http://cee.mitre.org/docs/CEE_Architecture_Overview-
v0.5.pdf))
“Logging is the act of collecting event records into logs. Examples of logging
include storing log entries into a text log file, or storing audit record data in
binary files or databases.” (source: CEE Architecture Document 2011) (source:
http://cee.mitre.org/docs/CEE_Architecture_Overview-v0.5.pdf)
On the other hand, a security incident is an occurrence of one or more security
events that indicate that Something Bad happened in the environment. The
Something Bad might be unauthorized access to a system, theft of informa-
tion, denial or service, or a range of other, sometimes organization-specific
activities. Security incidents also often involve being woken up at odd hours
of the morning, and are usually unwelcome (sometimes at the cost of “we’d
rather not know” delusion).
On the audit side, log records may be used as all or part of an audit, and as we
will show throughout this book, good logging will help with auditing. But log-
ging alone is not auditing, and log messages are not necessarily an audit trail.
It should be noted that sometimes people differentiate between logging and
auditing based on trust factor. Logging can be produced by system and user
applications, servers, OS components, while auditing is produced by more
trusted components such as the kernel or trusted computing based (TCB).
Such a distinction is used in Windows operating systems.
“Alert or Alarm” is an action taken in response to an event, usually intended
to get the attention of someone (or something). Sometimes people say that
log files contain alerts. Specifically, some intrusion detection logs are actually
collection of IDS alerts. In our book, we will treat an alert as an action taken
when a particular log message needs to be relayed to a user quickly. We will
treat alarms to mean the same as alerts.
Also, by now the reader recognized that logs are produced by various entities,
such as dedicated security devices, application software, operating systems, net-
work infrastructure components, etc. We will adopt a generic term device to
indicate a source of security-relevant logs. Thus, a security NIPS appliance and
Apache Web server become devices for the purposes of this definition. There

CHAPTER 2: What is a Log?
32
are reasons to believe that some of the Internet-enabled home appliance of the
future will also have logs and the nightmare scenario of “my toaster crashed
again” will be resolved by looking at its log file…
Now that we are armed with the terms, let’s look at some examples and thus
into the nature of log and logging.
LOGS? WHAT LOGS?
Most operating systems have some type of logging capability and generate log
messages. However, many computer users (and this include system administra-
tors, however surprising it might sound) don’t know the logs exist, let alone
look at them. Let’s study three primary reasons for logging across the entire
spectrum of log sources.
First, Security logging is focused on detecting and responding to attacks, mal-
ware infection, data theft, and other security issues. The classic example of
security-focused logging is recording of user authentication (login) and other
access decisions with the purpose of analyzing whether anybody has access to
the resource without proper authorization.
Next, Operational logging is performed to provide useful information to sys-
tem operators such as to notify them of failures and potentially actionable
conditions. Operational logging might also be used for service provisioning
and even financial decisions (access-based pricing, Web server access logs are
a common example of logs used for business not just for IT operations). This
category is extremely broad and covers a very large number of log types.
Also, Compliance logging often overlaps significantly with security logging since
regulations are commonly written to improve security of systems and data. It
is important to know the difference between two types of compliance logging:
regulations and mandates that affect the IT such as PCI DSS, HIPAA, ISO, ITIL,
etc,. AND system regulations such as common criteria and other mandates on
system design and security.
Finally, Application debug logging is a special type of logging that is useful to
application/system developers and not system operators. Such logging is typi-
cally disabled in production systems but can be enabled on request. Many of
the messages in debugging logs can already be analyzed by the application
developer with full knowledge of application internals and sometimes also
with possession of application source code.
These four types of logging are produced by nearly all log sources (event pro-
ducers), but are analyzed and consumed differently and by different systems
(event consumers).
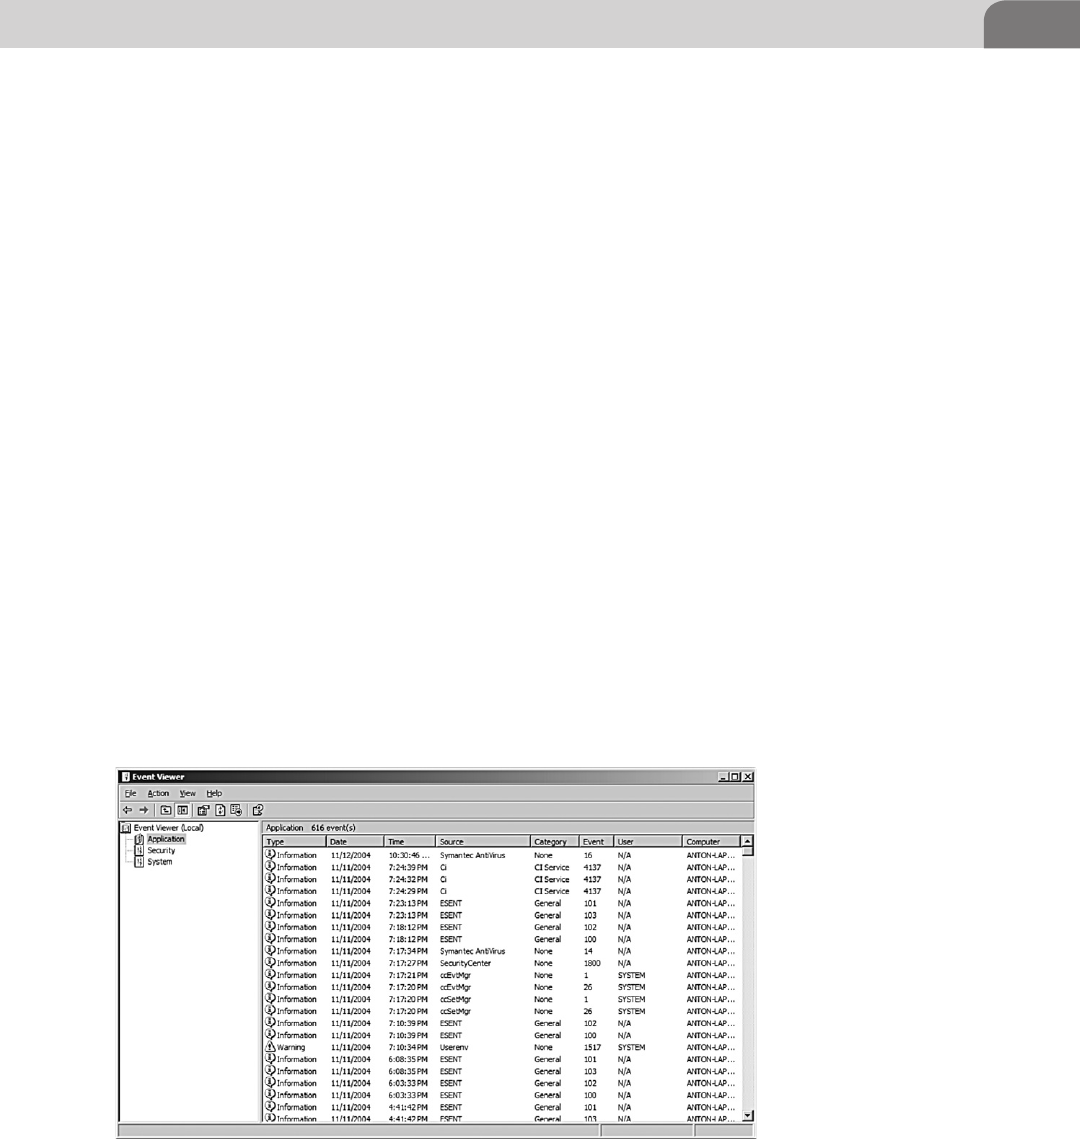
33
Logs? What logs?
Operating system produce logs from the above spectrum. For example, Windows
XP as well as Vista and Windows 7 have a logging system, called the Event Log.
When particular things happen on the system, the operating system or an applica-
tion will write some information to the Event Log. For example, when a Windows
program crashes, there is often an option to see “More details,” which most users
cheerfully ignore. That information is what ends up in the Event Log.
Savvy “power users” have known where to find the Event Viewer (Figure 2.1)
since the “bad old days” of Windows NT 3.5.
Unix systems have a logging technology called syslog, that harks from the days
of early Unix sendmail program in the 1980s. Like Windows, the operating sys-
tem itself and some applications write message to syslog. If the system admin-
istrator has not disabled logging or removed the logs files (“because the disk
was getting full”), he/she might see entries like this:
Nov 11 22:41:00 ns1 named[765]: sysquery: findns error (NXDOMAIN) on
ns2.example.edu?
The entry contains a date, host name, name of the service that generated the
message as well as the message itself. This particular message indicates an
attempt to do a DNS lookup on a non-existent domain.
Some applications generate their own logs. Web site administrators may be
familiar with Web server logs.
FIGURE 2.1 Windows Event Log Shown in Event Viewer

CHAPTER 2: What is a Log?
34
10.239.46.105 - - [09/Oct/2001:11:43:34 -0400] "GET /resume/ HTTP/1.0"
200 1100
10.222.104.178 - - [09/Oct/2001:11:48:31 -0400] "GET /security
HTTP/1.1" 301 322
10.222.104.178 - - [09/Oct/2001:11:48:31 -0400] "GET /security/
HTTP/1.1" 200 759
10.222.104.178 - - [09/Oct/2001:11:52:20 -0400] "GET / HTTP/1.1" 200
1014
This set of log entries show requests to a Web server from various sources (left)
with the date and time of the request, locations of requested documents, and
response codes (200,301, etc.) indicating the status of document delivery. Spe-
cifically, 200 indicates that the document was shown (“OK” code) and 301
indicates that its is moved to another location (Google for “http response
codes” to find the detailed into on them!)
Web server logs are commonly analyzed for utilization and other ecommerce,
marketing and others reasons. Web site administrators often mine Web server
logs to study customer profiles and learn about their behavior, as well as other
marketing-related tasks. In addition, Web server logs are used to study Web
server performance and Web site usability.
The following is an example of a Snort NIDS “alert” log message.
Nov 14 13:04:14 ns1 snort: [111:16:1] (spp_stream4) TCP CHECKSUM
CHANGED ON RETRANSMISSION (possible fragroute) detection {TCP}
10.15.23.130:1682 -> 10.26.50.3:25
Note that in case of Snort these messages are called alerts, while some other
NIDS / NIPS vendors call them alarms or even something else entirely. In all
cases, they are actually just log messages that one might want to use to raise an
alert to an operator or security analyst on duty.
All of the logging systems shown above are useful for security log analysis.
Unix, Windows, and Web server logs can contain important clues about the
organization's security posture.
These are just a few example of common logging systems. We will talk at length
about these and other systems in Chapters 9 and 15.
Log Formats and Types
Before we discuss the formats and other information, we should note that any
logging mechanism used for purposes listed above can be logically defined as
four components:

Logs? What logs? 35
n Log transport.
n Log syntax and format.
n Log event taxonomy.
n Logging settings, configuration, and recommendations.
These primary distinctions will be used throughout this report as well as other
documentation produced under this project. Let’s review their key concepts in
detail.
Log transport is simply a way of moving log messages from one place to another.
There are many event transport protocols in existence—syslog, WS-Management,
and numerous proprietary and product-specific log transport protocols—as well
as logging mechanisms without its own transport method (e.g., local log file
only). A proper log transport mechanism must preserve the integrity, and avail-
ability and (if required) confidentiality of log data, preserve log format and mean-
ing as well as allow for an accurate representation of all the events that occurred,
with correct timings and event sequence. The most important requirement for
log transport is to preserve the integrity of individual logs—event records—and
of the event stream/log as a whole.1 Even more important is the preservation of
each log entry correct time stamp.
Here is some well-known log transport mechanisms:
n syslog UDP.
n syslog TCP.
n encrypted syslog.
n SOAP over HTTP.
n SNMP.
n Regular file transfer such as FTPS or SCP.
For example, syslog UDP is by far the most popular log transport mechanism
today used by millions of Unix-derived systems and Network Devices. Despite
having multiple extreme weaknesses (such as lack of guaranteed message and
availability), syslog is still the #1 way to move log data around.
Log syntax and format defines how the log messages are formed, transported,
stored, reviewed, and analyzed. In the most trivial case, each event record
could be treated as a text string and the event consumer could perform a full
text search on the log and hope for consistency. But for reliable automated
event analysis, it’s necessary that event consumers and producers understand
and agree on the syntax of the event record.
1 As you can notice, some of the historical a popular mechanisms for transporting log data do
not fit this requirement—such as syslog UDP.

CHAPTER 2: What is a Log?
36
Here is some well-known log formats:
n W3C Extended Log File Format (ELF) (http://www.w3.org/TR/WD-logfile.
html).
n Apache access log (http://httpd.apache.org/docs/current/logs.html).
n Cisco SDEE/CIDEE (http://www.cisco.com/en/US/docs/security/ips/
specs/CIDEE_Specification.htm).
n ArcSight common event format (CEF) (http://www.arcsight.com/
solutions/solutions-cef/).
n Syslog (RFC3195 and newer RFC5424).
n IDMEF, an XML-based format (http://www.ietf.org/rfc/rfc4765.txt).
Regarding the last item, the term “syslog” is commonly applied to both a way
to move messages over port 514 UDP (syslog transport) and to create log mes-
sages with a few structured elements (syslog format).
In particular, each field of every formatted event record contains some infor-
mation in some representation. Although perhaps obvious to a human being,
it’s not at all clear that “Sun 12 3 2010 11:11pm” and “2010-12-03T11:11:00Z”
represent the same time. Moreover, in the first example, the time is not really
known due to lack of time zone information, and the date is ambiguous due to
regional date order preference concerns (March 12 or December 3). Here are a
few examples of various format that log files:
CEF:
CEF:0|security|threatmanager|1.0|100|detected a \| in
message|10|src=10.0.0.1 act=blocked a | dst=1.1.1.1
Apache CLF:
192.168.1.3 - - [18/Feb/2000:13:33:37 -0600] "GET / HTTP/1.0" 200 5073
127.0.0.1 - frank [10/Oct/2000:13:55:36 -0700] "GET /apache_pb.gif
HTTP/1.0" 200 2326
W3C ELF:
#Version: 1.0
#Date: 12-Jan-1996 00:00:00
#Fields: time cs-method cs-uri
00:34:23 GET /foo/bar.html
12:21:16 GET /foo/bar.html
IDMEF:
<?xml version="1.0" encoding="UTF-8"?>
<!DOCTYPE IDMEF-Message PUBLIC “-//IETF//DTD RFC XXXX IDMEF v1.0//EN"
"idmef-message.dtd">
<IDMEF-Message version="1.0" xmlns="urn:iana:xml:ns:idmef”>

Logs? What logs? 37
<Alert messageid="abc123456789">
<Analyzer analyzerid="hq-dmz-analyzer01">
<Node category="dns">
<location>Headquarters DMZ Network</location>
<name>analyzer01.example.com</name>
</Node>
</Analyzer>
<CreateTime ntpstamp="0xbc723b45.0xef449129">
2000-03-09T10:01:25.93464-05:00
</CreateTime>
<Source ident="a1b2c3d4">
<Node ident="a1b2c3d4-001" category="dns">
<name>badguy.example.net</name>
<Address ident="a1b2c3d4-002" category="ipv4-net-mask”>
<address>192.0.2.50</address>
<netmask>255.255.255.255</netmask>
</Address>
</Node>
</Source>
<Target ident="d1c2b3a4">
<Node ident="d1c2b3a4-001" category="dns">
<Address category="ipv4-addr-hex">
<address>0xde796f70</address>
</Address>
</Node>
</Target>
<Classification text="Teardrop detected">
<Reference origin="bugtraqid">
<name>124</name>
<url>http://www.securityfocus.com/bid/124</url>
</Reference>
</Classification>
</Alert>
</IDMEF-Message>
Most logs today, sadly, do not follow any specific or predetermined format (or
only followed for a very small part of the message, such as timestamp) and can
be considered free-form text.

CHAPTER 2: What is a Log?
38
There are various aspect of log formats. First, is the file in binary or ASCII for-
mat? Can a read the log file with a simple text browser or editor, or will he or
she need a conversion tools to get to the information?
The obvious example of a human readable or ASCII log is Unix syslog. If you
opened the book to this section, here is an example:
Nov 15 23:16:26 ns1 sshd2[12579]: connection from "10.85.179.198"
Web servers, firewalls, and many applications on all platforms log to text files
which can be easily viewed.
Note however that human-readable, text, and ASCII log formats are not exactly
synonymous. Unicode text (not ASCII) is not uncommon, and not every
human can (or ever will be willing to!) read a complicated nested XML-for-
matted log file with long lines and numerous tags, etc.
The most common example of a binary file is Windows Event log. The reader
might object that the Event Log is easily readable. But reading the Event Log
requires using the Event Viewer. This utility converts the binary log (typically
stored in files with an Evt extension in c:\WINDOWS\SYSTEM32\CONFIG\
directory) into a human-readable event, as shown in Figure 2.2.
Some other common binary formats are the Unix wtmp file, which contains
login records and the pacct which contains process accounting information.
While strictly not a log format, Tcpdump binary format can be defined as a
format for logging network packet data, thus falling in the same category.
Why do programmers choose to log data in binary format? It sure would be
simpler for us humans if all logs were text-based and easy to read! But there are
compelling reasons for binary logging: Performance and space. If one has to
log many thousands of records per second, the task could strain even modern
CPUs. And system users usually have a reasonable expectation that logging
will not disrupt system performance. In fact, one of the most common argu-
ments against logging is that “it will impact performance.” Our response to
that is usually “and what will performance be like when the system crashes and
you have no idea why?”
Binary format log entries are usually smaller (have less entropy), thus take less
processing to format and write. Since the messages are usually smaller than
ASCII message, the log files take up less disk space, and less IO when being
transported.
Also, binary logs usually require less processing to parse, and have clearly delin-
eated fields and data types, making analysis more efficient. An ASCII log parser
has to process more data, and often has to use pattern matching to extract the
useful bits of information.
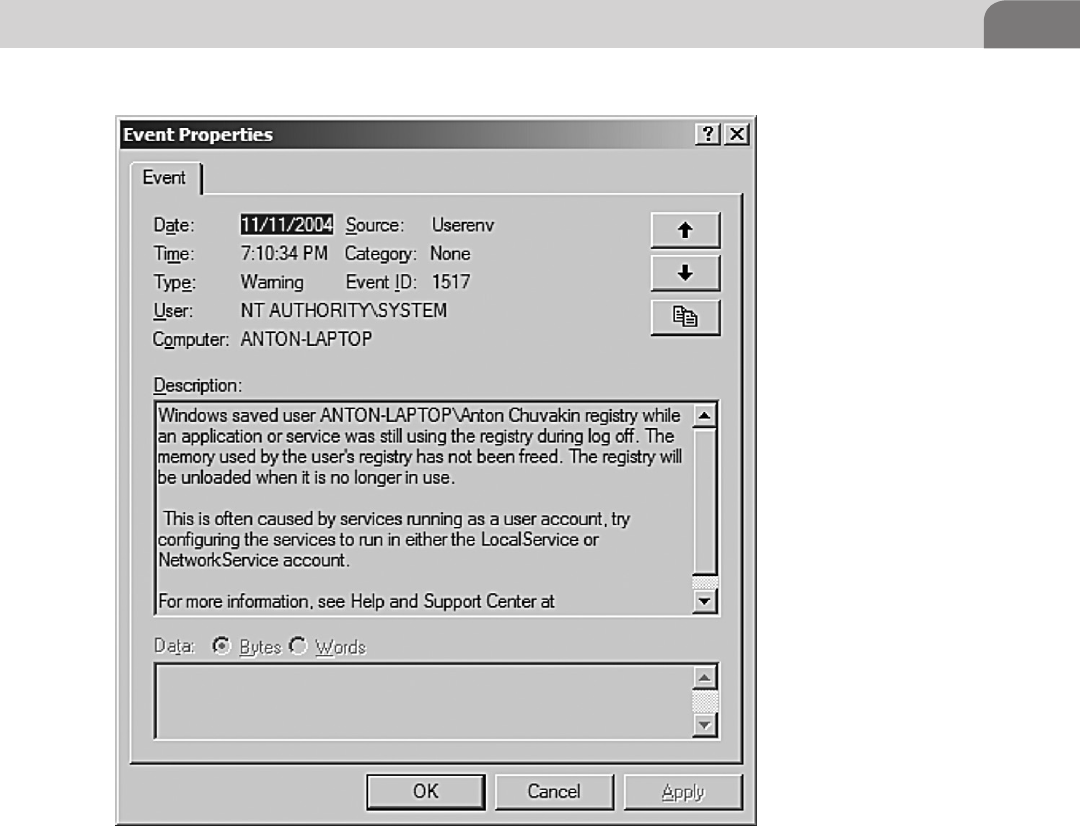
Logs? What logs? 39
A compressed log is by definition a binary log, which provides further reasons
for binary logging: it can be compressed. Just as obvious, if a log file is in an
encrypted format, it has to be binary as well. Another reason for binary logs
is that they are harder to read. How is that an advantage? Due to “security by
obscurity,” many believe that it makes their log files “more secure.”
Another type of log format is the relational database, which isn’t really text
nor binary, or could be considered a very fancy binary format. A relational
database stores binary records in a table for high-performance addition (called
“insertion”) and retrieval (called “selection”), defined by a database schema.
A database schema is simply a method of defining records in a table and tables
in the entire database.
FIGURE 2.2 Windows XP Event Log

CHAPTER 2: What is a Log?
40
Another important distinction between log types is whether the format is open
or proprietary. An open format means that the format is documented some-
where, possibly in a standard document (such as ISO, ANSI, or an Internet
Standard) or in a reference document (such as an RFC). A proprietary format
may or may not be documented and is usually used by one specific device ven-
dor. Proprietary formats are often undocumented, however, and one is at the
mercy of the vendor for log reading and processing tools.
One might be able to understand a proprietary text format just by studying
it (“reverse-engineering”—even though the term is more commonly used for
binary formats). However, one runs the risk of misinterpreting the meaning of
a particular fields, or it’s data type, or range of values, and end up with rather
useless or misleading results.
Logging settings, configuration, and recommendations is a common way for
event producers and system operators to decide on what events to log and what
logging to enable on each individual device. With a common way of express-
ing events, it is possible to advocate for what events products should generate.
While it should be expected that a firewall should log events such as blocked
connection attempts, there is no standard logging rules today. It is also impor-
tant to not only be concerned with what events to log, but also what informa-
tion details should be logged for each event.
There’s no industry-wide recommendation in this area today. One common
example is PCI DSS compliance.
Specifically, PCI DSS logging prescribes (see Figure 2.3) that each log entry
at least contain user name, type of an event, date and time, success or failure
indication, name of affected component as well as the system that originate
in the event (these in fact present a very useful set of commonly used log
details).
Many other industry organizations have created their own recommenda-
tions in regards to events and details to be logged. There is a way to general-
ize and summarize some of these recommendations, as done below in this
report.
Log Syntax
Every log file of any format also has a syntax. Log syntax is conceptually similar
to a syntax of a language, such as English. A sentence in human language syn-
tax typically contains a subject, a predicate, sometimes a predicative, as well as
complements and attributes. Sentence syntax covers the relations between the
sentence members and their meaning. Note that syntax does not address the
message contents. In other words, syntax deals with how we structure what we
choose to say, and not what specific words we use.
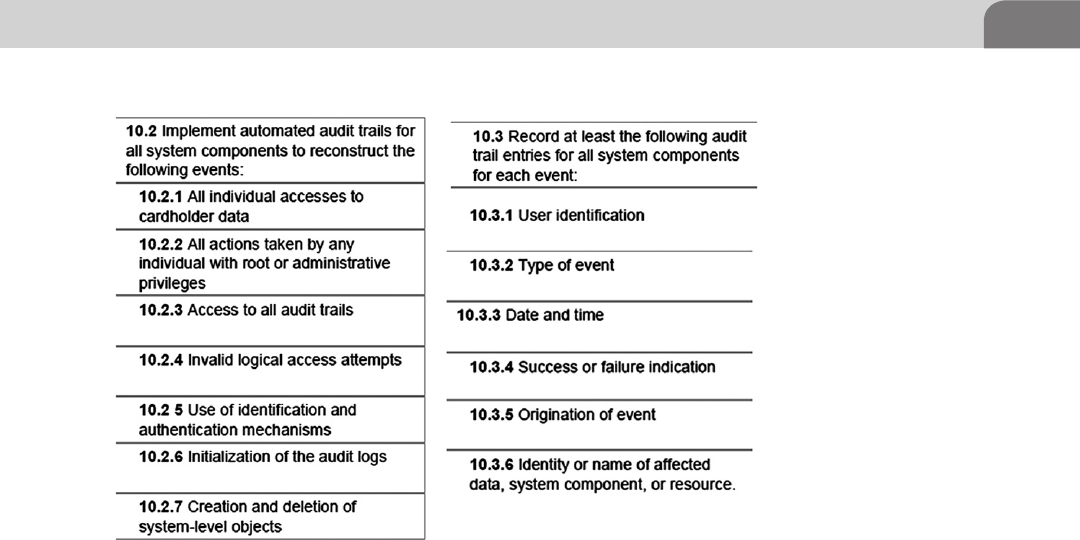
Logs? What logs? 41
So what does syntax mean in the context of log messages? Well, each log mes-
sage has a structure to it. Some types of log messages have portions of human
language in them. Regardless, log messages each consist of patterns of informa-
tion of various types. Based on regulations, one can define a common set of log
fields that have to be present in every log entry for it to be useful. For example,
a very common set of fields is:
1. Date/time (and, ideally, a time zone as well).
2. Type of log entry.
3. System that produced it.
4. Application or component that produced in.
5. Successful failure indication.
6. Severity, priority, or importance of a log message (typically present in all
syslog messages).
7. For logs related to user activities in any way, a username recorded as well.
Network device manufacturers commonly follow the above in most of their
logs, but they are notable exceptions where logs out lacking some of the details.
What is there in a log sentence? Let’s try a “syntactic analysis” of a single syslog
line. We will use a syslog message as an example of one of the most flexible
(and chaotic) log formats.
Nov 16 00:26:24 ns1 named[765]: check_hints: A records for J.ROOT-
SERVERS.NET class 1 do not match hint records
FIGURE 2.3 PCI DSS Requirement
Source: PCI DSS Standard, v 2.0

CHAPTER 2: What is a Log?
42
Isn’t that nicely obscure! We purposefully choose a fairly long and esoteric
line. We can say that a “subject” (answers “what” question) is a named pro-
cess that noted that the user should “check_hints” (“predicate”) for a specific
DNS server and that this happened around 00:26 on November 16 (appall-
ingly, syslog does not have a year in its timestamp, as will be explained in
more detail in Chapter 2). Just for the curious, what really happened here is
one of the root DNS servers has its IP address changed, but this DNS server
in question (the one that produced the above log line) still has the old infor-
mation in its configuration files (see, for example, an article “Some error
messages and problems with DNS” at http://www.reedmedia.net/misc/dns/
errors.html).
Why does the syntax of a log message matter? Log syntax is important for any
kind of automated analysis of log data—which is the main subject of this book.
Before the intelligent conclusions can be made from log data we need to split
the log into its parts, according to its syntax.
Some log analysis-related software products (commercial and open-source)
have developed “message schemas” to define the syntax of various types of
logs. Such schema is designed to fit just about any message that can occur in
various log files from devices, systems, application and other sources.
It may be obvious to the reader how most of our log message examples above
fit into such schema. For example, this Dragon NIDS message:
2004-09-11 23:01:40|dralion1|IIS:DECODE-
BUG|10.208.231.102|10.1.1.3|2611|80|T||6|tcp,dp=80,sp=2611|
easily fits into the general schema as shown in Table 2.1. The message indicates
that a server 10.1.1.3 was hit by a IIS Web server exploit (either launched by a
hacker or malware, such as a worm) from 10.208.231.102. The exploit is related
to Unicode decoding by the Internet Information Services (IIS)—a standard
Windows Web server.
Note that some data is also added when the message is collected (by the log
analysis solution).
Note that EVENT, EVENT_TYPE, and various names (DNS, NetBIOS, etc.) were
added by a log analysis system to complete the picture drawn by the Dragon
intrusion detection system.
What about those data that are specified to a particular type of a log source
such as from an unusual applications (although we’re not sure if we’ve seen
any “usual” application logs lately). In this case one might get away with using
generic “custom” fields for storing such data. It’s messy, but unfortunately
that’s the nature of log analysis today.

Logs? What logs? 43
Overall, knowing log file syntax is critical before any kind of analysis is
approached. The fact that some people can do such analysis in their heads
doesn’t discount its value; it just shows one trivial case where such thing is pos-
sible (as well as highlights some advantages humans have over machines). In
most cases, the automated system analyzing logs need to have an understand-
ing of a log syntax, usually encoded in some template.
Overall, various system and device vendors use a few select types of logging
coupled to a few common syntax choices (defined in the previous section). For
example, some security logging is done in XML for easier and more information-
rich integration with. A lot of operational logging is done via syslog and using
unstructured text or semi-structured messages. Similarly, a lot of debugging
logs is either syslog or even temporary text files. High-performance logging is
often binary and in proprietary format.
Common device logging options are summarized in Table 2.2.
Table 2.1 Example Event Attributes
Fields Example
EVENT eid656539475ha1
DEVICE_TYPE Dragon NIDS
DEVICE dralion1
IMPORTANCE High
EVENT_TYPE Web Attack
DEVICE_EVENT_TYPE IIS:DECODE-BUG
OCCUR_TIMESTAMP 2004-09-11 23:01:40
COLLECT_TIMESTAMP 2004-09-11 23:01:43
PROTOCOL_NET TCP
PROTOCOL_APP HTTP
SOURCE_IP 10.208.231.102
SOURCE_DNS Evil.attacker.com
SOURCE_NBT
SOURCE_MAC
SOURCE_PORT 2611
DESTINATION_IP 10.1.1.3
DESTINATION_DNS Poor.Webserver.com
DESTINATION _NBT Poor-Web
DESTINATION_MAC
DESTINATION_PORT 80
NETWORK
BYTES_XFERRED
EVENT_COUNT 1
STATUS

CHAPTER 2: What is a Log?
44
Among other notable logging methods, a few network devices log into comma-
separated (CSV) or ELF formats (mentioned above). These are relatively less
common.
Log Content
So we have talked about log format and syntax, but the real meat in is their
content. Content of logs is commonly defined a taxonomy of what the logs
actually mean. As a result, log event taxonomy is an unambiguous way of
classifying logged events. If multiple systems log the same event, it should be
expected that their taxonomy description of that event are identical. A com-
puter should be able to immediately determine whether two logs refer to the
same type of event. In order to make this happen, there needs to be a collec-
tion of well-defined words that can be combined in a predictable fashion—a
log taxonomy. Presumably these words would describe the type of activity, the
actors involved, the outcome, and other relevant event data.
Table 2.2 Pros/Cons of Logging Mechanisms
XML logging Syslog text
logging
Text file
logging
Proprietary
logging
Consumption
mode
Mostly ma-
chine reading
Mostly manual
reading
Only manual
reading
Only machine
reading
Common use
case
Security
logging
Operational
logging, debug-
ging logging
Debugging
logging
(enabled tem-
porarily)
High-
performance
logging
Example Cisco IPS
security
appliance
Most routers
and switches
Most applica-
tion debugging
Checkpoint
firewall logging,
packet capture
Recommendation Use when
a rich set of
structure infor-
mation need
to be trans-
ferred from
producing to
consumer and
then analyzed
Add struc-
ture such as
name = value to
simplify auto-
mated analysis;
use for most
operational
uses
Add structure
to enable
automated
analysis, if the
logs are to be
left enabled
during
operations
Use for super
high perfor-
mance uses
only
Disadvantages Relatively low
performance,
large log
message sizes
Lack of log
message
structure makes
automated
analysis
complicated
and expensive
Typically the
logs can only
be understood
by the applica-
tion developers
Not human
readable
without a
dedicated
application that
can convert
binary into text

Logs? What logs? 45
There are no well-defined public standards on event taxonomies yet, even
though some are in development. However, most security information and
event management and some log management vendors on the market today
have developed a log taxonomy that is utilized inside their products. Sadly,
every vendor has used slightly different foundational principles for their
taxonomy.
Content is a difficult topic, there’s a lot of stuff to look at, sometimes it’s incon-
sistent, incomplete, or misleading. We’ll be looking at log content in Chapters
8, 9, and 11 starting with the next chapter. In this section we’ll give an overview
of the types of information that one can expect to find, what one might want
to find, and what one could only dream of having logged.
Logs can contain information about user activity: who’s logged in, what they
were doing, mail they received and sent, etc. Logs can tell you about things
that are broken or are going to break, such as disk errors. Logs can tell you that
things are working fine and give you information about resource utilization
and performance. Logs can contain information about status changes, starts
and stops, etc. And logs can sometimes tell you about intrusion attempts, and
occasionally indicate a successful intrusion.
The types below cover the entire spectrum of security, operations and debug-
ging messages, these are:
1. Change Management: Records of system changes, component changes,
updates, account changes, and anything else that might be subject to a
change management process; these logs typically split into add, delete,
update, and modify records. These can cross the line between security and
operational types.
2. Authentication and Authorization: Records of authentication and authorization
decisions (such as successful or failed logins to the device) and especially
privileged user logins of the most common security messages and should
be produced by every application and every network device. These are the
security messages that often find operational uses as well (such as to track
who utilized a particular system).
3. Data and System Access: Related to the previous types, records of access to
application components, data (such as file or database tables) find
common security as well as performance/operational uses. In some cases
these messages are not enabled all the time and are only generated insensitive
environments.
4. Threat Management: From traditional intrusion alerts to other activities that
violate security policies, this types of messages is produced by Network
Devices that have a dedicated security function (such as firewalls).
5. Performance + Capacity Management: A broad category of messages related
to system performance and capacity management, including various

CHAPTER 2: What is a Log?
46
thresholds, memory and computing capability utilization and other finite
resource utilization. These are very common operational messages that
sometimes find security use as well.
6. Business Continuity + Availability Management: Most systems will produce a
log when the system is being shutdown or started; other types of continuing
tea and availability messages related to backups, redundancy or utilization
of business continue itty features. These are very common operational
messages with infrequent security use.
7. Miscellaneous errors and failures: Other types of system errors that the
designers decided to bring to users attention are classified here; these
are not critical operational messages that might or might not require an
action by the device administrator.
8. Miscellaneous debugging messages: Debugging logs are typically created at the
discretion of individual developers and are extremely hard to classify; most
debugging logs are not left enabled in operational production environments.
CRITERIA OF GOOD LOGGING
As we will show in various examples throughout this book, there are many
cases where the information logged is incomplete or sometimes just useless.
So what makes a “good” log? What information is necessary for a log message
to be usable for intrusion detection, resource management, or auditing? There
are many kinds of logs and even more kinds of log-producing devices 5, so it is
hard to define a single criterion.
In general, logs should tell you:
n What happened (with appropriate detail; “Something happened” is not
usually particularly useful).
n When did it happen (and when did it start and end, if relevant).
n Where did it happen (on what host, what file system, which network
interface, etc.).
n Who was involved.
n Where he, she or it came from.
The above list is the set of absolute essentials—the “5 W’s of Logging”. These
are taken from other disciplines where they are used: journalism, criminal
investigation, and other disciplines. For icing on the cake, many people would
also like to see:
n Where do I get more information.
n How certain should I be that the above is really what happened?
n What is affected.

Criteria of Good Logging 47
And since we are allowed to dream, one would also like to know:
n What will happen next.
n What else happened that I should care about.
n What should I do about it.
Of course, in some cases the latter items are dependent on the particular envi-
ronment—what your site should do about a particular event might not be the
same as what another site should do.
As organizations have finally taking network device and—to an extent—server
logging under control, the next battle front is clearly in application logging.
After getting used to neat Cisco ASA or other firewall logs and Linux “pass-
word accepted” messages, security incident investigators have been thrust into
horrific world application logging while trying to respond to the next wave of
attacks. These logs might miss details here and there and not always be useful,
but at least they are familiar.
Problems with many today’s application logs are truly staggering: logs are
often simply missing, critical details are omitted, no standard form or content
are anywhere to be found. On top of this, many security practitioners had to
deal with debugging logs masquerading as security audit logs.
Table 2.3 illustrates the key difference between two types of application logs.
While debugging logs are present in application frameworks more frequently
than well-designed security audit logs, using them for investigations often pres-
ents an exercise in frustration since key details needed for incident response
and forensics might not be recorded in debug logs. Chapter 18 provides more
detail on this topic.
Ideal Logging Scenario
So if we could have logging just the way we wanted it, what information we
would like to see in logs and how should it be presented?
Table 2.3 Logging and Timing Issues
Audit Logs Debug Logs
Intended consumer Security, audit System operator, developer
Condition for logging Always on Sometimes on
Content of log messages Attacks, activities, faults Faults, failures, errors
Scope of what should be
logged
Known in advance Not known
Time scope Useful for years Useful for hours/days

CHAPTER 2: What is a Log?
48
We would like to see only the stuff we need to know about at the moment, no
more—no less. Of course this is a pipe dream, so we will settle for having more
information than that—events of various severities so that log analysts can
make a decision based on the circumstances.
On a high-level, we would prefer to separate information into two categories:
Deal with now (urgent), and deal with later (not urgent). The first is a high
priority log that is clear and actionable. Wherever an entry is added to that log,
it should be conveyed to the operator or analyst for immediate action. There
should also be no confusion about what action to take.
The second log contains records that don’t necessarily require immediate
action. These events will, however, provide important information when sum-
marized, over time, or for auditing or forensic analysis.
To summarize, we would like to see:
Table 2.4 is not a comprehensive list, but it gives an idea of things that ideally
should be logged and how. It is possible to come up with more than two pri-
ority levels, but the concept continues to the be same. In fact, in reality there
are usually at least three, the third being the “ignore” log—messages that are
useless or unimportant.
SUMMARY
This chapter introduced the reader to general concepts log files, audit trails,
and other log related things.
Table 2.4 Critical Versus Accounting Logs
Critical log / “act now” Accounting log / “keep in mind”
Faults that can affect system operations System status messages
Attacks that are successful Attack attempts and probes
Attacks that have a high chance of being
successful
Low impact attacks
System reaching capacity or maximum of
some value
System reaching a relatively high value of
some parameter
System changes possibly leading to
security and availability problems
Various system changes
System crash System startup/shutdown
Failed login Successful login
Hardware failure Hardware status message
Security-relevant configuration change Routine and automated configuration
change
Unauthorized connection detected Connection established/terminated

References 49
n Logs come in all shapes and forms, but you can look at the similarly by
looking at the common denominators in them.
n There’s a big difference between what logs actually contain and what we
would like the to contain, which make log analysis a challenge.
In addition to that very basic conclusion—YOU MUST LOG!—we have to
remind our readers that the importance of logging will ONLY GROW. In par-
ticular, the need to analyze application behavior for security issues across dis-
tributed and also cloud-based application calls for us to finally get logging
under control.
Software architects and developer need to “get” logging—there is NO other
way since infrastructure logging from network devices and operating systems
won’t cut it for detecting and investigating application level threats. Security
teams will need to guide developers and architects tours useful and effective
logging.
REFERENCES
Common event expression. Web, September 26, 2011. <http://cee.mitre.org/docs/CEE_Architecture_
Overview-v0.5.pdf>.
Event log monitoring, event log management, syslog monitoring. Web, September 26, 2011.
<http://www.prismmicrosys.com/EventSourceNewsletters-July10.php>.
Log analysis mailing list “World Domination” thread. <http://lists.jammed.com/loganalysis/2002/
08/0012.html>.
Some error messages and problems with DNS. <http://www.reedmedia.net/misc/dns/errors.html>).
Syntax resources on the web. <http://www.utexas.edu/courses/linguistics/resources/syntax/>.

This page is intentionally left blank

Logging and Log Management
© 2013 Elsevier, Inc. All rights reserved.
http://dx.doi.org/10.1016/B978-1-59-749635-3.00003-8
51
CHAPTER 3
Log Data Sources
CONTENTS
Introduction ...............51
Logging Sources .......51
Syslog ................................52
Basic Logging with syslogd ... 53
Syslog Message
Classification............................ 54
The “Mark” Facility.................. 55
Syslog Priority .......................... 55
Syslog.conf ............................... 56
The Mark Interval .................... 57
Syslogd Output ........................ 58
The Syslog Protocol ................. 58
SNMP ................................58
Managers and Agents ............. 59
SNMP Traps and
Notifications ............................. 59
SNMP Get ................................. 60
SNMP Set ................................. 60
Issues with SNMP as a
Log Data Alternative ............... 60
The Windows Event
Log ....................................62
Log Source
Classification .............63
Security-Related
Host Logs .........................64
Operating System Logs .......... 64
Network Daemon Logs ........... 66
Application Logs ..................... 68
Security-Related Network
Logs ..................................68
Network Infrastructure
Logs .......................................... 68
n Logging Sources
n Log Source Classification
INFORMATION IN THIS CHAPTER:
INTRODUCTION
The first step of the log analysis process is to understand what a log source is.
Some applications and systems log by default, some do not. In some cases, the
application may be sending log data, but there is nothing to receive it. In this
chapter, we are going to show how to get basic logging enabled for systems
and applications. Since the default settings for some applications/systems are
not necessarily sufficient, we are also going to show how you can improve the
quality of your logs by tuning application settings. And in a few cases, we show
tools that you can use to augment the logs with information not provided by
the application. The overall goal is to provide examples that will help get you
thinking about how you can set up logging in your environment and also aug-
ment what you already have.
LOGGING SOURCES
We’ll first look at various logging systems and the format of the data they col-
lect. Log sources fall into two general categories:
Push-based.
Pull-based.
With push-based log sources, the device or application emits a message either
to local disk or over the network. If it’s over the network, you must have a log
collector ready to receive this message. The three main push-based sources are

CHAPTER 3: Log Data Sources
52
Syslog, SNMP, and the Windows Event Log. These are protocols over which log
message are transmitted. Technically, the Windows Event Log encompases the
protocol, transport mechanism, storage, and retrieval.
With pull-based, an application pulls the log message from the source. This
method almost always relies on a client-server model. Most systems which
operate in this manner store their log data in some proprietary format. For
example, Checkpoint offers the OPSEC C library which developers can use to
write applications to pull Checkpoint firewall logs. Other products use data-
bases like MSSQL, Oracle, MySQL, etc. to store their data. Pulling logs from a
database is somewhat easy and can be done in a script or program.
Let’s take a look at the three most common log source protocols. Up first is a
look at the syslog protocol.
Syslog
You have already seen syslog message examples in Chapters 1 and 2. This sec-
tion is more about the protocol itself. Syslog is used on Unix system by the
kernel and many applications for logging messages. Syslog was originally built
for collecting debugging information. As a result, it has some limitations that
are not optimal for security log analysis. Regardless, syslog has become the most
common method of recording application events on UNIX based systems.
Syslog consists of the syslog daemon (syslogd). It is normally started and
stopped at boot and shutdown, respectively. Applications communicate
with syslogd via the syslog(3) library calls. Syslogd receives log records from
applications and the kernel via a Unix domain socket. Syslogd can also
optionally receive data from remote hosts via UDP messages on port 514.
Modern versions and syslog replacements such as rsyslog and syslog-ng also
work with TCP.
Syslogd behavior is controlled by a configuration file, usually /etc/syslog.conf.
The daemon reads log messages from the Unix domain socket /dev/log (the
name may vary between flavors of Unix/Linux), and writes to one or more
output files or forwards the logs via UDP to a collection host. Changes to the
Security Host Logs ...........68
Host Intrusion Detection
and Prevention ......................... 68
Summary ...................70
CONFIGURATION
Configuring Log Data Sources
This chapter will provide an example syslog configuration for Unix. We will not provide exam-
ples of different log source types. The reason being is most log sources will either have ample
documentation provided by the vendor or, in the case of open source log sources, Google
searches can provide guidance on configuring such tools.

Logging Sources 53
configuration file require sending a SIGHUP to the syslogd process to re-read
the new configuration.
Syslogd is normally started at boot time, but to start it manually, just run “sys-
logd.” Standard arguments to syslogd allow specifying the location of the con-
figuration file, the “mark interval” (explained below), whether or not to accept
data from the network, and the path to the Unix domain socket. The particular
names for the options vary with different flavors of Unix/Linux. For instance,
Linux uses “-r” to enable accepting logs from other hosts (“remote”), whereas
OSX uses “-u” for the same thing. Some versions of syslogd accept remote
messages automatically, without requiring any command-line arguments.
These options usually have default values, the command-line arguments are
used to override the defaults. Consult your local man page for information
specific to your operating system.
The content of the default syslogd configuration file (/etc/syslog.conf) also
varies between distributions. Most configurations do not log everything by
default, and some log different things to different files. You should always
examine the syslog configuration file to determine if it is logging the things
you want it to log.
Basic Logging with syslogd
So, how to get started logging with syslogd? We recommend a simple approach:
log everything to a single file on the local host (we’ll talk much later on about
whether or not logging everything is a good idea in the long run). Logging
everything to a single file has two advantages. First, you can browse one file and
see what’s being logged. And if you don’t know what’s being logged, how are
you going to make decisions on what should be logged where, anyways? Sec-
ond, since later we’re going to be forwarding this message to a central loghost,
the local copy remains for troubleshooting and backup purposes.
To get everything logged in one file, put this in syslog.conf (the meaning and
syntax of this is explained later):
*.debug /var/log/messages
You can use a different pathname if you like, this is the one we’re going to use
as an example. If you do, you may have to create the (empty) file before syslog
will write to it (we’ll say more about that later in the chapter).
You can comment out other lines in the file, to avoid redundantly writing the
same information to more than one file. Place a “#” in front of the lines that
you want to comment out or disable.
Use ps to get the process-ID of your syslog daemon (syslogd)

CHAPTER 3: Log Data Sources
54
# ps -ef | grep syslog
root 3344 1 0 Oct20 ? 00:00:01 syslogd -m 0
send a SIGHUP to the process:
kill –HUP 3344
and look in the file /var/log/messages. You should see a message like this:
Oct 23 17:08:22 somehost syslogd 1.4.1: restart.
possibly followed by (a lot of) other messages. Voila! You are now recording
everything that is being sent to the syslog daemon. It is important to note that
on some versions of Unix, the syslog daemon does not listen for incoming
requests from remote systems by default. This means that remote systems that
have application that can emit Syslog log messages will not be able to log to a
central place, i.e. a central log server. In most cases a special flag will need to be
passed to the syslog daemon at startup. Recall that on most flavors of Linux this
is the −r option, while OS-X uses a −u option. Consult your syslog daemon’s
manual to be certain.
Soon we’ll discuss what the messages that you are seeing in your log file mean.
But right now we’re going to explain what you just did from a configuration
standpoint.
Syslog Message Classification
Syslog messages have two attributes used by syslogd to decide how to route
them: a facility and a priority. The facility is intended to give a general classifi-
cation of where the message was generated. The priority ...
The facility is one of a fixed set—you can’t make up your own facility and just
start using it. The set of facilities you can use are:
auth Non-sensitive authentication information. On Linux, the name
“security” can also be used.
Authpriv Sensitive authentication information (things that you might not
want in a generally readable log file)
Cron Cron activity
Daemon Messages from any daemon
Kern Messages generated by the kernel
Lpr Messages from the printing system
Mail Messages from the mail transport agent
Mark Internal messages generated at a regular interval
News Messages from the Usenet news system
Syslog Messages from the syslog daemon
User Messages from command-line utilities (e.g. logger)

Logging Sources 55
Uucp Messages from the uucp system
local0 through local7 Messages from “custom” applications. Intended for things like
in-house applications.
The names of these facilities vary slightly between different Unix/Linux distribu-
tions, and some OSes have a few categories that the others don’t. For example,
OS-X also has a facility called “install.” Solaris 9 does not have the “syslog” or
“authpriv” facilities. Consult your man pages for your operating system.
Note that the application programmer chooses the facility, and there are no
restrictions on the choice. A programmer could choose to use the mail facility
or the kern facility, even if her programs were neither a mail program nor a
kernel program.
The “Mark” Facility
There is one special facility called “mark.” This facility is used internally by
syslog, which generates a mark message at regular intervals like the following:
Oct 23 17:54:00 somehost -- MARK –
The purpose of the mark facility is to verify that the syslog daemon is work-
ing even if no messages have been received by it. Mark messages are useful for
monitoring whether a system is up and running, and for determining when a
host has crashed—you use the time of the last mark message before the crash
to determine (approximately) the time of failure.
The default interval, if not specified on the command line, is twenty minutes,
but some distributions have startup scripts which turn off the mark messages
completely (with a mark interval of zero).
Syslog Priority
The priority of a message is ostensibly to indicate the importance of a message.
The set of available priorities is (in increasing order of severity):
n debug.
n info.
n notice.
n warn.
n err.
n crit.
n alert.
n emerg.
Again, the priority attached to any given event is chosen by the application pro-
grammer, so there are no guarantees that the severity is actually meaningful.

CHAPTER 3: Log Data Sources
56
The practical application of the combination of facility and priority is that it
is used by the syslog daemon for a rudimentary form of filtering of messages.
This filtering is specified in the syslog.conf file.
Syslog.conf
The syslog.conf file contains one or more lines with the following format
<selector>... <tab> ... <action>
The <selector> specifies which types of messages to which the given line
applies, and <action> specifies what to do with that message.
The <selector> is a combination of a facility and a priority separated by a period,
e.g. daemon.debug. A given selector will match all messages of that facility at
the specified priority or higher. This means that kern.info matches kern.info up
though kern.crit (or whatever the highest priority is). Traditional syslog does
not allow you to specify only a single priority to match, only the lowest prior-
ity to match. Multiple facilities can be given for a single priority by separating
them with commas, e.g. daemon,lpr.debug specifies both daemon.debug and
lpr.debug. “*” can be used in place of a facility name to specify all facilities. Mul-
tiple selectors can be given on the same line by separating them with a “;”, e.g.
daemon,info;mail.crit. Finally, the keyword “none” can be given as a priority,
which negates any previous selectors on the same line, which can be used with
a wildcard to select everything except a particular facility, e.g. *.info;mail.none”
will select everything at the info priority, except for messages for the mail facility.
The selector and the action are separated by the <tab> character. While newer
versions of syslogd will accept <space> in addition to <tab>, older versions die
a rather ugly death if <space> is found on the line.
The action taken for a selector can be one of three things: append the message
to a file or a pipe, forward the message to syslogd on another host, and/or write
the message to a user’s terminal.
The most common action used is to append the message to a file, by specifying
the full path to the file. For example:
mail.debug /var/log/mail.log
On many versions of syslogd, the file has to already exist for syslogd to write to
it; syslogd will not create the file if it does not exist. If the file does not exist, you
can create the file with touch <filename> or if you prefer, cp /dev/null
<filename> (the advantage of using touch is that <filename> will not be
destroyed if it already exists, which is useful for shell scripts).
The same action can be used to write messages to devices. The most common
example is to write to the system console (/dev/console). In ancient times,

Logging Sources 57
consoles were actually hardcopy terminals (e.g. decwriters), and “important”
messages would be written to the console so that when the system crashed, the
administrators could go look at the printout and try and deduce what was hap-
pening at the time of the crash. Of course, in those days, systems were much
slower, and fewer services were running, so the amount of information printed
on the console was manageable. Plus, in those days, disks were expensive, and
paper was relatively inexpensive.
Forwarding log messages to another host is done by giving a hostname with
“@” prepended to it as the action, e.g.
*.info @loghost.mydomain
The loghost may be a hostname or an IP address. The advantage of specifying
an IP address is that messages will be forwarded even if DNS is not working
when the syslog daemon is started. Messages to the remote host are sent via
UDP, and no response is expected, so a failure of the remote host will not pre-
vent syslogd from running on the local host (this is both good and bad, we will
discuss it more below).
Finally, the third possible action is to write the message to a user’s terminal.
The user, of course, must be logged in for the message to appear. This is done
by just specifying the username in the action, e.g.:
kern.crit kjs
This example will cause all kernel messages of priority crit and higher to be
written to any tty owned by anton. Note that this action should be used judi-
ciously, sending *.debug to user “anton” will probably make anton rather
unhappy. Messages can be sent to all users by specifying “*” as the action. This
special case is usually reserved for very critical events, normally those which
indicate an impending system crash, e.g.:
kern.emerg *
Some syslog daemons have additional features which can be controlled
through the configuration file. For example, some syslogds allow you to limit
from which hosts the loghost will accept syslog messages. We recommend you
Read the Fine Man page for your system(s) to find out what extra features you
might have.
The Mark Interval
As we mentioned above, the frequency of the “mark” message can usually be
set as a command-line argument, with a granularity of one minute. The default
is usually twenty minutes. There are trade-offs in determining the “right”

CHAPTER 3: Log Data Sources
58
interval for mark messages. A small value such as one minute will give you
pretty precise timing as to when a host (or at least, the syslog daemon) is up or
down. However, if you have thousands of hosts sending mark messages to your
central loghost every minute, you’re going to have an awful lot of traffic on
your network just for those messages. But you’ll probably want to have some
mark interval, so that you can verify that syslog is actually working.
Syslogd Output
Syslogd writes messages as ASCII text, terminated with newlines. So no special
viewer is needed for reading the files, any text viewer will work. However, we
do not recommend using “vi” or any other editor for examining the log files.
For one thing, log files can get really big, and your editor may very well choke
on them. But more importantly, reading log files with a text editor creates the
risk that you’ll inadvertently modify the log file, which can be a big no-no if
you need the log data for legal or business purposes. And it’s good system
administration practice to not use a text editor on a file unless you intend to
modify the file.
The Syslog Protocol
For many years, the standard RFC for the Syslog protocol was RFC3194 (http://
www.ietf.org/rfc/rfc3164.txt). Now RFC5424 (http://tools.ietf.org/search/rfc5424)
is the new proposed draft standard for the Syslog protocol. In other words,
RFC5424 obsoletes RFC3194.
RFC5424 is a much-needed revamp of the older Syslog protocol. One of the
biggest changes to the protocol is the specification of timestamps that adhere
to RFC3339 (http://tools.ietf.org/search/rfc3339). The older protocol didn’t
specify much in the way of a timestamps. If you were lucky the log message
you received contained the bare minimum of month, day, hour and, second.
Typically there was no year in the timestamp and time zone information was
nonexistent. This made it very difficult from an analysis standpoint. RFC5424
also adds structured data such as name=value pairs to syslog which promises
to dramatically simplify automated log analysis.
We encourage you to review the RFCs presented and get a basic feel for what
the protocol is and has to offer.
SNMP
SNMP was designed to meet the growing needs of network managers. Since
the early 1990s, SNMP has been integrated into almost every network-able
system you can think of, including many network security systems. SNMP is a
protocol for querying and configuring devices. SNMP traps and notifications
are a particular type of SNMP message which is generated by a device when a

Logging Sources 59
particular event occurs. While the SNMP protocol as a whole is not a logging
system, SNMP traps or notifications can be considered types of log messages.
While many network devices are capable of sending event information via
syslog, some are not, especially some older devices, thus SNMP traps and
notifications are a method of getting event information from devices which
you otherwise could not collect. And in some cases, the type of information
sent via SNMP is different than that sent over Syslog.
There are multiple versions of SNMP, versions 1, 2, and 3, commonly known
as SNMPv1, SNMPv2, and SNMPv3. Covering SNMP in fine detail is beyond
the scope of this book, so we’ll just focus on traps/notifications, gets and sets.
The following sections introduce these topics, but first we need to discuss the
concept of managers and agents.
Managers and Agents
SNMP managed devices are typically controlled by a network management
station (NMS). The NMS polls devices periodically, querying for status infor-
mation, sends configuration changes as necessary. The NMS also listens for
traps or notifications. In this manner, the NMS functions similarly to a central-
ized log collector. The primary reason to support SNMP is so log events can
be exported to traditional NMS’s like HP’s OpenView. But they can also be
exported to log collection systems.
The exact manner of configuring SNMP traps varies with each device. This
document at the following link describes in more detail how to configure all
aspects of SNMP on IOS 12: http://www.cisco.com/en/US/docs/ios/12_2/
configfun/configuration/guide/fcf014.html.
This document is a good mix of general introduction to SNMP as well as prac-
tical guide to configuring SNMP which, while geared toward IOS, is general
enough that it can be used as a guide to other systems.
As with syslog, something has to be listening for the SNMP traps. The receiver
can be a NMS, or you can run some SNMP daemon on your favorite flavor of
Unix. Net-SNMP is the most popular open source SNMP toolkit. It is com-
prised of useful command-line tools and an SNMP trap daemon (snmpd)
which runs on most flavors of Unix and Windows. The official Web site is
http://www.net-snmp.org/
SNMP Traps and Notifications
SNMP traps are part of the SNMPv1 protocol. SNMP notifications are part of
the SNMPv2 and SNMPv3 protocols. The key difference between traps and
notifications is that notifications include the ability for the receiver to send
an acknowledgement back to the sender. The device has to be configured to

CHAPTER 3: Log Data Sources
60
generate the message, including which events generate messages, and where to
send the messages.
As with Syslog, SNMP is implemented over UDP, and thusly suffers from the
same reliability issues as Syslog. In 2002, CERT found vulnerabilities with
many commercial implementations of SNMP. Today this is largely a forgotten
issue, and vendors have tried to put their best foot forward in addressing these
security issues. But it is nonetheless worthwhile to be aware of its existence.
SNMPv2 notifications allow for an acknowledgement to be sent back from the
receiver, at least providing more reliable message delivery than unidirectional
UDP messages.
Also as with syslog, SNMPv1 traps are sent in clear text and are not authenti-
cated. They are therefore subject to the same types of spoofing attacks. SNMPv2
notifications are also sent in clear text. SNMPv3 has optional authentication
of messages, which protects against spoofing attacks at the cost of some CPU
cycles at both the sender and receiver.
SNMP Get
The SNMP protocol allows for a get operation which allows you to retrieve
information from a device or system. What exactly can you get? This var-
ies greatly depending on what the device in question has implemented. For
example, routers will track things like bytes sent and received for each inter-
face. Operating systems will often allow you to get information on CPU usage,
memory usage, etc. It is possible for you to get information from a device or
system which can aid you in log analysis. But, in reality, this is neither practi-
cal nor a reality. In the network management world there is a concept called
trap-directed polling. This means that when you receive an SNMP trap of some
sort, you initiate a poll of the device using an SNMP get to retrieve additional
information to further correlate or validate the trap you just received. But, in
general, security devices which send traps do just that: they send traps but
don’t track anything which can be “gotten.”
SNMP Set
For completeness we will briefly discuss the SNMP set. As its name implies,
the SNMP set allows you to change the value of something on a remote sys-
tem. For example, network bridges implement a certain specification which
allows you to use and SNMP set to turn a switch port up and down. In order
to do this you need to know the MAC address of the host attached to the
particular port.
Issues with SNMP as a Log Data Alternative
As mentioned earlier, one big problem with Syslog messages is that there is no
standardized format. This means that vendor ABC’s log messages will more

Logging Sources 61
than likely be different than vendor XYZ’s. With SNMP, however, the situation
is only slightly better. SNMP makes use of what is called a MIB, or Manage-
ment Information Base. At a high level this is a definition of, among other
things, which traps or notifications a particular system supports. The following
is a notification from the Snort MIB:
sidaAlertGeneric NOTIFICATION-TYPE
OBJECTS { sidaSensorVersion,
sidaSensorAddressType, sidaSensorAddress,
sidaAlertTimeStamp, sidaAlertActionsTaken,
sidaAlertMsg,
sidaAlertMoreInfo, sidaAlertSrcAddressType,
sidaAlertSrcAddress, sidaAlertDstAddressType,
sidaAlertDstAddress, sidaAlertSrcPort,
sidaAlertDstPort, sidaAlertImpact,
sidaAlertEventPriority, sidaAlertSrcMacAddress,
sidaAlertDstMacAddress }
STATUS current
DESCRIPTION
"The Sida Alert Generic Trap is sent whenever an
event is detected by snort (rules) and no specific
Alert is found applicable."
::= { sidaAlertTypes 1 }
It’s not important to look at the details of the structure and meaning of this
notification. We just want to give a general idea of what SNMP is about. One
thing to point out is the OBJECTS section of the definition. These are the indi-
vidual event details that will be sent in the notification. For example, the sida-
SensorVersion is defined in the same MIB as:
sidaSensorVersion OBJECT-TYPE
SYNTAX SnmpAdminString
MAX-ACCESS read-only
STATUS current
DESCRIPTION
" the version number of the sensor that detected the event."
::= { sidaSensorEntry 3}
This gives us an idea of what this particular detail may look like, in this case
it’s a string that represents the version of Snort which reported the notification.

CHAPTER 3: Log Data Sources
62
Unfortunately, even though MIBs provide a strong framework for providing
well formatted, understandable messages, vendors rarely provide such. There
are a number of ways in which vendors screw it up. For example, the MIB may
not match up with the actual trap or notification sent by the device or system.
Or, changes are made to the underlying SNMP implementation, and the MIB is
not updates and quickly gets out of sync. Then when end users like us go to use
the MIB to figure out what the traps might look like, they are at best confused,
if not completely misled.
Finally, instead of spending time creating a MIB much like the Snort one above,
a vendor will create a trap that sends a single variable in the trap, as a free-form
text string. The result is equally difficult to parse as Syslog messages. In fact,
many vendors just take the exact same message they would send as a Syslog
message and wrapper it in an SNMP trap.
So SNMP may not be the best thing for collecting log information, but it may
be the only way to get it from some devices.
The Windows Event Log
Microsoft decided a long time ago to invent their own log sourcing and collec-
tion system. This system is called the Event Log. It has evolved over the years
and has been around almost as long as Windows. Today’s Event Log has some
advanced features. The Event Log is used to collect and review primarily two
types of logs:
Windows Logs.
Application Logs.
Windows Logs encompasses at least Application, Security, and System. Of
importance is the Security log. This is where logons, logoffs, resource access
(shares, files, etc.) are logged. The Application Logs are pretty self-explanatory.
Applications can write to this log to relay status, errors, and other noteworthy
items.
Let’s take a quick look at an Event Log. To launch the viewer you can run
by going here: Control Panel->System and Security->Administrative Tools-
>View Event Logs. This brings up the Event Viewer. Figure 3.1 shows the
viewer.
On the left pane of the window are the various log message types. In the
middle are the actual log message for the type you have selected (in this case
Security). Below the log message in the middle are the details for the log mes-
sage. If you double-click the log message, you will get a pop-up message simi-
lar to that in Figure 3.2.
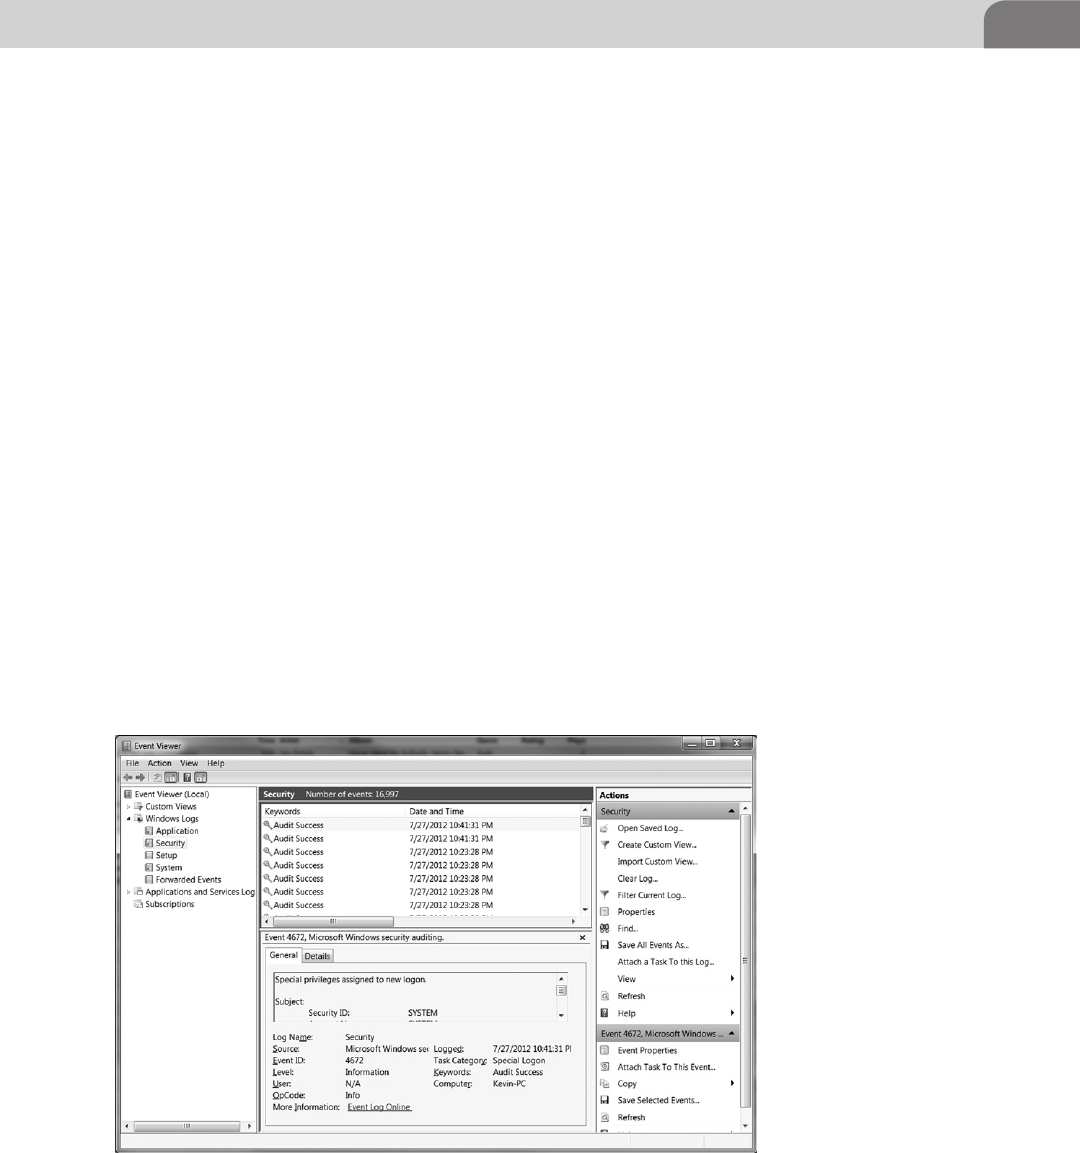
Log Source Classification 63
Figure 3.2 shows details of the log message you selected. Depending on the
type of log message you will see things like the following:
Event Id (4624 in Figure 3.2).
Account name.
Domain.
Resource (in the case of file or directory access).
Status (was the request successful or not).
While what the built-in log viewer shows you is great, http://eventid.net/ is a
resource you can use to get more insight into what a given event means. If you
have the Event Id you can use this Web site to pull up more detail on the event.
Figure 3.3 is a snippet from this Web site for the Event Id 4624.
As you can see, there is more content beyond that found in the actual log detail
in Figure 3.2.
Chapters 8 and 15 discuss the Windows Event Viewer in terms of ease of man-
agement of this invaluable resource.
LOG SOURCE CLASSIFICATION
The following sections provide examples of applications and systems which
generate log data.
FIGURE 3.1 Windows Event Viewer
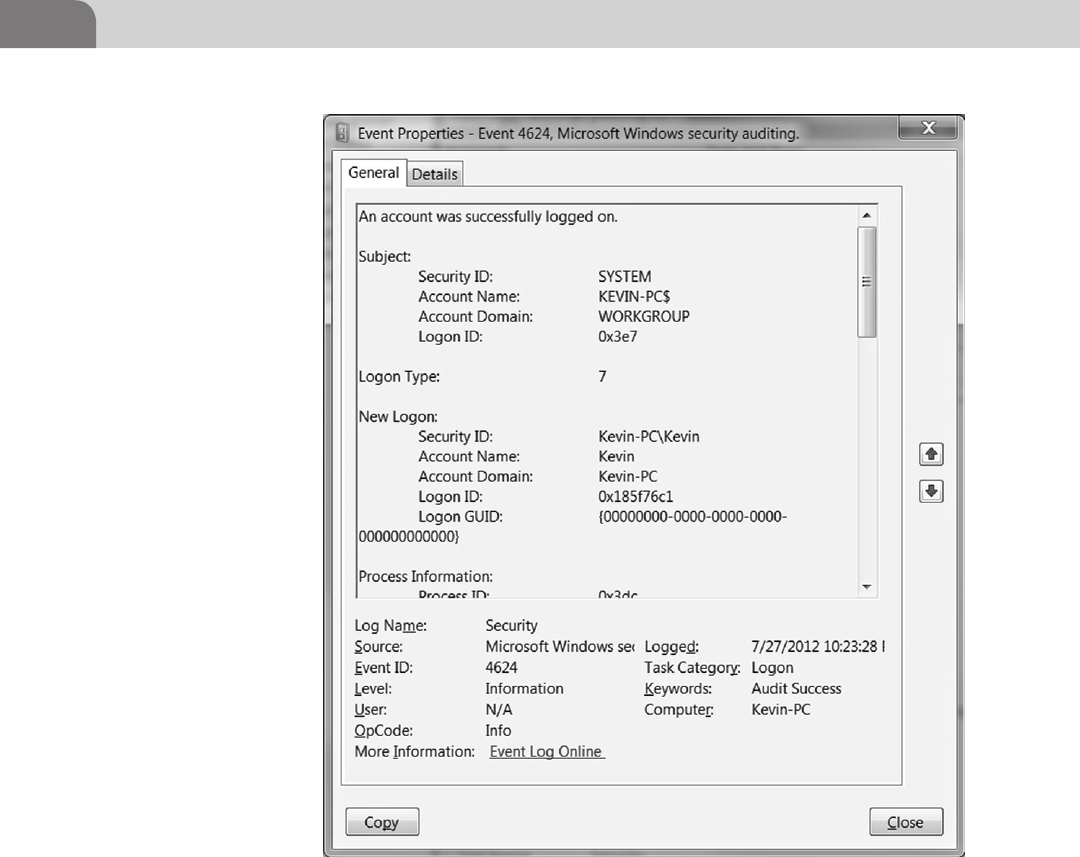
CHAPTER 3: Log Data Sources
64
Security-Related Host Logs
This category covers host logs produced by operating system components, vari-
ous network services logs as well as other applications running on the system.
While many of the messages are only or primarily produced for performance
tracking, audit or troubleshooting reasons, a vast majority of them is also useful
for security.
Operating System Logs
Operating systems log an amazing variety of messages. Let’s review some of the
security relevant types of messages produced by the operating systems:
FIGURE 3.2 Event Detail For Event 4624
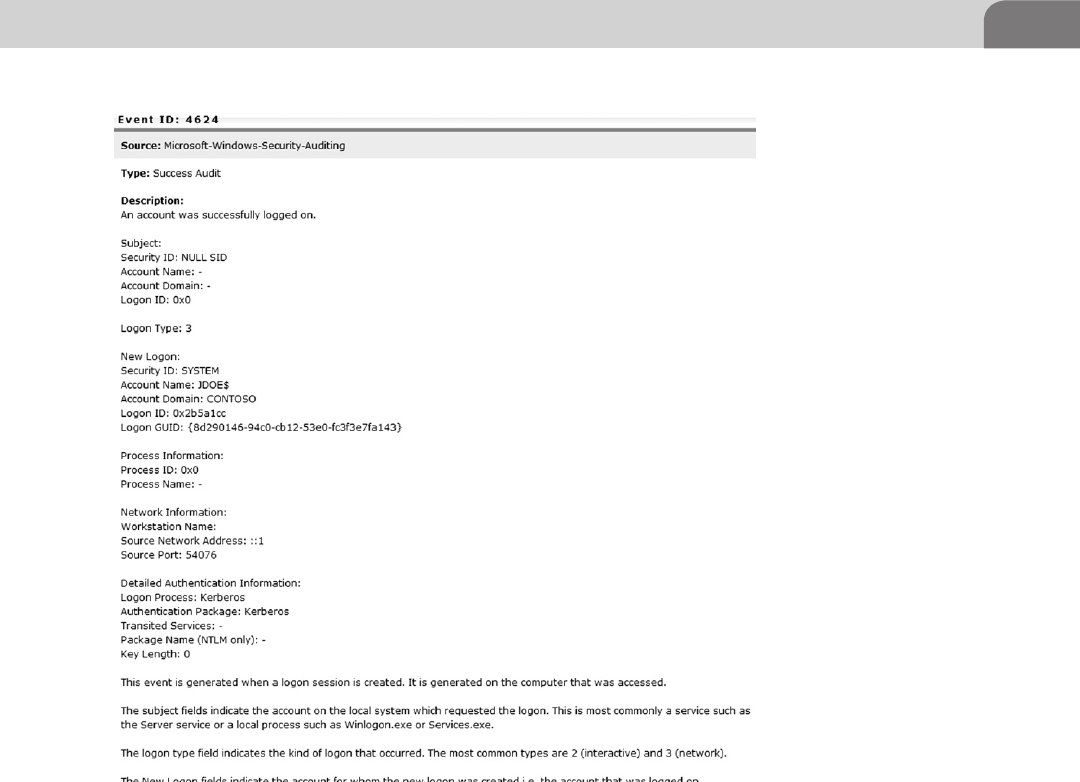
Log Source Classification 65
n Authentication: user logged, failed to log and so on.
Example (Linux syslog):
Jan 2 08:44:54 ns1 sshd2[23661]: User anton, coming from 65.211.15.100,
authenticated.
This example is a Linux syslog line related to remote user authenticating with
Secure Shell (SSH) daemon:
n System startup, shutdown, and reboot.
Example (Linux syslog):
Nov 4 00:34:08 localhost shutdown: shutting down for system reboot
FIGURE 3.3 Windows Event Viewer

CHAPTER 3: Log Data Sources
66
This example is a Linux syslog line related to system shutdown:
n Service startup, shutdown and status change.
Example (Solaris syslog):
Nov 5 13:13:24 solinst sendmail[412]: [ID 702911 mail.info] starting
daemon (8.11.6+Sun): SMTP+queueing@00:15:00
This example is a Linux syslog line related to sendmail daemon starting up:
n Service crash.
Example (Linux syslog):
Jan 3 12:20:28 ns1 ftpd: service shut down
This example is a Linux syslog line related to FTP server shutting down invol-
untarily (it might be due to a crash or a kill command):
n Miscellaneous status messages.
Example (Linux syslog):
Nov 20 15:45:59 localhost ntpd[1002]: precision = 24 usec
This example is a Linux syslog line related to a time synchronization daemon
(NTPD)
Overall, the operating system messages are considered security-relevant for two
main reasons:
1. They are useful for intrusion detection, since successful and failed attacks
often leave unique traces in the logs. Host intrusion detection systems
(HIDS) and security information and event management systems (SIEMs)
collect the messages and can make judgments about the past and upcoming
(in case of seeing traces of attacker’s reconnaissance activity in logs) threats.
2. They are also useful for incident response, (see Chapter 16) since successful
attacks will happen despite the presence of various security safeguards.
As we noted in many chapters, logs are paramount for incident response
since they allow the investigators to “piece together” the disjoint pieces of
the intrusion puzzle.
Network Daemon Logs
Network daemons usually log security-relevant messages of the following
categories:
n Connection established to the service.

Log Source Classification 67
Example (Linux syslog):
Dec 26 06:45:14 ns1 popper[14251]: (v4.0.5) POP login by user "anton"
at (10.192.17.92) 10.192.17.92
This message from a Linux syslog shows a successful connection to a POP3
mail daemon by a remote user “anton.”
n Connection failed to server.
Example (Linux syslog):
Dec 28 01:54:16 ns1 xinetd[14923]: FAIL: telnet libwrap
from=210.93.83.28
This message from a Linux syslog shows a connection failure (due to access
controls) to a telnet service.
n Connection was established, but access was not allowed.
Example (Linux syslog):
Dec 13 08:45:00 ns1 sshd2[18120]: connection lost: 'Connection closed.'
This message from a Linux syslog shows an unsuccessful connection to the
Secure Shell server.
n Various failure messages.
Example (Linux syslog):
Dec 26 06:47:12 ns1 sendmail[14259]: iBQBkZc14259: lost input channel
from [10.8.206.4] to MTA after rcpt
This message from a Linux syslog shows a failure of a sendmail daemon to
continue talking to a client (likely a spam program).
n Various status messages.
Example (Linux syslog):
Dec 26 06:47:12 ns1 sendmail[14259]: iBQBkZc14259: from=<cqywejwywwno@
fghjgh.com>, size=0, class=0, nrcpts=2, proto=SMTP, daemon=MTA,
relay=[10.10.206.4]
This message from a Linux syslog indicates a successful Email tranfer.
The network daemon logs are usually as useful as the general operating system
logs. In fact, they are commonly logged to the same place; for example, on
Unix and Windows the same logging mechanism is commonly used.

CHAPTER 3: Log Data Sources
68
Network daemons present of the most common entryways into the system
remotely and many of the attacks are targeted against them. Thus, having
robust logging is crucial in this environment.
Application Logs
Applications also log an amazing variety of messages. We can boil down the
types of things applications log to a single list:
n Application user activity.
n Privileged user activity.
n Routine but critical activity.
n Reconfiguration.
Security-Related Network Logs
This category covers network logs generated by network infrastructure. Routers
and switches generate an amazing variety of log messages, which are related to
their operation as well as traffic passing through them.
Network Infrastructure Logs
Network infrastructure includes routers, switches and other devices that com-
prise networks and tie desktops and servers together. Logs from such devices
play a critical role in security.
The most common messages fall into the following categories:
n Logins and logouts.
n Connection established to the service.
n Bytes transferred in and out.
n Reboots.
n Configuration changes.
Security Host Logs
This category covers host logs from applications with a security mission run-
ning on a host for protection. Unlike the above logs that might or might not be
relevant to security in each specific case, these security logs are always interest-
ing since they relate to attacks, intrusions, compromises infections, etc. How-
ever, in many cases the security gear will be lying to you, producing false alarms
of various types (such as the well-known “false positives.”)
Host Intrusion Detection and Prevention
Host intrusion detection systems (HIDS) and intrusion prevention systems
(HIPS) definition and mission have evolved since early 1990s when the first

Log Source Classification 69
commercial systems of that type were introduced. By the way, the first systems
actually looked at logs and tried to apply intrusion trace signatures to those
logs. The HIDS mission was extended to also watch for file systems changes
and other unauthorized system modifications.
Nowadays, such systems detect and block a wide variety of network, operating
system and application attacks. While HIDS only alert, HIPS can also block
attacks based on signatures, dynamic rules or other mechanisms.
Most of the event records generated by such systems are related to:
n Reconnaissance or probe detected.
n Changes to executable files.
Example (Dragon HIDS):
2002-10-11|10:38:38|labdragon-hids|FTP:NESSUS-
PROBE|0.0.0.0|146.127.94.13|0|0|I||0|target:146.127.94.13,file:messages|
This message from a Dragon host sensor (formerly known as Dragon Squire)
shows a Nessus vulnerability scanner probe detected by watching the FTP
log.
n Attack detected.
Example (Linux syslog):
Dec 26 06:47:12 ns1 sendmail[14259]: iBQBkZc14259: lost input channel
from [10.8.206.4] to MTA after rcpt
This message from a Linux syslog shows:
n Attack detected and blocked.
Example (Linux syslog):
Dec 26 06:47:12 ns1 sendmail[14259]: iBQBkZc14259: lost input channel
from [10.8.206.4] to MTA after rcpt
This message from a Linux syslog shows:
n Successful intrusion detected.
Example (Linux syslog):
Dec 26 06:47:12 ns1 sendmail[14259]: iBQBkZc14259: lost input channel
from [10.8.206.4] to MTA after rcpt

CHAPTER 3: Log Data Sources
70
This message from a Linux syslog shows:
n Insecure system reconfiguration or corruption.
Example (Dragon HIDS):
2002-10-11|10:32:11|labdragon-
hids|FILE:DELETED|0.0.0.0|146.127.94.13|0|0|I||0|target:146.127.94.13,f
ile:/etc/inetd.conf|
This message from a Dragon host sensor (formerly known as Dragon Squire)
shows a critical system file deletion alert.
n Authentication or authorization failed.
Example (Dragon HIDS):
2002-10-11|10:38:38|labdragon-hids|LOGIN-
FAILED|0.0.0.0|146.127.94.13|0|0|I||0|target:146.127.94.13,file:messag
es|
SUMMARY
This chapter covered a lot of ground. The focus was on presenting concepts by
way of example. The ideas presented in this chapter are by no means exhaus-
tive. They are meant to give you a basis for what is possible so you can go on to
solve problems in your own environment.
CHAPTER 3: Log Data Sources
70

Logging and Log Management.
© 2013 Elsevier, Inc. All rights reserved.
http://dx.doi.org/10.1016/B978-1-59-749635-3.00004-X
71
CHAPTER 4
Log Storage Technologies
CONTENTS
Introduction ...............71
Log Retention
Policy .........................71
Log Storage
Formats ......................73
Text-Based Log Files .......73
Flat Text Files ........................... 74
Indexed Flat Text Files ............ 75
Binary Files ......................76
Compressed Files ............76
Database Storage
of Log Data ................78
Advantages ......................78
Disadvantages .................78
Defining Database
Storage Goals ...................79
What to Store? ......................... 79
Fast Retrieval ........................... 80
Reporting .................................. 81
Hadoop Log
Storage .......................81
Advantages ......................82
Disadvantages .................82
The Cloud and
Hadoop ......................82
Getting Started with
Amazon Elastic
MapReduce ......................83
Navigating the
Amazon .............................83
Uploading Logs to
Amazon Simple
Storage Services (S3) .......84
n Log Retention Policy
n Log Storage Formats
n Database Storage of Log Data
n Hadoop Log Storage
n The Cloud and Hadoop
n Log Data Retrieval and Archiving
INFORMATION IN THIS CHAPTER:
INTRODUCTION
Storage of logs and being able to quickly retrieve and analyze logs is a criti-
cal issue within an organization. Log records retained by small- to medium-
sized businesses can grow into the size of terabytes or petabytes of data very
quickly. This data is stored in a variety of formats in an organization and we
will explore the numerous retention strategies to match environmental and
compliance needs.
LOG RETENTION POLICY
Developing a log retention policy will lay the groundwork for reviewing the
retention topics covered in this chapter. The policy that you design for your
organization will drive many of the decisions that will need to be made about
the type of storage, size, cost, retrieval speed, and archive and destruction
requirements for your log data.
We will go through a process of creating a retention strategy, based on the fol-
lowing factors explained below. A number of stakeholders from the security,
compliance, and business management groups in your organization should
be involved in the plan creation process to end up with a logical, useful, and

CHAPTER 4: Log Storage Technologies
72
appropriately scoped plan that will not be overly cost prohibitive, but still
meet the needs of the organization. The following items should be reviewed
when developing your log retention policy:
1. Assess applicable compliance requirements:
n There a number of robust compliance requirements placed on many
industries today. Examples include the Payment Card Industry Data
Security Standard (PCI DSS) with a very specific log retention period
of one year, PCI DSS section 10.7 (PCI Security Standards Council,
2010); the North American Electric Reliability Corporation (NERC)
rules mention specific times for specific types of logs; other regula-
tions call for retention of specific types of logs but do not state a time
period. This guidance helps lay the foundation and minimum require-
ments for a retention policy.
2. Review the organization’s risk posture:
n Internal versus external risks drive the retention period for various
parts of your network. The length of time and importance of the logs
may vary wildly in each of these risk areas for an organization. Keep
in mind that if you focus on using logs for investigating the internal
threats, the retention period needs to be longer, as such incidents are
often not discovered for years, but when discovered, cause an urgent
need to “get to the bottom of it!”
3. Look at various log sources and the size of the logs generated:
n Firewalls, servers, databases, web proxies—not only based on need,
but also on the typical log volume and the size and type of each log
record generated. There is a wide variety on the volume of logs you
will get from each type of device or application. For example, logs
from the main firewalls will generate a massive volume of logs and as
such should most likely only be stored for 30 days simply due to the
storage requirements of long-term retention of this log data. However,
an organization’s compliance needs, such as PCI DSS, and the critical-
ity of the main firewall should be closely evaluated to determine if a
longer retention period is required. Also you may have log sources that
produce logs that you don’t have the tools necessary to analyze the
logs, like custom applications and unsupported operating systems.
4. Review available storage options:
n Log storage options range from disks, DVDs, WORMs, tape, RDBMS,
log-specific storage, and cloud-based storage. A decision on this is
mostly about price, capacity, and speed of access and—what is VERY
important is the ability to get to the right log records in a reasonable
period of time. Tape is known to be a cheap option, but is notorious
Create a Pig Script to
Analyze an Apache
Access Log .......................86
Processing Log Data
in Amazon Elastic
MapReduce (EMR) ...........87
Log Data Retrieval
and Archiving ...........89
Online ...............................90
Near-line ...........................90
Offline ...............................90
Summary ...................90
References .................91

Log Storage Formats 73
for its inability to efficiently search the stored records and may require
human intervention to locate the proper tape and restore the data for
analysis. The longevity of the media will need to be considered here as
well and how often the media should be rewritten to meet a retention
period requirement. For example, seven years for cheap writable CDs or
DVDs is probably a stretch. Technology formats age and the availability
to purchase drives for reading tapes and disks may become scarce.
Table 4.1 is an example of an online business that focused most of the security
strategy outwards.
Table 4.1 Example Retention Policy for an Online Business (Chuvakin,
2011)
Type Network Storage Tier Retention Period
Intrusion Prevention
System (IPS)
Demilitarized Zone
(DMZ)
Online 90 days
Firewall Demilitarized Zone
(DMZ)
Online 30 days
Servers Internal Online 90 days
All Demilitarized Zone
(DMZ)
Archive 3 years
Critical Internal Archive 5 years
Other Internal Archive 1 year
The retention time and the space requirements to retain the logs in an orga-
nization can be overwhelming at first. The rest of this chapter will review the
types of log formats that will be encountered and strategies to maintain and
store log files in accordance with the policy for your organization.
LOG STORAGE FORMATS
In this section, we will cover a number of log storage formats. Our network
devices, applications, and operating systems produce a multitude of different
formats and in many cases the logs will be stored in a text-based, binary, or
compressed format.
Text-Based Log Files
Text-based logging is the most abundant type of log found due to low cost
for systems to generate these types of logs and the inclusion of frameworks in
many existing computer languages that ease the generation of text-based logs.
The popularity and abundance of systems that log to text-based files is a result
of the many benefits to this format.

CHAPTER 4: Log Storage Technologies
74
Benefits:
n It is a very inexpensive operation in terms of CPU and I/O resources for
an application to write to a text-based log file.
n The format is typically human readable and can be processed and
reviewed with common text manipulation tools, such as grep and awk,
that are native to many flavors of the Unix/Linux operating systems.
n A number of common text-based log formats exist, such as syslog, that
ease operational and security team’s ability to centralize and parse logs in
a common way and create a more powerful log management system.
Flat Text Files
Flat text files are in many ways as the name implies, a flat schema-less file that
may follow a common pattern or be free form. Typically a system will create
a new log file and continue to append to this file as long as there is disk space
or until a system process, like logrotate that we will discuss later, instructs the
system to begin a new log file and archive the current one. This format tends
to be in chronological order with the oldest events at the beginning of the file
and the most current activity at the end.
One of the more common formats adopted by many systems is the syslog for-
mat. From Chapters 1, 2, and 3, we learned that many servers are configured
to send their logs via syslog on port 514 utilizing the User Datagram Protocol
(UDP) or Transmission Control Protocol (TCP). The logs sent via syslog exist
on disk prior to being sent and have a very simple and specific format. The fol-
lowing is a typical syslog formatted log message:
May 1 00:14:54 Mac-mini kernel[0]: HFS: Very Low Disk: freeblks: 0,
dangerlimit: 334
May 1 00:30:47 Mac-mini kernel[0]: add_fsevent: unable to get path for
vp 0xffffff80154a3d10 (system.log; ret 22; type 4)
May 1 00:30:47 Mac-mini kernel[0]: add_fsevent: unabled to get a path
for vp 0xffffff80154a3d10. dropping the event.
May 1 06:45:55 Mac-mini kernel[0]: IOSurface: buffer allocation size is
zero
May 1 15:15:20 Mac-mini kernel[0]: 0 0 AppleUSBCDC: start - initDevice
failed
May 1 15:15:20 Mac-mini kernel[0]: USBMSC Identifier (non-unique):
000A2700229F4191 0x5ac 0x1266 0x1
A notable benefit of long-term storage of log data in flat text files is the abun-
dance of tools to read and review data in this format. There are many tools on
every platform that can easily access and read data in this format. This becomes
an important feature if you will need to read and review the data 5,7, or 10

Log Storage Formats 75
years in the future and will need tools capable of processing and correlating
events.
Indexed Flat Text Files
One of the limitations organizations quickly run into with flat text files is the
ability to query, sort, and retrieve key elements from a flat text quickly to find
meaningful trends across the platforms they are managing. Also, as the log
files quickly grow into gigabytes, terabytes, and petabytes of data, using tradi-
tional grep, awk, and text-based search tools because an exercise in patience
and quickly becomes a very time-intensive process.
Indexed flat text files are a way of organizing data from the log files so the key
elements of the logs can be queried more quickly. Many organizations may
start off adopting indexed flat text log files as their organizations grow and
they begin centralizing their log information and quickly realize they need
structure to generate reports and to aid in the destruction of log data once it
has aged beyond the required retention period. Indexed flat files share many
of the advantages of flat text files with quick data insertion and maintaining a
human-readable format to the data.
An example of flat file indexing is a strategy used by a log retention utility
which we will discuss in Chapter 15, OSSEC. OSSEC organizes logs it receives
in the following directory structure:
/var/ossec/logs/alerts/2011
/var/ossec/logs/alerts/2011/Jan
/var/ossec/logs/alerts/2011/Feb
/var/ossec/logs/alerts/2011/Mar
…
From the structure, it is noted that logs are organized based on the year and
month the log event was received. So if we wanted to review the web server logs
from January 2011, we could go to the directory “/var/ossec/logs/alerts/2011/
Jan” and begin using our analysis tools on the January logs.
SYSLOG
Syslog is a very widely used logging format and is the defacto logging format across many
systems including Unix/Linux. Though it is heavily used, it has not been formally standardized.
Due to the lack of standardization, implementations may vary widely across systems and may
make cross-platform correlation of events difficult in some environments. The more common
use of syslog is the BSD syslog protocol and is defined at http://www.ietf.org/rfc/rfc3164.txt.
Though not a true standard, this reference can be used to help correlate data across systems
that adhere to this RFC.

CHAPTER 4: Log Storage Technologies
76
There are also a number of utilities designed to generate indexes to speed the
searching and analysis of logs. One of the more powerful utilities is Apache
Lucene Core at http://lucene.apache.org/core/. Lucene is a Java-based frame-
work that aids in the generation of indexes to enable full text search logging
and integrating into utilities to aid in the searching and analysis of logs.
Binary Files
Binary log files as the name indicates are machine-readable log files that appli-
cations generate that require special utilities or tools to read and process them.
Some examples of the more common binary log files you will encounter in
environments are Microsoft Internet Information Server (IIS) logs and Win-
dows Event logs. In many environments with mainframes or custom applica-
tions, the log files may also be encoded in binary or machine-specific formats
like Extended Binary Coded Decimal Interchange Code (EBCDIC) that will
need tools to decode them and read them on Intel and PC hardware platforms.
The long-term storage of binary log files will pose a number of challenges to
your organization. Items to consider before storing and retaining binary log
files in their native format are:
n The availability of tools to read the log files 5, 7, or 10 years in the future.
It is probably highly unlikely that you will keep a Windows NT server
around 10 years from now to read and perform forensics on your legacy
IIS 6.0 web server logs!
n Binary log files tend to be efficient in terms of usage of disk space. How-
ever, they also do not compress well. Compressed binary files can occupy
90% of their original size. By contrast, text-based files may only occupy
10% of their original size when compressed. This may increase the storage
space needs for binary files compared to text-based logging.
Compressed Files
Most of the systems that generate logs will typically begin a new log file once
a log grows to a specific size, or a configured time period of daily, weekly,
monthly, etc (Kent and Souppaya, 2006). The previous log file is typically
renamed and archived on the system’s disks in an uncompressed format so it
can still be easily accessed and queried. As a log file ages, a log file becomes
less relevant for day-to-day reports, and log review tasks, but is still critical for
meeting the compliance retention period and in performing forensics. In many
cases we will still want the log files to be quickly accessible, but with a smaller
footprint on disk to save precious space for additional logging and other sys-
tem process needs. Compressing the log files on the system is a mechanism
that will address these needs and save precious disk space.

Log Storage Formats 77
On Unix/Linux systems, there is a handy utility called logrotate that will help
manage the number of log files you retain and additionally compress logs. The
following shows an example configuration file for logrotate to rotate syslog
messages. There is additional information on this utility for the reader at http://
linuxcommand.org/man_pages/logrotate8.html: (Troan and Brown, 2002)
# sample logrotate configuration file
compress
/var/log/messages {
rotate 5
weekly
postrotate
/sbin/killall -HUP syslogd
endscript
}
Let’s review the settings and how they help us rotate, compress, and maintain
our syslog events.
Table 4.2 shows the analysis of logrotate configuration script.
Unix/Linux systems have compression toolset equivalents for many of the
standard tools. The tools zgrep and zcat can read and retrieve data from com-
pressed files just like their cousins grep and cat can work on uncompressed
files. However, there are a number of tools that will not be able to work on
compressed files natively. To utilize the full set of tools many times, the file will
need to be decompressed and space should be allocated to meet this analysis
need. To avoid obsolescence when choosing a compression format, it is good
Table 4.2 Logrotate Settings, Example for Compressing and Retaining
Syslog Messages (Chuvakin, 2011)
Setting Configuration Value Notes
Rotate 5 The setting will retain the latest
five message files before remov-
ing the log files from the system.
Weekly N/A The log will be rotated once a
week. Other options in logrotate
are monthly and daily rotations.
postrotate / endscript /sbin/killall-HUP syslogd This allows a script to be run after
log rotation occurs. In this ex-
ample, we need to restart syslogd
to get it to start a new log file.

CHAPTER 4: Log Storage Technologies
78
to pick a compression format that has several years of use and is available on
multiple platforms. On Unix/Linux tar and zip formats have had a long history
of use and PKZip format compression files are a common format on Windows.
Just like with binary files, we want to limit the obsolesce of the toolsets used to
decompress and access log data in the future.
DATABASE STORAGE OF LOG DATA
Many of the storage techniques discussed till this point require direct access
to systems and specialized toolsets for log review. This is fast and efficient, but
in many cases our ability to create summary reports, filter, and correlate log
data across hosts is severely limited. Many organizations find that writing log
information to a database is useful in opening access to stakeholders that need
log information in a format that can be quickly searched and queried, and to
facilitate the setup and use of front-end tools in the log review process.
Advantages
One of the primary advantages of using a database for log retention is the ease
with which you can use standard SQL queries to search and retrieve log records
quickly. Database systems have robust user access and permission systems for
accessing data and may already be part of your organization’s backup and
recovery plan. Many standard tools exist to query databases. These tools allow
log data to be queried via a common toolset to retrieve data rather than using
platform-specific tools on each individual system that may require specialized
knowledge and access. Built-in support in many programming languages for
working with data in databases allows front-end tools to be developed for real-
time viewing and analysis of log data. In chapter 15, we will discuss a number
of tools that already have built-in support for writing directly to a database.
This reduces the need to develop and maintain specialized in-house systems to
load log data into a database. Also, this will aid in centralizing log data into a
database system and a number of tools we explore in Chapter 15 already have
tools that can be used for front-end analysis and review.
Disadvantages
Storing log information into a database system is not without its own set of
issues and risks though. Writing log messages to a database comes at a signifi-
cant cost. Writing data to the database will be significantly slower than writing
to a local on disk text file due to network latency, database SQL parsing, index
updates, and committing the information to disk. Disk space requirements for
log storage will also be higher in a database due to the number of index files
needed to perform fast search and retrieval, and the limited options available

Database Storage of Log Data 79
to compress the data in the database. Database systems are used for many pur-
poses in an organization and are subject to the risk of data loss when there is a
database outage, maintenance, or upgrade to support logging or other internal
systems. When log entries are no longer needed based on our retention policy,
data destruction can also be problematic. If not properly planned or parti-
tioned, deleting log data can take a very long time. Log data is typically very
large and log data destruction could instruct the database system to remove
millions or billions or more rows individually and update all indexes for the
removed data.
Defining Database Storage Goals
The key in avoiding a number of disadvantages we laid out is developing stor-
age goals when moving data into a database. A plan should be defined to
align the storage needs with the organization’s log retention plan we discussed
earlier in this chapter. A good plan upfront will reduce future maintenance
outages, data restores and rebuilds, and deployment and operations resource
needs in the future. We will review a number of critical areas to focus on in
developing your database log storage plan.
What to Store?
A critical question in designing the storage of logs into a database is “What to
store?” When using the database as the central repository and online tool for
daily log review and analysis, you will want to retain all the log entries and
log fields in the database. A number of syslog replacements in Chapter 15,
rsyslog and syslog-ng, come with pre-built database schemas and configura-
tion options to directly move syslog into database storage and store all the
fields of the syslog message. You may need to write your own utilities and
develop your own database schema for less common binary and application
logs to maintain your log data in the database. Good analysis and an effort to
retain all fields will avoid the situation in reviewing a critical system breach
and realizing that there is critical information missing to do a full analysis.
In many organizations, the disadvantages of using a database as the primary
log storage are too great from a log security or infrastructure perspective. It is
also possible that the volume of data cannot be supported by the database
infrastructure without impacting customers or other critical systems. A hybrid
storage approach may work best in these situations where the original log data
is retained on the source system or a centralized syslog server, but one or more
of the following is stored in the database to facilitate analysis and reporting
systems:
n Header Info—Typically includes the timestamp of an event and the
IP addresses involved in the event. Storage of this information alone

CHAPTER 4: Log Storage Technologies
80
is useful in building trending information to determine hosts that are
overreporting, underreporting, or linkages of event trends between
systems.
n Body—Typically the message of the event. Storage of this information
in a database system is useful in building a real-time alerting system. For
example, seeing the same failed login message in high frequency could be
queried and reported on quickly.
n Analysis and summary results—Custom scripts and tools may be in use
on each system to determine trends and summarize results. Storage of
this analysis in a central repository would ease reporting of event analysis
across the enterprise and ease the development of centralized auditing
and summary reports for an organization with lower overall database
storage and scalability requirements.
Fast Retrieval
After defining what will be stored, some analysis and review will need to be
done to optimize the database for fast retrieval of relevant data. A critical
item will be to define the columns in the database that will be used for daily
review or part of common queries for reporting and alerting. A recommended
approach when storing syslog data would be to create database indexes on
these common syslog fields:
n Priority—severity or relative importance of the message.
n Date and Time—indicate when an event occurred.
n Generating Host—system generating the event.
n Message—details on the event that occurred.
A recurring theme with log data is that the storage size will continue to grow.
Even in a database that is indexed and optimized for your queries, searching
over trillions and trillions of rows can become slow and cumbersome. Many
database systems support partitioning. Partitioning allows a logically single
database table to be split into smaller chunks. With log data, partitioning a
database table based on date and time is a logical approach and will provide
the following benefits:
n Improved data insertion speed as a smaller physical file will be appended
to and smaller index files are updated on each insertion.
n Query performance can be improved for some queries as small chunks of
data are reviewed and filtered by the database system.
n Bulk deletion can be accomplished by removing a data partition when a
set of log data is beyond the retention period. This dramatically improves
the destruction of log data over individual deletes in a single large
database.

Hadoop Log Storage 81
n Some systems allow seldom used partitions to be migrated to slower
cheaper storage options.
n Individual partitions can be taken offline for database maintenance. This
can allow the database to be maintained for optimal performance with-
out affecting the insertion of new log data.
Reporting
Organizations will typically need to generate reports off of log data to sup-
port the auditing and review of log data with external auditors and internal
stakeholders. Additional sets of reporting tables are usually necessary to allow
reports to be generated quickly and on demand. These tables should include
summary counts of key items relevant to the organization and can be cal-
culated by backend processes on a timed basis to speed front-end tool data
retrieval. Generating this information on the fly can take a significant amount
of time and changes to the reporting structure can be expensive. The follow-
ing are areas to consider generating summary reporting data on and should
be included as possible additions to the storage system to facilitate reporting:
n Analysis results—these are typically a combination of log entries that
indicate something interesting that needed to be reviewed or acted on.
n Number of events by severity per host—this can be useful in finding
attack patterns in an organization or pinpointing trouble areas quickly.
n Time-based summary counts—many organizations will need to have a
daily, weekly, or monthly report to share with the organization and rollup
summaries counts based on these time periods will automate and speed
up this reporting.
n Reporting based on network or device type—certain portions of your
network may require different reporting needs or fall under different com-
pliance frameworks. PCI is common use case where only payment card
processing segment of the network may have special reporting and audit-
ing needs. This requires additional reporting tables to support separate
auditing requirements.
HADOOP LOG STORAGE
Many of the challenges with a traditional database are the scalability of the
system as log data increases and spikes in activity require excess storage and
system capacity. Hadoop is a relatively new alternative to a traditional data-
base system. Traditional database systems are built utilizing fast high-end
hardware with fast SAN storage to support a large number of simultaneous
users and requests, and meet data storage needs. Hadoop systems by contrast
are typically built utilizing commodity PC Intel hardware running Linux and

CHAPTER 4: Log Storage Technologies
82
a few terabytes of local storage on each node of a cluster of machines with no
RAID. A Hadoop cluster consists of a few slave nodes and at least one master
node. Additional space and capacity can be added by simply adding another
node to the cluster. Companies like Yahoo and Facebook use Hadoop today
to support their applications with petabytes of information quickly being pro-
cessed and searched with end-user status updates and search queries.
Advantages
Hadoop shares many of the advantages of a traditional database system.
Hadoop allows for the quick retrieval and searching of log data rather than
using platform-specific query tools on each system. Hadoop scales well as data
size grows by distributing search requests to cluster nodes to quickly find, pro-
cess, and retrieve results. Hadoop is built primarily in Java and tools can be
developed for real-time viewing and analysis of log data. Hadoop stores data as
a structured set of flat files in Hadoop’s Distributed File System (HDFS) across
the nodes in the Hadoop cluster. This allows Hadoop to support faster data
insertion rates than traditional database systems. Hadoop is also fault tolerant
making multiple copies of data across the cluster nodes so if a single node fails
the data can still be retrieved from other nodes in the cluster.
Disadvantages
Hadoop is a powerful system for log storage, but has a number of shortcomings
that may impact your organization. There is currently limited direct support
for Hadoop by many of the existing logging tools. Rsyslog has recently added
the ability to write syslog messages to a Hadoop cluster, but for most other log
sources a tool will need to be developed to insert your log data into Hadoop.
The set of tools available to directly query and report on data in Hadoop is
also very limited. Organizations will need to develop and maintain custom
front-end systems for real-time analysis and review as few options already exist
to meet this need.
THE CLOUD AND HADOOP
Amazon has recently added a new offering called the Amazon Elastic MapRe-
duce (Amazon EMR). This system combines many services from Amazon’s
Elastic Compute Cloud (Amazon EC2) and Amazon Simple Storage Service
(Amazon S3) to provide an in the cloud Hadoop instance. This offering allows
organizations to pay for only the computing and storage options they need.
This option can be an alternative for organizations that do not want to build
and invest in an in-house instance of Hadoop. However, a careful evaluation
should be made in reviewing this as an option. Most notable the time to write

The Cloud and Hadoop 83
data to an in the cloud solution will be significantly higher as the data is no
longer in close proximity to many of the hosts generating logs. Also, organiza-
tions with long log retention periods may find that the costs are greater due to
the growing storage size and long-term storage period.
Getting Started with Amazon Elastic MapReduce
In the next sections, we will walk through a simple example of getting log data
into Amazon EMR, parsing the logs using Pig language MapReduce Job, evalu-
ating and reviewing the analysis output of this job. To go through these exam-
ples, you will need an Amazon Web Services (AWS) account. To get started,
sign up for an account at http://aws.amazon.com/.
Navigating the Amazon
To utilize Amazon EMR for log retention and analysis, we will be using several
services available from Amazon to load our data in the cloud, and to parse and
analyze it.
We will load our log data into the Amazon Simple Storage Service (S3) from
our individual servers. Amazon S3 is an online storage web service that allows
us to store an unlimited amount of data, at a cost of course, that is very scalable
and provides data security and redundancy. The data we upload into Amazon
S3 will be stored in named buckets. Buckets are a method in Amazon S3 that
allows us to create separate named data storage area for the data we upload.
Once we have uploaded our data into Amazon’s S3 storage, we will create
a MapReduce job to process our log data using the Hadoop Pig language.
MapReduce is the Hadoop framework for distributing the computational work
of processing large data sets into a set of jobs. Amazon EMR is the Amazon
in the cloud implementation of MapReduce that runs on the Amazon Web
Services (AWS) framework. We will write our MapReduce jobs utilizing Pig
AMAZON WEB SERVICES ACCOUNT
Charges and your account
The examples and steps illustrated in this section will incur charges to your Amazon Web Ser-
vices account. There will be charges for storage of log files uploaded to the Amazon S3 stor-
age buckets and compute costs for the execution time needed to process the logs in Amazon
EC2. The costs of running the examples will depend on the time you spend on the examples
and the amount of storage you use. For more details on Amazon Web Service pricing, review
the information at http://aws.amazon.com/pricing before running and experimenting with the
examples below.
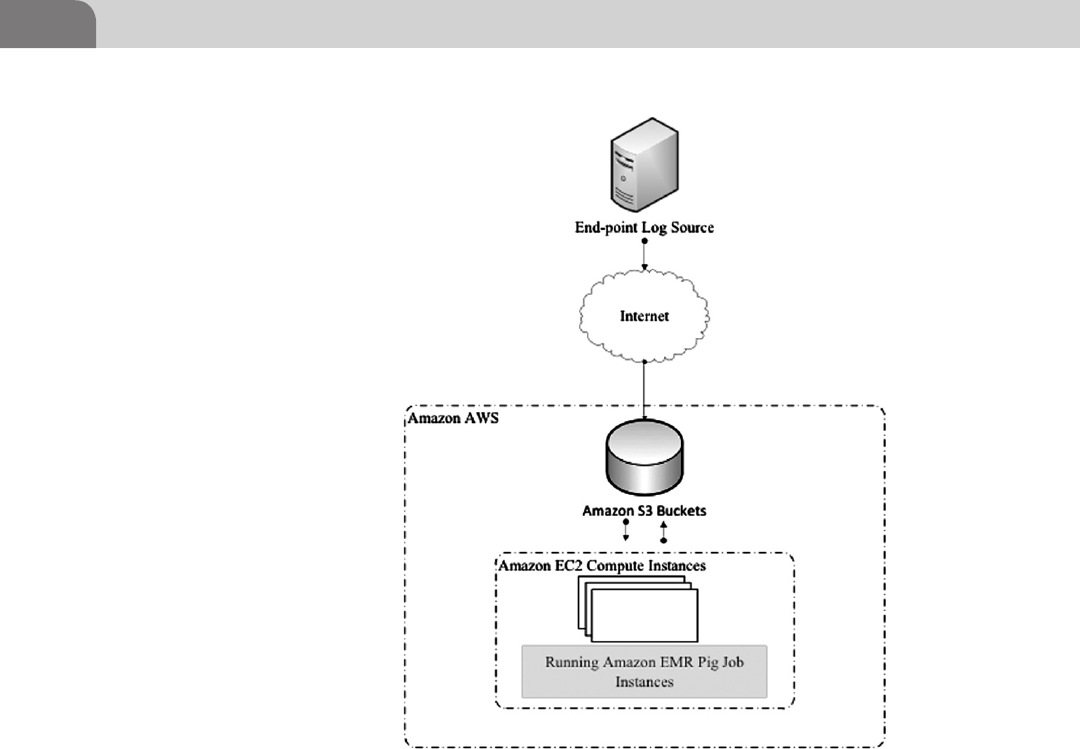
CHAPTER 4: Log Storage Technologies
84
and its Pig Latin job language for manipulating our log data. Pig is a utility
from the Apache project that is a subproject of Hadoop that aids in the cre-
ation of MapReduce programs utilizing its simple language Pig Latin. Amazon
EMR includes Pig to aid in processing the data we will upload to the S3 data
infrastructure. The high-level diagram in Figure 4.1 illustrates the flow of the
processes involved in our example.
Uploading Logs to Amazon Simple Storage Services (S3)
We will need to load our log data into Amazon S3 so that we can process the
data with our Pig script. There are numerous ways to get your data loaded into
Amazon S3 and Amazon provides an API for organizations that would like to
integrate Amazon S3 storage into their existing applications. For our example,
we will be using a third-party command line utility s3cmd.
FIGURE 4.1 High-Level Amazon Elastic MapReduce Log Processing Example

The Cloud and Hadoop 85
We will create a bucket in the Amazon S3 storage console named “apache-
accesslog-bucket.” This will be the storage location for our web server access
logs, pig parsing script, and the resulting reports. We create the storage bucket
and upload our Apache webserver access log via the following commands:
$ s3cmd mb s3://apache-accesslog-bucket
Bucket ‘s3://apache-accesslog-bucket/’ created
$ s3cmd put /var/log/httpd/access_log s3://apache-accesslog-bucket/
accesslog
/var/log/httpd/access_log -> s3://apache-accesslog-bucket/accesslog [1
of 1]
1203 of 1203 100% in 0s 1825.23 B/s done.
We now have our log data loaded in the cloud! We can review the log data we
have uploaded to Amazon in our S3 management console from https://con-
sole.aws.amazon.com/s3/home.
Figure 4.2 shows Apache access log loaded into Amazon S3.
This was a simple example of loading the data into Amazon’s S3 storage.
The s3cmd command line utility can be integrated into a logrotate script
FIGURE 4.2 Apache Access Log Loaded into Amazon S3
S3CMD AND AMAZON
Support for s3cmd
s3cmd is not an officially supported utility by Amazon and is currently in beta. For more infor-
mation about the utility and information on the setup, use, and configuration of it, visit the tool’s
website at http://s3tools.org/s3cmd

CHAPTER 4: Log Storage Technologies
86
like the one we discussed earlier in the chapter. This approach would help
automate the process of loading log information off of an end point server
to the Amazon cloud once a log file has been rotated. Amazon S3 does not
natively accept syslog feeds. However, Amazon does have an extensive API
to build your own utilities and in Chapter 15 we will discuss a syslog alter-
native, rsyslog, which has built-in support for Hadoop that can be used for
your own private Hadoop infrastructure and perhaps extended to Amazon
EMR.
Create a Pig Script to Analyze an Apache Access Log
We would like to parse our data and get useful intelligence about what is
going on in our environment. In web access logs, it is often useful to research
remote hosts that are generating a larger number of HTTP access errors. Access
and other HTTP errors have a status code of 400 or greater. We can create a
script in Pig’s language Pig Latin to parse our log we uploaded, and provide us
counts by IP address of all the remote hosts in the log generating these types
of errors. The following Pig script will perform the heavy lifting to generate us
a report:
--
-- setup piggyback functions. Useful pig function library
--
register file:/home/hadoop/lib/pig/piggybank.jar
DEFINE ApacheCommonLogLoader
org.apache.pig.piggybank.storage.apachelog.CommonLogLoader();
--
-- import log file and parse into individual components
--
logs = LOAD ‘$INPUT’ USING ApacheCommonLogLoader as (remoteHost,
hyphen, user, time, method, uri, protocol, statusCode,
responseSize);
--
-- Filter Apache GET requests from the log where the HTTP status code
is 400 or greater
--
logsfiltered = FILTER logs BY method == ‘GET’ AND statusCode >= 400;
--

The Cloud and Hadoop 87
-- Retrieve the remote host list that generated the HTTP errors
--
logsremoteaddr = FOREACH logsfiltered GENERATE remoteHost;
--
-- Group parsed information by the remote hosts performing GET requests
-- and create counts on the number of times the host generated an
error
--
groupedByRemote = GROUP logsremoteaddr BY remoteHost;
statusCounts = FOREACH groupedByRemote GENERATE group AS remoteHost,
COUNT(logsremoteaddr) AS numStatus;
--
--Store HTTP status error report to S3
--
STORE statusCounts INTO ‘$OUTPUT’;
In order to use this script, we will need to upload our Pig script to Amazon S3.
To follow along in later sections, upload the script to our Amazon S3 bucket at
s3://apache-accesslog-bucket/HttpStatusCodeReport.pig.
Processing Log Data in Amazon Elastic MapReduce
(EMR)
Now that we have our data loaded in Amazon S3 and our report script, we can
create an Amazon EMR job to process our log data. A new job can be created
from the Amazon EMR console at https://console.aws.amazon.com/elasticma-
preduce/home. From the Elastic MapReduce console, choose “Create New Job
Flow” to define a new job to process our Apache access log. We will create a job
called “Apache Log Parse Job” and utilize our own pig application to generate
a report.
LEARN MORE ABOUT PIG LATING
Pig Latin
To learn more about the Pig Latin language go to http://pig.apache.org/docs/r0.7.0/piglatin_
ref1.html.
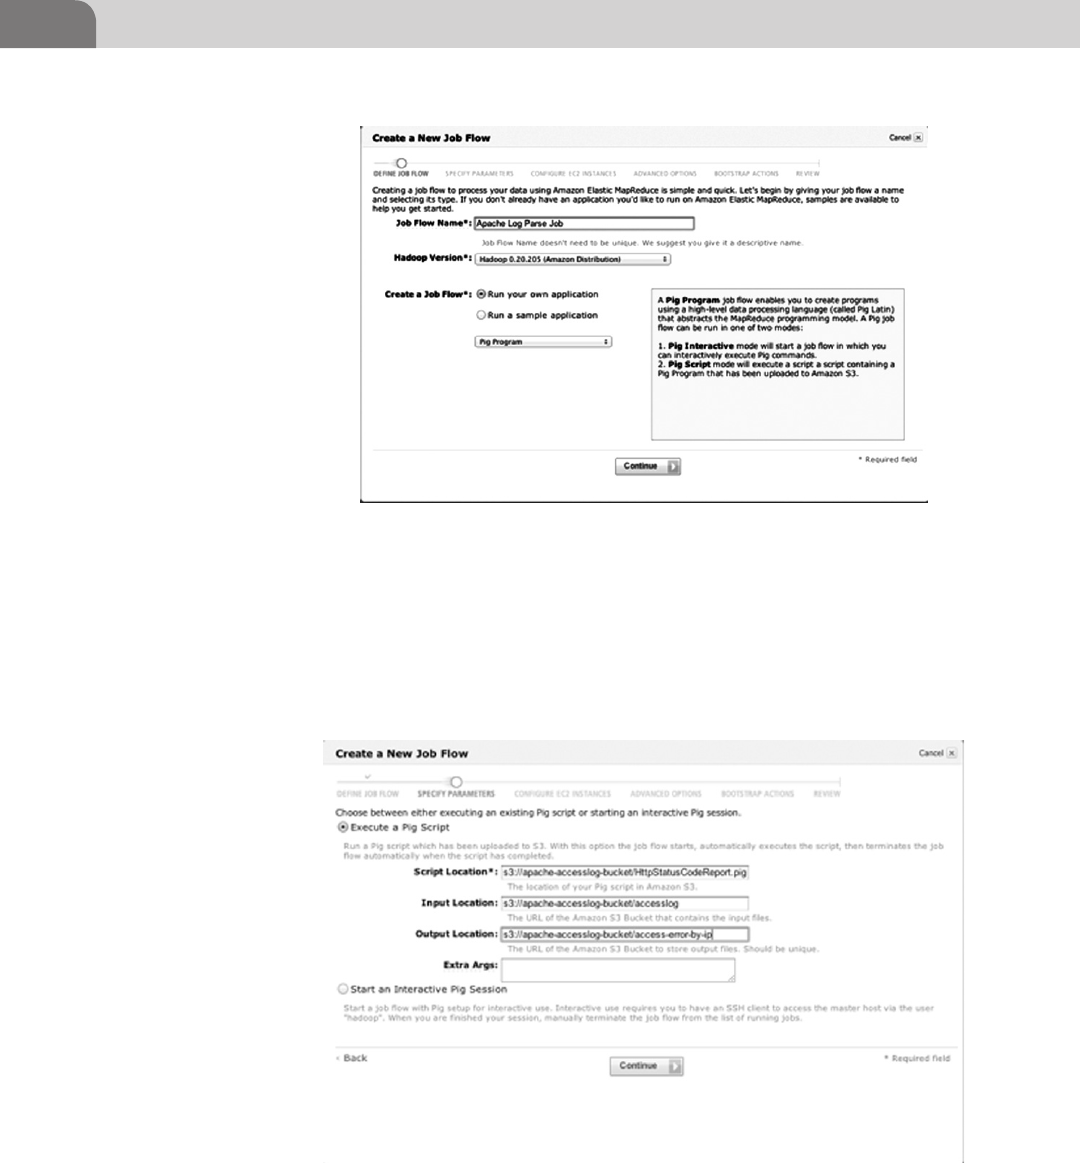
CHAPTER 4: Log Storage Technologies
88
Figure 4.3 shows how to create a new Amazon EMR Job Flow.
Next, we will use the pig script HttpStatusCodeReport.pig to process our log.
We set the parameters of the script to run, our log file to parse, and where we
would like our report to be stored.
Figure 4.4 shows how to configure the Amazon EMR Job Flow parameters.
FIGURE 4.4 Amazon EMR Job Flow parameters
FIGURE 4.3 Create a New Amazon EMR Job Flow

Log Data Retrieval and Archiving 89
In configuring our Amazon Elastic Compute (EC2) instances, we will configure
the lowest setting with only an instance count of one. For larger environments
processing gigabytes of logs, you will want to configure multiple jobs for the
different log types and multiple instances to keep up with the volume of logs
you receive on a daily basis. This will take some research and experimentation
for your environment, but fortunately Amazon EMR has the scalability and
flexibility to accommodate a wide range of computing needs. The remaining
settings we will leave at their defaults for this example. At the end, we will
choose “Create Job Flow” to create and start our processing of our access log.
Figure 4.5 shows a running Amazon EMR Job Flow instance.
After our Job Flow has completed, we have a report generated on Amazon S3
in a directory called “access-error-by-ip.” The log file uploaded for this example
generates the following report:
192.168.0.6 3
192.168.0.25 3
192.168.0.26 1
From the results, we can see remote host IP addresses 192.168.0.6, 192.168.0.25,
and 192.168.0.26 generated an HTTP status error and the number of times an
error occurred for each IP.
LOG DATA RETRIEVAL AND ARCHIVING
There are multiple options available for the physical storage of logs. A key in
reviewing each option will be the retrieval and access speed of each medium.
In general, the higher access speed options also have the highest cost. In log
FIGURE 4.5 Running Amazon EMR Job Flow Instance

CHAPTER 4: Log Storage Technologies
90
management we discuss online, near-line, and offline storage of logs and their
relative costs and access speed.
Online
Online log information is information that can be immediately accessed and
retrieved. This is typically the most expensive option, as dedicated hardware
must by powered on and available for immediate retrieval. Online storage can
be the physically attached disks to a server, a database system, or storage area
network (SAN) systems. Typical storage costs for online storage systems are
roughly $1.30 per gigabyte.
Near-line
Near-line storage is the in between state between online and offline storage.
Near-line systems typically do not require human intervention and data is
retrieved as part of an optical storage jukebox or robotic tape system. Access
times for this type of storage are typically high and can range from a few sec-
onds to a few minutes depending on the system. The costs vary widely for near-
line storage systems, but are typically half the cost of online storage options.
Near-line storage is also highly scalable by adding additional tapes or optical
disks to increase capacity.
Offline
Offline storage is the slowest and cheapest option. Offline systems typically
require human intervention to retrieve an optical disk or tape, and restore the
data onto online or near-line storage systems for data access. Offline storage is
highly scalable with the purchase of additional optical disks or tapes and sys-
tems are typically cheaper than near-line storage. The issue for both near-line
and offline storage will be the expected shelf life of the storage medium. The
generally accepted shelf life of a CD/DVD is roughly 2 to 5 years and roughly
the same life span for tape (National Archives). As you approach the end of the
media life span, you will need to rerecord data to media if you have a longer
retention policy than the life of the media.
SUMMARY
Log storage is an important consideration when it comes to logging. This chap-
ter introduced you to the concepts surrounding the storage of logs. Many exam-
ples were given, including an introduction to Amazon’s Hadoop interface.

91
References
REFERENCES
Chuvakin, A. (2011). SANS Sec434 Log Management Course Material, slide 108.
Kent, K., & Souppaya, M. (2006). Guide to computer security log management. <http://csrc.nist.
gov/publications/nistpubs/800-92/SP800-92.pdf>.
National Archives. Frequently asked questions (FAQs) about optical storage media: Storing tem-
porary records on CDs and DVDs. <http://www.archives.gov/records-mgmt/initiatives/temp-
opmedia-faq.html>.
PCI Security Standards Council (2010). PCI DSS v2.0. Retrieved July 7, 2012 from PCI Security
Standards, October. <https://www.pcisecuritystandards.org/documents/pci_dss_v2.pdf>.
Troan, E., & Brown, P (2002). logrotate. <http://linuxcommand.org/man_pages/logrotate8.html>.

This page is intentionally left blank

Logging and Log Management.
© 2013 Elsevier, Inc. All rights reserved.
http://dx.doi.org/10.1016/B978-1-59-749635-3.00005-1
93
CHAPTER 5
syslog-ng Case Study
CONTENTS
Introduction ...............93
Obtaining syslog-ng .93
What Is
syslog-ngsyslog-ng? .94
Example
Deployment ...............95
Configurations .................96
Log Sources.............................. 96
Local syslog-ng Server ............ 97
Global syslog-ng Server .......... 98
Database logging..................... 98
Troubleshooting
syslog-ng ...................99
Summary .................101
References ...............101
n Obtaining syslog-ng
n What Is syslog-ngsyslog-ng?
n Example Deployment
n Troubleshooting syslog-ng
INFORMATION IN THIS CHAPTER:
INTRODUCTION
You might be asking, “Why do I need a new or different syslog daemon?” That’s
a good question. For many years the standard syslog protocol found on Unix
systems was good enough for its purposes. As time went on, and the needs of
users, applications, systems, and organizations changed, it became clear that
something new was needed. syslog-ng began as an attempt to provide users
with more options and features than could be found in a stock syslog daemon.
It has grown over the years from open source software to a full-fledged, com-
mercial-grade software with varying levels of enterprise-level support options
available. This chapter will provide high-level details on some of its more use-
ful features, as well as a discussion of a real-world deployment. It should be
noted that syslog-ng comes in a free and enterprise edition. The enterprise edi-
tion is not free and it enables features that you cannot use with the free version.
OBTAINING SYSLOG-NG
The best place to obtain the latest version of syslog-ng for your particular
platform is to visit this Web site: http://www.balabit.com/network-security/
syslog-ng/opensource-logging-system/downloads/upgrade.
Providing step-by-step installation instructions is really beyond the scope of this
chapter. Earlier versions of syslog-ng required supplemental libraries and tools

CHAPTER 5: syslog-ng Case Study
94
installed. Today’s syslog-ng comes with everything bundled in a single download.
The syslog-ng Web site contains many sources of information to aid you in instal-
lation, setup and administration at http://www.balabit.com/network-security/
syslog-ng/opensource-logging-system/support/documentation/.
WHAT IS SYSLOG-NGSYSLOG-NG?
As we stressed before, classic syslog has multiple problems. For example, UDP is
used as the transport. UDP is unreliable. But sometimes a conscious decision is
made to forgo guaranteed delivery for the non-blocking and low-overhead nature
of UDP. It might be the case that this is more important to you than the features
of TCP, which do incur some overhead because of its connection-oriented nature.
Another issue is security. The standard Syslog protocol neither supports secure
transmission of log data, nor does it specify authentication.
syslog-ngsyslog-ng one of the options out there that attempts to solve many of
them without “changing the world.” To this end, some of the more noteworthy
syslog-ng features include:
n TCP support: This allows for more reliable transmission of syslog data.
n Transport Layer Security (TLS): syslog-ng natively supports the TLS
protocol. This feature allows for both the secure transmission of syslog
messages as well as mutual authentication of the source sender and the
recipient of syslog messages. These are critical features in today’s environ-
ments where log data must not be tampered and often has to be kept con-
fidential due to regulatory compliance issues, legal issues, etc. It should be
noted that TLS can only be used over TCP.
n Database support: syslog-ng supports sending syslog messages to a remote
database. As of version 3.3, MySQL, Oracle, MSSQL, PostgreSQL, and
SQLite 3 are supported. A major advantage to this feature is that it allows
for log data to be stored in a relational database. This makes reporting,
searching, and other analysis techniques very easy. The downside to this,
however, is that the raw log message is not preserved in the database. This
can have an impact on chain of custody if your log data is ever needed for
criminal prosecution.
n IPv4 and IPv6 support: syslog-ng supports sending and receiving syslog to
and from both types of networks.
n Flexible filtering: syslog-ng is able to filter on various fields in the syslog
message. Macros are created from what is filtered, which can be used to
write messages to files or directories.
n Message rewriting: It is possible to create rules to rewrite fields in a syslog
message. For example, you can supplement missing or incomplete data in
a message.

Example Deployment 95
n Processing the message body: syslog-ng allows you to process and parse
the actual log message. The current version of syslog-ng (3.3) can sepa-
rate the columns of CSV-formatted log messages, that is, columns sepa-
rated by commas, tabulators, or other delimiters, for example, Apache
logs.
n High performance: syslog-ng is geared towards handling high message
rates, and—of course, depending on the exact configuration and process-
ing requirements—can reliably handle hundreds of thousand messages
per second.
Let’s look brief example of one of the more advanced features of syslog-ng. It
can process the message using a fast and flexible pattern matching engine to
extract the useful information from the message body. For example, a login
message of an OpenSSH server looks like the following:
Accepted password for joe from 10.50.0.247 port 42156 ssh2.
This can be described with a syslog-ng pattern like:
Accepted @QSTRING:authentication_method: @ for @QSTRING:username:
@ from @QSTRING:client_address: @ port @NUMBER:port:@ @
QSTRING:protocol_version: @
As you can see, the changing parts of the log message are parsed using special
variables. The names assigned to the parsed message parts become syslog-ng
macros, and can be used in filters, file names, database column names, and so
on. The advantage of this pattern matching method over others (for example,
regular expressions) is that it is much faster, more scalable, and the patterns are
easier to read, understand, and maintain. It is also possible to trigger actions
if a log message matches a pattern: with some tweaking, this can be used to
send out alerts when specific events are detected. For a complete reference of
this feature, see chapter Processing message content with a pattern database in The
syslog-ng Administrator Guide.
These features and many other concepts are covered in detail in the 3.0 Adminis-
tration guide: http://www.balabit.com/sites/default/files/syslog-ng-v3.0-guide-
admin-en_0.pdf.
EXAMPLE DEPLOYMENT
In this example setup there are three components to the deployment:
1. Client machines which send syslog via UDP to local collection server. The
client machines are running stock syslog daemons.
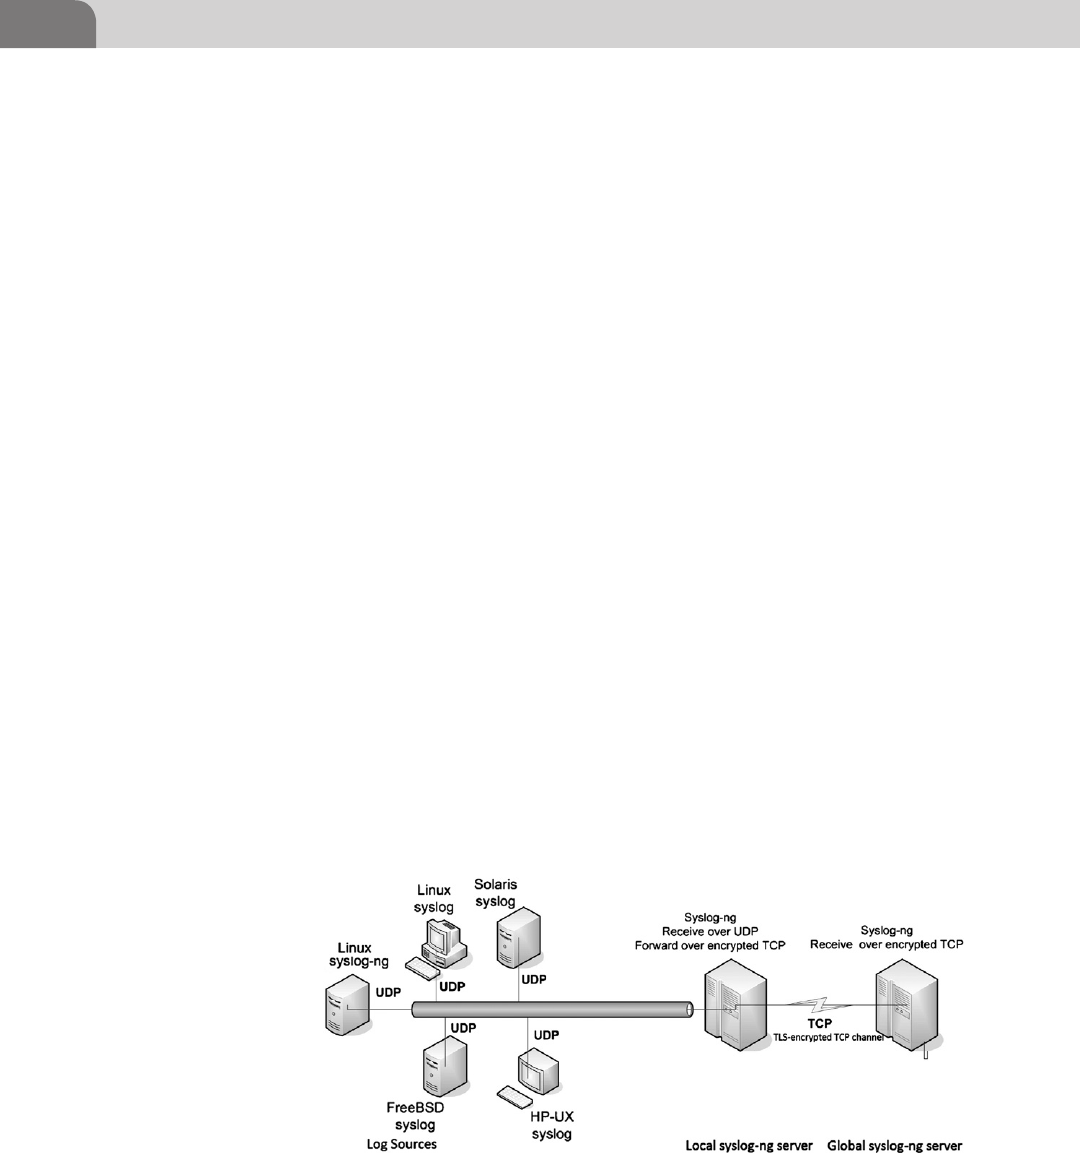
CHAPTER 5: syslog-ng Case Study
96
2. Local collection server which receives syslog from client machines. This
system is running syslog-ng.
3. Global collection server which receives logs from the local collection
server over TCP with TLS enabled.
Figure 5.1 depicts the deployment.
The local syslog-ng server will channel all the collected data to a remote site,
where another syslog-ng server is installed. Such a site might be the globally
centralization site, a backup “log drop” or some other environment, connected
to our syslog-ng collection server via a WAN. Due to this, log data transfer
needs to be protected by encryption. The easiest way to accomplish it will be
by using syslog-ng’s built-in TLS support.
So, after we deploy syslog-ng on both syslog-ng servers, it’s time to start config-
uring logging on all the systems.
Configurations
In this section we cover the basics required to configure our setup. A thorough
treatment of configuring syslog-ng is beyond the scope of this chapter; see the
syslog-ng Administration guide for complete details on using syslog-ng.
For consistency, we will refer to our central log server that collected logs over
UDP as 10.10.10.1 and the remote log server will be called 10.11.11.1. In this
scenario we will assume that all logs are being collected. In real life, filters can
be applied at multiple locations to curb the flood of data.
Log Sources
For modern Linux systems running vanilla syslog, we need just this line in /
etc/syslog.conf*.* @10.10.10.1
FIGURE 5.1 Shows Our Example Deployment

Example Deployment 97
Syslog daemon needs to be restarted; which is usually accomplished by
/etc/init.d/syslog restart
For older Solaris 7 or 8 systems, the changes are similar
*.debug @10.10.10.1
And then restart via:
/etc/init.d/syslog stop ; /etc/init.d/syslog start
For recent FreeBSD systems, the changes are similar.
For recent OpenBSD systems, the changes are similar to Linux:
*.* @10.10.10.1
And restart:
kill–SIGHUP 'cat /var/run/syslog.pid'
For HP-UX systems, the changes are:
*.debug @10.10.10.1
And restart.
Finally, syslog-ng needs the following configuration file implemented:
source src { unix-stream("/dev/log"); internal(); };
destination loghost { udp("10.10.10.1"); };
log { source(src); destination(loghost); };
In case of an existing syslog-ng configuration the above needs to be merged in. As
you can guess, the daemon (in the case, the syslog-ng daemon) needs a restart.
Local syslog-ng Server
This system will receive UDP messages from various sources and will forward
them over the TCP-based tunnel to the other machines. TLS is the best way to
accomplish this (Schroder, 2010). The following list outlines the basic steps
required in getting this feature working:
1. Create an X.509 certificate using a tool like openssl.
2. Copy the certificate to the local syslog-ng server.
3. Using a tool like openssl, create a hash file based on the X.509 certificate.
4. Create a TLS configuration statement which uses the following syslog-ng
configuration block.

CHAPTER 5: syslog-ng Case Study
98
destination demo_tls_destination {
tcp("10.11.11.1" port(6514)
tls(ca_dir("/opt/syslog-ng/etc/syslog-ng/ca.d"))); };
Section 3.13 of the 3.0 Administration guide provides more detail on these and
all features of syslog-ng.
Global syslog-ng Server
The global server will receive message encrypted using TLS. The basic steps to
configure it to receive such messages are as follows:
1. Copy the X.509 certificate to the server.
2. Copy the private key of the certificate to the server.
3. Configure the global server to receive encrypted log messages.
source demo_tls_source {
tcp(ip(0.0.0.0) port(6514)
tls(key_file("/opt/syslog-ng/etc/syslog-ng/key.d/syslog-ng.key")
cert_file("/opt/syslog-ng/etc/syslog-ng/cert.d/syslog-ng.cert"))
); };
Again, be sure to see Section 3.13 of the 3.0 Administration guide for more
details.
Database logging
The global syslog-ng forwards copies of the log messages it receives to a MySQL
database. The database serves as a structured and searchable store of what is
received from remote log collection points. The main advantage of this kind
of setup is that analysis and searching can be performed without impacting
remote systems, or needing to remotely log into these systems and search log
file by hand. A second advantage is that you have yet another place where log
data is stored. This can be ideal in situations where the global collection server
crashes or becomes unavailable.
The following is a sample syslog-ng configuration for MySQL:
options {
use_fqdn(yes);
};
destination d_sql {
sql(
type(mysql)
host("127.0.0.1") username("root") password("")
database("logs")

Troubleshooting syslog-ng 99
table("messages_${FULLHOST_FROM}_${R_YEAR}${R_MONTH}${R_DAY}")
columns("datetime", "host", "program", "pid", "message")
values("$R_DATE", "$FULLHOST_FROM", "$PROGRAM", "$PID",
"$MSGONLY")
indexes()
);
};
log {
destination(d_sql);
};
Some items are worth pointing out.
n The database name is logs.
n syslog-ng will automatically create a table named
messages_${FULLHOST_FROM}_${R_YEAR}${R_MONTH}${R_DAY},
which means each host that sends log messages will have its own set of
tables, segmented by the year, month, and day the log messages are sent.
n syslog-ng will also automatically create the columns for the table, namely
datetime, host, program, pid, and message. By default the SQL type used
for each column will text. You can override the default type.
n In the options section of the configuration, use_fqdn(yes); is speci-
fied. Without this option set and without DNS in use, the source of your
messages, which will be an IP address, would only record the first octet of
the IP address. With this option specified, the full IP address will be used
in the table name as well as the record itself.
Section 8.2.5 of the 3.0 Administration guide discusses this feature in great
detail.
TROUBLESHOOTING SYSLOG-NG
One the most important things to keep an eye on is when syslog-ng begins to
drop packets (Open Source Information Security, 2010). This can be an indica-
tor that your syslog-ng server is getting overloaded with incoming messages. In
order to keep any eye on this, you first need to enable stats collection in syslog-
ng. The following global configuration options are needed to control this:
options {
stats_freq(10);
stats_level(2);
};

CHAPTER 5: syslog-ng Case Study
100
The first statement turns on stats generation in the form of a syslog message.
The variable passed to the option is the number of seconds that syslog-ng will
write the message to whatever destination you have specified in your configu-
ration. Here we are emitting stats every 10 s. The second option specifies the
level. There are three levels, 1, 2, and 3. The default is 1, but in order to get the
particular data we need, we need to specify 2. The following is a sample stats
message generated by syslog-ng:
Nov 30 12:32:35 172 syslog-ng[1343]: Log statistics;
processed='source(s_net)=0', processed='src.file(s_local#2,/
proc/kmsg)=0', stamp='src.file(s_local#2,/proc/kmsg)=0',
processed='source(s_local)=1', processed='src.host(172)=1',
stamp='src.host(172)=1291138345', processed='src.udp(s_
net#0)=0', stamp='src.udp(s_net#0)=0', processed='src.
internal(s_local#0)=1', stamp='src.internal(s_
local#0)=1291138345', dropped='dst.file(d_messages#0,/
var/log/messages)=0', processed='dst.file(d_messages#0,/
var/log/messages)=1', stored='dst.file(d_messages#0,/
var/log/messages)=0', processed='center(received)=0',
processed='destination(d_messages)=1', processed='center(queu
ed)=0'
The item we are interested in is the dropped= item. It shows, for the given
destination, if it had to drop any messages. Each destination you have specified
in your configuration will be represented here.
There is a downside to enabling this feature. Per the syslog-ng manual, levels 2
and 3 can cause increased CPU and memory usage by the syslog-ng process. On
top of this, enabling these features requires a restart of syslog-ng, which may
not be feasible if you run in a highly available environment. There is an alter-
native way to detect if UDP packets are getting dropped: using the netstaty
command:
# netstat -us
Udp:
169412 packets received
170 packets to unknown port received.
0 packet receive errors
167002 packets sent
#
The output of this command shows if any UDP packets were dropped. This is
a simple but effective way to troubleshoot things.

101
References
SUMMARY
syslog-ng provides many advanced features which take log data transmission
and collection to a new level. With features like TCP transmission support,
TLS, and logging to a database, syslog-ng is an excellent replacement for the
stock Unix syslog daemons that are featureless and don’t provide much value.
The example deployment presented in this chapter provides a glimpse into a
real-world setup.
REFERENCES
Schroder, C. (n.d.). Build a secure logging server with syslog-ng (Part 2). EnterpriseNetworking-
Planet—News, trends and advice for network managers. N.p. Web. November 29, 2010. <http://
www.enterprisenetworkingplanet.com/netsysm/article.php/3598146/Build-a-Secure-Logging-
Server-with-syslog-ng-Part-2.htm>.
Open source information security: Syslog-NG performance tuning. Open Source Information Secu-
rity. N.p., n.d. Web. November 29, 2010. <http://15cards.blogspot.com/2007/11/syslog-ng-
performance-tuning.html>.

This page is intentionally left blank

Logging and Log Management.
© 2013 Elsevier, Inc. All rights reserved.
http://dx.doi.org/10.1016/B978-1-59-749635-3.00006-3
103
CHAPTER 6
Covert Logging
CONTENTS
Introduction .............103
Complete Stealthy
Log Setup ................105
Stealthy Log
Generation ......................105
Hiding Logging ...................... 105
Hiding Logging with
Misdirection ........................... 106
Stealthy Pickup of
Logs ................................106
IDS Log Source ...............106
Log Collection Server ....107
“Fake” Server or
Honeypot ........................109
Logging in
Honeypots ...............110
Honeynet’s Shell
Covert Keystroke
Logger .............................111
Honeynet’s Sebek2 Case
Study ...............................112
Covert Channels for
Logging Brief ..........113
Summary .................114
References ...............114
n Complete Stealthy Log Setup
n Logging in Honeypots
n Covert Channels for Logging Brief
INFORMATION IN THIS CHAPTER:
Evil can be covert
Can good be?
It can, for a reason
Haiku 8: Anton
INTRODUCTION
While common sense and various regulations compel us to focus on protect-
ing logs from various attacks, one of the protection methods that we can use
is making the log files and logging infrastructure hidden from the attackers,
who seek to undermine it. Encryption, secure agent-based log collection and
integrity checking are useful (and, in many cases, also mandatory), hiding your
logging and log collection architecture from the attacker has a unique appeal
of “winning the battle” for secure logging without firing a single shot. After
all, encryptions and other measures will be your fallback mechanism, if an
attacker discovers that he is being covertly logged. However, years of running
honeypots and even whole networks of them—honeynets—leads the chapter
author to believe that it is unlikely for most attackers. Such cover infrastructure
is one rare case in security technology where the defender might actually score
an advantage.

CHAPTER 6: Covert Logging
104
This section covers this specific methodology. It is singled out due to its impor-
tance, ability to be combined with other techniques, its use in honeypots as
well as a number of myths surrounding hidden logging.
The idea of stealthy logging is certainly appealing, especially if it is sometimes
interpreted like this: why secure, encrypt and protect log collection components
if we can just hide them from the would-be attackers and they will be completely
immune. Others, on the other hand, play the “security by obscurity” argument and
say that hiding logging is futile, since the attackers can always find it. As usual, both
extreme points of view are the farthest from the truth.
For it to become clear, let us briefly digress a bit and explain why “security by
obscurity” is considered to be bad security. First, “security by obscurity” should
really be known as “security by obscurity ONLY.” If your protective measures
are solely reliant on attackers’ not knowing some critical piece of information
about your infrastructure, said security measure, security technology in use, etc.
what happens if they do learn it?
Security wall comes thumbing down! On the other hand, security of the envi-
ronment can be significantly enhanced by hiding important information from
plain view, but still not relying on them being secret. The trivial example is:
what if your computers are not connected to the internet and armed guards are
posted next to each terminal. Does it mean that you have to use Post-It notes
to “broadcast” your password? No, it still makes sense to keep them secret even
though their disclosure will no break your security.
Similarly, hiding the pieces of your logging infrastructure help to improve secu-
rity of your otherwise solid security measures such as hardened log servers,
cryptographic tunneling, and trusted access controls.
Now, let’s review what logs can we hide and where. We will start from an
insightful example of “hidden” logging encountered and then utilized by one
of the authors early in his security career. It worked surprisingly well for the
task at hand.
It is well known that an amateur attacker breaking into Unix and Linux sys-
tems will first kill the syslog daemon to prevent logging from being accumu-
lated locally and sent to a remote log server. This will be done by something
similar to “killall syslogd” command. So, in this small company network, the
system administrator has compiled another copy of a syslog daemon, named
it “cachefd” (or some other similarly obscure, “Unix-sounding” process name)
and let it run using a configuration file in his home directory. This file con-
figured log files to be accumulated in some non-standard directory (such as,
for example, an obscure /usr/src/kernel). Thus, the amateur attackers (who
were perceived to be the main threat to this particular company—and, as we
know, to most companies nowadays as well) were effectively prevented from

Complete Stealthy Log Setup 105
terminating logging. Admittedly, such scheme relies on the company actually
looking at the log files and having a periodic log review or near-real-time log
monitoring capability.
Now, advanced security practitioners (authors included) may laugh at such
“secure logging,” but amateur attackers observed in honeypots never went
beyond killing the syslog daemon and never looked for any other logging
mechanisms, hidden or otherwise. Thus, the above measure would have been
in fact 100% effective…
We will start our journey into hidden logging from a classic example of a
stealthy sniffer for syslog pickup. It is used by one of the authors in the hon-
eynet and was also reported to be effectively used in production environments
as well (see, for example, Bauer, 2002).
COMPLETE STEALTHY LOG SETUP
In this section we will discuss a complete stealthy log setup using syslog and
log pickup using a sniffer. We’ll cover log generation, transfer, and pick up.
Stealthy Log Generation
Stealthy log generation presents a challenge since it is that very likely that the
program producing logs will reside on a compromised information asset. Pick-
ing logs via packet capture is nearly always stealthy, but generation of logs is
harder to hide.
In general, there are two options that they can exploit:
n Hide logging altogether.
n Hide logging and present a fake logging daemon for the attacker to kill
and feel good about.
Obviously, there are other techniques as well such as making a log daemon
unkillable logging via kernel privileges.
Hiding Logging
Hidden daemons via kernel capabilities or a dedicated loadable kernel module
(LKM) on Unix and Linux is well known. Essentially, we are talking about a
rootkit for logging. There are two additional choices:
n A separate hiding module or a general-purpose hiding program that can
obscure other running processes (such as our logging). Most root kits
work using this principle.
n A dedicated hidden login module. Honeynet Project Sebek tool works on
this method, even though it can also hide other programs.

CHAPTER 6: Covert Logging
106
Finally it should be noted that if an attacker deploys a rootkit based on similar
principles it might interfere with our log hiding.
Hiding Logging with Misdirection
If we utilized the above techniques but also leave default logging infrastructure
in place—for the attacker to kill—it is very likely that most attackers will not
beat further and would assume that there is no more login going on.
This simply requires creating a separate instance of syslog connecting it to the
infrastructure (see next section) and then leaving the default one in place, with
some functionality is able so that it does not interfere with real logging.
Stealthy Pickup of Logs
Here is how one can set up a somewhat covert pickup of NIDS, firewall, or other
syslog-based logs. We will use a sniffer to pick up the logs on the log server.
First, what do we protect? This method will defend against attacks on the cen-
tral log collection servers by hiding their identity or even redirecting the wrath
of the attacker onto a different server of our choosing (possibly, a “log server”
honeypot, configured to log and analyze attacks aimed at log servers). Used
in combination with the above stealthy logging, it can also defend against the
attacks on local logging capabilities.
The main idea is that we will not be using a listening daemon to pick-up User
Datagram Protocol (UDP)-based syslogs, but use a sniffer off a stealth interface
(i.e. one with no IP configured) instead. In combination with some other tricks,
it will allow us to deflect the interest of the attacker away from the valuable log
collection server. Now, in light of our description of “security by obscurity,” it
does not mean that the log server should not be hardened to the best of our
ability and protected against unauthorized access and malicious attacks.
Let’s consider what we should configure on each of the above:
IDS Log Source
Here we will configure the destination for syslog-based logs. We will need to
forward the logs somewhere; instead of sending them to the collection server
we will send them to either the “fake” server or to a random IP address on our
network (that has no host sitting on it)—or, better, a honeypot.
If we are sending the system logs or other logs we will modify the standard /
etc/syslog.conf file, such as by adding:
*.* @fakeserver

Complete Stealthy Log Setup 107
Where ‘fakeserver’ stands for the name or IP address of our decoy server (hope-
fully, it will have of a telltale name). Or:
*.* @10.10.10.10
where “10.10.10.10” is an IP on the same LAN segment which has no host on it.
The above will likely work only on Linux and modern BSD variants. On older
Solaris systems we will need to specify message priorities (which cannot be a
wildcard, like on Linux) like:
*.crit @fakeserver
In case of a popular Snort IDS running on Unix or Linux as a fake logging
source, the above recipe works as the alert forwarding is performed by a syslog
daemon and not by Snort. The same trick can be performed on a commercial
Sourcefire Snort appliance, for as long as syslog is the mechanism of choice.
In case of a Snort IDS running on Windows (not really common but still seen
in some environments) as a fake logging source, we will modify its own con-
figuration file snort.conf wherever it is located. It will be edited to have:
output alert_syslog: host=10.10.10.10, LOG_AUTH LOG_ALERT
Thus, the configuration on a log server will be no different from the normal.
However, should the attacker want to attack the log server upon compromising
this system or an IDS sensor, it will be redirected down the wrong track or, in
fact, “the right track” for us to study their behavior…
Log Collection Server
This is where most of the important changes occur. Here we will pick up the
logs off the network by using a sniffer program. There are several choices to
make here. First is: should this server have an IP address? If it has two network
cards (the ideal choice) we can make one a management interface (with an IP
address) while the other will be the sniffing interface (with no IP address, but a
sniffer program running on it). This configuration provides the best combina-
tion of manageability and security. We will describe such a configuration here.
On the management interface we will configure access controls via a firewall
(such as Linux iptables, a standard firewall code included in every Linux sys-
tem). This interface will have some remote access service running (ssh is the
standard for Unix remote management).
On a sniffing interface with no IP address (often called a stealth interface),
we install the sniffer program. There are many choices, here but the main one
boils down to: should we use a general-purpose sniffer (such as tcpdump

CHAPTER 6: Covert Logging
108
packet sniffer) to pick up the logs off the wire and then extract them from the
recorded traffic manually or use a purpose-built sniffer.
The drawbacks of the former are numerous. We will need some mechanism to
extract logs from capture traffic and convert them back to some standard format
such as syslog and then combine them with other logs. Also, such sniffer will record
data in binary format and we will need to convert it to text before we can analyze
it. However, many popular sniffers are well audited for security flaws and might
provide a better solution to be exposed to a hostile network. One might argue
about the word “exposed” here, since there is seemingly no way for an attacker to
know that there is sniffing going on and thus attack it. Unfortunately, the truth
is different. Exploits against sniffers running on stealth interfaces are known and
even tcpdump, the grand-daddy of all sniffers, has not escaped this fate.
Using a dedicated log sniffer allows for easy integration with other logging
infrastructure pieces. For example, we can pick up the syslog logs off the wire
and immediately send them to another system, such as an analysis server.
We will discuss two such logging solutions: plog (written by Marcus Ranum a
few years ago) and passlogd (written by Christian Void). Plog can be obtained
at http://www.ranum.com/security/computer_security/code/ and passlogd can
be downloaded from http://freecode.com/projects/passlogd.
Plog is a tool to sniff the traffic for syslog messages and forward them to /dev/
log (a syslog devices used for application to forward messages to a syslog dae-
mon running on a Unix system).
While we try to stay away from rephrasing manuals and listing command line
options, we will make an exception for these important tools. Here is an exam-
ple of plog in action on the honeynet system:
# ./plog –i eth1
The above command line starts the plog (it forks and becomes a daemon pro-
cess) and makes it sniff the eth1 network interface for syslog-formatted mes-
sages on UDP port 514 directed toward any system. The downside of the above
configuration is that the messages will appear to originate from the system
running plog and not from the actual source of the messages on the network.
It is used to pick up logs emitted from the honeypot victim server onto the
LAN. The messages are aimed at the other system that is not even equipped
with a syslog daemon. This is done to confuse the attacker!
Passlogd is a similar tool that can be used for the same purpose. The main dif-
ferences lie in having more options and an added ability to associate messages
with sources and destinations as captured on the wire. For example:
Mon May 5 14:22:42 2001 baby to mama: <23> su[821]: Authentication
succeeded for user ’anton’

Complete Stealthy Log Setup 109
Before using passlogd one should keep in mind that the versions before 0.1e
have serious bug that can be exploited even on the sniffing stealth interface
(just as we hinted above). Not only is the vulnerability known, but the working
exploit is actually posted publicly.
Here is how a modified passlogd sniffer program was used by one of the
authors on the honeynet:
$ passlogd […]
The above command captured all the syslog messages sent from the victim server
in the honeypot to another system (which had to syslog daemon installed).
Both can be setup on the log collection server to sniff logs and immediately
send them somewhere else or integrate with other collected log files.
One more important comment needs to be made about sending logs to non-
existing servers. For the UDP packet to be sent, the sending server needs to hear
a response from some server on the network that it is willing to receive IP con-
nection. Since this is accomplished via ARP (Address Resolution Protocol, that
maps IP to MAC hardware addresses), a little ARP spoofing is in order. This is
how it can be done:
# arp -s 00-05-00-e5-8a-28 10.10.10.10
The above command needs to be run on the server that runs the sniffer, but the
MAC address can belong to any machine on the network. IP address does not
even have to exist on the network.
“Fake” Server or Honeypot
This particular server is not required for the setup, but it is a very good idea to
have it. The reason is that if the attacker will see that there is no server listening
for the logs, there has to be something “funny” going on and that security of
this environment is much stronger than initially suspected (on the other hand,
an amateur attacker might thing that the syslog server crashed or was miscon-
figured by the administrators.)
There are several options for this server. It can have a minimum secure syslog
daemon running and nothing else. In this can it may or may not be configured
for actual log pickup, but its real purpose will be to provide a extremely hard-
ened target to waste attackers resources.
The second option is to set up a full-blown honeypot on this IP address. That
sounds like a good idea since the advanced attackers have a chance of being
stuck in its “honey” after compromising the system sending logs to it. Guide-
lines on setting up honeypots go beyond this book. Look at the references sec-
tion for some books with information on the subject. In this chapter we will
address some honeypots logging issues, but not the detailed setup guidelines.

CHAPTER 6: Covert Logging
110
LOGGING IN HONEYPOTS
While the references in the end provide a lot of material on the honeypots, we
will provide some brief definition and background.
A honeypot is a “dummy” target machine set up to observe hacker attacks. A
honeynet is a network built around such dummy machines in order to lure
and track hackers as they step through the attack process. By studying real-
world attacks, researchers hope to predict emerging trends in order to develop
advance defenses. Lance Spitzner, the founder of one such tracking endeavor
known as the Honeynet Project (http://www.honeynet.org), defines a hon-
eypot as “a security resource whose value lies in being probed, attacked or
compromised.” The Honeynet Project, that one of the authors works with,
differentiates between research and production honeypots. The former are
focused on gaining intelligence about attackers and their techniques, while the
latter are aimed at decreasing the risk to IT resources and providing advance
warning of incoming attacks on the network infrastructure as well as possibly
diverting attacks from real “crown jewels.”
As we mentioned above, honeypots are the environment where logs are the
most likely to be attacked, corrupted, and prevented. And it is also the environ-
ment where protecting logs by hiding the logging technology makes the most
sense as other honeynet infrastructure is also hidden from the attacker. On
the other hand, the environment has added difficulties as well since we need
to log much more details on the honeypot activities than in most production
environments.
What do we log in the honeypot?
1. Network transaction recording
2. Network traffic recording
3. Host activity recording
4. IDS alerts
Let’s briefly look at the above log types.
Network transaction recording in a honeypot includes network layers 3 and
4 data such as source and destination IP addresses, protocols, and ports. This
data is usually capture by a honeynet’s firewall and a network monitoring tools
(such as flow collector) as well as a network IDS. Network transactions include
inbound communication and connection attempts from the Internet, internal
connections between the machines within the honeynet, and the most omi-
nous outbound communications initiated from the honeypot.
Network traffic recording logs can be considered an exclusive feature of hon-
eypots as compared to production networks, as very few can afford to log all

Logging in Honeypots 111
the packets traversing the network. It includes a complete recording of network
communication in raw binary format.
Host activity recording includes the recording of the attacker’s activities (such
as keystrokes and attacker’s impact on the system) as well as other host process
activities, occurring at the same time (standard application and operating sys-
tem logs files).
IDS alerts, the last log category emanating from a honeypot, are the main
method of becoming aware of what is going on in the honeypot. They add
structure to network traffic analysis and allow you to take action based on what
is going on in the honeypot.
Obviously, all the above logs need to be protected.
First, we need to make sure that the events occurring on the honeypot are logged
even after system standard non-stealthy logging capabilities are destroyed by
the attacker. As we mentioned before, in most Unix honeynet compromises the
attackers kills the logging daemon as one of his first actions.
Honeynet’s Shell Covert Keystroke Logger
A simple example of honeypot logger is a Honeynet Project’s bash shell patch,
improved by one of the authors. It can be downloaded from the Honeynet
Project tool pages http://www.honeynet.org/tools/index.html.
The tool allows to log the keystrokes typed in a “bash” shell prompt (the most
important to capture on the honeypot since they show what the attacker did
on the system) and to transfer them from the honeypot to a collection server.
For those from the Windows part of the world, “bash” shell is the standard
command line interpreter on most Linux systems and is the main mechanism
used by remote (and many local) users to interact with the system.
Since we are discussing covert logging we will focus on the covert properties of
this tool. The main protection it can muster against the honeypot “guest” or
attacker is that its presence is hidden. Amateur attackers who are caught in the
honeypots usually do not suspect that the very system shell is working against
them. They usually disable history logging and think that their keystrokes are
not saved anywhere.
Bash shell forwards the commands to a remote machine directly via the UDP
protocol without utilizing any host programs. The bash binary itself contains
a UDP sender, which sends the packets to the wire. UDP communication is
ideally suitable for the covert log transfer task at hand (to remind, UDP is
also used by a standard syslog logger). UDP is somewhat harder to detect
than Transmission Control Protocol (TCP) (for example, UDP communi-
cation will not always show in netstat), does not require “root” privileges

CHAPTER 6: Covert Logging
112
(unlike more esoteric covert data transmission methods such as Internet
Control Message Protocol (ICMP) payloads or connectionless TCP data
transfer discussed in the works on network covert channels), and thus can
be used straight by the shell binary run by the attacker, even if he does not
possess “root” privileges.
Another protection of this logging channel is “destination spoofing”
(described above). UDP destination is hardcoded to be a non-relevant server
or even another honeypot, as described above. Note that this spoofing does
not refer to the usual IP spoofing (that can be called “source spoofing”), but
just sending the UDP datagrams to non-existent or non-listening hosts and
picking them up via a sniffer. This allows you to mask the position of the
receiving log server. This is possible since UDP protocol is connectionless and
the log packets can be sent to a machine that does not explicitly choose to
accept them.
Here is the example bash log:
T=17:19:15-12222004. PI=11354 UI=0 ./dumbscan –B 10.11
The format includes time and date of the command execution (17:19 am on
December 22, 2004 in the above example), UNIX process ID of the shell (it
can be used to track different shell sessions), the UNIX user ID (0 means that
the user is “root”), and the executed command. “./dumbscan –B 10.11” (an
attempt to scan a B class of IP addresses from 10.11.0.0 to 10.11.255.255 for
whatever exploit).
This covert logger can also be used to monitor users in production environments.
The stealthiness of such logging mechanism is not that high, since it can be
easily sniffed by the attacker on the honeypot. Also, it can be detected by look-
ing at the “bash” shell binary. To resolve these problems, Honeynet Project
came up with Sebek2 covert logger, briefly covered in the next section.
Honeynet’s Sebek2 Case Study
Sebek by the Honeynet Project (http://www.honeynet.org/papers/sebek.pdf) is
the best example of a covert logger. It has facilities for both covert audit collec-
tion and log information transfer from the source systems to the log collection
server. Sebek2 can be obtained at the Honeynet project’s tools’ page, referenced
above.
It can collect much more information, including keystrokes entered in appli-
cations as well as entered passwords. What is more interesting for us in this
chapter is its protection measures, presenting the ultimate in stealthy logging
(this side of “white hat–black hat divide,” of course).

Covert Channels for Logging Brief 113
These are the protections available in Sebek2 (as of 12/2004):
n Hidden process: Sebek2 doesn’t modify any program on the system, but
exists as a hidden kernel module. It can also exist in a compiled-in form,
embedded in the main kernel code during compilation, presenting the
extra-stealthy option.
n Hidden content: unlike the bash shell above, Sebek2 encrypt all the data
transmitted off the system, using SSL.
n Sniffing protection: Sebek modifies the kernel to block its packets from
being sniffed by the honeypot. Thus, even the rare attacker who tries to
monitor the local network will now know that he is being watched.
For more details on Sebek architecture and use refer to the whitepaper “Know
Your Enemy: Sebek” located at http://www.honeynet.org/papers/sebek.pdf.
Sebek can be used in production environments for user and potential intruder
activity monitoring in a highly clandestine manner. There are several benefits
for that type of hidden logging in a production environment. Those include an
obvious bonus to forensics analysis (a lot of evidence is available) and an abil-
ity to watch trusted users (such as system administrators). The latter comes very
handy when the possibility of audit destruction by a trusted attacker is high.
On the other hand, the main disadvantage is a sheer volume of logged data.
Such logging is much more detailed and granular than most standard auditing
system mechanisms.
COVERT CHANNELS FOR LOGGING BRIEF
Going beyond Sebek places us firmly in the realm of covert channels, an excit-
ing area but the one likely outside the scope of this book. We will briefly dis-
cuss the modern covert channels and their use for logging.
The classic notion of “covert channels” (first formalized in the “Light Pink Book”
from the NSA Rainbow Series) is all but irrelevant today. The more modern
instances of covert channels deal with covert information transfer using basic
TCP/IP protocols as well as common application protocols. Admittedly, the
protocols from lower layers (such as CDP mentioned below) can also be used.
For example, many of the fields in the TCP (also UDP) and IP headers are
somewhat undefined (e.g. The type of service (TOS)/Explicit Congestion Noti-
fication (ECN)TOS/ECN field), unset (padding), set to random values (like the
initial sequence number), set to varied values (IP ID), or are optional (such as
options). This very important fact creates possibilities for covertly adding the
information to transmit without breaking the TCP/IP standard (and thus los-
ing the packet) and making the packet appear anomalous (and thus triggering

CHAPTER 6: Covert Logging
114
the detection systems). Also, many of the higher layer protocols, such as HTTP
can be configured to carry data (such as via the HTTP tunnel tool) that is used
to channel a shell session through a sequence of web accesses.
More specifically, there are tools to transfer data, possibly log data, over Cisco
Discovery Protocol (CDP)—a non-routable protocol that is used for network
device communication.
Where one might choose to use such degree of stealth for logging? Honeynets
or closely monitored production servers in high-security environments are two
possibilities.
SUMMARY
This sectioned covered the covert and stealthy logging. It can be used to enhance
the protection of logging infrastructure in addition (to avoid being “security by
obscurity”) to other security measures.
The important lessons of this chapter are:
n Stealthy logging tools can be used for beneficial purposes.
n Honeypots are an environment where stealthy logging is usually found.
n Stealthy logging can ultimately be discovered, that is why it should not be
the only protection available.
REFERENCES
A guide to understanding covert channel analysis of trusted systems (ncsc-tg-030 version-1, “Light
Pink Book”) <http://www.fas.org/irp/nsa/rainbow/tg030.htm>, National Computer Security
Center, November 1993.
Bauer, M. (2002). Stealthful sniffing, intrusion detection and logging. <http://www.linuxjournal.
com/article/6222>.
Honeynet Project (2004). Know Your Enemy. (2nd ed.). AWL.
Know Your Enemy: Sebek <http://www.honeynet.org/papers/sebek.pdf>.
Spitzner, L. (xxxx). Honeypots: tracking hackers.

Logging and Log Management.
© 2013 Elsevier, Inc. All rights reserved.
http://dx.doi.org/10.1016/B978-1-59-749635-3.00007-5
115
CHAPTER 7
Analysis Goals, Planning, and Preparation:
What Are We Looking For?
CONTENTS
Introduction .............115
Goals ........................115
Past Bad Things .............115
Future Bad Things,
Never Before Seen
Things, and All But the
Known Good Things ......117
Planning ..................117
Accuracy .........................117
Integrity ..........................118
Confidence .....................119
Preservation ...................119
Sanitization.....................120
Normalization ................. 120
Challenges with
Time ................................121
Preparation ..............122
Separating Log
Messages ........................122
Parsing ............................122
Data Reduction ..............122
Data Compression ................. 123
Data De-duplication .............. 123
After Hours Data
Transmission .......................... 124
Summary .................125
n Goals
n Planning
n Preparation
INFORMATION IN THIS CHAPTER:
INTRODUCTION
So far we’ve covered the basics of what log data is, log data architectures, cen-
tralized logging, log retention, and a few other topics. Now it’s time to get into
log analysis. But before we can start talking about techniques and approaches,
we need to set some groundwork for what it takes to get to the point where you
can actually begin analyzing log data. This chapter will cover three important
topics: Goals, Planning, and Preparation. Log analysis goals are, as the name
implies, the goals of what you want to accomplish via log analysis. Planning is
the next step in the process of getting to log analysis. We plan out our approach
to log analysis. Finally we will cover Preparation. This deals with preparing
your log data and environment to handle the activity of log analysis.
GOALS
The goals of analysis can be varied depending on your particular needs. If you
are a banking institution you will have different goals from those of a restau-
rant chain. There are however a set of higher level goals which can apply to
mostly everyone.
Past Bad Things
The primary goal is to be cognizant of things which have already happened
and be able to alert on them. This section provides sample past bad things.

116 CH APT ER 7 : Analysis Goals, Planning, and Preparation: What Are We Looking for?
Creating New User (Windows):
EvntSLog:423: [AUS] Fri Oct 05 11:59:09 2001: HANDCUFFS/Security
(624) - "User Account Created: New Account Name: tbird New Domain:
HANDCUFFS New Account ID: S-1-5-21-1647595427-22557637-1039276024-
1001 Caller User Name: Administrator Caller Domain: HANDCUFFS Caller
Logon ID: (0x0,0x2B79) Privileges- "
EvntSLog:424: [AUS] Fri Oct 05 11:59:09 2001: HANDCUFFS/Security
(626) - "User Account Enabled: Target Account Name: tbird Target
Domain: HANDCUFFS Target Account ID: S-1-5-21-1647595427-22557637-
1039276024-1001 Caller User Name: Administrator Caller Domain:
HANDCUFFS Caller Logon ID: (0x0,0x2B79) "
EvntSLog:425: [AUS] Fri Oct 05 11:59:09 2001: HANDCUFFS/Security (628)
- "User Account password set: Target Account Name: tbird Target
Domain: HANDCUFFS Target Account ID: S-1-5-21-1647595427-22557637-
1039276024-1001 Caller User Name: Administrator Caller Domain:
HANDCUFFS Caller Logon ID: (0x0,0x2B79) "
SSH CRS-32 Attack:
sshd[6169]: fatal: Local: Corrupted check bytes on input.
sshd[6253]: fatal: Local: crc32 compensation attack: network attack
detected
sendmail Exploits:
Jul 21 01:25:49 ariel sendmail[308]: BAA00307: to=lamarbroc@delphi.
com, ctladdr=":/bin/mail root@ariel.sdsc.edu </etc/passwd",
delay=00:00:34, mailer=smtp, relay=bos1h.delphi.com. (192.80.63.8),
stat=Sent (Ok.)
Jul 21 01:35:40 ariel sendmail[545]: setsender: "/bin/mail root@
ariel.sdsc.edu </etc/passwd": invalid or unparseable, received from
[205.133.101.5]
Jul 21 13:13:04 ariel sendmail[784]: NAA00783: to=\tsutomu,
ctladdr=tsutomu@ariel.sdsc.edu, delay=00:03:09, mailer=local,
stat=Sent
Cisco IOS Change:
%SYS-5-CONFIG: Configured from host1-config by rcp from 172.16.101.101
FW-1 MAD Port Scan:
Feb 26 17:47:28 host.example.com root: 26Feb2001 17:47:28 accept
localhost >daemon useralert product MAD proto ip src elendil dst
host additionals: attack=blocked_connection_port_scanning
Chapter 9 will show you how correlation can be used to tackle this problem
with ease.

Planning 117
Future Bad Things, Never Before Seen Things,
and All But the Known Good Things
Aside from being able to recognize things that are known bad things, you will
want to be able to detect things that you don’t know about, have never seen
before, or are outside of what you already know about. Why is this critical? As
attackers evolve their techniques, normal means of detecting outside-the-norm
behavior, e.g. looking at your log data for things you know about, will eventu-
ally become the attacker’s way into your environment. This sort of analysis is
generally not easily accomplished by manual review of logs. It requires more
sophisticated techniques. Chapter 11 discusses using data mining techniques
while Chapter 10 shows how statistical analysis can be used to identify things
you have never seen, among other things.
PLANNING
Requirements for log analysis systems are as critical as what your goals are.
If you don’t understand the key concepts in planning an analysis system,
you will sort of be lost. This section will focus on higher level concerns
about the planning of a system. These concerns will serve as a blueprint of
sorts which you can refer to when logging at commercial and open source
solutions, managed security providers, or even if you want to build your
own system.
Accuracy
Accuracy is the cornerstone of any logging system. But what exactly are the
implications on a logging system? Accuracy, quite frankly, is ensuring that
any log data received, processed, archived, etc. is free from defects or mislead-
ing information in any way. In other words, the data that received is what
you or your logging systems intended it to be. One issue is that of false posi-
tives. Intrusion Detection Systems (IDS) are one source of false positives. For
example, an IDS may report malicious traffic that either isn’t malicious or may
not represent a true vulnerability on the target system. One solution to this
would be for the IDS to consult a vulnerability database to cross reference pos-
sible malicious behavior. Further yet, your IDS could also implement a policy
scheme whereby user and group profiles are used to create acceptable network
usage of individuals.
Cutting down on false positives can help keep clutter down to a minimum.
Obviously if you are consuming log data from vendors, you have almost no
control over what is transmitted. But in the event that you are planning to write
a custom logging system, keep in mind that, much like human conversations
and interactions, it is often useful to keep things brief and to the point.

CH APT ER 7 : Analysis Goals, Planning, and Preparation: What Are We Looking for?
118
One final area regarding accuracy involves the notion of timestamps. A time-
stamp is the date and time that some event occurred. Almost every security
application on the planet uses timestamps. Furthermore, most of these appli-
cations send along a timestamp with any log messages they forward upstream.
The problem is that different vendors use differing formats. Some use a UNIX
epoch, while others either use a standard formatted string for date and time
or, worse yet, make up their own. The main standard with regard to time-
stamps is the ISO 8601 standard. An example ISO 8601 timestamp follows:
2004-07-21T11:44:44+00:00
The format is YYYY-MM-DDTHH:MM:SS.SSS+/−H. There is a literal “T” in
the timestamp in order to delineate between the date and time. The +/− is an
offset for GMT. Additionally, RFC 3339 defines date and time formats for use
on the Internet.
Finally, here are a few samples of log timestamps from various systems:
n Fri Aug 31 15:44:13 2007
n 10/Jul/2006:00:02:20 −0400
n Jan 11 10:36:21
n 10/21/2005 11:11:38
n 2004-08-06 10:32:53
n 12/2/2003,3:29:05 PM
n 07-06-200400:00:49
n <time offset=”0” timeZone=”GMT”>1041880724715825000</time>
As you can see, log timestamp formats are a real problem. Sadly, you will most
likely have to deal with timestamps in formats like this.
Integrity
Integrity deals with trusting the source, and sometimes the content, of log
messages. If you are relying on log data from commercial log data, then you are
at the mercy of the vendor. Some vendors get it. For example, some commer-
cial products already make use of the Secure Sockets Layer (SSL) to not only
authenticate clients and servers, but also for encryption of data itself. Other
vendors rely on plain-old syslog or making use of the SNMP. Sure, the latest
version of SNMP (version 3) makes allowances for security and encryption, but
many vendors do not support it as of yet. In the event that you are relying on
a vendor’s insecure log data, you can use something like STunnel (http://www.
stunnel.org). STunnel is a generic application (written in C) that allows you to
forward and receive any type of data over an SSL tunnel. It does come in handy
when you need secure communication but either don’t have control over the
data itself, or you don’t have time to figure out a particular SSL API.

Planning 119
Yet another solution is to send data in clear, but make use of dedicated net-
work links which you know are free from prying eyes and hands. This is an
expensive proposition, however, since you may already have network links
that are multi use. Obviously you can’t use these links for sensitive data
transmission.
One last tidbit of information regarding integrity deals with digital signatures.
If you digitally sign your log data, you can be assured that it is authentic. Some
regulatory bodies may require this level of integrity within your system, if log
data ends up being used as evidence in a criminal investigation.
Confidence
We are reminded of the scene from the movie War Games where, just as Joshua
tried to convince NORAD that nuclear destruction was fast approaching, an
operator at some console announces over a loudspeaker that confidence was
high. Confidence has to do with how sure you are that what happened, or is
happening, is an actual event worth caring about. Some products attempt to do
this by placing a priority or severity on a given event. This conceptual notion
might be in the form of high, medium, or low, or it may be a sliding scale from
0 to 99. Many Cisco devices, for example, use a scale of 0 through 7.
Confidence in reality goes a bit deeper than a simple priority scheme. True
confidence is derived from knowing all you can about your network and infra-
structure. SIEM systems are useful in this regard. The SIEM marketplace is one
that is fairly new and ever evolving. SIEMs are typically enterprise applications
that sit atop all the security devices in a network. This includes, but is not lim-
ited to, firewalls, IDSes, vulnerability scanners, databases, and applications. All
these systems feed into the SIEM, where the SIEM can either use statistical algo-
rithms to analyze log data or allow an operator to create custom rules that look
for specific patterns in the log data. The benefit of creating custom rules is that
it allows for an abstraction of a potential security threat to be caught based on
heterogeneous log data. (firewalls and IDSes for example). This is at the heart
of confidence: the taking inputs from many areas (often disjoint) and deriving
a more mature (and accurate) fact from the set of all inputs.
Preservation
Preservation is the idea that log data should not be altered in any way what-
soever. This is a must if you ever plan to use a piece of log data to prosecute
malicious actions. For example, many security device vendors provide their
own notion of the type of potential attack, e.g. a firewall drop, an IDS port
sweep, and so forth. It is critical this information not get altered at all during
any point of the log system receipt, processing, analysis and archival.

CH APT ER 7 : Analysis Goals, Planning, and Preparation: What Are We Looking for?
120
The argument has been made time and time again that some vendors classify
events poorly. Some savvy network security engineer may feel that she knows
best and wants to rename a given event’s type description from that of the
vendor supplied one, which the engineer is confident is more expressive of the
“real” intrusion, threat, breach, etc. The motive is pure, however the method
may not be. In this scenario, the engineer should have a log system that allows
for this mapping to occur independent of the original data.
Sanitization
Confidentiality of log data can sometimes be a concern when dealing with log
systems. For example, you may have user account information or IP addresses
that you don’t want transmitted over a network link. Or possibly you are
transmitting logs to a third-party vendor and you want to keep certain things
private. There are two main techniques for log sanitization. The first is to detect
and either replace or remove the entries you want sanitized. For example, and
IP address of 10.0.3.4 may become xxx.xxx.xxx.xxx. This alerts someone view-
ing the sanitized log entry that there was an IP address in the log file. The other
technique is based on a scheme where the removed log data can be recon-
structed at some later point. For example, the sanitized information may be
extracted and placed into a secure file.
Normalization
Normalization, as it pertains to log and analysis systems, is an interesting topic.
What we are now concerned with is normalizing vendor data into a format we
as security and network analysts can manipulate, report on, etc. In other words
we are concerned with creating a well-known log event format. Many security
vendors choose their own logging format regardless if Syslog or SNMP is used.
To make matters worse, some vendors choose to provide a proprietary software
development kit (SDK) to access their application’s internal data formats. This
can be a real problem mainly when you actually want to process log messages
to extract pieces of data like IP addresses and port information. Normalization,
sometimes referred to as unification, is essentially the act of mapping many
different vendors’ log data format to one that is well known, i.e. one that you
have come up with.
As we saw in Chapter 4, defining a logical scheme for storing data is one piece
of the normalization puzzle. By coming up with a data schema which meets
the needs of your application or organization, you can easily map almost any
vendor’s log event data, no matter how verbose or unwieldy, to your own. This
makes things like forensic mining and historical searching much easier since
you know the format of the data up front. Chapter 9 expands on this topic by
discussing parsing and normalization.

Planning 121
Challenges with Time
Our final topic in the planning section is that of time synchronization. Time
is a very critical component of investigation after the fact. Logs can show with
exact certainty that something happened. Here are some challenges with time
and log data:
n Completely false timestamp in logs—a dead battery or another hardware
failure is a common reason for seeing time stamps that have no connection
to reality whatsoever.
n It’s always 5PM somewhere: which time zone are your logs in? Many log
files will contain no time zone in the logs themselves; one needs to take
care of noting down in which time zone the logging system was located.
n Are you in drift? Your clock might be—admittedly NTP clock drift cause
time deviations at the order of seconds, but even this might change the
sequence of events (e.g. did he launched an attack first or did he try to
login first—thus seeing the login banner?) Using UTC time on all systems
might resolve this issue.
n Syslog forwarder mysteries: his time vs. my time—less common
more likely in the future as people adopt buffering syslog servers
(such as syslog-ng or commercial systems that can store-and-
forward logs). In this case, one needs to make sure that a syslog mes-
sage contains the time of the event and not the time of the delayed log
transmission.
n So, which one is right? Systems with two timestamps! Some of the
systems will have more than one timestamp and one will possess a high
degree of certainty about which is the time of the event.
n If something got logged at 5:17AM, when did it happen? Log lag is real as
well, especially for logging processes or programs execution. For example,
some systems will log the process execution when the program terminates
or exits and not when it is launched.
n 5:17 in logs, sadly, may mean 5:17AM or 5:17PM (17:17). Some older
systems make that mistake.
n Finally, can you trust your NTP time source? Do you have an SLA with the
time provider? The answer to this is likely “no.” This is admittedly very
esoteric but needs to be at least considered briefly.
Here are some rules of thumb to abide by to mitigate these challenges.
n NTP religiously; run a time server that synchronizes with a guaranteed
time server (e.g. time.nist.gov).
n Implement time synchronization across all the logging systems with the
above NTP server.
n Note down the time zone when receiving and centralizing logs (make
sure to use EST, EST, PDT, or GMT+/−N format).

CH APT ER 7 : Analysis Goals, Planning, and Preparation: What Are We Looking for?
122
n If timing mechanism fails and you end up with January 1970, you can try
to use other logs to correlate—however, justifying the timing procedure in
court will be an uphill battle.
n To account for log lag mentioned above—know the system that logs!
n For higher levels of assurance investigate trusted time protocols (look up
ANSI X9.95:2005).
PREPARATION
Our final topic is that of preparation. Preparation deals with gearing up to get
down, so to speak. Here we want to make sure we have prepared our environ-
ment and log data so we can not only analyze it, but store it, report on it, etc.
Separating Log Messages
If you can separate your log messages by host and then by service, this can
make analysis much easier. It can also make the following tasks much easier,
too:
Develop a set of unique patterns: Easier to do if you separate messages by
service.
Identify the “variables” in each pattern: Type and range.
Check for false positives (in pattern matches) and corrupt data.
Storing patterns: Can be a flat text file, database, etc.
Parsing
Parsing deals with taking a raw log message and extracting feature informa-
tion from it. These features include the source of the log message, timestamp
of when the log occurred, source and destination IP information, user infor-
mation, etc. This allows you to gain a greater understanding of your log data
because you can work with the piece parts of the log message for detailed
analysis, reporting and so on. Chapter 9 goes into detail about parsing and the
concepts surrounding it.
Data Reduction
It is important to understand data reduction techniques in order to not only
efficiently transmit log data from its source to an intermediate processing
server, but to also store the data efficiently as well. Some of these techniques,
however, do come at a price. Some impact the CPU performance of the source
host system, receiving host system, or both. The gains had by some of these
techniques sometimes outweights the system impact. If you are able to send

Preparation 123
less data over your network, i.e. you utilize less bandwidth, which could be a
gain if you have limits of how much data you can transmit over your network.
Data Compression
Data compression deals with taking a sting of bytes and compressing it down
to a smaller set of bytes, whereby it takes either less bandwidth to transmit
the string or to store it to disk. The compressed string is then re-inflated by
the receiving side or application. The downside is that there is a performance
impact on both the sender and receiver when the data has to be compressed
and then inflated on the other end.
There are two ways in which compression can be applied to log analysis. One
is when we transmit our normalized events from the log aggregator to the pro-
cessing server for analysis and/or archival. The other way to use compression is
at the database level. This is largely a function of what your particular database
vendor supports.
Data De-duplication
In the normal course of log data collection, duplicate event data is often
received. Technically speaking, the notion of duplicate event data almost never
applies to security log data. What you end up with is the same sort of event that
has some variable characteristic. For example, let’s say an attacker is port scan-
ning hosts on your network. For each of these probe attempts, your IDS will
more than likely create separate events. The event type may be the same (port
sweep or some such type), but the attacker’s source IP address and port may
differ for each event, especially if spoofing is employed, but the destination IP
address (the attacked host) will be the same for each event.
Security log events fall into two main categories: those which are informational
and those which are of real operational and/or tactical value. Informational
messages are things like system start up or shut down. Operational or tactical
log data are events reported from your IDS, firewall and such. SSH login failure
attempts, for example, are of particular operational interest.
The goal is to come up with a unique identifier for an event which will allow
for seemingly disparate events to be lumped together logically into a single
event, differentiated only by a count of how many times the event in question.
This count allows hundreds and thousands of events to occur with a single
event representing all occurrences. This saves a tremendous amount of space.
There are several pieces of information in log data which can help you with
de-duplication. They are:
n Source of the Log Event (IDS, FW, etc.)
n Source IP Address

CH APT ER 7 : Analysis Goals, Planning, and Preparation: What Are We Looking for?
124
n Source Port
n Destination IP Address
n Destination Port.
Source of the Log Event: The source of the log event is the device, software,
etc. which generated the event. This has several implications. Many security
products are moving toward management server architecture. This means that
instead of every device reporting individually to a log server, each device will
report to a management system which forwards events to the log server on
behalf of one or more devices. This is a more efficient and scalable way for
vendors to transmit log events to third-party receivers. The downside is that,
whether SNMP or Syslog is used, the physical source of the log event is the
management server, i.e. the IP address of the management server will be what
we see in the Syslog message. In order to identify the sensor which actually
generated the event, the management server will place the origin of the event
inside the log message it emits to the log server. Note that we are using the
term sensor in a general sense; a sensor could be a firewall, IDS and so forth.
Now, much like the non-standardization of event log formats, the format of
the origin field is vendor specific. It may be the IP address or hostname of the
sensor, or it could be some unique identifier. This is a fact to be aware of when
you may want to use the source of the log event as part of your de-duplication
uniqueness key.
Source IP Address: The source IP address is from where the attack originated. In
practice, this is not enough to guarantee uniqueness. This is due mainly to the
fact that attackers may spoof one or more source IP address.
Source Port: The source port is the randomly created port of the origin of the
source system. Again, due to spoofing this is generally not reliable enough for
de-duplication.
Destination IP Address: The destination IP address is the IP of the target system.
This is generally the one thing that will remain static during the duration of an
attack. This is a good candidate to aid in our de-duplication efforts.
Destination Port: In the event that a port scan attack is happening, the IDS
will report many different ports for the same destination IP address. For
many attacks, there will be one destination IP address and one destination
port. Destination port is a somewhat good candidate for inclusion into our
de-duplication process.
After Hours Data Transmission
This topic is not technically a data reduction technique, but it does bare men-
tion in this chapter. This technique works well for transmission from your
aggregator to the main/analysis server. The basic principal is that you determine

Preparation 125
a time of day to transmit events for which you don’t necessarily wish to have
analyzed, but you do want to archive the data. For example, if you have very
strict firewall rules in place, you may not care about seeing or analyzing firewall
accepts, permits, and so on, but you still have a need to archive all of these
events. With after-hours transmission, you could send these firewall events at
some time, say 3AM, when network traffic is at a minimum. Also not analyzing
these events on your server can reduce the load and leave CPU cycles available
for events of a more dire nature to be dealt with.
The steps to accomplish this technique are quite straightforward. First, you
need to have a way to detect and segregate the log messages you wish to trans-
mit at a later time. This can be done via using built-in facilities in syslog-ng
or whatever your system supports. These messages need to be kept on the log
aggregation point, but stored in a place where they can’t impact the coming-
and-going of higher priority events. Second, a date and/or time will need to be
declared in order to define when events should be transmitted. Finally, when
the time comes, transmit events to the main server for analysis and/or archival.
You will also need to a way to communicate to the server that these events are
not to be analyzed; it doesn’t always make sense to process these events if you
are transmitting them at some later date and time. It should be noted that if
your particular log analysis tool doesn’t support this concept, you might have
to create your own solution using scp, rsync, or some other tool.
One issue to be aware of is that if you allow for time ranges to be specified, e.g.
3AM to 4AM, you may have the situation where an hour is not enough time
to transmit all the segregated event data. You now must make a decision: do
you stop sending the events, or do you keep going regardless of the time, until
all the events are sent? It really depends on your particular requirements, or
simply what your gut tells you is the right thing to do.
SUMMARY
Before log analysis can commence, you need to make sure you have your
ducks in a row. This includes setting your goals, planning your log analysis
system, and preparing your log data for analysis. The remaining chapters in
this book will go into more detail on many of the concepts introduced in this
chapter.

This page is intentionally left blank

Logging and Log Management.
© 2013 Elsevier, Inc. All rights reserved.
http://dx.doi.org/10.1016/B978-1-59-749635-3.00008-7
127
CHAPTER 8
Simple Analysis Techniques
CONTENTS
Introduction .............127
Line by Line: Road
to Despair ................127
Simple Log
Viewers ....................129
Real-Time Review ..........129
Historical Log Review ...130
Simple Log
Manipulation ..................131
Log Parser and Log Parser
Lizard: A Better Way to Sift
Through Windows Logs ........ 132
Limitations of
Manual Log
Review .....................134
Responding to
the Results of
Analysis ...................135
Acting on Critical
Logs ................................135
Acting on Summaries
of Non-Critical Logs .......137
Developing an Action
Plan .................................138
Automated Actions........140
Examples .................140
Incident Response
Scenario ..........................140
Routine Log Review ......141
Summary .................142
References ...............143
n Line by Line: Road to Despair
n Simple Log Viewers
n Limitations of Manual Log Review
n Responding to the Results of Analysis
n Examples
INFORMATION IN THIS CHAPTER:
INTRODUCTION
Manually reading logs should be reserved as a punishment in the appropri-
ate circle of Hell. However, lacking good, automated tools, one will always
fall back to manual review, thus we are reviewing it in this chapter. Having a
firm foundation in the basics will serve you well. Additionally we will provide
insight into responding to the results of log analysis.
But why do we perform log analysis? Here are some of the reasons:
n Compliance and Regulatory Concerns.
n Situational Awareness on Your Network.
n Infrastructure ROI.
n Measuring Security.
n Incident Response.
LINE BY LINE: ROAD TO DESPAIR
As we are starting up with a subject of manual analysis, let’s try to go through
a log file from a Nokia IPSO platform (a variant of BSD Unix) that is used for
a Checkpoint Firewall-1, line by line, as a beginner system administrator or a
security analyst just to get a feel for the process:

CHAPTER 8: Simple Analysis Techniques
128
Mar 25 15:56:42 cp41 [LOG_NOTICE] xpand[370]: Sending trap request
(to default addresses)..
Mar 25 15:56:42 cp41 [LOG_NOTICE] xpand[370]: Trap sent
Mar 25 15:56:42 cp41 [LOG_NOTICE] xpand[370]: Configuration changed
from 172.16.10.55 by user admin for page /opt/syswatch/templates/
configuration
Mar 25 15:57:00 cp41 [LOG_INFO] /USR/SBIN/CRON[18212]: (root) CMD
(/etc/hourly 2>&1 >>/var/log/hourly)
Mar 25 15:58:11 cp41 [LOG_NOTICE] xpand[370]: Configuration changed
from localhost by user admin
Mar 25 15:58:24 cp41 [LOG_INFO] sshd-x[16837]: Generating new 768 bit
RSA key.
Mar 25 15:58:25 cp41 [LOG_INFO] sshd-x[16837]: RSA key generation
complete.
Mar 25 15:59:05 cp41 [LOG_INFO] sshd-x[18383]: Accepted publickey for
ROOT from 172.16.10.55 port 36710 ssh2
Let’s quickly analyze the log file now:
1. OK, so the first line indicates sending of an SNMP trap. Looks perfectly
normal.
2. Second, same thing, looks like a success status that a trap was sent.
3. Next, looks like some configuration change done by “admin” from an IP
address 172.16.10.55. Might or might not be normal, depends upon what
else we know.
4. The next line indicates that a process was run from cron, a facility to run
programs periodically in the background. This looks normal.
5. Line five is also a configuration change, although unattributed to a specific
user, can’t tell whether it’s important, but looks like IPSO considers it a
low priority.
6. Next two messages are related to a routine activity by a sshd remote access
daemon, that regenerates the encryption key every predefined time period.
To be ignored.
7. The last of our batch indicates that the “root” has connected from the
same IP that we observed the above change from. This might be normal,
unless the previous configuration change was by itself malicious.
Aren’t you getting frustrated? And we just analyzed about 3 min from the life
of this specific computer systems; just eight lines of logs or 762 bytes. Now,
imagine that we had a month of logs from this busy system. We will be talk-
ing about gigabytes and millions of lines of logs. Suddenly, a manual reviews
sounds like a deeply troubled process. Indeed, manual log review doesn’t scale,
to put it mildly. However, we will still fall back to it in some circumstance, such
as lacking tools or needing a quick glance on something very specific.

Simple Log Viewers 129
As an additional complication, we were familiar with this log format and had
general environment knowledge of Unix, IPSO, etc. Often the analyst will have
to learn all that from scratch. As we pointed out in earlier chapters, binary
and other non-readable format will also complicate the situation significantly.
Thus, logs might be hard to read as well as hard to understand, which hampers
manual analysis.
SIMPLE LOG VIEWERS
Let’s now look at some simple viewers in Unix and Windows and how they help.
Real-Time Review
On most Unix and Linux flavors, there are several tools that can assist with log
analysis. Some of them help with real-time log viewing, while others help with
reviewing historical logs.
We will start from the classic:
# tail –f /var/log/messages
This command will show the last lines in the standard Unix messages file and
the new lines that appear after the command is launched. This is by far the sim-
plest real-time log viewer, albeit the least useful in most circumstances. How-
ever, it is quite handy if all that is needed is a look at the system log records as
they appear, for example, during a new program test or a daemon crash.
The above command may be enhanced with filtering by using the standard
Unix string matching utility—grep:
# tail –f /var/log/messages | grep sshd
This command will only show messages produced by the secure shell daemon,
such as:
Dec 12 17:31:56 ns1 sshd[4095]: refused connect from 80.92.67.68
Dec 12 17:37:34 ns1 sshd[484]: Generating new 768 bit RSA key.
Dec 12 17:37:34 ns1 sshd[484]: RSA key generation complete.
To further enhance the above real-time log viewing, we can throw in a tee com-
mand that will help us to look at the data as well as send it to a file:
# tail –f /var/log/messages | grep sshd | tee file-of-latest-sshd-logs.
txt

CHAPTER 8: Simple Analysis Techniques
130
This command shows log lines will also be recorded to a file “file-of-latest-
sshd-logs.txt.”
For the fans of less, they can use this Unix command in wait mode to perform
the same feat:
# less /var/log/messages
Now, press “F” for the less to go into the “tail” mode and show the latest and
newly arriving data.
In Windows environment, a bundled Event Viewer can be run to monitor
newly arriving log records in each of the three logs. It will be covered in the
next section on simple historical log viewers.
Historical Log Review
Now that we mentioned less, we can start talking about looking at stored logs.
Obviously, any text editor on your platform of choice can be used to look at
the plain text logs. There is one caveat however! Some log files are very large, as
we mentioned before. Thus, not every text editor will handle them efficiently
(if at all). Just try loading a 1 GB file in Windows notepad (without success) and
you’d get the point. Other editors will work, but operation will be extremely
slow. Thus, you’d want to have something lightweight, but, on the other hand,
with search and other useful features.
On Unix, more and less utilities usually fit the bill. They can handle large files (giga-
byte sizes) as well as have search. Following our policy not to rephrase manual
pages, we refer the reader to the output of a man command on his or her Unix/
Linux system. Typing man more and man less will show the information. Some-
times, more details help can be obtained by an info command, such as:
$ info less
On Windows, the only bundled tool is an Event Viewer. Here we will mention
that it allows perusing the three standard Windows logs (Application, Systems,
and Security), waiting for new events and displaying them as they arrive (by
clicking “Refresh”), as well as filtering and sorting. Figure 8.1 shows the viewer.
As described,1 some of the more interesting features of the Windows 7 Event
Viewer include:
n Working with individual events as XML.
n Subscribing to events on remote machines using event subscriptions.
n Saving filters as custom views.
1 http://www.razorleaf.com/2009/11/event-viewer-top-5/.
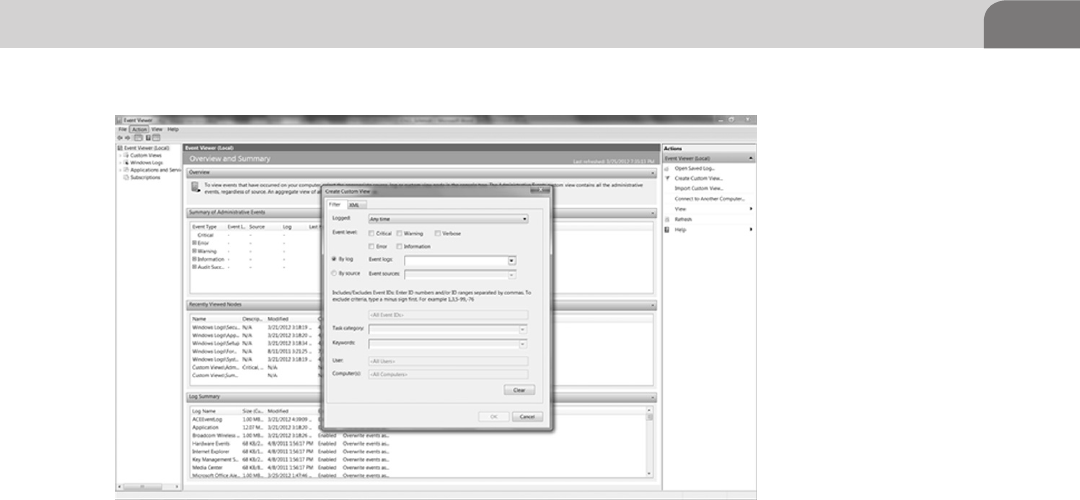
Simple Log Viewers 131
n Logging your own custom events in the application log.
n Running a task in response to an event.
The above tools will show you logs, but most likely you will start wishing for
more right away. Can we filter for that? Summarize like this? Slightly change
format? This is where some tools will help.
Simple Log Manipulation
We will start from Unix, since it has more tools for that purpose, and will go
to Windows afterwards.
We established that we can look at logs in real time on Unix using tail and less
and use many of the file viewing tools (such as cat, more, or less) for looking at
stored files.
Let’s first summarize what are we aiming at while using the simple tools and
then we will show how to do it:
1. Log filtering: We want to only see specific stuff.
2. Log reformatting: Modifying the way we see it.
3. Log summarization: Seeing a condensed view.
As we mentioned above, grep in combination with tail allows for simple filter-
ing. Grep can also help with more advanced filtering on large log files. Here is
a scatter of examples of common log filtering tasks with grep:
# grep –ev 'ssh|telnet' /var/log/messages
FIGURE 8.1 Windows 7 Event Log Viewer

CHAPTER 8: Simple Analysis Techniques
132
See all messages with the exception of those containing ssh and telnet:
| # grep –f patterns /var/log/messages
See all messages matching the patterns from a file “patterns.”
Other tools enhance the power of grep are tail and head. They are used to look
at the front and end parts of a log file. For example:
# tail – 1000 /var/log/messages | grep ailed
The above looks for records with a string “ailed” (aiming to catch both “Failed”
and “failed” since grep is case-sensitive) in the last 1000 lines of a messages file.
Similarly,
# head – 1000 /var/log/messages | grep ailed
looks for records with a string “ailed” in the first 1000 lines of a messages file.
If you add awk and sort tool to the mix, we can do a lot more with the logs. For
example, we can view what devices and systems has logged to our file:
# cat messages | awk '{print $4}' | sort –u
On our test system the above gives:
ns1
ns2
ns-backup
Those are the names of three Unix systems logging to the server, we just
extracted this summary information from a bunch of logs. This example brings
us into sorting and simple summaries of logs. In fact, awk allows writing com-
plicated (both in functionality and in comprehension) scripts to process the
log files, but we will focus only on commands used here.
Log Parser and Log Parser Lizard: A Better Way to Sift
Through Windows Logs
On Windows, the Event Viewer allows us to filter, sort, and extract logs to files.
On a typical Windows system filtering is limited to:
n Event type.
n Event category.
n Event ID.
n Source computer.
n Source application or system component name.

Simple Log Viewers 133
n User name.
n Date and time range.
For somewhat more advanced analysis of Windows logs we can use Log Parser
with Log Lizard. Log Parser is a Microsoft Windows add-on which gives you
an SQL-like interface to the Windows Event Log. For example, here is a query
which will retrieve all rows from the System Windows event log:
SELECT * FROM System
By itself it is a command-line tool, which makes it difficult to use in any ana-
lytical way. This is where Log Lizard comes in. It’s a GUI which puts a nice
interface around Log Parser. Installation of the two tools is very easy and
straightforward. You can obtain them from the following places:
1. Log Parser: http://www.microsoft.com/download/en/details.aspx?displayla
ng=en&id=24659.
2. Log Parser Lizard: http://www.lizard-labs.net/log_parser_lizard.aspx.
Figure 8.2 shows the Log Parser Lizard GUI.
Some of the features of Log Parser combines with Log Parser Lizard include:
n Charting.
n Customized searching.
n Limiting the rows returned.
FIGURE 8.2 Log Parser Lizard Screenshot

CHAPTER 8: Simple Analysis Techniques
134
n Export of results returned via queries.
n And many more.
The Microsoft Log Parser Toolkit provides a great introduction to Log Parser
(Giuseppini and Burnett, 2004). You can use this reference to understand how
it works and what features are available via the query language.
Log Parser Lizard has online documentation and forums which both provide a
good starting point to learn more about this useful tool.
LIMITATIONS OF MANUAL LOG REVIEW
At this stage it should become clear that while manual log review and using
simple tools and commands certainly has its place in log analysis, it should not
be relied upon as a main mechanism for log analysis.
The obvious limitations include:
n Manual log review just doesn’t scale up with the increasing log file sizes:
we looked at eight lines, but a more realistic task is to look at 8 million. In
large-scale enterprise environments, logs are often produced at the rate of
20,000 log records per second. Manual log analysis will break and become
ineffective and inefficient at a much lower logging rate.
n Manual log review is easy for easy logs: when the file is pretty-much
self-explanatory and tells you that something specific has failed it can be
interpreted manually, but in case of a more obscure and undocumented
log source, the approach fails flat on its face. The effort needed to inter-
pret each line will go from a second of quick thinking to hours of research
online and in other sources.
n Simple tools and manual review will likely never yield a big picture of
what is going on in the computing environment, but more advanced
tools can produce such a picture from log data.
n In addition to confusing and obscure formats, in many cases the analysis
will require relating logs from multiple sources together. Such activity can
indeed be performed manually but the time needed will go up by a large
margin (compared to just looking at one log file). Such correlated should
better be left to the automated tools.
n Last but not least, such activity is usually extremely boring. While this is a
problem by itself, boredom usually saps the efficiency of an analyst faster
than he can say “beer.”
Overall, as long as we don’t ask too much of our manual log review activities,
they definitely have this place. We summarize the results of this in the sum-
mary section at the end of the chapter.

Responding to the Results of Analysis 135
RESPONDING TO THE RESULTS OF ANALYSIS
One might think that since the book is about log analysis, we will stop when
the analysis is complete and we know for sure what was going on. However,
the only real practical purpose of the analysis is to act after it is complete. While
the emphasis of the book is obviously on the analysis itself, this brief chapter
reviews a spectrum of actions, which are usually performed based on log analy-
sis. In particular, relevance of logs to incident response will be discussed, since
sometimes the logs reveal that the incident has taken place.
Up to this point, we have pursued log analysis for various, now it is time to
tie various reasons we analyzed logs to real-world actions. We will deal with
actions on two levels: a micro level (what to do if you see a specific line or an
indication in a log file) and macro level (what kind of process improvements
needs to be implemented as a result of log analysis).
Acting on Critical Logs
If you see something like this in your network intrusion detection logs:
2004-12-02|00:46:58|dralion1|SSL:COMPROMISE-
SHELL|10.2.3.4|213.190.36.144|443|2328|X||6|tcp,dp=2328,sp=443|
which is then followed by this:
2004-12-02|00:47:02|dralion1|HIPORT:SHELL-
UNAME|10.2.3.4|213.190.36.144|443|2328|X||6|tcp,dp=2328,sp=443|
your action should be swift, decisive as well as planned and prepared. For those
who didn’t know, the above messages from the Enterasys Dragon Network Intru-
sion Detection system reliably indicate that the target server (with an address
10.2.3.4) has been compromised by an attacker (from 213.190.36.144). Note
that in the Dragon messages above the source and destination are reversed since
the NIDS detected the response from the victim system to the attacker that indi-
cates that an attacker has obtained interactive access to the target Web server.
Just for reference, the above Dragon messages are interpreted in Table 8.1.
This example aims to indicate that for some messages the required action is obvi-
ous: jump to your incident response plan right away. What are some of the log
files, messages that usually trigger an immediate action that does not require much
deliberation (or, rather, all deliberation can happen in advance)? Table 8.2 has
specific examples of actions to take on critical logs.
Note that the actions in Table 8.2 are not provided as a comprehensive “What
to Do Guide” for all the circumstances in life, but to illustrate that logs can
often be actionable.

CHAPTER 8: Simple Analysis Techniques
136
In this section we looked at a simple case of acting on logs, since we didn’t
have to design and implement a complicated plan. In addition, we only pro-
vided a summary of actions. In real-life, for example, “Investigate who accessed
the system and why” might evolve into a prolonged multi-day investigative
process.
Table 8.1 Definition of Dragon Log Message Fields
Field Meaning
2004-12-02| Date of the logged event
00:46:58| Time of the logged event
dralion1| Host name of the log producing machine
SSL:COMPROMISE-SHELL| Attack name as classified by the NIDS vendor
10.2.3.4| Source IP
213.190.36.144| Destination IP
443| Source port
2328| Destination port
X|| Unused in this case
6| Protocol (where 6 stands for TCP
tcp,dp=2328,sp=443| Other information
Table 8.2 Summary of Actions to Take on Critical Log Messages
Critical Log Required Action
Faults that can affect system operations If system operation is lost, a backup system
needs to be brought up
Attacks that are successful Initiate the incident response and recovery
process for the compromised machine
Attacks that have a high chance of being
successful
Initiate the incident response and recovery
process for the compromised machine
System reaching capacity or maximum of
some value
Bring additional capacity or risk losing the
entire system
System changes possibly leading to
security and availability problems
Reverse the changes if unauthorized to
avoid the problems
System crash A backup system needs to be brought up
Numerous failed logins Check for signs of compromise if an at-
tacker managed to guess the password
Hardware failure If system operation is lost, a backup system
needs to be brought up
Security-relevant configuration change Reverse the changes if unauthorized
Unauthorized connection detected Investigate who accessed the system
and why

Responding to the Results of Analysis 137
Acting on Summaries of Non-Critical Logs
This section touches upon acting on aggregates of non-critical logs. The vol-
ume of firewall, router, or host messages does not invoke such an immediate
response as the above critical messages from Dragon NIDS do. Just the fact that
a connection was denied by a firewall usually does not map into instantaneous
action by the user watching the logs (it is also unlikely that somebody is view-
ing those logs in near real time). However, a combination of such messages
will often invoke an indirect action (otherwise, why even analyze the stuff that
never leads to an action?).
As was pointed by Marcus Ranum “most log files are useless, and that most
organizations are better off deleting their files and saving the disk space for
something that’s actually productive” (Garfinkel, 2005). The reason this was
proclaimed is that if you never look at your log files (and thus, never act), there
is absolutely no sense in keeping them. While nowadays in this regulatory
compliance era one can claim that he keeps the logs “for compliance reasons,”
the above argument still applies since if neither you nor the compliance audi-
tor looks at the logs and acts based on what they find—they are still useless.
In the 2011 Verizion Data Breach Report, it was discovered that very high per-
centage of incidents had evidence in log messages of the breach, but no one
was paying attention to the logs. This is a clear-cut proof that log analysis can
indeed pay off.
We hope by that time the reader is already convinced that he not only needs to
retain log files, not only to review and analyze them, but also act on them in
order to derive the maximum value out of them.
There are several paths from seemingly non-actionable logs to action. We sum-
marize some of the most common ones below:
1. Acting on a summary or trend: A lot of non-actionable messages often
translate into action due to a developing trend or some new knowledge
deduced from the summary.
2. Acting on a correlated event or a group of events: Often, a known combina-
tion of non-critical events falls into a critical pattern due to their sequence
and timing.
3. Acting on a discovered pattern or unusual sequence of non-critical events: Using
advanced log analysis tools, one can sometimes mine a new suspicious
pattern out of otherwise normal and harmless log records.
Let’s consider examples of the above three possibilities in detail.
Summaries and trends are a common result of log analysis. A long log file might
be summarized into a brief “Top 10 Attacks” or “Top Suspicious IP Addresses”
or an infinite number of other useful summaries. Often, such summary view

CHAPTER 8: Simple Analysis Techniques
138
will prompt an action. For example, it might become obvious from a “Top
Bandwidth Users” report that the top three users in the company utilize 90%
of available bandwidth. This can quickly lead to a disciplinary action, espe-
cially if such bandwidth is used to share files on P2P or to download non-work
related materials. Similarly, an observation of a router CPU utilization log over
a long period of time might reveal periods of unusually high activity, leading
to an investigation possibly discovering attacker communication with a com-
promised system.
Correlation (described in Chapter 9) will often lead to groups of unimportant
events to be flagged. A connection here, a failed login there, and an applica-
tion launch in some other place might mean a system compromise or insider
abuse of system privileges. For example, if an administrator access to a system
is spotted at 3 AM, it might not mean anything bad, just slightly suspicious. If
the administrator then tries to access several applications and then connects
to a database and starts loading data, it might raise a flag, but still not mean
anything bad. If, however, the final action is a large data download attempted
from the same system, we know that an intrusion have likely taken place and
it is time to act. Thus, by putting together a rule to watch for such activity, we
can provide a (much needed!) action on relatively unimportant events.
Pattern discovery in logs is a novel area in log analysis (described in Chapters
10 and 11). It provides a highly effective and automated way of discovering
new knowledge in logs and thus making ultimately boring and routine logs
into actions. For example, a log file might be discovered to contain a repeat-
ing pattern of connections from a seemingly diverse set of source IP addresses.
When presented, this pattern might be interpreted as a new exploitation tools,
covertly tried on a company network. It can then lead to a set of actions by a
security team and even community at large.
Table 8.3 summarizes more examples of how actions are associated with non-
actionable logs.
Table 8.3 shows that even innocuous and routine events will often require an
action if they are analyzed appropriately and can save a lot of headache by
predicting the trouble early.
Developing an Action Plan
The above examples allow us to generalize and come to a valuable “Last step
of log analyses”—action.
Such a plan will incorporate all possible results of analysis (as well as actions
if the result doesn’t fit the defined results) and cover both critical and informa-
tional alerts.

Responding to the Results of Analysis 139
Table 8.3 Summary of Actions Associated With Non-Actionable Logs
Accounting Log /
“keep in mind”
Path to Action Action Needed
System status messages Correlated A pattern of system status
messages might indicate
unauthorized system use,
leading to an investigation and
then disciplinary action
Attack attempts and probes Correlated summary A pattern of probing might
indicate that an advanced at-
tacker is seeking to break in
and strengthening of security
defenses (an action!) is needed
Low impact attacks Trend A growth in low impact attack
might coincide with an increase
of more damaging attacks, that
need to be acted on
System reaching a relatively
high value of some parameter
Trend A sharp increase in such
messages indicates either an
intrusion or overall system
instability; both need an action
to restore performance
Various system changes Correlated A pattern of system change
messages might indicate unau-
thorized system reconfiguration,
leading to an investigation and
then disciplinary action
System startup/shutdown Summary A large number of system
shutdowns in a certain time pe-
riod might indicate that system
became unstable and needs
fixing
Successful login Correlated A successful logging coming
at the heels of a long string of
failed login indicates that a brute
forcing password attack has
succeeded.
Hardware status message Summary Summarizing hardware status
messages across various
systems might help pinpoint
systems having the most
problem, leading to overall
optimization program and im-
proved performance
Connection established/ter-
minated
Discovery Log mining can help to
discovery an connection pattern
indicative of a new hacking tool,
leading to a need to strengthen
security defenses

CHAPTER 8: Simple Analysis Techniques
140
Admittedly, a plan will have a close relation to an incident response plan (see
Chapter 16), but will also cover some of the early signs of danger (not consti-
tuting the incident) as well as changes in normal patterns of activity. A typical
incident response plan will include communication, escalation, and response.
Chapter 16 shows how to develop such a plan based around log data, along
with insights in how to tailor it toward your environment.
Automated Actions
We covered the planning and different types of actions, but one critical action
possibility was left outside the scope: automated action. Why plan and have
people execute that action if you can program a system to do them automati-
cally? While this is very tempting, real-life implementation of it faces a large
number of challenges.
What are some of the possible automated actions? What kind of environment
and what kind of circumstances call for their implementation?
In many cases of critical logged events, automated action is certainly appropriate.
For example, here is how one of the authors uses log-driven automated action
in the honeynet. Admittedly, the criticality of a honeypot environment is lower
than that of the production system, however the risks are often the same or even
higher. One of the most critical requirements for the honeypot is that it is always
monitored. Thus, if some monitoring features fail, the operation of the honey-
pot should be halted. This is logically similar to the feature of several operating
systems that can be configured to fail gracefully if audit collected stops workings.
Since the honeypot uses multiple monitoring mechanisms, the main failure
scenario is the disk space exhaustion: if there is no space, no monitoring can
function and record the attacker’s steps. Thus, a script runs a “df” command
AND watches the /var/log/messages file for the traces of “wite failure—check
your disk space,” “n space left on device,” “disk full” or “insufficient storage
available at the moment” messages. In case such messages appear in the syslog
or the “df” command shows that partitions holding log data are 100% full, the
script will run and block all access to and from honeypot network via a special
firewall configuration request.
EXAMPLES
This section will cover two examples of action on logs: log analysis in emer-
gency incident response and routine analysis conclusions review.
Incident Response Scenario
This scenario deals with a company that was attacked. Incident investigators
have analyzed (or, rather, tried to analyze, as logs were destroyed). “Rats R Us”

Examples 141
is a global leader in end-to-end rat management for business and consumers.
The Web site provides a significant part of the company revenue they have built
a DMZ architecture with two firewalls that protects publicly available servers
(Web, Email, etc.). One sunny day of May 2005, the intrusion prevention sys-
tem started generating a huge volume of alerts related to IRC (Internet Relay
Chat) program use on the company network.
The first action from the above log observation was to take a machine online—
a drastic action indeed. This provides an example of acting on a critical log,
similar to the above case of Dragon NIDS alert. The incident investigators have
tried looking for the logs, but all were erased. Next, the analysts have tried
looking at the external connectivity logs on a firewall.
As you know from above, such logs are not immediately actionable, but need
to be summarized, correlated, or mined. However, summaries didn’t really
help in this case and no advanced log analysis tools were available to the inves-
tigators. The firewall contained its normal noise and, even though there might
have been some interesting events, discovering them would have required hav-
ing a starting point. Otherwise, it was just a mix of random IP addresses con-
necting through the firewall and no indication of which one was the attacker.
Thus, they were unable to take action based on such logs and the incident
remained largely unresolved.
The overall and final action taken was to formulate generic security recom-
mendation. That included installing a security information and event manage-
ment (SIEM) product, so that even routine logs can be analyzed proactively
and acted upon.
Routine Log Review
Now, let’s take a look at the same company after all the incident find-
ings and lessons learned have been implemented and the company is
more proactive in log analysis and review. To remind, the company made
sure that the logs were configured to be sent to a commercial log collec-
tion and analysis product—SIEM—that can securely transfer and preserve
them as well as perform advanced analytics on logs in real time and over
the long term. For all practical purposes, “Rats R Us” was now in logging
paradise. Let’s take an example of how they now act on logs, routine, and
others.
The company now has a clear plan to act on logs. Every day the com-
pany runs various log summaries and trends to observe the “big picture”
of security. Those include “Top Attacked Ports,” “Top Event Types,” “Top
Growing Event Types,” as well as “Top Bandwidth Users” inside the com-
pany. Those are acted if some unusual things are observed in them or if

CHAPTER 8: Simple Analysis Techniques
142
whatever metric is growing dramatically. Similarly, if the number of con-
nection events goes down (“Summary of Network Connection” report),
another action is defined since it might indicate that the servers’ perfor-
mance is affected.
Other, less-common but very effective summaries include “Least Common
Event Types,” “Previously Unseen Events,” and “Correlated Events.” These help
to discover rare but critical events in logs.
SUMMARY
This chapter looked at trying to assault the log problem by force: using
manual log review and simple tools. In reality, this is similar to trying
to attack a well-defended fortress with just clubs and not siege weapons:
theoretically, it can be done, but it will take a huge crowd or a lot of time
(and, likely both). In addition, a lot of attackers will die in the process
and this is not something you want happening with your valuable IT per-
sonnel. The next chapter focuses on more automate analysis tools and
techniques.
The important points to remember from this chapter are:
n The time to use the methods and techniques from this chapter:
n A quick glance at the logs is all that is needed (such as to check some-
thing quickly).
n A log volume is not too large.
n The analyst is familiar with the log formats to be reviewed.
n The log files to be analyzed contain high-severity critical alerts, that
are immediately actionable without any further analysis.
n The time not to use the methods a techniques from this chapter:
n A big picture view or a trend is needed (such as for a senior manager).
n A high degree of automation and intelligence is needed in log
analysis.
n Logs are diverse and located in different places.
n A large volume of sparse and non-critical logs needs to be distilled
into something actionable.

References 143
REFERENCES
Garfinkel, S. (2005, April 1). Another look at log files. CSO. Web March 25, 2012. <http://www.
csoonline.com/article/220233/another-look-at-log-files>.
Giuseppini, G., & Burnett, M. (2004). Microsoft log parser toolkit. Rockland, MA: Syngress.
Verizion 2011 data breach report. Verizion. Web June 1, 2012. <http://www.verizonbusiness.com/
resources/reports/rp_data-breach-investigations-report-2011_en_xg.pdf>.

This page is intentionally left blank

Logging and Log Management.
© 2013 Elsevier, Inc. All rights reserved.
http://dx.doi.org/10.1016/B978-1-59-749635-3.00009-9
145
CHAPTER 9
Filtering, Normalization, and Correlation
CONTENTS
Introduction .............145
Filtering ...................147
Artificial Ignorance ........ 147
Normalization ..........148
IP Address Validation ....150
Snort ................................150
Windows Snare ..............150
Generic Cisco IOS
Messages ........................151
Regular Expression
Performance
Concerns.........................152
Correlation...............154
Micro-Level
Correlation......................155
Field Correlation .................... 156
Rule Correlation ..................... 156
Macro-Level
Correlation......................157
Rule Correlation ..................... 158
Vulnerability Correlation ....... 158
Profile (Fingerprint)
Correlation.............................. 159
Anti-Port Correlation ............. 160
Watch List Correlation .......... 160
Geographic Location
Correlation.............................. 161
Using Data in Your
Environment ...................161
Simple Event Correlator
(SEC) ...............................161
SEC Basics ............................. 162
Real-World Examples ............ 163
n Filtering
n Normalization
n Correlation
n Common Patterns to Look For
n The Future
INFORMATION IN THIS CHAPTER:
INTRODUCTION
In the world of logging and log management, a large part of an administra-
tor’s time is spent reviewing logs for potential problems. In the past, this task
was largely manual. Log analysis systems today provide automated mecha-
nisms to help alleviate this burden. This chapter provides insight into this pro-
cess. While no particular product is used, plenty of examples are given on the
topics of filtering, correlation, parsing, rules, and so on. The goal is to provide
you with the necessary concepts so you can use them no matter what logging
system you use.
At the heart of this chapter are three large concepts: filtering, normalization, and
correlation. Filtering is the act of taking in raw log data, determining if you want
to keep it. The output of filtering is a normalized log data. This data is an input
to correlation. Correlation is the act of matching a single normalized piece of
data, or a series of pieces data, for the purpose of taking an action. Figure 9.1
shows the logical flow of this process.
Let’s briefly describe each step in the process:
1. Raw Log Data: This is what you start with. This is the first input into the
process.
2. Filter: In the filter stage we look for log messages that we care about and
don’t care about. The ones we don’t care about can be “dropped” in order
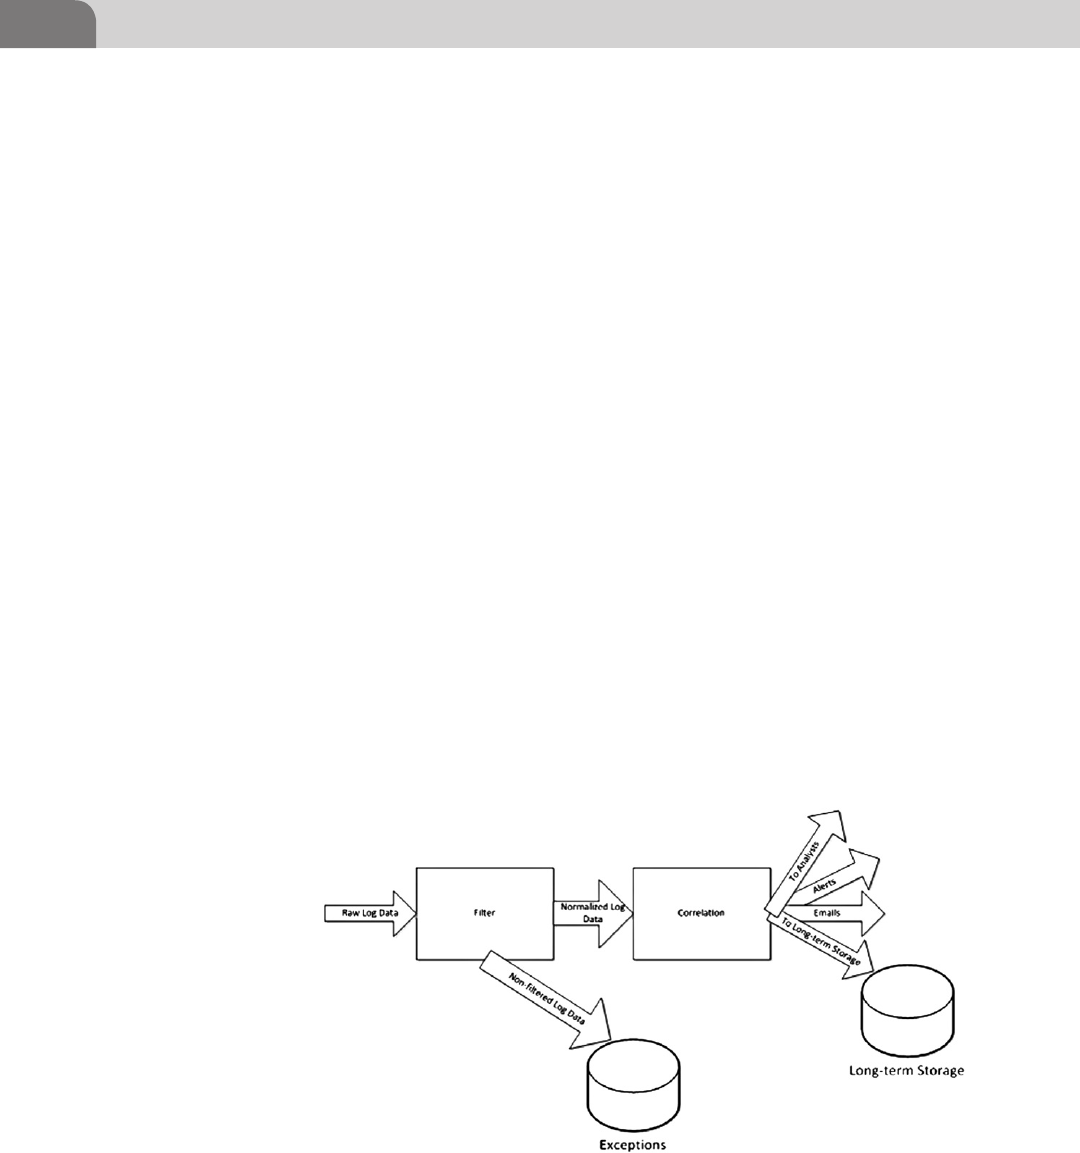
CHAPTER 9: Filtering, Normalization, and Correlation
146
to reduce load on the overall system. In Figure 9.1, this is shown with an
arrow going to an exceptions store. This can be used to review the less-
interesting log messages at a later time.
3. Normalization: In this step we take the raw log data and map its various
elements (source and destination IP, etc.) to a common format. This is
important for the correlation step. When a raw log message is normalized,
the typical term for what results is an event. This term will be used through-
out this chapter to denote a normalized log message. Another step in the
normalization process is that of categorization. This means that a log
message is transformed into a more meaningful piece of information. For
example, a vendor might only provide something like “ID = 6856” in the
log message. But this sting of characters, per the vendor, is a login failure. It
is the job of the person writing the normalization steps to do this transfor-
mation. A nice side effect of doing this is that it makes writing correlation
rules more robust and intuitive. More on this later.
4. Correlation: Correlation will often lead to groups of individually unimportant
events to be flagged. A connection here, a failed login there and an applica-
tion launch in some other place might mean a system compromise or insider
abuse of system privileges. The two basic forms of correlation are rules-based
and statistical.
5. Action: An action is generally what you do after a correlation has occurred.
Figure 9.1 shows several kinds (this list is by no means exhaustive):
a. To Analysts: If you have a log monitoring interface (generally some sort
of GUI), this is where you send your high-priority events that require
immediate attention.
Stateful Rule
Example ..........................163
Vulnerability Correlation
Example.................................. 166
Cisco IOS Configuration
Changes ................................. 166
Promiscuous Mode
Detection ................................ 168
Keywords to Watch For ......... 168
Application Exit Codes ......... 169
Final Words on SEC ............... 169
Building Your Own
Rules Engine ..................169
Rules-Based Engine
Using Jess .............................. 170
Stream-Based Engine
Using Esper ............................ 177
Common Patterns
to Look For ..............178
The Future ...............178
Summary .................179
Reference .................180
FIGURE 9.1 Basic Flow for Filtering and Correlation

Filtering 147
b. Alerts: This is generally a hybrid of sending an event to an analyst. In
this scenario an alert might be a grouping of events which indicate
something at a high level has occurred.
c. Email: This can be used as a means to alert on-call staff after hours.
d. Long-term Storage: Long-term storage is where you keep your log data
and normalized events. This is a prerequisite for reporting, auditing,
long-term analysis, etc.
Let’s now take a look at what is involved in filtering.
FILTERING
Filtering boils down to the following operations:
1. Keeping or discarding log data you care about.
2. Parsing the raw log message into a common format so you can more eas-
ily analyze the data.
As you may already know, vendors do not standardize log message formats
between each other. For example, Cisco’s log message format is totally differ-
ent from Palo Alto Networks or Sonicwall, and so on regardless of the fact that
each vendor may use Syslog as the underlying message transport. The power of
step number 2 allows for disparate log data formats to be in one common nor-
malization format. This is the key for efficient analysis and correlation (more
on this later). But how do you go about knowing what you want to keep or not
keep? Let’s look at a high-level example.
Artificial Ignorance
The Great Marcus Ranum coined the phrase “Artificial Ignorance” back in 1997.
At the heart of this concept is a mechanism for finding log data that you are
familiar with so that you can find things you don’t yet know about. He provided
the following UNIX shell commands to aid in this process: (Ranum, 1997).
CORRELATION CONCEPTS
General concepts
The authors of this book have a combined experience in this space approaching 20 years. We
present the concepts in a general so as to provide you with the foundation needed when it
comes to selecting or using a logging system. Of course, we do show some actual tools which
can be used to solve correlation needs.

CHAPTER 9: Filtering, Normalization, and Correlation
148
cd /var/log
cat * | \
sed -e 's/^.*demo//' -e 's/\[[0–9]*\]//' | \
sort | uniq -c | \
sort -r -n > /tmp/xx
In the sed command, the “demo” string is the name of the system on which the
commands are running. The idea is to strip this and the preceding timestamps
in the log messages so we can reduce the variability in the log data. This is the
key!
When you run this command you will see output similar to the following:
297 cron: (root) CMD (/usr/bin/at)
167 sendmail: alias database /etc/aliases.db out of date
120 ftpd: PORT
61 lpd: restarted
48 kernel: wdpi0: transfer size=2048 intr cmd DRQ
... etc
The number preceding the log message shows how many times the log message
was seen in log files. As you get to the bottom of the output, you will notice the
numbers getting smaller and smaller. The idea is that these are log messages
you may not know about because they occur less frequently than the others. As
he shows in his article, you can take the things you know about, place them in
an ignore file so you can exclude things you know about.
Most log analysis systems provide mechanisms to perform filtering. But it is
important to err on the side of keeping more data than filtering it out. The
example provided in this section was merely to acquaint you with the concept
so you know about it and understand its usefulness. The next section on nor-
malization takes us to the next step in the process.
NORMALIZATION
The next step after filtering is normalization. It is assumed that at this point you
already know what log data you would like to keep. Normalization means we
take known log messages, parse them for piece part components (timestamps,
IP addresses, etc.) and turn them into a common format. This common format
has historically been arrived at via the use of a Relational Database System
(RDBMS) or some other lower level format (binary on disk, etc.). However, in
today’s big data and No SQL movements, more and more vendors are moving
away from databases because they do not scale.

Normalization 149
The steps to normalizing a raw log message are:
1. Get documentation for product or products you are using.
2. Read the documentation for descriptions of what the raw log data looks
like and what each field is.
3. Come up with the proper parsing expression to normalize the data. Most
log analysis systems utilize a regular expression implementation to parse
the data.
4. Test the parsing logic on sample raw log data.
5. Deploy the parsing logic.
Regardless of the ending storage mechanism used for normalized events, cer-
tain fields are more common and useful than others. These include:
n Source and Destination IP addresses: These are very useful during the correlation
process.
n Source and Destination Ports: These are used to understand what services
are trying to be accessed or are accessed.
n Taxonomy: A taxonomy is a way to categorize and codify a log message’s
meaning. For example, all device vendors generate some sort of login
message. These typically map to login successes, failures, attempts, etc. An
example taxonomy for a login success might be: login.success. The reason
a taxonomy is critical is because it allows you to group like messages
together (from an analysis standpoint) without caring about the particu-
lar vendor who generated the log message.
n Timestamps: In the world of log data, we typically care about two types of
timestamps: the time the log message was generated on the device and the
time the logging system received the log message.
n User Information: If provided, it is often good to capture any user informa-
tion (username, command, directory location, etc.).
n Priority: Some log messages come with some sort of priority contained in
the log message. This is obviously the vendor’s assessment of the prior-
ity of the log message, but this might not match up with your thoughts
on the matter. So as part of normalization, you need to understand how
a particular log message impacts your environment. Typical values for
priority are low, medium, and high.
n Raw Log: As part of the normalization process, you want to keep the raw
log data around. This is used to ensure the validity of the normalized event.
Another use case is that of log retention. You might have a requirement to
keep your raw log data for X period of time. There are two solutions to this.
You can store the raw log as part of the normalized event or you can store it
on disk and provide for a means to “get back to” the raw log message from
the normalized event.

CHAPTER 9: Filtering, Normalization, and Correlation
150
Let’s run through a few examples on normalization which will help drive the
concept home.
IP Address Validation
It is often important to be able to recognize an IP address. We have seen the
following used many times:
\d+\.\d+\.\d+\.\d+
While this will catch IP addresses like 10.0.3.1, it will also catch an invalid IP
address like 300.500.27.900. The key to coming up with a regular expression
for matching IP addresses is to not only detect the dotted-quad, but also make
sure that each octet is in the proper range. The following regular expression will
validate an IP address:
^([01]?\d\d?|2[0-4]\d|25[0-5])\.([01]?\d\d?|2[0-4]\d|25[0-5])\. ([01]?\
d\d?|2[0-4]\d|25[0-5])\.([01]?\d\d?|2[0-4]\d|25[0-5])$
Note that the expression is broken up onto two lines, however, it should be
all on one line. Further note that this expression will detect an IP address of
0.0.0.0, which some network types might say is invalid. However, some secu-
rity systems report spoofed IP addresses as 0.0.0.0, so detecting this IP is valid
in certain contexts.
Snort
Snort (www.snort.org) is an open source intrusion detection system. Here’s a
sample Syslog message generated by Snort:
Feb 24 12:05:03 10.0.0.25 snort: [1:1002:2] WEB-IIS cmd.exe access
[Classification: Web Application Attack] [Priority: 1]: {TCP}
10.0.0.15:16936 -> 10.0.0.21:80
It’s a Microsoft IIS exploit. The following Perl snippet will parse the data:
my($a,$b,$c,$type,$class,$priority,$proto,$srcip,$srcport,$dstip,$dst
port) = $message =∼ /\[(.*?):(.*?):(.*?)\] (.*?)\[Classification:
(.*?)\]\[Priority: (.*?)\]: {(.*?)} (.*?):(.*?) -> (.*?):(.*?)$/;
Of course you will want to verify any IP addresses against the regular expres-
sion supplied in the previous section.
Windows Snare
Snare (http://www.intersectalliance.com/projects/BackLogNT/) is an agent-
based tool for finding and detecting abnormal system usage. Windows Snare

Normalization 151
is an agent for Microsoft Windows which is capable of reading Windows Event
Log and forwarding Syslog messages to a host. The following is a sample of
Windows Snare event:
Oct 29 13:54:50 10.0.1.2 MSWinEventLog 0 Security 238 Fri Oct 29
13:54:50 2011 593 Security kjs User Success Audit KJS600 Detailed
Tracking A process has exited: Process ID: 1452 Image File Name: C:\
windows\system32\ssbezier.scr User Name: kjs Domain: GUARDED Logon
ID: (0x0,0x2577F) 181
According to the Snare manual, each item in the Syslog message is separated via
a tab character. The following Perl snippet will parse Windows Snare messages:
my($cruft,$criticality,$sourceName1,$count,$dateTime,$eventId,$sourceN
ame2,
$user,$sidType,$eventLogType,$computerName,$categoryString,$dataString,
$expandedString,$md5) = split(/\t/,$message);
We use the split() function since everything is delimited by a tab. The names
of the variables returned by split() are pretty self-explanatory as to what each
of the items are. A good variable for setting a type might be $eventLogType,
which is “Success Audit” in the example event. However, the Snare documen-
tation provides definitions for all the possible event IDs which are generated
by Snare; the event ID (variable $eventId) above is 593. It might make more
sense to create a Perl hash with the keys being all the event IDs Snare knows
about. You can obtain Snare from http://sourceforge.net/projects/snare/. Also
see Chapter 15 for an example of Snare installation.
Generic Cisco IOS Messages
Cisco IOS is the operating system used to run Cisco routers, switches, and
other devices. It can emit an impressive amount of varying log messages. The
following is an example of an IOS SecurityEvent:
Nov 19 15:32:33 10.4.9.1%SEC-6-IPACCESSLOGP: list 110 denied tcp
10.0.0.2(113) -> 10.0.0.15(34237), 1 packet
The following Perl snippet will parse this event:
my($category,$severity,$type,$srcip,$srcport,$dstip,$dstport) = $x =∼
/%(.*?)-(.*?)-(.*?):.* (.*?) \((.*?)\) -> (.*?) \((.*?)\) /g;
Almost all IOS messages contain an identifier of the form%category-severity-
type. The code above shows a severity of six. Cisco defines the following
severities:
{0 | emergencies} System is unusable.
{1 | alerts}Immediate action needed.

CHAPTER 9: Filtering, Normalization, and Correlation
152
{2 | critical}Critical conditions.
{3 | errors}Error conditions.
{4 | warnings}Warning conditions.
{5 | notifications}Normal but significant conditions.
{6 | informational}Informational messages.
{7 | debugging} Debugging messages.
A more generic way to parse IOS message would be as follows:
my($category,$severity,$type,$rest) = $x =∼ /%(.*?)-(.*?)-
(.*?):(.*?)$/g;
This will capture the category, severity, and type, and place the remainder of the
message in the $rest variable.
Go to http://www.cisco.com/web/about/security/intelligence/identify-incidents-
via-syslog.html for a discussion on identifying incidents with Cisco firewalls
and IOS routers.
Regular Expression Performance Concerns
Due to the fact that regular expressions are based on the computer science con-
cept of Non-deterministic Finite Automata (NFA), you need to be aware of the
fact that writing regular expressions could impact performance for tasks you
perform over and over again. For example, if you want to extract a substring
from many log messages you are normalizing, you can craft a regular expres-
sion that will pull out the text you want. This is useful if you kind of know
where the string appears in the message, but is not entirely sure. For example,
look at the following Perl script:
#!/usr/bin/perl
my $text = "I would like to get the following IP address: 10.0.0.2";
for(my $a=0; $a<100000; $a++)
{
my($IP) = $text =∼ m/: (.*)$/;
}
We know that the IP address appears after the colon. So We crafted a regular
expression which grabs all characters after the colon. Since We use parentheses
around the regular expression, Perl will return what it matches, if anything, in
array context. This is why We use the syntax my($IP) = … When We time the
run of this script, here is what We get:
$ time ./regex.pl
real 0m0.727s

Normalization 153
user 0m0.724s
sys 0m0.003s
This may seem like a good time (0.727 s) for performing this regular expres-
sion match 100,000 times. A sub-second runtime is great. However, there
is a way to get even better performance, and it doesn’t involve any regular
expressions at all. Perl has a substr() function which will return a substring
from a text string, given and offset. Let’s now consider the following modi-
fied script:
#!/usr/bin/perl
my $text = "I would like to get the following IP address: 10.0.0.2";
for(my $a=0; $a<100000; $a++)
{
my $IP = substr $text, 46;
}
We now use the substr() function since We know the IP address starts at offset
position 46. When We time this run, here is what We see:
$ time ./substr.pl
real 0m0.103s
user 0m0.100s
sys 0m0.003s
This run time (0.103 s) is much better. This is because the substr() function
goes directly to the position we wish. It doesn’t have to search the string for
pattern matches. Using substr() only works if the data you wish to extract
always appears at the same offset position in the string. Unfortunately, things
are not always this easy in real-world processing. Vendors have a tendency to
have many different event formats, and things like IP addresses, ports, etc. will
often appear in different positions in the message. This is a real pain to deal
with to say the least.
For those of you who may be inclined to write your own parsing system using a
language like Java, you can use its overloaded indexOf() method for the String
class which allows for finding the beginning portion of a substring. This can
make finding arbitrary portions of a substring, no matter where it lies in the
string, pretty easy.
The next section takes to the next crucial step in the process: correlation.

CHAPTER 9: Filtering, Normalization, and Correlation
154
CORRELATION
The goal of this section is to provide plenty of examples using tools and con-
cepts so you can get a feel for what correlation is about. It is beyond the scope
of this chapter to provide an exhaustive set of correlation examples. Part of the
process of creating correlations is to understand your own environment and
the specific needs of your users, analysts, and so on.
Alright, now let’s define what is meant by the term correlation. One of Merriam-
Webster’s definitions for correlation is as follows:
the state or relation of being correlated; specifically: a relation existing between phe-
nomena or things or between mathematical or statistical variables which tend to vary,
be associated, or occur together in a way not expected on the basis of chance alone.
This definition is sort of vague and doesn’t fully capture the intent of correla-
tion as it relates to log data analysis. Alright, so what does correlation means to
system and network professionals? Well, what it means to log analysis is that
we are interested in tying together several similar or dissimilar events in a sin-
gle piece of knowledge that something much larger is happening, as opposed
to getting an incomplete view of what’s happening by simply looking at single
events. This is accomplished by the creation of rules in some sort of a language,
which model situations that are of interest to security and network administra-
tors and analysts.
For example, if we receive log data from firewalls and IDSes, we can capture
reconnaissance attempts followed by a firewall policy violation with the fol-
lowing rule:
If the system sees an event E1 where E1.eventType=portscan
followed by
an event E2 where E2.srcip=E1.srcip and E2.dstip=E1.dstip and
E2.eventType=fw.reject then
doSomething
This rule, expressed in pseudocode, details how two disjoint events can be tied
together. The rule looks at two different events from two different network
security systems. The first one is a portscan, which would be detected by IDS.
The next event, denoted by E2, is generated by a firewall. It reflects that an
attempt was made to access a host that has a firewall policy to exclude all but
certain trusted hosts. Note that the rule contains the phrase “followed by,” this
doesn’t necessarily mean that this event has to follow immediately, although
it could. What is meant by this is that at some point in the future the fw.reject
event must occur in order for the rule to perform the doSomething action
(Email, alert, etc.). It should be noted that using fw.reject and portscan for the

Correlation 155
two E1 and E2 eventTypes are simply arbitrary categorizations (taxonomy) for
these event types.
What we have seen is how useful stateful rule engine (SREs) are. They afford the
administrator and analyst the ability to create rules which can detect arbitrary
sequences or patterns. This is where simply looking at Syslog files and trying
to correlate these events yourself is next to impossible. The downside is that, as
the name indicates, there is a notion of state that must be maintained in order
to perform the tests. This is seen in the rule above when we compare event E1’s
srcip to event E2’s srcip. You cannot do this unless you have some way to keep
events in some sort of peripheral view or storage layer.
One way this can be accomplished is to naively use your archival data store
as the persistence layer. The SBR engine can simply mine the database for
event sequences which match one or more rules. This is a very costly propo-
sition, because to do it right requires vast amounts of SQL queries and
in-memory manipulation of event data. You will take a good I/O hit, as
well as impact other applications which may be trying to use the archival
database.
A better solution is to cut a feed of the event data prior to it that goes to long-
term storage. As the data is received either at the aggregator (if this is also where
you are performing your analysis) or on the analysis server itself, you feed the
data some sort of system message queue like a System V queue, where it is
consumed and processed by the SBR engine. As the SBR consumes event data,
it has to keep these events around in memory so it can apply rules to these
events. The problem is that if we never age these events out of memory then we
can eat up the RAM on the system. So this is why it is imperative that we age
out events as the data itself becomes invalid.
One way to accomplish this is to set a time-to-live (TTL) for each rule in the
engine. More specifically, we could set TTL’s for each step in the rule. For exam-
ple, in the rule above, we would not start tracking events until we get an event
with an eventType of portscan. Once this happens our TTL starts ticking. If we
don’t see an event that meets the requirements of the next stage of the rule by
the time the TTL is reached, we can reset the rule and discard all the events that
we are tracking for this rule.
Micro-Level Correlation
Micro-Level correlation is concerned with correlating fields within a single
event or set of events. Micro-Level correlation is sometimes referred to as
atomic correlation. This is where normalization of raw event data is crucial to
effectively perform atomic correlation. The remainder of this section will pres-
ent topics pertaining to atomic correlation, along with examples.

CHAPTER 9: Filtering, Normalization, and Correlation
156
Field Correlation
Field correlation provides a mechanism for discovering items of interest in one
or more fields within normalized event data. For example, you may be inter-
ested when your IDS detect activity targeting your Web server. The most logical
thing to do is to look for events which have port 80 or 443 as the destination
port.
Event types are yet another valuable source for field correlation. Many fire-
walls emit event types like accept, drop, and so forth. It is often times useful
to be able to correlate events based on event type names. If you are concerned
about unwanted access attempts to a particular server, you can correlate events
which have an event type of drop and a destination IP address of the server in
question.
Rule Correlation
Rule correlation deals with crafting a rule which is able to model a certain
behavior. Recall the pseudocode example from before:
If the system sees an event E1 where E1.eventType=portscan
followed by
an event E2 where E2.srcip=E1.srcip and E2.dstip=E1.dstip and
E2.eventType=fw.reject
then
doSomething
This rule models a behavior pattern. While it is pseudocode, you can see that
the rule is trying to find the situation where an attacker is port scaning a host
and at the same time is causing a firewall to reject his attempts.
In order for rule correlation to be affective, the following is a minimum func-
tionality list for a rule engines:
n Stateful Behavior: Systems which implement correlation are sometimes
referred to as engines. Furthermore, rule correlation engines are some-
times referred to as stateful rule engines or stateful business rule engines.
This stateful operation is exhibited by modeling behavior which is of
interest to a security engineer. A single stateful rule may consist of one or
more states. For example, one state may look for all events with destina-
tion port 80 (HTTP). If an event comes into the engine which matches
this criteria, then a next state in the rule might now look for all events
which have a certain source IP address (maybe to look for unauthorized
Web server access). If this second state is reached then we perform some
action.
n Counting: One very useful tool is also a simple one: counting. This
basically allows you to create a rule which waits for an event to occur a

Correlation 157
number of times before an action is taken. There is also counting unique
occurrences of an event. This is also very useful because it can be used to
detect situations where someone is scanning the same port across a bunch
of different destination hosts.
n Timeout: Most, if not all stateful rule engine implementations use memory
to perform their analysis, etc. This allows for speed and efficiency. We’ll
call the memory an engine uses working memory. As you add more and
more data to the engine’s working memory, this can cause not only the
engine to slow down, but impact the overall performance of the host
system. Timing or aging out events which haven’t matched a rule in a
certain time period is very critical to maintaining an effective engine. For
example, you may want to set a default age-out period of five minutes.
n Rule Reuse: You obviously want to lessen the burden of creating rules.
From the example rule above, the following is a single condition in the
rule itself: If the system sees an event E1 where E1.eventType=portscan.
A rule can have many conditional statements. It is always beneficial to be
able to reuse components like these in other rules create.
n Priorities: Priorities are useful in that they can dictate the order in which a
rule or set of rules will be performed.
n Language: All rule engines implement some sort of language or pseudo
language for specifying rules. What’s en vogue today is using XML as a
pseudo language, but We have seen rule engines also use Lisp. Some use
proprietary formats. The thing to keep in mind is that you want to have a
language which is easy to learn and use.
n Action: It almost goes without saying that performing actions is what rule
correlation is all about. There has to be a mechanism in your rules engine
to do something. Just knowing something happened is often not good
enough. As with rule reuse, there should be a mechanism in place to cre-
ate actions which can be reused by many rule sets.
Not all rules engines will have these features. Even if you decide to build your
own implementation of an engine, you may choose to have some of these
features, but not all. It is good to be aware of the things which are crucial to
successful rules processing. A few of the later sections discuss building your
own rule engine.
Macro-Level Correlation
Macro-Level correlation is concerned with pulling in other sources of infor-
mation in order to further validate or gain intelligence on your event
stream. This technique is sometimes referred to as fusion correlation. One
example of macro-correlation is taking vulnerability scan data into account
and comparing it inline with event data coming into your analysis system.

CHAPTER 9: Filtering, Normalization, and Correlation
158
If your IDS detect port scans to a series of hosts on your networks, it would be
nice to know if these hosts actually exist, and if so do any vulnerabilities exist
on these hosts. As with micro-correlation, normalization of your raw event
data is important. This also extends to the other data sets you would like to
bring into the correlation process. For example, having username to full name
mappings can be very useful, as can a user’s roles on a particular system. This
data is referred to as context data. Operating systems like Windows or Unix will
insert some context information into the log messages they generate. If you
want to get more detailed information for a user, you will need to do a second
gathering step by pulling it out of an LDAP server or Active Directory server.
The remainder of this section will preset concepts and examples of fusion
correlation.
Rule Correlation
Much like micro-level correlation, macro-level correlation makes use of rule
correlation. One of the main differences is that rule correlation in micro-level
correlation systems can often transition to a rule in macro-level correlation
which can be used either as input back into other micro-level rules or simply
actions which write to text files, create help desk tickets, etc.
Vulnerability Correlation
Vulnerability scanners help find hosts and other systems which are vulnerable
to known attacks. All scanners provide at least the following information:
Vulnerable Host: Hostname or IP Address.
Vulnerable Service or Port: Sendmail Port (25), etc.
Remediation Steps: Patch version of Sendmail, etc.
Most scanners (commercial or otherwise) are designed to be run on a daily,
weekly, or monthly basis. It is up to the user to run the scan by hand or to
schedule it to run at a preset time and date. The notion of real-time vulnerabil-
ity scanning has recently begun to get addressed by IDS vendors like Sourcefire
(http://www.sourcefire.com). Sourcefire employs Real-time Network Aware-
ness (RNA) as a form of real-time vulnerability analysis.
In threat analysis, we can combine vulnerability scan data with real-time event
data, in order to help reduce false positives. For example, if your IDS detect a
port scan is occurring across several hosts in your network, then the chances
are that it will report a range of ports which have been scanned. Furthermore,
it is likely that some of these reported ports may not be active. If you routinely
scan your network for vulnerabilities, you can use this information along with
the IDS messages you get in real time to verify if there is indeed an open port
on the host in question and whether or not it’s vulnerable.

Correlation 159
Profile (Fingerprint) Correlation
Information gathered through banner snatching, OS fingerprints, vulner-
ability scans, and remote port scans can be beneficial from a forensic stand-
point. Moreover, this data can be used to gain better insight into who might
be attacking you and also aid in prosecution. As part of normal correlation
(rule correlation, for example), an action can be setup to initiate one of
these forensic-gathering tasks as events of a particular nature come into the
system. This gathered information can then be stored to a database for later
use.
Nmap is a tool which is able to perform OS fingerprinting, among other
things. Nmap is available at http://www.insecure.org/nmap. Here is a basic
fingerprinting run of Nmap:
$ sudo nmap -A 192.168.1.6
Starting Nmap 5.21 (http://nmap.org) at 2012-03-25 18:03 EDT
Nmap scan report for 192.168.1.6
Host is up (0.00038s latency).
Not shown: 991 closed ports
PORT STATE SERVICE VERSION
135/tcp open msrpc Microsoft Windows RPC
139/tcp open netbios-ssn
445/tcp open netbios-ssn
2869/tcp open http Microsoft HTTPAPI httpd 2.0 (SSDP/UPnP)
|_html-title: Service Unavailable
49152/tcp open msrpc Microsoft Windows RPC
49153/tcp open msrpc Microsoft Windows RPC
49154/tcp open msrpc Microsoft Windows RPC
49158/tcp open msrpc Microsoft Windows RPC
49160/tcp open msrpc Microsoft Windows RPC
MAC Address: 68:A3:C4:4D:4A:FF (Unknown)
Device type: general purpose
Running: Microsoft Windows Vista|2008|7
OS details: Microsoft Windows Vista SP0 - SP2, Server 2008, or Windows
7 Ultimate (build 7000)
Network Distance: 1 hop
Service Info: OS: Windows
Host script results:
|_nbstat: NetBIOS name: KEVIN-PC, NetBIOS user: <unknown>, NetBIOS MAC:
68:a3:c4:4d:4a:ff
| smb-os-discovery:

CHAPTER 9: Filtering, Normalization, and Correlation
160
| OS: Windows 7 Professional 7600 (Windows 7 Professional 6.1)
| Name: WORKGROUP\KEVIN-PC
|_ System time: 2012-03-25 18:04:10 UTC-4
|_smbv2-enabled: Server supports SMBv2 protocol
HOP RTT ADDRESS
1 0.38 ms 192.168.1.6
OS and Service detection performed. Please report any incorrect results
at http://nmap.org/submit/ .
Nmap done: 1 IP address (1 host up) scanned in 56.55 seconds
$
The—A option instructs Nmap to perform fingerprinting.
Anti-Port Correlation
Most, if not all firewalls emit log messages based on allowed or denied packets
and other events. Anti-port correlation deals with using open port information
along with firewall data to be able to detect attacks in the slow or low category.
Nmap can be used to track open ports on your systems. The following pseudo-
code shows the basic idea:
if (event E1.dstport != (Known_Open_Ports on event E1.dstip))
then
doSomething
One attack this technique can help detect is worm activity. In general, however,
it can help detect when an attacker is trying to access a system’s ports or ser-
vices which don’t exist. There are several ways to track open port information.
One way is to regularly run Nmap and keep track of open ports. As you receive
events you can compare the destination ports from both firewalls and IDSs
against the known open ports. Another way to do this is to keep a list of hosts
and ports up to date by hand, rather than relying on Nmap. This technique is
only viable if you have a fairly static environment.
Watch List Correlation
It is sometimes beneficial to be able to know when events are received which
target a host or even a network. The opposite is often true; you may want to
place the source of an attack on a watch list, i.e. the attacker.
Often times this can be in the form of external intelligence gathered from dif-
ferent places such as Dshield (http://www.dshield.org/). Dshield has a list of
top 10 attackers which you can place on your own watchlist. SANS also has
similar information: http://isc.sans.org.

Correlation 161
Geographic Location Correlation
Many network management platforms employ the use of a network map to visu-
alize devices in the enterprise. As alarms and such are generated, nodes on the
map light up to indicate trouble. While this type of map in the security world is of
marginal value, what is really valuable is the ability to graph threats in real time
as they occur. This requires some unusual processing. The American Registry for
Internet Numbers (ARIN) is one resource that can help with this. ARIN (http://
www.arin.net) is the Internet number registry for North America, the Caribbean,
and sub-equatorial Africa. Internet providers, companies, etc. go through ARIN
for networks. ARIN collects contact information on these organizations. ARIN
does not collect latitude and longitude information, but you can obtain airport
codes or reverse lookup of IP addresses from WHOIS records. The ARIN Web site
has tools which you can use to query its services for information on IP addresses
and networks, especially contact information. While plotting attacks on a map
based on this information isn’t 100% accurate, it does go a long way to helping
track down evil doers. VisualRoute is a tool which can be used to visualize which
routes packets take from one place to another. See http://www.visualware.com/
personal/products/visualroute/index.html for information.
Using Data in your Environment
Using data about your environment is one of the best sources of correlated
data you can use. As was mentioned in the Macro-Level Correlation section,
this data is considered context. For example, if you know your company’s holi-
day schedule, you can use this information to raise an alert when you see access
to internal resources when everyone is at home. Some of the more common
environmental triggers you can use include:
n Vacation schedules.
n Business hours.
n Holiday schedule.
n Access rights to internal resources.
n Repeating network “events,” e.g. vulnerability scans.
n Scheduled backups of systems, data stores, etc.
n Maintenance schedule, e.g. router configuration changes and reboots, OS
patching, etc.
These things can be used to aid in determining if some behavior is legitimate
or outside of normal boundaries.
Simple Event Correlator (SEC)
The Simple Event Correlator (SEC) is a Perl-based tool which implements a
simple correlation system. It is available at http://kodu.neti.ee/~risto/sec/.

CHAPTER 9: Filtering, Normalization, and Correlation
162
SEC was developed to fill the gap between open source log analysis tools and
commercial systems. It has robust syntax for creating rules which can do sim-
ple things to very complex things. Rules can be chained together to form mod-
els of behavior, which can be used to detect known situations or help diagnose
or discover unknown situations. At the heart of SEC’s engine is the notion of
contexts. A context can be thought of as a place holder for some occurrence of
an event or series of events. It is the context notion which allows SEC act in a
stateful manner. This is a very critical feature for being able to detect multiple
log message patterns which when combined indicate something of interest.
We’ll see some useful examples soon.
SEC Basics
The purpose of this section is not to present SEC in its entirety, but rather
to present the key features. The installation of SEC is very straightforward, so
instead of showing this, I’ll present practical SEC rule examples. But for now,
let’s look at the various rule types which SEC supports:
n Single—Single matches an event and performs an action.
n SingleWithScript—SingleWithScript matches an event and gets the return
code from a script or program it runs.
n SingleWithSuppress—SingleWithSuppress matches an event and then
ignores any subsequent matches for t seconds.
n Pair—Pair combines two or more events into a single event, within a
given time range.
n PairWithWindow—PairWithWindow is similar to Pair, but it waits t sec-
onds for the next event to arrive.
n SingleWithThreshold—SingleWithThreshold counts matching events within
a time window and up to a threshold. An action is fired once the thresh-
old is met, and no other events will be considered during the remainder
of the time window.
n SingleWith2Thresholds—SingleWith2Thresholds counts matching events
within time window t1 and executes an action when the first threshold is
reached. The count is reset and matched events are counted for t2 sec-
onds. Execute another action if the count falls below the second threshold
within time window t2.
n Suppress—Suppress doesn’t match events and cannot execute actions.
n Calendar—Calendar executes actions at specific time, via a configuration
similar to UNIX crontab entries.
SEC rules have the following basic format:
type= <Rule Type>
ptype=RegExp
pattern= <regular expression pattern>

Correlation 163
desc= <description text>
action= <semicolon separate action list>
We’ll see some actual examples in a little bit. SEC supports many actions, but
only the more generic ones will be presented here:
write <filename> [<event text>]: The write command will write event text to file-
name. A dash (“-”) can be used to write to standard out.
shellcmd <shellcmd>: A shell command or program will be executed.
spawn <shellcmd>: This is identical to shellcmd, except the output of the shell
command or program is fed back into SEC. This means you can write SEC rules
to correlate this output.
event [<time>] [<event text>]: This causes an internal SEC event to be created.
This can be used as feedback into SEC. Time is the amount of time SEC waits
before it feeds event text back into SEC. Note that if you use a nonzero value for
time, SEC will wait until time has expired before it does anything else. In most
instances, a zero value could be used and SEC will not hold up its processing.
Real-World Examples
What We would like to do now is present how to use SEC in a few real-world
examples. All of these examples can easily be extended by you to fit your own
environment.
Stateful Rule Example
Recall the pseudocode rule from earlier in the chapter:
If the system sees an event E1 where E1.eventType=portscan
followed by
an event E2 where E2.srcip=E1.srcip and E2.dstip=E1.dstip and
E2.eventType=fw.reject
then doSomething
What we are interested in catching are two separate events. One is an IDS
portscan event and the other is a firewall reject event. If the source and destina-
tion IP addresses in both events are the same, we want to do something. The
SEC rule set for this is as follows:
#
# Rule 1: Catch a portscan from source IP address to destination IP
# address. It will then create a dynamic context based on whatever the
# source and destination IP addresses are.
#
type=Single

CHAPTER 9: Filtering, Normalization, and Correlation
164
ptype=RegExp
pattern=portscan (\d+\.\d+\.\d+\.\d+) -> (\d+\.\d+\.\d+\.\d+)
desc=$0
action= create PORTSCAN_$1_$2;
#
# Rule 2: Catch a firewall reject from source IP address to destination
IP
# address. If the portscan context already exists, we have a situation
# where an attacker is portscanning AND getting a reject from a
firewall, all
# from the same source IP address to the same destination IP address.
#
type=Single
ptype=RegExp
pattern=reject (\d+\.\d+\.\d+\.\d+) -> (\d+\.\d+\.\d+\.\d+)
context=PORTSCAN_$1_$2
desc=$0
action= write - Portscan and firewall reject from $1 to $2;
There are two rules. At first glance, you may be wondering why We didn’t use
the Pair rule. The problem with the Pair rule is that it only detects one event
followed immediately by another event. We want to be able to find the first
occurrence of an event and then find a second event at some later point in
time, not necessarily right after the first.
At any rate, the comments describe what’s happening pretty well. The first rule
catches a portscan event and gets the source and destination IP address. It then
creates a dynamic context which will take the form of PORTSCAN_SRCIP_
DSTIP, where, of course, SRCIP and DSTIP are actual IP addresses. It also uses
the special SEC variable $0, which is the entire log message which matched the
pattern. The second rule looks for a reject, extracts the source and destination
IP addresses and uses these to see if a portscan context exists with the same
source and destination IP addresses. A message is written to standard out if
this is indeed the case. Let’s run through an example run of SEC. A good way
to test rules is to run SEC so that it accepts input from standard in. This is
accomplished with the command-line parameter –input=-. You specify a rules
file with the –conf=filename option. In the example below, our input to SEC
is in boldface:
$ ./sec.pl -conf=portscan-reject.rule -input=-
Simple Event Correlator version 2.2.5
Reading configuration from portscan-reject.rule

Correlation 165
2 rules loaded from portscan-reject.rule
portscan 10.0.0.2 -> 10.0.0.3
portscan 10.0.0.2 -> 10.0.0.4
portscan 10.0.0.2 -> 10.0.0.5
portscan 10.0.0.2 -> 10.0.0.6
Some random text
More text..
reject 10.0.0.2 -> 10.0.0.4
reject 10.0.0.2 -> 10.0.0.6
reject 10.0.0.2 -> 10.0.0.5
reject 10.0.0.2 -> 10.0.0.3
Almost done..
There..
Creating context 'PORTSCAN_10.0.0.2_10.0.0.3'
Creating context 'PORTSCAN_10.0.0.2_10.0.0.4'
Creating context 'PORTSCAN_10.0.0.2_10.0.0.5'
Creating context 'PORTSCAN_10.0.0.2_10.0.0.6'
Writing event 'Portscan and firewall reject from 10.0.0.2 to 10.0.0.4'
to file -
Portscan and firewall reject from 10.0.0.2 to 10.0.0.4
Writing event 'Portscan and firewall reject from 10.0.0.2 to 10.0.0.6'
to file -
Portscan and firewall reject from 10.0.0.2 to 10.0.0.6
Writing event 'Portscan and firewall reject from 10.0.0.2 to 10.0.0.5'
to file -
Portscan and firewall reject from 10.0.0.2 to 10.0.0.5
Writing event 'Portscan and firewall reject from 10.0.0.2 to 10.0.0.3'
to file -
Portscan and firewall reject from 10.0.0.2 to 10.0.0.3
We simply placed our input data in a file and cut and pasted from this file into
the standard in of SEC. After our input we see that SEC creates four unique
contexts, one for each of the four portscan events. As each of the reject events
comes into SEC, it begins emitting the messages for each one of the distinct
portscan and reject event pairs. This is a valuable distinction in that SEC can
detect this situation regardless of what type of events occur between match-
ing portscan and reject events. It should be pointed out that the format of the
portscan and reject events are contrived and used only to simplify the example.
In real life you will need to write more elaborate regular expressions to capture
this information.

CHAPTER 9: Filtering, Normalization, and Correlation
166
Vulnerability Correlation Example
Let’s say you want to narrow down false positives by performing vulnerability
correlation. This means that you use a tool like Nessus to periodically scan
your network for vulnerable systems. Output from your scanner is placed into
a database. We can write a rule in SEC that can detect portscans, run a pro-
gram which queries the vulnerability database and returns whether or not the
attacked system is vulnerable. Here’s the SEC rule which accomplishes this:
#
# Rule 1: Check to see if the attacked system is vulnerable
#
type=SingleWithScript
ptype=RegExp
pattern=portscan \d+\.\d+\.\d+\.\d+ -> (\d+\.\d+\.\d+\.\d+)
script=./vulnCheck.pl $1
desc=$0
action=write - $1 is vulnerable!
action2=write - $1 is NOT vulnerable
The SingleWithScript rule executes a script or program. If the exit code of the
program is 0, then action is performed. If the exit code is anything other than 0
action2 is performed. The Perl script vulnCheck.pl simply performs an exit(0)
which will cause action to be performed, i.e. we have a vulnerable system.
Here’s an example run:
$ ./sec.pl -conf=vulnerability.rule -input=-
Simple Event Correlator version 2.2.5
Reading configuration from vulnerability.rule
1 rules loaded from vulnerability.rule
portscan 10.0.0.2 -> 10.0.3.4
Child 25163 created for command './vulnCheck.pl 10.0.3.4'
Child 25163 terminated with exitcode 0
Writing event '10.0.3.4 is vulnerable!' to file -
10.0.3.4 is vulnerable!
Cisco IOS Configuration Changes
Many environments have some sort of configuration change controls in place.
For example, all hardware or software changes are done between certain hours.
This can be used to your advantage in that if you receive router configura-
tion changes outside of normal hours, then you may have something to worry
about. SEC can be used to detect such occurrences. Let’s look at an example
configuration of how this would be caught:

Correlation 167
type=Single
ptype=RegExp
pattern=%SYS-\d+-CONFIG
desc=$0
action= write – A configuration change has occurred!
At first glance, this is an alright way to deal with it. But do we really want to
have it trigger during ever configuration time, even during your maintenance
hours? If you don’t mind, then you can leave the SEC configuration as is. But
for those who would like to limit the alerts, this configuration may be on inter-
est to you:
type=SingleWithScript
ptype=RegExp
pattern=%SYS-\d+-CONFIG
script=./isItMaintTime.pl
desc=$0
action=write – Configuration during non-maintenance period!
action2=write – Configuration attempt during maintenance period!
This SEC configuration block will now run a Perl script which will check to see
if the date and time the event is received coincides with maintenance time. We
can take this one more step:
type=SingleWithScript
ptype=RegExp
pattern=^.* (\d+\.\d+\.\d+\d+) .*%SYS-\d+-CONFIG: .* from (.*?)$
script=./isItMaintTime.pl $1
desc=$0
action=write – $1 Configured during non-maintenance period from $2!
action2=write – $1 Configured during maintenance period from $2!
We now extract the host from which the configuration attempt was made.
We then pass this to the isItMaintTime.pl script. The goal is to look up (maybe
in a database) to see if the router in question is scheduled to be configured dur-
ing the current maintenance period. Most, if not all Syslog messages include
the host which generated the message early on in the message itself. The first
regular expression attempts to gather this information. Note that you may
need to turn off DNS resolution in order to not convert the router’s IP address
to a hostname. Finally, the source of the configuration is gathered so this can
be reported, too.

CHAPTER 9: Filtering, Normalization, and Correlation
168
Promiscuous Mode Detection
When a network interface is placed into promiscuous mode, all packets are
sent to the kernel for processing, including packets not destined for the MAC
address of the network interface card. The one main reason that this is a bad
thing is because users on the system with a promiscuous mode network inter-
face can now use a tool like a sniffer to view any and all network packets. Let’s
look at how to detect an interface going into promiscuous mode on Linux:
type=Single
ptype=RegExp
pattern=^.*(\d+\.\d+\.\d+\.\d+).* (.*?) entered promiscuous mode$
desc=$0
action= write – Interface $2 on $1 entered promiscuous mode
Here the SEC rule will detect the host and the host’s network interface which
went to promiscuous mode.
Keywords to Watch For
The following SEC examples show some keywords that are noteworthy.
Kernel panics generally mean some sort of hardware is failing or some such
event. SEC can detect these with the following:
type=Single
ptype=RegExp
pattern=panic
desc=$0
action= write – A potential kernel panic has occurred
Messages with fatal in them should probably be captured. The following SEC
rule will catch these:
type=Single
ptype=RegExp
pattern=fatal
desc=$0
action= write – A fatal error may have occurred
Finally, keeping an eye out for messages which contain the string password or
passwd in them are noteworthy because they can be indicative of malicious
attempts to subvert normal channels for password maintenance. The following
will detect password messages:
type=Single
ptype=RegExp

Correlation 169
pattern=password|passwd
desc=$0
action= write – Password operation detected
Application Exit Codes
When applications exit, they generally return an error code to the operating
system. This code is generally zero (0) for normal program termination. An
exit status of one (1) is generally used to denote some sort of an abnormal
operation has occurred which caused the application to terminate abruptly.
The following SEC rule will detect such error codes:
type=Single
ptype=RegExp
pattern=exit status 1
desc=$0
action= write – An application exited with status of 1
Of course we could extend this rule to the following:
type=Single
ptype=RegExp
pattern=exit status (\d+)
desc=$0
action= write – An application exited with a status of $1
This has the benefit of actually getting the exit code so we can perform finer-
grained analysis on it.
Final Words on SEC
There is one last thing We should point out. For most of this chapter I have been
saying that you need to normalize your raw data in order to correlate it. With
SEC this isn’t the case. SEC works best by reading log files. But you can pass data
into SEC via alternate methods. So you can either use it to correlate your log
data, or use it to correlate data after you have gathered and normalized it.
Building Your Own Rules Engine
What if you are using a log analysis system which doesn’t have a rules engine?
If you are interested in writing your own engine, and you are Java inclined, this
section covers two frameworks which allow you to write two somewhat differ-
ent kinds of processing engines:
n Rules-based.
n Stream-based.

CHAPTER 9: Filtering, Normalization, and Correlation
170
Rules-Based Engine Using Jess
Jess is maintained by Sandia National Labs (http://herzberg.ca.sandia.gov/
Jess/). Jess is not open source, but it is free for non-commercial and academic
use. Still, the commercial licensing model is not cost prohibitive for most
organizations.
One of the best resources for getting to know Jess is a book called Jess In Action.
It was written by the author and maintainer of Jess, Dr. Ernest Friedman-Hill.
This section merely introduces Jess in the context of using it for security log
analysis, so you should see this book for a detailed and well-written explana-
tion of how to use Jess in a general sense.
Jess is written in Java. You don’t actually need to know Java in order to use
Jess, as Jess has its own rule language and can function as a shell (hence
the name). However, in order to use it in a manner consistent with how log
data is gathered and normalized, you will need to do some Java development.
So, this section assumes you have some understanding of Java development.
You don’t need to be a guru, but you should be familiar with it.
Jess and the Rete Algorithm
Central to Jess’ ability to perform its duty as a rules engine is the fact that it
implements the Rete algorithm (note that Rete is pronounced ree-tee). The
Rete algorithm was invented by Dr. Charles L. Forgy. The algorithm came
about in order to solve the problem of pattern matching. Traditional pat-
tern matching can be fairly inefficient, when used in the context of rules or
rules engines. According to Dr. Friedman-Hill, the Rete algorithm accom-
plishes its goal by remembering data that are asserted or retracted into
working memory (more on these in a moment). This means that the rules
engine only tests (or fires) rules against the data items which have actu-
ally changed. This reduces the amount of work the engine has to perform.
Rules generally have what is termed a left-hand side (LHS) and a right-hand
side (RHS). The LHS of a rule is the condition, similar to if-then-else state-
ments you are used to. The RHS is the action to take if the LHS evaluates to
true. It’s that simple.
The Rete algorithm organizes its data in a tree-like structure. Each node in the
tree represents a test which will get performed against data being added or
removed from memory. Each node will have one or two inputs and possibly
many outputs. As a new piece of data enters the tree, it is filtered through the
tree until it reaches a terminal node. If a terminal node is reached, this means
that a new activation record is created with all the data points which caused
the rule to be true. Rules in Rete systems work best if you can be as explicit as
possible. This means you should write rules that look for very detailed items
in a given piece of data. This causes a path in the Rete tree to be traversed in a

Correlation 171
somewhat determinant manner, which exposes the efficiencies inherent to the
Rete algorithm.
Many Rete-based rule engines exist. Certain terminology is commonly used
when talking about such engines, so We would like to discuss these now.
Forward- and Backward-Chaining. A forward-chaining system is one where
rules are executed against a set of data. In other words it’s data driven. Back-
ward-chaining is one where a data set is queried for truth values. The data
set is almost always pre-existing, so backward-chaining is not necessarily data-
driven. Prolog is the classic example for a backward-chaining system. Jess can
operate in both modes.
Working Memory. Working memory (WM) is the area in a rule engine where
data, to be processed by one or many rules, is kept. This area is sometimes
referred to as the fact space. The key to maintaining a high-performance rules
engine is to keep the number of facts in WM low. You cannot continually place
facts into WM without clearing them out. This will cause not only the Java
process to consume memory and possible cause swapping out to disk, but the
Rete algorithm will begin to perform poorly.
Object Assertion. Data is placed into WM via a process called assertion. We use the
term object because the example We provide in this section places Java objects
into WM. This can be done programmatically or from the rule language itself.
Object Retraction. Data in WM is removed via a process called retraction. This
can be done programmatically or from within the rule language itself.
Agenda. The agenda is the list of rules which have RHSs which will be executed/
fired.
Conflict Resolution. Conflict resolution is the process by which the actions in the
agenda are picked to fire. The programmer doesn’t entirely have direct control
over this process, but one way he or she can affect this is by setting salience
values. Salience is a form of priority. You may have rules which have similar
conditions. The rules engine will have to decide which rule to fire if the same
fact in WM would satisfy both rules. Setting a higher salience value (typically
a signed integer) for one rule will influence the engine to execute the rule as
opposed to another one which may also be a candidate for execution.
Jess Rule Language
Jess uses a LISP-like language for crafting rules. You do have to work with it a
bit to wrap your mind around it, but once you do you will see that it’s quite
expressive and powerful. We are only going to briefly present it. The Jess In
Action book does a great job of describing the language. There is also a freely
available manual on the Jess Web site which describes the syntax details, too.

CHAPTER 9: Filtering, Normalization, and Correlation
172
For our purposes here, We are only going to present the barest of syntactical
details to illustrate how to accomplish our goal of security log data analysis:
(defrule find-port-80
?event1 <- (event (dstport 80))
=>
(printout t "Found an event with dst port of 80: " (fact-slot-value
?event1 type) crlf)
(retract ?event1))
I’ll describe each of the piece-parts of the rule. First off, the defrule tag gives
a name to your rule. The code ?event1 <- (event (dstport 80)) is the LHS of
the rule. It takes an object called event, calls the getter method getDstport(),
checks to see if it is 80, and assigns (binds) the event object to a variable
called ?event1. Note that We left off the get portion of the getter. In Jess, you
simply use the portion after the get or your getter method. So this means all
your getters, in your Java code, need to be prefixed with get.
The => symbol defines the RHS of the rule. For those of you who took a logic
or discrete math course in school, think of the => operator as a conclusion,
therefore, or implies statement in a proof or argument. If the LHS evaluates to
true, then everything after the conclusion is executed. In the example above,
some text is printed using the printout operator. In the printout command, the
fact-slot-value operator is used to access a member of our event object. As with
dstport, type is the property name for getType() in the event object. Finally, we
remove the object from WM by calling the retract operation on the? event1.
Jess in the Real World
In order to use Jess for analyzing log data, we need to do some Java program-
ming. First off, We are going to assume that log aggregation and normalization
is already being done. The following Java Class, called SecurityEvent, is a bare-
bones object to represent a single log event:
public class SecurityEvent
JAVABEANS CONVENTIONS
Getters and Setters
Note that the naming conventions for getters (getType(), getDstPort(), etc.) is actually the com-
mon JavaBeans convention for naming properties. Jess uses the property name corresponding
to the getter method name—sometimes it can be “is” instead of “get,” for example, with bool-
ean properties.

Correlation 173
{
private String mSrcip;
private String mDstip;
private int mSrcport = 0;
private int mDstport = 0;
private String mType;
private String mHostname;
/*
Constructor
*/
public SecurityEvent(String hostname,
String dstip,
String srcip,
int dstport,
int srcport,
String type)
{
mSrcip = srcip;
mDstip = dstip;
mHostname = hostname;
mDstport = dstport;
mSrcport = srcport;
mType = type;
}
/* member data getters */
public String getType()
{
return mType;
}
public String getHostname()
{
return mHostname;
}
public String getSrcip()
{
return mSrcip;
}
public String getDstip()

CHAPTER 9: Filtering, Normalization, and Correlation
174
{
return mDstip;
}
public int getDstport()
{
return mDstport;
}
public int getSrcport()
{
return mSrcport;
}
}
The class has the usually private members and getters for these members. We
have omitted any setters, as you normally don’t want to alter log event details.
However, you can freely add them if you need this functionality.
The next bit of code shows how to use Jess and this event object:
import Jess.*;
public class Main
{
public static void main(String[] argv)
{
try
{
//Create new Rete instance
Rete rete = new Rete();
//Read in the rules file from file
rete.executeCommand("(batch myrules.clp)");
//Define our Java SecurityClass as a Jess class called event
rete.defclass("event," "SecurityEvent," null);
//Create an new instance of a SecurityEvent and assert it
rete.definstance("event,"
new SecurityEvent("webserver," //hostname
"10.0.0.2," //dst ip
"10.0.0.3," //src ip
80, //dst port
5512, //src port
"Web-Access-Event" // event type
), false);

Correlation 175
// Run the engine
rete.run();
}
catch(JessException jex)
{
jex.printStackTrace();
}
}
}
The in-line comments are pretty much self-explanatory. Basically, we load the
rules file from a disk file; this is done with the executeCommand() method. It
will attempt to load a file called myrules.clp. The defclass() method tells Jess
about our event class. The first parameter to this method defines how you will
refer to the object in the rules file. The definstance() method asserts an new
SecurityEvent object into WM. Finally, the run() method runs the engine. In a
production rule engine, you will want to assert objects and run the engine in
loop, maybe getting your event objects from some sort of queue or database.
Depending on the number of events you plan to assert per second, you may
want to run the engine with every object assertion, or you may want to assert a
certain number of events first and then run the engine.
Another alternative is to assert the events in one thread, and run the engine
continuously using Rete.runUntilHalt() in a dedicated thread. This is all highly
dependant on your event rate, how many rules you have, how many rules have
partial matches (more on partial matches in a bit), and so forth. You may need to
play with your own engine to see what works best for you and your environment.
Recall the rule from the previous section. Let’s say you wanted to find one type
of event followed by another, i.e. a stateful rule example:
(defrule find-portscan-followed-by-reject
?event1 <- (event (type portscan) (srcip ?sip))
?event2 <- (event (type reject) (srcip ?sip))
=>
(printout t "Portscan followed by Firewall Reject from: ?sip" crlf)
(retract ?event1 ?event2))
This rule has two states. One looks for an event of type portscan. The second
state looks for an event of reject. The first state gets the source IP of the event
and assigns it to ?sip. The second state uses ?sip and compares it to the source
IP of the second event, and if they match, i.e. the same person caused the

CHAPTER 9: Filtering, Normalization, and Correlation
176
portscan and reject events to occur, then the rule fires. The final action in the
LHS is to retract both ?event1 and ?event2 from WM.
We mentioned something about partial matches. This is an issue to be aware
of with any Rete-based engine. Let’s say in the rule above we get 5000 events
coming through the engine which match the first state. This means the engine
has to keep around these 5000 partial event matches in WM. When an event
comes into the engine that matches the second condition in the RHS, the rule
is complete and it fires.
This example is not entirely perfect. This rule will only match a portscan event
followed immediately by a reject event. In some cases this may be what you
want, but you will definitely want to be more flexible than this. The reject event
may not occur until several minutes after the portscan event. To remedy this
you will need to add a timestamp to your SecurityEvent object. This timestamp
should be of type long. You can use the System.currentTimeMillis() Java call to
set the value. You also need to add a corresponding getter. Once you do this,
the rule now looks like the following:
(defrule find-portscan-followed-by-reject
?event1 <- (event (type portscan) (srcip ?sip) (timestamp ?time1))
?event2 <- (event (type reject) (srcip ?sip) (timestamp ?time2))
(test (>= ?time2 ?time1))
=>
(printout t "Portscan followed by Firewall Reject from: ?sip" crlf)
(retract ?event1 ?event2))
The first state in the rule gets the object’s timestamp and assigns it to ?time1.
The second state assigns? event2’s timestamp to? time2. The new rule intro-
duces the test function, which used the >= operator to determine if ?event2
happens at the same time or later than ?event1.
Jess Performance
According to Friedman-Hill, determining the exact performance characteristic
of a Rete engine is difficult. He writes that the runtime of the engine will be
proportional to approximately the following: R'F'P'. R' is a number less than
the number of rules. F' is the number of facts which change on each iteration
through the engine. P' is a number greater than one but less than the average
number of patterns per rule.
Final Words on Jess
This section on Jess presented only the barest details regarding Jess. The
emphasis was on using Jess in a capacity consistent with security log analysis.

Correlation 177
Jess has a very small system footprint and can easily be embedded in any Java
application, including J2EE.
Stream-Based Engine Using Esper
The final of the two developer-centric examples deals with stream-based process-
ing or Complex Event Processing (CEP). The idea behind stream-based process-
ing is that streams of data (or events) are passed through a CEP engine, whereby
complex patterns can be discovered across multiple events. CEP engines employ
query languages which allow you to define the patterns you are interested in
discovering. The best and easiest way to understand a CEP engine is to compare
it to a database. Databases use queries to sift through data. CEP engines stream
data through queries to find interesting things. CEP engines tend to be very fast
with benchmarks in the range of hundreds of thousands of events per second
which get evaluated by thousands of rules (queries). How is this? CEP engines
do much of what they do by executing in memory, rather than disk. This has the
advantage of being fast, but means you need lots of RAM and CPU if you antici-
pate lots of events and queries. This section is going to introduce the basics on
CEP. There are many great resources online which will go into greater depth.
Let’s look at Figure 9.2. It depicts the basic flow through a CEP engine.
What we see in Figure 9.2 are events flowing in the CEP engine. What comes
out are the events themselves along with any alerts or actions created based on
patterns of discovery. The box labeled “Window” denotes the temporal aspect
of stream processing. With windowing you are able to define constraints around
how long you want to look for patterns of events before the engine nullifies
any events it is keeping in memory.
The most well-known open source CEP engine is Esper (http://esper.codehaus.
org/). Esper is a framework which allows you to rapidly build a CEP engine
with very little in the way of code. Esper in a nutshell is:
n Pure Java.
n Embeddable into any Java application.
n Expressive via Esper Query Language (EQL), which is a SQL-like language
for defining.
FIGURE 9.2 Basic CEP Engine Flow

CHAPTER 9: Filtering, Normalization, and Correlation
178
n Well documented.
On top of all of this, there is a way to obtain commercial support for Esper.
By now you might be asking how CEP can help with correlation. Let’s look at a
quick example. Like Jess, you will need to create Java classes which model the
kinds of normalized log messages you plan to analyze. In the following exam-
ple, we use two separate objects for the example, but there are other options.
OK, let’s look at an EQL statement:
select * from pattern [every LoginFailure -> (timer:interval(10 sec)
having count(*) >= 5 and LoginSuccess)]
The EQL statement is looking for a specific pattern. First, it is looking for Log-
inFailures. We set the window to be 10 s. Then we are looking for at least five
LoginFailures to occur in this window. The five failures in 10 s must be followed
by a LoginSuccess. Here is what we are looking for in English:
If 5 LoginFailures occur in 10 seconds followed by a LoginSuccess then alert.
This is a classic pattern for a brute-force login attempt. Of course in a real
application, we would need to make sure the LoginFailures and LoginSuccess
are mapped to each other via the source and user.
Stream processing is a viable alternative to using a rules-based engine. We
have only scratched the surface of how to use CEP for correlation. Esper
has lots of great documentation and has a ton of solution patterns found
at http://esper.codehaus.org/tutorials/solution_patterns/solution_patterns.
html.
COMMON PATTERNS TO LOOK FOR
There are some common patterns which correlation is uniquely positioned to
help uncover. Table 9.1 presents some of the more common patterns.
THE FUTURE
What does the future hold? The future is pretty bright actually. The Big Data
movement has brought a new way of storing and dealing with large volumes of
data. In the Big Data world, you are able to store large volumes of data across
commodity machines with on-board disk storage. Sifting through these stored
data is accomplished by running jobs which are geared toward finding what
you are interested in and then returning a result set which is narrowly focused
to what you need. A logical use for these types of systems is in finding patterns
of things you may or may not know about (sound familiar?).

The Future 179
Table 9.1 Common Patterns
Pattern Discussion
X login failures followed by a login
success.
This could be an indication of a brute-force login
attempt. What value should X take? We have seen
numbers like five or ten used. On Windows, when
someone logs in, Windows will actually generate
more than one login message. You will want to
investigate this in your environment by logging
into your workstation and looking at the number
of login events which are generated. Once you
identify all of the extra messages, you should use
your log analysis tool to filter out these other log
messages.
Non-admin account creation
followed by privilege escalation.
This isn’t the typical user administration path, i.e.
non-admin accounts don’t generally get their
privileges escalated to admin or some other
advanced user status.
Login by a VPN user outside/inside
of work hours and a transfer of
megabytes or more (at some point
during the VPN connection) of data
outside of the network.
This could be an indication of possible exfiltration
of data. This one is a bit harder to accomplish
because it would require the use of something
like Netflow. It’s not easy to collect, summarize,
and correlation Netflow in a real-time manner.
This might have to be done in a post-processing
manner.
A host on your network begins
attacking or probing other hosts on
the network.
This could be an indication that the source host is
infected with a worm/trojan/malware/etc. You can
use firewall logs to determine this.
X attempts in close proximity to
access a share/file/directory/etc. for
which a user doesn’t have access.
This could be an indication of user account
compromise. If this happens after hours this
should be investigated immediately.
Logins from multiple usernames
from the same workstation.
This is pretty simple. Some is using several
different user names to access multiple different
resources on the network.
Multiple AV failures across several
systems.
This pattern is more general, but if you begin
seeing many AV failures across a wide swatch
of your systems or hosts, this could be indicative
of a virus outbreak.
Exploit against DMZ system
followed by outbound connection
(the classic!).
This could be indicative of a bot infection.
Exploit against DMZ system
followed by a configuration change
on same system.
An attacker has gained access to a system and
altered.
Lots of Web 404s, 401s, 500 and
other Web error codes within a few
minutes.
This could be indicative of your Web server or
applications not functioning properly to various
causes.

CHAPTER 9: Filtering, Normalization, and Correlation
180
SUMMARY
We covered a lot of materials in this chapter. The intent was to provide you
with practical tools and concepts surrounding filtering, normalization, and
correlation. Network and security administrators will find the topics presented
in this chapter stimulating. A large part of dealing with log data, in a meaning-
ful way at least, has to do with properly dealing with the data in a way which
allows you to derive meaning and understanding of the data.
REFERENCE
Ranum, M. J. (1997). Artificial ignorance: how-to guide, September 23. Web, March 19, 2012.
<http://www.ranum.com/security/computer_security/papers/ai/>.

Logging and Log Management.
© 2013 Elsevier, Inc. All rights reserved.
http://dx.doi.org/10.1016/B978-1-59-749635-3.00010-5
181
CHAPTER 10
Statistical Analysis
CONTENTS
n Frequency
n Baseline
n Machine Learning
n Combining Statistical Analysis with Rules-based Correlation
INFORMATION IN THIS CHAPTER:
INTRODUCTION
In Chapter 9 one of the topics discussed was rules-based correlation. Correla-
tion of this type is very useful. Unfortunately, it is based on creating rules to
catch things you already have some knowledge of. In order to catch things you
don’t yet know about, or catch things which look similar to other things, you
need to employ some statistical methods. This chapter and Chapter 11 touch
on some of the more common uses of statistical concepts to help discover or
uncover things which are occurring, based on log data collection, in your envi-
ronment. In this chapter we look at frequencies, baselines, machine learning,
and how statistical analysis can be combined with rules-based correlation.
FREQUENCY
One very simple technique which can be used is to count source and destina-
tion IP addresses in incoming log flow, across all log sources. The idea is pretty
simple: a spike in the number of occurrences of a destination IP address could
be an early warning sign that something is occurring, e.g. someone is target-
ing an attack at this system. The same is also true of source IP addresses, too.
The reason this works so well is because many security devices and systems
emit source and destination IP addresses. Even when you don’t get source IP
information, you know the destination of the potential attack (you should, it’s
Introduction .............181
Frequency ................181
Baseline ...................182
Thresholds ......................186
Anomaly Detection ........186
Windowing .....................187
Machine
Learning ..................187
k-Nearest Neighbor
(kNN) ...............................188
Applying the k-NN
Algorithm to Logs ..........188
Combining
Statistical Analysis
with Rules-Based
Correlation...............190
Summary .................191
References ...............191

CHAPTER 10: Statistical Analysis
182
the device being monitored by a firewall, IDS or some other detection/control
system), which is often times all you need for further investigation.
Time is a factor which also needs to be a consideration in this form of analysis.
You don’t want to simply continue to count destination IP addresses, occur-
rences forever. After some predefined time period (the shorter the better), any
frequencies accumulated for a destination or source IP address should be con-
sidered null and void and accumulation should begin again, i.e. new occur-
rences of a particular destination IP address, for example, would begin all over
again. This allows hosts which have lower frequencies to not show up on your
radar, while others which have higher frequencies in the same amount of time
to show up on the radar in a more prominent manner.
While frequencies are a simple analysis technique, it can fall short. What we
need is a more automated technique for discovering when something occurs
outside of the “norm.” This is where baselines come into play. We will discuss
this topic in the next section.
BASELINE
As its name implies, a baseline gives you a measure of the normalness of some
set of data. Why do we need to baseline? There are several compelling reasons,
including:
n The gain situational awareness (SA).
n New threat discovery.
n Get better return on investment (ROI) on the gear you already have in
place.
n Extra meaning from your data so you can act upon it automatically.
n Measuring your security via metrics, trends, etc.
Some actual examples of baseline usage include:
n Hits on port 443 over the last week.
n User logins to a server X times per day.
n Use of su command per hour of day.
n Count of new ports hit on a firewall.
n Number of hosts touching servers in your environment per day.
In order to create baselines, we need lots of data, in normalized form, and
expert feedback. The expert feedback is needed to discern what is normal from
what is bad. In most cases, training data is not needed for baselines. The key
baseline assumptions are as follows:
n There is data available.
n The past was not disastrous, i.e. there were no gaping outages and so forth
in the data we plan to derive the baselines from.

Baseline 183
n A baseline is the correct model; it won’t work for erratic/random
phenomena (this causes bad baselines).
The basic idea is you calculate a baseline over a period of time so you get to see
how something operates normally. Then, once you’ve gathered enough data
points, you can then begin using techniques to see when things happen out-
side of the baseline, thus indicating a possible issue. In order to improve your
baseline, it is best to collect as much data as possible. The more data you have
the accurate your results will be.
One of the big questions is how much data should you collect before you can
say you have captured normalness? Ideally you will collect four to six weeks
of data points. In some cases, as little as one to two weeks of data can be used.
Let’s take a look at the basic formulas used in calculating a baseline.
First, we use the mean, or average, to find the average value of the data points.
This is simply where we add up all data points and divide by the number of
data points collected. Next, we will want to use the standard deviation formula.
Standard deviation is used to measure the amount of variability in your data.
The formula consists of taking the square root of each data point subtracted
by the mean, then squared (to get rid of negative values), then divided by the
number of data points in the sample. Finally, we need to cover the standard
error formula.
Standard error is used to determine a confidence interval, and it’s the standard
deviation divided by the square root of the number of data points. In other
words, we use this to denote an interval between which future values can fall
and not be deemed statistically relevant. Generally a 95-percent confidence
value is used (although 90 and 99 percent are also used). Refer to Kachigan
(1986) for a more in-depth discussion on this topic.
Now that we have all the basics in place, let’s outline the steps to calculating a
baseline:
1. Obtain the mean for your data set.
2. Calculate the standard deviation.
3. Calculate the standard error.
mean =n
k=1xk
n.
Standard deviation
=
n
k=1(xk−µ)2
n.
Standard error
=
σ
√n
.

CHAPTER 10: Statistical Analysis
184
4. Multiply your standard error by 1.96 (this is based on using a 95th percen-
tile. Again, see Kachigan (1986) for a deeper dive). Some texts use a value
of 2 rather than 1.96.
5. Add and subtract the number obtained in step 4 to define your 95th
percentile confidence interval. You compare future data points against this
interval. If future values fall within this range, they are not necessarily too
different from the baseline. If they fall outside of this interval, they might
be statistically different from the baseline.
6. Add new data to baseline and age out old data. This is critical since older
data is, well, old and skew results. You also need new data to detect
changes in behavior.
Figure 10.1 shows the lifecycle for baselines.
What sort of things should you baseline, i.e. what baselines well? In the world
of log data, there are some key things to observe. Let’s list out a few of these:
n User login and logoffs, both successes and failures.
n Network traffic bytes both inbound and outbound.
n Network traffic to particular ports/services/protocols.
n Administrative account usage/access.
n Processes running on a server.
n Hardware health statistics—depending on what instrumentation a
particular hardware vendor supports, it is possible to look at error rates
(error rates of the hardware) and try to determine when a particular piece
of hardware might fail.
n Domain Name System (DNS) requests.
n Dynamic Host Configuration Protocol (DHCP) requests.
n Total amount of log data sent and received—this can be used to detect situa-
tions where your log data sources might be misbehaving or are under attack.
n New attack type.
n New usernames.
n Log message type per sensor per day.
n Log message type per protocol and port.
n Log message types (new ones).
CONFIDENCE INTERVAL
Normal Distribution
It should be noted that the confidence interval only works if the data follows a Normal distribu-
tion (bell curve). If your data does not follow such a distribution, there are a few techniques
which can be applied like transforming the data to something approximating normal. Please
see some of the books in the reference section if you want to learn more about this.
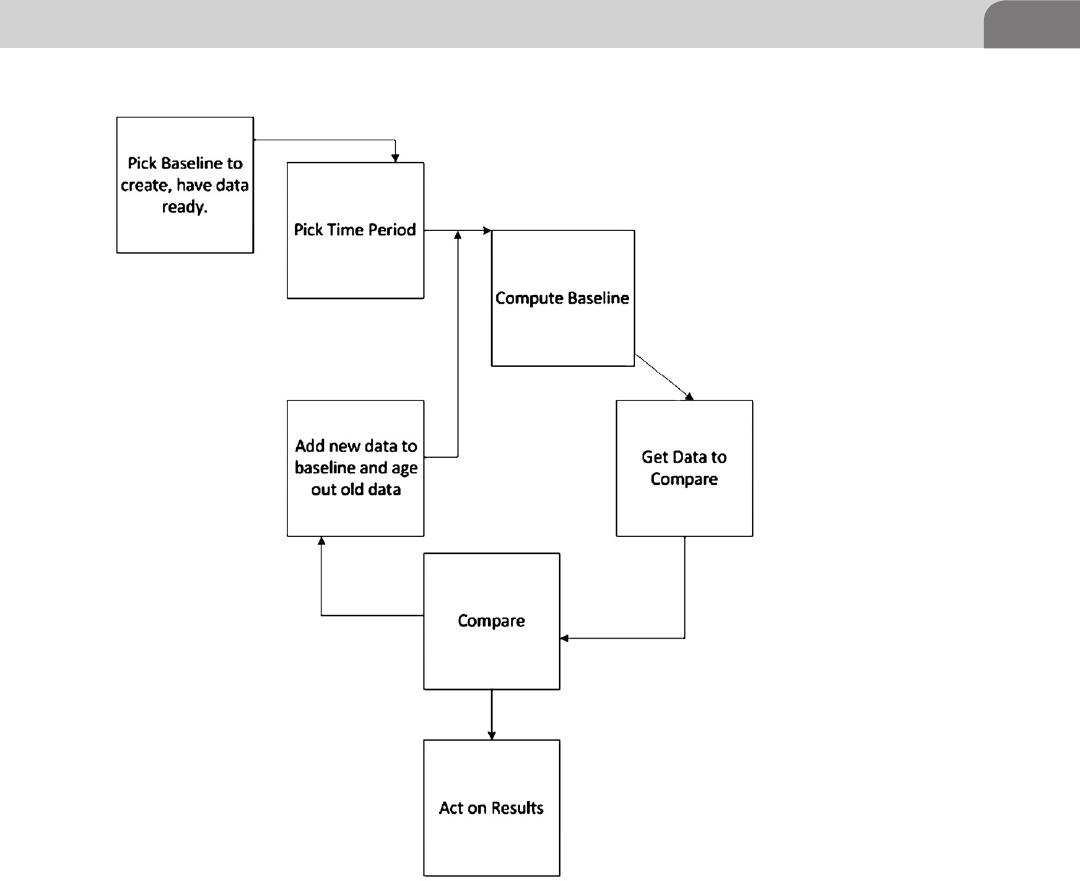
Baseline 185
n Protocols per sensor per day.
n Count of unique alerts per source.
n Count of unique ports per source.
What sort of things do not baseline well?
n Random things which have no relation to what you are monitoring, from
a log perspective, in your environment.
FIGURE 10.1 Lifecycle for Baselines

CHAPTER 10: Statistical Analysis
186
n Things which go up and down on their own, e.g. accesses to a document
on a server.
n Sometimes only large deviations matter at all.
n Let’s now delve into some topics which make use of baselines.
Thresholds
Thresholds are used for determining when something exceeds a baseline value.
For example, let’s say you know that a particular server normally receives an
average of 10 failed logins per hour. If you suddenly see this number jump up
to 23, then this is something you might want to investigate. This example also
shows how time can factor into thresholds. Thresholds are typically not useful
when are used with open-ended intervals of time. Overtime normal activity
will eventually exceed any threshold. This is why placing a time bound on a
threshold will help identifying things outside of the norm. But in some cases,
your time bound might be fairly large. For example, if you want to catch low
and slow attacks, you will need to cast your net over a wide time range, like
several weeks or a month. And, on top of this, it is uniqueness which is the key
here. You will likely be interested in looking at IPs which visited you more than
X distinct days.
Automating the creation of thresholds can be useful. But how can automated
threshold creation occur? An approach to this problem is that you can take a
look at log data over a 24-h period (you really need to have your log data nor-
malized at this point). Based on this, you can execute the following analysis:
1. Collect counts of log data / events which were not seen over the last 24 h
period.
2. Collect counts of log data / events which were not seen over the previous
week.
Based on the counts you collect, you can see what might be abnormal. This
will give you a basic threshold to use, especially if your analysis shows that the
sources of these events are not known to you. You can also use the same logic
with destination IP addresses appearing in your DMZ, etc.
Anomaly Detection
Anomaly detection deals with detecting things which have never before been
seen. Usage of a baseline, as described in the Baseline section, is a form of
anomaly detection. This is true because we are keeping track of confidence
intervals. What exactly is an example of anomaly detection? Think about a
denial of service (DoS) attack. If someone is trying to attack your infrastructure
to make them unavailable for your use, you can use statistical baseline to know

Machine Learning 187
when an increase in connections are being received by your infrastructure and
possibly detect the DoS before it really becomes a problem.
Windowing
Let’s say we want to be able to determine instances where users login either
outside of their normally observed times, or maybe when a user, uncharacteris-
tically, logs in from home after normal hours. One of the first things you will
need to do is track login times for each user in your environment, per day. You
can then establish a baseline of behavior and use steps 4 and 5 in the baseline
section to determine if something warrants investigation. For example, if Bob
all most never logs in after 9 pm and before 8 am, and he suddenly does, your
baseline can help detect this so it can be further investigated.
Another technique, albeit simpler, is to divide the distance from one side of the
baseline window by the size of the window. A small and arbitrary threshold
can be used to determine if a deviation from a pattern, in this case login time,
has occurred. More on this can be found in Singer and Bird (2004).
Windowing is very useful, but care must be taken. For example, simply track-
ing when someone logs in is fine, but it doesn’t take into account things like
sick days, vacation schedules, holidays, etc. These sorts of variables are called
seasonal parameters. Discussing this is beyond the scope of this chapter. Just
about any advanced book on statistics will cover this topic in detail, including
Kachigan (1986).
MACHINE LEARNING
Machine learning (ML) is a branch of Artificial Intelligence (AI). ML uses
algorithms and statistical methods to create systems which can learn. The
basic concept of many ML algorithms is not unlike that of establishing a
baseline. Data is used in conjunction with statistical methods to learn from
past experiences and behaviors to accomplish tasks like pattern recognition,
predictive systems, fraud detection, speech recognition, etc. ML algorithms
basically fall into one of two categories: supervised and unsupervised. In
supervised learning, a teacher is available to correct any mistakes made by
the algorithm. With unsupervised learning there is no teacher. An algorithm
of this type learns from available data and attempts to identify relationships
in data sets.
A thorough treatment of ML is beyond the scope of this chapter. See some of
the books references at the end of this chapter for more detail on the topic.
As for the topic of this book, log data, we can talk about one type of ML algo-
rithm which might be of use. It’s the k-Nearest Neighbor (kNN) technique.

CHAPTER 10: Statistical Analysis
188
k-Nearest Neighbor (kNN)
What is the kNN technique? It’s a learning algorithm and it basically aims to
classify unknown patterns against a set of a previously seen patterns. We are
interested in uncovering a pattern in unlabeled data. The key to this is the dis-
tance used to determine which of the known patterns, the unknown one closely
resembles. At the heart of this technique is a distance calculation. The most
commonly used calculation is the Euclidean distance formula.
The basic premise behind k-NN is that you define features of different patterns.
Each feature denotes something unique to the pattern. The more patterns and
features you have, the more likely you will be able to detect unknown patterns.
The patterns you have defined ahead of time, the better you will be able to
detect unknown patterns. So how does the distance formula factor in? The for-
mula makes use of two vectors of data: p and q. One is the set of known patterns
and the other is the pattern we are trying to detect. As we loop through each set
of vectors and the features of each pattern, we calculate the distance away from
each known feature and the unknown feature. Where the k comes in is that
we take the k closest neighbors and use a majority voting scheme. This has the
advantage of reducing misclassification since more examples can impact the
vote.
Let’s run through an example to see how this works in practice.
Applying the k-NN Algorithm to Logs
Let’s enumerate a set of features we want to use for our example:
1. Excessive Outbound Traffic: EOT.
2. Excessive Inbound Traffic: EIT.
3. VPN Login After Hours: VPNLI.
4. Firewall Accepts: FWA.
5. Firewall Drops: FWD.
6. Login Outside of Internal Network: LOIN.
7. Multiple Failed Logins in a Row: MFL.
8. At Least 1 Successful Login: SL.
9. Single Source Probing Multiple Destination IPs: SSPMD.
10. Single Source Probing Multiple Destination IPs and Ports: SSPMDP.
Table 10.1 shows a set of patterns along with what set of features each pattern
has. A blank column means the pattern does not have the feature.
distance =
n
i
=
1
(pi−qi)2.

Machine Learning 189
It should be noted that what we are trying to do is classify and detect scenarios
which require multiple events in order to make up a higher level behavior, i.e.
we are not simply classifying a single log message but multiple ones in order
to define a pattern.
If we apply the k-NN algorithm as it’s describe in k-Nearest Neighbor (kNN)
section, we can generate some results. Table 10.2 shows the results of running
a few unknown patterns through the k-NN algorithm.
Table 10.1 Patterns and Features
Pattern EOT EIT VPNLI FWA FWD LOIN MFL SL SSP-
MD
SSP-
MDP
Possible-
Brute
Force
Login
Yes Yes Yes
Possible-
Brute
Force
Login
Yes Yes Yes Yes
Portscan Yes Yes Yes
Portscan Yes Yes
Possible
Exfiltration
Yes Yes Yes
Possible
Exfiltration
Yes Yes Yes
Table 10.2 Unknown Patterns with k-NN Recognition Results
EOT EIT VPNLI FWA FWD LOIN MFL SL SSP-
MD
SSP-
MDP
Results
Yes Yes Yes Yes Possible
Brute
Force
Login
Yes Portscan
Yes Portscan
Yes Possible
Exfiltration
Attempt
Yes Yes Possible
Exfiltration
Attempt
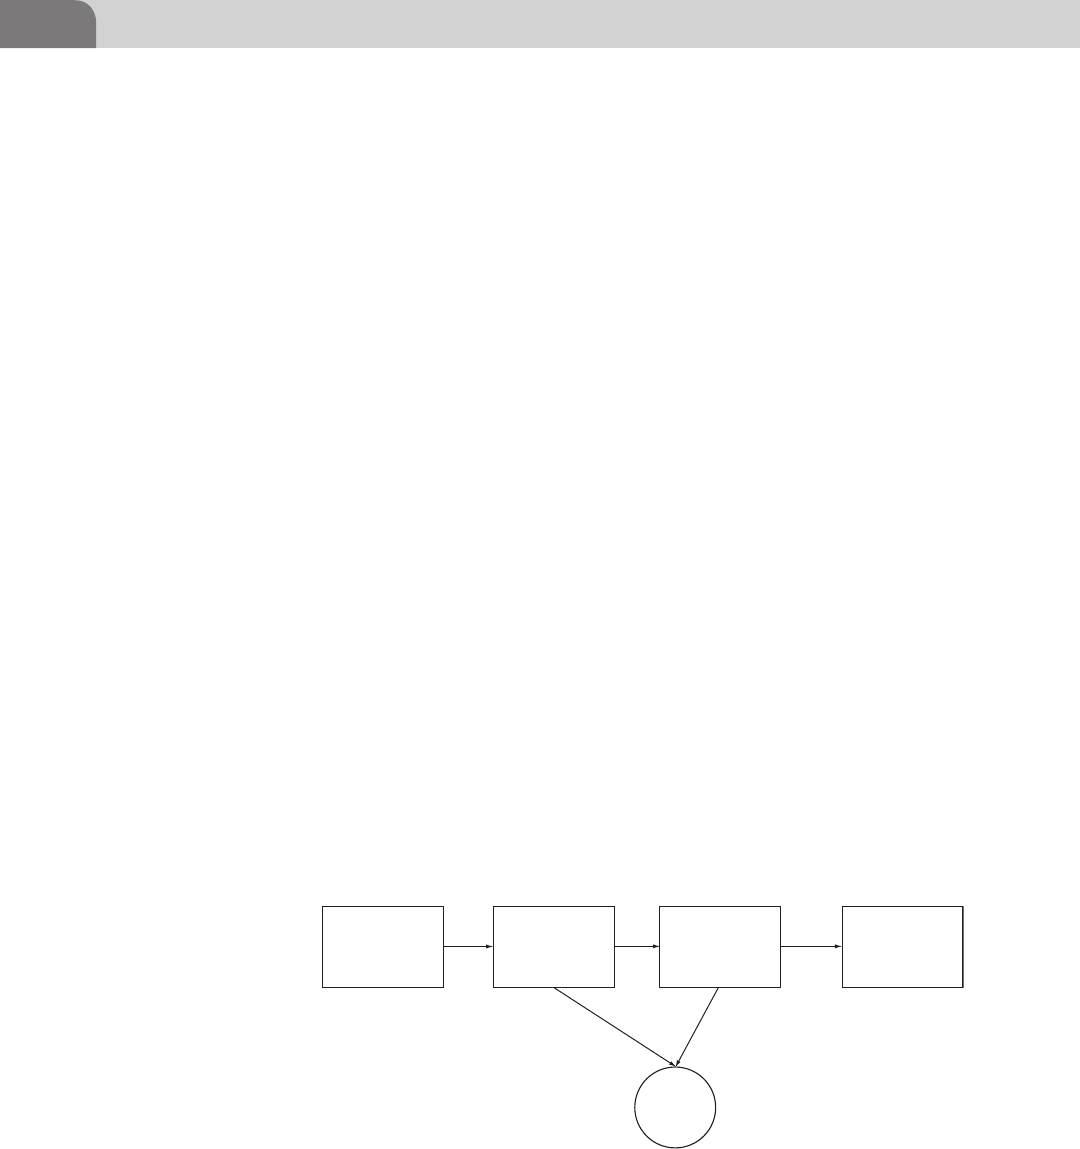
CHAPTER 10: Statistical Analysis
190
The classifications of the unknown patterns were not bad. k-NN was chosen
because it is easy to understand and implement. A quick Google search will
turn up implementations in Java, C, Perl, etc. One of the drawbacks in using
k-NN is that it can take a lot of computation time, if the features set and the
unknown set are large. It can also require lots of memory for processing, too.
COMBINING STATISTICAL ANALYSIS WITH
RULES-BASED CORRELATION
The final topic to cover is statistical analysis and rules-based correlation. More
specifically, we want to look at how the two are typically combined to make
each concept more powerful. In the section on k-NN, the outcome of the
algorithm is very similar to rules process, except for the fact that k-NN allows
for partial data to be present to make its determination. SIEM vendors have
always employed statistical methods alongside the rule processing compo-
nents. Figure 10.2 shows a high-level logical flow of correlation with statistics
embedded.
What this shows is the end-to-end flow of a raw log message all the way through
to its final resting place. Statistical calculations play an important role here.
Whether you are looking to buy a commercial log analysis or SIEM platform,
build one, etc. here are some things to keep in mind:
n How integrated is the statistical part of the system with the rules
engine? Some platforms all correlation rules to be created which
contain conditionals expressed as statistical calculations. Other
platforms allow for statistical analysis pre- and post-rules correlation,
and vice versa.
13
4
5
2
Perform Statistical
Calculations
Perform Action
Normalize Raw Data
Stream
PerformRules-Based
Correlation
Store Event Stream in
Archive Database
FIGURE 10.2 Conceptual Flow for Statistical and Rules-Based Correlation

References 191
n How easy is it to extend / enhance the statistical component of your
platform? You want to be able to tweak the analysis component without
needed a statistics degree.
n Is the statistical analysis adaptive in nature? The idea here is, simply, does
it use some sort of ML or data mining techniques to help thwart the ever
changing threat landscape of the hackers.
SUMMARY
This chapter introduced some of the most basic statistical analysis methods.
While basic, they are quite powerful in usage when applied to log data analysis.
Baselines are critical when it comes to understanding how something acts nor-
mally. We then apply techniques like thresholds and windows as specific appli-
cations of a baseline to find things which might not be so normal. Machine
learning is an interesting area of statistical analysis which can be used to learn
in either a supervised or unsupervised manner. It is suggested you learn more
about statistical and ML concepts.
REFERENCES
Kachigan, S. K. (1986). Statistical analysis: An interdisciplinary introduction to univariate & multivariate
methods. New York: Radius.
Singer, A., & Bird, T. (2004). Building a logging infrastructure. USENIX Association.

This page is intentionally left blank

Logging and Log Management.
© 2013 Elsevier, Inc. All rights reserved.
http://dx.doi.org/10.1016/B978-1-59-749635-3.00011-7
193
CHAPTER 11
Log Data Mining
CONTENTS
Introduction .............193
Data Mining Intro ...194
Log Mining Intro .....198
Log Mining
Requirements ..........200
What We Mine
For? ..........................201
Deeper into
Interesting ...............203
Summary .................205
References ...............205
n Data Mining Intro
n Log Mining Intro
n Log Mining Requirements
n What We Mine for?
n Deeper into Interesting
INFORMATION IN THIS CHAPTER:
INTRODUCTION
A vast majority of log analysis techniques require that an analyst know some-
thing specific about what he or she is looking for in the logs. For example, he
might “scan” the server logs for “known bad” log entries (just as OSSEC does.
See Chapter 15 for information on this tool.) which indicate attacks, exploits,
server failures, or whatever other infraction of interest by using string match-
ing or regular expressions. One can observe that it requires significant domain
knowledge; in this case, expertise in security and specific type of logs available
for analysis on all stages of the log analysis process, from reviewing the data to
running queries and searches all the way from interpreting the results to acting
on the conclusions. In other words, you have to know what questions to ask
before you get the answer you want—a tricky proposition at best. In addition,
it requires an immense amount of patience to even start the task, since one can
be going through logs for a long time without finding the aberrant line or a
group of lines; or, it might not even be there.
In this chapter, we will describe methods for discovering interesting patterns
in log files for security without specifically knowing what we look for and
thus without the onerous “patience requirement” and without the expensive
“expertise requirement” on all analysis stages. We will review some practical
results of such methods, demonstrate the tools, and discuss how they can be

CHAPTER 11: Log Data Mining
194
used in various scenarios that occur in the process of maintaining security and
availability of IT operation as well as assisting with compliance initiatives.
Since the techniques we will cover are similar in many regards to data mining,
we need to step back and provide a brief data mining overview for those read-
ers not familiar with it.
DATA MINING INTRO
We will start from a “dictionary” definition of Data Mining (DM), that can
be found in Encyclopedia Britannica Online (http://www.britannica.com/
EBchecked/topic/1056150/data-mining). It succinctly states that: “data min-
ing, also called knowledge discovery in databases, in computer science, the
process of discovering interesting and useful patterns and relationships in large
volumes of data. The field combines tools from statistics and artificial intelli-
gence (such as neural networks and machine learning) with database manage-
ment to analyze large digital collections, known as data sets.”
Two other definitions will also be useful for our purposes. They are: “The non-
trivial extraction of implicit, previously unknown, and potentially useful infor-
mation from data”1 and “The science of extracting useful information from
large data sets or databases.”2 Yet another definition useful for our purposes
is: “An information extraction activity whose goal is to discover hidden facts
contained in databases.”
Notice what is in common among those:
n Data Mining (further DM for brevity) deals with a pool of data, possibly
very large.
n Such data exists on a computer system in machine-readable format (such
as a relational database system); in other words, it is structured data.3
n Available data might lead us to some interesting conclusion, but, then
again, it might not.
n There is some useful outcome that we are trying to get to, which requires
searching or otherwise analyzing the data.
Structuring the DM using the above items reveals definite similarities between
it and log analysis. We have a large pool of log records and we need to
1 Frawley, Piatetsky-Shapiro, and Matheus (1992).
2 Hand, Mannila, and Smyth (2001).
3 Data mining on unstructured data is called “text mining.” Many logs nowadays are more
similar to unstructured, text data and thus text mining techniques will be useful. Even though
the author is conducting active research in this area, this chapter will focus on structure data
mining, not text mining.

Data Mining Intro 195
understand what the computer systems are trying to tell us by producing those
logs. What they are trying to say is sometimes on the surface, but in other cases
is hidden within a deluge of meaningless or irrelevant information. Thus, like-
ness between log analysis and DM leads us to believe that DM can be useful for
our challenge at hand: making sense of logs.
Let’s dive a bit deeper into data mining. The realm of data mining covers a
broad range of scientific methods, software applications, and usage scenarios.
Here we will try to show you the parts of data mining related to security log
analysis. Consequentially, DM finds uses in many areas of business, from retail
to fraud analysis and risk management.
In general, there are two broad types of data mining methods: predictive and
descriptive. While everybody will rush to trying to peek into the future by
using predictive DM, descriptive is just as useful since it can reveal the hid-
den truths applicable to past and present, a no mean feat by itself. Descrip-
tive DM also serves to describe data sets in an informative way, thus almost
“explaining” what is going on. Predictive DM, on the other hand, allows
making forecasts about the not-yet-available data based on whatever is
already here.
Since DM finds so many uses in retail, our illustrative DM examples—before
we move to mining the logs—will be from that area. Descriptive DM may
reveal what else you have likely bought if you just bought a car CD player (for
example, disks, cable kit, speakers), thus allowing the store to position them
closer to the player. On the other hand, predictive DM might help the store to
figure out what you will buy next (or when you will go broke from buying too
much already…)
Individual DM techniques are numerous, Table 11.1 shows some that find
common use.
Data mining process is often described as having the following steps:
1. Acquiring subject matter expertise in the area that the data relates to—it
is essential to “know what you are doing” in data mining, as much (or
more) than in other areas. DM tools do not “perform magic” and will
likely not produce the results unless the user understands the data to be
mined.4
2. Defining the goal is an obvious but critical step. While explorative tech-
niques are known, we still need to know why we want to collect, prepare,
and mine the data and what will be done with the results.
4 This “limitation” killed many worthwhile data mining projects …

CHAPTER 11: Log Data Mining
196
3. Planning for collection and then collecting data—this sets the foundation
for future DM endeavors. Data also has a nasty tendency to grow beyond
control, just as we observed with audit log data.
4. Data preprocessing and cleaning are often needed for the DM process to be
effective or even to happen at all. Sometimes, DM experts estimate that
this stage takes 60% of all the mining effort. This stage usually involves
dealing with missing bits of information as well as possibly duplicate
data points, smoothing “noisy” data, identifying, and correcting other
inconsistencies in the data set. Sometimes this step is also called “data
cleansing.”
5. Data reduction and transformation involves things such as dropping extra
dimensions of data as well as applying algorithms aimed at making the
data more manageable by removing parts of the data set.
6. Choosing the method to apply is the next step. Do we want to cluster the
data or look for sequences? Do we baseline or uncover associative rules?
The method chosen is likely to be driven by the goals, defined several
steps above.
7. Are we done yet? No, we need to choose a specific algorithm that imple-
ments the method chosen above. Researchers as well as tool vendors are
constantly working on new algorithm to look for patterns as well as on
the performance of the existing algorithms. The right choice might make
a difference between an efficient 10 min run versus a multi-day database
abusing disaster.
Table 11.1 Data Mining Techniques in Common Usage
Type Technique Example
Descriptive Clustering Group people with common hob-
bies together
Descriptive Association Rule Discovery Discover what parameters in data
are associated with other
Descriptive Frequent Itemsets Discovery Finding what objects occur in
groups
Descriptive Sequential Pattern Discov-
ery
Finding what objects occur in a
specific sequence
Predictive Classification Sorting out the data bits into
classes
Predictive Regression Predicting the behavior of a data
set, similar to the one being
mined.
Predictive Deviation Detection Discovering whether the data
points actually fit the profile,
mined previously

Data Mining Intro 197
8. Run the mining software and get the results. That might refer to seeing pic-
ture (when the results are visualized) or a table or other textual representa-
tion of data.
9. And now, as some estimate, the hard part starts: figuring out what the results
actually mean. From simple text reports to fancy visualizations, this stage is
where we can actually understand whether all the previous steps actually
brought the gold.
As one can see, the above steps fit closely to a normal log analysis process. That
is why in the next section we will start illustrating how one can use DM-like
techniques for log analysis.
Let us focus on the last step and discuss an interesting problem of “interesting-
ness.”5 Provided the DM succeeded and the results returned are correct (mean-
ing that the methodology and utilized application do not have flaws), where
are the assurances that we actually care to see them?
For example, one of the author’s experiments with associative rule discovery on
log data brought up the following bit of DM wisdom: if the protocol of the con-
nection is DNS (Domain Name System), then there is a high probability that
the ports where it was sent is 53. “Duh!” would be the appropriate response
here, since the mining algorithm did its job but we didn’t really care to see the
results. For the analyst, it is fairly obvious that most if not all DNS traffic always
occurs on port 53. This shows that DM techniques can discover “hidden” pat-
terns, but why are we so sure that the user will care to see them? “Interesting-
ness” measure is an attempt by the researchers to quantify that. Another useful
definition of it is: “A pattern is interesting if it is easily understood by humans,
valid on new or test data with some degree of certainty, potentially useful,
novel, or validates some hypothesis that a user seeks to confirm.” The measure
is sometimes classified into objective and subjective interestingness. The for-
mer is determined by the computer using whatever “interestingness” algorithm
while the latter is defined by the human expert. This distinction is obviously
useful for log analysis, since in many regards it is “an art, not science” and the
human analyst is the ultimate judge of any technique’s usefulness.
The main reason we wanted to highlight the “interestingness” at this stage, is
that when looking into data mining people often expect miracles. For example,
“let me put my logs into the systems and it will tell me everything I need to know
at the moment.” Such thing will hardly ever happen, since, even if system has
5 Yes, that is a data mining term. Specifically, it is defined at ftp://ftp.gte.com/pub/kdd/kdd-
terms.html#Interest as “a pattern instance measures its quality and has several dimensions.
The main dimensions are the validation on the sample set, the reliability on the universe, the
degree of redundancy with respect to other already known pattern instances, the generality,
the simplicity, and the usefulness.”

CHAPTER 11: Log Data Mining
198
perfectly tuned data mining capabilities, it will likely have no idea of what you
are interested in at the moment. However, the good news is that DM is a technol-
ogy that allows one to approach the above idea closer than any other method.
After this review, we are ready to see how data mining techniques can be
applied for our purposes of analyzing logs.
LOG MINING INTRO
While log mining is technically a kind of analysis, we want to show that it
starts where the usual log analysis ends, thus the differentiation. In addition,
the author would hate to say “log anomaly detection” since it is often (such
as in academic publication on information security) another way of saying
“it doesn’t work, but it well might one day if the moons are aligned and the
appropriate animal is sacrificed to the appropriate deity.”
Knowing a bit about the data mining methods and technologies, let’s step back
from it and review what are we trying to achieve by applying the data mining
to log data. In general, we are seeking to:
n Improve the quality of log analysis to provide better answers and predic-
tive power.
n Make the advanced and effective methods available without requiring rare
and expensive human expertise.
Richard Bejtlich in his book “Tao of Security Monitoring” described his view
on network monitoring for security. The monitoring obviously covers logs
(such as from intrusion detection or prevention systems) as well as network
traffic information, such as neftlow6 and full packet captures. The main tenet
of his NSM approach is that highly skilled analysts follow a well-optimized
analysis process and run tools in order to gain insight from the incoming data
such as logs, alerts, and packet dumps. A minor problem with this is that such
analysts might be simply unavailable or, at the very least, unaffordable for the
task at hand. As a result, the entire methodology breaks down ungracefully,
since it relies on having trained, intelligent, and motivated human analyst (or
even “expert”) in front of the console all the time. Thus, this approach will
likely remain in the realm of well-funded and security-minded organizations.
By using data mining and other advanced automated analytics, we will try to
move as much of the “analysis burden” (or “glory,” depending who you ask)
6 Cisco netflow format is used to collect network traffic information from the infrastructure
devices (see more at “Cisco IOS NetFlow” http://www.cisco.com/en/US/products/ps6601/
products_ios_protocol_group_home.html).

Log Mining Intro 199
to software and automated systems, away from exceptionally skilled—and just
as exceptionally hard to find—human analysts. At least, we will prefer that
the involvement of such analysis will be critical only at the early stages of the
process, when we designed the specific mining methods, as we outlined in the
previous section. In this case, the experts might define the specifics of the min-
ing process and then let the less-skilled operations stuff to run the algorithm
and act on the results with no reduction in efficiency.
Let’s briefly look at how DM techniques are applied to logs, why do it and what
are the benefits. We coin the term “log mining” to mean “application of data
mining techniques to advanced log analysis.”
We will start by asking “why mine the logs?” Ideally, our vision is to reduce
the human effort needed and increase the role of the automated system in log
analysis. Log mining, in brief, is one of the ways to get there. In fact, it is likely
to be the most promising, as we mentioned before. So, log analysis faces chal-
lenges such as these:
n Too much data: A volume of log data floods the log analysis systems as well
as the human analyst, thus destroying any possibility to get the answers
out. Indeed, logs can go into gigabytes and then crawl into terabytes; so
you need tools to deal with the deluge.
n Not enough data: Critical piece of data is missing for various reasons,
making log analysis more of a challenge that it should be.
n Diverse records: Too many different and dissimilar log sources need to be
analyzed to get to truth. This problem is due to the lack of the universal
audit standard; most applications log in whatever formats developed
by their creators, thus leading to the massive analysis challenge. Future
standard efforts such as MITRE’s Common Event Expression (CEE) (see
http://cee.mitre.org) will resolve this.
n False alarms: Logs are full of messages that do not reflect reality in any
measurable way (network IDS “false positives” largely occupy this
category).
n Duplicate data: Different logs refer to the same events without any indica-
tion of that; this situation is often further complicated by missing time
synchronization between different log sources.
n Hard to get data: While a device might create perfectly useful log records in
a proprietary format, it will not “cooperate” with centralized log collec-
tion by lacking “standard”7 log formats such as syslog or Windows NT
event log. Similarly, getting the detailed mainframe audit records may be
a challenge.
7 From reading this book, you already know that these standard are not real, but just common
formats used by many systems.

CHAPTER 11: Log Data Mining
200
Many techniques have been developed to deal with the challenges. So, why
mine the logs, if we have all those other approaches? Here are the top reasons:
n Reduce the reliance on skilled analysts by enabling more human-like pattern
recognition and only necessitating such expertise at the early stages of the
analysis.
n Deal with sparse data that cannot be effectively analyzed by other, more
conventional means. Looking at gigabytes or even terabytes of data is bet-
ter left to fully automated approaches, such as log mining.
n Detect things that sneak “below the radar” of other methods. Yes, log min-
ing promises to increase the efficiency of detecting the intrusion traces.
n Offload conclusion generation to machines; so that this so far human-only
task can also be automated. Human will still act on the conclusions, but
they won’t need to wrack their brains by trying to figure out what is going
on.
n Attempt to predict problems, rather than find ways to deal with things that
already occurred. While DM does not provide an easy guaranteed way to
such prediction, it certainly comes closer than any other method.
We should note that even though the trend will likely go toward “replacing”
humans, the algorithms will always need to be defined and tuned by experts.
However, DM techniques will clearly reduce the skill requirements on the
operational staff.
In case of some early implementations seen by the author, the users of DM-based
log analysis systems have commented that after a relatively brief tuning period
the systems become “better than junior analysts.” In this scenario, the systems
that used DM-like log analysis methods were implemented at a bank to look at
the detailed audit data from multiple intrusion detection and firewall devices,
deployed across the enterprise. The system developers and senior analysts have
utilized the systems during the initial phase; the same people also trained the
junior analysts who used to just watch the consoles with log records flowing
by and perform the initial alert investigation. Now, with tuned DM-based log
analysis system in place, the analysts focused on investigation only since the
systems picked the signification alerts and episodes as good as those analysts.
Let’s look at what is necessary before we can apply data mining to log data.
LOG MINING REQUIREMENTS
It is important to note up front that many requirements for log mining are the
same as needed for any significant log analysis. However, there are some added
factors that either appear to make log data suitable for mining or convert from
optional to mandatory requirements:

What We Mine For? 201
1. Data centralization: To look in just one place is nice to have for regular log
analysis such as filtering and summarization, but becomes critical for log
mining, since mining algorithms can crunch much more data than any
single human analyst.
2. Normalized: To look across the data sources centralized as described above
requires a uniform information format. It might not be the real standard,
just the uniform way of representing the log data.
3. Relational storage: Relational data storage such as a RDMBS is essential
here, but can be left out if only simple analysis and filtering is performed.8
Such normalization is accomplished by looking for common fields in
logs. Those commonly include:
n Time.
n Source.
n Destination.
n Protocol.
n Port(s).
n User name.
n Event/attack type.
n Bytes exchanged.
n Others.
Thus, normalized and centralized data can be subjected to the log data mining
algorithms. Now, we are ready to review what we will look for by applying the
data mining.
WHAT WE MINE FOR?
As we established, DM methods are most useful when we are not sure what we
look for (otherwise, we can just filter or search for what we need) How about
we find something “interesting,” as we hinted in the previous section? As we
mentioned above, interesting likely includes being unexpected to the user and
actionable.
What are some of the common examples that a system administrator or a secu-
rity analyst will find “interesting” and can use some help with finding?
n Infected system spreading malware: While obvious in many cases, systems
that get infected and then spread the infection enterprise-wide and even
8 Text mining that was mentioned above certainly does not need the two of the mentioned
requirements. Text mining methods will work on mere piles of log data.

CHAPTER 11: Log Data Mining
202
Internet-wide are high on the priority list of every security administra-
tor. Despite antivirus and other dedicated solutions, mining logs proves
invaluable in tracking that perky initial system that brought down the
house.
n Compromised system: Every security pro worth his weight in paper certifi-
cates, should be interested in knowing that attackers or their minions—
“malware”—have taken over a system or systems in their network.
n Successful attack: If the attacker just succeeded in breaching your system,
it will likely be “interesting” to know (to put it mildly); while this actu-
ally relates to the previous item, it usually describes the earlier stages of
the attack as it develops from an attempt to a full-blown compromise and
system utilization by the attackers.
n Insider abuse and intellectual property theft: While evil hackers and worms
steal all the glory, internal network abuse seems primitive by comparison.
However, insiders hold all the keys for the kingdom and have potential for
dealing much more damage; to add insult to injury, detecting their exploits
is much harder than average malware. Clear evidence of insider attacks,
even failed, will certainly be of interest to the administrators and analysts.
n Covert channel/hidden backdoor communication: Unless you are “into that
sort of thing,” covert channels are probably not in regular use on your
network; thus, it is highly likely that network security administrators will
be interested in knowing this.
n Increase in probing: While all but few sensitive government networks now
discount Internet probing activity as mere noise, certain increases in such
activity, reflected in logs, are known to serve as precursors to attacks, thus
becoming interesting.
n System crash: While “denial service detection” always causes a chuckle
(by definition, you detect it by noticing that you happen to not have any
service), a system administrator might not be monitoring for uptime of
all the systems.
Thus, the above summary shows some of the universally interesting things that
we can hope to discovery by mining the logs.
Criteria of what is interesting is very hard to define for a computer, but it is
possible with log mining! Let’s also look at common examples of not interest-
ing, that do not match the above “interestingness” criteria of unexpected and
actionable:
n Probe (not unexpected): Network probes and scans happen all the time and
people grew to expect them. One should be mindful of those, but will not
be likely to spend resources looking for them. At the same time, change
in the number of such probes (per day, week, month, etc.) has a higher
chance of being interesting.

Deeper into Interesting 203
n Common failed attack (not unexpected): If your security architecture is
solid you can expect to see failed attacks; those occur for various reasons
(attacker skill is one of them). Similar to probes, one should know about
them, but not spend resources looking for them.
n Normal message (not unexpected): Logs are full of messages indicating
completion of some routine process and other perfectly normal events,
recorded for audit and other purposes. Those are obviously not unex-
pected and we do not mine for them. However, changes matter here as
well: normal messages that stop coming or the ones that start appearing
more/less frequently might well be interesting.
n Blocked attack (not actionable): Similar to a failed attack, if your security
countermeasures block an attack, even an interesting one that you do
not expect, no prompt action is truly necessary. Indeed, an investiga-
tion might be in order, but this still fails to match the “interestingness”
criteria.
n System status update (not actionable): Similar to a normal event, those likely
invoke no action. At the same time, system status updates happening at
some unusual time might well be of high interest…
Let’s look at finding interesting things via log mining in more detail.
DEEPER INTO INTERESTING
Let’s look back at our data mining preview and again review some of the meth-
ods to see how they apply to the task at hand. Here are the things that we can
mine for and have a reasonable hope of finding interesting things:
n Rare things: maybe it doesn’t happen frequently for a reason! If some-
thing just hasn’t happened before, it well might be malicious. Thus, rare
events are prime candidates for our mining. Rare attacks, rare system mes-
sages, users that almost never logging are all fun to detect!
n Different things: while we do not advocate total “log xenophobia,” one
should be on the lookout for things differing from what they were. This is
where the baselining methods of data mining come into play.
n “Out of character” things: while being closely related to the above category,
log records that appear “out of character” need to be mined for, since they
are more likely to be interesting.
n Weird-looking things: if something just looks weird, it might be a sign of
trouble. There is a subtle difference here between the above two types that
we look for. To see something weird, such as your DNS system going to
packetstorm.com and downloading exploit tools all by itself, does not
require any baseline or prior data collection.

CHAPTER 11: Log Data Mining
204
n Things goings in the unusual direction: some log records completely
change their relevance to the analysts and administrators depending on
the communication direction. As in the above example, a connection to
your server is perfectly legitimate, while the server going out and connect-
ing (even on an innocent port such as TCP port 80) will likely raise some
eyebrows, at the very least.
n Top things: while sitting in the realm of summarization and reporting and
not strictly data mining, “Top X of Anything” remains useful for finding
interesting log records and their patterns. After all, if it climbed up there
to be (example: “top use by bandwidth transferred”), it well might be
interesting for that.
n Bottom things: similar to rare things (which as simply, “bottom by occur-
rence”), this “evil sister” to “Top X of Anything” is even more useful
to look at. It is well known that often systems that attract the smallest
amount of attention become the stepping stones to future attacks and
losses.
n Strange combinations of uninteresting things: this roughly follows a for-
mula of “good” + “good” = “evil.” Yes, even a bunch of perfectly normal
log record might form something malignant in aggregate. The simplest
example is a port scan, that is simply a set (often, a very large one) of
benign connection requests.
n Counts of an otherwise uninteresting things: count of something unin-
teresting might well generate some interest. Moreover, a change in such
count will often be even more significant. A sudden surge in a number of
“ping” ICMP packets even outside the firewall might well mean a denial
of service, especially if such ICMP flood came suddenly without warning.
Let’s give an example here that illustrates this. In this example, a hacking inci-
dent involving unauthorized use of a vulnerability scanner is discovered. As
we all know, network IDS (also referred to as “NIDS”) are deployed by a large
percentage of companies, but many have failed to realize value from such pur-
chases. Some reasons for such misfortune include high volumes of false alarms
in their logs, undermining trust people have in such systems. That especially
applies to signature-based systems that are supposed to flag packets and con-
nections having specific patterns in them. To realize value from NIDS we can
use log mining methods, aimed at flagging real attacks over routine noise and
false alarms. Note, that in this case we might not learn about the attack success,
but just the persistence and focus of the attacker as well as distinguish attacks
from benign and erroneous triggering of the NIDS.
When a legitimate connection is recorded by network infrastructure components
or whatever misuse detection systems (such as IDS), they usually produce a small
number of unique event types in the logs. For example, a connection through a

References 205
firewall generates one connection message. Even a scan of a firewall will likely
generate one event per connecting session and likely one event type (connec-
tion_denied) for the whole scan (this event will be repeated many times, but they
will all be of the same type). Similarly, a “false positive” will not commonly be
associated with other suspicious activity between the same hosts, such as recon
scanning or other exploits. On the opposite, false alarms are more likely to hap-
pen in complete isolation or in large numbers of the same log record type with
no other, “related” records. Here, by session we mean a unique combination of:
n Source.
n Destination.
n Protocol.
n Source port.
n Destination port.
Thus, if we organize events collected in the database by session and record the
number of unique events (often the same as number of attack types) in each
session we will have a way of distinguishing real attack from legit traffic and
false alarms. This log mining approach uses a generic pattern to arrive at a spe-
cific and interesting outcome of a potentially damaging attack. Again, we give
no indication of the attack’s success, but just qualify it as real or false.
SUMMARY
This chapter cast a brief look upon using data mining methods for practical log
analysis. We illustrated that log mining and knowledge discovery in logs is a
novel way of looking at log data, which actually works in real life! Many types
of logs can be subjected to such mining with useful results. While data mining
is indeed a truly esoteric area, log mining (at least some of its methods) are
not that hard and can be implemented within many environments. Moreover,
log mining can help where common analysis methods that requires skilled
analysts working long hours fail.
Finally, active research in the area—including mining of unstructured log via
text mining—is likely to bring more useful methods that people can use.
REFERENCES
Frawley, W., Piatetsky-Shapiro, G., & Matheus, C. (1992). Knowledge discovery in databases: An
overview. AI Magazine, 213–228.
Hand, D., Mannila, H., & Smyth, P. (2001). Principles of data mining. Cambridge, MA: MIT Press.
ISBN: 0-262-08290-X.

This page is intentionally left blank

Logging and Log Management.
© 2013 Elsevier, Inc. All rights reserved.
http://dx.doi.org/10.1016/B978-1-59-749635-3.00012-9
207
CHAPTER 12
Reporting and Summarization
CONTENTS
Introduction .............207
Defining the Best
Reports ....................208
Authentication and
Authorization Reports ...208
Why They Are Important ...... 208
Specifics Reports ................... 209
Who Can Use These
Reports ................................... 209
Change Reports ..................... 210
Why They Are Important ...... 210
Specifics Reports ................... 210
Who Can Use These
Reports ................................... 211
Network Activity
Reports ....................211
Why They Are
Important ........................ 211
Specifics Reports ...........212
Who Can Use These
Reports ...........................213
Example.................................. 213
Resource Access
Reports ....................213
Why They Are
Important ........................ 213
Specifics Reports ...........213
Who Can Use These
Reports ...........................214
Example.................................. 215
Malware Activity
Reports ....................215
Why They Are
Important ........................ 215
n Defining the Best Reports
n Network Activity Reports
n Resource Access Reports
n Malware Activity Reports
n Critical Errors and Failures Reports
INFORMATION IN THIS CHAPTER:
INTRODUCTION
Anybody who had to look at log data for any period of time knows that
nothing works by looking at the actual raw logs. However, as last majority of
log analysis tasks involve looking at summaries—reports—of log data over
a period of time or across a particular set of systems. The more data we have
to analyze, the more summarization and aggregation we have to do. In fact,
most people’s first experience reviewing logs likely happens to reports be on
log data—all the venerable “top 10 users,” “top attacks over time”, and other
reports.
Indeed, summarization and reports are the mainstay of log analysis: Top
Connection by Bandwidth, Top Attacks by Country, Top Users with Authentication
Failures, and other reports based on logs are what most people think about
when they think about log analysis today. Even commercial log analysis
and SIEM tool users will look at reports more often than they look at origi-
nal log data.
Summarization works and reduces the amount of data you need to see, but
by summarizing data we kill it—there is a loss of useful information; in addi-
tion, data might be lost due to the type of summaries we choose to utilize. For
example, if you look at top 10 users, don’t forget that your bottom 10 users
might be just as interesting.

CHAPTER 12: Reporting and Summarization
208
Finally, reports are typically pretty numerous, and there is the challenge of
which report to pick. As a fine example, one of the vendors used to tout having
“13,000 reports” in their product—as if it can be a good thing…
On top of this, many organization struggle with multiple regulatory compliance
frameworks (PCI DSS, HIPAA/HITECH, FISMA, and many others discussed in
other chapters of this book) as well as with advanced threats (malware, crimi-
nal hackers, mobile threats, cloud security challenges, etc.). Also, malicious
insiders now get additional opportunities to harm or defraud a business. At
the same time, the importance of information technology for businesses and
government organizations has grown tremendously and will grow even more.
DEFINING THE BEST REPORTS
In light of the broad usefulness of reporting for log analysis, as well as other
large number of possible reports, it is important to try to create a list of “the
best” reports or at least the ones with the broadest applicability in the industry.
This chapter is an attempt to create just such a list. The reports are organized
into six broad categories or report types with specific examples applicable to
most organizations. They designed to be a technology agnostic and can be
produced with commercial, open source or homegrown log management, and
analysis tools. More advanced SIEM tools can be used as well.
The top report categories are:
1. Authentication and Authorization Reports.
2. Systems and Data Change Reports.
3. Network Activity Reports.
4. Resource Access Reports.
5. Malware Activity Reports.
6. Failure and Critical Error Reports.
In the rest of the document, we will cover each category with specific examples.
Authentication and Authorization Reports
These reports identify successful and failed attempts to access various systems
at various user privilege levels (authentication) as well as specific privileged
user activities and attempts to use privileged capabilities (authorization).
Why They Are Important
Authentication is the main barrier and means of controlling access to today’s sys-
tems. From simple passwords to tokens and cryptographic mechanisms, reviewing
authentication activity across the organization is one of the key security activities.
Specific Reports .............215
Who Can Use These
Reports ...........................216
Example.................................. 216
Critical Errors and
Failures Reports ......216
Why They Are
Important ........................ 216
Specifics Reports ...........216
Who Can Use These
Reports ...........................217
Example.................................. 217
Summary .................217

Defining the Best Reports 209
Specifics Reports
Key reports in this category are:
n All login failures and successes by user, system, business unit: this may be one
report or multiple reports showing login successes and login failures
across various systems, access methods (local, remote), and user. Not that
to be valuable, this report requires that you log both login successes and
not just failures.
n Login attempts (successes, failures) to disabled/service/non-existing/default/
suspended accounts: this report group covers attempted access to accounts
and services that should not be accessed, ever. Both failures and successes
are of interest to security professionals.
n All logins after office hours / “off” hours: similar to the above report, such
activity is commonly of interest especially if access attempt is successful.
However, such events have to be investigated especially in environments
where system administrators work 24/7.
n Users failing to authentication by count of unique systems they tried: this aggre-
gate report has to detect account scans where a single machine checks for
the same or different account across many systems. It is a little similar to
an old school “host scan.”
n VPN authentication and other remote access logins (success, failure): while all
login attempts might be of interest under the right circumstances, remote
login attempts such as via VPN or other remote connectivity methods are
of escalated interest and should be tracked carefully.
n Privileged account access (successes, failures): root or administrator logins, su
use, Run As use, as well as relevant equivalents for other platforms and
systems have to be accounted for, since a privileged user can typically do
much more damage than a normal user.
n Multiple login failures followed by success by same account: while rule-
based (SIEM-style) correlation is needed to produce this report, track-
ing for multiple account failures immediately followed by a successful
connection would be of obvious interest, since it almost always indi-
cates attempts to guess login credentials (source: http://chuvakin.
blogspot.com/2010/08/updated-with-community-feedback-sans_
06.html).
Who Can Use These Reports
These reports have universal applicability, depending on scope of systems
covered. A chief security officer (CSO) may review authentication summa-
ries across the entire organization, security analyst may use these reports dur-
ing daily log review, incident responders may run them while investigating
an incident, and system administrators can run these reports on their own
systems.

CHAPTER 12: Reporting and Summarization
210
Example
Table 12.1 shows login attempts to systems.
Change Reports
These reports identify various system and security critical changes—configuration
files, accounts, regulated and sensitive data, and other components of the system
or applications.
Why They Are Important
Unauthorized changes to information systems lead to many costly crashes,
data losses, and security incidents. On top of this, attackers will often modify
your systems in order to enable their access in the future. Being diligent with
tracking changes will also improve your overall IT operation.
Specifics Reports
Key reports in this category are:
n Additions/changes/deletions to users, groups: attackers will frequently add
new act now owns and then sometimes delete them after access. These
activities should have been performed in an authorized manner.
n Additions of accounts to administrator / privileged groups: in particular,
changes to the administrator accounts and other privileged users should
be at the top of the list of tracked account changes.
n Password changes and resets—by users and by admins to users: password
changes are often just as important as new account creations. These can
be performed by users as well as by administrators. In addition, this
report can be used to make sure that if authorized password changes are
performed according to policy schedule.
n Additions/changes/deletions to network services: new services that allow net-
work connectivity may open your network to additional attacks; they also
are frequently performed by attackers.
n Changes to system files—binaries, configurations: changes to system files such
as buying at ease and configuration files—whether accidental, planned or
malicious—needed to be carefully tracked.
Table 12.1 Sample Report Showing Login Attempts
System Account Name Source IP Status Method Count
Venus administrator 10.1.1.2 Failure Local 1
Jupiter anton 10.11.12.13 Success Local 1
Mercury root 10.1.2.3 Failure SSH 893765

Network Activity Reports 211
n Changes to other key files: various systems might have broad lists of key files
in addition to binary executables and configuration files; track access to
these as well.
n Changes in file access permissions: a sneakier variety of a risky change is a
change in file permissions; if not accounted for, such changes have led to
sensitive data compromise.
n Changes to sensitive files: or downloading/copying of sensitive documents.
n Application installs and updates (success, failure) by system, application, user:
all application installs and updates need to be logged across all systems; at
the very least, these logs will be incredibly useful during incident response.
Who Can Use These Reports
These reports have universal applicability, depending on scope of systems cov-
ered. A chief security officer (CSO) may review change summaries across the
entire organization, security analyst may use these reports during daily log
review, incident responders may run them while investigating an incident, and
system administrators can run these reports on their own systems.
Example
Table 12.2 shows all account and group additions on a Linux system.
NETWORK ACTIVITY REPORTS
These reports identify various system suspicious and potentially dangerous
network activities as well as activities that need to be tracked for common
regulations.
Why They Are Important
Network is the main way for threats to arrive at information assets. Obviously,
the network is also the main way to steal information assets from today’s
organizations.
Table 12.2 Sample Report Showing Account and Group Additions
Date System Account
Name
Operation Object Status
1/10/11
11:11AM PST
Venus root Account
Added
anton Success
1/11/11
11:11AM PST
Jupiter anton Group
Added
sudoers Success
1/10/11
11:11AM PST
Venus root Account
Added
root1 Failure

CHAPTER 12: Reporting and Summarization
212
Specifics Reports
Key reports in this category are:
n All outbound connections from internal and DMZ systems by system, connection
count, user, bandwidth, count of unique destinations: there are multiple ways
to slice the information on outbound connections from your environ-
ment, but the main essence remains the same: tracking who is connecting
from your network outside is the way to detect intrusions and compro-
mises and malicious software—as well as users abusing network access.
n All outbound connections from internal and DMZ systems during “off” hours:
using firewall and web proxy logs, one can use a more targeted version of
the above report and only track outbound access during unusual hours.
n Top largest file transfers (inbound, outbound) OR Top largest sessions by bytes
transferred: either of the two reports allows organizations to track blatant
data theft and bandwidth abuse.
n Web file uploads to external sites: based on proxy logs, one can track what
files are being uploaded to external sites as well as being attached to
Webmail.
n All file downloads with by content type (exe, dll, scr, upx, etc.) and protocol (HTTP,
IM, etc.): tracking what files enter your environment from the Web is also
important and can be done by tracking files across protocols and methods.
n Internal systems using many different protocols/ports: while there is no reliable
way to always know malware activity from legitimate, internal systems,
suddenly starting to “talk” over many new ports and protocols, are a
known telltale sign of malicious activity.
n Top internal systems as sources of multiple types of NIDS, NIPS or WAF Alerts:
one of the most useful reports is tracking internal information assets that
“light up” like a holiday tree by generating many different types.
n VPN network activity by username, total session bytes, count of sessions, usage
of internal resources: we highlighted the need to track VPN logins in the
above section, but VPN usage should also be tracked in order to spot the
VPN access and traffic anomalies.
n P2P use by internal systems: while user-breaking AUP might be the focus of
this effort, P2P software was also implicated in accidental and malicious
data theft and loss.
n Wireless network activity: wireless network devices can record many differ-
ent events but it is useful to treat them as VPNs and other remote access
network mechanisms above and track access (with username or Windows
name); another useful report on wireless data will include rogue AP pres-
ence detection and rogue AP association logs.
n Log volume trend over days: while not strictly an example of network activ-
ity report, reviewing of a role lab volume produced on your network is
extremely useful as a big picture view across the entire pool of log data.

Resource Access Reports 213
Who Can Use These Reports
These reports have universal applicability, depending on scope of systems cov-
ered. A chief security officer (CSO) may review network activity summaries
across the entire organization, security analyst may use these reports during
daily log review, incident responders may run them while investigating an inci-
dent, and system administrators can run these reports on their own systems.
Example
Table 12.3 shows a report on all VPN account access and activities across the
organization network.
RESOURCE ACCESS REPORTS
These reports identify various system, application, and database resource access
patterns across the organization and can be used for both activity audit, trend-
ing, and incident detection.
Why They Are Important
Tracking resource access can be used to reveal insider abuse and even fraud.
They are valuable during incident response for determining which resources
the attacker has accessed and possibly corrupted or modified (see section
Change Reports). In addition, resource access can be used for purposes outside
of security, such as capacity planning and other purposes.
Specifics Reports
Key reports in this category are:
n Access to resources on critical systems after office hours / “off” hours: similar to
the above “off” of network access and Logins, this report can be used to
track access and activities on critical and regulated system during unusual
times.
n Top internal users blocked by proxy from accessing prohibited sites, malware
sources, etc.: this versatile Web access report can be used for our multiple
Table 12.3 VPN Account Access and Activities
Date VPN UserName System Action Status Count
1/11/11 VPN1 anton antonlaptop Login Success 2
1/12/11 VPN1 antom antonlaptop Login Failure 1
1/13/11 VPN2 root Lapt19847 Login Failure 77

CHAPTER 12: Reporting and Summarization
214
purposes from tracking compromised systems to the data leakage tracking
to improved productivity.
n File, network share, or resource access (success, failure): this report can only be
useful if run for specific audited resources; enabling logging of file access
(Windows) and system calls (Unix) will always lead to data overflow.
n Top database users: to be useful for security activity tracking it must exclude
known application access to the database; ideally, a production database
should have no direct access from users or developers.
n Summary of query types: similarly, excluding known application queries
have turned this report into anomaly detection tool that show anomalous
database access.
n All privileged database user access: as with servers and application, all privi-
leged user activities should be recorded and analyzed periodically.
n All users executing INSERT, DELETE database commands: in addition to
tracking application and user access, it makes sense to separately track
more damaging commands that can destroy data; excluding known appli-
cation queries is a useful practice here.
n All users executing CREATE, GRANT, schema changes on a database: in addi-
tion to tracking application and user access, it makes sense to separately
track more damaging commands that can destroy data and change the
database instance itself.
n Summary of database backups: backups present a clean way to extract mas-
sive quantities of data from a database and thus commit data theft; this
report will allow you to review which are the old database backups and
catch those who performed without authorization.
n Top internal Email addresses sending attachments to outside: across many
email access reports, this stands out in the it’s less a teller key and
usefulness for both detecting and investigating insider abuse and data
theft.
n All Emailed attachment content types, sizes, names: similar to the above
report, this can be used to track information leakage as well as detect
users emailing potentially sensitive information.
n All internal systems sending mail excluding known mail servers: a basic way to
find systems infected with spam-sending bots across your environment.
n Log access summary: logging and then reviewing access to logs is prescribed
by regulations; this basic report should allow you to exclude your own
viewing of log data.
Who Can Use These Reports
These reports have universal applicability, depending on scope of systems
covered. A chief security officer (CSO) may review resource access summaries
across the entire organization, security analyst may use these reports during

Malware Activity Reports 215
daily log review, and incident responders may run them while investigating
an incident. Resource owners can use these reports to plan capacity and make
other business decisions.
Example
Table 12.4 shows a report on all file access across multiple servers.
MALWARE ACTIVITY REPORTS
These reports summarize various malicious software activities and events likely
related to malicious software.
Why They Are Important
Malicious software in various forms remains one of the key threat vectors for
today’s organizations, large and small. Given that anti-virus tools have been
dropping in efficiency of stopping malware for the last few years, other infor-
mation sources such as logs must be used for fighting malware.
Specific Reports
Key reports in this category are:
n Malware detection trends with outcomes: a basic report with a summary or
a trend of malicious software detection, also showing the system and the
outcome (cleaned or left alone) is a good starting point.
n Detect-only events from anti-virus tools: all anti-malware tools log the cases
where malicious software was detected but not cleaned (for various
reasons); such logged “leave-alones” have helped many organization to
avoid massive damage.
n All anti-virus protection failures: given that today’s malicious software is
well equipped for fighting anti-virus tools, all crashes, protecting engine
unloads, update failures, etc. must be logged and reviewed.
n Internal connections to known malware IP addresses: one can run this incred-
ibly useful report using their logs (such firewall or other) and a public
Table 12.4 File Access Across Multiple Servers
Date Server UserName File Name Access
Type
Status Count
1/11/11 Win1 anton Expenses.xlsx Read Success 1
1/12/11 Win2 anton Roadmap.ppt Read Success 1
1/13/11 NFS anton Blank.docx Write Failure 37

CHAPTER 12: Reporting and Summarization
216
blacklist of IP address; such simple approach can stop the organization
from losing valuable data to malware operators.
n Least common malware types: along with other “Bottom 10” (as opposed
to “Top 10”) reports, this presents a useful insight into unusual and thus
possibly damaging malicious software in your organization.
Who Can Use These Reports
These reports are useful for all security professionals, from a junior administra-
tor in charge of desktop anti-virus to a CSO in charge all entire organization
security. Such reports are also useful for incident response and malware infec-
tion investigations.
Example
Table 12.5 shows virus types across a network and over a week of log data,
sorted by ascending count.
CRITICAL ERRORS AND FAILURES REPORTS
These reports summarize various significant errors and failure indications,
often with direct security significance.
Why They Are Important
Errors and failure log messages often present valuable early indication of
security threats, including advanced threats not captured by security-specific
devices, such as IDS and IPS systems. Paying diligent attention to unusual error
messages often pays off when a possibly damaging new threat factor manifests
on your network.
Specifics Reports
Key reports in this category are:
n Critical errors by system, application, business unit: while on the surface not
security significant, various error messages appearing in logs (especially
for the first time) should be investigated as they often present a very early
Table 12.5 Virus Types Across a Network
Malware type Status Infected System Count
VirusX Detected 1
VirusY Detected 1
Botz Quarantined 2

Critical Errors and Failures Reports 217
indication of malicious activities; analytic reports in the next section can
be used very effectively for managing these types of log messages.
n System and application crashes, shutdowns, restarts: whenever applications
crash—due to failed attacks or other reasons—business functioning is
likely to be affected; these events should not only be taken as having
impact on availability but investigated as possible early indirect indica-
tion of attacks.
n Backup failures are critical events affecting business continuity and possi-
bly regulatory compliance, in addition, unauthorized backups (failed, in
this case) may be triggered by attacker’s attempts to steal data.
n Capacity / limit exhaustion events for memory, disk, CPU, and other system
resources: often stem from attacker’s or other unauthorized use of business
systems, high resource usage may also be caused by attack floods, denial
of service, or brute force attacks.
Who Can Use These Reports
These reports are useful for all security professionals, from a junior administra-
tor in charge of desktop anti-virus to a CSO in charge of all entire organization
security. Such reports are also useful for incident response and malware infec-
tion investigations. Other IT personnel can benefit from them as well.
Example
Table 12.6 shows an example report on disk full and high CPU usage messages
across a pool of Unix/Linux servers.
SUMMARY
As we stated in the introduction, it is impossible to create one list of reports
that everybody would use across all log data. All attempts to create such a list
are doomed to fail, no matter how compliance regulations will be mandated.
However, it is useful to have a list of reports that almost everybody should use
and adjust to their circumstances.
Table 12.6 Disk Full and High CPU Report
Server Event Type Date
Serv1 Disk Full 10/1/11
Sirius Disk Full 1/1/11
VenusX CPU Load 100% 1/2/11

This page is intentionally left blank

Logging and Log Management.
© 2013 Elsevier, Inc. All rights reserved.
http://dx.doi.org/10.1016/B978-1-59-749635-3.00013-0
219
CHAPTER 13
Visualizing Log Data
CONTENTS
Introduction .............219
Visual Correlation ...219
Real-Time
Visualization ...........220
Treemaps .................221
Log Data
Constellations .........222
Traditional Log
Data Graphing .........227
Summary .................229
References ...............229
n Visual Correlation
n Real-time Visualization
n Treemaps
n Log Data Constellations
n Traditional Log Data Graphing
INFORMATION IN THIS CHAPTER:
INTRODUCTION
This chapter provides a brief introduction on the topic of log data visualiza-
tion. A thorough treatment of this topic is beyond the scope of this book.
Conti (2007) and Marty (2009a) provide in-depth treatment on this topic and
we encourage you to explore these and all the other references.
VISUAL CORRELATION
Recall Chapters 7 and 8 which discussed log analysis techniques. It was appar-
ent in that chapter we were leveraging the human eyeball for visualizing and
finding anomalous behavior in our log data. If you have a small log data load,
then Visual Correlation can be beneficial. You first need to begin gathering
your log data to an aggregation point. The next step is to use a tool to simply
watch your log data files for incoming events. Sometimes you can simply use
the UNIX tail command, especially if you are gathering all of your log messages
to a single file. The task becomes complicated very quickly if you have more
than one log file to watch.
The downside to this technique is that you realistically can only visually corre-
late about five or so events per second. This means that you will end up spend-
ing more of your time going back through your log data in a non-real-time
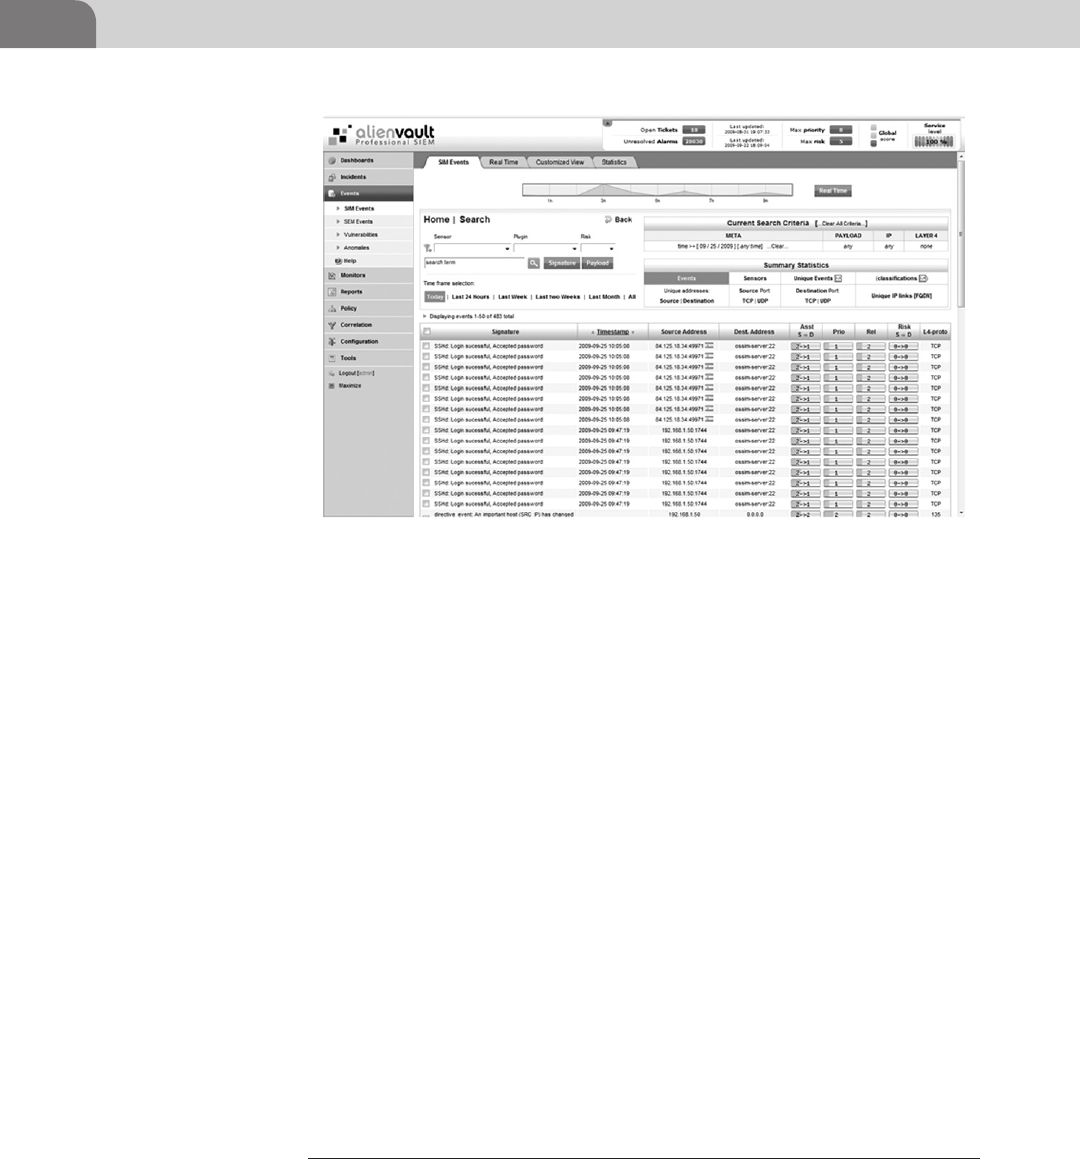
CHAPTER 13: Visualizing Log Data
220
fashion, which defeats one of the main purpose of correlation: finding things
in real-time.
REAL-TIME VISUALIZATION
There is, of course, and alternative. Most log analysis for SIEM platforms come
with some sort of real-time interface for viewing events. Figure 13.1 shows the
OSSIM1 event viewer.
Tools such as this allow you to visually inspect normalized log data (i.e. events)
as they flow from your remote log collection points into your analysis servers.
Also, most of these tools allow you to perform actions like filter, correlation,
and highlight events which might be of interest. Interfaces such as this are
important for several reasons:
1. It allows for aggregation of disparate event data.
2. Multiple users can use the tool at a time, thereby increasing scale.
3. Unknown or never-before-seen log data is easier to spot.
4. Reclassification of signature data is easier to achieve.
1 http://communities.alienvault.com
FIGURE 13.1 OSSIM Real-Time Event Viewer

Treemaps 221
TREEMAPS
A treemap is a visualization technique whereby hierarchical data is displayed
using colors to represent varying leaf nodes. This process allows for greater
identification of patterns.
Figure 13.2 (taken from Marty, 2009b) shows firewall data in a treemap image.
Each box in Figure 13.2 with an IP address at the top represents a source. Then
all the IP addresses contained within each box are the destinations along with
the connections each source made. For example, 192.141.69.45 is a source
IP and the sub boxes (like 192.134.0., 192.26.92., etc.) are the destinations
192.141.69.45 contacted.
It is hard to tell from the black and white image, but firewall accepts are green
(light) and firewall drops are red (dark). This sort of visualization can be
extremely useful in detecting when you need to add firewall rules, verify that
rules are working, or even combine firewall logs with IDS logs to create a cross-
sectional treemap view.
FIGURE 13.2 Treemap of Firewall Data

CHAPTER 13: Visualizing Log Data
222
LOG DATA CONSTELLATIONS
Jimmy Alderson, a network security industry veteran, started working with
GraphViz to create visual representations of log data. He coined the term
Constellations. GraphViz is a tool for representing information via graphs and
networks. The core distribution is available at http://www.graphviz.org/. This
appendix, however, will present the GraphViz Perl module, which is available at
http://search.cpan.org/CPAN/authors/id/R/RS/RSAVAGE/GraphViz-2.10.tgz. You
need to install the GraphViz package before you can install and use the Graph-
Viz Perl module. The module requires other Perl modules, and it will tell you
which are missing.
Figure 13.3 shows an example of what GraphViz can do for you.
You now see where the name comes from. The figure, while probably not obvi-
ous from the black and white figure, does have color. The idea is to represent
various services or servers in your infrastructure as nodes. As other systems
FIGURE 13.3 Sample GraphViz Graph

Log Data Constellations 223
initiate contact with these services, GraphViz can represent this communica-
tion as an edge from the source system to the destination system.
Figure 13.4 shows a GraphViz map for use in a browser.
In the interest of showing greater detail, the browser itself has been omitted.
The map in Figure 13.4 is designed to be a clickable image. Each node in the
map is either the destination or source of some kind of network communica-
tion. In essence, Figure 13.4 is a directed graph of nodes and edges. As you
can see each node has an edge to another node, with an arrow which shows
the direction of communication. The following Perl script creates not only the
clickable map images, but an HTML file which can be used to browse the map:
#!/usr/bin/perl
#
# Author: Jimmy Alderson
#
use GraphViz::Small;
my%dst_hash = ();
my%edge_hash = ();
FIGURE 13.4 Clickable GraphViz Graph

CHAPTER 13: Visualizing Log Data
224
my $g = GraphViz::Small->new(layout => 'neato', bgcolor => 'black');
while ($line = <STDIN>){
chomp($line);
undef($sip);
undef($dst);
undef($count);
if(($sip,$dst,$count) = $line =∼ m/^([^ ]+) ([^ ]+) (\d+)/)
{
($port) = $dst =∼ m/:(\d+)/;
($dip) = $dst =∼ m/(\d+):/;
if(!exists($sip_hash{$sip}))
{
$g->add_node("$sip", URL => "$sip.html", tooltip =>
"$sip", style => 'filled', fillcolor => 'red',);
$sip_hash{$sip} = 1;
}
else
{
$sip_hash{$sip}++;
}
if(!exists($dst_hash{$dst}))
{
$color = get_fill_color($port);
$color2 = get_border_color($port);
$g->add_node(name =>"$dst", URL => "$dst.html",
tooltip => "$dst", style => 'filled', color =>
"$color2", fillcolor => "$color", cluster => "$port", rank
=> "$port");
$dst_hash{$dst} = 1;
}
else
{
$dst_hash{$dst}++;
}
$edge_hash{"$sip-$count#$dst"} = 1;
}
}
foreach $edge (keys%edge_hash)
{
if(($s, $c, $d) = $edge =∼ m/([^-]+)-(\d+)\#(.+)/)

Log Data Constellations 225
{
($port) = $d =∼ m/:(\d+)/;
($dip) = $d =∼ m/(\d+):/;
$color = get_fill_color($port);
$g->add_edge("$s" => "$d", color => "$color", minlen => "$c");
}
}
open(FH, ">map.html");
print FH '<HTML><BODY BGCOLOR=black><img src="map.png"
usemap="#map"><map name="map">';
print FH $g->as_cmap;
print FH '</map></body></html>';
close(FH);
print $g->as_png;
sub get_fill_color
{
my $port = shift;
my $control = 'magenta';
my $web = 'white';
my $email = 'yellow';
my $encrypted = 'green';
my $ftp = 'pink';
my $netbios = 'blue';
my $console = 'cyan';
my $proxy = 'orange';
my $db = 'green';
my $suspect = 'red';
my $chat = $suspect;
my%colors = ();
$colors{'0'} = $control;
$colors{'21'} = $ftp;
$colors{'20'} = $ftp;
$colors{'23'} = $console;
$colors{'25'} = $email;
$colors{'53'} = '#00FF00';;
$colors{'80'} = $web;
$colors{'443'} = $web;
$colors{'135'} = $netbios;
$colors{'139'} = $netbios;

CHAPTER 13: Visualizing Log Data
226
$colors{'161'} = $control;
$colors{'1433'} = $db;
$colors{'1434'} = $db;
$colors{'1080'} = $proxy;
$colors{'5190'} = $chat;
$colors{'8080'} = $proxy;
$colors{'6000'} = $console;
$colors{'6667'} = $chat;
$colors{'31337'} = 'gold';
if(exists($colors{$port}))
{
return $colors{$port};
}
return 'lightblue';
}
sub get_border_color
{
my $port = shift;
my $encrypted = 'green';
my $unencrypted = 'yellow';
my%colors = ();
$colors{'0'} = $unencrypted;
$colors{'22'} = $encrypted;
$colors{'23'} = $unencrypted;
$colors{'25'} = $unencrypted;
$colors{'53'} = $unencrypted;
$colors{'80'} = $unencrypted;
$colors{'443'} = $encrypted;
$colors{'135'} = $unencrypted;
$colors{'139'} = $unencrypted;
$colors{'1433'} = $unencrypted;
$colors{'5190'} = $unencrypted;
$colors{'6000'} = $unencrypted;
$colors{'6667'} = $unencrypted;
if(exists($colors{$port}))
{
return $colors{$port};
}
}

Traditional Log Data Graphing 227
The script expects the input data to be in the following format:
source_ip destination_ip:port count
The source_ip is the source of communication to the destination_ip on the
port specified. Count is the number of times source_ip communicated with
destination_ip on port. This format mandates that you perform some sort of
pre-processing of your log data. Firewall and IDS events are the most likely
choices for graphing, however you could graph just about anything you want.
One item to note about the script is that it uses different colors for the edges
between nodes, based on whether the destination port’s underlying service was
encrypted or not and the type of service (Web, database, etc.).
An example run of the above script looks like the following:
$ ./graph_bloom.pl < data > map.png
We named the script above as graph_bloom.pl. The file data contains pro-
cessed data in the format previously mentioned. Two files are output: map.
html and map.png, which we specify as part of the command-line. Graphs of
this nature may not be suitable for real-time, but they can be useful for near-
real-time analysis or possibly forensics analysis. The main problem this tool
solves is it creates another dimension to how you view and analyze log data.
An interesting feature about these constellations is how different types of traffic
manifest themselves in unique and recognizable patterns. For example, HTTP,
SMTP, DNS, and Netbios each have their own unique constellation signature,
making anomalies easy to spot for the trained eye.
TRADITIONAL LOG DATA GRAPHING
The graphs presented in the previous section are very interesting from the
standpoint of being able to visualize traffic patterns and how different sources
interact with your critical servers. The Multi Router Traffic Grapher (MRTG)2
is used by many organizations across the world to analyze things like router
interface usage (in and out octets), as well as operating system resources like
memory and disk usage. It can be used to gather and graph just about any-
thing. For example, you can graph things like firewall accepts and drops. You
could also graph things like source and destination IP addresses.
The following MRTG configuration shows how to execute a script which returns
the number of firewall accepts:
2 www.mrtg.org

CHAPTER 13: Visualizing Log Data
228
Target[fw.accepts]: '/usr/bin/perl /usr/local/bin/accepts.pl'
MaxBytes[fw.accepts]: 512
Options[fw.accepts]: gauge
Title[fw.accepts]: Number of firewall accepts
YLegend[fw.accepts]: FW Accepts
PageTop[fw.accepts]: <H1>FW Accepts </H1>
<TABLE>
<TR><TD>System:</TD> <TD>My Firewall</TD></TR>
<TR><TD>Maintainer:</TD> <TD>""</TD></TR>
</TABLE>
The script, accepts.pl, simply opens a data file and prints a single line from the
file. In order for this process to work properly, you must pre-process your log
data, much like we did in the previous section. MRTG is typically run periodi-
cally and automatically via the UNIX cron facility. So you will want to have
a script or program pre-process your firewall data and dump out to a file the
number of occurrences of accepts. Here is an example accepts.pl:
#!/usr/bin/perl
open(FILE,">processedFile");
while($line = <FILE>)
{
chomp($line);
print "$line\n";
}
#
# The following code prints the system uptime and the hostname. These two
# items need to be included in every script that you write and should be
the
# very last thing that is printed.
#
chomp($uptime = '/usr/bin/uptime');
print "$uptime\n";
chomp($hostname = '/bin/hostname');
print "$hostname\n";
Here are some things to keep in mind:
n Since MRTG runs every 5 min (you can actually run it more or less often,
but 5 min is a good sampling interval), your pre-processing script will
need to be able to complete in less than 5 min in order for the next run of
MRTG to complete properly.

References 229
n Your pre-process script should keep track of where it is in the original log
data file, so it can pick up where it left off.
n For each firewall you wish to graph, you need a separate configuration
block.
SUMMARY
We covered a few key topics on the area of visualization. Visual Correlation
allows for a quick-and-dirty analysis of log data, but can be someone laborious
and error-prone. Real-time Visualization provides more of a 10,000 foot view
of your log analysis enterprise. Treemaps are an interesting way to visually see
patterns in your log data. Log Data Constellations provide you with a point-to-
point view of your log data. And finally, Traditional Log Data Graphing takes a
more network management centric approach to visualizing log data.
REFERENCES
Conti, G. (2007). Security data visualization: Graphical techniques for network analysis. San Francisco:
No Starch.
Marty, R. (2009a). Applied security visualization. Upper Saddle River, NJ: Addison-Wesley.
Marty, R. (2009b). Data visualization with treemaps—A hands-on tutorial. Network World. Net-
work World, May 20. Web. June 17, 2012. <http://www.networkworld.com/community/
node/42024>.

This page is intentionally left blank

Logging and Log Management.
© 2013 Elsevier, Inc. All rights Reserved.
http://dx.doi.org/10.1016/B978-1-59-749635-3.00014-2
231
CHAPTER 14
Logging Laws and Logging Mistakes
CONTENTS
Introduction .............231
Logging Laws .........231
Law 1—Law of
Collection ........................232
Law 2—Law of
Retention ........................232
Law 3—Law of
Monitoring ......................233
Law 3—Law of
Availability .....................233
Law 4—Law of
Security ...........................233
Law 5—Law of Constant
Changes ..........................234
Logging Mistakes ...234
Not Logging at All .........235
Not Looking at Log
Data .................................236
Storing for Too Short a
Time ................................237
Prioritizing Before
Collection ........................239
Ignoring Application
Logs ................................240
Only Looking for
Known Bad Entries ........241
Summary .................241
References ...............241
n Logging Laws
n Logging Mistakes
INFORMATION IN THIS CHAPTER:
INTRODUCTION
As we described in previous chapters, logs from information systems have been
collected and analyzed for decades. It is not surprising, therefore, that certain
general truths about avoiding have emerged. In this chapter we will call out
such universal truths about logs and label them—with some degree of pre-
sumption—logging laws.
LOGGING LAWS
Our logging laws will cover the entire spectrum of dealing with this important
source of IT data—from collection to analysis and decision-making. But before
we do that it would like to introduce our inspiration in regards to defining
universal logging truths—Ranum Laws of Logging and IDS.
Mentioned by Marcus Ranum (2012) in one of his security presentations back
in the 1990s, these laws are:
Ranum’s First Law of Logging and IDS
—Never collect more data than you can conceive of possibly using.
Ranum’s Second Law of Logging and IDS
—The number of times an uninteresting thing happens is an interest-
ing thing.

CHAPTER 14: Logging Laws and Logging Mistakes
232
Ranum’s Third Law of Logging and IDS
—Collect everything you can except for where you come into conflict
with the first law.
Ranum’s Fourth Law of Logging and IDS
—It doesn’t matter how real-time your IDS is if you don’t have real-time
system administrators.
(source: http://ranum.com/security/computer_security/archives/logging-notes.pdf).
These laws definitely remain true today but will be expanded and accompanied
by others.
Law 1—Law of Collection
The first law is similar in spirit to the above inspiration: “Do NOT collect log data
that you NEVER plan to use.”
This universal logging truths seem to contradict with recent calls to “collect
100% of data” and “never meeting the log one didn’t like,” promoted by some
vendors. Indeed, this law simply states that for every message logged and
retained, there has to be a reason.
In fact, reasons such as “I might need it to investigate an incident” are perfectly
legitimate, while “eh…. I guess I might need it” are not.
In fact, this law also applies to generation of log data not just collection—“Do
NOT log what you NEVER plan to use.”
Law 2—Law of Retention
While more data can be collected, it is rarely used at this very moment. That’s
the subject of log retention, as we cover in this book, becomes an important
consideration.
“Retain log data for as long as it is conceivable that it can be used—or longer if pre-
scribed by regulations.”
As we imply further in this chapter. When we talked about logging mistakes,
situations where a log message is needed exactly one day after it has been
purged by the retention routine are not as rare as you think. Storing the data
for as long as it might be useful thus presents the subject of this law.
On the other hand, it is rather unlikely that a mere debugging message will be
used for years after the application crashed. While we can manufacture an arti-
ficial situation where this will become the most important thing in the world,
it is not a recommendation to store every single message for 7 years.

Logging Laws 233
Law 3—Law of Monitoring
While the previous laws made one think that it would be wise to err on the side
of more logging and longer log retention, the opposite truth emerges about the
monitoring: “Log all you can (which is as much as possible), but alert only on what
you must respond (which is as little as possible).”
Indeed, the universal truth of this statement comes to life when you realize
that the system can easily store petabytes of data—trillions of log messages—
but your security response personnel can barely address a dozen issues a day.
This is a trillion: 1,000,000,000,000
This is a dozen: 12
A big difference, right? That is the difference between logging and monitoring!
Just as an organization must log before it can start to monitor, the approaches
are completely different. As we discussed elsewhere in the book the principle
that an organization should follow is “Log all, store some, monitor what is
needed.”
Law 3—Law of Availability
“Don’t pay to make your logging or monitoring system more available than your busi-
ness systems” sounds counterintuitive at times. However, it only makes sense
that security monitoring needs to be as available as business systems, but not
more so.
Indeed, it is important to make sure that log data is being collected and ana-
lyzed, and can be available for future investigations or even court cases. How-
ever, most business leaders would tell you that it is even more important that
business systems are available.
Law 4—Law of Security
If you understand the law of availability, you’d like the law of security as well:
“Don’t pay to protect your log data more than you pay to protect your critical business
data.”
Hard problem, is it? What should we protect better: a secret new fighter plans
(ok, we’d settle for a secret customer list or a celebrity health record) or a nice
set of syslog messages? Logs are indeed valuable—and sometimes can even
be considered business records—but most businesses will be able to point at
another data set that will be more valuable than the logs.
That is why few organizations actually choose to encrypt log data. Apart from
operational challenges that encryption brings up, in many cases such controls

CHAPTER 14: Logging Laws and Logging Mistakes
234
will be clearly excessive. Some settle for hashing of log archives which reduces
tampering of logs. Others prefer to rely on stringent access controls.
Law 5—Law of Constant Changes
One thing constant in the domain of logging, log management and log analy-
sis is change. “Logs sources, log types, and log messages change.”
While a legacy application has been checking alone for 20 years, it will not
suddenly have different logs. However, the environment around this applica-
tion will likely produce many different and new types of log messages. Today
in the age of virtualization and cloud computing, there are more changes com-
ing down the organizations, collecting and analyzing logs.
Thus organizations need to continually review the log review policies, pro-
cedures as well as operational tasks and system configurations. It is useful to
document each step in the log collection process and keep it up to date—from
the point the log is generated to its final resting place, show all the points in
between it flowed through.
LOGGING MISTAKES
Ignoring the above laws of login happens at the peril of organizations and
individuals doing so. However, there are more mistakes unrelated to laws,
some originating many years ago, but still relevant today, while others more
modern and specific to today’s IT environments.
This section covers the typical mistakes organizations make while approach-
ing management of information systems logs and other records produced by
computers and network devices. These mistakes are sadly common in many
organizations, even though awareness of them is growing.
As technology continues to spread and computers start playing even more impor-
tant role in our business and personal lives, logs—the records that they pro-
duce—start to play bigger and bigger role. Thus, the cost of making those mistakes
continues to increase. Twenty years ago making a mistake from this list would
only hinder troubleshooting or other system related activity. In 10 years, when
computers control an ever increasing parts of our lives, these mistakes—and we
are not trying to over dramatize the situation—can cost somebody their life.
From firewalls and intrusion prevention systems (IPS) to databases and enter-
prise applications to wireless access points and VOIP gateways and virtu-
alization platforms, logs are being spewed forth at an ever-increasing pace.
Moreover, locations where such log sources may be present are expanding—
from systems to cloud applications to mobile devices. Both security and other

Logging Mistakes 235
IT components not only increase in numbers, but now often come with more
logging enabled out of the box. Example of that trend include Linux systems
as well as web servers that now ship with increased level of logging. Windows
systems today also logs many more events than 10 years ago—and with more
details for each event.
All those systems, both legacy and novel, traditional and virtual of cloud based,
are known to generate copious amounts of logs, audit trails, records, and alerts,
that beg for constant attention. Thus, many companies and government agen-
cies are trying to set up repeatable log collection, centralization, and analysis
processes and tools.
In fact, companies at the forefront of cloud computing are the ones drowning in
logs. From the unique scale of Google and Facebook to other web companies,
logs are no longer measured in gigabytes, but terabytes and even petabytes. Orga-
nizations where combined volume of logged data—security as well as debug-
ging and operations—measures in terabytes a day are becoming more common.
However, when planning and implementing log collection and analysis infra-
structure, the organizations often discover that they are not realizing the full
promise of such a system and, in fact, sometimes notice that the efficiency is
not gained but lost as a result.
We will start from the obvious, but unfortunately all are too common even in
this age of regulations and mandates such as Sarbanes–Oxley and PCI DSS.
This mistake destroys all possible chances of benefiting from logs.
Not Logging at All
The mistake #1 is simply not logging at all. A more exciting flavor of this mis-
take is: “not logging and not even knowing it until it is too late.”
How can it be “too late,” some say? “Its just logs!” Not having “just logs” can
lead to losing your income (PCI DSS that contain explicit logging requirements
implies that violations might lead to your credit card processing privileges
being canceled by Visa or Mastercard and thus putting you out of business),
reputation (somebody stole a few credit card number from your database,
but the media reported that all of the 40 million credit card have been stolen
since you were unable to prove otherwise), or even your freedom (see various
Sarbanes-Oxley and HIPAA horror stories in the media).
Even better-prepared organizations fall for this one. Here is a recent example.
Does your web server have logging enabled? Sure, it is a default option on both
of the popular web servers: Apache and Microsoft IIS. Does your server operat-
ing system log messages? Sure, nobody canceled /var/log/messages. But does
your database? Oops! Default option in Oracle is to not do any data access

CHAPTER 14: Logging Laws and Logging Mistakes
236
audit logging. Maybe MS SQL fares better? Nope, same thing, you need to dig
deep in the system to even start a moderate level of audit trail generation (see
more on this in our database logging paper).
To add more detail, let’s review a common database type for what logs we can
get out of this by default. Oracle (and, in fact, other databases) will have very
minimum system logging, some database server access by DBA logging, and no
data access logging whatsoever (by default).
So, where is data access audit records, schema and data change audit logs, con-
figuration change audit logs? They can all be configured (you need to read the
documents for this!), but are off by default.
In fact, it appears that many systems deployed in cloud computing environ-
ments not only lack logging configuration settings but often lack login at
all. For example, at the time of this writing a popular cloud computing pro-
vider does not have any way of logging connections to and from its cloud
environment.
Thus, to avoid this mistake one needs to sometimes go beyond the defaults
and make sure that the software and hardware deployed does have some level
of logging enabled. In case of working with systems that does not even have
logging settings, the unfortunate choice is to either abandon the use of such
system, negotiate with your provider (which is probably not an option if they
are a much larger company), or add additional technology to record activities
and actions.
Not Looking at Log Data
Not looking at the logs is the second mistake. While making sure that logs do
exist and then collecting and storing them is important (yes, you can in fact
benefit from heaven log data to be looked at when needed), it is only a means
to an end—knowing what is going on in your environment and being able to
respond to it as well as possibly predict what will happen later. Thus, once the
technology is in place and logs are collected, there needs to be a process of
ongoing monitoring and review that hooks into actions and possible escala-
tions, if needed. In addition, personnel reviewing or monitoring logs should
have enough information to be able to determine what they really mean and
what—if any—action is required.
It is worthwhile to note that some organizations take a half-step in the right
direction: they only review logs (provided they didn’t commit the first mistake
and they actually have something to review) after a major incident (be it a com-
promise, information leak ,or a mysterious server crash) and avoid ongoing
monitoring and log review, often by quoting “the lack of resources.” This gives
them the reactive benefit of log analysis, which is important, but fails to realize

Logging Mistakes 237
the proactive one—knowing when bad stuff is about to happen or become
worse. For example, if you review logs, you might learn that the failover was
activated on a firewall, and, even though the connection stayed on, the inci-
dent is certainly worth looking into. If you don’t and your network connectiv-
ity goes away, you’d have to rely on your ever-helpful logs in investigation why
“both” failover devices went down … In fact, looking at logs proactively helps
organizations to better realize the value of their existing network, security, and
system infrastructure.
It is also critical to stress that some types of organizations have to look at log
files and audit tracks due to regulatory pressure of some kind. For example, US
HIPAA regulation compels medical organizations to establish audit record and
analysis program (even though the enforcement action is notorious lacking).
In a more extreme case, PCI DSS has provisions for both log collection and log
monitoring and periodic review, highlighting the fact that collection of logs
does not stand on its own.
This example below shows that review priorities were based on both risk assess-
ment (DMZ was seen as higher risk) and available skills (thus, application logs
were low on the list).
They went from high external risk to inside, and from servers to desktops, and
from the tools they know (firewalls and IDSs) to the ones that might matter
even, but for which the skill sets were not available.
1. DMZ NIDS
2. DMZ firewall
3. DMZ servers with applications
4. Critical internal servers
5. Other servers
6. Select critical application
7. Other applications
Such approach allows an organization to avoid the overwhelming feeling of
how can it ever look at logs if there are so many of them.
Storing for Too Short a Time
The third common mistake is storing logs for too short a time. This makes the
security or IT operations team think they have all the logs needed for moni-
toring and investigation or troubleshooting and then leading to the horrible
realization after the incident that all logs are gone due to their shortsighted
retention policy. It often happens (especially in the case of insider attacks)
that the incident is discovered a long time—sometimes many months—after

CHAPTER 14: Logging Laws and Logging Mistakes
238
the crime or abuse has been committed. One might save some money on
storage hardware, but lose the tenfold due to regulatory fines.
If low cost is critical, the solution is sometimes in splitting the retention
in two parts: shorter-term online storage (that costs more) and long-term
offline storage (that is much cheaper). A better three-tier approach is also
common and resolves some of the limitations of the previous one. In this
case, shorter-term online storage is complemented by a near-line storage
where logs are still accessible and searchable. The oldest and the least rel-
evant log records are offloaded to the third tier, such as tape or DVDs, where
they can be stored inexpensively, but without any way to selectively access
the needed logs.
More specifically, one financial institution was storing logs online for 90 days,
then in the near-line searchable storage for two years and then on tape for up
to seven years or even more.
Also, it is worth mentioning that a mandatory 7-year log retention requirement
is a myth!
It is interesting that it turns out that storing logs for too long can also be a mis-
take. How can that be? First, let’s be reminded that Log Retention equals Log
storage + access to stored data + log destruction.
So, why DESTROY LOGS? Three main factors make storing logs too long a
mistake.
First, Privacy regulations, rampant in Europe (but not—yet?—in the states)
often limit both data collection and retention. Yes, in some countries keep-
ing logs is illegal and thus needs to be considered when logging policy is
planned.
Second, Litigation risk management. Your legal team will definitely remind
you that collecting too much information that can be legally discovered in case
of a lawsuit is not a good thing. The most known example is that having a log
of some activity handy (but not reviewed by the security team!) can be seen as
knowing about infringement. Such things can get your organization into legal
hot water.
Finally, System resource utilization often drives limiting the amount of stored
log data. If you have a set of busy firewalls, keeping logs for several years
might be impossible or cost-prohibitive (or, you have to learn how to spell
petabyte).
Here is an example of a retention strategy that also teaches an approach to
creating one’s log retention strategy and avoiding the mistakes.

Logging Mistakes 239
So, the main model to learn is to use three dimensions for a retention strategy:
1. Type of log source—firewall, IDS, server, desktop, etc.
2. Network location—DMZ, geographic region, branch office, etc.
3. Storage tier—online (e.g. a log management system), near line (large hard drive
storage of raw logs), offline (tape or CD).
This means that you pick a type of log source (say, firewall), consider where
it is deployed on the network (say, DMZ), and then plan how it would be
stored (say, in a quick online storage)—this will give you one number to keep
the logs for. In the above example, the DMZ IDS logs are stored online for
90 days,while firewall logs from the same location are stored for 30 days (due
to their higher volume). The same logs are then retained in the offline storage
(2nd tier) for three years.
The order of picking the devices is also important, as this will define the prior-
ity of implementing log capture and retention.
Prioritizing Before Collection
The fourth mistake is related to log record prioritization. While people need
a sense of priority to better organize their log analysis efforts, the common
mistake nowadays is in prioritizing the log records before collection. In
fact, even some “best practice” documents recommend only collecting “the
important stuff.” But what is important? This is where the above guidance
documents fall short by not specifying it in any useful form. While there are
some approaches to the problem, all that we are aware of can lead to glar-
ing holes in security posture or even undermine the regulatory compliance
efforts.
For example, many people would claim that network intrusion detection
and prevention logs are inherently more important than, say, VPN con-
centrator logs. Well, it might be true in the world where external threats
completely dominate the insider abuse (i.e. not in this one). VPN logs,
together with server and workstation logs, are what you would most likely
need to conduct an internal investigation about the information leak or
even a malware infection. Thus, similar claims about the elevated impor-
tance of whatever other log type can be similarly disputed, which would
lead us to a painful realization that you do need to collect everything
(while being mindful of the Morgan loss. We discussed earlier in this
chapter).
But can you? Before you answer this, try to answer whether you can make
the right call on which log is more important even before seeing it and this

CHAPTER 14: Logging Laws and Logging Mistakes
240
problem will stop looking unsolvable.To teach you about avoiding this mis-
take we will employ the following gross oversimplification.
First, log everything does not mean that a human analyst will review every log
record. It means that most if not all log records are available, if needed, for
investigators, auditors, etc.
1. Log everything.
2. Retain most everything.
3. Analyze enough.
4. Summarize and report on a subset.
5. Monitor some.
6. Act on a few record, which are actionable.
To put it more simply, it means that information reduction happens AFTER the
logs are collected and stored, not before. This will enable you to use the logs for
any future situation, whether regulatory or security related.
Ignoring Application Logs
The next mistake is in ignoring the logs from applications, by only focusing on
the perimeter and internal network devices and possibly also servers, but not
going “higher up the stack” to look at the application logging.
The realm of enterprise applications ranges from SAPs and PeopleSofts of the
world to small homegrown applications, which nevertheless handle mission-
critical processes for many enterprises. Legacy applications, running on main-
frames and midrange systems, are out there as well, often running the core
business processes as well. The availability and quality of logs differs wildly
across the application, ranging from missing (the case for many homegrown
applications) to extremely detailed and voluminous (the case for many main-
frame applications). Lack of common logging standards and even of logging
guidance for software developers lead to many challenges with application
logs.
In fact when applications are deployed in the cloud or if your organization
utilizes software as a service (SaaS) cloud model, application logs are the only
way to monitor the activities and attacks. Be mindful of the fact that applica-
tion logs are increasing in importance and they will be a need to include them
in your analysis sooner or later.
Despite the challenges, one needs to make sure that the application logs are
collected and made available for analysis as well as for longer-term retention.
This can be accomplished by configuring your log management software to
collect them and by establishing a log review policy, both for the on-incident
review and periodic proactive log review.

Reference 241
Only Looking for Known Bad Entries
Even the most advanced and mature organizations fall into the pitfall of the
sixth error. It is sneaky and insidious, and can severely reduce the value of a
log analysis project. It occurs when organization is only looking at what they
know is bad in the logs. Indeed, a vast majority of open source and some
commercial tools are set up to filter and look for bad log lines, attack signa-
tures, critical events, etc. For example, “swatch” is a classic free log analysis tool
that is powerful, but only at one thing: looking for defined bad things in log
files. Moreover, when people talk about log analysis they usually mean sifting
through logs looking for things of note.
However, to fully realize the value of log data one has to take it to the next level
to log mining: actually discovering things of interest in log files without having
any preconceived notion of “what we need to find.” It sounds obvious—how
can we be sure that we know of all the possible malicious behavior in advance—
but it disregarded so often. Sometimes, it is suggested that it is simpler to just
list all the known good things and then look for the rest. It sounds like a solu-
tion, but such task is not only onerous, but also thankless: it is usually even
harder to list all the good things than it is to list all the bad things that might
happen on a system or network.
So many different things occur, malfunction or misbehave, that weeding out
attack traces just by listing all the possibilities is not effective. A more intel-
ligent approach is needed! Some of the data mining (also called “knowledge
discovery in databases” or KDD) and visualization methods actually work on
log data with great success—we discussed them elsewhere in the book. They
allow organizations to look for real anomalies in log data, beyond “known
bad” and “known good.”
SUMMARY
We have taken the liberty to define some of the universal truths in the area of
logging. It is useful to keep them in mind while planning and operating your
projects related to logs as well as while purchasing, building, and using the tools.
Also, avoiding the common mistakes will take your log management pro-
gram to a next level and enhance the value of the existing security and logging
infrastructures.
REFERENCE
Marcus Ranum Logging Laws are from http://ranum.com/security/computer_security/archives/
logging-notes.pdf (retrieved May 2012).

This page is intentionally left blank

Logging and Log Management.
© 2013 Elsevier, Inc. All rights reserved.
http://dx.doi.org/10.1016/B978-1-59-749635-3.00015-4
243
CHAPTER 15
Tools for Log Analysis and Collection
CONTENTS
Introduction .............243
Outsource, Build,
or Buy .......................243
Building a Solution ........244
Buy ..................................245
Outsource .......................246
Questions for You,
Your Organization, and
Vendors ...........................246
Basic Tools for Log
Analysis ...................247
Grep ................................247
Using Grep for Log
Analysis .................................. 249
Awk ................................. 249
Microsoft Log Parser .....251
Other Basic Tools to
Consider .........................252
tail ........................................... 252
head ........................................ 253
Sed .......................................... 253
Logwatch ............................... 253
Lire .......................................... 253
The Role of the Basic
Tools in Log Analysis ....254
Utilities for
Centralizing Log
Information ..............254
Syslog ..............................254
Guaranteed Delivery of
Messages ............................... 255
n Outsource, Build, or Buy
n Basic Tools for Log Analysis
n Utilities for Centralizing Log Information
n Log Analysis Tools—Beyond the Basics
n Commercial Vendors
INFORMATION IN THIS CHAPTER:
INTRODUCTION
The market place for log management and log analysis tools has grown signifi-
cantly over the years. Many toolset choices, such as grep and awk, are built into
many of the current servers and network devices in use in environments today.
We will review open source solutions and a number of good commercial tools
to help you centralize, manage, and report on logs inside your environment.
The tools range from basic flat file searching, centralized collection of logs, and
all the way to more robust tools that incorporate compliance-specific reporting
and real-time alerting. The tool that is right for you will depend on the num-
ber of systems being monitored and your organization’s compliance needs.
This chapter is not intended to be all encompassing, but will review a number
of log management and log analysis tools widely available today and provide
details on the tools and features most applicable to daily log management in
your organization.
OUTSOURCE, BUILD, OR BUY
In many businesses, security, and log management is not a core competency and
is a cost of doing business rather than a source of revenue. There have been a
number of high profile security incidents over the years that have reinforced the

CHAPTER 15: Tools for Log Analysis and Collection
244
cost aspects of poor security. In the latest 2012 Verizon Breach Report, reviewed
over 855 incidents were reviewed with the results determining that over 174 mil-
lion records were compromised in these attacks (Verizon Corporation, 2012).
Incidents like these have made many organizations take notice of the potentially
high cost and possible lost business involved in not choosing the right system or
not having enough talented resources monitoring the systems that are in place.
Many of the recent incidents, such as the recent Global Payments data breach,
were at businesses that need to conform with some of the most stringent com-
pliance guidelines like the Payment Card Industry Data Security Standard (PCI
DSS). Log management and review is key part of PCI DSS. Though we don’t
know what role in having the right log management and log analysis system
played in each of these events, we can assume that being able to quickly review,
correlate, and analyze logs was critical in identifying affected systems and cus-
tomers so the companies could close gaps in their security and continue to
operate their business.
Log management and log analysis systems should be evaluated like any criti-
cal IT system in your environment with a critical eye towards decisions to buy,
build, or outsource the solution. In many cases, a combination of buy and
build, buy and outsource, etc., may provide better overall benefits than a single
approach will in meeting your organization’s needs. As we discuss the various
tools through this chapter, you should consider a number of pros and cons in
the buy, build, or outsource decision.
Building a Solution
Many organizations choose to build a solution for log management due to the
availability of open source log management solutions and a desire to custom-
ize and tune solutions specific to their environment and needs. In many cases,
this approach allows an organization to start small with existing resources
and limited costs. A number of advantages and risks are associated with this
approach:
Advantages:
n You are likely to get a system and solution that exactly what you want for
your environment (Chuvakin, 2008).
n You can do things that cannot be found in commercial or open source
solutions since in many cases you can modify and update the code to the
system.
n You can choose and design the platform, tools, and processes for your
system.
n There are limited to no upfront costs in acquiring the system.
n It’s fun!
Secure Transport of Log
Messages ............................... 256
Maintaining Log Source
Information ............................. 256
Rsyslog ...........................256
Snare ...............................256
Log Analysis
Tools—Beyond
the Basics ................257
OSSEC .............................257
OSSEC Settings to Retain
All Log Information ............... 258
OSSEC Real-Time Alerting ... 259
OSSEC Log Retention Policy
and Storage Options.............. 260
OSSIM .............................261
Other Analysis Tools
to Consider .....................261
Logsurfer ................................ 261
LogHound .............................. 262
Log2Timeline ......................... 262
Commercial
Vendors ....................262
Splunk .............................263
Free vs. Enterprise................. 263
Log Source Support ............... 263
Dashboards and Views.......... 264
NetIQ Sentinel ................264
Free vs. Enterprise................. 264
IBM q1Labs ....................264
Loggly .............................265
Summary .................265
References ...............265

Outsource, Build, or Buy 245
Risks:
n You own the system and will need to allocate resources and time to
system maintenance and any updates necessary to continue to meet
changes to compliance standards.
n No third-party support. You are the support staff!
n Will you be able to hire, retain, and train staff to continue to maintain
the system if any of the key personnel that built the system leave the
company?
n Will the system be able to handle the volume of logs from all the systems
in the organization and will it continue to scale as the organization grows?
Buy
Many organizations may find the possibility of building a log manage-
ment system too time consuming and may not have the resources to devote
to building and maintaining these systems if systems development is not a
core competency of the organization. Larger organizations also need support
agreements with vendors to guarantee uptime and legal requirements. Sup-
port agreements and legal requirements frequently cannot be met with home-
grown solutions based on open source products. Due to these and many other
factors, many organizations look to purchase log management systems. The
following should be considered when purchasing a log management system.
Advantages:
n “Cash and carry”—pay and you get a solution to your log management
and analysis needs (Chuvakin, 2008).
n Purchased solutions support a wide variety of log sources and formats.
n Support agreements typically include service line agreements for uptime
and response time for issues.
n Product updates and improvements including updates to meet changes to
compliance standards.
n Potential to purchase services and onsite help to help get the system
installed and train your internal staff.
Risks:
n Beyond the initial system cost, you will get a system now and will need
to hire or train staff to install and use it now. Your organization should
consider the impact on current business priorities and budget constraints
outside of the initial system cost and the ongoing personnel retention and
education costs.
n Does your organization have anyone on staff that has the skills to learn,
use, and get value out of the purchased system?

CHAPTER 15: Tools for Log Analysis and Collection
246
n Gaps in the system that do not have support for installed applications in
your environment or processes specific to your compliance needs.
n Vendor maturity, longevity, and risks to the organization being able to
change vendors in the future.
Outsource
Many organizations find outsourcing a better alternative in areas where they
do not have the talent or resources to build or operate and maintain solu-
tions they purchase. Just like the buy option, outsourcing allows organizations
to meet uptime, support, and legal requirements for the systems operating in
their environment. The following are items that should be considered when
outsourcing:
Advantages:
n Somebody else will worry about the daily tasks and compliance needs for
log management in your organization. This frees resources to focus on
other items core to the business (Chuvakin, 2008).
n Outsourcing limits the infrastructure footprint and the outsourcing ven-
dor hosts' the infrastructure installed in the organization.
n Less staff needed to devote to log management and the daily activities of
reviewing logs and other compliance requirements.
Risks:
n Someone else is worrying about your problems and may not have the
same background in your environment or your compliance needs.
n There may be gaps in the system that do not have support for installed
applications in your environment or processes specific to your compliance
needs.
n The organization loses control of their data. This puts the data at risk for
loss if hosted outside the organization and may make it difficult to switch
log management providers in the future. We will discuss this in further
detail related to cloud vendors in Chapter 21.
n The volume of data from your organization may pose challenges for the
vendor and may impact your system SLAs when transporting the data
outside the organization.
n Access to log data may be limited based on vendor provided APIs and
online data retention times.
Questions for You, Your Organization, and Vendors
As we review tools and solutions in the chapter, consider the following ques-
tions and how each tool helps you in your environment answer these questions.

Basic Tools for Log Analysis 247
These questions are relevant regardless if your organization chooses to build,
buy, or outsource your log management and analysis solution (Chuvakin, 2008).
1. Are you collecting and aggregating 100% of all the log data from all data
sources on the network?
2. Are the logs transported and stored securely?
3. Are there packaged reports that suit your needs? Can you create the
needed reports to organize collected log data quickly?
4. Can you set alerts on anything in the logs?
5. Are you looking at log data on a daily basis and is there intelligence in the
system to aggregate or reduce the time burden of these activities? Can you
prove that you are and do you have the tools to perform this function and
are able to report on who reviewed the logs and when?
6. Can you perform fast, targeted searches for specific data?
7. Can you contextualize log data and correlate it across the organization for
forensics and other operational tasks?
8. Can you readily prove that security, change management, and access con-
trol policies are in use and up to date?
9. Can you securely share log data with other applications and users?
BASIC TOOLS FOR LOG ANALYSIS
There are a number of simple yet powerful tools available to do log analysis
built into Linux/Unix operating systems, available for download for free over
the Internet, or are part of existing office productivity suites already purchased
by many organizations. We will review a number of these here and provide
examples on using tools to perform log analysis.
Grep
Grep is a command line utility found on most Linux and Unix operating sys-
tems today that will search input files based on a pattern or regular expression.
The IEEE and The Open Group (2004).
Many of the log files and examples throughout this book note that many
systems log directly to human-readable text-based files. These files can be
GREP AND ITS POPULARITY
Grep
The utility has also been ported to many other operating systems including Windows with pop-
ular ports of this utility available as grep for Windows by GNU (http://gnuwin32.sourceforge.
net/packages/grep.htm) and as part of Cygwin (http://www.cygwin.com/).

CHAPTER 15: Tools for Log Analysis and Collection
248
easily searched with grep to find useful information for daily log reviews and
forensics. Grep, like many of the search tools presented in this chapter, is
heavily reliant on the user knowing a search term or what they are looking for
(see Table 15.1).
Table 15.1 Common Items to Search for in Reviewing Logs
What to look for on Linux/Unix
Successful user login “Accepted password,” “Accepted publickey,”
“session opened”
Failed user login “authentication failure,” “new user,” “delete
user”
User log off “session closed”
User account change or deletion “password changed,” “new user,” “delete user”
Sudo actions “sudo: … COMMAND=…,” “FAILED su”
Service failure (Chuvakin, 2011) “failed” or “failure”
What to look for on Windows
Event IDs are listed below for Windows 2000/XP. For Vista/7 security event IDs, add 4096
to the event ID
Most of the events below are in the Security log, but many are only logged on the domain
controller
User logon/logoff events Successful logon 528,540; failed logon
529–537, 539; logoff 538, 551
User account changes Created 624; enabled 626; changed 642;
disabled 629; deleted 630
Password changes To self: 628; to others: 627
Service started or stopped 7035, 7036
Object access denied (if auditing en-
abled)
560, 567
What to look for on Network Devices
Look at both inbound and outbound activities
Examples below show log excerpts from Cisco ASA logs; other devices have similar
functionality.
Traffic allowed on firewall “Built … connection,” “access-list … -permit-
ted”
Traffic blocked on firewall “access-list … denied,” “deny inbound,”
“Deny … by”
Bytes transferred (large files?) “Teardown TCP connection … duration …
bytes …”
Bandwidth and protocol usage “limit … exceeded,” “CPU utilization”
Detected attack activity “attack from”
User account changes “user added,” “user deleted,” “user priv level
changed”
Administrator access “AAA user …,” “User … locked out,” “login
failed”

Basic Tools for Log Analysis 249
Using Grep for Log Analysis
Let’s take an example of an Apache access_log. In many of the web server logs
in your organization, you will find 403 errors if you have protected content on
your website that is being accessed without proper authorization. Let’s use grep
to isolate these errors and look at what is going on more closely.
user$ grep -i -e "paybills.aspx?customer_acct=.* HTTP/1.1.* 403" /var/
log/httpd/access_log
192.168.0.6 - - [10/Jul/2011:00:00:00 +0200] "GET /paybills.
aspx?customer_acct=111111111 HTTP/1.1" 403 -
192.168.0.6 - - [10/Jul/2011:00:00:00 +0200] "GET /paybills.
aspx?customer_acct=111111112 HTTP/1.1" 403 -
192.168.0.6 - - [10/Jul/2011:00:00:00 +0200] "GET /paybills.
aspx?customer_acct=111111113 HTTP/1.1" 403 -
Similar to some of the examples in Chapter 9, we used a regular expression to
isolate instances where we are getting 403 errors against our paybills.aspx page.
Looking at the result now, it appears that someone at address 192.168.0.6 is
doing something malicious by incrementing a customer account number by
one and trying to guess the valid accounts we have in the system!
Awk
Awk is another powerful tool that is available in Linux/Unix platforms that can
be used as a log analysis tool to extract and isolate information from log files.
What to look for on Web servers
Excessive access attempts to non-existent files
Code (SQL, HTML) seen as part of the URL
Access to extensions you have not implemented
Web service stopped/started/failed messages
Access to “risky” pages that accept user input
Error code 200 on files that are not yours
Failed user authentication Error code 401, 403
Invalid request Error code 400
Internal server error Error code 500
GREP AND REGULAR EXPRESSIONS
Grep and Regular Expressions
For additional details on all the options for grep and regular expressions, go to the GNU site at:
http://www.gnu.org/software/grep/manual/grep.html
Table 15.1 Common Items to Search for in Reviewing Logs (continued)

CHAPTER 15: Tools for Log Analysis and Collection
250
As with grep, there are many ports of this utility to use on other operating sys-
tems. We will primarily focus on the “print” command of awk to help us piece
together what our malicious attacker is doing or has done from our previous
example.
The print command of awk is a powerful option that allows you to use an
expression and display the output of this function. In our case, we would
like to capture specific fields from our log file. The print command of awk by
default considers a space character as the delimiter separating the fields on a
line of text and we can reference a specific field using the “$[num]” command
in the field expression. Table 15.2 lists the fields in our log file and their specific
numeric field identifier.
Now that we know more about how to parse fields from our log file, let’s
combine our knowledge of using grep and awk. Suppose we want to see only
the URLs that were accessed by our attacker at 192.168.0.6 and what pages
returned an error, status code 403, and what pages were accessed successfully,
status code 200. In the example below, we will use grep to only return log
entries from client 192.168.0.6 and then pass this information on to the awk
Table 15.2 Awk Field Identifiers for Our Access_Log
The example data in this table is from the Apache Web server using the common
log file format:
192.168.0.6 - - [10/Jul/2011:00:00:00 +0200] “GET /paybills.aspx?
customer_acct=111111111 HTTP/1.1” 403 -
AWK Field ID Access Log Field Example Data
$1 IP Address 192.168.0.6
$2 Identifiera–
$3 User ID –
$4 Date and time of entry [10/Jul/2011:00:00:00
$5 Timezone +200]
$6 Type of request “GET
$7 URL and parameters /paybills.aspx?customer_
acct=111111111
$8 Protocol HTTP/1.1”
$9 HTTP status code 403
$10 Size of data returned –
aNote: A dash in the log file indicates this value is not available or not present.
Learn more about the powerful options available in awk at:
http://www.gnu.org/software/gawk/manual/gawk.html

Basic Tools for Log Analysis 251
command using the Unix “|” to extract the URL, field 7, and the status code,
field 9.
user$ grep '192.168.0.6' /var/log/httpd/access_log | awk '
{print $9,$7}'
403 /paybills.aspx?customer_acct=111111111
403 /paybills.aspx?customer_acct=111111112
403 /paybills.aspx?customer_acct=111111113
200 /paybills.aspx?customer_acct=111111114
200 /change_password.aspx?customer_acct=111111114&pwd=1234
Utilizing awk and grep together, we get a clearer picture of a possible attack on
our Web server and an account that may have been compromised. From the
example, it looks like the attacker at 192.168.0.6 was able to brute force guess
the account numbers 111111114 as a valid account and changed the password
on this client account!
Microsoft Log Parser
A lot of the previous tools in this chapter are tools built into the Linux/Unix
operating system with a number of ports to other operating systems like Win-
dows. Many organizations utilize Windows on a daily basis, and Windows has
its own specific logs and needs.
A free utility available from Microsoft is the Log Parser utility. The most
recent update of this utility can be downloaded from the Microsoft
Download Center at http://www.microsoft.com/en-us/download/details.
aspx?id=24659. As Microsoft states, “Log parser is a powerful, versatile
tool that provides universal query access to text-based data such as log files,
XML files, and CSV files, as well as key data sources on the Windows oper-
ating system such as the Event Log, the Registry, the file system, and Active
Directory.”
One of the more useful features of Log Parser is the ability to query the Win-
dows Event log using SQL-like statements. The following example illustrates
using the tool to generate a report on event 5159 from the Windows Security
Event log.
The Log Parser utility supports many different output formats. In this example,
a generated comma-separated values (CSV) format file was chosen. CSV format
files can be loaded by a variety of applications. The following below shows the
search results from Log Parser in Microsoft Excel where we can filter the results
and perform log analysis.
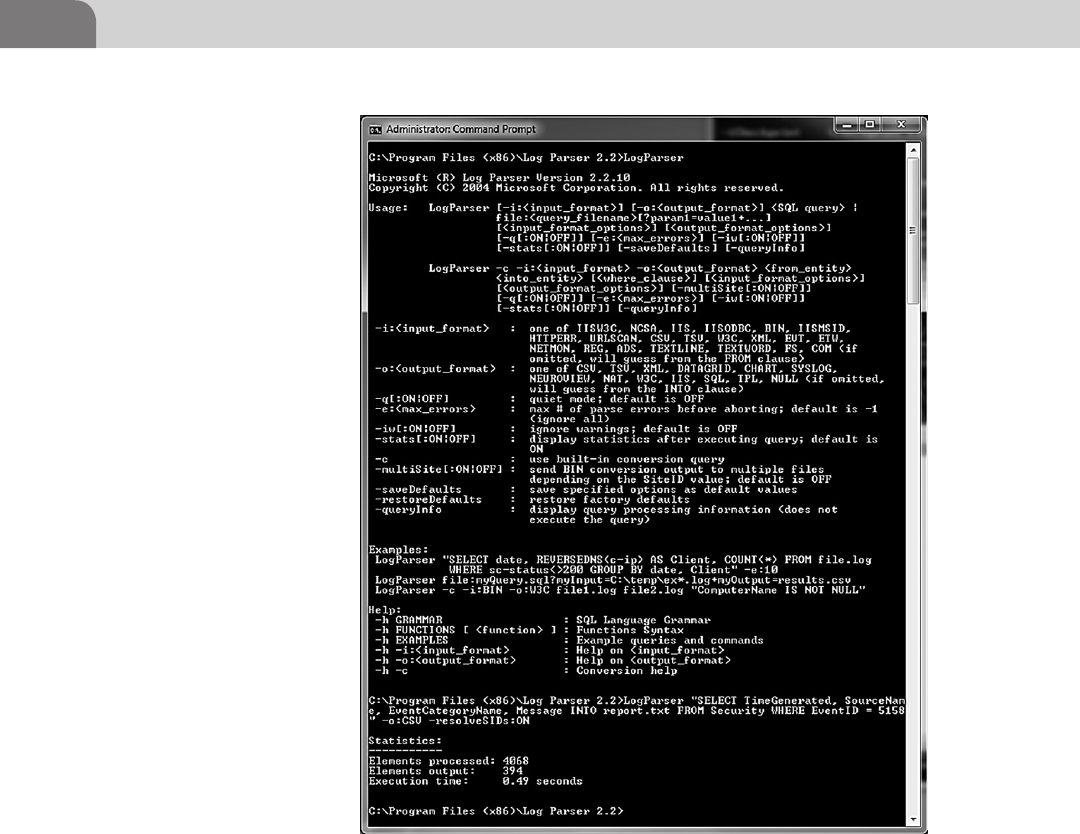
CHAPTER 15: Tools for Log Analysis and Collection
252
Other Basic Tools to Consider
We have covered some powerful tools for doing manual log analysis and combined
these tools to give you more detailed analysis in reviewing logs. There are many
others as well and below are a few others to consider adding to your tool chest:
tail
This utility can be useful in reviewing the end of the log file or actions cur-
rently occurring at the end of the log (http://www.gnu.org/software/coreutils/
manual/coreutils.html).
FIGURE 15.1 Microsoft Log Parser
Figure 15.1 shows an example using Microsoft Log Parser to generate a text report.

Basic Tools for Log Analysis 253
head
This utility is the opposite of tail and can be useful in retrieving the top por-
tion of a large log file to make it more manageable to review with other utilities
(http://www.gnu.org/software/coreutils/manual/coreutils.html).
Sed
Sed is a parsing utility like awk and is useful in doing search and replacements in
text to make the log clearer to read or to format the log output for better consump-
tion by other utilities (http://www.gnu.org/software/sed/manual/sed.html).
Logwatch
Logwatch is a useful utility to parse and review your logs offline. Logwatch has
a pluggable interface that allows you to customize it to your needs. The utility
can be downloaded at http://sourceforge.net/projects/logwatch/.
Lire
Lire is a suite of applications that allows you to generate custom reports from
log files. In this respect it is similar to the Microsoft Log Analyzer where you can
filter and generate a report off a log file. Lire supports a variety of log files from
mostly non-Windows appliances and software. This could be a good comple-
ment for Microsoft Log Analyzer for your non-Windows systems. For more
information, review the tool’s Website at http://www.logreport.org/lire.html.
FIGURE 15.2 Search results from Microsoft Excel
Figure 15.2 shows search results from Microsoft Excel.

CHAPTER 15: Tools for Log Analysis and Collection
254
The Role of the Basic Tools in Log Analysis
In the preceding sections, we showed some great ways to use basic tools that are
either freely available or are part systems and packages that you may already be
utilizing and managing in your environment. They demonstrated how you can
use these utilities to search and refine log data to isolate an attack. However,
these tools are best fitted for small organizations and for manual log analysis
and review. You should consider some of the limitations of these tools listed
below and how they will fit into an environment, the compliance needs of the
organization, and the time and resource requirements needed. In many cases,
these tools may only best be used for forensics as your log size and environ-
ment grows.
Factors to consider:
n You need to know what you are looking for—in the examples, we knew
exactly the text we were looking for and used grep and awk and other
tools to slice the data based on very specific text. If you are looking for
trends or statistical anomalies, these tools may not fit the bill.
n Very long run times on large files—if your organization has terabytes of
log information, the time needed to find specific strings may seem like
an eternity. These utilities typically search the entire file for what you are
looking for.
n Limited ability to correlate across logs—if your log files are dispersed across
multiple devices and multiple log files, it will be difficult to sync the dif-
ferent logs from the firewall, Web server, and client workstation. This will
make it difficult to get a clear picture of how an attack occurred across the
entire network path of an attack.
UTILITIES FOR CENTRALIZING LOG INFORMATION
Throughout the previous chapters we discussed the need to centralize logging
information in an organization to allow you to correlate across logs through-
out your environment and to facilitate many of the collection and analysis
compliance requirements of PCI DSS, HIPAA, and SOX. There are a number of
freely available tools to help you centralize logging information in your envi-
ronment. We will look at syslog, syslog-ng, rsyslog, and Snare and how these
tools facilitate centralizing logs.
Syslog
Syslog is the closest thing we have today to a ubiquitous logging solution
across all platforms. There is built-in support for syslog logging in network
devices, Unix/Linux systems, as well as many programming language library
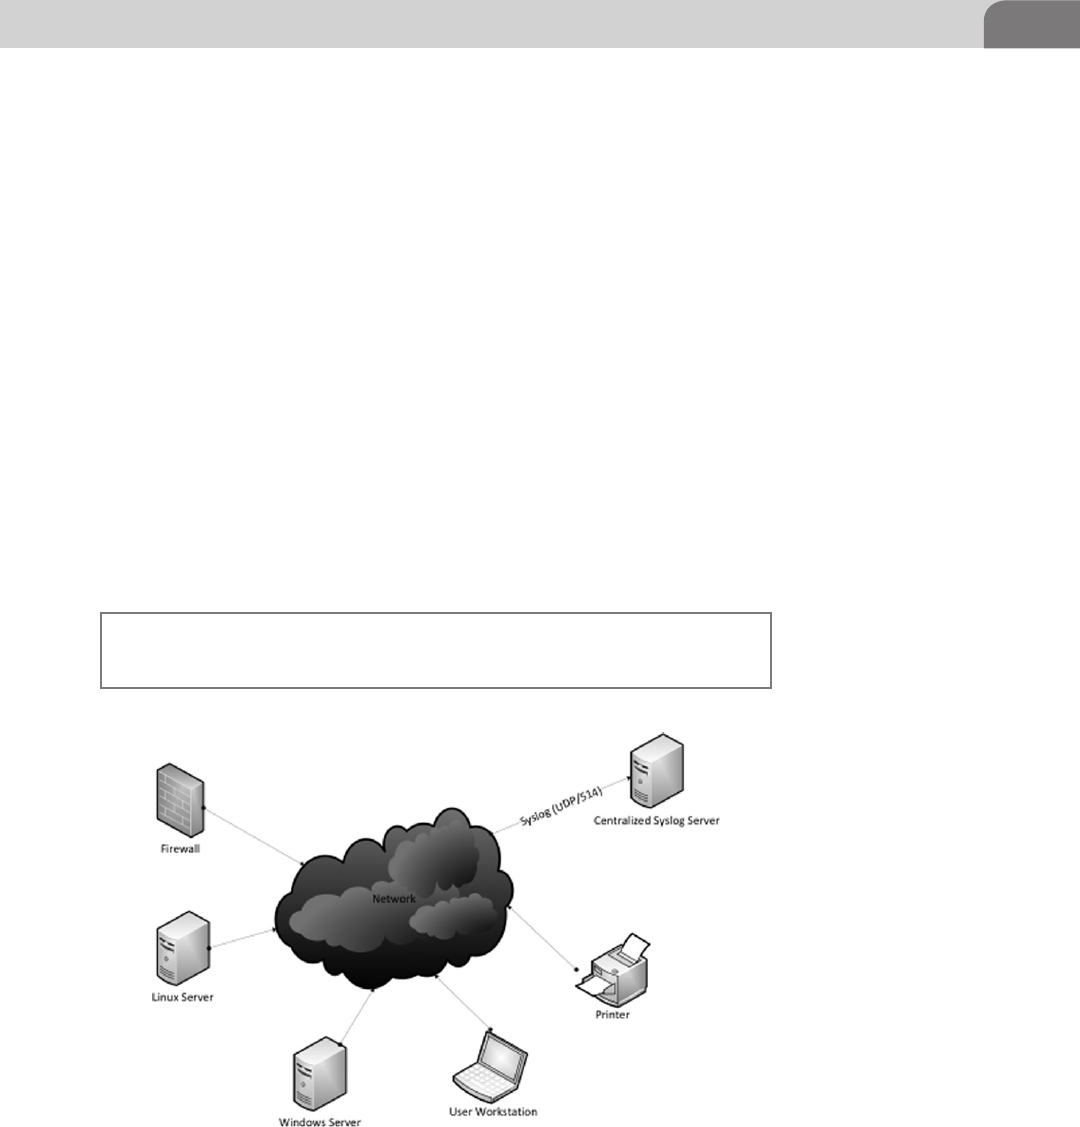
Utilities for Centralizing Log Information 255
extensions to facilitate an application developers’ ability to add syslog logging
to applications.
There are two major components of syslog. There is the syslog client that exists
on the system that is generating the logs and can be configured to send its logs
locally or to a centralized syslog server. Last, there is the syslog daemon, or
server-side process, that receives logs from other syslog clients configured to
send it data.
As powerful as syslog is in many of the key areas we discussed throughout this
book in centralizing log information, the following feature gaps exist in syslog
that may be required for your environment.
Guaranteed Delivery of Messages
On many of the stock implementations of syslog, syslog communicates and
relays log messages via UDP on port 514. On busy networks User Datagram
Protocol (UDP) traffic may drop messages to allow more high priority traffic
to be delivered, most notably Transmission Control Protocol (TCP) traffic. So
there is no guarantee that every log message from hosts will be recorded on the
centralized syslog server.
FIGURE 15.3 High-level Depiction of Centralizing Syslog Logs
Figure 15.3 shows a high-level depiction of centralizing syslog logs.
See “Unreliable Delivery” in RFC-5426 (http://tools.ietf.org/html/rfc5426)
for more details.

CHAPTER 15: Tools for Log Analysis and Collection
256
Secure Transport of Log Messages
Though proposed in RFC-5425 (http://tools.ietf.org/html/rfc5425), few syslog
implementations encrypt log messages from being snooped or altered across a
network. This is important for many of the logging guidelines laid out in this
book and is becoming more important to organizations as they increase the
number of remote sites and utilize virtualized hosts in the cloud.
Maintaining Log Source Information
In some syslog environments, a relay server is used to collect logs from a
remote site or network segment and forward the logs on to the central syslog
server. In many stock implementations of syslog, the source information on
where the log record was originally generated is lost as part of the relay pro-
cess. This can make it next to impossible to determine where a log message
came from.
Rsyslog
Rsyslog is another open source option and is also freely available in many
Linux distributions. There are a few feature differences between syslog-ng (see
Chapter 5) and rsyslog, but on the whole, rsyslog and syslog-ng are fairly com-
patible in feature set. A few key benefits to organizations in choosing rsyslog
vs. syslog-ng are as follows:
n Rsyslog is the default logger for Redhat and Fedora Linux systems. Rsyslog
will be a more natural choice for organizations with a large Redhat install
base.
n Rsyslog has recently added support for the Hadoop (HDFS). Organiza-
tions transitioning to Hadoop to enhance their log mining and security
intelligence will be able to integrate rsyslog using this feature with limited
need to write custom scripts to load data into Hadoop.
Snare
Windows systems in your environment log a significant amount of valuable
information into the Windows Event log. Unfortunately, this Event log is a
propriety Windows technology with no native support for syslog style messag-
ing. Syslog-ng and rsyslog have options available for purchase to retrieve Event
log information from Windows systems. However, another free alternative is
Snare.
The Snare (http://www.intersectalliance.com/projects/index.html) Windows agent
allows Windows events to be sent via syslog. Snare has agent and server collection
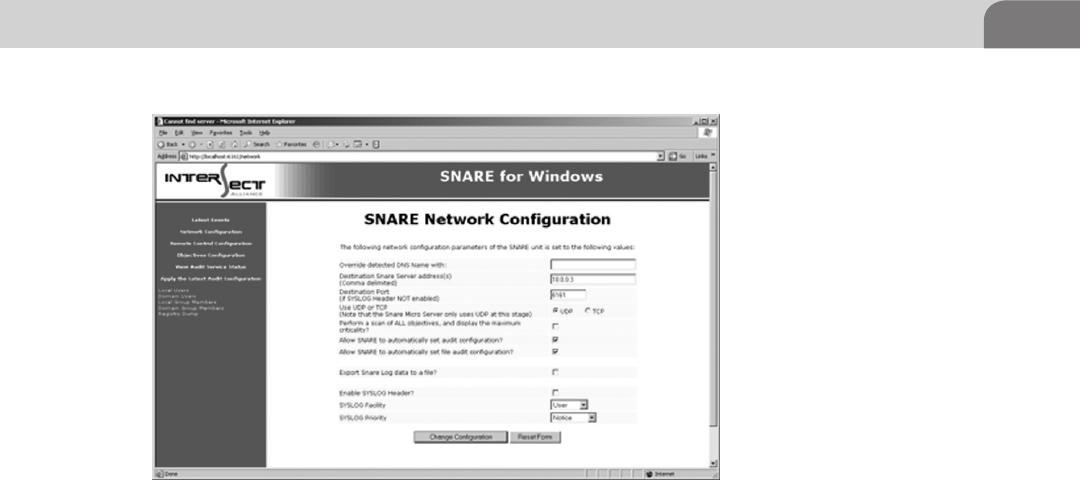
Log Analysis Tools—Beyond the Basics 257
options. However, the free Snare server option is limited only to log collection.
If you are on a budget, there are a number of free options that offer both collection
and analysis which we will cover later in this chapter.
To utilize the Snare Windows agent to send Event logs via syslog, you will need
to do some minor tweaking after the installation of the agent. After installa-
tion, go to the network configuration and do the following:
n Set the destination port to the default syslog port of 514.
n Enable the SYSLOG Header.
LOG ANALYSIS TOOLS—BEYOND THE BASICS
We have already covered the basic tools for log analysis. This section covers
tools that will give you in-depth analysis of your log information. Some of
the tools covered here will allow you to generate alerts on events in real time,
generate summary reports that will help you with compliance, and generally
give you features that reduce the amount of time needed to do your daily log
reviews and perform log forensics when events occur.
OSSEC
OSSEC (www.ossec.net) is a great open source tool for log retention and
analysis. The toolset includes agents for many of platforms that exist in many
organizations, has support to receive logs from existing syslog feeds, includes
support for an agentless option that can check file integrity on many of the
FIGURE 15.4 Snare Network Configuration Screen
Figure 15.4 shows the Snare network configuration screen.
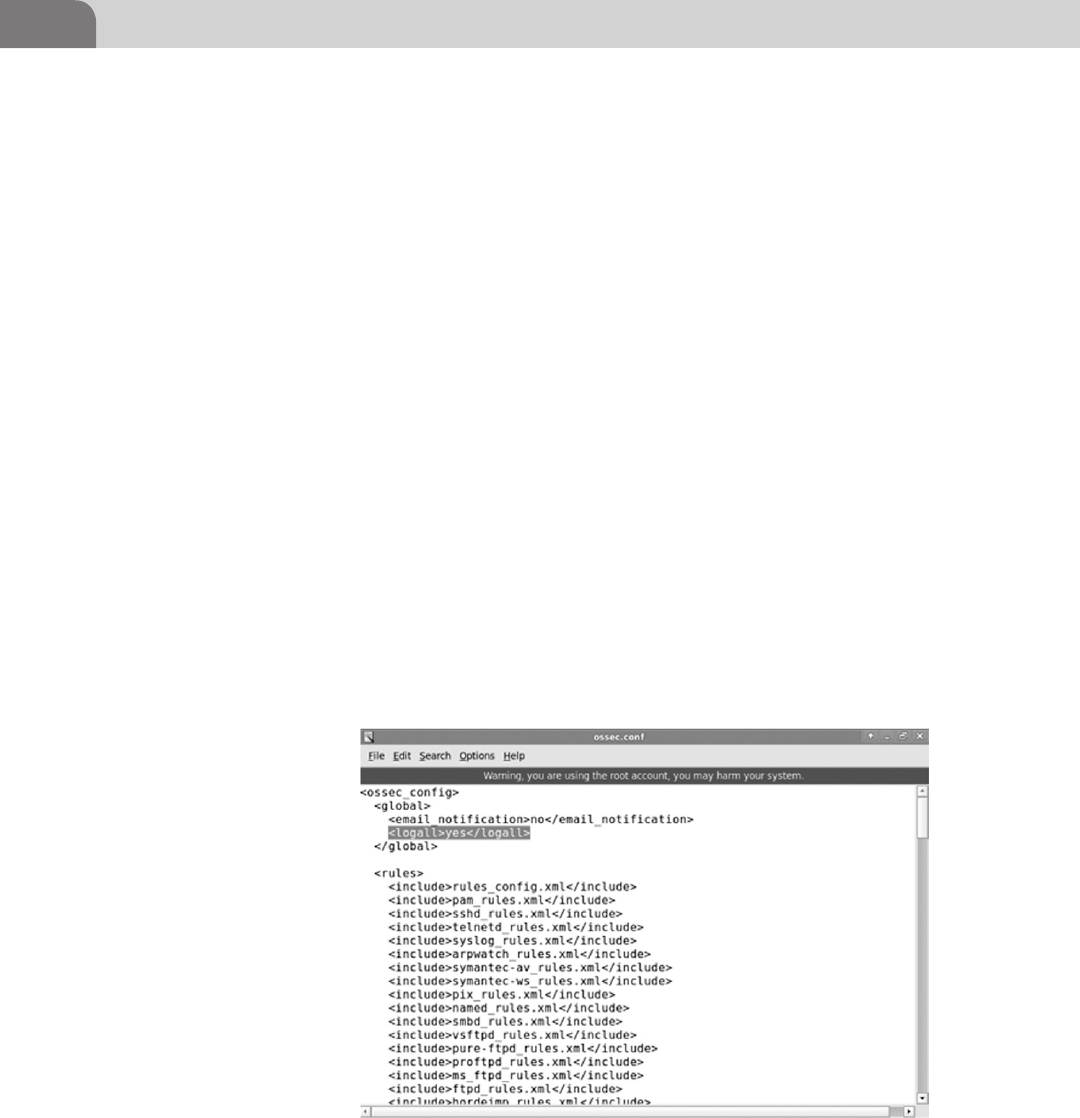
CHAPTER 15: Tools for Log Analysis and Collection
258
platforms where you cannot install the OSSEC agent, and can even be installed
on VMWare host systems to monitor your virtualization infrastructure. The
tool greatly reduces the manual process of log analysis with many pre-installed
rules to help you get started on real-time alerting and a Web-based user interface
for further alert and log review. OSSEC is a very lightweight process with only
a Unix/Linux option for the centralized management server. We will highlight
many of the features of OSSEC relevant to log analysis in this section. There are
many great Websites and books dedicated to OSSEC for readers wanting more
detailed information on the management and setup of the toolset.
OSSEC has an active user and developer community and has regular updates to
provide new features and bug fixes. In 2009, Trend Micro acquired OSSEC and
has continued to keep the tool open and free. The relationship could be benefi-
cial to organizations that already have a relationship with Trend Micro. Trend
Micro offers commercial support for OSSEC.
OSSEC Settings to Retain All Log Information
There are a number of tweaks and tips you should make to the default OSSEC
configuration to conform to your organization’s log retention policy. By default,
OSSEC only records the log entries that generate an alert. In log retention, we
typically want to retain all log information. We can adjust this by updating the
OSSEC configuration at /var/ossec/etc/ossec.conf. Simply set the log all option
to yes and we will retain all logs.
Figure 15.5 shows the OSSEC setup setting to retain all logs.
FIGURE 15.5 OSSEC Setup Setting to Retain All Logs

Log Analysis Tools—Beyond the Basics 259
OSSEC will use directories in the /var partition on your system to retain the
logs by default. You should allocate a significant portion of the systems disk
space to this partition or change the default location for logs to make sure you
have adequate space for logs.
OSSEC Real-Time Alerting
One of the powerful tools available in OSSEC for log analysis is the built-in rules
and the ability to write your own rules. Rules give you the ability to generate real-
time alerts based on log events received. By default, all the rules are stored in the
rules folder on the server. There are many built-in rules that come with OSSEC to
generate alerts on events from firewalls, Windows, Linux/Unix, applications like
McAfee and VMWare, and common attacks and rootkits. Documentation on the
built in rules is available at http://www.ossec.net/doc/rules/rules/index.html.
The rule syntax is written in an XML format. A rule can generate an alert based
on a single event, an atomic (simple) rule, or based on the number of times an
event is seen, a composite (correlation) rule. The following shows an example
of a built-in atomic rule:
<rule id="18100" level="0">
<category>windows</category>
<description>Group of windows rules.</description>
</rule>
…
<rule id="18105" level="4">
<if_sid>18100</if_sid>
<status>^AUDIT_FAILURE|^failure</status>
<description>Windows audit failure event.</description>
</rule>
In this rule, it is simply looking for an “AUDIT_FAILURE” or “failure” message
in the event. A composite rule allows us to tune this further so we can focus on
events that may require more immediate attention.
<var name="MS_FREQ">6</var>
…
<rule id="18153" level="10" frequency="$MS_FREQ" timeframe="240">
<if_matched_sid>18105</if_matched_sid>
<description>Multiple Windows audit failure events.</description>
</rule>
In this build-in composite rule, we build off of the atomic failure rule 18105
and create this composite rule that will fire if we see six failures in 4 min (240 s).

CHAPTER 15: Tools for Log Analysis and Collection
260
We can also build our own rules that may be more relevant for our organiza-
tion. Perhaps for your environment you want to be alerted if there are 10 login
failures that happen after business hours say 5 pm till 9 am. We can write our
own composite rule as follows:
<rule id="100999" level="10" frequency="10" timeframe="300">
<if_matched_sid>18105</if_matched_sid>
<time>5 pm – 9 am</time>
<description>Windows Logon Failure occurred 10 times after business
hours</description>
</rule>
The rules engine can help your team meet the log review requirements of many
of the compliance frameworks. The combination of atomic and composite
rules will also help reduce the time requirements of doing a manual review
with the basic toolset we discussed and also allow you to tune the alerting to
reduce false positives.
OSSEC Log Retention Policy and Storage Options
By default, OSSEC will store your log information at /var/ossec/logs/alerts.
OSSEC stores logs in a directory structure based on the year and the month
when the log event was generated. The following would be a typical log reten-
tion structure in an OSSEC installation:
/var/ossec/logs/alerts/2011
/var/ossec/logs/alerts/2011/Jan
/var/ossec/logs/alerts/2011/Feb
/var/ossec/logs/alerts/2011/Mar
…
This directory structure makes it fairly easy for us to write a script to clean up
our old logs that are older than our log retention period. A simple “rm –f /var/
ossec/logs/alerts/2011/Jan” will remove all our logs from January 2011.
Many organizations may want to write their own custom reports or be
able to extend the search and forensics capabilities of OSSEC. If you don’t
have a programmer on staff or you don’t want to modify and maintain
customized OSSEC source code, another option would be to send OSSEC
alerts to a database so you can write SQL queries to get exactly the report
or information you need. OSSEC currently supports MySQL and Post-
greSQL databases for its alerts. More information on sending your alerts
to a database can be found at http://www.ossec.net/doc/manual/output/
database-output.html.

Log Analysis Tools—Beyond the Basics 261
OSSIM
OSSIM is more than just log management and retention. OSSIM falls into
a group of products considered to be a Secure Information and Event Man-
agement (SIEM) system. OSSIM provides what it calls the “5 essential secu-
rity capabilities”—asset discovery, vulnerability assessment, threat detection,
behavioral monitoring, and security intelligence. The following open source
tools are utilized internally to provide these capabilities.
n Arpwatch is used for MAC address anomaly detection.
n P0f is used for passive OS detection and OS change analysis.
n Pads is used for service anomaly detection.
n Nessus is used for vulnerability assessment and for cross-correlation
(intrusion detection system (IDS) vs. Vulnerability Scanner).
n Snort is used as an intrusion detection system (IDS), and also used for
cross correlation with Nessus.
n Tcptrack is used for session data information that can garner useful infor-
mation for attack correlation.
n Ntop builds an impressive network information database for aberrant
behavior anomaly detection.
n Nagios used to monitor host and service availability information based
on a host asset database.
n Osiris as a host-based intrusion detection system (HIDS).
n Snare a log collector for windows systems.
n OSSEC a host-based IDS.
n OSSIM also includes its own tools including a generic correlation engine
with logical directive support and logs integration with plugins.
As you will note, OSSIM includes two of the tools we already discussed: OSSEC
and Snare. OSSIM includes a fairly impressive set of charts and data views that
are in their infancy or not part of OSSEC. AlienVault provides both a free and
commercial offering. Organizations should consider reviewing OSSIM if they
are looking for a full security information management system as opposed to
just a log management and retention system. More information is available at
http://www.alienvault.com/.
Other Analysis Tools to Consider
We have covered a lot of great tools in this section, and of course there are
many others. Here are a few honorable mentions to consider adding to your
tool chest.
Logsurfer
Unlike a lot of the tools mentioned in this section, Logsurfer is a useful utility
for reviewing logs in real time. Another benefit of Logsurfer is it attempts to

CHAPTER 15: Tools for Log Analysis and Collection
262
group messages that would be considered as events into a single logical event.
For example, consider the following FTP sequence of events.
somehost tcpd-ftpd[14311]: connect from host.some.where
somehost ftpd[14311]: connection from *@host.some.where [42.42.42.42]
somehost ftpd[14311]: USER anonymous
somehost ftpd[14311]: PASS password
somehost ftpd[14311]: failed login from host.some.where [42.42.42.42],
anonynous
somehost ftpd[14311]: SYST
somehost ftpd[14311]: PORT
somehost ftpd[14311]: cmd failure - not logged in
somehost ftpd[14311]: LIST
somehost ftpd[14311]: QUIT
somehost ftpd[14311]: FTP session closed
Seeing only a single one of these messages may create a false positive security
event. However, if we look at the content of the messages as a whole, we can
see someone attempted an anonymous login and then logged out. Analysis of
the log message would be something like this instead:
somehost ftpd[14311]: cmd failure - not logged in
The utility can be downloaded from http://www.crypt.gen.nz/logsurfer/
LogHound
LogHound is more of a research tool. LogHound attempts to find frequent
line patterns in mining log files utilizing a breadth-first algorithm. More
details on the utility and research papers are available on the tool’s Website at
http://ristov.users.sourceforge.net/loghound/.
Log2Timeline
Log2Timeline is useful in doing forensics analysis. The tool extracts time-
line information from some non-traditional sources such as the recycle bin,
Firefox history, proxy server data, etc. This can be useful when there is a con-
cern that data or logs have been altered or updated. The tool is available at
http://log2timeline.net/.
COMMERCIAL VENDORS
There are a number of superb log analysis and log retention solutions available
from leaders in the security space. The offerings range from solutions you can
outright purchase and run yourself to manage log management offerings that

Commercial Vendors 263
allow you to outsource daily log management to a third-party provider. We
will review a number of offerings here, but this definitely does not cover the
entire set of solutions available. Good resources for further research are avail-
able from Gartner (www.gartner.com) and Security Scoreboard (http://www.
securityscoreboard.com/).
Splunk
Splunk (www.splunk.com) is a commercial offering that provides many of the
same great features we discussed about OSSEC. Splunk will allow you to cen-
tralize your logs for forensics and correlation as well as generate real-time alerts
based on the types of events that need further investigation or action. A key
difference with Splunk is the wide variety of log sources it supports, real-time
dashboards to review activity, customizable reporting and dashboards, and
vendor-supported APIs to help integrate Splunk into your security infrastructure.
Free vs. Enterprise
One benefit with Splunk is they have a free and Enterprise offering. You can start
using Splunk by opening a free account on their Website and downloading the
software. There are a number of key limitations with the free offering though.
n A maximum of 500 MB per day of logs in the free offering. Though this
sounds like a lot, most medium to large organizations will quickly hit this
limit or just a few really busy Web servers can blow past this limit in no
time.
n Real-time monitoring and alerting is only available in the Enterprise
version of splunk. However, they do let you try the Enterprise edition for
60 days to evaluate this option.
n Role-based authentication is only available in the Enterprise edition.
Log Source Support
Splunk supports a wide variety of data inputs. Splunk supports many input
sources we have already discussed in this section such as standard syslog, syslog
over TCP, and of course syslog with TLS/SSL encryption. On top of this, Splunk
has “forwarders” that can retrieve information from files and directories,
DISCLAIMER AND COMMERCIAL OFFERINGS
Disclaimer
DISCLAIMER: This book does not explicitly advocate or recommend the commercial offerings in
this section. As with any purchase in your environment, we recommend a full review of any com-
mercial offering to determine if it meets your organization’s needs. As always, ask a lot of ques-
tions and try a proof of concept with a vendor before purchasing the solution that is right for you.

CHAPTER 15: Tools for Log Analysis and Collection
264
retrieve Windows events and registry information, and support for retrieving
many Web server logs. There are plenty of “recipes” as splunk call them for
things like Web logs, J2EE logs, Windows performance metrics, etc. On inputs
that are less common, Splunk lets you define the details as a recipe for Splunk
to process and index the data.
Dashboards and Views
Splunk has capabilities to allow users to create their own views of their data as
a dashboard or view. These are completely customizable and key differentiator
for some organizations compared to the other tools we discussed. Organiza-
tions that have a lot of custom reporting needs or need different views of the
data for different stakeholders in an organization will find this greatly reduces
the time of getting reports from some of the more manual toolsets we have
covered.
NetIQ Sentinel
NetIQ Sentinel (https://www.netiq.com/products/sentinel/), like OSSIM we
discussed earlier, is another product that is more than log management and
analysis and falls into the category of being a SIEM. Sentinel includes anomaly
detection and identity management information as additional sources of data
that can be useful in handling incident response and conducting forensics on
events. If you need more than just log management, the Enterprise Version of
NetIQ Sentinel can provide a full security information management tool for
your organization.
Free vs. Enterprise
This product was acquired from Novell in 2010 and there is a free version
of the product that is limited to only log management with a maximum of
25 events per second. An account can be created at http://www.novell.com/
promo/slm/slm25.html. Any load above this will of course require you to
purchase the Sentinel product. The product has strong search and reporting
capabilities.
IBM q1Labs
QRadar (http://q1labs.com/products.aspx) is the log management solution
available from IBM. IBM acquired q1Labs and their product lines in 2011.
There used to be a free version available, but since the acquisition, this appears
to no longer be available. Like many of the other products we have discussed,
QRadar has broad log source support and a wide variety of search and report-
ing functionality. QRadar can be acquired with some of the additional product
lines including a full SIEM offering for organizations needing a complete secu-
rity information management tool. One of the key differentiators for QRadar

References 265
is its reporting tailored for many of the current compliance frameworks with
reports to support auditing of:
n Payment Card Industry Data Security Standard (PCI DSS)
n North American Electric Reliability Corporation (NERC)
n Health Insurance Portability and Accountability Act (HIPAA)
n Sarbanes-Oxley (SOX), and Federal Information Security Management Act
(FISMA)
Loggly
Loggly (http://loggly.com/) is a cloud log provider with your log data being
stored offsite in the cloud. We will cover more details about this in Chapter 22
and factors to consider when storing your data in the cloud. The product sup-
ports many of the data sources we have already covered as well as publishing
data via a programmatic REST API and posting data via HTTP and HTTPS. The
product is relatively new and you should review the reporting capabilities from
their analytics engine to determine if the product will meet your compliance
needs. A key difference with Loggly will be the limited need to install any addi-
tional hardware in your environment to retain your logs and having someone
else maintain and upgrade your logging system. Review Chapter 22 and the
company’s Website to see if this is the right solution for your organization.
This chapter also has examples of how to use Loggly’s Web interface to send
and retrieve logs.
SUMMARY
This chapter provided an introduction to some of the most widely used tools
to perform log collection and analysis. Both open source and commercial sys-
tems were presented. Also, general guidance was given on how to choose a
tool.
REFERENCES
AlienVault. OSSIM the open source SIEM. <http://www.alienvault.com/>.
Chuvakin, A. (2008). How would you do it? Selecting a log management approach. <http://www.
slideshare.net/anton_chuvakin/choosing-your-log-management-approach-buy-build-or-out-
source>.
Chuvakin, A. (2011). Official page for critical log review checklist. <<http://chuvakin.blogspot.
com/2010/03/simple-log-review-checklist-released.html >.
GNU.org. GNU Grep 2.13. <http://www.gnu.org/software/grep/manual/grep.html>.
Ossec.net. Rules/decoders documentation. <http://www.ossec.net/doc/rules/rules/index.html>.
Rsyslog.com. Rsyslog home. <http://www.rsyslog.com/>.

CHAPTER 15: Tools for Log Analysis and Collection
266
Syslog.org. Syslog.org home. <http://www.syslog.org/>.
The IEEE and The Open Group (2004). The open group base specifications issue 6. <http://pubs.
opengroup.org/onlinepubs/009695399/utilities/grep.html>.
Verizon Corporation (2012). 2012 Data breach investigations report. Retrieved July 8,
2012, from Verizon Business: <http://www.verizonbusiness.com/resources/reports/
rp_data-breach-investigations-report-2012_en_xg.pdf>.

Logging and Log Management.
© 2013 Elsevier, Inc. All rights reserved.
http://dx.doi.org/10.1016/B978-1-59-749635-3.00016-6
267
CHAPTER 16
Log Management Procedures: Log Review,
Response, and Escalation
CONTENTS
Introduction .............267
Assumptions,
Requirements, and
Precautions ..............268
Requirements .................269
Precautions .....................269
Common Roles and
Responsibilities .......269
PCI and Log Data ....270
Key Requirement 10 ......271
10.1.......................................... 271
10.2.......................................... 271
10.3.......................................... 272
10.4.......................................... 272
10.5.......................................... 273
10.6.......................................... 274
10.7.......................................... 274
Other Requirements
Related to Logging ........275
Logging Policy ........277
Review, Response,
and Escalation
Procedures and
Workflows ...............278
Periodic Log Review
Practices and
Patterns ..........................279
Building an Initial
Baseline Using a Log
Management Tool ..........283
n Assumptions, Requirements, and Precautions
n Common Roles and Responsibilities
n PCI and Log data
n Logging Policy
n Review, Response, and Escalation Procedures and Workflows Validation
of Log Review
n Logbook—Evidence of Exception of Investigations
n PCI Compliance Evidence Package
n Management Reporting
n Periodic Operational Tasks Additional Information
INFORMATION IN THIS CHAPTER:
INTRODUCTION
You are now fluent in topics like log management, log analysis, correlation,
filtering, and so on, what is the next step? The goal of logging and log manage-
ment is, in essence, to provide you with situational awareness (SA) about the
goings-on in your environment, so you can review, respond to and, if need be,
escalate when something happens in or on your network. SA is achieved, in
part, by enabling log data collection, analysis, and retention. These topics have
been covered over the course of this book. This chapter, however, will provide
coverage of log data review, response, and escalation.
More than likely your organization falls into one of several of the following
reasons for implementing logging:
1. You do it because you want to protect your company’s assets (intellectual
property, financial data, etc.).

268 CHAPTER 16: Log Management Procedures
2. You are in an industry (banking, healthcare, credit card processing, etc.)
which requires regulatory compliance to ensure you are doing your level
best to mitigate against outside and inside threats, data loss, and so on.
3. You just eat, sleep, and breathe all things logging.
Now, number 2 is interesting. Not only do many regulations stipulate what you
need to do from a process and procedure standpoint, they also require you to be
able to prove that you are actually following and maintaining your policies and
procedures. This can mean anything from providing up-to-date documentation on
who has access to what systems on your network to producing reports which back-
up your documentation (login and logout records for example).
The approach used in this chapter is to present repeatable and extensible work-
flows to provide you with the insight and understanding to allow you to imple-
ment these processes as needed. In order to reinforce and drive these points
home, examples will be provided using the Payment Card Industry (PCI) Data
Security Standard (DSS).
From this point forward, PCI DSS concepts will be used for the remainder of
the chapter.
ASSUMPTIONS, REQUIREMENTS,
AND PRECAUTIONS
These critical items are essential for success of logging, log management, and
log review. It is assumed that the following requirements are satisfied before
the log review, response, and escalation procedures are put into practice.
Building an Initial
Baseline Manually .........285
Guidance for Identifying
“Known Bad” Messages ....... 286
Main Workflow: Daily
Log Review ....................286
Frequency of Periodic Log
Review .................................... 287
Exception Investigation
and Analysis ..................289
Initial Investigation ............... 289
External Information Sources
Investigation .......................... 290
Escalation to Other
Procedures ............................. 291
Incident Response and
Escalation .......................291
Validation of Log
Review .....................293
Proof of Logging.............294
Proof of Log Review.......294
Proof of Exception
Handling .........................294
Logbook—Evidence
of Exception of
Investigations .........296
Recommended Logbook
Format ............................296
Example Logbook
Entry ...............................297
PCI Compliance
Evidence Package ...299
Management
Reporting .................300
Periodic
Operational Tasks ...300
Daily Tasks .....................300
Weekly Tasks .................300
Monthly Tasks ................301
Quarterly Tasks..............302
Annual Tasks .................303
Additional
Resources ................303
Summary .................303
References ...............304
NOTE
PCI DSS in a Nutshell
PCI DSS is a set of technical and operational requirements meant to protect credit cardholder
data from misuse. Merchants, processors, issuers, and service providers all have a stake in PCI.
The ultimate goal is global adoption of these requirements. A complete treatment of PCI is
beyond the scope of this chapter (Requirements and Security Assessment Procedures, 2010).
WARNING
PCI Compliance Non-Guarantee
The authors cannot guarantee PCI compliance or passing PCI validation based on implement-
ing the procedures and workflows in this chapter. The material is presented for educational
purposes only.

Common Roles and Responsibilities 269
Requirements
A set of requirements needs to be in place before the operational procedures
described in this chapter can be used effectively:
1. Logging policy (see Logging Policy section later in this chapter) is created
to codify PCI DSS log-related requirements as well as other regulatory and
operational logging requirements.
2. Logging is enabled on the in-scope systems.
3. Interruption or termination of logging is in itself logged and monitored.
4. Event mandated in PCI DSS documentation is logged.
5. Generated logs satisfy PCI DSS logging requirements.
6. Time is synchronized across the in-scope systems and with the reliable
time server (NTP, etc.).
7. Time zones of all logging systems are known and recorded and can be
reviewed in conjunction with logs.
Items 2 through 7 can be applied to almost every environment, while item 1
seems fairly specific. But it should be noted that item 1 (logging policy) is a
best practice and should be followed regardless.
Precautions
These additional precautions need to be taken in order to make logs useful
for PCI DSS compliance, other regulations as well as security, forensics, and
operational requirement:
n Key precaution: The person whose actions are logged on a particular system
cannot be the sole party responsible for log review on this system.
n Key precaution: PCI DSS mandates log security measures, all access to logs
should be logged and monitored to identify attempts to terminate or
otherwise affect the presence and quality of logging.
The main idea behind these precautions is to ensure the integrity of the system.
Basically, no one person should have enough control such that he or she is able
to cover their tracks or those of others.
COMMON ROLES AND RESPONSIBILITIES
Table 16.1 summarizes common roles that are mentioned in this chapter and
are involved in review, escalate, and response process.
These roles and responsibilities are covered throughout the chapter. It should
be pointed out that you may or may not have all the roles defined for your
organization. It might be the case that your organization is small and a single
individual fulfills multiple roles.

CHAPTER 16: Log Management Procedures
270
PCI AND LOG DATA
This section covers the basics of PCI DSS logging and what is required by PCI
DSS. Requirements and Security Assessment Procedures, (2010). provides the
full details on the PCI DSS regulations, including sections, requirements, and
other items referenced in this chapter.
Now, logging and monitoring are not constrained to Requirement 10, but, in
fact, pervade all 12 of the PCI DSS requirement; the key areas where logging
and monitoring are mandated in PCI DSS are Requirement 10 and sections of
Requirement 11.
Table 16.1 Summary of Common Roles and Responsibilities
Role Responsibility Example Involvement
Application Administrator Administers the application Configured application
logging settings, may
perform daily log review
System or Network
Administrator
Administers the underlying
operating system or network
Configured logging
settings, may perform daily
log review
Application Business
Owner
Business manager who is
responsible for the application
Approves the changes to
application configuration
required for logging and log
review
Security Administrator Administers security controls
on one or more systems or
applications
Configured security and
logging settings, performs
daily log review
Security Analyst Deals with operational security
processes
Accesses security systems
and analyzes logs and other
data
Security Director or
Manager
Oversees security policy,
process, and operation
Owns log review
procedures, updates the
procedures
Incident Responder Gets involved in security
incident response
Deals with security
incidents, reviews logs
during the response
process
WARNING
Wearing Multiple Hats can Cause Conflicts of Interest Issues
It is often not a good idea for the same person to wear the same hat when it comes to the log
data review, response, and escalation. It can be viewed as a conflict of interest and should be
avoided if at all possible.

PCI and Log Data 271
Key Requirement 10
We will go through it line by line and then go into details, examples, and
implementation guidance.
10.1
Specifically, Requirement 10.1 covers “establish[ing] a process for linking
all access to system components (especially access done with administrative
privileges such as root) to each individual user” (Requirements and Security
Assessment Procedures, 2010). This is an interesting requirement indeed; it
doesn’t just mandate for logs to be there or for a logging process to be set, but
instead mentions that logs must be tied to individual persons (not computers
or “devices” where they are produced). It is this requirement that often creates
problems for PCI implementers, since many think of logs as “records of people
actions,” while in reality they will only have the “records of computer actions.”
Mapping the latter to actual users often presents an additional challenge. By the
way, PCI DSS Requirement 8.1 which mandates that an organization “assigns
all users a unique ID before allowing them to access system components or
cardholder data” (Requirements and Security Assessment Procedures, 2010)
helps to make the logs more useful here.
10.2
Next, Section 10.2 defines a minimum list of system events to be logged (or,
to allow “the events to be reconstructed”). Such requirements are motivated
by the need to assess and monitor user actions as well as other events that can
affect credit card data (such as system failures).
Following is the list from the requirements (events that must be logged) from
PCI DSS (v. 2.0; Requirements, and Security Assessment Procedures, 2010):
10.2.1 All individual user accesses to cardholder data.
10.2.2 All actions taken by any individual with root or administrative
privileges.
NOTE
Requirements 10–12
A requirement is as its name states: in order to be compliant, you must implement the require-
ment; it is required. From the PCI DSS document in Requirements and Security Assessment
Procedures, 2010, Requirement 10 states the following: “Track and monitor all access to network
resources and cardholder data” (Requirements and Security Assessment Procedures, 2010).
Requirement 11 states the following: “Regularly test security systems and processes.” And
Requirement 12 states the following: “Maintain a policy that addresses information security for
all personnel” (Requirements and Security Assessment Procedures, 2010).

CHAPTER 16: Log Management Procedures
272
10.2.3 Access to all audit trails.
10.2.4 Invalid logical access attempts.
10.2 5 Use of identification and authentication mechanisms.
10.2.6 Initialization of the audit logs.
10.2.7 Creation and deletion of system-level objects.
As can be seen, this covers data access, privileged user actions, log access and
initialization, failed and invalid access attempts, authentication and authoriza-
tion decisions, and system object changes. It is important to note that such a
list has its roots in IT governance “best practices,” which prescribe monitoring
access, authentication, authorization change management, system availability,
and suspicious activity.
10.3
Moreover, PCI DSS Requirement 10 goes into an even deeper level of detail
and covers specific data fields or values that need to be logged for each event.
They provide a healthy minimum requirement, which is commonly exceeded
by logging mechanisms in various IT platforms.
Such fields are:
10.3.1 User identification.
10.3.2 Type of event.
10.3.3 Date and time.
10.3.4 Success or failure indication.
10.3.5 Origination of event.
10.3.6 Identity or name of affected data, system component, or resource.
As can be seen, this minimum list contains all of the basic attributes needed for
incident analysis and for answering the questions: when, who, where, what,
and where from. For example, if trying to discover who modified a credit card
database to copy all of the transactions with all the details into a hidden file
(a typical insider privilege abuse), knowing all of the above records is very
useful.
10.4
The next requirement, 10.4, addresses a commonly overlooked but critical
requirement: a need to have accurate and consistent time in all of the logs
(William and Chuvakin, 2012). It seems fairly straightforward that time and
security event monitoring would go hand in hand as well. System time is fre-
quently found to be arbitrary in a home or small office network. It’s whatever
time your server was set at, or if you designed your network for some level of
reliance, you’re systems are configured to obtain time synchronization from a
reliable source, like the Network Time Protocol (NTP) servers.

PCI and Log Data 273
10.5
Next, one needs to address all of the confidentiality, integrity, and availability
(CIA) of logs. Section 10.5.1 of PCI DSS covers the confidentiality: “Limit view-
ing of audit trails to those with a job-related need” (Requirements and Security
Assessment Procedures, 2010). This means that only those who need to see the
logs to accomplish their jobs should be able to. One of the obvious reasons is
that authentication-related logs will always contain usernames. While not truly
secret, username information provides 50% of the information needed for pass-
word guessing (password being the other 50%). Moreover, due to users mistyp-
ing their credentials, it is not uncommon for passwords themselves to show up
in logs. Poorly written Web applications might result in a password being logged
together with the Web Uniform Resource Locator (URL) in Web server logs.
Next comes “integrity.” As per Section 10.5.2 of PCI DSS, one needs to “protect
audit trail files from unauthorized modifications” (Requirements and Secu-
rity Assessment Procedures, 2010). This one is obvious, since if logs can be
modified by unauthorized parties (or by anybody) they stop being an objective
assessment trail of system and user activities.
However, one needs to preserve the logs not only from malicious users, but also
from system failures and consequences of system configuration errors. This
touches upon both the “availability” and “integrity” of log data. Specifically,
Section 10.5.3 of PCI DSS covers that one needs to “promptly back-up audit
trail files to a centralized log server or media that is difficult to alter” (Require-
ments and Security Assessment Procedures, 2010). Indeed, centralizing logs to
a server or a set of servers that can be used for log analysis is essential for both
log protection as well as increasing log usefulness. Backing up logs to CDs or
DVDs (or tapes, for that matter) is another consequence of this requirement.
One should always keep in mind that logs on tape are not easily accessible and
not searchable in case of an incident.
Many pieces of network infrastructure such as routers and switches are designed
to log to an external server and only preserve a minimum (or none) of logs
on the device itself. Thus, for those systems, centralizing logs is most critical.
Requirement 10.5.4 of PCI DSS states the need to “copy logs for wireless net-
works onto a log server on the internal LAN.”
To further decrease the risk of log alteration as well as to enable proof that such
alteration didn’t take place, Requirement 10.5.5 calls for the “use file integrity
monitoring and change detection software on logs to ensure that existing log
data cannot be changed without generating alerts” (Requirements and Security
Assessment Procedures, 2010). At the same time, adding new log data to a log
file should not generate an alert since log files tend to grow and not shrink on
their own (unless logs are rotated or archived to external storage). File integrity
monitoring systems use cryptographic hashing algorithms to compare files to a

CHAPTER 16: Log Management Procedures
274
known good copy. The issue with logs is that log files tend to grow due to new
record addition, thus undermining the missing of integrity checking. To resolve
this contradiction, one should note that integrity monitoring can only assure the
integrity of logs that are not being actively written to by the logging components.
10.6
The next requirement is truly one of the most important as well as one of
the most often overlooked. Many PCI implementers simply forget that PCI
Requirement 10 does not just call for “having logs,” but also for “having the
logs AND looking at them.” Specifically, Section 10.6 states that the PCI orga-
nization must, as per PCI DSS, “review logs for all system components at least
daily. Log reviews must include those servers that perform security functions
like IDSes and AAA servers (e.g. RADIUS)” (Requirements and Security Assess-
ment Procedures, 2010). The rest of this chapter covers the detailed log review
procedures and practices.
Thus, the requirement covers the scope of log sources that need to be “reviewed
daily” and not just configured to log, and have logs preserved or centralized.
Given that a large IT environment might produce gigabytes of logs per day, it is
humanly impossible to read all of the logs. That is why a note is added to this
requirement of PCI DSS that states that “Log harvesting, parsing, and alerting
tools may be used to achieve compliance with Requirement 10.6” (Require-
ments and Security Assessment Procedures, 2010).
10.7
The final requirement (10.7) deals with another hugely important logging
question—log retention. It states: “retain audit trail history for at least one
year, with a minimum of three months online availability” (Requirements and
Security Assessment Procedures, 2010). Unlike countless other requirements,
this deals with the complicated log retention question directly. Thus, if you are
not able to go back 1 year and look at the logs, you are in violation. Moreover,
PCI DSS in its updated version v1.1 got more prescriptive when a one year
requirement was added explicitly.
So, let us summarize what we learned so far on logging in PCI:
n PCI Requirement 10 calls for logging specific events with a predefined
level of details from all in-scope systems.
n PCI calls for tying the actual users to all logged actions.
n All clocks and time on the in-scope systems should be synchronized.
n The CIA of all collected logs should be protected.
n Logs should be regularly reviewed; specific logs should be reviewed at
least daily.
n All in-scope logs should be retained for at least 1 year.

PCI and Log Data 275
Now we are ready to dig deeper to discover those logs and monitoring “live”
not only within Requirement 10, but in all other PCI requirements. While
many think that logs in PCI are represented only by Requirement 10, reality
is more complicated: logs are in fact present, undercover, in all other sections.
Other Requirements Related to Logging
Just about every claim that is made to satisfy the requirements, such as data
encryption or anti-virus updates, can make effective use of log files to actually
substantiate it.
For example, Requirement 1,“Install and maintain a firewall configuration to pro-
tect cardholder data” (Requirements and Security Assessment Procedures, 2010),
mentions that organizations must have “a formal process for approving and
testing all external network connections and changes to the firewall configuration”
(Requirements and Security Assessment Procedures, 2010). However, after such
process is established, one needs to validate that firewall configuration changes do
happen with authorization and in accordance with documented change manage-
ment procedures. That is where logging becomes extremely handy, since it shows
you what actually happened and not just what was supposed to happen.
The entire Requirement 1.3 contains guidance to firewall configuration, with
specific statements about inbound and outbound connectivity. One must use
firewall logs to verify this; even a review of configuration would not be suffi-
cient, since only logs show “how it really happened” and not just “how it was
configured.”
Similarly, Requirement 2 talks about password management “best practices”
as well as general security hardening, such as not running unneeded services.
Logs can show when such previously disabled services are being started, either
by misinformed system administrators or by attackers.
Further, Requirement 3, which deals with data encryption, has direct and
unambiguous links to logging. For example, the entire Subsection 3.6, shown
below in an abbreviated form, implies having logs to verify that such activity
actually take place. Specifically, key generation, distribution, and revocation
are logged by most encryption systems and such logs are critical for satisfying
this requirement.
Requirement 4, which also deals with encryption, has logging implications for
similar reasons.
Requirement 5 refers to anti-virus defenses. Of course, in order to satisfy
Section 5.2, which requires that you “Ensure that all anti-virus mechanisms are
current, actively running, and capable of generating audit logs” (Requirements
and Security Assessment Procedures, 2010), one needs to see such mentioned logs.

CHAPTER 16: Log Management Procedures
276
So, even the requirement to “use and regularly update anti-virus software” will
likely generate requests for log data during the assessment, since the informa-
tion is present in anti-virus assessment logs. It is also well known that failed
anti-virus updates, also reflected in logs, expose the company to malware risks,
since anti-virus without the latest signature updates only creates a false sense
of security and undermines the compliance effort.
Requirement 6 is in the same league: it calls for the organizations to “Develop
and maintain secure systems and applications” (Requirements and Security
Assessment Procedures, 2010), which is unthinkable without a strong assess-
ment logging functions and application security monitoring.
Requirement 7, which states that one needs to “Restrict access to cardholder
data by business need-to-know” (Requirements and Security Assessment Pro-
cedures, 2010), requires logs to validate who actually had access to said data. If
the users that should be prevented from seeing the data appear in the log files
as accessing the data usefully, remediation is needed.
Assigning a unique ID to each user accessing the system fits with other secu-
rity “best practices.” In PCI it is not just a “best practice;” it is a requirement
(Requirement 8 “Assign a unique ID to each person with computer access;”
Requirements and Security Assessment Procedures, 2010). Obviously, one
needs to “Control addition, deletion, and modification of user IDs, creden-
tials, and other identifier Objects” (Section 8.5.1 of PCI DSS). Most systems
log such activities.
In addition, Section 8.5.9, “Change user passwords at least every 90 days”
(Requirements and Security Assessment Procedures, 2010), can also be veri-
fied by reviewing the logs files from the server in order to assure that all the
accounts have their password changed at least every 90 days.
Requirement 9 presents a new realm of security—physical access control. Even
Section 9.4 that covers maintaining a visitor logs (likely in the form of a physi-
cal logbook) is connected to log management if such a visitor log is electronic.
There are separate data retention requirements for such logs: “Use a visitor log
to maintain a physical assessment trail of visitor activity. Retain this log for a
minimum of three months, unless otherwise restricted by law” (Requirements
and Security Assessment Procedures, 2010).
Requirement 11 addresses the need to scan (or “test”) the in-scope systems for
vulnerabilities However, it also calls for the use of IDS or IPS in Section 11.4:
“Use network intrusion detection systems, host-based intrusion detection sys-
tems, and intrusion prevention systems to monitor all network traffic and alert
personnel to suspected compromises. Keep all intrusion detection and preven-
tion engines up-to-date” (Requirements and Security Assessment Procedures,
2010). Intrusion detection is only useful if logs and alerts are reviewed.

Logging Policy 277
Requirement 12 covers the issues on a higher level—security policy as well as
security standards and daily operational procedures (e.g. a procedure for daily
log review mandates by Requirement 10 should be reflected here). However,
it also has logging implications, since assessment logging should be a part of
every security policy. In addition, incident response requirements are also tied
to logging: “Establish, document, and distribute security incident response and
escalation procedures to ensure timely and effective handling of all situations”
(Requirements and Security Assessment Procedures, 2010) is unthinkable to
satisfy without effective collection and timely review of log data.
Thus, event logging and security monitoring in PCI DSS program go much
beyond Requirement 10. Only through careful data collection and analysis can
companies meet the broad requirements of PCI.
The next section addresses the logging requirements in more details, focusing
on Requirements 10 and 12.
LOGGING POLICY
In light of the requirements of PCI DSS, a PCI-derived logging policy must at
least contain the following:
n Adequate logging, that covers both logged event types (login/logoffs,
resource access, firewall accepts/denies, IPS/IDS alerts, etc.) and details.
n Log aggregation and retention (1 year).
n Log protection (ensuring logs are not tampered with).
n Log review.
A logging policy defines what attributes of log data should be captured for later
review, escalation, and response. Again, PCI DSS concepts are used throughout
this chapter, but this policy is general enough that it can apply to non-PCI
activities, applications, and others.
Let’s now focus on log review in depth. PCI DSS states that “Review logs for all
system components at least daily. Log reviews must include those servers that
perform security functions like intrusion-detection system (IDS) and authen-
tication, authorization, and accounting protocol (AAA) servers (for example,
RADIUS)” (Requirements and Security Assessment Procedures, 2010). It then
adds that “Log harvesting, parsing, and alerting tools may be used to meet com-
pliance with Requirement 10.6” (Requirements and Security Assessment Pro-
cedures, 2010). PCI testing and validation procedures for log review mandate
that a Qualified Security Assessors (QSA) should “obtain and examine security
policies and procedures to verify that they include procedures to review secu-
rity logs at least daily and that follow-up to exceptions is required” (Require-
ments and Security Assessment Procedures, 2010). QSA must also assure that
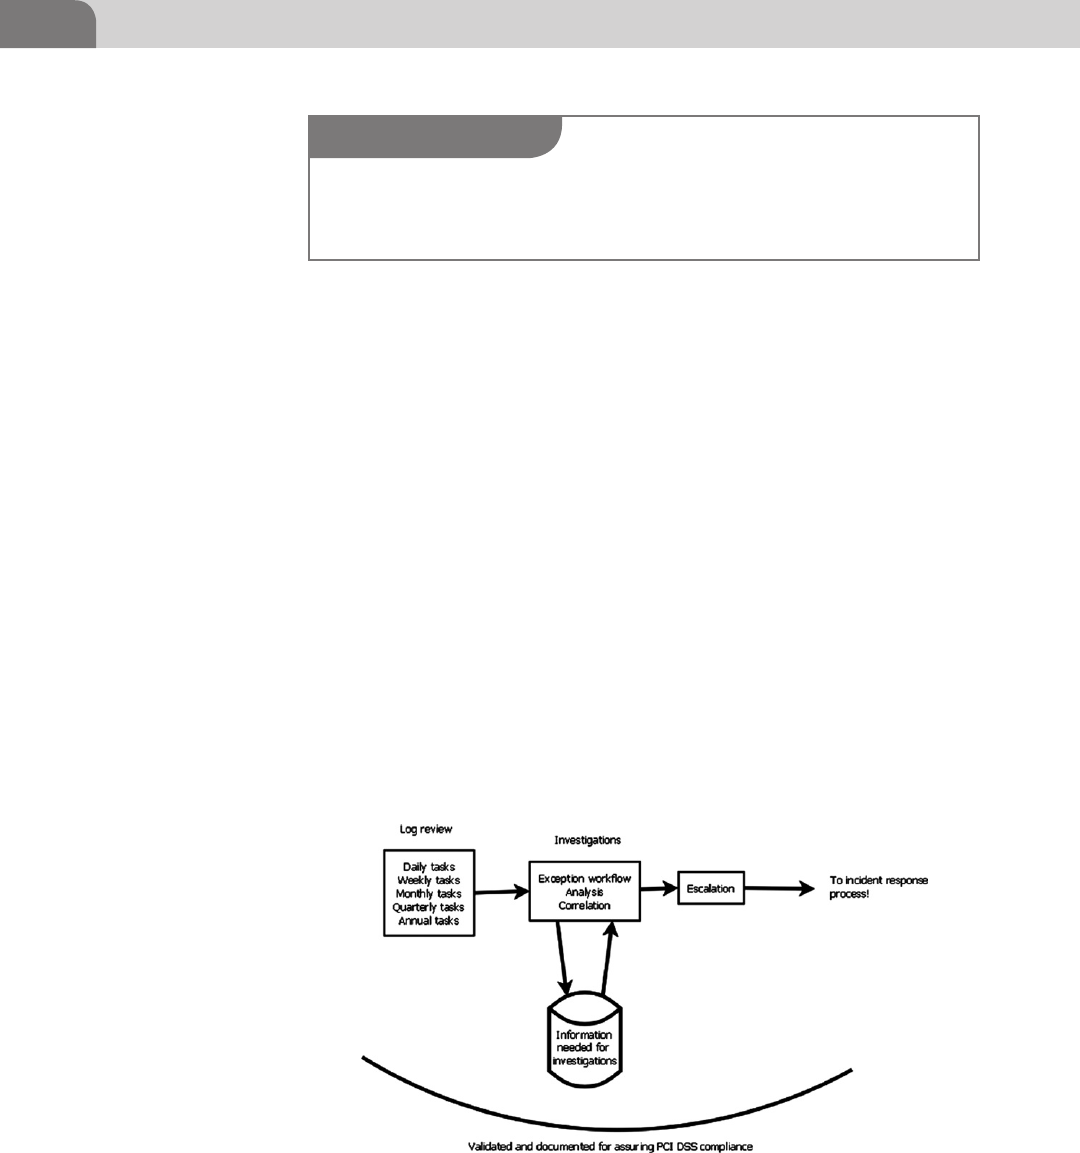
CHAPTER 16: Log Management Procedures
278
“Through observation and interviews, verify that regular log reviews are per-
formed for all system components” (Requirements and Security Assessment
Procedures, 2010).
To this end, the next section, we discuss application log review procedures and
workflows that cover:
1. Log review practices, patterns, and tasks.
2. Exception investigation and analysis.
3. Validation of these procedures and management reporting.
The procedures will be provided for using automated log management tools
as well as manually when tools are not available or not compatible with log
formats produced by the application.
REVIEW, RESPONSE, AND ESCALATION
PROCEDURES AND WORKFLOWS
The overall connection between the three types of PCI-mandates procedures is
outlined in Figure 16.1.
FIGURE 16.1 Assuring PCI DSS Compliance
NOTE
QSA
A Qualified Security Assessor (QSA) is a person who is qualified (through training, credentialing,
etc.) to perform PCI compliance assessments on firms which handle credit card data.

Review, Response, and Escalation Procedures and Workflows 279
In other words, “Periodic Log Review Practices” are performed every day (or
less frequently, if daily review is impossible) and any discovered exceptions or
are escalated to “Exception Investigation and Analysis.” Both are documented
as prescribed in “Validation of Log Review” section of this chapter to create
evidence of compliance. We will now provide details on all three types of tasks.
Periodic Log Review Practices and Patterns
This section covers periodic log review procedures for log management. Such
review is performed by either application administrator or security adminis-
trator (see section Roles and Responsibilities above). Such review can be per-
formed using automated tools (which is explicitly allowed in PCI DSS) or
manually, if such automated tools are not available or do not support log types
from PCI application.
Let’s build the entire end-to-end procedure for both cases and then illustrate it
using the examples.
The basic principle of PCI DSS periodic log review (further referred to as “daily
log review” even if it might not be performed daily for all the applications) is
to accomplish the following:
n Assure that card holder data has not been compromised by the attackers.
n Detect possible risks to cardholder data, as early as possible.
n Satisfy the explicit PCI DSS requirement for log review.
Even given the fact that PCI DSS is the motivation for daily log review, other
goals are accomplished by performing daily log review:
n Assure that systems that process cardholder data are operating securely
and efficiently.
n Reconcile all possible anomalies observed in logs with other systems,
activities (such as application code changes or patch deployments).
In light of the above goals, the daily log review is built around the concept of
“baselining” or learning and documenting normal set of messages appearing
in logs. See Chapter 10 for a discussion on baselines.
Baselining is then followed by the process of finding “exceptions” from the
normal routine and investigating them to assure that no breach of cardholder
data has occurred or is imminent.
The process can be visualized in Figure 16.2.
Before PCI daily log review is put into practice, it is critical to become familiar
with normal activities logged on each of the applications (Dr Anton Chuvakin
Blog, 2011).
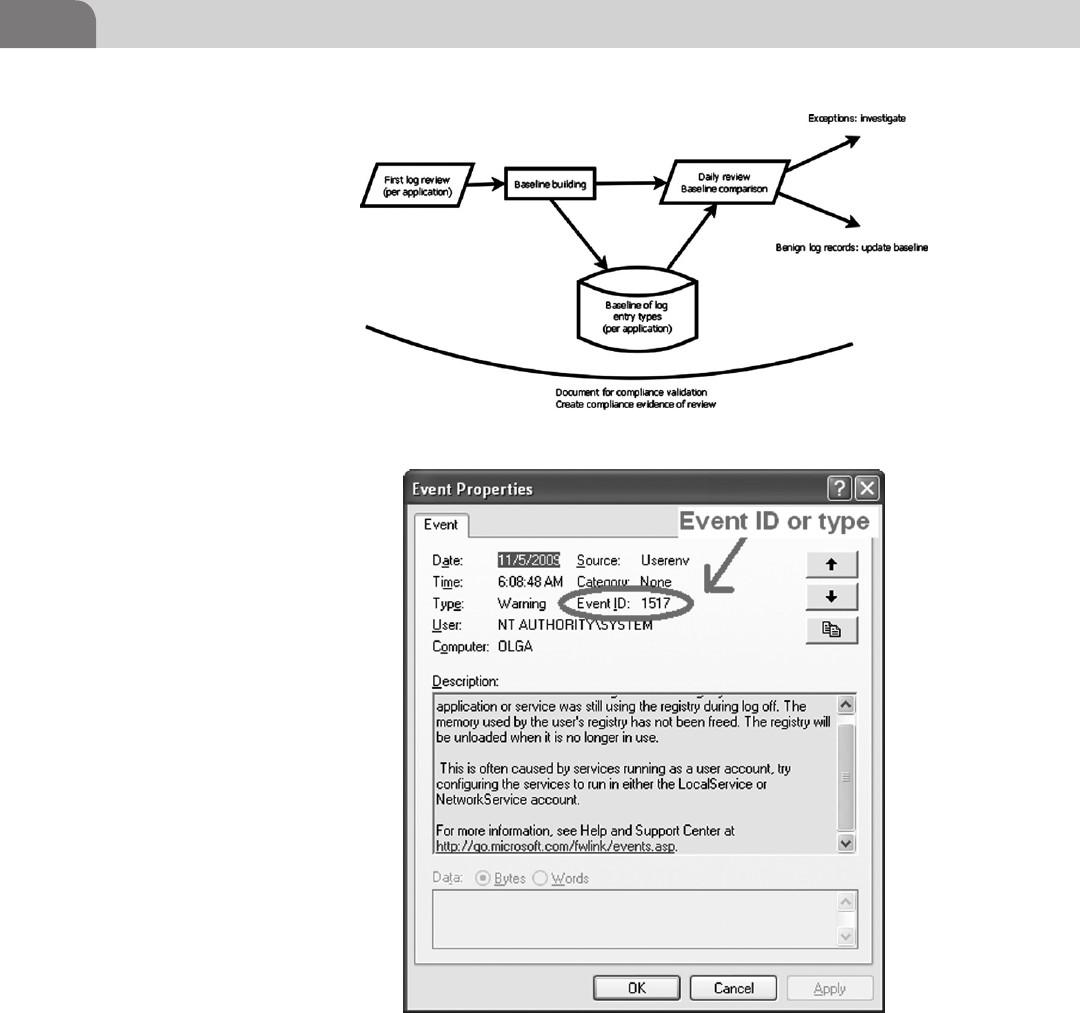
CHAPTER 16: Log Management Procedures
280
The main baseline to be built involves log message types. For example, review
Figure 16.3.
Figure 16.3 is seen the first time and we confirm that the message does not indi-
cate a critical failure of cardholder data security, we can add it to the expected
baseline. Figure 16.4 shows what a Windows 7 event ID example looks like.
FIGURE 16.2 The Process of Baselining
FIGURE 16.3 Windows XP Event ID Example
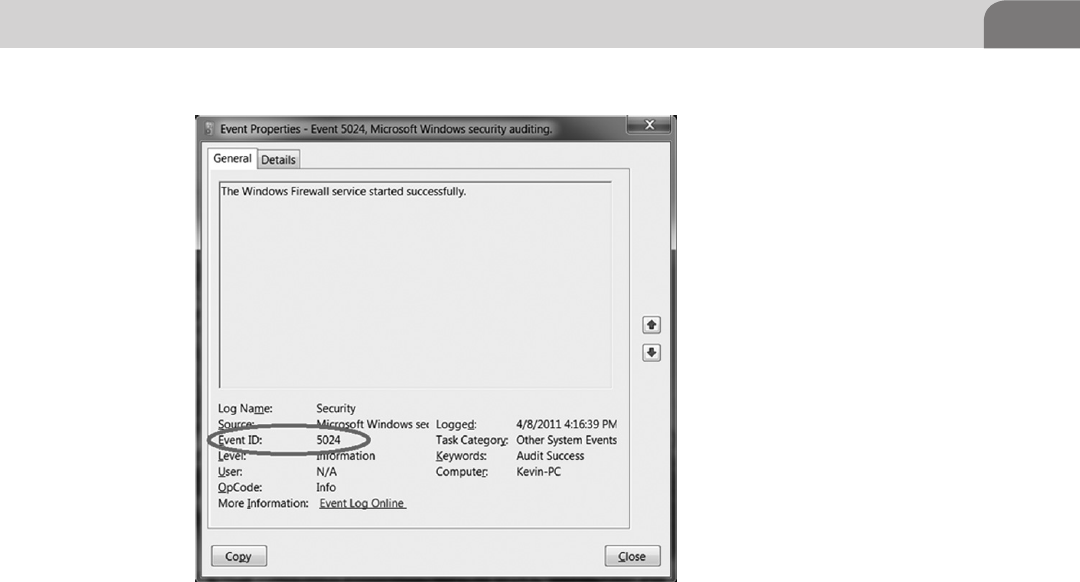
Review, Response, and Escalation Procedures and Workflows 281
It is important to note that explicit event types might not be available for some
log types. For example, some Java application logs and some Unix logs don’t
have explicit log or event types recorded in logs. What is needed is to create an
implicit event type (Requirements and Security Assessment Procedures, 2010).
The procedure for this case is as follows:
1. Review the log message.
2. Identify which part of the log message identifies what it is about.
3. Determine whether this part of the message is unique.
4. Create an event ID from this part of the message.
Even though log management tools perform the process automatically, it
makes sense to go through an example of doing it manually in case man-
ual log review procedure is utilized. For example (Dr Anton Chuvakin Blog,
2 011 ):
Example 1
1. Review the log message
The log message is:
[Mon Jan 26 22:55:37 2004] [notice] Digest: generating secret for
digest authentication.
2. Identify which part of the log message identifies what it is about
FIGURE 16.4 Windows 7 Event ID Example

CHAPTER 16: Log Management Procedures
282
It is very likely that the key part of the message is “generating secret for digest
authentication” or even “generating secret.”
3. Determine whether this part of the message is unique
A review of other messages in the log indicates that no other messages con-
tain the same phase and thus this phrase can be used to classify a message as
a particular type.
4. Create an event ID from this part of the message
We can create a message ID or message type as “generating_secret.” Now we
can update our baseline that this type of message was observed today.
Let’s go through another example of Java application logs.
Example 2
1. Review the log message.
The log message is:
>>>>17 Jul 2008
13:00:57|AFWVGBYMBHWMV|ERROR|MerchantPreferredQuoteStrategy| Error
getting merchant availability, will fall back to XFS
com.factory.service.travel.flying.exception.MerchantSupplierException
at com.
factory.service.travel.flying.PropertyAvailServiceImpl.
execute(MachineryAvailServiceImpl.java:407)
at
<truncated>
2. Identify which part of the log message identifies what it is about.
It is very likely that the key part of the message is “Error getting mer-
chant availability” or “Error getting availability”
3. Determine whether this part of the message is unique.
A review of other messages in the log indicates that no other messages con-
tain the phase “Error getting merchant availability” and thus
this phrase can be used to classify a message as a particular type. However,
other messages contain the phrase “Error getting object availability” and thus
it is not recommended to use the “Error getting availability” as a message type
(Dr Anton Chuvakin Blog, 2011).
4. Create an event ID from this part of the message.
We can create a message ID or message type as “Error_getting_merchant_
availability.” Now we can update our baseline that this type of message was
observed today.
An initial baseline can be quickly built using the following process, presented
for two situations: with automated log management tools and without them.

Review, Response, and Escalation Procedures and Workflows 283
In addition to this “event type,” it makes sense to perform a quick assessment
of the overlap log entry volume for the past day (past 24 h period). Significant
differences in log volume should also be investigated using the procedures
define below. In particular, loss of logging (often recognized from a dramatic
decrease in log entry volume) needs to be investigated and escalated as a secu-
rity incident (Dr Anton Chuvakin Blog, 2011).
Building an Initial Baseline Using a Log
Management Tool
To build a baseline using a log management tool perform the following:
1. Make sure that relevant logs from a PCI application are aggregated by the
log management tools (Chuvakin, n.d.).
2. Confirm that the tool can “understand” (parse, tokenize, etc.) the messages
and identify the “event ID” or message type of each log (Chuvakin, n.d.).
3. Select a time period for an initial baseline: “90 days” or “all time” if logs
have been collected for less than 90 days (Complete PCI DSS Log Review
Procedures Part 8, 2011).
4. Run a report that shows counts for each message type. This report
indicates all the log types that are encountered over the 90-day period of
system operation (Chuvakin, n.d.).
5. Assuming that no breaches of card data have been discovered, we can
accept the above report as a baseline for “routine operation”
(Anton Chuvakin, 2011).
6. “An additional step should be performed while creating a baseline: even
though we assume that no compromise of card data has taken place, there
is a chance that some of the log messages recorded over the 90 day period
triggered some kind of action or remediation. Such messages are referred
to as “known bad” and should be marked as such” (Complete PCI DSS
Log Review Procedures Part 8, 2011).
Let’s go through a complete example of the above strategy:
1. Make sure that relevant logs from a PCI application are aggregated by the
log management tools.
At this step, we look at the log management tools and verify that logs from
PCI applications are aggregated. It can be accomplished by looking at report
with all logging devices.
Table 16.2 indicates that aggregation is performed as needed.
2. Confirm that the tool can “understand” (parse, tokenize, etc.) the
messages and identify the “event ID” or message type of each log
(Anton Chuvakin, 2011).

CHAPTER 16: Log Management Procedures
284
This step is accomplished by comparing the counts of messages in the tool
(such as the above report that shows log message counts) to the raw
message counts in the original logs.
3. Select a time period for an initial baseline: “90 days” or “all time” if logs
have been collected for less than 90 days.
In this example, we are selecting 90 days since logs are available.
4. Run a report that shows counts for each message type. For example, the
report might look something like Table 16.3.
This report sample in Table 16.3 indicates all the log types that are
encountered over the 90-day period of system operation.
5. Assuming that no breaches of card data have been discovered, we can
accept the above report as a baseline for “routine operation.”
During the first review it logs, it might be necessary to investigate some of the
logged events before we accept them as normal. The next step explains how
this is done.
6. An additional step should be performed while creating a baseline: even
though we assume that no compromise of card data has taken place, there
is a chance that some of the log messages recorded over the 90-day period
triggered some kind of action or remediation. Such messages are referred
to as “known bad” and should be marked as such (Complete PCI DSS Log
Review Procedures Part 8, 2011).
Table 16.2 Report of All Logging Devices
Device Type Device Name Log Messages
Windows 2003 Winserver1 215,762
Windows 2003 Winserver2 215,756
CEMS CEMS1 53,445
TOPPS Topps1server 566
TABS Tabs 3,334,444
Timeframe: January 1, 2009–March 31, 2009 (90 days).
Table 16.3 Report Showing Message Type Counts
Event ID Event Description Count Average Count/Day
1517 Registry failure 212 2.3
562 Login failed 200 2.2
563 Login succeeded 24 0.3
550 User credentials
updated
12 0.1
Timeframe: January 1, 2009–March 31, 2009 (90 days).

Review, Response, and Escalation Procedures and Workflows 285
Some of the logs in our 90-day summary are actually indicative of the prob-
lems and require an investigation (see Table 16.4).
In this report, we notice the last line, the log record with an event ID = 666 and
event name “Memory exhausted” that only occurred once during the 90-day
period. Such rarity of the event is at least interesting; the message description
(“Memory exhausted”) might also indicate a potentially serious issue and thus
needs to be investigated as described below in the investigative procedures.
Creating a baseline manually is possible, but more complicated. We explore this
in the next section.
Building an Initial Baseline Manually
To build a baseline without using a log management tool has to be done when
logs are not compatible with an available tool or the available tool has poor
understanding of log data. To do it, perform the following (Complete PCI DSS
Log Review Procedures Part 8, 2011):
1. Make sure that relevant logs from a PCI application are saved in one
location.
2. Select a time period for an initial baseline: “90 days” or “all time” if logs
have been collected for less than 90 days; check the timestamp on the
earliest logs to determine that (Complete PCI DSS Log Review Procedures
Part 8, 2011).
3. Review log entries starting from the oldest to the newest, attempting to
identify their types (Complete PCI DSS Log Review Procedures Part 8, 2011).
4. Manually create a summary of all observed types; if realistic, collect the
counts of time each message was seen (not likely in case of high log data
volume; Complete PCI DSS Log Review Procedures Part 8, 2011).
5. Assuming that no breaches of card data have been discovered in that time
period, we can accept the above report as a baseline for “routine opera-
tion” (Complete PCI DSS Log Review Procedures Part 8, 2011).
Table 16.4 90-day Summary Report
Event ID Event
Description
Count Average
Count/Day
Routine or
“bad”
1517 Registry failure 212 2.3
562 Login failed 200 2.2
563 Login
succeeded
24 0.3
550 User credentials
updated
12 0.1
666 Memory
exhausted
1 N/A Action: restart
system

CHAPTER 16: Log Management Procedures
286
6. An additional step should be performed while creating a baseline: even
though we assume that no compromise of card data has taken place, there
is a chance that some of the log messages recorded over the 90-day period
triggered some kind of action or remediation. Such messages are referred
to as “known bad” and should be marked as such (Complete PCI DSS Log
Review Procedures Part 8, 2011).
Guidance for Identifying “Known Bad” Messages
The following are some rough guidelines for marking some messages as
“known bad” during the process of creating the baseline. If generated, these
messages will be looked at first during the daily review process:
1. Login and other “access granted” log messages occurring at unusual hour.
(Technically, this also requires a creation of a baseline for better accuracy.
However, logins occurring outside of business hours (for the correct time
zone!) are typically at least “interesting.”)
2. Credential and access modifications log messages occurring outside of a
change window.
3. Any log messages produced by the expired user accounts.
4. Reboot/restart messages outside of maintenance window (if defined).
5. Backup/export of data outside of backup windows (if defined).
6. Log data deletion.
7. Logging termination on system or application.
8. Any change to logging configuration on the system or application.
9. Any log message that has triggered any action in the past: system
configuration, investigation, etc.
10. Other logs clearly associated with security policy violations.
As we can see, this list is also very useful for creating “what to monitor in
near-real-time?” policy and not just for logging. Over time, this list should
be expanded based on the knowledge of local application logs and past
investigations.
After we built the initial baselines, we can start the daily log review.
Main Workflow: Daily Log Review
This is the very central piece of the log review—comparing the logs produced
over the last day (in case of a daily review) with an accumulated baseline.
Daily workflow follows this model as seen in Figure 16.5.
This summarizes the actions of the log analyst who performs the daily log
review. Before we proceed, the issue of frequency of the log review needs to be
addressed.
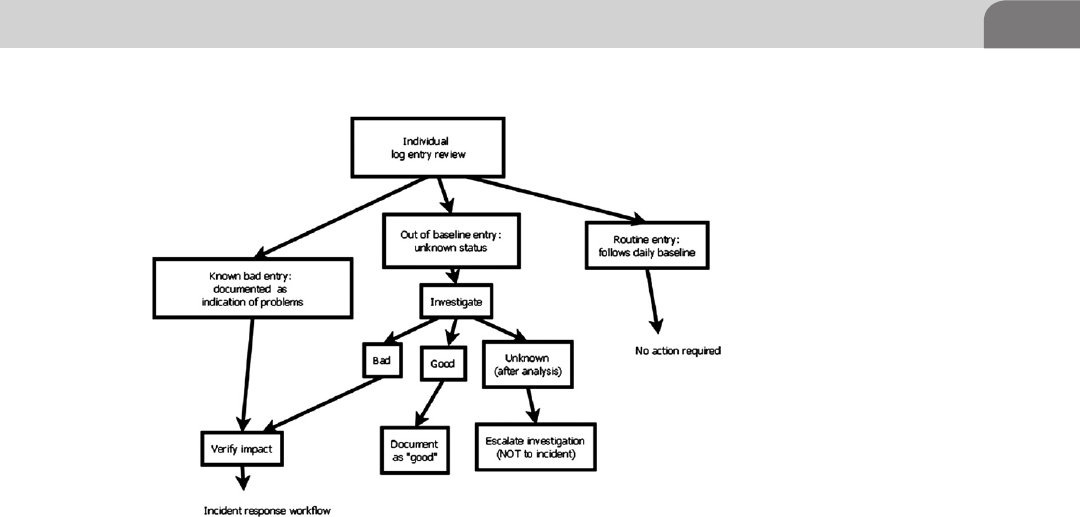
Review, Response, and Escalation Procedures and Workflows 287
Frequency of Periodic Log Review
PCI DSS Requirement 10.6 explicitly states that “Review logs for all system
components at least daily.” It is assumed that daily log review procedures will
be followed every day (Dr Anton Chuvakin Blog, 2011). Only your QSA may
approve less frequent log reviews, based on the same principle that QSA’s use
for compensating controls. What are some of the reasons when less frequent
log reviews may be approved? The list below contains some of the reasons why
daily log review may be performed less frequently than every day:
n Application or system does not produce logs every day. If log records are
not added every day, then daily log review is unlikely to be needed.
n Log review is performed using a log management system that collects log
in batch mode, and batches of logs arrive less frequently than once a day.
n Application does not handle or store credit card data; it is only in-scope
since it is directly connected to (Anton Chuvakin, 2011).
Remember that only your QSA’s opinion on this is binding and nobody else’s!
How does one actually compare today’s batch of logs to a baseline? Two meth-
ods are possible; both are widely used for log review—the selection can be
made based on the available resources and tools used. Figure 16.6 shows this.
Out of the two methods, the first method only considers log types not observed
before and can be done manually as well as with tools. Despite its simplicity,
it is extremely effective with many types of logs: simply noticing that a new log
FIGURE 16.5 Daily Workflow
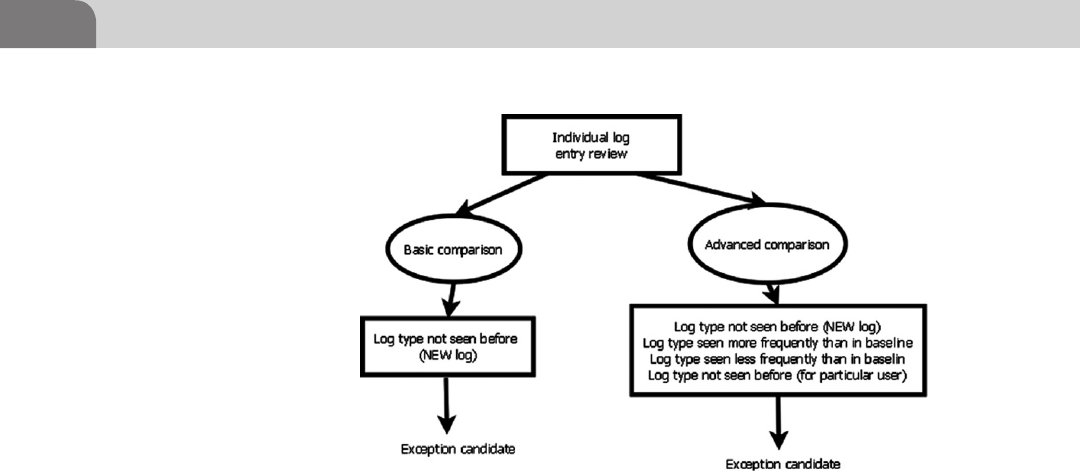
CHAPTER 16: Log Management Procedures
288
message type is produced is typically very insightful for security, compliance,
and operations (Dr Anton Chuvakin Blog, 2011).
For example, if log messages with IDs 1–7 are produced every day in large
numbers, but log message with ID 8 is never seen, each occurrence of such log
message is reason for an investigation. If it is confirmed that the message is
benign and no action is triggered, it can be later added to the baseline.
So, the summary of comparison methods for daily log review is:
n Basic method:
n Log type not seen before (NEW log message type).
n Advanced methods:
n Log type not seen before (NEW log message type).
n Log type seen more frequently than in baseline.
n Log type seen less frequently than in baseline.
n Log type not seen before (for particular user).
n Log type not seen before (for particular application module).
n Log type not seen before (on the weekend).
n Log type not seen before (during work day).
n New user activity noted (any log from a user not seen before on the
system).
While following the advanced method, other comparison algorithms can be
used by the log management tools as well.
After the message is flagged as an exception, we move to a different stage in our
daily workflow—from daily review to investigation and analysis.
FIGURE 16.6 Exception Candidate Selection
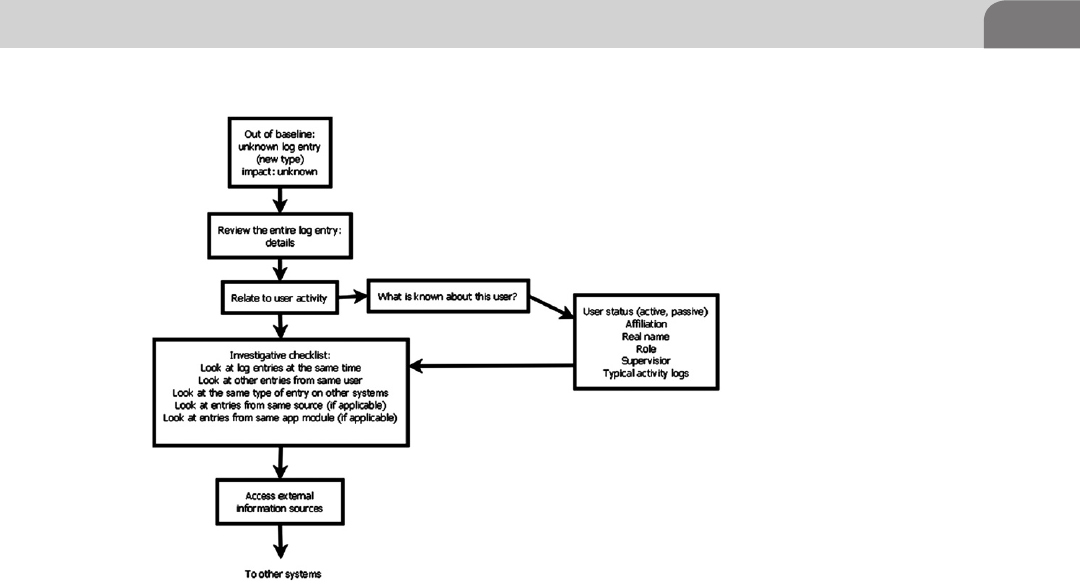
Review, Response, and Escalation Procedures and Workflows 289
Exception Investigation and Analysis
A message not fitting the profile of a normal is flagged “an exception.” It is
important to note that an exception is not the same as a security incident, but
it might be an early indication that one is taking place.
At this stage we have an individual log message that is outside of routine/normal
operation. How do we figure out whether it is significant, determine impact on
security and PCI compliance status? (Dr Anton Chuvakin Blog, 2011).
Initial Investigation
Figure 16.7 shows how a high-level investigative process (“Initial Investigation”)
is used on each “exception” entry (more details are added further in the chapter).
Specifically, this shows a process which makes use of a log investigative check-
list, which is explained below in more detail:
1. Look at log entries at the same time: This technique involves looking at an
increasing range of time periods around the log message that is being
investigated. Most log management products can allow you to review
logs or to search for all logs within a specific time frame. For example:
a. First, look at other log messages triggered 1 min before and 1 min after
the “suspicious” log.
FIGURE 16.7 Investigation of Each Exception

CHAPTER 16: Log Management Procedures
290
b. Second, look at other log messages triggered 10 min before and 10 min
after the “suspicious” log.
c. Third, look at other log messages triggered 1 h before and 1 h after the
“suspicious” log.
2. Look at other entries from same user: This technique includes looking for
other log entries produced by the activities of the same user. It often
happens that a particular logged event of a user activity can only be
interpreted in the context of other activities of the same user. Most log
management products can allow you to “drill down into” or search for a
specific user within a specific time frame.
3. Look at the same type of entry on other systems: This method covers looking
for other log messages of the same type, but on different systems in order
to determine its impact. Learning when the same message was products on
other system may hold clues to understanding the impact of this log message.
4. Look at entries from same source (if applicable): This method involves
reviewing all other log messages from the network source address (where
relevant).
5. Look at entries from same app module (if applicable): This method involves
reviewing all other log messages from the same application module or
components. While other messages in the same time frame (see item 1.
above) may be significant, reviewing all recent logs from the same compo-
nents typically helps to reveal what is going on.
In some cases, the above checklist will not render the result. Namely, the excep-
tion log entry will remain of unknown impact to security and PCI compliance.
In this case, we need to acquire information from other systems, such as File
Integrity Monitoring (FIM), Patch Management (PM), Change Management
(CM), and others (Chuvakin, 2011).
External Information Sources Investigation
This procedure can be expanded to cover other sources of information avail-
able at the organization. Figure 16.8 shows the procedure to follow is external
sources of information that are to be used during investigation.
The main idea of this procedure is to identify and then query information
sources, based on the type of the exception log entry and then to identify its
impact and the required actions (if any).
The procedure works to roughly identify the type of a log entry and then to
query the relevant information sources. In some cases, the log entry is deemed
to be an indication of a serious issue, incident response process is triggered.
However, it sometimes happens that neither the preliminary analysis nor the
query of external systems yields the results and the “exception” log entry is
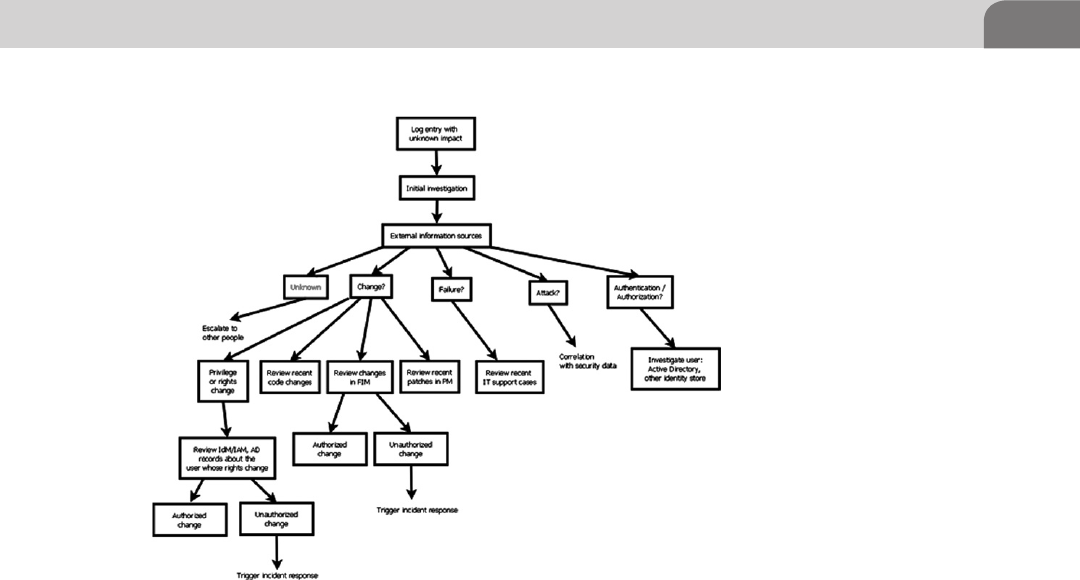
Review, Response, and Escalation Procedures and Workflows 291
exceptional. In this case, the collaborative workflow is triggered (Chuvakin
Blog, 2011).
Escalation to Other Procedures
This process allows tapping into the knowledge of other people at the organi-
zation who might know what this “anomaly” is about. The investigation and
escalation process is shown in Figure 16.9.
The main idea of this procedure it to identify and then interview the correct
people who might have knowledge about the events taking place on the appli-
cation then to identify its impact and the required actions (if any).
The very last resource is to query the application vendor; such info request is
typically time consuming or even expensive (depends on the support contract
available) so it should be used sparingly (Chuvakin, n.d.).
Before we move onto the next section, we need to discuss incident response
and escalation. The next section provides more detail on these topics.
Incident Response and Escalation
Many of the workflows presented thus far rely on incident response (IR) and
escalation. But what is incident response and escalation? This section provides
FIGURE 16.8 External Information Usage During Investigation
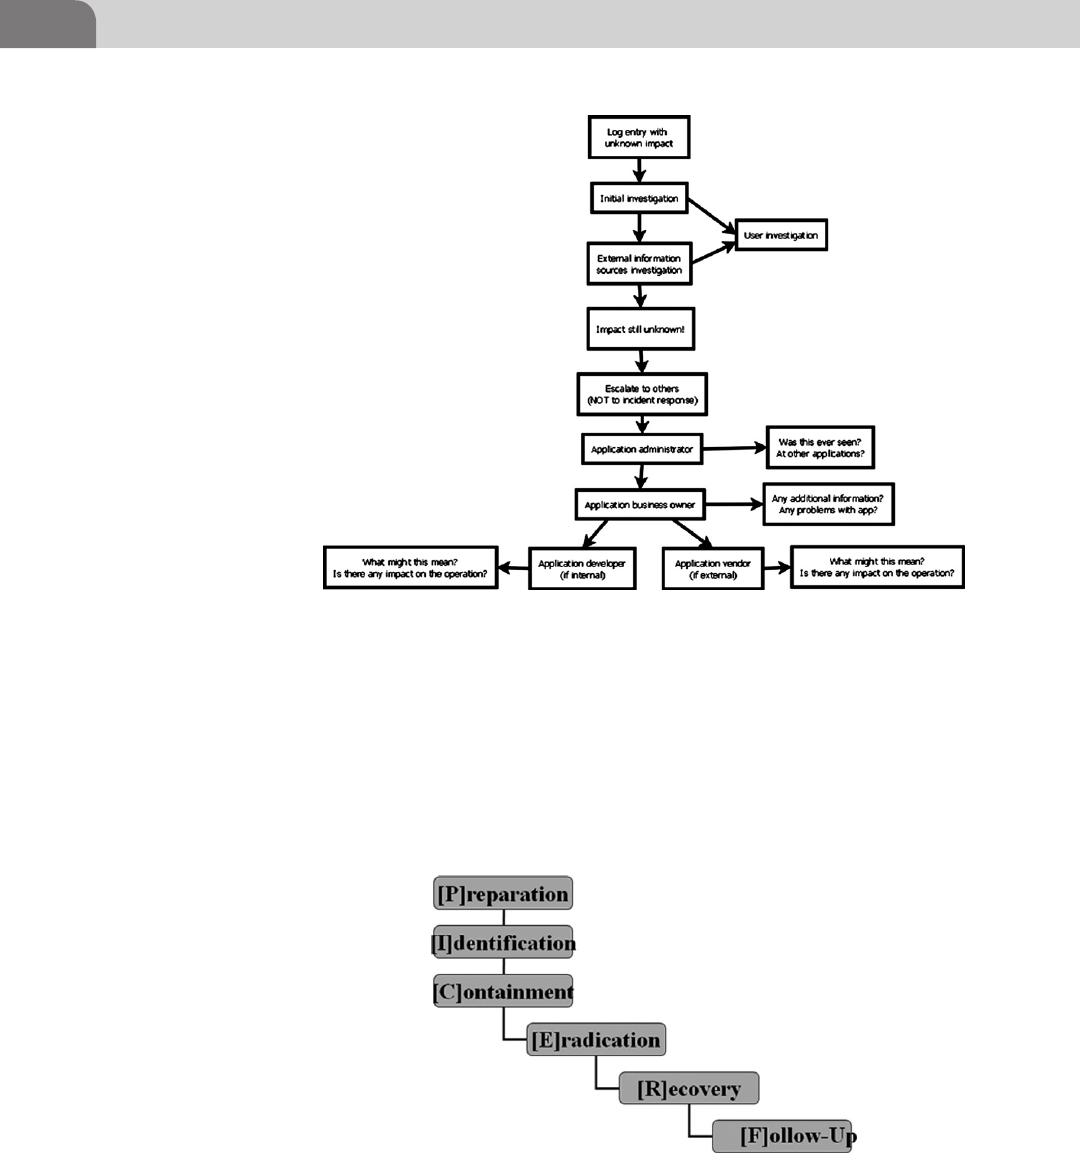
CHAPTER 16: Log Management Procedures
292
the needed understand how IR and escalation fit into the overall picture of
what has been presented in this chapter. As you will.
Let’s first discuss escalation. In log management, and IT in general, an escala-
tion procedure is used to determine when you should escalate the fact that
something has occurred.
Figure 16.10 shows the SANS-defined IR processes.
FIGURE 16.9 Escalation to Other Procedures
FIGURE 16.10 SANS IR Process

Validation of Log Review 293
Let’s discuss each step in the process.
The preparation stage includes tasks that need to be done before the incident:
from assembling a team, training people, collecting, and building tools, to
deploying additional monitoring and creating processes and incident proce-
dures. This is also the point at which you develop your escalation procedure/
policy. This policy is all about communicating that something has happened
to the proper individual, group, etc. (Anton Chuvakin, 2011).
Identification starts when the signs of an incident are seen. This is not only (and,
in fact, not so much) about IDS alerts, but about analyzing all kinds of signals
that might reveal an emerging incident. For example, sustained CPU utiliza-
tion, system reboots and/or configuration changes outside of maintenance
windows, and so on, are some signals which may be indicative of something
going on which requires further attention.
The containment stage is important for documenting what is going on, quaran-
tining the affected systems (or maybe even areas) as well as doing the famous
cable pull (i.e. disconnecting or turning off the system). At this stage we also try
to assess the scope of the damage by reviewing what other systems might have
also been infected, compromised, etc.
Eradication is where we are preparing to return to normal by evaluating the
available backups and preparing for either restoration or rebuilding of the sys-
tems. Network changes might also be planned.
Recovery is where everything returns to normal. Additional logging and moni-
toring should be enabled at this stage.
During follow-Up you discuss and document lessons learned, reporting the
incident to management, as well as planning future improvements in the inci-
dent process. This phase is often referred to as a postmortem.
VALIDATION OF LOG REVIEW
The final and critical part of log review is making sure that there is suffi-
cient evidence of the process, its real-world implementation, and diligence
in following the process. The good news here is that the same data can be
used for management reporting about the logging and log review processes.
Let’s determine what documentation should be produced as proof of log
review.
First, the common misconception is that having the actually logs provides that.
That is not really true: “having logs” and “having logs reviewed” are completely
different and sometime years of maturing the security and compliance pro-
gram separates one and the other.

CHAPTER 16: Log Management Procedures
294
Just to remember, we have several major pieces that we need to prove for PCI
DSS compliance validation. Here is the master-list of all compliance proof we
will assemble. Unlike other sections, here we will cover proof of logging and
not just proof of log review since the latter is so dependent on the former:
n Presence and adequacy of logging.
n Presence of log review processes and its implementation.
n Exception handling process and its implementation.
Now we can organize the proof around those areas and then build processes
to collect such proof.
Proof of Logging
The first category is: proof of presence and adequacy of logging. This section is
the easiest to prove out of the three.
The following items serve as proof of logging:
1. Documented logging policy, covering both logged events and details
logged for each event.
2. System/application configuration files implementing the above policy.
3. Logs produced by the above applications while following the policy.
Proof of Log Review
The second category: proof of log review processes and its implementation.
This section is harder to prove compared to the previous one.
The following items serve as proof of log review:
1. Documented logging policy, covering log review.
2. Documented operational procedures, detailing the exact steps taken to
review the logs.
3. Records of log review tasks being executed by the appropriate personnel
(some log management products create an audit log of reviewed reports
and events; such audit trail should cover it—the case of manual review is
covered below)—think about this item as “log review log.”
4. Also, records of exceptions being investigated (next section) indirectly
prove that log review has taken place as well.
Proof of Exception Handling
The third category: proof of exception handling process and its implementa-
tion. This section is by far the hardest to prove out of these three.

Validation of Log Review 295
The following items serve as proof of log exception process:
1. Documented logging policy, covering exceptions and their handling.
2. Documented operational procedures, detailing the exact steps taken to
investigate exceptions found during log review.
3. A log of all exceptions investigated with actions taken (“logbook”) (Com-
plete PCI DSS Log Review Procedures Part 8, 2011).
The above evidence should provide ample proof that the organization fol-
lows PCI DSS guidance with diligence. Let’s focus on producing this proof—
Table 16.5 has the details.
The critical item from the above list is “a logbook” that is used to record excep-
tion follow-up and investigation, thus creating powerful evidence of compli-
ance with PCI DSS requirements. In a more advanced form, the logbook can
even grow into an investigative “knowledge base” that contains all past excep-
tion analysis cases.
Table 16.5 Proof of Compliance
PCI Compliance
Logging Subdomain
Proof of Compliance How to Obtain Proof?
Proof of presence and
adequacy of logging
Documented logging policy Create policy, if not present
Proof of presence and
adequacy of logging
System/application configura-
tion files
After deployment, preserve the
configuration files as a master
copy
Proof of presence and
adequacy of logging
Logs produced by the above
applications
Collect sample logs and save
as proof of compliance
Proof of log review Documented logging policy Create policy, if not present
Proof of log review Documented operational
procedures
Create it based on the work-
flows and procedures based in
this chapter
Proof of log review Records of log review tasks
being executed
Either use the tool or create a
“logbook” (format below)
Proof of log review Records of exceptions being
investigated
Create a “logbook” of
investigations
Proof of exception
handling
Documented logging policy Create policy, if not present
Proof of exception
handling
Documented operational
procedures
Create it based on the work-
flows and procedures based in
this chapter
Proof of exception
handling
A log of all exceptions inves-
tigated
Create a “logbook” of
investigations or “knowledge
base”

CHAPTER 16: Log Management Procedures
296
LOGBOOK—EVIDENCE OF EXCEPTION
OF INVESTIGATIONS
How to create a logbook? The logbook is used to document everything related
to analyzing and investigating the exceptions flagged during daily review.
While the same logbook approach is used in the incident handling process
(such as SANS Incident Response Workflow), in this document it is utilized as
compliance evidence.
The logbook should record all systems involved, all people interviewed, all
actions taken as well as their justifications, what outcome resulted, what tools
and commands were used (with their results), etc.
The next section details the content of a logbook entry.
Recommended Logbook Format
A logbook entry should contain the following:
1. Date/time/time zone this logbook entry was started.
2. Name and role of the person starting the logbook entry.
3. Reason it is started: log exception (copied from log aggregation tool
or from the original log file), make sure that the entire log is copied,
especially its time stamp (which is likely to be different from the time
of this record) and system from which it came from (what/when/
where, etc.).
4. Detailed on why the log is not routine and why this analysis is
undertaken.
5. Information about the system that produced the exception log record or
the one this log exception is about (Complete PCI DSS Log Review
Procedures Part 8, 2011):
a. Hostname.
b. OS.
c. Application name.
d. IP address(s).
e. Location.
f. Ownership (if known).
g. System criticality (if defined and applicable).
h. Under patch management, change management, FIM, etc.
6. Information about the user whose activity produced the log (if
applicable).
7. Investigation procedure followed, tools used, screenshots, etc.
8. Investigative actions taken.
9. People contacted in the course of the log analysis.
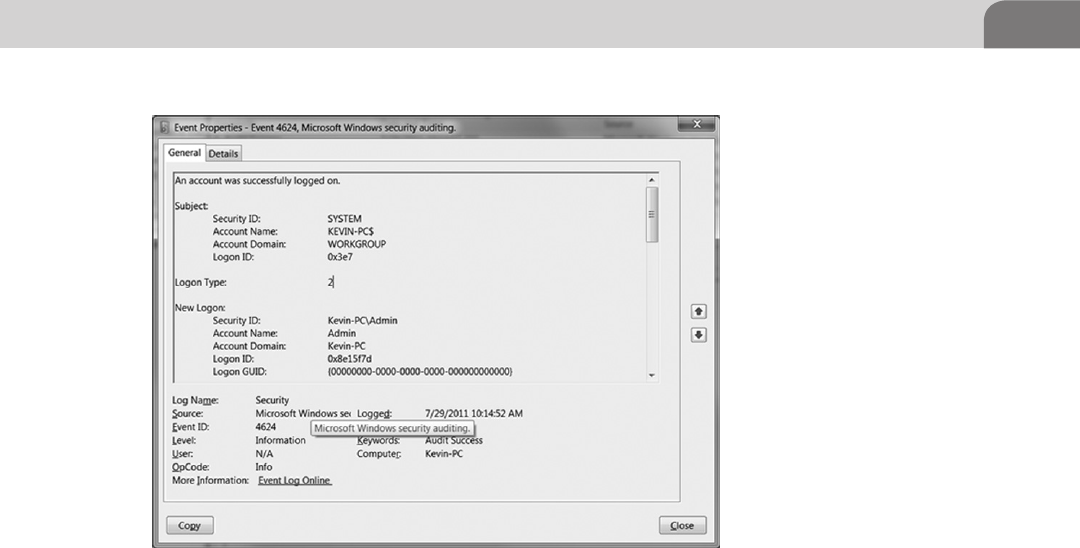
Logbook—Evidence of Exception of Investigations 297
10. Impact determined during the course of the analysis.
11. Recommendations for actions, mitigations (if needed; Dr Anton
Chuvakin Blog, 2011).
Example Logbook Entry
Here is an example following the above pattern, using the log entry in Figure
16.11:
1. Date/time/time zone this logbook entry was started: June 30, 2011,
4:15 PM EDT.
2. Name and role of the person starting the logbook entry: Kevin Schmidt.
3. Reason the logbook entry is started: log exception (copied from log aggre-
gation tool or from the original log file), make sure that the entire log is
copied, especially its time stamp (which is likely to be different from the
time of this record) and system from which it came from (what/when/
where, etc.).
Time/date of log: 7/29/2011 10:14:52 AM EDT.
System: Kevin-PC.example.com.
4. Detailed on why the log is not routine and why this analysis is under-
taken: this event ID (Windows event ID 4624, successful account login) from
FIGURE 16.11 Windows 7 Event Used for Logbook Example
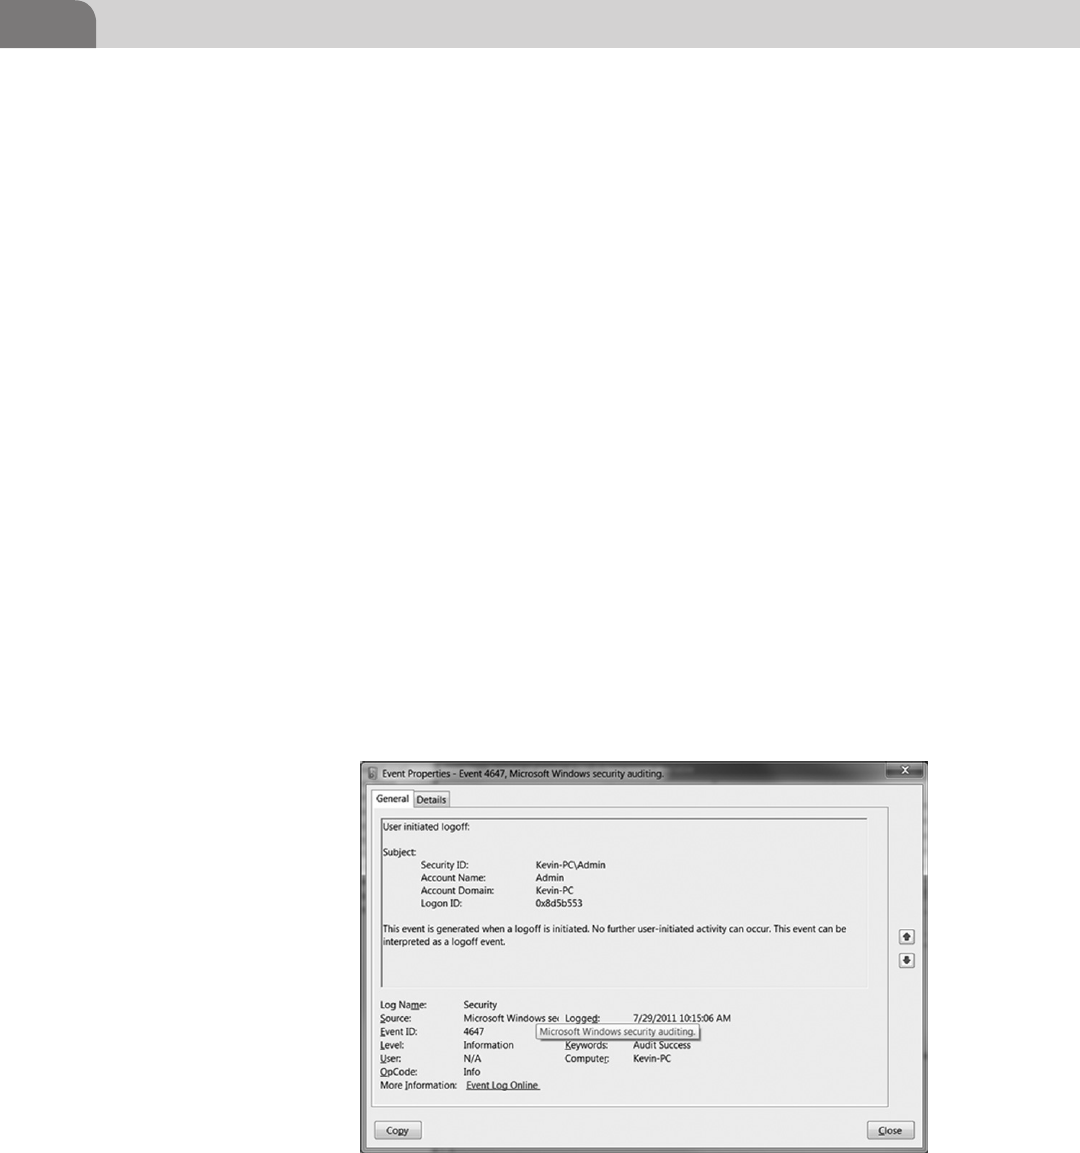
CHAPTER 16: Log Management Procedures
298
this source (Source Microsoft Windows security auditing) was never seen before
on any of the systems where logs are reviewed.
5. Information about the system that produced the exception log record or
the one this log exception is about:
a. Hostname: Kevin-PC.example.com.
b. OS: Windows 7.
c. Application name: N/A.
d. IP address(s): 10.1.1.1.
e. Location: Home office.
f. Ownership (if known): Kevin Schmidt.
g. System criticality (if defined and applicable): critical, laptop of the
principal.
h. Under patch management, change management, FIM, etc.: no.
6. Information about the user whose activity produced the log: N/A, no user
activity.
7. Investigation procedure followed, tools used, screenshots, etc.: procedure
for “Initial Investigation” described above.
8. Investigative actions taken: following the procedure for “Initial Investiga-
tion” described in a section above, it was determined that this log entry
is followed by a successful logoff. Specifically, on the same day, less than
1 min later, the log entry in Figure 16.12 appeared.
This entry indicates the successful log off of the action referenced in our
exception log entry.
9. People contacted in the course of the log analysis: none.
FIGURE 16.12 Windows 7 Event Log Entry

PCI Compliance Evidence Package 299
10. Impact determined during the course of the analysis: impact was deter-
mined to be low to non-existent; no functionality was adversely affected, no
system was at risk.
11. Recommendations for actions, mitigations (if needed): no mitigation
needed, added this log entry to baseline to be ignored in the future.
The logbook of that sort is used as compliance evidence since it establishes
log exceptions’ follow-up, required in item 10.6.a of PCI DSS testing proce-
dure, which states “Obtain and examine security policies and procedures to
verify that they include procedures to review security logs at least daily and that
follow-up to exceptions is required.”
The logbook (whether in electronic or paper form) can be presented to a QSA
or other auditor, if requested (Dr Anton Chuvakin Blog, 2011).
PCI COMPLIANCE EVIDENCE PACKAGE
Overall, it is useful to create a “PCI Compliance Evidence Package” to show
it to the QSA that will establish three keys of PCI DSS logging requirements:
n Presence and adequacy of logging.
n Log review.
n Exception handling.
While it is possible to prepare the evidence package before the assessment, it is
much easier to maintain it on the ongoing basis. For example, keep printed or
electronic copies of the following:
1. Logging policy that covers all of the PCI DSS in-scope systems.
2. Logging and log review procedures (this document).
3. List of log sources—all systems and their components (applications) from
the in-scope environment.
4. Sampling of configuration files that indicate that logging is configured
according to the policy (e.g. /etc/syslog.conf for Unix, screenshots of audit
policy for Windows, etc.).
5. Sampling of logs from in-scope systems that indicate that logs are
being generated according to the policy and satisfy PCI DSS logging
requirements.
6. Exported or printed report from a log management tools that shows that
log reviews are taking place.
7. Up-to-date logbook defined above.
This will allow always establishing compliant status and proving ongoing
compliance.

CHAPTER 16: Log Management Procedures
300
MANAGEMENT REPORTING
In addition for compliance evidence, validation activities can be used to report
the success of a log management program, processes, and procedures to senior
management.
The data accumulated in the above section as proof of PCI DSS compliance can
also be used for management reporting. Specifically, the following are useful
reports that can be produced:
n Presence and adequacy of logging:
n No useful management reporting in this section.
n Presence of log review processes and its implementation:
n Log policy and procedure changes.
n Application under log review.
n Log entries reviewed.
n Exception handling process and its implementation:
n Log exceptions handled by type, analyst name, etc.
n Exception escalated to incident response.
n (if relevant) Risk reduced due to timely escalation or incident prevention.
n Resources saved due to timely escalation or incident prevention.
n Application performance improvement due to log review.
n Other log management program reporting:
n Overall compliance readiness (PCI DSS and other).
Finally, let’s summarize all the operational tasks the organization should be
executing in connection with log review.
PERIODIC OPERATIONAL TASKS
The following section contains a summary of operational tasks related to log-
ging and log review. Some of the tasks are described in detail in previous sec-
tions; others are auxiliary tasks needed for successful implementation of PCI
DSS log review program.
Daily Tasks
Table 16.6 contains daily tasks, responsible role that performs them as well as
what record or evidence is created of their execution.
Weekly Tasks
Table 16.7 contains weekly tasks, responsible role that performs them as well
as what record or evidence is created of their execution.

Periodic Operational Tasks 301
Monthly Tasks
Table 16.8 contains daily tasks, responsible role that performs them as well as
what record or evidence is created of their execution.
Table 16.6 Daily Tasks
Task Responsible Role Evidence
Review all the types of logs
produced over the last day
as described in the daily log
review procedures
Security administrator, se-
curity analyst, (if authorized)
application administrator
Record of reports being run
on a log management tool
(As needed) investigate the
anomalous log entries as
described in the investiga-
tive procedures
Security administrator, se-
curity analyst, (if authorized)
application administrator
Recorded logbook entries
for investigated events
(As needed) take actions as
needed to mitigate, remedi-
ate, or reconcile the results
of the investigations
Security administrator, se-
curity analyst, (if authorized)
application administrator,
other parties
Recorded logbook entries
for investigated events and
taken actions
Verify that logging is taking
place across all in-scope
applications
Application administrator Create a spreadsheet to
record such activities for
future assessment
(As needed) enabled log-
ging if disabled or stopped
Application administrator Create a spreadsheet to
record such activities for
future assessment
Table 16.7 Weekly Tasks
Task Responsible Party Evidence
(If approved by a QSA)
Review all the types of logs
produced on less critical
application over the last day
as described in the daily log
review procedures
Security administrator, se-
curity analyst, (if authorized)
application administrator
● Record of reports being
run on a log manage-
ment tool
● Record of QSA approval
for less frequent log
reviews and reasons for
such approval
(As needed) investigate the
anomalous log entries as
described in the investiga-
tive procedures
Security administrator, se-
curity analyst, (if authorized)
application administrator
Recorded logbook entries
for investigated events
(As needed) take actions as
needed to mitigate, remedi-
ate, or reconcile the results
of the investigations
Security administrator,
security analyst, (if autho-
rized) application administra-
tor, other parties
Recorded logbook entries
for investigated events and
taken actions

CHAPTER 16: Log Management Procedures
302
Quarterly Tasks
Table 16.9 contains daily tasks, who performs them as well as what record or
evidence is created of their execution.
Table 16.8 Monthly Tasks
Task Responsible Party Evidence
Prepare a report on investi-
gated log entries
Security analyst, security
manager
Prepared report (to be filed)
Report on observed log
message types
Security analyst, security
manager
Prepared report (to be filed)
Report on observed NEW
log message types
Security analyst, security
manager
Prepared report (to be filed)
(If approved by a QSA)
Review all the types of logs
produced on non-critical
applications over the last
day as described in the daily
log review procedures
Security administrator, se-
curity analyst, (if authorized)
application administrator
● Record of reports being
run on a log management
tool
● Record of QSA approval
for less frequent log
reviews and reasons for
such approval
(As needed) investigate the
anomalous log entries as
described in the investiga-
tive procedures
Security administrator, se-
curity analyst, (if authorized)
application administrator
Recorded logbook entries
for investigated events
(As needed) take actions as
needed to mitigate, remedi-
ate, or reconcile the results
of the investigations
Security administrator, se-
curity analyst, (if authorized)
application administrator,
other parties
Recorded logbook entries
for investigated events and
taken actions
Table 16.9 Quarterly Tasks
Task Responsible Party Evidence
Verify that all the systems
in-scope for PCI are logging
and that logs are being
reviewed
Security analyst, security
manager
Review daily log review
procedures
Security analyst, security
manager
Review log investigation
procedures
Security analyst, security
manager
Review collected compli-
ance evidence
Security analyst, security
manager
Review compliance evi-
dence collection procedures
Security analyst, security
manager

Additional Resources 303
Annual Tasks
Table 16.10 contains daily tasks, who performs them as well as what record or
evidence is created of their execution.
ADDITIONAL RESOURCES
The following references are useful for PCI DSS log review program and log
management in general:
SANS CAG/CSC. “Twenty Critical Security Controls for Effective Cyber Defense:
Consensus Audit Guidelines”:
http://www.sans.org/critical-security-controls/.
Specifically, the relevant control on audit logs can be found here:
http://www.sans.org/critical-security-controls/control.php?id=6.
NIST 800-92 Logging Guide. “Guide to Computer Security Log Management:
Recommendations of the National Institute of Standards and Technology by
Karen Kent and Murugiah Souppaya”:
http://csrc.nist.gov/publications/nistpubs/800-92/SP800-92.pdf.
NIST 800-66 HIPAA Guide. “An Introductory Resource Guide for Implement-
ing the Health Insurance Portability and Accountability Act (HIPAA) Security
Rule”:
http://csrc.nist.gov/publications/nistpubs/800-66-Rev1/SP-800-66-
Revision1.pdf.
SUMMARY
Log review is the starting point which allows you to enter into the investigation
process, as well as provide assurances you are doing what is needed to satisfy
your own corporate, regulatory, or other mandates. The key points from this
chapter can best be summarized as follows:
Table 16.10 Annual Tasks
Task Responsible Party Evidence
Review logging and log
review policy
CSO
Review compliance
evidence before the QSA
assessment
Live tests with anomalies As needed

CHAPTER 16: Log Management Procedures
304
1. Make sure you are capturing log data from all your critical systems. You
cannot perform log review and response if you are not collecting anything.
2. Develop a logging policy which dictates, among other things, how long
you will keep your log data (retention) once it is collected and aggregated.
3. During log review, establish baselines of commonly occurring patterns.
This process can be done either manually or with an automated tool. Also,
understand how to identify known bad messages.
4. Establish an escalation policy based on your environmental makeup.
This will depend on your organization’s structure with respect division of
responsibility.
REFERENCES
Chuvakin, A. (2011, March 28). Log review for incident response: Part 2. Prism Microsystems. Web
June 10, 2011. <http://www.prismmicrosys.com/EventSourceNov2010.php>.
Chuvakin, A. (2011). PCI DSS and logging: What you need to know. N.p. Web October 4, 2011.
<http://www.slideshare.net/anton_chuvakin/pci-dss-and-logging-what-you-need-to-kn>.
Chuvakin, A. (2011). http://www.securitywarriorconsulting.com/siemblog/.
Complete PCI DSS Log Review Procedures Part 8. Insert name of site in italics. Web October 4,
2011. <https://www.infosecisland.com/blogview/10796-Complete-PCI-DSS-Log-Review-
Procedures-Part-8.html>.
Dr Anton Chuvakin Blog PERSONAL Blog: Complete PCI DSS log. <http://chuvakin.blogspot.
com/2010/12/complete-pci-dss-log-review-procedures_07.html>.
Requirements and Security Assessment Procedures (2010, October). Payment Card Industry (PCI)
Data Security Standard. PCI Security Standards Council. Web July 24, 2011. <https://www.pcise-
curitystandards.org/documents/pci_dss_v2.pdf>.
Schmidt, K. J. (2007, April) Introduction to security log analysis. Community Bankers Association
of Georgia. Georgia, Callaway Gardens. Presentation.
Williams, Branden R., & Chuvakin, Anton. In Tony Bradley (Ed.), (2007). PCI compliance: Imple-
menting effective PCI data security standards. Syngress Publishing.

Logging and Log Management.
© 2013 Elsevier, Inc. All rights reserved.
http://dx.doi.org/10.1016/B978-1-59-749635-3.00017-8
305
CHAPTER 17
Attacks Against Logging Systems
CONTENTS
Introduction .............305
Attacks ....................305
What to Attack? .............306
Attacks on
Confidentiality ...............307
Confidentiality at the
Source ..................................... 307
Confidentiality in Transit ...... 309
Confidentiality at the
loghost .................................... 311
Confidentiality at the
Log Store ................................ 311
Confidentiality at Analysis .... 313
Attacks on Integrity .......313
Integrity at the Source .......... 314
Integrity in Transit ................. 315
Integrity at the Loghost ........ 317
Integrity on the Database ..... 317
Integrity at Analysis .............. 318
Attacks on Availability ..318
Availability at the Source ...... 319
Availability in Transit ............ 323
Availability at the Loghost ... 324
Availability at Analysis .......... 324
Summary .................327
References ...............327
n Attacks
n Attack Case Study
INFORMATION IN THIS CHAPTER:
INTRODUCTION
A robust log analysis system relies on the integrity of the log data being ana-
lyzed. The system has to be resilient to attempts to modify and delete data. On
top of this, it also has to allow granular access control to log data. If log data is
to be used as evidence in a legal context, the ability to demonstrate the integ-
rity of log data may have an effect on whether or not the data is considered
acceptable evidence. This chapter explores possible attacks against the logging
system and suggests solutions for mitigating or detecting those attacks.
Why would an attacker target the logging system? Well, first of all, what do we
mean by “attacker” in this context? An attacker is someone who is conduct-
ing unauthorized activity, regardless of whether they are an “outsider” or an
“insider.”
A typical case of an outsider is the evil Internet hacker. An insider could be your
own system administrator. An attacker may not be directly looking to compro-
mise computers, but cold be someone involved in some malfeasant activity,
such as embezzling company funds or selling trade secrets to competitors.
ATTACKS
There are a variety of reasons these attackers might target logs. First of all,
the clever attacker usually wants to avoid getting caught. Since log data will
provide evidence of his activity, he would want to prevent the information

CHAPTER 17: Attacks Against Logging Systems
306
from being found. An even more clever attacker may want to hide her tracks
via misdirection, by making the observer think that something else is hap-
pening. In addition to hiding tracks, attackers may find information in logs
that are useful by themselves, such as transactional data, or information that
can assist in attacking other systems, such as passwords or account numbers.
Thus there is motivation in not being logged, destroying logs, modifying
logs as well as sneaking peeks at logs from various systems for intelligence
gathering.
What to Attack?
Attacks against the logging infrastructure can be done at any point in the
infrastructure:
n The source: The host(s) on which log messages are generated—attacking
the system or the logging application itself are both viable choices.
n In transit: The network between the sources and the loghost, or between
processing and storage.
n The collector or agent that collects logs: Where the logs from various sources
are collected.
n The log data store: The database system on which you store log informa-
tion (if you use a database for that). Can also apply to any mechanism
used for archiving log data—all the way down to utilizing trained backup
tape-eating rats ☺.
n At analysis: The system where analysis is done, and the analysis process
itself.
n Finally, one can attack the unavoidable part of any log management—a
human analyst looking at data and making decisions.
The attacks themselves can be classified using the “CIA” model of computer
threat analysis:
n Confidentiality: The ability of the attacker to read log data.
n Integrity: The ability of the attacker to alter, corrupt, or insert “constructed”
log data.
n Availability: The ability of the attacker to delete log data or disable the log-
ging system—or to deny the operation of analytics capability.
For example, a simple attack, often found in rootkits used by remote intruders,
is to delete any files found in /var/log. This attack can be mitigated through
the use of a secured central loghost—the data is still deleted on the originating
host, but a copy is still available at the loghost. An attack of this sort on the
loghost itself would be more catastrophic.

Attacks 307
Another trivial attack is to flood the network between the source and the log-
host, to cause packet loss and prevent the log data from ever reaching the
loghost.
This section explores these and other attacks in detail.
Attacks on Confidentiality
Attacks on confidentiality against log data are not about an intruder hiding
their tracks, but about gathering intelligence. That intelligence might be infor-
mation about systems and networks, to be used in another attack, or it might
be the collection of information itself which is the attack. Even if the data itself
is not obviously sensitive, law or company policy may consider exposure of the
data to be a violation.
What can an intruder find in your logs? Here are some useful examples from
across the logging realm:
n What applications you are running, and what hosts they are running
on. The logs often show the application version, and might information
about their configuration. All of this data can be used to find points of
vulnerability.
n What you might be looking at in your logs, in order to determine how to
avoid being noticed. Or what’s not being logged, for the same reason.
n Useful tidbits of information, such as who has privileged access, when
people are logged in, etc.
n Accidental exposure of credentials. For example, a user accidentally types
their password when prompted for their username, and doesn’t realize
it until after authentication fails. The mistakenly typed password may be
logged as a username in a “failed login” message.
n Locations of data that can be stolen, or transactional records, which might
be the actual objective of the attack.
Confidentiality at the Source
The simplest way to get at log data is to get access to the data where they are
generated—at the source of the messages. Excessive permissions or indirect
access may allow an attacker to read the log data. The simple example is having
the log file be world-readable:
#ls -l /var/log/messages
-rw-r--r-- 1 root root 327533 Oct 9 15:25 /var/log/messages
While it is easier for unprivileged users to diagnose their own problems if they
can read the log file, they may be able to read something they shouldn’t—such
as system administrator typing her password in place of the username—root.

CHAPTER 17: Attacks Against Logging Systems
308
An example of indirect access is having world-read permissions on the device
file for the disk partition on which the log file is stored:
# ls -l /dev/hd*
brw-r----- 1 root disk 3, 0 Oct 9 04:45 /dev/had
In this case, any user in the group “disk” can read the entire disk. On the partic-
ular system from which this example was taken, the only user who is a member
of that group is “root.”
# grep disk /etc/group
disk:x:6:root
So that’s not so bad. But if another user managed to become a member of this
group, they could read anything on the disk (not just log files, mind you, but
anything! Shadow file, anyone?).
Reading raw disk data might sound difficult, but can be done with standard
Unix tools and a little patience. Here is an example:
dd if=/dev/hda2 bs=1M | strings | grep '^[A-Z][a-z][a-z] *[0-9][0-9]*
[0-9][0-9]:[0-9][0-9]:[0-9][0-9] [^ ]'
dd is a simple tool used to transfer data between devices. The arguments spec-
ify the input device, and the “block size,” which in this situation just tells dd
how much data to read at a time. The strings command reads binary input and
prints anything that looks like a readable string (a series of printable charac-
ters). grep matches input against a regular expression, (for more details see
Chapter 8). The pattern provided matches the timestamp found at the begin-
ning of syslog messages. The output looks like this:
Sep 5 07:29:00 linux syslogd 1.4.1: restart.
Sep 5 07:29:05 linux kernel: klogd 1.4.1, log source = /proc/kmsg
started.
Sep 5 07:29:05 linux kernel: Inspecting /boot/System.map-2.6.4-52-
default
Sep 5 07:29:05 linux kernel: Loaded 23439 symbols from /boot/System.
map-2.6.4-52-default.
which is pretty much just how it looks in the log file.
Now this example may take a while on a large disk partition, but an attacker
often has all the time in the world. Plus, more sophisticated tools could do this
in a shorter amount of time.

Attacks 309
This method not entirely accurate, as it will find any data that looks like a log
message, included deleted data. In creating this example, our test script sur-
prised us with:
Feb 6 22:45:05 glen kernel: HiSax: Driver for Siemens chip set ISDN
cards
Feb 6 22:45:05 glen kernel: HiSax: Version 2.1
Feb 6 22:45:05 glen kernel: HiSax: Revisions 1.15/1.10/1.10/1.30/1.8
Feb 6 22:45:05 glen kernel: HiSax: Total 1 card defined
Feb 6 22:45:05 glen kernel: HiSax: Card 1 Protocol EDSS1 Id=HiSax (0)
Feb 6 22:45:05 glen kernel: HiSax: AVM driver Rev. 1.6
which turned out to be example log messages in a tutorial on configuring
ISDN, which was installed with the operating system.
To prevent this type of attack, verify that permissions on the log files and direc-
tories restrict access to privileged users. And make sure that all directories above
the log directory are writable only by a privileged user. Otherwise, an attacker
can rename directories and files and create files that he can read.
If there are users who need access to the logs, create a separate group
(e.g. “logs”) and provide group read access. Permissions should also be checked
on the disk and partition devices (e.g. /dev/hde*). And make sure that any
log rotation program set the proper permissions on files.
Aside from direct access to files, if an attacker can modify the syslog configura-
tion file, she could make a second copy of the logs in an alternate location, or
forward the logs to another host. Normally the configuration file is not world
writeable by default, and you should keep it that way. In fact, there is rarely a
reason to have any regular file world writeable. Of course, an attacker with root
privileges could still modify the file, but an attacker with root privileges can do
just about anything, so at that point you probably have much worse problems
to think about than log files.
Some people recommend keeping the configuration file in an alternate loca-
tion so that it is not so obvious where the logs are. Also, automated rootkits
which try and modify the file, using the default location, would fail to do so.
A rootkit is a packaged set of intruder tools, which often are designed to auto-
matically erase tracks and install backdoors. Whether or not it is worth the
trouble to obfuscate the location of the log files is up to you.
Confidentiality in Transit
If you are forwarding log data to a central loghost, an attacker with access to
the network path between the source and the loghost could intercept the data

CHAPTER 17: Attacks Against Logging Systems
310
while in transit. This type of attack can be done at either endpoint, with access
to the network device on either host, or by “sniffing” (intercepting traffic) on
any one of the network segments between the two hosts. Intercepting network
traffic is not as hard as it may sound to some. Here is a simple example of sniff-
ing syslog traffic using tcpdump:
# tcpdump –s 1600 –w syslog-dump.dmp src host 172.16.90.128 and proto
UDP and port 514
This line collects all User Datagram Protocol UDP packets on port 514 (the
syslog port) from the host 172.16.90.128, and writes them to the file syslog-
dump.dmp. To view the results, use tcpdump again:
# tcpdump –r syslog-dump.dmp source –X -v
the result looks like this:
12:02:29.402842 anton.syslog > anotherbox.syslog: [udp sum ok] udp 36
(ttl 128, id 47609, len 64)
0x0000 4500 0040 b9f9 0000 8011 5fdd ac10 5a80 E..@......_...Z.
0x0010 ac10 6e35 0202 0202 002c a5c3 3c31 3839 ..n5.....,..<189
0x0020 3e73 7973 6c6f 673a 206b 6c6f 6764 2073 >syslog:.klogd.s
0x0030 7461 7274 7570 2073 7563 6365 6564 6564 tartup.succeeded
Not quite as easy to read as viewing the log file, but readable enough for an
attacker. Strings that we cover in this chapter can also help make tcpdump data
more readable. Furthermore, the tool plog (discussed in Chapter 6 on covert
logging) convert this data back into syslog formatted records.
At this point, someone usually says “we have a switched network, an attacker
can’t sniff traffic on our network…” Switches can often leak traffic. Some low-
end switches are not truly switched on all ports; groups of ports may share the
same traffic. And, some switches can be turned into hubs by overflowing their
MAC tables.
So don’t rely on your network electronics to keep data confidential, it wasn’t
designed to do it.
There are a variety of methods to mitigate network interception of log data,
all based on encryption of log data in transit. The syslog-reliable RFC provides
for encryption of the log data stream, provided you are using syslog clients
and servers that support the RFC. We discuss the RFC and clients in Chapter 3.
syslog-ng allows you to encrypt log data with PGP or crypt or any other method
you like (and there’s always rot13:)).

Attacks 311
That approach is covered in Chapter 5 on syslog-ng. Or, if you are using a TCP-
based log transport, traffic can be tunneled over SSL using sslwra, stunnel, or
using an SSH tunnel.
Remember, an attacker in control of one of the endpoints (source or log-
host) may be able to intercept the log data before it is encrypted, or can
intercept the encryption key. Use of a public-key encryption method, such
as the PGP example we presented, can mitigate the latter attack by not hav-
ing the private key stored on either the source or the loghost (the private
key only needs to be available where the data is encrypted, not where it is
decrypted).
Of course, if you believe you are in good control of the network between the
client and the loghost, you may choose not to worry about interception of log
traffic. It’s a matter of your own judgment and risk analysis.
Confidentiality at the loghost
All of the issues with protecting data confidentiality at the source () apply to
the loghost. Additionally, since the loghost should normally be used only for
collecting and possibly examining log data, you can restrict the accounts on the
loghost to only those users who need access to the log data or to administer
the loghost.
For some environments, a stealth loghost may be desirable. A stealth loghost is
not visible from network, but hosts on that network can still forward their logs
to it. See Chapter 6 for details.
Confidentiality at the Log Store
Databases where logs are stored are another vector for confidentiality attacks.
The same issues as for protecting a loghost apply. Additionally, an attacker with
a database username and password may be able to connect to the database and
query data, or intercept the transactions between the loghost and the database
server in transit.
The database server should be considered as critical as the loghost, and pro-
tected in the same manner. Connections to the database should be restricted
to the loghost and to any systems used for log analysis. The same connections
should be encrypted to avoid interception. And access rules for database users
should be limited so that only authorized users can query the data.
There are many ways to get logs in a database. All databases support direct
network connections, with varying levels of authentication. Another method
of getting logs into a database is to “pull” the data from the loghost to the
database server using a file transfer mechanism, and then load the data into the
database from the local file.

CHAPTER 17: Attacks Against Logging Systems
312
Most databases provide some means of controlling access to the database,
both by host and by user. mysql used the same mechanism for both, using the
GRANT statement:
mysql> GRANT ALL PRIVILEGES ON db.* TO
someuser@’10.1.2.0/255.255.255.0’;
This statement allows the user “someuser” to connect to any database from
any host on the 10.1.2.0 network, and do anything they want. You probably
want to make the privileges even more restrictive, limiting the ability to make
changes to just a user on the loghost, and only allow read privileges to others:
mysql> GRANT INSERT, UPDATE PRIVILEGES ON logdb TO
logwriter@loghost.example.com;
mysql> GRANT SELECT PRIVILEGES ON logdb TO logreader@analsysis-station.
example.com;
This example allows one user, logwriter, to write to the database, and only from
the loghost. Another user, logreader, is only allowed to query the database, but
not to make changes, and only from the log analysis station. Note that the log-
writer user can’t query the data, only insert and change data.
Postgresql has similar access controls, but they are implemented in a different
manner. Access controls for hosts and users are put in text file called pg_hba.
conf. Implementing the same access controls as in the previous mysql example,
we would put the following in pg_hba.conf:
hostssl logdb logwriter 192.168.3.2/32 password
hostssl logdb logreader 192.168.3.5/32 password
where 192.168.3.2 is the IP address of the loghost, and 192.168.3.5 is the
address of the analysis system. Note also that we chose an access method which
uses SSL to encrypt the data stream. Then, the SQL GRANT command is used
to control what each user can do with the database:
admin=> GRANT INSERT, UPDATE logdb TO logwriter;
admin=> GRANT SELECT logdb TO logreader;
And Oracle has yet another mechanism for providing similar access.
The advantage of the “pull” method is that the database doesn’t have to allow
any network connection, eliminating one vector of attack on the database.
As we mentioned, if you don’t want to deal with managing database access
controls, you can pull the data to the database server and then load it locally.

Attacks 313
For example, the “rsync” command, using SSH as a transport, can be used
like this:
# export RSYNC_RSH = /usr/bin/ssh
# rsync -avz logwriter@loghost.example.com:/var/log/* /var/log/store/
remotehost1
This will copy any files which haven’t previously been copied from /var/log
on the loghost. You still have to decide whether or not to allow read access for
the analysis station, but at least do not have to grant write permissions over the
network. Some might consider this “pull” method to be more secure, in that
one cannot directly attack the database server over the network.
Confidentiality at Analysis
Analysis systems need access to log data, and therefore are also a point of attack
for gaining access to log data, in addition to information on how the logs are
being analyzed. As with databases and loghosts, the analysis station should be
protected by limiting access to only those who work with the tools, verifying
file permissions, and encrypting traffic.
And of course, an attacker could shoulder-surf the security analyst while look-
ing at log data, which is another type of confidentiality attack altogether. And
is one to which we don’t have a technical solution.
Attacks on Integrity
An attack on log integrity is the ability to corrupt real data by overwriting or
inserting false data, or deleting data. An attacker often corrupts data in order
to hide evidence of his activity. The most common approach is simply deleting
the data in question. A more-clever attacker might delete just the log message
that indicates his activity on the system, or simply modify messages so that
they appear benign and do not attract attention. An inside attacker might even
wish to alter logs in order to “frame” another or to give the appearance that
someone else is doing something wrong.
Either type of attacker may want to create a distraction by inserting bogus mes-
sages which indicate some other activity is occurring, perhaps which might
cause one to overlook the attacker’s activity. For example, an attacker might
insert bogus error messages to keep the system administrator busy tracking
down non-existent issues. Another technique is to show bogus attacks from
another host on the same network.
And if log data is to be used for evidentiary purposes, being able to assert the
integrity of the log data may have an impact on whether the logs are accept-
able as evidence. An attacker who can show that the logs were not safe from

CHAPTER 17: Attacks Against Logging Systems
314
corruption can claim that the logs have been forged and aren’t evidence of
their malfeasance.
Integrity at the Source
Similar to the confidentiality issues that we already explored, improper per-
missions can allow an attacker to directly modify log data as it is stored.
For example, say a user “anton” on a system is doing something nefarious, and
doesn’t want the activity to be connected to him. If anton can modify the log
files where they are stored, he could replace all instances of “anton” in the logs
with “marcus,” shifting the blame for the activity onto someone else. This can
be easily done like this:
% sed 's/anton/marcus/g' < /var/log/logfile > /var/log/logfile.x; /bin/
mv /var/log/logfile.x /var/log/logfile
(and for the pedantic, the syslog daemon would have to be sent a SIGHUP to
cause it to start writing to the new log file).
The same approach should be taken to verify permissions on the log data,
devices, configuration file, etc. as we talked about in the confidentiality section.
Additionally, having logs forward to a central loghost, while not preventing
this attack, creates another set of logs which would have to be modified for
the attacker to be effective in hiding his tracks. Multiple sets of logs and mul-
tiple sources of log information make it easier to detect an attackers activity,
even when some of the log files have been modified. Multiple sources of
data are also useful for non-repudiation, when the accused attacker claims
“it wasn’t me, it was someone else!” “Hackers,” when they are caught, often
try to make the argument that it was someone else who did the attack. Hav-
ing logs from multiple sources sometimes goes a long way towards proving
the case. Similar attacks—modifying or deleting logs—can also be done on
Windows systems and not only on Unix; other platform can be affected as
well.
Against the event log, the attack is slightly more difficult as the file is a binary
format. One needs a tool to read and write the file, which is just a small matter
of programming. And the formats of the files are well enough documented as
to make it very simple to write such a tool. By the way, newer Windows variants
such as Windows 2008 and Windows 7 make this more difficult.
On Unix systems which support extended attributes, log files can be set to
append-only to prevent regular users from overwriting the file. A user with root
privileges, of course, can reset this attribute (see comment about intruders hav-
ing root privileges). But append-only files prevent ordinary users from modify-
ing the data, even with write privileges to the files. And, it even takes root an

Attacks 315
extra step to make the files writable again, and prevents something or someone
from “accidentally” overwriting a file.
Generating bogus log messages is a difficult issue to mitigate. It is rather trivial
to do create the messages, for example one can easily use the logger program.
Here is an authentic syslog message from a Linux system:
Nov 11 22:41:00 ns1 named[765]: sysquery: findns error (NXDOMAIN) on
ns2.example.edu?
Using logger, a standard tool on many Unix and Linux systems, a bogus
message is created matching the original:
$ logger -t "named[765]" "sysquery: findns error (NXDOMAIN) on ns2.dac.
net?"
The resulting bogus message looks like this:
Nov 11 22:45:51 ns1 named[765]: sysquery: findns error (NXDOMAIN) on
ns2.dac.net?
Due to the nature of the syslog mechanism, it is very difficult to protect against
this kind of attack. One could remove the logger program from the system, but
the attacker can easily bring her own copy.
In fact, it might be possible to create a restricted logger program. This would
involve changing the permissions on the logging socket (usually /dev/log)
to remove world write permissions. Of course there are applications which
log data which are not run as root which would not be able to write to the
log device. A group for accessing the log device, e.g. log can be created, the
log device group ownership changed to log, and those applications that run
as daemons under a role account1 can be added to the log group. We haven’t
actually tried this, though.
Applications run by regular users would not be able to log however. Possibly
a wrapper for logger could be built, which would run setgid logs, and would
insert a real process name, and possibly username, into the log message.
Finally, attacks against log timing can be seen as a special, but damaging kind
of attacks against integrity.
Integrity in Transit
Standard Unix syslog messages are transported over UDP. There is no authen-
tication of IP addresses in UDP packet headers, so there is no way to know if
they are from the actual host they claim to be from. And, the syslog transport is
1 A role account is one created specifically for the purpose of running a specific daemon.

CHAPTER 17: Attacks Against Logging Systems
316
unidirectional; the server does not send any acknowledgment to the client. And
since packets received by the server are accepted as coming from the apparent
sender, an attacker with access to the network can inject forged syslog messages
which appear to be coming from legitimate hosts on the network.
There are many programs for generating arbitrary network packets, most based
on libnet. Packit is one example of such a tool. Note that packit itself is not
a syslog-generation tool, it is described by its author as a “network auditing
tool.” Here is an example of generating a fake syslog message using packit:
packit -t UDP -d 172.16.110.53 -s 172.16.90.128 -D 514 -S 514 -vvv -p
'0x 3c 31 38 39 3e 73 79 73 6c 6f 67 3a 20 6b 6c 6f 67 64 20 73 74
61 72 74 75 70 20 73 75 63 63 65 65 64 65 64'
This command creates a UDP packet to be sent to the IP address 172.16.110.53
on port 514, appearing to come from the address 172.16.90.128. with the con-
tents “syslog: klogd startup succeeded.” (the numbers you see in the
example are the hexadecimal codes for the characters in the message string. This
message might be used to make the system administrator think that a system had
suddenly rebooted.
An attacker with access to a network segment between the source and des-
tination can intercept and modify IP traffic (“hijack the session”) using an
ARP-spoofing man-in-the-middle attack. The best defense against all of these
network-based attacks is to use a mechanism which verifies message integrity.
The syslog-sign protocol provides this mechanism. Another option is using
Secure Sockets Layer (SSL) or even Internet Protocol Security (IPSEC).
If those message integrity mechanisms are not feasible on your network, you can
mitigate the attacks by implementing appropriate anti-spoofing filters on net-
work borders,2 and restricting which hosts the loghost will accept messages from.
ARP-spoofing can be prevented by forcing an entry for the loghost on each of
the log sources (and vice versa if you want to be thorough). This can be done
with the arp command on Unix:
# arp –s loghost.example.com AA:BB:CC:DD:EE:FF
which creates an arp table entry for loghost.example.com with MAC address
aa:bb:cc:dd:ee:ff. You can view the status of your arp cache with:
# arp –a" fw.example.com (10.0.0.1) at 00:10:4B:26:46:A0 [ether] on
eth0 loghost.example.com (10.0.0.127) at AA:BB:CC:DD:EE:FF [ether]
PERM on eth0
2
Which is something you should do anyways. We recommend both ingress and egress filters,
so that an attacker on one network segment can’t pretend to be on another network segment
or from an external host.

Attacks 317
The word “PERM” in the second line indicates that the entry has been perma-
nently added to the arp cache and will not be overwritten.
Of course, manually maintaining arp caches can be a nuisance, and cause confu-
sion when moving hosts around. Additionally, when the source and loghost are on
different network segments, one has to maintain static entries for gateways instead
of the loghost, all of which creates more complication and potential confusion.
There are some who sidestep the issue of network interception and modifica-
tion by connecting sources to the loghost via serial lines. A bit harder to attack
remotely, but can be costly for sites with multiple locations.
Integrity at the Loghost
Integrity attacks on the loghost are basically the same as the attacks at the
source, and the same protection techniques apply. The impact of such attacks,
however, is greater than the impact on a single source, as the integrity of *all*
data collected by the loghost is at stake.
Integrity on the Database
As with attacks on confidentiality on the database, similar rules apply. Limit
the ability of database users to write or append to the log data space. Verify that
network access protects authentication credentials, and is secure from session
hijacking. The best approach is to use a mechanism that verifies data integrity
in addition to access rules.
Database brings two key data protection challenges, dealing with “data in
motion” and “data at rest.” The former refer to data as it arrives into the data-
base, while the latter refers to data stored in the database. Database security
is a huge area of knowledge and we will only briefly touch upon some of the
challenges related to protecting the databases with log data.
Data in motion is typically protected by encrypting the connection from the
application to the database or by using a “push” log collection method, as we
mentioned in this chapter.
The main challenge with encrypting connections is that there is no standard
mechanism, such as HTTPS for HTTP+SSL. There is now “SQLS” for transfer-
ring SQL commands and data over SS, but it is not widely used.
For example, later versions of MySQL database (www.mysql.com) support
native SSL encryption. In the Windows realm, Microsoft SQL Server (MSSQL)
can also encrypt connections using SSL5 Oracle 8 and 9 requires “Oracle
Advanced Security” (OAS) for SSL support.
The only reliable way to protect the data stored in the data is database encryp-
tion. At the time of this writing, few databases natively support encryption and
third-party software is required.

CHAPTER 17: Attacks Against Logging Systems
318
Integrity at Analysis
Attacks on analysis integrity seek to undermine confidence in the accuracy of
the analysis system. Too many false positives and the system is useless. False
negatives undermine the confidence that the system is catching everything.
There are three places at which to attack the integrity of the analysis system:
n the data being processed (the input),
n the tools used for analysis (the system), and
n the presentation of the results (the output).
By modifying the input data, the attacker can cause the system to report on
false attacks, or not report on actual attacks. The method used by the analysis
system for accessing data should have integrity protection mechanisms. If the
method is via a database, the same rules the one for storage access apply. If via
a file-server, the transport should be secure from session hijacking and data
stream corruption.
Targeting the analysis system itself, an attacker could change the analysis tools
so that the system behaves differently than expected. The analysis system
should have access restricted to only authorized users, and the software used
for analysis should be appropriately protected from modification. Consider
separate privileges for those users who use the software versus those who can
modify it. Revision control or other software should be implemented for track-
ing changes made to the software (including configuration files), and the integ-
rity of the software verified regularly.
Finally, the system used to present the data can be altered to change or suppress
data from being shown to the analyst. This can be done by altering reports cre-
ated by the system, creating false reports, or hijacking a session when output
data is being reviewed.
The security of the output data should be equal to that of the input data, limit-
ing who has write access and who has access to the system.
The presentation system should also be immune to hijacking of sessions. For
instance, if using a Web server for reviewing repots, the transport could use SSL
with properly signed certificates, along with password controlled access.
Attacks on Availability
Attacks on availability are aimed at preventing legitimate users from access the
data or system. As we already mentioned, a common intruder technique is to
delete log files upon gaining access to a system. Some availability attacks are
very similar to integrity attacks, and use the same vectors for attack. Others take
a different approach, such as causing a system to crash in order to prevent access.

Attacks 319
Attacks against availability can be considered a type of denial-of-service attack.
And in this case “service” can mean human resources as well as computer
resources. Staff time is often the most valuable commodity one has, loss of
time can be just as devastating as a network being down.
Availability at the Source
The simplest denial of availability is the deletion of log data at the source.
For example, here is the session capture in the compromised Linux honeypot,
run by one of the authors as a part of a Honeynet Research Alliance (http://
www.honeynet.org/alliance). These are the commands issued by the attacker
after gaining root privileges3:
# killall syslog
# rm ∼/.bash_history
# ln –s ∼/.bash_history /dev/null
Note that his first command was to kill the syslog daemon, indicating that he
wanted to stop from possible remote logging (in addition to stopping all local
logging). He deletes root’s .bash_history file to destroy the record of any
commands he has typed, and symlinks it to /dev/null to prevent further
recording of any new commands. The intruder then installed a rootkit, which
ran the following:
# zap /var/log/messages
which overwrites with zeros the relevant data in the file /var/log/messages.
Zeroing data, as opposed to deleting it, overwrites the data stored on disk, mak-
ing it impossible to recover. Simply deleting a file leaves data on disk where it may
be recovered with the right tools, as shown in Attacks against Confidentiality.4
Many hacker tools are written to “sanitize” login records, which mean covertly
removing undesirable, implicating records. Common examples of such tools
are zap, clear, and cloak. These tools operate in two distinct ways: they either
zero out/replace the binary log records (thus stuffing the file with zero records,
which is suspicious) or they erase them (thus making the log file shorter, which
is also suspicious). Both methods have shortcomings, and both can be detected.
3
For the curious, The example session was the result of an intruder gaining access to the
victim system being compromised via an OpenSSL exploit. The attacker then escalated his
privileges to “root” by using local exploit against “ptrace”.
4
In a specific investigation of a compromised system led by one of the authors, log files were
recovered by using the standard Linux file systems utilities as well as forensics toolkit TCT
(The Coroner Toolkit by Dan Farmer and Wietse Venema, see www.fish.com/forensics or
www.porcupine.org/forensics). The detailed account of the investigation can be read in chap-
ter 20 of the book “Security Warrior” (O’Reilly, 2004).
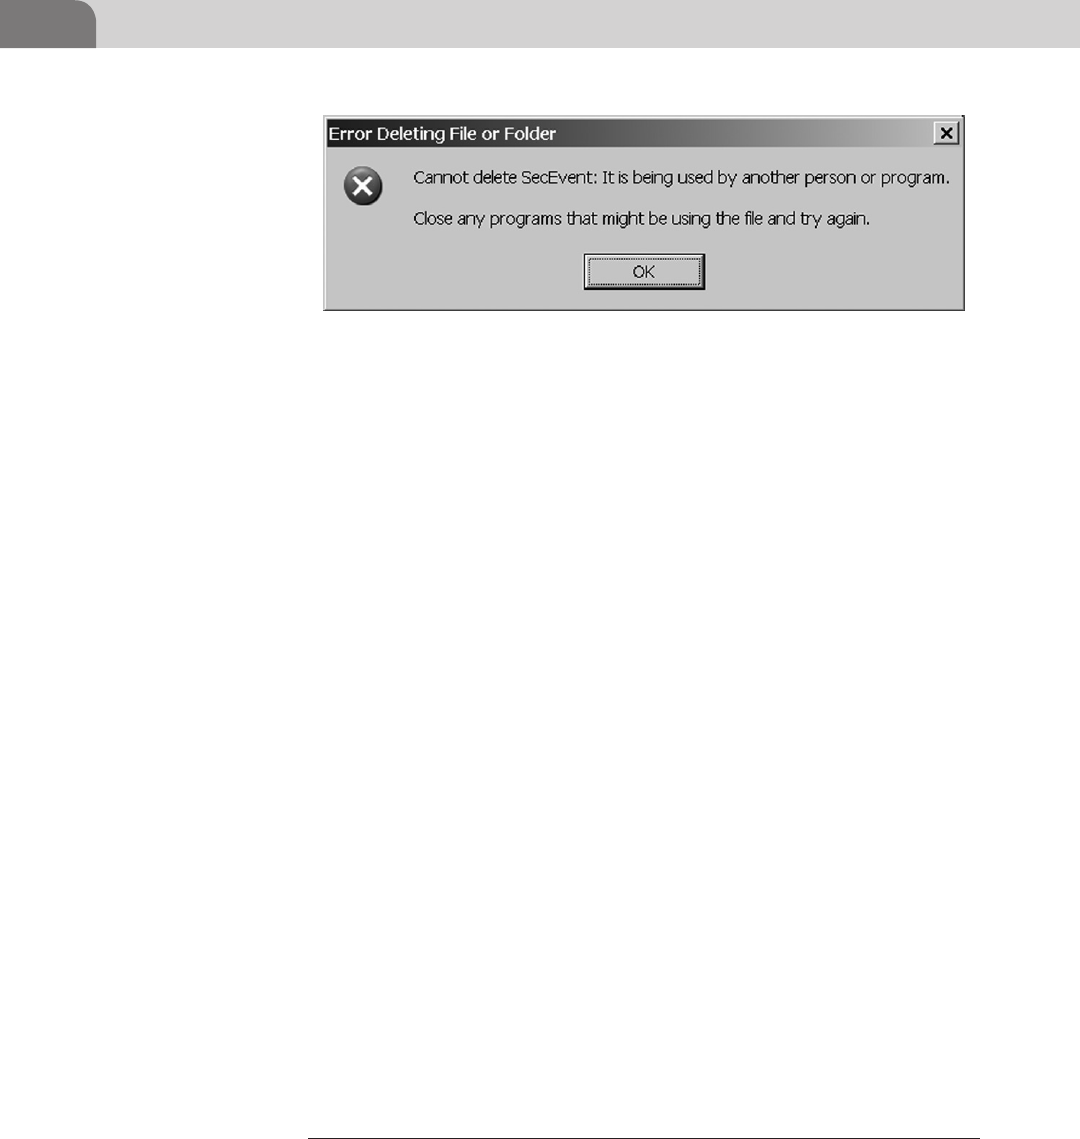
CHAPTER 17: Attacks Against Logging Systems
320
Binary formatted files, such as wtmp and pact, are also candidates for erasure.
As one of the authors covered in his previous book there are many tools to
“sanitize” the binary files, used on Unix and Windows.
Here’s what happens if a Windows XP event log is deleted or purged. Let’s
assume that the attacker has tried deleting the files AppEvent.Evt, SecEv-
ent.Evt, and SysEvent.Evt in C:\WINDOWS\system32\config from
the standard Windows Explorer shell.
It doesn’t work (see Figure 17.1), since the system protects the files that are in
use. The EventViewer application can be used to purge the logs (see Figure 17.2).
However, this case, the security log will not be cleaned “cleanly.” An event indi-
cating log cleanup will be generated (see Figure 17.3).
The event log can also be deleted by booting into a separate operating system
instance (such as a Linux floppy) or using special tools for log clearing. Two
examples of slightly dated but still effective tools are WinZapper (http://www.
ntsecurity.nu/toolbox/winzapper/) and ClearLogs (http://www.ntsecurity.nu/
toolbox/clearlogs/). In addition, the log records can be forced out of the file by
abusing the rotation scheme.
The methods for mitigating attacks which involve deletion of data are exactly
the same as for integrity attacks.
As shown in our sample, in addition to deleting local log files, the log daemon
can be killed, effectively stopping all logging, including forwarding data to a
loghost. Currently versions of “standard” syslog are not susceptible to denial-
of-service attacks, but some older versions have been.5
TCP-based syslog daemons (e.g. syslog-ng) may be vulnerable to SYN flooding
attacks. While some, mostly experimental, technology exists to help prevent
5
For example, “Cisco IOS Syslog Denial-of-Service Vulnerability” (http://www.ciac.org/ciac/
bulletins/j-023.shtml) can lead to a syslog daemon collapse.
FIGURE 17.1 Windows Logs Deletion Failure
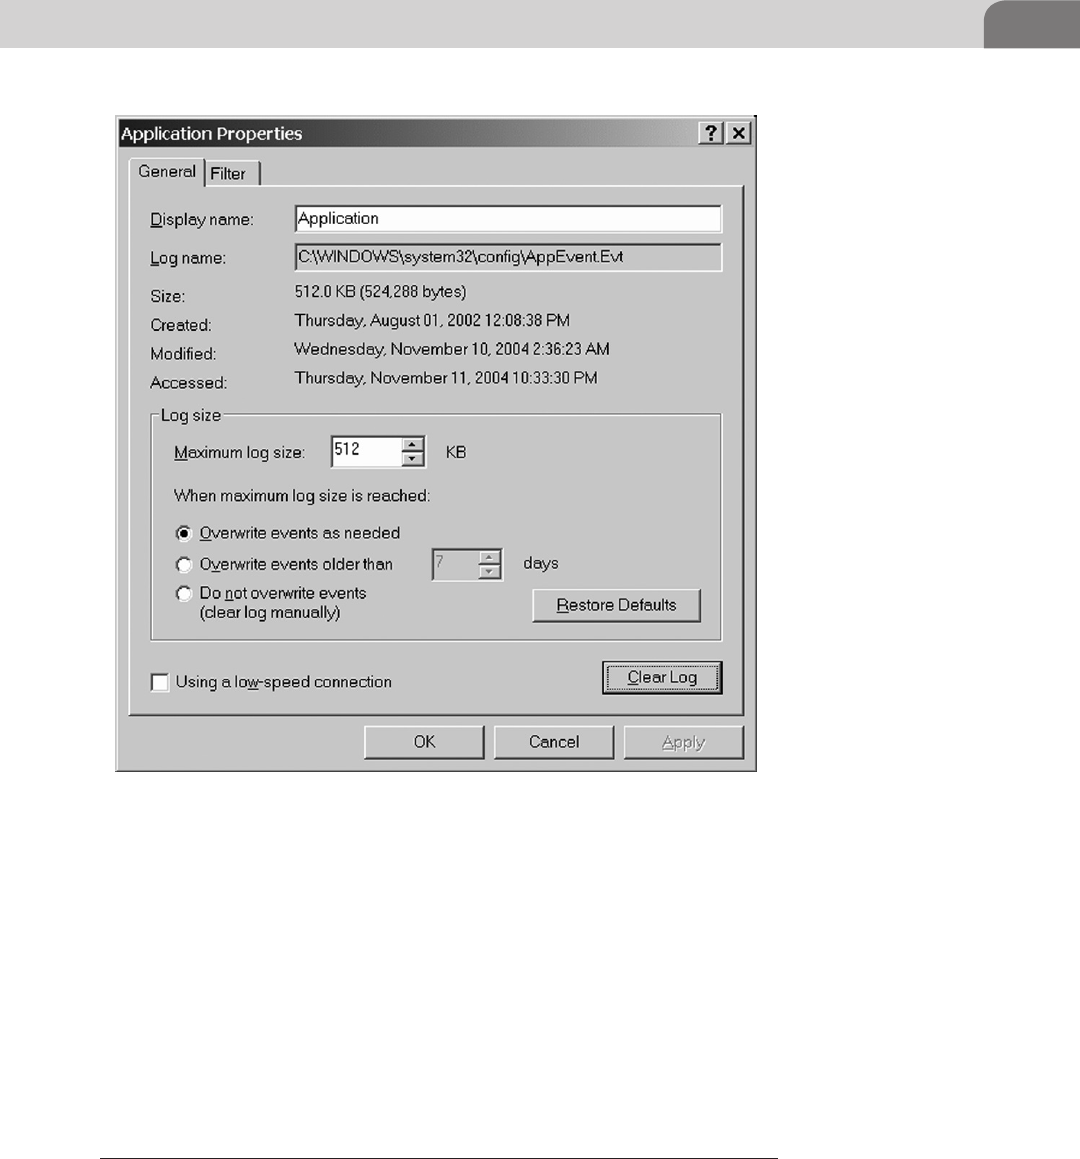
Attacks 321
such attacks, the simplest approach is to block network access to the log dae-
mon for networks other than the one that it lives on.
Additionally, while it is commonly understood that UDP packets may be
dropped on a busy network, we have observed, anecdotally,6 that such packets
may even be dropped on a local network connection (such as “loopback”). An
attacker might be able to suppress messages from being recorded by the log
daemon by simply flooding the log daemon with bogus traffic. Such an attack
can even be conducted on the host itself, by an unprivileged user.
There isn’t much in the way of a remedy against local flooding attacks. However,
by base lining activity from your systems, and looking for unusual amounts of
6
Meaning: We think we have seen it happen, but haven’t measured accurately enough to be sure.
FIGURE 17.2 Windows Logs Deletion Success
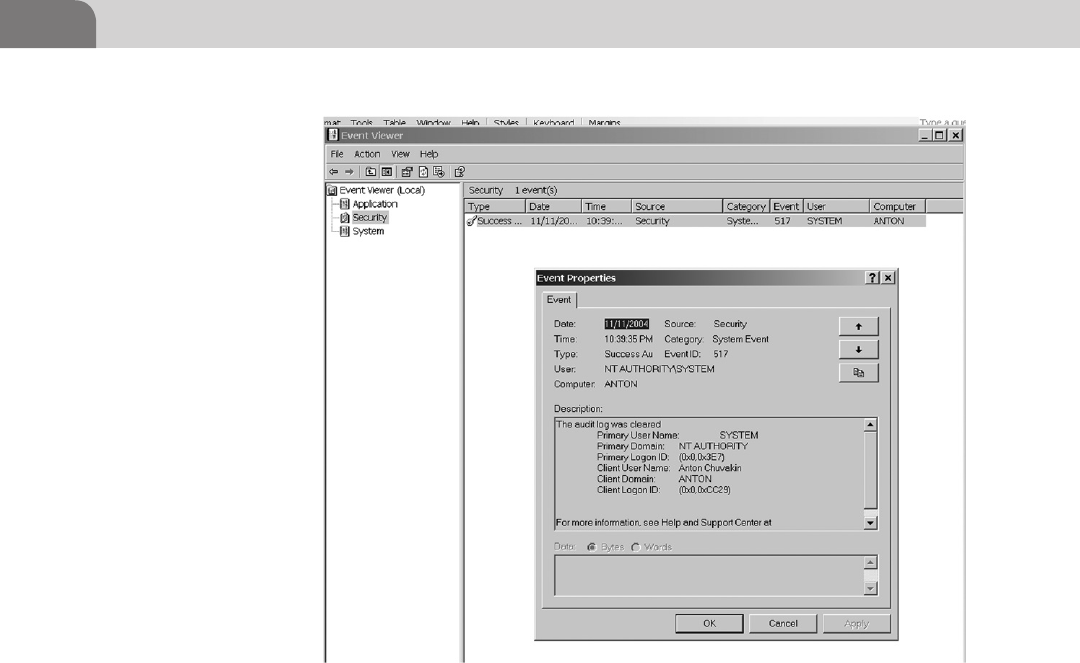
CHAPTER 17: Attacks Against Logging Systems
322
log messages, you may be able to detect a flooding attack as it’s happening. A
similar approach could be used to detect a crashed log server, by looking for a
lack of messages from a host.
Another method of suppressing local logging is by filling the disk partition
on which the logs are stored. This can be done by flooding the logs, or if the
attacker has another method of write access to the partition. Verify that users
cannot write to the partition that the logs live on.
An interestingly indirect way of destroying log data is by taking advantage of
the log rotation system. Log rotation is used to protect the logging server from
overflowing and also for organizing archive log files. Log rotation means sim-
ply stashing away the old log file (possibly compressing and/or moving to
another location) and switching the logging to a new file. It is done on both
Unix and Windows systems.
If an attacker knows that logs are being rotated when they reach a particular
size, she may able to destroy evidence of her activity by generating log mes-
sages to cause enough rotation to occur to delete the evidence of her activity.
FIGURE 17.3 Windows Logs Deletion Event

Attacks 323
Windows rotates logs based on size, and the default settings are to keep only a
small amount, overwriting the old entries when the log file becomes full (see
Figure 17.2). It is fairly easy to produce more log records in order to supplant
incriminating log messages.
The approaches to mitigating against rotational abuse are just to have enough
disk space and a large enough rotation capacity so that you can detect such an
abuse before the attacker can fill up the log files.
Availability in Transit
As already mentioned, the standard syslog transport mechanism uses UDP,
commonly called an “unreliable” transport. Heavy network traffic can result in
UDP packets being dropped between the source and the loghost. An attacker
could try to hide his tracks by flooding the network with traffic, causing the
traffic he doesn’t want you to see to be dropped.
The network does not have to be flooded with log traffic, or even traffic for an
actual host on the network. A nifty way for an attacker to stay “under the radar”
is to flood the network with completely bogus traffic, either to unused ports
on existing hosts, or nonexistent hosts on the network, or on another network.
The traffic won’t show up as connections on hosts or in any other way that is
obvious, short of monitoring utilization statistics on network devices.
One of the simplest ways to flood a network that can easily go unnoticed
is by “ping flooding.” Many versions of the ping program have an option
(usually “-f”) which tells the program to put out packets at a rate of at least
100 packets per second, up to the speed that the host being pinged is able to
respond. Ping flooding a host on the same network segment as the loghost
will probably cause packets to the loghost to be dropped, with no indication
on the loghost that there is a problem. In fact, the only indication of anything
out of the ordinary would be traffic counters on the router or switch showing
dropped packets and a large amount of Internet Control Message Protocol
(ICMP) traffic.
Here is an example ping command run against a loghost:
# ping –f loghost
Notice that only root user on a Unix system can run ping with such option.
Here is what happens if a non-root user tries to run it on a Linux system:
# ping –f loghost
ping: Operation not permitted
Network flooding is difficult to mitigate. How do you differentiate between
legitimate traffic and bogus traffic? How can you tell if a burst of network traffic

CHAPTER 17: Attacks Against Logging Systems
324
isn’t just because business got really good? About the only thing you can do is
monitor traffic statistics and look for things that are “unusual” (see Chapter 11).
Availability at the Loghost
Along with flooding the network, the loghost can be flooded, either with false
log data, or just bogus traffic. Flooding the loghost with false log traffic can
have two effects. First, it can cause legitimate traffic to be dropped either by the
network or by the kernel on the loghost. Additionally, the log data can fill up
the log file partition, forcing the loghost to stop logging any data. (Sometimes
this happens just to do system failure on a host).
Here is an example shell script that can be used to flood the loghost from a cli-
ent machine that normally forwards the logs to that loghost:
i=0
while: do
i=$i+1
logger -p "Flooding $i"
done
The use of the incrementing variable is to prevent the syslog daemon from
aggregating the messages with “last messages repeated X times.”
Not flooding fast enough for you? Run several of these in the background at
the same time.
This example is useful for flooding the local logs in addition to the remote
loghost.
A TCP-based syslog daemon protects you from packet loss, but can be sub-
ject to SYN flooding, which can crash the server, or at least cause it to refuse
to accept additional connections, just like one can choke all other TCP-based
services. The same measures used to protect the loghost from integrity attacks
apply here.
In addition, the loghost is subject to the same sorts of denial-of-service attacks
as the log source is, and the same protective measures apply.
Finally, databases are subject to similar types of attacks as the loghost—net-
work flooding, SYN floods, exploits to crash the database, and deletion of
stored files. The same recommendations as for integrity attacks apply here.
Availability at Analysis
In addition to disabling an analysis system, it can be bogged down by over-
whelming it with data to be analyzed. Effective data reduction techniques can
help mitigate this.

Attacks 325
An interesting, and often overlooked, attack on availability is on the availabil-
ity of the analyst. An attacker may escape notice simply by executing enough
different attacks, or injecting data to make it look like attacks are happening,
in order to overwhelm the security analyst, or make her spend time looking at
other activity which appears more serious.
And an analysis system which has too many “false alarms” will quickly be con-
sidered useless and discarded. The famous examples of such attack were alert
flooding tools such as stick, sneeze, and snot, that caused problems for early
intrusion detection systems. In addition to straining the system running the
intrusion detection software, the alert flooding tools generated so many alerts
that the personnel watching the system were left dazed and confused.
Log event collection and analysis need to be organized in a way to minimize an
ability of outsiders to inject forged data. Usually, cryptography helps to solve
the problem. At the very least, it will solve the data forging problem in trans-
mission from the source to the collection point. For example, replacing UDP-
based syslog with reliable syslog tunneled via SSL, SSH, or IPSec will prevent
the attackers from injecting data in the collection point.
Source authentication, also supported by some of the mechanisms, will, in
addition, prevent an attacker from bringing a fake source of logging online and
using it to flood the systems, overwhelming the technological components as
well as the analyst.
ATTACK CASE STUDY
In this section, we will describe a fictitious company and how it fared during a server intrusion,
followed by an attack on their logging infrastructure.
“Rats R Us” is a global leader in end-to-end rat management for business and consumers. It
offers a broad range of products and services for rat management, including rat threat preven-
tion, rat extermination, rat-related incident cleanup as well as raising rats for various purposes,
training rats, and creating custom genetically modified rats for commercial clients and govern-
ment. It offers its services and products direct through its Web site, printed catalogues, and
through the network of resellers and partners (combined under “RatOne” partner program).
The company’s central office houses several hundred people, including the entire IT staff. The
rest of the personnel are spread through regional sales offices and rat spawning facilities. The
datacenter is also located in the same building as the central office.
The corporate Web site provides a significant part of the company revenue, so “Rats R Us” has
invested in IT security resources. A Demilitarized Zone (DMZ) architecture with two firewalls
protects publicly available servers (Web, Email, etc.) and separates them from both internal
systems and the Internet. An e-commerce application server, the heart of the web-based rat
trading system, is connected to a Web server and is separated with an additional firewall. An
intrusion prevention system is sitting behind the external firewall and is supposed to prevent
the attacks against the DMZ assets.

CHAPTER 17: Attacks Against Logging Systems
326
One sunny day of May 2009, the intrusion prevention system started generating a huge amount
of alerts related to the IRC (Internet Relay Chat) program used on the company network. The
IDS was configured not to block such activity automatically when detected as IRC traffic could
be legitimate activity. The admin viewing the daily activity reports noticed that 90% of all
logged activity was related to IRC communication to multiple IRC servers around the world.
He reasoned that one of their systems was compromised and it had to be located in the DMZ,
since internal systems did not have a direct link to the Internet. By looking at the IRC messages
sources, the admin located one suspect Unix system in the DMZ—a mail server.
Since the machine was obviously compromised, the decision was made to take it offline for
investigation and recovery. It was promptly disconnected from a network but kept powered on.7
When the incident response team looked at the system, they noticed that an unknown process was
running with “root” privileges, a pretty good sign of a compromise (see Issues Discovering Com-
promised Machines for example) So they knew the host was compromised, but did not know how.
The response team tried looking at the logs on the host, and found that they had been erased.
The logs files were in place but no content had been recorded for the previous seven days. Old
logs were still in place (rotated and compressed by the log rotation script). The old logs pro-
vided no insight into the compromise. The server had been configured for remote logging, so the
team went to look at the logs on the loghost.
The team was shocked to learn that the syslog server system had no logs for the same time
period (seven days) from any of the servers that were supposed to be sending data to it. In
fact, they discovered that the syslog daemon was not even running on the loghost. So not
only had a host on the DMZ been compromised, but the central loghost had been DoSed, if not
compromised.
A network intrusion detection system had been watching the communication between
external systems and the DMZ machines, but had not picked up any exploits. The logs on the
network IDS (NIDS) contained normal day-to-day noise but no attack activity. Unfortunately,
the NIDS was not looking at internal-to-internal communication.
The team tried looking at external connectivity logs on the firewall. They discovered that the
company had not configured aggressive logging on their firewall, and were not logging allowed
connections, as allowed connections were automatically considered legitimate activity and
therefore didn’t need to be logged. In fact, the reality was quite the opposite: blocked traffic only
showed that the firewall was doing its job—the accepted traffic were the vectors for attack.
So, the next thing the team did was to try and recover the deleted logs. Pulling out their
expensive forensic tools, they proceeded to spend hours imaging hard drives and searching
for log data. They eventually discovered that the logs had not only been deleted, but had been
over-written with zeros.
Not having much evidence to go on, the team hypothesized that the intruder had used a
“zero-day” exploit to gain access to the log server. The exploit left telltale traces in the log files,
so the intruder had erased the logs to avoid giving away clues as to how the exploit worked.
But all they could do was guess, for lack of actual evidence.
The loghost was rebuilt and verified that it was fully patched. Logging levels were increased,
and an “intrusion prevention system” deployed on the loghost in the hopes that it might block
7
This decision is always tough on a compromised or infected machine: light off or light on?
There are compelling reasons for both approaches.

References 327
SUMMARY
This chapter should have given a good foundation on which to understand
what the common attacks are against logging systems. We also provided you
with examples on confidentiality, integrity, and other concepts as they apply
to log systems.
REFERENCES
For brief intro on SYN flooding, see this old CERT advisory. <http://www.cert.org/advisories/
CA-1996-21.html>.
libnet. <http://www.packetfactory.net/libnet/>.
Packit. <http://packit.sourceforge.net>.
Peikari, Cyrus, and Anton Chuvakin. Security Warrior. Beijing: O’Reilly & Associates, 2004. Print.
<http://www.eurocompton.net/stick/projects8.html>,<http://www.securiteam.com/
tools/5DP0T0AB5G.html>, <http://www.securityfocus.com/tools/113> (see this article “Issues
Discovering Compromised Machines” at <http://www.securityfocus.com/infocus/1808> for
reference for compromise detection hints).
a new exploit. However, not without much information on how the loghost was compromised,
Rats R Us was still probably vulnerable to the same exploit that got them in the first place.
What might the company do to better protect the loghost, or at least preserve log informa-
tion? They could archive log data to some sort of write-once medium or append-only file, which
would not prevent intrusion, but improve the chance of preserving log data up through the time
of the intrusion.
The loghost could be configured as a stealth loghost, with login access only from its console,
so that remote attack would be difficult, if not impossible.8 Of course, that makes administration
of the loghost a log more difficult, but if the log data is valuable enough, it might be worth it.
If not a stealth loghost, the loghost could be a different OS from the other hosts on the net-
work, in the hopes that heterogeneity will protect against attacks that work on the other hosts.
All of these solutions have their ups and downs. In your environment, do the best that you
can. Protect against the obvious things that are usually pretty easy to do, such as check file
permissions. Do additional things as you have the resources for, and are merited by the require-
ments for your site.
8
It’s pretty darned hard to remotely compromise a host that doesn’t transmit packets on the
network, but we know better than to use the term “impossible.” Did someone say “Titanic?”

This page is intentionally left blank

Logging and Log Management.
© 2013 Elsevier, Inc. All rights Reserved.
http://dx.doi.org/10.1016/B978-1-59-749635-3.00018-X
329
CHAPTER 18
Logging for Programmers
CONTENTS
Introduction .............329
Roles and
Responsibilities .......329
Logging for
Programmers ...........331
What Should Be
Logged? ..........................332
Logging APIs for
Programmers ..................333
Log Rotation ...................335
Bad Log Messages .........336
Log Message
Formatting ...................... 337
Security
Considerations ........ 340
Performance
Considerations ........341
Summary .................342
References ...............342
n Roles and Responsibilities
n Logging for Programmers
n Security Considerations
n Performance Considerations
INFORMATION IN THIS CHAPTER:
INTRODUCTION
Are you a programmer? Have you ever had the support staff come to your desk
and ask why your application isn’t working right? It is often the case that pro-
grammers either don’t provide enough information in log messages or provide
too much information. The trick is to understand how to balance providing
enough information in your logs with security and performance consider-
ations. Additionally, the log messages your software generates might be col-
lected by log collection and analysis tools. This means the parse-ability of your
logs is also a consideration which needs to be understood and considered.
The concepts presented in this chapter can be applied to any language and
environment and can be considered best practices.
ROLES AND RESPONSIBILITIES
Before we dive into the details on logging techniques of programmers, it is
important to understand the common roles and responsibilities as they are
related to software development and programing. The roles presented in this
section are the more common ones; your organization’s actual roles may differ.
Table 18.1 outlines the common roles and responsibilities.
Separation of duties is a security principle that is needed to provide protection to
the production environment. However, it is important to note that in some cases,

CHAPTER 18: Logging for Programmers
330
the software developer is also the architect, who is also the IT support person. This
typically happens in smaller organizations. This is not ideal, but it does happen.
It’s not ideal because when a person wears several different hats, the lines become
blurred and judgment and good process can go the way of the dodo bird.
Another reason that separation of duties is critical surrounds regulatory com-
pliance. Various regulatory bodies dictate that software developers cannot have
write access to production systems. In some cases, developers cannot have any
access to production systems. So how would a developer help troubleshoot a
problem in production? There are several avenues for this:
1. The developer shoulder-surfs with the production support staff and
provides guidance to the operator.
2. Screen control (like Cisco’s Web-ex, Microsoft’s Office Communicator, etc.)
can be used where the developer is given temporary view and control of
the production system, from the perspective of the support staff
member’s terminal.
3. A security exception can be granted. This is typically allowed if it is
documented properly. The gist is that the developer is given temporary
access to the system for a short period of time, e.g. 30 min, 1 h, etc.
Make sure you understand what your development staff can and can’t do in the
context of regulatory compliance. See Chapter 19 for more information.
You may have noticed that these roles are internally facing and do not reflect
roles, outside of your organization. Table 18.2 summarizes the common roles
and responsibilities found outside of an organization, typically found in
commercial and open source organizations.
Table 18.1 Summary of Internal Roles and Responsibilities
(Chuvakin, 2011)
Role Responsibility
Business/Product Owner The individual or group who has responsibility
for a product, feature set, application, etc.
Security Team Develop logging standard for internally
developed software; Involve business owners
in the process
IT/Development Managers Enforce logging standard as a “must have” feature
IT Support Team Support production applications; Read log files
when applications are misbehaving, etc.
Software Architects “Get” the value of logging and understand audit
vs. debug logging
Software developers/Programmers Follow the logging standard by using libraries,
APIs, and logging features

Logging for Programmers 331
LOGGING FOR PROGRAMMERS
This section assumes you are a novice to program logging. If you are already some-
what versed in the concepts surrounding logging, you can safely skip this section.
Now, let’s briefly look at common reasons why programmers should take care
when it comes to logging.
n Programmers are the ultimate source of log messages. It is up to you to
ensure your programs are generating great logs that have value and are
useful. Well-formed and timely log messages can aid in debugging, more
diagnostics gathering, and aid the programmer in understanding what the
program is actually doing.
n When the proper information is provided in a log message, it can aid in
detecting malicious behavior.
These are just a few of the compelling reasons to care about logging. We are
now beginning to get a picture of why logging for programmers is so critical.
But as a programmer, what are the mechanics behind logging? Let’s look at the
high-level steps in the process.
1. The programmer writes the application, decides what to log messages to
add to the code.
2. The list of what to log should be reviewed, at the very least, with the
IT support staff in order to get their input. A second reason to involve
them is so you will be able to understand their requirements from a
monitoring standpoint. They may have special requirements that you
are not aware of.
3. The programmer writes code that actually makes function or method calls
which facilitate the act of logging. The devil is in the details:
a. Typically there is a configuration file which drives where the logs are
written. This includes, local disk, remote disk (network file system
(NFS), etc.) Syslog, and so on.
Table 18.2 Summary of External Roles and Responsibilities
Chuvakin (2011)
Role Responsibility
Commercial software vendors Develop and then adopt log standards
Open source community Create logging APIs, libraries, etc. and then use
them to gain popularity and adoption
Log analysis vendors Encourage logging standardization and utilize
the standards for consuming the data and rep-
resenting it inside the products

CHAPTER 18: Logging for Programmers
332
b. Log rotation schemes are also considered (more on this in a subse-
quent section).
4. The logs are then used for debugging, analysis, and so on.
That’s the process at a high level. But what sort of things should be logged? We
explore this in the next section.
What Should Be Logged?
Before discussing this topic, it will be good to understand what makes a log
useful. A log message should tell what happened and why it happened. Recall
from Chapter 2 the concept of the five W’s of Logging. Let’s go over them again
real quick.
n Who was involved?
n What happened?
n Where did it happen?
n When did it happen?
n Why did it happen?
n How did it happen?
What do you notice, besides the fact that there are actually six items, and the
sixth one starts with an “H”? When these are applied to logging, it is easy to see
that the five W’s have all the components necessary to help understand what
happened and why. Generalizing things a bit, with an eye toward the five W’s, a
useful log should include state and context. State would be any sort of program
information contained in variables, return values, stack information, and so on.
Context is the supporting information which helps to describe why the log mes-
sage is being written in the first place.
Table 18.3 provides basic guidelines for the types of log messages that should
be logged.
Table 18.3 is a good rule-of-thumb reference list. This is a good base set of
types to always make sure you are logging. Your specific needs will vary from
what is listed above, but knowing the basic log types is half the battle.
WARNING
Logging State Information
There are some security ramifications with respect to logging certain information in log files.
See the Security Considerations section later in the chapter for more information on this topic.

Logging for Programmers 333
Logging APIs for Programmers
It is beyond the scope of this chapter to provide deep details on any one
logging API. Instead, a list of commonly used APIs is outlined in Table 18.4.
Let’s take a brief example. Logback is a popular logging API for Java. You can
control its logging behavior with configuration files, which is the actual idea.
The following is a sample Logback configuration file Logback Manual:
<configuration>
<appender name="STDOUT" class="ch.qos.logback.core.
ConsoleAppender">
<!-- encoders are assigned the type ch.qos.logback.classic.
encoder.PatternLayoutEncoder by default -->
<encoder>
<pattern>
%d{HH:mm:ss.SSS} [%thread]%-5level%logger{36} -%msg%n
</pattern>
</encoder>
</appender>
<root level="debug">
<appender-ref ref="STDOUT" />
</root>
</configuration>
Table 18.3 Basic Guidelines of Log Types
What Should be Logged Description
AAA (Authentication,
Authorization, Access)
Successful and failed authentication or authorization
decisions; System access, data access, and application
component access; and Remote access, including from
one application component to another in a distributed
environment
Change Events System or application changes (especially privilege
changes); Data changes (including creation and
destruction); and Application and component
installation and changes
“Badness”/Threats Invalid inputs and other likely application abuses; and
Other security issues known to affect the application
Resource Issues Exhausted resources, exceeded capacities, and so on;
Connectivity issues and problems; and Reached limits
Mixed Availability Issues Startups and shutdowns of systems, applications, and
application modules or components; Faults and errors,
especially errors affecting the application’s availability; and
Backup successes and failures that affect availability

CHAPTER 18: Logging for Programmers
334
This sample will log to standard out (STDOUT) and is the simplest of examples.
The format of a log message generated from an application using the library,
with the above configuration, will look like the following:
17:44:58.828 [main] INFO chapters.configuration.MyApp2 - Entering
application.
This line in the configuration drives the formatting:
%d{HH:mm:ss.SSS} [%thread]%-5level%logger{36} -%msg%n
Let’s take a look at each parameter in turn:
n %d{HH:mm:ss.SSS}:%d outputs the date of the logged event. The left-
and-right curly braces tell Logback accept ISO 8601 date formatting.
n [%thread]: The left-and-right brackets are literal strings, meaning they
will be seen in the log message. %thread will print the thread name (if
set) or the method from which the logging message was called.
n %-5level: Emit the logging level and left justify it with a minimum
width of 5 and no maximum width.
n %logger{36}: This parameter prints the logger, up to 36 characters. The
logger in this case is the application itself.
n %msg%n: %msg is the raw log message that is supplied to the logging call
(by the programmer). %n is the platform-dependent line separator char-
acter or characters.
The configuration is very readable, which is a key advantage to using an API
like Logback. Another nice feature of Logback is you can configure it to notice
when changes are made to the configuration file. This is useful because you
don’t have to stop and restart the application. First, the API detects the change,
then loads the changes into the file, and starts using and alteration automati-
cally within the running application. This feature is accomplished with the use
of the scan parameter in the configuration block:
Table 18.4 Summary of Common Logging Libraries by Language
Language Library
Java Log4j (http://logging.apache.org/log4j/)
Logback (http://logback.qos.ch/)
Perl Log4Perl (http://mschilli.github.com/log4perl/)
C/C++ Log4C (http://log4c.sourceforge.net/)
Unix / Shell Logger (man logger)

Logging for Programmers 335
<configuration scan="true">
…
</configuration>
The default scan period is 1 min. This can come in very handy when you want
to change the format of your log messages. All you have to do is edit the file,
make the change, and save it. The Logback infrastructure takes care of the rest.
You have just made a change “on the fly” without needing to recompile the
code or restart your application.
For full detail on Logback, please see Logback Manual for more detail.
Log Rotation
It is worth discussing log rotation for a moment. While it is typically not the
responsibility of the programmer to worry about log rotation, it is good if you
have an understanding of what it is. First off, there are two basic types of log
rotation mechanisms:
1. Log rotation scripts are used to manage when logs are rotated and
archived off to some external storage location.
2. The application itself handles log rotation duties, which can either be
handled by custom-written application code or by using built-in features
of a third-party logging library.
However, what is log rotation? Log file rotation is a scheme whereby an active log
file is moved to an archive copy, and a new, empty file is created for an applica-
tion to begin writing to. This technique is valuable when multiple copies of a log
file are kept around for short-term analysis and/or offsite archival and storage.
From the application’s standpoint, it doesn’t know that log rotation has occurred.
There are several log rotation schemes, which can be employed:
n time based: A log file is rotated based on some time period, e.g. hourly,
daily, weekly, etc.
n size based: A log file is rotated when it reaches some predefined sized, e.g.
10 MB, 100 MB, etc.
n size and Time based: This scheme combines both time-and size-based
schemes. The log file is archived based on time but each log file is also
capped at some predefined size.
Let’s briefly look at a Logback configuration for time—and size-based rotation:
<configuration>
<appender name="ROLLING" class="ch.qos.logback.core.rolling.
RollingFileAppender">

CHAPTER 18: Logging for Programmers
336
<file>mylog.txt</file>
<rollingPolicy class="ch.qos.logback.core.rolling.
TimeBasedRollingPolicy">
<!-- rollover daily -->
<fileNamePattern>mylog-%d{yyyy-MM-dd}.%i.txt</fileNamePattern>
<timeBasedFileNamingAndTriggeringPolicy
class="ch.qos.logback.core.rolling.
SizeAndTimeBasedFNATP">
<!-- or whenever the file size reaches 100MB -->
<maxFileSize>100MB</maxFileSize>
</timeBasedFileNamingAndTriggeringPolicy>
</rollingPolicy>
<encoder>
<pattern>%msg%n</pattern>
</encoder>
</appender>
<root level="DEBUG">
<appender-ref ref="ROLLING" />
</root>
</configuration>
This sample configuration file will rotate the log file each day OR when it
reaches 100 MB. This can be a useful technique for applications, which log
a high volume of messages. Instead of a log file growing to 1 GB before it’s
rotated, you can have manageable (and easily searchable!) chunks of log data.
Bad Log Messages
A chapter on logging for programmers would not be complete, unless we talk
about the bad habits of log messaging. First let’s look at some bad log messages
Chuvakin, 2010. First we will look at a message that contains a time stamp
missing the year:
Aug 11 09:11:19 xx null pif ?exit! 0
It is also missing time zone information as well as anything meaningful.
Next up we have a message which not only omits the time stamp all together,
but it also doesn’t include the actual username of the person transitioning to
a privilege level:
Message 202 User transitioning priv level

Logging for Programmers 337
The use of magic or secret numbers (in this case 202) is very bad. If there is no
documentation on what the number means, it shouldn’t have been included
in the log entry in the first place.
Finally, this little gem is all too common in the world of logging:
userenv[error] 1040 XYZCORP\wsupx No description available
It is scary how honest the programmer was: she decided to just give up and tell
us that there is no description available.
Table 18.5 outlines some common bad habits which you should avoid like the
plague.
Log Message Formatting
The best log messages lend themselves to manual and/or automated analysis.
A log message is made up of components that when taken in total allow for
greater meaning to be derived. The following list provides a starting point for
what to include in a useful log entry:
n The username helps answer “who” for those events relevant to user or
administrator activities. In addition, it’s helpful to include the name of
the identity provider or security realm that vouched for the username, if
that information is available.
n The object helps answer “what” by indicating the affected system compo-
nent or the object (such as a user account, data resource, or file).
n The status also helps answer “what” by explaining whether the action
aimed at the object succeeded or failed. (Other types of status are pos-
sible, such as “deferred.”)
n The system, application, or component helps answer “where” and must pro-
vide relevant application context, such as the initiator and target systems,
applications, or components.
n The source helps answer “from where” for messages related to network
connectivity or distributed application operation. Source can be in the
form of an Internet Protocol (IP) address or hostname. Related compo-
nents that should be used, depending on your application, are destination,
source port, and destination port.
n The time stamp and time zone help answer “when.” The time zone is essen-
tial for distributed applications. In addition to the time stamp and time
zone, some high-volume systems use a transaction ID.
n The reason helps answer “why,” so that log analysis doesn’t require much
digging for a hidden reason. Remember, the log’s customers are the secu-
rity and audit personnel.
n The action helps answer “how” by providing the nature of the event.

CHAPTER 18: Logging for Programmers
338
n A priority helps indicate the event’s importance. However, a uniform scale
for rating events by importance is impossible because different organiza-
tions will have different priorities. (For example, different companies
might have different policies regarding information availability versus
confidentiality.)
n A unique session id can help with grouping together related messages
across multiple threads and processes.
Table 18.5 Summary of Logging Bad Habits
Bad Habit Explanation
Missing time stamp and time zone Without this information, it makes it hard to
know when the log actually occurred, which
can hurt investigative procedures, data search-
ing, and so on
Magic or Secret Numbers Magic or secret numbers appear quite often in
log messages. The problem is that many times
there is no documentation to back up the num-
ber. This not only can lead to misinformation on
the log reviewer part, but also to frustration
Vague or no Description Log entries need to be clear, concise and
comprehendible. Vague or missing descrip-
tions not only make it difficult for humans and
automated tools to decipher a message, it can
waste valuable time when investigating systems
outages or potential security issues
No source / Destination IP/
Hostnames and ports
Not all applications are connection-oriented. But
for systems that are client-server, source and
destination IP and port information needs to be
included in the log entry
No unique message identifier It is important that each log message have a
unique identifier. This id is generally an integer
value that is monotonically increasing
Having a way to uniquely describe a message
has value for searching and other applica-
tions on the log message. Many programing
languages have predefined routines to generate
universal unique identifiers (UUIDs). Having said
this, unique message identifiers are typically
generated by the system or tool which parses
log messages
No unique message type identifier This differs from a unique id in that this is
typically an alphanumeric value which identi-
fies the message as belong to a type or class
of messages. One approach to solve this is to
concatenate together common parts of a log
message

Logging for Programmers 339
n Process id (pid) and thread id (tid) are both useful to log in order to be
able to correlate a running application with its log records. This is largely
useful if your application is writing to a log file that other applications are
sharing.
n Activity measurement is a component which not all applications will need to
log. For example, you would use this if your application acts on behalf of
a person or other applications to transfer data from one place to another.
This component, when logged, could be used by analysis systems to detect
when some attempts to transfer a larger-than-expected batch of data.
Alright, based on this guidance, what might a useful log message look like?
Let’s consider this hypothetical message:
2010/12/31 10:00:01AM GMT+7 priority=3, system=mainserver,
module=authentication, source=127.0.0.1, user=kjschmidt(idp:solar),
action=login, object=database, status=failed, reason="password
incorrect"
We see that this message has many of the components we just discussed. Name/
value pairs are used for each component. This common technique uses the
equal character to create a name to value mapping. A comma is then used as a
delimiter to mark the separation between name/value pairs. Also, you should
see there is no ambiguity with respect to how to parse the message. You would
first split on the comma which will get you a list of the name/value pairs. You
then split on the equal character for each name/value pair which gives you
both the name and its value.
To bring things full circle we should inspect the log message against our Five
W’s to see if it stands up to scrutiny. Let’s do that now:
n Who was involved: kjschmidt
n What happened: failed authentication
n Where did it happen: database
n When did it happen: 2010/12/31 10:00:01AM GMT+7
NOTE
Delimiters
While a comma is commonly used as a delimiter, care needs to be taken. If you anticipate any of
the values for your name/value pairs containing commas, it might be wise to choose a different
delimiter character. For example, if you have something like reason=”1, 2, 3,” the com-
mas between the numbers might cause issues with the parsing mechanism.

CHAPTER 18: Logging for Programmers
340
n Why did it happen: Password incorrect
n How did it happen: The user entered a bad password
As you can see, the format allowed use to easily answer the Five W’s questions
very easily. This really exemplifies the end goal: clarity in understanding what
happened so resolution can take place in a timely manner.
SECURITY CONSIDERATIONS
There are certain things which should never, ever be logged with a log message.
Any data that can be used to identify people, financial records, birthdates, and
other items like this should not be logged. Basically anything that is personally
identifiable information (PII) is off limits. This includes:
n Passwords (database, user, etc.)
n Social Security Numbers
n Birthdates
n Phone Numbers
n Full Names
n Credit Card Numbers
n Driver’s License Numbers
n Genetic Information
n Insurance Information
n Any sort of identifying number
n Biometric Information
You get the picture. Some programmers try to be cute and format log messages
which look something like this:
…Database login failure for user=Bob, password=XXXXXX
Why would you log the password parameter just to X it out? This is a waste of
time and space. Just resist the temptation to write log messages in this manner.
NOTE
Unique Message Type Identifier
Recall from Table 21.5 that one of the bad habits is “No unique message identifier.” If we use
the hypothetical log message presented in this section, one way “object-action-status” to give
an identifier of “database-login-failed.” The goal is to create a unique message identifier that
can be used to uniquely identify what happened in this log message. Keep in mind that other
log message may have the same unique message identifier, but have differing parameters (like
username, system, etc.).

Performance Considerations 341
PERFORMANCE CONSIDERATIONS
By now you should have been asking yourself about how all this logging is
going to affect performance of your application. Consider this pseudo-code
example that reads records from a database and processes them:
While(resultSet) {
Log("Getting record..\n");
Record = getRecord();
Log("About to process record\n");
processRecord(Record);
Log("Done processing record\n");
}
If we are only processing a few hundred records each time there is a result
set from the database, this is no big deal. But what about thousands, tens of
thousands or even hundreds of thousands records per result set? What if we are
getting this volume of record data every minute? Each time we call the Log()
method, it will, effectively, open the log file and write the log message. Now,
this doesn’t account for if the operating system is buffering the output or not.
But let’s assume each time we call Log(), it writes directly to the log file. This
means that for each record, we write three log messages. This is a lot if you
spread it out of hundreds of thousands of records. Instead of logging each
operation your program is executing, it is a better idea to have a logging level
scheme in place.
Most logging APIs allow you to specify a logging level along with the actual
log message itself. Log levels generally include INFO, DEBUG, WARN, ERROR,
and FATAL. The meaning of each log level is pretty self-explanatory. These same
APIs also typically allow you to turn on and turn off which log levels to log to
the log file; this is done at the configuration level. Table 18.6 is a sample log
level scheme.
The idea is to understand your threshold for what levels you want to log by
default and which ones will get “turned on” when a problem arises. For exam-
ple, if an application is not operating properly, the following set of steps might
be followed:
1. Enable DEBUG logging level in configuration file.
2. Allow application to write debug-level log messages for a period of time.
3. Disable DEBUG logging level in configuration file.
This allows you to collect the log messages you need while balancing the need
to make sure your application is operating optimally.

CHAPTER 18: Logging for Programmers
342
Another thing to be aware of is that the large the log message is, the more disk
space it will take up. Today, however, disk space is pretty cheap. It is possible
to have a vast amount of disk space available for you to periodically archive off
application log files.
SUMMARY
We can summarize this chapter with the following set of rules-of-thumb:
1. Make sure your applications are generating clear, concise, and parse-able
log messages.
2. Understand log rotation.
3. Understand what NOT to put in a log message.
4. Understand the basic performance considerations and how to deal with
them.
REFERENCES
Chuvakin, A. (2011). Application logging good bad ugly ... beautiful? Upload & Share PowerPoint
Presentations and Documents.Web, August 5. <http://www.slideshare.net/anton_chuvakin/
application-logging-good-bad-ugly-beautiful-presentation>.
Chuvakin, A. (2010). How to do application logging right. Building Security In. Web. <http://arctec-
group.net/pdf/howtoapplogging.pdf>.
Logback Manual. Web, August 5, 2011. <http://logback.qos.ch/manual/>.
Table 18.6 Sample Log Level Scheme
Log Level Description Log by default?
INFO INFO is used to log normal processing
messages and status of an application
No
DEBUG This level is used to identify log mes-
sages that can aid developers with
debugging
No
WARN The WARN level is used to draw atten-
tion to possibly harmful log messages
Yes
ERROR An ERROR is a condition that is ab-
normal to the operation of application,
but it doesn’t necessarily cause the
application to fail
Yes
FATAL The FATAL level is for severe situations
that will cause the application to halt
Yes

Logging and Log Management.
© 2013 Elsevier, Inc. All rights reserved.
http://dx.doi.org/10.1016/B978-1-59-749635-3.00019-1
343
CHAPTER 19
Logs and Compliance
CONTENTS
Introduction .............343
PCI DSS ....................344
Key Requirement 10 ......345
ISO2700x Series ......350
HIPAA ......................353
FISMA ......................360
NIST 800-53 Logging
Guidance ........................361
Summary .................366
n PCI DSS
n ISO2700x Series
n HIPAA
n FISMA
INFORMATION IN THIS CHAPTER:
INTRODUCTION
Logs, while often underappreciated by IT managers, can provide useful infor-
mation for security management. However, getting that data takes time and
energy—both of which are often in short supply inside IT organizations. It
can seem daunting at first, given the sheer volume and subjective nature of
the data. Adding to their strategic value, logs are increasingly more than just a
source of data for system administrators. Logging—and tracking such activity
through log management software or other tools—is a primary means of IT
accountability because most user and system actions can be recorded in logs.
There are many other means of accountability inside an organization, but logs
are the one mechanism that pervades all of IT, stretching even beyond the
bounds of technology. If your IT operation is not accountable, that means your
business is not accountable.
If your organization doesn’t take logs seriously, it should raise flags about just
how attentive you are when it comes to IT accountability. This is why logging
is a perfect compliance technology, now mandated by a raft of regulations and
laws, including PCI DSS, FISMA, HIPAA, and best practice frameworks such as
ISO2700 and COBIT.
As already mentioned, all IT users, whether they are malicious or good corpo-
rate citizens, leave behind traces of their activity in various logs. These digital

CHAPTER 19: Logs and Compliance
344
fingerprints are generated by a number of IT components, such as user-owned
desktops, servers and firewalls, routers, databases, and business applications.
Such records accumulate over time, creating mountains of different types of
log data.
Overall regulations require some or all of the following related to log data:
n Typical logging, log management, and security monitoring requirements
in the above regulations include:
n Have adequate logging. Regulations vary significantly regarding the
meaning of adequate. Some mandates stop after stipulating that an
organization have audit logging.
n Collect logs centrally. Some regulations prescribe collection of logs
and centralized storage and analysis.
n Review log data. The most onerous part of many regulations is a man-
date for log review. PCI DSS, for example, calls for daily review of logs
from in-scope systems. Clearly, this does not mean that every single
log entry needs to be read by a person.
n Retain logs for a period of time. Regulations prescribe various reten-
tion periods for logs, from months to years. Some stop at saying that
an organization must have a log retention policy without specifying
the exact number.
n Monitor security. Some regulations prescribe reviews of
network and Web alerts, and that an incident response
process be deployed when required. Additional tasks may
include protection of log data, time synchronization,
etc. (source: http://searchcompliance.techtarget.com/tip/
Log-management-and-compliance-Whats-the-real-story).
It’s a common misconception that such regulations mandate only that you
possess the log data.
Let’s review a few popular regulations and how they relate to logging, log anal-
ysis, and log management.
PCI DSS
This section covers the basics of PCI DSS logging and what is required by PCI
DSS.
Overall, logging and monitoring are not constrained to Requirement 10, but,
in fact, pervades all 12 of the PCI DSS requirement; the key areas where logging
and monitoring are mandated in PCI DSS are Requirement 10 and sections of
Requirements 11 and 12.

PCI DSS 345
Key Requirement 10
Specifically, Requirement 10.1 covers “establish[ing] a process for linking all
access to system components (especially access done with administrative privi-
leges such as root) to each individual user.” This is an interesting requirement
indeed; it doesn’t just mandate for logs to be there or for a logging process
to be set, but instead mentions that logs must be tied to individual persons
(not computers or “devices” where they are produced). It is this requirement
that often creates problems for PCI implementers, since many think of logs as
“records of people actions,” while in reality they will only have the “records of
computer actions.” Mapping the latter to actual users often presents an addi-
tional challenge. By the way, PCI DSS requirement 8.1 which mandates that an
organization “assigns all users a unique ID before allowing them to access sys-
tem components or cardholder data” helps to make the logs more useful here
(source: http://chuvakin.blogspot.com/2010/11/complete-pci-dss-log-review-
procedures_30.html).
Next, Section 10.2 defines a minimum list of system events to be logged
(or, to allow “the events to be reconstructed”). Such requirements are moti-
vated by the need to assess and monitor user actions as well as other events
that can affect credit card data (such as system failures) (source: http://
chuvakin.blogspot.com/2010/11/complete-pci-dss-log-review-procedures_
30.html).
Following is the list from the requirements (events that must be logged) from
PCI DSS (v. 2.0):
10.2.1 All individual user accesses to cardholder data.
10.2.2 All actions taken by any individual with root or administrative
privileges.
10.2.3 Access to all audit trails.
10.2.4 Invalid logical access attempts.
10.2.5 Use of identification and authentication mechanisms.
10.2.6 Initialization of the audit logs.
10.2.7 Creation and deletion of system-level objects.
As can be seen, this covers data access, privileged user actions, log access and
initialization, failed and invalid access attempts, authentication and authoriza-
tion decisions, and system object changes. It is important to note that such a
list has its roots in IT governance “best practices,” which prescribe monitoring
access, authentication, authorization change management, system availability,
and suspicious activity.
Moreover, PCI DSS Requirement 10 goes into an even deeper level of detail
and covers specific data fields or values that need to be logged for each event.

CHAPTER 19: Logs and Compliance
346
They provide a healthy minimum requirement, which is commonly exceeded
by logging mechanisms in various IT platforms.
Such fields are:
10.3.1 User identification.
10.3.2 Type of event.
10.3.3 Date and time.
10.3.4 Success or failure indication.
10.3.5 Origination of event.
10.3.6 Identity or name of affected data, system component, or
resource.(Source: PCI DSS from www.pcisecuritystandards.org.)
As can be seen, this minimum list contains all of the basic attributes needed for
incident analysis and for answering the questions: when, who, where, what,
and where from. For example, if trying to discover who modified a credit card
database to copy all of the transactions with all the details into a hidden file
(a typical insider privilege abuse), knowing all of the above records is very
useful.
The next requirement, 10.4, addresses a commonly overlooked but critical
requirement: a need to have accurate and consistent time in all of the logs. It
seems fairly straightforward that time and security event monitoring would
go hand in hand as well. System time is frequently found to be arbitrary in a
home or small office network. It’s whatever time your server was set at, or if you
designed your network for some level of reliance, your systems are configured
to obtain time synchronization from a reliable source, like the Network Time
Protocol (NTP) servers.
Next, one needs to address all of the confidentiality, integrity, and availabil-
ity (CIA) of logs. Section 10.5.1 of PCI DSS covers the confidentiality: “Limit
viewing of audit trails to those with a job-related need.” This means that only
those who need to see the logs to accomplish their jobs should be able to.
One of the obvious reasons is that authentication-related logs will always con-
tain usernames. While not truly secret, username information provides 50%
of the information needed for password guessing (password being the other
50%). Moreover, due to users mistyping their credentials, it is not uncommon
for passwords themselves to show up in logs. Poorly written Web applica-
tions might result in a password being logged together with the Web Uniform
Resource Locator (URL) in Web server logs.
Next comes “integrity.” As per section 10.5.2 of PCI DSS, one needs to “protect
audit trail files from unauthorized modifications.” This one is obvious, since if
logs can be modified by unauthorized parties (or by anybody) they stop being
an objective assessment trail of system and user activities.

PCI DSS 347
However, one needs to preserve the logs not only from malicious users, but
also from system failures and consequences of system configuration errors.
This touches upon both the “availability” and “integrity” of log data. Specifi-
cally, Section 10.5.3 of PCI DSS covers that one needs to “promptly back up
audit trail files to a centralized log server or media that is difficult to alter.”
Indeed, centralizing logs to a server or a set of servers that can be used for log
analysis is essential for both log protection as well as increasing log usefulness.
Backing up logs to CDs or DVDs (or tapes, for that matter) is another conse-
quence of this requirement. One should always keep in mind that logs on tape
are not easily accessible and not searchable in case of an incident.
Many pieces of network infrastructure such as routers and switches are designed
to log to an external server and only preserve a minimum (or none) of logs
on the device itself. Thus, for those systems, centralizing logs is most critical.
Requirement 10.5.4 of PCI DSS states the need to “copy logs for wireless net-
works onto a log server on the internal LAN.”
To further decrease the risk of log alteration as well as to enable proof that such
alteration didn’t take place, Requirement 10.5.5 calls for the “use file integrity
monitoring and change detection software on logs to ensure that existing log
data cannot be changed without generating alerts.” At the same time, adding
new log data to a log file should not generate an alert since log files tend to
grow and not shrink on their own (unless logs are rotated or archived to exter-
nal storage). File integrity monitoring systems use cryptographic hashing algo-
rithms to compare files to a known good copy. The issue with logs is that log
files tend to grow due to new record addition, thus undermining the missing of
integrity checking. To resolve this contradiction, one should note that integrity
monitoring can only assure the integrity of logs that are not being actively writ-
ten to by the logging components.
The next requirement is truly one of the most important as well as one of
the most often overlooked. Many PCI implementers simply forget that PCI
Requirement 10 does not just call for “having logs,” but also for “having the
logs AND looking at them.” Specifically, Section 10.6 states that the PCI orga-
nization must, as per PCI DSS, “review logs for all system components at least
daily. Log reviews must include those servers that perform security functions
like IDSes and AAA servers (e.g. RADIUS).” The rest of this document covers
the detailed log review procedures and practices.
Thus the requirement covers the scope of log sources that need to be “reviewed
daily” and not just configured to log, and have logs preserved or centralized.
Given that a large IT environment might produce gigabytes of logs per day, it is
humanly impossible to read all of the logs. That is why a note is added to this
requirement of PCI DSS that states that “Log harvesting, parsing, and alerting
tools may be used to achieve compliance with Requirement 10.6.”

CHAPTER 19: Logs and Compliance
348
The final requirement (10.7) deals with another hugely important logging
question—log retention. It says: “retain audit trail history for at least 1 year,
with a minimum of 3 months online availability.” Unlike countless other
requirements, this deals with the complicated log retention question directly.
Thus, if you are not able to go back one year and look at the logs, you are in
violation. Moreover, PCI DSS in its updated version v1.1 got more prescriptive
when a one-year requirement was added explicitly.
So, let us summarize what we learned so far on logging in PCI:
n PCI Requirement 10 calls for logging-specific events with a pre-defined
level of details from all in-scope systems.
n PCI calls for tying the actual users to all logged actions.
n All clocks and time on the in-scope systems should be synchronized.
n The CIA of all collected logs should be protected.
n Logs should be regularly reviewed; specific logs should be reviewed at
least daily.
n All in-scope logs should be retained for at least 1 year.
Now we are ready to dig deeper to discover that logs and monitoring “live”
not only within Requirement 10, but in all other PCI requirements. While
many think that logs in PCI are represented only by Requirement 10, reality
is more complicated: logs are in fact present, undercover, in all other sections
(source: http://chuvakin.blogspot.com/2010/12/complete-pci-dss-log-review-
procedures.html) .
Just about every claim that is made to satisfy the requirements, such as data
encryption or anti-virus updates, can make effective use of log files to actually
substantiate it.
For example, Requirement 1,“Install and maintain a firewall configuration to
protect cardholder data” mentions that organizations must have “a formal pro-
cess for approving and testing all external network connections and changes
to the firewall configuration.” However, after such process is established, one
needs to validate that firewall configuration changes do happen with authori-
zation and in accordance with documented change management procedures.
That is where logging becomes extremely handy, since it shows you what actu-
ally happened and not just what was supposed to happen.
The entire Requirement 1.3 contains guidance to firewall configuration, with spe-
cific statements about inbound and outbound connectivity. One must use firewall
logs to verify this; even a review of configuration would not be sufficient, since
only logs show “how it really happened” and not just “how it was configured.”
Similarly, Requirement 2 talks about password management “best practices”
as well as general security hardening, such as not running unneeded services.

PCI DSS 349
Logs can show when such previously disabled services are being started, either
by misinformed system administrators or by attackers.
Further, Requirement 3, which deals with data encryption, has direct and
unambiguous links to logging. For example, the entire subsection 3.6, shown
below in an abbreviated form, implies having logs to verify that such activity
actually take place. Specifically, key generation, distribution, and revocation
are logged by most encryption systems and such logs are critical for satisfying
this requirement.
Requirement 4, which also deals with encryption, has logging implications for
similar reasons.
Requirement 5 refers to anti-virus defenses. Of course, in order to satisfy
Section 5.2, which requires that you “Ensure that all anti-virus mechanisms are
current, actively running, and capable of generating audit logs,” one needs to
see such mentioned logs.
So, even the requirement to “use and regularly update anti-virus software” will
likely generate requests for log data during the assessment, since the informa-
tion is present in anti-virus assessment logs. It is also well known that failed
anti-virus updates, also reflected in logs, expose the company to malware risks,
since anti-virus without the latest signature updates only creates a false sense
of security and undermines the compliance effort.
Requirement 6 is in the same league: it calls for the organizations to “Develop
and maintain secure systems and applications,” which is unthinkable without
a strong assessment logging functions and application security monitoring.
Requirement 7, which states that one needs to “Restrict access to cardholder
data by business need-to-know,” requires logs to validate who actually had
access to said data. If the users that should be prevented from seeing the data
appear in the log files as accessing the data usefully, remediation is needed.
Assigning a unique ID to each user accessing the system fits with other secu-
rity “best practices.” In PCI it is not just a “best practice,” it is a requirement
(Requirement 8 “Assign a unique ID to each person with computer access”).
Obviously, one needs to “Control addition, deletion, and modification of user
IDs, credentials, and other identifier Objects” (Section 8.5.1 of PCI DSS) Most
systems log such activities.
In addition, Section 8.5.9, “Change user passwords at least every 90 days,” can
also be verified by reviewing the logs files from the server in order to assure that
all the accounts have their password changed at least every 90 days.
Requirement 9 presents a new realm of security—physical access control. Even
Section 9.4 that covers maintaining visitor logs (likely in the form of a physical

CHAPTER 19: Logs and Compliance
350
logbook) is connected to log management if such a visitor log is electronic.
There are separate data retention requirements for such logs: “Use a visitor log
to maintain a physical assessment trail of visitor activity. Retain this log for a
minimum of three months, unless otherwise restricted by law.”
Requirement 11 addresses the need to scan (or “test”) the in-scope systems
for vulnerabilities. However, it also calls for the use of IDS or IPS in Section
11.4: “Use network intrusion detection systems, host-based intrusion detection
systems, and intrusion prevention systems to monitor all network traffic and
alert personnel to suspected compromises. Keep all intrusion detection and
prevention engines up to date.” Intrusion detection is only useful if logs and
alerts are reviewed.
Requirement 12 covers the issues on a higher level—security policy as well as
security standards and daily operational procedures (e.g. a procedure for daily
log review mandates by Requirement 10 should be reflected here). However,
it also has logging implications, since assessment logging should be a part of
every security policy. In addition, incident response requirements are also tied
to logging: “Establish, document, and distribute security incident response
and escalation procedures to ensure timely and effective handling of all situa-
tions” is unthinkable to satisfy without effective collection and timely review
of log data.
Thus, event logging and security monitoring in PCI DSS program go much
beyond Requirement 10. Only through careful data collection and analysis can
companies meet the broad requirements of PCI.
ISO2700X SERIES
ISO27001 belongs to the ISO27000 family of standards. It is an Information
Security Management System (ISMS) standard published by International
Organization for Standardization (ISO). Its full name is ISO/IEC 27001:2005
“Information technology—Security techniques—Information security man-
agement systems—Requirements.” The specification can be found at http://
www.27000.org and in other places (sadly, for a fee).
Let’s focus on specific ISO controls related to logging and monitoring. These
are concentrated in section “A.10.10 Monitoring” which has the following
objective: “to detect unauthorized information processing activities.” This fol-
lows the security mission of ISO27001 framework and also places emphasis on
detection—rather than investigation—of security issues.
ISO Section A.10.10.1 Audit Logging states that “Audit logs recording user activi-
ties, exceptions, and information security events shall be produced and kept for an
agreed period to assist in future investigations and access control monitoring.” This

ISO2700x Series 351
prescribes having logs and also retaining them for a pre-defined period of
time—your log retention policy. It also briefly highlights what types of events
need to be recorded in logs, and follows a traditional set of compliance rel-
evant log categories as mentioned in the Introduction section.
Broadening the above definition and including additional requirements from
Section A.10.10.4 Administrator and Operator Logs (“System administrator
and system operator activities shall be logged”) and Section A.10.10.5 Fault
Logging (“Faults shall be logged, analyzed, and appropriate action taken”), we
can summarize the types of events that need to be logged across all systems in
an ISO environment in Table 19.1.
All of these may provide useful initial evidence for security incidents such as
data theft.
On Windows, the above will cover a broad range of events from logins to pol-
icy changes to application updates as well as user operations with data. On
network devices, it will include security and availability issues.
Table 19.1 Types of Events Which Need to be Logged in an ISO
Environment
Logged Message Category Purpose Within ISO27000 Logging
and Monitoring
Authentication, authorization, and access
events, such as successful and failed authenti-
cation decisions (logins), system access, data
access, and application component access;
and especially remote access
Tracking and investigating access to
systems by authorized users as well as
attackers and malicious insiders
Changes such as system or application
changes (especially privilege changes), data
changes (including creation and destruction),
and even application and component installa-
tions and updates
Monitoring for changes that can
expose system to attacks as well as
for changes made by attackers and
malicious insiders
Availability issues such as startups and
shutdowns of systems, applications, and
application modules or components and also
faults and errors, especially errors affecting the
application’s availability and data security
Monitoring for operational issues as
well as security related failures and loss
of system availability for business
Fourth type is resource issues covering the
range of exhausted resources, exceeded
capacities, and network connectivity availability
issues, various reached limits. All of these
may provide useful initial evidence for security
incidents such as data theft
Detecting resource issues due to
security and operational reasons
Known threats such as invalid inputs and other
likely application abuses, exploits and known
attacks
Detecting and blocking attacks, as well
as investigating their consequences

CHAPTER 19: Logs and Compliance
352
Special attention is paid to privileged user monitoring such as “system admin-
istrator and system operator activities.” These are in fact some of the most
important logs you would create under an ISO program as they serve as the
key vehicle of accountability for all-powerful IT administrators. However, to
be useful for such purpose, logs have to be removed from the control of such
administrators via a log management solution.
The above sections also contain additional requirements for log retention and
investigation. Unlike PCI DSS that prescribes a clear 1 year log retention, ISO
only touches upon log retention and requires a separate policy to define the
log retention period. In fact, retaining security relevant logs for 1 year presents
a common industry practice. It is recommended that organizations implement
such log retention across the entire environment, and over both physical and
virtual components.
Also note the “action to be taken” requirement in Section 10.10.5. This hints at
not just collecting logs but also defining policies and procedures for monitor-
ing, investigation, and exception follow-up.
ISO27002 provides additional details useful when implementing the ISO series
in practice. For example, addition guidance for 10.10.1 “Audit logging” states that
“use of privileges” and “use of system utilities and applications” must be logged.
Specifically, the next Section A.10.10.2 Monitoring System Use mandates that
“procedures for monitoring use of information processing facilities shall be established
and the results of the monitoring activities reviewed regularly.” This calls for a log-
ging policy and operational procedures for monitoring. ISO does hint at an
ongoing review of such policies and procedures as well. For example, such
operational procedures must cover periodic or real-time log review workflows
for systems and applications in scope for the ISO project. Such review is per-
formed by either application administrator or security administrator using
automated tools or manually (even though the latter is unlikely for larger envi-
ronments due to a volume of logs being collected and retained).
The ISO27002 suggests that “the level of monitoring required for individual
facilities should be determined by a risk assessment” which allows for a sen-
sible foundation for security monitoring activities, without either gaps or
excessive controls. It is interesting that “I/O device attachment/detachment” is
specifically called out as a monitoring goal.
Overall this key controls calls for the creation of a logging policy that defines
logging, log collection and retention, as well as review and analysis—and likely
real-time alerting as well.
ISO27001 does cover the subject of securing logs from unauthorized modi-
fication and observation. Section A.10.10.3 Protection of Log Information

HIPAA 353
states that “Logging facilities and log information shall be protected against tam-
pering and unauthorized access.” Note the dual focus of log protection: access
control (preserves log confidentiality) and integrity protection (preserved log
integrity). Most modern log management and SIEM systems will offer stringent
role-based access controls to limit law operations to authorized parties on a
“need-to-know” basis. On top of this, systems also employ integrity check-
ing using cryptographic mechanisms to detect any possible log changes. As a
last resort, logs can be written to “write-once” media such as DVD or network
backup archives. Without explicitly mentioning this, this control implies that
malicious insiders should not be able to use logs to further their nefarious
goals—log security measures should work against both outside attackers and
malicious (as well as careless) insiders.
In addition, the organization must monitor for “storage capacity of the log file
media being exceeded, resulting in either the failure to record events or over-
writing of past recorded events” (as per ISO27002). Such accidental loss of log
data should not be tolerated.
Finally, ISO Section A.10.10.6 Clock synchronization states “the clocks of all rel-
evant information processing systems within an organization or security domain shall
be synchronized with an agreed accurate time source.”
Just like in PCI DSS, log timing is important for security monitoring, forensics,
and troubleshooting. It is a best practice to make sure that all collected and
analyzed logs have correct timestamps, and relevant time zone information
is preserved. Using NTP or other reliable timing mechanisms for logs need to
be used in order to preserve the accurate sequence of events as well as their
absolute timings.
HIPAA
The Health Insurance Portability and Accountability Act of 1996 (HIPAA)
outlines relevant security and privacy standards for health information—both
electronic and physical. The main mission of the law is “to improve portabil-
ity and continuity of health insurance coverage in the group and individual
markets, to combat waste, fraud, and abuse in health insurance and health care
delivery” (HIPAA Act of 1996). The copy of the act can be obtained at the HHS
Website (http://www.hhs.gov/ocr/privacy/hipaa/).
In particular, Title II of the law, “Preventing Health Care Fraud and Abuse;
Administrative Simplification; Medical Liability Reform,” contains Security
Rule (Section 2.3) that covers Electronic Protected Health Information (EPHI)
and Privacy Rule (Section 2.1) that covers all Protected Health Information
(PHI).

CHAPTER 19: Logs and Compliance
354
A recent enhancement to HIPAA is called Health Information Technology for
Economic and Clinical Health Act or HITECH Act. The act seeks to “promote the
adoption and meaningful use of health information technology” and “addresses
the privacy and security concerns associated with the electronic transmission of
health information, in part, through several provisions that strengthen the civil
and criminal enforcement of the HIPAA rules” (HITECH Act of 2009).
Unlike PCI DSS, HIPAA itself does not descend to the level of security controls
and technologies to implement. This requires the organizations affected by
HIPAA—also known as “covered entities”—to try to follow the spirit of the
regulation as opposed to its letter. What is also interesting to note is that insur-
ance companies and many hospitals that accept payment cards are subject to
both HIPAA and PCI DSS. Understandably, the scope of their applicability
across the organization might be different since payment processing systems
should not store patient health information and vice versa. Still, considering
the same technical and administrative controls for both regulations is prudent
and will save money in both the short term and long term.
The following HIPAA requirements are broadly applicable to logging, log
review, and security monitoring:
n Section 164.308(a)(5)(ii)(C) “Log-in Monitoring” calls for monitor-
ing the systems touching patient information for login and access. The
requirement applies to “login attempts” which implies both failed and
successful logins.
n Section 164.312(b) “Audit Controls” broadly covers audit logging and
other audit trails on systems that deal with sensitive health information.
Review of such audit logs seem to be implied by this requirement.
n Section 164.308(a)(1)(ii)(D) “Information System Activity Review” pre-
scribes review of various records of IT activities such as logs, systems utili-
zation reports, incident reports, and other indications of security relevant
activities.
n Other requirements in HIPAA might potentially affect logging as well (source:
http://www.prismmicrosys.com/EventSourceNewsletters-June10.php).
The above reveals that, compared to PCI DSS, logging and monitoring require-
ments inside HIPAA itself do not really help companies to answer key ques-
tions needed to deploy and operationalize logging and log management—from
both technical and policy/procedure point of view.
In particular, the following questions are left unanswered:
n What information should be logged by “audit controls”? What activities
and events? What details for each activity or event?
n Should the log records be centrally collected?

HIPAA 355
n For how long should the records be retained?
n What particular “activities” should be reviewed? How often?
n How should security monitoring and “log-in monitoring” be performed?
n How should audit records be protected?
In light of this, it is often noticed that HIPAA log collection and review seems
to be a perpetual stumbling point for organizations of all sizes. Log require-
ments can be difficult for some companies, such as organizations with com-
plex systems in place, or small shops that lack the time, money, and expertise.
And vague guidance does not help the organization to get motivated to do
logging and log review. On top of this, logging and log review complexity rises
dramatically when custom applications—not simply Windows servers or Cisco
firewalls—are in scope. Despite the movement away from legacy and custom
applications, a lot of medical data still sits inside homegrown applications
where logging can be a nightmare to configure.
In addition to the above questions, another issue is unclear: do these controls
apply to the actual application that handles sensitive health data or do they
apply to the underlying platform as well (source: http://www.prismmicrosys.
com/EventSourceNewsletters-June10.php).
Fortunately, some additional details for HIPAA Security Rule implementa-
tion are covered in NIST Publication 800-66 “An Introductory Resource Guide
for Implementing the Health Insurance Portability and Accountability Act
(HIPAA) Security Rule” (see http://csrc.nist.gov/publications/nistpubs/800-
66-Rev1/SP-800-66-Revision1.pdf).
NIST SP 800-66 guide details log management requirements for the securing of
electronic protected health information—based on HIPAA security rule.
Section 4.1 of NIST 800-66 describes the need for regular review of informa-
tion system activity, such as audit logs, information and system access reports,
and security incident tracking reports. The section asks questions (“How often
will reviews take place?” and “Where will audit information reside (e.g. sepa-
rate server)?”) rather than providing answers.
Section 4.15 attempts to provide additional guidance on “audit controls.”
While striving to provide the methodology and questions that implementers
need to be asking such as “What activities will be monitored (e.g. creation,
reading, updating, and/or deleting of files or records containing EPHI)?” and
“What should the audit record include (e.g. user ID, event type/date/time)?”,
the document does not really address key implementation concern—in other
words, it does not tell covered entities what they must do to be compliant.
Also, Section 4.22 specifies that documentation of actions and activities
need to be retained for at least 6 years—and leaves the discussion of whether

CHAPTER 19: Logs and Compliance
356
security activity records such as logs are considered “documentation” to
implementers.
A recommended strategy suggests that the company starts from information
security activity review policy and processes. Using the guiding questions from
NIST 800-66, one can formulate what such policy should cover: requirement
applicability, recorded activities, and recorded details, review procedures,
exception monitoring process, etc.
Quoting from NIST 800-66:
n “Who is responsible for the overall process and results?
n How often will reviews take place?
n How often will review results be analyzed?
n What is the organization’s sanction policy for employee violations?
n Where will audit information reside (e.g. separate server)?”
Next, the organization has to actually implement the above process for both
logging and log review. This would make sure that log records are created on
covered systems and have sufficient details (logging). By the way, such details
can be borrowed from the corresponding PCI DSS guidance. Also, it will cre-
ate the procedures to “regularly review records of information system activ-
ity, such as audit logs, access reports, and security incident tracking reports”
(log review). While daily log reviews are not required, if they are performed
for PCI DSS, they can be expanded to cover HIPAA systems as well.
On this, NIST 800-66 advices:
n “Develop Appropriate Standard Operating Procedures.
n Determine the types of audit trail data and monitoring procedures that
will be needed to derive exception reports.
n How will exception reports or logs be reviewed?
n Where will monitoring reports be filed and maintained?”
Only then is the organization ready to proceed to the next step and initiate
logging and then start ongoing log reviews.
Even though HIPAA does not provide detailed step-by-step guidance on log-
ging and log management, it gives companies an opportunity to follow the
spirit of the regulation and not simply the letter. Understandably, a few organi-
zations might be waiting for fines and enforcement activity to be started before
taking any action. Such shortsighted approach to logging simply plays for the
“bad guys” side—allowing cyber-criminals to steal the most sensitive data all
of us will ever have…
Furthermore, HIPAA itself does not descend to the level of security controls
and technologies to implement. This requires the organizations affected by

HIPAA 357
HIPAA—also known as “covered entities”—to try to follow the spirit of the
regulation as opposed to its letter. What is also interesting to note is that insur-
ance companies and many hospitals that accept payment cards are subject to
both HIPAA and PCI DSS. Understandably, the scope of their applicability
across the organization might be different since payment processing systems
should not store patient health information and vice versa. Still, considering
the same technical and administrative controls for both regulations is prudent
in both the short term and long term.
While platform level logging is useful for protecting sensitive health information,
and it is a fact that a majority of health information is stored in databases and pro-
cessed by healthcare-specific applications, such applications are either procured
from specialty vendors or developed internally—via outsourced developers.
HIPAA of audit controls, mentioned in Section 164.312(b), apply to appli-
cation logging as much or more than to platform logging. This means that
custom applications need to be engineered to have adequate logging. Existing
application logging needs to be assessed having adequate logging—it should
be noted that many legacy applications will often not record sufficient details
for events and might even skip logging events altogether. Thus, before embark-
ing on this project, it makes sense to determine which applications within your
organization contain Protected Health Information (PHI) and what their exist-
ing levels and methods of logging are.
Let’s define some of the guidance for what to log to satisfy the spirit and letter
of HIPAA Security Requirement as well as NIST 800-66 HIPAA clarifications.
From high level, best audit logs tell you exactly what happened—when, where,
and how—as well as who was involved. Such logs are suitable for manual,
semi-automated, and automated analysis. Ideally, they can be analyzed with-
out having the application that produced them at hand—and definitely with-
out having the application developer on call. In case of healthcare applications,
such developer might not be available at all and the security team will have to
proceed on their own. From the log management point of view, the logs can be
centralized for analysis and retention. Finally, they should not slow the system
down and can be proven reliable, if used as forensic evidence (source: http://
www.prismmicrosys.com/EventSourceNewsletters-July10.php).
Two primary things need to be defined:
n First, there are types of activities or events that always need to be recorded.
For example, authentication decisions, health information access, and
system changes should always appear in logs.
n Second, for each type of a recorded event there are particulate details that are
mandatory for its interpretation, whether by a human or by an automated
system. For example, every log should have a reliable timestamp and every
log related to user activity should contain the username of that user.

CHAPTER 19: Logs and Compliance
358
It should also be noted that certain details should never be logged. The exam-
ple is obvious: application or system passwords should never appear in logs
(this, sadly, still happens for Web applications sometimes). Just as obviously,
the health information itself should be kept out of logs.
What events should we log? What is the overall theme for selecting which
events to log?
Clearly, we need to know who, when, and why accesses any of health informa-
tion. We also need to know who adds, changes, or deletes it. But this is not
all—we also need to note who tries but fails to read, change, or delete informa-
tion. If we are unable to record access to each piece of data, we need to carefully
record all access to the application itself.
Next, we need to know who performs other actions on systems that process
health information as such activities might affect future access to healthcare data.
For example, we need to record if somebody turns logging off or adds a new
component to the system which might enable unfettered access to data. In addi-
tion, we need to record other critical events caring on health information systems
as such events might present circumstantial evidence for unauthorized access.
The following list presents a structured view of the above criteria:
n Authentication, Authorization, Access:
n Authentication/authorization decisions, successful and failed (see
“status” below)—and especially privileged authentication.
n Recording user logoffs is also important for knowing when user no
longer had access to the application.
n Switching from one user account to another.
n System access, data access, application component access.
n Network access to the application, including remote access from one
application component to another in a distribute environment.
n Changes:
n System/application changes (especially privilege changes).
n Data change (creation and destruction are changes too).
n Application and component installation and updates as well as
removals.
n Sensitive data changes, additions, and deletions.
n Availability Issues:
n Startups and shutdowns of systems, applications and application
modules/components.
n Faults and errors, especially those errors that affect the availability of
the application.
n Backups’ successes and failures (affect availability).

HIPAA 359
n “Badness”/Threats:
n Invalid inputs other likely application abuses.
n Malicious software detection events.
n Attempts—successful and failed—to disrupt or disable security con-
trols or logging.
n Logging termination events and possible attempts to modify or delete
the logs.
n Other security issues that are known to affect the application.
While creating a comprehensive “what to log” list for every healthcare applica-
tion in existence is probably impossible, the above list should give you a use-
ful starting point for your relevant applications. It can be converted into your
application logging policy without much extra work.
What details should we log? Next, what data should you log for each event,
and at what level of detail should you log it? The overall theme we use here is
the following:
n Who was involved?
n What happened?
n Where did it happen?
n When did it happen?
n Why did it happen?
n How did it happen?
We also mentioned above that being able to easily centralize logs is essential
for distributed log analysis either across multiple systems or across multiple
application components of a distributed application. While syslog has been
the king of log centralization due to its easy UDP delivery, modern cross-plat-
form application frameworks like a call for publish/subscribe model for log
delivery, similar to the ones used in modern Windows versions. In this case
security monitoring tool can request a subscription for a particular type of a
logged event—and receive all relevant logs in near real time, if needed.
In addition to that very basic conclusion—you must log access to sensitive
healthcare data—we have to remind our readers that the importance of logging
will only grow—along with growing application complexity. In particular, the
need to analyze application behavior and movement of sensitive information
across distributed and cloud-based application calls for us to finally get appli-
cation logging under control.
Software architects and implementers need to “get” logging—there is NO
other way since infrastructure logging from network devices and operating
systems won’t do it for detecting and investigating application level threats

CHAPTER 19: Logs and Compliance
360
to ePHI. Security team—ultimately responsible for log review—will need to
guide developers towards useful and effective logging that can be used for both
monitoring and investigative activities.
Certainly, logging standards such as MITRE CEE (cee.mitre.org) will help—
but it might take a few years before they are developed and their adoption
increases. Pending a global standard, an organization should quickly build
and then use its own application logging standard for applications. HIPAA
compliance presents a great motivation to creating and adopting such logging
standards (source: http://www.prismmicrosys.com/EventSourceNewsletters-
July10.php).
FISMA
The Federal Information Security Management Act of 2002 (FISMA)
“requires each federal agency to develop, document, and implement an
agency-wide program to provide information security for the information
and information systems that support the operations and assets of the
agency, including those provided or managed by another agency, contrac-
tor, or other source.”
While some criticize FISMA for being “all documentation and no action,” the
law emphasizes the need for each Federal agency to develop, document, and
implement an organization-wide program to secure the information systems
that support its operations and assets.
The law itself does not prescribe any logging, log management, or security
monitoring since it stays on a high level of policy, planning, and risk to federal
systems. In accordance with the law, detailed guidance has been developed by
NIST to cover the specifics of FISMA compliance. For example, the following
umbrella page http://csrc.nist.gov/groups/SMA/fisma/overview.html covers
how to plan a FISMA project at a federal agency. In addition to NIST, OMB was
tasked with collecting agency reports on compliance—FISMA periodic valida-
tion regime.
The main source for detailed guidance is NIST Special Publication 800-53
“Recommended Security Controls for Federal Information Systems,” now in
revision 3 (http://csrc.nist.gov/publications/nistpubs/800-53-Rev3/sp800-53-
rev3-final_updated-errata_05-01-2010.pdf). Among other things, the docu-
ment describes log management controls including the generation, review,
protection, and retention of audit records, and steps to take in the event of
audit failure (source: http://www.prismmicrosys.com/EventSourceNewsletters-
Aug10.php).
Let’s review the guidance in detail.

FISMA 361
NIST 800-53 Logging Guidance
The section “AUDIT AND ACCOUNTABILITY POLICY AND PROCEDURES”
(AU controls) focuses on AU-1 “AUDIT AND ACCOUNTABILITY POLICY
AND PROCEDURES” that covers “Formal, documented procedures to facili-
tate the implementation of the audit and accountability policy and associated
audit and accountability controls.” This is indeed the right way to approach
audit logging by starting from the logging policy and procedures for log collec-
tion and review. While audit controls in FISMA go beyond logging, the above
guidance is very true for log management.
AU-2 “AUDITABLE EVENTS” refers to NIST 800-92, covered in the next part of
the series. As expected, risk assessment as well as logging needs for other orga-
nizational units needs to be considered for creating a list of auditable events.
Events that are only audited under “special circumstances,” such as after an
incident, are also defined here.
Logically, after the list of events to audit is established, AU-3 “CONTENT
OF AUDIT RECORDS” clarifies the level of details recorded for each event.
Examples such as “timestamps, source and destination addresses, user/process
identifiers, event descriptions, success/fail indications, filenames involved, and
access control or flow control rules invoked” which should be in every good
log records are provided. Refer to CEE standard work (http://cee.mitre.org) for
further discussion of high-quality logging.
AU-4 “AUDIT STORAGE CAPACITY” and actually AU-11 “AUDIT RECORD
RETENTION” cover the subject critical for many organizations—log retention.
Unlike PCI DSS, NIST guidance only offers tips for selecting the right attention
and not a simple answer (like, 1 year in PCI).
AU-5 “RESPONSE TO AUDIT PROCESSING FAILURES” mandates an impor-
tant but commonly overlooked aspect of logging and log analysis—you have
to act when logging fails. Examples that require action include “software/
hardware errors, failures in the audit capturing mechanisms, and audit storage
capacity being reached or exceeded” as well as other issues affecting logging.
AU-6 “AUDIT REVIEW, ANALYSIS, AND REPORTING” is about what happens
with collected log data. Specifically it prescribes that organization “reviews and
analyzes information system audit records for indications of inappropriate or
unusual activity” at “organization-defined frequency.” Again, NIST/FISMA guid-
ance stays away from giving a simple answer (like daily log reviews in PCI DSS).
AU-7 “AUDIT REDUCTION AND REPORT GENERATION” deals with report-
ing and summarization, the most common way to review log data.
AU-8 “TIME STAMPS” and AU-9 “PROTECTION OF AUDIT INFORMATION”
as well as AU-10 “NON-REPUDIATION” address log reliability for investigative

CHAPTER 19: Logs and Compliance
362
and monitoring purposes. Logs must be accurately timed and stored in a man-
ner preventing changes. One mentioned choice is “hardware-enforced, write-
once media.” The use of cryptography is another mentioned method.
AU-12 “AUDIT GENERATION” essentially makes sure that the organization
“generates audit records for the list of audited events defined in AU-2 with the
content as defined in AU-3.”
Next, logging guidance ends and security monitoring part begins: AU-13
“MONITORING FOR INFORMATION DISCLOSURE” focuses on information
theft (“exfiltration” of sensitive data) and AU-14 “SESSION AUDIT” covers
recording and analysis of user activity (“session data”). We often say that log-
ging is largely futile without exception handling and response procedures.
Overall, here is what is likely needed for a successful FISMA-driven log man-
agement implementation. The way to address the requirement can vary across
the type of an organization, as it is the case for all log management projects
(source: http://www.prismmicrosys.com/EventSourceNewsletters-Aug10.php).
What do you actually need to do? The following distills FISMA/NIST guidance
into actionable items that can be implemented and maintained, for as long as
FISMA compliance is desired or mandated:
n Logging policy comes first. But it means nothing without operational pro-
cedures which are developed base and policy and then put into practice
(AU-1).
n This will likely require configuration changes to multiple types of systems;
updates to configuration standards prescribed elsewhere in the document
are in order.
n Based on the policy, define which event will be logged (AU-2) and what
details will be generated and recorded for each event (AU-3). Start the log-
ging as per AU-12.
n Consider logging all outbound connectivity to detect exfiltration of data
(as per AU-13) and make sure that user access sessions are recorded
(AU-14).
n Define log storage methods and retention times (AU-4 and AU-11) and
retain the generated logs.
n Protect logs from changes, keep time accurate to preserve the evidentiary
power of logs (AU-8–10).
n Also according to policy, implement log review procedures and report
generation (AU-6, AU-7). Distributing reports to parties that should see
the information (also as per policy created in item 1).
At this point, your organization should be prepared for FISMA compliance
on both policy level and technical level. It is now up to you to maintain that

FISMA 363
awareness for as long as needed. A dangerous mistake that some organization
make is to stay on the policy and procedure level and never configure actual sys-
tems for logging. Remember—documents don’t stop malicious hackers, policies
don’t help investigate incidents when log data is missing and talking about “align-
ment of compliance strategy” does not make you secure—or even compliant…
FISMA itself does not prescribe any logging, log management, or security moni-
toring since it stays on a high level of policy, planning, and risk to federal sys-
tems. In accordance with the law, detailed guidance has been developed by NIST
to cover the specifics of FISMA compliance. The main source for detailed guid-
ance is NIST Special Publication 800-53 “Recommended Security Controls for
Federal Information Systems,” now in revision 3, that we covered in the previous
issue. Among other things, the document describes log management controls
including the generation, review, protection, and retention of audit records, and
steps to take in the event of audit failure. On top of this, NIST has created a dedi-
cated “Guide to Computer Security Log Management.” The guide states “Imple-
menting the following recommendations should assist in facilitating more
efficient and effective log management for Federal departments and agencies.”
(Source: http://www.prismmicrosys.com/EventSourceNewsletters-Aug10.php).
A lot of additional guidance has been built for FISMA. SANS Institute, in partic-
ular, has created “Twenty Critical Security Controls for Effective Cyber Defense:
Consensus Audit Guidelines” by SANS (http://www.sans.org/critical-security-
controls/). One of the top controls, “Critical Control 6: Maintenance, Moni-
toring, and Analysis of Audit Logs,” is about logging and log management. It
maps to NIST 800-53 AU and other controls—in particular “AC-17 (1), AC-19,
AU-2 (4), AU-3 (1, 2), AU-4, AU-5, AU-6 (a, 1, 5), AU-8, AU-9 (1, 2), AU-12
(2), SI-4 (8)” that we also covered previously. Unlike end to end coverage of
logging in NIST 800-92 which can be overwhelming for casual reader, SANS
document contains “quick wins” that agencies can follow immediately to
ramp up their FISMA efforts.
How can you use NIST 800-92 document in your organization? First, let’s
become familiar with what is inside the 80 page document. The guide starts
with an introduction to computer security log management and follows with
three main sections:
n Log management infrastructure.
n Log management planning.
n Log management operational processes.
Indeed, this is the right way to think about any log management project since
organizations usually have challenges with planning, logging architecture
building, and then with ongoing operation—that has to be maintained for as
long as the organization exists.

CHAPTER 19: Logs and Compliance
364
The guide defines log management as “the process for generating, transmit-
ting, storing, analyzing, and disposing of computer security log data.” By the
way, keep in mind that security log management must cover both “Logs from
Security Applications” (e.g. IPS alerts) and “Security Logs from Applications”
(e.g. user authentication decisions from a business application). Focusing on
just one is a mistake.
In the area of log management infrastructure, the guide defines three tiers of
log management architecture:
n Log generation.
n Log analysis and storage.
n Log monitoring.
Following this order is simply log common sense; but many organizations,
unfortunately, sometimes start from purchasing an expensive tool without
thinking about their logging policy and they use for logs. Thinking of the needs
(what you want to get from logs?) and logs (what logs can help me get there?)
before thinking about boxes and software will save your organization many
headaches.
Log management project planning starts from focusing on a key item—
organization roles. Log management is inherently “horizontal” and touches
many areas of an organization. NIST suggests that system and network admin-
istrators, security administrators, incident respondents, CSOs, auditors, and—
yes!—even internal application developers be invited to the party. This will
help the organization choose and implement the right answer to their log
management question (source: http://www.prismmicrosys.com/EventSource-
Newsletters-Aug10.php).
Next—the real work starts: creation of a logging policy. It is a common theme
that security starts from a policy; this strongly applies to logging. According to
the guide, such policies need to cover:
n Log generation: What events are logged, with what level of detail.
n Log transmission: How logs are collected and centralized across the entire
environment.
n Log storage and disposal: How and where the logs are retained and then
disposed of.
n Log analysis: How are the logged events interpreted and what actions are
taken as a result.
What does this mean in practical terms? It means that configuring tools need
to happen only after the policy that covers what will be done is created. Goals
first, infrastructure choices second! In case of privacy and other regulations on

FISMA 365
top of FISMA, the legal department should also have their say, however unpal-
atable it may be to the security team.
After defining policy and building the systems to implement the policy, as well
as configuring the log sources, the hard work of building lasting ongoing pro-
gram begins. The core of such a program is about performing periodic analysis
of log data and taking appropriate responses to identified exceptions. Obviously,
no external guide can define what is most important to your organization—but
hopefully using this book, NIST, and other guidance, you already have some
idea about what logs you would care the most about (source: http://www.
prismmicrosys.com/EventSourceNewsletters-Sep10.php).
On a less frequent basis, the agency will perform tasks related to long-term man-
agement of log data. It is a surprisingly hard problem, if your log data volume
goes into terabytes of data or more. NIST 800-92 suggests first choosing “a log for-
mat for the data to be archived”—original, parsed, etc. It also contains guidance
on storing log data securely and with integrity verification, just like in PCI DSS.
First, it gives a solid foundation to build a log management program—a lot
of other mandates focus on tools, but this contains hugely useful program
management tips, all the way down to how to avoid log analyst burnout from
looking at too many logs.
Second, you can use the guide to learn about commonly overlooked aspects
of log management: log protection, storage management, etc. For example, it
contains a few useful tips on how to prioritize log records for review.
Third, it provides you with a way to justify your decisions in the area of log
management—even if you don’t work for a government agency.
At the same time, the guide is mostly about process, and less about bits and
bytes. It won’t tell you which tool is the best for you.
In fact, even though NIST 800-92 is not binding guidance outside of federal
government, commercial organizations can profit from it as well. For example,
one retail organization built its log management program based on 800-92
even though complying with PCI DSS was their primary goal. They used the
NIST guide for tool selection, as a source of template policies and even to
assure ongoing operational success for their log management project.
Other technical log management guidance for agencies subject to FISMA is
published by SANS in the form of their “Twenty Critical Security Controls for
Effective Cyber Defense” or CSC20. If you are looking for quick actionable tips
(called “QuickWins” in the document), that is the resource for you. For example:
n “Validate audit log settings for each hardware device and the software
installed on it, ensuring that logs include a date, timestamp, source

CHAPTER 19: Logs and Compliance
366
addresses, destination addresses, and various other useful elements of
each packet and/or transaction. Systems should record logs in a standard-
ized format such as syslog entries or those outlined by the Common
Event Expression (CEE) initiative.”
n “System administrators and security personnel should devise profiles of
common events from given systems, so that they can tune detection to
focus on unusual activity…”
n “All remote access to an internal network, whether through VPN, dial-up,
or other mechanism, should be logged verbosely.”
It is recommended to use all of NIST 800-53, NIST 800-92, and SANS CSC20
to optimize your logging for FISMA compliance project.
To conclude, NIST 800-92 and SANS CSC20 teach us to do the following,
whether for FISMA compliance alone, for multi-regulation programs, or sim-
ply improve security and operations:
n Find the critical systems where logging is essential.
n Enable logging—and make sure that logs satisfy the “good log” criteria
mentioned in the standards.
n Involve different teams in logging initiatives—logging cuts horizontally
across the agency.
n Look at your logs! You’d be happy you started now and not tomorrow.
n Automate log management, where possible, and have solid repeatable
process in all areas.(Source: http://www.prismmicrosys.com/EventSource-
Newsletters-Sep10.php.)
On top of this, NIST 800-92 brings log management to the attention of people
who thought “Logs? Let them rot.” Its process guidance is more widely repre-
sented than technical guidance which makes it very useful for IT management
and not just for “in the trenches” people, who might already know that there
is gold in the logs…
SUMMARY
To conclude, logging and regulatory compliance are closely linked and will
likely remain so for the future. Despite log challenges, logging is a primary
means of IT accountability since most user and system actions can be recorded
in logs. That’s exactly why logging is a perfect compliance technology, man-
dated by many regulations and laws.

Logging and Log Management.
© 2013 Elsevier, Inc. All rights reserved.
http://dx.doi.org/10.1016/B978-1-59-749635-3.00020-8
367
CHAPTER 20
Planning Your Own Log Analysis System
CONTENTS
Introduction .............367
Planning ..................367
Roles and
Responsibilities ..............368
Resources .......................368
Goals ...............................370
Selecting Systems and
Devices for Logging .......371
Software Selection ..371
Open Source ...................371
Commercial ....................372
Managed Security Services
Provider (MSSP) ..................... 373
Policy Definition ......374
Logging Policy ...............374
Log File Rotation ............375
Log Data Collection .......375
Retention/Storage ..........375
Response ........................376
Architecture ............376
Basic ...............................376
Log Server and Log
Collector .........................377
Log Server and Log
Collector with
Long-Term Storage ........378
Distributed .....................378
Scaling .....................378
Summary .................379
n Planning
n Software Selection
n Policy Definition
n Architecture
n Scaling
INFORMATION IN THIS CHAPTER:
INTRODUCTION
Now that we have come close to the end of the book, it’s time to put some
practical guidance on paper. In this chapter, we take you through a checklist of
sorts which can be used when planning or considering a log analysis system
deployment. If you are paying for a commercial system, most of what is pre-
sented here will typically be handled by the vendor you chose. However, you
must stay involved in the project every step of the way. Ultimately, it is you who
need to have your needs met by the vendor. Not the other way around. If you
find yourself needing to deploy an open source solution, of which there are
many, this chapter will serve you well. It should be noted that, depending on
where you are in the process, parts of or all of the sections covered can apply
to you. For example, if you have already settled on software, but have no clue
about hardware allocation, then you can safely ignore the Software Selection
section. Whichever path you are on, you can use the guidance provided here
in many situations.
PLANNING
The very first thing you need to do, outside of deciding on a product or service,
is to understand what your exact need is for such a product. The sort of things
you should be considering include:

CHAPTER 20: Planning Your Own Log Analysis System
368
n Use cases: Can you define exact scenarios which show how a system like
this will be used? For example, here is a sample use case: “As a user of the
system, I would like to be able to run a report which shows me the login
failures for my Windows servers over the last 24 h.”
n Drivers: What is “driving” you to embark on such a project? Is it for
fun, necessity, government regulation or, what? If you can answer this
an assign a priority to your driver (e.g. if it’s for fun, this would be low),
this can help you see clearly about how you want to allocate your time,
money, and resources.
n Problems Solved: Will deploying a log analysis system help solve other
problems? For example, due to the type of information you will be
collecting, a log analysis system could help you with server or network
monitoring.
n Security and Compliance: Does such a product help you prove compli-
ance to auditors, regulators, and so on?
Alright, now that this is out of the way, you need to begin planning. If you have
your own project management team, then this is probably the sort of project
you would want them to help you manage and track. If not you can still do it
yourself. You will just be doing double duty.
Roles and Responsibilities
One of the first things you need to establish is the roles and responsibilities.
One reason is because it can help you identify who you might need to include
during the planning and implementation phase of the project. But a second
reason is because the exercise helps you understand who in your organization
might be users of a log analysis system. For example, programmers are users of
a logging system since the applications they write will need to create log mes-
sages for diagnostic and troubleshooting purposes.
Table 20.1 provides a summary of common roles and responsibilities.
Resources
Resourcing has to do with understanding your organization’s need with respect
to logging and what impact it will make on your environment. Here are some
general questions you can ask yourself during the planning phase.
1. What existing staff do you have who can perform log analysis and
monitoring?
2. What existing staff do you have who can perform administration of a log
analysis system?
3. Will you operate 24 × 7, in a lights out mode, or hybrid?

Planning 369
4. Do you have a need to build out a security operations center (SOC) or will
you have a virtual SOC? A virtual SOC is a team who is not sitting and
watching screens 24 × 7, but rather use alerting to drive response, work-
flow, etc.
5. What is your plan for incident response?
6. What kind of budget do you have for building a log analysis system?
7. What kind of budget do you have for running and maintaining the system
over time (hardware upgrades, network upgrades, people upgrades, etc.)?
Table 20.1 Summary of Roles and Responsibilities
Role Responsibility
Log analysis system administra-
tor
It is likely this role falls to you. As this person, you are
responsible for the maintenance and upkeep of the
system. This will include installing software updates,
configuring log collectors, and other tasks. Another
task is working with other constituents in your orga-
nization to understand their needs and requirements
as they pertain to the analysis system. In other words,
how do you help others derive value from the system.
Business / Product owner The individual or group who has responsibility for a
product, feature set, application, etc. This group will
typically have their own requirements with respect to
logging, but they may not know or need to know that
there is a log analysis system. It might fall to you to
help tease out their requirements.
Security team The security team is typically responsible for config-
uring logging on security devices and ensuring the
security posture of an organization.
IT / Development managers Enforce logging standard as a “must have” feature,
which impacts the organization as a whole.
IT support team / Administrators
/ Network operators
This team supports production applications; They
might have a use case to read and analyze log files
when applications are misbehaving, etc.
Software developers / Program-
mers
Follow logging standards by using libraries, APIs, and
logging features. The log analysis system can also be
useful to developers when they need to track down
application issues and so forth.
Incident response team The incident response team can be considered a
customer of the log analysis system. They will use the
collected logs during incident response and escala-
tions.
Internal / External auditors Depending on what sort of business you are in, you
may have to deal with auditors. Auditors often need
for you to verify that you are collecting certain types
of logs in order to be in compliance with various
regulations.

CHAPTER 20: Planning Your Own Log Analysis System
370
The answers to these questions will help you better understand the resourcing
needs of the project and ultimate implementation. For example, if you plan to
have a 24 × 7 operations center, you will need to consider things like the following:
n Will you need to hire new staff or use internal staff?
n Do you have real estate in your office to host a 24 × 7 operations center?
n Do you have the power capacity to handle a 24 × 7 center?
n Do you have budget to purchase the hardware and software necessary to
run an operation such as this?
n What will your incident response and escalation procedures be?
n What sort of reporting will you be responsible for producing (like for
executives, etc.)?
You kind of get the picture, right? The list could go on for pages.
A final few things to consider are the hard and soft costs associated with deploy-
ing a log analysis system. Hard costs typically deal with capital expenditure.
Hardware on which to run the system, infrastructure upgrades to support the
system, operating system costs, etc. The soft costs tend center around the time
required to deploy, maintain, monitor, etc., such as system. While it might not
seem like these sort of activities have cost, in fact they do.
It is apparent that when undertaking a venture such as planning for the imple-
mentation of a log analysis system, you have a lot to think about.
Goals
It is critical to set goals before, during, and after the project. Goals help you
know that you are making progress. Some of your goals might actually be mile-
stones which mark major deliverables for the project. A sample set of goals and
milestones for planning a log analysis system follows.
n Goal 1—Pre-planning
n Goal 2—Stakeholder Identification
n Goal 3—Requirements Gathering
n Milestone 1—Project plan creation
n Goal 4—Log analysis tool evaluation
n Goal 5—Log analysis tool selection
n Goal 6—Hardware requirements gathering
n Milestone 2—Procurement of hardware and software
n Goal 7—Deployment of software
n Goal 8—Build out of operations center
n Goal 9—Staff up the operations center
n Goal 10—Define incident response and escalation procedures
n Milestone 3—System goes live

Software Selection 371
Selecting Systems and Devices for Logging
A log analysis system is no good if you don’t have devices logging to it. A
critical aspect of the planning process is to establish a repeatable process for
evaluating and selecting systems and devices for logging. Assigning a criticality
to a device is one way to do this. For example, your firewalls will have higher
criticality than workstations. An example process for selecting sources of log
data might look like this:
1. Criticality: You need to understand how critical a log data source is to
your environment. Is it you business’s primary Web server? Is it a critical
R&D server with company secrets? Systems which can threaten your very
existence if they are compromised should be at the top of the list. It is also
the case that different log sources will have different criticalities to your
business. For example, your DNS server might have lower criticality than
your credit processing server.
2. Validation: Once you have identified a data source, it is likely another
group owns the system (sometimes such a group might come to you). You
need to get the stakeholders together and verify that the source is indeed a
critical asset which needs to be brought into the log analysis system.
3. Incident Response: Finally, you will need to establish a workflow around
how incident handling and response is carried out when a given log data
source is compromised. Who is the person you need to call when some-
thing happens? Does the system have a hot standby that you can fail over
to while investigation is happening on the compromised primary?
SOFTWARE SELECTION
When choosing your log analysis system, there are various considerations depend-
ing on if it’s open source, commercial or a managed service. This section briefly
outlines the top items you should consider when looking at a log analysis solution.
Open Source
There are various open source options for log analysis. Some of these have
been enumerated in Chapter 15. This section will provide with some of the
more important things to consider when looking at such tools.
1. Update Frequency: How often is the project contributed to by the commu-
nity and/or core development team? If you haven’t seen activity in a few
months or more, it might be a clue that it’s a dead project.
2. Cost: Some say open source means “free.” This isn’t always the case.
There are several ways open source can cost you. You will generally

CHAPTER 20: Planning Your Own Log Analysis System
372
expend more effort acquiring, learning, and deploying an open source
solution.
3. License: It is often times good to pay attention to the opens source license
under which the application is released. The license used can restrict
how you deploy the software and even dictate how you integrate your of
custom-built software with the tool.
4. Support: Many-open source tools offer support contracts you can purchase
with e-mail support and other features. Some tools even provide a “free”
version of the tool (sometimes called community editions) in addition
to a pay-for version which is more enhanced version of the tool. The
enhanced version usually comes with some level or support.
5. Features: Make sure you fully understand what the tool can and cannot
do. This is when you really need to understand your requirements. If you
define your requirements first, you will be better equipped to evaluate log
analysis tools.
6. Documentation: This is pretty obvious. If the application comes with a
single README text file for its documentation, then it might not be a
good “purchase.”
7. Community: This can sometimes be a critical feature. You will want
to see if the open source tool has some sort of community support
behind it. This typically manifests itself in the form of a message
board. This is a great place where you get help and support for the
application.
8. Extensibility: If you envision extending your log analysis system (maybe
with custom scripts, programs, etc.) then you might want to see how
extensible the platform is. Does it have an API or some other integration
point? And if the platform supports this, who ultimately supports this
when things break?
9. Features: Some of the features to think about and explore include:
a. Supported log acquisition methods (Syslog, raw file, Checkpoint’s
OPSEC API, etc.)
b. Ease of maintenance and upkeep (For example, how easy is it to add
support for a new device source?)
c. Correlation (Does it support rules-based, statistical, etc.)
d. Reporting (What sort of reports come out of the box and how easy is it
to create new reports?)
Commercial
For many different market segments in the software world, the word commer-
cial is often associated with enterprise grade solutions. This is often the case,
but in the world of logging and log analysis, the devil is in the details with

Software Selection 373
commercial solutions. Let’s look at a few things you need to be aware of when
considering a commercial log analysis system.
1. Cost: This is fairly obvious. The cost of a commercial log analysis system
can vary depending on things like how large your network is, how much
data you plan to retain, and so on.
2. Support Model: Proper support for a commercial solution is key to
making sure you get the most of the platform. You need to understand
all aspects of the support model and understand how it aligns with your
business requirements for things like uptime, turnaround time, etc.
3. Professional Services: Most commercial vendors offer some kind of profes-
sional services for helping with installation and setup. This usually costs
extra, i.e. it’s not a freebee.
4. Features: The items outlined in the section on open source are identical
for commercial.
5. Extensibility: Similar to the open source version of this, you should get a
feel for how extensible the product is.
Managed Security Services Provider (MSSP)
MSSPs offer an alternative to build it / deploy it yourself log analysis. While
looking toward an MSSP isn’t exactly in line with the nature of this chapter, it
is worth mentioning as a viable alternative. The main appeal is that an orga-
nization doesn’t need to worry about hiring and training staff, deploying and
maintaining software and hardware, and other mundane things. A distinct
advantage of an MSSP, especially to top-tier ones, is they have highly trained
and certified analysts on staff. This can be a huge win for a customer who
doesn’t have the same expertise on staff. Some of the things to think about
when looking at an MSSP are as follows:
1. Features: The features to explore for an MSSP differ from that of an on-
site log analysis system. Much of the other features mentioned before
are maintained by the MSSP. Features you should be more concerned
about include how useful the customer portal is. The portal is the primary
interface you will use to search for log messages, run reports, respond to
incidents and tickets and so on.
2. Analysis and Incident Response: One thing to look at is how the MSSP
conducts analysis and incident response. This can be critical to your busi-
ness and you must make sure the MSSP is in alignment with you.
3. Professional Services: Professional services provided by the MSSP can be
useful, especially if you require on-site incident response due to breaches.
Usually these services tend to be offered at additional cost above and
beyond your normal service fees.

CHAPTER 20: Planning Your Own Log Analysis System
374
4. Data Retention: Make sure you understand how long your log data is
retained. You might have to meet certain regulatory guidelines related to
retention. You might likely need at least one year, possibly longer.
5. Cloud Logging: Chapter 21provides detailed coverage on the topic of
cloud logging. The basic gist is that the provider provides an environment
in their data center in which you can forward your logs to them. This
approach requires no special hardware to be on premise. This can be ideal
for some organizations, but for others it might not be. Various compliance
and regulations might prohibit some organizations from operating in
such a manner.
6. Service Level Agreement: MSSPs offer Service Level Agreements (SLA).
An SLA, in the context of MSSPs, dictates minimums and maximums for
analysis, incident response, and escalation. These are typically baked into
the contract you sign.
7. Using Data to Protect Data: Because MSSPs monitor the security for a
great number of customers, when a threat or intrusion is detected at one,
protections are created and applied to all customers. This is a powerful
tool where all customers benefit.
POLICY DEFINITION
Policy definition deals with creating a set of procedures you follow as part of
a routine. This section will briefly describe the more common and necessary
policies which need to be considered when planning a log analysis system.
It is also critical to periodically and regularly review your policies to make
sure they are in alignment with your organization’s needs, requirements, etc.
Logging Policy
The most immediate concern is to define a logging policy for your organiza-
tion. A set of logging policies include:
n Adequate logging which covers both logged event types (login/logoff’s,
resource access, firewall accepts/denies, IPS/IDS alerts, etc.) and details.
n Log aggregation and retention (1 year, etc.).
n Log protection (ensuring logs are not tampered with).
n Log review.
A logging policy defines what attributes of log data should be captured for later
review, escalation, and response. A logging policy also extends to applications
as well. For example, if you have custom-built applications, it is necessary you

Policy Definition 375
work with the stakeholders of the application to define what sort of things
should be logged and made available to the logging system.
Log File Rotation
Log file rotation is another policy which needs to be defined. As the log files
you are monitoring grow, disk on the local system is filling up. When disks fill
up, applications tend to stop working properly. Worse yet, you will potentially
miss critical log data you might need. So develop a log file rotation policy
across your organization which adheres to the following:
n Time based: Rotate log files based on time boundaries, i.e. minutes,
hours, etc.
n Maximize usefulness: The key here is to make the system useful to those
who use it. It’s a balancing act to keep rotated logs around just long
enough to be useful while not impacting the system as a whole.
n Move to long-term storage soonest: The idea here is to keep rotated logs
around on the source system just long enough for them to be useful for
review. Depending on how busy the system is, this could be on the order
of hours.
Log Data Collection
Data collection is the most import part of a log analysis system. Without it
you are not going to accomplish much with your log analysis system. As such
you should understand what devices in environment should be configured
to generate log data. For example, just because your laser print can generate
log data, doesn’t mean you want to capture it. A policy for log data collection
needs to be tailored to your environment. For example, it might be the case
that you only need to acquire log messages from your external firewalls and
IDS/IPS systems. Or you might need to collect log records from every firewall,
IPS, server, and desktop in your network. Regardless, you should make sure
you continually review this policy every three to six months to make sure the
needs of your organization are in alignment with your data collection policies.
Retention/Storage
Log retention is often a requirement of many regulations. Recall from Chapter 4
that log retention is actually comprised of three things: log storage, accessibil-
ity, and log destruction. Never use a syslog server as a log retention system. This
is a major no-no. Also, something to be aware of is how to size the storage you
need for retention. There is a simple way to figure this out:
log records per second
(in bytes)∗
86400

CHAPTER 20: Planning Your Own Log Analysis System
376
The calculation will tell you how much storage (in bytes) you will need per
day. The hard part is knowing how much log records per second are being
generated across your environment. This will likely require some early dis-
covery and playing once your analysis system is up and running. You can usu-
ally run your system in a provisioning/tuning mode where you acquire log
data from log sources, but you don’t take any action on the data. This gives
you time to make sure your devices are configured properly, as well as the sys-
tem itself. It is during this phase when you can develop a sense of the log data
load for your environment. A general rule of thumb is to add 25% to your log
retention capacity needs to help with planning for unforeseen events.
Keep in mind you are not necessarily relegated to going with some huge honk-
ing box with huge disk packs attached to it. Depending on the log analysis
solution you go with, it might support a distributed storage model. In such a
model the system of deployed nodes which receive log data also act as retention
points. Just keep this in mind when you are evaluating log analysis systems.
Response
Chapter 16 provided lots of detail on incident response and escalation. We
mention it here to draw attention to the fact that it’s an important consider-
ation in the policy scheme of things. See Chapter 19 for a more detailed treat-
ment of the topic.
ARCHITECTURE
The deployment of your log analysis systems will greatly depend on the size of
your network and also from where in the network you want to collect logs. We
discuss four basic deployment models. They are:
1. Basic
2. Log server and log collector
3. Log server and log collector with long-term storage
4. Distributed
Basic
The basic deployment model is the simplest you can use. It consists of a single
log server which has several devices sending logs to it. Figure 20.1 depicts this
situation.
In this model, you would typically log into the log server to conduct log review.
This is not the most ideal situation, but in some instances it is the best you
can do.
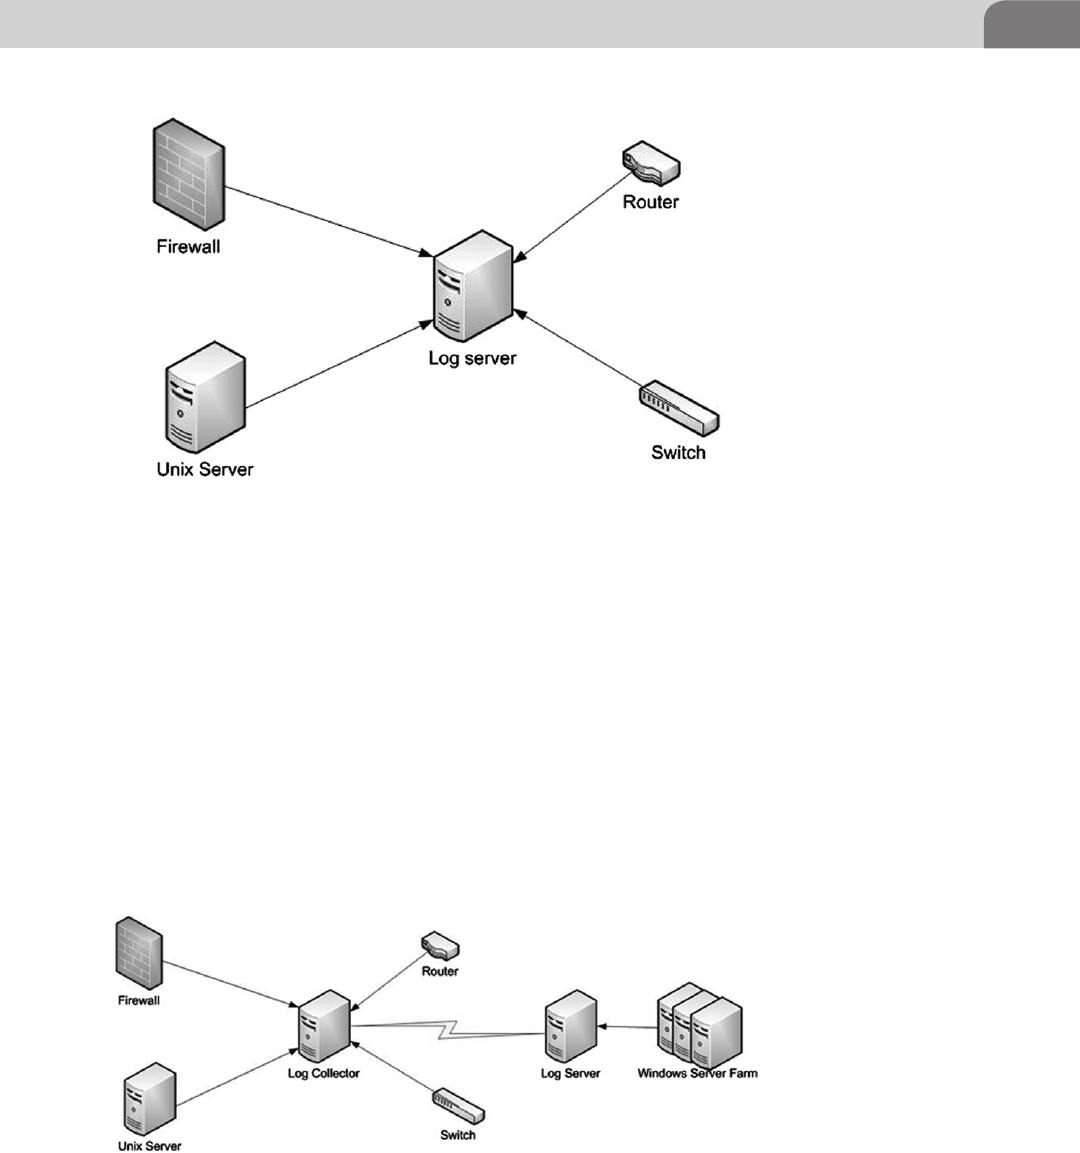
Architecture 377
Log Server and Log Collector
A more common deployment model is one where you distribute log collectors
in strategic points in your network. These systems collect logs from devices
where they are located. It could be that the log collector is in particular part of
your network (maybe an ingress point) and you want to make sure you capture
your firewall logs. This log collector will forward logs to a central log server.
Figure 20.2 shows such a deployment.
Here we have the log collector sending logs to a log server. Note also that
the log server itself can act as a log collector (note the Windows server farm).
Depending on the log analysis system you choose, the ins and outs of how you
configure a deployment like this will be vendor specific. The log server acts as
FIGURE 20.1 Basic Log Server Deployment
FIGURE 20.2 Log Server and Log Collector Deployment
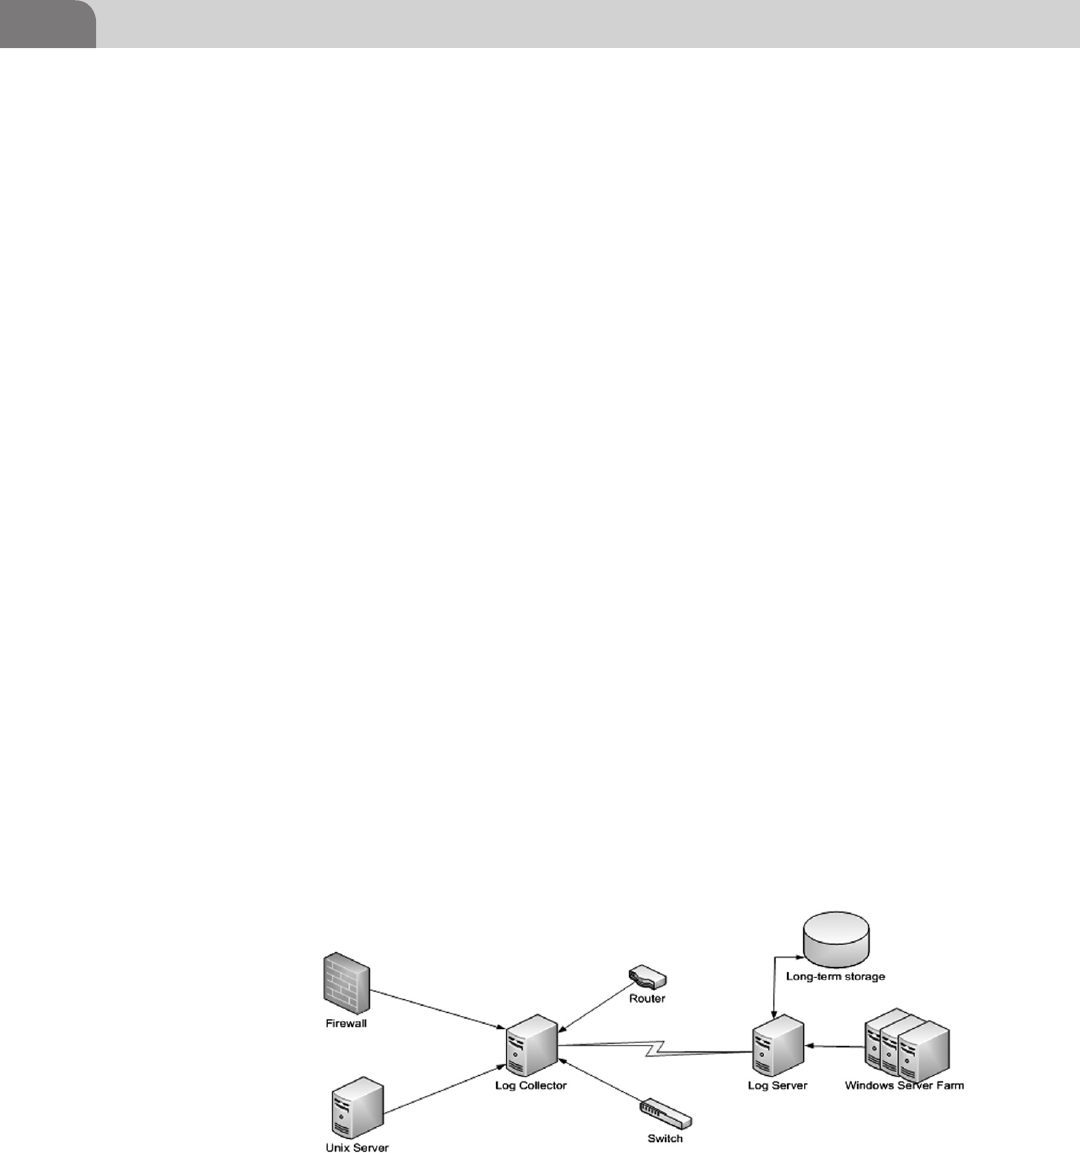
CHAPTER 20: Planning Your Own Log Analysis System
378
the central place for reviewing logs, analyzing logs, etc. The log collectors can
be thought of as a temporary backup of your logs, but you should never rely
on this.
Log Server and Log Collector with Long-Term Storage
In this model we have simply added long-term storage. Figure 20.3 shows this.
The log server is writing to some sort of long-term storage. Again, configuration
of this will be vendor specific.
Distributed
The distributed model is really something we have already discussed. You use
log collectors distributed throughout your environment for log collecting pur-
poses. These log collectors roll up a log server or in some cases several log serv-
ers. In a hierarchical model, you could have multiple log servers rolling up to
a central log server which provides a higher-level view of your environment.
It is also the case that automated analysis can be performed at the log server
level. This allows for a distributed analysis scheme which can reduce the need
to have a single server act in this capacity. This reduces load on the server and
mitigates a single point of failure.
SCALING
Scaling is an important part of managing a log analysis system. Here are some
general tips you can use to help aid this endeavor.
1. Know your environment. In order to scale, you need to have a grasp on
what devices are coming on and off your network. Make sure you have
weekly meetings with stakeholders to review plans to roll out new gear
FIGURE 20.3 Basic Log Server Deployment with Long-Term Storage

379
Scaling
and equipment. Making sure you get the proper devices logging to the
analysis system is critical to maximizing the usefulness of the deployment.
2. Ensure you know what log data on your network takes priority. For
example, firewall logs probably take precedence over logs from printers.
3. Understand when your environment is getting saturated. If you notice,
during log review, that your log data is hours old, you might have a
problem. If you have a distributed deployment, you should investigate
the log collector and / or log server to see why they are getting behind.
Does the box have high CPU load? Is it having I/O issues? These sorts
of things can be signs that your data volume has increased. This can be
indications of malicious behavior or just the fact that you need to pos-
sibly introduce a new log collector and divert log data to this new server.
SUMMARY
This chapter provided you with a solid set of guidance when you find yourself
needing to plan and roll out a log analysis system. We covered planning, pol-
icy definition, software selection, deployment, and scaling. These are essential
piece parts to understanding the how’s and why’s of selecting and deploying a
log analysis system. For additional resources, you should consult the references
listed at the end of this chapter.

This page is intentionally left blank

Logging and Log Management.
© 2013 Elsevier, Inc. All rights Reserved.
http://dx.doi.org/10.1016/B978-1-59-749635-3.00021-X
381
CHAPTER 21
Cloud Logging
CONTENTS
Introduction .............381
Cloud Computing ....381
Service Delivery
Models ............................382
Software as a Service
(SaaS) ...................................... 382
Platform as a Service
(PaaS) ...................................... 382
Infrastructure as a Service
(IaaS) ....................................... 383
Storage as a Service .............. 383
Cloud Deployment
Models ............................383
Public Cloud ........................... 383
Private Cloud ......................... 384
Community Cloud ................. 384
Hybrid Cloud .......................... 384
Characteristics of a Cloud
Infrastructure .................384
Standards? We Don’t
Need No Stinking
Standards! ......................385
Cloud Logging ........386
A Quick Example:
Loggly .............................388
Regulatory,
Compliance, and
Security Issues ........390
Big Data in the
Cloud ........................392
A Quick Example:
Hadoop ...........................394
n Cloud Computing
n Cloud Logging
n Regulatory, Compliance, and Security Issues
n Big Data in the Cloud
n SIEM in the Cloud
n Pros and Cons of Cloud Logging
n Cloud Logging Provider Inventory
n Additional Resources
INFORMATION IN THIS CHAPTER:
INTRODUCTION
This chapter will describe the basic concepts surrounding cloud computing,
cloud security, and ultimately cloud logging (this chapter focuses on logging
to the cloud). The goal of this chapter is not to make you an expert in these
topics, but rather give you the basic knowledge and understanding required
to make educated decisions with respect to logging in the cloud. Why is this
important? You might find yourself needing to consider using a cloud-based
provider for logging, security, Security Information and Event Management
(SIEM), or other software applications and systems. The more you know about
the ins-and-outs of cloud concepts, the better off you will be to make the right
decision when selecting a provider.
CLOUD COMPUTING
What is cloud computing? Cloud computing has been the subject of many
commentaries over the last few years. As such there are no shortages of descrip-
tions of what cloud computing is. At its essence cloud computing is a term

CHAPTER 21: Cloud Logging
382
used to characterize how a user interacts with a set of computer resources
(CPU, memory, disk, etc.). To the end user, it appears, he or she is using a
single computer system. However, in reality there might be many different,
often virtualized, components. A parallel concept that is often used to explain
cloud computing is that of the power company. We all have electrical outlets
in our home. These outlets can be thought of as simple interfaces. When we
want to use a toaster, television, computer, etc., we simply plug it into the wall
socket. We don’t really care how the power is created. All we know and care
about is that it works. A key feature of cloud computing is elasticity. Elasticity is
the ability to scale out (when more resources are needed) and to scale in when
the resources are no longer needed.
For the remainder of the chapter, the terms provider and consumer will be used.
It is critical that we briefly describe each. A provider is someone who provides
cloud services. This can be a third-party entity or an internal group within a
company. The term cloud logging provider will sometimes be used as well. This
more concretely describes the type of provider we are discussing in this chap-
ter. A consumer is someone who consumes cloud services. The distinction will
become clear soon.
Service Delivery Models
To further clarify cloud computing, it helps to understand the service delivery
models. Service delivery models refer to how a particular computing resource
is delivered to an end user. In the next several sections, we will discuss the SPI,
which stands for Software as a Service, Platform as a Service, and Infrastructure
as a Service. We’ll discuss these now.
Software as a Service (SaaS)
SaaS is the term used to describe software which resides on a provider’s infra-
structure. The consumer uses a thin client or Web browsers to interact with and
use the software. From the consumer’s point of view, they are interacting with
a single computer system. They are also not responsible for things like software
and hardware maintenance, up keep, and so on. It should be noted that a SaaS
provider might be an external third-party provider like Salesforce.com or an
internal provider inside of the consumer’s own organization. Cloud logging
providers fall into this delivery model, i.e. an organization who accepts logs in
order to analyze them for other organizations.
Platform as a Service (PaaS)
With PaaS, a consumer can deploy custom-built application or tools to a pro-
vider’s cloud. As with SaaS, the consumer doesn’t have control over the under-
lying hardware or network (in some cases, the consumer might have access to
firewall configuration), but, unlike SaaS, the consumer has control over the
SIEM in the Cloud ...395
Pros and Cons of
Cloud Logging ........396
Cloud Logging
Provider Inventory ..396
Additional
Resources ................396
Summary .................398
References ...............399

Cloud Computing 383
deployed application and any associated configuration. Cloud logging provid-
ers don’t allow consumers to install their own applications.
Infrastructure as a Service (IaaS)
The final service delivery model deals with infrastructure. IaaS allows a con-
sumer to provision computing resources such as CPU, memory, disk, network,
and other related resources. The consumer typically controls the operating
system, deployed applications, and amount of storage. They do not control
the underlying infrastructure.
Storage as a Service
As its name implies, Storage as a Service deals with storage in the cloud. A
consumer signs an agreement with a provider to rent space on the provid-
er’s network. The pricing is typically based on per gigabyte stored and some
data transfer rate. The most common use case for this is an offsite backup and
retrieval service. Small- to medium-sized consumers can greatly benefit from a
service like this since the IT, hardware, software, and network management are
all undertaken by the provider.
Cloud Deployment Models
Now that we have discussed the delivery models for cloud, the next thing to
understand is the manner in which services are deployed. “A cloud comput-
ing system may be deployed privately or hosted on the premises of a cloud
customer, may be shared among a limited number of trusted partners, may be
hosted by a third-party, or may be a publically accessible service, i.e. a public
cloud” (Web, 2011b). You might be asking yourself why you should care about
the different deployment models. The reason it is important, from a cloud log-
ging standpoint, is because you will need to understand your options when
evaluating these providers. For example, it might be the case a provider has
built their offering on top of one of the many cloud computing providers.
Alternatively, it might be the case that the logging provider has built their own
private cloud.
Two key concepts to understanding the deployment models are that of on-
premise versus off-premise. On-premise means the infrastructure resides on the
consumer’s premise, i.e. in their data center. Off-premise, as you might guess,
means that the cloud resides off the consumer’s premise, i.e. in the cloud pro-
vider’s data center. The following sections describe the common deployment
types.
Public Cloud
As its name implies, the infrastructure is made available to the public. It is typi-
cal that an industry group or company owns the cloud and sells cloud services

CHAPTER 21: Cloud Logging
384
in various forms. The cloud’s infrastructure is operated for an organization and
might be managed by that organization or by the cloud provider. The infra-
structure can reside both on- and off-premise.
Private Cloud
Again, as the name implies, the cloud is private and intended for use by a
single organization. The management of the cloud is performed by the organi-
zation or the cloud provider. Private clouds can be both on- and off-premise.
Community Cloud
Organizations which have shared concerns can utilize a community cloud.
Shared concerns can be “mission, security requirements, policy, or compliance
considerations” (Cloud Security Alliance, 2009). The management of the cloud
is performed by the community or the cloud provider. Community clouds can
be both on- and off-premise.
Hybrid Cloud
A hybrid cloud allows for two or more cloud types (public, private, etc.) to be
tied together in a way, which allows portability. For example, a cloud logging
provider might allow for a consumer to create their own private cloud so that
the provider’s application stack can be co-located. This has the advantage of
providing a means for the consumer to deal with issues around disaster recov-
ery, centralization, compliance issues, etc.
Characteristics of a Cloud Infrastructure
The next topic we need to cover for cloud computing are the characteristics of
a cloud infrastructure. The idea here is to expose the ways that cloud infrastruc-
tures differ from traditional computing environments.
n On-demand self-service: The consumer can provision aspects of the service
(CPU, storage, network, etc.) without the need to interact with the cloud
provider. This is typically accomplished with the use of user interfaces
and/or APIs.
n Broad network access: It is critical that the cloud infrastructure be accessible
via variety of network-capable devices, e.g. SmartPhones, PCs, laptops,
tablets, and so on.
n Resource pooling: The provider uses an infrastructure which allows for the
pooling of physical computing resources to service many consumers.
This implies a multi-tenant model. The most common technology used
to accomplish this is a virtual machine(s). The advantage here is that it
allows consumers who do not know or care about how their resources are
being managed.

Cloud Computing 385
n Rapid elasticity: This was already discussed. The basic idea is that resources
can quickly be increased or decreased depending on the consumer’s
needs. The manner in which this is accomplished is either manually or
automatically.
n Measured service: Cloud providers typically meter and measure the services
they provide (CPU, memory, storage, etc.). The time unit or measurement is
typically based on the hour. You only pay for what you use. Cloud logging
providers typically charge based on the amount of log data you are allowed
to send to the cloud, as well as how long you want to retain your log.
n Multi-tenancy: Due to the multi-tenant nature of the cloud, there is a need
“for policy-driven enforcement, segmentation, isolation, governance,
service levels, and chargeback/billing models for different consumer con-
stituencies” (Cloud Security Alliance, 2009).
More details on these topics can be found in Cloud Security Alliance (December
2009) and Web (2011a, 2011b).
Standards? We Don’t Need No Stinking Standards!
The final word for this section is on standards. As Cloud Security Alliance (Decem-
ber 2009) points out, “it is also important to note the emergence of many efforts
centered around the development of both open and proprietary APIs which seek
to enable things such as management, security, and interoperability for cloud.”
Why is it important to have open APIs for cloud providers? Think about the case
where you are using cloud provider XYZ and they increase their usage costs or the
Quality of Service (QoS) is going downhill or you decide to bring the function-
ality back in house. With open standards and APIs, you will be able to migrate
from one provider to the next and take your data, metadata, configurations, etc.
with you. Some of the standardization efforts already underway include:
n Open Cloud Computing Interface Working Group.
n Amazon EC2 API.
n VMware’s vCloud API.
n Rackspace API.
n GoGrid’s API.
NOTE
Cloud Computing Providers
It doesn’t make sense to provide a detailed list of cloud computing providers, since as soon as
this book is printed the content will be out of date. The more common providers today are Dell,
Rackspace, and Amazon. We suggest performing some Internet searches to find the current
players in the space.
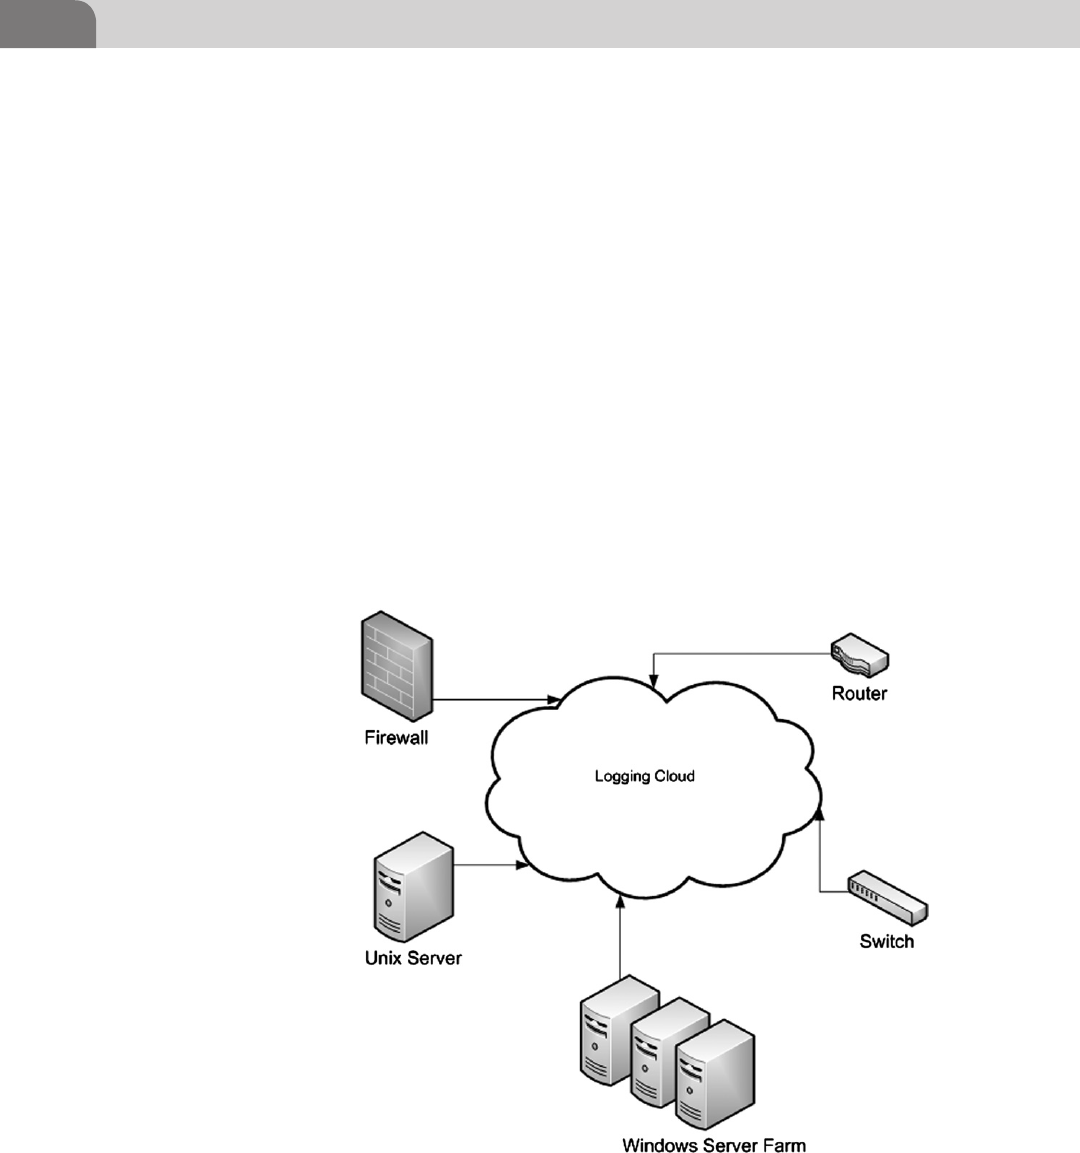
CHAPTER 21: Cloud Logging
386
Open APIs can help ensure portability between cloud providers. However, ulti-
mately when providers know that you, as a consumer, can easily migrate to
other providers at will, this will force the industry to make sure they are liv-
ing up to best practices, cause innovation to happen and treat the consumers
properly.
CLOUD LOGGING
We have finally made it to the topic of this chapter. While the chapter is about
cloud logging, we had to provide lots of supporting information about cloud
computing. This is because cloud logging is simply an application of cloud
computing. In other words, it is cloud computing which enables cloud logging
to exist. In fact, a new deployment model has emerged: Logging as a Service
(LaaS). LaaS refers to providers who provide logging services in a cloud setting.
That is, providers who take in log data to analyze it on behalf of others. This
section will hopefully give you an introduction to what cloud logging is. It will
by no means make you an expert. Instead, you will come away with an apprecia-
tion of what it is and how it might benefit you and your organization.
FIGURE 21.1 Logical Layout of a Cloud Logging.

Cloud Logging 387
Figure 21.1 shows a high-level depiction of cloud logging.
What we have here is a series of devices logging to a cloud. But what is in the
cloud? As a consumer, you don’t care. The provider gives you an IP address or
hostname at which to point your Syslog configuration and away you go. But, as
always, it is more complicated than this, at least for the cloud logging provider.
For example, the other end of that IP address might be a load balancer that
handles incoming connections. The balancer will hand off the request to one
of many machines which will take the data, normalize it (not always), index it,
and store it for later retrieval.
The cloud logging space is fairly new and as such the sophistication and fea-
tures found with the providers are spread out. The following list represents
a bare minimum set of features and capabilities shared by cloud logging
entities:
n Log acquisition methods: For getting data into the cloud, most cloud
logging providers support Syslog (TCP/UDP and secure/TLS) and a
proprietary API (typically RESTful over HTTP/HTTPS). Syslog covers
95%+ devices in the world. An API allows you to build cloud logging
into your applications.
n Deployment model: Some cloud logging providers have built their offering
on top of cloud computing providers, while others have built their own
clouds. It might even be the case that the provider supports a hybrid model.
n Log retention: Long-term storage of your log data is something all provid-
ers support, but where they differ is what they charge you to store it.
Typically, you control the time-period (days, weeks, months) you wish to
keep your data. Some providers only allow up to six months of log data
to be retained.
n Core features: The basic core features of a logging cloud service include
log data acquisition, log data indexing (for fast searching, etc.), long-
term storage, and a user interface (typically Web-based) to search and
review your data. Beyond these, things like correlation, custom alerting,
and custom reporting are extras (some providers don’t even support
these yet).
n Billing: Most cloud logging vendors support a pay-as-you-go model. You
don’t enter into a contract and only pay for the log data you send to them
and wish to retain. Also, most providers have “try before you buy” plans
which essentially allow you to send through a small number of log
messages per day for free in order to try the service and see if you like it.
n Disaster recovery (DR): Some cloud logging providers spell out in their
terms of service that they are not responsible for loss of data. As it stands
now, the cloud logging industry needs to address this in order to make
themselves viable to larger consumers.

CHAPTER 21: Cloud Logging
388
This space is growing and expanding at a phenomenal rate. Providers are pop-
ping up all the time, each boasting the latest in whiz-bang features. However,
many providers focus only on operations and not the security and compliance
side of things. If you come across provider, you want to use, don’t be afraid to
ask them questions about the service. This is the best way to get to know what
they offer. Here are some basic questions to ask:
1. Is there a director of security or CSO on staff to help set the security posture?
2. What security controls are in place to safeguard my data?
3. What is their overall security posture?
4. How is my data segregated from other people’s data?
5. What is the deployment model?
6. What is the billing plan?
7. What are the DR and business continuity plans?
8. What are their SLAs with respect to uptime and availability of
a. log acquisition service;
b. log retention service;
c. user interface;
d. reporting system.
9. What does the roadmap look like for the next four quarters?
10. What alerting options do they support (email, SMS, etc.)?
11. Do they offer correlation? If so what forms, i.e. statistical and/or
rule-based?
12. Similar to number 8 above, what is their maintenance schedule, i.e. do
they perform maintenance every Tuesday at 3 am? What is the availability
of the service while maintenance is on-going?
A Quick Example: Loggly
Let’s briefly look at an example which shows how to get log data into a cloud
logging provider. The example is from the logging provider Loggly (www.loggly.
com). They have a Web-based API for getting data into their cloud. As you will
also see, this is the mechanism you use to search for log data. The first example
shows how to use Loggly’s API input type:
# curl -d "this is a test" https://logs.loggly.com/inputs/dccac609-
d626-4d49-a826-088efc415c77
{"response":"ok"}
#
We are using the curl command to simplify things. The URL we use takes the
form of the following:
httpps://logs.loggly.com/inputs/ [SHA-2 key]

Cloud Logging 389
The SHA-2 key is generated for each API input you create in the Loggly Web
UI. It is used to uniquely identify this API. In the example, we send the log
message “this is a test” to the cloud. We get a response of ok. This is a very
nice feature because the response is easily parse-able and you can automate the
sending of logs to the cloud. If we want to search the cloud we can do so with
the following command:
# curl -u username:password 'http://foo.loggly.com/api/search?q=test'
{
"data": [
{
"timestamp": "2011-08-24T13:55:12.227Z",
"isjson": false,
"ip": "206.55.100.193",
"inputname": "api",
"inputid": "1735",
"text": "{\"this is a test\":\"\"}"
}
],
"numFound": 1,
"context": {
"rows": "100",
"from": "",
"until": "NOW",
"start": 0,
"query": "test",
"order": "desc"
}
}
#
This example shows several points. First, the URL for searching and retrieval is
different from that of sending data. It takes this form:
https://[domain].loggly.com/api/search?q="value to search for"
The domain is the domain for your organization. You set this when you first cre-
ate your account. Our domain is foo. The query parameter is “q” and adheres
to standard URI query string format. We searched for “test” which returned a
JSON response showing our exact log message, “this is a test”. JSON is the
default return format, but using the format URL parameter, you specify xml or
text return formatting.

CHAPTER 21: Cloud Logging
390
Finally, if your search doesn’t return anything, here is what the result looks like:
# curl -u username:password 'http://foo.loggly.com/api/search?q=foo'
{
"data": [],
"numFound": 0,
"context": {
"rows": "100",
"from": "",
"until": "NOW",
"start": 0,
"query": "foo",
"order": "desc"
}
}
#
Cloud logging providers should support custom APIs like this. Why is having
an API like this useful? Here are some reasons:
1. You can send log data from virtually any system or application you con-
trol, which may not support Syslog.
2. You can build your own alerting system. By periodically querying the cloud,
you can write scripts to look for various things that you care about and,
subsequently, send an email, SMS message, etc. A nice side effect is that you
can even interface with your internal ticketing system (if you have one).
3. It allows for checks-and-balances. For example, you can meter the amount
of data you send to the provider, and you can cross-check billing numbers.
You can even detect when data you send to the cloud doesn’t make it and
resend it if it fails, i.e. you get a bad error response from the provider.
The Cloud Logging Provider Inventory section later in the chapter provides
some detail on cloud logging providers and should serve as a good starting
point for more research and exploration.
REGULATORY, COMPLIANCE, AND
SECURITY ISSUES
By now you are probably thinking that this cloud thing is sounding pretty
sweet. And it is. But it should also be obvious that, given how cloud logging
providers deploy their software and services, there are regulatory, compliance
and security issues that need to be addressed. It is true. Many of the legislative

Regulatory, Compliance, and Security Issues 391
and regulatory requirements were written without an eye toward cloud com-
puting. As such you, as the cloud consumer, need to understand you are
responsible for the following (Cloud Security Alliance, 2009):
n Regulatory applicability for the use of a given cloud service. Also, don’t
forget about cross-border issues like having European Union data in the
United States and so on.
n Division of compliance responsibilities between cloud provider and cloud
customer.
n Cloud provider’s ability to produce evidence needed for compliance.
n Cloud customer’s role in bridging the gap between cloud provider and
auditor/assessor.
Be sure you work with your internal audit team (if you have one) to coordinate
the transition to a cloud provider.
Turning to IT security, the security posture of a cloud provider is really no
different from that of regular organizations. Of course they have extra issues
to deal with, given the use of virtualized hardware, data separation concerns,
identity management, and so on. Let’s look at some base best practices cloud
providers should adhere to:
n The risk of insider breach (form inside the provider) of your data is a
possibility.
n Cloud providers should use background checks as part of the hiring
process.
n Cloud providers should employ security policies, controls, etc. which
match the most stringent of any customer.
n Contractual agreements or terms of service should outline the specifics of
security policies, backup and recovery, business continuity, etc.
n Cloud providers should provide, upon request, documentation outlining
the provider’s IT security posture.
From a compliance and security standpoint, it’s easy to understand the impli-
cations of using a public cloud provider. Where it becomes interesting is with
a hybrid deployment model. Consider Figure 21.2.
The hybrid cloud spans both the private cloud (on-premise to the consumer
and includes two servers) and the public cloud (off-premise to the consumer
and includes three servers). The lines become blurred because in this deploy-
ment, the consumer is using cloud resources both at the provider’s site and on
their own site. There are many things to consider like:
1. Who is responsible for securing the link between to two sites?
2. Who is responsible for securing the on-premise gear?
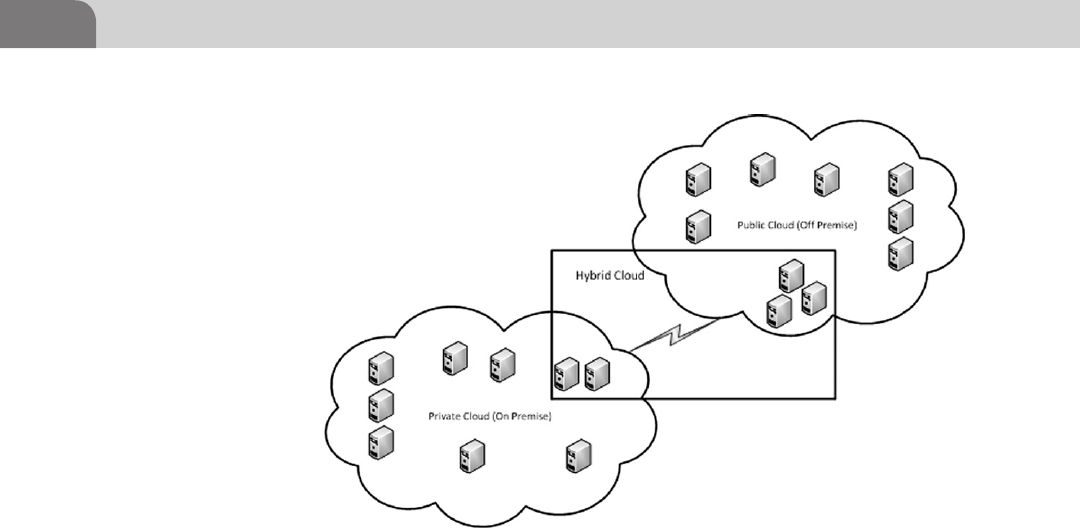
CHAPTER 21: Cloud Logging
392
3. Who is responsible for securing the off-premise gear?
4. If a breach occurs on the consumer’s side from the cloud provider’s side,
how is incident response and escalation handled?
5. Per any regulatory and legislative mandates for your organization, can you
participate in a hybrid deployment?
There is definitely a lot to think about with any decision to move to the cloud.
But by approaching cloud computing from a position of understanding what
your responsibilities and needs are, you will be able to more clearly make the
transition. More detail on regulatory, compliance, and IT security issues with
cloud computing can be found in Cloud Security Alliance (2009) and Web
(2011b).
BIG DATA IN THE CLOUD
We have a big problem. There is a lot of data across the IT enterprise. It’s liter-
ally everywhere. As Stephen Marsland stated in his book, “if data had mass,
the earth would be a black hole” (Marsland, 2009). This is what has led to the
NoSQL and big data movements (see Chapter 4 for a Hadoop example using
Amazon’s EC2). These movements, and the communities that have sprung up
around them, are trying to solve the problem of how you take in, manage, and
analyze large volumes of data.
FIGURE 21.2 High-level Hybrid Deployment

Big Data in the Cloud 393
But what is a large volume of data? Let’s look at a real-life company. The
company (name withheld to protect the innocent!) in question has over
5000 servers, 2000 routers and switches, approximately 600 security devices
(Firewalls, IDS, IPS, VPN, content service switches, Anti-Virus), and 50,000
plus desktop firewalls and host anti-virus (desktops and laptops). This is a
substantial network to say the least. Across the enterprise, they see about
100,000 log messages a second from all systems. Let’s assume an average log
message size of 300 bytes. How many log messages per hour do you think
this equates to? How much does this equate to over a day? What about a
year? To see this, let’s do some quick log math:
This is a lot of data to say the least. Many people will question whether it
makes sense to collect this much data. As you have seen throughout this book,
we have advocated an approach to logging whereby you continually evaluate
what you are collecting. Via this process you don’t log anything you never plan
to look at, don’t care about, or is of little value, and so on. These are generally
good principles, but some people want or need to collect as much of their log
data as possible. Traditional relational databases (RDBMS) are just made to
deal with continually increasing high volumes of data along with stringent
query and analysis requirements, i.e. data-intensive applications. This is where
NoSQL comes into the picture.
What is NoSQL? It’s “Next Generation Databases mostly addressing some of
the points: being non-relational, distributed, open-source, and horizontally
scalable. The original intention has been modern Web-scale databases. The
movement began early 2009 and is growing rapidly. Often more character-
istics apply as: schema-free, easy replication support, simple API, eventually
consistent /BASE (not ACID), a huge data amount, and more. So the mislead-
ing term “nosql” (the community now translates it mostly with “not only sql”)
should be seen as an alias to something like the definition above” (NOSQL
Databases, 2011).
The idea is simple: via the use of an architecture which is highly distributed,
you achieve greater throughput by breaking up the data in small chunks (on
the order of 64 megabytes) and distributing the chunks out to clusters of com-
modity machines. These machines then crunch on the data and return results.
Compare this to the traditional RDBMS technique of scaling up a machine, i.e.
a machine with more CPU, RAM, and multiple input/output (I/O) channels.
100, 000 log messages
/s×300 bytes/log message ∼28. 6 MB
×3600 s ∼100. 6 GB/h
×24 h ∼2. 35 TB/day
×365 days ∼860. 5 TB/year
×3 years ∼2. 52 PB
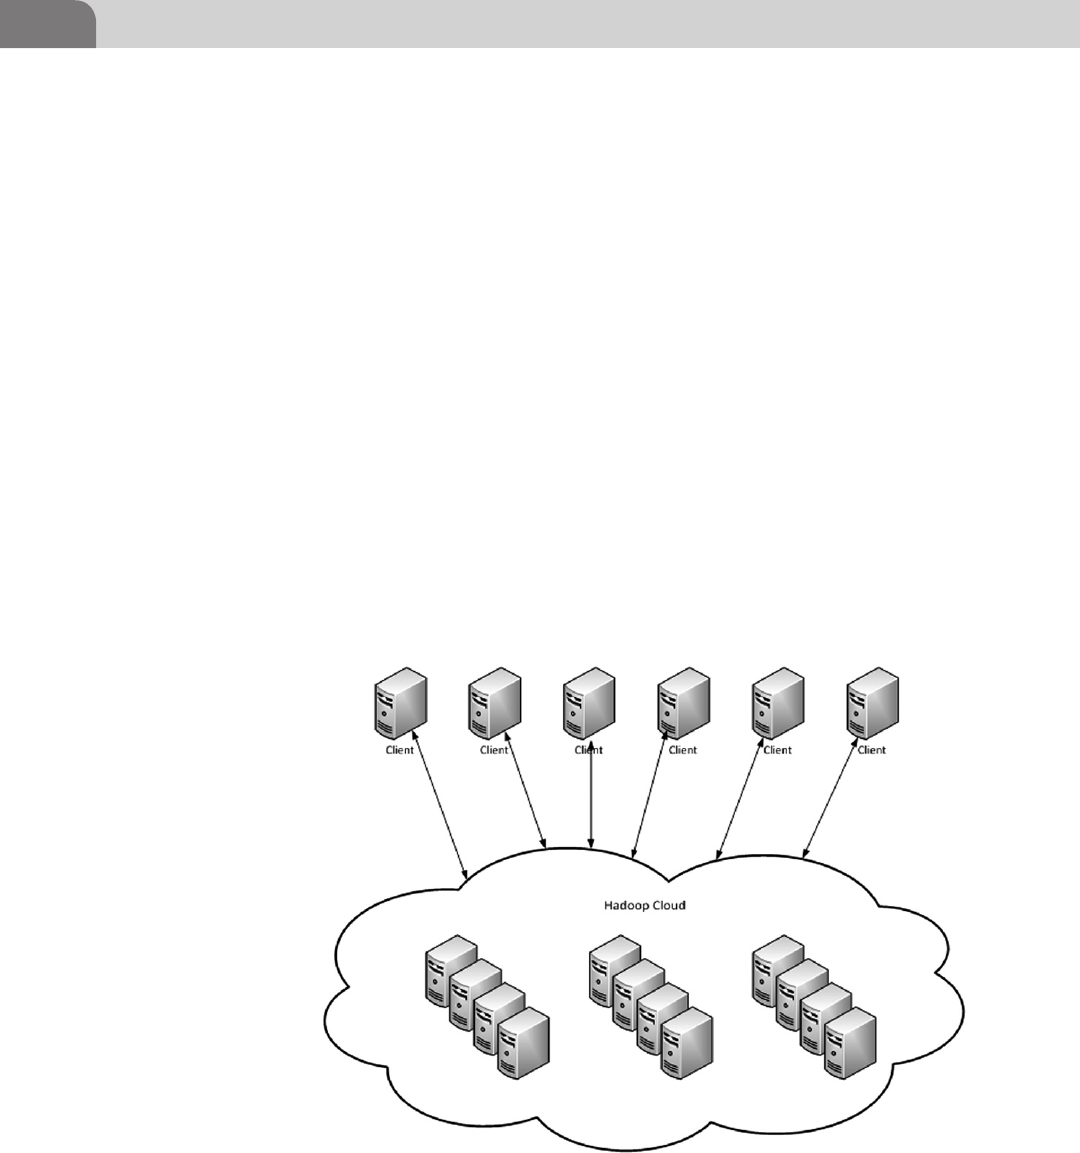
CHAPTER 21: Cloud Logging
394
For example, a machine with two I/O channels which have a throughput
of 100 megabytes a second will take 3 hours to read over 2 terabytes. Why is
this? Over time, transfer rates have increased, but disk drive seek rates have
not increased proportionally. Because of this fact, among others, many people
(including cloud logging providers) use systems and software which imple-
ment NoSQL concepts in order to provide fast searching, indexing, and other
features.
A Quick Example: Hadoop
Hadoop is a leading MapReduce implementation. MapReduce is a technique
whereby during a Map step, a master node in the takes input and breaks it up
into smaller chunks. It then distributes the smaller chunks to worker nodes.
Each worker node gets an answer and returns it to the master node. During
the Reduce step, the master node takes all the answers returned and combines
them in a way, which returns an answer to a client. Figure 21.3 shows the logi-
cal layout of Hadoop.
What we have here is a Hadoop cloud of commodity machines. These machines
run jobs on behalf of the clients (client can be end users, applications, and
so on). The clients in-turn are expecting answers to questions. The reason the
FIGURE 21.3 Logical Layout of Hadoop

SIEM in the Cloud 395
Map/Reduce approach works so well is because the data, and subsequent analy-
sis that needs to be done on the data, allows for batch processing. The Hadoop
cloud in Figure 21.3 is a distributed system which allows for data to be chunked
and executed upon in parallel. Another technique at the core of Hadoop and
MapReduce is that of data locality. Data locality deals with executing the Map
step against data on the file system on which it lives. This allows administrators
of Hadoop clusters to configure which servers are closest to the data with respect
job execution. This can cut down on network bandwidth and response times.
A complete treatment of big data, NoSQL, Hadoop, MapReduce, and other
related technologies is beyond the scope of this section. Please refer to NOSQL
Databases (2011) for more information.
SIEM IN THE CLOUD
This chapter would not be complete without a discussion of SIEM in the cloud.
Traditionally, SIEM systems are shrink wrapped. This means you buy a license
for the software and depending on the complexity of the software, you spend
money on consultants who in-turn spend long periods of time installing and
configuring the SIEM. SIEM software companies have realized that companies
are unwilling to spend hundreds of thousands of dollars (or more) on SIEM
deployments. In fact many of these software companies are scrambling to
retro-fit their software to be cloud deployable.
This is where Managed Security Service Providers (MSSPs) have really shined
over the years (in fact MSSPs were doing cloud logging way before cloud log-
ging was a phrase). MSSPs are companies which take on the burden of man-
aging network security for another organization. The different models are
typically monitoring only, management only or monitoring and management.
Figure 21.4 shows the logical layout for a SIEM cloud.
What is the first thing you notice? It looks very similar to the cloud logging fig-
ure we saw in the Cloud Logging section. The main difference is that the SIEM
cloud tends to be a little more on the mature side with respect to feature sets.
The other obvious difference is that of an application stack in the cloud. This
is used to show that SIEM cloud has a robust set of features all accessible via
an API or set of APIs. This is key not only to providing services to internal cus-
tomers and systems (Operations, Security Operations Center (SOC), Network
Operations Center (NOC), billing, HR, etc.), but also for external customers.
For example, customers will often want to export tickets from the provider
to their internal systems. Most providers implement some sort of Web-based
API (RESTful, SOAP, etc.). This makes it easy for the customer to write custom
application code to obtain their tickets.
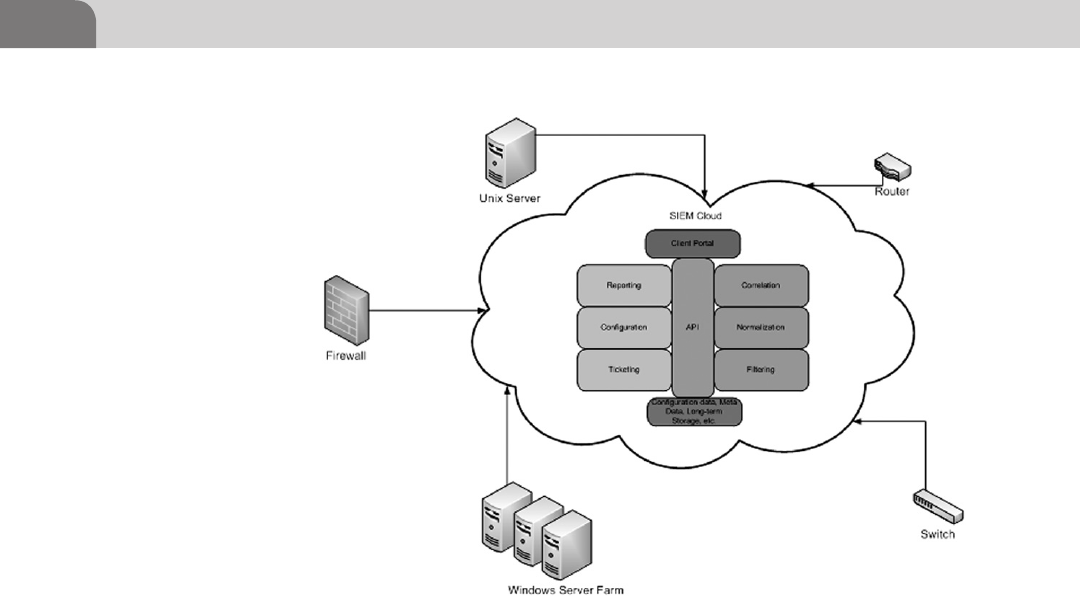
CHAPTER 21: Cloud Logging
396
PROS AND CONS OF CLOUD LOGGING
Let’s discuss some of the pros and cons related to logging to a cloud. This is
not an exhaustive list, but it does outline some of the common pros and cons
encountered with cloud logging. Of course, depending on your own require-
ments, you will likely need to perform some analysis to understand if migrat-
ing to a log provider makes sense for you. Table 21.1 reviews the pros and cons.
CLOUD LOGGING PROVIDER INVENTORY
Now we will provide you with some information on some logging providers.
Table 21.2 provides an inventory of some cloud logging providers.
ADDITIONAL RESOURCES
If you only visit two Web sites in your search for information about all things
cloud, you should visit these:
n NIST Cloud Computing: http://www.nist.gov/itl/cloud/.
n Cloud Security Alliance (CSA): https://cloudsecurityalliance.org.
FIGURE 21.4 Logical Layout of SIEM Cloud

Additional Resources 397
Table 21.1 Pros and Cons of Cloud Logging
Pro Con Mitigation against Con
Management: Someone
else manages the hard-
ware, software, etc.
Pay-as-you-go Model:
Pay for what you use.
You control what to send,
when to send it, etc.
API Support: Many
logging providers have
robust APIs which allow
you transmit log data to
the cloud via means other
than Syslog. You typically
also use this API to search
the cloud for data, etc.
API Support This can be both a pro and
a con. If the API itself is not
secure (authentication and
privacy) and you have regula-
tory and/or compliance issues
to deal with, this might be a
sticky point
Off-premise storage: The
storage burden is handled
by the vendor. The best
part is, typically, you can
choose how long and/or
how much data you want
to keep
Off-premise storage Yes, this is also a con. Depend-
ing on the security controls,
trust matrix, and other security-
related criteria employed by the
provider, it may not be feasible
to store your log data in the
cloud. Find out if the provider
utilizes a hybrid deployment
model which allows for portions
of their stack to reside in your
data center
Security: Security is a
concern due to the nature
of the “graceful loss of
control” that comes with
migrating to the cloud
Understand your provider’s
overall security posture
Table 21.2 Inventory of Cloud Logging Vendors
Vendor Web site Information
Dell SecureWorks www.secureworks.com Dell SecureWorks is a Managed
Security Services Provider (MSSP)
who offers a full log retention and
management service
Loggly www.loggly.com Loggly is a full LaaS provider. They
offer a searching console in the
browser, a try-before-you-buy option
SplunkStorm www.splunkstorm.com/ SplunkStorm is a LaaS offering from
Splunk. It is currently in beta, but they
are planning to offer pay-as-you-go
billing and other features

CHAPTER 21: Cloud Logging
398
These are two great sites with lots of information and resources. And, of course,
Internet searches will return more results than you can shake a log at.
SUMMARY
We covered a lot of material in this chapter. The main points you need to take
away are:
n Cloud service delivery models: The three basic types are SaaS, IaaS, and
PaaS
n Cloud deployment models: The four basic types are Public, Private, Commu-
nity, and Hybrid
n Cloud logging: It’s a young field which is growing every day. Be sure you
understand what it is you and your organization require before you
embark on logging all your log data to the cloud. Be sure to ask lots of
questions of whatever perspective provider you are interested in using.
n SIEM in the cloud: MSSPs have supported this model for years. Traditional
Shrink-wrapped SIEM vendors are starting to realize the value in this
model and are scrambling to build cloud capabilities and offerings into
their products.
n Security concerns: Be sure you understand how the provider approaches
IT security. Also, make sure you understand your responsibility when it
comes to legislative and regulatory compliance when operating in a cloud
environment.
Sumo Logic www.sumologic.com SUMO LOGIC is a LaaS and aims
to provide consumers with real-time
forensic and log management capa-
bilities
Log Entries www.logentries.com The goal of Log Entries is to provide
those managing, building, and testing
large enterprise systems with tools
which allow for root cause analysis of
IT issues
Papertrail www.papertrailapp.com Papertrail is a hosted log manage-
ment service for servers, applications,
and cloud services
Table 21.2 Inventory of Cloud Logging Vendors (continued)
Vendor Web site Information

References 399
REFERENCES
Cloud Security Alliance (2009). Security guidance for critical areas of focus in cloud computing
V2.1. Web, August 17, 2011. <https://cloudsecurityalliance.org/guidance/csaguide.v2.1.pdf>.
Logging challenges and logging in the cloud – PodCast. Loggly Blog. Loggly, December 2010. Web August 13,
2011. <http://loggly.com/blog/2010/12/logging-challenges-and-logging-in-the-cloud-podcast/>.
Marsland, S. (2009). Machine learning: An algorithmic perspective. Boca Raton: Chapman & Hall/
CRC. (print)
NOSQL Databases. Web, August 28, 2011. <http://nosql-database.org/>.
Storage as a Service (SaaS). Web, January 02, 2012. <http://searchstorage.techtarget.com/definition/
Storage-as-a-Service-SaaS>.
Web (August 20, 2011a). <http://collaborate.nist.gov/twiki-cloud-computing/pub/CloudComput-
ing/StandardsRoadmap/NIST_SP_500-291_Jul5A.pdf>.
Web (August 20, 2011b). <http://csrc.nist.gov/publications/drafts/800-146/Draft-NIST-SP800-146.
pdf>.
10 things to think about with cloud computing and forensics. Web, January 02, 2012. <http://
www.cloudave.com/670/10-things-to-think-about-with-cloud-computing-and-forensics/>.

This page is intentionally left blank

Logging and Log Management.
© 2013 Elsevier, Inc. All rights reserved.
http://dx.doi.org/10.1016/B978-1-59-749635-3.00022-1
401
CHAPTER 22
Log Standards and Future Trends
n Extrapolations of Today to the Future
n Log Future and Standards
n Desired Future
INFORMATION IN THIS CHAPTER:
INTRODUCTION
Richard Feynman, a noted physicist in the 20th century, once won a lot of
prediction bets by simply predicting that the future will look exactly as the
present. Admittedly, in our ever-changing IT environments that seems like a
recipe for failure. However, many things do stay the same, and in the area of
logging and log analysis that is more true than in other domains.
More than enough of problems that IT administrators and organizations
in general dealt with in late 1980–early 1990s—which is more than two
decades ago—are still with us in a nearly untouched form. This is also
true, by the way, with many information security problems as well—is
sometimes said that no information security problem has actually been
solved for good. For example, password failures were reported as a security
problem nearly 50 years ago (and, essentially, may even go way back before
the computer age), yet companies still failed in a spectacular way with the
same issue today. Over the years that authors have been in the industry,
logs are constantly called “untapped riches”—likely from the 1990s until
now—and it is up to the IT community to make sure they would not be
called that in the future.
Organizations ability to collect various IT records, including logs, has defi-
nitely improved in the last decade or two. However, companies still struggle
with this domain, despite access to service providers and expensive tools, as
CONTENTS
Introduction .............401
Extrapolations of
Today to the
Future ......................402
More Log Data ...............402
More Motivations ...........404
More Analysis ................405
Log Future and
Standards ................406
Adoption Trends ............410
Desired Future ........410
Summary .................411

CHAPTER 22: Log Standards and Future Trends
402
well as much expanded knowledge base about this domain. Logs have moved
from the domain of IT by compliance, logs now has to move again to high level
of intelligence.
Let’s start our discussion about the future with a quick discussion of what they
can extrapolate from today. Note that this chapter is not only the future of logs
but also the future of people who look at logs and make conclusions than take
actions.
EXTRAPOLATIONS OF TODAY TO THE FUTURE
As a form of a very quick historical overview, we can mention that syslog was
born as a part of Eric Allman sendmail project in the early 1980s. Admittedly,
the history of logging and log analysis has started before that, but this date
marks a 30 year span of evolution (1982–2012).
Over the course of that time frame, the volume of logged data has increased
dramatically. In addition, not only the quantity but also the quality of log data
has increased. New log sources, and even conceptually new IT environments
such as mobile computing, cloud computing and virtualization have emerged
and became mainstream. In fact, even a PC was born in the same timeframe,
and logging predates this important advance, which now seems commonplace
mundane and even obsolete.
It appears that the analysis methods to make sense of log data as well as the
quality and usefulness of the information, communicated in the form of log
files, have not increased nearly enough. Instead of looking at syslog from UNIX
systems and Event Logs from Windows (a 1990s invention), people now have
to look at the much wider set of logs, ranging from barely comprehensible text
to highly structured XML (that sadly, often uses megabytes of data to commu-
nicate the meaning that a 50 byte syslog message will hold just fine).
More Log Data
Our first extrapolation is simply more log data. This splits into multiple dimen-
sions, each more dangerous than the other.
Definitely, and sheer volume of logged data will be increasing in the next
5–7 years and likely more. More computing resources are brought online and
more of them are capable of producing logs. Regulatory pressure motivates
organization to also increase the volume of logging from which system and
application.
In addition to a simple volume increase, there will be a increase in the
number of systems producing logs. Dealing with one or two systems is

Extrapolations of Today to the Future 403
always easy. Dealing with thousands gets to be pretty challenging. However,
it is expected that the upcoming “Internet of things” where a lot of different
systems are brought online as well as growth in mobile and cloud comput-
ing, will result in dramatic increases of both volume and the number of
logging instances.
In addition to increased number of systems that produce logs, existing systems
are expected to produce more log data or produce more detailed, and thus
more voluminous, log data piles. For example, where a system used to login
failed access attempts a few years ago will now log successful attempts as well
as other activities. It would not surprise the authors if the same system will log
all access to sensitive files in a year or so. While in a few years, it is expected that
many more activities would create an audit trail which needs to be analyzed,
retained, and acted upon in some cases.
There is also a trend towards auditing more access and more activity through
logs; for example, few of the file server, storage, or database vendors cared much
about logging, but now they do (well, some do and some start to). What used
to be just about access to data is now evolving into auditable access to data.
Regulatory as well as investigative pressure leads organizations to save logs
for longer, thus increasing the volume of retained data. Even having the same
number of log sources, producing the same volume of logged data—a very
unlikely assumption—will lead to increased log volumes being stored and col-
lected, due to increased retention periods. It was quite uncommon to see orga-
nizations preserve the logs for more than three months a few years ago—now a
year is much more common. In many cases, such longer retention periods are
not driven by regulations and external mandates but by the need to investigate
entrenched threats inside the organization, insider activities, state-sponsored
threats, and other advanced malicious activities.
Increased volume of data leads to challenges with analysis and comprehen-
sion. It might not be obvious to some of the readers but many of the tasks that
are trivial on 10 MB of log data and easy on 1 GB of log data, become grand
scheme of challenges when the data hits petabyte ranges. Admittedly, few orga-
nizations today have to analyze even 1 PB of log data, but they are a known to
exist and their numbers are growing. And with that type of volume, even sim-
ply copying the data, much less passing it through an analysis engine, becomes
an engineering and architectural challenge.
The log the same line, a massive increase of log volume will come applications:
where a system is used to analyze and infrastructure logs, the shift the applica-
tion logging in addition to infrastructure logging will happen. For some of the
cloud scenarios, discussed in Chapter 24, application logging is the only log-
ging that the organization can have. From enterprise traditional applications,

CHAPTER 22: Log Standards and Future Trends
404
the cloud applications, to mobile applications—increase of produced the log
data is expected across the board.
Moreover, IT logging will likely be accompanied by OT—operational technology—
and by CT—communication technology—logging as well. From mobile phone
provider equipment to elevator and building control systems, the world of log
data will be expanded beyond IT with a corresponding increase in the volume
and diversity of data.
Today few people even know that some of the mobile applications can also be
made to produce audit trails of activities. As enterprise use of various mobile
technologies expands, the need to analyze logs from such devices will come
into the picture in the coming years. First used for operational purposes, such
logs will also likely to be used for security purposes as well as prescribed by
various regulations.
Always made some people conclude that the arrival of the “big data” age is
here. In reality, many organizations struggle with essentially “small data.”
If the tools your organizations have had trouble analyzing 10 GB of data, it
makes no sense to even look up the word “petabyte” in a dictionary… Exist-
ing tools are barely manage to help people understand what happens in their
environments, before any discussion of big data happens. Deal with small data
first and build your own knowledge base—then start thinking about big data.
Many organizations will be puzzled by an individual log line, a single record,
and thus are unprepared to deal with trillions of such messages.
More Motivations
Our second extrapolation is more motivations for taking logs seriously. Ana-
lysts estimate that a large percentage of log analysis and log management tools
(including commercial SIEM tools) are deployed for regulatory compliance.
However, the language regarding log management prescriptions is vague, which
can lead to confusion. Still, compliance is motivated a large set of advances in
log management and log analysis in recent years and it is expected to continue
being a force for further improvements. We discuss logging and compliance in
other chapters.
The prediction here is that more mandates, control frameworks, laws and other
external guidance will compel organizations to expand what they do with log
data. Getting the value of the data takes time and energy—both of which are
often in short supply inside IT organizations. It can seem daunting at first,
given the sheer volume and subjective nature of the data. Despite such chal-
lenges, logging is a primary means of IT accountability since most user and
system actions can be recorded in logs. That’s exactly why logging is a perfect

Extrapolations of Today to the Future 405
compliance technology, mandated by many regulations and laws—and it con-
tinued to be that for the foreseeable future.
Additional motivation for taking logs seriously will come from environments
where the organization has less control, and thus has to compensate with more
visibility. I’m looking at you, Cloud! It is expected that the needs to monitor
the assets deployed outside of direct control would require more monitoring
and more visibility features, often relying on logs.
More Analysis
Our third extrapolation is more controversial (even though it shouldn’t be)—
more analysis methods and more ways to get value out of log data. Many
predict that we are now at the critical junction for many data analysis tech-
nologies, including log data analysis for security. Some of the industry observ-
ers noted that in the past a simple Netflix movie selection action triggers more
algorithm brainpower on the backend than is available in all log analysis
products combined. In many regards, we are reaching the limits of current
analysis methods.
It is expected that new analysis methods will emerge as well as existing methods—
from rule-based correlation to statistical analysis to data mining—will be used
more widely to analyze log data. Such algorithms has to satisfy requirement
such as analysis of distributed logs (such as coming components of cloud
applications), analysis of data of any scale, any user, any system, any log—and
for multiple purposes.
In addition, other types of data such as context data are likely to be analyzed
widely in the future together with log data. A full range of tools from small to
enterprise need to emerge to help people make sense of the data of various
kinds.
This prediction is less of an extrapolation but it is also look at some new capa-
bilities and your possibilities that opened by the new analytics age.
In addition to extrapolations listed above there would be absolutely new chal-
lenges that stem from the changing tide of information technology today.
While one can consider an application, deployed inside the public cloud pro-
vider environment, to be somewhat of a remote application, in reality cloud
computing brings some new technologies as well as new operational practices
that affect how logs are produced and utilized.
In general, a recent media noise about “big data” (and especially “big data”
ANALYSIS, not just handling of petabytes of it) is directly relevant of log data.
Several companies have been launched to use Hadoop and other big data-
associated technologies to collect and analyze log data. It is done, in some
cases, in the cloud for many customers, while on-premise for others.

CHAPTER 22: Log Standards and Future Trends
406
LOG FUTURE AND STANDARDS
Given such possibilities for increased challenges what are some of the good
things that the future of logging and log analysis might bring. The primary fac-
tor is log standardization. Emergence of log standards such as Common Event
Expression (CEE)1 will have a chance to dramatically change how the future
will look like.
But first, why now? More than 30 years have passed by without IT logging
standardization. But what about syslog, an old workhorse of logging?
Syslog, encoded as a “standard” in RFC3164, is really a “nonstandard stan-
dard.” Even its RFC document is full of “Since the beginning, life has relied
upon the transmission of messages. For the self-aware organic unit, these mes-
sages can relay many different things” which reminds us that syslog was created
in Bekreley, CA, possibly a pot smoking capital of the United States. Further,
“Since each process, application and operating system was written somewhat
independently, there is little uniformity to the content of syslog messages. For
this reason, no assumption is made upon the formatting or contents of the
messages.” The last sentence firmly states that it is the standard of nothing, but
the way to move log from place A to place B, using the UDP protocol. Marcus
Ranum once called syslog “the worst logging architecture known to man—and
also the most used.”2
Today, Common Event Expression (CEE) work has resulted in a draft specifi-
cation being created. The standard has the chance of putting an end to fuzzy,
ambiguous, and unstructured log data. Instead, it would replace it with logs
that are human readable and machine readable, effective and efficient, concise
and unambiguous. This draft standard seeks to influence all aspects of the log-
ging ecosystem (see Figure 22.1).
Specifically, it would define how logs are produced, transferred, analyzed, and
so on. At the time of this writing, the following specifications are published:
CEE Architecture Overview Specification, Version 1.0α
The CEE Overview provides a high-level overview of CEE along with details on
the overall architecture and introduces each of the CEE components including
the CEE Profile, CEE Log Syntax, and the CEE Log Transport. The CEE Overview
is the first in a collection of documents and specifications, whose combination
provides the necessary pieces to create the complete CEE event log standard:
1 http://cee.mitre.org/.
2 http://www.scribd.com/doc/94205026/16/Syslog-RFC-3164.

Log Future and Standards 407
n CEE Profiles Specification, Version 1.0α
The CEE Profile allows for the improved interpretation and analysis of event
data by allowing users to define how events are structured and what data they
provide. The Profile consists of three components that provide a standardize
field dictionary, event taxonomy, and base requirements for CEE-compatible
events:
n CEE Log Syntax (CLS) Specification, Version 1.0α
The CLS Specification describes the requirements for encoding and decoding
for a Common Event Expression (CEE) Event, and provides encoding declara-
tions for XML and JSON event records:
n CEE Log Transport (CLT) Specification, Version 1.0α
The CEE Log Transport (CLT) provides the technical support necessary for a
secure and reliable log infrastructure. The CLT Specification defines a listing
of requirements conformant log transports must meet. In addition, the CLT
defines transport mappings, which define a standard methodology for trans-
mitting encoded CEE Event Records over certain protocols.”3
CEE also defines a taxonomy that will unify what to log messages mean and
allow developers to unambiguously define which specific events have trans-
pired and is being recorded in logs. The taxonomy will be included in event
profile specification. The key idea for taxonomy is defining each event using
the fields: Object (what it happened with?), Action (what happened?), and
3 http://cee.mitre.org/about/documents.html.
FIGURE 22.1 CEE Influences the Whole Ecosystem, http://cee.mitre.org/docs/overview.html

CHAPTER 22: Log Standards and Future Trends
408
Status (what was the result?) (O-A-S). An early version of a taxonomy can be
found at http://cee.mitre.org/repository/schemas/v10alpha/taxonomy.xsd.
It includes the following values for Object:
n System
n File
n User
n Directory
n Connection
Values for Action include:
n Open
n Close
n Delete.
n Update
Finally, Status includes:
n Success
n Failure
n Deferred
The most useful way to think of this taxonomy approach is to think of every log is
a complete sentence: what happened, what happened with, what was the result?
As a result, the standard can accommodate all of the required domain stan-
dardization. See Figure 22.2. What needs to be logged, how to log it, what
details to log, how to transport the record from generation to analysis.
Even today, a developer can choose to use CEE formats and create logs that
look like this:
Let's look at a CEE XML example:4
<?xml version="1.0" encoding="UTF-8"?>
<CEE>
<Event>
<crit>123</crit>
<id>abc</id>
<p_app>application</p_app>
<p_proc>auth</p_proc>
<p_proc_id>123</p_proc_id>
4 http://cee.mitre.org/docs/cls.html.
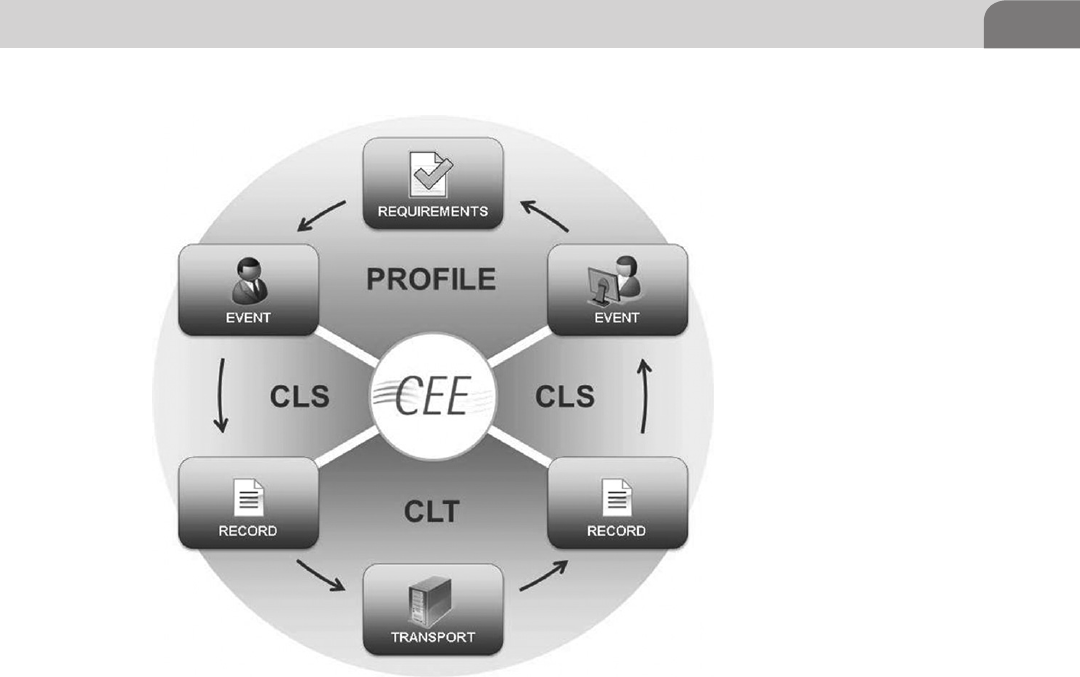
Log Future and Standards 409
<p_sys>system.example.com</p_sys>
<pri>10</pri>
<time>2011-12-20T12:38:05.123456-05:00</time>
<Type>
<action>login</action>
<domain>app</domain>
<object>account</object>
<service>web</service>
<status>success</status>
</Type>
</Event>
</CEE>
Next we see a CEE JSON example, which can be used for syslog transport.4
{"Event":{"crit":123,"id":"abc","p_app":"application","p_
proc":"auth","p_proc_id":123,"p_sys":"system.example.
FIGURE 22.2 Domain Standardization, http://cee.mitre.org/docs/overview.html

CHAPTER 22: Log Standards and Future Trends
410
com","pri":10,"time":"2011-12-20T12:38:05.123456-05:00",
"Type":{"action":"login","domain":"app","object":"account",
"service":"web","status":"success"}},"Module":[{"Augment":{
"p_proc":"my_process","p_proc_id":123,"p_sys":"syslog-relay.
example.com","time":"2011-12-20T17:41:12Z"}},{"Augment":{"p_
proc":"my_process","p_proc_id":123,"p_sys":"syslog-relay.example.
com","time":"2011-12-20T17:41:12Z"}}]}
These logs can be easily consumed by any current log analysis system, effort-
lessly integrated into commercial SIEM tools and (in case of JSON) trivially
understood by human analysts. The JSON/text logs, in particular, are just as
easy to create as other name=value pair formats and are much more useful
than traditional free-form logs.
Such logs can be stored in relational databases or in modern Hadoop-based or
other NoSQL storage facilities.
Adoption Trends
Given the miserable track record of past attempts to standardize logging, CEE
adoption is no assured matter. How can adoption happen? What can log pro-
ducers, log consumers, government, and regulators do?
Strategically, adoption can happen to multiple mechanisms:
n MITRE is close to US government procurement contracts that can be used
to push adoption, just as happened with vulnerability formats such as C,
and vulnerabilities and exposures (CVE) a few years ago.
n Smaller software vendors can use CEE in place of their nascent formats
and achieve standard compliance when CEE is finished.
n Open source logging tools can facilitate conversion from native UNIX
logs and other syslog logs into structured CEE (in JSON format).
As of today, open source logging tools such as rsyslog (covered in Chapter 15)
and syslog-ng (covered in Chapter 5) built their support for CEE. Several com-
mercial SIEM vendors also use CEE formats and ideas internally in their tools,
making them easily usable in environments where some logs are produced in
this format natively. Operating system vendors are looking in the converters
from their formats to CEE.
DESIRED FUTURE
Apart from making predictions, let’s try to define how the desired future will
look like. Here are some of things that he would like to see in the world of log-
ging in the next few years:

Desired Future 411
n Log standard is widely adopted by log producers. Application and equip-
ment makers, as well as cloud platform makers, old produce logs in a
standard format. Ambiguity of log data and the need to treat logs as bro-
ken English is gone—hopefully forever.
n Application developers implement useful logs right away when the appli-
cation is written, using log standards and standard libraries and APIs. The
resulting data is not only standards-based—but also comprehensive, not
excessively voluminous, and useful for most operational, security and
regulatory needs.
n In general we have more transparent, visible, and accountability- enabled
systems, whether mobile cloud virtual of traditional. As Dan Geer once
said “The problem is, these technologies [access control—A.C.] do not
scale and if you try to have ever finer control over the avalanche of new
data items appearing by the second, you will be contributing to the com-
plexity that is the bane of security. What does scale is Accountability. In a
free country, you don’t have to ask permission for much of anything, but
that freedom is buttressed by the certain knowledge that if you sufficiently
screw things then up you will have to pay.”5
n Tools that help make sense of the logs must become smarter, as well
as easier-to-use at the same time. The tools can consume data, whether
standard compliant or legacy, and produce useful recommendations and
conclusions based on the data with minimal human tuning and interac-
tions. However, those humans that want to interact with the tools can
absolutely do so and receive even greater results.
n More companies move up on log maturity curve and more organizations
become more enlightened in regard to analyzing and making sense of log
data. Such enlightenment does not come cheap—but improved tools and
improved logs, described above, makes their experience bearable.
n Finally, people—within and outside the domain of IT—use logs more
across purposes, backed up by tools, improved log data as well as improved,
mature practices and processes that center on obtaining useful insights for
business and technology, protecting systems and compliant with regulations.
SUMMARY
How can organizations prepare for that future? Use the principle highlighted
one of the notable science-fiction writers: the future is here, it’s just unevenly
distributed.
5 http://geer.tinho.net/geer.housetestimony.070423.txt.

CHAPTER 22: Log Standards and Future Trends
412
For example, you can choose to wait until the log standards of mainstream and
supported by every software manufacturer (decades). We can use the material
from the emerging standards to create your own organization wide standard
that will be derived and inspired by the future global standard. This would
allow you to gain some of the value and produce more useful logs that would
tell you more information about what happened and the systems and net-
works, as well as in the cloud.
Instead of waiting for smarter tools to arrive and become common, you can
write your own tool that is smarter in some aspects useful for you.
Instead of being afraid of a large log volume, start analyzing the data you have
so that you gain expertise given the small log data (which in this day and age
means gigabytes of data) so that you’re ready for the future of 10x–1000x log
volumes.
In essence, prepare for the future don’t fear it. And it will bring things useful for
you and your organization in regard to logging and log analysis.
A
AAA protocol. See Authentication, authorization,
and accounting protocol
Access control list (ACL), 1–2
Access-error-by-ip, 89
ACL. See Access control list
Action, 146–147
Address Resolution Protocol (ARP), 109
After hours data transmission technique
principal, 124–125
straightforward technique, 125
time ranges, 125
Agenda, 171
Aging out events. See Timing out events
AI. See Articial Intelligence
Alert ooding tools, 325
Alert log messages, 3–4
Amazon EC2. See Amazon’s Elastic Compute
Cloud
Amazon Elastic MapReduce (Amazon EMR),
82–84
job ow creation, 87–88
job ow parameters, 88
utilization, 83
Amazon EMR. See Amazon Elastic MapReduce
Amazon S3. See Amazon Simple Storage Service
Amazon Simple Storage Service (Amazon S3),
82–83
Amazon Web Services (AWS), 83
Amazon’s Elastic Compute Cloud (Amazon EC2),
82–83
American Registry for Internet Numbers (ARIN),
161
Analysis burden, 198–199
Anomaly detection, 186–187
arpwatch, 261
denition, 186–187
NetIQ Sentinel, 264
Ntop, 261
pads, 261
Anti-port correlation, 160
AntiVirus Systems (AV Systems), 9
Apache Log Parse Job, 87
Apache-access-log-bucket, 85
API. See Application Programming Interface
Application
debug logging, 32
logs, 68
Application Programming Interface (API), 5
ARIN. See American Registry for Internet Numbers
ARP. See Address Resolution Protocol
Articial Intelligence (AI), 187
Assertion, 171
Atomic correlation. See Micro-Level correlation
Attacker, 305
Attacks, 305–306
case study, 327
using CIA model, 306
availability, 306
condentiality, 306
integrity, 306
against logging infrastructure, 306
using remote intruders, 306
trivial attack, 307
Attacks on availability, 318
availability at analysis, 324–327
availability at loghost, 324
availability at source, 319
binary formatted les, 320
Honeynet Research Alliance, 319
local ooding attacks, 321–322
local network connection, 321
log rotation, 322
mitigating against rotational abuse, 323
sanitizing login records, 319
suppressing local logging, 322
syslog daemon, 319
TCP-based syslog daemons, 320–321
Windows logs deletion event, 320, 322
Windows logs deletion failure, 320
Windows logs deletion success, 321
Windows XP event log, 320
zeroing data, 319
availability in transit, 323–324
denial-of-service attack, 319
Attacks on condentiality, 307
condentiality at analysis, 313
condentiality at loghost, 311
condentiality at log store
connections, 311
databases, 311
using GRANT statement, 312
managing database access controls, 312–313
pg_hba. conf, 312
privileges, 312
pull method, 311
Index
413
Note: Page numbers followed by “f” and “t” indicate gures and tables respectively
414 Index
using rsync command, 313
using SQL GRANT command, 312
condentiality at source
conguration le, 309
dd tool, 308
deleted data nding, 309
disk, 308
getting log data, 307
indirect access, 308
permissions, 309
reading raw disk data, 308
sophisticated tools, 308
unprivileged users, 307
condentiality in transit, 309–310
using public-key encryption method, 311
switched network, 310
syslog-reliable RFC, 310
using tcpdump, 310
tool plog, 310
UDP packets, 310
intruder nding logs, 307
Attacks on integrity, 313
evidentiary purposes, 313–314
inserting bogus messages, 313
integrity at analysis, 318
integrity at loghost, 317
integrity at source, 314
anton instances, 314
applications, 315
authentic syslog message, 315
binary format, 314
bogus log messages generation, 315
central loghost, 314
resulting bogus message, 315
Unix systems, 314–315
integrity in transit, 315–316
arbitrary network packets
generation, 316
arp caches, 317
ARP-spoong, 316
IP trafc, 316
loghost via serial lines, 317
MAC address, 316–317
integrity on database, 317–318
Audit, 31
Authentication, 208
account and group additions, 211
and authorization reports, 208
change reports, 210
CSO, 209–211
key reports, 209–211
sample report showing login attempts, 210
unauthorized changes, 210
Authentication, authorization, and accounting
protocol (AAA protocol), 277–278
AV Systems. See AntiVirus Systems
Availability law, 233
Awk tool, 132, 249–250
eld identiers for access_log, 250–251
options, 250
Web server, 251
AWS. See Amazon Web Services
B
Backup failures, 217
Backward-chaining, 171
Baseline, 182–187
anomaly detection, 186–187
average value nding, 183
calculations, 183
compelling reasons, 182
initial baseline building
using log management system, 283–285
via manual process, 285–286
key baseline assumptions, 182–183
lifecycle for, 185
standard deviation formula, 183
standard error formula, 183
thresholds, 186
usage, 182
windowing, 187
Baselining, 279–280
Big data in cloud, 392
Hadoop, 394–395
large volume, 393
NoSQL, 393–394
Binary formatted les, 320
Binary log les, 76
Brute-force login attempt, 178
Buffer overow, 20
Building initial baseline, 283–285
See also Periodic Log Review Practices
using log management tool
90-day summary report, 285
implementation, 283–284
logging device report, 284
message type counts, 284
procedure, 279
manual technique
“known bad” message identication, 286
procedure, 285–286
C
C, and vulnerabilities and exposures (CVE), 410
CAG. See Consensus Audit Guidelines
415
Index
Calendar rule, 162
Cat tool, 131
CDP. See Cisco Discovery Protocol
CEE. See Common Event Expression
CEE Log Syntax Specication
(CLS Specication), 407
CEE Log Transport Specication
(CLT Specication), 407
CEF. See Common event format
Change Management (CM), 45, 290
Chief security ofcer (CSO), 209, 211, 213–216
CIA. See Condentiality, integrity, and
availability
Cisco Discovery Protocol (CDP), 114
Cisco IOS
Change, 116
operating system, 151
Cloud and Hadoop, 82–83
Amazon EMR, 83
Amazon S3, 83–84
Apache Access Log, 85
conguration, 88
creation, 88
log data processing, 87
MapReduce, 83–84
processes, 83–84
report generation, 89
running, 89
Pig script, 86–87
Cloud computing, 381–382
cloud deployment models, 383–384
cloud infrastructure characteristics, 384–385
cloud logging, 386–390
infrastructure characteristics, 384–385
service delivery models, 382
IaaS, 383
PaaS, 382–383
SaaS, 382–383
standardization, 385–386
Cloud deployment models, 383
community cloud, 384
hybrid cloud, 384
private cloud, 384
public cloud, 383–384
Cloud logging, 386
compliance, 391–392
features, 387
LaaS, 386
Loggly, 388
APIs, 390
curl command, 388
SHA-2 key, 389
pros and cons, 396–397
provider inventory, 396–398
regulatory requirements, 390–391
security issues, 388, 391
CLS Specication. See CEE Log Syntax
Specication
CLT Specication. See CEE Log Transport
Specication
CM. See Change Management
Collection law, 232
Comma-separated values (CSV), 251
Commercial log analysis system, 372–374
Common Event Expression (CEE), 365–366,
406–407
Architecture Overview Specication, 406
CEE JSON example, 409–410
CEE XML example, 408–409
CLS Specication, 407
CLT Specication, 407
Domain Standardization, 409
inuences, 407
JSON, 410
NoSQL storage facilities, 410
overview, 406–407
specications, 406
status, 408
taxonomy, 407–408
values for action, 408
values for object, 408
Common event format (CEF), 36
Communication technology (CT), 404
Community cloud, 384
Complete stealthy log setup, 105
honeypot, 109–110
IDS log source, 106–107
log collection server
ARP spoong, 109
using command, 109
using dedicated log sniffer, 108
honeypot victim server, 108
IP address, 107
Linux system, 107
passlogd, 108–109
plog, 108
sniffers, 108
snifng interface, 107–108
syslog-formatted messages, 108
stealthy log generation, 105
hiding logging, 105–106
stealthy pickup of logs
production, 106
syslog-based logs, 106
UDP-based syslogs, 106
416 Index
Compliance
logging, 32, 343
multiple regulatory, 208
Compliance validation, 293
See also Periodic Log Review Practices
misconception, 293
proof of compliance, 295
proof of exception handling, 294–296
proof of log review, 294
proof of logging, 294
Compressed les, 76
log generation, 76
logrotate conguration script, 77
on Unix/Linux systems, 77
Compressed log, 39
Condentiality, integrity, and availability (CIA),
273, 346
Conict resolution, 171
Consensus Audit Guidelines (CAG), 303
Constant changes law, 234
Context data, 157–158, 332
Correlation, 145–146, 154
See also Filtering; Normalization
log data receiving, 154
macro-level, 157–158
anti-port correlation, 160
ngerprint correlation, 159–160
geographic location correlation, 161
rule correlation, 158
vulnerability correlation, 158
watch list correlation, 160
micro-level, 155
eld correlation, 156
rule correlation, 156–157
patterns, 178–179
process, 145–147
SBR engine, 155
SRE, 155
TTL, 155
Counting tool, 156–157
Covered entities, 354
Covert channels, 113
for logging, 113–114
Covert logging, 111
Critical errors and failures reports, 216
CSO, 217
disk full and high CPU report, 217
errors and failure log messages, 216
key reports, 216–217
CSO. See Chief security ofcer
CSV. See Comma-separated values
CT. See Communication technology
curl command, 388
CVE. See C, and vulnerabilities and exposures
D
Daily log review. See Periodic Log Review
Practices
Data de-duplication, 123
destination IP address, 124
destination port, 124
goal, 123
information in log data, 123–124
log event source, 124
security log events, 123
source IP address, 124
source port, 124
Data mining (DM), 194
See also Log mining
analyzing logs, 198
blocked attack, 203
channel/hidden backdoor communication
conversion, 202
common failed attack, 203
compromised system, 202
descriptive methods, 195
domain name system, 197
nding interesting things, 203–204
bottom things, 204
“out of character” things, 203
counts, 204
different things, 203
rare things, 203
strange combinations, 204
top things, 204
unusual direction things, 204
weird-looking things, 203
increase in probing, 202
infected system spreading malware, 201–202
insider abuse and intellectual property theft, 202
making sense of logs, 194–195
misuse detection systems, 204–205
NIDS, 204
normal message, 203
predictive methods, 195
probe, 202
processes, 195–197
acquiring subject matter expertise, 195
choosing method, 196
collecting data, 196
data preprocessing and cleaning, 196
data reduction and transformation, 196
dening goal, 195
estimation, 197
run mining software, 197
specic algorithm choosing, 196
realm of, 195
417
Index
successful attack, 202
system crash, 202
system status update, 203
techniques in common usage, 196
usage, 194
Database storage of log data, 78
advantages, 78
database infrastructure, 79–80
disadvantages, 78–79
fast retrieval, 80–81
hybrid storage approach, 79–80
logs storage, 79
reporting, 81
Databases, 311, 324
Debug log messages, 3
Debugging logs, 47
defclass() method, 175
denstance() method, 175
Delimiters, 339
Denial of service (DoS), 186–187
Deployment models, 376
basic, 376–377
distributed, 378
log collector
deployment, 377–378
with long-term storage, 378
log server
deployment, 377–378
with long-term storage, 378
distributed model, 378
Destination
IP address, 124
port, 124
spoong, 112
DHCP. See Dynamic Host Conguration Protocol
Disaster recovery (DR), 387
Distributed deployment model, 378
DM. See Data mining
DNS. See Domain Name System
Documented process, 24
Domain Name System (DNS), 184, 197
DoS. See Denial of service
DR. See Disaster recovery
Dragon Squire, 69
Dynamic Host Conguration Protocol (DHCP), 184
E
E-Streamer, 5
EBCDIC. See Extended Binary Coded Decimal
Interchange Code
ECN. See Explicit Congestion Notication
EIT. See Excessive Inbound Trafc
Elasticity, 381–382
Electronic Protected Health Information (EPHI),
353
ELF. See Extended Log File Format
Encryption, 103
Environmental triggers, 161
EOT. See Excessive Outbound Trafc
EPHI. See Electronic Protected Health Information
Error
getting availability, 282
log messages, 3
Escalation
to other procedures, 291–292
SANS IR process, 292
stages, 293
Esper framework, 177–178
Euclidean distance formula, 188
Event, 30, 146
audit, 31
eld, 30
IDS alerts, 31
log, 30–31, 62
methodologies, 30
record, 30–31
security incident, 31
Evil Internet hacker, 305
Excessive Inbound Trafc (EIT), 188
Excessive Outbound Trafc (EOT), 188
executeCommand() method, 175
Explicit Congestion Notication (ECN),
113–114
Extended Binary Coded Decimal Interchange Code
(EBCDIC), 76
Extended Log File Format (ELF), 36
eXtensible Markup Language (XML), 5
F
Fake server. See Honeypot
Federal Information Security Management Act
(FISMA), 208, 265, 360
compliance, 360, 362
log management, 364
architecture, 364
project planning, 364
logging policy creation, 364
log analysis, 364
log generation, 364
log storage and disposal, 364
log transmission, 364
NIST 800-53 logging guidance
AU controls and procedures, 361
audit generation, 362
418 Index
audit information, time stamps and protection
of, 361–362
audit processing failures, response to, 361
audit reduction and report generation, 361
audit review, analysis, and reporting, 361
audit records, content of, 361
audit storage capacity, 361
auditable events, 361
information disclosure, monitoring for, 362
NIST 800-92 and SANS CSC20, 366
NIST 800-92 document, 363
NIST Special Publication 800–53, 360
PCI DSS, 365
performing periodic analysis, 365
policy, planning, and risk level, 363
QuickWins, 365–366
Field, 30
correlation, 156
dragon log message, 136
set of log elds, 41
File Integrity Monitoring (FIM), 290
Filtering, 145–146
See also Correlation; Normalization
articial ignorance, 147–148
log message, 148
in sed command, 148
operations, 147
FIM. See File Integrity Monitoring
Fingerprint correlation, 159–160
Firewall Accepts (FWA), 188
Firewall Drops (FWD), 188
FISMA. See Federal Information Security
Management Act
Flat text les, 74
benet, 74–75
logs sent via syslog, 74
Forward-chaining, 171
Frequencies
automated technique, 182
IP address, 181–182
time, 182
Fusion correlation. See Macro-level correlation
FW-1 MAD Port Scan, 116
F WA . See Firewall Accepts
FWD. See Firewall Drops
G
Geographic location correlation, 161
Global syslog-ng server, 98
Glory. See Analysis burden
GraphViz tool, 222
Grep tool, 247
using grep for log analysis, 249
log les and examples, 247–248
and regular expressions, 249
reviewing logs, common items to search for,
248–249
H
Hadoop log storage, 81–82
advantages, 82
cluster, 81–82
disadvantages, 82
Hadoop Pig language, 83–84
Hadoop’s Distributed File System (HDFS), 82
HDFS. See Hadoop’s Distributed File System
Head tool, 253
Health Information Technology for Economic and
Clinical Health Act (HITECH Act), 354
Health Insurance Portability and Accountability Act
(HIPAA), 208, 265, 303, 353
applications, 359
audit record, 355
authentication, authorization and access, 358
automated analysis, 357
availability issues, 358
badness/threats, 359
changes, 358
covered entities, 354
EPHI and PHI, 353
HITECH Act, 354
log requirements, 355
logging standards, 360
NIST Publication 800–66, 355
PCI DSS guidance, 356
platform level logging, 357
policies, 356
primary things, 357
questions, 354–355
requirements, 354
audit controls, 354
information system activity review, 354
log-in monitoring, 354
and logging, 354
security controls and technologies, 356–357
semi-automated analysis, 357
software architects and implementers, 359–360
Hiding logging, 105–106
with misdirection, 106
HIDS. See Host intrusion detection systems
High priority events, 10
Higher layer protocols, 113–114
HIPAA. See Health Insurance Portability and
Accountability Act
419
Index
Historical log review, 130
features, 130–131
using info command, 130
more and less utilities, 130
Windows 7 event log viewer, 130–131
HITECH Act. See Health Information Technology
for Economic and Clinical Health Act
Honeynet Research Alliance, 319
Honeynet’s shell covert keystroke logger
bash shell prompt, 111
using command, 112
covert logging, 111
Honeynet Project, 112
honeypot logger, 111
monitor users, 112
source and destination spoong, 112
UDP communication, 111–112
Honeypot, 109–110
full-blown honeypot, 109
honeynet’s Sebek2 case study, 112
disadvantage, 113
production environments, 113
protections, 113
Sebek architecture, 113
stealthy logging, 112
logging in, 110
host activity recording, 111
IDS alerts, 111
infrastructure, 110
network trafc recording logs, 110–111
network transaction recording, 110
process, 110
Unix honeynet, 111
Host activity recording, 111
Host intrusion detection systems (HIDS), 20, 66,
68–69, 261
Hybrid cloud, 384
Hybrid deployment, high-level, 391–392
I
IaaS. See Infrastructure as a Service
IBM q1labs, 264–265
ICMP. See Internet Control Message
Protocol
IDS. See Intrusion Detection System
IDS log source, 106–107
IIS. See Internet Information Server
Incident response (IR), 291–292
SANS IR process, 292
stages, 293
Indexed at text les, 75
data organization, 75
directory structure, 75
utilities, 76
indexOf() method, 153
Information Security Management System standard
(ISMS standard), 350
Informational log messages, 3
Infrastructure as a Service (IaaS), 383
International Organization for Standardization
(ISO), 350
Internet Control Message Protocol (ICMP), 17,
111–112, 323
Internet Information Server (IIS), 76
Internet Protocol Security (IPSEC), 20, 316
Intrusion Detection System (IDS), 117, 261
Intrusion Prevention System (IPS), 3–4, 234–235,
277–278
IPS. See Intrusion Prevention System
IPSEC. See Internet Protocol Security
IR. See Incident response
ISMS standard. See Information Security
Management System standard
ISO. See International Organization for
Standardization
ISO 8601 timestamp, 118
ISO2700x series
A. 10. 10 monitoring, 350
administrator and operator logs, 351
audit logging states, 350–351
clock synchronization, 353
I/O device attachment/detachment, 352
ISMS standard, 350
ISO environment, 351
ISO/IEC 27001:2005, 350
log information, protection of,
352–353
log timing, 353
monitoring system use, 352
privileged user monitoring, 352
review and analysis, 352
security incidents, 351
IT components, 343–344
IT users, 343–344
J
Java-based framework. See Lucene
Javabeans conventions, 172
Java libraries, 5
Jess algorithm, 170
and Rete algorithm, 170–171
JSON response, 389
J2EE logs, 263–264
Juniper devices, 15
420 Index
K
k-Nearest Neighbor technique (kNN technique),
187–188
k-NN algorithm to logs, 189
behavior, 189
drawbacks, 190
features, 188
patterns and features, 189
unknown patterns, 189
KDD. See Knowledge discovery in databases
Killall syslogd command, 104–105
kNN technique. See k-Nearest Neighbor technique
Knowledge discovery in databases (KDD), 241
“Known bad” message, 284
identication, 286
L
LaaS. See Logging as a Service
LAN. See Local area network
LEA. See Log Extraction API
Left-hand side (LHS), 170
Lire tool, 253
Loadable kernel module (LKM), 105
Local area network (LAN), 8
Local syslog-ng server, 97–98
Log analysis, 127, 194–195, 364
acting on critical logs
actions to take on critical log messages,
135–136
dragon log message elds, 136
dragon messages, 135
network intrusion detection logs, 135
acting on non-critical logs summaries, 137
actions associated with non-actionable logs,
138–139
clear-cut proof, 137
correlation, 137–138
non-actionable logs, 137
pattern discovery, 137–138
summaries and trends, 137–138
automated actions, 140
best reports denition, 208
report categories, 208
building solution, 244
advantages, 244
risks, 245
buy, 245
advantages, 245
risks, 245–246
commercial vendors, 262–263
dashboards and views, 264
free vs. enterprise, 263
IBM q1labs, 264–265
log source support, 263–264
loggly, 265
NetIQ sentinel, 264
Splunk, 263
developing action plan, 138–140
goals, 115–117
high prole security incidents, 243–244
incident response scenario, 140–141
log management and log analysis systems, 244
organization and vendors, 246–247
questions, 247
outsource, 246
advantages, 246
risks, 246
PCI DSS, 244
performance, 127
process, 51
reports and summarization, 207
results of analysis, 135
pursued log analysis, 135
routine log review, 141–142
system, 305
technology, 23
Log analysis system planning, 367–368
accuracy, 117
IDS, 117
log timestamps, 118
condence, 119
deployment models, 376–378
integrity, 118
dedicated network links, 119
digital signatures, 119
normalization, 120
policy denition
log data collection, 375
log le rotation, 375
logging policy, 374–375
response, 376
retention/storage, 375–376
preservation, 119–120
roles and responsibilities, 368–369
goals, 370
hard and soft costs, 370
resources, 368–369
selecting systems and devices for logging, 371
sanitization, 120
scaling, 378–379
software selection, 371
commercial, 372–374
open source, 371–372
time, 121–122
Log analysis preparation
421
Index
data compression, 123
data de-duplication, 123
goal, 123
information in log data, 123–124
security log events, 123
data reduction techniques, 122–123
after hours data transmission technique
principal, 124–125
straightforward technique, 125
time ranges, 125
parsing, 122
separating log messages, 122
Log analysis tools, 257
awk tool, 249–250
Field ID, 250–251
eld identiers for access_log, 250
powerful options, 250
Web server, 251
factors, 254
grep tool, 247, 249
and regular expressions, 249
head tool, 253
lire tool, 253
LogHound, 262
logsurfer, 261–262
Log2Timeline, 262
logwatch tool, 253
microsoft log parser, 251–252
CSV format, 251
features, 251
Linux/Unix operating system, 251
results from Microsoft Excel, 253
OSSEC tool, 257–258
log retention policy and storage options,
260–261
real-time alerting, 259–260
setup settings to retain all logs, 258–259
OSSIM, 261
log2timeline, 262
loghound, 262
logsurfer, 261–262
role, 254
sed tool, 253
tail tool, 252
Log collection server
ARP spoong, 109
using command, 109
using dedicated log sniffer, 108
honeypot victim server, 108
IP address, 107
Linux system, 107
passlogd, 108–109
plog and passlogd, 108
sniffers, 108
snifng interface, 107–108
syslog-formatted messages, 108
Log collector
deployment, 377–378
with long-term storage, 378
Log content, 44–45
authentication and authorization, 45
business continuity + availability management,
46
change management, 45
data and system access, 45
information about user activity, 45
log taxonomy, 45
miscellaneous debugging messages, 46
miscellaneous errors and failures, 46
performance + capacity management, 45–46
threat management, 45
Log data, 2–3
constellations, 222
clickable GraphViz graph, 223–226
GraphViz graph, 222
Perl script, 223–227
data transmission and collection
central log collector, 4
Syslog, 4–5
syslog-ng, 11
databases, 5
proprietary logging formats, 5
retrieval and archiving
near-line storage, 90
ofine storage, 90
online log information, 90
SNMP, 5
source conguration, 52
Syslog protocol, 4
Windows Event Log, 4–5
Log event source, 124
Log Extraction API (LEA), 5
Log information centralization
rsyslog, 256
snare, 256–257
syslog, 254–255
maintaining log source information, 256
messages, guaranteed delivery of, 255–256
secure transport of log messages, 256
utilities for, 254
Log management, 244, 364
architecture, 364
project planning, 364
regulations, 344
Log messages, 3–4
formatting, 337–339
422 Index
components, 339
goal, 340
router message data, 7
source, 6
Syslog message, 6, 7
timestamp, 6
Log mining, 198–199
See also Data mining (DM)
challenges, 199
diverse records, 199
duplicate data, 199
false alarms, 199
hard to get data, 199
not enough data, 199
too much data, 199
DM-based log analysis systems, 200
network trafc information, 198
reasons, 200
requirements, 200–201
data centralization, 201
normalized, 201
normalized and centralized data, 201
relational data storage, 201
using data, 198
using data mining, 198–199
Log Parser Lizard, 133
command-line tool, 133
date and time range, 133
event type, 132
features, 133–134
Log Parser, 133
Log Parser Lizard GUI, 133–134
Microsoft log parser toolkit, 134
online documentation and forums, 134
using query, 133
screenshot, 133
Windows system ltering, 132–133
Log retention policy, 71
development, 71–73
compliance requirements, 72
log sources, 72
online business, 73
organization’s risk, 72
storage, 72–73
Log review, 274, 277–278
building initial baseline, 283–286
PCI DSS compliance, 278
Periodic Log Review Practices, 279–283
QSA, 277–278
Log rotation, 322, 335
Logback conguration, 335–336
schemes, 335
types, 335
Log server
deployment, 377–378
with long-term storage, 378
Log sources, 63, 96–97
security-related host logs, 64
application logs, 68
network daemon logs, 66–68
operating system logs, 64–66
security-related network logs, 68
host intrusion detection and prevention, 68–70
network infrastructure logs, 68
security host logs, 68–70
Log storage formats, 73
binary log les, 76
compressed les, 76–78
text-based log les, 73–74
at text les, 74–75
indexed at text les, 75–76
Log storage technologies
Hadoop log storage, 81–82
log retention policy, 71
log storage formats, 73–78
Log syntax, 40, 42
analysis-related software products, 42
automated system, 43
common set of log elds, 41
Dragon NIDS message, 42
example event attributes, 42–43
fairly long and esoteric line, 42
network device manufacturers, 41
notable logging methods, 44
pros/cons of logging mechanisms, 43–44
system and device vendors, 43
using syslog message, 41
Log2timeline tool, 262
Logback logging, 333
advantage, 334–335
conguration le, 333, 335
Logbook, 295
example logbook entry, 297–299
PCI DSS testing procedure, 299
Windows 7 event, 297–298
recommended logbook format, 296–297
Logging, 31–32, 214, 343
See also Payment Card Industry Data Security
Standard (PCI DSS)
application debug logging, 32
assumptions, 268
compliance logging, 32
criteria, 46
application logs, 47
debugging logs, 47
5W’s of logging, 46–47
423
Index
logging and timing issues, 47
using neat Cisco ASA, 47
Event Viewer, 33
ideal logging scenario, 47
critical versus accounting logs, 47–48
high priority log, 48–49
implementation, reasons for, 267–268
operating system, 33
operational logging, 32
precautions, 269
regulations, 344
requirements, 269, 275–277
roles and responsibilities, 269–270
security logging, 32
Snort NIDS alert log message, 34
sources and systems, 32
syslog, 33
TCB, 31
Web server logs, 34
Web site administrators, 33–34
Logging as a Service (LaaS), 386
Logging ecosystem, 7–8
advantages, 12–13
cloud computing, 13
cloud logging, 13
enabling logging, 9
ltering, 9
log message
analysis, 14
collection, 11–12
generation, 8–9
long-term storage, 14
log server, 11–12
normalization, 9
message from Snort, 11
parsing, 10–11
Sourcere IPS, 10
plan, 8
priorities, 10
Logging for programmers, 331
APIs, 333–334
advantage, 334–335
Logback, 333, 335
bad log messages
gem, 337
logging bad habits, 337–338
secret numbers, 337
time stamp missing, 336
username, 336
high-level process steps, 331–332
log message formatting, 337–339
components, 339
goal, 340
log rotation, 335
Logback conguration, 335–336
schemes, 335
types, 335
log types, 332–333
performance considerations, 341–342
security considerations, 340–341
state and context, 332
Logging infrastructure. See Logging ecosystem
Logging laws, 231
availability law, 233
collection law, 232
constant changes law, 234
monitoring law, 233
retention law, 232–233
security law, 233–234
Logging mistakes
ignoring application logs, 240–241
looking for known bad entries, 241
mistake making, 234
not logging at all, 235
in cloud computing environments, 236
in Oracle, 235–236
not looking at logs
collecting and storing, 236
HIPAA regulation, 237
reactive benet of log analysis, 236–237
risk assessment, 237
prioritization before collection, 239
gross oversimplication, 240
VPN concentrator logs, 239
storing logs for too short time, 237–238
retention strategy, 238
storing logs for too long, 238
three dimensions, 239
three-tier approach, 238
Logging policy, 277, 374
creation, 364
log analysis, 364
log generation, 364
log storage and disposal, 364
log transmission, 364
Logging sources, 51
categories, 51
pull-based log sources, 52
push-based log sources, 51–52
SNMP, 58–59
get, 60
issues with, 60–62
managers and agents, 59
set, 60
traps and notications, 59–60
versions, 59
424 Index
syslog, 52
logging with syslogd, 53–54
mark facility, 55
mark interval, 57–58
syslog message classication, 54
syslog priority, 55–56
syslog protocol, 58
syslog.conf, 56
syslogd output, 58
Windows Event Log, 62
application logs, 62
event detail for event 4624, 62, 64
Windows event viewer, 62–63, 65
Windows logs, 62
Loggly, 265
logging provider, 388
Loghost, 4, 324
LogHound utility, 262
Login Outside of Internal Network (LOIN), 188
Logrotate, 77
Logs, 1, 3, 30–31, 193, 207, 343, 401
adoption trends, 410
analysis
big data, 405
context data, 405
controversial, 405
rule-based correlation, 405
auditing
audit trails, 23
fun discovery, 23
user activity, 23
data, 2–3, 375
entities, 31–32
extrapolations of today to future, 402
UNIX systems and Event Logs from Windows,
402
volume of logged data, 402
le rotation, 375
ltering, 131
rewall, 1–2
forensics, 21–22
formats and types, 34–35
ASCII log, 38
binary format log entries, 38
binary logging, 38
components, 35
compressed log, 39
event transport protocols, 35
free-form text, 37
industry-wide recommendation, 40
log les formats, 36–37
log formats, 36
log syntax and format, 35
log transport mechanism, 35
open and proprietary formats, 40
PCI DSS compliance, 40–41
primary distinctions, 35
relational database, 39
syslog UDP, 35
Tcpdump binary format, 38
Windows XP Event Log, 38–39
future, 410–411
generation, 364
in intrusion detection
account password, 20
binary data, 19
HIDS, 20
NIDS, 18–19
system auditing tools, 21
TCP-Wrappers, 19
intrusion detection logs, 31
log data, 402
access and activity, 403
analysis and comprehension, 403
applications, 403–404
dealing with data, 404
dealing with systems, 402–403
investigative pressure, 403
operational purposes, 404
OT and CT, 404
regulatory pressure motivates, 402
log future and standards
CEE, 406
CEE JSON example, 409–410
CEE XML example, 408–409
Domain Standardization, 409
JSON, 410
log standardization, 406
NoSQL storage facilities, 410
RFC document, 406
messages, 3–4
motivations, 404–405
parser, 133, 251
record, 31
reformatting, 131
regulations, 344
in resource management
failure, 18
pinging, 17
var lesystem, 18
retention, 274–275
stealthy pickup
production, 106
syslog-based logs, 106
UDP-based syslogs, 106
summarization, 131
425
Index
transmission, 364
transport mechanism, 35
troubleshooting, 21
under-appreciated, 16
no plug-in log analysis tools, 17
plug-and-pray opposition, 16–17
untapped riches, 401
Web server logs, 34
Logsurfer utility, 261–262
Logwatch, 253
Logwatch tool, 253
LOIN. See Login Outside of Internal Network
Low priority events, 10
Lucene, 76
M
Machine learning (ML), 187
applying k-NN algorithm to logs, 188
kNN technique, 188
treatment, 187
Machine-readable format, 194
Macro-level correlation, 157–158
See also Micro-level correlation
anti-port correlation, 160
ngerprint correlation, 159–160
geographic location correlation, 161
rule correlation, 158
vulnerability correlation, 158
watch list correlation, 160
Malicious software, 215
Malware activity reports, 215
CSO, 216
key reports, 215–216
malicious software, 215
virus types across network, 216
Managed Security Service Providers (MSSP), 13,
373–374
Management Information Base (MIB), 60–61
Manual log
analysis, 127–128
complication, 129
log les, 128
security analyst, 128
review, 128, 134
limitations, 134–135
MapReduce, 83–84
Mark facility, 55
Medium priority events, 10
“Memory exhausted,” 285
MFL. See Multiple Failed Logins in Row
MIB. See Management Information Base
Micro-level correlation, 155
eld correlation, 156
rule correlation, 156–157
Microsoft log parser, 251–252
CSV format, 251
features, 251
Linux/Unix operating system, 251
results from Microsoft Excel, 253
Microsoft SQL Server (MSSQL), 317
ML. See Machine learning
Monitoring law, 233
MRTG. See Multi Router Trafc Grapher
MSSP. See Managed Security Service Providers
MSSQL. See Microsoft SQL Server
Multi Router Trafc Grapher (MRTG), 227
Multiple Failed Logins in Row (MFL), 188
N
Near-line storage, 90
NERC. See North American Electric Reliability
Corporation
Net-SNMP, 59
NetIQ sentinel, 264
free vs. enterprise, 264
Network, 211
daemon logs, 66–68
ooding, 323–324
infrastructure logs, 68
trafc information, 198
trafc recording logs, 110–111
transaction recording, 110
Network activity reports, 211
CSO, 213
reports, 212
VPN account access and activities, 213
Network le system (NFS), 331
Network Intrusion Detection System (NIDS),
16, 204
Network management station (NMS), 59
Network Operations Center (NOC), 395
Network Time Protocol (NTP), 272, 346
NFA. See Non-deterministic Finite Automata
NFS. See Network le system
NIDS. See Network Intrusion Detection System
NIST 800-66 HIPAA Guide, 303
NIST 800-92 Logging Guide, 303
Nmap tool, 159–160
NMS. See Network management station
NOC. See Network Operations Center
Non-deterministic Finite Automata (NFA), 152
Normal distribution, 184
Normalization, 146, 148
See also Correlation; Filtering
426 Index
Cisco IOS messages, 151–152
to parse IOS message, 152
Perl snippet, 151
severities, 151–152
IP address validation, 150
raw log message, 149
regular expressions performance, 152
indexOf() method, 153
Perl script, 152–153
substr() function, 153
Snort, 150
storage mechanism, 149
Windows Snare, 150–151
North American Electric Reliability Corporation
(NERC), 72, 265
NTP. See Network Time Protocol
O
OAS. See Oracle Advanced Security
Off-premise, 383
Ofine storage, 90
On-premise, 383
Open source
log analysis tools
OSSEC, 257–262
OSSIM, 261
Rsyslog, 256
software, 371–372
Operating system logs, 64–65
authentication: user logged, 65
Linux syslog, 65
miscellaneous status messages, 66
operating system messages, 66
service crash, 66
service startup, shutdown and status
change, 66
SSH daemon, 65
system startup, shutdown, and reboot, 65
Operational logging, 32
Operational technology (OT), 404
Oracle Advanced Security (OAS), 317
OSSEC tool, 257–258
log retention policy and storage options,
260–261
real-time alerting, 259–260
setup settings to retain all logs, 258–259
OSSIM tool, 261
AlienVault, 261
log2timeline, 262
logHound, 262
logsurfer utility, 261–262
OT. See Operational technology
P
PaaS. See Platform as a Service
Pair rule, 162
PairWithWindow rule, 162
Parsing, 10–11
Passlogd, 108
Patch Management (PM), 290
Payment Card Industry Data Security Standard
(PCI DSS), 22, 72, 208, 244, 268
compliance validation, 293–296
log review, 277–278
building initial baseline, 283–286
PCI DSS compliance, 278
Periodic Log Review Practices, 279–283
QSA, 277–278
logging policy, 277
references, 303
requirements
CIA of logs, 273–274
data elds or values, 272
log retention, 274–275
log reviews, 274
process establishment, 271
system events, 271–272
system time, 272–273
PCI Compliance Evidence Package, 299–300
management reporting, 300
PCI DSS logging requirements, 299
periodic operational tasks, 300
annual tasks, 303
daily tasks, 300–301
monthly tasks, 301–302
quarterly tasks, 302
weekly tasks, 300–301
PCI DSS. See Payment Card Industry Data Security
Standard
PCI DSS logging requirements, 299, 344, 346
anti-virus defenses, 349
anti-virus updates, 348
backing up logs, 347
cardholder data, 349
using change detection software, 347
CIA, 346
daily operational procedures, 350
data encryption, 349
event logging, 350
elds, 346
rewall conguration, 348
general security hardening, 348–349
guidance to rewall conguration, 348
having logs, 347
healthy minimum requirement, 345–346
427
Index
incident analysis, 346
intrusion detection, 350
IT governance, 345
linking all access to system components, 345
log retention, 348
logging in PCI, 348
minimum list of system events, 345
network infrastructure, 347
physical access control, 349–350
protect audit trail les, 346
same league, 349
security monitoring, 350
security standards, 350
updating anti-virus software, 349
user password changing, 349
using le integrity monitoring, 347
version 2.0, 345
Periodic Log Review Practices, 279
baselining, 279–280
daily workow, 286–287
comparison methods, 288
exception candidate selection, 287–288
periodic log review frequency, 287
event creation procedure, 281–283
exception investigation and analysis, 289
escalation to other procedures, 291–292
external information sources investigation,
290–291
initial investigation, 289–290
investigation of each exception, 289
goals, 279
IR and escalation, 291–292
SANS IR process, 292
stages, 293
principle, 279
Windows 7 event ID example, 280–281
Windows XP event ID example, 280
Personally identiable information (PII), 340
PHI. See Protected Health Information
pid. See Process id
PII. See Personally identiable information
Ping command, 323
Platform as a Service (PaaS), 382–383
Plog logging solution, 108
PM. See Patch Management
Policy denition, 374
log data collection, 375
log le rotation, 375
log retention, 375
log storage, 376
logging policy, 374–375
response, 376
Polling, 5
portscan events, 154–155, 164–165
Postgresql, 312
Preservation, 119–120
Private cloud, 384
Process id (pid), 339
Programmers, 329
logging, 331
APIs, 333–335
high-level process steps, 331–332
log types, 332–333
state and context, 332
roles and responsibilities
external, 330–331
internal, 329–330
Protected Health Information (PHI), 353, 357
Public cloud, 383–384
Pull method, 311–312
Pull-based log sources, 52
Push-based log sources, 51–52
Q
QoS. See Quality of Service
QRadar, 264–265
QSA. See Qualied Security Assessor
Qualied Security Assessor (QSA), 277–278
Quality of Service (QoS), 385
QuickWins, 365–366
R
Rats R Us, 140–141
RDBMS. See Relational Database System
Real-time Network Awareness (RNA), 158
Real-time review
bundled Event Viewer, 130
using command, 129
le-of-latest-sshd-logs.txt, 130
using grep command, 129
using less command, 130
secure shell daemon, 129
using tee command, 129
Unix and Linux avors, 129
Real-time visualization, 220
interfaces, 220
OSSIM event viewer, 220
tools, 220
Reject events, 164–165
Relational database, 39
Relational Database System (RDBMS), 148
Resource access reports, 213
CSO, 214–215
le access across multiple servers, 215
key reports, 213–214
resource access, 213
428 Index
Rete algorithm, 170
See also Jess algorithm
Rete-based rule engines, 171
rules, 170–171
tree-like structure, 170–171
Rete-based rule engines, 171
Retention law, 232–233
Retraction, 171
RFC5424, 58
RHS. See Right-hand side
Right-hand side (RHS), 170
rlogin service, 15
RNA. See Real-time Network Awareness
Routine log review, 141–142
Rsyslog, 256
Rules engine, 156, 169
Rules-based engine using Jess, 170
See also Stream-based engine using Esper
Java programming, 172–174
events, 175–176
in-line comments, 175
partial event matches, 176
stateful rule, 175
Jess performance, 176–177
Jess rule language, 171–172
Rete algorithm implementation, 170
Rete-based rule engines, 171
run() method, 175
S
s3cmd command, 85
in Amazon’s S3 storage, 85
SA. See Situational awareness
SaaS. See Software as a Service
SAN. See Storage area network
Sanitization, 120
SANS CAG/CSC, 303
SANS IR process, 292–293
Sarbanes-Oxley (SOX), 265
Scaling, 378–379
SDEE. See Security Device Event Exchange
SDK. See Software development kit
SEC. See Simple Event Correlator
Secure Information and Event Management
(SIEM), 261
Secure Shell daemon (SSH daemon), 65
Secure Sockets Layer (SSL), 20, 118, 316
Security, outside of, 213
Security analyst, 209
Security Device Event Exchange (SDEE), 5
Security hardening, 348–349
Security host logs, 68
host intrusion detection and prevention, 68–70
Security information and event management
(SIEM), 24–27, 66, 141
in cloud, 395
difference, 395
MSSPs, 395
Security Information Management (SIM), 119
Security incident, 31
Security law, 233–234
Security logging, 32
Security Operations Center (SOC), 395
Security-related host logs, 64
application logs, 68
network daemon logs, 66–68
operating system logs, 64–65
authentication: user logged, 65
Linux syslog, 65
miscellaneous status messages, 66
operating system messages, 66
service crash, 66
service startup, shutdown and status change, 66
SSH daemon, 65
system startup, shutdown, and reboot, 65
Security-related network logs, 68
network infrastructure logs, 68
security host logs, 68
HIDS, 68–70
HIPS, 68–70
Security-specic devices, 216
Sed tool, 253
shell command, 163
SIEM. See Secure Information and Event
Management; Security information and
event management
SIM. See Security Information Management
Simple Event Correlator (SEC), 161–162
applications, 169
Cisco IOS conguration changes, 166–168
format, 162–163
keywords, 168–169
promiscuous mode, 168
rules, 162
Stateful rule, 163–166
vulnerability correlation, 166
Simple log viewers, 129
historical log review, 130
features, 130–131
using info command, 130
more and less utilities, 130
Windows 7 event log viewer, 130–131
real-time review
bundled Event Viewer, 130
429
Index
using command, 129
le-of-latest-sshd-logs. txt, 130
using grep command, 129
using less command, 130
secure shell daemon, 129
using tee command, 129
Unix and Linux avors, 129
simple log manipulation, 131
awk and sort tool, 132
using grep command, 131
log parser and log parser lizard, 132–134
using simple tools, 131
ssh and telnet tool, 132
tail and head tool, 132
viewing tools, 131
Simple Network Management Protocol (SNMP),
5, 58–59
get operation, 60
issues
MIB, 60–61
snort MIB notication, 61
Syslog messages, 62
managers and agents
conguration, 59
IOS, 59
Net-SNMP, 59
NMS polls devices, 59
set operation, 60
traps, 59–60
notications, 59–60
SNMPv1 traps, 60
with Syslog, 60
versions, 59
Single rule, 162
Single Source Probing Multiple Destination IPs
(SSPMD), 188
Single Source Probing Multiple Destination IPs and
Ports (SSPMDP), 188
SingleWith2Thresholds rule, 162
SingleWithScript rule, 162, 166
SingleWithSuppress rule, 162
SingleWithThreshold rule, 162
Situational awareness (SA), 267
SL. See Successful Login
Snare, 256–257
Snifng interface, 107–108
SNMP. See Simple Network Management Protocol
SNMPv1 traps, 60
Snort open source, 150
SOC. See Security Operations Center
Software as a Service (SaaS), 240, 382
Software development kit (SDK), 120
Solid security measures, 104
Sort tool, 132
Source IP address, 124
Source port, 124
Source spoong, 112
SOX. See Sarbanes-Oxley
split() function, 151
Splunk, 263
dashboards and views, 264
free vs. enterprise, 263
log source support, 263–264
SRE. See Stateful rule engine
SSH CRS-32 Attack, 116
SSH daemon. See Secure Shell daemon
SSL. See Secure Sockets Layer
SSPMD. See Single Source Probing Multiple
Destination IPs
SSPMDP. See Single Source Probing Multiple
Destination IPs and Ports
Standard deviation, 183
Standard error, 183
Standard out (STDOUT), 334
State, 332
Stateful rule, 163–164
pair rule, 164
portscan events, 164–165
reject events, 164–165
Stateful rule engine (SRE), 155
Statistical analysis
baseline, 182
anomaly detection, 186–187
average value nding, 183
calculations, 183
compelling reasons, 182
key baseline assumptions, 182–183
standard deviation formula, 183
standard error formula, 183
thresholds, 186
usage, 182
windowing, 187
frequency
automated technique, 182
IP address, 181–182
time, 182
lifecycle for baselines, 185
machine learning, 187
applying k-NN algorithm to logs, 188
kNN, 188
rules-based correlation, 190
conceptual ow for statistical, 190
correlation rules, 190
data mining techniques, 191
end-to-end ow, 190–191
STDOUT. See Standard out
430 Index
Stealth interface. See Snifng interface
Stealthy log generation, 105
hiding logging, 105–106
with misdirection, 106
Stealthy logging, 104
Storage area network (SAN), 90
Storage as a Service, 383
Stream-based engine using Esper, 177
brute-force login attempt, 178
CEP engine ow, 177–178
with correlation, 178
Esper in nutshell, 177–178
STunnel, 118
substr() function, 153
Successful Login (SL), 188
Summarization and reports, 207
See also Log analysis
authentication and authorization reports, 208
account and group additions, 211
change reports, 210
CSO, 209–211
key reports, 209–211
login attempts, 210–211
critical errors and failures reports, 216
CSO, 217
disk full and high CPU report, 217
errors and failure log messages, 216
key reports, 216–217
malware activity reports, 215
CSO, 216
key reports, 215–216
malicious software, 215
virus types across network, 216
network activity reports, 211
CSO, 213
key reports, 212
VPN account access and activities, 213
resource access reports, 213
CSO, 214–215
le access across multiple servers, 215
key reports, 213–214
Suppress rule, 162
swatch tool, 241
Syslog, 15, 33, 52, 75, 254–255
components, 255
guaranteed delivery of messages, 255–256
high-level depiction, 255
logging with syslogd, 53–54
maintaining log source information, 256
mark facility, 55
mark interval, 57–58
message classication, 54
priority, 55–56
protocol, 4, 58
secure transport of log messages, 256
syslog.conf, 56
syslogd output, 58
Syslog daemon, 319
Syslog message
application programmer, 55
classication, 54
set of facilities, 54–55
Unix/Linux distributions, 55
Syslog-ng, 93, 254, 256
congurations, 96
database logging, 98–99
global syslog-ng server, 98
local syslog-ng server, 97–98
log sources, 96–97
deployment, 95–96
local syslog-ng server, 96
and example deployment, 96
syslog-ngsyslog-ng, 94–95
database supporting, 94
exible ltering, 94
high performance, 95
IPv4 and IPv6 supporting, 94
message body processing, 95
message rewriting, 94
OpenSSH server, 95
using special variables, 95
standard syslog protocol, 94
TCP supporting, 94
TLS, 94
3.0 Administration guide, 95
UDP, 94
troubleshooting syslog-ng, 99–101
Windows systems, 256
Syslog.conf le, 56
action, 56–57
hardcopy terminals, 56–57
kernel messages, 57
loghost, 57
syslog daemons, 57
syslogd, 56
<selector>, 56
<tab>, 56
user’s terminal, 57
T
Tail tool, 252
TCB. See Trusted computing based
TCP. See Transmission Control Protocol
TCP-based syslog daemons, 320–321
Tcpdump binary format, 38
431
Index
Text mining, 205
Text-based logging, 73–74
Thread id (tid), 339
Thresholds, 186
tid. See Thread id
Time-to-live (TTL), 155
Timestamps, 118
Timing out events, 157
TLS. See Transport Layer Security
Toolset choices, 243
TOS. See Type of service
Traditional log data graphing, 227
accepts. pl, 228
MRTG conguration, 227–229
Transmission Control Protocol (TCP), 4, 74, 94,
111–112, 255
Transport Layer Security (TLS), 94
Trap-directed polling, 60
Traps, 5
Treemap technique, 221
of rewall data, 221
with IP address, 221
Treemap visualization technique, 221
of rewall data, 221
with IP address, 221
Trusted computing based (TCB), 31
TTL. See Time-to-live
Type of service (TOS), 113–114
U
UDP. See User Datagram Protocol
Uniform Resource Locator (URL), 273, 346
Untapped riches, 401
URL. See Uniform Resource Locator
User Datagram Protocol (UDP), 4, 74, 94, 106,
255, 310
V
Virtual Private Network Server (VPN Server), 9
Visual correlation, 219
real-time visualization, 220
interfaces, 220
OSSIM event viewer, 220
tools, 220
treemap technique, 221
of rewall data, 221
with IP address, 221
VisualRoute tool, 161
VPN Login After Hours (VPNLI), 188
VPN Server. See Virtual Private Network
Server
VPNLI. See VPN Login After Hours
Vulnerability correlation, 158
W
WA N . See Wide area network
Warning log messages, 3
Watch list correlation, 160
Web server logs, 34
Wide area network (WAN), 8
Windowing, 187
Windows 7 event ID example,
280–281
Windows Event Log, 4–5, 38
Windows XP event ID example, 280
Wireless network devices, 212
Working memory (WM), 171
write command, 163
X
XML. See eXtensible Markup Language

This page is intentionally left blank
