Présentation Manual Analysistool
Manual_analysistool
User Manual:
Open the PDF directly: View PDF ![]() .
.
Page Count: 14

Analysis Tool
Manual
Isam BEN SOLTANE
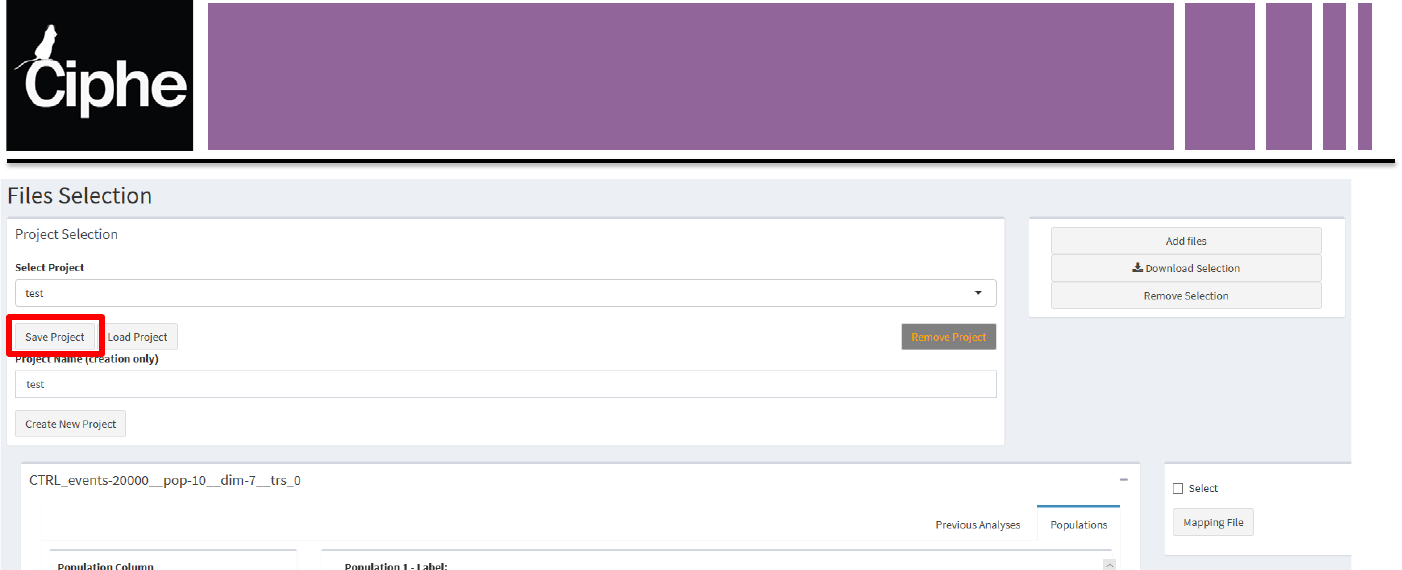
Files Selection Tab
2
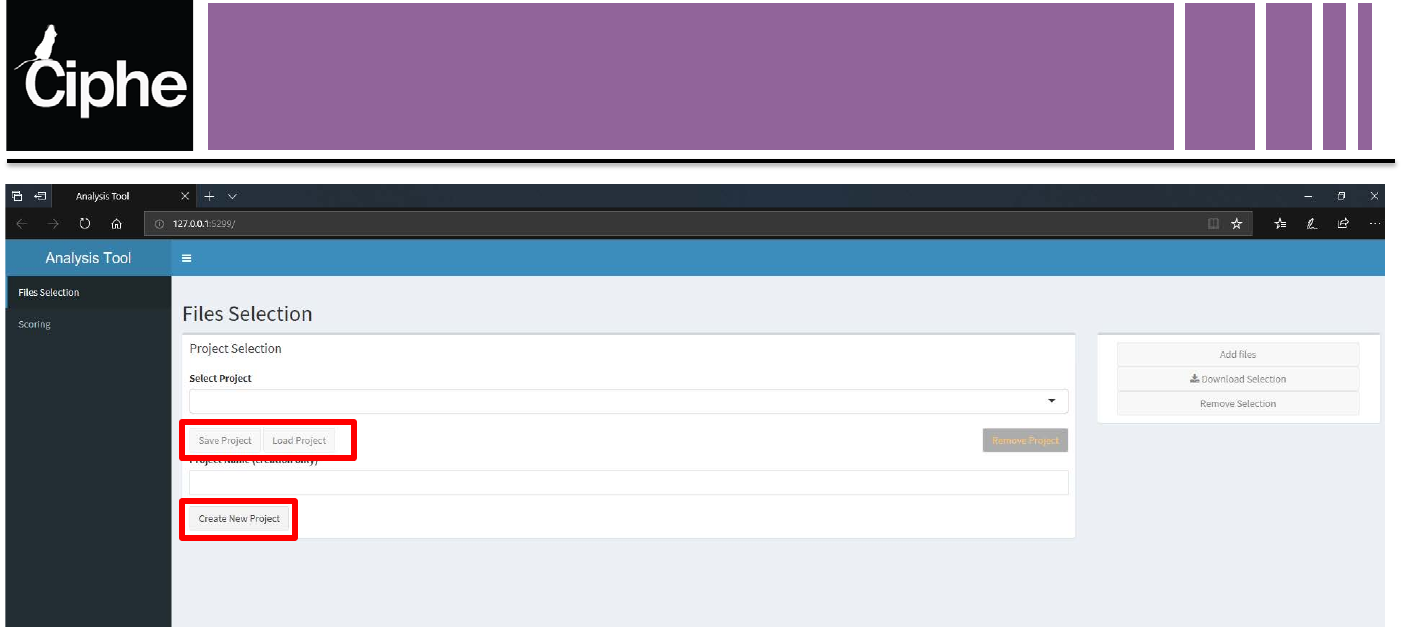
Files stored in projects:
•Local folders containing modified versions of the selected files
•Creating a project: Create an empty local folder
•Load a project: Load the files and the information of a project formerly created
SAVE THE PROJECT AFTER ADDING ALL THE FILES
Files Selection Tab
3
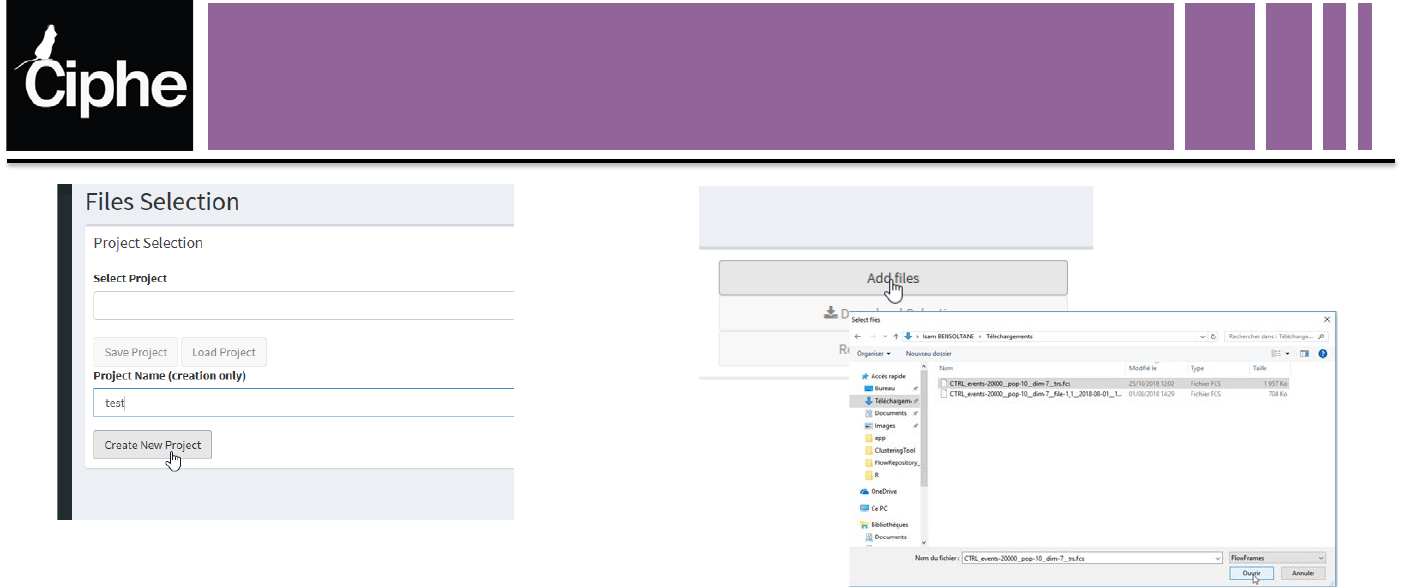
Creates a new project
named test
Add local files to the project:
•ENRICHED FCS FILE
•REQUIRED KEYWORDS
Use Clustering Tool or Keywords Registor
Files Selection Tab
4
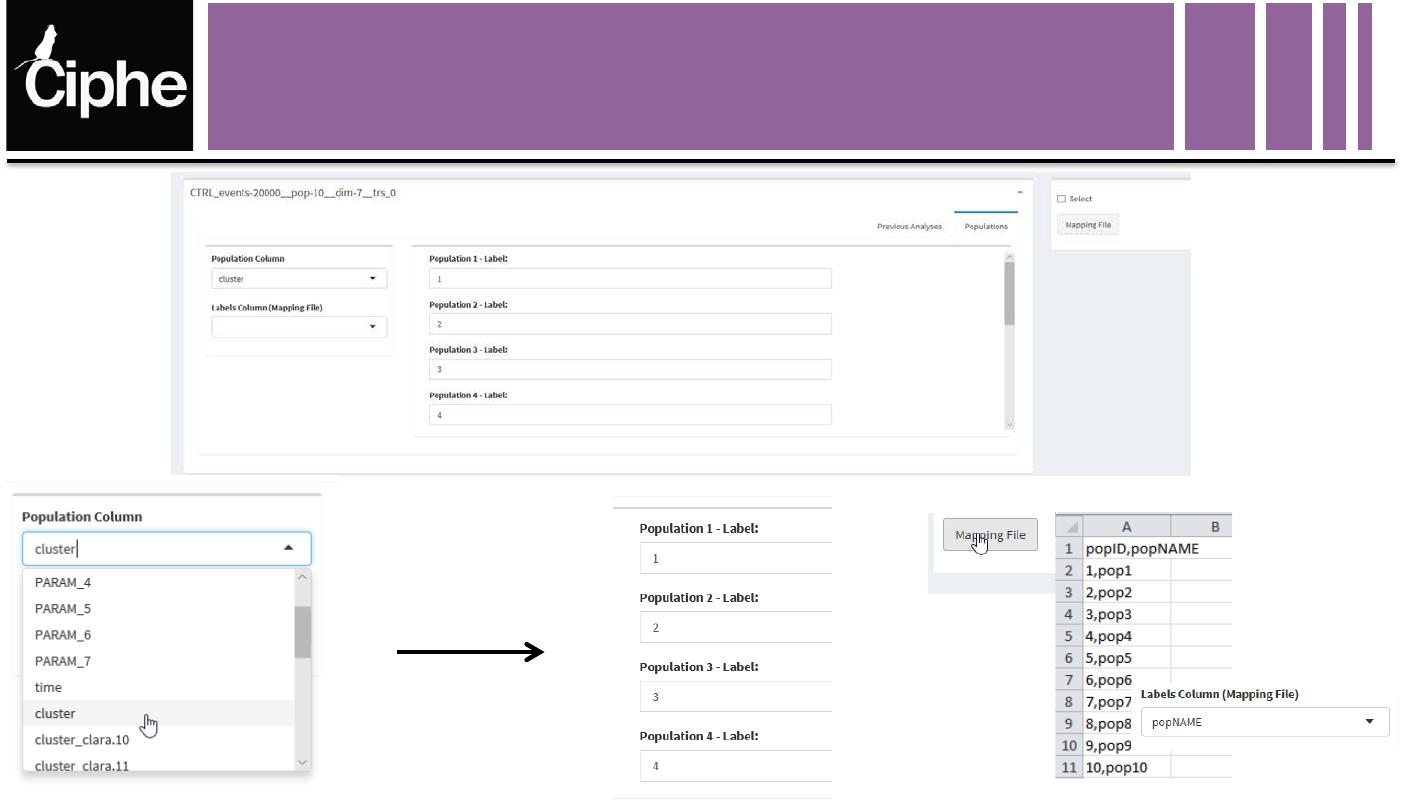
Select the column containing the
populations labels Rename each population Or load a mapping file (.csv)
eg: scaffold node landmarks
OR
Files Selection Tab
5
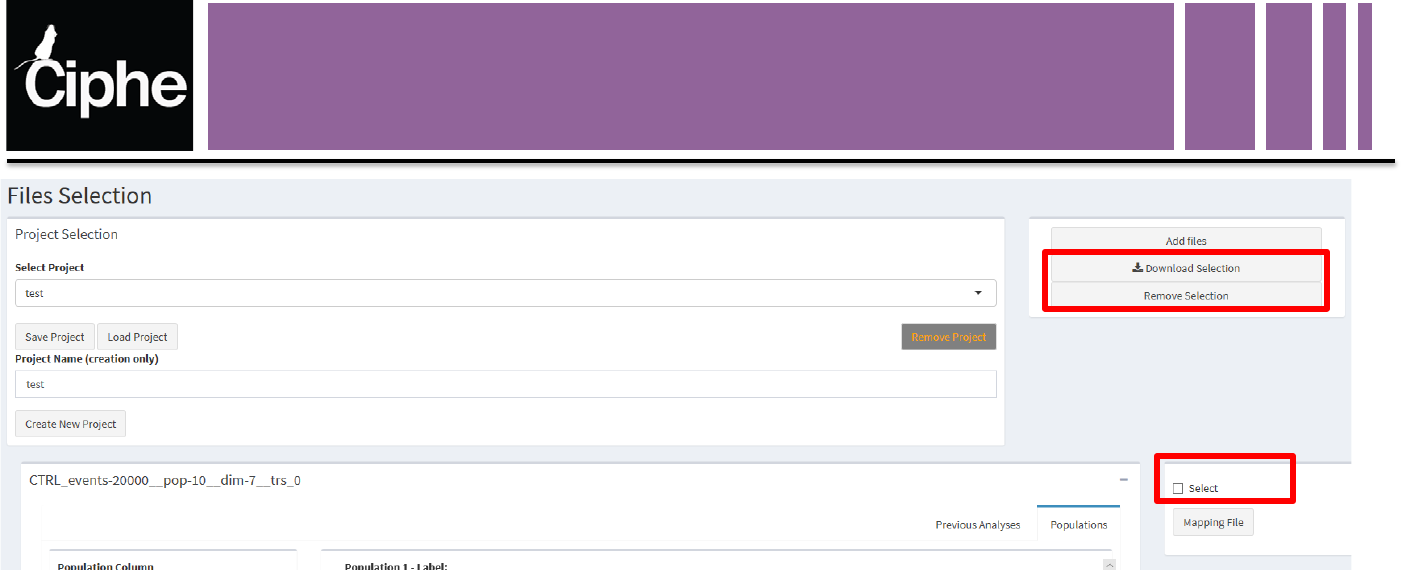
Selected Files:
•Download the selected files stored in each project
•Remove all the selected files and their information from the project
Files Selection Tab
6
Save Project:
•Save all the files and their information in the folder associated with the project
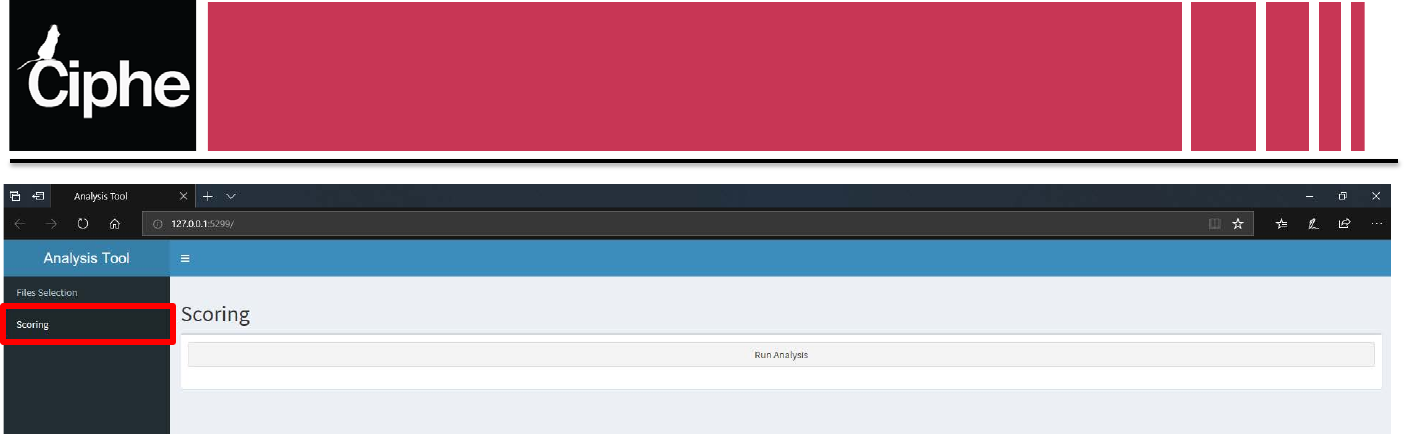
Scoring Tab
Run Analysis Button:
Compute the purity, precision, recall, FG matrices and clusters information for each
registered set of parameters, for each algorithm
Scoring Tab
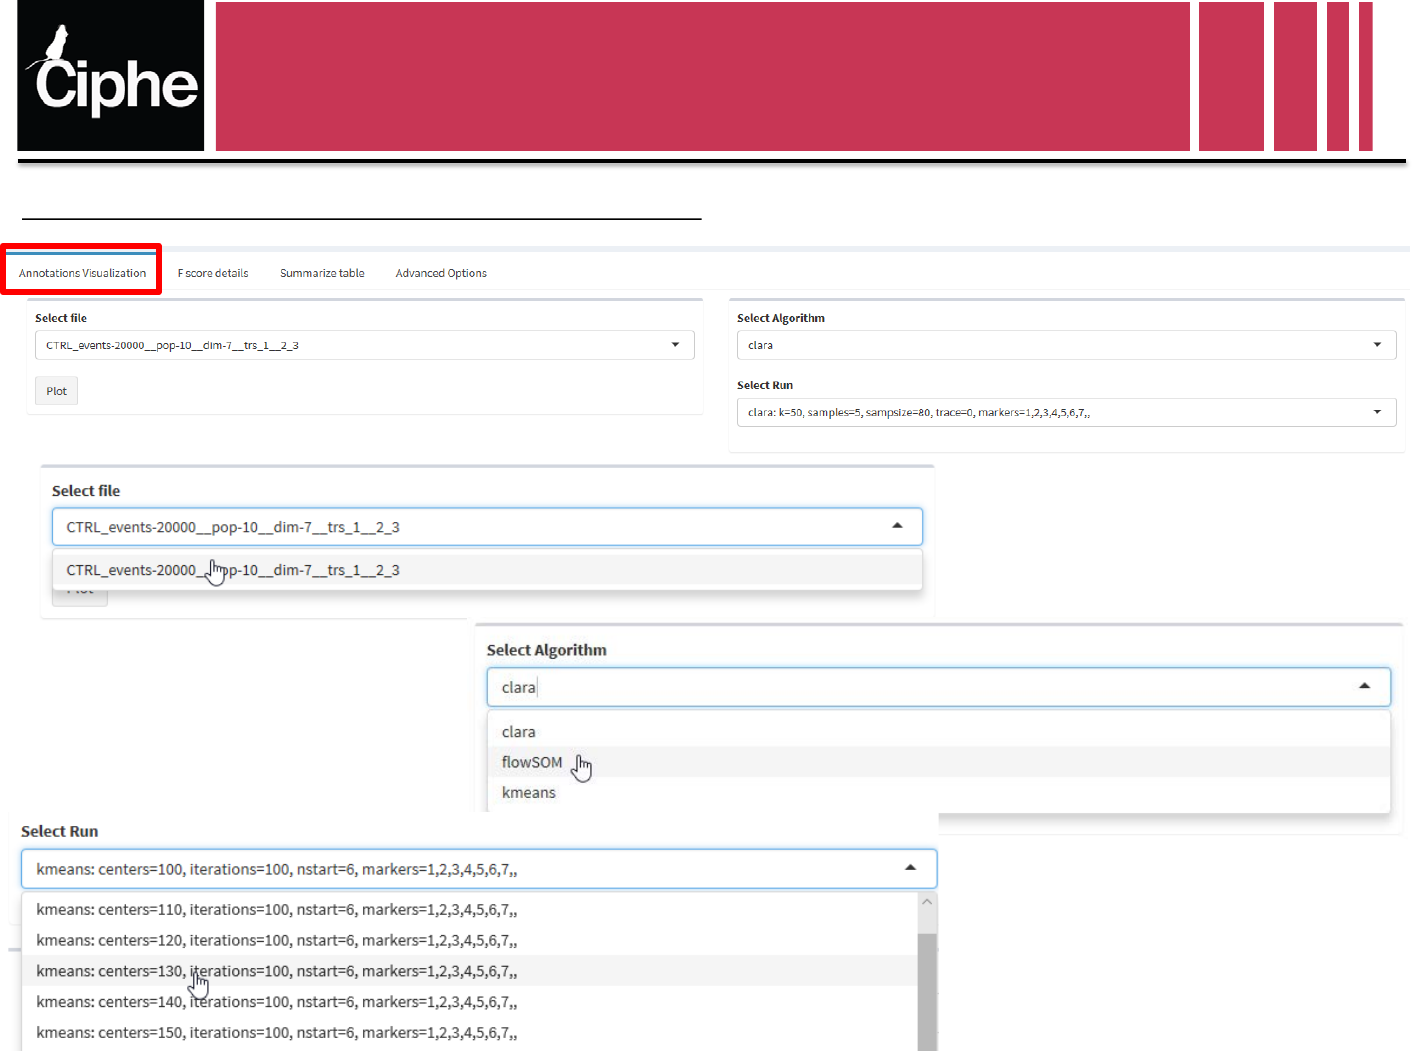
Select a file (only one in this case)
Select an algorithm among those used
on the chosen file
Select a set of parameters of the chose
selected algorithm
Visualization Panel : Annotations Visualization
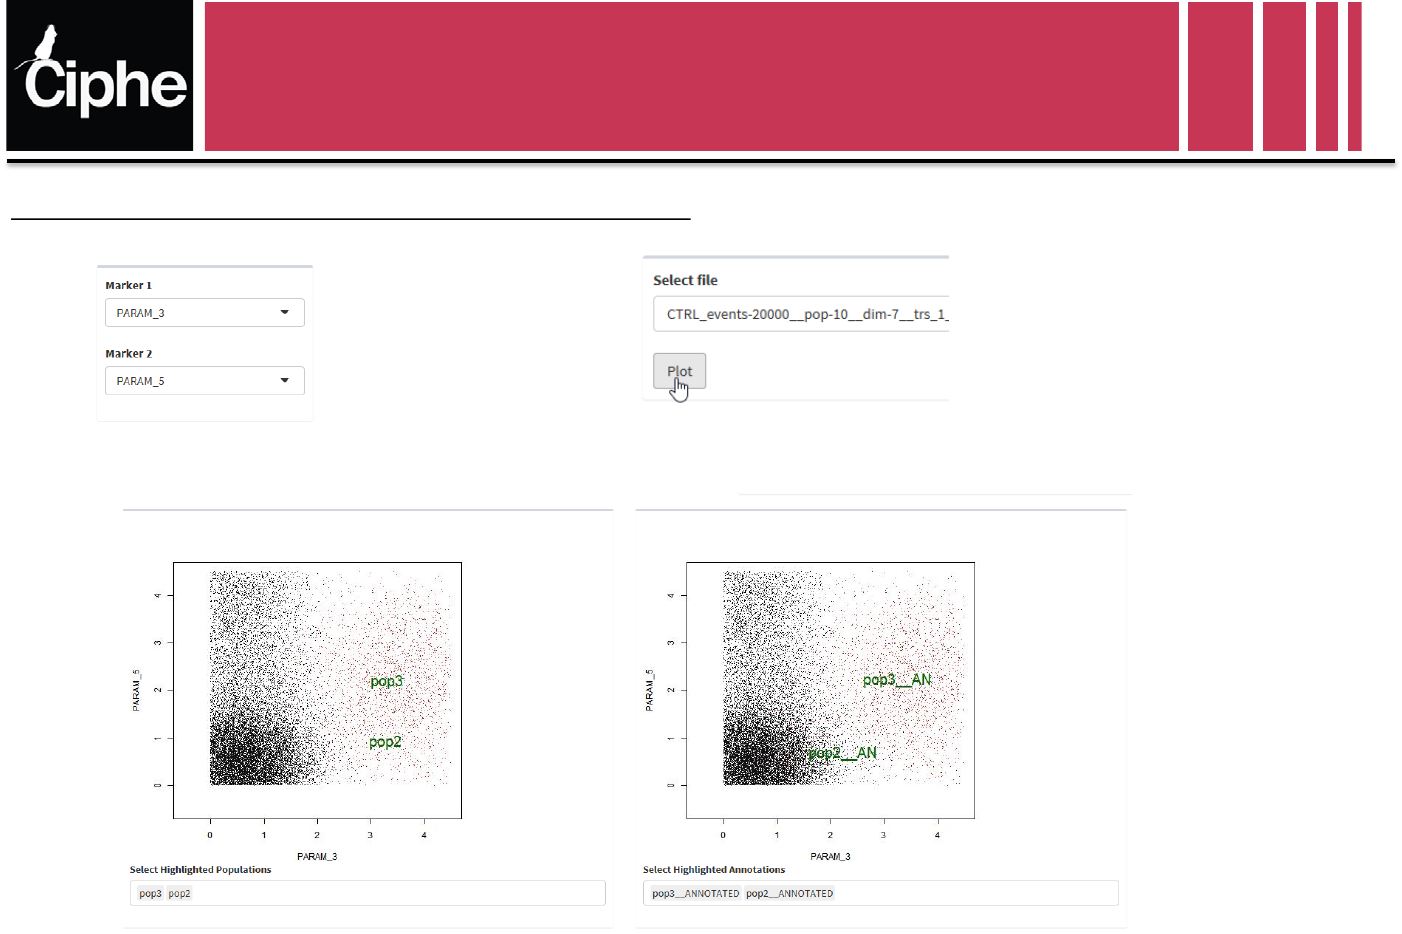
Scoring Tab
Select the markers to visualize Plot
Selected Populations :
Markers expression
Selected Annotations :
Markers expression
Visualization Panel : Annotations Visualization
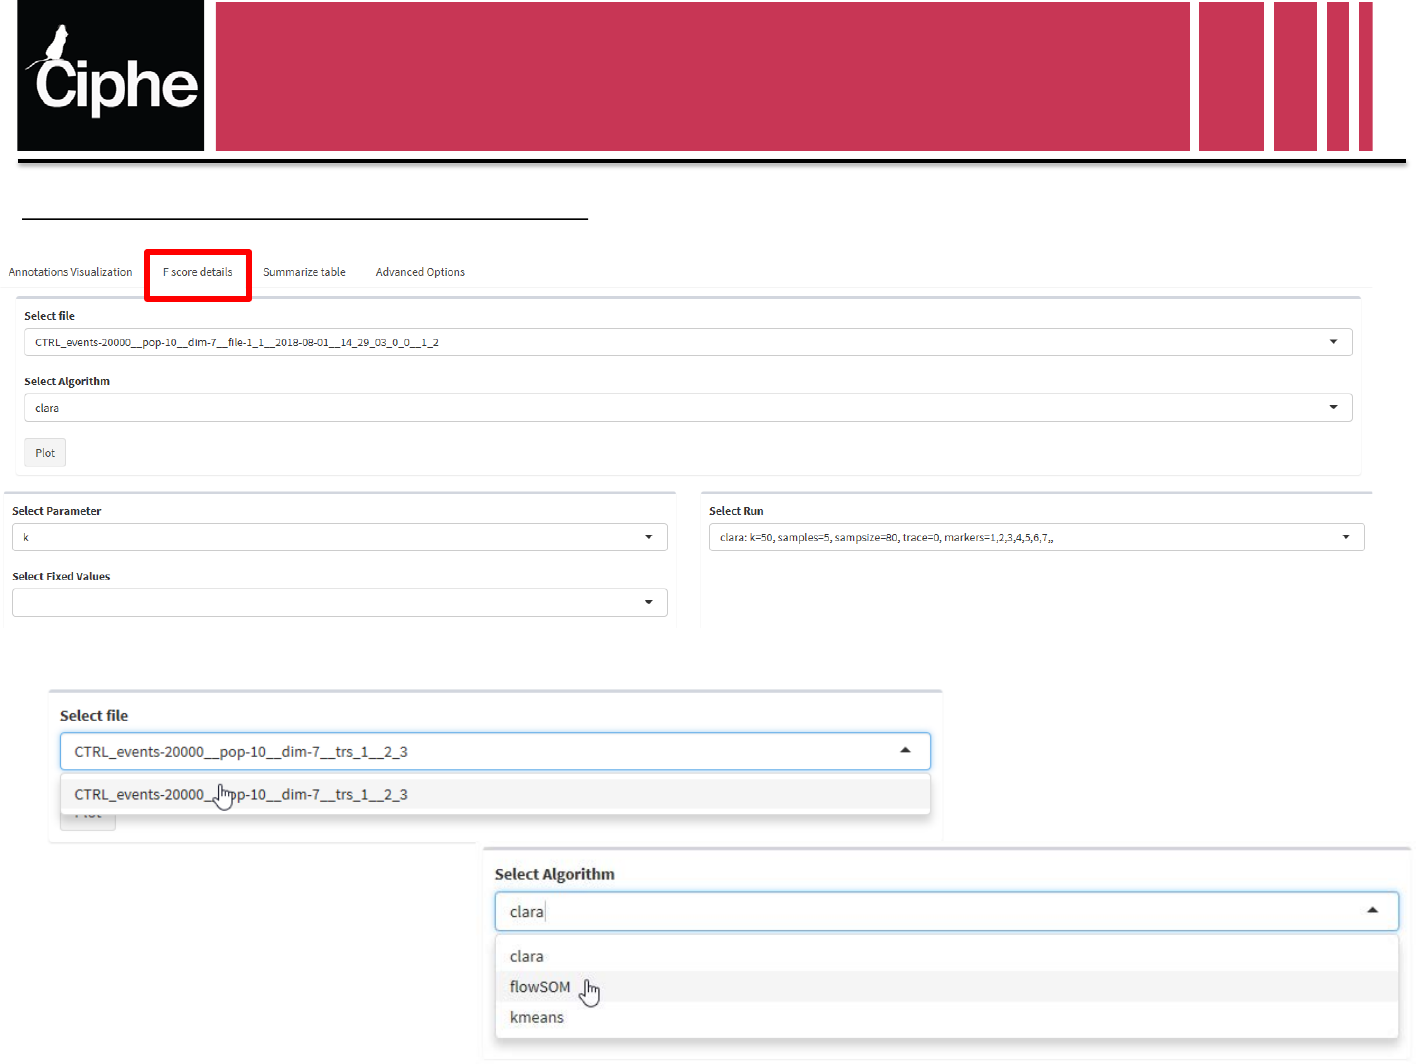
Scoring Tab
Select a file (only one in this case)
Select an algorithm among those used
on the chosen file
Visualization Panel : F-score variations
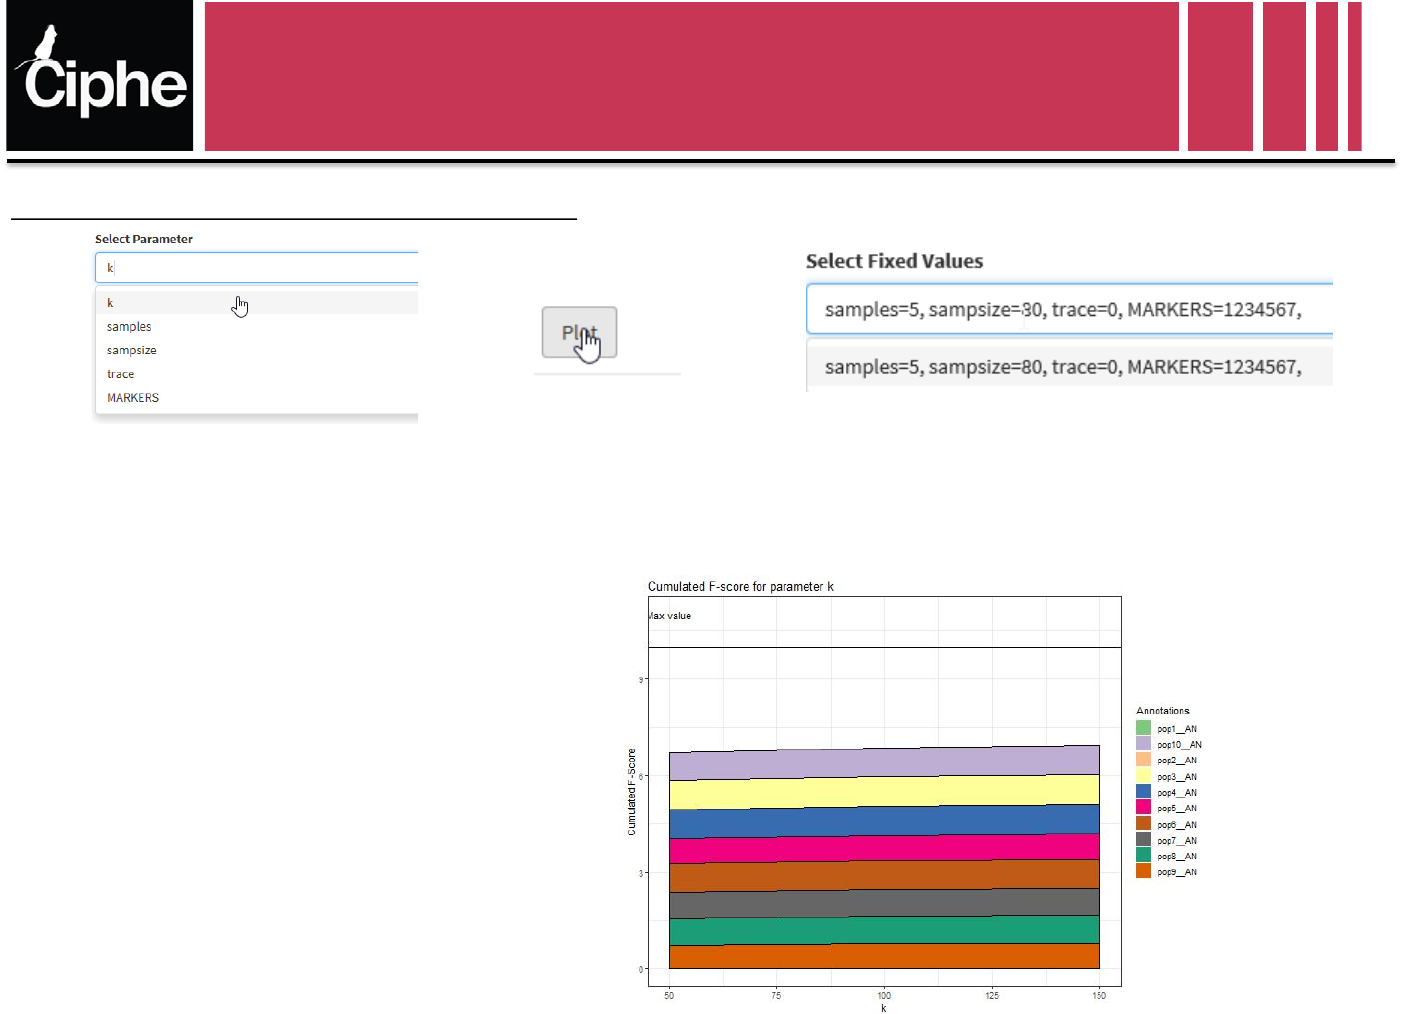
Scoring Tab
Select the variable parameter Plot Select the values of the other parameters
Visualization Panel : F-score variations
Evolution of the F-score of all populations:
•Depending on the values of the
variable parameter
•Each population is identified by a
color
•The maximum value of the
cumulated F-score is the number of
populations
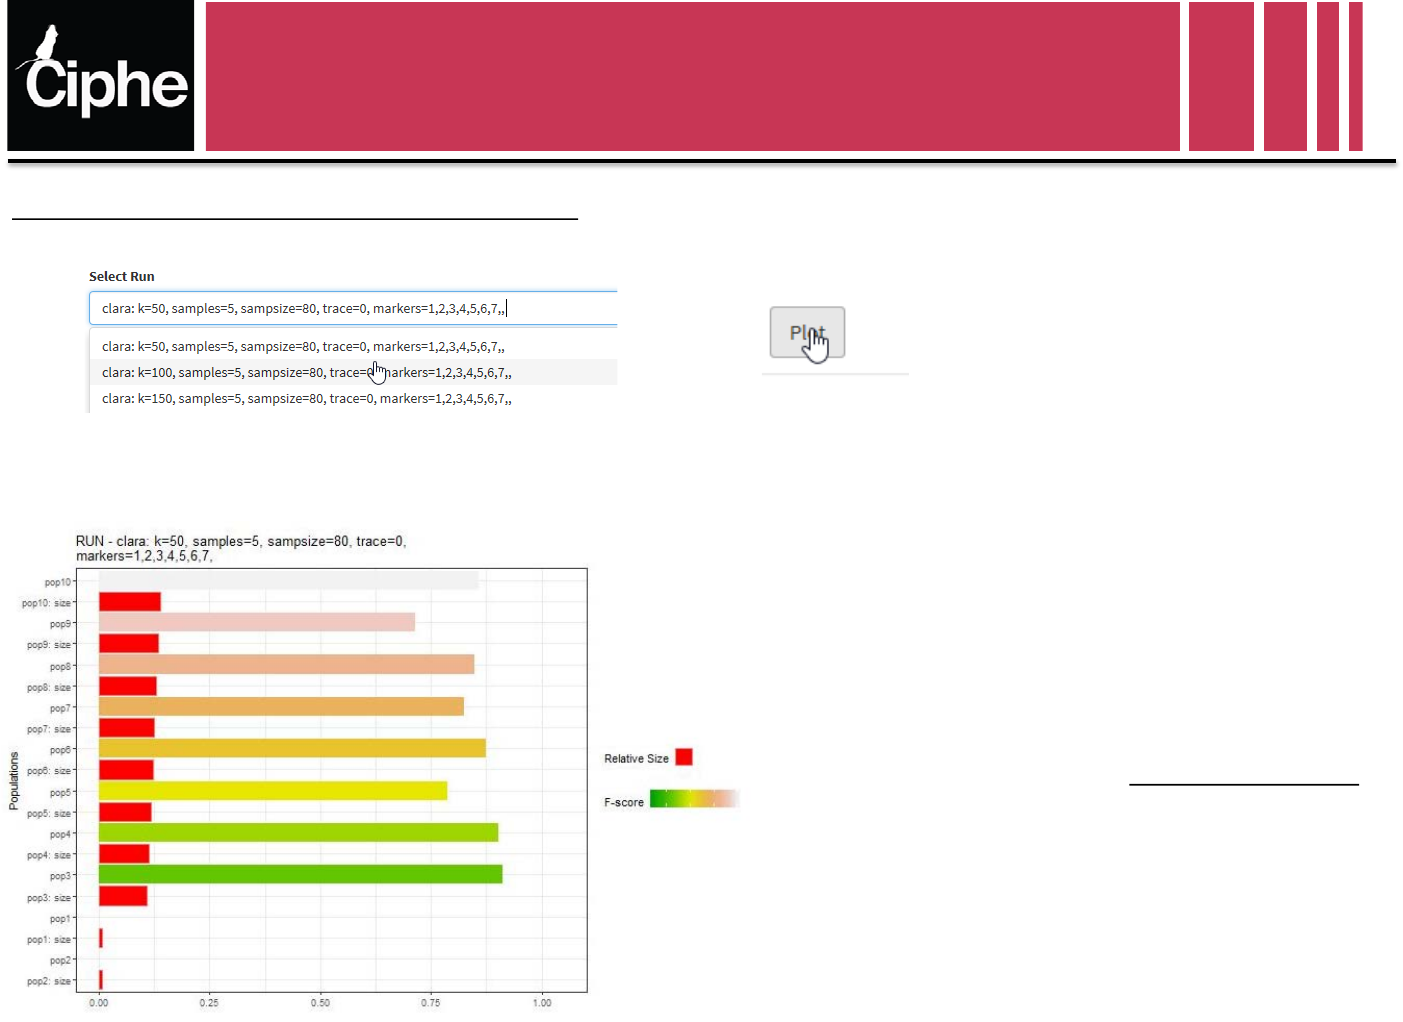
Scoring Tab
Select a set of parameters Plot
Visualization Panel : F-score variations
•F-Score of each population for the selected set of
parameters
•The relative size gives the ratio size of population
number of events in the file
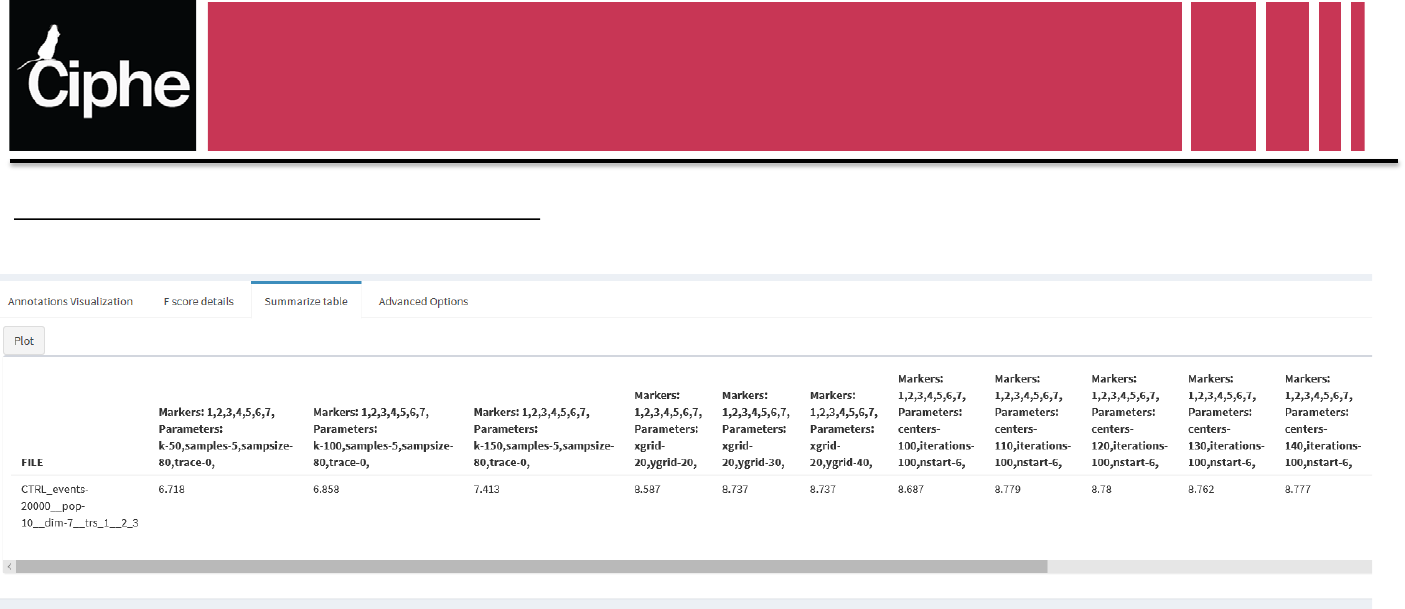
Scoring Tab
Visualization Panel : Summary table
Summary Table:
Sum of the F-Score of all populations for every file, every algorithm with every set of parameters
Scoring Tab
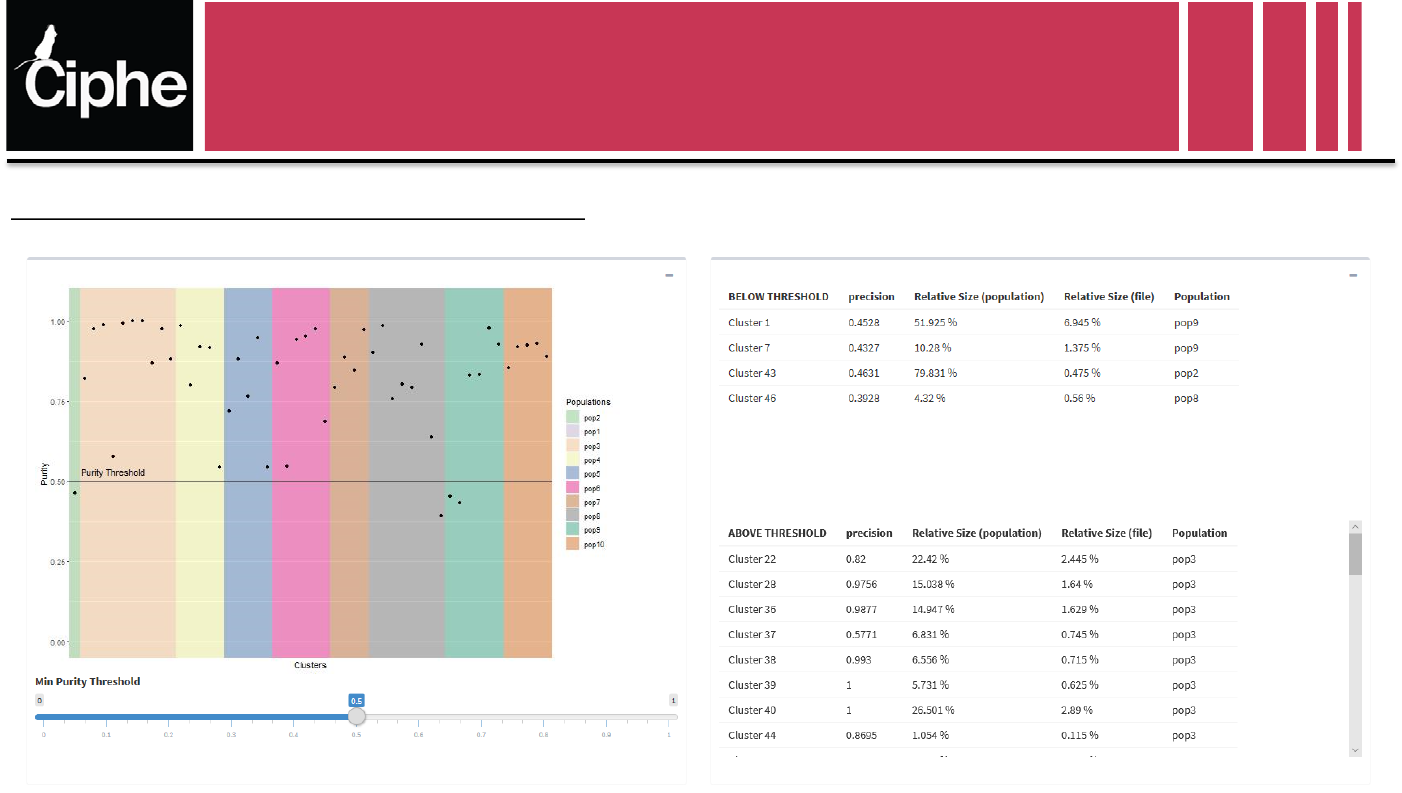
Visualization Panel : Advanced Options
•Purity of each cluster relative to their population.
•The clusters are grouped into populations
•The purity threshold sorts clusters in the two tables on the left
