Micros 3700 Reports Manual
User Manual:
Open the PDF directly: View PDF ![]() .
.
Page Count: 498 [warning: Documents this large are best viewed by clicking the View PDF Link!]
- Warranties
- Trademarks
- Design and Production
- Printing History
- Related Manuals
- Conventions and Symbols
- Reader Response
- Preface
- Introduction to 3700 Reports
- Profiles
- Employee Reports
- Introduction
- Cashier Summary Totals
- Cashier Summary Totals by Revenue Center
- Cashier Detail Totals
- Cashier Detail Totals by Revenue Center
- Consolidated Cashier Detail Totals
- Consolidated Cashier Detail Totals by Revenue Center
- Employee Detail Totals
- Employee Detail Totals by Revenue Center
- Consolidated Employee Detail Totals
- Consolidated Employee Detail Totals by Revenue Center
- Employee Sales and Tip Totals by Revenue Center
- Employee Open LDS Report
- Labor Reports
- Tax Reports
- Tip Reports
- Time Period Sales Reports
- Introduction
- Revenue Center Time Period Totals
- Revenue Center Time Period Detail
- Consolidated Revenue Center Time Period Totals
- Revenue Center Time Period Summary
- Consolidated Revenue Center Time Period Summary
- System Time Period Totals
- System Time Period Detail
- Consolidated System Time Period Totals
- System Time Period Summary
- Consolidated System Time Period Summary
- Consolidated System Time Period Summary w/Graph
- Sales Balance Reports
- Group Sales Reports
- Introduction
- Daily RVC Group Sales Detail Subtotal by Category
- Daily RVC Group Sales Detail
- Consolidated RVC Group Sales Detail Subtotal by Category
- Consolidated RVC Group Sales Detail
- Daily RVC Group Sales Summary
- Consolidated RVC Group Sales Summary
- Consolidated RVC Group Sales Summary
- Daily SYS Group Sales Detail Subtotal by Category
- Daily SYS Group Sales Detail
- Consolidated System Group Sales Detail Subtotal by Category
- Consolidated System Group Sales Detail
- Consolidated System Group Sales Detail w/Graph
- Daily System Group Sales Summary
- Consolidated System Group Sales Summary
- Menu Item Sales Reports
- Introduction
- Daily Revenue Center Menu Item Sales Detail
- Consolidated Revenue Center Menu Item Sales Detail
- Daily System Menu Item Sales Detail
- Consolidated System Menu Item Sales Detail
- Daily Revenue Center Menu Item Sales Summary
- Consolidated Revenue Center Menu Item Sales Summary
- Daily System Menu Item Sales Summary
- Consolidated System Menu Item Sales Summary
- Consolidated Food Cost Detail Report
- Check Reports
- CA/EDC Reports
Copyright 2000
MICROS Systems, Inc.
Beltsville, MD USA
All Rights Reserved
Part Number: 100134-511 (3rd Edition)
micros Systems, Inc.
Reports Manual
3 7 0 0 P O S
Restaurant Enterprise Series
LL
'HFODUDWLRQV
Declarations
:DUUDQWLHV
Although the best efforts are made to ensure that the information in this manual is
complete and correct, MICROS Systems, Inc. makes no warranty of any kind with
regard to this material, including but not limited to the implied warranties of
marketability and fitness for a particular purpose. Information in this manual is
subject to change without notice. No part of this manual may be reproduced or
transmitted in any form or by any means, electronic or mechanical, including
photocopying, recording, or information recording and retrieval systems, for any
purpose other than for personal use, without the express written permission of
MICROS Systems, Inc.
MICROS Systems, Inc. shall not be liable for errors contained herein or for
incidental or consequential damages in connection with the furnishing,
performance, or use of this manual.
7UDGHPDUNV
CorelDraw is a registered trademark of Corel Corporation.
Crystal Reports is a registered trademark of Crystal Computer Services Inc.
FrameMaker is a registered trademark of Adobe Corporation.
Microsoft, Win32, Windows, and Windows NT are either registered trademarks or trademarks
of Microsoft Corporation in the U.S and/or other countries.
SQL Server is a registered trademark of Microsoft in the U.S. and other countries.
Sybase SQL Anywhere™ is a registered trademark of Sybase, Inc.
Visio is a registered trademark of Visio Corporation.
'HVLJQDQG3URGXFWLRQ
This manual was written with FrameMaker 5.1 for Windows.
3ULQWLQJ+LVWRU\
New editions of this manual incorporate new and changed material since the
previous edition. Minor corrections and updates may be incorporated into reprints
of the current edition without changing the publication date or the edition number.
Edition Month Year Software Version
1st September 1996 1.00
2nd April 1998 2.00
3rd August 2000 2.60

5HSRUWV LLL
Table of Contents
Preface
Why Read This Manual? .................................................................................. viii
Conventions and Symbols ................................................................................ xi
Reader Response............................................................................................... xiii
Chapter 1: Introduction to 3700 Reports
Welcome to 3700 Reports ................................................................................ 1-2
Basic Concepts and Terms................................................................................ 1-4
Running Reports from the Reports Folder ....................................................... 1-19
Running an Autosequence................................................................................ 1-25
Chapter 2: Profiles
Introduction....................................................................................................... 2-2
Detailed Sales Profile ...................................................................................... 2-3
Detailed Sales and Tip Profile ........................................................................ 2-9
Employee Labor Profile ................................................................................... 2-17
Labor Category Profile ................................................................................... 2-19
Labor/Sales Profile ........................................................................................ 2-21
Sales Profile...................................................................................................... 2-24
Sales and Guest Profile .................................................................................. 2-26
Tax Profile ....................................................................................................... 2-28
Tip Profile ...................................................................................................... 2-31
Tracking Group Profile .................................................................................... 2-33
Chapter 3: Employee Reports
Introduction....................................................................................................... 3-2
Cashier Summary Totals................................................................................... 3-3
Cashier Summary Totals by Revenue Center................................................... 3-11
Cashier Detail Totals ....................................................................................... 3-17
Cashier Detail Totals by Revenue Center......................................................... 3-25
Consolidated Cashier Detail Totals .................................................................. 3-32
Consolidated Cashier Detail Totals by Revenue Center................................... 3-39
Employee Detail Totals .................................................................................... 3-46
Employee Detail Totals by Revenue Center..................................................... 3-54
Consolidated Employee Detail Totals .............................................................. 3-61
Consolidated Employee Detail Totals by Revenue Center............................... 3-68
Employee Sales and Tip Totals by Revenue Center......................................... 3-75
Employee Open LDS Report............................................................................ 3-80

LY
7DEOHRI&RQWHQWV
Chapter 4: Labor Reports
Introduction....................................................................................................... 4-2
Employee Time Card and Job Detail ............................................................... 4-3
Employee Job Summary ................................................................................... 4-8
Consolidated Employee Job Summary............................................................. 4-12
Revenue Center Job Summary.......................................................................... 4-16
Consolidated Revenue Center Job Summary.................................................... 4-22
System Job Summary........................................................................................ 4-27
Consolidated System Job Summary ................................................................. 4-33
Clock In Status.................................................................................................. 4-38
Labor Availability ............................................................................................ 4-42
Chapter 5: Tax Reports
Introduction....................................................................................................... 5-2
Daily Revenue Center Tax Totals .................................................................... 5-3
Consolidated Revenue Center Tax Totals ........................................................ 5-8
Daily System Tax Totals................................................................................... 5-11
Consolidated System Tax Totals ..................................................................... 5-15
Chapter 6: Tip Reports
Introduction....................................................................................................... 6-2
Employee Tip Totals......................................................................................... 6-3
Employee Tip Totals by Revenue Center......................................................... 6-8
Consolidated Employee Tip Totals .................................................................. 6-12
Consolidated Employee Tip Totals by Revenue Center................................... 6-17
Consolidated Revenue Center Tip Totals......................................................... 6-22
Consolidated System Tip Totals ...................................................................... 6-27
Chapter 7: Time Period Sales Reports
Introduction....................................................................................................... 7-2
Revenue Center Time Period Totals................................................................. 7-3
Revenue Center Time Period Detail ................................................................. 7-8
Consolidated Revenue Center Time Period Totals........................................... 7-14
Revenue Center Time Period Summary ........................................................... 7-18
Consolidated Revenue Center Time Period Summary ..................................... 7-22
System Time Period Totals............................................................................... 7-25
System Time Period Detail............................................................................... 7-30
Consolidated System Time Period Totals......................................................... 7-36
System Time Period Summary ......................................................................... 7-39
Consolidated System Time Period Summary................................................... 7-43
Consolidated System Time Period Summary w/Graph.................................... 7-46

5HSRUWV Y
7DEOHRI&RQWHQWV
Chapter 8: Sales Balance Reports
Introduction ...................................................................................................... 8-2
Daily Revenue Center Sales Detail .................................................................. 8-3
Consolidated Revenue Center Sales Detail...................................................... 8-12
Daily System Sales Detail ................................................................................ 8-20
Consolidated System Sales Detail.................................................................... 8-29
Chapter 9: Group Sales Reports
Introduction ...................................................................................................... 9-2
Daily RVC Group Sales Detail Subtotal by Category...................................... 9-3
Daily RVC Group Sales Detail......................................................................... 9-12
Consolidated RVC Group Sales Detail Subtotal by Category ......................... 9-15
Consolidated RVC Group Sales Detail ............................................................ 9-24
Daily RVC Group Sales Summary................................................................... 9-26
Consolidated RVC Group Sales Summary....................................................... 9-33
Daily SYS Group Sales Detail Subtotal by Category ...................................... 9-39
Daily SYS Group Sales Detail ......................................................................... 9-48
Consolidated System Group Sales Detail Subtotal by Category...................... 9-51
Consolidated System Group Sales Detail......................................................... 9-58
Consolidated System Group Sales Detail w/Graph.......................................... 9-60
Daily System Group Sales Summary ............................................................... 9-62
Consolidated System Group Sales Summary................................................... 9-68
Chapter 10: Menu Item Sales Reports
Introduction ...................................................................................................... 10-2
Daily Revenue Center Menu Item Sales Detail................................................ 10-3
Consolidated Revenue Center Menu Item Sales Detail ................................... 10-10
Daily System Menu Item Sales Detail.............................................................. 10-15
Consolidated System Menu Item Sales Detail ................................................. 10-21
Daily Revenue Center Menu Item Sales Summary.......................................... 10-25
Consolidated Revenue Center Menu Item Sales Summary.............................. 10-30
Daily System Menu Item Sales Summary........................................................ 10-34
Consolidated System Menu Item Sales Summary............................................ 10-39
Consolidated Food Cost Detail Report............................................................. 10-43
Chapter 11: Check Reports
Introduction ...................................................................................................... 11-2
Employee Open Guest Checks Report ............................................................. 11-3
Employee Closed Guest Checks Report........................................................... 11-8
Return/Void Reason Code Report.................................................................... 11-15
Chapter 12: CA/EDC Reports
Introduction ...................................................................................................... 12-2
Credit Card Batch Detail Report ...................................................................... 12-3
Credit Card Batch Transfer Status Report........................................................ 12-8
Driver-Specific Information............................................................................. 12-12


5HSRUWV YLL
Preface
This preface provides an introduction to the organization, conventions,
and contents of this manual.
In this chapter
Why Read This Manual?........................................................................viii
Conventions and Symbols........................................................................xi
Reader Response ................................................................................... xiii

YLLL
:K\5HDG7KLV0DQXDO"
Why Read This Manual?
3XUSRVH
Welcome to the MICROS Systems 3700 Restaurant Enterprise System—
the powerful, easy-to-use, state-of-the-art, point-of-sale (POS) system.
The 3700 Reports Manual is your guide to MICROS 3700 reports. This
manual explains how to run reports and provides an example of each
report, along with programming considerations and tips about how the
report might be used. Managers or other report users will benefit from the
general explanations of each field included in a report.
Advanced users will appreciate the detail tables that specify where in the
database each figure in the report originates. This information can be
helpful to people who are modifying existing reports or creating new
ones.
:KR6KRXOG8VH7KLV0DQXDO
All persons who will either program, modify, or use the MICROS 3700
Reports should read this manual.
This manual is organized in logical groupings of related reports. A
detailed table of contents makes it easy to find reports quickly.
+RZ7KLV0DQXDOLV2UJDQL]HG
This manual is divided into three major sections:
6HFWLRQ2QH
This section (Chapter 1) will introduce you to basic concepts and
terminology. You will learn how to start the Autosequences and Reports
Module, take single reports, and run autosequences. Privilege
considerations are also discussed. Read this section if you are new to
MICROS POS products.
6HFWLRQ7ZR
This section (Chapter 2) introduces you to the profiles or building blocks
used to create the reports. In this section, each field in the profile is
described in general, easy-to-understand terms. Each report description
will refer you to this chapter for a general description of the profiles
included in the report. Read this section if you are a manager, or will be
using the 3700 reports.
6HFWLRQ7KUHH
This section (Chapters 3-12) explains each report in the 3700 System.
Each explanation includes the following:

5HSRUWV L[
:K\5HDG7KLV0DQXDO"
qThe purpose of the report.
qThe format, which includes a list of each profile included in the
report.
qThe template the report uses. This information is included for
advanced users.
qA full-page report example.
qA 40-column report example (if applicable).
qDetail tables, which list the source, in the database, for each field in
the report. This information is included for advanced users.
qProgramming considerations, which include explanations of how
various programming options will effect the report. Not all reports
include programming options.
qNotes, which include any additional information related to the report
that may be helpful. This could include balancing information or tips
about what to check if the report does not seem to be accurate. Not all
reports include notes.
Read this section to reference a specific report.
Note
For specific programming information related to
autosequences or tracking groups, please refer to the POS
Configurator module’s Online Help.

[
:K\5HDG7KLV0DQXDO"
5HODWHG0DQXDOV
This section provides a list of the related MICROS documentation as well
as a list of suggested reading materials.
MICROS Documentation
The 3700 Restaurant Enterprise Series library includes:
q3700 Administration Applications Manual 100134-503
q3700 Custom Reports Design Manual 100134-508
q3700 Feature Quick Reference Manual 100134-506
q3700 Feature Reference Manual 100134-501
q3700 Hardware Installation Guide 100134-514
q3700 Hardware User’s Maintenance Guide 100134-512
qPC Workstation Model 32 Setup Guide 100016-085
q3700 Reports Manual 100134-511
q3700 Site Preparation Guide 100134-513
q3700 Site Survey Manual 100134-505
q3700 SQL / Database Access Manual 100134-507
q3700 POS Configurator User’s Guide 100134-504
q3700 System Interface Module User’s Guide 100134-516
q3700 User’s Manual100134-502
Suggested Reading
qCrystal Reports documentation
qMicrosoft Windows 95 Resource Kit
qMicrosoft Windows NT Server 3.51 documentation
qMicrosoft Windows NT 3.51 Resource Kit
qMicrosoft SQL Server 6.0 documentation
qSybase SQL documentation
5HSRUWV [L
&RQYHQWLRQVDQG6\PEROV
Conventions and Symbols
This section describes the conventions and symbols that are used
throughout the printed 3700 documentation.
&RQYHQWLRQV
The following conventions are used throughout this manual.
6\PEROV
The following symbols are used throughout this manual.
Convention Meaning
[Key] Keys on a PC or PC Workstation. Example:
[Enter]
‘Message’ Messages that may appear during the program-
ming process. Example: ‘Select Menu Item
Range’
Courier Information to be entered by a User. Example:
copy a:\readme.txt c:\micros
[Key1]+[Key2] The plus sign (+) between key names indicates
that you should press the keys simultaneously.
|Indicates the sequence of menu items to be
selected. Example: File | Sales | Condiments
∑Some numbers in reports are the sum of a col-
umn of numbers or of a formula. This is repre-
sented in the detail tables using the symbol for
summation (∑), followed by the column or for-
mula name.
Note
This symbol is used to bring special attention to a related
feature.
Caution
This symbol indicates that care should be exercised when
programming a feature or performing an action.
[LL
&RQYHQWLRQVDQG6\PEROV
'HVLJQDQG3URGXFWLRQ
This manual was written using FrameMaker 5.0.1.
WARNING
This symbol indicates that an action may have adverse results
if extreme caution is not taken when performing the action.
Tip
This symbol is used to point out suggestions that can save you
time and difficulty.

5HSRUWV [LLL
5HDGHU5HVSRQVH
Reader Response
As you read this, the documentation staff at MICROS is hard at work
preparing the next edition of this manual. Your feedback could be
instrumental in changing that next edition.
7HOOXVZKDW\RXWKLQN³ZH·GOLNHWRKHDUIURP\RX
We are very interested in hearing from you about:
qGood ideas -
Tell us about some part of this manual that you think works well–
we’ll be sure to maintain it.
qIdeas that need work -
Tell us about an area that needs to be improved– we’ll punch it up.
qInformation not included -
Did we miss something? Let us know so we can add it.
qInformation that’s not clear -
Did you find something hard to follow? We’ll rethink it and rewrite it.
qInformation that’s not correct -
Did something get past our arduous tech edit process? Help us fix it.
+RZWRUHDFKXV
3RVWDO$GGUHVV
If you can offer any criticisms or suggestions about this manual, please
mail a note or postcard to:
MICROS Systems, Inc.
7031 Columbia Gateway Drive
Columbia, MD 21046-2289 USA
Attn: Documentation Group Manager
(PDLO$GGUHVV
As an alternative, you may address criticisms and suggestions regarding
this manual by electronic mail to:
microsdoc@micros.com.
Please use the name of the manual as the subject line.

[LY
5HDGHU5HVSRQVH

5HSRUWV
Chapter 1
Introduction to 3700 Reports
This chapter introduces you to basic 3700 report concepts and
terminology. You will learn how to start the Autosequences and Reports
module to take single reports. Privilege considerations are also discussed.
In this chapter
Welcome to 3700 Reports ......................................................................1-2
Basic Concepts and Terms .................................................................... 1-4
Running Reports from the Reports Folder.......................................... 1-19
Running an Autosequence................................................................... 1-25

,QWURGXFWLRQWR5HSRUWV
:HOFRPHWR5HSRUWV
Welcome to 3700 Reports
The 3700 system provides standard reports developed to meet the needs
of most operations. These reports are designed to be easy to use and
understand.
However, no standard report, no matter how carefully designed, can
provide all the detailed information you may want. So the standard
reports also include features that allow you to make simple
customizations without developing customized reports.
For example, you can define tracking totals to track and report specific
information you need. You can assign major groups, family groups, and
menu item groups to categories, to specify the grouping and subtotals that
are printed on reports. You can define a fiscal period type to calculate
date ranges for reports. These and other features can help you get the
information you need using standard reports.
This manual will describe the standard 3700 reports as they are developed
and shipped. Since reports can be changed and customized, your reports
may not be identical to the ones included here.
MICROS will set all standard reports at object number 9999 and below.
Any custom reports should be given an object number above 9999. This
will ensure that MICROS can add changes to reports without overwriting
a custom report

5HSRUWV
,QWURGXFWLRQWR5HSRUWV
:HOFRPHWR5HSRUWV
*HQHUDWLQJ5HSRUWV
Reports can be generated in any of the following ways:
qDirectly, using the Reports options in the Autosequences and Reports
module
Managers may choose to run some reports directly, either to produce
seldom-used reports that are not included in autosequences, or to get
the most current information available. See “Running Reports from
the Reports Folder” on page 1-19 for additional information.
qDirectly, using an autosequence in the Autosequences and Reports
module, or using a key programmed to run an autosequence
Usually wait staff will run end-of-shift or tip reports using a key that
launches an autosequence.
qAutomatically, through an autosequence scheduled to run at specified
times
Autosequences can be programmed to produce a specified series of
reports See POS ConfiguratorPOS Configurator Online Help for
additional information.
qFrom the command line.
Enter the command and the the number associated with the
autosequences in the Autosequences form.
When you create a report using the Reports options, you can choose to
view or print the report. You can also select the printer.
,QWURGXFWLRQWR5HSRUWV
%DVLF&RQFHSWVDQG7HUPV
Basic Concepts and Terms
This section covers basic concepts and terms which are specifically
related to reports.
)XOO3DJH&ROXPQDQG8:65HSRUWV
Reports come in three formats: full-page, 40-column and UWS. A
full-page report is designed for standard-size paper, and can be printed on
any Windows-compatible printer, excluding dot-matrix printers. All
reports include a full-page version.
A 40-column report includes basically the same information as the
full-page version, but is formatted to be 40 characters wide and is
designed to be printed on a MICROS roll printer.
A UWS report is a 40-column report designed to run from the User
Workstation for the entire system. UWS reports must be run through an
autosequence and can only print on a thermal or autocut roll printer.
These reports look like standard 40-column reports, but do not use Crystal
Report templates and can not be modified.
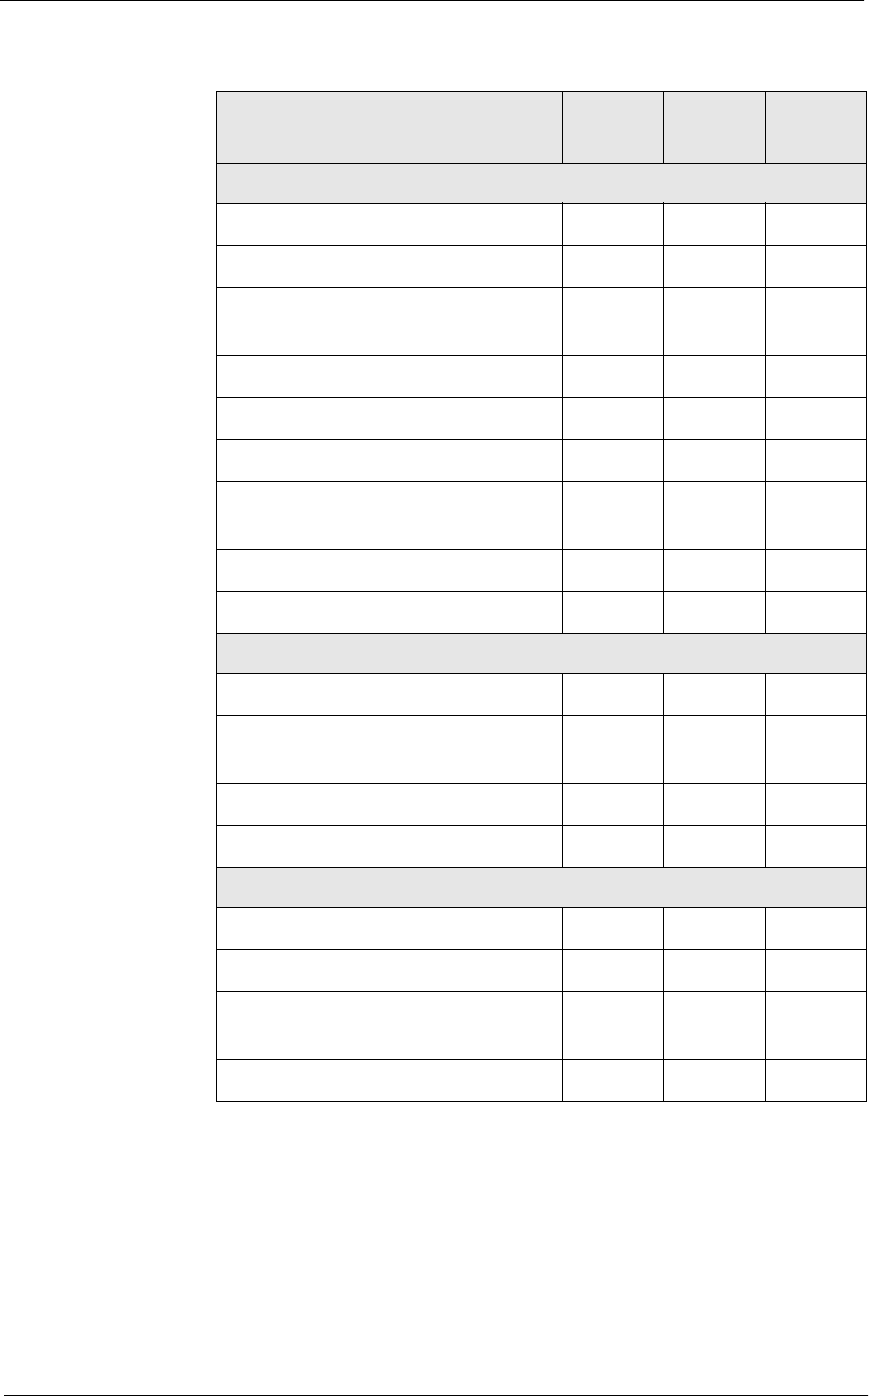
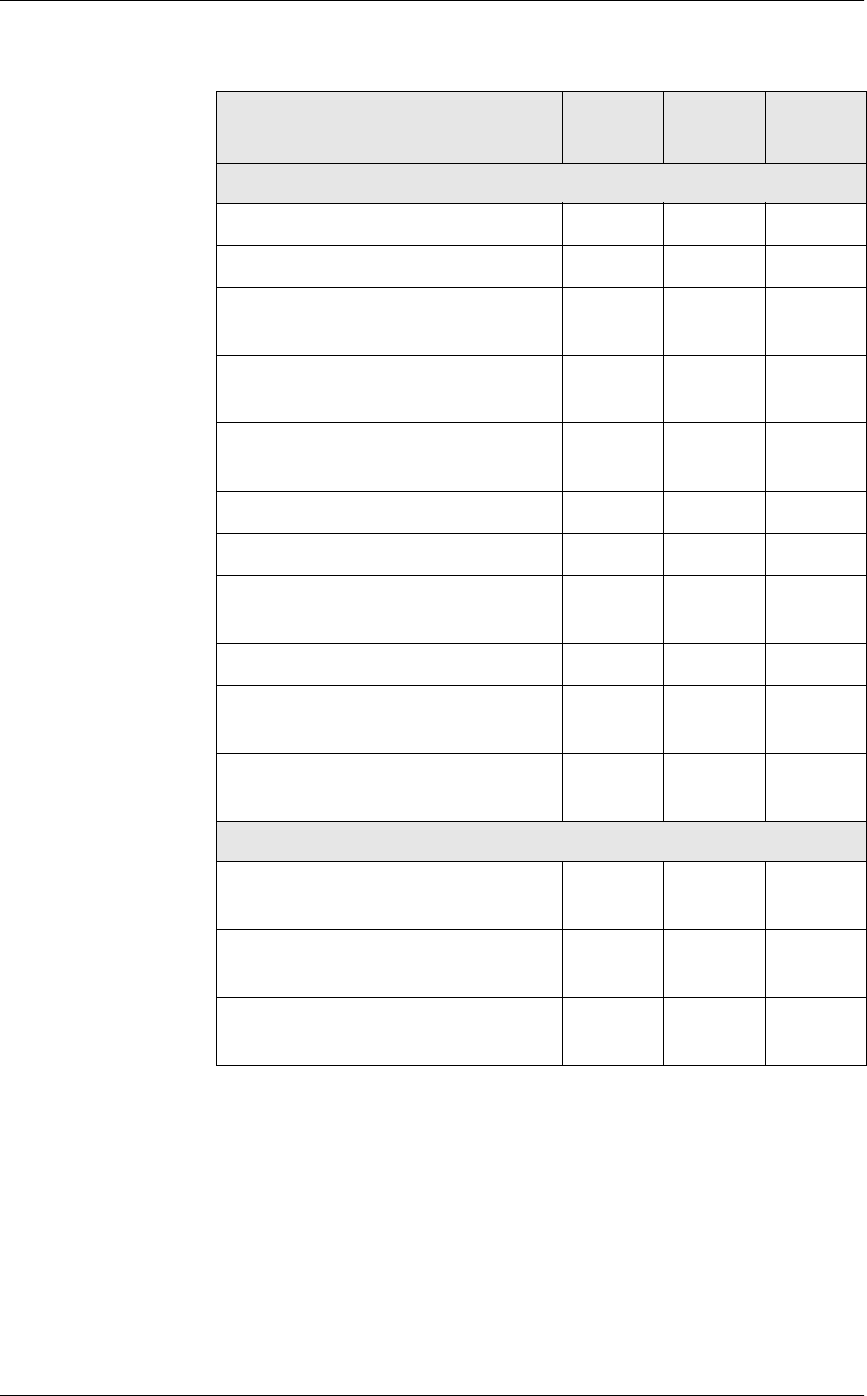
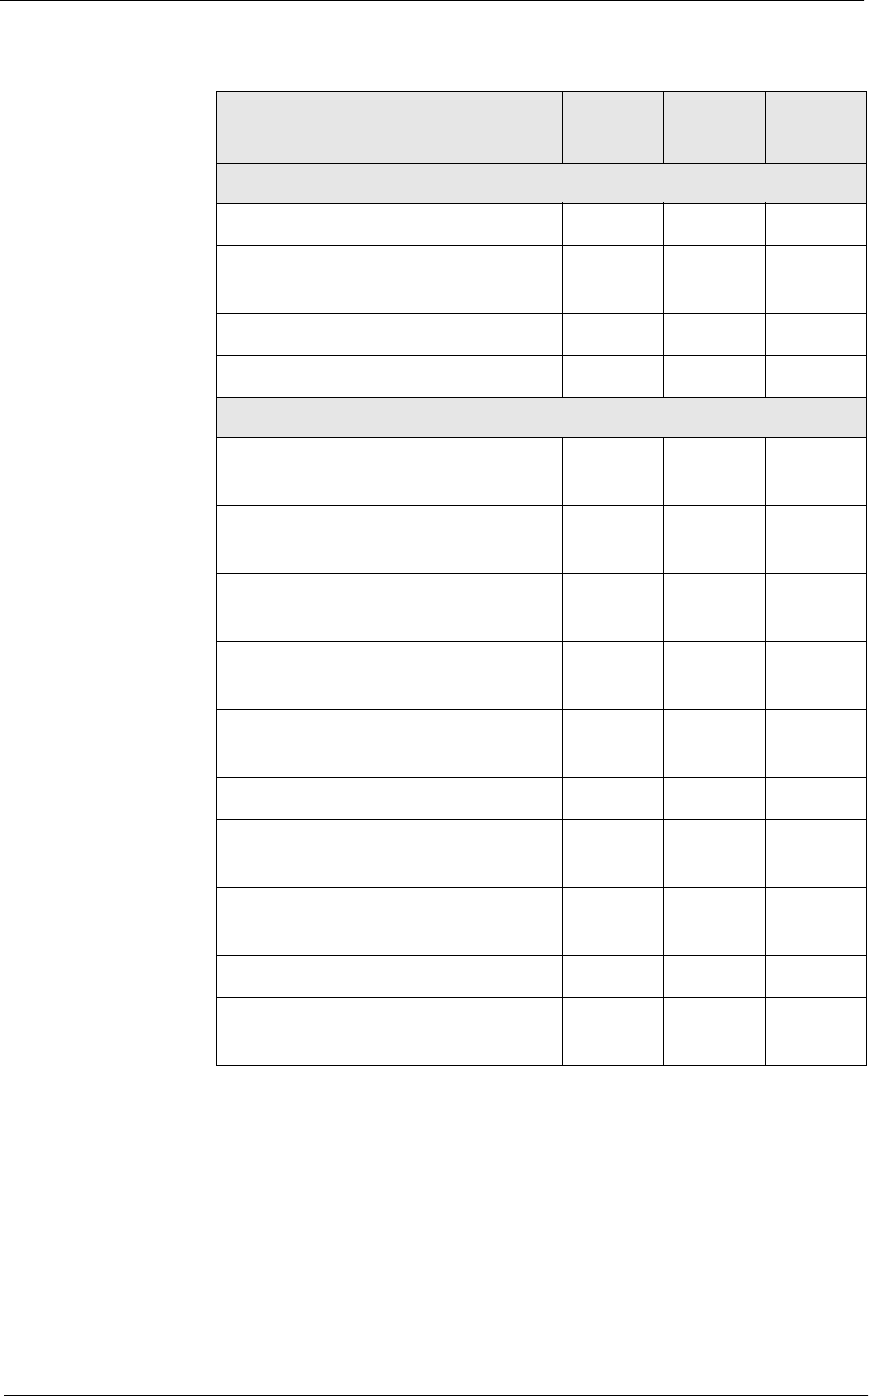
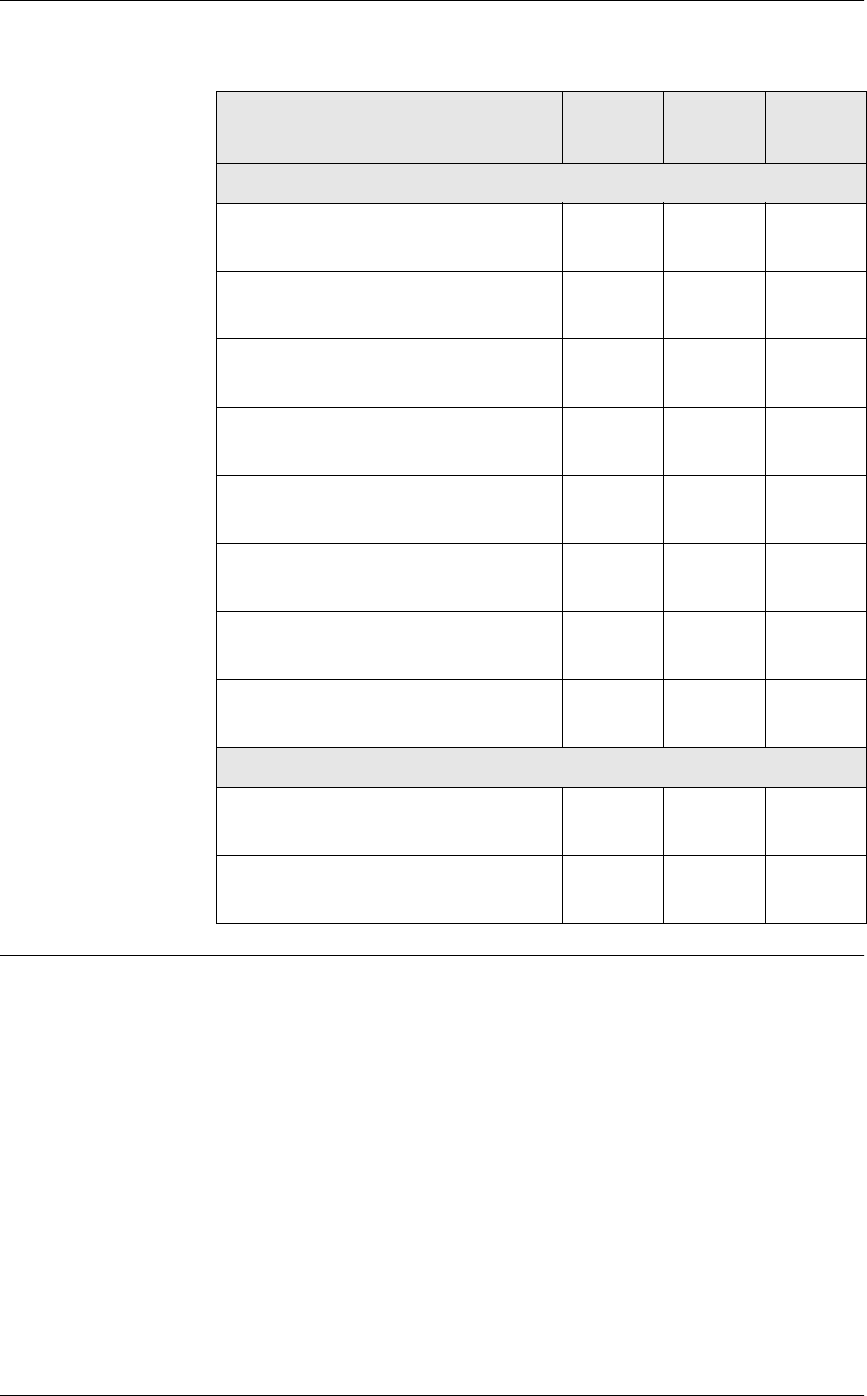
The following table lists each of the standard reports, grouped according
to subject, and indicates which format is available for each report.
Note
A printer cannot print both 40-column reports and 32-column
guest checks. The 40-column reports must be printed on a
printer that is not used for guest checks.
Report Name Full-
Page 40-
Column UWS
Employee Reports
Cashier Summary XX
Cashier Detail XX
Consolidated Cashier Detail X
Daily Employee Detail XXX
Consolidated Employee Detail X
Employee Sales and Tip Totals X
5HSRUWV
,QWURGXFWLRQWR5HSRUWV
%DVLF&RQFHSWVDQG7HUPV
Labor Reports
Employee Time Card and Job Detail X
Employee Job Summary XX
Consolidated Employee Job Code
Labor Summary
X
Revenue Center Job Summary XX
Consolidated RVC Job Summary X
System Job Summary XX
Consolidated System Job Code
Labor Summary
X
Clock In Status XXX
Labor Availability XX
Tax Reports
Revenue Center Tax Totals XX
Consolidated Revenue Center Tax
Totals
X
System Tax Totals XX
Consolidated System Tax Totals X
Tip Reports
Employee Tip Totals XXX
Consolidated Employee Tip Totals X
Consolidated Revenue Center Tip
Totals
X
Consolidated System Tip Report X
Report Name Full-
Page 40-
Column UWS
,QWURGXFWLRQWR5HSRUWV
%DVLF&RQFHSWVDQG7HUPV
Time Period Sales Reports
Revenue Center Time Period Totals XX
Revenue Center Time Period Detail XX
Consolidated Revenue Center Time
Period Totals
X
Revenue Center Time Period
Summary
XX
Consolidated Revenue Center Time
Period Summary
X
System Time Period Totals XX
System Time Period Detail XX
Consolidated System Time Period
Totals
X
System Time Period Summary XX
Consolidated System Time Period
Summary
X
Consolidated System Time Period
Summary w/Graph
X
Serving Period Sales Reports
Revenue Center Serving Period
Totals
XX
Consolidated Revenue Center
Serving Period Totals
X
Revenue Center Serving Period
Detail
XX
Report Name Full-
Page 40-
Column UWS
5HSRUWV
,QWURGXFWLRQWR5HSRUWV
%DVLF&RQFHSWVDQG7HUPV
Sales Balance Reports
Daily Revenue Center Sales Detail XXX
Consolidated Revenue Center Sales
Detail
X
Daily System Sales Detail XXX
Consolidated System Sales Detail X
Group Sales Reports
Daily Revenue Center Group Sales
Detail
XX
Daily Revenue Center Group Sales
Detail by Category
X
Consolidated Revenue Center
Group Sales Detail
X
Daily Revenue Center Group Sales
Summary
XX
Consolidated Revenue Center
Group Sales Summary
X
Daily System Group Sales Detail XX
Daily System Group Sales Detail
Subtotal by Category
X
Consolidated System Group Sales
Detail
X
Daily System Group Sales Summary XX
Consolidated System Group Sales
Summary
X
Report Name Full-
Page 40-
Column UWS
,QWURGXFWLRQWR5HSRUWV
%DVLF&RQFHSWVDQG7HUPV
7UDFNLQJ*URXSV
A tracking group is a set of up to 64 tracking totals that are used to track
specific items of interest not included in the standard reports. (Although
up 64 tracking totals can be programmed in each tracking group, only the
first 42 appear on standard reports. The additional tracking totals are
included for customization purposes.)
Each tracking total includes a name, a quantity and a value amount. The
name is a descriptor programmed in the Tracking Groups form. The count
is the number of specified items that were posted. The value is the sum of
the associated monetary amounts.
Menu Item Sales Reports
Daily Revenue Center Menu Item
Sales Detail
XX
Consolidated Revenue Center Menu
Item Sales Detail
X
Daily Revenue Center Menu Item
Sales Summary
XX
Consolidated Revenue Center Menu
Item Sales Summary
X
Daily System Menu Item Sales
Detail
XX
Consolidated System Menu Item
Sales Detail
X
Daily System Menu Item Sales
Summary
XX
Consolidated System Menu Item
Sales Summary
X
Check Reports
Employee Open Guest Checks
Report
XXX
Employee Closed Guest Checks
Report
XX
Report Name Full-
Page 40-
Column UWS

5HSRUWV
,QWURGXFWLRQWR5HSRUWV
%DVLF&RQFHSWVDQG7HUPV
This information is included on any reports with tracking totals. You can
define an almost unlimited number of tracking groups, subject to the
constraints of system resources.
Using tracking totals, you can produce reports with customized totals
information with a minimum of programming time and expertise.
8VLQJ7UDFNLQJ*URXSV
Tracking groups are created and defined on the Tracking Groups form.
Some tracking types require that you specify a tracking number, to
specify exactly which item you wish to track. For example, if you select
Void/Return Total as a tracking type, you will need to select which reason
to track using this tracking total.
Some tracking totals are predefined, and require no further selection. For
example, Void is predefined; no tracking number is required.
Note
In other MICROS products, tracking totals include math
operators and formatting commands. In the 3700, math
operations and formatting are done through Crystal Reports
using a template. Tracking totals include only items you wish
to track.
,QWURGXFWLRQWR5HSRUWV
%DVLF&RQFHSWVDQG7HUPV
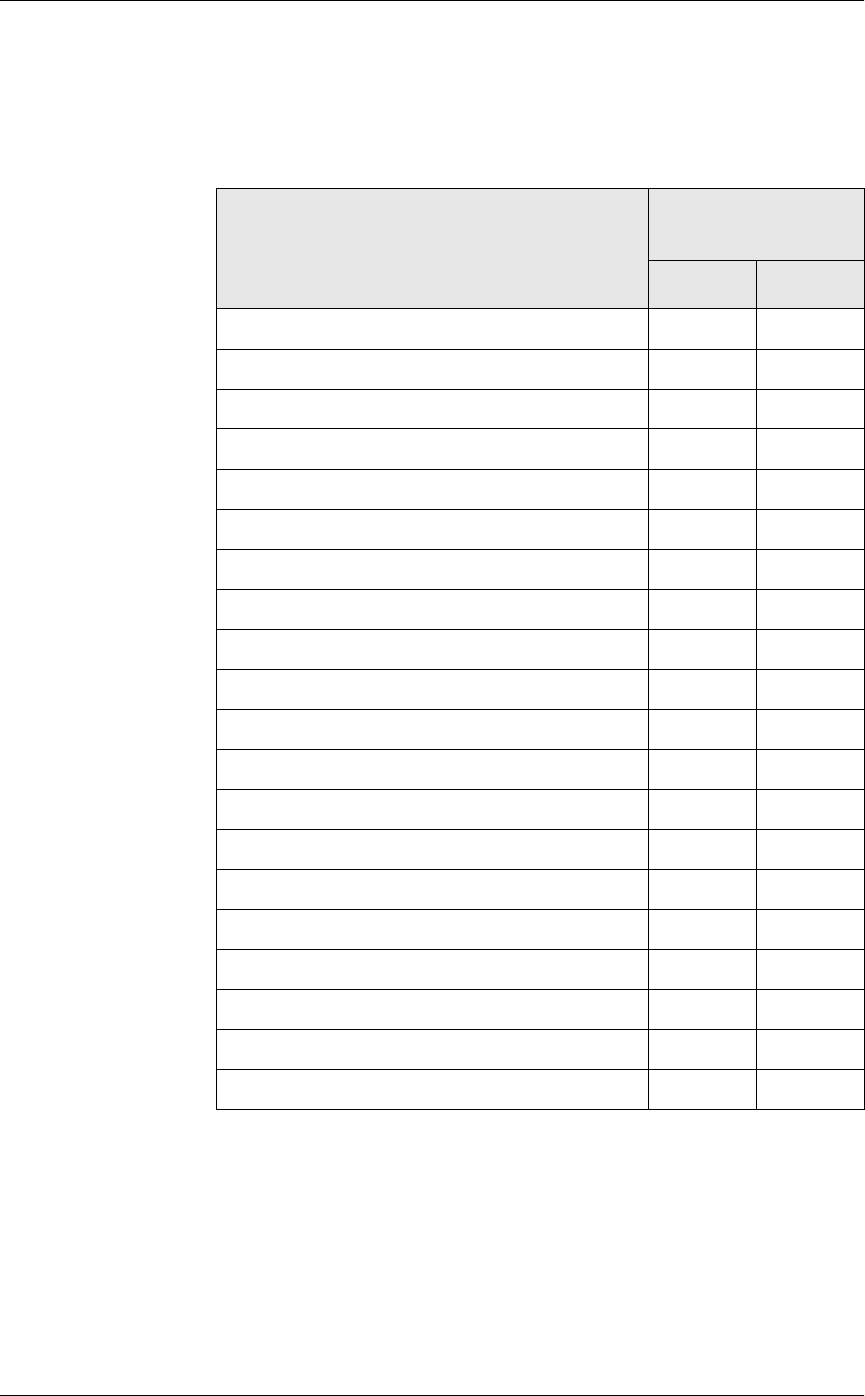
A tracking group can include any of the tracking total types listed in the
table that follows. Tracking total types are listed in the order in which
they display in the Tracking Group form.
When setting up tracking totals, keep in mind that although you can create
up to 64 tracking totals for each tracking group, only 48 tracking totals
will be printed on the standard reports. The system will record totals
information for the remaining tracking totals, but you cannot report on
these totals without using a customized report.
Tracking Total Type
Tracking Total
Number Required
Yes No
Major group X
Family group X
Menu item X
Discount/Service charge X
Tender /Media X
Currency conversion total X
Tax total X
Subtotal discount X
Order type total X
Void/Return total X
Insufficient beverages total X
Beverages total X
Media declaration total X
Cover count X
Void X
Check transfer X
Employee meal X
Sales Itemizer X
Discount/Service Charge Category X
Tender/Media Category X

5HSRUWV
,QWURGXFWLRQWR5HSRUWV
%DVLF&RQFHSWVDQG7HUPV
Tracking totals appear on standard reports in three columns, with a
subtotal for each column. You may be able to get useful subtotal
information by grouping tracking totals appropriately. A subtotal is
provided for each of the following groups of tracking totals:
qTracking totals 1-14
qTracking totals 15-28
qTracking totals 29-42
When you have created a tracking group, you can assign it to a historical
totals class in Historical Totals |Classes. Historical Totals Classes assign a
tracking group to a specific totals table in Historical Totals |Descriptor. A
tracking group can be linked to one or more of the following:
qCashiers
qEmployees
qServing periods
qRevenue center time periods
qRevenue centers
qSystem time periods
qSystem
Each of these tables can have only one associated tracking group. The
tracking group link determines what tracking totals will be recorded for
that table, and what will appear on related reports that include tracking
totals. For example, if you create a tracking group and assign to the
Employees Trk Total table on the Historical Totals form, the tracking
totals in the tracking group will be recorded for every employee, and will
be reported on any employee reports that include tracking totals.
Note
Once a tracking group has been used it cannot be modified. To
change a tracking total, create a new tracking group that
includes the necessary changes and assign it to a historical
totals class.
In a functioning 3700 system, changes made to a tracking
group do not take effect until the next time the business day
changes (as defined by the Business Day Start Time).

,QWURGXFWLRQWR5HSRUWV
%DVLF&RQFHSWVDQG7HUPV
([DPSOH
A restaurant wants to see how many of a certain group of special desserts
are sold. Each of these five desserts is assigned to a tracking total in the
tracking groups assigned to employees, revenue centers, and time periods.
When these tracking groups are used, a manager can see any of the
following:
qWhich employee sold the most special desserts
qHow many special desserts were sold in the Dining Room
qWhich Time Period had the most sales of special desserts
qWhich desserts are the most popular
5HSRUW6HOHFWLRQ2SWLRQV
Most reports are designed to provide either revenue center-level or
system-level information. For example, the System Sales Detail Report is
inherently a system-wide report; you cannot select the revenue centers to
include in the report. You can, however, specify a revenue center or range
of revenue centers for the Revenue Center Sales Detail Report.
The following are common report selection options:
qDate
Many reports include a from date and to date as selection options. The
default value is always today’s business date. For reports that are not
consolidated, a report will be produced for each business day
included in the range you specify. For consolidated reports, one
report will be produced that provides combined totals for the period
you specify.
qRevenue Center
You can specify one revenue center or a range of revenue centers. All
revenue center reports include this selection option.
qShift
You can specify one shift or a range of shifts. The default is always
the current shift. This selection option is included on all employee
and cashier reports.
qEmployee
You can specify one employee or a range of employees. This
selection option is included on all employee reports.
qCashier
You can specify one cashier or a range of cashiers. This selection
option is included on all cashier reports.
qMenu Item
You can specify one menu item or a range of menu items. This
selection option is included on all menu item reports.

5HSRUWV
,QWURGXFWLRQWR5HSRUWV
%DVLF&RQFHSWVDQG7HUPV
qGroup By
This option is available only on menu item reports. You can specify if
menu items should be grouped by family group, major group, or
menu item group.
qTime Period
This option is available only on time period reports. You can specify
one time period or a range of time periods for the report.
2WKHU2SWLRQV
It is also possible to designate the report printer.
3URILOHV
A profile is a standard block of related information presented in a
consistent format. Each report is made up of one or more profiles.
Each report description in this manual lists the profiles included in the
report, and refers you to the page in Chapter 2 where that profile is
described. Profile descriptions provide a non-technical explanation of
each field included in the profile.
Some reports use a unique profile that is not used for any other reports. In
these cases, the profile is described with the report.
,QWURGXFWLRQWR5HSRUWV
%DVLF&RQFHSWVDQG7HUPV
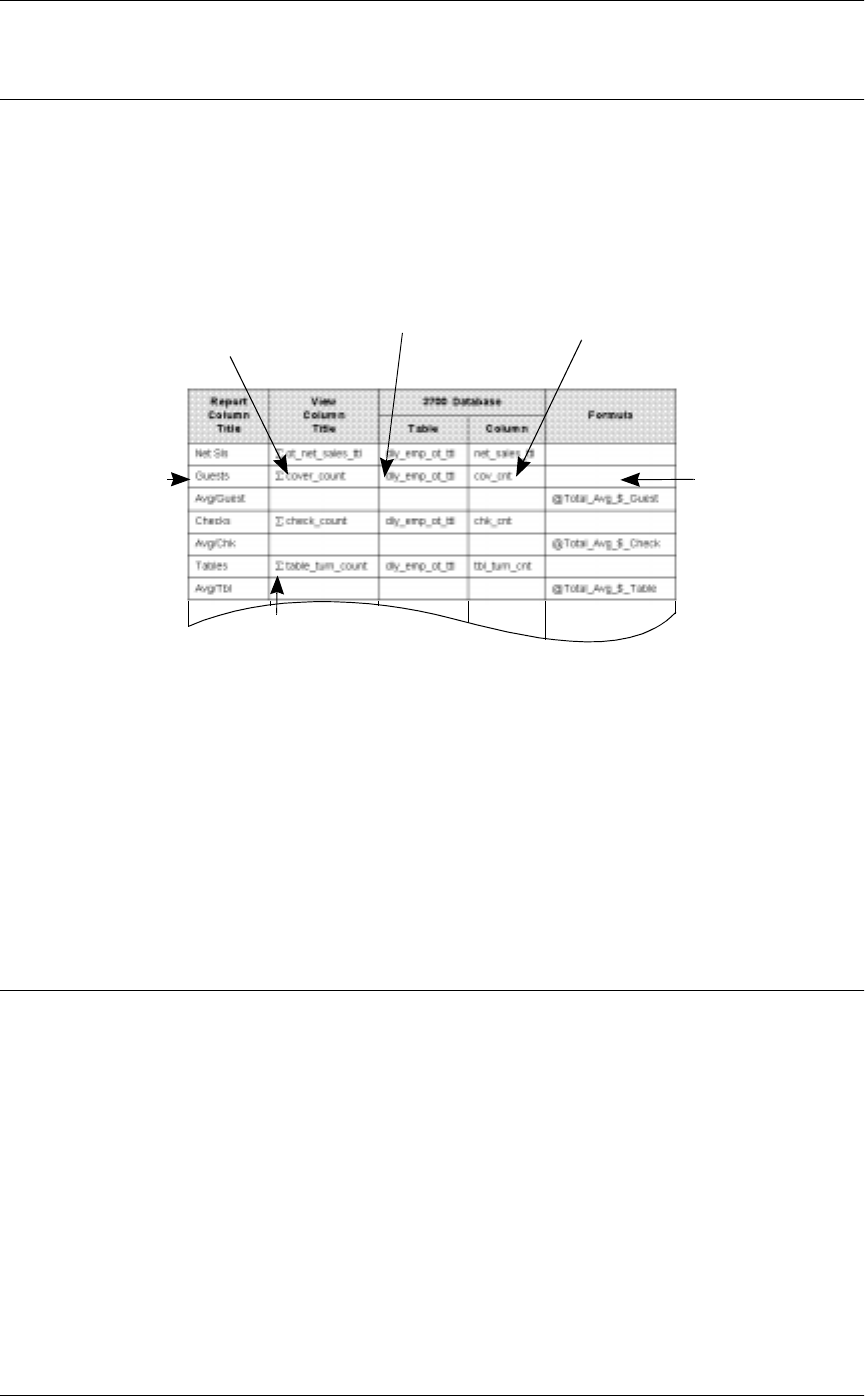
'HWDLO7DEOHV
Each report description includes a detail table for each profile included in
the report. Detail tables are included for advanced users who need to
know exactly where each number in the report comes from in the
database.
For each field or column in a report that comes from the database through
a view, the detail table lists the name of the column and table in the
database, as well as the name of the column in the view associated with
the report. For each field or column that is derived from a formula, the
detail table lists the formula name the template uses.
Some numbers in reports are the sum of a column of numbers or of a
formula. This is represented in the detail tables using the symbol for
summation (∑), followed by the column or formula name.
7HPSODWHV
Each standard report is generated using a Crystal Reports template.
Template information is included in each report description for advanced
users.
A template is used to format and organize the information in a report. The
fonts, spacing, and field placement of a report are all specified in the
report template. Templates also include formulas that are used to
calculate information for some fields.
The name of the
column as it appears
on the report
The information on
the report for this
specific column
comes directly from
the database; no
formula is used
The name of the
column as it appears
in the view
The database table
the column is in The name of the column as it
appears in the database table
The summation symbol
(∑) indicates a sum of
values

5HSRUWV
,QWURGXFWLRQWR5HSRUWV
%DVLF&RQFHSWVDQG7HUPV
9LHZV
A view is a specified set of database information that is used by a Crystal
Reports template to produce a report. View information is included in
each report description for advanced users who may need to modify the
standard reports.
Modifying existing reports or creating new reports is made easier through
the use of views. The 3700 system includes views for all the totals tables
in the database. For more detailed information on views, see the 3700
SQL Manual. For more information on customizing reports, see the 3700
Custom Report Design Manual.
6WRUHG3URFHGXUHV
A stored procedure is a collection of SQL statements that is used to carry
out certain database-related functions. For reports, each view has an
associated stored procedure that updates all the totals referenced by the
view. When you run a report, a stored procedure first updates the
database, and then the necessary information is accessed. This guarantees
that, you get current, up-to-date information.
Some reports are based on a stored procedure, rather than a view, to allow
totals to be consolidated. When this is done, the stored procedure returns a
result set which is used by the report template to create the report.
)RUPXODV
Formula information is included in detail tables for advanced users.
Formulas are used for one of the following reasons:
qTo perform calculations such as adding totals or calculating
percentages
qTo allow numbers or text to be formatted appropriately
Sometimes a formula is used on a report template even though the
information is coming from a database table. For example, dates and
times are always included as formulas. The following is a sample date/
time string as it is stored in the database:
1995/12/31 14:59:30:04

,QWURGXFWLRQWR5HSRUWV
%DVLF&RQFHSWVDQG7HUPV
A formula is used to format the date and/or time so it can be printed on the
report in a more appropriate format such as December 31, 1995 or 12
December 1995.
Note
Information on a report may be coming from a database table,
even though the field on the report contains a formula. The
formula may be merely formatting the information.

5HSRUWV
,QWURGXFWLRQWR5HSRUWV
%DVLF&RQFHSWVDQG7HUPV
(PSOR\HH6KLIWV
The system tracks and stores employee shift information. When the
option Employee Classes | Clock In/Sign In | Increment employee shift on
Clock In is enabled, every time an employee clocks in and is not returning
from a break the system automatically increments the employee shift.
Reports can be run based on the employee’s previous shift, current shift,
or a specified date range.

,QWURGXFWLRQWR5HSRUWV
%DVLF&RQFHSWVDQG7HUPV
3ULYLOHJH&RQVLGHUDWLRQV
Reports can be run either from the Reports folder in the Autosequences
and Reports module, or through an autosequence.
Access to the Reports folder is controlled through the option Employee
Classes | Procedures | Use Reports. If this option is selected, employees
assigned to the associated employee class will have access to any reports
included in the Reports folder.
A report can be included in the 3700 system, and run by autosequences,
but not appear in the Reports folder. The option Report Templates | Hide
on run screen determines if the report is included in the Reports folder.
Access to autosequences is controlled through privilege levels. Privilege
levels are assigned to an employee class in Employee Classes | Privileges
| Autosequences. An employee class can be assigned a privilege level
from 0 (lowest) to 3 (highest).
Required privilege levels are assigned to autosequences in Autosequences
| Privilege. An autosequence can require a privilege level from 0 (lowest)
to 3 (highest).
Employees can run any autosequence with a required privilege level equal
to or less than the privilege level assigned to the employee class to which
they belong. For example, an employee belonging to an employee class
with an autosequence privilege level of 2 can run autosequences with a
required privilege level of 0, 1, or 2.
5HSRUWV
,QWURGXFWLRQWR5HSRUWV
5XQQLQJ5HSRUWVIURPWKH5HSRUWV)ROGHU
Running Reports from the Reports Folder
The Autosequences and Reports module includes an Autosequences
folder and a Reports folder. This section explains how to generate a report
directly, using the options in the Reports folder. You might want to
generate reports directly during POS Operations to quickly examine
something, or to generate seldom-used reports, which may not be part of
an autosequence.
6WDUWLQJ$XWRVHTXHQFHVDQG5HSRUWV
The database server must be running before this module can be started. In
the MICROS 3700 Control Panel, select SQL Database Server. (If DBS
Services or All Processes are already selected, the database server is
already running. You can start the module.)
You can then start the module by double-clicking the icon on your PC’s
desktop. If the Autosequences and Reports icon is not visible, from the
Start Menu select Programs | MICROS 3700 Applications |
Autosequences and Reports.
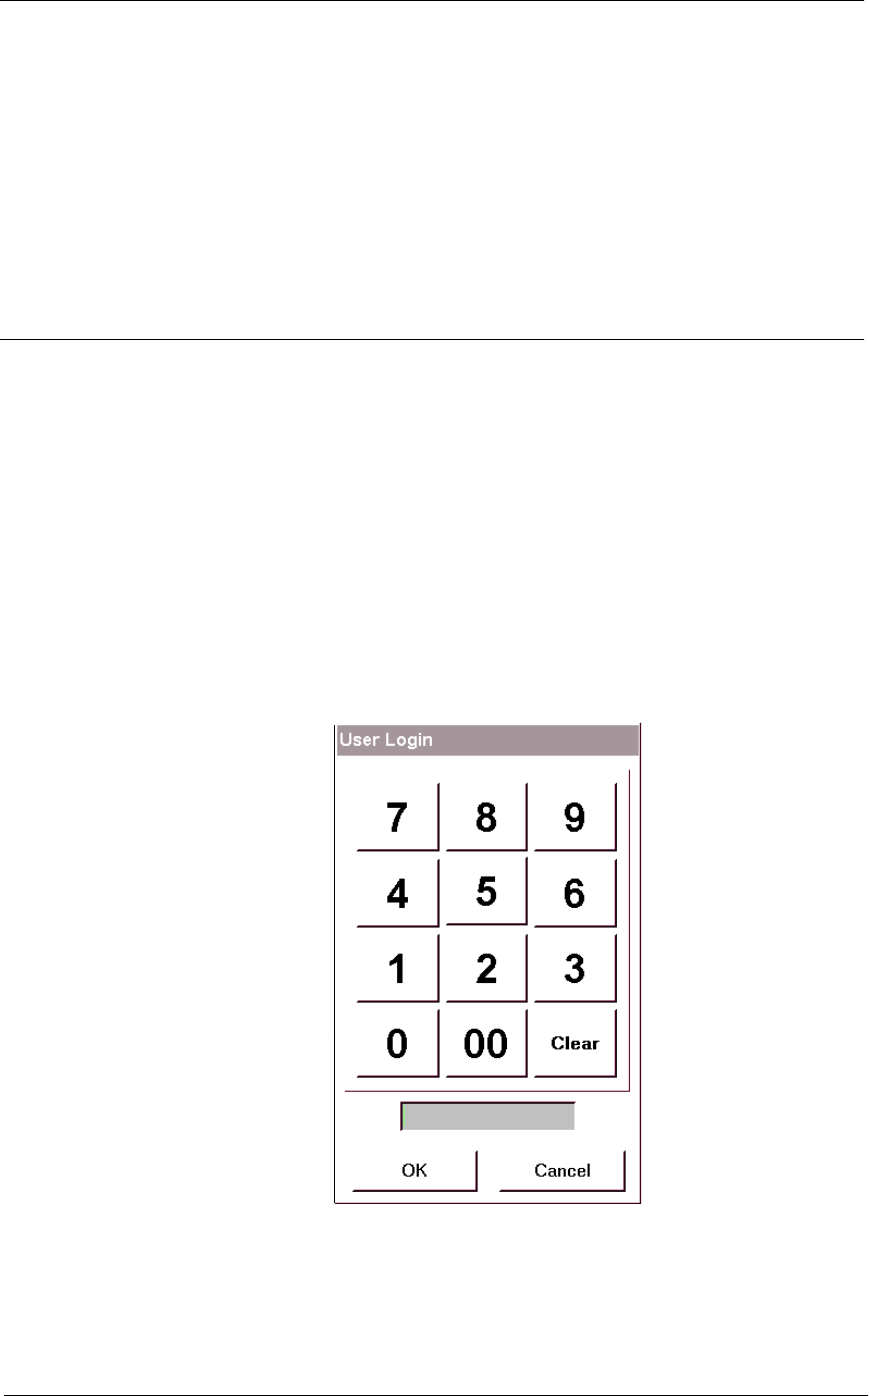
When prompted, enter your Employee ID number and click OK. You
must be specifically privileged to run reports. Report privileges are
determined by the option Employee Classes | Procedures | Use Reports.
When you have logged in to the module, select the Reports folder.
,QWURGXFWLRQWR5HSRUWV
5XQQLQJ5HSRUWVIURPWKH5HSRUWV)ROGHU
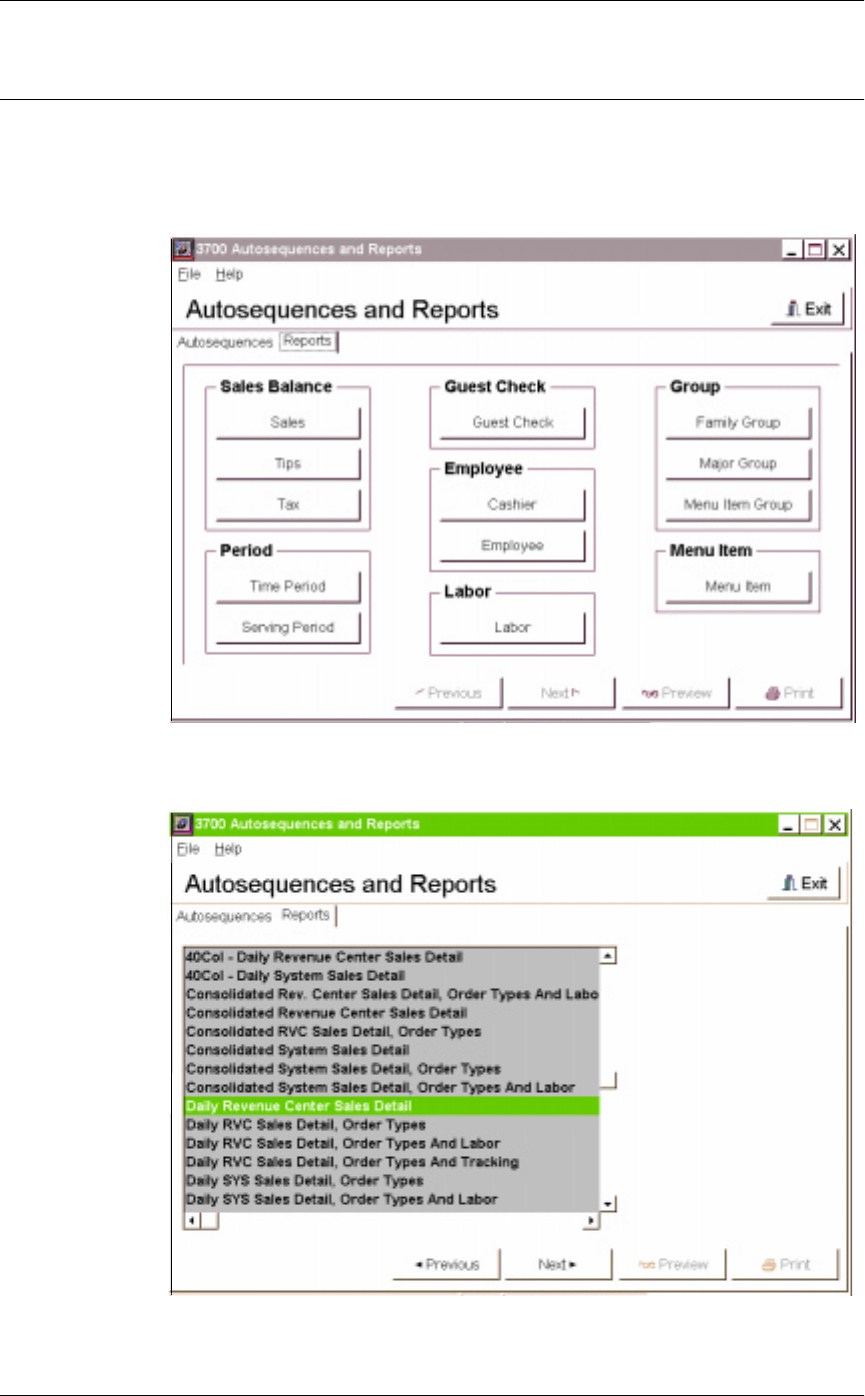
6HOHFWLQJD5HSRUW
On the Reports folder, related reports are grouped together in general
category boxes. Within the general category boxes are more specific
category buttons.
Click a button to select a category. A list of reports displays.
Highlight a report name and click Next.
5HSRUWV
,QWURGXFWLRQWR5HSRUWV
5XQQLQJ5HSRUWVIURPWKH5HSRUWV)ROGHU
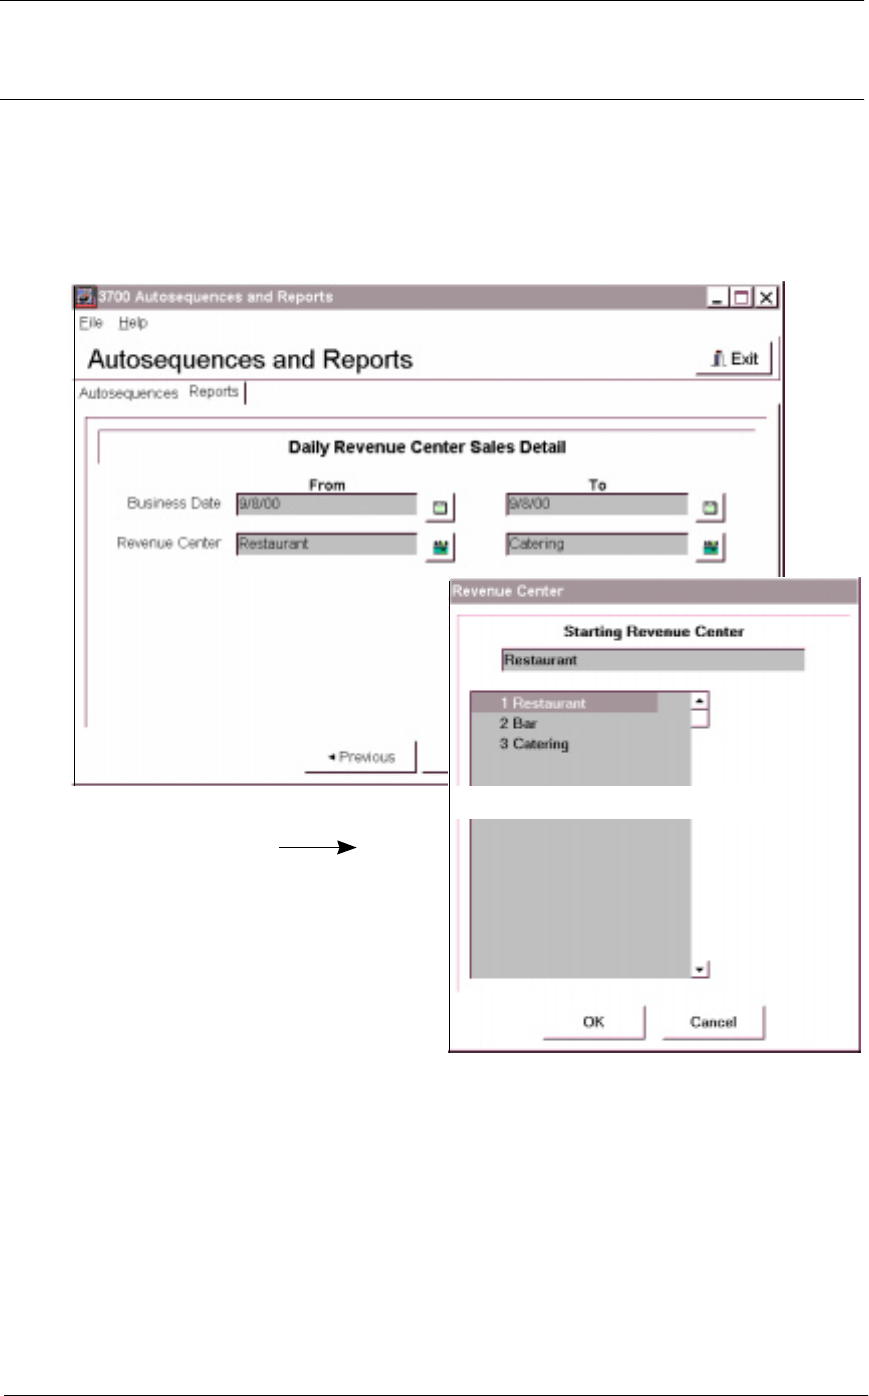
5HSRUW2SWLRQV
When you have selected the report you wish to generate, you will be
prompted for range information. This allows you to specify the
information to include or exclude from the report. Different reports
require different range information. You can see the possible options for
each range by clicking the icon beside each field.
A range selection window for
starting Revenue Center.
,QWURGXFWLRQWR5HSRUWV
5XQQLQJ5HSRUWVIURPWKH5HSRUWV)ROGHU
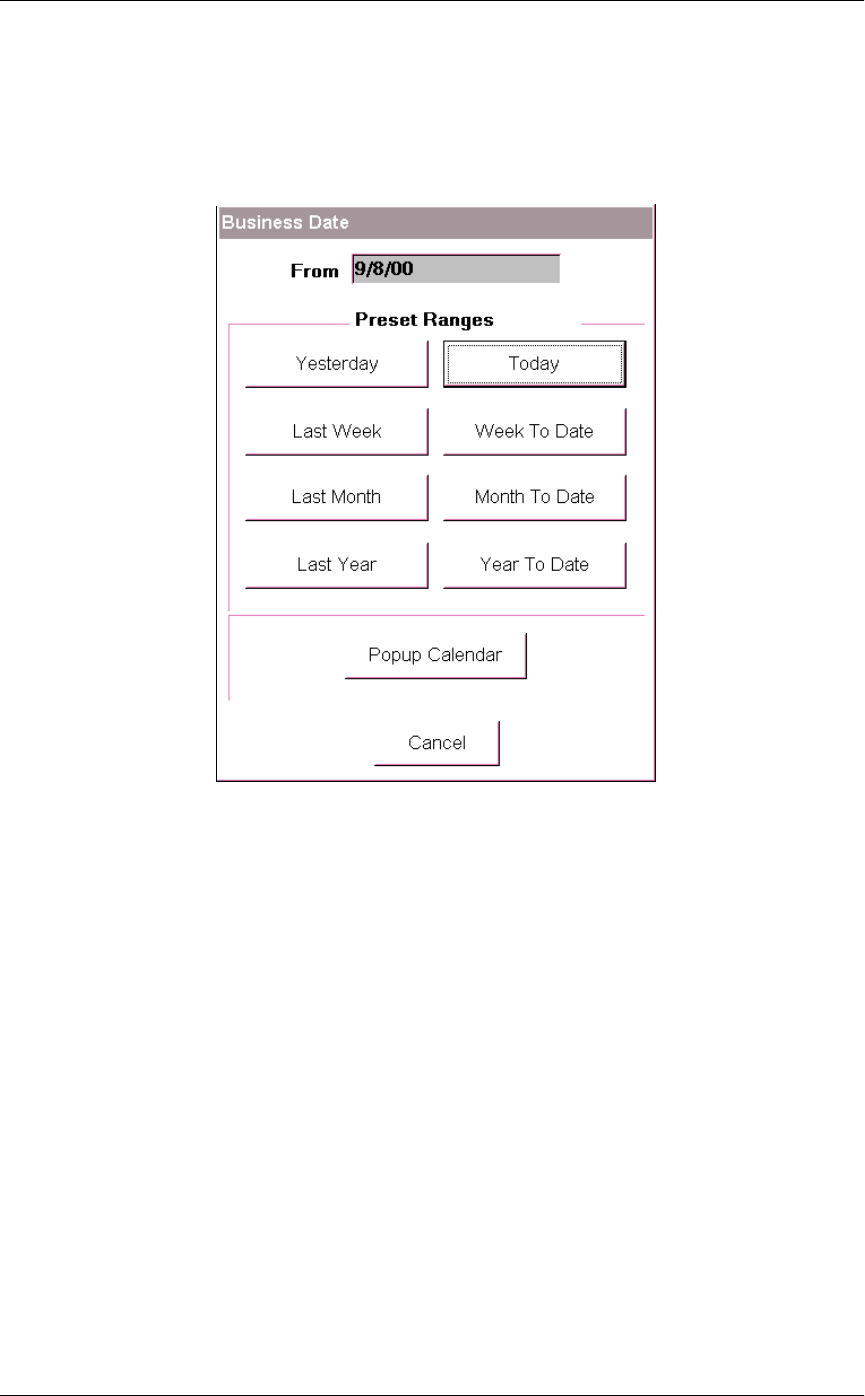
'DWHV
Many reports allow you to specify a date range for the report. When you
are prompted for a date range, click the down arrow at the right of the
business date field. The following window displays:
5HSRUWV
,QWURGXFWLRQWR5HSRUWV
5XQQLQJ5HSRUWVIURPWKH5HSRUWV)ROGHU
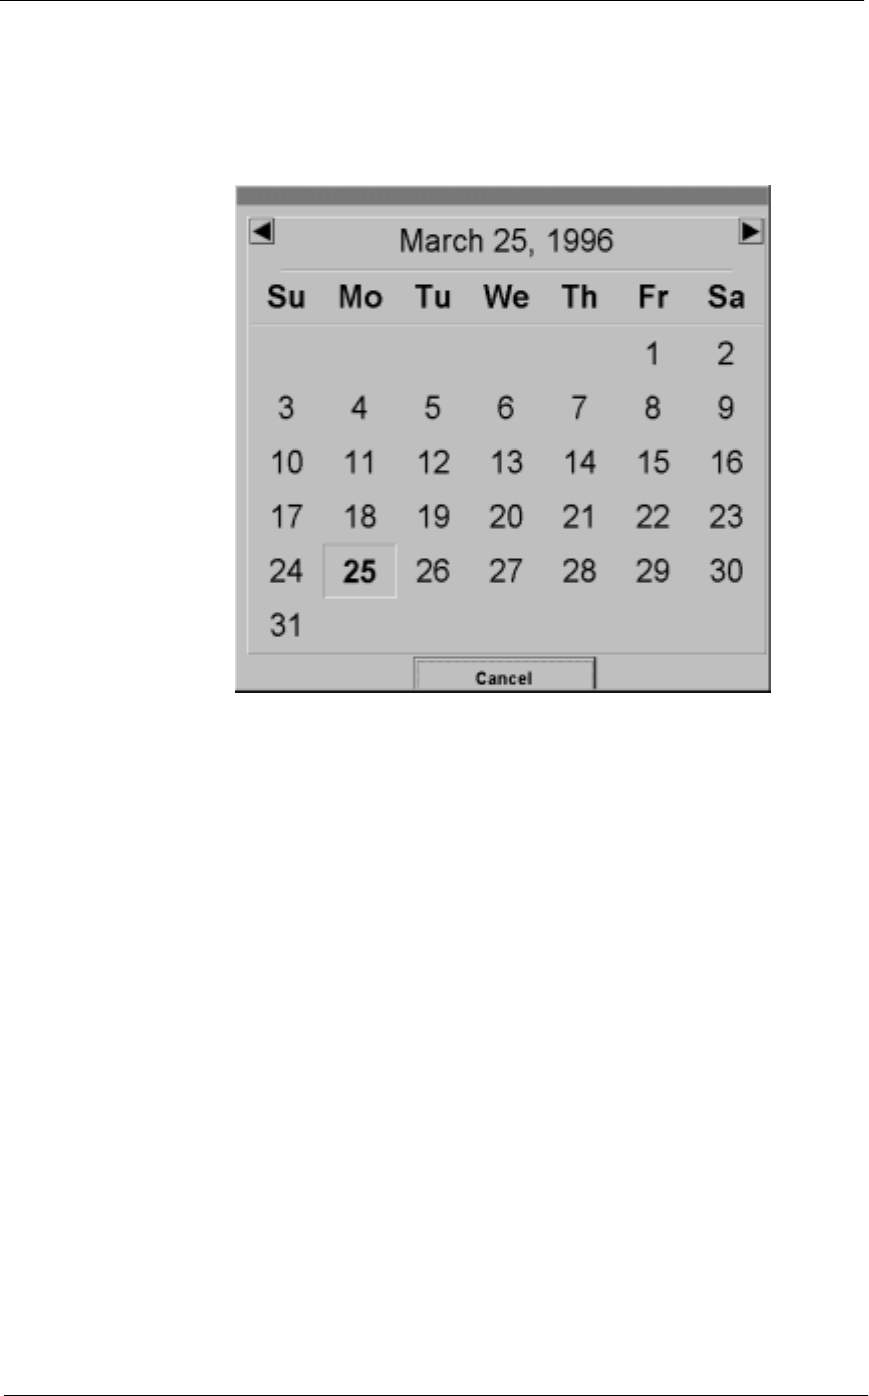
You can select one of the preset ranges by clicking the appropriate button,
or you can specify a From date by typing it in the From box, or by
clicking the Popup Calendar button.
When you select a date by clicking it, the window closes and the date is
entered in the range field.
For a list of possible range types, see “Report Selection Options” on page
1-12.
3UHYLHZRU3ULQW
When you have made the necessary range selections, you can choose to
either preview or print the report by clicking the appropriate button at the
bottom of the window.
If you select print, the report will be printed on the printer designated as
your default printer in the Control Panel. You can then go on to select a
different range for the same report, or you can select previous to choose a
different report.
To print a report, in the Override Default Printer field in POS
Configurator (Autosequence Steps | Report) enter the path and name of
the printer to which you want to print.

,QWURGXFWLRQWR5HSRUWV
5XQQLQJ5HSRUWVIURPWKH5HSRUWV)ROGHU
If you select preview, the report displays on your screen in the Report
Viewer. You can make the report larger or smaller on the screen by
clicking the Zoom button. You can also print the report from the Report
Viewer. If you click the Print button, the report will be printed on the
printer designated as your default printer in the Control Panel. You can
select a different printer in Report Viewer using File | Printer Setup.
At any time during the range selection process, you can select previous to
select a different report.

5HSRUWV
,QWURGXFWLRQWR5HSRUWV
5XQQLQJDQ$XWRVHTXHQFH
Running an Autosequence
Many autosequences are run automatically at programmed times. Some
autosequences, however, can be run manually. To run an autosequence,
start the Autosequences and Reports module. (For information on starting
the Autosequences and Reports module, see page 1-19.)
When you log in, the module opens to the Autosequences folder. Any
autosequences you are privileged to use appear as buttons on the folder.
(Autosequence privilege levels are assigned to employee classes in
Employee Classes | Privileges | Autosequences. The privilege level
required to run a specific autosequence is assigned in Autosequences |
Privilege.)
To run an autosequence, click the appropriate button. A window opens
with a message saying the autosequence has started. When the
autosequence is finished, the message ‘DONE’ appears in the window.
Some autosequences may be programmed to prompt the user for
information, such as a date range. When this happens, a window opens
prompting for information.

,QWURGXFWLRQWR5HSRUWV
5XQQLQJDQ$XWRVHTXHQFH

5HSRUWV
Chapter 2
Profiles
Each 3700 report is made up of several different profiles, or blocks of
information. This chapter provides a detailed description of these profiles.
In this chapter
Introduction ............................................................................................2-2
Detailed Sales Profile............................................................................ 2-3
Detailed Sales and Tip Profile............................................................... 2-9
Employee Labor Profile ...................................................................... 2-17
Labor Category Profile........................................................................ 2-19
Labor/Sales Profile.............................................................................. 2-21
Sales Profile......................................................................................... 2-24
Sales and Guest Profile ....................................................................... 2-26
Tax Profile........................................................................................... 2-28
Tip Profile............................................................................................ 2-31
Tracking Group Profile ....................................................................... 2-33

3URILOHV
,QWURGXFWLRQ
Introduction
The 3700 reports are designed to be easy to learn and to use.
Standard blocks of related information are presented repeatedly
in a consistent format, so you can quickly recognize them and
become familiar with them. These blocks of information are
called profiles. Each report is made up of one or more profiles.
The explanation of each report includes a list of the profiles
included in the report, along with a page reference to the profile
description in this chapter.
These profile descriptions are designed to give you a general
understanding of what each column in the report is and where the
numbers originate. This information is useful when you work
with an unfamiliar report, or when you decide which reports will
provide the information you need. The profile descriptions also
include programming information (What do I program for totals
to add to this field?) and the general equations that are used to
calculate the numbers. (For example, Total Hours = Regular
Hours + Overtime Hours.)
Advanced users who need to know specific information about
where numbers originate in the database should use the detail
tables in the section on the specific report. A detail table is
included for each profile included in the report.
Most profiles are used repeatedly, and are explained in this
section. A few profiles are used for only one report. These
profiles are explained with the specific report.
5HSRUWV
3URILOHV
'HWDLOHG6DOHV3URILOH
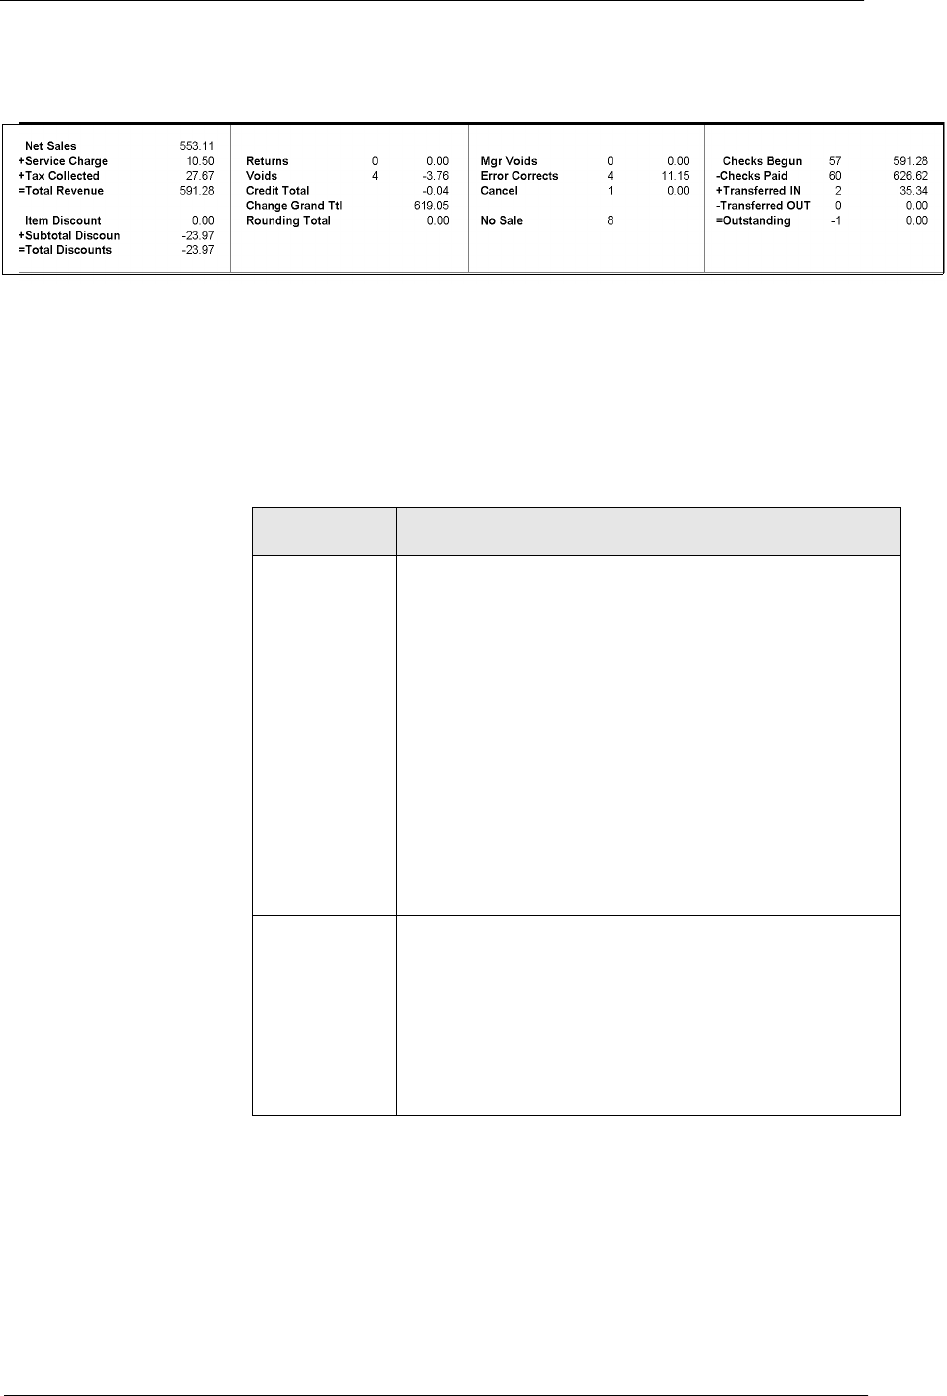
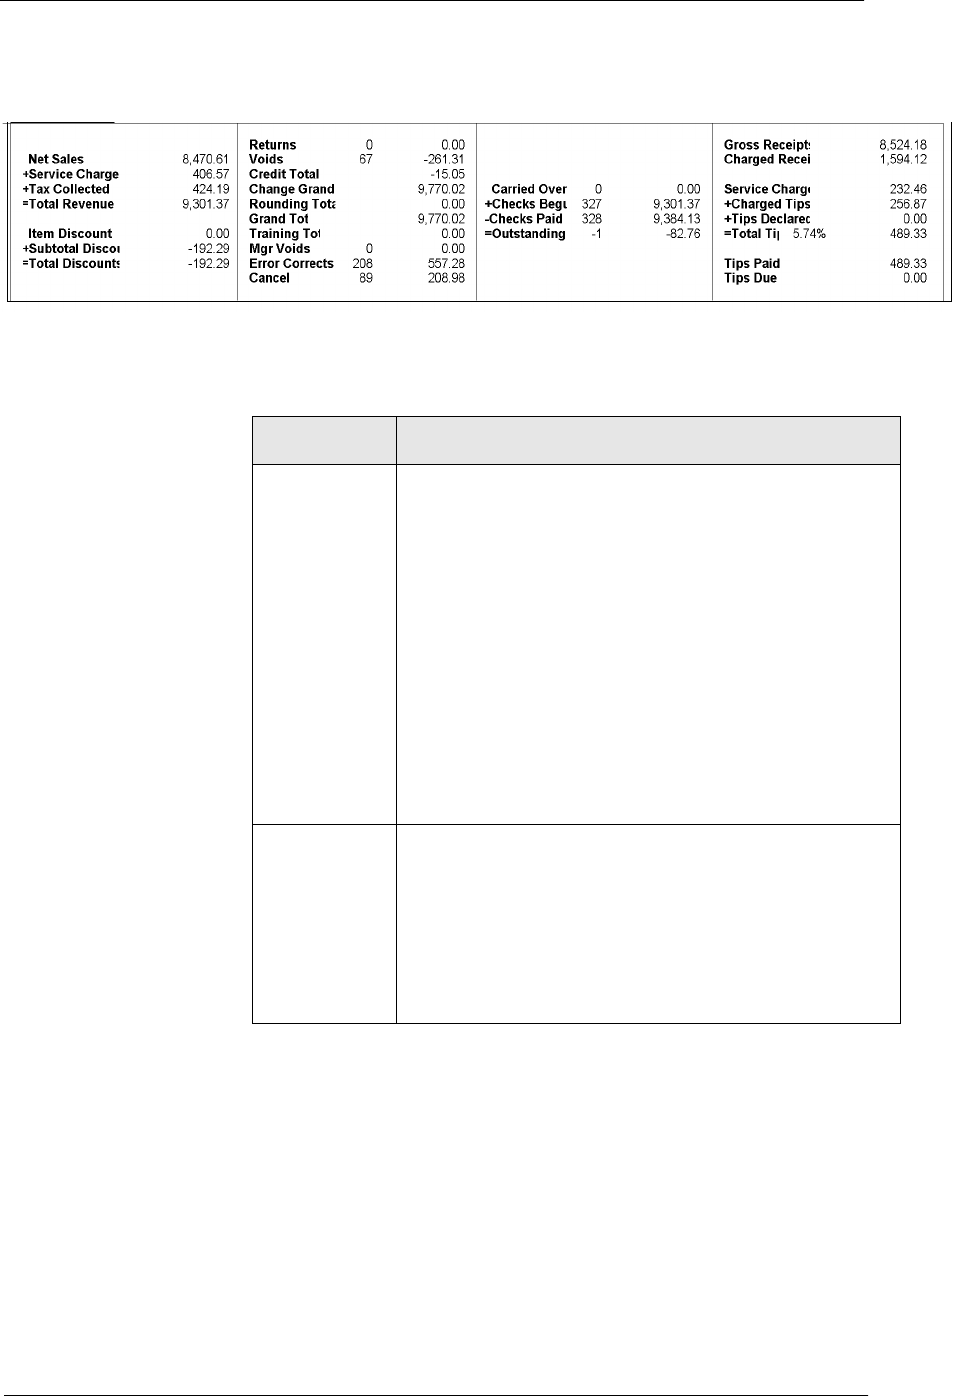
Detailed Sales Profile
This profile provides detailed information on sales, including
discounts, returns, voids, corrections, and check data.
Included here are all the fields in the basic Detailed Sales profile.
Some reports that use this profile include additional information
in the profile. When this occurs, the additional information is
explained with the report.
Column Description
Net Sales The net total of all sales activity. All discounts, voids,
returns and any inclusive tax associated with the sales
activity have been subtracted.
The Net Sales total is calculated as follows.
+sum of all menu item entries (less any included tax)
–all voids of menu item entries
–all discount entries
+any voids of discount entries
–all returns of menu item entries
+any voids of returns of menu item entries
You can change the label that prints on the report for
this field in Tax Rates | General | Net Sales Name.
Service
Charge The sum of all service charge entries as calculated by
the sum of all service charge keys plus the calculated
value of any autogratuity. The Service Charge is
calculated as follows.
+sum of all Service Charge key entries
–all Voids of service charge entries
+computed autogratuity
3URILOHV
'HWDLOHG6DOHV3URILOH
Tax
Collected The net tax collected based on taxable menu item
sales adjusted for taxable (or non-taxable) discounts,
taxable service charges, voids and returns. The figure
includes any U.S. inclusive or add-on taxes.
Tax Collected is calculated as follows:
+sum of tax from taxable menu item entries
–tax from voids of menu item entries
–tax from returns of menu item entries
+tax from voids of returns of menu item entries
–tax from voids of taxable service charge entries
–tax from non-taxable discount entries
+tax from voids of taxable discount entries
You can change the label that prints on the report for
this field in Tax Rates | General | Tax Collected Name.
Total
Revenue The sum of Net Sales, Service Charge, and Tax
Collected.
The Total Revenue is calculated as follows:
+Net Sales Total
+Service Charge
+Tax Collected
Item
Discount The net value of discounts recorded through any
discount keys programmed as Item Discount keys.
This figure is calculated as follows:
+sum of all item discount entries
–all voids of item discount entries
Subtotal
Discount The net value of all subtotal discounts. A subtotal
discount is any discount recorded through a discount
key that is not programmed as an item discount. This
figure is calculated as follows:
+sum of all subtotal discount entries
–all voids of subtotal discount entries
Total
Discounts The sum of Item Discount and Subtotal Discount
amounts.
Total discount is calculated as follows:
+Item Discount
+Subtotal Discount
Column Description

5HSRUWV
3URILOHV
'HWDLOHG6DOHV3URILOH
Returns The Returns field includes two figures. The first is the
number of items returned. The second is the value of
the returned items.
The number of returned items is calculated as follows:
+number of return entries
–voids of return entries
The value of returned items is calculated as follows:
+value of return entries
–value of voids of return entries
Voids The Voids field includes two figures. The first is the
number of void items. The second is the value of the
void items.
The number of void items is calculated as follows:
+number of voids of menu item entries
+number of voids of service charge entries
–number of voids of void entries
The value of void items is calculated as follows:
+value of void menu item entries
+value of voids of service charge entries
–value of voids of void entries
Column Description
3URILOHV
'HWDLOHG6DOHV3URILOH
Credit Total A total created when a round results in a negative
balance.
If the negative balance was created by voiding a menu
item, the tax associated with the item is posted to
Credit Total.
If the negative balance was created by a negative-
value menu item, the entire value of the menu item
and any associated taxes is posted to Credit Total.
In either case, the amount posted to Credit Total
cannot exceed the negative balance of the round.
For example, a server voids two lobster dinners priced
at $20 with $2 total tax for a void total of $42. In the
same round, the server orders several more menu
items with a total value (including tax) of $41. The
transaction value of the round is -$1.
Since the round resulted in a negative balance, and
the negative balance was created by voiding menu
items, the tax associated with those menu items ($2)
will post to Credit Total. However, the negative
balance of the round is only $1; the amount posted to
Credit Total cannot exceed this amount. In this
example, -$1 is posted to Credit Total.
This field is used in conjunction with Change In Grand
Ttl and Grand Total to verify system accounting
security. Credit Total is not used to balance revenue.
Change in
Grand Ttl The total value of all sales activity in the system for the
period of the report. Change in Grand Ttl is
represented as an absolute value; it is always a
positive number.
Change in Grand Ttl is calculated as follows:
+Total Revenue
+Total Discount
+Return
+Voids
+Credit Total
This field is used in conjunction with Credit Total and
Grand Total to verify system accounting security.
Change in Grand Total is not used to balance
revenue.
Column Description
5HSRUWV
3URILOHV
'HWDLOHG6DOHV3URILOH
Rounding
Total The difference between the rounded totals printed on
guest checks as the amount due and the actual totals
(without rounding) posted to total revenue.
Rounding Total is used for total due rounding (Finnish
rounding).
This field prints only if rounding is enabled. To enable
Rounding Totals, select RVC Posting | Options |
Enable total due rounding.
Mgr Voids The count and value of the voids that required
manager authorization.
Error
Corrects The count and value amount of items that were voided
in the current round. This is considered an error
correction, rather than a void.
Cancel The count and value amount of entries that were
cancelled using the [Transaction Cancel] key.
No Sale The number of times a transaction employee used the
[No Sale] key to open the cash drawer outside of a
transaction. If the [No Sale] key was not used during
the reporting period, the count will be zero.
Checks
Begun The count and value amount of checks, including fast
transactions, begun during the report period. These
totals include checks created using split check and
closed check edit procedures. The value amount
includes net sales, service charges, and tax.
Checks Paid The count and value of all checks (including fast
transactions) closed by tendering during the report
period. Only closed checks will be included in the
count. The value amount includes net sales, service
charges, and tax and will include any amount that has
been tendered on a check, even if it was a partial
tender.
Transferred
IN The count and value of guest checks that were
transferred to an employee (and corresponding
revenue center) using the [Transfer Check] key. The
value amount includes net sales, service charges, and
tax. The value of the check is determined at the time of
the transfer.
Transferred
OUT The count and value of guest checks that were
transferred away from an employee (or out of a
revenue center) to any other employee using the
[Transfer Check] key. The value amount includes net
sales, service charges, and tax. The value of the
check is determined at the time of the transfer.
Column Description
3URILOHV
'HWDLOHG6DOHV3URILOH
Outstanding The number and current value of open checks. This
amount is calculated as follows:
+Checks Begun
–Checks Paid
+Transferred IN
–Transferred OUT
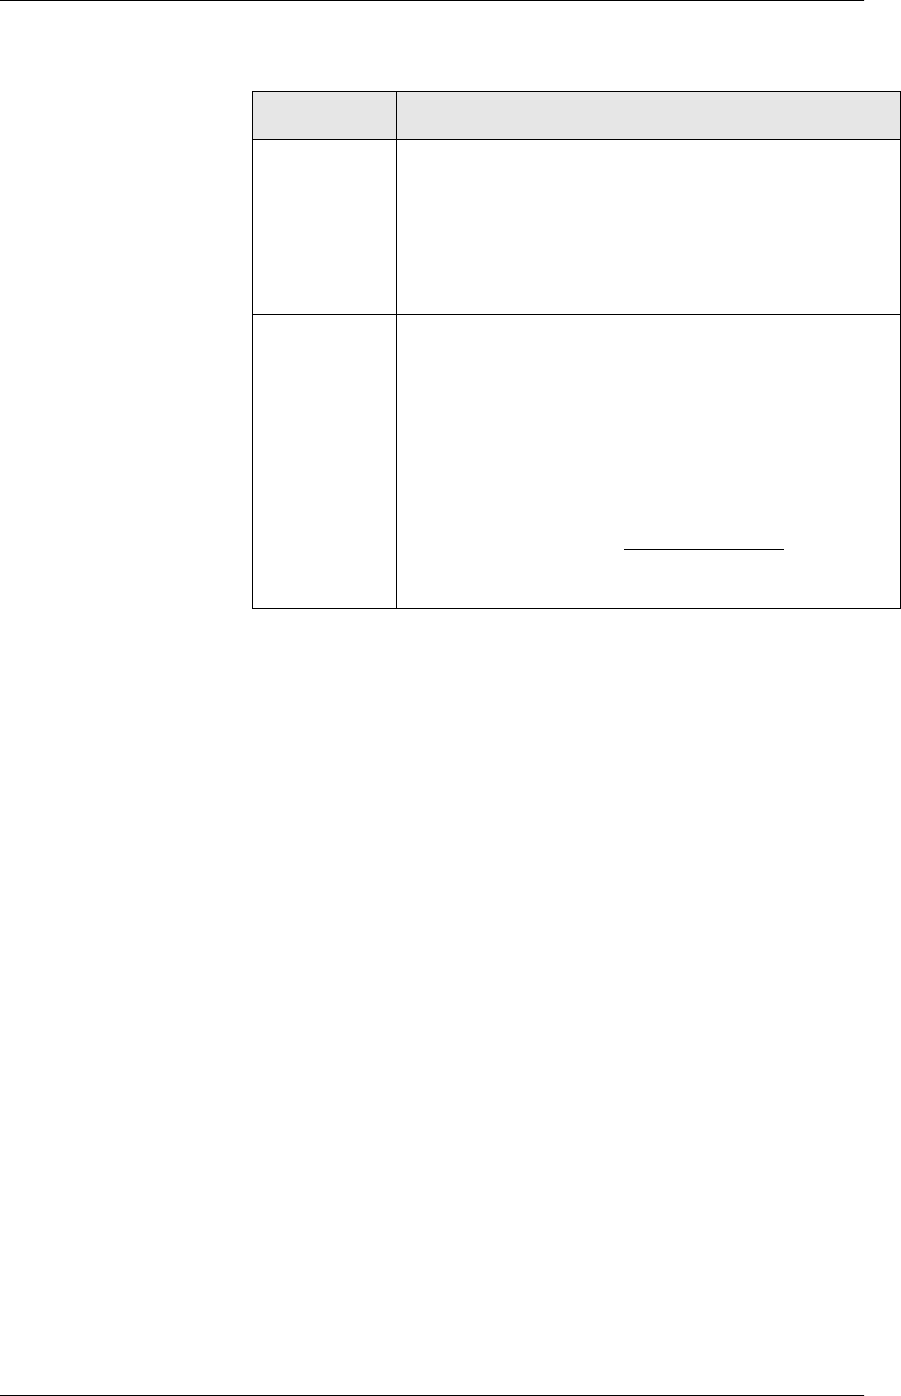
Table Turn
Time Minutes The average turn time. A turn begins when a check is
opened by table number while no other checks are
open for this table. A turn ends with the tendering of a
check that leaves no other checks open at the table. A
turn is counted only if it is less than four hours.
The average turn time is calculated as follows:
Column Description
(Avg) Turn Time =
Sum of All
Tables
Turn Times
5HSRUWV
3URILOHV
'HWDLOHG6DOHVDQG7LS3URILOH
Detailed Sales and Tip Profile
This profile is a combination of the Detailed Sales profile (page
2-3) and the Tip profile (page 2-31).
Column Description
Net Sales The net total of all sales activity. All discounts, voids,
returns and any inclusive tax associated with the sales
activity have been subtracted.
The Net Sales total is calculated as follows.
+sum of all menu item entries (less any included tax)
–all voids of menu item entries
–all discount entries
+any voids of discount entries
–all returns of menu item entries
+any voids of returns of menu item entries
You can change the label that prints on the report for
this field in Tax Rates | General | Net Sales Name.
Service
Charge The sum of all service charge entries as calculated by
the sum of all service charge keys plus the calculated
value of any autogratuity. The Service Charge is
calculated as follows.
+sum of all Service Charge key entries
–all Voids of service charge entries
+computed autogratuity

3URILOHV
'HWDLOHG6DOHVDQG7LS3URILOH
Tax
Collected The net tax collected based on taxable menu item
sales adjusted for taxable (or non-taxable) discounts,
taxable service charges, voids and returns. The figure
includes any U.S. inclusive or add-on taxes.
Tax Collected is calculated as follows:
+sum of tax from taxable menu item entries
–tax from voids of menu item entries
–tax from returns of menu item entries
+tax from voids of returns of menu item entries
–tax from voids of taxable service charge entries
–tax from non-taxable discount entries
+tax from voids of taxable discount entries
You can change the label that prints on the report for
this field in Tax Rates | General | Tax Collected Name.
Total
Revenue The sum of Net Sales, Service Charge, and Tax
Collected.
The Total Revenue is calculated as follows:
+Net Sales Total
+Service Charge
+Tax Collected
Item
Discount The net value of discounts recorded through any
discount keys programmed as Item Discount keys.
This figure is calculated as follows:
+sum of all item discount entries
–all voids of item discount entries
Subtotal
Discount The net value of all subtotal discounts. A subtotal
discount is any discount recorded through a discount
key that is not programmed as an item discount. This
figure is calculated as follows:
+sum of all subtotal discount entries
–all voids of subtotal discount entries
Total
Discounts The sum of Item Discount and Subtotal Discount
amounts.
Total discount is calculated as follows:
+Item Discount
+Subtotal Discount
Column Description

5HSRUWV
3URILOHV
'HWDLOHG6DOHVDQG7LS3URILOH
Returns The Returns field includes two figures. The first is the
number of items returned. The second is the value of
the returned items.
The number of returned items is calculated as follows:
+number of return entries
–voids of return entries
The value of returned items is calculated as follows:
+value of return entries
–value of voids of return entries
Voids The Voids field includes two figures. The first is the
number of void items. The second is the value of the
void items.
The number of void items is calculated as follows:
+number of voids of menu item entries
+number of voids of service charge entries
–number of voids of void entries
The value of void items is calculated as follows:
+value of void menu item entries
+value of voids of service charge entries
–value of voids of void entries
Column Description

3URILOHV
'HWDLOHG6DOHVDQG7LS3URILOH
Credit Total A total created when a round results in a negative
balance.
If the negative balance was created by voiding a menu
item, the tax associated with the item is posted to
Credit Total.
If the negative balance was created by a negative-
value menu item, the entire value of the menu item
and any associated taxes is posted to Credit Total.
In either case, the amount posted to Credit Total
cannot exceed the negative balance of the round.
For example, a server voids two lobster dinners priced
at $20 with $2 total tax for a void total of $42. In the
same round, the server orders several more menu
items with a total value (including tax) of $41. The
transaction value of the round is -$1.
Since the round resulted in a negative balance, and
the negative balance was created by voiding menu
items, the tax associated with those menu items ($2)
will post to Credit Total. However, the negative
balance of the round is only $1; the amount posted to
Credit Total cannot exceed this amount. In this
example, -$1 is posted to Credit Total.
This field is used in conjunction with Change In Grand
Ttl and Grand Total to verify system accounting
security. Credit Total is not used to balance revenue.
Change in
Grand Ttl The total value of all sales activity in the system for the
period of the report. Change in Grand Ttl is
represented as an absolute value; it is always a
positive number.
Change in Grand Ttl is calculated as follows:
+Total Revenue
+Total Discount
+Return
+Voids
+Credit Total
This field is used in conjunction with Credit Total and
Grand Total to verify system accounting security.
Change in Grand Total is not used to balance
revenue.
Column Description

5HSRUWV
3URILOHV
'HWDLOHG6DOHVDQG7LS3URILOH
Rounding
Total The difference between the rounded totals printed on
guest checks as the amount due and the actual totals
(without rounding) posted to total revenue.
Rounding Total is used for total due rounding (Finnish
rounding).
This field will only contain a value if rounding is
enabled. To enable Rounding Totals, select RVC
Posting | Options | Enable total due rounding.
Grand Total The total value of all sales activity. Discounts, returns,
voids, and credits are included as positive numbers.
This number is never reset; it always accumulates.
This field is used in conjunction with Change In Grand
Ttl and Credit Total to verify system accounting
security. Grand Total is not used to balance revenue.
Grand Total is calculated as follows:
+previous Grand Total
+Change in Grand Ttl
Training
Total The sum of all entries posted in the training mode.
Training sales activity does not add to any other
values on the report.
This total is similar to Grand Total, but for training
totals. This amount is always positive, always
accumulates, and is never reset.
Mgr Voids The count and value of the voids that required
manager authorization.
Error
Corrects The count and value amount of items that were voided
in the current round. This is considered an error
correction, rather than a void.
Cancel The count and value amount of entries that were
cancelled using the [Transaction Cancel] key.
No Sale The number of times a transaction employee used the
[No Sale] key to open the cash drawer outside of a
transaction. If the [No Sale] key was not used during
the reporting period, the count will be zero.
Carried Over The amount carried over from the previous shift or
business day.
Column Description
3URILOHV
'HWDLOHG6DOHVDQG7LS3URILOH
Checks
Begun The count and value amount of checks, including fast
transactions, begun during the report period. These
totals include checks created using split check and
closed check edit procedures.
Checks Paid The count and value of all checks (including fast
transactions) closed by tendering during the report
period. Only closed checks will be included in the
count. The value will include any amount that has
been tendered on a check, even if it was a partial
tender.
Transferred
IN The count and value of guest checks that were
transferred to an employee (and corresponding
revenue center) using the [Transfer Check] key. The
value of the check is determined at the time of the
transfer.
Transferred
OUT The count and value of guest checks that were
transferred away from an employee (or out of a
revenue center) to any other employee using the
[Transfer Check] key. The value of the check is
determined at the time of the transfer.
Outstanding The number and current value of open checks. This
amount is calculated as follows:
+Checks Begun
–Checks Paid
+Transferred IN
–Transferred OUT
Gross
Receipts The total receipts recorded by Tender/Media keys
programmed to add to this total. Tax Collected can
also be included. This figure does not include charged
tips.
Receipts posted to a tendering key will add to Gross
Receipts if Tender/Media | Tender | Post to gross
receipts is selected.
Tax collected is not included in Gross Receipts if RVC
Taxes | General | Do not post tax to tip reports is
selected.
Charged
Receipts The total receipts for this employee recorded by
Tender/Media keys defined as charge keys (such as
credit cards and/or room charges) that are
programmed to require a charged tip.
Only tenders that include a non-zero charged tip (less
the tip) are included in this total.
Column Description
5HSRUWV
3URILOHV
'HWDLOHG6DOHVDQG7LS3URILOH
Service
Charge The total of all charged tips that will be paid to an
employee through payroll. Because they are paid
through the standard payroll process, these tips are
subject to payroll tax withholding. These tips do not
need to be declared separately, as do direct cash tips.
Service charges can be programmed to add to either
the Service Charge field, or the Gross Receipts field.
When RVC Discount/Service | Covers post as service
charge is selected, the service charge will post to the
service charge field. When this option is cleared, the
totals will post to Gross Receipts.
For more information on programming service
charges, see “Service Charge” on page 6-7.
Charged Tips The value of tips charged to credit cards or room
charge keys when the tender key is programmed to
automatically calculate any over-tendered amount as
a charged tip. A charged tip can also be entered
manually through a [Charged Tips] key.
Tips
Declared The value of cash tips declared by the employee using
the [Tips Declared] key.
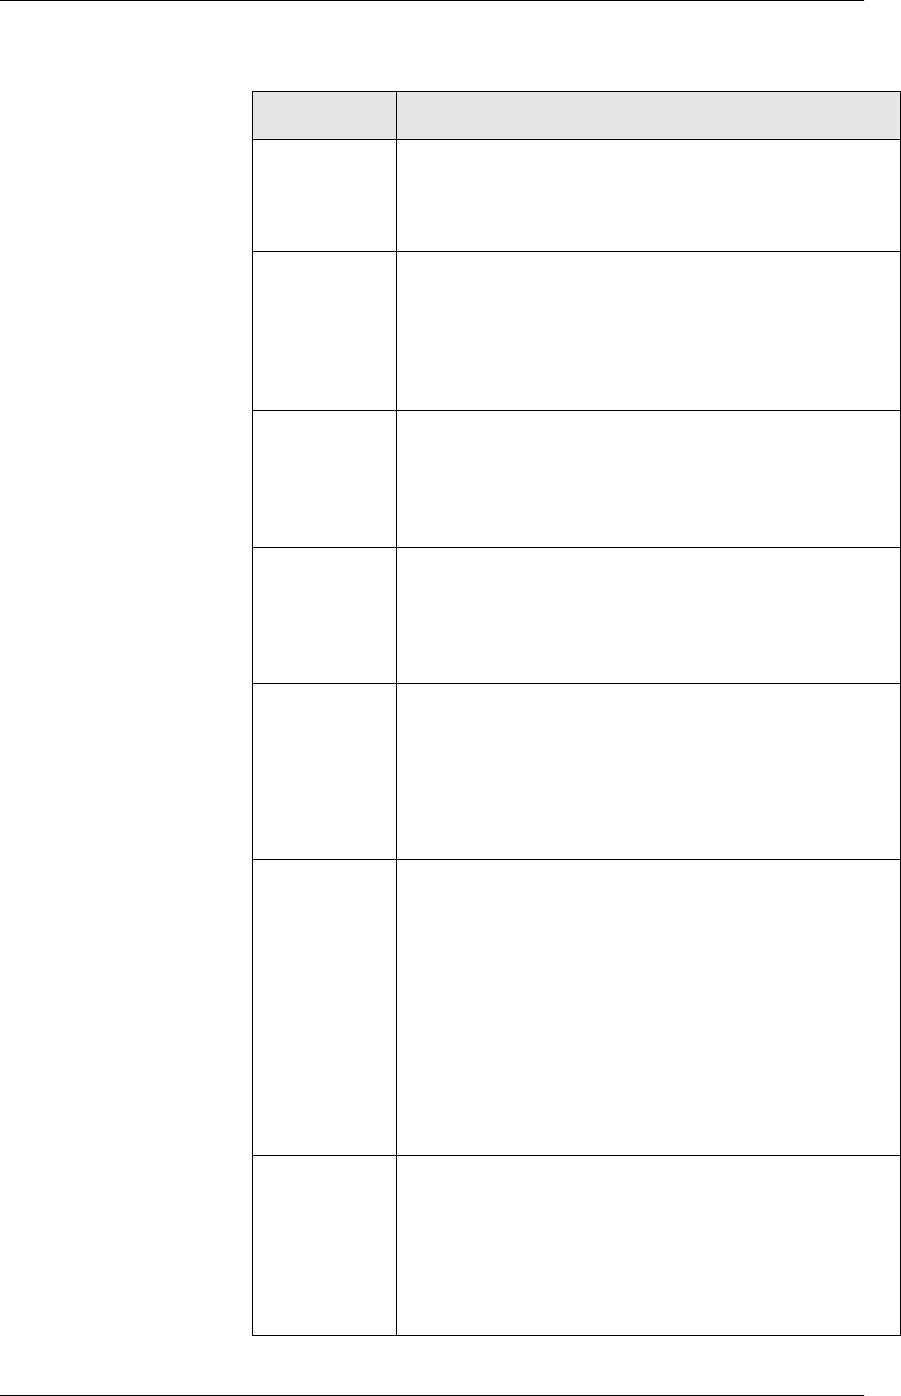
Total Tips Total Tips includes a tip percentage and a value
amount.
The tip percentage is the value of total tips expressed
as a percentage of gross receipts. It is calculated
using the following formula:
The value amount is the total amount of service
charge tips, charged tips and declared tips. It is
calculated using the following formula:
Tips Paid The sum of all charged tips and service charges that
are programmed to add automatically to Tips Paid
and/or recorded manually through a [Tips Paid] key.
This figure should equal the sum of charged tips and
service charge tips; otherwise, your employees have
not been paid all their tips.
Column Description
Tip % = Total Tips
Gross Receipts x 100%
Total =
Service
Charge
Tips +Charged
Tips +Declared
Tips
Tips
3URILOHV
'HWDLOHG6DOHVDQG7LS3URILOH
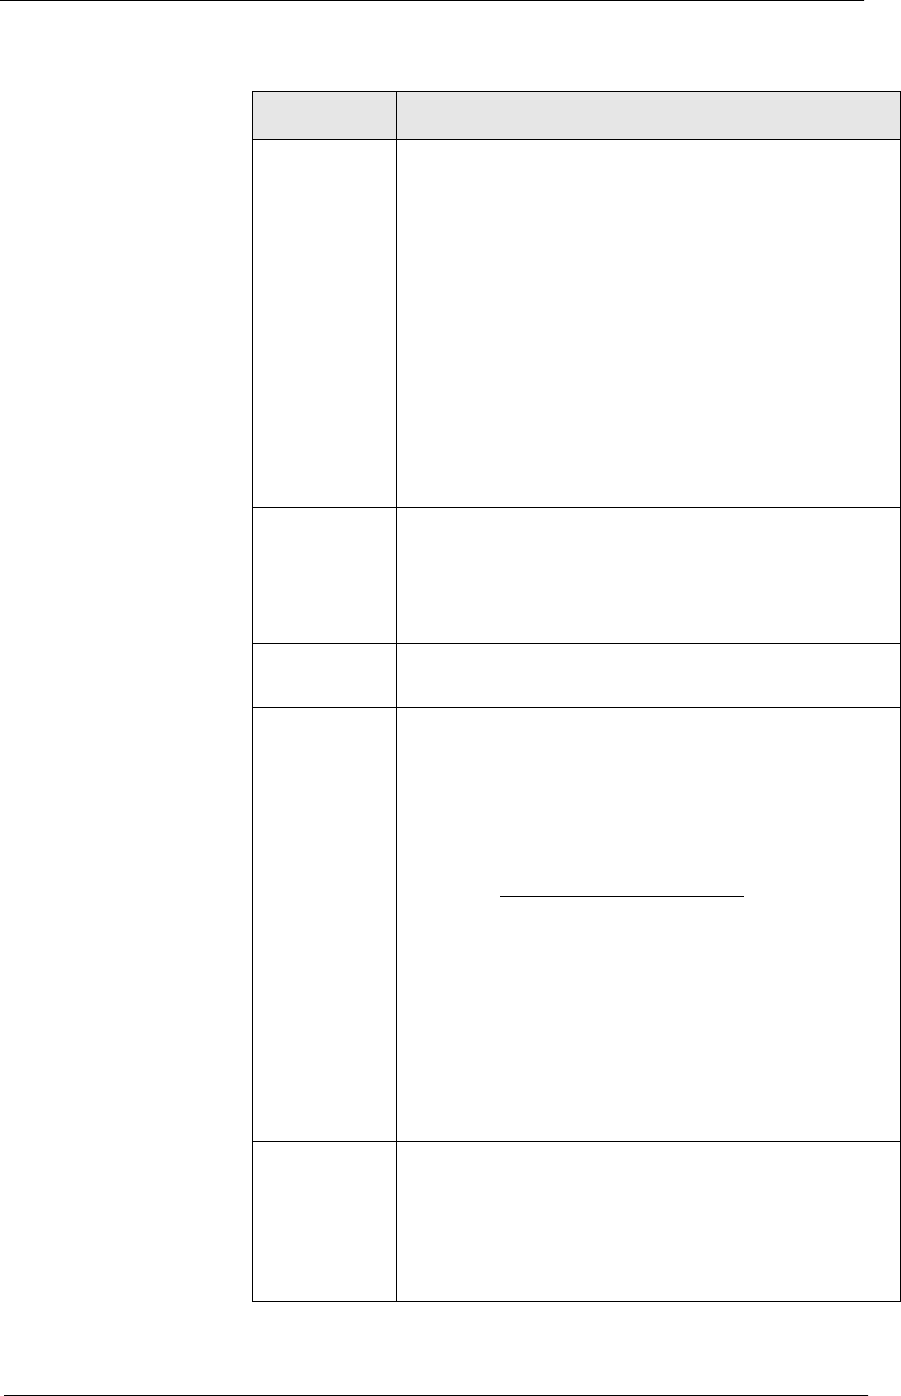
Tips Due Tips Due is calculated using the following formula:
Column Description
Tips =Total
Tips -Tips
Paid
Due
5HSRUWV
3URILOHV
(PSOR\HH/DERU3URILOH
Employee Labor Profile
The Employee Labor profile provides information on the number
of hours an employee worked and the associated wages.
Column Description
Hours Worked
Regular The total number of non-overtime hours worked in the
period covered by the report. The number of hours is
reported to the nearest hundredth of an hour and is
represented as a decimal figure.
Overtime The total number of overtime hours worked in the
period covered by the report. The number of hours is
reported to the nearest hundredth of an hour and is
represented as a decimal figure.
Total The total number of hours worked. This figure is
calculated as follows:
% of Ttl The number of hours worked by this employee
expressed as a percentage of the total number of
hours worked by all employees in this job.
= Regular [Hours] + Overtime [Hours]
Total
=
% of Ttl Total [Hours]
Total Hours
for Job
X100%
3URILOHV
(PSOR\HH/DERU3URILOH
Employee Wages
Regular The gross wages earned for non-overtime hours. The
default regular wage rate is programmed by job on
Jobs | Job Definitions.
Overtime The gross wages earned for overtime hours. The
default overtime wage rate is programmed by job on
Jobs | Job Definitions.
Total The total gross salary earned by this employee. This
figure is calculated as follows:
% of Ttl The wages earned by this employee expressed as a
percentage of the total wages earned by all employees
in this job.
Column Description
= Regular [Wages] + Overtime [Wages]
Total
=
% of Ttl Total [Wages]
Total Wages
for Job
X100%
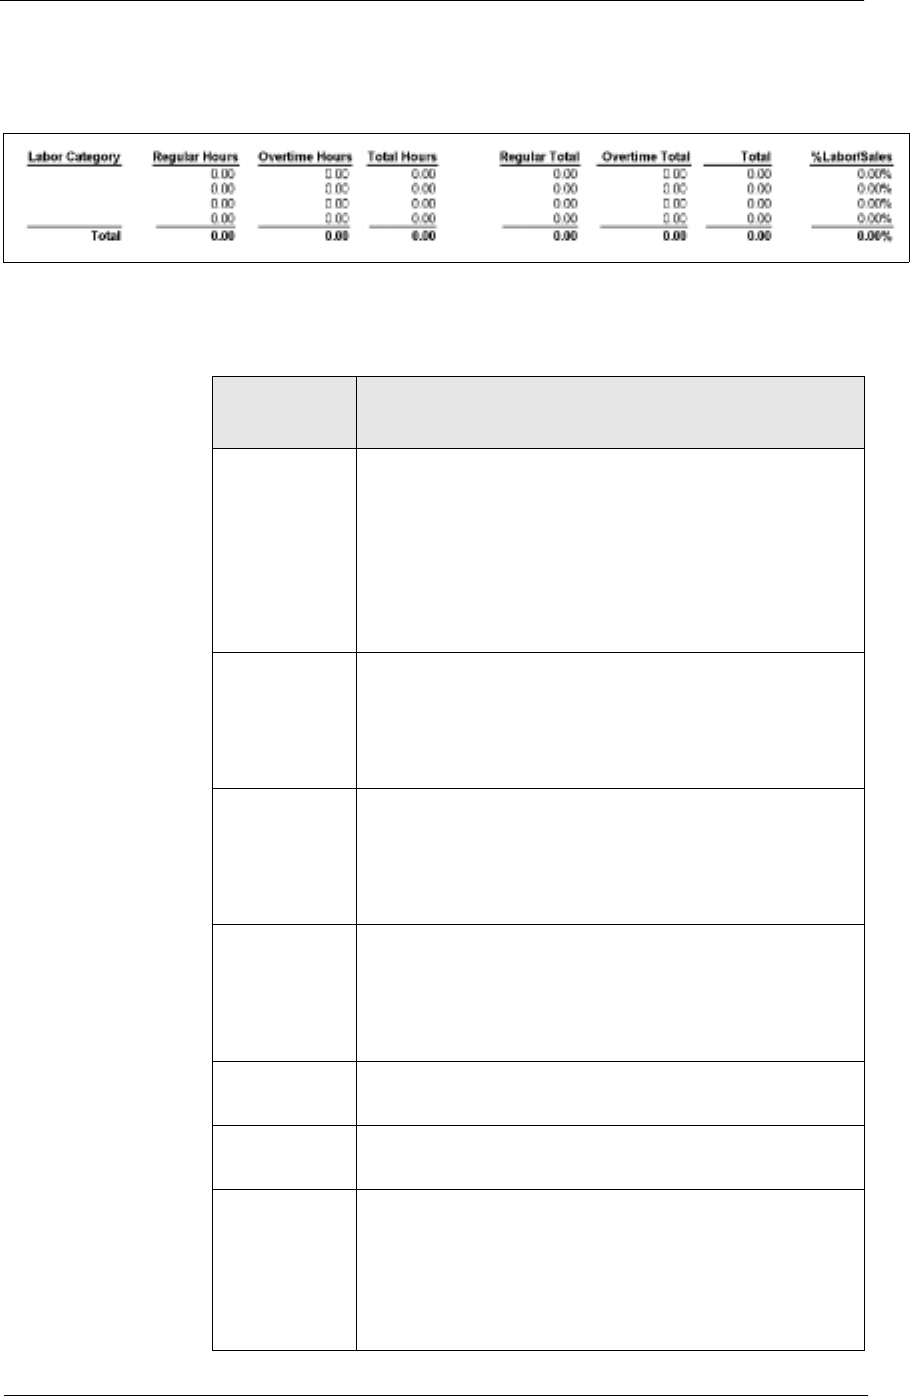
5HSRUWV
3URILOHV
/DERU&DWHJRU\3URILOH
Labor Category Profile
The Labor Category profile provides information on the number
of hours worked and the associated wages by labor category.
Column Description
Labor
Category The name of the labor category being reported. Labor
categories are used to report the number of hours
worked and the associated employee wages for a
specified group of jobs. You can create up to four labor
categories in Time and Attendance | General.
Labor categories are then associated with job
definitions in Jobs | Job Definitions.
Regular
Hours The total number of non-overtime hours for this labor
category worked in the period covered by the report.
The number of hours is reported to the nearest
hundredth of an hour and is represented as a decimal
figure.
Overtime
Hours The total number of overtime hours for this labor
category worked in the period covered by the report.
The number of hours is reported to the nearest
hundredth of an hour and is represented as a decimal
figure.
Total Hours The total number of hours worked in this labor
category. This figure is calculated as follows:
Regular Total The total wages earned for non-overtime hours in this
labor category.
Overtime
Total The total wages earned for overtime hours in this labor
category.
Total Total wages for this labor category, including regular
and overtime hours. This figure is calculated as
follows:
=Regular +Overtime
Total
Hours Hours Hours
=Regular +Overtime
Total [Wages] Total [Wages] Total
3URILOHV
/DERU&DWHJRU\3URILOH
% Labor/
Sales The cost of labor for this labor category expressed as a
percentage of sales.
Column Description
=
%Labor/ Total [Wages]
Sales
Sales X100%
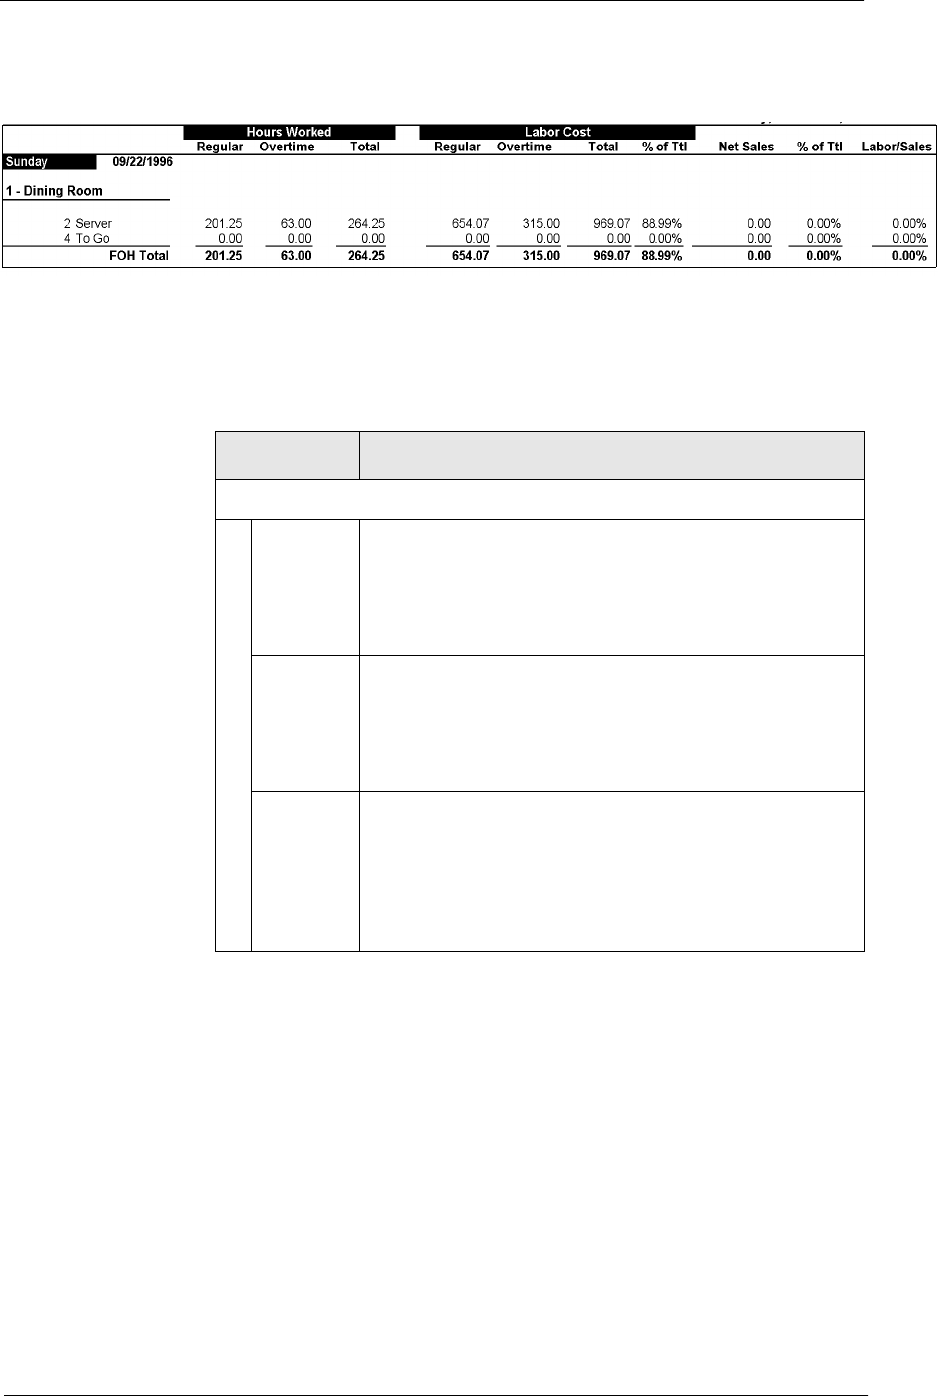
5HSRUWV
3URILOHV
/DERU6DOHV3URILOH
Labor/Sales Profile
Information in the Labor/Sales profile is listed by revenue center.
Within each revenue center, the figures are grouped by job
category. Each job is listed separately, and totals are provided for
each job category, as well as for the revenue center.
Column Description
Hours Worked
Regular The total number of non-overtime hours worked by
employees assigned to this job for the period of the
report. The number of hours is reported to the nearest
hundredth of an hour and is represented as a decimal
figure.
Overtime The total number of overtime hours worked by
employees assigned to this job for the period of the
report. The number of hours is reported to the nearest
hundredth of an hour and is represented as a decimal
figure.
Total The total number of hours worked by employees
assigned to this job. This figure is calculated as
follows:
=Regular [Hours] +Overtime [Hours]
Total
3URILOHV
/DERU6DOHV3URILOH
Employee Wages
Regular The cost of wages for regular hours (not overtime) for
employees assigned to this job for the period of the
report.
Overtime The cost of wages for overtime hours for employees
assigned to this job for the period of the report.
Total The total cost of wages for employees assigned to this
job for the period of the report. This figure is calculated
as follows:
% of Ttl The cost of total wages for this job expressed as a
percentage of wages for this job category.
Totals are also provided for this field. The following
totals information may be included:
Job Category Total The cost of total wages for this
job category expressed as a
percentages of revenue center
total wages.
Revenue Center
Total The cost of total wages for this
revenue center expressed as a
percentage of report period
(i.e. daily, weekly, monthly,
etc.) total wages.
Daily Total The cost of total wages for this
day expressed as a
percentage of the weekly total
wages.
Weekly Total The cost of total wages for this
week expressed as a
percentage of report period
total wages, for monthly and
yearly reports.
Grand Total This field is blank. Grand total
wages are 100% of the total.
Column Description
=Regular [Wages] +Overtime [Wages]
Total
=
% of Ttl Total [Wages]
Total Wages
for Job Category
X100%
5HSRUWV
3URILOHV
/DERU6DOHV3URILOH
Net Sales The net total of all sales activity for this job. All
discounts, voids, returns, and any inclusive taxes have
been subtracted.
You can change the label that prints on the report for
this field in Tax Rates | General | Net Sales Name.
% of Ttl The Net Sales for this job expressed as a percentage
of Net Sales for the job category. This figure is
calculated as follows:
Labor/Sales The cost of labor for this job expressed as a
percentage of Daily Total Net Sales. This figure is
calculated as follows:
Column Description
=
% of Ttl Net Sales
Total Net Sales
for Job Category
X100%
=
Labor/
Employee
Daily Total
Net Sales
X100%
Sales
Wages
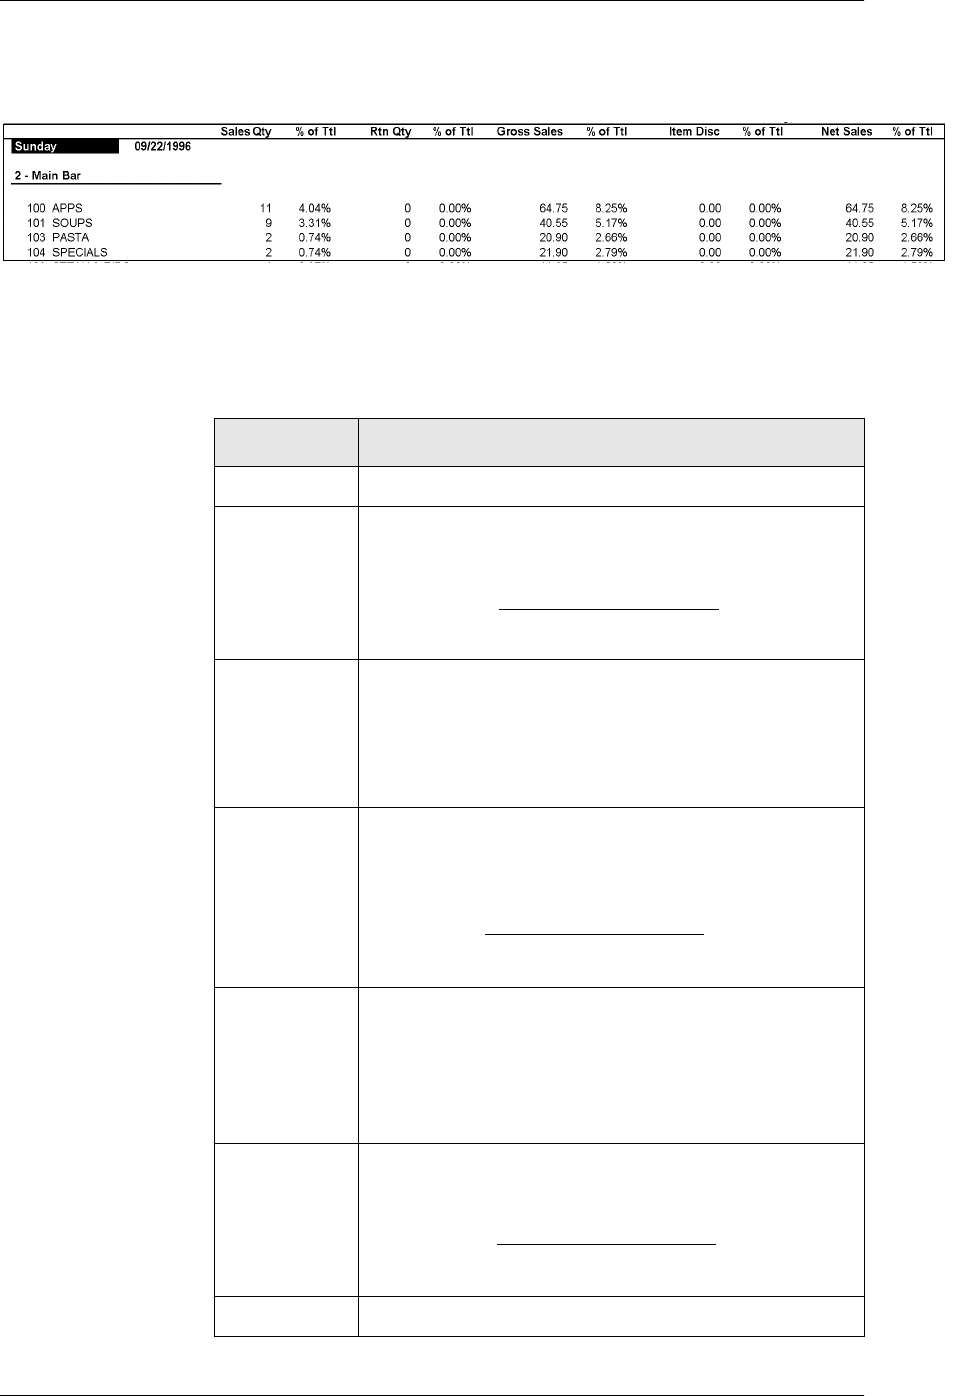
3URILOHV
6DOHV3URILOH
Sales Profile
The Sales profile provides sales quantity and gross and net value
amounts, as well as percentage of total amounts. Return quantity
and percentage amounts, and discount values and percentages are
also included.
Column Description
Sales Qty The number of items sold.
% of Ttl The number of items sold represented as a percentage
of the total. This figure is calculated as follows:
Rtn Qty The number of items returned.
The returned quantity is calculated as follows:
+number of Return items
–Voids of Return items
% of Ttl The number of items returned represented as a
percentage of total returned items in this revenue
center. This figure is calculated as follows:
Gross Sales The value amount of sales of this group. This figure is
the sum of all sales in this category.
VAT is included in the Gross Sales figure. Inclusive
taxes, add-on taxes, Florida surcharges, item and
subtotal discounts are not included.
% of Ttl Gross Sales represented as a percentage of the total.
This figure is calculated as follows:
Item Disc The net sales value of this group that were discounted.
% of Ttl = Sales Qty
Total Sales Quantity
X100%
% of Ttl = X 100%
Rtn Qty
Total Return Quantity
% of Ttl = X 100%
Gross Sales
Total Gross Sales
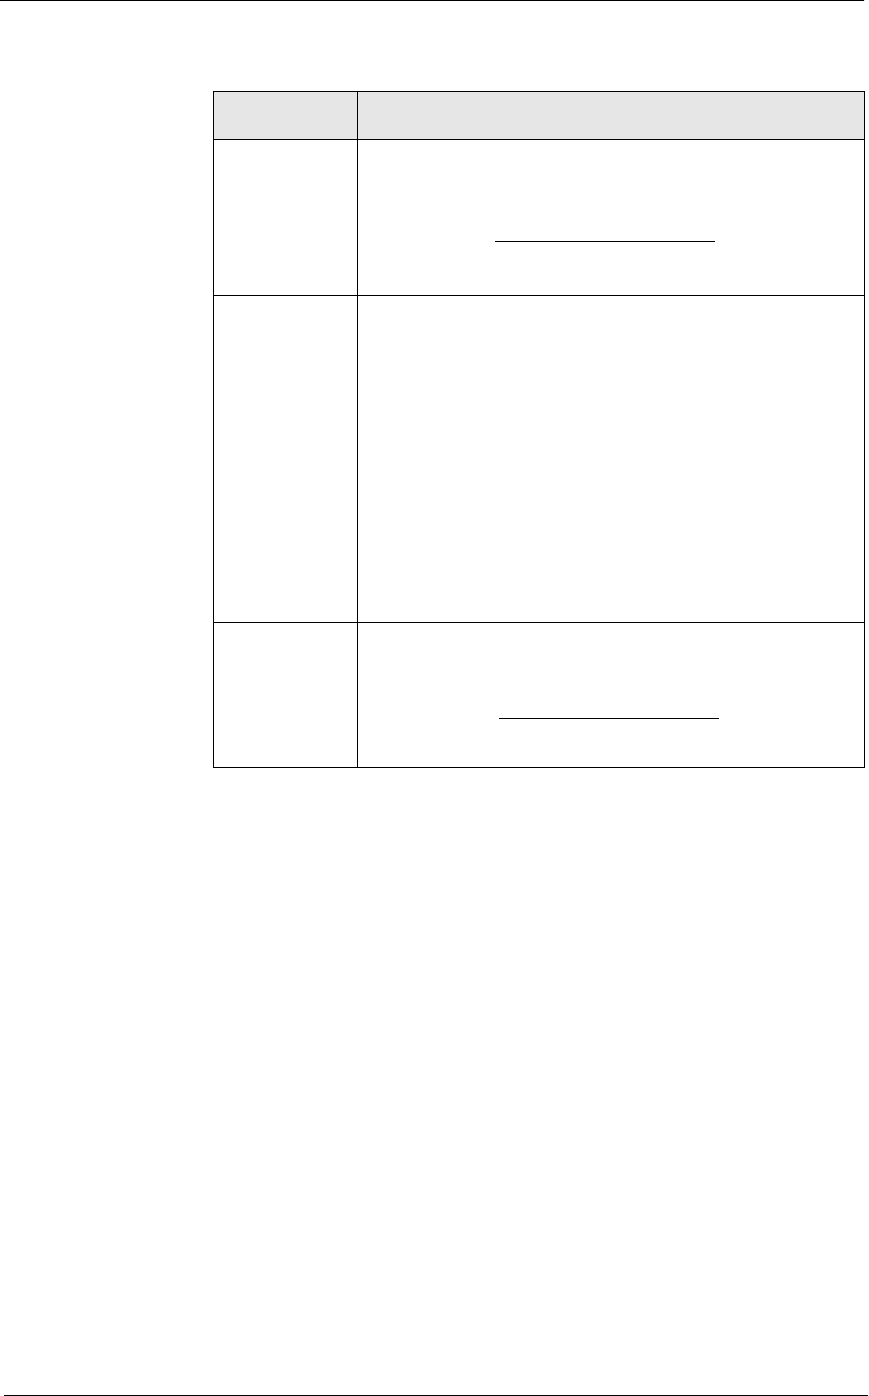
5HSRUWV
3URILOHV
6DOHV3URILOH
% of Ttl Item Disc represented as a percentage of the total.
This figure is calculated as follows:
Net Sales The Net Sales value of items in this group. This figure
is calculated as follows:
VAT is included in the Net Sales figure. Inclusive
taxes, add-on taxes, Florida surcharges, and subtotal
discounts are not included.
You can change the label that prints on the report for
this field in Tax Rates | General | Net Sales Name.
% of Ttl Net Sales represented as a percentage of the total.
This figure is calculated as follows:
Column Description
% of Ttl = X100%
Item Disc
Total Item Discounts
Net =Gross
Sales _Item
DiscSales
% of Ttl = X100%
Net Sales
Total Net Sales
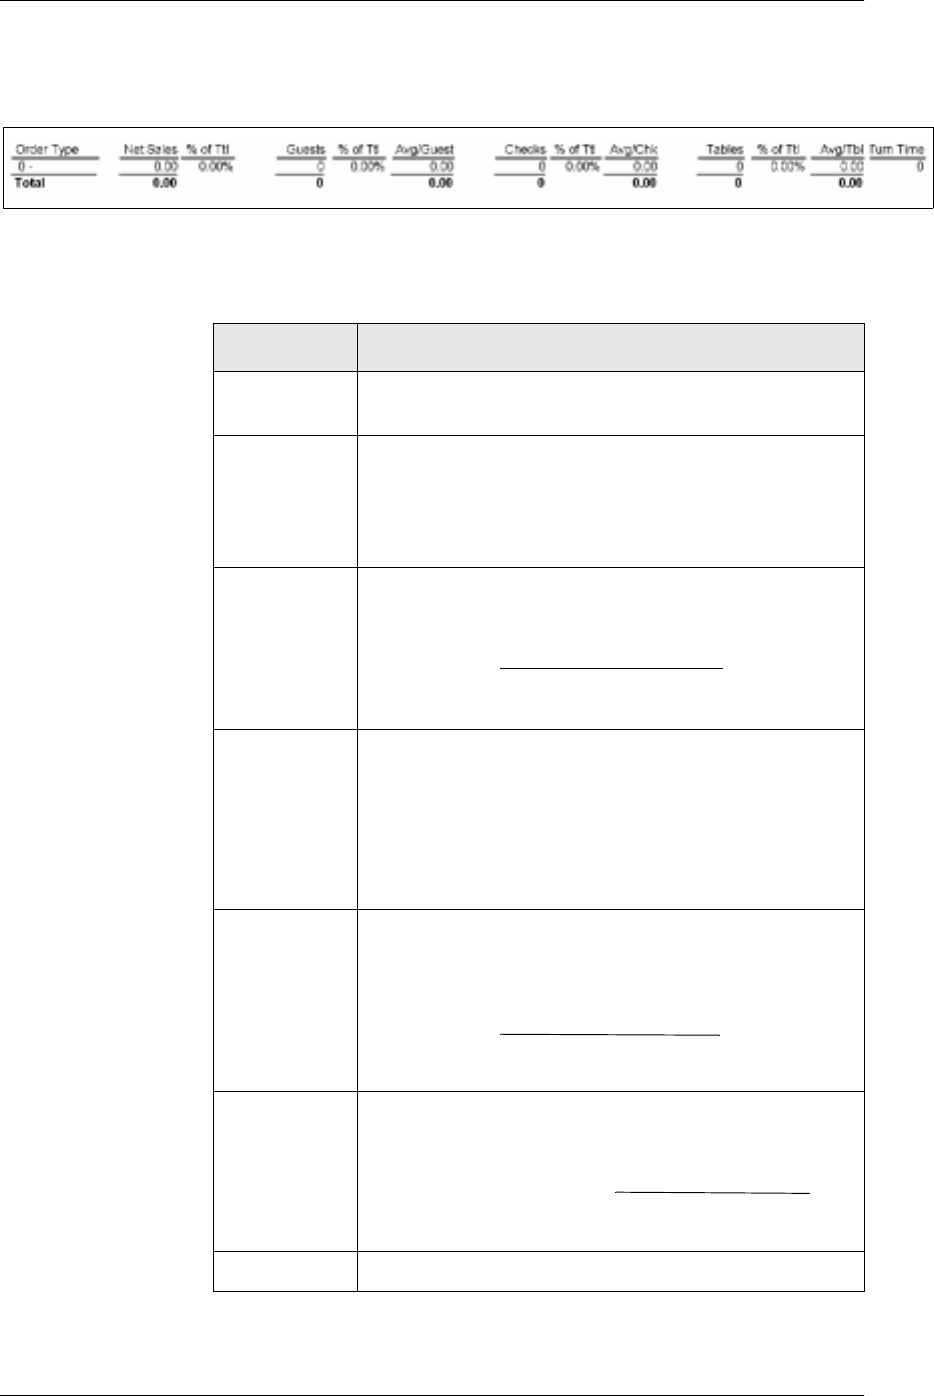
3URILOHV
6DOHVDQG*XHVW3URILOH
Sales and Guest Profile
This profile includes information about sales, guests, checks, and
tables for different order types.
Column Description
Order Type The name of the order type. Examples of typical order
types are eat in and take out.
Net Sales The gross sales value minus all voids, returns, and
discounts.
You can change the label that prints on the report for
this field in Tax Rates | General | Net Sales Name.
% of Ttl Net Sales represented as a percentage of total net
sales. This figure is calculated as follows:
Guests The number of guests.
Depending on how the System is programmed, this
total can be the sum of guest counts entered by
employees when beginning checks, the number of
seats on a check, or the number of specified menu
items or service charges.
% of Total The number of guests represented as a percentage of
the total number of guests for this revenue center. This
figure is calculated as follows:
Avg/Guest The average value amount per guest. This figure is
calculated as follows:
Checks The number of guest checks.
% of Ttl = Net Sales
Total Net Sales X100%
% of Ttl = Guests
Total Guests X100%
Avg/Guest = Net Sales
Guests
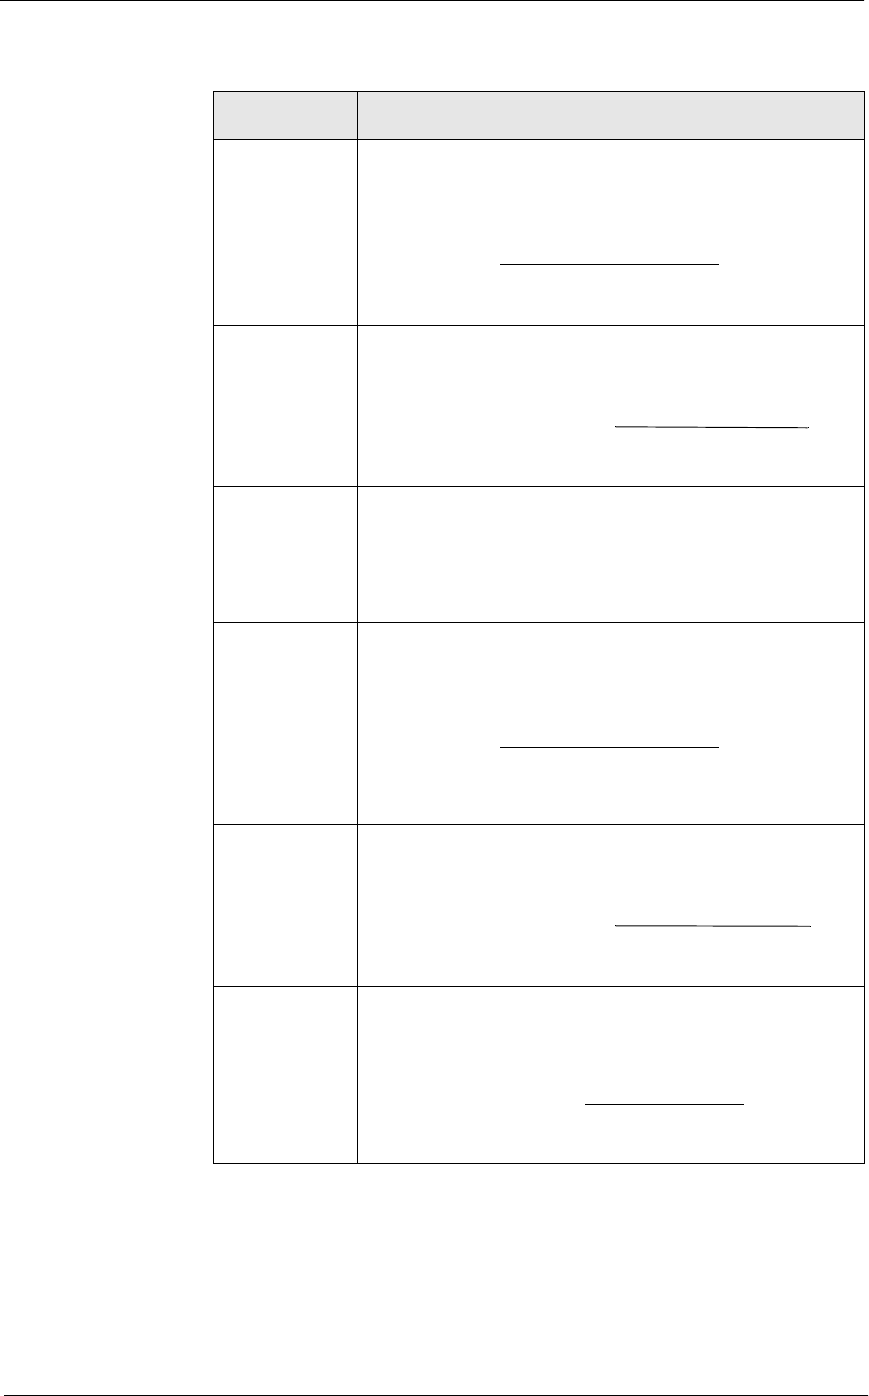
5HSRUWV
3URILOHV
6DOHVDQG*XHVW3URILOH
% of Ttl The number of guest checks represented as a
percentage of total guest checks in the revenue center.
This figure is calculated as follows:
Avg/Chk The average value amount per guest check. This
figure is calculated as follows:
Tables The number of table turns. A turn begins when a check
is opened by table number while no other checks are
open for this table. A turn ends with the tendering of a
check that leaves no other checks open at the table. A
turn is counted only if it is less than four hours.
% of Ttl The number of tables represented as a percentage of
the total number of tables in the revenue center. This
figure is calculated as follows:
Avg/Tbl The average value amount per table. This figure is
calculated as follows:
Turn Time The average turn time. This figure is calculated as
follows:
Column Description
% of Ttl = Checks
Total Checks X100%
Avg/Chk = Net Sales
Checks
% of Ttl = Tables
Total Tables
X100%
Avg/Tbl = Net Sales
Tables
(Avg) Turn Time =
Sum of All
Tables
Turn Times
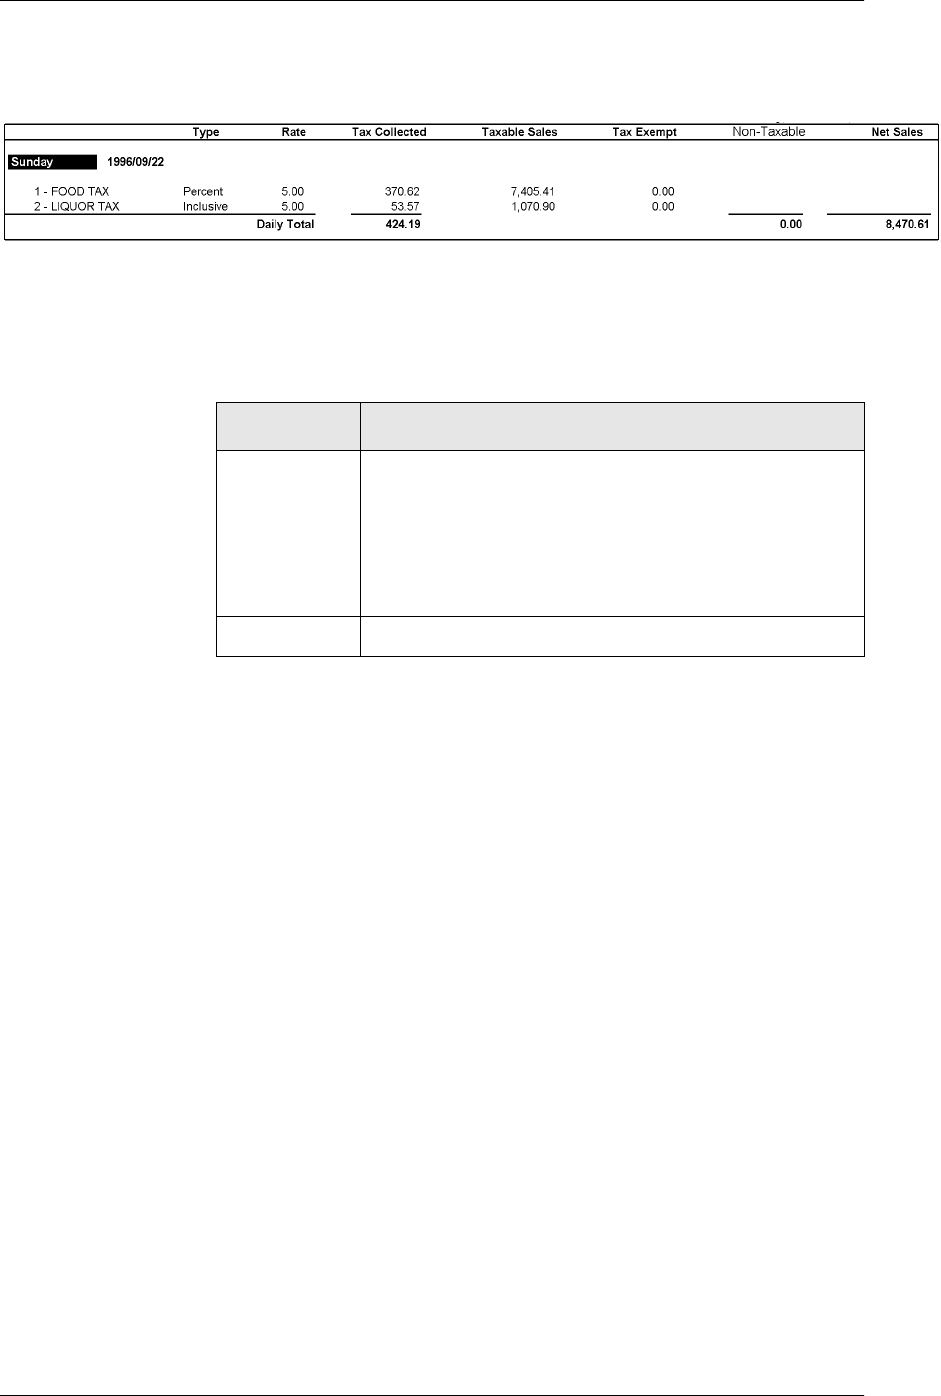
3URILOHV
7D[3URILOH
Tax Profile
The Tax profile is used for all the tax-related reports. It includes
the type, rate, and amount collected for each tax rate programmed
on the Tax Rates form. It also includes taxable, tax exempt, and
net sales information.
Column Description
Type The type of tax. Possible tax types include the
following:
oBreakpoint
oInclusive
oPercent
Rate The tax rate for this tax type.
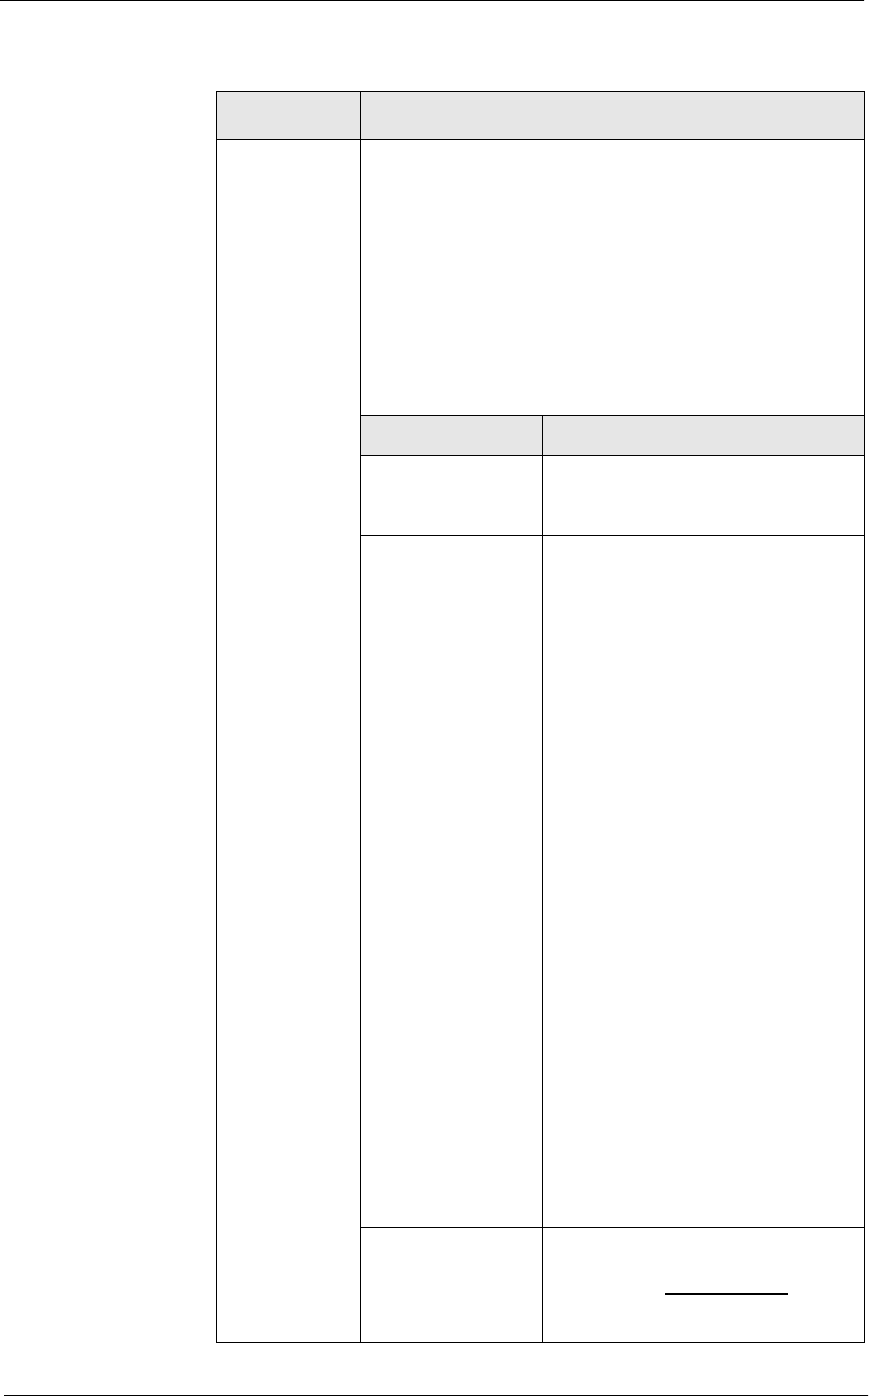
5HSRUWV
3URILOHV
7D[3URILOH
Tax
Collected The total value of collected sales tax for this tax rate.
This tax is calculated for each item at the time of sale
and is rounded to the smallest currency denomination.
(In U.S. dollars, this is the cent.) Tax Collected is the
sum of these rounded numbers. Because of the
rounded numbers, Tax Collected does not necessarily
equal Taxable Sales multiplied by Rate. However, the
amount of Tax Collected is the correct total of tax
calculated on menu items.
Tax is calculated on menu items as follows:
If the tax type is... The formula is...
Add-on,
percentage
Add-on,
breakpoint This tax is calculated in two
steps:
1. The item price is rounded down
to the nearest $10.00. This
rounded amount is multiplied by
the tax rate to determine Tax A.
2. The rounded amount from the
previous step is subtracted from
the item price to determine the
remainder. Tax on the remainder
is calculated as follows:
+tax at price break 1
+tax at price break 2
.
.
.
+tax at price break
n
where price break
n
+1 > item
price.
This tax amount is Tax B. Tax A
and B are then added to calculate
the total tax.
This method approximates a
straight add-on percentage tax.
Inclusive
Column Description
Item
Price XRate
Item
Price _
Item
Price
1 + Rate
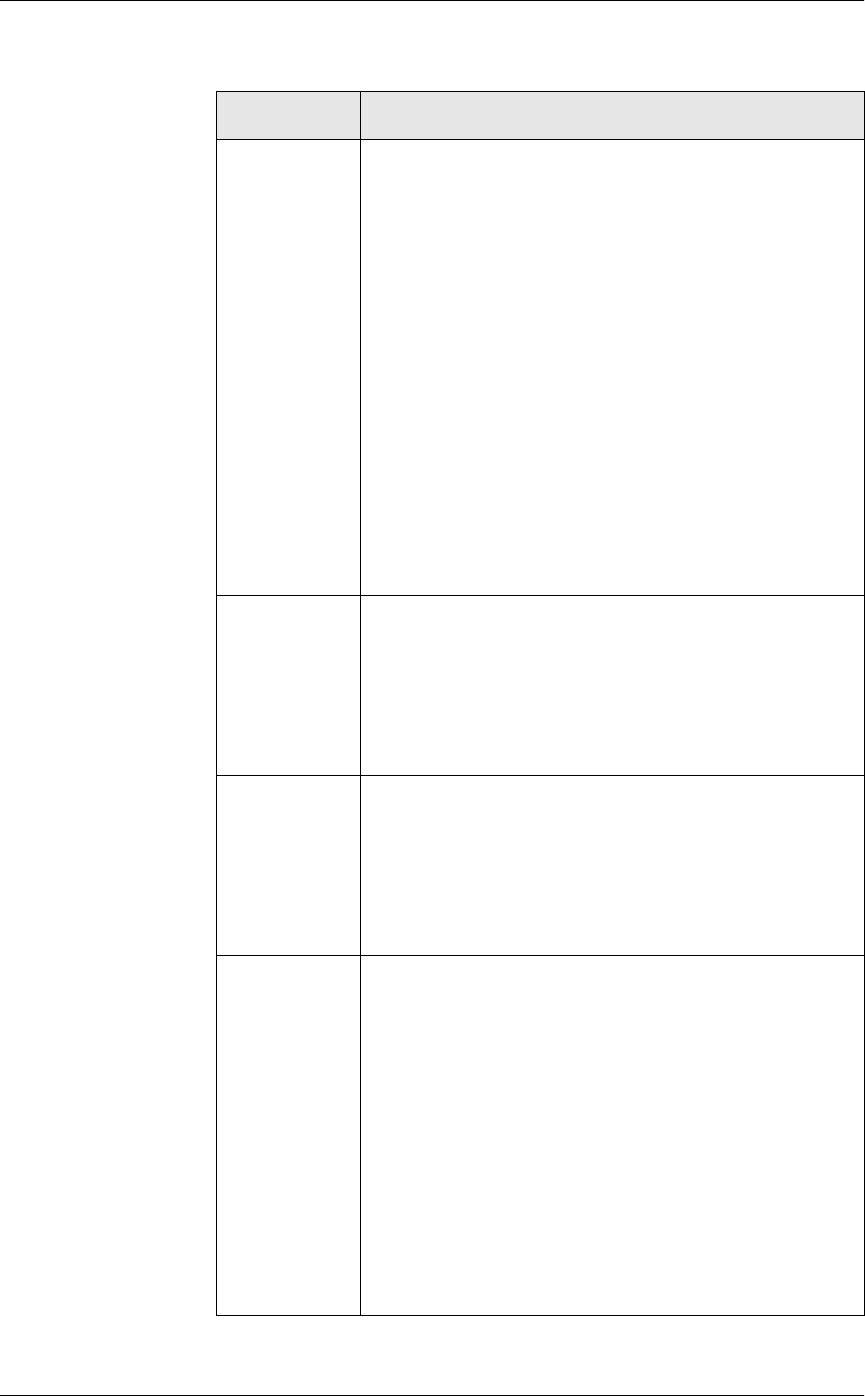
3URILOHV
7D[3URILOH
Taxable
Sales The value of sales that were taxed at this rate.
This figure is calculated using information from all
menu item sales linked to the active tax rate. The
formula is as follows:
+value of all menu items sold
–value of all menu items sold that were tax exempt
–voids of menu item sales
–returns of menu items
+voids of returns of menu items
+service charges
–voids of service charges
–non-taxable discounts
+voids of non-taxable discounts
You can change the label that prints on the report for
this field in Tax Rates | General | Taxable Sales
Name.
Tax Exempt The value amount of sales that are exempt from the
active sales tax. This figure is the sum of menu item
sales that are linked to the active tax rate and have an
exempt status.
You can change the label that prints on the report for
this field in Tax Rates | General | Tax Exempt Name.
Non Taxable
Sales The value amount of sales of non taxable items. A tax
class is assigned to a menu item class in Menu Item
Classes | Description | Tax Class.
You can change the label that prints on the report for
this field in Restaurant | Descriptions | Non-taxable
Name.
Net Sales The net sales of menu items with this tax type.
This figure is calculated using information from all
menu item sales linked to the active tax rate. The
formula is as follows:
+value of all menu items sold (less any included tax)
–all voids of menu item entries
–all discount entries
+any voids of discount entries
–all returns of menu item entries
+any voids of returns of menu item entries
You can change the label that prints on the report for
this field in Tax Rates | General | Net Sales Name.
Column Description
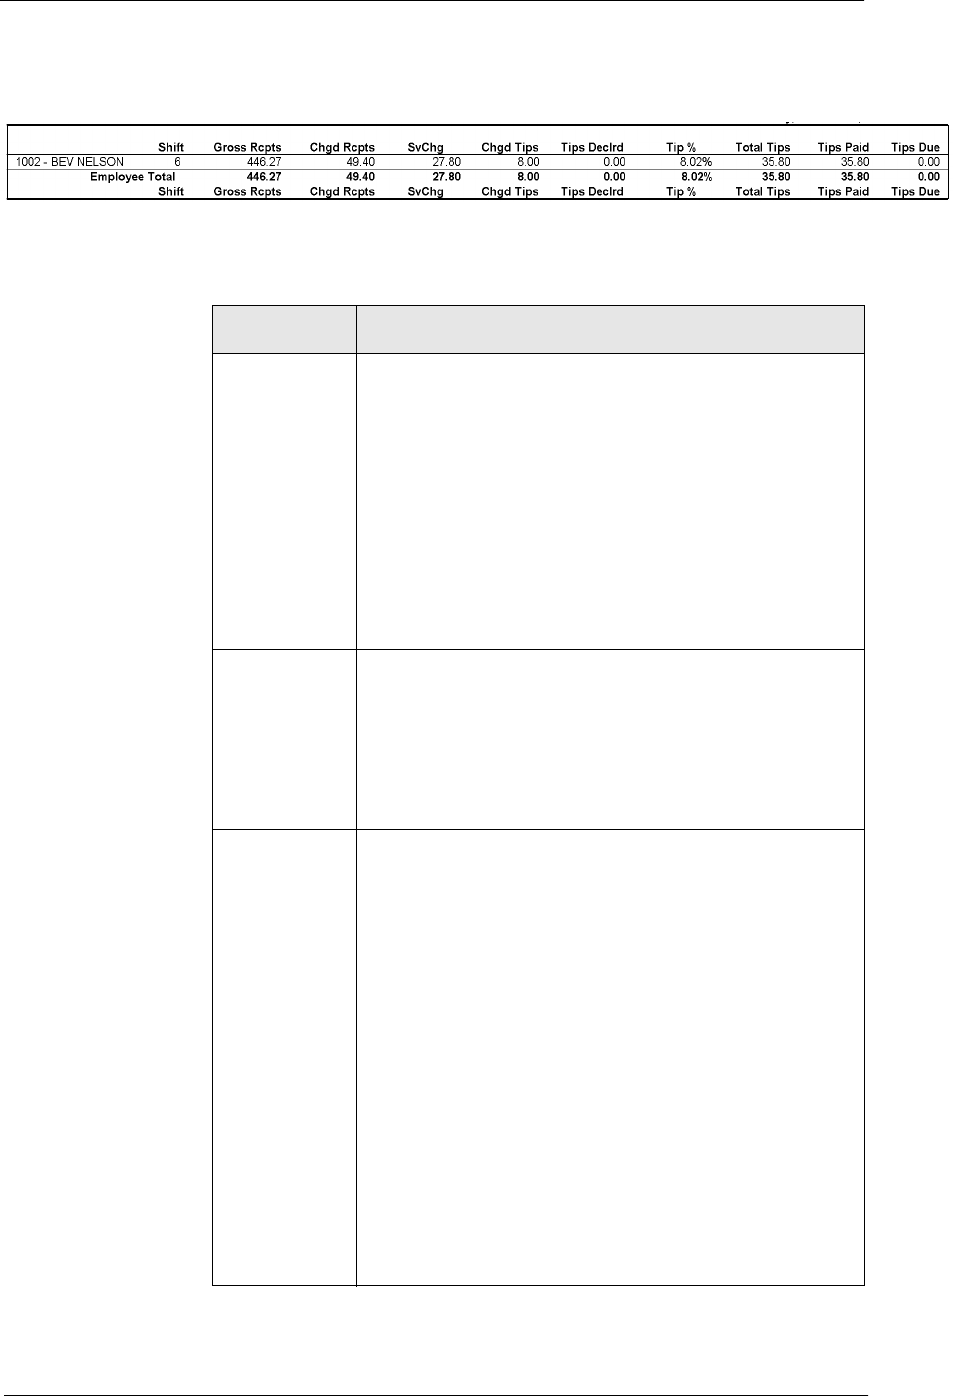
5HSRUWV
3URILOHV
7LS3URILOH
Tip Profile
The Tip profile includes information on gross receipts and
charged receipts, as well as tip details.
Column Description
Gross Rcpts The total receipts recorded by Tender/Media keys
programmed to add to this total. Tax Collected can
also be included. This figure does not include charged
tips.
Receipts posted to a tendering key will add to Gross
Receipts if Tender/Media | Tender | Post to gross
receipts is selected.
Tax collected is not included in Gross Rcpts if RVC
Taxes | General | Do not post tax to tip reports is
selected.
Chgd Rcpts The total receipts for this employee recorded by
Tender/Media keys defined as charge keys (such as
credit cards and/or room charges) that are
programmed to require a charged tip.
Only tenders that include a non-zero charged tip (less
the tip) are included in this total.
SvChg The total of all service charges except for charged tips.
Depending on restaurant practice, these service
charges may include charged tips that will be paid to
an employee through payroll. If so, these tips are
subject to payroll tax withholding.
These tips do not need to be declared separately, as
do direct cash tips.
Service charges can be programmed to add to either
the Service Charge field, or the Gross Receipts field.
When Discount/Service | Discount/Service Charges |
Post to svc charges total is selected, the service
charge will post to the service charge field. When this
option is cleared, the totals will post to Gross Receipts.
For more information on programming service
charges, see “Service Charge” on page 6-7.
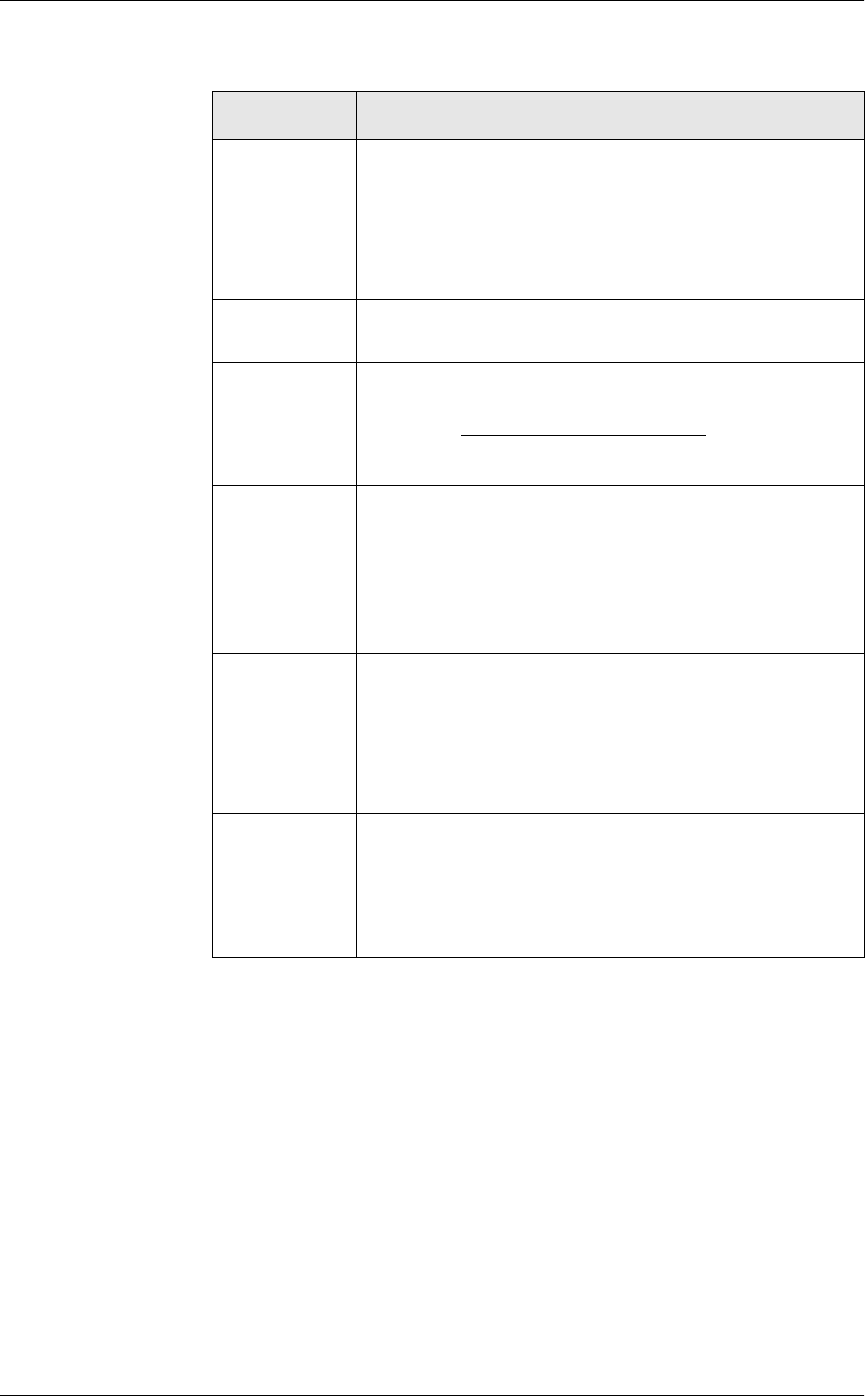
3URILOHV
7LS3URILOH
Chgd Tips The value of tips charged to credit cards or to room
charges through a PMS system when the tender key is
programmed to automatically calculate any over-
tendered amount as a charged tip. A charged tip can
also be entered manually through a [Charged Tips]
key.
Tips Declrd The value of cash tips declared by the employee using
the [Tips Declared] key.
Tip % The Tip % is calculated using the following formula:
Total Tips The total amount of service charge tips, charged tips
and declared tips:
Tips Paid The sum of all charged tips and service charges that
are programmed to add automatically to Tips Paid and/
or recorded manually through a [Tips Paid] key. This
figure should equal the sum of charged tips and
service charge tips; otherwise, the employees have not
been paid all their tips.
Tips Due Tips Due is calculated using the following formula:
Column Description
Tip % = Total Tips
Gross Receipts x 100%
Total =
Service
Charge
Tips +Charged
Tips +Declared
Tips
Tips
Tips =Total
Tips Tips
PaidDue
Declared
Tips __
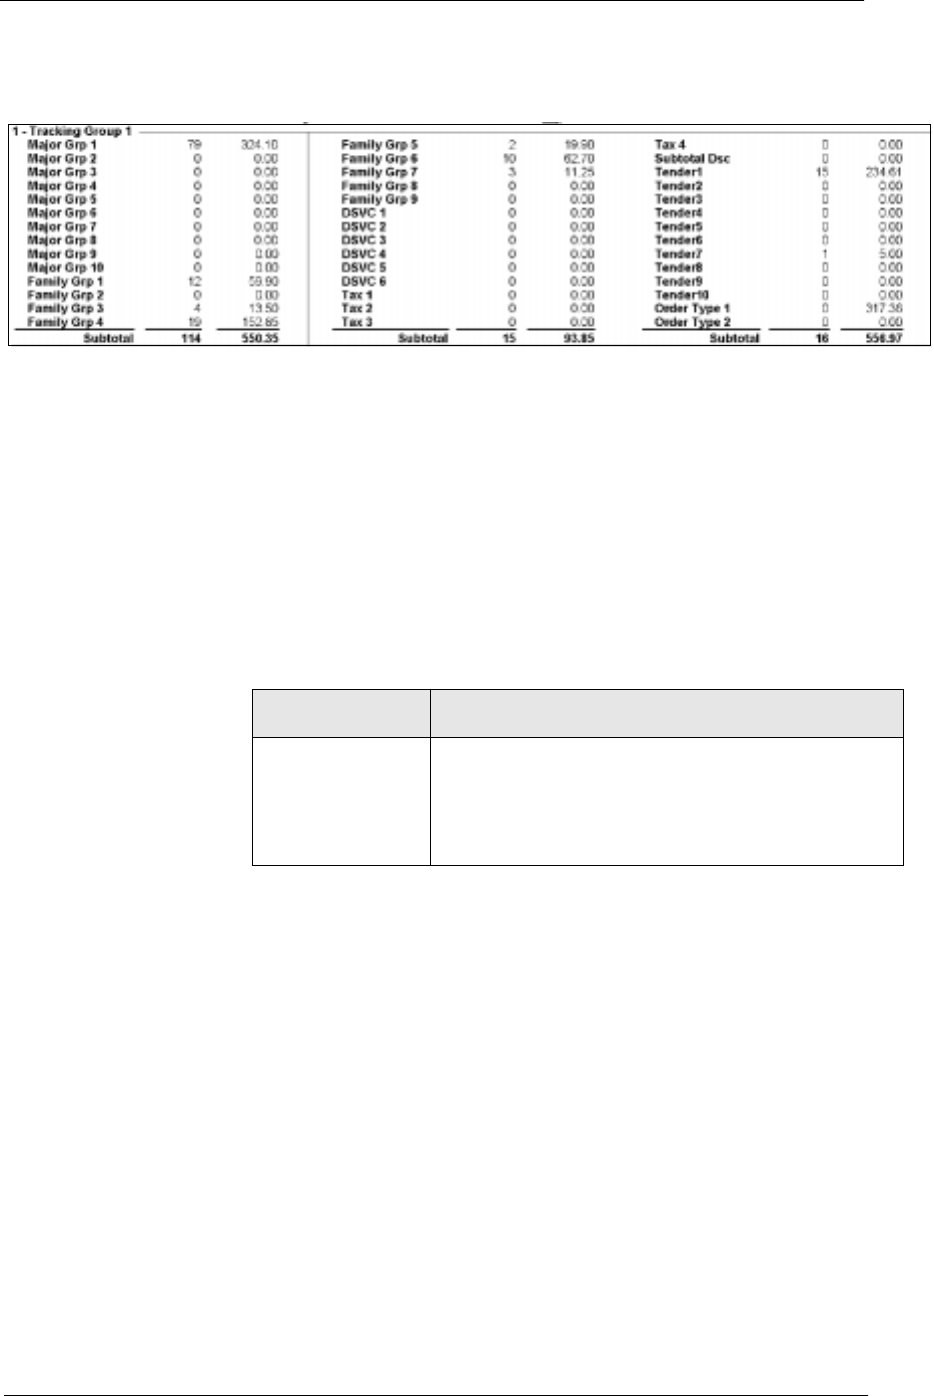
5HSRUWV
3URILOHV
7UDFNLQJ*URXS3URILOH
Tracking Group Profile
The purpose of tracking groups is to provide customized totals
information that does not appear on any of the standard report
templates. You can specify the name of the tracking group and
the type of information to be tracked. See “Tracking Groups” on
page 1-8 for more information.
The tracking groups are arranged in three columns of 14 items,
with a subtotal for each column. Since you can control where you
place a tracking group item, you can create a customized report
with totals information without having to make changes using
Crystal Reports.
Report Field Description
Programmable1
to
Programmable42
The count and value amount for this tracking
group.

3URILOHV
7UDFNLQJ*URXS3URILOH

5HSRUWV
Chapter 3
Employee Reports
This chapter gives examples and provides an explanation of all employee
reports.
In this chapter
Introduction ............................................................................................3-2
Cashier Summary Totals ....................................................................... 3-3
Cashier Summary Totals by Revenue Center.......................................3-11
Cashier Detail Totals ........................................................................... 3-17
Cashier Detail Totals by Revenue Center ........................................... 3-25
Consolidated Cashier Detail Totals..................................................... 3-32
Consolidated Cashier Detail Totals by Revenue Center ..................... 3-39
Employee Detail Totals ....................................................................... 3-46
Employee Detail Totals by Revenue Center ....................................... 3-54
Consolidated Employee Detail Totals................................................. 3-61
Consolidated Employee Detail Totals by Revenue Center ................. 3-68
Employee Sales and Tip Totals by Revenue Center............................ 3-75
Employee Open LDS Report............................................................... 3-80

(PSOR\HH5HSRUWV
,QWURGXFWLRQ
Introduction
Employee Reports provide both financial and operational statistics for
cashiers and employees. The cashier and employee detail reports include
all sales-related transactions (checks opened, menu item keys pressed,
service charges, discounts, etc.) that occurred on a specified business date
or range of dates.
This information can be used to balance an employee’s bank or a cashier’s
drawer. You can also track an individual employee’s sales performance,
and identify employees who could benefit from additional training.
The Employee Sales and Tip Totals by Revenue Center Report provides a
summary of both sales and tip information for each employee within a
Revenue Center or range of Revenue Centers included in the report.
Most employees use these reports for balancing. Good internal control
demands that there be a hard copy representation of every aspect of a
transaction. For front-of-the-house employees, this means that every sale
must have a guest check, every credit card or charge payment must have a
voucher, every discount must have a supporting coupon, and so on. Using
the totals provided by the financial reports, employees can verify that the
balance of their hard copies matches those posted in the system. Errors,
such as posting a payment to the wrong tender/media or misplacing
checks or vouchers, can be corrected before the end of the day. The result
is tight internal control, as well as accurate financial information.
&KHFN(PSOR\HHDQG7UDQVDFWLRQ(PSOR\HH
Some programming considerations are related to posting totals to the
cashier linked to either the check employee or the transaction employee.
The check employee owns the check. Ownership is established when a
check is started using the [Begin Check] key or when a check is
transferred to an employee. (The receiving employee becomes both the
check and transaction employee.)
The transaction employee is the employee who picks up the guest check
and either adds to it or closes it.
In many cases, one employee is responsible for a check from the time it is
opened until it is closed. In this case, the employee is both the check
employee and the transaction employee.
In some cases, however, a check may be opened by one employee and
then added to by another employee. In some restaurants, a check is begun
by a waiter (the check employee), and then closed by a cashier or
bartender (the transaction employee).

5HSRUWV
(PSOR\HH5HSRUWV
&DVKLHU6XPPDU\7RWDOV
Cashier Summary Totals
3XUSRVH
Cashier reports are a means of tracking financial information (tendering
detail, amounts transferred in or out, cash draw balance, etc.) for each
cashier in your system.
This report provides a financial summary for one or more cashiers in a
concise format.
)RUPDW
This report includes the following profiles:
qDetailed Sales profile
qSales and Guest profile
The profile has been modified for this report. It does not include this
field:
Table Turn Time
7HPSODWH
CSHR_001.RPT
2-3
2-26
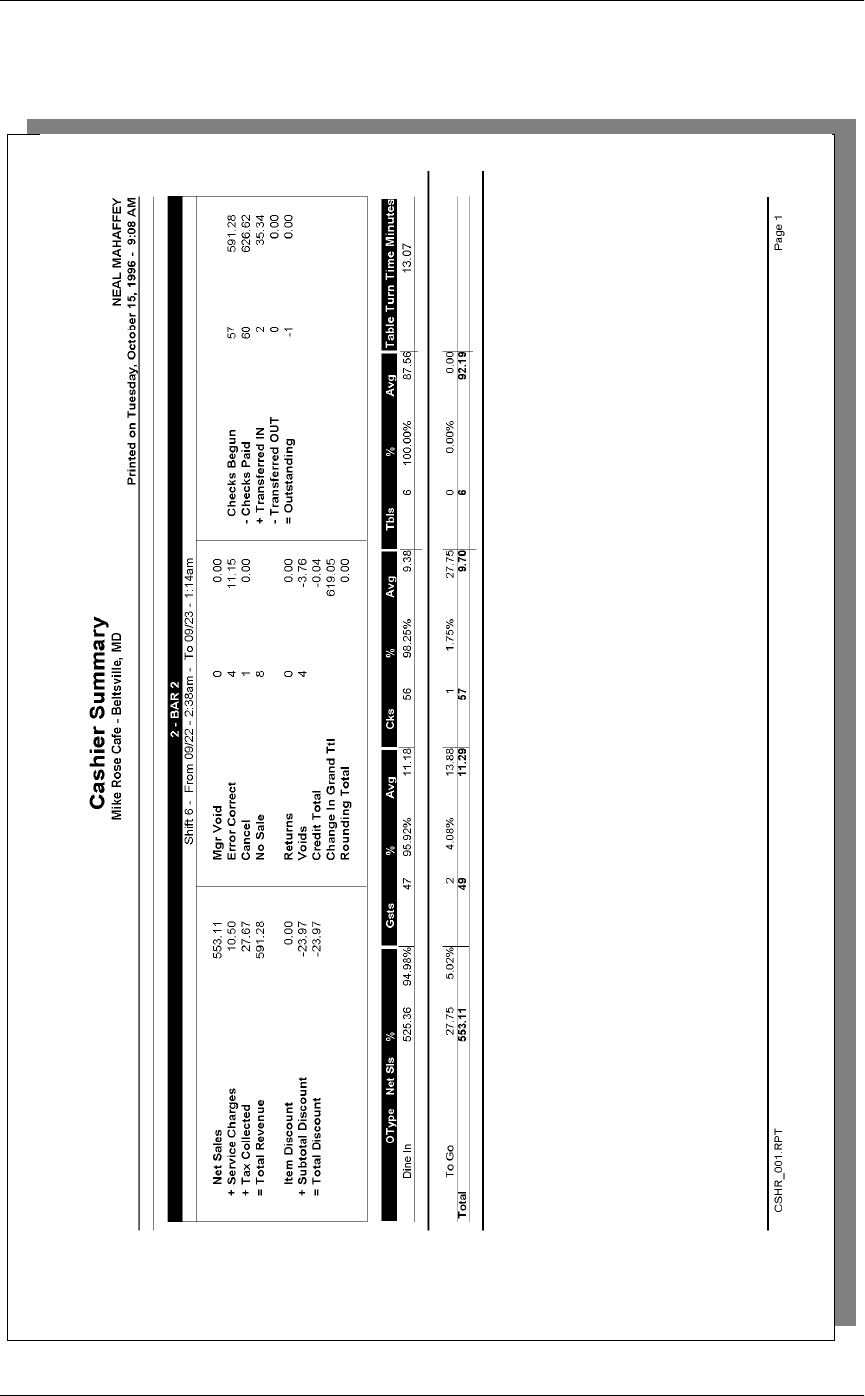
(PSOR\HH5HSRUWV
&DVKLHU6XPPDU\7RWDOV

5HSRUWV
(PSOR\HH5HSRUWV
&DVKLHU6XPPDU\7RWDOV
Cashier Summary
Cashier Summary
Mike Rose Cafe - Beltsville, MD
NEAL MAHAFFEY
Printed on 10/16/1996 - 2:01
----------------------------------------
Shift - From 09/22 - 2:38am
To 09/23 - 1:14am
2 - BAR 2
Net Sales 553.11
+ Service Charg 10.50
+ Tax Collected 27.67
= Total Revenue 591.28
Item Discount 0.00
+ Subtotal Disc -23.97
= Total Discoun -23.97
Returns 0 0.00
Voids 4 -3.76
Credit Total -0.04
Change Grand Tt 619.05
Rounding Total 0.00
Mgr Void 0 0.00
Error Corr 4 11.15
Cancel 1 0.00
No Sale 8
Cks Begu 57 591.28
- Cks Paid 60 626.62
+ Xfer IN 2 35.34
- Xfer OU 0 0.00
= Outstand -1 0.00
----------------------------------------
Dine In Net Sa 525.36
Guests, Avg 47 11.18
Checks, Avg 56 9.38
Tables, Avg 6 87.56
To Go Net Sale 27.75
Guests, Avg 2 13.88
Checks, Avg 1 27.75
Tables, Avg 0 0.00
Total Net Sale 553.11
Guests, Avg 49 11.29
Checks, Avg 57 9.70
Tables, Avg 6 92.19
========================================
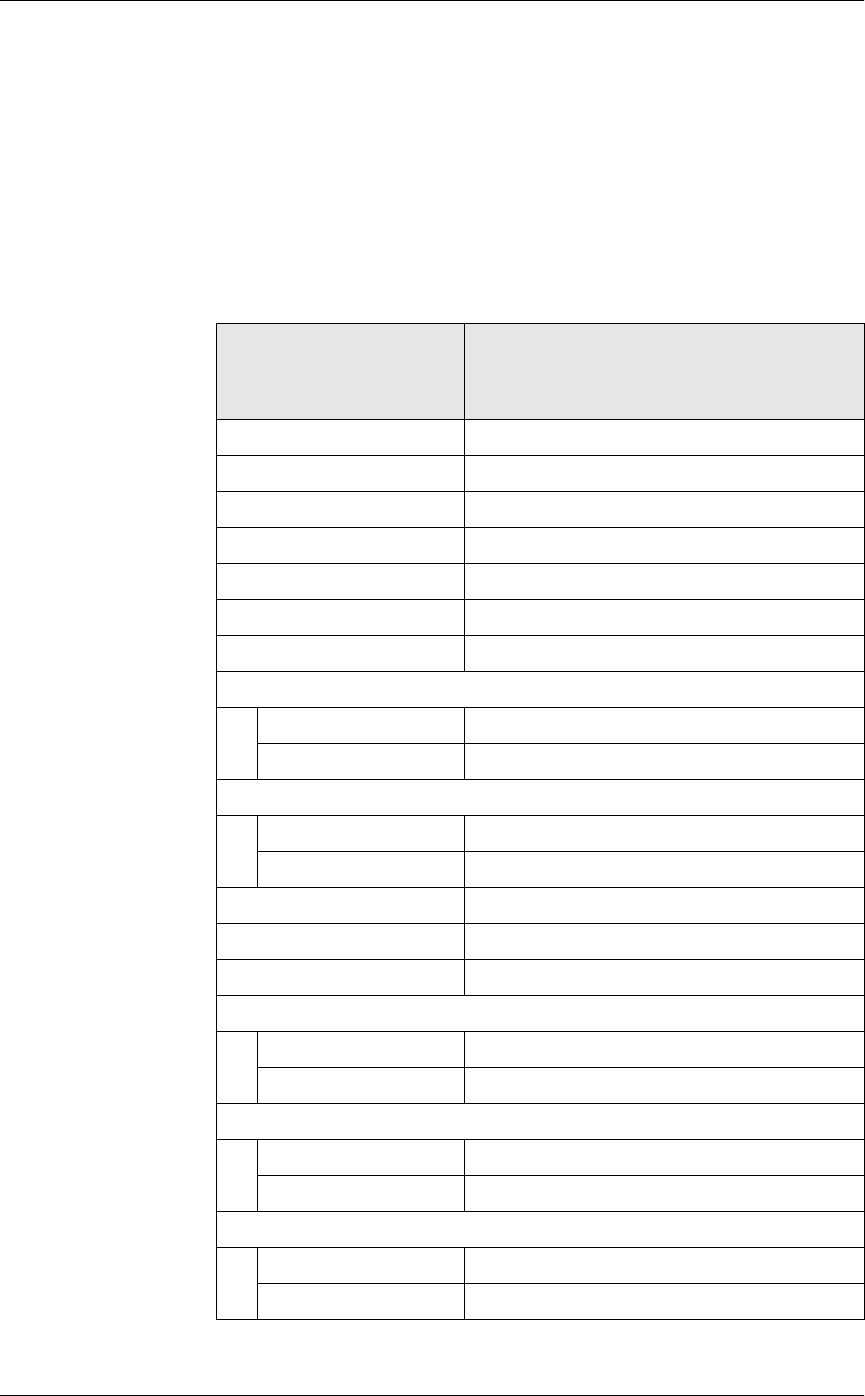
(PSOR\HH5HSRUWV
&DVKLHU6XPPDU\7RWDOV
Detailed Sales Profile Details
View: v_R_cashier
Stored Procedure: sp_R_cashier
The following table lists each field in the Detailed Sales profile and
provides detailed information on the source of each of the figures. Since
all the numbers in this profile come from formulas, there is no view, table,
or column information.
Report
Field
Title Formula
Net Sales @ttl_Net_Sales
Service Charge @ttl_Service_Charges
Tax Collected @ttl_Tax_Collected
Total Revenue @ttl_Total_Revenue
Item Discount @ttl_Item_Discount
Subtotal Discount @ttl_Sbtl_Discount
Total Discount @ttl_Total_Discount
Return
Number @ttl_Return_Qty
Value @ttl_Return_Total
Void
Number @ttl_Void_Qty
Value @ttl_Void_Total
Credit Total @ttl_Credit
Change In Grand Ttl @ttl_Change_Grand_Ttl
Rounding Total @ttl_Rounding
Mgr Void
Number @ttl_Mgr_Void_Qty
Value @ttl_Mgr_Void_Total
Error Correct
Number @ttl_Error_Correct_Qty
Value @ttl_Error_Correct_Total
Cancel
Number @ttl_Cancel_Qty
Value @ttl_Cancel_Total
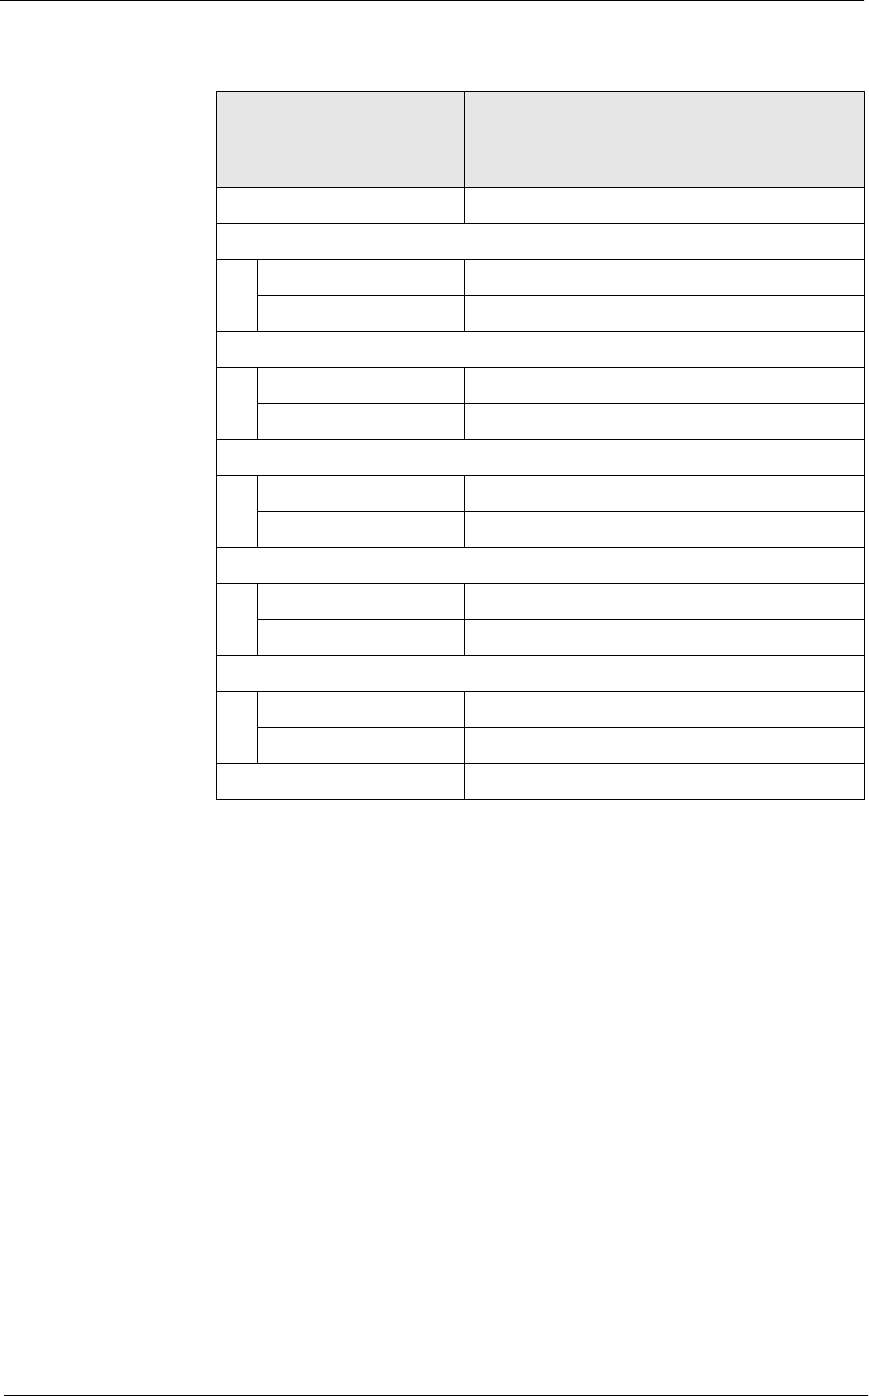
5HSRUWV
(PSOR\HH5HSRUWV
&DVKLHU6XPPDU\7RWDOV
No Sale @ttl_NoSale
Checks Begun
Number @ttl_Cks_Begun_Qty
Value @ttl_Cks_Begun_Total
Checks Paid
Number @ttl_Cks_Paid_Qty
Value @ttl_Cks_Paid_Total
Transferred IN
Number @ttl_Xfer_IN_Qty
Value @ttl_Xfer_IN_Total
Transferred OUT
Number @ttl_Xfer_OUT_Qty
Value @ttl_Xfer_OUT_Total
Outstanding
Number @ttl_Outstanding_Qty
Value @ttl_Outstanding_Total
Table Turn Time Minutes @ttl_Table_Turn
Report
Field
Title Formula
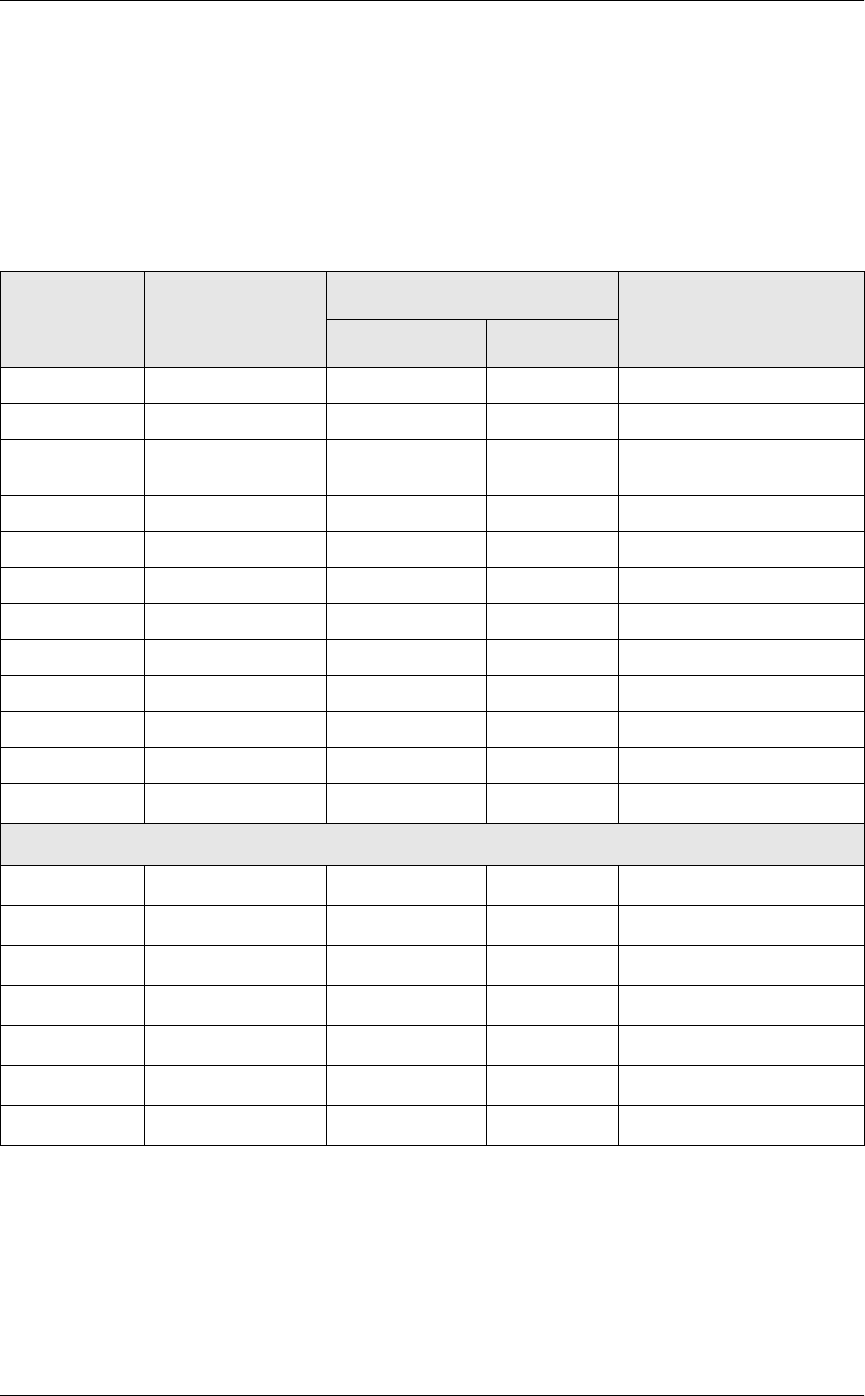
(PSOR\HH5HSRUWV
&DVKLHU6XPPDU\7RWDOV
Sales and Guest Profile Details
View: v_R_cashier
Stored Procedure: sp_R_cashier
The following table lists each field in the Sales and Guest profile and
provides detailed information on the source of each of the figures.
Programming Considerations
*HQHUDO
qRVC Posting | Options | Current round posts to transaction employee
determines if totals are posted to the cashier linked to the check
employee or the transaction employee.
Select this option to post totals to the cashier linked to the check
Report
Column
Title
View
Column
Title
3700 Database Formula
Table Column
OType order_type_name order_type_def name
Net Sls ot_net_sales_ttl dly_cshr_ot_ttl net_sales_ttl
%@Percent_Of_Total_Net_Sale
s
Gsts cover_count dly_cshr_ot_ttl cov_cnt
%@Percent_Of_Total_Guests
Avg @Avg_$_Guest
Cks check_count dly_cshr_ot_ttl chk_cnt
%@Percent_Of_Total_Checks
Avg @Avg_$_Check
Tbls table_turn_count dly_cshr_ot_ttl tbl_turn_cnt
%@Percent_Of_Total_Tables
Avg @Avg_$_Table
Total
Net Sls @ttl_OT_Net_Sales_Total
Gsts @ttl_OT_Cover_Count
Avg @ttl_Avg_$_Guest
Cks @ttl_OT_Check_Count
Avg @ttl_Avg_$_Check
Tbls @ttl_OT_Table_Count
Avg @ttl_Avg_$_Table

5HSRUWV
(PSOR\HH5HSRUWV
&DVKLHU6XPPDU\7RWDOV
employee if the transaction employee does not have a cashier linked.
Clear this option to always post tendering totals to the cashier linked
to the transaction employee.
qWithin a revenue center, a cashier may be required for all
transactions, only for tendering actions, or not at all. In RVC
Transactions | Cashier, the following options determine when a
cashier is required:
Require cashier for all transactions
Require cashier for pickup/loan and tips
qSelect User Workstations | Cashier | Assign cashier by UWS to define
a cashier as a time period or shift.
*XHVWV
qThe number of guests is determined by the seat count, the number of
specified service charges or menu items, or by the guest count entered
by the employees.
To use seat count to determine the number of guests, select RVC Seats
| Use seat count for cover count.
To use a service charge to determine the number of guests, select
Discount/Service | Discount/Service Charge | Post to cover count.
To use specified menu items to determine the number of guests, select
Menu Item Classes | Price/Totals | Add to cover count. Then assign
this menu item class to the menu items that will determine the guest
count.
If none of these options is selected, the system will use the guest
count entered by employees when beginning checks as the guest
count.
Notes
7\SHVRI&DVKLHUV
Depending on how a restaurant operates, cashiers can be a useful means of
tracking cash flow and balancing media (payments and receipts) at a UWS
and/or a cash drawer level.
You can define two types of cashiers: a cashier as an employee or a cashier
as a time period, or shift. When the cashier is defined as a person, totals are
linked to the employee or cash drawer. Using this method, employees can
be held accountable for balancing their individual media.
When the cashier is defined as a shift, totals are linked to a UWS. Then, all
employees who work at the UWS during the same period add to the set of
totals. Using this method, no single employee can be held accountable for
the media that is collected. This is useful when many employees share a
common bank, such as at a counter service or bar area.
%DODQFLQJ1RWHV
The combination of revenue center and UWS programming effects the
totals that appear in a cashier report.

(PSOR\HH5HSRUWV
&DVKLHU6XPPDU\7RWDOV
If a cashier is required for all transactions, and the cashier is assigned by
workstation, the cashier reports will reflect all transaction activity during
the period of the report.
If a cashier is required for all transactions and cashiers are assigned as
individual employees who close their own checks, a given cashier report
will be similar to the individual’s Employee Detail Report.

5HSRUWV
(PSOR\HH5HSRUWV
&DVKLHU6XPPDU\7RWDOVE\5HYHQXH&HQWHU
Cashier Summary Totals by Revenue Center
3XUSRVH
This report provides a financial summary for one or more cashiers in a
Revenue Center.
)RUPDW
This report includes the following profiles:
qDetail Sales profile
qSales and Guest profile
The profile has been modified for this report. It dies not include this
field:
Table Turn Time
7HPSODWH
CSHR_601.RPT
2-3
2-26
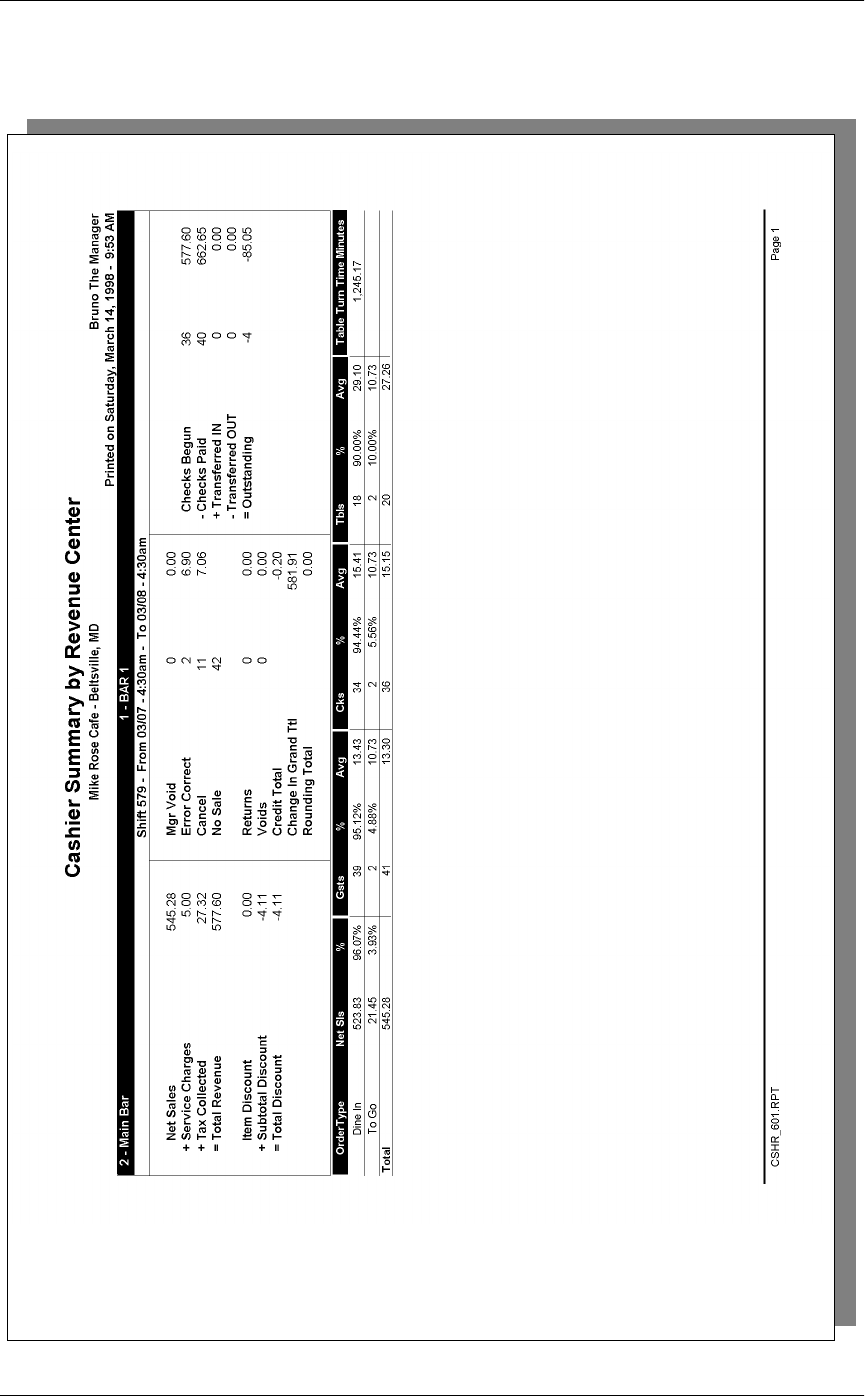
(PSOR\HH5HSRUWV
&DVKLHU6XPPDU\7RWDOVE\5HYHQXH&HQWHU
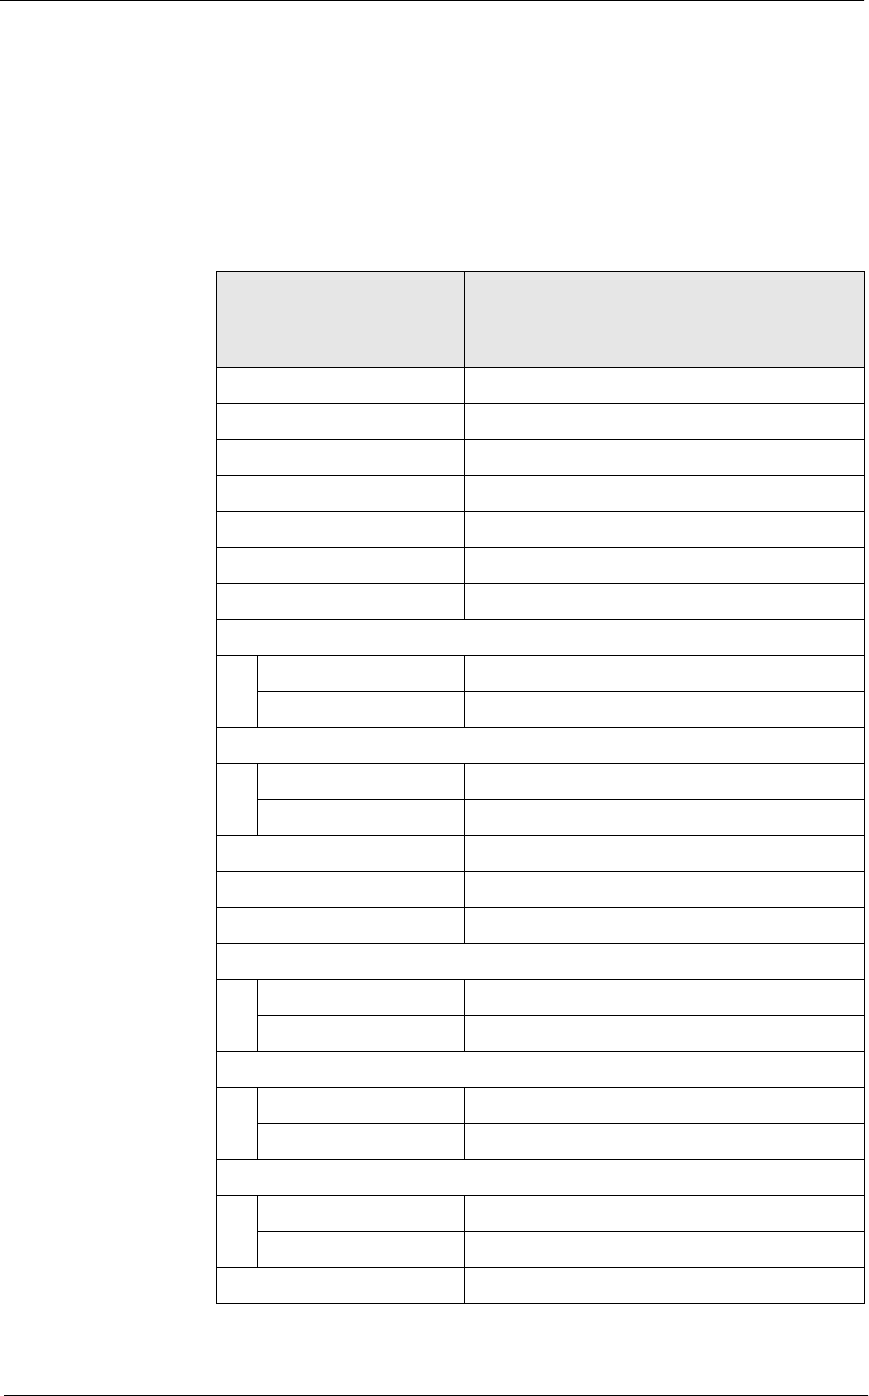
5HSRUWV
(PSOR\HH5HSRUWV
&DVKLHU6XPPDU\7RWDOVE\5HYHQXH&HQWHU
Detailed Sales Profile Details
Views: v_R_rvc_cashier
Stored Procedure: sp_R_rvc_cashier
The following table lists each field in the Detailed Sales profile and
provides detailed information on the source of each of the figures.
Report
Field
Title Formula
Net Sales @ttl_Net_Sales
Service Charge @ttl_Service_Charges
Tax Collected @ttl_Tax_Collected
Total Revenue @ttl_Total_Revenue
Item Discount @ttl_Item_Discount
Subtotal Discount @ttl_Sbtl_Discount
Total Discount @ttl_Total_Discount
Return
Number @ttl_Return_Qty
Value @ttl_Return_Total
Void
Number @ttl_Void_Qty
Value @ttl_Void_Total
Credit Total @ttl_Credit
Change In Grand Ttl @ttl_Change_Grand_Ttl
Rounding Total @ttl_Rounding
Mgr Void
Number @ttl_Mgr_Void_Qty
Value @ttl_Mgr_Void_Total
Error Correct
Number @ttl_Error_Correct_Qty
Value @ttl_Error_Correct_Total
Cancel
Number @ttl_Cancel_Qty
Value @ttl_Cancel_Total
No Sale @ttl_NoSale
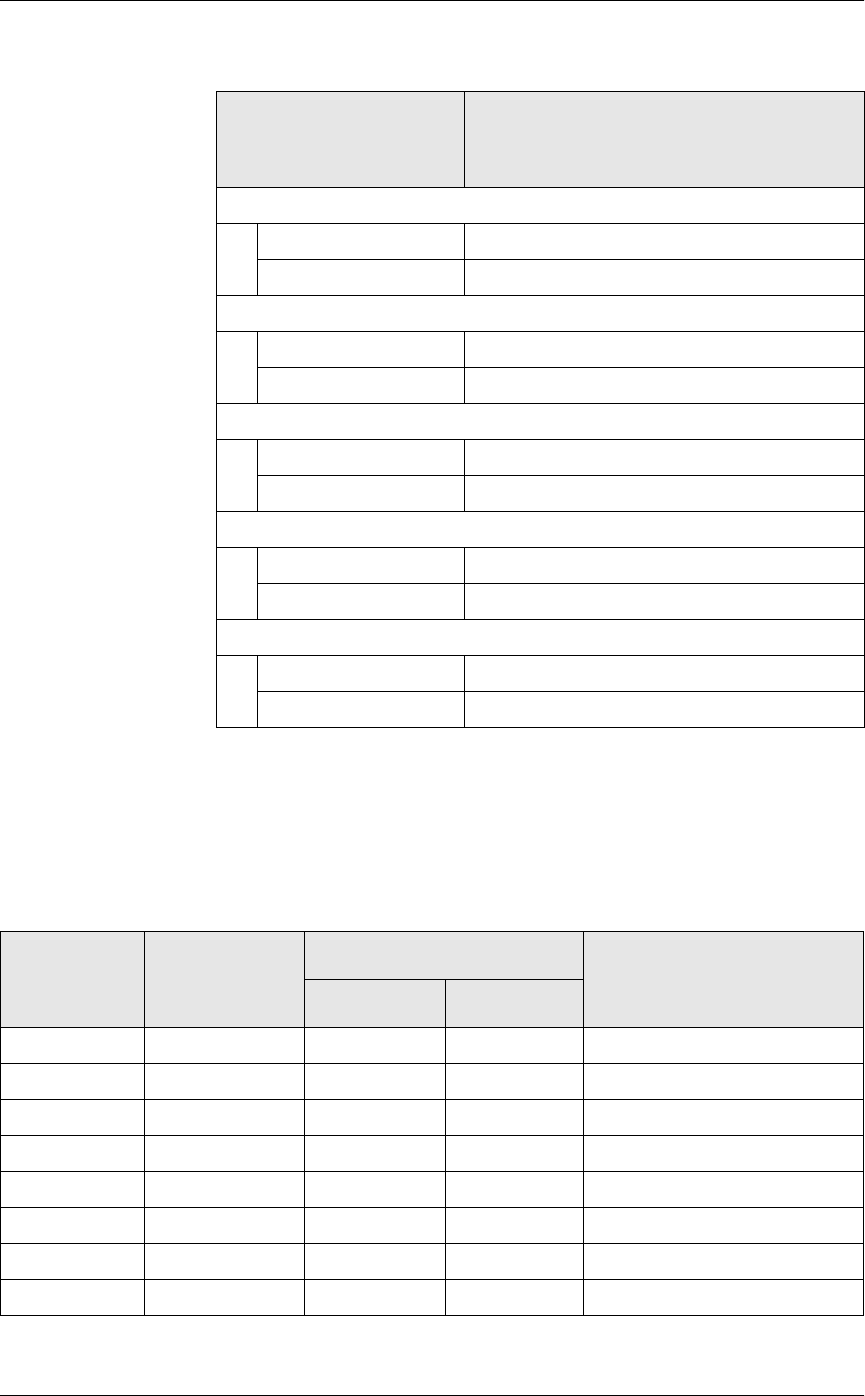
(PSOR\HH5HSRUWV
&DVKLHU6XPPDU\7RWDOVE\5HYHQXH&HQWHU
Sales and Guest Profile Detail
Views: v_R_rvc_cashier
Stored Procedure: sp_R_rvc_cashier
The following table lists each field in the Sales and Guest profile and
detailed information on the source of each figure.
Checks Begun
Number @ttl_Cks_Begun_Qty
Value @ttl_Cks_Begun_Total
Checks Paid
Number @ttl_Cks_Paid_Qty
Value @ttl_Cks_Paid_Total
Transferred IN
Number @ttl_Xfer_IN_Qty
Value @ttl_Xfer_IN_Total
Transferred OUT
Number @ttl_Xfer_OUT_Qty
Value @ttl_Xfer_OUT_Total
Outstanding
Number @ttl_Outstanding_Qty
Value @ttl_Outstanding_Total
Report
Column
Title
View
Column
Title
3700 Database Formula
Table Column
Order Type @lbl_OT_Total
Net Sales @ttl_OT_Net _Sales_Total
Cover Count @ttl_OT_Cover_Count
Avg/Guest @ttl_Avg_$_Guest
Checks @ttl_OT_Check_Count
Avg/Chk @ttl_Avg_$_Check
Tables @ttl_OT_Table_Count
Avg/Tbl @ttl_Avg_$_Table
Report
Field
Title Formula

5HSRUWV
(PSOR\HH5HSRUWV
&DVKLHU6XPPDU\7RWDOVE\5HYHQXH&HQWHU
Programming Considerations
*HQHUDO
qRVC Posting | Options | Current round posts to transaction employee
determines if totals are posted to the cashier linked to the check
employee or the transaction employee.
Select this option to post totals to the cashier linked to the check
employee if the transaction employee does not have a cashier linked.
Clear this option to always post tendering totals to the cashier linked
to the transaction employee.
qWithin a revenue center, a cashier may be required for all
transactions, only for tendering actions, or not at all. In RVC
Transactions | Cashier, the following options determine when a
cashier is required:
Require cashier for all transactions
Require cashier for pickup/loan and tips
qSelect User Workstations | Cashier | Assign cashier by UWS to define
a cashier as a time period or shift.
*XHVWV
qThe number of guests is determined by the seat count, the number of
specified service charges or menu items, or by the guest count entered
by the employees.
To use seat count to determine the number of guests, select RVC Seats
| Use seat count for cover count.
To use a service charge to determine the number of guests, select
Discount/Service | Discount/Service Charge | Post to cover count.
To use specified menu items to determine the number of guests, select
Menu Item Classes | Price/Totals | Add to cover count. Then assign
this menu item class to the menu items that will determine the guest
count.
If none of these options is selected, the system will use the guest
count entered by employees when beginning checks as the guest
count.
Notes
7\SHVRI&DVKLHUV
Depending on how a restaurant operates, cashiers can be a useful means of
tracking cash flow and balancing media (payments and receipts) at a UWS
and/or a cash drawer level.
You can define two types of cashiers: a cashier as an employee or a cashier
as a time period, or shift. When the cashier is defined as a person, totals are
linked to the employee or cash drawer. Using this method, employees can
be held accountable for balancing their individual media.
When the cashier is defined as a shift, totals are linked to a UWS. Then, all
employees who work at the UWS during the same period add to the set of

(PSOR\HH5HSRUWV
&DVKLHU6XPPDU\7RWDOVE\5HYHQXH&HQWHU
totals. Using this method, no single employee can be held accountable for
the media that is collected. This is useful when many employees share a
common bank, such as at a counter service or bar area.
%DODQFLQJ1RWHV
The combination of revenue center and UWS programming effects the
totals that appear in a cashier report.
If a cashier is required for all transactions, and the cashier is assigned by
workstation, the cashier reports will reflect all transaction activity during
the period of the report.
If a cashier is required for all transactions and cashiers are assigned as
individual employees who close their own checks, a given cashier report
will be similar to the individual’s Employee Detail Report.
5HSRUWV
(PSOR\HH5HSRUWV
&DVKLHU'HWDLO7RWDOV
Cashier Detail Totals
3XUSRVH
The Cashier Detail Report provides detailed information, including
tracking totals, on one cashier or a range of cashiers.
)RUPDW
This report includes the following profiles:
qDetailed Sales profile
The profile has been modified for this report. It does not include this
field:
Turn Time
qSales and Guest profile
qTracking Group profile
7HPSODWH
CSHR_101.RPT
Note
This report can be run as a UWS report and looks like the 40-
column Crystal Report
2-3
2-26
2-33
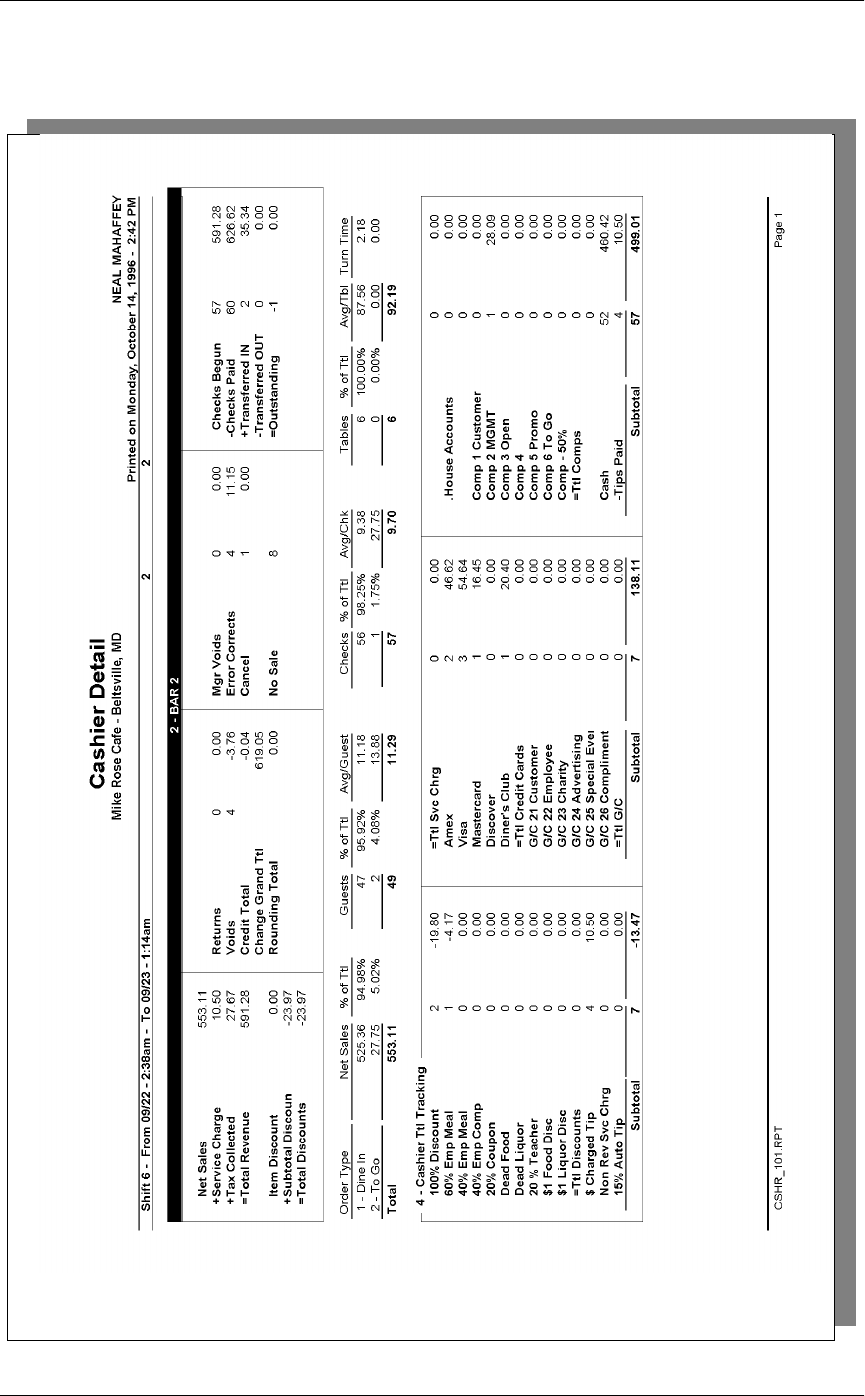
(PSOR\HH5HSRUWV
&DVKLHU'HWDLO7RWDOV

5HSRUWV
(PSOR\HH5HSRUWV
&DVKLHU'HWDLO7RWDOV
Cashier Detail
Cashier Detail
Mike Rose Cafe - Beltsville, MD
NEAL MAHAFFEY
Printed on 10/16/1996 - 1:46
----------------------------------------
Shift 6 From 09/22 - 2:38am
To 09/23 - 1:14am
2 - BAR 2
Net Sales 553.11
+Service Charge 10.50
+Tax Collected 27.67
=Total Revenue 591.28
Item Discount 0.00
+Subtotal Disc -23.97
=Total Discount -23.97
Returns 0 0.00
Voids 4 -3.76
Credit Total -0.04
Change Grand Tt 619.05
Rounding Total 0.00
Mgr Voids 0 0.00
Error Corr 4 11.15
Cancel 1 0.00
No Sale 8
Cks Begun 57 591.28
-Cks Paid 60 626.62
+ Xfer IN 2 35.34
- Xfer OUT 0 0.00
=Outstandi -1 0.00
----------------------------------------
1-Dine In Net S 525.36
Guests, Avg 47 11.18
Checks, Avg 56 9.38
Tables, Avg 6 87.56
Turn Time 2.18
2-To Go Net Sal 27.75
Guests, Avg 2 13.88
Checks, Avg 1 27.75
Tables, Avg 0 0.00
Turn Time 0.00
Total Net Sales 553.11
Guests, Avg 49 11.29
Checks, Avg 57 9.70
Tables, Avg 6 92.19
----------------------------------------
4 - Cashier Ttl Tracking
100% Disco 2 -19.80
60% Emp Me 1 -4.17
40% Emp Me 0 0.00
40% Emp Co 0 0.00
20% Coupon 0 0.00
Dead Food 0 0.00
Dead Liquo 0 0.00
20 % Teach 0 0.00
$1 Food Di 0 0.00
$1 Liquor 0 0.00
=Ttl Disco 0 0.00
$ Charged 4 10.50
Non Rev Sv 0 0.00
15% Auto T 0 0.00
Subtotal 7 -13.47
=Ttl Svc C 0 0.00
0 0.00
Cash 52 460.42
-Tips Paid 4 10.50
Subtotal 57 499.01
========================================
Totals omitted for
display
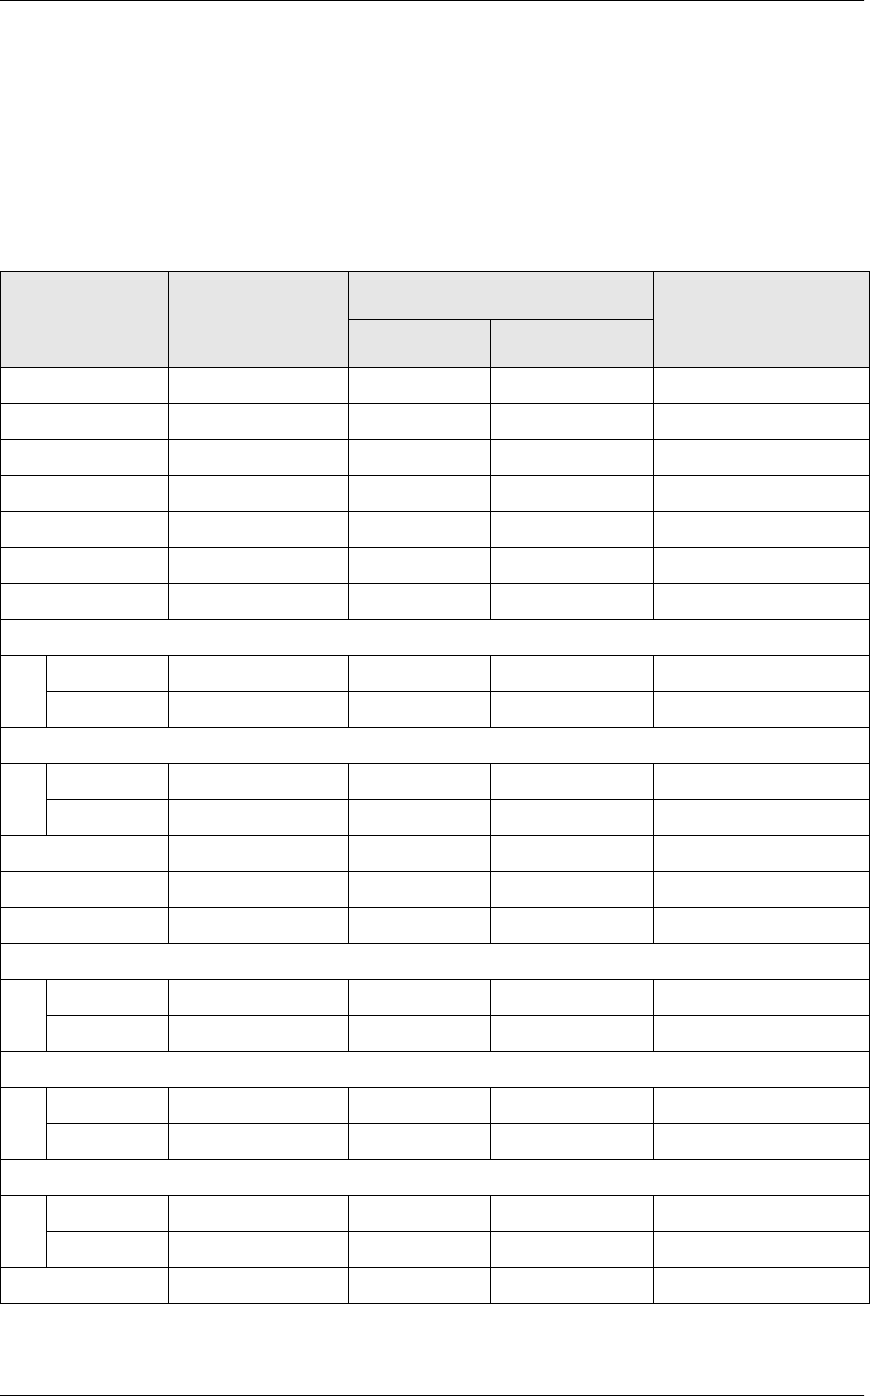
(PSOR\HH5HSRUWV
&DVKLHU'HWDLO7RWDOV
Detailed Sales Profile Details
Views: v_R_cashier and v_R_cashier_trk
Stored Procedure: sp_R_cashier_sales_tracking
The following table lists each field in the Detailed Sales profile and
provides detailed information on the source of each of the figures.
Report
Field
Title
View
Column
Title
3700 Database Formula
Table Column
Net Sales @ttl_Net_Sales
Service Charges @ttl_Service_Chg
Tax Collected @ttl_Tax_Collected
Total Revenue @ttl_Total_Revenue
Item Discount @ttl_Item_Disc
Subtotal Discount @ttl_Sbtl_Disc
Total Discount @ttl_Total_Disc
Return
Number @ttl_Return_Qty
Value @ttl_Return_Total
Void
Number @ttl_Void_Qty
Value @ttl_Void_Total
Credit Total credit_ttl daily_cshr_ttl credit_ttl
Change In Grand Ttl change_grand_ttl daily_cshr_ttl change_grand_ttl
Rounding Total rounding_ttl daily_cshr_ttl rounding_ttl
Mgr Void
Number @ttl_Mgr_Void_Qty
Value @ttl_Mgr_Void_Total
Error Correct
Number @ttl_Error_Correct_Qty
Value @ttl_Error_Correct_Total
Cancel
Number @ttl_Trans_Cancel_Qty
Value @ttl_Trans_Cancel_Total
No Sale no_sale_cnt daily_cshr_ttl no_sale_cnt
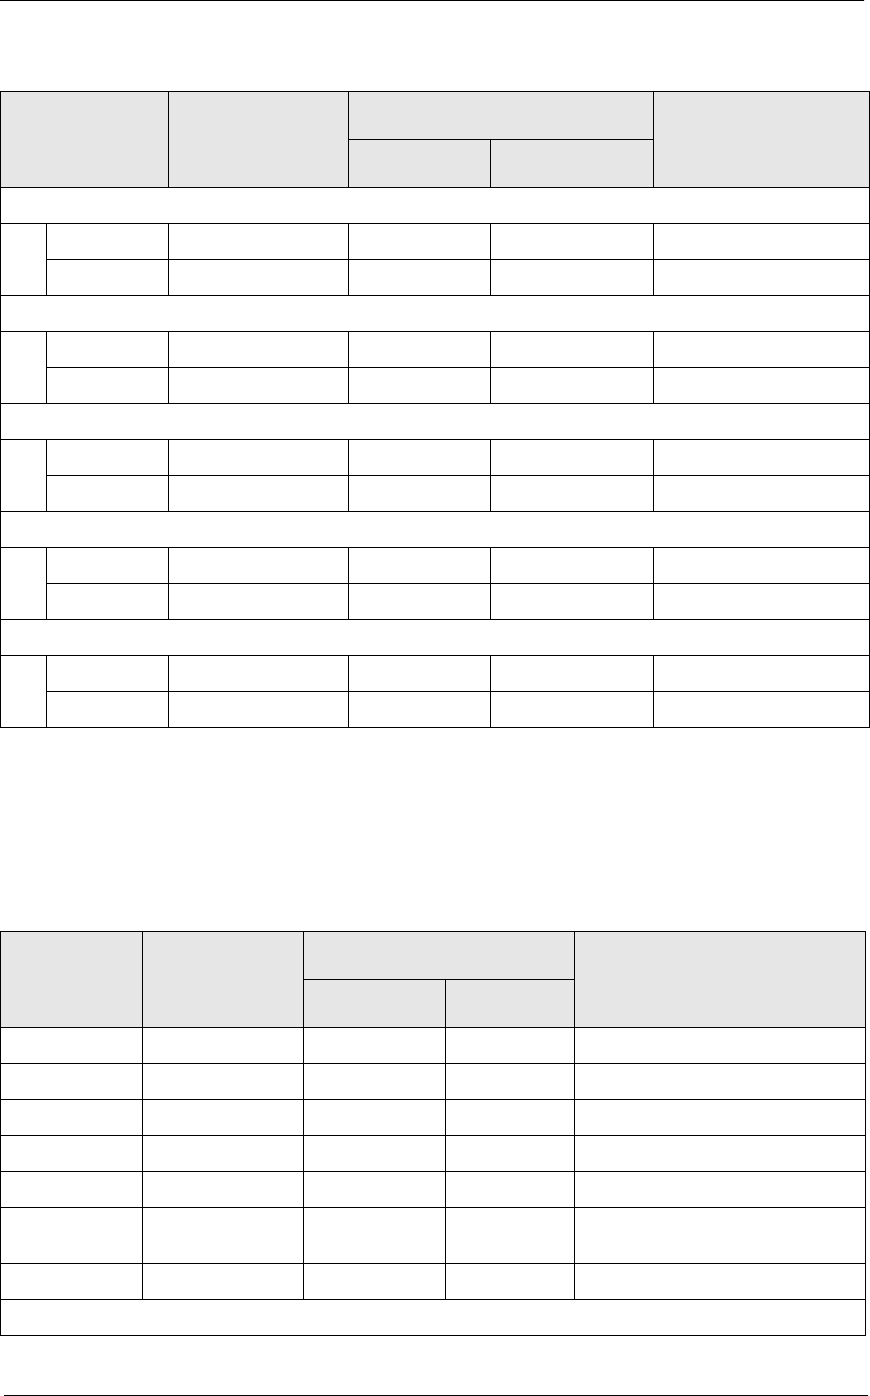
5HSRUWV
(PSOR\HH5HSRUWV
&DVKLHU'HWDLO7RWDOV
Sales and Guest Profile Details
Views: v_R_cashier and v_R_cashier_trk
Stored Procedure: sp_R_cashier_sales_tracking
The following table lists each field in the Sales and Guest profile and
detailed information on the source of each figure.
Checks Begun
Number @ttl_Checks_Begun_Qty
Value @ttl_Checks_Begun_Total
Checks Paid
Number @ttl_Checks_Paid_Qty
Value @ttl_Checks_Paid_Total
Transferred IN
Number chk_xfer_in_cnt daily_cshr_ttl chk_xfer_in_cnt
Value chk_xfer_in_ttl daily_cshr_ttl chk_xfer_in_ttl
Transferred OUT
Number chk_xfer_out_cnt daily_cshr_ttl chk_xfer_out_cnt
Value chk_xfer_out_ttl daily_cshr_ttl chk_xfer_out_ttl
Outstanding
Number @ttl_Outstanding_Qty
Value @ttl_Outstanding_Total
Report
Field
Title
View
Column
Title
3700 Database Formula
Table Column
Net Sales @ttl_Net_Sales
Service Charges @ttl_Service_Chg
Tax Collected @ttl_Tax_Collected
Total Revenue @ttl_Total_Revenue
Item Discount @ttl_Item_Disc
Subtotal
Discount
@ttl_Sbtl_Disc
Total Discount @ttl_Total_Disc
Return
Report
Field
Title
View
Column
Title
3700 Database Formula
Table Column
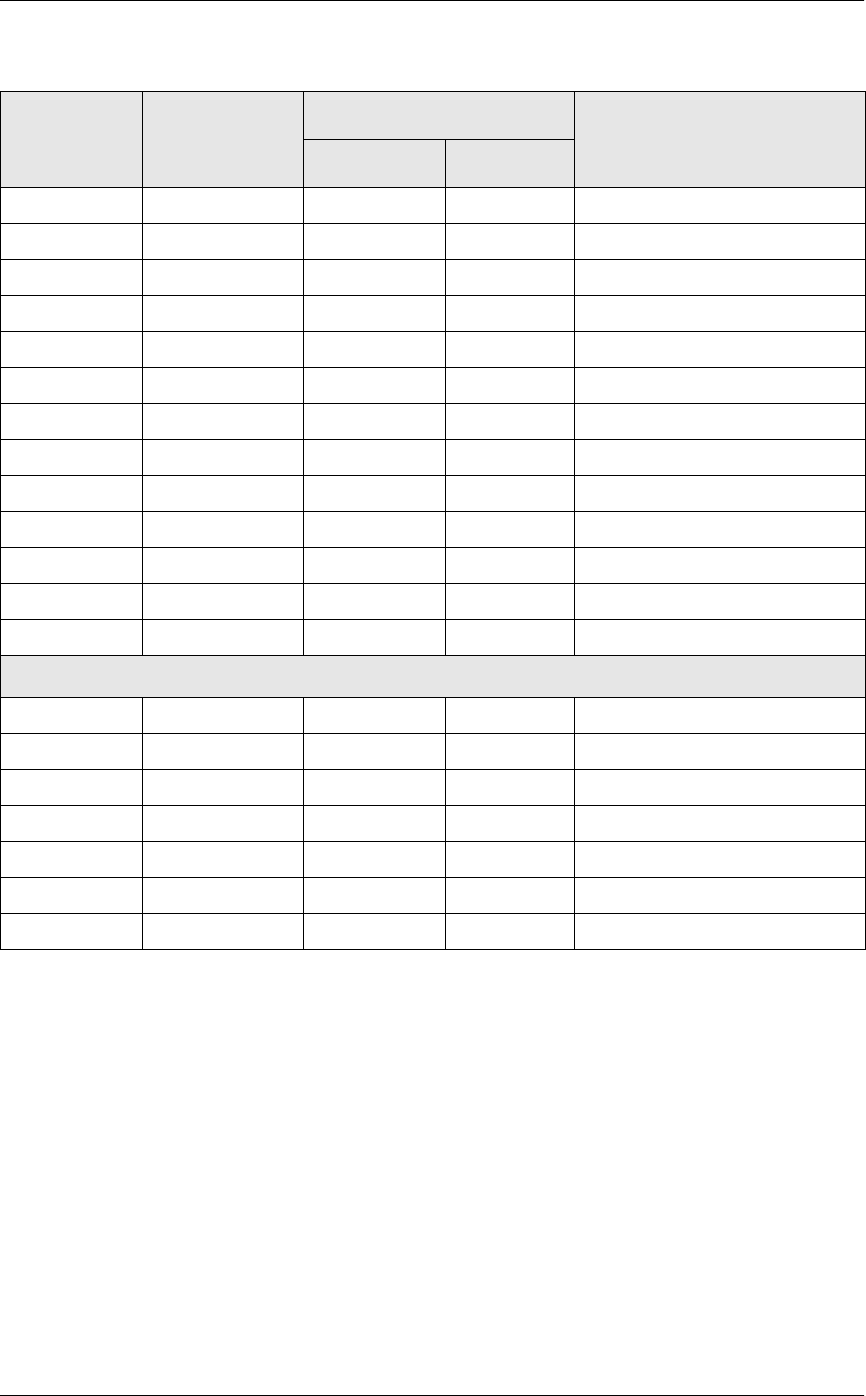
(PSOR\HH5HSRUWV
&DVKLHU'HWDLO7RWDOV
Order Type @lbl_Order_Type_Num_And_Name
Net Sls ot_net_sls_ttl dly_cshr_ot_ttl net_sls_ttl
% of Ttl @Percent_Of_Net_Total
Guests cover_count dly_cshr_ot_ttl cov_cnt
% of Ttl @Percent_Of_Guest_Total
Avg/Guest @Avg_$_Guest
Checks check_count dly_cshr_ot_ttl chk_cnt
% of Ttl @Percent_Of_Check_Total
Avg/Chk @Avg_$_Check
Tables table_turn_count dly_cshr_ot_ttl tbl_turn_cnt
% of Ttl @Percent_Of_Table_Total
Avg/Tbl @Avg_$_Table
Turn Time @Avg_Turn_Time
Total
Net Sls ∑ ot_net_sales_ttl dly_cshr_ot_ttl net_sls_ttl
Guests ∑ cover_count dly_cshr_ot_ttl cov_cnt
Avg/Guest @Total_Avg_$_Guest
Checks ∑ check_count dly_cshr_ot_ttl chk_cnt
Avg/Chk @Total_Avg_$_Check
Tables ∑ table_turn_count dly_cshr_ot_ttl tbl_turn_cnt
Avg/Tbl @Total_Avg_$_Table
Report
Field
Title
View
Column
Title
3700 Database Formula
Table Column
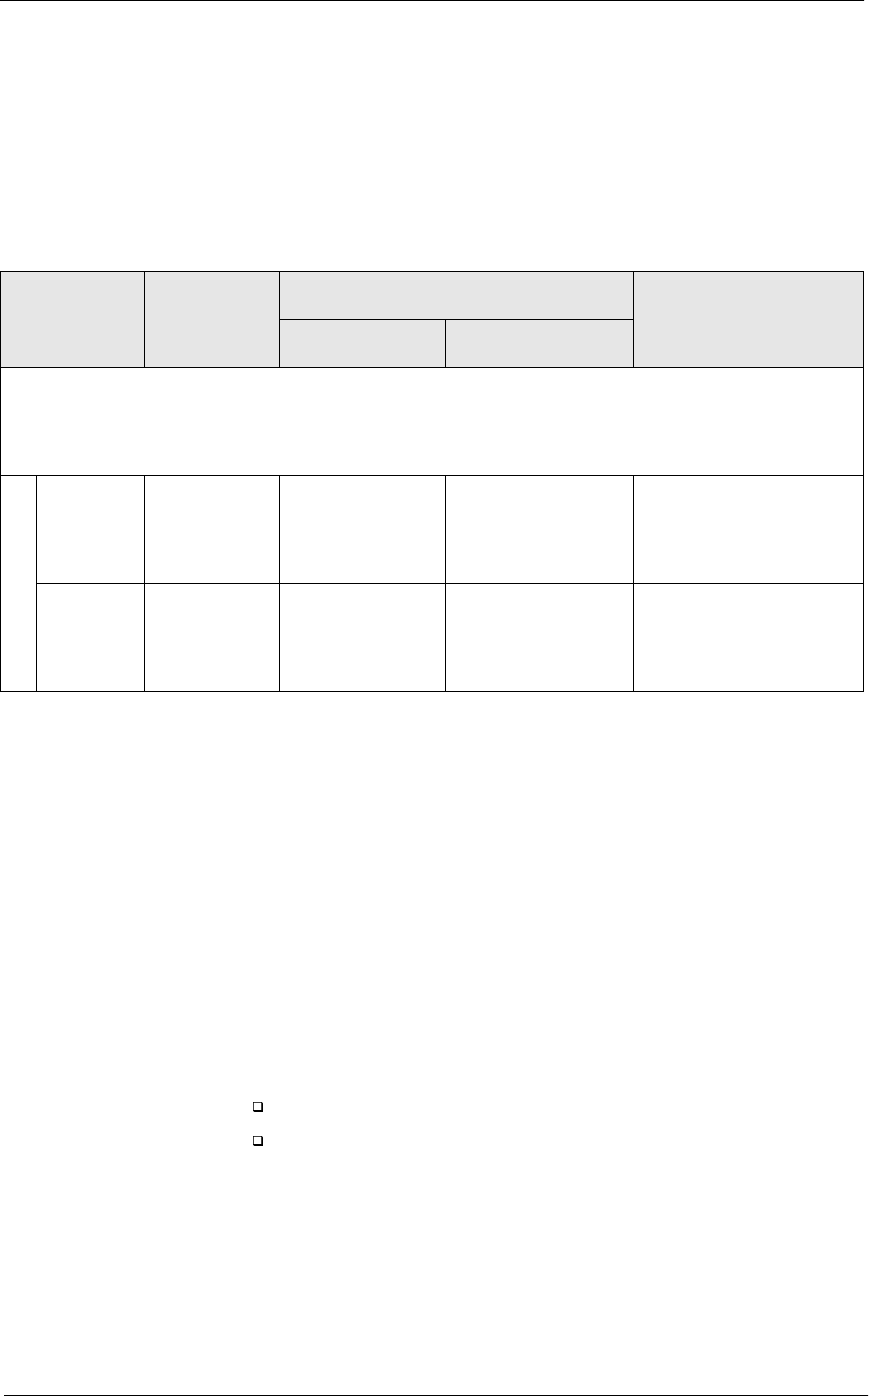
5HSRUWV
(PSOR\HH5HSRUWV
&DVKLHU'HWDLO7RWDOV
Tracking Group Profile Details
Views: v_R_cashier and v_R_cashier_trk
Stored Procedure: sp_R_cashier_sales_tracking
The following table lists each field in the Tracking Group profile and
provides detailed information on the source of each of the figures.
Programming Considerations
*HQHUDO
qRVC Posting | Options | Current round posts to transaction employee
determines if totals are posted to the cashier linked to the check
employee or the transaction employee.
Select this option to post totals to the cashier linked to the check
employee if the transaction employee does not have a cashier linked.
Clear this option to always post tendering totals to the cashier linked
to the transaction employee.
qWithin a revenue center, a cashier may be required for all
transactions, only for tendering actions, or not at all. On RVC
Transactions | Cashier, the following options determine when a
cashier is required:
Require cashier for all transactions
Require cashier for pickup / loan and tips
qSelect User Workstations | Cashier | Assign cashier by UWS to define
a cashier as a time period or shift.
Report
Column
Title
View
Column
Title
3700 Database Formula
Table Column
Programmable1
to
Programmable42
Number trk_cnt_01
to
trk_cnt_42
dly_cshr_trk_ttl trk_cnt_01
to
trk_cnt_42
Value trk_ttl_01
to
trk_cnt_42
dly_cshr_trk_ttl trk_ttl_01
to
trk_cnt_42

(PSOR\HH5HSRUWV
&DVKLHU'HWDLO7RWDOV
*XHVWV
qThe number of guests is determined by the seat count, the number of
specified service charges or menu items, or by the guest count entered
by the employees.
To use seat count to determine the number of guests, select RVC Seats
| Use seat count for cover count.
To use a service charge to determine the number of guests, select
Discount/Service | Discount/Service Charge | Post to cover count.
To use specified menu items to determine the number of guests, select
Menu Item Classes | Price/Totals | Add to cover count. Then assign
this menu item class to the menu items that will determine the guest
count.
If none of these options is selected, the system will use the guest
count entered by employees when beginning checks as the guest
count.
Notes
7\SHVRI&DVKLHUV
Depending on how a restaurant operates, cashiers can be a useful means of
tracking cash flow and balancing media (payments and receipts) at a UWS
and/or a cash drawer level.
You can define two types of cashiers: a cashier as an employee or a cashier
as a time period, or shift. When the cashier is defined as a person, totals are
linked to the employee or cash drawer. Using this method, employees can
be held accountable for balancing their individual media.
When the cashier is defined as a shift, totals are linked to a UWS. Then, all
employees who work at the UWS during the same period add to the set of
totals. Using this method, no single employee can be held accountable for
the media that is collected. This is useful when many employees share a
common bank, such as at a counter service or bar area.
7UDFNLQJ7RWDOV
Each defined cashier can be assigned to different tracking totals. When a
specific employee is assigned as a cashier, tracking totals can provide
useful cash drawer balancing information.
%DODQFLQJ1RWHV
The combination of revenue center and UWS programming affects the
totals that appear in a cashier report.
If a cashier is required for all transactions, and the cashier is assigned by
workstation, the cashier reports will reflect all transaction activity during
the period of the report.
If a cashier is required for all transactions and cashiers are assigned as
individual employees who close their own checks, a given cashier report
will be identical to the individual’s Employee Detail Report.

5HSRUWV
(PSOR\HH5HSRUWV
&DVKLHU'HWDLO7RWDOVE\5HYHQXH&HQWHU
Cashier Detail Totals by Revenue Center
3XUSRVH
The Cashier Detail Total by Revenue Center report provides detailed
information including tracking totals, on one cashier or a range of
cashiers within a Revenue Center.
3XUSRVH
This report includes the following profiles:
qDetail Sales profile
This profile has been modified for this report. It does not include this
field:
Turn Time
qSales and Guest profile
qTracking Group profile
7HPSODWH
CSHR_701.RPT
2-3
2-26
2-33
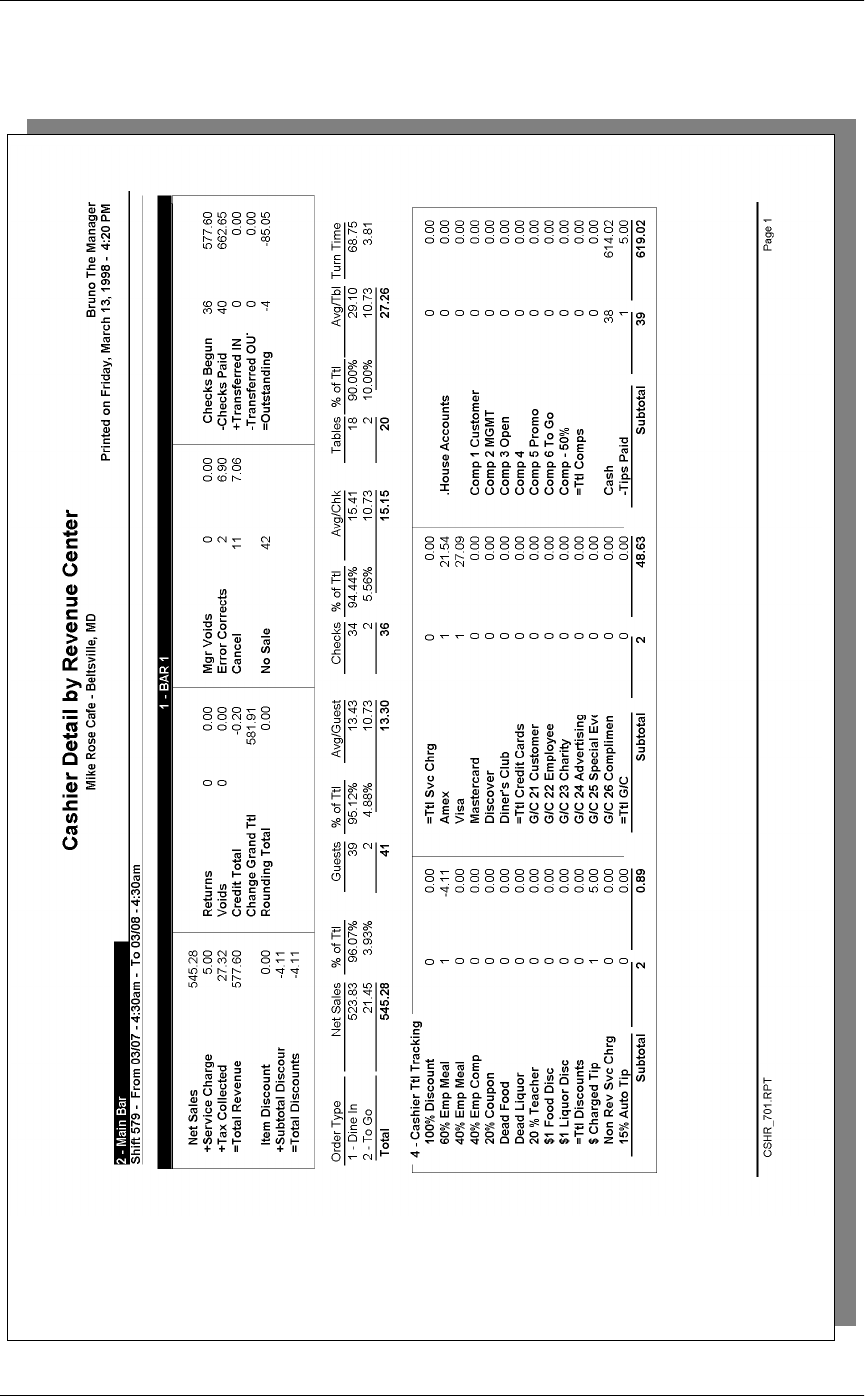
(PSOR\HH5HSRUWV
&DVKLHU'HWDLO7RWDOVE\5HYHQXH&HQWHU
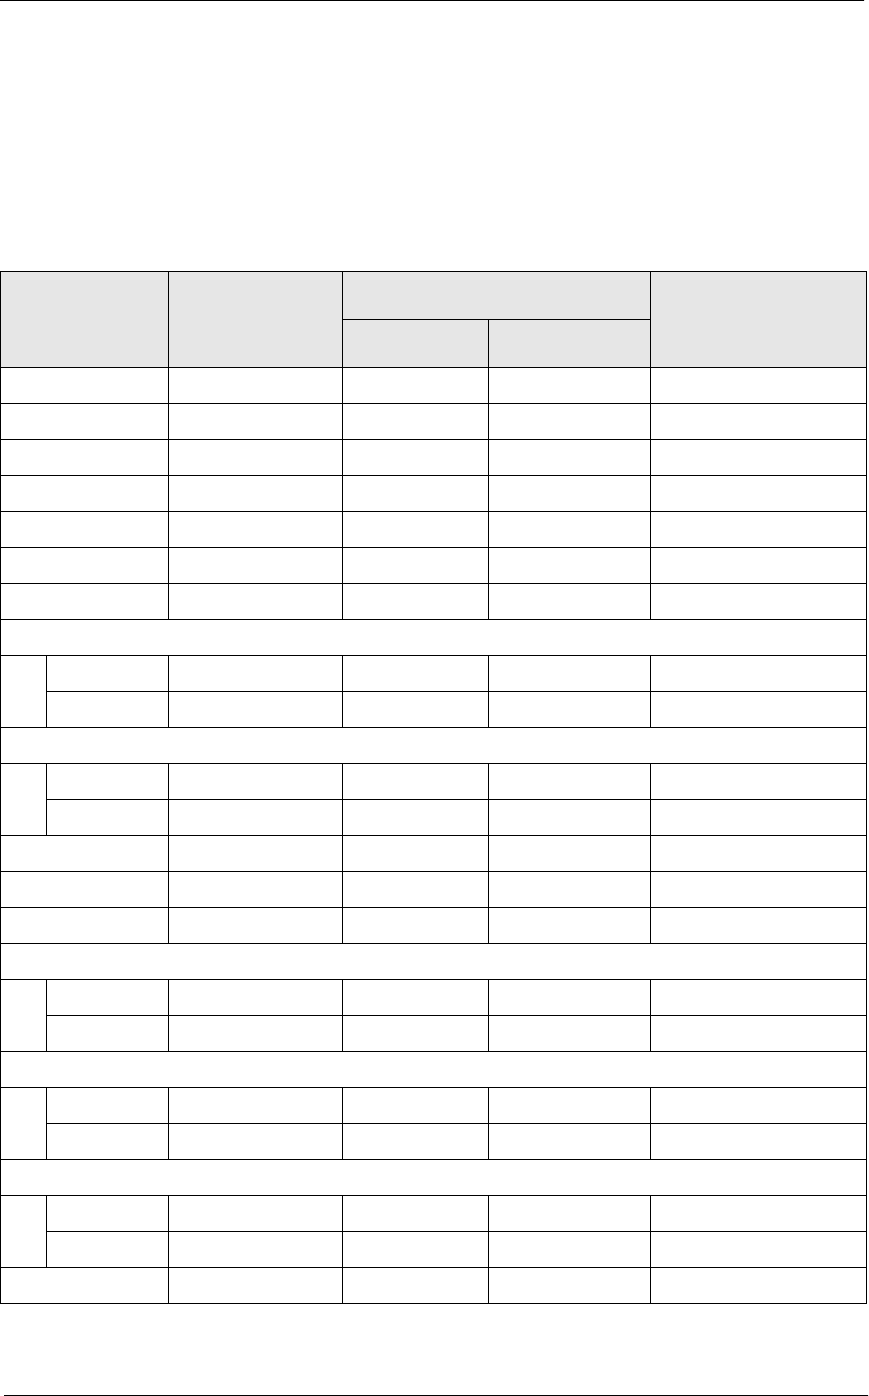
5HSRUWV
(PSOR\HH5HSRUWV
&DVKLHU'HWDLO7RWDOVE\5HYHQXH&HQWHU
Detailed Sales Profile Details
Views: v_R_rvc_cashier and v_R_rvc_cashier_trk
Stored Procedure: sp_R_rvc_cashier_sales_tracking
The following table lists each field in the Detailed Sales profile and
provides detailed information on the source of each of the figures.
Report
Field
Title
View
Column
Title
3700 Database Formula
Table Column
Net Sales @ttl_Net_Sales
Service Charges @ttl_Service_Chg
Tax Collected @ttl_Tax_Collected
Total Revenue @ttl_Total_Revenue
Item Discount @ttl_Item_Disc
Subtotal Discount @ttl_Sbtl_Disc
Total Discount @ttl_Total_Disc
Return
Number @ttl_Return_Qty
Value @ttl_Return_Total
Void
Number @ttl_Void_Qty
Value @ttl_Void_Total
Credit Total credit_ttl shift_rvc_cshr_ttl credit_ttl
Change In Grand Ttl change_grand_ttl shift_rvc_cshr_ttl change_grand_ttl
Rounding Total rounding_ttl shift_rvc_cshr_ttl rounding_ttl
Mgr Void
Number @ttl_Mgr_Void_Qty
Value @ttl_Mgr_Void_Total
Error Correct
Number @ttl_Error_Correct_Qty
Value @ttl_Error_Correct_Total
Cancel
Number @ttl_Trans_Cancel_Qty
Value @ttl_Trans_Cancel_Total
No Sale no_sale_cnt shift_rvc_cshr_ttl no_sale_cnt
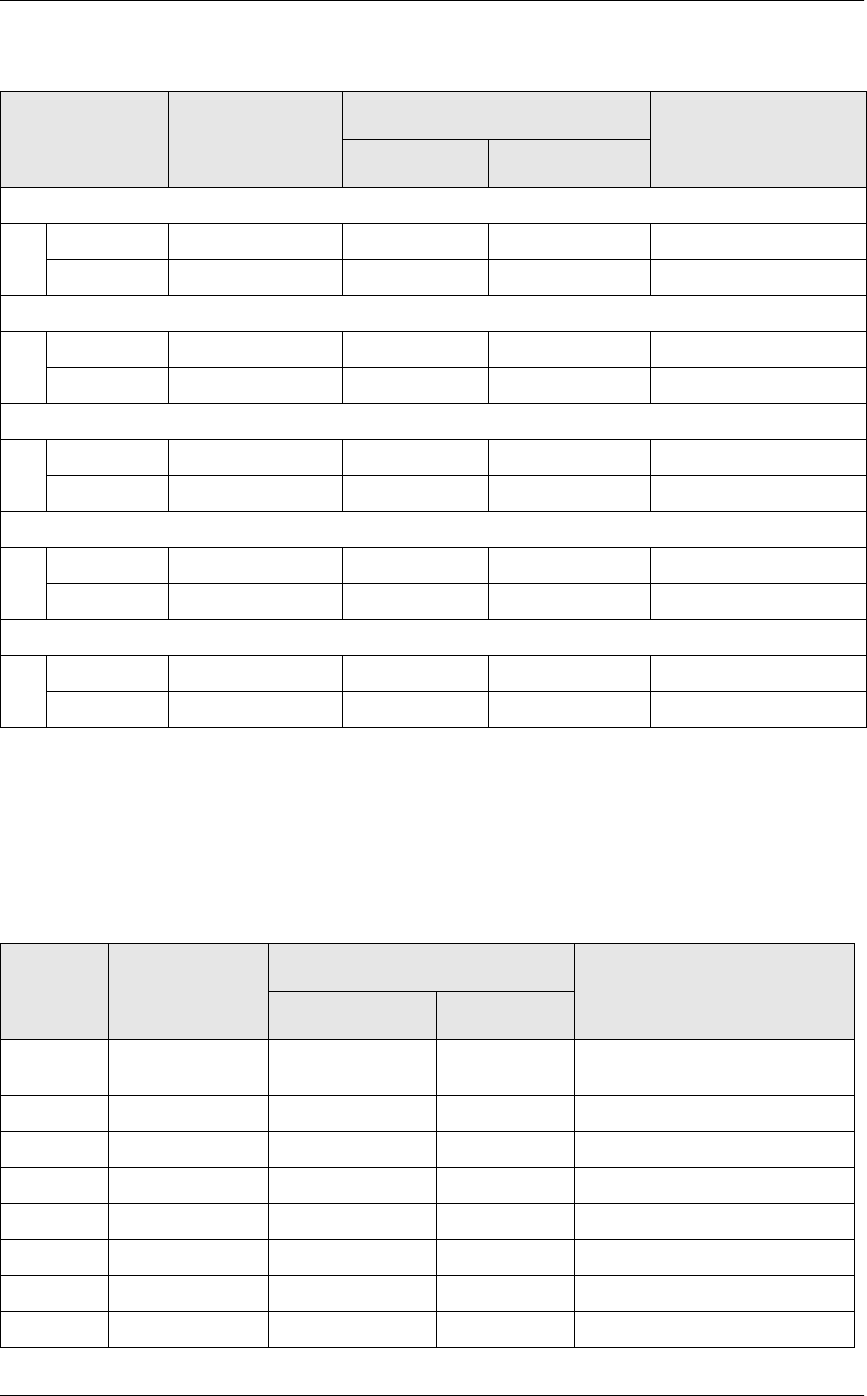
(PSOR\HH5HSRUWV
&DVKLHU'HWDLO7RWDOVE\5HYHQXH&HQWHU
Sales and Guest Profile Details
Views: v_R_rvc_cashier and v_R_rvc_cashier_trk
Stored Procedure: sp_R_rvc_cashier_sales_tracking
The following table lists each field in the Sales profile and provides detailed
information on the source of each of the figures.
Checks Begun
Number @ttl_Checks_Begun_Qty
Value @ttl_Checks_Begun_Total
Checks Paid
Number @ttl_Checks_Paid_Qty
Value @ttl_Checks_Paid_Total
Transferred IN
Number chk_xfer_in_cnt shift_rvc_cshr_ttl check_xfer_in_cnt
Value chk_xfer_in_ttl shift_rvc_cshr_ttl check_xfer_in_ttl
Transferred OUT
Number chk_xfer_out_cnt shift_rvc_cshr_ttl check_xfer_out_ttl
Value chk_xfer_out_ttl shift_rvc_cshr_ttl check_xfer_out_ttl
Outstanding
Number @ttl_Outstanding_Qty
Value @ttl_Outstanding_Total
Report
Column
Title
View
Column
Title
3700 Database Formula
Table Column
Order Type @lbl_Order_Type_Num_And_Nam
e
Net Sls ot_net_sales_ttl shift_rvc_cshr_ot_ttl net_sls_ttl
% of Ttl @Percent_Of_Net_Total
Guests cover_count shift_rvc_cshr_ot_ttl cov_cnt
% of Ttl @Percent_Of_Guest_Total
Avg/Guest @Avg_$_Guest
Checks check_count shift_rvc_cshr_ot_ttl chk_cnt
% of Ttl @Percent_Of_Check_Total
Report
Field
Title
View
Column
Title
3700 Database Formula
Table Column
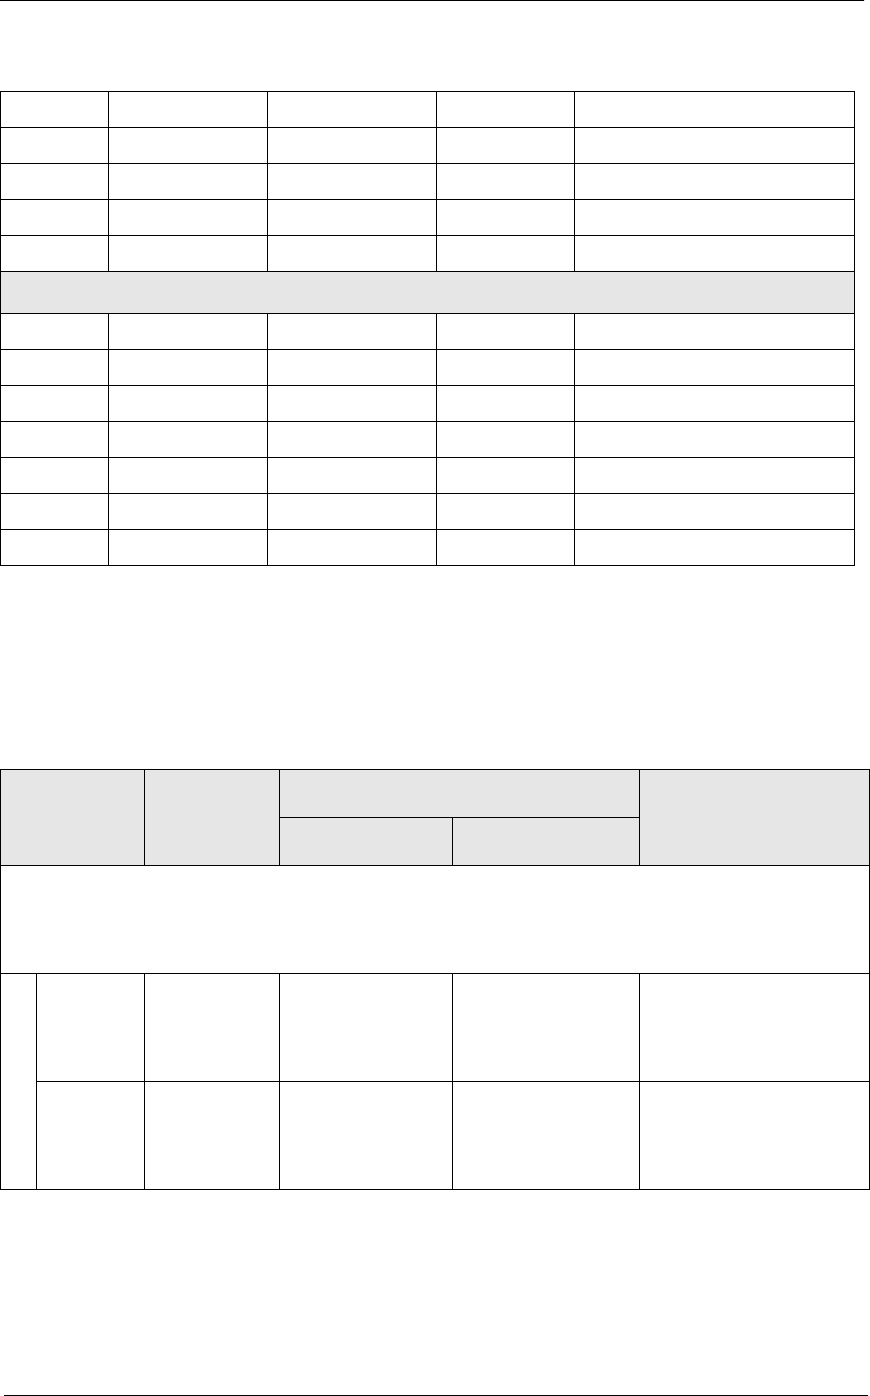
5HSRUWV
(PSOR\HH5HSRUWV
&DVKLHU'HWDLO7RWDOVE\5HYHQXH&HQWHU
Tracking Group Profile Details
Views: v_R_rvc_cashier and v_R_rvc_cashier_trk
Stored Procedure: sp_R_rvc_cashier_sales_tracking
The following table lists each field in the Tracking Group profile and
provides detailed information on the source of each figure.
Avg/Chk @Avg_$_Check
Tables table_turn_count shift_rvc_cshr_ot_ttl tbl_turn_cnt
% of Ttl @Percent_Of_Table_Total
Avg/Tbl @Avg_$_Table
Turn Time @Avg_Turn_Time
Total
Net Sls ∑ ot_net_sales_ttl shift_rvc_cshr_ot_ttl net_sls_ttl
Guests ∑ cover_count shift_rvc_cshr_ot_ttl cov_cnt
Avg/Guest @Total_Avg_$_Guest
Checks ∑ check_count shift_rvc_cshr_ot_ttl chk_cnt
Avg/Chk @Total_Avg_$_Check
Tables ∑ table_turn_count shift_rvc_cshr_ot_ttl tbl_turn_cnt
Avg/Tbl @Total_Avg_$_Table
Report
Column
Title
View
Column
Title
3700 Database Formula
Table Column
Programmable1
to
Programmable42
Number trk_cnt_01
to
trk_cnt_42
shift_rvc_cshr_trk_ttl trk_cnt_01
to
trk_cnt_42
Value trk_ttl_01
to
trk_cnt_42
shift_rvc_cshr_trk_ttl trk_ttl_01
to
trk_ttl_42

(PSOR\HH5HSRUWV
&DVKLHU'HWDLO7RWDOVE\5HYHQXH&HQWHU
Programming Considerations
*HQHUDO
qRVC Posting | Options | Current round posts to transaction employee
determines if totals are posted to the cashier linked to the check
employee or the transaction employee.
Select this option to post totals to the cashier linked to the check
employee if the transaction employee does not have a cashier linked.
Clear this option to always post tendering totals to the cashier linked
to the transaction employee.
qWithin a revenue center, a cashier may be required for all
transactions, only for tendering actions, or not at all. On RVC
Transactions | Cashier, the following options determine when a
cashier is required:
Require cashier for all transactions
Require cashier for pickup / loan and tips
qSelect User Workstations | Cashier | Assign cashier by UWS to define
a cashier as a time period or shift.
*XHVWV
qThe number of guests is determined by the seat count, the number of
specified service charges or menu items, or by the guest count entered
by the employees.
To use seat count to determine the number of guests, select RVC Seats
| Use seat count for cover count.
To use a service charge to determine the number of guests, select
Discount/Service | Discount/Service Charge | Post to cover count.
To use specified menu items to determine the number of guests, select
Menu Item Classes | Price/Totals | Add to cover count. Then assign
this menu item class to the menu items that will determine the guest
count.
If none of these options is selected, the system will use the guest
count entered by employees when beginning checks as the guest
count.
Notes
7\SHVRI&DVKLHUV
Depending on how a restaurant operates, cashiers can be a useful means of
tracking cash flow and balancing media (payments and receipts) at a UWS
and/or a cash drawer level.
You can define two types of cashiers: a cashier as an employee or a cashier
as a time period, or shift. When the cashier is defined as a person, totals are
linked to the employee or cash drawer. Using this method, employees can
be held accountable for balancing their individual media.
When the cashier is defined as a shift, totals are linked to a UWS. Then, all
employees who work at the UWS during the same period add to the set of

5HSRUWV
(PSOR\HH5HSRUWV
&DVKLHU'HWDLO7RWDOVE\5HYHQXH&HQWHU
totals. Using this method, no single employee can be held accountable for
the media that is collected. This is useful when many employees share a
common bank, such as at a counter service or bar area.
7UDFNLQJ7RWDOV
Each defined cashier can be assigned to different tracking totals. When a
specific employee is assigned as a cashier, tracking totals can provide
useful cash drawer balancing information.
%DODQFLQJ1RWHV
The combination of revenue center and UWS programming affects the
totals that appear in a cashier report.
If a cashier is required for all transactions, and the cashier is assigned by
workstation, the cashier reports will reflect all transaction activity during
the period of the report.
If a cashier is required for all transactions and cashiers are assigned as
individual employees who close their own checks, a given cashier report
will be identical to the individual’s Employee Detail Report.

(PSOR\HH5HSRUWV
&RQVROLGDWHG&DVKLHU'HWDLO7RWDOV
Consolidated Cashier Detail Totals
3XUSRVH
The Consolidated Cashier Detail Report provides the same information as
the Cashier Detail Report, but for a range of business days.
)RUPDW
This report includes the following profiles:
qDetailed Sales profile
The profile has been modified for this report. It does not include this
field:
Turn Time
qSales and Guest profile
qTracking Group profile
7HPSODWH
CSHR_102.RPT
2-3
2-26
2-33

5HSRUWV
(PSOR\HH5HSRUWV
&RQVROLGDWHG&DVKLHU'HWDLO7RWDOV
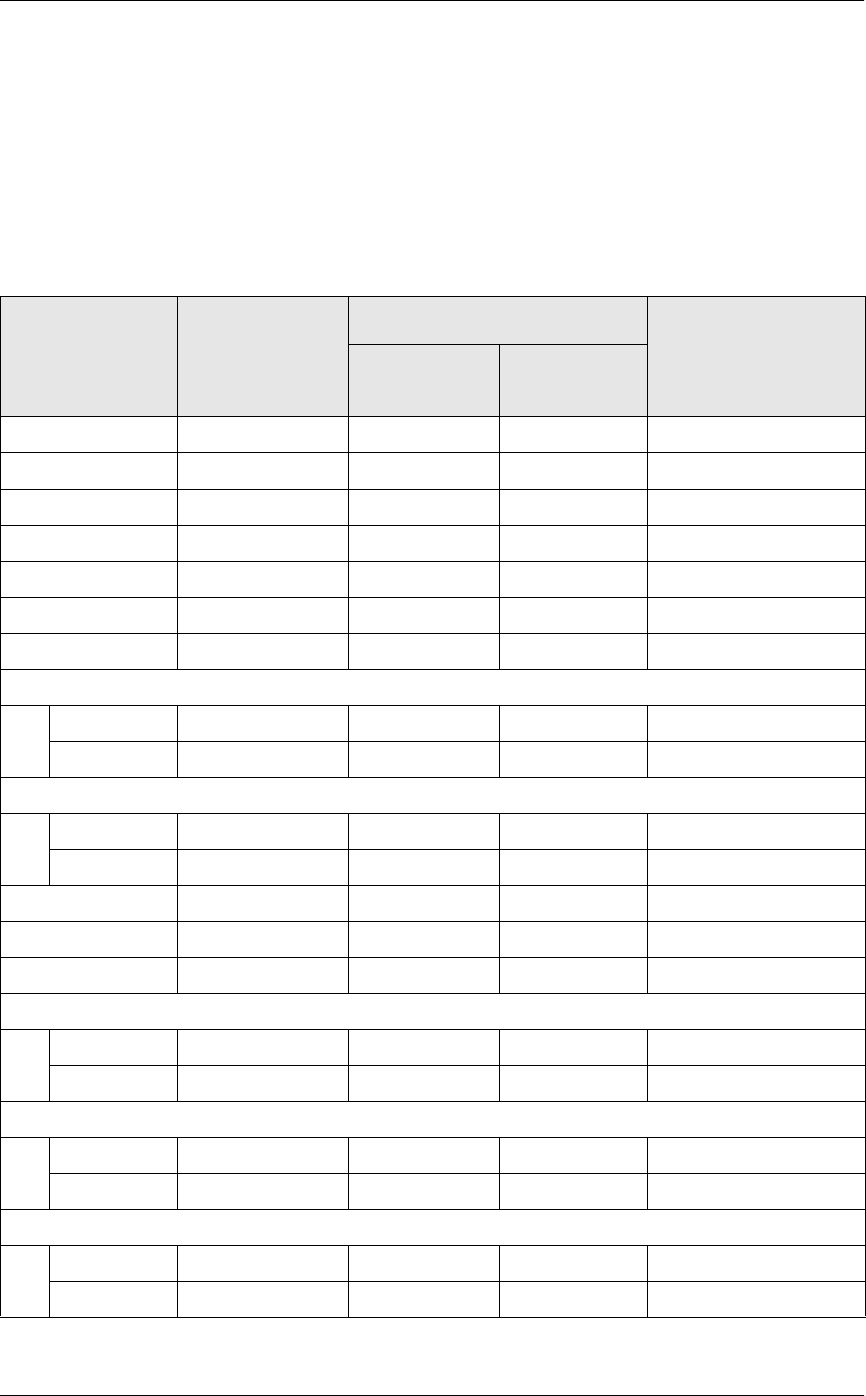
(PSOR\HH5HSRUWV
&RQVROLGDWHG&DVKLHU'HWDLO7RWDOV
Detailed Sales Profile Details
Stored Procedures: sp_R_cons_cshr_ttls and
sp_R_cashier_sales_tracking
This report does not use any views.
The following table lists each field in the Detailed Sales profile and
provides detailed information on the source of each of the figures.
Report
Field
Title
Stored
Procedure
Column
Title
3700 Database
Formula
Table Column
Net Sales @ttl_Net_Sales
Service Charge @ttl_Service_Chg
Tax Collected @ttl_Tax_Collected
Total Revenue @ttl_Total_Revenue
Item Discount @ttl_Item_Disc
Subtotal Discount @ttl_Sbtl_Disc
Total Discount @ttl_Total_Disc
Return
Number @ttl_Return_Qty
Value @ttl_Return_Total
Void
Number @ttl_Void_Qty
Value @ttl_Void_Total
Credit Total credit_ttl shift_cshr_ttl credit_ttl
Change In Grand Ttl change_grand_ttl shift_cshr_ttl change_grand_ttl
Rounding Total rounding_ttl shift_cshr_ttl rounding_ttl
Mgr Void
Number @ttl_Mgr_Void_Qty
Value @ttl_Mgr_Void_Total
Error Correct
Number @ttl_Error_Correct_Qty
Value @ttl_Error_Correct_Total
Cancel
Number @ttl_Trans_Cancel_Qty
Value @ttl_Trans_Cancel_Total
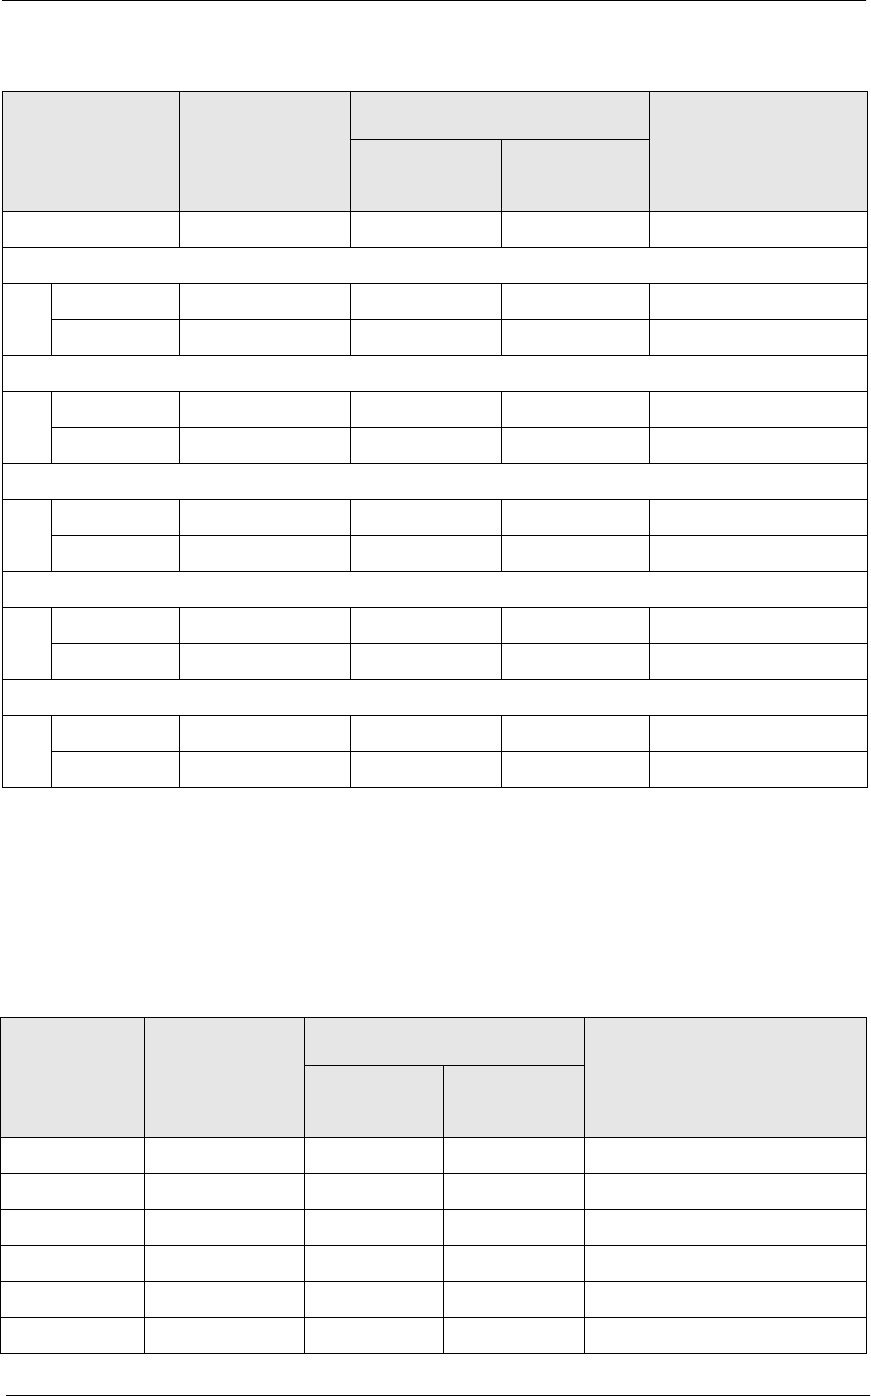
5HSRUWV
(PSOR\HH5HSRUWV
&RQVROLGDWHG&DVKLHU'HWDLO7RWDOV
Sales and Guest Profile Details
Stored Procedures: sp_R_cons_cshr_ttls and
sp_R_cashier_sales_tracking
This report does not use any views.
The following table lists each field in the Sales and Guest profile and
provides information on the source of each figure.
No Sale no_sale_cnt shift_cshr_ttl no_sale_cnt
Checks Begun
Number @ttl_Checks_Begun_Qty
Value @ttl_Checks_Begun_Total
Checks Paid
Number @ttl_Checks_Paid_Qty
Value @ttl_Checks_Paid_Total
Transferred IN
Number chk_xfer_in_cnt shift_cshr_ttl chk_xfer_in_cnt
Value chk_xfer_in_ttl shift_cshr_ttl chk_xfer_in_ttl
Transferred OUT
Number chk_xfer_out_cnt shift_cshr_ttl chk_xfer_out_cnt
Value chk_xfer_out_ttl shift_cshr_ttl chk_xfer_out_ttl
Outstanding
Number @ttl_Outstanding_Qty
Value @ttl_Outstanding_Total
Report
Column
Title
Stored
Procedure
Column
Title
3700 Database
Formula
Table Column
Order Type @lbl_Order_Type_Num_And_Name
Net Sls ot_net_sales_ttl shift_cshr_ot_ttl net_sales_ttl
% of Ttl @Percent_Of_Net_Total
Guests cover_count shift_cshr_ot_ttl cov_cnt
Report
Field
Title
Stored
Procedure
Column
Title
3700 Database
Formula
Table Column
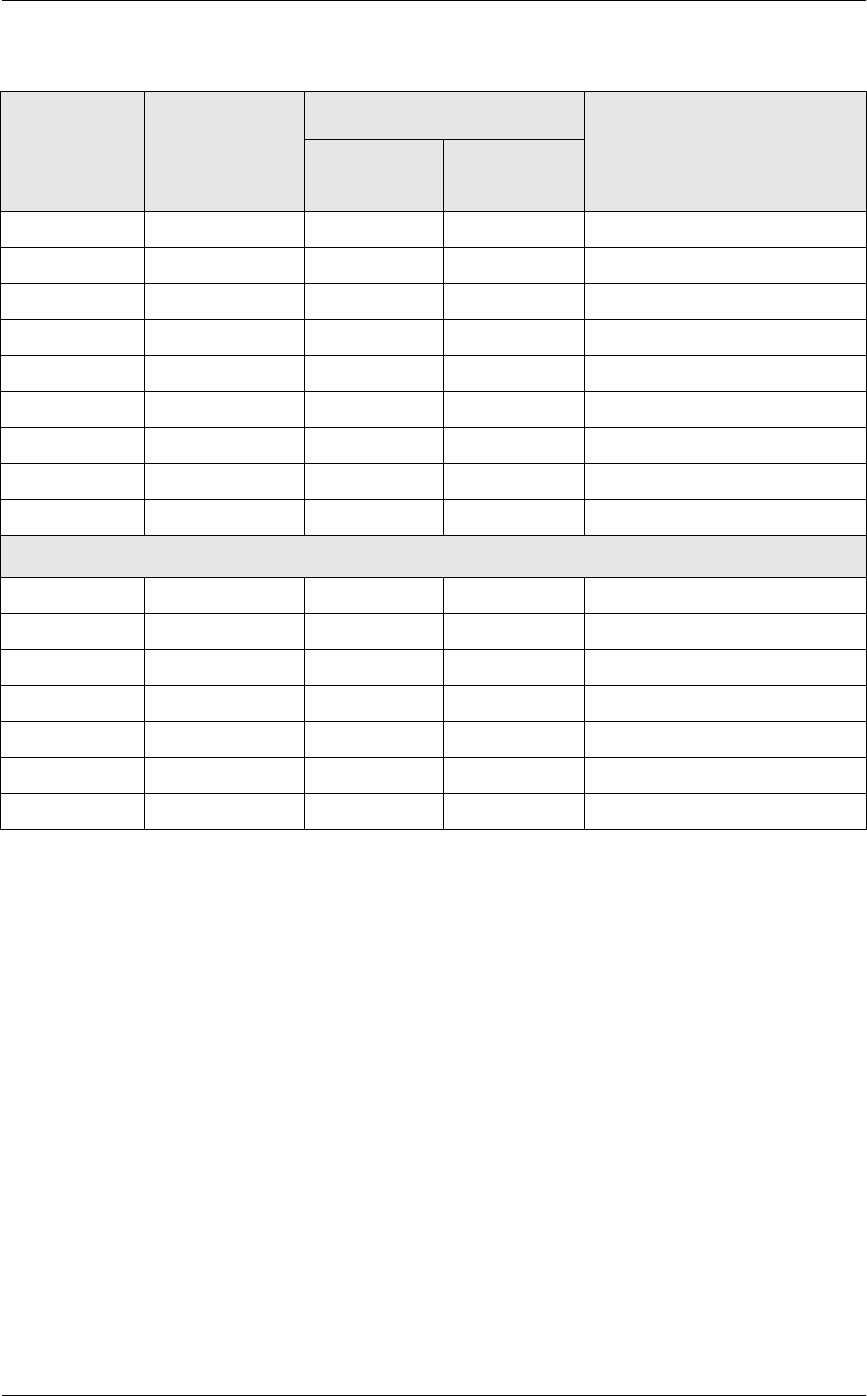
(PSOR\HH5HSRUWV
&RQVROLGDWHG&DVKLHU'HWDLO7RWDOV
% of Ttl @Percent_Of_Guest_Total
Avg/Guest @Avg_$_Guest
Checks check_count shift_cshr_ot_ttl chk_cnt
% of Ttl @Percent_Of_Check_Total
Avg/Chk @Avg_$_Check
Tables table_turn_count shift_cshr_ot_ttl tbl_turn_cnt
% of Ttl @Percent_Of_Table_Total
Avg/Tbl @Avg_$_Table
Turn Time @Avg_Turn_Time
Total
Net Sls ∑ ot_net_sales_ttl shift_cshr_ot_ttl net_sales_ttl
Guests ∑ cover_count shift_cshr_ot_ttl cov_cnt
Avg/Guest @Total_Avg_$_Guest
Checks ∑ check_count shift_cshr_ot_ttl chk_cnt
Avg/Chk @Total_Avg_$_Check
Tables ∑ table_turn_count shift_cshr_ot_ttl tbl_turn_cnt
Avg/Tbl @Total_Avg_$_Table
Report
Column
Title
Stored
Procedure
Column
Title
3700 Database
Formula
Table Column

5HSRUWV
(PSOR\HH5HSRUWV
&RQVROLGDWHG&DVKLHU'HWDLO7RWDOV
Tracking Group Profile Details
Stored Procedures: sp_R_cons_cshr_ttls and
sp_R_cashier_sales_tracking
This report does not use any views.
The following table lists each field in the Tracking Group profile and
provides detailed information on the source of each figure.
Programming Considerations
*HQHUDO
qRVC Posting | Options | Current round posts to transaction employee
determines if totals are posted to the cashier linked to the check
employee or the transaction employee.
Select this option to post totals to the cashier linked to the check
employee if the transaction employee does not have a cashier linked.
Clear this option to always post tendering totals to the cashier linked
to the transaction employee.
qWithin a revenue center, a cashier may be required for all
transactions, only for tendering actions, or not at all. On RVC
Transactions | Cashier, the following options determine when a
cashier is required:
Require cashier for all transactions
Require cashier for pickup / loan and tips
qSelect User Workstations | Cashier | Assign cashier by UWS to define
a cashier as a time period or shift.
Report
Column
Title
Stored
Procedure
Column
Title
3700 Database
Formula
Table Column
Programmable1
to
Programmable42
Number trk_cnt_01
to
trk_cnt_42
shift_cshr_trk_ttl trk_cnt_01
to
trk_cnt_42
Value trk_ttl_01
to
trk_cnt_42
shift_cshr_trk_ttl trk_ttl_01
to
trk_cnt_42

(PSOR\HH5HSRUWV
&RQVROLGDWHG&DVKLHU'HWDLO7RWDOV
*XHVWV
qThe number of guests is determined by the seat count, the number of
specified service charges or menu items, or by the guest count entered
by the employees.
To use seat count to determine the number of guests, select RVC Seats
| Use seat count for cover count.
To use a service charge to determine the number of guests, select
Discount/Service | Discount/Service Charge | Post to cover count.
To use specified menu items to determine the number of guests, select
Menu Item Classes | Price/Totals | Add to cover count. Then assign
this menu item class to the menu items that will determine the guest
count.
If none of these options is selected, the system will use the guest
count entered by employees when beginning checks as the guest
count.
Notes
7\SHVRI&DVKLHUV
Depending on how a restaurant operates, cashiers are a useful means of
tracking cash flow and balancing media (payments and receipts) at a UWS
and/or a cash drawer level.
You can define two types of cashiers: a cashier as an employee or a cashier
as a time period, or shift. When the cashier is defined as a person, totals are
linked to the employee or cash drawer. Using this method, employees can
be held accountable for balancing their individual media.
When the cashier is defined as a shift, totals are linked to a UWS. Then, all
employees who work at the UWS during the same period add to the set of
totals. Using this method, no single employee can be held accountable for
the media that is collected. This is useful when many employees share a
common bank, such as at a counter service or bar area.
7UDFNLQJ7RWDOV
Each defined cashier can have a different tracking totals group assigned.
When a specific employee is assigned as a cashier, tracking totals can
provide useful cash drawer balancing information.
%DODQFLQJ1RWHV
The combination of revenue center and UWS programming affects the
totals that appear in a cashier report.
If a cashier is required for all transactions, and the cashier is assigned by
workstation, the cashier reports will reflect all transaction activity during
the period of the report.
If a cashier is required for all transactions and cashiers are assigned as
individual employees who close their own checks, a given cashier report
will be identical to the individual’s Employee Detail Report.

5HSRUWV
(PSOR\HH5HSRUWV
&RQVROLGDWHG&DVKLHU'HWDLO7RWDOVE\5HYHQXH&HQWHU
Consolidated Cashier Detail Totals by Revenue Center
3XUSRVH
The Consolidates Cashier Detail Report by Revenue Center provides
tracking information for a range of business days for a Revenue Center.
)RUPDW
This report includes the following profiles:
qDetail Sales profile
This profile has been modified for this report. It does not include this
field:
Turn Time
qSales and Guest profile
qTracking Group profile
7HPSODWH
CSHR_702.RPT
2-3
2-26
2-33
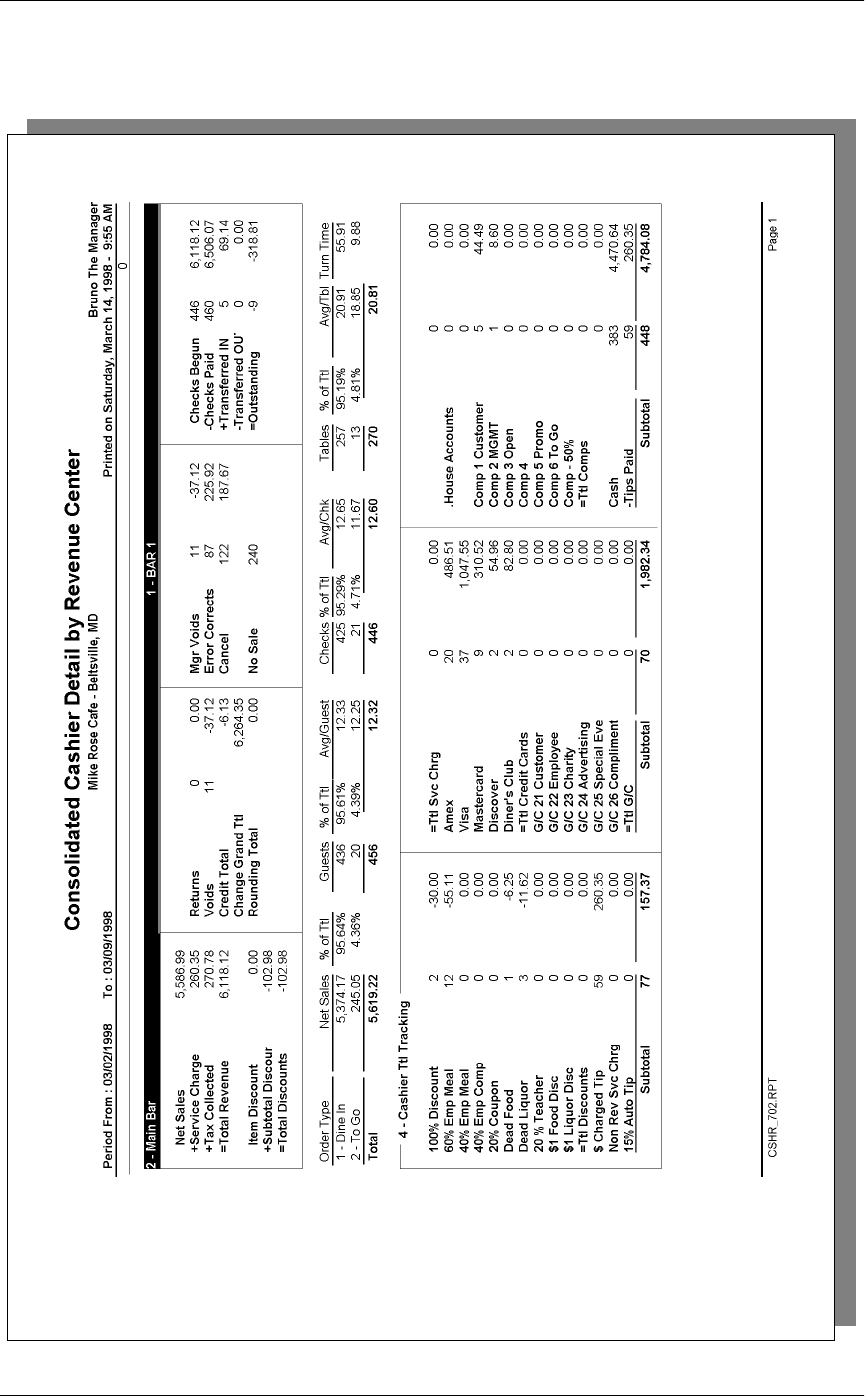
(PSOR\HH5HSRUWV
&RQVROLGDWHG&DVKLHU'HWDLO7RWDOVE\5HYHQXH&HQWHU
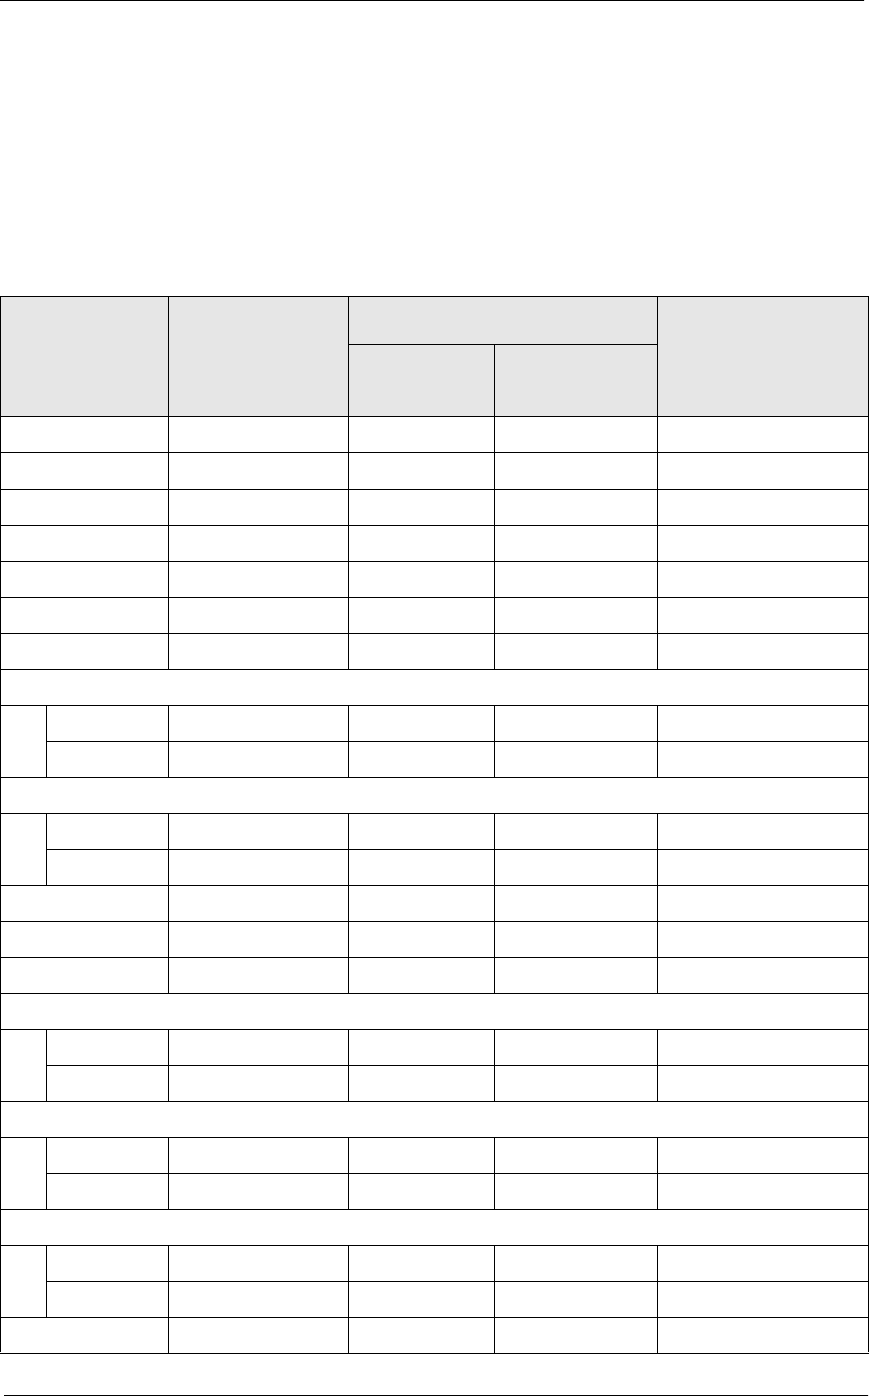
5HSRUWV
(PSOR\HH5HSRUWV
&RQVROLGDWHG&DVKLHU'HWDLO7RWDOVE\5HYHQXH&HQWHU
Detailed Sales Profile Details
Stored Procedures: sp_R_cons_rvc_cshr_ttls and
sp_R_rvc_cashier_sales_tracking
This report does not use any views.
The following table lists each field in the Detailed Sales profile and
provides detailed information on the source of each of the figures.
Report
Field
Title
Stored
Procedure
Column
Title
3700 Database
Formula
Table Column
Net Sales @ttl_Net_Sales
Service Charges @ttl_Service_Chg
Tax Collected @ttl_Tax_Collected
Total Revenue @ttl_Total_Revenue
Item Discount @ttl_Item_Disc
Subtotal Discount @ttl_Sbtl_Disc
Total Discount @ttl_Total_Disc
Return
Number @ttl_Return_Qty
Value @ttl_Return_Total
Void
Number @ttl_Void_Qty
Value @ttl_Void_Total
Credit Total credit_ttl shift_rvc_cshr_ttl credit_ttl
Change In Grand Ttl change_grand_ttl shift_rvc_cshr_ttl change_grand_ttl
Rounding Total rounding_ttl shift_rvc_cshr_ttl rounding_ttl
Mgr Void
Number @ttl_Mgr_Void_Qty
Value @ttl_Mgr_Void_Total
Error Correct
Number @ttl_Error_Correct_Qty
Value @ttl_Error_Correct_Total
Cancel
Number @ttl_Trans_Cancel_Qty
Value @ttl_Trans_Cancel_Total
No Sale no_sale_cnt shift_rvc_cshr_ttl no_sale_cnt
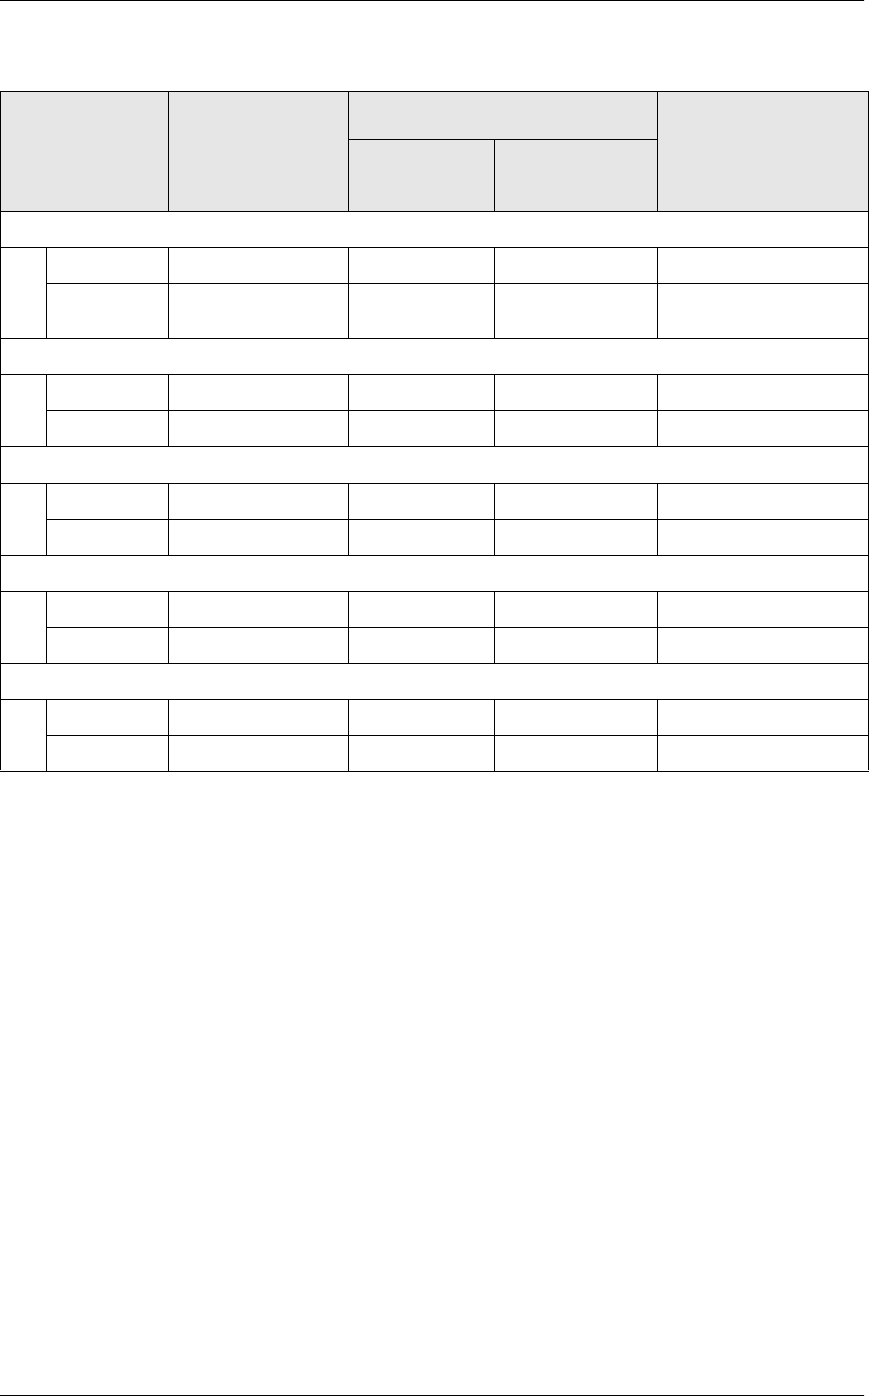
(PSOR\HH5HSRUWV
&RQVROLGDWHG&DVKLHU'HWDLO7RWDOVE\5HYHQXH&HQWHU
Checks Begun
Number @ttl_Checks_Begun_Qty
Value @ttl_Checks_Begun_Tot
al
Checks Paid
Number @ttl_Checks_Paid_Qty
Value @ttl_Checks_Paid_Total
Transferred IN
Number chk_xfer_in_cnt shift_rvc_cshr_ttl chk_xfer_in_cnt
Value chk_xfer_in_ttl shift_rvc_cshr_ttl chk_xfer_in_ttl
Transferred OUT
Number chk_xfer_out_cnt shift_rvc_cshr_ttl chk_xfer_out_cnt
Value chk_xfer_out_ttl shift_rvc_cshr_ttl chk_xfer_out_ttl
Outstanding
Number @ttl_Outstanding_Qty
Value @ttl_Outstanding_Total
Report
Field
Title
Stored
Procedure
Column
Title
3700 Database
Formula
Table Column
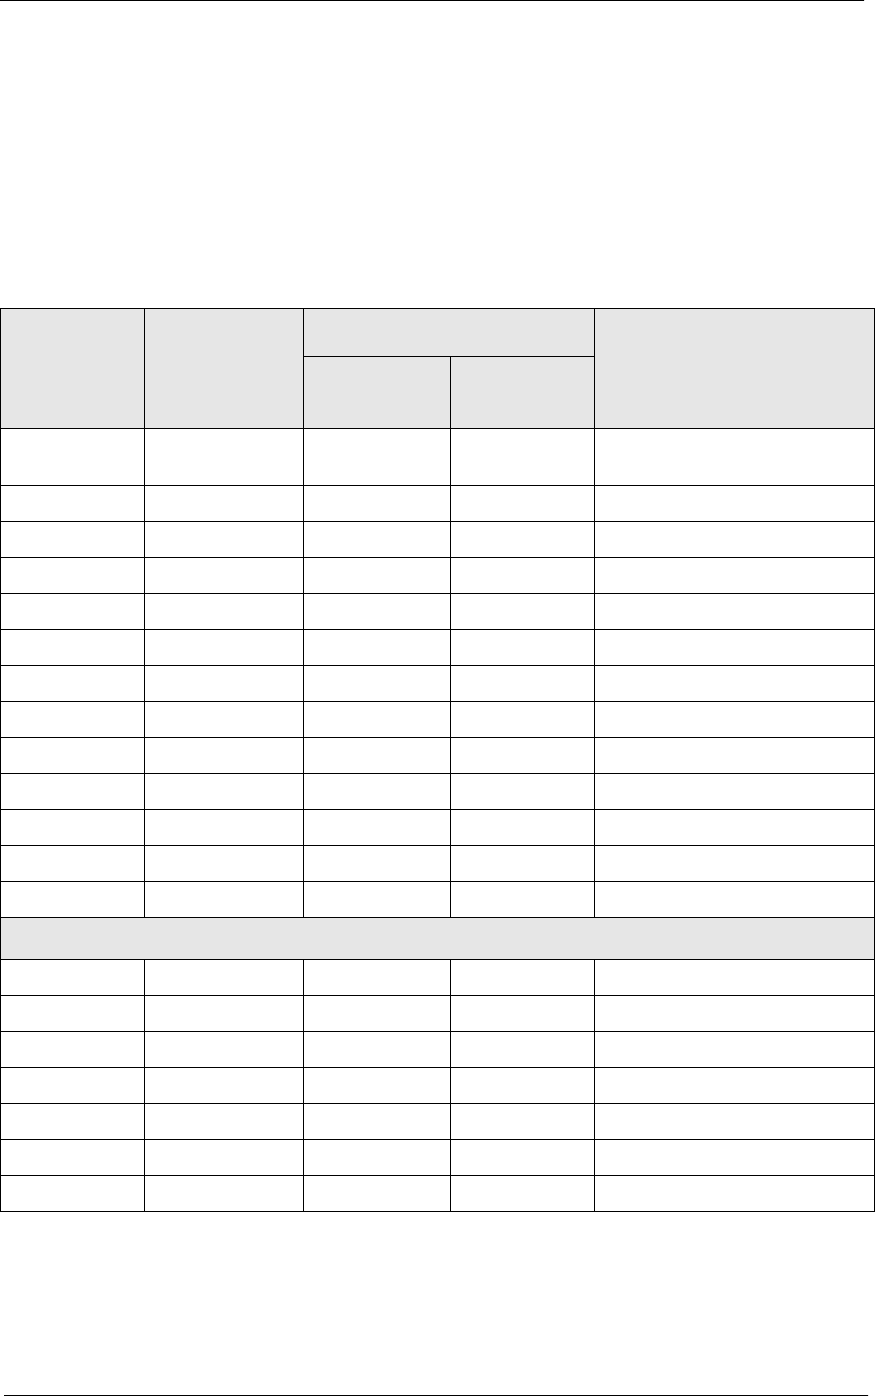
5HSRUWV
(PSOR\HH5HSRUWV
&RQVROLGDWHG&DVKLHU'HWDLO7RWDOVE\5HYHQXH&HQWHU
Sales and Guest Profile Details
Stored Procedures: sp_R_cons_rvc_cshr_ttls and
sp_R_rvc_cashier_sales_tracking
This report does not use any views.
The following table lists each field in the Sales profile and provides detailed
information on the source of each of the figures.
Report
Column
Title
Stored
Procedure
Column
Title
3700 Database
Formula
Table Column
Order Type @lbl_Order_Type_Num_And_Nam
e
Net Sls ot_net_sales_ttl shift_rvc_cshr_ttl ot_net_sales_ttl
% of Ttl @Percent_Of_Net_Total
Guests cover_count shift_rvc_cshr_ttl cover_count
% of Ttl @Percent_Of_Guest_Total
Avg/Guest @Avg_$_Guest
Checks check_count shift_rvc_cshr_ttl check_count
% of Ttl @Percent_Of_Check_Total
Avg/Chk @Avg_$_Check
Tables table_turn_count shift_rvc_cshr_ttl table_turn_count
% of Ttl @Percent_Of_Table_Total
Avg/Tbl @Avg_$_Table
Turn Time @Avg_Turn_Time
Total
Net Sls ∑ ot_net_sales_ttl shift_rvc_cshr_ttl ot_net_sales_ttl
Guests ∑ cover_count shift_rvc_cshr_ttl cover_count
Avg/Guest @Total_Avg_$_Guest
Checks ∑ check_count shift_rvc_cshr_ttl check_count
Avg/Chk @Total_Avg_$_Check
Tables ∑ table_turn_count shift_rvc_cshr_ttl table_turn_count
Avg/Tbl @Total_Avg_$_Table
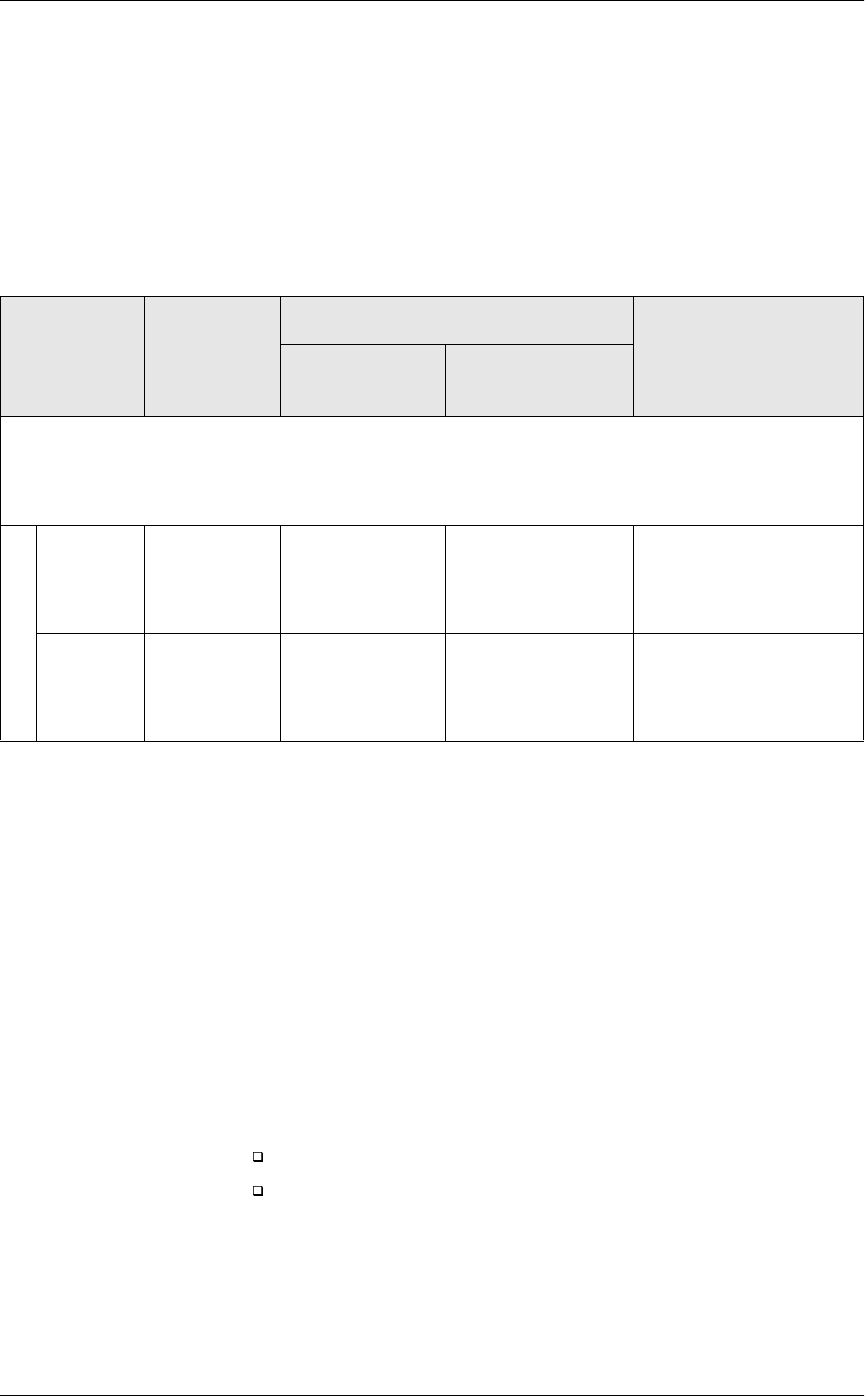
(PSOR\HH5HSRUWV
&RQVROLGDWHG&DVKLHU'HWDLO7RWDOVE\5HYHQXH&HQWHU
Tracking Group Profile Details
Stored Procedures: sp_R_cons_rvc_cshr_ttls and
sp_R_rvc_cashier_sales_tracking
This report does not use any views.
The following table lists each field in the Tracking Group profile and
provides detailed information on the source of each figure.
Programming Considerations
*HQHUDO
qRVC Posting | Options | Current round posts to transaction employee
determines if totals are posted to the cashier linked to the check
employee or the transaction employee.
Select this option to post totals to the cashier linked to the check
employee if the transaction employee does not have a cashier linked.
Clear this option to always post tendering totals to the cashier linked
to the transaction employee.
qWithin a revenue center, a cashier may be required for all
transactions, only for tendering actions, or not at all. On RVC
Transactions | Cashier, the following options determine when a
cashier is required:
Require cashier for all transactions
Require cashier for pickup / loan and tips
qSelect User Workstations | Cashier | Assign cashier by UWS to define
a cashier as a time period or shift.
Report
Column
Title
Stored
Procedure
Column
Title
3700 Database
Formula
Table Column
Programmable1
to
Programmable42
Number trk_cnt_01
to
trk_cnt_42
shift_rvc_cshr_ttl trk_cnt_01
to
trk_cnt_42
Value trk_ttl_01
to
trk_cnt_42
shift_rvc_cshr_ttl trk_ttl_01
to
trk_ttl_42

5HSRUWV
(PSOR\HH5HSRUWV
&RQVROLGDWHG&DVKLHU'HWDLO7RWDOVE\5HYHQXH&HQWHU
*XHVWV
qThe number of guests is determined by the seat count, the number of
specified service charges or menu items, or by the guest count entered
by the employees.
To use seat count to determine the number of guests, select RVC Seats
| Use seat count for cover count.
To use a service charge to determine the number of guests, select
Discount/Service | Discount/Service Charge | Post to cover count.
To use specified menu items to determine the number of guests, select
Menu Item Classes | Price/Totals | Add to cover count. Then assign
this menu item class to the menu items that will determine the guest
count.
If none of these options is selected, the system will use the guest
count entered by employees when beginning checks as the guest
count.
Notes
7\SHVRI&DVKLHUV
Depending on how a restaurant operates, cashiers are a useful means of
tracking cash flow and balancing media (payments and receipts) at a UWS
and/or a cash drawer level.
You can define two types of cashiers: a cashier as an employee or a cashier
as a time period, or shift. When the cashier is defined as a person, totals are
linked to the employee or cash drawer. Using this method, employees can
be held accountable for balancing their individual media.
When the cashier is defined as a shift, totals are linked to a UWS. Then, all
employees who work at the UWS during the same period add to the set of
totals. Using this method, no single employee can be held accountable for
the media that is collected. This is useful when many employees share a
common bank, such as at a counter service or bar area.
7UDFNLQJ7RWDOV
Each defined cashier can have a different tracking totals group assigned.
When a specific employee is assigned as a cashier, tracking totals can
provide useful cash drawer balancing information.
%DODQFLQJ1RWHV
The combination of revenue center and UWS programming affects the
totals that appear in a cashier report.
If a cashier is required for all transactions, and the cashier is assigned by
workstation, the cashier reports will reflect all transaction activity during
the period of the report.
If a cashier is required for all transactions and cashiers are assigned as
individual employees who close their own checks, a given cashier report
will be identical to the individual’s Employee Detail Report.
(PSOR\HH5HSRUWV
(PSOR\HH'HWDLO7RWDOV
Employee Detail Totals
3XUSRVH
The Daily Employee Detail report provides detailed financial information
for an individual employee or a range of employees. This information can
be used to balance an employee’s bank, determine tips due, or track an
employee’s sales performance.
)RUPDW
This report includes the following profiles:
qDetailed Sales and Tip profile
The profile has been modified for this report. It includes these extra
fields:
No Sale
Transferred In
Transferred Out
It does not include these fields:
Non Taxable Total
Grand Total
qSales and Guest profile
qTracking Group profile
7HPSODWH
EMP_101.RPT
Note
This report can be run as a UWS report and looks like the 40-
column Crystal Report
2-9
2-26
2-33
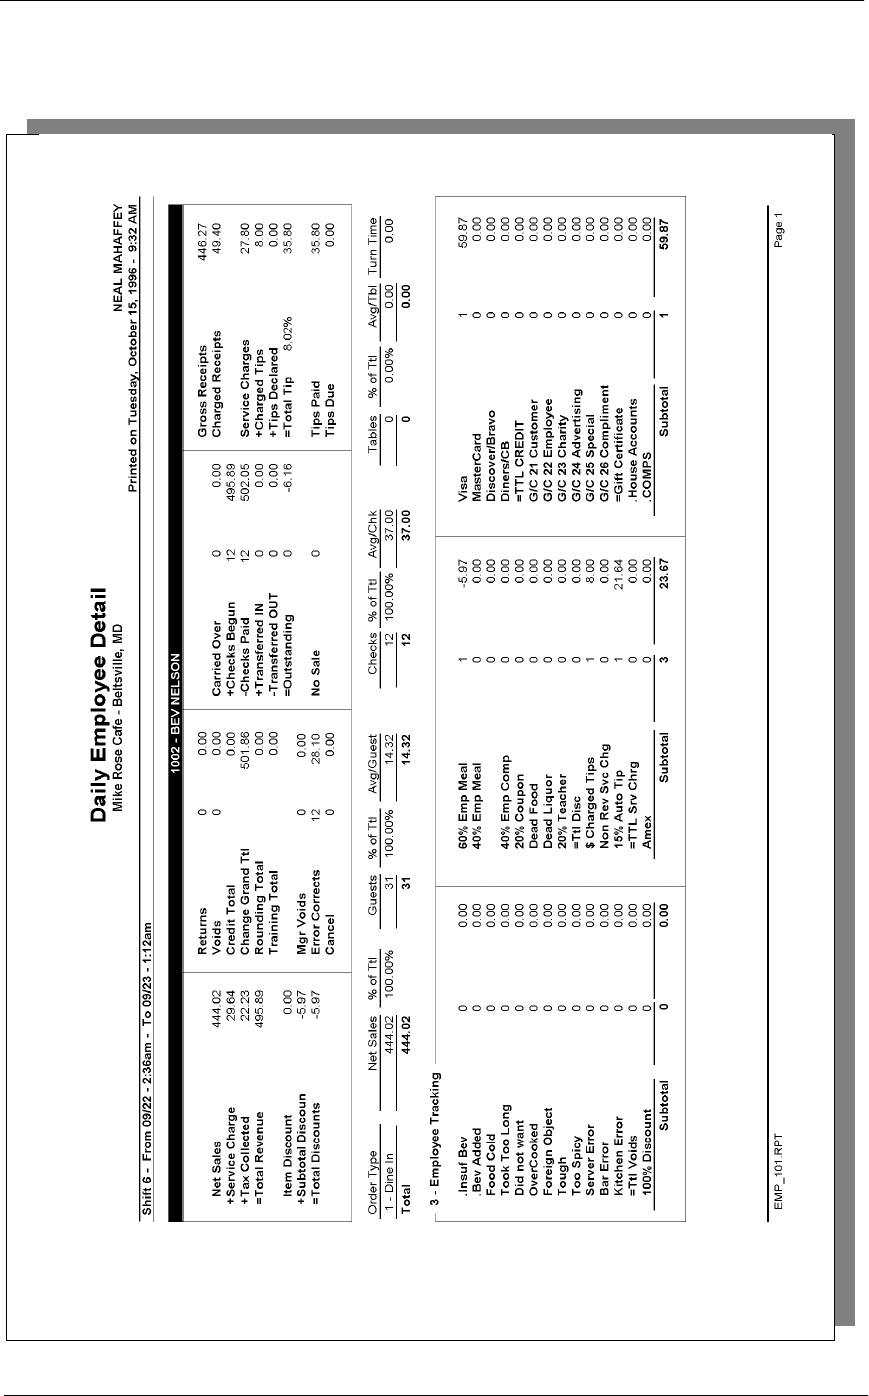
5HSRUWV
(PSOR\HH5HSRUWV
(PSOR\HH'HWDLO7RWDOV
(PSOR\HH5HSRUWV
(PSOR\HH'HWDLO7RWDOV
Daily Employee Detail
Daily Employee Detail
Mike Rose Cafe - Beltsville, MD
NEAL MAHAFFEY
Printed on 10/16/1996 - 2:04
----------------------------------------
Shift 6 From 09/22 - 2:36am
To 09/23 - 1:12am
_
1002-BEV NELSON
_
Net Sales 444.02
+Service Charge 29.64
+Tax Collected 22.23
=Total Revenue 495.89
_
Item Discount 0.00
+Subtotal Disc -5.97
=Total Discount -5.97
Returns 0 0.00
Voids 0 0.00
Credit Total 0.00
Change Grand Tt 501.86
Rounding Total 0.00
Training Total 0.00
Mgr Voids 0 0.00
Error Corre 12 28.10
Cancel 0 0.00
_
Carry Ove 0 0.00
+Cks Begun 12 495.89
-Cks Paid 12 502.05
+ Xfer IN 0 0.00
- Xfer OUT 0 0.00
=Outstandin 0 -6.16
No Sale 0
_
Gross Receipts 446.27
Charged Receipt 49.40
Service Charges 27.80
+Charged Tips 8.00
+Tips Declared 0.00
=Ttl Tip 8.02% 35.80
Tips Paid 35.80
Tips Due 0.00
----------------------------------------
1-Dine In Net 444.02
Guests, Avg 31 14.32
Checks, Avg 12 37.00
Tables, Avg 0 0.00
Turn Time 0.00
Total Net Sale 444.02
Guests, Avg 31 14.32
Checks, Avg 12 37.00
Tables, Avg 0 0.00
----------------------------------------
3 - Employee Tracking
.Insuf Bev 0 0.00
.Bev Added 0 0.00
Food Cold 0 0.00
Took Too L 0 0.00
Did not wa 0 0.00
OverCooked 0 0.00
Foreign Ob 0 0.00
Tough 0 0.00
Too Spicy 0 0.00
Server Err 0 0.00
.House Acc 0 0.00
.COMPS 0 0.00
Subtotal 1 59.87
========================================
Totals omitted for
display
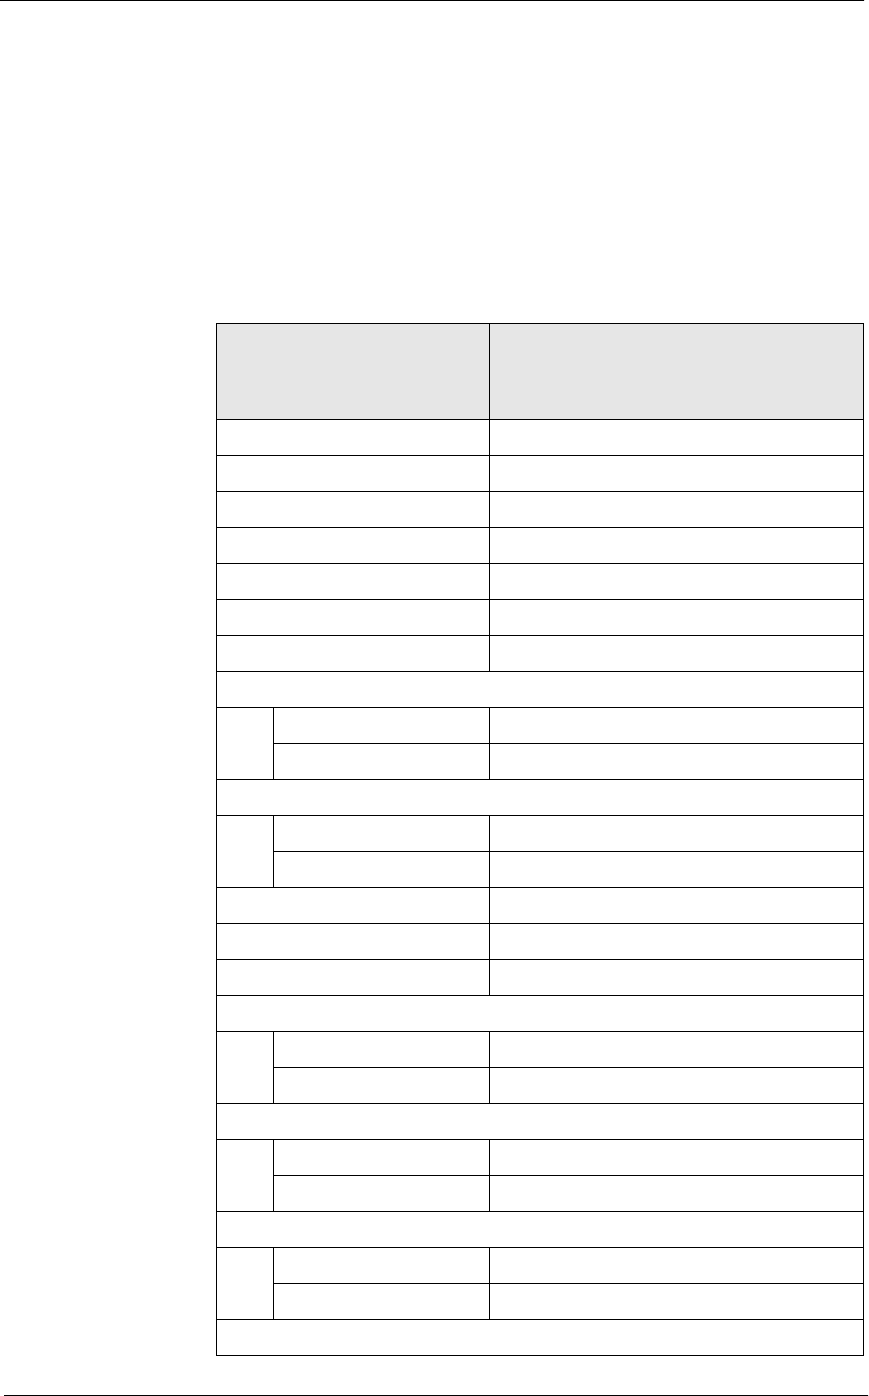
5HSRUWV
(PSOR\HH5HSRUWV
(PSOR\HH'HWDLO7RWDOV
Detailed Sales and Tip Profile Details
Views: v_R_employee v_R_employee_trk
Stored Procedure: sp_R_employee_sales_tracking
The following table lists each field in the Detailed Sales and Tip profile
and provides detailed information on the source of each of the figures.
Since all the numbers in this profile come from formulas, there is no view,
table, or column information.
Report
Field
Title Formula
Net Sales @ttl_Net_Sales
Service Charge @ttl_Service_Chg
Tax Collected @ttl_Tax_Collected
Total Revenue @ttl_Total_Revenue
Item Discount @ttl_Item_Disc
Subtotal Discount @ttl_Sbtl_Disc
Total Discount @ttl_Total_Disc
Return
Number @ttl_Return_Qty
Value @ttl_Return_Total
Void
Number @ttl_Void_Qty
Value @ttl_Void_Total
Credit Total @ttl_Credit_Total
Change In Grand Ttl @ttl_Change_Grand_Total
Rounding Total @ttl_Rounding_Total
Mgr Void
Number @ttl_Mgr_Void_Qty
Value @ttl_Mgr_Void_Total
Error Correct
Number @ttl_Error_Correct_Qty
Value @ttl_Error_Correct_Total
Cancel
Number @ttl_Trans_Cancel_Qty
Value @ttl_Trans_Cancel_Total
Carried Over
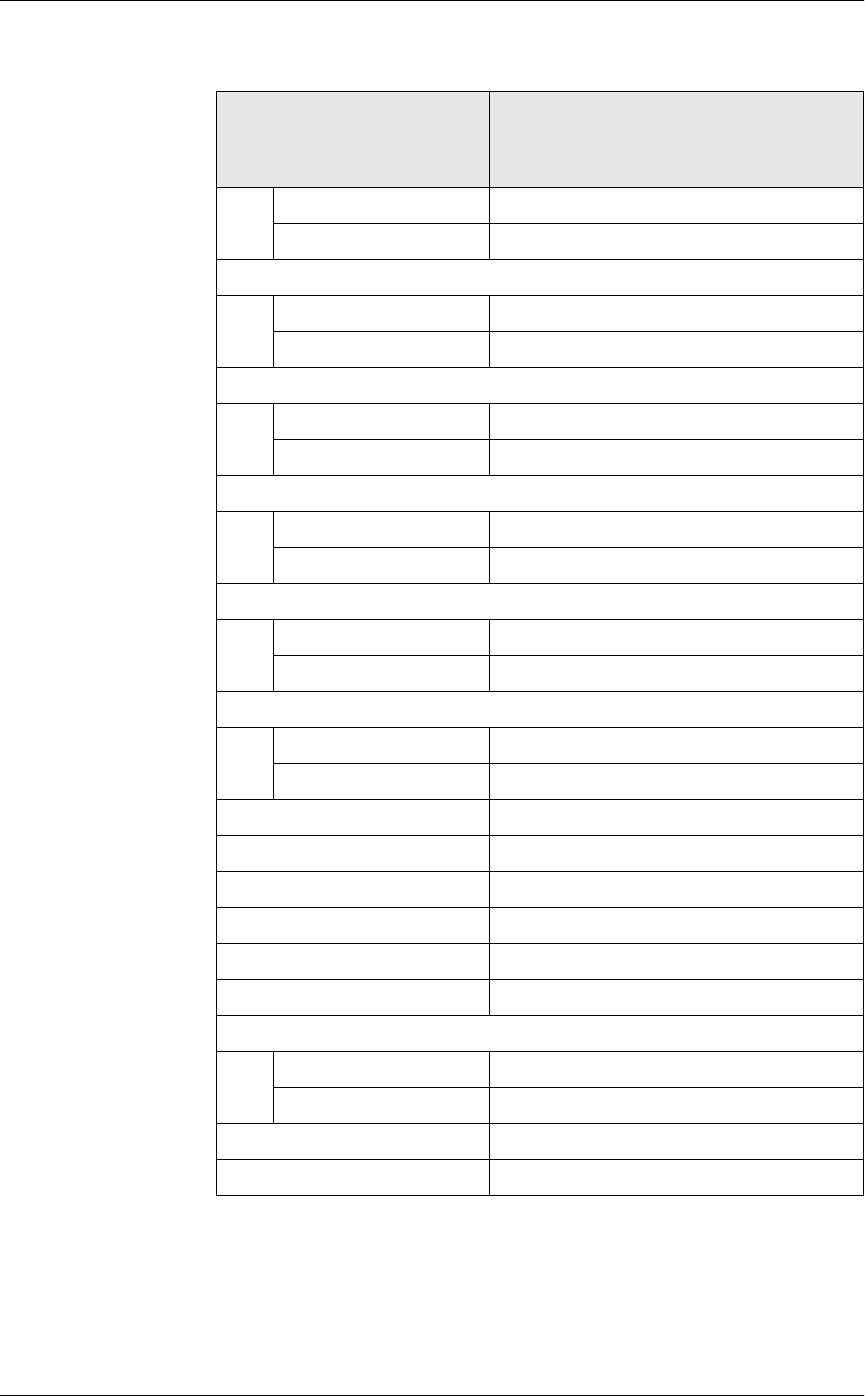
(PSOR\HH5HSRUWV
(PSOR\HH'HWDLO7RWDOV
Number @ttl_Carried_Over_Qty
Value @ttl_Carried_Over_Total
Checks Begun
Number @ttl_Checks_Begun_Qty
Value @ttl_Checks_Begun_Total
Checks Paid
Number @ttl_Checks_Paid_Qty
Value @ttl_Checks_Paid_Total
Transferred IN
Number @ttl_Xfer_IN_Qty
Value @ttl_Xfer_IN_Total
Transferred OUT
Number @ttl_Xfer_OUT_Qty
Value @ttl_Xfer_OUT_Total
Outstanding
Number @ttl_Outstanding_Qty
Value @ttl_Outstanding_Total
No Sale @ttl_No_Sale
Gross Receipts @ttl_Gross_Rcpts_Total
Charged Receipts @ttl_Charged_Rcpts_Total
Service Charges @ttl_Service_Chg_Total
Charged Tips @ttl_Charged_Tips
Tips Declared @ttl_Tips_Declared
Total Tips
Number @ttl_Tip_Percent
Value @ttl_Total_Tips
Tips Paid @ttl_Tips_Paid
Tips Due @ttl_Tips_Due
Report
Field
Title Formula
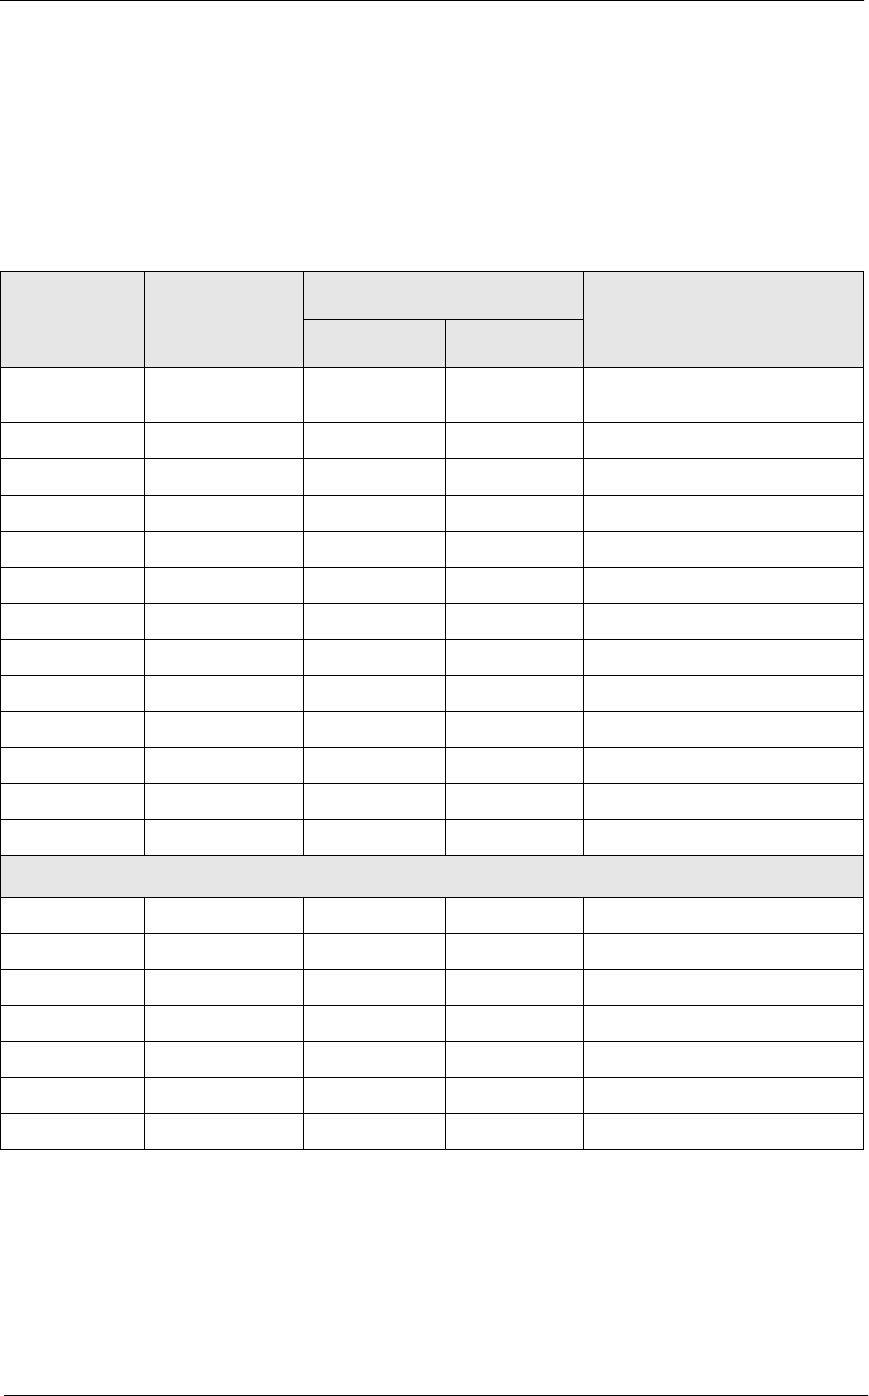
5HSRUWV
(PSOR\HH5HSRUWV
(PSOR\HH'HWDLO7RWDOV
Sales and Tip Profile Details
Views: v_R_employee and v_R_employee_trk
Stored Procedure: sp_R_employee_sales_tracking
The following table lists each field in the Sales profile and provides
detailed information on the source of each of the figures.
Report
Column
Title
View
Column
Title
3700 Database Formula
Table Column
Order Type @lbl_Order_Type_Num_And_Nam
e
Net Sls ot_net_sales_ttl dly_emp_ot_ttl net_sales_ttl
% of Ttl @Percent_Of_Net_Total
Guests cover_count dly_emp_ot_ttl cov_cnt
% of Ttl @Percent_Of_Guest_Total
Avg/Guest @Avg_$_Guest
Checks check_count dly_emp_ot_ttl chk_cnt
% of Ttl @Percent_Of_Check_Total
Avg/Chk @Avg_$_Check
Tables table_turn_count dly_emp_ot_ttl tbl_turn_cnt
% of Ttl @Percent_Of_Table_Total
Avg/Tbl @Avg_$_Table
Turn Time @Avg_Turn_Time
Total
Net Sls ∑ ot_net_sales_ttl dly_emp_ot_ttl net_sales_ttl
Guests ∑ cover_count dly_emp_ot_ttl cov_cnt
Avg/Guest @Total_Avg_$_Guest
Checks ∑ check_count dly_emp_ot_ttl chk_cnt
Avg/Chk @Total_Avg_$_Check
Tables ∑ table_turn_count dly_emp_ot_ttl tbl_turn_cnt
Avg/Tbl @Total_Avg_$_Table
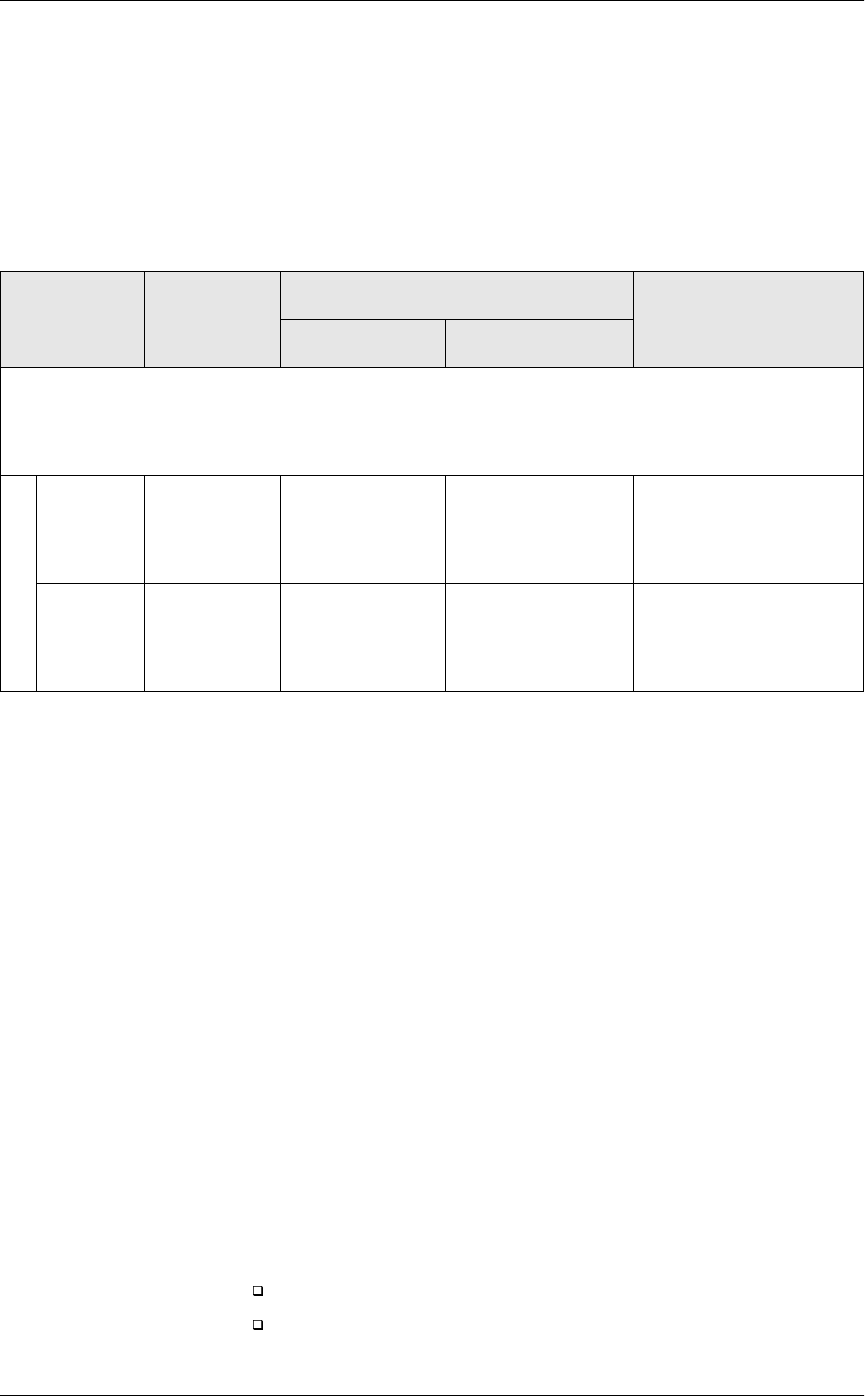
(PSOR\HH5HSRUWV
(PSOR\HH'HWDLO7RWDOV
Tracking Group Profile Details
Views: v_R_employee and v_R_employee_trk
Stored Procedure: sp_R_employee_sales_tracking
The following table lists each field in the Tracking Group profile and
provides detailed information on the source of each figure.
Programming Considerations
*URVV5HFHLSWV
qReceipts posted to a tendering key will add to Gross Receipts if
Tender/Media | Tender | Post to gross receipts is selected.
qTax collected is not included in gross receipts if RVC Taxes | Do not
post tax to tip reports is selected.
qThis field does not include charged tips.
&KDUJHG5HFHLSWV
qOnly charge keys that are programmed to allow a charged tip add to
the charged receipts field. To post totals to Charged Receipts select
Tender/Media | CC Tender | Post to charge receipts.
6HUYLFH&KDUJH
qService charges can be programmed to add to either the Service
Charge field, or the Gross Receipts field. Select Discount/Service |
Discount/Service Charge | Post to svc charges total to post the service
charge to the service charge field. Clear this option to post the totals
to Gross Receipts.
You can use the Service Charge figures in one of two ways:
to produce totals that can be used in preparing IRS tax forms, or
to report autogratuities.
Report
Column
Title
View
Column
Title
3700 Database Formula
Table Column
Programmable1
to
Programmable42
Number trk_cnt_01
to
trk_cnt_42
dly_emp_trk_ttl trk_cnt_01
to
trk_cnt_42
Value trk_ttl_01
to
trk_cnt_42
dly_emp_trk_ttl trk_ttl_01
to
trk_cnt_42

5HSRUWV
(PSOR\HH5HSRUWV
(PSOR\HH'HWDLO7RWDOV
Service charges that are tips may be programmed to post to the
service charge field. (Post to svc charges total is selected). Services
charges that are not tips (for example, a cover charge, or banquet
room charge) should be programmed to add to Gross Receipts (Post
to svc charges total is cleared).
You may wish to use the Service Charge total to track autogratuities.
In this case, program any autogratuities you wish to track to add to the
service charge, and program all other service charges to add to gross
receipts.
Post to svc charges total works in conjunction with Charge tip on the
same form. Only one of these options should be selected. If both
options are selected, Post to svc charges total will be ignored.
Notes
&KHFN7UDQVIHUV
Even if all active employees are included in the range of the report,
neither the sum nor the count of all checks transferred in and out will
necessarily equal that of checks transferred on the corresponding Daily
Revenue Center Sales Detail Report. This is because checks transferred
between employees in the same revenue center are included in employee
balance reports but not in revenue center balance reports.
3HUFHQWSHU(PSOR\HH
If you run this report for all employees who were active during the period
of the report, the percent of total fields for net sales, guests, checks, and
tables should add to 100%.
%DODQFLQJ1RWHV
If you print a complete set of Daily Employee Detail Reports that includes
all employees that were active during the period of the report, the
combined totals should equal the totals on the corresponding Daily
Revenue Center Sales Detail Report.

(PSOR\HH5HSRUWV
(PSOR\HH'HWDLO7RWDOVE\5HYHQXH&HQWHU
Employee Detail Totals by Revenue Center
3XUSRVH
This report provides detailed financial information for an employee or a
range of employees for a Revenue Center. This information can be used to
determine tips due or track employee sales performance.
)RUPDW
This report includes the following profiles:
qDetail Sales and Tip profile
qSales and Guest profile
qTracking Group profile
7HPSODWH
EMP_701.RPT
2-9
2-26
2-33
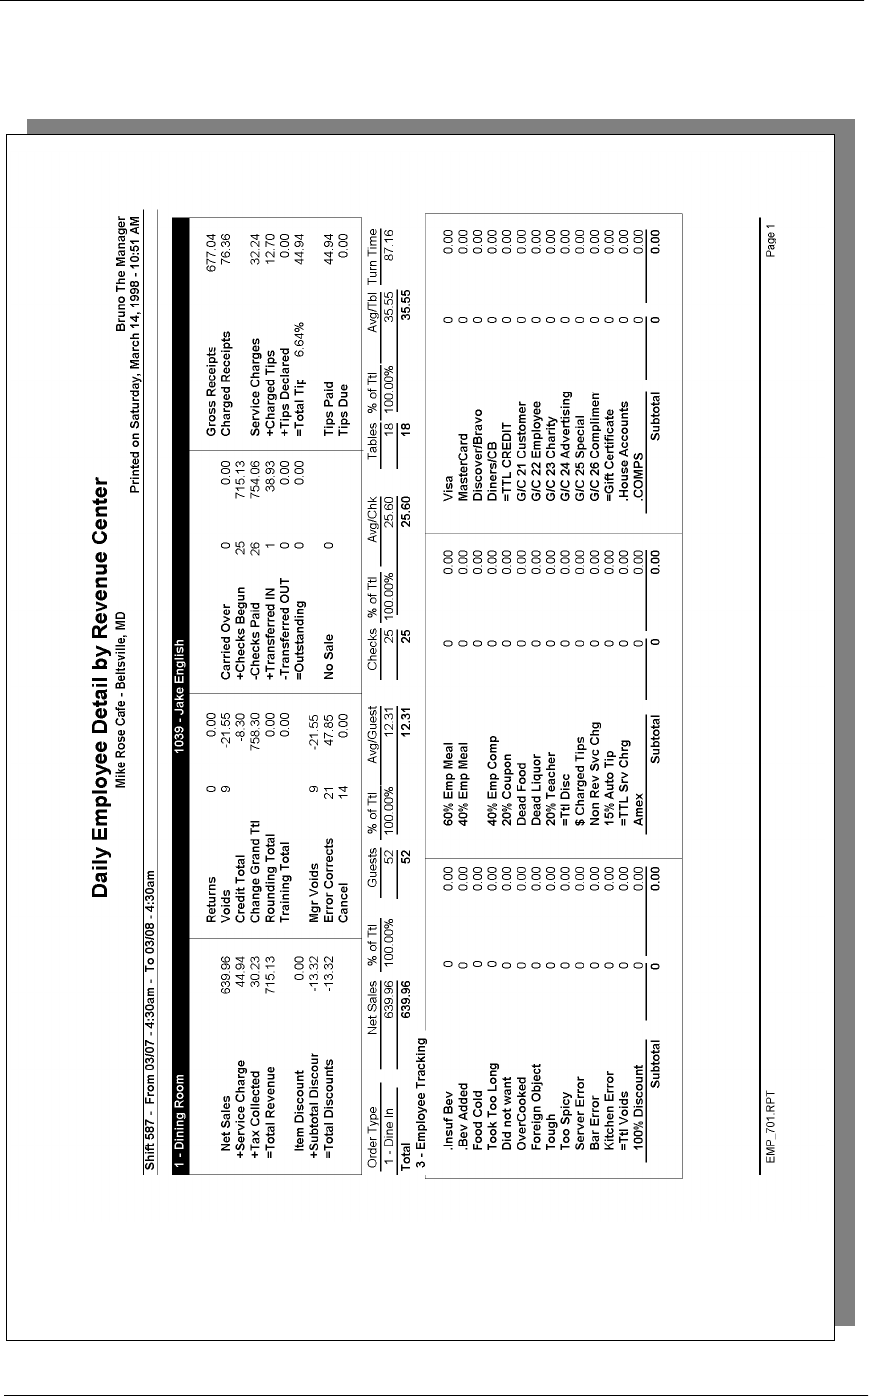
5HSRUWV
(PSOR\HH5HSRUWV
(PSOR\HH'HWDLO7RWDOVE\5HYHQXH&HQWHU
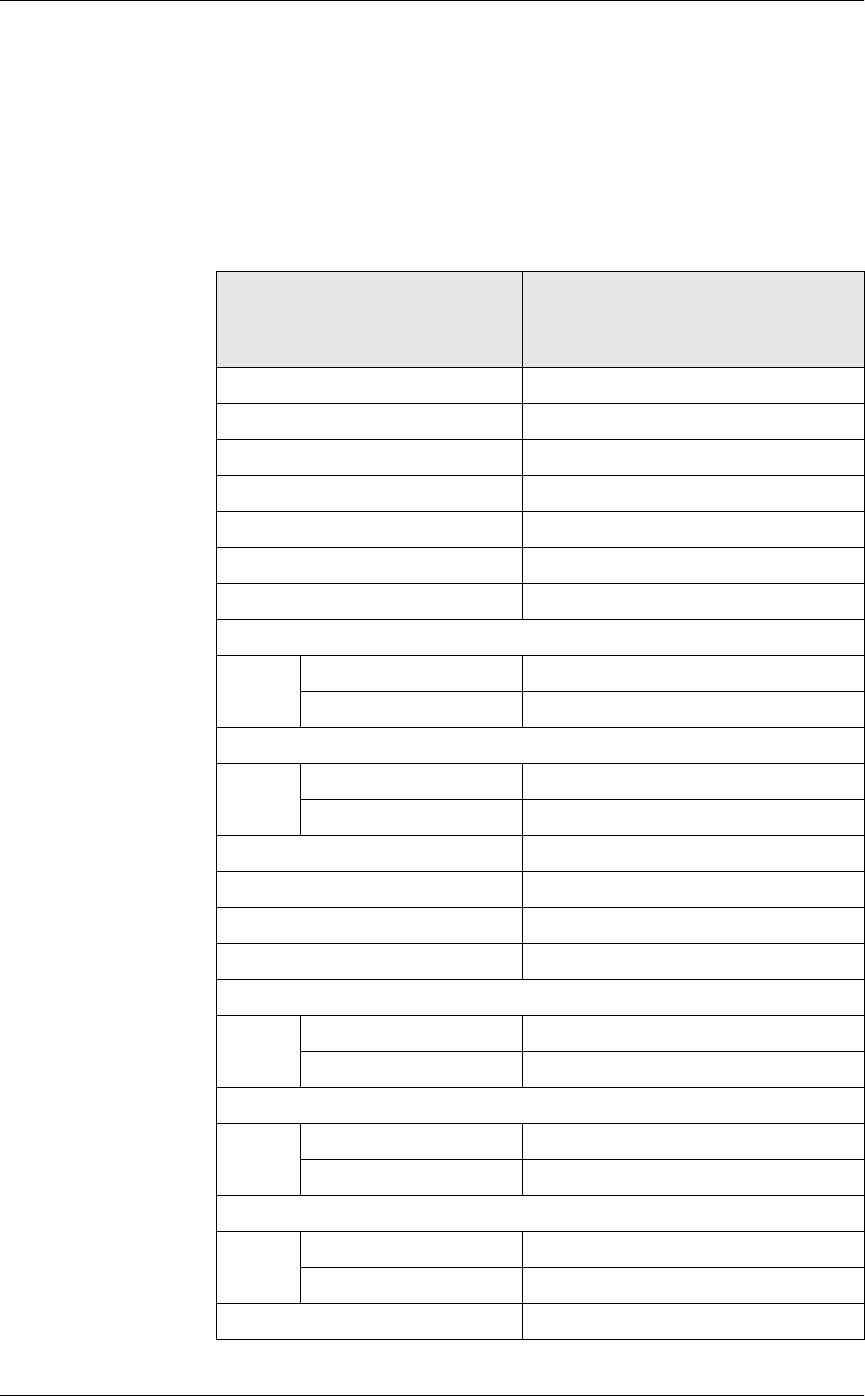
(PSOR\HH5HSRUWV
(PSOR\HH'HWDLO7RWDOVE\5HYHQXH&HQWHU
Detailed Sales and Tip Profile Details
Views: v_R_rvc_employee and v_R_rvc_employee_trk
Stored Procedure: sp_R_rvc_employee_sales_tracking
The following table lists each field in the Detailed Sales profile and
provides detailed information on the source of each of the figures.
Report
Field
Title Formula
Net Sales @ttl_Net_Sales
Service Charges @ttl_Service_Chg
Tax Collected @ttl_Tax_Collected
Total Revenue @ttl_Total_Revenue
Item Discount @ttl_Item_Disc
Subtotal Discount @ttl_Sbtl_Disc
Total Discount @ttl_Total_Disc
Return
Number @ttl_Return_Qty
Value @ttl_Return_Total
Void
Number @ttl_Void_Qty
Value @ttl_Void_Total
Credit Total @ttl_Credit_Total
Change In Grand Ttl @ttl_Change_Grand_Total
Rounding Total @ttl_Rounding_Total
Training Total @ttl_Training_Total
Mgr Void
Number @ttl_Mgr_Void_Qty
Value @ttl_Mgr_Void_Total
Error Correct
Number @ttl_Error_Correct_Qty
Value @ttl_Error_Correct_Total
Cancel
Number @ttl_Trans_Cancel_Qty
Value @ttl_Trans_Cancel_Total
No Sale @ttl_No_Sale
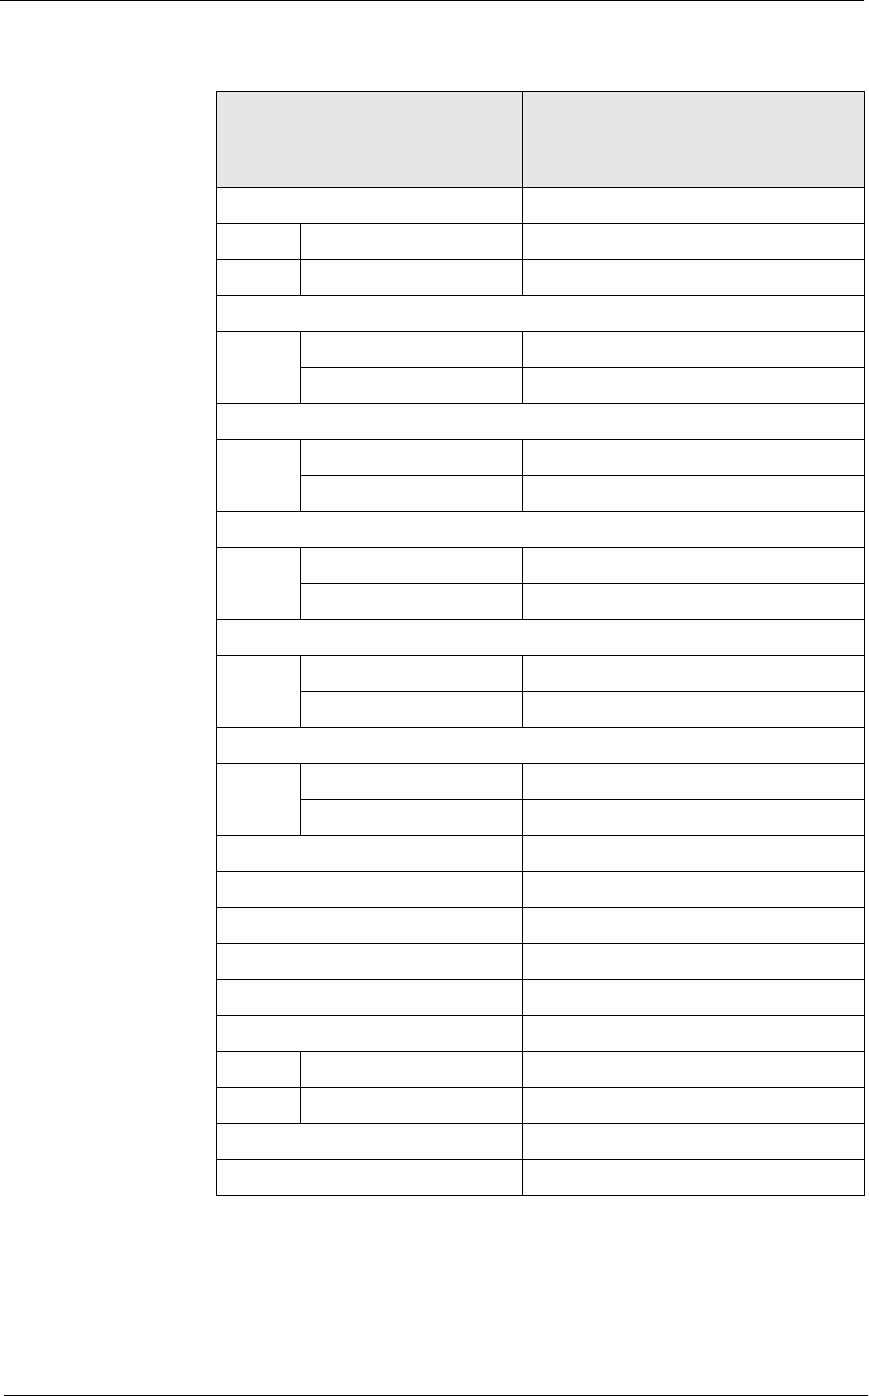
5HSRUWV
(PSOR\HH5HSRUWV
(PSOR\HH'HWDLO7RWDOVE\5HYHQXH&HQWHU
Checks Carried Over
Number @ttl_Carried_Over_Qty
Value @ttl_Carried_Over_Total
Checks Begun
Number @ttl_Checks_Begun_Qty
Value @ttl_Checks_Begun_Total
Checks Paid
Number @ttl_Checks_Paid_Qty
Value @ttl_Checks_Paid_Total
Transferred IN
Number @ttl_Xfer_IN_Qty
Value @ttl_Xfer_IN_Total
Transferred OUT
Number @ttl_Xfer_OUT_Qty
Value @ttl_Xfer_OUT_Total
Outstanding
Number @ttl_Outstanding_Qty
Value @ttl_Outstanding_Total
Gross Receipts @ttl_Gross_Rcpts_Total
Charged Receipts @ttl_Charged_Rcpts_Total
Service Charge @ttl_Service_Chg_Total
Charged Tips @ttl_Charged_Tips
Tips Declared @ttl_Tips_Declared
Total Tips
Percent @ttl_Tips_Percent
Total @ttl_Total_Tips
Tips Paid @ttl_Tips_Paid
Tips Due @ttl_Tips_Due
Report
Field
Title Formula
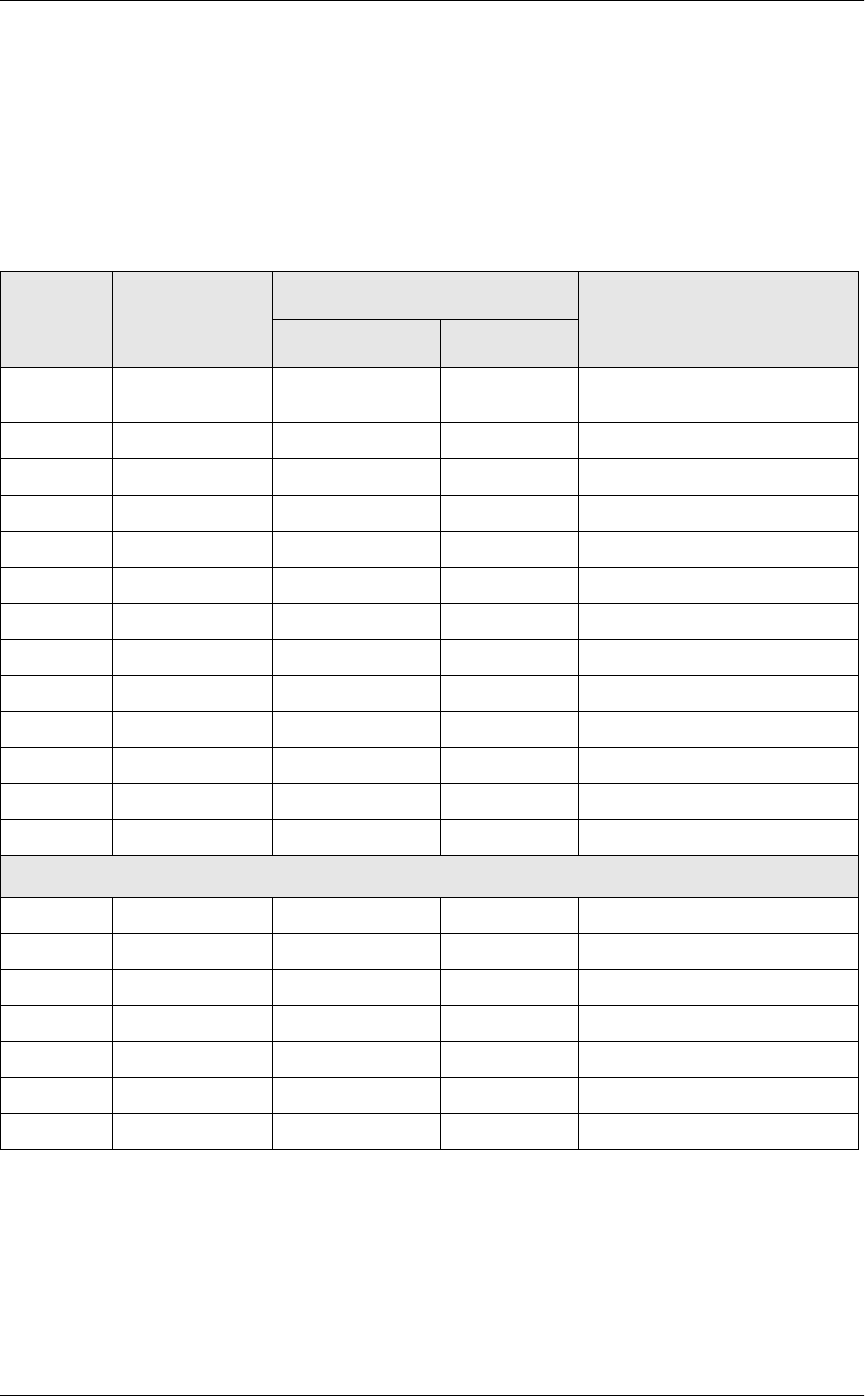
(PSOR\HH5HSRUWV
(PSOR\HH'HWDLO7RWDOVE\5HYHQXH&HQWHU
Sales and Guest Profile Details
Views: v_R_rvc_employee and v_R_rvc_employee_trk
Stored Procedure: sp_R_rvc_employee_sales_tracking
The following table lists each field in the Sales profile and provides
detailed information on the source of each of the figures.
Report
Column
Title
View
Column
Title
3700 Database Formula
Table Column
Order Type @lbl_Order_Type_Num_And_Nam
e
Net Sls ot_net_sales_ttl shift_rvc_emp_ot_ttl net_sls_ttl
% of Ttl @Percent_Of_Net_Total
Guests cover_count shift_rvc_emp_ot_ttl cov_cnt
% of Ttl @Percent_Of_Guest_Total
Avg/Guest @Avg_$_Guest
Checks check_count shift_rvc_emp_ot_ttl chk_cnt
% of Ttl @Percent_Of_Check_Total
Avg/Chk @Avg_$_Check
Tables table_turn_count shift_rvc_emp_ot_ttl tbl_turn_cnt
% of Ttl @Percent_Of_Table_Total
Avg/Tbl @Avg_$_Table
Turn Time @Avg_Turn_Time
Total
Net Sls ∑ ot_net_sales_ttl shift_rvc_emp_ot_ttl net_sls_ttl
Guests ∑ cover_count shift_rvc_emp_ot_ttl cov_cnt
Avg/Guest @Total_Avg_$_Guest
Checks ∑ check_count shift_rvc_emp_ot_ttl chk_cnt
Avg/Chk @Total_Avg_$_Check
Tables ∑ table_turn_count shift_rvc_emp_ot_ttl tbl_turn_cnt
Avg/Tbl @Total_Avg_$_Table
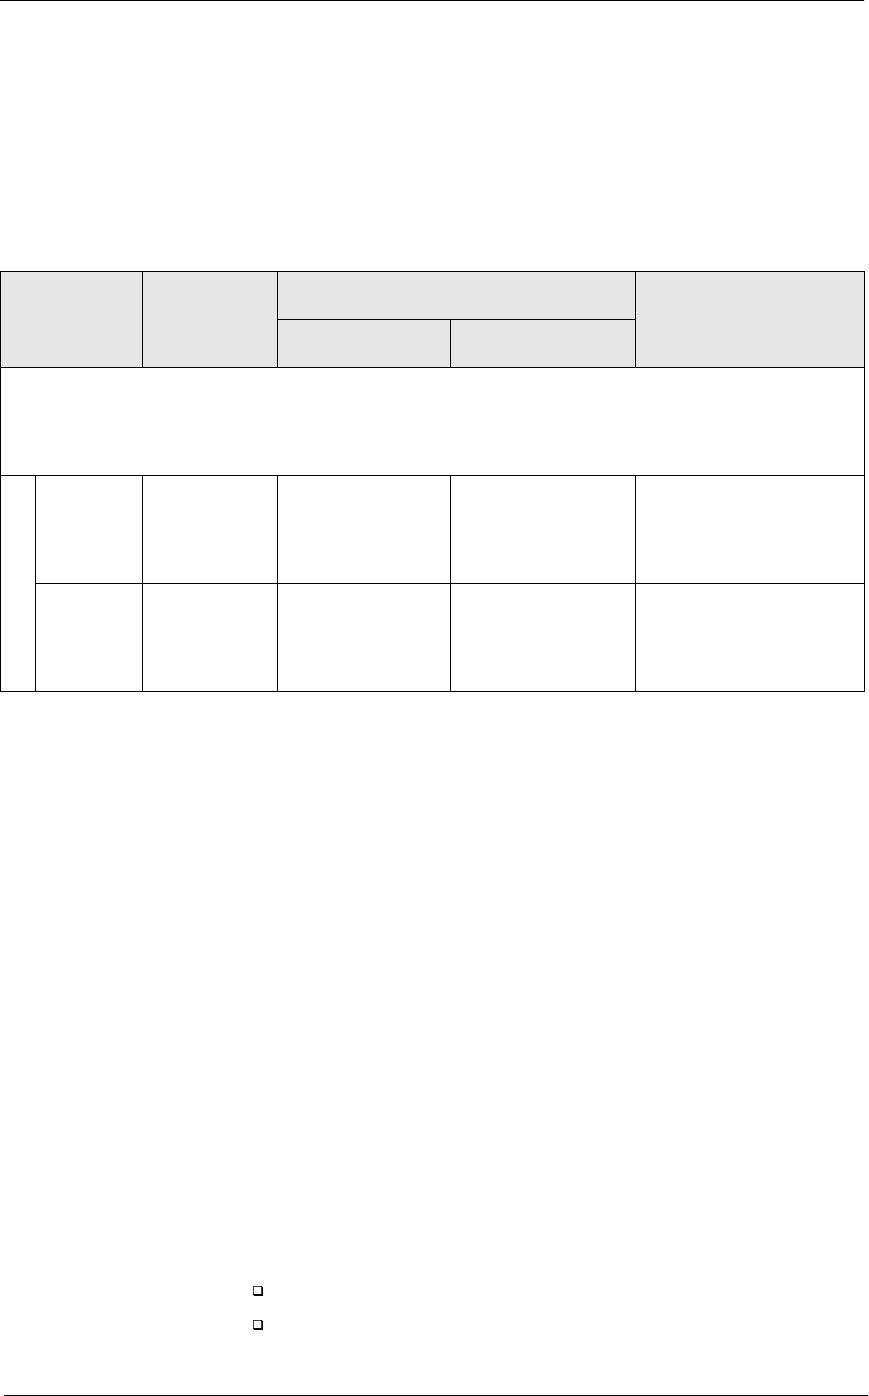
5HSRUWV
(PSOR\HH5HSRUWV
(PSOR\HH'HWDLO7RWDOVE\5HYHQXH&HQWHU
Tracking Group Profile Details
Views: v_R_rvc_employee and v_R_rvc_employee_trk
Stored Procedure: sp_R_rvc_employee_sales_tracking
The following table lists each field in the Tracking Group profile and
provides detailed information on the source of each figure.
Programming Considerations
*URVV5HFHLSWV
qReceipts posted to a tendering key will add to Gross Receipts if
Tender/Media | Tender | Post to gross receipts is selected.
qTax collected is not included in gross receipts if RVC Taxes | Do not
post tax to tip reports is selected.
qThis field does not include charged tips.
&KDUJHG5HFHLSWV
qOnly charge keys that are programmed to allow a charged tip add to
the charged receipts field. To post totals to Charged Receipts select
Tender/Media | CC Tender | Post to charge receipts.
6HUYLFH&KDUJH
qService charges can be programmed to add to either the Service
Charge field, or the Gross Receipts field. Select Discount/Service |
Discount/Service Charge | Post to svc charges total to post the service
charge to the service charge field. Clear this option to post the totals
to Gross Receipts.
You can use the Service Charge figures in one of two ways:
to produce totals that can be used in preparing IRS tax forms, or
to report autogratuities.
Report
Column
Title
View
Column
Title
3700 Database Formula
Table Column
Programmable1
to
Programmable42
Number trk_cnt_01
to
trk_cnt_42
shift_rvc_emp_trk_ttl trk_cnt_01
to
trk_cnt_42
Value trk_ttl_01
to
trk_cnt_42
shift_rvc_emp_trk_ttl trk_ttl_01
to
tr_ttl_42

(PSOR\HH5HSRUWV
(PSOR\HH'HWDLO7RWDOVE\5HYHQXH&HQWHU
Service charges that are tips may be programmed to post to the
service charge field. (Post to svc charges total is selected). Services
charges that are not tips (for example, a cover charge, or banquet
room charge) should be programmed to add to Gross Receipts (Post
to svc charges total is cleared).
You may wish to use the Service Charge total to track autogratuities.
In this case, program any autogratuities you wish to track to add to the
service charge, and program all other service charges to add to gross
receipts.
Post to svc charges total works in conjunction with Charge tip on the
same form. Only one of these options should be selected. If both
options are selected, Post to svc charges total will be ignored.
Notes
&KHFN7UDQVIHUV
Even if all active employees are included in the range of the report,
neither the sum nor the count of all checks transferred in and out will
necessarily equal that of checks transferred on the corresponding Daily
Revenue Center Sales Detail Report. This is because checks transferred
between employees in the same revenue center are included in employee
balance reports but not in revenue center balance reports.
3HUFHQWSHU(PSOR\HH
If you run this report for all employees who were active during the period
of the report, the percent of total fields for net sales, guests, checks, and
tables should add to 100%.
%DODQFLQJ1RWHV
If you print a complete set of Daily Employee Detail Reports that includes
all employees that were active during the period of the report, the
combined totals should equal the totals on the corresponding Daily
Revenue Center Sales Detail Report.

5HSRUWV
(PSOR\HH5HSRUWV
&RQVROLGDWHG(PSOR\HH'HWDLO7RWDOV
Consolidated Employee Detail Totals
3XUSRVH
The Consolidated Employee Detail Report provides the same detailed
financial information as the Daily Employee Detail Report, but for a
range of business dates.
)RUPDW
This report includes the following profiles:
qDetailed Sales and Tip profile
It does not include these fields:
Grand Total
qSales and Guest profile
qTracking Group profile
7HPSODWH
EMP_102.RPT
2-9
2-26
2-33
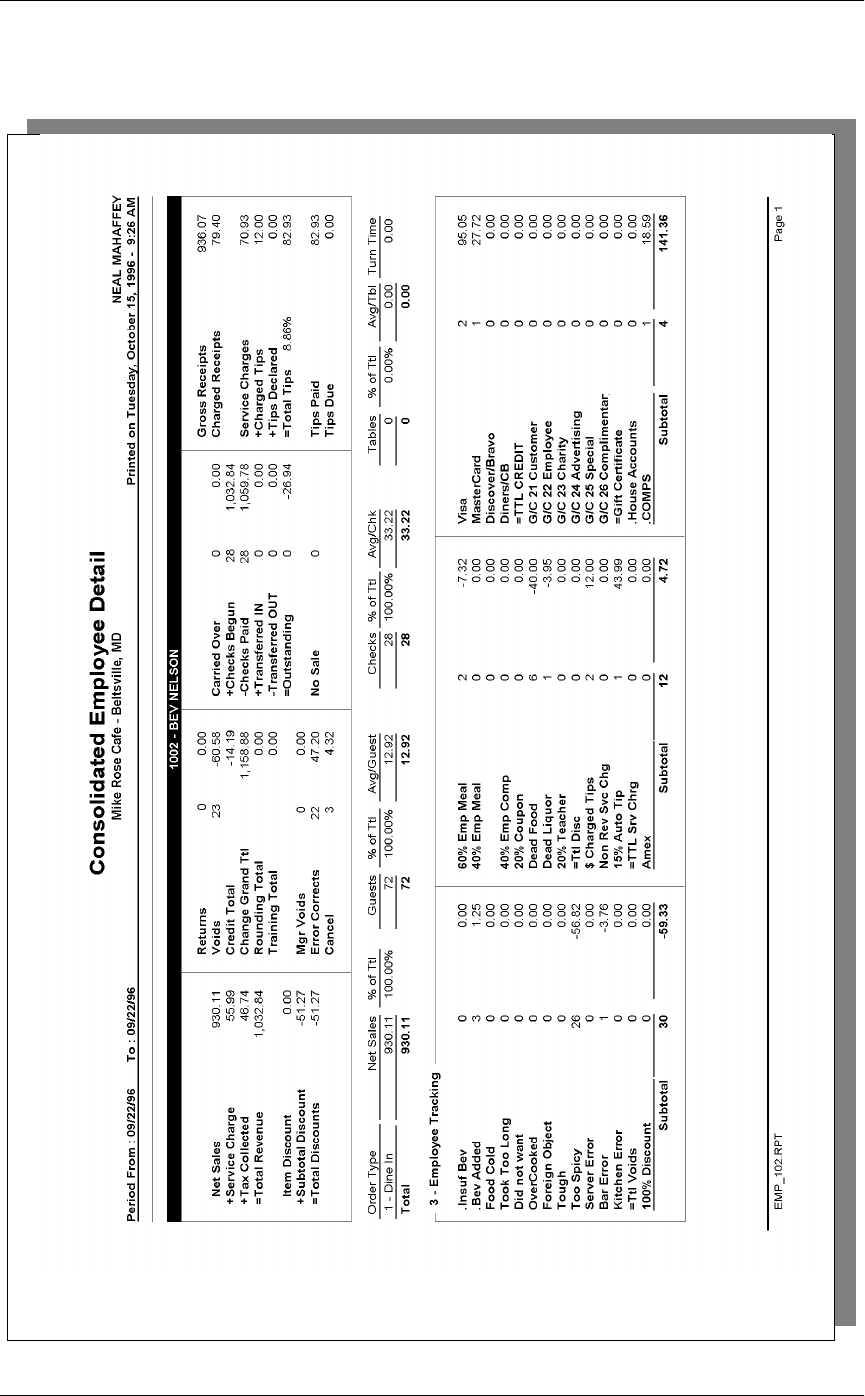
(PSOR\HH5HSRUWV
&RQVROLGDWHG(PSOR\HH'HWDLO7RWDOV
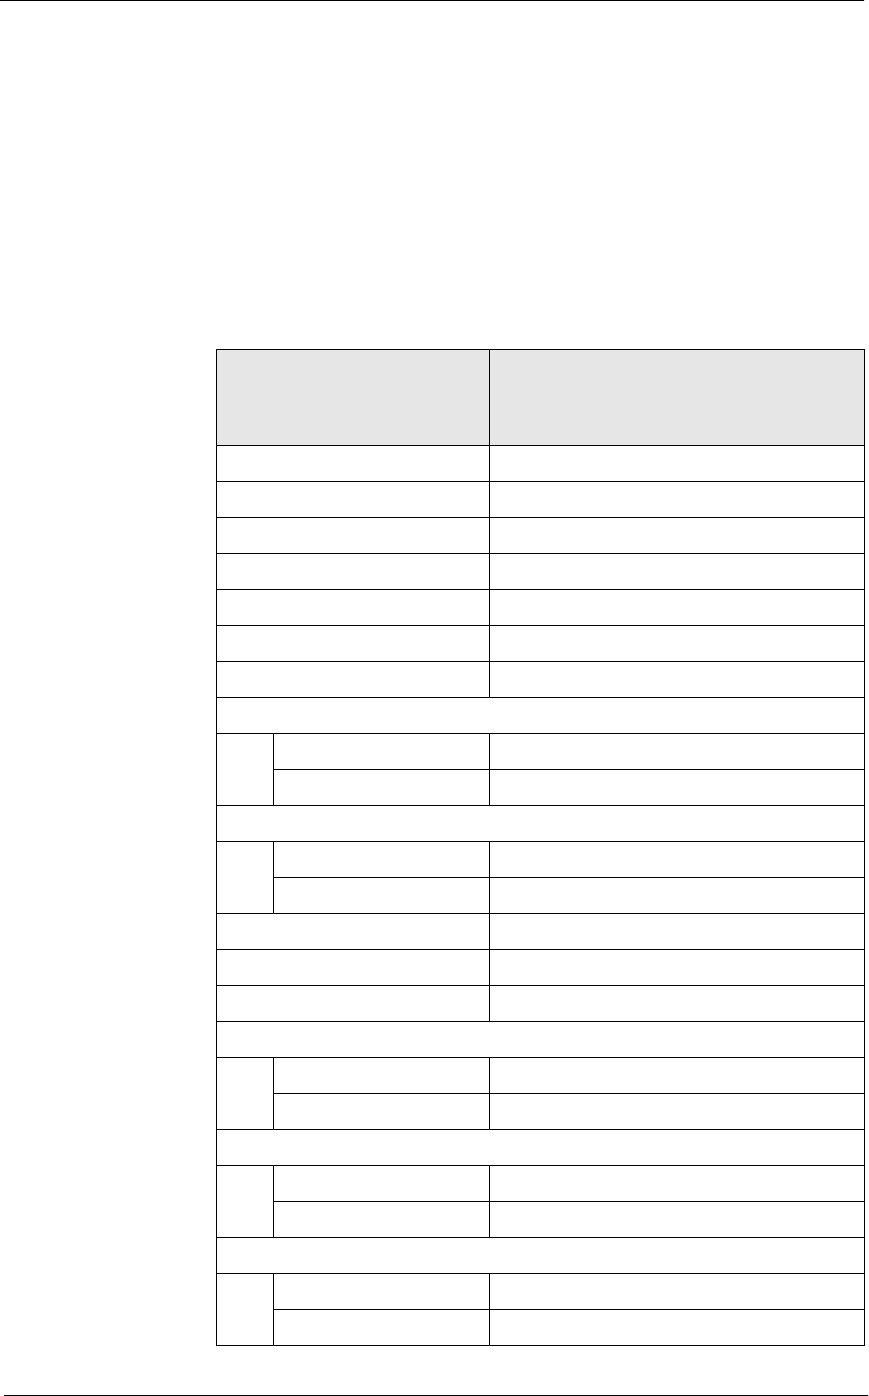
5HSRUWV
(PSOR\HH5HSRUWV
&RQVROLGDWHG(PSOR\HH'HWDLO7RWDOV
Detailed Sales and Tip Profile Details
Stored Procedure: sp_R_consolidated_emp_ttls and
sp_R_employee_sales_tracking
This report does not use any views.
The following table lists each field in the Detailed Sales and Tip profile
and provides detailed information on the source of each of the figures.
Since all the numbers in this profile come from formulas, there is no table,
or column information.
Report
Field
Title Formula
Net Sales @ttl_Net_Sales
Service Charge @ttl_Service_Chg
Tax Collected @ttl_Tax_Collected
Total Revenue @ttl_Total_Revenue
Item Discount @ttl_Item_Disc
Subtotal Discount @ttl_Sbtl_Disc
Total Discount @ttl_Total_Disc
Return
Number @ttl_Return_Qty
Value @ttl_Return_Total
Void
Number @ttl_Void_Qty
Value @ttl_Void_Total
Credit Total @ttl_Credit_Total
Change In Grand Ttl @ttl_Change_Grand_Total
Rounding Total @ttl_Rounding_Total
Mgr Void
Number @ttl_Mgr_Void_Qty
Value @ttl_Mgr_Void_Total
Error Correct
Number @ttl_Error_Correct_Qty
Value @ttl_Error_Correct_Total
Cancel
Number @ttl_Trans_Cancel_Qty
Value @ttl_Trans_Cancel_Total
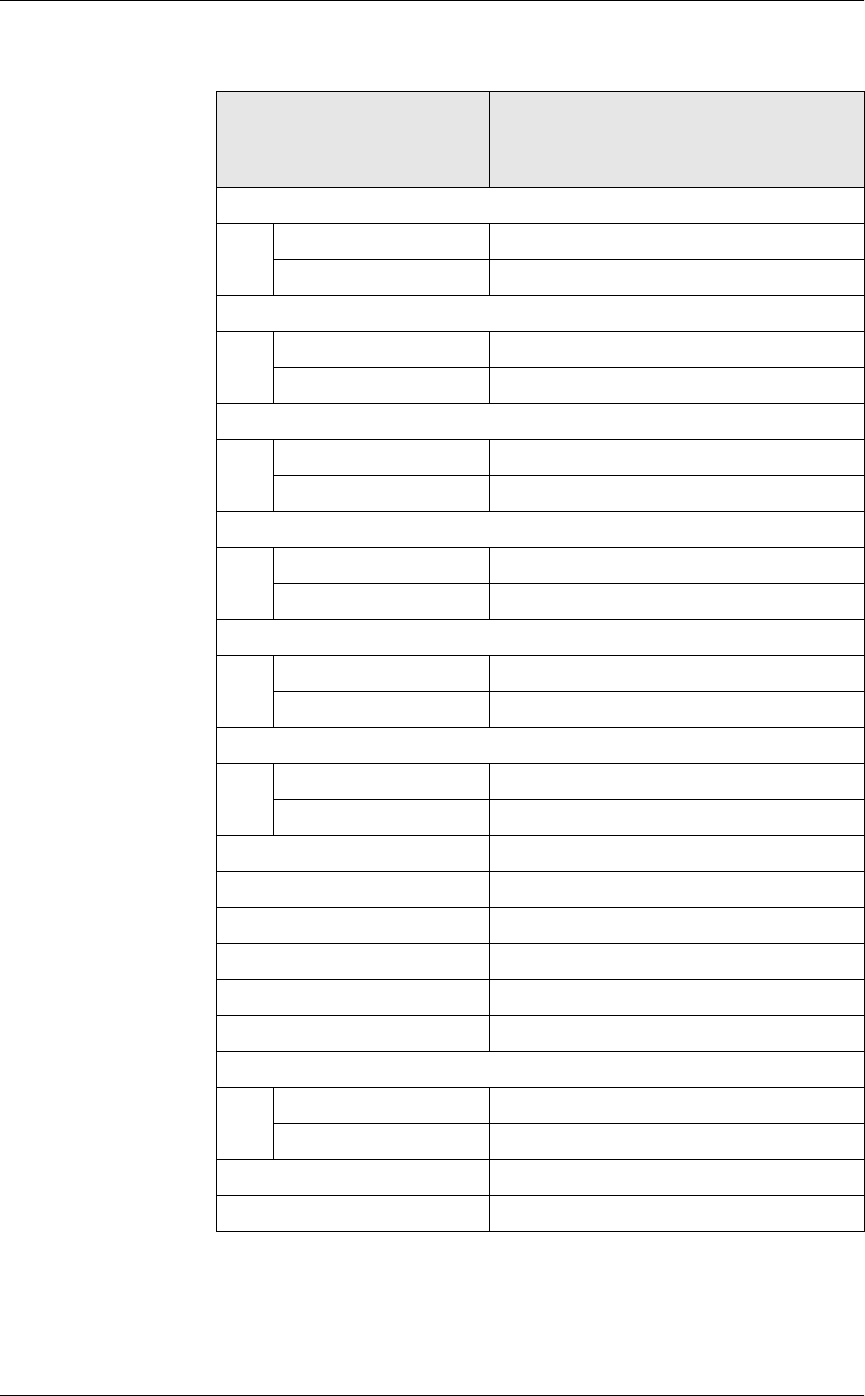
(PSOR\HH5HSRUWV
&RQVROLGDWHG(PSOR\HH'HWDLO7RWDOV
Carried Over
Number @ttl_Carried_Over_Qty
Value @ttl_Carried_Over_Total
Checks Begun
Number @ttl_Checks_Begun_Qty
Value @ttl_Checks_Begun_Total
Checks Paid
Number @ttl_Checks_Paid_Qty
Value @ttl_Checks_Paid_Total
Transferred IN
Number @ttl_Xfer_IN_Qty
Value @ttl_Xfer_IN_Total
Transferred OUT
Number @ttl_Xfer_OUT_Qty
Value @ttl_Xfer_OUT_Total
Outstanding
Number @ttl_Outstanding_Qty
Value @ttl_Outstanding_Total
No Sale @ttl_No_Sale
Gross Receipts @ttl_Gross_Rcpts_Total
Charged Receipts @ttl_Charged_Rcpts_Total
Service Charges @ttl_Service_Chg_Total
Charged Tips @ttl_Charged_Tips
Tips Declared @ttl_Tips_Declared
Total Tips
Number @ttl_Tip_Percent
Value @ttl_Total_Tips
Tips Paid @ttl_Tips_Paid
Tips Due @ttl_Tips_Due
Report
Field
Title Formula

5HSRUWV
(PSOR\HH5HSRUWV
&RQVROLGDWHG(PSOR\HH'HWDLO7RWDOV
Sales and Guest Profile Details
Stored Procedure: sp_R_consolidated_emp_ttls
This report does not use any views.
The following table lists each field in the Sales and Guest profile and
provides detailed information on the source of each of the figures.
Report
Column
Title
Stored
Procedure
Column Title
3700 Database Formula
Table Column
Order Type @lbl_Order_Type_Num_And_Nam
e
Net Sls ot_net_sales_ttl dly_emp_ot_ttl net_sales_ttl
% of Ttl @Percent_Of_Net_Total
Guests cover_count dly_emp_ot_ttl cov_cnt
% of Ttl @Percent_Of_Guest_Total
Avg/Guest @Avg_$_Guest
Checks check_count dly_emp_ot_ttl chk_cnt
% of Ttl @Percent_Of_Check_Total
Avg/Chk @Avg_$_Check
Tables table_turn_count dly_emp_ot_ttl tbl_turn_cnt
% of Ttl @Percent_Of_Table_Total
Avg/Tbl @Avg_$_Table
Turn Time @Avg_Turn_Time
Total
Net Sls ∑ ot_net_sales_ttl dly_emp_ot_ttl net_sales_ttl
Guests ∑ cover_count dly_emp_ot_ttl cov_cnt
Avg/Guest @Total_Avg_$_Guest
Checks ∑ check_count dly_emp_ot_ttl chk_cnt
Avg/Chk @Total_Avg_$_Check
Tables ∑ table_turn_count dly_emp_ot_ttl tbl_turn_cnt
Avg/Tbl @Total_Avg_$_Table
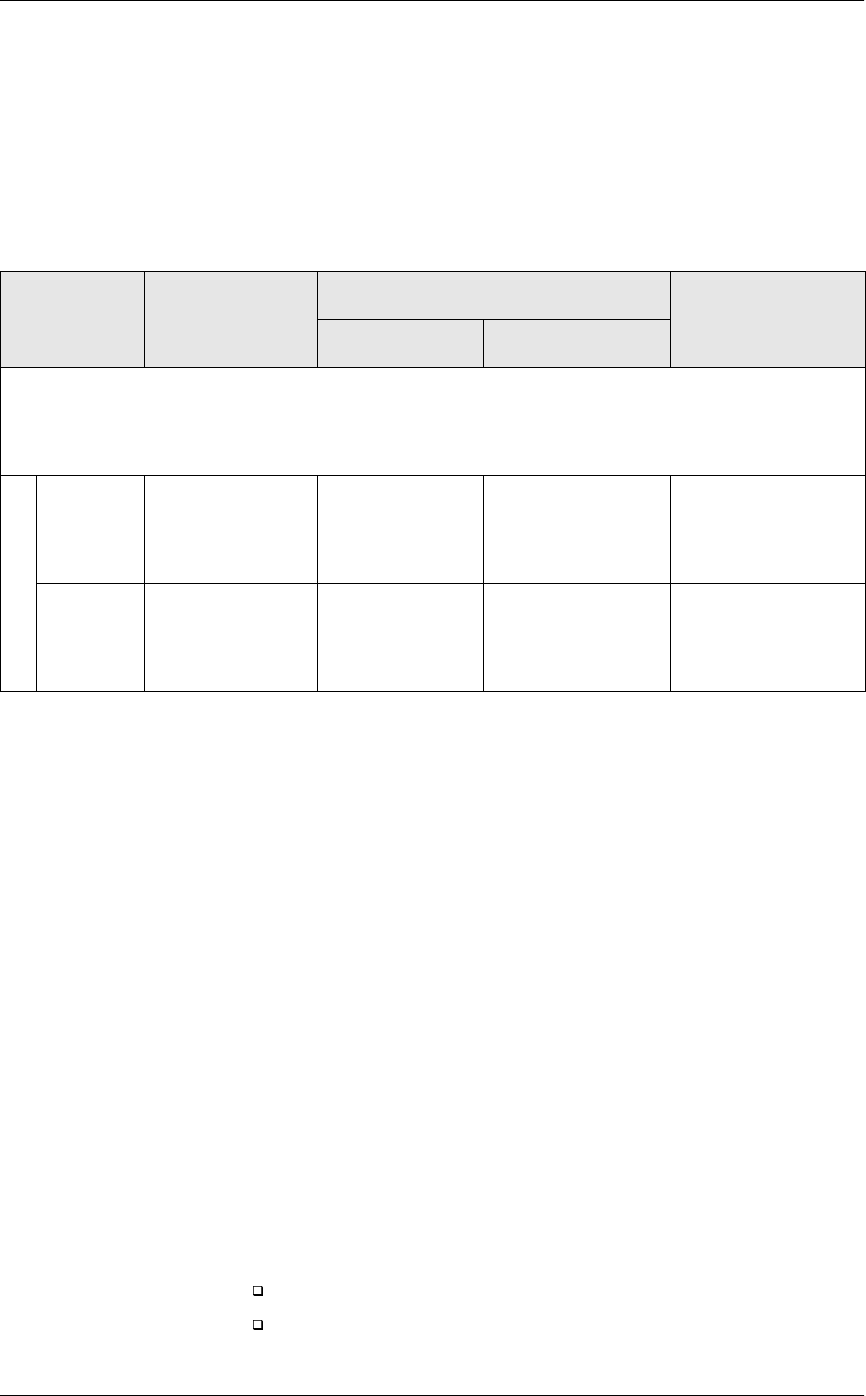
(PSOR\HH5HSRUWV
&RQVROLGDWHG(PSOR\HH'HWDLO7RWDOV
Tracking Group Profile Details
Stored Procedure: sp_R_consolidated_emp_ttls
This report does not use any views.
The following table lists each field in the Tracking Group profile and
provides detailed information on the source of each of the figures.
Programming Considerations
*URVV5HFHLSWV
qReceipts posted to a tendering key will add to Gross Receipts if
Tender/Media | Tender | Post to gross receipts is selected.
qTax collected is not included in gross receipts if
RVC Taxes | Do not post tax to tip reports is selected.
qThis field does not include charged tips.
&KDUJHG5HFHLSWV
q Only charge keys that are programmed to allow a charged tip add to
the charged receipts field. To post totals to Charged Receipts select
Tender/Media | CC Tender | Post to charge receipts.
6HUYLFH&KDUJH
qService charges can be programmed to add to either the Service
Charge field, or the Gross Receipts field. Select Discount/Service |
Discount/Service Charge | Post to svc charges total to post the service
charge to the service charge field. Clear this option to post the totals
to Gross Receipts.
You can use the Service Charge figures in one of two ways:
to produce totals that can be used in preparing IRS tax forms, or
to report autogratuities.
Report
Column
Title
Stored
Procedure
Column Title
3700 Database Formula
Table Column
Programmable1
to
Programmable42
Number trk_cnt_01
to
trk_cnt_42
dly_emp_trk_ttl trk_cnt_01
to
trk_cnt_42
Value trk_ttl_01
to
trk_cnt_42
dly_emp_trk_ttl trk_ttl_01
to
trk_cnt_42

5HSRUWV
(PSOR\HH5HSRUWV
&RQVROLGDWHG(PSOR\HH'HWDLO7RWDOV
Service charges that are tips may be programmed to post to the
service charge field. (Post to svc charges total is selected). Services
charges that are not tips (for example, a cover charge, or banquet
room charge) should be programmed to add to Gross Receipts (Post
to svc charges total is cleared).
You may wish to use the Service Charge total to track autogratuities.
In this case, program any autogratuities you wish to track to add to the
service charge, and program all other service charges to add to gross
receipts.
Post to svc charges total works in conjunction with Charge tip on the
same form. Only one of these options should be selected. If both
options are selected, Post to svc charges total will be ignored.
*XHVWV
qThe number of guests is determined by the seat count, the number of
specified service charges or menu items, or by the guest count entered
by the employees.
To use seat count to determine the number of guests, select RVC Seats
| Use seat count for cover count.
To use a service charge to determine the number of guests, select
Discount/Service | Discount/Service Charge | Post to cover count.
To use specified menu items to determine the number of guests, select
Menu Item Classes | Price/Totals | Add to cover count. Then assign
this menu item class to the menu items that will determine the guest
count.
If none of these options is selected, the system will use the guest
count entered by employees when beginning checks as the guest
count.

(PSOR\HH5HSRUWV
&RQVROLGDWHG(PSOR\HH'HWDLO7RWDOVE\5HYHQXH&HQWHU
Consolidated Employee Detail Totals by Revenue Center
3XUSRVH
This reports provides detailed financial information for an employee or a
range of employees for a range of business dates for a Revenue Center.
)RUPDW
This report includes the following profiles:
qDetail Sales and Tip profile
qSales and Guest profile
qTracking Group profile
7HPSODWH
EMP_702.RPT
2-9
2-26
2-33
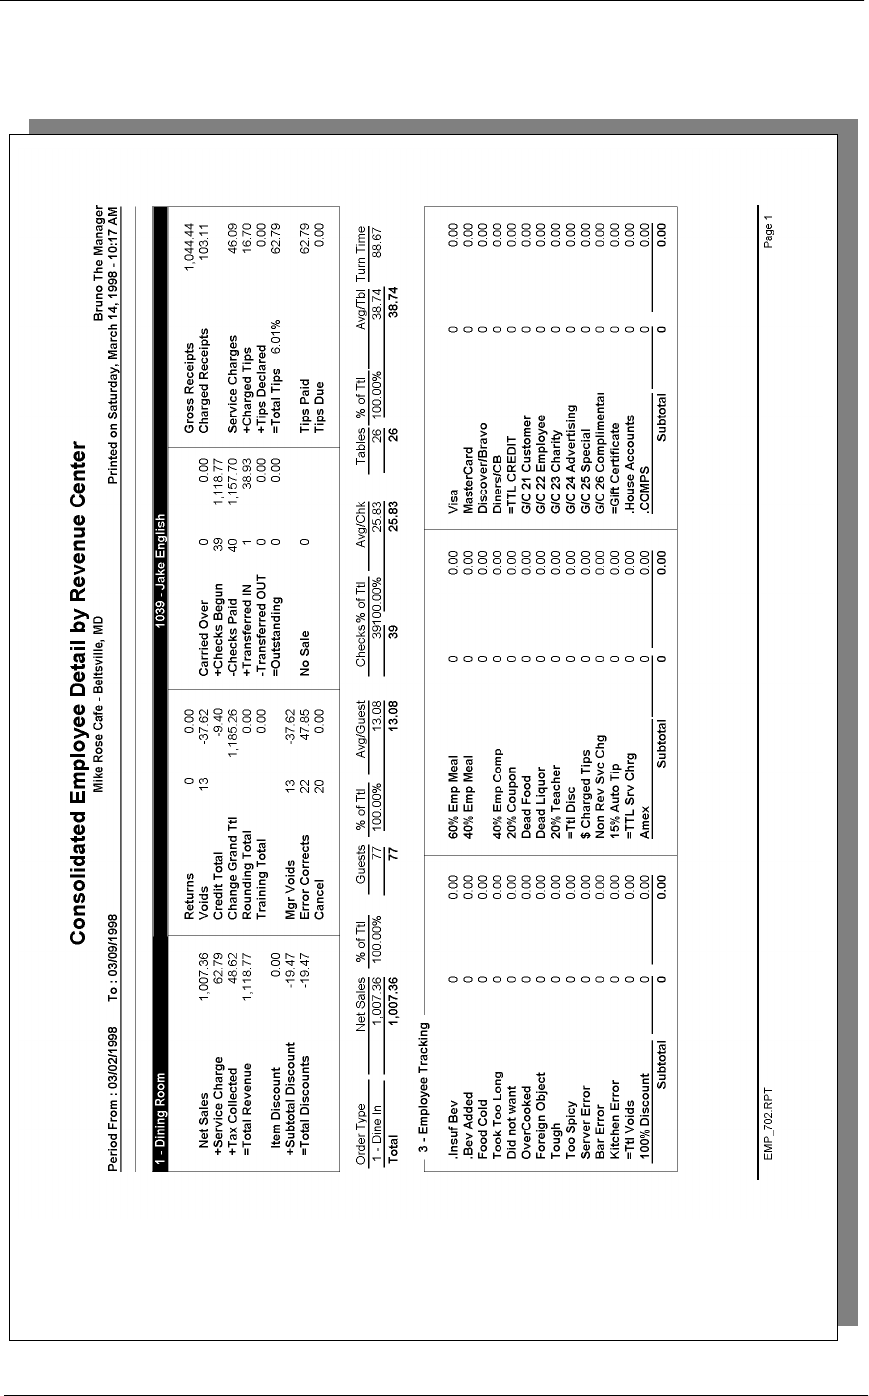
5HSRUWV
(PSOR\HH5HSRUWV
&RQVROLGDWHG(PSOR\HH'HWDLO7RWDOVE\5HYHQXH&HQWHU
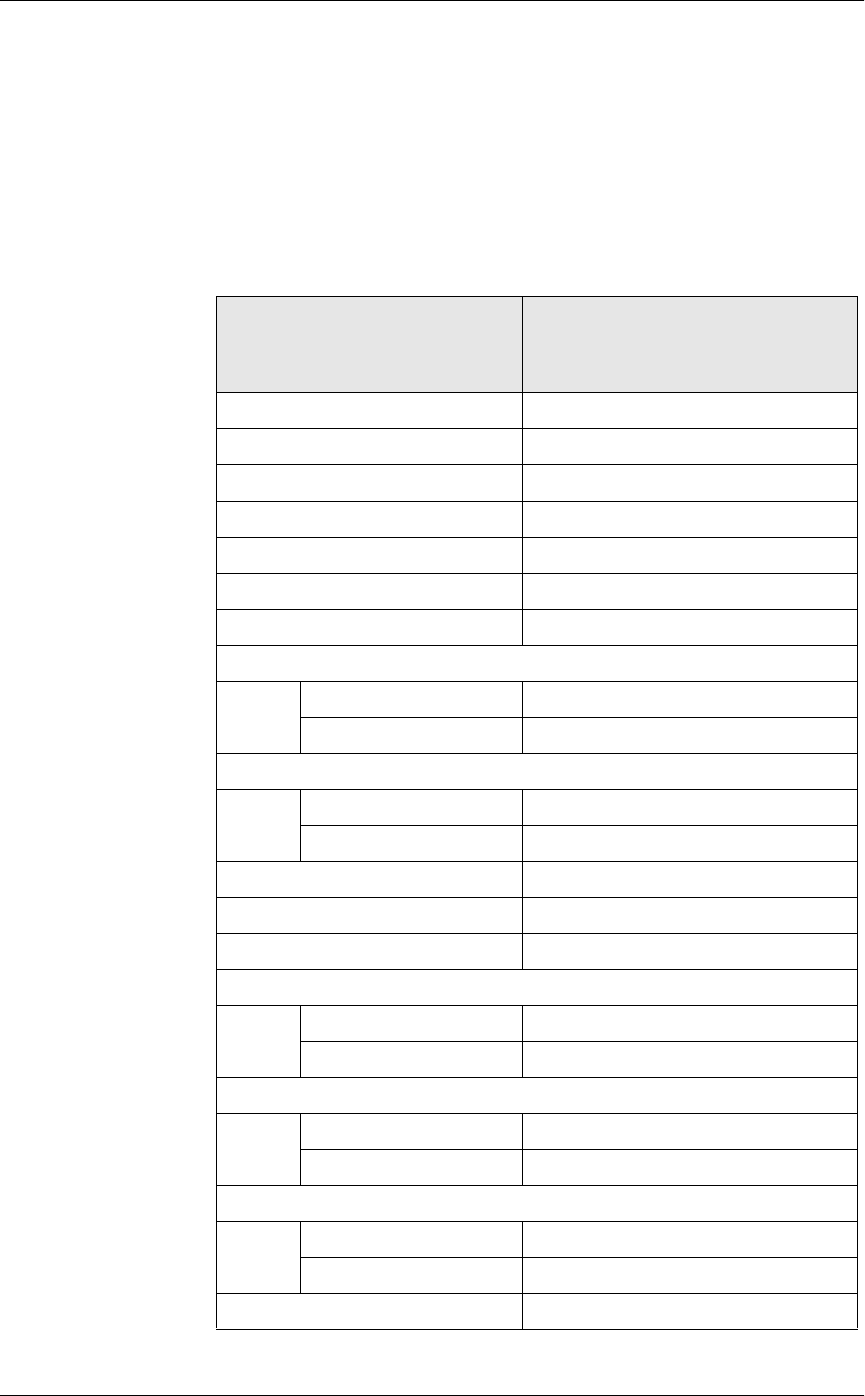
(PSOR\HH5HSRUWV
&RQVROLGDWHG(PSOR\HH'HWDLO7RWDOVE\5HYHQXH&HQWHU
Detailed Sales and Tip Profile Details
Stored Procedures: sp_R_cons_rvc_emp_ttls and
sp_R_rvc_employee_sales_tracking
This report does not use any views.
The following table lists each field in the Detailed Sales profile and
provides detailed information on the source of each of the figures.
Report
Field
Title Formula
Net Sales @ttl_Net_Sales
Service Charges @ttl_Service_Chg
Tax Collected @ttl_Tax_Collected
Total Revenue @ttl_Total_Revenue
Item Discount @ttl_Item_Disc
Subtotal Discount @ttl_Sbtl_Disc
Total Discount @ttl_Total_Disc
Return
Number @ttl_Return_Qty
Value @ttl_Return_Total
Void
Number @ttl_Void_Qty
Value @ttl_Void_Total
Credit Total @ttl_Credit_Total
Change In Grand Ttl @ttl_Change_Grand_Total
Rounding Total @ttl_Rounding_Total
Mgr Void
Number @ttl_Mgr_Void_Qty
Value @ttl_Mgr_Void_Total
Error Correct
Number @ttl_Error_Correct_Qty
Value @ttl_Error_Correct_Total
Cancel
Number @ttl_Trans_Cancel_Qty
Value @ttl_Trans_Cancel_Total
No Sale @ttl_No_Sale
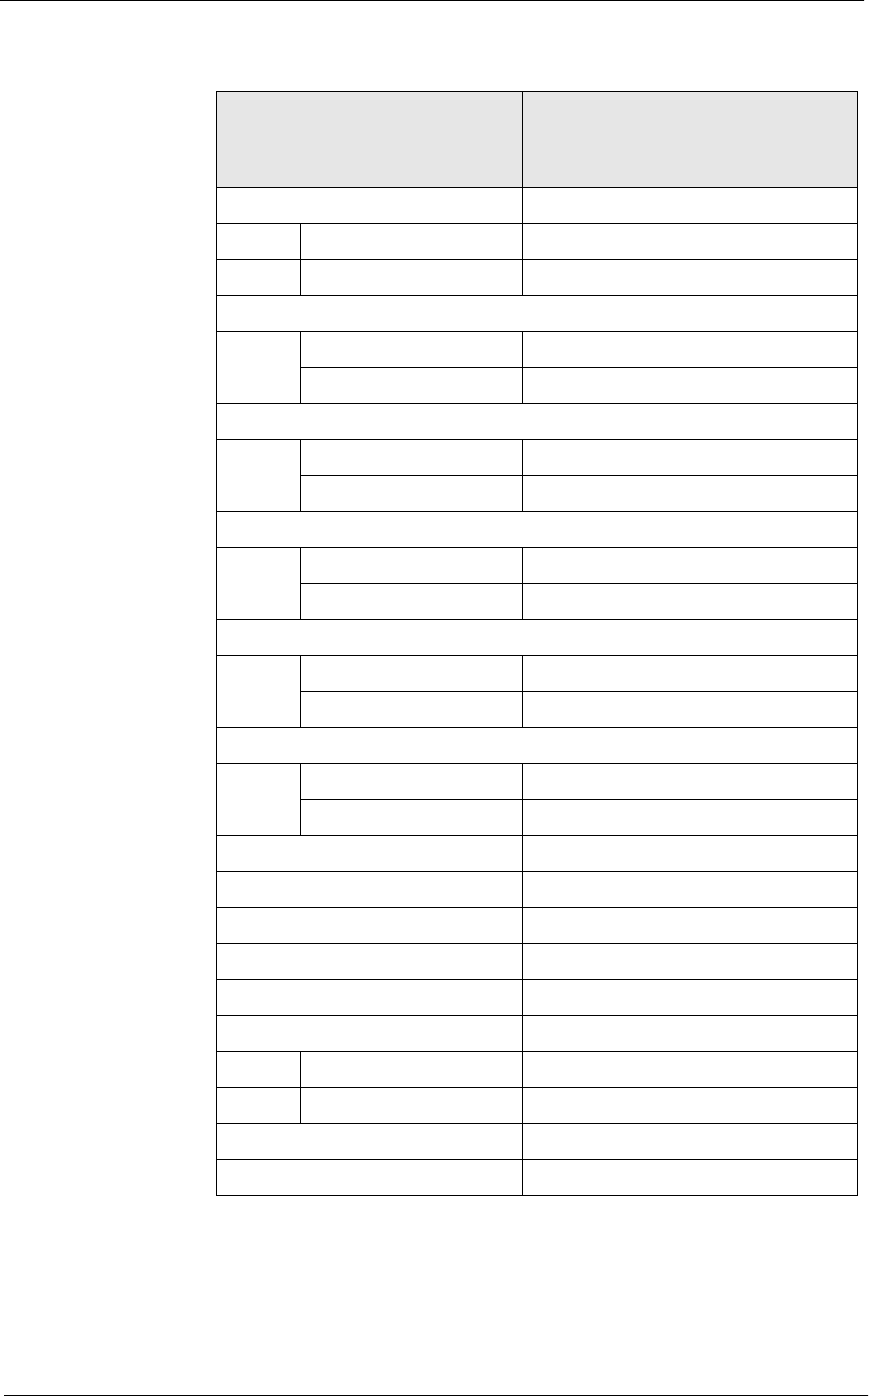
5HSRUWV
(PSOR\HH5HSRUWV
&RQVROLGDWHG(PSOR\HH'HWDLO7RWDOVE\5HYHQXH&HQWHU
Checks Carried Over
Number @ttl_Carried_Over_Qty
Value @ttl_Carried_Over_Total
Checks Begun
Number @ttl_Checks_Begun_Qty
Value @ttl_Checks_Begun_Total
Checks Paid
Number @ttl_Checks_Paid_Qty
Value @ttl_Checks_Paid_Total
Transferred IN
Number @ttl_Xfer_IN_Qty
Value @ttl_Xfer_IN_Total
Transferred OUT
Number @ttl_Xfer_OUT_Qty
Value @ttl_Xfer_OUT_Total
Outstanding
Number @ttl_Outstanding_Qty
Value @ttl_Outstanding_Total
Gross Receipts @ttl_Gross_Rcpts_Total
Charged Receipts @ttl_Charged_Rcpts_Total
Service Charge @ttl_Service_Chg_Total
Charged Tips @ttl_Charged_Tips
Tips Declared @ttl_Tips_Declared
Total Tips
Percent @ttl_Tips_Percent
Total @ttl_Total_Tips
Tips Paid @ttl_Tips_Paid
Tips Due @ttl_Tips_Due
Report
Field
Title Formula
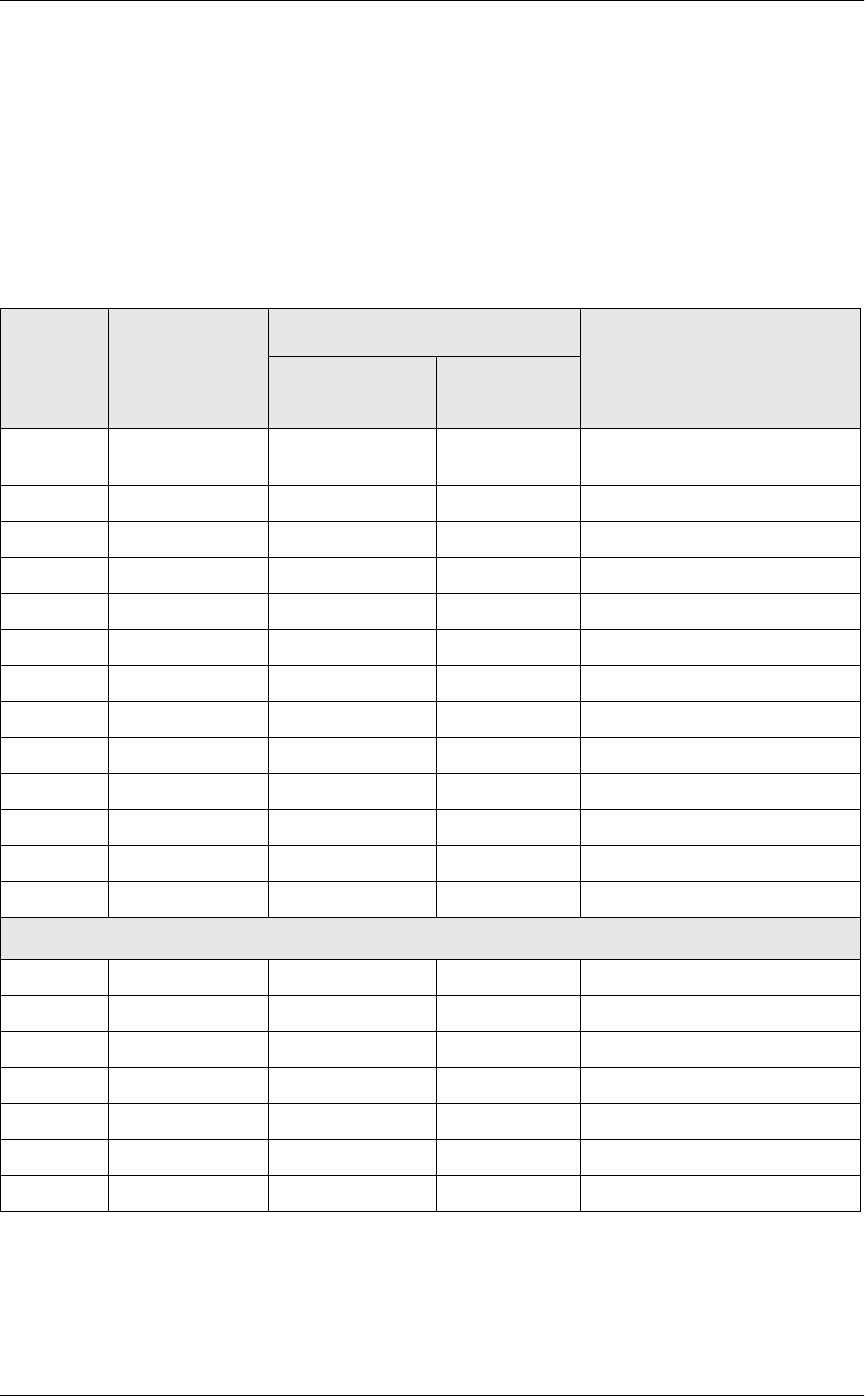
(PSOR\HH5HSRUWV
&RQVROLGDWHG(PSOR\HH'HWDLO7RWDOVE\5HYHQXH&HQWHU
Sales and Tip Profile Details
Stored Procedures: sp_R_cons_rvc_emp_ttls and
sp_R_rvc_employee_sales_tracking
This report does not use any views.
The following table lists each field in the Sales profile and provides detailed
information on the source of each of the figures.
Report
Column
Title
Stored
Procedure
Column
Title
3700 Database
Formula
Table Column
Order Type @lbl_Order_Type_Num_And_Nam
e
Net Sls ot_net_sales_ttl shift_rvc_emp_ot_ttl ot_net_sales
% of Ttl @Percent_Of_Net_Total
Guests cover_count shift_rvc_emp_ot_ttl cover_count
% of Ttl @Percent_Of_Guest_Total
Avg/Guest @Avg_$_Guest
Checks check_count shift_rvc_emp_ot_ttl check_count
% of Ttl @Percent_Of_Check_Total
Avg/Chk @Avg_$_Check
Tables table_turn_count shift_rvc_emp_ot_ttl table_turn_count
% of Ttl @Percent_Of_Table_Total
Avg/Tbl @Avg_$_Table
Turn Time @Avg_Turn_Time
Total
Net Sls ∑ ot_net_sales_ttl shift_rvc_emp_ot_ttl ot_net_sales
Guests ∑ cover_count shift_rvc_emp_ot_ttl cover_count
Avg/Guest @Total_Avg_$_Guest
Checks ∑ check_count shift_rvc_emp_ot_ttl check_count
Avg/Chk @Total_Avg_$_Check
Tables ∑ table_turn_count shift_rvc_emp_ot_ttl table_turn_count
Avg/Tbl @Total_Avg_$_Table
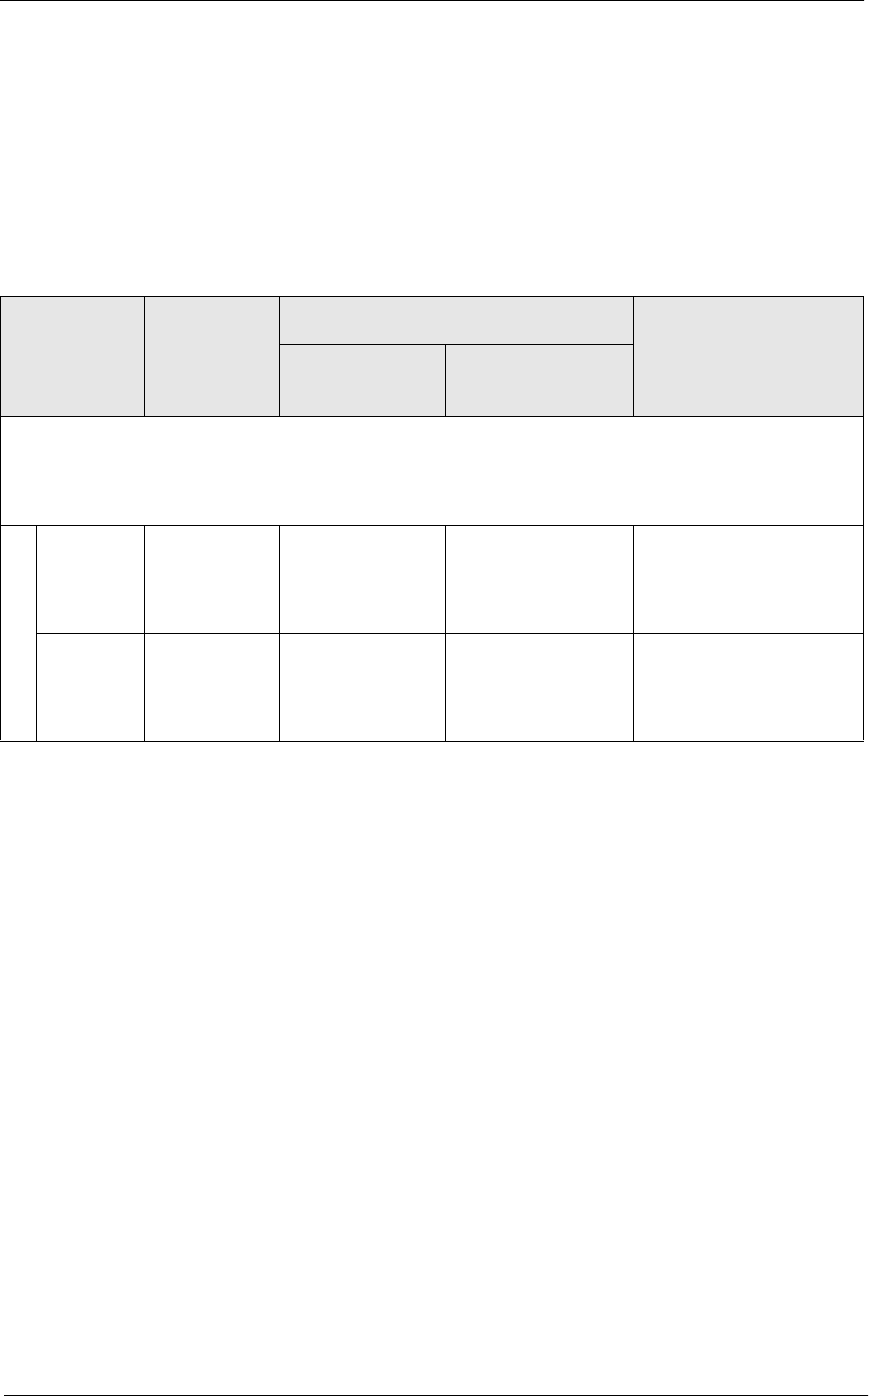
5HSRUWV
(PSOR\HH5HSRUWV
&RQVROLGDWHG(PSOR\HH'HWDLO7RWDOVE\5HYHQXH&HQWHU
Tracking Group Profile Details
Stored Procedures: sp_R_cons_rvc_emp_ttls and
sp_R_rvc_employee_sales_tracking
This report does not use any views.
The following table lists each field in the Tracking Group profile and
provides detailed information on the source of each figure.
Programming Considerations
*URVV5HFHLSWV
qReceipts posted to a tendering key will add to Gross Receipts if
Tender/Media | Tender | Post to gross receipts is selected.
qTax collected is not included in gross receipts if
RVC Taxes | Do not post tax to tip reports is selected.
qThis field does not include charged tips.
&KDUJHG5HFHLSWV
q Only charge keys that are programmed to allow a charged tip add to
the charged receipts field. To post totals to Charged Receipts select
Tender/Media | CC Tender | Post to charge receipts.
Report
Column
Title
Stored
Procedure
Column
Title
3700 Database
Formula
Table Column
Programmable1
to
Programmable42
Number trk_cnt_01
to
trk_cnt_42
shift_rvc_emp_ttl trk_cnt_01
to
trk_cnt_42
Value trk_ttl_01
to
trk_cnt_42
shift_rvc_emp_ttl trk_ttl_01
to
trk_ttl_42

(PSOR\HH5HSRUWV
&RQVROLGDWHG(PSOR\HH'HWDLO7RWDOVE\5HYHQXH&HQWHU
6HUYLFH&KDUJH
qService charges can be programmed to add to either the Service
Charge field, or the Gross Receipts field. Select Discount/Service |
Discount/Service Charge | Post to svc charges total to post the service
charge to the service charge field. Clear this option to post the totals
to Gross Receipts.
You can use the Service Charge figures in one of two ways:
to produce totals that can be used in preparing IRS tax forms, or
to report autogratuities.
Service charges that are tips may be programmed to post to the
service charge field. (Post to svc charges total is selected). Services
charges that are not tips (for example, a cover charge, or banquet
room charge) should be programmed to add to Gross Receipts (Post
to svc charges total is cleared).
You may wish to use the Service Charge total to track autogratuities.
In this case, program any autogratuities you wish to track to add to the
service charge, and program all other service charges to add to gross
receipts.
Post to svc charges total works in conjunction with Charge tip on the
same form. Only one of these options should be selected. If both
options are selected, Post to svc charges total will be ignored.
*XHVWV
qThe number of guests is determined by the seat count, the number of
specified service charges or menu items, or by the guest count entered
by the employees.
To use seat count to determine the number of guests, select RVC Seats
| Use seat count for cover count.
To use a service charge to determine the number of guests, select
Discount/Service | Discount/Service Charge | Post to cover count.
To use specified menu items to determine the number of guests, select
Menu Item Classes | Price/Totals | Add to cover count. Then assign
this menu item class to the menu items that will determine the guest
count.
If none of these options is selected, the system will use the guest
count entered by employees when beginning checks as the guest
count.
5HSRUWV
(PSOR\HH5HSRUWV
(PSOR\HH6DOHVDQG7LS7RWDOVE\5HYHQXH&HQWHU
Employee Sales and Tip Totals by Revenue Center
3XUSRVH
This report provides a summary of sales and tip information for each
employee within a Revenue Center.
)RUPDW
The profile used for this report is unique—it is not used for any other
reports. It is explained in the Report profile below.
7HPSODWH
EMP_821.RPT
5HSRUW3URILOH
This profile includes guest, check, and tip information.
Column Description
Net Sales Ttl The total sales amount recorded for an employee,
minus all voids, returned items, and discounts.
Guests The total number of guests served by the employee.
Depending on how the system is programmed, this
total can be the sum of the guest counts entered by the
employee when beginning checks, the number of seats
on a check, or the number of specified menu items or
service charges.
Chks The total number of checks either opened using the
[Begin Check] key or started as fast transactions and
then service totalled.
To allow a fast transaction to be service totalled select
RVC Transactions | Checks/Receipts | Allow fast
transaction service total.
Avg Ttl Guest The average revenue generated by each guest. This
figure is calculated using the following formula:
Avg Ttl Chk The average revenue per check. This figure is
calculated using the following formula:
Svc Charge The preset or percent amount added to a guest check.
Net Sales Ttl
Guests
Avg Ttl Guest =
Net Sales Ttl
Chks
Avg Ttl Chk =

(PSOR\HH5HSRUWV
(PSOR\HH6DOHVDQG7LS7RWDOVE\5HYHQXH&HQWHU
Chgd Tips The value of tips charged to credit cards or room
charge keys when the tender key is programmed to
automatically calculate any over-tendered amount as a
charged tip. A charged tip can also be entered
manually through a [Charged Tips] key.
Tips Declrd The value of cash tips declared by the employee using
the [Tips Declared] key.
Tip % The Tip % is calculated using the following formula:
Total Tips The total amount of service charge tips, charged tips
and declared tips:
Tips Paid The sum of all charged tips and service charges that
are programmed to add automatically to Tips Paid and/
or recorded manually through a [Tips Paid) key. This
figure should equal the sum of charged tips and
service charge tips; otherwise, your employees have
not been paid all their tips.
Tips Due Tips Due is the amount owed to the employee and is
calculated using the following formula:
Column Description
Tip % = Total Tips
Employee Gross Receipts x 100%
Total =
Service
Charge
Tips +Charged
Tips +Declared
Tips
Tips
Tips =Total
Tips _Tips
Paid
Due
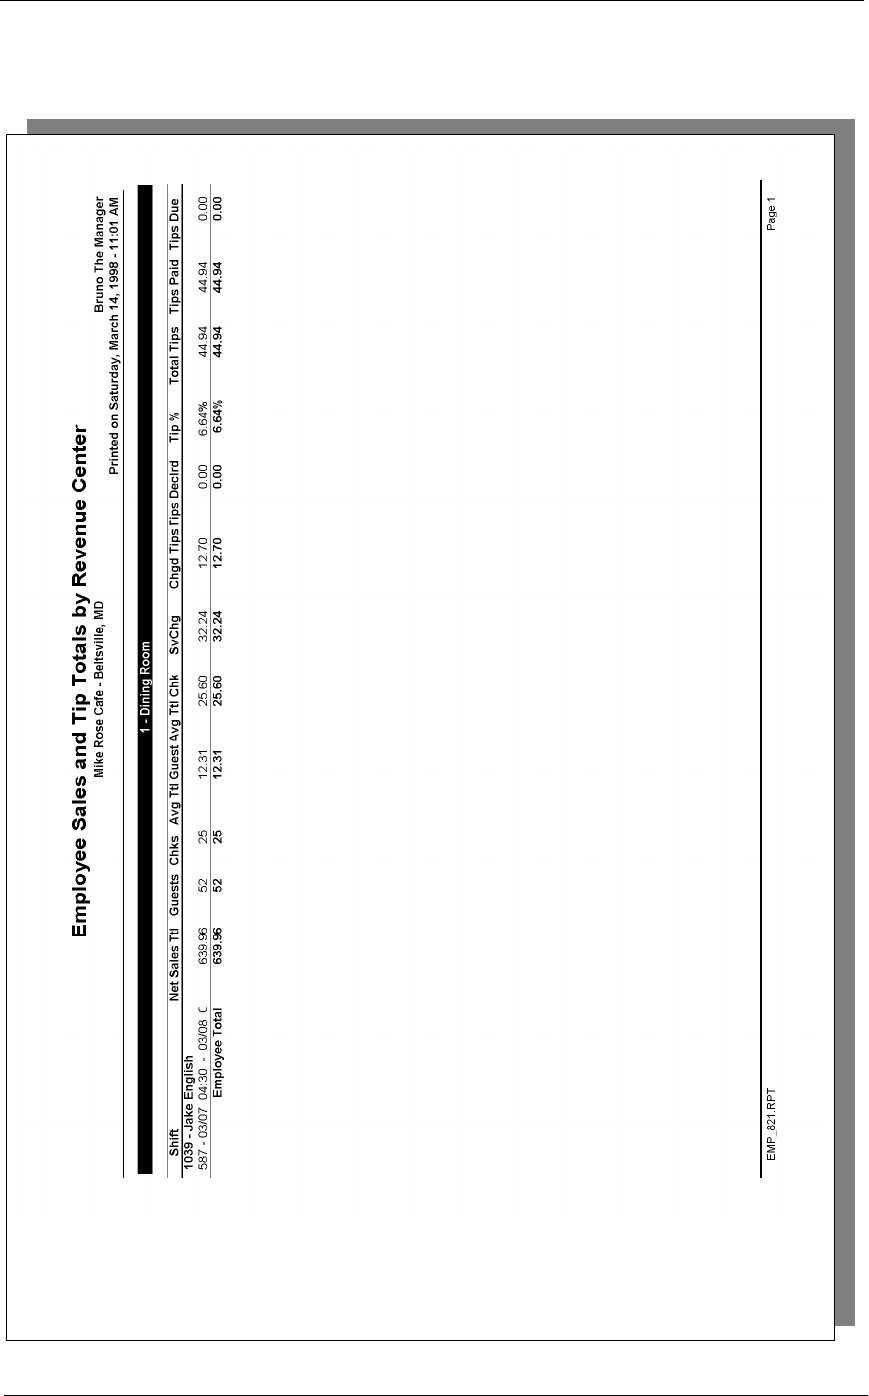
5HSRUWV
(PSOR\HH5HSRUWV
(PSOR\HH6DOHVDQG7LS7RWDOVE\5HYHQXH&HQWHU
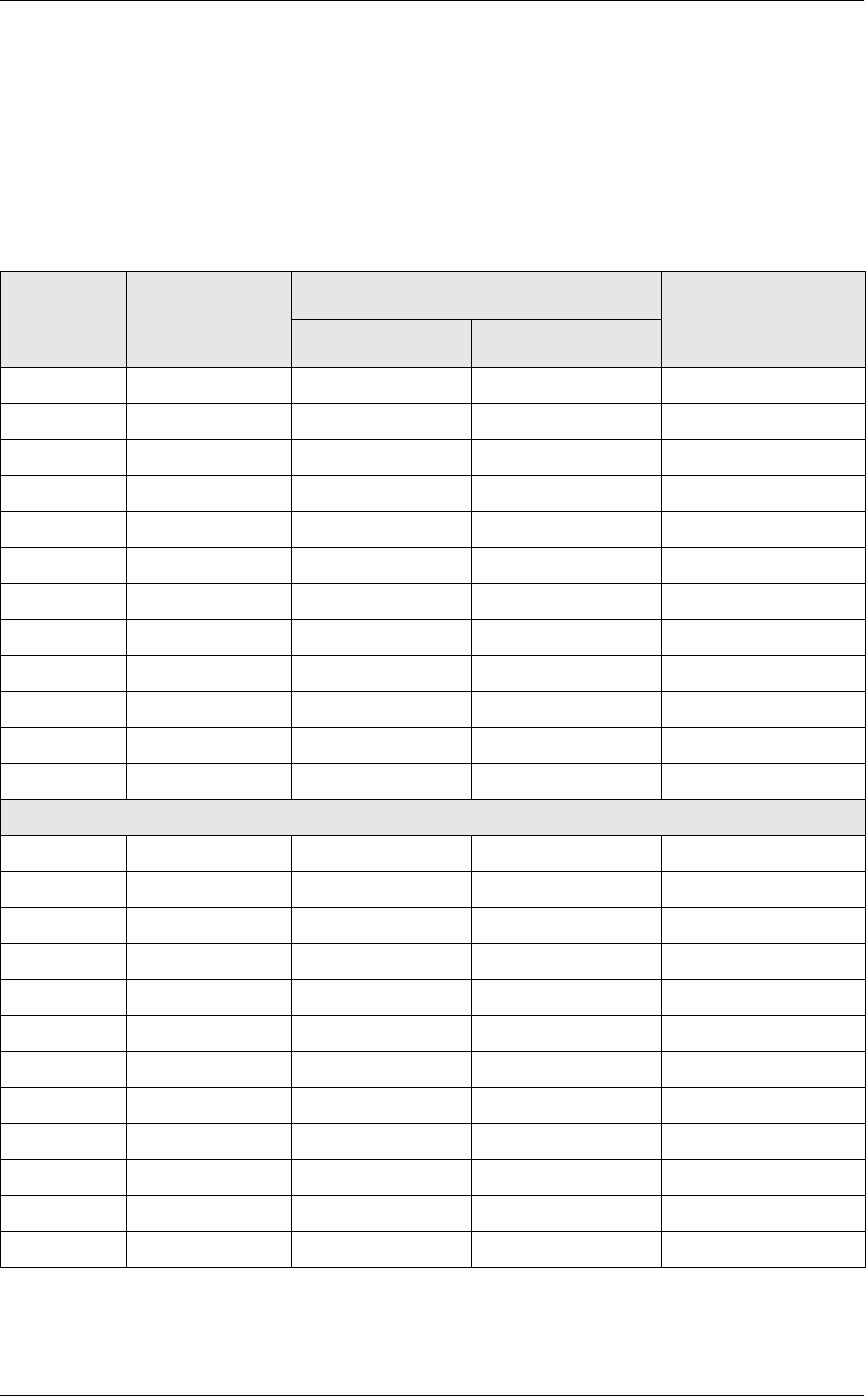
(PSOR\HH5HSRUWV
(PSOR\HH6DOHVDQG7LS7RWDOVE\5HYHQXH&HQWHU
Report Profile Details
View: v_R_rvc_employee_sales_tips
Stored Procedure: sp_R_rvc_employee
The following table lists each column in the report and provides detailed
information on the source of the figures in each column.
Report
Column
Title
View
Column
Name
3700 Database Formula
Table Column
Net Sales Ttl net_sls_ttl shift_rvc_emp_ttl net_sls_ttl
Guests cov_cnt shift_rvc_emp_ttl cov_cnt
Chks chk_cnt shift_rvc_emp_ttl chk_cnt
Avg Ttl Guest @Avg_$_Guest
Avg Ttl Chk @Avg_$_Check
Service Total tip_scv_ttl shift_rvc_emp_ttl tip_svc_ttl
Chgd Tips chgd_tips_ttl shift_rvc_emp_ttl charged_tips_ttl
Tips Declrd tips_decl_ttl shift_rvc_emp_ttl tips_decl_ttl
Tip % @Tip_%
Total Tips @Total_Tips
Tips Paid tips_paid_ttl shift_rvc_emp_ttl tips_paid_ttl
Tips Due @Tips_Due
Daily Total
Net Sales Ttl ∑ net_sls_ttl shift_rvc_emp_ttl net_sls_ttl
Guests ∑ cov_cnt shift_rvc_emp_ttl cov_cnt
Chks ∑ chk_cnt shift_rvc_emp_ttl chk_cnt
Avg Ttl Guest @Ttl_Avg_$_Guest
Avg Ttl Chk @Ttl_Avg_$_Check
Service Total ∑ tip_svc_ttl shift_rvc_emp_ttl tip_scv_ttl
Chgd Tips ∑ chgd_tips_ttl shift_rvc_emp_ttl charged_tips_ttl
Tips Declrd ∑ tips_decl_ttl shift_rvc_emp_ttl tips_decl_ttl
Tip % @Total_Tip_%
Total Tips @Total_Tips
Tips Paid ∑ tips_paid_ttl shift_rvc_emp_ttl tips_paid_ttl
Tips Due @Tips_Due

5HSRUWV
(PSOR\HH5HSRUWV
(PSOR\HH6DOHVDQG7LS7RWDOVE\5HYHQXH&HQWHU
Programming Considerations
*XHVWV
qTo use seat count to determine the number of guests, select RVC Seats
| Use seat count for cover count.
To use a service charge to determine the number of guests, select
Discount/Service | Discount/Service Charge | Post to cover count.
To use specified menu items to determine the number of guests, select
Menu Item Classes | Price/Totals | Add to cover count. Then assign
this menu item class to the menu items that will determine the guest
count.
If none of these options is selected, the system will use the guest
count entered by employees when beginning checks as the guest
count.
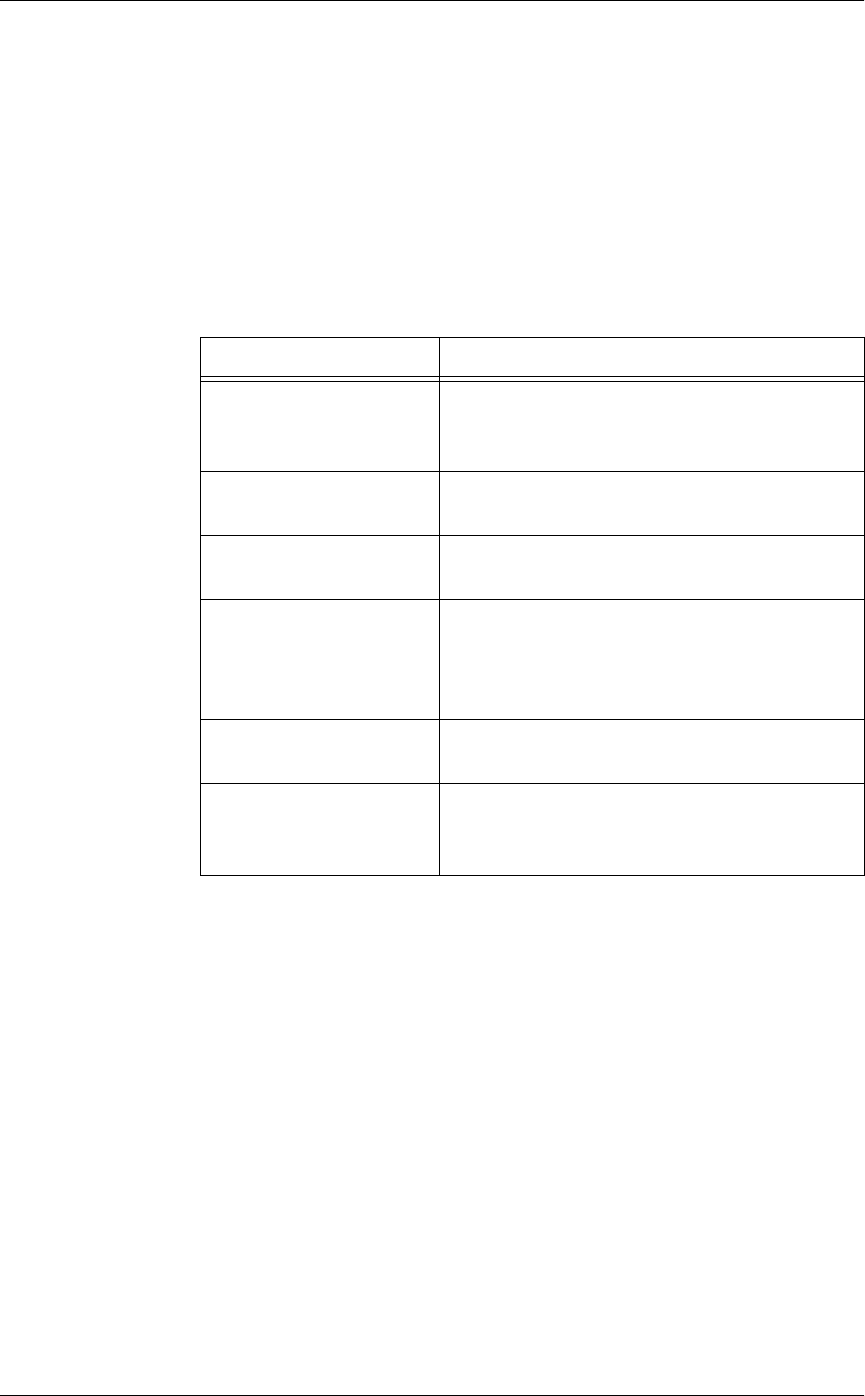
(PSOR\HH5HSRUWV
(PSOR\HH2SHQ/'65HSRUW
Employee Open LDS Report
3XUSRVH
This report is used to identify the status of the LDS Suspense File at any
given time.
5HSRUW3URILOH
The following table lists each field in the Employee Open LDS Report
and provides detailed information on the source of the information.
Column Heading Description
Header This area shows the name, address, and
phone number (if desired) of the
restaurant.
Employee Number
and Name These columns are generated in order,
according to the employee ID number.
Item Quantity This column specifies the quantity of
outstanding drinks by item number.
Item Number and
Name This column provides a description of the
drink items as they are programmed in
the Menu Item File, and identifies each
drink by its Menu Item Number.
Item Total This column specifies the net total for
each outstanding drink.
Report Total This column shows the net number of
outstanding drinks and the net total for
those drinks.
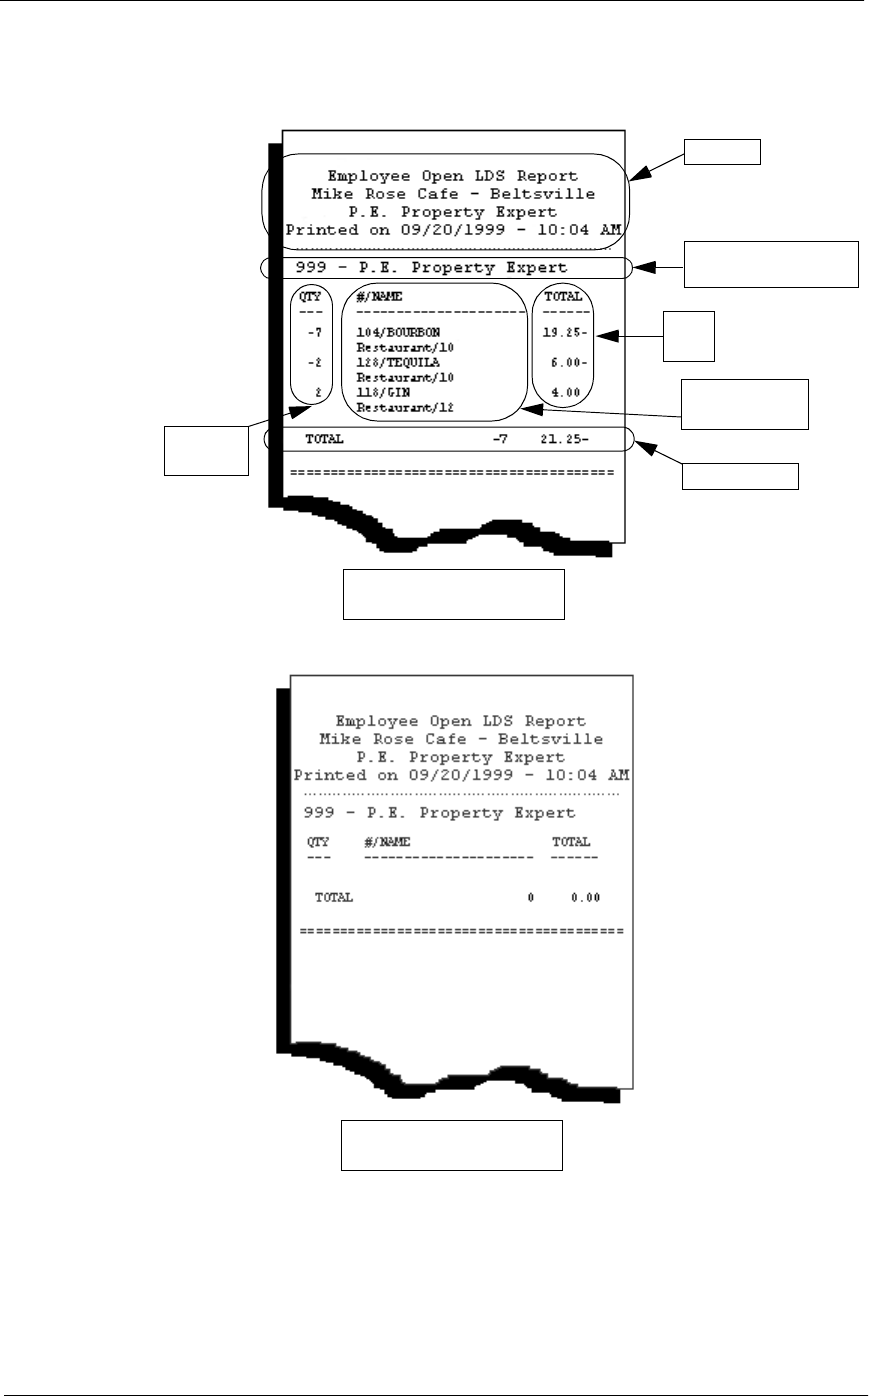
5HSRUWV
(PSOR\HH5HSRUWV
(PSOR\HH2SHQ/'65HSRUW
Below are examples of the Employee Open LDS Report.
Unbalanced Report
(drinks still outstanding)
Header
Employee Number
and Name
Report Total
Item
Total
Item
Quantity
Item Number
and Name
Balanced Report (no
drinks outstanding)

(PSOR\HH5HSRUWV

5HSRUWV
Chapter 4
Labor Reports
This chapter shows examples and provides an explanation of all labor
reports, which are used to track time and attendance.
In this chapter
Introduction ............................................................................................4-2
Employee Time Card and Job Detail .................................................... 4-3
Employee Job Summary........................................................................ 4-8
Consolidated Employee Job Summary ............................................... 4-12
Revenue Center Job Summary............................................................ 4-16
Consolidated Revenue Center Job Summary...................................... 4-22
System Job Summary.......................................................................... 4-27
Consolidated System Job Summary.................................................... 4-33
Clock In Status .................................................................................... 4-38
Labor Availability ............................................................................... 4-42
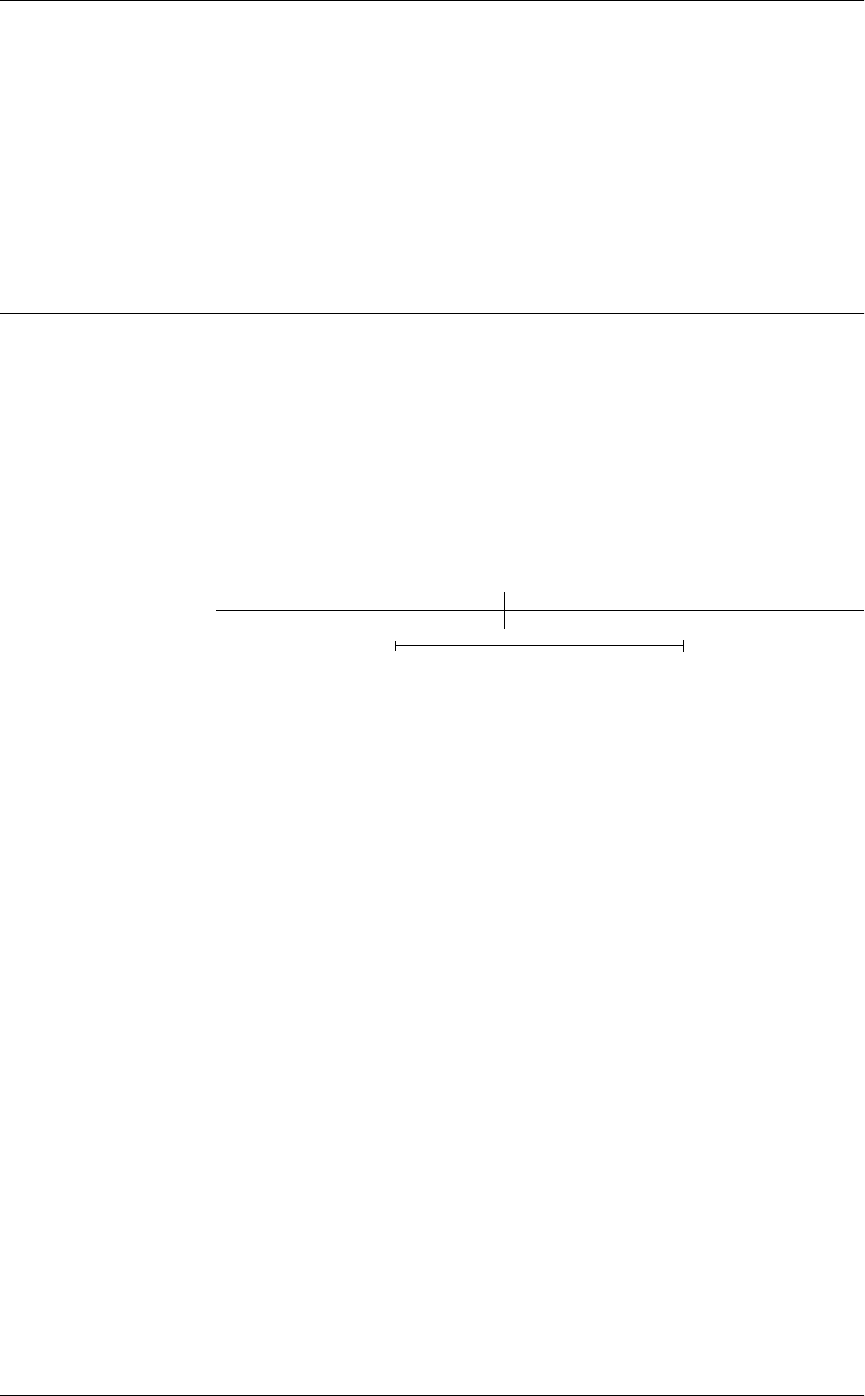
/DERU5HSRUWV
,QWURGXFWLRQ
Introduction
In addition to tracking sales revenue and food costs, the 3700 also
provides comprehensive labor reporting capabilities. Labor reports are
designed to provide you with information about labor availability, an
accounting of gross wages, and an analysis of labor costs and net sales
percentages for a particular job category or department.
&UHGLWLQJ/DERU+RXUV
You can specify when your business day starts since many restaurants are
open past midnight, or even 24 hours a day. You can also specify if labor
hours are credited to the actual business day on which they occur, or if an
employee’s entire shift is credited to the clock-in business day. Define
how labor hours are credited in Time and Attendance | General | Allocate
Labor Hours.
([DPSOH
Tim works an eight-hour shift, with three hours on business day 1 and five
hours on business day 2. If Allocate Labor Hours To actual business day
is selected, three hours are credited to business day one and five hours to
business day two. If Allocate Labor Hours To clock-in business day is
selected, all eight hours are credited to business day 1.
Business Day 1 Business Day 2
Tim’s Shift
3 hours 5 hours
5HSRUWV
/DERU5HSRUWV
(PSOR\HH7LPH&DUGDQG-RE'HWDLO
Employee Time Card and Job Detail
3XUSRVH
This report provides an accounting of work performed by each employee:
the dates, times, and job of each clock in and clock out, the total hours of
regular and overtime worked at each job, and the gross pay earned.
)RUPDW
The profile used for this report is unique—it is not used for any other
reports. It is explained in the Report Profile below.
7HPSODWH
TIME_002.RPT
5HSRUW3URILOH
This profile provides time clock and pay information by job.
Report Column Description
Job # and Name The job number and name on Jobs | Job Definitions
that is associated with the clock in detailed in the
next column.
Clock In/Out
Date and Time Each clock in and clock out for the specified
employee is listed here in chronological order. The
clock in includes the day of the week and the date,
as well as time of day. Clock out only includes day
and date information if it is different than the clock in
day and date.
Hours The number of hours between clock in and clock
out, expressed as a decimal figure. Each clock out
row includes an entry in the hours column.
Status The status of this clock in or clock out. Possible
statuses are:
oOnTime
oEarly
oLate
oOnBreak
oOnPaidBreak
oEarlyFromBreak
oLateFromBreak
oNotScheduled
oMgrClockOut
oNo Schedule
/DERU5HSRUWV
(PSOR\HH7LPH&DUGDQG-RE'HWDLO
This profile also includes totals figures by week (if the pay period is
something other than weekly) and by pay period. The weekly totals list
the number of regular hours, the number of overtime hours, and the total
number of hours for the week. The pay period totals list the total number
of hours, as well as regular hours, overtime hours, regular pay, overtime
pay, and total pay for the pay period.
Adjusted By If a clock in or clock out has been adjusted, this
column provides the name of the person who made
the change. If the clock in or clock out was not
adjusted, this field is blank.
Reason The reason for any adjustment made to the time
card. Reasons are defined on the Reasons form.
You can define as many reasons as necessary,
subject to the space restraints of your system.
Job Totals
Regular Hours The total number of regular (not overtime) hours
worked by this employee at this job expressed as a
decimal figure.
Overtime Hours The total number of overtime hours worked by this
employee at this job expressed as a decimal figure.
Regular Pay The value of wages earned for regular hours. This
figure is calculated using the wage rate defined in
Jobs | Job Definitions unless an overriding rate is
defined in Employees | Job Rates | Override
Regular Rate.
Overtime Pay The value of wages earned for overtime hours. This
figure is calculated using the overtime wage rate
defined in the Jobs | Job Definitions unless an
overriding rate is defined in Employees | Job Rates |
Override Overtime Rate.
Total Pay The total wages earned for regular and overtime
hours.
Report Column Description
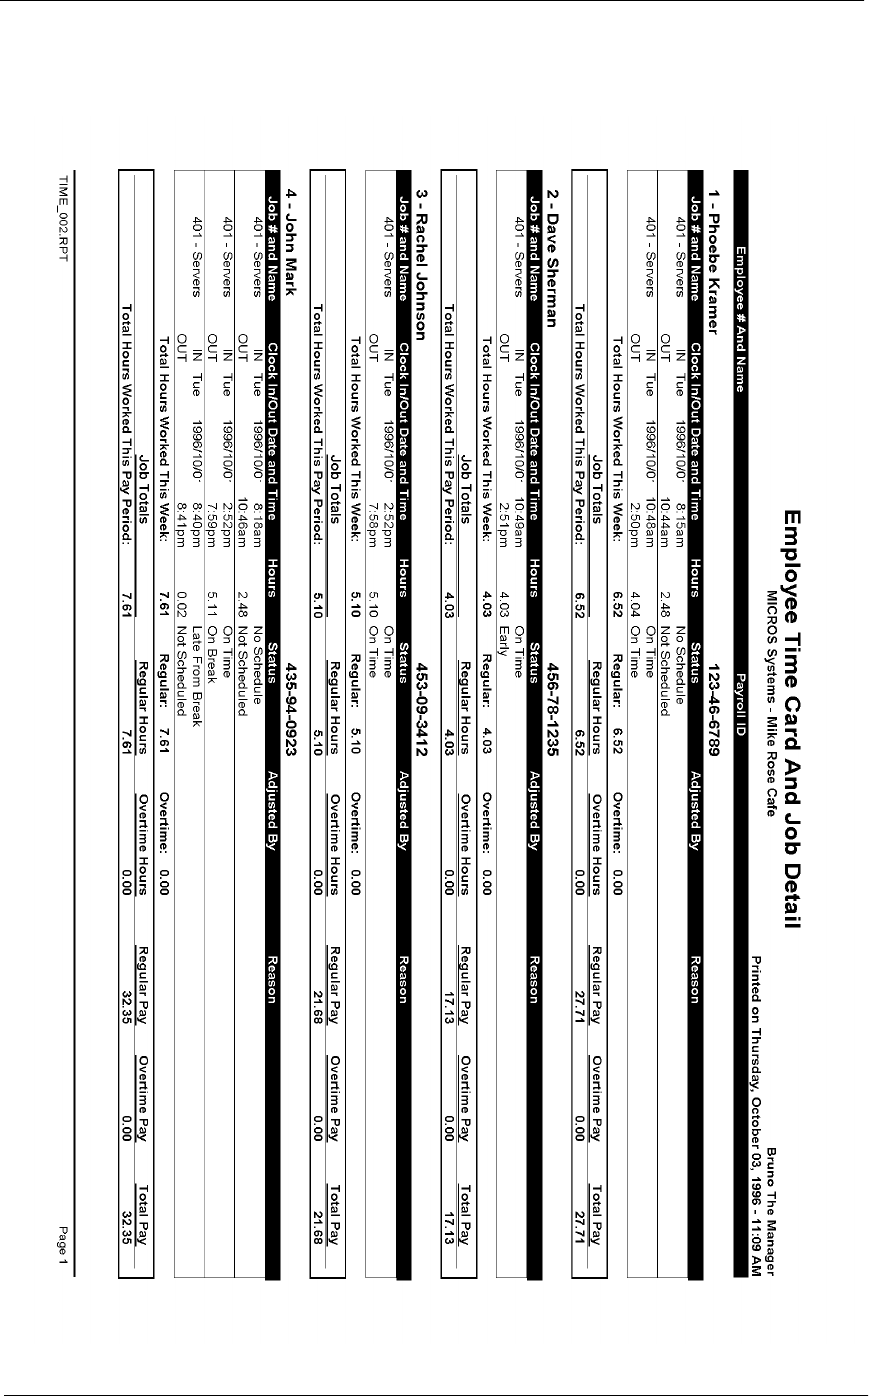
5HSRUWV
/DERU5HSRUWV
(PSOR\HH7LPH&DUGDQG-RE'HWDLO
/DERU5HSRUWV
(PSOR\HH7LPH&DUGDQG-RE'HWDLO
Report Details
View: v_R_employee_time_card
Stored Procedure: sp_R_time_card_ttls
The following table lists each column in the report and provides
information on the source of the figures in each column.
Report
Column
Title
View
Column
Title
3700 Database Formula
Table Column
Job # and Name @Job_Number_And_Name
Clock In Information
Day @IN_Weekday
Date @IN_Date
Time @IN_Time
Status @IN_Status
Adjusted By @IN_Adj_Employee
Reason @IN_Adj_Reason
Clock Out Information
Day @OUT_Weekday
Date @OUT_Date
Time @OUT_Time
Hours @Hours_Worked
Status @OUT_Status
Adjusted By @OUT_Adj_Employee
Reason @OUT_Adj_Reason
5HSRUWV
/DERU5HSRUWV
(PSOR\HH7LPH&DUGDQG-RE'HWDLO
Programming Issues
*HQHUDO
qJobs and default pay rates are defined on the Jobs form.
2YHUWLPH3D\
qConditions for awarding overtime are defined on the Time and
Attendance form.
Notes
5HSRUWV3URGXFHG:KLOH(PSOR\HHV$UH&ORFNHG,Q
If this report is produced for the current day while employees are clocked
in, the report shows a clock in with a date and time, but no clock out for
these employees. The hours column shows the number of hours the
employees have worked in this shift. The Job Totals and Total Hours
Worked This Pay Period fields both include the current hours.
Job Totals
Regular Hours @Job1_Reg_Hours
to
@Job6_Reg_Hours
Overtime Hours @Job1_Ovt_Hours
to
@Job6_Ovt_Hours
Regular Pay @Job1_Reg_Rate
to
@Job6_Reg_Rate
Overtime Pay @Job1_Ovt_Rate
to
@Job6_Ovt_Rate
Total Pay @Job1_Rate_Ttl
to
@Job6_Rate_Ttl
Weekly Totals
Total Hours ∑ @Hours_Worked
Regular ∑ regular_hours time_card_dtl reg_hrs
Overtime ∑ overtime_hours time_card_dtl ovt_hrs
Pay Period Totals
Total Hours ∑ @Hours_Worked
Regular Hours ∑ regular_hours time_card_dtl reg_hrs
Overtime Hours ∑ overtime_hours time_card_dtl ovt_hrs
Regular Pay ∑ regular_ttl time_card_dtl reg_dtl
Overtime Pay ∑ overtime_ttl time_card_dtl ovt_ttl
Total Pay @ttl_Rate_Total

/DERU5HSRUWV
(PSOR\HH-RE6XPPDU\
Employee Job Summary
3XUSRVH
This report summarizes labor information by job. It also provides weekly
and period totals.
This information can be useful in analyzing scheduling and the wages of
employees. For example, by reviewing this report you could discover that
you have scheduled too many individuals in one labor classification and
not enough in another.
)RUPDW
This report includes the following profile:
qEmployee Labor Profile
7HPSODWH
TIME_003.RPT
2-17
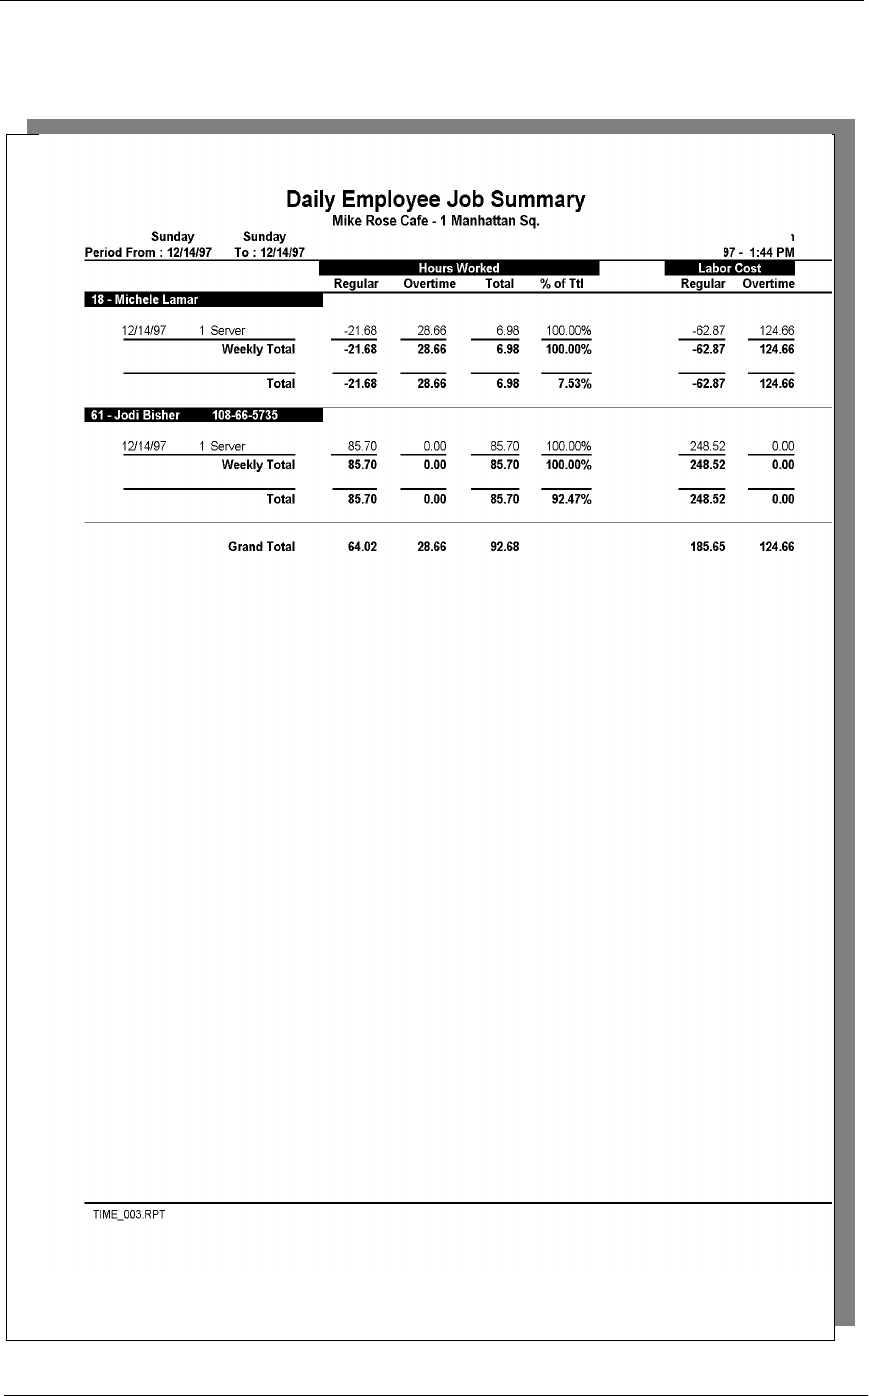
5HSRUWV
/DERU5HSRUWV
(PSOR\HH-RE6XPPDU\
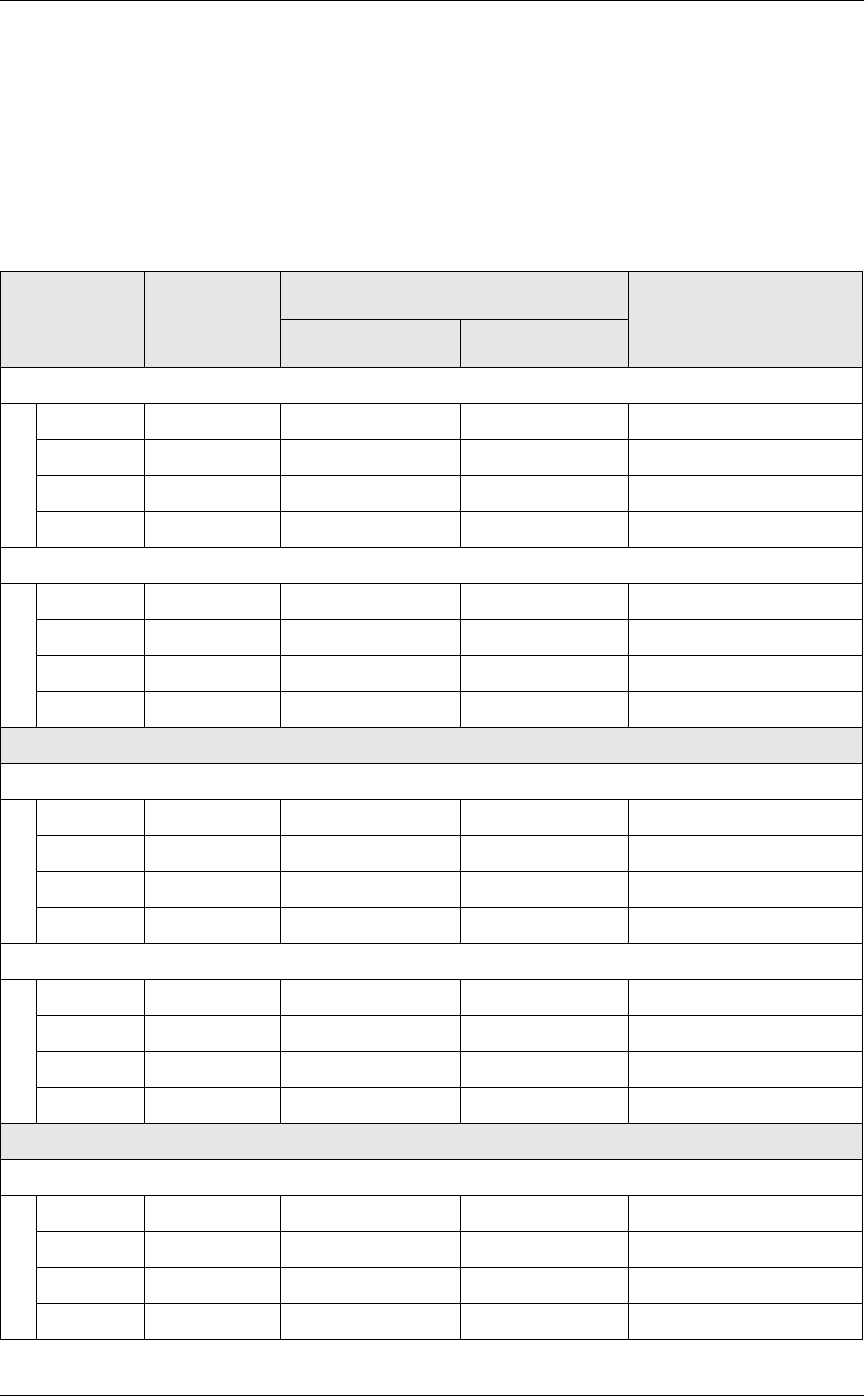
/DERU5HSRUWV
(PSOR\HH-RE6XPPDU\
Employee Labor Profile Details
View: v_R_employee_job_code
Stored Procedure: sp_R_employee_job_code
The following table lists each column in the Employee Labor Profile and
provides detailed information on the source of each figure.
Report
Column
Title
View
Column
Title
3700 Database Formula
Table Column
Hours Worked
Regular reg_hours dly_emp_job_code_ttl reg_hrs
Overtime ovt_hours dly_emp_job_code_ttl otm_hrs
Total @ttl_Hours
% of Ttl @ttl_%_Of_Weekly_Hours
Labor Cost
Regular reg_ttl dly_emp_job_code_ttl reg_ttl
Overtime ovt_ttl dly_emp_job_code_ttl otm_ttl
Total @ttl_Cost
% of Ttl @ttl_%_Of_Weekly_Cost
Weekly Total
Hours Worked
Regular ∑ reg_hours dly_emp_job_code_ttl reg_hrs
Overtime ∑ ovt_hours dly_emp_job_code_ttl otm_hrs
Total ∑ @ttl_Hours
% of Ttl @ttl_%_Of_Employee_Hours
Labor Cost
Regular ∑ reg_ttl dly_emp_job_code_ttl reg_ttl
Overtime ∑ ovt_ttl dly_emp_job_code_ttl otm_ttl
Total ∑ @ttl_Cost
% of Ttl @ttl_%_Of_Employee_Cost
Total
Hours Worked
Regular ∑ reg_hours dly_emp_job_code_ttl reg_hrs
Overtime ∑ ovt_hours dly_emp_job_code_ttl otm_hrs
Total ∑ @ttl_Hours
% of Ttl @ttl_%_Of_Hours
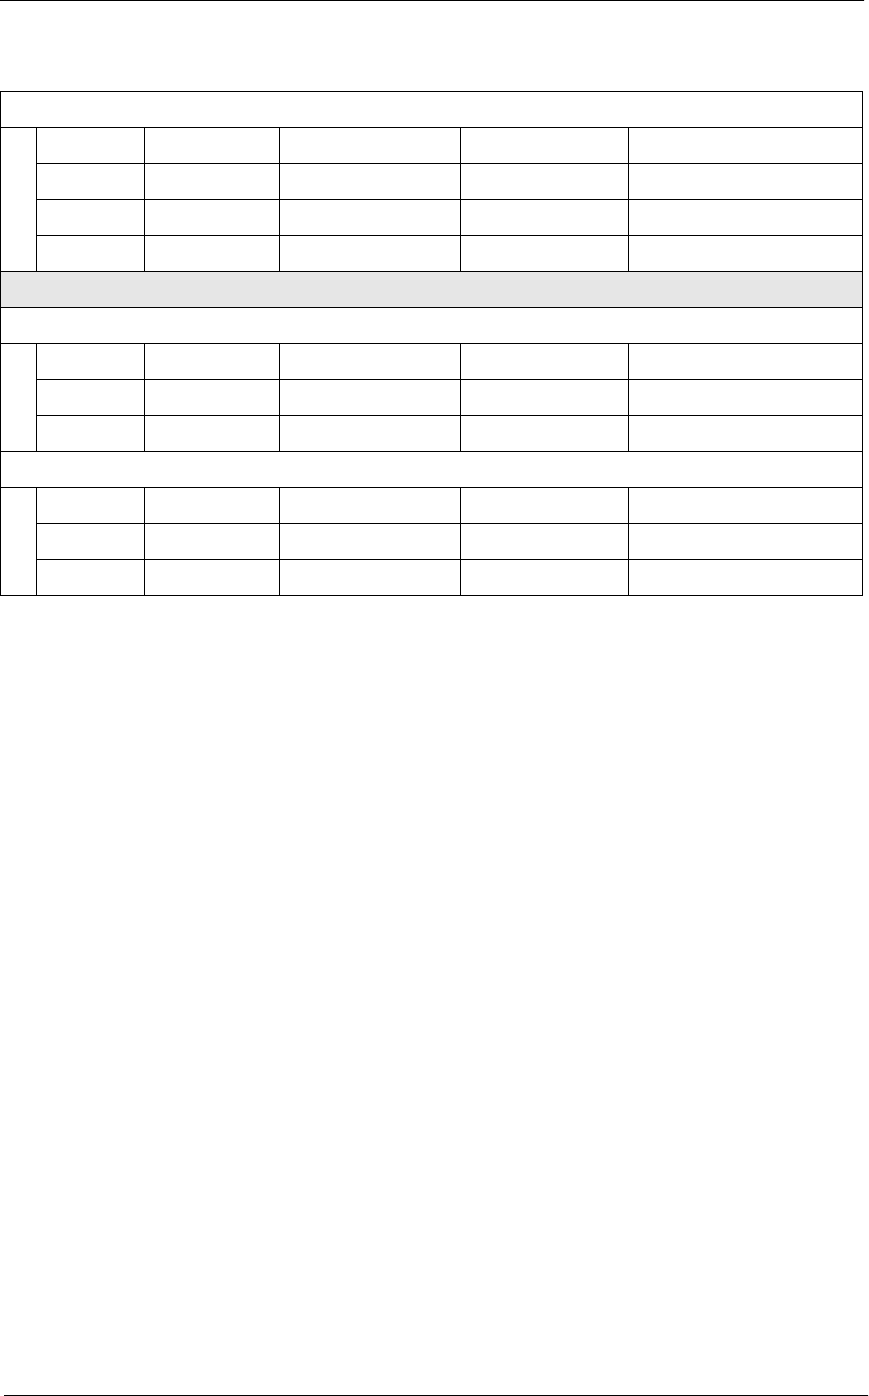
5HSRUWV
/DERU5HSRUWV
(PSOR\HH-RE6XPPDU\
Programming Considerations
*HQHUDO
qJobs and default pay rates are defined on the Jobs form.
Default pay rates are overridden by Employees | Job Rates | Override
Regular Rate and Override Overtime Rate fields.
2YHUWLPH3D\
qConditions for awarding overtime are defined on the Time and
Attendance form.
Notes
5HSRUWV3URGXFHG:KLOH(PSOR\HHV$UH&ORFNHG,Q
If this report is produced for a time period that includes the current day,
and employees are clocked in at the time, any hours they have worked in
their current shift will be included in the report.
-RE3D\5DWHV
Wages will not reflect a consistent wage rate by job unless all employees
clocking in under the same job use the default pay rates defined on the
Jobs form.
Labor Cost
Regular ∑ reg_ttl dly_emp_job_code_ttl reg_ttl
Overtime ∑ ovt_ttl dly_emp_job_code_ttl otm_ttl
Total ∑ @ttl_Cost
% of Ttl @ttl_%_Of_Cost
Grand Total
Hours Worked
Regular ∑ reg_hours dly_emp_job_code_ttl reg_hrs
Overtime ∑ ovt_hours dly_emp_job_code_ttl otm_hrs
Total ∑ @ttl_Hours
Labor Cost
Regular ∑ reg_ttl dly_emp_job_code_ttl reg_ttl
Overtime ∑ ovt_ttl dly_emp_job_code_ttl otm_ttl
Total ∑ @ttl_Cost

/DERU5HSRUWV
&RQVROLGDWHG(PSOR\HH-RE6XPPDU\
Consolidated Employee Job Summary
3XUSRVH
This report is similar to the Employee Job Summary except information
for each employee is consolidated into one set of figures for each job,
rather than being individually listed by date. The report also provides
totals for each employee for the period of the report, and grand total
figures that include all employees on the report.
)RUPDW
This report includes the following profile:
qEmployee Labor Profile
7HPSODWH
TIME_004.RPT
2-17
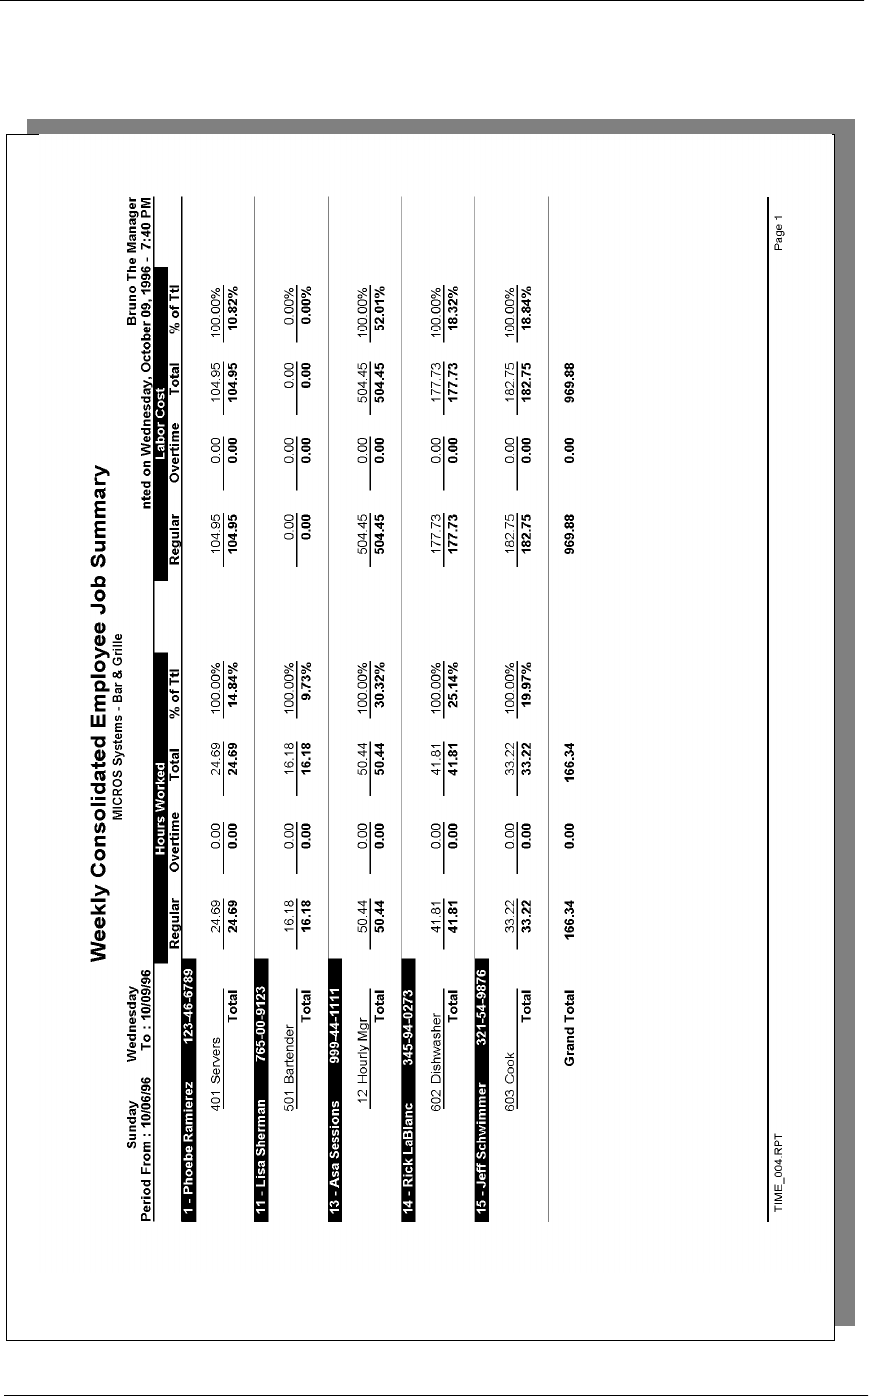
5HSRUWV
/DERU5HSRUWV
&RQVROLGDWHG(PSOR\HH-RE6XPPDU\
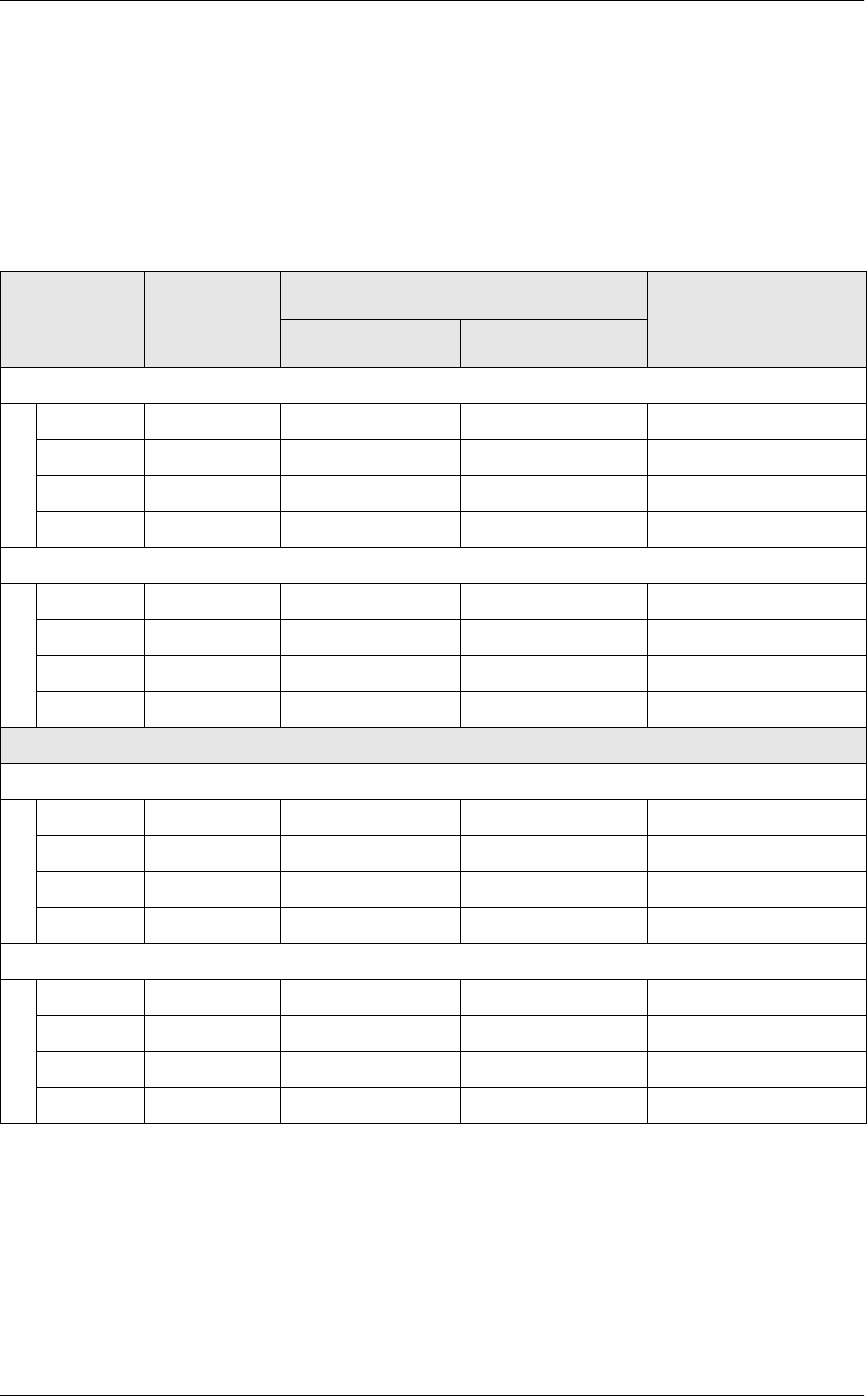
/DERU5HSRUWV
&RQVROLGDWHG(PSOR\HH-RE6XPPDU\
Employee Labor Profile Details
View: v_R_employee_job_code
Stored Procedure: sp_R_employee job_code
The following table lists each column in the Employee Labor Profile and
provides detailed information on the source of the figures in each column.
Report
Column
Title
View
Column
Title
3700 Database Formula
Table Column
Hours Worked
Regular reg_hours dly_emp_job_code_ttl reg_hrs
Overtime ovt_hours dly_emp_job_code_ttl otm_hrs
Total ∑ @ttl_Hours
% of Ttl @ttl_%_Of_Weekly_Hours
Labor Cost
Regular ∑ reg_ttl dly_emp_job_code_ttl reg_ttl
Overtime ∑ ovt_ttl dly_emp_job_code_ttl otm_ttl
Total ∑ @ttl_Cost
% of Ttl @ttl_%_Of_Weekly_Cost
Total
Hours Worked
Regular ∑ reg_hours dly_emp_job_code_ttl reg_hrs
Overtime ∑ ovt_hours dly_emp_job_code_ttl otm_hrs
Total ∑ @ttl_Hours
% of Ttl @ttl_%_Of_Hours
Labor Cost
Regular ∑ reg_ttl dly_emp_job_code_ttl reg_ttl
Overtime ∑ ovt_ttl dly_emp_job_code_ttl otm_ttl
Total ∑ @ttl_Cost
% of Ttl @ttl_%_Of_Cost
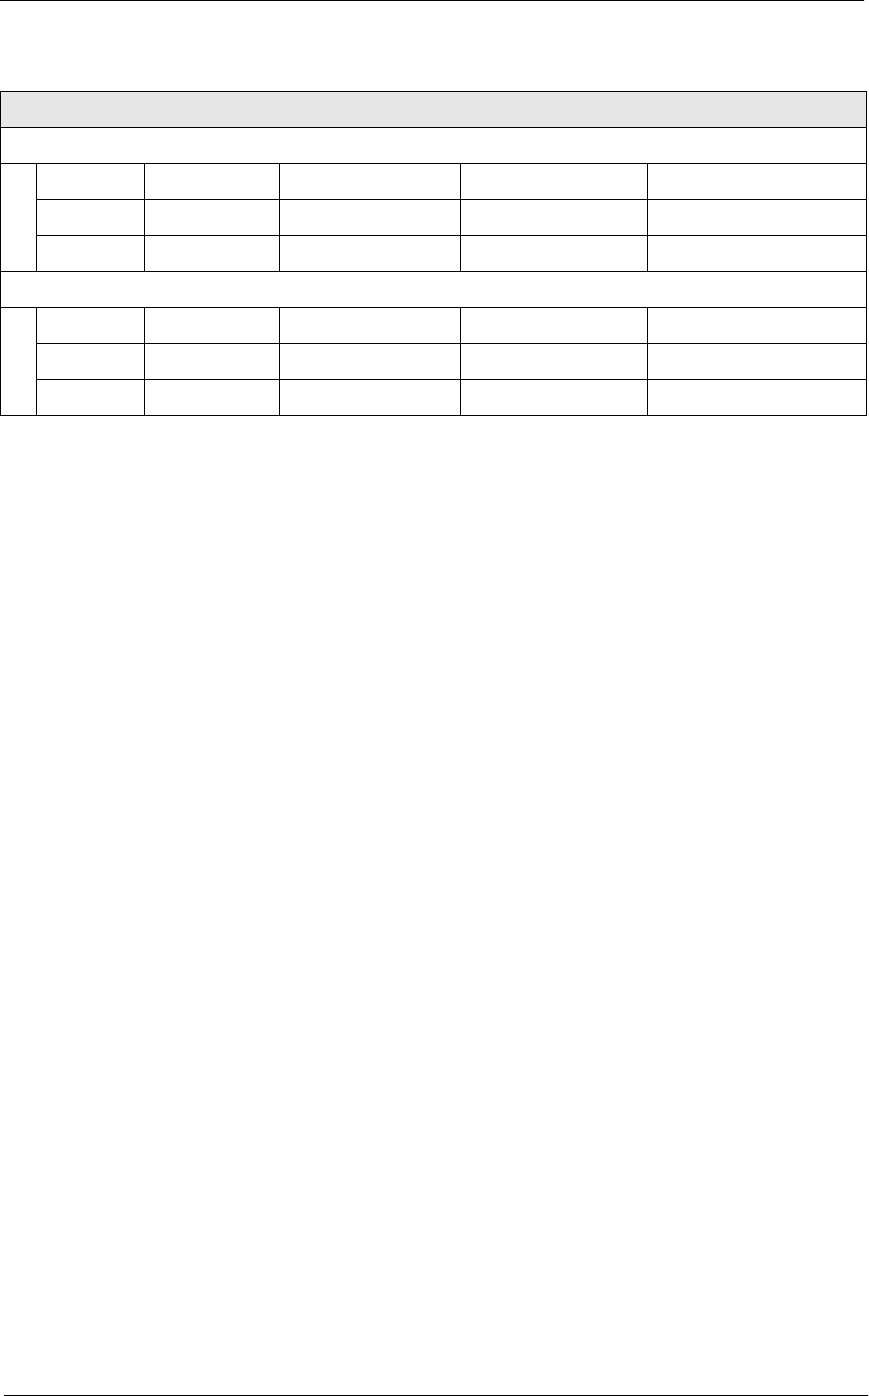
5HSRUWV
/DERU5HSRUWV
&RQVROLGDWHG(PSOR\HH-RE6XPPDU\
Programming Considerations
*HQHUDO
qJobs and default pay rates are defined on the Jobs form.
Default pay rates are overridden by Employees | Job Rates | Override
Regular Rate and Override Overtime Rate fields.
2YHUWLPH3D\
qConditions for awarding overtime are defined on the Time and
Attendance form.
Notes
5HSRUWV3URGXFHG:KLOH(PSOR\HHV$UH&ORFNHG,Q
If this report is produced for a time period that includes the current day,
and employees are clocked in at the time, any hours they have worked in
their current shift will be included in the report.
-RE3D\5DWHV
Wages will not reflect a consistent wage rate by job unless all employees
clocking in under the same job use the default pay rates defined on the
Jobs form.
Grand Total
Hours Worked
Regular ∑ reg_hours dly_emp_job_code_ttl reg_hrs
Overtime ∑ ovt_hours dly_emp_job_code_ttl otm_hrs
Total ∑ @ttl_Hours
Labor Cost
Regular ∑ reg_ttl dly_emp_job_code_ttl reg_ttl
Overtime ∑ ovt_ttl dly_emp_job_code_ttl otm_ttl
Total ∑ @ttl_Cost

/DERU5HSRUWV
5HYHQXH&HQWHU-RE6XPPDU\
Revenue Center Job Summary
3XUSRVH
This report summarizes labor information by job for each revenue center.
It also provides labor category totals, revenue center totals, and daily
totals.
)RUPDW
This report includes the following profile:
qLabor/Sales Profile
7HPSODWH
TIME_R011.RPT
2-21
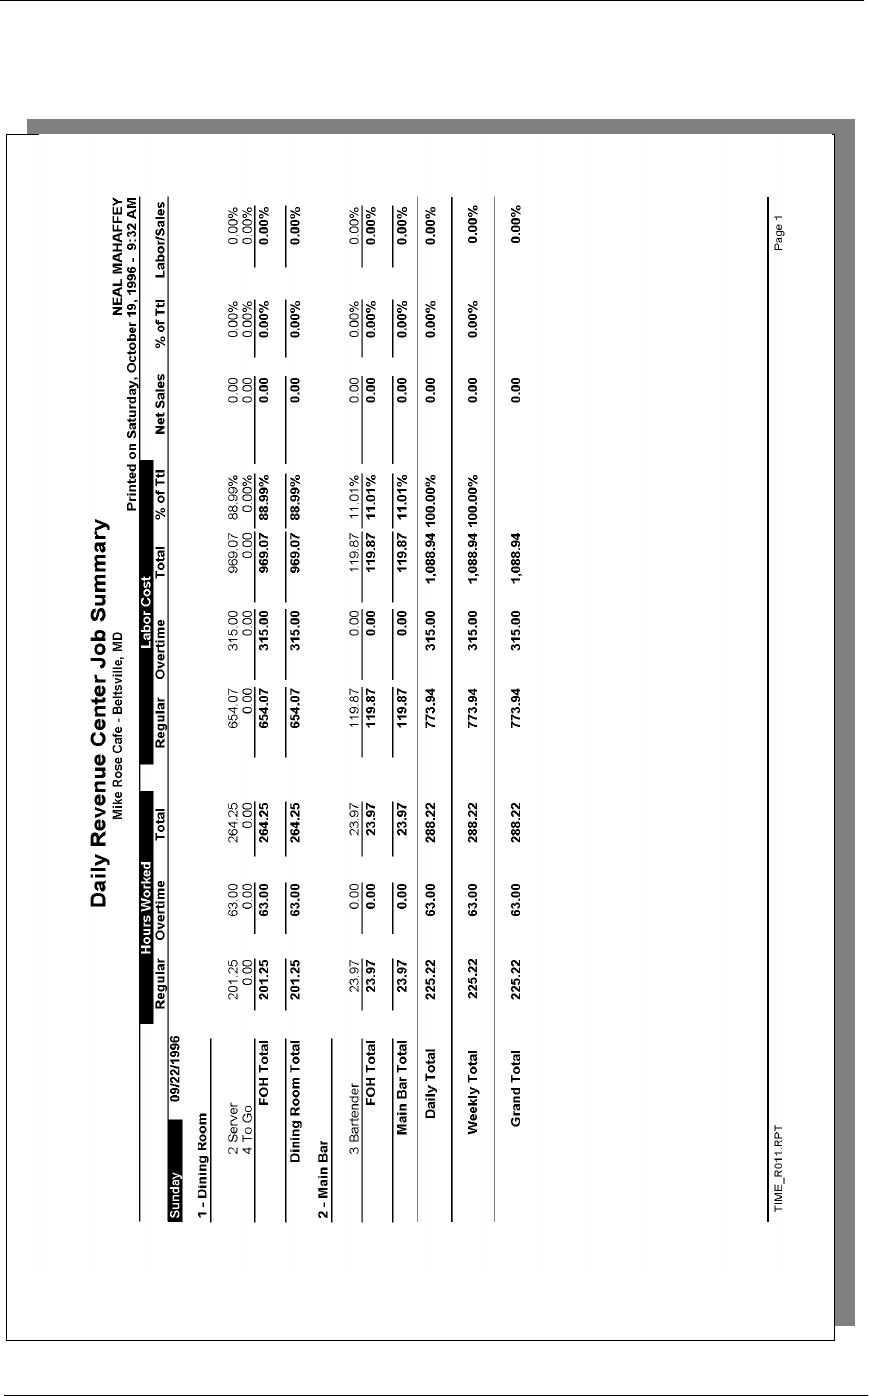
5HSRUWV
/DERU5HSRUWV
5HYHQXH&HQWHU-RE6XPPDU\

/DERU5HSRUWV
5HYHQXH&HQWHU-RE6XPPDU\
Revenue Center Job Summary
Daily RVC Job Summary
Mike Rose Cafe - Beltsville, M
NEAL MAHAFFEY
Printed on 10/19/1996 - 11:27
----------------------------------------
Sunday 09/22/1996
Net Sales: 0.00
1 - Dining Room
Labor/
Hours Pay Dly Net
2 Server
Regular 201.2 654.07
Overtime 63.00 315.00
Total 264.2 969.07 0.00%
% of RVC Total 100.00%
4 To Go
Regular 0.00 0.00
Overtime 0.00 0.00
Total 0.00 0.00 0.00%
% of RVC Total 0.00%
FOH Total
Regular 201.2 654.07
Overtime 63.00 315.00
Total 264.2 969.07 0.00%
% of RVC Total 100.00%
Dining Room Total
Regular 201.2 654.07
Overtime 63.00 315.00
Total 264.2 969.07 0.00%
% of Daily Total 100.00%
----------------------------------------
Daily Total
Regular 201.2 654.07
Overtime 63.00 315.00
Total 264.2 969.07 0.00%
% of Grand Total 100.00%
========================================
Grand Total
Regular 201.2 654.07
Overtime 63.00 315.00
Total 264.2 969.07
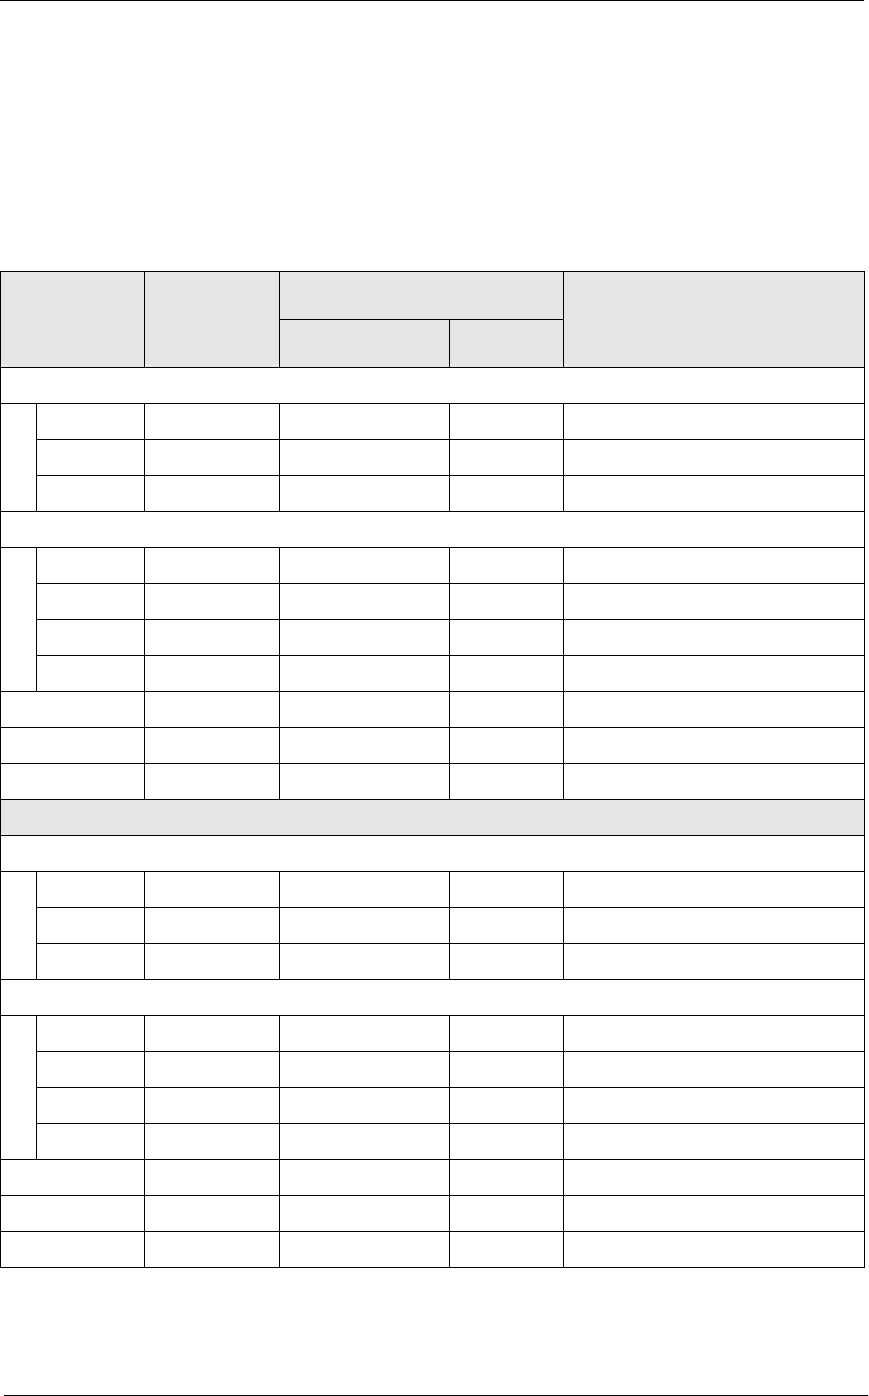
5HSRUWV
/DERU5HSRUWV
5HYHQXH&HQWHU-RE6XPPDU\
Labor/Sales Profile Details
View: v_R_job_code
Stored Procedure: sp_R_job_code_totals
The following table lists each column in the Labor/Sales Profile and
provides detailed information on the source of the figures in each column.
Report
Column
Title
View
Column
Title
3700 Database Formula
Table Column
Hours Worked
Regular reg_hours dly_job_code_ttl reg_hrs
Overtime ovt_hours dly_job_code_ttl otm_hrs
Total @ttl_Hours
Labor Cost
Regular reg_ttl dly_job_code_ttl reg_ttl
Overtime ovt_ttl dly_job_code_ttl otm_ttl
Total @ttl_Cost
% of Ttl @ttl_%_Of_Category_Cost
Net Sales net_sls_ttl dly_job_code_ttl net_sls_ttl
% of Ttl @ttl_%_Of_Category_Net_Sales
Labor/Sales @ttl_%_Of_Job_Labor
Job Category Total
Hours Worked
Regular ∑ reg_hours dly_job_code_ttl reg_hrs
Overtime ∑ ovt_hours dly_job_code_ttl otm_hrs
Total ∑ @ttl_Hours
Labor Cost
Regular ∑ reg_ttl dly_job_code_ttl reg_ttl
Overtime ∑ ovt_ttl dly_job_code_ttl otm_ttl
Total ∑ @ttl_Cost
% of Ttl @ttl_%_Of_RVC_Cost
Net Sales ∑ net_sls_ttl dly_job_code_ttl net_sls_ttl
% of Ttl @ttl_%_Of_RVC_Net_Sales
Labor/Sales @ttl_%_Of_Category_Labor
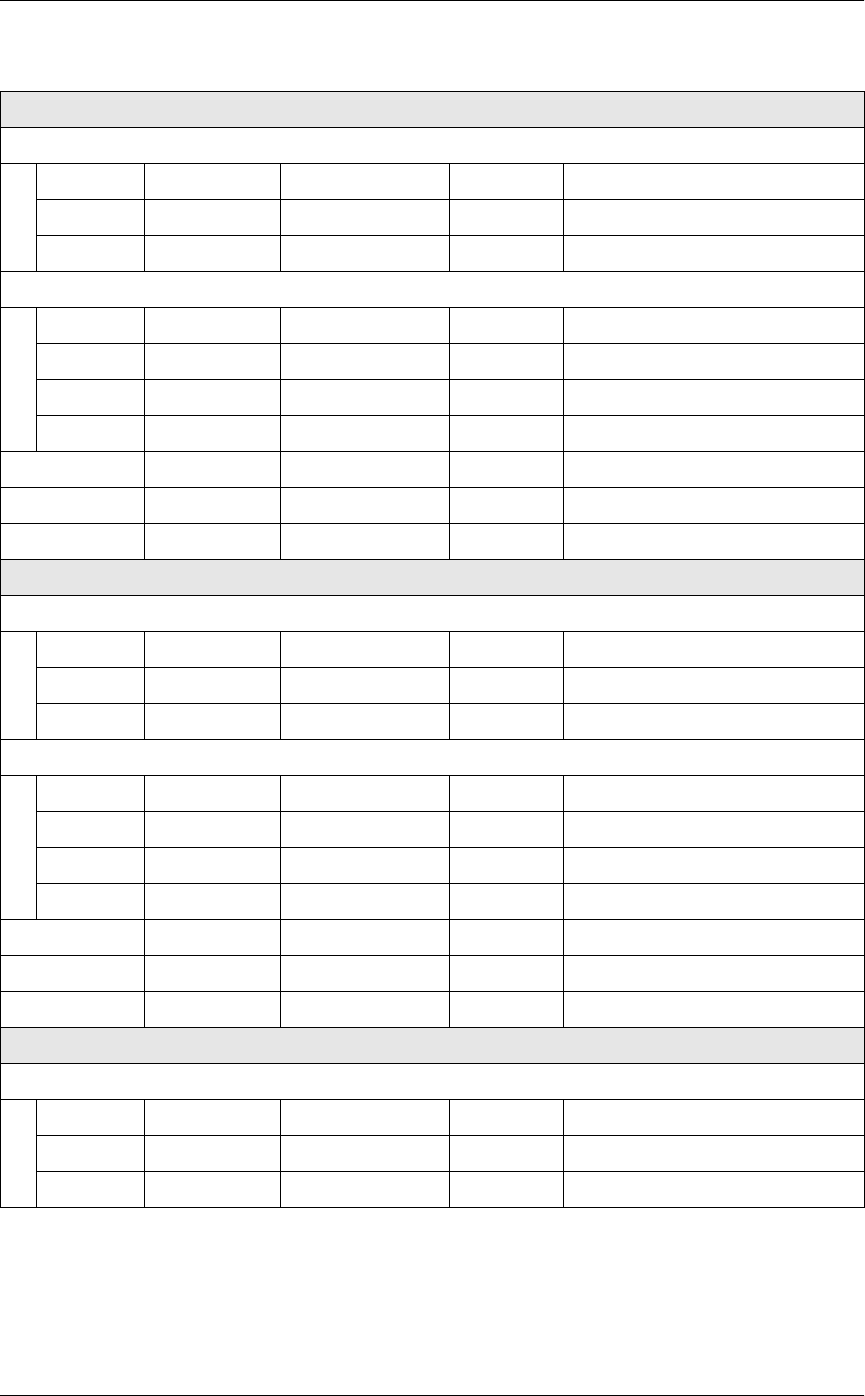
/DERU5HSRUWV
5HYHQXH&HQWHU-RE6XPPDU\
Revenue Center Total
Hours Worked
Regular ∑ reg_hours dly_job_code_ttl reg_hrs
Overtime ∑ ovt_hours dly_job_code_ttl otm_hrs
Total ∑ @ttl_Hours
Labor Cost
Regular ∑ reg_ttl dly_job_code_ttl reg_ttl
Overtime ∑ ovt_ttl dly_job_code_ttl otm_ttl
Total ∑ @ttl_Cost
% of Ttl @ttl_%_Of_Daily_Cost
Net Sales ∑ net_sls_ttl dly_job_code_ttl net_sls_ttl
% of Ttl @ttl_%_Of_Daily_Net_Sales
Labor/Sales @ttl_%_Of_RVC_Labor
Daily Total
Hours Worked
Regular ∑ reg_hours dly_job_code_ttl reg_hrs
Overtime ∑ ovt_hours dly_job_code_ttl otm_hrs
Total ∑ @ttl_Hours
Labor Cost
Regular ∑ reg_ttl dly_job_code_ttl reg_ttl
Overtime ∑ ovt_ttl dly_job_code_ttl otm_ttl
Total ∑ @ttl_Cost
% of Ttl @ttl_%_Of_Weekly_Cost
Net Sales ∑ net_sls_ttl dly_job_code_ttl net_sls_ttl
% of Ttl @ttl_%_Of_Weekly_Net_Sales
Labor/Sales @ttl_%_Of_Daily_Labor
Weekly Total
Hours Worked
Regular ∑ reg_hours dly_job_code_ttl reg_hrs
Overtime ∑ ovt_hours dly_job_code_ttl otm_hrs
Total ∑ @ttl_Hours
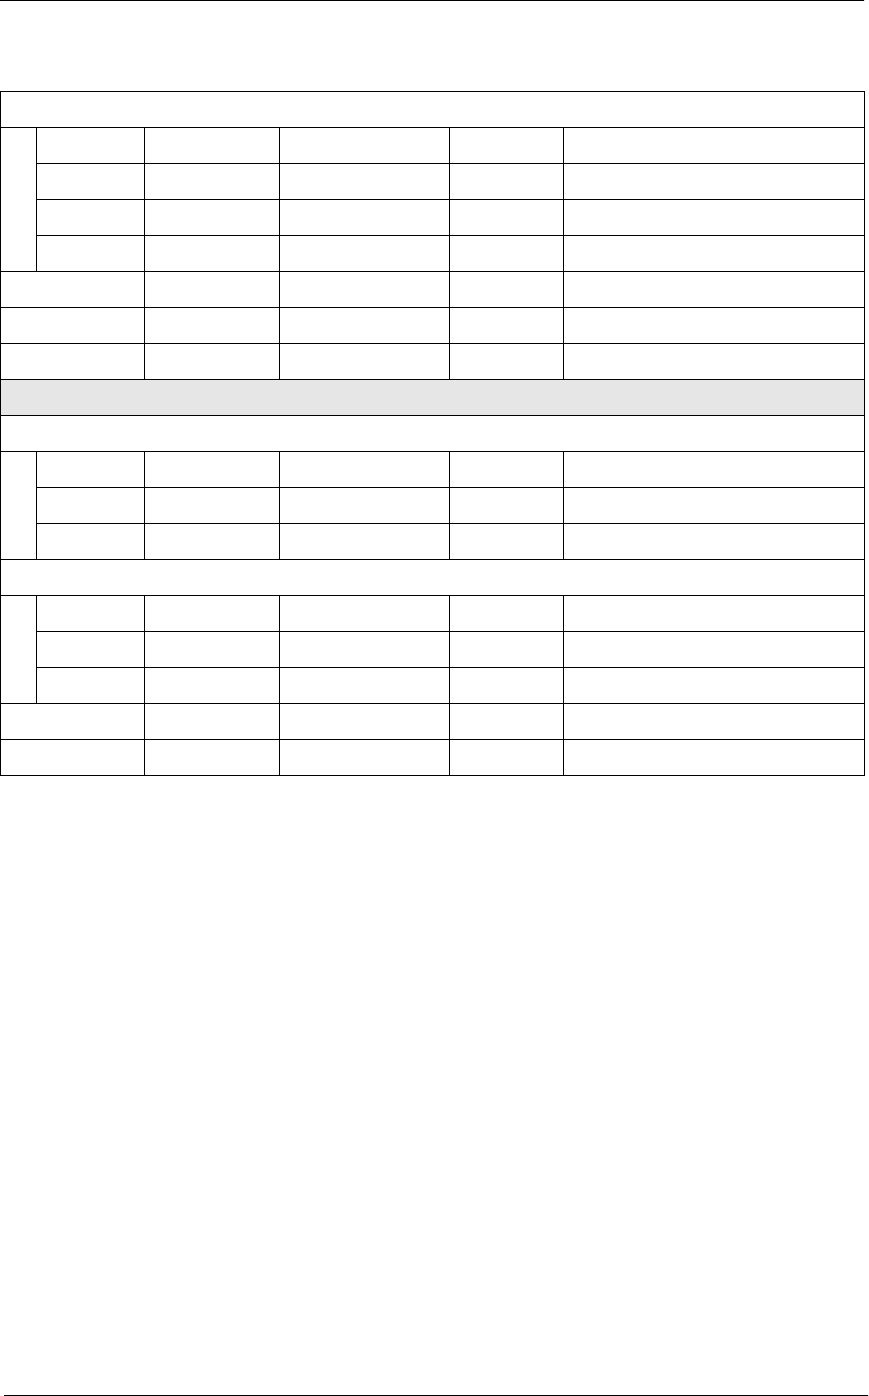
5HSRUWV
/DERU5HSRUWV
5HYHQXH&HQWHU-RE6XPPDU\
Programming Considerations
*HQHUDO
qJobs and default pay rates are defined on the Jobs form.
Default pay rates are overridden by Employees | Job Rates | Override
Regular Rate and Override Overtime Rate fields.
2YHUWLPH3D\
qConditions for awarding overtime are defined on the Time and
Attendance form.
Notes
5HSRUWV3URGXFHG:KLOH(PSOR\HHV$UH&ORFNHG,Q
If this report is produced for a time period that includes the current day,
and employees are clocked in at the time, any hours they have worked in
their current shift will be included in the report.
-RE3D\5DWHV
Wages will not reflect a consistent wage rate by job unless all employees
clocking in under the same job use the default pay rates defined on the
Jobs form.
Labor Cost
Regular ∑ reg_ttl dly_job_code_ttl reg_ttl
Overtime ∑ ovt_ttl dly_job_code_ttl otm_ttl
Total ∑ @ttl_Cost
% of Ttl @ttl_%_Of_Grand_Cost
Net Sales ∑ net_sls_ttl dly_job_code_ttl net_sls_ttl
% of Ttl @ttl_%_Of_Grand_Net_Sales
Labor/Sales @ttl_%_Of_Weekly_Labor
Grand Total
Hours Worked
Regular ∑ reg_hours dly_job_code_ttl reg_hrs
Overtime ∑ ovt_hours dly_job_code_ttl otm_hrs
Total ∑ @ttl_Hours
Labor Cost
Regular ∑ reg_ttl dly_job_code_ttl reg_ttl
Overtime ∑ ovt_ttl dly_job_code_ttl otm_ttl
Total ∑ @ttl_Cost
Net Sales ∑ net_sls_ttl dly_job_code_ttl net_sls_ttl
Labor/Sales @ttl_%_Of_Grand_Labor

/DERU5HSRUWV
&RQVROLGDWHG5HYHQXH&HQWHU-RE6XPPDU\
Consolidated Revenue Center Job Summary
3XUSRVH
This report is similar to the Revenue Center Job Summary except
information for each revenue center is consolidated, rather than being
individually listed by date.
)RUPDW
This report includes the following profile:
qLabor/Sales Profile
7HPSODWH
TIME_R012.RPT
2-21
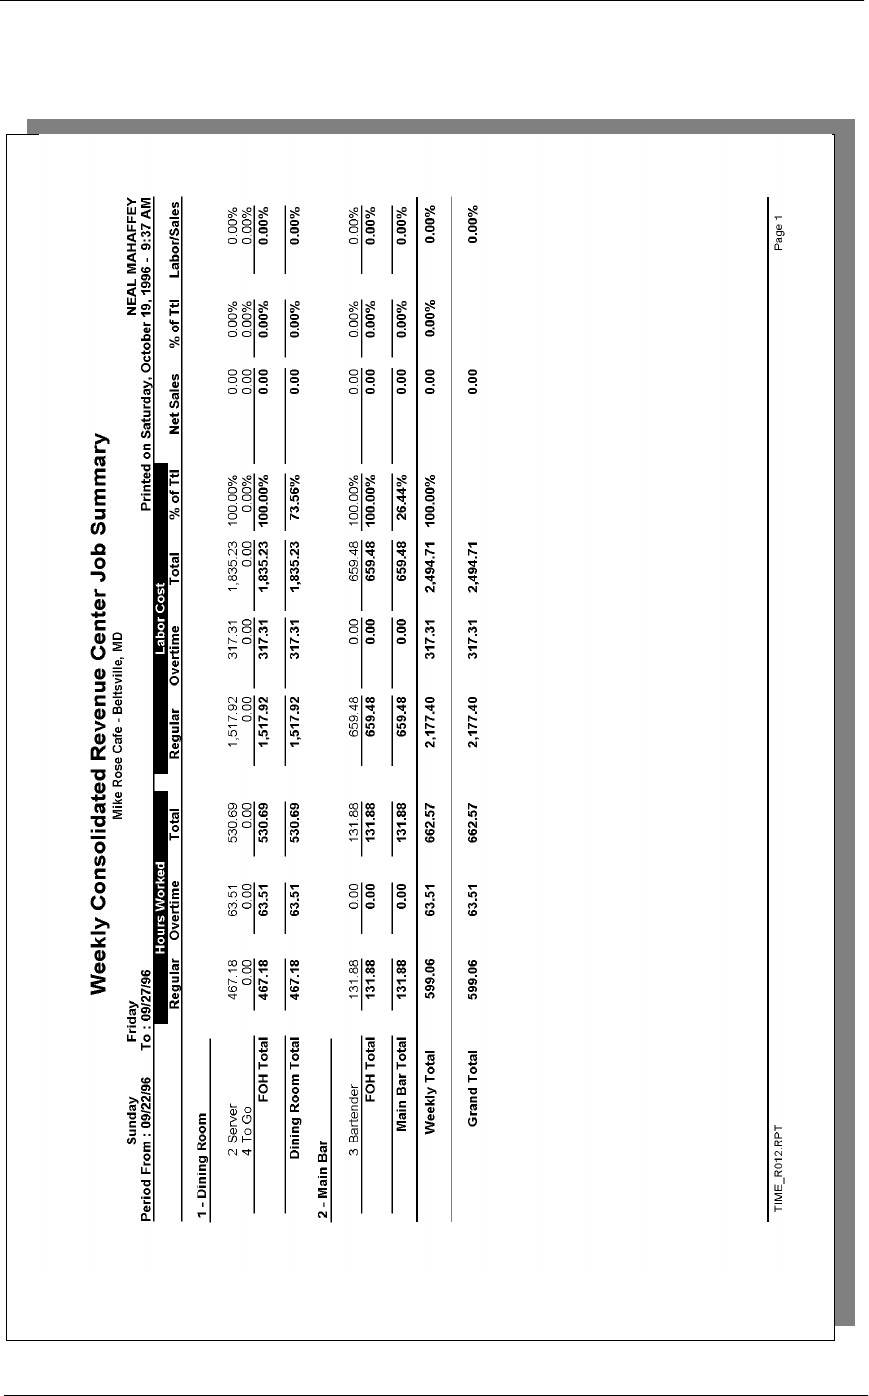
5HSRUWV
/DERU5HSRUWV
&RQVROLGDWHG5HYHQXH&HQWHU-RE6XPPDU\
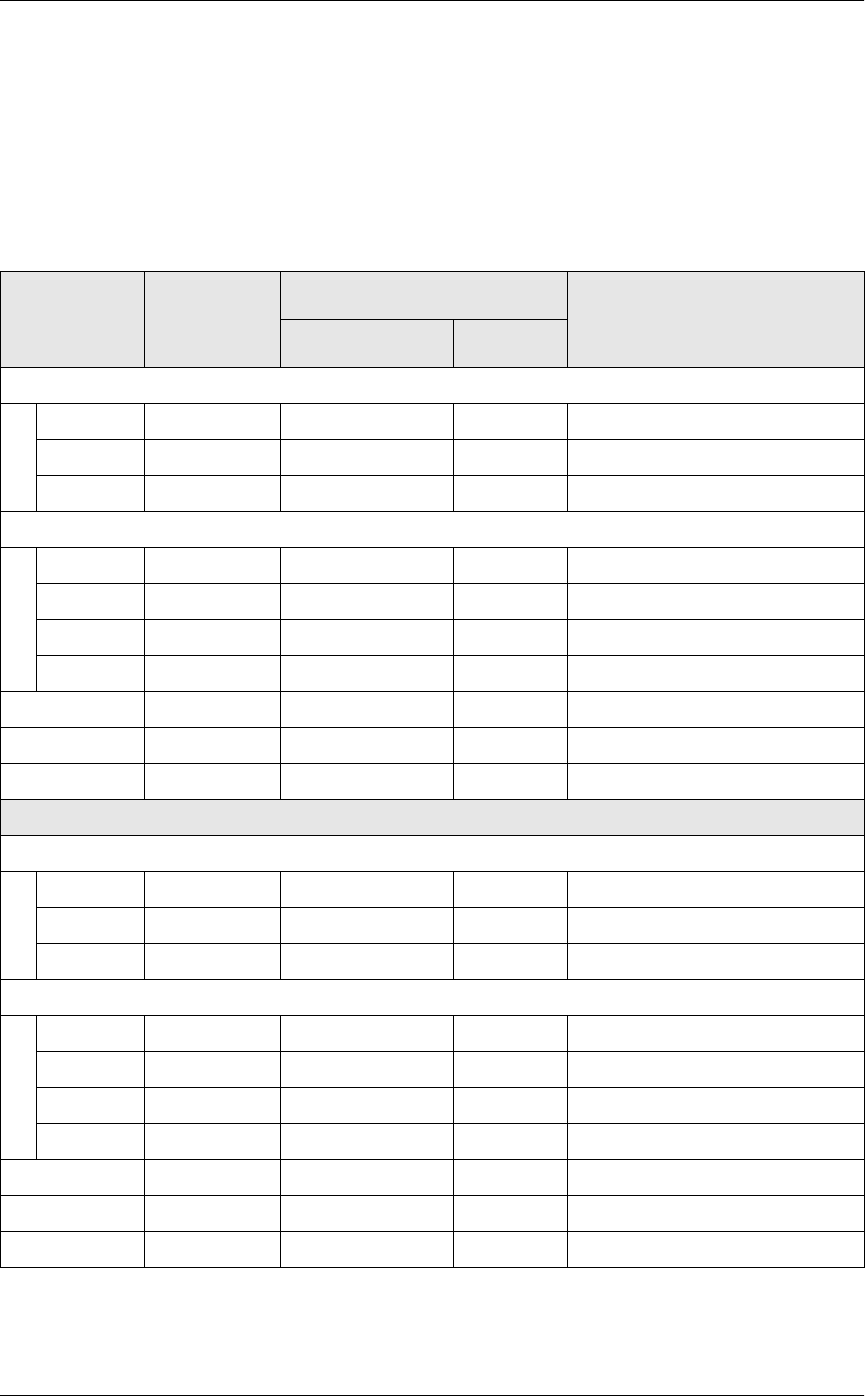
/DERU5HSRUWV
&RQVROLGDWHG5HYHQXH&HQWHU-RE6XPPDU\
Labor/Sales Profile Details
View: v_R_job_code
Stored Procedure: sp_R_job_code_totals
The following table lists each column in the Labor/Sales Profile and
provides detailed information on the source of the figures in each column.
Report
Column
Title
View
Column
Title
3700 Database Formula
Table Column
Hours Worked
Regular ∑ reg_hours dly_job_code_ttl reg_hrs
Overtime ∑ ovt_hours dly_job_code_ttl otm_hrs
Total ∑ @ttl_Hours
Labor Cost
Regular ∑ reg_ttl dly_job_code_ttl reg_ttl
Overtime ∑ ovt_ttl dly_job_code_ttl otm_ttl
Total ∑ @ttl_Cost
% of Ttl @ttl_%_Of_Category_Cost
Net Sales ∑ net_sls_ttl dly_job_code_ttl net_sls_ttl
% of Ttl @ttl_%_Of_Category_Net_Sales
Labor/Sales @ttl_%_Of_Job_Labor
Job Category Total
Hours Worked
Regular ∑ reg_hours dly_job_code_ttl reg_hrs
Overtime ∑ ovt_hours dly_job_code_ttl otm_hrs
Total ∑ @ttl_Hours
Labor Cost
Regular ∑ reg_ttl dly_job_code_ttl reg_ttl
Overtime ∑ ovt_ttl dly_job_code_ttl otm_ttl
Total ∑ @ttl_Cost
% of Ttl @ttl_%_Of_RVC_Cost
Net Sales ∑ net_sls_ttl dly_job_code_ttl net_sls_ttl
% of Ttl @ttl_%_Of_RVC_Net_Sales
Labor/Sales @ttl_%_Of_Category_Labor
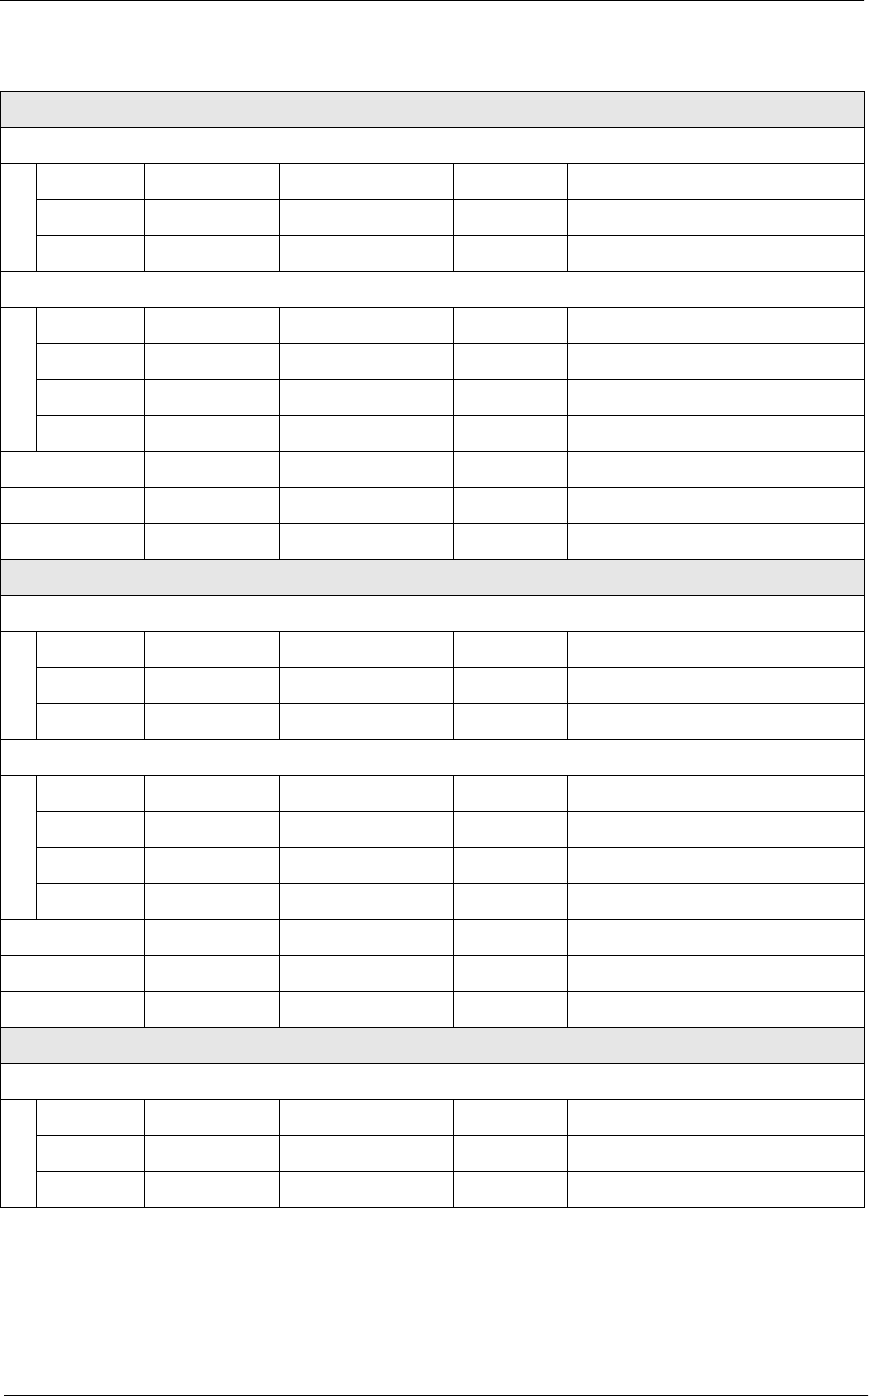
5HSRUWV
/DERU5HSRUWV
&RQVROLGDWHG5HYHQXH&HQWHU-RE6XPPDU\
Revenue Center Total
Hours Worked
Regular ∑ reg_hours dly_job_code_ttl reg_hrs
Overtime ∑ ovt_hours dly_job_code_ttl otm_hrs
Total ∑ @ttl_Hours
Labor Cost
Regular ∑ reg_ttl dly_job_code_ttl reg_ttl
Overtime ∑ ovt_ttl dly_job_code_ttl otm_ttl
Total ∑ @ttl_Cost
% of Ttl @ttl_%_Of_Daily_Cost
Net Sales ∑ net_sls_ttl dly_job_code_ttl net_sls_ttl
% of Ttl @ttl_%_Of_Daily_Net_Sales
Labor/Sales @ttl_%_Of_RVC_Labor
Weekly Total
Hours Worked
Regular ∑ reg_hours dly_job_code_ttl reg_hrs
Overtime ∑ ovt_hours dly_job_code_ttl otm_hrs
Total ∑ @ttl_Hours
Labor Cost
Regular ∑ reg_ttl dly_job_code_ttl reg_ttl
Overtime ∑ ovt_ttl dly_job_code_ttl otm_ttl
Total ∑ @ttl_Cost
% of Ttl @ttl_%_Of_Cost
Net Sales ∑ net_sls_ttl dly_job_code_ttl net_sls_ttl
% of Ttl @ttl_%_Of_Net_Sales
Labor/Sales @ttl_%_Of_Weekly_Labor
Grand Total
Hours Worked
Regular ∑ reg_hours dly_job_code_ttl reg_hrs
Overtime ∑ ovt_hours dly_job_code_ttl otm_hrs
Total ∑ @ttl_Hours
/DERU5HSRUWV
&RQVROLGDWHG5HYHQXH&HQWHU-RE6XPPDU\
Programming Considerations
*HQHUDO
qJobs and default pay rates are defined on the Jobs form.
Default pay rates are overridden by Employees | Job Rates | Override
Regular Rate and Override Overtime Rate fields.
2YHUWLPH3D\
qConditions for awarding overtime are defined on the Time and
Attendance form.
Notes
5HSRUWV3URGXFHG:KLOH(PSOR\HHV$UH&ORFNHG,Q
If this report is produced for a time period that includes the current day,
and employees are clocked in at the time, any hours they have worked in
their current shift will be included in the report.
-RE3D\5DWHV
Wages will not reflect a consistent wage rate by job unless all employees
clocking in under the same job use the default pay rates defined on the
Jobs form.
Labor Cost
Regular ∑ reg_ttl dly_job_code_ttl reg_ttl
Overtime ∑ ovt_ttl dly_job_code_ttl otm_ttl
Total ∑ @ttl_Cost
Net Sales ∑ net_sls_ttl dly_job_code_ttl net_sls_ttl
Labor/Sales @ttl_%_Of_Labor

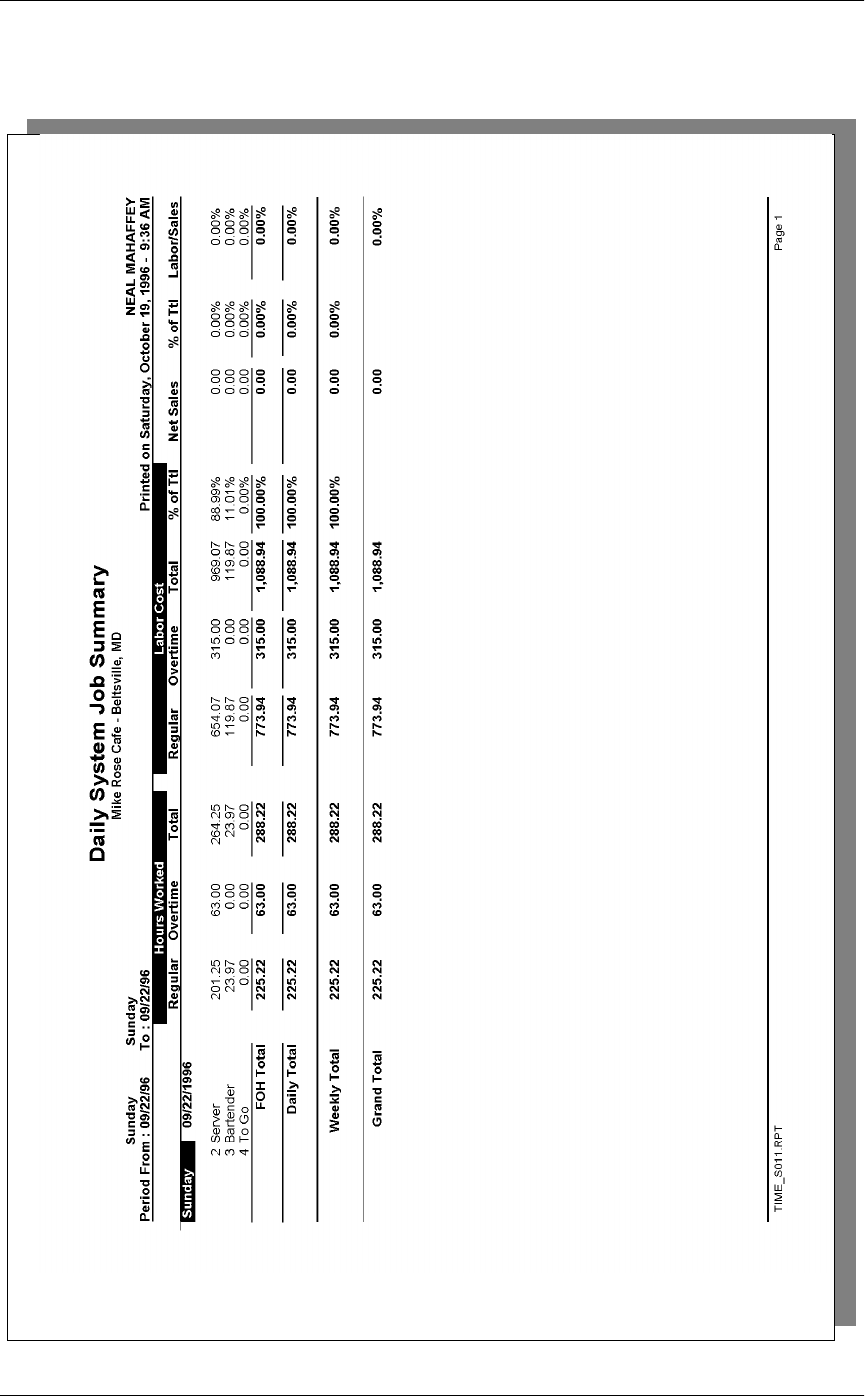
/DERU5HSRUWV
6\VWHP-RE6XPPDU\

5HSRUWV
/DERU5HSRUWV
6\VWHP-RE6XPPDU\
System Job Summary
Daily System Job Summary
Mike Rose Cafe - Beltsville, M
NEAL MAHAFFEY
Printed on 10/19/1996 - 11:29
Sunday
Period From: 09/22/96
Sunday
To: 09/22/96
----------------------------------------
Sunday 09/22/1996
Net Sales: 0.00
0.00
Labor/
Hours Pay Dly Net
2 Server
Regular 201.2 654.07
Overtime 63.00 315.00
Total 264.2 969.07 0.00%
% of Daily Total 88.99%
3 Bartender
Regular 23.97 119.87
Overtime 0.00 0.00
Total 23.97 119.87 0.00%
% of Daily Total 11.01%
4 To Go
Regular 0.00 0.00
Overtime 0.00 0.00
Total 0.00 0.00 0.00%
% of Daily Total 0.00%
FOH Total
Regular 225.2 773.94
Overtime 63.00 315.00
Total 288.2 1,088.9 0.00%
% of Dalily Total 100.00%
Daily Total
Regular 225.2 773.94
Overtime 63.00 315.00
Total 288.2 1,088.9 0.00%
% of Grand Total 100.00%
Grand Total
Regular 225.2 773.94
Overtime 63.00 315.00
Total 288.2 1,088.94
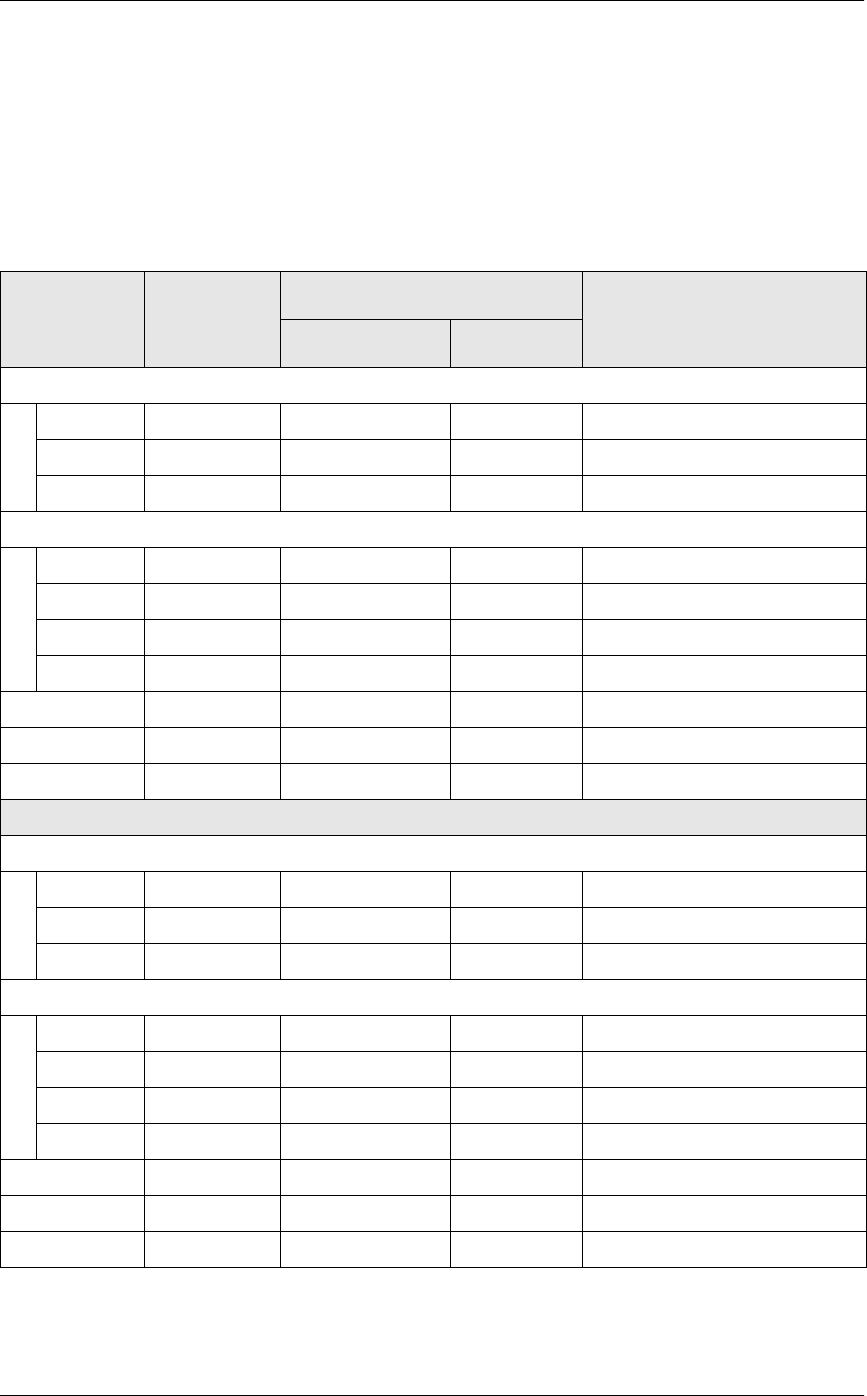
/DERU5HSRUWV
6\VWHP-RE6XPPDU\
Labor/Sales Profile Details
View: v_R_job_code
Stored Procedure: sp_R_job_code_totals
The following table lists each column in the Labor/Sales Profile and
provides detailed information on the source of the figures in each column.
Report
Column
Title
View
Column
Title
3700 Database Formula
Table Column
Hours Worked
Regular ∑ reg_hours dly_job_code_ttl reg_hrs
Overtime ∑ ovt_hours dly_job_code_ttl otm_hrs
Total ∑ @ttl_Hours
Labor Cost
Regular ∑ reg_ttl dly_job_code_ttl reg_ttl
Overtime ∑ ovt_ttl dly_job_code_ttl otm_ttl
Total ∑ @ttl_Cost
% of Ttl @ttl_%_Of_Category_Cost
Net Sales ∑ net_sls_ttl dly_job_code_ttl net_sls_ttl
% of Ttl @ttl_%_Of_Category_Net_Sales
Labor/Sales @ttl_%_Of_Job_Labor
Job Category Total
Hours Worked
Regular ∑ reg_hours dly_job_code_ttl reg_hrs
Overtime ∑ ovt_hours dly_job_code_ttl otm_hrs
Total ∑ @ttl_Hours
Labor Cost
Regular ∑ reg_ttl dly_job_code_ttl reg_ttl
Overtime ∑ ovt_ttl dly_job_code_ttl otm_ttl
Total ∑ @ttl_Cost
% of Ttl @ttl_%_Of_Daily_Cost
Net Sales ∑ net_sls_ttl dly_job_code_ttl net_sls_ttl
% of Ttl @ttl_%_Of_Daily_Net_Sales
Labor/Sales @ttl_%_Of_Category_Labor
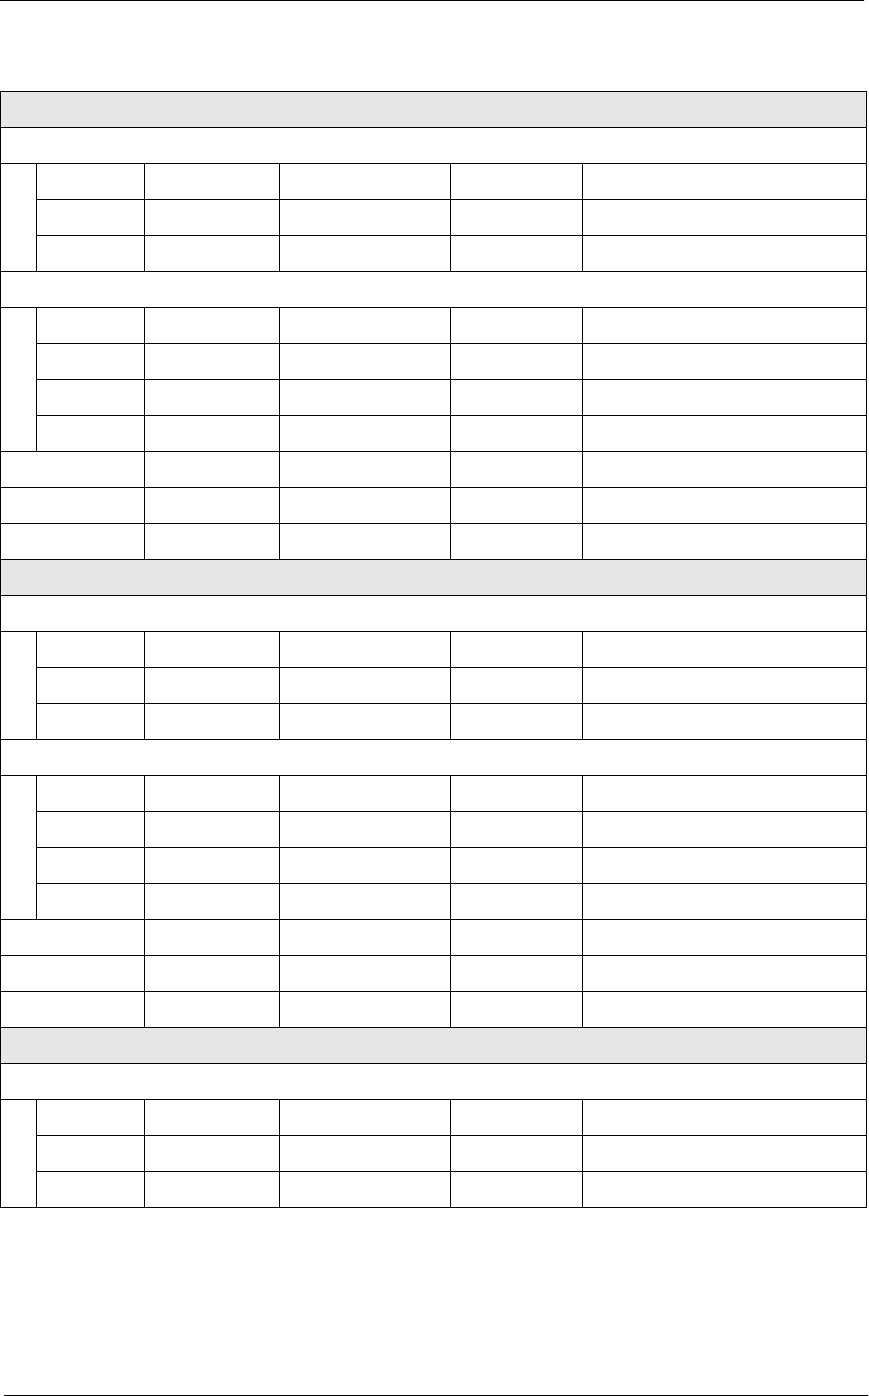
5HSRUWV
/DERU5HSRUWV
6\VWHP-RE6XPPDU\
Daily Total
Hours Worked
Regular ∑ reg_hours dly_job_code_ttl reg_hrs
Overtime ∑ ovt_hours dly_job_code_ttl otm_hrs
Total ∑ @ttl_Hours
Labor Cost
Regular ∑ reg_ttl dly_job_code_ttl reg_ttl
Overtime ∑ ovt_ttl dly_job_code_ttl otm_ttl
Total ∑ @ttl_Cost
% of Ttl @ttl_%_Of_Weekly_Cost
Net Sales ∑ net_sls_ttl dly_job_code_ttl net_sls_ttl
% of Ttl @ttl_%_Of_Weekly_Net_Sales
Labor/Sales @ttl_%_Of_Daily_Labor
Weekly Total
Hours Worked
Regular ∑ reg_hours dly_job_code_ttl reg_hrs
Overtime ∑ ovt_hours dly_job_code_ttl otm_hrs
Total ∑ @ttl_Hours
Labor Cost
Regular ∑ reg_ttl dly_job_code_ttl reg_ttl
Overtime ∑ ovt_ttl dly_job_code_ttl otm_ttl
Total ∑ @ttl_Cost
% of Ttl @ttl_%_Of_Cost
Net Sales ∑ net_sls_ttl dly_job_code_ttl net_sls_ttl
% of Ttl @ttl_%_Of_Net_Sales
Labor/Sales @ttl_%_Of_Weekly_Labor
Grand Total
Hours Worked
Regular ∑ reg_hours dly_job_code_ttl reg_hrs
Overtime ∑ ovt_hours dly_job_code_ttl otm_hrs
Total ∑ @ttl_Hours
/DERU5HSRUWV
6\VWHP-RE6XPPDU\
3URJUDPPLQJ&RQVLGHUDWLRQV
*HQHUDO
qJobs and default pay rates are defined on the Jobs form.
Default pay rates are overridden by Employees | Job Rates | Override
Regular Rate and Override Overtime Rate fields.
2YHUWLPH3D\
qConditions for awarding overtime are defined on the Time and
Attendance form.
Notes
5HSRUWV3URGXFHG:KLOH(PSOR\HHV$UH&ORFNHG,Q
If this report is produced for a time period that includes the current day,
and employees are clocked in at the time, any hours they have worked in
their current shift will be included in the report.
-RE3D\5DWHV
Wages will not reflect a consistent wage rate by job unless all employees
clocking in under the same job use the default pay rates defined on the
Jobs form.
Labor Cost
Regular ∑ reg_ttl dly_job_code_ttl reg_ttl
Overtime ∑ ovt_ttl dly_job_code_ttl otm_ttl
Total ∑ @ttl_Cost
Net Sales ∑ net_sls_ttl dly_job_code_ttl net_sls_ttl
Labor/Sales @ttl_%_Of_Labor

5HSRUWV
/DERU5HSRUWV
&RQVROLGDWHG6\VWHP-RE6XPPDU\
Consolidated System Job Summary
3XUSRVH
This report is similar to the System Job Summary except information for
each revenue center is consolidated, rather than being individually listed
by date.
)RUPDW
This report includes the following profile:
qLabor/Sales Profile
7HPSODWH
TIME_S012.RPT
2-21
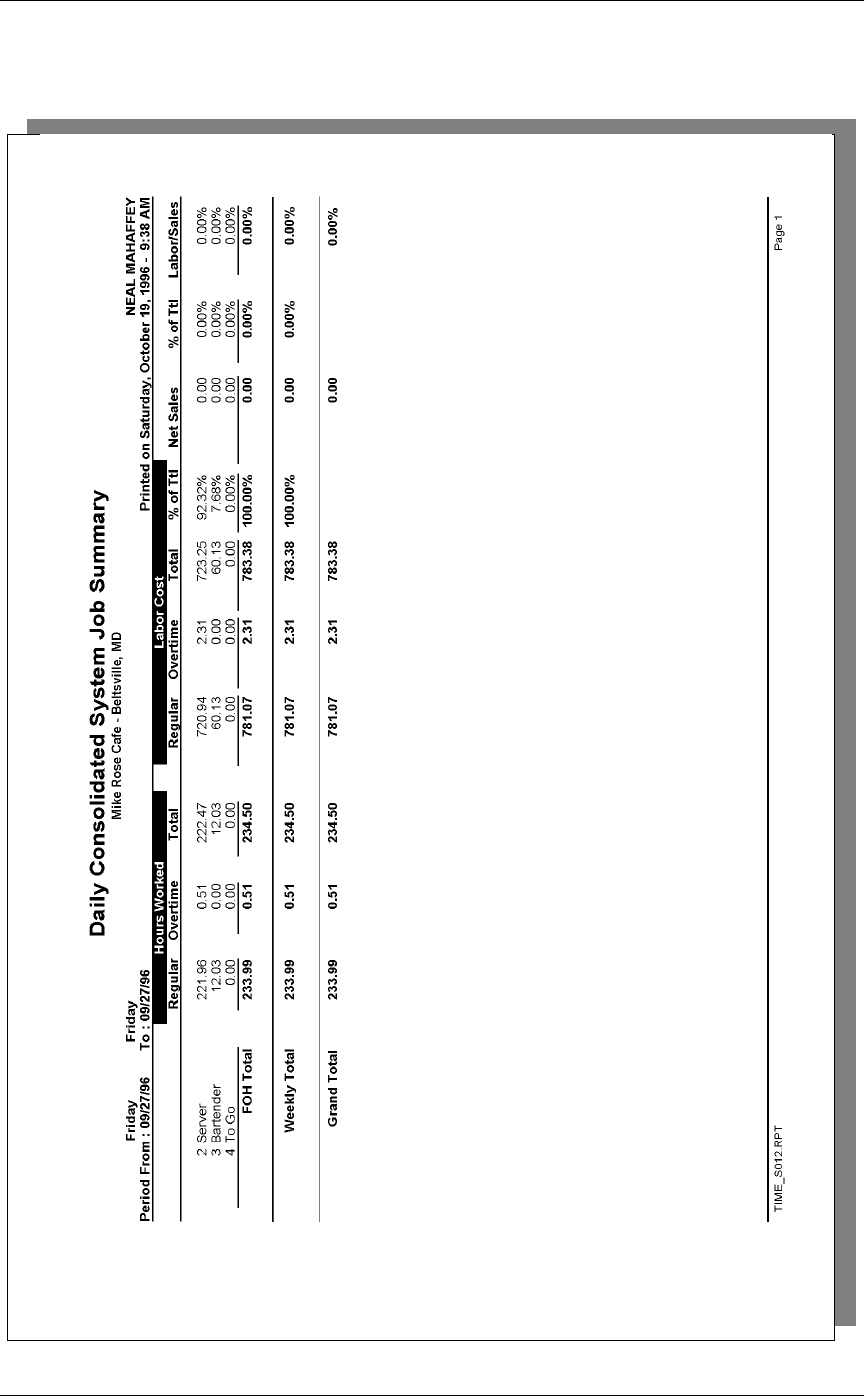
/DERU5HSRUWV
&RQVROLGDWHG6\VWHP-RE6XPPDU\
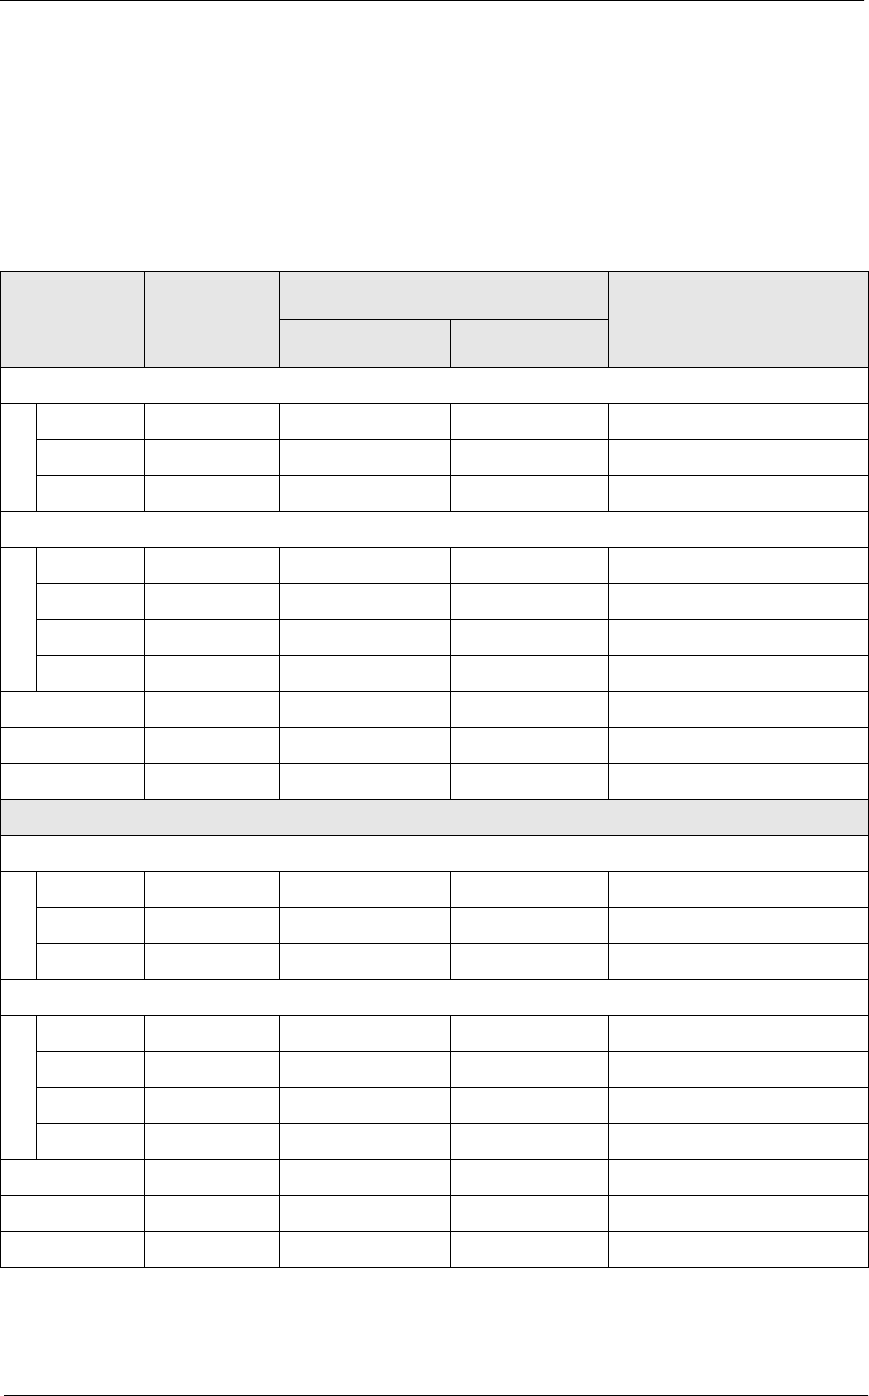
5HSRUWV
/DERU5HSRUWV
&RQVROLGDWHG6\VWHP-RE6XPPDU\
Labor/Sales Profile Details
View: v_R_job_code
Stored Procedure: sp_R_job_code_totals
The following table lists each column in the Labor/Sales Profile and
provides detailed information on the source of the figures in each column.
Report
Column
Title
View
Column
Title
3700 Database Formula
Table Column
Hours Worked
Regular ∑ reg_hours dly_job_code_ttl reg_hrs
Overtime ∑ ovt_hours dly_job_code_ttl otm_hrs
Total ∑ @ttl_Hours
Labor Cost
Regular ∑ reg_ttl dly_job_code_ttl reg_ttl
Overtime ∑ ovt_ttl dly_job_code_ttl otm_ttl
Total ∑ @ttl_Cost
% of Ttl @ttl_%_Of_Category_Cost
Net Sales ∑ net_sls_ttl dly_job_code_ttl net_sls_ttl
% of Ttl @ttl_%_Of_Category_Net_Sales
Labor/Sales @ttl_%_Of_Job_Labor
Job Category Total
Hours Worked
Regular ∑ reg_hours dly_job_code_ttl reg_hrs
Overtime ∑ ovt_hours dly_job_code_ttl otm_hrs
Total ∑ @ttl_Hours
Labor Cost
Regular ∑ reg_ttl dly_job_code_ttl reg_ttl
Overtime ∑ ovt_ttl dly_job_code_ttl otm_ttl
Total ∑ @ttl_Cost
% of Ttl @ttl_%_Of_RVC_Cost
Net Sales ∑ net_sls_ttl dly_job_code_ttl net_sls_ttl
% of Ttl @ttl_%_Of_RVC_Net_Sales
Labor/Sales @ttl_%_Of_Category_Labor
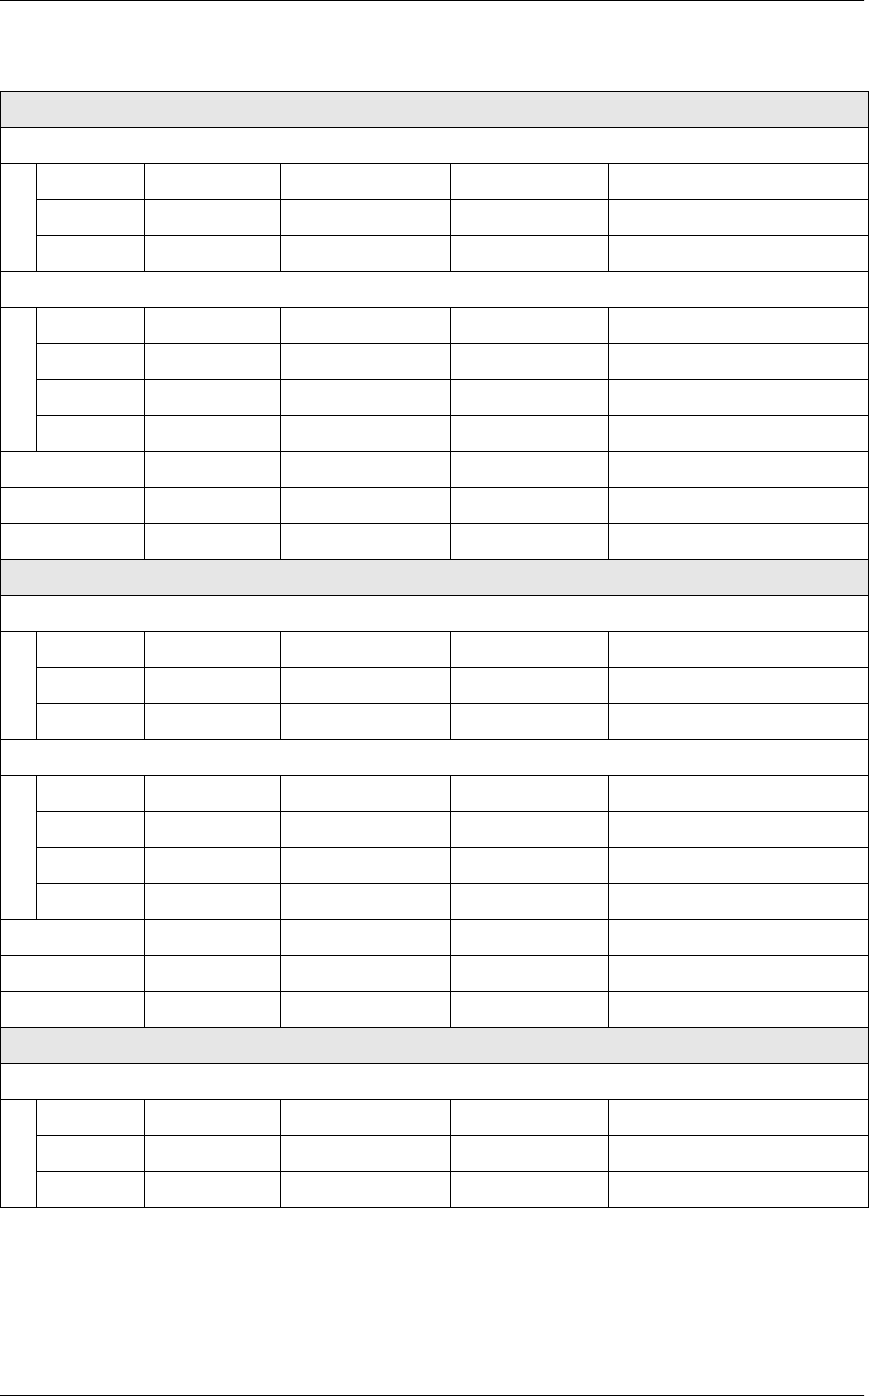
/DERU5HSRUWV
&RQVROLGDWHG6\VWHP-RE6XPPDU\
Revenue Center Total
Hours Worked
Regular ∑ reg_hours dly_job_code_ttl reg_hrs
Overtime ∑ ovt_hours dly_job_code_ttl otm_hrs
Total ∑ @ttl_Hours
Labor Cost
Regular ∑ reg_ttl dly_job_code_ttl reg_ttl
Overtime ∑ ovt_ttl dly_job_code_ttl otm_ttl
Total ∑ @ttl_Cost
% of Ttl @ttl_%_Of_Daily_Cost
Net Sales ∑ net_sls_ttl dly_job_code_ttl net_sls_ttl
% of Ttl @ttl_%_Of_Daily_Net_Sales
Labor/Sales @ttl_%_Of_RVC_Labor
Weekly Total
Hours Worked
Regular ∑ reg_hours dly_job_code_ttl reg_hrs
Overtime ∑ ovt_hours dly_job_code_ttl otm_hrs
Total ∑ @ttl_Hours
Labor Cost
Regular ∑ reg_ttl dly_job_code_ttl reg_ttl
Overtime ∑ ovt_ttl dly_job_code_ttl otm_ttl
Total ∑ @ttl_Cost
% of Ttl @ttl_%_Of_Cost
Net Sales ∑ net_sls_ttl dly_job_code_ttl net_sls_ttl
% of Ttl @ttl_%_Of_Net_Sales
Labor/Sales @ttl_%_Of_Weekly_Labor
Grand Total
Hours Worked
Regular ∑ reg_hours dly_job_code_ttl reg_hrs
Overtime ∑ ovt_hours dly_job_code_ttl otm_hrs
Total ∑ @ttl_Hours
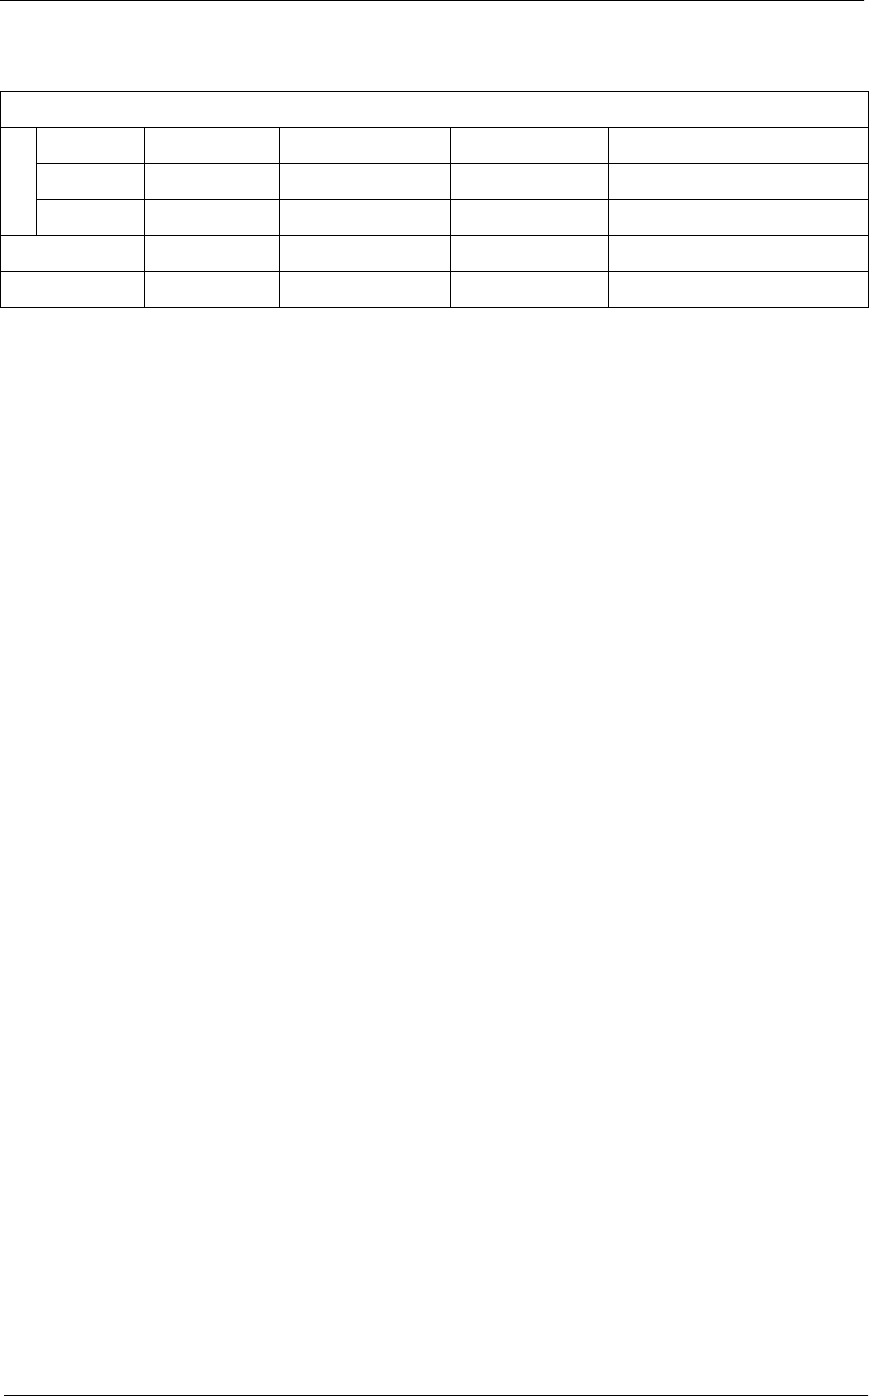
5HSRUWV
/DERU5HSRUWV
&RQVROLGDWHG6\VWHP-RE6XPPDU\
Programming Considerations
*HQHUDO
qJobs and default pay rates are defined on the Jobs form.
Default pay rates are overridden by Employees | Job Rates | Override
Regular Rate and Override Overtime Rate fields.
2YHUWLPH3D\
qConditions for awarding overtime are defined on the Time and
Attendance form.
Notes
5HSRUWV3URGXFHG:KLOH(PSOR\HHV$UH&ORFNHG,Q
If this report is produced for a time period that includes the current day,
and employees are clocked in at the time, any hours they have worked in
their current shift will be included in the report.
-RE3D\5DWHV
Wages will not reflect a consistent wage rate by job unless all employees
clocking in under the same job use the default pay rates defined on the
Jobs form.
Labor Cost
Regular ∑ reg_ttl dly_job_code_ttl reg_ttl
Overtime ∑ ovt_ttl dly_job_code_ttl otm_ttl
Total ∑ @ttl_Cost
Net Sales ∑ net_sls_ttl dly_job_code_ttl net_sls_ttl
Labor/Sales @ttl_%_Of_Labor
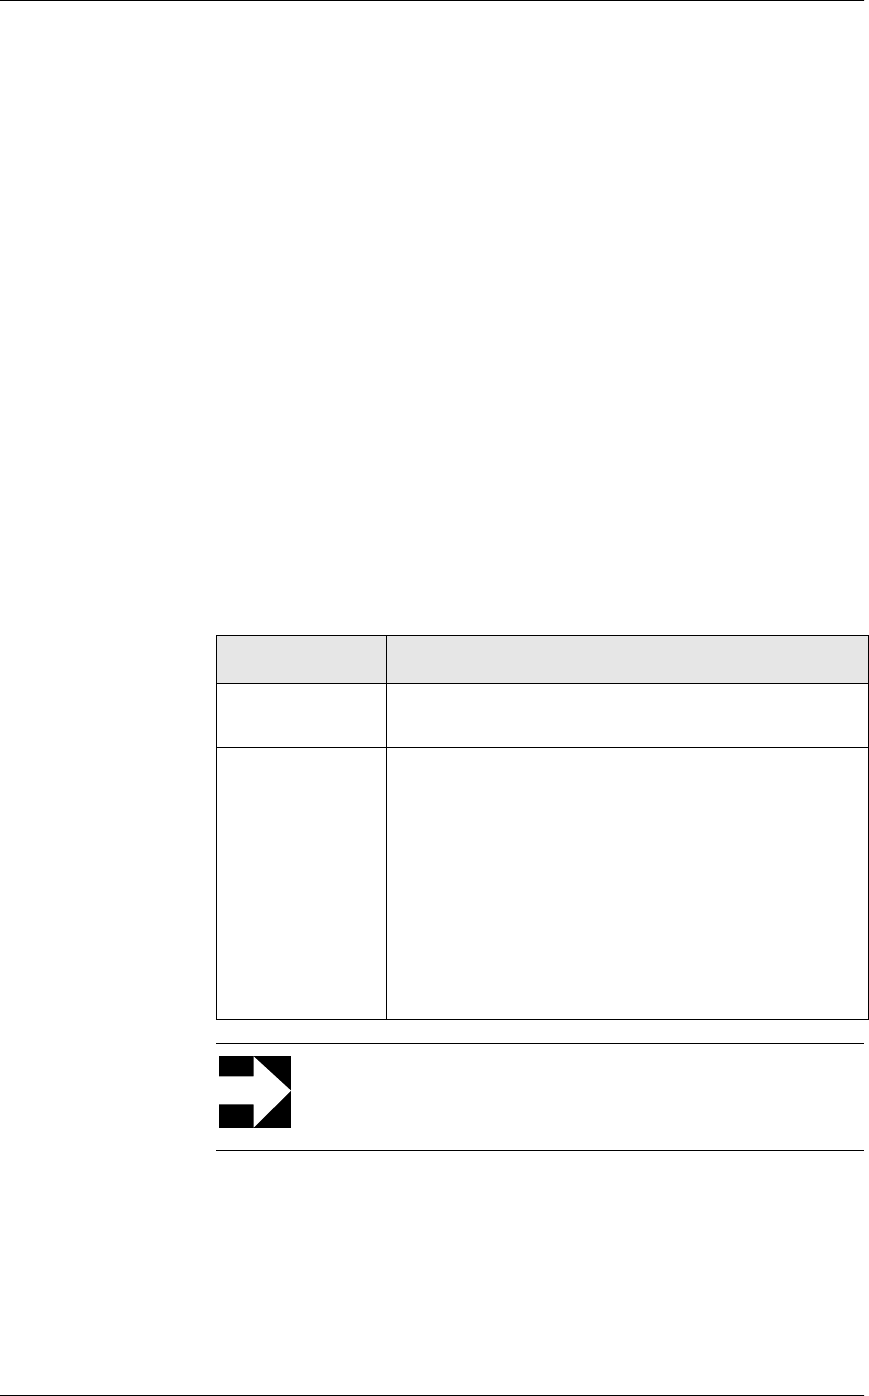
/DERU5HSRUWV
&ORFN,Q6WDWXV
Clock In Status
3XUSRVH
This report is designed to indicate which employees are clocked in at the
time the report is generated. This information can be useful for a variety
of reasons. For example, at the beginning of a shift, you can determine if
anyone is late. You may want a list of the employees that are currently
working when you make decisions about who to send home early. Or,
before generating any of the labor reports, you may want to verify that
everyone is clocked out.
)RUPDW
The profile used for this report is unique—it is not used for any other
reports. It is explained in the Report Profile below.
7HPSODWH
TIME_005.RPT
5HSRUW3URILOH
This profile provides job information and clock in date and time for each
employee who is currently clocked in.
Column Description
Job # and Name The job number and name the employee used when
clocking in.
Clock IN Date/
TIme The date and time the employee clocked in. Only
employees who are currently clocked in appear on
this report.
The date is in the format month/day.
The time on this report is rounded to the nearest
minute. However, the system stores clock in data as
a decimal figure, rounded to the nearest 1/100th of
an hour. This decimal figure is used for any
calculations involving clock in time.
Note
This report can be run as a UWS report and looks like the 40-
column Crystal Report

5HSRUWV
/DERU5HSRUWV
&ORFN,Q6WDWXV

/DERU5HSRUWV
&ORFN,Q6WDWXV
Employee Clock In Status
Employee Clock IN Status
Mike Rose Cafe - Beltsville, MD
NEAL MAHAFFEY
Printed on 10/19/1996 - 11:55
----------------------------------------
1 - Dining Room
1006 - HICKSON LARRY
Saturday 10/12/96 6:40pm
2 - Server 161:15
----------------------------------------
1 - Dining Room
1004 - SUE DINGFELDER
Saturday 10/19/96 11:34am
2 - Server 0:21
1003 - CHRIS MARTIN
Saturday 10/19/96 11:34am
2 - Server 0:21
1002 - BEV NELSON
Saturday 10/19/96 11:33am
2 - Server 0:22
1023 - SARAH SMITH
Saturday 10/19/96 11:47am
2 - Server 0:08
1034 - DARLENE JOHNSON
Saturday 10/19/96 11:47am
2 - Server 0:08
----------------------------------------
2 - Main Bar
5001 - HOPE WILSON
Saturday 10/19/96 11:48am
1 - Manager 0:07
----------------------------------------
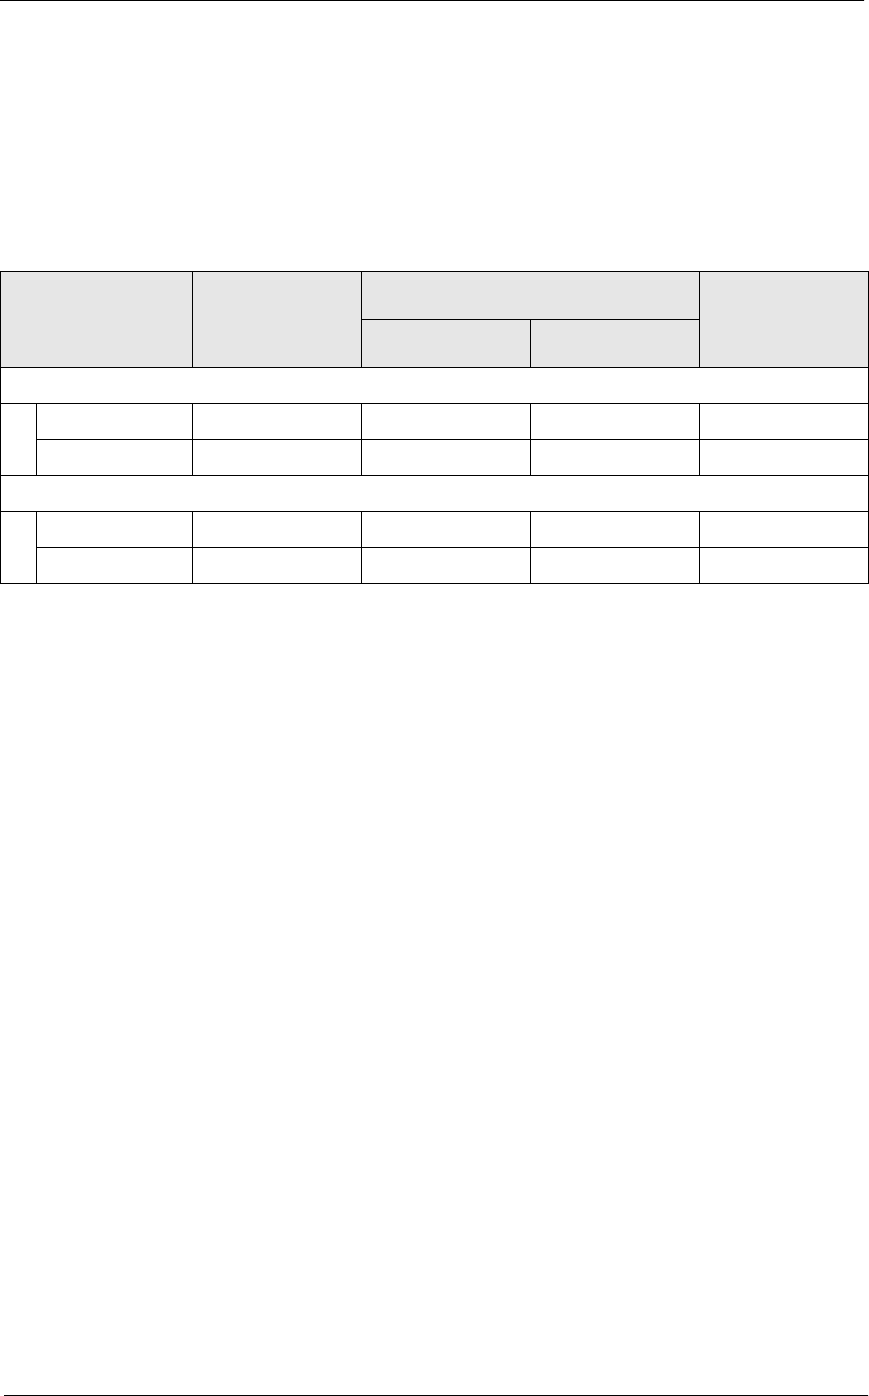
5HSRUWV
/DERU5HSRUWV
&ORFN,Q6WDWXV
Report Details
View: v_R_employee_time_card
There are no stored procedures used with this report.
The following table lists each column in the report and provides detailed
information on the source of the figures in each column.
Notes
qThe number associated with the employee’s name is the object
number from the Employees form, not the employee’s ID number.
qThe clock in date and time on this report should match the most
recent clock in date and time on the Employee Time Card and Job
Detail Report. No clock out should be associated with this clock in.
Report
Column
Title
View
Column
Title
3700 Database Formula
Table Column
Job # and Name
Job # job_number job_def obj_num
Job Name job_name name
Clock IN Date/Time
Clock IN Date @IN_Date
Clock IN TIME @IN_Time
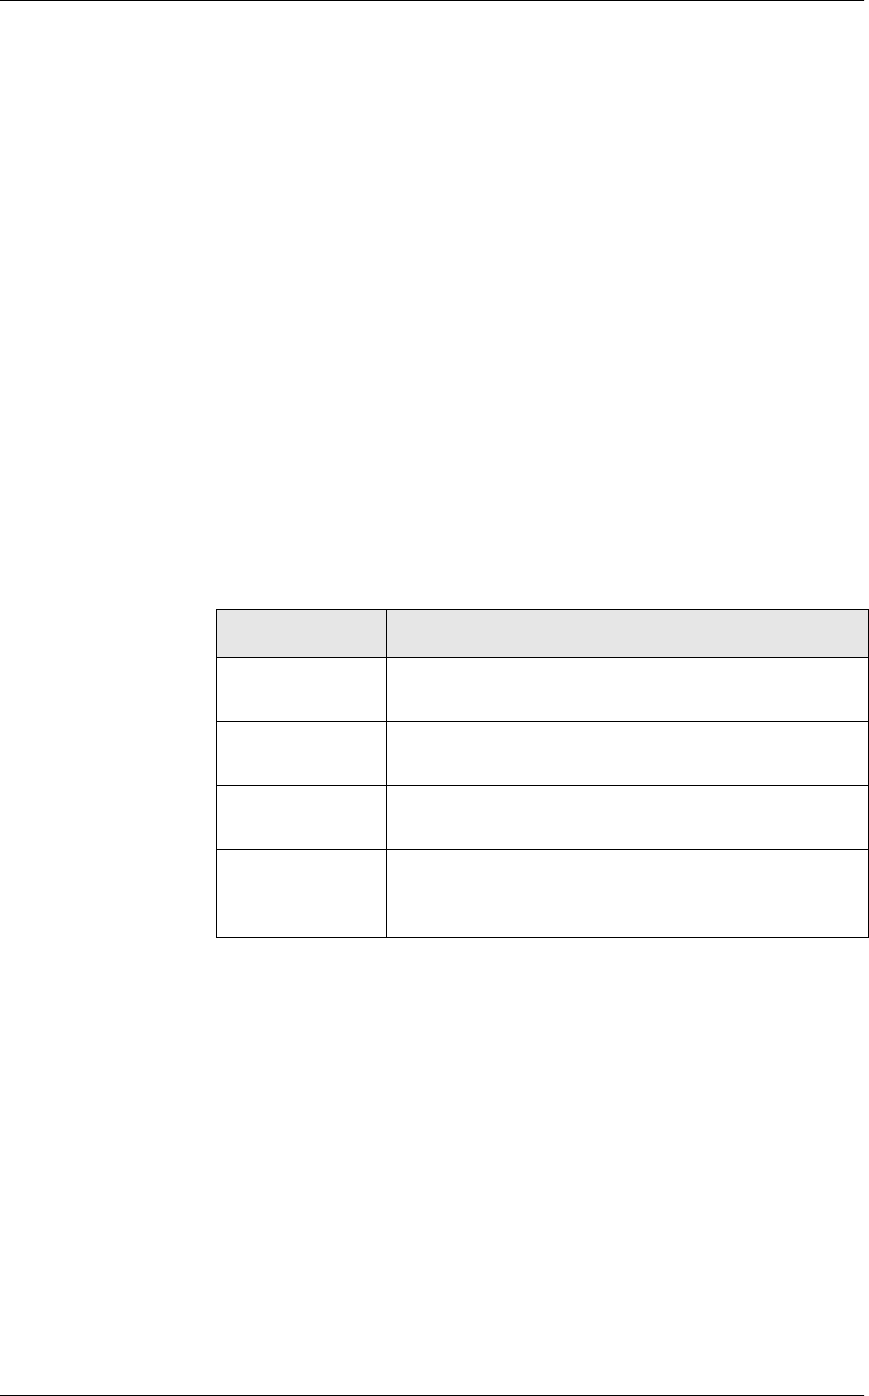
/DERU5HSRUWV
/DERU$YDLODELOLW\
Labor Availability
3XUSRVH
This report provides a count of all employees (by job) who are clocked in
(including those on break) at the time the report is generated. This is
particularly useful for establishments that need a quick summary, by job,
of the number of employees that are currently active in the system. It also
provides management with an efficient way to confirming that the
scheduled number of employees are available.
)RUPDW
The profile used for this report is unique—it is not used for any other
reports. It is explained in the Report Profile below.
7HPSODWH
TIME_006.RPT
5HSRUW3URILOH
This profile includes the number of employees clocked in, on break, and
total numbers for each job category.
This profile also includes totals by job category, revenue center, and a
daily total.
Column Description
Job # and Name The job number and name the employee used when
clocking in.
Clocked IN The number of employees in this job category who
are currently clocked in and not on break.
On Break The number of employees in this job category who
are currently clocked in but are on break.
Total The total number of employees in this job category
who are currently clocked in. This figure includes
both working and on-break employees.
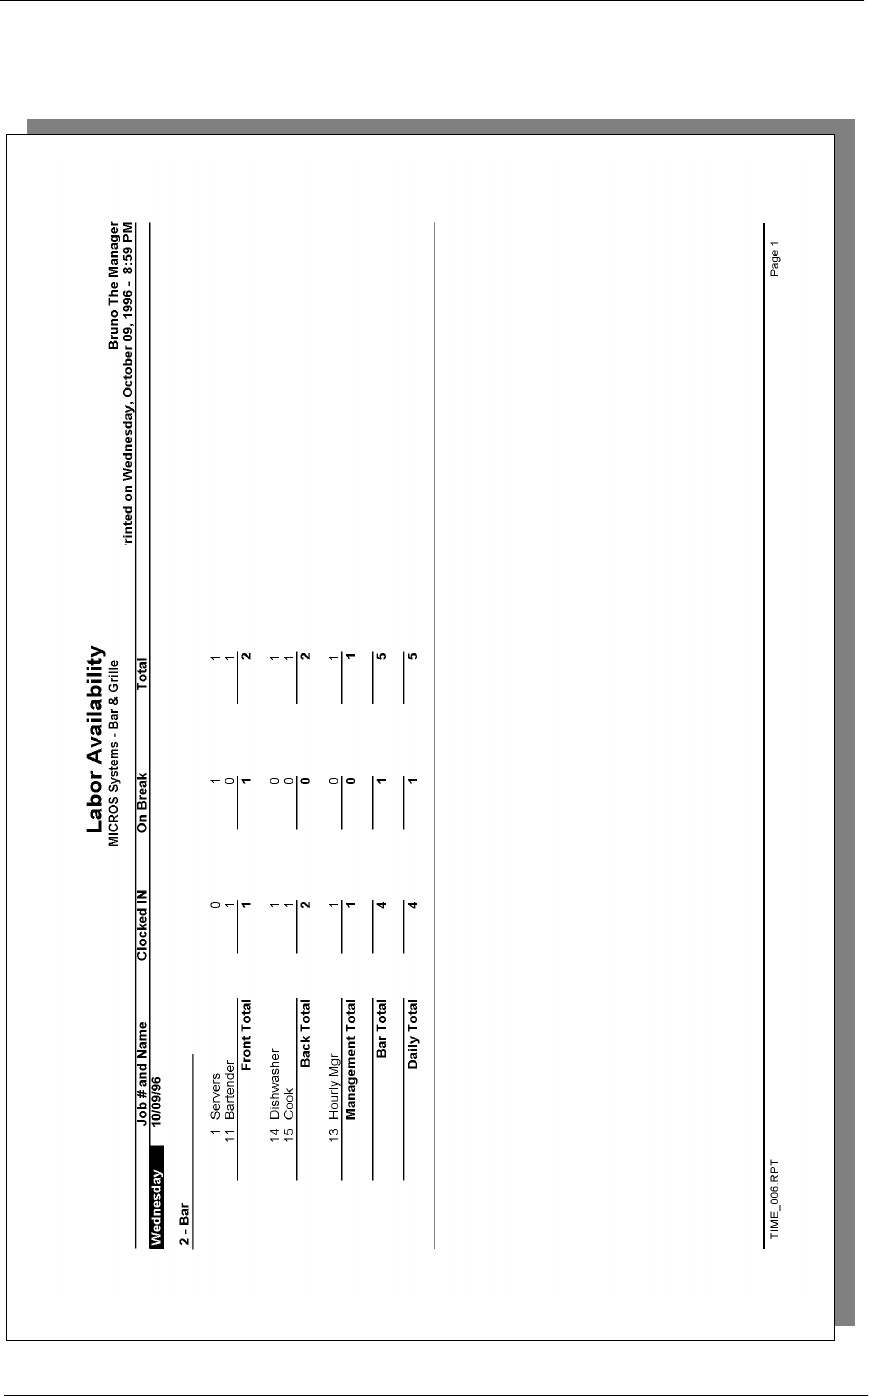
5HSRUWV
/DERU5HSRUWV
/DERU$YDLODELOLW\

/DERU5HSRUWV
/DERU$YDLODELOLW\
Labor Availability
Labor Availability
Mike Rose Cafe - Beltsville, MD
NEAL MAHAFFEY
Printed on 10/19/1996 - 11:49
----------------------------------------
Saturday 10/12/96
1 - Dining Room
IN Break Total
1 0 1
2 Server
FOH Total 1 0 1
Dining Room Tot 1 0 1
----------------------------------------
Daily Total 1 0 1
========================================
Saturday 10/19/96
1 - Dining Room
IN Break Total
5 0 5
2 Server
FOH Total 5 0 5
Dining Room Tot 5 0 5
2 - Main Bar
IN Break Total
1 0 1
1 Manager
ADMIN Total 1 0 1
Main Bar Total 1 0 1
----------------------------------------
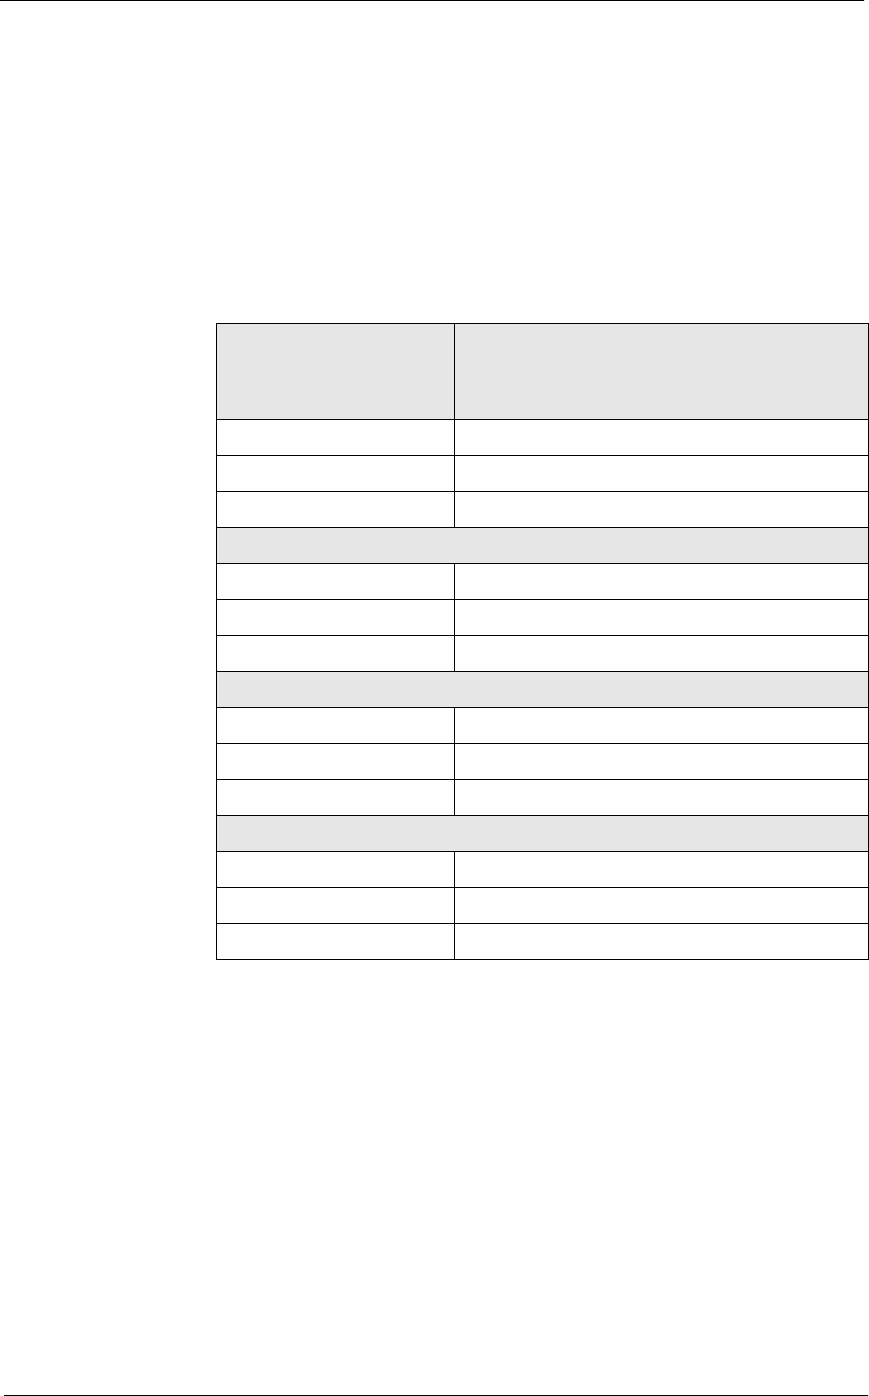
5HSRUWV
/DERU5HSRUWV
/DERU$YDLODELOLW\
Report Details
View: v_R_employee_time_card
There are no stored procedures used with this report.
The following table lists each column in the report and provides detailed
information on the source of the figures in each column. Since all the
numbers in this profile come from formulas, there is no view, table, or
column information.
Programming Considerations
*HQHUDO
qJobs are defined on the Jobs form.
Notes
&ORFNHG,Q(PSOR\HHV
The number of employees listed on this report should match the number
of employees on the Clock In Status Report. If these numbers do not
match, check to be sure both reports are for the same range of jobs.
Report
Column
Title Formula
Clocked IN @ttl_IN_Job_Number
On Break @ttl_BREAK_Job_Number
Total @ttl_Job_Number
Job Category Total
Clocked IN @ttl_IN_Job_Category
On Break @ttl_BREAK_Job_Category
Total @ttl_Job_Category
Revenue Center Total
Clocked IN @ttl_IN_RVC_Number
On Break @ttl_BREAK_RVC_Number
Total @ttl_RVC_Number
Daily Total
Clocked IN @ttl_IN_Business_Date
On Break @ttl_BREAK_Business_Date
Total @ttl_Business_Date

/DERU5HSRUWV
/DERU$YDLODELOLW\

5HSRUWV
Chapter 5
Tax Reports
This chapter provides a detailed explanation of the standard tax reports
with examples of each.
In this chapter
Introduction ............................................................................................5-2
Daily Revenue Center Tax Totals.......................................................... 5-3
Consolidated Revenue Center Tax Totals ............................................. 5-8
Daily System Tax Totals.......................................................................5-11
Consolidated System Tax Totals ......................................................... 5-15

7D[5HSRUWV
,QWURGXFWLRQ
Introduction
Tax reports provide a detailed listing of all federal, state, province, or city
taxes which may apply to menu items and service charges.
The 3700 supports the following tax types:
qUnited States Add-on and Inclusive Taxes
qEuropean Value Added Tax (VAT)
qCanadian GST
qSingapore Tax
qFlorida Surcharge Tax
qJapanese Tax
qThai Tax
&DOFXODWLQJ7D[$PRXQWV
The tax amount due for each item on the check is calculated at the time of
sale and rounded to the smallest currency denomination. (In U.S. dollars,
the smallest currency denomination is the cent.) The tax collected total is
the sum of the tax on each individual item.
Because of accumulated rounding differences, you will find that, for
example, at a 5% tax rate, the tax collected is not 5% of taxable sales. A
5% tax is calculated for each menu item, and these amounts are then
totalled to arrive at the tax collected amount. This tax collected is the
correct amount for the tax rate.

5HSRUWV
7D[5HSRUWV
'DLO\5HYHQXH&HQWHU7D[7RWDOV
Daily Revenue Center Tax Totals
3XUSRVH
This report summarizes tax collections by active tax rate for a revenue
center and provides revenue center totals, daily totals, and grand total
amounts.
This template supports U.S. taxes. Other taxes may require a different
template.
)RUPDW
This report includes the following profile:
qTax Profile
The profile has been modified for this report. It includes this extra
field:
Non Taxable Sales
7HPSODWH
TAX_R001.RPT
2-28
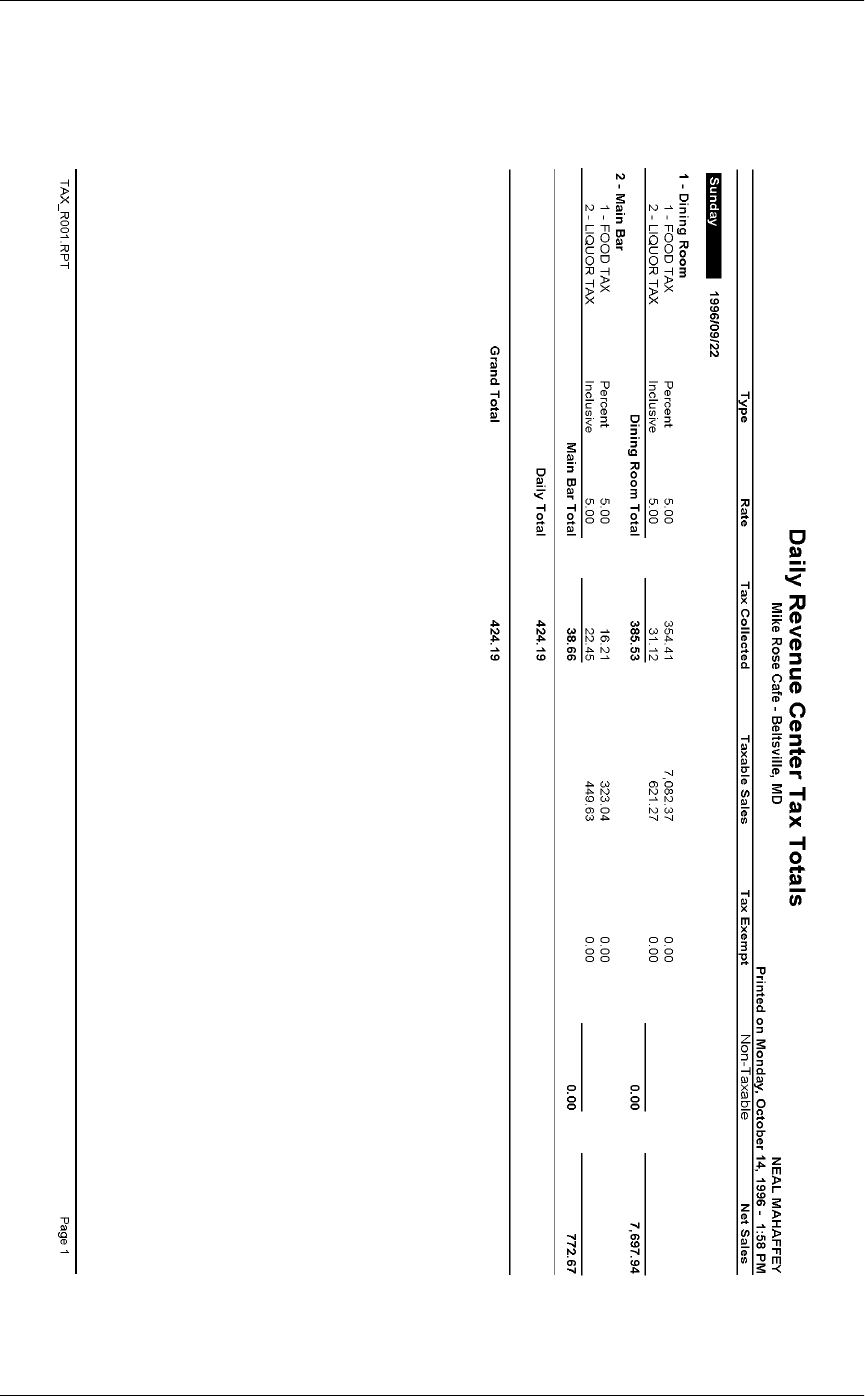
7D[5HSRUWV
'DLO\5HYHQXH&HQWHU7D[7RWDOV

5HSRUWV
7D[5HSRUWV
'DLO\5HYHQXH&HQWHU7D[7RWDOV
Revenue Center Tax Totals
Daily Revenue Center Tax Total
Mike Rose Cafe - Beltsville, MD
NEAL MAHAFFEY
Printed on 10/16/1996 - 1:00
----------------------------------------
Sunday 9/22/19
1 - Dining Room
Type Rate
1 - FOOD TAX Percent 5.00
FOOD TAX 354.41
TAXABLE SALE 7,082.37
TAX EXEMPT 0.00
Type Rate
2 - LIQUOR TAX Inclusive 5.00
BEV TAX 31.12
TAXABLE SALE 621.27
TAX EXEMPT 0.00
Dining Room Total
Tax Collected 385.53
Non-Taxable 0.00
Net Sales 7,697.94
----------------------------------------
2 - Main Bar
Type Rate
1 - FOOD TAX Percent 5.00
FOOD TAX 16.21
TAXABLE SALE 323.04
TAX EXEMPT 0.00
Daily Total
Tax Collected 424.19
========================================
Grand Total
Tax Collected 424.19
Totals omitted for
display
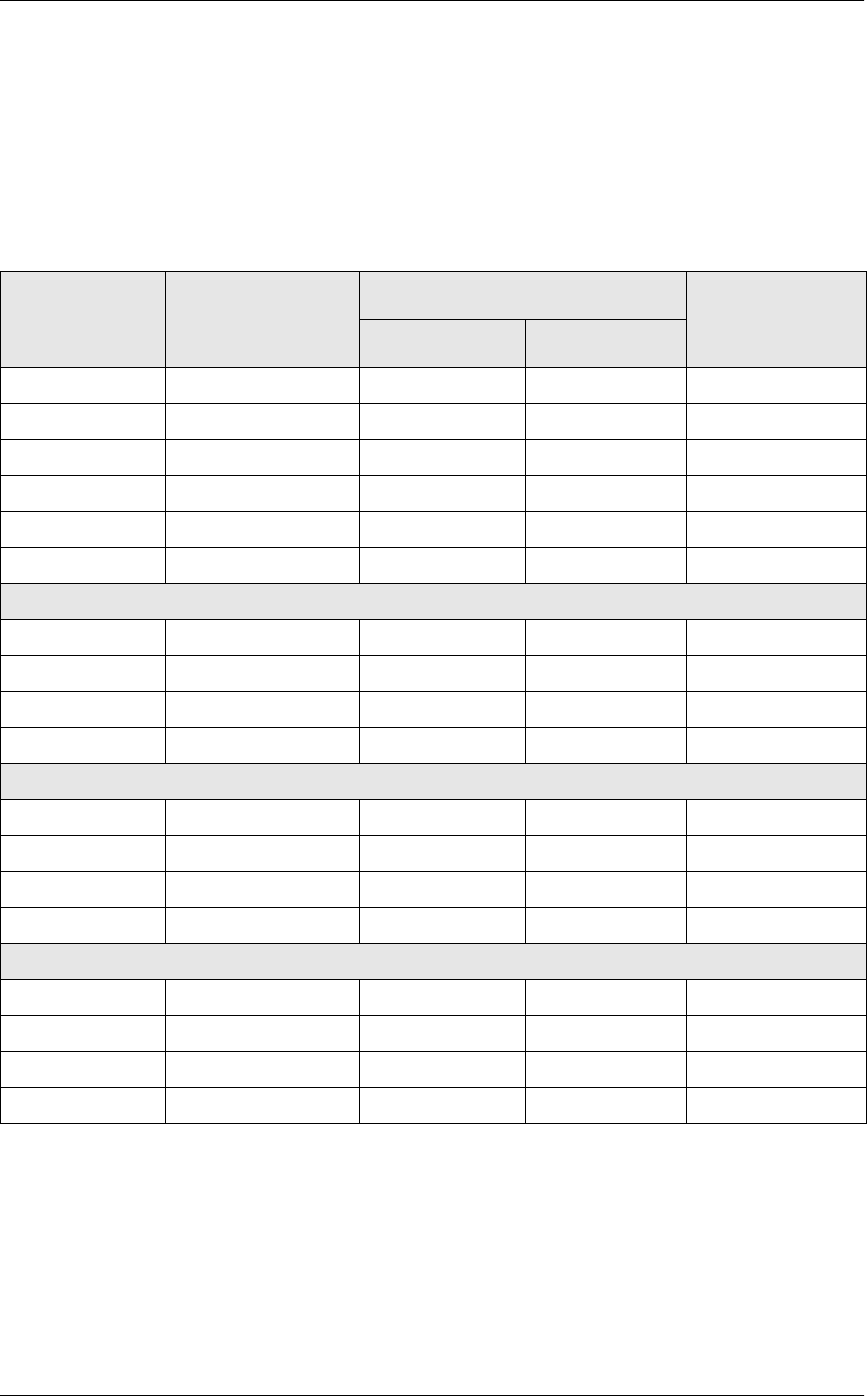
7D[5HSRUWV
'DLO\5HYHQXH&HQWHU7D[7RWDOV
Tax Profile Details
View: v_R_rvc_tax
Stored Procedure: sp_R_tax
The following table lists each column in the Tax Profile and provides
detailed information on the source of the figures in each column.
Programming Considerations
*HQHUDO
qOnly tax rates that are active and include totals print on this report. A
tax rate is active when it is assigned to a tax class on Tax Classes.
Report
Column
Title
View
Column
Title
3700 Database Formula
Table Column
Type @Tax_Type
Rate tax_percentage tax_rate_def percentage
Tax Collected tax_collected_ttl dly_rvc_tax_ttl coll_ttl
Taxable Sales taxable_sales_ttl dly_rvc_tax_ttl txable_sls_ttl
Tax Exempt tax_exempt_ttl dly_rvc_tax_ttl exempt_ttl
Net Sales net_sales_ttl dly_rvc_ttl net_sls_ttl
Revenue Center Total
Tax Collected ∑ tax_collected_ttl
Taxable Sales ∑ taxable_sales_ttl
Tax Exempt ∑ tax_exempt_ttl
Net Sales ∑ net_sales_ttl
Daily Total
Tax Collected ∑ tax_collected_ttl
Taxable Sales ∑ taxable_sales_ttl
Tax Exempt ∑ tax_exempt_ttl
Net Sales ∑ net_sales_ttl
Grand Total
Tax Collected ∑ tax_collected_ttl
Taxable Sales ∑ taxable_sales_ttl
Tax Exempt ∑ tax_exempt_ttl
Net Sales ∑ net_sales_ttl

5HSRUWV
7D[5HSRUWV
'DLO\5HYHQXH&HQWHU7D[7RWDOV
5DWH
qTax rates are programmed on the Tax Rates form. Rates are assigned
to a class on the Tax Classes form.
Notes
%DODQFLQJ
The sums of the figures for all revenue centers should equal the figures on
the System Tax Totals Report for the same period.

7D[5HSRUWV
&RQVROLGDWHG5HYHQXH&HQWHU7D[7RWDOV
Consolidated Revenue Center Tax Totals
3XUSRVH
This report is similar to the Revenue Center Tax Totals Report except the
tax totals are summarized for the date range, rather than being listed
separately for each day. Revenue center totals and grand total amounts are
included.
This template supports U.S. taxes. Other taxes may require a different
template.
)RUPDW
This report includes the following profile:
qTax Profile
The profile has been modified for this report. It includes this extra
field:
Non Taxable Sales
7HPSODWH
TAX_R002.RPT
2-28
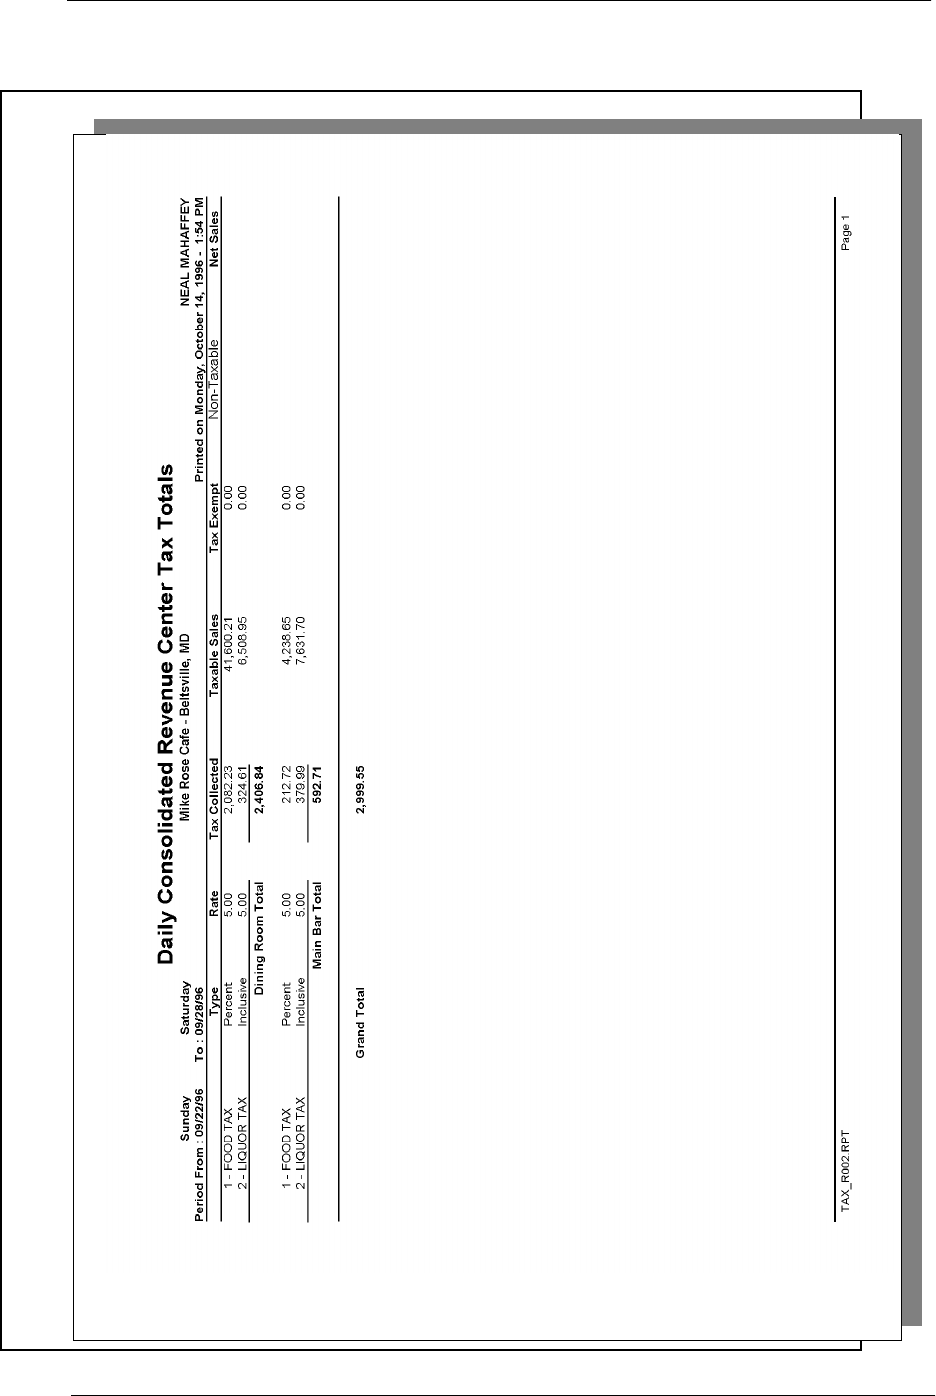
5HSRUWV
7D[5HSRUWV
&RQVROLGDWHG5HYHQXH&HQWHU7D[7RWDOV
7D[5HSRUWV
&RQVROLGDWHG5HYHQXH&HQWHU7D[7RWDOV
Tax Profile Details
View: v_R_rvc_tax
Stored Procedure: sp_R_tax
The following table lists each column in the report and provides detailed
information on the source of the figures in each column.
Programming Considerations
*HQHUDO
qOnly tax rates that are active and include totals print on this report. A
tax rate is active when it is assigned to a tax class on Tax Classes.
Notes
%DODQFLQJ
The sums of the figures for all revenue centers should equal the figures on
the Consolidated System Tax Totals Report for the same period.
Report
Column
Title
View
Column
Title
3700 Database Formula
Table Column
Type @Tax_Type
Rate tax_percentage tax_rate_def percentage
Tax Collected ∑ tax_collected_ttl dly_rvc_tax_ttl
Taxable Sales ∑ taxable_sales_ttl dly_rvc_tax_ttl
Tax Exempt ∑ tax_exempt_ttl dly_rvc_tax_ttl
Net Sales ∑ net_sales_ttl dly_rvc_tax_ttl
Revenue Center Total
Tax Collected ∑ tax_collected_ttl
Taxable Sales ∑ taxable_sales_ttl
Tax Exempt ∑ tax_exempt_ttl
Net Sales ∑ net_sales_ttl
Grand Total
Tax Collected ∑ tax_collected_ttl
Taxable Sales ∑ taxable_sales_ttl
Tax Exempt ∑ tax_exempt_ttl
Net Sales ∑ net_sales_ttl

5HSRUWV
7D[5HSRUWV
'DLO\6\VWHP7D[7RWDOV
Daily System Tax Totals
3XUSRVH
This report summarizes tax collections by active tax rate for an entire
system and provides daily total and grand total amounts.
This template supports U.S. taxes. Other taxes may require a different
template.
)RUPDW
This report includes the following profile:
qTax Profile
The profile has been modified for this report. It includes this extra
field:
Non Taxable Sales
7HPSODWH
TAX_S001.RPT
2-28
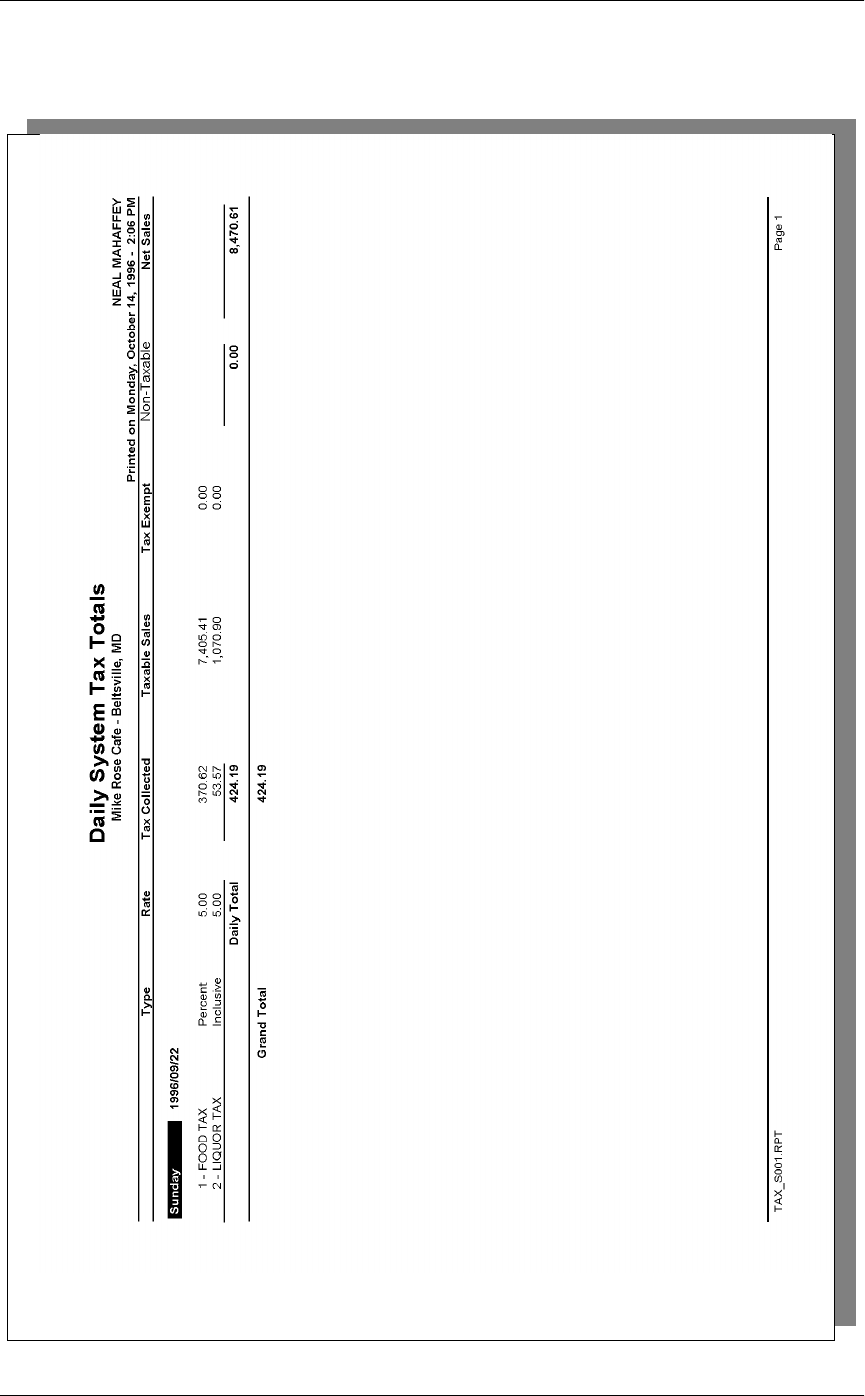
7D[5HSRUWV
'DLO\6\VWHP7D[7RWDOV

5HSRUWV
7D[5HSRUWV
'DLO\6\VWHP7D[7RWDOV
System Tax Totals
Daily System Tax Totals
Mike Rose Cafe - Beltsville, MD
NEAL MAHAFFEY
Printed on 10/16/1996 - 1:03
----------------------------------------
Sunday 9/22/19
Type Rate
1 - FOOD TAX Percent 5.00
FOOD TAX 370.62
TAXABLE SALE 7,405.41
TAX EXEMPT 0.00
Type Rate
2 - LIQUOR TAX Inclusive 5.00
BEV TAX 53.57
TAXABLE SALE 1,070.90
TAX EXEMPT 0.00
Daily Total
Tax Collected 424.19
Non-Taxable 0.00
Net Sales 8,470.61
----------------------------------------
Grand Total
Tax Collected 424.19
7D[5HSRUWV
'DLO\6\VWHP7D[7RWDOV
Tax Profile Details
View: v_R_sys_tax
Stored Procedure: sp_R_tax
The following table lists each column in the Tax Profile and provides
detailed information on the source of the figures in each column.
Programming Considerations
*HQHUDO
qOnly tax rates that are active and include totals print on this report. A
tax rate is active when it is assigned to a tax class on Tax Classes.
Report
Column
Title
View
Column
Title
3700 Database Formula
Table Column
Type @Tax_Type
Rate tax_percentage tax_rate_def percentage
Tax Collected tax_collected_ttl dly_sys_tax_ttl coll_ttl
Taxable Sales taxable_sales_ttl dly_sys_tax_ttl txbl_sls_ttl
Tax Exempt tax_exempt_ttl dly_sys_tax_ttl exempt_ttl
Net Sales net_sales_ttl dly_sys_ttl net_sales_ttl
Daily Total
Tax Collected ∑ tax_collected_ttl
Taxable Sales ∑ taxable_sales_ttl
Tax Exempt ∑ tax_exempt_ttl
Net Sales ∑ net_sales_ttl
Grand Total
Tax Collected ∑ tax_collected_ttl
Taxable Sales ∑ taxable_sales_ttl
Tax Exempt ∑ tax_exempt_ttl
Net Sales ∑ net_sales_ttl

5HSRUWV
7D[5HSRUWV
&RQVROLGDWHG6\VWHP7D[7RWDOV
Consolidated System Tax Totals
3XUSRVH
This report is similar to the System Tax Totals Report except the tax totals
are summarized for the date range, rather than being listed separately for
each day. Period totals are included.
This template supports U.S. taxes. Other taxes may require a different
template.
)RUPDW
This report includes the following profile:
qTax Profile
The profile has been modified for this report. It includes this extra
field:
Non Taxable Sales
7HPSODWH
TAX_S002.RPT
2-28
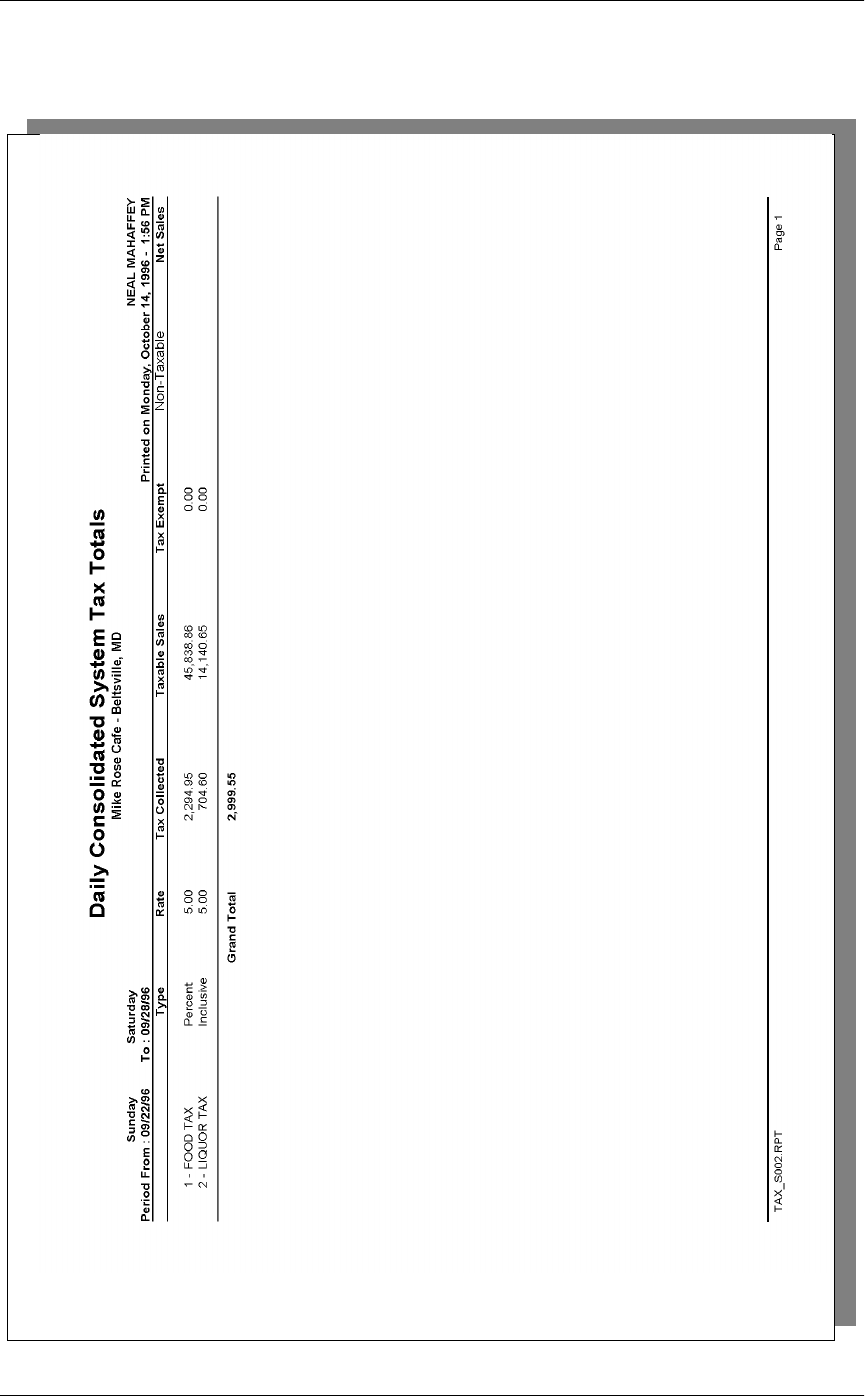
7D[5HSRUWV
&RQVROLGDWHG6\VWHP7D[7RWDOV
5HSRUWV
7D[5HSRUWV
&RQVROLGDWHG6\VWHP7D[7RWDOV
Tax Profile Details
View: v_R_sys_tax
Stored Procedure: sp_R_tax
The following table lists each column in the report and provides detailed
information on the source of the figures in each column.
Programming Considerations
*HQHUDO
qOnly tax rates that are active and include totals print on this report. A
tax rate is active when it is assigned to a tax class on Tax Classes.
Report
Column
Title
View
Column
Title
3700 Database Formula
Table Column
Type @Tax_Type
Rate tax_percentage tax_rate_def
Tax Collected ∑ tax_collected_ttl dly_sys_tax_ttl
Taxable Sales ∑ taxable_sales_ttl dly_sys_tax_ttl
Tax Exempt ∑ tax_exempt_ttl dly_sys_tax_ttl
Net Sales ∑ net_sales_ttl dly_sys_ttl
Grand Total
Tax Collected ∑ tax_collected_ttl
Taxable Sales ∑ taxable_sales_ttl
Tax Exempt ∑ tax_exempt_ttl
Net Sales ∑ net_sales_ttl

7D[5HSRUWV
&RQVROLGDWHG6\VWHP7D[7RWDOV

5HSRUWV
Chapter 6
Tip Reports
This chapter shows examples and provides an explanation of all 3700 Tip
Reports.
In this chapter
Introduction ............................................................................................6-2
Employee Tip Totals.............................................................................. 6-3
Employee Tip Totals by Revenue Center.............................................. 6-8
Consolidated Employee Tip Totals ..................................................... 6-12
Consolidated Employee Tip Totals by Revenue Center...................... 6-17
Consolidated Revenue Center Tip Totals............................................ 6-22
Consolidated System Tip Totals.......................................................... 6-27

7LS5HSRUWV
,QWURGXFWLRQ
Introduction
Tip handling is an integral part of any restaurant’s operation. The 3700
Tip Reports keep track of tips received from either cash, charges, or
automatic gratuities. The 3700 Tip Reports record tips paid to employees,
directly and indirectly. These reports can serve as documentation in the
event of an IRS audit. Therefore, we recommend that tip reports be
included in your daily and period autosequences.
5HSRUWV
7LS5HSRUWV
(PSOR\HH7LS7RWDOV
Employee Tip Totals
3XUSRVH
This report summarizes the total tip activity by employee.
)RUPDW
This report includes the following profile:
qTip Profile
7HPSODWH
EMP_205.RPT.
Note
This report can be run as a UWS report and looks like the 40-
column Crystal Report.
2-31
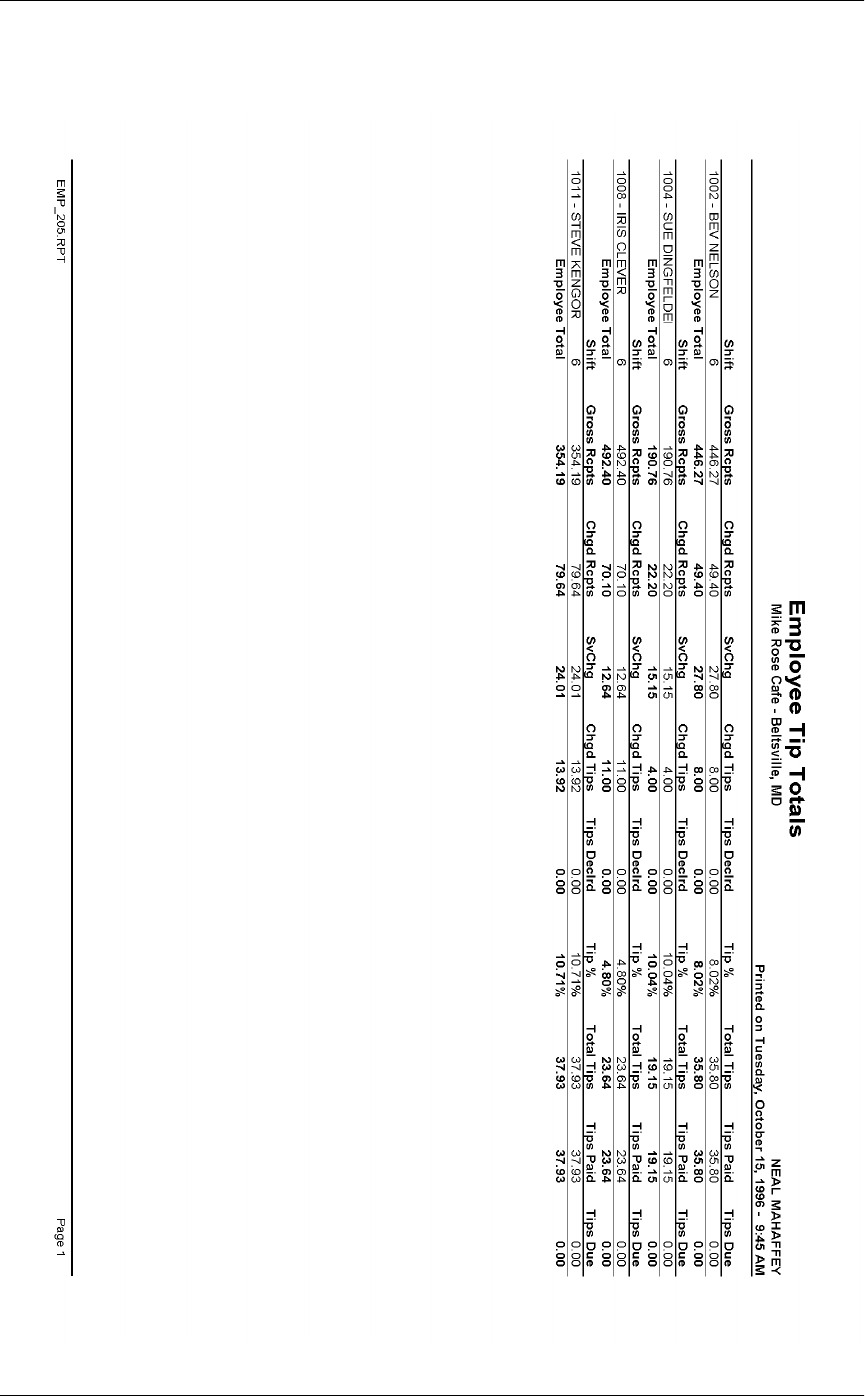
7LS5HSRUWV
(PSOR\HH7LS7RWDOV
5HSRUWV
7LS5HSRUWV
(PSOR\HH7LS7RWDOV
Employee Tip Totals
Employee Tip Totals
Mike Rose Cafe - Beltsville
Neal Mahaffey
Printed on 9/8/96 - 10:04 PM
-----------------------------------
Shift 1-From 09/03 - 5:45pm
To 09/06 - 2:37pm
1,009 - BETH FOX
887.54
Charged Receipts 91.74
Service Chg Rcpt 0.00
Charged Tips 14.43
Gross Receipts
Tips Declared 0.00
Total Tips 1.63% 14.43
Tips Paid 14.43
Tips Due 0.00
-----------------------------------
Shift 1-From 09/03 - 5:45pm
To 09/06 - 2:37pm
1,013 - GARY KENGOR
Gross Receipts 815.18
Charged Receipts 109.51
Service Chg Rcpt 0.00
Charged Tips 15.00
Tips Declared 0.00
Total Tips 1.84% 15.00
Tips Paid 15.00
Tips Due 0.00
-----------------------------------
Shift 1-From 09/03 - 5:45pm
To 09/06 - 2:36pm
2,005 - STEVE THOMAS
Gross Receipts 598.53
Charged Receipts 10.80
Service Chg Rcpt 0.00
Charged Tips 1.00
Tips Declared 0.00
Total Tips 0.17% 1.00
Tips Paid 1.00
Tips Due 0.00
-----------------------------------
Daily Total
Gross Receipts 2,301.25
Charged Receipts 212.05
Service Chg Rcpt 0.00
Charged Tips 30.43
Tips Declared 0.00
7LS5HSRUWV
(PSOR\HH7LS7RWDOV
Tip Profile Details
View: v_R_employee_sales_tip
Stored Procedure: sp_R_employee
The following table lists each column in the Tip Profile and provides
detailed information on the source of the figures in each column.
Programming Considerations
*HQHUDO
qRVC Posting | Options | Current round posts to transaction employee
determines if totals are posted to the check employee (and associated
cashier) or the transaction employee (and associated cashier). See
“Check Employee and Transaction Employee” on page 3-2 for more
information.
Report
Column
Title
View
Column
Name
3700 Database Formula
Table Column
Gross Rcpts gross_rcpts_ttl shift_emp_ttl gross_rcpts_ttl
Chgd Rcpts chgd_rcpts_ttl shift_emp_ttl charged_rcpts_ttl
SvChg tip_svc_ttl shift_emp_ttl tip_svc_ttl
Chgd Tips chgd_tips_ttl shift_emp_ttl charged_tips_ttl
Tips Declrd tips_decl_ttl shift_emp_ttl tips_decl_ttl
Tip % @Tip_%
Total Tips @Total_Tips
Tips Paid tips_paid_ttl shift_emp_ttl tips_paid_ttl
Tips Due @Tips_Due
Daily Total
Gross Rcpts ∑ gross_rcpts_ttl shift_emp_ttl gross_rcpts_ttl
Chgd Rcpts ∑ chgd_rcpts_ttl shift_emp_ttl charged_rcpts_ttl
SvChg ∑ tip_svc_ttl shift_emp_ttl tip_svc_ttl
Chgd Tips ∑ chgd_tips_ttl shift_emp_ttl charged_tips_ttl
Tips Declrd ∑ tips_decl_ttl shift_emp_ttl tips_decl_ttl
Tip % @Total_Tip_%
Total Tips ∑ @Total_Tips
Tips Paid ∑ tips_paid_ttl shift_emp_ttl tips_paid_ttl
Tips Due ∑ @Tips_Due

5HSRUWV
7LS5HSRUWV
(PSOR\HH7LS7RWDOV
Select this option to post totals to the check employee (and associated
cashier) if the transaction employee does not have a cashier link.
Clear this option to always post tendering totals to the transaction
employee (and associated cashier).
*URVV5HFHLSWV
qReceipts posted to a tendering key will add to Gross Receipts if
Tender/Media | Tender |Post to gross receipts is selected.
qTax collected is not included in gross receipts if RVC Taxes | Do not
post tax to tip reports is selected.
qThis field does not include charged tips.
qThis field may not include some service charges.
&KDUJHG5HFHLSWV
qOnly charge keys that are programmed to allow a charged tip add to
the charged receipts field. To post totals to Charged Receipts select
Tender/Media | CC Tender | Post to charge receipts.
6HUYLFH&KDUJH
qService charges can be programmed to add to either the Service
Charge field, or the Gross Receipts field. Select Discount/Service |
Discount/Service Charge | Post to svc charges total to post the service
charge to the service charge field. Clear this option to post the totals
to Gross Receipts.
You can use the Service Charge figures in one of two ways:
to produce totals that can be used in preparing IRS tax forms, or
to report autogratuities.
Service charges that are tips may be programmed to post to the
Service Charge field. (Post to svc charges total is selected). Service
charges that are not tips (for example, a cover charge, or banquet
room charge) should be programmed to add to Gross Receipts (Post
to svc charges total is cleared).
You may wish to use the Service Charge total to track autogratuities.
In this case, program any autogratuities you wish to track to add to the
service charge, and program all other service charges to add to gross
receipts.
Post to svc charges total works in conjunction with Charge tip on the
same form. Only one of these options should be selected. If both
options are selected, Post to svc charges total will be ignored.
Note
Only tenders that include a non-zero charged tip (less the tip)
add to this value.

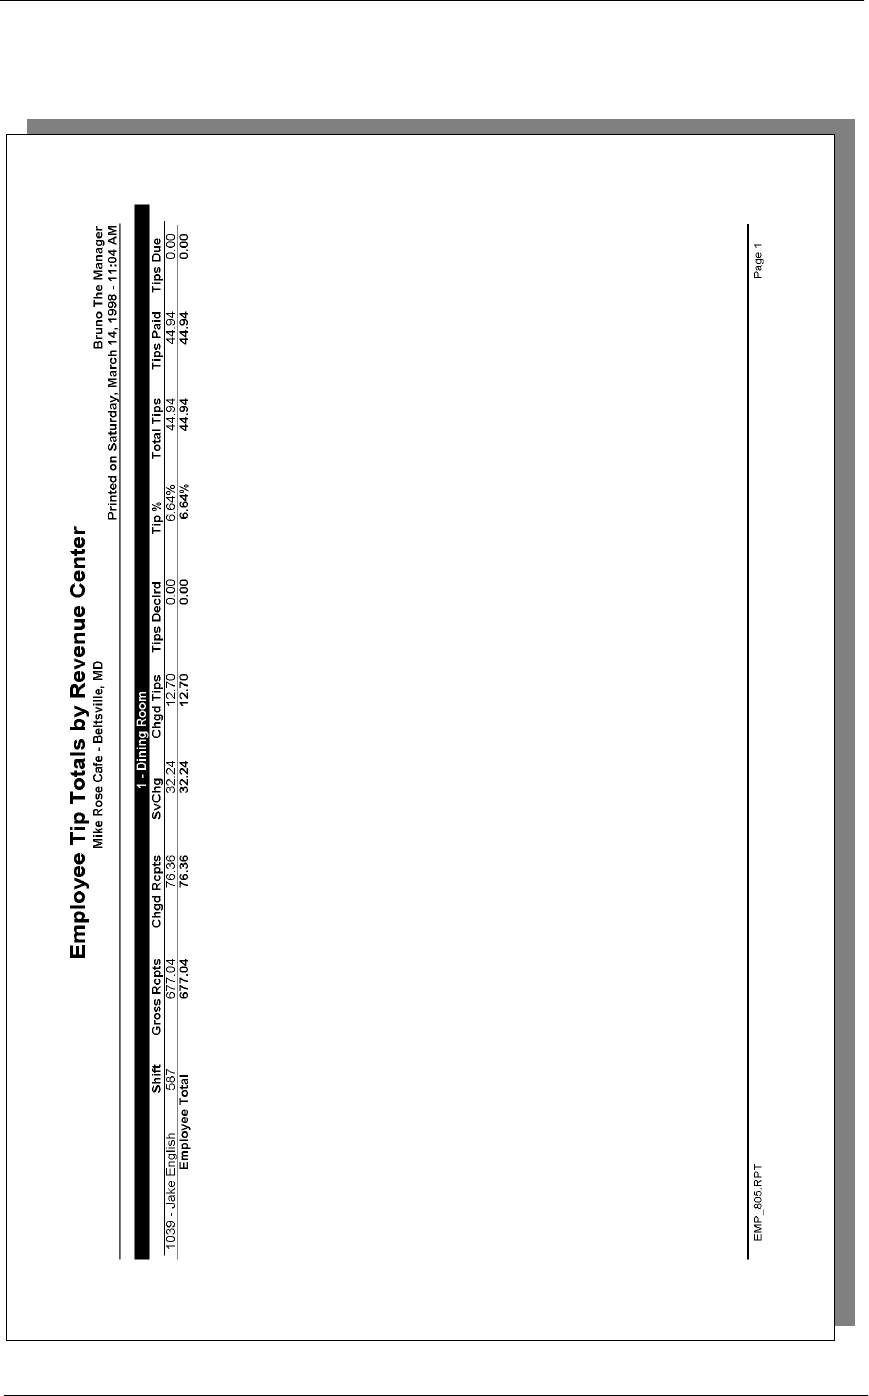
5HSRUWV
7LS5HSRUWV
(PSOR\HH7LS7RWDOVE\5HYHQXH&HQWHU

7LS5HSRUWV
(PSOR\HH7LS7RWDOVE\5HYHQXH&HQWHU
Tip Profile Details
View: v_R_rvc_employee_sales_tip
Stored Procedure: sp_R_rvc_employee
The following table lists each column in the Tip Profile and provides
detailed information on the source of the figures in each column.
Programming Considerations
*HQHUDO
qRVC Posting | Options | Current round posts to transaction employee
determines if totals are posted to the check employee (and associated
cashier) or the transaction employee (and associated cashier). See
“Check Employee and Transaction Employee” on page 3-2 for more
information.
Report
Column
Title
View
Column
Name
3700 Database Formula
Table Column
Gross Rcpts gross_rcpts_ttl shift_rvc_emp_ttl gross_rcpts_ttl
Chgd Rcpts chg_rcpts_ttl shift_rvc_emp_ttl charged_rcpts_ttl
SvChg tip_svc_ttl shift_rvc_emp_ttl tip_svc_ttl
Chgd Tips chgd_tips_ttl shift_rvc_emp_ttl charged_tips_ttl
Tips Declrd tips_decl_ttl shift_rvc_emp_ttl tips_decl_ttl
Tip % @Tip_%
Total Tips @Total_Tips
Tips Paid tips_paid_ttl shift_rvc_emp_ttl tips_paid_ttl
Tips Due @tips_due
Employee Total
Gross Rcpts ∑ gross_rcpts_ttl shift_rvc_emp_ttl gross_rcpts_ttl
Chgd Rcpts ∑ chgd_rcpts_ttl shift_rvc_emp_ttl charged_rcpts_ttl
SvChg ∑ tip_svc_ttl shift_rvc_emp_ttl tip_svc_ttl
Chgd Tips ∑ chgd_tips_ttl shift_rvc_emp_ttl charged_tips_ttl
Tips Declrd ∑ tips_decl_ttl shift_rvc_emp_ttl tips_decl_ttl
Tip % @Total_Tip_%
Total Tips ∑ @Total_Tips
Tips Paid ∑ tips_paid_ttl shift_rvc_emp_ttl tips_paid_ttl
Tips Due ∑ @Tips_Due

5HSRUWV
7LS5HSRUWV
(PSOR\HH7LS7RWDOVE\5HYHQXH&HQWHU
Select this option to post totals to the check employee (and associated
cashier) if the transaction employee does not have a cashier link.
Clear this option to always post tendering totals to the transaction
employee (and associated cashier).
*URVV5HFHLSWV
qReceipts posted to a tendering key will add to Gross Receipts if
Tender/Media | Tender |Post to gross receipts is selected.
qTax collected is not included in gross receipts if RVC Taxes | Do not
post tax to tip reports is selected.
qThis field does not include charged tips.
qThis field may not include some service charges.
&KDUJHG5HFHLSWV
qOnly charge keys that are programmed to allow a charged tip add to
the charged receipts field. To post totals to Charged Receipts select
Tender/Media | CC Tender | Post to charge receipts.
6HUYLFH&KDUJH
qService charges can be programmed to add to either the Service
Charge field, or the Gross Receipts field. Select Discount/Service |
Discount/Service Charge | Post to svc charges total to post the service
charge to the service charge field. Clear this option to post the totals
to Gross Receipts.
You can use the Service Charge figures in one of two ways:
to produce totals that can be used in preparing IRS tax forms, or
to report autogratuities.
Service charges that are tips may be programmed to post to the
Service Charge field. (Post to svc charges total is selected). Service
charges that are not tips (for example, a cover charge, or banquet
room charge) should be programmed to add to Gross Receipts (Post
to svc charges total is cleared).
You may wish to use the Service Charge total to track autogratuities.
In this case, program any autogratuities you wish to track to add to the
service charge, and program all other service charges to add to gross
receipts.
Post to svc charges total works in conjunction with Charge tip on the
same form. Only one of these options should be selected. If both
options are selected, Post to svc charges total will be ignored.
Note
Only tenders that include a non-zero charged tip (less the tip)
add to this value.

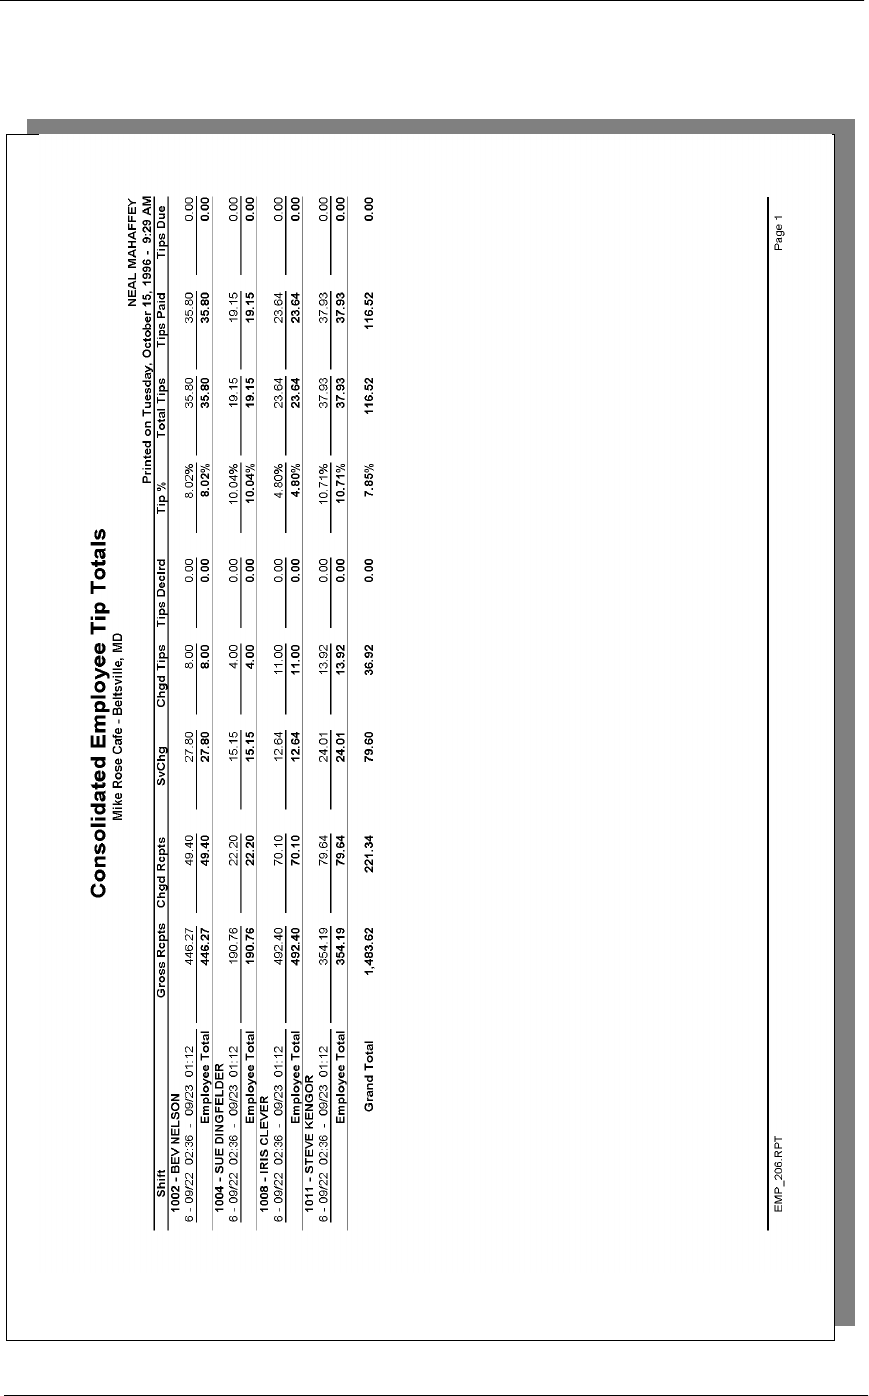
5HSRUWV
7LS5HSRUWV
&RQVROLGDWHG(PSOR\HH7LS7RWDOV
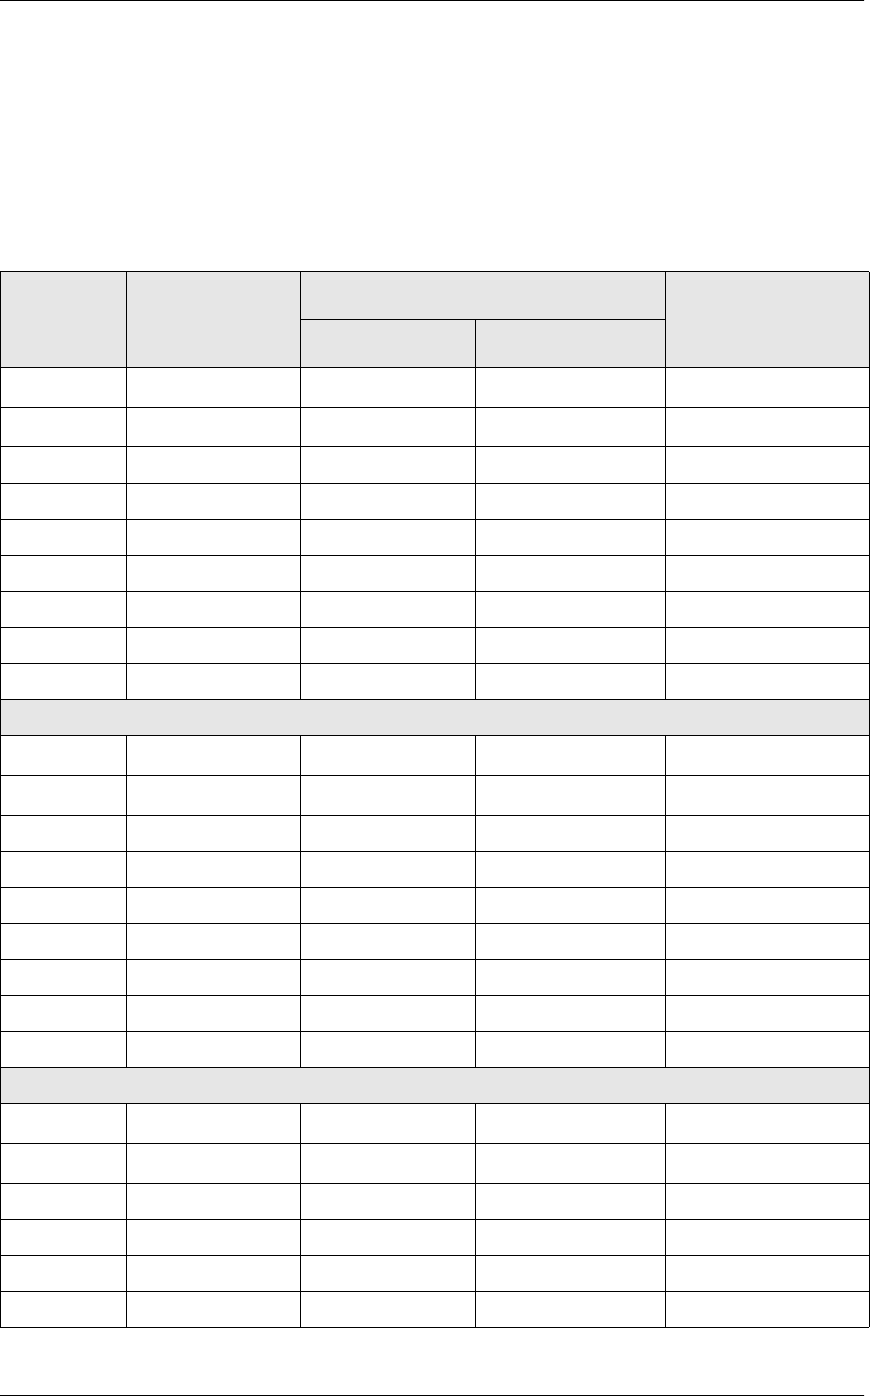
7LS5HSRUWV
&RQVROLGDWHG(PSOR\HH7LS7RWDOV
Tip Profile Details
View: v_R_employee_sales_tip
Stored Procedure:sp_R_employee
The following table lists each column in the Tip Profile and provides
detailed information on the source of the figures in each column.
Report
Column
Title
View
Column
Title
3700 Database Formula
Table Column
Gross Rcpts gross_rcpts_ttl shift_emp_ttl gross_rcpts_ttl
Chgd Rcpts chgd_rcpts_ttl shift_emp_ttl charged_rcpts_ttl
SvChg tip_svc_ttl shift_emp_ttl tip_svc_ttl
Chgd Tips chgd_tips_ttl shift_emp_ttl charged_tips_ttl
Tips Declrd tips_decl_ttl shift_emp_ttl tips_decl_ttl
Tip % @Tip_%
Total Tips @Total_Tips
Tips Paid tips_paid_ttl shift_emp_ttl tips_paid_ttl
Tips Due @Tips_Due
Employee Total
Gross Rcpts ∑ gross_rcpts_ttl shift_emp_ttl gross_rcpts_ttl
Chgd Rcpts ∑ chgd_rcpts_ttl shift_emp_ttl charged_rcpts_ttl
SvChg ∑ tip_svc_ttl shift_emp_ttl tip_svc_ttl
Chgd Tips ∑ chgd_tips_ttl shift_emp_ttl charged_tips_ttl
Tips Declrd ∑ tips_decl_ttl shift_emp_ttl tips_decl_ttl
Tip % @Total_Tip_%
Total Tips ∑ @Total_Tips
Tips Paid ∑ tips_paid_ttl shift_emp_ttl tips_paid_ttl
Tips Due ∑ @Tips_Due
Grand Total
Gross Rcpts ∑ gross_rcpts_ttl shift_emp_ttl gross_rcpts_ttl
Chgd Rcpts ∑ chgd_rcpts_ttl shift_emp_ttl charged_rcpts_ttl
SvChg ∑ tip_svc_ttl shift_emp_ttl tip_svc_ttl
Chgd Tips ∑ chgd_tips_ttl shift_emp_ttl charged_tips_ttl
Tips Declrd ∑ tips_decl_ttl shift_emp_ttl tips_decl_ttl
Tip % @Grand_Ttl_Tip_%
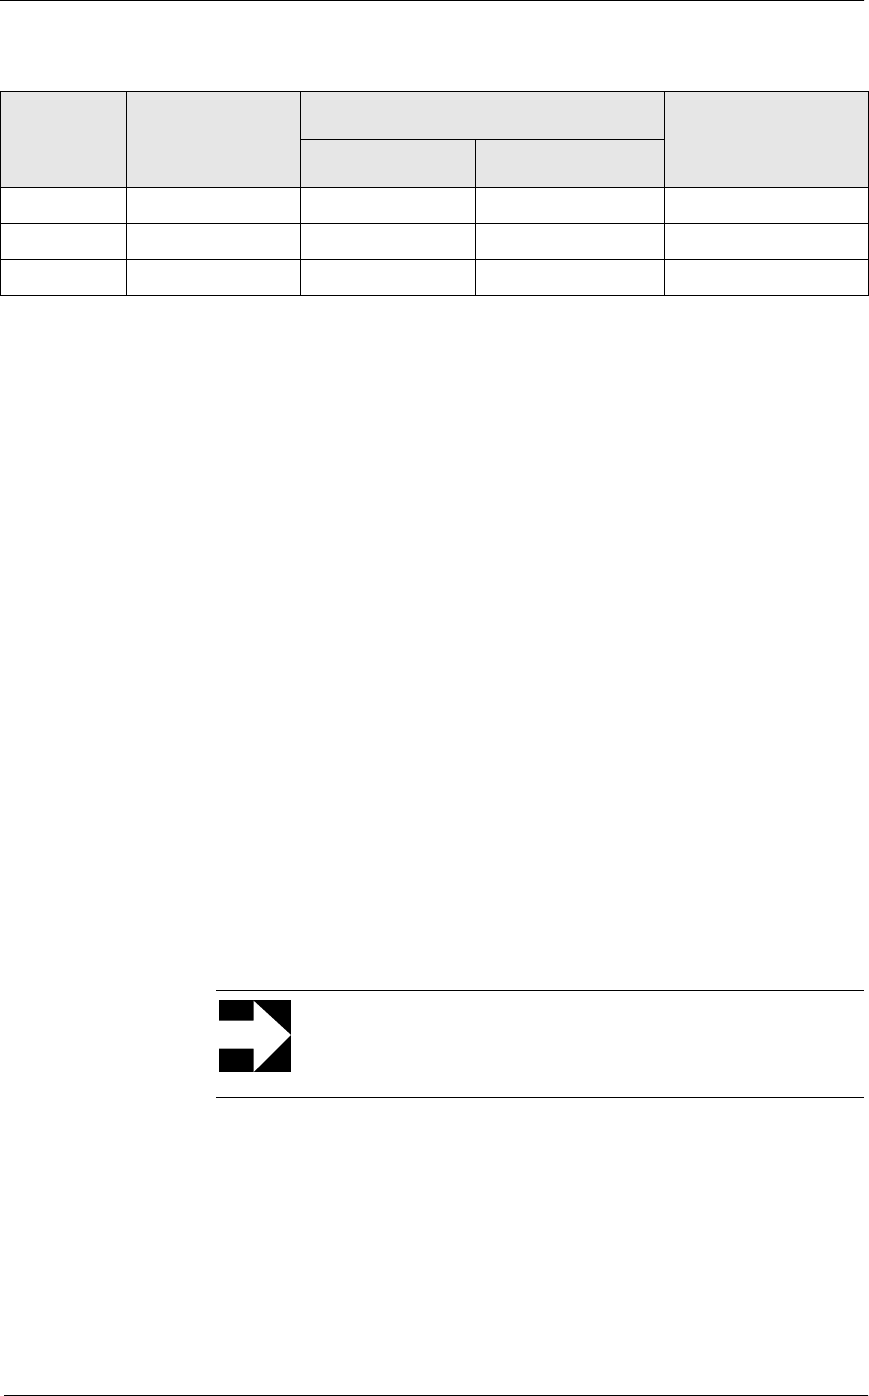
5HSRUWV
7LS5HSRUWV
&RQVROLGDWHG(PSOR\HH7LS7RWDOV
Programming Considerations
*HQHUDO
qRVC Posting | Options | Current round posts to transaction employee
determines if totals are posted to the check employee (and associated
cashier) or the transaction employee (and associated cashier). See
“Check Employee and Transaction Employee” on page 3-2 for more
information.
Select this option to post totals to the check employee (and associated
cashier) if the transaction employee does not have a cashier link.
Clear this option to always post tendering totals to the transaction
employee (and associated cashier).
*URVV5HFHLSWV
qReceipts posted to a tendering key will add to Gross Receipts if
Tender/Media | Tender | Post to gross receipts is selected.
qTax collected is not included in gross receipts if RVC Taxes | Do not
post tax to tip reports is selected.
qThis field does not include charged tips.
qThis field may not include some service charges.
&KDUJHG5HFHLSWV
Only charge keys that are programmed to allow a charged tip add to
the charged receipts field. To post totals to Charged Receipts select
Tender/Media | CC Tender | Post to charge receipts.
6HUYLFH&KDUJH
qService charges can be programmed to add to either the Service
Charge field, or the Gross Receipts field. Select Discount/Service |
Discount/Service Charge | Post to svc charges total to post the service
charge to the service charge field. Clear this option to post the totals
to Gross Receipts.
You can use the Service Charge figures in one of two ways:
Total Tips ∑ @Total_Tips
Tips Paid ∑ tips_paid_ttl shift_emp_ttl tips_paid_ttl
Tips Due ∑ @Tips_Due
Note
Only tenders that include a non-zero charged tip (less the tip)
add to this value.
Report
Column
Title
View
Column
Title
3700 Database Formula
Table Column

7LS5HSRUWV
&RQVROLGDWHG(PSOR\HH7LS7RWDOV
to produce totals that can be used in preparing IRS tax forms, or
to report autogratuities.
Service charges that are tips may be programmed to post to the
service charge field. (Post to svc charges total is selected). Service
charges that are not tips (for example, a cover charge, or banquet
room charge) should be programmed to add to Gross Receipts (Post
to svc charges total is cleared).
You may wish to use the Service Charge total to track autogratuities.
In this case, program any autogratuities you wish to track to add to the
service charge, and program all other service charges to add to gross
receipts.
Post to svc charges total works in conjunction with Charge tip on the
same form. Only one of these options should be selected. If both
options are selected, Post to svc charges total will be ignored.

5HSRUWV
7LS5HSRUWV
&RQVROLGDWHG(PSOR\HH7LS7RWDOVE\5HYHQXH&HQWHU
Consolidated Employee Tip Totals by Revenue Center
3XUSRVH
This report summarizes the total tip activity, by Revenue Center, for
employees over several business days.
)RUPDW
This report includes the following profiles:
qTip Profile
7HPSODWH
EMP_806.RPT
2-31
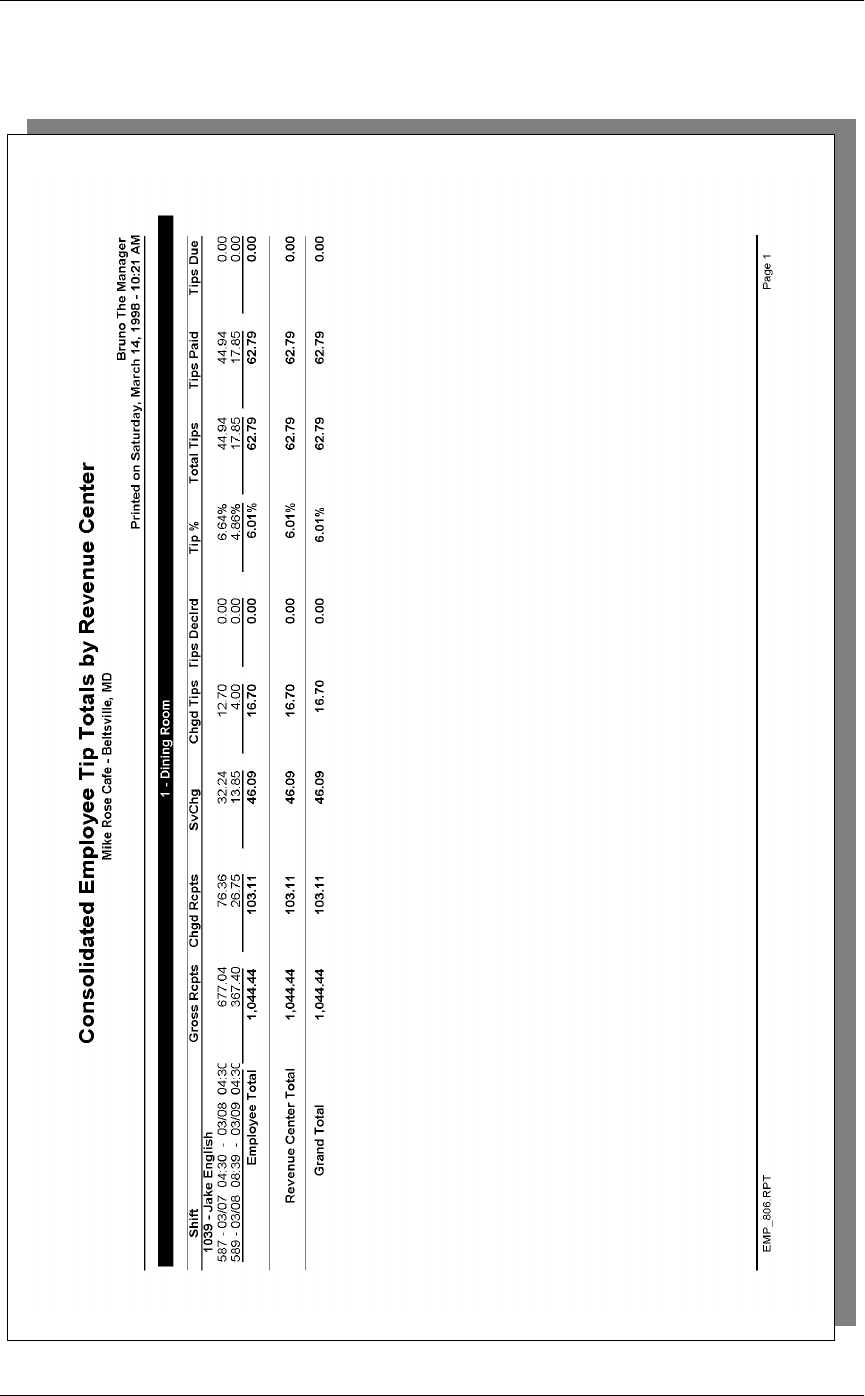
7LS5HSRUWV
&RQVROLGDWHG(PSOR\HH7LS7RWDOVE\5HYHQXH&HQWHU
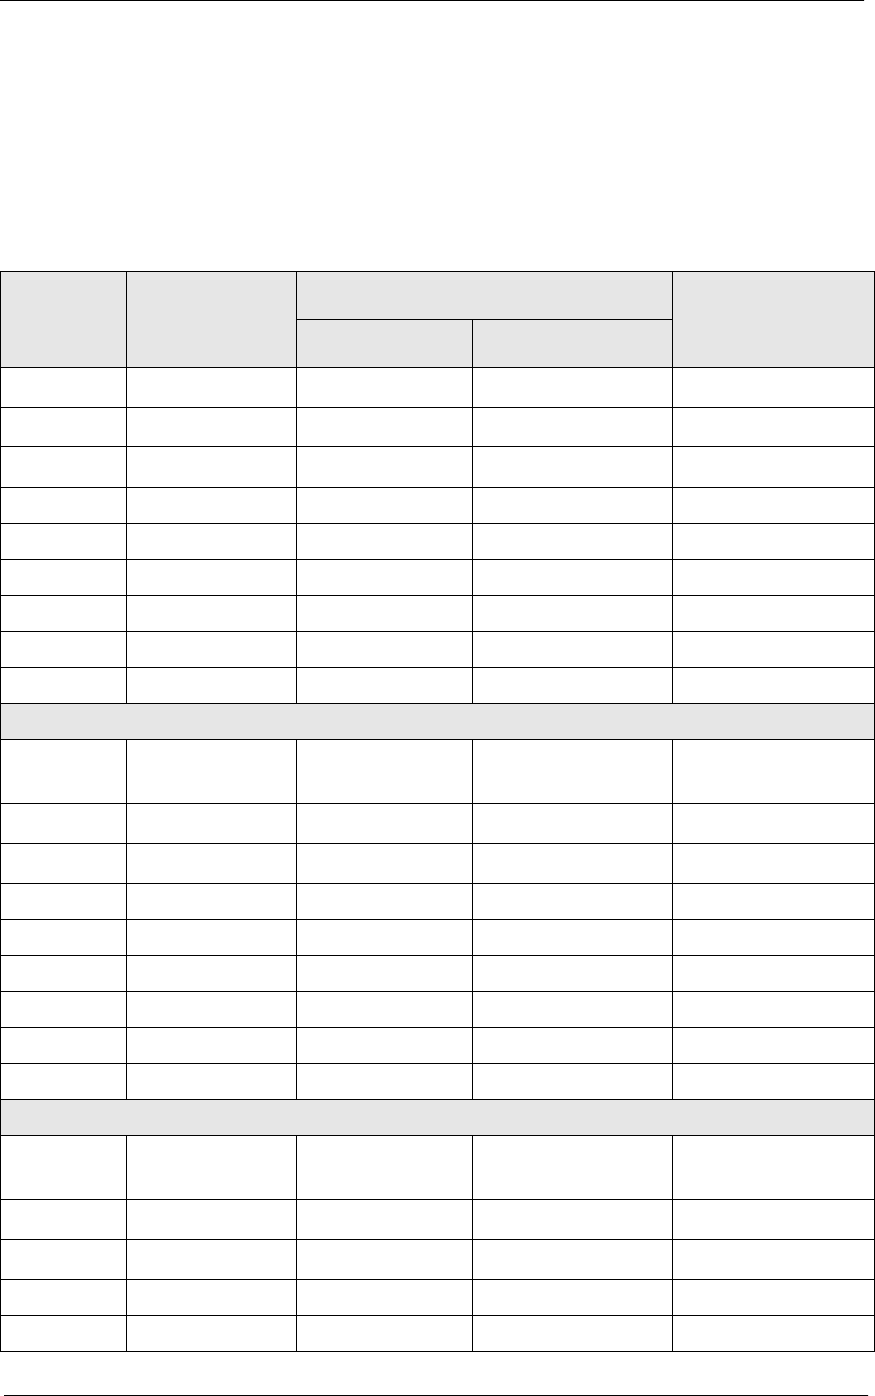
5HSRUWV
7LS5HSRUWV
&RQVROLGDWHG(PSOR\HH7LS7RWDOVE\5HYHQXH&HQWHU
Tip Profile Details
View: v_R_employee_sales_tip
Stored Procedure: sp_R_rvc_employee
The following table lists each column in the Tip Profile and provides
detailed information on the source of the figures in each column.
Report
Column
Title
View
Column
Title
3700 Database Formula
Table Column
Gross Rcpts gross_rcpts_ttl shift_rvc_emp_ttl gross_rcpt_ttl
Chgd Rcpts chgd_rcpts_ttl shift_rvc_emp_ttl charged_rcpts_total
SvChg tip_svc_ttl shift_rvc_emp_ttl tip_svc_ttl
Chgd Tips chgd_tips_ttl shift_rvc_emp_ttl charged_tips_ttl
Tips Declrd tips_decl_ttl shift_rvc_emp_ttl tips_decl_ttl
Tip % @Tip_%
Total Tips @Total_Tips
Tips Paid tips_paid_ttl shift_rvc_emp_ttl tips_paid_ttl
Tips Due @Tips_Due
Employee Total
Gross Rcpts ∑
gross_rcpts_ttl shift_rvc_emp_ttl gross_rcpt_ttl
Chgd Rcpts ∑ chgd_rcpts_ttl shift_rvc_emp_ttl charged_rcpts_total
SvChg ∑ tip_svc_ttl shift_rvc_emp_ttl tip_svc_ttl
Chgd Tips ∑ chgd_tips_ttl shift_rvc_emp_ttl charged_tips_ttl
Tips Declrd ∑ tips_decl_ttl shift_rvc_emp_ttl tips_decl_ttl
Tip % @Total_Tip_%
Total Tips ∑ @Total_Tips
Tips Paid ∑ tips_paid_ttl shift_rvc_emp_ttl tips_paid_ttl
Tips Due ∑ @Tips_Due
Revenue Center
Gross Rcpts ∑
gross_rcpts_ttl shift_rvc_emp_ttl gross_rcpt_ttl
Chgd Rcpts ∑ chgd_rcpts_ttl shift_rvc_emp_ttl charged_rcpts_total
SvChg ∑ tip_svc_ttl shift_rvc_emp_ttl tip_svc_ttl
Chgd Tips ∑ chgd_tips_ttl shift_rvc_emp_ttl charged_tips_ttl
Tips Declrd ∑ tips_decl_ttl shift_rvc_emp_ttl tips_decl_ttl
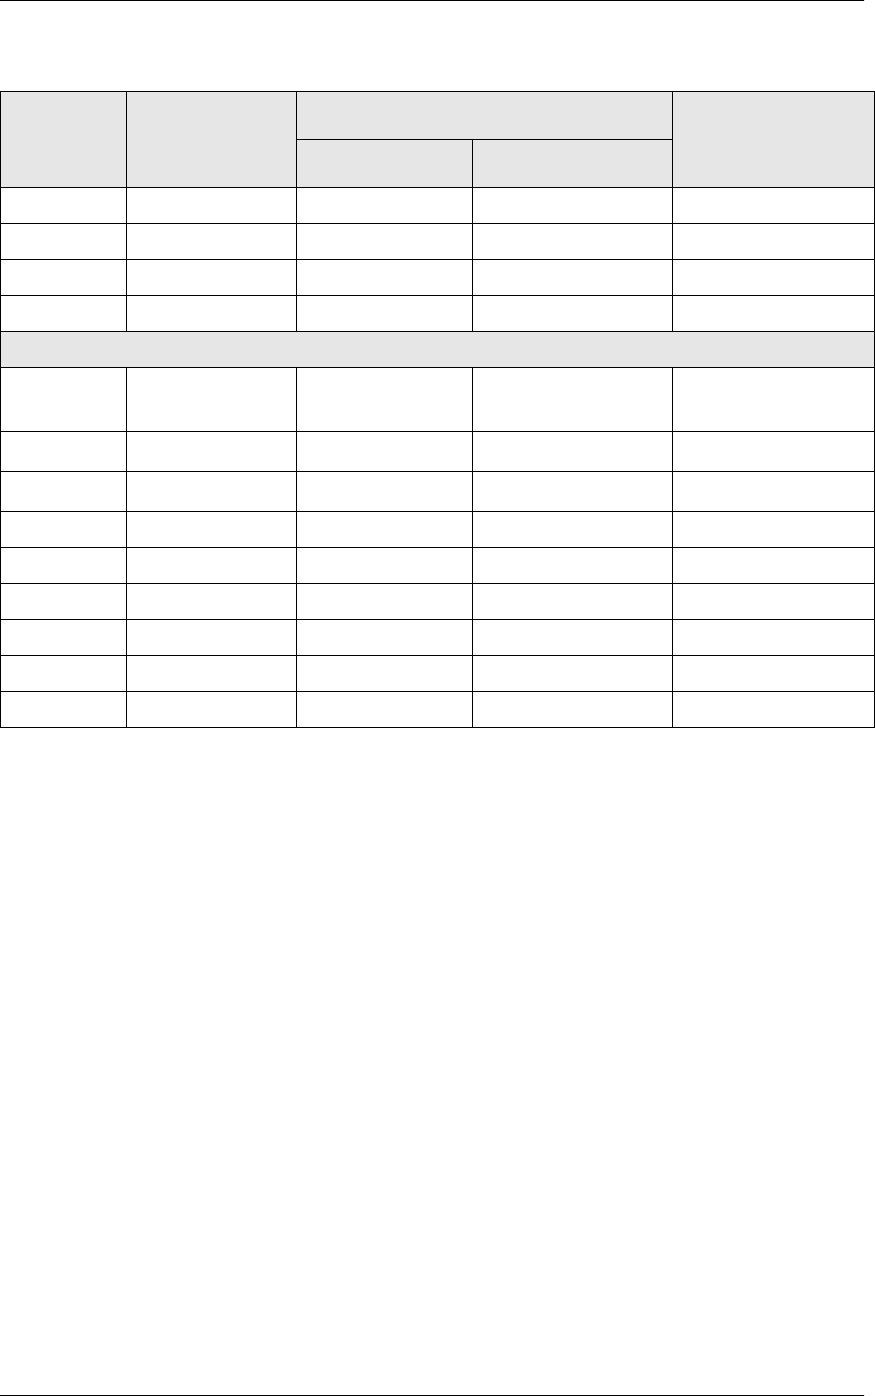
7LS5HSRUWV
&RQVROLGDWHG(PSOR\HH7LS7RWDOVE\5HYHQXH&HQWHU
Programming Considerations
*HQHUDO
qRVC Posting | Options | Current round posts to transaction employee
determines if totals are posted to the check employee (and associated
cashier) or the transaction employee (and associated cashier). See
“Check Employee and Transaction Employee” on page 3-2 for more
information.
Select this option to post totals to the check employee (and associated
cashier) if the transaction employee does not have a cashier link.
Clear this option to always post tendering totals to the transaction
employee (and associated cashier).
*URVV5HFHLSWV
qReceipts posted to a tendering key will add to Gross Receipts if
Tender/Media | Tender | Post to gross receipts is selected.
qTax collected is not included in gross receipts if RVC Taxes | Do not
post tax to tip reports is selected.
qThis field does not include charged tips.
qThis field may not include some service charges.
Tip % @Grand_Ttl_Tip_%
Total Tips ∑ @Total_Tips
Tips Paid ∑ tips_paid_ttl shift_rvc_emp_ttl tips_paid_ttl
Tips Due ∑ @Tips_Due
Grand Total
Gross Rcpts ∑
gross_rcpts_ttl shift_rvc_emp_ttl gross_rcpt_ttl
Chgd Rcpts ∑ chgd_rcpts_ttl shift_rvc_emp_ttl charged_rcpts_total
SvChg ∑ tip_svc_ttl shift_rvc_emp_ttl tip_svc_ttl
Chgd Tips ∑ chgd_tips_ttl shift_rvc_emp_ttl charged_tips_ttl
Tips Declrd ∑ tips_decl_ttl shift_rvc_emp_ttl tips_decl_ttl
Tip % @Grand_Ttl_Tip_%
Total Tips ∑ @Total_Tips
Tips Paid ∑ tips_paid_ttl shift_rvc_emp_ttl tips_paid_ttl
Tips Due ∑ @Tips_Due
Report
Column
Title
View
Column
Title
3700 Database Formula
Table Column
5HSRUWV
7LS5HSRUWV
&RQVROLGDWHG(PSOR\HH7LS7RWDOVE\5HYHQXH&HQWHU
&KDUJHG5HFHLSWV
Only charge keys that are programmed to allow a charged tip add to
the charged receipts field. To post totals to Charged Receipts select
Tender/Media | CC Tender | Post to charge receipts.
6HUYLFH&KDUJH
qService charges can be programmed to add to either the Service
Charge field, or the Gross Receipts field. Select Discount/Service |
Discount/Service Charge | Post to svc charges total to post the service
charge to the service charge field. Clear this option to post the totals
to Gross Receipts.
You can use the Service Charge figures in one of two ways:
to produce totals that can be used in preparing IRS tax forms, or
to report autogratuities.
Service charges that are tips may be programmed to post to the
service charge field. (Post to svc charges total is selected). Service
charges that are not tips (for example, a cover charge, or banquet
room charge) should be programmed to add to Gross Receipts (Post
to svc charges total is cleared).
You may wish to use the Service Charge total to track autogratuities.
In this case, program any autogratuities you wish to track to add to the
service charge, and program all other service charges to add to gross
receipts.
Post to svc charges total works in conjunction with Charge tip on the
same form. Only one of these options should be selected. If both
options are selected, Post to svc charges total will be ignored.
Note
Only tenders that include a non-zero charged tip (less the tip)
add to this value.

7LS5HSRUWV
&RQVROLGDWHG5HYHQXH&HQWHU7LS7RWDOV
Consolidated Revenue Center Tip Totals
3XUSRVH
This report summarizes total tip activity during the selected period for a
revenue center and provides revenue center totals and a grand total.
)RUPDW
This report includes the following profile:
qTip Profile
7HPSODWH
TIP_R001.RPT
2-31
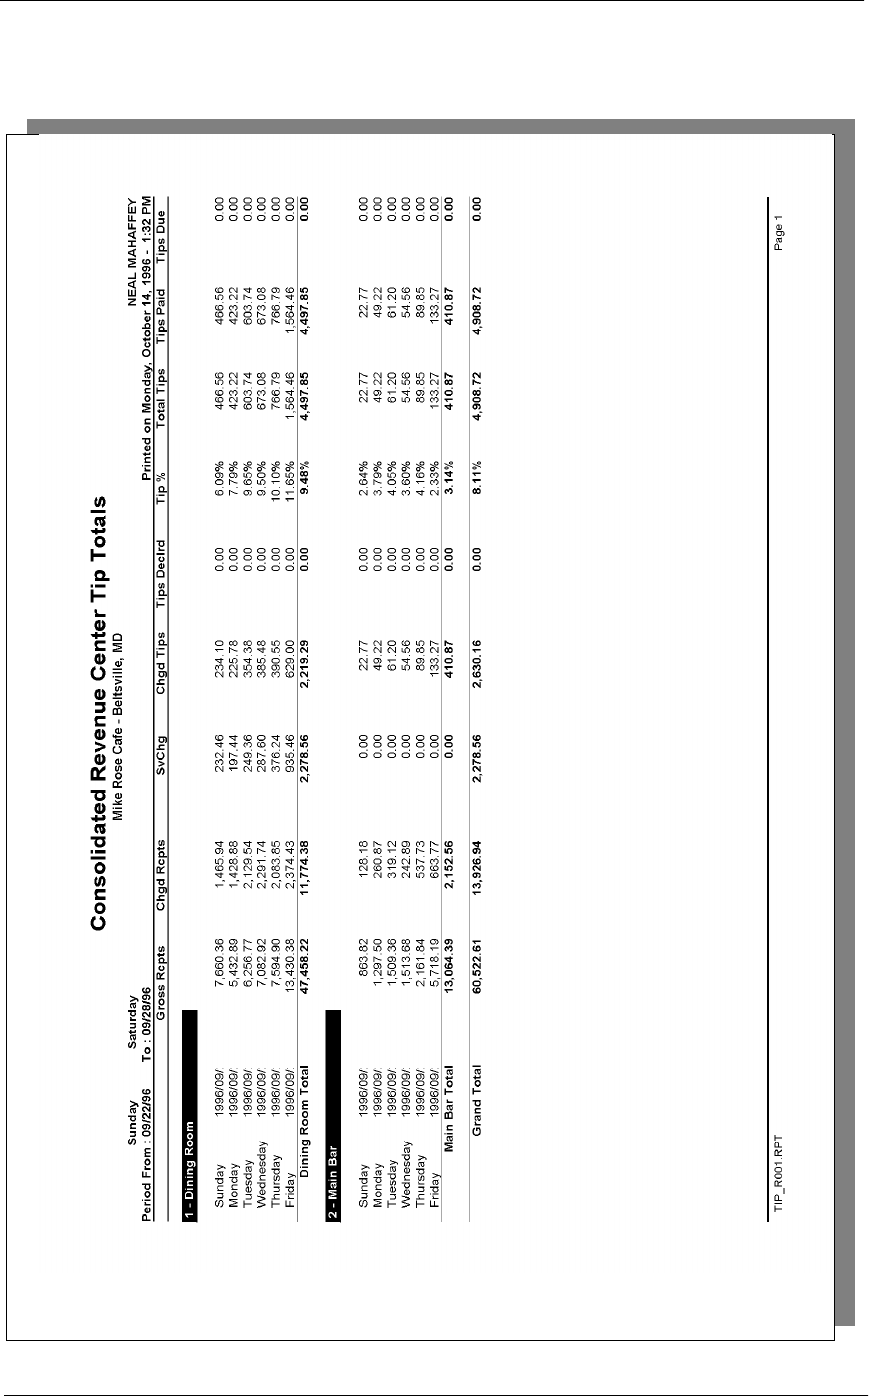
5HSRUWV
7LS5HSRUWV
&RQVROLGDWHG5HYHQXH&HQWHU7LS7RWDOV
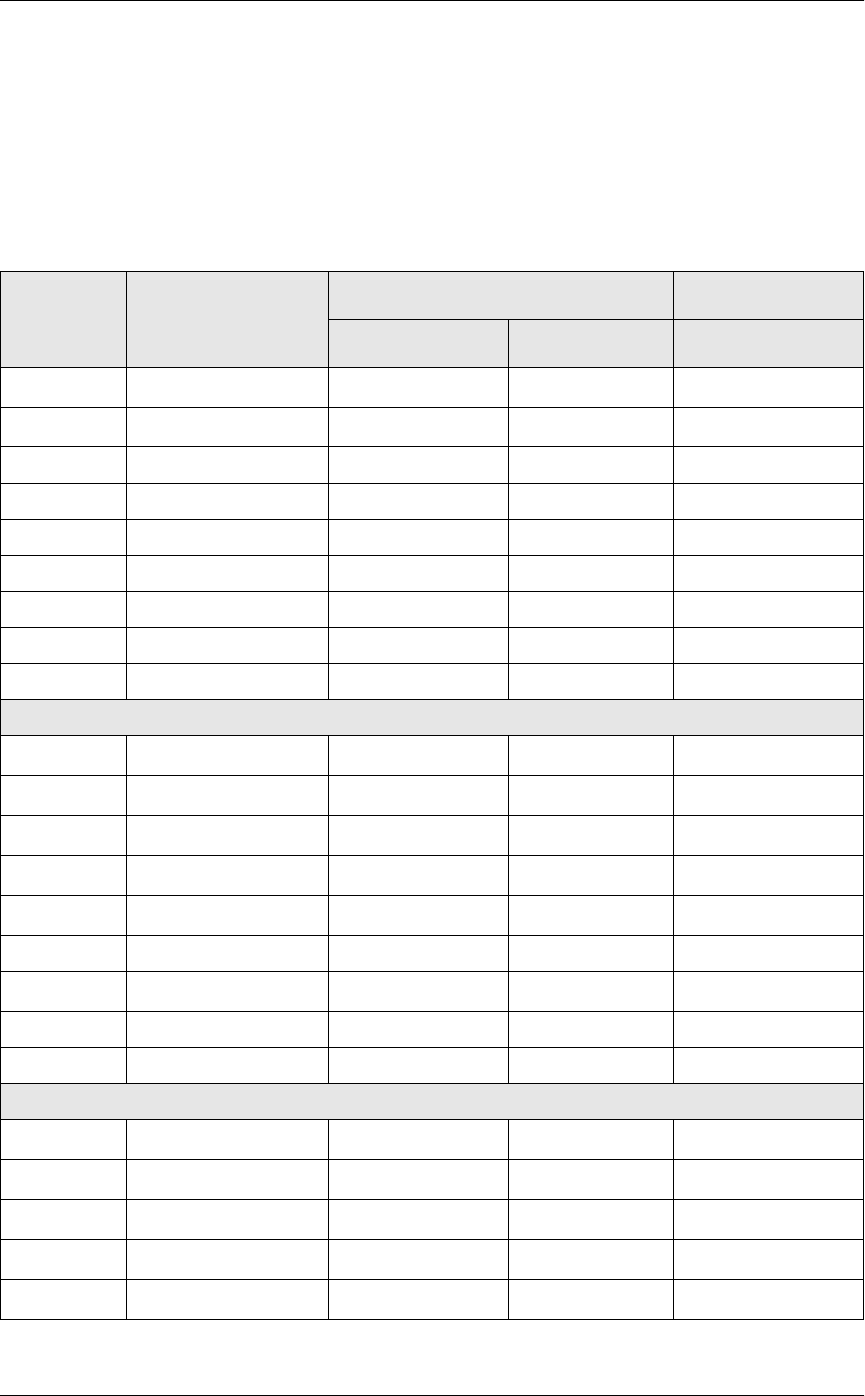
7LS5HSRUWV
&RQVROLGDWHG5HYHQXH&HQWHU7LS7RWDOV
Tip Profile Details
View: v_R_rvc_sales_tips
Stored Procedure: sp_R_rvc_totals
The following table lists each column in the Tip Profile and provides
detailed information on the source of the figures in each column.
Report
Column
Title
View
Column
Title
3700 Database
Table Column Formula
Gross Rcpts gross_receipts_ttl dly_rvc_ttl gross_rcpts_ttl
Chgd Rcpts chgd_receipts_ttl dly_rvc_ttl chgd_rcpts_ttl
SvChg tip_svc_ttl dly_rvc_ttl tip_svc_ttl
Chgd Tips tips_paid_ttl dly_rvc_ttl chgd_tips_ttl
Tips Declrd tips_declared_ttl dly_rvc_ttl tips_decl_ttl
Tip % @Tip_%
Total Tips @Total_Tips
Tips Paid tips_paid_ttl dly_rvc_ttl tips_paid_ttl
Tips Due @Tips_Due
Revenue Center Total
Gross Rcpts ∑ gross_receipts_ttl dly_rvc_ttl gross_rcpts_ttl
Chgd Rcpts ∑ chgd_receipts_ttl dly_rvc_ttl chgd_rcpts_ttl
SvChg ∑ tip_svc_ttl dly_rvc_ttl tip_svc_ttl
Chgd Tips ∑ tips_paid_ttl dly_rvc_ttl chgd_tips_ttl
Tips Declrd ∑ tips_declared_ttl dly_rvc_ttl tips_decl_ttl
Tip % @RVC_Tip_%
Total Tips ∑ @Total_Tips
Tips Paid ∑ tips_paid_ttl dly_rvc_ttl tips_paid_ttl
Tips Due ∑ @Tips_Due
Grand Total
Gross Rcpts ∑ gross_receipts_ttl dly_rvc_ttl gross_rcpts_ttl
Chgd Rcpts ∑ chgd_receipts_ttl dly_rvc_ttl chgd_rcpts_ttl
SvChg ∑ tip_svc_ttl dly_rvc_ttl tip_svc_ttl
Chgd Tips ∑ tips_paid_ttl dly_rvc_ttl chgd_tips_ttl
Tips Declrd ∑ tips_declared_ttl dly_rvc_ttl tips_decl_ttl
5HSRUWV
7LS5HSRUWV
&RQVROLGDWHG5HYHQXH&HQWHU7LS7RWDOV
Programming Considerations
*URVV5HFHLSWV
qReceipts posted to a tendering key will add to Gross Receipts if
Tender/Media | Tender | Post to gross receipts is selected.
qTax collected is not included in gross receipts if RVC Taxes | Do not
post tax to tip reports is selected.
qThis field does not include charged tips.
qThis field may not include some service charges.
&KDUJHG5HFHLSWV
Only charge keys that are programmed to allow a charged tip add to
the charged receipts field. To post totals to Charged Receipts select
Tender/Media | CC Tender | Post to charge receipts.
6HUYLFH&KDUJH
qService charges can be programmed to add to either the Service
Charge field, or the Gross Receipts field. Select Discount/Service |
Discount/Service Charge | Post to svc charges total to post the service
charge to the service charge field. Clear this option to post the totals
to Gross Receipts.
You can use the Service Charge figures in one of two ways:
to produce totals that can be used in preparing IRS tax forms, or
to report autogratuities.
Service charges that are tips may be programmed to post to the
service charge field. (Post to svc charges total is selected). Service
charges that are not tips (for example, a cover charge, or banquet
room charge) should be programmed to add to Gross Receipts (Post
to svc charges total is cleared).
Tip % @Total_Tip_%
Total Tips ∑ @Total_Tips
Tips Paid ∑ tips_paid_ttl dly_rvc_ttl tips_paid_ttl
Tips Due ∑ @Tips_Due
Note
Only tenders that include a non-zero charged tip (less the tip)
add to this value.
Report
Column
Title
View
Column
Title
3700 Database
Table Column Formula

7LS5HSRUWV
&RQVROLGDWHG5HYHQXH&HQWHU7LS7RWDOV
You may wish to use the Service Charge total to track autogratuities.
In this case, program any autogratuities you wish to track to add to the
service charge, and program all other service charges to add to gross
receipts.
Post to svc charges total works in conjunction with Charge tip on the
same form. Only one of these options should be selected. If both
options are selected, Post to svc charges total will be ignored.

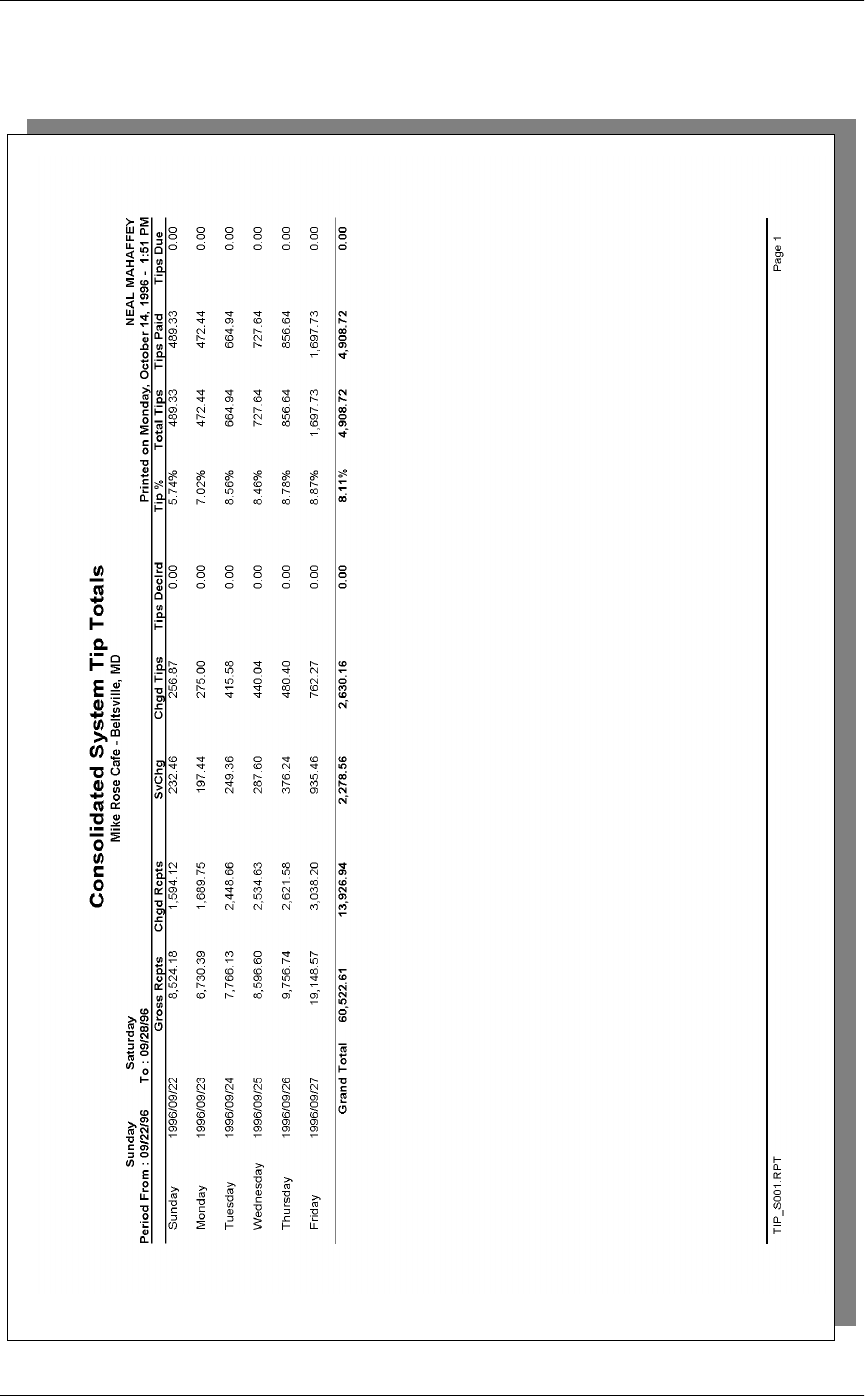
7LS5HSRUWV
&RQVROLGDWHG6\VWHP7LS7RWDOV

5HSRUWV
7LS5HSRUWV
&RQVROLGDWHG6\VWHP7LS7RWDOV
Tip Profile Details
View: v_R_sys_sales_tips
Stored Procedure: sp_R_sys_totals
The following table lists each column in the Tip Profile and provides
detailed information on the source of the figures in each column.
Programming Considerations
*URVV5HFHLSWV
qReceipts posted to a tendering key will add to Gross Receipts if
Tender/Media | Tender | Post to gross receipts is selected.
qTax collected is not included in gross receipts if RVC Taxes | Do not
post tax to tip reports is selected.
qThis field does not include charged tips.
qThis field may not include some service charges.
Report
Column
Title
View
Column
Title
3700 Database Formula
Table Column
Gross Rcpts gross_receipts_ttl dly_sys_ttl gross_rcpts_ttl
Chgd Rcpts chgd_receipts_ttl dly_sys_ttl chgd_rcpts_ttl
SvChg tip_svc_ttl dly_sys_ttl tip_svc_ttl
Chgd Tips tips_paid_ttl dly_sys_ttl chgd_tips_ttl
Tips Declrd tips_declared_ttl dly_sys_ttl tips_decl_ttl
Tip % @Tip_%
Total Tips @Total_Tips
Tips Paid tips_paid_ttl dly_sys_ttl tips_paid_ttl
Tips Due @Tips_Due
Grand Total
Gross Rcpts ∑ gross_receipts_ttl dly_sys_ttl gross_rcpts_ttl
Chgd Rcpts ∑ chgd_receipts_ttl dly_sys_ttl chgd_rcpts_ttl
SvChg ∑ tip_svc_ttl dly_sys_ttl tip_svc_ttl
Chgd Tips ∑ tips_paid_ttl dly_sys_ttl chgd_tips_ttl
Tips Declrd ∑ tips_declared_ttl dly_sys_ttl tips_decl_ttl
Tip % @Total_Tip_%
Total Tips ∑ @Total_Tips
Tips Paid ∑ tips_paid_ttl dly_sys_ttl tips_paid_ttl
Tips Due ∑ @Tips_Due

7LS5HSRUWV
&RQVROLGDWHG6\VWHP7LS7RWDOV
&KDUJHG5HFHLSWV
qOnly charge keys that are programmed to allow a charged tip add to
the charged receipts field. To post totals to Charged Receipts select
Tender/Media | CC Tender | Post to charge receipts.
6HUYLFH&KDUJH
qService charges can be programmed to add to either the Service
Charge field, or the Gross Receipts field. Select Discount/Service |
Discount/Service Charge | Post to svc charges total to post the service
charge to the service charge field. Clear this option to post the totals
to Gross Receipts.
You can use the Service Charge figures in one of two ways:
to produce totals that can be used in preparing IRS tax forms, or
to report autogratuities.
Service charges that are tips may be programmed to post to the
service charge field. (Post to svc charges total is selected). Service
charges that are not tips (for example, a cover charge, or banquet
room charge) should be programmed to add to Gross Receipts (Post
to svc charges total is cleared).
You may wish to use the Service Charge total to track autogratuities.
In this case, program any autogratuities you wish to track to add to the
service charge, and program all other service charges to add to gross
receipts.
Post to svc charges total works in conjunction with Charge tip on the
same form. Only one of these options should be selected. If both
options are selected, Post to svc charges total will be ignored.
Note
Only tenders that include a non-zero charged tip (less the tip)
add to this value.

5HSRUWV
Chapter 7
Time Period Sales Reports
This chapter shows examples and provides an explanation of all time
period sales reports.
In this chapter
Introduction ............................................................................................7-2
Revenue Center Time Period Totals...................................................... 7-3
Revenue Center Time Period Detail...................................................... 7-8
Consolidated Revenue Center Time Period Totals.............................. 7-14
Revenue Center Time Period Summary.............................................. 7-18
Consolidated Revenue Center Time Period Summary........................ 7-22
System Time Period Totals.................................................................. 7-25
System Time Period Detail.................................................................. 7-30
Consolidated System Time Period Totals ........................................... 7-36
System Time Period Summary............................................................ 7-39
Consolidated System Time Period Summary...................................... 7-43
Consolidated System Time Period Summary w/Graph....................... 7-46
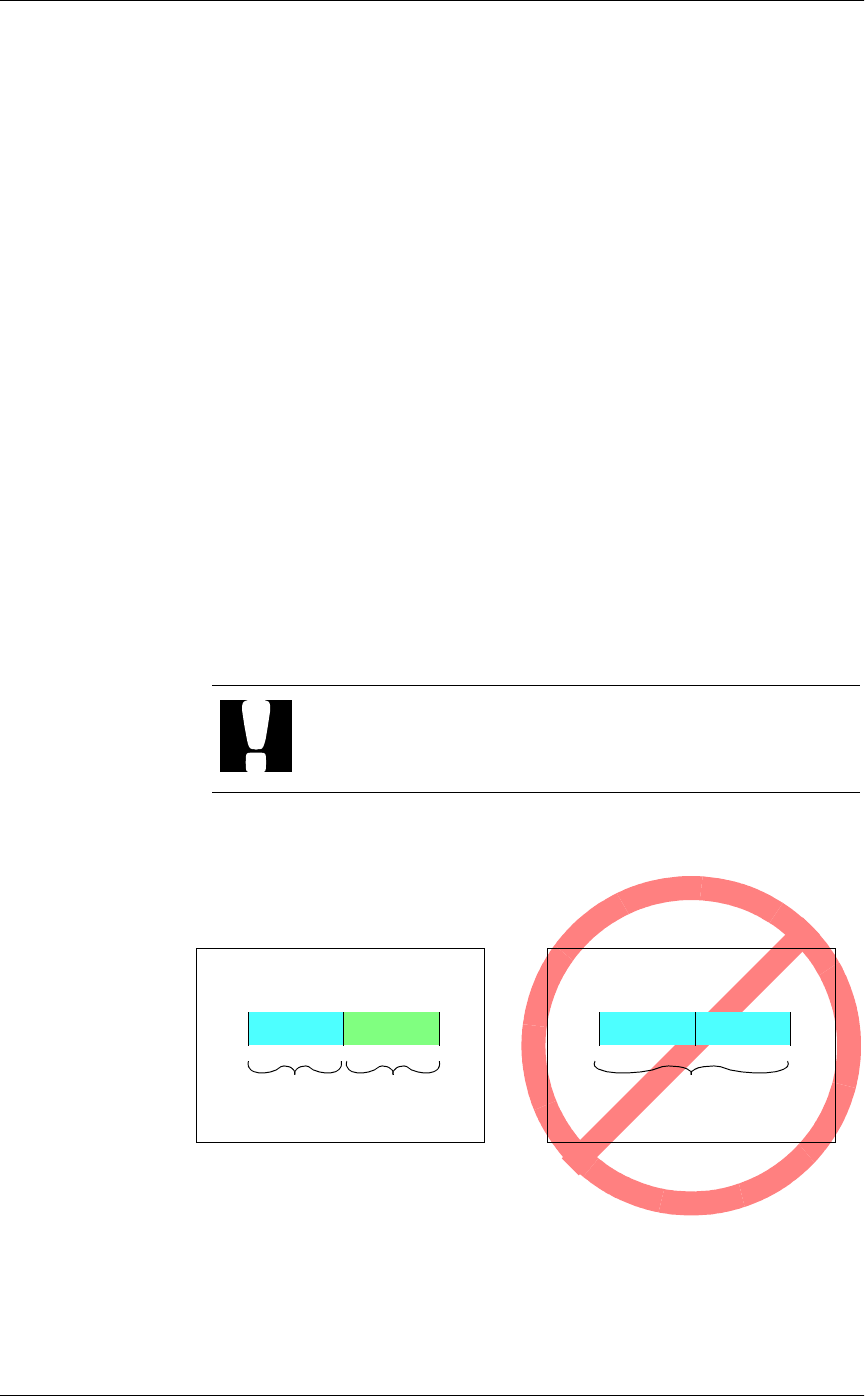
7LPH3HULRG6DOHV5HSRUWV
,QWURGXFWLRQ
Introduction
The Time Period Sales reports allow you to see how effectively revenues
were generated during a specific time period. These reports include
operational statistics such as the average turn time and average amount
per table to help you gauge the efficiency of the revenue center or system.
To allow you to analyze the flow of sales over time, time periods may be
of varying length and may overlap. For example, sales made between
5:00 p.m. and 6:00 p.m. might be included in two time period reports—
happy hour (5:00 p.m. to 6:00 p.m.) and dinner (5:00 p.m. to 11:00 p.m.).
Longer time periods may be used to analyze shifts. Short time periods
may be defined to predict peak work load or peak demand times in order
to develop server work schedules or to better schedule kitchen activity.
Comparing time period reports over a period of weeks or months can help
you to analyze trends and link sales to external factors such as the
influence of the weather or of holidays.
qBecause time periods can overlap, these reports are generally not used
to balance cash drawers or banks. They provide sales and labor
information that can be used to spot trends, and to make informed
decisions about labor scheduling.
Caution
Time periods must not be programmed to span the Business
Day Start Time.
Example:
OK
Business Day Start Time - 4:00
3:00 4:00 5:00
3:00 - 4:00 4:00 - 5:00
2 Time Periods
Business Day Start Time - 4:00
3:00 4:00 5:00
3:00 - 5:00
1 Time Period

5HSRUWV
7LPH3HULRG6DOHV5HSRUWV
5HYHQXH&HQWHU7LPH3HULRG7RWDOV
Revenue Center Time Period Totals
3XUSRVH
This report provides sales information for each selected revenue center by
time period for each order type. The report includes net sales, turn time,
and guest, check, and table details. Revenue center totals, daily totals, and
grand totals are also included.
)RUPDW
This report includes the following profile:
qSales and Guest Profile
7HPSODWH
TP_R001.RPT
2-26
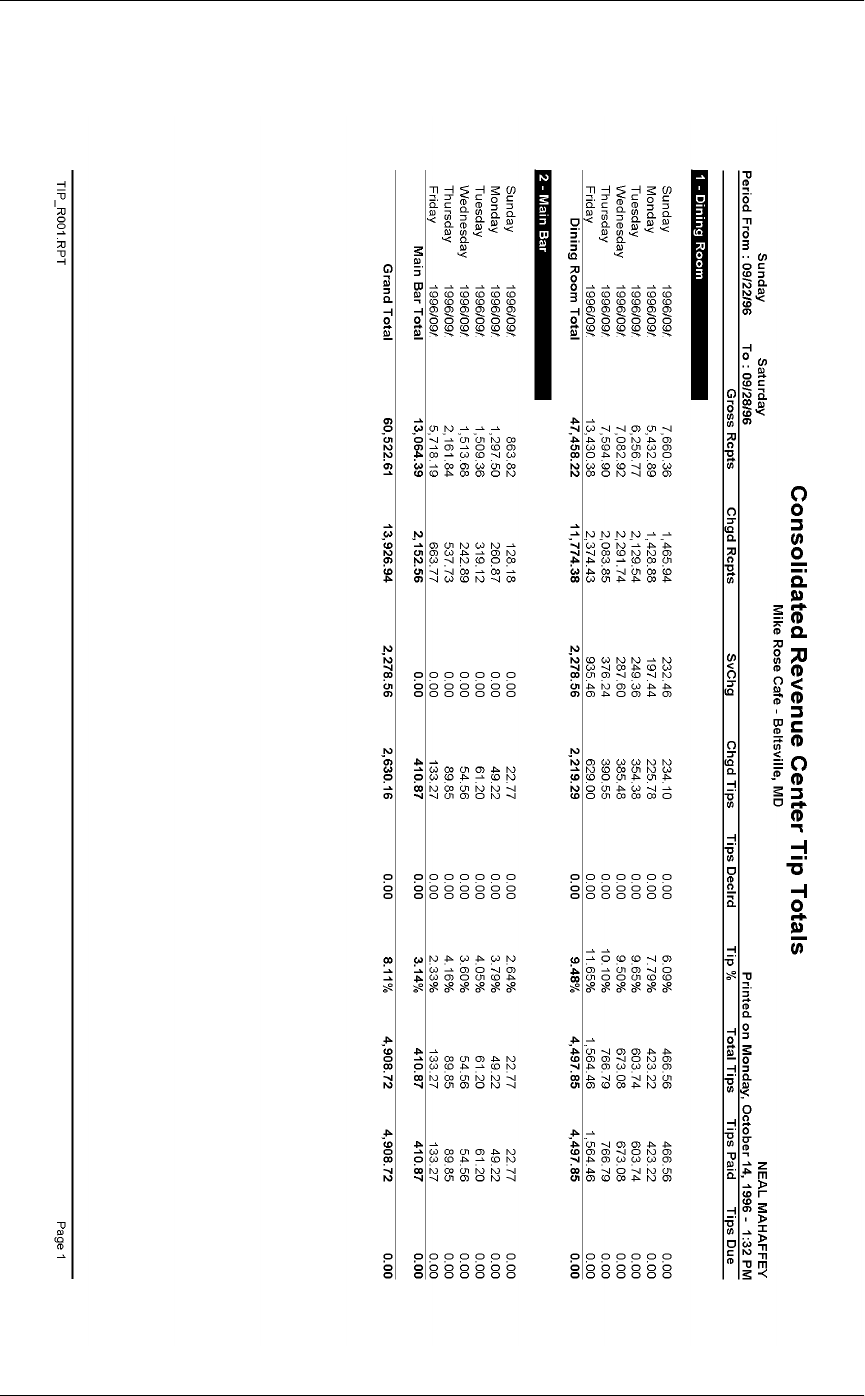
7LPH3HULRG6DOHV5HSRUWV
5HYHQXH&HQWHU7LPH3HULRG7RWDOV

5HSRUWV
7LPH3HULRG6DOHV5HSRUWV
5HYHQXH&HQWHU7LPH3HULRG7RWDOV
Revenue Center Time Period Totals
Revenue Center
Time Period Total
Mike Rose Cafe - Beltsville, MD
Neil Mahaffey
Printed on 9/8/96 - 10:46 PM
-----------------------------------
Tuesday 9/ 3/96
1 - Dining Room
1 - Lunch Period
5:00am to 10:00pm
1 - Dine In
38.60 100.00%
Guests 3
Average, % 12.87 100.00%
Checks 3
Average, % 12.87 100.00%
Tables 3
Average, % 12.87 100.00%
Turn Time 0.17
Period Total
38.60 1.13%
Guests 3
Average, % 12.87 1.18%
Checks 3
Average, % 12.87 4.76%
Tables 3
Average, % 12.87 5.88%
-----------------------------------
2 - Dinner Period
10:01pm to 4:59am
1 - Dine In
1,674.69 100.00%
Guests 125
Average, % 13.40 100.00%
Checks 29
Average, % 57.75 100.00%
Tables 23
Average, % 72.81 100.00%
Turn Time 1.11
Period Total
1,674.69 48.98%
Guests 125
Average, % 13.40 49.02%
Checks 29
Average, % 57.75 46.03%
Tables 23
Average, % 72.81 45.10%
-----------------------------------
3 - Happy Hour
3:00pm to 7:00pm
Guests
Average, %
Checks
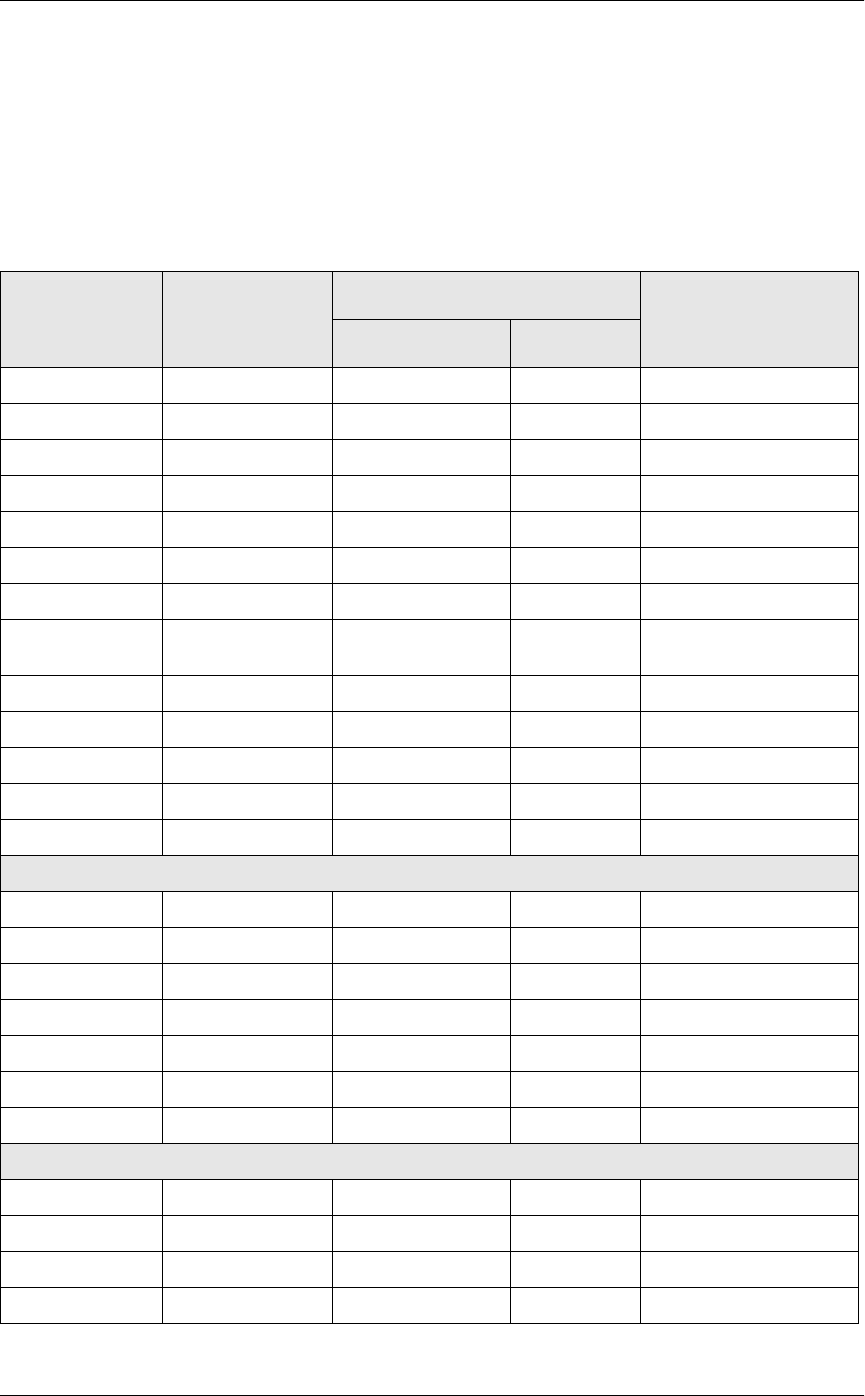
7LPH3HULRG6DOHV5HSRUWV
5HYHQXH&HQWHU7LPH3HULRG7RWDOV
Sales and Guest Profile Details
View: v_R_rvc_time_period
Stored Procedure: sp_R_time_period
The following table lists each column in the Sales and Guest Profile and
provides detailed information on the source of the figures in each column.
Report
Column
Title
View
Column
Title
3700 Database Formula
Table Column
Total Net Sales @ttl_Net_Sales
Net Sales ot_net_sales_ttl dly_rvc_tm_prd_ot_ttl net_sls_ttl
% of Ttl @Percent_Of_Net_Total
Guests cover_count dly_rvc_tm_prd_ot_ttl cov_cnt
% of Ttl @Percent_Of_Guest_Total
Avg/Guest @Avg_$_Guest
Checks check_count dly_rvc_tm_prd_ot_ttl chk_cnt
% of Ttl @Percent_Of_Check_Tota
l
Avg/Chk @Avg_$_Check
Tables table_turn_count dly_rvc_tm_prd_ot_ttl tbl_turn_cnt
% of Ttl @Percent_Of_Table_Total
Avg/Tbl @Avg_$_Table
Turn Time @Avg_Turn_Time
Total
Net Sales ∑ ot_net_sales_ttl dly_rvc_tm_prd_ot_ttl net_sls_ttl
Guests ∑ cover_count dly_rvc_tm_prd_ot_ttl cov_cnt
Avg/Guest @Total_Avg_$_Guest
Checks ∑ check_count dly_rvc_tm_prd_ot_ttl chk_cnt
Avg/Chk @Total_Avg_$_Check
Tables ∑ table_turn_count dly_rvc_tm_prd_ot_ttl tbl_turn_cnt
Avg/Tbl @Total_Avg_$_Table
Revenue Center Total
Net Sales ∑ ot_net_sales_ttl dly_rvc_tm_prd_ot_ttl net_sls_ttl
Guests ∑ cover_count dly_rvc_tm_prd_ot_ttl cov_cnt
Checks ∑ check_count dly_rvc_tm_prd_ot_ttl chk_cnt
Tables ∑ table_turn_count dly_rvc_tm_prd_ot_ttl tbl_turn_cnt
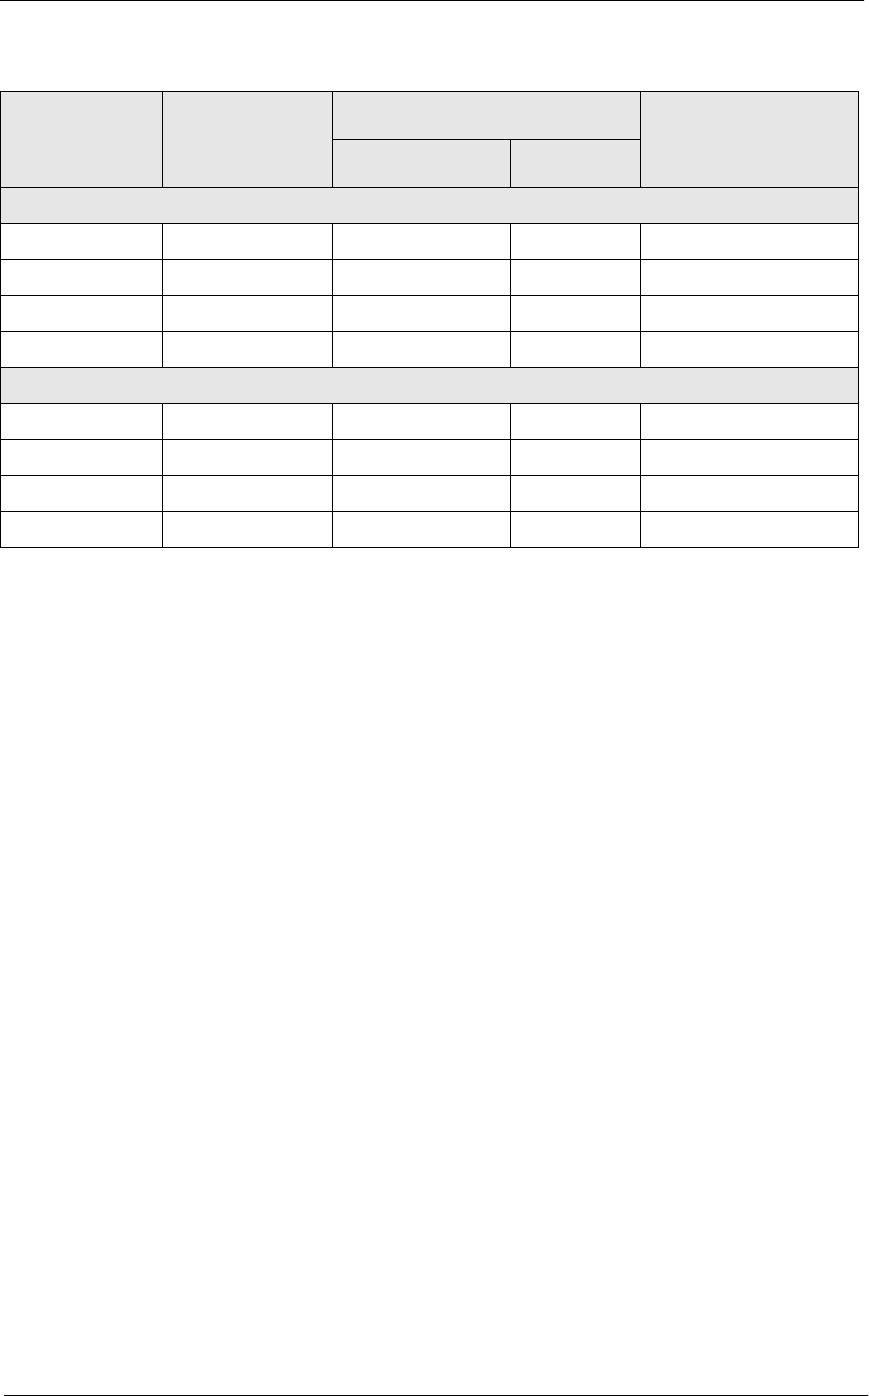
5HSRUWV
7LPH3HULRG6DOHV5HSRUWV
5HYHQXH&HQWHU7LPH3HULRG7RWDOV
Daily Total
Net Sales ∑ ot_net_sales_ttl dly_rvc_tm_prd_ot_ttl net_sls_ttl
Guests ∑ cover_count dly_rvc_tm_prd_ot_ttl cov_cnt
Checks ∑ check_count dly_rvc_tm_prd_ot_ttl chk_cnt
Tables ∑ table_turn_count dly_rvc_tm_prd_ot_ttl tbl_turn_cnt
Grand Total
Net Sales ∑ ot_net_sales_ttl dly_rvc_tm_prd_ot_ttl net_sls_ttl
Guests ∑ cover_count dly_rvc_tm_prd_ot_ttl cov_cnt
Checks ∑ check_count dly_rvc_tm_prd_ot_ttl chk_cnt
Tables ∑ table_turn_count dly_rvc_tm_prd_ot_ttl tbl_turn_cnt
Report
Column
Title
View
Column
Title
3700 Database Formula
Table Column

7LPH3HULRG6DOHV5HSRUWV
5HYHQXH&HQWHU7LPH3HULRG'HWDLO
Revenue Center Time Period Detail
3XUSRVH
This report is identical to the Revenue Center Time Period Totals Report,
with the addition of tracking group and labor category information.
)RUPDW
This report includes the following profiles:
qSales and Guest Profile
qTracking Group Profile
qLabor Category Profile
The profile has been modified for this report. It includes this extra
field:
% Labor/Sales
7HPSODWH
TP_R101.RPT
2-26
2-33
2-19
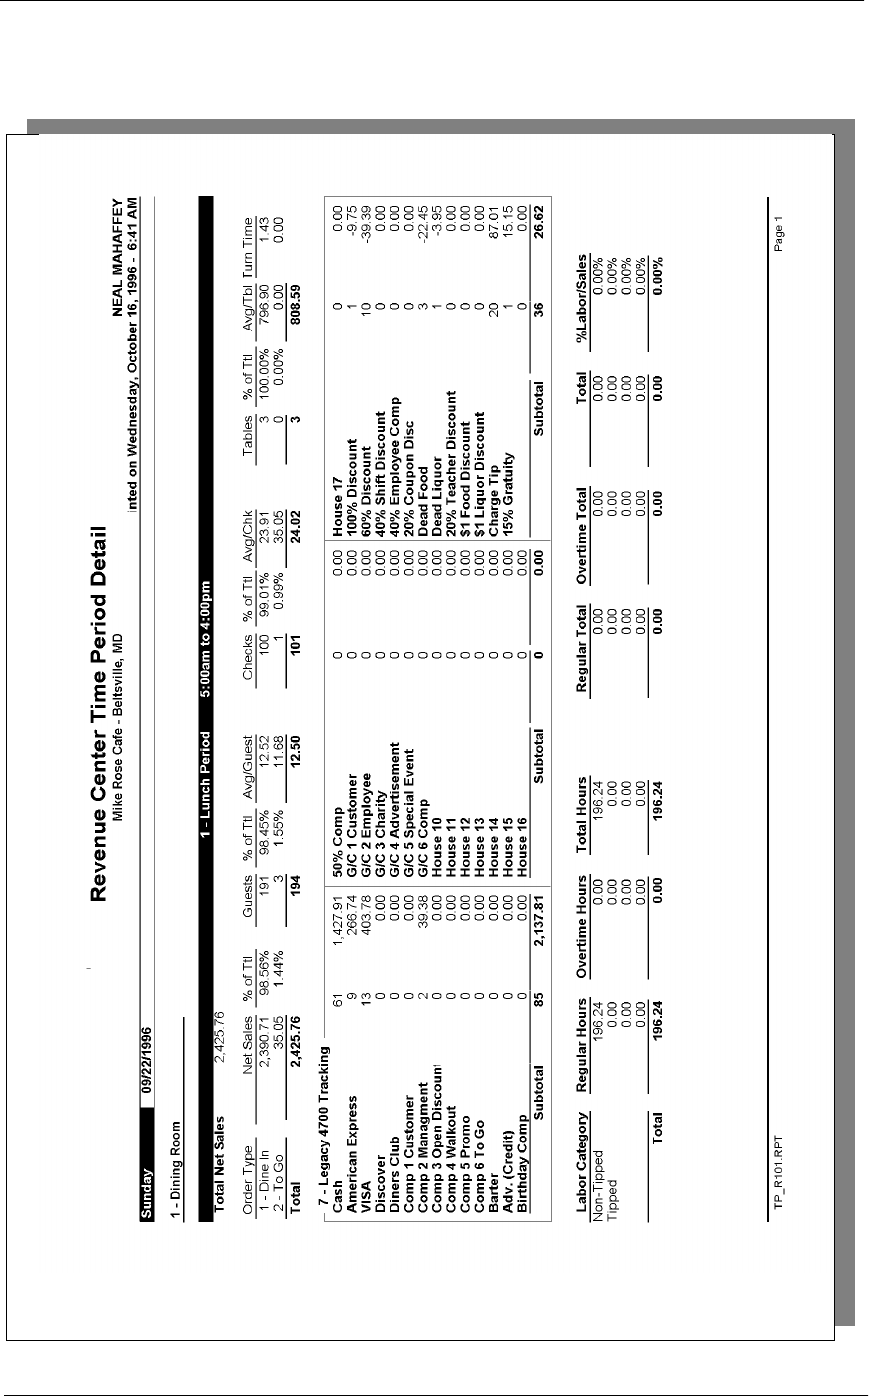
5HSRUWV
7LPH3HULRG6DOHV5HSRUWV
5HYHQXH&HQWHU7LPH3HULRG'HWDLO
7LPH3HULRG6DOHV5HSRUWV
5HYHQXH&HQWHU7LPH3HULRG'HWDLO
Revenue Center Time Period Detail
Revenue Center Time Period Detail
Mike Rose Cafe - Beltsville, MD
NEAL MAHAFFEY
Printed on 10/16/1996 - 1:07
----------------------------------------
Sunday 9/22/1996
1 - Dining Room
1 - Lunch Period
5:00am to 4:00pm
1 - Dine In
2,390.71 98.56%
Guests 191
Average, % 12.52 98.45%
Checks 100
Average, % 23.91 99.01%
Tables 3
Average, % 796.90 100.00%
Turn Time 1.43
2 - To Go
35.05 1.44%
Guests 3
Average, % 11.68 1.55%
Checks 1
Average, % 35.05 0.99%
Tables 0
Average, % 0.00 0.00%
Turn Time 0.00
Period Totals
2,425.76 100.00%
Guests 194
Average, % 12.50 100.00%
Checks 101
Average, % 24.02 100.00%
Tables 3
Average, % 808.59 100.00%
---------------------------------------
7 - Tracking
Cash 61 1,427.91
American E 9 266.74
VISA 13 403.78
Discover 0 0.00
Diners Clu 0 0.00
Comp 1 Cus 0 0.00
Comp 2 Man 2 39.38
Comp 3 Ope 0 0.00
Comp 4 Wal 0 0.00
Comp 5 Pro 0 0.00
Comp 6 To 0 0.00
Barter 0 0.00
Adv. (Cred 0 0.00
Birthday C 0 0.00
Subtotal 85 2,137.81
----------------------------------------
Labor/
Hours Pay Sales
Non-Tipped
Reg 196.24 0.00
Ovt 0.00 0.00
Ttl 196.24 0.00 0.00%
Tipped
Reg 0.00 0.00
Ovt 0.00 0.00
Ttl 0.00 0.00 0.00%
Reg 0.00 0.00
Ovt 0.00 0.00
Ttl 0.00 0.00 0.00%
Reg 0.00 0.00
Ovt 0.00 0.00
Ttl 0.00 0.00 0.00%
Total Labor
Reg 196.24 0.00
Ovt 0.00 0.00
Ttl 196.24 0.00 0.00%
========================================
Totals omitted for
display
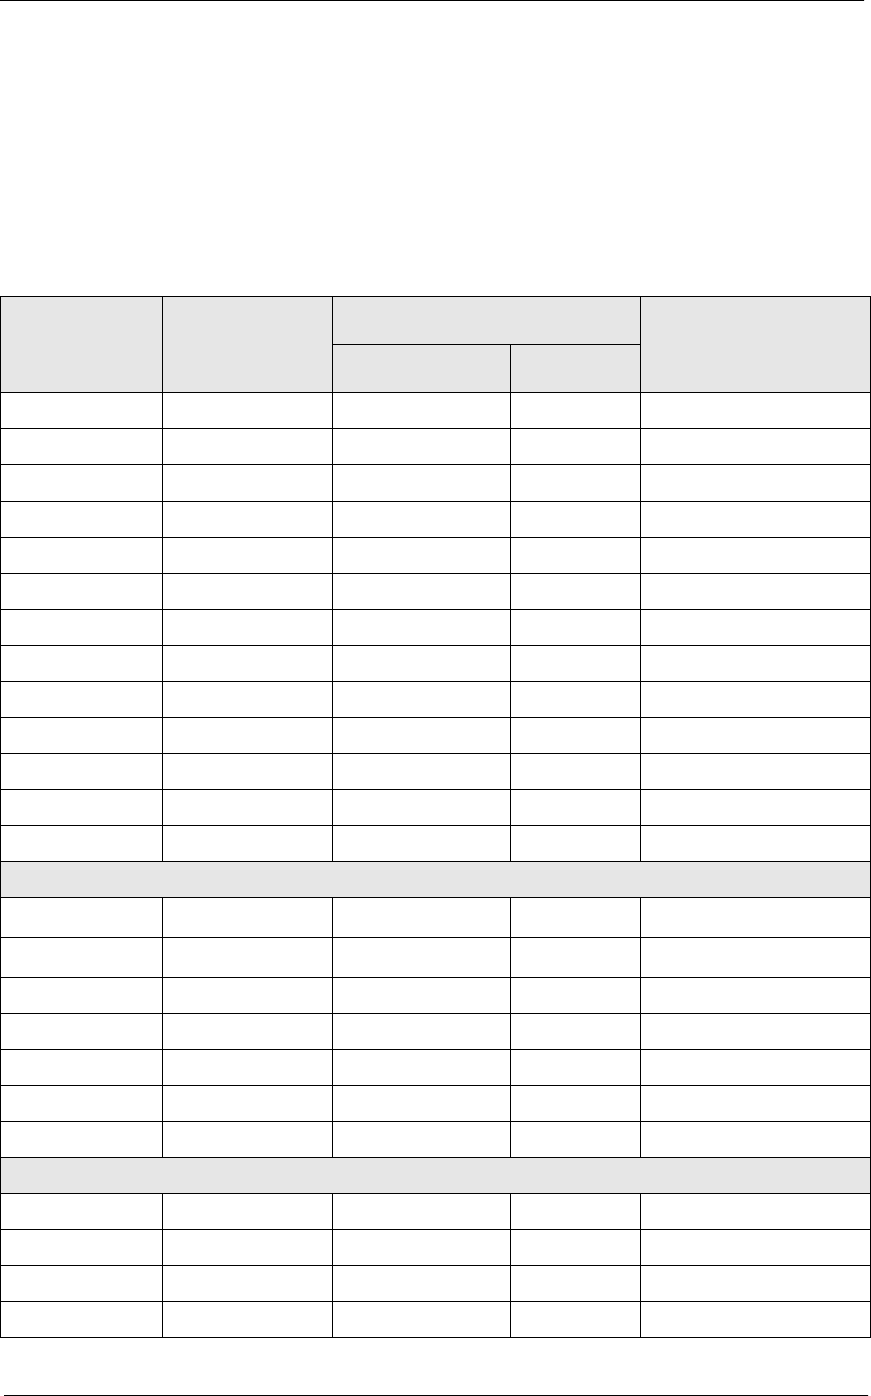
5HSRUWV
7LPH3HULRG6DOHV5HSRUWV
5HYHQXH&HQWHU7LPH3HULRG'HWDLO
Sales and Guest Profile Details
Views: v_R_rvc_time_period and v_R_rvc_time_period_trk
Stored Procedures: sp_R_time_prd_time_card_ttls and
sp_R_rvc_time_prd_sales_trk
The following table lists each column in the Sales and Guest Profile and
provides detailed information on the source of the figures in each column.
Report
Column
Title
View
Column
Title
3700 Database Formula
Table Column
Total Net Sales @ttl_Net_Sales
Net Sales net_sales_ttl dly_rvc_tm_prd_ttl net_sls_ttl
% of Ttl @Percent_Of_Net_Total
Guests cover_count dly_rvc_tm_prd_ot_ttl cov_cnt
% of Ttl @Percent_Of_Guest_Total
Avg/Guest @Avg_$_Guest
Checks check_count dly_rvc_tm_prd_ot_ttl chk_cnt
% of Ttl @Percent_Of_Check_Total
Avg/Chk @Avg_$_Check
Tables table_turn_count dly_rvc_tm_prd_ot_ttl tbl_turn_cnt
% of Ttl @Percent_Of_Table_Total
Avg/Tbl @Avg_$_Table
Turn Time @Avg_Turn_Time
Total
Net Sales ∑ net_sales_ttl dly_rvc_tm_prd_ttl net_sls_ttl
Guests ∑ cover_count dly_rvc_tm_prd_ot_ttl cov_cnt
Avg/Guest @Total_Avg_$_Guest
Checks ∑ check_count dly_rvc_tm_prd_ot_ttl chk_cnt
Avg/Chk @Total_Avg_$_Check
Tables ∑ table_turn_count dly_rvc_tm_prd_ot_ttl tbl_turn_cnt
Avg/Tbl @Total_Avg_$_Table
Revenue Center Total
Net Sales ∑ net_sales_ttl dly_rvc_tm_prd_ttl net_sls_ttl
Guests ∑ cover_count dly_rvc_tm_prd_ot_ttl cov_cnt
Checks ∑ check_count dly_rvc_tm_prd_ot_ttl chk_cnt
Tables ∑ table_turn_count dly_rvc_tm_prd_ot_ttl tbl_turn_cnt
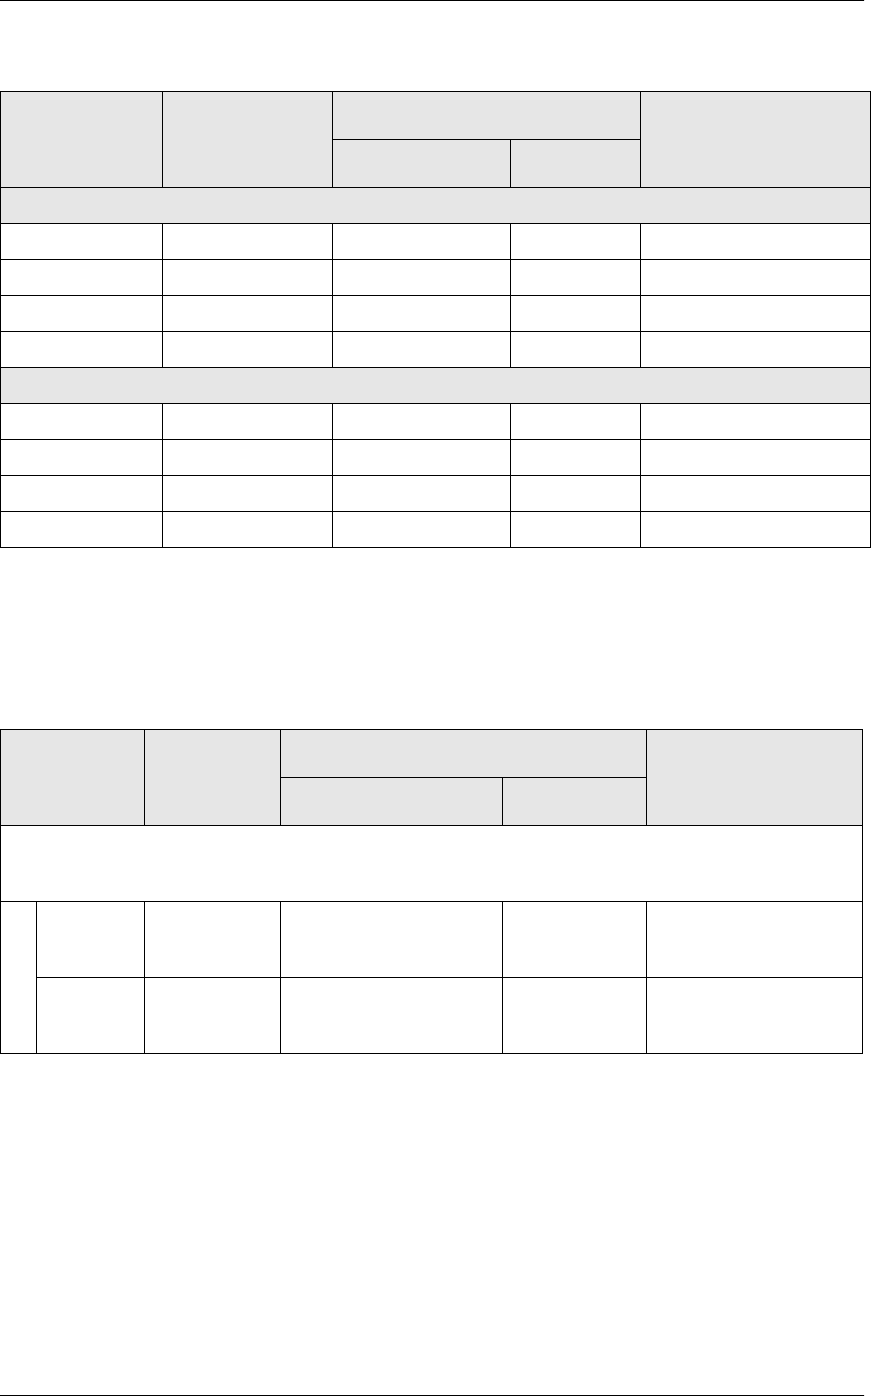
7LPH3HULRG6DOHV5HSRUWV
5HYHQXH&HQWHU7LPH3HULRG'HWDLO
Tracking Group Profile Details
Views: v_R_rvc_time_period and v_Rrvc__time_period_trk
The following table lists each column in the Tracking Group Profile and
provides detailed information on the source of the figures in each column.
Daily Total
Net Sales ∑ net_sales_ttl dly_rvc_tm_prd_ttl net_sls_ttl
Guests ∑ cover_count dly_rvc_tm_prd_ot_ttl cov_cnt
Checks ∑ check_count dly_rvc_tm_prd_ot_ttl chk_cnt
Tables ∑ table_turn_count dly_rvc_tm_prd_ot_ttl tbl_turn_cnt
Grand Total
Net Sales ∑ net_sales_ttl dly_rvc_tm_prd_ttl net_sls_ttl
Guests ∑ cover_count dly_rvc_tm_prd_ot_ttl cov_cnt
Checks ∑ check_count dly_rvc_tm_prd_ot_ttl chk_cnt
Tables ∑ table_turn_count dly_rvc_tm_prd_ot_ttl tbl_turn_cnt
Report
Column
Title
View
Column
Title
3700 Database Formula
Table Column
Programmable1
to
Programmable42
Number trk_cnt_01
to
trk_cnt_42
dly_rvc_tm_prd_trk_ttl trk_cnt_01
to
trk_cnt_42
Value trk_ttl_01
to
trk_ttl_42
dly_rvc_tm_prd_trk_ttl trk_ttl_01
to
trk_ttl_42
Report
Column
Title
View
Column
Title
3700 Database Formula
Table Column
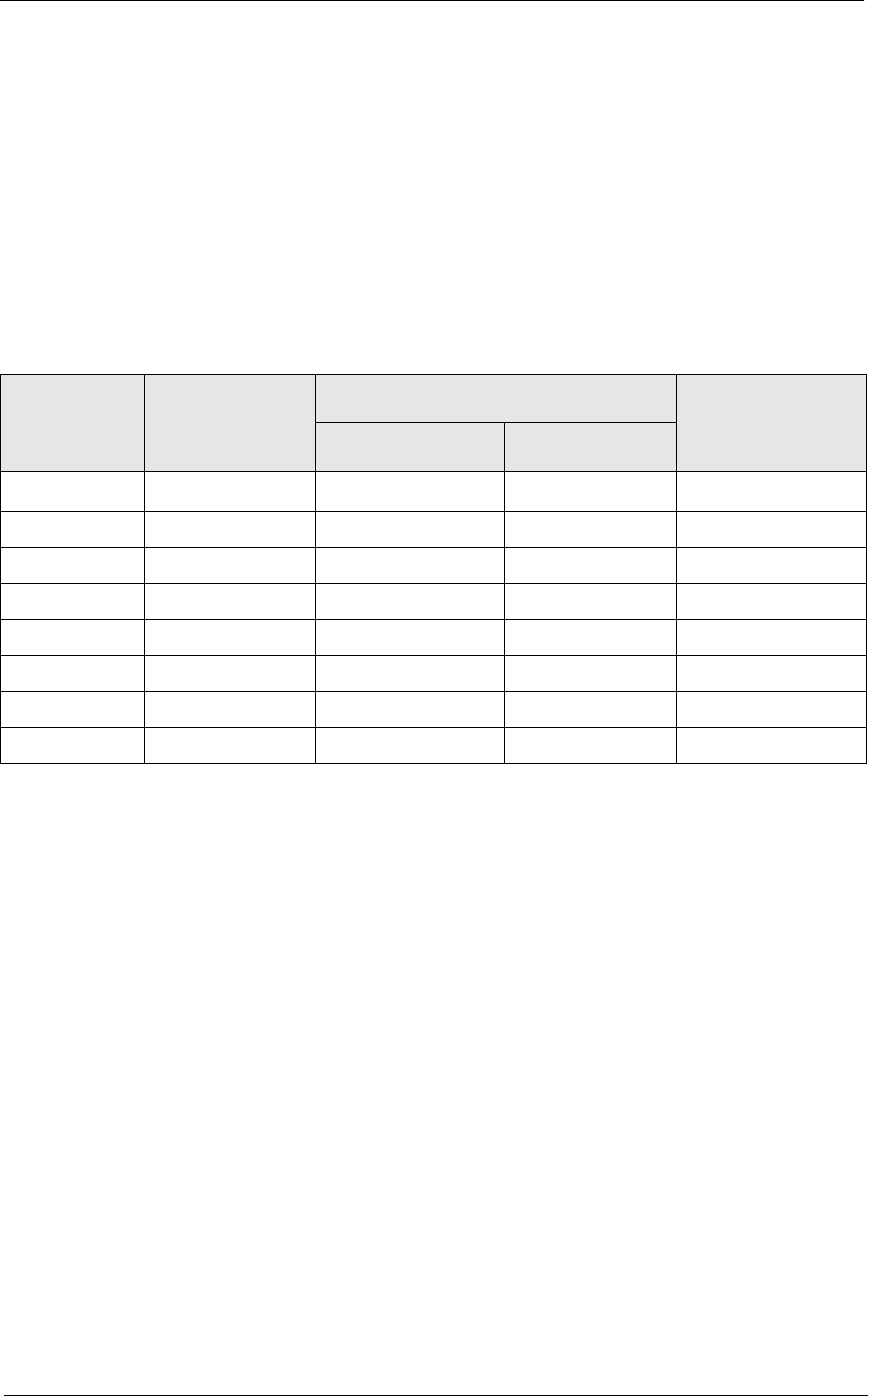
5HSRUWV
7LPH3HULRG6DOHV5HSRUWV
5HYHQXH&HQWHU7LPH3HULRG'HWDLO
Labor Category Profile Details
Views: v_R_rvc_time_period and v_R_rvc_time_period_trk
The following table lists each column in the Labor Profile and provides
detailed information on the source of the figures in each column. You can
program four labor categories. Each of these labor categories is then
associated with a number that is represented in the following table as the
variable #. For example, if labor category 1 is programmed as dining
room, then the regular hours for dining room staff comes from the view
column labor_cat_1_reg_hrs.
Programming Considerations
/DERU&DWHJRULHV
qLabor categories are programmed in Time and Attendance | General.
Report
Column
Title
View
Column
Title
3700 Database Formula
Table Column
Labor Category @Lab_
#
_Name
Regular Hours labor_cat_
#
_reg_hrs dly_rvc_tm_prd_ttl labor_cat_
#
_reg_hrs
Overtime Hours labor_cat_
#
_ovt_hrs dly_rvc_tm_prd_ttl labor_cat_
#
_ovt_hrs
Total Hours @ttl_Total_Hours_
#
Regular Total labor_cat_
#
_reg_ttl dly_rvc_tm_prd_ttl labor_cat_
#
_reg_ttl
Overtime Total labor_cat_
#
_ovt_ttl dly_rvc_tm_prd_ttl labor_cat_
#
_ovt_ttl
Total @ttl_Total_
#
%Labor/Sales @ttl_%Labor_
#

7LPH3HULRG6DOHV5HSRUWV
&RQVROLGDWHG5HYHQXH&HQWHU7LPH3HULRG7RWDOV
Consolidated Revenue Center Time Period Totals
3XUSRVH
This report provides the same information as the Revenue Center Time
Period Totals Report, but for a range of business days.
)RUPDW
This report includes the following profile:
qSales and Guest Profile
7HPSODWH
TP_R002.RPT
2-26
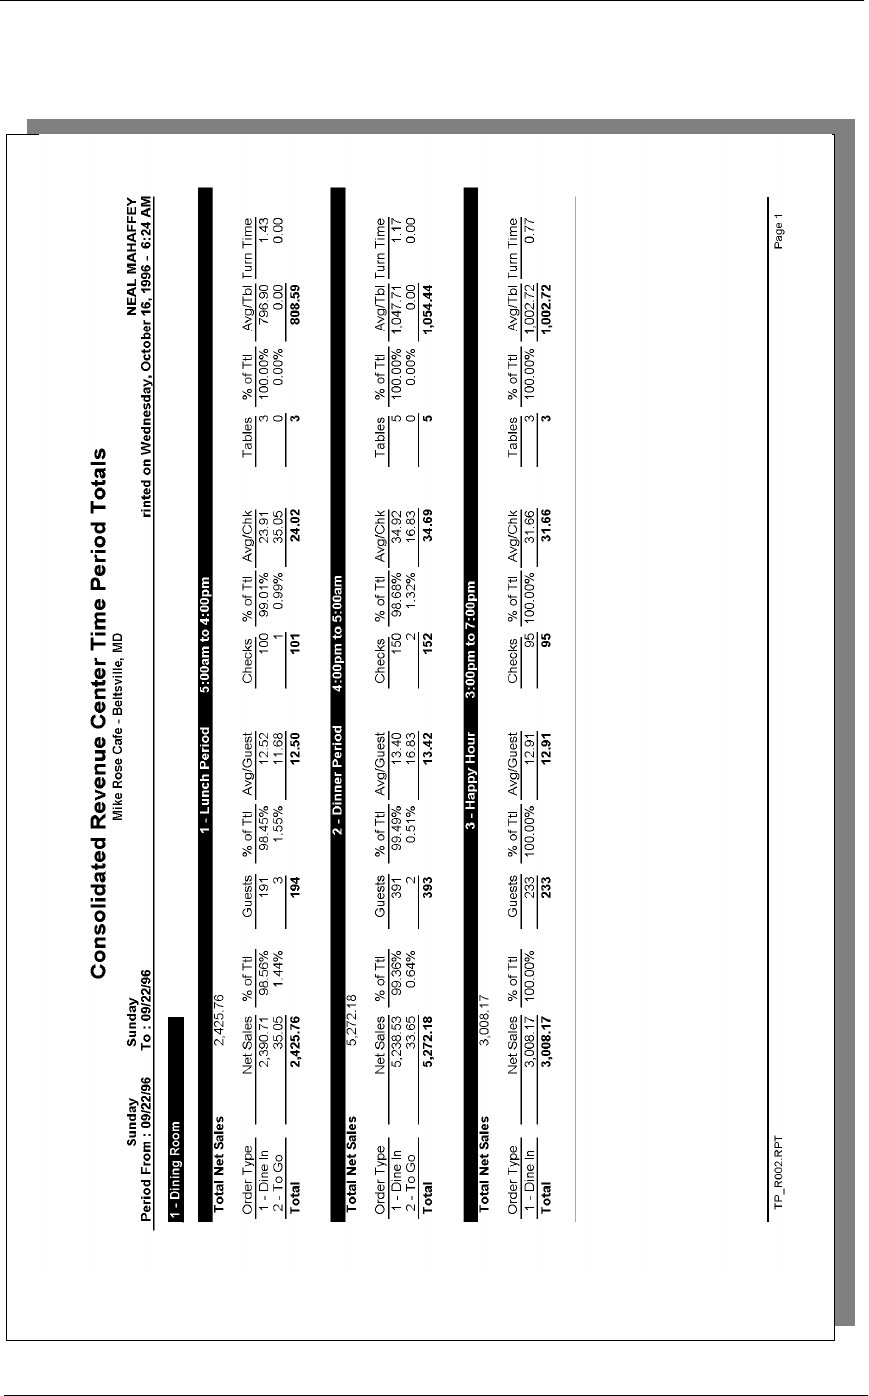
5HSRUWV
7LPH3HULRG6DOHV5HSRUWV
&RQVROLGDWHG5HYHQXH&HQWHU7LPH3HULRG7RWDOV
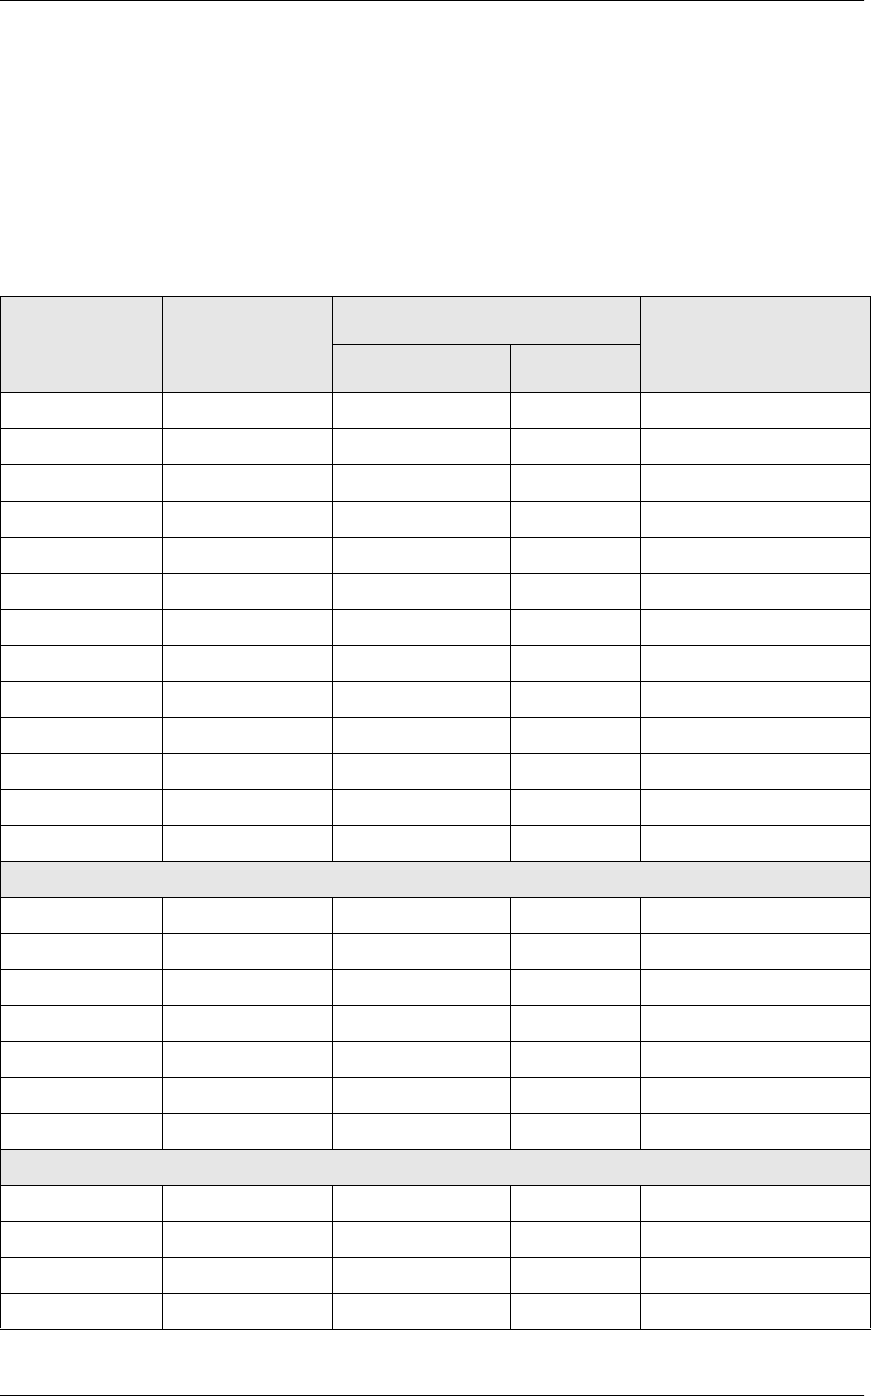
7LPH3HULRG6DOHV5HSRUWV
&RQVROLGDWHG5HYHQXH&HQWHU7LPH3HULRG7RWDOV
Sales and Guest Profile Details
Stored Procedure: sp_R_consolidated_rvc_time_prd_ttls and
sp_R_time_period
This report does not use any views.
The following table lists each column in the Sales and Guest Profile and
provides detailed information on the source of the figures in each column.
Report
Column Title
Stored
Procedure
Column Title
3700 Database Formula
Table Column
Total Net Sales @ttl_Net_Sales
Net Sales ∑ ot_net_sales_ttl dly_rvc_tm_prd_ot_ttl net_sls_ttl
% of Ttl @Percent_Of_Net_Total
Guests ∑ cover_count dly_rvc_tm_prd_ot_ttl cov_cnt
% of Ttl @Percent_Of_Guest_Total
Avg/Guest @Avg_$_Guest
Checks ∑ check_count dly_rvc_tm_prd_ot_ttl chk_cnt
% of Ttl @Percent_Of_Check_Total
Avg/Chk @Avg_$_Check
Tables ∑ table_turn_count dly_rvc_tm_prd_ot_ttl tbl_turn_cnt
% of Ttl @Percent_Of_Table_Total
Avg/Tbl @Avg_$_Table
Turn Time @Avg_Turn_Time
Total
Net Sales ∑ ot_net_sales_ttl dly_rvc_tm_prd_ot_ttl net_sls_ttl
Guests ∑ cover_count dly_rvc_tm_prd_ot_ttl cov_cnt
Avg/Guest @Total_Avg_$_Guest
Checks ∑ check_count dly_rvc_tm_prd_ot_ttl chk_cnt
Avg/Chk @Total_Avg_$_Check
Tables ∑ table_turn_count dly_rvc_tm_prd_ot_ttl tbl_turn_cnt
Avg/Tbl @Total_Avg_$_Table
Revenue Center Total
Net Sales ∑ net_sales_ttl dly_rvc_tm_prd_ttl net_sls_ttl
Guests ∑ cover_count dly_rvc_tm_prd_ot_ttl cov_cnt
Checks ∑ check_count dly_rvc_tm_prd_ot_ttl chk_cnt
Tables ∑ table_turn_count dly_rvc_tm_prd_ot_ttl tbl_turn_cnt
5HSRUWV
7LPH3HULRG6DOHV5HSRUWV
&RQVROLGDWHG5HYHQXH&HQWHU7LPH3HULRG7RWDOV
Grand Total
Net Sales ∑ net_sales_ttl dly_rvc_tm_prd_ttl net_sls_ttl
Guests ∑ cover_count dly_rvc_tm_prd_ot_ttl cov_cnt
Checks ∑ check_count dly_rvc_tm_prd_ot_ttl chk_cnt
Tables ∑ table_turn_count dly_rvc_tm_prd_ot_ttl tbl_turn_cnt
Report
Column Title
Stored
Procedure
Column Title
3700 Database Formula
Table Column

7LPH3HULRG6DOHV5HSRUWV
5HYHQXH&HQWHU7LPH3HULRG6XPPDU\
Revenue Center Time Period Summary
3XUSRVH
This report provides a summary of sales, guest, check, and table
information for each time period in the specified revenue center. Revenue
center totals, daily totals, and grand totals are also included.
)RUPDW
This report includes the following profile:
qSales and Guest Profile
The profile has been modified for this report. It does not include these
fields:
Order Type
Turn Time
7HPSODWH
TP_R103.RPT
2-26
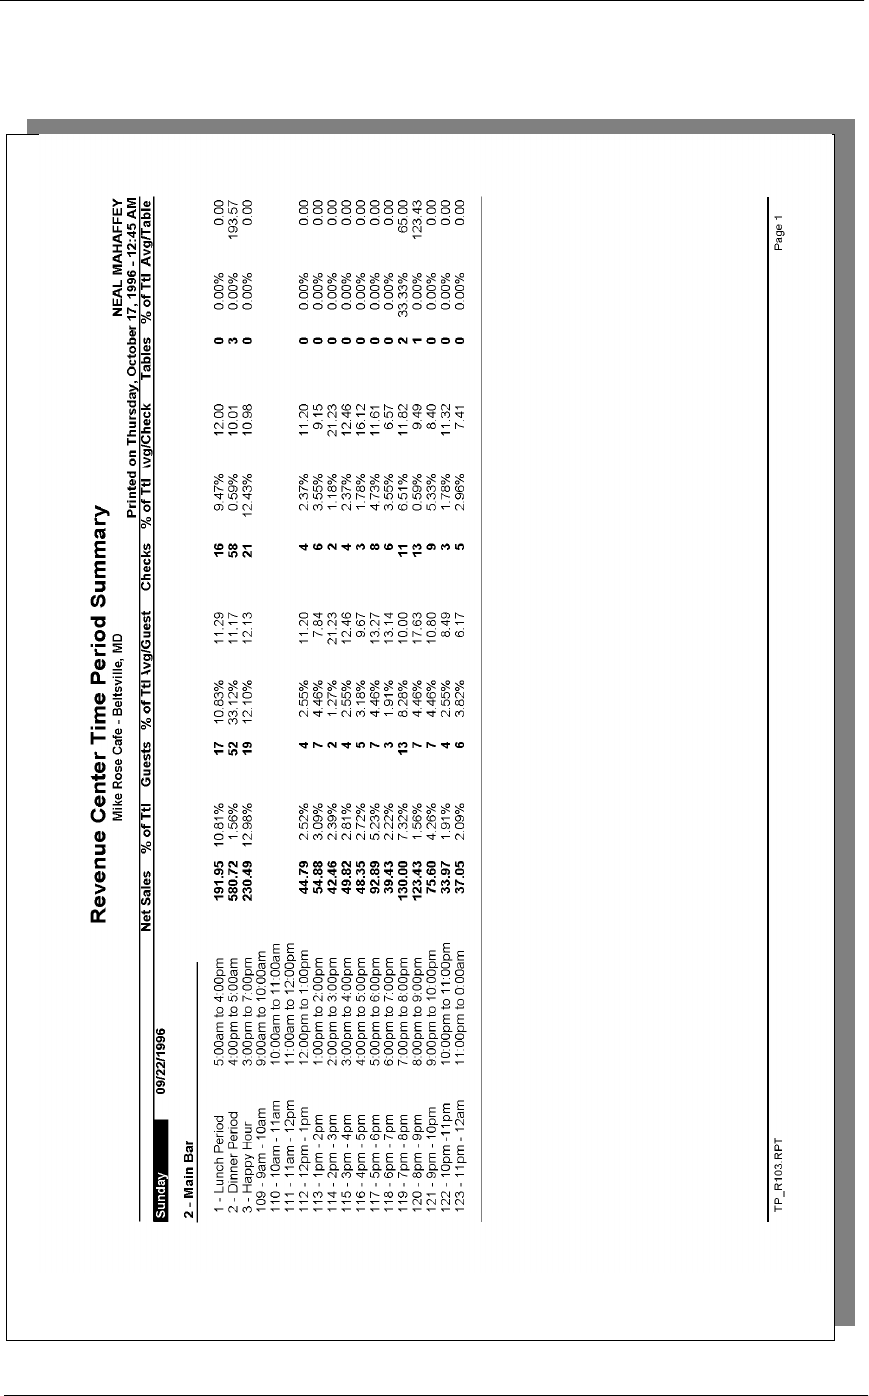
5HSRUWV
7LPH3HULRG6DOHV5HSRUWV
5HYHQXH&HQWHU7LPH3HULRG6XPPDU\

7LPH3HULRG6DOHV5HSRUWV
5HYHQXH&HQWHU7LPH3HULRG6XPPDU\
Revenue Center Time Period Summary
Revenue Center Time Period Summary
Mike Rose Cafe - Beltsville, MD
NEAL MAHAFFEY
Printed on 10/19/1996 - 10:37
----------------------------------------
Sunday 09/22/199
2 - Main Bar
1 - Lunch Period
5:00am to 4:00pm
Net Sales
191.95 12.12%
Guests 17
Average, % 11.29 19.32%
Checks 16
Average, % 12.00 16.84%
Tables 0
Average, % 0.00 0.00%
2 - Dinner Period
4:00pm to 5:00am
Net Sales
580.72 36.66%
Guests 52
Average, % 11.17 59.09%
Checks 58
Average, % 10.01 1.05%
Tables 3
Average, % 193.57 0.00%
3 - Happy Hour
3:00pm to 7:00pm
Net Sales
230.49 14.55%
Guests 19
Average, % 12.13 21.59%
Checks 21
Average, % 10.98 22.11%
Tables 0
Average, % 0.00 0.00%
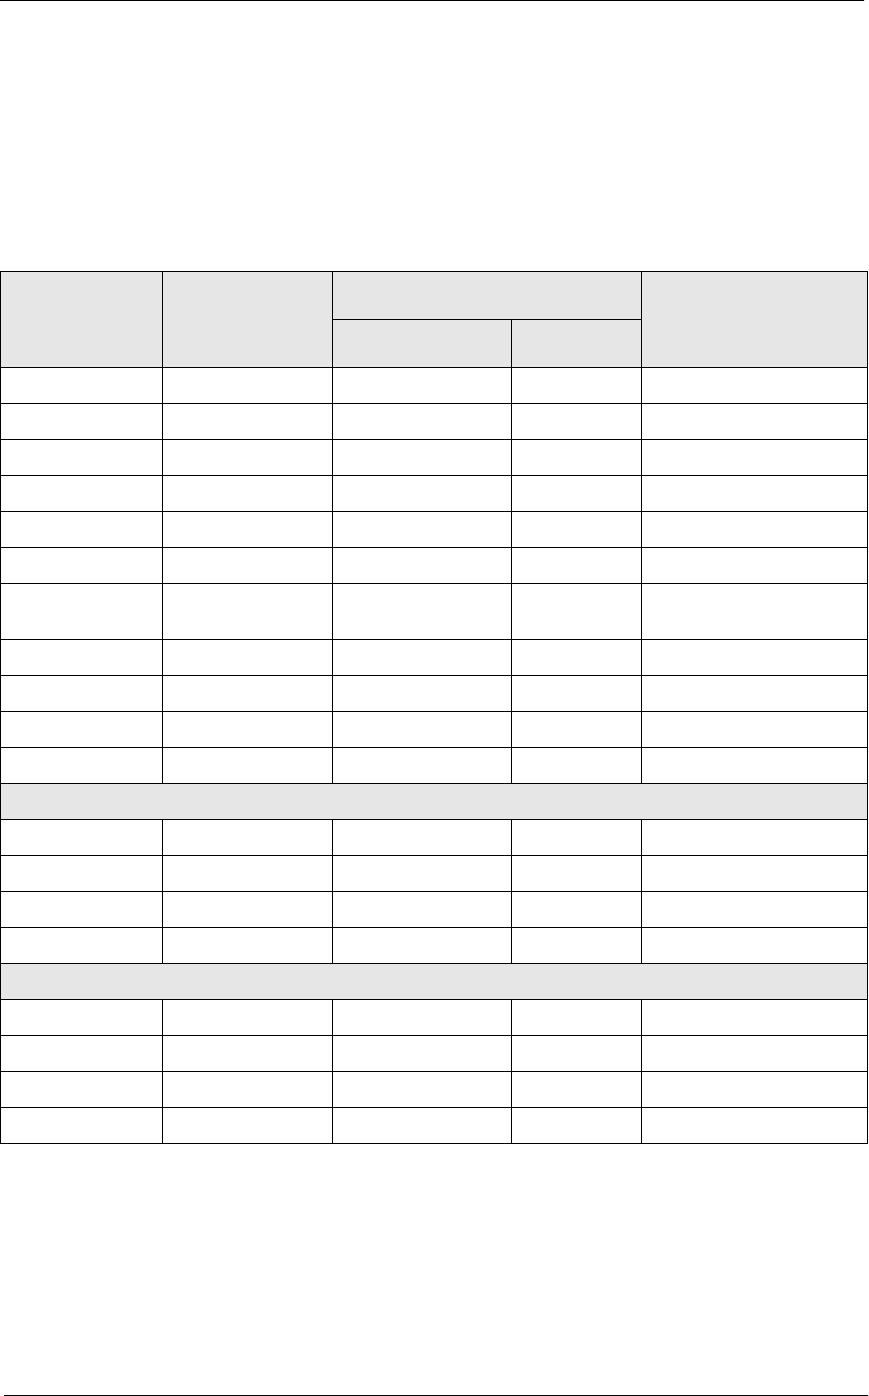
5HSRUWV
7LPH3HULRG6DOHV5HSRUWV
5HYHQXH&HQWHU7LPH3HULRG6XPPDU\
Sales and Guest Profile Details
View: v_R_rvc_time_period
Stored Procedure: sp_R_time_period
The following table lists each column in the Sales and Guest Profile and
provides detailed information on the source of the figures in each column.
Report
Column
Title
View
Column
Title
3700 Database Formula
Table Column
Net Sales net_sales_ttl dly_rvc_tm_prd_ttl net_sls_ttl
% of Ttl @Percent_Of_Net_Total
Guests ∑ cover_count dly_rvc_tm_prd_ot_ttl cov_cnt
% of Ttl @Percent_Of_Guest_Count
Avg/Guest @Average_$_Guest
Checks ∑ check_count dly_rvc_tm_prd_ot_ttl chk_cnt
% of Ttl @Percent_Of_Check_Coun
t
Avg/Check @Average_$_Check
Tables ∑ table_turn_count dly_rvc_tm_prd_ot_ttl tbl_turn_cnt
% of Ttl @Percent_Of_Table_Count
Avg/Table @Average_$_Table
Daily Total
Net Sales ∑ net_sales_ttl dly_rvc_tm_prd_ttl net_sls_ttl
Guests ∑ cover_count dly_rvc_tm_prd_ot_ttl cov_cnt
Checks ∑ check_count dly_rvc_tm_prd_ot_ttl chk_cnt
Tables ∑ table_turn_count dly_rvc_tm_prd_ot_ttl tbl_turn_cnt
Grand Total
Net Sales ∑ net_sales_ttl dly_rvc_tm_prd_ttl net_sls_ttl
Guests ∑ cover_count dly_rvc_tm_prd_ot_ttl cov_cnt
Checks ∑ check_count dly_rvc_tm_prd_ot_ttl chk_cnt
Tables ∑ table_turn_count dly_rvc_tm_prd_ot_ttl tbl_turn_cnt

7LPH3HULRG6DOHV5HSRUWV
&RQVROLGDWHG5HYHQXH&HQWHU7LPH3HULRG6XPPDU\
Consolidated Revenue Center Time Period Summary
3XUSRVH
This report provides the same information as the Revenue Center Time
Period Summary Report, but for a range of business days.
)RUPDW
This report includes the following profile:
qSales and Guest Profile
The profile has been modified for this report. It does not include these
fields:
Order Type
Turn Time
7HPSODWH
TP_R104.RPT
2-26
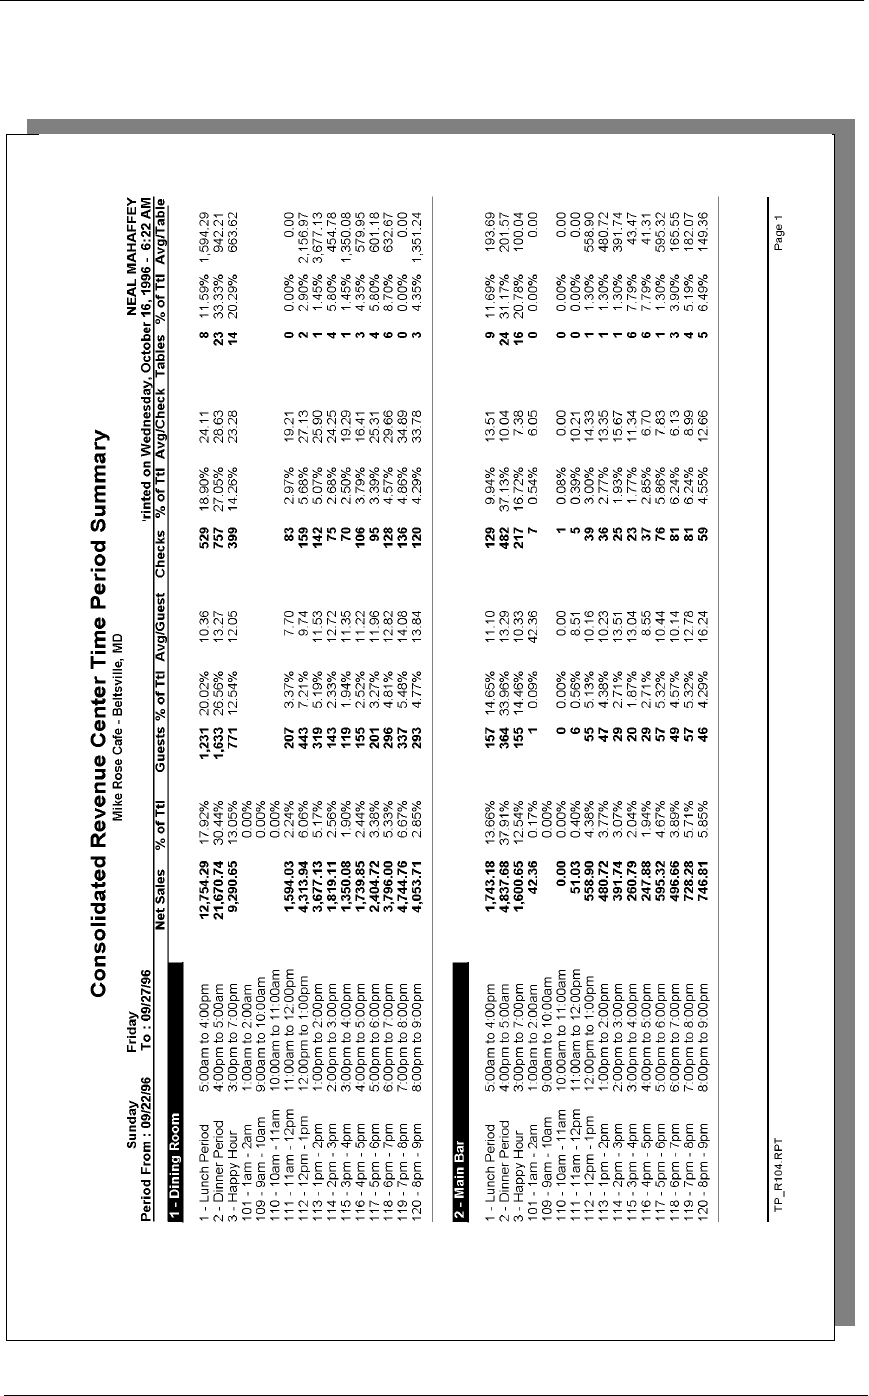
5HSRUWV
7LPH3HULRG6DOHV5HSRUWV
&RQVROLGDWHG5HYHQXH&HQWHU7LPH3HULRG6XPPDU\
7LPH3HULRG6DOHV5HSRUWV
&RQVROLGDWHG5HYHQXH&HQWHU7LPH3HULRG6XPPDU\
Sales and Guest Profile Details
Stored Procedure: sp_R_consolidated_rvc_time_prd_ttls and
sp_time_period
This report does not use any views.
The following table lists each column in the Sales and Guest Profile and
provides detailed information on the source of the figures in each column.
Report
Column Title
Stored
Procedure
Column Title
3700 Database Formula
Table Column
Net Sales net_sales_ttl dly_rvc_tm_prd_ttl net_sls_ttl
% of Ttl @Percent_Of_Net_Total
Guests ∑ cover_count dly_rvc_tm_prd_ot_ttl cov_cnt
% of Ttl @Percent_Of_Guest_Count
Avg/Guest @Average_$_Guest
Checks ∑ check_count dly_rvc_tm_prd_ot_ttl chk_cnt
% of Ttl @Percent_Of_Check_Count
Avg/Check @Average_$_Check
Tables ∑ table_turn_count dly_rvc_tm_prd_ot_ttl tbl_turn_cnt
% of Ttl @Percent_Of_Table_Count
Avg/Table @Average_$_Table
Revenue Center Total
Guests ∑ cover_count dly_rvc_tm_prd_ot_ttl cov_cnt
Checks ∑ check_count dly_rvc_tm_prd_ot_ttl chk_cnt
Tables ∑ table_turn_count dly_rvc_tm_prd_ot_ttl tbl_turn_cnt
Daily Total
Net Sales ∑ net_sales_ttl dly_rvc_tm_prd_ttl net_sls_ttl
Guests ∑ cover_count dly_rvc_tm_prd_ot_ttl cov_cnt
Checks ∑ check_count dly_rvc_tm_prd_ot_ttl chk_cnt
Tables ∑ table_turn_count dly_rvc_tm_prd_ot_ttl tbl_turn_cnt
Grand Total
Net Sales ∑ net_sales_ttl dly_rvc_tm_prd_ttl net_sls_ttl
Guests ∑ cover_count dly_rvc_tm_prd_ot_ttl cov_cnt
Checks ∑ check_count dly_rvc_tm_prd_ot_ttl chk_cnt
Tables ∑ table_turn_count dly_rvc_tm_prd_ot_ttl tbl_turn_cnt

5HSRUWV
6\VWHP7LPH3HULRG7RWDOV
Chapter 7
System Time Period Totals
3XUSRVH
This report provides a summary of sales, guest, check, and table
information for each time period in the system. Sales are listed by order
type.
)RUPDW
This report includes the following profile:
qSales and Guest Profile
7HPSODWH
TP_S001.RPT
2-26
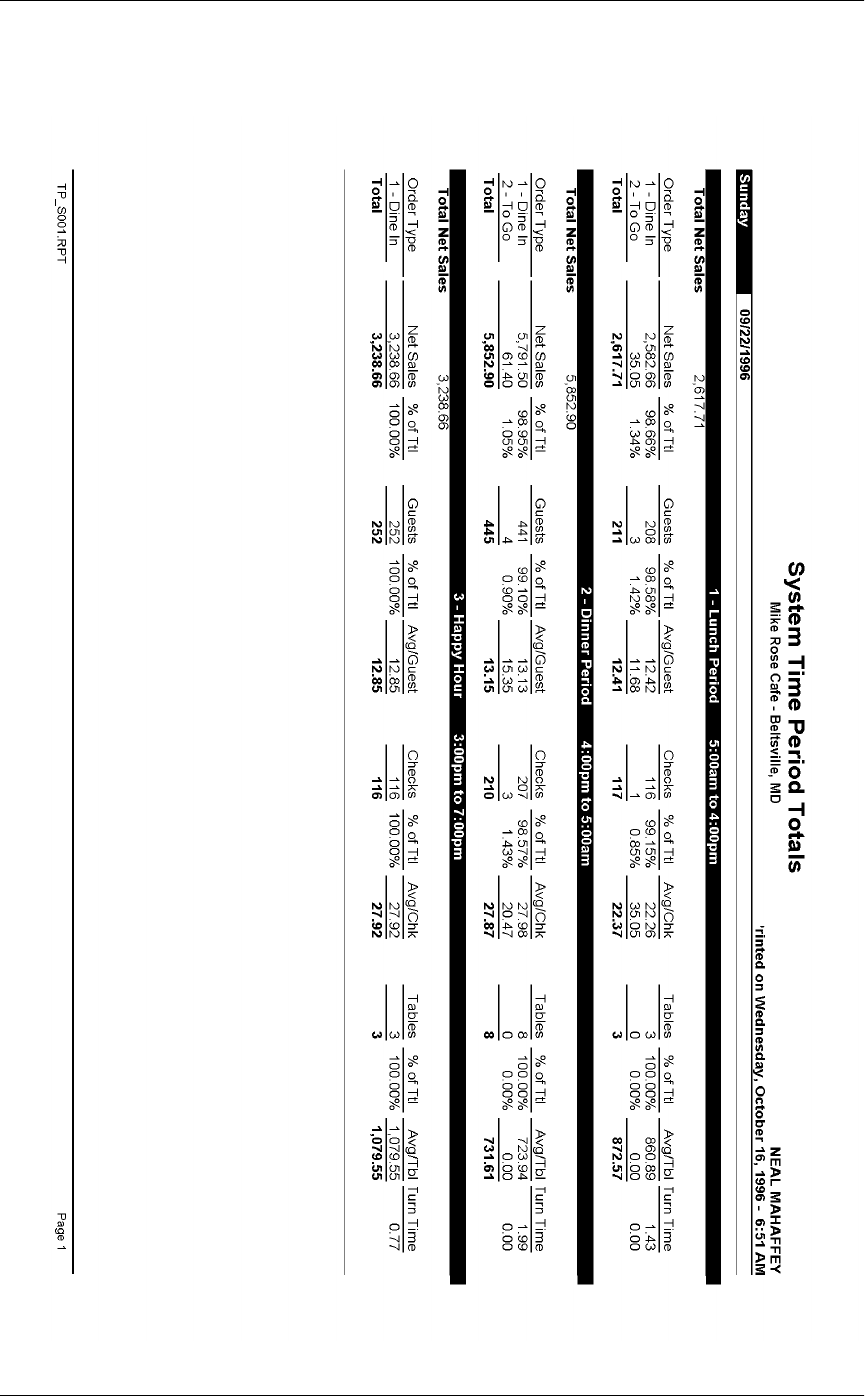
6\VWHP7LPH3HULRG7RWDOV

5HSRUWV
6\VWHP7LPH3HULRG7RWDOV
System Time Period Totals
System Time Period Totals
Mike Rose Cafe - Beltsville, MD
NEAL MAHAFFEY
Printed on 10/16/1996 - 1:13
----------------------------------------
Sunday 9/22/1996
1 - Lunch Period
5:00am to 4:00pm
1 - Dine In
2,582.66 98.66%
Guests 208
Average, % 12.42 98.58%
Checks 116
Average, % 22.26 99.15%
Tables 3
Average, % 860.89 100.00%
Turn Time 1.43
2 - To Go
35.05 1.34%
Guests 3
Average, % 11.68 1.42%
Checks 1
Average, % 35.05 0.85%
Tables 0
Average, % 0.00 0.00%
Turn Time 0.00
Period Totals
2,617.71 22.36%
Guests 211 23.24%
Average, % 12.41
Checks 117 26.41%
Average, % 22.37
Tables 3 21.43%
Average, % 872.57
----------------------------------------
2 - Dinner Period
4:00pm to 5:00am
1 - Dine In
5,791.50 98.95%
Guests 441
Average, % 13.13 99.10%
Checks 207
Average, % 27.98 98.57%
Tables 8
Average, % 723.94 100.00%
Turn Time 1.99
2 - To Go
61.40 1.05%
Guests 4
Average, % 15.35 0.90%
Checks 3
Average, % 20.47 1.43%
Tables 0
Average, % 0.00 0.00%
Turn Time 0.00
Period Totals
5,852.90 49.99%
Guests 445 49.01%
Average, % 13.15
Checks 210 47.40%
Average, % 27.87
Tables 8 57.14%
Average, % 731.61
----------------------------------------
6\VWHP7LPH3HULRG7RWDOV
Sales and Guest Profile Details
View: v_R_sys_time_period
Stored Procedure:sp_R_time_period
The following table lists each column in the Sales and Guest Profile and
provides detailed information on the source of the figures in each column.
Report
Column
Title
View
Column
Title
3700 Database Formula
Table Column
Total Net Sales @ttl_Net_Sales
Net Sales ot_net_sales_ttl dly_sys_tm_prd_ot_ttl net_sls_ttl
% of Ttl @Percent_Of_Net_Total
Guests cover_count dly_sys_tm_prd_ot_ttl cov_cnt
% of Ttl @Percent_Of_Guest_Total
Avg/Guest @Avg_$_Guest
Checks check_count dly_sys_tm_prd_ot_ttl chk_cnt
% of Ttl @Percent_Of_Check_Total
Avg/Chk @Avg_$_Check
Tables table_turn_count dly_sys_tm_prd_ot_ttl tbl_turn_cnt
% of Ttl @Percent_Of_Table_Total
Avg/Tbl @Avg_$_Table
Turn Time @Avg_Turn_Time
Total
Net Sales ∑ ot_net_sales_ttl dly_sys_tm_prd_ot_ttl net_sls_ttl
Guests ∑ cover_count dly_sys_tm_prd_ot_ttl cov_cnt
Avg/Guest @Total_Avg_$_Guest
Checks ∑ check_count dly_sys_tm_prd_ot_ttl chk_cnt
Avg/Chk @Total_Avg_$_Check
Tables ∑ table_turn_count dly_sys_tm_prd_ot_ttl tbl_turn_cnt
Avg/Tbl @Total_Avg_$_Table
Daily Total
Net Sales ∑ ot_net_sales_ttl dly_sys_tm_prd_ot_ttl net_sls_ttl
Guests ∑ cover_count dly_sys_tm_prd_ot_ttl cov_cnt
Checks ∑ check_count dly_sys_tm_prd_ot_ttl chk_cnt
Tables ∑ table_turn_count dly_sys_tm_prd_ot_ttl tbl_turn_cnt
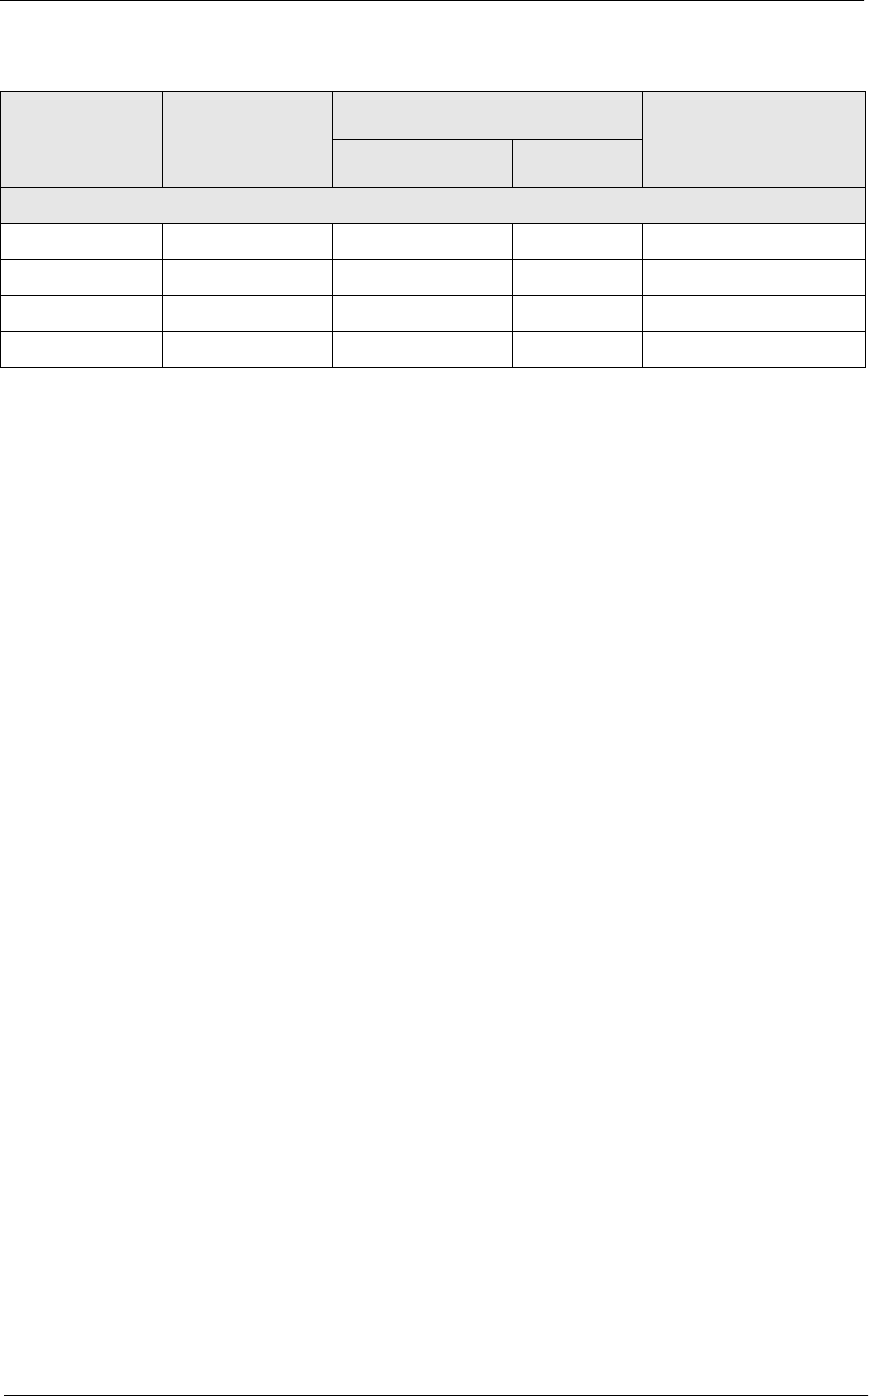
5HSRUWV
6\VWHP7LPH3HULRG7RWDOV
Grand Total
Net Sales ∑ ot_net_sales_ttl dly_sys_tm_prd_ot_ttl net_sls_ttl
Guests ∑ cover_count dly_sys_tm_prd_ot_ttl cov_cnt
Checks ∑ check_count dly_sys_tm_prd_ot_ttl chk_cnt
Tables ∑ table_turn_count dly_sys_tm_prd_ot_ttl tbl_turn_cnt
Report
Column
Title
View
Column
Title
3700 Database Formula
Table Column

6\VWHP7LPH3HULRG'HWDLO
System Time Period Detail
3XUSRVH
This report is identical to the System Time Period Totals Report, with the
addition of tracking group and labor category information.
)RUPDW
This report includes the following profiles:
qSales and Guest Profile
qTracking Group Profile
qLabor Category Profile
The profile has been modified for this report. It includes this extra
field:
% Labor/Sales
7HPSODWH
TP_S101.RPT
2-26
2-33
2-19
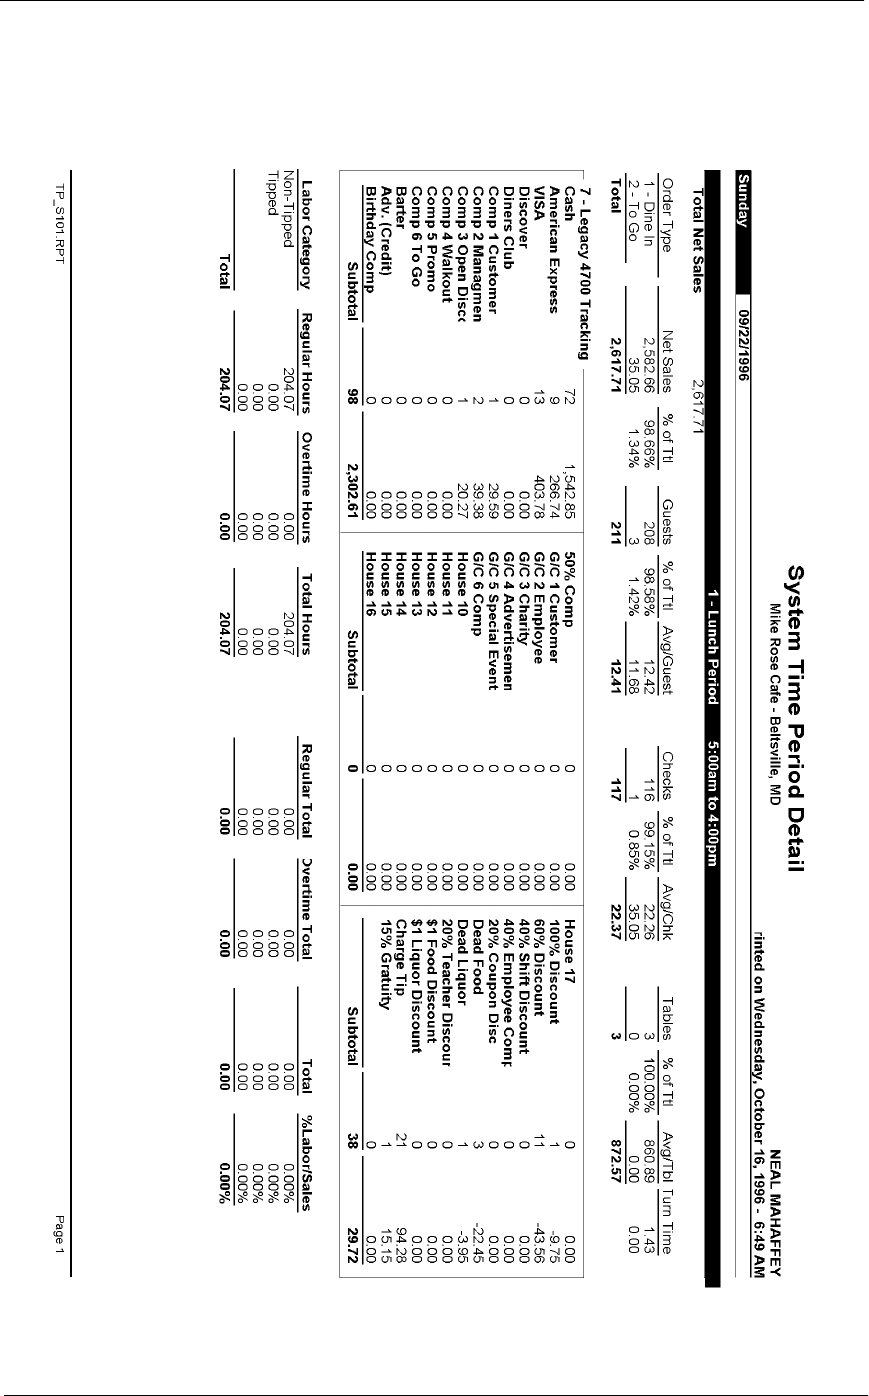
5HSRUWV
6\VWHP7LPH3HULRG'HWDLO

6\VWHP7LPH3HULRG'HWDLO
System Time Period Detail
System Time Period Detail
Mike Rose Cafe - Beltsville, MD
NEAL MAHAFFEY
Printed on 10/16/1996 - 1:15
----------------------------------------
Sunday 9/22/1996
1 - Lunch Period
5:00am to 4:00pm
1 - Dine In
2,582.66 98.66%
Guests 208
Average, % 12.42 98.58%
Checks 116
Average, % 22.26 99.15%
Tables 3
Average, % 860.89 100.00%
Turn Time 1.43
2 - To Go
35.05 1.34%
Guests 3
Average, % 11.68 1.42%
Checks 1
Average, % 35.05 0.85%
Tables 0
Average, % 0.00 0.00%
Turn Time 0.00
Period Total
2,617.71 100.00%
Guests 211
Average, % 12.41 100.00%
Checks 117
Average, % 22.37 100.00%
Tables 3
Average, % 872.57 100.00%
----------------------------------------
7 - Tracking
Cash 72 1,542.85
American E 9 266.74
VISA 13 403.78
Discover 0 0.00
Diners Clu 0 0.00
Comp 1 Cus 1 29.59
Comp 2 Man 2 39.38
Comp 3 Ope 1 20.27
Comp 4 Wal 0 0.00
Comp 5 Pro 0 0.00
Comp 6 To 0 0.00
Barter 0 0.00
Adv. (Cred 0 0.00
Birthday C 0 0.00
Subtotal 98 2,302.61
----------------------------------------
Hours Pay Labor/
Non-Tipped Sales
Reg 204.07 0.00
Ovt 0.00 0.00
Ttl 204.07 0.00 0.00%
Tipped
Reg 0.00 0.00
Ovt 0.00 0.00
Ttl 0.00 0.00 0.00%
Reg 0.00 0.00
Ovt 0.00 0.00
Ttl 0.00 0.00 0.00%
Reg 0.00 0.00
Ovt 0.00 0.00
Ttl 0.00 0.00 0.00%
Total Labor
Reg 204.07 0.00
Ovt 0.00 0.00
Ttl 204.07 0.00 0.00%
========================================
Totals omitted for
display
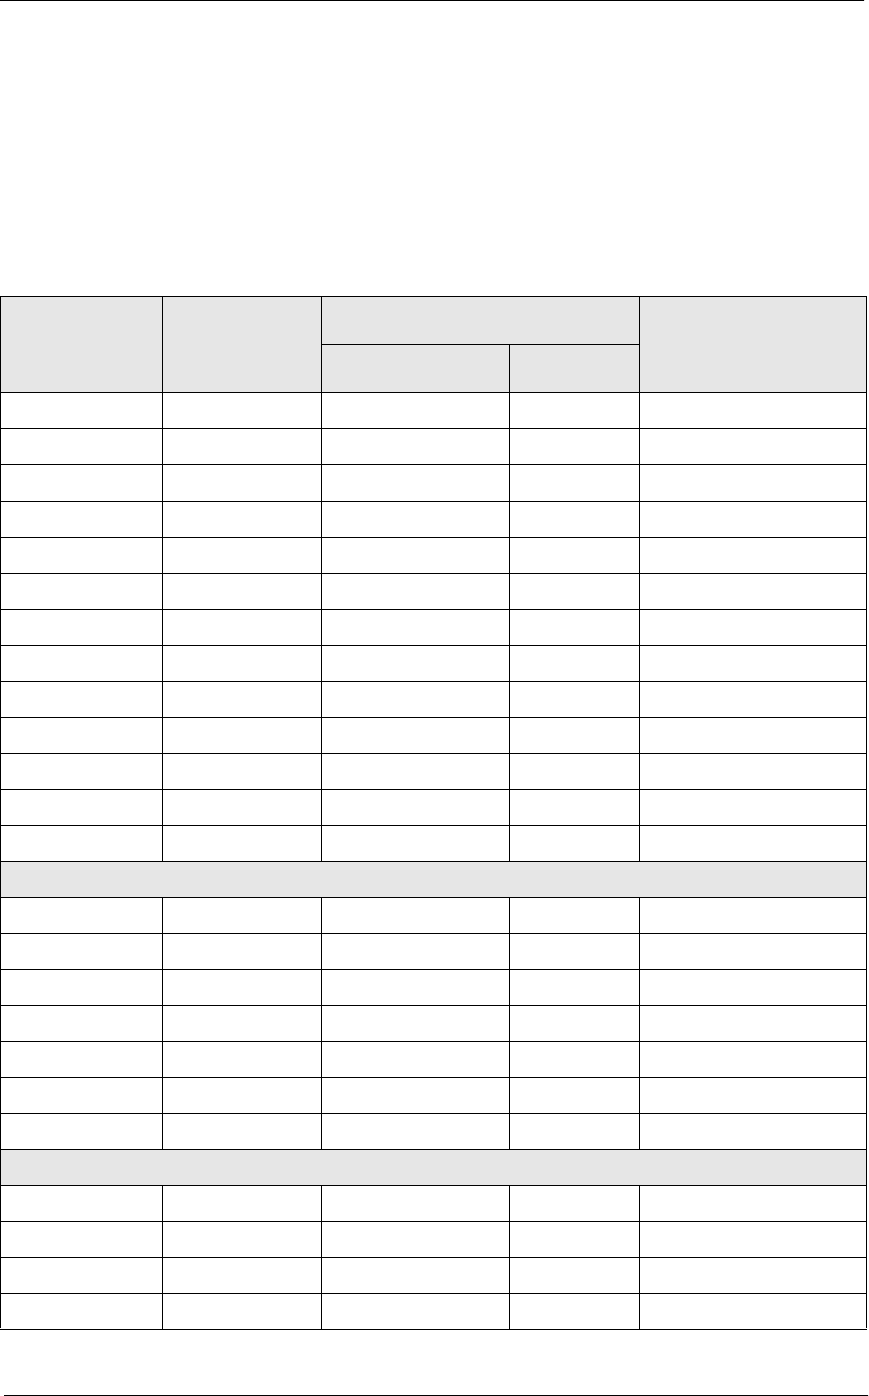
5HSRUWV
6\VWHP7LPH3HULRG'HWDLO
Sales and Guest Profile Details
Views: v_R_sys_time_period and v_R_sys_time_period_trk
Stored Procedures: sp_R_time_prd_time_card_ttls and
sp_R_sys_time_prd_sales_trk
The following table lists each column in the Sales and Guest Profile and
provides detailed information on the source of the figures in each column.
Report
Column
Title
View
Column
Title
3700 Database Formula
Table Column
Total Net Sales @ttl_Net_Sales
Net Sales net_sales_ttl dly_sys_tm_prd_ttl net_sls_ttl
% of Ttl @Percent_Of_Net_Total
Guests cover_count dly_sys_tm_prd_ot_ttl cov_cnt
% of Ttl @Percent_Of_Guest_Total
Avg/Guest @Avg_$_Guest
Checks check_count dly_sys_tm_prd_ot_ttl chk_cnt
% of Ttl @Percent_Of_Check_Total
Avg/Chk @Avg_$_Check
Tables table_turn_count dly_sys_tm_prd_ot_ttl tbl_turn_cnt
% of Ttl @Percent_Of_Table_Total
Avg/Tbl @Avg_$_Table
Turn Time @Avg_Turn_Time
Total
Net Sales ∑ net_sales_ttl dly_sys_tm_prd_ttl net_sls_ttl
Guests ∑ cover_count dly_sys_tm_prd_ot_ttl cov_cnt
Avg/Guest @Total_Avg_$_Guest
Checks ∑ check_count dly_sys_tm_prd_ot_ttl chk_cnt
Avg/Chk @Total_Avg_$_Check
Tables ∑ table_turn_count dly_sys_tm_prd_ot_ttl tbl_turn_cnt
Avg/Tbl @Total_Avg_$_Table
Daily Total
Net Sales ∑ net_sales_ttl dly_sys_tm_prd_ttl net_sls_ttl
Guests ∑ cover_count dly_sys_tm_prd_ot_ttl cov_cnt
Checks ∑ check_count dly_sys_tm_prd_ot_ttl chk_cnt
Tables ∑ table_turn_count dly_sys_tm_prd_ot_ttl tbl_turn_cnt
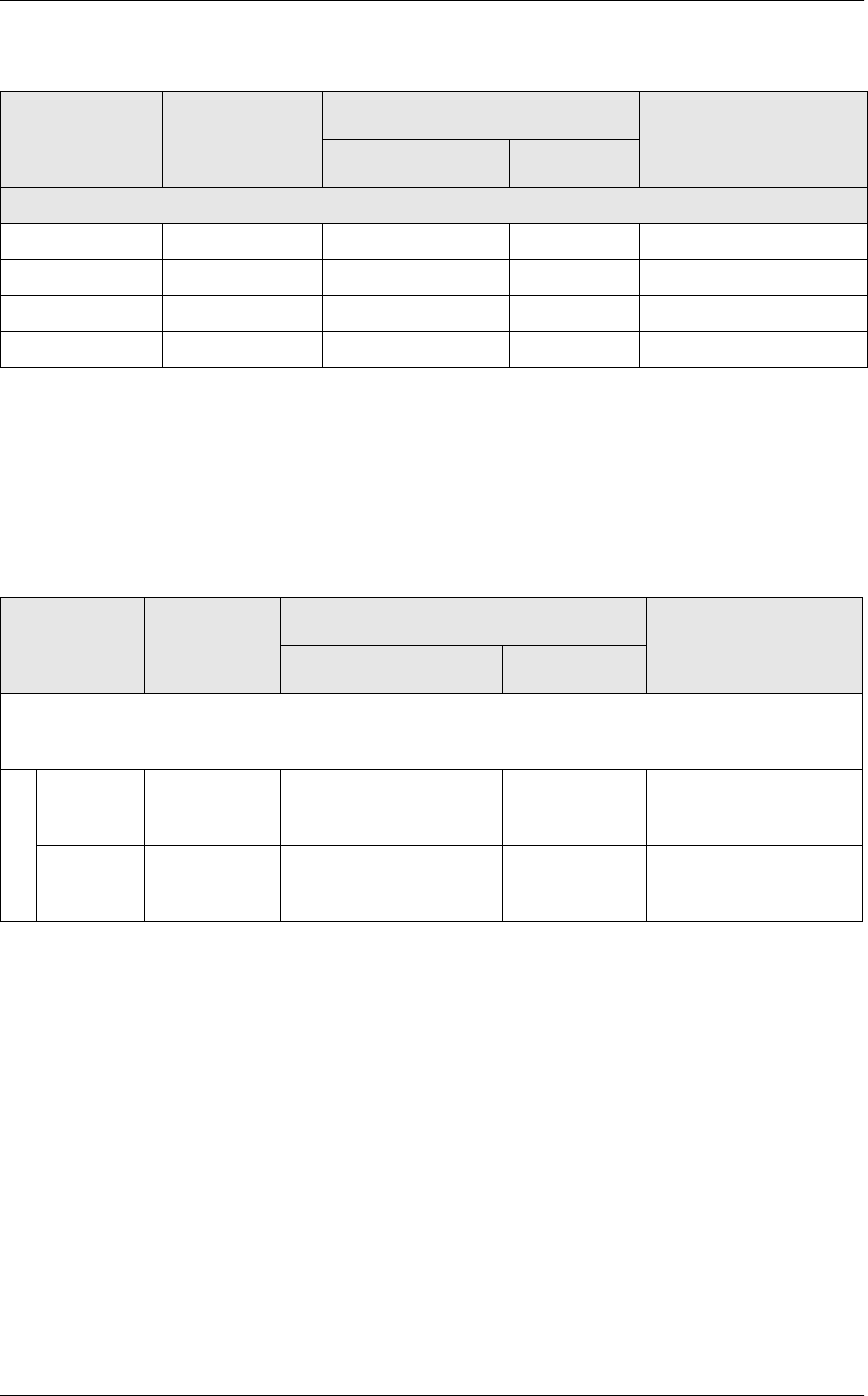
6\VWHP7LPH3HULRG'HWDLO
Tracking Group Profile
Views: v_R_sys_time_period and v_R_sys_time_period_trk
Stored Procedures: sp_R_time_prd_time_card_ttls and
sp_R_sys_time_prd_sales_trk
The following table lists each column in the Tracking Group Profile and
provides detailed information on the source of the figures in each column.
Grand Total
Net Sales ∑ net_sales_ttl dly_sys_tm_prd_ttl net_sls_ttl
Guests ∑ cover_count dly_sys_tm_prd_ot_ttl cov_cnt
Checks ∑ check_count dly_sys_tm_prd_ot_ttl chk_cnt
Tables ∑ table_turn_count dly_sys_tm_prd_ot_ttl tbl_turn_cnt
Report
Column
Title
View
Column
Title
3700 Database Formula
Table Column
Programmable1
to
Programmable42
Number trk_cnt_01
to
trk_cnt_42
dly_sys_tm_prd_trk_ttl trk_cnt_01
to
trk_cnt_42
Value trk_ttl_01
to
trk_ttl_42
dly_sys_tm_prd_trk_ttl trk_ttl_01
to
trk_ttl_42
Report
Column
Title
View
Column
Title
3700 Database Formula
Table Column
5HSRUWV
6\VWHP7LPH3HULRG'HWDLO
Labor Category Profile
Views: v_R_sys_time_period and v_R_sys_time_period_trk
Stored Procedures: sp_R_time_prd_time_card_ttls and
sp_R_sys_time_prd_sales_trk
The following table lists each column in the Labor Profile and provides
detailed information on the source of the figures in each column. You can
program four labor categories. Each of these labor categories is then
associated with a number that is represented in the following table as the
variable #. For example, if labor category 1 is programmed as dining
room, then the regular hours for dining room staff comes from the view
column labor_cat_1_reg_hrs..
Report
Column
Title
View
Column
Title
3700 Database Formula
Table Column
Labor Category @Lab_
#
_Name
Regular Hours labor_cat_
#
_reg_hrs dly_rvc_tm_prd_ttl labor_cat_
#
_reg_hrs
Overtime Hours labor_cat_
#
_ovt_hrs dly_rvc_tm_prd_ttl labor_cat_
#
_ovt_hrs
Total Hours @ttl_Total_Hours_
#
Regular Total labor_cat_
#
_reg_ttl dly_rvc_tm_prd_ttl labor_cat_
#
_reg_ttl
Overtime Total labor_cat_
#
_ovt_ttl dly_rvc_tm_prd_ttl labor_cat_
#
_ovt_ttl
Total @ttl_Total_
#
%Labor/Sales @ttl_%Labor_
#

&RQVROLGDWHG6\VWHP7LPH3HULRG7RWDOV
Consolidated System Time Period Totals
3XUSRVH
This report provides the same information as the System Time Period
Totals Report, but for a range of business days.
)RUPDW
This report includes the following profile:
qSales and Guest Profile
7HPSODWH
TP_S002.RPT
2-26
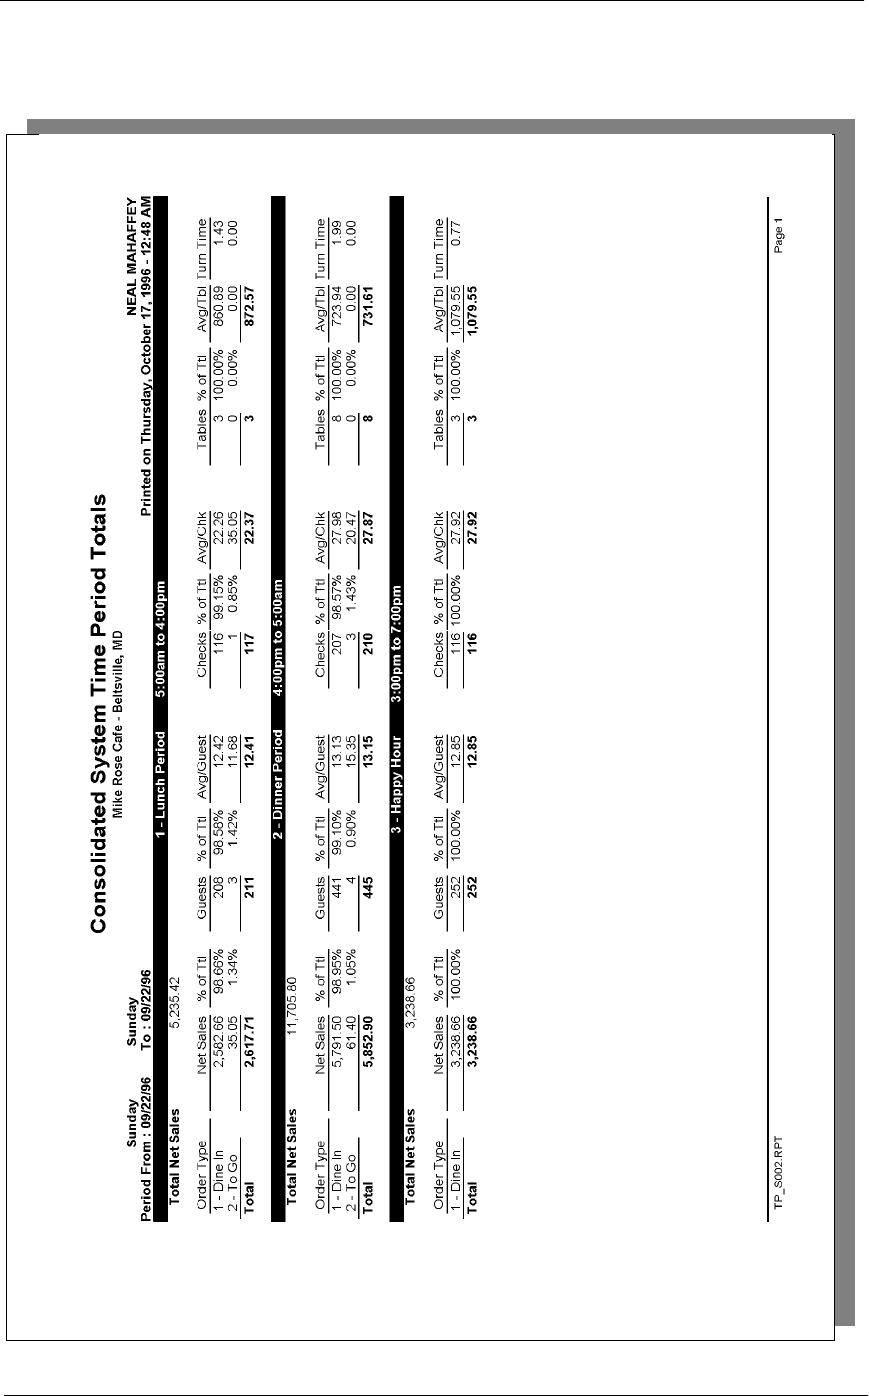
5HSRUWV
&RQVROLGDWHG6\VWHP7LPH3HULRG7RWDOV
&RQVROLGDWHG6\VWHP7LPH3HULRG7RWDOV
Sales and Guest Profile Details
Stored Procedure: sp_R_consolidated_sys_time_prd_ttls and
sp_R_time_period
This report dies not use any views.
The following table lists each column in the Sales and Guest Profile and
provides detailed information on the source of the figures in each column.
Report
Column Title
Stored
Procedure
Column Title
3700 Database Formula
Table Column
Total Net Sales @ttl_Net_Sales
Net Sales ∑ ot_net_sales_ttl dly_sys_tm_prd_ot_ttl net_sls_ttl
% of Ttl @Percent_Of_Net_Total
Guests ∑ cover_count dly_sys_tm_prd_ot_ttl cov_cnt
% of Ttl @Percent_Of_Guest_Total
Avg/Guest @Avg_$_Guest
Checks ∑ check_count dly_sys_tm_prd_ot_ttl chk_cnt
% of Ttl @Percent_Of_Check_Total
Avg/Chk @Avg_$_Check
Tables ∑ table_turn_count dly_sys_tm_prd_ot_ttl tbl_turn_cnt
% of Ttl @Percent_Of_Table_Total
Avg/Tbl @Avg_$_Table
Turn Time @Avg_Turn_Time
Total
Net Sales ∑ ot_net_sales_ttl dly_sys_tm_prd_ot_ttl net_sls_ttl
Guests ∑ cover_count dly_sys_tm_prd_ot_ttl cov_cnt
Avg/Guest @Total_Avg_$_Guest
Checks ∑ check_count dly_sys_tm_prd_ot_ttl chk_cnt
Avg/Chk @Total_Avg_$_Check
Tables ∑ table_turn_count dly_sys_tm_prd_ot_ttl tbl_turn_cnt
Avg/Tbl @Total_Avg_$_Table
Grand Total
Net Sales ∑ ot_net_sales_ttl dly_sys_tm_prd_ot_ttl net_sls_ttl
Guests ∑ cover_count dly_sys_tm_prd_ot_ttl cov_cnt
Checks ∑ check_count dly_sys_tm_prd_ot_ttl chk_cnt
Tables ∑ table_turn_count dly_sys_tm_prd_ot_ttl tbl_turn_cnt

5HSRUWV
6\VWHP7LPH3HULRG6XPPDU\
System Time Period Summary
3XUSRVH
This report provides a summary of sales, guest, check, and table
information for each time period in the system. Daily totals and grand
totals are also included.
)RUPDW
This report includes the following profile:
qSales and Guest Profile
The profile has been modified for this report. It does not include these
fields:
Order Type
Turn Time
7HPSODWH
TP_S103.RPT
2-26
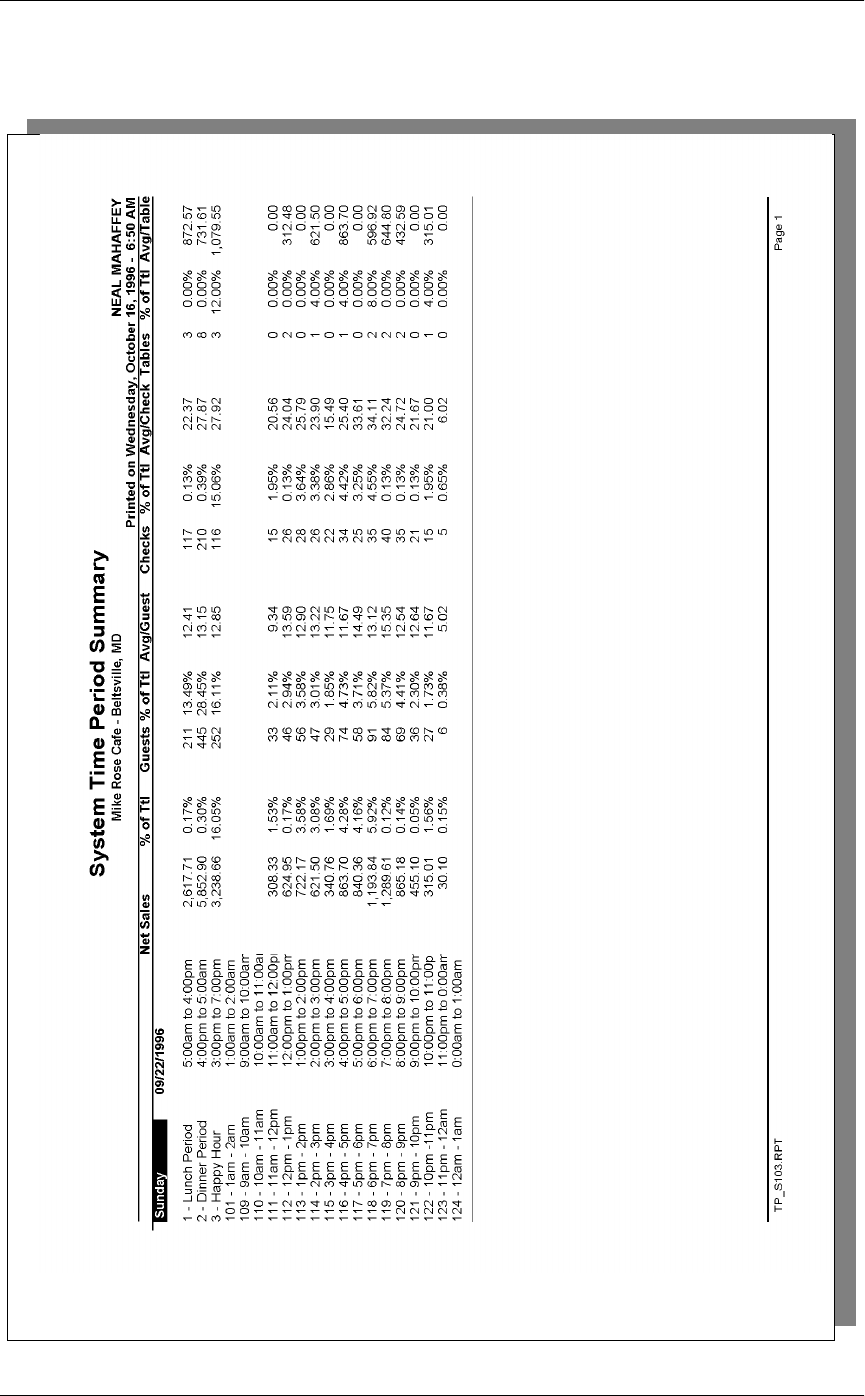
6\VWHP7LPH3HULRG6XPPDU\

5HSRUWV
6\VWHP7LPH3HULRG6XPPDU\
System Time Period Summary
System Time Period Summary
Mike Rose Cafe - Beltsville, MD
NEAL MAHAFFEY
Printed on Wed, Oct 16, 1996
----------------------------------------
Sunday 9/22/1996
1 - Lunch Period
5:00am to 4:00pm
Net Sales
2,617.71 12.97%
Guests 211
Average, % 12.41 23.24%
Checks 117
Average, % 22.37 0.23%
Tables 3
Average, % 872.57 0.00%
2 - Dinner Period
4:00pm to 5:00am
Net Sales
5,852.90 29.00%
Guests 445
Average, % 13.15 49.01%
Checks 210
Average, % 27.87 0.68%
Tables 8
Average, % 731.61 0.00%
3 - Happy Hour
3:00pm to 7:00pm
Net Sales
3,238.66 16.05%
Guests 252
Average, % 12.85 27.75%
Checks 116
Average, % 27.92 26.19%
Tables 3
Average, % 1,079. 21.43%
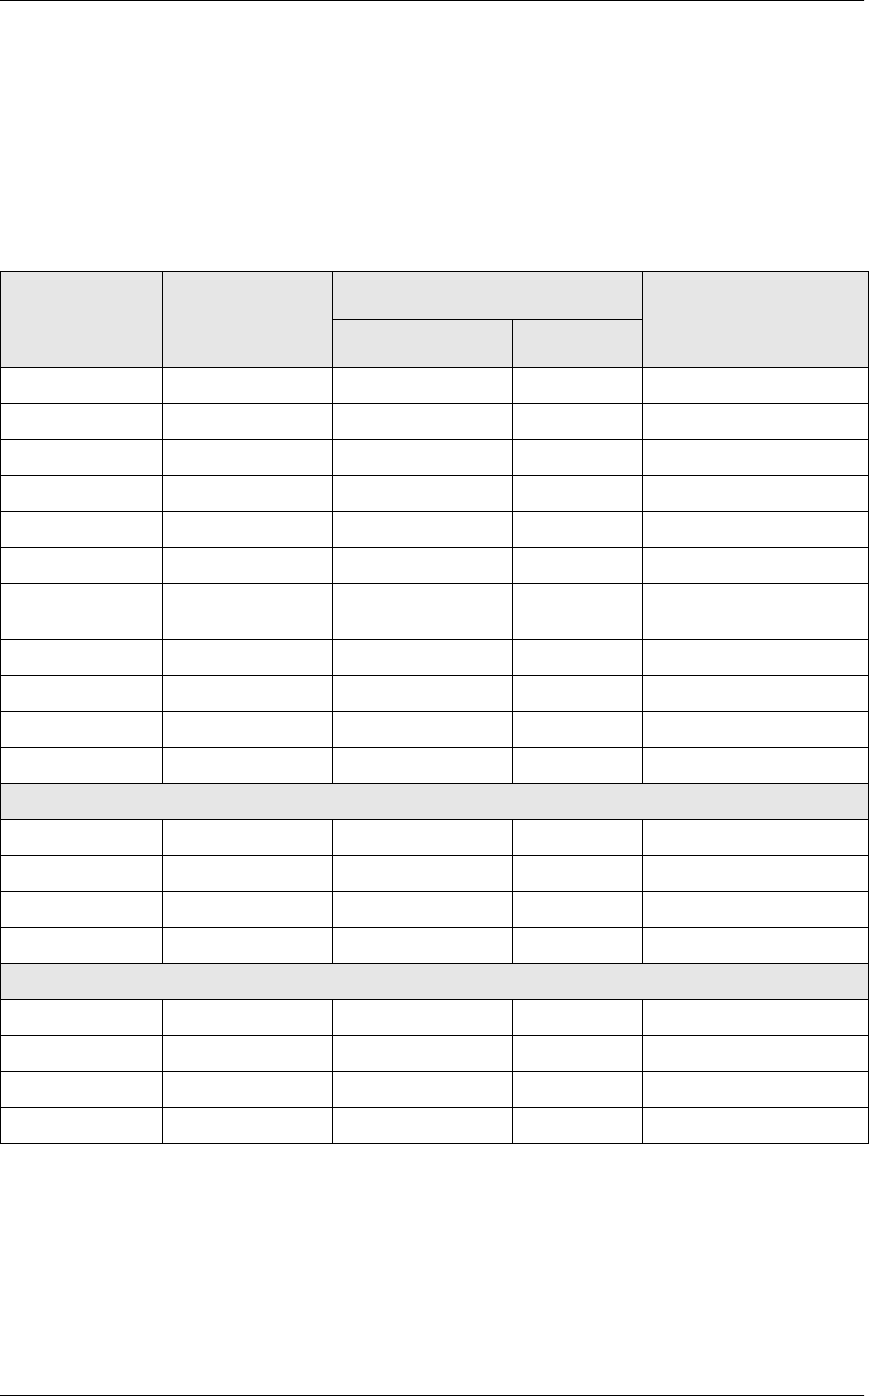
6\VWHP7LPH3HULRG6XPPDU\
Sales and Guest Profile Details
View: v_R_sys_time_period
Stored Procedure: sp_R_time_period
The following table lists each column in the Sales and Guest Profile and
provides detailed information on the source of the figures in each column.
Report
Column
Title
View
Column
Title
3700 Database Formula
Table Column
Net Sales net_sales_ttl dly_sys_tm_prd_ttl net_sls_ttl
% of Ttl @Percent_Of_Net_Total
Guests ∑ cover_count dly_sys_tm_prd_ot_ttl cov_cnt
% of Ttl @Percent_Of_Guest_Count
Avg/Guest @Average_$_Guest
Checks ∑ check_count dly_sys_tm_prd_ot_ttl chk_cnt
% of Ttl @Percent_Of_Check_Coun
t
Avg/Check @Average_$_Check
Tables ∑ table_turn_count dly_sys_tm_prd_ot_ttl tbl_turn_cnt
% of Ttl @Percent_Of_Table_Count
Avg/Table @Average_$_Table
Daily Total
Net Sales ∑ net_sales_ttl dly_sys_tm_prd_ttl net_sls_ttl
Guests ∑ cover_count dly_sys_tm_prd_ot_ttl cov_cnt
Checks ∑ check_count dly_sys_tm_prd_ot_ttl chk_cnt
Tables ∑ table_turn_count dly_sys_tm_prd_ot_ttl tbl_turn_cnt
Grand Total
Net Sales ∑ net_sales_ttl dly_sys_tm_prd_ttl net_sls_ttl
Guests ∑ cover_count dly_sys_tm_prd_ot_ttl cov_cnt
Checks ∑ check_count dly_sys_tm_prd_ot_ttl chk_cnt
Tables ∑ table_turn_count dly_sys_tm_prd_ot_ttl tbl_turn_cnt

5HSRUWV
&RQVROLGDWHG6\VWHP7LPH3HULRG6XPPDU\
Consolidated System Time Period Summary
3XUSRVH
This report provides the same information as the System Time Period
Summary Report, but for a range of business days.
)RUPDW
This report includes the following profile:
qSales and Guest Profile
The profile has been modified for this report. It does not include these
fields:
Order Type
Turn Time
7HPSODWH
TP_S104.RPT
2-26
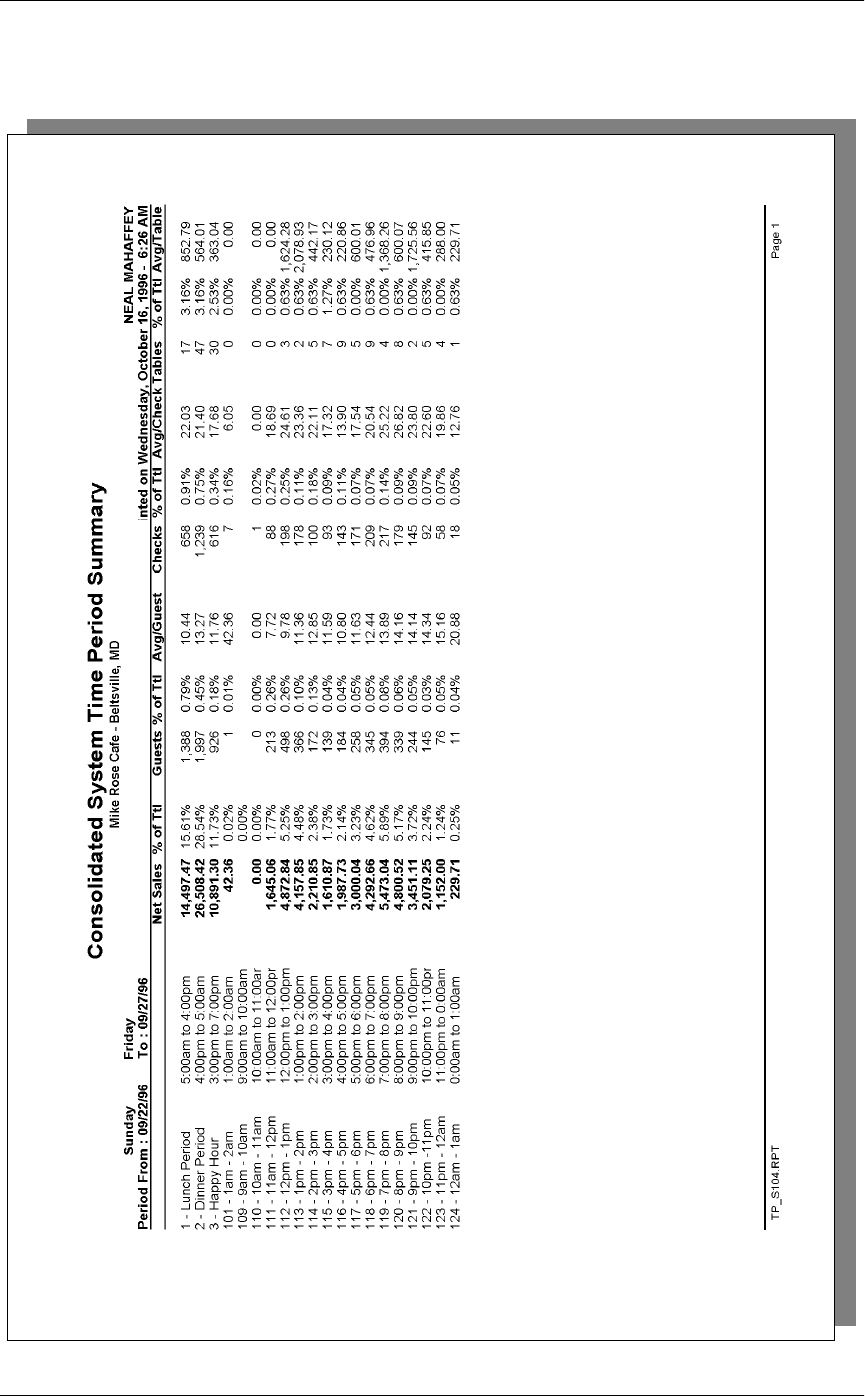
&RQVROLGDWHG6\VWHP7LPH3HULRG6XPPDU\
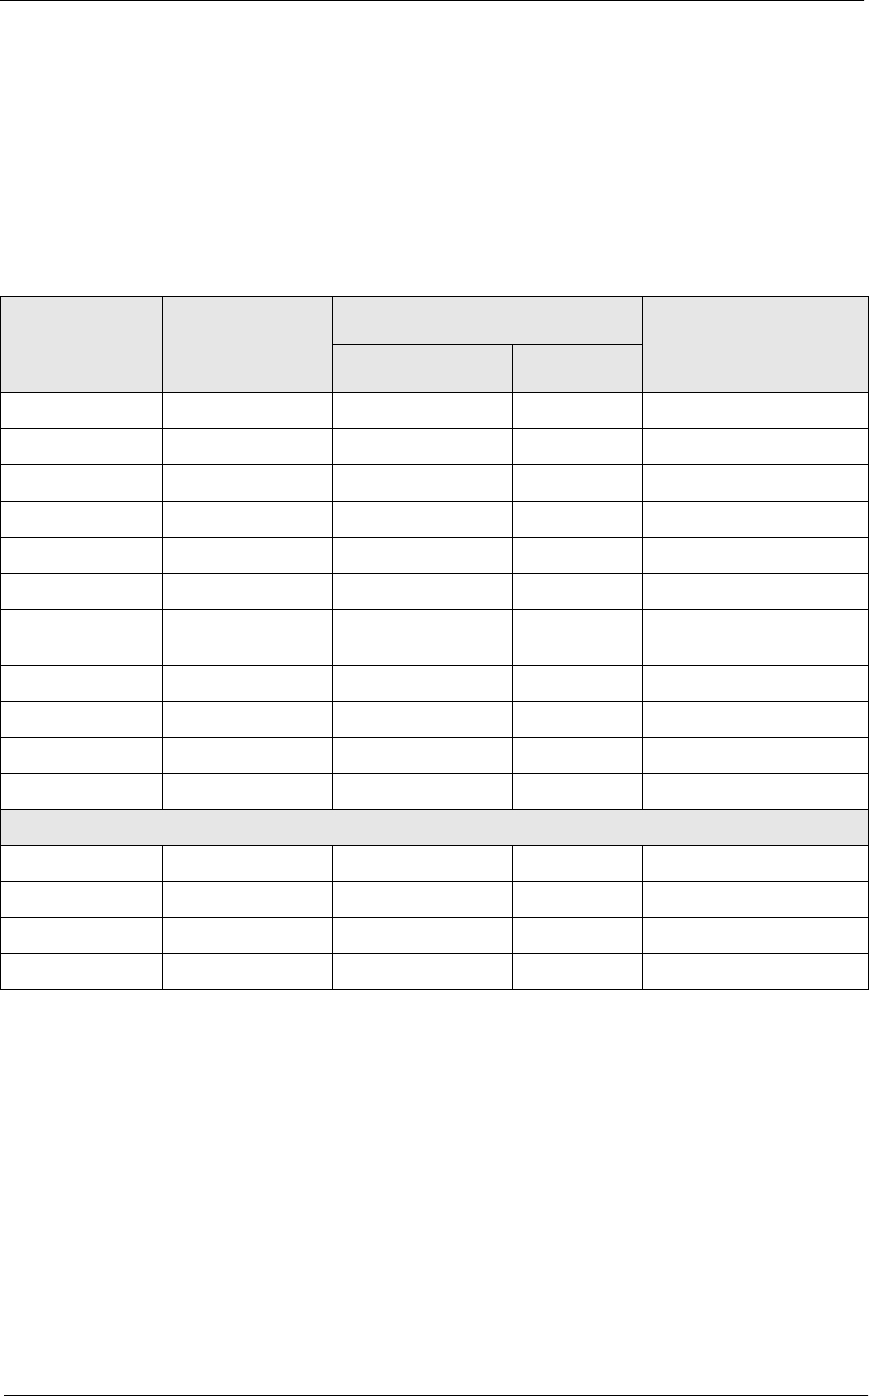
5HSRUWV
&RQVROLGDWHG6\VWHP7LPH3HULRG6XPPDU\
Sales and Guest Profile Details
Stored Procedure: sp_R_consolidated_sys_time_prd_ttls and
sp_R_time_period
This report does use any views.
The following table lists each column in the Sales and Guest Profile and
provides detailed information on the source of the figures in each column.
Report
Column Title
Stored
Procedure
Column Title
3700 Database Formula
Table Column
Net Sales net_sales_ttl dly_sys_tm_prd_ttl net_sls_ttl
% of Ttl @Percent_Of_Net_Total
Guests ∑ cover_count dly_sys_tm_prd_ot_ttl cov_cnt
% of Ttl @Percent_Of_Guest_Count
Avg/Guest @Average_$_Guest
Checks ∑ check_count dly_sys_tm_prd_ot_ttl chk_cnt
% of Ttl @Percent_Of_Check_Coun
t
Avg/Check @Average_$_Check
Tables ∑ table_turn_count dly_sys_tm_prd_ot_ttl tbl_turn_cnt
% of Ttl @Percent_Of_Table_Count
Avg/Table @Average_$_Table
Grand Total
Net Sales ∑ net_sales_ttl dly_sys_tm_prd_ttl net_sls_ttl
Guests ∑ cover_count dly_sys_tm_prd_ot_ttl cov_cnt
Checks ∑ check_count dly_sys_tm_prd_ot_ttl chk_cnt
Tables ∑ table_turn_count dly_sys_tm_prd_ot_ttl tbl_turn_cnt

&RQVROLGDWHG6\VWHP7LPH3HULRG6XPPDU\Z*UDSK
Consolidated System Time Period Summary w/Graph
3XUSRVH
This report is identical to the Consolidated System Time Period
Summary, with the addition of a graph that charts net sales by time period.
A sample report is included here. However, see page 7-43 for a complete
description of the report which includes detail tables.
)RUPDW
This report includes the following profile:
qSales and Guest Profile
The profile has been modified for this report. It does not include these
fields:
Order Type
Turn Time
7HPSODWH
TP_S204.RPT
2-26
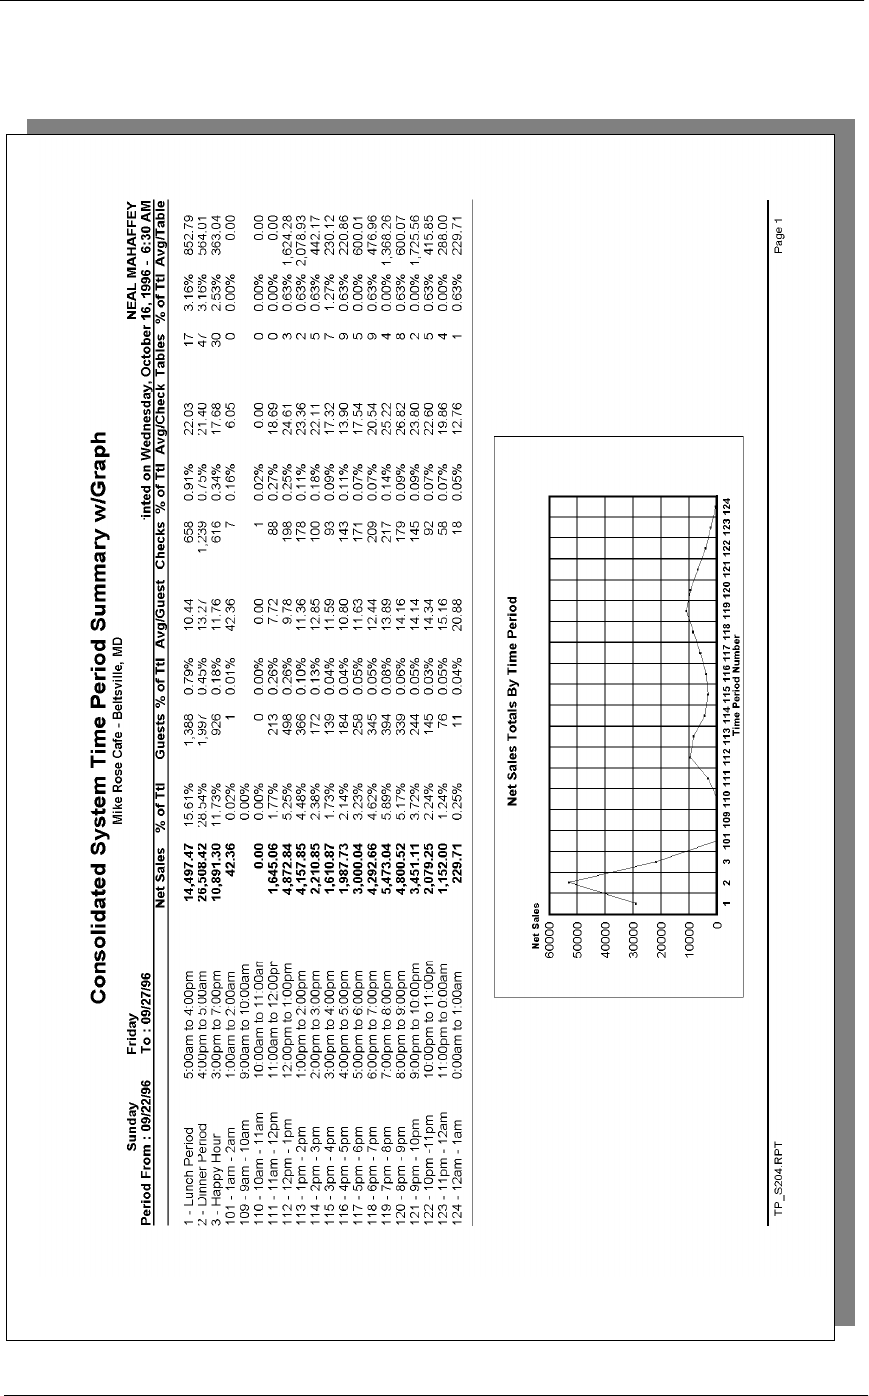
5HSRUWV
&RQVROLGDWHG6\VWHP7LPH3HULRG6XPPDU\Z*UDSK

&RQVROLGDWHG6\VWHP7LPH3HULRG6XPPDU\Z*UDSK

5HSRUWV
Chapter 8
Sales Balance Reports
This chapter gives examples and provides an explanation of all sales
balance reports.
In this chapter
Introduction ............................................................................................8-2
Daily Revenue Center Sales Detail....................................................... 8-3
Daily Revenue Center Sales Detail....................................................... 8-3
Consolidated Revenue Center Sales Detail......................................... 8-12
Daily System Sales Detail................................................................... 8-20
Consolidated System Sales Detail....................................................... 8-29

6DOHV%DODQFH5HSRUWV
,QWURGXFWLRQ
Introduction
The sales balance reports provide a wealth of information about how well
the restaurant is operating financially. They allow management to see how
effectively revenues were generated in the entire restaurant or in a given
revenue center. In addition, the reports gauge efficiency by providing
operational statistics, such as the average turn time and the average check
amount. In general, the sales balance reports act as a report card for each
revenue center, the system, and the management.
8VLQJ6DOHV%DODQFH5HSRUWV
The potential uses of sales balance reports are practically limitless. The
information provided by the reports not only helps to summarize today’s
sales, but can also guide you in operating better tomorrow. In other words,
the reports allow you to evaluate how well today’s work was done, and to
act on the results.
(YDOXDWLQJ
Managers can use the reports to see if the day’s sales were as high as
expected. Managers will also find the sales balance reports useful in
evaluating the day’s operations and asking such questions as: Is a low net
sales total deceiving because of a correspondingly high amount of
discounts? Could sales have been higher if we turned tables faster? Is an
over-abundance of credit card payments eating into profits? Were
employee meals especially costly? Are there too many tables in this
restaurant, or too few? Was there an excessive number of returned meals?
Why are there so many voided transactions? The information provided by
sales balance reports can be used in examining these and other issues.
7DNLQJ$FWLRQ
Evaluation of the day’s operations can lead to your desired results. For
instance, you may want to limit the availability of discounts during
certain periods. You may want to change procedures so that tables can
turn faster. You may even decide to change the layout of your restaurant.
The possibilities are endless, so in general, you should realize that the
sales balance reports can help you with more than just accounting; they
are tools which can help you make informed management decisions.
5HSRUWV
6DOHV%DODQFH5HSRUWV
'DLO\5HYHQXH&HQWHU6DOHV'HWDLO
Daily Revenue Center Sales Detail
3XUSRVH
This report provides detailed sales information, as well as guest, check,
and table totals, percentages, and averages for each order type in the
revenue center. Tracking group and labor category information are also
included.
This information can be useful, for example, in balancing banks, and
comparing sales activity between outlets or departments. The report can
also be helpful for financial forecasting and determining staff
requirements.
)RUPDW
This report includes the following profiles:
qDetailed Sales and Tip Profile
The profile has been modified for this report. It includes these extra
fields:
Transferred In
Transferred Out
It does not include this field:
Non Taxable Total
qSales and Guest Profile
qTracking Group Profile
qLabor Category Profile
The profile has been modified for this report. It includes this extra
field:
% Labor/Sales
7HPSODWH
RVC_101.RPT.
Note
This report can be run as a UWS report and looks like the 40-
column Crystal Report.
2-9
2-26
2-33
2-19
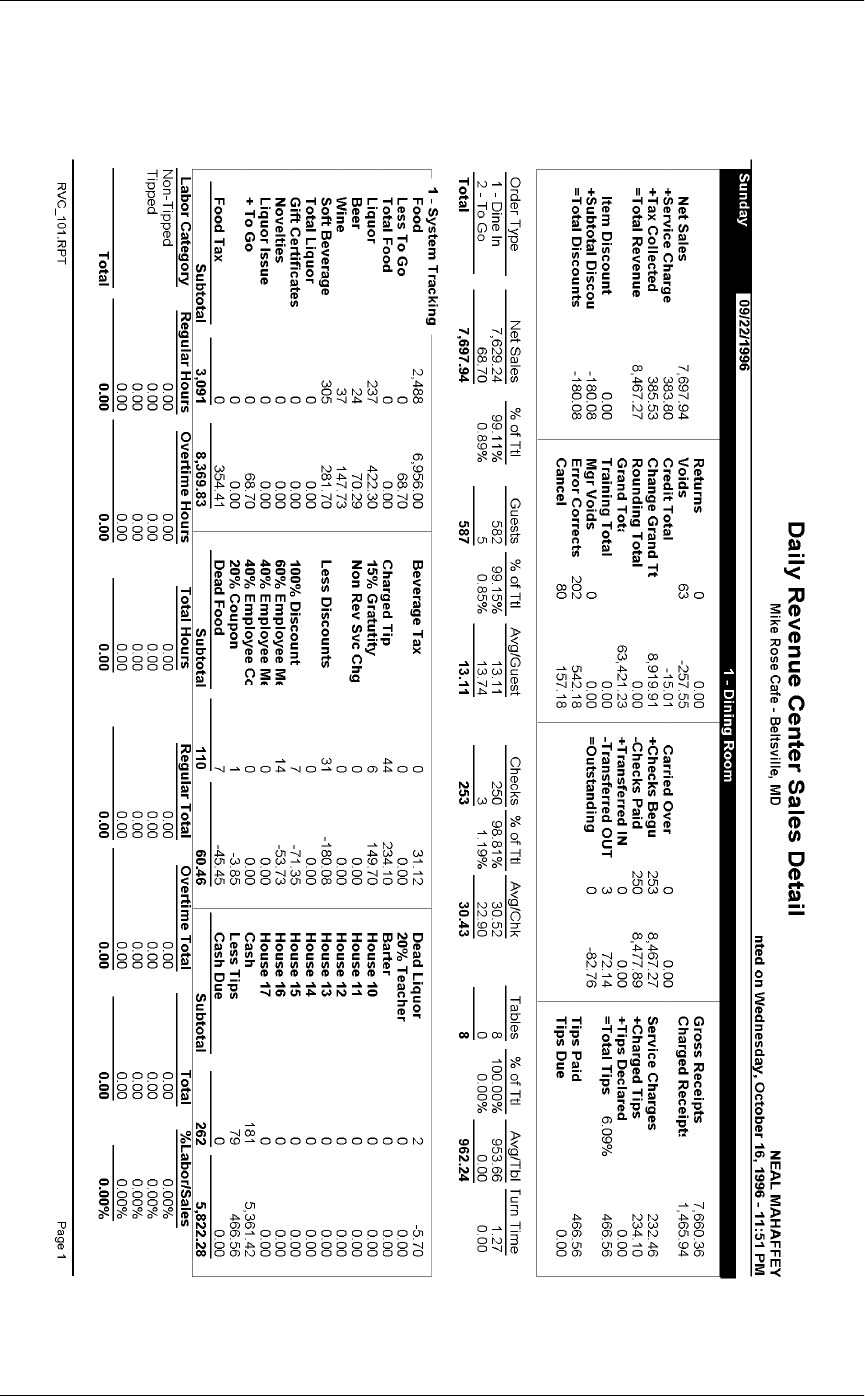
6DOHV%DODQFH5HSRUWV
'DLO\5HYHQXH&HQWHU6DOHV'HWDLO

5HSRUWV
6DOHV%DODQFH5HSRUWV
'DLO\5HYHQXH&HQWHU6DOHV'HWDLO
Daily Revenue Center Sales Detail
Daily Revenue Center Sales Detail
Mike Rose Cafe - Beltsville
Report Employee
Printed on 9/8/96 - 10:33 PM
-----------------------------------
Tuesday 9/ 3/96
1 - Dining Room
Net Sales 1,713.29
+Service Charge 29.43
+Tax Collected 70.87
=Total Revenue 1,813.59
Item Discount 0.00
+Subtotal Disc -68.05
=Total Discount -68.05
Returns 0 0.00
Voids 0 0.00
Credit Total 0.00
Change Grand Tt 1,897.59
Rounding Total 0.00
Grand Total 1,897.59
Training Total 0.00
Mgr Voids 0 0.00
Error Corr 12 164.00
Cancel 2 44.55
Carry Ove 0 0.00
+Cks Begun 32 1,813.59
-Cks Paid 31 1,802.49
+ Xfer IN 0 0.00
- Xfer OUT 0 0.00
=Outstandi 1 11.10
Gross Receipts 1,702.72
Charged Receipt 201.25
Service Charges 0.00
+Charged Tips 29.43
+Tips Declared 0.00
=Ttl Tip 1.73% 29.43
Tips Paid 29.43
Tips Due 0.00
-----------------------------------
1 - Dine In 1,713.29
Guests, Avg 128 13.39
Checks, Avg 32 53.54
Tables, Avg 26 65.90
Turn Time 1.00
Total 1,713.29
Guests, Avg 128 13.39
Checks, Avg 32 53.54
Tables, Avg 26 65.90
-----------------------------------
1 - System Tracking
Food 454 1,230.75
Less To Go 0 0.00
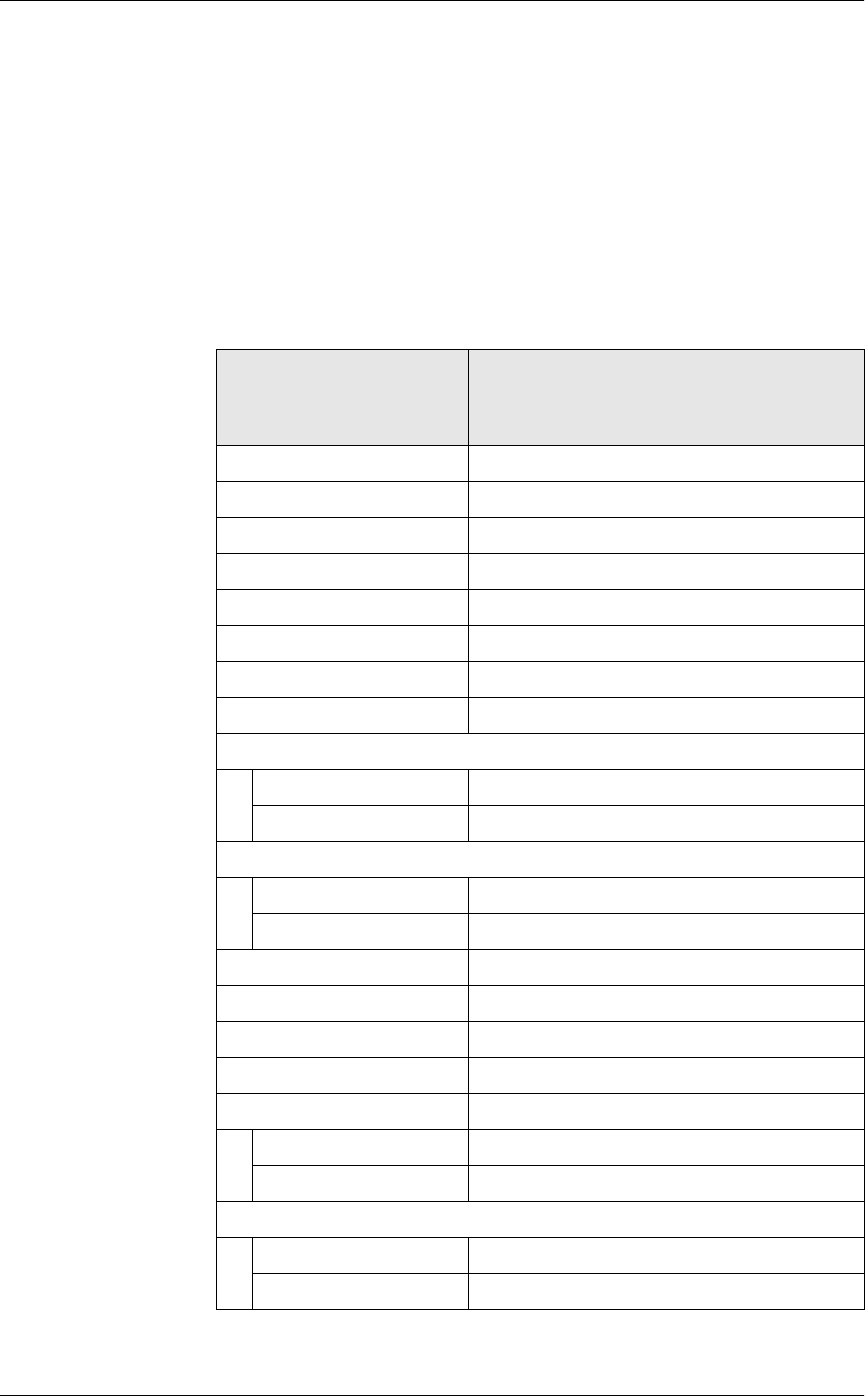
6DOHV%DODQFH5HSRUWV
'DLO\5HYHQXH&HQWHU6DOHV'HWDLO
Detailed Sales and Tip Profile Details
Views: v_R_rvc_sales and v_R_rvc_trk
Stored Procedures: sp_R_time_card_ttls and
sp_R_rvc_sales_tracking
The following table lists each column in the Detailed Sales and Tip
Profile and provides detailed information on the source of the figures.
Since all the numbers in this profile come from formulas, there is no view,
table, or column information.
Report
Field
Title Formula
Net Sales @ttl_Net_Sales
Service Charge @ttl_Service_Chg
Tax Collected @ttl_Tax_Collected
Total Revenue @ttl_Total_Revenue
Item Discount @ttl_Item_Disc
Subtotal Discount @ttl_Sbtl_Disc
Total Discount @ttl_Total_Disc
Non Taxable Total @ttl_Non_Tax
Returns
Number @ttl_Return_Qty
Value @ttl_Return_Total
Voids
Number @ttl_Void_Qty
Value @ttl_Void_Total
Credit Total @ttl_Credit_Total
Change In Grand Ttl @ttl_Change_Grand_Total
Rounding Total @ttl_Rounding_Total
Grand Total @ttl_Grand_Total
Mgr Voids
Number @ttl_Mgr_Void_Qty
Value @ttl_Mgr_Void_Total
Error Corrects
Number @ttl_Error_Correct_Qty
Value @ttl_Error_Correct_Total
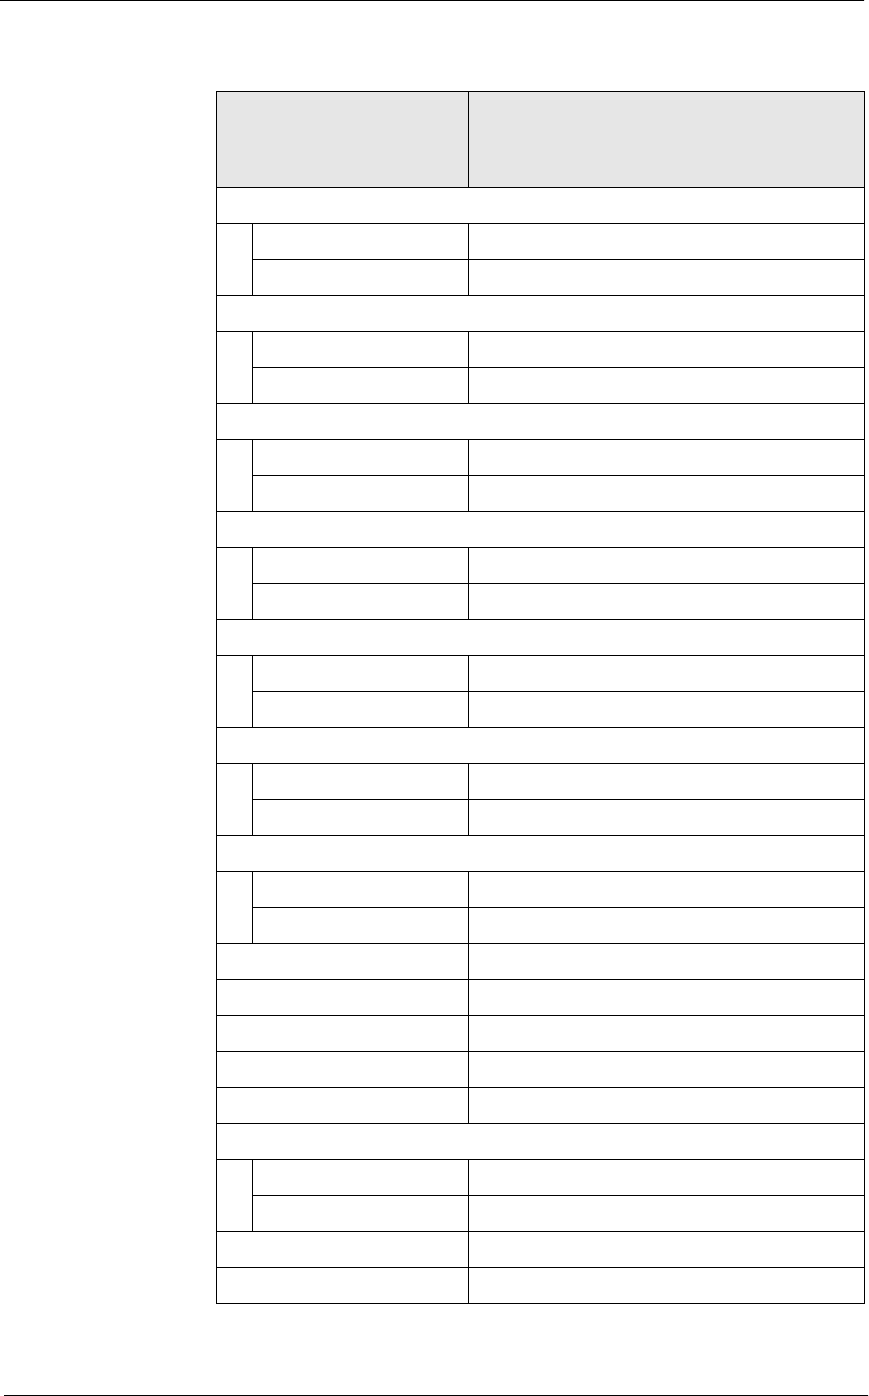
5HSRUWV
6DOHV%DODQFH5HSRUWV
'DLO\5HYHQXH&HQWHU6DOHV'HWDLO
Cancel
Number @ttl_Trans_Cancel_Qty
Value @ttl_Trans_Cancel_Total
Carried Over
Number @ttl_Carried_Over_Qty
Value @ttl_Carried_Over_Total
Checks Begun
Number @ttl_Checks_Begun_Qty
Value @ttl_Checks_Begun_Total
Checks Paid
Number @ttl_Checks_Paid_Qty
Value @ttl_Checks_Paid_Total
Transferred IN
Number @ttl_Xfer_IN_Qty
Value @ttl_Xfer_IN_Total
Transferred OUT
Number @ttl_Xfer_OUT_Qty
Value @ttl_Xfer_OUT_Total
Outstanding
Number @ttl_Outstanding_Qty
Value @ttl_Outstanding_Total
Gross Receipts @ttl_Gross_Rcpts_Total
Charged Receipts @ttl_Charged_Rcpts_Total
Service Charges @ttl_Service_Chg_Total
Charged Tips @ttl_Charged_Tips
Tips Declared @ttl_Tips_Declared
Total Tips
Percent @ttl_Tip_Percent
Value @ttl_Total_Tips
Tips Paid @ttl_Tips_Paid
Tips Due @ttl_Tips_Due
Report
Field
Title Formula
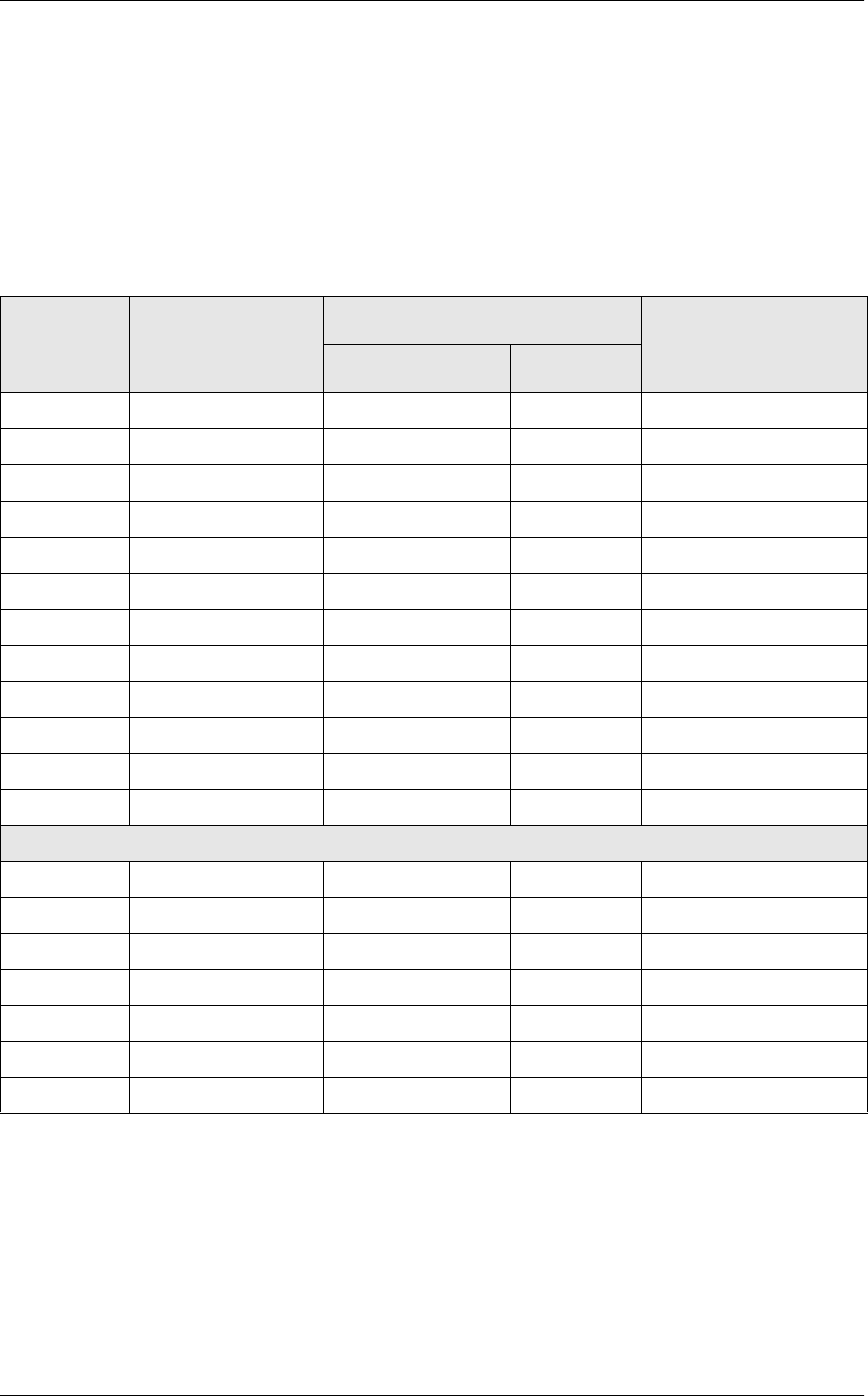
6DOHV%DODQFH5HSRUWV
'DLO\5HYHQXH&HQWHU6DOHV'HWDLO
Sales and Guest Profile Details
Views: v_R_rvc_sales and v_R_rvc_trk
Stored Procedures: sp_R_time_card_ttls and
sp_R_rvc_sales_tracking
The following table lists each field in the Sales and Guest Profile and
provides detailed information on the source of each of the figures.
Report
Column
Title
View
Column
Title
3700 Database Formula
Table Column
Net Sales ot_net_sls_ttl dly_rvc_ot_ttl net_sls_ttl
% of Ttl @Percent_Of_Net_Total
Guests cover_count dly_rvc_ot_ttl cov_cnt
% of Ttl @Percent_Of_Guest_Total
Avg/Guest @Avg_$_Guest
Checks check_count dly_rvc_ot_ttl chk_cnt
% of Ttl @Percent_Of_Check_Total
Avg/Chk @Avg_$_Check
Tables table_turn_count dly_rvc_ot_ttl tbl_turn_cnt
% of Ttl @Percent_Of_Table_Total
Avg/Tbl @Avg_$_Table
Turn Time @Avg_Turn_Time
Total
Net Sales ∑ ot_net_sales_ttl dly_rvc_ot_ttl net_sls_ttl
Guests ∑ cover_count dly_rvc_ot_ttl cov_cnt
Avg/Guest @Total_Avg_$_Guest
Checks ∑ check_count dly_rvc_ot_ttl chk_cnt
Avg/Chk @Total_Avg_$_Check
Tables ∑ table_turn_count dly_rvc_ot_ttl tbl_turn_cnt
Avg/Tbl @Total_Avg_$_Table
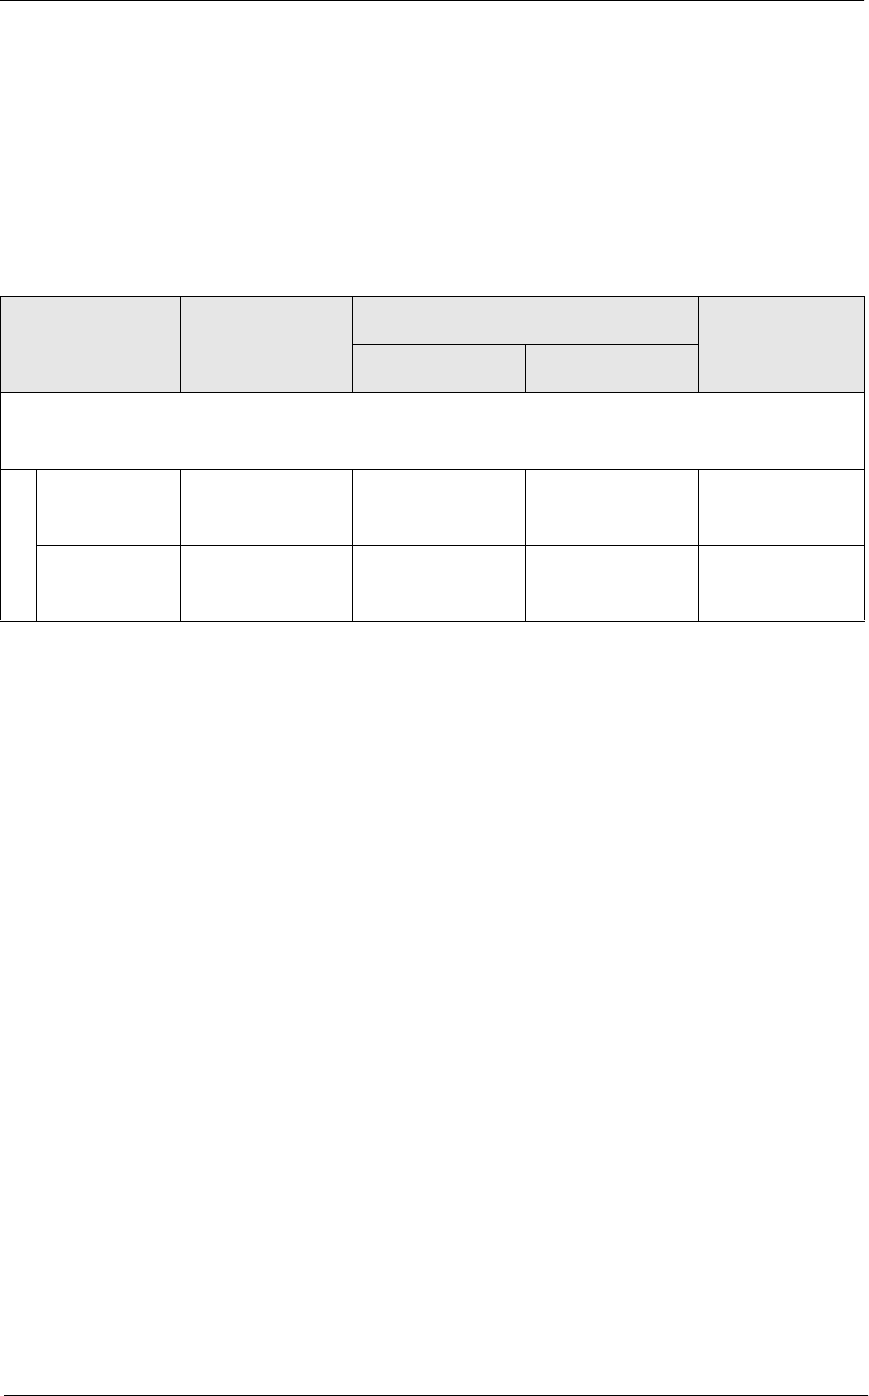
5HSRUWV
6DOHV%DODQFH5HSRUWV
'DLO\5HYHQXH&HQWHU6DOHV'HWDLO
Tracking Group Profile Details
Views: v_R_rvc_sales and v_R_rvc_trk
Stored Procedures: sp_R_time_card_ttls and
sp_R_rvc_sales_tracking
The following table lists each field in the Tracking Group Profile and
provides detailed information on the source of each of the figures.
Report
Column
Title
View
Column
Title
3700 Database Formula
Table Column
Programmable1
to
Programmable42
Number trk_cnt_01
to
trk_cnt_42
dly_rvc_trk_ttl trk_cnt_01
to
trk_cnt_42
Value trk_ttl_01
to
trk_ttl_42
dly_rvc_trk_ttl trk_ttl_01
to
trk_ttl_42
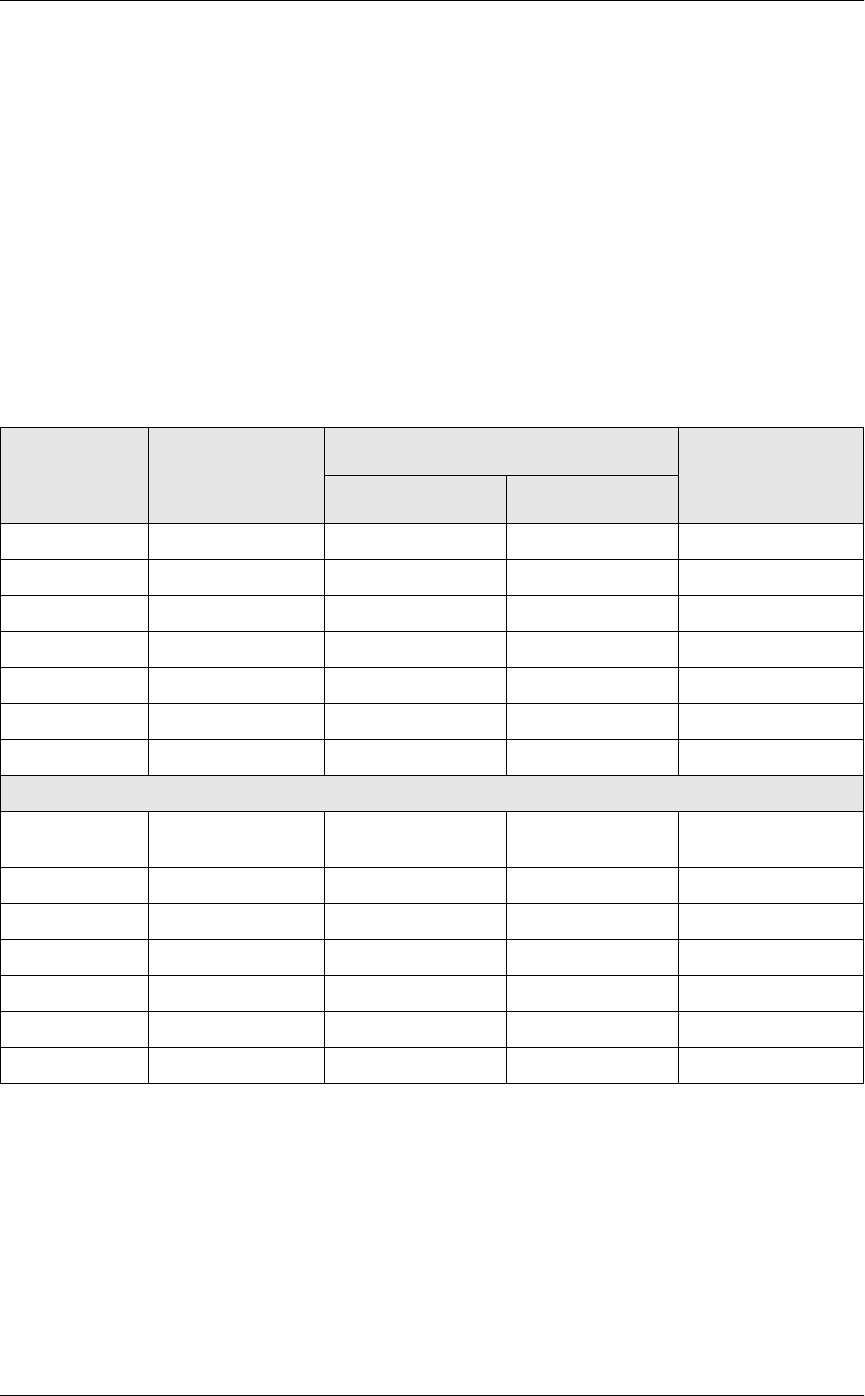
6DOHV%DODQFH5HSRUWV
'DLO\5HYHQXH&HQWHU6DOHV'HWDLO
Labor Category Profile Details
Views: v_R_rvc_sales and v_R_rvc_trk
Stored Procedures: sp_R_time_card_ttls and
sp_R_rvc_sales_tracking
The following table lists each field in the Labor Category Profile and
provides detailed information on the source of each of the figures. You
can program up to four labor categories. Each of these labor categories is
then associated with a number that is represented in the following table as
the variable #. For example, if labor category 1 is programmed as dining
room, then the regular hours for dining room staff comes from the view
column labor_cat_1_reg_hrs.
Programming Considerations
*XHVWV
qThe number of guests is determined by the seat count, the number of
specified service charges or menu items, or by the guest count entered
by the employees.
To use seat count to determine the number of guests, select RVC Seats
| Use seat count for cover count.
Report
Column
Title
View
Column
Title
3700 Database Formula
Table Column
Regular Hours labor_cat_
#
_reg_hrs dly_rvc_tm_prd_ttl labor_cat_
#
_reg_hrs
Overtime Hours labor_cat_
#
_ovt_hrs dly_rvc_tm_prd_ttl labor_cat_
#
_ovt_hrs
Total Hours @ttl_Total_Hours_#
Regular Total labor_cat_
#
_reg_ttl dly_rvc_tm_prd_ttl labor_cat_
#
_reg_ttl
Overtime Total labor_cat_
#
_ovt_ttl dly_rvc_tm_prd_ttl labor_cat_
#
_ovt_ttl
Total @ttl_Total_#
%Labor/Sales @ttl_%Labor_#
Total
Regular Hours @ttl_Total_Reg_Hour
s
Overtime Hours @ttl_Total_Ovt_Hours
Total Hours @ttl_Total_Hours
Regular Total @ttl_Total_Reg_Total
Overtime Total @ttl_Total_Ovt_Total
Total @ttl_Total
%Labor/Sales @ttl_%Labor_Total

5HSRUWV
6DOHV%DODQFH5HSRUWV
'DLO\5HYHQXH&HQWHU6DOHV'HWDLO
To use a service charge to determine the number of guests, select
Discount/Service | Discount/Service Charge | Post to cover count.
To use specified menu items to determine the number of guests, select
Menu Item Classes | Price/Totals | Add to cover count. Then assign
this menu item class to the menu items that will determine the guest
count.
If none of these options is selected, the System will use the guest
count entered by employees when beginning checks as the guest
count.
Notes
*HQHUDO
The sum of the figures on all revenue center reports should add up, line by
line, to equal the figures on the Daily System Sales Detail Report. For
example, if there are two revenue centers in the system, restaurant and
bar, the Net Sales on the system report will equal restaurant Net Sales plus
bar Net Sales.
&KHFN7UDQVIHUV
The sum of checks transferred out in all revenue centers will equal the
sum of all checks transferred in.
For example, in a system with three revenue centers, the number of
checks transferred out is 6 + 2 + 1 = 9. The number of checks transferred
in is 5 + 0 + 4 = 9. The totals are the same.
&KHFNV2XWVWDQGLQJ
The sum of all checks outstanding in the revenue center will equal the
sum of all open checks in the revenue center at the time of the report.
7XUQ7LPH
If the average table turn time does not seem reasonable, check the date
and time of the UWSs in this revenue center using a manager procedure.
For example, if a check were begun by table number on UWS 1 at 1:00
p.m., and tendered at UWS 2 at 1:30 p.m., then the table turn time for that
check would be 30 minutes. But if the clock in UWS 2 read 2:30 p.m., one
hour ahead of UWS 1, then the table turn time for that check would be 90
minutes. If the clock in UWS 2 were one hour behind UWS 1 (reading
12:30 when the clock in UWS 1 reads 1:30) then the table turn time would
be negative 30 minutes (printed as 30-).
If a table is actually turned in thirty minutes, but the check is not closed
for another three hours, average table turn time will not be correct.
Table turns longer than four hours are not included in the average table
turn.
6DOHV%DODQFH5HSRUWV
&RQVROLGDWHG5HYHQXH&HQWHU6DOHV'HWDLO
Consolidated Revenue Center Sales Detail
3XUSRVH
This report provides the same information as the Revenue Center Sales
Detail Report, but for a range of business days.
)RUPDW
This report includes the following profiles:
qDetailed Sales and Tip Profile
The profile has been modified for this report. It includes these extra
fields:
Transferred In
Transferred Out
It does not include this field:
Non Taxable Total
qSales and Guest Profile
qTracking Group Profile
qLabor Category Profile
The profile has been modified for this report. It includes this extra
field:
% Labor/Sales
7HPSODWH
RVC_102.RPT
2-9
2-26
2-33
2-19
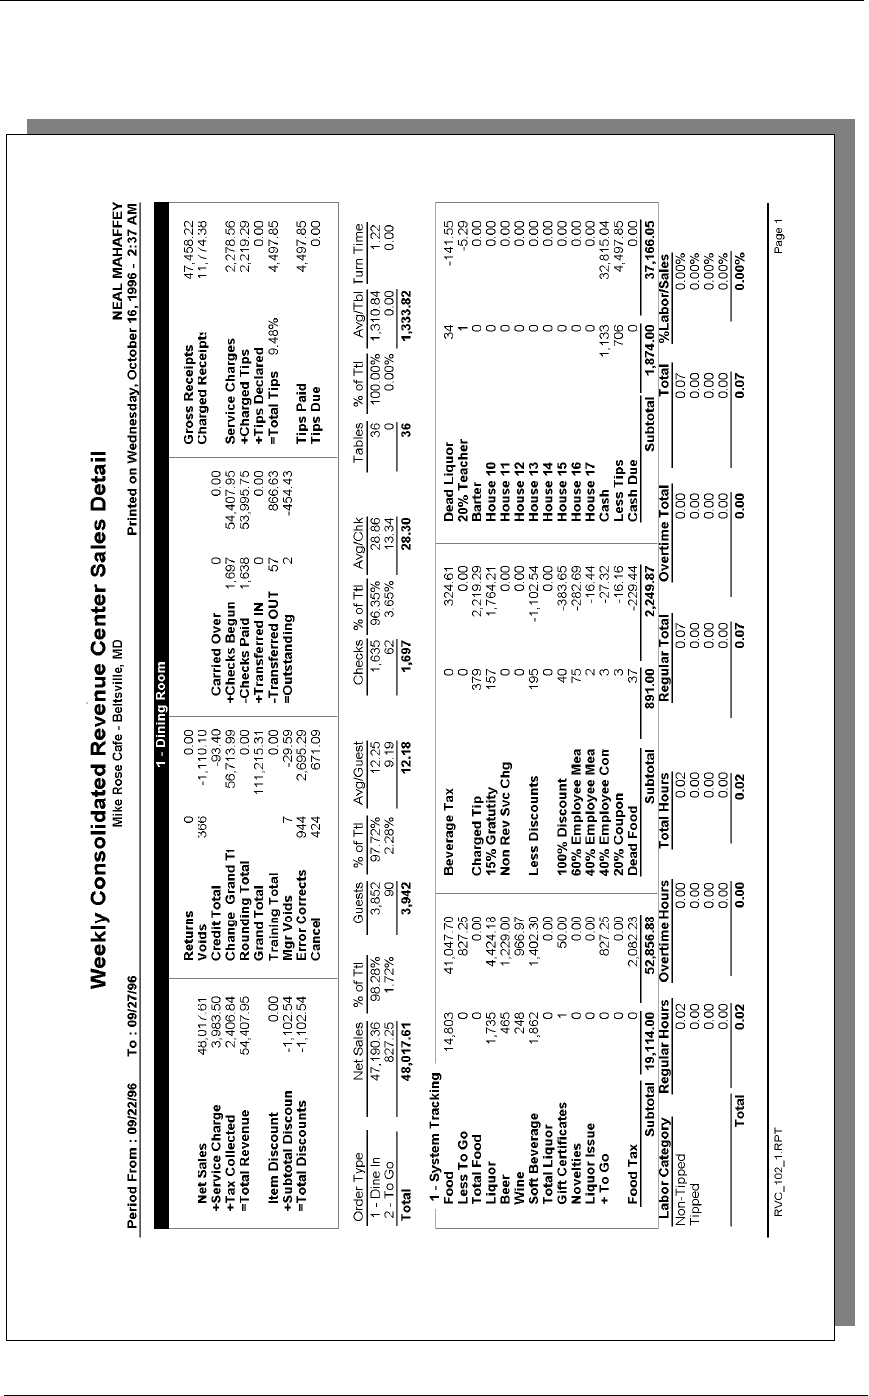
5HSRUWV
6DOHV%DODQFH5HSRUWV
&RQVROLGDWHG5HYHQXH&HQWHU6DOHV'HWDLO

6DOHV%DODQFH5HSRUWV
&RQVROLGDWHG5HYHQXH&HQWHU6DOHV'HWDLO
Detailed Sales and Tip Profile Details
Stored Procedures: sp_R_time_card_ttls, sp_R_cons_rvc_ttls, and
sp_R_rvc_sales_tracking
This report does not use any views.
The following table lists each column in the Detailed Sales and Tip
Profile and provides detailed information on the source of the figures.
Since all the numbers in this profile come from formulas, there is no view,
table, or column information.
Report
Field
Title Formula
Net Sales @ttl_Net_Sales
Service Charge @ttl_Service_Chg
Tax Collected @ttl_Tax_Collected
Total Revenue @ttl_Total_Revenue
Item Discount @ttl_Item_Disc
Subtotal Discount @ttl_Sbtl_Disc
Total Discount @ttl_Total_Disc
Returns
Number @ttl_Return_Qty
Value @ttl_Return_Total
Voids
Number @ttl_Void_Qty
Value @ttl_Void_Total
Credit Total @ttl_Credit_Total
Change In Grand Ttl @ttl_Change_Grand_Total
Rounding Total @ttl_Rounding_Total
Grand Total @ttl_Grand_Total
Training @ttl_training_
Mgr Voids
Number @ttl_Mgr_Void_Qty
Value @ttl_Mgr_Void_Total
Error Corrects
Number @ttl_Error_Correct_Qty
Value @ttl_Error_Correct_Total

5HSRUWV
6DOHV%DODQFH5HSRUWV
&RQVROLGDWHG5HYHQXH&HQWHU6DOHV'HWDLO
Cancel
Number @ttl_Trans_Cancel_Qty
Value @ttl_Trans_Cancel_Total
Carried Over
Number @ttl_Carried_Over_Qty
Value @ttl_Carried_Over_Total
Checks Begun
Number @ttl_Checks_Begun_Qty
Value @ttl_Checks_Begun_Total
Checks Paid
Number @ttl_Checks_Paid_Qty
Value @ttl_Checks_Paid_Total
Transferred IN
Number @ttl_Xfer_IN_Qty
Value @ttl_Xfer_IN_Total
Transferred OUT
Number @ttl_Xfer_OUT_Qty
Value @ttl_Xfer_OUT_Total
Outstanding
Number @ttl_Outstanding_Qty
Value @ttl_Outstanding_Total
Gross Receipts @ttl_Gross_Rcpts_Total
Charged Receipts @ttl_Charged_Rcpts_Total
Service Charges @ttl_Service_Chg_Total
Charged Tips @ttl_Charged_Tips
Tips Declared @ttl_Tips_Declared
Total Tips
Percent @ttl_Tip_Percent
Value @ttl_Total_Tips
Tips Paid @ttl_Tips_Paid
Tips Due @ttl_Tips_Due
Report
Field
Title Formula

6DOHV%DODQFH5HSRUWV
&RQVROLGDWHG5HYHQXH&HQWHU6DOHV'HWDLO
Sales and Guest Profile Details
Stored Procedures: sp_R_time_card_ttls, sp_R_cons_rvc_ttls, and
sp_R_rvc_sales_tracking
This report does not use any views.
The following table lists each field in the Sales and Guest Profile and
provides detailed information on the source of each of the figures.
Report
Column
Title
Stored Procedure
Column
Title
3700 Database Formula
Table Column
Net Sales ot_net_sls_ttl dly_rvc_ot_ttl ot_net_sls_ttl
% of Ttl @Percent_Of_Net_Total
Guests cover_count dly_rvc_ot_ttl cov_cnt
% of Ttl @Percent_Of_Guest_Total
Avg/Guest @Avg_$_Guest
Checks check_count dly_rvc_ot_ttl check_cnt
% of Ttl @Percent_Of_Check_Total
Avg/Chk @Avg_$_Check
Tables table_turn_count dly_rvc_ot_ttl table_turn_cnt
% of Ttl @Percent_Of_Table_Total
Avg/Tbl @Avg_$_Table
Turn Time @Avg_Turn_Time
Total
Net Sales ∑ ot_net_sales_ttl dly_rvc_ot_ttl net_sls_ttl
Guests ∑ cover_count dly_rvc_ot_ttl cov_cnt
Avg/Guest @Total_Avg_$_Guest
Checks ∑ check_count dly_rvc_ot_ttl chk_cnt
Avg/Chk @Total_Avg_$_Check
Tables ∑ table_turn_count dly_rvc_ot_ttl tbl_turn_cnt
Avg/Tbl @Total_Avg_$_Table
5HSRUWV
6DOHV%DODQFH5HSRUWV
&RQVROLGDWHG5HYHQXH&HQWHU6DOHV'HWDLO
Tracking Group Profile Details
Stored Procedures: sp_R_time_card_ttls, sp_R_cons_rvc_ttls, and
sp_R_rvc_sales_tracking
This report does not use any views.
The following table lists each field in the Tracking Group Profile and
provides detailed information on the source of each of the figures.
Report
Column
Title
Stored
Procedure
Column
Title
3700 Database
Formula
Table Column
Programmable1
to
Programmable42
Number trk_cnt_01
to
trk_cnt_42
dly_rvc_trk_ttl trk_cnt_01
to
trk_cnt_42
Value trk_ttl_01
to
trk_ttl_42
dly_rvc_trk_ttl trk_ttl_01
to
trk_ttl_42
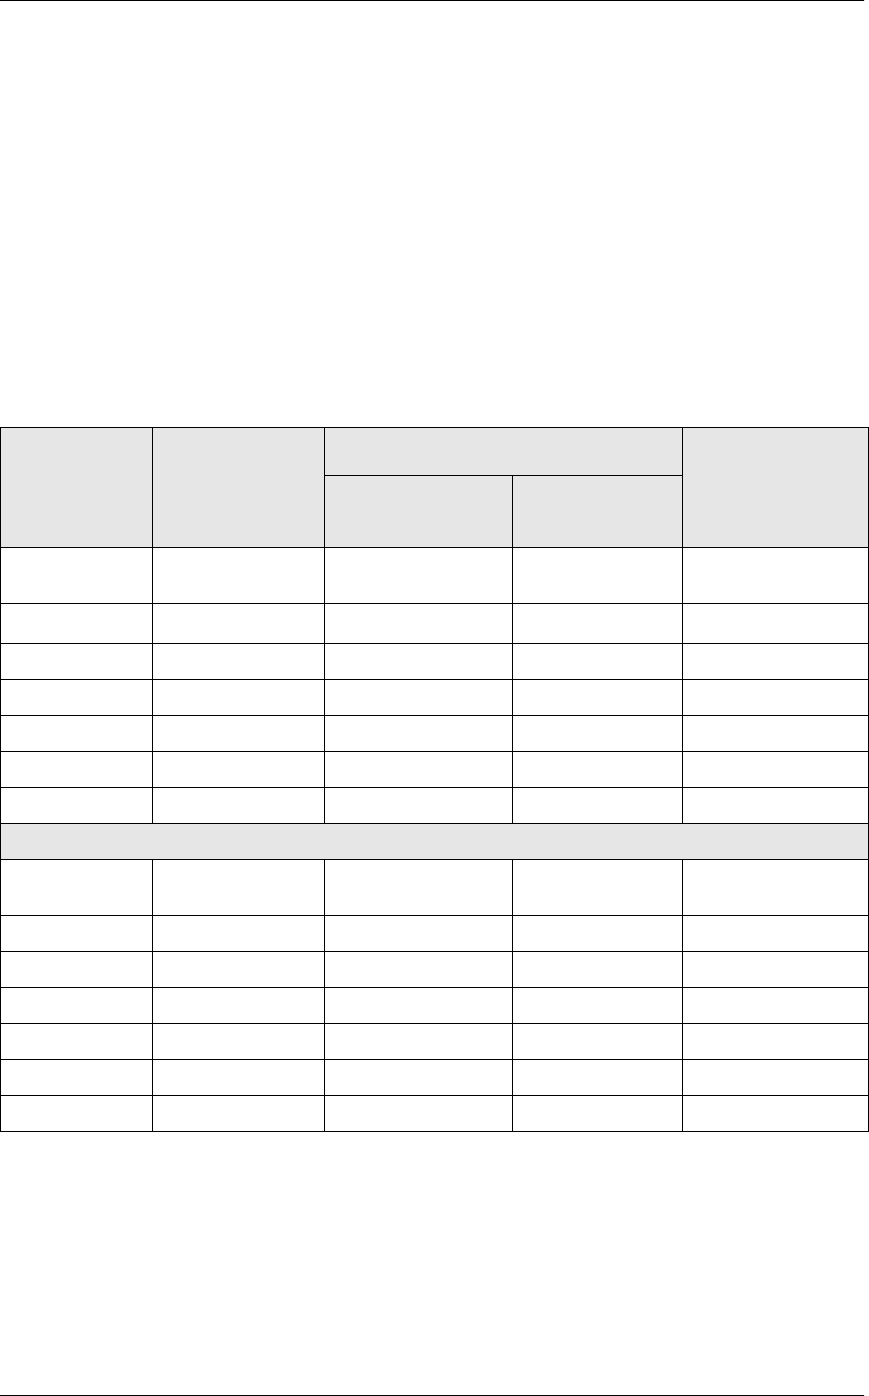
6DOHV%DODQFH5HSRUWV
&RQVROLGDWHG5HYHQXH&HQWHU6DOHV'HWDLO
Labor Category Profile Details
Stored Procedures: sp_R_time_card_ttls, sp_R_cons_rvc_ttls, and
sp_R_rvc_sales_tracking
This report does not use any views.
The following table lists each field in the Labor Category Profile and
provides detailed information on the source of each of the figures. You
can program up to four labor categories. Each of these labor categories is
then associated with a number that is represented in the following table as
the variable #. For example, if labor category 1 is programmed as dining
room, then the regular hours for dining room staff comes from the view
column labor_cat_1_reg_hrs.
Programming Considerations
*XHVWV
qThe number of guests is determined by the seat count, the number of
specified service charges or menu items, or by the guest count entered
by the employees.
Report
Column
Title
Stored
Procedure
Column
Title
3700 Database
Formula
Table Column
Regular Hours labor_cat_
#
_reg_hrs dly_rvc_ttl labor_cat_
#
_reg_hr
s
Overtime Hours labor_cat_
#
_ovt_hrs dly_rvc_ttl labor_cat_
#
_ovt_hrs
Total Hours @ttl_Total_Hours_
#
Regular Total labor_cat_
#
_reg_ttl dly_rvc_ttl labor_cat_
#
_reg_ttl
Overtime Total labor_cat_
#
_ovt_ttl dly_rvc_ttl labor_cat_
#
_ovt_ttl
Total @ttl_Total_
#
%Labor/Sales @ttl_%Labor_
#
Total
Regular Hours @ttl_Total_Reg_Hour
s
Overtime Hours @ttl_Total_Ovt_Hours
Total Hours @ttl_Total_Hours
Regular Total @ttl_Total_Reg_Total
Overtime Total @ttl_Total_Ovt_Total
Total @ttl_Total
%Labor/Sales @ttl_%Labor_Total

5HSRUWV
6DOHV%DODQFH5HSRUWV
&RQVROLGDWHG5HYHQXH&HQWHU6DOHV'HWDLO
To use seat count to determine the number of guests, select RVC Seats
| Use seat count for cover count.
To use a service charge to determine the number of guests, select
Discount/Service | Discount/Service Charge | Post to cover count.
To use specified menu items to determine the number of guests, select
Menu Item Classes | Price/Totals | Add to cover count. Then assign
this menu item class to the menu items that will determine the guest
count.
If none of these options is selected, the System will use the guest
count entered by employees when beginning checks as the guest
count.
Notes
*HQHUDO
The sum of the figures on all revenue center reports should add up, line by
line, to equal the figures on the Consolidated System Sales Detail Report
for the same period. For example, if there are two revenue centers in the
system, restaurant and bar, the Net Sales on the system report will equal
restaurant Net Sales plus bar Net Sales.
&KHFN7UDQVIHUV
The sum of checks transferred out in all revenue centers will equal the
sum of all checks transferred in.
For example, in a system with three revenue centers, the number of
checks transferred out is 6 + 2 + 1 = 9. The number of checks transferred
in is 5 + 0 + 4 = 9. The totals are the same.
7XUQ7LPH
If the average table turn time does not seem reasonable, check the date
and time of the UWSs in this revenue center.
For example, if a check were begun by table number on UWS 1 at 1:00
p.m., and tendered at UWS 2 at 1:30 p.m., then the table turn time for that
check would be 30 minutes. But if the clock in UWS 2 read 2:30 p.m., one
hour ahead of UWS 1, then the table turn time for that check would be 90
minutes. If the clock in UWS 2 were one hour behind UWS 1 (reading
12:30 when the clock in UWS 1 reads 1:30) then the table turn time would
be negative 30 minutes (printed as 30-).
Table turns longer than four hours are not included in the average table
turn. However, if a table was actually turned in thirty minutes, but the
check was not closed for three hours longer, average table turn time will
not be correct.
6DOHV%DODQFH5HSRUWV
'DLO\6\VWHP6DOHV'HWDLO
Daily System Sales Detail
3XUSRVH
This report provides detailed sales information, as well as guest, check,
and table totals, percentages, and averages for each order type in the
system. Tracking group and labor category information are also included.
)RUPDW
This report includes the following profiles:
qDetailed Sales and Tip Profile
The profile has been modified for this report. It does not include this
field:
Non Taxable Total
qSales and Guest Profile
qTracking Group Profile
qLabor Category Profile
The profile has been modified for this report. It includes this extra
field:
% Labor/Sales
7HPSODWH
SYS_101.RPT.
Note
This report can be run as a UWS report and looks like the 40-
column Crystal Report.
2-9
2-26
2-33
2-19
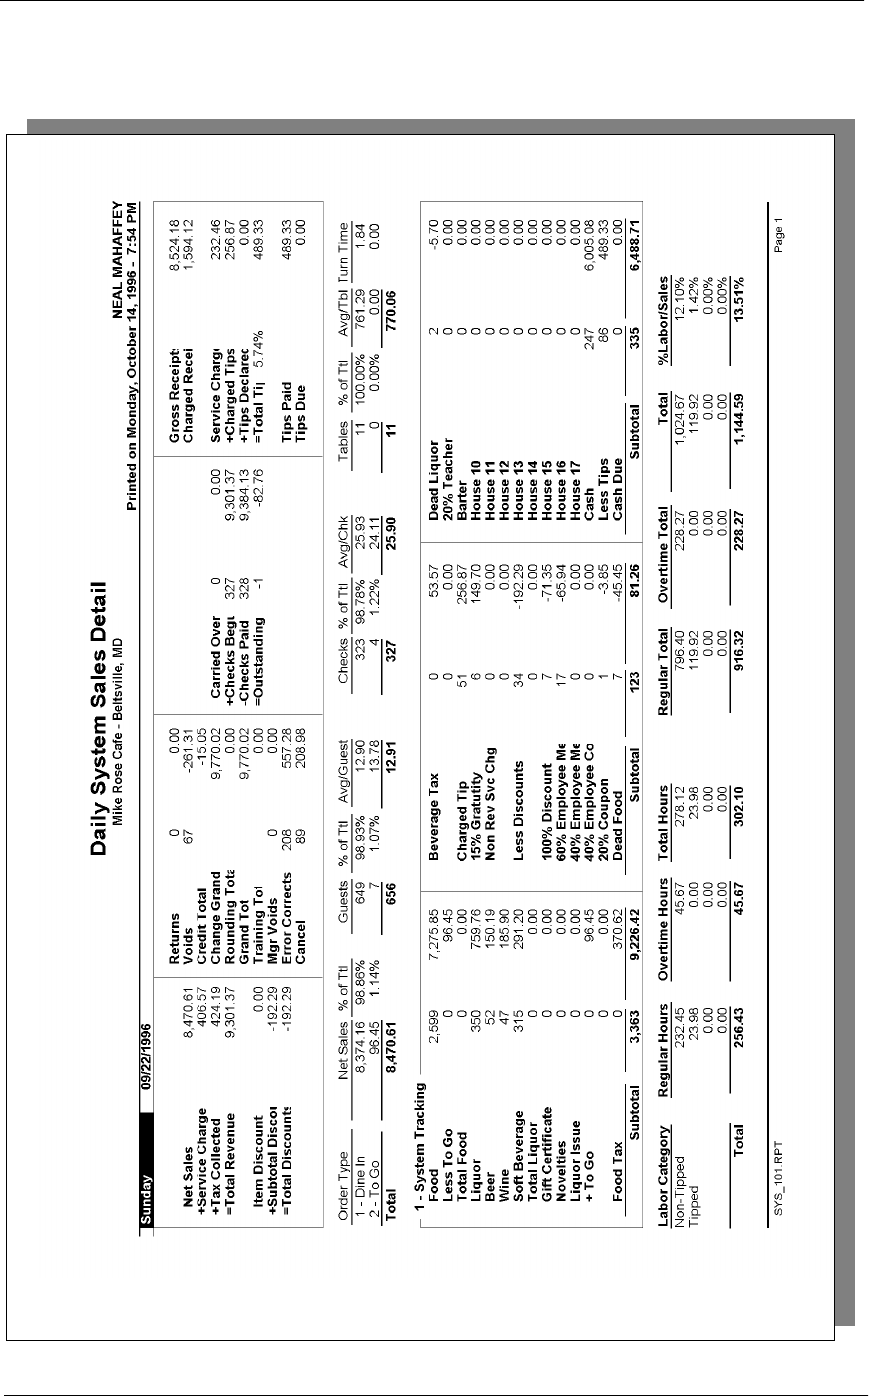
5HSRUWV
6DOHV%DODQFH5HSRUWV
'DLO\6\VWHP6DOHV'HWDLO
6DOHV%DODQFH5HSRUWV
'DLO\6\VWHP6DOHV'HWDLO
Daily System Sales Detail
Daily System Sales Detail
Mike Rose Cafe - Beltsville, MD
NEAL MAHAFFEY
Printed on 10/16/1996 - 12:49
----------------------------------------
S u n d a y 9 / 2 2 / 1 9 9 6
Net Sales 8,470.61
+Service Charge 406.57
+Tax Collected 424.19
=Total Revenue 9,301.37
Item Discount 0.00
+Subtotal Disc -192.29
=Total Discount -192.29
Returns 0 0.00
Voids 67 -261.31
Credit Total -15.05
Change Grand Tt 9,770.02
Rounding Total 0.00
Grand Total 9,770.02
Training Total 0.00
Mgr Voids 0 0.00
Error Corr 208 557.28
Cancel 89 208.98
Carry Ove 0 0.00
+Cks Begun 327 9,301.37
-Cks Paid 328 9,384.13
=Outstandi -1 -82.76
Gross Receipts 8,524.18
Charged Receipt 1,594.12
Service Charges 232.46
+Charged Tips 256.87
+Tips Declared 0.00
=Ttl Tip 5.74% 489.33
Tips Paid 489.33
Tips Due 0.00
1 - Dine In 8,374.16
Guests, Avg 649 12.90
Checks, Avg 323 25.93
Tables, Avg 11 761.29
Turn Time 1.84
2 - To Go 96.45
Guests, Avg 7 13.78
Checks, Avg 4 24.11
Tables, Avg 0 0.00
Turn Time 0.00
Total 8,470.61
Guests, Avg 656 12.91
Checks, Avg 327 25.90
Tables, Avg 11 770.06
----------------------------------------
1 - System Tracking
Hours Pay Labor/
Non-Tipped Sales
Reg 232.45 796.40
Ovt 45.67 228.27
Ttl 278.12 1,024.67 12.10%
Tipped
Reg 23.98 119.92
Ovt 0.00 0.00
Ttl 23.98 119.92 1.42%
Reg 0.00 0.00
Ovt 0.00 0.00
Ttl 0.00 0.00 0.00%
Reg 0.00 0.00
Ovt 0.00 0.00
Ttl 0.00 0.00 0.00%
Total Labor
Reg 256.43 916.32
Ovt 45.67 228.27
Ttl 302.10 1,144.59 13.51%
========================================
Totals omitted for
display

5HSRUWV
6DOHV%DODQFH5HSRUWV
'DLO\6\VWHP6DOHV'HWDLO
Detailed Sales and Tip Profile Details
Views: v_R_sys_sales and v_R_sys_trk
Stored Procedures: sp_R_time_card_ttls and
sp_R_sys_sales_tracking
The following table lists each column in the Detailed Sales and Tip
Profile and provides detailed information on the source of the figures.
Since all the numbers in this profile come from formulas, there is no view,
table, or column information.
Report
Field
Title
View
Column
Title
3700 Database Formula
Table Column
Net Sales @ttl_Net_Sales
Service Charge @ttl_Service_Chg
Tax Collected @ttl_Tax_Collected
Total Revenue @ttl_Total_Revenue
Item Discount @ttl_Item_Disc
Subtotal Discount @ttl_Sbtl_Disc
Total Discount @ttl_Total_Disc
Non Taxable Total non_txbl_ttl dly_sys_ttl non_txbl_ttl
Returns
Number @ttl_Return_Qty
Value @ttl_Return_Total
Voids
Number @ttl_Void_Qty
Value @ttl_Void_Total
Credit Total @ttl_Credit_Total
Change In Grand Ttl @ttl_Change_Grand_Total
Rounding Total @ttl_Rounding_Total
Grand Total grand_total dly_sys_ttl grand_ttl
Mgr Voids
Number @ttl_Mgr_Void_Qty
Value @ttl_Mgr_Void_Total
Error Corrects
Number @ttl_Error_Correct_Qty
Value @ttl_Error_Correct_Total

6DOHV%DODQFH5HSRUWV
'DLO\6\VWHP6DOHV'HWDLO
Cancel
Number @ttl_Trans_Cancel_Qty
Value @ttl_Trans_Cancel_Total
Carried Over
Number @ttl_Carried_Over_Qty
Value @ttl_Carried_Over_Total
Checks Begun
Number @ttl_Checks_Begun_Qty
Value @ttl_Checks_Begun_Total
Checks Paid
Number @ttl_Checks_Paid_Qty
Value @ttl_Checks_Paid_Total
Outstanding
Number @ttl_Outstanding_Qty
Value @ttl_Outstanding_Total
Gross Receipts @ttl_Gross_Rcpts_Total
Charged Receipts @ttl_Charged_Rcpts_Total
Service Charges @ttl_Service_Chg_Total
Charged Tips @ttl_Charged_Tips
Tips Declared @ttl_Tips_Declared
Total Tips
Percent @ttl_Tip_Percent
Value @ttl_Total_Tips
Tips Paid @ttl_Tips_Paid
Tips Due @ttl_Tips_Due
Report
Field
Title
View
Column
Title
3700 Database Formula
Table Column

5HSRUWV
6DOHV%DODQFH5HSRUWV
'DLO\6\VWHP6DOHV'HWDLO
Sales and Guest Profile Details
Views: v_R_sys_sales and v_R_sys_trk
Stored Procedures: sp_R_time_card_ttls and
sp_R_sys_sales_tracking
The following table lists each field in the Sales and Guest Profile and
provides detailed information on the source of each of the figures.
Report
Column
Title
View
Column
Title
3700 Database Formula
Table Column
Net Sales ot_net_sls_ttl dly_sys_ot_ttl net_sls_ttl
% of Ttl @Percent_Of_Net_Total
Guests cover_count dly_sys_ot_ttl cov_cnt
% of Ttl @Percent_Of_Guest_Total
Avg/Guest @Avg_$_Guest
Checks check_count dly_sys_ot_ttl chk_cnt
% of Ttl @Percent_Of_Check_Total
Avg/Chk @Avg_$_Check
Tables table_turn_count dly_sys_ot_ttl tbl_turn_cnt
% of Ttl @Percent_Of_Table_Total
Avg/Tbl @Avg_$_Table
Turn Time @Avg_Turn_Time
Total
Net Sales ∑ ot_net_sales_ttl dly_sys_ot_ttl net_sls_ttl
Guests ∑ cover_count dly_sys_ot_ttl cov_cnt
Avg/Guest @Total_Avg_$_Guest
Checks ∑ check_count dly_sys_ot_ttl chk_cnt
Avg/Chk @Total_Avg_$_Check
Tables ∑ table_turn_count dly_sys_ot_ttl tbl_turn_cnt
Avg/Tbl @Total_Avg_$_Table
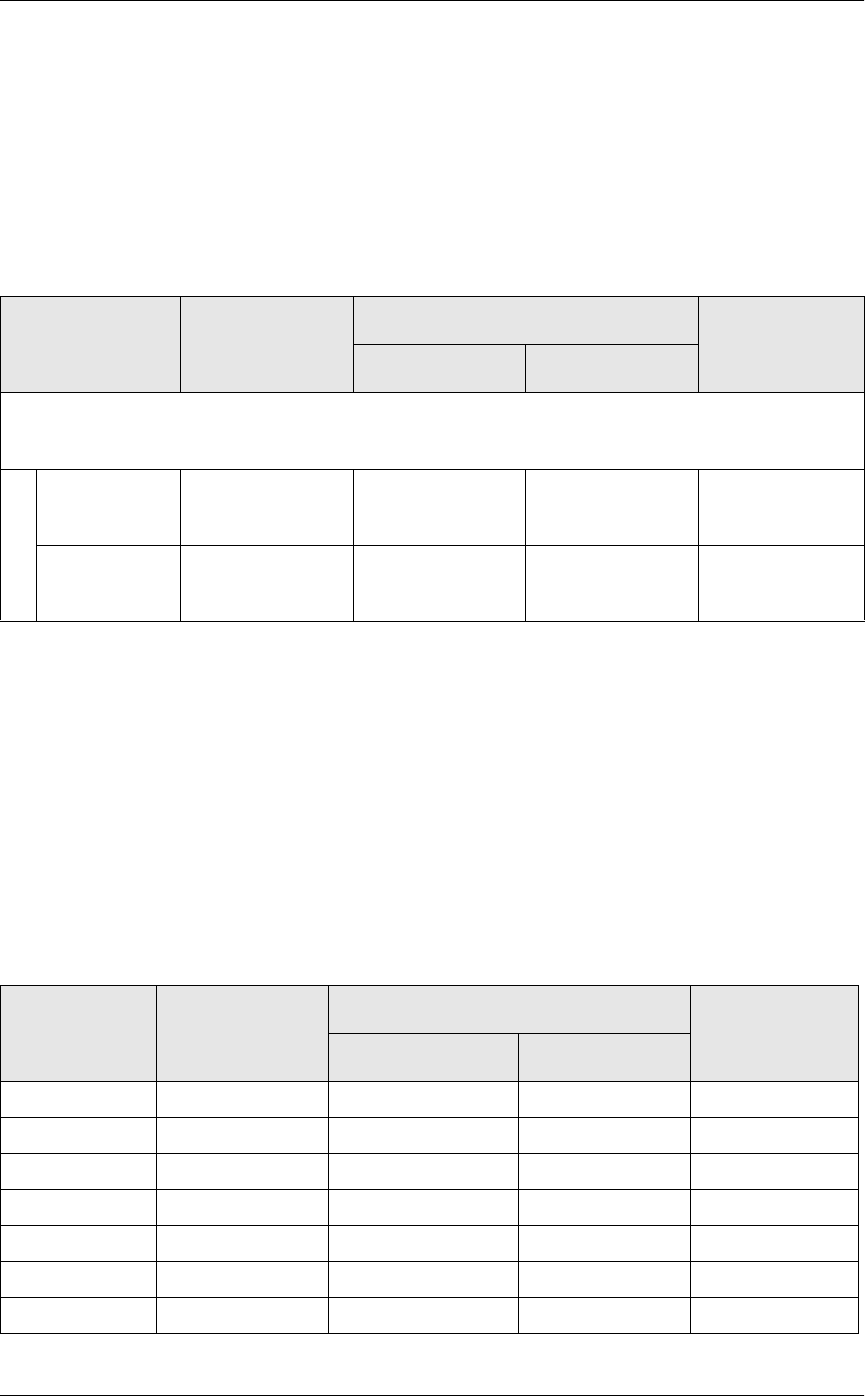
6DOHV%DODQFH5HSRUWV
'DLO\6\VWHP6DOHV'HWDLO
Tracking Group Profile Details
Views: v_R_sys_sales and v_R_sys_trk
Stored Procedures: sp_R_time_card_ttls and
sp_R_sys_sales_tracking
The following table lists each field in the Tracking Group Profile and
provides detailed information on the source of each of the figures.
Labor Category Profile Details
Views: v_R_sys_sales and v_R_sys_trk
Stored Procedures: sp_R_time_card_ttls and
sp_R_sys_sales_tracking
The following table lists each field in the Labor Category Profile and
provides detailed information on the source of each of the figures. You
can program up to four labor categories. Each of these labor categories is
then associated with a number that is represented in the following table as
the variable #. For example, if labor category 1 is programmed as dining
room, then the regular hours for dining room staff comes from the view
column labor_cat_1_reg_hrs.
Report
Column
Title
View
Column
Title
3700 Database Formula
Table Column
Programmable1
to
Programmable42
Number trk_cnt_01
to
trk_cnt_42
dly_sys_trk_ttl trk_cnt_01
to
trk_cnt_42
Value trk_ttl_01
to
trk_ttl_42
dly_sys_trk_ttl trk_ttl_01
to
trk_ttl_42
Report
Column
Title
View
Column
Title
3700 Database Formula
Table Column
Regular Hours labor_cat_
#
_reg_hrs dly_rvc_tm_prd_ttl labor_cat_
#
_reg_hrs
Overtime Hours labor_cat_
#
_ovt_hrs dly_rvc_tm_prd_ttl labor_cat_
#
_ovt_hrs
Total Hours @ttl_Total_Hours_#
Regular Total labor_cat_
#
_reg_ttl dly_rvc_tm_prd_ttl labor_cat_
#
_reg_ttl
Overtime Total labor_cat_
#
_ovt_ttl dly_rvc_tm_prd_ttl labor_cat_
#
_ovt_ttl
Total @ttl_Total_#
%Labor/Sales @ttl_%Labor_#
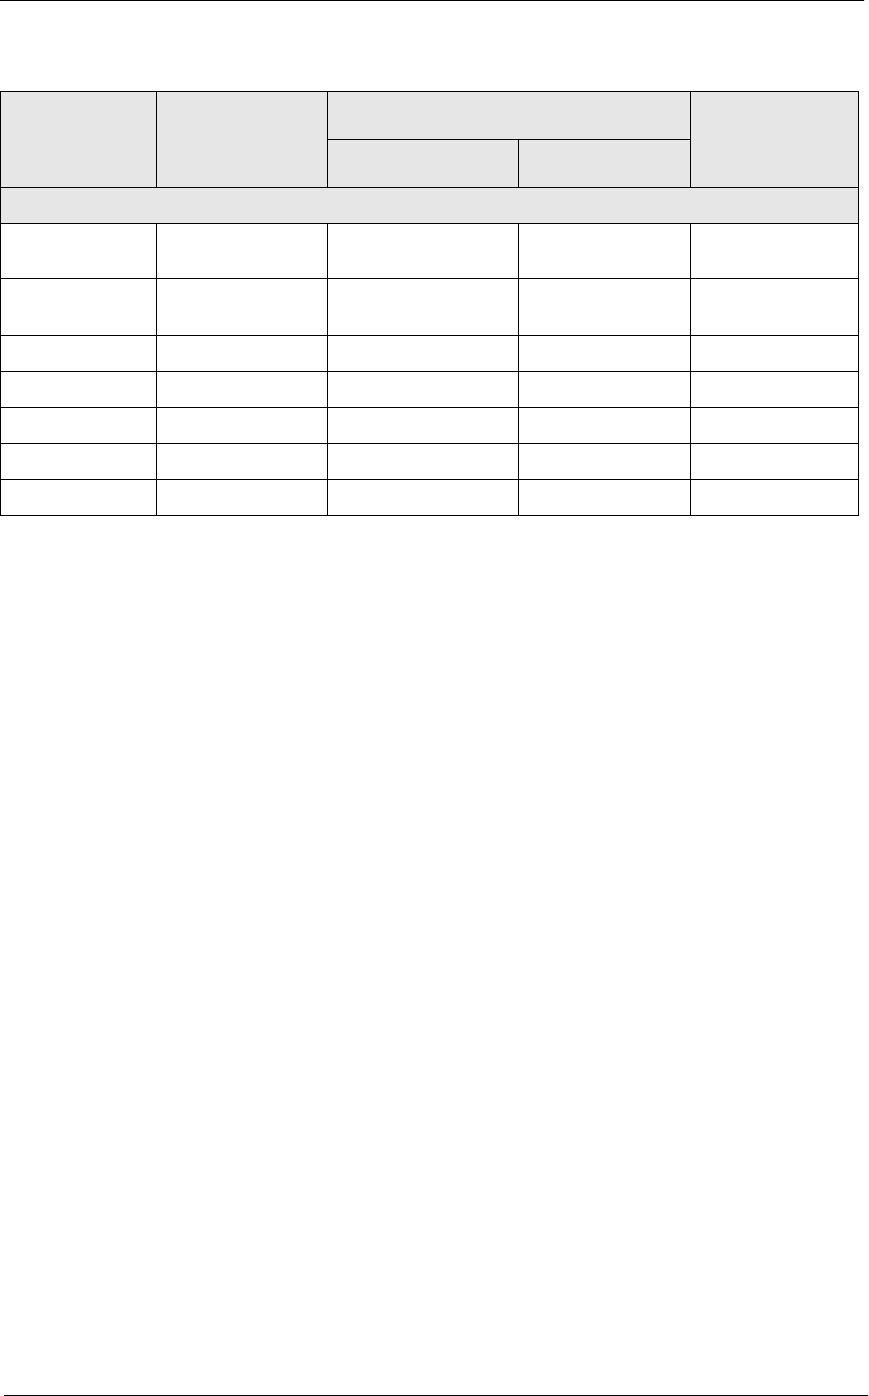
5HSRUWV
6DOHV%DODQFH5HSRUWV
'DLO\6\VWHP6DOHV'HWDLO
Programming Considerations
*XHVWV
qThe number of guests is determined by the seat count, the number of
specified service charges or menu items, or by the guest count entered
by the employees.
To use seat count to determine the number of guests, select RVC Seats
| Use seat count for cover count.
To use a service charge to determine the number of guests, select
Discount/Service | Discount/Service Charge | Post to cover count.
To use specified menu items to determine the number of guests, select
Menu Item Classes | Price/Totals | Add to cover count. Then assign
this menu item class to the menu items that will determine the guest
count.
If none of these options is selected, the System will use the guest
count entered by employees when beginning checks as the guest
count.
Notes
&KHFN7UDQVIHUV
This report does not include check transfer information because checks
are not transferred in to or out of the system.
7XUQ7LPH
If the average table turn time does not seem reasonable, check the date
and time of the UWSs in this revenue center.
Total
Regular Hours @ttl_Total_Reg_Ho
urs
Overtime Hours @ttl_Total_Ovt_Ho
urs
Total Hours @ttl_Total_Hours
Regular Total @ttl_Reg_Total
Overtime Total @ttl_Ovt_Total
Total @ttl_Total
%Labor/Sales @ttl_%Labor_Total
Report
Column
Title
View
Column
Title
3700 Database Formula
Table Column

6DOHV%DODQFH5HSRUWV
'DLO\6\VWHP6DOHV'HWDLO
For example, if a check were begun by table number on UWS 1 at 1:00
p.m., and tendered at UWS 2 at 1:30 p.m., then the table turn time for that
check would be 30 minutes. But if the clock in UWS 2 read 2:30 p.m., one
hour ahead of UWS 1, then the table turn time for that check would be 90
minutes. If the clock in UWS 2 were one hour behind UWS 1 (reading
12:30 when the clock in UWS 1 reads 1:30) then the table turn time would
be negative 30 minutes (printed as 30-).
Table turns longer than four hours are not included in the average table
turn. However, if a table was actually turned in thirty minutes, but the
check was not closed for three hours longer, average table turn time will
not be correct.
5HSRUWV
6DOHV%DODQFH5HSRUWV
&RQVROLGDWHG6\VWHP6DOHV'HWDLO
Consolidated System Sales Detail
3XUSRVH
This report provides the same information as the System Sales Detail
Report, but for a range of business days.
)RUPDW
This report includes the following profiles:
qDetailed Sales and Tip Profile
The profile has been modified for this report. It does not include this
field:
Non Taxable Total
qSales and Guest Profile
qTracking Group Profile
qLabor Category Profile
The profile has been modified for this report. It includes this extra
field:
% Labor/Sales
7HPSODWH
SYS_102.RPT
2-9
2-26
2-33
2-19
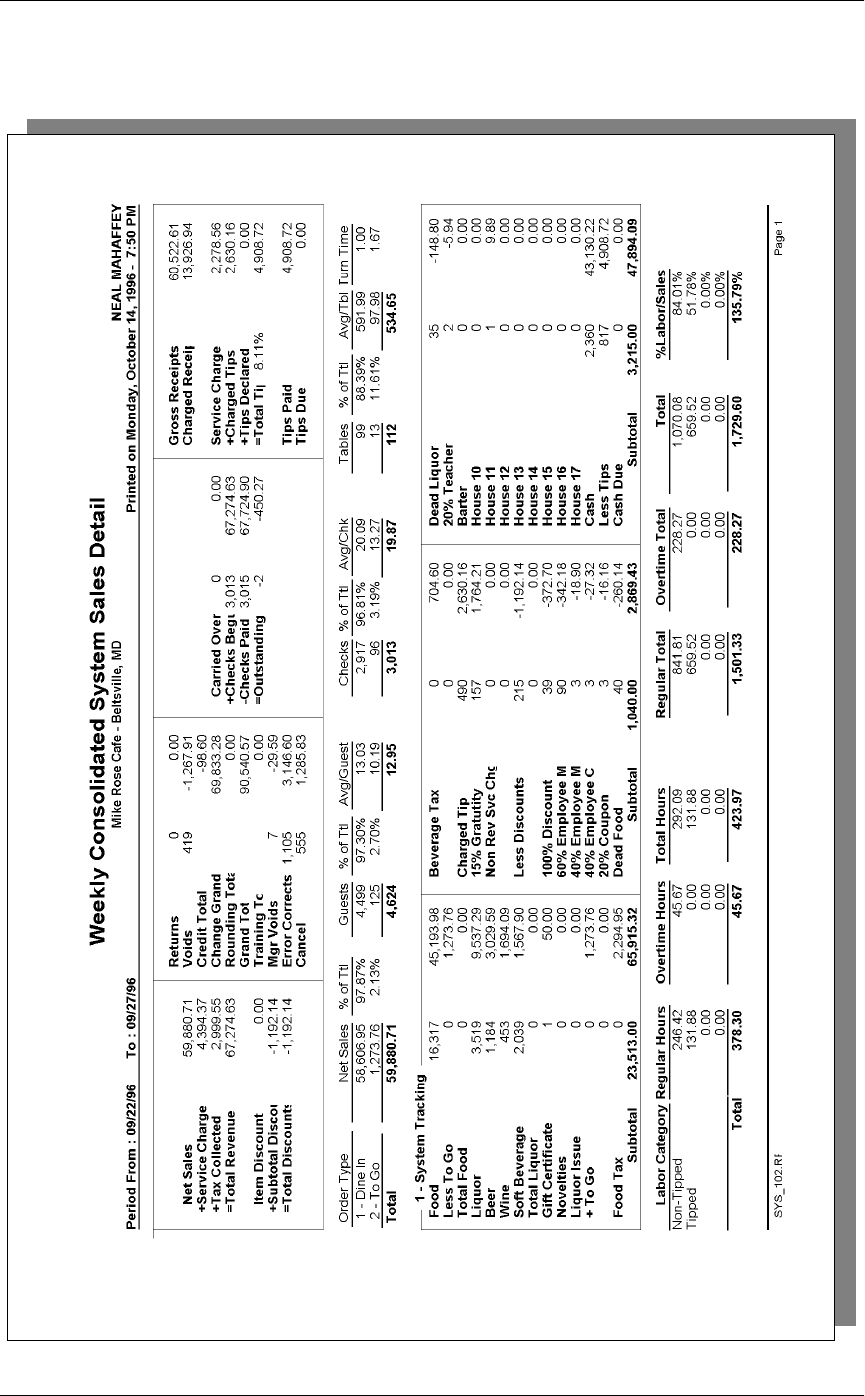
6DOHV%DODQFH5HSRUWV
&RQVROLGDWHG6\VWHP6DOHV'HWDLO
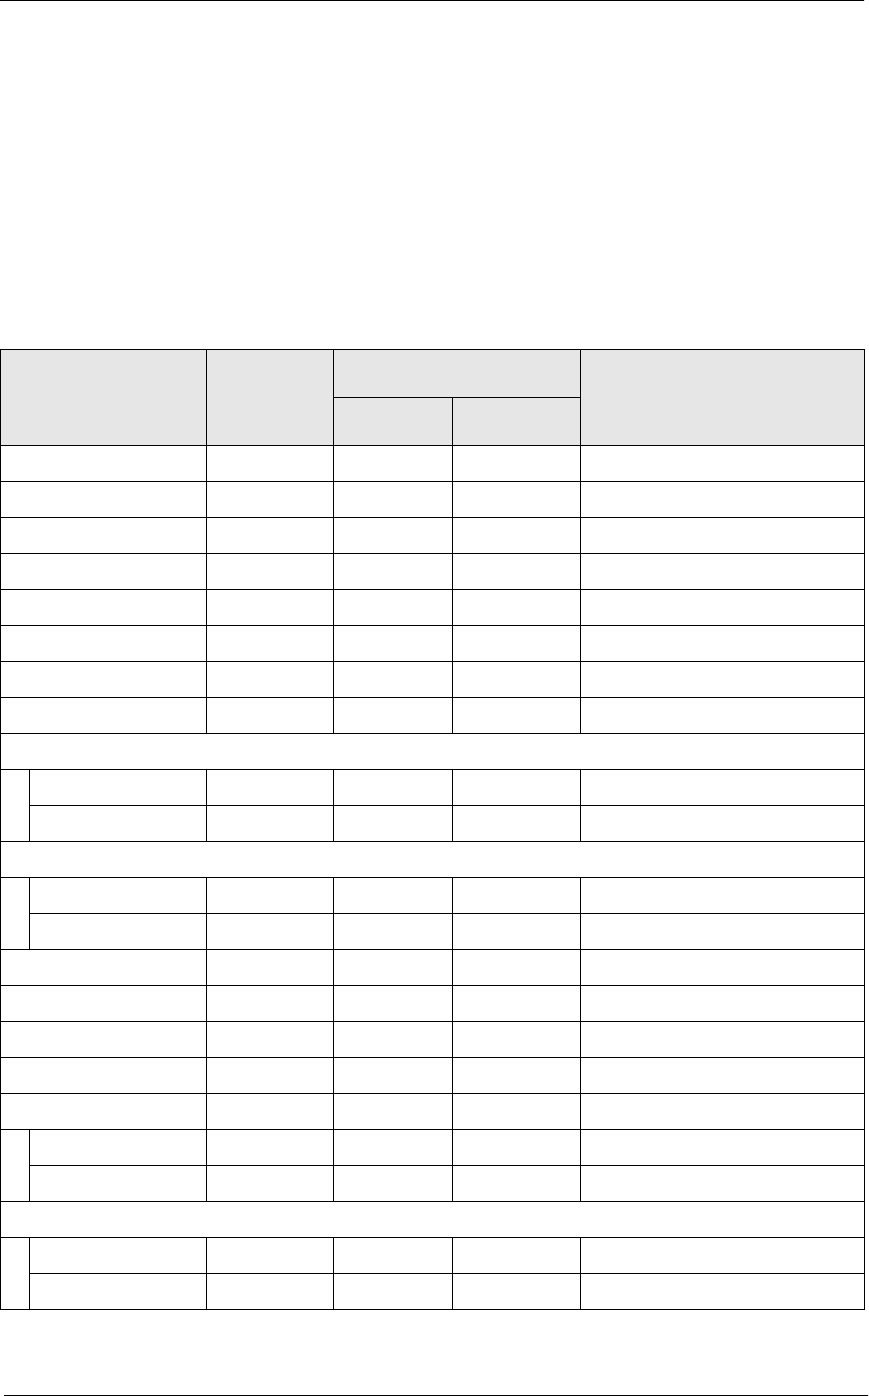
5HSRUWV
6DOHV%DODQFH5HSRUWV
&RQVROLGDWHG6\VWHP6DOHV'HWDLO
Detailed Sales and Tip Profile Details
Stored Procedures: sp_R_time_card_ttls and sp_R_cons_sys_ttls and
sp_R_sys_sales_tracking
This report does not use any views.
The following table lists each column in the Detailed Sales and Tip
Profile and provides detailed information on the source of the figures.
Since all the numbers in this profile come from formulas, there is no view,
table, or column information.
Report
Field
Title
View
Column
Title
3700 Database Formula
Table Column
Net Sales @ttl_Net_Sales
Service Charge @ttl_Service_Chg
Tax Collected @ttl_Tax_Collected
Total Revenue @ttl_Total_Revenue
Item Discount @ttl_Item_Disc
Subtotal Discount @ttl_Sbtl_Disc
Total Discount @ttl_Total_Disc
Non Taxable Total non_txbl_ttl dly_sys_ttl non_txbl_ttl
Returns
Number @ttl_Return_Qty
Value @ttl_Return_Total
Voids
Number @ttl_Void_Qty
Value @ttl_Void_Total
Credit Total @ttl_Credit_Total
Change In Grand Ttl @ttl_Change_Grand_Total
Rounding Total @ttl_Rounding_Total
Grand Total grand_total dly_sys_ttl grand_ttl
Mgr Voids
Number @ttl_Mgr_Void_Qty
Value @ttl_Mgr_Void_Total
Error Corrects
Number @ttl_Error_Correct_Qty
Value @ttl_Error_Correct_Total
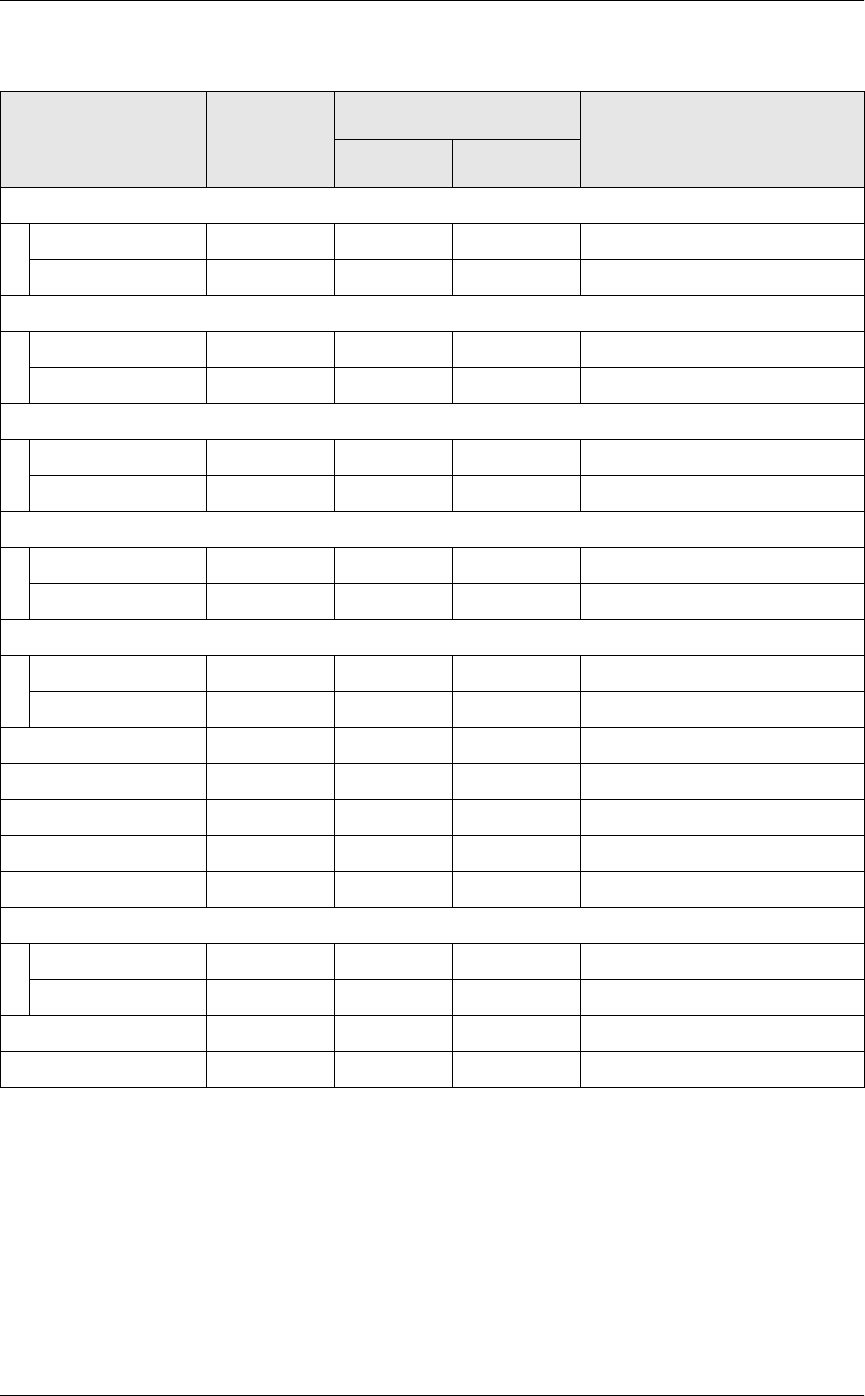
6DOHV%DODQFH5HSRUWV
&RQVROLGDWHG6\VWHP6DOHV'HWDLO
Cancel
Number @ttl_Trans_Cancel_Qty
Value @ttl_Trans_Cancel_Total
Carried Over
Number @ttl_Carried_Over_Qty
Value @ttl_Carried_Over_Total
Checks Begun
Number @ttl_Checks_Begun_Qty
Value @ttl_Checks_Begun_Total
Checks Paid
Number @ttl_Checks_Paid_Qty
Value @ttl_Checks_Paid_Total
Outstanding
Number @ttl_Outstanding_Qty
Value @ttl_Outstanding_Total
Gross Receipts @ttl_Gross_Rcpts_Total
Charged Receipts @ttl_Charged_Rcpts_Total
Service Charges @ttl_Service_Chg_Total
Charged Tips @ttl_Charged_Tips
Tips Declared @ttl_Tips_Declared
Total Tips
Percent @ttl_Tip_Percent
Value @ttl_Total_Tips
Tips Paid @ttl_Tips_Paid
Tips Due @ttl_Tips_Due
Report
Field
Title
View
Column
Title
3700 Database Formula
Table Column
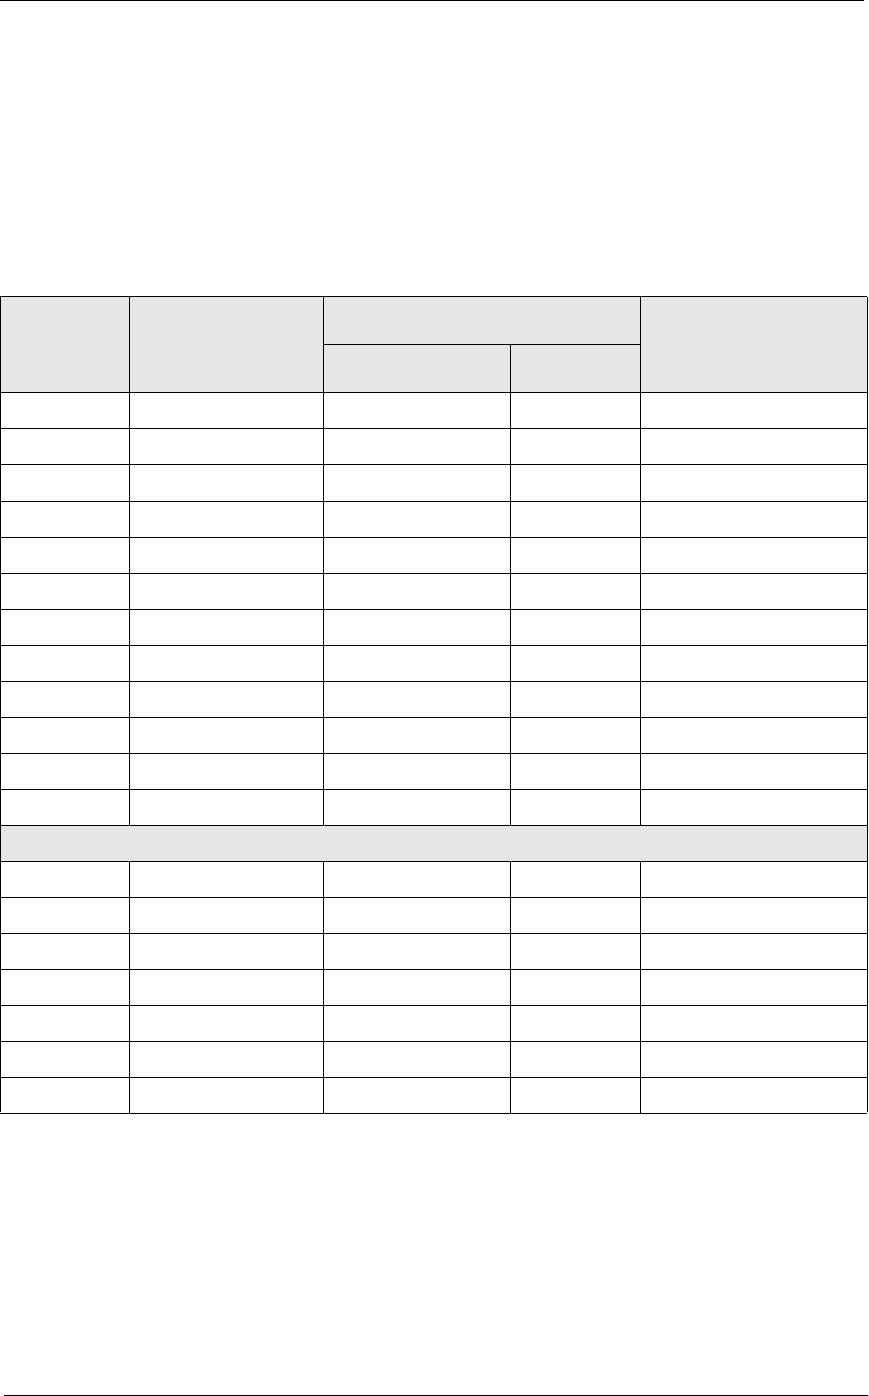
5HSRUWV
6DOHV%DODQFH5HSRUWV
&RQVROLGDWHG6\VWHP6DOHV'HWDLO
Sales and Guest Profile Details
Stored Procedures: sp_R_time_card_ttls and sp_R_cons_sys_ttls and
sp_R_sys_sales_tracking
This report does not use any views
The following table lists each field in the Sales and Guest Profile and
provides detailed information on the source of each of the figures.
Report
Column
Title
View
Column
Title
3700 Database Formula
Table Column
Net Sales ot_net_sls_ttl dly_sys_ot_ttl net_sls_ttl
% of Ttl @Percent_Of_Net_Total
Guests cover_count dly_sys_ot_ttl cov_cnt
% of Ttl @Percent_Of_Guest_Total
Avg/Guest @Avg_$_Guest
Checks check_count dly_sys_ot_ttl chk_cnt
% of Ttl @Percent_Of_Check_Total
Avg/Chk @Avg_$_Check
Tables table_turn_count dly_sys_ot_ttl tbl_turn_cnt
% of Ttl @Percent_Of_Table_Total
Avg/Tbl @Avg_$_Table
Turn Time @Avg_Turn_Time
Total
Net Sales ∑ ot_net_sales_ttl dly_sys_ot_ttl net_sls_ttl
Guests ∑ cover_count dly_sys_ot_ttl cov_cnt
Avg/Guest @Total_Avg_$_Guest
Checks ∑ check_count dly_sys_ot_ttl chk_cnt
Avg/Chk @Total_Avg_$_Check
Tables ∑ table_turn_count dly_sys_ot_ttl tbl_turn_cnt
Avg/Tbl @Total_Avg_$_Table
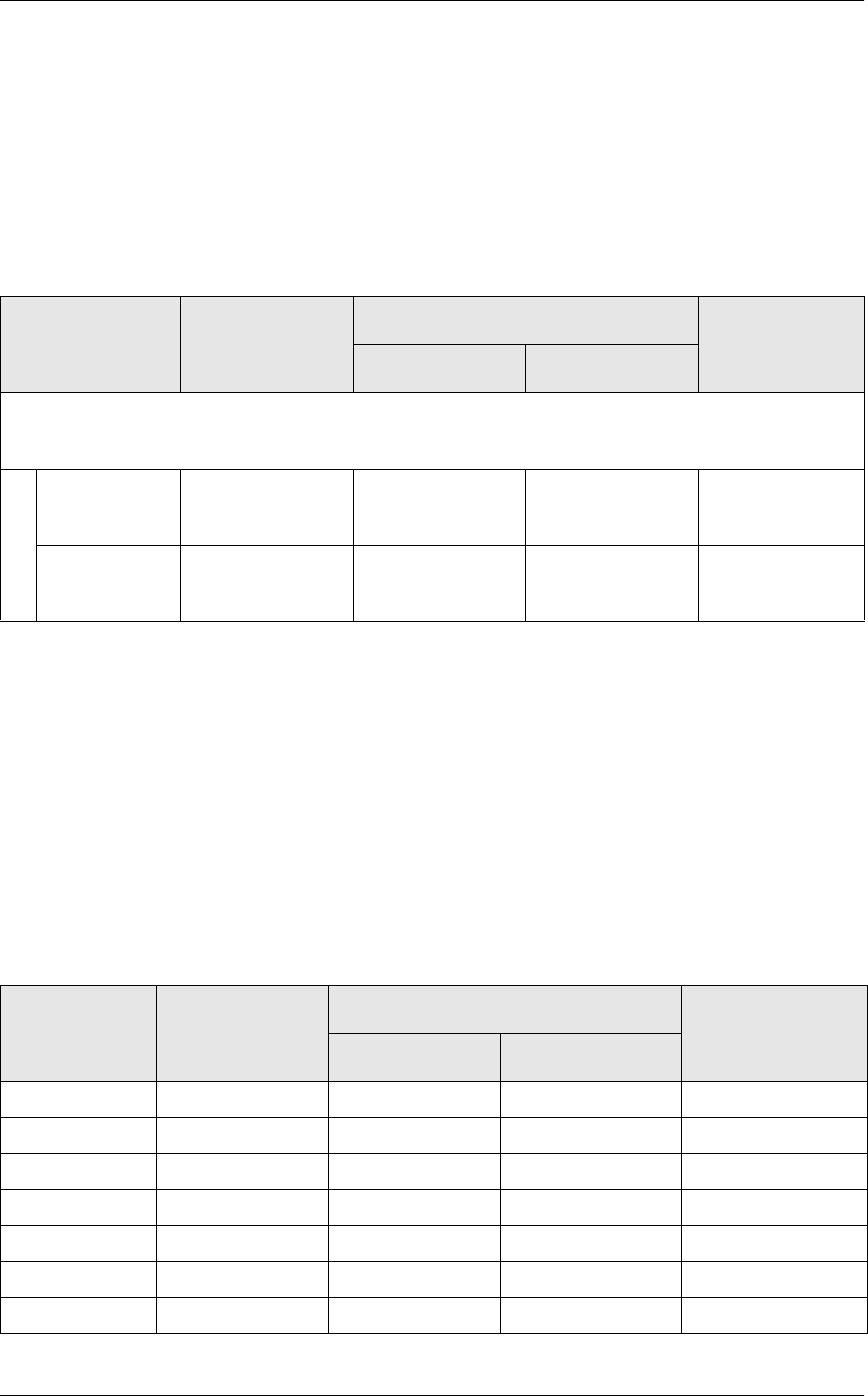
6DOHV%DODQFH5HSRUWV
&RQVROLGDWHG6\VWHP6DOHV'HWDLO
Tracking Group Profile Details
Stored Procedures: sp_R_time_card_ttls and sp_R_cons_sys_ttls and
sp_R_sys_sales_tracking
This report does not use any views
The following table lists each field in the Tracking Group Profile and
provides detailed information on the source of each of the figures.
Labor Category Profile Details
Stored Procedures: sp_R_time_card_ttls and sp_R_cons_sys_ttls and
sp_R_sys_sales_tracking
This report does not use any views.
The following table lists each field in the Labor Category Profile and
provides detailed information on the source of each of the figures. You
can program up to four labor categories. Each of these labor categories is
then associated with a number that is represented in the following table as
the variable #. For example, if labor category 1 is programmed as dining
room, then the regular hours for dining room staff comes from the view
column labor_cat_1_reg_hrs.
Report
Column
Title
View
Column
Title
3700 Database Formula
Table Column
Programmable1
to
Programmable42
Number trk_cnt_01
to
trk_cnt_42
dly_sys_trk_ttl trk_cnt_01
to
trk_cnt_42
Value trk_ttl_01
to
trk_ttl_42
dly_sys_trk_ttl trk_ttl_01
to
trk_ttl_42
Report
Column
Title
View
Column
Title
3700 Database Formula
Table Column
Regular Hours labor_cat_
#
_reg_hrs dly_rvc_tm_prd_ttl labor_cat_
#
_reg_hrs
Overtime Hours labor_cat_
#
_ovt_hrs dly_rvc_tm_prd_ttl labor_cat_
#
_ovt_hrs
Total Hours @ttl_Total_Hours_
#
Regular Total labor_cat_
#
_reg_ttl dly_rvc_tm_prd_ttl labor_cat_
#
_reg_ttl
Overtime Total labor_cat_
#
_ovt_ttl dly_rvc_tm_prd_ttl labor_cat_
#
_ovt_ttl
Total @ttl_Total_
#
%Labor/Sales @ttl_%Labor_
#
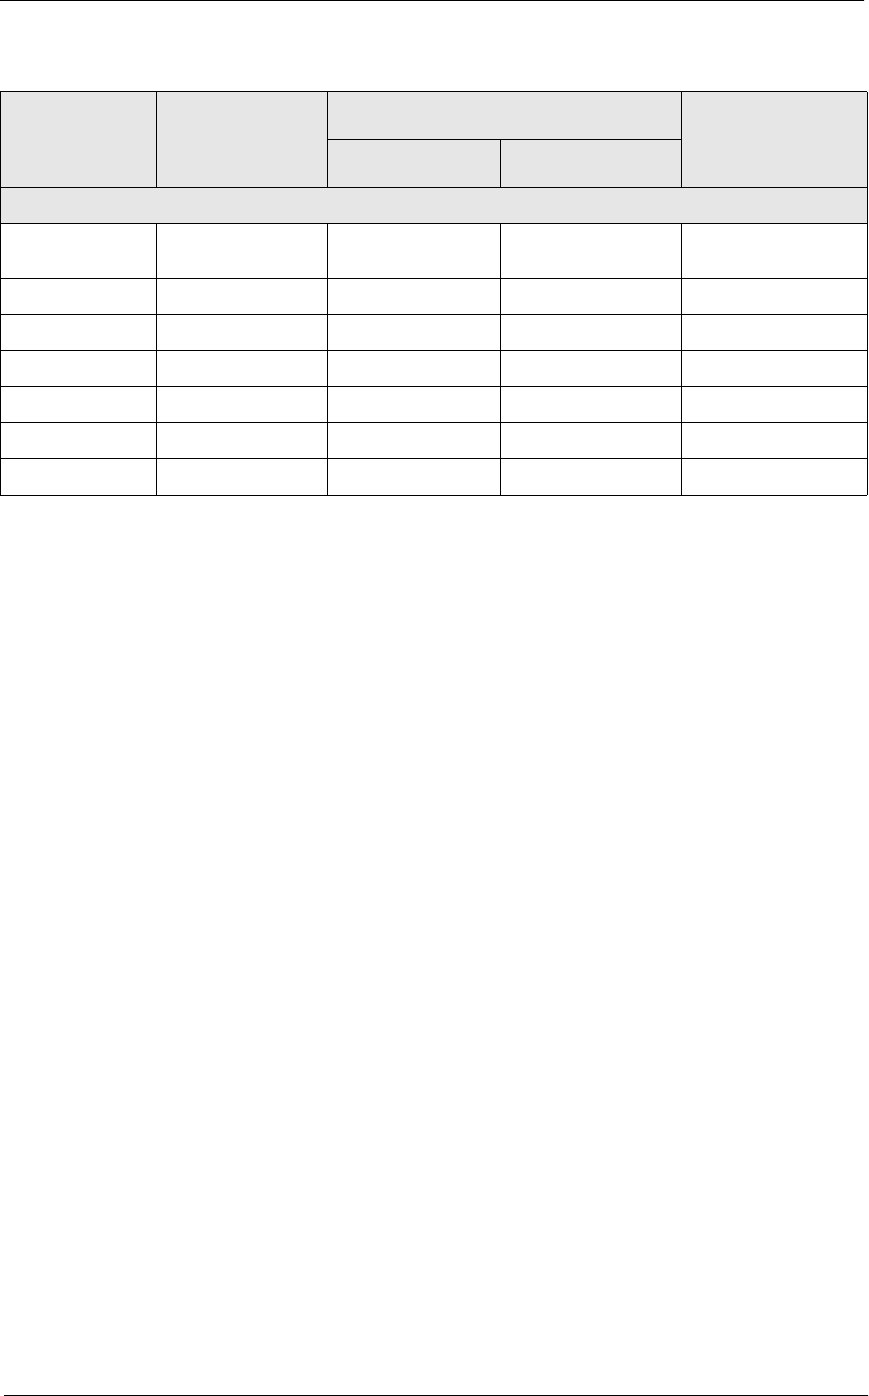
5HSRUWV
6DOHV%DODQFH5HSRUWV
&RQVROLGDWHG6\VWHP6DOHV'HWDLO
Total
Regular Hours @ttl_Total_Reg_Hour
s
Overtime Hours @ttl_Total_Ovt_Hours
Total Hours @ttl_Total_Hours
Regular Total @ttl_Reg_Total
Overtime Total @ttl_Ovt_Total
Total @ttl_Total
%Labor/Sales @ttl_%Labor_Total
Report
Column
Title
View
Column
Title
3700 Database Formula
Table Column

6DOHV%DODQFH5HSRUWV
&RQVROLGDWHG6\VWHP6DOHV'HWDLO

5HSRUWV
Chapter 9
Group Sales Reports
This chapter provides detailed information on each of the group sales reports.
In this chapter
Introduction....................................................................................................9-2
Daily RVC Group Sales Detail Subtotal by Category .................................. 9-3
Daily RVC Group Sales Detail ................................................................... 9-12
Consolidated RVC Group Sales Detail Subtotal by Category .................... 9-15
Consolidated RVC Group Sales Detail ....................................................... 9-24
Daily RVC Group Sales Summary.............................................................. 9-26
Consolidated RVC Group Sales Summary ................................................. 9-33
Daily SYS Group Sales Detail Subtotal by Category................................. 9-39
Daily SYS Group Sales Detail.................................................................... 9-48
Consolidated System Group Sales Detail Subtotal by Category ................ 9-51
Consolidated System Group Sales Detail ................................................... 9-58
Consolidated System Group Sales Detail w/Graph .................................... 9-60
Daily System Group Sales Summary.......................................................... 9-62
Consolidated System Group Sales Summary.............................................. 9-68
*URXS6DOHV5HSRUWV
,QWURGXFWLRQ
Introduction
Next to financial and labor reports, sales reports may be the most useful.
These reports allow you to see how your revenue is being generated. You
will find that the information provided in these reports (much like that
provided by a marketing research firm) offers an insight to seasonal
trends, customer profiles, etc. The information provided in these reports
helps take the guess work out of marketing approaches and gives you the
hard facts needed to develop your concept.
Each of the reports in this chapter can be produced for family groups,
major groups, and menu item groups. The format and content of the
reports is identical, and is only explained once for each report. All
examples in this chapter are of family group reports.
However, since the numbers in the different group reports are being
drawn from different places in the database, there is a separate detail table
for each group. The detail tables tell you the exact source of the
information in the report.
Note
Family groups, major groups, and menu item groups can also
be assigned to tracking totals. When this is done, group
information appears on any reports that include tracking totals.

5HSRUWV
*URXS6DOHV5HSRUWV
'DLO\59&*URXS6DOHV'HWDLO6XEWRWDOE\&DWHJRU\
Daily RVC Group Sales Detail Subtotal by Category
3XUSRVH
This report provides a detailed summary of sales quantities, returns, item
discounts, gross sales, and net sales for each group. Percentage
information is also included. Information for each day is presented
separately, with totals for each revenue center and each day, and grand
totals for the period of the report. Subtotals by category are also included.
)RUPDW
This report includes the following profile:
qLabor/Sales Profile
7HPSODWH
FG_R010.RPT
2-21
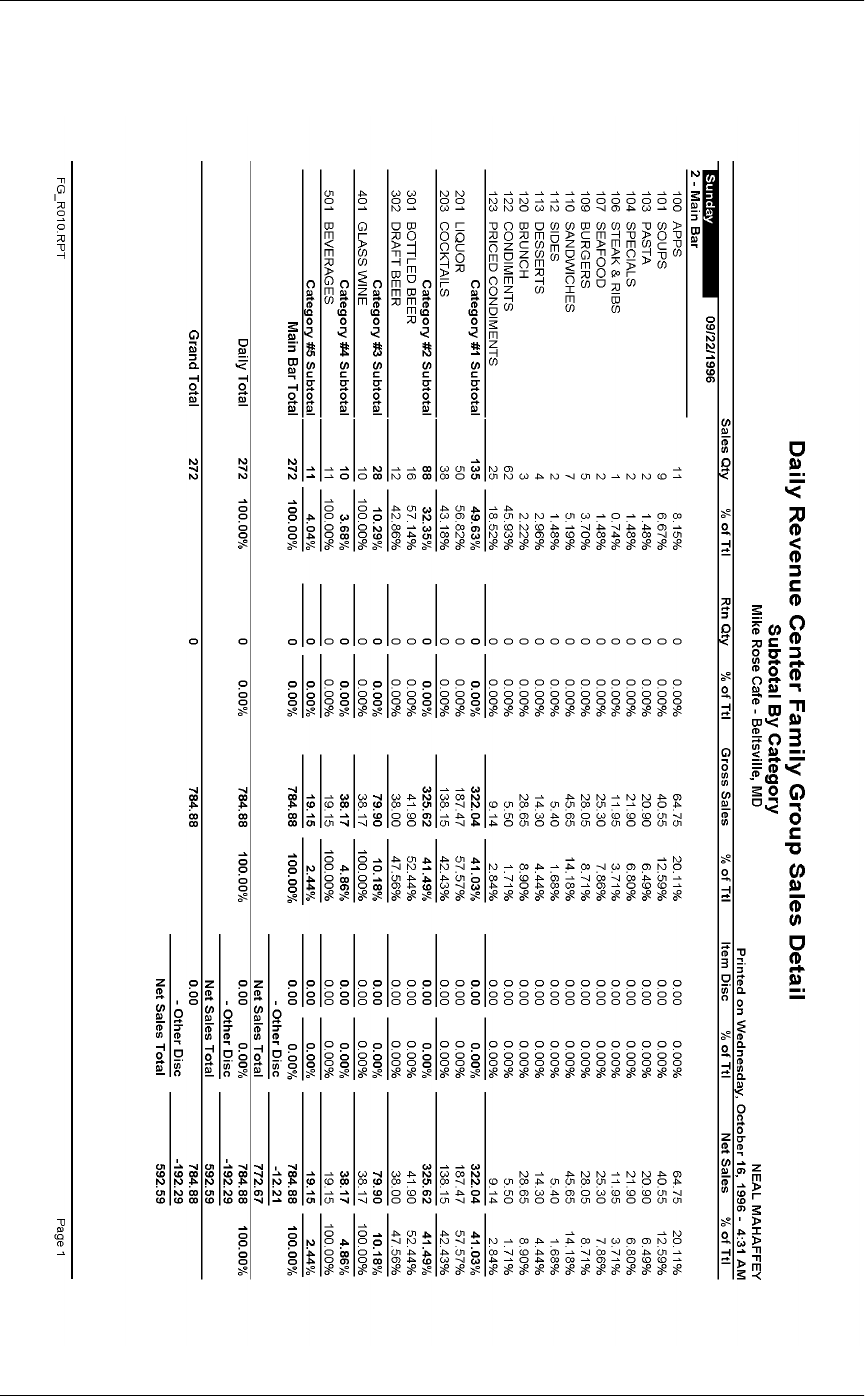
*URXS6DOHV5HSRUWV
'DLO\59&*URXS6DOHV'HWDLO6XEWRWDOE\&DWHJRU\
5HSRUWV
*URXS6DOHV5HSRUWV
'DLO\59&*URXS6DOHV'HWDLO6XEWRWDOE\&DWHJRU\
Family Group Labor/Sales Profile Details
View: v_R_rvc_fam_grp
Stored Procedure: sp_R_family_group
The following table lists each column in the Family Group Labor/Sales
Profile and provides detailed information on the source of the figures in
each column.
Report
Column
Title
View
Column
Title
3700 Database Formula
Table Column
Sales Qty sales_qty dly_rvc_fam_grp_ttl sls_cnt
% of Ttl @Percent_Category_Qty
Rtn Qty return_qty dly_rvc_fam_grp_ttl rtn_cnt
% of Ttl @Percent_Category_Rtn_Qty
Gross Sales sales_total dly_rvc_fam_grp_ttl sls_ttl
% of Ttl @Percent_Category_Total
Item Disc discount_total dly_rvc_fam_grp_ttl dsc_ttl
% of Ttl @Percent_Category_Discount
Net Sales @Net_Sales_Total
% of Ttl @Percent_Category_Net_Total
Category Subtotal
Sales Qty ∑ sales_qty dly_rvc_fam_grp_ttl sls_cnt
% of Ttl @Percent_RVC_Qty
Rtn Qty ∑ return_qty dly_rvc_fam_grp_ttl rtn_cnt
% of Ttl @Percent_RVC_Rtn_Qty
Gross Sales ∑ sales_total dly_rvc_fam_grp_ttl sls_ttl
% of Ttl @Percent_RVC_Total
Item Disc ∑ discount_total dly_rvc_fam_grp_ttl dsc_ttl
% of Ttl @Percent_RVC_Discount
Net Sales ∑ @Net_Sales_Total
% of Ttl @Percent_RVC_Net_Total
*URXS6DOHV5HSRUWV
'DLO\59&*URXS6DOHV'HWDLO6XEWRWDOE\&DWHJRU\
Revenue Center Total
Sales Qty ∑ sales_qty dly_rvc_fam_grp_ttl sls_cnt
% of Ttl @Percent_Daily_Qty
Rtn Qty ∑ return_qty dly_rvc_fam_grp_ttl rtn_cnt
% of Ttl @Percent_Daily_Rtn_Qty
Gross Sales ∑ sales_total dly_rvc_fam_grp_ttl sls_ttl
% of Ttl @Percent_Daily_Total
Item Disc ∑ discount_total dly_rvc_fam_grp_ttl dsc_ttl
% of Ttl @Percent_Daily_Discount
Net Sales ∑ @Net_Sales_Total
% of Ttl @Percent_Daily_Net_Total
Daily Total
Sales Qty ∑ sales_qty dly_rvc_fam_grp_ttl sls_cnt
% of Ttl @Percent_Total_Qty
Rtn Qty ∑ return_qty dly_rvc_fam_grp_ttl rtn_cnt
% of Ttl @Percent_Total_Rtn_Qty
Gross Sales ∑ sales_total dly_rvc_fam_grp_ttl sls_ttl
% of Ttl @Percent_Total_Total
Item Disc ∑ discount_total dly_rvc_fam_grp_ttl dsc_ttl
% of Ttl @Percent_Total_Discount
Net Sales ∑ @Net_Sales_Total
% of Ttl @Percent_Total_Net_Total
Other Disc ∑ rvc_sbtl_discount_total dly_rvc_ttl sttl_dsc_ttl
Net Sales Total @ttl_Net_Sales_Total
Grand Total
Sales Qty ∑ sales_qty dly_rvc_fam_grp_ttl sls_cnt
Rtn Qty ∑ return_qty dly_rvc_fam_grp_ttl rtn_cnt
Gross Sales ∑ sales_total dly_rvc_fam_grp_ttl sls_ttl
Item Disc ∑ discount_total dly_rvc_fam_grp_ttl dsc_ttl
Net Sales ∑ @Net_Sales_Total
Other Disc ∑ rvc_sbtl_discount_total
Net Sales Total @ttl_Net_Sales_Total
Report
Column
Title
View
Column
Title
3700 Database Formula
Table Column

5HSRUWV
*URXS6DOHV5HSRUWV
'DLO\59&*URXS6DOHV'HWDLO6XEWRWDOE\&DWHJRU\
Major Group Labor/Sales Profile Details
View: v_R_rvc_maj_grp
Stored Procedure: sp_R_major_group
The following table lists each column in the Major Group Labor/Sales
Profile and provides detailed information on the source of the figures in
each column.
Report
Column
Title
View
Column
Title
3700 Database Formula
Table Column
Sales Qty sales_qty dly_rvc_maj_grp_ttl sls_cnt
% of Ttl @Percent_Category_Qty
Rtn Qty return_qty dly_rvc_maj_grp_ttl rtn_cnt
% of Ttl @Percent_Category_Rtn_Qty
Gross Sales sales_total dly_rvc_maj_grp_ttl sls_ttl
% of Ttl @Percent_Category_Total
Item Disc discount_total dly_rvc_maj_grp_ttl dsc_ttl
% of Ttl @Percent_Category_Discount
Net Sales @Net_Sales_Total
% of Ttl @Percent_Category_Net_Total
Category Subtotal
Sales Qty ∑ sales_qty dly_rvc_maj_grp_ttl sls_cnt
% of Ttl @Percent_RVC_Qty
Rtn Qty ∑ return_qty dly_rvc_maj_grp_ttl rtn_cnt
% of Ttl @Percent_RVC_Rtn_Qty
Gross Sales ∑ sales_total dly_rvc_maj_grp_ttl sls_ttl
% of Ttl @Percent_RVC_Total
Item Disc ∑ discount_total dly_rvc_maj_grp_ttl dsc_ttl
% of Ttl @Percent_RVC_Discount
Net Sales ∑ @Net_Sales_Total
% of Ttl @Percent_RVC_Net_Total
*URXS6DOHV5HSRUWV
'DLO\59&*URXS6DOHV'HWDLO6XEWRWDOE\&DWHJRU\
Revenue Center Total
Sales Qty ∑ sales_qty dly_rvc_maj_grp_ttl sls_cnt
% of Ttl @Percent_Daily_Qty
Rtn Qty ∑ return_qty dly_rvc_maj_grp_ttl rtn_cnt
% of Ttl @Percent_Daily_Rtn_Qty
Gross Sales ∑ sales_total dly_rvc_maj_grp_ttl sls_ttl
% of Ttl @Percent_Daily_Total
Item Disc ∑ discount_total dly_rvc_maj_grp_ttl dsc_ttl
% of Ttl @Percent_Daily_Discount
Net Sales ∑ @Net_Sales_Total
% of Ttl @Percent_Daily_Net_Total
Daily Total
Sales Qty ∑ sales_qty dly_rvc_maj_grp_ttl sls_cnt
% of Ttl @Percent_Total_Qty
Rtn Qty ∑ return_qty dly_rvc_maj_grp_ttl rtn_cnt
% of Ttl @Percent_Total_Rtn_Qty
Gross Sales ∑ sales_total dly_rvc_maj_grp_ttl sls_ttl
% of Ttl @Percent_Total_Total
Item Disc ∑ discount_total dly_rvc_maj_grp_ttl dsc_ttl
% of Ttl @Percent_Total_Discount
Net Sales ∑ @Net_Sales_Total
% of Ttl @Percent_Total_Net_Total
Other Disc ∑ rvc_sbtl_discount_total dly_rvc_ttl sttl_dsc_ttl
Net Sales Total @ttl_Net_Sales_Total
Grand Total
Sales Qty ∑ sales_qty dly_rvc_maj_grp_ttl sls_cnt
Rtn Qty ∑ return_qty dly_rvc_maj_grp_ttl rtn_cnt
Gross Sales ∑ sales_total dly_rvc_maj_grp_ttl sls_ttl
Item Disc ∑ discount_total dly_rvc_maj_grp_ttl dsc_ttl
Net Sales ∑ @Net_Sales_Total
Other Disc ∑ rvc_sbtl_discount_total dly_rvc_ttl sttl_dsc_ttl
Net Sales Total @gttl_Net_Sales_Total
Report
Column
Title
View
Column
Title
3700 Database Formula
Table Column
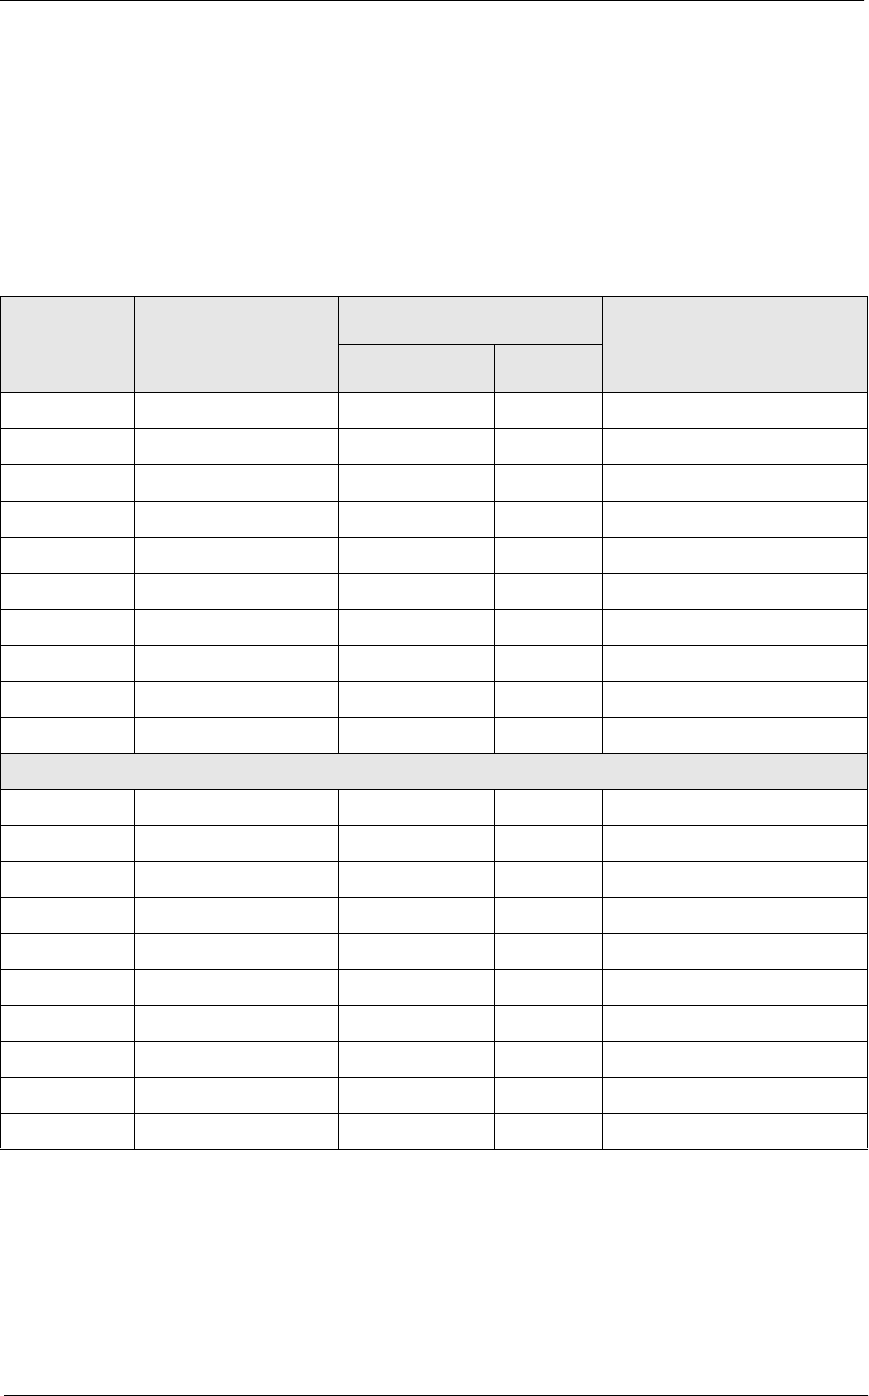
5HSRUWV
*URXS6DOHV5HSRUWV
'DLO\59&*URXS6DOHV'HWDLO6XEWRWDOE\&DWHJRU\
Menu Item Group Labor/Sales Profile Details
View: v_R_rvc_mi_grp
Stored Procedure: sp_R_menuitem_group
The following table lists each column in the Menu Item Group Labor/
Sales Profile and provides detailed information on the source of the
figures in each column.
Report
Column
Title
View
Column
Title
3700 Database Formula
Table Column
Sales Qty sales_qty dly_rvc_mi_grp_ttl sls_cnt
% of Ttl @Percent_Category_Qty
Rtn Qty return_qty dly_rvc_mi_grp_ttl rtn_cnt
% of Ttl @Percent_Category_Rtn_Qty
Gross Sales sales_total dly_rvc_mi_grp_ttl sls_ttl
% of Ttl @Percent_Category_Total
Item Disc discount_total dly_rvc_mi_grp_ttl dsc_ttl
% of Ttl @Percent_Category_Discount
Net Sales @Net_Sales_Total
% of Ttl @Percent_Category_Net_Total
Category Subtotal
Sales Qty ∑ sales_qty dly_rvc_mi_grp_ttl sls_cnt
% of Ttl @Percent_RVC_Qty
Rtn Qty ∑ return_qty dly_rvc_mi_grp_ttl rtn_cnt
% of Ttl @Percent_RVC_Rtn_Qty
Gross Sales ∑ sales_total dly_rvc_mi_grp_ttl sls_ttl
% of Ttl @Percent_RVC_Total
Item Disc ∑ discount_total dly_rvc_mi_grp_ttl dsc_ttl
% of Ttl @Percent_RVC_Discount
Net Sales ∑ @Net_Sales_Total
% of Ttl @Percent_RVC_Net_Total
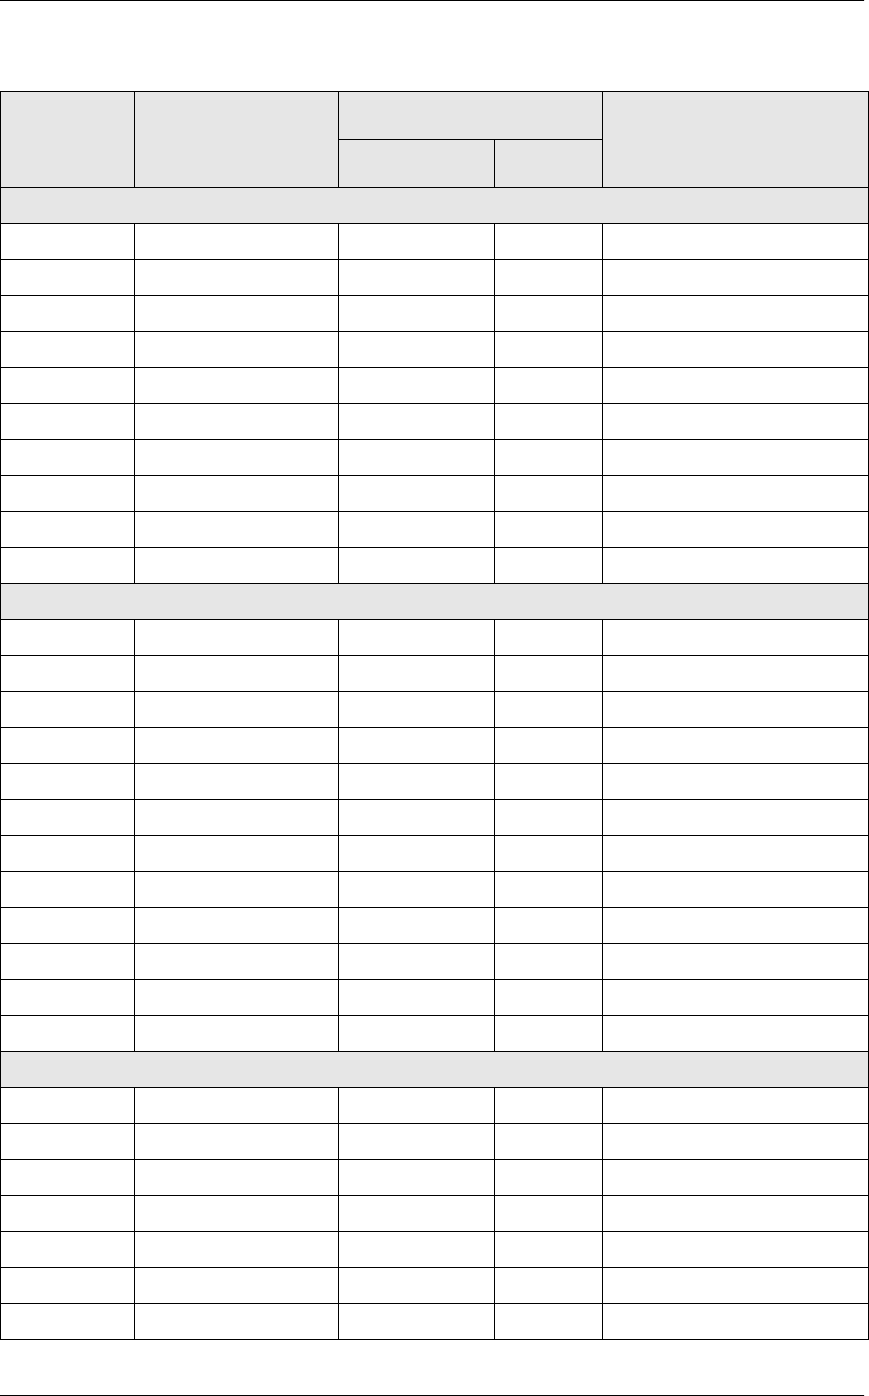
*URXS6DOHV5HSRUWV
'DLO\59&*URXS6DOHV'HWDLO6XEWRWDOE\&DWHJRU\
Revenue Center Total
Sales Qty ∑ sales_qty dly_rvc_mi_grp_ttl sls_cnt
% of Ttl @Percent_Daily_Qty
Rtn Qty ∑ return_qty dly_rvc_mi_grp_ttl rtn_cnt
% of Ttl @Percent_Daily_Rtn_Qty
Gross Sales ∑ sales_total dly_rvc_mi_grp_ttl sls_ttl
% of Ttl @Percent_Daily_Total
Item Disc ∑ discount_total dly_rvc_mi_grp_ttl dsc_ttl
% of Ttl @Percent_Daily_Discount
Net Sales ∑ @Net_Sales_Total
% of Ttl @Percent_Daily_Net_Total
Daily Total
Sales Qty ∑ sales_qty dly_rvc_mi_grp_ttl sls_cnt
% of Ttl @Percent_Total_Qty
Rtn Qty ∑ return_qty dly_rvc_mi_grp_ttl rtn_cnt
% of Ttl @Percent_Total_Rtn_Qty
Gross Sales ∑ sales_total dly_rvc_mi_grp_ttl sls_ttl
% of Ttl @Percent_Total_Total
Item Disc ∑ discount_total dly_rvc_mi_grp_ttl dsc_ttl
% of Ttl @Percent_Total_Discount
Net Sales ∑ @Net_Sales_Total
% of Ttl @Percent_Total_Net_Total
Other Disc ∑ rvc_sbtl_discount_total dly_rvc_ttl sttl_dsc_ttl
Net Sales Total @ttl_Net_Sales_Total
Grand Total
Sales Qty ∑ sales_qty dly_rvc_mi_grp_ttl sls_cnt
Rtn Qty ∑ return_qty dly_rvc_mi_grp_ttl rtn_cnt
Gross Sales ∑ sales_total dly_rvc_mi_grp_ttl sls_ttl
Item Disc ∑ discount_total dly_rvc_mi_grp_ttl dsc_ttl
Net Sales ∑ @Net_Sales_Total
Other Disc ∑ rvc_sbtl_discount_total dly_rvc_ttl sttl_dsc_ttl
Net Sales Total @gttl_Net_Sales_Total
Report
Column
Title
View
Column
Title
3700 Database Formula
Table Column

5HSRUWV
*URXS6DOHV5HSRUWV
'DLO\59&*URXS6DOHV'HWDLO6XEWRWDOE\&DWHJRU\
Programming Considerations
0HQX,WHPV
qA menu item with a price of zero will not post to reports if Menu Item
Classes | Print/Display | Do not post to reports if price = 0 is selected.
qA menu item with a price of zero will not add to detail totals if Menu
Item Classes | Print/Display | Do not add to detail if price = 0 is
selected.
qA menu item can be programmed to have up to four different prices if
Menu Item Classes | Price/Totals | Enable prices 2 through 4 is
selected.
&DWHJRULHV
qCategories for each group are defined on the Report Groups form.
Notes
'LVFRXQWV
The sum of Daily Total Item Disc and Other Disc should equal Total
Discounts on the corresponding sales balance report.
0HQX,WHPV
On Menu Items | Groups, each menu item must be assigned a major and a
family group.
&DWHJRULHV
Major groups, family groups, and menu item groups are assigned to
categories on the Report Groups form. You can use up to nine categories.
These categories are used on any sales reports with subtotal by category
to provide subtotal information.
7D[
Figures in this report, including Gross Sales, do not include tax. When tax
is included in the sale price of a menu item (for example, when an
inclusive tax is in effect), only the net price (sales price minus the tax)
will be posted to these totals.

*URXS6DOHV5HSRUWV
'DLO\59&*URXS6DOHV'HWDLO
Daily RVC Group Sales Detail
3XUSRVH
This report provides a detailed summary of sales quantities, returns, item
discounts, gross sales, and net sales for this group. It also includes
percentage information for each of these categories. Information for each
day is presented separately, with totals for each revenue center and each
day, and grand totals for the period of the report.
This report is similar to the Daily RVC Group Sales Detail Subtotal by
Category Report, but subtotal information is not provided. For complete
detail and programming information, see page 9-3.
)RUPDW
This report includes the following profile:
qSales Profile
7HPSODWH
FG_R001.RPT
2-24
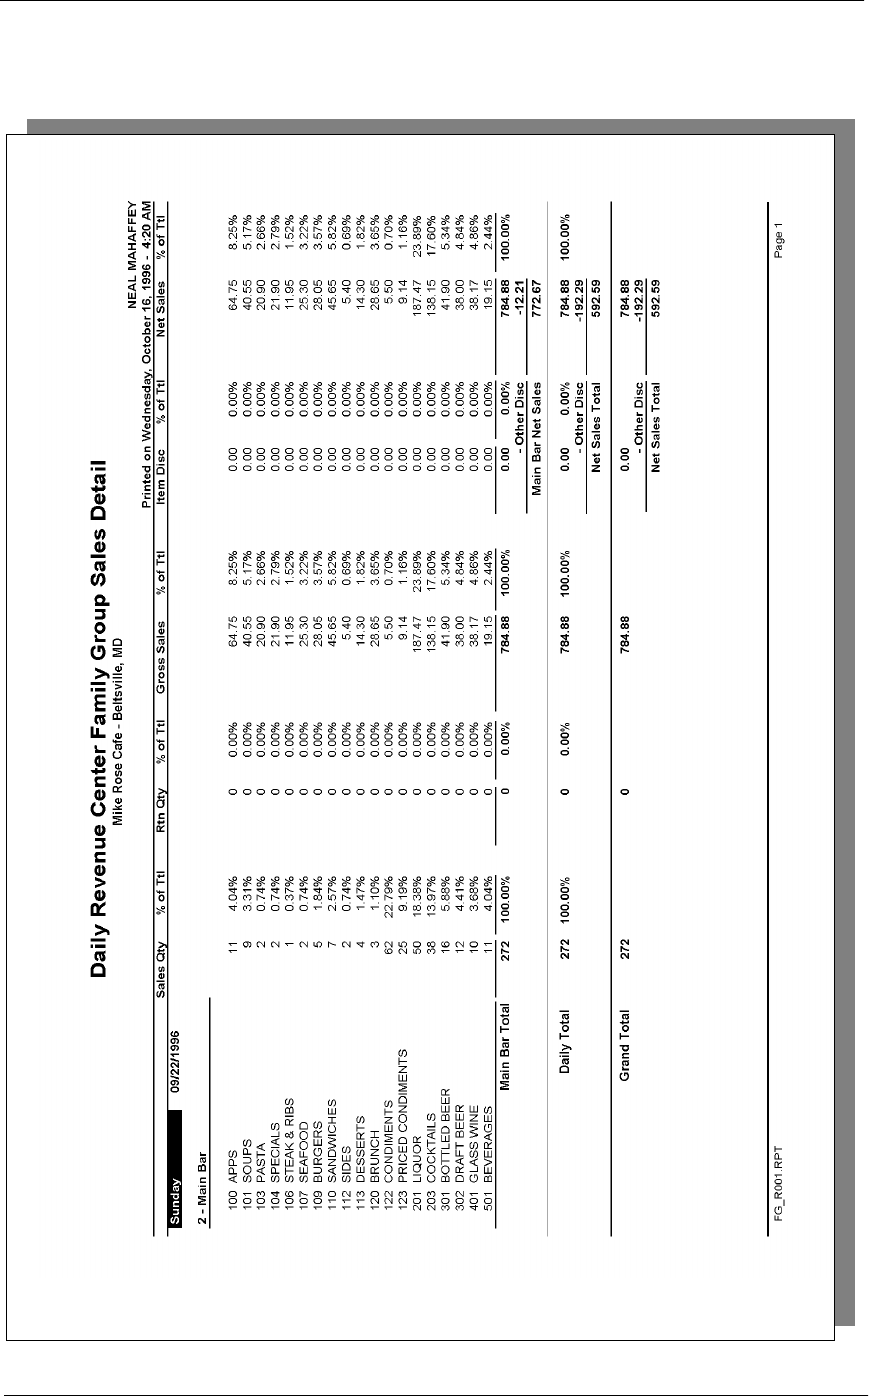
5HSRUWV
*URXS6DOHV5HSRUWV
'DLO\59&*URXS6DOHV'HWDLO
*URXS6DOHV5HSRUWV
'DLO\59&*URXS6DOHV'HWDLO
Daily Revenue Center Family Group Sales Detail
Daily Revenue Center
Family Group Sales Detail
Mike Rose Cafe - Beltsville, MD
NEAL MAHAFFEY
Printed on 10/16/1996 - 2:27
----------------------------------------
Sunday 9/22/1996
2 - Main Bar
100 APPS
Sales Qty 11 4.04%
Returns 0 0.00%
Gross 64.75 8.25%
Item Disc 0.00 0.00%
Net Sls 64.75 8.25%
101 SOUPS
Sales Qty 9 3.31%
Returns 0 0.00%
Gross 40.55 5.17%
Item Disc 0.00 0.00%
Net Sls 40.55 5.17%
103 PASTA
Sales Qty 2 0.74%
Returns 0 0.00%
Gross 20.90 2.66%
Item Disc 0.00 0.00%
Net Sls 20.90 2.66%
104 SPECIALS
Sales Qty 2 0.74%
Returns 0 0.00%
Gross 21.90 2.79%
Item Disc 0.00 0.00%
Net Sls 21.90 2.79%
106 STEAK & RIBS
Sales Qty 1 0.37%
Returns 0 0.00%
Gross 11.95 1.52%
Item Disc 0.00 0.00%
Net Sls 11.95 1.52%
107 SEAFOOD
Sales Qty 2 0.74%
Returns 0 0.00%
Gross 25.30 3.22%
Item Disc 0.00 0.00%
Net Sls 25.30 3.22%
Main Bar Total
Sales Qty 272 100.00%
Returns 0 0.00%
Gross 784.88 100.00%
Item Disc 0.00 0.00%
Sbtotal 784.88 100.00%
Sbtl Disc -12.21
Net Sls 772.67
----------------------------------------
Daily Total
Sales Qty 272 100.00%
Returns 0 0.00%
Gross 784.88 100.00%
Item Disc 0.00 0.00%
Sbtotal 784.88 100.00%
Sbtl Disc -192.29
Net Sls 592.59
========================================
Grand Total
Sales Qty 272
Return Qty 0
Gross Sales 784.88
Item Disc 0.00
Sales Subtt 784.88
-Other Disc -192.29
Net Sales 592.59
Totals omitted for
display

5HSRUWV
*URXS6DOHV5HSRUWV
&RQVROLGDWHG59&*URXS6DOHV'HWDLO6XEWRWDOE\&DWHJRU\
Consolidated RVC Group Sales Detail Subtotal by Category
3XUSRVH
This report provides a detailed summary of sales quantities, returns, item
discounts, gross sales, and net sales for each group. Percentage
information is also included. Totals are provided for each revenue center,
as well as a grand total and net sales total for the period of the report.
Subtotals by category are also included.
This report is almost identical to the Daily Revenue Center Group Sales
Detail Report Subtotal by Category, except the information for the period
of the report is consolidated into one set of figures, rather than being
presented separately for each day.
)RUPDW
This report includes the following profile:
qSales Profile
7HPSODWH
FG_R012.RPT
2-24
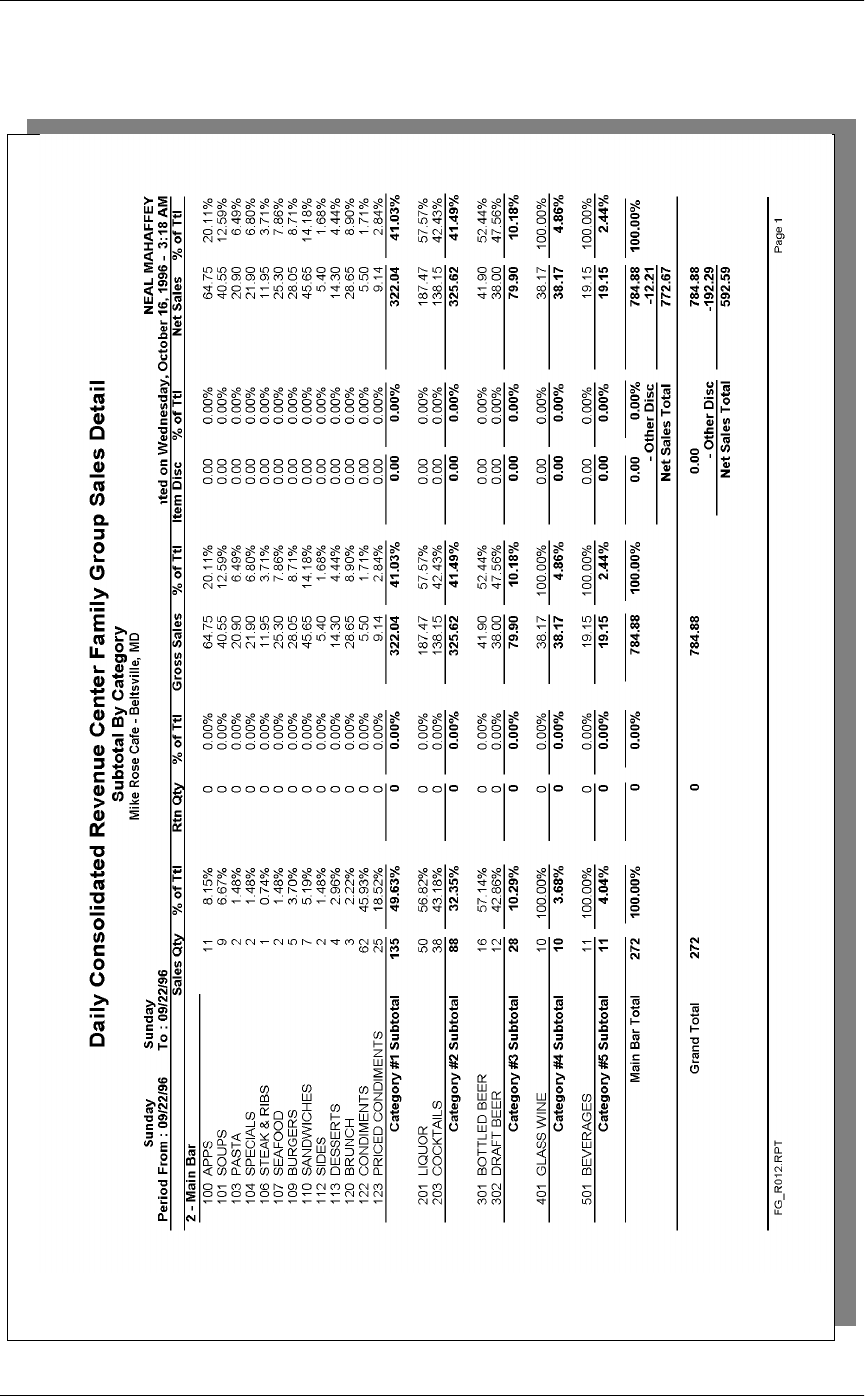
*URXS6DOHV5HSRUWV
&RQVROLGDWHG59&*URXS6DOHV'HWDLO6XEWRWDOE\&DWHJRU\
5HSRUWV
*URXS6DOHV5HSRUWV
&RQVROLGDWHG59&*URXS6DOHV'HWDLO6XEWRWDOE\&DWHJRU\
Family Group Sales Profile Details
View: v_R_rvc_fam_grp
Stored Procedure: sp_R_family_group
The following table lists each column in the Family Group Sales Profile
and provides detailed information on the source of the figures in each
column.
Report
Column
Title
View
Column
Title
3700 Database Formula
Table Column
Sales Qty ∑ sales_qty dly_rvc_fam_grp_ttl sls_cnt
% of Ttl @Percent_RVC_Qty
Rtn Qty ∑ return_qty dly_rvc_fam_grp_ttl rtn_cnt
% of Ttl @Percent_RVC_Rtn_Qty
Gross Sales ∑ sales_total dly_rvc_fam_grp_ttl sls_ttl
% of Ttl @Percent_RVC_Total
Item Disc ∑ discount_total dly_rvc_fam_grp_ttl dsc_ttl
% of Ttl @Percent_RVC_Discount
Net Sales ∑ @Net_Sales_Total
% of Ttl @Percent_Net_RVC_Total
Category Subtotal
Sales Qty ∑ sales_qty dly_rvc_fam_grp_ttl sls_cnt
% of Ttl @Percent_RVC_Qty
Rtn Qty ∑ return_qty dly_rvc_fam_grp_ttl rtn_cnt
% of Ttl @Percent_RVC_Rtn_Qty
Gross Sales ∑ sales_total dly_rvc_fam_grp_ttl sls_ttl
% of Ttl @Percent_RVC_Total
Item Disc ∑ discount_total dly_rvc_fam_grp_ttl dsc_ttl
% of Ttl @Percent_RVC_Discount
Net Sales ∑ @Net_Sales_Total
% of Ttl @Percent_Net_RVC_Total
*URXS6DOHV5HSRUWV
&RQVROLGDWHG59&*URXS6DOHV'HWDLO6XEWRWDOE\&DWHJRU\
Revenue Center Total
Sales Qty ∑ sales_qty dly_rvc_fam_grp_ttl sls_cnt
% of Ttl @Percent_Total_Qty
Rtn Qty ∑ return_qty dly_rvc_fam_grp_ttl rtn_cnt
% of Ttl @Percent_Total_Rtn_Qty
Gross Sales ∑ sales_total dly_rvc_fam_grp_ttl sls_ttl
% of Ttl @Percent_Total_Total
Item Disc ∑ discount_total dly_rvc_fam_grp_ttl dsc_ttl
% of Ttl @Percent_Total_Discount
Net Sales ∑ @Net_Sales_Total
% of Ttl @Percent_Total_Net_Total
Grand Total
Sales Qty ∑ sales_qty dly_rvc_fam_grp_ttl sls_cnt
Rtn Qty ∑ return_qty dly_rvc_fam_grp_ttl rtn_cnt
Gross Sales ∑ sales_total dly_rvc_fam_grp_ttl sls_ttl
Item Disc ∑ discount_total dly_rvc_fam_grp_ttl dsc_ttl
Net Sales ∑ @Net_Sales_Total
Other Disc ∑ rvc_sbtl_discount_total dly_rvc_ttl sttl_dsc_ttl
Net Sales Total @ttl_Net_Sales_Total
Report
Column
Title
View
Column
Title
3700 Database Formula
Table Column
5HSRUWV
*URXS6DOHV5HSRUWV
&RQVROLGDWHG59&*URXS6DOHV'HWDLO6XEWRWDOE\&DWHJRU\
Major Group Sales Profile Details
View: v_R_rvc_maj_grp
Stored Procedure: sp_R_major_group
The following table lists each column in the Major Group Sales Profile
and provides detailed information on the source of the figures in each
column.
Report
Column
Title
View
Column
Title
3700 Database Formula
Table Column
Sales Qty ∑ sales_qty dly_rvc_maj_grp_ttl sls_cnt
% of Ttl @Percent_RVC_Qty
Rtn Qty ∑ return_qty dly_rvc_maj_grp_ttl rtn_cnt
% of Ttl @Percent_RVC_Rtn_Qty
Gross Sales ∑ sales_total dly_rvc_maj_grp_ttl sls_ttl
% of Ttl @Percent_RVC_Total
Item Disc ∑ discount_total dly_rvc_maj_grp_ttl dsc_ttl
% of Ttl @Percent_RVC_Discount
Net Sales ∑ @Net_Sales_Total
% of Ttl @Percent_Net_RVC_Total
Category Subtotal
Sales Qty ∑ sales_qty dly_rvc_maj_grp_ttl sls_cnt
% of Ttl @Percent_RVC_Qty
Rtn Qty ∑ return_qty dly_rvc_maj_grp_ttl rtn_cnt
% of Ttl @Percent_RVC_Rtn_Qty
Gross Sales ∑ sales_total dly_rvc_maj_grp_ttl sls_ttl
% of Ttl @Percent_RVC_Total
Item Disc ∑ discount_total dly_rvc_maj_grp_ttl dsc_ttl
% of Ttl @Percent_RVC_Discount
Net Sales ∑ @Net_Sales_Total
% of Ttl @Percent_Net_RVC_Total

*URXS6DOHV5HSRUWV
&RQVROLGDWHG59&*URXS6DOHV'HWDLO6XEWRWDOE\&DWHJRU\
Revenue Center Total
Sales Qty ∑ sales_qty dly_rvc_maj_grp_ttl sls_cnt
% of Ttl @Percent_Total_Qty
Rtn Qty ∑ return_qty dly_rvc_maj_grp_ttl rtn_cnt
% of Ttl @Percent_Total_Rtn_Qty
Gross Sales ∑ sales_total dly_rvc_maj_grp_ttl sls_ttl
% of Ttl @Percent_Total_Total
Item Disc ∑ discount_total dly_rvc_maj_grp_ttl dsc_ttl
% of Ttl @Percent_Total_Discount
Net Sales ∑ @Net_Sales_Total
% of Ttl @Percent_Total_Net_Total
Grand Total
Sales Qty ∑ sales_qty dly_rvc_maj_grp_ttl sls_cnt
Rtn Qty ∑ return_qty dly_rvc_maj_grp_ttl rtn_cnt
Gross Sales ∑ sales_total dly_rvc_maj_grp_ttl sls_ttl
Item Disc ∑ discount_total dly_rvc_maj_grp_ttl dsc_ttl
Net Sales ∑ @Net_Sales_Total
Other Disc ∑ rvc_sbtl_discount_total dly_rvc_ttl sttl_dsc_ttl
Net Sales Total @ttl_Net_Sales_Total
Report
Column
Title
View
Column
Title
3700 Database Formula
Table Column
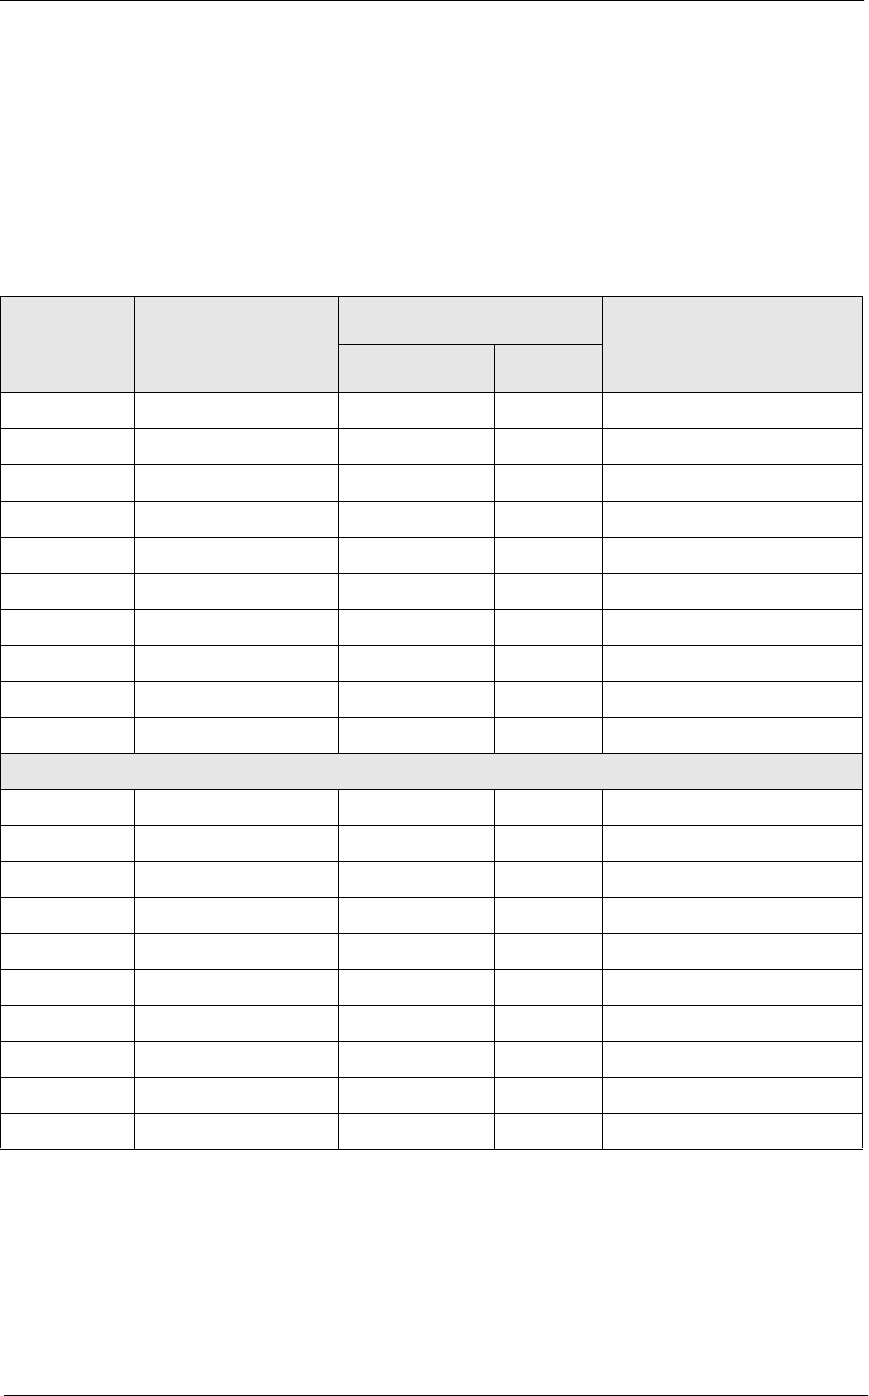
5HSRUWV
*URXS6DOHV5HSRUWV
&RQVROLGDWHG59&*URXS6DOHV'HWDLO6XEWRWDOE\&DWHJRU\
Menu Item Group Sales Profile Details
View: v_R_rvc_mi_grp
Stored Procedure: sp_R_menuitem_group
The following table lists each column in the Menu Item Group Sales
Profile and provides detailed information on the source of the figures in
each column.
Report
Column
Title
View
Column
Title
3700 Database Formula
Table Column
Sales Qty ∑ sales_qty dly_rvc_mi_grp_ttl sls_cnt
% of Ttl @Percent_RVC_Qty
Rtn Qty ∑ return_qty dly_rvc_mi_grp_ttl rtn_cnt
% of Ttl @Percent_RVC_Rtn_Qty
Gross Sales ∑ sales_total dly_rvc_mi_grp_ttl sls_ttl
% of Ttl @Percent_RVC_Total
Item Disc ∑ discount_total dly_rvc_mi_grp_ttl dsc_ttl
% of Ttl @Percent_RVC_Discount
Net Sales ∑ @Net_Sales_Total
% of Ttl @Percent_Net_RVC_Total
Category Subtotal
Sales Qty ∑ sales_qty dly_rvc_mi_grp_ttl sls_cnt
% of Ttl @Percent_RVC_Qty
Rtn Qty ∑ return_qty dly_rvc_mi_grp_ttl rtn_cnt
% of Ttl @Percent_RVC_Rtn_Qty
Gross Sales ∑ sales_total dly_rvc_mi_grp_ttl sls_ttl
% of Ttl @Percent_RVC_Total
Item Disc ∑ discount_total dly_rvc_mi_grp_ttl dsc_ttl
% of Ttl @Percent_RVC_Discount
Net Sales ∑ @Net_Sales_Total
% of Ttl @Percent_Net_RVC_Total
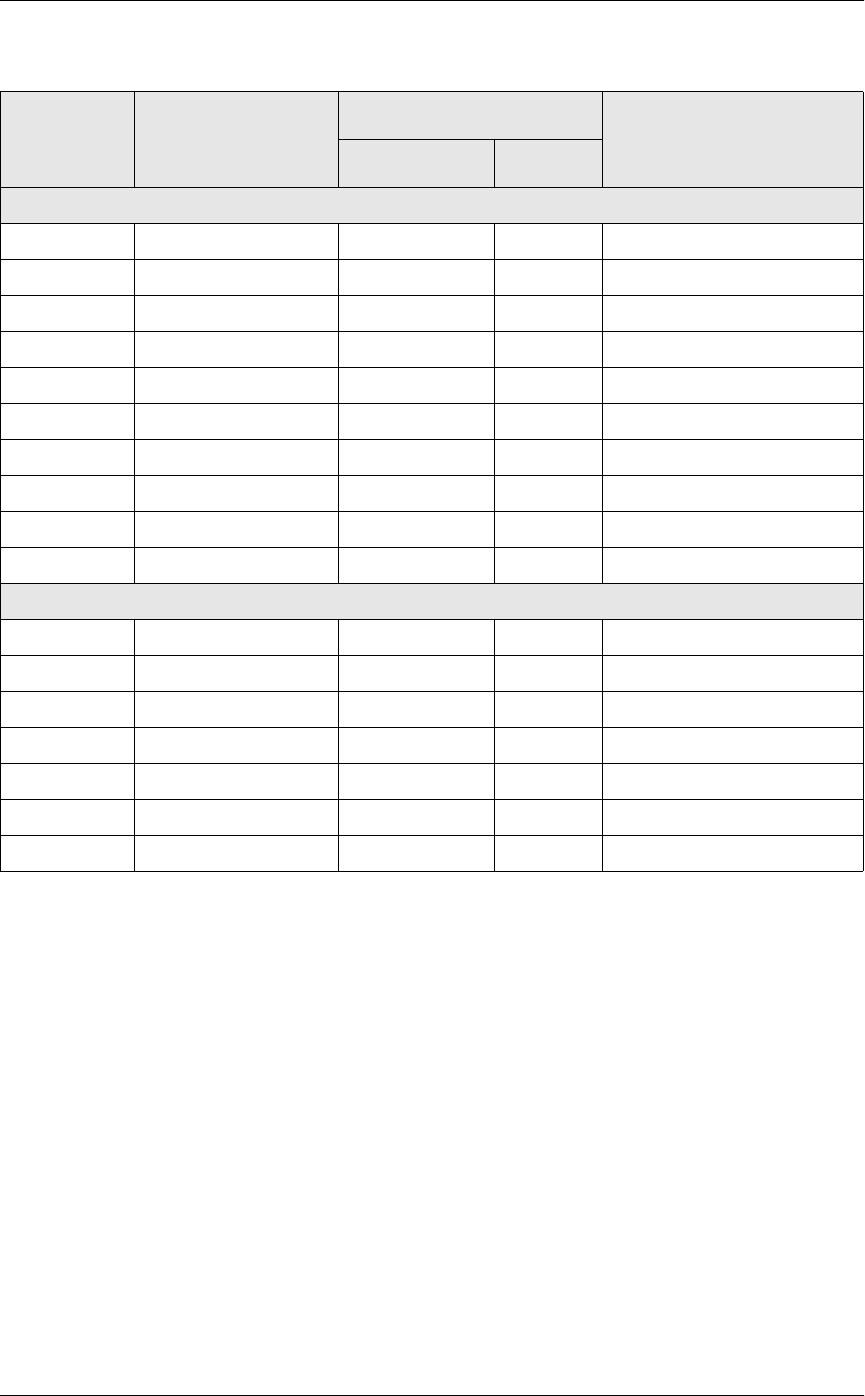
*URXS6DOHV5HSRUWV
&RQVROLGDWHG59&*URXS6DOHV'HWDLO6XEWRWDOE\&DWHJRU\
Programming Considerations
0HQX,WHPV
qA menu item with a price of zero will not post to reports if Menu Item
Classes | Print/Display | Do not post to reports if price = 0 is selected.
qA menu item with a price of zero will not add to detail totals if Menu
Item Classes | Print/Display | Do not add to detail if price = 0 is
selected.
qA menu item can be programmed to have up to four different prices if
Menu Item Classes | Price/Totals | Enable prices 2 through 4 is
selected.
Notes
'LVFRXQWV
The sum of Daily Total Item Disc and Other Disc should equal Total
Discounts on the corresponding sales balance report.
Revenue Center Total
Sales Qty ∑ sales_qty dly_rvc_mi_grp_ttl sls_cnt
% of Ttl @Percent_Total_Qty
Rtn Qty ∑ return_qty dly_rvc_mi_grp_ttl rtn_cnt
% of Ttl @Percent_Total_Rtn_Qty
Gross Sales ∑ sales_total dly_rvc_mi_grp_ttl sls_ttl
% of Ttl @Percent_Total_Total
Item Disc ∑ discount_total dly_rvc_mi_grp_ttl dsc_ttl
% of Ttl @Percent_Total_Discount
Net Sales ∑ @Net_Sales_Total
% of Ttl @Percent_Total_Net_Total
Grand Total
Sales Qty ∑ sales_qty dly_rvc_mi_grp_ttl sls_cnt
Rtn Qty ∑ return_qty dly_rvc_mi_grp_ttl rtn_cnt
Gross Sales ∑ sales_total dly_rvc_mi_grp_ttl sls_ttl
Item Disc ∑ discount_total dly_rvc_mi_grp_ttl dsc_ttl
Net Sales ∑ @Net_Sales_Total
Other Disc ∑ rvc_sbtl_discount_total dly_rvc_ttl sttl_dsc_ttl
Net Sales Total @ttl_Net_Sales_Total
Report
Column
Title
View
Column
Title
3700 Database Formula
Table Column

5HSRUWV
*URXS6DOHV5HSRUWV
&RQVROLGDWHG59&*URXS6DOHV'HWDLO6XEWRWDOE\&DWHJRU\
0HQX,WHPV
On Menu Items | Groups each menu item must be assigned a major and a
family group.
7D[
Figures in this report, including Gross Sales, do not include tax. When tax
is included in the sale price of a menu item (for example, when a VAT or
inclusive tax is in effect), only the net price (sales price minus the tax)
will be posted to these totals.

*URXS6DOHV5HSRUWV
&RQVROLGDWHG59&*URXS6DOHV'HWDLO
Consolidated RVC Group Sales Detail
3XUSRVH
This report is similar to the Consolidated RVC Group Sales Detail
Subtotal by Category Report, but subtotal information is not provided.
For complete detail and programming information, see page 9-15.
)RUPDW
This report includes the following profile:
qSales Profile
7HPSODWH
FG_R002.RPT
2-24
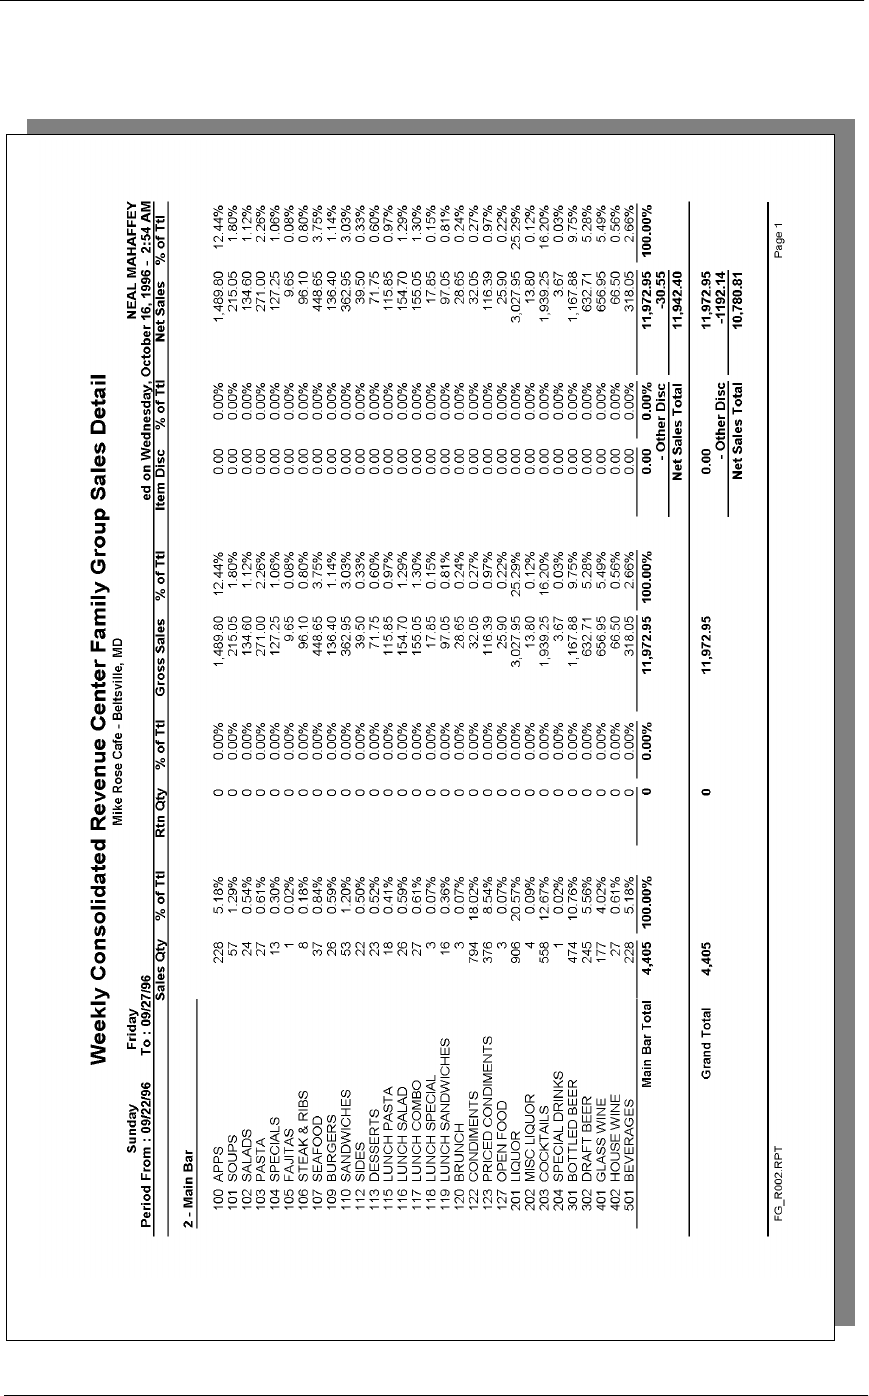
5HSRUWV
*URXS6DOHV5HSRUWV
&RQVROLGDWHG59&*URXS6DOHV'HWDLO

*URXS6DOHV5HSRUWV
'DLO\59&*URXS6DOHV6XPPDU\
Daily RVC Group Sales Summary
3XUSRVH
This report provides a brief summary of sales quantities, and net sales for
each group, as well as percentages for each. Information for each day is
presented separately, with totals for each revenue center and each day, and
a grand total for net sales for the period of the report.
)RUPDW
This report includes the following profile:
qSales Profile
The profile has been modified for this report. It does not include these
fields:
Rtn Qty
% of Ttl
Gross Sales
% of Ttl
Item Disc
% of Ttl
7HPSODWH
FG_R101.RPT
2-24
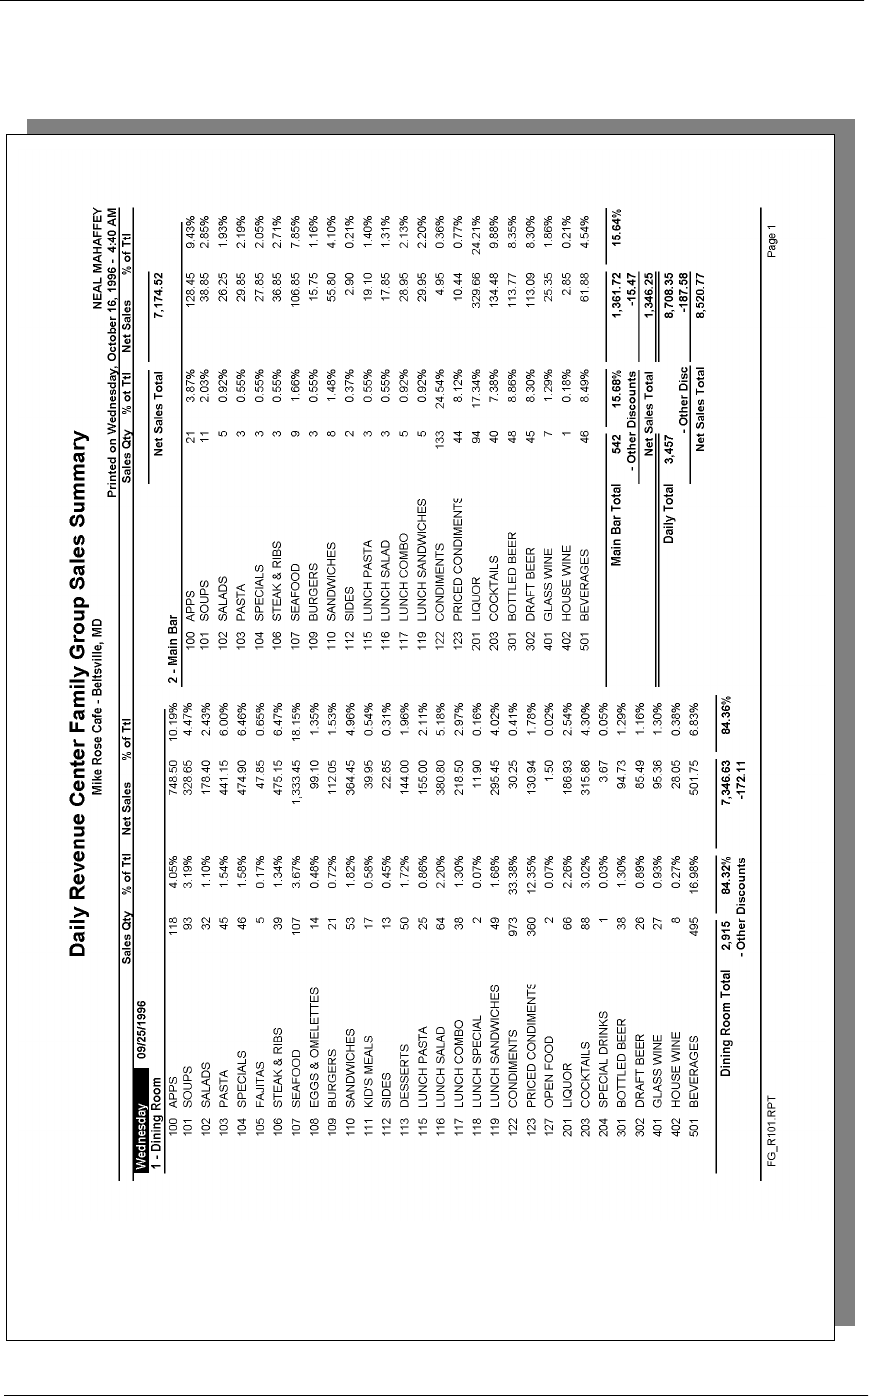
5HSRUWV
*URXS6DOHV5HSRUWV
'DLO\59&*URXS6DOHV6XPPDU\
*URXS6DOHV5HSRUWV
'DLO\59&*URXS6DOHV6XPPDU\
Daily Revenue Center Group Sales Summary
Daily Revenue Center
Family Group Sales Summary
Mike Rose Cafe - Beltsville, MD
NEAL MAHAFFEY
Printed on 10/16/1996 - 2:30
----------------------------------------
Wednesday 9/25/1996
1 - Dining Room
100APPS
Sales Qty 118 4.05%
Net Sls 748.50 10.19%
101SOUPS
Sales Qty 93 3.19%
Net Sls 328.65 4.47%
102SALADS
Sales Qty 32 1.10%
Net Sls 178.40 2.43%
103PASTA
Sales Qty 45 1.54%
Net Sls 441.15 6.00%
104SPECIALS
Sales Qty 46 1.58%
Net Sls 474.90 6.46%
105FAJITAS
Sales Qty 5 0.17%
Net Sls 47.85 0.65%
106STEAK & RIBS
Sales Qty 39 1.34%
Net Sls 475.15 6.47%
107SEAFOOD
Sales Qty 107 3.67%
Net Sls 1,333.45 18.15%
108EGGS & OMELE
Sales Qty 14 0.48%
Net Sls 99.10 1.35%
109BURGERS
Sales Qty 21 0.72%
Net Sls 112.05 1.53%
110SANDWICHES
Sales Qty 53 1.82%
Net Sls 364.45 4.96%
111KID’S MEALS
Sales Qty 17 0.58%
Net Sls 39.95 0.54%
112SIDES
Sales Qty 13 0.45%
Net Sls 22.85 0.31%
113DESSERTS
Sales Qty 50 1.72%
Net Sls 144.00 1.96%
115LUNCH PASTA
Sales Qty 25 0.86%
Net Sls 155.00 2.11%
116LUNCH SALAD
Sales Qty 64 2.20%
Net Sls 380.80 5.18%
117LUNCH COMBO
Sales Qty 38 1.30%
Net Sls 218.50 2.97%
118LUNCH SPECIA
Sales Qty 2 0.07%
Net Sls 11.90 0.16%
119LUNCH SANDWI
Sales Qty 49 1.68%
Net Sls 295.45 4.02%
122CONDIMENTS
Sales Qty 973 33.38%
Net Sls 30.25 0.41%
123PRICED CONDI
Sales Qty 360 12.35%
Net Sls 130.94 1.78%
Dining Room Total
Sales Qty 2,915 100.00%
Subttl 7,346.63 100.00%
Other Di -172.11
Net Sls 7,174.52
----------------------------------------
Daily Total
Sales Qty 2,915
Totals omitted for
display
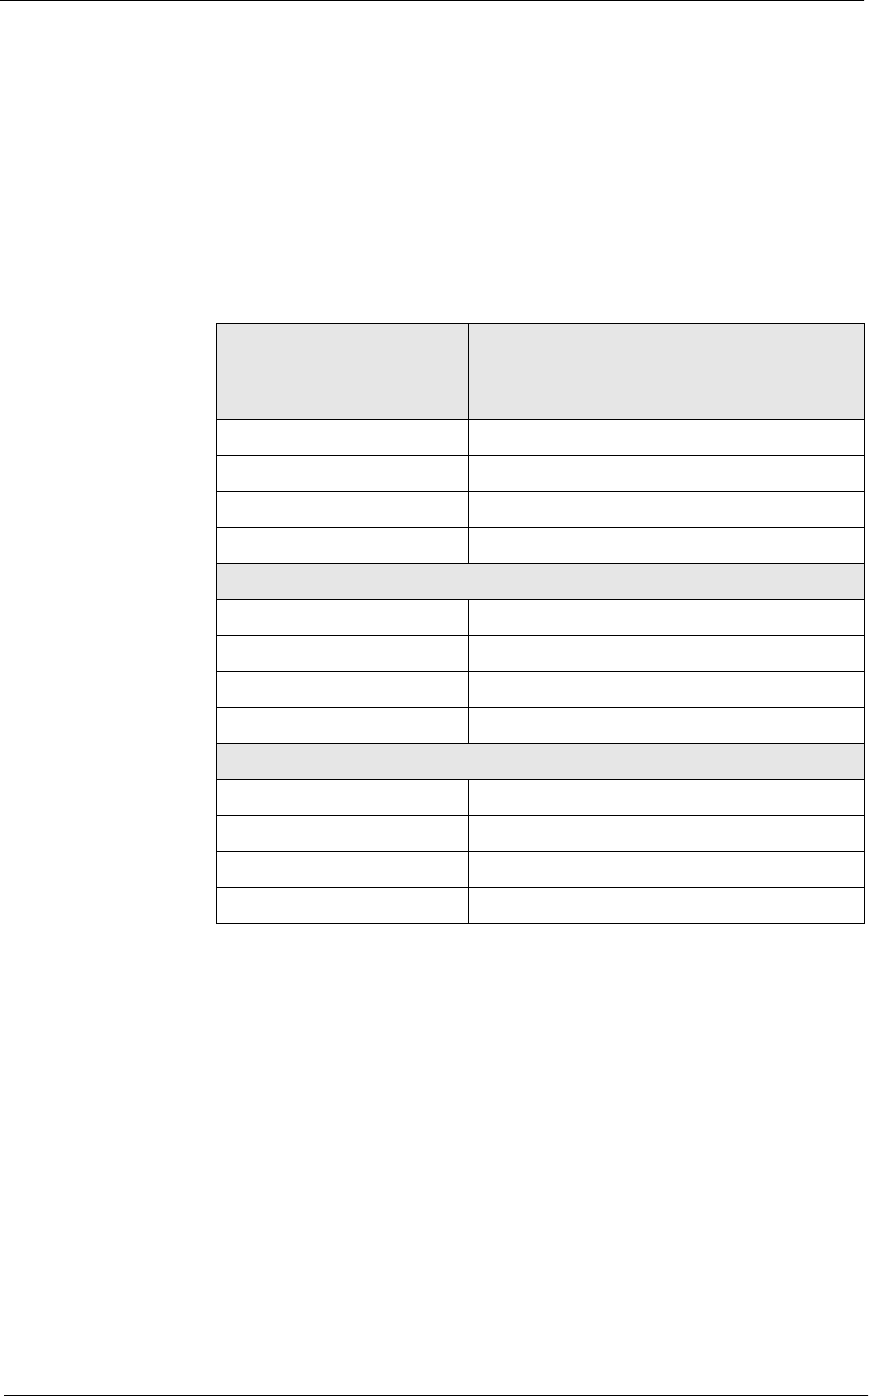
5HSRUWV
*URXS6DOHV5HSRUWV
'DLO\59&*URXS6DOHV6XPPDU\
Family Group Sales Profile Details
View: v_R_rvc_fam_grp
Stored Procedure: sp_R_family_group
The following table lists each column in the Family Group Sales Profile
and provides detailed information on the source of the figures in each
column. Since all the numbers in this profile come from formulas, there is
no view, table, or column information.
Report
Column
Title Formula
Sales Qty @Detail_Qty
% of Ttl @Percent_of_RVC_Qty
Net Sales @Detail_Net_Sales
% of Ttl @Percent_of_RVC_Net_Sales
Revenue Center Total
Sales Qty @RVC_Total_Qty
% of Ttl @Percent_of_Daily_Qty
Net Sales @RVC_Total_Total
% of Ttl @Percent_of_Daily_Total
Daily Total
Sales Qty @Daily_Total_Qty
Net Sales @Daily_Total_Total
Other Disc @Daily_Other_Discount
Net Sales Total @Daily_Net_Sales
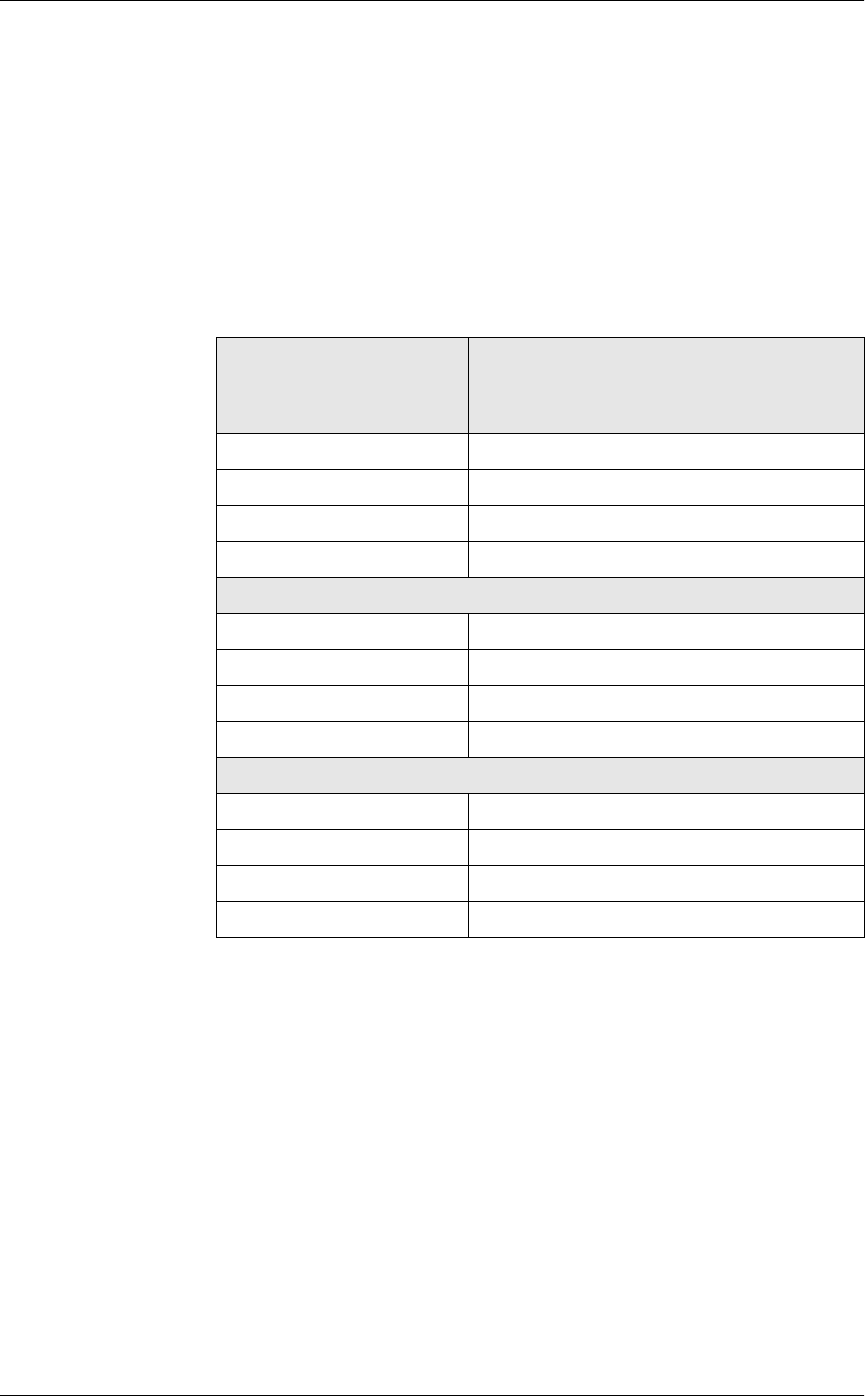
*URXS6DOHV5HSRUWV
'DLO\59&*URXS6DOHV6XPPDU\
Major Group Sales Profile Details
View: v_R_rvc_maj_grp
Stored Procedure: sp_R_major_group
The following table lists each column in the Major Group Sales Profile
and provides detailed information on the source of the figures in each
column. Since all the numbers in this profile come from formulas, there is
no view, table, or column information.
Report
Column
Title Formula
Sales Qty @Detail_Qty
% of Ttl @Percent_of_RVC_Qty
Net Sales @Detail_Net_Sales
% of Ttl @Percent_of_RVC_Net_Sales
Revenue Center Total
Sales Qty @RVC_Total_Qty
% of Ttl @Percent_of_Daily_Qty
Net Sales @RVC_Total_Total
% of Ttl @Percent_of_Daily_Total
Daily Total
Sales Qty @Daily_Total_Qty
Net Sales @Daily_Total_Total
Other Disc @Daily_Other_Discount
Net Sales Total @Daily_Net_Sales

5HSRUWV
*URXS6DOHV5HSRUWV
'DLO\59&*URXS6DOHV6XPPDU\
Menu Item Group Sales Profile Details
View: v_R_rvc_mi_grp
Stored Procedure: sp_R_menuitem_group
The following table lists each column in the Menu Item Group Sales
Profile and provides detailed information on the source of the figures in
each column. Since all the numbers in this profile come from formulas,
there is no view, table, or column information.
Programming Considerations
0HQX,WHPV
qA menu item with a price of zero will not post to reports if Menu Item
Classes | Print/Display | Do not post to reports if price = 0 is selected.
qA menu item with a price of zero will not add to detail totals if Menu
Item Classes | Print/Display | Do not add to detail if price = 0 is
selected.
qA menu item can be programmed to have up to four different prices if
Menu Item Classes | Price/Totals | Enable prices 2 through 4 is
selected.
Report
Column
Title Formula
Sales Qty @Detail_Qty
% of Ttl @Percent_of_RVC_Qty
Net Sales @Detail_Net_Sales
% of Ttl @Percent_of_RVC_Net_Sales
Revenue Center Total
Sales Qty @RVC_Total_Qty
% of Ttl @Percent_of_Daily_Qty
Net Sales @RVC_Total_Total
% of Ttl @Percent_of_Daily_Total
Daily Total
Sales Qty @Daily_Total_Qty
Net Sales @Daily_Total_Total
Other Disc @Daily_Other_Discount
Net Sales Total @Daily_Net_Sales

*URXS6DOHV5HSRUWV
'DLO\59&*URXS6DOHV6XPPDU\
Notes
'LVFRXQWV
The sum of Daily Total Item Disc and Other Disc should equal Total
Discounts on the corresponding sales balance report.
0HQX,WHPV
On Menu Item | Groups each menu item must be assigned a major and a
family group.
7D[
Figures in this report, including Gross Sales, do not include tax. When tax
is included in the sale price of a menu item (for example, when a VAT or
inclusive tax is in effect), only the net price (sales price minus the tax)
will be posted to these totals.

5HSRUWV
*URXS6DOHV5HSRUWV
&RQVROLGDWHG59&*URXS6DOHV6XPPDU\
Consolidated RVC Group Sales Summary
3XUSRVH
This report provides a brief summary of sales quantities, and net sales for
each group, as well as percentages for each. Totals are provided for each
revenue center, as well as a grand total and net sales total for the period of
the report.
This report is almost identical to the Daily Revenue Center Group Sales
Summary Report, except the information for the period of the report is
consolidated into one set of figures, rather than being presented separately
for each day.
)RUPDW
This report includes the following profile:
qSales Profile
The profile has been modified for this report. It does not include these
fields:
Rtn Qty
% of Ttl
Gross Sales
% of Ttl
Item Disc
% of Ttl
7HPSODWH
FG_R111.RPT
2-24
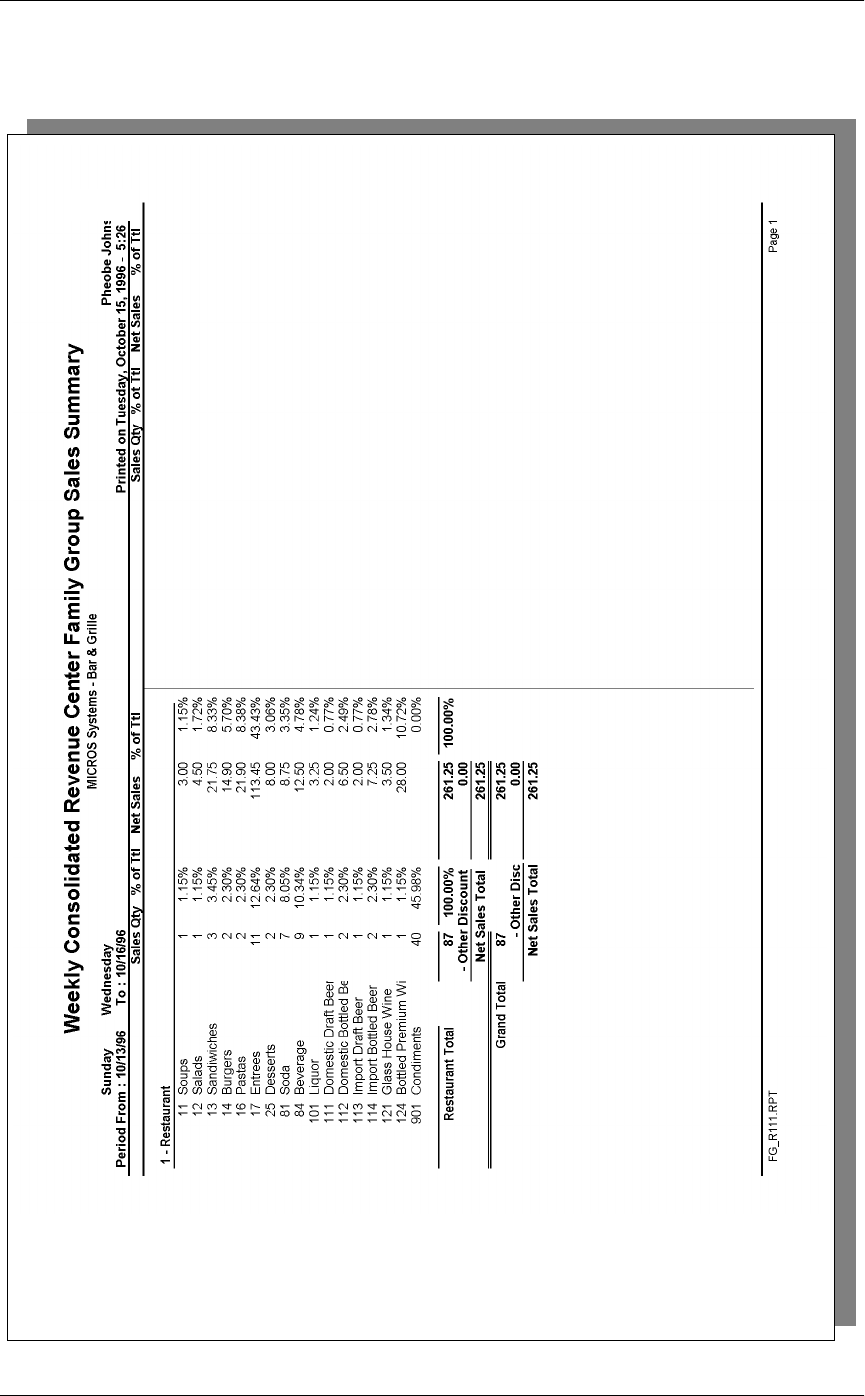
*URXS6DOHV5HSRUWV
&RQVROLGDWHG59&*URXS6DOHV6XPPDU\
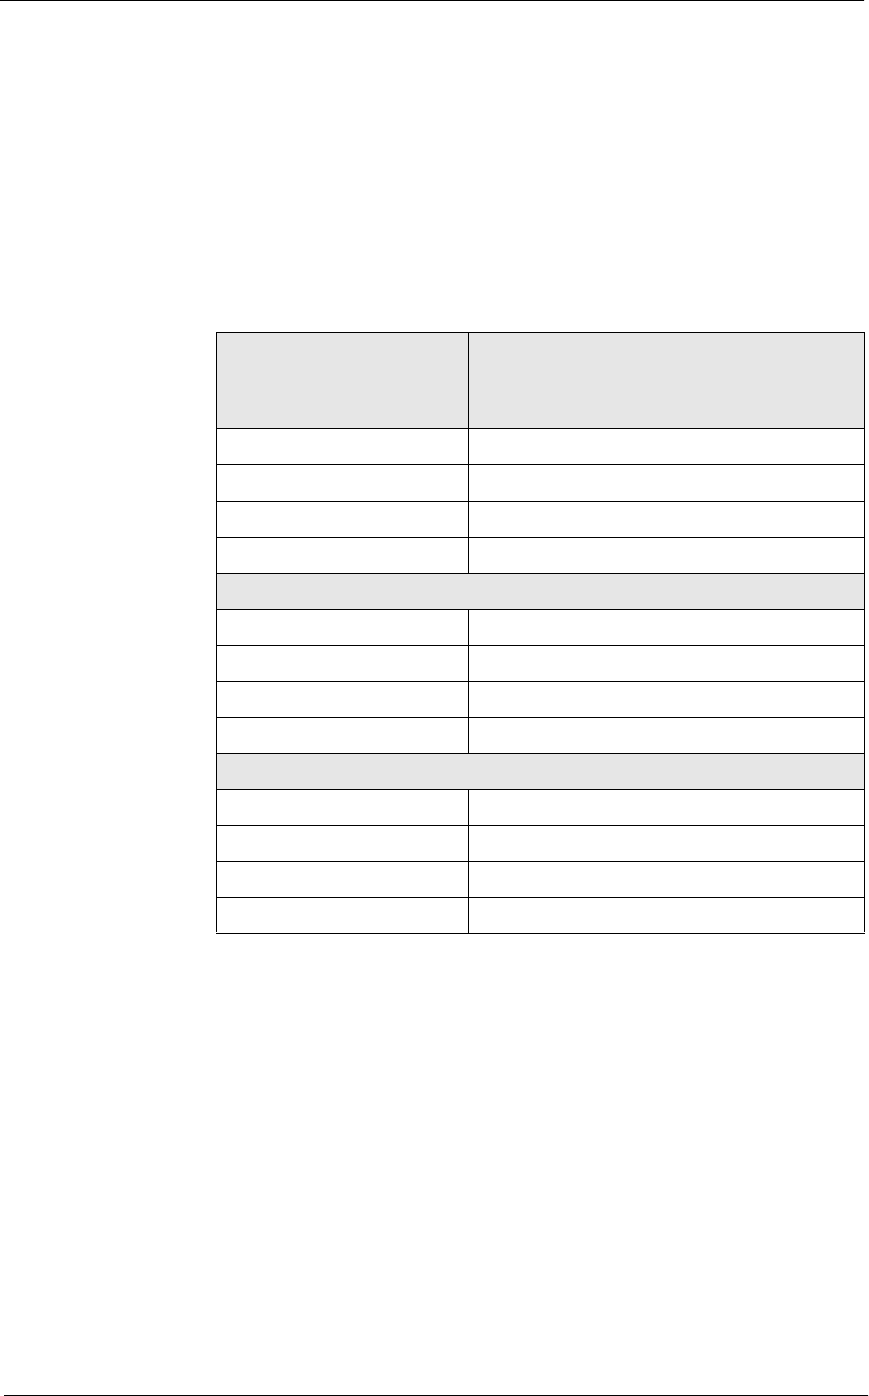
5HSRUWV
&RQVROLGDWHG59&*URXS6DOHV6XPPDU\
Chapter 9
Consolid ated RVC Group Sa les Summary Family Group Sales Profile Details
View: v_R_rvc_fam_grp
Stored Procedure: sp_R_family_group
The following table lists each column in the Family Group Sales Profile
and provides detailed information on the source of the figures in each
column. Since all the numbers in this profile come from formulas, there is
no view, table, or column information.
Report
Column
Title Formula
Sales Qty @Detail_Qty
% of Ttl @Percent_of_RVC_Qty
Net Sales @Detail_Net_Sales
% of Ttl @Percent_of_RVC_Net_Sales
Revenue Center Total
Sales Qty @RVC_Total_Qty
% of Ttl @Percent_of_Daily_Qty
Net Sales @RVC_Total_Total
% of Ttl @Percent_of_Daily_Total
Daily Total
Sales Qty @Daily_Total_Qty
Net Sales @Daily_Total_Total
Other Disc @Daily_Other_Discount
Net Sales Total @Daily_Net_Sales

&RQVROLGDWHG59&*URXS6DOHV6XPPDU\
Major Group Sales Profile Details
View: v_R_rvc_maj_grp
Stored Procedure: sp_R_family_group
The following table lists each column in the Major Group Sales Profile
and provides detailed information on the source of the figures in each
column. Since all the numbers in this profile come from formulas, there is
no view, table, or column information.
Report
Column
Title Formula
Sales Qty @Detail_Qty
% of Ttl @Percent_of_RVC_Qty
Net Sales @Detail_Net_Sales
% of Ttl @Percent_of_RVC_Net_Sales
Revenue Center Total
Sales Qty @RVC_Total_Qty
% of Ttl @Percent_of_Daily_Qty
Net Sales @RVC_Total_Total
% of Ttl @Percent_of_Daily_Total
Daily Total
Sales Qty @Daily_Total_Qty
Net Sales @Daily_Total_Total
Other Disc @Daily_Other_Discount
Net Sales Total @Daily_Net_Sales
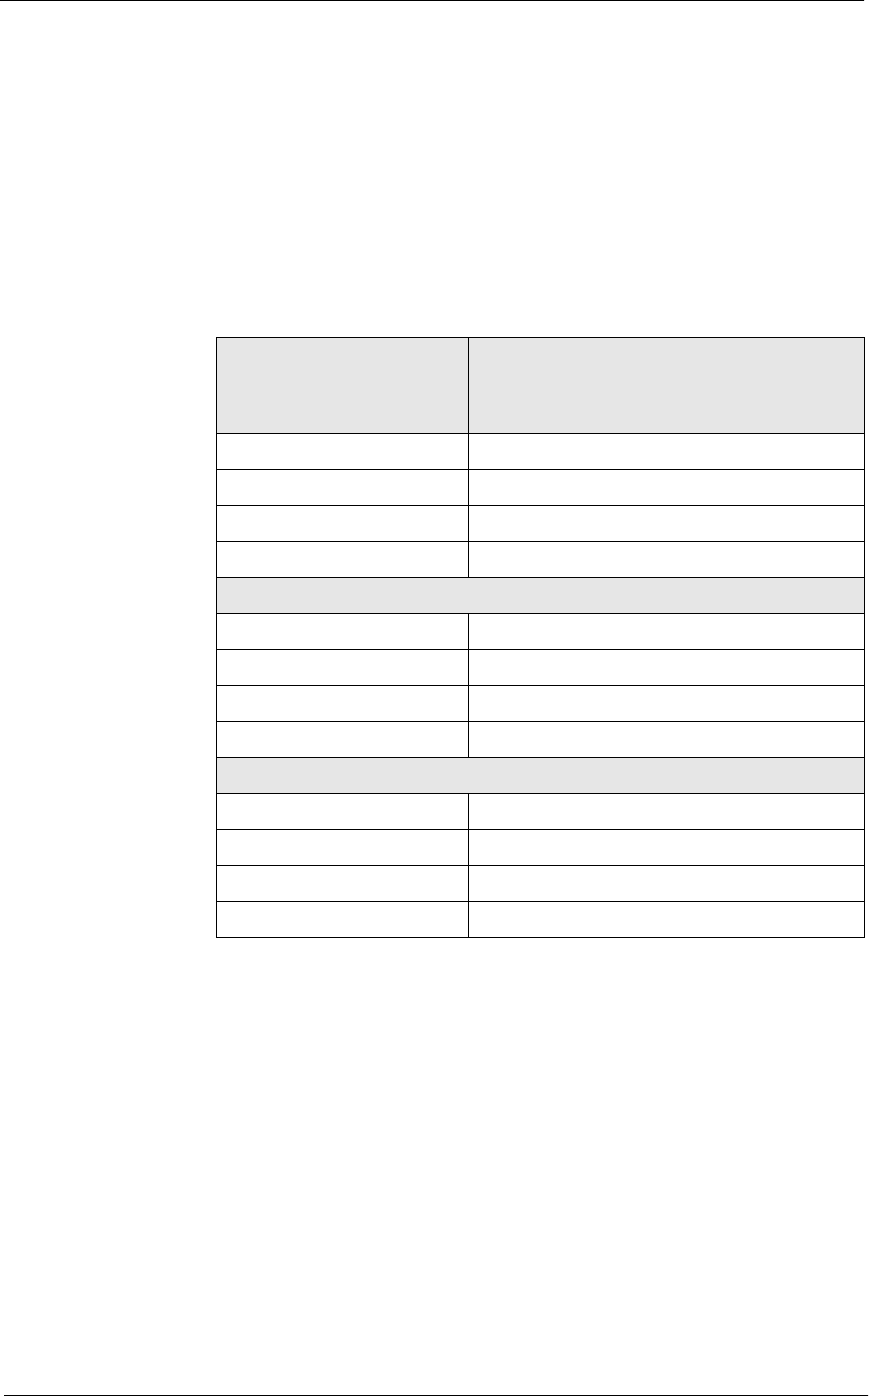
5HSRUWV
&RQVROLGDWHG59&*URXS6DOHV6XPPDU\
Menu Item Group Sales Profile Details
View: v_R_rvc_mi_grp
Stored Procedure: sp_R_family_group
The following table lists each column in the Menu Item Group Sales
Profile and provides detailed information on the source of the figures in
each column. Since all the numbers in this profile come from formulas,
there is no view, table, or column information.
Programming Considerations
0HQX,WHPV
qA menu item with a price of zero will not post to reports if Menu Item
Classes | Print/Display | Do not post to reports if price = 0 is selected.
qA menu item with a price of zero will not add to detail totals if Menu
Item Classes | Print/Display | Do not add to detail if price = 0 is
selected.
qA menu item can be programmed to have up to four different prices if
Menu Item Classes | Price/Totals | Enable prices 2 through 4 is
selected.
Report
Column
Title Formula
Sales Qty @Detail_Qty
% of Ttl @Percent_of_RVC_Qty
Net Sales @Detail_Net_Sales
% of Ttl @Percent_of_RVC_Net_Sales
Revenue Center Total
Sales Qty @RVC_Total_Qty
% of Ttl @Percent_of_Daily_Qty
Net Sales @RVC_Total_Total
% of Ttl @Percent_of_Daily_Total
Daily Total
Sales Qty @Daily_Total_Qty
Net Sales @Daily_Total_Total
Other Disc @Daily_Other_Discount
Net Sales Total @Daily_Net_Sales

&RQVROLGDWHG59&*URXS6DOHV6XPPDU\
Notes
0HQX,WHPV
On Menu Item | Groups, each menu item must be assigned a major and a
family group.
7D[
Figures in this report, including Gross Sales, do not include tax. When tax
is included in the sale price of a menu item (for example, when a VAT or
inclusive tax is in effect), only the net price (sales price minus the tax)
will be posted to these totals.

5HSRUWV
'DLO\6<6*URXS6DOHV'HWDLO6XEWRWDOE\&DWHJRU\
Daily SYS Group Sales Detail Subtotal by Category
3XUSRVH
This report provides a detailed summary of sales quantities, returns, item
discounts, gross sales, and net sales for each group. Percentage
information is also included. Information for each day is presented
separately, with totals for each day, and grand totals for the period of the
report.
This report is almost identical to the Daily System Group Sales Detail
Report, except it includes subtotals by category.
)RUPDW
This report includes the following profile:
qSales Profile
7HPSODWH
FG_S010.RPT
2-24
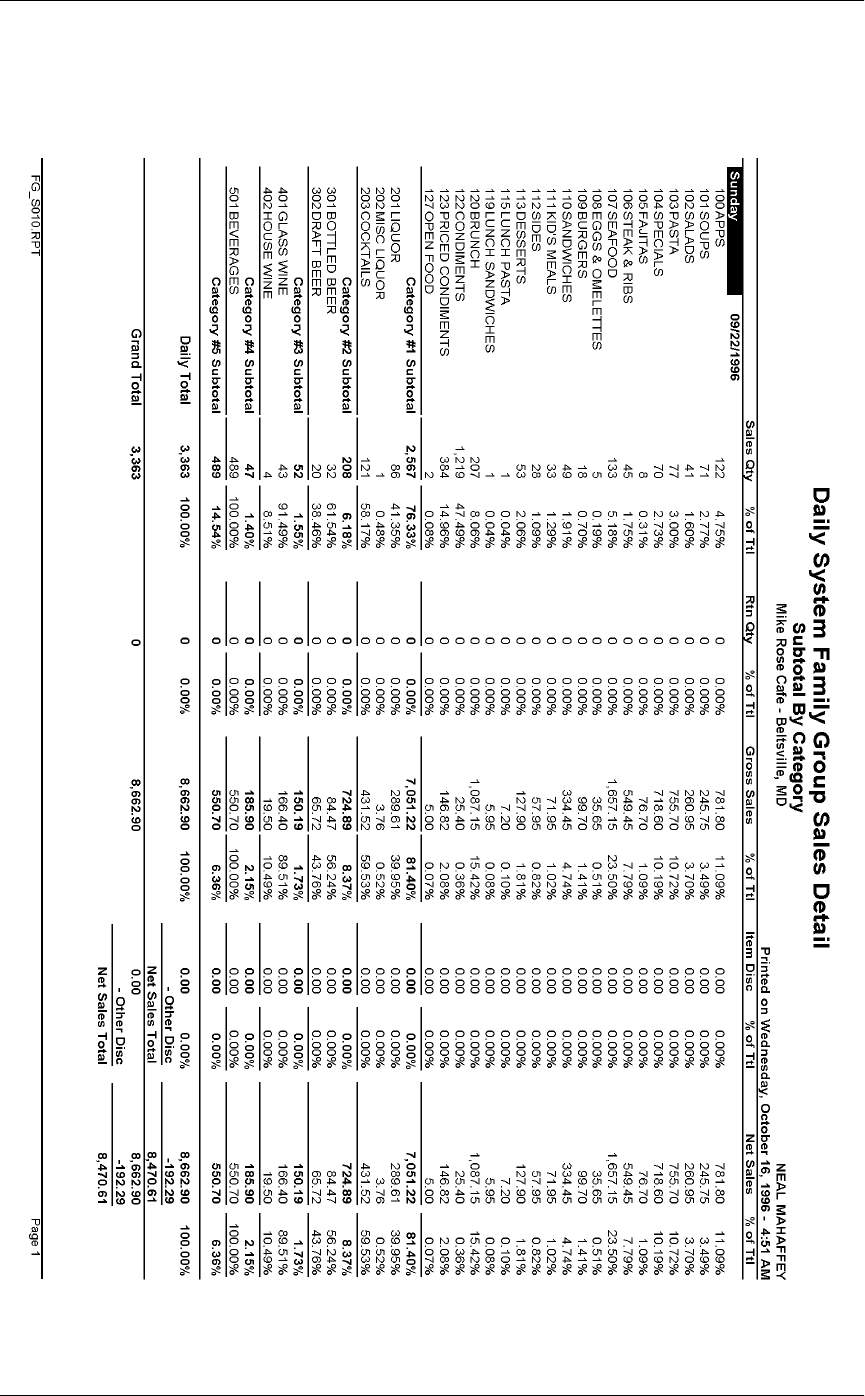
'DLO\6<6*URXS6DOHV'HWDLO6XEWRWDOE\&DWHJRU\
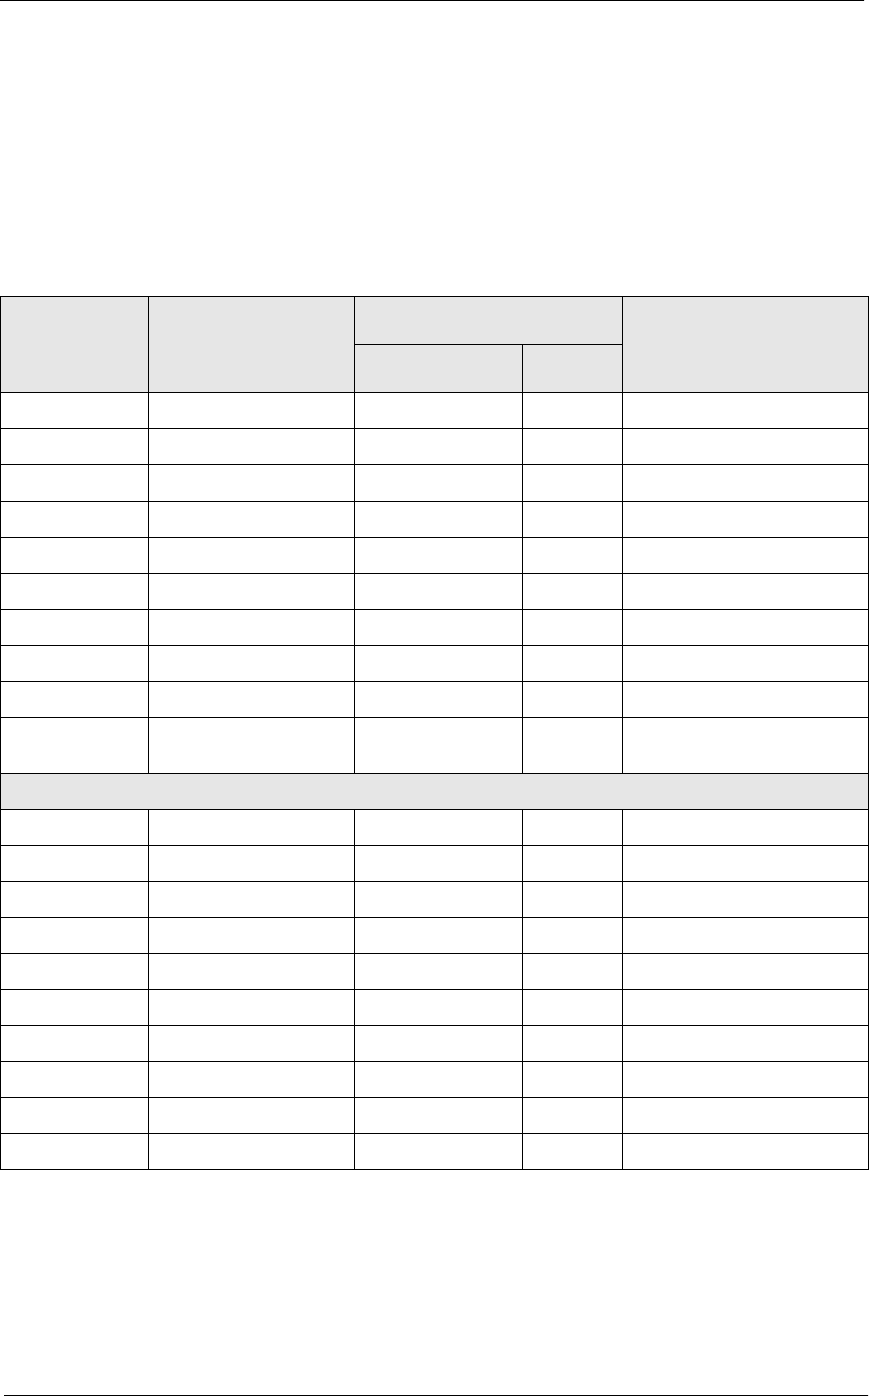
5HSRUWV
'DLO\6<6*URXS6DOHV'HWDLO6XEWRWDOE\&DWHJRU\
Family Group Sales Profile Details
View: v_R_sys_fam_grp
Stored Procedure: sp_R_family_group
The following table lists each column in the Family Group Sales Profile
and provides detailed information on the source of the figures in each
column.
Report
Column
Title
View
Column
Title
3700 Database Formula
Table Column
Sales Qty sales_qty dly_sys_fam_grp_ttl sls_cnt
% of Ttl @Percent_Category_Qty
Rtn Qty return_qty dly_sys_fam_grp_ttl rtn_cnt
% of Ttl @Percent_Category_Rtn_Qty
Gross Sales sales_total dly_sys_fam_grp_ttl sls_ttl
% of Ttl @Percent_Category_Total
Item Disc discount_total dly_sys_fam_grp_ttl dsc_ttl
% of Ttl @Percent_Category_Discount
Net Sales @Net_Sales_Total
% of Ttl @Percent_Category_Net_Tota
l
Category Subtotal
Sales Qty ∑ sales_qty dly_sys_fam_grp_ttl sls_cnt
% of Ttl @Percent_Daily_Qty
Rtn Qty ∑ return_qty dly_sys_fam_grp_ttl rtn_cnt
% of Ttl @Percent_Daily_Rtn_Qty
Gross Sales ∑ sales_total dly_sys_fam_grp_ttl sls_ttl
% of Ttl @Percent_Daily_Total
Item Disc ∑ discount_total dly_sys_fam_grp_ttl dsc_ttl
% of Ttl @Percent_Daily_Discount
Net Sales ∑ @Net_Sales_Total
% of Ttl @Percent_Daily_Net_Total
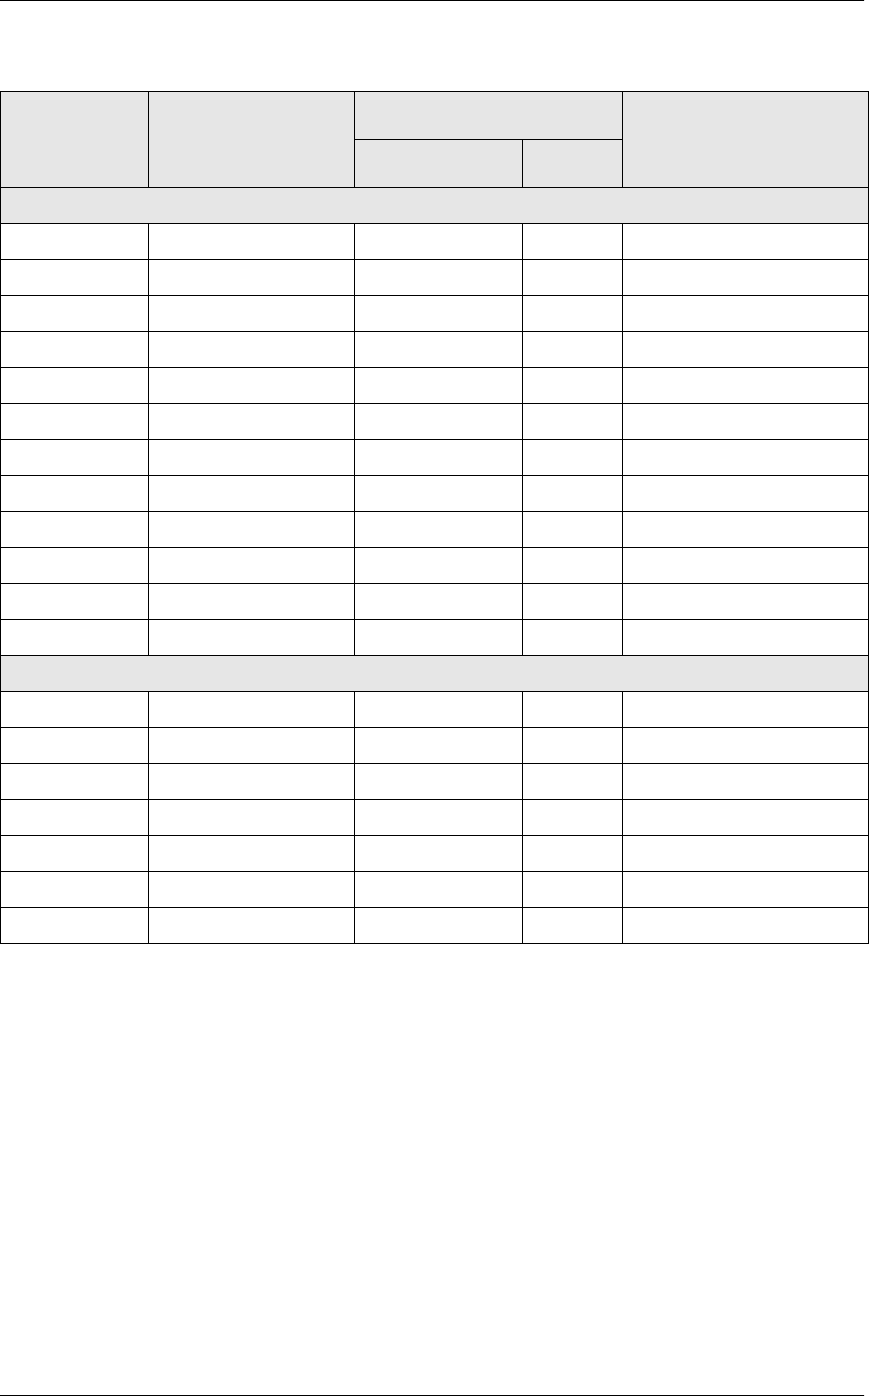
'DLO\6<6*URXS6DOHV'HWDLO6XEWRWDOE\&DWHJRU\
Daily Total
Sales Qty ∑ sales_qty dly_sys_fam_grp_ttl sls_cnt
% of Ttl @Percent_Total_Qty
Rtn Qty ∑ return_qty dly_sys_fam_grp_ttl rtn_cnt
% of Ttl @Percent_Total_Rtn_Qty
Gross Sales ∑ sales_total dly_sys_fam_grp_ttl sls_ttl
% of Ttl @Percent_Total_Total
Item Disc ∑ discount_total dly_sys_fam_grp_ttl dsc_ttl
% of Ttl @Percent_Total_Discount
Net Sales ∑ @Net_Sales_Total
% of Ttl @Percent_Total_Net_Total
Other Disc ∑ sys_sbtl_discount_total dly_sys_ttl sttl_dsc_ttl
Net Sales Total @ttl_Net_Sales_Total
Grand Total
Sales Qty ∑ sales_qty dly_sys_fam_grp_ttl sls_cnt
Rtn Qty ∑ return_qty dly_sys_fam_grp_ttl rtn_cnt
Gross Sales ∑ sales_total dly_sys_fam_grp_ttl sls_ttl
Item Disc ∑ discount_total dly_sys_fam_grp_ttl dsc_ttl
Net Sales ∑ @Net_Sales_Total
Other Disc ∑ sys_sbtl_discount_total dly_sys_ttl sttl_dsc_ttl
Net Sales Total @ttl_Net_Sales_Total
Report
Column
Title
View
Column
Title
3700 Database Formula
Table Column
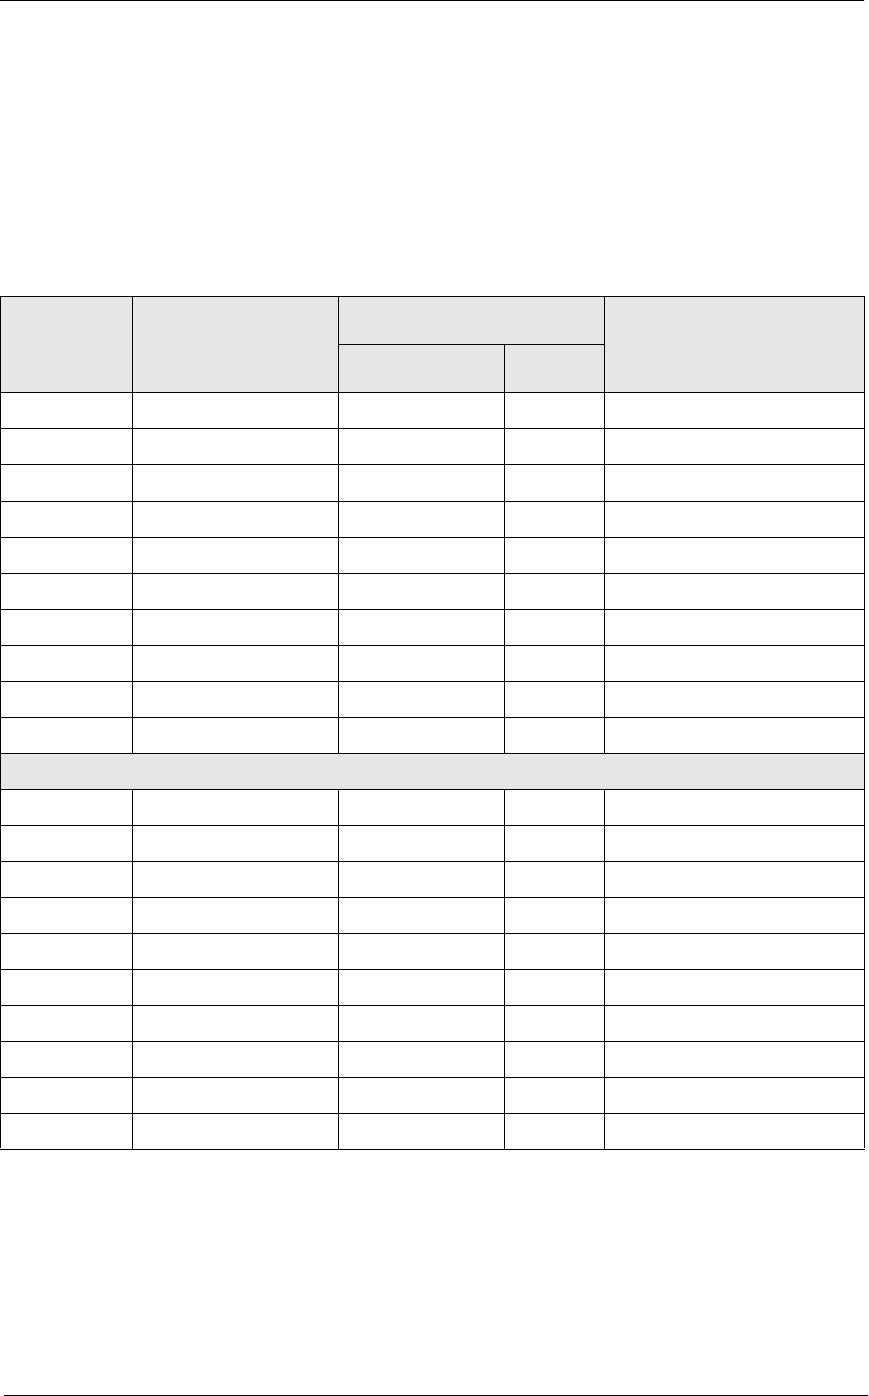
5HSRUWV
'DLO\6<6*URXS6DOHV'HWDLO6XEWRWDOE\&DWHJRU\
Major Group Sales Profile Details
View: v_R_sys_maj_grp
Stored Procedure: sp_R_family_group
The following table lists each column in the Major Group Sales Profile
and provides detailed information on the source of the figures in each
column.
Report
Column
Title
View
Column
Title
3700 Database Formula
Table Column
Sales Qty sales_qty dly_sys_maj_grp_ttl sls_cnt
% of Ttl @Percent_Category_Qty
Rtn Qty return_qty dly_sys_maj_grp_ttl rtn_cnt
% of Ttl @Percent_Category_Rtn_Qty
Gross Sales sales_total dly_sys_maj_grp_ttl sls_ttl
% of Ttl @Percent_Category_Total
Item Disc discount_total dly_sys_maj_grp_ttl dsc_ttl
% of Ttl @Percent_Category_Discount
Net Sales @Net_Sales_Total
% of Ttl @Percent_Category_Net_Total
Category Subtotal
Sales Qty ∑ sales_qty dly_sys_maj_grp_ttl sls_cnt
% of Ttl @Percent_Daily_Qty
Rtn Qty ∑ return_qty dly_sys_maj_grp_ttl rtn_cnt
% of Ttl @Percent_Daily_Rtn_Qty
Gross Sales ∑ sales_total dly_sys_maj_grp_ttl sls_ttl
% of Ttl @Percent_Daily_Total
Item Disc ∑ discount_total dly_sys_maj_grp_ttl dsc_ttl
% of Ttl @Percent_Daily_Discount
Net Sales ∑ @Net_Sales_Total
% of Ttl @Percent_Daily_Net_Total
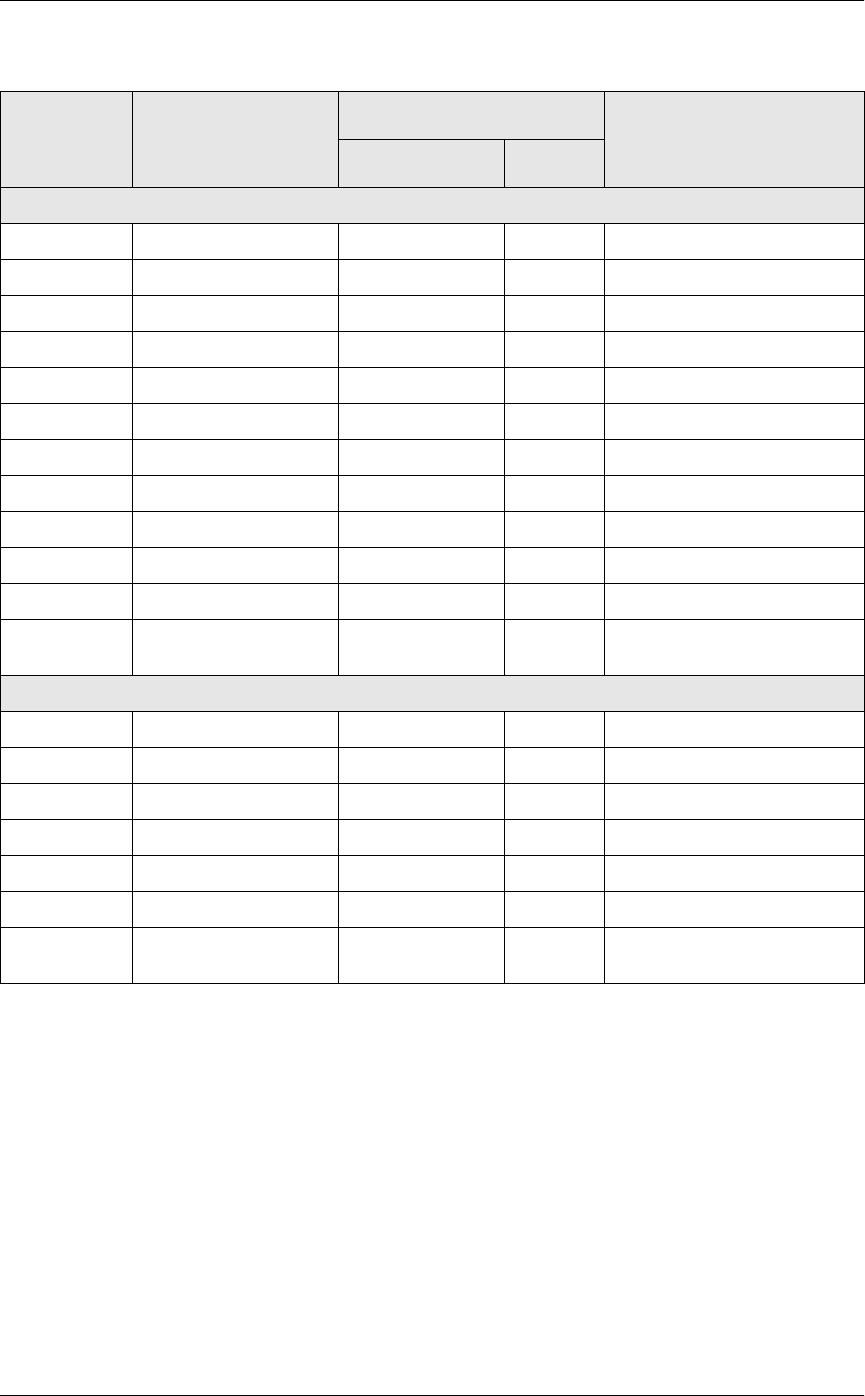
'DLO\6<6*URXS6DOHV'HWDLO6XEWRWDOE\&DWHJRU\
Daily Total
Sales Qty ∑ sales_qty dly_sys_maj_grp_ttl sls_cnt
% of Ttl @Percent_Total_Qty
Rtn Qty ∑ return_qty dly_sys_maj_grp_ttl rtn_cnt
% of Ttl @Percent_Total_Rtn_Qty
Gross Sales ∑ sales_total dly_sys_maj_grp_ttl sls_ttl
% of Ttl @Percent_Total_Total
Item Disc ∑ discount_total dly_sys_maj_grp_ttl dsc_ttl
% of Ttl @Percent_Total_Discount
Net Sales ∑ @Net_Sales_Total
% of Ttl @Percent_Total_Net_Total
Other Disc ∑ sys_sbtl_discount_total dly_sys_ttl sttl_dsc_ttl
Net Sales
Total
@ttl_Net_Sales_Total
Grand Total
Sales Qty ∑ sales_qty dly_sys_maj_grp_ttl sls_cnt
Rtn Qty ∑ return_qty dly_sys_maj_grp_ttl rtn_cnt
Gross Sales ∑ sales_total dly_sys_maj_grp_ttl sls_ttl
Item Disc ∑ discount_total dly_sys_maj_grp_ttl dsc_ttl
Net Sales ∑ @Net_Sales_Total
Other Disc ∑ sys_sbtl_discount_total dly_sys_ttl sttl_dsc_ttl
Net Sales
Total
@ttl_Net_Sales_Total
Report
Column
Title
View
Column
Title
3700 Database Formula
Table Column
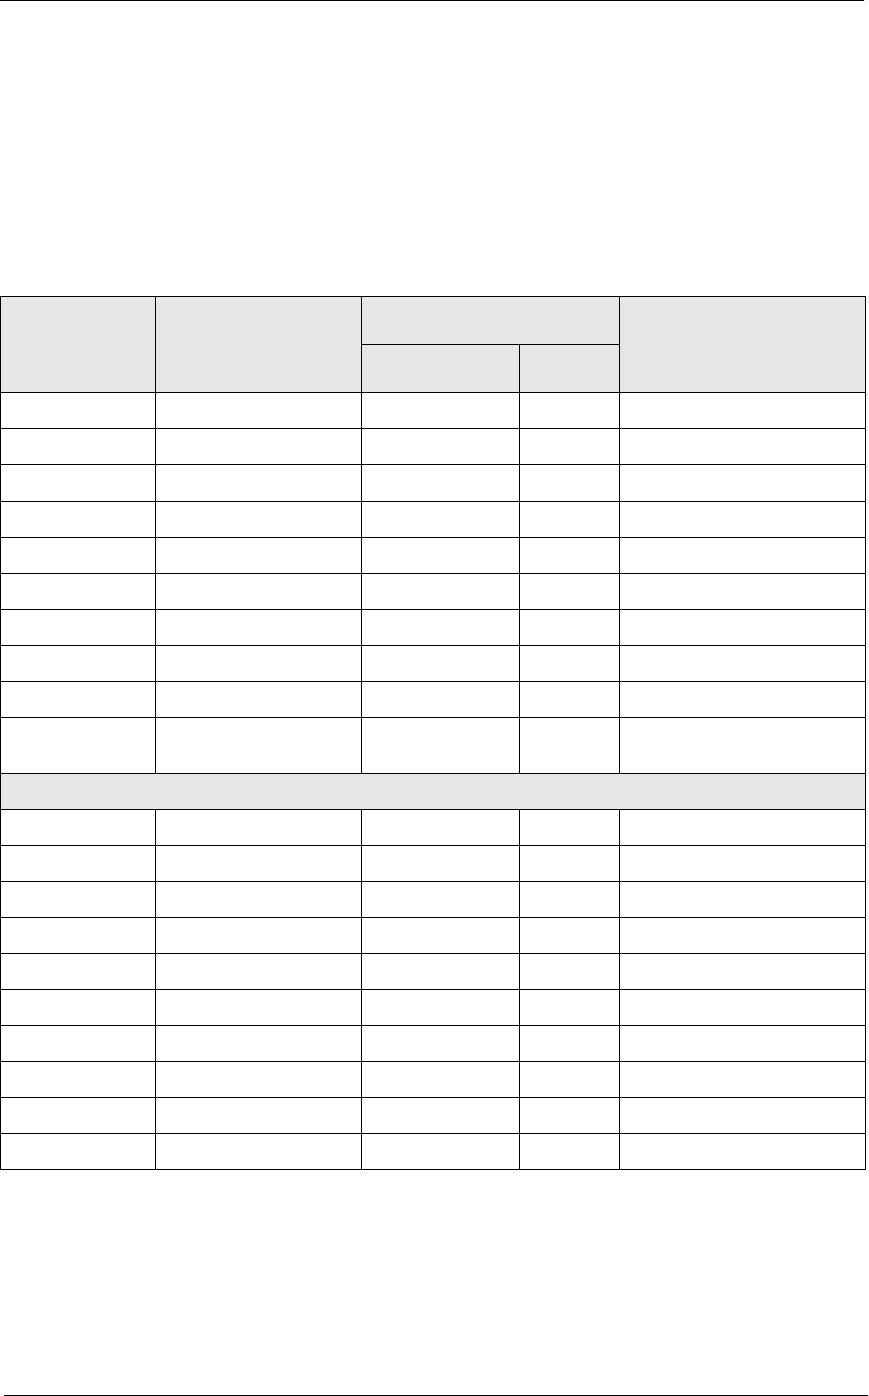
5HSRUWV
'DLO\6<6*URXS6DOHV'HWDLO6XEWRWDOE\&DWHJRU\
Menu Item Group Sales Profile Details
View: v_R_sys_mi_grp
Stored Procedure: sp_R_family_group
The following table lists each column in the Menu Item Group Sales
Profile and provides detailed information on the source of the figures in
each column.
Report
Column
Title
View
Column
Title
3700 Database Formula
Table Column
Sales Qty sales_qty dly_sys_mi_grp_ttl sls_cnt
% of Ttl @Percent_Category_Qty
Rtn Qty return_qty dly_sys_mi_grp_ttl rtn_cnt
% of Ttl @Percent_Category_Rtn_Qty
Gross Sales sales_total dly_sys_mi_grp_ttl sls_ttl
% of Ttl @Percent_Category_Total
Item Disc discount_total dly_sys_mi_grp_ttl dsc_ttl
% of Ttl @Percent_Category_Discount
Net Sales @Net_Sales_Total
% of Ttl @Percent_Category_Net_Tota
l
Category Subtotal
Sales Qty ∑ sales_qty dly_sys_mi_grp_ttl sls_cnt
% of Ttl @Percent_Daily_Qty
Rtn Qty ∑ return_qty dly_sys_mi_grp_ttl rtn_cnt
% of Ttl @Percent_Daily_Rtn_Qty
Gross Sales ∑ sales_total dly_sys_mi_grp_ttl sls_ttl
% of Ttl @Percent_Daily_Total
Item Disc ∑ discount_total dly_sys_mi_grp_ttl dsc_ttl
% of Ttl @Percent_Daily_Discount
Net Sales ∑ @Net_Sales_Total
% of Ttl @Percent_Daily_Net_Total
'DLO\6<6*URXS6DOHV'HWDLO6XEWRWDOE\&DWHJRU\
Programming Considerations
0HQX,WHPV
qA menu item with a price of zero will not post to reports if Menu Item
Classes | Print/Display | Do not post to reports if price = 0 is selected.
qA menu item with a price of zero will not add to detail totals if Menu
Item Classes | Print/Display | Do not add to detail if price = 0 is
selected.
qA menu item can be programmed to have up to four different prices if
Menu Item Classes | Price/Totals | Enable prices 2 through 4 is
selected.
&DWHJRULHV
qCategories for each group are defined on the Report Groups form.
Daily Total
Sales Qty ∑ sales_qty dly_sys_mi_grp_ttl sls_cnt
% of Ttl @Percent_Total_Qty
Rtn Qty ∑ return_qty dly_sys_mi_grp_ttl rtn_cnt
% of Ttl @Percent_Total_Rtn_Qty
Gross Sales ∑ sales_total dly_sys_mi_grp_ttl sls_ttl
% of Ttl @Percent_Total_Total
Item Disc ∑ discount_total dly_sys_mi_grp_ttl dsc_ttl
% of Ttl @Percent_Total_Discount
Net Sales ∑ @Net_Sales_Total
% of Ttl @Percent_Total_Net_Total
Other Disc ∑ sys_sbtl_discount_total dly_sys_ttl sttl_dsc_ttl
Net Sales Total @ttl_Net_Sales_Total
Grand Total
Sales Qty ∑ sales_qty dly_sys_mi_grp_ttl sls_cnt
Rtn Qty ∑ return_qty dly_sys_mi_grp_ttl rtn_cnt
Gross Sales ∑ sales_total dly_sys_mi_grp_ttl sls_ttl
Item Disc ∑ discount_total dly_sys_mi_grp_ttl dsc_ttl
Net Sales ∑ @Net_Sales_Total
Other Disc ∑ sys_sbtl_discount_total dly_sys_ttl sttl_dsc_ttl
Net Sales Total @ttl_Net_Sales_Total
Report
Column
Title
View
Column
Title
3700 Database Formula
Table Column

5HSRUWV
'DLO\6<6*URXS6DOHV'HWDLO6XEWRWDOE\&DWHJRU\
Notes
0HQX,WHPV
On Menu Item | Groups, each menu item must be assigned a major and a
family group.
&DWHJRULHV
On the Report Groups form, family groups, major groups, and menu item
groups are all identified by a sequential number. These groups may then
be assigned to up to nine categories. Categories are used to provide
additional subtotals on some sales reports.
7D[
Figures in this report, including Gross Sales, do not include tax. When tax
is included in the sale price of a menu item (for example, when a VAT or
inclusive tax is in effect), only the net price (sales price minus the tax)
will be posted to these totals.

'DLO\6<6*URXS6DOHV'HWDLO
Daily SYS Group Sales Detail
3XUSRVH
This report provides a detailed summary of sales quantities, returns, item
discounts, gross sales, and net sales for each group. Percentage
information is also included. Information for each day is presented
separately, with totals for each day, and grand totals for the period of the
report.
This report is similar to the Daily SYS Group Sales Detail Subtotal by
Category Report except subtotal information is not included. See page 9-
39 for complete detail and programming information.
)RUPDW
This report includes the following profile:
qSales Profile
7HPSODWH
FG_S001.RPT
2-24
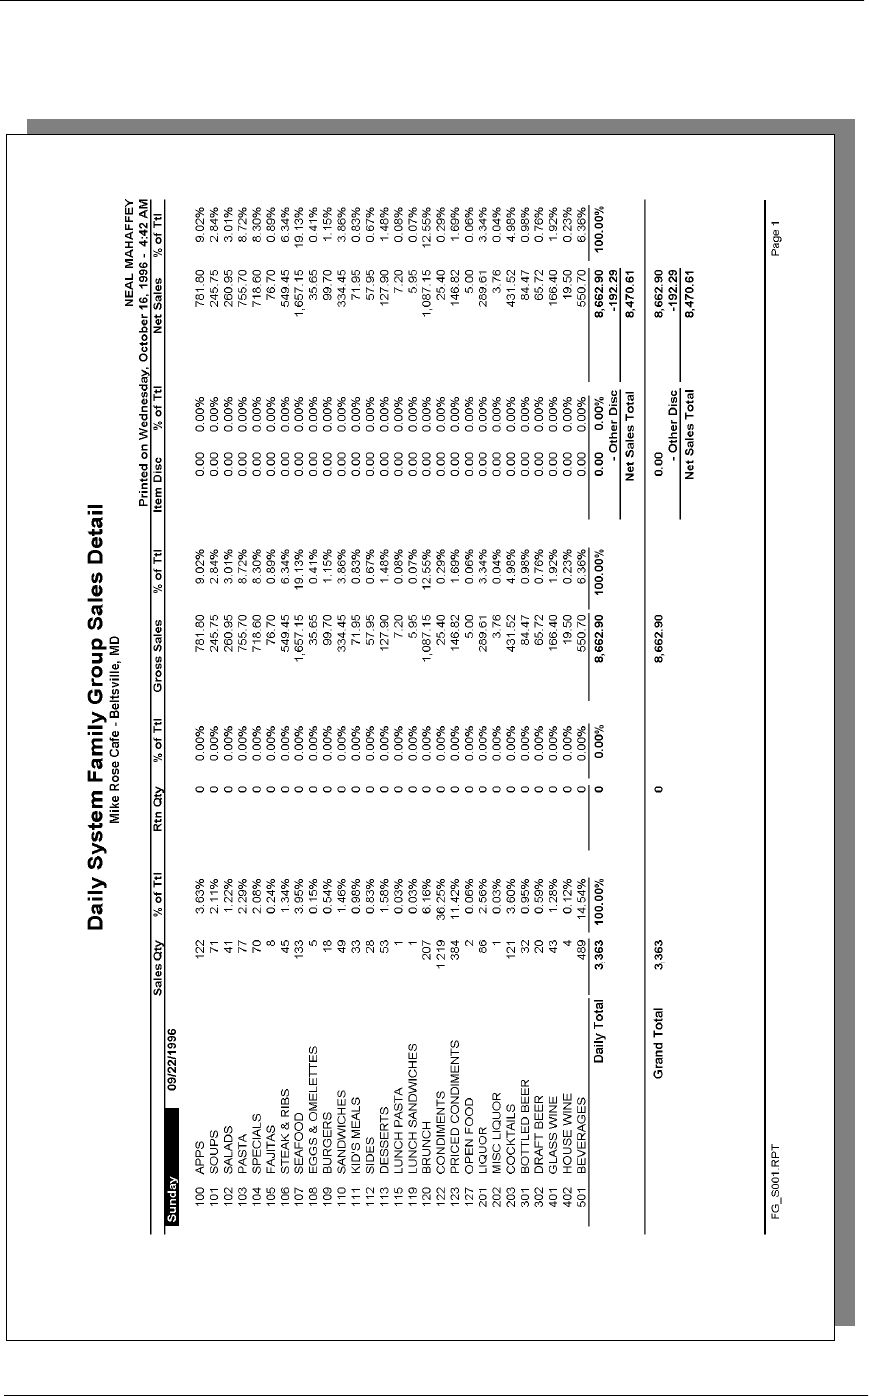
5HSRUWV
'DLO\6<6*URXS6DOHV'HWDLO

'DLO\6<6*URXS6DOHV'HWDLO
Daily System Family Group Sales Detail
Daily System
Family Group Sales Detail
Mike Rose Cafe - Beltsville, M
NEAL MAHAFFEY
Printed on 10/16/1996 - 2:34
----------------------------------------
Sunday 9/22/1996
100 APPS
Sales Qty 122 3.63%
Returns 0 0.00%
Gross 781.80 9.02%
Item Disc 0.00 0.00%
Net Sls 781.80 9.02%
101 SOUPS
Sales Qty 71 2.11%
Returns 0 0.00%
Gross 245.75 2.84%
Item Disc 0.00 0.00%
Net Sls 245.75 2.84%
102 SALADS
Sales Qty 41 1.22%
Returns 0 0.00%
Gross 260.95 3.01%
Item Disc 0.00 0.00%
Net Sls 260.95 3.01%
103 PASTA
Sales Qty 77 2.29%
Returns 0 0.00%
Gross 755.70 8.72%
Item Disc 0.00 0.00%
Net Sls 755.70 8.72%
104 SPECIALS
Sales Qty 70 2.08%
Returns 0 0.00%
Gross 718.60 8.30%
Item Disc 0.00 0.00%
Net Sls 718.60 8.30%
105 FAJITAS
Sales Qty 8 0.24%
Returns 0 0.00%
Gross 76.70 0.89%
Item Disc 0.00 0.00%
Net Sls 76.70 0.89%
106 STEAK & RIBS
Sales Qty 45 1.34%
Returns 0 0.00%
Gross 549.45 6.34%
Item Disc 0.00 0.00%
Net Sls 549.45 6.34%
Daily Total
Sales Qty 3,363 100.00%
Returns 0 0.00%
Gross 8,662.90 100.00%
Item Disc 0.00 0.00%
Sls Sbt 8,662.90 100.00%
Sbtl Disc -192.29
Net Sls 8,470.61
----------------------------------------
Grand Total
Sales Qty 3,363
Return Qty 0
Gross Sales 8,662.90
Item Disc 0.00
Sales Subttl 8,662.90
- Other Disc -192.29
Net Sales Ttl 8,470.61
Totals omitted for
display

5HSRUWV
&RQVROLGDWHG6\VWHP*URXS6DOHV'HWDLO6XEWRWDOE\&DWHJRU\
Consolidated System Group Sales Detail Subtotal by Category
3XUSRVH
This report provides a detailed summary of sales quantities, returns, item
discounts, gross sales, and net sales for each group. Percentage
information is also included. Grand totals are provided for the period of
the report.
This report is almost identical to the Daily System Group Sales Detail
Report, except the information for the period of the report is consolidated
into one set of figures, rather than being presented separately for each day.
)RUPDW
This report includes the following profile:
qSales Profile
7HPSODWH
FG_S012.RPT
2-24
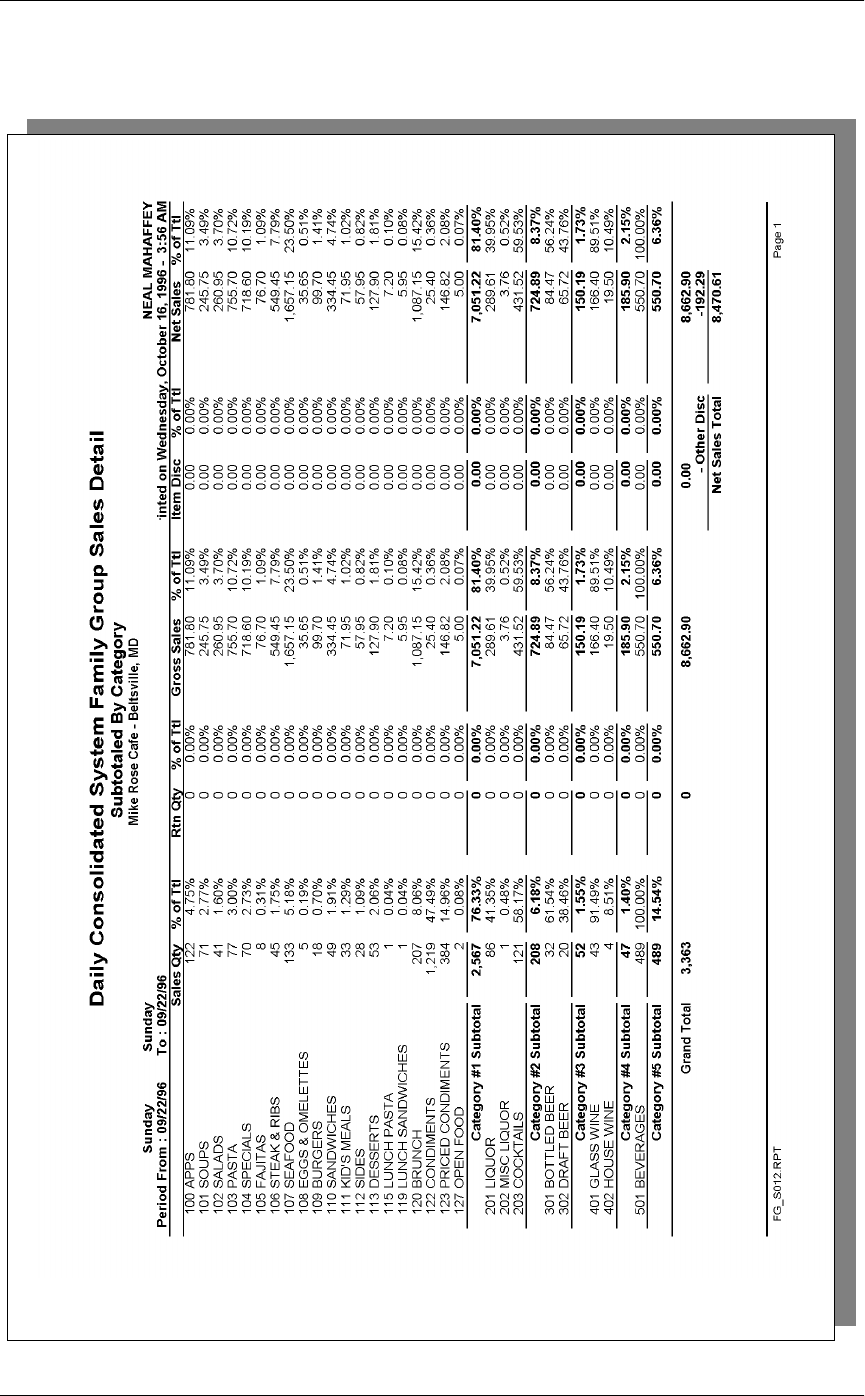
&RQVROLGDWHG6\VWHP*URXS6DOHV'HWDLO6XEWRWDOE\&DWHJRU\
5HSRUWV
&RQVROLGDWHG6\VWHP*URXS6DOHV'HWDLO6XEWRWDOE\&DWHJRU\
Family Group Sales Profile Details
View: v_R_sys_fam_grp
Stored Procedure: sp_R_family_group
The following table lists each column in the Family Group Sales Profile
and provides detailed information on the source of the figures in each
column.
Report
Column
Title
View
Column
Title
3700 Database Formula
Table Column
Sales Qty ∑ sales_qty dly_sys_fam_grp_ttl sls_cnt
% of Ttl @Percent_Total_Qty
Rtn Qty ∑ return_qty dly_sys_fam_grp_ttl rtn_cnt
% of Ttl @Percent_Total_Rtn_Qty
Gross Sales ∑ sales_total dly_sys_fam_grp_ttl sls_ttl
% of Ttl @Percent_Total_Total
Item Disc ∑ discount_total dly_sys_fam_grp_ttl dsc_ttl
% of Ttl @Percent_Total_Discount
Net Sales ∑ @Net_Sales_Total
% of Ttl @Percent_Total_Net_Tot
al
Category Subtotal
Sales Qty ∑ sales_qty dly_sys_fam_grp_ttl sls_cnt
% of Ttl @Percent_Total_Qty
Rtn Qty ∑ return_qty dly_sys_fam_grp_ttl rtn_cnt
% of Ttl @Percent_Total_Rtn_Qty
Gross Sales ∑ sales_total dly_sys_fam_grp_ttl sls_ttl
% of Ttl @Percent_Total_Total
Item Disc ∑ discount_total dly_sys_fam_grp_ttl dsc_ttl
% of Ttl @Percent_Total_Discount
Net Sales ∑ @Net_Sales_Total
% of Ttl @Percent_Total_Net_Tot
al
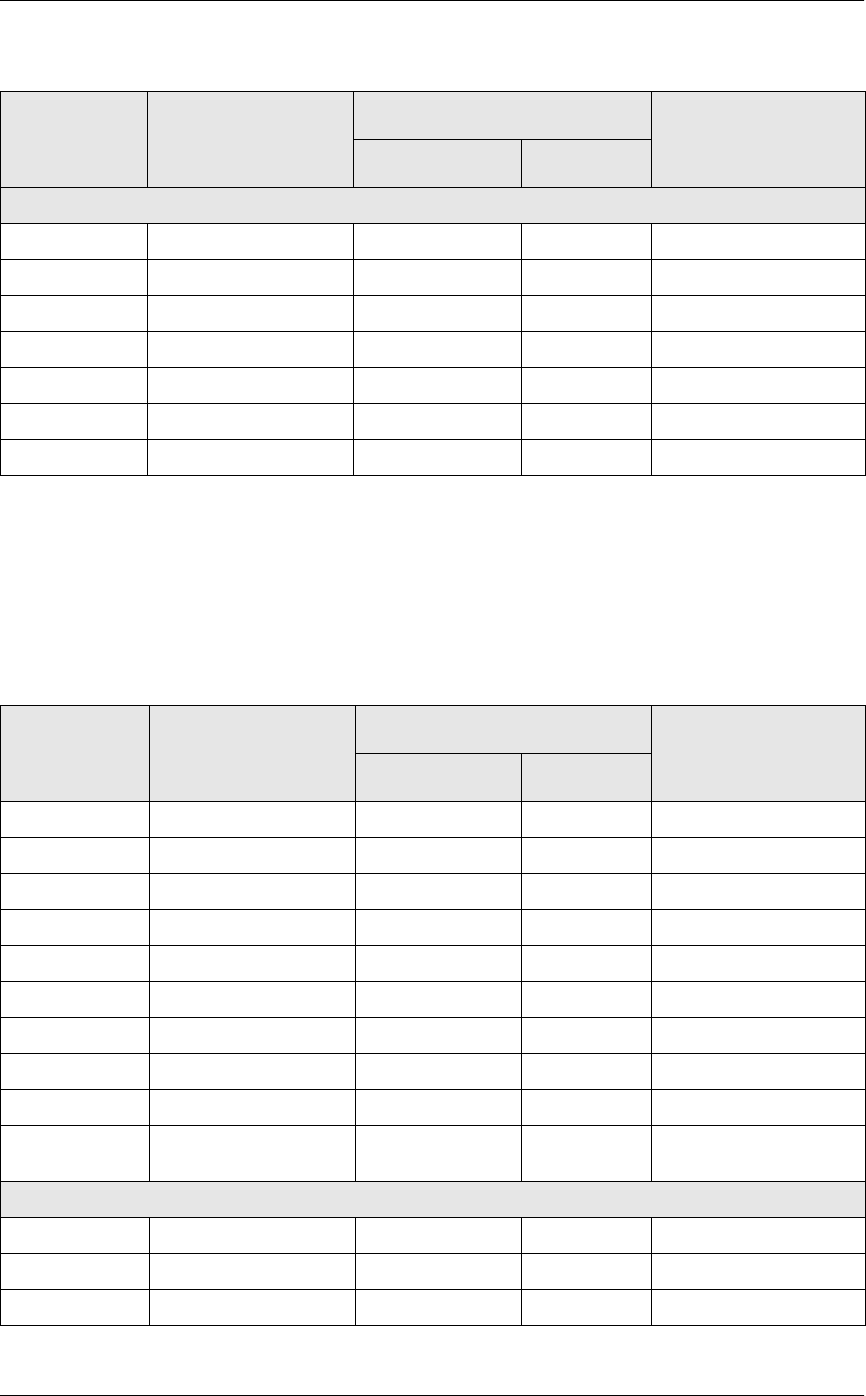
&RQVROLGDWHG6\VWHP*URXS6DOHV'HWDLO6XEWRWDOE\&DWHJRU\
Major Group Sales Profile Details
View: v_R_sys_maj_grp
Stored Procedure: sp_R_family_group
The following table lists each column in the Major Group Sales Profile
and provides detailed information on the source of the figures in each
column.
Grand Total
Sales Qty ∑ sales_qty dly_sys_fam_grp_ttl sls_cnt
Rtn Qty ∑ return_qty dly_sys_fam_grp_ttl rtn_cnt
Gross Sales ∑ sales_total dly_sys_fam_grp_ttl sls_ttl
Item Disc ∑ discount_total dly_sys_fam_grp_ttl dsc_ttl
Net Sales ∑ @Net_Sales_Total
Other Disc ∑ sys_sbtl_discount_total dly_sys_ttl sttl_dsc_ttl
Net Sales Total @ttl_Net_Sales_Total
Report
Column
Title
View
Column
Title
3700 Database Formula
Table Column
Sales Qty ∑ sales_qty dly_sys_maj_grp_ttl sls_cnt
% of Ttl @Percent_Total_Qty
Rtn Qty ∑ return_qty dly_sys_maj_grp_ttl rtn_cnt
% of Ttl @Percent_Total_Rtn_Qty
Gross Sales ∑ sales_total dly_sys_maj_grp_ttl sls_ttl
% of Ttl @Percent_Total_Total
Item Disc ∑ discount_total dly_sys_maj_grp_ttl dsc_ttl
% of Ttl @Percent_Total_Discount
Net Sales ∑ @Net_Sales_Total
% of Ttl @Percent_Total_Net_Tot
al
Category Subtotal
Sales Qty ∑ sales_qty dly_sys_maj_grp_ttl sls_cnt
% of Ttl @Percent_Total_Qty
Rtn Qty ∑ return_qty dly_sys_maj_grp_ttl rtn_cnt
Report
Column
Title
View
Column
Title
3700 Database Formula
Table Column
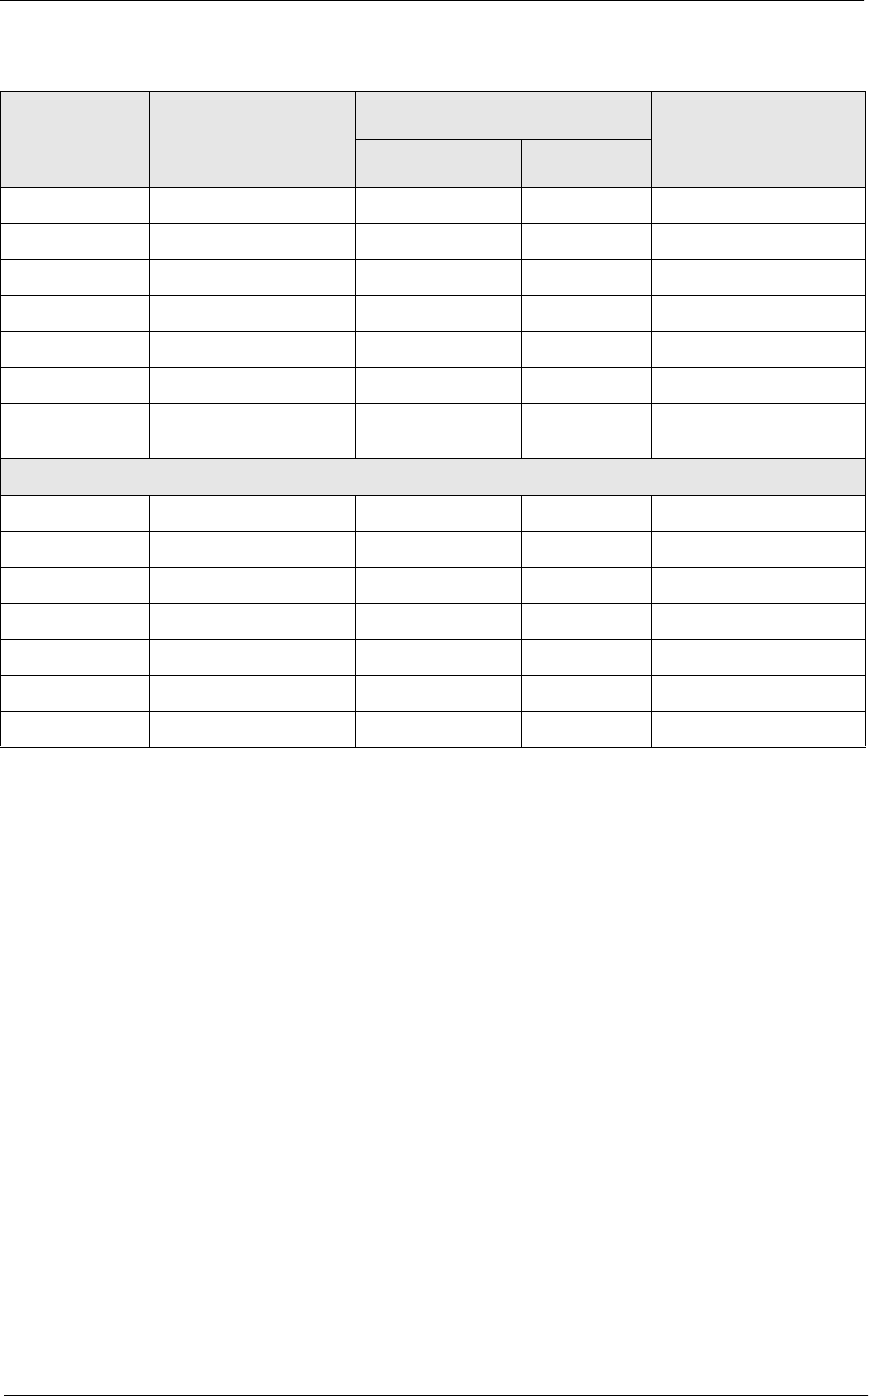
5HSRUWV
&RQVROLGDWHG6\VWHP*URXS6DOHV'HWDLO6XEWRWDOE\&DWHJRU\
% of Ttl @Percent_Total_Rtn_Qty
Gross Sales ∑ sales_total dly_sys_maj_grp_ttl sls_ttl
% of Ttl @Percent_Total_Total
Item Disc ∑ discount_total dly_sys_maj_grp_ttl dsc_ttl
% of Ttl @Percent_Total_Discount
Net Sales ∑ @Net_Sales_Total
% of Ttl @Percent_Total_Net_Tot
al
Grand Total
Sales Qty ∑ sales_qty dly_sys_maj_grp_ttl sls_cnt
Rtn Qty ∑ return_qty dly_sys_maj_grp_ttl rtn_cnt
Gross Sales ∑ sales_total dly_sys_maj_grp_ttl sls_ttl
Item Disc ∑ discount_total dly_sys_maj_grp_ttl dsc_ttl
Net Sales ∑ @Net_Sales_Total
Other Disc ∑ sys_sbtl_discount_total dly_sys_ttl sttl_dsc_ttl
Net Sales Total @ttl_Net_Sales_Total
Report
Column
Title
View
Column
Title
3700 Database Formula
Table Column
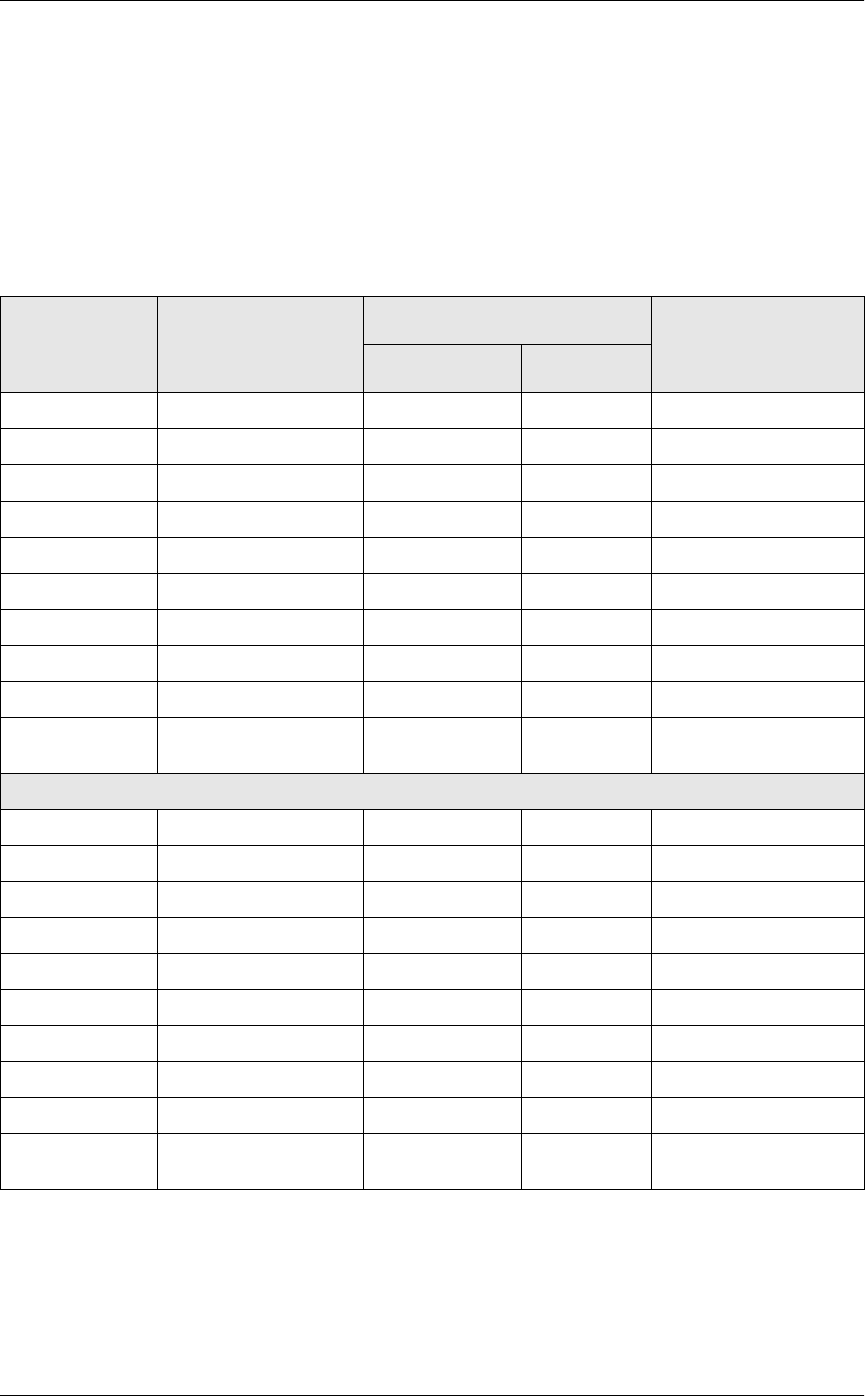
&RQVROLGDWHG6\VWHP*URXS6DOHV'HWDLO6XEWRWDOE\&DWHJRU\
Menu Item Group Sales Profile Details
View: v_R_sys_mi_grp
Stored Procedure: sp_R_family_group
The following table lists each column in the Menu Item Group Sales
Profile and provides detailed information on the source of the figures in
each column.
Report
Column
Title
View
Column
Title
3700 Database Formula
Table Column
Sales Qty ∑ sales_qty dly_sys_mi_grp_ttl sls_cnt
% of Ttl @Percent_Total_Qty
Rtn Qty ∑ return_qty dly_sys_mi_grp_ttl rtn_cnt
% of Ttl @Percent_Total_Rtn_Qty
Gross Sales ∑ sales_total dly_sys_mi_grp_ttl sls_ttl
% of Ttl @Percent_Total_Total
Item Disc ∑ discount_total dly_sys_mi_grp_ttl dsc_ttl
% of Ttl @Percent_Total_Discount
Net Sales ∑ @Net_Sales_Total
% of Ttl @Percent_Total_Net_Tot
al
Category Subtotal
Sales Qty ∑ sales_qty dly_sys_mi_grp_ttl sls_cnt
% of Ttl @Percent_Total_Qty
Rtn Qty ∑ return_qty dly_sys_mi_grp_ttl rtn_cnt
% of Ttl @Percent_Total_Rtn_Qty
Gross Sales ∑ sales_total dly_sys_mi_grp_ttl sls_ttl
% of Ttl @Percent_Total_Total
Item Disc ∑ discount_total dly_sys_mi_grp_ttl dsc_ttl
% of Ttl @Percent_Total_Discount
Net Sales ∑ @Net_Sales_Total
% of Ttl @Percent_Total_Net_Tot
al
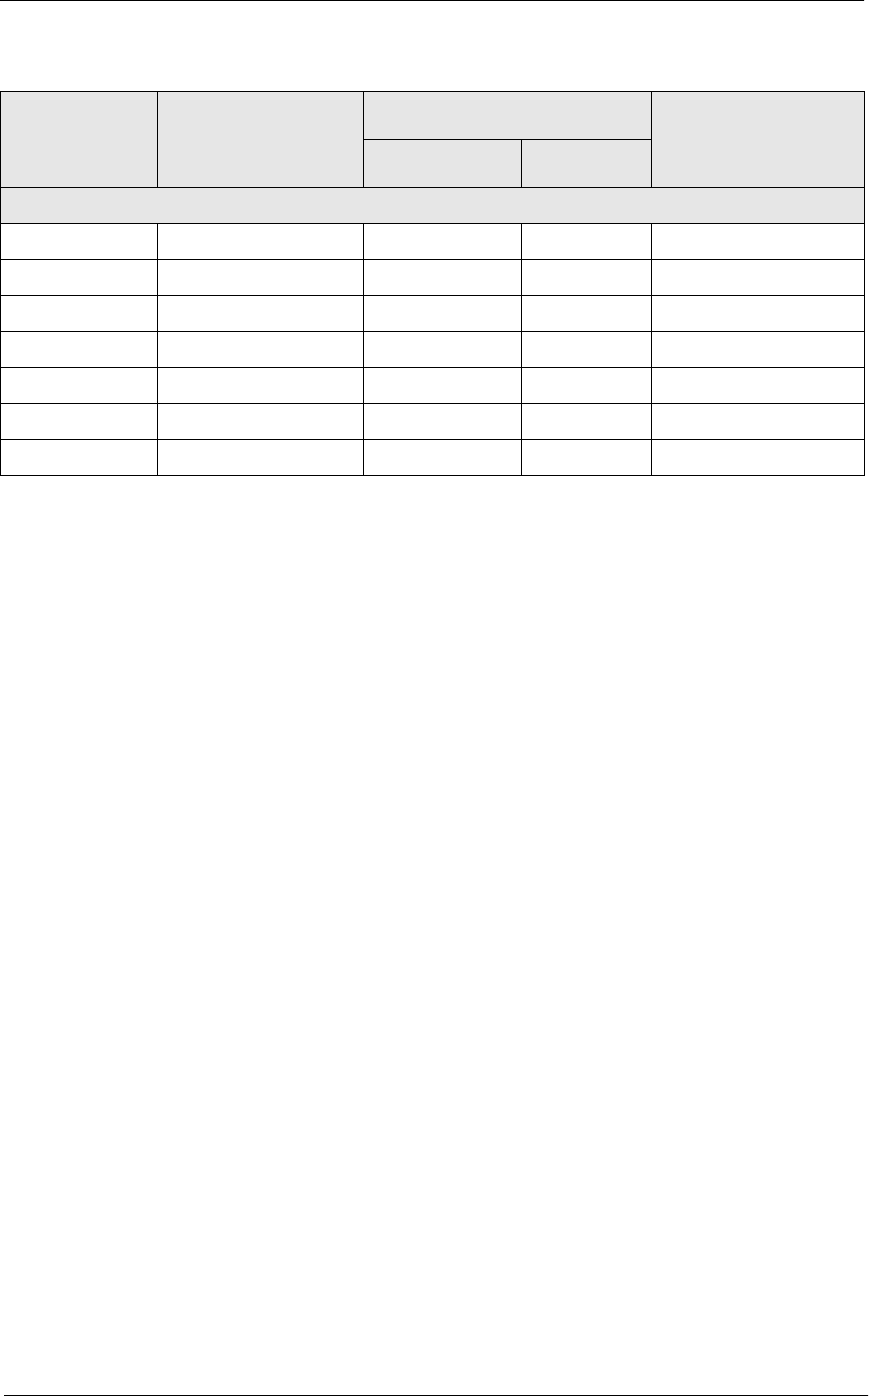
5HSRUWV
&RQVROLGDWHG6\VWHP*URXS6DOHV'HWDLO6XEWRWDOE\&DWHJRU\
Programming Considerations
0HQX,WHPV
qA menu item with a price of zero will not post to reports if Menu Item
Classes | Print/Display | Do not post to reports if price = 0 is selected.
qA menu item with a price of zero will not add to detail totals if Menu
Item Classes | Print/Display | Do not add to detail if price = 0 is
selected.
qA menu item can be programmed to have up to four different prices if
Menu Item Classes | Price/Totals | Enable prices 2 through 4 is
selected.
Notes
0HQX,WHPV
On Menu Item | Groups, each menu item must be assigned a major and a
family group.
7D[
Figures in this report, including Gross Sales, do not include tax. When tax
is included in the sale price of a menu item (for example, when a VAT or
inclusive tax is in effect), only the net price (sales price minus the tax)
will be posted to these totals.
Grand Total
Sales Qty ∑ sales_qty dly_sys_mi_grp_ttl sls_cnt
Rtn Qty ∑ return_qty dly_sys_mi_grp_ttl rtn_cnt
Gross Sales ∑ sales_total dly_sys_mi_grp_ttl sls_ttl
Item Disc ∑ discount_total dly_sys_mi_grp_ttl dsc_ttl
Net Sales ∑ @Net_Sales_Total
Other Disc ∑ sys_sbtl_discount_total dly_sys_ttl sttl_dsc_ttl
Net Sales Total @ttl_Net_Sales_Total
Report
Column
Title
View
Column
Title
3700 Database Formula
Table Column

&RQVROLGDWHG6\VWHP*URXS6DOHV'HWDLO
Consolidated System Group Sales Detail
3XUSRVH
This report is similar to the Consolidated System Group Sales Detail
Subtotal by Category, but subtotal information is not provided. For
complete detail and programming information, see pages 9-51.
)RUPDW
This report includes the following profile:
qSales Profile
7HPSODWH
FG_S002.RPT
2-24
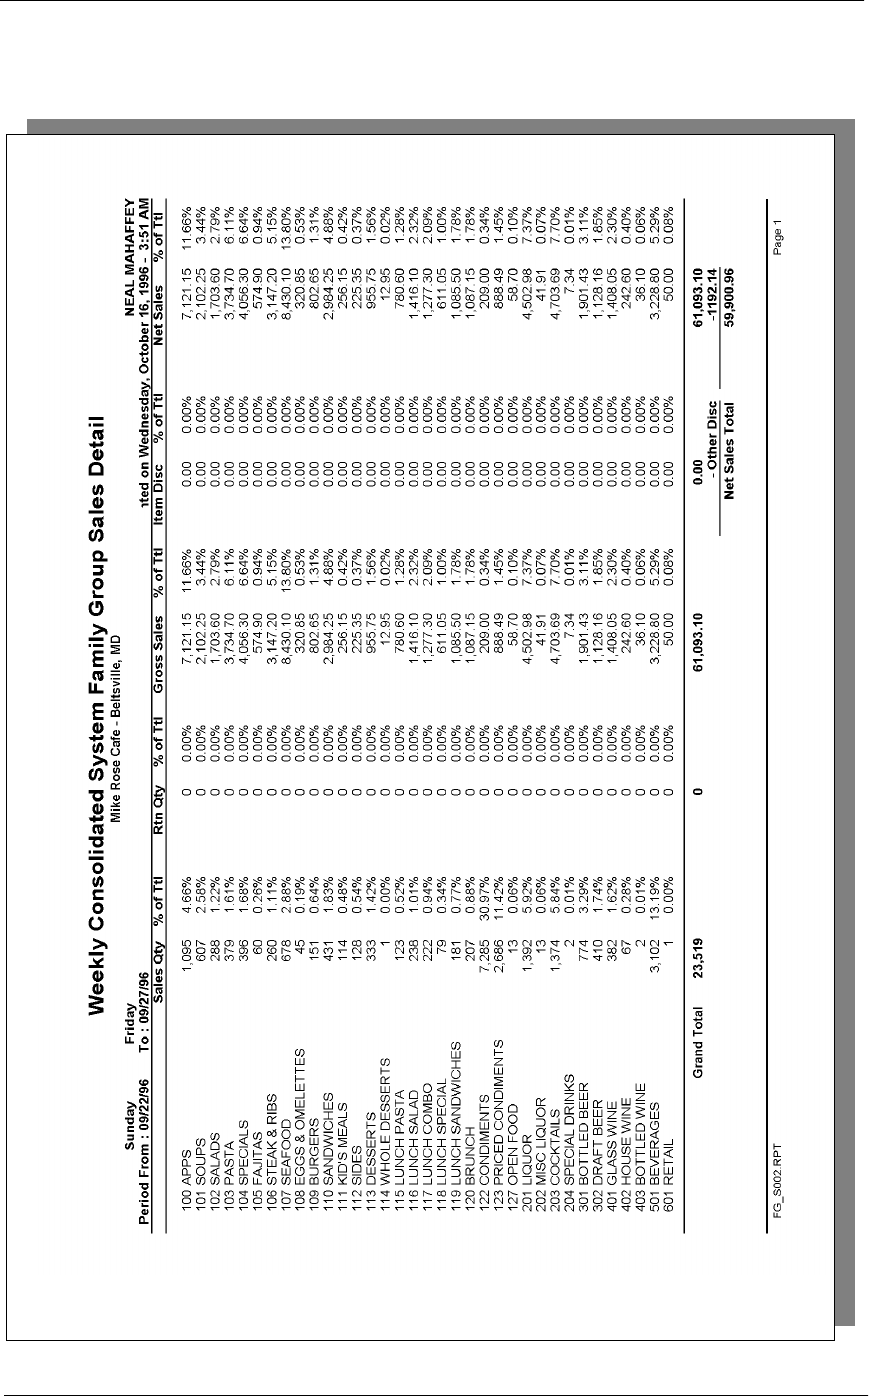
5HSRUWV
&RQVROLGDWHG6\VWHP*URXS6DOHV'HWDLO

&RQVROLGDWHG6\VWHP*URXS6DOHV'HWDLOZ*UDSK
Consolidated System Group Sales Detail w/Graph
3XUSRVH
This report is identical to the Consolidated System Group Sales Detail
Report with the addition of a graph. See page 9-51 for complete details
and programming information. The graph is a pie chart showing sales of
each group as a percentage of total sales.
)RUPDW
This report includes the following profile:
qSales Profile
7HPSODWH
FG_S202.RPT
2-24
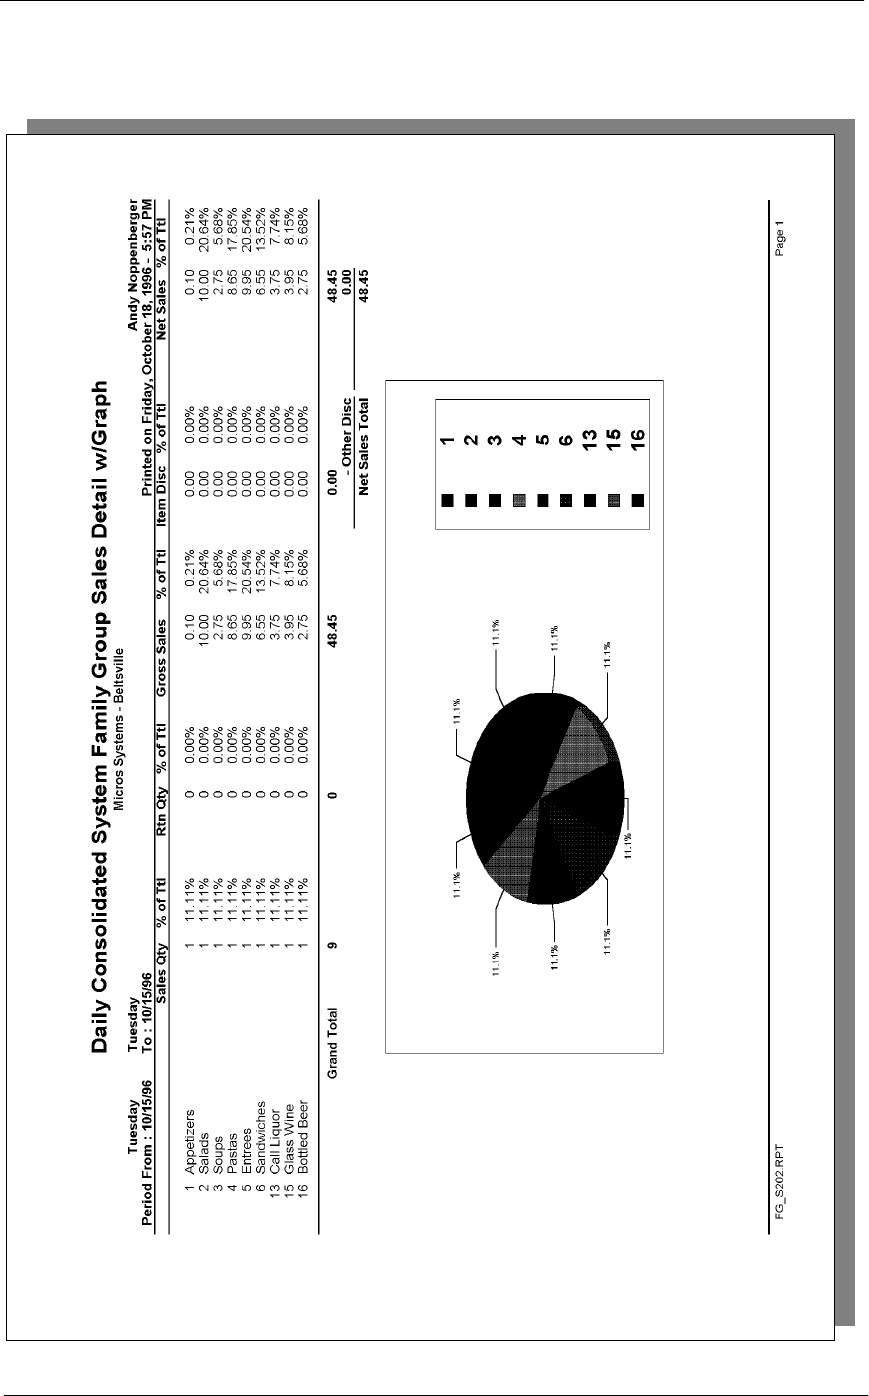
5HSRUWV
&RQVROLGDWHG6\VWHP*URXS6DOHV'HWDLOZ*UDSK
'DLO\6\VWHP*URXS6DOHV6XPPDU\
Daily System Group Sales Summary
3XUSRVH
This report provides a brief summary of sales quantities, and net sales for
each group, as well as percentages for each. Information for each day is
presented separately, with daily totals, and a net sales total with subtotal
discounts taken out.
)RUPDW
This report includes the following profile:
qSales Profile
The profile has been modified for this report. It does not include these
fields:
Rtn Qty
% of Ttl
Gross Sales
% of Ttl
Item Disc
% of Ttl
7HPSODWH
FG_S101.RPT
2-24
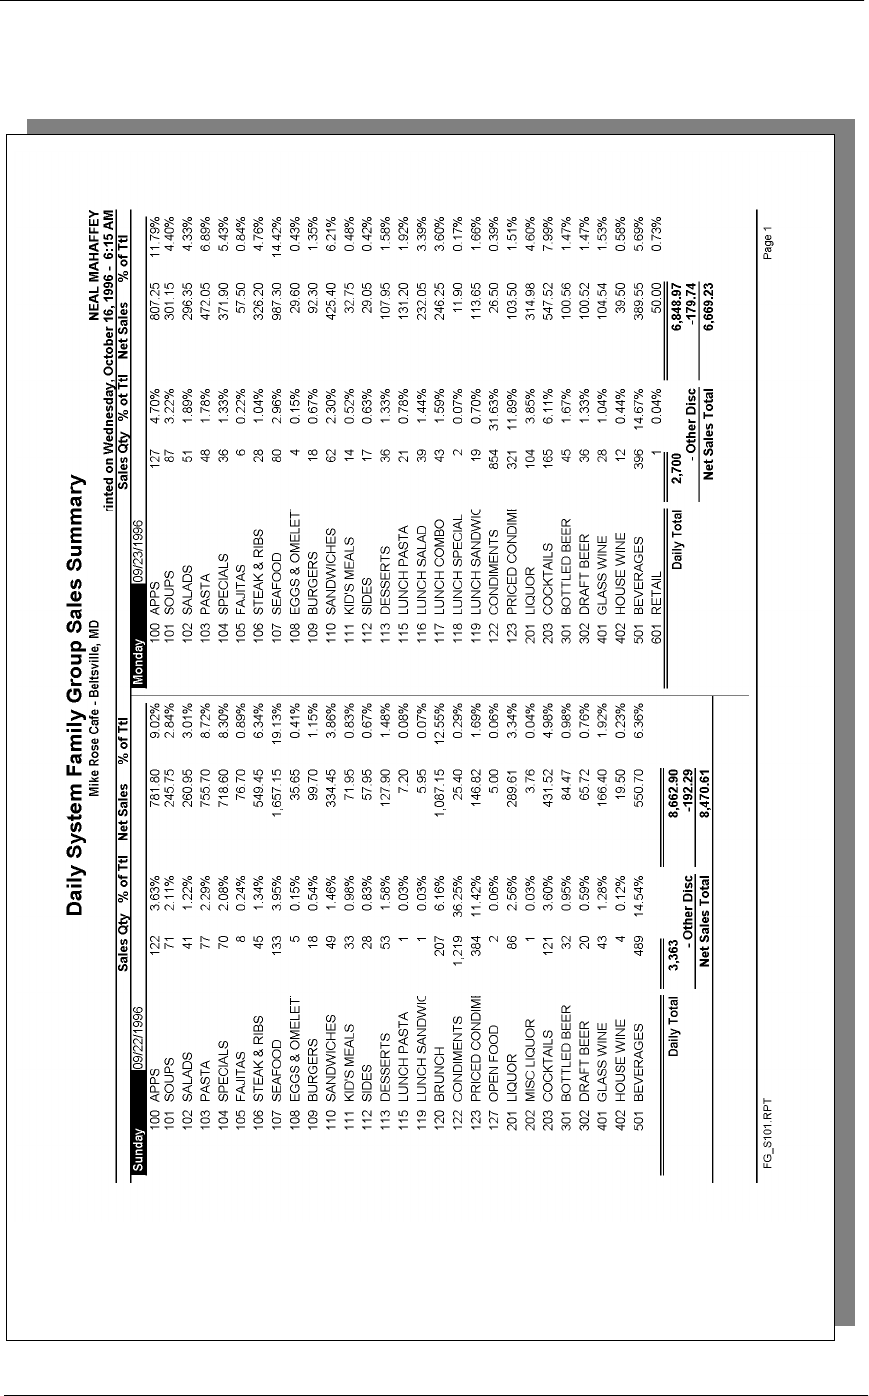
5HSRUWV
'DLO\6\VWHP*URXS6DOHV6XPPDU\

'DLO\6\VWHP*URXS6DOHV6XPPDU\
Daily System Group Sales Summary
Daily System
Family Group Sales Summary
Mike Rose Cafe - Beltsville
Neil Mahaffey
Printed on 9/8/96 - 10:14 PM
-----------------------------------
Tuesday 9/ 3/96
100 APPS
Sales Qty 5 0.66%
Net Sls 33.35 1.41%
101 SOUPS
Sales Qty 21 2.79%
Net Sls 73.05 3.09%
102 SALADS
Sales Qty 3 0.40%
Net Sls 14.85 0.63%
103 PASTA
Sales Qty 10 1.33%
Net Sls 105.25 4.46%
104 SPECIALS
Sales Qty 1 0.13%
Net Sls 12.95 0.55%
106 STEAK & RIBS
Sales Qty 9 1.20%
Net Sls 115.65 4.90%
107 SEAFOOD
Sales Qty 9 1.20%
Net Sls 110.45 4.68%
108 EGGS & OMELETTES
Sales Qty 15 1.99%
Net Sls 107.85 4.57%
109 BURGERS
Sales Qty 30 3.99%
Net Sls 156.70 6.63%
110 SANDWICHES
Sales Qty 33 4.39%
Net Sls 219.85 9.31%
111 KID’S MEALS
Sales Qty 14 1.86%
Net Sls 24.25 1.03%
112 SIDES
Sales Qty 13 1.73%
Net Sls 23.85 1.01%
113 DESSERTS
Sales Qty 35 4.65%
Net Sls 115.25 4.88%
114 WHOLE DESSERTS
5HSRUWV
'DLO\6\VWHP*URXS6DOHV6XPPDU\
Family Group Sales Profile Details
View: v_R_sys_fam_grp
Stored Procedure: sp_R_family_group
The following table lists each column in the Family Group Sales Profile
and provides detailed information on the source of the figures in each
column. Since all the numbers in this profile come from formulas, there is
no view, table, or column information.
Major Group Sales Profile Details
View: v_R_sys_maj_grp
Stored Procedure: sp_R_family_group
The following table lists each column in the Major Group Sales Profile
and provides detailed information on the source of the figures in each
column. Since all the numbers in this profile come from formulas, there is
no view, table, or column information.
Report
Column
Title Formula
Sales Qty @Detail_Qty
% of Ttl @Percent_of_Daily_Qty
Net Sales @Detail_Net_Sales
% of Ttl @Percent_of_Daily_Total
Daily Total
Sales Qty @Daily_Total_Qty
Net Sales @Daily_Total_Total
Other Disc @Daily_Other_Discount
Net Sales Total @Daily_Net_Sales
Report
Column
Title Formula
Sales Qty @Detail_Qty
% of Ttl @Percent_of_Daily_Qty
Net Sales @Detail_Net_Sales
% of Ttl @Percent_of_Daily_Total
'DLO\6\VWHP*URXS6DOHV6XPPDU\
Menu Item Group Sales Profile Details
View: v_R_sys_mi_grp
Stored Procedure: sp_R_family_group
The following table lists each column in the Menu Item Group Sales
Profile and provides detailed information on the source of the figures in
each column. Since all the numbers in this profile come from formulas,
there is no view, table, or column information.
Programming Considerations
0HQX,WHPV
qA menu item with a price of zero will not post to reports if Menu Item
Classes | Print/Display | Do not post to reports if price = 0 is selected.
qA menu item with a price of zero will not add to detail totals if Menu
Item Classes | Print/Display | Do not add to detail if price = 0 is
selected.
Daily Total
Sales Qty @Daily_Total_Qty
Net Sales @Daily_Total_Total
Other Disc @Daily_Other_Discount
Net Sales Total @Daily_Net_Sales
Report
Column
Title Formula
Sales Qty @Detail_Qty
% of Ttl @Percent_of_Daily_Qty
Net Sales @Detail_Net_Sales
% of Ttl @Percent_of_Daily_Total
Daily Total
Sales Qty @Daily_Total_Qty
Net Sales @Daily_Total_Total
Other Disc @Daily_Other_Discount
Net Sales Total @Daily_Net_Sales
Report
Column
Title Formula

5HSRUWV
'DLO\6\VWHP*URXS6DOHV6XPPDU\
qA menu item can be programmed to have up to four different prices if
Menu Item Classes | Price/Totals | Enable prices 2 through 4 is
selected.
Notes
0HQX,WHPV
On Menu Item | Groups, each menu item must be assigned a major and a
family group.
7D[
Figures in this report, including Gross Sales, do not include tax. When tax
is included in the sale price of a menu item (for example, when a VAT or
inclusive tax is in effect), only the net price (sales price minus the tax)
will be posted to these totals.
&RQVROLGDWHG6\VWHP*URXS6DOHV6XPPDU\
Consolidated System Group Sales Summary
3XUSRVH
This report provides a brief summary of sales quantities, and net sales for
each group, as well as percentages for each. Information for each day is
presented separately, with daily totals, and a net sales total with subtotal
discounts taken out.
This report is almost identical to the System Group Sales Summary
Report, except the information for the period of the report is consolidated
into one set of figures, rather than being presented separately for each day.
)RUPDW
This report includes the following profile:
qSales Profile
The profile has been modified for this report. It does not include these
fields:
Rtn Qty
% of Ttl
Gross Sales
% of Ttl
Item Disc
% of Ttl
7HPSODWH
FG_S111.RPT
2-24
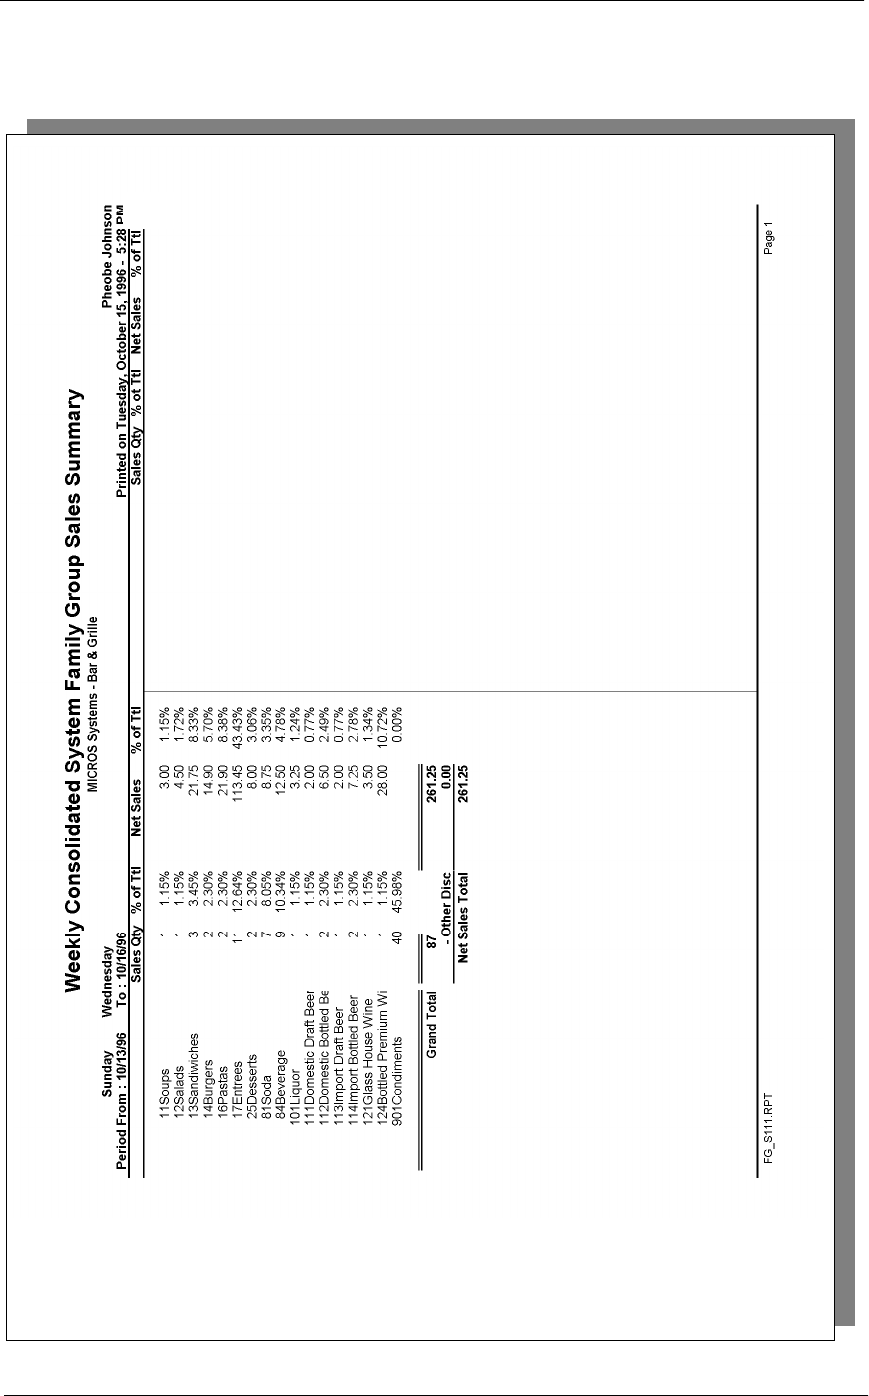
5HSRUWV
&RQVROLGDWHG6\VWHP*URXS6DOHV6XPPDU\
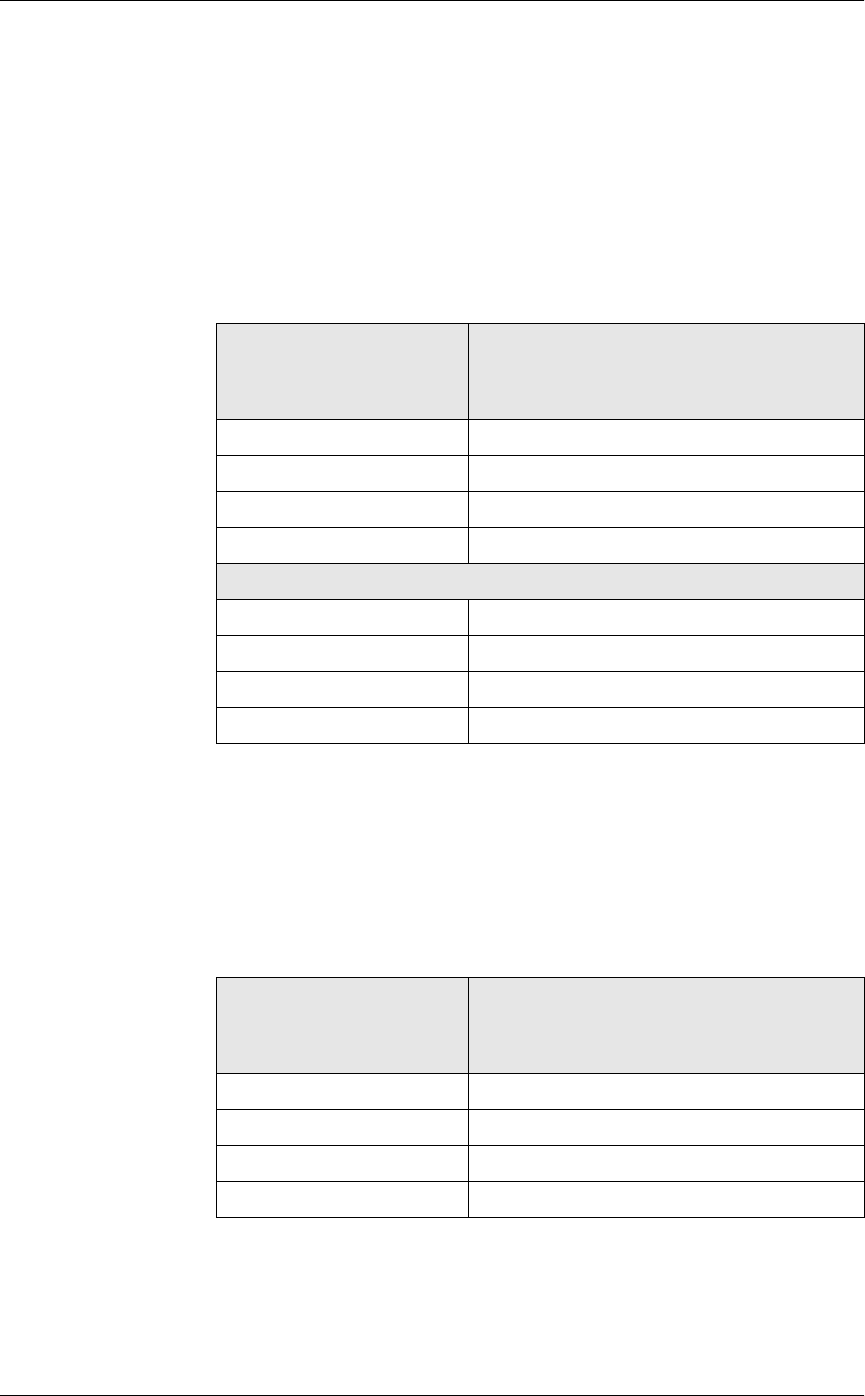
&RQVROLGDWHG6\VWHP*URXS6DOHV6XPPDU\
Family Group Sales Profile Details
View: v_R_sys_fam_grp
Stored Procedure: sp_R_family_group
The following table lists each column in the Family Group Sales Profile
and provides detailed information on the source of the figures in each
column. Since all the numbers in this profile come from formulas, there is
no view, table, or column information.
Major Group Sales Profile Details
View: v_R_sys_maj_grp
Stored Procedure: sp_R_family_group
The following table lists report columns and the source of the figures in
each column. The numbers in this profile come from formulas; there is no
view, table, or column information.
Report
Column
Title Formula
Sales Qty @Detail_Qty
% of Ttl @Percent_of_Daily_Qty
Net Sales @Detail_Net_Sales
% of Ttl @Percent_of_Daily_Total
Daily Total
Sales Qty @Daily_Total_Qty
Net Sales @Daily_Total_Total
Other Disc @Daily_Other_Discount
Net Sales Total @Daily_Net_Sales
Report
Column
Title Formula
Sales Qty @Detail_Qty
% of Ttl @Percent_of_Daily_Qty
Net Sales @Detail_Net_Sales
% of Ttl @Percent_of_Daily_Total
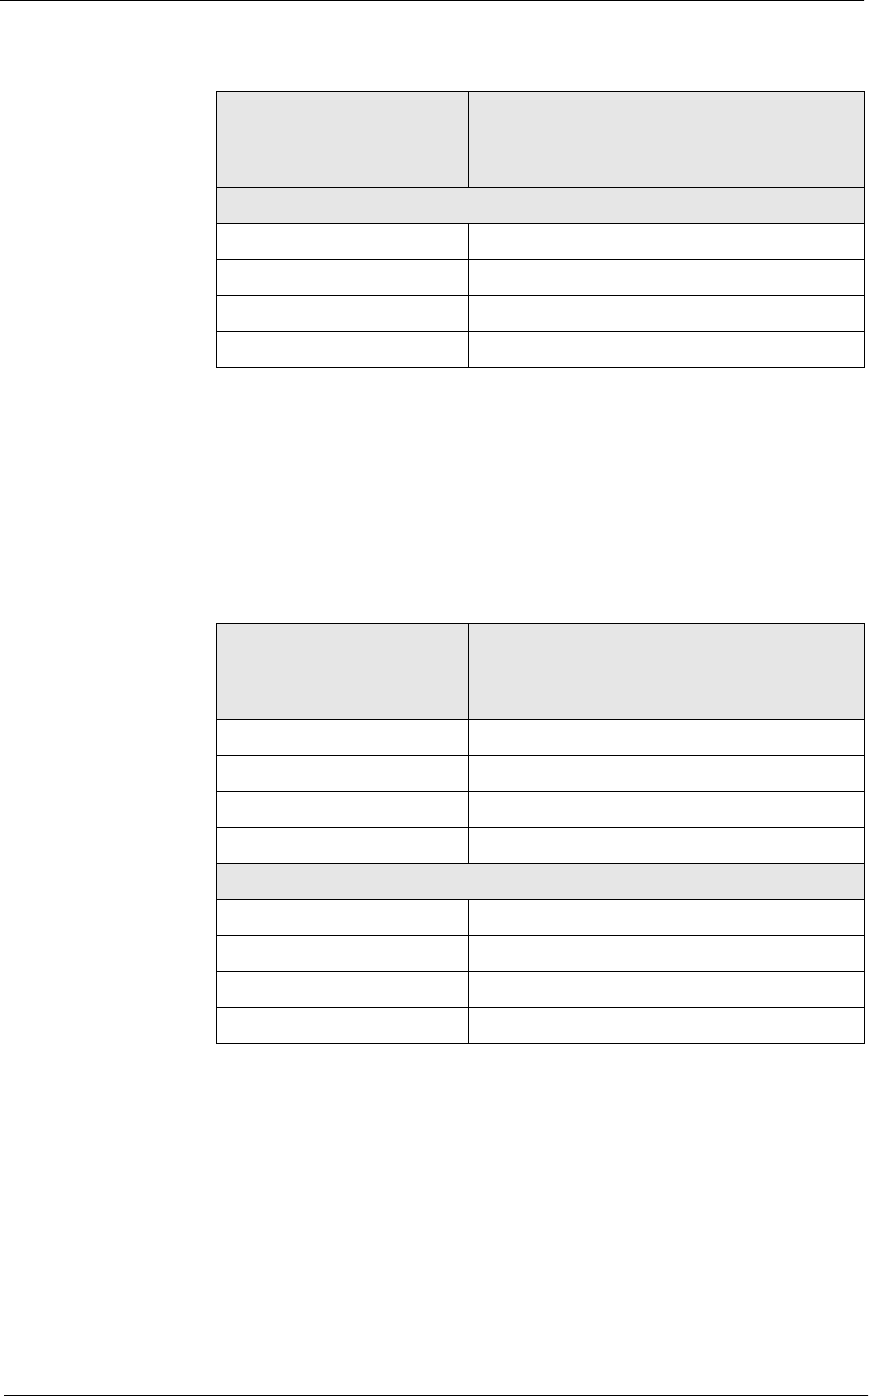
5HSRUWV
&RQVROLGDWHG6\VWHP*URXS6DOHV6XPPDU\
Menu Item Group Sales Profile Details
View: v_R_sys_mi_grp
Stored Procedure: sp_R_family_group
The following table lists each column in the Menu Item Group Sales
Profile and provides detailed information on the source of the figures in
each column. Since all the numbers in this profile come from formulas,
there is no view, table, or column information.
Daily Total
Sales Qty @Daily_Total_Qty
Net Sales @Daily_Total_Total
Other Disc @Daily_Other_Discount
Net Sales Total @Daily_Net_Sales
Report
Column
Title Formula
Sales Qty @Detail_Qty
% of Ttl @Percent_of_Daily_Qty
Net Sales @Detail_Net_Sales
% of Ttl @Percent_of_Daily_Total
Daily Total
Sales Qty @Daily_Total_Qty
Net Sales @Daily_Total_Total
Other Disc @Daily_Other_Discount
Net Sales Total @Daily_Net_Sales
Report
Column
Title Formula

&RQVROLGDWHG6\VWHP*URXS6DOHV6XPPDU\

5HSRUWV
Chapter 10
Menu Item Sales Reports
This chapter provides a detailed explanation of the menu item sales
reports with examples of each.
In this chapter
Introduction ..........................................................................................10-2
Daily Revenue Center Menu Item Sales Detail .................................. 10-3
Consolidated Revenue Center Menu Item Sales Detail .................... 10-10
Daily System Menu Item Sales Detail .............................................. 10-15
Consolidated System Menu Item Sales Detail.................................. 10-21
Daily Revenue Center Menu Item Sales Summary........................... 10-25
Consolidated Revenue Center Menu Item Sales Summary .............. 10-30
Daily System Menu Item Sales Summary......................................... 10-34
Consolidated System Menu Item Sales Summary ............................ 10-39
Consolidated Food Cost Detail Report.............................................. 10-43

0HQX,WHP6DOHV5HSRUWV
,QWURGXFWLRQ
Introduction
Menu item sales reports allow you to see, very specifically, how your
revenue is being generated. These reports reveal which items are selling,
and which need to be discontinued, advertised more, repriced, or sized
differently. These reports can help you determine the best price for the
daily special, or to evaluate the success of a menu change.
This information takes the guess work out of marketing approaches and
gives you the hard facts necessary to develop your concept.
All the menu item sales reports include subtotals. You can group and
subtotal menu items by family group, major group, or menu item group.
In the examples in this chapter the menu items are subtotaled by family
group.

5HSRUWV
0HQX,WHP6DOHV5HSRUWV
'DLO\5HYHQXH&HQWHU0HQX,WHP6DOHV'HWDLO
Daily Revenue Center Menu Item Sales Detail
3XUSRVH
This report provides a detailed summary of sales quantities, returns, item
discounts, gross sales, and net sales for this group. It also includes
percentage information for each of these categories. Information for each
day is presented separately, with totals for each revenue center and each
day, and grand totals for the period of the report.
)RUPDW
This report includes the following profile:
qSales Profile
7HPSODWH
MI_R001.RPT
2-24
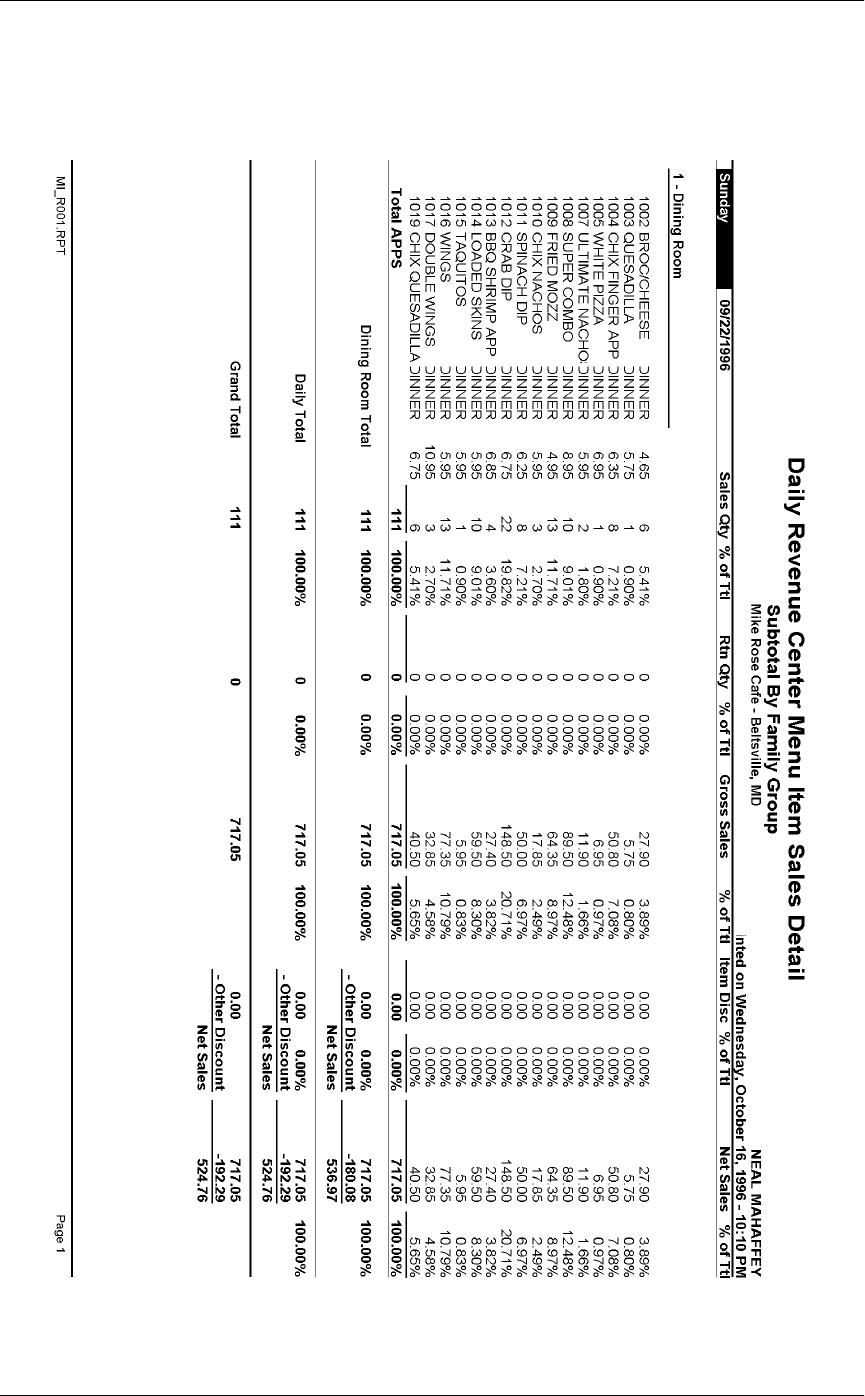
0HQX,WHP6DOHV5HSRUWV
'DLO\5HYHQXH&HQWHU0HQX,WHP6DOHV'HWDLO

5HSRUWV
0HQX,WHP6DOHV5HSRUWV
'DLO\5HYHQXH&HQWHU0HQX,WHP6DOHV'HWDLO
Programming Considerations
Define new return/void codes or edit existing return/void codes on the
Reasons form.
Select Reasons | Use with voids and/or Reasons | Use with returns as
appropriate for each return/void code.
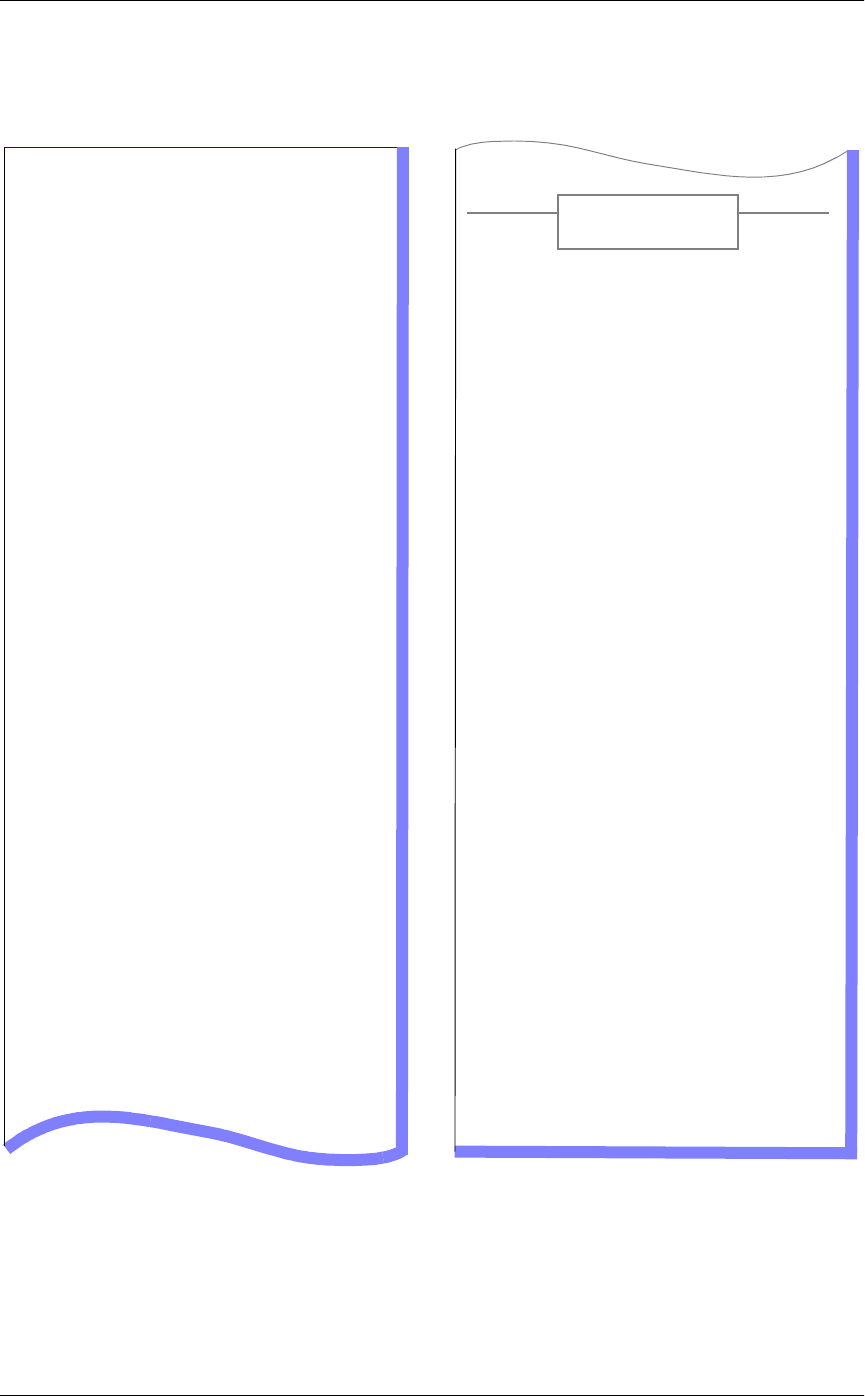
0HQX,WHP6DOHV5HSRUWV
'DLO\5HYHQXH&HQWHU0HQX,WHP6DOHV'HWDLO
Daily Revenue Center Menu Item Sales Detail
Daily Revenue Center
Menu Item Sales Detail
Subtotal By Family Group
Mike Rose Cafe - Beltsville, MD
NEAL MAHAFFEY
Printed on 10/16/1996 - 2:59
----------------------------------------
Sunday 9/22/1996
1 - Dining Room
1002 BROC/CHEESE
DINNER 4.65
Sales Qty 6 5.41%
Returns 0 0.00%
Gross Sls 27.90 3.89%
Item Disc 0.00 0.00%
Net Sales 27.90 3.89%
1003 QUESADILLA
DINNER 5.75
Sales Qty 1 0.90%
Returns 0 0.00%
Gross Sls 5.75 0.80%
Item Disc 0.00 0.00%
Net Sales 5.75 0.80%
1004 CHIX FINGER APP
DINNER 6.35
Sales Qty 8 7.21%
Returns 0 0.00%
Gross Sls 50.80 7.08%
Item Disc 0.00 0.00%
Net Sales 50.80 7.08%
1005 WHITE PIZZA
DINNER 6.95
Sales Qty 1 0.90%
Returns 0 0.00%
Gross Sls 6.95 0.97%
Item Disc 0.00 0.00%
Net Sales 6.95 0.97%
Total APPS
Sales Qty 111 100.00%
Returns 0 0.00%
Gross Sls 717.05 100.00%
Item Disc 0.00 0.00%
Net Sales 717.05 100.00%
Dining Room Tota
Sales Qty 111 100.00%
Returns 0 0.00%
Gross Sls 717.05 100.00%
Item Disc 0.00 0.00%
Subttl 717.05 100.00%
Sttl Disc -180.08
Net Sales 536.97
----------------------------------------
Daily Total
Sales Qty 111 100.00%
Returns 0 0.00%
Gross Sls 717.05 100.00%
Item Disc 0.00 0.00%
Subttl 717.05 100.00%
Sttl Disc -192.29
Net Sales 524.76
========================================
Grand Total
Sales Qty 111
Returns 0
Gross Sls 717.05
Item Disc 0.00
Subttl 717.05
Sttl Disc -192.29
Net Sales 524.76
Totals omitted for
display

5HSRUWV
0HQX,WHP6DOHV5HSRUWV
'DLO\5HYHQXH&HQWHU0HQX,WHP6DOHV'HWDLO
Sales Profile Details
View: The subtotal group you choose determines which view is used to
produce the report. The possible views follow:
qv_R_rvc_menuitem_fam_grp (subtotal by family group)
qv_R_rvc_menuitem_maj_grp (subtotal by major group)
qv_R_rvc_menuitem_mi_grp (subtotal by menu item group)
Stored Procedure: sp_R_menuitem
The following table lists each column in the Sales Profile and provides
detailed information on the source of the figures in each column. Since all
the numbers in this profile come from formulas, there is no view, table, or
column information.
Any given menu item could have up to four prices defined. So that
information for each of these price levels prints on the report, a formula is
defined for each price level. In this table, the price level is represented by
the variable x.
Report
Column
Title Formula
Sales Qty @Px_Qty
% of Ttl @Percent_Of_Group_Qtyx
Rtn Qty @Px_Rtn_Qty
% of Ttl @Percent_Of_Group_Rtn_Qtyx
Gross Sales @Px_Total
% of Ttl @Percent_Of_Group_Totalx
Item Disc @Px_Discount_Total
% of Ttl @Percent_Of_Group_Disc_Ttlx
Net Sales @Px_Net_Total
% of Ttl @Percent_Of_Group_Net_Ttlx
0HQX,WHP6DOHV5HSRUWV
'DLO\5HYHQXH&HQWHU0HQX,WHP6DOHV'HWDLO
Total
Sales Qty @Group_Qty
% of Ttl @Percent_Of_RVC_Qty
Rtn Qty @Group_Rtn_Qty
% of Ttl @Percent_Of_RVC_Rtn_Qty
Gross Sales @Group_Total
% of Ttl @Percent_Of_RVC_Total
Item Disc @Group_Disc_Total
% of Ttl @Percent_Of_RVC_Disc_Total
Net Sales @Group_Net_Total
% of Ttl @Percent_Of_RVC_Net_Total
Revenue Center Total
Sales Qty @RVC_Qty
% of Ttl @Percent_Of_Daily_Qty
Rtn Qty @RVC_Rtn_Qty
% of Ttl @Percent_Of_Daily_Rtn_Qty
Gross Sales @RVC_Total
% of Ttl @Percent_Of_Daily_Total
Item Disc @RVC_Disc_Total
% of Ttl @Percent_Of_Daily_Disc_Total
Net Sales @RVC_Net_Total
% of Ttl @Percent_Of_Daily_Net_Total
Report
Column
Title Formula
5HSRUWV
0HQX,WHP6DOHV5HSRUWV
'DLO\5HYHQXH&HQWHU0HQX,WHP6DOHV'HWDLO
Programming Considerations
0HQX,WHPV
qA menu item with a price of zero will not post to reports if Menu Item
Classes | Print/Display | Do not post to reports if price = 0 is selected.
qA menu item with a price of zero will not add to detail totals if Menu
Item Classes | Print/Display | Do not add to detail if price = 0 is
selected.
qA menu item can be programmed to have up to four different prices if
Menu Item Classes | Price/Totals | Enable prices 2 through 4 is
selected.
Notes
0HQX,WHPV
On Menu Items | Groups, each menu item must be assigned a major and a
family group.
Daily Total
Sales Qty @Daily_Qty
Rtn Qty @Daily_Rtn_Qty
Gross Sales @Daily_Total
Item Disc @Daily_Disc_Total
Net Sales @Daily_Net_Total
Grand Total
Sales Qty @Total_Qty
Rtn Qty @Total_Rtn_Qty
Gross Sales @Total_Total
Item Disc @Total_Disc_Total
Net Sales @Total_Net_Total
Report
Column
Title Formula

0HQX,WHP6DOHV5HSRUWV
&RQVROLGDWHG5HYHQXH&HQWHU0HQX,WHP6DOHV'HWDLO
Consolidated Revenue Center Menu Item Sales Detail
3XUSRVH
This report provides the same information as the Daily Revenue Center
Menu Item Sales Detail Report, but for a range of business days.
)RUPDW
This report includes the following profile:
qSales Profile
7HPSODWH
MI_R002.RPT
2-24
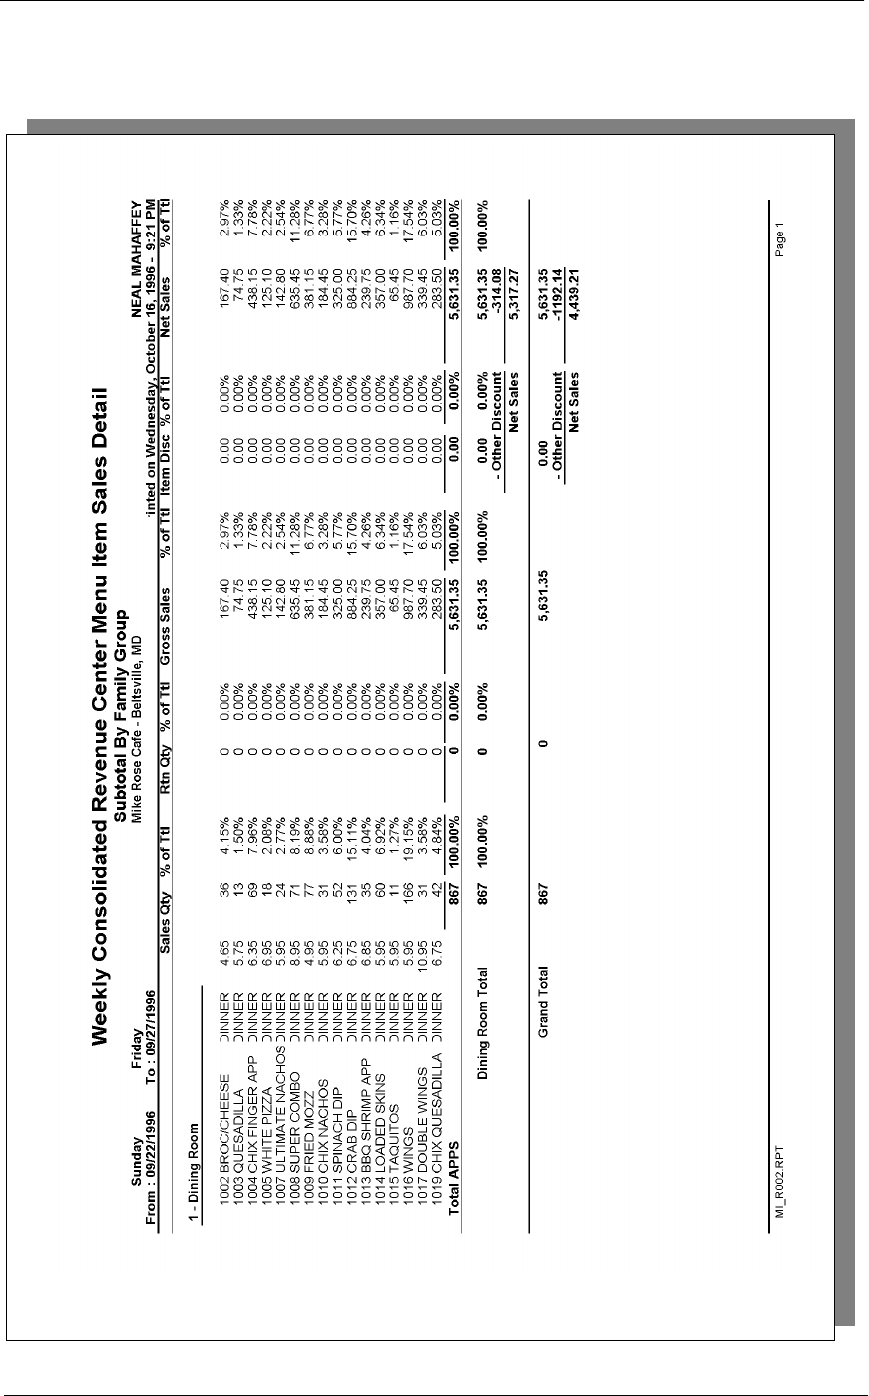
5HSRUWV
0HQX,WHP6DOHV5HSRUWV
&RQVROLGDWHG5HYHQXH&HQWHU0HQX,WHP6DOHV'HWDLO

0HQX,WHP6DOHV5HSRUWV
&RQVROLGDWHG5HYHQXH&HQWHU0HQX,WHP6DOHV'HWDLO
Sales Profile Details
View: The subtotal group you choose determines which view is used to
produce the report. The possible views follow:
qv_R_rvc_menuitem_fam_grp (subtotal by family group)
qv_R_rvc_menuitem_maj_grp (subtotal by major group)
qv_R_rvc_menuitem_mi_grp (subtotal by menu item group)
Stored Procedure: sp_R_menuitem
The following table lists each column in the Sales Profile and provides
detailed information on the source of the figures in each column. Since all
the numbers in this profile come from formulas, there is no view, table, or
column information.
Any given menu item could have up to four prices defined. So that
information for each of these price levels prints on the report, a formula is
defined for each price level. In this table, the price level is represented by
the variable x.
Report
Column
Title Formula
Sales Qty @Px_Qty
% of Ttl @Percent_Of_Group_Qtyx
Rtn Qty @Px_Rtn_Qty
% of Ttl @Percent_Of_Group_Rtn_Qtyx
Gross Sales @Px_Total
% of Ttl @Percent_Of_Group_Totalx
Item Disc @Px_Discount_Total
% of Ttl @Percent_Of_Group_Disc_Ttlx
Net Sales @Px_Net_Total
% of Ttl @Percent_Of_Group_Net_Ttlx
5HSRUWV
0HQX,WHP6DOHV5HSRUWV
&RQVROLGDWHG5HYHQXH&HQWHU0HQX,WHP6DOHV'HWDLO
Programming Considerations
0HQX,WHPV
qA menu item with a price of zero will not post to reports if Menu Item
Classes | Print/Display | Do not post to reports if price = 0 is selected.
Total
Sales Qty @Group_Qty
% of Ttl @Percent_Of_RVC_Qty
Rtn Qty @Group_Rtn_Qty
% of Ttl @Percent_Of_RVC_Rtn_Qty
Gross Sales @Group_Total
% of Ttl @Percent_Of_RVC_Total
Item Disc @Group_Disc_Total
% of Ttl @Percent_Of_RVC_Disc_Total
Net Sales @Group_Net_Total
% of Ttl @Percent_Of_RVC_Net_Total
Revenue Center Total
Sales Qty @RVC_Qty
% of Ttl @Percent_Of_Daily_Qty
Rtn Qty @RVC_Rtn_Qty
% of Ttl @Percent_Of_Daily_Rtn_Qty
Gross Sales @RVC_Total
% of Ttl @Percent_Of_Daily_Total
Item Disc @RVC_Disc_Total
% of Ttl @Percent_Of_Daily_Disc_Total
Net Sales @RVC_Net_Total
% of Ttl @Percent_Of_Daily_Net_Total
Grand Total
Sales Qty @Daily_Qty
Rtn Qty @Daily_Rtn_Qty
Gross Sales @Daily_Total
Item Disc @Daily_Disc_Total
Net Sales @Daily_Net_Total
Report
Column
Title Formula

0HQX,WHP6DOHV5HSRUWV
&RQVROLGDWHG5HYHQXH&HQWHU0HQX,WHP6DOHV'HWDLO
qA menu item with a price of zero will not add to detail totals if Menu
Item Classes | Print/Display | Do not add to detail if price = 0 is
selected.
qA menu item can be programmed to have up to four different prices if
Menu Item Classes | Price/Totals | Enable prices 2 through 4 is
selected.
Notes
0HQX,WHPV
On Menu Items| Groups, each menu item must be assigned a major and a
family group.

5HSRUWV
0HQX,WHP6DOHV5HSRUWV
'DLO\6\VWHP0HQX,WHP6DOHV'HWDLO
Daily System Menu Item Sales Detail
3XUSRVH
This report provides a detailed summary of sales quantities, returns, item
discounts, gross sales, and net sales for this group. It also includes
percentage information for each of these categories. Information for each
day is presented separately, with totals for each revenue center and each
day, and grand totals for the period of the report.
)RUPDW
This report includes the following profile:
qSales Profile
7HPSODWH
MI_S001.RPT
2-24
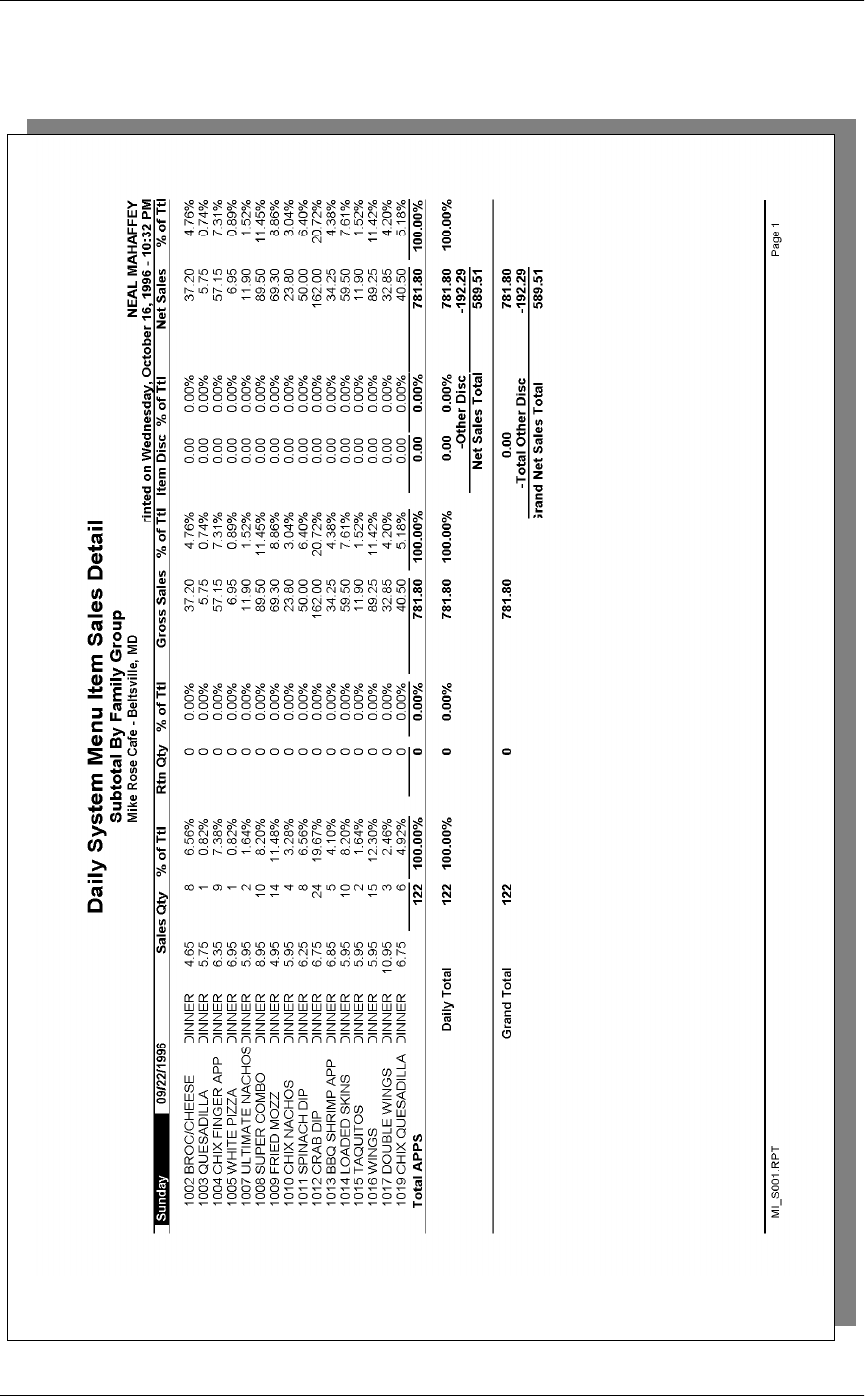
0HQX,WHP6DOHV5HSRUWV
'DLO\6\VWHP0HQX,WHP6DOHV'HWDLO
5HSRUWV
0HQX,WHP6DOHV5HSRUWV
'DLO\6\VWHP0HQX,WHP6DOHV'HWDLO
Daily System Menu Item Sales Detail
Daily System
Menu Item Sales Detail
Subtotal By Family Group
Mike Rose Cafe - Beltsville, MD
NEAL MAHAFFEY
Printed on 10/16/1996 - 3:25
----------------------------------------
Sunday 9/22/1996
1002 BROC/CHEESE
DINNER 4.65
Sales Qty 8 9.30%
Returns 0 0.00%
Gross Sls 37.20 6.79%
Item Disc 0.00 0.00%
Net Sales 37.20 6.79%
1003 QUESADILLA
DINNER 5.75
Sales Qty 1 1.16%
Returns 0 0.00%
Gross Sls 5.75 1.05%
Item Disc 0.00 0.00%
Net Sales 5.75 1.05%
1004 CHIX FINGER APP
DINNER 6.35
Sales Qty 9 10.47%
Returns 0 0.00%
Gross Sls 57.15 10.43%
Item Disc 0.00 0.00%
Net Sales 57.15 10.43%
1005 WHITE PIZZA
DINNER 6.95
Sales Qty 1 1.16%
Returns 0 0.00%
Gross Sls 6.95 1.27%
Item Disc 0.00 0.00%
Net Sales 6.95 1.27%
1007 ULTIMATE NACHOS
DINNER 5.95
Sales Qty 2 2.33%
Returns 0 0.00%
Gross Sls 11.90 2.17%
Item Disc 0.00 0.00%
Net Sales 11.90 2.17%
1008 SUPER COMBO
DINNER 8.95
Sales Qty 10 11.63%
Returns 0 0.00%
Gross Sls 89.50 16.34%
Item Disc 0.00 0.00%
Net Sales 89.50 16.34%
1009 FRIED MOZZ
DINNER 4.95
Sales Qty 14 16.28%
Returns 0 0.00%
Gross Sls 69.30 12.65%
Item Disc 0.00 0.00%
Net Sales 69.30 12.65%
Total APPS
Sales Qty 86 100.00%
Returns 0 0.00%
Gross Sls 547.80 100.00%
Item Disc 0.00 0.00%
Net Sales 547.80 100.00%
Daily Total
Sales Qty 86 100.00%
Returns 0 0.00%
Gross Sls 547.80 100.00%
Item Disc 0.00 0.00%
Subtotal 547.80 100.00%
-Other Dis -192.29
Net Sales 355.51
----------------------------------------
Grand Total
Sales Qty 86
Returns 0
Gross Sls 547.80
Item Disc 0.00
Subtotal 547.80
-Other Disc -192.29
Net Sales 355.51
Totals omitted for
display
0HQX,WHP6DOHV5HSRUWV
'DLO\6\VWHP0HQX,WHP6DOHV'HWDLO
Report Details
View: The subtotal group you choose determines which view is used to
produce the report. The possible views include:
qv_R_sys_menuitem_fam_grp (subtotal by family group)
qv_R_sys_menuitem_maj_grp (subtotal by major group)
qv_R_sys_menuitem_mi_grp (subtotal by menu item group)
Stored Procedure: sp_R_menuitem
The following table lists report columns and the source of figures in each
column. All numbers in this profile come from formulas; there is no view,
table, or column information.
The report may include each of the four prices available for each menu
item. A formula is defined for each price level. In this table, the price
level is represented by the variable x.
Report
Column
Title Formula
Sales Qty @Px_Qty
% of Ttl @Percent_Of_Group_Qtyx
Rtn Qty @Px_Rtn_Qty
% of Ttl @Percent_Of_Group_Rtn_Qtyx
Gross Sales @Px_Total
% of Ttl @Percent_Of_Group_Totalx
Item Disc @Px_Discount_Total
% of Ttl @Percent_Of_Group_Disc_Ttlx
Net Sales @Px_Net_Total
% of Ttl @Percent_Of_Group_Net_Ttlx
5HSRUWV
0HQX,WHP6DOHV5HSRUWV
'DLO\6\VWHP0HQX,WHP6DOHV'HWDLO
Programming Considerations
0HQX,WHPV
qA menu item with a price of zero will not post to reports if Menu Item
Classes | Print/Display | Do not post to reports if price = 0 is selected.
Total
Sales Qty @Group_Qty
% of Ttl @Percent_Of_Daily_Qty
Rtn Qty @Group_Rtn_Qty
% of Ttl @Percent_Of_Daily_Rtn_Qty
Gross Sales @Group_Total
% of Ttl @Percent_Of_Daily_Total
Item Disc @Group_Disc_Total
% of Ttl @Percent_Of_Daily_Disc_Total
Net Sales @Group_Net_Total
% of Ttl @Percent_Of_Daily_Net_Total
Daily Total
Sales Qty @Daily_Qty
Rtn Qty @Daily_Rtn_Qty
Gross Sales @Daily_Total
Item Disc @Daily_Disc_Total
Net Sales @Daily_Net_Total
Other Disc @ttl_Other_Disc
Net Sales Total @ttl_Net_Sales_Total
Grand Total
Sales Qty @Total_Qty
Rtn Qty @Total_Rtn_Qty
Gross Sales @Grand_Daily_Total
Item Disc @Total_Disc_Total
Net Sales @Total_Net_Total
Total Other Disc @Total_Other_Disc
Grand Net Sales Total @Total_Net_Sales_Total
Report
Column
Title Formula

0HQX,WHP6DOHV5HSRUWV
'DLO\6\VWHP0HQX,WHP6DOHV'HWDLO
qA menu item with a price of zero will not add to detail totals if Menu
Item Classes | Print/Display | Do not add to detail if price = 0 is
selected.
qA menu item can be programmed to have up to four different prices if
Menu Item Classes | Price/Totals | Enable prices 2 through 4 is
selected.
Notes
0HQX,WHPV
On Menu Items| Groups, each menu item must be assigned a major and a
family group.

5HSRUWV
0HQX,WHP6DOHV5HSRUWV
&RQVROLGDWHG6\VWHP0HQX,WHP6DOHV'HWDLO
Consolidated System Menu Item Sales Detail
3XUSRVH
This report provides the same information as the Daily System Menu Item
Sales Detail Report, but for a range of business days.
)RUPDW
This report includes the following profile:
qSales Profile
7HPSODWH
MI_S002.RPT
2-24
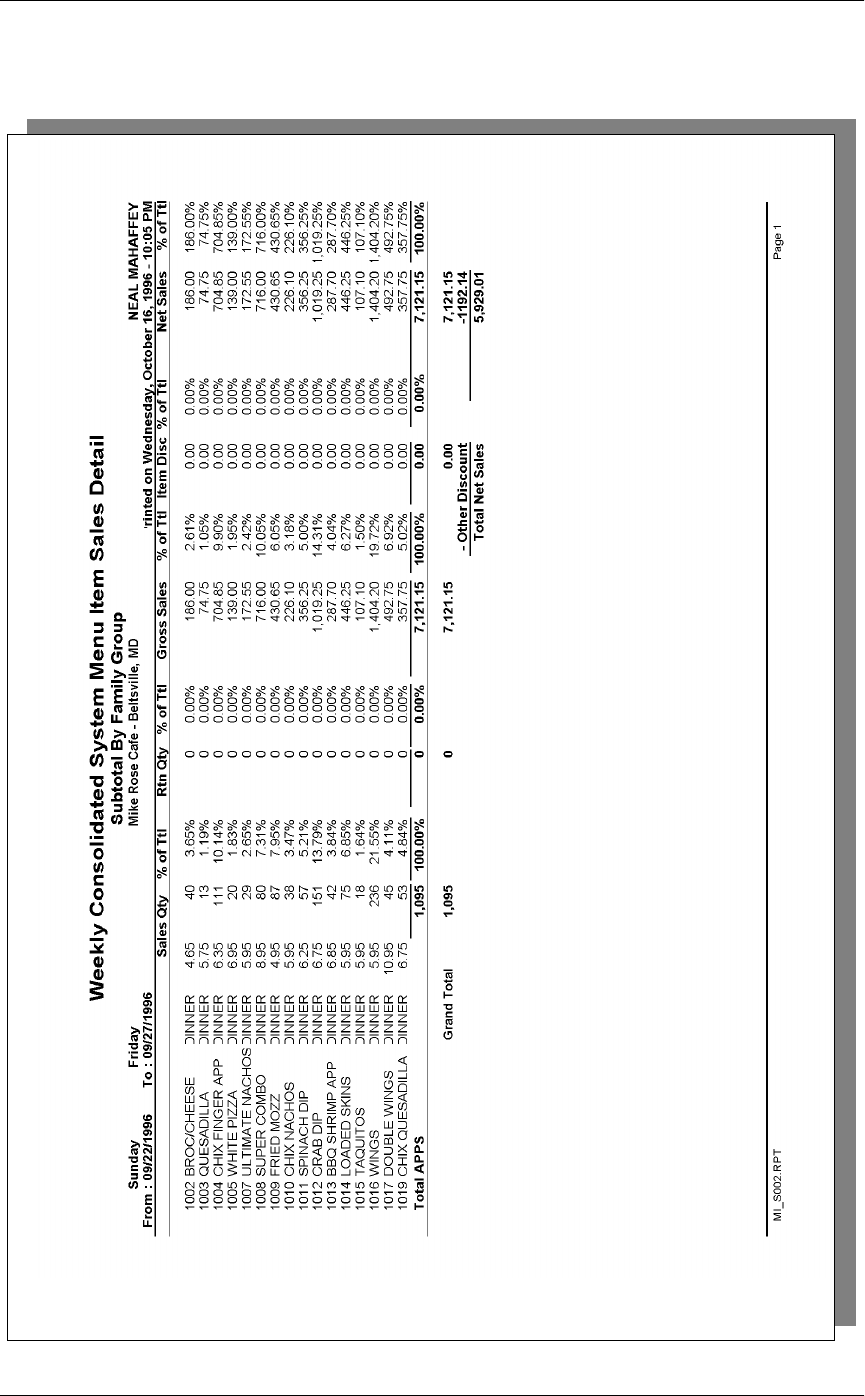
0HQX,WHP6DOHV5HSRUWV
&RQVROLGDWHG6\VWHP0HQX,WHP6DOHV'HWDLO
5HSRUWV
0HQX,WHP6DOHV5HSRUWV
&RQVROLGDWHG6\VWHP0HQX,WHP6DOHV'HWDLO
Sales Profile Details
View: The subtotal group you choose determines which view is used to
produce the report. The possible views follow:
qv_R_sys_menuitem_fam_grp (subtotal by family group)
qv_R_sys_menuitem_maj_grp (subtotal by major group)
qv_R_sys_menuitem_mi_grp (subtotal by menu item group)
Stored Procedure: sp_R_menuitem
The following table lists each column in the Sales Profile and provides
detailed information on the source of the figures in each column. Since all
the numbers in this profile come from formulas, there is no view, table, or
column information
Any given menu item could have up to four prices defined. So that
information for each of these price levels prints on the report, a formula is
defined for each price level. In this table, the price level is represented by
the variable x.
Report
Column
Title Formula
Sales Qty @Px_Qty
% of Ttl @Percent_Of_Group_Qtyx
Rtn Qty @Px_Rtn_Qty
% of Ttl @Percent_Of_Group_Rtn_Qtyx
Gross Sales @Px_Total
% of Ttl @Percent_Of_Group_Totalx
Item Disc @Px_Discount_Total
% of Ttl @Percent_Of_Group_Disc_Ttlx
Net Sales @Px_Net_Total
% of Ttl @Percent_Of_Group_Net_Ttlx
0HQX,WHP6DOHV5HSRUWV
&RQVROLGDWHG6\VWHP0HQX,WHP6DOHV'HWDLO
Programming Considerations
0HQX,WHPV
qA menu item with a price of zero will not post to reports if Menu Item
Classes | Print/Display | Do not post to reports if price = 0 is selected.
qA menu item with a price of zero will not add to detail totals if Menu
Item Classes | Print/Display | Do not add to detail if price = 0 is
selected.
qA menu item can be programmed to have up to four different prices if
Menu Item Classes | Price/Totals | Enable prices 2 through 4 is
selected.
Notes
0HQX,WHPV
On Menu Items | Groups, each menu item must be assigned a major and a
family group.
Total
Sales Qty @Group_Qty
% of Ttl @Percent_Of_Daily_Qty
Rtn Qty @Group_Rtn_Qty
% of Ttl @Percent_Of_Daily_Rtn_Qty
Gross Sales @Group_Total
% of Ttl @Percent_Of_Daily_Total
Item Disc @Group_Disc_Total
% of Ttl @Percent_Of_Daily_Disc_Total
Net Sales @Group_Net_Total
% of Ttl @Percent_Of_Daily_Net_Total
Grand Total
Sales Qty @Daily_Qty
Rtn Qty @Daily_Rtn_Qty
Gross Sales @Daily_Total
Item Disc @Daily_Disc_Total
Net Sales @Daily_Net_Total
Report
Column
Title Formula

5HSRUWV
0HQX,WHP6DOHV5HSRUWV
'DLO\5HYHQXH&HQWHU0HQX,WHP6DOHV6XPPDU\
Daily Revenue Center Menu Item Sales Summary
3XUSRVH
This report provides a detailed summary of sales quantities, returns, item
discounts, gross sales, and net sales for this group. It also includes
percentage information for each of these categories. Information for each
day is presented separately, with totals for each revenue center and each
day, and grand totals for the period of the report.
)RUPDW
This report includes the following profile:
qSales Profile
The profile has been modified for this report. It does not include these
fields:
Rtn Qty
% of Ttl
Gross Sales
% of Ttl
Item Disc
% of Ttl
7HPSODWH
MI_R101.RPT
2-24
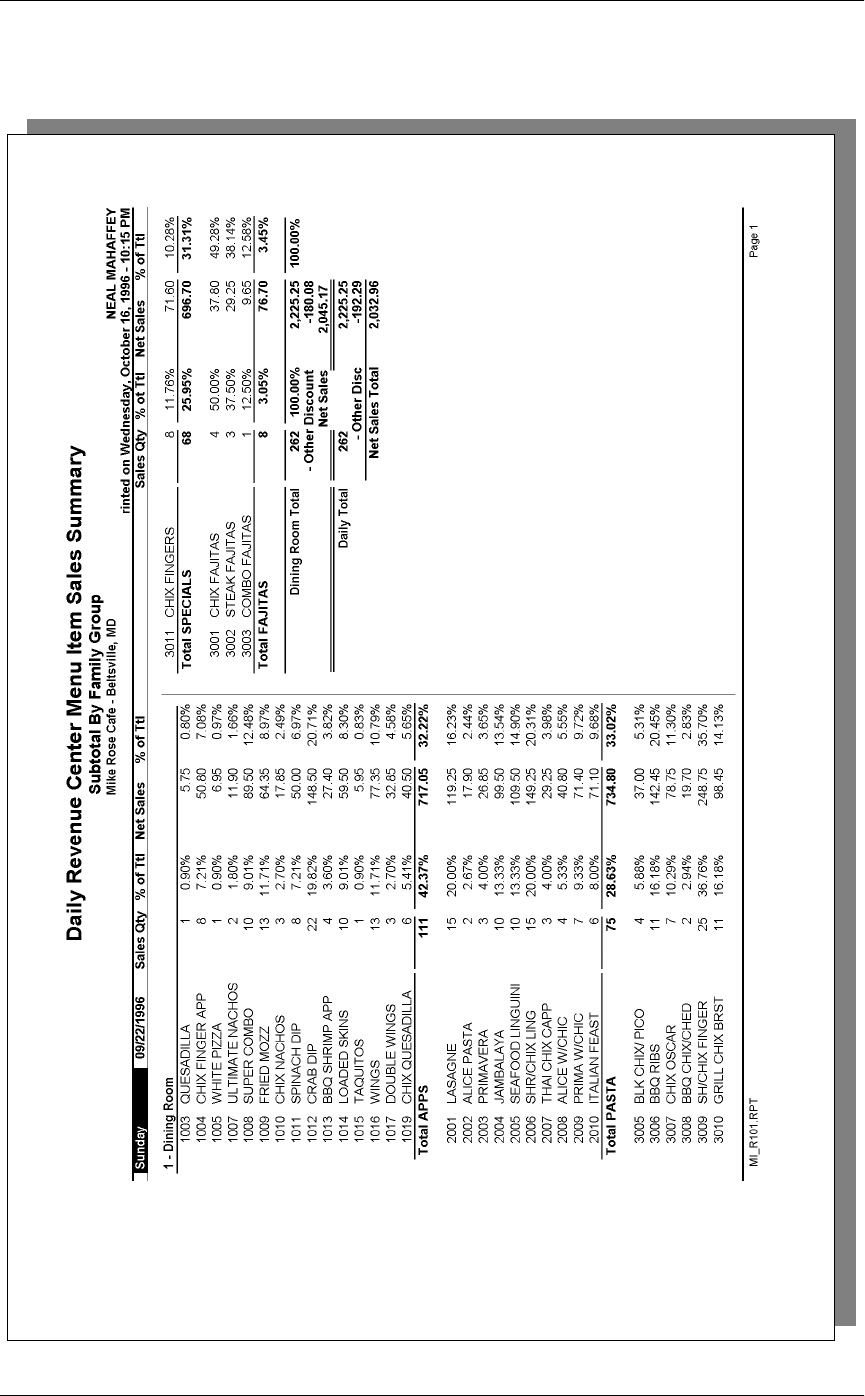
0HQX,WHP6DOHV5HSRUWV
'DLO\5HYHQXH&HQWHU0HQX,WHP6DOHV6XPPDU\
5HSRUWV
0HQX,WHP6DOHV5HSRUWV
'DLO\5HYHQXH&HQWHU0HQX,WHP6DOHV6XPPDU\
Daily Revenue Center Menu Item Sales Summary
Daily Revenue Center
Menu Item Sales Summary
Subtotal By Family Group
Mike Rose Cafe - Beltsville, MD
NEAL MAHAFFEY
Printed on 10/16/1996 - 3:19
----------------------------------------
Friday 9/27/199
1 - Dining Room
1002 BROC/CHEESE 11 3.51%
51.15 2.47%
1003 QUESADILLA 4 1.28%
23.00 1.11%
1004 CHIX FINGER 28 8.95%
177.80 8.59%
1005 WHITE PIZZA 6 1.92%
41.70 2.01%
1007 ULTIMATE NA 4 1.28%
23.80 1.15%
1008 SUPER COMBO 33 10.54%
295.35 14.26%
1009 FRIED MOZZ 24 7.67%
118.80 5.74%
1010 CHIX NACHOS 11 3.51%
65.45 3.16%
1011 SPINACH DIP 19 6.07%
118.75 5.73%
1012 CRAB DIP 34 10.86%
229.50 11.08%
1013 BBQ SHRIMP 12 3.83%
82.20 3.97%
1014 LOADED SKIN 19 6.07%
113.05 5.46%
1015 TAQUITOS 5 1.60%
29.75 1.44%
1016 WINGS 72 23.00%
428.40 20.69%
1017 DOUBLE WING 15 4.79%
164.25 7.93%
1019 CHIX QUESAD 16 5.11%
108.00 5.21%
Total APPS 313 24.49%
2,070.95 47.60%
10.20 1.20%
2009 PRIMA W/CHI 3 3.49%
30.60 3.61%
2010 ITALIAN FEA 6 6.98%
71.10 8.39%
Total PASTA 86 6.73%
847.90 19.49%
Total OPEN FOOD 3 0.23%
11.35 0.26%
Dining Room Total 1,2 83.75%
4,350.85 84.03%
Sbttl Di -283.53
Net Sale 4,067.32
----------------------------------------
Friday 9/27/199
2 - Main Bar
Main Bar Total 248 16.25%
826.85 15.97%
Sbttl Di -30.55
Net Sale 796.30
----------------------------------------
Daily Total 1,526
5,177.70
- Other Disc -314.08
Net Sales Total 4,863.62
========================================
Totals omitted for
display

0HQX,WHP6DOHV5HSRUWV
'DLO\5HYHQXH&HQWHU0HQX,WHP6DOHV6XPPDU\
Sales Profile Details
View: The subtotal group you choose determines which view is used to
produce the report. The possible views follow:
qv_R_rvc_menuitem_fam_grp (subtotal by family group)
qv_R_rvc_menuitem_maj_grp (subtotal by major group)
qv_R_rvc_menuitem_mi_grp (subtotal by menu item group)
Stored Procedure: sp_R_menuitem
The following table lists each column in the Sales Profile and provides
detailed information on the source of the figures in each column. Since all
the numbers in this profile come from formulas, there is no view, table, or
column information.
Any given menu item could have up to four prices defined. So that
information for each of these price levels prints on the report, a formula is
defined for each price level. In this table, the price level is represented by
the variable x.
Report
Column
Title Formula
Sales Qty @Px_Qty
% of Ttl @Percent_Of_Ttl_Countx
Net Sales @Px_Total
% of Ttl @Percent_Of_Ttl_Amountx
Total
Sales Qty @Total_Qty
% of Ttl @Percent_Of_RVC_Count
Net Sales @Total_Total
% of Ttl @Percent_Of_RVC_Amount
Revenue Center Total
Sales Qty @RVC_Total_Qty
% of Ttl @Percent_Of_Daily_Count
Net Sales @RVC_Total_Total
% of Ttl @Percent_Of_Daily_Amount
5HSRUWV
0HQX,WHP6DOHV5HSRUWV
'DLO\5HYHQXH&HQWHU0HQX,WHP6DOHV6XPPDU\
Programming Considerations
0HQX,WHPV
qA menu item with a price of zero will not post to reports if Menu Item
Classes | Print/Display | Do not post to reports if price = 0 is selected.
qA menu item with a price of zero will not add to detail totals if Menu
Item Classes | Print/Display | Do not add to detail if price = 0 is
selected.
qA menu item can be programmed to have up to four different prices if
Menu Item Classes | Price/Totals | Enable prices 2 through 4 is
selected.
Notes
0HQX,WHPV
On Menu Items | Groups, each menu item must be assigned a major and a
family group.
Daily Total
Sales Qty @Daily_Total_Qty
Net Sales @Daily_Total_Total
Other Disc @ttl_Other_Disc
Net Sales Total @ttl_Net_Sales
Report
Column
Title Formula
0HQX,WHP6DOHV5HSRUWV
&RQVROLGDWHG5HYHQXH&HQWHU0HQX,WHP6DOHV6XPPDU\
Consolidated Revenue Center Menu Item Sales Summary
3XUSRVH
This report provides the same information as the Daily Revenue Center
Menu Item Sales Summary Report, but for a range of business days.
)RUPDW
This report includes the following profile:
qSales Profile
The profile has been modified for this report. It does not include these
fields:
Rtn Qty
% of Ttl
Gross Sales
% of Ttl
Item Disc
% of Ttl
7HPSODWH
MI_R102.RPT
2-24
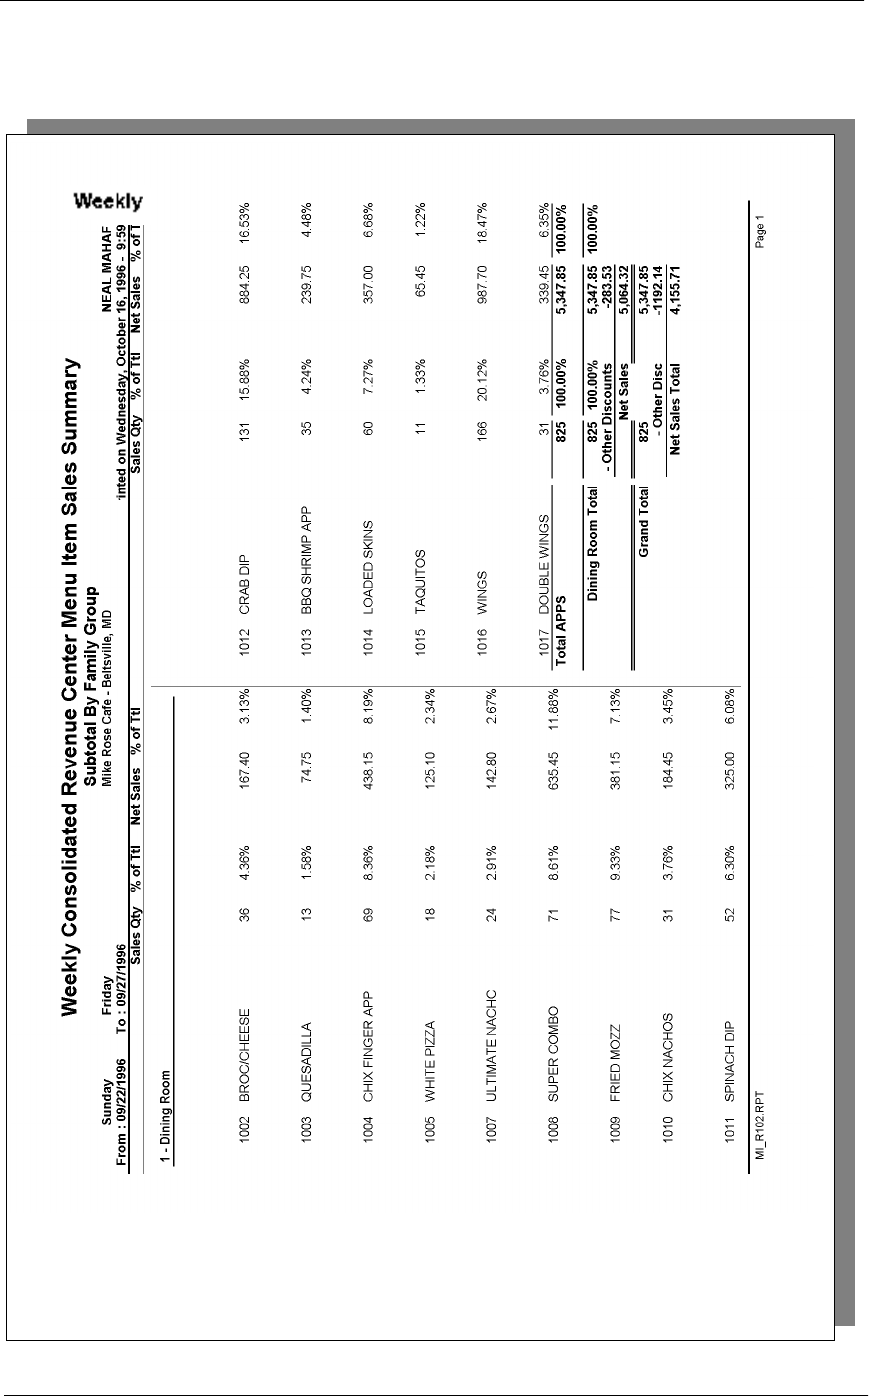
5HSRUWV
0HQX,WHP6DOHV5HSRUWV
&RQVROLGDWHG5HYHQXH&HQWHU0HQX,WHP6DOHV6XPPDU\
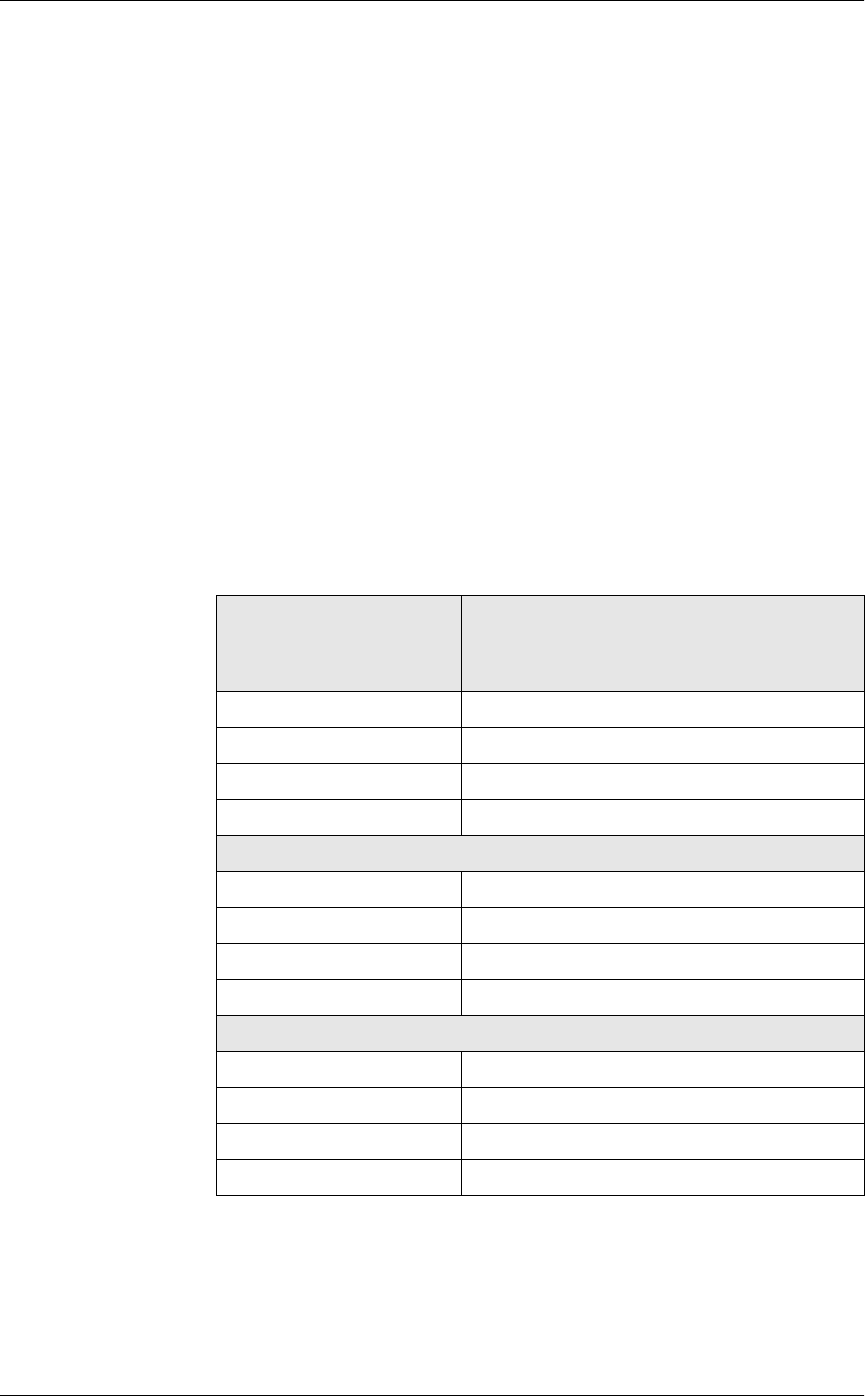
0HQX,WHP6DOHV5HSRUWV
&RQVROLGDWHG5HYHQXH&HQWHU0HQX,WHP6DOHV6XPPDU\
Sales Profile Details
View: The subtotal group you choose determines which view is used to
produce the report. The possible views follow:
qv_R_rvc_menuitem_fam_grp (subtotal by family group)
qv_R_rvc_menuitem_maj_grp (subtotal by major group)
qv_R_rvc_menuitem_mi_grp (subtotal by menu item group)
Stored Procedure: sp_R_menuitem
The following table lists each column in the Sales Profile and provides
detailed information on the source of the figures in each column. Since all
the numbers in this profile come from formulas, there is no view, table, or
column information.
Any given menu item could have up to four prices defined. So that
information for each of these price levels prints on the report, a formula is
defined for each price level. In this table, the price level is represented by
the variable x.
Report
Column
Title Formula
Sales Qty @Px_Qty
% of Ttl @Percent_Of_Ttl_Countx
Net Sales @Px_Total
% of Ttl @Percent_Of_Ttl_Amountx
Total
Sales Qty @Sum_Qty
% of Ttl @Percent_Of_Daily_Qty
Net Sales @Sum_Total
% of Ttl @Percent_Of_Daily_Total
Revenue Center Total
Sales Qty @RVC_Group_Qty
% of Ttl @Percent_Grand_Total_Qty
Net Sales @RVC_Group_Total
% of Ttl @Percent_Of_Grand_Total_Total

5HSRUWV
0HQX,WHP6DOHV5HSRUWV
&RQVROLGDWHG5HYHQXH&HQWHU0HQX,WHP6DOHV6XPPDU\
Programming Considerations
0HQX,WHPV
qA menu item with a price of zero will not post to reports if Menu Item
Classes | Print/Display | Do not post to reports if price = 0 is selected.
qA menu item with a price of zero will not add to detail totals if Menu
Item Classes | Print/Display | Do not add to detail if price = 0 is
selected.
qA menu item can be programmed to have up to four different prices if
Menu Item Classes | Price/Totals | Enable prices 2 through 4 is
selected.
Notes
0HQX,WHPV
On Menu Items | Groups, each menu item must be assigned a major and a
family group.
Grand Total
Sales Qty @Total_Qty
Net Sales @Total_Total
Other Disc @ttl_Other_Disc
Net Sales Total @ttl_Net_Sales
Report
Column
Title Formula
0HQX,WHP6DOHV5HSRUWV
'DLO\6\VWHP0HQX,WHP6DOHV6XPPDU\
Daily System Menu Item Sales Summary
3XUSRVH
This report provides a detailed summary of sales quantities, returns, item
discounts, gross sales, and net sales for this group. It also includes
percentage information for each of these categories. Information for each
day is presented separately, with totals for each revenue center and each
day, and grand totals for the period of the report.
)RUPDW
This report includes the following profile:
qSales Profile
The profile has been modified for this report. It does not include these
fields:
Rtn Qty
% of Ttl
Gross Sales
% of Ttl
Item Disc
% of Ttl
7HPSODWH
MI_S101.RPT
2-24
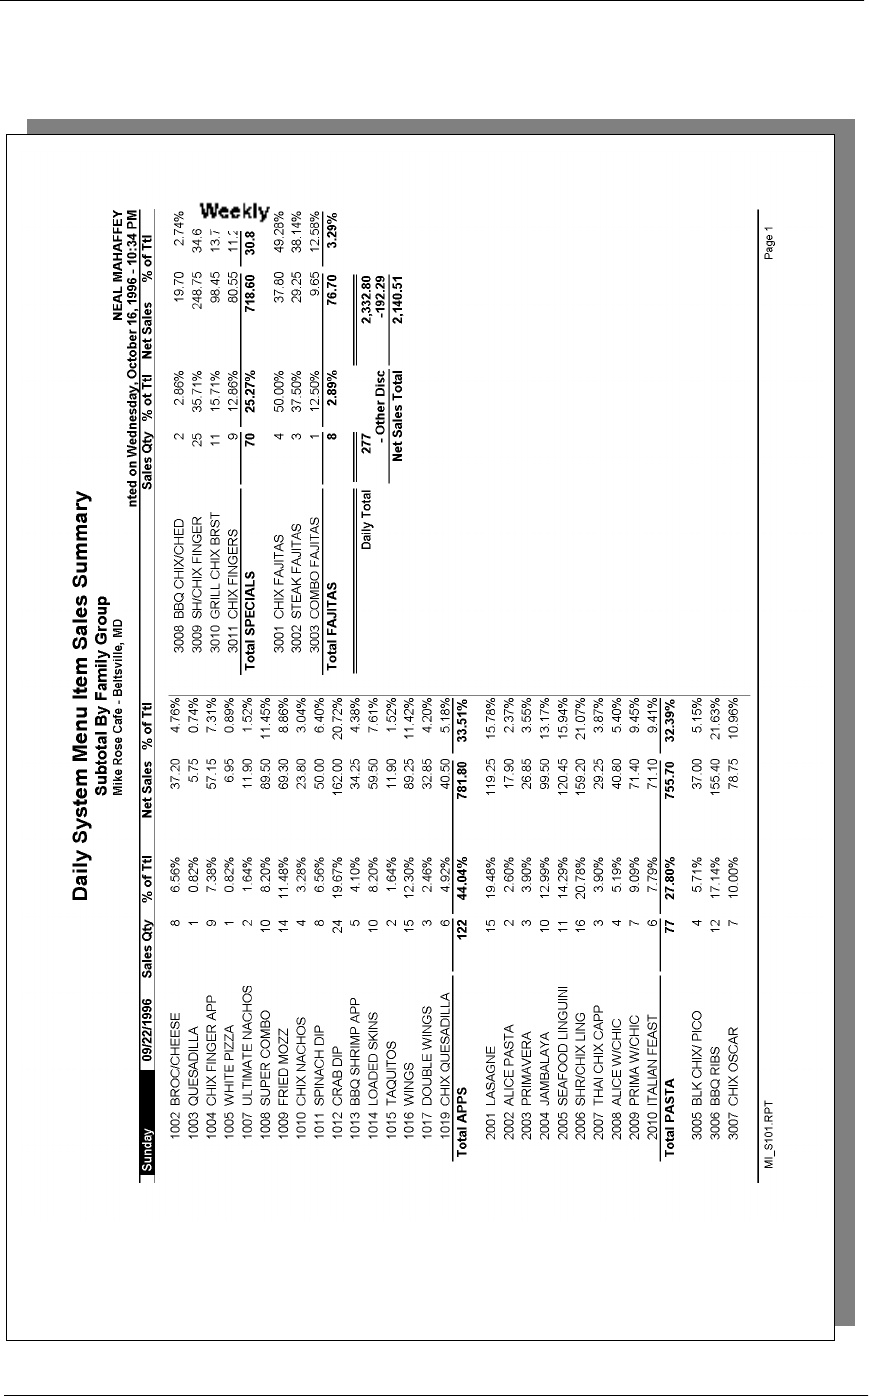
5HSRUWV
0HQX,WHP6DOHV5HSRUWV
'DLO\6\VWHP0HQX,WHP6DOHV6XPPDU\
0HQX,WHP6DOHV5HSRUWV
'DLO\6\VWHP0HQX,WHP6DOHV6XPPDU\
Daily System Menu Item Sales Summary
Sales Profile Details
View: The subtotal group you choose determines which view is used to
produce the report. The possible views follow:
qv_R_sys_menuitem_fam_grp (subtotal by family group)
Daily System
Menu Item Sales Summary
Subtotal By Family Group
Mike Rose Cafe - Beltsville, MD
NEAL MAHAFFEY
Printed on 10/16/1996 - 3:29
----------------------------------------
Sunday 9/22/19
1002 BROC/CHEES 8 6.56%
37.20 4.76%
1003 QUESADILLA 1 0.82%
5.75 0.74%
1004 CHIX FINGE 9 7.38%
57.15 7.31%
1005 WHITE PIZZ 1 0.82%
6.95 0.89%
1007 ULTIMATE N 2 1.64%
11.90 1.52%
1008 SUPER COMB 10 8.20%
89.50 11.45%
1009 FRIED MOZZ 14 11.48%
69.30 8.86%
1010 CHIX NACHO 4 3.28%
23.80 3.04%
1011 SPINACH DI 8 6.56%
50.00 6.40%
1012 CRAB DIP 24 19.67%
162.00 20.72%
1013 BBQ SHRIMP 5 4.10%
34.25 4.38%
1014 LOADED SKI 10 8.20%
59.50 7.61%
1015 TAQUITOS 2 1.64%
11.90 1.52%
1016 WINGS 15 12.30%
89.25 11.42%
1017 DOUBLE WIN 3 2.46%
32.85 4.20%
1019 CHIX QUESA 6 4.92%
40.50 5.18%
Total APPS 122 61.31%
781.80 50.85%
2001 LASAGNE 15 19.48%
119.25 15.78%
2002 ALICE PAST 2 2.60%
17.90 2.37%
2003 PRIMAVERA 3 3.90%
26.85 3.55%
2004 JAMBALAYA 10 12.99%
99.50 13.17%
2005 SEAFOOD LI 11 14.29%
120.45 15.94%
2006 SHR/CHIX L 16 20.78%
159.20 21.07%
2007 THAI CHIX 3 3.90%
29.25 3.87%
2008 ALICE W/CH 4 5.19%
40.80 5.40%
2009 PRIMA W/CH 7 9.09%
71.40 9.45%
2010 ITALIAN FE 6 7.79%
71.10 9.41%
Total PASTA 77 38.69%
755.70 49.15%
Daily Total 199
1,537.50
- Other Disc -192.29
Net Sales Total 1,345.21
----------------------------------------
5HSRUWV
0HQX,WHP6DOHV5HSRUWV
'DLO\6\VWHP0HQX,WHP6DOHV6XPPDU\
qv_R_sys_menuitem_maj_grp (subtotal by major group)
qv_R_sys_menuitem_mi_grp (subtotal by menu item group)
Stored Procedure: sp_R_menuitem
The following table lists each column in the Sales Profile and provides
detailed information on the source of the figures in each column. Since all
the numbers in this profile come from formulas, there is no view, table, or
column information.
Any given menu item could have up to four prices defined. So that
information for each of these price levels prints on the report, a formula is
defined for each price level. In this table, the price level is represented by
the variable x.
Programming Considerations
0HQX,WHPV
qA menu item with a price of zero will not post to reports if Menu Item
Classes | Print/Display | Do not post to reports if price = 0 is selected.
qA menu item with a price of zero will not add to detail totals if Menu
Item Classes | Print/Display | Do not add to detail if price = 0 is
selected.
Report
Column
Title Formula
Sales Qty @Px_Qty
% of Ttl @Percent_Of_Ttl_Countx
Net Sales @Px_Total
% of Ttl @Percent_Of_Ttl_Amountx
Total
Sales Qty @Total_Qty
% of Ttl @Percent_Of_Daily_Count
Net Sales @Total_Total
% of Ttl @Percent_Of_Daily_Amount
Daily Total
Sales Qty @Daily_Total_Qty
Net Sales @Daily_Total_Total
Other Disc @ttl_Other_Disc
Net Sales Total @ttl_Net_Sales_Total

0HQX,WHP6DOHV5HSRUWV
'DLO\6\VWHP0HQX,WHP6DOHV6XPPDU\
qA menu item can be programmed to have up to four different prices if
Menu Item Classes | Price/Totals | Enable prices 2 through 4 is
selected.
Notes
0HQX,WHPV
On Menu Items | Groups, each menu item must be assigned a major and a
family group.

5HSRUWV
0HQX,WHP6DOHV5HSRUWV
&RQVROLGDWHG6\VWHP0HQX,WHP6DOHV6XPPDU\
Consolidated System Menu Item Sales Summary
3XUSRVH
This report provides the same information as the Daily System Menu Item
Sales Summary Report, but for a range of business days.
)RUPDW
This report includes the following profile:
qSales Profile
The profile has been modified for this report. It does not include these
fields:
Rtn Qty
% of Ttl
Gross Sales
% of Ttl
Item Disc
% of Ttl
7HPSODWH
MI_S102.RPT
2-24
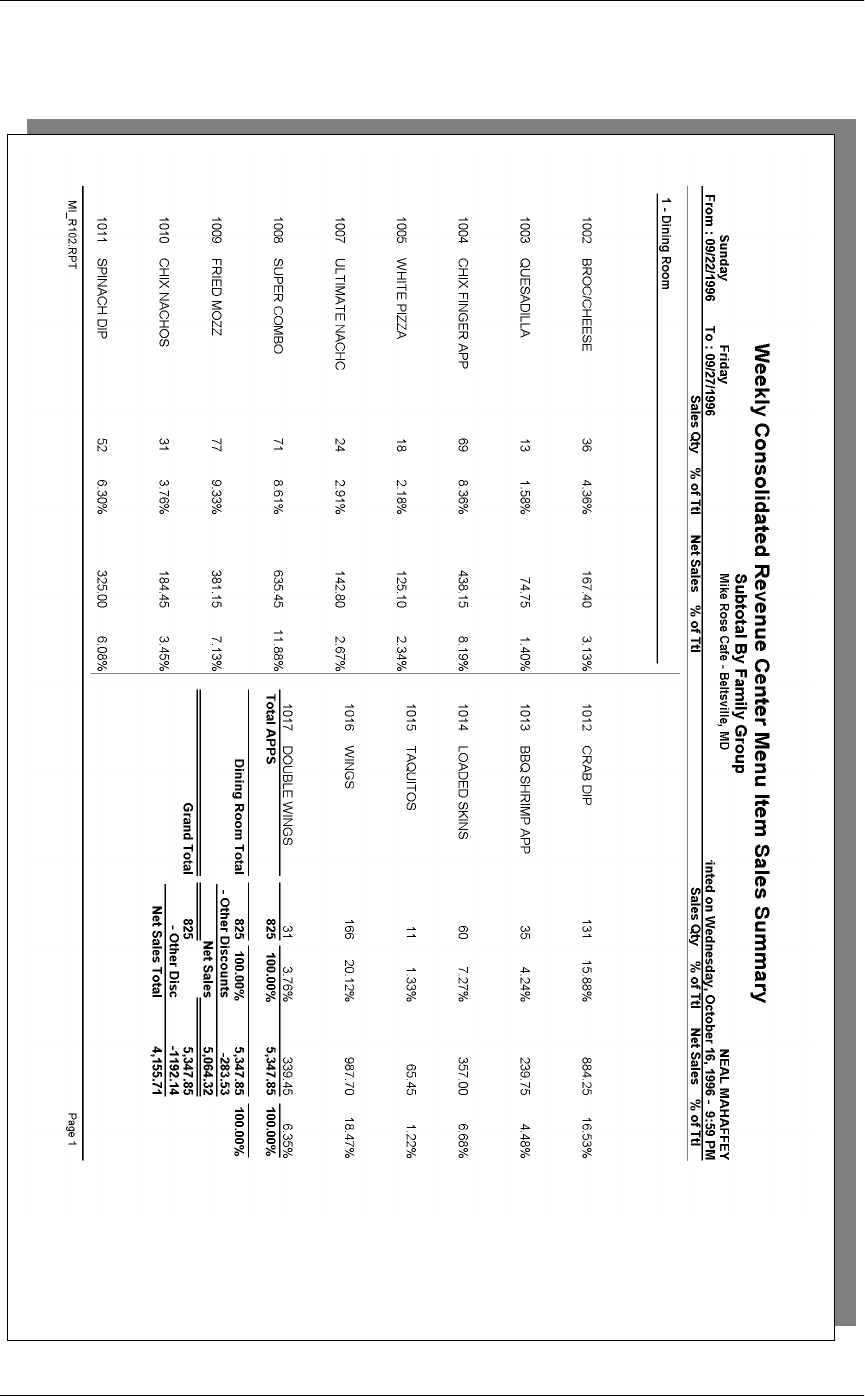
0HQX,WHP6DOHV5HSRUWV
&RQVROLGDWHG6\VWHP0HQX,WHP6DOHV6XPPDU\

5HSRUWV
0HQX,WHP6DOHV5HSRUWV
&RQVROLGDWHG6\VWHP0HQX,WHP6DOHV6XPPDU\
Sales Profile Details
View: The subtotal group you choose determines which view is used to
produce the report. The possible views follow:
qv_R_sys_menuitem_fam_grp (subtotal by family group)
qv_R_sys_menuitem_maj_grp (subtotal by major group)
qv_R_sys_menuitem_mi_grp (subtotal by menu item group)
Stored Procedure: sp_R_menuitem
The following table lists each column in the Sales Profile and provides
detailed information on the source of the figures in each column. Since all
the numbers in this profile come from formulas, there is no view, table, or
column information.
Any given menu item could have up to four prices defined. So that
information for each of these price levels prints on the report, a formula is
defined for each price level. In this table, the price level is represented by
the variable x.
Programming Considerations
0HQX,WHPV
qA menu item with a price of zero will not post to reports if Menu Item
Classes | Print/Display | Do not post to reports if price = 0 is selected.
Report
Column
Title Formula
Sales Qty @Px_Qty
% of Ttl @Percent_Of_Ttl_Countx
Net Sales @Px_Total
% of Ttl @Percent_Of_Ttl_Amountx
Total
Sales Qty @Sum_Qty
% of Ttl @Percent_Of_Grand_Total_Qty
Net Sales @Sum_Total
% of Ttl @Percent_Of_Grand_Total_Total
Grand Total
Sales Qty @Total_Qty
Net Sales @Total_Total
Other Disc @ttl_Other_Disc
Net Sales Total @ttl_Net_Sales_Total

0HQX,WHP6DOHV5HSRUWV
&RQVROLGDWHG6\VWHP0HQX,WHP6DOHV6XPPDU\
qA menu item with a price of zero will not add to detail totals if Menu
Item Classes | Print/Display | Do not add to detail if price = 0 is
selected.
qA menu item can be programmed to have up to four different prices if
Menu Item Classes | Price/Totals | Enable prices 2 through 4 is
selected.
Notes
0HQX,WHPV
On Menu Items | Groups, each menu item must be assigned a major and a
family group.

5HSRUWV
0HQX,WHP6DOHV5HSRUWV
&RQVROLGDWHG)RRG&RVW'HWDLO5HSRUW
Consolidated Food Cost Detail Report
3XUSRVH
The Consolidated Food Cost report provides a comparison of food costs
as percentages of net sales by Family Group.
)RUPDW
This report includes these profiles:
qFamily Group profile
7HPSODWH
CONSFOODCOST.RPT
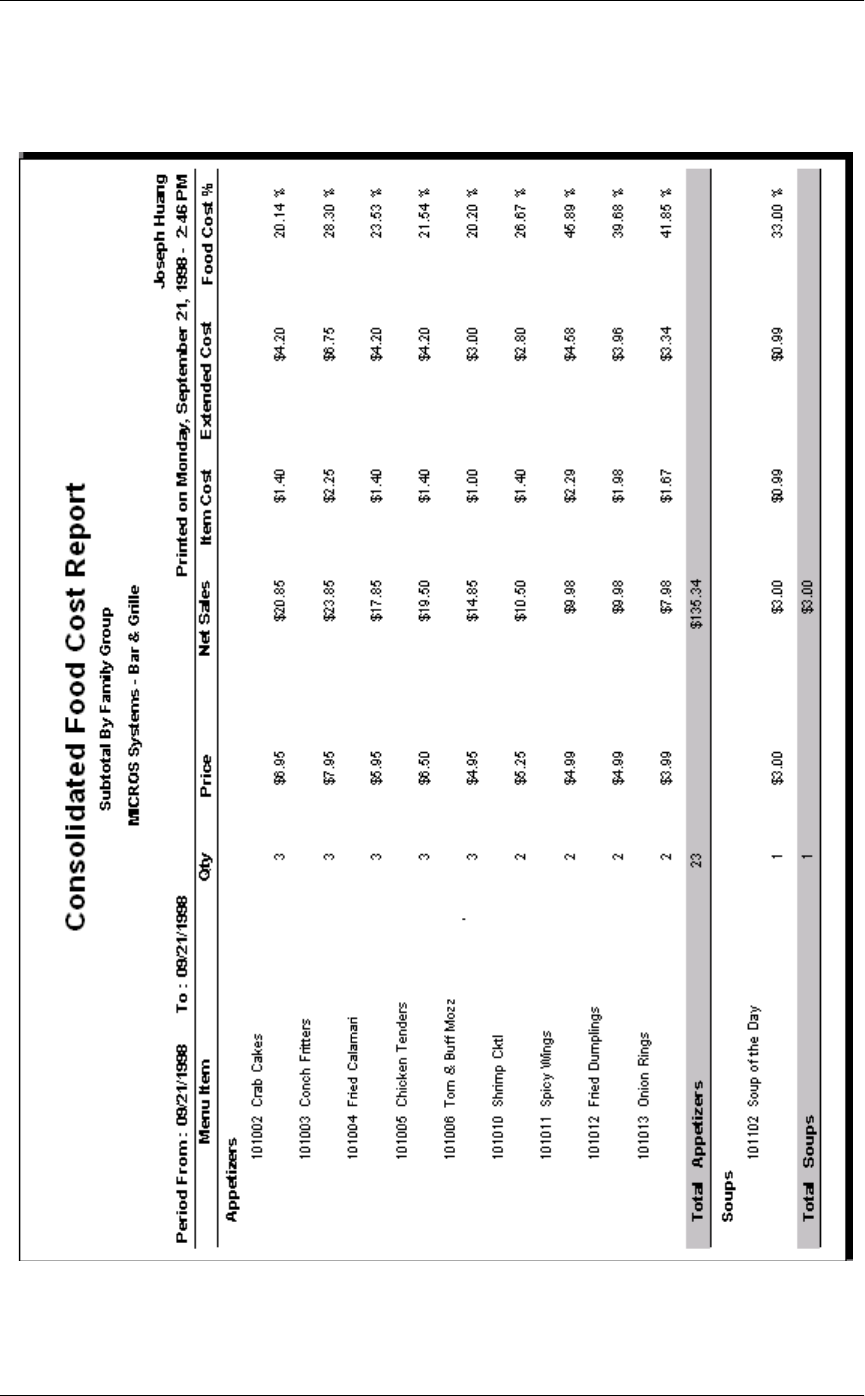
0HQX,WHP6DOHV5HSRUWV
&RQVROLGDWHG)RRG&RVW'HWDLO5HSRUW

5HSRUWV
Chapter 11
Check Reports
This chapter provides examples and explanations of the check reports.
In this chapter
Introduction ..........................................................................................11-2
Employee Open Guest Checks Report.................................................11-3
Employee Closed Guest Checks Report...............................................11-8
Return/Void Reason Code Report ......................................................11-15

&KHFN5HSRUWV
,QWURGXFWLRQ
Introduction
Often there are open checks at the end of the shift because waiters or
cashiers have simply forgotten to close all their checks. The Employee
Open Checks Report will identify the owner of open checks so they can
be closed. Usually this procedure is performed before running
autosequences (except in 24-hour operations).
The Employee Closed Guest Checks Report is often used for internal
audits and to match closed checks with pre-issued physical checks (to
ensure that all checks issued have been returned). This report can also be
helpful by identifying checks that are either lost or taken by customers.
Once the check number is identified, the check can be reprinted.
5HSRUWV
&KHFN5HSRUWV
(PSOR\HH2SHQ*XHVW&KHFNV5HSRUW
Employee Open Guest Checks Report
3XUSRVH
This report lists all checks that remain open at the time the report is
generated. It can be used to identify the owners of open checks so they
can be closed. This report is usually run before running autosequences.
)RUPDW
The profile used for this report is unique—it is not used for any other
reports. It is explained in the Report Profile below.
7HPSODWH
CHK_101.RPT
5HSRUW3URILOH
This profile provides check identification information, open date and
time, and details of the charges associated with this check..
Column Description
Check The check number assigned to this guest check.
Tbl/Grp The table and group number of the check.
Guests The number of guests on the check.
Check ID An identifier associated with this check. If no Check ID
is associated with this guest check, this field will be
blank.
Open Date/
Time The date and time the check was opened.
Printed
Count The number of times this check has been printed.
Subtotal The check subtotal (which includes discounts) before
tax and service charges are added. If the tax type is
VAT (Value Added Tax), the subtotal includes tax.
Tax Total The tax that has been added to this check. VAT is not
included in this total.
Svchg The total of all service charges for this check.
Payment
Total The total of all payments (less change due) recorded
for this check.
Note
This report can be run as a UWS report and looks like the 40-
column Crystal Report.
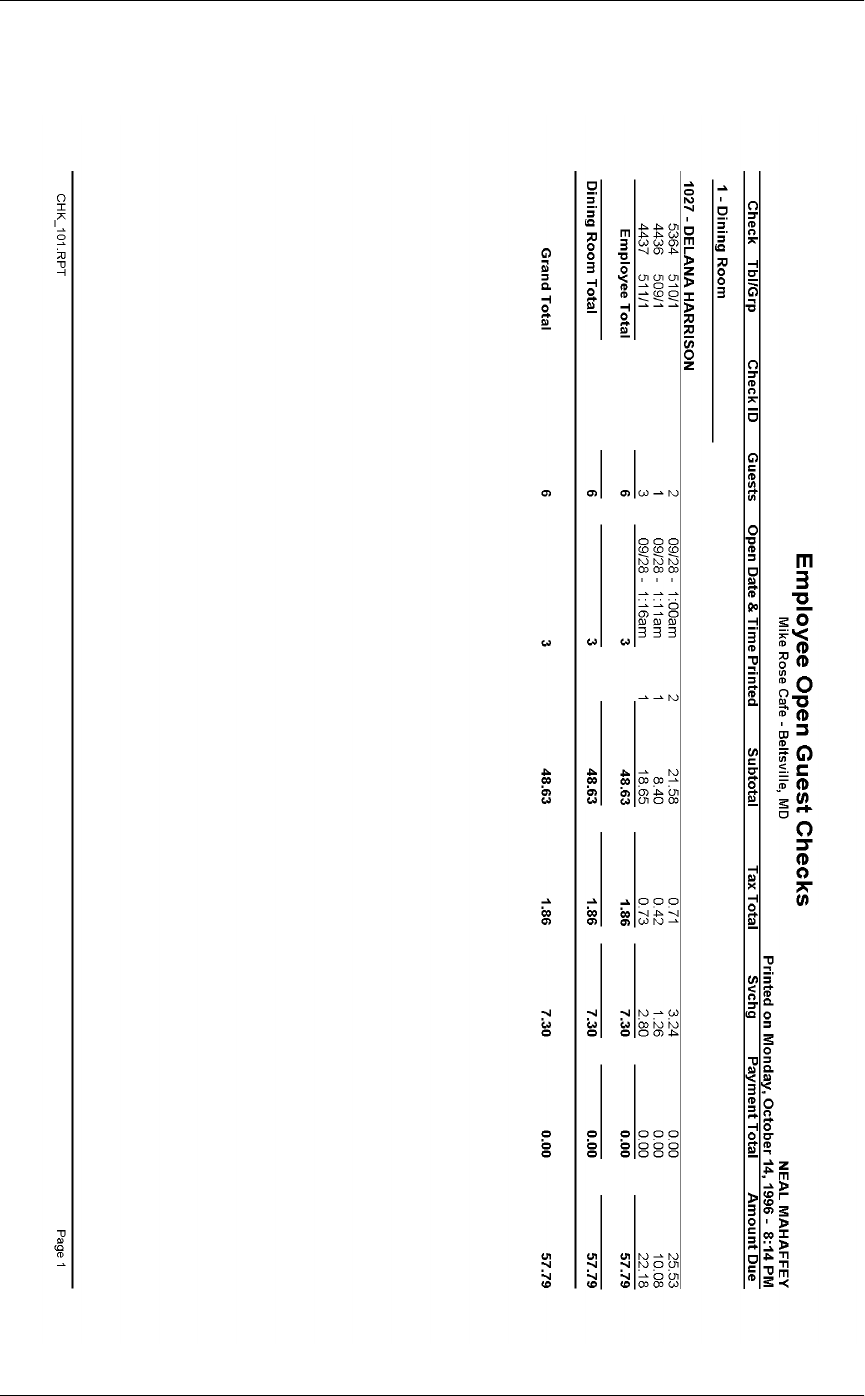
&KHFN5HSRUWV
(PSOR\HH2SHQ*XHVW&KHFNV5HSRUW

5HSRUWV
&KHFN5HSRUWV
(PSOR\HH2SHQ*XHVW&KHFNV5HSRUW
Employee Open Guest Checks Report
Employee Open Guest Checks
Mike Rose Cafe - Beltsville, MD
NEAL MAHAFFEY
Printed on 10/16/1996 - 1:34
----------------------------------------
1 - Dining Room
1027 - DELANA HARRISON
Check Tbl Opened Amt Due
5364 510/1 25.53
2 09/28 - 1:00am
4436 509/1 10.08
1 09/28 - 1:11am
4437 511/1 22.18
1 09/28 - 1:16am
Employee Total 3 57.79
----------------------------------------
Dining Room Total 3 57.79
========================================
Grand Total 3 57.79
&KHFN5HSRUWV
(PSOR\HH2SHQ*XHVW&KHFNV5HSRUW
Report Details
View: v_R_guest_checks
This report does not use any stored procedures.
The following table lists each column in the report and provides detailed
information on the source of the figures in each column.
Report
Column
Title
View
Column
Title
3700 Database Formula
Table Column
Check check_number chk_dtl chk_num
Table/Group @Table_Group
Guests cover_count chk_dtl cov_cnt
Check ID check_id chk_dtl chk_seq
Open Date & Time
Date @Open_Date
Time @Open_Time
Printed Count printed_count chk_dtl chk_prntd_cnt
Subtotal sub_ttl chk_dtl sub_ttl
Tax Total tax_ttl chk_dtl tax_ttl
Svchg @Service_Chg_Total
Payment Total paymnt_ttl chk_dtl pymnt_ttl
Employee Total
Guests ∑ cover_count chk_dtl cov_cnt
Open Date & Time @Count_Of_Checks
Printed Count ∑ printed_count chk_dtl chk_prntd_cnt
Subtotal ∑ sub_ttl chk_dtl sub_ttl
Tax Total ∑ tax_ttl chk_dtl tax_ttl
Svchg ∑ @Service_Chg_Total
Payment Total ∑ paymnt_ttl chk_dtl pymnt_ttl
Revenue Center Total
Guests ∑ cover_count chk_dtl cov_cnt
Open Date & Time @RVC_Count_Of_Checks
Printed Count ∑ printed_count chk_dtl chk_prntd_cnt
5HSRUWV
&KHFN5HSRUWV
(PSOR\HH2SHQ*XHVW&KHFNV5HSRUW
Notes
1XPEHURI2SHQ&KHFNV(TXDOV2XWVWDQGLQJ&KHFNV
The count of open checks on this report will equal the count of
outstanding checks on the revenue center or system sales detail report if
all the following are true:
qThe sales balance report and the open check report are for the same
period.
qThe range of employees covered by the open check report includes all
employees active in the sales balance report.
qThe reports are taken close enough in time that no checks are opened
or closed between the two reports.
2SHQ&KHFNV'R1RW$SSHDURQ5HSRUW
If you believe a check is still open for a particular employee, but it does
not appear on the report, run the Employee Closed Guest Checks Report
to see if one of the following has occurred:
qThe check was closed. The check detail will tell you how the check
was tendered.
qThe check was transferred to another employee. See the explanation
of the Employee Closed Guest Checks Report.
7UDLQLQJ&KHFNV
Open training checks appear on the report with a T beside the check
number. The counts and subtotals of these checks are included in the
Employee Total and Grand Total.
Subtotal ∑ sub_ttl chk_dtl sub_ttl
Tax Total ∑ tax_ttl chk_dtl tax_ttl
Svchg ∑ @Service_Chg_Total
Payment Total ∑ paymnt_ttl chk_dtl pymnt_ttl
Grand Total
Guests ∑ cover_count chk_dtl cov_cnt
Open Date & Time Count of @Open_DateTime
Printed Count ∑ printed_count chk_dtl chk_prntd_cnt
Subtotal ∑ sub_ttl chk_dtl sub_ttl
Tax Total ∑ tax_ttl chk_dtl tax_ttl
Svchg ∑ @Service_Chg_Total
Payment Total ∑ paymnt_ttl chk_dtl pymnt_ttl
Report
Column
Title
View
Column
Title
3700 Database Formula
Table Column
&KHFN5HSRUWV
(PSOR\HH&ORVHG*XHVW&KHFNV5HSRUW
Employee Closed Guest Checks Report
3XUSRVH
This report lists all checks that have been closed by an employee,
including reopened checks that were closed again, and memo tenders. In
addition, symbols appear in the margin next to the check number to
indicate if the check was split (s), edited (e), cancelled (c), added (a),
transferred (x), part of a block transfer (b), or a fast transaction (f). This
information can be used as an employee audit trail, and can be helpful if
the hard copy of the check is lost.
)RUPDW
The profile used for this report is unique—it is not used for any other
reports. It is explained in the Report Profile below.
7HPSODWH
CHK_102.RPT
&ORVHG&KHFN3URILOH
This profile provides identifying information, date and time information,
and details about charges and payments.
Column Description
Check The check number assigned to this guest check.
Tbl/Grp The table and group number of the check.
Check ID The Check ID associated with this check.
Opened The date and time the check was opened.
Closed The date and time the check was closed.
Duration The amount of time the check was open. This figure
is calculated by finding the difference between the
check’s open and closed times.
Guests The number of guests on the check.
Subtotal The check subtotal (which includes discounts)
before tax and service charges are added. If the tax
type is VAT (Value Added Tax), the subtotal
includes tax.
Tax The tax that has been added to this check. VAT is
not included in this total.
Svchg The total of all service charges for this check.
5HSRUWV
&KHFN5HSRUWV
(PSOR\HH&ORVHG*XHVW&KHFNV5HSRUW
Pymnt1
(Programmable) These fields can be programmed to provide specific
Tender/Media information. For example, you might
want to know the amount paid in cash or the amount
charged for each closed check.
Tender/Media keys are assigned to payment groups
in the Category field in Tender/Media | General in
POS Configurator.
Pymnt2
(Programmable)
Pymnt3
(Programmable)
Pymnt4
(Programmable)
Pymnt Ttl The total of all payments (less change due)
recorded for this check.
Column Description
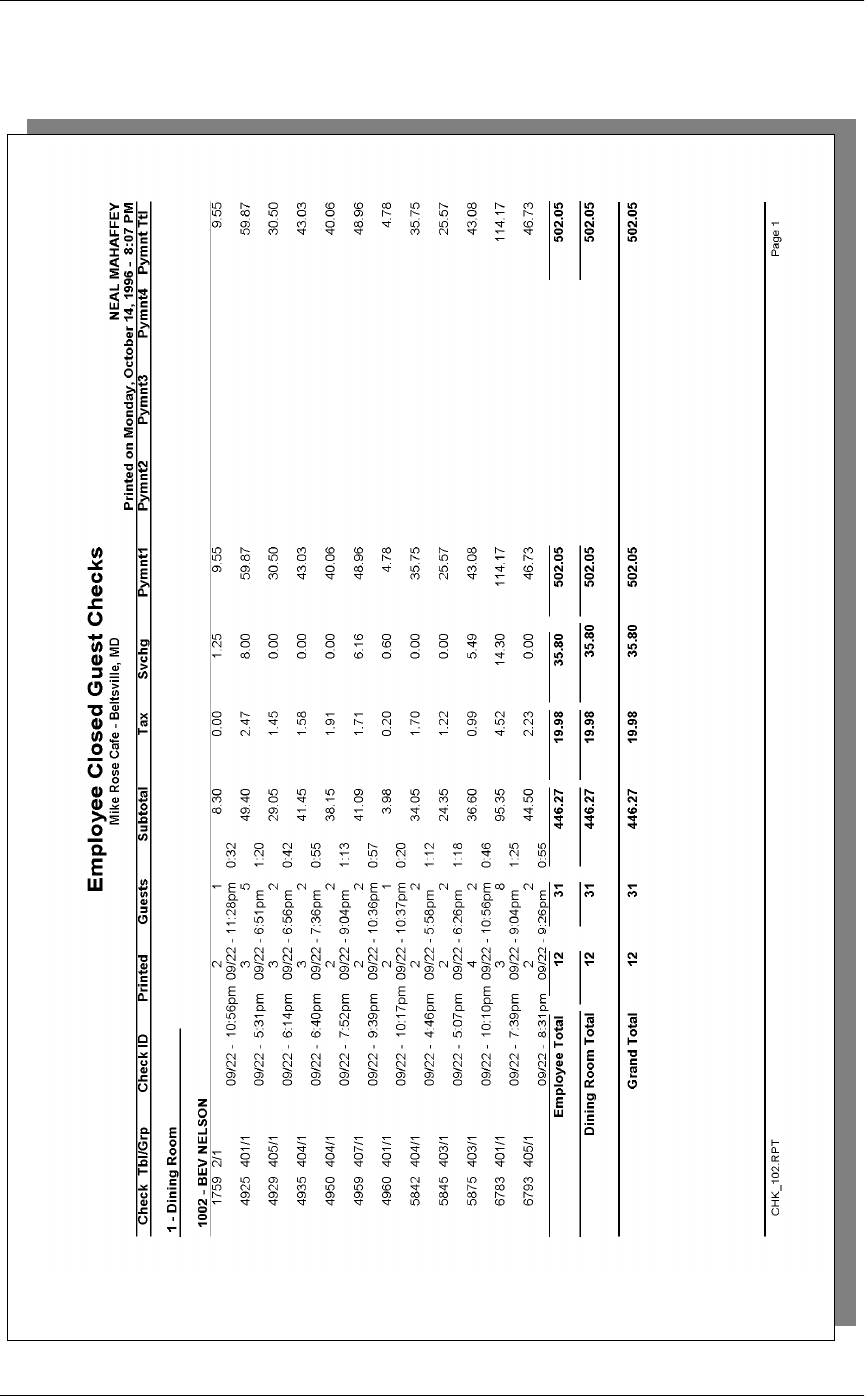
&KHFN5HSRUWV
(PSOR\HH&ORVHG*XHVW&KHFNV5HSRUW

5HSRUWV
&KHFN5HSRUWV
(PSOR\HH&ORVHG*XHVW&KHFNV5HSRUW
Employee Closed Checks Report
Employee Closed Guest Checks
MIke Rose Cafe - Beltsville, MD
NEIL MAHAFFEY
Printed on 10/16/1996 - 1:40
----------------------------------------
1 - Dining Room
1027 - DELANA HARRISON
Check Opened/Closed Amount
5275 09/274:38p 5.90
0:30 09/275:09p 2
5279 09/274:55p 2.84
0:00 09/274:55p 1
5280 09/275:02p 34.57
2:19 09/277:21p 2
4351 09/275:31p 46.12
1:51 09/277:22p 2
4356 09/276:01p 37.35
1:44 09/277:44p 2
5289 09/276:04p 25.24
0:44 09/276:49p 2
4362 09/276:21p 8.15
0:59 09/277:20p 2
5297 09/277:00p 8.77
0:44 09/277:44p 2
5298 09/277:00p 26.78
1:08 09/278:09p 2
4371 09/277:07p 42.23
1:02 09/278:09p 2
4373 09/277:16p 5.98
0:06 09/277:22p 1
6141 09/277:34p 15.65
0:54 09/278:28p 2
6142 09/277:34p 37.34
0:54 09/278:28p 2
5308 09/277:53p 0.00
0:00 09/277:53p 0 C
5311 09/278:15p 85.47
1:40 09/279:56p 2
4397 09/278:44p 53.19
2:08 09/2710:52 3
5317 09/278:49p 24.62
0:48 09/279:37p 2
5327 09/279:37p 37.87
1:05 09/2710:42 3
5335 09/279:54p 50.29
1:30 09/2711:24 3
4411 09/2710:04 5.95
0:48 09/2710:51 4
4413 09/2710:19 10.70
0:14 09/2710:33 3
6170 09/2710:33 51.66
22:1 09/280:18a 2
6174 09/2710:43 10.64
0:07 09/2710:50 2
5343 09/2710:49 32.94
22:3 09/280:12a 2
6178 09/2711:12 29.98
22:4 09/280:32a 3
6179 09/2711:17 34.32
22:4 09/280:32a 3
4423 09/2711:29 46.97
23:0 09/280:25a 4
5351 09/2711:34 7.88
23:2 09/280:08a 2
Employee Total 28 779.40
----------------------------------------
Dining Room To 28 779.40
========================================
Grand Total 28 779.40
&KHFN5HSRUWV
(PSOR\HH&ORVHG*XHVW&KHFNV5HSRUW
Report Details
View: v_R_guest_checks
This report does not use any stored procedures.
The following table lists each column in the report and provides detailed
information on the source of the figures in each column.
Report
Column
Title
View
Column
Title
3700 Database Formula
Table Column
Check check_number chk_dtl chk_num
Table/Group @Table_Group
Check ID check_id chk_dtl chk_seq
Opened
Date @Open_Date
Time @Open_Time
Closed
Date @Closed_Date
Time @Closed_Time
Duration @Check_Duration
Guests cover_count chk_dtl cov_cnt
Subtotal sub_ttl chk_dtl sub_ttl
Tax tax_ttl chk_dtl tax_ttl
Schg @Service_Chg_Total
Pymnt1 pay_type1_ttl tmed_def cat
Pymnt2 pay_type2_ttl tmed_def cat
Pymnt3 pay_type3_ttl tmed_def cat
Pymnt4 pay_type4_ttl tmed_def cat
Pymnt Ttl paymnt_ttl chk_dtl pymnt_ttl
5HSRUWV
&KHFN5HSRUWV
(PSOR\HH&ORVHG*XHVW&KHFNV5HSRUW
Employee Total
Closed @Count_Of_Checks
Guests ∑ cover_count chk_dtl cov_cnt
Subtotal ∑ sub_ttl chk_dtl sub_ttl
Tax ∑ tax_ttl chk_dtl tax_ttl
Svchg ∑ @Service_Chg_Total
Pymnt1 ∑ pay_type1_ttl tmed_def cat
Pymnt2 ∑ pay_type2_ttl tmed_def cat
Pymnt3 ∑ pay_type3_ttl tmed_def cat
Pymnt4 ∑ pay_type4_ttl tmed_def cat
Pymnt Ttl ∑ paymnt_ttl chk_dt pymnt_ttl
Revenue Center Total
Closed @RVC_Count_Of_Checks
Guests ∑ cover_count chk_dtl cov_cnt
Subtotal ∑ sub_ttl chk_dtl sub_ttl
Tax ∑ tax_ttl chk_dtl tax_ttl
Svchg ∑ @Service_Chg_Total
Pymnt1 ∑ pay_type1_ttl tmed_def cat
Pymnt2 ∑ pay_type2_ttl tmed_def cat
Pymnt3 ∑ pay_type3_ttl tmed_def cat
Pymnt4 ∑ pay_type4_ttl tmed_def cat
Pymnt Ttl ∑ paymnt_ttl chk_dt pymnt_ttl
Report
Column
Title
View
Column
Title
3700 Database Formula
Table Column
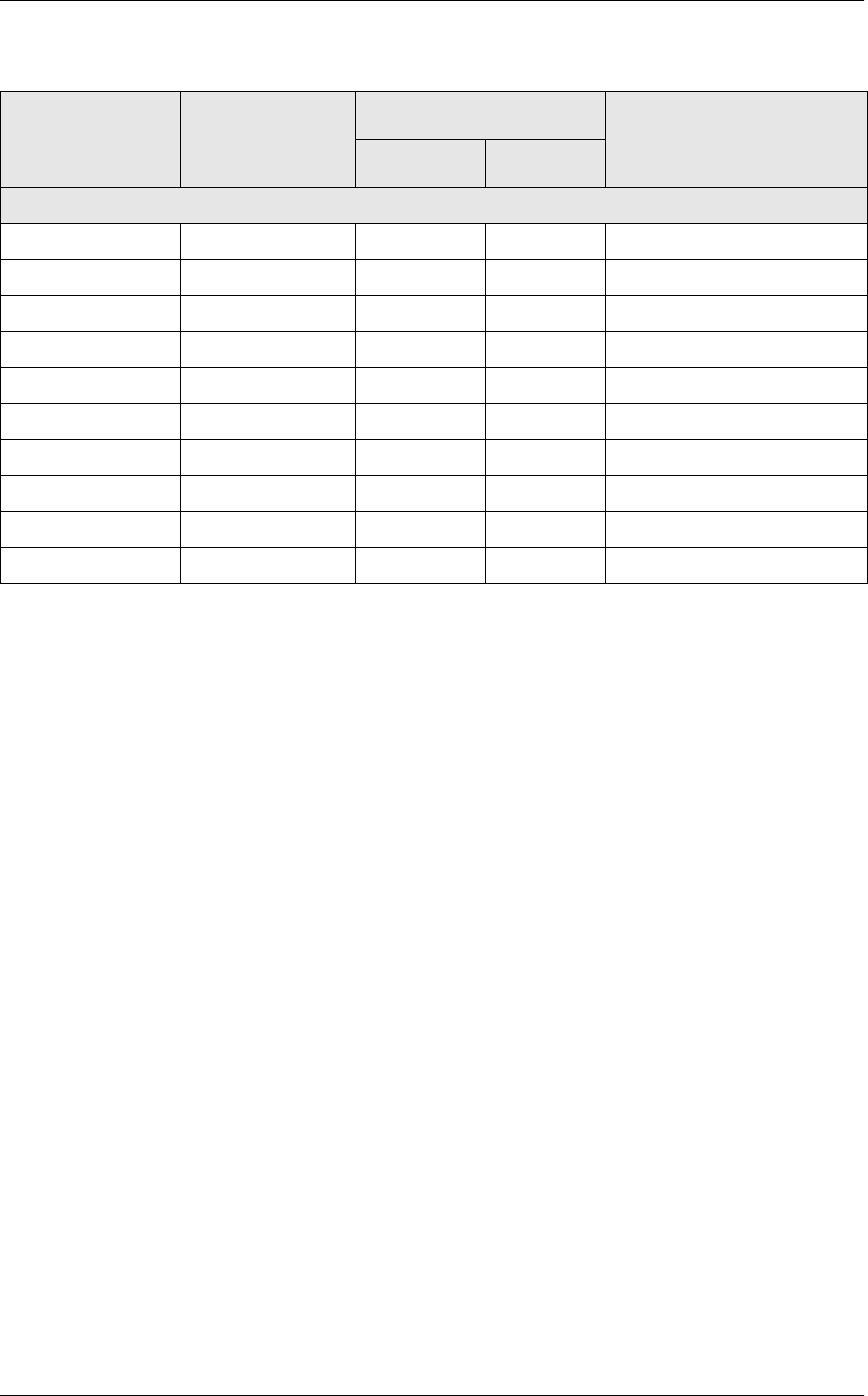
&KHFN5HSRUWV
(PSOR\HH&ORVHG*XHVW&KHFNV5HSRUW
Notes
&DQFHOOHG&KHFNV
The value of cancelled checks will always be 0.00 because when a check
is cancelled, its value is automatically zero.
Grand Total
Closed Count of @Open_DateTime
Guests ∑ cover_count chk_dtl cov_cnt
Subtotal ∑ sub_ttl chk_dtl sub_ttl
Tax ∑ tax_ttl chk_dtl tax_ttl
Svchg ∑ @Service_Chg_Total
Pymnt1 ∑ pay_type1_ttl tmed_def cat
Pymnt2 ∑ pay_type2_ttl tmed_def cat
Pymnt3 ∑ pay_type3_ttl tmed_def cat
Pymnt4 ∑ pay_type4_ttl tmed_def cat
Pymnt Ttl ∑ paymnt_ttl chk_dt pymnt_ttl
Report
Column
Title
View
Column
Title
3700 Database Formula
Table Column

5HSRUWV
&KHFN5HSRUWV
5HWXUQ9RLG5HDVRQ&RGH5HSRUW
Return/Void Reason Code Report
3XUSRVH
The Return/Void Reason Code report summarizes returns/voids of menu
items by revenue center, employee and guest check. The report provides
void total for each menu item, employee void total, reason code, and
authorizing employee for each return/void.
)RUPDW
This report includes these profiles:
qRevenue center profile
qEmployee profile
qGuest check profile
7HPSODWH
VOIDREASON.RPT
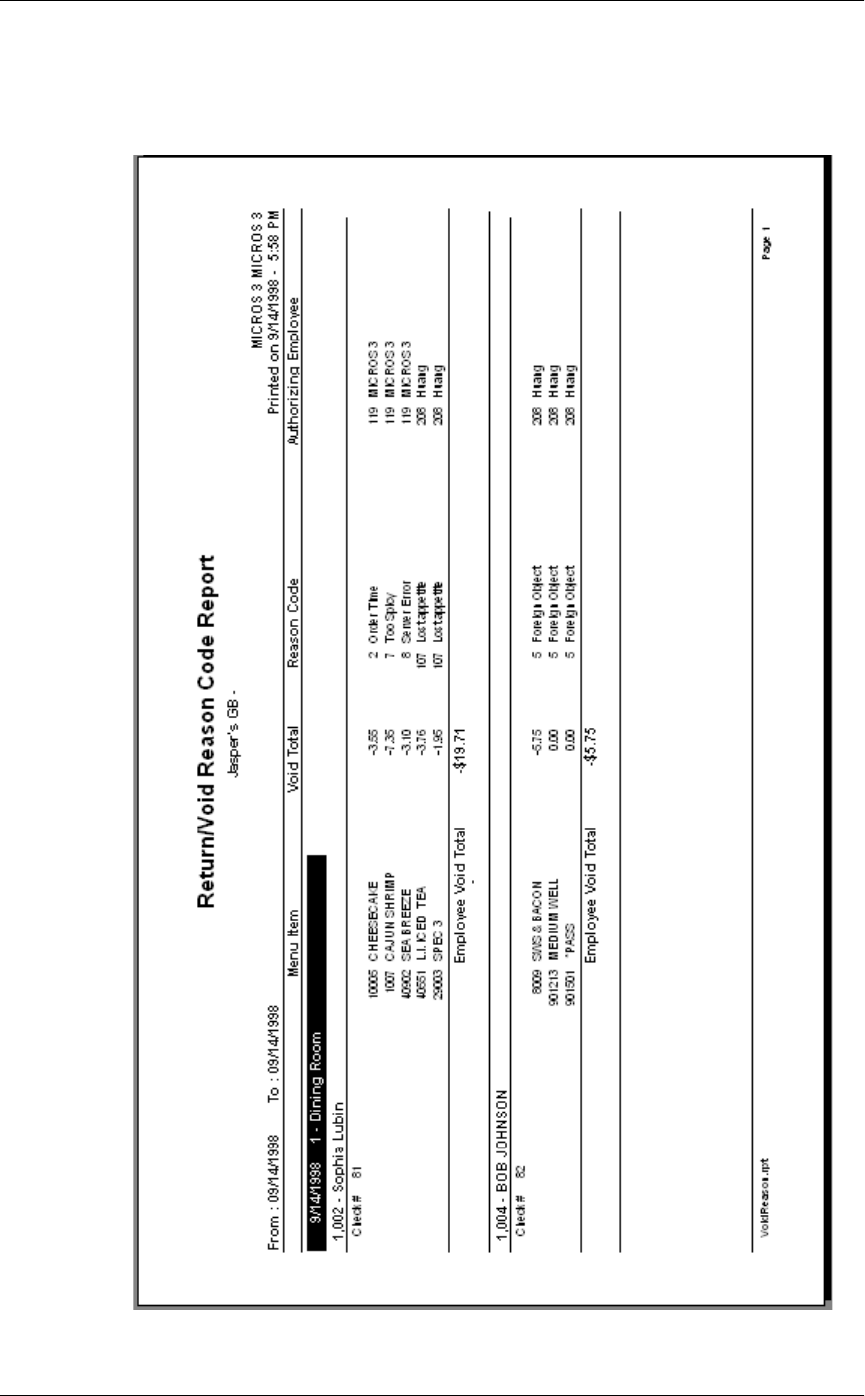
&KHFN5HSRUWV
5HWXUQ9RLG5HDVRQ&RGH5HSRUW

5HSRUWV
&KHFN5HSRUWV
5HWXUQ9RLG5HDVRQ&RGH5HSRUW
Programming Considerations
Define new return/void codes or edit existing return/void codes on the
Reasons form.
Select Reasons | Use with voids and/or Reasons | Use with returns as
appropriate for each return/void code.

&KHFN5HSRUWV

5HSRUWV
Chapter 12
CA/EDC Reports
This chapter provides examples and explanations of the credit
authorization/electronic draft capture (CA/EDC) reports.
In this chapter
Introduction ..........................................................................................12-2
Credit Card Batch Detail Report ......................................................... 12-3
Credit Card Batch Transfer Status Report........................................... 12-8
Driver-Specific Information.............................................................. 12-12

&$('&5HSRUWV
,QWURGXFWLRQ
Introduction
Most restaurants that accept credit cards perform credit authorizations,
either electronically or manually. Many also perform credit card
settlement electronically. Electronic settlement involves transmitting
information about each authorized charge to the processor. For each
charge, the 3700 system creates a record that can be transmitted to the
processor for settlement. Records are usually grouped together in a
“batch,” then transmitted to the processor together.
The 3700 CA/EDC Reports list all credit card charges in a batch and
provide account information about each one. They also track electronic
credit card settlements that are done using drivers supported by the 3700
system. These reports tell you the status of a batch settlement, notify you
of credit card charges that did not settle, and help you balance your bank
statements.
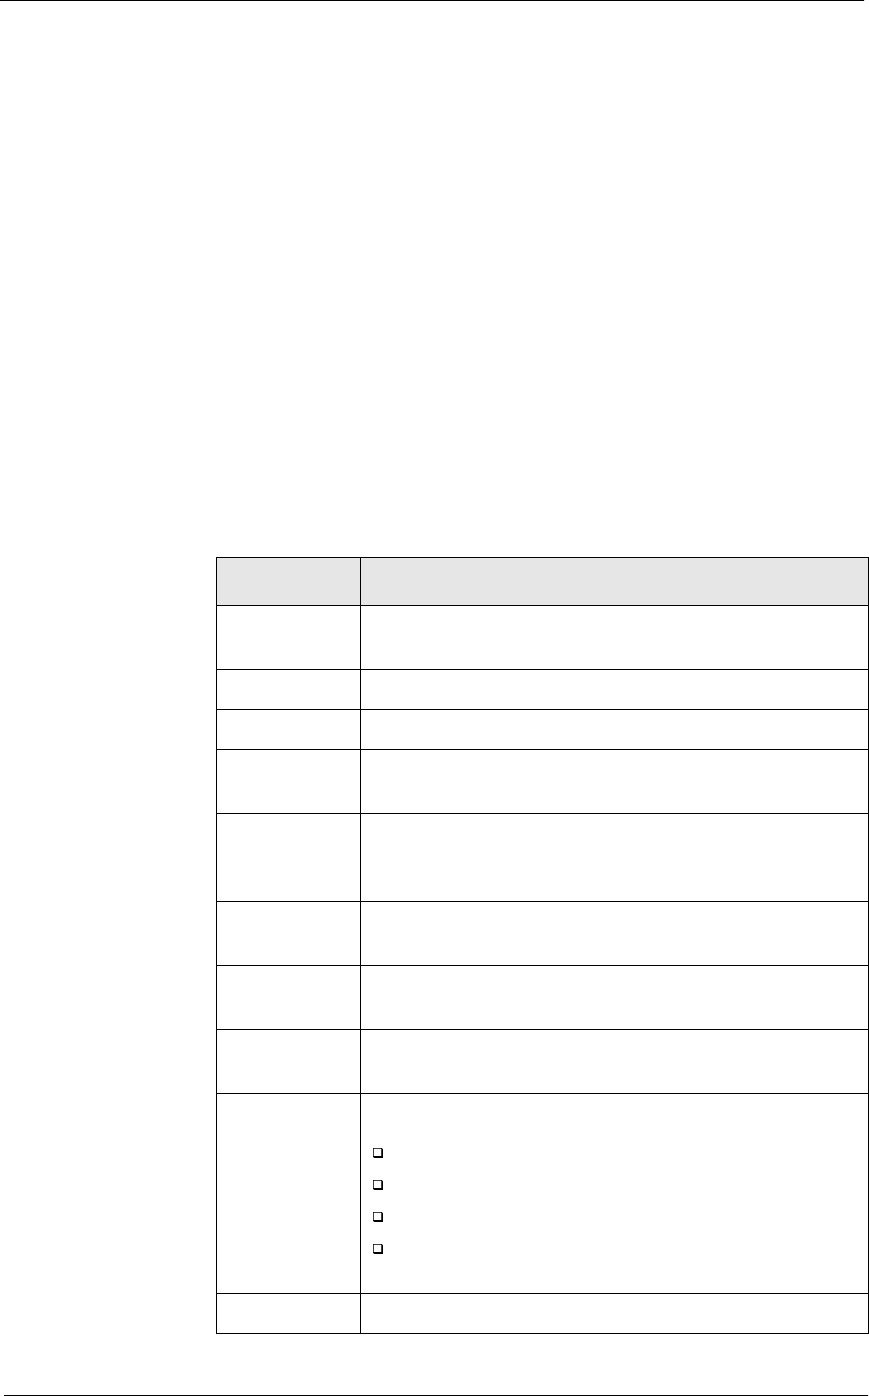
5HSRUWV
&$('&5HSRUWV
&UHGLW&DUG%DWFK'HWDLO5HSRUW
Credit Card Batch Detail Report
3XUSRVH
This report gives you detailed information about each record in a
settlement batch. Use this report to balance your bank statement. You can
print it before or after a batch is transferred. It can be printed manually or
as part of an autosequences.
)RUPDW
The profile used for this report is unique—it is not used for any other
reports. It is explained in the Report Profile below.
7HPSODWH
CC_001.RPT
5HSRUW3URILOH
This profile provides guest check, account, and tender details about each
charge
Column Description
Rec # The record number assigned by the batch to this
charge.
Account # The credit card number associated with this charge.
Exp Date The credit card’s expiration date.
Chk # The check number of the guest check to which this
charge was posted.
Customer
Name The name of the person on the credit card account.
This name only shows for cards that were entered with
the magnetic card reader.
Employee The employee number and last name of the check
employee.
Auth Code/
Amount The alphanumeric authorization code received from
the credit card processor, and the amount authorized.
Auth Date/
Time The date and time the authorization was done.
Flags Special indicators M, A, S, O that tell if:
the credit card number was entered manually (M)
the credit authorization was entered manually (A)
the charge has already been settled (S)
the charge was omitted from the batch settlement,
i.e., not settled (O).
Chg Tip The amount of the charged tip.
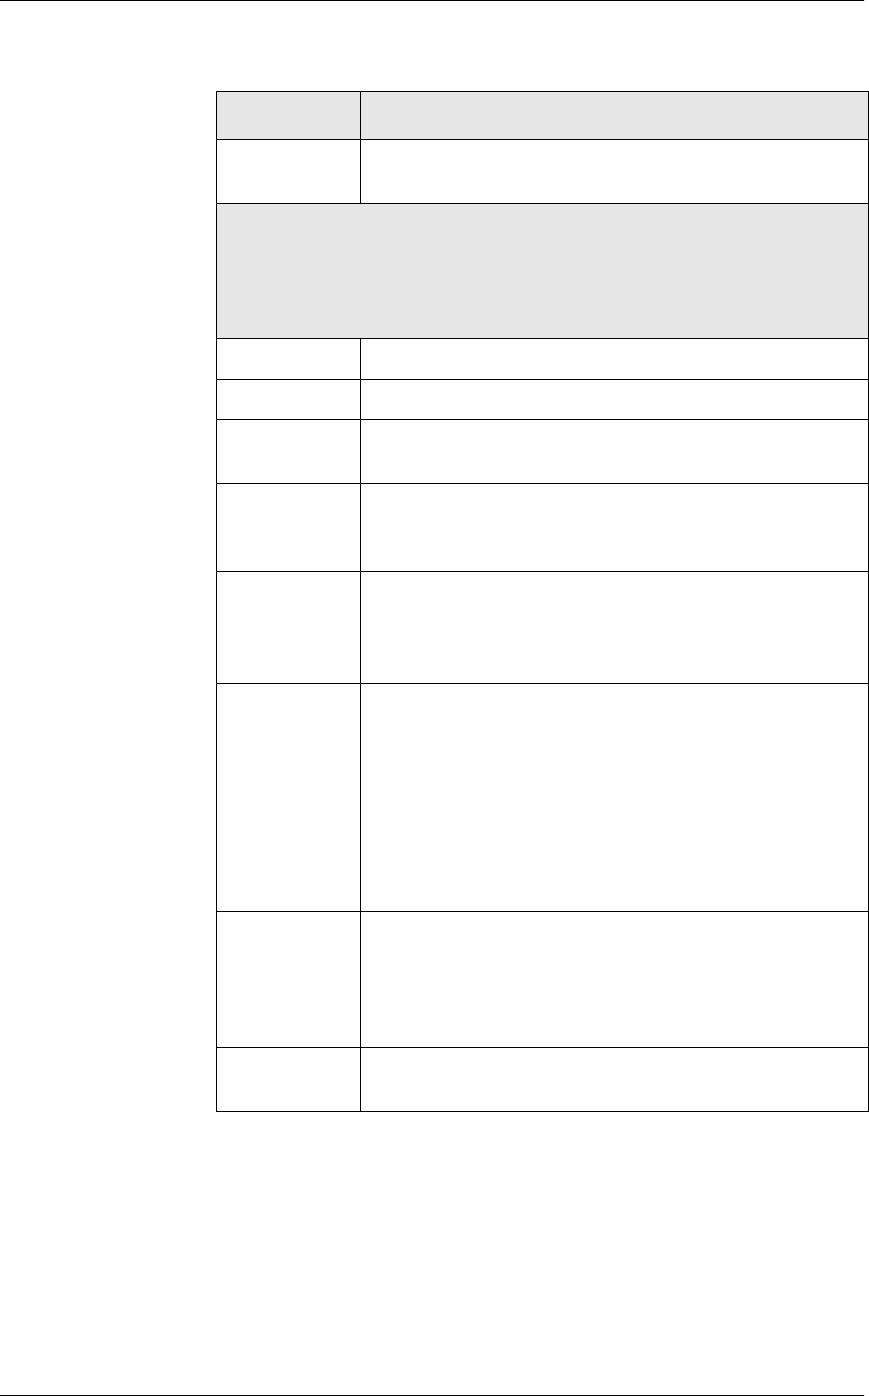
&$('&5HSRUWV
&UHGLW&DUG%DWFK'HWDLO5HSRUW
Total The total amount tendered to this credit card (including
charged tip).
Secondary Authorization Information
If the total amount is greater than the authorized amount, the system
notes the difference (the secondary authorization amount) on the next
line and provides the following information about that amount. This
information is not assigned a new batch record number.
Account # The credit card number associated with this charge.
Exp Date The credit card’s expiration date.
Chk # The check number of the guest check to which this
charge was posted.
Customer
Name The name of the person on the credit card account.
This name only shows for cards that were entered with
the magnetic card reader.
Employee The employee number and last name of the check
employee. (This name can be different from the first
authorization’s check employee for example, if the
check was transferred between authorizations.)
Auth Code The alphanumeric authorization code received from
the processor for the secondary amount. This code
only appears if a secondary authorization was
requested from the processor.
Secondary amounts that fall within the system’s
programmed secondary floor limit or difference
percentage do not require authorization from the
processor and so will not have an auth code listed.
Amount The secondary authorization amount (whether or not
authorization was requested from the processor). This
amount is the difference between the amount already
authorized and the total amount of the charge
(including charged tip).
Auth Date/
Time The date and time the authorization was done.
Column Description
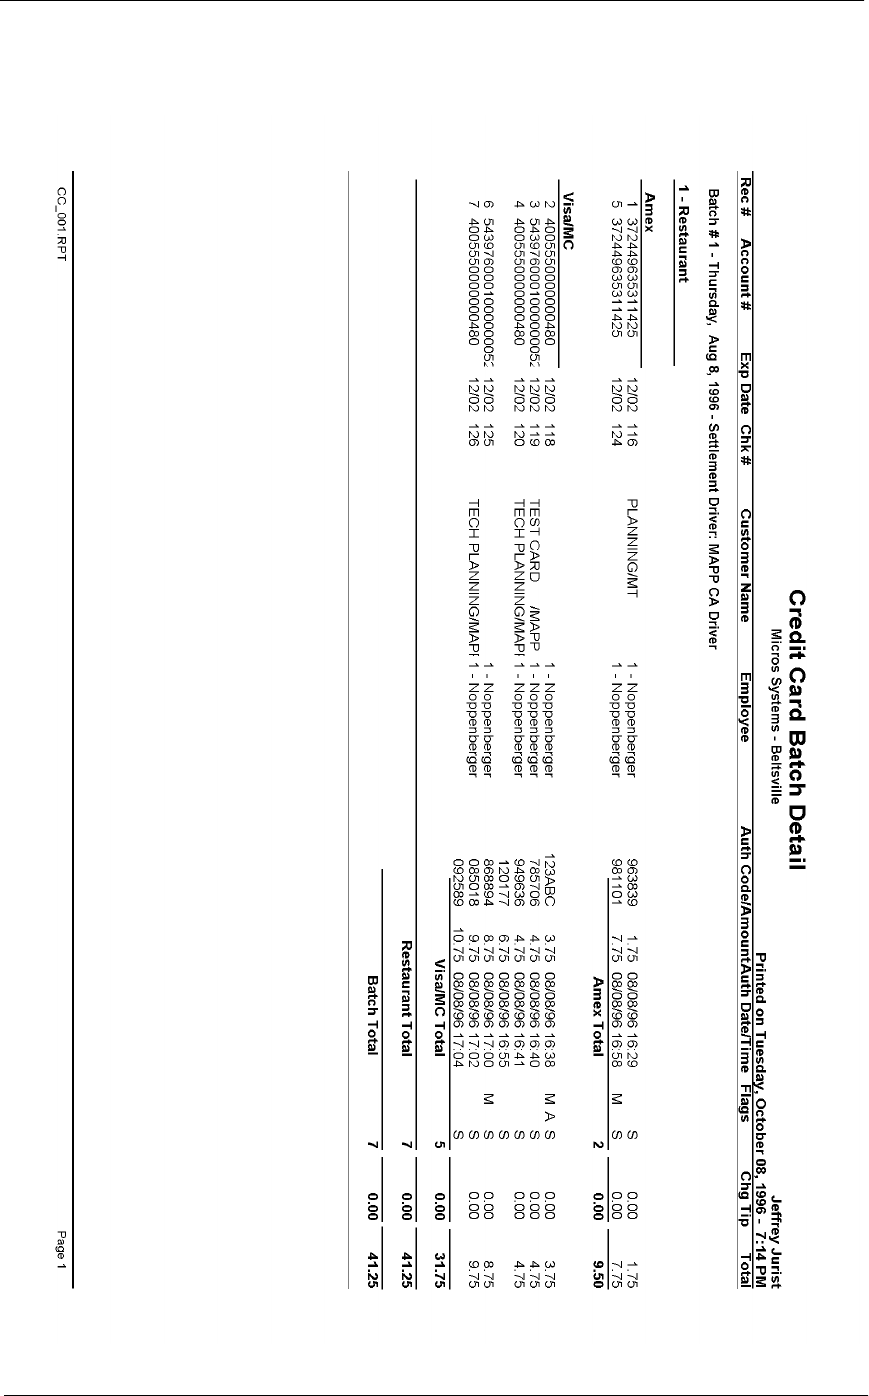
5HSRUWV
&$('&5HSRUWV
&UHGLW&DUG%DWFK'HWDLO5HSRUW
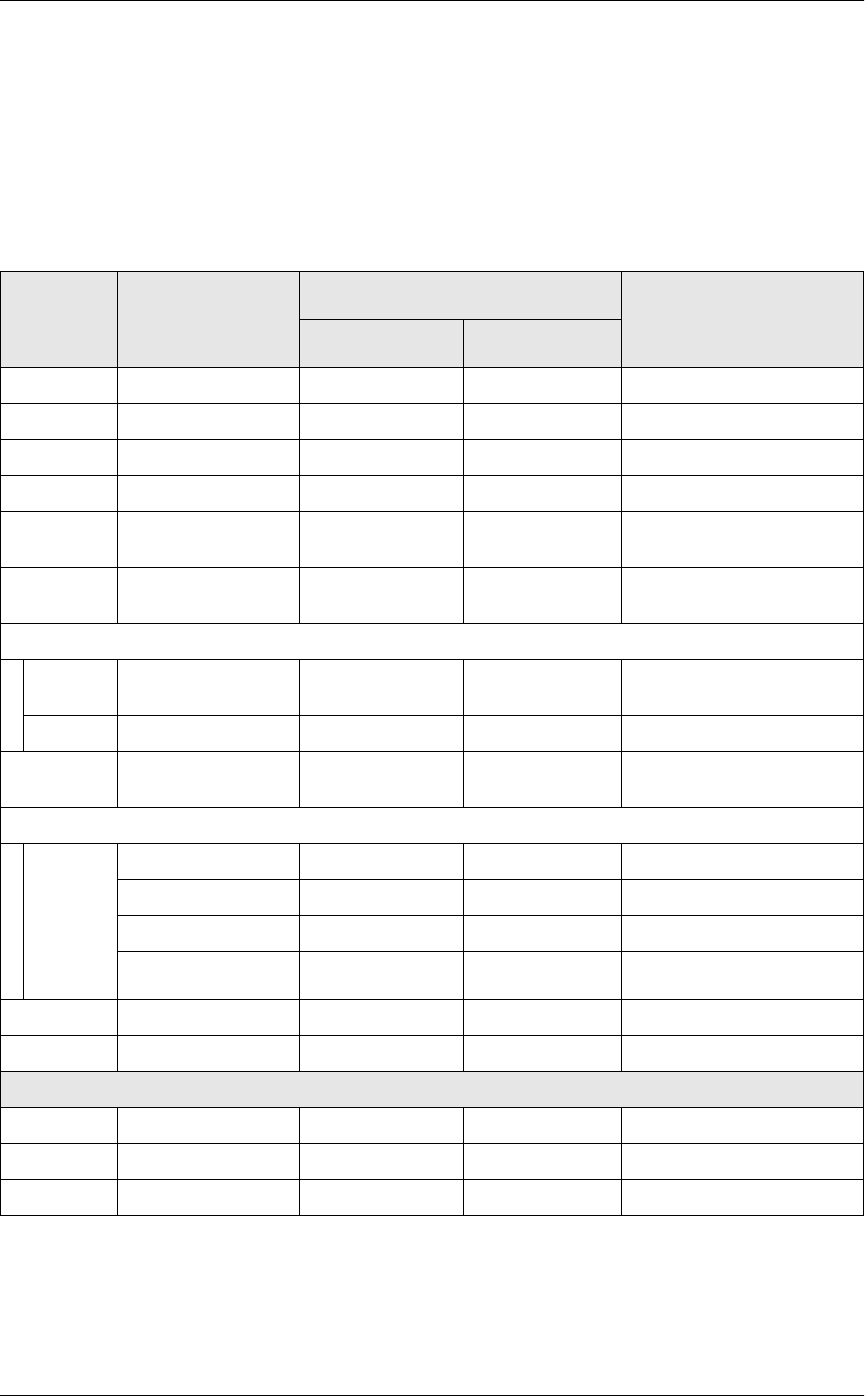
&$('&5HSRUWV
&UHGLW&DUG%DWFK'HWDLO5HSRUW
Report Details
View: v_R_CCBatch
This report does not use any stored procedures.
The following table lists each column in the report and provides detailed
information on the source of the figures in each column.
Report
Column
Title
View
Column
Title
3700 Database Formula
Table Column
Rec # batch_record_number cc_batch_item_dtl batch_record_num
Account # @CC_Account_Num
Exp Date @Exp_Date
Chk # check_number cc_batch_item_dtl chk_num
Customer
Name
@Customer_Name
Employee @Employee_Num_And_Nam
e
Auth Code/Amount
Auth
code
auth_code cc_batch_ca_dtl auth_code
Amount @Auth_Amount
Auth Date/
Time
@Auth_Date_Time
Flags
All flags
that apply
to the
charge
appear
on the
report
@Flag_Manual_Entry
@Manual_Auth_Flag
@Flag_Settled
@Flag_Omitted_By
Chg Tip @Tip_Total
Total @Tender_Total
Tender/Media Total
@CC_Count
Chg Tip @Tip_Total
Total @Media_Tender_Total
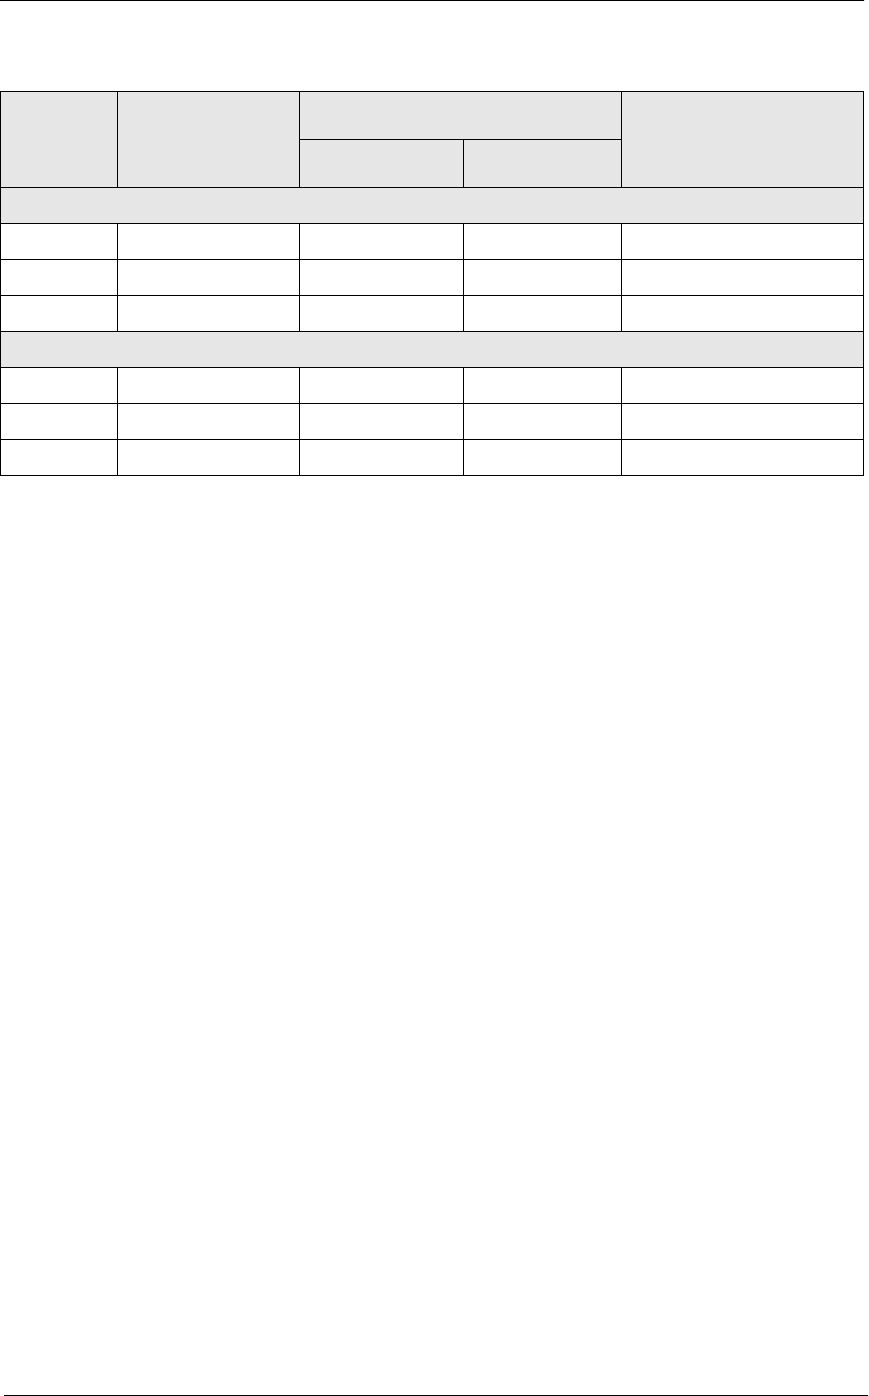
5HSRUWV
&$('&5HSRUWV
&UHGLW&DUG%DWFK'HWDLO5HSRUW
Programming Considerations
*HQHUDO
qTender/Media | Credit Auth | Preambles - Under each revenue center
heading on the report, batch records are grouped by credit card type
according to the preambles set here.
Notes
6HFRQGDU\$XWKRUL]DWLRQV
If the total amount of a charge is greater than the authorized amount, the
system performs a secondary authorization. However, not all secondary
authorizations are requested from the processor. The system first checks
the secondary floor limit and secondary difference percentage that are
programmed in Tender Media | Credit Auth. If the secondary amount is
within the programmed limits, the system does an “internal” authorization
(i.e., does not request authorization from the processor). If the secondary
amount is outside the programmed limits, the system requests
authorization from the processor.
On this report, secondary authorization amounts that have an
authorization code next to them were authorized by the processor.
Secondary amounts that do not have a code listed were authorized
internally.
Revenue Center Total
@CC_Count_RVC
Chg Tip @RVC_Tip_Total
Total @RVC_Tender_Total
Batch Total
@CC_Batch_Count
Chg Tip @Batch_Tip_Total
Total @Batch_Tender_Total
Report
Column
Title
View
Column
Title
3700 Database Formula
Table Column
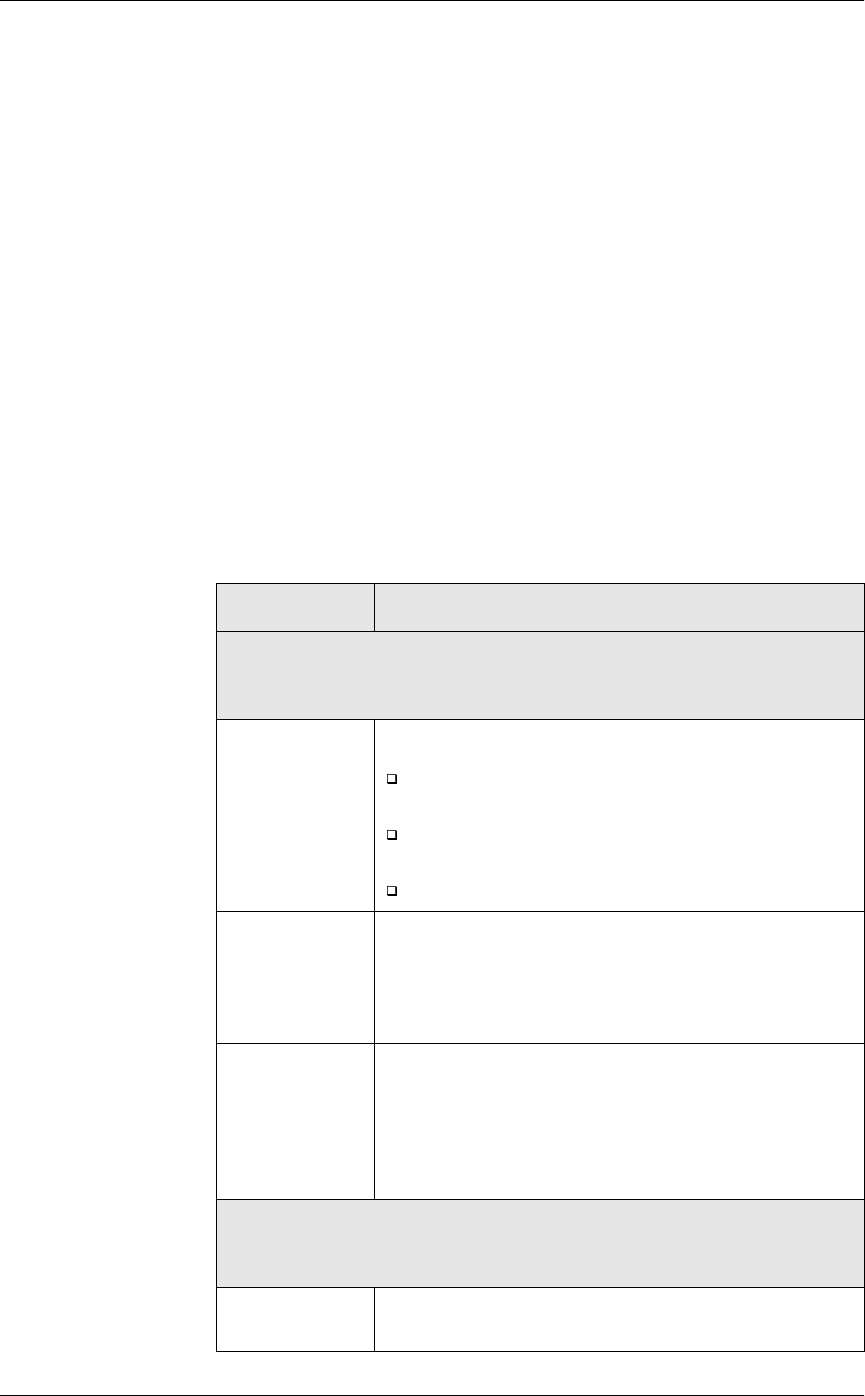
&$('&5HSRUWV
&UHGLW&DUG%DWFK7UDQVIHU6WDWXV5HSRUW
Credit Card Batch Transfer Status Report
3XUSRVH
This report tells you the status of a batch that was transferred to the credit
card processor to be settled. Any records that were not settled are listed
under the status line along with an explanation. Run this report after
transferring a batch and use it to determine if any records were not settled.
This report can be printed manually or as part of an autosequence.
)RUPDW
The profile used for this report is unique—it is not used for any other
reports. It’s explained in the Report Profile below.
7HPSODWH
CC_002.RPT
5HSRUW3URILOH
This profile provides identifying information, date and time information,
and details about charges and payments.
Column Description
Batch Status Information
This information does not use column headings. Instead, the
information displays in up to 5 lines.
Line 1 This line lists the following:
The MICROS reference number assigned to this
batch.
The date the batch was transferred to the credit
card processor.
The credit card driver used to transfer the batch.
Line 2
(optional) The reference number assigned by the credit card
processor to this batch (up to 20 characters).
If the processor does not include a reference number
in its transmission, this line is left blank.
Lines 3-5 Information indicating if records were settled
successfully or if there were errors.
Most messages that appear here are driver-specific.
See “Driver-Specific Information” beginning on page
12-12 for your driver’s information.
Omitted Record Summary
This information prints below the batch status information. It prints for
each record that was rejected by the processor and not settled.
Rec # The record number assigned by the batch to this
charge.
5HSRUWV
&$('&5HSRUWV
&UHGLW&DUG%DWFK7UDQVIHU6WDWXV5HSRUW
Account # The credit card number associated with this charge.
Exp Date The credit card’s expiration date.
Chk # The check number of the guest check on which this
charge appears.
Omitted Flag A special flag indicating that this charge was omitted
from the batch settlement (i.e., was not settled). A
“U” means the user omitted the record before
transmitting the batch; a “D” means the driver
(processor) rejected the record after it was
transmitted.
Omitted
Description A description of why this charge was not settled.
If the Omitted Flag is “U”, the message Omitted
by a user before transfer displays.
If the Omitted Flag is “D”, the message is driver-
specific. Contact the credit card processor if you
need to know what the message means.
Chg Tip The amount of the charged tip.
Total The total amount tendered to this credit card
(including charged tip).
Column Description
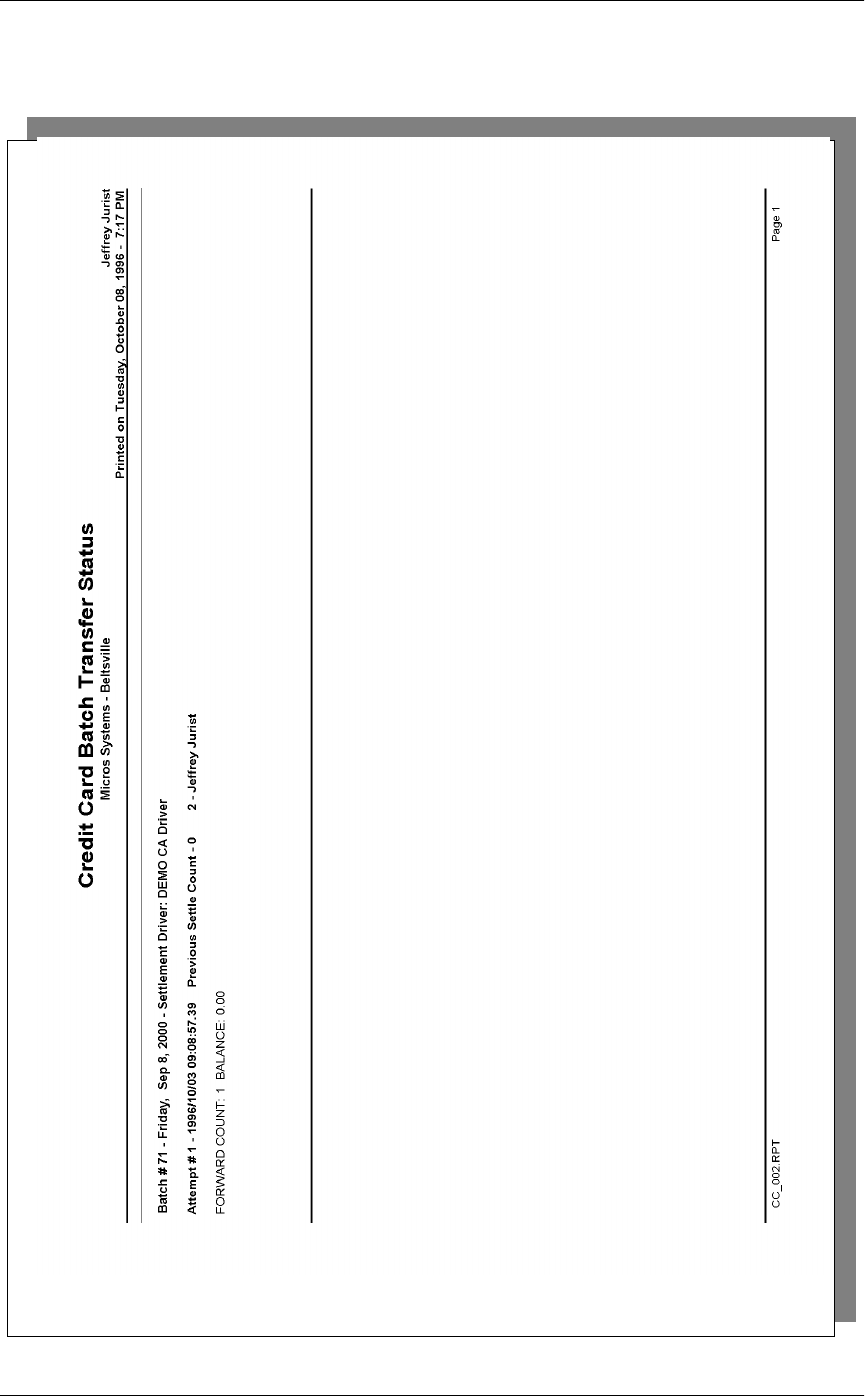
&$('&5HSRUWV
&UHGLW&DUG%DWFK7UDQVIHU6WDWXV5HSRUW
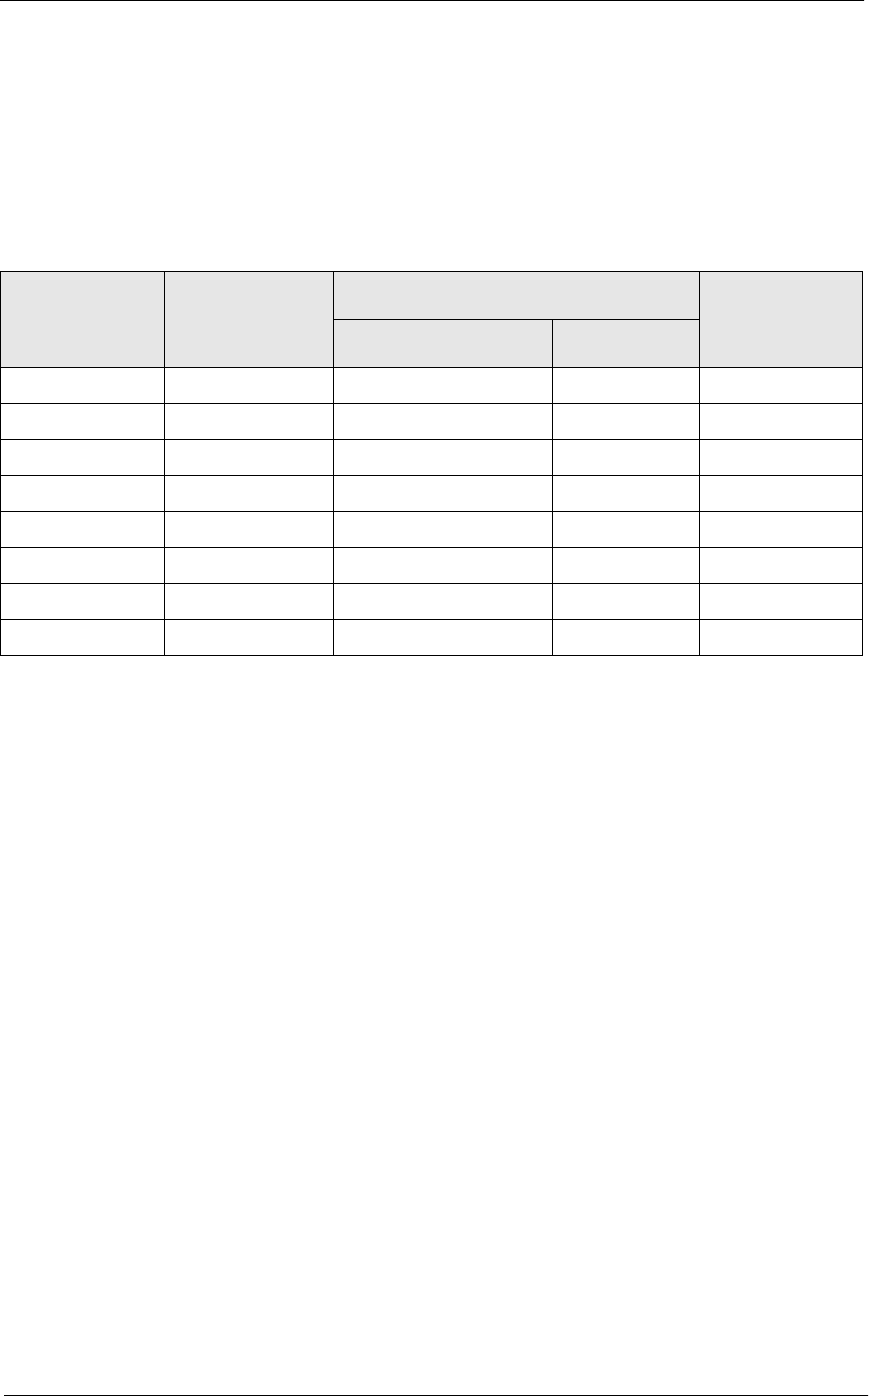
5HSRUWV
&$('&5HSRUWV
&UHGLW&DUG%DWFK7UDQVIHU6WDWXV5HSRUW
Report Details
View: v_R_CCBatch_Xfer_Status
This report does not use any stored procedures.
The following table lists each column in the report and provides detailed
information on the source of the figures in each column.
Notes
See the following section for driver-specific information that appears on
this report.
Report
Column
Title
View
Column
Title
3700 Database Formula
Table Column
Rec # item_number cc_batch_xfer_item_status item_seq
Account # cc_account_number cc_batch_xfer_item_status cc_acct_num
Exp Date @Exp_Date
Chk # check_number cc_batch_xfer_item_status chk_num
Omitted Flag @Flag_Omitted_By
Omitted Description omitted_description cc_batch_xfer_item_status omit_desc
Chg Tip @Tip_Total
Total @Tender_Total
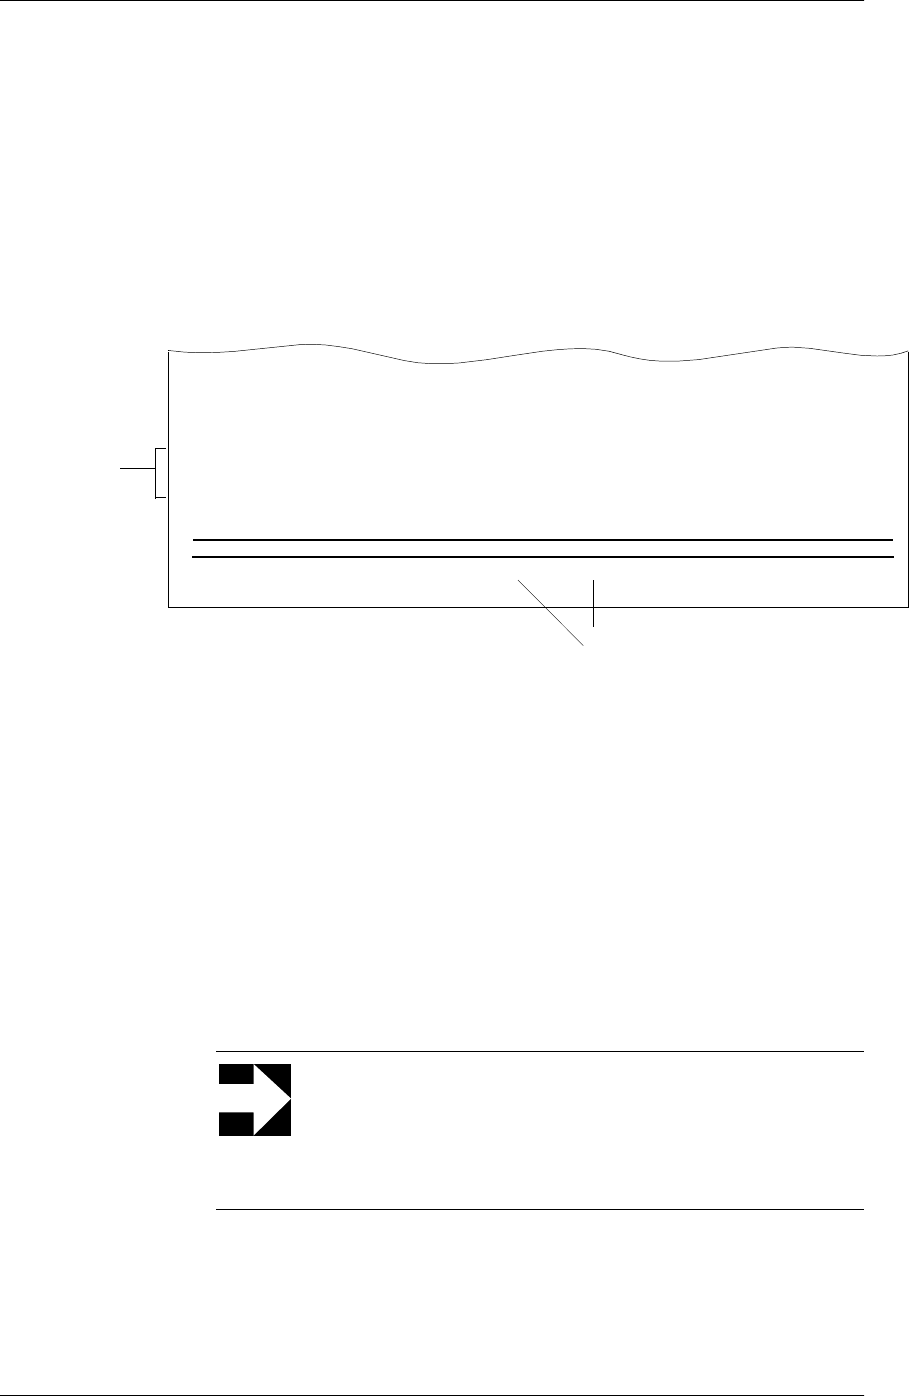
&$('&5HSRUWV
'ULYHU6SHFLILF,QIRUPDWLRQ
Driver-Specific Information
Much of the Credit Card Batch Transfer Status Report includes driver-
specific information. Status and error messages are often similar, but not
the same, for different drivers. This section lists the messages for each
driver that may appear on this report.
:KHUH,QIRUPDWLRQ$SSHDUV
Driver-specific information shows up in two areas on the report:
Any message that begins with an asterisk (*) comes directly from the
credit card processor. MICROS does not have information about these
messages. You must contact the credit card processor directly if you need
to know what they mean.
+RZ7R8VH7KLV6HFWLRQ
This section explains the messages that appear in the batch status section
of the report. The first table lists generic messages that may appear for
any driver, no matter which one you’re using. The rest of the tables list
driver-specific messages.
Find the driver that your restaurant uses. (Drivers are listed in
alphabetical order.) Then, in the table for that driver, find the specific
message you need explained.
Note
All driver-specific messages that appear in the Omitted
Description field (in the Omitted Record Summary of the
report) come directly from the credit card processor. Therefore,
they are not described here.
Batch # 37 - Sunday, Sep 15, 1996 - Settlement Driver: MAPP
Batch Reference: 0262
Attempt #1 - 1996/09/16 01:30:21.41 Previous Settle Count - 0 2 - CROMPTON PETER
Forward Count: 14 Forward Balance: 381.10
Terminal ID: F259096170330
*CLS0262 CNT 014>BAL 381.10 >CIC 299061
Rec # Account # Exp Date Chk# Omitted Flag Omitted Description Chg Tip Total
1 372430136619005 04/98 1832 D DUPLICATE TRANS>96389 7.00 52.74
Driver-specific
Driver-specific
(only if this flag is “D”)
Omitted Record Summary
¨
¦
5HSRUWV
&$('&5HSRUWV
'ULYHU6SHFLILF,QIRUPDWLRQ
All Drivers
Message Description
Error Messages
Busy The processor’s phone number was busy. Wait a few
minutes and try again. If the problem persists, do the
following:
Check the driver configuration information (including
correct phone number and prefix) in POS
Configurator.
Connect a telephone to the phone jack used by the
driver, then dial the phone number and see if the
call goes through.
Contact your support representative.
Comm Abort...Receive
Error The information transmitted from the credit card
processor to the 3700 system was garbled. The
communications parameters in the driver software
may be incorrect. Try again, or contact your support
representative.
Comm Abort...Transmit
Error The information transmitted from the 3700 system to
the credit card processor was garbled. The
communications parameters in the driver software
may be incorrect. Try again, or contact your support
representative.
Error: Check Modem The modem may be turned off or disconnected. Check
the modem, then try again.
Error Connecting To Host The driver encountered a problem in connecting to the
credit card processor. Try again, or contact your
support representative.
Host Disconnected The credit card processor received an erroneous
request from the driver and disconnected by issuing
an End of Transmission (EOT) byte. Try the settlement
again. If the problem persists, do the following:
Connect a telephone to the phone jack used by the
modem and dial the same number. Verify the
connection is not noisy.
Verify that the correct modem setup string has been
configured for this modem.
Contact your support representative.
Internal Error The driver encountered an internal error. Contact your
support representative.
&$('&5HSRUWV
'ULYHU6SHFLILF,QIRUPDWLRQ
Line In Use By Other
Application The modem is being used by another application
(such as a fax driver). Wait a few seconds, then try
again; or terminate the application using the modem,
then try again.
Lost Host Connection The host detect signal was lost while the driver was
waiting for data. This usually means the telephone call
disconnected. Try the settlement again. If the problem
persists, do the following:
Connect a telephone to the phone jack used by the
modem and dial the same number. Verify the
connection is not noisy.
Verify that the correct modem setup string has been
configured for this modem.
Contact your support representative.
No Answer The credit card processor’s modem did not answer the
driver’s initial call within a specified period of time.
Connect a telephone to the phone jack used by the
modem and dial the same number. If the modem
answers, you will hear a screeching sound (the sound
of the modem connecting.) Hang up and try the
settlement again.
If the modem does not answer, verify the following:
The correct phone number is listed in the driver’s
configuration information in POS Configurator.
You have a dial tone (change the modem setup
string from M0 to M1 and listen for the dial tone).
The modem is connected to the correct tty port.
The phone cord is connected to the line or wall jack
on the modem.
The modem is powered-on, and the cable
connections between the UWS and the modem are
secure.
Try the settlement again. If the problem persists,
contact your support representative.
Message Description

5HSRUWV
&$('&5HSRUWV
'ULYHU6SHFLILF,QIRUPDWLRQ
No Dial Tone The modem used by the driver could not get a dial
tone. Verify the modem is connected by doing the
following:
Check the telephone cord. It should be plugged into
the LINE jack on most modems (not the PHONE
jack).
Connect a telephone to the modem’s jack and listen
for a dial tone.
Try the settlement again. If the problem persists,
contact your support representative.
Timeout Awaiting POLL The driver did not receive a communications control
character from the credit card processor. The control
character (ENQ) tells the driver that the processor is
ready to receive information. Do the following:
Review the communications parameters for the
driver. Make sure the driver uses the same baud
rate as the processor, and that the modem setup
string is correct.
Try the settlement procedure again. If the problem
persists, contact your support representative.
Timeout Awaiting
Response The 3700 system tried unsuccessfully to contact the
credit card processor in the time allowed. Wait a few
minutes and try again. If the problem persists, contact
your support representative.
Unexpected Host
Response The 3700 system could not understand a message
received from the driver. Try again, or call your support
representative.
Message Description
&$('&5HSRUWV
'ULYHU6SHFLILF,QIRUPDWLRQ
CES
Message Description
Success Messages
Forward Count The number of records from this batch that settled
successfully.
Forward Balance The total dollar amount that the successfully-settled
records represent.
Error Message
Batch Close Rejected by
Host The host is unable to close the batch at the end of the
settlement process. For example, this may appear if
the host has calculated a different total charge amount
than MICROS (due to a lost record). If a batch does
not close successfully, no records within that batch
have been settled.
Try again, or call your support representative.
Batch Open Rejected by
Host The host is unable to let you perform a batch
settlement for some reason. Try again, then call your
support representative.
Record Number
[n]
Rejected by Host The record indicated in the message has something
wrong with it, for example, the record may contain an
incorrect account number. The host cannot settle the
record and the settlement process aborts.
Check the record’s data and re-enter correct
information (such as the account number), or omit the
record from the batch. Resubmit the batch for
settlement. Contact your support representative if you
omitted the record and cannot figure out what is wrong
with it.
5HSRUWV
&$('&5HSRUWV
'ULYHU6SHFLILF,QIRUPDWLRQ
MAPP
Message Description
Success Messages
Forward Count The number of records from this batch that settled
successfully.
Forward Balance The total dollar amount that the successfully-settled
records represent.
Terminal ID An alphanumeric code that identifies your restaurant
to the credit card processor.
Error Messages
Unexpected Host
Response The 3700 system could not understand a message
received from the driver. Try again, or call your support
representative.
Unexpected Batch
CLOSE Response The driver received an erroneous message from the
3700 system at the end of the settlement process. Try
again, or call your support representative.
Any records that were settled before the message was
received are not affected.
Unexpected Batch
INQUIRE Response The driver received a message from the 3700 system
at the beginning of the settlement that it could not
read. Therefore, it cannot begin the settlement
process. Check the phone number and try again, or
call your support representative

&$('&5HSRUWV
'ULYHU6SHFLILF,QIRUPDWLRQ

$
7HPSODWH7DEOH
Template Table
This table lists the template, view, and stored procedure (if applicable) for
each report in the 3700 system.
Note
Template name, view, and stored procedure are identical for
full-page and 40-column reports. Therefore each report is listed
only once in this table.
However, full-page and 40-column reports do use different
templates, stored in different directories.
Report Template View(s) Stored Procedure(s)
CA/EDC REPORTS
Credit Card Batch
Detail CC_001.RPT v_R_CCBatch
Credit Card Batch
Transfer Status CC_002.RPT v_R_CCBatch_Xfer_Status
CHECK REPORTS
Employee Open Guest
Checks CHK_101.RPT v_R_guest_checks
Employee Closed
Guest Checks CHK_102.RPT v_R_guest_checks
EMPLOYEE REPORTS
Cashier Summary
Totals CSHR_001.RPT v_R_cashier sp_R_cashier
Cashier Summary
Totals by RVC CSHR_601.RPT v_R_rvc_cashier sp_R_rvc_cashier
Cashier Detail Totals CSHR_101.RPT v_R_cashier
v_R_cashier_trk sp_R_cashier
sp_R_cashier_tracking
Cashier Detail Totals by
Revenue Center CSHR_701.RPT v_R_rvc_cashier
v_R_rvc_cashier_trk
sp_R_rvc_cashier_sales_trk
Consolidated Cashier
Detail Totals CSHR_102.RPT v_R_cashier
v_R_cashier_trk sp_R_cashier_tracking
sp_consolidated_cshr_ttls
Consolidated Cashier
Detail Totals by RVC CSHR_702.RPT This report does not use
any views. sp_R_cons_rvc_cshr_ttls
sp_R_rvc_cashier_sales_tracki
ng
Employee Detail Totals EMP_101.RPT v_R_employee
v_R_employee_trk sp_R_employee
sp_R_employee_tracking
Employee Detail Totals
by RVC EMP_701.RPT v_R_rvc_employee
v_R_rvc_employee_trk sp_R_rvc_employee_sales_trk
5HSRUWV $
7HPSODWH7DEOH
Consolidated Employee
Detail Totals EMP_102.RPT v_R_employee
v_R_employee_trk sp_R_employee
sp_R_employee_tracking
sp_R_consolidated_emp_ttls
Consolidated Employee
Detail Totals by RVC EMP_702.RPT This report does not use
any views. sp_R_rvc_employee_sales_trk
sp_R_cons_rvc_emp_ttls
Employee Sales and
Tip Totals by RVC EMP_821.RPT v_R_employee_sales_tips sp_R_rvc_employee
GROUP SALES REPORTS
RVC Group Sales
Detail FG_R001.RPT v_R_rvc_fam_grp sp_R_family_group
RVC Group Sales
Detail by Category FG_R010.RPT v_R_rvc_fam_grp sp_R_family_group
Consolidated RVC
Group Sales Detail FG_R002.RPT v_R_rvc_fam_grp sp_R_family_group
Consolidated RVC
Group Sales Detail by
Category
FG_R012.RPT v_R_rvc_fam_grp sp_R_family_group
RVC Group Sales
Summary FG_R101.RPT v_R_rvc_fam_grp sp_R_family_group
Consolidated RVC
Group Sales Summary FG_R111.RPT v_R_rvc_fam_grp sp_R_family_group
SYS Group Sales Detail FG_S001.RPT v_R_sys_fam_grp sp_R_family_group
SYS Group Sales Detail
by Category FG_S010.RPT v_R_sys_fam_grp sp_R_family_group
Consolidated SYS
Group Sales Detail FG_S002.RPT v_R_sys_fam_grp sp_R_family_group
Consolidated SYS
Group Sales Detail by
Category
FG_S012.RPT v_R_sys_fam_grp sp_R_family_group
SYS Group Sales
Summary FG_S101.RPT v_R_sys_fam_grp sp_R_family_group
Consolidated SYS
Group Sales Summary FG_S111.RPT v_R_sys_fam_grp sp_R_family_group
Consolidated SYS
Group Sales Detail w/
Graph
FG_S202.RPT v_R_sys_fam_grp sp_R_family_group
LABOR REPORTS
Employee Time Card
and Job Detail TIME_002.RPT v_R_employee_time_card sp_R_time_card_ttls
Report Template View(s) Stored Procedure(s)
$
7HPSODWH7DEOH
Employee Job
Summary TIME_003.RPT v_R_employee_job_code sp_R_employee_job_code
Consolidated Employee
Job Summary TIME_004.RPT v_R_employee_job_code sp_R_employee_job_code
RVC Job Summary TIME_R011.RPT v_R_job_code sp_R_job_code_totals
Consolidated RVC Job
Summary TIME_R012.RPT v_R_job_code sp_R_job_code_totals
SYS Job Summary TIME_S011.RPT v_R_job_code sp_R_job_code_totals
Consolidated SYS Job
Summary TIME_S012.RPT v_R_job_code sp_R_job_code_totals
Clock IN Status TIME_005.RPT v_R_employee_time_card
Labor Availability TIME_006.RPT v_R_employee_time_card
MENU ITEM SALES REPORTS
RVC Menu Item Sales
Detail MI_R001.RPT v_R_rvc_menuitem_fam_g
rp sp_R_menuitem
Consolidated RVC
Menu Item Sales Detail MI_R002.RPT v_R_rvc_menuitem_fam_g
rp sp_R_menuitem
RVC Menu Item Sales
Summary MI_R101.RPT v_R_rvc_menuitem_fam_g
rp sp_R_menuitem
Consolidated RVC
Menu Item Sales
Summary
MI_R102.RPT v_R_rvc_menuitem_fam_g
rp sp_R_menuitem
SYS Menu Item Sales
Detail MI_S001.RPT v_R_sys_menuitem_fam_g
rp sp_R_menuitem
Consolidated SYS
Menu Item Sales Detail MI_S002.RPT v_R_sys_menuitem_fam_g
rp sp_R_menuitem
SYS Menu Item Sales
Summary MI_S101.RPT v_R_sys_menuitem_fam_g
rp sp_R_menuitem
Consolidated SYS
Menu Item Sales
Summary
MI_S102.RPT v_R_sys_menuitem_fam_g
rp sp_R_menuitem
SALES BALANCE REPORTS
Daily RVC Sales Detail RVC_101.RPT v_R_rvc_sales
v_R_rvc_trk sp_R_rvc_totals
sp_R_rvc_tracking
sp_R_time_card_ttls
Consolidated RVC
Sales Detail RVC_102.RPT v_R_rvc_sales
v_R_rvc_trk sp_R_rvc_totals
sp_R_rvc_tracking
sp_R_time_card_ttls
Report Template View(s) Stored Procedure(s)
5HSRUWV $
7HPSODWH7DEOH
Daily SYS Sales Detail SYS_101.RPT v_R_sys_sales
v_R_sys_trk sp_R_sys_totals
sp_R_sys_tracking
sp_R_time_card_ttls
Consolidated SYS
Sales Detail SYS_102.RPT v_R_sys_sales
v_R_sys_trk sp_R_sys_totals
sp_R_sys_tracking
TAX REPORTS
Daily RVC Tax Totals TAX_R001.RPT v_R_rvc_tax sp_R_tax
Consolidated RVC Tax
Totals TAX_R002.RPT v_R_rvc_tax sp_R_tax
Daily SYS Tax Totals TAX_S001.RPT v_R_sys_tax sp_R_tax
Consolidated SYS Tax
Totals TAX_S002.RPT v_R_sys_tax sp_R_tax
TIME PERIOD SALES REPORTS
RVC Time Period
Totals TP_R001.RPT v_R_rvc_time_period sp_R_time_period
RVC Time Period Detail TP_R101.RPT v_R_rvc_time_period
v_R_rvc_time_period_trk sp_R_time_period
sp_R_rvc_time_period_tracking
sp_R_time_prd_time_card_ttls
Consolidated RVC Time
Period Totals TP_R002.RPT sp_R_time_period
sp_R_consolidated_rvc_time_
prd_ttls
RVC Time Period
Summary TP_R103.RPT v_R_rvc_time_period sp_R_rvc_time_period_tracking
Consolidated RVC Time
Period Summary TP_R104.RPT sp_R_time_period
sp_R_consolidated_rvc_time_
prd_ttls
SYS Time Period Totals TP_S001.RPT v_R_sys_time_period sp_R_time_period
SYS Time Period Detail TP_S101.RPT v_R_sys_time_period
v_R_sys_time_period_trk sp_R_time_period
sp_R_sys_time_period_tracking
sp_R_time_prd_time_card_ttls
Consolidated SYS Time
Period Totals TP_S002.RPT sp_R_time_period
sp_R_consolidated_sys_time_
prd_ttls
SYS Time Period
Summary TP_S103.RPT v_R_sys_time_period sp_R_sys_time_period_tracking
Consolidated SYS Time
Period Summary TP_S104.RPT sp_R_sys_time_period_tracking
sp_R_consolidated_sys_time_
prd_ttls
Consolidated SYS Time
Period Summary w/
Graph
TP_S204.RPT sp_R_sys_time_period_tracking
sp_R_consolidated_sys_time_
prd_ttls
Report Template View(s) Stored Procedure(s)
$
7HPSODWH7DEOH
TIP REPORTS
Employee Tip Totals EMP_205.RPT v_R_employee_sales_tips sp_R_employee
Employee Tip Totals by
RVC EMP_805.RPT v_R_rvc_employee_sales_
tip sp_R_rvc_employee
Consolidated Employee
Tip Totals EMP_206.RPT v_R_employee_sales_tips sp_R_employee
Consolidated Employee
Tip Totals by RVC EMP_806.RPT v_R_employee_sales_tips sp_R_rvc_employee
Consolidated RVC Tip
Totals TIP_R001.RPT v_R_rvc_sales_tips sp_R_rvc_totals
Consolidated SYS Tip
Totals TIP_S001.RPT v_R_sys_sales_tips sp_R_sys_totals
Report Template View(s) Stored Procedure(s)

5HSRUWV ,QGH[
Index
Note: A Master Index is located in the 3700 Feature Quick Reference Manual.
All page numbers are hotspots.
Symbols
∑1-14
% labor/sales field 2-20
A
add-on tax
breakpoint type 2-29
percentage type 2-29
supported 5-2
adjusted by field 4-4
autogratuities
reporting 3-52, 3-59, 3-66, 3-74
autosequences 1-3
average total check 3-75
average total guest field 3-75
average/check field 2-27
average/guest field 2-26
average/table field 2-27
B
business day
crediting labor hours 4-2
C
cancel field 2-7, 2-13
carried over field 2-13
cashier
assigning by workstation
3-9, 3-15, 3-23, 3-30, 3-37, 3-44
linking to check or transaction employee 3-2
required 3-9, 3-10, 3-15, 3-16
Cashier Balance report
described 3-9, 3-15, 3-38, 3-45
Cashier Detail Totals by Revenue Center report
3-25 to 3-31
Cashier Detail Totals report 3-17 to 3-24
Cashier Summary Totals by Revenue Center report
3-11 to 3-16
Cashier Summary Totals report 3-3 to 3-10
categories, for reports 9-11
change in grand total field 2-6, 2-12
charged receipts field
described 2-14, 2-31
posting to 3-52, 3-59, 3-66, 3-73
charged tips field 2-15, 2-32, 3-76
check employee
defined 3-2
posting to 3-8, 3-15
check field 11-3
check ID field 11-3, 11-8
check reports, using 11-2
checks begun field 2-7, 2-14
checks field 2-26, 3-75, 11-8
checks paid field 2-7, 2-14
CHK_101.RPT template 11-3
CHK_102.RPT template 11-8
clock in date/time field 4-38, 4-41
Clock In Status report 4-38 to 4-41
clock in/out date and time 4-3
clock in/out statuses 4-3
clocked in
effect on reports 4-7
clocked in field 4-42
closed field 11-8
Consolidated Cashier Detail Totals by Revenue Center
report 3-39 to 3-45
Consolidated Cashier Detail Totals report
3-32 to 3-38
Consolidated Employee Detail Totals by Revenue
Center report 3-68 to 3-74
Consolidated Employee Detail Totals report
3-61 to 3-67
Consolidated Employee Job Summary report
4-12 to 4-15
Consolidated Employee Tip Totals by Revenue Center
report 6-17 to 6-21
Consolidated Employee Tip Totals report
6-12 to 6-16
Consolidated Food Cost Detail 10-43
Consolidated RVC Group Sales Detail report
9-24 to 9-25
Consolidated RVC Group Sales Detail report, subtotal
by category 9-15 to 9-23
Consolidated RVC Group Sales Summary report
9-33 to 9-38
Consolidated RVC Job Summary report 4-22 to 4-26
Consolidated RVC Menu Item Sales Detail report
10-10 to 10-14
Consolidated RVC Menu Item Sales Summary
10-30 to 10-33
Consolidated RVC Sales Detail report 8-12 to 8-19
Consolidated RVC Tax Totals report 5-8 to 5-10
Consolidated RVC Time Period Summary report
7-22 to 7-24
Consolidated RVC Time Period Totals report
7-14 to 7-17
Consolidated RVC Tip Totals report 6-22 to 6-26

,QGH[
'
Consolidated SYS Group Sales Detail report
9-58 to 9-59
Consolidated SYS Group Sales Detail report, subtotal by
category 9-51 to 9-57
Consolidated SYS Group Sales Detail report, w/graph
9-60 to 9-61
Consolidated SYS Group Sales Summary report
9-68 to 9-71
Consolidated SYS Job Summary report 4-33 to 4-37
Consolidated SYS Menu Item Sales Detail report
10-21 to 10-24
Consolidated SYS Menu Item Sales Summary report
10-39 to 10-42
Consolidated SYS Sales Detail report 8-29 to 8-35
Consolidated SYS Tax Totals report 5-15 to 5-17
Consolidated SYS Time Period Summary report
7-43 to 7-45
Consolidated SYS Time Period Summary report
w/Graph 7-46 to 7-47
Consolidated SYS Time Period Totals report
7-36 to 7-38
Consolidated SYS Tip Totals report 6-27 to 6-30
Credit Card Batch Detail report 12-3 to 12-7
Credit Card Batch Transfer Status report
12-8 to 12-11
credit total field 2-6, 2-12
CSHR_001.RPT template 3-3
CSHR_101.RPT template 3-17
CSHR_102.RPT template 3-32
CSHR_601.RPT template 3-11
CSHR_701.RPT template 3-25
CSHR_702.RPT template 3-39
D
Daily Employee Detail Totals report 3-46 to 3-53
Daily RVC Group Sales Detail report 9-12 to 9-14
Daily RVC Group Sales Detail report, subtotal by
category 9-3 to 9-11
Daily RVC Group Sales Summary report 9-26 to 9-32
Daily RVC Menu Item Sales Detail report
10-3 to 10-9
Daily RVC Menu Item Sales Summary report
10-25 to 10-29
Daily RVC Sales Detail report 8-3 to 8-11
Daily RVC Tax Totals report 5-3 to 5-7
Daily SYS Group Sales Detail report 9-48 to 9-50
Daily SYS Group Sales Detail report, subtotal by
category 9-39 to 9-47
Daily SYS Menu Item Sales Detail report
10-15 to 10-20
Daily SYS Menu Item Sales Summary report
10-34 to 10-38
Daily SYS Tax Totals report 5-11 to 5-14
Daily System Group Sales Summary report
9-62 to 9-67
Daily System Sales Detail report 8-20 to 8-28
detail tables
formulas in 1-14
detail tables in 3700 Reports Manual
described 1-14
for group reports 9-2
Detailed Sales and Tip profile 2-9 to 2-16
Detailed Sales profile 2-3 to 2-13
discounts
on reports, balancing 9-11
duration field 11-8
E
EMP_101.RPT template 3-46
EMP_102.RPT template 3-61
EMP_205.RPT template 6-3
EMP_206.RPT template 6-12
EMP_221.RPT template 3-75
EMP_701.RPT template 3-54
EMP_702.RPT template 3-68
EMP_805.RPT template 6-8
EMP_806.RPT template 6-17
Employee Closed Guest Checks report 11-8 to 11-14
Employee Detail Totals by Revenue Center report
3-54 to 3-60
Employee Job Summary report 4-8 to 4-11
Employee Labor profile 2-17 to 2-18
Employee Open Guest Checks report 11-3 to 11-7
Employee Open LDS Report 3-80
Employee Sales and Tip Totals by Revenue Center
report 3-75 to 3-79
employee shifts
defined 1-17
Employee Time Card and Job Detail report 4-3 to 4-7
Employee Tip Totals by Revenue Center report
6-8to6-11
Employee Tip Totals report 6-3 to 6-7
employee wages field 2-18, 2-22
employees
clocked in 4-45
error corrects field 2-7, 2-13
F
family groups 9-2, 10-9
FG_R001.RPT template 9-12
FG_R002.RPT template 9-24
FG_R010.RPT template 9-3
FG_R012.RPT template 9-15
FG_R101.RPT template 9-26
FG_R111.RPT template 9-33
FG_S002.RPT template 9-58
FG_S010.RPT template 9-39
FG_S012.RPT template 9-51
FG_S101.RPT template 9-62
FG_S111.RPT template 9-68
FG_S202.RPT template 9-60

5HSRUWV ,QGH[
*
Florida surcharge tax
supported 5-2
formulas
described 1-15
G
grand total field 2-13
gross receipts field
described 2-14, 2-31
posting to 3-52, 3-59
gross sales field 2-24
group categories 9-11
GST
supported 5-2
guest check
open 11-7
outstanding 8-11
training 11-7
transferring 3-53, 3-60, 8-11
guests
number of, determining
3-9, 3-15, 3-24, 3-30, 3-38, 3-45
guests field 2-26, 3-75, 11-3, 11-8
H
hours field 4-3
hours worked field 2-17, 2-21
I
inclusive tax type 2-29
IRS requirements 3-52, 3-59
item discount field 2-4, 2-10, 2-24
J
job # and name field 4-3, 4-38, 4-42
job number 4-41
jobs
defining 4-7
L
Labor Availability report 4-42 to 4-45
labor categories, programming 7-13
labor category field 2-19
Labor Category profile 2-19 to 2-20
labor hours
crediting to actual or clock-in business day 4-2
labor/sales field 2-23
Labor/Sales profile 2-21 to 2-23
M
major groups 9-2, 10-9
manager voids field 2-7, 2-13
menu item groups 9-2
menu item reports, using 10-2
menu items
posting zero amounts 9-11
MI_R001.RPT template 10-3
MI_R002.RPT template 10-10
MI_R101.RPT template 10-25
MI_R102.RPT template 10-30
MI_S001.RPT template 10-15
MI_S002.RPT template 10-21
MI_S101.RPT template 10-34
MI_S102.RPT template 10-39
N
net sales field 2-3, 2-9, 2-13, 2-23, 2-25, 2-26, 2-30
net sales total field 3-75
no sale field 2-7
non taxable sales field 2-30
O
on break field 4-42
open checks 2-14
open date/time 11-3
opened field 11-8
order type field 2-26
outstanding field 2-8, 2-14
overtime
setting up conditions 4-7
overtime employee wages field 2-18, 2-22
overtime hours field 2-19, 4-4
overtime hours worked field 2-17, 2-21
overtime pay field 4-4
overtime total field 2-19
P
pay rates
default 4-11
defining 4-7
payment total field 11-3, 11-9
payment type field 11-9
% labor/sales field 2-20
post to gross receipts 3-52, 3-59
profiles
defined 1-13, 2-2
described 2-3 to 2-33
R
rate field 2-28
reasons field 4-4
regular employee wages field 2-18, 2-22
regular hours field 2-19, 4-4
regular hours worked field 2-17

,QGH[
6
regular pay field 4-4
regular total field 2-19
reports
40-column 1-4 to 1-8
customized 1-2
full-page 1-4 to 1-8
previewing 1-23
printing 1-23
running 1-3, 1-19 to 1-24
selecting 1-20
selection options 1-12, 1-21 to 1-24
return quantity field 2-24
returns field 2-5, 2-11
rounding total field 2-7, 2-13
RVC Job Summary report 4-16 to 4-21
RVC Time Period Detail report 7-8 to 7-13
RVC Time Period Summary report 7-18 to 7-21
RVC Time Period Totals report 7-3 to 7-7
RVC_101.RPT template 8-3
RVC_102.RPT template 8-12
S
Sales and Guest profile 2-26 to 2-27
sales balance reports, using 8-2
Sales profile 2-24 to 2-25
sales quantity field 2-24
sales, evaluating 8-2
security, system accounting 2-6
service charge field
described 2-3, 2-9, 2-15, 2-31, 11-3, 11-8
posting to 3-52, 3-59
Singapore tax
supported 5-2
status field 4-3
stored procedures
defined 1-15
subtotal discount field 2-4, 2-10
subtotal field 11-3, 11-8
∑1-14
SYS Job Summary report 4-27 to 4-32
SYS Time Period Detail report 7-30 to 7-34
SYS Time Period Summary report 7-39 to 7-42
SYS Time Period Totals report 7-25 to 7-29
SYS_101.RPT template 8-20
SYS_102.RPT template 8-29
T
table turn time minutes field 2-8
table/group 11-3, 11-8
tables field 2-27
tax collected field 2-4, 2-10, 2-29
tax exempt field 2-30
tax field 11-8
Tax profile 2-28 to 2-30
tax total field 11-3
(tax) type field 2-28
TAX_R001.RPT template 5-3
TAX_R002.RPT template 5-8
TAX_S001.RPT template 5-11
TAX_S002.RPT template 5-15
taxable sales field 2-30
taxes
active rate 5-7
calculating 5-2
not included 9-11
printing 5-6
supported 5-2
template
defined 1-14
time periods
using 7-2
TIME_002.RPT template 4-3
TIME_003.RPT template 4-8
TIME_004.RPT template 4-12
TIME_005.RPT template 4-38
TIME_006.RPT template 4-42
TIME_R012.RPT template 4-22, 4-33
TIME_S011.RPT template 4-27
tip % field 2-32, 3-76
Tip profile 2-31 to 2-32
TIP_S001.RPT template 6-27
tips declared field 2-15, 2-32, 3-76
tips due field 2-16, 2-32, 3-76
tips paid field 2-15, 2-32, 3-76
total (wages) field 2-19
total discount field 2-4
total discounts field 2-10
total field 4-42
total hours field 2-19
total pay field 4-4
total revenue field 2-4, 2-10
total tips field 2-15, 2-32, 3-76
TP_R001.RPT template 7-3
TP_R002.RPT template 7-14
TP_R101.RPT template 7-8
TP_R103.RPT template 7-18
TP_R104.RPT template 7-22
TP_S002.RPT template 7-36
TP_S103.RPT template 7-39
TP_S104.RPT template 7-43
Tracking Group profile 2-33
tracking groups
defined 1-8
using 1-9 to 1-12
tracking totals
defined 1-8
number of 1-10
subtotals of 1-11
types of 1-10
uses of 3-24, 3-31
training total field 2-13


,QGH[
9
