SRI Tech Guide
User Manual:
Open the PDF directly: View PDF ![]() .
.
Page Count: 101 [warning: Documents this large are best viewed by clicking the View PDF Link!]
COVER
74216_SRI_TechGuide_FC-105.indd i74216_SRI_TechGuide_FC-105.indd i 9/26/07 6:03:09 PM9/26/07 6:03:09 PM

inside front cover
74216_SRI_TechGuide_FC-105.indd ii74216_SRI_TechGuide_FC-105.indd ii 8/14/07 6:54:02 PM8/14/07 6:54:02 PM

Technical Guide
74216_SRI_TechGuide_FC-105.indd 174216_SRI_TechGuide_FC-105.indd 1 9/26/07 6:03:20 PM9/26/07 6:03:20 PM

Parts of this compilation originally appeared in the following Scholastic Inc. products:
Scholastic Reading Inventory Target Success with the Lexile Framework for Reading,
copyright © 2005, 2003, 1999; Scholastic Reading Inventory Using the Lexile Framework,
Technical Manual Forms A and B, copyright © 1999; Scholastic Reading Inventory Technical
Guide, copyright © 2001, 1999; Lexiles: A System for Measuring Reader Ability and
Text Di culty, A Guide for Educators, copyright © Scholastic Inc.
No part of this publication may be reproduced in whole or in part, or stored in a retrieval
system, or transmitted in any form or by any means, electronic, mechanical, photocopying,
recording, or otherwise, without written permission of the publisher. For information regarding
permission, write to Scholastic Inc., Education Group, 557 Broadway, New York, NY 10012.
Copyright © 2007 by Scholastic Inc.
All rights reserved. Published by Scholastic Inc. Printed in the U.S.A.
ISBN-13: 978-0-439-74216-0
ISBN-10: 0-439-74216-1
SCHOLASTIC, SCHOLASTIC READING INVENTORY, SCHOLASTIC READING
COUNTS!, and associated logos and designs are trademarks and/or registered trademarks
of Scholastic Inc.
LEXILE and LEXILE FRAMEWORK are registered trademarks of MetaMetrics, Inc.
Other company names, brand names, and product names are the property and/or trade-
marks of their respective owners.
1 2 3 4 5 6 7 8 9 10 23 16 15 14 13 12 11 10 09 08 07
74216_SRI_TechGuide_FC-105.indd 274216_SRI_TechGuide_FC-105.indd 2 8/14/07 6:54:02 PM8/14/07 6:54:02 PM

TABLE OF CONTENTS
Introduction
Features of Scholastic Reading Inventory . . . . . . . . . . . . . . . . . . . . . . . . . . . . . . . . . . . . . . 8
Purposes and Uses of Scholastic Reading Inventory . . . . . . . . . . . . . . . . . . . . . . . . . . . . . 9
Limitations of Scholastic Reading Inventory . . . . . . . . . . . . . . . . . . . . . . . . . . . . . . . . . . 10
Theoretical Framework of Reading Ability and The Lexile Framework for Reading
Readability Formulas and Reading Levels . . . . . . . . . . . . . . . . . . . . . . . . . . . . . . . . . . 11
The Lexile Framework for Reading . . . . . . . . . . . . . . . . . . . . . . . . . . . . . . . . . . . . . . 14
Validity of The Lexile Framework for Reading . . . . . . . . . . . . . . . . . . . . . . . . . . . . . . 18
Lexile Item Bank . . . . . . . . . . . . . . . . . . . . . . . . . . . . . . . . . . . . . . . . . . . . . . . . . . . . 22
Description of the Test
Test Materials . . . . . . . . . . . . . . . . . . . . . . . . . . . . . . . . . . . . . . . . . . . . . . . . . . . . . . 25
Test Administration and Scoring . . . . . . . . . . . . . . . . . . . . . . . . . . . . . . . . . . . . . . . . . 26
Interpreting Scholastic Reading Inventory Scores . . . . . . . . . . . . . . . . . . . . . . . . . . . . . . . 28
Using Scholastic Reading Inventory Results . . . . . . . . . . . . . . . . . . . . . . . . . . . . . . . . . . 37
Development of Scholastic Reading Inventory
Development of the Scholastic Reading Inventory Item Bank . . . . . . . . . . . . . . . . . . . . . . 43
Scholastic Reading Inventory Computer-Adaptive Algorithm . . . . . . . . . . . . . . . . . . . . . . 47
Scholastic Reading Inventory Algorithm Testing During Development . . . . . . . . . . . . . . . 55
Reliability
Standard Error of Measurement . . . . . . . . . . . . . . . . . . . . . . . . . . . . . . . . . . . . . . . . . 61
Sources of Measurement Error—Text . . . . . . . . . . . . . . . . . . . . . . . . . . . . . . . . . . . . . 62
Sources of Measurement Error—Item Writers . . . . . . . . . . . . . . . . . . . . . . . . . . . . . . . 67
Sources of Measurement Error—Reader . . . . . . . . . . . . . . . . . . . . . . . . . . . . . . . . . . . 71
Forecasted Comprehension Error . . . . . . . . . . . . . . . . . . . . . . . . . . . . . . . . . . . . . . . . 73
Validity
Content Validity . . . . . . . . . . . . . . . . . . . . . . . . . . . . . . . . . . . . . . . . . . . . . . . . . . . . 75
Criterion-Related Validity . . . . . . . . . . . . . . . . . . . . . . . . . . . . . . . . . . . . . . . . . . . . . 76
Construct Validity . . . . . . . . . . . . . . . . . . . . . . . . . . . . . . . . . . . . . . . . . . . . . . . . . . . 84
Appendices
Appendix 1: Lexile Framework Map . . . . . . . . . . . . . . . . . . . . . . . . . . . . . . . . . . . . . . 88
Appendix 2: Norm Reference Tables . . . . . . . . . . . . . . . . . . . . . . . . . . . . . . . . . . . . . 90
Appendix 3: References . . . . . . . . . . . . . . . . . . . . . . . . . . . . . . . . . . . . . . . . . . . . . . . 92
74216_SRI_TechGuide_FC-105.indd 374216_SRI_TechGuide_FC-105.indd 3 9/26/07 6:03:27 PM9/26/07 6:03:27 PM

List of Tables
Table 1: Results from linking studies connected with The Lexile Framework for Reading.
page 19
Table 2: Correlations between theory-based calibrations produced by the Lexile equation
and rank order of unit in basal readers. page 20
Table 3: Correlations between theory-based calibrations produced by the Lexile equation
and the empirical item di culty. page 21
Table 4: Comprehension rates for the same individual with materials of varying
compre hension di culty. page 33
Table 5: Comprehension rates of di erent-ability readers with the same material. page 34
Table 6: Performance standard pro ciency bands for SRI, in Lexiles, by grade. page 36
Table 7: Distribution of items in SRI item bank by Lexile zone. page 46
Table 8: Student responses to Question 7: preferred test format. page 56
Table 9: Relationship between SRI and SRI-print version. page 58
Table 10: Relationship between SRI and other measures of reading comprehension. page 58
Table 11: Descriptive statistics for each test administration group in the comparison study,
April/May 2005. page 59
Table 12: Mean SEM on SRI by extent of prior knowledge. page 62
Table 13: Standard errors for selected values of the length of the text. page 64
Table 14: Analysis of 30 item ensembles providing an estimate of the theory
misspeci cations error. page 66
Table 15: Old method text readabilities, resampled SEMs, and new SEMs for
selected books. page 68
Table 16: Lexile measures and standard errors across item writers. page 69
Table 17: SRI reader consistency estimates over a four-month period, by grade. page 72
Table 18: Con dence intervals (90%) for various combinations of comprehension rates and
standard error of di erences (SED) between reader and text measures. page 74
Table 19: Clark County (NV) School District: Normal curve equivalents of SRI by
grade level. page 78
Table 20: Indian River (DE) School District: SRI average scores (Lexiles) for READ 180
students in 2004–2005. page 80
Table 21: Large Urban School District: SRI scores by student demographic
classi cation. page 82
Table 22: Large Urban School District: Descriptive statistics for SRI and the SAT-9/10,
matched sample. page 85
Table 23: Large Urban School District: Descriptive statistics for SRI and the SSS,
matched sample. page 85
Table 24: Large Urban School District: Descriptive statistics for SRI and the PSAT,
matched sample. page 86
74216_SRI_TechGuide_FC-105.indd 474216_SRI_TechGuide_FC-105.indd 4 8/14/07 6:54:03 PM8/14/07 6:54:03 PM

List of Figures
Figure 1: An example of an SRI test item. page 9
Figure 2: Sample administration of SRI for a sixth-grade student with a prior Lexile
measure of 880L. page 27
Figure 3: Normal distraction of scores described in scale scores, percentiles, stanines, and
normal curve equivalents (NCEs). page 29
Figure 4: Relationship between reader-text discrepancy and forecasted reading
compre hension rate. page 33
Figure 5: The Rasch Model—the probability person n responds correctly to item i.
page 49
Figure 6: The “start” phase of the SRI computer-adaptive algorithm. page 51
Figure 7: The “step” phase of the SRI computer-adaptive algorithm. page 53
Figure 8: The “stop” phase of the SRI computer-adaptive algorithm. page 54
Figure 9: Scatter plot between observed item di culty and theoretical item
di culty. page 64
Figure 10a: Plot of observed ensemble means and theoretical calibrations (RMSE 111L).
page 67
Figure 10b: Plot of simulated “true” ensemble means and theoretical calibrations
(RMSE 64L). page 67
Figure 11: Examination of item writer error across items and occasions. page 70
Figure 12: Growth on SRI—Median and upper and lower quartiles, by grade. page 77
Figure 13: Memphis (TN) Public Schools: Distribution of initial and nal SRI scores for
READ 180 participants. page 78
Figure 14: Des Moines (IA) Independent Community School District: Group SRI mean
Lexile measures, by starting grade level in READ 180. page 79
Figure 15: Kirkwood (MO) School District: Pretest and posttest SRI scores, school year
2000–2001, general education students. page 82
Figure 16: Kirkwood (MO) School District: Pretest and posttest SRI scores, school year
2001–2002, general education students. page 83
Figure 17: Kirkwood (MO) School District: Pretest and posttest SRI scores, school year
2002–2003, general education students. page 83
Figure 18: Large Urban School District: Fit of quadratic growth model to SRI data for
students in Grades 2 through 10. page 87
74216_SRI_TechGuide_FC-105.indd 574216_SRI_TechGuide_FC-105.indd 5 8/14/07 6:54:03 PM8/14/07 6:54:03 PM

74216_SRI_TechGuide_FC-105.indd 674216_SRI_TechGuide_FC-105.indd 6 8/14/07 6:54:03 PM8/14/07 6:54:03 PM

Technical Guide 7
INTRODUCTION
Scholastic Reading Inventory™ (SRI), developed by Scholastic Inc., is an objective assessment of
a student’s reading comprehension level (Scholastic, 2006a). The assessment can be admin-
istered to students in Grades 1 through 12 by paper and pencil or by computer; the result
of either mode is a Lexile® measure for the reader. The assessment is based on the Lexile
Framework® for Reading and can be used for two purposes: (1) to assess a student’s reading
comprehension level, and (2) to match students with appropriate texts for successful reading
experiences. Using the Lexile score reported by SRI, teachers and administrators can:
identify struggling readers,
plan for instruction,
gauge the e ectiveness of a curriculum, and
demonstrate accountability.
Scholastic Reading Inventory was initially developed in 1998 and 1999 as a print-based
assessment of reading comprehension. In late 1998, Scholastic began developing a
computer-based version. Pilot studies of the computer application were conducted in
fall and winter 1998. Version 1 of the interactive presentation was launched in fall 1999.
Subsequent versions were launched between 1999 and 2003, with Version 4.0/Enterprise
Edition appearing in winter 2006.
This technical guide for the interactive version of SRI is intended to provide users with the
broad research foundation essential for deciding if and how SRI should be used and what
kinds of inferences about readers and texts can be drawn from it. SRI Technical Report #2 is
the second in a series of technical publications describing the development and psychomet-
ric characteristics of SRI. SRI Technical Report #1 described the development and validation
of the print version of SRI. Subsequent publications are forthcoming as additional data
become available.
•
•
•
•
74216_SRI_TechGuide_FC-105.indd 774216_SRI_TechGuide_FC-105.indd 7 8/14/07 6:54:03 PM8/14/07 6:54:03 PM

Scholastic Reading Inventory
8
Features of Scholastic Reading Inventory
SRI is designed to measure how well readers comprehend literary and expository texts.
It measures reading comprehension by focusing on the skills readers use to understand
written materials sampled from various content areas. These skills include referring to
details in the passage, drawing conclusions, and making comparisons and generalizations.
SRI does not require prior knowledge of ideas beyond the test passages, vocabulary taken
out of context, or formal logic. SRI is composed of authentic passages that are typical of
the materials students read both in and out of school, including topics in prose ction, the
humanities, social studies, science, and everyday texts such as magazines and newspapers.
The purpose of SRI is to locate the reader on the Lexile Map for Reading (see Appendix
1). Once a reader has been measured, it is possible to forecast how well the reader will likely
comprehend hundreds of thousands of texts that have been analyzed using the Lexile metric.
Several features of SRI are noteworthy.
Passages are authentic: they are sampled from best-selling literature,
curriculum texts, and familiar periodicals.
The “embedded completion” item format used by SRI has been
shown to measure the same core reading competency measured by
norm-referenced, criterion-referenced, and individually administered
reading tests (Stenner, Smith, Horiban, and Smith, 1987).
A decade of research de ned the rules for sampling text and develop-
ing embedded completion items. A multi-stage review process ensured
conformity with item-writing speci cations.
SRI is the rst among available reading tests in using the Lexile Theory
to convert a raw score (number correct) into the Lexile metric. The
equation used to calibrate SRI test items is the same equation used
to measure texts. Thus, readers and texts are measured using the same
metric.
SRI is a full-range instrument capable of accurately measuring reading
performance from the middle of rst grade to college.
The test format supports quick administration in an un-timed, low-
pressure format.
SRI employs a computer-adaptive algorithm to adapt the test to the
speci c level of the reader. This methodology continuously targets the
reading level of the student and produces more precise measurements
than “ xed-form” assessments.
SRI applies a Bayesian scoring algorithm that uses past performance
to predict future performance. This methodology connects each test
administration to every other administration to produce more precise
measurements when compared with independent assessments.
•
•
•
•
•
•
•
•
74216_SRI_TechGuide_FC-105.indd 874216_SRI_TechGuide_FC-105.indd 8 8/14/07 6:54:03 PM8/14/07 6:54:03 PM
Technical Guide 9
Little specialized preparation is needed to administer SRI, though
proper interpretation and use of the results requires knowledge of the
Lexile Framework.
Purposes and Uses of Scholastic Reading Inventory
SRI is designed to measure a reader’s ability to comprehend narrative and expository texts
of increasing di culty. Students are generally well measured when they are administered a
test that is targeted near their true reading ability. When students take poorly targeted tests,
there is considerable uncertainty about their location on the Lexile Map.
SRI’s lowest-level item passages are sampled from beginning rst-grade literature; the
highest-level item passages are sampled from high school (and more di cult) literature and
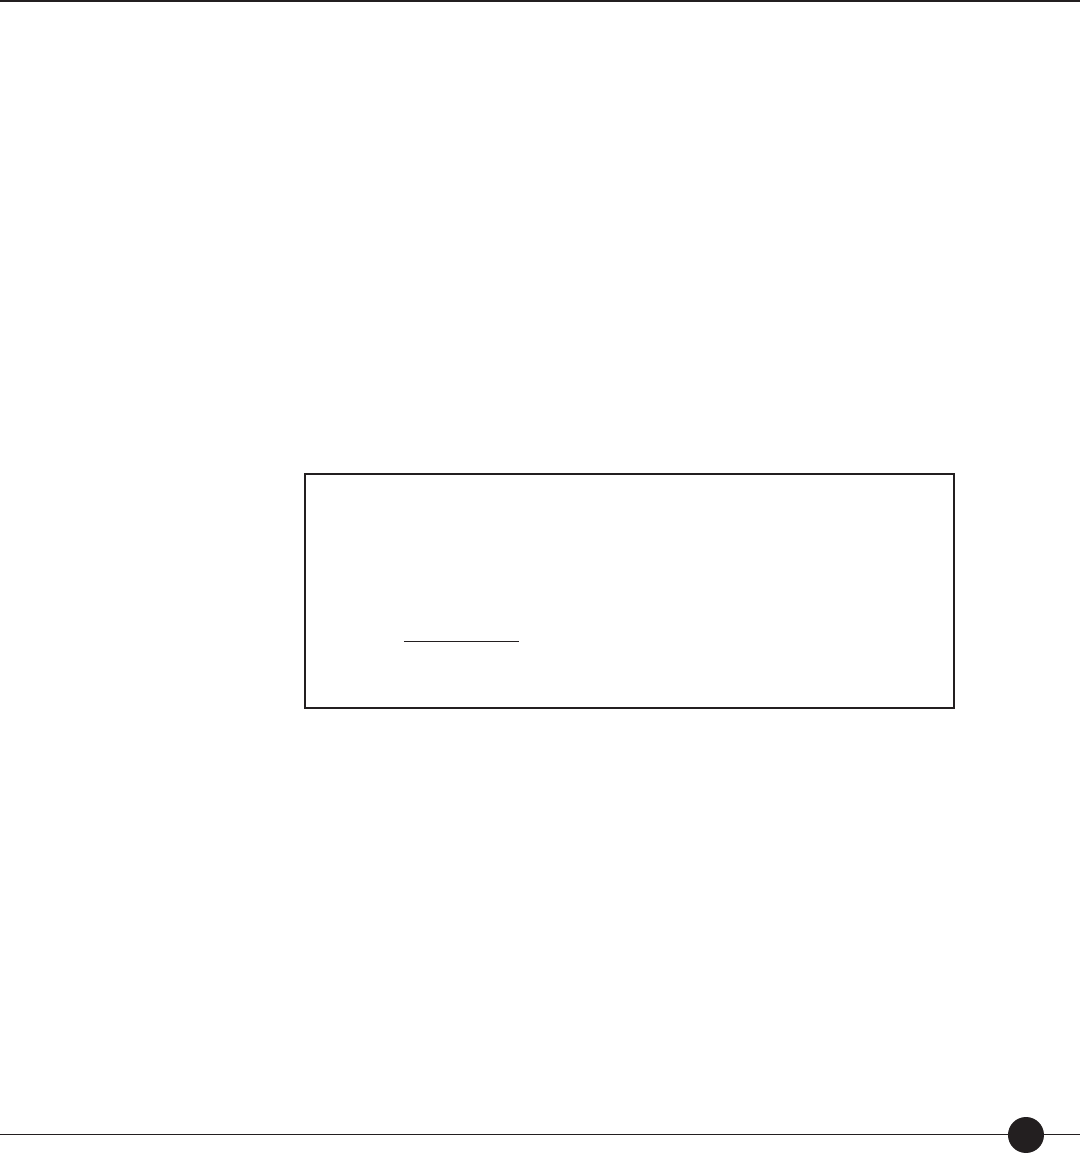
other print materials. Figure 1 shows an example of an 800L item from SRI.
Figure 1. An example of an
SRI
test item.
Wilbur likes Charlotte better and better each day. Her campaign against insects seemed
sensible and useful. Hardly anybody around the farm had a good word to say for a y.
Flies spent their time pestering others. The cows hated them. The horses hated them.
The sheep loathed them. Mr. and Mrs. Zuckerman were always complaining about
them, and putting up screens.
Everyone about them.
A. agreed C. laughed
B. gathered D. learned
From Charlotte’s Web by E. B. White, 1952, New York: Harper & Row.
Readers and texts are measured using the same Lexile metric, making it possible to directly
compare reader and text. When reader and text measures match, the Lexile Framework
forecasts 75% comprehension. The operational de nition of 75% comprehension is that
given 100 items from a text, the reader will be able to correctly answer 75. When a text
has a Lexile measure 250L higher than the reader’s measure, the Framework forecasts 50%
comprehension. When the reader measure exceeds the text measure by 250L, the fore-
casted comprehension is 90%.
•
74216_SRI_TechGuide_FC-105.indd 974216_SRI_TechGuide_FC-105.indd 9 8/14/07 6:54:04 PM8/14/07 6:54:04 PM

Scholastic Reading Inventory
10
Limitations of Scholastic Reading Inventory
A well-targeted SRI assessment can provide useful information for matching texts and
readers. SRI, like any other assessment, is just one source of evidence about a reader’s
level of comprehension. Obviously, decisions are best made when using multiple sources
of evidence about a reader. Other sources include other reading test data, reading group
placement, lists of books read, and, most importantly, teacher judgment. One measure of
reader performance, taken on one day, is not su cient to make high-stakes, student-level
decisions such as summer school placement or retention.
The Lexile Framework provides a common metric for combining di erent sources of
information about a reader into a best overall judgment of the reader’s ability expressed in
Lexiles. Scholastic encourages users of SRI to employ multiple measures when deciding
where to locate a reader on the Lexile scale.
74216_SRI_TechGuide_FC-105.indd 1074216_SRI_TechGuide_FC-105.indd 10 8/14/07 6:54:04 PM8/14/07 6:54:04 PM

Technical Guide 11
Theoretical Framework of Reading Ability
and The Lexile Framework for Reading
All symbol systems share two features: a semantic component and a syntactic component. In
language, the semantic units are words. Words are organized according to rules of syntax into
thought units and sentences (Carver, 1974). In all cases, the semantic units vary in familiar-
ity and the syntactic structures vary in complexity. The comprehensibility or di culty of a
message is dominated by the familiarity of the semantic units and by the complexity of the
syntactic structures used in constructing the message.
Readability Formulas and Reading Levels
Readability Formulas. Readability formulas have been in use for more than 60 years.
These formulas are generally based on a theory about written language and use mathemati-
cal equations to calculate text di culty. While each formula has discrete features, nearly
all attempt to assign di culty based on a combination of semantic (vocabulary) features
and syntactic (sentence length) features. Traditional readability formulas are all based on a
simple theory about written language and a simple equation to calculate text di culty.
Unless users are interested in conducting research, there is little to be gained by choosing a
highly complex readability formula. A simple two-variable formula is su cient, especially
if one of the variables is a word or semantic variable and the other is a sentence or syntactic
variable. Beyond these two variables, more data adds relatively little predictive validity
while increasing the application time involved. Moreover, a formula with many variables is
likely to be di cult to calculate by hand.
The earliest readability formulas appeared in the 1920s. Some of them were esoteric
and primarily intended for chemistry and physics textbooks or for shorthand dictation
materials. The rst milestone that provided an objective way to estimate word di culty
was Thorndike’s The Teacher Word Book, published in 1921. The concepts discussed in
Thorndike’s book led Lively and Pressey in 1923 to develop the rst readability formula
based on tabulations of the frequency with which words appear. In 1928, Vogel and
Washburne developed a formula that took the form of a regression equation involving
more than one language variable. This format became the prototype for most of the
formulas that followed. The work of Washburne and Morphett in 1938 provided a formula
that yielded scores on a grade-placement scale. The trend to make the formulas easy to
apply resulted in the most widely used of all readability formulas—Flesch’s Reading Ease
Formula (1948). Dale and Chall (1948) published another two-variable formula that
became very popular in educational circles. Spache designed his renowned formula using a
word-list approach in 1953. This design was useful for Grades 1 through 3 at a time when
most formulas were designed for the upper grade levels. That same year, Taylor proposed
the cloze procedure for measuring readability. Twelve years later, Coleman used this
procedure to develop his ll-in-the-blank method as a criterion for his formula. Danielson
74216_SRI_TechGuide_FC-105.indd 1174216_SRI_TechGuide_FC-105.indd 11 8/14/07 6:54:04 PM8/14/07 6:54:04 PM

Scholastic Reading Inventory
12
and Bryan developed the rst computer-generated formulas in 1963. Also in 1963, Fry
simpli ed the process of interpreting readability formulas by developing a readability graph.
Later, in 1977, he extended his readability graph, and his method is the most widely used of
all current methods (Klare, 1984; Zakaluk and Samuels, 1988).
Two often-used formulas—the Fog Index and the Flesch-Kincaid Readability Formula—
can be calculated by hand for short passages. First, a passage is selected that contains
100 words. For a lengthy text, several di erent 100-word passages are selected.
For the Fog Index, rst the average number of words per sentence is determined. If
the passage does not end at a sentence break, the percentage of the nal sentence to be
included in the passage is calculated and added to the total number of sentences. Then,
the percentage of “long” words (words with three or more syllables) is determined. Finally,
the two measures are added together and multiplied by 0.4. This number indicates the
approximate Reading Grade Level (RGL) of the passage.
For the Flesch-Kincaid Readability Formula the following equation is used:
RGL ⴝ 0.39 (ave rage number of words per sentence) ⴙ
11.8 (average number of syllables per word) ⴚ 15.59
For a lengthy text, using either formula, the RGLs are averaged for the several di erent
100-word passages.
Another commonly used readability formula is ATOS™ for Books developed by Advan-
tage Learning Systems. ATOS is based on the following variables related to the reading
demands of text: words per sentence, characters per word, and average grade level of the
words. ATOS uses whole-book scans instead of text samples, and results are reported on a
grade-level scale.
Guided Reading Levels. Within the Guided Reading framework (Fountas & Pinnell, 1996),
books are assigned to levels by teachers according to speci c characteristics. These charac-
teristics include the level of support provided by the text (e.g., the use and role of illustra-
tions, the size and layout of the print) and the predictability and pattern of language (e.g.,
oral language compared to written language). An initial list of leveled books is provided so
teachers have models to compare when leveling a book.
For students in kindergarten through Grade 3, there are 18 Guided Reading Levels, A
through R (kindergarten: Levels A–C; rst grade: Levels A–I; second grade: Levels C–P; and
third grade: Levels J–R). The books include several genres: informational texts on a variety
of topics, “how to” books, mysteries, realistic ction, historical ction, biography, fantasy,
traditional folk and fairy tales, science ction, and humor.
How do readability formulas and reading levels relate to readers? The previous section described
how to level books in terms of grade levels and reading levels based on the characteristics
of the text. But how can these levels be connected to the reader? Do we say that a reader
in Grade 6 should read only books whose readability measures between 6.0 and 6.9?
74216_SRI_TechGuide_FC-105.indd 1274216_SRI_TechGuide_FC-105.indd 12 8/14/07 6:54:04 PM8/14/07 6:54:04 PM

Technical Guide 13
How do we know that a student is reading at Guided Reading Level “G” and when is he
or she ready to move on to Level “H”? What is needed is some way to put readers on
these scales.
To match students with readability levels, their “reading“ grade level needs to be deter-
mined, which is often not the same as their “nominal” grade level (the grade level of the
class they are in). On a test, a grade equivalent (GE) is a score that represents the typical
(mean or median) performance of students tested in a given month of the school year. For
example, if Alicia, a fourth-grade student, obtained a GE of 4.9 on a fourth-grade reading
test, her score is the score that a student at the end of the ninth month of fourth grade
would likely achieve on that same reading test. But there are two main problems with
grade equivalents:
How grade equivalents are derived determines the appropriate conclusions that may be drawn from
the scores. For example, if Stephanie scores 5.9 on a fourth-grade mathematics test, it is
not appropriate to conclude that Stephanie has mastered the mathematics content of the
fth grade (in fact, it may be unknown how fth-grade students would perform on the
fourth-grade test). It certainly cannot be assumed that Stephanie has the prerequisites
for sixth-grade mathematics. All that is known for certain is that Stephanie is well above
average in mathematics.
Grade equivalents represent unequal units. The content of instruction varies somewhat from
grade to grade (as in high school, where subjects may be studied only one or two years), and
the emphasis placed on a subject may vary from grade to grade. Grade units are unequal, and
these inequalities occur irregularly in di erent subjects. A di erence of one grade equivalent in
elementary school reading (2.6 to 3.6) is not the same as a di erence of one grade equivalent
in middle school (7.6 to 8.6).
To match students with Guided Reading Levels, the teacher makes decisions based on
observations of what the child can or cannot do to construct meaning. Teachers also use
ongoing assessments—such as running records, individual conferences, and observations of
students’ reading—to monitor and support student progress.
Both of these approaches to helping readers select books appropriate to their reading
level—readability formulas and reading levels—are subjective and prone to misinterpreta-
tion. What is needed is one scale that can describe the reading demands of a piece of text
and the reading ability of a child. The Lexile Framework for Reading is a powerful tool for
determining the reading ability of children and nding texts that provide the appropriate
level of challenge.
Jack Stenner, a leading psychometrician and one of the developers of the Lexile Frame-
work, likens this situation to an experience he had several years ago with his son.
Some time ago I went into a shoe store and asked for a fth-grade
shoe. The clerk looked at me suspiciously and asked if I knew how
much shoe sizes varied among eleven-year-olds. Furthermore, he
74216_SRI_TechGuide_FC-105.indd 1374216_SRI_TechGuide_FC-105.indd 13 8/14/07 6:54:04 PM8/14/07 6:54:04 PM

Scholastic Reading Inventory
14
pointed out that shoe size was not nearly as important as purpose,
style, color, and so on. But if I would specify the features I wanted
and the size, he could walk to the back and quickly reappear with
several options to my liking. The clerk further noted, somewhat
condescendingly, that the store used the same metric to measure
feet and shoes, and when there was a match between foot and shoe,
the shoes got worn, there was no pain, and the customer was happy
and became a repeat customer. I called home and got my son’s
shoe size and then asked the clerk for a “size 8, red hightop Penny
Hardaway basketball shoe.” After a brief transaction, I had the shoes.
I then walked next door to my favorite bookstore and asked for
a fth-grade fantasy novel. Without hesitation, the clerk led me
to a shelf where she gave me three choices. I selected one and
went home with The Hobbit, a classic that I had read three times
myself as a youngster. I later learned my son had yet to achieve
the reading uency needed to enjoy The Hobbit. His understand-
able response to my gifts was to put the book down in favor of
passionately practicing free throws in the driveway.
The next section of this technical report describes the development and validation of
the Lexile Framework for Reading.
The Lexile Framework for Reading
A reader’s comprehension of text depends on several factors: the purpose for reading, the
ability of the reader, and the text being read. The reader can read a text for entertainment
(literary experience), to gain information, or to perform a task. The reader brings to the
reading experience a variety of important factors: reading ability, prior knowledge, interest
level, and developmental appropriateness. For any text, three factors determine readability:
di culty, support, and quality. All of these factors are important to consider when evaluat-
ing the appropriateness of a text for a reader. The Lexile Framework focuses primarily on
two: reader ability and text di culty.
Like other readability formulas, the Lexile Framework examines two features of text
to determine its readability—semantic di culty and syntactic complexity. Within the
Lexile Framework, text di culty is determined by examining the characteristics of word
frequency and sentence length. Text measures typically range from 200L to 1700L, but
they can go below zero (reported as “Beginning Reader”) and above 2000L. Within any
one classroom, the reading materials will span a range of di culty levels.
All symbol systems share two features: a semantic component and a syntactic component.
In language, the semantic units are words. Words are organized according to rules of
syntax into thought units and sentences (Carver, 1974). In all cases, the semantic units
vary in familiarity and the syntactic structures vary in complexity. The comprehensibility
74216_SRI_TechGuide_FC-105.indd 1474216_SRI_TechGuide_FC-105.indd 14 8/14/07 6:54:05 PM8/14/07 6:54:05 PM

Technical Guide 15
or di culty of a message is dominated by the familiarity of the semantic units and by the
complexity of the syntactic structures used in constructing the message.
The Semantic Component. Most operationalizations of semantic di culty are proxies for the
probability that an individual will encounter a word in a familiar context and thus be able
to infer its meaning (Bormuth, 1966). This is the basis of exposure theory, which explains
the way receptive or hearing vocabulary develops (Miller and Gildea, 1987; Stenner, Smith,
and Burdick, 1983). Klare (1963) hypothesized that the semantic component varied along
a familiar-to-rare continuum. This concept was further developed by Carroll, Davies,
and Richman (1971), whose word-frequency study examined the reoccurrence of words
in a ve-million-word corpus of running text. Knowing the frequency of words as they
are used in written and oral communication provided the best means of inferring the
likelihood that a word would be encountered by a reader and thus become part of that
individual’s receptive vocabulary.
Variables such as the average number of letters or syllables per word have been observed
to be proxies for word frequency. There is a high negative correlation between the length
of a word and the frequency of its usage. Polysyllabic words are used less frequently than
monosyllabic words, making word length a good proxy for the likelihood that an individual
will be exposed to a word.
In a study examining receptive vocabulary, Stenner, Smith, and Burdick (1983) analyzed
more than 50 semantic variables in order to identify those elements that contributed to the
di culty of the 350 vocabulary items on Forms L and M of the Peabody Picture Vocabulary
Test—Revised (Dunn and Dunn, 1981). Variables included part of speech, number of letters,
number of syllables, the modal grade at which the word appeared in school materials,
content classi cation of the word, the frequency of the word from two di erent word
counts, and various algebraic transformations of these measures.
The word frequency measure used was the raw count of how often a given word
appeared in a corpus of 5,088,721 words sampled from a broad range of school materials
(Carroll, Davies, and Richman, 1971). A “word family” included: (1) the stimulus word;
(2) all plurals (adding “-s” or changing “-y” to “-ies”); (3) adverbial forms; (4) compara-
tives and superlatives; (5) verb forms (“-s,” “-d,” “-ed,” and “-ing”); (6) past participles;
and (7) adjective forms. Correlations were computed between algebraic transforma-
tions of these means and the rank order of the test items. Since the items were ordered
according to increasing di culty, the rank order was used as the observed item di culty.
The mean log word frequency provided the highest correlation with item rank order
(r 0.779) for the items on the combined form.
The Lexile Framework currently employs a 600-million-word corpus when examining
the semantic component of text. This corpus was assembled from the thousands of texts
publishers have measured. When text is analyzed by MetaMetrics, all electronic les are
initially edited according to established guidelines used with the Lexile Analyzer software.
These guidelines include the removal of all incomplete sentences, chapter titles, and para-
graph headings; running of a spell check; and repunctuating where necessary to correspond
74216_SRI_TechGuide_FC-105.indd 1574216_SRI_TechGuide_FC-105.indd 15 8/14/07 6:54:05 PM8/14/07 6:54:05 PM

Scholastic Reading Inventory
16
to how the book would be read by a child (for example, at the end of a page). The text
is then submitted to the Lexile Analyzer that examines the lengths of the sentences and
the frequencies of the words and reports a Lexile measure for the book. When enough
additional texts have been analyzed to make an adjustment to the corpus necessary and
desirable, a linking study will be conducted to adjust the calibration equation such that
the Lexile measure of a text based on the current corpus will be equivalent to the Lexile
measure based on the new corpus.
The Syntactic Component. Klare (1963) provided a possible interpretation for how sentence
length works in predicting passage di culty. He speculated that the syntactic component
varied with the load placed on short-term memory. Crain and Shankweiler (1988),
Shankweiler and Crain (1986), and Liberman, Mann, Shankweiler, and Westelman (1982)
have also supported this explanation. The work of these individuals has provided evidence
that sentence length is a good proxy for the demand that structural complexity places upon
verbal short-term memory.
While sentence length has been shown to be a powerful proxy for the syntactic complex-
ity of a passage, an important caveat is that sentence length is not the underlying causal
in uence (Chall, 1988). Researchers sometimes incorrectly assume that manipulation of
sentence length will have a predictable e ect on passage di culty. Davidson and Kantor
(1982), for example, illustrated rather clearly that sentence length can be reduced and
di culty increased and vice versa.
Based on previous research, it was decided to use sentence length as a proxy for the
syntactic component of reading di culty in the Lexile Framework.
Calibration of Text Di culty. A research study on semantic units conducted by Stenner,
Smith, and Burdick (1983) was extended to examine the relationship of word frequency
and sentence length to reading comprehension. In 1987(a), Stenner, Smith, Horabin, and
Smith performed exploratory regression analysis to test the explanatory power of these
variables. This analysis involved calculating the mean word frequency and the log of
the mean sentence length for each of the 66 reading comprehension passages on the
Peabody Individual Achievement Test. The observed di culty of each passage was the mean
di culty of the items associated with the passage (provided by the publisher) converted
to the logit scale. A regression analysis based on the word-frequency and sentence-length
measures produced a regression equation that explained most of the variance found in the
set of reading comprehension tasks. The resulting correlation between the observed logit
di culties and the theoretical calibrations was 0.97 after correction for range restriction
and measurement error. The regression equation was further re ned based on its use in
predicting the observed di culty of the reading comprehension passages on eight other
standardized tests. The resulting correlation between the observed logit di culties and
the theoretical calibrations when the nine tests were combined into one was 0.93 after
correction for range restriction and measurement error.
Once a regression equation was established linking the syntactic and semantic features of a
text to its di culty, that equation was used to calibrate test items and text.
74216_SRI_TechGuide_FC-105.indd 1674216_SRI_TechGuide_FC-105.indd 16 8/14/07 6:54:05 PM8/14/07 6:54:05 PM

Technical Guide 17
The Lexile scale. In developing the Lexile scale, the Rasch item response theory model
(Wright and Stone, 1979) was used to estimate the di culties of items and the abilities
of readers on the logit scale.
The calibrations of the items from the Rasch model are objective in the sense that the
relative di culties of the items will remain the same across di erent samples of readers
(i.e., speci c objectivity). When two items are administered to the same person, which
item is harder and which one is easier can be determined. This ordering is likely to hold
when the same two items are administered to a second person. If two di erent items are
administered to the second person, there is no way to know which set of items is harder
and which set is easier. The problem is that the location of the scale is not known. General
objectivity requires that scores obtained from di erent test administrations be tied to a
common zero—absolute location must be sample independent (Stenner, 1990). To achieve
general objectivity, the theoretical logit di culties must be transformed to a scale where
the ambiguity regarding the location of zero is resolved.
The rst step in developing a scale with a xed zero was to identify two anchor points for
the scale. The following criteria were used to select the two anchor points: they should be
intuitive, easily reproduced, and widely recognized. For example, with most thermometers
the anchor points are the freezing and boiling points of water. For the Lexile scale, the
anchor points are text from seven basal primers for the low end and text from The Electronic
Encyclopedia (Grolier, Inc., 1986) for the high end. These points correspond to medium-
di culty rst-grade text and medium-di culty workplace text.
The next step was to determine the unit size for the scale. For the Celsius thermometer,
the unit size (a degree) is 1/100th of the di erence between freezing (0 degrees) and
boiling (100 degrees) water. For the Lexile scale, the unit size was de ned as 1/1000th of
the di erence between the mean di culty of the primer material and the mean di culty
of the encyclopedia samples. Therefore, a Lexile by de nition equals 1/1000th of the
di erence between the comprehensibility of the primers and the comprehensibility of the
encyclopedia.
The third step was to assign a value to the lower anchor point. The low-end anchor on the
Lexile scale was assigned a value of 200.
Finally, a linear equation of the form
[(Logit ⴙ constant) ⴛ CF] ⴙ 200 ⴝ Lexile text measure (Equation 1)
was developed to convert logit di culties to Lexile calibrations. The values of the conver-
sion factor (CF) and the constant were determined by substituting in the anchor points and
then solving the system of equations.
74216_SRI_TechGuide_FC-105.indd 1774216_SRI_TechGuide_FC-105.indd 17 8/14/07 6:54:05 PM8/14/07 6:54:05 PM

Scholastic Reading Inventory
18
Validity of The Lexile Framework for Reading
Validity is the “extent to which a test measures what its authors or users claim it measures;
speci cally, test validity concerns the appropriateness of inferences that can be made on
the basis of test results” (Salvia and Ysseldyke, 1998). The 1999 Standards for Educational and
Psychological Testing (America Educational Research Association, American Psycho logical
Association, and National Council on Measurement in Education) state that “validity
refers to the degree to which evidence and theory support the interpretations of test scores
entailed in the uses of tests” (p. 9). In other words, does the test measure what it is supposed
to measure? For the Lexile Framework, which measures a skill, the most important aspect
of validity that should be examined is construct validity. The construct validity of The
Lexile Framework for Reading can be evaluated by examining how well Lexile measures
relate to other measures of reading comprehension and text di culty.
Lexile Framework Linked to Other Measures of Reading Comprehension. The Lexile Framework
for Reading has been linked to numerous standardized tests of reading comprehension.
When assessment scales are linked, a common frame of reference can be used to interpret
the test results. This frame of reference can be “used to convey additional normative
information, test-content information, and information that is jointly normative and
content-based. For many test uses, [this frame of reference] conveys information that is
more crucial than the information conveyed by the primary score scale” (Petersen, Kolen,
and Hoover, 1989, p. 222).
Table 1 presents the results from linking studies conducted with the Lexile Framework for
Reading. For each of the tests listed, student reading comprehension scores can also be
reported as Lexile measures. This dual reporting provides a rich, criterion-related frame
of reference for interpreting the standardized test scores. When a student takes one of the
standardized tests, in addition to receiving his norm-referenced test results, he can receive a
reading list that is targeted to his speci c reading level.
Lexile Framework and the Di culty of Basal Readers. In a study conducted by Stenner,
Smith, Horabin, and Smith (1987b), Lexile calibrations were obtained for units in eleven
basal series. It was hypothesized that each basal series was sequenced by di culty. So, for
example, the latter portion of a third-grade reader is presumably more di cult than the
rst portion of the same book. Likewise, a fourth-grade reader is presumed to be more
di cult than a third-grade reader. Observed di culties for each unit in a basal series were
estimated by the rank order of the unit in the series. Thus, the rst unit in the rst book of
the rst grade was assigned a rank order of one, and the last unit of the eighth-grade reader
was assigned the highest rank order number.
74216_SRI_TechGuide_FC-105.indd 1874216_SRI_TechGuide_FC-105.indd 18 9/26/07 6:03:34 PM9/26/07 6:03:34 PM
Technical Guide 19
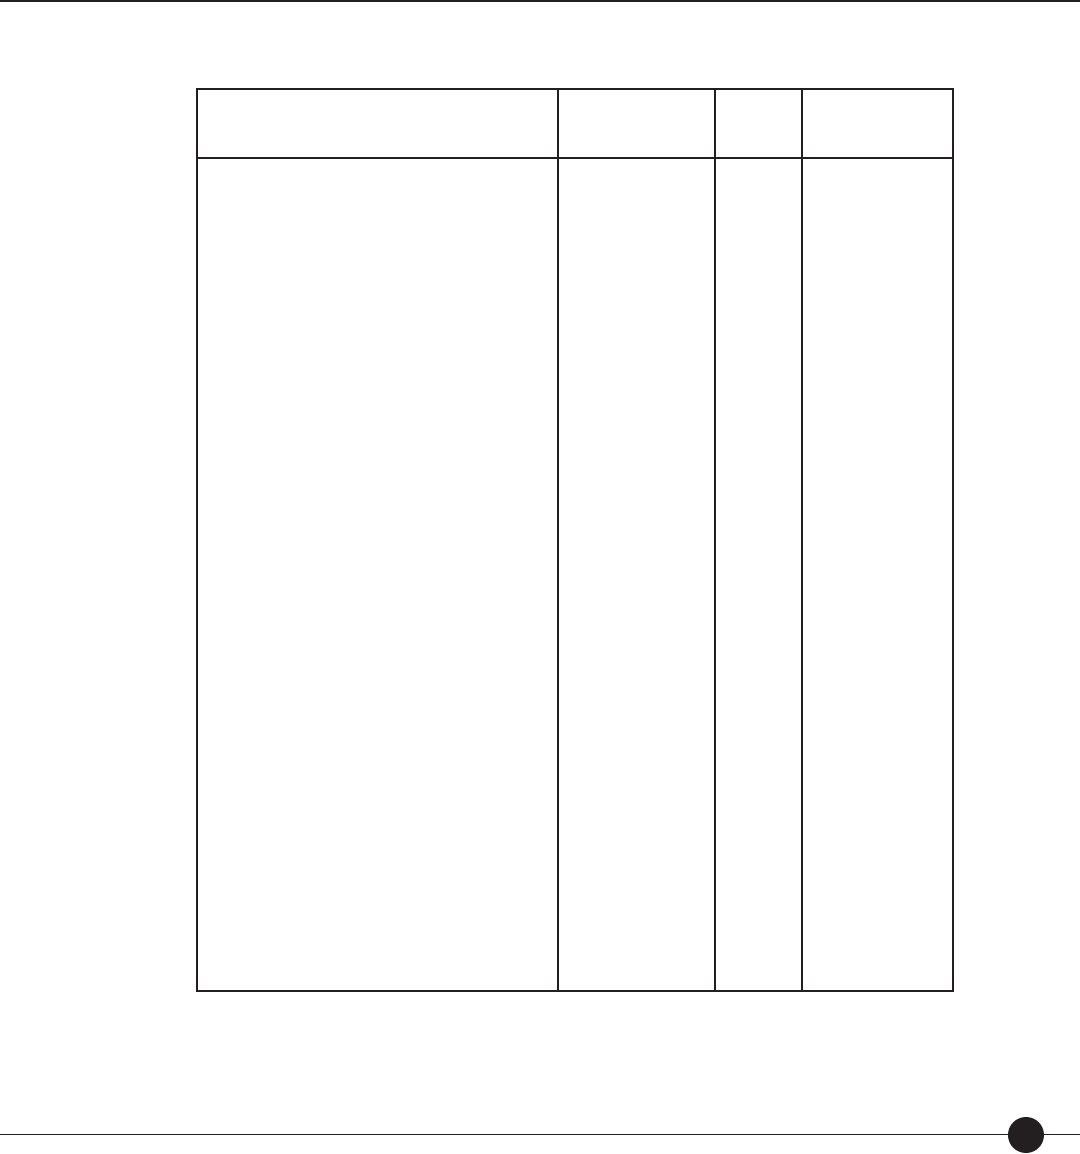
Table 1. Results from linking studies conducted with The Lexile Framework for Reading.
Standardized Test Grades in Study NCorrelation between
Test Score and
Lexile Measure
Stanford Achievement Tests (Ninth Edition)
Stanford Diagnostic Reading Test (Version 4.0)
North Carolina End-of-Grade Tests (Reading
Comprehension)
TerraNova (CTBS/5)
Texas Assessment of Academic Skills (TAAS)
Metropolitan Achievement Test (Eighth
Edition)
Gates-MacGinitie Reading Test (Version 4.0)
Utah Core Assessments
Texas Assessment of
Knowledge and Skills
The Iowa Tests (Iowa Tests of Basic Skills and
Iowa Tests of Educational Development)
Stanford Achievement Test (Tenth Edition)
Oregon Knowledge and Skills
California Standards Test (CST)
Mississippi Curriculum Test (MCT)
Georgia Criterion
Referenced Competency Test (CRCT)
4, 6, 8, 10
4, 6, 8, 10
3, 4, 5, 8
2, 4, 6, 8
3–8
2, 4, 6, 8, and 10
2, 4, 6, 8, and 10
3–6
3, 5, and 8
3, 5, 7, 9, and 11
2, 4, 6, 8, and 10
3, 5, 8, and 10
2–12
2, 4, 6, and 8
1–8
1,167
1, 169
956
2,713
3,623
2,382
4,644
1,551
1,960
4,666
3,064
3,180
55,564
7,045
16,363
0.92
0.91
0.90
0.92
0.73 to 0.78*
0.93
0.92
0.73
0.60 to 0.73*
0.88
0.93
0.89
NA**
0.90
0.72 to 0.88*
Notes: Results are based on nal samples used with each linking study.
*TAAS, TAKS and CRCT were not vertically equated; separate linking equations were derived for each grade.
** CST was linked using a set of Lexile calibrated items embedded in the CST research blocks. CST items were calibrated to the Lexile scale.
74216_SRI_TechGuide_FC-105.indd 1974216_SRI_TechGuide_FC-105.indd 19 8/14/07 6:54:05 PM8/14/07 6:54:05 PM
Scholastic Reading Inventory
20
Correlations were computed between the rank order and the Lexile calibration of each
unit in each series. After correction for range restriction and measurement error, the
average disattenuated correlation between the Lexile calibration of text comprehensibility
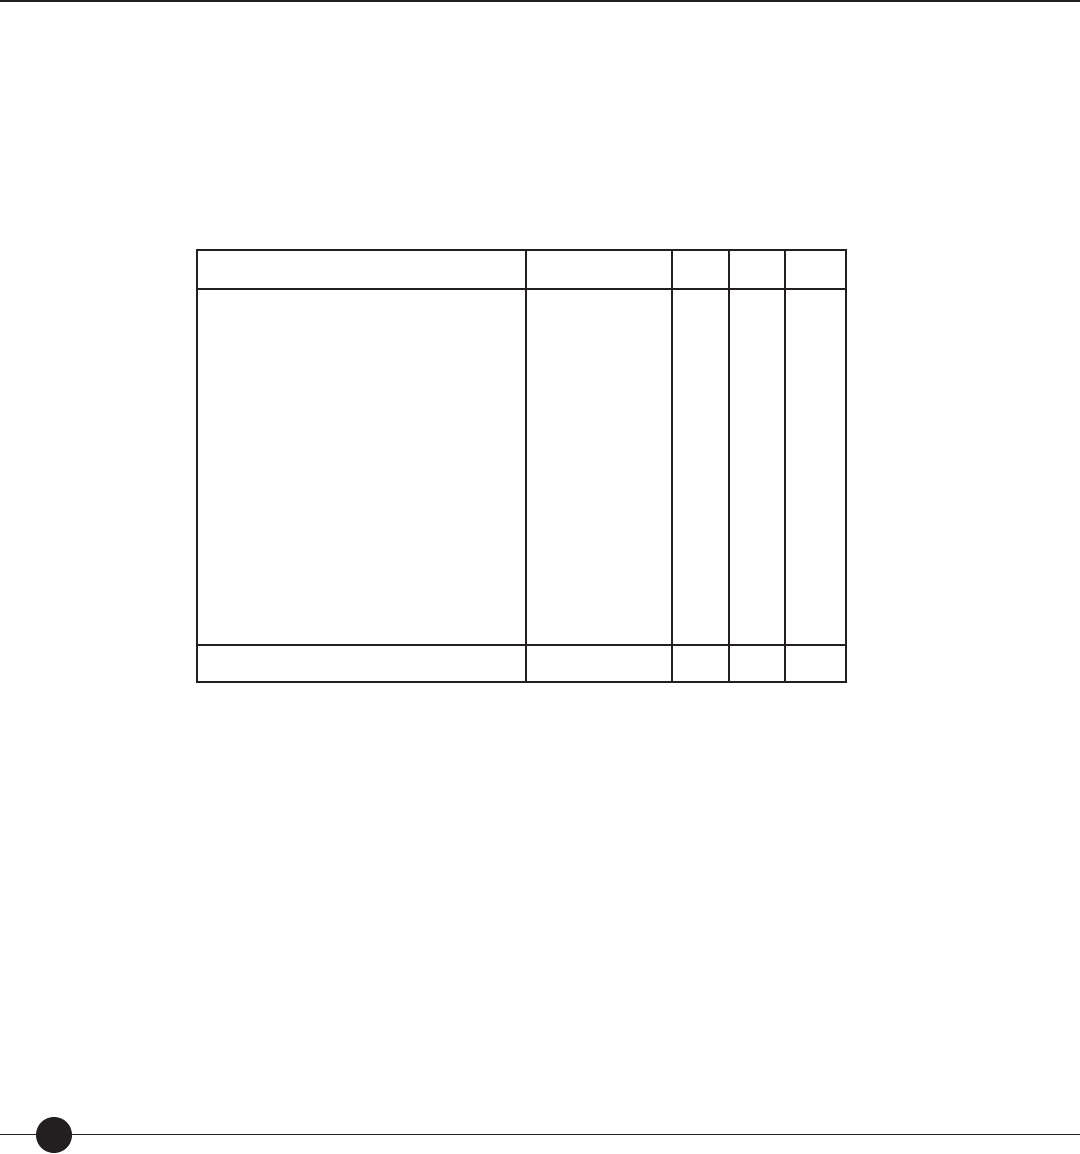
and the rank order of the basal units was 0.995 (see Table 2).
Table 2. Correlations between theory-based calibrations produced by the Lexile equation
and rank order of unit in basal readers.
Basal Series Number of Units
rOT R
OT
R
′
OT
Ginn Rainbow Series (1985)
HBJ Eagle Series (1983)
Scott Foresman Focus Series (1985)
Riverside Reading Series (1986)
Houghton-Mi in Reading Series (1983)
Economy Reading Series (1986)
Scott Foresman American Tradition (1987)
HBJ Odyssey Series (1986)
Holt Basic Reading Series (1986)
Houghton-Mi in Reading Series (1986)
Open Court Headway Program (1985)
53
70
92
67
33
67
88
38
54
46
52
.93
.93
.84
.87
.88
.86
.85
.79
.87
.81
.54
.98
.98
.99
.97
.96
.96
.97
.97
.96
.95
.94
1.00
1.00
1.00
1.00
.99
.99
.99
.99
.98
.98
.97
Total/Means 660 .839 .965 .995
rOT raw correlation between observed di culties (O) and theory-based calibrations (T).
ROT correlation between observed di culties (O) and theory-based calibrations (T) corrected for range restriction.
R′
OT correlation between observed di culties (O) and theory-based calibrations (T) corrected for range restriction and measurement error.
Mean correlations are the weighted averages of the respective correlations.
Based on the consistency of the results in Table 2, the Lexile theory was able to account
for the unit rank ordering of the eleven basal series despite numerous di erences among
them—prose selections, developmental range addressed, types of prose introduced (e.g.,
narrative versus expository), and purported skills and objectives emphasized.
Lexile Framework and the Di culty of Reading Test Items. In a study conducted by Stenner,
Smith, Horabin, and Smith (1987a), 1,780 reading comprehension test items appearing on
nine nationally normed tests were analyzed. The study correlated empirical item di culties
provided by the publisher with the Lexile calibrations speci ed by computer analysis of the
text of each item. The empirical di culties were obtained in one of three ways. Three of
the tests included observed logit di culties from either a Rasch or three-parameter analysis
(e.g., NAEP). For four of the tests, logit di culties were estimated from item p-values and
raw score means and standard deviations (Poznansky, 1990; Stenner, Wright, and Linacre,
74216_SRI_TechGuide_FC-105.indd 2074216_SRI_TechGuide_FC-105.indd 20 8/14/07 6:54:06 PM8/14/07 6:54:06 PM
Technical Guide 21
1994). Two of the tests provided no item parameters, but in each case items were ordered
on the test in terms of di culty (e.g., PIAT). For these two tests, the empirical di culties
were approximated by the di culty rank order of the items. In those cases where multiple
questions were asked about a single passage, empirical item di culties were averaged to
yield a single observed di culty for the passage.
Once theory-speci ed calibrations and empirical item di culties were computed, the two
arrays were correlated and plotted separately for each test. The plots were checked for
unusual residual distributions and curvature, and it was discovered that the equation did
not t poetry items and noncontinuous prose items (e.g., recipes, menus, or shopping lists).
This indicated that the universe to which the Lexile equation could be generalized was
limited to continuous prose. The poetry and noncontinuous prose items were removed and
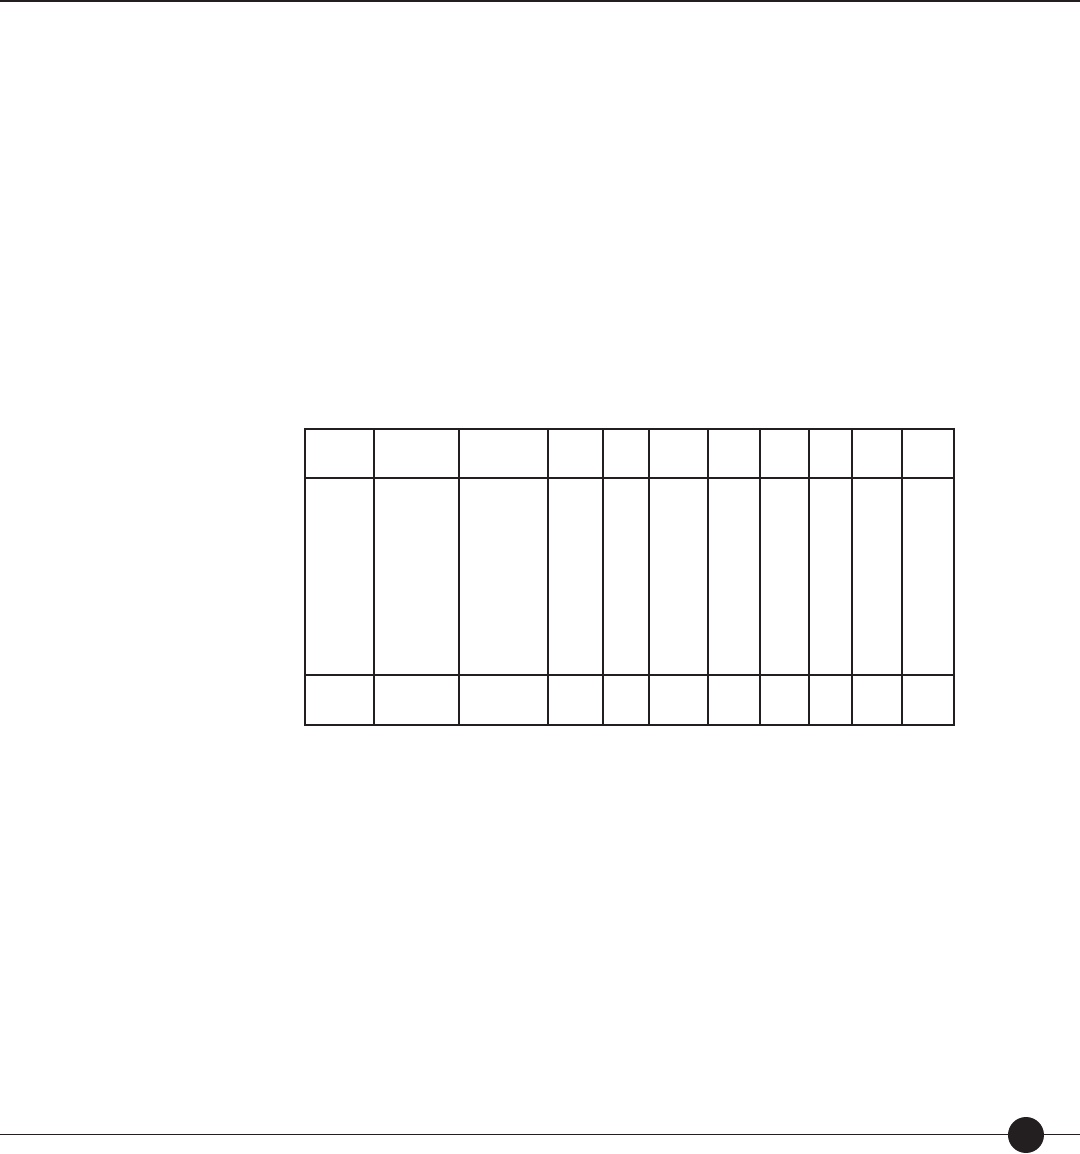
correlations were recalculated. Table 3 contains the results of this analysis.
Table 3. Correlations between theory-based calibrations produced by the Lexile equation
and empirical item diffi culty.
Test Number of
Questions Number of
Passages Mean SD Range Min Max
r
OT
R
OT
R
′
OT
SRA
CAT-E
Lexile
PIAT
CAT-C
CTBS
NAEP
Battery
Mastery
235
418
262
66
253
246
189
26
85
46
74
262
66
43
50
70
26
85
644
789
771
939
744
703
833
491
593
353
258
463
451
238
271
263
560
488
1303
1339
1910
1515
810
1133
1162
2186
2135
33
212
304
242
314
173
169
702
586
1336
1551
1606
1757
1124
1306
1331
1484
1549
.95
.91
.93
.93
.83
.74
.65
.88
.74
.97
.95
.95
.94
.93
.92
.92
.84
.75
1.00
.98
.97
.97
.96
.95
.94
.87
.77
Total/
Mean
1780 722 767 343 1441 50 1491 .84 .91 .93
rOT raw correlation between observed di culties (O) and theory-based calibrations (T).
ROT correlation between observed di culties (O) and theory-based calibrations (T) corrected for range restriction.
R′
OT correlation between observed di culties (O) and theory-based calibrations (T) corrected for range restriction and measurement error.
Means are computed on Fisher Z transformed correlations.
The last three columns in Table 3 show the raw correlations between observed (O) item
di culties and theoretical (T) item calibrations, with the correlations corrected for restric-
tion in range and measurement error. The Fisher Z mean of the raw correlations (rOT) is
0.84. When corrections are made for range restriction and measurement error, the Fisher
Z mean disattenuated correlation between theory-based calibration and empirical di culty
in an unrestricted group of reading comprehension items (R′
OT) is 0.93. These results
show that most attempts to measure reading comprehension—no matter what the item
form, type of skill objectives assessed, or response requirement used—measure a common
comprehension factor speci ed by the Lexile Theory.
74216_SRI_TechGuide_FC-105.indd 2174216_SRI_TechGuide_FC-105.indd 21 8/14/07 6:54:06 PM8/14/07 6:54:06 PM

Scholastic Reading Inventory
22
Lexile Item Bank
The Lexile Item Bank contains over 10,000 items that were developed between 1986 and
2003 for research purposes with the Lexile Framework.
Passage Selection. Passages selected for use came from “real-world” reading materials that
students may encounter both in and out of the classroom. Sources include textbooks,
literature, and periodicals from a variety of interest areas and material written by authors of
di erent backgrounds. The following criteria were used to select passages:
the passage must develop one main idea or contain one complete
piece of information,
understanding of the passage is independent of the information that
comes before or after the passage in the source text, and
understanding of the passage is independent of prior knowledge not
contained in the passage.
With the aid of a computer program, item writers examined blocks of text (minimum
of three sentences) that were calibrated to be within 100L of the source text. From these
blocks of text item writers were asked to select four to ve that could be developed as
items. If it was necessary to shorten or lengthen the passage in order to meet the criteria
for passage selection, the item writer could immediately recalibrate the text to ensure that
it was still targeted within 100L of the complete text (i.e., source targeting).
Item Format. The native-Lexile item format is embedded completion. The embedded
completion format is similar to the ll-in-the-blank format. When properly written,
this format directly assesses the reader’s ability to draw inferences and establish logical
connections between the ideas in the passage. The reader is presented with a passage of
approximately 30 to 150 words in length. The passages are shorter for beginning readers
and longer for more advanced readers. The passage is then response illustrated—a state-
ment with a word or phrase missing is added at the end of the passage, followed by four
options. From the four presented options, the reader is asked to select the “best” option
that completes the statement. With this format, all options are semantically and syntac tically
appropriate completions of the sentence, but one option is unambiguously the “best”
option when considered in the context of the passage.
The statement portion of the embedded completion item can assess a variety of skills
related to reading comprehension: paraphrase information in the passage, draw a logical
conclusion based on information in the passage, make an inference, identify a support-
ing detail, or make a generalization based on information in the passage. The statement
is written to ensure that by reading and comprehending the passage, the reader is able to
select the correct option. When the embedded completion statement is read by itself, each
of the four options is plausible.
•
•
•
74216_SRI_TechGuide_FC-105.indd 2274216_SRI_TechGuide_FC-105.indd 22 8/14/07 6:54:06 PM8/14/07 6:54:06 PM

Technical Guide 23
Item Writer Training. Item writers were classroom teachers and other educators who had
experience with the everyday reading ability of students at various levels. The use of
individuals with these types of experiences helped to ensure that the items are valid
measures of reading comprehension. Item writers were provided with training materials
concerning the embedded completion item format and guidelines for selecting passages,
developing statements, and creating options. The item writing materials also contained
incorrect items that illustrated the criteria used to evaluate items and corrections based
on those criteria. The nal phase of item writer training was a short practice session with
three items.
Item writers were provided vocabulary lists to use during statement and option develop-
ment. The vocabulary lists were compiled from spelling books one grade level below the
level targeted by the item. The rationale was that these words should be part of a reader’s
“working” vocabulary if they were learned the previous year.
Item writers were also given extensive training related to sensitivity issues. Part of the
item-writing materials addressed these issues and identi ed areas to avoid when selecting
passages and developing items. The following areas were covered: violence and crime,
depressing situations/death, o ensive language, drugs/alcohol/tobacco, sex/attraction,
race/ethnicity, class, gender, religion, supernatural/magic, parent/family, politics, animals/
environment, and brand names/junk food. These materials were developed to be com pliant
with standards of universal design and fair access—equal treatment of the sexes, fair
representation of minority groups, and the fair representation of disabled individuals.
Item Review. All items were subjected to a two-stage review process. First, items were
reviewed and edited according to the 19 criteria identi ed in the item-writing materials
and for sensitivity issues. Approximately 25% of the items developed were deleted for
various reason. Where possible, items were edited and maintained in the item bank.
Items were then reviewed and edited by a group of specialists representing various
perspectives: test developers, editors, and curriculum specialists. These individuals examined
each item for sensitivity issues and the quality of the response options. During the second
stage of the item review process, items were either “approved as presented,” “approved with
edits,” or “deleted.” Approximately 10% of the items written were “approved with edits” or
“deleted” at this stage. When necessary, item writers received additional ongoing feedback
and training.
74216_SRI_TechGuide_FC-105.indd 2374216_SRI_TechGuide_FC-105.indd 23 8/14/07 6:54:06 PM8/14/07 6:54:06 PM

Scholastic Reading Inventory
24
Item Analyses. As part of the linking studies and research studies conducted by MetaMetrics,
items in the Lexile Item Bank were evaluated for di culty (relationship between logit
[observed Lexile measure] and theoretical Lexile measure), internal consistency (point-
biserial correlation), and bias (ethnicity and gender where possible). Where necessary, items
were deleted from the item bank or revised and recalibrated.
During the spring of 1999, eight levels of a Lexile assessment were administered in a large
urban school district to students in Grades 1 through 12. The eight test levels were admin-
istered in Grades 1, 2, 3, 4, 5, 6, 7–8, and 9–12 and ranged from 40 to 70 items depending
on the grade level. A total of 427 items were administered across the eight test levels. Each
item was answered by at least 9,000 students (the number of students per level ranged
from 9,286 in Grade 2 to 19,056 in Grades 9–12). The item responses were submitted
to a Winsteps IRT analysis. The resulting item di culties (in logits) were assigned Lexile
measures by multiplying by 180 and anchoring each set of items to the mean theoretical
di culty of the items on the form.
74216_SRI_TechGuide_FC-105.indd 2474216_SRI_TechGuide_FC-105.indd 24 8/14/07 6:54:07 PM8/14/07 6:54:07 PM

Technical Guide 25
Description of the Test
Test Materials
SRI is “an interactive reading comprehension test that provides an assessment of reading
levels, reported in Lexile measures” (Scholastic, 2006a, p. 1). The results can be used to
measure how well readers comprehend literary and expository texts of varying di culties.
Item Bank. SRI consists of a bank of approximately 5,000 multiple-choice items that are
presented as embedded completion items. In this question format the student is asked to
read a passage taken from an actual text and then choose the option that best lls the blank
in the last statement. In order to complete the statement, the student must respond on a
literal level (recall a fact) or an inferential level (determine the main idea of the passage,
draw an inference from the material presented, or make a connection between sentences in
the passage).
Educator’s Guide. This guide provides an overview of the SRI software and software
support. Educators are provided information on getting started with the software (install-
ing it, enrolling students, reporting results), how the SRI student program works (login,
book interest screen, Practice Test, Locator Test, SRI test, and reports), and working with
the Scholastic Achievement Manager (SAM). SAM is the learning management system
for all Scholastic software programs including READ 180, Scholastic Reading Counts!, and
ReadAbout. Educators use SAM to collect and organize student-produced data. SAM
helps educators understand and implement data-driven instruction by
managing student rosters;
generating reports that capture student performance data at various
levels of aggregation (student, classroom, group, school, and district);
locating helpful resources for classroom instruction and aligning the
instruction to standards; and
communicating student progress to parents, teachers, and administrators.
The Educator’s Guide also provides teachers with information on how to use the results
from SRI in the classroom. Teachers can access their students’ reading levels and prescribe
appropriate instructional support material to aid in developing their students’ reading
skills and growth as readers. Information related to best practices for test administration,
interpreting reports, and using Lexiles in the classroom is provided. Reproducibles are
also provided to help educators communicate SRI results to parents, monitor growth, and
recommend books.
•
•
•
•
74216_SRI_TechGuide_FC-105.indd 2574216_SRI_TechGuide_FC-105.indd 25 9/26/07 6:03:39 PM9/26/07 6:03:39 PM

Scholastic Reading Inventory
26
Test Administration and Scoring
Administration Time. SRI can be administered at any time during the school year. The
tests are intended to be untimed. Typically, students take 20–30 minutes to complete the
test. There should be at least eight weeks of elapsed time between administrations to allow
for growth in reading ability.
Administration Setting. SRI can be administered in a group setting or individually—
wherever computers are available: in the classroom, in a computer lab, or in the library
media center. The setting should be quiet and free from distractions. Teachers should make
sure that students have the computer skills needed to complete the test. Practice items
are provided to ensure that students understand the directions and know how to use the
computer to take the test.
Administration and Scoring. The student experience with SRI consists of three phrases:
practice test, locator test, and SRI test. Prior to testing, the teacher or administrator inputs
information into the computer-adaptive algorithm that controls the administration of the
test. The student’s identi cation number and grade level must be input; prior standardized
reading results (Lexile measure, percentile, stanine, or NCE) and the teacher’s judgment of
the student’s reading level (Far Below, Below, On, Above, or Far Above) should be input.
This information is used to determine the best starting point for the student.
The Practice Test consists of three items that are signi cantly below the student’s reading level
(approximately 10th percentile for grade level). The practice items are administered only
during the student’s rst experience with SRI and are designed to ensure that the student
understands the directions and how to use the computer to take the test.
For students in Grades 7 and above and for whom the only data to set the starting item
di culty is their grade level, a Locator Test is presented to better target the students. The
Locator Test consists of 2–5 items that have a reading demand 500L below the “On Level”
designation for the grade. The results are used to establish the student’s prior reading ability
level. If students respond incorrectly to one or more items, their prior reading ability is set
to “Far Below Grade Level.”
SRI uses a three-phase approach to assess a student’s level of reading comprehension: Start,
Step, Stop. During test administration, the computer adapts the test continually according
to the student’s responses to the items. The student starts the test; the test steps up or down
according to the student’s performance; and, when the computer has enough information
about the student’s reading level, the test stops.
The rst phase, Start, determines the best point on the Lexile scale to begin testing the
student. The more information that is input into the algorithm, the better targeted the
beginning of the test. Research has shown that well-targeted tests include less error in
reporting student scores than poorly targeted tests. A student is targeted in one of three
ways: (1) the teacher or test administrator enters the student’s Estimated Reading Level;
(2) the student is in Grade 6 or below and the student’s grade level is used; or (3) the
student is in Grade 7 or above and the Locator Test is administered.
74216_SRI_TechGuide_FC-105.indd 2674216_SRI_TechGuide_FC-105.indd 26 8/14/07 6:54:07 PM8/14/07 6:54:07 PM
Technical Guide 27
For the student whose test administration is illustrated in Figure 2, the teacher input the
student’s grade (6) and Lexile measure from the previously administered SRI Print.
Figure 2. Sample administration of
SRI
for a sixth-grade student with a prior Lexile
measure of 880L.
Item Difficulty
SRI Administration
900
890
880
870
860
850
840
830
820
810
800
790
Q1
Q2
Q3
Q4
Q5
Q6
Q7
Q8
Q9
Q10
Q11
Q12
Q13
Q14
The second phase, Step, controls the selection of items presented to the student. If only the
student’s grade level was input during the rst phase, then the student is presented with an
item that has a Lexile measure at the 50th percentile for her grade. If more information
about the student’s reading ability was input during the rst phase, then the student is
presented with an item that is nearer her true ability. If the student answers the item
correctly, then she is presented with an item that is slightly more di cult. If the student
responds incorrectly to the item, then she is presented with an item that is slightly easier.
After the student responds to each item, her SRI score (Lexile measure) is recomputed.
Figure 2 above shows how SRI could be administered. The rst item presented to the
student measured 800L. Because she answered the item correctly, the next item was slightly
more di cult (810L), her third item measured 830L. Because she responded incorrectly to
this item, the next item was slightly easier (820L).
The nal phase, Stop, controls the termination of the test. Each student will be presented
15–25 items. The exact number of items a student receives depends on how the student
responds to the items as they are presented. In addition, the number of items presented to
the student is a ected by how well the test is targeted in the beginning. Well-targeted tests
74216_SRI_TechGuide_FC-105.indd 2774216_SRI_TechGuide_FC-105.indd 27 8/14/07 6:54:07 PM8/14/07 6:54:07 PM

Scholastic Reading Inventory
28
begin with less measurement error and, therefore, the student will be asked to respond to
fewer items.
Because the test administered to the student in Figure 2 was well-targeted to her reading
level (50th percentile for Grade 6 is 880L), only 15 items were administered to the student
to determine her Lexile measure.
Results from SRI are reported as scale scores (Lexile measures). This scale extends from
Beginning Reader (less than 100L) to 1500L. A scale score is determined by the di culty
of the items a student answered both correctly and incorrectly. Scale scores can be used to
report the results of both criterion-referenced tests and norm-referenced tests.
There are many reasons to use scale scores rather than raw scores to report test results.
Scale scores overcome the disadvantage of many other types of scores (e.g., percentiles and
raw scores) in that equal di erences between scale score points represent equal di erences
in achievement. Each question on a test has a unique level of di culty; therefore, answer-
ing 23 items correctly on one form of a test requires a slightly di erent level of achieve-
ment than answering 23 items correctly on another form of the test. But receiving a scale
score (in this case, a Lexile measure) of 675L on one form of a test represents the same level
of reading ability as receiving a scale score of 675L on another form of the test.
Keep in mind that no one test should be the sole determinate when making high-stakes
decisions about students (e.g., summer-school placement or retention). Consider the
student’s interests and experiences, as well as knowledge of each student’s reading abilities,
when making these kinds of decisions.
SRI begins with the concept of targeted level testing and takes it a step further. With the
Lexile Framework as the yardstick of text di culty, SRI produces a measure that places texts
and readers on the same scale. The Lexile measure connects each student to actual reading
materials—school texts, story books, magazines, newspapers, employee instructions—which
can be readily understood by that student. Because SRI provides an accurate measure of
where each student reads among the variety of reading materials calibrated in the Lexile
Titles Database, the instructional approach and reading assignments for optimal growth are
explicit. SRI targeted testing not only measures how well each student can actually read, but
also locates them among the real reading materials which are most useful to them. In addi-
tion, the performance experience of taking a targeted test, a test that, because of its targeting,
is both challenging and reassuring, brings out the best in students.
Interpreting Scholastic Reading Inventory Scores
SRI provides both criterion-referenced and norm-referenced interpretations of the
Lexile measures. Criterion-referenced interpretations of test results provide a rich frame
of reference that can be used to guide instruction and text selection for optimal student
reading growth. While norm-referenced interpretations of test results are often required for
accountability purposes, they indicate only how well the student is reading in relation to
how other, similar students read.
74216_SRI_TechGuide_FC-105.indd 2874216_SRI_TechGuide_FC-105.indd 28 8/14/07 6:54:09 PM8/14/07 6:54:09 PM
Technical Guide 29
Norm-Referenced Interpretations. A norm-referenced interpretation of a test score expresses
how a student performed on the test compared to other students of the same age or grade.
Norm-referenced interpretations of reading test results, however, do not provide any infor-
mation about what a student can or cannot read. For accountability purposes, percentiles,
normal curve equivalents (NCEs), and stanines are used to report test results when making
comparisons (norm-referenced interpretations). For a comparison of these measures, refer
to Figure 3.
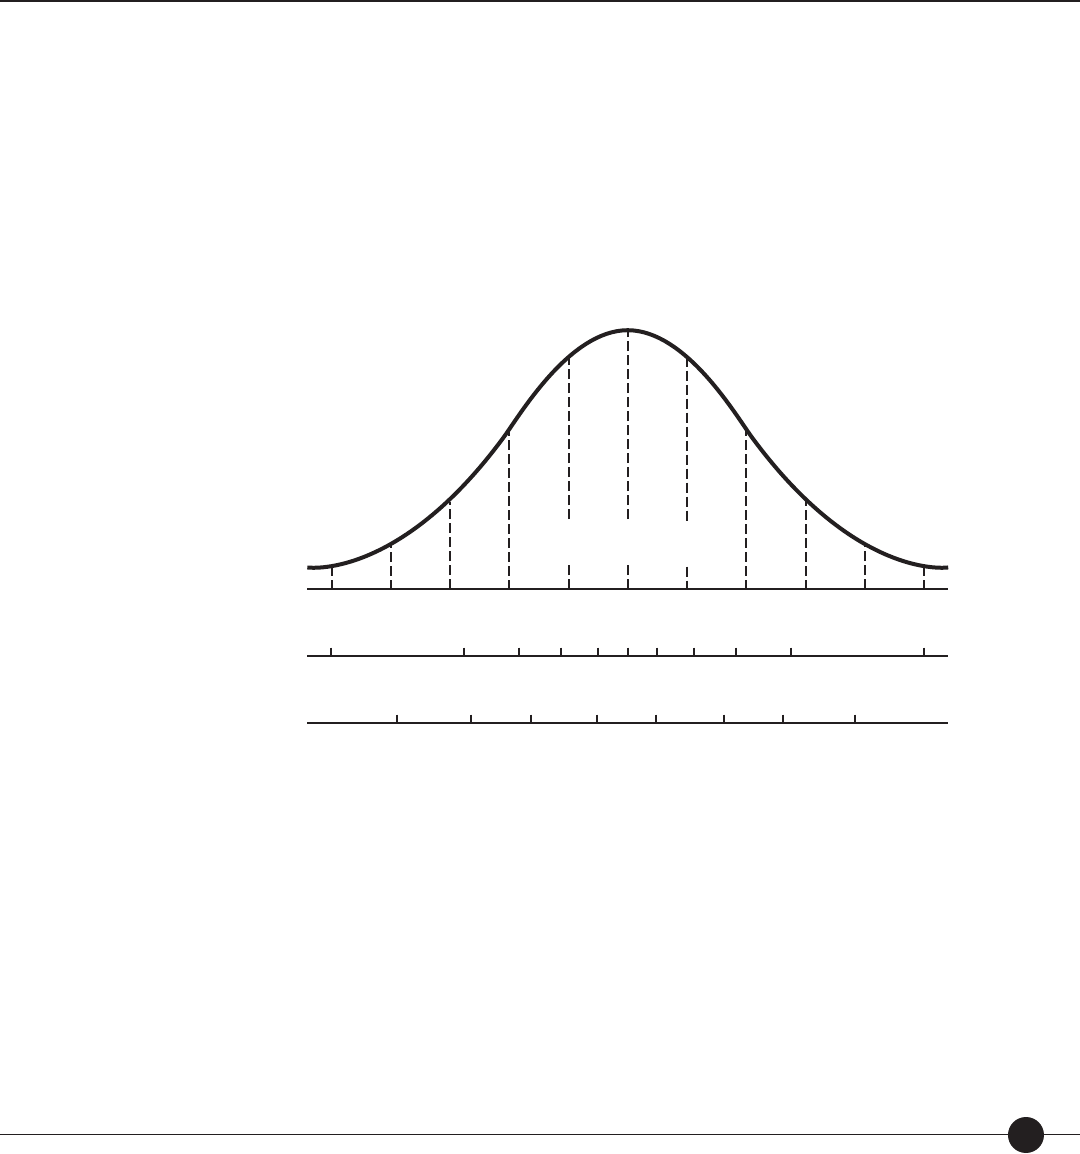
Figure 3. Normal distraction of scores described in scale scores, percentiles, stanines,
and normal curve equivalents (NCEs).
Stanines
1
1
1 10203040506070
151818159512 9 5 21
80 90 99
10 20 30 40 50 60 70 80 90 95
2 3 4567 8 9
Percentiles
Normal curve equivalent scores (NCEs)
Percentage of area
under the normal curve
The percentile rank of a score indicates the percentage of scores less than or equal to that score.
Percentile ranks range from 1 to 99. For example, if a student scores at the 65th percentile,
it means that he or she performed as well as or better than 65% of the norm group. Real
di erences in performance are greater at the ends of the percentile range than in the middle.
Percentile ranks of scores can be compared across two or more distributions; percentile ranks
cannot be used to determine di erences in relative rank due to the fact that the intervals
between adjacent percentile ranks do not necessarily represent equal raw score intervals. Note
that the percentile rank does not refer to the percentage of items answered correctly.
A normal curve equivalent (NCE) is a normalized student score with a mean of 50 and a
standard deviation of 21.06. NCEs range from 1 to 99. NCEs allow comparisons between
di erent tests for the same student or group of students and between di erent students on
74216_SRI_TechGuide_FC-105.indd 2974216_SRI_TechGuide_FC-105.indd 29 8/14/07 6:54:09 PM8/14/07 6:54:09 PM

Scholastic Reading Inventory
30
the same test. NCEs have many of the same characteristics as percentile ranks, but have the
additional advantage of being based on an interval scale. That is, the di erence between
two consecutive scores on the scale has the same meaning throughout the scale. NCEs are
required by many categorical funding agencies (for example, Title I).
A stanine is a standardized student score with a mean of 5 and a standard deviation of 2.
Stanines range from 1 to 9. In general, stanines of 1–3 are considered below average, stanines
of 4–6 are considered average, and stanines of 7–9 are considered above average. A di erence
of 2 between the stanines for two measures indicates that the two measures are signi cantly
di erent. Stanines, like percentiles, indicate a student’s relative standing in a norm group.
While not very useful at the student level, normative information can be useful (and often
required) at the aggregate levels for program evaluation. Appendix 2 contains normative
data (percentiles, stanines, and NCEs) for some levels of SRI. Complete levels are found
in the SRI program under the Resource Section in the Scholastic Achievement Manager
(SAM).
A linking study conducted with the Lexile Framework developed normative information
based on a sample of 512,224 students from a medium-to-large state. The majority of the
students in the norming population were Caucasian (66.3%), with 29.3% African American,
1.7% Native American, 1.2% Hispanic, 1.0% Asian, and 0.6% Other. Less than 1% (0.7%) of
the students were classi ed as “limited English pro cient,” and 10.1% of the students were
classi ed as “Students with Disabilities.” Approximately 40% of the students were eligible
for the free or reduced-price lunch program. Approximately half of the schools in the state
had some form of Title I program (either school-wide or targeted assistance). The sample’s
distributions of scores on norm-referenced and other standardized measures of reading
comprehension are similar to those reported for national distributions.
Criterion-Referenced Interpretations. An important feature of the Lexile Framework is that it
also provides criterion-referenced interpretations of every measure. A criterion-referenced
interpretation of a test score compares the speci c knowledge and skills measured by the
test to the student’s pro ciency with the same knowledge and skills. Criterion-referenced
scores have meaning in terms of what the student knows or can do, rather than in relation
to the scores produced by some external reference (or norm) group.
When a reader’s measure is equal to the task’s calibration, then the Lexile scale forecasts that
the individual has a 75% comprehension rate on that task. When 20 such tasks are given
to this reader, one expects three-fourths of the responses to be correct. If the task is more
di cult than the reader is able, then the probability is less than 75% that the response of the
person to the task will be correct. Similarly, when the task is easier compared to a reader’s
measure, then the probability is greater than 75% that the response will be correct.
There is empirical evidence supporting the choice of a 75% target comprehension rate,
as opposed to, say, a 50% or a 90% rate. Squires, Huitt, and Segars (1983) observed that
reading achievement for second-graders peaked when the success rate reached 75%. A
75% success rate also is supported by the ndings of Crawford, King, Brophy, and Evertson
(1975), Rim (1980), and Huynh (1998). It may be, however, that there is no one optimal
74216_SRI_TechGuide_FC-105.indd 3074216_SRI_TechGuide_FC-105.indd 30 8/14/07 6:54:09 PM8/14/07 6:54:09 PM

Technical Guide 31
rate of reading comprehension. It may be that there is a range in which individuals can
operate to optimally improve their reading ability.
Since the Lexile Theory provides complementary procedures for measuring people and text,
the scale can be used to match a person’s level of comprehension with books that the person
is forecast to read with a high comprehension rate. Trying to identify possible supplemental
reading materials for students has, for the most part, relied on a teacher’s familiarity with the
titles. For example, an eighth-grade girl who is interested in sports but is not reading at grade
level may be interested in reading a biography about Chris Evert. The teacher may not know,
however, whether a speci c biography is too di cult or too easy for the student. The Lexile
Framework provides a reader measure and a text measure on the same scale. Armed with this
information, a teacher, librarian, media specialist, student, or parent can plan for success.
Readers develop reading comprehension skills by reading. Skill development is enhanced
when their reading is accompanied by frequent response requirements. Response require-
ments may be structured in a variety of ways. An instructor may ask oral questions as
the reader progresses through the prose or written questions may be embedded in the
text, much as is done with Scholastic Reading Inventory items. Response requirements are
important; unless there is some evaluation and self-assessment, there can be no assurance
that the reader is properly targeted and comprehending the material. Students need to
be given a text on which they can practice being a competent reader (Smith, 1973). The
above approach does not complete a fully articulated instructional theory, but its prescrip-
tion is straightforward. Students need to read more and teachers need to monitor this
reading with some e cient response requirement. One implication of these notions is that
some of the time spent on skill sheets might be better spent reading targeted prose with
concomitant response requirements (Anderson, Hiebert, Scott, and Wilkinson, 1985). This
approach has been supported by the research of Five (1980) and Hiebert (1998).
As the reader improves, new titles with higher text measures can be chosen to match the
growing reader ability. This results in a constantly growing person-measure, thus keeping
the comprehension rate at the most productive level. We need to locate a reader’s “edge”
and then expose the reader to text that plays on that edge. When this approach is followed
in any domain of human development, the edge moves and the capacities of the individual
are enhanced.
What happens when the “edge” is over-estimated and repeatedly exceeded? In physical exer-
tion, if you push beyond the edge you feel pain; if you demand even more from the muscle,
you will experience severe muscle strain or ligament damage. In reading, playing on the edge
is a satisfying and con dence-building activity, but exceeding that edge by over-challenging
readers with out-of-reach materials reduces self-con dence, stunts growth, and results in the
individual “tuning out.” The tremendous emphasis on reading in daily activities makes every
encounter with written text a recon rmation of a poor reader’s inadequacy.
For individuals to become competent readers, they need to be exposed to text that results
in a comprehension rate of 75% or better. If an 850L reader is faced with an 1100L text
(resulting in a 50% comprehension rate), there will be too much unfamiliar vocabulary
74216_SRI_TechGuide_FC-105.indd 3174216_SRI_TechGuide_FC-105.indd 31 8/14/07 6:54:10 PM8/14/07 6:54:10 PM

Scholastic Reading Inventory
32
and too much of a load placed on the reader’s tolerance for syntactical complexity for that
reader to attend to meaning. The rhythm and ow of familiar sentence structures will
be interrupted by frequent unfamiliar vocabulary, resulting in ine cient chunking and
short-term memory overload. When readers are correctly targeted, they read uidly with
comprehension; when incorrectly targeted, they struggle both with the material and with
maintaining their self-esteem. Within the Lexile Framework, there are no poor readers—only
mistargeted readers who are being over challenged.
Forecasting Comprehension Rates. A reader with a measure of 600L who is given a text
measured at 600L is expected to have a 75% comprehension rate. This 75% comprehension
rate is the basis for selecting text that is targeted to a reader’s ability, but what exactly does
it mean? And what would the comprehension rate be if this same reader were given a text
measured at 350L or one at 850L?
The 75% comprehension rate for a reader-text pairing can be given an operational mean-
ing by imagining the text is carved into item-sized ”chunks” of approximately 125–140
words with a question embedded in each chunk. A reader who answers three-fourths of
the questions correctly has a 75% comprehension rate.
Suppose instead that the text and reader measures are not the same. The di erence in
Lexiles between reader and text governs comprehension. If the text measure is less than
the reader measure, the comprehension rate will exceed 75%. If the text measure is much
less, the comprehension rate will be much greater. But how much greater? What is the
expected comprehension rate when a 600L reader reads a 350L text?
If all the item-sized chunks in the 350L text had the same calibration, the 250L di erence
between the 600L reader and the 350L text could be determined using the Rasch model
equation (Equation 2 on page 37). This equation describes the relationship between the
measure of a student’s level of reading comprehension and the calibration of the items.
Unfortunately, comprehension rates calculated only by this procedure would be biased
because the calibrations of the slices in ordinary prose are not all the same. The average
di culty level of the slices and their variability both a ect the comprehension rate.
Figure 4 shows the general relationship between reader-text discrepancy and forecasted
comprehension rate. When the reader measure and the text calibration are the same, then
the forecasted comprehension rate is 75%. In the example from the preceding paragraph,
the di erence between the reader measure of 600L and the text calibration of 350L is
250L. Referring to Figure 4 and using +250L (reader minus text), the forecasted compre-
hension rate for this reader-text combination would be 90%.
The subjective experience of 50%, 75%, and 90% comprehension as reported by readers
varies greatly. A 1000L reader reading 1000L text (75% comprehension) reports con dence
and competence. Teachers listening to such a reader report that the reader can sustain the
meaning thread of the text and can read with motivation and appropriate emotion and
emphasis. In short, such readers appear to comprehend what they are reading. A 1000L
reader reading 1250L text (50% comprehension) encounters so much unfamiliar vocabu-
lary and di cult syntax that the meaning thread is frequently lost.
74216_SRI_TechGuide_FC-105.indd 3274216_SRI_TechGuide_FC-105.indd 32 8/14/07 6:54:10 PM8/14/07 6:54:10 PM
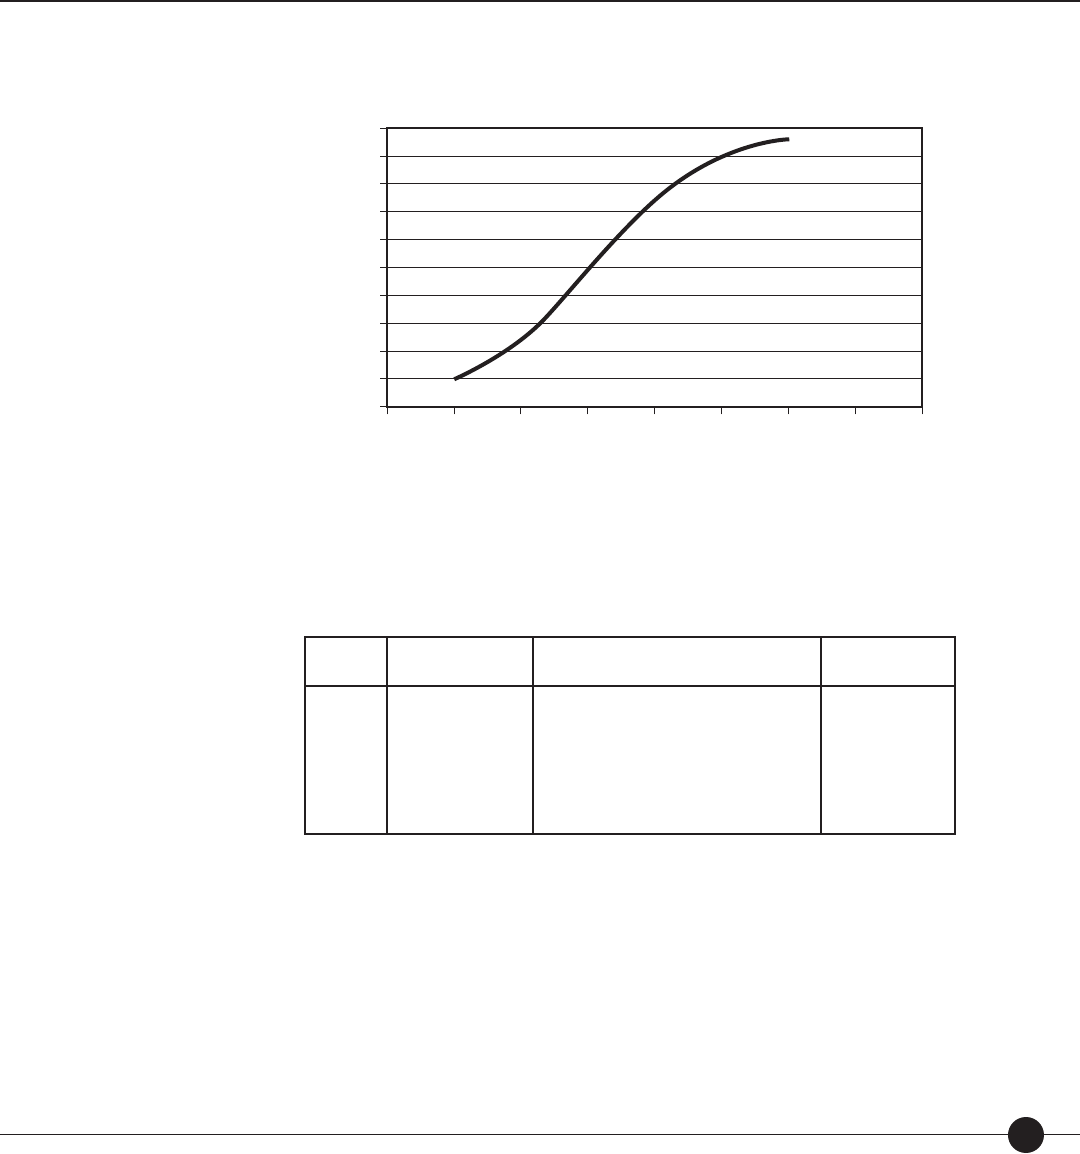
Technical Guide 33
Figure 4. Relationship between reader-text discrepancy and forecasted reading
comprehension rate.
Forecasted Comprehension Rate
1.00
0.90
0.80
0.70
0.60
0.50
0.40
0.30
0.20
0.10
0.00
–1000 –750 –500 –250 0 250 500 750 1000
Reader – Text (in Lexiles)
Tables 4 and 5 show comprehension rates calculated for various combinations of reader
measures and text calibrations.
Table 4. Comprehension rates for the same individual with materials of varying
comprehension diffi culty.
Reader
Measure Text Calibration Sample Titles Forecasted
Comprehension
1000L
1000L
1000L
1000L
1000L
500L
750L
1000L
1250L
1500L
Tornado (Byars)
The Martian Chronicles (Bradbury)
Reader’s Digest
The Call of the Wild (London)
On the Equality Among Mankind
(Rousseau)
96%
90%
75%
50%
25%
Such readers report frustration and seldom choose to read independently at this level of
comprehension. Finally, a 1000L reader reading 750L text (90% comprehension) reports total
control of the text, reads with speed, and experiences automaticity during the reading process.
The primary utility of the Lexile Framework is its ability to forecast what happens when
readers confront text. Every application by a teacher, student, librarian, or parent is a test
of the Lexile framework’s accuracy. The Lexile framework makes a point prediction every
time a text is chosen for a reader. Anecdotal evidence suggests that the Lexile Framework
74216_SRI_TechGuide_FC-105.indd 3374216_SRI_TechGuide_FC-105.indd 33 8/14/07 6:54:10 PM8/14/07 6:54:10 PM
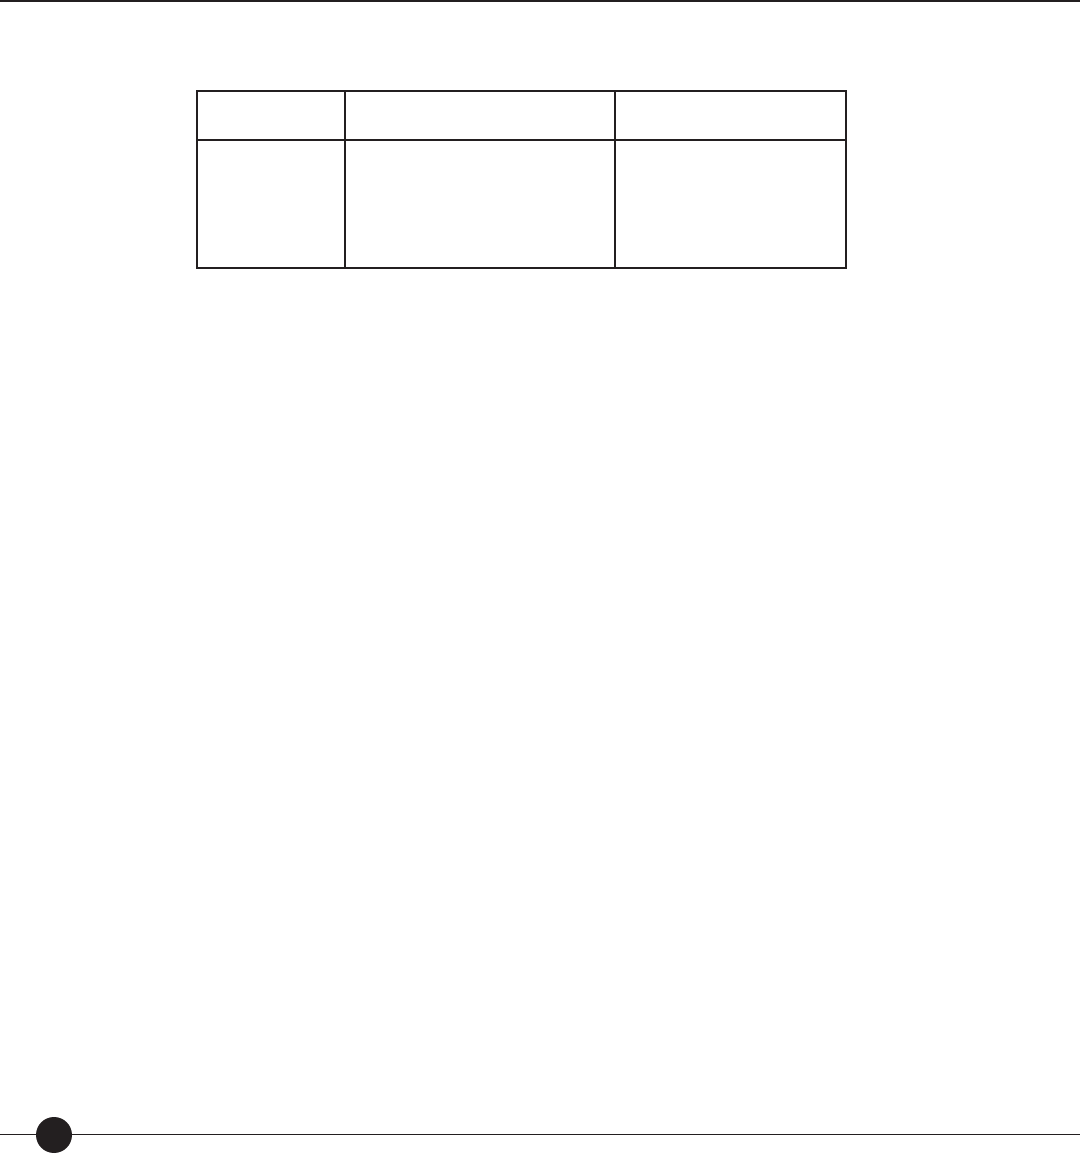
Scholastic Reading Inventory
34
Table 5. Comprehension rates of different-ability readers with the same material.
Reader
Measure Calibration of
Typical Grade 10 Textbook Forecasted
Comprehension Rate
500L
750L
1000L
1250L
1500L
1000L
1000L
1000L
1000L
1000L
25%
50%
75%
90%
96%
predicts as intended. That is not to say the forecasted comprehension is error-free. There is
error in text measures, reader measures, and their di erence modeled as forecasted compre-
hension. However, the error is su ciently small that the judgments about readers, texts, and
comprehension rates are useful.
Performance Standard Pro ciency Bands. A growing trend in education is to di erentiate
between content standards—curricular frameworks that specify what should be taught at each
grade level—and performance standards—what students must do to demonstrate pro ciency
with respect to the speci c content. Increasingly, educators and parents want to know more
than just how a student’s performance compares with that of other students: they ask, “What
level of performance does a score represent?” and “How good is good enough?”
The Lexile Framework for Reading, in combination with Scholastic Reading Inventory,
provides a context for examining performance standards from two perspectives—
reader-based standards and text-based standards. Reader-based standards are determined
by examining the skills and knowledge of students identi ed as being at the requisite level
(the examinee-centered method) or by examining the test items and de ning what level of
skills and knowledge the student must have to be at the requisite level (the task-centered
method). A cut score is established that di erentiates between students who have the
desired level of skills and knowledge to be considered as meeting the standard and those
who do not. Text-based standards are determined by specifying those texts that students
with a certain level of skills and knowledge (for example, a high school graduate) should be
able to read with a speci ed level of comprehension. A cut score is established that re ects
this level of ability and is then annotated with benchmark texts descriptive of the standard.
In 1999, four performance standards were set at each grade level in SRI—Below Basic,
Basic, Pro cient, and Advanced. Pro cient was de ned as performance that exhibited
competent academic performance when students read grade-level appropriate text and
could be considered as reading “on Grade Level.” Students performing at this level should
be able to identify details, draw conclusions, and make comparisons and generalizations
when reading materials developmentally appropriate for their nominal grade level.
74216_SRI_TechGuide_FC-105.indd 3474216_SRI_TechGuide_FC-105.indd 34 8/14/07 6:54:10 PM8/14/07 6:54:10 PM

Technical Guide 35
The standard-setting group consisted of curriculum specialists, test development consul-
tants, and other educators. A general description of the process used by the standard-setting
group to arrive at the nal cut scores follows:
Group members reviewed previously established performance standards
for Grades 1–12 that could be reported in terms of the Lexile scale.
Information that de ned and/or described each of the measures was
provided to the group. In addition, for the reader-based standards,
information was provided concerning when the standards were set, the
policy de nition of the standards, the performance descriptors of the
standards (where available), the method used to set the standards, and the
type of impact data provided to the panelists.
Reader-based standards included the following: the Stanford Achievement
Test, Version 9 (Harcourt Brace Educational Measurement, 1997); the
North Carolina End-of-Grade Test (North Carolina Department of Public
Instruction, 1996); and the National Assessment of Educational Progress
(National Assessment Governing Board, 1997).
Text-based standards included the following: Miami-Dade Public
Schools (Miami, Florida, 1998); text on the National Assessment of
Educational Progress at Grades 4, 8, and 12; text-based materials found
in classrooms and delineated on the Lexile Map; materials associated
with adult literacy (workplace—1100L–1400L; continuing educa-
tion—1100L–1400L; citizenship—newspapers 1200L–1400L; morals,
ethics, and religion—1400L–1500L; and entertainment—typical
novels 900L–1100L); and grade-level based curriculum materials such
as READ 180 by Scholastic Inc.
Round 1. Members of the standard-setting group individually studied
the previously established performance standards and determined
corresponding Lexile measures for student performance at the top and
bottom of the “Pro cient” standard.
Round 2. The performance levels identi ed for each grade in Round
1 were distributed to all members of the standard-setting group. The
group discussed the range of cut scores identi ed for a grade level
until consensus was reached. The process was repeated for each grade,
1–11. In addition, lower “intervention” points were identi ed that
could be used to ag results that indicated a student was signi cantly
below grade level (the “Below Basic” performance standard).
Round 3. In this round impact data were provided to the members
of the standard-setting group. This information was based on the
reader-based standards that had been previously established (Stanford
Achievement Test, Version 9 national percentiles).
•
•
•
•
•
•
74216_SRI_TechGuide_FC-105.indd 3574216_SRI_TechGuide_FC-105.indd 35 8/14/07 6:54:11 PM8/14/07 6:54:11 PM
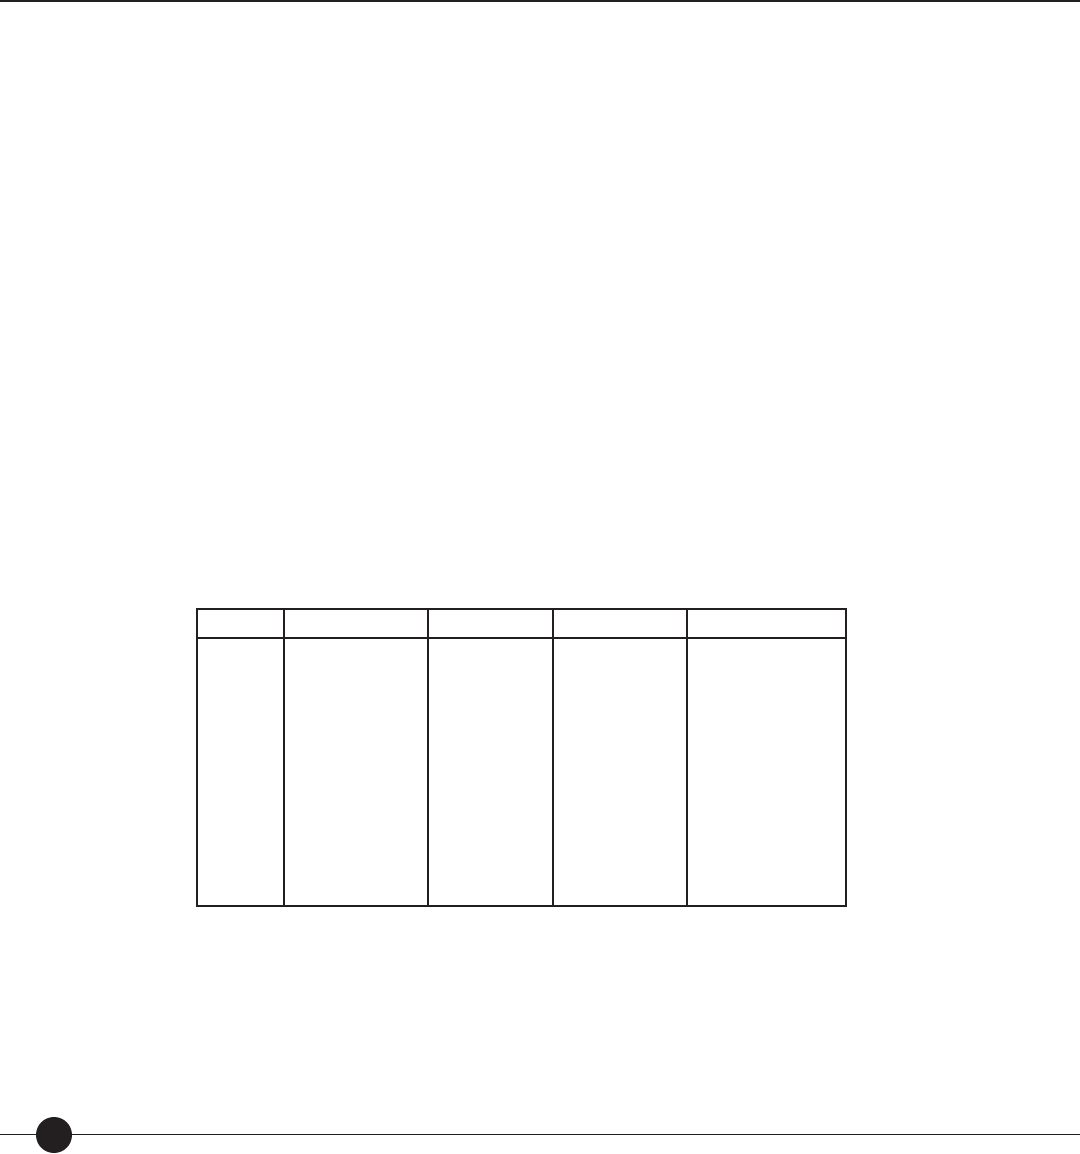
Scholastic Reading Inventory
36
The policy descriptions for each of the performance standard pro ciency band used at
each grade level are as follows:
Advanced: Students scoring in this range exhibit superior performance
when reading grade-level appropriate text and can be considered as
reading “above Grade Level.”
Pro cient: Students scoring in this range exhibit competent performance
when reading grade-level appropriate text and can be considered as
reading “on Grade Level.” Students performing at this level should be
able to identify details, draw conclusions, and make comparisons and
generalizations when reading materials developmentally appropriate for
the grade level.
Basic: Students scoring in this range exhibit minimally competent
performance when reading grade-level appropriate text and can be
considered as reading “Below Grade Level.”
Below Basic: Students scoring in this range do not exhibit minimally
competent performance when reading grade-level appropriate text
and can be considered as reading signi cantly “Below Grade Level.”
The nal cut scores for each grade level in Scholastic Reading Inventory are presented in Table 6.
Table 6. Performance standard profi ciency bands for
SRI
, in Lexiles, by grade.
Grade Below Basic Basic Profi cient Advanced
1
2
3
4
5
6
7
8
9
10
11
—
99 and Below
249 and Below
349 and Below
449 and Below
499 and Below
549 and Below
599 and Below
649 and Below
699 and Below
799 and Below
99 and Below
100 to 299
250 to 499
350 to 599
450 to 699
500 to 799
550 to 849
600 to 899
650 to 999
700 to 1024
800 to 1049
100 to 400
300 to 600
500 to 800
600 to 900
700 to 1000
800 to 1050
850 to 1100
900 to 1150
1000 to 1200
1025 to 1250
1050 to 1300
401 and Above
601 and Above
801 and Above
901 and Above
1001 and Above
1051 and Above
1101 and Above
1151 and Above
1201 and Above
1251 and Above
1301 and Above
Note: The original standards for Grade 2 were revised by Scholastic Inc. (December 1999) and are presented above. The original
standards for Grades 9, 10, and 11 were revised by Scholastic Inc. (January 2000) and are presented above.
•
•
•
•
74216_SRI_TechGuide_FC-105.indd 3674216_SRI_TechGuide_FC-105.indd 36 8/14/07 6:54:11 PM8/14/07 6:54:11 PM

Technical Guide 37
Using SRI Results
The Lexile Framework for Reading provides teachers and educators with tools to help
them link the results of assessment with subsequent instruction. Tests such as SRI that are
linked to the Lexile scale provide tools for monitoring the progress of students at any time
during the school year.
When a reader takes an SRI test, his or her results are reported as a Lexile measure. This
means, for example, that a student whose reading skills have been measured at 500L is
expected to read with 75% comprehension a book that is also measured at 500L. When the
reader and text are matched by their Lexile measures, the reader is “targeted.” A targeted
reader reports con dence, competence, and control over the text. When a text measure
is 250L above the reader’s measure, comprehension is predicted to drop to 50% and the
reader experiences frustration and inadequacy. Conversely, when a text measure is 250L
below the reader’s measure, comprehension is predicted to increase to 90% and the reader
experiences total control and automaticity.
Lexile Framework. The Lexile Framework for Reading is a tool that can help determine
the reading level of written material—from a book, to a test item, to a magazine article,
to a Web site, to a textbook. After test results are converted into Lexile measures, readers
can be matched with materials on their own level. More than 100,000 books, 80 million
periodical articles, and many newspapers have been leveled using this tool to assist in select-
ing reading materials.
Developed by the psychometric research company MetaMetrics, Inc., the Lexile Frame-
work was funded in part by a series of grants from the National Institute of Child Health
and Human Development. The Lexile Framework makes provisions for students who
read below or beyond their grade level. See the Lexile Framework Map in Appendix 1
for ction and non ction titles, leveled reading samples, and approximate grade ranges.
A Lexile measure is the speci c number assigned to any text. A computer program called
the Lexile Analyzer® computes it. The Lexile Analyzer carefully examines the complete text
to measure such characteristics as sentence length and word frequency—characteristics
that are highly related to overall reading comprehension. The Lexile Analyzer then reports a
Lexile measure for the text.
Using the Lexile Framework to Select Books. Teachers, parents, and students can use the
tools provided by the Lexile Framework to plan instruction. When teachers provide parents
and students with lists of titles that match the students’ Lexile measures, they can then work
together to choose appropriate titles that also match the students’ interest and background
knowledge. The Lexile Framework does not prescribe a reading program; it is a tool that gives
educators more control over the variables involved when they design reading instruction. The Lexile
Framework yields multiple opportunities for use in a variety of instructional activities.
After becoming familiar with the Lexile Framework, teachers are likely to think of a
variety of additional creative ways to use this tool to match students to books that they nd
challenging but not frustrating.
74216_SRI_TechGuide_FC-105.indd 3774216_SRI_TechGuide_FC-105.indd 37 8/14/07 6:54:11 PM8/14/07 6:54:11 PM

Scholastic Reading Inventory
38
The Lexile Framework is a system that helps match readers with literature appropriate for
their reading skills. When reading a book within their Lexile range (50L above to 100L
below their Lexile measure), readers should comprehend enough of the text to make sense
of it, while still being challenged enough to maintain interest and learning.
Remember, there are many factors that a ect the relationship between a reader and a book.
These factors include content, age of the reader, interest, suitability of the text, and text
di culty. The Lexile measure of a text, a measure of text di culty, is a good starting point
for the selection process; other factors should then be considered. The Lexile measure
should never be the sole factor considered when selecting a text.
Helping Students Set Appropriate Learning Goals. Students’ Lexile measures can be
used to identify reading materials that they are likely to comprehend with 75% accuracy.
Students can set goals for improving their reading comprehension, and plan clear strategies
to reach those goals, using literature from the appropriate Lexile ranges. Students can be
retested using SRI during the school year to monitor their progress toward their goals.
Monitoring Progress Toward Reading Program Goals. As students’ Lexile measures increase,
their reading comprehension ability increases, and the set of reading materials they can
comprehend at 75% accuracy expands. Many school districts are required to write school
improvement plans that include measurable goals. Schools also write grant applications in
which they are required to state how they will monitor progress of the intervention funded
by the grant. For example, schools that receive Reading Excellence Act funds can use the
Lexile Framework for evaluation purposes. Schools can use student-level and district-level
Lexile information to monitor and evaluate interventions designed to improve reading skills.
Examples of measurable goals and clearly related strategies for reading intervention
programs might include:
Goal: At least half of the students will improve their reading compre -
hension abilities by 100L after one year’s use of an intervention.
Goal: Students’ attitudes about reading will improve after reading
10 books at their 75% comprehension rate.
These examples of goals emphasize the fact that the Lexile Framework is not an intervention,
but a tool to help educators plan instruction and measure the success of the reading program.
Including Parents in the Educational Process. Teachers can use the Lexile Framework to
engage parents in the following sample exchanges: “Your child will be able to read with at
least 75% comprehension these materials from the next grade level”; “Your child will need
to improve by 400–500 Lexiles to prepare for college in the next few years. Here is a list of
appropriate titles your child can choose from for reading this summer.”
Challenging the Best Readers. A variety of instructional programs are available for the
poorest readers, but few resources are available to help teachers challenge their best readers.
The Lexile Framework links reading comprehension levels to reading material for the
entire range of reading abilities and will help teachers identify age-appropriate reading
material to challenge the best readers.
74216_SRI_TechGuide_FC-105.indd 3874216_SRI_TechGuide_FC-105.indd 38 8/14/07 6:54:11 PM8/14/07 6:54:11 PM

Technical Guide 39
Studies have shown that students who succeed in school without being challenged often
develop poor work habits and unrealistic expectations of e ortless success as adults. Even
though these problems are not likely to be evidenced until the reader is beyond school age,
providing appropriate-level curriculum to the best students may be as important as it is for
the poorest-reading students.
Improving Students’ Reading Fluency. Educational researchers have found that students
who spend a minimum of three hours a week reading at their own level develop reading
uency that leads to improved mastery. Researchers have also found that students who read
age-appropriate materials with a high level of comprehension also learn to enjoy reading.
Teaching Learning Strategies by Controlling Comprehension Match. The Lexile Frame-
work permits teachers to intentionally under- or over-target students when they want
students to work on uency and automaticity or new skills. Metacognitive ability has
been well documented to play an important role in reading comprehension performance.
When teachers know the level of texts that would challenge a group of readers, they can
systematically target instruction that will allow students to encounter di cult text in a
controlled fashion. Teachers can model appropriate learning strategies for students, such as
rereading or rephrasing text in one’s own words, so that students can then learn what to do
when comprehension breaks down. Then students can practice metacognitive strategies on
selected text while the teacher monitors their progress.
Teachers can use Lexiles to guide a struggling student toward texts at the lower end of the
student’s Lexile range (below 100L to 50L above the Lexile measure). Similarly, advanced
students can be adequately challenged by reading texts at the midpoint of their Lexile
range, or slightly above. Challenging new topics may be approached in the same way.
Reader-focused adjustment of the learning experience relates to the student’s motivation
and purpose. If a student is highly motivated for a particular reading task, the teacher
may suggest books higher in the student’s Lexile range. If the student is less motivated
or intimidated by a reading task, material at the lower end of his or her Lexile range can
provide the comprehension support to keep the student from feeling overwhelmed.
Targeting Instruction to Students’ Abilities. To encourage optimal progress with reading,
teachers need to be aware of the di culty level of the text relative to a student’s reading
level. A text that is too di cult serves to undermine a student’s con dence and diminishes
learning itself. A text that is too easy fosters bad work habits and unrealistic expectations.
When students confront new kinds of texts, their introduction can be softened and made
less intimidating by guiding students to easier reading. On the other hand, students who
are comfortable with a particular genre or format can be challenged with more material
from di cult levels, which will prevent boredom and promote the greatest improvement in
vocabulary and comprehension skills.
74216_SRI_TechGuide_FC-105.indd 3974216_SRI_TechGuide_FC-105.indd 39 8/14/07 6:54:11 PM8/14/07 6:54:11 PM

Scholastic Reading Inventory
40
To become better readers, students need to be continually challenged—they need to be
exposed to less common and more di cult vocabulary in meaningful contexts. A 75%
comprehension rate provides an appropriate level of challenge. If text is too di cult for
a reader, the result is frustration and a probable dislike for reading. If text is too easy, the
result is often boredom. Reading levels promote growth and literacy by providing the
optimal balance. Reading just 20 minutes a day can be vital.
Applying Lexiles Across the Curriculum. Over 450 publishers Lexile their titles, enabling
educators to link all the di erent components of the curriculum to target instruction more
e ectively. Equipped with a student’s Lexile measure, teachers can connect him or her to
books and newspaper and magazine articles that have Lexile measures (visit www.Lexile.
com for more details).
Using Lexiles in the Classroom
Develop individualized reading lists that are tailored to provide
appropriately challenging reading.
Enhance thematic teaching by building a bank of titles at varying
levels that not only support the theme, but also provide a way for all
students to participate in the theme successfully.
Sequence reading materials according to their di culty. For example,
choose one book a month for use as a read-aloud throughout the school
year, then increase the di culty of the books throughout the year. This
approach is also useful for core programs or textbooks organized in
anthology format. (Educators often nd that they need to rearrange the
order of the anthologies to best meet their students’ needs.)
Develop a reading folder that goes home with students and returns
weekly for review. The folder can contain a reading list of books
within the student’s Lexile range, reports of recent assessments, and a
parent form to record reading that occurs at home.
Choose texts lower in a student’s Lexile range when factors make the
reading situation more challenging, threatening, or unfamiliar. Select
texts at or above a student’s range to stimulate growth, when a topic
holds high interest for a student, or when additional support such as
background teaching or discussion is provided.
Use the Lexile Titles Database (at www.Lexile.com) to support book
selection and create booklists within a student’s Lexile range to inform
students’ choices of texts.
Use the Lexile Calculator (at www.Lexile.com) to gauge expected read-
ing comprehension at di erent Lexile measures for readers and texts.
•
•
•
•
•
•
•
74216_SRI_TechGuide_FC-105.indd 4074216_SRI_TechGuide_FC-105.indd 40 8/14/07 6:54:12 PM8/14/07 6:54:12 PM

Technical Guide 41
Using Lexiles in the Library
Label books with Lexile measures to help students nd interesting
books at their reading level.
Compare student Lexile levels with the Lexile levels of the books and
periodicals in the library to help educators analyze and develop the
collection to more fully meet the needs of all students.
Use the Lexile Titles Database (at www.Lexile.com) to support book
selection and create booklists within a student’s Lexile range to help
educators guide student reading selections.
Using Lexiles at Home
Ensure that each child gets plenty of reading practice, concentrating
on material within his or her Lexile range. Parents can ask their child’s
teacher or school librarian to print a list of books in their child’s range
or search the Lexile Titles Database.
Communicate with the child’s teacher and school librarian about the
child’s reading needs and accomplishments. They can use the Lexile
scale to describe their assessment of the child’s reading ability.
When a reading assignment proves too challenging for a child, use
activities to help. For example, review the words and de nitions from
the glossary and the study questions at the end of a chapter before the
child reads the text. Afterwards, be sure to return to the glossary and
study questions to make certain the child understands the material.
Celebrate a child’s reading accomplishments. The Lexile Framework
provides an easy way for readers to track their own growth. Parents
and children can set goals for reading—following a reading schedule,
reading a book with a higher Lexile measure, trying new kinds of
books and articles, or reading a certain number of pages per week.
When children reach the goal, make it an occasion!
Limitations of the Lexile Framework. Just as variables other than temperature a ect
comfort, variables other than semantic and syntactic complexity a ect reading compre-
hension ability. A student’s personal interests and background knowledge are known to
a ect comprehension. We do not dismiss the importance of temperature simply because it
alone does not dictate the comfort of an environment. Similarly, though the information
communicated by the Lexile Framework is valuable, the inclusion of other information
enhances instructional decisions. Parents and students should have the opportunity to give
input regarding students’ interests and background knowledge when test results are linked
to instruction.
•
•
•
•
•
•
•
74216_SRI_TechGuide_FC-105.indd 4174216_SRI_TechGuide_FC-105.indd 41 8/14/07 6:54:12 PM8/14/07 6:54:12 PM

Scholastic Reading Inventory
42
SRI Results and Grade Levels. Lexile measures do not translate precisely to grade levels.
Any grade will encompass a range of readers and reading materials. A fth-grade classroom
will include some readers who are far ahead of the rest (about 250L above) and some read-
ers who are far below the rest (about 250L below). To say that some books are “just right”
for fth graders assumes that all fth graders are reading at the same level. The Lexile
Framework can be used to match readers with texts at whatever level is appropriate.
Just because a student is an excellent reader does not mean that he or she would compre-
hend a text typical of a higher grade level. Without the requisite background knowledge,
a student will still struggle to make sense of the text. A high Lexile measure for a grade
indicates only that the student can read grade-level appropriate materials at a higher level
of comprehension (say 90%).
The real power of the Lexile Framework is in tracking readers’ growth—wherever they
may be in the development of their reading skills. Readers can be matched with texts that
they are forecasted to read with 75% comprehension. As readers grow, they can be matched
with more demanding texts. And, as texts become more demanding, readers grow.
74216_SRI_TechGuide_FC-105.indd 4274216_SRI_TechGuide_FC-105.indd 42 8/14/07 6:54:12 PM8/14/07 6:54:12 PM

Technical Guide 43
Development of Scholastic Reading Inventory
Scholastic Reading Inventory was developed to assess a student’s overall level of reading
comprehension based on the Lexile Framework. SRI is an extension of the test develop-
ment work begun in the 1980s and 1990s on the Early Learning Inventory (MetaMetrics,
1995) and the Lexile Framework which was funded by a series of grants from the National
Institute of Child Health and Human Development. The Early Learning Inventory was
developed for use in Grades 1 through 3 as an alternative to many standardized assessments
of reading comprehension; it was neither normed nor timed and was designed to examine
a student’s ability to read text for meaning.
Item development and test development are interrelated processes; for the purpose of this
document they will be treated as independent activities. A bank of approximately 3,000
items was developed for the initial implementation of SRI. Two subsequent item develop-
ment phases were completed in 2002 and 2003. SRI was rst developed as a print-based
assessment. Two parallel forms of the assessment (A and B) were developed during 1998
and 1999. Also in 1998, Scholastic decided to develop a computer-based, interactive
version of the assessment. The interactive Version 1 of SRI was launched in fall 1999.
Subsequent versions were launched between 1999 and 2003 with Version 1.0/Enterprise
Edition launched in winter 2006.
Development of the SRI Item Bank
Passage Selection. Passages selected for use on Scholastic Reading Inventory came from “real
world” reading materials that students may encounter both in and out of the classroom.
Sources included school textbooks, literature, and periodicals from a variety of interest areas
and material written by authors of di erent backgrounds. The following criteria were used
to select passages:
the passage must develop one main idea or contain one complete
piece of information,
understanding of the passage is independent of the information that
comes before or after the passage in the source text, and
understanding of the passage is independent of prior knowledge not
contained in the passage.
With the aid of a computer program, item writers examined prose excerpts of 125 words
in length that included a minimum of three sentences and were calibrated to within
100L of the source text. This process, called source targeting, uses information from an
entire text to ensure that the estimated syntactic complexity and semantic demand of an
excerpted passage are consistent with the “true” reading demand of the source text. From
these passages the item writers were asked to select four to ve that could be developed as
items. If it was necessary to shorten or lengthen the passage in order to meet the criteria
for selection, the item writer could immediately recalibrate the passage to ensure that it was
still targeted within 100L of the complete text.
•
•
•
74216_SRI_TechGuide_FC-105.indd 4374216_SRI_TechGuide_FC-105.indd 43 8/14/07 6:54:12 PM8/14/07 6:54:12 PM

Scholastic Reading Inventory
44
Item Writing—Format. The traditional cloze procedure for item creation is based on
deleting every fth to seventh word (or some variation) regardless of its part of speech
(Bormuth, 1967, 1968, 1970). Certain categories of words can also be selectively deleted.
Selective deletions have shown greater instructional e ects than random deletions.
Evidence shows that cloze items reveal both text comprehension and language mastery
levels. Some of the research on metacognition shows that better readers use more strategies
(and, more importantly, appropriate strategies) when they read. Cloze items have been
shown to require more rereading of the passage and increased use of context clues.
Scholastic Reading Inventory consists of embedded completion items. Embedded completion
items are an extension of the cloze format, similar to ll-in-the-blank. When properly
written, this item type directly assesses a reader’s ability to draw inferences and establish
logical connections among the ideas in a passage. SRI presents a reader with a passage of
approximately 30 to 150 words in length. Passages are shorter for beginning readers and
longer for more advanced readers. The passage is then response illustrated—a statement
with a word or phrase missing is added at the end of the passage, followed by four options.
From the four presented options, which may be a single word or phrase, a reader is asked to
select the “best” option to complete the statement.
Items were written so that the correct response is not stated directly in the passage, and
the correct answer cannot be suggested by the item itself. Rather, the examinee must
determine the correct answer by comprehending the passage. The four options derive from
the Lexile Vocabulary Analyzer word list that corresponds with the Lexile measure of the
passage. In this format, all options are semantically and syntactically appropriate comple-
tions of the sentence, but one option is unambiguously “best” when considered in the
context of the passage. This format is “well-suited for testing a student’s ability to evaluate”
(Haladyna, 1994, p. 62). In addition, this format is useful instructionally.
The statement portion of the embedded completion item can assess a variety of skills
related to reading comprehension: paraphrase information in the passage; draw a logical
conclusion based on information in the passage; make an inference; identify a supporting
detail; or make a generalization based on information in the passage. The statements were
written to ensure that by reading and comprehending the passage, the reader can select the
correct option. When the statement is read by itself, each of the four options is plausible.
There are two main advantages to using embedded completion items on SRI. The rst
is that the reading di culty of the statement and the four options is easier than the most
di cult word in the passage. The second advantage of the embedded completion format
is that only authentic passages are used, with no attempt to control the length of sentences
or level of vocabulary in the passage. The embedded completion statement is as short as or
shorter than the briefest sentence in the passage. These two advantages help ensure that the
statement is easier than the accompanying passage.
74216_SRI_TechGuide_FC-105.indd 4474216_SRI_TechGuide_FC-105.indd 44 8/14/07 6:54:12 PM8/14/07 6:54:12 PM

Technical Guide 45
Item Writing—Training. Item writers for Scholastic Reading Inventory were classroom
teachers and other educators who had experience with the everyday reading ability of
students at various levels. In 1998 and 1999, twelve individuals developed items for Forms
A and B of SRI and the second set of items. In 2003, six individuals developed items for
the third set. Using individuals with classroom teaching experience helped to ensure that
the items are valid measures of reading comprehension. Item writers were provided with
training materials concerning the embedded completion item format and guidelines for
selecting passages, developing statements, and selecting options. The item writing materials
also contained model items that illustrated the criteria used to evaluate items and correc-
tions based on those criteria. The nal phase of item writer training was a short practice
session with three items.
Item writers were provided vocabulary lists to use during statement and option develop-
ment. The vocabulary lists were compiled by MetaMetrics based on research to determine
the Lexile measures of words (i.e., their di culty). The Lexile Vocabulary Analyzer (LVA)
determines the Lexile measure of a word using a set of features related to the source text and
the word’s prevalence in the MetaMetrics corpus (MetaMetrics, 2006b). The rationale used to
compile the vocabulary lists was that the words should be part of a reader’s “working” vocabu-
lary if they had likely been encountered in easier text (those with lower Lexile measures).
Item writers were also given extensive training related to “sensitivity” issues. Part of the
item writing materials addressed these issues and identi ed areas to avoid when selecting
passages and developing items. The following areas were covered: violence and crime,
depressing situations/death, o ensive language, drugs/alcohol/tobacco, sex/attraction,
race/ethnicity, class, gender, religion, supernatural/magic, parent/family, politics, animals/
environment, and brand names/junk food. These materials were developed based on
standards published by CTB/McGraw-Hill for universal design and fair access—equal
treatment of the sexes, fair representation of minority groups, and the fair representation of
disabled individuals (Guidelines for Bias-Free Publishing).
Item writers were rst asked to develop 10 items independently. The items were then
reviewed for item format, grammar, and sensitivity. Based on this review, item writers
received feedback and more training if necessary. Item writers were then asked to develop
additional items.
Item Writing—Review. All items were subjected to a two-stage review process. First, items
were reviewed and edited according to the 19 criteria identi ed in the item-writing mate-
rials and for sensitivity issues. Approximately 25% of the items developed were rejected for
various reasons. Where possible, items were edited and maintained in the item bank.
Items were then reviewed and edited by a group of specialists representing various perspectives
—test developers, editors, and curriculum specialists. These individuals examined each item for
sensitivity issues and the quality of the response options. During the second stage of the item
review process, items were either “approved as presented,” “approved with edits,” or “deleted.”
Approximately 10 percent of the items written were approved with edits or deleted at this
stage. When necessary, item writers received additional feedback and training.
74216_SRI_TechGuide_FC-105.indd 4574216_SRI_TechGuide_FC-105.indd 45 8/14/07 6:54:12 PM8/14/07 6:54:12 PM
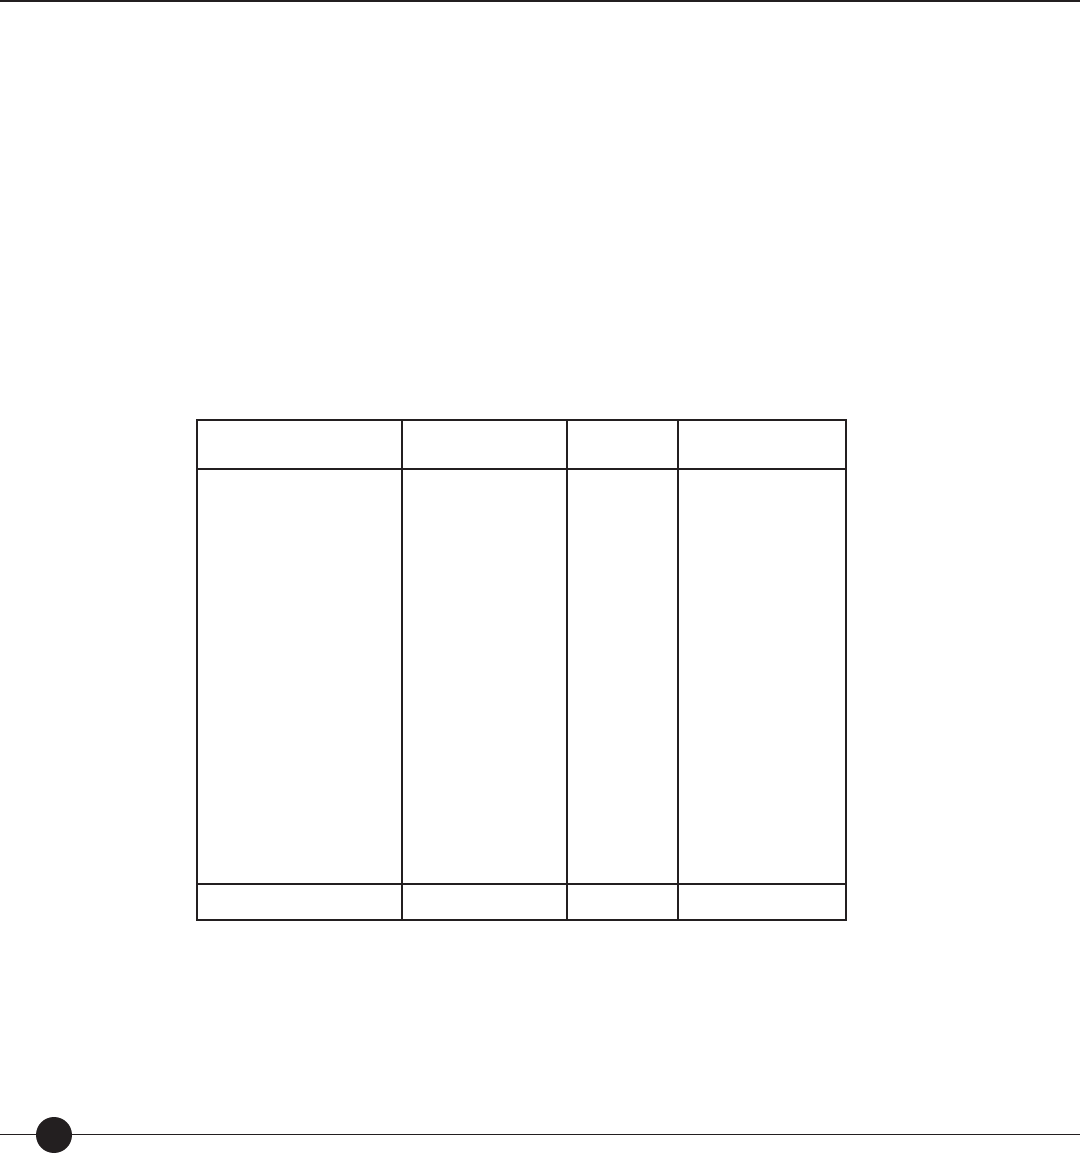
Scholastic Reading Inventory
46
SRI Item Bank Speci cations. Three sets of items were developed between 1998 and 2003.
Set 1 was developed in 1998 and used with the print and online versions of the test. Item
speci cations required that the majority of the items be developed for the 500L through
1100L range (70% of the total number of items; 10% per Lexile zone) with 15% below this
range and 15% above this range. This range is typical of the majority of readers in Grades
3 through 9. Set 2 was written in fall 2002 and followed the same speci cations. Set 3
was written in spring and summer of 2003. This set of items was developed for a di erent
purpose—to provide items that would be interesting and developmentally appropriate for
students in middle and high school, but written at a lower Lexile level (below the 50th
percentile) than would typically be administered to students in these grades. A total of
4,879 items were submitted to Scholastic for inclusion in SRI. Table 7 presents the number
of items developed for each item set by Lexile zone.
Table 7. Distribution of items in
SRI
item bank by Lexile zone.
Lexile Zone Item Set 1
Original Item Bank Item Set 2 Item Set 3
“Hi-Lo” Item Bank
BR (0L and Below)
5L to 100L
105L to 200L
205L to 300L
305L to 400L
405L to 500L
505L to 600L
605L to 700L
705L to 800L
805L to 900L
905L to 1000L
1005L to 1100L
1105L to 1200L
1205L to 1300L
1305L to 1400L
1405L to 1500L
1500+L (Above 1500L)
22
10
45
55
129
225
314
277
332
294
294
335
304
212
110
42
15
15
6
13
23
30
58
96
91
83
83
83
84
88
76
79
57
35
--
--
--
16
91
169
172
170
131
76
37
2
--
--
--
--
--
Total 3,015 1,000 864
74216_SRI_TechGuide_FC-105.indd 4674216_SRI_TechGuide_FC-105.indd 46 8/14/07 6:54:13 PM8/14/07 6:54:13 PM

Technical Guide 47
SRI Computer-Adaptive Algorithm
Schoolwide tests are often administered at grade level to large groups of students in order
to make decisions about students and schools. Consequently, since all students in a grade
are given the same test, each test must include a wide range of items to cover the needs of
both low- and high-achieving students. These wide-range tests are often unable to measure
some students as precisely as a more focused assessment could.
To provide the most accurate measure of a student’s level of reading comprehension, it is
important to assess the student’s reading level as precisely as possible. One method is to use as
much background information as possible to target a speci c test level for each student. This
information can consist of the student’s grade level, a teacher’s judgment concerning the read-
ing level of the student, or the student’s standardized test results (e.g., scale scores, percentiles,
stanines). This method requires the test administrator to administer multiple test forms during
one test session, which can be cumbersome and may introduce test security problems.
With the widespread availability of computers in classrooms and schools, another more e cient
method is to administer a test tailored to each student—Computer-Adaptive Testing (CAT).
Computer-adaptive testing is conducted individually with the aid of a computer algorithm
to select each item so that the greatest amount of information about the student’s ability is
obtained before the next item is selected. SRI employs such a methodology for testing online.
What are the bene ts of CAT testing? Many bene ts of computer-adaptive testing have
been described in the literature (Wainer et al., 1990; Stone and Lunz, 1994; Wang and
Vispoel, 1998). Each test is tailored to the student. Item selection is based on the student’s
ability and responses to each question. The bene ts include the following:
increased e ciency through reduced testing time and targeted testing;
immediate scoring. A score can be reported as soon as the student
nishes the test; and
more control over the test item bank. Because the test forms do not
have to be physically developed, printed, shipped, administered, or
scored, a broader range of forms can be used.
In addition, studies conducted by Hardwicke and Yoes (1984) and Schino and Steed
(1988) provide evidence that below-level students tend to prefer computer-adaptive tests
because they do not discourage students by presenting a large number of questions that are
too hard for them (cited in Wainer, 1992).
Bayesian Paradigm and the Rasch Model. Bayesian methodology provides a paradigm for
combining prior information with current data, both subject to uncertainty, to produce an
estimate of current status, which is again subject to uncertainty. Uncertainty is modeled
mathematically using probability.
Within SRI, prior information can be the student’s current grade level, the student’s
performance on previous assessments, or teacher estimates of the student’s abilities. The
current data in this context is the student’s performance on SRI, which can be summarized
as the number of items answered correctly from the total number of items attempted.
•
•
•
74216_SRI_TechGuide_FC-105.indd 4774216_SRI_TechGuide_FC-105.indd 47 8/14/07 6:54:13 PM8/14/07 6:54:13 PM

Scholastic Reading Inventory
48
Both prior information and current data are represented by probability models re ecting
uncertainty. The need to incorporate uncertainty when modeling prior information is
intuitively clear. The need to incorporate uncertainty when modeling test performance
is perhaps less intuitive. When the test has been taken and scored, and assuming that no
scoring errors were made, the performance, i.e., the raw score, is known with certainty.
Uncertainty arises because test performance is associated with, but not wholly determined
by, the ability of the student, and it is that ability, rather than the test performance per se,
that we are trying to measure. Thus, though the test results re ect the test performance
with certainty, we remain uncertain about the ability that produced the performance.
The uncertainty associated with prior knowledge is modeled by a probability distribution
for the ability parameter. This distribution is called the prior distribution, and it is usually
represented by a probability density function, e.g., the normal bell-shaped curve. The
uncertainty arising from current data is modeled by a probability function for the data
when the ability parameter is held xed. When roles are reversed so that the data are held
xed and the ability parameter is allowed to vary, this function is called the likelihood
function. In the Bayesian paradigm, the posterior probability density for the ability
parameter is proportional to the product of the prior density and the likelihood, and this
posterior density is used to obtain the new ability estimate along with its uncertainty.
The computer-adaptive algorithm used with SRI is also based on the Rasch (one-parameter)
item response theory model. Classical test theory has two basic shortcomings: (1) the use of
item indices whose values depend on the particular group of examinees from which they
were obtained, and (2) the use of examinee ability estimates that depend on the particu-
lar choice of items selected for a test. The basic premises of item response theory (IRT)
overcome these shortcomings by predicting the performance of an examinee on a test item
based on a set of underlying abilities (Hambleton and Swaminathan, 1985). The relationship
between an examinee’s item performance and the set of traits underlying item performance
can be described by a monotonically increasing function called an item characteristic curve
(ICC). This function speci es that as the level of the trait increases, the probability of a cor-
rect response to an item increases.
The conversion of observations into measures can be accomplished using the Rasch (1980)
model, which requires that item calibrations and observations (count of correct items)
interact in a probability model to produce measures. The Rasch item response theory
model expresses the probability that a person (n) answers a certain item (i) correctly by the
following relationship:
Pni ebndi
1ebndi
(Equation 2)
where di is the di culty of item i (i 1, 2, …, number of items);
bn is the ability of person n (n 1, 2, …, number of persons);
bn di is the di erence between the ability of person n and the di culty of item i; and
P
ni is the probability that examinee n responds correctly to item i
(Hambleton and Swaminathan, 1985; Wright and Linacre, 1994).
74216_SRI_TechGuide_FC-105.indd 4874216_SRI_TechGuide_FC-105.indd 48 8/14/07 6:54:13 PM8/14/07 6:54:13 PM
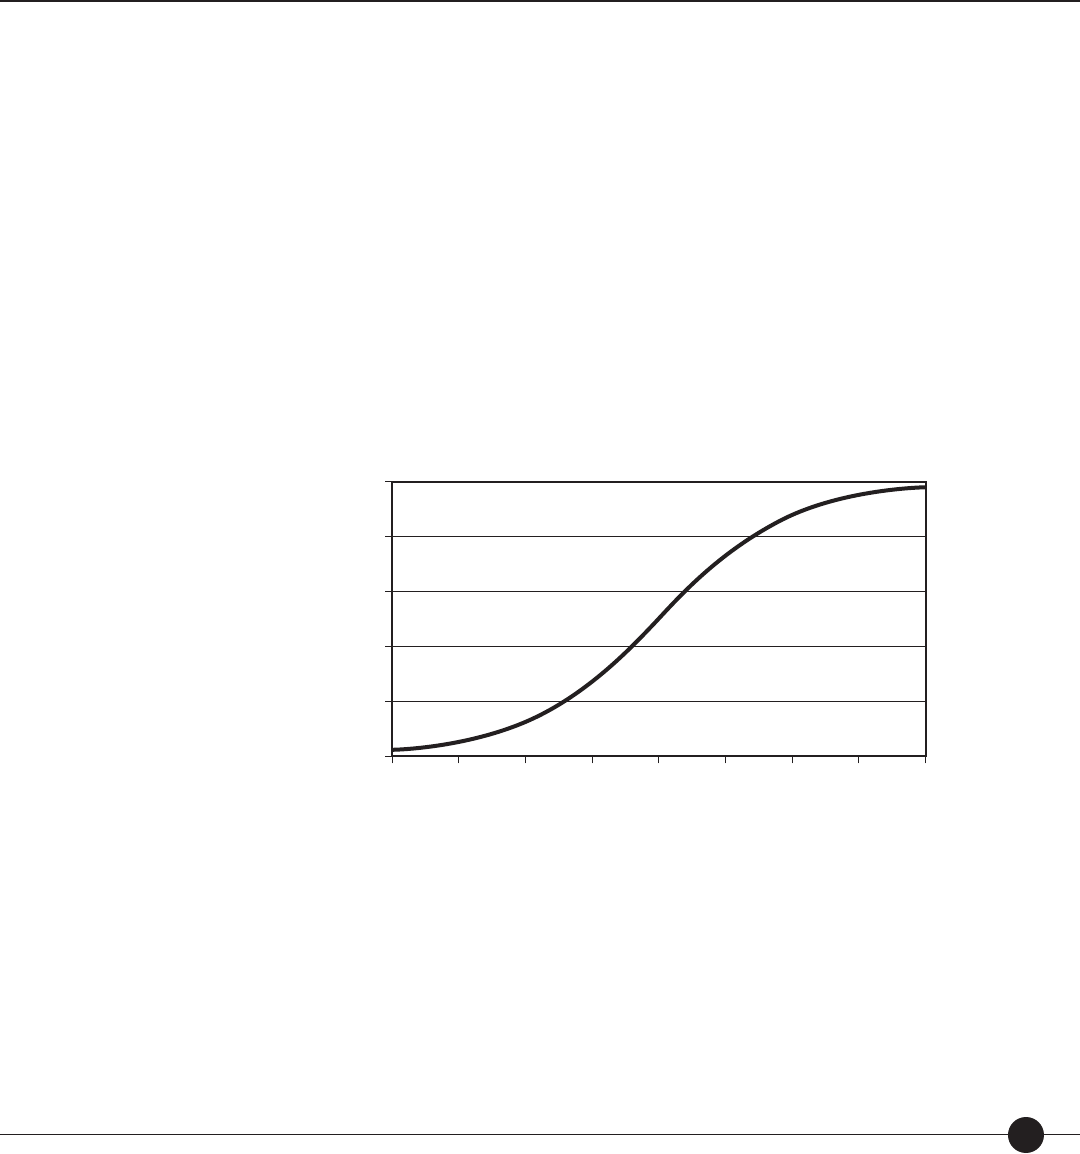
Technical Guide 49
This measurement model assumes that item di culty is the only item characteristic that
in uences the examinee’s performance such that all items are equally discriminating in
their ability to identify low-achieving persons and high-achieving persons (Bond and Fox,
2001; and Hambleton, Swaminathan, and Rogers, 1991). In addition, the lower asymptote
is zero, which speci es that examinees of very low ability have zero probability of correctly
answering the item. The Rasch model has the following assumptions: (1) unidimensional-
ity—only one ability is assessed by the set of items; and (2) local independence—when
abilities in uencing test performance are held constant, an examinee’s responses to any pair
of items are statistically independent (conditional independence, i.e., the only reason an
examinee scores similarly on several items is because of his or her ability, not because the
items are correlated). The Rasch model is based on fairly restrictive assumptions, but it is
appropriate for criterion-referenced assessments. Figure 5 shows the relationship between
the di erence of a person’s ability and an item’s di culty and the probability that a person
will respond correctly to the item.
Figure 5. The Rasch Model—the probability person
n
responds correctly to item
i
.
Probability Correct Response
b(n) – d(i)
1.0
0.8
0.6
0.4
0.2
0.0–4 –3 –2 –1 0 1 2 4
3
An assumption of the Rasch model is that the probability of a response to an item is
governed by the di erence between the item calibration (di ) and the person’s measure (bn
).
From an examination of the graph in Figure 5, when the ability of the person matches the
di culty of the item (bn di 0), then the person has a 50% probability of responding
to the item correctly. With the Lexile Framework, 75% comprehension is modeled by
subtracting a constant.
The number correct for a person is the probability of a correct response summed over
the number of items. When the measure of a person greatly exceeds the calibration
(di culties) of the items (bn di 0), then the expected probabilities will be high and
74216_SRI_TechGuide_FC-105.indd 4974216_SRI_TechGuide_FC-105.indd 49 8/14/07 6:54:14 PM8/14/07 6:54:14 PM

Scholastic Reading Inventory
50
the sum of these probabilities will yield an expectation of a high number correct. Con-
versely, when the item calibrations generally exceed the person measure (bn di 0),
the modeled probabilities of a correct response will be low and a low number correct is
expected.
Thus, Equation 2 can be rewritten in terms of a person’s number of correct responses on
a test
Op3ebndi
t1
L
1ebndi
(Equation 3)
where Op is the number of person p’s correct responses and L is the number of items on
the test.
When the sum of the correct responses and the item calibrations (di) is known, an iterative
procedure can be used to nd the person measure (bn) that will make the sum of the mod-
eled probabilities most similar to the number of correct responses. One of the key features
of the Rasch item response model is its ability to place both persons and items on the
same scale. It is possible to predict the odds of two individuals answering an item correctly
based on knowledge of the relationship between the abilities of the two individuals. If one
person has an ability measure double that of another person (as measured by b—the ability
scale), then he or she has double the odds of answering the item correctly.
Equation 3 has several distinguishing characteristics:
The key terms from the de nition of measurement are placed in a
precise relationship to one another.
The individual responses of a person to each item on an instrument
are absent from the equation. The only piece of data that survives the
act of observation is the “count correct” (Op
), thus con rming that
the observation is “su cient” for estimating the measure.
For any set of items the possible raw scores are known. When it is possible to know the
item calibrations (either theoretically or empirically from eld studies), the only parameter
that must be estimated in Equation 3 is the measure that corresponds to each observ-
able count correct. Thus, when the calibrations (di) are known, a correspondence table
linking observation and measure can be constructed without reference to data from other
individuals.
How does CAT testing work with SRI? As described earlier, SRI uses a three-phase
approach to assess a student’s level of reading ability: Start, Step, Stop. During test adminis-
tration, the computer adapts the test continually according to the student’s responses to the
questions. The student starts the test; the test steps up or down according to the student’s
performance; and, when the computer has enough information about the student’s reading
level, the test stops.
The rst phase, Start, determines the best point on the Lexile scale to begin testing the
student. Figure 6 presents a owchart of the “start” phase of SRI.
•
•
74216_SRI_TechGuide_FC-105.indd 5074216_SRI_TechGuide_FC-105.indd 50 8/14/07 6:54:14 PM8/14/07 6:54:14 PM
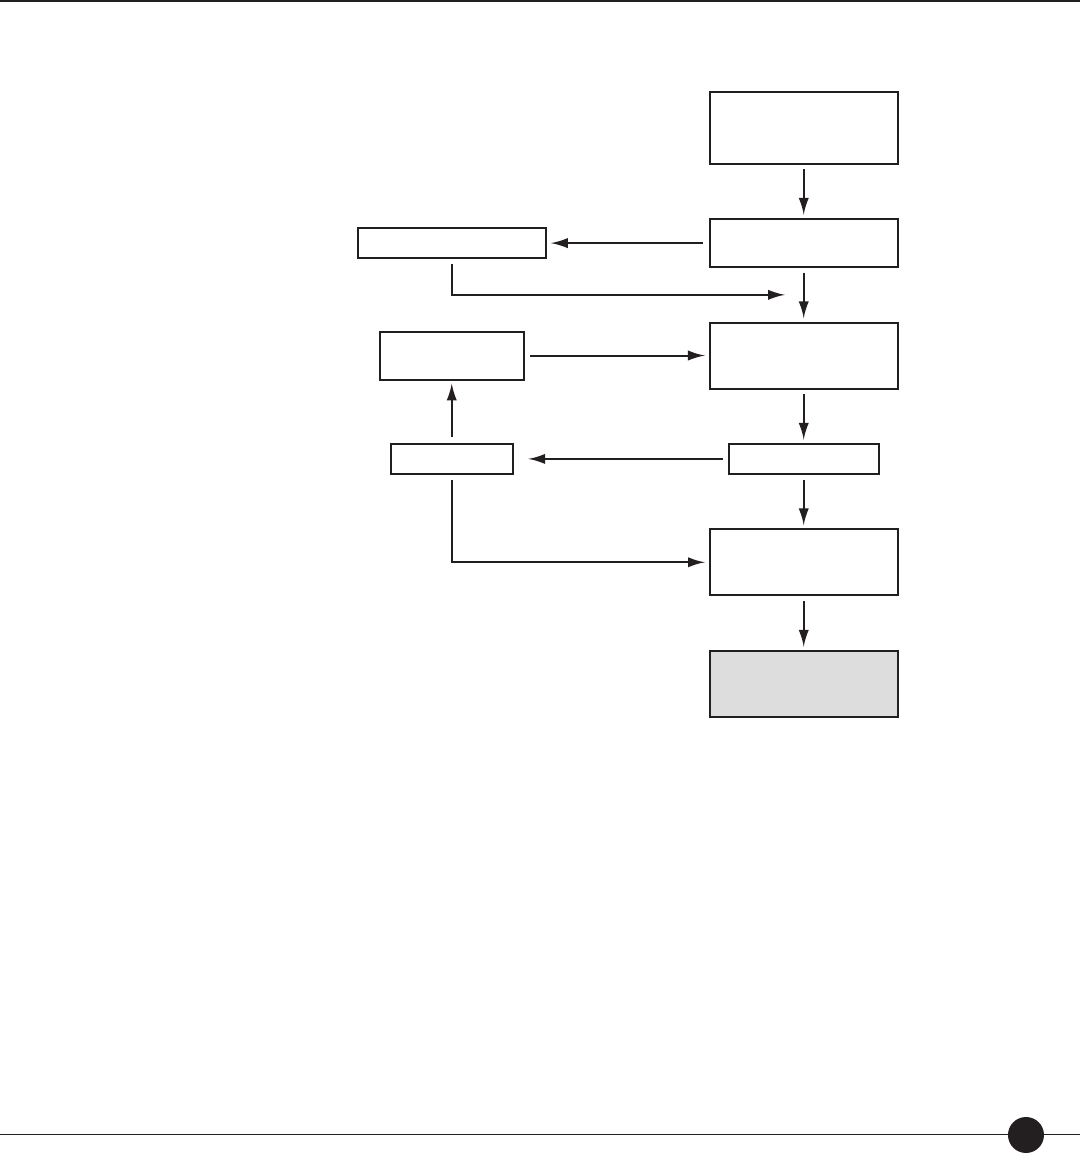
Technical Guide 51
Figure 6: The “start” phase of the
SRI
computer-adaptive algorithm.
Input Student Data
•Grade Level
•Other Test Scores
•Teacher Judgment
Determine Bayesian Priors:
Ability b
Uncertainty S
Take Practice Test:
Ask question at 10th
percentile of grade level
Randomly selected item at
75% success level:
difficulty of item b
Other Test Scores or
Teacher Judgments Entered?
Get interface help
from teacher
Pass Practice Test?
1st Time?
Administer Locator Test?
Yes
Yes
No
No
No
Yes
Prior to testing, the teacher or administrator inputs information into the computer-adaptive
algorithm that controls the administration of the test. The student’s identi cation number
and grade level must be input; prior standardized reading results (e.g., a Lexile measure from
SRI-print) and the teacher’s estimate of the student’s reading level may also be input. This
information is used to determine the best starting point (Reader Measure) for the student.
The more information input into the algorithm, the better targeted the beginning of the
test. Research has shown that well-targeted tests report less error in student scores than
poorly-targeted tests.
Within the Bayesian algorithm, initial Reader Measures (ability [b]) are determined by the
following information: grade level, prior SRI test score, or teacher estimate of the student’s
reading level. If only grade level is entered, the student starts SRI with a Reader Measure
equal to the 50th percentile for his or her grade. If a prior SRI test score and administra-
tion date are entered, then this Lexile measure is used as the student’s Reader Measure.
74216_SRI_TechGuide_FC-105.indd 5174216_SRI_TechGuide_FC-105.indd 51 8/14/07 6:54:15 PM8/14/07 6:54:15 PM

Scholastic Reading Inventory
52
The Reader Measure is adjusted based on the amount of growth expected per month since
the prior test was administered. The amount of growth expected in Lexiles per month
is based on research by MetaMetrics, Inc. related to cross-sectional norms. If the teacher
enters an estimated reading level, then the Lexile measure associated with each percentile
for the grade is used as the student’s Reader Measure. Teachers can enter the following
estimated reading levels: far below grade level (5th percentile), below grade level (25th
percentile), on grade level (50th percentile), above grade level (75th percentile), and far
above grade level (95th percentile).
Initial uncertainties (sigma ) are determined by a prior Reader Measure (if available),
when the measure was collected, and the reliability of the measure. If a prior Reader
Measure is unavailable or if teacher estimation is the basis of the prior Reader Measure,
then maximum uncertainty (225L) is assumed. This value is based on prior research
conducted by MetaMetrics, Inc. (2006a). If a prior Reader Measure is available, then the
elapsed time, measured in months, is used to prorate the maximum uncertainty associated
with three years of elapsed time.
If the administration is the student’s rst time interacting with SRI, three practice items
are presented. The practice items are selected at the 10th percentile for the grade level.
The practice items are not counted in the student’s score; their purpose is solely to
familiarize the student with the embedded completion item format and the test’s internal
navigation.
If the student is enrolled in middle or high school (Grade 7 or above) and no prior reading
ability information (i.e., other test scores or teacher estimate) is provided, a short Locator Test is
administered. The purpose of the Locator Test is to ensure that students who read signi cantly
below grade level receive a valid Lexile measure from the rst administration of SRI. When
a student is initially mis-targeted, it is di cult for the algorithm to produce a valid Lexile
measure given the logistical parameters of the program. The items administered as the Locator
Test are 500L below the “on grade level” (50th percentile) estimated reading level.
For subsequent administrations of SRI, the Reader Measure and uncertainty are the prior
values adjusted for time. The Reader Measure is adjusted based on the amount of growth
expected per month during the elapsed time. The elapsed time (measured in months) is
used to prorate the maximum uncertainty associated with three years of elapsed time.
The second phase, Step, controls the selection of questions presented to the student.
Figure 7 presents a owchart of the “step” phase of SRI.
If only the student’s grade level was input during the rst phase, then the student is
presented with a question that has a Lexile measure at the 50th percentile for his or her
grade. If more information about the student’s reading ability was input during the rst
phase, then the student is presented with a question that is nearer his or her true ability.
If the student responds correctly to the question, then he or she is presented with a question
that is slightly more di cult. If the student responds incorrectly to the question, then he
or she is presented with a question that is slightly easier. After the student responds to each
question, his or her SRI score (Lexile measure) is recomputed.
74216_SRI_TechGuide_FC-105.indd 5274216_SRI_TechGuide_FC-105.indd 52 8/14/07 6:54:15 PM8/14/07 6:54:15 PM
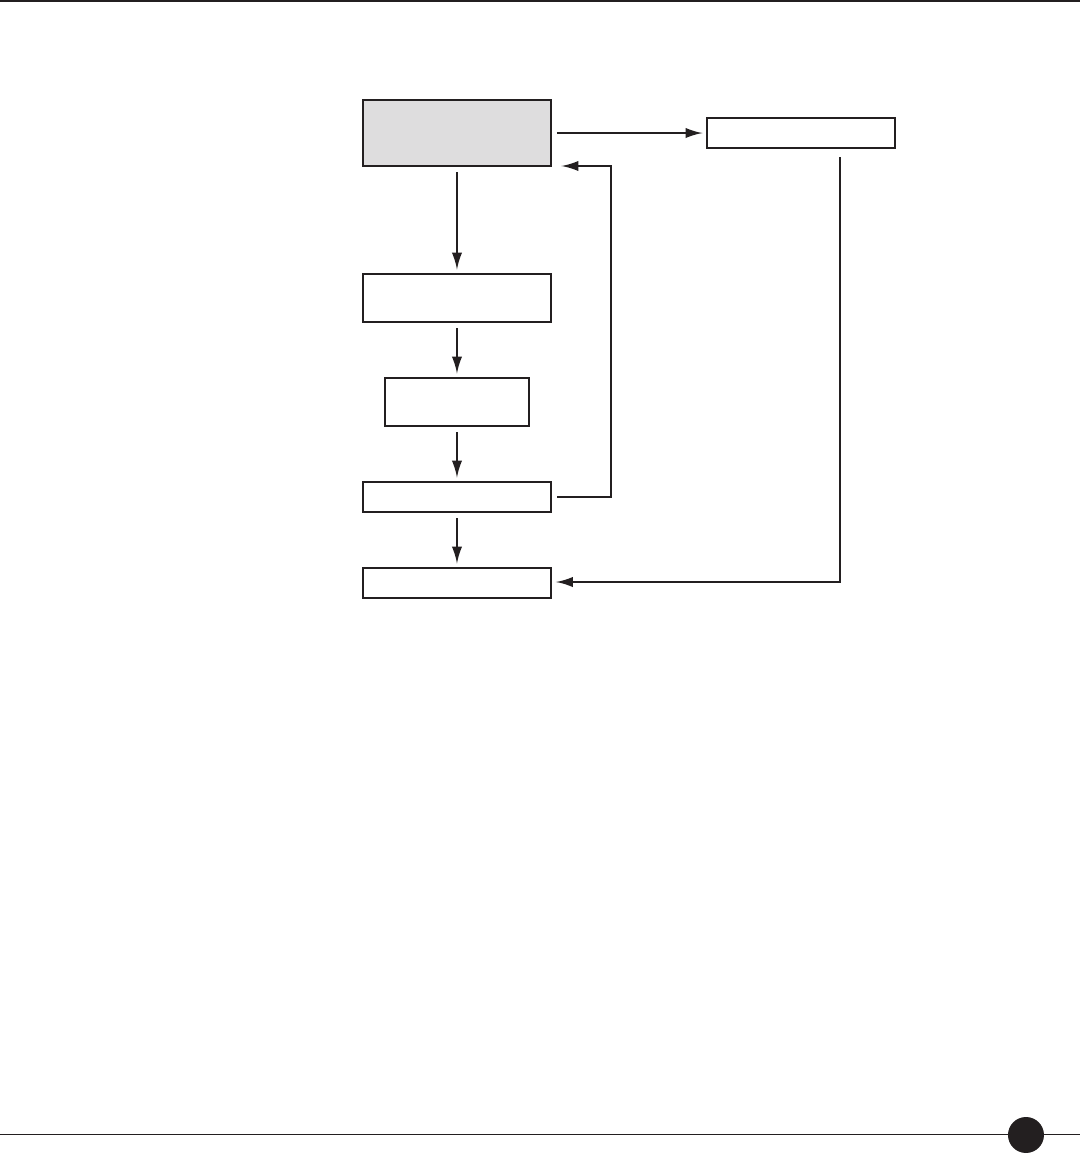
Technical Guide 53
Figure 7: The “step” phase of the
SRI
computer-adaptive algorithm.
Find new b iteratively
Find new ability estimate (b)
iteratively
Randomly selected item at
75% success level:
difficulty of item b
Set
bnewb
Adjust Uncertainty ( S)
If number incorrect 0
Yes
No
Correct
Incorrect
Questions are randomly selected from all possible items that are within 10L of the student’s
current Reader Measure. If necessary, the range of items available for selection can be
broadened to 50L. The frequency with which items appear is controlled by marking an
item “Do Not Use” once it has been administered to a student. The item is then unavail-
able for selection in the next three test administrations.
If the student is in Grade 6 or above and his or her Lexile measure is below the speci ed
minimum measure for the grade (15th percentile), then he or she is administered items
from the Hi-Lo pool. This set of items has been identi ed from all items developed for
SRI based on the following criteria: (1) developmentally appropriate for middle and high
school students (high interest), and (2) Lexile text measure between 200L and 1000L (low
di culty).
The nal phase, Stop, controls the termination of the test. Figure 8 presents a owchart of
the “stop” phase of SRI.
Approximately 20 items are presented to every student. The exact number of questions
administered depends on how the student responds to the items as they are presented. In
addition, how well-targeted the test is at its start a ects the number of questions presented
to the student.
74216_SRI_TechGuide_FC-105.indd 5374216_SRI_TechGuide_FC-105.indd 53 8/14/07 6:54:15 PM8/14/07 6:54:15 PM
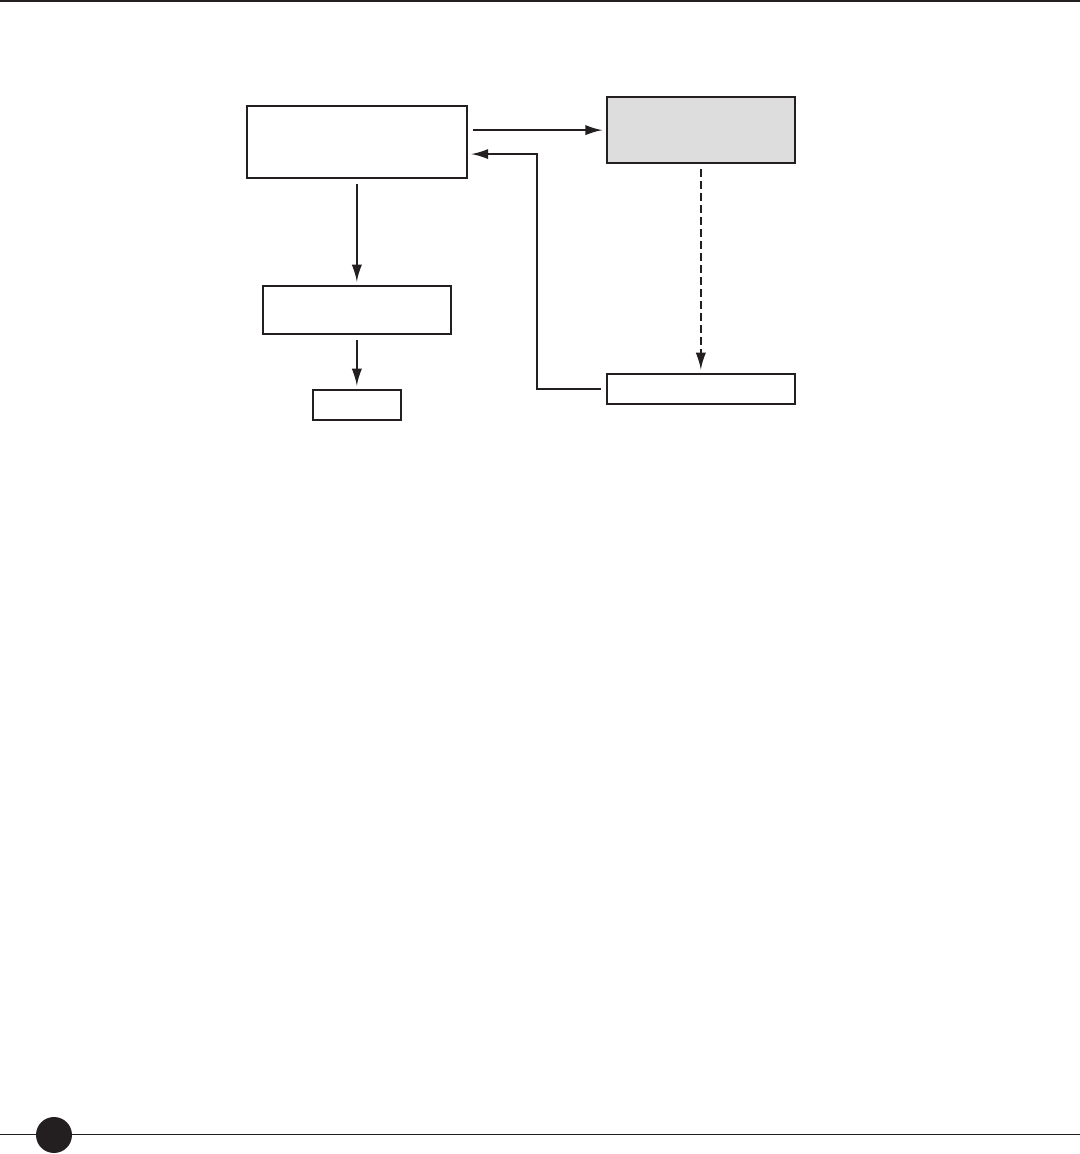
Scholastic Reading Inventory
54
Figure 8: The “stop” phase of the
SRI
computer-adaptive algorithm.
Randomly select item at
75% success level:
difficulty of item b
Adjust Uncertainty ( S)
Are stopping conditions satisfied?
• Number of items answered
• Number of correct/incorrect responses
• Amount of elapsed time
Stop
Convert Reader Measure
to Lexiles
Yes
No
Well-targeted tests begin with less measurement error and, subsequently, the student will
be asked to respond to fewer items. After the student responds to each item, his or her
Reader Measure is calculated through an iterative process using the Rasch model
(Equation 2, page 48).
The testing session ends when one of the following conditions is met:
the student has responded to at least 20 items and has responded
correctly to at least 6 items and incorrectly to at least 3 items,
the student has responded to 30 items, and
the elapsed test administration time is at least 40 minutes and the
student has responded to at least 10 items.
At this time the student’s resulting Lexile measure and uncertainty are converted to Lexiles.
Lexile measures are reported as a number followed by a capital “L.” There is no space
between the measure and the “L,” and measures of 1,000 or greater are reported without
a comma (e.g., 1050L). Within SRI, Lexile measures are reported to the nearest whole
number. As with any test score, uncertainty in the form of measurement error is present.
Lexile measures below 100L are reported as “BR” for “Beginning Reader.”
•
•
•
74216_SRI_TechGuide_FC-105.indd 5474216_SRI_TechGuide_FC-105.indd 54 8/14/07 6:54:16 PM8/14/07 6:54:16 PM

Technical Guide 55
SRI Algorithm Testing During Development
Feasibility Study. SRI was eld tested with 879 students in Grades 3, 4, 5, and 7 from
four schools in North Carolina and Florida. The schools were selected according to the
following criteria: school location (urban versus rural), school size (small, medium, or large
based on the number of students and sta ), and availability of Macintosh computers within
a laboratory setting.
In School 1 (suburban K–5), 72.1% of the students were Caucasian, 22.5%
African American, 4.8% Hispanic, 0.3% Asian, and 0.2% Native Ameri-
can. The computer lab was equipped with Power Mac G3s with 32 MB
RAM. A total of 28 computers were in the lab arranged in 4 rows with a
teacher station. There were also two video monitor displays in the lab.
In School 2 (rural K–5), 60.5% of the students were Caucasian, 29.7%
African American, 8.6% Hispanic, 0.7% Asian, and 0.5% Native
American. Of the students sampled, 60% were male and 40% were
female. The computer lab was equipped with Macintosh LC 580s.
School 3 (urban 6–8) was predominately Caucasian (91%), with 5%
of the students classi ed as African American, 2% of the students
Hispanic, and 2% Asian. At the school, 17% of the students quali ed
for the Free and Reduced Price Lunch Program, 14% were classi ed
as having a disability, 6% were classi ed as gifted, and 0.1% were clas-
si ed as limited English pro cient. Of the students sampled, 49% were
male and 51% were female.
School 4 (urban K–5) was predominately Caucasian (86%), with 14% of
the students classi ed as minority. Of the students sampled, 58% were
male and 42% were female. At the school 46% of the students quali ed
for the Free and Reduced Price Lunch Program, 21% were classi ed as
having a disability, 4% were classi ed as gifted, and 0.1% were classi ed
as limited English pro cient. Technology was integrated into all subjects
and content areas, and the curriculum included a variety of hands-
on activities and projects. The school had a school-wide computer
network and at least one computer for every three students. Multimedia
development stations with video laser and CD-ROM technology were
also available.
The purpose of this phase of the study was to examine the algorithm and the software used
to administer the computer-adaptive test. In addition, other reading test data was collected
to examine the construct validity of the assessment.
Based on the results of the rst administration in School 1, it was determined that the item
selection routine was not selecting the optimal item each time. As a result, the calculation
of the ability estimate was changed to occur after the administration of each item, and a
speci ed minimum number of responses was required before the program terminated.
•
•
•
•
74216_SRI_TechGuide_FC-105.indd 5574216_SRI_TechGuide_FC-105.indd 55 8/14/07 6:54:16 PM8/14/07 6:54:16 PM
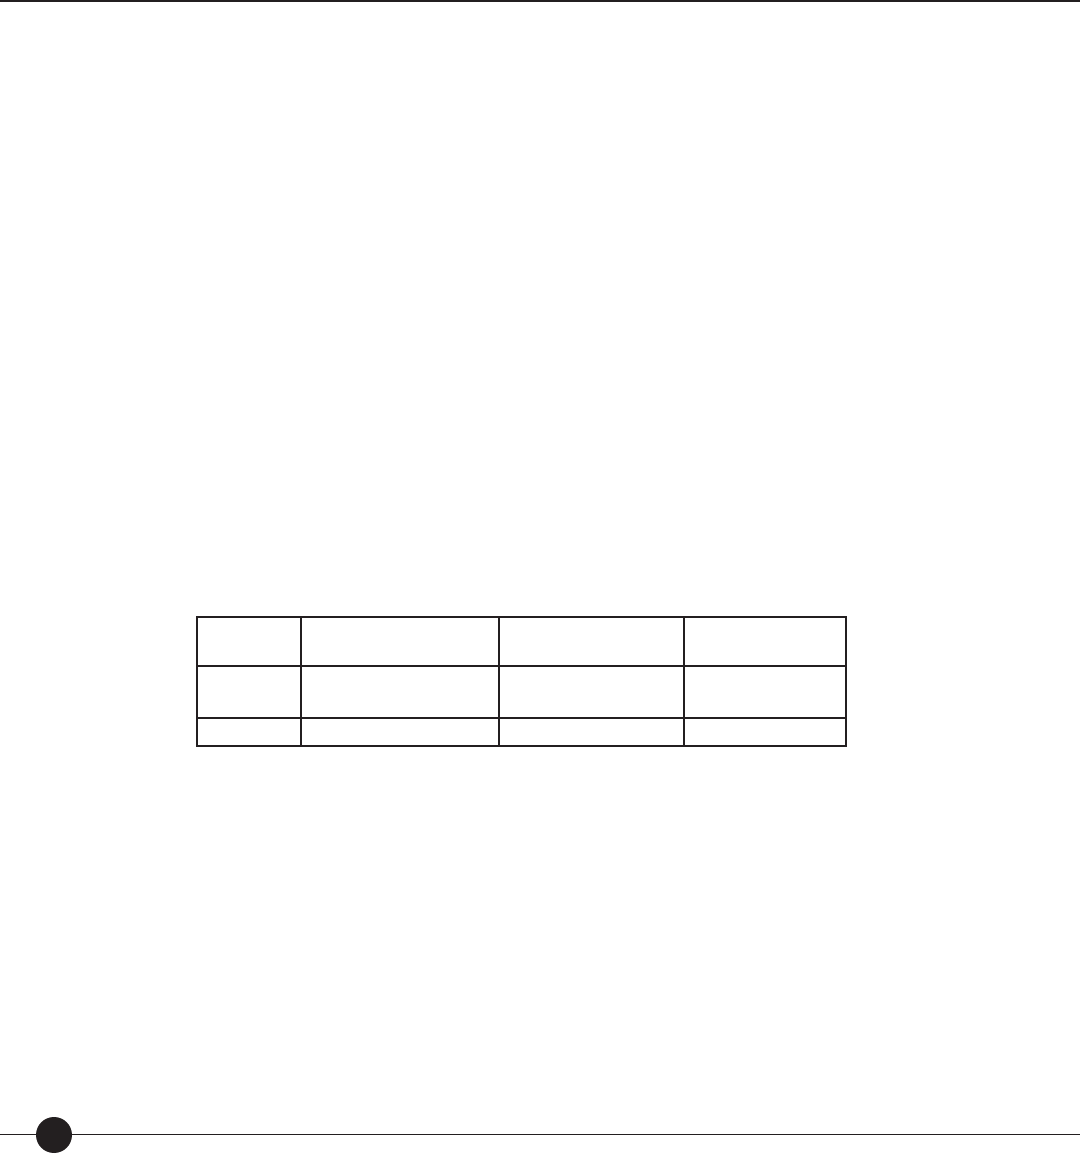
Scholastic Reading Inventory
56
The Computer-Adaptive Test Survey was completed by 255 students (Grade 3, N 71;
Grade 5, N 184). There were no signi cant di erences by grade (Grade 3 versus Grade
5) or by school within grade (Grade 5: School 1 versus School 2) in the responses to any of
the questions on the survey.
Question 1 asked students if they had understood how to take the computer-adaptive test.
On a scale with 0 being “no” and 2 being “yes,” the mean was 1.83. Students in Grades 3
and 5 responded the same way. This information was also con rmed in the written student
comments and in the discussion at the end of the session. The program was easy to use and
follow.
Question 2 asked students whether they used the mouse, the keyboard, or both to respond
to the test. Of the 254 students responding to this question, 76% (194) used the mouse,
20% (52) used the keyboard, and 3% (8) used both the keyboard and the mouse. Several
students commented that they liked the computer-adaptive test because it allowed them to
use the mouse.
Question 7 asked students which testing format they preferred—paper-and-pencil,
computer-adaptive, or both formats equally. Sixty- ve percent of the sample liked the
computer-adaptive test format better. There were no signi cant di erences between the
responses for students in Grade 3 compared to those in Grade 5. The results for each grade
and the total sample are presented in Table 8.
Table 8. Student responses to Question 7: preferred test format.
Grade Paper-and-Pencil Format
Computer-Adaptive
Format Both Formats Equally
3
5
9%
17%
71%
62%
20%
21%
Total 15% 65% 21%
Students o ered a variety of reasons for liking the computer-adaptive test format better:
✓ “I liked that you don’t have to
turn the pages.”
✓ “I liked that you didn’t have to
write.”
✓ “I liked that you only had to
point and click.”
✓ “I liked the concept that you
don’t have a certain amount of
questions to answer.”
✓ “You don’t write and don’t have
to worry about lead breaking or
black stu on your ngers.”
✓ “I like working on computers.”
✓ “Because you didn’t have to circle
the answer with a pencil and your
hand won’t hurt.”
74216_SRI_TechGuide_FC-105.indd 5674216_SRI_TechGuide_FC-105.indd 56 8/14/07 6:54:16 PM8/14/07 6:54:16 PM

Technical Guide 57
Of the 21% of students who liked both test formats equally, several students provided reasons:
✓ “They’re about the same thing except on the computer your
hand doesn’t get tired.”
✓ “On number 7, I put about the same because I like just the
point that we don’t have to write.”
A greater percentage of Grade 5 students (17%) than Grade 3 students (9%) stated that
they preferred the paper-and-pencil test format. This may be explained by the further
development of test-taking strategies by the Grade 5 students. Their reasons for preferring
the paper-and-pencil version generally dealt with features of the computer-adaptive test
format—the ability to skip questions and review and change answers:
✓ “I liked the computer test, but I like paper-and-pencil because
I can check over.”
✓ “Because I can skip a question and look back on the story.”
Four students stated that they preferred the paper-and-pencil format because of the
computer environment:
✓ “I liked the paper-and-pencil test better because you don’t
have to stare at a screen with a horrible glare!”
✓ “Because it would be much easier for me because I didn’t feel
comfortable at a computer.”
✓ “Because it is easier to read because my eyesight is bad.”
✓ “I don’t like reading on a computer.”
Questions 4 and 5 on the survey dealt with the student’s test-taking strategies—the ability to
skip questions and to review and change responses. Question 4 asked students whether they
had skipped any of the questions on the computer-adaptive test. Seventy-three percent (73%)
of the students skipped at least one item on the test. From the student’s comments, this was
one of the features of the computer-adaptive test that they really liked. Several students com-
mented that they were not allowed enough passes. One student stated, “It’s [the CAT] very
easy to control and we can pass on the hard ones.” Another student stated that, “I like the part
where you could pass some [questions] where you did not understand.”
Question 5 asked students whether they went back and changed answers when they took
tests on paper. On a scale with 0 being “never” and 2 being “always,” the mean was 0.98.
According to many students’ comments, this was one of the features of the computer-
adaptive test that they did not like.
Several students commented on the presentation of the text in the computer-adaptive test
format.
✓ “I liked the way you answered the questions. I like the way it
changes colors.”
✓ “The words keep getting little, then big.”
74216_SRI_TechGuide_FC-105.indd 5774216_SRI_TechGuide_FC-105.indd 57 8/14/07 6:54:16 PM8/14/07 6:54:16 PM
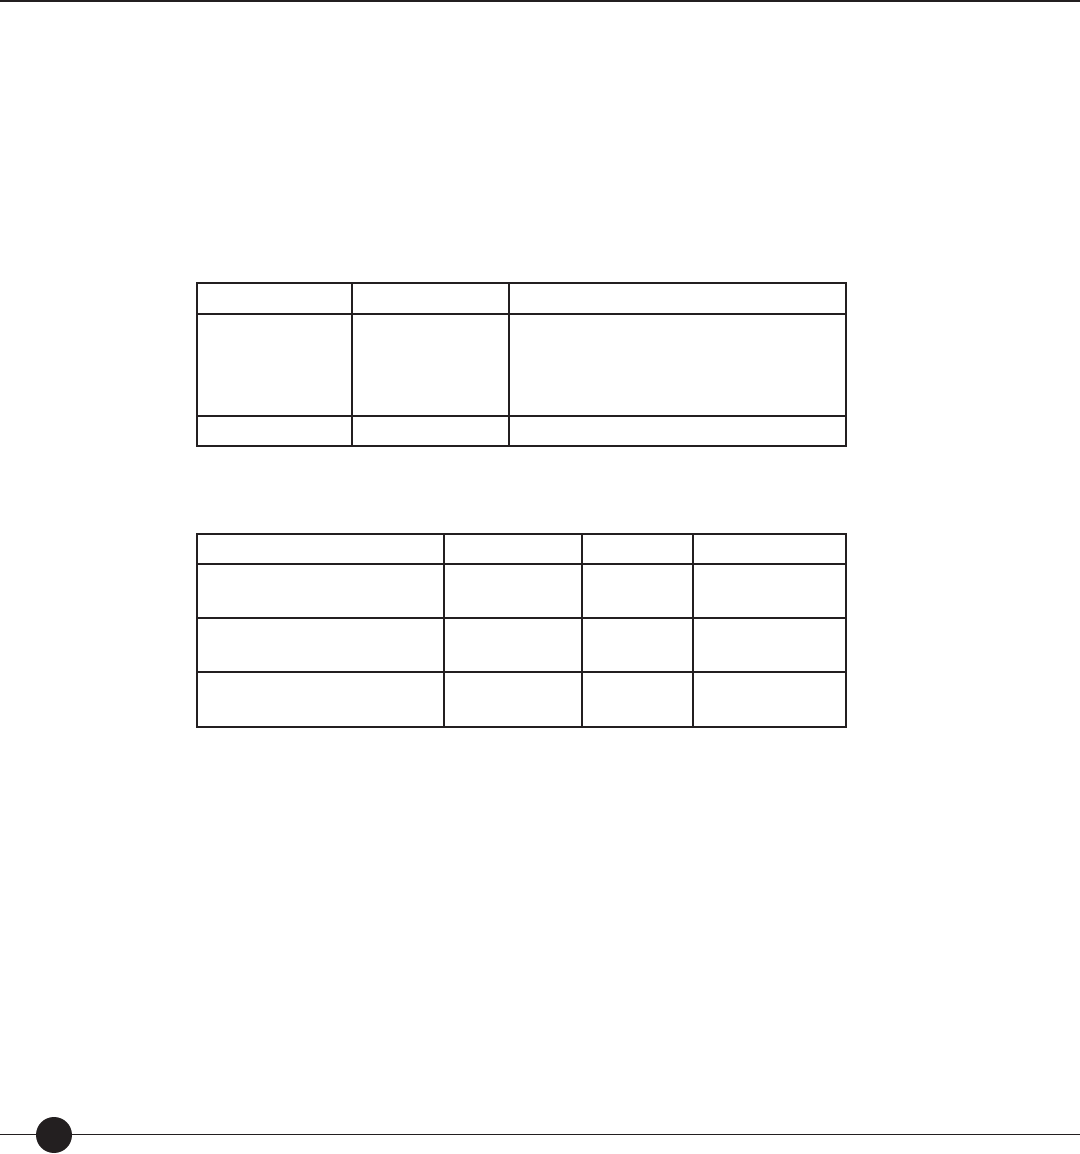
Scholastic Reading Inventory
58
Questions 3 and 6 dealt with the student’s perceptions of the computer-adaptive test’s dif-
culty. The information from these questions was not analyzed due to the redevelopment
of the algorithm for selecting items.
When SRI was eld tested with this sample of students in Grades 3, 4, 5, and 7 (N 879)
during the 1998–1999 school year, other measures of reading were collected. Tables 9 and
10 present the correlations between SRI and other measures of reading comprehension.
Table 9. Relationship between
SRI
and
SRI
-print
version.
Grade
N
Correlation with
SRI
-print version
3
4
5
7
226
104
93
122
0.72
0.74
0.73
0.62
Total 545 0.83
Table 10. Relationship between
SRI
and other measures of reading comprehension.
Test Grade
N
Correlation
North Carolina End-of-Grade
Tests (NCEOG)
3
4
109
104
0.73
0.67
Pinellas Instructional
Assessment Program (PIAP)
3 107 0.62
Comprehensive Test of Basic
Skills (CTBS)
5
7
110
117
0.74
0.56
From the results it can be concluded that SRI measures a construct similar to that
measured by other standardized tests designed to measure reading comprehension. The
magnitude of the within-grade correlations with SRI-print version is close to that of the
observed correlations for parallel test forms (i.e., alternate forms reliability), thus suggesting
that the di erent tests are measuring the same construct. The NCEOG, PIAP, and CTBS
tests consist of passages followed by traditional multiple-choice items, and SRI consists of
embedded completion multiple-choice items. Given the di erences in format, the limited
range of scores (within-grade), and the small sample sizes, the correlations suggest that the
four assessments are measuring a similar construct.
74216_SRI_TechGuide_FC-105.indd 5874216_SRI_TechGuide_FC-105.indd 58 8/14/07 6:54:17 PM8/14/07 6:54:17 PM
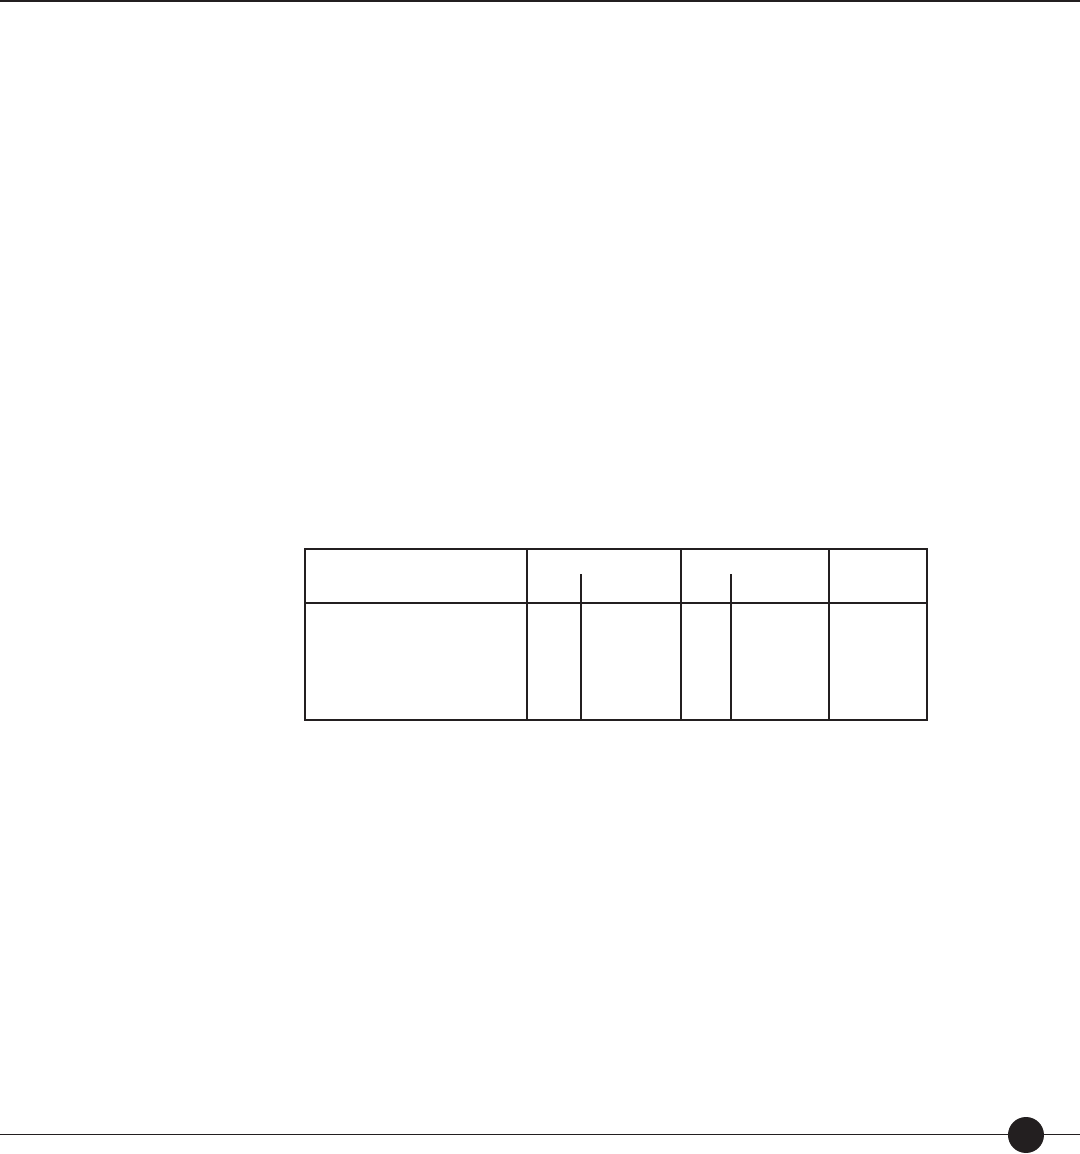
Technical Guide 59
Comparison of SRI v3.0 and SRI v4.0. The newest edition of SRI, the Enterprise Edition
of the suite of Scholastic technology products, is built on Industry-Standard Technology
that is smarter and faster, featuring SAM (Scholastic Achievement Manager)—a robust
new management system. SRI provides district-wide data aggregation capabilities to help
administrators meet AYP accountability requirements and provide teachers with data to
di erentiate instruction e ectively.
Prior to the integration of Version 4.0/Enterprise Edition (April/May 2005), a study was
conducted to compare results from version 3.0 with those from Version 4.0 (Scholastic,
May 2005). A sample of 144 students in Grades 9 through 12 participated in the study.
Each student was randomly assigned to one of four groups: (A) Test 1/v4.0; Test 2/v3.0;
(B) Test 1/v3.0; Test 2/v4.0; (C) Test 1/v3.0; Test 2/v3.0; and (D) Test 1/v4.0; Test 2/v4.0.
Each student’s grade level was set and veri ed prior to testing. For students in groups (C)
and (D), two accounts were established for each student to ensure that the starting criteria
were the same for both test administrations. The nal sample of students (N 122) con-
sisted of students who completed both assessments. Table 11 presents the summary results
from the two testing groups that completed di erent versions of SRI.
Table 11. Descriptive statistics for each test administration group in the comparison
study, April/May 2005
Test Group Test 1 Test 2 Difference
N
Mean (SD)
N
Mean (SD)
A: Test 1/v4.0; Test 2/v3.0
B: Test 1/v3.0; Test 2/v4.0
32
30
1085.00
(179.13)
1114.83
(198.24)
32
30
1103.34
(194.72)
1094.67
(232.51)
18.34
20.16
p .05
The di erences between the two versions of the test for each group were not signi cant
(paired t-test) at the .05 level. It can be concluded that scores from versions 3.0 and 4.0
for groups (A) and (B) were not signi cantly di erent. A modest correlation of 0.69 was
observed between the two sets of scores (v3.0 and v4.0). Given the small sample size
(N = 62) that took the two di erent versions, the correlation meets expectations.
Locator Test Introduction Simulations. In 2005, with the move to SRI Enterprise Edition,
Scholastic introduced the Locator Test. The purpose of the Locator Test is to ensure that
students who read signi cantly below grade level (at grade level 50th percentile) receive
a valid Lexile measure from the rst administration of SRI. Two studies were conducted to
examine whether the Locator Test was serving the purpose for which it was designed.
74216_SRI_TechGuide_FC-105.indd 5974216_SRI_TechGuide_FC-105.indd 59 8/14/07 6:54:17 PM8/14/07 6:54:17 PM

Scholastic Reading Inventory
60
Study 1. The rst study was conducted in September 2005 and consisted of simulating
the responses of approximately 90 test administrations “by hand.” The results showed that
students who failed the Locator Test could get BR scores (Scholastic, 2006b, p.1).
Study 2. The second study was conducted in 2006 and consisted of the simulation of
6,900 students under ve di erent test conditions. Each simulated student took all ve tests
(three tests included the Locator Test and two excluded it).
The rst simulation tested whether students who perform as well on the Locator Test as they
perform on the rest of SRI can expect to receive higher or lower scores (Trial 1) than if
they never receive the Locator Test (Trial 4). A total of 4,250 simulated students participated
in this study, and a correlation of .96 was observed between the two test scores (with and
without the Locator Test). The results showed that performance on the Locator Test did not
a ect SRI scores for students who had reading abilities above BR (N 4,150; Wilcoxson
Rank Sum Test 1.7841e07; p .0478). In addition, the proportion of students who
scored BR from each administration was examined. As expected, the proportion of
students who scored BR without the Locator Test was 12.17% (840 out of 6,900) compared
to 22.16% (1,529 out of 6,900) who scored BR with the Locator Test. The results con rmed
the hypothesis that the Locator Test allows students to start SRI at a much lower Reader
Measure and, thus, descend to the BR level with more reliability.
The third simulation tested whether students who failed the Locator Test (Trial 3) received
basically the same score as when they had a prior Reader Measure 500L below grade level
and were administered SRI without the Locator Test (Trial 5). The results showed that failing
the Locator Test produced results similar to inputting a “below basic” estimated reading level
(N 6,900; Wilcoxson Rank Sum Test 4.7582e07; p .8923).
74216_SRI_TechGuide_FC-105.indd 6074216_SRI_TechGuide_FC-105.indd 60 8/14/07 6:54:17 PM8/14/07 6:54:17 PM

Technical Guide 61
Reliability
To be useful, a piece of information should be reliable—stable, consistent, and depend-
able. In reality, all test scores include some measure of error (or level of uncertainty). This
uncertainty in the measurement process is related to three factors: the statistical model used
to compute the score, the questions used to determine the score, and the condition of the
test taker when the questions used to determine the score were administered. Once the
level of uncertainty in a test score is known, then it can be taken into account when the
test results are used.
Reliability, or the consistency of scores obtained from an assessment, is a major consid-
eration in evaluating any assessment procedure. Two sources of uncertainty have been
examined for SRI—text error and reader error.
Standard Error of Measurement
Uncertainty and Standard Error of Measurement. There is always some uncertainty about a
student’s true score because of the measurement error associated with test unreliability.
This uncertainty is known as the standard error of measurement (SEM). The magnitude of
the SEM of an individual student’s score depends on the following characteristics of
the test:
the number of test items—smaller standard errors are associated with
longer tests;
the quality of the test items—in general, smaller standard errors are
associated with highly discriminating items for which correct answers
cannot be obtained by guessing; and
the match between item di culty and student ability—smaller stan-
dard errors are associated with tests composed of items with di cul-
ties approximately equal to the ability of the student (targeted tests).
(Hambleton, Swaminathan, and Rogers, 1991).
SRI was developed using the Rasch one-parameter item response theory model to relate
a reader’s ability to the di culty of the items. There is a unique amount of measurement
error due to model misspeci cation (violation of model assumptions) associated with each
score on SRI. The computer algorithm that controls the administration of the assessment
uses a Bayesian procedure to estimate each student’s reading comprehension ability. This
procedure uses prior information about students to control the selection of questions and
the recalculation of each student’s reading ability after responding to each question.
Compared to a xed-item test where all students answer the same questions, a computer-
adaptive test produces a di erent test for every student. When students take a computer-
adaptive test, they all receive approximately the same raw score or number of items correct.
This occurs because all students are answering questions that are targeted for their unique
•
•
•
74216_SRI_TechGuide_FC-105.indd 6174216_SRI_TechGuide_FC-105.indd 61 8/14/07 6:54:17 PM8/14/07 6:54:17 PM
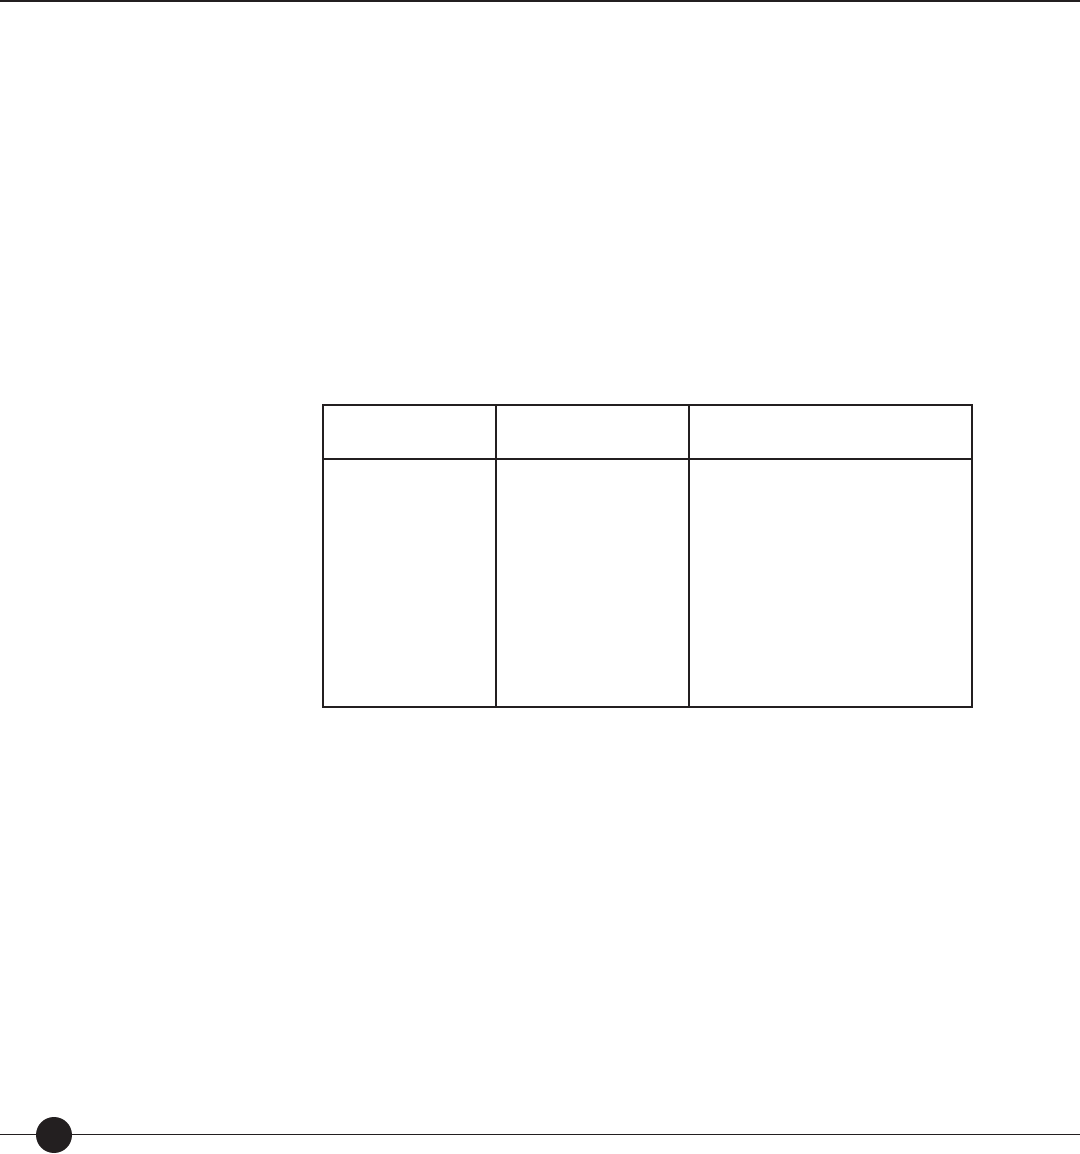
Scholastic Reading Inventory
62
ability—not questions that are too easy or too hard. Because each student takes a unique
test, the error associated with any one score or student is also unique.
The initial uncertainty for an SRI score is 225L (within-grade standard deviation from
previous research conducted by MetaMetrics, Inc.). When a student retests with SRI, the
uncertainty of his or her score is the uncertainty that resulted from the previous assess-
ment adjusted for the time elapsed between administrations. An assumption is made that
after three years without a test, the student’s ability should again be measured at maximum
uncertainty. Average SEMs are presented in Table 12. These values can be used as a general
“rule of thumb” when reviewing SRI results. It bears repeating that because each student
takes a unique test and the results rely partly on prior information, the error associated with any one
score or student is also unique.
Table 12. Mean SEM on
SRI
by extent of prior knowledge.
Number of Items SEM
Grade Level Known SEM
Grade and Reading Level Known
15
16
17
18
19
20
21
22
23
24
104L
102L
99L
96L
93L
91L
89L
87L
86L
84L
58L
57L
57L
57L
57L
56L
56L
55L
54L
54L
As can be seen from the information in Table 12, when the test is well-targeted (grade level
and prior reading level of the student are known), the student can respond to fewer test
questions and not increase the error associated with the measurement process. When only
the grade level of the student is known, the more questions the student responds to, the less
error in the score associated with the measurement process.
Sources of Measurement Error—Text
SRI is a theory-referenced measurement system for reading comprehension. Internal
consistency and other traditional indices of test quality are not critical considerations.
What matters is how well individual and group performances conform to theoretical
expectations. The Lexile Framework states an invariant and absolute requirement that the
performance of items and test takers must match.
74216_SRI_TechGuide_FC-105.indd 6274216_SRI_TechGuide_FC-105.indd 62 8/14/07 6:54:17 PM8/14/07 6:54:17 PM

Technical Guide 63
Measurement is the process of converting observations into quantities via theory. There
are many sources of error in the measurement process: the model used to relate observed
measurements to theoretical ones, the method used to determine measurements, and the
moment when measurements are made.
To determine a Lexile measure for a text, the standard procedure is to process the entire
text. All pages in the work are concatenated into an electronic le that is processed by a
software package called the Lexile Analyzer (developed by MetaMetrics, Inc.). The Analyzer
“slices” the text le into as many 125-word passages as possible, analyzes the set of slices,
and then calibrates each slice in terms of the logit metric. That set of calibrations is then
processed to determine the Lexile measure corresponding to a 75% comprehension rate.
The analyzer uses the slice calibrations as test item calibrations and then solves for the
measure corresponding to a raw score of 75% (e.g., 30 out of 40 correct, as if the slices
were test items). Obviously, the measure corresponding to a raw score of 75% on Goodnight
Moon (300L) slices would be lower than the measure corresponding to a comparable raw
score on USA Today (1200L) slices. The Lexile Analyzer automates this process, but what
“certainty” can be attached to each text measure?
Using the bootstrap procedure to examine error due to the text samples, the above analysis
could be repeated. The result would be an identical text measure to the rst because there
is no sampling error when a complete text is calibrated.
There is, however, another source of error that increases the uncertainty about where a
text is located on the Lexile Map. The Lexile Theory is imperfect in its calibration of the
di culty of individual text slices. To examine this source of error, 200 items that had been
previously calibrated and shown to t the model were administered to 3,026 students in
Grades 2 through 12 in a large urban school district. The sample of students was socio-
economically and ethnically diverse. For each item the observed item di culty calibrated
from the Rasch model was compared with the theoretical item di culty calibrated from
the regression equation used to calibrate texts. A scatter plot of the data is presented in
Figure 9.
The correlation between the observed and the theoretical calibrations for the 200 items
was .92 and the root mean square error was 178L. Therefore, for an individual slice of text
the measurement error is 178L.
The standard error of measurement associated with a text is a function of the error
associated with one slice of text (178L) and the number of slices that are calibrated from a
text. Very short books have larger uncertainties than longer books. A book with only four
slices would have an uncertainty of 89 Lexiles whereas a longer book such as War and Peace
(4,082 slices of text) would only have an uncertainty of three Lexiles (Table 13).
Study 2. A second study was conducted by Stenner, Burdick, Sanford, and Burdick (2006)
during 2002 to examine ensemble di erences across items. An ensemble consists of the all
of the items that could be developed from a selected piece of text. The Lexile measure of a
piece of text is the mean di culty.
74216_SRI_TechGuide_FC-105.indd 6374216_SRI_TechGuide_FC-105.indd 63 8/14/07 6:54:18 PM8/14/07 6:54:18 PM
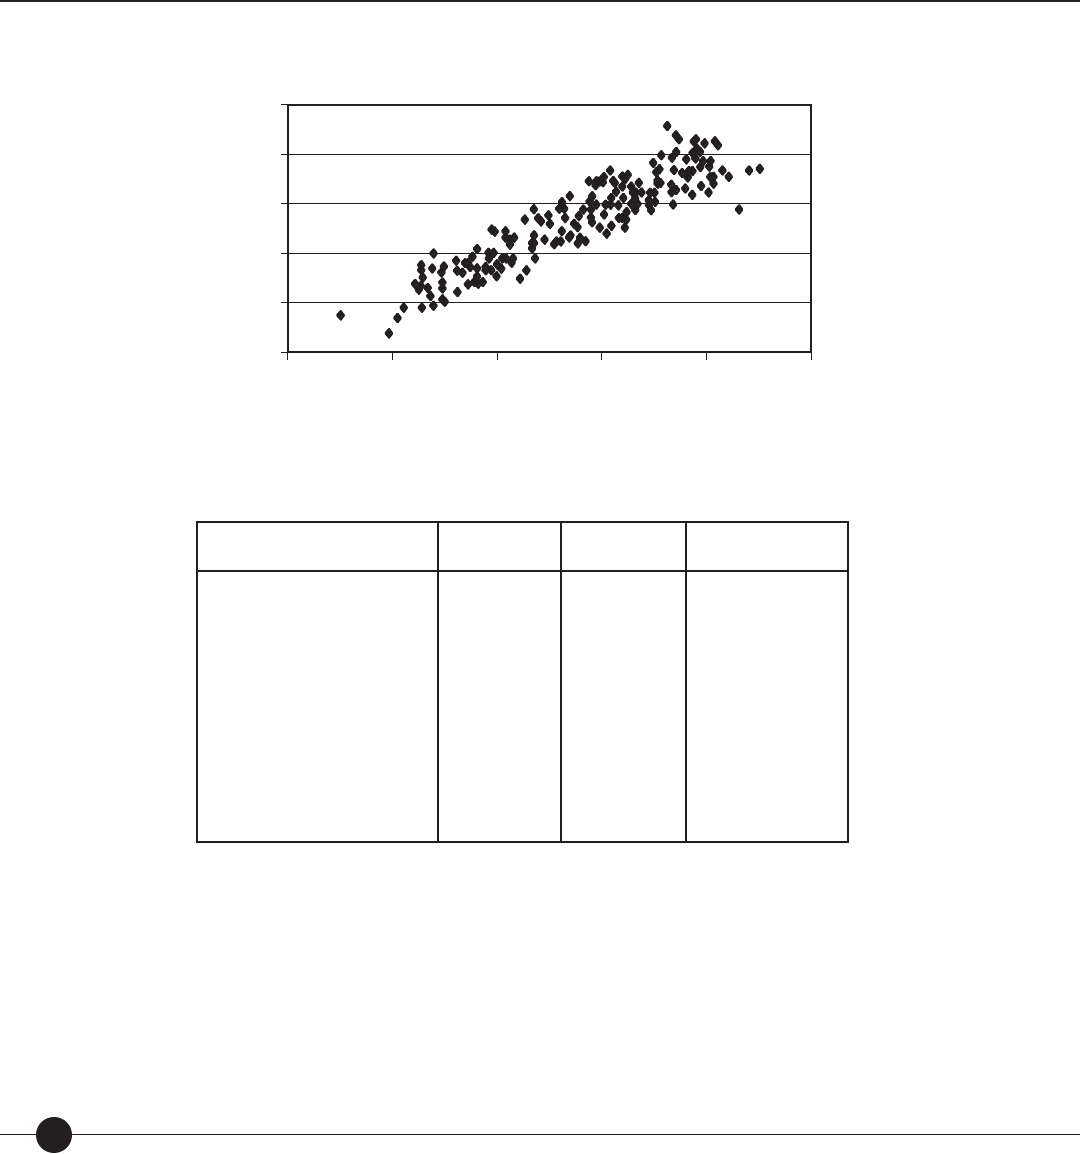
Scholastic Reading Inventory
64
Figure 9. Scatter plot between observed item diffi culty and theoretical item diffi culty.
Observed Difficulties
Theoretical Difficulties
2000
1500
1000
500
0
–500
–500 5000 2000
1000 1500
Table 13. Standard errors for selected values of the length of the text.
Title Number
of Slices Text
Measure Standard Error
of Text
The Stories Julian Tells
Bunnicula
The Pizza Mystery
Meditations of First Philosophy
Metaphysics of Morals
Adventures of Pinocchio
Red Badge of Courage
Scarlet Letter
Pride and Prejudice
Decameron
War and Peace
46
102
137
206
209
294
348
597
904
2431
4082
520L
710L
620L
1720L
1620L
780L
900L
1420L
1100L
1510L
1200L
26L
18L
15L
12L
12L
10L
10L
7L
6L
4L
3L
Participants. Participants in this study were students from four school districts in a large
southwestern state. These students were participating in a larger study that was designed to
assess reading comprehension with the Lexile scale. The total sample included 1,186 Grade
3 students, 893 Grade 5 students, and 1,531 Grade 8 students. The mean tested abilities
of the three samples were similar to the mean tested abilities of all students in each grade
on the state reading assessment. Though 3,610 students participated in the study, the data
records for only 2,867 of these students were used for determining the ensemble item
di culties presented in this paper. The students were administered one of four forms at
each grade level. The reduction in sample size is because one of the four forms was created
74216_SRI_TechGuide_FC-105.indd 6474216_SRI_TechGuide_FC-105.indd 64 8/14/07 6:54:18 PM8/14/07 6:54:18 PM

Technical Guide 65
using the same ensemble items as another form. For consistency of sample size across
forms, the data records from this fourth form were not included in the ensemble study.
Instrument. Thirty text passages were response-illustrated by three di erent item writing
teams resulting in three items nested within each of 30 passages for a total of 90 items. All
three teams employed a similar item-writing protocol. The ensemble items were spiraled
into test forms at the grade level (3, 5, or 8) that most closely corresponded with the item’s
theoretical calibration.
Winsteps (Wright & Linacre, 2003) was used to estimate item di culties for the 90
ensemble study items. Of primary interest in this study was the correspondence between
theoretical text calibrations, ensemble means and the consequences that theory misspeci -
cation holds for text measure standard errors.
Results. Table 14 presents the ensemble study data in which three independent teams wrote
one item for each of thirty passages for ninety items. Observed ensemble means taken over
the three ensemble item di culties for each passage are given along with an estimate of the
within ensemble standard deviation for each passage.
The di erence between passage text calibration and observed ensemble mean is provided
in the last column. The RMSE from regressing observed ensemble means on text calibra-
tions is 110L. Figures 10a and 10b show plots of observed ensemble means compared to
theoretical text calibrations.
Note, that some of the deviations about the identity line are because ensemble means are
poorly estimated given that each mean is based on only three items. The bottom panel
in Figure 10b depicts simulated data when an error term [distributed N(0, = 64L)] is
added to each theoretical value. Contrasting the two plots in Figures 10a and 10b provides
a visual depiction of the di erence between regressing observed ensemble means on theory
and regressing “true” ensemble means on theory. An estimate of the RMSE when “true”
ensemble means are regressed on the Lexile Theory is 64L (
1102 892
4,038
63.54). This is the average error at the passage level when predicting “true” ensemble
means from the Lexile Theory.
Since the RMSE equal to 64L applies to the expected error at the passage/slice level, a text
made up of ni slices would have an expected error of 64
ni . Thus, a short periodi-
cal article of 500 words (ni 4) would have a SEM of 32L (64
4 ), whereas a much
longer text like the novel Harry Potter and the Chamber of Secrets (880L, Rowling, 2001)
would have a SEM of 2L (64
900 ). Table 15 contrasts the SEMs computed using the
old method with SEMs computed using the Lexile Framework for several books across a
broad range of Lexile measures.
As can be see in Table 15, the uncertainty associated with the measurement of the reading
demand of the text is small.
74216_SRI_TechGuide_FC-105.indd 6574216_SRI_TechGuide_FC-105.indd 65 8/14/07 6:54:18 PM8/14/07 6:54:18 PM
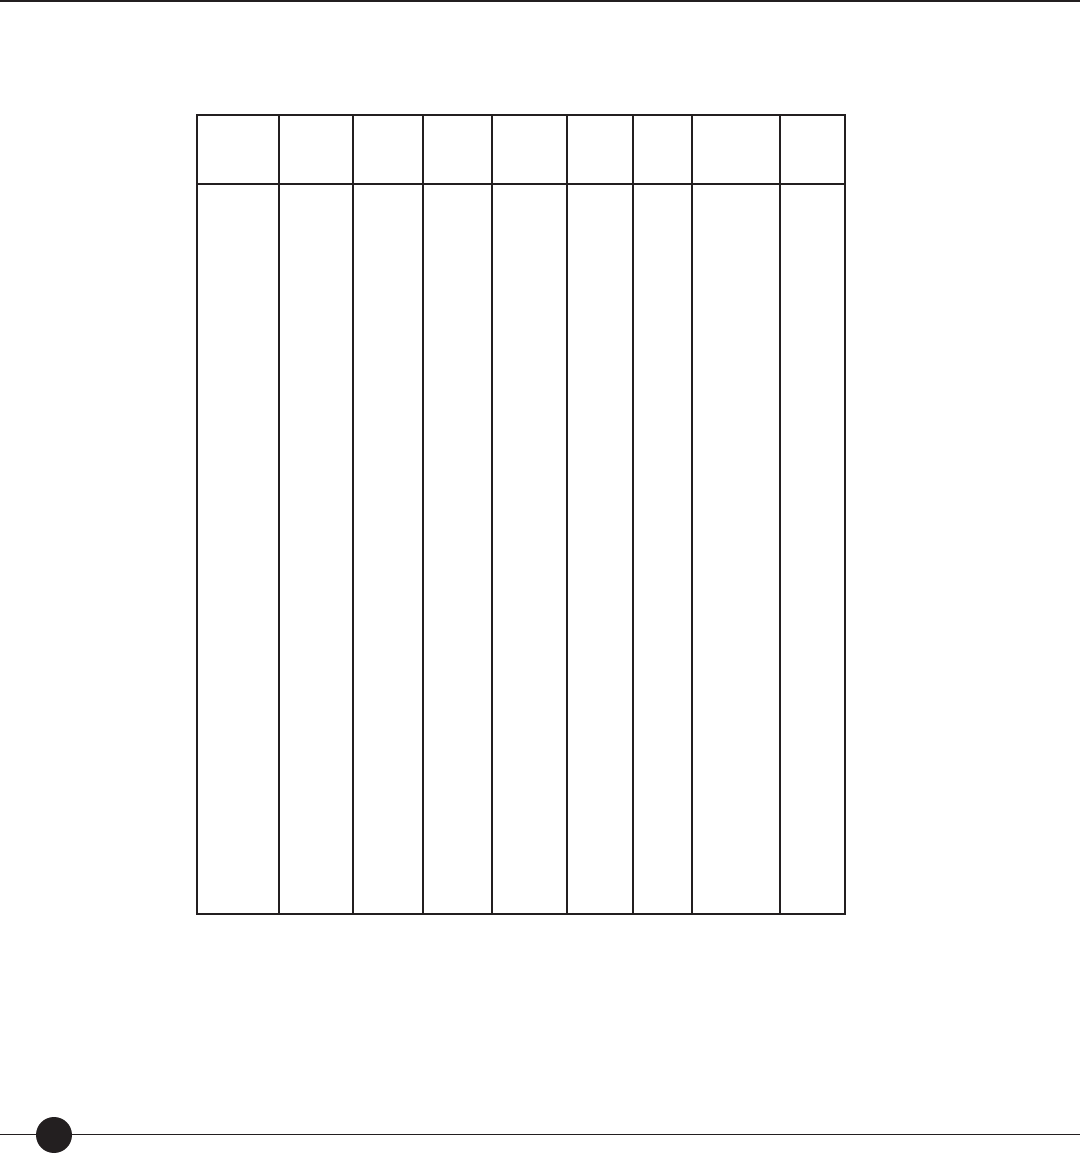
Scholastic Reading Inventory
66
Table 14. Analysis of 30 item ensembles providing an estimate of the theory
misspecifi cation error.
Item
Number Theory
(T) Team A Team B Team C Meana
(O) SDbWithin
Ensemble
Variance T-O
1
2
3
4
11
5
6
7
8
9
12
13
14
16
15
21
10
17
22
18
19
23
24
25
20
26
27
28
29
30
400L
430L
460L
490L
510L
540L
569L
580L
620L
720L
720L
745L
770L
770L
790L
812L
820L
850L
866L
870L
880L
940L
960L
1010L
1020L
1020L
1040L
1060L
1150L
1210L
456
269
306
553
267
747
909
594
897
584
953
791
855
1077
866
902
967
747
819
974
1093
945
1124
926
888
1260
1503
1109
1014
1270
553
632
407
508
602
8925
657
683
805
850
587
972
1017
1095
557
1133
740
864
809
1197
733
1057
1205
1172
1372
987
1361
1091
1104
1291
303
704
483
670
468
654
582
807
497
731
774
490
958
893
553
715
675
674
780
870
692
965
1170
899
863
881
1239
981
1055
1014
437
535
399
577
446
742
716
695
733
722
771
751
944
1022
659
917
794
762
803
1014
839
989
1166
999
1041
1043
1368
1061
1058
1193
126
234
88
84
169
86
172
107
209
133
183
244
82
112
180
209
153
96
20
167
221
60
41
151
287
196
132
69
45
156
15,909
54,523
7,832
6,993
28,413
7,332
29,424
11,386
43,808
17,811
33,386
59,354
6,717
12,446
32,327
43,753
23,445
9,257
419
28,007
48,739
3,546
1,653
22,733
82,429
38,397
17,536
4,785
2,029
24,204
37
105
61
87
64
202
147
115
113
2
51
6
74
252
131
105
26
88
63
144
41
49
206
11
21
23
328
1
92
17
Total MSE Average of (T O)2 12022; Pooled within variance for ensembles 7984; Remaining between ensemble variance
4038; Theory misspeci cation error 64L
Barlett’s test for homogeneity of variance produced an approximate chi-square statistic of 24.6 on 29 degrees of freedom and sustained
the null hypothesis that the variances are equal across ensembles.
Note. All data is reported in Lexiles.
a. Mean (O) is the observed ensemble mean.
b. SD is the standard deviation within ensemble.
74216_SRI_TechGuide_FC-105.indd 6674216_SRI_TechGuide_FC-105.indd 66 8/14/07 6:54:18 PM8/14/07 6:54:18 PM
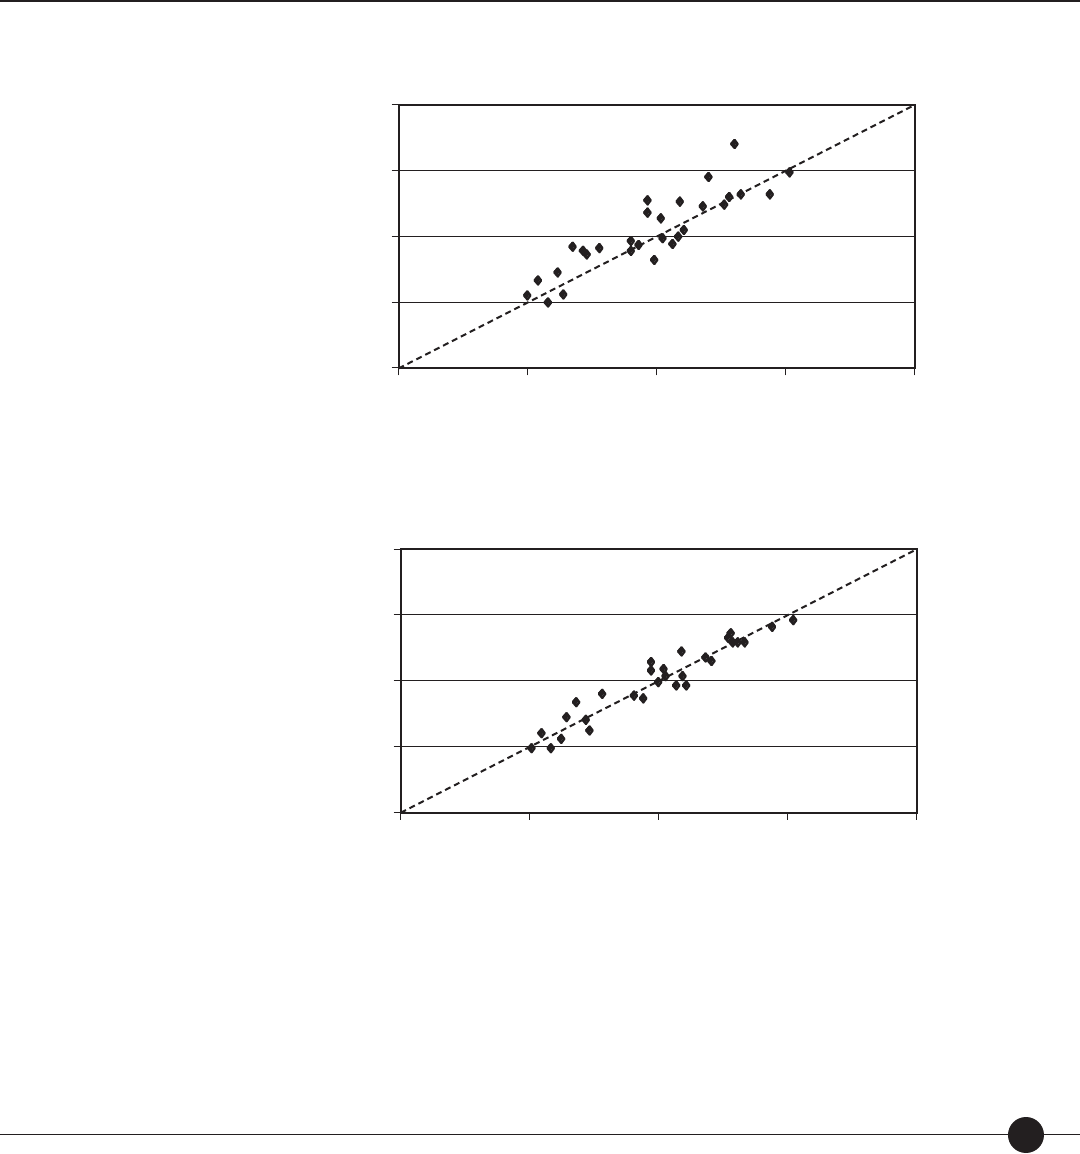
Technical Guide 67
Figure 10a. Plot of observed ensemble means and theoretical calibrations (RMSE ⴝ 111L).
Ensemble Mean
Theory
1600
1200
800
400
04000 1600
800 1200
Figure 10b. Plot of simulated “true” ensemble means and theoretical calibrations
(RMSE ⴝ 64L).
Ensemble Mean
Theory
1600
1200
800
400
04000 1600
800 1200
Sources of Measurement Error—Item Writers
Another source of uncertainty in a test measure is due to the writers who develop the test
items. Item writers are trained to develop items according to a set of procedures, but item
writers are individuals and therefore subject to di erences in behavior. General objectivity
requires that the origin and unit of measure be maintained independently of the instant
and particulars of the measurement process (Stenner, 1994). SRI purports to yield generally
objective measures of reader performance.
74216_SRI_TechGuide_FC-105.indd 6774216_SRI_TechGuide_FC-105.indd 67 8/14/07 6:54:19 PM8/14/07 6:54:19 PM
Scholastic Reading Inventory
68
Table 15. Old method text readabilities, resampled SEMs, and new SEMs for selected books.
Book Number of
Slices Lexile
Measure
Resampled
Old
SEMa
New
SEM
The Boy Who Drank Too Much
Leroy and the Old Man
Angela and the Broken Heart
The Horse of Her Dreams
Little House by Boston Bay
Marsh Cat
The Riddle of the Rosetta Stone
John Tyler
A Clockwork Orange
Geometry and the Visual Arts
The Patriot Chiefs
Traitors
257
309
157
277
235
235
49
223
419
481
790
895
447L
647L
555L
768L
852L
954L
1063L
1151L
1260L
1369L
1446L
1533L
102
9
118
126
126
125
70
89
268
140
139
140
4
4
5
4
4
4
9
4
3
3
2
2
Three slices selected for each replicate: one slice from the rst third of the book, one from the middle third, and one from the last third.
Resampled 1,000 times. SEM SD of the resampled distribution.
Prior to working on SRI, ve item writers attended a four-hour training session that included
an introduction to the Lexile Framework, rules for writing native-Lexile format items, practice
in writing items, and instruction in how to use the Lexile Analyzer software to calibrate test
items. Each item writer was instructed to write 60 items uniformly distributed over the range
from 900L to 1300L. Items were edited for rule compliance by two trained item writers.
The resulting 300 items were organized into ve test forms of 60 items each. Each item
writer contributed twelve items to each form. Items on a form were ordered from lowest
calibration to highest. The ve forms were administered in random order over ve days
to seven students (two sixth graders and ve seventh graders). Each student responded
to all 300 items. Raw score performances were converted via the Rasch model to Lexile
measures using the theoretical calibrations provided by the Lexile Analyzer.
Table 16 displays the students’ scores by item writer. A part measure is the Lexile measure for
the student on the cross-referenced writer’s items (n 60). Part-measure resampled SEMs
describe expected variability in student performances when generalizing over items and days.
Two methods were used to determine each student’s Lexile measure: (1) across all 300
items and (2) by item writer. By employing two methods, di erent aspects of uncertainty
could be examined. Using the rst method, resampling using the bootstrap procedure
accounted for uncertainty across item writers, items, and occasions. The reading compre-
hension abilities of the students ranged from 972L to 1360L. Since the items were targeted
at 900L to 1300L, only student D was mis-targeted. Mis-targeting resulted in the SEM of
the student’s score being almost twice that of the other students measured.
74216_SRI_TechGuide_FC-105.indd 6874216_SRI_TechGuide_FC-105.indd 68 8/14/07 6:54:19 PM8/14/07 6:54:19 PM
Technical Guide 69
Table 16. Lexile measures and standard errors across item writers.
Writer Student
ABCDE F G
1 937 (58) 964 (74) 1146 (105) 1375 (70) 1204 (73) 1128 (93) 1226 (155)
2 1000 (114) 927 (85) 1156 (72) 1249 (76) 1047 (118) 1156 (83) 136 (129)
3 1002 (94) 1078 (72) 1095 (86) 1323 (127) 1189 (90) 1262 (90) 1236 (111)
4 952 (74) 1086 (71) 1251 (108) 1451 (126) 1280 (115) 1312 (95) 1251 (114)
5 973 (77) 945 (88) 1163 (82) 1452 (85) 1163 (77) 1223 (71) 1109 (116)
Across Items
& Days
972 (13) 1000 (34) 1162 (25) 1370 (39) 1176 (38) 1216 (42) 1192 (29)
Across IWs,
Items, Days
972 (48) 998 (46) 1158 (50) 1360 (91) 1170 (51) 1209 (54) 1187 (47)
Using the second method (level determined by analysis of the part scores of the items
written by each item writer), resampling using the bootstrap procedure accounted
for uncertainty across days and items. Error due to di erences in occasions and items
accounted for about two-thirds of the errors in the student measures.
The box-and-whisker plots in Figure 11 display each student’s results with the box
representing the 90% con dence interval. The long line through each graph shows where
the student’s overall measure falls in relation to the part scores computed separately for each
item writer. For each student, his or her measure line passes through every box on the plot.
By chance alone at least three graphs would show lines that did not pass through a box.
Thus, the item writer’s e ect on the student’s measure is negligible. Item writer is a proxy
for (1) mode of the text—whether the writer chose a narrative or expository passage,
(2) source of the text—no two writers wrote items for the same passage, and
(3) style variation—how writers created embedded completion items. A combination
of item-writing speci cation and the Lexile Analyzer’s calibration of items resulted in
reproducible reader measures based on theory alone.
General objectivity requires that the origin and unit of measure be maintained indepen-
dently of the instant and particulars of the measurement process. This study demonstrates
that SRI produces reproducible measures of reader performance independently of item
author, source of text, and occasion of measurement.
The Lexile unit is speci ed through the calibration equations that operationalize the
construct theory. These equations are used to de ne and maintain the unit of measurement
independently of the method and instant of measurement. A Lexile unit transcends the
instrument and thereby achieves the status of a quantity. Without this transcendent quality,
units remain local and dependent on particular instruments and samples for their absolute
expression (Stenner, 1994).
74216_SRI_TechGuide_FC-105.indd 6974216_SRI_TechGuide_FC-105.indd 69 8/14/07 6:54:20 PM8/14/07 6:54:20 PM
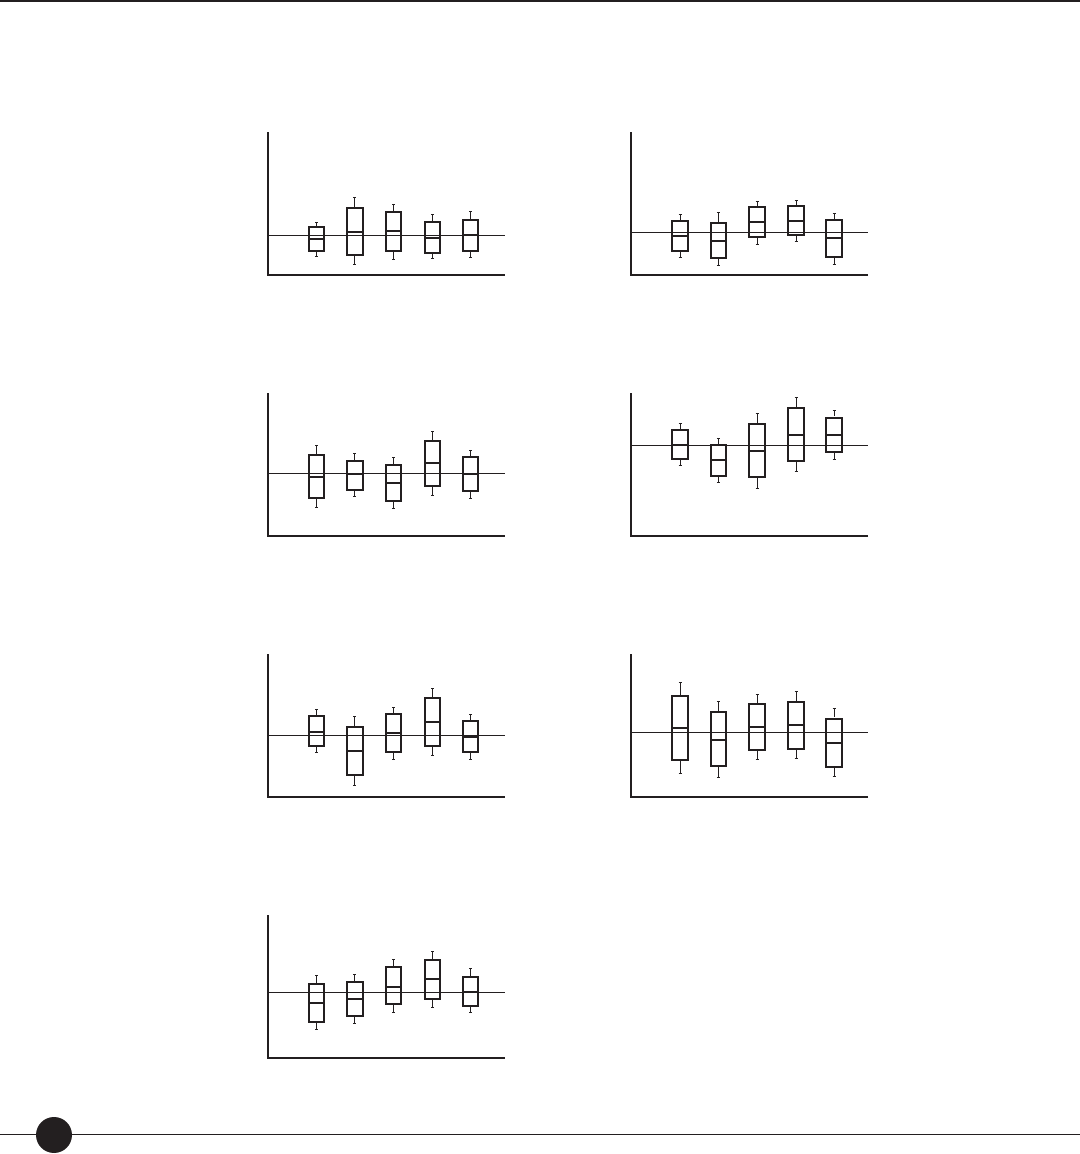
Scholastic Reading Inventory
70
Figure 11. Examination of item writer error across items and occasions.
LEXILE Measures
Writers
Student A—Five Writers
1700
1500
1300
1100
900
700
12345
LEXILE Measures
Writers
Student B—Five Writers
1700
1500
1300
1100
900
700
12345
LEXILE Measures
Writers
Student C—Five Writers
1700
1500
1300
1100
900
700
12345
LEXILE Measures
Writers
Student E—Five Writers
1700
1500
1300
1100
900
700
12345
LEXILE Measures
Writers
Student G—Five Writers
1700
1500
1300
1100
900
700
12345
LEXILE Measures
Writers
Student D—Five Writers
1700
1500
1300
1100
900
700
12345
LEXILE Measures
Writers
Student F—Five Writers
1700
1500
1300
1100
900
700
12345
74216_SRI_TechGuide_FC-105.indd 7074216_SRI_TechGuide_FC-105.indd 70 8/14/07 6:54:20 PM8/14/07 6:54:20 PM

Technical Guide 71
Sources of Measurement Error—Reader
Resampling of reader performance implies a di erent set of items (method) on a di erent
occasion (moment)—method and moment are random facets and are expected to vary
with each replication of the measurement process. With this de nition of a replication
there is nothing special about one set of items compared with another set, nor is there any-
thing special about one Tuesday morning compared to another. Any calibrated set of items
given on any day within a two-week period is considered interchangeable with any other
set of items given on another day (method and moment). The interchangeability of the
item sets suggests there is no a priori basis for believing that one particular method-moment
combination will yield a higher or lower measure than any other. That is not to say that
the resulting measures are expected to be the same. On the contrary, they are expected to
be di erent. It is unknown which method-moment combination will prove more di cult
and which more easy. The anticipated variance among replications due to method-moment
combinations and their interactions is error.
A better understanding of how these sources of error come about can be gained by describ-
ing some of the measurement and behavior factors that may vary from administration to
administration. Suppose that most of the SRI items that Sally responds to are sampled from
books in the Baby Sitter series (by Ann M. Martin), which is Sally’s favorite series. When Sally
is measured again, the items are sampled from less familiar texts. The di erences in Lexile
measures resulting from highly familiar and unfamiliar texts would be error. The items on
each level of SRI were selected to minimize this source of error. It was speci ed during item
development that no more than two items could be developed from a single source or series.
Characteristics of the moment and context of measurement can contribute to variation in
replicate measures. Suppose, unknown to the test developer, scores increase with each replica-
tion due to practice e ects. This “occasion main e ect” also would be treated as error. Again,
suppose Sally is fed breakfast and rides the bus on Tuesdays and Thursdays, but on other days
Sally gets no breakfast and must walk one mile to school. Some of the test administrations occur
on what Sally calls her “good days” and some occur on “bad days.” Variation in her reading
performance due to these context factors contributes to error. (For more information related
to why scores change, see the paper entitled “Why do Scores Change?” by Gary L. Williamson
(2004) located at www.Lexile.com.)
The best approach to attaching uncertainty to a reader’s measure is to resample the item response
record (i.e., simulating what would happen if the reader were actually assessed again). Suppose
eight-year-old José takes two 40-item SRI tests one week apart. Occasions (the two di erent
days) and the 40 items nested within each occasion can be independently resampled (two-stage
resampling), and the resulting two measures averaged for each replicate. One thousand replica-
tions would result in a distribution of replicate measures. The standard deviation of this distribu-
74216_SRI_TechGuide_FC-105.indd 7174216_SRI_TechGuide_FC-105.indd 71 8/14/07 6:54:22 PM8/14/07 6:54:22 PM
Scholastic Reading Inventory
72
tion is the resampled SEM, and it describes uncertainty in José’s reading measure by treating
methods (items), moments (occasion and context), and their interactions as error. Furthermore,
in computing José’s reading measure and the uncertainty in that measure, he is treated as an
individual without reference to the performance of other students. In general, on SRI, typical
reader measure error across items (method) and days (moment) is 70L (Stenner, 1996).
Reader Measure Consistency. Alternate-form reliability examines the extent to which two
equivalent forms of an assessment yield the same results (i.e., students’ scores have the same
rank order on both tests). Test-retest reliability examines the extent to which two adminis-
trations of the same test yield similar results. When taken together, alternate-form reliability
and test-retest reliability are estimates of reader measure consistency. A study has examined
the consistency of reader measures. If decisions about individuals are to be made on the
basis of assessment data (for example, placement or instructional program decisions), then
the assessment results should exhibit a reliability coe cient of at least 0.85.
Study 1. In a large urban school district, SRI was administered to all students in Grades 2
through 10. Table 17 shows the reader consistency estimates for each grade level and across
all grades over a four-month period. The data is from the rst and second SRI administra-
tions during the 2004–2005 school year.
Table 17. SRI reader consistency estimates over a four-month period, by grade.
Grade
N
Reader Consistency Correlation
3
4
5
6
7
8
9
10
1,241
7,236
8,253
6,339
3,783
3,581
2,694
632
0.829
0.832
0.854
0.848
0.860
0.877
0.853
0.901
Total 33,759 0.894
74216_SRI_TechGuide_FC-105.indd 7274216_SRI_TechGuide_FC-105.indd 72 8/14/07 6:54:22 PM8/14/07 6:54:22 PM

Technical Guide 73
Forecasted Comprehension Error
The di erence between a text measure and a reader measure can be used to forecast the
reader’s comprehension of the text. If a 1200L reader reads USA Today (1200L), the Lexile
Framework forecasts 75% comprehension. This forecast means that if a 1200L reader
responds to 100 items developed from USA Today, the number correct is estimated to be
75, or 75% of the items are administered. The same 1200L reader is forecast to have 50%
comprehension of senior-level college text (1450L) and 90% comprehension of The Secret
Garden (950L). How much error is present in such a forecast? That is, if the forecast were
recalculated, what kind of variability in the comprehension rate would be expected?
The comprehension rate is determined by the relationship between the reader measure and
the text measure. Consequently, error variation in the comprehension rate derives from error
variation in those two quantities. Using resampling theory, a small amount of variation in
the text measure and considerably more variation in the reader measure will be expected.
The result of resampling is a new text measure and a new reader measure, which combine to
forecast a new comprehension rate. Thus, errors in reader measure and text measure combine
to create variability in the replicated comprehension rate. Unlike text and reader error,
comprehension rate error is not symmetrical about the forecasted comprehension rate.
It is possible to determine a con dence interval for the forecasted comprehension rate.
Suppose a 1000L reader measured with 71L of error reads a 1000L text measured with 30L
of error. The error associated with the di erence between the reader measure and the text
measure (0L) is 77L (Stenner and Burdick, 1997). Referring to Table 18, the 90% con-
dence interval for a 75% forecasted comprehension rate is 63% to 84% comprehension
(round the SED of 77L to 80L for nearest tabled value).
74216_SRI_TechGuide_FC-105.indd 7374216_SRI_TechGuide_FC-105.indd 73 8/14/07 6:54:22 PM8/14/07 6:54:22 PM
Scholastic Reading Inventory
74
Table 18. Confi dence intervals (90%) for various combinations of comprehension rates
and standard error differences (SED) between reader and text measures.
Reader—Text
(in Lexiles) Forecasted
Comprehension Rate SED
40 SED
60 SED
80 SED
100 SED
120
250
225
200
175
150
125
100
75
50
25
0
25
50
75
100
125
150
175
200
225
250
50%
53%
55%
58%
61%
63%
66%
68%
71%
73%
75%
77%
79%
81%
82%
84%
85%
87%
88%
89%
90%
43–57
46–60
48–62
51–65
54–67
56–70
59–72
62–74
64–76
67–78
69–80
72–82
74–83
76–85
78–86
80–87
81–89
83–90
84–91
86–92
87–92
39–61
42–63
45–66
47–68
50–71
53–73
56–75
58–77
61–79
64–81
66–82
68–84
71–85
73–87
75–88
77–89
79–90
81–91
82–92
84–93
85–93
36–64
38–67
41–69
44–71
47–73
49–76
52–78
55–79
57–81
60–83
63–84
65–86
68–87
70–88
72–89
74–90
77–91
78–92
80–93
82–94
83–94
33–67
35–70
38–72
40–74
43–76
46–78
48–80
51–82
54–83
57–85
59–86
62–87
64–89
67–90
69–91
72–91
74–92
76–93
78–94
80–94
81–95
30–70
32–73
34–75
37–77
39–79
42–81
45–82
48–84
50–85
53–87
56–88
58–89
61–90
64–91
66–92
69–93
71–93
73–94
76–95
77–95
79–96
74216_SRI_TechGuide_FC-105.indd 7474216_SRI_TechGuide_FC-105.indd 74 8/14/07 6:54:22 PM8/14/07 6:54:22 PM

Technical Guide 75
Validity
Validity is the “extent to which a test measures what its authors or users claim it measures;
speci cally, test validity concerns the appropriateness of inferences that can be made on
the basis of test results” (Salvia and Ysseldyke, 1998). The 1999 Standards for Educational and
Psychological Testing (America Educational Research Association, American Psychological
Association, and National Council on Measurement in Education) state that “validity
refers to the degree to which evidence and theory support the interpretations of test scores
entailed in the uses of tests” (p. 9). In other words, does the test measure what it is supposed
to measure?
“The process of ascribing meaning to scores produced by a measurement procedure is
generally recognized as the most important task in developing an educational or psycho-
logical measure, be it an achievement test, interest inventory, or personality scale” (Stenner,
Smith, and Burdick, 1983). The appropriateness of any conclusions drawn from the results
of a test is a function of the test’s validity. The validity of a test is the degree to which the
test actually measures what it purports to measure. Validity provides a direct check on how
well the test ful lls its purpose.
The sections that follow describe the studies conducted to establish the validity of SRI. A s
additional validity studies are conducted, they will be described in future editions of the SRI
Technical Manual. For the sake of clarity, the various components of test validity—content
validity, criterion-related validity, and construct validity—will be described as if they are
unique, independent components rather than interrelated parts.
Content Validity
The content validity of a test refers to the adequacy with which relevant content has been
sampled and represented in the test. Content validity was built into SRI during its develop-
ment. All texts sampled for SRI items are authentic and developmentally appropriate, and
the student is asked to respond to the texts in ways that are relevant to the texts’ genres
(e.g., a student is asked speci c questions related to a non ction text’s content rather than
asked to make predictions about what would happen next in the text—a question more
appropriate for ction). For middle school and high school students who read below
grade level, a subset of items from the main item pool is classi ed “Hi-Lo.” The Hi-Lo
pool of items was identi ed from all items developed for SRI based on whether they were
developmentally appropriate for middle school and high school students (high interest) and
had Lexile measures between 200L and 1000L (low di culty). The administration of these
items ensures that students will read developmentally appropriate content.
74216_SRI_TechGuide_FC-105.indd 7574216_SRI_TechGuide_FC-105.indd 75 8/14/07 6:54:23 PM8/14/07 6:54:23 PM

Scholastic Reading Inventory
76
Criterion-Related Validity
The criterion-related validity of a test indicates the test’s e ectiveness in predicting an
individual’s behavior in a speci c situation. Convergent validity examines those situations in
which test scores are expected to be in uenced by behavior; conversely, discriminate validity
examines those situations in which test scores are not expected to be in uenced by behavior.
Convergent validity looks at the relationships between test scores and other criterion
variables (e.g., number of class discussions, reading comprehension grade equivalent,
library usage, remediation). Because targeted reading intervention programs are speci cally
designed to improve students’ reading comprehension, an e ective intervention would be
expected to improve students’ reading test scores.
READ 180® is a research-based reading intervention program designed to meet the needs
of students in Grades 4 through 12 whose reading achievement is signi cantly below
the pro cient level. READ 180 was initially developed through a collaboration between
Vanderbilt University and the Orange County (FL) Public School System between 1991
and 1999. It combines research-based reading practices with the e ective use of technol-
ogy to o er students an opportunity to achieve reading success through a combination of
instructional, modeled, and independent reading components. Because READ 180 is a
reading intervention program, students who participate in the program would be expected
to show improvement in their reading comprehension as measured by SRI.
Reading comprehension generally increases as a student progresses through school. It
increases rapidly during elementary school because students are speci cally instructed in
reading. In middle school, reading comprehension grows at a slower rate because instruc-
tion concentrates on speci c content areas, such as science, literature, and social studies.
SRI was designed to be a developmental measure of reading comprehension. Figure 12
shows the median performance (and upper and lower quartiles) on SRI for students at each
grade level. As predicted, student scores on SRI climb rapidly in elementary grades and
level o in middle school.
Discriminate validity looks at the relationships between test scores and other criterion
variables that the scores should not be related to (e.g., gender, race/ethnicity). SRI scores
would not be expected to uctuate according to the demographic characteristics of the
students taking the test.
Study 1. During the 2003–2004 school year, the Memphis (TN) Public Schools remedi-
ated 525 students with READ 180 (Memphis Public Schools, no date). Pretests were
administered between May 1, 2003 and December 1, 2003, and posttests were administered
between January 1, 2004 and August 1, 2004. A minimum of one month and a maximum
of 15 months elapsed between the pretest and posttest. Pretest scores ranged from 24L to
1070L with a mean of 581L (standard deviation of 606L). Posttest scores ranged from 32L
to 1261L with a mean of 667L (standard deviation of 214L). The mean gain from pretest to
posttest was 85.2L (standard deviation of 183L). Figure 13 shows the distribution of scores
on the pretest and the posttest for all students.
74216_SRI_TechGuide_FC-105.indd 7674216_SRI_TechGuide_FC-105.indd 76 8/14/07 6:54:23 PM8/14/07 6:54:23 PM
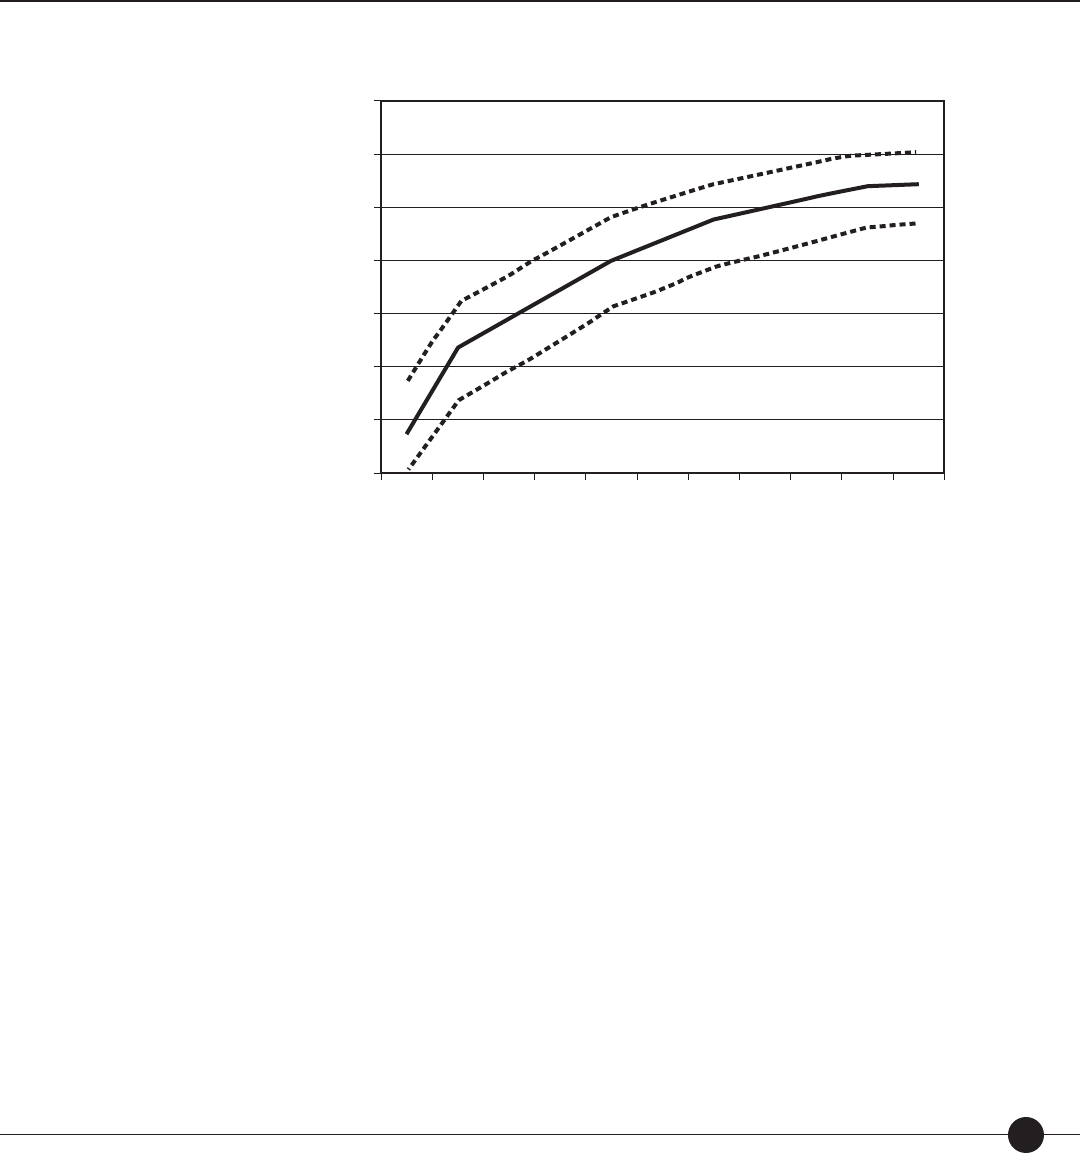
Technical Guide 77
Figure 12. Growth on
SRI
—Median and upper and lower quartiles, by grade.
Lexile Measure
Grade Level
1400
1200
1000
800
600
400
200
01234567891011
The results of the study show a positive relationship between SRI scores and enrollment in
a reading intervention program.
Study 2. During the 2002–2003 school year, students at 14 middle schools in Clark
County (NV) School District participated in READ 180 and completed SRI. Of the
4,223 students pretested in August through October and posttested in March through May,
399 students had valid numerical data for both the pretest and the posttest. Table 19 shows
the mean gains in Lexile measures by grade level.
The results of the study show a positive relationship between SRI scores and enrollment in
a reading intervention program.
Study 3. During the 2000–2001 through 2004–2005 school years, the Des Moines (IA)
Independent Community School District administered READ 180 to 1,213 special educa-
tion middle school and high school students (Hewes, Mielke, and Johnson, 2006; Palmer,
2003). SRI was administered as a pretest to students entering the intervention program and
as a posttest at the end of each school year. SRI pretest scores were collected for 1,168 of
the sampled students; posttest 1 scores were collected for 1,122 of the sampled students; and
posttest 2 scores were collected for 361 of the sampled students. Figure 14 shows the mean
pretest and posttest scores (1 and 2) for students in various cohorts. The standard deviation
across all students was 257.40 Lexiles.
As shown in Figure 14, reading ability as measured by SRI increased from the initial grade
level of the student. In addition, when the students’ cohort, starting grade, pattern of
74216_SRI_TechGuide_FC-105.indd 7774216_SRI_TechGuide_FC-105.indd 77 8/14/07 6:54:23 PM8/14/07 6:54:23 PM
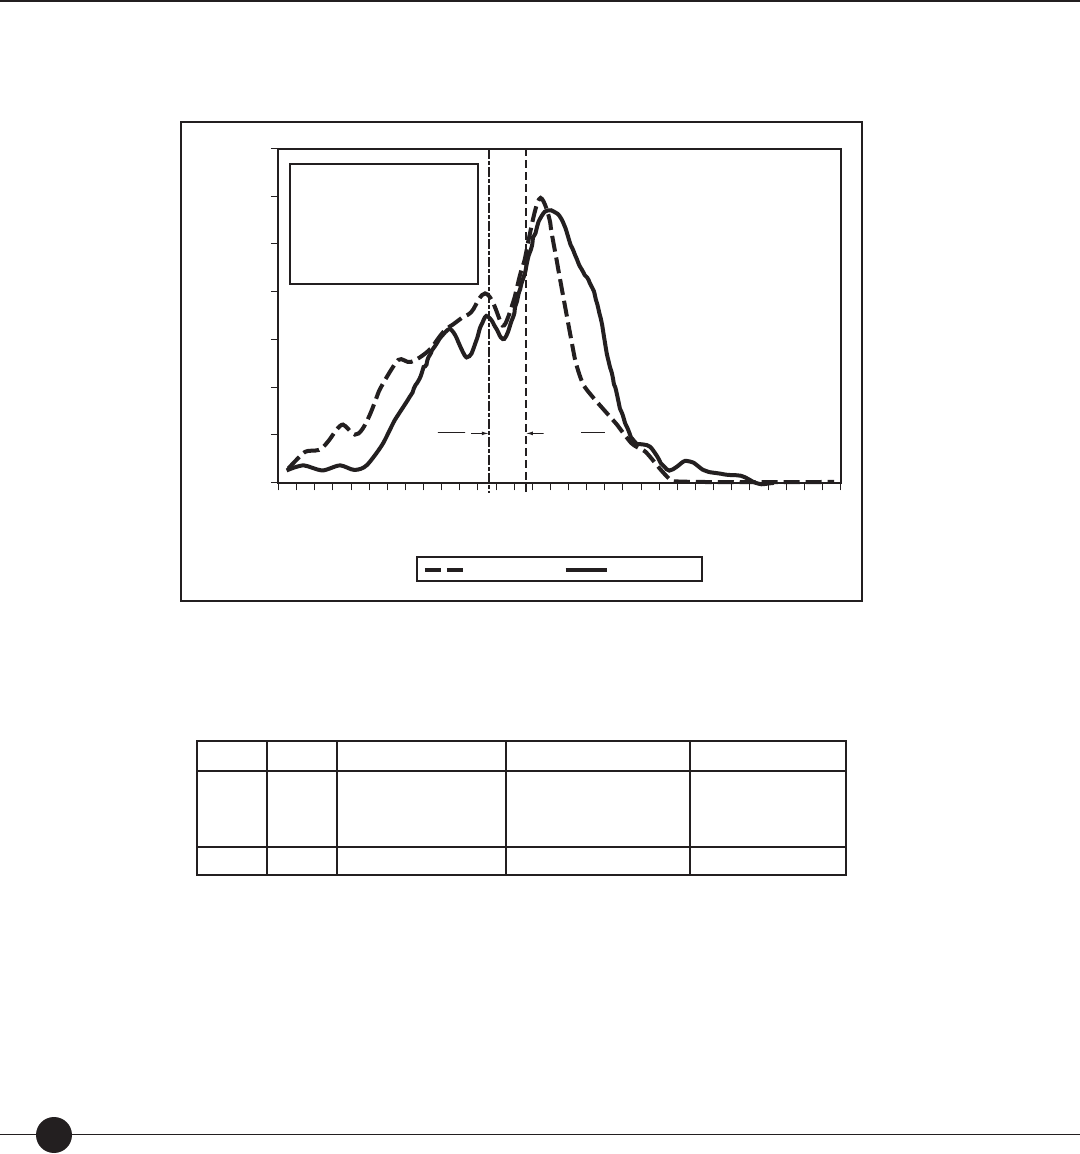
Scholastic Reading Inventory
78
Figure 13. Memphis (TN) Public Schools: Distribution of initial and fi nal
SRI
scores for
READ 180
participants.
Percent of Fall 2003 READ 180
Participants (N = 314)
Lexile Scale Score
0
050
100
150
200
250
300
350
400
450
500
550
600
650
700
750
800
850
900
950
1000
1050
1100
1150
1200
1250
1300
1350
1400
1450
1500
2
4
6
8
Mean Initial
SRI Score
Initial Test Score Final Test Score
Mean Final
SRI Score
10
12
Distribution of SRI Scores
Mean
Stnd Dev
Median
Medium
Maximum
Initial SRI Final SRI
Scores Scores
581L ( 18.7L) 667L ( 17.7L)
218L 214L
606L 698L
24L 32L
1070L 1261L
14
Adapted from Memphis Public Schools (no date), Exhibit 2.
Table 19. Clark County (NV) School District: Normal curve equivalents on
SRI
by grade level.
Grade
N SRI
Pretest Mean (SD)
SRI
Posttest Mean (SD) Gain (SD)
6
7
8
159
128
52
N/A
N/A
N/A
N/A
N/A
N/A
88.91 (157.24)**
137.84 (197.44)**
163.12 (184.20)**
Total 399 461.09 (204.57) 579.86 (195.74) 118.77
Adapted from Papalewis (2003), Table 4.
** p .01, pre to post paired t test.
participation, and level of special education were controlled for, students grew at a rate of
39.68 Lexiles for each year of participation in READ 180 (e ect size .15; NCE 3.16).
“These were annual gains associated with READ 180 above and beyond yearly growth in
achievement” (Hewes, Mielke, and Johnson, 2006, p. 14). Students who started READ 180
in middle school (Grades 6 and 7) improved the most.
74216_SRI_TechGuide_FC-105.indd 7874216_SRI_TechGuide_FC-105.indd 78 9/26/07 6:03:45 PM9/26/07 6:03:45 PM
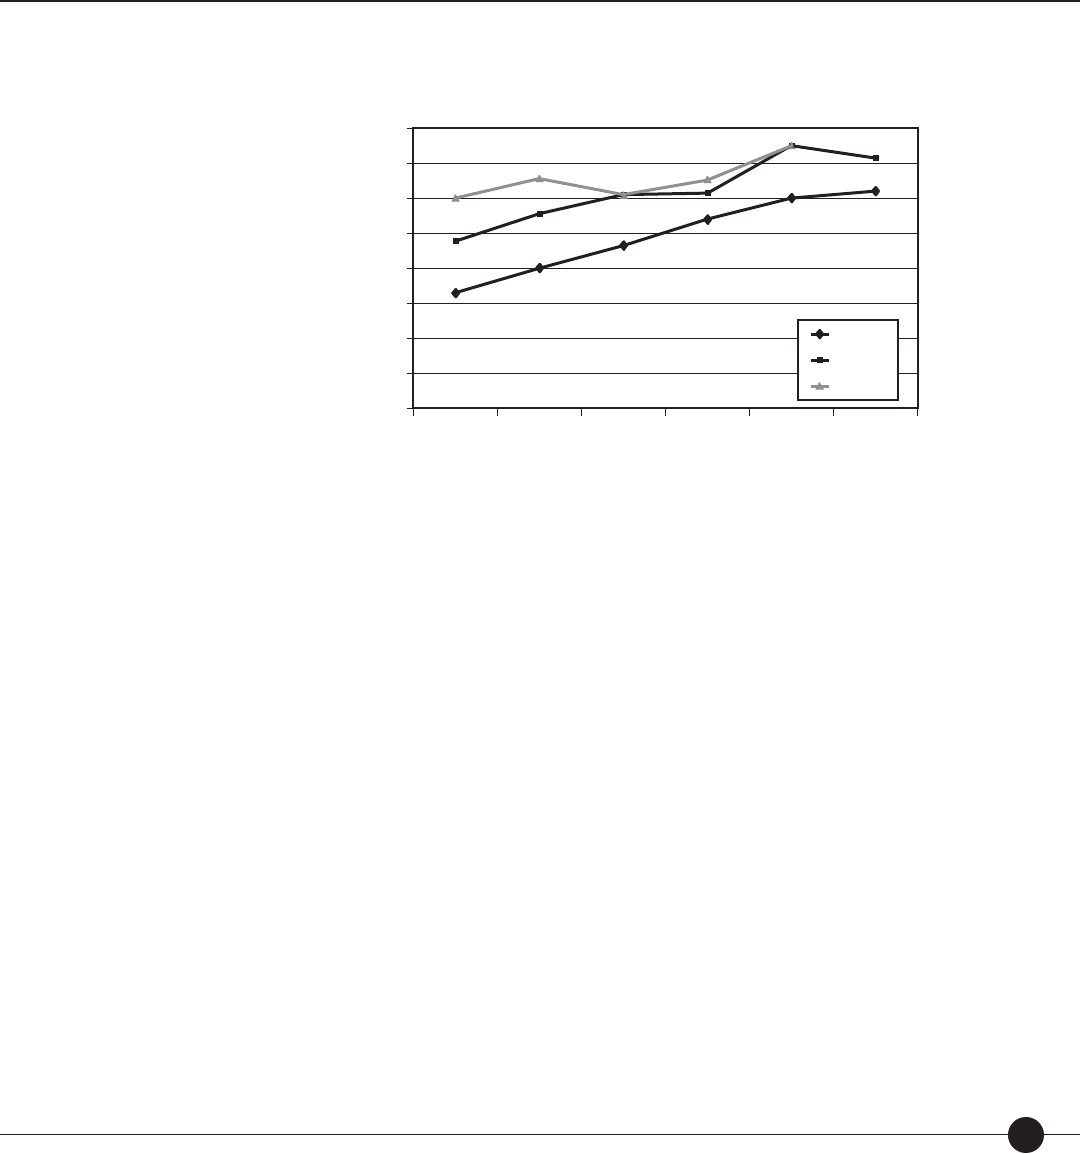
Technical Guide 79
Figure 14. Des Moines (IA) Independent Community School District: Group
SRI
mean Lexile
measures, by starting grade level in
READ 180.
Lexile Measure
Initial Grade Level
0
691078 11
800
700
600
500
400
300
200
100
Pretest
Posttest 1
Posttest 2
Study 4. The St. Paul (MN) School District implemented READ 180 in middle schools
during the 2003–2004 school year (St. Paul School District, no date). A total of 820
students were enrolled in READ 180 (45% regular education, 34% English language learn-
ers, 15% special education, and 6% ELL/SPED), and of those students 44% were African
American, 30% Asian, 15% Caucasian, 9% Hispanic, and 2% Native American. Of the 820
students in the program, 573 students in Grades 7 and 8 had complete data for SRI. The
mean group pretest score was 659.0L, and the mean group posttest score was 768.5L with a
gain of 109.5L (p .01). The results of the study show a positive relationship between SRI
scores and enrollment in a reading intervention program.
Study 5. Fairfax County (VA) Public Schools implemented READ 180 for 548 students
in Grades 7 and 8 at 11 middle schools during the 2002–2003 school year (Pearson and
White, 2004). The general population at the 11 schools was as follows: 45% Caucasian, 22%
Hispanic, and 18% African American; 55% male and 45% female; 16% classi ed as English
for Speakers of Other Languages (ESOL); and 25% classi ed as receiving special education
services. The sample of students enrolled in READ 180 can be described as follows: 15%
Caucasian, 37% Hispanic, and 29% African American; 52% male and 48% female; 42% clas-
si ed as ESOL; and 14% classi ed as receiving special education services. The population
that participated in the READ 180 program can be considered signi cantly di erent from
the general population in terms of race/ethnicity, ESOL classi cation, and special educa-
tion services received.
Pretest Lexile scores from SRI ranged from 136L to 1262L with a mean of 718L (standard
deviation of 208L). Posttest Lexile scores from SRI ranged from 256L to 1336L with a
mean of 815L (standard deviation of 203L). The mean gain from pretest to posttest was
74216_SRI_TechGuide_FC-105.indd 7974216_SRI_TechGuide_FC-105.indd 79 8/14/07 6:54:24 PM8/14/07 6:54:24 PM
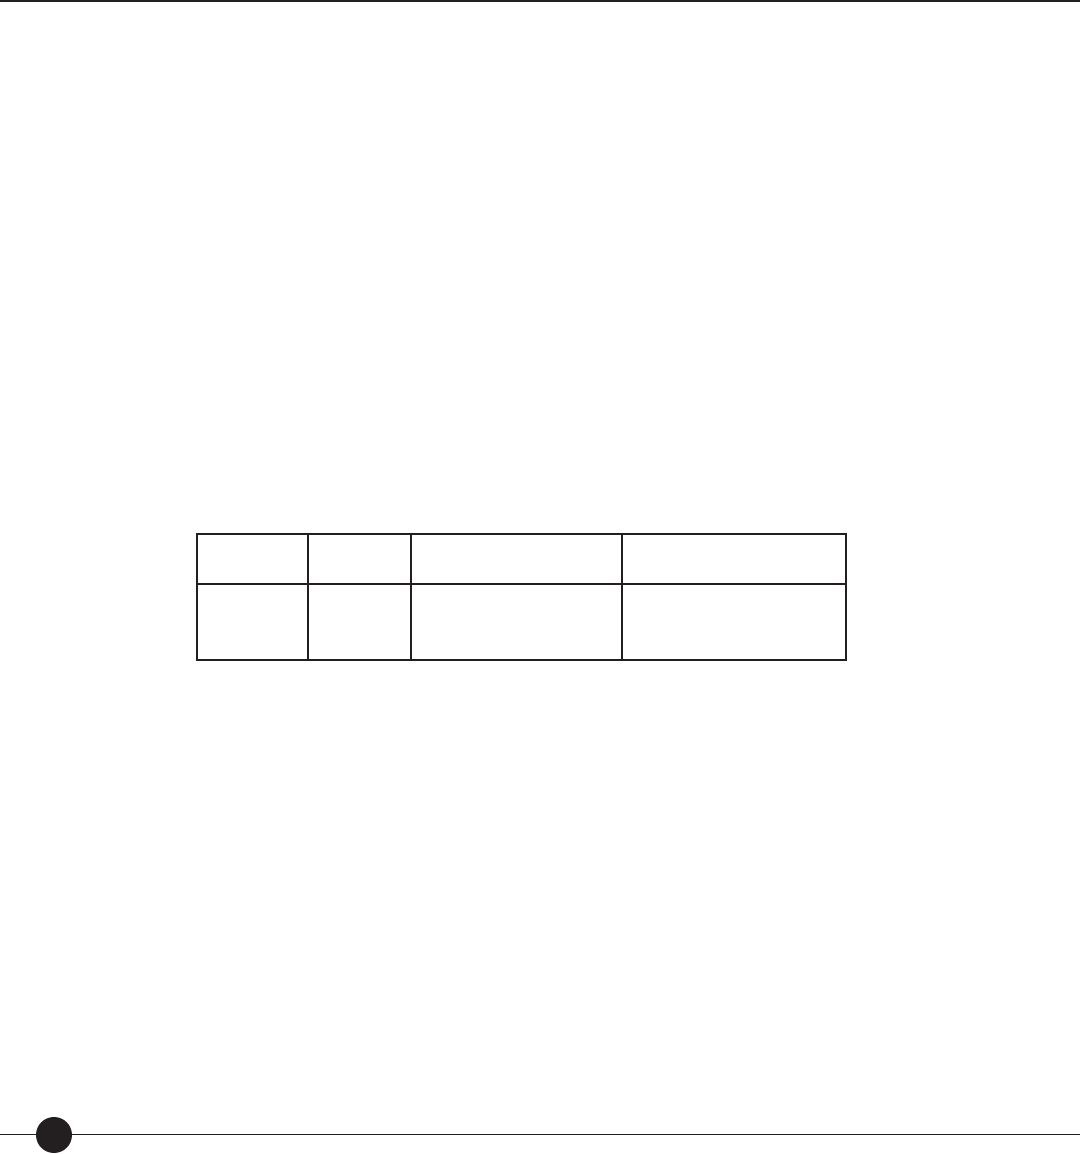
Scholastic Reading Inventory
80
95.9L (standard deviation of 111.3L). The gains in Lexile scores were statistically signi cant,
and the e ect size was 0.46 standard deviations. The results of the study showed a positive
relationship between SRI scores and enrollment in a reading intervention program.
The study also examined the gains of various subgroups of students and observed that “no
statistically signi cant di erences in the magnitude of pretest-posttest changes in reading
ability were found to be associated with other characteristics of READ 180 participants:
gender, race, eligibility for ESOL, eligibility for special education, and the number of days
the student was absent from school during 2002–03” (Pearson and White, 2004, p. 13).
Study 6. Indian River (DE) School District piloted READ 180 at Selbyville Middle
School during the 2003–2004 school year for students in Grades 6 though 8 performing
in the bottom quartile of standardized assessments (Indian River School District, no date).
During the 2004–2005 school year, SRI was administered to all students in the district
enrolled in READ 180 (the majority of students also received special education services).
Table 20 presents the descriptive statistics for students enrolled in READ 180 at Selbyville
Middle School and Sussex Central Middle School.
Table 20. Indian River (DE) School District:
SRI
average scores (Lexiles) for
READ 180
students in 2004–2005.
Grade
N
Fall
SRI
Lexile measure
(Mean/SD) Spring
SRI
Lexile measure
(Mean/SD)
6
7
8
65
57
62
498.0 (242.1)
518.0 (247.7)
651.5 (227.8)
651.2 (231.7)
734.8 (182.0)
818.6 (242.9)
Adapted from Indian River School District (no date), Table 1.
Based on the results, the increase in students classi ed as “Reading at Grade Level” was
18.5% in Grade 6, 13.4% in Grade 7, and 26.2% in Grade 8. “Students not only showed
improvement in the quantitative data, they also showed an increase in their positive
attitudes toward reading in general” (Indian River School District, no date, p. 1). The results
of the study show a positive relationship between SRI scores and enrollment in a reading
intervention program. In addition, SRI scores monotonically increased across grade levels.
Study 7. In response to a drop-out problem with special education students at Fulton
Middle School (Callaway County, GA), READ 180 was implemented in 2005 (Som-
merhauser, 2006). Students in Grades 6 and 7 whose reading skills were signi cantly below
grade level (N = 24) participated in the program. The results showed that “20 of the 24
students have shown improvement in their Lexile scores, a basic reading test.”
Study 8. East Elementary School in Kodiak, Alaska, instituted a reading program in 2000
that matched readers with text at their level of comprehension (MetaMetrics, 2006c).
Students were administered SRI as part of the Scholastic Reading Counts! ® program and
encouraged to read books at their Lexile level. Reed, the school reading specialist, stated
74216_SRI_TechGuide_FC-105.indd 8074216_SRI_TechGuide_FC-105.indd 80 8/14/07 6:54:25 PM8/14/07 6:54:25 PM

Technical Guide 81
that the program has led to more books being checked out of the library, increased student
enthusiasm for reading, and increased teacher participation in the program (e.g., lesson
planning, materials selection across all content areas).
Study 9. The Kirkwood (MO) School District Implemented READ 180 between 1999
and 2003 (Thomas, 2003). Initially, students in Grades 6 through 8 were enrolled. In sub-
sequent years, the program was expanded to include students in Grades 4 through 8. The
program served: 379 students during the 2000–2001 school year (34% classi ed as Special
Education/SSD); 311 students during the 2001–2002 school year (43% classi ed as Special
Education/SSD); and 369 students during the 2002–2003 school year (41% classi ed as
Special Education/SSD). Figures 15 through 17 show the pretest and posttest scores of
general education students for three years of the program.
The results of the study show a positive relationship between SRI scores and enrollment
in a reading intervention program (within school year gains for 90% of students enrolled
in the program). The study concluded that “fourth and fth grade students have higher
increases than middle school, students, reinforcing the need for earliest intervention.
Middle school scores, however, are in uenced by higher numbers of new students needing
reading intervention” (Thomas, 2003, p. 7).
Study 10. In fall 2003, the Phoenix (AZ) Union High School District began using
Stage C of READ 180 to help struggling ninth- and tenth-grade students become
pro cient readers and increase their opportunities for success in school (White and
Haslam, 2005). Of the Grade 9 students (N 882) who participated, 49% were classi ed
as ELL and 9% were eligible for Special Education services. Information was not provided
for the Grade 10 students (N 697).
For students in Grade 9, the mean gain from SRI pretest to posttest was 110.9L. For
students in Grade 10, the mean gain from pretest to posttest was 68.8L for the fall cohort
and 110.9L for the spring cohort. The gains in Lexile scores were statistically signi cant at
the .05 level. The results of the study showed a positive relationship between SRI scores
and enrollment in a reading intervention program.
The study also examined the gains of various subgroups of students. No signi cant dif-
ferences were observed between students classi ed as ELL (ELL gain scores of 13.3 NCEs
and non-ELL gain scores of 13.5 NCEs, p .86). No signi cant di erences were observed
between students eligible for Special Education services (Special Education gain scores of
13.7 NCEs and non-Special Education gain scores of 13.5 NCEs, p .88).
Study 11. A large urban school district administers SRI to all students in Grades 2 through
10. Data has been collected since the 2000–2001 school year and matched at the student
level. All students are administered SRI at the beginning of the school year (September)
and in March, and a sample of students in intervention programs are administered SRI in
December also. Information is collected on race/ethnicity, gender, and limited English
pro ciency (LEP) classi cation. The student demographic data presented in Table 21 is from
the 2004–2005 school year.
74216_SRI_TechGuide_FC-105.indd 8174216_SRI_TechGuide_FC-105.indd 81 8/14/07 6:54:25 PM8/14/07 6:54:25 PM
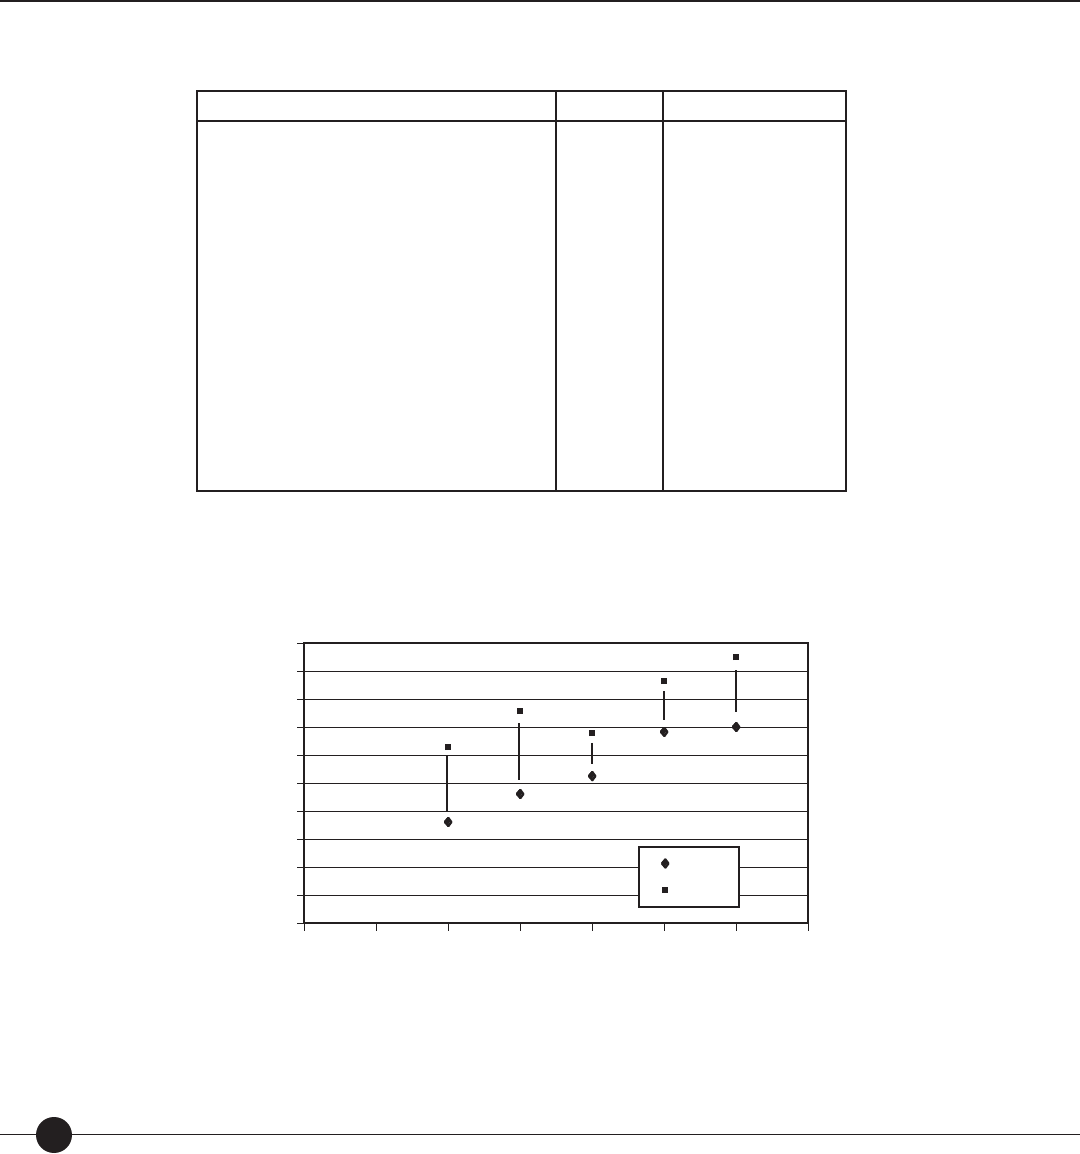
Scholastic Reading Inventory
82
Table 21. Large Urban School District:
SRI
scores by student demographic classifi cation.
Student Demographic Characteristic
N
Mean (SD)
Race/Ethnicity
• Asian
• African American
• Hispanic
• Indian
• Multiracial
• Caucasian
Gender
• Female
• Male
Limited English Pro ciency Status
• Former LEP student
• Limited English and in ESOL program
• Exited from ESOL program
• Never in ESOL program
3,498
35,500
27,260
723
5,305
65,124
68,454
68,956
6,926
7,459
13,917
109,108
979.90 (316.21)
753.43 (316.55)
790.24 (338.11)
868.41 (311.20)
906.42 (310.10)
982.54 (303.79)
898.21 (316.72)
865.10 (345.26)
689.73 (258.22)
435.98 (292.68)
890.52 (288.37)
923.10 (316.67)
Figure 15. Kirkwood (MO) School District: Pretest and posttest
SRI
scores, school year
2000–2001, general education students.
Lexile Measure
Grade Level
0
25634 789
Pretest
Posttest 1
1000
900
800
700
600
500
400
300
200
100
74216_SRI_TechGuide_FC-105.indd 8274216_SRI_TechGuide_FC-105.indd 82 8/14/07 6:54:25 PM8/14/07 6:54:25 PM
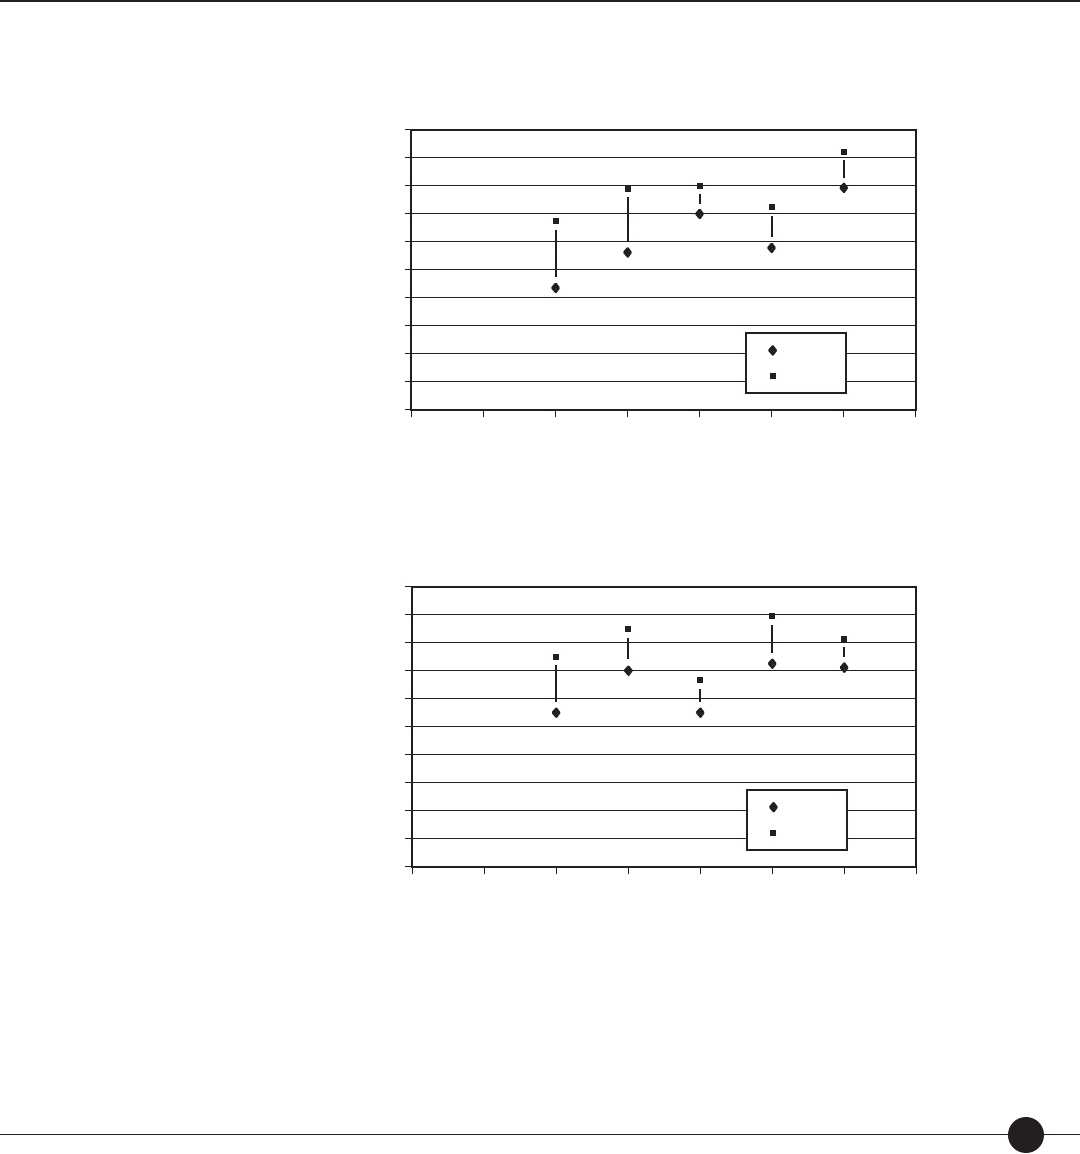
Technical Guide 83
Figure 16. Kirkwood (MO) School District: Pretest and posttest
SRI
scores, school year
2001–2002, general education students.
Lexile Measure
Grade Level
0
25634 789
Pretest
Posttest
1000
900
800
700
600
500
400
300
200
100
Figure 17. Kirkwood (MO) School District: Pretest and posttest
SRI
scores, school year
2002–2003, general education students.
Lexile Measure
Grade Level
0
25634 789
Pretest
Posttest
1000
900
800
700
600
500
400
300
200
100
Given the sample sizes, the contrasts are signi cant. Using the rule of thumb that a quarter
of a standard deviation represents an educational di erence, the data shows that Caucasian
students score signi cantly higher than all other groups except Asian students. The data does
not show any di erences based on gender, and the observed di erences based on LEP status
are expected.
74216_SRI_TechGuide_FC-105.indd 8374216_SRI_TechGuide_FC-105.indd 83 8/14/07 6:54:25 PM8/14/07 6:54:25 PM

Scholastic Reading Inventory
84
Construct Validity
The construct validity of a test is the extent to which the test may be said to measure a
theoretical construct or trait, such as reading comprehension. Anastasi (1982) identi es a
number of ways that the construct validity of a test can be examined. Two of the tech-
niques are appropriate for examining the construct validity of Scholastic Reading Inventory.
One technique is to examine developmental changes in test scores for traits that are
expected to increase with age. Another technique is to examine the “correlations between
a new test and other similar tests . . . [the correlations are] evidence that the new test
measures approximately the same general areas of behavior as other tests designated by the
same name” (p. 145).
Construct validity is the most important aspect of validity related to the computer adaptive
test of SRI. This product is designed to measure the development of reading comprehen-
sion; therefore, how well it measures reading comprehension and how well it measures the
development of reading comprehension must be examined.
Reading Comprehension Construct. Reading comprehension is the process of inde-
pendently constructing meaning from text. Scores from tests purporting to measure the
same construct, for example “reading comprehension,” should be moderately correlated
(Anastasi, 1982). (For more information related to how to interpret multiple test scores
reported in the same metric, see the paper entitled “Managing Multiple Measures” by Gary
L. Williamson (2006) located at www.Lexile.com.)
Study 1. During the 2000–2001 through 2004–2005 school years, the Des Moines (IA)
Independent Community School District enrolled 1,213 special education middle and
high school students in READ 180. SRI was administered as a pretest to students entering
READ 180 and annually at the end of each school year as a posttest. A correlation of 0.65
(p .05) was observed between SRI and the Stanford Diagnostic Reading Test (SDRT4)
Comprehension subtest; a correlation of 0.64 (p .05) was observed between SRI and the
SDRT4 Vocabulary subtest; and a correlation of 0.65 (p .05) was observed between SRI
and the SDRT4 total score. “The low correlations observed for this sample of students may
be related to the fact that this sample is composed exclusively of special education students”
(Hewes, Mielke, and Johnson, 2006, p. A-3)
74216_SRI_TechGuide_FC-105.indd 8474216_SRI_TechGuide_FC-105.indd 84 8/14/07 6:54:26 PM8/14/07 6:54:26 PM
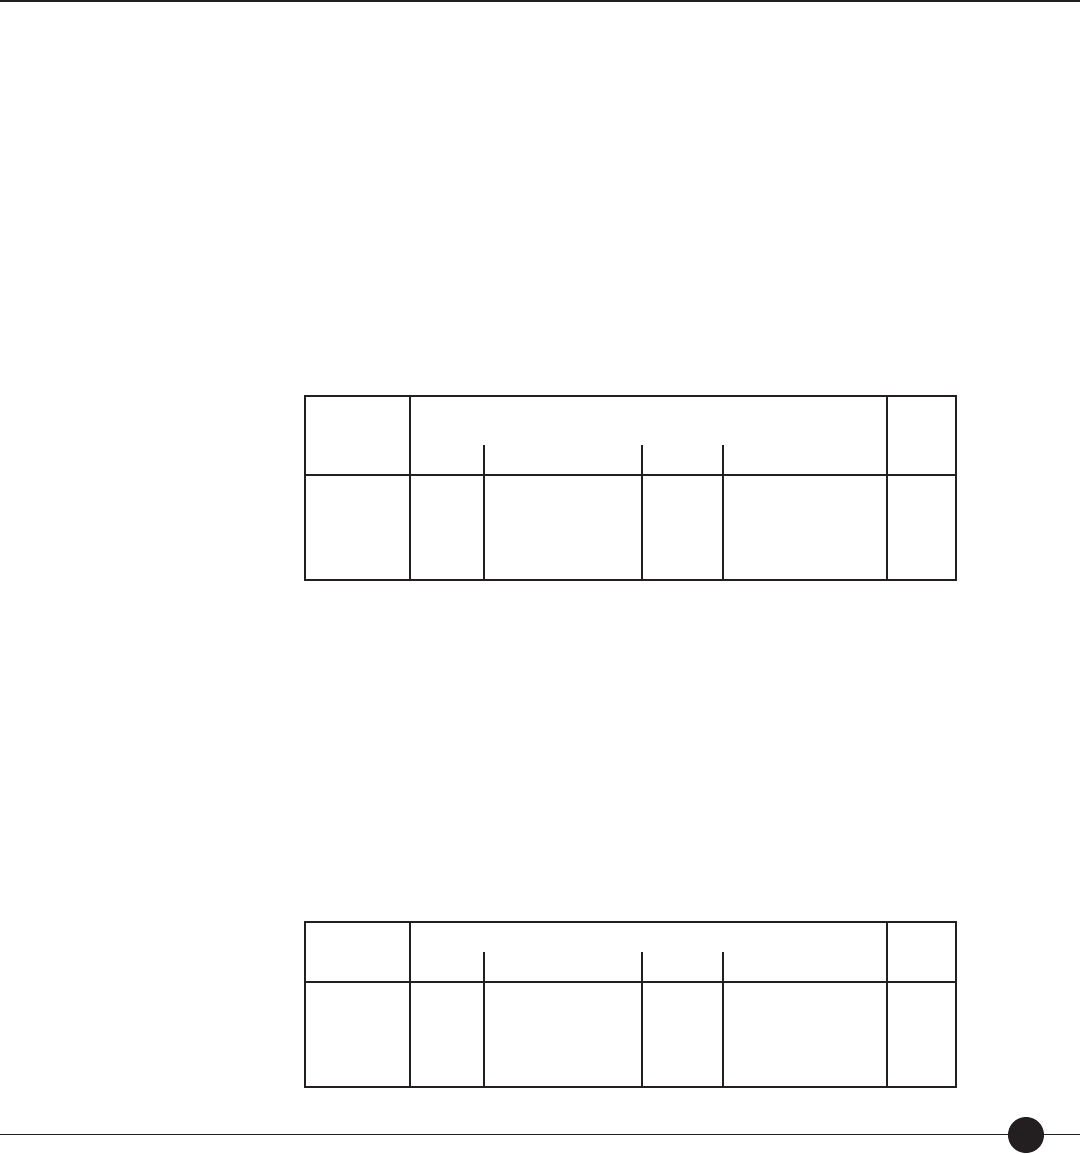
Technical Guide 85
Study 2. A large urban school district administers SRI to all students in Grades 2 through
10. Data has been collected since the 2000–2001 school year and matched at the student
level. All students are administered SRI at the beginning of the school year (September)
and in March, and a sample of students in intervention programs are administered SRI in
December also. Students are also administered the state assessment, the Florida Comprehen-
sive Assessment Test, which consists of a norm-referenced assessment (Stanford Achievement
Tests, Ninth or Tenth Edition [SAT-9/10]) and a criterion-referenced assessment (Sunshine
State Standards Test [SSS]). In addition, a sample of students takes the PSAT. Tables 22
through 24 show the descriptive statistics for matched samples of students during four years
of data collection.
Table 22. Large Urban School District: Descriptive statistics for
SRI
and the
SAT-9/10,
matched sample.
School Year
SRI
SAT-9/10
(reported in Lexiles)
r
N
Mean (SD)
N
Mean (SD)
2001–2002
2002–2003
2003–2004
2004–2005
79,423
80,677
84,707
85,486
848.22 (367.65)
862.42 (347.03)
895.70 (344.45)
885.07 (349.40)
87,380
88,962
91,018
101,776
899.47 (244.30)
909.54 (231.29)
920.94 (226.30)
881.11 (248.53)
0.824
0.800
0.789
0.821
From the results it can be concluded that SRI measures a construct similar to that measured
by other standardized tests designed to measure reading comprehension. The magnitude
of the within-grade correlations between SRI and the PSAT is close to the observed
correlations for parallel test forms (i.e., alternate forms reliability), thus suggesting that the
di erent tests are measuring the same construct. The SAT-9/10, SSS, and PSAT consist
of passages followed by traditional multiple-choice items, and SRI consists of embedded
completion multiple-choice items. Despite the di erences in format, the correlations
suggest that the four assessments are measuring a similar construct.
Table 23. Large Urban School District: Descriptive statistics for
SRI
and the
SSS,
matched
sample.
School Year
SRI
SSS
r
N
Mean (SD)
N
Mean (SD)
2001–2002
2002–2003
2003–2004
2004–2005
79,423
80,677
84,707
85,486
848.22 (367.65)
862.42 (347.03)
895.70 (344.45)
885.07 (349.40)
87,969
90,770
92,653
104,803
1641 (394.98)
1679 (368.26)
1699 (361.46)
1683 (380.13)
0.835
0.823
0.817
0.825
74216_SRI_TechGuide_FC-105.indd 8574216_SRI_TechGuide_FC-105.indd 85 8/14/07 6:54:26 PM8/14/07 6:54:26 PM
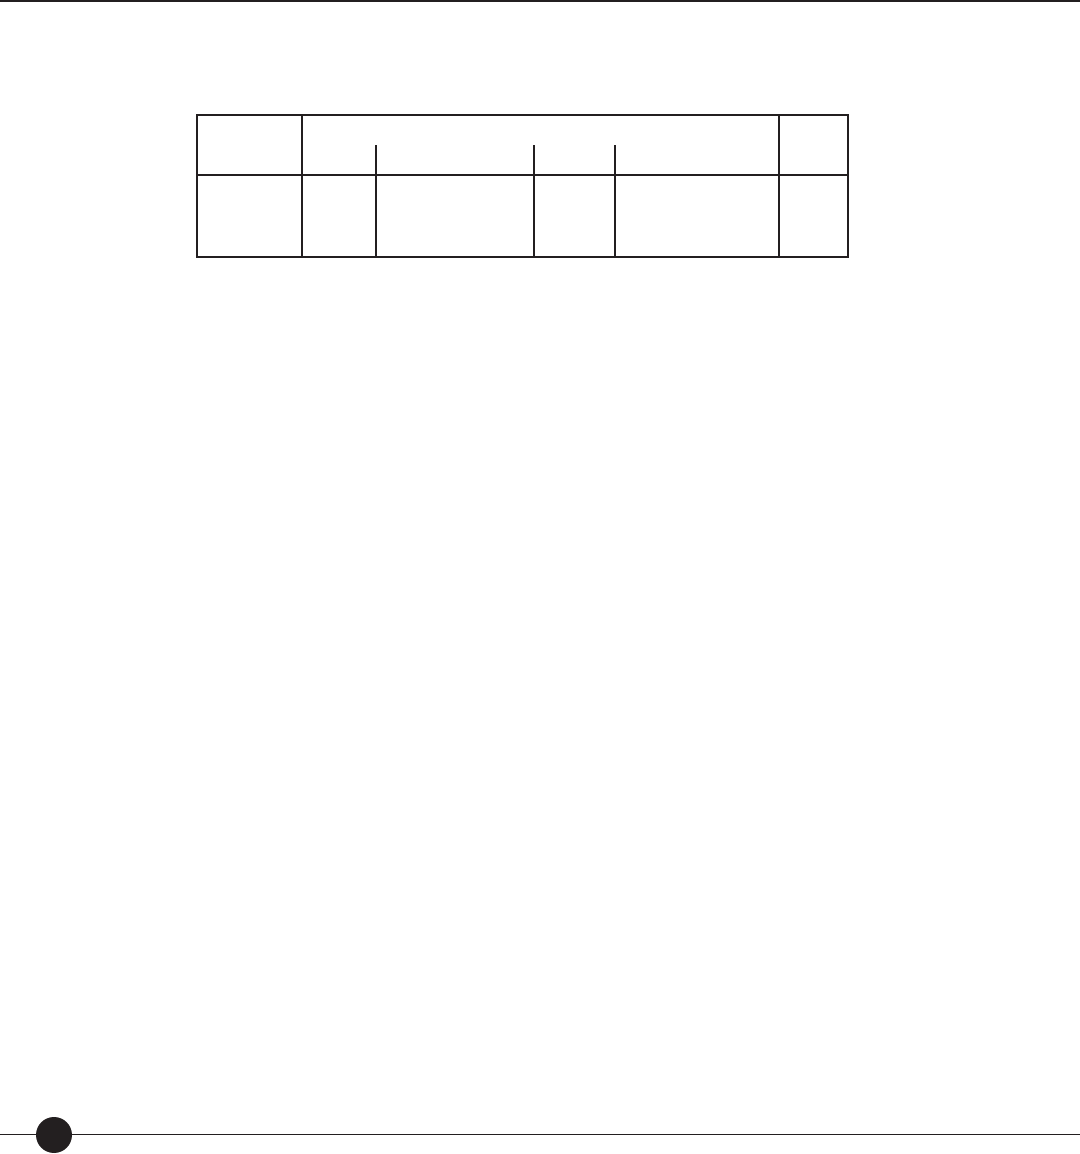
Scholastic Reading Inventory
86
Table 24. Large Urban School District: Descriptive statistics for
SRI
and the
PSAT,
matched
sample.
School Year
SRI PSAT r
N
Mean (SD)
N
Mean (SD)
2002–2003
2003–2004
2004–2005
80,677
84,707
85,486
862.42 (347.03)
895.70 (344.45)
885.07 (349.40)
2,219
2,146
1,731
44.48 (11.70)
41.86 (12.14)
44.64 (11.40)
0.730
0.696
0.753
Study 3. In 2005, a group of 20 Grade 4 students at a Department of Defense Educa-
tion Activity (DoDEA) school in Fort Benning (GA), were administered both SRI and
SRI-Print (Level 14, Form B). The correlation between the two Lexile measures was 0.92
(MetaMetrics, 2005). The results show that the two tests measure similar reading constructs.
Developmental Nature of Scholastic Reading Inventory. Reading is a skill that is expected
to develop with age—as students read more, their skills improve, and therefore they are able
to read more complex material. Because growth in reading comprehension is uneven, with
the greatest growth usually taking place in earlier grades, SRI scores should show a similar
trend of decreasing gains as grade level increases.
Study 1. A middle school in Pasco County (FL) School District administered SRI during
the 2005–2006 school year to 721 students. Growth in reading ability was examined by
collecting data in September and April. The mean Lexile measure in September across all
grades was 978.26L (standard deviation of 194.92), and the mean Lexile measure in April was
1026.12L (standard deviation of 203.20). The mean growth was 47.87L (standard deviation
of 143.09). The typical growth for middle school students is approximately 75L across a
calendar year (see Williamson, Thompson, and Baker, 2006). When the growth for the sample
of students in Pasco County was prorated to compare with a typical year’s growth, 73.65L
is consistent with prior research. In addition, when the data was examined by grade level,
it was observed that Grade 6 exhibited the most growth, while growth tapered o in later
grades (Grade 6, N ⫽ 211, Growth ⫽ 56L [prorated 87L]; Grade 7, N ⫽ 254, Growth ⫽ 52L
[prorated 79L]; Grade 8, N ⫽ 256, Growth ⫽ 37L [prorated 58L]).
Study 2. A large urban school district administers SRI to all students in Grades 2 through
10. Data has been collected since the 2000–2001 school year and matched at the student
level. All students are administered SRI at the beginning of the school year (September)
and in March, and a sample of students in intervention programs are administered SRI in
December also.
The data was examined to estimate growth in reading ability using a quadratic regression
equation. Students with at least seven SRI scores were included in the analyses (45,495
students out of a possible 172,412). The resulting quadratic regression slope was slightly
more than 0.50L/day (about 100L of growth between fall and spring), which is consistent
with prior research conducted by MetaMetrics, Inc. (see Williamson, Thompson, and Baker,
74216_SRI_TechGuide_FC-105.indd 8674216_SRI_TechGuide_FC-105.indd 86 9/26/07 6:03:56 PM9/26/07 6:03:56 PM
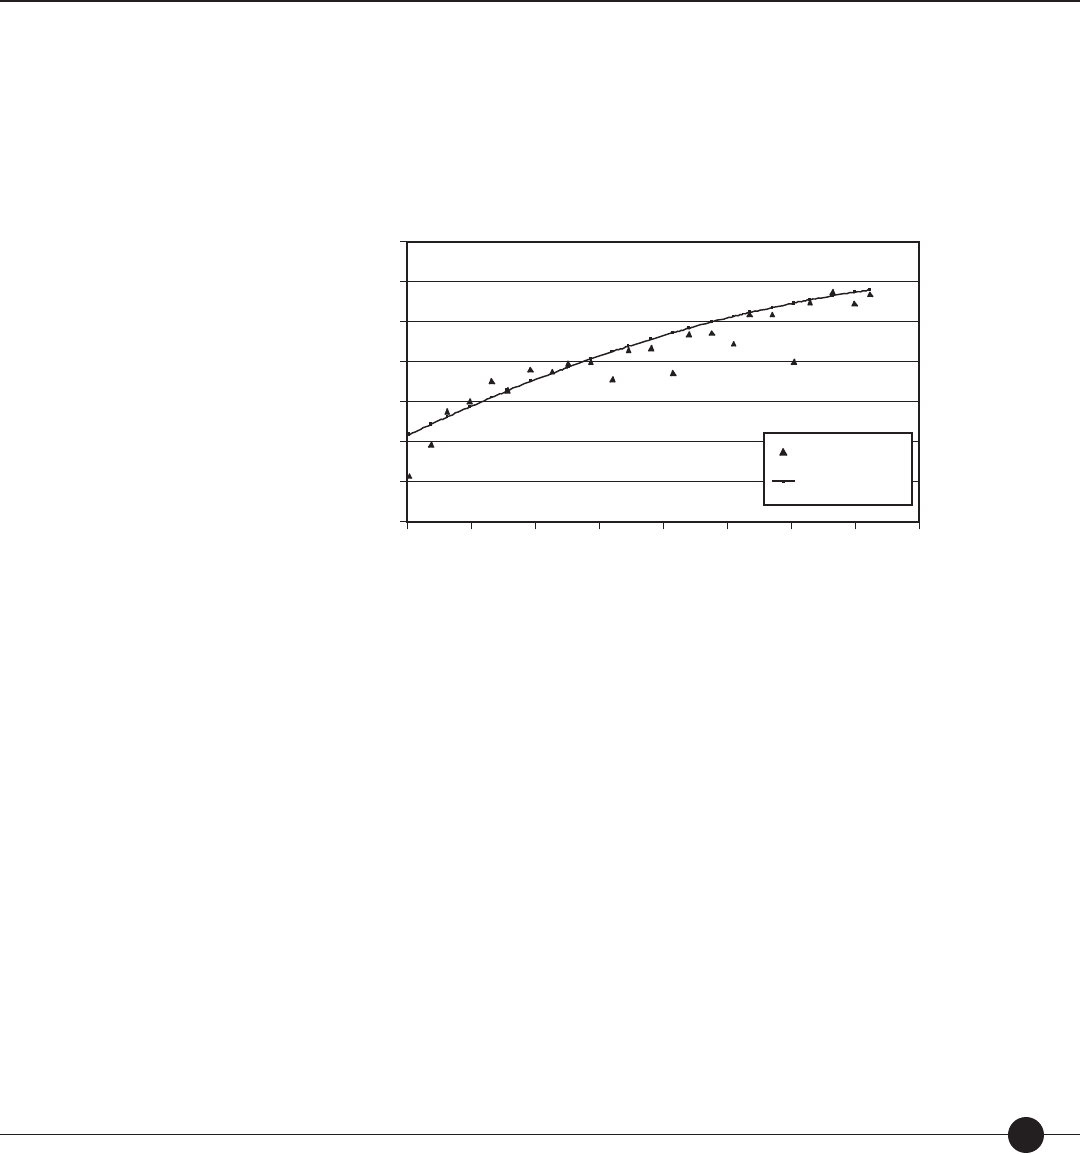
Technical Guide 87
2006). The median R-squared coe cient was between .800 and .849, which indicates that
the correlation between reading ability and time is approximately 0.91. Figure 18 shows
the t of the model compared to observed SRI data.
Figure 18. Large Urban School District: Fit of quadratic growth model to
SRI
data for
students in Grades 3 through 10.
Lexile Measure
Grade
1400
1200
1000
600
400
200
800
0
36745 8 11910
SRI Observed Lexile
SRI Quadratic Fit
74216_SRI_TechGuide_FC-105.indd 8774216_SRI_TechGuide_FC-105.indd 87 8/14/07 6:54:27 PM8/14/07 6:54:27 PM
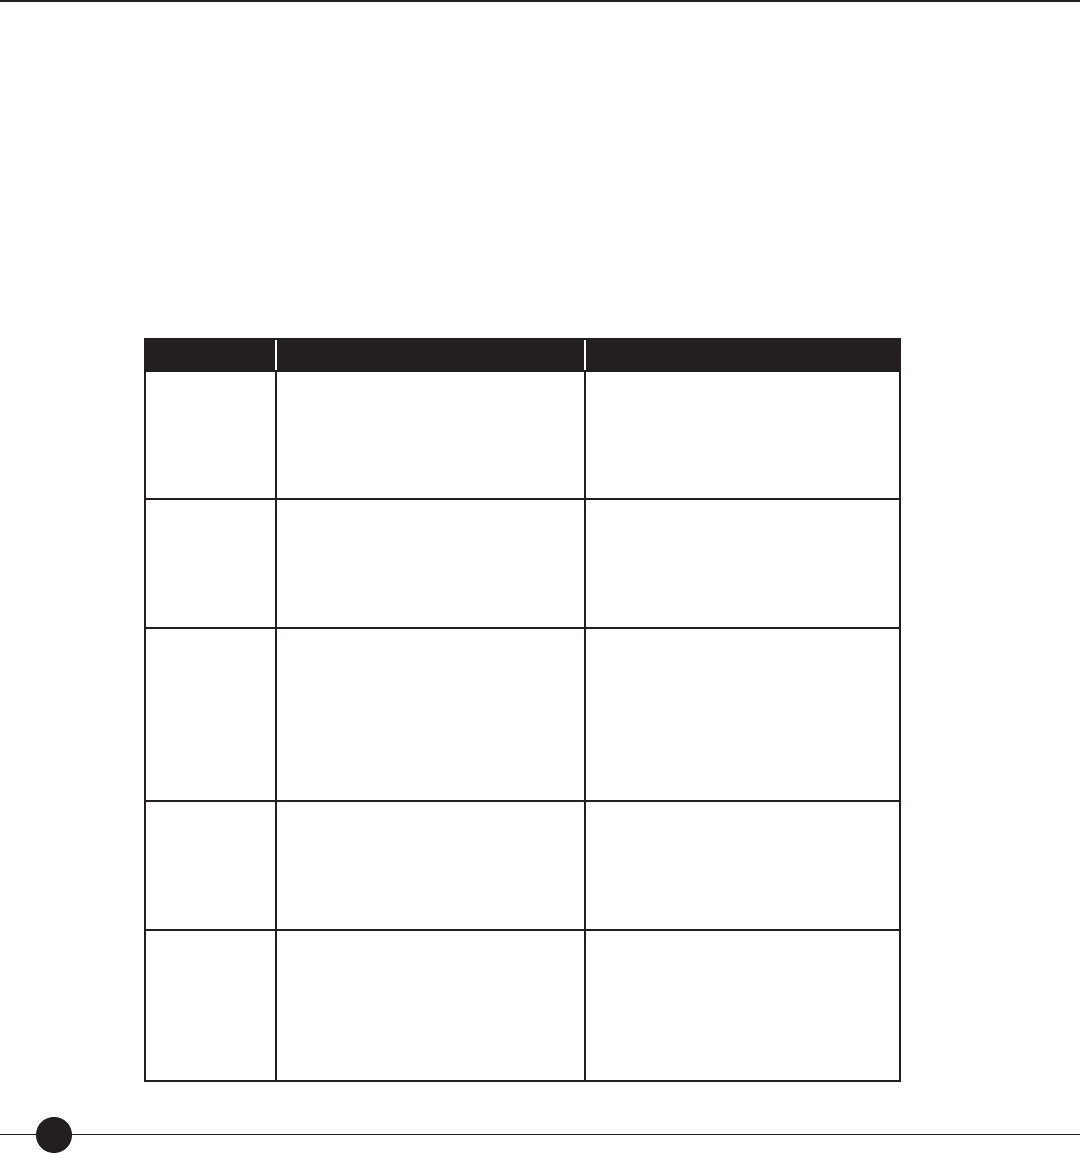
Scholastic Reading Inventory
88
Appendix 1: Lexile Framework Map
Connecting curriculum-based reading to the Lexile Framework, the titles in this chart are typical of texts
that developmentally correspond to Lexile® level.
There are many readily available texts that have older interest levels but a lower Lexile level (hi-lo titles).
Conversely, there are many books that have younger interests but are written on a higher Lexile level
(adult-directed picture books). By evaluating the Lexile level for any text, educators can provide reading
opportunities that foster student growth.
For more information on the Lexile ranges for additional titles, please visit www.Lexile.com or the
Scholastic Reading Counts!® e-Catalog at www.Scholastic.com.
LEXILE LEVEL BENCHMARK LITERATURE BENCHMARK NONFICTION TEXTS
200L
Clifford The Big Red Dog
by Norman Bridwell (220L)
Amanda Pig, Schoolgirl
by Jean Van Leeuwen (240L)
The Cat in the Hat by Dr. Seuss (260L)
Inch by Inch by Leo Lionni (210L)
Harbor by Donald Crews (220L)
Ms. Frizzle’s Adventure: Medieval Castles
by Joanna Cole (270L)
300L
Hey, Al! by Arthur Yorinks (320L)
“A” My Name is Alice
by Jane Bayer (370L)
Arthur Goes to Camp
by Marc Brown (380L)
You Forgot Your Skirt, Amelia Bloomer
by Shana Corey (350L)
George Washington and the General’s
Dog by Frank Murphy (380L)
How A Book is Made by Aliki (390L)
400L
Frog and Toad are Friends
by Arnold Lobel (400L)
Cam Jansen and the Mystery of
the Stolen Diamonds
by David A. Adler (420L)
Bread and Jam for Frances
by Russell Hoban (490L)
How My Parents Learned to Eat
by Ina R. Friedman (450L)
Finding Providence by Avi (450L)
When I Was Nine
by James Stevenson (470L)
500L
Bicycle Man by Allen Say (500L)
Can I Keep Him?
by Steven Kellogg (510L)
The Music of Dolphins
by Karen Hesse (560L)
By My Brother’s Side by Tiki Barber (500L)
The Wild Boy by Mordicai Gerstein (530L)
The Emperor’s Egg
by Martin Jenkins (570L)
600L
Artemis Fowl by Eoin Colfer (600L)
Sadako and the Thousand Paper Cranes
by Eleanor Coerr (630L)
Charlotte’s Web by E.B. White (680L)
Koko’s Kitten
by Dr. Francine Patterson (610L)
Lost City: The Discovery of Machu Picchu
by Ted Lewin (670L)
Passage to Freedom: The Sugihara Story
by Ken Mochizuki (670L)
74216_SRI_TechGuide_FC-105.indd 8874216_SRI_TechGuide_FC-105.indd 88 9/26/07 6:04:17 PM9/26/07 6:04:17 PM
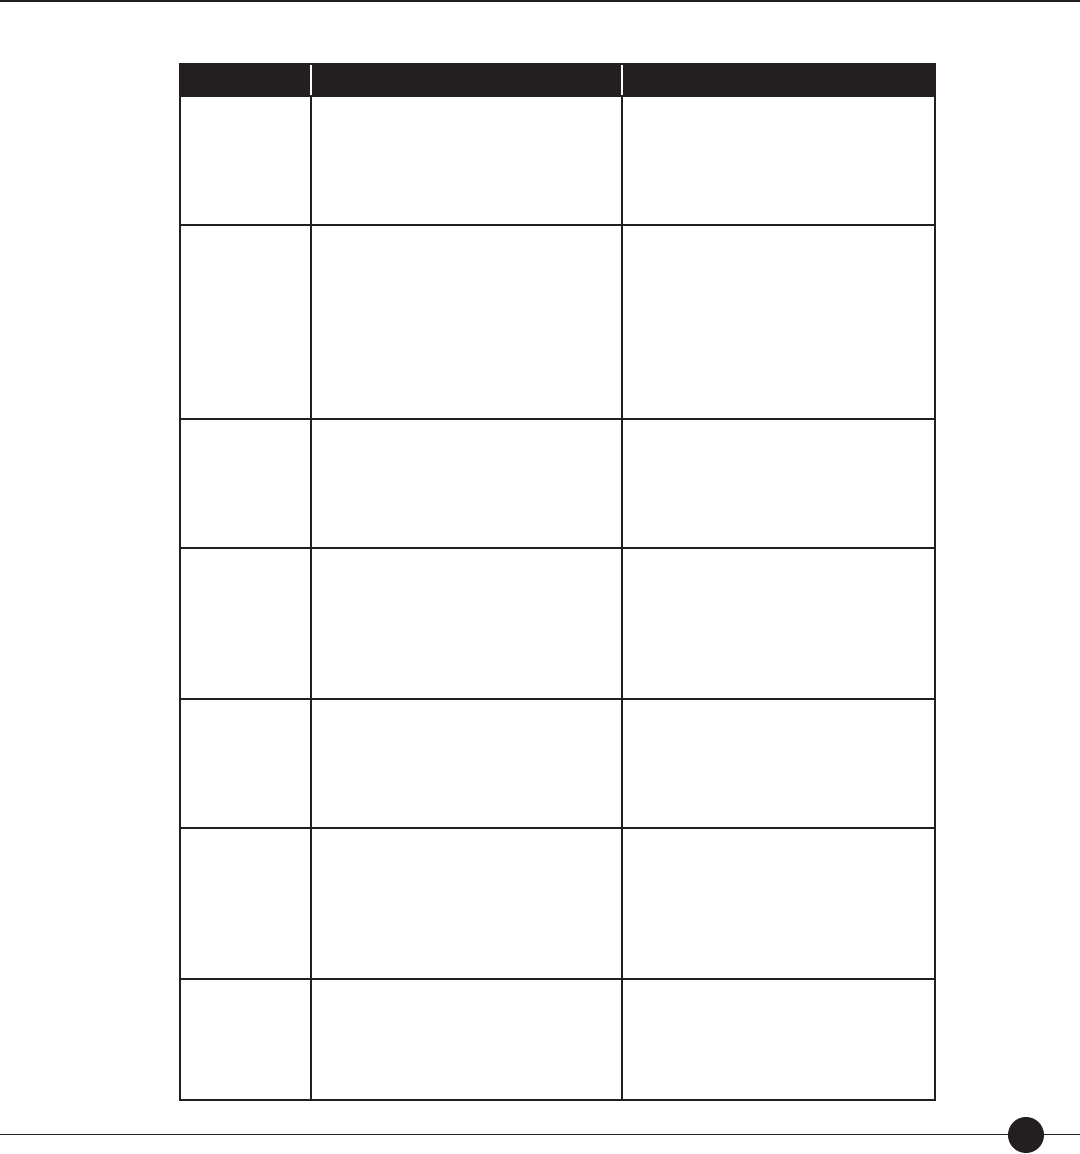
Technical Guide 89
LEXILE LEVEL BENCHMARK LITERATURE BENCHMARK NONFICTION TEXTS
700L
Bunnicula
by Deborah Howe, James Howe (710L)
Beethoven Lives Upstairs
by Barbara Nichol (750L)
Harriet the Spy by Louise Fitzhugh (760L)
Journey to Ellis Island: How My Father
Came to America by Carol Bierman (750L)
The Red Scarf Girl by Ji-li Jiang (780L)
Four Against the Odds
by Stephen Krensky (790L)
800L
Interstellar Pig by William Sleator (810L)
Charlie and the Chocolate Factory
by Roald Dahl (810L)
Julie of the Wolves
by Jean Craighead George (860L)
Can’t You Make Them Behave, King
George? by Jean Fritz (800L)
Anthony Burns: The Defeat and
Triumph of a Fugitive Slave
by Virginia Hamilton (860L)
Having Our Say: The Delany Sisters’
First 100 Years by Sarah L. Delany
and A. Elizabeth Delany (890L)
900L
Roll of Thunder, Hear My Cry
by Mildred D. Taylor (920L)
Abel’s Island by William Steig (920L)
The Slave Dancer by Paula Fox (970L)
October Sky
by Homer H. Hickam, Jr. (900L)
Black Boy by Richard Wright (950L)
All Creatures Great and Small
by James Herriott (990L)
1000L
Hatchet by Gary Paulsen (1020L)
The Great Gatsby
by F. Scott Fitzgerald (1070L)
Their Eyes Were Watching God
by Zora Neale Hurston (1080L)
The Greatest: Muhammad Ali
by Walter Dean Myers (1030L)
Anne Frank: Diary of A Young Girl
by Anne Frank (1080L)
My Thirteenth Winter
by Samantha Abeel (1050L)
1100L
Pride and Prejudice
by Jane Austen (1100L)
Ethan Frome by Edith Wharton (1160L)
Animal Farm by George Orwell (1170L)
Black Diamond
by Patricia McKissack (1100L)
Dead Man Walking
by Helen Prejean (1140L)
Hiroshima by John Hersey (1190L)
1200L
Great Expectations
by Charles Dickens (1200L)
The Midwife’s Apprentice
by Karen Cushman (1240L)
The House of the Spirits
by Isabel Allende (1280L)
In the Shadow of Man
by Jane Goodall (1220L)
Fast Food Nation: The Dark Side of the
All-American Meal
by Eric Schlosser (1240L)
Into the Wild by Jon Krakauer (1270L)
1300L
Eight Tales of Terror
by Edgar Allan Poe (1340L)
The Metamorphosis
by Franz Kafka (1320L)
Silas Marner by George Eliot (1330L)
Common Sense by Thomas Paine (1330L)
Never Cry Wolf by Farley Mowat (1330L)
The Life and Times of Frederick Douglass
by Frederick Douglass (1400L)
74216_SRI_TechGuide_FC-105.indd 8974216_SRI_TechGuide_FC-105.indd 89 10/8/07 9:47:54 AM10/8/07 9:47:54 AM
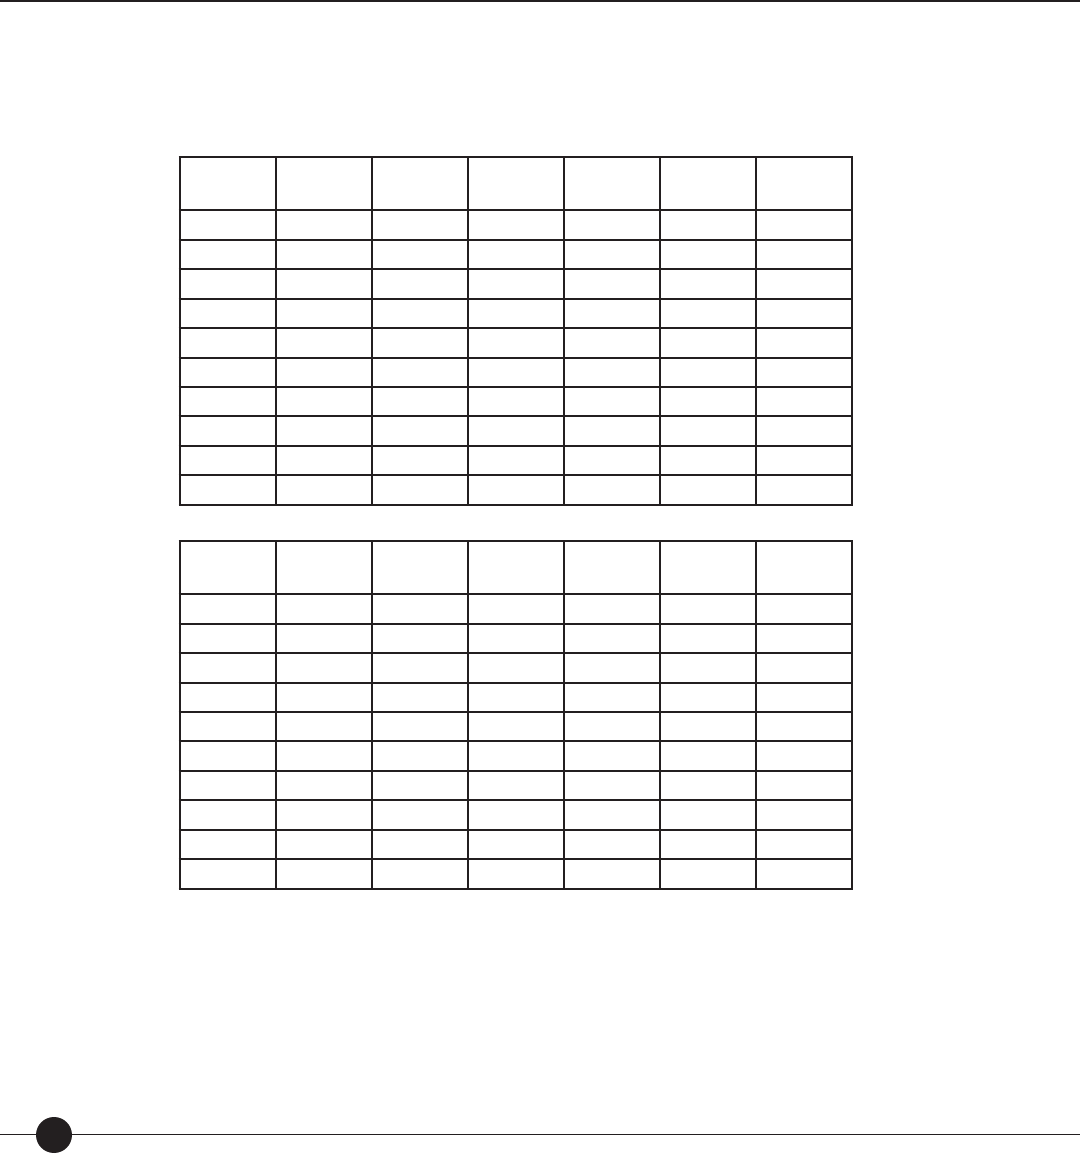
Scholastic Reading Inventory
90
Appendix 2: Fall Norm Tables
Fall scores based norming study performed by MetaMetrics to determine a baseline for growth.
Fall
Percentile Grade 1 Grade 2 Grade 3 Grade 4 Grade 5 Grade 6
1 BRBRBRBR 50 160
5 BR BR 75 225 350 425
10 BR BR 160 295 430 490
25 BR 115 360 470 610 670
35 BR 200 455 560 695 760
50 BR 310 550 670 795 845
65 BR 425 645 770 875 925
75 BR 520 715 835 945 985
90 105 650 850 960 1060 1095
95 205 750 945 1030 1125 1180
Fall
Percentile Grade 7 Grade 8 Grade 9 Grade 10 Grade 11 Grade 12
1 210 285 380 415 455 460
5 510 550 655 670 720 745
10 590 630 720 735 780 805
25 760 815 865 880 930 945
35 825 885 935 960 995 1010
50 910 970 1015 1045 1080 1090
65 985 1045 1095 1125 1155 1165
75 1050 1105 1150 1180 1205 1215
90 1160 1210 1260 1290 1315 1325
95 1245 1295 1345 1365 1390 1405
74216_SRI_TechGuide_FC-105.indd 9074216_SRI_TechGuide_FC-105.indd 90 9/26/07 6:04:18 PM9/26/07 6:04:18 PM
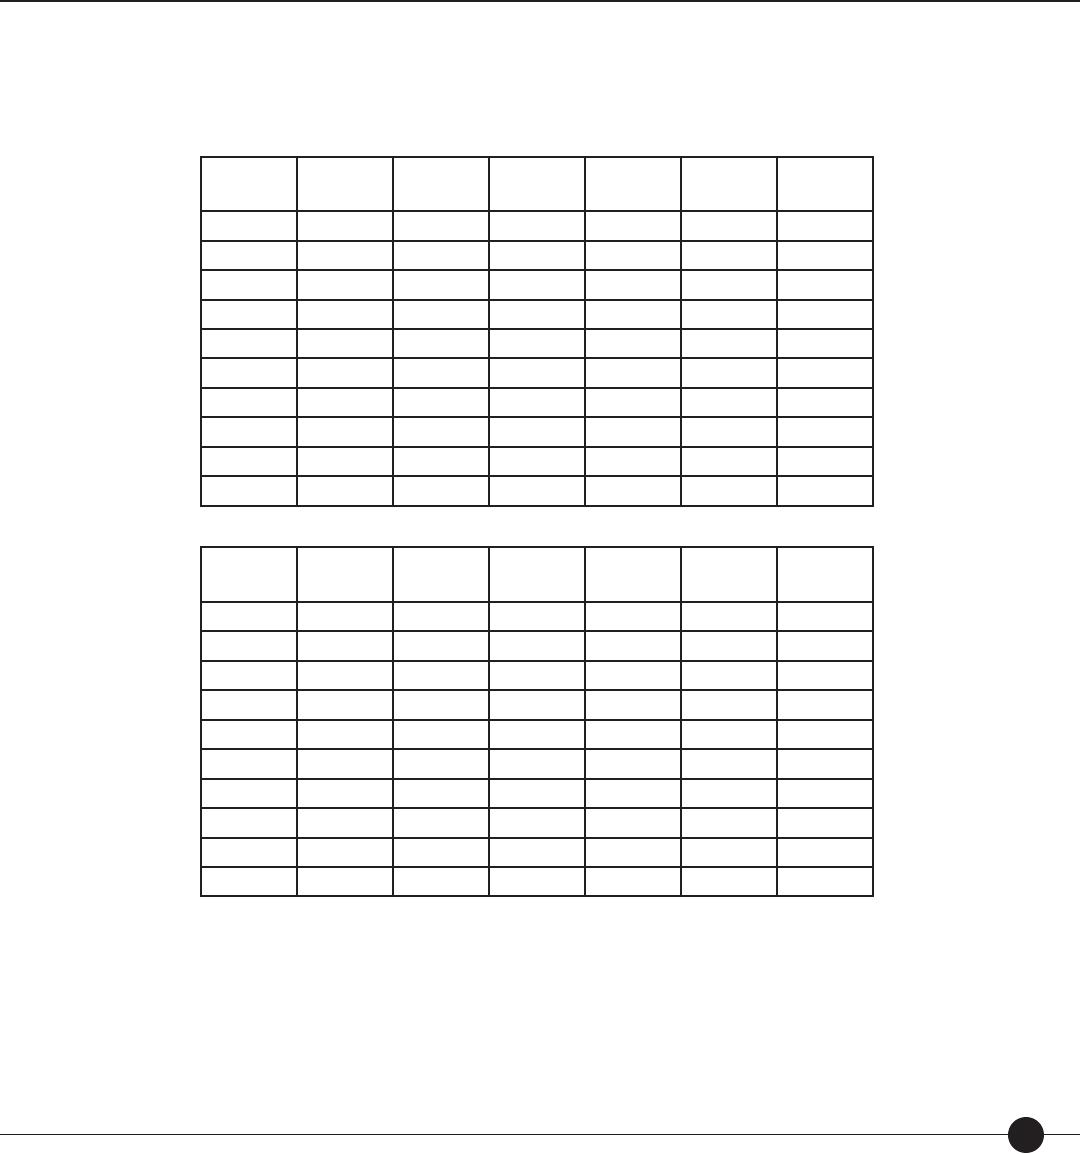
Technical Guide 91
Appendix 2: Spring Norm Tables
Spring
Percentile Grade 7 Grade 8 Grade 9 Grade 10 Grade 11 Grade 12
1 240 295 400 435 465 465
5 545 560 670 720 745 755
10 625 645 730 780 810 820
25 780 835 880 930 945 955
35 860 905 960 995 1010 1020
50 955 1000 1045 1080 1090 1100
65 1040 1090 1125 1155 1165 1175
75 1095 1145 1180 1205 1215 1225
90 1210 1265 1290 1320 1330 1340
95 1270 1330 1365 1290 1405 1415
Spring
Percentile Grade 1 Grade 2 Grade 3 Grade 4 Grade 5 Grade 6
1 BRBRBRBRBR 190
5 BR BR 125 255 390 455
10 BR BR 210 325 475 525
25 BR 275 390 505 630 700
35 BR 400 480 595 710 775
50 150 475 590 700 810 880
65 270 575 690 800 905 975
75 345 645 755 865 970 1035
90 550 780 890 990 1085 1155
95 635 870 965 1060 1155 1220
74216_SRI_TechGuide_FC-105.indd 9174216_SRI_TechGuide_FC-105.indd 91 10/8/07 9:47:58 AM10/8/07 9:47:58 AM

Scholastic Reading Inventory
92
Appendix 3: References
America Educational Research Association, American Psychological Association, and
National Council on Measurement in Education. (1999). Standards for educational and
psychological testing. Washington, DC: American Educational Research Association.
Anastasi, A. (1982). Psychological Testing (Fifth Edition). New York: MacMillan Publishing
Company, Inc.
Anderson, R.C., Hiebert, E.H., Scott, J.A., & Wilkinson, I. (1985). Becoming a nation of read-
ers: The report of the commission on reading. Washington, DC: U.S. Department of Education.
Bond, T.G. & Fox, C.M. (2001). Applying the Rasch model: Fundamental measurement in the
human sciences. Mahwah, NJ: Lawrence Erlbaum Associates, Publishers.
Bormuth, J.R. (1966). Readability: New approach. Reading Research Quarterly, 7, 79–132.
Bormuth, J.R. (1967). Comparable cloze and multiple-choice comprehension test scores.
Journal of Reading, February 1967, 292–299.
Bormuth, J.R. (1968). Cloze test readability: Criterion reference scores. Journal of Educa-
tional Measurement, 3(3), 189–196.
Bormuth, J.R. (1970). On the theory of achievement test items. Chicago: The University of
Chicago Press.
Carroll, J.B., Davies, P., & Richman, B. (1971). Word frequency book. Boston: Houghton
Mi in.
Carver, R.P. (1974). Measuring the primary e ect of reading: Reading storage technique,
understanding judgments and cloze. Journal of Reading Behavior, 6, 249–274.
Chall, J.S. (1988). “The beginning years.” In B.L. Zakaluk and S.J. Samuels (Eds.), Readabil-
ity: Its past, present, and future. Newark, DE: International Reading Association.
Crain, S. & Shankweiler, D. (1988). “Syntactic complexity and reading acquisition.” In
A. Davidson and G.M. Green (Eds.), Linguistic complexity and text comprehension: Readability
issues reconsidered. Hillsdale, NJ: Erlbaum Associates.
Crawford, W. J., King, C.E., Brophy, J.E., & Evertson, C.M. (1975, March). Error rates and
question di culty related to elementary children’s learning. Paper presented at the annual
meeting of the American Educational Research Association, Washington, D.C.
Davidson, A. & Kantor, R.N. (1982). On the failure of readability formulas to de ne read-
able text: A case study from adaptations. Reading Research Quarterly, 17, 187–209.
Dunn, L.M. & Dunn, L.M. (1981). Peabody Picture Vocabulary Test-Revised, Forms L and M.
Circle Pines, MN: American Guidance Service.
Five, C. L. (1986). Fifth graders respond to a changed reading program. Harvard Educational
Review, 56, 395-405.
74216_SRI_TechGuide_FC-105.indd 9274216_SRI_TechGuide_FC-105.indd 92 9/26/07 6:04:19 PM9/26/07 6:04:19 PM

Technical Guide 93
Fountas, I.C. & Pinnell, G.S. (1996). Guided Reading: Good First Teaching for All Children.
Portsmouth, NH: Heinemann Press.
Grolier, Inc. (1986). The Electronic Encyclopedia, a computerized version of the Academic
American Encyclopedia. Danbury, CT: Author.
Haladyna, T.M. (1994). Developing and validating multiple-choice test items. Hillsdale, NJ:
Lawrence Erlbaum Associates.
Hambleton, R.K. & Swaminathan, H. (1985). Item response theory: Principles and appplications.
Boston: Kluwer · Nijho Publishing.
Hambleton, R.K., Swaminathan, H., & Rogers, H.J. (1991). Fundamentals of item response
theory (Measurement methods for the social sciences, Volume 2). Newbury Park, CA: Sage
Publications, Inc.
Hardwicke S.B. & Yoes M.E (1984). Attitudes and performance on computerized adaptive test-
ing. San Diego: Rehab Group.
Hewes, G.M., Mielke, M.B., & Johnson, J.C. (2006, January). Five years of READ 180 in Des
Moines: Middle and high school special education students. Policy Studies Associates: Washington,
DC.
Hiebert, E.F. (1998, November). Text matters in learning to read. CIERA Report 1-001.
Ann Arbor, MI: Center for the Improvement of Early Reading Achievement (CIERA).
Huynh, H. (1998). On score locations of binary and partial credit items and their applica-
tions to item mapping and criterion-referenced interpretation. Journal of Educational and
Behavioral Statistics, 23(1), 38–58.
Indian River School District. (no date). Special education students: Shelbyville Middle and
Sussex Central Middle Schools. [Draft manuscript provided by Scholastic Inc., January 25,
2006.]
Klare, G.R. (1963). The measurement of readability. Ames, IA: lowa State University Press.
Klare, G.R. (1984). Readability. In P.D. Pearson (Ed.), Handbook of reading research (Volume
1, 681-744). Newark, DL: International Reading Association.
Liberman, I.Y., Mann, V.A., Shankweiler, D., & Westelman, M. (1982). Children’s memory
for recurring linguistic and non-linguistic material in relation to reading ability. Cortex, 18,
367–375.
Memphis Public Schools. (no date). How did MPS students perform at the initial adminis-
tration of SRI? [Draft manuscript provided by Scholastic Inc., January 25, 2006.]
MetaMetrics, Inc. (2005, December). SRI paper vs. SRI Interactive [unpublished data].
Durham, NC: Author.
MetaMetrics, Inc. (2006a, January). Brief description of Bayesian grade level priors [unpub-
lished manuscript]. Durham, NC: Author.
74216_SRI_TechGuide_FC-105.indd 9374216_SRI_TechGuide_FC-105.indd 93 8/14/07 6:54:28 PM8/14/07 6:54:28 PM

Scholastic Reading Inventory
94
MetaMetrics, Inc. (2006b, August). Lexile Vocabulary Analyzer: Technical report. Durham, NC:
Author.
MetaMetrics, Inc. (2006c, October). “Lexiles help Alaska elementary school foster strong
reading habits, increase students reading pro ciency.” Lexile Case Studies, October 2006
[available at www.Lexile.com]. Durham, NC: Author.
Miller, G.A. & Gildea, P.M. (1987). How children learn words. Scienti c American, 257,
94–99.
Palmer, N. (2003, July). An evaluation of READ 180 with special education students. New
York: Scholastic Research and Evaluation Department/Scholastic Inc.
Papalewis R. (2003, December). A study of READ 180 in middle schools in Clark County
School District, Las Vegas, Nevada. New York: Scholastic Research and Evaluation Depart-
ment/Scholastic Inc.
Pearson, L.M. & White, R.N. (2004, June). Study of the impact of READ 180 on student
performance in Fairfax County Public Schools. [Draft manuscript provided by Scholastic
Inc., January 25, 2006.]
Petersen, N.S., Kolen, M.J., & Hoover, H.D. (1989). “Scaling, Norming, and Equating.”
In R.L. Linn (Ed.), Educational Measurement (Third Edition) (pp. 221–262). New York:
American Council on Education and Macmillan Publishing Company.
Petty, R. (1995, May 24). Touting computerized tests’ potential for K–12 arena. Education
Week on the web, Letters To the Editor, pp. 1–2.
Poznanski, J.B. (1990). A meta-analytic approach to the estimation of item di culties.
Unpublished doctoral dissertation, Duke University, Durham, NC.
Rasch, G. (1980). Probabilistic Models for Some Intelligence and Attachment Tests. Chicago: The
University of Chicago Press ( rst published in 1960).
Rim, E-D. (1980). Personal communication to Squires, Huitt, and Segars.
Salvia, J. & Ysseldyke, J.E. (1998). Assessment (Seventh Edition). Boston: Houghton Mi in
Company.
Scholastic Inc. (2005, May). SRI 3.0/4.0 comparison study [unpublished manuscript]. New
York; Author.
Scholastic Inc. (2006a). Scholastic Reading Inventory: Educator’s Guide. New York: Author.
Scholastic Inc. (2006b). Analysis of the e ect of the “locator test” on SRI scores on a large
population of simulated students [unpublished manuscript]. New York: Author.
School Renaissance Institute. (2000).Comparison of the STAR Reading Computer-
Adaptive Test and the Scholastic Reading Inventory-Interactive Test. Madison, WI: Author.
Shankweiler, D. & Crain, S. (1986). Language mechanisms and reading disorder: A modular
approach. Cognition, 14, 139-168.
74216_SRI_TechGuide_FC-105.indd 9474216_SRI_TechGuide_FC-105.indd 94 9/26/07 6:04:26 PM9/26/07 6:04:26 PM

Technical Guide 95
Smith, F. (1973). Psycholinguistics and reading. New York: Holt Rinehart Winston.
Sommerhauser, M. (2006, January 16). Read 180 sparks turnaround for FMS special-needs
students. Fulton Sun, Callaway County, Georgia. Retrieved January 17, 2006, from http://
www.fultonsun.com/articles/2006/01/15/news/351news13.txt.
Squires, D.A., Huitt, W.G., & Segars, J.K. (1983). E ective schools and classrooms. Alexandria,
VA: Association for Supervisor and Curricular Development.
St. Paul School District. (no date). Read 180 Stage B: St. Paul School District, Minnesota.
[Draft manuscript provided by Scholastic Inc., January 25, 2006.]
Stenner, A.J. (1990). Objectivity: Speci c and general. Rasch Measurement Transactions, 4, 111.
Stenner, A.J. (1994). Speci c objectivity—local and general. Rasch Measurement Transactions,
8, 374.
Stenner, A.J. (1996, October). Measuring reading comprehension with the Lexile Frame-
work. Paper presented at the California Comparability Symposium, Burlingame, CA.
Stenner, A.J. & Burdick, D.S. (1997, January). The objective measurement of reading
comprehension in response to technical questions raised by the California Department of
Education Technical Study Group. Durham, NC: MetaMetrics, Inc.
Stenner, A.J., Burdick, H., Sanford, E.E., & Burdick, D.S. (2006). How accurate are Lexile
text measures? Journal of Applied Measurement, 7(3), 307–322.
Stenner, A.J., Smith, M., & Burdick, D.S. (1983). Toward a theory of construct de nition.
Journal of Educational Measurement, 20(4), 305–315.
Stenner, A.J., Smith, D.R., Horabin, I., & Smith, M. (1987a). Fit of the Lexile Theory to
item di culties on fourteen standardized reading comprehension tests. Durham, NC:
MetaMetrics, Inc.
Stenner, A.J., Smith, D.R., Horabin, I., & Smith, M. (1987b). Fit of the Lexile Theory to
sequenced units from eleven basal series. Durham, NC: MetaMetrics, Inc.
Stone, G.E. & Lunz, M.E. (1994). The e ect of review on the psychometric characteristics
of computerized adaptive Tests. Applied Measurement in Education, 7, 211–222.
Thomas, J. (2003, November). Reading program Evaluation: READ 180, Grades 4–8.
[Draft manuscript provided by Scholastic Inc., January 25, 2006.]
Wainer, H. (1992). Some practical considerations when converting a linearly administered
test to an adaptive format. (Program Statistics Research Technical Report No. 92-21).
Princeton, NJ: Educational testing Service.
Wainer, H., Dorans, N.J., Flaugher, R., Green, B.F., Mislevy, R.J., Steinberg, L., & Thissen,
D. (1990). Computerized adaptive testing: A primer. Hillsdale, NJ: Lawrence Erlbaum Associates,
Publishers.
74216_SRI_TechGuide_FC-105.indd 9574216_SRI_TechGuide_FC-105.indd 95 10/8/07 9:48:00 AM10/8/07 9:48:00 AM

Scholastic Reading Inventory
96
Wang, T. & Vispoel, W.P. (1998). Properties of ability estimation methods in computerized
adaptive testing. Journal of Educational Measurement, 35, 109–135.
White, E.B. (1952). Charlotte’s Web. New York: Harper and Row.
White, R.N. & Haslam, M.B. (2005, June). Study of performance of READ 180 participants
in the Phoenix Union High School District – 2003–04. Policy Studies Associates: Washington,
DC.
Williamson G.L. (2004). Why do Scores Change? Durham NC: MetaMetrics, Inc.
Williamson G.L. (2006). Managing Multiple Measures. Durham: NC: MetaMetrics, Inc.
Williamson, G.L., Thompson, C.L., & Baker, R.F. (2006, March). North Carolina’s growth
in reading and mathematics. Paper presented at the annual meeting of the North Carolina
Association for Research in Education (NCARE), Hickory, NC.
Wright, B.D. & Linacre, J.M. (1994). The Rasch model as a foundation for the Lexile
Framework. Unpublished manuscript.
Wright, B.D., & Linacre, J.M. (2003). A user’s guide to WINSTEPS Rasch-Model computer
program, 3.38. Chicago, Illinois: Winsteps.com.
Wright, B.D. & Stone, M.H. (1979). Best Test Design. Chicago: MESA Press.
Zakaluk, B.L. & Samuels, S.J. (1988). Readability: Its past, present, and future. Newark, DL:
International Reading Association.
74216_SRI_TechGuide_FC-105.indd 9674216_SRI_TechGuide_FC-105.indd 96 9/26/07 6:04:28 PM9/26/07 6:04:28 PM

Technical Guide 97
Notes
74216_SRI_TechGuide_FC-105.indd 9774216_SRI_TechGuide_FC-105.indd 97 8/14/07 6:54:29 PM8/14/07 6:54:29 PM

Scholastic Reading Inventory
98
Notes
74216_SRI_TechGuide_FC-105.indd 9874216_SRI_TechGuide_FC-105.indd 98 8/14/07 6:54:29 PM8/14/07 6:54:29 PM

Technical Guide 99
Notes
74216_SRI_TechGuide_FC-105.indd 9974216_SRI_TechGuide_FC-105.indd 99 8/14/07 6:54:29 PM8/14/07 6:54:29 PM
