001 058SaipemSem15Ing SA 100 Saipem Sem15Ing
User Manual: SA-100
Open the PDF directly: View PDF ![]() .
.
Page Count: 116 [warning: Documents this large are best viewed by clicking the View PDF Link!]

Interim Consolidated Report as of June 30, 2015
001-058SaipemSem15Ing.qxd 6-08-2015 11:41 Pagina I

Mission
Pursuing the satisfaction of our clients in the energy industry, we tackle each challenge with safe, reliable and innovative solutions.
We entrust our competent and multi-local teams to provide sustainable development for our Company and for the communities where
we operate.
Our core values
Commitment to health and safety, openness, flexibility, integration, innovation, quality, competitiveness, teamwork, humility,
internationalisation, responsibility and integrity.
Disclaimer
By their nature, forward-looking statements are subject to risk and uncertainty since they are dependent upon circumstances which
should or are considered likely to occur in the future and are outside of the Company’s control. These include, but are not limited to:
monetary exchange and interest rate fluctuations, commodity price volatility, credit and liquidity risks, HSE risks, the levels of capital
expenditure in the oil and gas industry and other sectors, political instability in areas where the Group operates, actions by competitors,
success of commercial transactions, risks associated with the execution of projects (including ongoing investment projects),
in addition to changes in stakeholders’ expectations and other changes affecting business conditions.
Actual results could therefore differ materially from the forward-looking statements.
The financial reports contain in-depth analyses of some of the aforementioned risks.
Forward-looking statements are to be considered in the context of the date of their release. Saipem SpA is under no obligation to review,
update or correct them subsequently, except where this is a mandatory requirement of the applicable legislation.
The forward-looking statements given herein are not intended to constitute an invitation to invest or to provide legal, accounting, tax
or investment advice and should not be relied upon in that regard.
BOARD OF DIRECTORS1
Chairman
Paolo Andrea Colombo
Chief Executive Officer (CEO)
Stefano Cao
Directors
Maria Elena Cappello, Federico Ferro-Luzzi, Francesco Antonio Ferrucci,
Guido Guzzetti, Flavia Mazzarella, Nicla Picchi, Stefano Siragusa
BOARD OF STATUTORY AUDITORS2
Chairman
Mario Busso
Statutory Auditors
Anna Gervasoni
Massimo Invernizzi
Alternate Auditors
Paolo Sfameni
Giulia De Martino3
Countries in which Saipem operates
EUROPE
Austria, Belgium, Bulgaria, Croatia, Cyprus, Denmark, France, Italy, Luxembourg, Malta, Netherlands, Norway, Poland, Portugal, Romania, Spain, Sweden,
Switzerland, Turkey, United Kingdom
AMERICAS
Bolivia, Brazil, Canada, Chile, Colombia, Dominican Republic, Ecuador, Mexico, Peru, Suriname, Trinidad and Tobago, United States, Venezuela
CIS
Azerbaijan, Georgia, Kazakhstan, Russia, Turkmenistan, Ukraine
AFRICA
Algeria, Angola, Congo, Egypt, Gabon, Ghana, Libya, Mauritania, Morocco, Mozambique, Nigeria, South Africa, Uganda
MIDDLE EAST
Iraq, Kuwait, Oman, Qatar, Saudi Arabia, United Arab Emirates
FAR EAST AND OCEANIA
Australia, China, India, Indonesia, Japan, Malaysia, Pakistan, Papua New Guinea, Singapore, South Korea, Thailand, Vietnam
Board of Directors and auditors of Saipem SpA
Independent Auditors
Reconta Ernst & Young SpA
Saipem is a subsidiary of Eni SpA
(1) Appointed by the Shareholders on April 30, 2015.
(2) Appointed by the Shareholders on May 6, 2014.
(3) Appointed by the Shareholders on April 30, 2015 to replace Elisabetta Maria Corvi, who resigned on January 14, 2015.
001-058SaipemSem15Ing.qxd 6-08-2015 11:41 Pagina II

2Interim results
3Saipem Group structure
Operating and Financial
Review
Condensed consolidated
interim financial statements
8 Saipem SpA share performance
10 Glossary
13 Operating review
13 Market conditions
13 New contracts and backlog
15 Capital expenditure
16 Offshore Engineering & Construction
21 Onshore Engineering & Construction
25 Offshore Drilling
27 Onshore Drilling
29 Financial and economic results
29 Results of operations
33 Balance sheet and financial position
35 Reclassified cash flow statement
36 Key profit and financial indicators
37 Sustainability
38 Research and development
40 Quality, Safety and Environment
42 Human resources and health
45 Information technology
47 Risk management
54 Additional information
57 Reconciliation of reclassified balance sheet, income statement
and cash flow statement to statutory schemes
60 Financial statements
66 Notes to the condensed consolidated interim financial statements
110 Management certification
111 Independent Auditors’ Review report
Approved by the Board of Directors on July 28, 2015
001-058SaipemSem15Ing.qxd 6-08-2015 18:38 Pagina 1

The principal cause of the rapid deterioration seen during the first half of 2015 in the market environment in which Saipem
operates was the low price of oil, whose downward trajectory commenced towards the end of the previous year. This highly
deteriorated environment led in turn to the following:
- delays and cancellations of orders already underway, as well as the adoption by clients of an increasingly inflexible attitude
during negotiations for change orders and claims, related to projects underway;
- an increased credit risk in certain geographical areas;
- the need to rethink Saipem’s operating strategy. Accordingly, a turnaround plan called ‘Fit for the future’ has been launched,
which involves the rationalisation of fabrication yards and vessels that are no longer viable in the new market environment;
- the need to review the Company’s negotiating strategy with a view to reaching settlements with clients, aiming to keep
potential disputes to a minimum and seeking to secure an immediate financial benefit.
The result for the first half of 2015, as impacted by the cancellation of the South Stream contract and the write-downs described
above, were as follows:
- Adjusted EBIT1: -€579 million;
-EBIT: -€790 million, including €211 million in write-downs of non-current assets;
- Adjusted net result: -€709 million;
- Net result: -€920 million;
- Capital expenditure: €268 million (€329 million in the first half of 2014);
- Net debt at June 30, 2015: €5,531 million (€4,424 million at December 31, 2014), including the negative cash impact of
€502 million relating to foreign exchange hedging derivatives maturing during the period;
- New contracts: €3,500 million (€13,132 million in the first half of 2014);
-Backlog: €19,018 million2at June 30, 2015 (€22,147 million at December 31, 2014).
2
Interim results
Saipem Interim Consolidated Report as of June 30, 2015 / Interim results
(1) Adjusted EBIT and the adjusted net result do not include a €211 million decrease in net capital employed resulting from the write-down of non-current assets.
(2) Cancelled from backlog €1,232 million relating to the South Stream contract and €24 million relating to a contract for the semi-submersible rig Scarabeo 5.
001-058SaipemSem15Ing.qxd 6-08-2015 16:51 Pagina 2
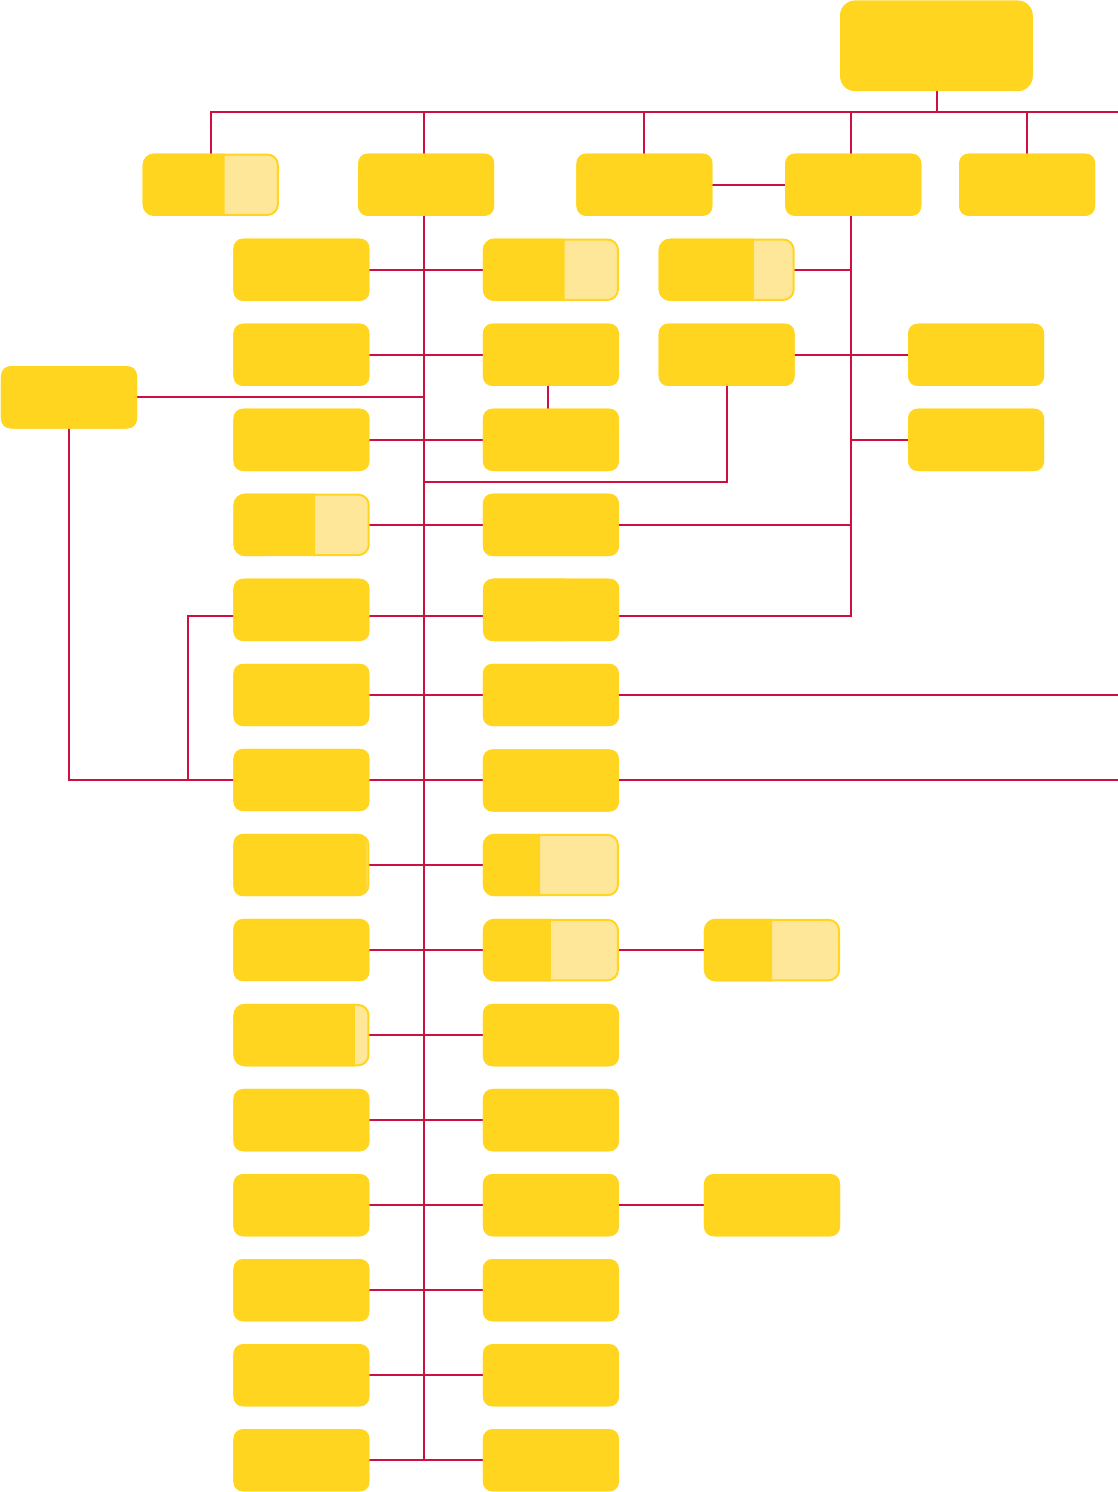
Saipem Group structure
(subsidiaries)
3
Saipem Interim Consolidated Report as of June 30, 2015 / Saipem Group structure
001-058SaipemSem15Ing.qxd 6-08-2015 11:41 Pagina 3
100.00% ,
95.00%
Saipem
SpA
Saipem
International
BV
Sigurd Rück AG
Saipem
Asia Sdn Bhd
Global
Petroprojects
Services AG
PT Saipem
Indonesia
Saipem (Portugal)
Comércio Maritimo
Sociedade Unipessoal Lda
Saipem do Brasil
Serviçõs de
Petroleo Ltda
Saudi Arabian
Saipem Ltd
Saipem
Ukraine Llc
Saipem
Contracting
(Nigeria) Ltd
Saipem Ingenieria
Y Construcciones
SLU
Saipem
(Nigeria) Ltd
Saipem
(Malaysia)
Sdn Bhd
ER SAI Caspian
Contractor Llc
Saipem
Canada Inc
North Caspian
Service Co
ERS Equipment
Rental & Services
BV
Saipem Drilling
Norway AS
100.00%
60.00%
100.00%
68.55%
99.00%
100.00% 50.00%
100.00%
100.00%
Moss
Maritime Inc
100.00%
5.00%
100.00%
100.00%
100.00%
60.00%
97.94%
89.41%
41.94%
100.00%
100.00%
100.00%
Moss
Maritime AS
Petrex SA
Andromeda
Consultoria Tecnica e
Representações Ltda
100.00%
99.00%
Snamprogetti
Netherlands BV
100.00%
Snamprogetti
Ltd
Snamprogetti
Romania Srl
Snamprogetti
Lummus
Gas Ltd
99.00%
1.00%
100.00%
99.00%
1.00%
Sonsub
International
Pty Ltd
Saipem
Norge AS
100.00%
100.00%
99.92%
Saipem Misr for
Petroleum
Services (S.A.E.)
0.04%
0.04%
Saipem
Australia Pty Ltd
Snamprogetti
Saudi Arabia
Co Ltd Llc
Saipem
America Inc
100.00%
1.00%
Saipem Drilling
Co Private Ltd
49.73%
100.00%
Saipem Ltd
Saipem
(Beijing) Technical
Services Co Ltd
100.00%
50.27%
31.45%
100.00%
Saipem Libya
Llc
SA.LI.CO. Llc
60.00% 40.00%
Sajer Iraq Llc
100.00%
Saipem
Contracting
Netherlands BV
Saipem
Offshore
Norway AS
100.00%
Professional
Training Center Llc
50.00%
70.00%
Snamprogetti
Engineering
& Contracting Co Ltd
60.00%
Smacemex
Scarl
001-058SaipemSem15Ing.qxd 6-08-2015 11:41 Pagina 4

The chart only shows subsidiaries
Servizi Energia
Italia SpA
Snamprogetti
Chiyoda sas
di Saipem SpA
Saipem
Luxembourg SA Sofresid SA
Boscongo SA
Sofresid
Engineering SA
Saipem
India Projects
Private Ltd
Saimexicana
SA de Cv
100.00%99.90%
Saipem SA
100.00%
100.00%
100.00%
100.00%
100.00%
Saipem
Services México
SA de Cv
100.00%
Saigut SA de Cv
100.00%
100.00%
Saipem
Contracting
Algérie SpA
100.00%
Saipem Maritime
Asset Management
Luxembourg Sàrl
100.00%
Saipem
Singapore Pte Ltd
100.00%
99.99%
Snamprogetti
Engineering BV
100.00%
0%
Denuke Scarl
55.00%
SAIMEP
Limitada
100.00%
001-058SaipemSem15Ing.qxd 6-08-2015 11:41 Pagina 5

001-058SaipemSem15Ing.qxd 6-08-2015 11:41 Pagina 6

Operating and Financial Review saipem
001-058SaipemSem15Ing.qxd 6-08-2015 11:41 Pagina 7

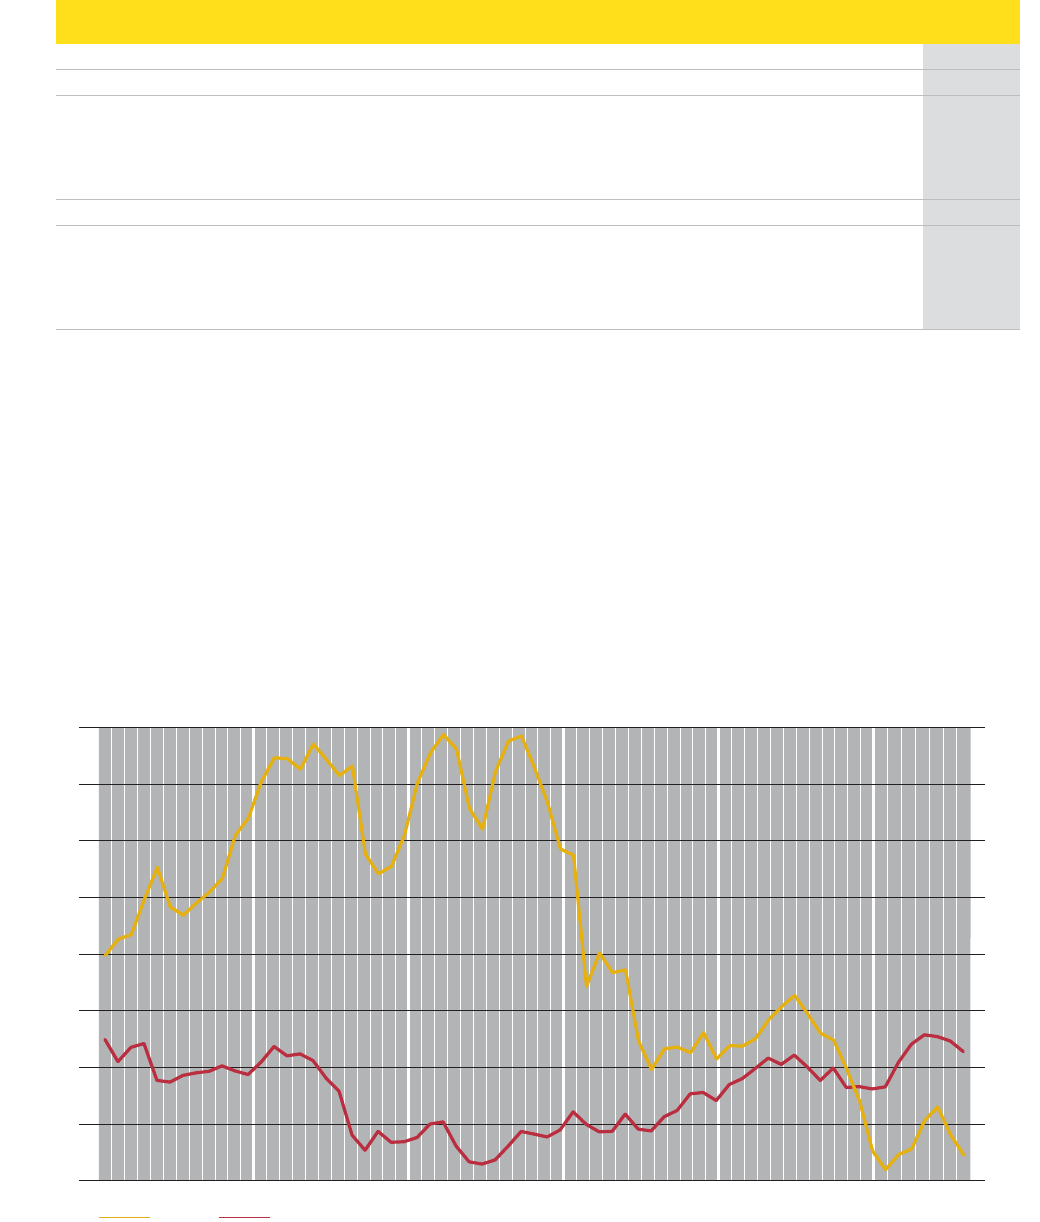
During the first half of 2015, the value of Saipem ordinary shares
on the Milan Stock Exchange registered an increase of 8.7%,
reaching a price of €9.52 at June 30, 2015, versus €8.76 at the
beginning of January.
In the same period, the FTSE MIB index, which records the
performance of the 40 most liquid and capitalised Italian stocks,
reported a gain of 17.4%.
The first few days of the year saw the Saipem share continue the
downward trajectory that began midway through 2014. This was
mainly due to the sharp fall in oil prices, as well as to the
suspension of the South Stream contract in December 2014.
The share price hit its period low of €7.29 on January 20. However,
already by the end of January 2015, the price had begun to reverse
the downward trend, registering a gradual upturn that was
supported by the financial community’s positive reaction to the
presentation of Saipem’s annual results for 2014 in mid-February.
From April 2015, the oil price recovery helped consolidate the
upturn in the share price, fostering a climate of renewed
confidence with regard to the Company’s future prospects.
An added boost was provided by the appointment of a new Board
of Directors at the helm of the Company, with a three-year
mandate. On April 16, the share price reached €12.29.
The end of the suspension of the South Stream contract
announced at the end of May, coupled with reports from financial
analysts that were optimistic with regard to the outlook for the
Company and the sector in general helped push the Saipem share
towards its period high of €12.76 on May 13.
Subsequently, in the wake of an announcement made by a
competitor on the evening of July 6 after trading had closed of a
significant deterioration in its results, the oil services sector
registered a sharp fall in prices, causing the Saipem share to lose
6.7% on the previous day’s price and close the day at €8.41.
Saipem’s market capitalisation at period end was approximately
€4.2 billion. In terms of share liquidity, shares traded during the
period totalled 1,074 million, versus the 391 million registered in
the same period of 2014. The average number of shares traded
daily during the period totalled approximately 8.6 million
(3.1 million in the first half of 2014), while the value of shares
traded amounted to €10.6 billion, compared with €7 billion in the
first half of 2014.
The period saw a high level of share price volatility, due in part to
the growing presence of investors employing a speculative
approach, based on a short-term investment horizon.
On April 30, the Saipem Board of Directors approved the payment
of a preferential dividend of €0.05 per share on savings shares
only, in accordance with the limit of 5% of the nominal value of the
share, pursuant to Article 6 of the Articles of Association.
The price of savings shares, which are convertible at par with
ordinary shares, and are of limited number (109,326 at June 30,
2015), decreased by 15% over the period, closing at €15.30 on
June 30, 2015.
8
Saipem SpA share performance
Saipem Interim Consolidated Report as of June 30, 2015 / Saipem SpA share performance
001-058SaipemSem15Ing.qxd 6-08-2015 11:41 Pagina 8
Share prices on the Milan Stock Exchange (€)2011 2012 2013 2014 First half
2015
Ordinary shares:
- maximum 38.60 39.78 32.18 20.89 12.76
- minimum 23.77 29.07 12.60 8.31 7.29
- average 33.89 35.52 19.31 16.59 9.98
- period end 32.73 29.41 15.54 8.77 9.52
Savings shares:
- maximum 39.25 39.40 35.00 20.99 18.05
- minimum 30.00 30.00 16.00 16.22 15.30
- average 34.89 34.72 24.50 18.58 17.58
- period end 30.00 35.00 17.10 18.05 15.30
1234567891011121234567891011121234567891011121234567891011121234567891011121234567
2010 2011 2013 20152012 2014
Price in euro of Saipem shares FTSE MIB
Value
Saipem and FTSE MIB - Average monthly prices January 2010-July 2015
Saipem FTSE MIB
12,000
21,000
16,500
25,500
30,000
48,000
39,000
43,500
34,500
39.00
7,00
11.00
15.00
35.00
31.00
27.00
23.00
19.00
Saipem Interim Consolidated Report as of June 30, 2015 / Saipem SpA share performance
9
001-058SaipemSem15Ing.qxd 6-08-2015 11:41 Pagina 9

Financial terms
-Adjusted operating result/net result operating result/net
result adjusted to exclude special items.
-EBIT Earnings Before Interest and Tax (operating result).
-EBITDA Earnings Before Interest, Taxes, Depreciation and
Amortisation.
-IFRS International Financial Reporting Standards. Accounting
standards issued by the IASB (International Accounting
Standards Board) and adopted by the European Commission,
which comprise International Financial Reporting Standards
(IFRS), International Accounting Standards (IAS), and the
interpretations issued by the International Financial Reporting
Interpretation Committee (IFRIC) and the Standing
Interpretations Committee (SIC) adopted by the IASB.
The name International Financial Reporting Standards (IFRS)
has been adopted by the IASB for standards issued after May
2003. Standards issued before May 2003 have maintained
the denomination IAS.
-Leverage a measure of a company’s level of indebtedness,
calculated as the ratio between net borrowings and
shareholders’ equity including non-controlling interests.
-OECD Organisation for Economic Cooperation and
Development.
-ROACE Return On Average Capital Employed, calculated as the
ratio between the net result before non-controlling interests,
plus net finance charges on net borrowings less the related
tax effect and net average capital employed.
-Special items items of income arising from events or
transactions that are non-recurring or that are not considered
to be representative of the ordinary course of business.
Operational terms
-Buckle detection system that utilises electromagnetic waves
during pipelaying to signal collapse of or deformations to
pipeline laid.
-Carbon Capture and Storage technology which enables the
carbon present in gaseous effluents from hydrocarbon
combustion and treatment plants to be captured and stored
over long periods of time in underground geological
formations, thus reducing or eliminating carbon dioxide
emissions into the atmosphere.
-Central Processing Facility production unit performing the
first transformation of crude oil or natural gas.
-Commissioning series of processes and procedures
undertaken in order to start operations of a gas pipeline,
associated plants or equipment.
-Concrete coating reinforced concrete coating for subsea
pipelines in order to ballast and protect them from damage
and corrosion.
-Conventional waters water depths of up to 500 metres.
-Cracking chemical-physical process, typically employed in
dedicated refinery plants, whose objective is to break down
the heavy hydrocarbon molecules obtained from primary
distillation into lighter fractions.
-Deck area of a vessel or platform where process plants,
equipment, accommodation modules and drilling units are
located.
-Decommissioning process undertaken in order to end
operations of a gas pipeline, associated plant or equipment.
Decommissioning may occur at the end of the life of the plant,
following an accident, for technical or financial reasons,
and/or on environmental or safety grounds.
-Deep waters water depths of over 500 metres.
-Downstream all operations that follow exploration and
production operations in the oil sector.
-Drillship vessel capable of self-propulsion, designed to carry
out drilling operations in deep waters.
-Dry-tree wellhead located above the water on a floating
production platform.
-Dynamically Positioned Heavy Lifting Vessel vessel
equipped with a heavy-lift crane, capable of holding a precise
position through the use of thrusters, thereby counteracting
the force of the wind, sea, current, etc.
-EPC (Engineering, Procurement, Construction) type of
contract typical of the Onshore construction sector,
comprising the provision of engineering services,
procurement of materials and construction. The term ‘turnkey’
is used to indicate that the system is delivered to the client
ready for operations, i.e. already commissioned.
-EPCI (Engineering, Procurement, Construction, Installation)
type of contract typical of the Offshore construction sector,
which relates to the realisation of a complex project where the
global or main contractor (usually a construction company or
a consortium) provides the engineering services,
procurement of materials, construction of the system and its
infrastructure, transport to site, installation and
commissioning/preparatory activities for the start-up of
operations.
-Fabrication yard yard at which offshore structures are
fabricated.
-Facilities auxiliary services, structures and installations
required to support the main systems.
-FDS (Field Development Ship) dynamically-positioned
multi-purpose crane and pipelay vessel.
-FEED (Front-End Engineering and Design) basic engineering
and preliminary activities carried out before beginning a
complex project to evaluate its technical aspects and enable
an initial estimate of the investment required.
-Flare tall metal structure used to burn off gas produced by
oil/gas separation in oil fields when it is not possible to utilise
it on site or ship it elsewhere.
10
Glossary
Saipem Interim Consolidated Report as of June 30, 2015 / Glossary
001-058SaipemSem15Ing.qxd 6-08-2015 11:41 Pagina 10
-FLNG Floating Liquefied Natural Gas unit used for the
treatment, liquefaction and storage of gas which is
subsequently transferred onto vessels for transportation to
end-use markets.
-Floatover type of module installation on offshore platforms
that does not require lifting operations. A specialised vessel
transporting the module uses a ballast system to position
itself directly above the location where the module is to be
installed. Once this has been completed, the vessel backs off
and the module is secured to the support structure.
-Flowline pipeline used to connect individual wells to a
manifold or to gathering and processing facilities.
-FPSO vessel Floating Production, Storage and Offloading
system comprising a large tanker equipped with a
high-capacity production facility. This system, moored at the
bow to maintain a geo-stationary position, is effectively a
temporarily fixed platform that uses risers to connect the
subsea wellheads to the on-board processing, storage and
offloading systems.
-FSRU (Floating Storage Regasification Unit) a floating terminal
in which liquefied natural gas is stored and then regasified
before being transported by pipeline.
-Gas export line pipeline for carrying gas from the subsea
reservoirs to the mainland.
-Hydrocracker installation in which large hydrocarbon
molecules are broken down into smaller ones.
-Hydrotesting operation involving high pressure water being
pumped into a pipeline to ensure that it is devoid of defects.
-Hydrotreating refining process aimed at improving the
characteristics of oil fractions.
-International Oil Companies privately-owned, typically
publicly traded, oil companies engaged in various fields of the
upstream and/or downstream oil industry.
-Jacket platform underside structure fixed to the seabed using
piles.
-Jack-up mobile self-lifting unit comprising a hull and
retractable legs used for offshore drilling operations.
-J-laying method of pipelaying that utilises an almost vertical
launch ramp, making the pipe configuration resemble the
letter ‘J’. This configuration is suited to deep water pipe laying.
-Leased FPSO FPSO vessel for which a lease contract is in
place between a client/lessee (i.e. an oil company) and a
contractor/lessor, whereby the lessee makes lease payments
to the lessor for use of the vessel for a specific period of time.
At the end of the lease term, the lessee has the option to
purchase the FPSO.
-LNG Liquefied Natural Gas, obtained by cooling natural gas to
minus 160° C at normal pressure. The gas is liquefied to
facilitate its transportation from the place of extraction to that
of processing and/or utilisation. A tonne of LNG is equivalent
to 1,500 cubic metres of gas.
-Local Content policy whereby a company develops local
capabilities, transfers its technical and managerial know-how
and enhances the local labour market and businesses
through its own business activities.
-LPG (Liquefied Petroleum Gas) produced in refineries through
the fractionation of crude oil and subsequent processes, liquid
petroleum gas exists in a gaseous state at ambient
temperatures and atmospheric pressure, but changes to a
liquid state under moderate pressure at ambient
temperatures, thus enabling large quantities to be stored in
easy-to-handle metal pressure vessels.
-LTI (Lost Time Injury) any work-related injury that renders the
injured person temporarily unable to perform any regular job
or restricted work on any day/shift after the day or shift on
which the injury occurred.
-Midstream sector comprising all those activities relating to
the construction and management of the oil transport
infrastructure.
-Moon pool opening in the hull of a drillship to allow for the
passage of operational equipment.
-Mooring buoy offshore mooring system.
-Multipipe system subsea gas/liquid gravity separation
system using a series of small diameter vertical separators
operating in parallel (for deep water application).
-National Oil Companies State-owned/controlled companies
engaged in oil exploration, production, transportation and
conversion.
-NDT (Non Destructive Testing) series of inspections and tests
used to detect structural defects conducted using methods
that do not alter the material under inspection.
-NDT Phased Array non-destructive testing method that
employs ultrasound to detect structural or welding defects.
-Offshore/Onshore the term offshore indicates a portion of
open sea and, by extension, the activities carried out in this
area, while onshore refers to land operations.
-Oil Services Industry companies that provide services to the
oil exploration and production sector but which are not
directly engaged themselves in oil production.
-Pig piece of equipment used to clean, descale and survey a
pipeline internally.
-Piggy backed pipeline small-diameter pipeline, fixed to a
larger pipeline, used to transport a product other than that of
the main line.
-Pile long, heavy steel pylon driven into the seabed. A system
of piles is used as the foundation for anchoring a fixed
platform or other offshore structures.
-Pipe-in-pipe subsea pipeline system comprising 2 coaxial
pipes, used to transport hot fluids (oil and gas). The inner pipe
transports the fluid, whereas the outer pipe carries the
insulating material necessary to reduce heat loss to the sea.
The outer pipe also protects the pipeline from water pressure.
-Pipe-in-pipe forged end forged end of a coaxial double pipe.
-Pipelayer vessel used for subsea pipelaying.
Saipem Interim Consolidated Report as of June 30, 2015 / Glossary
11
001-058SaipemSem15Ing.qxd 6-08-2015 11:41 Pagina 11
-Pipeline pipes and auxiliary equipment used principally for
transporting crude oil, oil products and natural gas to the
point of delivery.
-Pipe Tracking System (PTS) an electronic system used to
ensure the full traceability of the components of subsea pipes
installed on a project.
-Piping and Instrumentation Diagram (P&ID) diagram
showing all plant equipment, piping and instrumentation with
associated shutdown and safety valves.
-Pre-commissioning phase comprising pipeline cleaning out
and drying.
-Pre-drilling template support structure for a drilling platform.
-Pre-Salt layer geological formation present on the continental
shelves offshore Brazil and Africa.
-Pre-Travel Counselling health and medical advice designed to
take into account the health of the individual worker and
ensure that he/she is furnished with adequate information on
the specific risks present in his/her country of destination
and the preventive measures that should be adopted.
-Pulling minor operations on oil wells for maintenance or
marginal replacements.
-QHSE Quality, Health, Safety, Environment.
-Rig drilling installation comprising the derrick, the drill deck
(which supports the derrick), and ancillary installations that
enable the descent, ascent and rotation of the drill unit, as
well as mud extraction.
-Riser manifold connecting the subsea wellhead to the surface.
-ROV (Remotely Operated Vehicle) unmanned vehicle, piloted
and powered via umbilical, used for subsea surveys and
operations.
-Shale gas unconventional gas extracted from shale deposits.
-Shallow waters see Conventional waters.
-Sick Building Syndrome a combination of ailments associated
with a person’s place of work. The exact causes of the
syndrome are not known but the presence of volatile organic
compounds, formaldehyde, moulds and dust mites may be
contributing factors.
-S-laying method of pipelaying that utilises the elastic
properties of steel, making the pipe configuration resemble
the letter ‘S’, with one end on the seabed and the other under
tension on-board the ship. This configuration is suited to
medium to shallow-water pipelaying.
-Slug catcher equipment for the purification of gas.
-Sour water water containing dissolved pollutants.
-Spar floating production system, anchored to the seabed by
means of a semi-rigid mooring system, comprising a vertical
cylindrical hull supporting the platform structure.
-Spare capacity relationship between crude oil production and
production capacity, i.e. quantity of oil that is not currently
needed to meet demand.
-Spool connection between a subsea pipeline and the platform
riser, or between the terminations of two pipelines.
-Spoolsep unit used to separate water from oil as part of the
crude oil treatment process.
-Stripping process through which volatile compounds are
removed from the liquid solution or the solid mass in which
they have been diluted.
-Subsea processing operations performed in offshore oil
and/or natural gas field developments, especially relating to
the equipment and technology employed for the extraction,
treatment and transportation of oil or gas below sea level.
-Subsea tiebacks lines connecting new oil fields with existing
fixed or floating facilities.
-Subsea treatment new process for the development of
marginal fields. The system involves the injection and
treatment of sea-water directly on the seabed.
-SURF (Subsea, Umbilicals, Risers, Flowlines) facilities,
pipelines and equipment connecting the well or subsea
system to a floating unit.
-Tandem Offloading method used for the transfer of liquids
(oil or LNG) between two offshore units in a line via aerial,
floating or subsea lines (unlike side-by-side offloading, where
the two units are positioned next to each other).
-Tar sands mixture of clay, sand, mud, water and bitumen.
The bitumen in tar sands is composed principally of high
molecular weight hydrocarbons and can be converted into a
variety of oil products.
-Template rigid modular subsea structure where the oilfield
well-heads are located.
-Tender Assisted Drilling unit (TAD) offshore platform
complete with drilling tower, connected to a drilling support
tender vessel housing all necessary ancillary infrastructures.
-Tendon pulling cables used on tension leg platforms to ensure
platform stability during operations.
-Tension Leg Platform (TLP) fixed-type floating platform held
in position by a system of tendons and anchored to ballast
caissons located on the seabed. These platforms are used in
ultra-deep waters.
-Tie-in connection between a production line and a subsea
wellhead or simply a connection between two pipeline
sections.
-Tight oil oil ‘trapped’ in liquid form deep below the earth’s
surface in low permeability rock formations, which it is
difficult to extract using conventional methods.
-Topside portion of a platform above the jacket.
-Train series of units that perform a complex refining,
petrochemical, liquefaction or natural gas regasification
process. A plant can be made up of one or more trains of
equal capacity operating in parallel.
-Trenching burying of offshore or onshore pipelines.
-Trunkline oil pipeline connecting large storage facilities to the
production facilities, refineries and/or onshore terminals.
-Umbilical flexible connecting sheath, containing flexible pipes
and cables.
-Upstream relating to exploration and production operations.
-Vacuum second stage of oil distillation.
-Wellhead fixed structure separating the well from the outside
environment.
-Wellhead Barge (WHB) vessel equipped for drilling, workover
and production (partial or total) operations, connected to
process and/or storage plants.
-Workover major maintenance operation on a well or
replacement of subsea equipment used to transport the oil to
the surface.
Saipem Interim Consolidated Report as of June 30, 2015 / Glossary
12
001-058SaipemSem15Ing.qxd 6-08-2015 11:41 Pagina 12

Market conditions
Global market conditions further deteriorated in the first half of
2015.
The causes of the deterioration are essentially a change in the
energy market scenario triggered by oil supply outstripping
demand, leading to a collapse in oil prices that saw West Texas
Intermediate fall to below 50 dollars a barrel, before stabilising at
around 60 dollars a barrel in the second quarter. The declining
trend began towards the end of 2014, with the decision by the
Organisation of the Petroleum Exporting Countries (OPEC) not to
regulate the market by reducing their production output. OPEC’s
decision has had a negative adverse impact on oil company
investments, as well as on all oil-producing countries, who have
seen significant drops in their revenues. Recent months have
seen these new conditions take its toll on the market. With new
construction projects on the table constantly growing in
complexity, the principal impact has been the award of a limited
number of contracts, as well as the adoption by clients of an
increasingly inflexible attitude during negotiations for change
orders and claims.
New contracts and backlog
New contracts awarded to the Saipem Group during the first half
of 2015 amounted to €3,500 million (€13,132 million in the first
half of 2014).
Saipem Group - New contracts awarded during the first half of 2015
Financial year 2014 (€million) First half 2014 First half 2015
Amount % Amount % Amount %
5,729 32 Saipem SpA 3,568 27 659 19
12,242 68 Group companies 9,564 73 2,841 81
17,971 100 Total 13,132 100 3,500 100
10,043 56 Offshore Engineering & Construction 8,238 63 2,742 78
6,354 36 Onshore Engineering & Construction 4,328 33 431 12
722 4 Offshore Drilling 142 1 189 6
852 4 Onshore Drilling 424 3 138 4
17,971 100 Total 13,132 100 3,500 100
529 3 Italy 406 3 136 4
17,442 97 Outside Italy 12,726 97 3,364 96
17,971 100 Total 13,132 100 3,500 100
1,434 8 Eni Group 1,040 8 214 6
16,537 92 Third parties 12,092 92 3,286 94
17,971 100 Total 13,132 100 3,500 100
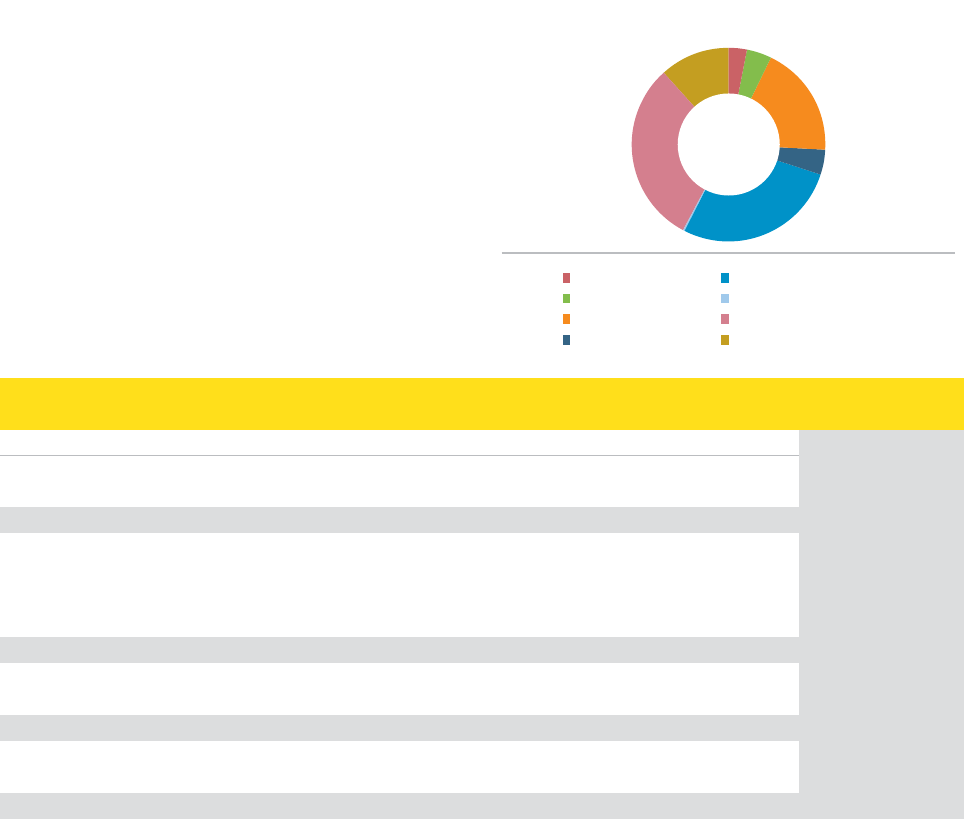
New contracts by geographical area
(€3,500 million)
€136 Italy
€145 Rest of Europe
€1,663 CIS
€43 Far East
€700 Middle East
€32 North Africa
€468 West Africa and rest of Africa
€313 Americas
13
Operating review
Saipem Interim Consolidated Report as of June 30, 2015 / Operating review
78% of all contracts awarded were in the Offshore Engineering
& Construction sector, 12% in the Onshore Engineering
& Construction sector, 6% in the Offshore Drilling sector and 4% in
the Onshore Drilling sector.
New contracts to be carried out abroad made up 96% and
contracts awarded by Eni Group companies 6% of the overall
figure. Orders awarded to the parent company Saipem SpA
amounted to 19% of the total.
The backlog of the Saipem Group as at June 30, 2015 stood at
€19,018 million. This was impacted by the effects of the
001-058SaipemSem15Ing.qxd 6-08-2015 11:41 Pagina 13
14
Saipem Group - Backlog as at June 30, 2015
Dec. 31, 2014 (€million) June 30, 2014 June 30, 2015
Amount % Amount % Amount %
7,167 32 Saipem SpA 7,071 29 5,176 27
14,980 68 Group companies 17,144 71 13,842 73
22,147 100 Total 24,215 100 19,018 100
11,161 51 Offshore Engineering & Construction 13,374 55 9,283 49
6,703 30 Onshore Engineering & Construction 6,552 27 6,086 32
2,920 13 Offshore Drilling 2,976 12 2,547 13
1,363 6 Onshore Drilling 1,313 6 1,102 6
22,147 100 Total 24,215 100 19,018 100
689 3 Italy 928 4 613 3
21,458 97 Outside Italy 23,287 96 18,405 97
22,147 100 Total 24,215 100 19,018 100
2,458 11 Eni Group 2,850 12 2,067 11
19,689 89 Third parties 21,365 88 16,951 89
22,147 100 Total 24,215 100 19,018 100
Backlog by geographical area
(€19,018 million)
€613 Italy
€784 Rest of Europe
€3,519 CIS
€841 Far East
€5,215 Middle East
€37 North Africa
€5,834 West Africa and rest of Africa
€2,174 Americas
cancellation of outstanding orders totalling €1,232 million from
the South Stream contract, which was terminated by the client
under a termination for convenience provision, and the
suspension by the client Statoil of a €24 million contract for the
charter of the semi-submersible rig Scarabeo 5.
The breakdown of the backlog by sector is as follows: 49% in the
Offshore Engineering & Construction sector, 32% in the Onshore
Engineering & Construction sector, 13% in Offshore Drilling and 6%
in Onshore Drilling.
97% of orders are on behalf of overseas clients, while orders from
Eni Group companies represent 11% of the overall backlog.
The parent company Saipem SpA accounted for 27% of the total
order backlog.
Saipem Interim Consolidated Report as of June 30, 2015 / Operating review
001-058SaipemSem15Ing.qxd 6-08-2015 11:41 Pagina 14

15
Capital expenditure
Year First half
2014 (€million) 2014 2015
117 Saipem SpA 48 24
577 Group companies 281 244
694 Total 329 268
260 Offshore Engineering & Construction 135 82
55 Onshore Engineering & Construction 20 17
180 Offshore Drilling 105 107
199 Onshore Drilling 69 62
694 Total 329 268
Capital expenditure
Capital expenditure in the first half of 2015 amounted to €268
million (€329 million in the first half of 2014) and mainly related
to:
-€82 million in the Offshore Engineering & Construction sector,
relating mainly to the maintenance and upgrading of the
existing asset base;
-€17 million in the Onshore Engineering & Construction sector
relating to the purchase of equipment and the maintenance of
existing assets;
-€107 million in the Offshore Drilling sector, relating mainly to
class reinstatement works on the drillships Saipem 10000 and
Saipem 12000 and on the drilling jack-up Perro Negro 8, as well
as maintenance and upgrading to the existing asset base;
-€62 million in the Onshore Drilling sector, relating to upgrading
work on the existing asset base.
The following table provides a breakdown of capital expenditure in
the first half of 2015:
Details of capital expenditure for the individual business units are
provided in the following pages.
Saipem Interim Consolidated Report as of June 30, 2015 / Operating review
001-058SaipemSem15Ing.qxd 6-08-2015 11:41 Pagina 15

General overview
The Saipem Group possesses a strong, technologically advanced
and highly versatile fleet, as well as world class engineering and
project management expertise. These unique capabilities and
competencies, together with a long-standing presence in strategic
frontier markets, represent an industrial model that is particularly
well suited to EPCI projects.
The latest addition to the fleet is the Castorone – a 330-metre
long, 39-metre wide mono-hull pipelay vessel equipped with a
class 3 dynamic positioning (DP) system, an S-lay system and
features allowing for the installation of a J-lay tower.
The Castorone has been designed for challenging large-diameter,
deep-water pipelay projects, but it also possesses the flexibility
and productivity necessary for effective deployment on less
complex projects. The vessel’s distinctive features include a class
3 DP system, the capacity to fabricate and lay triple joint pipes of
up to 48” in diameter (60” including coating) with a tensioning
capacity of up to 750 tonnes (up to 1,500 tonnes in flooded pipe
conditions, using a special patented clamp), a highly automated
firing line made up of 7 workstations (3 welding and
4 completion/inspection stations), an articulated stinger for
pipelaying in shallow and deep water with an advanced control
system, and the capacity to operate in extreme environments
(Ice Class A0).
Meanwhile, the current trend for deep-water field developments
continues to drive the success of the FDS 2, which is a 183-metre
long, 32-metre wide mono-hull equipped with a cutting-edge class
3 DP system and a pipeline fabrication system. The FDS 2 has a
vertical J-lay tower with a holding capacity of 2,000 tonnes
capable of laying quad joint sealines of up to 36” in diameter and
also possesses the capability to lay pipe in S-lay mode.
With its 1,000 tonne crane and two 750 and 500 tonne capstan
winches (the latter featuring a heave compensation system), the
FDS 2 is suited to even the most challenging of deep-water
projects.
Saipem’s fleet of technologically advanced vessels also includes
the Saipem 7000, which is equipped with a dynamic positioning
system, has a 14,000-tonne lifting capacity, is capable of laying
subsea pipelines in ultra-deep waters using the J-lay system and
can handle a suspended load of up to 1,450 tonnes during pipelay
operations. The fleet further comprises the Castoro Sei, a
semi-submersible pipelay vessel capable of laying large diameter
subsea pipelines, the Field Development Ship (FDS), which is a
special purpose vessel used in the development of deep-water
fields, equipped with a dynamic positioning system, a 600-tonne
lifting capacity crane and a vertical pipelaying system capable of
operating in water depths of over 2,000 metres and the Saipem
3000, which is capable of laying flexible pipelines and installing
umbilicals and mooring systems in deep waters and installing
subsea structures of up to 2,200 tonnes.
Saipem is involved on an ongoing basis in the management and
development of its fleet, carrying out constant maintenance and
continuous upgrading and improvement of its assets in line with
technological developments and client requirements, with the aim
of maintaining its operating capacity and high safety standards in
a continuously evolving market.
With its portfolio of cutting-edge mobile assets, such as ROVs and
specially equipped robots capable of carrying out complex
deep-water interventions on pipelines, Saipem also enjoys a
strong position in the subsea market.
Finally, the Company is active in the Leased FPSO segment, with a
fleet comprising the Cidade de Vitoria and the Gimboa, which are
currently operating in Brazil and Angola, respectively.
The review of Saipem’s competitive positioning in a highly
deteriorated market environment has led to the rationalisation of
a fabrication yard and the disposal of vessels for which there is
poor visibility with regard to their future deployment (Castoro
Sette, S355 and Saibos 230). Following the revision of the
depreciation schedule on December 31, 2014, Semac 1, which has
been slated for scrapping, was fully depreciated as of June 30,
2015.
Market conditions
2015 is shaping up to be a year of growth, with global GDP
forecast to increase by approximately 3.5 % against 2014. Levels
of growth in advanced countries are exceeding expectations and
would appear to be capable of offsetting an overall slowdown in
emerging markets. The price of Brent crude remained significantly
below the levels recorded in 2014, contributing to major market
uncertainty and leading to a significant contraction in orders from
oil companies, as well as repeated postponements of major
projects compared with the previous year. Overall, the contraction
is greater for North American and Brazilian operators. Current
market conditions have led oil companies to adopt a more prudent
approach, with the current goal continuing to be cost
containment. As a consequence, a number of investments, such
as North Sea field developments Johan Castberg and Snorre C, the
deep-water field Bonga SW/Aporo in West Africa and the Jupiter
field in Brazil, have either been postponed or cancelled.
Another sign, in addition to the significant revisions and delays to
development plans, of the difficult period the market is
16
Offshore Engineering & Construction
Saipem Interim Consolidated Report as of June 30, 2015 / Operating review
001-058SaipemSem15Ing.qxd 6-08-2015 11:41 Pagina 16
17
experiencing has been the adoption by clients of an increasingly
rigid negotiating position. Since continuous interaction with clients
with a view to overcoming any difficulties that may arise during
project execution is a typical feature of the construction sector,
this change in client attitudes during negotiations is proving to be
a major critical factor in project operations.
In the subsea developments market, activities recorded in the
first six months of the year were in line with 2014. Installations
continue to be driven by activities in the North Sea, the Gulf of
Mexico and South America, where the major projects assigned in
recent years, such as Goliat and Roncador (Eni and Petrobras,
respectively) are nearing completion.
The pipelay segment on the other hand is undergoing a
contraction in 2015, with a significant number of projects either
cancelled or delayed, particularly in Northern Europe and North
America. The flowlines segment is also experiencing a decline in
volumes. This is being driven in particular by the Asia-Pacific
Region, which is seeing a significant slowdown, with numerous
projects awarded in recent years now close to completion.
The decline in installations is affecting both the shallow and
ultra-deep water markets, with the former affected mainly by the
trend in South-East Asia and the latter influenced by a drop-off in
areas that have historically been very active, such as the Gulf of
Mexico and Brazil.
The fixed platform fabrication segment is continuing to experience
numerous delays on major investment projects, such as Kasawari
in Malaysia (Petronas) and West White Rose (Husky) – a sign of
the difficult period the segment is at present undergoing. In terms
of platform type, the biggest contribution to activities at this
halfway stage of the year has been from lighter platform
installations in South-East Asia, with larger size platform
installations so far relatively few in number.
In the FPSO segment, 2015 is expected to come in below
expectations after a good 2014. At present, there have been only
two awards, in Ghana (Eni) and Iran (PEDCO) and a limited
number of orders for new units are expected during the remainder
of the year. A large number of projects are experiencing delays
and difficulties securing a final investment decision, such as
Camelia and Chissonga in Africa, Gendalo/Gehem in the
Asia-Pacific Region and Johan Castberg in North Europe. In Brazil,
after the large number of contract awards registered in recent
years, activities are expected to be concentrated on the
completion of units currently under construction, with forecasts
showing a drastic slowdown in new unit orders in the area.
The first half of the year brought no new FLNG contract awards,
mainly due to the uncertainty prevailing with regard to the market
outlook, especially in relation to the LNG supply and demand
balance and the technical complexity of projects in this sector.
A number of projects have been recently cancelled, such as the
FLNG unit slated for construction in Guinea, and others may be
set to experience delays, such as Browse FLNG in the Asia-Pacific
Region (Woodside) and Lavaca Bay in North America (Excelerate).
There are, however, a number of other initiatives that are
continuing to move through the approval process with their
respective operators which may in 2015 receive a FID, such as
Abadi (Inpex) in Indonesia, Coral (Eni) in Mozambique and
Scarborough (Exxon) in Australia. At present, there are six FLNG
units under construction.
New contracts
The most significant contracts awarded to the Group during the
period were as follows:
- a contract with the North Caspian Operating Co (NCOC) for the
construction of two 95 kilometre pipelines, which will connect D
island in the Caspian Sea to the Karabatan onshore plant in
Kazakhstan. The scope of work includes the engineering, the
supply of welding materials, the conversion and the preparation
of the vessels, dredging, and the installation, burial and
pre-commissioning of the two pipelines. Construction is due to
be completed by the end of 2016;
- an EPC contract in Saudi Arabia encompassing the engineering,
procurement, fabrication, transportation and installation of new
offshore structures, three production modules, and
approximately 5 kilometres of subsea pipelines and cables,
under the Long Term Agreement with Saudi Aramco, which was
recently renewed until 2021.
Capital expenditure
Capital expenditure in the Offshore Engineering & Construction
sector mainly related to maintenance and upgrading of the
existing asset base.
Work performed
The biggest and most important projects underway or completed
during the first half of 2015 were as follows.
In Saudi Arabia, for Saudi Aramco:
-under the Long Term Agreement for the engineering,
procurement, construction, transport and installation of
structures, platforms and pipelines, construction work was
completed on two jackets, two pipelines and a deck, while
Saipem Interim Consolidated Report as of June 30, 2015 / Operating review
001-058SaipemSem15Ing.qxd 6-08-2015 11:41 Pagina 17
18
work is underway on the construction and installation of three
decks;
- installation work has almost been completed as part of the Al
Wasit Gas Program for the development of the Arabiyah and
Hasbah offshore fields. The contract encompasses the
engineering, procurement, construction and installation of 15
fixed platforms, an export pipeline, offshore lines, and subsea
and control cables. Operations are also underway under the
same contract supplementing the scope of work with the
engineering, procurement, transport, installation and
commissioning of 2 trunklines in the Arabiyah and Hasbah
fields;
- work continued on the Marjan Zuluf contract for the
engineering, procurement, fabrication, transport and
installation of new offshore facilities, including three platforms,
three jackets and associated pipelines and subsea cables.
Engineering and procurement work is ongoing, while fabrication
work has just commenced, for Eni Muara in Indonesia on the
Jangrik EPCI project. The project encompasses engineering,
procurement and fabrication of the FPU and the installation of a
mooring system, as well as hook-up, commissioning and
assistance to the start-up.
Pipelaying activities are currently in full swing in Australia for
Inpex on the Ichthys LNG project, which consists of the
engineering, procurement, construction and installation of a
subsea pipeline connecting the offshore central processing
facility to the onshore processing facility in Darwin.
In West Africa:
- work was completed for ExxonMobil, in Angola, on the Kizomba
Satellite Phase 2 project at the yards in Soyo and Ambriz.
The scope of work included engineering, procurement,
fabrication and installation of production and water injection
pipelines and flowlines, rigid jumpers and other related subsea
structures;
- work was completed for Eni Congo, in Congo, on two contracts
– WP4 and WP10 – encompassing the engineering,
procurement, fabrication and transportation of the Litchendjili
jacket, piles and related appurtenances;
- project management and procurement work continued for Total,
in Angola, on the Kaombo Field Development Project, which
comprises engineering, procurement and commissioning of
two FPSO vessels;
- work continued for Total Upstream Nigeria Ltd on the EPCI
contract for the subsea development of the Egina field.
The scope of work includes engineering, procurement,
fabrication, installation and pre-commissioning of subsea oil
production and gas export pipelines, flexible jumpers, and
umbilicals;
- work continued for Cabinda Gulf Oil Co Ltd (CABGOC), in Angola,
on the Mafumeira 2 project, comprising engineering,
procurement, fabrication, installation and pre-commissioning of
URF (umbilical, riser and flowline) facilities and export
pipelines;
- work continued for CABGOC, in Angola, on the EPCI 3 contract
encompassing the engineering, procurement and
pre-fabrication activities for subsequent offshore modifications
and tie-ins on the existing Mafumeira Norte platform and the
future Mafumeira Sul production platforms;
- work continued for Total Exploration and Production on the GirRI
(Girassol Resources Initiatives) contract, in Block 17, in
Angola, which encompasses engineering, procurement,
fabrication, installation and commissioning of changes to the
topside of the pumping system on the FPSOs Girassol and Dalia;
- work continued for CABGOC on the fourth and fifth installation
campaign of the Congo River Crossing Pipeline project, in
Angola, which comprises engineering, procurement, fabrication
and the installation of three subsea pipelines and subsea
spools, as well as trenching and crossing works. The project is
being carried out off the coasts of Angola and the Democratic
Republic of the Congo;
- work continued for Aker Solutions, in Congo, on the fabrication
of subsea structures, including suction anchors, for the Moho
Nord project.
In the North Sea:
- work continued for Det Norske Oljeselskap ASA on a contract
encompassing the transportation and installation of the Ivar Aasen
jacket and topside, in the Norwegian sector of the North Sea;
- in addition, various structures were installed using the Saipem
7000 for ConocoPhillips (Eldfisk), Statoil (Statoil
decommissioning), Nexen (Golden Eagle) and Lundin.
In Russia, work was completed for Lukoil-Nizhnevolzhskneft on
the Filanovsky contract for the engineering, procurement,
fabrication and installation of an oil pipeline and a gas pipeline in a
maximum water depth of 6 metres, along with related onshore
pipelines connecting the riser block in the offshore field to the
onshore shut-off valves. Work was also completed on the
additional scope, which comprised the transport and installation
of four platforms.
In Azerbaijan, work continued for BP on a T&I contract involving
the transportation and installation of jackets, topsides, subsea
production systems and subsea structures for stage 2 of the Shah
Deniz field development project.
In Kazakhstan:
- work began on a contract with the North Caspian Operating Co
(NCOC) for the construction of two 95-kilometre pipelines,
Saipem Interim Consolidated Report as of June 30, 2015 / Operating review
001-058SaipemSem15Ing.qxd 6-08-2015 11:41 Pagina 18
19
which will connect D island in the Caspian Sea to the Karabatan
onshore plant in Kazakhstan. The scope of work includes the
engineering, the supply of welding materials, the conversion
and the preparation of the vessels, dredging, and the
installation, burial and pre-commissioning of the two pipelines;
- work continued for Agip Kazakhstan North Caspian Operating Co
NV on the contract for the EP Clusters 2 and 3 project in the
framework of the Kashagan field development. The contract
includes engineering, procurement, fabrication, and
transportation of three topside production manifold modules;
- work continued for North Caspian Production Operations Co BV
on the Major Maintenance Services project. The contract
encompasses the provision of maintenance and services for
offshore (D island) and onshore (OPF) facilities;
- work continued for Teniz Burgylau Llp on the fabrication,
outfitting and commissioning of a jack-up rig in consortium
with Keppel Kazakhstan Llp.
In the Gulf of Mexico, engineering and procurement work started
on the Lakach project for Pemex. The contract encompasses the
engineering, procurement, construction and installation of the
system connecting the offshore field with the onshore gas
conditioning plant.
In Brazil, for Petrobras:
- work continued on the Sapinhoà Norte and Cernambi Sul
project, encompassing the engineering, procurement,
fabrication, installation and pre-commissioning of the SLWR
(Steel Lazy Wave Riser) for the collection system at the
Sapinhoà Norte field, and of the FSHR (Free Standing Hybrid
Risers) for the gas export systems at the Sapinhoà Norte and
Cernambi Sul fields. Work also continued on the Sapinhoà Norte
and Iracema Sul project;
- work continued on the contract for the construction of the Rota
Cabiúnas gas export trunkline, situated in the Santos Basin
Pre-Salt Region. The development comprises the engineering
and procurement of subsea equipment and the installation of a
gas pipeline in a maximum water depth of 2,200 metres.
The pipeline will connect the Central Gathering Manifold in the
Lula field, in the Santos Basin, to the onshore processing plant
of Cabiúnas, located in the Macaé district, in the State of Rio de
Janeiro;
- work continued on the Lula Norte, Lula Sul and Lula Extremo
Sul project, which encompasses the engineering, procurement,
fabrication and installation of three offshore pipelines and two
Free Standing Hybrid Risers for the gas export systems.
In Venezuela:
- work has almost been completed for Cardon IV on the Perla EP
project encompassing the transport and installation of three
platforms and three pipelines;
- work continued for PDVSA on the construction of the Dragon -
CIGMA project involving the transportation and installation of a
gas pipeline which will connect the Dragon gas platform to the
CIGMA complex.
In Italy, work is underway for Eni E&P as part of its 2015 Offshore
Campaign on a contract for the transportation and installation of
two platforms and two subsea pipelines in the Mediterranean Sea.
In the Leased FPSO segment, the following vessels carried out
operations during the period:
-the FPSO Cidade de Vitoria carried out operations as part of an
eleven-year contract with Petrobras on the second phase of
development of the Golfinho field, situated off the coast of
Brazil at a water depth of 1,400 metres;
-the FPSO Gimboa carried out operations on behalf of Sonangol
P&P under a contract for the provision and operation of an FPSO
unit for the development of the Gimboa field, located in Block
4/05 offshore Angola, at a water depth of 700 metres.
Saipem Interim Consolidated Report as of June 30, 2015 / Operating review
001-058SaipemSem15Ing.qxd 6-08-2015 11:41 Pagina 19

Offshore fleet at June 30, 2015
Saipem 7000 Self-propelled, semi-submersible, dynamically positioned crane and pipelay vessel capable of lifting
structures of up to 14,000 tonnes and J-laying pipelines at depths of up to 3,000 metres.
Saipem FDS Dynamically positioned vessel utilised for the development of deep-water fields at depths of over
2,000 metres. Capable of launching 22” diameter pipes in J-lay configuration with a holding capacity of up to
550 tonnes (upgrade to 750 tonnes currently underway) and a lifting capacity of up to 600 tonnes.
Saipem FDS 2 Dynamically positioned vessel utilised for the development of deep water fields, capable of launching pipes
with a maximum diameter of 36” in J-lay mode with a holding capacity of up to 2,000 tonnes. Also capable of
operating in S-lay mode with a lifting capacity of up to 1,000 tonnes.
Castoro Sei Semi-submersible pipelay vessel capable of laying large diameter pipe at depths of up to 1,000 metres.
Castorone Self-propelled, dynamically positioned pipe-laying vessel operating in S-lay mode with a 120-metre long S-lay
stern ramp composed of 3 articulated and adjustable stinger sections for shallow and deep-water operation, a
holding capacity of up to 750 tonnes (expandable to 1,000 tonnes), pipelay capability of up to 60 inches,
onboard fabrication facilities for triple and double joints and large pipe storage capacity in cargo holds.
Castoro Otto Derrick pipelay ship capable of laying pipes of up to 60” diameter and lifting structures weighing up to
2,200 tonnes.
Saipem 3000 Self-propelled, dynamically positioned derrick crane ship, capable of laying flexible pipes and umbilicals in
deep waters and lifting structures of up to 2,200 tonnes.
Bar Protector Dynamically positioned, multi-purpose support vessel used for deep water diving operations and offshore
works.
Castoro II Derrick lay barge capable of laying pipe of up to 60” diameter and lifting structures of up to 1,000 tonnes.
Castoro 10 Trench/pipelay barge capable of burying pipes of up to 60” diameter and of laying pipes in shallow waters.
Castoro 12 Pipelay barge capable of laying pipes of up to 40” diameter in ultra-shallow waters of a minimum depth of
1.4 metres.
Castoro 16 Post-trenching and back-filling barge for pipes of up to 40” diameter in ultra-shallow waters of a minimum
depth of 1.4 metres.
Ersai 1 Heavy lifting barge equipped with 2 crawler cranes, capable of carrying out installations whilst grounded on
the seabed. The lifting capacities of the 2 crawler cranes are 300 and 1,800 tonnes, respectively.
Ersai 2 Work barge equipped with a fixed crane capable of lifting structures of up to 200 tonnes.
Ersai 3 Support barge with storage space, workshop and offices for 50 people.
Ersai 4 Support barge with workshop and offices for 150 people.
Ersai 400 Accommodation barge for up to 400 people, equipped with antigas shelter for H2S leaks.
Castoro 9 Cargo barge.
Castoro XI Heavy-duty cargo barge.
Castoro 14 Cargo barge.
Castoro 15 Cargo barge.
S42 Cargo barge, currently used for storing the J-lay tower of the Saipem 7000.
S43 Cargo barge.
S44 Launch cargo barge, for structures of up to 30,000 tonnes.
S45 Launch cargo barge, for structures of up to 20,000 tonnes.
S46 Cargo barge.
S47 Cargo barge.
S 600 Launch cargo barge, for structures of up to 30,000 tonnes.
FPSO - Cidade de Vitoria FPSO unit with a production capacity of 100,000 barrels a day.
FPSO - Gimboa FPSO unit with a production capacity of 60,000 barrels a day.
With poor visibility into their prospects of deployment on future projects, the vessels Castoro Sette, S355 and Saibos 230 were written
down during the first half of 2015 and have been slated for scrapping. Following the revision of the depreciation schedule on December
31, 2014, Semac 1, which has been slated for scrapping, was fully depreciated as of June 30, 2015.
Saipem Interim Consolidated Report as of June 30, 2015 / Operating review
20
001-058SaipemSem15Ing.qxd 6-08-2015 11:41 Pagina 20

Saipem Interim Consolidated Report as of June 30, 2015 / Operating review
21
General overview
The Saipem Group’s Onshore Engineering & Construction expertise
is focused on the execution of large-scale projects with a high
degree of complexity in terms of engineering, technology and
operations, with a strong bias towards challenging projects in
difficult environments and remote areas.
Saipem enjoys a worldwide leading position in the Onshore sector,
providing a complete range of integrated basic and detailed
engineering, procurement, project management and construction
services, principally to the oil&gas, complex civil and marine
infrastructure and environmental markets. The Company places
great emphasis on maximising Local Content during project
execution phase in a large number of the areas in which it operates.
The review of Saipem’s competitive positioning in the light of a
significant deterioration in market conditions led to the
rationalisation of a fabrication yard and has made more complex
the negotiations for the recognition of change orders and claims
with clients.
Market conditions
The volume of EPC contracts assigned on the Onshore E&C market
(Upstream, Midstream and Downstream) in the first half of 2015
dropped significantly compared with the same period of previous
years.
At global level, a significant share of EPC project awards were
located in the United States in the Pipeline, Petrochemical, LNG
and Fertilizer segments. In the Middle East (Kuwait and United
Arab Emirates), awards were almost exclusively concentrated in
the Upstream segment. In the CIS (Russia and Azerbaijan), the
principle focus of contracting activity were the Refining, Fertilizer
and Petrochemical segments. Central Africa (Uganda) registered
the award of a project in the Refining segment, while in Europe
(Slovak Republic), the period saw a project awarded for the
construction of a Fertilizer facility.
The value of EPC contracts awarded in the Upstream segment
during the first half of 2015 were comparable with the average for
the same period in recent years – confirmation that the market is
holding up in spite of the unfavourable conditions.
Most new EPC contracts awarded during the reporting period were
concentrated in the Middle East, confirming both its strategic
importance and its countercyclical nature, while important
contracts were also awarded in Kuwait and the United Arab
Emirates. Canada on the other hand saw a sudden and dramatic
fall-off in contracting activity, which saw the cancellation and
postponement of planned projects.
The Upstream segment continues to show good short to medium
term growth potential driven by gas and oil field discoveries and
developments, but there is an increasingly pressing need for
investments to maintain gradually declining production levels in
existing fields.
Activity during the period in the Pipeline segment was driven by
the award of a major EPC contract award in China for the
construction of a third gas pipeline on the West-East China Gas
Pipeline (Stage 2) project. Smaller gas pipeline awards were also
made in the Middle East (Kuwait) and South America.
With the pipeline segment heavily driven by the abundance of
available gas and, consequently, by the need to transport the gas
from the production fields to the end user markets, recent years
have seen projects to build new gas pipelines or to expand
existing ones outnumbering oil pipeline initiatives. This trend is
expected to continue in the short to medium term, particularly in
countries opting to develop non-conventional fields, as this will
require them to make investments to upgrade their distribution
infrastructure.
Following a year in which awards were abundant, the LNG
segment registered a downturn, with relatively few awards
registered, mainly in North America (United States), but also in
Asia-Pacific (Malaysia), either for the construction of additional
units or the expansion of existing facilities.
North America’s growing role as an exporter of LNG is being driven
by a continuous and constant abundance of gas from
non-conventional fields, which is enabling natural gas to be
produced at low cost. Henry Hub natural gas prices are currently
much lower than gas prices on the rest of the world’s markets,
and with American gas likely to remain affordable in the short to
medium term, liquefaction terminal projects represent an
increasingly attractive investment opportunity.
The Refining segment – which has always been one of the drivers
of the E&C market in terms of EPC contract awards – saw a
considerable drop in the overall value of contract awards
compared with prior years. The fall in awards notwithstanding, the
first half of 2015 nevertheless saw two contracts assigned in the
CIS (Russia) and the construction of a refinery in Central Africa
(Uganda).
The increasingly strict environmental legislation in force,
particularly in OECD countries (and especially in Europe), is
requiring the refining industry to modernise continually, with
existing facilities forced to revamp constantly in pursuit of
process efficiencies. The effect of this has been to encourage
small and medium size investments, the closure of outdated
refineries and the construction of new Mega Export Refineries in
crude producing countries, particularly in the Middle East.
In the short to medium term, the volume of future investments
continues to be considerable and pertains to all of the
geographical areas being monitored by the Company.
The largest investments are planned in Asia-Pacific and the Middle
East, although all other geographical areas continue to present
interesting opportunities.
Onshore Engineering & Construction
001-058SaipemSem15Ing.qxd 6-08-2015 12:44 Pagina 21
Saipem Interim Consolidated Report as of June 30, 2015 / Operating review
22
After a year featuring a large number of important major project
awards in 2014, the Petrochemical segment experienced a
significant downward turn in the first few months of 2015.
The period saw the award of a project for the construction of an
ethylene plant in the United States, as well as contracts for two
smaller facilities in the Asia-Pacific Region (China and Singapore).
The Fertilizer segment also registered a significant drop in overall
volumes of awards compared with the same period of 2014, but
there were important contract awards for the construction of
ammonia plants in both Russia and the United States.
New contracts
The most significant contract awarded to Saipem during the
period was a contract for Fermaca relating to the El Encino
Pipeline project situated in Mexico, encompassing the
engineering, procurement, construction and commissioning
support for a compressor station at El Encino.
Capital expenditure
Capital expenditure in the Onshore Engineering & Construction
sector focused mainly on the acquisition of equipment and the
maintenance of the existing asset base.
Work performed
The biggest and most important projects underway or completed
during the first half of 2015 were:
In Saudi Arabia:
- work continued for Petrorabigh (a joint venture between Saudi
Aramco and Sumitomo Chemical) on the contract for the
Naphtha and Aromatics Package of the Rabigh II project, which
encompasses the engineering, procurement, construction and
pre-commissioning of two processing units: a naphtha reformer
unit and an aromatics complex;
- work continued for Saudi Aramco on two EPC contracts
(Packages 1 & 2) relating to the Jazan Integrated Gasification
Combined Cycle project to be undertaken approximately
80 kilometres from the city of Jazan, in south western Saudi
Arabia. The Package 1 contract comprises the gasification,
soot/ash removal, acid gas removal and hydrogen recovery
units. The Package 2 contract includes six sulphur recovery
units (SRU) trains and relevant storage facilities. The scopes of
work of both packages include engineering, procurement,
construction, pre-commissioning, assistance to commissioning
and performance tests of the concerned facilities;
- work continued for Saudi Aramco on the Complete Shedgum -
Yanbu Pipeline Loop 4&5 contract, encompassing detailed
engineering, the procurement of all materials except for the
pipeline supplied by the client Aramco, installation,
commissioning and start up assistance for two pipelines;
- work commenced for Saudi Aramco on the EPC project relating
to the expansion of the onshore production centres at the
Khurais, Mazajili and Adu Jifan fields;
- work continued for Safco on the Safco V contract, which
encompasses the engineering, procurement and construction of
a urea production plant, together with associated utilities and off-
site systems and interconnecting structures to existing plants.
In the United Arab Emirates:
- construction work for the three product lines (sales gas, natural
gas liquids and condensate) have almost been completed on
the contract for Abu Dhabi Gas Development Co Ltd forming part
of the development of the high sulphur content Shah sourgas
field. The development project encompasses the treatment of
28 million cubic metres of gas a day from the Shah field, the
separation of the sulphur from the gas, the transportation of the
gas product lines by pipeline to Habshan (where it is injected
into the national gas network) and to Ruwais, and the
transportation of the sulphur by separate pipeline to the
granulation facility at Habshan and from there to Ruwais by
railway. Negotiations are underway to secure approval by the
client of change orders and claims occurring during project
execution;
- work continued on a project for the Etihad Rail Co in Abu Dhabi,
encompassing the engineering and construction of a railway
line for the transportation of granulated sulphur, linking the
natural gas production fields of Shah and Habshan (located
inland) to the port of Ruwais.
In Kuwait, work continued for Kuwait Oil Co (KOC) on the BS 171
contract, which encompasses the engineering, procurement,
construction and commissioning of a new gas booster station
comprising three high and low-pressure gas trains for the
production of dry gas and condensate. Negotiations are underway
to secure approval by the client of change orders and claims
occurring during project execution.
In Iraq:
- work continued for Fluor Transworld Services Inc and Morning
Star for General Services Llc on the West Qurna project.
The contract comprises engineering, procurement,
construction, pre-commissioning and commissioning of water
treatment and conveyance infrastructure, a pipeline and a
water injection system;
- work started for Shell Iraq Petroleum Development on the FCP
GAS project, encompassing the installation of two
001-058SaipemSem15Ing.qxd 6-08-2015 11:41 Pagina 22
Saipem Interim Consolidated Report as of June 30, 2015 / Operating review
23
turbocompressors and auxiliary equipment, as well as tie-ins to
existing facilities. The facilities will supply gas to the North
Rumaila power plant;
- construction work is underway for Basrah Gas Co (BGC) on the
Inlet Booster Compressors (IBC) project, encompassing the
installation of three turbocompressors and related auxiliary
systems, as well as interconnections to the existing facility;
- work continued on the Zubair Gathering System project for
Morning Star for General Services Llc and ExxonMobil Iraq Ltd,
which encompasses the construction of a gathering system,
flowlines and interconnecting facilities, as well as the
distribution node.
In Turkey, work continued for Star Refinery AS on the Aegean
Refinery project, encompassing the engineering, procurement
and construction of a refinery.
In Nigeria:
- complex work is underway for Southern Swamp Associated Gas
Solution (SSAGS) on the Southern Swamp contract, comprising
engineering, procurement, construction and commissioning of
compression facilities at four sites and of new central
production facilities at one of the sites, which will treat the
routed associated gas;
- work continued for Dangote Fertilizer Ltd on the Dangote
project for a new ammonia and urea production complex.
The facility was originally due to be located in Edo State, but
was reallocated by the client to the Lekki Free Trade Zone in
Lagos State. The scope of work encompasses engineering,
procurement and construction of two twin production streams
and related utilities and off-site facilities;
- work continued for Total Exploration and Production Nigeria Ltd
(TEPNG) on the Northern Option Pipeline project, comprising
engineering, procurement, construction and commissioning of
a pipeline that will connect Rumuji to Imo River;
- work is underway for Shell Petroleum Development Co on the
Otumara-Saghara-Escravos Pipeline contract, which
encompasses the engineering, procurement, fabrication and
commissioning of a network of pipelines in a swamp area, to
connect the client’s flowstations in the Otumara, Saghara and
Escravos fields;
- work continued for the Government of Rivers State (Nigeria) on the
contract for the engineering, procurement and construction of the
first and second train of the Independent Power Plant at Afam.
In Congo, work continued for Eni Congo on the Litchendjili project
for the construction of an onshore treatment facility which will
treat the feed stream from the Litchendjili Offshore Platform and
separate the fluid into two main streams: the gas product
(delivered to Centrale Electrique du Congo) and liquid
hydrocarbons.
In Italy:
- work is underway for Rete Ferroviaria Italiana SpA (Ferrovie
dello Stato Group) on the contract for the detailed engineering,
project management and construction of a 39-kilometre section
of high-speed railway line and of an additional 12 kilometres of
interconnections with the existing conventional railway, along
the Treviglio-Brescia section across the Milan, Bergamo and
Brescia provinces, as well as all associated works, such as
power lines, works to reduce road interference, road crossings
and environmental mitigation;
- work started on an EPC contract for Versalis-Ferrara IT for the
construction of a fourth production line to operate alongside
three existing lines, in addition to increasing production
capacity and upgrading the plant’s outside battery limit
auxiliary systems.
In Poland, engineering work continued for Polskie LNG on the
Polskie contract for a re-gasification terminal. The contract
encompasses the engineering, procurement and construction of
the regasification facilities, including two liquid gas storage tanks.
On certain Canadian projects in relation to which the clients
(Canadian Natural Resources Ltd and Husky Oil) announced the
contract termination, the parties are in the process of
negotiations relating to claims and change orders. From an
operating point of view, the period saw the completion of the
U&O/Williams projects, while Phase 3 and SRU-SWC continue
according to schedule.
In Mexico:
- work is underway for Transcanada (Transportadora de Gas
Natural Norte - Noroeste) on the El Encino project, comprising
engineering, procurement and construction of a pipeline from
El Encino (Chihuahua State) to Topolobampo (Sinaloa State).
The project includes two compressor stations and three
metering stations;
- work continued for Pemex on the Tula and Salamanca contract
for the construction of two desulphurisation units and two
amine regeneration units to be built at two of the client’s
refineries. The facilities will be built at the Miguel Hidalgo
refinery, located 2,000 metres above sea level near the town of
Tula and at the Antonio M. Amor refinery, located 1,700 metres
above sea level near the town of Salamanca.
In Suriname, for Staatsolie, work has almost been completed on
the contract encompassing engineering, procurement, fabrication
and construction for the expansion of the Tout Lui Faut refinery,
located south of the capital Paramaribo.
In Azerbaijan and Georgia, work is underway for the Shah Deniz
consortium on the SPCX Pipeline contract, which encompasses
001-058SaipemSem15Ing.qxd 6-08-2015 11:41 Pagina 23
24
the construction of two pipelines and associated above ground
installations.
In Australia, work was completed for Gladstone LNG Operations Pty
Ltd on the Gladstone LNG contract involving the engineering,
procurement and construction of a gas pipeline connecting the
Bowen and Surat fields to the Gladstone State Development Area
(GSDA) near the city of Gladstone, Queensland, where an LNG
liquefaction and export plant is due to be built. Negotiations are
underway to secure approval by the client of change orders and
claims occurring during project execution.
Saipem Interim Consolidated Report as of June 30, 2015 / Operating review
001-058SaipemSem15Ing.qxd 6-08-2015 11:41 Pagina 24

25
General overview
At June 30, 2015, the Saipem offshore drilling fleet consisted of
fifteen vessels: seven deep-water units for operations at depths in
excess of 1,000 metres (the drillships Saipem 10000 and Saipem
12000 and the semi-submersible drilling rigs Scarabeo 5,
Scarabeo 6, Scarabeo 7, Scarabeo 8 and Scarabeo 9), one for
mid-water operations at depths of up to 500 metres
(the semi-submersible Scarabeo 3), two high specification
jack-ups for operations at depths of up to 375 feet (Perro Negro 7
and Perro Negro 8), four standard jack-ups for activities at depths
up to 300 feet (Perro Negro 2, Perro Negro 3, Perro Negro 4 and
Perro Negro 5) and one tender-assisted drilling rig (TAD). All units
are the property of Saipem. The fleet also includes other minor
units operating offshore Peru. During the first half of 2015,
Saipem’s offshore drilling fleet operated in the Norwegian sector
of the North Sea and the Barents Sea, in the Mediterranean Sea
(Italy, Egypt and Cyprus), the Red Sea, the Persian Gulf, in West
Africa, Indonesia, offshore Ecuador and Peru.
The semi-submersible platform Scarabeo 4 was fully written down
during the first half of 2015 and slated for scrapping.
Market conditions
The negative cycle that commenced in 2014 continued to prevail
during the first few months of 2015, with the oil price environment
remaining fairly weak, and the general climate of uncertainty
surrounding the medium term outlook, which emerged during the
second half of 2014, continuing to obtain.
The unfavourable market conditions in the offshore drilling
segment impacted principally on spending by oil and gas
companies. The declining trend affecting spending on drilling
services, which began in 2014, continued during the period, with a
fall of 13% registered compared to forecasts made at year end
2014. Data for rig utilisation continued to follow a general
downward trend, with all types of rig affected. Only the latest
models (i.e. deep water floaters and high spec jack-ups) were able
to maintain rates close to 90%. The negative cycle affecting the oil
and gas industry also led to a number of industry operators opting
to retire and dismantle older units. Since year end 2014, over
30 rigs have been retired from the market due to a lack of work
and poor medium-term prospects. The trend has had a particularly
significant impact on the mid-water segment, where the number
of rigs dropped by approximately 20% compared with 2014.
Day rates for contracts awarded during the period continued the
downward trend that began in 2014, with falls registered in
particular for ultra-deep water operations (where rates have
stabilised at below $400,000 per day, even dipping below
$300,000 per day, compared with rates in excess of $600,000
per day in 2013) and high spec jack-ups (which went from peaks
in 2013 of more than $200,000 per day to $110,000 per day in
the first half of 2015).
The significant number of orders placed in previous years enabled
new offshore drilling rig construction activities to remain at
healthy levels, with 176 new rigs under construction
(115 jack-ups, 21 semi-submersibles and 40 drillships),
156 of which are slated for delivery by the end of 2016. Overall,
only 43 of these units have already secured contracts, while the
remainder will in the short to medium term contribute to a
significant increase in the global drilling services fleet. The
negative cycle affecting the market has however led to a number
of client companies postponing their newbuild rig deliveries
pending improved market conditions. The significant number of
new builds scheduled for delivery in the medium term, combined
with the retirements of a portion of the existing fleet cited above
represent a structural change in the offshore drilling segment
that may have significant effects over the medium to long term.
New contracts
The most significant contract awarded to Saipem during the
period was with National Drilling of Abu Dhabi in the United Arab
Emirates, involving the charter of the Perro Negro 8 for a
thirty-month period starting June 2015.
Capital expenditure
The principal investments made in the Offshore Drilling sector
during the first half of 2015 related principally to class
reinstatement works on the drillships Saipem 10000 and Saipem
12000 and on the drilling jack-up Perro Negro 8, as well as
maintenance and upgrading works on the existing asset base.
Work performed
In the first half of 2015, Saipem’s offshore units drilled 42 wells
totalling 84,848 metres.
The fleet was deployed as follows:
- deep-water units: the drillship Saipem 12000 continued to
operate in Angola for Total, while the drillship Saipem 10000
operated under a long-term contract with Eni in Cyprus and
then started planned maintenance operations; the
semi-submersible rig Scarabeo 9 operated in Angola on a
long-term contract with Eni; the semi-submersible rig
Scarabeo 8 continued to work in the Norwegian sector of the
Barents Sea for Eni Norge; the semi-submersible rig Scarabeo 7
continued to operate in Indonesia for Eni Muara Bakau under a
long-term contract; the semi-submersible rig Scarabeo 6
Offshore Drilling
Saipem Interim Consolidated Report as of June 30, 2015 / Operating review
001-058SaipemSem15Ing.qxd 6-08-2015 11:41 Pagina 25

Vessel Days under contract (1)
Semi-submersible platform Scarabeo 3 144
Semi-submersible platform Scarabeo 4 (2) 95
Semi-submersible platform Scarabeo 5 175
Semi-submersible platform Scarabeo 6 174
Semi-submersible platform Scarabeo 7 181
Semi-submersible platform Scarabeo 8 181
Semi-submersible platform Scarabeo 9 180
Drillship Saipem 10000 90
Drillship Saipem 12000 152
Jack-up Perro Negro 2 107
Jack-up Perro Negro 3 181
Jack-up Perro Negro 4 171
Jack-up Perro Negro 5 179
Jack-up Perro Negro 7 181
Jack-up Perro Negro 8 -
Tender Assisted Drilling Unit 172
Ocean Spur (3) 96
(1) For the remaining days (to 181) the vessel underwent class reinstatement and maintenance works as a result of technical issues.
(2) Vessel fully written down and slated for scrapping.
(3) Third party rig returned to client.
Saipem Interim Consolidated Report as of June 30, 2015 / Operating review
26
continued to operate in Egypt for Burullus; in mid-February the
semi-submersible rig Scarabeo 5 recommenced work in the
Norwegian sector of the North Sea for Statoil. Operations had
previously been suspended by the client due to adverse market
conditions. The vessel received the standby rate during this idle
period, which was used to complete upgrades;
- mid-water units: the semi-submersible rig Scarabeo 4
continued activities in Egypt on a contract for International
Egyptian Oil Co (IEOC) and was subsequently transferred to
Cyprus, placed in standby and slated for scrapping; after
completing operations in Nigeria for Addax,
the semi-submersible rig Scarabeo 3 carried out planned
maintenance operations and then began preparations for work
for FASL, which started towards the end of the reporting
period;
- high specifications jack-ups: the Perro Negro 8 completed
maintenance and upgrades before starting operations for
National Drilling Co (NDC) in the United Arab Emirates towards
the end of the period; the Perro Negro 7 continued operations
for Saudi Aramco offshore Saudi Arabia;
- standard jack-ups: the Perro Negro 3 and Perro Negro 2
continued operations in the United Arab Emirates for NDC, while
the Perro Negro 5 continued work for Saudi Aramco in Saudi
Arabia; the Perro Negro 4 continued to operate in the Red Sea
for Petrobel; the Ocean Spur, which is operated by Saipem and
owned by third parties, completed operations in Ecuador for
Petroamazonas and was then returned to its owners;
- other activities: in Congo, the tender assisted drilling unit TAD
continued work for Eni Congo SA, while operation of the
Loango-Zatchi platforms also proceeded; offshore Peru, work
was carried out for Pacific Offshore Energy and Savia.
Utilisation of vessels
Vessel utilisation in the first half of 2015 was as follows:
001-058SaipemSem15Ing.qxd 6-08-2015 11:41 Pagina 26

27
General overview
At June 30, 2015, Saipem’s onshore drilling rig fleet was
composed of 107 units. Of these, 100 are owned by Saipem, while
7 are owned by third parties but operated by Saipem. The areas of
operations were South America (Peru, Bolivia, Colombia, Ecuador,
Chile and Venezuela), Saudi Arabia, the Caspian Sea Region
(Kazakhstan and Turkmenistan), Africa (Congo), and Europe
(Italy).
Market conditions
The overall volume of investments by oil companies during the
first half of 2015 was down compared with the previous year.
Unlike in the previous period, where the Onshore Drilling segment
was less affected by the unfavourable market conditions than its
offshore counterpart, in the first half of 2015 the negative
market cycle and the weak oil price environment had a more
significant impact overall.
One of the geographical areas registering the biggest drops in
activity was the United States. During the second half of 2014,
the general market slowdown had been offset by the increase in
gas demand to meet storage requirements for winter use, but in
the first half of 2015, with this no longer a requirement, there
was a drastic fall in active rigs of approximately 50% compared
with the previous year.
Levels of activity on the international market, on which Saipem
operates, were not immune to the negative cycle either.
South America, which historically has always been an oil price
sensitive region, recorded the biggest fall in activity, of
approximately 30%. Given the Company’s significant deployment
of vessels in the country, the situation in Venezuela is
particularly critical for Saipem. The drops in activity seen in other
regions were smaller, although the only exception to the
declining trend was the Middle East, where levels of activity
remained substantially stable, thanks to the region’s key market,
Saudi Arabia, as well as to other countries with significant major
development programmes in place, such as Kuwait.
New contracts
New contracts for the use of fourteen drilling rigs in Italy and
South America, with durations ranging in length from four months
to two years, were awarded to the Group during the reporting
period by various clients.
Capital expenditure
The main investments made during the period in the Onshore
Drilling segment related to upgrading work on the existing asset
base.
Work performed
204 wells were drilled during the period, totalling approximately
401,837 metres drilled.
In South America, Saipem operated in a number of countries:
in Peru, work was carried out for various clients, including Cepsa,
China National Petroleum Corp, Pluspetrol, Gran Tierra, Perenco,
Hunt, and Savia, deploying nineteen company-owned rigs and
operating five rigs owned by clients or third parties; in Bolivia,
four rigs were deployed for YPFB Andina, Pluspetrol and Repsol;
in Chile, work continued for Empresa Nacional del Petróleo
(ENAP), deploying one rig, while operations on a second rig
started for Yacimientos Petrolíferos Fiscales (YPF); in Colombia,
where Saipem has six rigs, work was performed for various
clients, including Equion, Canacol, and Ecopetrol, while operations
were completed for Schlumberger; in Ecuador, four
company-owned rigs were deployed for various clients, including
Agip Oil and Petroamazonas, while work was completed for
Tecpeservices; finally, in Venezuela, work continued for PDVSA
involving the deployment of twenty-eight rigs.
In Saudi Arabia, Saipem deployed twenty-six rigs, continuing
operations for Saudi Aramco under previously acquired long-term
contracts.
In the Caspian Sea Region, Saipem operated in Kazakhstan for
various clients, including Karachaganak Petroleum Operating BV,
Agip KCO, and Zhaikmunai, using 4 rigs supplied by a partner and
4 owned rigs, one of which operated until May and then, at the
client’s request, was stacked due to adverse market conditions.
The stacking period will be paid for by the client. Operations with
the rig are due to start up again in October. In Turkmenistan, work
continued for Burren/Rheinisch-Westfälisches Elektrizitätswerk
AG using one rig.
In West Africa, Saipem continued to operate in Congo for Eni
Congo SA, using one company-owned rig and operating one
client-owned rig.
Saipem has one rig in both Tunisia and Mauritania. Neither rig
carried out operations during the first half of 2015.
Operations in Italy saw the deployment of one rig which
performed work for Total in the Tempa Rossa area. Another rig is
currently undergoing upgrading works in the country.
Onshore Drilling
Saipem Interim Consolidated Report as of June 30, 2015 / Operating review
001-058SaipemSem15Ing.qxd 6-08-2015 11:41 Pagina 27
Saipem Interim Consolidated Report as of June 30, 2015 / Operating review
28
Utilisation of rigs
The average utilisation of rigs in the first half of 2015 was 93.5%
(96.5% in the first half of 2014). At June 30, 2015,
company-owned rigs amounted to 100, located as follows: 28 in
Venezuela, 28 in Saudi Arabia, 19 in Peru, 6 in Colombia, 4 in
Kazakhstan, 4 in Bolivia, 4 in Ecuador, 2 in Italy, 1 in Chile, 1 in
Congo, 1 in Mauritania, 1 in Tunisia, and 1 in Turkmenistan.
Additionally, 5 third-party rigs were deployed in Peru, 1 in Congo
and 1 in Chile.
001-058SaipemSem15Ing.qxd 6-08-2015 11:41 Pagina 28
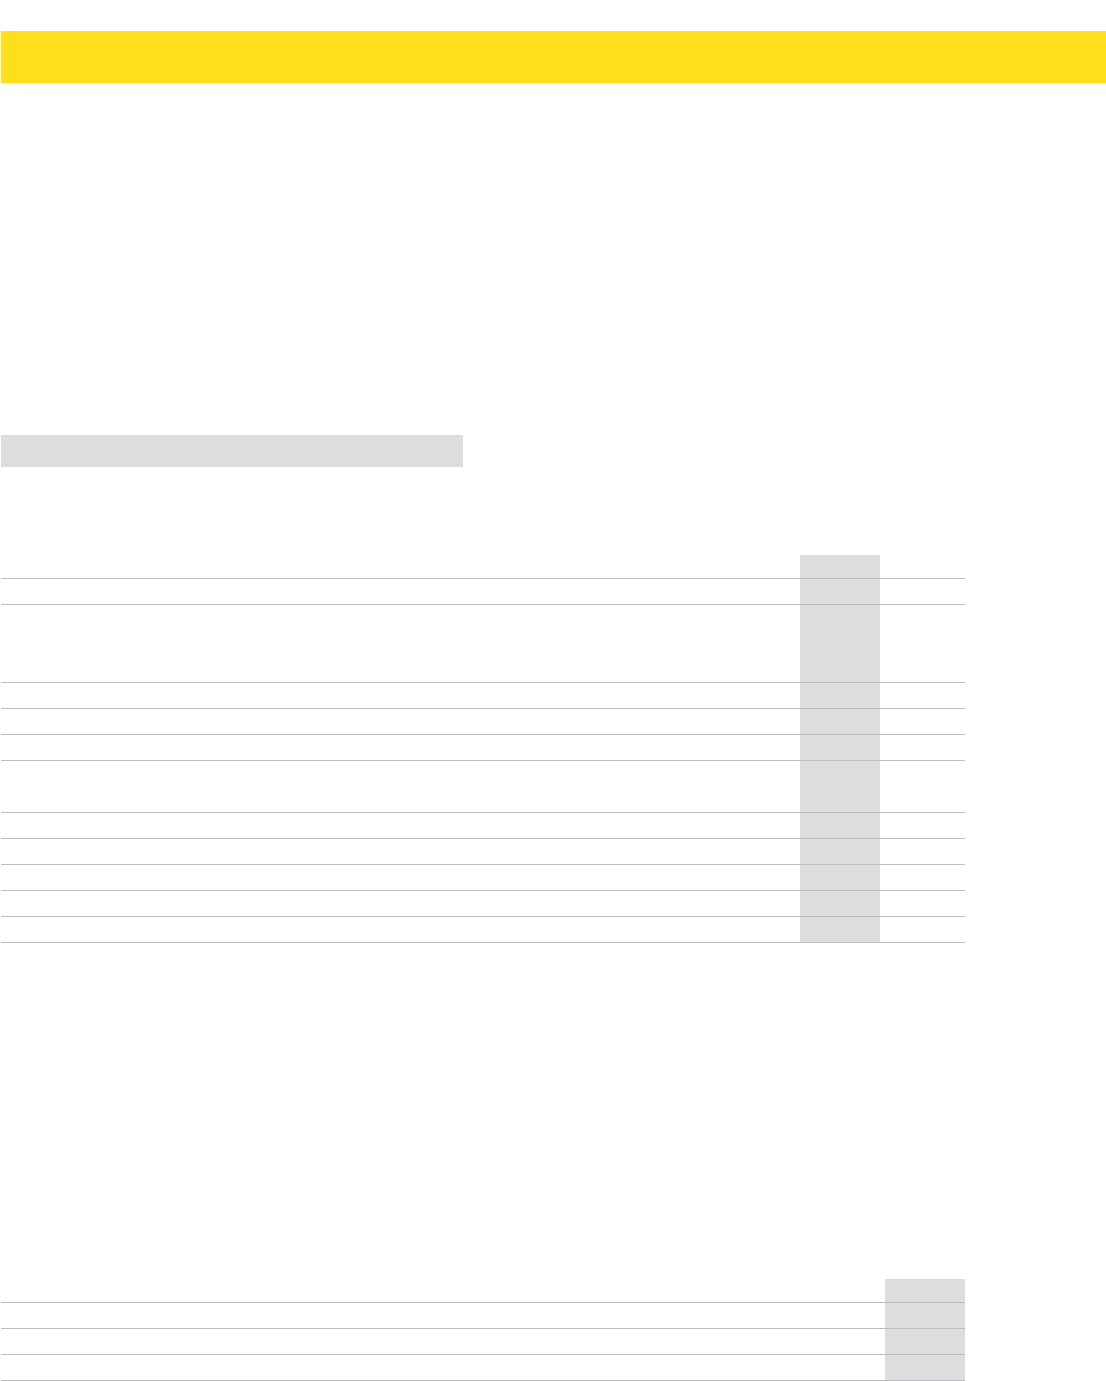
29
Financial and economic results
Saipem Interim Consolidated Report as of June 30, 2015 / Financial and economic results
As previously stated, revenues and associated profit levels,
particularly in the Engineering & Construction sectors, and, to a
lesser extent, in the Drilling sector, are not consistent over time,
as they are influenced not only by market performance but also
by climatic conditions and individual project schedules.
Consequently, the results from any one particular fiscal period
can vary significantly, thereby precluding a direct comparison
with the same period in other fiscal years or extrapolation of
figures from a single quarter to the entire year.
Given the conditions described over the preceding pages, market
prospects in the oil services sector are steadily worsening. Clients
are focusing on cost reduction, which results in a more rigid
approach to negotiations, demands for greater efficiency on
awarded projects, delays in new contract awards and, in some
cases, the cancellation of already approved projects.
Results of operations
Saipem Group - Income statement
Year First half
2014 (€million) 2014 2015 % Ch.
12,873 Net sales from operations 5,966 5,373 (9.9)
9 Other income and revenues 4-
(9,262) Purchases, services and other costs (4,118) (4,349)
(2,408) Payroll and related costs (1,197) (1,221)
1,212 Gross operating result (EBITDA) 655 (197) ..
(1,157) Depreciation, amortisation and impairment (362) (593)
55 Operating result (EBIT) 293 (790) ..
(199) Net finance expense (110) (110)
24 Net income from investments 17 7
(120) Result before income taxes 200 (893) ..
(118) Income taxes (64) (13)
(238) Result before non-controlling interests 136 (906) ..
8 Non-controlling interests -(14)
(230) Net result 136 (920) ..
Net sales from operations for the first half of 2015 amounted to
€5,373 million, representing a decrease of 9.9% compared to the
same period of 2014.
The gross operating result (EBITDA) amounted to -€197 million.
Depreciation and amortisation of tangible and intangible assets
amounted to €593 million.
The operating result (EBIT) for the first half of 2015 was -€790
million. The largest variations are analysed in detail in the
subsequent sections describing the performance of the various
business units.
Net finance expense increased by €110 million, which was in line
with the first half of 2014.
Net income from investments amounted to €7 million.
The result before income taxes amounted to -€893 million.
Income taxes amounted to €13 million. The decrease compared
to the first half of 2014 was principally due to a decrease in
taxable income.
The net result for the period was -€920 million.
Year First half
2014 (€million) 2014 2015
55 Operating result (EBIT) 293 (790)
410 Depreciation -211
465 Adjusted operating result (EBIT) 293 (579)
001-058SaipemSem15Ing.qxd 6-08-2015 11:41 Pagina 29
Saipem Interim Consolidated Report as of June 30, 2015 / Financial and economic results
30
In the first half of 2015, the Saipem Group reported net sales from
operations of €5,373 million, representing a decrease of
€593 million compared to the same period of the previous year.
This was mainly due to lower volumes registered in the Middle
East, Australia and North America.
Production costs (which include direct costs of sales and
depreciation of vessels and equipment) amounted to
€5,690 million, representing an increase of €255 million over the
first half of 2014. This was mainly due to the effect of the
write-downs of non-current assets and the increase in the
country risk.
Idle costs increased by €25 million, mainly due to the
semi-submersible Scarabeo 3, which was not under contract in
March, as well as to inactivity of a number of vessels in South
America.
Selling expenses amounted to €63 million.
Research and development costs included in operating costs
increased by €1 million.
General and administrative expenses amounted to €99 million,
representing an increase of €5 million.
The results of the business units were as follows:
Year First half
2014 (€million) 2014 2015 % Ch.
12,873 Net sales from operations 5,966 5,373 (9.9)
(11,916) Production costs (5,435) (5,690)
(116) Idle costs (61) (86)
(143) Selling expenses (70) (63)
(11) Research and development costs (5) (6)
(21) Other operating income (expenses) (8) (8)
(201) General and administrative expenses (94) (99)
465 Adjusted operating result (EBIT) 293 (579) ..
Operating result and costs by function
The write-down of €211 million against non-current assets is
related to vessels that are due to be scrapped because they are
no longer commercially viable for the execution of projects in the
order backlog and to Saipem’s components within logistics bases
that have been affected by the rescheduling and/or cancellation
of projects by their main clients, leading to reduced utilisation
compared with forecasts.
Year First half
2014 (€million) 2014 2015 % Ch.
12,873 Net sales from operations 5,966 5,373 (9.9)
9 Other income and revenues 4-
(9,262) Purchases, services and other costs (4,118) (4,349)
(2,408) Payroll and related costs (1,197) (1,221)
1,212 Gross operating result (EBITDA) 655 (197) ..
(747) Depreciation, amortisation and impairment (362) (382)
465 Adjusted operating result (EBIT) 293 (579) ..
(199) Net finance expense (110) (110)
24 Net income from investments 17 7
290 Adjusted result before income taxes 200 (682) ..
(118) Income taxes (64) (13)
172 Adjusted result before non-controlling interests 136 (695) ..
8 Non-controlling interests -(14)
180 Adjusted net result 136 (709) ..
001-058SaipemSem15Ing.qxd 7-08-2015 9:56 Pagina 30

Saipem Interim Consolidated Report as of June 30, 2015 / Financial and economic results
Revenues for the first six months of 2015 amounted to €1,048
million, representing a 44.6% decrease compared to the same
period of 2014. This was mainly attributable to lower volumes
recorded in the Middle East, Australia and North America.
The cost of sales, which amounted to €1,735 million, also
decreased compared with the same period of the previous year.
Depreciation and amortisation amounted to €21 million, which
was in line with the figure for the same period of 2014.
Adjusted operating result (EBIT) for the first half of 2015
amounted to -€708 million, compared with €81 million for the
same period of 2014. This was mainly due to lower revenues
generated by projects in the Middle East and Australia.
The operating result (EBIT) for the first half of 2015 amounted to
negative €758 million, compared with -€81 million for the same
period of 2014 due to the write-down of a yard.
Offshore Engineering & Construction
Year First half
2014 (€million) 2014 2015
7,202 Net sales from operations 3,184 3,388
(6,470) Cost of sales (2,857) (3,192)
732 EBITDA 327 196
(297) Depreciation, amortisation and impairment (147) (160)
435 Adjusted operating result (EBIT) 180 36
(160) Impairment -(150)
275 Operating result (EBIT) 180 (114)
Onshore Engineering & Construction
Year First half
2014 (€million) 2014 2015
3,765 Net sales from operations 1,890 1,048
(4,138) Cost of sales (1,952) (1,735)
(373) EBITDA (62) (687)
(38) Depreciation, amortisation and impairment (19) (21)
(411) Adjusted operating result (EBIT) (81) (708)
- Impairment -(50)
(411) Operating result (EBIT) (81) (758)
Revenues for the first half of 2015 amounted to €3,388 million,
representing a 6.4% increase compared to the same period of
2014, due mainly to higher volumes recorded in Azerbaijan and
Kazakhstan, which offset lower volumes registered in North and
South America.
The cost of sales amounted to €3,192 million, increasing
compared with the first half of 2014 consistently with the increase
registered in volumes. Depreciation and amortisation rose by
€13 million compared to the first six months of 2014, due to an
adjustment of the economic useful life of a vessel at December 31,
2014, which led to a revision of its depreciation schedule.
Adjusted operating result (EBIT) for the first half of 2015 amounted
to €36 million, compared with €180 million for the same period of
2014. This was mainly due to the cancellation of the South Stream
project and to lower revenues from projects in South America.
Operating result (EBIT) for the first half of 2015 amounted to
-€114 million versus €180 million in the first half of 2014, due to
write-downs of one yard and certain vessels.
31
Offshore Drilling
Year First half
2014 (€million) 2014 2015
1,192 Net sales from operations 556 538
(580) Cost of sales (278) (274)
612 EBITDA 278 264
(262) Depreciation, amortisation and impairment (123) (113)
350 Adjusted operating result (EBIT) 155 151
(250) Impairment -(11)
100 Operating result (EBIT) 155 140
001-058SaipemSem15Ing.qxd 6-08-2015 11:41 Pagina 31
Saipem Interim Consolidated Report as of June 30, 2015 / Financial and economic results
32
Onshore Drilling
Year First half
2014 (€million) 2014 2015
714 Net sales from operations 336 399
(473) Cost of sales (224) (369)
241 EBITDA 112 30
(150) Depreciation, amortisation and impairment (73) (88)
91 Operating result (EBIT) 39 (58)
Revenues for the first half of 2015 amounted to €399 million,
representing an increase of 18.8% compared with the same period
of 2014, due principally to an increase in activity in Saudi Arabia
and South America.
The cost of sales increased by €145 million compared with the
same period of 2014, principally due to an increase in the country
risk.
Depreciation and amortisation amounted to €88 million,
representing an increase of €15 million compared with the same
period of 2014, due mainly to a higher level of activities in Saudi
Arabia and South America.
EBIT for the first half of the year totalled -€58 million compared
with €39 million for the first half of 2014 due to the write-down
recorded against a portion of overdue receivables in the light of an
increase in the country risk.
Revenues for the first half of 2015 amounted to €538 million,
down 3.2% on the same period of 2014. This was due to decreases
in revenue from the drillship Saipem 10000 and the drilling
jack-up Perro Negro 8 as a result of class reinstatement works
performed during the period and from the semi-submersible
platform Scarabeo 3, which was not under contract in March.
The drop in revenue from the above vessels was partially offset
by an increase in revenue from the Scarabeo 7, which was fully
operative during the period, having undergone preparatory works
during the same period of 2014.
The cost of sales €274 million was almost in line with the same
period of 2014.
Depreciation and amortisation fell by €4 million compared with
the first half of 2014.
Adjusted operating result (EBIT) for the first half of 2015
amounted to €151 million, compared with €155 million in the
first half of 2014, with the margin on revenues remaining almost
unchanged.
The operating result (EBIT) for the first half of 2015 amounted to
€140 million, compared to €155 million in the first half of 2014,
while the margin on revenues fell from 27.9% to 26% due to the
write-down of the semi-submersible Scarabeo 4.
001-058SaipemSem15Ing.qxd 6-08-2015 11:41 Pagina 32

Saipem Interim Consolidated Report as of June 30, 2015 / Financial and economic results
Management uses the reclassified consolidated balance sheet to
calculate key ratios such as the Return On Average Capital
Employed (ROACE) and leverage (used to indicate the robustness
of a company’s capital structure).
Non-current assets at June 30, 2015 stood at €8,248 million, a
decrease of €225 million compared to December 31, 2014.
The decrease was the result of capital expenditure of €269
million; negative changes in investments accounted for using the
equity method of €11 million, depreciation and amortisation of
€382 million, write-downs of €211 million and the positive effect
of €110 million deriving mainly from the translation of financial
statements in foreign currencies and other changes.
Net current assets increased by €572 million, from positive
€297 million at December 31, 2014 to positive €869 million at
June 30, 2015.
The provision for employee benefits amounted to €240 million,
representing an increase of €3 million compared with December
31, 2014.
As a result of the above, net capital employed increased by
€275 million, reaching €8,877 million at June 30, 2015,
compared with €8,602 million at December 31, 2014.
Shareholders’ equity, including non-controlling interests,
decreased by €832 million, to €3,346 million at June 30, 2015,
compared with €4,178 million at December 31, 2014.
This decrease reflected the negative effect of the net result for the
period of €906 million, the negative effect of changes in the fair
value of exchange rate and commodity hedging instruments of
€15 million and the positive effect of the translation into euro of
financial statements expressed in foreign currencies and other
variations amounting to €89 million.
The increase in net capital employed, which was greater than the
increase in shareholders’ equity, led to an increase in net
borrowings which, at June 30, 2015, stood at €5,531 million,
compared with €4,424 million at December 31, 2014,
representing an increase of €1,107 million.
The reclassified consolidated balance sheet aggregates asset and
liability amounts from the statutory balance sheet according to
function, under three basic areas: operating, investing and
financing.
Management believes that the reclassified consolidated balance
sheet provides useful information that helps investors to assess
Saipem’s capital structure and to analyse its sources of funds and
investments in fixed assets and working capital.
June 30, 2014 (€million) Dec. 31, 2014 June 30, 2015
7, 910 N e t t a n g i b l e a s s e t s 7, 6 01 7, 3 83
759 Net intangible assets 760 758
8,669 8,361 8,141
3,804 - Offshore Engineering & Construction 3,666 3,462
590 - Onshore Engineering & Construction 590 544
3,332 - Offshore Drilling 3,034 3,031
943 - Onshore Drilling 1,071 1,104
169 Investments 112 107
8,838 Non-current assets 8,473 8,248
1,308 Net current assets 297 869
(221) Employee termination indemnities (237) (240)
- Assets (liabilities) available for sale 69 -
9,925 Net capital employed 8,602 8,877
4,773 Shareholders’ equity 4,137 3,288
48 Non-controlling interests 41 58
5,104 Net debt 4,424 5,531
9,925 Funding 8,602 8,877
Leverage (net borrowings/shareholders’ equity
1.06 including non-controlling interests) 1.06 1.63
441,410,900 No. shares issued and outstanding 441,410,900 441,410,900
(1) See ‘Reconciliation of reclassified balance sheet, income statement and cash flow statement to statutory schemes’ on page 57
.
Balance sheet and financial position
Saipem Group - Reclassified consolidated balance sheet (1)
33
001-058SaipemSem15IngxTipo.qxd 8-09-2015 10:51 Pagina 33

Saipem Interim Consolidated Report as of June 30, 2015 / Financial and economic results
34
A breakdown by currency of gross debt, amounting to
€7,001 million, is provided in Note 14 ‘Short-term debt’ and Note
19 ‘Long-term debt and current portion of long-term debt’.
Statement of comprehensive income
First half
(€million) 2014 2015
Net profit (loss) for the period 136 (906)
Other comprehensive income:
- change in the fair value of cash flow hedges (*) (48) (68)
- exchange rate differences arising from the translation into euro of financial statements currencies other than the euro 19 86
- share of other comprehensive income of investments accounted for using the equity method (1) -
- income tax relating to other items of comprehensive income 17 53
Total other comprehensive income, net of taxation (13) 71
Total comprehensive income (loss) for the period 123 (835)
Attributable to:
- Saipem Group 123 ( 852)
- non-controlling interests -17
(*) The change in the fair value of cash flow hedges relates almost exclusively to transactions with the parent company Eni.
Shareholders’ equity including non-controlling interests
(€million)
Shareholders’ equity including non-controlling interests at December 31, 2014 4,178
Total comprehensive income for the period (906)
Dividend distribution -
Sale of treasury shares -
Other changes 74
Total changes (832)
Shareholders’ equity including non-controlling interests at June 30, 2015 3,346
Attributable to:
- Saipem Group 3,288
- non-controlling interests 58
Analysis of net borrowings
June 30, 2014 (€million) Dec. 31, 2014 June 30, 2015
(1) Financing receivables due after one year (1) (1)
- Payables to banks due after one year 250 -
3,125 Payables to other financial institutions due after one year 3,064 3,477
3,124 Net medium/long-term debt 3,313 3,476
(1,393) Accounts c/o bank, post and Group finance companies (1,595) (1,424)
- Available-for-sale securities (9) (8)
(8) Cash and cash on hand (7) (5)
(55) Financing receivables due within one year (58) (32)
465 Payables to banks due within one year 277 465
2,971 Payables to other financial institutions due within one year 2,503 3,059
1,980 Net short-term debt 1,111 2,005
5,104 Net debt 4,424 5,531
The fair value of derivative assets (liabilities) is detailed in Note 7 ‘Other current assets’ and Note 18 ‘Other current liabilities’.
001-058SaipemSem15Ing.qxd 6-08-2015 11:41 Pagina 34

Saipem’s reclassified cash flows statement derives from the
statutory cash flow statement. It enables investors to understand
the link existing between changes in cash and cash equivalents
(deriving from the statutory cash flow statement) and in net
borrowings (deriving from the reclassified cash flows statement)
that occurred between the beginning and the end of the period.
The measure enabling such a link is represented by the free cash
flow, which is the cash in excess of capital expenditure
requirements. Starting from free cash flow it is possible to
determine either: (i) changes in cash and cash equivalents for the
period by adding/deducting cash flows relating to financing
debts/receivables (issuance/repayment of debt and receivables
related to financing activities), shareholders’ equity (dividends
paid, net repurchase of treasury shares, capital issuance) and the
effect of changes in consolidation and of exchange differences; or
(ii) changes in net borrowings for the year by adding/deducting
cash flows relating to shareholders’ equity and the effect of
changes in consolidation and of exchange rate differences.
Reclassified cash flow statement (1)
Year First half
2014 (€million) 2014 2015
(230) Net result for the period 136 (920)
(8) Non-controlling interests -14
Adjustments to reconcile cash generated from operating result before changes in working capital:
1,011 Depreciation, amortisation and other non-monetary items 338 487
(2) Net (gains) losses on disposal and write-off of assets (3) (17)
291 Dividends, interests and income taxes 145 106
1,062 Net cash generated from operating result before changes in working capital 616 (330)
569 Changes in working capital related to operations (382) (334)
(433) Dividends received, income taxes paid, interest paid and received (184) (188)
1,198 Net cash flow from (used in) operations 50 (852)
(694) Capital expenditure (329) (268)
(9) Investments and purchase of consolidated subsidiaries and businesses (2) (1)
15 Disposals 797
- Other cash flow related to capital expenditures, investments and disposals - -
510 Free cash flow (274) (1,024)
(10) Borrowings (repayment) of debt related to financing activities 1 28
(170) Changes in short and long-term financial debt 414 817
- Sale of treasury shares --
(45) Cash flow from capital and reserves (44) 1
18 Effect of changes in consolidation and exchange differences 5 5
303 NET CASH FLOW FOR THE PERIOD 102 (173)
510 Free cash flow (274) (1,024)
- Sale of treasury shares --
(45) Cash flow from capital and reserves (44) 1
(129) Exchange differences on net borrowings and other changes (26) (84)
336 CHANGE IN NET BORROWINGS (344) (1,107)
(1) See ‘Reconciliation of reclassified balance sheet, income statement and cash flow statement to statutory schemes’ on page 57.
Net cash flow used in operations (negative €852 million)
together with capital expenditures of €172 million generated a
negative free cash flow of €1,024 million.
Cash flow from capital and reserves amounted to €1 million; the
effect of exchange differences on net borrowings and other
changes produced a net negative effect of €84 million.
As a result, net borrowings increased by €1,107 million.
In particular:
Net cash generated from operating result before changes in
working capital of negative €330 million related to:
- the net result for the period of negative €906 million;
- depreciation, amortisation and impairment of tangible and
intangible assets of €593 million, after negative changes in
investments accounted for using the equity method of
€11 million and other changes of negative €117 million;
- net gains on the disposal of assets, which had an impact of
negative €17 million;
- net finance expense of €93 million and income taxes of
€13 million.
Saipem Interim Consolidated Report as of June 30, 2015 / Financial and economic results
35
001-058SaipemSem15Ing.qxd 6-08-2015 11:41 Pagina 35

Saipem Interim Consolidated Report as of June 30, 2015 / Financial and economic results
36
The negative change in working capital related to operations of
€334 million was due to financial flows of projects underway.
Dividends received, income taxes paid, interest paid and received
during the first half of 2015 of €188 million were mainly related
to taxes paid and refunded and to the purchase and sale of tax
credits.
Capital expenditure on tangible and intangible assets amounted to
€268 million. Details of investments by sector are as follows:
Offshore Drilling (€107 million), Offshore Engineering
&Construction (€82 million), Onshore Drilling (€62 million) and
Onshore Engineering & Construction (€17 million). Additional
information concerning capital expenditure during the first half of
2015 can be found in the ‘Operating Review’ section.
Investments and purchase of consolidated subsidiaries and
businesses amounted to €1 million.
Cash flow generated by disposals amounted to €97 million.
Return On Average Capital Employed
(ROACE)
Return On Average Capital Employed is calculated as the ratio
between adjusted net result before minority interest, plus net
finance charges on net borrowings less the related tax effect and
net average capital employed. The tax rate applied on finance
charges is 27.5%, as per the applicable tax legislation.
Return On Average Operating Capital
To calculate the Return On Average Operating Capital, the average
capital employed is netted of investments in progress that did not
contribute to net result for the period, which amounted to €0
million at December 31, 2014, €295 million for the twelve-month
period ended June 30, 2014 and €0 million for the twelve-month
period ended June 30, 2015.
Key profit and financial indicators
Dec. 31, 2014 June 30, 2014 June 30, 2015
Net result (€million) (238) 322 (1,280)
Exclusion of finance costs on borrowings (net of tax effect) (€million) 144 151 144
Unlevered net result (€million) (94) 473 (1,136)
Capital employed, net: (€million)
- at the beginning of the period 9,504 9,193 9,925
- at the end of the period 8,602 9,925 8,877
Average capital employed, net (€million) 9,053 9,559 9,406
ROACE (%) (1.04) 4.9 (12.1)
Return On Average Operating Capital (%) (1.05) 5.1 (12.3)
Net borrowings and leverage
Saipem management uses leverage ratios to assess the
soundness and efficiency of the Group’s capital structure in terms
of an optimal mix between net borrowings and shareholders’
equity, and to carry out benchmark analyses against industry
standards. Leverage is a measure of a Company’s level of
indebtedness, calculated as the ratio between net borrowings and
shareholders’ equity, including non-controlling interests.
June 30, 2014 June 30, 2015
Leverage 1.06 1.63
001-058SaipemSem15Ing.qxd 6-08-2015 11:41 Pagina 36

37
Sustainability
Saipem Interim Consolidated Report as of June 30, 2015 / Sustainability
Saipem operates a complex network of activities, each of which is
expected to contribute to ensuring balanced and sustainable
development in the communities and geographical areas in which
the Company operates in order to improve competitiveness and
help maintain a long-term license to operate. For this reason, it is
of primary importance for Saipem to be able to build and maintain
strong relations with all of its stakeholders, engaging and
involving them and endeavouring to fully understand their needs
and their expectations.
The Sustainability Committee1, which exercises a sustainability
strategy-setting role and is chaired by the CEO, meets to discuss
and approve the Company’s sustainability strategy, to verify its
implementation on the ground and to monitor the progress being
made on the sustainability initiatives planned at its operating
companies. One of the tools used to do this is a Management by
Objectives system, whose aim is to ensure that sustainability
principles and values are translated into concrete business
actions. The first half of 2015 brought the completion of the
definition of the MBOs targets for the year for 60 managers at
Saipem SpA and Group operating companies, in accordance with
high level Company targets set by top management and focusing
particularly on the material issues identified as a result of the
materiality analysis carried out in 2014.
The Sustainability Committee met in an official capacity during the
first half of the year to discuss the results achieved in 2014, to
approve the 2014 Sustainability Report, and to lay down lines of
action for the forthcoming year. The Committee is scheduled to
meet again during the first half of 2015 to discuss planned
activities and projects underway and to monitor progress being
made.
Measuring value creation
in local communities
Increasing the level of Local Content is one of the key elements of
Saipem’s sustainability strategy. The Company actively pursues
the objective of promoting sustainable development and creating
wealth and well-being by maximising the number of local
employees and suppliers and by contributing to developing their
capabilities and know-how.
Since 2009, Saipem has used a model developed in-house known
as SELCE (Saipem Externalities Local Content Evaluation) that
enables the analysis and quantification of the value generated
(i.e. the direct, indirect and induced effects, measured in terms of
economic value, employment and human capital development) by
the Local Content strategy over a given time frame and in a
specific geographical situation.
The first half of 2015 saw the completion of the model’s
application on the El Encino-Topolobampo project in Mexico at the
request of the client. The principal indicators used by the model
showed a total economic impact of approximately €420 million
for the 2013-2014 period and a contribution of 0.03% to the
country’s GDP in 2014. The model was applied to Chihuahua and
Sinaloa states only, which are the geographical areas most
affected by operations. Respectively, total economic impacts of
€160 million and €64 million and contributions to state GDP of
0.40% and 0.20% were calculated for 2014.
During the second half of the year, the model will be applied to the
other significant operating companies of the Saipem Group.
Saipem continued during the first half of the year with its efforts
to monitor and improve the social impacts of its operations,
particularly in relation to human rights. This drive saw Saipem
dialogue with its external stakeholders, such as ratings agencies
and clients, on initiatives currently underway, including major
projects such as South Stream, as well as working on a Social
Responsibility campaign aimed at Saipem vendors and a Human
Rights Training Programme.
Sustainability reporting
The first half of 2015 saw the completion and publication of the
annual sustainability reporting documents ‘Sustainability
Performance 2014’ – published as an addendum to the Annual
Report – and ‘Saipem Sustainability 2014’. Both documents, which
are approved by the Board of Directors and audited by the
independent auditor Reconta Ernst & Young SpA, are prepared in
accordance with the international guidelines of the Global
Reporting Initiative (GRI - version G3) and are designed to furnish
readers with greater detail with regard to the commitments
undertaken, the initiatives carried out and the results achieved by
Saipem in relation to the issues identified by the materiality
analysis, which is conducted in collaboration with the Company’s
stakeholders.
(1) The Saipem Sustainability Committee is composed of the Chief Executive Officer (Chairman) plus the heads of the Company’s business areas and managers of key functions.
001-058SaipemSem15Ing.qxd 6-08-2015 11:41 Pagina 37

Saipem Interim Consolidated Report as of June 30, 2015 / Research and development
38
Research and development
Technological innovation is one of the key drivers of Saipem’s
competitiveness. An essential factor in the Company’s success in
most of our activities, innovation enables us to identify and
anticipate the future needs of the Oil & Gas industry and offer our
clients the most advanced solutions, capture new and challenging
opportunities, achieve improved operational performance and
reduce the environmental impact of our construction activities.
Technological innovations at Saipem are usually developed in
steps, from idea through to application or conceived on projects or
the Company’s proprietary assets and vessels as the result of a
problem-solving approach.
Research and development activities at Saipem are organised into
thematic areas directly coinciding with the activities of the
business units with the aim of ensuring clearer alignment with
their strategies and fostering an effective transfer of the fruits of
Saipem’s technology development efforts to the business areas.
During the first half of 2015, the Offshore Business Unit focused
its development efforts primarily on the Subsea (SURF and
Subsea Processing) and pipelines areas. In addition, work was
carried out in relation to materials technologies, which are of
interdisciplinary interest for both of the first two areas.
Significant results were achieved during the reporting period in
the SURF (Subsea, Umbilicals, Risers and Flowlines) segment,
including:
- the first commercial application of an innovative downline for
commissioning and intervention operations on subsea
pipelines;
- work continued during the period for the industrialisation of a
J-lay installation method adapted to plastic-lined pipes.
Tests simulating offshore installation conditions were
conducted successfully;
- in relation to active heating using pipe-in-pipe technology, a
campaign of demonstration tests for the development and
qualification of a technology suitable for J-lay installation was
completed in early 2015. The design arrangement and the
solution for the connection of electrical cables and of the
temperature monitoring system were confirmed. Further
qualification activities are planned for the remainder of 2015.
In the subsea processing segment, work continued during the
period on the development of a number of innovative subsea
processing systems in partnership with various leading oil
companies.
- a second qualification campaign to achieve design
improvements is being carried out on the proprietary ‘Spoolsep’
liquid/liquid gravity separation system. In parallel, a JIP (Joint
Industry Project) funded by leading oil companies and focusing
on the application of the system in cases of specific interest to
the partners was launched in early 2015;
- technology refinements continued during the period on the
subsea water treatment system developed jointly with
Total/Veolia for the removal of sulphates present in seawater.
In parallel with the technology development activities mentioned
above, following the completion of a study to develop
standardised interfaces for subsea processing plants (‘subsea
factories’) carried out in collaboration with Statoil, a programme
for the industrialisation of subsea production technologies
developed by Saipem is now underway.
A number of innovative laying technologies for export lines and
trunklines are ready for commercial application, including:
- development activities for the Anti-Flooding Tool (AFT) system,
which prevents the flooding of the pipe during the installation
phase, were completed and two units have been installed and
are ready for use on a pipelay vessel;
- industrialised versions of the new IAU acoustic measurement
tool for remotely measuring internal pipe ovality to prevent
buckling during S and J-lay operations have been installed on a
number of pipelay vessels and are awaiting final
commissioning. Currently, technological qualification is being
conducted on the measurement system;
- a new automated field joint coating system for sealines,
capable of significantly reducing coating cycle times in the
firing line, was built, qualified and successfully tested on board
a pipelay vessel.
Meanwhile, the plasma welding technology developed in recent
years, which enhances weld seam quality and production rates on
carbon steel and clad pipelines, has seen increasing and
successful application on commercial projects.
The focus of the Floater business line during the half-year period
was primarily on high-end technological solutions, such as FLNG
and floaters for harsh/Arctic conditions. In the Floating LNG
technology segment, the focus was on the following areas:
- creation of innovative solutions for floating liquefaction
facilities with the objective of achieving more efficient and safer
gas production under increasingly challenging conditions;
- qualification of a tandem LNG offloading system using floating
flexible hoses in collaboration with an industrial partner.
The Drilling Business Unit concentrated mainly on the adoption of
new drilling techniques and rigs for harsh conditions. This
involved:
- monitoring of methods and equipment for the Managed
Pressure Drilling market;
- development of designs for drilling rigs suited to Arctic
conditions.
In addition, a recently developed package of new technologies
based on a ‘green design’ approach became available.
001-058SaipemSem15Ing.qxd 6-08-2015 11:41 Pagina 38
Saipem Interim Consolidated Report as of June 30, 2015 / Research and development
39
The package offers solutions designed to minimise the
environmental impact and maximise the energy-saving
capabilities of the next generation of drilling semi-submersibles
and drillships (Moss EcoDriveTM, Moss EcoLNGTM and Moss
EcoGreenTM).
The Onshore E&C Business Unit focused mainly on the
optimisation of proprietary licensed process technologies and
innovative solutions for selected non-proprietary business
segments (LNG, heavy oil, gas monetisation) in order to increase
the value proposition to clients, principally in the energy
efficiency and environment fields.
Implementation started of a long-term development plan designed
to ensure that the competitiveness of proprietary fertilizer
production technology ‘SnamprogettiTM Urea’ is maintained at
maximum levels. Activities underway as part of this drive include:
- yield improvement through the use of the innovative
‘SupercupsTM’ trays in the reactor, which were successfully
tested in two commercial facilities in 2014 and which are now
ready to bring to market;
- improved corrosion resistance and cost reductions through the
development of new construction materials;
- a reduction in energy consumption through the optimisation of
utility systems;
- reduction of environmental impact (‘Urea Zero Emissions’
programme) through highly innovative solutions currently
under development.
In relation to non-proprietary technologies, work done during the
period included a comprehensive study of the regasification of
liquefied natural gas, which is nearing completion. The study is
looking at a number of different options for reducing energy
consumption compared with currently technology.
Other work focused on developments to improve energy efficiency
and reduce environmental impacts, with a wide range of potential
applications (e.g. use of renewable energy in process facilities,
optimisation of Life Cycle Assessment methodologies).
The period also saw an increased effort devoted to two significant
cross-business themes, Oil Spill Response and Pipeline Integrity
Management.
Lastly, the 15 patent applications filed by the Company during the
first half of the year provided confirmation of the significant
efforts made by Saipem in the area of technological innovations
during the period.
001-058SaipemSem15Ing.qxd 6-08-2015 11:41 Pagina 39

40
Quality, Safety and Environment
Saipem Interim Consolidated Report as of June 30, 2015 / Quality, Safety and Environment
Quality
As part of the Bring Quality to the Next Level programme, work
was carried out for the homogenisation and migration of the
Document Management System at all subsidiaries from November
until its conclusion in January. System content can be accessed
by all Saipem employees.
A gap analysis between existing documentation and the new
Corporate documentation under development has been
commenced at all subsidiaries, with the aim of cutting down on
the number of local documents.
The analysis of processes performed on the project identified
improvements to cross-cutting processes relating to welding and
plant completion.
The final part of the previous year saw the creation of two
cross-cutting work groups. Work on the cross-cutting welding
processes ended with the sharing of a series of responsibility
matrices. A procedure is currently in the process of being issued.
As part of the Cost Structure Optimisation project, the period saw
the start of an analysis of Quality cost centres used worldwide
with the aim of homogenising them and monitoring costs
allocated to them.
A quality management review approved the ISO 9001 multi-sites
certification model. Use of this model will produce a cost saving
and will lead to ISO 9001 certification of the Corporate quality
management system at all companies and branches where it is
required.
Currently, work is being carried out to select the certifying body
which will provide certification services worldwide.
The process will run from December 2015 until recertification of
Saipem SpA. During the subsequent three-year period, Saipem
subsidiaries and branches will also gradually achieve certification.
The period also saw the continuation of the following activities:
- issue of corporate standards and technical instructions with the
aim of ensuring uniformity and integration of quality assurance
and quality control at the business lines (approximately forty
documents issued in the period);
- improvement and redefinition of Technical and Vessel
Document Systems;
- a review of the reporting system launched in 2013 for quality
activities at branches/subsidiaries (Company and project level);
- review of KPIs for all processes in accordance with output of
‘Regulatory System Improvement’ project;
- modification to Quality System Internal Audit planning and
performance in accordance with new Process definition and
Process Owners;
- measurement of customer satisfaction.
Safety
Saipem’s safety performance in the first half of 2015 was
generally in line with the overall performance recorded in 2014.
The recordable incidents index (TRIFR) stood at 1.10, which is very
close to the final result of 1.09 posted in the previous year.
This positive outcome is closely correlated to a series of technical
and cultural initiatives conducted at the Company. The main
initiatives conducted during the reporting period were as follows:
- ongoing delivery to personnel of the cultural change
programme, Leadership in Health and Safety, which from 2007
has seen the participation of Saipem personnel at all levels.
The initial one and a half day interactive workshop for Company
management has now been delivered more than 900 times,
while the cascading event designed to ensure direct
dissemination by management to their own team of the
messages contained in the opening workshop has been held on
over a thousand occasions. Saipem-wide delivery of both the
internal training program, ‘Five Stars’, whose aim is to ensure
the effective management of unsafe behaviours and the
‘Leading Behaviours’ campaign, designed to foster the spread
and embedding within the Saipem DNA of the 5 non-negotiable
behaviours, also continued during the period. Meanwhile, the
fifth phase of LiHS program ‘Choose Life’, which is designed to
raise awareness among employees of the importance of a
healthy lifestyle, reached its 500th edition during the first half
of 2015;
- in parallel with the LiHS programme’s training initiatives, on the
occasion of the World Day for Safety and Health at work on April
28, the LHS Foundation and Saipem launched a three-day
initiative called ‘Italia loves sicurezza’ (Italy loves safety) in
three Italian cities, as part of an international campaign to raise
public awareness about emerging trends in the field of health
and safety at work, with the ultimate goal of furthering the
prevention of occupational injury and illness on a global level;
- the initiatives organised in connection with the day also
included the launch of an in-house competition connected with
the ‘Sharing Love For Health And Safety’ campaign.
The competition, entitled the ‘Safe & Sound Contest’, received
more than 40 video entries from all around the Saipem world;
- also in April, the LHS Foundation and Saipem supported the
participation by Saipem employees in the ‘Milano Relay
Marathon 2015’, with the objective of helping to promote the
adoption of active healthy lifestyles within the Company;
- the ‘Keep Your Hands Safe’ campaign continued during the
period at a number of the Group’s operating sites.
The campaign, which aims to reduce the frequency of hand
injuries, saw a number of workshops connected with the theme
‘Know Your Barriers’ held at various offshore drilling rigs;
- the campaign to promote the ‘Life-Saving Rules’ developed by
the OGP (International Association of Oil & Gas Producers) will
001-058SaipemSem15Ing.qxd 6-08-2015 11:41 Pagina 40
Saipem Interim Consolidated Report as of June 30, 2015 / Quality, Safety and Environment
41
shortly be finalised and launched. The campaign aims to step
up efforts to call attention to the life-saving rules and to shine a
spotlight on dangerous activities and on the actions that
individuals can take to protect both themselves and others;
- in terms of information tools and systems, work ongoing during
the period included updates to the HSE training portal ‘Delphi’,
the release of HSE audit application ‘Corinth’, which will enable a
shared database to be established, and the deployment of a
‘Safety Dashboard’, which will enable users to monitor Saipem
accident and incident trends in real-time, with data viewable for
the Group as a whole, by business unit and by activity.
Meanwhile, testing continued on new accident management
application ‘Prometheus’, which is designed to facilitate the
statistical analysis of HSE incidents at the Company.
Environment
Saipem aims to achieve the continuous improvement of its
environmental performance and adopts strategies designed to
reduce all types of impact and to promote the conservation and
enhancement of natural resources.
To achieve this goal means promoting a high level degree of
environmental awareness at all Saipem projects, sites and offices.
During the first half of 2015, Saipem once again stepped up its
effort in relation to a wide number of aspects, including:
- Energy efficiency: energy diagnostics were planned and
conducted at a number of offices and an onshore drilling rig.
Energy diagnostics are also due to be conducted in the coming
months at a fabrication yard. The objective of energy
diagnostics is to identify technical solutions for achieving
enhanced energy efficiency that will be implemented in
2015-2016. Saipem also aims to gather together all of the
‘best practices’ adopted in relation energy efficiency.
- Waste management: Saipem organised a technical workshop on
waste management and related legislative developments in
Italy. Meanwhile, from an operational point of view the Company
focused on reducing the quantity and hazardousness of the
waste it produces.
- Environmental awareness raising initiatives: to coincide with
‘World Environmental Day’ (WED), which was celebrated in
June, a number of initiatives were launched to motivate and
raise the awareness of personnel with regard to environmental
sustainability.
As always, all of the health, safety and environment initiatives
mentioned above are part of a wider process of continuous
improvement based on the careful analysis of incidents and
accidents, the findings of HSE audits and HSE management
reviews. Reviews are conducted at individual business unit level
to ensure a greater depth of analysis.
001-058SaipemSem15Ing.qxd 6-08-2015 11:41 Pagina 41

Human resources and health
Human Resources Management
The first period of 2015 saw the Human Resources Management
function continue its efforts to define and implement internal cost
structure optimisation initiatives and to align contractual and
expatriation instruments and procedures with developments in
the applicable national and international legislation, pursuant to
its role of guidance, coordination and control over decentralised
Human Resources functions (business and geographical area HR
functions in Italy and abroad).
Meanwhile, the review of Company documentation relating to key
human resource processes currently underway continued during
the period. The aim of the review is to ensure continuous updating
of human resource management processes in accordance with all
relevant developments in national and international legislation
and regulations, as well as to achieve their continuous
improvement. One of the key outcomes of the review was the
issue of a new Company standard, which will enable all Saipem
Group companies around the world to establish shared rules for
assigning company cars.
Process roll-out/digitalisation actions also continued, in step with
the latest relevant technological developments, bringing during
the period the development of dedicated information tools
designed to ensure an even more effective and accurate
monitoring of Human Resource activities. This included the roll out
to a number of important Saipem companies of various tools that
were already in place in Italian offices, thus increasing the
integration of Saipem’s process governance systems.
Industrial Relations
The Company has for many years now been working to
consolidate a model of industrial relations that aims to harmonise
and achieve optimal management of relations with trade unions,
employers’ associations, institutions and public bodies in line with
Company policies.
In view of the global nature of the environment in which Saipem
operates today, which encompasses a wide range of
socio-economic, political, industrial and legislative situations and
conditions, continuous monitoring of the industrial relations
model in place is fundamental.
In Italy, the first half of 2015 saw a large number of important
moments of discussion and dialogue, which were conducted in
accordance with the consolidated working relationship already
established with trade union organisations.
With a view to further reinforcing the participatory model of
Industrial Relations, the Company and the trade union
organisations continued discussions focused on establishing an
Industrial Relations protocol that recognises the centrality of
communication, negotiation and dialogue.
Internationally, the reporting period saw the renewal of important
collective labour agreements in Nigeria, in the engineering and
construction sector, in Peru and Nigeria, in the drilling sector and,
finally, in Canada, in the fabrication sector.
The signing of the new agreements was also an opportunity to
consolidate the provisions of the agreements, through the
introduction of enhanced resolution mechanisms for industrial
disputes and the inclusion of clear references to the Code of
Ethics. The aim of this latter aspect was to encourage our trade
union partners to take full ownership of the fundamental
principles underlying Saipem’s business approach, with the aim of
securing maximum applicability and buy-in, through a
commitment by the unions to respect the principles and to work
to promote them amongst the Saipem workforce.
Finally, the first half of 2015 also brought the renewal for the
2015-2018 period of the Construction Barge Agreement with the
International Transport Workers’ Federation (ITF), which covers
maritime personnel working on twelve vessels in the Saipem fleet.
Development, Organisation,
Compensation and Senior Manager
Administration
In terms of organisational developments, the first half of 2015
brought a redefinition of the operating model for engineering
activities, which saw the Business Units assigned direct
management of engineering competencies specific to their
respective areas, as well as governance of project engineering
activities.
Work also continued during the period to align the organisational
structures of subsidiaries and branches with the newly
introduced organisational models adopted for engineering and
fabrication activities.
The following measures were taken with a view to securing the
continuous improvement of company governance and the system
of internal controls and risk management:
- drive to secure adoption by joint ventures of instruments of
organisational governance;
- continuation of the programme of improvements currently
underway on the Company regulatory system with a view to
achieving rationalisation and simplification.
Saipem’s 2015 Remuneration Policy was again defined in
accordance with the governance model adopted by the Company
Saipem Interim Consolidated Report as of June 30, 2015 / Human resources and health
42
001-058SaipemSem15Ing.qxd 6-08-2015 11:41 Pagina 42

Saipem Interim Consolidated Report as of June 30, 2015 / Human resources and health
43
and the recommendations included in the Corporate Governance
Code, with the aim of attracting and retaining highly skilled
professional and managerial resources and aligning the interests
of management with the priority objective of value creation for the
shareholders in the medium-long term.
The 2015 Remuneration Report was prepared in compliance with
the legal obligations pursuant to Article 123-ter of Legislative
Decree No. 58/1998 and with Article 84-quater of the Consob
Issuers’ Regulation. The Saipem Board of Directors approved the
2015 Remuneration Report on March 10, 2015, while the
Company’s shareholders voted in favour of the First Section of the
Report at their meeting on April 30, 2015.
The 2015 Remuneration Policy Guidelines call for the setting of
challenging 2015 goals, which will be built into management
assessments.
In keeping with the Company’s Strategic Plan, the performance
targets assigned are designed to allow the guidance, monitoring
and assessment of actions related to cost containment and to the
monitoring, development and promotion of skills critical for
business requirements and for the attainment of long-term
business objectives.
In order to provide an incentive-based loyalty program for the
Company’s key managers, with the aim of strengthening their
participation in business risk, improving the Company’s
performances, and maximising value for shareholders in the long
term, the Company confirmed the adoption of the Long-Term
Monetary Incentive Plan for critical managerial resources for the
three-year period 2015-2017 which, as with the plan approved in
2014, uses both Total Shareholder Return and ROACE as
performance parameters. The Plan was approved by the Saipem
Board of Directors on March 10, 2015, while the Company’s
shareholders voted in favour of its adoption at their meeting on
April 30, 2015.
During the first half of 2015, an analysis and review of the
development, training, selection and skill management processes
was launched with a view to consolidating the alignment between
the business strategy and the people strategy and to improving,
simplifying, and increasing the effectiveness of the processes
and tools in place.
The work focused on segmenting criteria, strategic resource
planning, succession plans and the performance assessment
system.
Actions were implemented designed to enable Saipem and its
employees to maintain and enhance their critical personal and
professional skills. This included the launch of an analysis of
competencies, which was accompanied by a review of the
methods deployed in the recruitment, training and skill
management processes.
Meanwhile, the basic framework of an On-the-Job Training model
was defined during the period. The model, whose aim is to
maximise and promote employee competencies and knowledge
sharing, is set for a worldwide roll-out within Saipem, together
with a set of operating tools.
First half consolidated companies
Year as per IFRS 10 and 11
2014 (units) Average workforce 2014 Average workforce 2015
16,840 Offshore Engineering & Construction 15,774 19,980
19,831 Onshore Engineering & Construction 20,425 15,662
2,725 Offshore Drilling 2,671 2,710
7,892 Onshore Drilling 7, 76 4 7, 759
1,679 Staff positions 1,895 1,493
48,967 Total 48,529 47,604
7,491 Italian personnel 7, 4 9 8 7, 4 5 6
41,476 Other nationalities 41,031 40,148
48,967 Total 48,529 47,604
6,722 Italian personnel under open-ended contract 6,722 6,716
769 Italian personnel under fixed-term contract 776 740
7, 4 91 To t a l 7, 4 9 8 7, 4 5 6
Dec. 31, 2014 (units) June 30, 2014 June 30, 2015
7,908 Number of engineers 7,7 9 8 7,7 62
49,580 Number of employees 49,497 46,527
001-058SaipemSem15Ing.qxd 6-08-2015 11:41 Pagina 43
Saipem Interim Consolidated Report as of June 30, 2015 / Human resources and health
44
Saipem continues to invest in employer branding initiatives aimed
at top universities and secondary level technical schools.
The effectiveness and penetration of these initiatives will be
increased by a global roll-out of e-recruitment technologies, which
will also benefit the overall selection process.
With the complex and increasingly challenging market conditions
requiring Saipem to maintain high standards of excellence, the
Company has also designed and is in the process of rolling out a
new responsible leadership model applicable to all levels of the
Company. The aim of the model is to foster the development of
managers capable of making decisions that successfully
reconcile integrity requirements and business needs, working
towards long-term value creation.
The ultimate goal of the model is to provide the Company with
leaders who, while recognising and working towards their own
personal objectives, are capable of effectively translating the
Company mission into daily actions, strategies, programmes and
procedures, have a strong sense of the effects of their actions on
all stakeholders, and who act to promote the principles of the
model to their teams.
A Compliance and Governance training matrix has been defined
for application at Group level with the aim of consolidating
awareness of Compliance and Governance issues and injecting
the numerous training initiatives launched over the last two years
with a greater degree of clarity and consistency of purpose.
The matrix maps out the initiatives designed to meet specific
Compliance and Governance training needs/gaps for all company
roles. Its introduction will also allow training delivery to all of the
company workforce to be monitored.
Investments have been commenced to enhance the e-learning
training system. In addition, the roll-out of the new training
management application ‘Peoplearning’ continued during the
period. So far, the roll-out has covered France, United States,
Canada and Mexico. During the remainder of the year, the
application will be extended to other Group companies and to the
training centres.
Finally, the Safety training required by Legislative Decree
No. 81/2008 for Employers, Safety Managers, Safety Supervisors
and Safety Officers continues to be a main priority for the
Company.
Health
With regard to work done in connection with health and
occupational medicine related issues in Italy (Saipem SpA), the
first half of 2015 saw Saipem consolidate its routine activities and
promote a series of new initiatives.
- 3,370 preventive and periodical medical check-ups were carried
out at Saipem SpA in Italy and abroad; 439 further medical
examinations and 10 alcohol and drug tests were carried out.
- The diffusion of the ‘Pre-Travel Counselling’ programme for all
Saipem SpA personnel due to work abroad, which includes
updates based on international health alerts, continued during
the period, with 579 employees receiving counselling.
The program has been in place since 2008 and has so far seen
a total of 6,700 employees receive health and medical advice
related to the specific risks present in his/her country of
destination, in accordance with the applicable legislation.
- The sessions to raise vaccine awareness, which focus on
mandatory and strongly recommended vaccines, continued
during the first six months of the year for all Saipem SpA
personnel due to work in Italy and abroad. Meanwhile, the frame
agreement signed with the local health authority in San Donato
Milanese for yellow fever vaccination also continued.
- An update of the ‘Sì Viaggiare’ international travellers’ handbook
application, which is available in Android, Apple and Windows 8
versions, was completed during the period. The new version
now features up-to-date information on epidemiological
emergencies. 11,000 downloads of the application have so far
have been registered.
- The period also saw ongoing work under agreements with a
variety of organisations on a wide range of issues.
These included partnerships with the IRCCS Policlinico di San
Donato Milanese for health promotion initiatives (One Stop
Clinic) and emergency medical assistance provided to Saipem
employees at the hospital’s A&E unit and with the IRCCS San
Raffaele on a Work-Related Stress assessment programme.
001-058SaipemSem15Ing.qxd 6-08-2015 11:41 Pagina 44

45
Information technology
Saipem Interim Consolidated Report as of June 30, 2015 / Information technology
Saipem’s ICT efforts in 2014 and the first half of 2015 focused on
a substantial review of ICT activities in accordance with the cost
containment objectives the ICT function is pursuing. Change
initiatives implemented on the Company’s information
management systems during the reporting period were therefore
focused on the consolidation of results already obtained in
relation to both applications and infrastructure, in keeping with
the policies set by top management.
A large number of ICT service contracts were subjected to review
with a view to securing conditions and prices that were in line
with management’s expectations. A procurement plan was
prepared for contract reviews. Most of these focused on
renegotiating the Company’s key infrastructure contracts –
producing significant cost savings in relation to
telecommunication services (British Telecom, NewSat and
Fastweb) and data infrastructure services (HP and EMC2) – and
its key application management contracts.
In terms of management applications, the period saw the
completion of the release of the new Business Intelligence and
Consolidated Financial Statements environments. Saipem’s
adoption of high-performance platform SAP HANA – an in-memory
database supporting columnar storage – enabled the unification
of enterprise data warehouse environment SAP BW, and the SAP
BPC environment, on which consolidated financial statements
application SAP SEM is based. The unification of the two previously
separate environments not only produced cost savings but also
led to a significant performance improvement, with the time
required to produce reports and to perform consolidations falling
considerably.
In terms of new Business Intelligence initiatives, the first half of
2015 saw releases of dashboards for Procurement and HR, as well
as new solutions in the Offshore E&C and Drilling business areas.
The period also saw the roll-out at Saipem’s Mexican companies of
SAP R/3, as well as the follow-up to the roll-out of the system at
Saipem do Brasil. Meanwhile, the roll-out plan for the inventory
management application SAP Material Ledger was completed at all
of the main Group companies.
Alongside SAP R/3, new e-Procurement system SAP SRM has
reached full maturity, with significant results achieved in terms of
use of the platform for e-tenders and more than 16,000 vendors
now registered. In addition, catalogue ordering functionality is
now operational for stationery items and is also ready for
extension to more complex items.
In the Human Resources area, the release of the Talent
Management module on the Peoplesoft HCM application has been
completed. Meanwhile, the roll-out of the Saipem developed
international payroll solution continued with success.
Development and maintenance of the payroll software, as well as
related HR management activities have been assigned to Saipem
India Projects Private Ltd in Chennai, producing significant cost
savings. Finally, also in HR, development of the new Falcon suite –
a comprehensive HR management application – is currently
ongoing. At Saipem SA in Paris, France, the first release of new
recruitment solution Oracle Taleo got underway during the period,
with subsequent releases of the application also scheduled for
Saipem locations in other countries. Taleo is one of the first
‘cloud-based’ solutions to be employed by Saipem, with the
application based on information systems provided by the
supplier at its own premises, which are accessed via a web
browser. The use of a dedicated single tenant operating
environment ensures adequate data security.
Finally, work started during the period on the new Saipem
website. As well as offering a high degree of usability, the site’s
responsive design makes it suitable for access from a variety of
devices.
These initiatives were accompanied by a broad range of business
support initiatives underlining the Company’s firm commitment to
its strategy of work process digitalisation.
Business support development initiatives carried out during the
period focused on the adoption of innovative tools targeted at
increasing the efficiency and quality of engineering design and
construction activities and on the automation of business
processes through the optimisation of existing applications.
This second area of intervention, named Project Information
Management, is an improvement initiative that the ICT function is
carrying out for the Engineering, Project Management and Quality
functions, which aims to identify areas in which improvements in
efficiency can be targeted, as well as to enhance the quality of the
engineering data Saipem is able to offer to its clients.
One of the most important innovations introduced during 2014
concerned the completion of the Knowledge Sharing project
sponsored by Saipem Top Management and the release of
e-collaboration application K-hub, which is based on Microsoft
Sharepoint. The initiative has proved a significant success in
terms of both numbers of registered users and contributions.
New processes for automated drawing generation based on
modelling tool Intergraph SmartPlant 3D were also developed and
new engineering data control procedures based on Aveva
Engineering were released with the aim of improving data quality.
These solutions have now been leveraged on a large number of
contracts, providing the Company with a genuine competitive
edge.
In terms of new business support initiatives, the period saw use of
the new Spool Tracking System for on site pipe spool management
continue to grow. The system, which provides integrated
management of pipe spool fabrication activities together with the
related technical documentation, is emblematic of the type of
001-058SaipemSem15Ing.qxd 6-08-2015 11:41 Pagina 45
Saipem Interim Consolidated Report as of June 30, 2015 / Information technology
46
applications ICT is currently working on for the business areas.
The period also saw the deployment of specialised solutions for
enhanced management of project documentation, including an
integrated client comment management system, as well as
applications designed for managing technical documentation on
board vessels and at fabrication yards.
A review was conducted of the development plan established by
Onshore Business Management for implementation of the new
construction management suite, which features integrated site
activity planning using Oracle Primavera, as well as functionalities
for job accounting and the development of quality plans.
Some recent developments have now been abandoned in favour of
a more efficient and less costly revisitation of tried and tested
applications included in the Construction Management suite
SICON, developed in-house.
In terms of infrastructure, following a period of limited
investment, a number of initiatives have now been launched,
including the deployment of applications such as Splunk for the
management and optimisation of centralised infrastructure and
the roll-out of Webex, an inexpensive videoconferencing product
developed by Cisco.
The period also saw the continued development according to plan
of the ICT function’s presence in Chennai, India, which was set up
in 2013 to enable the offshoring of a number of infrastructure
activities. International infrastructure management services have
been operational since July 2014, meaning the Saipem Group
enjoys 24x7 first level support for its international servers and
local networks. During the reporting period coverage was
extended to ICT security and some technical monitoring activities.
Approximately 70% of service tickets for international server
management issues were managed and resolved by the Chennai
team, meaning service levels were raised despite a reduction in
overall costs.
Governance, compliance and security processes were all carried
out successfully and according to schedule during the period.
Deployment of the RCM Role & Compliance Manager System
developed by CA Technologies, which allows the definition of
standard user application profiles, has now been extended to all
SAP environments, to Peoplesoft HCM and to all of the main
software applications. This completes the automation of the role
assignment process, allowing internal client managers to perform
the controls required by the relevant legislation. This was
combined with a cutting-edge use of IT security technologies
designed to mitigate the security risks associated with data
processing by the company information systems. Finally, in
terms of security, the period saw the extension of the coverage of
credential management system, Oracle FastLogon, which enables
users to access the principal Company applications on a Single
Sign-On basis.
001-058SaipemSem15Ing.qxd 6-08-2015 11:41 Pagina 46

Saipem Interim Consolidated Report as of June 30, 2015 / Risk management
47
Saipem implements and maintains an adequate system of
internal controls and risk management, composed of instruments,
organisational structures and Company regulations designed to
safeguard Company assets and to ensure the effectiveness and
efficiency of Company processes, reliable financial reporting, and
compliance with all laws and regulations, the Articles of
Association and Company procedures. The structure of Saipem’s
internal control system constitutes an integral part of the
Organisational and Management Model of the Company. It assigns
specific roles to the Company’s management bodies, compliance
committees, control bodies, Company management and all
personnel and is based on the principles contained in the Code of
Ethics and the Corporate Governance Code, taking into account
the applicable legislation, the CoSO report and national and
international best practices.
Additional information on the internal control system and risk
management, including details concerning its architecture,
instruments and design, as well as the roles, responsibilities and
duties of its key actors, is contained in the Corporate Governance
Report and Shareholding Structure document.
The main industrial risks that Saipem faces and is actively
monitoring and managing are as follows:
(i) the market risk deriving from exposure to fluctuations in
interest rates and exchange rates between the euro and the
other currencies used by the Company and the risk deriving
from exposure to commodity price volatility;
(ii) the credit risk deriving from the possible default of a
counterparty;
(iii) the liquidity risk, i.e. the risk that suitable sources of funding
for the Group’s operations may not be available;
(iv) the HSE risk associated with the potential occurrence of
accidents, malfunctions, or failures with injury to persons
and damage to the environment and impacts on operating
and financial results;
(v) the country risk;
(vi) the project risk associated mainly with the executions phase
of engineering and construction contracts undertaken by the
Onshore E&C and Offshore E&C Business Units.
Financial risks are managed in accordance with guidelines
defined by the parent company, with the objective of aligning and
coordinating Group companies’ policies on financial risks.
Market risk
Market risk is the possibility that changes in currency exchange
rates, interest rates or commodity prices will adversely affect
the value of the Group’s financial assets, liabilities or expected
future cash flows. Saipem manages market risk in accordance
with the above-mentioned guidelines and with procedures that
provide a centralised model of conducting finance and treasury
operations based on the Group’s Treasury functions.
Exchange rate risk
Exchange rate risk derives from the fact that Saipem’s operations
are conducted in currencies other than the euro and that
revenues and costs from a significant portion of projects are
denominated and settled in non-euro currencies. This impacts on:
- individual profits, which may be significantly affected by
exchange rate fluctuations on specific transactions arising from
the time lag existing between the execution of a given
transaction and the definition of the relevant contractual terms
(economic risk) and by the conversion of foreign
currency-denominated trade and financial payables and
receivables (transaction risk);
- the Group’s reported results and shareholders equity, as
financial statements of subsidiaries denominated in currencies
other than the euro are translated from their functional
currency into euro.
Saipem’s foreign exchange risk management policy is to minimise
economic and transactional exposures. Saipem does not
undertake any hedging activity for risks deriving from the
translation of foreign currency denominated profits or assets and
liabilities of subsidiaries that prepare financial statements in a
currency other than the euro.
Saipem uses a number of different types of derivative contract to
reduce economic and transaction exposure, such as currency
swaps, forwards and options. The fair value of exchange rate
derivatives is determined by the Corporate Finance Unit of Eni SpA
on the basis of standard valuation models and market prices/input
provided by specialised sources. Planning, coordination and
management of this activity at Group level is the responsibility of
the Saipem Treasury Department, which closely monitors the
correlation between derivatives and their underlying flows, as well
as ensuring their correct accounting representation in compliance
with the International Financial Reporting Standards (IFRS).
An exchange rate sensitivity analysis was performed for those
currencies other than the euro for which exchange risk exposure
in the first half of 2015 was highest, in order to calculate the
effect on the income statement and shareholders’ equity of
hypothetical positive and negative variations of 10% in the
exchange rates.
The analysis was performed for all relevant financial assets and
liabilities denominated in the currencies considered and regarded
in particular the following items:
Risk management
001-058SaipemSem15Ing.qxd 6-08-2015 11:41 Pagina 47

Saipem Interim Consolidated Report as of June 30, 2015 / Risk management
48
- exchange rate derivatives;
- trade and other receivables;
- trade and other payables;
- cash and cash equivalents;
- short and long-term financial liabilities.
For exchange rate derivatives, the sensitivity analysis on fair
value was conducted by comparing the conditions underlying the
forward price fixed in the contract (i.e. spot exchange rate and
interest rate) with spot rates and interest rate curves
corresponding to the relevant contractual maturity dates, on the
basis of period-end exchange rates subjected to hypothetical
positive and negative changes of 10%, with the resulting effects
weighted on the basis of the notional amounts.
The analysis did not examine the effect of exchange rate
fluctuations on the measurement of work-in-progress because
work-in-progress does not constitute a financial asset under IAS
32. Moreover, the analysis regards exposure to exchange rate risk
in accordance with IFRS 7 and therefore does not consider the
effects of the conversion of financial statements of consolidated
companies with functional currencies other than the euro.
A positive variation in exchange rates between the foreign
currencies examined and the euro (i.e. depreciation of the euro
against the other currencies) would have produced an overall
effect on the pre-tax result of -€76 million (-€46 million at
December 31, 2014) and an overall effect on shareholders’ equity,
before related tax effects, of -€427 million (-€377 million at
December 31, 2014).
A negative variation in exchange rates between the foreign
currencies examined and the euro (i.e. appreciation of the euro
against the other currencies) would have produced an overall
effect on the pre-tax result of €76 million (€46 million at
December 31, 2014) and an overall effect on shareholders’ equity,
before related tax effects, of €427 million (€377 million at
December 31, 2014).
The increases/decreases with respect to the previous period are
essentially due to the currency exchange rates on the two
reference dates and to variations in the assets and liabilities
exposed to exchange rate fluctuations.
Interest rate risk
Interest rate fluctuations affect the market value of the
Company’s financial assets and liabilities and its net finance
expenses. The purpose of risk management is to reduce interest
rate risk to a minimum in pursuit of the financial structuring
objectives set and approved by management.
When entering into long-term financing agreements with variable
rates, the Treasury Department of the Saipem Group assesses
their compliance with objectives and, where necessary, uses
Interest Rate Swaps (IRS) to manage the risk exposure arising
from interest rate fluctuations. Planning, coordination and
management of this activity at Group level is the responsibility of
the Saipem Finance function, which closely monitors the
correlation between derivatives and their underlying flows, as well
as ensuring their correct accounting representation in compliance
with the International Financial Reporting Standards (IFRS).
Such derivatives are evaluated by the Corporate Finance Unit of
Eni SpA at fair value on the basis of standard valuation models
and market prices/input provided by specialised sources. To
measure sensitivity to interest rate risk, a sensitivity analysis
was performed. The analysis calculated the effect on the income
statement and shareholders’ equity of hypothetical positive and
negative variations of 10% in interest rates.
The analysis was performed for all relevant financial assets and
liabilities exposed to interest rate fluctuations and regarded in
particular the following items:
- cash and cash equivalents;
- short and long-term debt.
For interest rate derivatives, the sensitivity analysis on fair value
was conducted by comparing the interest rate conditions
(fixed and variable rate) underlying the contract and used to
calculate future interest rate differentials with discount curves for
variable interest rates on the basis of period-end interest rates
subjected to hypothetical positive and negative changes of 10%,
with the resulting changes weighted on the basis of the notional
amounts. For cash and cash equivalents, the analysis used the
average balance for the period and the average rate of return for
the period, while for short and long-term financial liabilities, the
average exposure for the period and average interest rate for the
period were considered.
A positive variation in interest rates would have produced an
overall effect on the pre-tax result of -€6 million (-€11 million at
December 31, 2014) and an overall effect on shareholders’ equity,
before related tax effects of -€6 million (-€11 million at
December 31, 2014). A negative variation in interest rates would
have produced an overall effect on the pre-tax result of €6 million
(€11 million at December 31, 2014) and an overall effect on
shareholders’ equity, before related tax effects of €6 million
(€11 million at December 31, 2014).
The increases/decreases with respect to the previous period are
essentially due to the interest rates on the two reference dates
and to variations in the assets and liabilities exposed to interest
rate fluctuations.
001-058SaipemSem15Ing.qxd 6-08-2015 11:41 Pagina 48

Saipem Interim Consolidated Report as of June 30, 2015 / Risk management
49
Saipem Interim Consolidated Report as of June 30, 2015 / Risk management
Commodity price risk
Saipem’s results are affected by changes in the prices of oil
products (fuel oil, lubricants, bunker oil, etc.) and raw materials,
since they represent associated costs in the running of vessels,
offices and yards and the implementation of projects and
investments.
In order to reduce its commodity risk, in addition to adopting
solutions at a commercial level, Saipem also trades over the
counter derivatives (swap and bullet swaps in particular) whose
underlying commodities are oil products (mainly gasoil and
naphtha) through Eni Trading & Shipping (ETS) on the organised
markets of ICE and NYMEX where the relevant physical
commodity market is well correlated to the financial market and
is price efficient.
As regards commodity price risk management, derivative
instruments on commodities are entered into by Saipem to hedge
underlying contractual commitments. Hedge transactions may
also be entered into in relation to future underlying contractual
commitments, provided these are highly probable.
The fair value of such derivatives is determined by the Treasury
Department of Eni SpA on the basis of standard valuation models
and market prices/input provided by specialised sources.
With regard to commodity risk hedging instruments, a 10%
positive variation in the underlying rates would have produced no
significant effect on the net result or shareholders’ equity
(€1 million at December 31, 2014). A 10% negative variation in
the underlying rates would have produced no significant effect on
the net result or shareholders’ equity (-€1 million at December
31, 2014).
The increase (decrease) with respect to the previous period is
essentially due to the differences between the prices used in
calculating the fair value of the instrument at the two reference
dates.
Credit risk
Credit risk represents Saipem’s exposure to potential losses in the
event of non-performance by a counterparty. With regard to
counterparty risk in commercial contracts, credit management is
the responsibility of the business units and of specific corporate
finance and administration functions operating on the basis of
standard business partner evaluation and credit worthiness
procedures. For counterparty financial risk deriving from the
investment of surplus liquidity, from positions in derivative
contracts and from physical commodities contracts with financial
counterparties, Group companies adopt guidelines defined by the
Treasury Department of Saipem in compliance with the
centralised treasury model of Eni.
The critical situation that has developed on the financial markets
has led to additional preventative measures being adopted to
avoid the concentration of risk and assets. This situation has also
required the setting of limits and conditions for operations
involving derivative instruments.
At June 30, 2015, the area with the biggest concentration of credit
risk was South America, where the total exposure amounted to
€478 million.
Liquidity risk
Liquidity risk is the risk that suitable sources of funding for the
Group may not be available (funding liquidity risk), or that the
Group is unable to sell its assets on the market place (asset
liquidity risk), making it unable to meet its short-term finance
requirements and settle obligations. Such a situation would
negatively impact the Group’s results as it would result in the
Company incurring higher borrowing expenses to meet its
obligations or, under the worst of conditions, the inability of the
Company to continue as a going concern. As part of its financial
planning process, Saipem manages liquidity risk by targeting a
capital structure that guarantees a level of liquidity adequate for
the Group’s needs, optimising the opportunity cost of
maintaining liquidity reserves and achieving an efficient balance
in terms of maturity and composition of debt in accordance with
business objectives and prescribed limits.
At present, in spite of the current market conditions, Saipem
believes it has access to sufficient funding and borrowing
facilities to meet currently foreseeable requirements, thanks to a
use of credit lines that is both flexible and targeted to meet
business needs.
The liquidity management policies used have the objective of
ensuring both adequate funding to meet short-term
requirements and obligations and a sufficient level of operating
flexibility to fund Saipem’s development plans, while maintaining
a balance in terms of debt composition and maturity profile, as
well as adequate credit facilities.
As of June 30, 2015, Saipem maintained unused borrowing
facilities of €2,478 million. In addition, Eni SpA provides lines of
credit to Saipem SpA under Eni Group centralised treasury
arrangements. These facilities were under interest rates that
reflected market conditions. Fees charged for unused facilities
were not significant.
The following tables show total contractual payments (including
interest payments) and maturities on financial debt and
payments and due dates for trade and other payables.
001-058SaipemSem15Ing.qxd 6-08-2015 12:38 Pagina 49

Saipem Interim Consolidated Report as of June 30, 2015 / Risk management
50
Outstanding contractual obligations
In addition to the financial and trade debt recorded in the balance
sheet, the Saipem Group has contractual obligations relating to
non-cancellable operating leases whose performance will entail
payments being made in future years. The following table shows
undiscounted payments due in future years in relation to
outstanding contractual obligations.
Trade and other payables
Maturity
(€million) 2016 2017-2019 After Total
Trade payables 3,295 - - 3,295
Other payables and advances 2,493 - - 2,493
Maturity
(€million) 2016 2017 2018 2019 After Total
Non-cancellable operating leases 151 107 72 69 251 650
Operating leases mainly relate to office buildings, long-term time
charters and land.
The table below Saipem’s investment commitments on major
projects, for which procurement contracts will normally have
already been entered into.
Maturity
(€million) 2015 2016
Committed on major projects 2-
Committed on other investments 12 144
14 144
Finance debt
Maturity
(€million) 2016 2017 2018 2019 After Total
Long-term debt 736 1,059 638 1,487 44 3,964
Short-term debt 3,037----3,037
Derivative liabilities 347 1 - - - 348
4,120 1,060 638 1,487 44 7,349
Interest on debt 163 88 49 24 1 325
HSE (Health, Safety & Environment) risk
Saipem’s business activities conducted both in and outside Italy
are subject to a broad range of national legislation and
regulations, including laws implementing international protocols
and conventions relating to specific sectors of activity.
Saipem is fully committed to a process of continuous
improvement of its safety, health, and environmental
performance, to minimising the impact of its operations and to
ensuring compliance with all applicable legislation.
An ongoing process of risk identification, evaluation and
mitigation is at the heart of HSE management operations in all
phases of activity and for all business units. This process is
implemented through the adoption of effective management
procedures and systems designed to suit the specific
characteristics of each activity and the sites in which they take
place and with a view to achieving the continuous improvement of
plant and processes.
The Saipem HSE organisational model establishes varying levels
of responsibility, starting from the persons closest to the risk
001-058SaipemSem15Ing.qxd 6-08-2015 11:41 Pagina 50
Saipem Interim Consolidated Report as of June 30, 2015 / Risk management
51
sources, who are best positioned to assess the potential impact
of risks and to ensure adequate preventive measures are put in
place. In addition, HSE departments perform a governance,
coordination, support and control role and issue and update
guidelines, procedures and best practices designed to ensure
continuous improvement.
In addition, campaigns to secure improvements and raise
awareness on health, safety and environmental issues are
designed, developed and launched centrally, and subsequently
rolled out on projects and work sites. In recent years, campaigns
have included ‘Leadership in Health and Safety’, ‘Choose Life’,
‘Working at Height & in Confined Spaces’, ‘Keep your hands safe’,
and ‘Life saving rules’. A number of these campaigns form part of
a broader initiative which aims to completely eliminate workplace
fatalities, called ‘We Want Zero’.
Saipem has always invested heavily in HSE training and continues
to work to promote and facilitate training, not just at a theoretical
level, but also in terms of effective practical training experiences,
particularly on key HSE issues.
All HSE initiatives and management of HSE issues are subjected
to periodic audits conducted by independent bodies, who verify
that the Company’s HSE management system is compliant with
international standards ISO 14001 (Environment) and OHSAS
18001 (Health and Safety). Both Saipem SpA, as well as a
number of other Group companies have already achieved and
maintain this certification. HSE monitoring is also planned and
carried out either directly or indirectly for key Saipem contractor
companies.
Country risk
Substantial portions of Saipem’s operations are performed in
countries outside the EU and North America, certain of which may
be politically, socially or economically less stable. Developments
in the political framework, economic crises, internal social unrest
and conflicts with other countries may temporarily or
permanently compromise Saipem’s ability to operate cost
efficiently in such countries and may require specific measures
(where possible in compliance with Saipem corporate policy) to
be taken at an organisational or management level in order to
enable the continuation of activities underway in conditions that
differ from those originally anticipated. If Saipem’s ability to
operate is temporarily compromised, demobilisation is planned
according to criteria designed to guarantee the protection of
Company assets that remain on site and to minimise the
business interruption by employing solutions that accelerate and
reduce the cost of business recovery once favourable conditions
have returned. Such measures may be costly and have an impact
on expected results. Further risks associated with activities in
such countries include: (i) lack of well-established and reliable
legal systems and uncertainties surrounding the enforcement of
the rights of foreign companies in the event of non-performance
of contractual obligations by private parties or governments;
(ii) unfavourable developments in/unfavourable applications of
laws and regulations, and unilateral contract changes, leading to
reductions in the value of assets, forced sales and expropriations;
(iii) restrictions of various kinds on construction, drilling, import
and export activities; (iv) tax increases; (v) civil and social unrest
leading to sabotage, attacks, violence and similar incidents.
Such events are predictable only to a very limited extent and may
occur and develop at any time, causing a materially adverse
impact on Saipem’s financial position and results.
Saipem regularly monitors political, social and economic risk in
countries in which it operates or intends to invest, drawing on
reports on principal project risks and related trends prepared in
accordance with Corporate risk management procedures and
standards, as well as on security reports prepared in accordance
with Corporate guidelines and standards on security activities.
The risk assessment model used by Saipem is compliant with
Legislative Decree No. 81/2008 (the Consolidated Act on Health
and Safety at the workplace), which requires employers to adopt
instruments to reduce and, where possible, eliminate risks.
Article 28 of the decree states that ‘the assessment pursuant to
Article 17, paragraph 1, letter a) [...] shall take into account all
risks to the health and safety of workers, including those for
groups of workers who are exposed to particular risks...’. In terms
of security, this means risks deriving from unlawful acts
committed by physical or legal persons which may expose the
Company and its assets, people and image to potential damage.
To manage the security risks to which it is exposed in the
countries in which it operates, Saipem has adopted a security
model based on the criteria of prevention, planning, protection,
information, promotion and participation, with the aim of
protecting the safety of employees, contractors and the public, as
well as the integrity of assets and brand reputation.
The Company’s Security function has implemented a
comprehensive security management system, which provides an
organisational, legal and procedural tool for minimising and
managing the consequences of security-related events.
The system is designed for the management of risks deriving
from unlawful acts committed by physical or legal persons which
may expose the Company and its assets, people and image to
potential damage. This is made possible by synergies between the
Security functions and the units in charge of the Company’s
maritime certification and logistics bases.
The Security management system, which is designed to suit the
specific characteristics of Saipem’s business, has the following
key features:
- a strong central security structure which monitors and provides
guidelines for security issues to an extensive local security
network equipped with adequate powers and resources;
001-058SaipemSem15Ing.qxd 6-08-2015 11:41 Pagina 51

- an information system supporting project Security Risk
Management activities during the commercial and execution
phases;
- the coordination of security training, planning, reporting and
audits.
As a global contractor, Saipem applies the highest standards of
security, meeting all company and client requirements and
adhering to all relevant international best practices. The Saipem
Security function provides support to operations in all contractual
phases, from the bid phase through to project execution, to ensure
all operations are carried out in conditions of security for all
personnel and assets.
Specific project risks
The Industrial Risk Management function is structured to enable it
to meet all of the following objectives:
- ensure the application of the Risk Management methodology
during the commercial and execution phases of projects
managed by Business Units, as well as on the Company’s
principal investment projects;
- assure periodic reporting to management on principal project
risks and on trends observed, aggregated by Business Unit and
at global level. Implement project portfolio analyses in order to
support management decisions and provide an understanding
of the external macro risk factors on projects that may impact
on Company results, enabling management to intervene by
deploying the appropriate risk management tools of avoidance,
mitigation, transfer or acceptance;
- assure the spread of a Risk Management culture within Saipem
with a view to achieving structured management of risk and
opportunity during business activities and contributing also to
improved management of contingencies;
- provide advice, support and guidelines to the Business Units
and projects in terms of the implementation of mitigation and
improvement measures for risk management and the
optimisation of opportunities, respectively;
- define, develop and update tools and methods for collecting
and organising lessons learned and making them available to
projects;
- ensure adequate training to commercial and project
management teams;
- ensure that Corporate Guidelines, Procedures and Standards
are constantly updated in accordance with international
Standards and Codes of Practice, promoting full compliance and
correct application within Saipem and its subsidiaries;
- contribute to promoting the observance of the Golden Rules
and Silver Guidelines, the tool for regulating risk
assumption through which Saipem assigns responsibility for
decisions to assume significant risks to the appropriate
managerial levels.
The standards and procedures in force at Saipem are in line with
the principal international risk management standards.
Insurance
The Corporate Insurance function, in close cooperation with top
management, defines annual Saipem Group guidelines for
insurance coverage against the risk of damage to property, third
party liability, as well as risks related to the performance of
contracts.
An Insurance Programme is defined on the basis of the guidelines,
which identifies specific excess and maximum limit coverage for
each type of risk based on an analysis that takes into account
claim statistics for recent years, industry statistics and conditions
offered by the international insurance market.
The Saipem Insurance Programme is structured in such a way as
to appropriately transfer risks deriving from operations to the
insurance market, in particular the risks associated with the
management of the fleet, equipment and other assets, including
third party liability risks and risks deriving from the performance
of contracts awarded by its clients.
In view of the coverage offered by the insurance market and the
changing circumstances on the energy market in which Saipem
operates, it is not possible to guarantee that all circumstances and
events will be adequately covered by the Insurance Programme.
Equally, due to the volatility of the insurance market, it cannot be
guaranteed that it will be possible in the future to reasonably
maintain adequate insurance coverage at the current rates, terms
and conditions.
Within the Saipem Insurance Programme, a distinction can be
made between insurance cover for Group assets (‘Corporate
insurance policies’) and the insurance cover connected with
project execution.
Corporate insurance policies
The Corporate insurance programme is structured with an
initial band of risk that is self-insured through a captive
reinsurance company, with amounts in excess covered by a
catastrophic insurance programme taken out on the insurance
market.
The catastrophic Insurance Programme is composed of policies
that cover damage to property, and maritime and non-maritime
third party liability. Cover can be broken down as follows:
Saipem Interim Consolidated Report as of June 30, 2015 / Risk management
52
001-058SaipemSem15Ing.qxd 6-08-2015 11:41 Pagina 52

Saipem Interim Consolidated Report as of June 30, 2015 / Risk management
53
Damage to property
- ‘Fleet Insurance’ policy: covers the entire fleet against events
that cause partial or total damage to vessels;
- ‘Equipment’ policy: covers all onshore and offshore equipment,
for example site equipment, onshore drilling rigs, subsea
Remote Operating Vehicles (ROV), etc.;
- ‘Transport’ policy: covers transport, handling and storage of
assets and equipment by land, sea or air;
- ‘Buildings and Sites’ policy: covers owned or rented buildings,
offices, storage facilities and shipyards;
- ‘Other minor risks’ policy: covers minor risks such as theft and
employee dishonesty.
Third-party liability
- ‘Protection & Indemnity’ (‘P&I’) policy: shipowners’ liability
cover through a P&I Club that is part of the International Group
of P&I Clubs for events occurring during transit and for events
occurring during offshore drilling and construction operations;
- ‘Comprehensive General Liability’ policy: covers all other types
of general and third party liability claims arising from Saipem’s
industrial activities and supplements the specific P&I coverage;
- ‘Employer’s Liability’ and ‘Personal Accident’ policies: these
cover employer liability and employee accident risks
respectively on the basis of the specific regulations in force in
each country where the Group operates.
A key tool in the management of Saipem’s insurable risks is the
captive reinsurance company Sigurd Rück AG, which covers the
initial part of risk.
Sigurd Rück AG in turn carries out risk mitigation by re-insuring its
portfolio on primary securities markets.
Project execution insurance policies
For all contracts awarded, specific project insurance coverage
must be taken out. Generally, the contractual responsibility for
such insurance lies with the client.
Where the responsibility lies with the contractor, Saipem takes out
insurance that will cover all risks connected with the project for
its entire duration.
Usually, it takes out ‘Builders’ All Risks’ insurance, which covers
the scope of work of the contract, i.e. damage to the works under
construction, as well as to equipment, products and materials
required for its construction and third party liability for all works
to be performed by the Group during all phases of project
execution (engineering, transportation, construction, assembly,
and testing) including the warranty period.
The high insurance premiums and excesses on such policies are
an incentive to Saipem in its efforts to achieve the continuous
improvement of its prevention and protection processes in terms
of quality, health, safety and environmental impact.
001-058SaipemSem15Ing.qxd 6-08-2015 11:41 Pagina 53

Saipem Interim Consolidated Report as of June 30, 2015 / Additional information
54
Purchase of treasury shares
As of June 30, 2015, the share capital amounted to
€441,410,900. On the same day, the number of shares in
circulations was 439,471,068. No treasury shares were purchased
on the market during the period.
Consob Regulation on Markets
Article 36 of Consob Regulation on Markets:
conditions for the listing of shares of companies
with control over companies established
and regulated under the law of non-EU countries
With regard to the regulations setting out conditions for the listing
of shares of companies with control over companies established
and regulated under the law of non-EU countries that are deemed
to be of material significance in relation to the consolidated
financial statements, the Company discloses that at June 30,
2015, the following twenty Saipem subsidiaries fell within the
scope of application of the regulation in question:
- Saipem Australia Pty Ltd;
- Petrex SA;
- Snamprogetti Saudi Arabia Co Ltd Llc;
- Saipem Contracting (Nigeria) Ltd;
- PT Saipem Indonesia;
- ER SAI Caspian Contractor Llc;
- Saipem Misr for Petroleum Services (S.A.E.);
- Saipem (Nigeria) Ltd;
- Saudi Arabian Saipem Ltd;
- Global Petroprojects Services AG;
- Saipem America Inc;
- Saipem Asia Sdn Bhd;
- Saipem do Brasil Serviçõs de Petroleo Ltda;
- Saipem Contracting Algérie SpA;
- Saipem Canada Inc;
- Saipem Offshore Norway AS;
- Saipem Drilling Norway AS;
- Sajer Iraq Llc;
- Boscongo SA;
- Saimexicana SA de Cv.
Procedures designed to ensure full compliance with Article 36
have already been adopted.
Article 37 of Consob Regulation on Markets:
conditions preventing the admission to trading
on an Italian regulated market of the shares
of subsidiaries subject to management
and coordination by another company
Pursuant to the requirements set out in paragraph 10 of Article
2.6.2 of the Rules of the Markets organised and managed by
Borsa Italiana SpA, the Board of Directors in its meeting of March
10, 2015, ascertained that the Company satisfies the conditions
set out in Article 37 of Consob Regulation on Markets for the
admission to trading on an Italian regulated market of the shares
of subsidiaries subject to management and coordination by
another company.
The Board of Directors Meeting on March 10, 2015 verified that the
composition of the Board itself, as appointed by the Shareholders’
Meeting of May 6, 2014, and of its internal Committees, was in
accordance with letter d), paragraph 1 of Article 37. The Board was
found to be made up of a majority of independent directors, while
the Committees (the Compensation and Nomination Committee
and the Audit and Risk Committee) were found to be composed
exclusively of independent directors.
Following the appointment of the Board of Directors by the
Shareholders on April 30, 2015, the Board of Directors Meeting on
April 30, 2015 verified that the composition of the new Board was
in accordance with letter d), paragraph 1 of Article 37. The Board
was found to be made up of a majority of independent directors.
The Board of Statutory Auditors verified the correct application of
the relevant criteria by the Board of Directors.
On May 15, 2015, the Board of Directors appointed the members
of the Board Committees. The Committees required by the
Corporate Governance Code (the Compensation and Nomination
Committee and the Audit and Risk Committee) are composed
exclusively of independent directors, in accordance with letter d),
paragraph 1 of Article 37 of the Consob Regulation on Markets.
Disclosure of transactions
with related parties
Transactions with related parties entered into by Saipem and
identified by IAS 24 concern mainly the exchange of goods, the
supply of services, and the provision and utilisation of financial
resources, including entering into derivative contracts.
All such transactions are an integral part of ordinary day-to-day
business and are carried out on an arm’s length basis
(i.e. at conditions which would be applied between independent
parties) and in the interest of Group companies.
Directors and senior managers with strategic responsibilities
must declare, every 6 months, any transactions they enter into
with Saipem SpA or its subsidiaries, directly or through a third
party, in accordance with the provisions of IAS 24.
The amounts of trade, financial or other operations with related
parties are provided in Note 43 of the ‘Notes to the condensed
consolidated interim financial statements’.
Additional information
001-058SaipemSem15Ing.qxd 6-08-2015 11:41 Pagina 54
Saipem Interim Consolidated Report as of June 30, 2015 / Additional information
55
Transactions with the parent company
Eni and companies subject to its direction
and coordination
Saipem is subject to the direction and coordination of Eni SpA.
Transactions with Eni SpA and with entities subject to its direction
and coordination constitute transactions with related parties and
are commented on in Note 43 ‘Transactions with related parties’ of
the ‘Notes to the condensed consolidated interim financial
statements’.
Events subsequent to period end
On July 8, South Stream Transport BV, following the suspension of
the contract on December 30, 2014 and its partial reopening on
May 8, 2015, has definitively terminated the South Stream project
under a convenience termination provision. The contract
encompassed the installation design and the construction of the
first line of the South Stream Offshore Pipeline, from Russia to
Turkey across the Black Sea.
The sale for scrapping of the semi-submersible Scarabeo 4 to
Simsekler Gida Gemi Sokum Ins in Turkey was completed on July 18.
‘Fit for the future’:
Saipem’s turnaround plan
In the current oil price environment the outlook for the oil services
industry is continuing to deteriorate. Clients are focusing on cost
reduction, resulting in them adopting a more rigid approach to
negotiations, constant pressure on supply-chain margins, delays
in new contract awards and in some cases in the cancellation of
already approved projects.
To maximise its competitive capabilities and create value in this
new market scenario, Saipem has launched a turnaround and cost
cutting programme which will achieve savings of €1,300 million
over the period 2015-2017.
This programme involves a rationalisation of the Company’s asset
portfolio to refocus on higher-value areas and businesses.
In terms of its geographical footprint, operations in certain
countries, such as Canada and Brazil, will be downsized. The fleet
will see the scrapping of 5 vessels which are not commercially
viable in the current market. Furthermore, a review of the
organisation and processes is currently ongoing within Saipem in
order to increase the speed and efficiency of operations.
These measures are expected to yield a workforce reduction of
8,800 people between 2015 and 2017, mainly as a result of the
conclusion of certain large projects and the rationalisation of the
Company’s business operations and geographical presence.
This turnaround plan also entails a review of the Company’s
investment plans, with effects on capital expenditure starting
from 2015. This year’s investments are now forecast at below
€600 million.
Further details of Saipem’s turnaround plan will be provided in an
update of the Company’s strategic plan prior to the date scheduled
for the release of the third quarter results.
Management outlook for 2015
In the context of the continuing low oil price environment,
Saipem’s results for 2015 will be affected by the termination of
the South Stream contract and write-downs carried out during the
first six months of the year.
The Company expects to achieve revenues of €12 billion, at the
lower end of the previously-released range. EBIT is forecast at
around -€450 million. The reported net result is expected to be
-€800 million.
Capital expenditure will amount to less than €600 million, a
saving of €50 million compared to previous long-term indications,
thanks to the measures adopted to improve efficiency.
Finally, net debt at year end is expected below €5 billion,
excluding the impact of exchange rate fluctuations. Based on the
current prevailing foreign exchange rates, we expect the cash
impact of hedging derivatives to affect net debt by approximately
€500 million at year end.
Non-GAAP measures
Some of the performance indicators used in the ‘Operating and
Financial Review’ are not included in the IFRS (i.e. they are what
are known as Non-GAAP measures).
Non-GAAP measures are disclosed to enhance the user’s
understanding of the Group’s performance and are not intended to
be considered as a substitute for IFRS measures.
The Non-GAAP measures used in the Operating and Financial
Review are as follows:
- cash flow: the sum of the net result plus depreciation and
amortisation;
- capital expenditure: calculated by excluding investments in
equity interests from total investments;
- EBITDA: a useful measure for evaluating the operating
001-058SaipemSem15Ing.qxd 7-08-2015 9:57 Pagina 55

Saipem Interim Consolidated Report as of June 30, 2015 / Additional information
56
performance of the Group as a whole and of the individual
sectors of activity, in addition to operating profit. EBITDA is an
intermediate measure, which is calculated by adding
depreciation and amortisation to operating profit;
- non-current assets: the sum of net tangible assets, net
intangible assets and investments;
- net current assets: includes working capital and provisions for
contingencies;
- net capital employed: the sum of non-current assets, working
capital and the provision for employee benefits;
- funding: shareholders’ equity, non-controlling interests and net
borrowings;
- special items: (i) non-recurring events or transactions;
(ii) events or transactions that are not considered to be
representative of the ordinary course of business.
Secondary offices
Pursuant to Article 2428 of the Italian Civil Code, the Company
declares that it has a secondary office in Cortemaggiore (PC), Via
Enrico Mattei, 20.
001-058SaipemSem15Ing.qxd 6-08-2015 11:41 Pagina 56

Saipem Interim Consolidated Report as of June 30, 2015 / Reconciliation of reclassified balance sheet, income statement and cash flow statement to statutory schemes
57
Reconciliation of reclassified balance sheet, income statement
and cash flow statement to statutory schemes
Reclassified balance sheet
(€million) Dec. 31, 2014 June 30, 2015
Partial amounts Amounts Partial amounts Amounts
Reclassified balance sheet items from reclassified from reclassified from reclassified from reclassified
(where not stated otherwise, items comply with statutory scheme) scheme scheme scheme scheme
A) Net tangible assets 7, 6 01 7, 3 83
Note 8 - Property, plant and equipment 7,601 7,383
B) Net intangible assets 760 758
Note 9 - Intangible assets 760 758
C) Investments 112 107
Note 10 - Investments accounted for with the equity method 120 124
Reclassified from E) - provisions for losses related to investments (8) (17)
D) Working capital 576 1,116
Note 3 - Trade and other receivables 3,391 3,466
Reclassified to I) - financing receivables not related to operations (58) (32)
Note 4 - Inventories 2,485 2,531
Note 5 - Current tax assets 317 311
Note 6 - Other current tax assets 307 399
Note 7 - Other current assets 520 359
Note 11 - Other financial assets 1 1
Reclassified to I) - financing receivables not related to operations (1) (1)
Note 12 - Deferred tax assets 297 482
Note 13 - Other non-current assets 115 111
Note 15 - Trade and other payables (5,669) (5,788)
Note 16 - Income tax payables (134) (128)
Note 17 - Other current tax liabilities (184) (181)
Note 18 - Other current liabilities (838) (380)
Note 22 - Deferred tax liabilities (40) (29)
Note 23 - Other non-current liabilities (2) (5)
Note 24 - Assets held for sale 69 -
E) Provisions for contingencies (210) (247)
Note 20 - Provisions for contingencies (218) (264)
Reclassified to C) - provisions for losses related to investments 8 17
F) Provision for employee benefits (237) (240)
Note 21 - Provisions for employee benefits (237) (240)
CAPITAL EMPLOYED, NET 8,602 8,877
G) Shareholders’ equity 4,137 3,288
Note 26 - Saipem shareholders’ equity 4,137 3,288
H) Non-controlling interests 41 58
Note 25 - Non-controlling interests 41 58
I) Net debt 4,424 5,531
Note 1 - Cash and cash equivalents (1,602) (1,429)
Note 2 - Other financial assets held for trading or available for sale (9) (8)
Note 14 - Short-term debt 2,186 3,037
Note 19 - Long-term debt 3,314 3,477
Note 19 - Current portion of long-term debt 594 487
Reclassified from D) - financing receivables not related to operations (Note 3) (58) (32)
Reclassified from D) - financing receivables not related to operations (Note 11) (1) (1)
FUNDING 8,602 8,877
001-058SaipemSem15Ing.qxd 6-08-2015 11:41 Pagina 57
Saipem Interim Consolidated Report as of June 30, 2015 / Reconciliation of reclassified balance sheet, income statement and cash flow statement to statutory schemes
58
Reclassified income statement
The only items of the reclassified income statement which differ
from the statutory scheme are those stated hereafter:
- ‘finance income’ (€516 million), ‘finance expenses’
(-€607 million) and ‘derivatives’ (-€19 million), which are
indicated separately under the statutory scheme, are stated
under the item ‘net finance expense’ (-€110 million) in the
reclassified income statement.
All other items are unchanged.
Reclassified cash flow statement
The only items of the reclassified cash flow statement which differ
from the statutory scheme are those stated hereafter:
- the items ‘depreciation and amortisation’ (€382 million),
‘net impairment of tangible and intangible assets’ (€211
million), ‘other changes’ (-€117 million) and the ‘effect of
accounting using the equity method’ (€11 million), indicated
separately and included in cash generated from operating profit
in the statutory scheme, are shown net under the item
‘depreciation/amortisation and other non-monetary items’
(€487 million);
- the items ‘interest expense’ (€96 million), ‘income taxes’
(€13 million) and ‘interest income’ (-€3 million), indicated
separately and included in cash generated from operating profit
in the statutory scheme, are shown net under the item
‘dividends, interests and taxes’ (€106 million);
- the items regarding ‘trade payables’ (-€41 million),
‘trade receivables’ (€277 million), ‘provisions for
contingencies’ (€37 million), changes in ‘inventories’
(€6 million) and ‘other assets and liabilities’ (-€613 million),
indicated separately and included in cash generated from
operating profit in the statutory scheme, are shown net under
the item ‘changes in working capital related to operations’
(-€334 million);
- the items ‘dividends received’ (€4 million), ‘interest received’
(€7 million), ‘income taxes paid net of refunds of tax credits’
(-€102 million) and ‘interest paid’ (-€97 million), indicated
separately and included in cash generated from operating profit
in the statutory scheme, are shown net under the item
‘dividends received, income taxes paid and interest paid and
received’ (-€188 million);
- the items relating to investments in ‘tangible assets’
(€265 million) and ‘intangible assets’ (€3 million), indicated
separately and included in cash flow from investing activities in
the statutory scheme, are shown net under the item ‘capital
expenditure’ (€268 million);
- the items relating to disposals of ‘securities’ (€1 million) and
‘financing receivables’ (€27 million), indicated separately and
included in cash flow used in investing activities in the
statutory scheme, are shown under the item ‘borrowings
(repayment) of debt related to financing activities’
(€28 million);
- the items ‘proceeds from long-term debt’ (€739 million),
‘increase (decrease) in short-term debt’ (€551 million) and
‘repayments of long-term debt’ (-€473 million), indicated
separately and included in net cash flow used in financing
activities in the statutory scheme, are shown net under the
item ‘changes in short and long-term financial debt’
(€817 million).
All other items are unchanged.
001-058SaipemSem15Ing.qxd 6-08-2015 11:41 Pagina 58

Condensed consolidated interim financial statements saipem
059-112SemSaipem15Ing.qxd 6-08-2015 18:41 Pagina 59

Saipem Condensed consolidated interim financial statements 2015 / Financial statements
60
Balance sheet
Dec. 31, 2014 June 30, 2015
of which with of which with
related related
(€million) Note Total parties
(1)
Total parties
(1)
ASSETS
Current assets
Cash and cash equivalents (No. 1) 1,602 885 1,429 678
Other financial assets held for trading or available for sale (No. 2) 9 8
Trade and other receivables (No. 3) 3,391 868 3,466 756
Inventories (No. 4) 2,485 2,531
Current tax assets (No. 5) 317 311
Other current tax assets (No. 6) 307 399
Other current assets (No. 7) 520 360 359 218
Total current assets 8,631 8,503
Non-current assets
Property, plant and equipment (No. 8) 7,601 7,383
Intangible assets (No. 9) 760 758
Investments accounted for using the equity method (No. 10) 120 124
Other financial assets (No. 11) 1 1
Deferred tax assets (No. 12) 297 482
Other non-current assets (No. 13) 115 2 111 12
Total non-current assets 8,894 8,859
Assets held for sale (No. 24) 69 -
TOTAL ASSETS 17,594 17,362
LIABILITIES AND SHAREHOLDERS’ EQUITY
Current liabilities
Short-term debt (No. 14) 2,186 1,873 3,037 2,530
Current portion of long-term debt (No. 19) 594 594 487 487
Trade and other payables (No. 15) 5,669 382 5,788 238
Income tax payables (No. 16) 134 128
Other current tax liabilities (No. 17) 184 181
Other current liabilities (No. 18) 838 828 380 344
Total current liabilities 9,605 10,001
Non-current liabilities
Long-term debt (No. 19) 3,314 3,064 3,477 3,477
Provisions for contingencies (No. 20) 218 264
Provisions for employee benefits (No. 21) 237 240
Deferred tax liabilities (No. 22) 40 29
Other non-current liabilities (No. 23) 2 - 5 4
Total non-current liabilities 3,811 4,015
TOTAL LIABILITIES 13,416 14,016
SHAREHOLDERS’ EQUITY
Non-controlling interests (No. 25) 41 58
Saipem shareholders’ equity: (No. 26) 4,137 3,288
- share capital (No. 27) 441 441
- share premium reserve (No. 28) 55 55
- other reserves (No. 29) (209) (150)
- retained earnings 4,123 3,905
- net profit (loss) for the period (230) (920)
- treasury shares (No. 30) (43) (43)
Total shareholders’ equity 4,178 3,346
TOTAL LIABILITIES AND SHAREHOLDERS’ EQUITY 17,594 17,362
(1) For an analysis of figures shown as ‘of which with related parties’, see Note 43 ‘Transactions with related parties’.
059-112SemSaipem15Ing.qxd 6-08-2015 18:41 Pagina 60

Income statement
First half 2014 First half 2015
of which with of which with
related related
(€million) Note Total parties
(1)
Total parties
(1)
REVENUES
Net sales from operations (No. 32) 5,966 968 5,373 890
Other income and revenues (No. 33) 12 8 1 -
Total revenues 5,978 5,374
Operating expenses
Purchases, services and other costs (No. 34) (4,126) (154) (4,350) (103)
Payroll and related costs (No. 35) (1,197) - (1,221) (1)
Depreciation, amortisation and impairment (No. 36) (362) (593)
Other operating income (expense) ----
OPERATING PROFIT 293 (790)
Finance income (expense)
Finance income 333 - 516 -
Finance expense (373) (67) (607) (80)
Derivative financial instruments (70) (71) (19) (18)
Total finance income (expense) (No. 37) (110) (110)
Income (expense) from investments
Share of profit (loss) of equity-accounted investments 13 (11)
Other income from investments 4 18
Total income (expense) from investments (No. 38) 17 7
RESULT BEFORE INCOME TAXES 200 (893)
Income taxes (No. 39) (64) (13)
NET RESULT 136 (906)
Attributable to:
- Saipem 136 (920)
- non-controlling interests (No. 40) - 14
Earnings (loss) per share attributable to Saipem (€per share)
Basic earnings (loss) per share (No. 41) 0.310 (2.094)
Diluted earnings (loss) per share (No. 41) 0.309 (2.093)
(1) For an analysis of figures shown as ‘of which with related parties’, see Note 43 ‘Transactions with related parties’.
Statement of comprehensive income
First half First half
(€million) 2014 2015
Net profit (loss) for the period 136 (906)
Other items of comprehensive income
Items that will not be reclassified subsequently to profit or loss
Remeasurements of defined benefit plans for employees --
Share of other comprehensive income of investments accounted for using the equity method relating to remeasurements of defined benefit plans - -
Income tax relating to items that will not be reclassified --
Items that may be reclassified subsequently to profit or loss
Change in the fair value of cash flow hedges
(1)
(48) (68)
Exchange rate differences arising from the translation into euro of financial statements currencies other than the euro 19 86
Share of other comprehensive income of investments accounted for using the equity method (1) -
Income tax on items that may be reclassified subsequently to profit or loss 17 53
Total other items of comprehensive income net of taxation (13) 71
Total comprehensive income (loss) for the period 123 (835)
Attributable to:
- Saipem Group 123 ( 852)
- non-controlling interests -17
(1) The change in the fair value of cash flow hedges relates almost exclusively to transactions with the parent company Eni.
Saipem Condensed consolidated interim financial statements 2015 / Financial statements
61
059-112SemSaipem15Ing.qxd 6-08-2015 18:41 Pagina 61

Statement of changes in shareholders’ equity
Saipem shareholders’ equity
(€million)
Balance at December 31, 2013 441 55 7 88 - 85 (100) (5) 4,283 (159) (43) 4,652 92 4,744
Net profit (loss)
for the first half of 2014 ---------136-136-136
Other items
of comprehensive income
Items that will not be reclassified
subsequently to profit or loss
Remeasurements of defined benefit plans
for employees, net of tax --------------
Share of other comprehensive
income of investments accounted for
using the equity method relating
to remeasurements of defined benefit plans
for employees, net of tax --------------
Items that may be reclassified
subsequently to profit or loss
Change in the fair value of cash flow hedging
derivatives, net of the tax effect -----(31)-----(31)-(31)
Currency translation differences of financial
statements currencies other than euro ------25-(6)--19-19
Share of other comprehensive
income of investments accounted for
using the equity method --------(1)--(1)-(1)
Total comprehensive income (loss)
for the first half of 2014 -----(31)25-(7)136-123-123
Transactions with shareholders
Dividend distribution for the first half of 2014 ------------(44)(44)
Retained earnings --------(159)159----
Other changes in shareholders’ equity
Other changes ------(1)-(1)--(2)-(2)
Transactions with companies
under common control ------ -------
Total ------(1)-(160)159-(2)(44)(46)
Balance at June 30, 2014 441 55 7 88 - 54 (76) (5) 4,116 136 (43) 4,773 48 4,821
Net profit (loss)
for the second half of 2014 ---------(366)-(366)(8)(374)
Other items
of comprehensive income
Items that will not be reclassified
subsequently to profit or loss
Remeasurements of defined benefit plans
for employees, net of tax -------(15)---(15)(1)(16)
Share of other comprehensive
income of investments accounted for
using the equity method relating
to remeasurements of defined benefit plans
for employees, net of tax -------1---1-1
Items that may be reclassified
subsequently to profit or loss
Change in the fair value of cash flow hedging
derivatives, net of the tax effect -----(328)-----(328)(3)(331)
Currency translation differences of financial
statements currencies other than euro ------68-2--70676
Share of other comprehensive
income of investments accounted for
using the equity method --(1)-----1-----
Share capital
Share premium
reserve
Other reserves
Legal reserve
Reserve for
treasury shares
Cash flow hedge
reserve, net of tax
Cumulative
currency translation
differences
Employee defined
benefits reserve,
net of tax
Retained earnings
Net profit (loss)
for the period
Treasury shares
Total
Non-controlling
interests
Total
shareholders’ equity
Saipem Condensed consolidated interim financial statements 2015 / Financial statements
62
059-112SemSaipem15Ing.qxd 6-08-2015 18:41 Pagina 62

cont’d Statement of changes in shareholders’ equity
Saipem shareholders’ equity
(€million)
Total comprehensive income (loss)
for the second half of 2014 - - (1) - - (328) 68 (14) 3 (366) - (638) (6) (644)
Transactions with shareholders
Dividend distribution in the second half of 2014------------(1)(1)
Other changes in shareholders’ equity
Expired stock options --------(1)--(1)-(1)
Other changes -----(1)(1)-5--3-3
Transactions with companies
under common control --------------
Total -----(1)(1)-4--2(1)1
Balance at December 31, 2014 441 55 6 88 - (275) (9) (19) 4,123 (230) (43) 4,137 41 4,178
Net profit (loss)
for the first half of 2015 ---------(920)-(920)14(906)
Other items
of comprehensive income
Items that will not be reclassified
subsequently to profit or loss
Remeasurements of defined benefit plans
for employees, net of tax -------(1)---(1)1-
Share of other comprehensive
income of investments accounted for
using the equity method relating
to remeasurements of defined benefit plans
for employees, net of tax --------------
Items that may be reclassified
subsequently to profit or loss
Change in the fair value of cash flow hedging
derivatives, net of the tax effect -----(14)-----(14)(1)(15)
Currency translation differences of financial
statements currencies other than euro ------74-9--83386
Share of other comprehensive income
of investments accounted for
using the equity method --------------
Total comprehensive income (loss)
for the first half of 2015 -----(14)74(1)9(920)-(852)17(835)
Transactions with shareholders
Dividend distribution for the first half of 2015 --------------
Retained earnings --------(230)230----
Contribution from non-controlling interests
Snamprogetti Engineering & Contracting Co Ltd------------11
Total --------(230)230--11
Other changes in shareholders’ equity
Other changes --------3--3(1)2
Transactions with companies
under common control --------------
Total --------3--3(1)2
Balance at June 30, 2015 441 55 6 88 - (289) 65 (20) 3,905 (920) (43) 3,288 58 3,346
Share capital
Share premium
reserve
Other reserves
Legal reserve
Reserve for
treasury shares
Cash flow hedge
reserve, net of tax
Cumulative
currency translation
differences
Employee defined
benefits reserve,
net of tax
Retained earnings
Net profit (loss)
for the period
Treasury shares
Total
Non-controlling
interests
Total
shareholders’ equity
Saipem Condensed consolidated interim financial statements 2015 / Financial statements
63
059-112SemSaipem15Ing.qxd 6-08-2015 18:41 Pagina 63

Cash flow statement
(€million) Note First half 2014 First half 2015
Net profit (loss) for the period 136 (920)
Non-controlling interests -14
Adjustments to reconcile net profit to cash flow from operations:
- depreciation and amortisation (No. 35) 362 382
- net impairment of tangible and intangible assets (No. 35) - 211
- share of profit (loss) of equity accounted investments (No. 38) (13) 11
- net (gains) losses on disposal of assets (3) (17)
- interest income (2) (3)
- interest expense 83 96
- income taxes (No. 39) 64 13
- other changes (13) (117)
Changes in working capital:
- inventories (835) 6
- trade receivables 419 277
- trade payables (34) (41)
- provisions for contingencies (27) 38
- other assets and liabilities 95 (614)
Cash flow from working capital 232 (664)
Change in the provision for employee benefits 2 -
Dividends received 14
Interest received 17
Interest paid (78) (97)
Income taxes paid net of refunds of tax credits (108) (102)
Net cash flow from operations 50 (852)
of which with related parties
(1)
(No. 43) 585 642
Investing activities:
- tangible assets (No. 8) (324) (265)
- intangible assets (No. 9) (5) (3)
- investments (No. 10) (2) (1)
- financing receivables (39) (1)
- change in payables and receivables relating to investments - 1
Cash flow used in investing activities (370) (269)
Disposals:
- tangible assets --
- consolidated subsidiaries and businesses - -
- investments 797
- financing receivables 14 27
- securities 26 1
Cash flow from disposals 47 125
Net cash flow used in investing activities
(2)
(323) (144)
of which with related parties
(1)
(No. 43) (29) 14
Saipem Condensed consolidated interim financial statements 2015 / Financial statements
64
059-112SemSaipem15IngxTipo.qxd 8-09-2015 10:49 Pagina 64

Saipem Condensed consolidated interim financial statements 2015 / Financial statements
65
cont’d Cash flow statement
(€million) Note First half 2014 First half 2015
Proceeds from long-term debt 504 739
Repayments of long-term debt (207) (473)
Increase (decrease) in short-term debt 117 551
414 817
Net capital contributions from non-controlling shareholders - 1
Dividend distribution (44) -
Sale of treasury shares --
Net cash flow from financing activities 370 818
of which with related parties
(1)
(No. 43) 360 963
Effect of changes in consolidation - (2)
Effect of exchange rate changes
and other changes on cash and cash equivalents 5 7
Net cash flow for the period 102 (173)
Cash and cash equivalents - beginning of period (No. 1) 1,299 1,602
Cash and cash equivalents - end of period (No. 1) 1,401 1,429
(1) For an analysis of figures shown as ‘of which with related parties’, see Note 43 ‘Transactions with related parties’.
(2) Net cash used in investing activities included investments in certain financial assets to absorb temporary surpluses of cash or as part of our ordinary management of financing activities. Due to their
nature and the fact that they are very liquid, these financial assets are netted against finance debt in determining net borrowings. For the definition of net borrowings, see the ‘Financial and economic
results’ section of the ‘Operating and Financial Review’.
The cash flows of these investments were as follows:
First half First half
(€million) 2014 2015
Financing investments:
- financing receivables (39) -
(39) -
Disposal of financing investments:
- securities 26 1
- financing receivables 14 27
40 28
Net cash flows from investments/disposals related to financing activities 1 28
059-112SemSaipem15Ing.qxd 6-08-2015 18:41 Pagina 65

66
Saipem Condensed consolidated interim financial statements 2015 / Notes to the condensed consolidated interim financial statements
Basis of presentation
The condensed consolidated interim financial statements have been
prepared in accordance with IAS 34 ‘Interim Financial Reporting’. The
structure of the financial statements is the same as that used in the
annual report.
The condensed consolidated interim financial statements have been
prepared in accordance with the same principles of consolidation and
evaluation criteria described in the annual report, with the exception of
the International Accounting Standards that became into effect as of
January 1, 2015, as illustrated in the ‘Recent accounting principles’
section of the 2014 Annual Report.
The notes to these financial statements have been prepared in a
condensed format. Current income taxes are determined on the basis of
estimated taxable income at the balance sheet date. Current income tax
assets and liabilities are measured at the amount expected to be paid
to/recovered from the tax authorities, using tax laws that have been
enacted or substantively enacted by the end of the reporting period and
tax rates estimated on an annual basis.
Consolidated companies, non-consolidated subsidiaries, interests in joint
ventures and joint operations and associated companies are indicated in
the section ‘Scope of consolidation’, which constitutes an integral part of
these notes. The same section contains a list detailing the changes that
occurred in the scope of consolidation during the period. The condensed
consolidated interim financial statements as of June 30, 2015, approved
by Saipem’s Board of Directors on July 28, 2015, were subjected to a
limited review by the independent auditor Reconta Ernst & Young SpA.
A limited review is substantially less in scope than an audit performed in
accordance with generally accepted auditing standards.
Amounts stated in the financial statements and the notes thereto are in
millions of euros.
Foreign currency translation
Financial statements of foreign companies having a functional currency
other than euro are converted into euro applying: (i) closing exchange
rates for assets and liabilities; (ii) historical exchange rates for equity
accounts; and (iii) the average rates for the period to the income
statement (source: Bank of Italy).
Cumulative exchange rate differences resulting from this translation are
recognised in shareholders’ equity under the caption ‘Cumulative
currency translation differences’ for the portion relating to the Group’s
interest and under ‘Non-controlling interests’ for the portion related to
non-controlling shareholders. Cumulative exchange differences are taken
to profit or loss when an investment is fully disposed of or when the
investment ceases to qualify as a controlled company. In the event of a
partial disposal that does not result in the loss of control, the portion of
exchange differences relating to the interest disposed of is attributed to
non-controlling interests in equity.
The financial statements used for translation into euros are those
denominated in the functional currency, i.e. the local currency or the
currency in which most financial transactions and assets and liabilities
are denominated.
The exchange rates that have been applied for the translation of financial
statements in foreign currencies are as follows:
Notes to the condensed consolidated interim financial statements
US Dollar 1.2141 1.1189 1.11579
British Pound Sterling 0.7789 0.7114 0.732325
Algerian Dinar 106.607 110.698 106.76
Angolan Kwanza 124.884 135 .972 121.283
Argentine Peso 10.2755 10.1653 9.83968
Australian Dollar 1.4829 1.455 1.42608
Brazilian Real 3.2207 3.4699 3.31015
Canadian Dollar 1.4063 1.3839 1.37736
Egyptian Pound 8.68519 8.53421 8.43588
Indian Rupee 76.719 71.1873 70.1244
Indonesian Rupee 15,076.1 14,938.4 14,469.2
Malaysian Ringgit 4.2473 4.2185 4.06212
Nigerian Naira 223.693 222.697 219.547
Norwegian Kroner 9.042 8.791 8.64826
Peruvian New Sol 3.63265 3.55333 3.45828
Qatari Riyal 4.42155 4.0728 4.0623
Romanian New Leu 4.4828 4.4725 4.44793
Russian Rouble 72.337 62.355 64.6407
Saudi Arabian Riyal 4.55733 4.19622 4.18599
Singapore Dollar 1.6058 1.5068 1.50608
Swiss Franc 1.2024 1.0413 1.05673
Currency
Exchange rate
at Dec. 31, 2014
Exchange rate
at June 30, 2015
2015 average
exchange rate
059-112SemSaipem15Ing.qxd 6-08-2015 18:41 Pagina 66

67
Saipem Condensed consolidated interim financial statements 2015 / Notes to the condensed consolidated interim financial statements
Use of accounting estimates
The preparation of financial statements and interim reports in accordance
with generally accepted accounting standards requires management to
make accounting estimates based on complex or subjective judgements,
past experience and assumptions deemed reasonable and realistic
based on the information available at the time. The use of these
estimates and assumptions affects the reported amounts of assets and
liabilities and the disclosure of contingent assets and liabilities at the
balance sheet date and the reported amounts of income and expenses
during the reporting period. Actual results may differ from these
estimates given the uncertainty surrounding the assumptions and
conditions upon which the estimates are based.
Accounting estimates are a critical factor in the preparation of
consolidated financial statements and interim reports because they
require management to make a large number of subjective judgements,
assumptions and estimates regarding matters that are inherently
uncertain. Changes in the conditions underlying such judgements,
assumptions and estimates may have a significant effect on future
results.
For a description of the accounting estimates used, see the 2014 Annual
Report.
Changes to accounting criteria
European Commission Regulation No. 2015/29 dated December 17, 2014,
approved the amendments to IAS 19 ‘Defined Benefit Plans: Employee
Contributions’, which allow defined benefit plan contributions from
employees or third parties to be recognised as a reduction in the service
cost in the period in which the related service is rendered, provided that
the contributions: (i) are set out in the formal terms of the plan; (ii) are
linked to service; and (iii) are independent of the number of years of
service (e.g. a fixed percentage of the employee’s salary, a fixed amount
throughout the service period or contributions that are dependent on the
employee’s age).
European Commission Regulation No. 2015/28 dated December 17, 2014,
approved the document ‘Annual Improvements to IFRSs 2010-2012
Cycle’, which essentially consists of changes of a technical and editorial
nature to existing standards.
The adoption rules required the amendments to be adopted for annual
periods beginning on or after February 2015, with earlier application
permitted. Saipem has taken the early application option, applying the
provisions as from the 2015 annual period. The adoption of these
principles did not generate a significant effect.
The other changes to accounting standards that became applicable as
from January 1, 2015 did not produce any significant effects.
Recent accounting principles
See the most recent annual report for a description of recently published
accounting principles.
Saipem is currently reviewing these new standards to determine if their
adoption will have a significant impact on the financial statements.
059-112SemSaipem15Ing.qxd 6-08-2015 18:41 Pagina 67

68
Saipem Condensed consolidated interim financial statements 2015 / Notes to the condensed consolidated interim financial statements
Scope of consolidation at June 30, 2015
Parent company
Saipem SpA San Donato Milanese EUR 441,410,900 Eni SpA 42.91
Saipem SpA 0.44
Third parties 56.65
Subsidiaries
Italy
Denuke Scarl San Donato Milanese EUR 10,000 Saipem SpA 55.00 55.00 F.C.
Third parties 45.00
Servizi Energia Italia SpA San Donato Milanese EUR 291,000 Saipem SpA 100.00 100.00 F.C.
Smacemex Scarl San Donato Milanese EUR 10,000 Saipem SpA 60.00 60.00 F.C.
Third parties 40.00
Snamprogetti Chiyoda sas San Donato Milanese EUR 10,000 Saipem SpA 99.90 99.90 F.C.
di Saipem SpA Third parties 0.10
Outside Italy
Andromeda Consultoria Tecnica Rio de Janeiro BRL 5,494,210 Saipem SpA 99.00 100.00 F.C.
e Representações Ltda (Brazil) Snamprogetti 1.00
Netherlands BV
Boscongo SA Pointe-Noire XAF 1,597,805,000 Saipem SA 100.00 100.00 F.C.
(Congo)
ER SAI Caspian Contractor Llc Almaty KZT 1,105,930,000 Saipem International BV 50.00 50.00 F.C.
(Kazakhstan) Third parties 50.00
ERS - Equipment Rental & Services BV Amsterdam EUR 90,760 Saipem International BV 100.00 100.00 F.C.
(Netherlands)
Global Petroprojects Services AG Zurich CHF 5,000,000 Saipem International BV 100.00 100.00 F.C.
(Switzerland)
Moss Maritime AS Lysaker NOK 40,000,000 Saipem International BV 100.00 100.00 F.C.
(Norway)
Moss Maritime Inc Houston USD 145,000 Moss Maritime AS 100.00 100.00 F.C.
(USA)
North Caspian Service Co Almaty KZT 1,910,000,000 Saipem International BV 100.00 100.00 F.C.
(Kazakhstan)
Petrex SA Iquitos PEN 762,729,045 Saipem International BV 100.00 100.00 F.C.
(Peru)
Professional Training Center Llc Karakiyan District, KZT 1,000,000 ER SAI Caspian 100.00 50.00 F.C.
Mangistau Oblast Contractor Llc
(Kazakhstan)
PT Saipem Indonesia Jakarta USD 152,778,100 Saipem International BV 68.55 100.00 F.C.
(Indonesia) Saipem Asia Sdn Bhd 31.45
SAGIO - Companhia Angolana Luanda AOA 1,600,000 Saipem International BV 60.00 60.00 E.M.
de Gestão de Instalaçao Offshore Ltda (Angola) Third parties 40.00
Company
Registered office
Currency
Share capital
Shareholders
% held
% Saipem’s
consolidation
Method
of consolidation
or accounting
principle
(*)
Company
Registered office
Currency
Share capital
Shareholders
% held
% Saipem’s
consolidation
Method
of consolidation
or accounting
principle
(*)
(*) F.C. = full consolidation, W.I. = working interest, E.M. = equity method, Co. = cost method
059-112SemSaipem15Ing.qxd 6-08-2015 18:41 Pagina 68

69
Saipem Condensed consolidated interim financial statements 2015 / Notes to the condensed consolidated interim financial statements
Saigut SA de Cv Delegacion Cuauhtemoc MXN 90,050,000 Saimexicana SA de Cv 100.00 100.00 F.C.
(Mexico)
SAIMEP Lda Maputo MZN 70,000,000 Saipem SA 99.98 100.00 F.C.
(Mozambique) Saipem International BV 0.02
Saimexicana SA de Cv Delegacion Cuauhtemoc MXN 1,528,188,000 Saipem SA 100.00 100.00 F.C.
(Mexico)
Saipem (Beijing) Technical Beijing USD 1,750,000 Saipem International BV 100.00 100.00 F.C.
Services Co Ltd (China)
Saipem (Malaysia) Sdn Bhd Kuala Lumpur MYR 1,033,500 Saipem International BV 41.94 100.00 F.C.
(Malaysia) Third parties 58.06
Saipem (Nigeria) Ltd Lagos NGN 259,200,000 Saipem International BV 89.41 89.41 F.C.
(Nigeria) Third parties 10.59
Saipem (Portugal) Comércio Marítimo, Caniçal EUR 299,278,738 Saipem International BV 100.00 100.00 F.C.
Sociedade Unipessoal Lda (Portugal)
Saipem America Inc Wilmington USD 50,000,000 Saipem International BV 100.00 100.00 F.C.
(USA)
Saipem Argentina de Perforaciones, Buenos Aires ARS 1,805,300 Saipem International BV 99.90 99.90 E.M.
Montajes y Proyectos Sociedad Anónima, (Argentina) Third parties 0.10
Minera, Industrial, Comercial
y Financiera
(**) (***)
Saipem Asia Sdn Bhd Kuala Lumpur MYR 8,116,500 Saipem International BV 100.00 100.00 F.C.
(Malaysia)
Saipem Australia Pty Ltd West Perth AUD 10,661,000 Saipem International BV 100.00 100.00 F.C.
(Australia)
Saipem Canada Inc Montreal CAD 100,100 Saipem International BV 100.00 100.00 F.C.
(Canada)
Saipem Contracting (Nigeria) Ltd Lagos NGN 827,000,000 Saipem International BV 97.94 97.94 F.C.
(Nigeria) Third parties 2.06
Saipem Contracting Algérie SpA Algeri DZD 1,556,435,000 Sofresid SA 100.00 100.00 F.C.
(Algeria)
Saipem Contracting Netherlands BV Amsterdam EUR 20,000 Saipem International BV 100.00 100.00 F.C.
(Netherlands)
Saipem do Brasil Rio de Janeiro BRL 1,154,796,299 Saipem International BV 100.00 100.00 F.C.
Serviçõs de Petroleo Ltda (Brazil)
Saipem Drilling Co Private Ltd Mumbai INR 50,273,400 Saipem International BV 49.73 100.00 F.C.
(India) Saipem SA 50.27
Saipem Drilling Norway AS Sola NOK 100,000 Saipem International BV 100.00 100.00 F.C.
(Norway)
Saipem East Africa Ltd Kampala UGX 50,000,000 Saipem International BV 51.00 51.00 E.M.
(Uganda) Third parties 49.00
Saipem India Projects Private Ltd Chennai INR 407,000,000 Saipem SA 100.00 100.00 F.C.
(India)
Saipem Ingenieria Madrid EUR 80,000 Saipem International BV 100.00 100.00 F.C.
y Construcciones SLU (Spain)
Saipem International BV Amsterdam EUR 172,444,000 Saipem SpA 100.00 100.00 F.C.
(Netherlands)
Saipem Libya LLC - SA.LI.CO. Llc Tripoli LYD 10,000,000 Saipem International BV 60.00 100.00 F.C.
(Libya) Snamprogetti 40.00
Netherlands BV
Saipem Ltd Kingston upon Thames, Surrey EUR 7,500,000 Saipem International BV 100.00 100.00 F.C.
(United Kingdom)
Saipem Luxembourg SA Luxembourg EUR 31,002 Saipem Maritime Asset 99.99 100.00 F.C.
(Luxembourg)
Management Luxembourg Sàrl
Saipem (Portugal) Comércio 0.01
Marítimo, Sociedade
Unipessoal Lda
Saipem Maritime Asset Luxembourg USD 378,000 Saipem SpA 100.00 100.00 F.C.
Management Luxembourg Sàrl (Luxembourg)
Company
Registered office
Currency
Share capital
Shareholders
% held
% Saipem’s
consolidation
Method
of consolidation
or accounting
principle
(*)
(*) F.C. = full consolidation, W.I. = working interest, E.M. = equity method, Co. = cost method
(**) In liquidation.
(***) Inactive throughout the period.
059-112SemSaipem15Ing.qxd 6-08-2015 18:41 Pagina 69

70
Saipem Condensed consolidated interim financial statements 2015 / Notes to the condensed consolidated interim financial statements
Saipem Misr Port Said EUR 2,000,000 Saipem International BV 99.92 100.00 F.C.
for Petroleum Services (S.A.E.) (Egypt) ERS - Equipment Rental 0.04
& Services BV
Saipem (Portugal) Comércio 0.04
Marítimo, Sociedade
Unipessoal Lda
Saipem Norge AS Sola NOK 100,000 Saipem International BV 100.00 100.00 F.C.
(Norway)
Saipem Offshore Norway AS Sola NOK 120,000 Saipem SpA 100.00 100.00 F.C.
(Norway)
Saipem SA Montigny le Bretonneux EUR 26,488,695 Saipem SpA 100.00 100.00 F.C.
(France)
Saipem Services México SA de Cv Delegacion Cuauhtemoc MXN 50,000 Saimexicana SA de Cv 100.00 100.00 F.C.
(Mexico)
Saipem Singapore Pte Ltd Singapore SGD 28,890,000 Saipem SA 100.00 100.00 F.C.
(Singapore)
Saipem Ukraine Llc Kiev EUR 106,061 Saipem International BV 99.00 100.00 F.C.
(Ukraine) Saipem Luxembourg SA 1.00
Sajer Iraq Co for Petroleum Services, Baghdad IQD 300,000,000 Saipem International BV 60.00 60.00 F.C.
Trading, General Contracting (Iraq) Third parties 40.00
& Transport Llc
Saudi Arabian Saipem Ltd Al-Khobar SAR 5,000,000 Saipem International BV 60.00 60.00 F.C.
(Saudi Arabia) Third parties 40.00
Sigurd Rück AG Zurich CHF 25,000,000 Saipem International BV 100.00 100.00 F.C.
(Switzerland)
Snamprogetti Engineering Al-Khobar SAR 10,000,000 Snamprogetti 70.00 70.00 F.C.
& Contracting Co Ltd (Saudi Arabia) Netherlands BV
Third parties 30.00
Snamprogetti Engineering BV Amsterdam EUR 18,151 Saipem Maritime 100.00 100.00 F.C.
(Netherlands) Asset Management
Luxembourg Sàrl
Snamprogetti Ltd
(**)
London GBP 9,900 Snamprogetti 100.00 100.00 F.C.
(United Kingdom) Netherlands BV
Snamprogetti Lummus Gas Ltd Sliema EUR 50,000 Snamprogetti 99.00 99.00 F.C.
(Malta) Netherlands BV
Third parties 1.00
Snamprogetti Netherlands BV Amsterdam EUR 203,000 Saipem SpA 100.00 100.00 F.C.
(Netherlands)
Snamprogetti Romania Srl Bucharest RON 5,034,100 Snamprogetti 99.00 100.00 F.C.
(Romania) Netherlands BV
Saipem International BV 1.00
Snamprogetti Saudi Arabia Co Ltd Llc Al-Khobar SAR 10,000,000 Saipem International BV 95.00 100.00 F.C.
(Saudi Arabia) Snamprogetti 5.00
Netherlands BV
Sofresid Engineering SA Montigny le Bretonneux EUR 1,267,143 Sofresid SA 99.99 100.00 F.C.
(France) Third parties 0.01
Sofresid SA Montigny le Bretonneux EUR 8,253,840 Saipem SA 100.00 100.00 F.C.
(France)
Sonsub International Pty Ltd Sydney AUD 13,157,570 Saipem International BV 100.00 100.00 F.C.
(Australia)
Company
Registered office
Currency
Share capital
Shareholders
% held
% Saipem’s
consolidation
Method
of consolidation
or accounting
principle
(*)
(*) F.C. = full consolidation, W.I. = working interest, E.M. = equity method, Co. = cost method
(**) In liquidation.
059-112SemSaipem15Ing.qxd 6-08-2015 18:41 Pagina 70

71
Saipem Condensed consolidated interim financial statements 2015 / Notes to the condensed consolidated interim financial statements
Associated and jointly-controlled companies
Italy
ASG Scarl San Donato Milanese EUR 50,864 Saipem SpA 55.41 55.41 E.M.
Third parties 44.59
Baltica Scarl
(***)
Rome EUR 10,000 Saipem SpA 50.00 50.00 E.M.
Third parties 50.00
CEPAV (Consorzio Eni San Donato Milanese EUR 51,646 Saipem SpA 52.00 52.00 E.M.
per l’Alta Velocità) Due Third parties 48.00
CEPAV (Consorzio Eni San Donato Milanese EUR 51,646 Saipem SpA 50.36 50.36 E.M.
per l’Alta Velocità) Uno Third parties 49.64
Consorzio F.S.B. Venice - Marghera EUR 15,000 Saipem SpA 28.00 28.00 Co.
Third parties 72.00
Consorzio Sapro San Giovanni Teatino EUR 10,329 Saipem SpA 51.00 51.00 Co.
Third parties 49.00
Modena Scarl
(**)
San Donato Milanese EUR 400,000 Saipem SpA 59.33 59.33 E.M.
Third parties 40.67
Rodano Consortile Scarl San Donato Milanese EUR 250,000 Saipem SpA 53.57 53.57 E.M.
Third parties 46.43
Rosetti Marino SpA Ravenna EUR 4,000,000 Saipem SA 20.00 20.00 E.M.
Third parties 80.00
Ship Recycling Scarl Genoa EUR 10,000 Saipem SpA 51.00 51.00 W.I.
Third parties 49.00
Outside Italy
02 Pearl Snc Montigny le Bretonneux EUR 1,000 Saipem SA 50.00 50.00 E.M.
(France) Third parties 50.00
CCS Netherlands BV
(***)
Amsterdam EUR 300,000 Saipem International BV 33.33 33.33 E.M.
(Netherlands) Third parties 66.67
Charville - Consultores e Serviços Lda Funchal EUR 5,000 Saipem International BV 50.00 50.00 E.M.
(Portugal) Third parties 50.00
CMS&A Wll Doha QAR 500,000 Snamprogetti 20.00 50.00 E.M.
(Qatar) Netherlands BV
Third parties 80.00
CSC Japan Godo Kaisha
(***)
Yokohama JPY 3,000,000 CCS Netherlands BV 100.00 33.33 E.M.
(Japan)
CSFLNG Netherlands BV Amsterdam EUR 600,000 Saipem SA 50.00 50.00 E.M.
(Netherlands) Third parties 50.00
FPSO Mystras (Nigeria) Ltd
(**) (***)
Victoria Island - Lagos NGN 15,000,000 FPSO Mystras - Produção 100.00 50.00 E.M.
(Nigeria) de Petròleo Lda
FPSO Mystras - Produção de Petròleo Lda Funchal EUR 50,000 Saipem International BV 50.00 50.00 E.M.
(Portugal) Third parties 50.00
Hazira Cryogenic Engineering Mumbai INR 500,000 Saipem SA 55.00 55.00 E.M.
& Construction Management Private Ltd (India) Third parties 45.00
KWANDA Suporte Logistico Lda Luanda AOA 25,510,204 Saipem SA 40.00 40.00 E.M.
(Angola) Third parties 60.00
LNG - Serviços e Gestao de Projectos Lda Funchal EUR 5,000 Snamprogetti 25.00 25.00 E.M.
(Portugal) Netherlands BV
Third parties 75.00
Company
Registered office
Currency
Share capital
Shareholders
% held
% Saipem’s
consolidation
Method
of consolidation
or accounting
principle
(*)
(*) F.C. = full consolidation, W.I. = working interest, E.M. = equity method, Co. = cost method
(**) In liquidation.
(***) Inactive throughout the period.
059-112SemSaipem15Ing.qxd 6-08-2015 18:41 Pagina 71

72
Saipem Condensed consolidated interim financial statements 2015 / Notes to the condensed consolidated interim financial statements
Mangrove Gas Netherlands BV Amsterdam EUR 2,000,000 Saipem International BV 50.00 50.00 E.M.
(Netherlands) Third parties 50.00
Petromar Lda Luanda USD 357,143 Saipem SA 70.00 70.00 E.M.
(Angola) Third parties 30.00
S.B.K. Baltica Società Consortile Gdan´sk PLN 10,000 Saipem SpA 49.00 50.00 Co.
a Responsabilità Limitata Spólka (Poland) Baltica Scarl 2.00
Komandytowa
(***)
Third parties 49.00
Sabella SAS Quimper EUR 5,263,495 Sofresid Engineering SA 22.04 22.04 E.M.
(France) Third parties 77.96
Saidel Ltd Victoria Island - Lagos NGN 236,650,000 Saipem International BV 49.00 49.00 E.M.
(Nigeria) Third parties 51.00
Saipar Drilling Co BV Amsterdam EUR 20,000 Saipem International BV 50.00 50.00 E.M.
(Netherlands) Third parties 50.00
Saipem Dangote E&C Ltd
(***)
Victoria Island - Lagos NGN 100,000,000 Saipem International BV 49.00 49.00 E.M.
(Nigeria) Third parties 51.00
Saipem Taqa Al Rushaid Dammam SAR 40,000,000 Saipem International BV 40.00 40.00 E.M.
Fabricators Co Ltd (Saudi Arabia) Third parties 60.00
Saipon Snc Montigny le Bretonneux EUR 20,000 Saipem SA 60.00 60.00 W.I.
(France) Third parties 40.00
Sairus Llc Krasnodar RUB 83,603,800 Saipem International BV 50.00 50.00 E.M.
(Russian Federation) Third parties 50.00
Société pour la Réalisation Anjra EUR 33,000 Saipem SA 33.33 33.33 E.M.
du Port de Tanger Méditerranée (Morocco) Third parties 66.67
Southern Gas Constructors Ltd Lagos NGN 10,000,000 Saipem International BV 50.00 50.00 E.M.
(Nigeria) Third parties 50.00
SPF - TKP Omifpro Snc Paris EUR 50,000 Saipem SA 50.00 50.00 E.M.
(France) Third parties 50.00
Sud-Soyo Urban Development Lda
(***)
Soyo AOA 20,000,000 Saipem SA 49.00 49.00 E.M.
(Angola) Third parties 51.00
Tchad Cameroon Maintenance BV Rotterdam EUR 18,000 Saipem SA 40.00 40.00 E.M.
(Netherlands) Third parties 60.00
Tecnoprojecto Internacional Porto Salvo - EUR 700,000 Saipem SA 42.50 42.50 E.M.
Projectos e Realizações Industriais SA Concelho de Oeiras Third parties 57.50
(Portugal)
T.C.P.I. Angola Tecnoprojecto Luanda AOA 9,000,000 Petromar Lda 35.00 24.50 E.M.
Internacional SA (Angola) Third parties 65.00
TMBYS SAS Guyancourt EUR 30,000 Saipem SA 33.33 33.33 E.M.
(France) Third parties 66.67
TSGI Mühendislik I
·ns¸aat Ltd S¸irketi Istanbul TRY 600,000 Saipem Ingenieria 30.00 33.33 E.M.
(Turkey) Y Construcciones SLU
Third parties 70.00
TSKJ II - Construções Internacionais, Funchal EUR 5,000 TSKJ - Servições 100.00 25.00 E.M.
Sociedade Unipessoal, Lda (Portugal) de Engenharia Lda
TSKJ - Nigeria Ltd Lagos NGN 50,000,000 TSKJ II - Construções 100.00 25.00 E.M.
(Nigeria) Internacionais, Sociedade
Unipessoal, Lda
TSKJ - Servições de Engenharia Lda Funchal EUR 5,000 Snamprogetti 25.00 25.00 E.M.
(Portugal) Netherlands BV
Third parties 75.00
Xodus Subsea Ltd London GBP 1,000,000 Saipem International BV 50.00 50.00 E.M.
(United Kingdom) Third parties 50.00
Company
Registered office
Currency
Share capital
Shareholders
% held
% Saipem’s
consolidation
Method
of consolidation
or accounting
principle
(*)
(*) F.C. = full consolidation, W.I. = working interest, E.M. = equity method, Co. = cost method
(***) Inactive throughout the period.
059-112SemSaipem15Ing.qxd 6-08-2015 18:41 Pagina 72

73
Saipem Condensed consolidated interim financial statements 2015 / Notes to the condensed consolidated interim financial statements
The Saipem Group comprises 106 companies: 59 are consolidated using the full consolidation method, 2 using the working interest method, 42 using
the equity method and 3 using the cost method.
At June 30, 2015, the companies of Saipem SpA can be broken down as follows:
Subsidiaries Associates and jointly-controlled entities
Italy Outside Italy Total Italy Outside Italy Total
Subsidiaries/Joint operations and their participating interests 4 55 59 1 1 2
Companies consolidated using the full consolidation method 4 55 59 - - -
Companies consolidated using the working interest method - - - 1 1 2
Participating interests held by consolidated companies
(1)
-3393342
Accounted for using the equity method - 3 3 7 32 39
Accounted for using the cost method - - - 2 1 3
Total companies 4 58 62 10 34 44
(1) The participating interests held by subsidiaries and joint operations accounted for using the equity method and the cost method concern non-material entities and entities whose consolidation would not
have a material impact.
059-112SemSaipem15Ing.qxd 6-08-2015 18:41 Pagina 73

74
Saipem Condensed consolidated interim financial statements 2015 / Notes to the condensed consolidated interim financial statements
Changes in the scope of consolidation
There were no significant changes in the scope of consolidation during
the first six months of 2015 with respect to the consolidated financial
statements at December 31, 2014. Changes are shown by order of
occurrence.
New incorporations, disposals, liquidations, mergers and changes to the
consolidation method:
- Construction Saipem Canada Inc, previously consolidated using the
full consolidation method, was merged by incorporation into Saipem
Canada Inc;
- 02 Pearl Snc, previously consolidated using the working interest
method, was consolidated using the equity method, as it became
immaterial;
- SPF - TKP Omifpro Snc, previously consolidated using the working
interest method, was consolidated using the equity method, as it
became immaterial;
- Baltica Scarl, with registered offices in Italy, was incorporated and is
accounted for using the equity method;
- Fertilizantes Nitrogenados de Oriente CEC, previously consolidated
using the cost method, was sold to third parties;
- Fertilizantes Nitrogenados de Oriente SA, previously consolidated
using the cost method, was sold to third parties;
- S.B.K. Baltica Società Consortile a Responsabilità Limitata Spólka
Komandytowa, with registered offices in Poland, was incorporated and
is accounted for using the cost method;
- Saipem UK Ltd, previously consolidated using the full consolidation
method, was removed from the Register of Companies;
- Barber Moss Ship Management AS, previously accounted for using the
equity method, was sold to third parties;
- Saipem Dangote E&C Ltd, with registered offices in Nigeria, was
incorporated and is accounted for using the equity method;
- PLNG 9 Snc di Chiyoda Corp e Servizi Energia Italia SpA, previously
accounted for using the equity method, was removed from the Register
of Companies.
059-112SemSaipem15Ing.qxd 6-08-2015 18:41 Pagina 74

Current assets
Cash and cash equivalents
Cash and cash equivalents amounted to €1,429 million, representing a decrease of €173 million compared with December 31, 2014 (€1,602 million).
Cash and equivalents at period-end, 29% of which are denominated in euro, 41% in US dollars and 30% in other currencies, received an average interest
rate of 0.295%. €678 million thereof (€885 million at December 31, 2014) are on deposit at Eni Group financial companies. Cash and cash equivalents
included cash and cash on hand of €5 million (€7 million at December 31, 2014).
Funds in two current accounts held by the subsidiary Saipem Contracting Algérie SpA (equivalent to €87 million at June 30, 2015) have been frozen
since February 2010 in connection with an investigation being conducted into third parties. The decrease of €3 million registered in the amount frozen
compared with the situation at December 31, 2014 was due to exchange rate differences.
The subsidiary Saipem Canada Inc has also deposited the equivalent of €7 million in trust funds in connection with disputes with a number of suppliers.
The breakdown of cash and cash equivalents of Saipem and other Group companies at June 30, 2015 by geographical area (based on the country where
the relevant position or account was domiciled) was as follows:
(€million) Dec. 31, 2014 June 30, 2015
Italy 173 225
Rest of Europe 1,069 807
CIS 11 16
Middle East 97 159
Far East 33 45
North Africa 104 94
West Africa and Rest of Africa 79 36
Americas 36 47
Total 1,602 1,429
For details on amounts relating to projects under execution in Algeria, see Note 47 ‘Additional information: Algeria’ on page 109.
Other financial assets held for trading or available for sale
Other financial assets held for trading or available for sale amounted to €8 million (€9 million at December 31, 2014) and were as follows:
(€million) Dec. 31, 2014 June 30, 2015
Financing receivables for non-operating purposes
Listed bonds issued by sovereign states 65
Listed securities issued by financial institutions 33
Total 98
Listed bonds issued by sovereign states of €5 million at June 30, 2015 were as follows:
(€million)
Fixed rate bonds
France 3 3 2.50 2018 AA+
Spain 2 2 3.75 2020 BBB
Total 5 5
The listed securities issued by financial institutions amounting to €3 million carry a rating of Aaa (Moody’s).
Nominal value
Fair value
Nominal rate
of return %
Maturity
Rating - Moody’s
2
1
75
Saipem Condensed consolidated interim financial statements 2015 / Notes to the condensed consolidated interim financial statements
059-112SemSaipem15Ing.qxd 6-08-2015 18:41 Pagina 75

76
Trade and other receivables
Trade and other receivables of €3,466 million (€3,391 million at December 31, 2014) were as follows:
(€million) Dec. 31, 2014 June 30, 2015
Trade receivables 2,808 2,716
Financing receivables for operating purposes 33
Financing receivables for non-operating purposes 58 32
Prepayments for services 341 465
Other receivables 181 250
Total 3,391 3,466
Receivables are stated net of a provision for impairment losses of €230 million.
(€million)
Trade receivables 110 135 (36) 3 - 212
Other receivables 36 - (18) - - 18
Total 146 135 (54) 3 - 230
Trade receivables amounted to €2,716 million, representing a decrease of €92 million, due principally to the write-down of a portion of overdue
receivables as the result of an increase in the country risk.
At June 30, 2015, Saipem had non-recourse non-notification factoring agreements relating to trade receivables, including not past due receivables,
amounting to €366 million (€512 million at December 31, 2014). Saipem is responsible for managing the collection of the assigned receivables and for
transferring the sums collected to the factors.
Trade receivables included retention amounts guaranteeing contract work-in-progress of €179 million (€162 million at December 31, 2014), of which
€64 million was due within one year and €115 million due after one year.
Financing receivables for operating purposes of €3 million (€3 million at December 31, 2014) were mainly related to a receivable held by Saipem SpA
from Serfactoring SpA.
The financing receivables for non-operating purposes of €32 million (€58 million at December 31, 2014) related mainly to the deposit paid by
Snamprogetti Netherlands BV in relation to the TSKJ matter of €25 million (see the ‘Legal proceedings’ section for full details).
Other receivables of €250 million were as follows:
(€million) Dec. 31, 2014 June 30, 2015
Receivables from:
- insurance companies 73
- employees 29 37
Guarantee deposits 13 17
Other receivables 132 193
Total 181 250
Trade receivables and other receivables from related parties are detailed in Note 43 ‘Transactions with related parties’.
The fair value of trade and other receivables did not differ significantly from their carrying amount due to the short period of time elapsed between their
date of origination and their due date.
For details on amounts relating to projects under execution in Algeria, see Note 47 ‘Additional information: Algeria’ on page109.
Dec. 31, 2014
Additions
Deductions
Currency
translation
differences
Other changes
June 30, 2015
3
Saipem Condensed consolidated interim financial statements 2015 / Notes to the condensed consolidated interim financial statements
059-112SemSaipem15Ing.qxd 6-08-2015 18:41 Pagina 76

Inventories
Inventories amounted to €2,531 million (€2,485 million at December 31, 2014) and were as follows:
(€million) Dec. 31, 2014 June 30, 2015
Raw and auxiliary materials and consumables 530 530
Contract work-in-progress 1,955 2,001
Total 2,485 2,531
The item ‘Raw and auxiliary materials and consumables’ includes spare parts for drilling and construction activities, as well as consumables for internal
use and not for sale. The item is stated net of a valuation allowance of €48 million.
(€million)
Raw and auxiliary materials and consumables valuation allowance 9 44 (5) - 48
Total 9 44 (5) - 48
Contract work-in-progress relates to timing differences between actual project progress and the achievement of contractual invoicing milestones, and
to the recognition of additional contract revenues deemed probable and reasonably estimated.
The amount of contract work-in-progress as presented in these condensed interim consolidated financial statements as at and for the six-month period
ended June 30, 2015 was affected by delays and cancellations of projects already underway, as well as by the adoption by clients of an increasingly
inflexible attitude during negotiations for change orders and claims.
The amount recorded in relation to contract work-in-progress was largely in line with the same period of the previous year, due to the combined effect of:
(i) the increase related to project progress made over the half year period pending the approval of milestones by clients, whose timeframe has been
affected by the prolongation of negotiations for additional work; (ii) the negative effect produced by estimation of a limited number of specific projects,
which were in part due to a change in the negotiating approach adopted in relation to certain positions.
Information on construction contracts accounted for in accordance with IAS 11 is provided in Note 42 ‘Segment information, geographical information
and construction contracts’.
For details on amounts relating to projects under execution in Algeria, see Note 47 ‘Additional information: Algeria’ on page 109.
Current tax assets
Current tax assets amounted to €311 million (€317 million at December 31, 2014) and were as follows:
(€million) Dec. 31, 2014 June 30, 2015
Italian tax authorities 150 170
Foreign tax authorities 167 141
Total 317 311
Other current tax assets
Other current tax assets amounted to €399 million (€307 million at December 31, 2014) and were as follows:
(€million) Dec. 31, 2014 June 30, 2015
Italian tax authorities 47 79
Foreign tax authorities 260 320
Total 307 399
6
5
Dec. 31, 2014
Additions
Deductions
Other changes
June 30, 2015
4
77
Saipem Condensed consolidated interim financial statements 2015 / Notes to the condensed consolidated interim financial statements
059-112SemSaipem15Ing.qxd 7-08-2015 9:58 Pagina 77

Other current assets
Other current assets amounted to €359 million (€520 million at December 31, 2014) and were as follows:
(€million) Dec. 31, 2014 June 30, 2015
Fair value of hedging derivatives 193 136
Fair value of non-hedging derivatives 154 82
Other assets 173 141
Total 520 359
At June 30, 2015, derivative instruments had a positive fair value of €218 million (€347 million at December 31, 2014).
The fair value of derivative instruments was determined using valuation models commonly used in the financial sector and based on period-end market
data (exchange and interest rates).
The fair value of forward contracts (outrights, forwards and currency swaps) was determined by comparing the net present value at contractual
conditions of forward contracts outstanding at June 30, 2015, with their present value recalculated at period-end market conditions. The model used is
the Net Present Value model, which is based on the forward contract exchange rate, the period-end exchange rate and the respective forward interest
rate curves.
The table below shows the assets considered in the calculation of the fair value of derivative contracts, including the long-term portion, broken down by
type.
Assets Dec. 31, 2014 Assets June 30, 2015
Fair value Commitments Fair value Commitments
(€million) purchase sale purchase sale
1) Derivative contracts qualified for hedge accounting:
- forward currency contracts (Spot component)
. purchase 192 46
. sale 3 105
Total 195 151
- forward currency contracts (Forward component)
. purchase (2) 2
. sale - (7)
Total (2) 2,413 64 (5) 787 4,089
- forward commodity contracts (Forward component)
. purchase - -
Total - - - -
Total derivative contracts qualified for hedge accounting 193 2,413 64 146 787 4,089
2) Derivative contracts not qualified for hedge accounting:
- forward currency contracts (Spot component)
. purchase 135 47
. sale 21 36
Total 156 83
- forward currency contracts (Forward component)
. purchase - 1
. sale (2) (2)
Total (2) 3,367 229 (1) 835 1,183
- forward commodity contracts (Forward component)
. sale - -
Total 2-
Total derivative contracts not qualified for hedge accounting 154 3,367 231 82 835 1,183
Total 347 5,780 295 228 1,622 5,272
Cash flow hedge transactions related to forward purchase and sale transactions (outrights, forwards and currency swaps).
The cash flows and the income statement impact of hedged highly probably forecast transactions at June 30, 2015 are expected to occur up until 2017.
During the first half of 2015, there were no significant cases of hedged items being no longer considered highly probable.
The positive fair value of derivatives qualified for hedge accounting at June 30, 2015, including the long-term portion described in Note 13 ‘Other
non-current assets’, totalled €146 million (€193 million at December 31, 2014). The spot component of these derivatives of €151 million (€195 million
at December 31, 2014) was deferred in a hedging reserve in equity (€142 million; €171 million at December 31, 2014) and recorded as finance income
7
78
Saipem Condensed consolidated interim financial statements 2015 / Notes to the condensed consolidated interim financial statements
059-112SemSaipem15Ing.qxd 6-08-2015 18:41 Pagina 78

and expense (€9 million; €24 million at December 31, 2014), while the forward component, which was not designated as a hedging instrument, was
recognised as finance income and expense (€5 million; €2 million at December 31, 2014).
The negative fair value of derivatives qualified for hedge accounting at June 30, 2015, analysed in Note 18 ‘Other current liabilities’ and including the
long-term portion described in Note 23 ‘Other non-current liabilities’, was €221 million (€556 million at December 31, 2014). The spot component of
these derivatives of €221 million was deferred in a hedging reserve in equity (€181 million; €501 million at December 31, 2014) and recorded as
finance income and expense (€40 million; €52 million at December 31, 2014).
During the period, operating revenues and expenses were adjusted by a net negative amount of €267 million to reflect the effects of hedging.
Other assets at June 30, 2015 amounted to €141 million, representing a decrease of €32 million compared with December 31, 2014, and consisted
mainly of prepayments.
Other assets from related parties are shown in Note 43 ‘Transactions with related parties’.
Non-current assets
Property, plant and equipment
Property, plant and equipment amounted to €7,383 million (€7,601 million at December 31, 2014) and consisted of the following:
(€million)
Property, plant and equipment 13,639 6,038 7,601 265 (377) (211) (1) 106 - 7,383 14,071 6,688
Total 13,639 6,038 7,601 265 (377) (211) (1) 106 - 7,383 14,071 6,688
Capital expenditure in the first half of 2015 amounted to €265 million (€324 million in the first half of 2014) and mainly related to:
-€80 million in the Offshore Engineering & Construction sector, relating mainly to the maintenance and upgrading of the existing asset base;
-€16 million in the Onshore Engineering & Construction sector relating to the purchase of equipment and the maintenance of existing assets;
-€107 million in the Offshore Drilling sector, relating mainly to class reinstatement works on the drillships Saipem 10000 and Saipem 12000 and on
the drilling jack-up Perro Negro 8, as well as maintenance and upgrading of the existing asset base;
-€62 million in the Onshore Drilling sector relating to upgrading work on the existing asset base.
No finance expenses were capitalised during the period.
Exchange rate differences arising from the translation of financial statements prepared in currencies other than the euro, amounting to €106 million,
mainly related to companies whose functional currency is the US dollar.
Fully-depreciated property, plant and equipment that is still in use mainly consisted of project-specific equipment which has been fully depreciated over
the life of the project.
During the first half of the year, no government grants were recorded as a decrease of the carrying value of property, plant and equipment.
At June 30, 2015, all property, plant and equipment was free from pledges, liens and encumbrances.
The total commitment on current items of capital expenditure at June 30, 2015 amounted to €144 million (€174 million at December 31, 2014), as
indicated in the ‘Risk management’ section of the ‘Operating and Financial Review’.
Property, plant and equipment includes assets carried under finance leases amounting to the equivalent of €30 million, relating to finance leases for
the utilisation of two onshore drilling rigs in Saudi Arabia.
In accordance with the need to rethink Saipem’s operating strategy via the rationalisation of fabrication yards and vessels that are no longer viable in the
new market environment and with the guidelines set out in the turnaround plan ‘Fit for the future’, the first half of 2015 saw a write-down totalling
€41 million recorded against the vessels Scarabeo 4, Castoro Sette, S355 and Saibos 230, which have been slated for scrapping. In addition, write-downs
totalling €170 million were recorded in relation to components of two fabrication yards that will not be used in future activities. Finally, following the
revision of the depreciation schedule on December 31, 2014, the rig Semac 1, which has been slated for scrapping, was fully depreciated as of June 30,
2015.
In reviewing its impairment indicators, Saipem considers, among other factors, the relationship between its market capitalisation and net assets. At June
30, 2015, the Group’s market capitalisation was higher than its net assets. This notwithstanding, in the light of the size of the write-downs recorded
during the period against tangible assets that are not independent cash generating units and against contract work-in-progress and also in view of
ongoing market conditions characterised by low oil prices and a high degree of volatility, management deemed it necessary to update impairment tests
on all cash generating units. The cash generating units identified were as follows: two leased FPSO units, the other Offshore E&C assets, the Onshore E&C
sector, the Onshore Drilling sector and the individual offshore drilling rigs (15 separate rigs).
The analyses performed showed that the carrying amount of the cash generating units tested could be recovered through use.
Gross value
at Dec. 31, 2014
Accumulated depreciation
and impairment
at Dec. 31, 2014
Net value
at Dec. 31, 2014
Capital expenditure
Depreciation
Impairment
Disposals
Exchange differences
Other changes
Final net value
at June 30, 2015
Final gross value
at June 30, 2015
Accumulated depreciation
and impairment
at June 30, 2015
8
79
Saipem Condensed consolidated interim financial statements 2015 / Notes to the condensed consolidated interim financial statements
059-112SemSaipem15Ing.qxd 6-08-2015 18:41 Pagina 79

Intangible assets
Intangible assets amounted to €758 million (€760 million at December 31, 2014) and were as follows:
(€million)
Intangible assets with finite useful lives 191 159 32 3 (5) - - - (1) - 29 193 164
Other intangible assets with indefinite useful lives728-728-----1-729729-
Total 9191597603(5)-----758922164
Goodwill of €729 million related to the difference between the purchase price, including transaction costs, and the net assets of Saipem SA (€689
million), Sofresid SA (€21 million) and the Moss Maritime Group (€14 million) on the date that control was acquired.
For impairment purposes, goodwill has been allocated to the following cash-generating units:
(€million) June 30, 2015
Offshore E&C 415
Onshore E&C 314
Total 729
Management has retested the value in use of the CGUs to which goodwill has been allocated to verify the recoverability of their carrying amounts,
including allocated goodwill. The recoverable amount of the two cash generating units in question was determined based on value in use, calculated by
discounting the future cash flows expected to result from the use of each CGU.
The expected future cash flows for the explicit forecast period of four years were derived from Saipem’s 2015-2018 Strategic Plan, has been updated to
reflect the revision of results expected for 2015 and for the following years of the plan to take into account current business trends.
For all cash generating units, value in use was calculated by discounting expected future post-tax cash flows at a rate of 5.9% (down 1% compared with
2014). The discount rate was based on: (i) a cost of debt consistent with current interest rates and Eni’s rating; (ii) Eni’s leverage target; and (iii) the beta
of the Saipem share.
The terminal value (i.e. for subsequent years beyond the plan horizon) was estimated using the perpetuity model, applying a real growth rate of zero
(unchanged from 2014) reflecting expected long-term growth for the sectors, applied to the normalised free cash flow of the final projection year to take
into account the cyclical nature of the business.
Post-tax cash flows and discounting rates are used as they result in values similar to those resulting from a calculation using pre-tax cash flows and
discount rates.
The table below shows the amounts by which the recoverable amounts of the Offshore E&C and Onshore E&C cash generating units exceed their carrying
amounts, including allocated goodwill.
(€million)
Goodwill 415 314 729
Amount by which recoverable amount exceeds carrying amount 4,467 1,824 6,291
The key assumptions adopted for assessing recoverable amounts were principally the operating results of the CGU (based on a combination of various
factors, e.g. sales volumes, service prices, project profit margins, cost structure), the discount rate, and the growth rates adopted to determine the
terminal value.
Offshore E&C
Onshore E&C
Total
Gross value
at Dec. 31, 2014
Accumulated amortisation
and impairment
at Dec. 31, 2014
Net value
at Dec. 31, 2014
Investments
Amortisation
Impairment
Reversals
Disposals
Exchange differences
Other changes
Final net value
at June 30, 2015
Final gross value
at June 30, 2015
Accumulated amortisation
and impairment
at June 30, 2015
9
80
Saipem Condensed consolidated interim financial statements 2015 / Notes to the condensed consolidated interim financial statements
059-112SemSaipem15Ing.qxd 6-08-2015 18:41 Pagina 80
Investments accounted for using the equity method
Investments accounted for using the equity method of €124 million (€120 million at December 31, 2014) were as follows:
(€million)
Dec. 31, 2014
Investments in joint ventures
and associates 166 9 (3) 27 (3) (11) - 9 - (74) 120 -
Total 166 9 (3) 27 (3) (11) - 9 - (74) 120 -
June 30, 2015
Investments in joint ventures
and associates 120 1 - 8 (10) (1) - 5 - 1 124 -
Total 1201 -8(10)(1)-5 -1124 -
Investments in subsidiaries, jointly-controlled entities and associates are analysed in the section ‘Scope of consolidation at June 30, 2015’.
Acquisitions and subscriptions of €1 million related to the subscription of the share capital of Saipem Dangote E&C Ltd.
The share of profit of investments accounted for using the equity method of €8 million included profits for the period of €3 million recorded by the
jointly-controlled entity TSGI Mühendislik I
·ns¸aat Ltd S¸irketi, €4 million recorded by the associate KWANDA Suporte Logistico Lda and €1 million recorded
by other companies.
The share of losses of investments accounted for using the equity method of €10 million included losses for the period of €7 million recorded by the
jointly-controlled entities Petromar Lda (€5 million) and Xodus Subsea Ltd (€2 million) and a loss for the period of €3 million recorded by the associate
Saipem Taqa Al Rushaid Fabricators Co Ltd.
Deductions for dividends of €1 million related mainly to Rosetti Marino SpA.
The net carrying value of investments accounted for using the equity method related to the following companies:
(€million)
Rosetti Marino SpA 20.00 31 31
Petromar Lda 70.00 42 41
Other 47 52
Total investments in joint ventures and associates 120 124
The total carrying value of investments accounted for using the equity method does not include the provision for losses of €17 million (€8 million at
December 31, 2014) recorded under the provisions for contingencies.
Other financial assets
At June 30, 2015 other long-term financial assets amounted to €1 million (€1 million at December 31, 2014) and related to financing receivables held
for non-operating purposes by Sofresid SA.
11
Group
interest (%)
Net value
at Dec. 31, 2014
Net value
at June 30, 2015
Opening net value
Acquisitions
and subscriptions
Sales and redemption
Share of profit
of equity-accounted
investments
Share of loss
of equity-accounted
investments
Deduction
for dividends
Change in the scope
of consolidation
Currency translation
differences
Movements
in reserves
Other changes
Closing net value
Provision for impairment
10
81
Saipem Condensed consolidated interim financial statements 2015 / Notes to the condensed consolidated interim financial statements
059-112SemSaipem15Ing.qxd 6-08-2015 18:41 Pagina 81

Deferred tax assets
Deferred tax assets of €482 million (€297 million at December 31, 2014) are shown net of offsettable deferred tax liabilities.
(€million)
Deferred tax assets 297 279 11 (105) 482
Total 297 279 11 (105) 482
‘Other changes’, which amounted to negative €105 million, included: (i) offsetting of deferred tax assets against deferred tax liabilities at individual
entity level (negative €32 million); (ii) the negative tax effects (€69 million) of fair value changes of derivatives designated as cash flow hedges
reported in equity; and (iii) other changes (negative €4 million).
Net deferred tax assets consisted of the following:
(€million) Dec. 31, 2014 June 30, 2015
Deferred tax (314) (335)
Deferred tax assets available for offset 274 306
Deferred tax liabilities (40) (29)
Deferred tax assets 297 482
Net deferred tax assets (liabilities) 257 453
Taxes are shown in Note 39 ‘Income taxes’.
Other non-current assets
Other non-current assets of €111 million (€115 million at December 31, 2014) were as follows:
(€million) Dec. 31, 2014 June 30, 2015
Fair value of hedging derivatives -10
Other receivables 16 16
Other non-current assets 99 85
Total 115 111
The fair value of hedging derivatives relates to foreign exchange risk hedges mainly entered into by Saipem SA and Sofresid SA with the Eni Group
maturing in 2016.
Other non-current assets mainly related to prepayments.
Other non-current assets from related parties are shown in Note 43 ‘Transactions with related parties’.
Current liabilities
Short-term debt
Short-term debt of €3,037 million (€2,186 million at December 31, 2014) consisted of the following:
(€million) Dec. 31, 2014 June 30, 2015
Banks 277 465
Other financial institutions 1,909 2,572
Total 2,186 3,037
Short-term debt increased by €851 million. Debt to banks include €250 million classified at December 31, 2014 under long-term debt relating to a loan
agreement signed in 2014 with covenants requiring Saipem to maintain specific financial and economic ratios. The loan has been reclassified under
short-term debt because the negative value recorded for EBITDA at June 30, 2015 is in breach of the one of the covenants, thus giving the lender the
ability to demand repayment of the loan.
The current portion of long-term debt, amounting to €487 million (€594 million at December 31, 2014), is detailed in Note 19 ‘Long-term debt and
current portion of long-term debt’.
14
13
Dec. 31, 2014
Additions
(Deductions)
Currency
translation
differences
Other changes
June 30, 2015
12
82
Saipem Condensed consolidated interim financial statements 2015 / Notes to the condensed consolidated interim financial statements
059-112SemSaipem15Ing.qxd 6-08-2015 18:41 Pagina 82

The breakdown of short-term debt by issuing institution, currency and average interest rate was as follows:
(€million)
Dec. 31, 2014 June 30, 2015
Interest rate % Interest rate %
Issuing institution Currency Amount from to Amount from to
Eni SpA Euro 124 1.518 1.518 363 1.510 1.510
Eni SpA US Dollar - - - 18 7.000 7.000
Serfactoring SpA Euro 7-----
Serfactoring SpA US Dollar 11 - - 20 - -
Serfactoring SpA Other 6-----
Eni Finance International SA Euro 697 0.657 2.157 749 0.660 1.510
Eni Finance International SA US Dollar 710 0.821 2.321 632 1.037 1.690
Eni Finance International SA Australian Dollar 197 3.150 3.150 235 2.650 2.650
Eni Finance International SA Canadian Dollar - - - 505 2.250 2.250
Eni Finance International SA Other 121 variable - - -
Eni Finance USA US Dollar - - - 8 1.687 1.687
Third parties Euro 5 1.018 1.018 257 0.940 1.585
Third parties US Dollar 4 1.351 1.571 1 0.417 8.000
Third parties Other 304 variable 249 variable
Total 2,186 3,037
At June 30, 2015, Saipem had unused lines of credit amounting to €2,478 million (€2,450 million at December 31, 2014). Commission fees on unused
lines of credit were not significant.
Short-term debt to related parties is shown in Note 43 ‘Transactions with related parties’.
Trade and other payables
Trade and other payables of €5,788 million (€5,669 million at December 31, 2014) consisted of the following:
(€million) Dec. 31, 2014 June 30, 2015
Trade payables 3,283 3,295
Deferred income and advances 1,980 1,990
Other payables 406 503
Total 5,669 5,788
Trade payables amounted to €3,295 million, representing an increase of €12 million compared with December 31, 2014.
Deferred income and advances of €1,990 million (€1,980 million at December 31, 2014), consisted mainly of adjustments to revenues from long-term
contracts of €1,381 million (€1,314 million at December 31, 2014) made on the basis of amounts contractually earned in accordance with the accruals
concept and advances on contract work in progress received by Saipem SpA and a number of foreign subsidiaries of €609 million (€666 million at
December 31, 2014).
Trade and other payables to related parties are shown in Note 43 ‘Transactions with related parties’.
Other payables of €503 million were as follows:
(€million) Dec. 31, 2014 June 30, 2015
Payables to:
- employees 189 293
- national insurance/social security contributions 71 54
- insurance companies 55
- consultants and professionals 43
- Board Directors and Statutory Auditors 1-
Other payables 136 148
Total 406 503
15
83
Saipem Condensed consolidated interim financial statements 2015 / Notes to the condensed consolidated interim financial statements
059-112SemSaipem15Ing.qxd 6-08-2015 18:41 Pagina 83

The fair value of trade and other payables did not differ significantly from their carrying amount due to the short period of time elapsed between their
date of origination and their due date.
For details on amounts relating to projects under execution in Algeria, see Note 47 ‘Additional information: Algeria’ on page 109.
Income tax payables
Income tax payables of €128 million (€134 million at December 31, 2014) were as follows:
(€million) Dec. 31, 2014 June 30, 2015
Italian tax authorities 312
Foreign tax authorities 131 116
Total 134 128
Other current tax liabilities
Other current tax liabilities amounted to €181 million (€184 million at December 31, 2014) and were as follows:
(€million) Dec. 31, 2014 June 30, 2015
Italian tax authorities 13 -
Foreign tax authorities 171 181
Total 184 181
Other current liabilities
Other current liabilities amounted to €380 million (€838 million at December 31, 2014) and were as follows:
(€million) Dec. 31, 2014 June 30, 2015
Fair value of hedging derivatives 555 216
Fair value of non-hedging derivatives 280 127
Other liabilities 337
Total 838 380
At June 30, 2015, derivative instruments had a negative fair value of €343 million (€835 million at December 31, 2014).
The following table shows the positive and negative fair values of derivative contracts at June 30, 2015.
(€million) Dec. 31, 2014 June 30, 2015
Positive fair value of derivative contracts 347 228
Negative fair value of derivative contracts (836) (348)
Total (489) (120)
The fair value of derivative instruments was determined using valuation models commonly used in the financial sector and based on period-end market
data (exchange and interest rates).
The fair value of forward contracts (outrights, forwards and currency swaps) was determined by comparing the net present value at contractual
conditions of forward contracts outstanding at June 30, 2015, with their present value recalculated at period-end market conditions. The model used is
the Net Present Value model, which is based on the forward contract exchange rate, the period-end exchange rate and the respective forward interest
rate curves.
A liability of €1 million (€1 million at December 31, 2014) relating to the fair value of an interest rate swap has been recorded under Note 19 ‘Long-term
debt’. The fair value of interest rate swaps was determined by comparing the net present value at contractual conditions of swaps outstanding at June
30, 2015, with their present value recalculated at period-end market conditions. The model used is the Net Present Value model, which is based on EUR
forward interest rates.
18
17
16
84
Saipem Condensed consolidated interim financial statements 2015 / Notes to the condensed consolidated interim financial statements
059-112SemSaipem15Ing.qxd 6-08-2015 18:41 Pagina 84

The table below shows the liabilities considered in the calculation of the fair value of derivative contracts, including the long-term portion, broken down
by type.
Liabilities Dec. 31, 2014 Liabilities June 30, 2015
Fair value Commitments Fair value Commitments
(€million) purchase sale purchase sale
1) Derivative contracts qualified for hedge accounting:
- interest rate contracts (Spot component)
. purchase 1 1
Total 1 250 1 250
- forward currency contracts (Spot component)
. purchase 27 47
. sale 525 173
Total 552 220
- forward currency contracts (Forward component)
. purchase (2) (4)
. sale - 4
Total (2) 582 6,047 - 2,036 2,143
- forward commodity contracts (Forward component)
. purchase 5 -
Total 5 16 - - 3 -
Total derivative contracts qualified for hedge accounting 556 848 6,047 221 2,289 2,143
2) Derivative contracts not qualified for hedge accounting:
- forward currency contracts (Spot component)
. purchase 19 17
. sale 261 109
Total 280 126
- forward currency contracts (Forward component)
. purchase (1) (1)
. sale 1 2
Total - 290 3,404 1 715 930
- forward commodity contracts (Forward component)
. purchase - -
. sale - -
Total - 1 - - 3 3
Total derivative contracts not qualified for hedge accounting 280 291 3,404 127 718 933
Total 836 1,139 9,451 348 3,007 3,076
For a comprehensive analysis of the fair value of hedging derivatives, see Note 7 ‘Other current assets’, Note 13 ‘Other non-current assets’ and Note 23
‘Other non-current liabilities’.
Other liabilities amounted to €37 million (€3 million at December 31, 2014).
Other liabilities to related parties are shown in Note 43 ‘Transactions with related parties’.
85
Saipem Condensed consolidated interim financial statements 2015 / Notes to the condensed consolidated interim financial statements
059-112SemSaipem15Ing.qxd 6-08-2015 18:41 Pagina 85

Non-current liabilities
Long-term debt and current portion of long-term debt
Long-term debt, including the current portion of long-term debt, amounted to €3,964 million (€3,908 million at December 31, 2014) and was as follows:
Dec. 31, 2014 June 30, 2015
Current Long-term Current Long-term
(€million) portion portion Total portion portion Total
Banks - 250 250 - - -
Other financial institutions 594 3,064 3,658 487 3,477 3,964
Total 594 3,314 3,908 487 3,477 3,964
The long-term portion of long-term debt is shown below by year of maturity:
(€million)
Other financial institutions 2016-2024 249 1,059 638 1,487 44 3,477
Total 249 1,059 638 1,487 44 3,477
The long-term portion of long-term debt amounted to €3,477 million, up €163 million against December 31, 2014 (€3,314 million).
The following table breaks down long-term debt, inclusive of the current portion, by issuing entity and currency and also shows maturities and average
interest rates:
(€million)
Dec. 31, 2014 June 30, 2015
Interest rate % Interest rate %
Issuing institution Currency Maturity Amount from to Amount from to
Eni SpA Euro 2015-2017 1,674 2.518 4.950 2,018 2.510 4.950
Eni Finance International SA Euro 2015-2024 1,319 0.757 2.507 1,337 0.760 2.510
Eni Finance International SA US Dollar 2015-2016 665 0.921 4.330 609 0.940 2.687
Third parties Euro 2017 250 1.585 1.585 - - -
Total 3,908 3,964
There was no debt secured by mortgages or liens on fixed assets of consolidated companies or by pledges on securities.
The fair value of long-term debt, including the current portion of long-term debt, amounted to €4,247 million (€4,189 million at December 31, 2014) and
was calculated by discounting the expected future cash flows at the following rates:
(%) 2014 2015
Euro 0.16-0.36 0.01-0.50
US Dollar 0.27-1.28 0.18-0.89
The difference between the fair value of long-term debt and its nominal value was mainly due to the debt of €750 million expiring in 2019.
Long-term debt to related parties is shown in Note 43 ‘Transactions with related parties’.
Type
Maturity range
2016
2017
2018
2019
After
Total
19
86
Saipem Condensed consolidated interim financial statements 2015 / Notes to the condensed consolidated interim financial statements
059-112SemSaipem15Ing.qxd 6-08-2015 18:41 Pagina 86
The following table shows net borrowings as indicated in the section ‘Financial and economic results’ of the ‘Operating and Financial Review’:
Dec. 31, 2014 June 30, 2015
(€million) Current Non-current Total Current Non-current Total
A. Cash and cash equivalents 1,602 - 1,602 1,429 - 1,429
B. Available-for-sale securities 9 - 9 8 - 8
C. Liquidity (A+B) 1,611 - 1,611 1,437 - 1,437
D. Financing receivables 58 - 58 32 - 32
E. Short-term bank debt 277 - 277 465 - 465
F. Long-term bank debt - 250 250 - - -
G. Short-term related party debt 1,873 - 1,873 2,530 - 2,530
H. Long-term related party debt 594 3,064 3,658 487 3,477 3,964
I. Other short-term debt 36 - 36 42 - 42
L.Other long-term debt ------
M. Total borrowings (E+F+G+H+I+L) 2,780 3,314 6,094 3,524 3,477 7,001
N. Net financial position pursuant to Consob
communication No. DEM/6064293/2006 (M-C-D) 1,111 3,314 4,425 2,055 3,477 5,532
O. Non-current financing receivables - 1 1 - 1 1
P. Net borrowings (N-O) 1,111 3,313 4,424 2,055 3,476 5,531
Net borrowings include a liability relating to the interest rate swap but do not include the fair value of derivatives indicated in Note 7 ‘Other current
assets’, Note 13 ‘Other non-current assets’, Note 18 ‘Other current liabilities’ and Note 23 ‘Other non-current liabilities’.
Cash and cash equivalents included €94 million deposited in accounts that are frozen or placed in trust funds, as indicated in Note 1 ‘Cash and cash
equivalents’.
Provisions for contingencies
Provisions for contingencies of €264 million (€218 million at December 31, 2014) consisted of the following:
(€million)
Dec. 31, 2014
Provisions for taxes 55 4 (13) 2 48
Provisions for contractual penalties and disputes 14 19 (5) - 28
Provisions for losses of investments 8 4 - (4) 8
Provision for contractual expenses and losses on long-term contracts 83 63 (48) 4 102
Other provisions 44 50 (59) (3) 32
Total 204 140 (125) (1) 218
June 30, 2015
Provisions for taxes 48 1 (4) - 45
Provisions for contractual penalties and disputes 28 6 (19) 2 17
Provisions for losses of investments 8 9 - - 17
Provision for contractual expenses and losses on long-term contracts 102 88 (26) - 164
Other provisions 32 1 (10) (2) 21
Total 218 105 (59) - 264
The provisions for taxes amounted to €45 million and related principally to disputes with foreign tax authorities that are either ongoing or potential,
taking into account the results of recent assessments.
The provisions for contractual penalties and disputes amounted to €17 million and consisted of provisions set aside by Saipem SpA and a number of
foreign subsidiaries in relation to ongoing disputes.
Opening balance
Additions
Deductions
Other changes
Closing balance
20
87
Saipem Condensed consolidated interim financial statements 2015 / Notes to the condensed consolidated interim financial statements
059-112SemSaipem15Ing.qxd 6-08-2015 18:41 Pagina 87

The provisions for losses of investments amounted to €17 million and related to provisions for losses of investments that exceed their carrying
amount. The provision related mainly to amounts set aside in connection with the investment held in the company Southern Gas Constructor Ltd by
Saipem International BV.
The provision for contractual expenses and losses on long-term contracts stood at €164 million and related to an estimate of expected losses on
long-term contracts in the Offshore and Onshore Engineering & Construction sectors.
Other provisions amounted to €21 million.
For details on amounts relating to projects under execution in Algeria, see Note 47 ‘Additional information: Algeria’ on page 109.
Provisions for employee benefits
Provisions for employee benefits at June 30, 2015 amounted to €240 million (€237 million at December 31, 2014).
Deferred tax liabilities
Deferred tax liabilities of €29 million (€40 million at December 31, 2014) are shown net of offsettable deferred tax assets of €306 million.
(€million)
Deferred tax liabilities 40 145 4 (160) 29
Total 40 145 4 (160) 29
The item ‘Other changes’, which amounted to negative €160 million, included: (i) offsetting of deferred tax assets against deferred tax liabilities at
individual entity level (negative €32 million); (ii) the negative tax effects (€122 million) of fair value changes of derivatives designated as cash flow
hedges reported in equity; and (iii) other changes (negative €6 million).
A breakdown of deferred tax assets is provided in Note 12 ‘Deferred tax assets’.
Tax losses
Tax losses amounted to €2,374 million (€1,427 million at December 31, 2014) of which a considerable part can be carried forward without limit. Tax
recovery corresponds to a tax rate of 27.5% for Italian companies and to an average tax rate of 28% for foreign companies.
Tax losses related mainly to foreign companies and can be used in the following periods:
(€million)
2015 --
2016 -62
2017 - 111
2018 -60
2019 -25
After 2019 -571
Without limit 285 1,260
Total 285 2,089
Other non-current liabilities
Other non-current liabilities of €5 million (€2 million at December 31, 2014) were as follows:
(€million) Dec. 31, 2014 June 30, 2015
Fair value of hedging derivatives -4
Trade and other payables 21
Total 25
The fair value of hedging derivatives relates to foreign exchange risk hedges entered into by Saipem SpA and Saipem SA with the Eni Group maturing in
2016.
23
Italian
subsidiaries
Foreign
subsidiaries
Dec. 31, 2014
Additions
(Deductions)
Currency
translation
differences
Other changes
June 30, 2015
22
21
88
Saipem Condensed consolidated interim financial statements 2015 / Notes to the condensed consolidated interim financial statements
059-112SemSaipem15IngxTipo.qxd 8-09-2015 10:49 Pagina 88

Assets held for sale
In January 2015, Snamprogetti Netherlands BV completed the sale of its interests in Fertilizantes Nitrogenados de Oriente CEC and Fertilizantes
Nitrogenados de Oriente SA. As of June 30, 2015 there were no assets held for sale.
Shareholders’ equity
Non-controlling interests
Non-controlling interests at June 30, 2015 amounted to €58 million (€41 million at December 31, 2014).
Saipem’s shareholders’ equity
Saipem’s shareholders’ equity at June 30, 2015 amounted to €3,288 million and was as follows:
(€million) Dec. 31, 2014 June 30, 2015
Share capital 441 441
Share premium reserve 55 55
Legal reserve 88 88
Cash flow hedge reserve (275) (289)
Cumulative currency translation differences (9) 65
Employee defined benefits reserve (19) (20)
Other 66
Retained earnings 4,123 3,905
Net profit (loss) for the period (230) (920)
Treasury shares (43) (43)
Total 4,137 3,288
Saipem’s shareholders’ equity at June 30, 2015 included distributable reserves of €3,830 million (€3,931 million at December 31, 2014), some of which
are subject to taxation upon distribution. A deferred tax liability has been recorded in relation to the share of reserves that may potentially be distributed
(€107 million).
Share capital
At June 30, 2015, the share capital of Saipem SpA, fully paid-up, amounted to €441 million, corresponding to 441,410,900 shares with a nominal value
of €1 each, of which 441,301,574 are ordinary shares and 109,326 savings shares.
On April 30, 2015, the Annual Shareholders’ Meeting resolved to forego the distribution of a dividend for ordinary shares and to distribute a dividend for
savings shares amounting to 5% of the nominal value, i.e. €0.05 per share.
Share premium reserve
The share premium reserve amounted to €55 million at June 30, 2015 and was unchanged from December 31, 2014.
Other reserves
At June 30, 2015, ‘Other reserves’ amounted to negative €150 million (€209 million at December 31, 2014) and consisted of the following items.
(€million) Dec. 31, 2014 June 30, 2015
Legal reserve 88 88
Cash flow hedge reserve (275) (289)
Cumulative currency translation differences (9) 65
Employee defined benefits reserve (19) (20)
Other 66
Total (209) (150)
29
28
27
26
25
24
89
Saipem Condensed consolidated interim financial statements 2015 / Notes to the condensed consolidated interim financial statements
059-112SemSaipem15Ing.qxd 6-08-2015 18:41 Pagina 89

Legal reserve
At June 30, 2015, the legal reserve stood at €88 million. This represents the portion of profits, accrued as per Article 2430 of the Italian Civil Code, that
cannot be distributed as dividends. The reserve remained unchanged, having reached a fifth of share capital.
Cash flow hedge reserve
This reserve showed a negative balance at period end of €289 million (negative balance of €275 million at December 31, 2014), which related to the
fair value of interest rate swaps, commodity hedges and the spot component of foreign exchange risk hedges at June 30, 2015.
The cash flow hedge reserve is shown net of tax effects of €144 million (€91 million at December 31, 2014).
Cumulative currency translation differences
This reserve amounted to positive €65 million (negative €9 million at December 31, 2014) and related to exchange rate differences arising from the
translation into euro of financial statements denominated in functional currencies other than euro (mainly the US dollar).
Employee defined benefits reserve
This reserve is used to recognise remeasurements of employee defined benefit plans. At June 30, 2015, it had a negative balance of €20 million
(negative €19 million at December 31, 2014).
The reserve is shown net of tax effects of €8 million (€8 million at December 31, 2014) and includes a positive amount of €1 million relating to
investments accounted for using the equity method.
Other
This item amounted to €6 million (€6 million at December 31, 2014), relating to the allocation of part of 2005 net profit, pursuant to Article 2426, 8-bis
of the Italian Civil Code. It also contains the revaluation reserve set up by Saipem SpA in previous years, amounting to €2 million, and a reserve with a
negative balance of €1 million for cash flow hedges of investments accounted for using the equity method.
Treasury shares
Saipem SpA holds treasury shares to the value of €43 million (€43 million at December 31, 2014), consisting of 1,939,832 (1,939,832 at December 31,
2014) with a nominal value of €1 each.
Treasury shares were allocated under the 2002-2008 stock option plans. Operations involving treasury shares during the period were as follows:
Treasury shares repurchased
2003 (from May 2) 2,125,000 6.058 13 0.48
2004 1,395,000 7.044 10 0.32
2005 3,284,589 10.700 35 0.74
2006 1,919,355 18.950 36 0.43
2007 848,700 25.950 22 0.19
2008 2,245,300 25.836 58 0.51
Total 11,817,944 14.745 174 2.67
Less treasury shares allocated:
- without consideration, as stock grants 1,616,400
- against payment, as stock options 8,261,712
Treasury shares held at June 30, 2015 1,939,832
At June 30, 2015, there were 61,350 stock options outstanding for the purchase of Company shares.
Further information on stock option plans is provided in Note 35 ‘Payroll and related costs’.
Number
of shares
Average cost
(€)
Total cost
(€million)
Share capital
(%)
30
90
Saipem Condensed consolidated interim financial statements 2015 / Notes to the condensed consolidated interim financial statements
059-112SemSaipem15Ing.qxd 6-08-2015 18:41 Pagina 90

Guarantees, commitments and risks
Guarantees
Guarantees amounted to €7,461 million (€8,169 million at December 31, 2014).
Dec. 31, 2014 June 30, 2015
Other Other
(€million) Unsecured guarantees Total Unsecured guarantees Total
Joint ventures and associates 283 184 467 300 180 480
Consolidated companies 126 2,331 2,457 126 2,115 2,241
Own 142 5,103 5,245 24 4,716 4,740
Total 551 7,618 8,169 450 7,011 7,461
Other guarantees issued for consolidated companies amounted to €2,115 million (€2,331 million at December 31, 2014) and related to independent
guarantees given to third parties relating mainly to bid bonds and performance bonds.
Guarantees issued to/through related parties are detailed in Note 43 ‘Transactions with related parties’.
For details on amounts relating to projects under execution in Algeria, see Note 47 ‘Additional information: Algeria’ on page 109.
Commitments
Saipem SpA has provided commitments towards customers and/or other beneficiaries (financial and insurance institutions, export credit agencies)
relating to the fulfilment of contractual obligations entered into by itself and/or by its subsidiaries, jointly-controlled entities or associated companies in
the event of non-performance and payment of any damages arising from non-performance.
These commitments guarantee contracts whose overall value amounted to €45,781 million (€40,912 million at December 31, 2014), including both
work already performed and the relevant portion of the backlog of orders at June 30, 2015.
Risk management
The main risks that the Company is facing and actively monitoring and managing are described in the ‘Risk management’ section of the ‘Operating and
Financial Review’.
FAIR VALUE MEASUREMENT
Below, financial assets and liabilities measured at fair value in the balance sheet are classified using the ‘fair value hierarchy’ based on the significance
of the inputs used in the measurement process. The fair value hierarchy consists of the following three levels:
a) Level 1: quoted prices (unadjusted) in active markets for identical assets or liabilities;
b) Level 2: inputs other than quoted prices included within Level 1 that are observable for the asset or liability, either directly (i.e. as prices) or indirectly
(i.e. derived from prices);
c) Level 3: inputs for assets or liabilities that are not based on observable market data.
Financial instruments measured at fair value at June 30, 2015 are classified as follows:
June 30, 2015
(€million) Level 1 Level 2 Level 3 Total
Held for trading financial assets (liabilities):
- non-hedging derivatives - (45) - (45)
Available-for-sale financial assets:
- other available-for-sale financial assets 8 - - 8
Net hedging derivative assets (liabilities) - (75) - (75)
Total 8 (120) - (112)
There was no movement between Levels 1 and 2 during the first half of 2015.
Legal proceedings
Saipem is involved in civil and administrative proceedings and legal actions connected with the ordinary course of its business. Provisions for legal risks
are made on the basis of information currently available, including information acquired by external consultants providing the Company with legal
support. Information available to the Company for the purposes of risk assessment regarding criminal proceedings is by its very nature incomplete due
to the principle of pre-trial secrecy. A brief summary of the most important disputes is provided below.
31
91
Saipem Condensed consolidated interim financial statements 2015 / Notes to the condensed consolidated interim financial statements
059-112SemSaipem15Ing.qxd 6-08-2015 18:41 Pagina 91

TSKJ Consortium - Investigations by the US, Italian and other overseas Authorities
Snamprogetti Netherlands BV holds a 25% interest in the TSKJ Consortium of companies. The remaining interests are held in equal shares of 25% by KBR,
Technip and JGC. From 1994, the TSKJ Consortium was involved in the construction of natural gas liquefaction facilities at Bonny Island, Nigeria.
Snamprogetti SpA, the parent company of Snamprogetti Netherlands BV, was a direct subsidiary of Eni SpA until February 2006, when an agreement was
entered into for the sale of Snamprogetti SpA to Saipem SpA. Snamprogetti SpA was merged into Saipem SpA as of October 1, 2008. As part of the sale of
Snamprogetti SpA, Eni agreed to indemnify Saipem for costs and potential losses resulting from the investigations into the TSKJ matter, including in
connection with all related subsidiaries.
A number of judicial authorities, including the Milan Public Prosecutor’s office, have carried out investigations into alleged improper payments made by
the TSKJ Consortium to certain Nigerian public officials. The proceedings in both the United States and Nigeria have been resolved through settlements.
The proceedings in Italy: the investigation regards events dating back to 1994 and also concerns the period subsequent to the introduction of Legislative
Decree No. 231 of June 8, 2001 regarding the administrative responsibility of companies. The proceedings brought by the Milan Public Prosecutor
against Eni SpA and Saipem SpA related to administrative responsibility under Legislative Decree No. 231/2001 arising from offences of international
corruption allegedly committed by former managers of Snamprogetti.
The Milan Public Prosecutor requested the application of precautionary measures pursuant to Legislative Decree No. 231/2001 consisting in Eni and
Saipem being debarred from activities involving – directly or indirectly – any agreement with the Nigerian National Petroleum Corp or its subsidiaries,
claiming the ineffectiveness and inadequacy and violation of the organisational, management and control model adopted to prevent the commission of
the alleged offences by persons subject to direction and supervision.
On November 17, 2009, the Judge for the Preliminary Investigation rejected the request for precautionary measures of disqualification filed by the
Milan Public Prosecutor, which subsequently appealed against this decision. On February 9, 2010, the Court of Appeal, exercising the function of judicial
review court, handed down its ruling, which dismissed as unfounded the appeal of the Milan Public Prosecutor and upheld the decision of the Judge
for the Preliminary Investigation. On September 30, 2010, an appeal against this decision filed by the Milan Public Prosecutor was upheld by the Court
of Cassation, which ruled that the request for precautionary measures was also admissible pursuant to Legislative Decree No. 231/2001 in cases of
alleged international corruption. The Milan Public Prosecutor’s office subsequently withdrew its request for precautionary measures against Eni and
Saipem following the payment by Snamprogetti Netherlands BV of a deposit of €24,530,580, which was also on behalf of Saipem SpA. The accusations
regarded alleged acts of corruption in Nigeria committed until and after July 31, 2004, with the aggravating circumstance of Snamprogetti SpA’s having
allegedly obtained significant financial gain (indicated as being not less than USD 65 million). On January 26, 2011, the Judge for the Preliminary
Hearing ordered Saipem SpA (as the legal entity incorporating Snamprogetti SpA) and five former Snamprogetti SpA employees to stand trial. In
February 2012, following a request made by the defence, the Court dismissed the charges against the physical persons under investigation, ruling that
the charges had expired under the statute of limitations. The Court also ordered a separate trial for the continuation of proceedings against the legal
person of Saipem only.
On July 11, 2013, the Court of Milan ruled that Saipem SpA had committed the unlawful administrative act, but accepted the existence of the attenuating
circumstances provided for by Article 12, No. 2, letter a) of Legislative Decree No. 231/2001. The Court sentenced the Company to pay a fine of €600,000
and also ordered it to pay court costs. Finally, the Court ordered the confiscation of the deposit of €24,530,580 posted by Snamprogetti Netherlands BV
with the Milan Public Prosecutor’s office. On February 19, 2015, the Court of Appeal upheld the ruling of the Court of Milan.
On July 3, 2015, Saipem filed an appeal against the decision of the Court of Appeal with the Italian Court of Cassation.
Saipem’s involvement in the investigation into the activity of the TSKJ Consortium in Nigeria during the period 1994-2004 is due solely to the fact that in
2006 Saipem SpA acquired Snamprogetti SpA, the parent company of Snamprogetti Netherlands BV, which holds a 25% stake in the TSKJ Consortium.
The decisions of the Court of Milan and the Milan Court of Appeal have no financial impact on Saipem since Eni SpA, at the time of the sale of Snamprogetti
SpA to Saipem, undertook to indemnify Saipem for costs and losses sustained in connection with the TSKJ matter.
Algeria
On February 4, 2011, the Milan Public Prosecutor’s office, through Eni, requested the transmission of documentation pursuant to Article 248 of the Italian
Code of Criminal Procedure, relating to the activities of Saipem Group companies in Algeria in connection with an allegation of international corruption.
The crime of ‘international corruption’ specified in the request is one of the offences punishable under Legislative Decree No. 231 of June 8, 2001 in
connection with the direct responsibility of collective entities for certain crimes committed by their own employees.
The collection of documentation was commenced in prompt compliance with the request, and on February 16, 2011, Saipem filed the material requested.
On November 22, 2012, Saipem received a notification of inquiry from the Milan Public Prosecutor’s office related to alleged unlawful administrative acts
arising from the crime of international corruption pursuant to Article 25, paragraphs 2 and 3 of Legislative Decree No. 231/2001, together with a request
to provide documentation regarding a number of contracts connected with activities in Algeria. This request was followed by notification of a seizure order
on November 30, 2012, two further requests for documentation on December 18, 2012 and February 25, 2013 and the issue of a search warrant on
January 16, 2013.
On February 7, 2013, a search was conducted, including at offices belonging to Eni SpA, to obtain additional documentation relating to intermediary
agreements and subcontracts entered into by Saipem in connection with its Algerian projects.
The subject of the investigations are allegations of corruption which, according to the Milan Public Prosecutor, occurred up until and after March 2010 in
relation to a number of contracts the Company was awarded in Algeria.
Several former employees of the Company are involved in the proceedings, including the former Deputy Chairman and CEO and the former Chief
Operating Officer of the Engineering & Construction Business Unit. The Company has collaborated fully with the Prosecutor’s office on every occasion
92
Saipem Condensed consolidated interim financial statements 2015 / Notes to the condensed consolidated interim financial statements
059-112SemSaipem15Ing.qxd 6-08-2015 18:41 Pagina 92

and rapidly implemented decisive managerial and administrative restructuring measures, irrespective of any liability that might result from the
proceedings. In agreement with its Internal Control Bodies and the Compliance Committee, and having duly informed the Prosecutor’s office, Saipem
performed its own checks on the contracts that are subject to investigation, and to this end appointed an external legal firm. On July 17, 2013, the Board
of Directors analysed the conclusions reached by the external consultants following an internal investigation carried out in relation to a number of
brokerage contracts and subcontracts regarding projects in Algeria. The internal investigation was based on the examination of documents and
interviews with personnel from the Company and other companies in the Group, excluding those who, to the best knowledge of the Company, were
directly involved in the criminal investigation, so as not to interfere with the investigative activities of the Prosecutor. The Board, confirming its full
cooperation with the investigative authorities, decided to convey the findings of the external consultants to the Milan Public Prosecutor for assessment
and appropriate action within the wider context of the ongoing investigation. The consultants reported to the Board: (i) that they found no evidence of
payments to Algerian public officials through the intermediary agreements or subcontracts examined; and (ii) that they found violations deemed
detrimental to the interests of the Company of internal rules and procedures in force at that time in relation to the approval and management of
intermediary agreements and subcontracts examined and a number of activities in Algeria.
The Board decided to initiate legal action against certain former employees and suppliers in order to protect the interests of the Company, reserving the
right to take any further action necessary should additional information emerge.
On June 14, 2013, January 8, 2013 and July 23, 2014 the Milan Public Prosecutor’s office submitted requests for extensions to the preliminary
investigations. On October 24, 2014, notice was received of a request from the Milan Public Prosecutor for gathering evidence before trial, by way of
questioning of the former Chief Operating Officer of the Saipem Engineering & Construction Business Unit and another former manager of Saipem, who
are both being investigated in the criminal proceedings. After the request was granted, the Judge for the Preliminary Hearing in Milan set hearings for
December 1 and 2, 2014. On January 15, 2015, Saipem SpA defence counsel received notice from the Milan Public Prosecutor’s office of the conclusion
of preliminary investigations, pursuant to Article 415-bis of the Italian Code of Criminal Procedure. Notice was also received by eight physical persons
and the legal person of Eni SpA. In addition to the crime of ‘international corruption’ specified in the request from the Milan Public Prosecutor’s office, the
notice also contained an allegation against seven physical persons of a violation of Article 3 of Legislative Decree No. 74 of March 10, 2000 concerning
the filing of fraudulent tax returns, in connection with the recording in the books of Saipem SpA of ‘brokerage costs deriving from the agency agreement
with Pearl Partners signed on October 17, 2007, as well as Addendum No. 1 to the agency agreement signed entered into August 12, 2009’, which is
alleged to have led subsequently to the inclusion in the ‘consolidated tax return of Saipem SpA of profits that were lower than the real total by the
following amounts: 2008: -€85,935,000; 2009: -€54,385,926’. On February 5, 2015, the Milan tax unit of the Guardia di Finanza (Italian Finance Police)
conducted a tax inspection at Saipem SpA premises. The official minutes describe the inspection as having focused on: ‘a) Ires (Italian corporate income
tax) and Irap (Italian regional production tax) for tax periods from January 1, 2008 to December 31, 2010, as well as fiscally relevant aspects elements
emerging from checks performed as part of criminal proceedings No. 58461/14 - mod. 21 instituted by the Public Prosecutor’s office of the Court of Milan
(Substitute Public Prosecutors Fabio De Pasquale, Giordano Baggio and Isidoro Palma) [Algeria affair]. (omissis) b) identifying, for the 2010 tax period
only, transactions with companies resident or domiciled in non-EU countries or territories with preferential tax regimes (Article 110, paragraph 10 et seq.
of the Italian Consolidated Income Tax Act; - verifying the compliance of the tax position of company employees for the year 2015 up until the day of the
inspection’. In connection with point a) of the tax inspection, on April 14, 2015, the Guardia di Finanza served Saipem SpA with a tax audit report in which
the following costs are deemed as non-deductible because they are alleged to be ‘costs arising from the commission of crimes’ (pursuant to Article 14,
paragraph 4-bis of Law No. 437/1993):
- amounts paid in 2008 and 2009 by Snamprogetti SpA and Saipem SpA to Pearl Partners totalling approximately €140 million;
-approximately €41.5 million in costs allegedly over-invoiced to Saipem SpA by a subcontractor in 2009 and 2010.
Saipem SpA did not concur with the findings contained in the tax audit report and, on June 12, 2015, pursuant to Article 12, paragraph 5, of Law
No. 212/2000 (the Italian Taxpayers’ charter), presented its arguments in its defence, requesting that the question be closed, to the Large Taxpayers Unit
of the Italian revenue agency’s Lombardy Regional Tax Office, to which the Guardia di Finanza had transmitted the report. On July 9, 2015, the Large
Taxpayers Unit of the Italian revenue agency’s Lombardy Regional Tax Office served Saipem with four tax assessment notices relating to Ires and Irap
taxes for 2008 and 2009. The total amounts requested in the four notices for taxes due, interest and fines, amounted to approximately €155 million.
Saipem plans to file an appeal with the Provincial Tax Commission in accordance with the time limit prescribed by law, requesting that the assessment
notices be annulled and their enforcement suspended provisionally.
On February 26, 2015, Saipem SpA defence counsel received notice from the Judge for the Preliminary Hearing of the scheduling of a preliminary hearing,
together with a request for committal for trial filed by the Milan Public Prosecutor’s office on February 11, 2015. The same notice was also served on eight
physical persons, as well as on the legal person of Eni SpA. The hearing was scheduled by the Judge for the Preliminary Hearing for May 13, 2015. At the
hearing, the Italian revenue agency instituted civil proceedings, while other requests to bring civil proceedings were rejected.
The Judge for the Preliminary Investigation granted a request for adjournment made by the defence to allow time for the examination of the substantial
amount of documentation filed by the Milan Public Prosecutor’s office prior to the hearing. The hearing was adjourned until June 12, when the Prosecutor
commenced presentation of its arguments. Subsequent hearings before the Judge for the Preliminary Hearing were held on July 10, 21 and 22, 2015.
The decision regarding the request for committal to trial will be announced by the Judge for the Preliminary Hearing at the hearing scheduled for
September 30, 2015.
Meanwhile, at the request of the US Department of Justice (‘DoJ’), Saipem SpA entered into a ‘tolling agreement’ which extended by 6 months the
limitation period applicable to any possible violations of federal laws of the United States in relation to previous activities of Saipem and its subsidiaries.
The tolling agreement, which has been renewed until November 29, 2015, does not constitute an admission by Saipem SpA of having committed any
unlawful act, nor does it imply any recognition on the Company’s part of United States jurisdiction in relation to any investigation or proceedings. Saipem
93
Saipem Condensed consolidated interim financial statements 2015 / Notes to the condensed consolidated interim financial statements
059-112SemSaipem15Ing.qxd 6-08-2015 18:41 Pagina 93

therefore intends to offer its complete cooperation in relation to investigations by the DoJ, which on April 10, 2014 made a request for documentation
relating to past activities of the Saipem Group in Algeria, with which Saipem has complied.
We also note that the investigations commenced in 2010 into the procedures used for the award by Sonatrach of the GK3 contract (the ‘Sonatrach 1’
investigation), in relation to which a number of Saipem Contracting Algérie SpA’s current accounts in local currency were frozen, are still currently
underway. Some of these accounts were subsequently unfrozen, although two in Algerian Dinars, containing in total the equivalent of €86,840,646
(calculated at the exchange rate prevailing on June 30, 2015) remain frozen. The two bank accounts in question relate to the MLE and GK3 projects. The
frozen MLE bank account is no longer used for MLE project payments, while the GK3 bank account is still being used to receive contractual payments in
Algerian Dinars due in relation to the project. The outstanding payments amount to an approximate equivalent of €4,539,405 (calculated at the
exchange rate prevailing on June 30, 2015). In relation to the investigations into the procedures used to award the GK3 contract, in 2012 Saipem
Contracting Algérie SpA received formal notice of the referral to the Chambre d’accusation at the Court of Algiers of an investigation underway into the
company regarding allegations that the company took advantage of the authority or influence of representatives of a government-owned industrial and
trading company in order to inflate prices in relation to contracts awarded by that company. At the beginning of 2013, the ‘Chambre d’accusation’ ordered
Saipem Contracting Algérie SpA to stand trial and further ordered that the aforementioned current accounts remain frozen. In April 2013 and in October
2014, the Algerian Supreme Court rejected a request to unfreeze the above-mentioned bank accounts that had been made by Saipem Contracting Algérie
SpA in 2010. The case was transferred to the Court of Algiers where, at the hearing of March 15, 2015 proceedings were adjourned to the next court
session, held on June 7, 2015. At this hearing, the Court adjourned proceedings, due to the absence of a number of witnesses, to the next court session,
which is due to begin in October 2015.
In March 2013, the legal representative of Saipem Contracting Algérie SpA was summoned to appear at the Court of Algiers, where he received verbal
notification from the local investigating judge of an investigation (‘Sonatrach 2’) underway ‘into Saipem for charges pursuant to Articles 25a, 32 and 53
of Anti-Corruption Law No. 01/2006’. The investigating judge also requested documentation (articles of association) and other information concerning
Saipem Contracting Algérie SpA, Saipem SpA and Saipem SA.
Kuwait
On June 21, 2011, an order requested by the Milan Public Prosecutor was served on Saipem SpA for the search of the office of a Saipem employee. The
order was issued in connection with alleged crimes committed by said employee together with third parties related to the award of tenders by Saipem
SpA to third party companies for a project in Kuwait. In connection with the same matter, the Public Prosecutor also served a notification of inquiry upon
Saipem SpA pursuant to Italian Legislative Decree No. 231/2001. In this regard, the Company believes that its position will be cleared, since it is the
injured party in respect of the illicit conduct under investigation.
Having consulted its lawyers, and in agreement with the Compliance Committee and the Internal Control Bodies, Saipem, through its Internal Audit
function, and also using an external consulting company, promptly undertook an Internal Audit of the project under investigation. On March 2, 2012
Saipem SpA was served a request to extend the preliminary investigations filed by the Public Prosecutor. As of such date, the Company has received no
further notifications, nor has there been any further news or evidence of any developments in the investigations.
EniPower - Enquiries by the Judiciary
In the frame of the inquiries commenced by the Milan Public Prosecutor (criminal proceedings 2460/2003 R.G.N.R. pending at the Milan Public
Prosecutor’s office) into contracts awarded by EniPower to various companies, Snamprogetti SpA (now Saipem SpA) as engineering and procurement
services contractor, together with other parties, were served a notification of inquiry pursuant to Article 25 of Legislative Decree No. 231/2001.
Preliminary investigations ended in August 2007, with a favourable outcome for Snamprogetti SpA, which was not included among the parties still under
investigation for whom committals for trial were requested. Snamprogetti subsequently brought proceedings against the physical and legal persons
implicated in transactions relating to the Company and reached settlements with a number of parties that requested the application of settlement
procedures. Following the conclusion of the preliminary hearing, criminal proceedings continued against former employees of the above companies, as
well as against employees and managers of a number of their suppliers, pursuant to Legislative Decree No. 231/2001. Eni SpA, EniPower SpA and
Snamprogetti SpA presented themselves as injured parties in the preliminary hearing. The preliminary hearing related to the main proceeding concluded
on April 27, 2009. The Judge for the Preliminary Hearing requested that all parties that did not request the application of plea agreements stand trial, with
the exception of a number of parties for whom the statute of limitations applied. At the hearing of March 2, 2010, the Court confirmed the admission as
plaintiffs of Eni SpA, EniPower SpA and Saipem SpA against the defendants under the provisions of Legislative Decree No. 31/2001. The defendants of the
other companies involved were also sued. Subsequently, at the hearing of September 20, 2011, sentence was passed which included several convictions
and acquittals for numerous physical and legal defendants, the latter being deemed responsible for unlawful administrative acts, with fines being
imposed and value confiscation for significant sums ordered. The Court also rejected the admission as plaintiffs against the parties accused of unlawful
administrative acts pursuant to Legislative Decree No. 231/2001. On December 19, 2011, the grounds for the ruling were filed with the office of the clerk
of the Court. The convicted parties promptly filed an appeal against the above sentence. On October 24, 2013, the Milan Court of Appeal essentially
confirmed the first instance ruling, which it modified only partially in relation to a number of physical persons, against whom it dismissed the charges,
ruling that they had expired under the statute of limitations. The accused parties have filed an appeal with the Court of Cassation. The hearing before the
Court of Cassation has been scheduled for September 30, 2015.
Fos Cavaou
With regard to the Fos Cavaou (‘FOS’) project for the construction of a regasification terminal, the client Société du Terminal Méthanier de Fos Cavaou
(‘STMFC’, now Fosmax LNG) in January 2012 commenced arbitration proceedings before the International Chamber of Commerce in Paris (‘Paris ICC’)
94
Saipem Condensed consolidated interim financial statements 2015 / Notes to the condensed consolidated interim financial statements
059-112SemSaipem15Ing.qxd 6-08-2015 18:41 Pagina 94

against the contractor STS [a French ‘société en participation’ made up of Saipem SA (50%), Tecnimont SpA (49%) and Sofregaz SA (1%)]. On July 11,
2011, the parties signed a mediation protocol pursuant to the rules of Conciliation and Arbitration of the Paris ICC. With Fosmax LNG refusing to extend
the deadline, the mediation procedure ended on December 31, 2011, with no agreement having been reached.
The brief filed by Fosmax LNG in support of its request for arbitration included a demand for payment of approximately €264 million for damages
allegedly suffered, penalties for delays and costs for the completion of works (‘mise en régie’). Of the total sum demanded, approximately €142 million
was for loss of profit, an item excluded from the contract except for cases of wilful misconduct or gross negligence. STS filed its reply, including a
counterclaim for damages due to the excessive interference of Fosmax LNG in works execution and as payment for extra works not recognised by the
client (reserving the right to quantify the amount of such extra works at a later stage in proceedings). On October 19, 2012, Fosmax LNG lodged its
Statement of Claim. Against this, STS lodged its own Statement of Defence on January 28, 2013, in which it filed a counterclaim for €338 million. The final
hearing was held on April 1, 2014. On April 30, 2015, on the basis of the award issued by the Arbitration Panel on February 13, 2015, Fosmax LNG paid STS
€84,349,554.92 (including interest), 50% of which is due to Saipem SA. On June 26, 2015, Fosmax LNG lodged an appeal against the award with the
French Council of State, in which it requested the annulment of the award, claiming that the Arbitration Panel had mistakenly applied private law to what
was a public law case. STS has 60 days from the date of receipt of the notice of appeal to submit its own observations to the French Council of State.
Arbitration on Menzel Ledjmet Est project (‘MLE’), Algeria
On December 23, 2013, Saipem filed a request for arbitration with the International Chamber of Commerce in Paris (‘Paris ICC’) in connection with the
contract entered into on March 22, 2009, by Saipem SpA and Saipem Contracting Algérie SpA (collectively, ‘Saipem’) on the one hand, and Société
Nationale pour la Recherche, la Production, le Transport, la Transformation et la Commercialisation des Hydrocarbures SpA (‘Sonatrach’) and First Calgary
Petroleums LP (collectively, the ‘Client’) on the other, for the engineering, procurement and construction of a natural gas gathering and treatment plant
and related export pipelines in the Menzel Ledjmet Est field in Algeria. The Client was notified of the request on January 8, 2014. In its request for
arbitration, Saipem asked the arbitral tribunal to grant: (i) an extension of 14.5 months to the contractual term; and (ii) Saipem’s right to receive
approximately €580 million (not including the €145.8 million already paid by First Calgary Petroleums LP) relating to an increase in the contract price
for the extension of the contract terms, variation orders, unpaid invoices past due and spare parts, as well as a sum yet to be quantified for having
completed the works in advance of the contractually agreed term. Both Sonatrach and First Calgary Petroleums LP (this latter wholly owned by the Eni
Group since 2008) have appointed their arbitrator and, on March 28, 2014, filed their respective Answers to the Request for Arbitration. The Chairman of
the Arbitral Tribunal was appointed on May 26, 2014. On December 17, 2014, Saipem submitted a Statement of Claim, together with all of the relevant
supporting documentation, in which it requested a total equivalent of approximately €898.5 million from the Client.
Sonatrach and First Calgary Petroleums LP will file their Statements of Defence by August 14, 2015.
Arbitration proceedings regarding LPG project in Algeria
On March 14, 2014, Saipem filed a request for arbitration with the International Chamber of Commerce in Paris in connection with the contract for the
construction of the LDHP ZCINA plant for the ‘extraction des liquides des gaz associés Hassi Messaoud et séparation d’huile’ (LDHP ZCINA unit for
extraction of liquids from associated gas from the Hassi Messaoud field and oil-gas separation), entered into on November 12, 2008 between, on the one
hand, Sonatrach, and on the other, Saipem SA and Saipem Contracting Algérie SpA (collectively ‘Saipem’). In its request, Saipem asked the Arbitration
Tribunal to order Sonatrach to pay the equivalent of approximately €171.1 million for additional costs incurred as contractor during the execution of the
project in relation to variation orders, time extensions, force majeure, non-payment or late payment of invoices and related interest. Sonatrach, in its
answer to the request, which it filed on June 10, 2014, denied all liability and asserted a counterclaim requesting that Saipem be ordered to pay liquidated
damages for delays amounting to USD 70.8 million. The Arbitral Tribunal was officially constituted on September 16, 2014, following the Chairman of the
Arbitral Tribunal’s acceptance of his appointment. On November 13, 2014, the parties reached an agreement with regard to the procedural timetable, in
accordance with which Saipem filed its Statement of Claim by March 13, 2015, while Sonatrach is required to file its Statement of Defence by September
14, 2015. Arbitration hearings are scheduled to be held in October 2016.
Arbitration proceedings regarding LZ2 project in Algeria
On May 12, 2015, Saipem SpA and Saipem Contracting Algérie SpA (collectively ‘Saipem’) filed a request for arbitration against Sonatrach for payment of
€7,339,038 and 605,447,169 Algerian Dinars, plus interest, for wrongly applied liquidated damages, extra works and project extension costs, with the
International Chamber of Commerce in Paris. The request relates to the contract for the construction of a pipeline between Hassi R’Mel and Arzew in
Algeria entered into by Saipem and Sonatrach on November 5, 2007 (‘LZ2 project’). Saipem and Sonatrach have both appointed their arbitrators. The
respondent has until September 7, 2015 to file its reply.
Court of Cassation - Consob Resolution No. 18949 of June 18, 2014 - Actions for damages
With Resolution No. 18949 of June 18, 2014, Italian stock market regulator Consob fined Saipem SpA €80,000 for having allegedly delayed the profit
warning it issued on January 29, 2013. On July 28, 2014, Saipem SpA filed an appeal against the resolution with the Milan Court of Appeal, but this was
rejected by the Court in its ruling of December 11, 2014. The Company has lodged an appeal against the Court of Appeal’s decision with the Italian Court
of Cassation.
On April 28, 2015, Saipem received notice of legal proceedings before the Court of Milan by 64 investors claiming compensation for damages of
approximately €174 million allegedly incurred following the purchase of Saipem shares in the period between February 13, 2012 and June 14, 2013. The
first hearing is scheduled for November 17, 2015. Saipem SpA will challenge the claim in court.
95
Saipem Condensed consolidated interim financial statements 2015 / Notes to the condensed consolidated interim financial statements
059-112SemSaipem15Ing.qxd 6-08-2015 18:41 Pagina 95

Significant tax disputes
Saipem SpA
On February 5, 2015, the Milan tax unit of the Italian financial police (“Guardia di Finanza”) commenced a tax verification of Saipem SpA, which is still
underway. As part of the verification, on April 14, 2015, the Guardia di Finanza served Saipem SpA with a tax audit report, full details of which are provided
in the ‘Algeria’ section of the note on legal proceedings.
Potential significant tax disputes
Saipem SpA
As part of the same tax verification process, on July 20, 2015, the Guardia di Finanza served Saipem SpA with a tax audit report at the conclusion of
checks carried out in relation to costs arising from transactions occurring in 2010 with companies resident or domiciled in territories with preferential
tax regimes, pursuant to Italian Ministerial Decree of January 23, 2002 (i.e. ‘black list costs’). In the report, the Guardia di Finanza notified the Italian
Revenue Agency of costs amounting to €235,502,590.30 it deemed non-deductible pursuant to Article 110, paragraph 10 of the Italian Income Tax Act,
in order to allow the Agency to carry out the checks provided for by paragraph 11 of the same article. If the checks confirm the conclusions contained in
the tax audit report either fully or partially, this may result in the issue of a tax assessment notice. Saipem may, within a 90-day period following receipt
of notification of the start of checks, file its own observations with the Italian Revenue Agency, as well as any further documentation demonstrating the
existence of one of the exonerating circumstances provided for by Italian anti-avoidance legislation, and may also request to be heard by the Agency in
an adversarial proceeding.
Saipem Drilling Norway AS
On December 18, 2014, following an audit conducted by the Norwegian revenue agency between January and May 2014 regarding the fiscal years 2012
and 2013, Saipem Drilling Norway AS was served with a report containing the preliminary findings of the inspection. The report does not constitute a tax
assessment and therefore does not represent a request for payment. The agency is contesting the value assigned to the rig Scarabeo 8 when it was
transferred from Saipem (Portugal) Comércio Marítimo, Sociedade Unipessoal Lda to Saipem Drilling Norway AS in July 2012, deeming it higher than its
market value, and proposes taxing the extra depreciation charges deducted in the years under consideration, which amount to NOK 630 million
(€72 million). The report also proposes a discretionary increase in the 2012 tax base of NOK 1.2 billion (€136 million), corresponding to the recovery
of the presumed negative value of the charter contract for the Scarabeo 8. On April 30, 2015, the company filed its response to the findings contained in
the report. Objecting to the conclusions of the authority, it attached a report prepared by a leading Norwegian Oil & Gas sector analyst, which provides
an extensive description of the Norwegian domestic offshore drilling market and its prospects at the moment the rig was purchased by Saipem Drilling
Norway AS. The report concludes with an estimate of the then market value of the rig that is substantially in line with the price at which the rig was
transferred between the two Saipem Group companies. Following the issue of the report on December 18, 2014, the statute of limitations on the tax
periods under examination were suspended. As a result, the Norwegian revenue agency may now proceed with its checks without a definite term and
may invite the company to submit further evidence or, alternatively, issue a definitive tax assessment. Should a definitive tax assessment confirm fully
or partially the request contained in the report, the company intends to file an appeal and enter into legal proceedings.
Revenues
The following is a summary of the main components of revenues. The most significant variations are analysed in the ‘Financial and economic results’
section of the ‘Operating and Financial Review’.
Net sales from operations
Net sales from operations were as follows:
First half First half
(€million) 2014 2015
Net sales from operations 5,128 5,365
Change in contract work-in-progress 838 8
Total 5,966 5,373
32
96
Saipem Condensed consolidated interim financial statements 2015 / Notes to the condensed consolidated interim financial statements
059-112SemSaipem15Ing.qxd 6-08-2015 18:41 Pagina 96
Net sales by geographical area were as follows:
First half First half
(€million) 2014 2015
Italy 292 184
Rest of Europe 473 627
CIS 392 855
Middle East 1,246 1,103
Far East 570 346
North Africa 275 107
West Africa and Rest of Africa 1,130 1,219
Americas 1,588 932
Total 5,966 5,373
The disclosures required by IAS 11 are provided by business sector in Note 42 ‘Segment information, geographical information and construction
contracts’.
Contract revenues include the amount agreed in the initial contract, plus revenues from change orders and claims.
Change orders are changes to the contracted scope of work requested by the client, while claims are requests for the reimbursement of costs not
included in the contract price. Change orders and claims are included in revenues when: (a) contract negotiations with the client are at an advanced
stage and approval is probable; and (b) their amount can be reliably estimated.
The cumulative amount of additional payments for change orders and claims, including amounts pertaining to previous years, based on project progress
at June 30, 2015, totalled €788 million, down €254 million compared with the previous period. For projects where additional payments exceed €50
million, estimates are supported by a technical/legal opinion provided by third party consultants. Contributing factors in the decrease in revenues
compared with the same period of the previous year included the cancellation of specific orders, among which the South Stream project, and the
deterioration of the market environment, particularly in relation to a number of specific counterparties, as described in the operating and financial
review. Revenues from related parties are shown in Note 43 ‘Transactions with related parties’.
Other income and revenues
Other income and revenues were as follows:
First half First half
(€million) 2014 2015
Indemnities 2-
Other income 10 1
Total 12 1
Operating expenses
The following is a summary of the main components of operating expenses. The most significant variations are analysed in the ‘Financial and economic
results’ section of the ‘Operating and Financial Review’.
Purchases, services and other costs
Purchases, services and other costs included the following:
First half First half
(€million) 2014 2015
Production costs - raw, ancillary and consumable materials and goods 1,172 1,079
Production costs - services 2,367 2,511
Operating leases and other 608 622
Net provisions for contingencies (27) 40
Other expenses 15 95
less:
- capitalised direct costs associated with self-constructed tangible assets (7) (10)
- change in inventories of raw, ancillary and consumable materials and goods (2) 13
Total 4,126 4,350
34
33
97
Saipem Condensed consolidated interim financial statements 2015 / Notes to the condensed consolidated interim financial statements
059-112SemSaipem15Ing.qxd 6-08-2015 18:41 Pagina 97

The variation in ‘Production costs - raw, ancillary and consumable materials and goods’ was related to work on projects underway during the period.
Costs for services included agency fees of €1 million (€1 million in the first half of 2014).
Provisions for contingencies are detailed in Note 20 ‘Provisions for contingencies’.
Purchase services and other costs to related parties are shown in Note 43 ‘Transactions with related parties’.
Payroll and related costs
Payroll and related costs were as follows:
First half First half
(€million) 2014 2015
Wages and salaries 1,204 1,226
less:
- capitalised direct costs associated with self-constructed/developed fixed assets (7) (5)
Total 1,197 1,221
Stock-based compensation plans for Saipem senior managers
Saipem discontinued its managerial incentive program involving the assignment of stock options to senior managers of Saipem SpA and its subsidiaries
in 2009. At June 30, 2015, the only stock option plan still in force was the 2008 plan approved by the Shareholders of Saipem SpA on April 28, 2008.
Neither the general plan conditions nor the other information provided in the consolidated financial statements at December 31, 2014 underwent any
significant changes during the period.
STOCK OPTIONS
The following table shows changes in the stock option plans:
2014 2015
Average Average
Number strike Market Number strike Market
(€thousand) of shares price price
(a)
of shares price price
(a)
Options as of January 1 259,500 25.979 4,038 61,350 25.872 538
New options granted - - - - - -
(Options exercised during the period) - - - - - -
(Options expiring during the period) (198,150) - 3,547 - - -
Options outstanding as of June 30 61,350 25.872 538 61,350 25.872 582
Of which: exercisable at June 30 61,350 25.872 538 61,350 25.872 582
(a) The market price of shares underlying options granted, exercised or expiring during the period corresponds to the average market value. The market price of shares underlying options outstanding at the
beginning and end of the period is the price recorded at January 1 and June 30.
At June 30, 2015, 61,350 options were outstanding for the purchase of the same amount of ordinary shares of Saipem SpA with a nominal value of €1
each. The options related to the following plans:
2008 plan 61,350 25.872 1 - 582
Total 61,350
Number
of shares
Strike price
(€)
Average
remaining life
(months)
Fair value (€)
for assignees
resident
in Italy
Fair value (€)
for assignees
resident
in France
35
98
Saipem Condensed consolidated interim financial statements 2015 / Notes to the condensed consolidated interim financial statements
059-112SemSaipem15Ing.qxd 6-08-2015 18:41 Pagina 98

Average number of employees
The average number of employees, by category, for all consolidated companies was as follows:
First half First half
(number) 2014 2015
Senior managers 414 409
Junior managers 4,732 4,859
White collars 21,508 22,058
Blue collars 21,546 19,946
Seamen 329 332
Total 48,529 47,604
The average number of employees was calculated as the arithmetic mean of the number of employees at the beginning and end of the period. The
average number of senior managers included managers employed and operating in foreign countries whose position was comparable to senior manager
status.
Depreciation, amortisation and impairment
Depreciation, amortisation and impairment are detailed below:
First half First half
(€million) 2014 2015
Depreciation and amortisation:
- tangible assets 358 377
- intangible assets 45
Total 362 382
Impairment:
- tangible assets -211
- intangible assets --
Total -211
Total write-downs of tangible assets amounting to €211 million related to a write-down of €41 million recorded against four vessels slated for scrapping
and a write-down of €170 million recorded in relation to components of two fabrication yards that will not be used in future activities, as described in
Note 8 ‘Property, plant and equipment’.
36
99
Saipem Condensed consolidated interim financial statements 2015 / Notes to the condensed consolidated interim financial statements
059-112SemSaipem15Ing.qxd 6-08-2015 18:41 Pagina 99

Finance income (expense)
Finance income (expense) was as follows:
First half First half
(€million) 2014 2015
Finance income (expense)
Finance income 333 516
Finance expense (373) (607)
Total (40) (91)
Derivatives (70) (19)
Total (110) (110)
Net finance income and expense was as follows:
First half First half
(€million) 2014 2015
Exchange gains (losses) 56 7
Exchange gains 331 511
Exchange losses (275) (504)
Finance income (expense) related to net borrowings (93) (95)
Interest and other income from Group financial companies - -
Interest from banks and other financial institutions 25
Interest and other expense due to Group financial companies (67) (80)
Interest and other expense due to banks and other financial institutions (28) (20)
Other finance income (expense) (3) (3)
Other finance income from third parties --
Finance income (expense) on defined benefit plans (3) (3)
Total finance income (expense) (40) (91)
Gains (losses) on derivatives consisted of the following:
First half First half
(€million) 2014 2015
Exchange rate derivatives (70) (18)
Interest rate derivatives - (1)
Total (70) (19)
Net expenses from derivatives of €19 million (expenses of €70 million in the first half of 2014) mainly related to the recognition in income of the change
in fair value of derivatives that do not qualify for hedge accounting under IFRS and the recognition of the forward component of derivatives that qualify
for hedge accounting.
Finance income (expense) with related parties is shown in Note 43 ‘Transactions with related parties’.
Income (expense) from investments
Effect of accounting using the equity method
The share of profit (loss) of investments accounted for using the equity method and other gains (losses) from investments were as follows:
First half First half
(€million) 2014 2015
Share of profit of investments accounted for using the equity method 13 8
Share of loss of investments accounted for using the equity method (1) (10)
Net additions to (deductions from) the provisions for losses related to investments accounted for using the equity method 1 (9)
Total 13 (11)
38
37
100
Saipem Condensed consolidated interim financial statements 2015 / Notes to the condensed consolidated interim financial statements
059-112SemSaipem15Ing.qxd 6-08-2015 18:41 Pagina 100
The share of profit (losses) of investments accounted for using the equity method is commented on in Note 10 ‘Investments accounted for using the
equity method’.
Other income (expense) from investments
A gain of €18 million was registered during the period mainly in relation to the sale of the Venezuelan companies Fertilizantes Nitrogenados de Oriente
CEC and Fertilizantes Nitrogenados de Oriente SA (classified as held for sale at December 31, 2014).
Income taxes
Income taxes consisted of the following:
First half First half
(€million) 2014 2015
Current taxes:
- Italian companies 19 (4)
- foreign companies 84 151
Net deferred taxes:
- Italian companies (36) (217)
- foreign companies (3) 83
Total 64 13
First half First half
(€million) 2014 2015
Income taxes presented in consolidated income statement 64 13
Income tax related to items of other comprehensive income (17) (53)
Tax on total comprehensive income 47 (40)
Non-controlling interests
Profit attributable to non-controlling interests amounted to €14 million (no profit attributable to non-controlling interests recorded during the first half
of 2014).
Earnings (loss) per share
Basic earnings per ordinary share are calculated by dividing net profit (loss) for the period attributable to Saipem’s shareholders by the weighted average
of ordinary shares outstanding during the period, excluding treasury shares.
The number of shares outstanding used for the calculation of the basic earnings per share was 439,361,742 and 439,359,038 in 2015 and 2014,
respectively.
Diluted earnings per share are calculated by dividing net profit for the period attributable to Saipem’s shareholders by the weighted average of
fully-diluted shares issued and outstanding during the period with the exception of treasury shares and including the number of shares that could
potentially be issued. At June 30, 2015, shares that could potentially be issued only regarded shares granted under stock option plans. The average
number of shares outstanding used for the calculation of diluted earnings for 2015 and 2014 was 439,532,418 and 439,702,259, respectively.
Reconciliation of the average number of shares used for the calculation of basic and diluted earnings per share is as follows:
June 30, 2014 June 30, 2015
Average number of shares used for the calculation of the basic earnings per share 439,359,038 439,361,742
Number of potential shares following stock option plans 232,425 61,350
Number of savings shares convertible into ordinary shares 110,796 109,326
Average number of shares used for the calculation of the diluted earnings per share 439,702,259 439,532,418
Saipem’s net profit (loss) (€million) 136 (920)
Basic earnings (loss) per share (€per share) 0.310 (2.094)
Diluted earnings (loss) per share (€per share) 0.309 (2.093)
41
40
39
101
Saipem Condensed consolidated interim financial statements 2015 / Notes to the condensed consolidated interim financial statements
059-112SemSaipem15Ing.qxd 6-08-2015 18:41 Pagina 101

Segment information, geographical information and construction contracts
Segment information
(€million)
First half 2014
Net sales from operations 3,990 2,331 747 420 - 7,488
less: intra-group sales 806 441 191 84 - 1,522
Net sales to customers 3,184 1,890 556 336 - 5,966
Operating result 180 (81) 155 39 - 293
Depreciation, amortisation and impairment 147 19 123 73 - 362
Net income from investments 12 5 - - - 17
Capital expenditure 135 20 105 69 - 329
Tangible and intangible assets 3,804 590 3,332 943 - 8,669
Investments 8382- 4-169
Current assets 2,696 2,554 579 491 1,923 8,243
Current liabilities 3,089 1,688 293 156 3,771 8,997
Provisions for contingencies 47 57 1 2 62 169
First half 2015
Net sales from operations 4,476 1,321 744 493 - 7,034
less: intra-group sales 1,088 273 206 94 - 1,661
Net sales to customers 3,388 1,048 538 399 - 5,373
Operating result (114) (758) 140 (58) - (790)
Depreciation, amortisation and impairment 310 71 124 88 - 593
Net income from investments (5) 12 - - - 7
Capital expenditure 82 17 107 62 - 268
Tangible and intangible assets 3,462 544 3,031 1,104 - 8,141
Investments 106 (4) - 5 - 107
Current assets 3,008 2,223 556 533 2,183 8,503
Current liabilities 3,688 2,018 255 207 3,833 10,001
Provisions for contingencies 49 132 1 2 63 247
Geographical information
Since Saipem’s business involves the deployment of a fleet on a number of different projects over a single year, it is difficult to allocate assets to a
specific geographic area. As a result, certain assets have been deemed not directly attributable.
The unallocated part of tangible and intangible assets and capital expenditure related to vessels and their related equipment and goodwill.
The unallocated part of current assets pertained to inventories related to vessels.
A breakdown of revenues by geographical area is provided in Note 32 ‘Net sales from operations’.
(€million)
First half 2014
Capital expenditure 846461765192329
Tangible and intangible assets 102 36 315 716 17 304 951 6,228 8,669
Identifiable assets (current) 249 1,416 491 2,321 501 763 1,666 836 8,243
First half 2015
Capital expenditure 7 3 15 58 - 2 26 157 268
Tangible and intangible assets 108 31 303 949 2 155 805 5,788 8,141
Identifiable assets (current) 403 1,419 811 1,667 356 956 1,819 1,072 8,503
Current assets were allocated by geographical area using the following criteria: (i) cash and cash equivalents and financing receivables were allocated
on the basis of the country in which individual company bank accounts were held; (ii) inventory was allocated on the basis of the country in which
onshore storage facilities were situated (i.e. excluding inventory in storage facilities situated on vessels); and (iii) trade receivables and other assets
were allocated to the geographical area to which the related project belonged.
Italy
Rest of Europe
CIS
Rest of Asia
North Africa
West Africa
Americas
Unallocated
Total
Offshore E&C
Onshore E&C
Offshore
Drilling
Onshore
Drilling
Unallocated
Total
42
102
Saipem Condensed consolidated interim financial statements 2015 / Notes to the condensed consolidated interim financial statements
059-112SemSaipem15Ing.qxd 6-08-2015 18:41 Pagina 102

Non-current assets were allocated on the basis of the country in which the asset operates, except for offshore drilling and construction vessels, which
were included under ‘Unallocated’.
Construction contracts
Construction contracts were accounted for in accordance with IAS 11.
First half First half
(€million) 2014 2015
Construction contracts - assets 2,635 2,001
Construction contracts - liabilities (1,289) (1,545)
Construction contracts - net 1,346 456
Costs and margins (completion percentage) 6,464 5,943
Progress billings (5,137) (5,425)
Change in provision for future losses 19 (62)
Construction contracts - net 1,346 456
Transactions with related parties
Saipem SpA is a subsidiary of Eni SpA. Transactions with related parties entered into by Saipem SpA and/or companies within the scope of consolidation
concern mainly the supply of services, the exchange of goods, the provision and utilisation of financial resources, and entering into derivative contracts
with joint ventures, associates and unconsolidated subsidiaries, with subsidiaries, jointly-controlled entities and associates of Eni SpA, and with a
number of entities owned or controlled by the State. These transactions are an integral part of the ordinary course of its business and are carried out on
an arm’s length basis, i.e. at conditions which would be applied between willing and independent parties. All transactions were carried out for the mutual
benefit of the Saipem companies involved. Pursuant to disclosure requirements covered under Consob Regulation No. 17221 of March 12, 2010, the
following transactions with related parties were carried out in the first half of 2015:
- on January 8, 2015, Saipem Drilling Norway AS, an indirect subsidiary of Saipem SpA, signed with Eni Finance International SA, a subsidiary of Eni SpA,
a 3-year long-term revolving loan agreement for €300 million, carrying a variable rate of interest plus a spread of 250 basis points;
- on March 11, 2015, Saipem Canada Inc, an indirect subsidiary of Saipem SpA, signed with Eni Finance International SA, a subsidiary of Eni SpA, a
one-year loan agreement for 625 million Canadian Dollars carrying a variable rate of interest based on Libor plus a spread of 150 basis points;
- on March 17, 2015, Saimexicana SA de Cv, an indirect subsidiary of Saipem SpA, signed with Eni Finance International SA, a subsidiary of Eni SpA, a
one-year loan agreement for 200 million US dollars carrying a variable rate of interest based on Libor plus a spread of 150 basis points;
- on March 23, 2015, Sofresid SA, an indirect subsidiary of Saipem SpA, signed with Eni Finance International SA, a subsidiary of Eni SpA, a one-year loan
agreement for €300 million carrying a variable rate of interest based on Libor plus a spread of 150 basis points;
- on June 29, 2015, Snamprogetti Saudi Arabia Ltd, an indirect subsidiary of Saipem SpA, signed with Eni Finance International SA, a subsidiary of Eni
SpA, two loan agreements: the first is a two-year loan agreement for 290 million US dollars carrying a variable rate of interest based on Libor plus a
spread of 250 basis points, while the second is a one-year loan agreement for 280 million US dollars carrying a variable rate of interest based on Libor
plus a spread of 150 basis points;
- the transaction with Vodafone Omnitel BV which, pursuant to the provisions of Consob’s Regulation concerning transactions with related parties of
March 12, 2010 and Saipem’s internal procedure ‘Interests held by Board Directors and Statutory Auditors and transactions with related parties’, is
related to Eni SpA through a member of the Board of Directors. The transaction in question was carried out on an arm’s length basis and essentially
related to costs for mobile communication services amounting to €1 million.
The tables below show the value of transactions of a trade, financial or other nature entered into with related parties. The analysis by company is based
on the principle of relevance in relation to the total amount of transactions. Transactions not itemised because they are immaterial are aggregated under
the following captions:
- unconsolidated subsidiaries;
- associated and jointly-controlled companies;
- Eni subsidiaries;
- Eni associated and jointly-controlled companies;
-other related parties.
43
103
Saipem Condensed consolidated interim financial statements 2015 / Notes to the condensed consolidated interim financial statements
059-112SemSaipem15Ing.qxd 6-08-2015 18:41 Pagina 103

Trade and other transactions
Trade and other transactions as of December 31, 2014 and for the six-month period ended June 30, 2014 were as follows:
(€million)
Dec. 31, 2014 First half 2014
Costs Revenues
Name Receivables Payables Guarantees Goods Services
(1)
Goods and services
Other
Unconsolidated subsidiaries
SAGIO - Companhia Angolana de Gestão de Instalaçao Offshore Lda - 2 - - 1 - -
Total unconsolidated subsidiaries - 2 - - 1 - -
Associated and jointly-controlled companies
ASG Scarl - 6 - - - - -
CEPAV (Consorzio Eni per l’Alta velocità) Due 114 152 150 - 68 69 -
CEPAV (Consorzio Eni per l’Alta velocità) Uno 21 12 278 - - 1 -
CSFLNG Netherlands BV - 1 - - - 7 -
Gruppo Rosetti Marino SpA - - - - 1 - -
KWANDA Suporte Logistico Lda 68 15 - - 4 4 -
Petromar Lda 90 4 39 - 1 31 -
PLNG 9 Snc di Chiyoda Corp e Servizi Energia Italia SpA 1 - - - - - -
Saipar Drilling Co BV - - - - - - -
Saipem Taqa Al Rushaid Fabricators Co Ltd 14 16 - - 17 3 -
Société pour la Réalisation du Port de Tanger Méditerranée 1 - - - - - -
Southern Gas Constructors Ltd 1 - - - - - -
TMBYS SAS 2 1 - - - 5 -
Others (for transactions not exceeding €500 thousand) 1 2 - - 1 2 -
Total associated and jointly-controlled companies 313 209 467 - 92 122 -
Eni consolidated subsidiaries
Eni SpA 5 11 4,742 - 8 - -
Eni SpA Exploration & Production Division 87 7 - - - 92 -
Eni SpA Gas & Power Division 1 1 - - 1 - -
Eni SpA Refining & Marketing Division 18 1 - 1 - 13 -
Agip Energy & Natural Resources (Nigeria) Ltd 2 - - - - - -
Agip Karachaganak BV 1 - - - - 1 -
Agip Oil Ecuador BV 2 - - - - 1 -
Banque Eni SA - - - - 1 - -
Eni Adfin SpA - 3 - - 2 - -
Eni Angola SpA 55 - - - - 62 -
Eni Congo SA 150 21 - - - 96 -
Eni Corporate University SpA - 3 - - 3 - -
Eni Cyprus Ltd 27 - - - - - -
Eni East Sepinggan Ltd 1 - - - - - -
Eni Finance International SA - 1 - - - - -
Eni Insurance Ltd - 5 - - 13 - 8
Eni Lasmo PLC 2 - - - - 3 -
Eni Mediterranea Idrocarburi SpA - - - - - 1 -
Eni Muara Bakau BV 35 25 - - - 3 -
Eni Norge AS 46 - - - - 85 -
EniPower SpA 2 - - - - 1 -
EniServizi SpA 1 17 - - 24 1 -
Eni Turkmenistan Ltd 2 - - - - - -
Floaters SpA 1 - - - - 3 -
Hindustan Oil Exploration Co Ltd 1 - - - - - -
104
Saipem Condensed consolidated interim financial statements 2015 / Notes to the condensed consolidated interim financial statements
059-112SemSaipem15Ing.qxd 6-08-2015 18:41 Pagina 104

(€million)
Dec. 31, 2014 First half 2014
Costs Revenues
Name Receivables Payables Guarantees Goods Services
(1)
Goods and services
Other
Naoc - Nigerian Agip Oil Co Ltd 4 - - - - - -
Nigerian Agip Exploration Ltd 1 - - - - 11 -
Raffineria di Gela SpA - - - - - 3 -
Serfactoring SpA 3 13 - - 1 - -
Syndial SpA 9 - - - - 5 -
Versalis SpA 13 - - - - 27 -
Others (for transactions not exceeding €500 thousand) 1 - - - - 1 -
Total Eni consolidated subsidiaries 470 108 4,742 1 53 409 8
Unconsolidated Eni subsidiaries
Agip Kazakhstan North Caspian Operating Co NV - - - - - 84 -
Total Eni subsidiaries 470 108 4,742 1 53 493 8
Eni associated and jointly-controlled companies
Eni East Africa SpA 7 3 - - - 59 -
Greenstream BV 1 - - - - - -
Mellitah Oil&Gas BV 10 - - - - (1) -
Petrobel Belayim Petroleum Co 23 - - - - 42 -
Raffineria di Milazzo 6 - - - - - -
South Stream Transport BV - - - - - 230 -
Others (for transactions not exceeding €500 thousand) 1 - - - - 4 -
Total Eni associated and jointly-controlled companies 48 3 - - - 334 -
Total Eni companies 518 111 4,742 1 53 827 8
Entities controlled or owned by the State 16 60 - - 6 19 -
Pension funds: FOPDIRE - - - - 1 - -
Total transactions with related parties 847 382 5,209 1 153 968 8
Overall total 3,391 5,669 8,169 1,172 2,990 5,966 12
Incidence (%) 25.60
(2)
6.74 63.77 0.09 5.08
(3)
16.23 66.67
(1) The item ‘Services’ includes costs for services, costs for the use of third-party assets and other costs.
(2) Incidence includes receivables shown in the table ‘Financial transactions’.
(3) Incidence is calculated net of pension funds.
Trade transactions as at and for the six-month period ended June 30, 2015 were as follows:
(€million)
June 30, 2015 First half 2015
Costs Revenues
Name Receivables Payables Guarantees Goods Services
(1)
Goods and services
Other
Unconsolidated subsidiaries
SAGIO - Companhia Angolana de Gestão de Instalaçao Offshore Lda - 1 - - - - -
Total unconsolidated subsidiaries - 1 - - - - -
Associated and jointly-controlled companies
ASG Scarl - 6 - - - - -
CEPAV (Consorzio Eni per l’Alta velocità) Due 58 104 150 - - 81 -
CEPAV (Consorzio Eni per l’Alta velocità) Uno 15 8 291 - - - -
Charville - Consultores e Servicos, Lda - - - - - - -
CSFLNG Netherlands BV 22 - - - - 23 -
Fertilizantes Nitrogenados de Venezuela CEC - - - - - - -
Gruppo Rosetti Marino SpA 2 2 - 2 - - -
KWANDA Suporte Logistico Lda 68 12 - - 2 5 -
Petromar Lda 111 3 39 - 1 29 -
PLNG 9 Snc di Chiyoda Corp e Servizi Energia Italia SpA - - - - - - -
Saipar Drilling Co BV - - - - - 1 -
105
Saipem Condensed consolidated interim financial statements 2015 / Notes to the condensed consolidated interim financial statements
059-112SemSaipem15Ing.qxd 6-08-2015 18:41 Pagina 105

(€million)
June 30, 2015 First half 2015
Costs Revenues
Name Receivables Payables Guarantees Goods Services
(1)
Goods and services
Other
Saipem Taqa Al Rushaid Fabricators Co Ltd 13 16 - - 48 (1) -
Southern Gas Constructors Ltd 1 - - - - - -
TMBYS SAS 2 1 - -- --
Others (for transactions not exceeding €500 thousand) 1 - - - 1 - -
Total associated and jointly-controlled companies 293 152 480 2 52 138 -
Eni consolidated subsidiaries
Eni SpA 4 10 3,783 - 9 - -
Eni SpA Downstream Gas Division - - - - 1 - -
Eni SpA Exploration & Production Division 79 5 - - - 52 -
Eni SpA Gas & Power Division 1 - - - - - -
Eni SpA Refining & Marketing Division 6 1 - 2 - 8 -
Agip Energy & Natural Resources (Nigeria) Ltd - - - - - - -
Agip Karachaganak BV 1------
Agip Oil Ecuador BV 2 - - - - 2 -
Banque Eni SA - - - - 1 - -
Eni Adfin SpA - 4 - - 2 - -
Eni Angola SpA 51 - - - - 124 -
Eni Congo SA 139 10 - - - 224 -
Eni Corporate University SpA - 3 - - 2 - -
Eni Cyprus Ltd - - - - - 42 -
Eni East Sepinggan Ltd - - - - - - -
Eni Finance International SA - - - - - - -
Eni Insurance Ltd 9 6 - - 3 - -
Eni Lasmo PLC 8 - - - - 7 -
Eni Mediterranea Idrocarburi SpA - - - - - - -
Eni Muara Bakau BV 30 5 - - - 128 -
Eni Norge AS 42 - - - - 78 -
EniPower SpA - - - -- --
EniServizi SpA - 21 - - 22 - -
Eni Trading & Shipping SpA - - - - 5 - -
Eni Turkmenistan Ltd 8 - - - - 7 -
Floaters SpA - - - -- --
Hindustan Oil Exploration Co Ltd 1 - - - - - -
Naoc - Nigerian Agip Oil Co Ltd 5 - - - - - -
Nigerian Agip Exploration Ltd - - - - - - -
Raffineria di Gela SpA 1 - - - - 1 -
Serfactoring SpA 3 17 - - 1 - -
Syndial SpA 4 - - - - 3 -
Versalis SpA 13 - - - - 9 -
Others (for transactions not exceeding €500 thousand) - 2 - - - 3 -
Total Eni consolidated subsidiaries 407 84 3,783 2 46 688 -
Unconsolidated Eni subsidiaries
Agip Kazakhstan North Caspian Operating Co NV - - - - - - -
Total Eni subsidiaries 407 84 3,783 2 46 688 -
Eni associated and jointly-controlled companies
Eni East Africa SpA 11 - - - - 20 -
Greenstream BV 2 - - - - 1 -
Mellitah Oil&Gas BV 10 - - - - - -
Petrobel Belayim Petroleum Co 15 - - - - 27 -
106
Saipem Condensed consolidated interim financial statements 2015 / Notes to the condensed consolidated interim financial statements
059-112SemSaipem15Ing.qxd 6-08-2015 18:41 Pagina 106

(€million)
June 30, 2015 First half 2015
Costs Revenues
Name Receivables Payables Guarantees Goods Services
(1)
Goods and services
Other
Raffineria di Milazzo 1 - - - - 4 -
Others (for transactions not exceeding €500 thousand) - - - -- --
Total Eni associated and jointly-controlled companies 39 - - - - 52 -
Total Eni companies 446 84 3,783 2 46 740 -
Entities controlled or owned by the State 10 1 - - 1 12 -
Pension funds: FOPDIRE - - - - 1 - -
Total transactions with related parties 749 238 4,263 4 100 890 -
Overall total 3,466 5,788 7,461 1,079 3,228 5,373 1
Incidence (%) 21.81
(2)
4.11 57.14 0.37 3.07
(3)
16.56 0.00
(1) The item ‘Services’ includes costs for services, costs for the use of third-party assets and other costs.
(2) Incidence includes receivables shown in the table ‘Financial transactions’.
(3) Incidence is calculated net of pension funds.
The figures shown in the tables refer to Note 3 ‘Trade and other receivables’, Note 15 ‘Trade and other payables’, Note 31 ‘Guarantees, commitments and
risks’, Note 32 ‘Net sales from operations’, Note 33 ‘Other income and revenues’ and Note 34 ‘Purchases, services and other costs’.
The Saipem Group provides services to Eni Group companies in all sectors in which it operates, both in Italy and abroad.
Existing relations with entities controlled or owned by the State are mainly in relation to the Snam Group.
Other transactions consisted of the following:
Dec. 31, 2014 June 30, 2015
Other Other Other Other
(€million) receivables payables receivables payables
Eni SpA 356 805 226 332
Agip Oil Ecuador BV - - - 2
Banque Eni SA 3 18 1 5
CEPAV (Consorzio Eni per l’Alta Velocità) Uno 3 - 3 -
Eni Insurance Inc - - - 8
Eni Trading & Shipping SpA - 5 - 1
Total transactions with related parties 362 828 230 348
Overall total 635 840 470 385
Incidence (%) 57.01 98.57 48.94 90.39
Financial transactions
Financial transactions as of December 31, 2014 and for the six-month period ended June 30, 2014 were as follows:
(€million)
Dec. 31, 2014 First half 2014
Cash and cash
Name equivalents Receivables
(1)
Payables
(2)
Commitments Expenses Income Derivatives
Eni SpA 87 - 1,798 15,864 (34) - (62)
Banque Eni SA 57 - - 366 - - (9)
Eni Finance International SA 741 - 3,709 - (32) - -
Eni Finance Usa Inc - 14 - - - - -
Eni Trading & Shipping SpA -------
Serfactoring SpA - - 24 - (1) - -
TMBYS SAS -7-----
Total transactions with related parties 885 21 5,531 16,230 (67) - (71)
(1) Shown on the balance sheet under ‘Trade and other receivables’ (€21 million).
(2) Shown on the balance sheet under ‘Short-term debt’ (€1,873 million); ‘Long-term debt’ (€3,064 million) and ‘Current portion of long-term debt’ (€594 million).
107
Saipem Condensed consolidated interim financial statements 2015 / Notes to the condensed consolidated interim financial statements
059-112SemSaipem15Ing.qxd 6-08-2015 18:41 Pagina 107
Financial transactions as of and for the six-month period ended June 30, 2015 were as follows:
(€million)
June 30, 2015 First half 2015
Cash and cash
Name equivalents Receivables
(1)
Payables
(2)
Commitments Expenses Income Derivatives
Eni SpA 113 - 2,399 12,373 (40) - (24)
Banque Eni SA 67 - - 200 - - 6
Eni Finance International SA 498 - 4,067 - (38) - -
Eni Finance Usa Inc - - 8 - - - -
Eni Trading & Shipping SpA - - - - - - -
Serfactoring SpA - - 20 - (2) - -
TMBYS SAS -7-----
Total transactions with related parties 678 7 6,494 12,573 (80) - (18)
(1) Shown on the balance sheet under ‘Trade and other receivables’ (€7 million).
(2) Shown on the balance sheet under ‘Short-term debt’ (€2,530 million); ‘Long-term debt’ (€3,477 million) and ‘Current portion of long-term debt’ (€487 million).
Financial transactions also included transactions with Eni Trading & Shipping SpA which are included in the income statement under the item ‘Other
operating income (expense)’.
As the result of a special agreement between Saipem and the Eni Corporate Finance Unit, Eni SpA supplies financial services to the Italian companies of
the Saipem Group, consisting of loans, deposits and financial instruments for the hedging of foreign exchange and interest rate risks.
The incidence of financial transactions and positions with related parties was as follows:
Dec. 31, 2014 June 30, 2015
Related Related
(€million) Total parties Incidence % Total parties Incidence %
Short-term debt 2,186 1,873 85.68 3,037 2,530 83.31
Long-term debt (including current portion) 3,908 3,658 93.60 3,964 3,964 100.00
First half 2014 First half 2015
Related Related
(€million) Total parties Incidence % Total parties Incidence %
Finance income 333 - - 516 - -
Finance expense (373) (67) 17.96 (607) (80) 13.18
Derivative financial instruments (70) (71) 101.43 (19) (18) 94.74
Other operating income (expense) - - - - - -
The main cash flows with related parties were as follows:
(€million) June 30, 2014 June 30, 2015
Revenues and other income 976 890
Costs and other expenses (154) (104)
Finance income (expenses) and derivatives (138) (98)
Change in trade receivables and payables (99) (46)
Net cash flow from operations 585 642
Change in financial receivables (29) 14
Net cash flow from (used in) investing activities (29) 14
Change in financial debt 360 963
Net cash flow from (used in) financing activities (360) 963
Total cash flows with related parties 916 1,619
108
Saipem Condensed consolidated interim financial statements 2015 / Notes to the condensed consolidated interim financial statements
059-112SemSaipem15Ing.qxd 6-08-2015 18:41 Pagina 108

The incidence of cash flows with related parties was as follows:
June 30, 2014 June 30, 2015
Related Related
(€million) Total parties Incidence % Total parties Incidence %
Net cash flow from operations 50 585 1,170.00 (852) 642 (75.35)
Net cash flow from (used in) investing activities (323) (29) 8.98 (144) 14 (9.72)
Net cash flow from (used in) financing activities
(*)
414 360 86 .9 6 817 9 63 117.87
(*) Net cash flow from (used in) financing activities does not include dividends distributed, net purchase of treasury shares or capital contributions by non-controlling interests.
Disclosure of interests in joint operations
The table below contains information regarding interests in joint operations that are consolidated using the working interest method as at June 30, 2015:
(€million) June 30, 2014 June 30, 2015
Net capital employed (61) (48)
Total assets 62 88
Total current assets 62 86
Total non-current assets -2
Total liabilities 61 85
Total current liabilities 61 84
Total non-current liabilities -1
Total revenues 19
Total operating expenses (1) (12)
Operating result - (3)
Net profit (loss) for the period - (1)
Significant non-recurring events and operations
No significant non-recurring events or operations took place in the first half of 2015 or the first half of 2014.
Transactions deriving from atypical or unusual operations
No transactions deriving from atypical and/or unusual operations occurred in the first half of 2014 or the first half of 2015.
Events subsequent to period end
Information on subsequent events is provided in the ‘Events subsequent to period-end’ section of the ‘Operating and Financial Review’.
Additional information Algeria
Further to the disclosures provided in the Algeria paragraph of the ‘Legal proceedings’ section, we note the following additional information with regard
to projects under execution in Algeria as at June 30, 2015, with the sole purpose of providing a complete and comprehensive picture of the current
situation:
- funds in two current accounts (ref. Note 1) amounting to the equivalent of €87 million are currently frozen;
- trade receivables (ref. Note 3) totalled €52 million, all past due and not impaired;
- work-in-progress (ref. Note 4) on projects under execution amounted to €154 million;
- deferred income and advance payments (ref. Note 15) totalled €65 million and €1 million, respectively;
- provisions for future losses (ref. Note 20) for projects under execution amounted to €3 million;
- guarantees (ref. Note 32) on projects under execution totalled €546 million.
47
46
45
44
109
Saipem Condensed consolidated interim financial statements 2015 / Notes to the condensed consolidated interim financial statements
059-112SemSaipem15Ing.qxd 6-08-2015 18:41 Pagina 109

Certification of the Condensed Consolidated Interim Financial
Statements pursuant to Article 81-
ter
of Consob Resolution
No. 11971 of May 14, 1999 and subsequent amendments
1. The undersigned Stefano Cao and Alberto Chiarini in their capacity as CEO and manager responsible for the preparation of financial reports of Saipem
SpA, respectively, pursuant to Article 154-bis, paragraphs 3 and 4 of Legislative Decree No. 58 of February 24, 1998, certify that the internal controls
over financial reporting in place for the preparation of the condensed consolidated interim financial statements at June 30, 2015 and during the period
covered by the report, were:
- adequate to the company structure, and
- effectively applied during the process of preparation of the Report.
2. Internal controls over financial reporting in place for the preparation of the condensed consolidated interim financial statements as of June 30, 2015
have been defined and the evaluation of their effectiveness has been assessed based on principles and methodologies adopted by Saipem in accordance
with the Internal Control - Integrated Framework Model issued by the Committee of Sponsoring Organizations of the Treadway Commission, which
represents an internationally-accepted framework for the internal control system.
3. The undersigned officers also certify that:
3.1 the condensed consolidated interim financial statements at June 30, 2015:
a) were prepared in accordance with the evaluation and measurement criteria issued by the International Accounting Standards Board (IASB) and
adopted by the European Commission according to the procedure set forth in Article 6 of the European Regulation (CE) No. 1606/2002 of the
European Parliament and European Council of July 19, 2002;
b) correspond to the Company’s evidence and accounting books and entries;
c) fairly represent the financial condition, results of operations and cash flows of the parent company and the Group consolidated companies as
of and for the period presented in this Report;
3.2 the interim operating and financial review includes a reliable analysis of the material events occurring during the first half of 2015 and their
impact on the condensed consolidated interim financial statements, as well as a description of the main risks and uncertainties for the second
half of the year. The interim operating and financial review also contains a reliable analysis of the disclosure on significant related-party
transactions.
July 28, 2015
Stefano Cao Alberto Chiarini
CEO Chief Financial Officer and Compliance Officer
110
059-112SemSaipem15Ing.qxd 6-08-2015 18:41 Pagina 110
Independent Auditors’ Review report
111
059-112SemSaipem15Ing.qxd 6-08-2015 18:41 Pagina 111
059-112SemSaipem15Ing.qxd 6-08-2015 18:41 Pagina 112

Headquarters: San Donato Milanese (Milan) - Italy
Via Martiri di Cefalonia, 67
Branches:
Cortemaggiore (Piacenza) - Italy
Via Enrico Mattei, 20
Information for Shareholders
Saipem SpA, Via Martiri di Cefalonia, 67 - 20097
San Donato Milanese (Milan) - Italy
Relations with institutional investors
and financial analysts
Fax +39-0252054295
e-mail: investor.relations@saipem.eni.it
Publications
Bilancio al 31 dicembre (in Italian)
Annual Report (in English)
Interim Consolidated Report as of June 30
(in Italian and English)
Saipem Sustainability (in English)
Also available on Saipem’s website:
www.saipem.com
Website: www.saipem.com
Operator: +39-025201
Design: Gruppo Korus Srl - Rome - Italy
Cover: Inarea
Layout and supervision: Studio Joly Srl - Rome - Italy
Printing: STILGRAF - Viadana (Mantova) - Italy
saipem Società per Azioni
Share Capital €441,410,900 fully paid up
Tax identification number and Milan Companies’
Register No. 00825790157
059-112SemSaipem15Ing.qxd 6-08-2015 18:41 Pagina III

www.saipem.com
059-112SemSaipem15Ing.qxd 6-08-2015 18:41 Pagina IV
