System Analysis And Tuning Guide OpenSUSE Leap 42.3 System.Analysis.and.Tuning.Guide.Open SUSE
User Manual:
Open the PDF directly: View PDF ![]() .
.
Page Count: 218 [warning: Documents this large are best viewed by clicking the View PDF Link!]
- System Analysis and Tuning Guide
- Contents
- About This Guide
- Part I. Basics
- Part II. System Monitoring
- Chapter 2. System Monitoring Utilities
- Chapter 3. Analyzing and Managing System Log Files
- Part III. Kernel Monitoring
- Chapter 4. SystemTap—Filtering and Analyzing System Data
- Chapter 5. Kernel Probes
- Chapter 6. Hardware-Based Performance Monitoring with Perf
- Chapter 7. OProfile—System-Wide Profiler
- Part IV. Resource Management
- Chapter 8. General System Resource Management
- Chapter 9. Kernel Control Groups
- Chapter 10. Automatic Non-Uniform Memory Access (NUMA) Balancing
- Chapter 11. Power Management
- Part V. Kernel Tuning
- Chapter 12. Tuning I/O Performance
- Chapter 13. Tuning the Task Scheduler
- Chapter 14. Tuning the Memory Management Subsystem
- Chapter 15. Tuning the Network
- Part VI. Handling System Dumps
- Chapter 16. Tracing Tools
- Chapter 17. Kexec and Kdump
- 17.1. Introduction
- 17.2. Required Packages
- 17.3. Kexec Internals
- 17.4. Calculating crashkernel Allocation Size
- 17.5. Basic Kexec Usage
- 17.6. How to Configure Kexec for Routine Reboots
- 17.7. Basic Kdump Configuration
- 17.8. Analyzing the Crash Dump
- 17.9. Advanced Kdump Configuration
- 17.10. For More Information
- Part VII. Synchronized Clocks with Precision Time Protocol
- Appendix A. GNU Licenses

System Analysis and
Tuning Guide
openSUSE Leap 42.3

System Analysis and Tuning Guide
openSUSE Leap 42.3
An administrator's guide for problem detection, resolution and optimization. Find
how to inspect and optimize your system by means of monitoring tools and how to
efficiently manage resources. Also contains an overview of common problems and
solutions and of additional help and documentation resources.
Publication Date: January26,2018
SUSE LLC
10 Canal Park Drive
Suite 200
Cambridge MA 02141
USA
https://www.suse.com/documentation
Copyright © 2006– 2018 SUSE LLC and contributors. All rights reserved.
Permission is granted to copy, distribute and/or modify this document under the terms of the GNU Free
Documentation License, Version 1.2 or (at your option) version 1.3; with the Invariant Section being this
copyright notice and license. A copy of the license version 1.2 is included in the section entitled “GNU
Free Documentation License”.
For SUSE trademarks, see http://www.suse.com/company/legal/ . All other third-party trademarks are the
property of their respective owners. Trademark symbols (®, ™ etc.) denote trademarks of SUSE and its
affiliates. Asterisks (*) denote third-party trademarks.
All information found in this book has been compiled with utmost attention to detail. However, this does
not guarantee complete accuracy. Neither SUSE LLC, its affiliates, the authors nor the translators shall be
held liable for possible errors or the consequences thereof.
Contents
About This Guide xi
I BASICS 1
1 General Notes on System Tuning 2
1.1 Be Sure What Problem to Solve 2
1.2 Rule Out Common Problems 3
1.3 Finding the Bottleneck 4
1.4 Step-by-step Tuning 4
II SYSTEM MONITORING 5
2 System Monitoring Utilities 6
2.1 Multi-Purpose Tools 6
vmstat 6•dstat 9• System Activity Information: sar 10
2.2 System Information 14
Device Load Information: iostat 14 • Processor Activity Monitoring:
mpstat 15 • Processor Frequency Monitoring: turbostat 16 • Task
Monitoring: pidstat 16 • Kernel Ring Buffer: dmesg 17 • List of
Open Files: lsof 17 • Kernel and udev Event Sequence Viewer: udevadm
monitor 18
2.3 Processes 19
Interprocess Communication: ipcs 19 • Process List: ps 19 • Process
Tree: pstree 21 • Table of Processes: top 22 • A top-like I/O Monitor:
iotop 23 • Modify a process's niceness: nice and renice 24
2.4 Memory 25
Memory Usage: free 25 • Detailed Memory Usage: /proc/
meminfo 25 • Process Memory Usage: smaps 29
iii System Analysis and Tuning Guide
2.5 Networking 30
Basic Network Diagnostics: ip 30 • Show the Network Usage of Processes:
nethogs 31 • Ethernet Cards in Detail: ethtool 31 • Show the Network
Status: ss 32
2.6 The /proc File System 34
procinfo 36 • System Control Parameters: /proc/sys/ 37
2.7 Hardware Information 38
PCI Resources: lspci 38 • USB Devices: lsusb 40 • Monitoring
and Tuning the Thermal Subsystem: tmon 40 • MCELog: Machine Check
Exceptions (MCE) 41 • x86_64: dmidecode: DMI Table Decoder 41
2.8 Files and File Systems 42
Determine the File Type: file 42 • File Systems and Their Usage: mount,
df and du 43 • Additional Information about ELF Binaries 43 • File
Properties: stat 44
2.9 User Information 45
User Accessing Files: fuser 45 • Who Is Doing What: w45
2.10 Time and Date 46
Time Measurement with time 46
2.11 Graph Your Data: RRDtool 47
How RRDtool Works 47 • A Practical Example 48 • For More
Information 52
3 Analyzing and Managing System Log Files 53
3.1 System Log Files in /var/log/ 53
3.2 Viewing and Parsing Log Files 55
3.3 Managing Log Files with logrotate 55
3.4 Monitoring Log Files with logwatch 56
3.5 Using logger to Make System Log Entries 58
iv System Analysis and Tuning Guide
III KERNEL MONITORING 59
4 SystemTap—Filtering and Analyzing System Data 60
4.1 Conceptual Overview 60
SystemTap Scripts 60 • Tapsets 61 • Commands and
Privileges 61 • Important Files and Directories 62
4.2 Installation and Setup 63
4.3 Script Syntax 64
Probe Format 65 • SystemTap Events (Probe Points) 66 • SystemTap
Handlers (Probe Body) 67
4.4 Example Script 71
4.5 User Space Probing 72
4.6 For More Information 73
5 Kernel Probes 75
5.1 Supported Architectures 75
5.2 Types of Kernel Probes 76
Kprobes 76 • Jprobes 76 • Return Probe 76
5.3 Kprobes API 77
5.4 debugfs Interface 78
Listing Registered Kernel Probes 78 • How to Switch All Kernel Probes On or
Off 78
5.5 For More Information 79
6 Hardware-Based Performance Monitoring with
Perf 80
6.1 Hardware-Based Monitoring 80
6.2 Sampling and Counting 80
6.3 Installing Perf 81
6.4 Perf Subcommands 81
vSystem Analysis and Tuning Guide
6.5 Counting Particular Types of Event 82
6.6 Recording Events Specific to Particular Commands 83
6.7 For More Information 83
7 OProfile—System-Wide Profiler 85
7.1 Conceptual Overview 85
7.2 Installation and Requirements 85
7.3 Available OProfile Utilities 86
7.4 Using OProfile 86
Creating a Report 86 • Getting Event Configurations 88
7.5 Using OProfile's GUI 89
7.6 Generating Reports 90
7.7 For More Information 90
IV RESOURCE MANAGEMENT 92
8 General System Resource Management 93
8.1 Planning the Installation 93
Partitioning 93 • Installation Scope 94 • Default Target 94
8.2 Disabling Unnecessary Services 94
8.3 File Systems and Disk Access 95
File Systems 96 • Time Stamp Update Policy 96 • Prioritizing Disk
Access with ionice 97
9 Kernel Control Groups 98
9.1 Technical Overview and Definitions 98
9.2 Scenario 99
9.3 Control Group Subsystems 99
vi System Analysis and Tuning Guide
9.4 Using Controller Groups 103
Prerequisites 103 • Example: Cpusets 103 • Example:
cgroups 104 • Setting Directory and File Permissions 105
9.5 For More Information 106
10 Automatic Non-Uniform Memory Access (NUMA)
Balancing 107
10.1 Implementation 107
10.2 Configuration 108
10.3 Monitoring 109
10.4 Impact 110
11 Power Management 112
11.1 Power Management at CPU Level 112
C-States (Processor Operating States) 112 • P-States (Processor Performance
States) 113 • Turbo Features 114
11.2 In-Kernel Governors 114
11.3 The cpupower Tools 115
Viewing Current Settings with cpupower 116 • Viewing Kernel Idle Statistics
with cpupower 116 • Monitoring Kernel and Hardware Statistics with
cpupower 117 • Modifying Current Settings with cpupower 119
11.4 Monitoring Power Consumption with powerTOP 119
11.5 Special Tuning Options 120
Tuning Options for P-States 121
11.6 Troubleshooting 121
11.7 For More Information 122
V KERNEL TUNING 123
12 Tuning I/O Performance 124
12.1 Switching I/O Scheduling 124
vii System Analysis and Tuning Guide
12.2 Available I/O Elevators 125
CFQ (Completely Fair Queuing) 125 •NOOP 129 •DEADLINE 130
12.3 I/O Barrier Tuning 130
12.4 Enable blk-mq I/O Path for SCSI by Default 131
13 Tuning the Task Scheduler 132
13.1 Introduction 132
Preemption 132 • Timeslice 133 • Process Priority 133
13.2 Process Classification 133
13.3 Completely Fair Scheduler 134
How CFS Works 135 • Grouping Processes 135 • Kernel
Configuration Options 135 • Terminology 136 • Changing Real-
time Attributes ofProcesses with chrt 137 • Runtime Tuning with
sysctl 137 • Debugging Interface and Scheduler Statistics 141
13.4 For More Information 143
14 Tuning the Memory Management Subsystem 144
14.1 Memory Usage 144
Anonymous Memory 145 • Pagecache 145 • Buffercache 145 • Buffer
Heads 145 • Writeback 145 • Readahead 146 • VFS caches 146
14.2 Reducing Memory Usage 147
Reducing malloc (Anonymous) Usage 147 • Reducing Kernel Memory
Overheads 147 • Memory Controller (Memory Cgroups) 147
14.3 Virtual Memory Manager (VM) Tunable Parameters 148
Reclaim Ratios 148 • Writeback Parameters 149 • Readahead
Parameters 150 • Transparent Huge Page Parameters 151 • khugepaged
Parameters 152 • Further VM Parameters 153
14.4 Monitoring VM Behavior 153
15 Tuning the Network 155
15.1 Configurable Kernel Socket Buffers 155
viii System Analysis and Tuning Guide
15.2 Detecting Network Bottlenecks and Analyzing Network Traffic 157
15.3 Netfilter 157
15.4 Improving the Network Performance with Receive Packet Steering
(RPS) 158
15.5 For More Information 159
VI HANDLING SYSTEM DUMPS 160
16 Tracing Tools 161
16.1 Tracing System Calls with strace 161
16.2 Tracing Library Calls with ltrace 165
16.3 Debugging and Profiling with Valgrind 166
Supported Architectures 166 • General Information 166 • Default
Options 167 • How Valgrind Works 168 • Messages 168 • Error
Messages 170
16.4 For More Information 170
17 Kexec and Kdump 171
17.1 Introduction 171
17.2 Required Packages 171
17.3 Kexec Internals 172
17.4 Calculating crashkernel Allocation Size 173
17.5 Basic Kexec Usage 177
17.6 How to Configure Kexec for Routine Reboots 178
17.7 Basic Kdump Configuration 178
Manual Kdump Configuration 179 • YaST Configuration 181
17.8 Analyzing the Crash Dump 183
Kernel Binary Formats 184
17.9 Advanced Kdump Configuration 188
ix System Analysis and Tuning Guide
17.10 For More Information 189
VII SYNCHRONIZED CLOCKS WITH PRECISION TIME PROTOCOL 190
18 Precision Time Protocol 191
18.1 Introduction to PTP 191
PTP Linux Implementation 191
18.2 Using PTP 192
Network Driver and Hardware Support 192 • Using ptp4l 193 •ptp4l
Configuration File 194 • Delay Measurement 194 • PTP Management
Client: pmc 195
18.3 Synchronizing the Clocks with phc2sys 196
Verifying Time Synchronization 197
18.4 Examples of Configurations 198
18.5 PTP and NTP 199
NTP to PTP Synchronization 199 • PTP to NTP Synchronization 200
A GNU Licenses 201
A.1 GNU Free Documentation License 201
xSystem Analysis and Tuning Guide
About This Guide
openSUSE Leap is used for a broad range of usage scenarios in enterprise and scientific data
centers. SUSE has ensured openSUSE Leap is set up in a way that it accommodates different op-
eration purposes with optimal performance. However, openSUSE Leap must meet very different
demands when employed on a number crunching server compared to a le server, for example.
It is not possible to ship a distribution that is optimized for all workloads. Different workloads
vary substantially in some aspects. Most important among those are I/O access patterns, memory
access patterns, and process scheduling. A behavior that perfectly suits a certain workload might
reduce performance of another workload. For example, I/O-intensive tasks, such as handling
database requests, usually have completely different requirements than CPU-intensive tasks,
such as video encoding. The versatility of Linux makes it possible to configure your system in
a way that it brings out the best in each usage scenario.
This manual introduces you to means to monitor and analyze your system. It describes methods
to manage system resources and to tune your system. This guide does not offer recipes for spe-
cial scenarios, because each server has got its own different demands. It rather enables you to
thoroughly analyze your servers and make the most out of them.
PartI, “Basics”
Tuning a system requires a carefully planned proceeding. Learn which steps are necessary
to successfully improve your system.
PartII, “System Monitoring”
Linux offers a large variety of tools to monitor almost every aspect of the system. Learn
how to use these utilities and how to read and analyze the system log les.
PartIII, “Kernel Monitoring”
The Linux kernel itself offers means to examine every nut, bolt and screw of the system.
This part introduces you to SystemTap, a scripting language for writing kernel modules that
can be used to analyze and filter data. Collect debugging information and nd bottlenecks
by using kernel probes and Perf. Last, monitor applications with Oprofile.
PartIV, “Resource Management”
Learn how to set up a tailor-made system fitting exactly the server's need. Get to know how
to use power management while at the same time keeping the performance of a system at
a level that matches the current requirements.
PartV, “Kernel Tuning”
xi openSUSE Leap 42.3

The Linux kernel can be optimized either by using sysctl, via the /proc and /sys le sys-
tems or by kernel command line parameters. This part covers tuning the I/O performance
and optimizing the way how Linux schedules processes. It also describes basic principles
of memory management and shows how memory management can be ne-tuned to suit
needs of specific applications and usage patterns. Furthermore, it describes how to opti-
mize network performance.
PartVI, “Handling System Dumps”
This part enables you to analyze and handle application or system crashes. It introduces
tracing tools such as strace or ltrace and describes how to handle system crashes using
Kexec and Kdump.
1Available Documentation
Note: Online Documentation and Latest Updates
Documentation for our products is available at http://doc.opensuse.org/ , where you
can also nd the latest updates, and browse or download the documentation in various
formats.
In addition, the product documentation is usually available in your installed system under /
usr/share/doc/manual .
The following documentation is available for this product:
Book “Start-Up”
This manual will see you through your initial contact with openSUSE® Leap. Check out
the various parts of this manual to learn how to install, use and enjoy your system.
Book “Reference”
Covers system administration tasks like maintaining, monitoring and customizing an ini-
tially installed system.
Book “Virtualization Guide”
Describes virtualization technology in general, and introduces libvirt—the unified inter-
face to virtualization—and detailed information on specific hypervisors.
Book “AutoYaST”
xii Available Documentation openSUSE Leap 42.3

AutoYaST is a system for installing one or more openSUSE Leap systems automatically
and without user intervention, using an AutoYaST profile that contains installation and
configuration data. The manual guides you through the basic steps of auto-installation:
preparation, installation, and configuration.
Book “Security Guide”
Introduces basic concepts of system security, covering both local and network security
aspects. Shows how to use the product inherent security software like AppArmor or the
auditing system that reliably collects information about any security-relevant events.
System Analysis and Tuning Guide
An administrator's guide for problem detection, resolution and optimization. Find how to
inspect and optimize your system by means of monitoring tools and how to efficiently
manage resources. Also contains an overview of common problems and solutions and of
additional help and documentation resources.
Book “GNOME User Guide”
Introduces the GNOME desktop of openSUSE Leap. It guides you through using and con-
figuring the desktop and helps you perform key tasks. It is intended mainly for end users
who want to make efficient use of GNOME as their default desktop.
2Feedback
Several feedback channels are available:
Bug Reports
To report bugs for openSUSE Leap, go to https://bugzilla.opensuse.org/ , log in, and click
New.
Mail
For feedback on the documentation of this product, you can also send a mail to doc-
team@suse.com . Make sure to include the document title, the product version and the
publication date of the documentation. To report errors or suggest enhancements, provide
a concise description of the problem and refer to the respective section number and page
(or URL).
xiii Feedback openSUSE Leap 42.3
3Documentation Conventions
The following notices and typographical conventions are used in this documentation:
/etc/passwd : directory names and le names
PLACEHOLDER : replace PLACEHOLDER with the actual value
PATH : the environment variable PATH
ls , --help : commands, options, and parameters
user : users or groups
package name : name of a package
Alt , Alt –F1 : a key to press or a key combination; keys are shown in uppercase as on
a keyboard
File, File Save As: menu items, buttons
Dancing Penguins (Chapter Penguins, ↑Another Manual): This is a reference to a chapter in
another manual.
Commands that must be run with root privileges. Often you can also prefix these com-
mands with the sudo command to run them as non-privileged user.
root # command
tux > sudo command
Commands that can be run by non-privileged users.
tux > command
Notices
Warning: Warning Notice
Vital information you must be aware of before proceeding. Warns you about security
issues, potential loss of data, damage to hardware, or physical hazards.
Important: Important Notice
Important information you should be aware of before proceeding.
xiv Documentation Conventions openSUSE Leap 42.3

Note: Note Notice
Additional information, for example about differences in software versions.
Tip: Tip Notice
Helpful information, like a guideline or a piece of practical advice.
xv Documentation Conventions openSUSE Leap 42.3

1General Notes on System Tuning
This manual discusses how to nd the reasons for performance problems and pro-
vides means to solve these problems. Before you start tuning your system, you
should make sure you have ruled out common problems and have found the cause
for the problem. You should also have a detailed plan on how to tune the system,
because applying random tuning tips often will not help and could make things
worse.
PROCEDURE1.1:GENERAL APPROACH WHEN TUNING A SYSTEM
1. Specify the problem that needs to be solved.
2. In case the degradation is new, identify any recent changes to the system.
3. Identify why the issue is considered a performance problem.
4. Specify a metric that can be used to analyze performance. This metric could for example
be latency, throughput, the maximum number of users that are simultaneously logged in,
or the maximum number of active users.
5. Measure current performance using the metric from the previous step.
6. Identify the subsystem(s) where the application is spending the most time.
7.
a. Monitor the system and/or the application.
b. Analyze the data, categorize where time is being spent.
8. Tune the subsystem identified in the previous step.
9. Remeasure the current performance without monitoring using the same metric as before.
10. If performance is still not acceptable, start over with Step 3.
1.1 Be Sure What Problem to Solve
Before starting to tuning a system, try to describe the problem as exactly as possible. A statement
like “The system is slow!” is not a helpful problem description. For example, it could make a
difference whether the system speed needs to be improved in general or only at peak times.
2Be Sure What Problem to Solve openSUSE Leap 42.3

Furthermore, make sure you can apply a measurement to your problem, otherwise you will
not be able to verify if the tuning was a success or not. You should always be able to compare
“before” and “after”. Which metrics to use depends on the scenario or application you are looking
into. Relevant Web server metrics, for example, could be expressed in terms of
Latency
The time to deliver a page
Throughput
Number of pages served per second or megabytes transferred per second
Active Users
The maximum number of users that can be downloading pages while still receiving pages
within an acceptable latency
1.2 Rule Out Common Problems
A performance problem often is caused by network or hardware problems, bugs, or configuration
issues. Make sure to rule out problems such as the ones listed below before attempting to tune
your system:
Check the output of the systemd journal (see Book “Reference”, Chapter11 “journalctl:
Query the systemd Journal”) for unusual entries.
Check (using top or ps ) whether a certain process misbehaves by eating up unusual
amounts of CPU time or memory.
Check for network problems by inspecting /proc/net/dev .
In case of I/O problems with physical disks, make sure it is not caused by hardware prob-
lems (check the disk with the smartmontools ) or by a full disk.
Ensure that background jobs are scheduled to be carried out in times the server load is
low. Those jobs should also run with low priority (set via nice ).
If the machine runs several services using the same resources, consider moving services
to another server.
Last, make sure your software is up-to-date.
3Rule Out Common Problems openSUSE Leap 42.3
1.3 Finding the Bottleneck
Finding the bottleneck very often is the hardest part when tuning a system. openSUSE Leap offers
many tools to help you with this task. See PartII, “System Monitoring” for detailed information on
general system monitoring applications and log le analysis. If the problem requires a long-time
in-depth analysis, the Linux kernel offers means to perform such analysis. See PartIII, “Kernel
Monitoring” for coverage.
Once you have collected the data, it needs to be analyzed. First, inspect if the server's hardware
(memory, CPU, bus) and its I/O capacities (disk, network) are sufficient. If these basic conditions
are met, the system might benefit from tuning.
1.4 Step-by-step Tuning
Make sure to carefully plan the tuning itself. It is of vital importance to only do one step at
a time. Only by doing so you will be able to measure if the change provided an improvement
or even had a negative impact. Each tuning activity should be measured over a sufficient time
period to ensure you can do an analysis based on significant data. If you cannot measure a
positive effect, do not make the change permanent. Chances are, that it might have a negative
effect in the future.
4Finding the Bottleneck openSUSE Leap 42.3

2System Monitoring Utilities
There are number of programs, tools, and utilities which you can use to examine
the status of your system. This chapter introduces some and describes their most im-
portant and frequently used parameters.
For each of the described commands, examples of the relevant outputs are presented. In the ex-
amples, the rst line is the command itself (after the tux > or root #). Omissions are indicated
with square brackets ( [...] ) and long lines are wrapped where necessary. Line breaks for long
lines are indicated by a backslash ( \).
tux > command -x -y
output line 1
output line 2
output line 3 is annoyingly long, so long that \
we need to break it
output line 4
[...]
output line 98
output line 99
The descriptions have been kept short so that we can include as many utilities as possible. Further
information for all the commands can be found in the manual pages. Most of the commands also
understand the parameter --help , which produces a brief list of possible parameters.
2.1 Multi-Purpose Tools
While most Linux system monitoring tools monitor only a single aspect of the system, there are
a few tools with a broader scope. To get an overview and nd out which part of the system to
examine further, use these tools rst.
2.1.1 vmstat
vmstat collects information about processes, memory, I/O, interrupts and CPU. If called without
a sampling rate, it displays average values since the last reboot. When called with a sampling
rate, it displays actual samples:
EXAMPLE2.1:vmstat OUTPUT ON A LIGHTLY USED MACHINE
tux > vmstat 2
6Multi-Purpose Tools openSUSE Leap 42.3
procs -----------memory---------- ---swap-- -----io---- -system-- ------cpu-----
r b swpd free buff cache si so bi bo in cs us sy id wa st
1 0 44264 81520 424 935736 0 0 12 25 27 34 1 0 98 0 0
0 0 44264 81552 424 935736 0 0 0 0 38 25 0 0 100 0 0
0 0 44264 81520 424 935732 0 0 0 0 23 15 0 0 100 0 0
0 0 44264 81520 424 935732 0 0 0 0 36 24 0 0 100 0 0
0 0 44264 81552 424 935732 0 0 0 0 51 38 0 0 100 0 0
EXAMPLE2.2:vmstat OUTPUT ON A HEAVILY USED MACHINE (CPU BOUND)
tux > vmstat 2
procs -----------memory----------- ---swap-- -----io---- -system-- -----cpu------
r b swpd free buff cache si so bi bo in cs us sy id wa st
32 1 26236 459640 110240 6312648 0 0 9944 2 4552 6597 95 5 0 0 0
23 1 26236 396728 110336 6136224 0 0 9588 0 4468 6273 94 6 0 0 0
35 0 26236 554920 110508 6166508 0 0 7684 27992 4474 4700 95 5 0 0 0
28 0 26236 518184 110516 6039996 0 0 10830 4 4446 4670 94 6 0 0 0
21 5 26236 716468 110684 6074872 0 0 8734 20534 4512 4061 96 4 0 0 0
Tip: First Line of Output
The rst line of the vmstat output always displays average values since the last reboot.
The columns show the following:
r
Shows the number of processes in a runnable state. These processes are either executing or
waiting for a free CPU slot. If the number of processes in this column is constantly higher
than the number of CPUs available, this may be an indication of insufficient CPU power.
b
Shows the number of processes waiting for a resource other than a CPU. A high number
in this column may indicate an I/O problem (network or disk).
swpd
The amount of swap space (KB) currently used.
free
The amount of unused memory (KB).
inact
Recently unused memory that can be reclaimed. This column is only visible when calling
vmstat with the parameter -a (recommended).
7vmstat openSUSE Leap 42.3

active
Recently used memory that normally does not get reclaimed. This column is only visible
when calling vmstat with the parameter -a (recommended).
buff
File buer cache (KB) in RAM that contains le system metadata. This column is not visible
when calling vmstat with the parameter -a .
cache
Page cache (KB) in RAM with the actual contents of les. This column is not visible when
calling vmstat with the parameter -a .
si / so
Amount of data (KB) that is moved from swap to RAM ( si ) or from RAM to swap ( so )
per second. High so values over a long period of time may indicate that an application
is leaking memory and the leaked memory is being swapped out. High si values over a
long period of time could mean that an application that was inactive for a very long time
is now active again. Combined high si and so values for prolonged periods of time are
evidence of swap thrashing and may indicate that more RAM needs to be installed in the
system because there is not enough memory to hold the working set size.
bi
Number of blocks per second received from a block device (for example, a disk read). Note
that swapping also impacts the values shown here. The block size may vary between le
systems but can be determined using the stat utility. If throughput data is required then
iostat may be used.
bo
Number of blocks per second sent to a block device (for example, a disk write). Note that
swapping also impacts the values shown here.
in
Interrupts per second. A high value may indicate a high I/O level (network and/or disk),
but could also be triggered for other reasons such as inter-processor interrupts triggered
by another activity. Make sure to also check /proc/interrupts to identify the source
of interrupts.
cs
Number of context switches per second. This is the number of times that the kernel replaces
executable code of one program in memory with that of another program.
8vmstat openSUSE Leap 42.3

us
Percentage of CPU usage executing application code.
sy
Percentage of CPU usage executing kernel code.
id
Percentage of CPU time spent idling. If this value is zero over a longer period of time,
your CPU(s) are working to full capacity. This is not necessarily a bad sign—rather refer
to the values in columns r and b to determine if your machine is equipped with sufficient
CPU power.
wa
If "wa" time is non-zero, it indicates throughput lost because of waiting for I/O. This may
be inevitable, for example, if a le is being read for the rst time, background writeback
cannot keep up, and so on. It can also be an indicator for a hardware bottleneck (network
or hard disk). Lastly, it can indicate a potential for tuning the virtual memory manager
(refer to Chapter14, Tuning the Memory Management Subsystem).
st
Percentage of CPU time stolen from a virtual machine.
See vmstat --help for more options.
2.1.2 dstat
dstat is a replacement for tools such as vmstat , iostat , netstat , or ifstat . dstat dis-
plays information about the system resources in real time. For example, you can compare disk
usage in combination with interrupts from the IDE controller, or compare network bandwidth
with the disk throughput (in the same interval).
By default, its output is presented in readable tables. Alternatively, CSV output can be produced
which is suitable as a spreadsheet import format.
It is written in Python and can be enhanced with plug-ins.
This is the general syntax:
dstat [-afv] [OPTIONS..] [DELAY [COUNT]]
9dstat openSUSE Leap 42.3
All options and parameters are optional. Without any parameter, dstat displays statistics about
CPU ( -c , --cpu ), disk ( -d , --disk ), network ( -n , --net ), paging ( -g , --page ), and the
interrupts and context switches of the system ( -y , --sys ); it refreshes the output every second
ad infinitum:
root # dstat
You did not select any stats, using -cdngy by default.
----total-cpu-usage---- -dsk/total- -net/total- ---paging-- ---system--
usr sys idl wai hiq siq| read writ| recv send| in out | int csw
0 0 100 0 0 0| 15k 44k| 0 0 | 0 82B| 148 194
0 0 100 0 0 0| 0 0 |5430B 170B| 0 0 | 163 187
0 0 100 0 0 0| 0 0 |6363B 842B| 0 0 | 196 185
-a , --all
equal to -cdngy (default)
-f , --full
expand -C , -D , -I , -N and -S discovery lists
-v , --vmstat
equal to -pmgdsc , -D total
DELAY
delay in seconds between each update
COUNT
the number of updates to display before exiting
The default delay is 1 and the count is unspecified (unlimited).
For more information, see the man page of dstat and its Web page at http://dag.wieer-
s.com/home-made/dstat/ .
2.1.3 System Activity Information: sar
sar can generate extensive reports on almost all important system activities, among them CPU,
memory, IRQ usage, IO, or networking. It can also generate reports on the y. sar gathers all
their data from the /proc le system.
10 System Activity Information: sar openSUSE Leap 42.3

Note: sysstat Package
sar is a part of the sysstat package either with YaST, or with zypper in sysstat .
2.1.3.1 Generating reports with sar
To generate reports on the y, call sar with an interval (seconds) and a count. To generate
reports from les specify a le name with the option -f instead of interval and count. If le
name, interval and count are not specified, sar attempts to generate a report from /var/log/
sa/saDD , where DD stands for the current day. This is the default location to where sadc (the
system activity data collector) writes its data. Query multiple les with multiple -f options.
sar 2 10 # on-the-fly report, 10 times every 2 seconds
sar -f ~/reports/sar_2014_07_17 # queries file sar_2014_07_17
sar # queries file from today in /var/log/sa/
cd /var/log/sa && \
sar -f sa01 -f sa02 # queries files /var/log/sa/0[12]
Find examples for useful sar calls and their interpretation below. For detailed information on
the meaning of each column, refer to the man (1) of sar . Also refer to the man page for more
options and reports— sar offers plenty of them.
2.1.3.1.1 CPU Usage Report: sar
When called with no options, sar shows a basic report about CPU usage. On multi-processor
machines, results for all CPUs are summarized. Use the option -P ALL to also see statistics for
individual CPUs.
root # sar 10 5
Linux 4.4.21-64-default (jupiter) 10/12/16 _x86_64_ (2 CPU)
17:51:29 CPU %user %nice %system %iowait %steal %idle
17:51:39 all 57,93 0,00 9,58 1,01 0,00 31,47
17:51:49 all 32,71 0,00 3,79 0,05 0,00 63,45
17:51:59 all 47,23 0,00 3,66 0,00 0,00 49,11
17:52:09 all 53,33 0,00 4,88 0,05 0,00 41,74
17:52:19 all 56,98 0,00 5,65 0,10 0,00 37,27
Average: all 49,62 0,00 5,51 0,24 0,00 44,62
11 System Activity Information: sar openSUSE Leap 42.3

%iowait displays the percentage of time that the CPU was idle while waiting for an I/O request.
If this value is significantly higher than zero over a longer time, there is a bottleneck in the I/
O system (network or hard disk). If the %idle value is zero over a longer period of time, your
CPU is working at capacity.
2.1.3.1.2 Memory Usage Report: sar -r
Generate an overall picture of the system memory (RAM) by using the option -r :
root # sar -r 10 5
Linux 4.4.21-64-default (jupiter) 10/12/16 _x86_64_ (2 CPU)
17:55:27 kbmemfree kbmemused %memused kbbuffers kbcached kbcommit %commit kbactive kbinact kbdirty
17:55:37 104232 1834624 94.62 20 627340 2677656 66.24 802052 828024 1744
17:55:47 98584 1840272 94.92 20 624536 2693936 66.65 808872 826932 2012
17:55:57 87088 1851768 95.51 20 605288 2706392 66.95 827260 821304 1588
17:56:07 86268 1852588 95.55 20 599240 2739224 67.77 829764 820888 3036
17:56:17 104260 1834596 94.62 20 599864 2730688 67.56 811284 821584 3164
Average: 96086 1842770 95.04 20 611254 2709579 67.03 815846 823746 2309
The columns kbcommit and %commit show an approximation of the maximum amount of memory
(RAM and swap) that the current workload could need. While kbcommit displays the absolute
number in kilobytes, %commit displays a percentage.
2.1.3.1.3 Paging Statistics Report: sar -B
Use the option -B to display the kernel paging statistics.
root # sar -B 10 5
Linux 4.4.21-64-default (jupiter) 10/12/16 _x86_64_ (2 CPU)
18:23:01 pgpgin/s pgpgout/s fault/s majflt/s pgfree/s pgscank/s pgscand/s pgsteal/s %vmeff
18:23:11 366.80 11.60 542.50 1.10 4354.80 0.00 0.00 0.00 0.00
18:23:21 0.00 333.30 1522.40 0.00 18132.40 0.00 0.00 0.00 0.00
18:23:31 47.20 127.40 1048.30 0.10 11887.30 0.00 0.00 0.00 0.00
18:23:41 46.40 2.50 336.10 0.10 7945.00 0.00 0.00 0.00 0.00
18:23:51 0.00 583.70 2037.20 0.00 17731.90 0.00 0.00 0.00 0.00
Average: 92.08 211.70 1097.30 0.26 12010.28 0.00 0.00 0.00 0.00
The majflt/s (major faults per second) column shows how many pages are loaded from disk
into memory. The source of the faults may be le accesses or faults. There are times when a
large number of major faults are normal such as during application start-up time. If major faults
are experienced for the entire lifetime of the application it may be an indication that there
is insufficient main memory, particularly if combined with large amounts of direct scanning
(pgscand/s).
12 System Activity Information: sar openSUSE Leap 42.3

The %vmeff column shows the number of pages scanned (pgscand/s) in relation to the ones being
reused from the main memory cache or the swap cache (pgsteal/s). It is a measurement of the
efficiency of page reclaim. Healthy values are either near 100 (every inactive page swapped out
is being reused) or 0 (no pages have been scanned). The value should not drop below 30.
2.1.3.1.4 Block Device Statistics Report: sar -d
Use the option -d to display the block device (hard disk, optical drive, USB storage device, etc.).
Make sure to use the additional option -p (pretty-print) to make the DEV column readable.
root # sar -d -p 10 5
Linux 4.4.21-64-default (jupiter) 10/12/16 _x86_64_ (2 CPU)
18:46:09 DEV tps rd_sec/s wr_sec/s avgrq-sz avgqu-sz await svctm %util
18:46:19 sda 1.70 33.60 0.00 19.76 0.00 0.47 0.47 0.08
18:46:19 sr0 0.00 0.00 0.00 0.00 0.00 0.00 0.00 0.00
18:46:19 DEV tps rd_sec/s wr_sec/s avgrq-sz avgqu-sz await svctm %util
18:46:29 sda 8.60 114.40 518.10 73.55 0.06 7.12 0.93 0.80
18:46:29 sr0 0.00 0.00 0.00 0.00 0.00 0.00 0.00 0.00
18:46:29 DEV tps rd_sec/s wr_sec/s avgrq-sz avgqu-sz await svctm %util
18:46:39 sda 40.50 3800.80 454.90 105.08 0.36 8.86 0.69 2.80
18:46:39 sr0 0.00 0.00 0.00 0.00 0.00 0.00 0.00 0.00
18:46:39 DEV tps rd_sec/s wr_sec/s avgrq-sz avgqu-sz await svctm %util
18:46:49 sda 1.40 0.00 204.90 146.36 0.00 0.29 0.29 0.04
18:46:49 sr0 0.00 0.00 0.00 0.00 0.00 0.00 0.00 0.00
18:46:49 DEV tps rd_sec/s wr_sec/s avgrq-sz avgqu-sz await svctm %util
18:46:59 sda 3.30 0.00 503.80 152.67 0.03 8.12 1.70 0.56
18:46:59 sr0 0.00 0.00 0.00 0.00 0.00 0.00 0.00 0.00
Average: DEV tps rd_sec/s wr_sec/s avgrq-sz avgqu-sz await svctm %util
Average: sda 11.10 789.76 336.34 101.45 0.09 8.07 0.77 0.86
Average: sr0 0.00 0.00 0.00 0.00 0.00 0.00 0.00 0.00
Compare the Average values for tps, rd_sec/s, and wr_sec/s of all disks. Constantly high values in
the svctm and %util columns could be an indication that I/O subsystem is a bottleneck.
If the machine uses multiple disks, then it is best if I/O is interleaved evenly between disks
of equal speed and capacity. It will be necessary to take into account whether the storage has
multiple tiers. Furthermore, if there are multiple paths to storage then consider what the link
saturation will be when balancing how storage is used.
13 System Activity Information: sar openSUSE Leap 42.3
2.1.3.1.5 Network Statistics Reports: sar -n KEYWORD
The option -n lets you generate multiple network related reports. Specify one of the following
keywords along with the -n :
DEV: Generates a statistic report for all network devices
EDEV: Generates an error statistics report for all network devices
NFS: Generates a statistic report for an NFS client
NFSD: Generates a statistic report for an NFS server
SOCK: Generates a statistic report on sockets
ALL: Generates all network statistic reports
2.1.3.2 Visualizing sar Data
sar reports are not always easy to parse for humans. kSar, a Java application visualizing your
sar data, creates easy-to-read graphs. It can even generate PDF reports. kSar takes data gener-
ated on the y and past data from a le. kSar is licensed under the BSD license and is available
from https://sourceforge.net/projects/ksar/ .
2.2 System Information
2.2.1 Device Load Information: iostat
To monitor the system device load, use iostat . It generates reports that can be useful for better
balancing the load between physical disks attached to your system.
To be able to use iostat , install the package sysstat .
The rst iostat report shows statistics collected since the system was booted. Subsequent
reports cover the time since the previous report.
tux > iostat
Linux 4.4.21-64-default (jupiter) 10/12/16 _x86_64_ (4 CPU)
14 System Information openSUSE Leap 42.3
avg-cpu: %user %nice %system %iowait %steal %idle
17.68 4.49 4.24 0.29 0.00 73.31
Device: tps kB_read/s kB_wrtn/s kB_read kB_wrtn
sdb 2.02 36.74 45.73 3544894 4412392
sda 1.05 5.12 13.47 493753 1300276
sdc 0.02 0.14 0.00 13641 37
Invoking iostat in this way will help you nd out whether throughput is different from your
expectation, but not why. Such questions can be better answered by an extended report which
can be generated by invoking iostat -x . Extended reports additionally include, for example,
information on average queue sizes and average wait times. It may also be easier to evaluate
the data if idle block devices are excluded using the -z switch. Find definitions for each of the
displayed column titles in the man page of iostat ( man 1 iostat ).
You can also specify that a certain device should be monitored at specified intervals. For exam-
ple, to generate ve reports at three-second intervals for the device sda , use:
tux > iostat -p sda 3 5
To show statistics of network le systems (NFS), there are two similar utilities:
nfsiostat-sysstat is included with the package sysstat .
nfsiostat is included with the package nfs-client .
2.2.2 Processor Activity Monitoring: mpstat
The utility mpstat examines activities of each available processor. If your system has one
processor only, the global average statistics will be reported.
The timing arguments work the same way as with the iostat command. Entering mpstat 2
5 prints ve reports for all processors in two-second intervals.
root # mpstat 2 5
Linux 4.4.21-64-default (jupiter) 10/12/16 _x86_64_ (2 CPU)
13:51:10 CPU %usr %nice %sys %iowait %irq %soft %steal %guest %gnice %idle
13:51:12 all 8,27 0,00 0,50 0,00 0,00 0,00 0,00 0,00 0,00 91,23
13:51:14 all 46,62 0,00 3,01 0,00 0,00 0,25 0,00 0,00 0,00 50,13
13:51:16 all 54,71 0,00 3,82 0,00 0,00 0,51 0,00 0,00 0,00 40,97
13:51:18 all 78,77 0,00 5,12 0,00 0,00 0,77 0,00 0,00 0,00 15,35
13:51:20 all 51,65 0,00 4,30 0,00 0,00 0,51 0,00 0,00 0,00 43,54
Average: all 47,85 0,00 3,34 0,00 0,00 0,40 0,00 0,00 0,00 48,41
15 Processor Activity Monitoring: mpstat openSUSE Leap 42.3

There are a number of key observations that can be made with the mpstat data. The rst is the
ratio between the %usr and %sys. For example, a ratio of 10:1 would indicate the workload is
mostly running application code and analysis should focus on the application. A ratio of 1:10
would indicate the workload is mostly kernel-bound and tuning the kernel is worth considering.
Alternatively determine why the application is kernel-bound and see if that can be alleviated.
The second is whether there is a subset of CPUs that are nearly fully utilized even if the system
is lightly loaded overall. A small number of hot CPUs may indicate that the workload is not
parallelized and may benefit from executing on a machine with a smaller number of faster
processors.
2.2.3 Processor Frequency Monitoring: turbostat
turbostat shows frequencies, load, temperature, and power of AMD64/Intel64 processors.
It can operate in two modes: If called with a command, the command process is forked and
statistics are displayed upon command completion. When run without a command, it will display
updated statistics every ve seconds. Note that turbostat requires the kernel module msr to
be loaded.
tux > sudo turbostat find /etc -type d -exec true {} \;
0.546880 sec
CPU Avg_MHz Busy% Bzy_MHz TSC_MHz
- 416 28.43 1465 3215
0 631 37.29 1691 3215
1 416 27.14 1534 3215
2 270 24.30 1113 3215
3 406 26.57 1530 3214
4 505 32.46 1556 3214
5 270 22.79 1184 3214
The output depends on the CPU type and may vary. To display more details such as temperature
and power, use the --debug option. For more command line options and an explanation of the
eld descriptions, refer to man 8 turbostat .
2.2.4 Task Monitoring: pidstat
If you need to see what load a particular task applies to your system, use pidstat command. It
prints activity of every selected task or all tasks managed by Linux kernel if no task is specified.
You can also set the number of reports to be displayed and the time interval between them.
16 Processor Frequency Monitoring: turbostat openSUSE Leap 42.3

For example, pidstat -C firefox 2 3 prints the load statistic for tasks whose command name
includes the string “firefox”. There will be three reports printed at two second intervals.
root # pidstat -C firefox 2 3
Linux 4.4.21-64-default (jupiter) 10/12/16 _x86_64_ (2 CPU)
14:09:11 UID PID %usr %system %guest %CPU CPU Command
14:09:13 1000 387 22,77 0,99 0,00 23,76 1 firefox
14:09:13 UID PID %usr %system %guest %CPU CPU Command
14:09:15 1000 387 46,50 3,00 0,00 49,50 1 firefox
14:09:15 UID PID %usr %system %guest %CPU CPU Command
14:09:17 1000 387 60,50 7,00 0,00 67,50 1 firefox
Average: UID PID %usr %system %guest %CPU CPU Command
Average: 1000 387 43,19 3,65 0,00 46,84 - firefox
Similarly, pidstat -d can be used to estimate how much I/O tasks are doing, whether they
are sleeping on that I/O and how many clock ticks the task was stalled.
2.2.5 Kernel Ring Buffer: dmesg
The Linux kernel keeps certain messages in a ring buer. To view these messages, enter the
command dmesg -T .
Older events are logged in the systemd journal. See Book “Reference”, Chapter11 “journalctl:
Query the systemd Journal” for more information on the journal.
2.2.6 List of Open Files: lsof
To view a list of all the les open for the process with process ID PID , use -p . For example,
to view all the les used by the current shell, enter:
root # lsof -p $$
COMMAND PID USER FD TYPE DEVICE SIZE/OFF NODE NAME
bash 8842 root cwd DIR 0,32 222 6772 /root
bash 8842 root rtd DIR 0,32 166 256 /
bash 8842 root txt REG 0,32 656584 31066 /bin/bash
bash 8842 root mem REG 0,32 1978832 22993 /lib64/libc-2.19.so
[...]
bash 8842 root 2u CHR 136,2 0t0 5 /dev/pts/2
17 Kernel Ring Buffer: dmesg openSUSE Leap 42.3

bash 8842 root 255u CHR 136,2 0t0 5 /dev/pts/2
The special shell variable $$ , whose value is the process ID of the shell, has been used.
When used with -i , lsof lists currently open Internet les as well:
root # lsof -i
COMMAND PID USER FD TYPE DEVICE SIZE/OFF NODE NAME
wickedd-d 917 root 8u IPv4 16627 0t0 UDP *:bootpc
wickedd-d 918 root 8u IPv6 20752 0t0 UDP [fe80::5054:ff:fe72:5ead]:dhcpv6-client
sshd 3152 root 3u IPv4 18618 0t0 TCP *:ssh (LISTEN)
sshd 3152 root 4u IPv6 18620 0t0 TCP *:ssh (LISTEN)
master 4746 root 13u IPv4 20588 0t0 TCP localhost:smtp (LISTEN)
master 4746 root 14u IPv6 20589 0t0 TCP localhost:smtp (LISTEN)
sshd 8837 root 5u IPv4 293709 0t0 TCP jupiter.suse.de:ssh->venus.suse.de:33619 (ESTABLISHED)
sshd 8837 root 9u IPv6 294830 0t0 TCP localhost:x11 (LISTEN)
sshd 8837 root 10u IPv4 294831 0t0 TCP localhost:x11 (LISTEN)
2.2.7 Kernel and udev Event Sequence Viewer: udevadm monitor
udevadm monitor listens to the kernel uevents and events sent out by a udev rule and prints
the device path (DEVPATH) of the event to the console. This is a sequence of events while
connecting a USB memory stick:
Note: Monitoring udev Events
Only root user is allowed to monitor udev events by running the udevadm command.
UEVENT[1138806687] add@/devices/pci0000:00/0000:00:1d.7/usb4/4-2/4-2.2
UEVENT[1138806687] add@/devices/pci0000:00/0000:00:1d.7/usb4/4-2/4-2.2/4-2.2
UEVENT[1138806687] add@/class/scsi_host/host4
UEVENT[1138806687] add@/class/usb_device/usbdev4.10
UDEV [1138806687] add@/devices/pci0000:00/0000:00:1d.7/usb4/4-2/4-2.2
UDEV [1138806687] add@/devices/pci0000:00/0000:00:1d.7/usb4/4-2/4-2.2/4-2.2
UDEV [1138806687] add@/class/scsi_host/host4
UDEV [1138806687] add@/class/usb_device/usbdev4.10
UEVENT[1138806692] add@/devices/pci0000:00/0000:00:1d.7/usb4/4-2/4-2.2/4-2.2
UEVENT[1138806692] add@/block/sdb
UEVENT[1138806692] add@/class/scsi_generic/sg1
UEVENT[1138806692] add@/class/scsi_device/4:0:0:0
UDEV [1138806693] add@/devices/pci0000:00/0000:00:1d.7/usb4/4-2/4-2.2/4-2.2
UDEV [1138806693] add@/class/scsi_generic/sg1
UDEV [1138806693] add@/class/scsi_device/4:0:0:0
UDEV [1138806693] add@/block/sdb
UEVENT[1138806694] add@/block/sdb/sdb1
UDEV [1138806694] add@/block/sdb/sdb1
18 Kernel and udev Event Sequence Viewer: udevadm monitor openSUSE Leap 42.3

UEVENT[1138806694] mount@/block/sdb/sdb1
UEVENT[1138806697] umount@/block/sdb/sdb1
2.3 Processes
2.3.1 Interprocess Communication: ipcs
The command ipcs produces a list of the IPC resources currently in use:
root # ipcs
------ Message Queues --------
key msqid owner perms used-bytes messages
------ Shared Memory Segments --------
key shmid owner perms bytes nattch status
0x00000000 65536 tux 600 524288 2 dest
0x00000000 98305 tux 600 4194304 2 dest
0x00000000 884738 root 600 524288 2 dest
0x00000000 786435 tux 600 4194304 2 dest
0x00000000 12058628 tux 600 524288 2 dest
0x00000000 917509 root 600 524288 2 dest
0x00000000 12353542 tux 600 196608 2 dest
0x00000000 12451847 tux 600 524288 2 dest
0x00000000 11567114 root 600 262144 1 dest
0x00000000 10911763 tux 600 2097152 2 dest
0x00000000 11665429 root 600 2336768 2 dest
0x00000000 11698198 root 600 196608 2 dest
0x00000000 11730967 root 600 524288 2 dest
------ Semaphore Arrays --------
key semid owner perms nsems
0xa12e0919 32768 tux 666 2
2.3.2 Process List: ps
The command ps produces a list of processes. Most parameters must be written without a minus
sign. Refer to ps --help for a brief help or to the man page for extensive help.
To list all processes with user and command line information, use ps axu :
tux > ps axu
19 Processes openSUSE Leap 42.3

USER PID %CPU %MEM VSZ RSS TTY STAT START TIME COMMAND
root 1 0.0 0.3 34376 4608 ? Ss Jul24 0:02 /usr/lib/systemd/systemd
root 2 0.0 0.0 0 0 ? S Jul24 0:00 [kthreadd]
root 3 0.0 0.0 0 0 ? S Jul24 0:00 [ksoftirqd/0]
root 5 0.0 0.0 0 0 ? S< Jul24 0:00 [kworker/0:0H]
root 6 0.0 0.0 0 0 ? S Jul24 0:00 [kworker/u2:0]
root 7 0.0 0.0 0 0 ? S Jul24 0:00 [migration/0]
[...]
tux 12583 0.0 0.1 185980 2720 ? Sl 10:12 0:00 /usr/lib/gvfs/gvfs-mtp-volume-monitor
tux 12587 0.0 0.1 198132 3044 ? Sl 10:12 0:00 /usr/lib/gvfs/gvfs-gphoto2-volume-monitor
tux 12591 0.0 0.1 181940 2700 ? Sl 10:12 0:00 /usr/lib/gvfs/gvfs-goa-volume-monitor
tux 12594 8.1 10.6 1418216 163564 ? Sl 10:12 0:03 /usr/bin/gnome-shell
tux 12600 0.0 0.3 393448 5972 ? Sl 10:12 0:00 /usr/lib/gnome-settings-daemon-3.0/gsd-
printer
tux 12625 0.0 0.6 227776 10112 ? Sl 10:12 0:00 /usr/lib/gnome-control-center-search-
provider
tux 12626 0.5 1.5 890972 23540 ? Sl 10:12 0:00 /usr/bin/nautilus --no-default-window
[...]
To check how many sshd processes are running, use the option -p together with the command
pidof , which lists the process IDs of the given processes.
tux > ps -p $(pidof sshd)
PID TTY STAT TIME COMMAND
1545 ? Ss 0:00 /usr/sbin/sshd -D
4608 ? Ss 0:00 sshd: root@pts/0
The process list can be formatted according to your needs. The option L returns a list of all
keywords. Enter the following command to issue a list of all processes sorted by memory usage:
tux > ps ax --format pid,rss,cmd --sort rss
PID RSS CMD
PID RSS CMD
2 0 [kthreadd]
3 0 [ksoftirqd/0]
4 0 [kworker/0:0]
5 0 [kworker/0:0H]
6 0 [kworker/u2:0]
7 0 [migration/0]
8 0 [rcu_bh]
[...]
12518 22996 /usr/lib/gnome-settings-daemon-3.0/gnome-settings-daemon
12626 23540 /usr/bin/nautilus --no-default-window
12305 32188 /usr/bin/Xorg :0 -background none -verbose
12594 164900 /usr/bin/gnome-shell
USEFUL ps CALLS
ps aux --sort COLUMN
20 Process List: ps openSUSE Leap 42.3

Sort the output by COLUMN . Replace COLUMN with
pmem for physical memory ratio
pcpu for CPU ratio
rss for resident set size (non-swapped physical memory)
ps axo pid,%cpu,rss,vsz,args,wchan
Shows every process, their PID, CPU usage ratio, memory size (resident and virtual), name,
and their syscall.
ps axfo pid,args
Show a process tree.
2.3.3 Process Tree: pstree
The command pstree produces a list of processes in the form of a tree:
tux > pstree
systemd---accounts-daemon---{gdbus}
| |-{gmain}
|-at-spi-bus-laun---dbus-daemon
| |-{dconf worker}
| |-{gdbus}
| |-{gmain}
|-at-spi2-registr---{gdbus}
|-cron
|-2*[dbus-daemon]
|-dbus-launch
|-dconf-service---{gdbus}
| |-{gmain}
|-gconfd-2
|-gdm---gdm-simple-slav---Xorg
| | |-gdm-session-wor---gnome-session---gnome-setti+
| | | | |-gnome-shell+++
| | | | |-{dconf work+
| | | | |-{gdbus}
| | | | |-{gmain}
| | | |-{gdbus}
| | | |-{gmain}
| | |-{gdbus}
| | |-{gmain}
| |-{gdbus}
| |-{gmain}
21 Process Tree: pstree openSUSE Leap 42.3

[...]
The parameter -p adds the process ID to a given name. To have the command lines displayed
as well, use the -a parameter:
2.3.4 Table of Processes: top
The command top (an abbreviation of “table of processes”) displays a list of processes that
is refreshed every two seconds. To terminate the program, press Q. The parameter -n 1
terminates the program after a single display of the process list. The following is an example
output of the command top -n 1 :
tux > top -n 1
Tasks: 128 total, 1 running, 127 sleeping, 0 stopped, 0 zombie
%Cpu(s): 2.4 us, 1.2 sy, 0.0 ni, 96.3 id, 0.1 wa, 0.0 hi, 0.0 si, 0.0 st
KiB Mem: 1535508 total, 699948 used, 835560 free, 880 buffers
KiB Swap: 1541116 total, 0 used, 1541116 free. 377000 cached Mem
PID USER PR NI VIRT RES SHR S %CPU %MEM TIME+ COMMAND
1 root 20 0 116292 4660 2028 S 0.000 0.303 0:04.45 systemd
2 root 20 0 0 0 0 S 0.000 0.000 0:00.00 kthreadd
3 root 20 0 0 0 0 S 0.000 0.000 0:00.07 ksoftirqd+
5 root 0 -20 0 0 0 S 0.000 0.000 0:00.00 kworker/0+
6 root 20 0 0 0 0 S 0.000 0.000 0:00.00 kworker/u+
7 root rt 0 0 0 0 S 0.000 0.000 0:00.00 migration+
8 root 20 0 0 0 0 S 0.000 0.000 0:00.00 rcu_bh
9 root 20 0 0 0 0 S 0.000 0.000 0:00.24 rcu_sched
10 root rt 0 0 0 0 S 0.000 0.000 0:00.01 watchdog/0
11 root 0 -20 0 0 0 S 0.000 0.000 0:00.00 khelper
12 root 20 0 0 0 0 S 0.000 0.000 0:00.00 kdevtmpfs
13 root 0 -20 0 0 0 S 0.000 0.000 0:00.00 netns
14 root 0 -20 0 0 0 S 0.000 0.000 0:00.00 writeback
15 root 0 -20 0 0 0 S 0.000 0.000 0:00.00 kintegrit+
16 root 0 -20 0 0 0 S 0.000 0.000 0:00.00 bioset
17 root 0 -20 0 0 0 S 0.000 0.000 0:00.00 crypto
18 root 0 -20 0 0 0 S 0.000 0.000 0:00.00 kblockd
By default the output is sorted by CPU usage (column %CPU, shortcut Shift –P). Use the
following key combinations to change the sort eld:
Shift –M: Resident Memory (RES)
Shift –N: Process ID (PID)
Shift –T: Time (TIME+)
22 Table of Processes: top openSUSE Leap 42.3
To use any other eld for sorting, press F and select a eld from the list. To toggle the sort
order, Use Shift –R.
The parameter -U UID monitors only the processes associated with a particular user. Replace
UID with the user ID of the user. Use top -U $(id -u) to show processes of the current user
2.3.5 A top-like I/O Monitor: iotop
The iotop utility displays a table of I/O usage by processes or threads.
Note: Installing iotop
iotop is not installed by default. You need to install it manually with zypper in iotop
as root .
iotop displays columns for the I/O bandwidth read and written by each process during the
sampling period. It also displays the percentage of time the process spent while swapping in
and while waiting on I/O. For each process, its I/O priority (class/level) is shown. In addition,
the total I/O bandwidth read and written during the sampling period is displayed at the top
of the interface.
The ← and → keys change the sorting.
R reverses the sort order.
O toggles between showing all processes and threads (default view) and showing only
those doing I/O. (This function is similar to adding --only on command line.)
P toggles between showing threads (default view) and processes. (This function is similar
to --only .)
A toggles between showing the current I/O bandwidth (default view) and accumulated
I/O operations since iotop was started. (This function is similar to --accumulated .)
I lets you change the priority of a thread or a process's threads.
Q quits iotop .
Pressing any other key will force a refresh.
23 A top-like I/O Monitor: iotop openSUSE Leap 42.3

Following is an example output of the command iotop --only , while find and emacs are
running:
root # iotop --only
Total DISK READ: 50.61 K/s | Total DISK WRITE: 11.68 K/s
TID PRIO USER DISK READ DISK WRITE SWAPIN IO> COMMAND
3416 be/4 tux 50.61 K/s 0.00 B/s 0.00 % 4.05 % find /
275 be/3 root 0.00 B/s 3.89 K/s 0.00 % 2.34 % [jbd2/sda2-8]
5055 be/4 tux 0.00 B/s 3.89 K/s 0.00 % 0.04 % emacs
iotop can be also used in a batch mode ( -b ) and its output stored in a le for later analysis.
For a complete set of options, see the manual page ( man 8 iotop ).
2.3.6 Modify a process's niceness: nice and renice
The kernel determines which processes require more CPU time than others by the process's nice
level, also called niceness. The higher the “nice” level of a process is, the less CPU time it will
take from other processes. Nice levels range from -20 (the least “nice” level) to 19. Negative
values can only be set by root .
Adjusting the niceness level is useful when running a non time-critical process that lasts long
and uses large amounts of CPU time. For example, compiling a kernel on a system that also
performs other tasks. Making such a process “nicer”, ensures that the other tasks, for example
a Web server, will have a higher priority.
Calling nice without any parameters prints the current niceness:
tux > nice
0
Running nice COMMAND increments the current nice level for the given command by 10. Using
nice -n LEVEL COMMAND lets you specify a new niceness relative to the current one.
To change the niceness of a running process, use renice PRIORITY -p PROCESS_ID , for ex-
ample:
tux > renice +5 3266
To renice all processes owned by a specific user, use the option -u USER . Process groups are
reniced by the option -g PROCESS_GROUP_ID .
24 Modify a process's niceness: nice and renice openSUSE Leap 42.3

2.4 Memory
2.4.1 Memory Usage: free
The utility free examines RAM and swap usage. Details of both free and used memory and
swap areas are shown:
tux > free
total used free shared buffers cached
Mem: 32900500 32703448 197052 0 255668 5787364
-/+ buffers/cache: 26660416 6240084
Swap: 2046972 304680 1742292
The options -b , -k , -m , -g show the output in bytes, KB, MB, or GB, respectively. The para-
meter -s delay ensures that the display is refreshed every DELAY seconds. For example, free
-s 1.5 produces an update every 1.5 seconds.
2.4.2 Detailed Memory Usage: /proc/meminfo
Use /proc/meminfo to get more detailed information on memory usage than with free . Ac-
tually free uses some of the data from this le. See an example output from a 64-bit system
below. Note that it slightly differs on 32-bit systems because of different memory management:
MemTotal: 1942636 kB
MemFree: 1294352 kB
MemAvailable: 1458744 kB
Buffers: 876 kB
Cached: 278476 kB
SwapCached: 0 kB
Active: 368328 kB
Inactive: 199368 kB
Active(anon): 288968 kB
Inactive(anon): 10568 kB
Active(file): 79360 kB
Inactive(file): 188800 kB
Unevictable: 80 kB
Mlocked: 80 kB
SwapTotal: 2103292 kB
SwapFree: 2103292 kB
Dirty: 44 kB
Writeback: 0 kB
25 Memory openSUSE Leap 42.3

AnonPages: 288592 kB
Mapped: 70444 kB
Shmem: 11192 kB
Slab: 40916 kB
SReclaimable: 17712 kB
SUnreclaim: 23204 kB
KernelStack: 2000 kB
PageTables: 10996 kB
NFS_Unstable: 0 kB
Bounce: 0 kB
WritebackTmp: 0 kB
CommitLimit: 3074608 kB
Committed_AS: 1407208 kB
VmallocTotal: 34359738367 kB
VmallocUsed: 145996 kB
VmallocChunk: 34359588844 kB
HardwareCorrupted: 0 kB
AnonHugePages: 86016 kB
HugePages_Total: 0
HugePages_Free: 0
HugePages_Rsvd: 0
HugePages_Surp: 0
Hugepagesize: 2048 kB
DirectMap4k: 79744 kB
DirectMap2M: 2017280 kB
These entries stand for the following:
MemTotal
Total amount of RAM.
MemFree
Amount of unused RAM.
MemAvailable
Estimate of how much memory is available for starting new applications without swapping.
Buffers
File buer cache in RAM containing le system metadata.
Cached
Page cache in RAM. This excludes buer cache and swap cache, but includes Shmem mem-
ory.
SwapCached
Page cache for swapped-out memory.
26 Detailed Memory Usage: /proc/meminfo openSUSE Leap 42.3

Active, Active(anon), Active(file)
Recently used memory that will not be reclaimed unless necessary or on explicit request.
Active is the sum of Active(anon) and Active(file):
Active(anon) tracks swap-backed memory. This includes private and shared anony-
mous mappings and private le pages after copy-on-write.
Active(file) tracks other le system backed memory.
Inactive, Inactive(anon), Inactive(file)
Less recently used memory that will usually be reclaimed rst. Inactive is the sum of Inac-
tive(anon) and Inactive(file):
Inactive(anon) tracks swap backed memory. This includes private and shared anony-
mous mappings and private le pages after copy-on-write.
Inactive(file) tracks other le system backed memory.
Unevictable
Amount of memory that cannot be reclaimed (for example, because it is Mlocked or used
as a RAM disk).
Mlocked
Amount of memory that is backed by the mlock system call. mlock allows processes to
define which part of physical RAM their virtual memory should be mapped to. However,
mlock does not guarantee this placement.
SwapTotal
Amount of swap space.
SwapFree
Amount of unused swap space.
Dirty
Amount of memory waiting to be written to disk, because it contains changes compared
to the backing storage. Dirty data can be explicitly synchronized either by the applica-
tion or by the kernel after a short delay. A large amount of dirty data may take consider-
able time to write to disk resulting in stalls. The total amount of dirty data that can exist
at any given time can be controlled with the sysctl parameters vm.dirty_ratio or
vm.dirty_bytes (refer to Section14.1.5, “Writeback” for more details).
Writeback
27 Detailed Memory Usage: /proc/meminfo openSUSE Leap 42.3

Amount of memory that is currently being written to disk.
Mapped
Memory claimed with the mmap system call.
Shmem
Memory shared between groups of processes, such as IPC data, tmpfs data, and shared
anonymous memory.
Slab
Memory allocation for internal data structures of the kernel.
SReclaimable
Slab section that can be reclaimed, such as caches (inode, dentry, etc.).
SUnreclaim
Slab section that cannot be reclaimed.
KernelStack
Amount of kernel space memory used by applications (through system calls).
PageTables
Amount of memory dedicated to page tables of all processes.
NFS_Unstable
NFS pages that have already been sent to the server, but are not yet committed there.
Bounce
Memory used for bounce buers of block devices.
WritebackTmp
Memory used by FUSE for temporary writeback buers.
CommitLimit
Amount of memory available to the system based on the overcommit ratio setting. This is
only enforced if strict overcommit accounting is enabled.
Committed_AS
An approximation of the total amount of memory (RAM and swap) that the current work-
load would need in the worst case.
VmallocTotal
Amount of allocated kernel virtual address space.
28 Detailed Memory Usage: /proc/meminfo openSUSE Leap 42.3

VmallocUsed
Amount of used kernel virtual address space.
VmallocChunk
The largest contiguous block of available kernel virtual address space.
HardwareCorrupted
Amount of failed memory (can only be detected when using ECC RAM).
AnonHugePages
Anonymous hugepages that are mapped into user space page tables. These are allocated
transparently for processes without being specifically requested, therefore they are also
known as transparent hugepages (THP).
HugePages_Total
Number of preallocated hugepages for use by SHM_HUGETLB and MAP_HUGETLB or through
the hugetlbfs le system, as defined in /proc/sys/vm/nr_hugepages .
HugePages_Free
Number of hugepages available.
HugePages_Rsvd
Number of hugepages that are committed.
HugePages_Surp
Number of hugepages available beyond HugePages_Total (“surplus”), as defined in /proc/
sys/vm/nr_overcommit_hugepages .
Hugepagesize
Size of a hugepage—on AMD64/Intel64 the default is 2048KB.
DirectMap4k etc.
Amount of kernel memory that is mapped to pages with a given size (in the example: 4kB).
2.4.3 Process Memory Usage: smaps
Exactly determining how much memory a certain process is consuming is not possible with
standard tools like top or ps . Use the smaps subsystem, introduced in kernel 2.6.14, if you
need exact data. It can be found at /proc/PID/smaps and shows you the number of clean
and dirty memory pages the process with the ID PID is using at that time. It differentiates
between shared and private memory, so you can see how much memory the process is using
29 Process Memory Usage: smaps openSUSE Leap 42.3
without including memory shared with other processes. For more information see /usr/src/
linux/Documentation/filesystems/proc.txt (requires the package kernel-source to be
installed).
smaps is expensive to read. Therefore it is not recommended to monitor it regularly, but only
when closely monitoring a certain process.
2.5 Networking
Tip: Traffic Shaping
In case the network bandwidth is lower than expected, you should rst check if any traffic
shaping rules are active for your network segment.
2.5.1 Basic Network Diagnostics: ip
ip is a powerful tool to set up and control network interfaces. You can also use it to quickly
view basic statistics about network interfaces of the system. For example, whether the interface
is up or how many errors, dropped packets, or packet collisions there are.
If you run ip with no additional parameter, it displays a help output. To list all network inter-
faces, enter ip addr show (or abbreviated as ip a ). ip addr show up lists only running
network interfaces. ip -s link show DEVICE lists statistics for the specified interface only:
root # ip -s link show br0
6: br0: <BROADCAST,MULTICAST,UP,LOWER_UP> mtu 1500 qdisc noqueue state UP mode DEFAULT
link/ether 00:19:d1:72:d4:30 brd ff:ff:ff:ff:ff:ff
RX: bytes packets errors dropped overrun mcast
6346104756 9265517 0 10860 0 0
TX: bytes packets errors dropped carrier collsns
3996204683 3655523 0 0 0 0
ip can also be used to show interfaces ( link ), routing tables ( route ), and much more—refer
to man 8 ip for details.
root # ip route
default via 192.168.2.1 dev eth1
192.168.2.0/24 dev eth0 proto kernel scope link src 192.168.2.100
192.168.2.0/24 dev eth1 proto kernel scope link src 192.168.2.101
192.168.2.0/24 dev eth2 proto kernel scope link src 192.168.2.102
30 Networking openSUSE Leap 42.3

root # ip link
1: lo: <LOOPBACK,UP,LOWER_UP> mtu 65536 qdisc noqueue state UNKNOWN mode DEFAULT group default
link/loopback 00:00:00:00:00:00 brd 00:00:00:00:00:00
2: eth0: <BROADCAST,MULTICAST,UP,LOWER_UP> mtu 1500 qdisc pfifo_fast state UP mode DEFAULT group default qlen
1000
link/ether 52:54:00:44:30:51 brd ff:ff:ff:ff:ff:ff
3: eth1: <BROADCAST,MULTICAST,UP,LOWER_UP> mtu 1500 qdisc pfifo_fast state UP mode DEFAULT group default qlen
1000
link/ether 52:54:00:a3:c1:fb brd ff:ff:ff:ff:ff:ff
4: eth2: <BROADCAST,MULTICAST,UP,LOWER_UP> mtu 1500 qdisc pfifo_fast state UP mode DEFAULT group default qlen
1000
link/ether 52:54:00:32:a4:09 brd ff:ff:ff:ff:ff:ff
2.5.2 Show the Network Usage of Processes: nethogs
In some cases, for example if the network traffic suddenly becomes very high, it is desirable to
quickly nd out which application(s) is/are causing the traffic. nethogs , a tool with a design
similar to top , shows incoming and outgoing traffic for all relevant processes:
PID USER PROGRAM DEV SENT RECEIVED
27145 root zypper eth0 5.719 391.749 KB/sec
? root ..0:113:80c0:8080:10:160:0:100:30015 0.102 2.326 KB/sec
26635 tux /usr/lib64/firefox/firefox eth0 0.026 0.026 KB/sec
? root ..0:113:80c0:8080:10:160:0:100:30045 0.000 0.021 KB/sec
? root ..0:113:80c0:8080:10:160:0:100:30045 0.000 0.018 KB/sec
? root ..0:113:80c0:8080:10:160:0:100:30015 0.000 0.018 KB/sec
? root ..0:113:80c0:8080:10:160:0:100:30045 0.000 0.017 KB/sec
? root ..0:113:80c0:8080:10:160:0:100:30045 0.000 0.017 KB/sec
? root ..0:113:80c0:8080:10:160:0:100:30045 0.069 0.000 KB/sec
? root unknown TCP 0.000 0.000 KB/sec
TOTAL 5.916 394.192 KB/sec
Like in top , nethogs features interactive commands:
M: cycle between display modes (kb/s, kb, b, mb)
R: sort by RECEIVED
S: sort by SENT
Q: quit
2.5.3 Ethernet Cards in Detail: ethtool
ethtool can display and change detailed aspects of your Ethernet network device. By default
it prints the current setting of the specified device.
31 Show the Network Usage of Processes: nethogs openSUSE Leap 42.3
root # ethtool eth0
Settings for eth0:
Supported ports: [ TP ]
Supported link modes: 10baseT/Half 10baseT/Full
100baseT/Half 100baseT/Full
1000baseT/Full
Supports auto-negotiation: Yes
Advertised link modes: 10baseT/Half 10baseT/Full
100baseT/Half 100baseT/Full
1000baseT/Full
Advertised pause frame use: No
[...]
Link detected: yes
The following table shows ethtool options that you can use to query the device for specific
information:
TABLE2.1:LIST OF QUERY OPTIONS OF ethtool
ethtool option it queries the device for
-a pause parameter information
-c interrupt coalescing information
-g Rx/Tx (receive/transmit) ring parameter in-
formation
-i associated driver information
-k offload information
-S NIC and driver-specific statistics
2.5.4 Show the Network Status: ss
ss is a tool to dump socket statistics and replaces the netstat command. To show a list of
all connections use ss without parameters:
root # ss
Netid State Recv-Q Send-Q Local Address:Port Peer Address:Port
u_str ESTAB 0 0 * 14082 * 14083
32 Show the Network Status: ss openSUSE Leap 42.3

u_str ESTAB 0 0 * 18582 * 18583
u_str ESTAB 0 0 * 19449 * 19450
u_str ESTAB 0 0 @/tmp/dbus-gmUUwXABPV 18784 * 18783
u_str ESTAB 0 0 /var/run/dbus/system_bus_socket 19383 * 19382
u_str ESTAB 0 0 @/tmp/dbus-gmUUwXABPV 18617 * 18616
u_str ESTAB 0 0 @/tmp/dbus-58TPPDv8qv 19352 * 19351
u_str ESTAB 0 0 * 17658 * 17657
u_str ESTAB 0 0 * 17693 * 17694
[..]
To show all network ports currently open, use the following command:
root # ss -l
Netid State Recv-Q Send-Q Local Address:Port Peer Address:Port
nl UNCONN 0 0 rtnl:4195117 *
nl UNCONN 0 0 rtnl:wickedd-auto4/811 *
nl UNCONN 0 0 rtnl:wickedd-dhcp4/813 *
nl UNCONN 0 0 rtnl:4195121 *
nl UNCONN 0 0 rtnl:4195115 *
nl UNCONN 0 0 rtnl:wickedd-dhcp6/814 *
nl UNCONN 0 0 rtnl:kernel *
nl UNCONN 0 0 rtnl:wickedd/817 *
nl UNCONN 0 0 rtnl:4195118 *
nl UNCONN 0 0 rtnl:nscd/706 *
nl UNCONN 4352 0 tcpdiag:ss/2381 *
[...]
When displaying network connections, you can specify the socket type to display: TCP ( -t )
or UDP ( -u ) for example. The -p option shows the PID and name of the program to which
each socket belongs.
The following example lists all TCP connections and the programs using these connections. The
-a option make sure all established connections (listening and non-listening) are shown. The
-p option shows the PID and name of the program to which each socket belongs.
root # ss -t -a -p
State Recv-Q Send-Q Local Address:Port Peer Address:Port
LISTEN 0 128 *:ssh *:* users:(("sshd",1551,3))
LISTEN 0 100 127.0.0.1:smtp *:* users:(("master",1704,13))
ESTAB 0 132 10.120.65.198:ssh 10.120.4.150:55715 users:(("sshd",2103,5))
LISTEN 0 128 :::ssh :::* users:(("sshd",1551,4))
LISTEN 0 100 ::1:smtp :::* users:(("master",1704,14))
33 Show the Network Status: ss openSUSE Leap 42.3

2.6 The /proc File System
The /proc le system is a pseudo le system in which the kernel reserves important information
in the form of virtual les. For example, display the CPU type with this command:
tux > cat /proc/cpuinfo
processor : 0
vendor_id : GenuineIntel
cpu family : 6
model : 30
model name : Intel(R) Core(TM) i5 CPU 750 @ 2.67GHz
stepping : 5
microcode : 0x6
cpu MHz : 1197.000
cache size : 8192 KB
physical id : 0
siblings : 4
core id : 0
cpu cores : 4
apicid : 0
initial apicid : 0
fpu : yes
fpu_exception : yes
cpuid level : 11
wp : yes
flags : fpu vme de pse tsc msr pae mce cx8 apic sep mtrr pge mca cmov pat
pse36 clflush dts acpi mmx fxsr sse sse2 ss ht tm pbe syscall nx rdtscp lm constant_tsc
arch_perfmon pebs bts rep_good nopl xtopology nonstop_tsc aperfmperf pni dtes64 monitor
ds_cpl vmx smx est tm2 ssse3 cx16 xtpr pdcm sse4_1 sse4_2 popcnt lahf_lm ida dtherm
tpr_shadow vnmi flexpriority ept vpid
bogomips : 5333.85
clflush size : 64
cache_alignment : 64
address sizes : 36 bits physical, 48 bits virtual
power management:
[...]
Tip: Detailed Processor Information
Detailed information about the processor on the AMD64/Intel 64 architecture is also
available by running x86info .
34 The /proc File System openSUSE Leap 42.3

Query the allocation and use of interrupts with the following command:
tux > cat /proc/interrupts
CPU0 CPU1 CPU2 CPU3
0: 121 0 0 0 IO-APIC-edge timer
8: 0 0 0 1 IO-APIC-edge rtc0
9: 0 0 0 0 IO-APIC-fasteoi acpi
16: 0 11933 0 0 IO-APIC-fasteoi ehci_hcd:+
18: 0 0 0 0 IO-APIC-fasteoi i801_smbus
19: 0 117978 0 0 IO-APIC-fasteoi ata_piix,+
22: 0 0 3275185 0 IO-APIC-fasteoi enp5s1
23: 417927 0 0 0 IO-APIC-fasteoi ehci_hcd:+
40: 2727916 0 0 0 HPET_MSI-edge hpet2
41: 0 2749134 0 0 HPET_MSI-edge hpet3
42: 0 0 2759148 0 HPET_MSI-edge hpet4
43: 0 0 0 2678206 HPET_MSI-edge hpet5
45: 0 0 0 0 PCI-MSI-edge aerdrv, P+
46: 0 0 0 0 PCI-MSI-edge PCIe PME,+
47: 0 0 0 0 PCI-MSI-edge PCIe PME,+
48: 0 0 0 0 PCI-MSI-edge PCIe PME,+
49: 0 0 0 387 PCI-MSI-edge snd_hda_i+
50: 933117 0 0 0 PCI-MSI-edge nvidia
NMI: 2102 2023 2031 1920 Non-maskable interrupts
LOC: 92 71 57 41 Local timer interrupts
SPU: 0 0 0 0 Spurious interrupts
PMI: 2102 2023 2031 1920 Performance monitoring int+
IWI: 47331 45725 52464 46775 IRQ work interrupts
RTR: 2 0 0 0 APIC ICR read retries
RES: 472911 396463 339792 323820 Rescheduling interrupts
CAL: 48389 47345 54113 50478 Function call interrupts
TLB: 28410 26804 24389 26157 TLB shootdowns
TRM: 0 0 0 0 Thermal event interrupts
THR: 0 0 0 0 Threshold APIC interrupts
MCE: 0 0 0 0 Machine check exceptions
MCP: 40 40 40 40 Machine check polls
ERR: 0
MIS: 0
The address assignment of executables and libraries is contained in the maps le:
tux > cat /proc/self/maps
08048000-0804c000 r-xp 00000000 03:03 17753 /bin/cat
0804c000-0804d000 rw-p 00004000 03:03 17753 /bin/cat
0804d000-0806e000 rw-p 0804d000 00:00 0 [heap]
b7d27000-b7d5a000 r--p 00000000 03:03 11867 /usr/lib/locale/en_GB.utf8/
b7d5a000-b7e32000 r--p 00000000 03:03 11868 /usr/lib/locale/en_GB.utf8/
b7e32000-b7e33000 rw-p b7e32000 00:00 0
35 The /proc File System openSUSE Leap 42.3

b7e33000-b7f45000 r-xp 00000000 03:03 8837 /lib/libc-2.3.6.so
b7f45000-b7f46000 r--p 00112000 03:03 8837 /lib/libc-2.3.6.so
b7f46000-b7f48000 rw-p 00113000 03:03 8837 /lib/libc-2.3.6.so
b7f48000-b7f4c000 rw-p b7f48000 00:00 0
b7f52000-b7f53000 r--p 00000000 03:03 11842 /usr/lib/locale/en_GB.utf8/
[...]
b7f5b000-b7f61000 r--s 00000000 03:03 9109 /usr/lib/gconv/gconv-module
b7f61000-b7f62000 r--p 00000000 03:03 9720 /usr/lib/locale/en_GB.utf8/
b7f62000-b7f76000 r-xp 00000000 03:03 8828 /lib/ld-2.3.6.so
b7f76000-b7f78000 rw-p 00013000 03:03 8828 /lib/ld-2.3.6.so
bfd61000-bfd76000 rw-p bfd61000 00:00 0 [stack]
ffffe000-fffff000 ---p 00000000 00:00 0 [vdso]
A lot more information can be obtained from the /proc le system. Some of the important les
and their contents are:
/proc/devices
Available devices
/proc/modules
Kernel modules loaded
/proc/cmdline
Kernel command line
/proc/meminfo
Detailed information about memory usage
/proc/config.gz
gzip -compressed configuration le of the kernel currently running
/proc/ PID/
Find information about processes currently running in the /proc/ NNN directories, where
NNN is the process ID (PID) of the relevant process. Every process can nd its own char-
acteristics in /proc/self/ .
Further information is available in the text le /usr/src/linux/Documentation/filesys-
tems/proc.txt (this le is available when the package kernel-source is installed).
2.6.1 procinfo
Important information from the /proc le system is summarized by the command procinfo :
tux > procinfo
36 procinfo openSUSE Leap 42.3

Linux 3.11.10-17-desktop (geeko@buildhost) (gcc 4.8.1 20130909) #1 4CPU
[jupiter.example.com]
Memory: Total Used Free Shared Buffers Cached
Mem: 8181908 8000632 181276 0 85472 2850872
Swap: 10481660 1576 10480084
Bootup: Mon Jul 28 09:54:13 2014 Load average: 1.61 0.85 0.74 2/904 25949
user : 1:54:41.84 12.7% page in : 2107312 disk 1: 52212r 20199w
nice : 0:00:00.46 0.0% page out: 1714461 disk 2: 19387r 10928w
system: 0:25:38.00 2.8% page act: 466673 disk 3: 548r 10w
IOwait: 0:04:16.45 0.4% page dea: 272297
hw irq: 0:00:00.42 0.0% page flt: 105754526
sw irq: 0:01:26.48 0.1% swap in : 0
idle : 12:14:43.65 81.5% swap out: 394
guest : 0:02:18.59 0.2%
uptime: 3:45:22.24 context : 99809844
irq 0: 121 timer irq 41: 3238224 hpet3
irq 8: 1 rtc0 irq 42: 3251898 hpet4
irq 9: 0 acpi irq 43: 3156368 hpet5
irq 16: 14589 ehci_hcd:usb1 irq 45: 0 aerdrv, PCIe PME
irq 18: 0 i801_smbus irq 46: 0 PCIe PME, pciehp
irq 19: 124861 ata_piix, ata_piix, f irq 47: 0 PCIe PME, pciehp
irq 22: 3742817 enp5s1 irq 48: 0 PCIe PME, pciehp
irq 23: 479248 ehci_hcd:usb2 irq 49: 387 snd_hda_intel
irq 40: 3216894 hpet2 irq 50: 1088673 nvidia
To see all the information, use the parameter -a . The parameter -nN produces updates of the
information every N seconds. In this case, terminate the program by pressing Q.
By default, the cumulative values are displayed. The parameter -d produces the differential
values. procinfo -dn5 displays the values that have changed in the last ve seconds:
2.6.2 System Control Parameters: /proc/sys/
System control parameters are used to modify the Linux kernel parameters at runtime. They
reside in /proc/sys/ and can be viewed and modified with the sysctl command. To list all
parameters, run sysctl -a . A single parameter can be listed with sysctl PARAMETER_NAME .
Parameters are grouped into categories and can be listed with sysctl CATEGORY or by listing
the contents of the respective directories. The most important categories are listed below. The
links to further readings require the installation of the package kernel-source .
37 System Control Parameters: /proc/sys/ openSUSE Leap 42.3

sysctl dev (/proc/sys/dev/)
Device-specific information.
sysctl fs (/proc/sys/fs/)
Used le handles, quotas, and other le system-oriented parameters. For details see /usr/
src/linux/Documentation/sysctl/fs.txt .
sysctl kernel (/proc/sys/kernel/)
Information about the task scheduler, system shared memory, and other kernel-related
parameters. For details see /usr/src/linux/Documentation/sysctl/kernel.txt
systctl net (/proc/sys/net/)
Information about network bridges, and general network parameters (mainly the ipv4/
subdirectory). For details see /usr/src/linux/Documentation/sysctl/net.txt
sysctl vm (/proc/sys/vm/)
Entries in this path relate to information about the virtual memory, swapping, and caching.
For details see /usr/src/linux/Documentation/sysctl/vm.txt
To set or change a parameter for the current session, use the command sysctl -w PARA-
METER =VALUE . To permanently change a setting, add a line PARAMETER =VALUE to /etc/
sysctl.conf .
2.7 Hardware Information
2.7.1 PCI Resources: lspci
Note: Accessing PCI configuration.
Most operating systems require root user privileges to grant access to the computer's PCI
configuration.
The command lspci lists the PCI resources:
root # lspci
00:00.0 Host bridge: Intel Corporation 82845G/GL[Brookdale-G]/GE/PE \
38 Hardware Information openSUSE Leap 42.3

DRAM Controller/Host-Hub Interface (rev 01)
00:01.0 PCI bridge: Intel Corporation 82845G/GL[Brookdale-G]/GE/PE \
Host-to-AGP Bridge (rev 01)
00:1d.0 USB Controller: Intel Corporation 82801DB/DBL/DBM \
(ICH4/ICH4-L/ICH4-M) USB UHCI Controller #1 (rev 01)
00:1d.1 USB Controller: Intel Corporation 82801DB/DBL/DBM \
(ICH4/ICH4-L/ICH4-M) USB UHCI Controller #2 (rev 01)
00:1d.2 USB Controller: Intel Corporation 82801DB/DBL/DBM \
(ICH4/ICH4-L/ICH4-M) USB UHCI Controller #3 (rev 01)
00:1d.7 USB Controller: Intel Corporation 82801DB/DBM \
(ICH4/ICH4-M) USB2 EHCI Controller (rev 01)
00:1e.0 PCI bridge: Intel Corporation 82801 PCI Bridge (rev 81)
00:1f.0 ISA bridge: Intel Corporation 82801DB/DBL (ICH4/ICH4-L) \
LPC Interface Bridge (rev 01)
00:1f.1 IDE interface: Intel Corporation 82801DB (ICH4) IDE \
Controller (rev 01)
00:1f.3 SMBus: Intel Corporation 82801DB/DBL/DBM (ICH4/ICH4-L/ICH4-M) \
SMBus Controller (rev 01)
00:1f.5 Multimedia audio controller: Intel Corporation 82801DB/DBL/DBM \
(ICH4/ICH4-L/ICH4-M) AC'97 Audio Controller (rev 01)
01:00.0 VGA compatible controller: Matrox Graphics, Inc. G400/G450 (rev 85)
02:08.0 Ethernet controller: Intel Corporation 82801DB PRO/100 VE (LOM) \
Ethernet Controller (rev 81)
Using -v results in a more detailed listing:
root # lspci -v
[...]
00:03.0 Ethernet controller: Intel Corporation 82540EM Gigabit Ethernet \
Controller (rev 02)
Subsystem: Intel Corporation PRO/1000 MT Desktop Adapter
Flags: bus master, 66MHz, medium devsel, latency 64, IRQ 19
Memory at f0000000 (32-bit, non-prefetchable) [size=128K]
I/O ports at d010 [size=8]
Capabilities: [dc] Power Management version 2
Capabilities: [e4] PCI-X non-bridge device
Kernel driver in use: e1000
Kernel modules: e1000
Information about device name resolution is obtained from the le /usr/share/pci.ids . PCI
IDs not listed in this le are marked “Unknown device.”
The parameter -vv produces all the information that could be queried by the program. To view
the pure numeric values, use the parameter -n .
39 PCI Resources: lspci openSUSE Leap 42.3

2.7.2 USB Devices: lsusb
The command lsusb lists all USB devices. With the option -v , print a more detailed list. The
detailed information is read from the directory /proc/bus/usb/ . The following is the output
of lsusb with these USB devices attached: hub, memory stick, hard disk and mouse.
root # lsusb
Bus 004 Device 007: ID 0ea0:2168 Ours Technology, Inc. Transcend JetFlash \
2.0 / Astone USB Drive
Bus 004 Device 006: ID 04b4:6830 Cypress Semiconductor Corp. USB-2.0 IDE \
Adapter
Bus 004 Device 005: ID 05e3:0605 Genesys Logic, Inc.
Bus 004 Device 001: ID 0000:0000
Bus 003 Device 001: ID 0000:0000
Bus 002 Device 001: ID 0000:0000
Bus 001 Device 005: ID 046d:c012 Logitech, Inc. Optical Mouse
Bus 001 Device 001: ID 0000:0000
2.7.3 Monitoring and Tuning the Thermal Subsystem: tmon
tmon is a tool to help visualize, tune, and test the complex thermal subsystem. When started
without parameters, tmon runs in monitoring mode:
┌──────THERMAL ZONES(SENSORS)──────────────────────────────┐
│Thermal Zones: acpitz00 │
│Trip Points: PC │
└──────────────────────────────────────────────────────────┘
┌─────────── COOLING DEVICES ──────────────────────────────┐
│ID Cooling Dev Cur Max Thermal Zone Binding │
│00 Processor 0 3 ││││││││││││ │
│01 Processor 0 3 ││││││││││││ │
│02 Processor 0 3 ││││││││││││ │
│03 Processor 0 3 ││││││││││││ │
│04 intel_powerc -1 50 ││││││││││││ │
└──────────────────────────────────────────────────────────┘
┌──────────────────────────────────────────────────────────┐
│ 10 20 30 40 │
│acpitz 0:[ 8][>>>>>>>>>P9 C31 │
└──────────────────────────────────────────────────────────┘
┌────────────────── CONTROLS ──────────────────────────────┐
│PID gain: kp=0.36 ki=5.00 kd=0.19 Output 0.00 │
│Target Temp: 65.0C, Zone: 0, Control Device: None │
└──────────────────────────────────────────────────────────┘
40 USB Devices: lsusb openSUSE Leap 42.3

Ctrl-c - Quit TAB - Tuning
For detailed information on how to interpret the data, how to log thermal data and how to use
tmon to test and tune cooling devices and sensors, refer to the man page: man 8 tmon . The
package tmon is not installed by default.
2.7.4 MCELog: Machine Check Exceptions (MCE)
The mcelog package logs and parses/translates Machine Check Exceptions (MCE) on hardware
errors (also including memory errors). Formerly this has been done by a cron job executed
hourly. Now hardware errors are immediately processed by an mcelog daemon.
However, the mcelog service is not enabled by default, resulting in memory and CPU errors also
not being logged by default. In addition, mcelog has a new feature to also handle predictive bad
page offlining and automatic core offlining when cache errors happen.
The service can either be enabled and started via the YaST system services editor or via command
line:
root # systemctl enable mcelog
root # systemctl start mcelog
2.7.5 x86_64: dmidecode: DMI Table Decoder
dmidecode shows the machine's DMI table containing information such as serial numbers and
BIOS revisions of the hardware.
root # dmidecode
# dmidecode 2.12
SMBIOS 2.5 present.
27 structures occupying 1298 bytes.
Table at 0x000EB250.
Handle 0x0000, DMI type 4, 35 bytes
Processor Information
Socket Designation: J1PR
Type: Central Processor
Family: Other
Manufacturer: Intel(R) Corporation
ID: E5 06 01 00 FF FB EB BF
Version: Intel(R) Core(TM) i5 CPU 750 @ 2.67GHz
41 MCELog: Machine Check Exceptions (MCE) openSUSE Leap 42.3

Voltage: 1.1 V
External Clock: 133 MHz
Max Speed: 4000 MHz
Current Speed: 2667 MHz
Status: Populated, Enabled
Upgrade: Other
L1 Cache Handle: 0x0004
L2 Cache Handle: 0x0003
L3 Cache Handle: 0x0001
Serial Number: Not Specified
Asset Tag: Not Specified
Part Number: Not Specified
[..]
2.8 Files and File Systems
2.8.1 Determine the File Type: file
The command file determines the type of a le or a list of les by checking /usr/share/
misc/magic .
tux > file /usr/bin/file
/usr/bin/file: ELF 64-bit LSB executable, x86-64, version 1 (SYSV), \
for GNU/Linux 2.6.4, dynamically linked (uses shared libs), stripped
The parameter -f LIST specifies a le with a list of le names to examine. The -z allows
file to look inside compressed les:
tux > file /usr/share/man/man1/file.1.gz
/usr/share/man/man1/file.1.gz: gzip compressed data, from Unix, max compression
tux > file -z /usr/share/man/man1/file.1.gz
/usr/share/man/man1/file.1.gz: troff or preprocessor input text \
(gzip compressed data, from Unix, max compression)
The parameter -i outputs a mime type string rather than the traditional description.
tux > file -i /usr/share/misc/magic
/usr/share/misc/magic: text/plain charset=utf-8
42 Files and File Systems openSUSE Leap 42.3

2.8.2 File Systems and Their Usage: mount, df and du
The command mount shows which le system (device and type) is mounted at which mount
point:
root # mount
/dev/sda2 on / type ext4 (rw,acl,user_xattr)
proc on /proc type proc (rw)
sysfs on /sys type sysfs (rw)
debugfs on /sys/kernel/debug type debugfs (rw)
devtmpfs on /dev type devtmpfs (rw,mode=0755)
tmpfs on /dev/shm type tmpfs (rw,mode=1777)
devpts on /dev/pts type devpts (rw,mode=0620,gid=5)
/dev/sda3 on /home type ext3 (rw)
securityfs on /sys/kernel/security type securityfs (rw)
fusectl on /sys/fs/fuse/connections type fusectl (rw)
gvfs-fuse-daemon on /home/tux/.gvfs type fuse.gvfs-fuse-daemon \
(rw,nosuid,nodev,user=tux)
Obtain information about total usage of the le systems with the command df . The parameter -
h (or --human-readable ) transforms the output into a form understandable for common users.
tux > df -h
Filesystem Size Used Avail Use% Mounted on
/dev/sda2 20G 5,9G 13G 32% /
devtmpfs 1,6G 236K 1,6G 1% /dev
tmpfs 1,6G 668K 1,6G 1% /dev/shm
/dev/sda3 208G 40G 159G 20% /home
Display the total size of all the les in a given directory and its subdirectories with the command
du . The parameter -s suppresses the output of detailed information and gives only a total for
each argument. -h again transforms the output into a human-readable form:
tux > du -sh /opt
192M /opt
2.8.3 Additional Information about ELF Binaries
Read the content of binaries with the readelf utility. This even works with ELF les that were
built for other hardware architectures:
tux > readelf --file-header /bin/ls
43 File Systems and Their Usage: mount, df and du openSUSE Leap 42.3

ELF Header:
Magic: 7f 45 4c 46 02 01 01 00 00 00 00 00 00 00 00 00
Class: ELF64
Data: 2's complement, little endian
Version: 1 (current)
OS/ABI: UNIX - System V
ABI Version: 0
Type: EXEC (Executable file)
Machine: Advanced Micro Devices X86-64
Version: 0x1
Entry point address: 0x402540
Start of program headers: 64 (bytes into file)
Start of section headers: 95720 (bytes into file)
Flags: 0x0
Size of this header: 64 (bytes)
Size of program headers: 56 (bytes)
Number of program headers: 9
Size of section headers: 64 (bytes)
Number of section headers: 32
Section header string table index: 31
2.8.4 File Properties: stat
The command stat displays le properties:
tux > stat /etc/profile
File: `/etc/profile'
Size: 9662 Blocks: 24 IO Block: 4096 regular file
Device: 802h/2050d Inode: 132349 Links: 1
Access: (0644/-rw-r--r--) Uid: ( 0/ root) Gid: ( 0/ root)
Access: 2009-03-20 07:51:17.000000000 +0100
Modify: 2009-01-08 19:21:14.000000000 +0100
Change: 2009-03-18 12:55:31.000000000 +0100
The parameter --file-system produces details of the properties of the le system in which
the specified le is located:
tux > stat /etc/profile --file-system
File: "/etc/profile"
ID: d4fb76e70b4d1746 Namelen: 255 Type: ext2/ext3
Block size: 4096 Fundamental block size: 4096
Blocks: Total: 2581445 Free: 1717327 Available: 1586197
Inodes: Total: 655776 Free: 490312
44 File Properties: stat openSUSE Leap 42.3
2.9 User Information
2.9.1 User Accessing Files: fuser
It can be useful to determine what processes or users are currently accessing certain les. Sup-
pose, for example, you want to unmount a le system mounted at /mnt . umount returns "de-
vice is busy." The command fuser can then be used to determine what processes are accessing
the device:
tux > fuser -v /mnt/*
USER PID ACCESS COMMAND
/mnt/notes.txt tux 26597 f.... less
Following termination of the less process, which was running on another terminal, the le sys-
tem can successfully be unmounted. When used with -k option, fuser will terminate processes
accessing the le as well.
2.9.2 Who Is Doing What: w
With the command w, nd out who is logged in to the system and what each user is doing.
For example:
tux > w
16:00:59 up 1 day, 2:41, 3 users, load average: 0.00, 0.01, 0.05
USER TTY FROM LOGIN@ IDLE JCPU PCPU WHAT
tux :0 console Wed13 ?xdm? 8:15 0.03s /usr/lib/gdm/gd
tux console :0 Wed13 26:41m 0.00s 0.03s /usr/lib/gdm/gd
tux pts/0 :0 Wed13 20:11 0.10s 2.89s /usr/lib/gnome-
If any users of other systems have logged in remotely, the parameter -f shows the computers
from which they have established the connection.
45 User Information openSUSE Leap 42.3
2.10 Time and Date
2.10.1 Time Measurement with time
Determine the time spent by commands with the time utility. This utility is available in two
versions: as a Bash built-in and as a program ( /usr/bin/time ).
tux > time find . > /dev/null
real 0m4.051s 1
user 0m0.042s 2
sys 0m0.205s 3
1The real time that elapsed from the command's start-up until it finished.
2CPU time of the user as reported by the times system call.
3CPU time of the system as reported by the times system call.
The output of /usr/bin/time is much more detailed. It is recommended to run it with the -
v switch to produce human-readable output.
/usr/bin/time -v find . > /dev/null
Command being timed: "find ."
User time (seconds): 0.24
System time (seconds): 2.08
Percent of CPU this job got: 25%
Elapsed (wall clock) time (h:mm:ss or m:ss): 0:09.03
Average shared text size (kbytes): 0
Average unshared data size (kbytes): 0
Average stack size (kbytes): 0
Average total size (kbytes): 0
Maximum resident set size (kbytes): 2516
Average resident set size (kbytes): 0
Major (requiring I/O) page faults: 0
Minor (reclaiming a frame) page faults: 1564
Voluntary context switches: 36660
Involuntary context switches: 496
Swaps: 0
File system inputs: 0
File system outputs: 0
Socket messages sent: 0
Socket messages received: 0
Signals delivered: 0
Page size (bytes): 4096
46 Time and Date openSUSE Leap 42.3

Exit status: 0
2.11 Graph Your Data: RRDtool
There are a lot of data in the world around you, which can be easily measured in time. For
example, changes in the temperature, or the number of data sent or received by your comput-
er's network interface. RRDtool can help you store and visualize such data in detailed and cus-
tomizable graphs.
RRDtool is available for most Unix platforms and Linux distributions. openSUSE® Leap ships
RRDtool as well. Install it either with YaST or by entering
zypper install rrdtool in the command line as root .
Tip: Bindings
There are Perl, Python, Ruby, and PHP bindings available for RRDtool, so that you can
write your own monitoring scripts in your preferred scripting language.
2.11.1 How RRDtool Works
RRDtool is an abbreviation of Round Robin Database tool. Round Robin is a method for manipu-
lating with a constant amount of data. It uses the principle of a circular buer, where there is no
end nor beginning to the data row which is being read. RRDtool uses Round Robin Databases
to store and read its data.
As mentioned above, RRDtool is designed to work with data that change in time. The ideal
case is a sensor which repeatedly reads measured data (like temperature, speed etc.) in constant
periods of time, and then exports them in a given format. Such data are perfectly ready for
RRDtool, and it is easy to process them and create the desired output.
Sometimes it is not possible to obtain the data automatically and regularly. Their format needs
to be pre-processed before it is supplied to RRDtool, and often you need to manipulate RRDtool
even manually.
The following is a simple example of basic RRDtool usage. It illustrates all three important phases
of the usual RRDtool workflow: creating a database, updating measured values, and viewing the
output.
47 Graph Your Data: RRDtool openSUSE Leap 42.3
2.11.2 A Practical Example
Suppose we want to collect and view information about the memory usage in the Linux system
as it changes in time. To make the example more vivid, we measure the currently free memory
over a period of 40 seconds in 4-second intervals. Three applications that usually consume a lot
of system memory are started and closed: the Firefox Web browser, the Evolution e-mail client,
and the Eclipse development framework.
2.11.2.1 Collecting Data
RRDtool is very often used to measure and visualize network traffic. In such case, the Simple
Network Management Protocol (SNMP) is used. This protocol can query network devices for
relevant values of their internal counters. Exactly these values are to be stored with RRDtool.
For more information on SNMP, see http://www.net-snmp.org/ .
Our situation is different—we need to obtain the data manually. A helper script free_mem.sh
repetitively reads the current state of free memory and writes it to the standard output.
tux > cat free_mem.sh
INTERVAL=4
for steps in {1..10}
do
DATE=`date +%s`
FREEMEM=`free -b | grep "Mem" | awk '{ print $4 }'`
sleep $INTERVAL
echo "rrdtool update free_mem.rrd $DATE:$FREEMEM"
done
The time interval is set to 4 seconds, and is implemented with the sleep command.
RRDtool accepts time information in a special format - so called Unix time. It is defined
as the number of seconds since the midnight of January 1, 1970 (UTC). For example,
1272907114 represents 2010-05-03 17:18:34.
The free memory information is reported in bytes with free -b . Prefer to supply basic
units (bytes) instead of multiple units (like kilobytes).
The line with the echo ... command contains the future name of the database le
(free_mem.rrd ), and together creates a command line for updating RRDtool values.
After running free_mem.sh , you see an output similar to this:
tux > sh free_mem.sh
48 A Practical Example openSUSE Leap 42.3
rrdtool update free_mem.rrd 1272974835:1182994432
rrdtool update free_mem.rrd 1272974839:1162817536
rrdtool update free_mem.rrd 1272974843:1096269824
rrdtool update free_mem.rrd 1272974847:1034219520
rrdtool update free_mem.rrd 1272974851:909438976
rrdtool update free_mem.rrd 1272974855:832454656
rrdtool update free_mem.rrd 1272974859:829120512
rrdtool update free_mem.rrd 1272974863:1180377088
rrdtool update free_mem.rrd 1272974867:1179369472
rrdtool update free_mem.rrd 1272974871:1181806592
It is convenient to redirect the command's output to a le with
sh free_mem.sh > free_mem_updates.log
to simplify its future execution.
2.11.2.2 Creating the Database
Create the initial Robin Round database for our example with the following command:
tux > rrdtool create free_mem.rrd --start 1272974834 --step=4 \
DS:memory:GAUGE:600:U:U RRA:AVERAGE:0.5:1:24
POINTS TO NOTICE
This command creates a le called free_mem.rrd for storing our measured values in a
Round Robin type database.
The --start option specifies the time (in Unix time) when the rst value will be added to
the database. In this example, it is one less than the rst time value of the free_mem.sh
output (1272974835).
The --step specifies the time interval in seconds with which the measured data will be
supplied to the database.
The DS:memory:GAUGE:600:U:U part introduces a new data source for the database. It
is called memory, its type is gauge, the maximum number between two updates is 600
seconds, and the minimal and maximal value in the measured range are unknown (U).
RRA:AVERAGE:0.5:1:24 creates Round Robin archive (RRA) whose stored data are
processed with the consolidation functions (CF) that calculates the average of data points. 3
arguments of the consolidation function are appended to the end of the line.
49 A Practical Example openSUSE Leap 42.3

If no error message is displayed, then free_mem.rrd database is created in the current directory:
tux > ls -l free_mem.rrd
-rw-r--r-- 1 tux users 776 May 5 12:50 free_mem.rrd
2.11.2.3 Updating Database Values
After the database is created, you need to ll it with the measured data. In Section2.11.2.1, “Col-
lecting Data”, we already prepared the le free_mem_updates.log which consists of rrdtool
update commands. These commands do the update of database values for us.
tux > sh free_mem_updates.log; ls -l free_mem.rrd
-rw-r--r-- 1 tux users 776 May 5 13:29 free_mem.rrd
As you can see, the size of free_mem.rrd remained the same even after updating its data.
2.11.2.4 Viewing Measured Values
We have already measured the values, created the database, and stored the measured value in
it. Now we can play with the database, and retrieve or view its values.
To retrieve all the values from our database, enter the following on the command line:
tux > rrdtool fetch free_mem.rrd AVERAGE --start 1272974830 \
--end 1272974871
memory
1272974832: nan
1272974836: 1.1729059840e+09
1272974840: 1.1461806080e+09
1272974844: 1.0807572480e+09
1272974848: 1.0030243840e+09
1272974852: 8.9019289600e+08
1272974856: 8.3162112000e+08
1272974860: 9.1693465600e+08
1272974864: 1.1801251840e+09
1272974868: 1.1799787520e+09
1272974872: nan
POINTS TO NOTICE
AVERAGE will fetch average value points from the database, because only one data source
is defined (Section2.11.2.2, “Creating the Database”) with AVERAGE processing and no other
function is available.
50 A Practical Example openSUSE Leap 42.3

The rst line of the output prints the name of the data source as defined in Section2.11.2.2,
“Creating the Database”.
The left results column represents individual points in time, while the right one represents
corresponding measured average values in scientific notation.
The nan in the last line stands for “not a number”.
Now a graph representing the values stored in the database is drawn:
tux > rrdtool graph free_mem.png \
--start 1272974830 \
--end 1272974871 \
--step=4 \
DEF:free_memory=free_mem.rrd:memory:AVERAGE \
LINE2:free_memory#FF0000 \
--vertical-label "GB" \
--title "Free System Memory in Time" \
--zoom 1.5 \
--x-grid SECOND:1:SECOND:4:SECOND:10:0:%X
POINTS TO NOTICE
free_mem.png is the le name of the graph to be created.
--start and --end limit the time range within which the graph will be drawn.
--step specifies the time resolution (in seconds) of the graph.
The DEF:... part is a data definition called free_memory. Its data are read from the
free_mem.rrd database and its data source called memory. The average value points are
calculated, because no others were defined in Section2.11.2.2, “Creating the Database”.
The LINE... part specifies properties of the line to be drawn into the graph. It is 2 pixels
wide, its data come from the free_memory definition, and its color is red.
--vertical-label sets the label to be printed along the y axis, and --title sets the
main label for the whole graph.
--zoom specifies the zoom factor for the graph. This value must be greater than zero.
--x-grid specifies how to draw grid lines and their labels into the graph. Our example
places them every second, while major grid lines are placed every 4 seconds. Labels are
placed every 10 seconds under the major grid lines.
51 A Practical Example openSUSE Leap 42.3
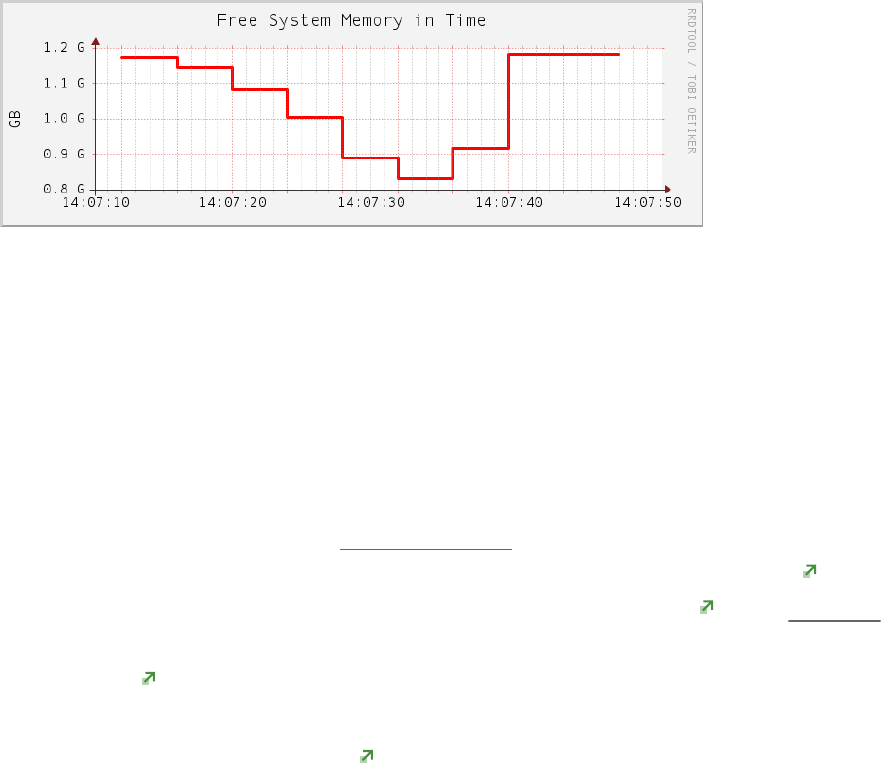
FIGURE2.1:EXAMPLE GRAPH CREATED WITH RRDTOOL
2.11.3 For More Information
RRDtool is a very complex tool with a lot of sub-commands and command line options. Some are
easy to understand, but to make it produce the results you want and ne-tune them according
to your liking may require a lot of effort.
Apart from RRDtool's man page ( man 1 rrdtool ) which gives you only basic information,
you should have a look at the RRDtool home page (http://oss.oetiker.ch/rrdtool/) . There is a
detailed documentation (http://oss.oetiker.ch/rrdtool/doc/index.en.html) of the rrdtool com-
mand and all its sub-commands. There are also several tutorials (http://oss.oetiker.ch/rrdtool/tut/
index.en.html) to help you understand the common RRDtool workflow.
If you are interested in monitoring network traffic, have a look at MRTG (Multi Router Traffic
Grapher) (http://oss.oetiker.ch/mrtg/) . MRTG can graph the activity of many network devices.
It can use RRDtool.
52 For More Information openSUSE Leap 42.3

3Analyzing and Managing System Log Files
System log le analysis is one of the most important tasks when analyzing the system. In fact,
looking at the system log les should be the rst thing to do when maintaining or troubleshooting
a system. openSUSE Leap automatically logs almost everything that happens on the system in
detail. Since the move to systemd , kernel messages and messages of system services registered
with systemd are logged in systemd journal (see Book “Reference”, Chapter11 “journalctl:
Query the systemd Journal”). Other log les (mainly those of system applications) are written in
plain text and can be easily read using an editor or pager. It is also possible to parse them using
scripts. This allows you to filter their content.
3.1 System Log Files in /var/log/
System log les are always located under the /var/log directory. The following list presents
an overview of all system log les from openSUSE Leap present after a default installation.
Depending on your installation scope, /var/log also contains log les from other services and
applications not listed here. Some les and directories described below are “placeholders” and
are only used, when the corresponding application is installed. Most log les are only visible
for the user root .
apparmor/
AppArmor log les. See Book “Security Guide” for details of AppArmor.
audit/
Logs from the audit framework. See Book “Security Guide” for details.
ConsoleKit/
Logs of the ConsoleKit daemon (daemon for tracking what users are logged in and how
they interact with the computer).
cups/
Access and error logs of the Common Unix Printing System ( cups ).
firewall
Firewall logs.
gdm/
Log les from the GNOME display manager.
53 System Log Files in /var/log/ openSUSE Leap 42.3

krb5/
Log les from the Kerberos network authentication system.
lastlog
A database containing information on the last login of each user. Use the command last-
log to view. See man 8 lastlog for more information.
localmessages
Log messages of some boot scripts, for example the log of the DHCP client.
mail*
Mail server ( postfix , sendmail ) logs.
messages
This is the default place where all kernel and system log messages go and should be the
rst place (along with /var/log/warn ) to look at in case of problems.
NetworkManager
NetworkManager log les.
news/
Log messages from a news server.
ntp
Logs from the Network Time Protocol daemon ( ntpd ).
pk_backend_zypp*
PackageKit (with libzypp back-end) log les.
puppet/
Log les from the data center automation tool puppet.
samba/
Log les from Samba, the Windows SMB/CIFS le server.
warn
Log of all system warnings and errors. This should be the rst place (along with the output
of the systemd journal) to look in case of problems.
wtmp
Database of all login/logout activities, and remote connections. Use the command last
to view. See man 1 last for more information.
54 System Log Files in /var/log/ openSUSE Leap 42.3

xinetd.log
Log les from the extended Internet services daemon ( xinetd ).
Xorg.0.log
X.Org start-up log le. Refer to this in case you have problems starting X.Org. Copies from
previous X.Org starts are numbered Xorg. ?.log.
YaST2/
All YaST log les.
zypp/
libzypp log les. Refer to these les for the package installation history.
zypper.log
Logs from the command line installer zypper .
3.2 Viewing and Parsing Log Files
To view log les, you can use any text editor. There is also a simple YaST module for viewing
the system log available in the YaST control center under Miscellaneous System Log.
For viewing log les in a text console, use the commands less or more . Use head and tail
to view the beginning or end of a log le. To view entries appended to a log le in real-time use
tail -f . For information about how to use these tools, see their man pages.
To search for strings or regular expressions in log les use grep . awk is useful for parsing and
rewriting log les.
3.3 Managing Log Files with logrotate
Log les under /var/log grow on a daily basis and quickly become very large. logrotate is
a tool that helps you manage log les and their growth. It allows automatic rotation, removal,
compression, and mailing of log les. Log les can be handled periodically (daily, weekly, or
monthly) or when exceeding a particular size.
logrotate is usually run daily by systemd , and thus usually modifies log les only once a
day. However, exceptions occur when a log le is modified because of its size, if logrotate is
run multiple times a day, or if --force is enabled. Use /var/lib/misc/logrotate.status
to nd out when a particular le was last rotated.
55 Viewing and Parsing Log Files openSUSE Leap 42.3

The main configuration le of logrotate is /etc/logrotate.conf . System packages and
programs that produce log les (for example, apache2 ) put their own configuration les in
the /etc/logrotate.d/ directory. The content of /etc/logrotate.d/ is included via /etc/
logrotate.conf .
EXAMPLE3.1:EXAMPLE FOR /etc/logrotate.conf
# see "man logrotate" for details
# rotate log files weekly
weekly
# keep 4 weeks worth of backlogs
rotate 4
# create new (empty) log files after rotating old ones
create
# use date as a suffix of the rotated file
dateext
# uncomment this if you want your log files compressed
#compress
# comment these to switch compression to use gzip or another
# compression scheme
compresscmd /usr/bin/bzip2
uncompresscmd /usr/bin/bunzip2
# RPM packages drop log rotation information into this directory
include /etc/logrotate.d
Important: Avoid Permission Conflicts
The create option pays heed to the modes and ownerships of les specified in /etc/
permissions* . If you modify these settings, make sure no conflicts arise.
3.4 Monitoring Log Files with logwatch
logwatch is a customizable, pluggable log-monitoring script. It parses system logs, extracts
the important information and presents them in a human readable manner. To use logwatch ,
install the logwatch package.
56 Monitoring Log Files with logwatch openSUSE Leap 42.3

logwatch can either be used at the command line to generate on-the-y reports, or via cron to
regularly create custom reports. Reports can either be printed on the screen, saved to a le, or
be mailed to a specified address. The latter is especially useful when automatically generating
reports via cron .
On the command line, you can tell logwatch for which service and time span to generate a
report and how much detail should be included:
# Detailed report on all kernel messages from yesterday
logwatch --service kernel --detail High --range Yesterday --print
# Low detail report on all sshd events recorded (incl. archived logs)
logwatch --service sshd --detail Low --range All --archives --print
# Mail a report on all smartd messages from May 5th to May 7th to root@localhost
logwatch --service smartd --range 'between 5/5/2005 and 5/7/2005' \
--mailto root@localhost --print
The --range option has got a complex syntax—see logwatch --range help for details. A
list of all services that can be queried is available with the following command:
ls /usr/share/logwatch/default.conf/services/ | sed 's/\.conf//g'
logwatch can be customized to great detail. However, the default configuration should usual-
ly be sufficient. The default configuration les are located under /usr/share/logwatch/de-
fault.conf/ . Never change them because they would get overwritten again with the next
update. Rather place custom configuration in /etc/logwatch/conf/ (you may use the de-
fault configuration le as a template, though). A detailed HOWTO on customizing logwatch is
available at /usr/share/doc/packages/logwatch/HOWTO-Customize-LogWatch . The follow-
ing configuration les exist:
logwatch.conf
The main configuration le. The default version is extensively commented. Each configu-
ration option can be overwritten on the command line.
ignore.conf
Filter for all lines that should globally be ignored by logwatch .
services/*.conf
The service directory holds configuration les for each service you can generate a report
for.
logfiles/*.conf
Specifications on which log les should be parsed for each service.
57 Monitoring Log Files with logwatch openSUSE Leap 42.3

3.5 Using logger to Make System Log Entries
logger is a tool for making entries in the system log. It provides a shell command interface to
the rsyslogd system log module. For example, the following line outputs its message in /var/
log/messages or directly in the journal (if no logging facility is running):
logger -t Test "This message comes from $USER"
Depending on the current user and host name, the log contains a line similar to this:
Sep 28 13:09:31 venus Test: This message comes from tux
58 Using logger to Make System Log Entries openSUSE Leap 42.3

4SystemTap—Filtering and Analyzing System Data
SystemTap provides a command line interface and a scripting language to examine the activities
of a running Linux system, particularly the kernel, in ne detail. SystemTap scripts are written
in the SystemTap scripting language, are then compiled to C-code kernel modules and inserted
into the kernel. The scripts can be designed to extract, filter and summarize data, thus allowing
the diagnosis of complex performance problems or functional problems. SystemTap provides
information similar to the output of tools like netstat , ps , top , and iostat . However, more
filtering and analysis options can be used for the collected information.
4.1 Conceptual Overview
Each time you run a SystemTap script, a SystemTap session is started. A number of passes are
done on the script before it is allowed to run. Then, the script is compiled into a kernel module
and loaded. If the script has been executed before and no system components have changed (for
example, different compiler or kernel versions, library paths, or script contents), SystemTap does
not compile the script again. Instead, it uses the *.c and *.ko data stored in the SystemTap
cache ( ~/.systemtap ). The module is unloaded when the tap has finished running. For an
example, see the test run in Section4.2, “Installation and Setup” and the respective explanation.
4.1.1 SystemTap Scripts
SystemTap usage is based on SystemTap scripts ( *.stp ). They tell SystemTap which type of
information to collect, and what to do once that information is collected. The scripts are written
in the SystemTap scripting language that is similar to AWK and C. For the language definition,
see http://sourceware.org/systemtap/langref/ . A lot of useful example scripts are available from
http://www.sourceware.org/systemtap/examples/ .
The essential idea behind a SystemTap script is to name events , and to give them handlers .
When SystemTap runs the script, it monitors for certain events. When an event occurs, the Linux
kernel runs the handler as a sub-routine, then resumes. Thus, events serve as the triggers for
handlers to run. Handlers can record specified data and print it in a certain manner.
The SystemTap language only uses a few data types (integers, strings, and associative arrays of
these), and full control structures (blocks, conditionals, loops, functions). It has a lightweight
punctuation (semicolons are optional) and does not need detailed declarations (types are in-
ferred and checked automatically).
60 Conceptual Overview openSUSE Leap 42.3

For more information about SystemTap scripts and their syntax, refer to Section4.3, “Script Syn-
tax” and to the stapprobes and stapfuncs man pages, that are available with the system-
tap-docs package.
4.1.2 Tapsets
Tapsets are a library of pre-written probes and functions that can be used in SystemTap scripts.
When a user runs a SystemTap script, SystemTap checks the script's probe events and handlers
against the tapset library. SystemTap then loads the corresponding probes and functions before
translating the script to C. Like SystemTap scripts themselves, tapsets use the le name extension
*.stp .
However, unlike SystemTap scripts, tapsets are not meant for direct execution. They constitute
the library from which other scripts can pull definitions. Thus, the tapset library is an abstraction
layer designed to make it easier for users to define events and functions. Tapsets provide aliases
for functions that users could want to specify as an event. Knowing the proper alias is often
easier than remembering specific kernel functions that might vary between kernel versions.
4.1.3 Commands and Privileges
The main commands associated with SystemTap are stap and staprun . To execute them, you
either need root privileges or must be a member of the stapdev or stapusr group.
stap
SystemTap front-end. Runs a SystemTap script (either from le, or from standard input). It
translates the script into C code, compiles it, and loads the resulting kernel module into a
running Linux kernel. Then, the requested system trace or probe functions are performed.
staprun
SystemTap back-end. Loads and unloads kernel modules produced by the SystemTap front-
end.
For a list of options for each command, use --help . For details, refer to the stap and the
staprun man pages.
61 Tapsets openSUSE Leap 42.3

To avoid giving root access to users solely to enable them to work with SystemTap, use one of
the following SystemTap groups. They are not available by default on openSUSE Leap, but you
can create the groups and modify the access rights accordingly. Also adjust the permissions of
the staprun command if the security implications are appropriate for your environment.
stapdev
Members of this group can run SystemTap scripts with stap , or run SystemTap instru-
mentation modules with staprun . As running stap involves compiling scripts into ker-
nel modules and loading them into the kernel, members of this group still have effective
root access.
stapusr
Members of this group are only allowed to run SystemTap instrumentation modules
with staprun . In addition, they can only run those modules from /lib/modules/KER-
NEL_VERSION/systemtap/ . This directory must be owned by root and must only be
writable for the root user.
4.1.4 Important Files and Directories
The following list gives an overview of the SystemTap main les and directories.
/lib/modules/KERNEL_VERSION/systemtap/
Holds the SystemTap instrumentation modules.
/usr/share/systemtap/tapset/
Holds the standard library of tapsets.
/usr/share/doc/packages/systemtap/examples
Holds several example SystemTap scripts for various purposes. Only available if the sys-
temtap-docs package is installed.
~/.systemtap/cache
Data directory for cached SystemTap les.
/tmp/stap*
Temporary directory for SystemTap les, including translated C code and kernel object.
62 Important Files and Directories openSUSE Leap 42.3
4.2 Installation and Setup
As SystemTap needs information about the kernel, some additional kernel-related packages must
be installed. For each kernel you want to probe with SystemTap, you need to install a set of
the following packages. This set should exactly match the kernel version and flavor (indicated
by * in the overview below).
Important: Repository for Packages with
Debugging Information
If you subscribed your system for online updates, you can nd “debuginfo” packages
in the *-Debuginfo-Updates online installation repository relevant for openSUSE Leap
42.3. Use YaST to enable the repository.
For the classic SystemTap setup, install the following packages (using either YaST or zypper ).
systemtap
systemtap-server
systemtap-docs (optional)
kernel-*-base
kernel-*-debuginfo
kernel-*-devel
kernel-source-*
gcc
To get access to the man pages and to a helpful collection of example SystemTap scripts for
various purposes, additionally install the systemtap-docs package.
To check if all packages are correctly installed on the machine and if SystemTap is ready to use,
execute the following command as root .
stap -v -e 'probe vfs.read {printf("read performed\n"); exit()}'
It probes the currently used kernel by running a script and returning an output. If the output is
similar to the following, SystemTap is successfully deployed and ready to use:
Pass 1: parsed user script and 59 library script(s) in 80usr/0sys/214real ms.
63 Installation and Setup openSUSE Leap 42.3

Pass 2: analyzed script: 1 probe(s), 11 function(s), 2 embed(s), 1 global(s) in
140usr/20sys/412real ms.
Pass 3: translated to C into
"/tmp/stapDwEk76/stap_1856e21ea1c246da85ad8c66b4338349_4970.c" in 160usr/0sys/408real ms.
Pass 4: compiled C into "stap_1856e21ea1c246da85ad8c66b4338349_4970.ko" in
2030usr/360sys/10182real ms.
Pass 5: starting run.
read performed
Pass 5: run completed in 10usr/20sys/257real ms.
1Checks the script against the existing tapset library in /usr/share/systemtap/tapset/
for any tapsets used. Tapsets are scripts that form a library of pre-written probes and func-
tions that can be used in SystemTap scripts.
2Examines the script for its components.
3Translates the script to C. Runs the system C compiler to create a kernel module from it.
Both the resulting C code ( *.c ) and the kernel module ( *.ko ) are stored in the SystemTap
cache, ~/.systemtap .
4Loads the module and enables all the probes (events and handlers) in the script by hooking
into the kernel. The event being probed is a Virtual File System (VFS) read. As the event
occurs on any processor, a valid handler is executed (prints the text read performed )
and closed with no errors.
5After the SystemTap session is terminated, the probes are disabled, and the kernel module
is unloaded.
In case any error messages appear during the test, check the output for hints about any missing
packages and make sure they are installed correctly. Rebooting and loading the appropriate
kernel may also be needed.
4.3 Script Syntax
SystemTap scripts consist of the following two components:
SystemTap Events (Probe Points)
Name the kernel events at the associated handler should be executed. Examples for events
are entering or exiting a certain function, a timer expiring, or starting or terminating a
session.
SystemTap Handlers (Probe Body)
64 Script Syntax openSUSE Leap 42.3
Series of script language statements that specify the work to be done whenever a certain
event occurs. This normally includes extracting data from the event context, storing them
into internal variables, or printing results.
An event and its corresponding handler is collectively called a probe . SystemTap events are
also called probe points . A probe's handler is also called a probe body .
Comments can be inserted anywhere in the SystemTap script in various styles: using either #,
/* */ , or // as marker.
4.3.1 Probe Format
A SystemTap script can have multiple probes. They must be written in the following format:
probe EVENT {STATEMENTS}
Each probe has a corresponding statement block. This statement block must be enclosed in { }
and contains the statements to be executed per event.
EXAMPLE4.1:SIMPLE SYSTEMTAP SCRIPT
The following example shows a simple SystemTap script.
probe 1 begin 2
{3
printf 4 ("hello world\n") 5
exit () 6
}7
1Start of the probe.
2Event begin (the start of the SystemTap session).
3Start of the handler definition, indicated by {.
4First function defined in the handler: the printf function.
5String to be printed by the printf function, followed by a line break ( /n ).
6Second function defined in the handler: the exit() function. Note that the System-
Tap script will continue to run until the exit() function executes. If you want to
stop the execution of the script before, stop it manually by pressing Ctrl –C.
7End of the handler definition, indicated by }.
65 Probe Format openSUSE Leap 42.3

The event begin 2 (the start of the SystemTap session) triggers the handler enclosed in
{ } . Here, that is the printf function 4. In this case, it prints hello world followed
by a new line 5. Then, the script exits.
If your statement block holds several statements, SystemTap executes these statements in se-
quence—you do not need to insert special separators or terminators between multiple state-
ments. A statement block can also be nested within another statement blocks. Generally, state-
ment blocks in SystemTap scripts use the same syntax and semantics as in the C programming
language.
4.3.2 SystemTap Events (Probe Points)
SystemTap supports several built-in events.
The general event syntax is a dotted-symbol sequence. This allows a breakdown of the event
namespace into parts. Each component identifier may be parametrized by a string or number
literal, with a syntax like a function call. A component may include a * character, to expand to
other matching probe points. A probe point may be followed by a ? character, to indicate that
it is optional, and that no error should result if it fails to expand. Alternately, a probe point may
be followed by a ! character to indicate that it is both optional and sufficient.
SystemTap supports multiple events per probe—they need to be separated by a comma ( ,). If
multiple events are specified in a single probe, SystemTap will execute the handler when any
of the specified events occur.
In general, events can be classified into the following categories:
Synchronous events: Occur when any process executes an instruction at a particular loca-
tion in kernel code. This gives other events a reference point (instruction address) from
which more contextual data may be available.
An example for a synchronous event is vfs.FILE_OPERATION : The entry to the FILE_OP-
ERATION event for Virtual File System (VFS). For example, in Section4.2, “Installation and
Setup”, read is the FILE_OPERATION event used for VFS.
Asynchronous events: Not tied to a particular instruction or location in code. This family
of probe points consists mainly of counters, timers, and similar constructs.
Examples for asynchronous events are: begin (start of a SystemTap session—when a Sys-
temTap script is run, end (end of a SystemTap session), or timer events. Timer events spec-
ify a handler to be executed periodically, like example timer.s(SECONDS), or timer.m-
s(MILLISECONDS).
66 SystemTap Events (Probe Points) openSUSE Leap 42.3

When used in conjunction with other probes that collect information, timer events allow
you to print out periodic updates and see how that information changes over time.
EXAMPLE4.2:PROBE WITH TIMER EVENT
For example, the following probe would print the text “hello world” every 4 seconds:
probe timer.s(4)
{
printf("hello world\n")
}
For detailed information about supported events, refer to the stapprobes man page. The See
Also section of the man page also contains links to other man pages that discuss supported events
for specific subsystems and components.
4.3.3 SystemTap Handlers (Probe Body)
Each SystemTap event is accompanied by a corresponding handler defined for that event, con-
sisting of a statement block.
4.3.3.1 Functions
If you need the same set of statements in multiple probes, you can place them in a function for
easy reuse. Functions are defined by the keyword function followed by a name. They take any
number of string or numeric arguments (by value) and may return a single string or number.
function FUNCTION_NAME(ARGUMENTS) {STATEMENTS}
probe EVENT {FUNCTION_NAME(ARGUMENTS)}
The statements in FUNCTION_NAME are executed when the probe for EVENT executes. The AR-
GUMENTS are optional values passed into the function.
Functions can be defined anywhere in the script. They may take any
One of the functions needed very often was already introduced in Example4.1, “Simple SystemTap
Script”: the printf function for printing data in a formatted way. When using the printf
function, you can specify how arguments should be printed by using a format string. The format
string is included in quotation marks and can contain further format specifiers, introduced by
a % character.
67 SystemTap Handlers (Probe Body) openSUSE Leap 42.3
Which format strings to use depends on your list of arguments. Format strings can have mul-
tiple format specifiers—each matching a corresponding argument. Multiple arguments can be
separated by a comma.
EXAMPLE4.3:printf FUNCTION WITH FORMAT SPECIFIERS
printf (" 1%s 2(%d 3) open\n 4", execname(), pid())
1Start of the format string, indicated by ".
2String format specifier.
3Integer format specifier.
4End of the format string, indicated by ".
The example above prints the current executable name ( execname() ) as a string and the process
ID ( pid() ) as an integer in brackets. Then, a space, the word open and a line break follow:
[...]
vmware-guestd(2206) open
hald(2360) open
[...]
Apart from the two functions execname() and pid() ) used in Example4.3, “printf Function with
Format Specifiers”, a variety of other functions can be used as printf arguments.
Among the most commonly used SystemTap functions are the following:
tid()
ID of the current thread.
pid()
Process ID of the current thread.
uid()
ID of the current user.
cpu()
Current CPU number.
execname()
Name of the current process.
gettimeofday_s()
Number of seconds since Unix epoch (January 1, 1970).
68 SystemTap Handlers (Probe Body) openSUSE Leap 42.3

ctime()
Convert time into a string.
pp()
String describing the probe point currently being handled.
thread_indent()
Useful function for organizing print results. It (internally) stores an indentation counter for
each thread ( tid() ). The function takes one argument, an indentation delta, indicating
how many spaces to add or remove from the thread's indentation counter. It returns a string
with some generic trace data along with an appropriate number of indentation spaces.
The generic data returned includes a time stamp (number of microseconds since the initial
indentation for the thread), a process name, and the thread ID itself. This allows you to
identify what functions were called, who called them, and how long they took.
Call entries and exits often do not immediately precede each other (otherwise it would
be easy to match them). In between a rst call entry and its exit, usually several other
call entries and exits are made. The indentation counter helps you match an entry with
its corresponding exit as it indents the next function call in case it is not the exit of the
previous one. For an example SystemTap script using thread_indent() and the respec-
tive output, refer to the SystemTap Tutorial: http://sourceware.org/systemtap/tutorial/Trac-
ing.html#fig:socket-trace .
For more information about supported SystemTap functions, refer to the stapfuncs man page.
4.3.3.2 Other Basic Constructs
Apart from functions, you can use several other common constructs in SystemTap handlers,
including variables, conditional statements (like if /else , while loops, for loops, arrays or
command line arguments.
4.3.3.2.1 Variables
Variables may be defined anywhere in the script. To define one, simply choose a name and
assign a value from a function or expression to it:
foo = gettimeofday( )
69 SystemTap Handlers (Probe Body) openSUSE Leap 42.3

Then you can use the variable in an expression. From the type of values assigned to the variable,
SystemTap automatically infers the type of each identifier (string or number). Any inconsisten-
cies will be reported as errors. In the example above, foo would automatically be classified as
a number and could be printed via printf() with the integer format specifier ( %d ).
However, by default, variables are local to the probe they are used in: They are initialized, used
and disposed of at each handler evocation. To share variables between probes, declare them
global anywhere in the script. To do so, use the global keyword outside of the probes:
EXAMPLE4.4:USING GLOBAL VARIABLES
global count_jiffies, count_ms
probe timer.jiffies(100) { count_jiffies ++ }
probe timer.ms(100) { count_ms ++ }
probe timer.ms(12345)
{
hz=(1000*count_jiffies) / count_ms
printf ("jiffies:ms ratio %d:%d => CONFIG_HZ=%d\n",
count_jiffies, count_ms, hz)
exit ()
}
This example script computes the CONFIG_HZ setting of the kernel by using timers that
count jies and milliseconds, then computing accordingly. (A jiy is the duration of one
tick of the system timer interrupt. It is not an absolute time interval unit, since its duration
depends on the clock interrupt frequency of the particular hardware platform). With the
global statement it is possible to use the variables count_jiffies and count_ms also
in the probe timer.ms(12345) . With ++ the value of a variable is incremented by 1.
4.3.3.2.2 Conditional Statements
There are several conditional statements that you can use in SystemTap scripts. The following
are probably the most common:
If/Else Statements
They are expressed in the following format:
if (CONDITION)1STATEMENT1 2
else 3STATEMENT2 4
70 SystemTap Handlers (Probe Body) openSUSE Leap 42.3
The if statement compares an integer-valued expression to zero. If the condition expres-
sion 1 is non-zero, the rst statement 2 is executed. If the condition expression is zero,
the second statement 4 is executed. The else clause ( 3 and 4) is optional. Both 2 and
4 can also be statement blocks.
While Loops
They are expressed in the following format:
while (CONDITION)1STATEMENT 2
As long as condition is non-zero, the statement 2 is executed. 2 can also be a statement
block. It must change a value so condition will eventually be zero.
For Loops
They are a shortcut for while loops and are expressed in the following format:
for (INITIALIZATION 1; CONDITIONAL 2; INCREMENT 3) statement
The expression specified in 1 is used to initialize a counter for the number of loop iter-
ations and is executed before execution of the loop starts. The execution of the loop con-
tinues until the loop condition 2 is false. (This expression is checked at the beginning of
each loop iteration). The expression specified in 3 is used to increment the loop counter.
It is executed at the end of each loop iteration.
Conditional Operators
The following operators can be used in conditional statements:
==: Is equal to
!=: Is not equal to
>=: Is greater than or equal to
<=: Is less than or equal to
4.4 Example Script
If you have installed the systemtap-docs package, you can nd several useful SystemTap
example scripts in /usr/share/doc/packages/systemtap/examples .
This section describes a rather simple example script in more detail: /usr/share/doc/pack-
ages/systemtap/examples/network/tcp_connections.stp .
71 Example Script openSUSE Leap 42.3
EXAMPLE4.5:MONITORING INCOMING TCP CONNECTIONS WITH tcp_connections.stp
#! /usr/bin/env stap
probe begin {
printf("%6s %16s %6s %6s %16s\n",
"UID", "CMD", "PID", "PORT", "IP_SOURCE")
}
probe kernel.function("tcp_accept").return?,
kernel.function("inet_csk_accept").return? {
sock = $return
if (sock != 0)
printf("%6d %16s %6d %6d %16s\n", uid(), execname(), pid(),
inet_get_local_port(sock), inet_get_ip_source(sock))
}
This SystemTap script monitors the incoming TCP connections and helps to identify unautho-
rized or unwanted network access requests in real time. It shows the following information for
each new incoming TCP connection accepted by the computer:
User ID ( UID )
Command accepting the connection ( CMD )
Process ID of the command ( PID )
Port used by the connection ( PORT )
IP address from which the TCP connection originated ( IP_SOUCE )
To run the script, execute
stap/usr/share/doc/packages/systemtap/examples/network/tcp_connections.stp
and follow the output on the screen. To manually stop the script, press Ctrl –C.
4.5 User Space Probing
For debugging user space applications (like DTrace can do), openSUSE Leap 42.3 supports user
space probing with SystemTap: Custom probe points can be inserted in any user space appli-
cation. Thus, SystemTap lets you use both kernel space and user space probes to debug the
behavior of the whole system.
72 User Space Probing openSUSE Leap 42.3
To get the required utrace infrastructure and the uprobes kernel module for user space probing,
you need to install the kernel-trace package in addition to the packages listed in Section4.2,
“Installation and Setup”.
utrace implements a framework for controlling user space tasks. It provides an interface that
can be used by various tracing “engines”, implemented as loadable kernel modules. The engines
register callback functions for specific events, then attach to whichever thread they want to
trace. As the callbacks are made from “safe” places in the kernel, this allows for great leeway
in the kinds of processing the functions can do. Various events can be watched via utrace, for
example, system call entry and exit, fork(), signals being sent to the task, etc. More details about
the utrace infrastructure are available at http://sourceware.org/systemtap/wiki/utrace .
SystemTap includes support for probing the entry into and return from a function in user space
processes, probing predefined markers in user space code, and monitoring user-process events.
To check if the currently running kernel provides the needed utrace support, use the following
command:
grep CONFIG_UTRACE /boot/config-`uname -r`
For more details about user space probing, refer to https://sourceware.org/systemtap/System-
Tap_Beginners_Guide/userspace-probing.html .
4.6 For More Information
This chapter only provides a short SystemTap overview. Refer to the following links for more
information about SystemTap:
http://sourceware.org/systemtap/
SystemTap project home page.
http://sourceware.org/systemtap/wiki/
Huge collection of useful information about SystemTap, ranging from detailed user and de-
veloper documentation to reviews and comparisons with other tools, or Frequently Asked
Questions and tips. Also contains collections of SystemTap scripts, examples and usage
stories and lists recent talks and papers about SystemTap.
http://sourceware.org/systemtap/documentation.html
Features a SystemTap Tutorial, a SystemTap Beginner's Guide, a Tapset Developer's Guide, and
a SystemTap Language Reference in PDF and HTML format. Also lists the relevant man pages.
73 For More Information openSUSE Leap 42.3

You can also nd the SystemTap language reference and SystemTap tutorial in your installed
system under /usr/share/doc/packages/systemtap . Example SystemTap scripts are avail-
able from the example subdirectory.
74 For More Information openSUSE Leap 42.3
5Kernel Probes
Kernel probes are a set of tools to collect Linux kernel debugging and performance information.
Developers and system administrators usually use them either to debug the kernel, or to nd
system performance bottlenecks. The reported data can then be used to tune the system for
better performance.
You can insert these probes into any kernel routine, and specify a handler to be invoked after a
particular break-point is hit. The main advantage of kernel probes is that you no longer need to
rebuild the kernel and reboot the system after you make changes in a probe.
To use kernel probes, you typically need to write or obtain a specific kernel module. Such mod-
ules include both the init and the exit function. The init function (such as register_kprobe() )
registers one or more probes, while the exit function unregisters them. The registration func-
tion defines where the probe will be inserted and which handler will be called after the probe
is hit. To register or unregister a group of probes at one time, you can use relevant regis-
ter_<PROBE_TYPE>probes() or unregister_<PROBE_TYPE>probes() functions.
Debugging and status messages are typically reported with the printk kernel routine. printk
is a kernel space equivalent of a user space printf routine. For more information on printk ,
see Logging kernel messages (http://www.win.tue.nl/~aeb/linux/lk/lk-2.html#ss2.8) . Normally,
you can view these messages by inspecting the output of the systemd journal (see Book “Refer-
ence”, Chapter11 “journalctl: Query the systemd Journal”). For more information on log les,
see Chapter3, Analyzing and Managing System Log Files.
5.1 Supported Architectures
Kernel probes are fully implemented on the following architectures:
x86
AMD64/Intel64
ARM
POWER
Kernel probes are partially implemented on the following architectures:
IA64 (does not support probes on instruction slot1 )
sparc64 (return probes not yet implemented)
75 Supported Architectures openSUSE Leap 42.3

5.2 Types of Kernel Probes
There are three types of kernel probes: Kprobes, Jprobes, and Kretprobes. Kretprobes are some-
times called return probes. You can nd source code examples of all three type of probes
in the Linux kernel. See the directory /usr/src/linux/samples/kprobes/ (package ker-
nel-source ).
5.2.1 Kprobes
Kprobes can be attached to any instruction in the Linux kernel. When Kprobes is registered, it
inserts a break-point at the rst byte of the probed instruction. When the processor hits this
break-point, the processor registers are saved, and the processing passes to Kprobes. First, a pre-
handler is executed, then the probed instruction is stepped, and, finally a post-handler is executed.
The control is then passed to the instruction following the probe point.
5.2.2 Jprobes
Jprobes is implemented through the Kprobes mechanism. It is inserted on a function's entry
point and allows direct access to the arguments of the function which is being probed. Its handler
routine must have the same argument list and return value as the probed function. To end it,
call the jprobe_return() function.
When a jprobe is hit, the processor registers are saved, and the instruction pointer is directed
to the jprobe handler routine. The control then passes to the handler with the same register
contents as the function being probed. Finally, the handler calls the jprobe_return() function,
and switches the control back to the control function.
In general, you can insert multiple probes on one function. Jprobe is, however, limited to only
one instance per function.
5.2.3 Return Probe
Return probes are also implemented through Kprobes. When the register_kretprobe() func-
tion is called, a kprobe is attached to the entry of the probed function. After hitting the probe,
the kernel probes mechanism saves the probed function return address and calls a user-defined
return handler. The control is then passed back to the probed function.
76 Types of Kernel Probes openSUSE Leap 42.3

Before you call register_kretprobe() , you need to set a maxactive argument, which spec-
ifies how many instances of the function can be probed at the same time. If set too low, you
will miss a certain number of probes.
5.3 Kprobes API
The programming interface of Kprobes consists of functions which are used to register and
unregister all used kernel probes, and associated probe handlers. For a more detailed description
of these functions and their arguments, see the information sources in Section 5.5, “For More
Information”.
register_kprobe()
Inserts a break-point on a specified address. When the break-point is hit, the pre_handler
and post_handler are called.
register_jprobe()
Inserts a break-point in the specified address. The address needs to be the address of the
rst instruction of the probed function. When the break-point is hit, the specified handler
is run. The handler should have the same argument list and return type as the probed.
register_kretprobe()
Inserts a return probe for the specified function. When the probed function returns, a
specified handler is run. This function returns 0 on success, or a negative error number
on failure.
unregister_kprobe() , unregister_jprobe() , unregister_kretprobe()
Removes the specified probe. You can use it any time after the probe has been registered.
register_kprobes() , register_jprobes() , register_kretprobes()
Inserts each of the probes in the specified array.
unregister_kprobes() , unregister_jprobes() , unregister_kretprobes()
Removes each of the probes in the specified array.
disable_kprobe() , disable_jprobe() , disable_kretprobe()
Disables the specified probe temporarily.
enable_kprobe() , enable_jprobe() , enable_kretprobe()
Temporarily enables disabled probes.
77 Kprobes API openSUSE Leap 42.3

5.4 debugfs Interface
In recent Linux kernels, the Kprobes instrumentation uses the kernel's debugfs interface. It can
list all registered probes and globally switch all probes on or o.
5.4.1 Listing Registered Kernel Probes
The list of all currently registered probes is in the /sys/kernel/debug/kprobes/list le.
saturn.example.com:~ # cat /sys/kernel/debug/kprobes/list
c015d71a k vfs_read+0x0 [DISABLED]
c011a316 j do_fork+0x0
c03dedc5 r tcp_v4_rcv+0x0
The rst column lists the address in the kernel where the probe is inserted. The second column
prints the type of the probe: k for kprobe, j for jprobe, and r for return probe. The third column
specifies the symbol, offset and optional module name of the probe. The following optional
columns include the status information of the probe. If the probe is inserted on a virtual address
which is not valid anymore, it is marked with [GONE] . If the probe is temporarily disabled, it
is marked with [DISABLED] .
5.4.2 How to Switch All Kernel Probes On or Off
The /sys/kernel/debug/kprobes/enabled le represents a switch with which you can glob-
ally and forcibly turn on or o all the registered kernel probes. To turn them o, simply enter
echo "0" > /sys/kernel/debug/kprobes/enabled
on the command line as root . To turn them on again, enter
echo "1" > /sys/kernel/debug/kprobes/enabled
Note that this way you do not change the status of the probes. If a probe is temporarily disabled,
it will not be enabled automatically but will remain in the [DISABLED] state after entering the
latter command.
78 debugfs Interface openSUSE Leap 42.3

5.5 For More Information
To learn more about kernel probes, look at the following sources of information:
Thorough but more technically oriented information about kernel probes is in /usr/src/
linux/Documentation/kprobes.txt (package kenrel-source ).
Examples of all three types of probes (together with related Makefile ) are in the /usr/
src/linux/samples/kprobes/ directory (package kenrel-source ).
In-depth information about Linux kernel modules and printk kernel routine is in The
Linux Kernel Module Programming Guide (http://tldp.org/LDP/lkmpg/2.6/html/lkmpg.html)
Practical but slightly outdated information about the use of kernel probes can be
found in Kernel debugging with Kprobes (http://www.ibm.com/developerworks/library/l-
kprobes.html)
79 For More Information openSUSE Leap 42.3

6Hardware-Based Performance Monitoring with Perf
Perf is an interface to access the performance monitoring unit (PMU) of a proces-
sor and to record and display software events such as page faults. It supports sys-
tem-wide, per-thread, and KVM virtualization guest monitoring.
You can store resulting information in a report. This report contains information about, for
example, instruction pointers or what code a thread was executing.
Perf consists of two parts:
Code integrated into the Linux kernel that is responsible for instructing the hardware.
The perf user space utility that allows you to use the kernel code and helps you analyze
gathered data.
6.1 Hardware-Based Monitoring
Performance monitoring means collecting information related to how an application or system
performs. This information can be obtained either through software-based means or from the
CPU or chipset. Perf integrates both of these methods.
Many modern processors contain a performance monitoring unit (PMU). The design and func-
tionality of a PMU is CPU-specific. For example, the number of registers, counters and features
supported will vary by CPU implementation.
Each PMU model consists of a set of registers: the performance monitor configuration (PMC)
and the performance monitor data (PMD). Both can be read, but only PMCs are writable. These
registers store configuration information and data.
6.2 Sampling and Counting
Perf supports several profiling modes:
Counting. Count the number of occurrences of an event.
Event-Based Sampling. A less exact way of counting: A sample is recorded whenever a
certain threshold number of events has occurred.
80 Hardware-Based Monitoring openSUSE Leap 42.3

Time-Based Sampling. A less exact way of counting: A sample is recorded in a defined
frequency.
Instruction-Based Sampling (AMD64 only). The processor follows instructions appearing
in a given interval and samples which events they produce. This allows following up on
individual instructions and seeing which of them is critical to performance.
6.3 Installing Perf
The Perf kernel code is already included with the default kernel. To be able to use the user space
utility, install the package perf .
6.4 Perf Subcommands
To gather the required information, the perf tool has several subcommands. This section gives
an overview of the most often used commands.
To see help in the form of a man page for any of the subcommands, use either perf help SUB-
COMMAND or man perf- SUBCOMMAND .
perf stat
Start a program and create a statistical overview that is displayed after the program quits.
perf stat is used to count events.
perf record
Start a program and create a report with performance counter information. The report is
stored as perf.data in the current directory. perf record is used to sample events.
perf report
Display a report that was previously created with perf record .
perf annotate
Display a report le and an annotated version of the executed code. If debug symbols are
installed, you will also see the source code displayed.
perf list
List event types that Perf can report with the current kernel and with your CPU. You can
filter event types by category—for example, to see hardware events only, use perf list
hw .
81 Installing Perf openSUSE Leap 42.3

The man page for perf_event_open has short descriptions for the most important
events. For example, to nd a description of the event branch-misses , search for
BRANCH_MISSES (note the spelling differences):
tux > man perf_event_open | grep -A5 BRANCH_MISSES
Sometimes, events may be ambiguous. Note that the lowercase hardware event names are
not the name of raw hardware events but instead the name of aliases created by Perf. These
aliases map to differently named but similarly defined hardware events on each supported
processor.
For example, the cpu-cycles event is mapped to the hardware event UNHALT-
ED_CORE_CYCLES on Intel processors. On AMD processors, however, it is mapped to the
hardware event CPU_CLK_UNHALTED .
Perf also allows measuring raw events specific to your hardware. To look up their descrip-
tions, see the Architecture Software Developer's Manual of your CPU vendor. The relevant
documents for AMD64/Intel64 processors are linked to in Section6.7, “For More Information”.
perf top
Display system activity as it happens.
perf trace
This command behaves similarly to strace . With this subcommand, you can see which
system calls are executed by a particular thread or process and which signals it receives.
6.5 Counting Particular Types of Event
To count the number of occurrences of an event, such as those displayed by perf list , use:
root # perf stat -e EVENT -a
To count multiple types of events at once, list them separated by commas. For example, to count
cpu-cycles and instructions , use:
root # perf stat -e cpu-cycles,instructions -a
To stop the session, press Ctrl –C.
You can also count the number of occurrences of an event within a particular time:
root # perf stat -e EVENT -a -- sleep TIME
Replace TIME by a value in seconds.
82 Counting Particular Types of Event openSUSE Leap 42.3
6.6 Recording Events Specific to Particular
Commands
There are various ways to sample events specific to a particular command:
To create a report for a newly invoked command, use:
root # perf record COMMAND
Then, use the started process normally. When you quit the process, the Perf session will
also stop.
To create a report for the entire system while a newly invoked command is running, use:
root # perf record -a COMMAND
Then, use the started process normally. When you quit the process, the Perf session will
also stop.
To create a report for an already running process, use:
root # perf record -p PID
Replace PID with a process ID. To stop the session, press Ctrl –C.
Now you can view the gathered data ( perf.data ) using:
tux > perf report
This will open a pseudo-graphical interface. To receive help, press H. To quit, press Q.
If you prefer a graphical interface, try the GTK+ interface of Perf:
tux > perf report --gtk
However, note that the GTK+ interface is very limited in functionality.
6.7 For More Information
This chapter only provides a short overview. Refer to the following links for more information:
https://perf.wiki.kernel.org/index.php/Main_Page
83 Recording Events Specific to Particular Commands openSUSE Leap 42.3

The project home page. It also features a tutorial on using perf .
http://www.brendangregg.com/perf.html
Unofficial page with many one-line examples of how to use perf .
http://web.eece.maine.edu/~vweaver/projects/perf_events/
Unofficial page with several resources, mostly relating to the Linux kernel code of Perf and
its API. This page includes, for example, a CPU compatibility table and a programming
guide.
https://www-ssl.intel.com/content/dam/www/public/us/en/documents/manuals/64-ia-32-
architectures-software-developer-vol-3b-part-2-manual.pdf
The Intel Architectures Software Developer's Manual, Volume 3B.
https://support.amd.com/TechDocs/24593.pdf
The AMD Architecture Programmer's Manual, Volume 2.
Chapter7, OProfile—System-Wide Profiler
Consult this chapter for other performance optimizations.
84 For More Information openSUSE Leap 42.3

7OProfile—System-Wide Profiler
OProfile is a profiler for dynamic program analysis. It investigates the behavior of
a running program and gathers information. This information can be viewed and
gives hints for further optimization.
It is not necessary to recompile or use wrapper libraries to use OProfile. Not even a
kernel patch is needed. Usually, when profiling an application, a small overhead is
expected, depending on the workload and sampling frequency.
7.1 Conceptual Overview
OProfile consists of a kernel driver and a daemon for collecting data. It makes use of the hard-
ware performance counters provided on many processors. OProfile is capable of profiling all
code including the kernel, kernel modules, kernel interrupt handlers, system shared libraries,
and other applications.
Modern processors support profiling through the hardware by performance counters. Depending
on the processor, there can be many counters and each of these can be programmed with an
event to count. Each counter has a value which determines how often a sample is taken. The
lower the value, the more often it is used.
During the post-processing step, all information is collected and instruction addresses are
mapped to a function name.
7.2 Installation and Requirements
To use OProfile, install the oprofile package.
It is useful to install the *-debuginfo package for the respective application you want to profile.
If you want to profile the kernel, you need the debuginfo package as well.
85 Conceptual Overview openSUSE Leap 42.3

7.3 Available OProfile Utilities
OProfile contains several utilities to handle the profiling process and its profiled data. The fol-
lowing list is a short summary of programs used in this chapter:
opannotate
Outputs annotated source or assembly listings mixed with profile information. An anno-
tated report can be used in combination with addr2line to identify the source le and
line where hotspots potentially exist. See man addr2line for more information.
opcontrol
Controls the profiling sessions (start or stop), dumps profile data, and sets up parameters.
ophelp
Lists available events with short descriptions.
opimport
Converts sample database les from a foreign binary format to the native format.
opreport
Generates reports from profiled data.
7.4 Using OProfile
With OProfile, you can profile both the kernel and applications. When profiling the kernel, tell
OProfile where to nd the vmlinuz* le. Use the --vmlinux option and point it to vmlinuz*
(usually in /boot ). If you need to profile kernel modules, OProfile does this by default. However,
make sure you read http://oprofile.sourceforge.net/doc/kernel-profiling.html .
Applications usually do not need to profile the kernel, therefore you should use the --no-
vmlinux option to reduce the amount of information.
7.4.1 Creating a Report
Starting the daemon, collecting data, stopping the daemon, and creating a report.
1. Open a shell and log in as root .
86 Available OProfile Utilities openSUSE Leap 42.3

2. Decide if you want to profile with or without the Linux kernel:
a. Profile With the Linux Kernel. Execute the following commands, because opcontrol
can only work with uncompressed images:
cp /boot/vmlinux-`uname -r`.gz /tmp
gunzip /tmp/vmlinux*.gz
opcontrol --vmlinux=/tmp/vmlinux*
b. Profile Without the Linux Kernel. Use the following command:
opcontrol --no-vmlinux
If you want to see which functions call other functions in the output, additionally
use the --callgraph option and set a maximum DEPTH :
opcontrol --no-vmlinux --callgraph DEPTH
3. Start the OProfile daemon:
opcontrol --start
Using 2.6+ OProfile kernel interface.
Using log file /var/lib/oprofile/samples/oprofiled.log
Daemon started.
Profiler running.
4. Now start the application you want to profile.
5. Stop the OProfile daemon:
opcontrol --stop
6. Dump the collected data to /var/lib/oprofile/samples :
opcontrol --dump
7. Create a report:
opreport
Overflow stats not available
CPU: CPU with timer interrupt, speed 0 MHz (estimated)
Profiling through timer interrupt
TIMER:0|
samples| %|
87 Creating a Report openSUSE Leap 42.3

------------------
84877 98.3226 no-vmlinux
...
8. Shut down the oprofile daemon:
opcontrol --shutdown
7.4.2 Getting Event Configurations
The general procedure for event configuration is as follows:
1. Use rst the events CPU-CLK_UNHALTED and INST_RETIRED to nd optimization oppor-
tunities.
2. Use specific events to nd bottlenecks. To list them, use the command opcontrol --
list-events .
If you need to profile certain events, rst check the available events supported by your processor
with the ophelp command (example output generated from Intel Core i5 CPU):
ophelp
oprofile: available events for CPU type "Intel Architectural Perfmon"
See Intel 64 and IA-32 Architectures Software Developer's Manual
Volume 3B (Document 253669) Chapter 18 for architectural perfmon events
This is a limited set of fallback events because oprofile does not know your CPU
CPU_CLK_UNHALTED: (counter: all))
Clock cycles when not halted (min count: 6000)
INST_RETIRED: (counter: all))
number of instructions retired (min count: 6000)
LLC_MISSES: (counter: all))
Last level cache demand requests from this core that missed the LLC (min count:
6000)
Unit masks (default 0x41)
----------
0x41: No unit mask
LLC_REFS: (counter: all))
Last level cache demand requests from this core (min count: 6000)
Unit masks (default 0x4f)
----------
0x4f: No unit mask
BR_MISS_PRED_RETIRED: (counter: all))
88 Getting Event Configurations openSUSE Leap 42.3
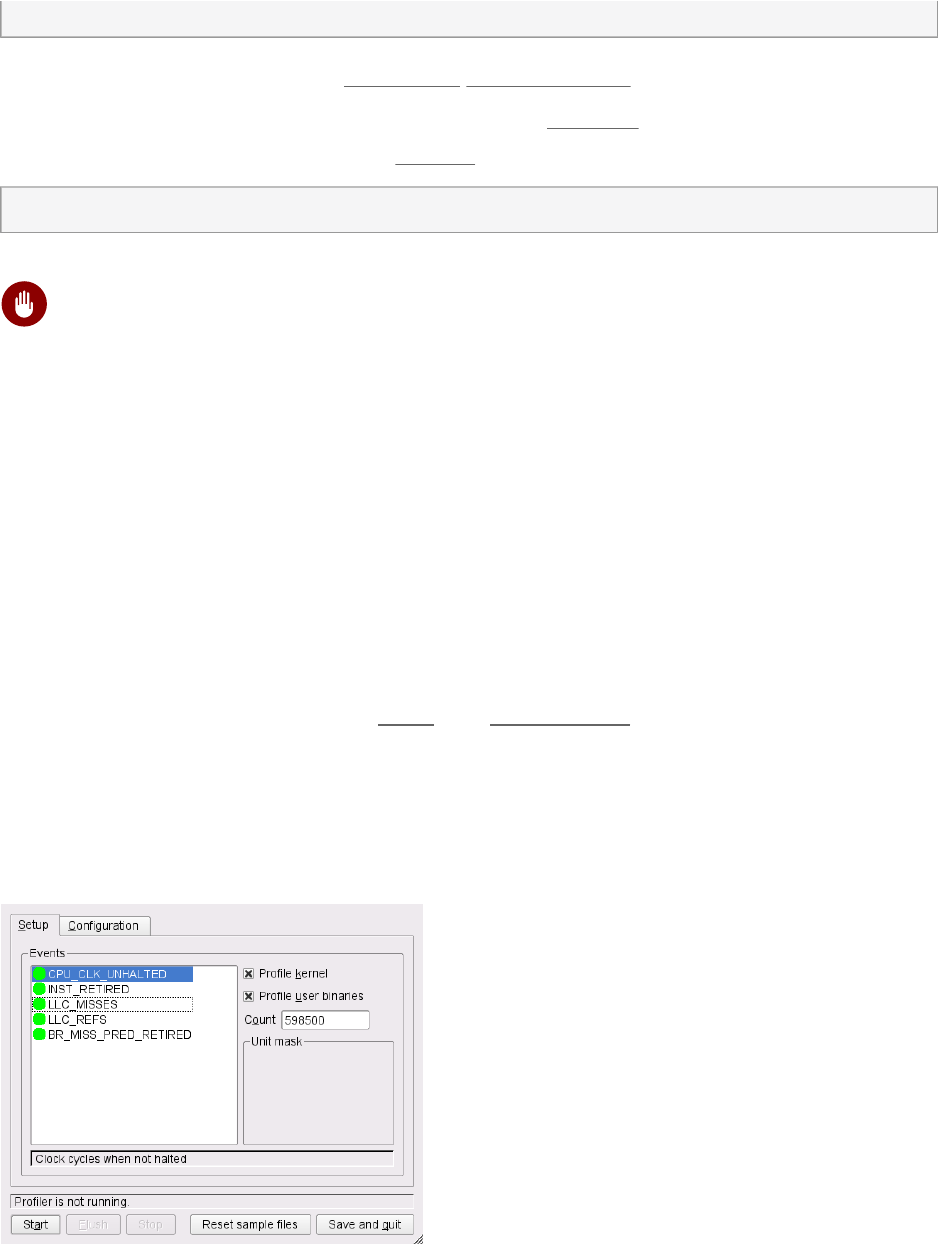
number of mispredicted branches retired (precise) (min count: 500)
You can get the same output from opcontrol --list-events .
Specify the performance counter events with the option --event . Multiple options are possible.
This option needs an event name (from ophelp ) and a sample rate, for example:
opcontrol --event=CPU_CLK_UNHALTED:100000
Warning: Setting Sampling Rates with
CPU_CLK_UNHALTED
Setting low sampling rates can seriously impair the system performance while high sam-
ple rates can disrupt the system to such a high degree that the data is useless. It is recom-
mended to tune the performance metric for being monitored with and without OProfile
and to experimentally determine the minimum sample rate that disrupts the performance
the least.
7.5 Using OProfile's GUI
The GUI for OProfile can be started as root with oprof_start , see Figure7.1, “GUI for OProfile”.
Select your events and change the counter, if necessary. Every green line is added to the list
of checked events. Hover the mouse over the line to see a help text in the status line below.
Use the Configuration tab to set the buer and CPU size, the verbose option and others. Click
Start to execute OProfile.
FIGURE7.1:GUI FOR OPROFILE
89 Using OProfile's GUI openSUSE Leap 42.3
7.6 Generating Reports
Before generating a report, make sure OProfile has dumped your data to the /var/lib/opro-
file/samples directory using the command opcontrol --dump . A report can be generated
with the commands opreport or opannotate .
Calling opreport without any options gives a complete summary. With an executable as an
argument, retrieve profile data only from this executable. If you analyze applications written in
C++, use the --demangle smart option.
The opannotate generates output with annotations from source code. Run it with the following
options:
opannotate --source \
--base-dirs=BASEDIR \
--search-dirs= \
--output-dir=annotated/ \
/lib/libfoo.so
The option --base-dir contains a comma separated list of paths which is stripped from debug
source les. These paths were searched prior to looking in --search-dirs . The --search-
dirs option is also a comma separated list of directories to search for source les.
Note: Inaccuracies in Annotated Source
Because of compiler optimization, code can disappear and appear in a different place.
Use the information in http://oprofile.sourceforge.net/doc/debug-info.html to fully un-
derstand its implications.
7.7 For More Information
This chapter only provides a short overview. Refer to the following links for more information:
http://oprofile.sourceforge.net
The project home page.
Manpages
Details descriptions about the options of the different tools.
/usr/share/doc/packages/oprofile/oprofile.html
90 Generating Reports openSUSE Leap 42.3

Contains the OProfile manual.
http://developer.intel.com/
Architecture reference for Intel processors.
http://www-01.ibm.com/chips/techlib/techlib.nsf/productfamilies/PowerPC/
Architecture reference for PowerPC64 processors in IBM iSeries, pSeries, and Blade server
systems.
91 For More Information openSUSE Leap 42.3

8General System Resource Management
Tuning the system is not only about optimizing the kernel or getting the most out of
your application, it begins with setting up a lean and fast system. The way you set
up your partitions and le systems can influence the server's speed. The number of
active services and the way routine tasks are scheduled also affects performance.
8.1 Planning the Installation
A carefully planned installation ensures that the system is set up exactly as you need it for
the given purpose. It also saves considerable time when ne tuning the system. All changes
suggested in this section can be made in the Installation Settings step during the installation. See
Book “Start-Up”, Chapter2 “Installation with YaST”, Section2.12 “Installation Settings” for details.
8.1.1 Partitioning
Depending on the server's range of applications and the hardware layout, the partitioning
scheme can influence the machine's performance (although to a lesser extent only). It is beyond
the scope of this manual to suggest different partitioning schemes for particular workloads.
However, the following rules will positively affect performance. They do not apply when using
an external storage system.
Make sure there always is some free space available on the disk, since a full disk delivers
inferior performance
Disperse simultaneous read and write access onto different disks by, for example:
using separate disks for the operating system, data, and log les
placing a mail server's spool directory on a separate disk
distributing the user directories of a home server between different disks
93 Planning the Installation openSUSE Leap 42.3

8.1.2 Installation Scope
The installation scope has no direct influence on the machine's performance, but a carefully
chosen scope of packages has advantages. It is recommended to install the minimum of packages
needed to run the server. A system with a minimum set of packages is easier to maintain and
has fewer potential security issues. Furthermore, a tailor made installation scope also ensures
that no unnecessary services are started by default.
openSUSE Leap lets you customize the installation scope on the Installation Summary screen. By
default, you can select or remove preconfigured patterns for specific tasks, but it is also possible
to start the YaST Software Manager for a ne-grained package-based selection.
One or more of the following default patterns may not be needed in all cases:
GNOME Desktop Environment
Servers rarely need a full desktop environment. In case a graphical environment is needed,
a more economical solution such as IceWM can be sufficient.
X Window System
When solely administrating the server and its applications via command line, consider not
installing this pattern. However, keep in mind that it is needed to run GUI applications
from a remote machine. If your application is managed by a GUI or if you prefer the GUI
version of YaST, keep this pattern.
Print Server
This pattern is only needed if you want to print from the machine.
8.1.3 Default Target
A running X Window System consumes many resources and is rarely needed on a server. It is
strongly recommended to start the system in target multi-user.target . You will still be able
to remotely start graphical applications.
8.2 Disabling Unnecessary Services
The default installation starts several services (the number varies with the installation scope).
Since each service consumes resources, it is recommended to disable the ones not needed. Run
YaST System Services Manager to start the services management module.
94 Installation Scope openSUSE Leap 42.3

If you are using the graphical version of YaST, you can click the column headlines to sort the
list of services. Use this to get an overview of which services are currently running. Use the
Start/Stop button to disable the service for the running session. To permanently disable it, use
the Enable/Disable button.
The following list shows services that are started by default after the installation of openSUSE
Leap. Check which of the components you need, and disable the others:
alsasound
Loads the Advanced Linux Sound System.
auditd
A daemon for the Audit system (see Book “Security Guide” for details). Disable this if you
do not use Audit.
bluez-coldplug
Handles cold plugging of Bluetooth dongles.
cups
A printer daemon.
java.binfmt_misc
Enables the execution of *.class or *.jar Java programs.
nfs
Services needed to mount NFS.
smbfs
Services needed to mount SMB/CIFS le systems from a Windows* server.
splash / splash_early
Shows the splash screen on start-up.
8.3 File Systems and Disk Access
Hard disks are the slowest components in a computer system and therefore often the cause for
a bottleneck. Using the le system that best suits your workload helps to improve performance.
Using special mount options or prioritizing a process's I/O priority are further means to speed
up the system.
95 File Systems and Disk Access openSUSE Leap 42.3

8.3.1 File Systems
openSUSE Leap ships with several le systems, including BtrFS, Ext4, Ext3, Ext2, ReiserFS, and
XFS. Each le system has its own advantages and disadvantages.
8.3.1.1 NFS
NFS (Version 3) tuning is covered in detail in the NFS Howto at http://nfs.sourceforge.net/nfs-
howto/ . The rst thing to experiment with when mounting NFS shares is increasing the read
write blocksize to 32768 by using the mount options wsize and rsize .
8.3.2 Time Stamp Update Policy
Each le and directory in a le system has three time stamps associated with it: a time when the
le was last read called access time, a time when the le data was last modified called modification
time, and a time when the le metadata was last modified called change time. Keeping access
time always up to date has significant performance overhead since every read-only access will
incur a write operation. Thus by default every le system updates access time only if current
le access time is older than a day or if it is older than le modification or change time. This
feature is called relative access time and the corresponding mount option is relatime . Updates
of access time can be completely disabled using the noatime mount option, however you need
to verify your applications do not use it. This can be true for le and Web servers or for network
storage. If the default relative access time update policy is not suitable for your applications,
use the strictatime mount option.
Some le systems (for example ext4) also support lazy time stamp updates. When this feature is
enabled using the lazytime mount option, updates of all time stamps happen in memory but
they are not written to disk. That happens only in response to fsync or sync system calls, when
the le information is written due to another reason such as le size update, when time stamps
are older than 24 hours, or when cached le information needs to be evicted from memory.
To update mount options used for a le system, either edit /etc/fstab directly, or use the
Fstab Options dialog when editing or adding a partition with the YaST Partitioner.
96 File Systems openSUSE Leap 42.3

8.3.3 Prioritizing Disk Access with ionice
The ionice command lets you prioritize disk access for single processes. This enables you to
give less I/O priority to background processes with heavy disk access that are not time-critical,
such as backup jobs. ionice also lets you raise the I/O priority for a specific process to make
sure this process always has immediate access to the disk. The caveat of this feature is that
standard writes are cached in the page cache and are written back to persistent storage only later
by an independent kernel process. Thus the I/O priority setting generally does not apply for these
writes. Also be aware that I/O class and priority setting is obeyed only by CFQ I/O scheduler
(refer to Section12.2, “Available I/O Elevators”). You can set the following three scheduling classes:
Idle
A process from the idle scheduling class is only granted disk access when no other process
has asked for disk I/O.
Best effort
The default scheduling class used for any process that has not asked for a specific I/O
priority. Priority within this class can be adjusted to a level from 0 to 7 (with 0 being the
highest priority). Programs running at the same best-effort priority are served in a round-
robin fashion. Some kernel versions treat priority within the best-effort class differently—
for details, refer to the ionice(1) man page.
Real-time
Processes in this class are always granted disk access rst. Fine-tune the priority level
from 0 to 7 (with 0 being the highest priority). Use with care, since it can starve other
processes.
For more details and the exact command syntax refer to the ionice(1) man page. If you need
more reliable control over bandwidth available to each application, please use Kernel Control
Groups as described in Section9.3, “Control Group Subsystems”.
97 Prioritizing Disk Access with ionice openSUSE Leap 42.3

9Kernel Control Groups
Kernel Control Groups (abbreviated known as “cgroups”) are a kernel feature that
allows aggregating or partitioning tasks (processes) and all their children into hier-
archical organized groups. These hierarchical groups can be configured to show a
specialized behavior that helps with tuning the system to make best use of available
hardware and network resources.
In the following sections, we often reference kernel documentation such as /usr/
src/linux/Documentation/cgroups/ . These les are part of the kernel-source
package.
This chapter is an overview. To use cgroups properly and to avoid performance im-
plications, you must study the provided references.
9.1 Technical Overview and Definitions
The following terms are used in this chapter:
“cgroup” is another name for Control Groups.
In a cgroup there is a set of tasks (processes) associated with a set of subsystems that act
as parameters constituting an environment for the tasks.
Subsystems provide the parameters that can be assigned and define CPU sets, freezer, or
—more general—“resource controllers” for memory, disk I/O, network traffic, etc.
cgroups are organized in a tree-structured hierarchy. There can be more than one hierarchy
in the system. You use a different or alternate hierarchy to cope with specific situations.
Every task running in the system is in exactly one of the cgroups in the hierarchy.
98 Technical Overview and Definitions openSUSE Leap 42.3
9.2 Scenario
See the following resource planning scenario for a better understanding (source: /usr/src/
linux/Documentation/cgroups/cgroups.txt ):
CPUs Memory
Network I/O Disk I/O
Professors (50%)
Students (30%)
System (20%)
Network File Systems (60%)
WWW Browsing (20%)
Others (20%)
Professors (15%) Students (5%)
Top CPU Set (20%)
CPU Set 1 (60%) CPU Set 2 (20%)
Professors Students
Professors (50%)
Students (30%)
System (20%)
FIGURE9.1:RESOURCE PLANNING
Web browsers such as Firefox will be part of the Web network class, while the NFS daemons such
as (k)nfsd will be part of the NFS network class. On the other side, Firefox will share appropriate
CPU and memory classes depending on whether a professor or student started it.
9.3 Control Group Subsystems
The following subsystems are available: cpuset , cpu , cpuacct , memory , devices , freezer ,
net_cls , net_prio , blkio , perf_event , and hugetlbt .
99 Scenario openSUSE Leap 42.3

Either mount each subsystem separately, for example:
mkdir /cpuset /cpu
mount -t cgroup -o cpuset none /cpuset
mount -t cgroup -o cpu,cpuacct none /cpu
or all subsystems in one go; you can use an arbitrary device name (for example none ), which
will appear in /proc/mounts , for example:
mount -t cgroup none /sys/fs/cgroup
Some additional information on available subsystems:
net_cls (Identification)
The Network classifier cgroup helps with providing identification for controlling processes
such as Traffic Controller (tc) or Netfilter (iptables). These controller tools can act on
tagged network packets.
For more information, see /usr/src/linux/Documentation/cgroups/net_cls.txt .
net_prio (Identification)
The Network priority cgroup helps with setting the priority of network packets.
For more information, see /usr/src/linux/Documentation/cgroups/net_prio.txt .
devices (Isolation)
A system administrator can provide a list of devices that can be accessed by processes
under cgroups.
It limits access to a device or a le system on a device to only tasks that belong to the
specified cgroup. For more information, see /usr/src/linux/Documentation/cgroups/
devices.txt .
freezer (Control)
The freezer subsystem is useful for high-performance computing clusters (HPC clus-
ters). Use it to freeze (stop) all tasks in a group or to stop tasks, if they reach a de-
fined checkpoint. For more information, see /usr/src/linux/Documentation/cgroups/
freezer-subsystem.txt .
Here are basic commands to use the freezer subsystem:
mount -t cgroup -o freezer freezer /freezer
# Create a child cgroup:
mkdir /freezer/0
# Put a task into this cgroup:
echo $task_pid > /freezer/0/tasks
100 Control Group Subsystems openSUSE Leap 42.3
# Freeze it:
echo FROZEN > /freezer/0/freezer.state
# Unfreeze (thaw) it:
echo THAWED > /freezer/0/freezer.state
perf_event (Control)
perf_event collects performance data.
cpuset (Isolation)
Use cpuset to tie processes to system subsets of CPUs and memory (“memory nodes”).
For an example, see Section9.4.2, “Example: Cpusets”.
cpuacct (Accounting)
The CPU accounting controller groups tasks using cgroups and accounts the CPU usage
of these groups. For more information, see /usr/src/linux/Documentation/cgroups/
cpuacct.txt .
memory (Resource Control)
Tracking or limiting memory usage of user space processes.
Control swap usage by setting swapaccount=1 as a kernel boot parameter.
Limit LRU (Least Recently Used) pages.
Anonymous and le cache.
No limits for kernel memory.
Maybe in another subsystem if needed.
Note: Protection from Memory Pressure
Memory cgroup now offers a mechanism allowing easier workload opt-in isolation.
Memory cgroup can define its so called low limit ( memory.low_limit_in_bytes ),
which works as a protection from memory pressure. For workloads that need to
be isolated from outside memory management activity, the value should be set to
the expected Resident Set Size (RSS) plus some head room. If a memory pressure
condition triggers on the system and the particular group is still under its low limit,
its memory is protected from reclaim. As a result, workloads outside of the cgroup
do not need the aforementioned capping.
For more information, see /usr/src/linux/Documentation/cgroups/memory.txt .
101 Control Group Subsystems openSUSE Leap 42.3

hugetlb (Resource Control)
The HugeTLB controller manages the memory allocated to huge pages.
For more information, see /usr/src/linux/Documentation/cgroups/hugetlb.txt .
cpu (Control)
Share CPU bandwidth between groups with the group scheduling function of CFS (the
scheduler). Mechanically complicated.
Blkio (Resource Control)
The Block IO controller is available as a disk I/O controller. With the blkio controller you
can currently set policies for proportional bandwidth and for throttling.
These are the basic commands to configure proportional weight division of bandwidth by
setting weight values in blkio.weight :
# Setup in /sys/fs/cgroup
mkdir /sys/fs/cgroup/blkio
mount -t cgroup -o blkio none /sys/fs/cgroup/blkio
# Start two cgroups
mkdir -p /sys/fs/cgroup/blkio/group1 /sys/fs/cgroup/blkio/group2
# Set weights
echo 1000 > /sys/fs/cgroup/blkio/group1/blkio.weight
echo 500 > /sys/fs/cgroup/blkio/group2/blkio.weight
# Write the PIDs of the processes to be controlled to the
# appropriate groups
COMMAND1 &
echo $! > /sys/fs/cgroup/blkio/group1/tasks
COMMAND2 &
echo $! > /sys/fs/cgroup/blkio/group2/tasks
These are the basic commands to configure throttling or upper limit policy by setting val-
ues in blkio.throttle.read_bps_device for reads and blkio.throttle.write_bp-
s_device for writes:
# Setup in /sys/fs/cgroup
mkdir /sys/fs/cgroup/blkio
mount -t cgroup -o blkio none /sys/fs/cgroup/blkio
# Bandwidth rate of a device for the root group; format:
# <major>:<minor> <byes_per_second>
echo "8:16 1048576" > /sys/fs/cgroup/blkio/blkio.throttle.read_bps_device
For more information about caveats, usage scenarios, and additional parameters, see /
usr/src/linux/Documentation/cgroups/blkio-controller.txt .
102 Control Group Subsystems openSUSE Leap 42.3
9.4 Using Controller Groups
9.4.1 Prerequisites
To conveniently use cgroups, install the following additional packages:
libcgroup-tools — basic user space tools to simplify resource management
libcgroup1 — control groups management library
cpuset — contains the cset to manipulate cpusets
libcpuset1 — C API to cpusets
kernel-source — only needed for documentation purposes
9.4.2 Example: Cpusets
With the command line proceed as follows:
1. To determine the number of CPUs and memory nodes see /proc/cpuinfo and /proc/
zoneinfo .
2. Create the cpuset hierarchy as a virtual le system (source: /usr/src/linux/Documen-
tation/cgroups/cpusets.txt ):
mount -t cgroup -ocpuset cpuset /sys/fs/cgroup/cpuset
cd /sys/fs/cgroup/cpuset
mkdir Charlie
cd Charlie
# List of CPUs in this cpuset:
echo 2-3 > cpuset.cpus
# List of memory nodes in this cpuset:
echo 1 > cpuset.mems
echo $$ > tasks
# The subshell 'sh' is now running in cpuset Charlie
# The next line should display '/Charlie'
cat /proc/self/cpuset
3. Remove the cpuset using shell commands:
rmdir /sys/fs/cgroup/cpuset/Charlie
103 Using Controller Groups openSUSE Leap 42.3
This fails as long as this cpuset is in use. First, you must remove the inside cpusets or tasks
(processes) that belong to it. Check it with:
cat /sys/fs/cgroup/cpuset/Charlie/tasks
For background information and additional configuration ags, see /usr/src/linux/Docu-
mentation/cgroups/cpusets.txt .
With the cset tool, proceed as follows:
# Determine the number of CPUs and memory nodes
cset set --list
# Creating the cpuset hierarchy
cset set --cpu=2-3 --mem=1 --set=Charlie
# Starting processes in a cpuset
cset proc --set Charlie --exec -- stress -c 1 &
# Moving existing processes to a cpuset
cset proc --move --pid PID --toset=Charlie
# List task in a cpuset
cset proc --list --set Charlie
# Removing a cpuset
cset set --destroy Charlie
9.4.3 Example: cgroups
Using shell commands, proceed as follows:
1. Create the cgroups hierarchy:
mount -t cgroup cgroup /sys/fs/cgroup
cd /sys/fs/cgroup/cpuset/cgroup
mkdir priority
cd priority
cat cpu.shares
2. Understanding cpu.shares:
1024 is the default (for more information, see /Documentation/scheduler/sched-
design-CFS.txt ) = 50% usage
1524 = 60% usage
104 Example: cgroups openSUSE Leap 42.3
2048 = 67% usage
512 = 40% usage
3. Changing cpu.shares
echo 1024 > cpu.shares
9.4.4 Setting Directory and File Permissions
This is a simple example. Use the following in /etc/cgconfig.conf :
group foo {
perm {
task {
uid = root;
gid = users;
fperm = 660;
}
admin {
uid = root;
gid = root;
fperm = 600;
dperm = 750;
}
}
}
mount {
cpu = /mnt/cgroups/cpu;
}
Then start the cgconfig service and stat /mnt/cgroups/cpu/foo/tasks which should show
the permissions mask 660 with root as an owner and users as a group. stat /mnt/cgroups/
cpu/foo/ should be 750 and all les (but tasks ) should have the mask 600 . Note that fperm
is applied on top of existing le permissions as a mask.
For more information, see the cgconfig.conf man page.
105 Setting Directory and File Permissions openSUSE Leap 42.3

9.5 For More Information
Kernel documentation (package kernel-source ): les in /usr/src/linux/Documenta-
tion/cgroups .
http://lwn.net/Articles/604609/ —Brown, Neil: Control Groups Series (2014, 7 parts).
http://lwn.net/Articles/243795/ —Corbet, Jonathan: Controlling memory use in containers
(2007).
http://lwn.net/Articles/236038/ —Corbet, Jonathan: Process containers (2007).
106 For More Information openSUSE Leap 42.3
10 Automatic Non-Uniform Memory Access (NUMA)
Balancing
There are physical limitations to hardware that are encountered when large num-
bers of CPU and memory are required. For the purposes of this chapter, the impor-
tant limitation is that there is limited communication bandwidth between the CPUs
and the memory. One architecture modification that was introduced to address this
is Non-Uniform Memory Access (NUMA).
In this configuration, there are multiple nodes. Each of the nodes contains a subset
of all CPUs and memory. The access speed to main memory is determined by the lo-
cation of the memory relative to the CPU. The performance of a workload depends
on the application threads accessing data that is local to the CPU the thread is exe-
cuting on. Automatic NUMA Balancing is a new feature of SLE 12. Automatic NU-
MA Balancing migrates data on demand to memory nodes that are local to the CPU
accessing that data. Depending on the workload, this can dramatically boost perfor-
mance when using NUMA hardware.
10.1 Implementation
Automatic NUMA balancing happens in three basic steps:
1. A task scanner periodically scans a portion of a task's address space and marks the memory
to force a page fault when the data is next accessed.
2. The next access to the data will result in a NUMA Hinting Fault. Based on this fault, the
data can be migrated to a memory node associated with the task accessing the memory.
3. To keep a task, the CPU it is using and the memory it is accessing together, the scheduler
groups tasks that share data.
The unmapping of data and page fault handling incurs overhead. However, commonly the over-
head will be offset by threads accessing data associated with the CPU.
107 Implementation openSUSE Leap 42.3

10.2 Configuration
Static configuration has been the recommended way of tuning workloads on NUMA hardware
for some time. To do this, memory policies can be set with numactl , taskset or cpusets .
NUMA-aware applications can use special APIs. In cases where the static policies have already
been created, automatic NUMA balancing should be disabled as the data access should already
be local.
numactl --hardware will show the memory configuration of the machine and whether it
supports NUMA or not. This is example output from a 4-node machine.
tux > numactl --hardware
available: 4 nodes (0-3)
node 0 cpus: 0 4 8 12 16 20 24 28 32 36 40 44
node 0 size: 16068 MB
node 0 free: 15909 MB
node 1 cpus: 1 5 9 13 17 21 25 29 33 37 41 45
node 1 size: 16157 MB
node 1 free: 15948 MB
node 2 cpus: 2 6 10 14 18 22 26 30 34 38 42 46
node 2 size: 16157 MB
node 2 free: 15981 MB
node 3 cpus: 3 7 11 15 19 23 27 31 35 39 43 47
node 3 size: 16157 MB
node 3 free: 16028 MB
node distances:
node 0 1 2 3
0: 10 20 20 20
1: 20 10 20 20
2: 20 20 10 20
3: 20 20 20 10
Automatic NUMA balancing can be enabled or disabled for the current session by writing 1
or 0 to /proc/sys/kernel/numa_balancing which will enable or disable the feature respec-
tively. To permanently enable or disable it, use the kernel command line option numa_balanc-
ing=[enable|disable] .
If Automatic NUMA Balancing is enabled, the task scanner behavior can be configured. The task
scanner balances the overhead of Automatic NUMA Balancing with the amount of time it takes
to identify the best placement of data.
numa_balancing_scan_delay_ms
The amount of CPU time a thread must consume before its data is scanned. This prevents
creating overhead because of short-lived processes.
108 Configuration openSUSE Leap 42.3

numa_balancing_scan_period_min_ms and numa_balancing_scan_period_max_ms
Controls how frequently a task's data is scanned. Depending on the locality of the faults
the scan rate will increase or decrease. These settings control the min and max scan rates.
numa_balancing_scan_size_mb
Controls how much address space is scanned when the task scanner is active.
10.3 Monitoring
The most important task is to assign metrics to your workload and measure the performance
with Automatic NUMA Balancing enabled and disabled to measure the impact. Profiling tools
can be used to monitor local and remote memory accesses if the CPU supports such monitoring.
Automatic NUMA Balancing activity can be monitored via the following parameters in /proc/
vmstat :
numa_pte_updates
The amount of base pages that were marked for NUMA hinting faults.
numa_huge_pte_updates
The amount of transparent huge pages that were marked for NUMA hinting faults. In
combination with numa_pte_updates the total address space that was marked can be
calculated.
numa_hint_faults
Records how many NUMA hinting faults were trapped.
numa_hint_faults_local
Shows how many of the hinting faults were to local nodes. In combination with numa_hin-
t_faults , the percentage of local versus remote faults can be calculated. A high percent-
age of local hinting faults indicates that the workload is closer to being converged.
numa_pages_migrated
Records how many pages were migrated because they were misplaced. As migration is
a copying operation, it contributes the largest part of the overhead created by NUMA
balancing.
109 Monitoring openSUSE Leap 42.3

10.4 Impact
The following illustrates a simple test case of a 4-node NUMA machine running the SpecJBB
2005 using a single instance of the JVM with no static tuning around memory policies. Note,
however, that the impact for each workload will vary and that this example is based on a pre-
release version of openSUSE Leap 12.
Balancing disabled Balancing enabled
TPut 1 26629.00 ( 0.00%) 26507.00 ( -0.46%)
TPut 2 55841.00 ( 0.00%) 53592.00 ( -4.03%)
TPut 3 86078.00 ( 0.00%) 86443.00 ( 0.42%)
TPut 4 116764.00 ( 0.00%) 113272.00 ( -2.99%)
TPut 5 143916.00 ( 0.00%) 141581.00 ( -1.62%)
TPut 6 166854.00 ( 0.00%) 166706.00 ( -0.09%)
TPut 7 195992.00 ( 0.00%) 192481.00 ( -1.79%)
TPut 8 222045.00 ( 0.00%) 227143.00 ( 2.30%)
TPut 9 248872.00 ( 0.00%) 250123.00 ( 0.50%)
TPut 10 270934.00 ( 0.00%) 279314.00 ( 3.09%)
TPut 11 297217.00 ( 0.00%) 301878.00 ( 1.57%)
TPut 12 311021.00 ( 0.00%) 326048.00 ( 4.83%)
TPut 13 324145.00 ( 0.00%) 346855.00 ( 7.01%)
TPut 14 345973.00 ( 0.00%) 378741.00 ( 9.47%)
TPut 15 354199.00 ( 0.00%) 394268.00 ( 11.31%)
TPut 16 378016.00 ( 0.00%) 426782.00 ( 12.90%)
TPut 17 392553.00 ( 0.00%) 437772.00 ( 11.52%)
TPut 18 396630.00 ( 0.00%) 456715.00 ( 15.15%)
TPut 19 399114.00 ( 0.00%) 484020.00 ( 21.27%)
TPut 20 413907.00 ( 0.00%) 493618.00 ( 19.26%)
TPut 21 413173.00 ( 0.00%) 510386.00 ( 23.53%)
TPut 22 420256.00 ( 0.00%) 521016.00 ( 23.98%)
TPut 23 425581.00 ( 0.00%) 536214.00 ( 26.00%)
TPut 24 429052.00 ( 0.00%) 532469.00 ( 24.10%)
TPut 25 426127.00 ( 0.00%) 526548.00 ( 23.57%)
TPut 26 422428.00 ( 0.00%) 531994.00 ( 25.94%)
TPut 27 424378.00 ( 0.00%) 488340.00 ( 15.07%)
TPut 28 419338.00 ( 0.00%) 543016.00 ( 29.49%)
TPut 29 403347.00 ( 0.00%) 529178.00 ( 31.20%)
TPut 30 408681.00 ( 0.00%) 510621.00 ( 24.94%)
TPut 31 406496.00 ( 0.00%) 499781.00 ( 22.95%)
TPut 32 404931.00 ( 0.00%) 502313.00 ( 24.05%)
TPut 33 397353.00 ( 0.00%) 522418.00 ( 31.47%)
TPut 34 382271.00 ( 0.00%) 491989.00 ( 28.70%)
TPut 35 388965.00 ( 0.00%) 493012.00 ( 26.75%)
TPut 36 374702.00 ( 0.00%) 502677.00 ( 34.15%)
TPut 37 367578.00 ( 0.00%) 500588.00 ( 36.19%)
TPut 38 367121.00 ( 0.00%) 496977.00 ( 35.37%)
110 Impact openSUSE Leap 42.3

TPut 39 355956.00 ( 0.00%) 489430.00 ( 37.50%)
TPut 40 350855.00 ( 0.00%) 487802.00 ( 39.03%)
TPut 41 345001.00 ( 0.00%) 468021.00 ( 35.66%)
TPut 42 336177.00 ( 0.00%) 462260.00 ( 37.50%)
TPut 43 329169.00 ( 0.00%) 467906.00 ( 42.15%)
TPut 44 329475.00 ( 0.00%) 470784.00 ( 42.89%)
TPut 45 323845.00 ( 0.00%) 450739.00 ( 39.18%)
TPut 46 323878.00 ( 0.00%) 435457.00 ( 34.45%)
TPut 47 310524.00 ( 0.00%) 403914.00 ( 30.07%)
TPut 48 311843.00 ( 0.00%) 459017.00 ( 47.19%)
Balancing Disabled Balancing Enabled
Expctd Warehouse 48.00 ( 0.00%) 48.00 ( 0.00%)
Expctd Peak Bops 310524.00 ( 0.00%) 403914.00 ( 30.07%)
Actual Warehouse 25.00 ( 0.00%) 29.00 ( 16.00%)
Actual Peak Bops 429052.00 ( 0.00%) 543016.00 ( 26.56%)
SpecJBB Bops 6364.00 ( 0.00%) 9368.00 ( 47.20%)
SpecJBB Bops/JVM 6364.00 ( 0.00%) 9368.00 ( 47.20%)
Automatic NUMA Balancing takes away some of the pain when tuning workloads for high per-
formance on NUMA machines. Where possible, it is still recommended to statically tune the
workload to partition it within each node. However, in all other cases, automatic NUMA bal-
ancing should boost performance.
111 Impact openSUSE Leap 42.3

11 Power Management
Power management aims at reducing operating costs for energy and cooling systems
while at the same time keeping the performance of a system at a level that match-
es the current requirements. Thus, power management is always a matter of bal-
ancing the actual performance needs and power saving options for a system. Power
management can be implemented and used at different levels of the system. A set of
specifications for power management functions of devices and the operating system
interface to them has been defined in the Advanced Configuration and Power Inter-
face (ACPI). As power savings in server environments can primarily be achieved at
the processor level, this chapter introduces some main concepts and highlights some
tools for analyzing and influencing relevant parameters.
11.1 Power Management at CPU Level
At the CPU level, you can control power usage in various ways. For example by using idling
power states (C-states), changing CPU frequency (P-states), and throttling the CPU (T-states).
The following sections give a short introduction to each approach and its significance for power
savings. Detailed specifications can be found at http://www.acpi.info/spec.htm .
11.1.1 C-States (Processor Operating States)
Modern processors have several power saving modes called C-states . They reflect the capa-
bility of an idle processor to turn o unused components in order to save power.
When a processor is in the C0 state, it is executing instructions. A processor running in any other
C-state is idle. The higher the C number, the deeper the CPU sleep mode: more components are
shut down to save power. Deeper sleep states can save large amounts of energy. Their downside
is that they introduce latency. This means, it takes more time for the CPU to go back to C0 .
Depending on workload (threads waking up, triggering CPU usage and then going back to sleep
again for a short period of time) and hardware (for example, interrupt activity of a network
device), disabling the deepest sleep states can significantly increase overall performance. For
details on how to do so, refer to Section11.3.2, “Viewing Kernel Idle Statistics with cpupower”.
112 Power Management at CPU Level openSUSE Leap 42.3

Some states also have submodes with different power saving latency levels. Which C-states and
submodes are supported depends on the respective processor. However, C1 is always available.
Table11.1, “C-States” gives an overview of the most common C-states.
TABLE11.1:C-STATES
Mode Definition
C0 Operational state. CPU fully turned on.
C1 First idle state. Stops CPU main internal
clocks via software. Bus interface unit and
APIC are kept running at full speed.
C2 Stops CPU main internal clocks via hard-
ware. State in which the processor main-
tains all software-visible states, but may take
longer to wake up through interrupts.
C3 Stops all CPU internal clocks. The processor
does not need to keep its cache coherent, but
maintains other states. Some processors have
variations of the C3 state that differ in how
long it takes to wake the processor through
interrupts.
To avoid needless power consumption, it is recommended to test your workloads with deep sleep
states enabled versus deep sleep states disabled. For more information, refer to Section11.3.2,
“Viewing Kernel Idle Statistics with cpupower” or the cpupower-idle-set(1) man page.
11.1.2 P-States (Processor Performance States)
While a processor operates (in C0 state), it can be in one of several CPU performance states (P-
states) . Whereas C-states are idle states (all but C0), P-states are operational states that
relate to CPU frequency and voltage.
The higher the P-state, the lower the frequency and voltage at which the processor runs. The
number of P-states is processor-specific and the implementation differs across the various types.
However, P0 is always the highest-performance state (except for Section11.1.3, “Turbo Features”).
113 P-States (Processor Performance States) openSUSE Leap 42.3

Higher P-state numbers represent slower processor speeds and lower power consumption. For
example, a processor in P3 state runs more slowly and uses less power than a processor running
in the P1 state. To operate at any P-state, the processor must be in the C0 state, which means
that it is working and not idling. The CPU P-states are also defined in the ACPI specification,
see http://www.acpi.info/spec.htm .
C-states and P-states can vary independently of one another.
11.1.3 Turbo Features
Turbo features allow to dynamically overtick active CPU cores while other cores are in deep
sleep states. This increases the performance of active threads while still complying with Thermal
Design Power (TDP) limits.
However, the conditions under which a CPU core can use turbo frequencies are architecture-spe-
cific. Learn how to evaluate the efficiency of those new features in Section11.3, “The cpupower
Tools”.
11.2 In-Kernel Governors
The in-kernel governors belong to the Linux kernel CPUfreq infrastructure and can be used to
dynamically scale processor frequencies at runtime. You can think of the governors as a sort
of preconfigured power scheme for the CPU. The CPUfreq governors use P-states to change
frequencies and lower power consumption. The dynamic governors can switch between CPU
frequencies, based on CPU usage, to allow for power savings while not sacrificing performance.
The following governors are available with the CPUfreq subsystem:
Performance Governor
The CPU frequency is statically set to the highest possible for maximum performance.
Consequently, saving power is not the focus of this governor.
See also Section11.5.1, “Tuning Options for P-States”.
Powersave Governor
The CPU frequency is statically set to the lowest possible. This can have severe impact on
the performance, as the system will never rise above this frequency no matter how busy
the processors are. An important exception is the intel_pstate which defaults to the
powersave mode. This is due to a hardware-specific decision but functionally it operates
similarly to the on-demand governor.
114 Turbo Features openSUSE Leap 42.3

However, using this governor often does not lead to the expected power savings as the
highest savings can usually be achieved at idle through entering C-states. With the pow-
ersave governor, processes run at the lowest frequency and thus take longer to finish. This
means it takes longer until the system can go into an idle C-state.
Tuning options: The range of minimum frequencies available to the governor can be ad-
justed (for example, with the cpupower command line tool).
On-demand Governor
The kernel implementation of a dynamic CPU frequency policy: The governor monitors
the processor usage. As soon as it exceeds a certain threshold, the governor will set the
frequency to the highest available. If the usage is less than the threshold, the next lowest
frequency is used. If the system continues to be underemployed, the frequency is again
reduced until the lowest available frequency is set.
Important: Drivers and In-kernel Governors
Not all drivers use the in-kernel governors to dynamically scale power frequency at run-
time. For example, the intel_pstate driver adjusts power frequency itself. Use the
cpupower frequency-info command to nd out which driver your system uses.
11.3 The cpupower Tools
The cpupower tools are designed to give an overview of all CPU power-related parameters that
are supported on a given machine, including turbo (or boost) states. Use the tool set to view and
modify settings of the kernel-related CPUfreq and cpuidle systems and other settings not related
to frequency scaling or idle states. The integrated monitoring framework can access both ker-
nel-related parameters as well as hardware statistics, and is thus ideally suited for performance
benchmarks. It also helps you to identify the dependencies between turbo and idle states.
After installing the cpupower package, view the available cpupower subcommands with
cpupower--help . Access the general man page with mancpupower , and the man pages of
the subcommands with mancpupower-SUBCOMMAND .
115 The cpupower Tools openSUSE Leap 42.3

11.3.1 Viewing Current Settings with cpupower
The cpupower frequency-info command shows the statistics of the cpufreq driver used in
the kernel. Additionally, it shows if turbo (boost) states are supported and enabled in the BIOS.
Run without any options, it shows an output similar to the following:
EXAMPLE11.1:EXAMPLE OUTPUT OF cpupower frequency-info
root # cpupower frequency-info
analyzing CPU 0:
driver: intel_pstate
CPUs which run at the same hardware frequency: 0
CPUs which need to have their frequency coordinated by software: 0
maximum transition latency: 0.97 ms.
hardware limits: 1.20 GHz - 3.80 GHz
available cpufreq governors: performance, powersave
current policy: frequency should be within 1.20 GHz and 3.80 GHz.
The governor "powersave" may decide which speed to use
within this range.
current CPU frequency is 3.40 GHz (asserted by call to hardware).
boost state support:
Supported: yes
Active: yes
3500 MHz max turbo 4 active cores
3600 MHz max turbo 3 active cores
3600 MHz max turbo 2 active cores
3800 MHz max turbo 1 active cores
To get the current values for all CPUs, use cpupower-callfrequency-info .
11.3.2 Viewing Kernel Idle Statistics with cpupower
The idle-info subcommand shows the statistics of the cpuidle driver used in the kernel. It
works on all architectures that use the cpuidle kernel framework.
EXAMPLE11.2:EXAMPLE OUTPUT OF cpupower idle-info
root # cpupower idle-info
CPUidle driver: intel_idle
CPUidle governor: menu
Analyzing CPU 0:
Number of idle states: 6
Available idle states: POLL C1-SNB C1E-SNB C3-SNB C6-SNB C7-SNB
POLL:
Flags/Description: CPUIDLE CORE POLL IDLE
116 Viewing Current Settings with cpupower openSUSE Leap 42.3

Latency: 0
Usage: 163128
Duration: 17585669
C1-SNB:
Flags/Description: MWAIT 0x00
Latency: 2
Usage: 16170005
Duration: 697658910
C1E-SNB:
Flags/Description: MWAIT 0x01
Latency: 10
Usage: 4421617
Duration: 757797385
C3-SNB:
Flags/Description: MWAIT 0x10
Latency: 80
Usage: 2135929
Duration: 735042875
C6-SNB:
Flags/Description: MWAIT 0x20
Latency: 104
Usage: 53268
Duration: 229366052
C7-SNB:
Flags/Description: MWAIT 0x30
Latency: 109
Usage: 62593595
Duration: 324631233978
After finding out which processor idle states are supported with cpupower idle-info , indi-
vidual states can be disabled using the cpupower idle-set command. Typically one wants to
disable the deepest sleep state, for example:
cpupower idle-set -d 5
Or, for disabling all CPUs with latencies equal to or higher than 80 :
cpupower idle-set -D 80
11.3.3 Monitoring Kernel and Hardware Statistics with cpupower
Use the monitor subcommand to report processor topology, and monitor frequency and idle
power state statistics over a certain period of time. The default interval is 1 second, but it
can be changed with the -i . Independent processor sleep states and frequency counters are
117 Monitoring Kernel and Hardware Statistics with cpupower openSUSE Leap 42.3
implemented in the tool—some retrieved from kernel statistics, others reading out hardware
registers. The available monitors depend on the underlying hardware and the system. List them
with cpupowermonitor-l . For a description of the individual monitors, refer to the cpupow-
er-monitor man page.
The monitor subcommand allows you to execute performance benchmarks. To compare kernel
statistics with hardware statistics for specific workloads, concatenate the respective command,
for example:
cpupower monitor db_test.sh
EXAMPLE11.3:EXAMPLE cpupower monitor OUTPUT
root # cpupower monitor
|Mperf || Idle_Stats
1 2
CPU | C0 | Cx | Freq || POLL | C1 | C2 | C3
0| 3.71| 96.29| 2833|| 0.00| 0.00| 0.02| 96.32
1| 100.0| -0.00| 2833|| 0.00| 0.00| 0.00| 0.00
2| 9.06| 90.94| 1983|| 0.00| 7.69| 6.98| 76.45
3| 7.43| 92.57| 2039|| 0.00| 2.60| 12.62| 77.52
1Mperf shows the average frequency of a CPU, including boost frequencies, over a
period of time. Additionally, it shows the percentage of time the CPU has been active
(C0 ) or in any sleep state ( Cx ). As the turbo states are managed by the BIOS, it is
impossible to get the frequency values at a given instant. On modern processors with
turbo features the Mperf monitor is the only way to nd out about the frequency a
certain CPU has been running in.
2Idle_Stats shows the statistics of the cpuidle kernel subsystem. The kernel updates
these values every time an idle state is entered or left. Therefore there can be some
inaccuracy when cores are in an idle state for some time when the measure starts
or ends.
Apart from the (general) monitors in the example above, other architecture-specific mon-
itors are available. For detailed information, refer to the cpupower-monitor man page.
By comparing the values of the individual monitors, you can nd correlations and dependen-
cies and evaluate how well the power saving mechanism works for a certain workload. In Exam-
ple11.3 you can see that CPU 0 is idle (the value of Cx is near 100%), but runs at a very high
frequency. This is because the CPUs 0 and 1 have the same frequency values which means that
there is a dependency between them.
118 Monitoring Kernel and Hardware Statistics with cpupower openSUSE Leap 42.3
11.3.4 Modifying Current Settings with cpupower
You can use cpupowerfrequency-set command as root to modify current settings. It allows
you to set values for the minimum or maximum CPU frequency the governor may select or to
create a new governor. With the -c option, you can also specify for which of the processors the
settings should be modified. That makes it easy to use a consistent policy across all processors
without adjusting the settings for each processor individually. For more details and the available
options, refer to the cpupower-freqency-set man page or run cpupower frequency-set
--help .
11.4 Monitoring Power Consumption with powerTOP
You can monitor system power consumption with powerTOP. It helps you to identify the reasons
for unnecessary high power consumption (for example, processes that are mainly responsible for
waking up a processor from its idle state) and to optimize your system settings to avoid these.
It supports both Intel and AMD processors.
powerTOP combines various sources of information (analysis of programs, device drivers, kernel
options, amounts and sources of interrupts waking up processors from sleep states) and shows
them in one screen. Example11.4, “Example powerTOP Output” shows which information categories
are available:
EXAMPLE11.4:EXAMPLE POWERTOP OUTPUT
Cn Avg residency P-states (frequencies)
1 2 3 4 5
C0 (cpu running) (11.6%) 2.00 Ghz 0.1%
polling 0.0ms ( 0.0%) 2.00 Ghz 0.0%
C1 4.4ms (57.3%) 1.87 Ghz 0.0%
C2 10.0ms (31.1%) 1064 Mhz 99.9%
Wakeups-from-idle per second : 11.2 interval: 5.0s 6
no ACPI power usage estimate available 7
Top causes for wakeups: 8
96.2% (826.0) <interrupt> : extra timer interrupt
0.9% ( 8.0) <kernel core> : usb_hcd_poll_rh_status (rh_timer_func)
0.3% ( 2.4) <interrupt> : megasas
0.2% ( 2.0) <kernel core> : clocksource_watchdog (clocksource_watchdog)
0.2% ( 1.6) <interrupt> : eth1-TxRx-0
0.1% ( 1.0) <interrupt> : eth1-TxRx-4
119 Modifying Current Settings with cpupower openSUSE Leap 42.3
[...]
Suggestion: 9 Enable SATA ALPM link power management via:
echo min_power > /sys/class/scsi_host/host0/link_power_management_policy
or press the S key.
1The column shows the C-states. When working, the CPU is in state 0, when resting it is
in some state greater than 0, depending on which C-states are available and how deep
the CPU is sleeping.
2The column shows average time in milliseconds spent in the particular C-state.
3The column shows the percentages of time spent in various C-states. For considerable power
savings during idle, the CPU should be in deeper C-states most of the time. In addition, the
longer the average time spent in these C-states, the more power is saved.
4The column shows the frequencies the processor and kernel driver support on your system.
5The column shows the amount of time the CPU cores stayed in different frequencies during
the measuring period.
6Shows how often the CPU is awoken per second (number of interrupts). The lower the
number, the better. The interval value is the powerTOP refresh interval which can be
controlled with the -t option. The default time to gather data is 5 seconds.
7When running powerTOP on a laptop, this line displays the ACPI information on how much
power is currently being used and the estimated time until discharge of the battery. On
servers, this information is not available.
8Shows what is causing the system to be more active than needed. powerTOP displays the
top items causing your CPU to awake during the sampling period.
9Suggestions on how to improve power usage for this machine.
For more information, refer to the powerTOP project page at https://01.org/powertop .
11.5 Special Tuning Options
The following sections highlight some of the most relevant settings that you might want to touch.
120 Special Tuning Options openSUSE Leap 42.3
11.5.1 Tuning Options for P-States
The CPUfreq subsystem offers several tuning options for P-states: You can switch between the
different governors, influence minimum or maximum CPU frequency to be used or change in-
dividual governor parameters.
To switch to another governor at runtime, use cpupowerfrequency-set with the -g option.
For example, running the following command (as root ) will activate the performance governor:
cpupower frequency-set -g performance
To set values for the minimum or maximum CPU frequency the governor may select, use the
-d or -u option, respectively.
11.6 Troubleshooting
BIOS options enabled?
To use C-states or P-states, check your BIOS options:
To use C-states, make sure to enable CPU C State or similar options to benefit from
power savings at idle.
To use P-states and the CPUfreq governors, make sure to enable Processor Per-
formance States options or similar.
Even if P-states and C-states are available, it is possible that the platform rmware is
managing CPU frequencies which may be sub-optimal. For example, if pcc-cpufreq
is loaded then the OS is only giving hints to the rmware, which is free to ignore
the hints. This can be addressed by selecting "OS Management" or similar for CPU
frequency managed in the BIOS. After reboot, an alternative driver will be used but
the performance impact should be carefully measured.
In case of a CPU upgrade, make sure to upgrade your BIOS, too. The BIOS needs to know
the new CPU and its frequency stepping to pass this information on to the operating system.
Log file information?
Check the systemd journal (see Book “Reference”, Chapter11 “journalctl: Query the sys-
temd Journal”) for any output regarding the CPUfreq subsystem. Only severe errors are re-
ported there.
121 Tuning Options for P-States openSUSE Leap 42.3

If you suspect problems with the CPUfreq subsystem on your machine, you can also enable
additional debug output. To do so, either use cpufreq.debug=7 as boot parameter or
execute the following command as root :
echo 7 > /sys/module/cpufreq/parameters/debug
This will cause CPUfreq to log more information to dmesg on state transitions, which is
useful for diagnosis. But as this additional output of kernel messages can be rather com-
prehensive, use it only if you are fairly sure that a problem exists.
11.7 For More Information
Platforms with a Baseboard Management Controller (BMC) may have additional power manage-
ment configuration options accessible via the service processor. These configurations are ven-
dor specific and therefore not subject of this guide. For more information, refer to the manuals
provided by your vendor.
122 For More Information openSUSE Leap 42.3

12 Tuning I/O Performance
I/O scheduling controls how input/output operations will be submitted to storage. openSUSE
Leap offers various I/O algorithms—called elevators —suiting different workloads. Elevators
can help to reduce seek operations and can prioritize I/O requests.
Choosing the best suited I/O elevator not only depends on the workload, but on the hardware,
too. Single ATA disk systems, SSDs, RAID arrays, or network storage systems, for example, each
require different tuning strategies.
12.1 Switching I/O Scheduling
openSUSE Leap picks a default I/O scheduler at boot-time, which can be changed on the y
per block device. This makes it possible to set different algorithms, for example, for the device
hosting the system partition and the device hosting a database.
The default I/O scheduler is chosen for each device based on whether the device reports to
be rotational disk or not. For non-rotational disks DEADLINE I/O scheduler is picked. Other
devices default to CFQ (Completely Fair Queuing). To change this default, use the following
boot parameter:
elevator=SCHEDULER
Replace SCHEDULER with one of the values cfq , noop , or deadline . See Section12.2, “Available
I/O Elevators” for details.
To change the elevator for a specific device in the running system, run the following command:
echo SCHEDULER > /sys/block/DEVICE/queue/scheduler
Here, SCHEDULER is one of cfq , noop , or deadline . DEVICE is the block device ( sda for
example). Note that this change will not persist during reboot. For permanent I/O scheduler
change for a particular device either place the command switching the I/O scheduler into init
scripts or add appropriate udev rule into /lib/udev/rules.d/ . See /lib/udev/rules.d/60-
ssd-scheduler.rules for an example of such tuning.
124 Switching I/O Scheduling openSUSE Leap 42.3

12.2 Available I/O Elevators
In the following elevators available on openSUSE Leap are listed. Each elevator has a set of
tunable parameters, which can be set with the following command:
echo VALUE > /sys/block/DEVICE/queue/iosched/TUNABLE
where VALUE is the desired value for the TUNABLE and DEVICE the block device.
To nd out which elevator is the current default, run the following command. The currently
selected scheduler is listed in brackets:
jupiter:~ # cat /sys/block/sda/queue/scheduler
noop deadline [cfq]
This le can also contain the string none meaning that I/O scheduling does not happen for
this device. This is usually because the device uses multi-queue queueing mechanism (refer to
Section12.4, “Enable blk-mq I/O Path for SCSI by Default”).
12.2.1 CFQ (Completely Fair Queuing)
CFQ is a fairness-oriented scheduler and is used by default on openSUSE Leap. The algorithm
assigns each thread a time slice in which it is allowed to submit I/O to disk. This way each
thread gets a fair share of I/O throughput. It also allows assigning tasks I/O priorities which
are taken into account during scheduling decisions (see Section8.3.3, “Prioritizing Disk Access with
ionice”). The CFQ scheduler has the following tunable parameters:
/sys/block/DEVICE/queue/iosched/slice_idle_us
When a task has no more I/O to submit in its time slice, the I/O scheduler waits for a while
before scheduling the next thread. The slice_idle_us is the time in microseconds the
I/O scheduler waits. File slice_idle controls the same tunable but in millisecond units.
Waiting for more I/O from a thread can improve locality of I/O. Additionally, it avoids
starving processes doing dependent I/O. A process does dependent I/O if it needs a result
of one I/O in order to submit another I/O. For example, if you rst need to read an index
block in order to nd out a data block to read, these two reads form a dependent I/O.
For media where locality does not play a big role (SSDs, SANs with lots of disks) setting /
sys/block/<device>/queue/iosched/slice_idle_us to 0 can improve the throughput
considerably.
125 Available I/O Elevators openSUSE Leap 42.3

/sys/block/DEVICE/queue/iosched/quantum
This option limits the maximum number of requests that are being processed at once by
the device. The default value is 4. For a storage with several disks, this setting can unnec-
essarily limit parallel processing of requests. Therefore, increasing the value can improve
performance. However, it can also cause latency of certain I/O operations to increase be-
cause more requests are buered inside the storage. When changing this value, you can
also consider tuning /sys/block/DEVICE/queue/iosched/slice_async_rq (the default
value is 2). This limits the maximum number of asynchronous requests—usually write
requests—that are submitted in one time slice.
/sys/block/DEVICE/queue/iosched/low_latency
When enabled (which is the default on openSUSE Leap) the scheduler may dynamically
adjust the length of the time slice by aiming to meet a tuning parameter called the tar-
get_latency . Time slices are recomputed to meet this target_latency and ensure that
processes get fair access within a bounded length of time.
/sys/block/DEVICE/queue/iosched/target_latency
Contains an estimated latency time for the CFQ . CFQ will use it to calculate the time slice
used for every task.
/sys/block/DEVICE/queue/iosched/group_idle_us
To avoid starving of blkio cgroups doing dependent I/O, CFQ waits a bit after comple-
tion of I/O for one blkio cgroup before scheduling I/O for a different blkio cgroup. When
slice_idle_us is set, this parameter does not have a big impact. However, for fast media,
the overhead of slice_idle_us is generally undesirable. Disabling slice_idle_us and
setting group_idle_us is a method to avoid starvation of blkio cgroups doing dependent
I/O with lower overhead. Note that the le group_idle controls the same tunable how-
ever with millisecond granularity.
EXAMPLE12.1:INCREASING INDIVIDUAL THREAD THROUGHPUT USING CFQ
In openSUSE Leap 42.3, the low_latency tuning parameter is enabled by default to en-
sure that processes get fair access within a bounded length of time. (Note that this para-
meter was not enabled in versions prior to openSUSE Leap.)
126 CFQ (Completely Fair Queuing) openSUSE Leap 42.3

This is usually preferred in a server scenario where processes are executing I/O as part
of transactions, as it makes the time needed for each transaction predictable. However,
there are scenarios where that is not the desired behavior:
If the performance metric of interest is the peak performance of a single process
when there is I/O contention.
If a workload must complete as quickly as possible and there are multiple sources of
I/O. In this case, unfair treatment from the I/O scheduler may allow the transactions
to complete faster: Processes take their full slice and exit quickly, resulting in reduced
overall contention.
To address this, there are two options—increase target_latency or disable low_la-
tency . As with all tuning parameters it is important to verify your workload behaves
as expected before and after the tuning modification. Take careful note of whether your
workload depends on individual process peak performance or scales better with fairness.
It should also be noted that the performance will depend on the underlying storage and
the correct tuning option for one installation may not be universally true.
Find below an example that does not control when I/O starts but is simple enough to
demonstrate the point. 32 processes are writing a small amount of data to disk in parallel.
Using the openSUSE Leap default (enabling low_latency ), the result looks as follows:
root # echo 1 > /sys/block/sda/queue/iosched/low_latency
root # time ./dd-test.sh
10485760 bytes (10 MB) copied, 2.62464 s, 4.0 MB/s
10485760 bytes (10 MB) copied, 3.29624 s, 3.2 MB/s
10485760 bytes (10 MB) copied, 3.56341 s, 2.9 MB/s
10485760 bytes (10 MB) copied, 3.56908 s, 2.9 MB/s
10485760 bytes (10 MB) copied, 3.53043 s, 3.0 MB/s
10485760 bytes (10 MB) copied, 3.57511 s, 2.9 MB/s
10485760 bytes (10 MB) copied, 3.53672 s, 3.0 MB/s
10485760 bytes (10 MB) copied, 3.5433 s, 3.0 MB/s
10485760 bytes (10 MB) copied, 3.65474 s, 2.9 MB/s
10485760 bytes (10 MB) copied, 3.63694 s, 2.9 MB/s
10485760 bytes (10 MB) copied, 3.90122 s, 2.7 MB/s
10485760 bytes (10 MB) copied, 3.88507 s, 2.7 MB/s
10485760 bytes (10 MB) copied, 3.86135 s, 2.7 MB/s
10485760 bytes (10 MB) copied, 3.84553 s, 2.7 MB/s
10485760 bytes (10 MB) copied, 3.88871 s, 2.7 MB/s
10485760 bytes (10 MB) copied, 3.94943 s, 2.7 MB/s
10485760 bytes (10 MB) copied, 4.12731 s, 2.5 MB/s
10485760 bytes (10 MB) copied, 4.15106 s, 2.5 MB/s
127 CFQ (Completely Fair Queuing) openSUSE Leap 42.3

10485760 bytes (10 MB) copied, 4.21601 s, 2.5 MB/s
10485760 bytes (10 MB) copied, 4.35004 s, 2.4 MB/s
10485760 bytes (10 MB) copied, 4.33387 s, 2.4 MB/s
10485760 bytes (10 MB) copied, 4.55434 s, 2.3 MB/s
10485760 bytes (10 MB) copied, 4.52283 s, 2.3 MB/s
10485760 bytes (10 MB) copied, 4.52682 s, 2.3 MB/s
10485760 bytes (10 MB) copied, 4.56176 s, 2.3 MB/s
10485760 bytes (10 MB) copied, 4.62727 s, 2.3 MB/s
10485760 bytes (10 MB) copied, 4.78958 s, 2.2 MB/s
10485760 bytes (10 MB) copied, 4.79772 s, 2.2 MB/s
10485760 bytes (10 MB) copied, 4.78004 s, 2.2 MB/s
10485760 bytes (10 MB) copied, 4.77994 s, 2.2 MB/s
10485760 bytes (10 MB) copied, 4.86114 s, 2.2 MB/s
10485760 bytes (10 MB) copied, 4.88062 s, 2.1 MB/s
real 0m4.978s
user 0m0.112s
sys 0m1.544s
Note that each process completes in similar times. This is the CFQ scheduler meeting its
target_latency : Each process has fair access to storage.
Note that the earlier processes complete somewhat faster. This happens because the start
time of the processes is not identical. In a more complicated example, it is possible to
control for this.
This is what happens when low_latency is disabled:
root # echo 0 > /sys/block/sda/queue/iosched/low_latency
root # time ./dd-test.sh
10485760 bytes (10 MB) copied, 0.813519 s, 12.9 MB/s
10485760 bytes (10 MB) copied, 0.788106 s, 13.3 MB/s
10485760 bytes (10 MB) copied, 0.800404 s, 13.1 MB/s
10485760 bytes (10 MB) copied, 0.816398 s, 12.8 MB/s
10485760 bytes (10 MB) copied, 0.959087 s, 10.9 MB/s
10485760 bytes (10 MB) copied, 1.09563 s, 9.6 MB/s
10485760 bytes (10 MB) copied, 1.18716 s, 8.8 MB/s
10485760 bytes (10 MB) copied, 1.27661 s, 8.2 MB/s
10485760 bytes (10 MB) copied, 1.46312 s, 7.2 MB/s
10485760 bytes (10 MB) copied, 1.55489 s, 6.7 MB/s
10485760 bytes (10 MB) copied, 1.64277 s, 6.4 MB/s
10485760 bytes (10 MB) copied, 1.78196 s, 5.9 MB/s
10485760 bytes (10 MB) copied, 1.87496 s, 5.6 MB/s
10485760 bytes (10 MB) copied, 1.9461 s, 5.4 MB/s
10485760 bytes (10 MB) copied, 2.08351 s, 5.0 MB/s
10485760 bytes (10 MB) copied, 2.28003 s, 4.6 MB/s
10485760 bytes (10 MB) copied, 2.42979 s, 4.3 MB/s
10485760 bytes (10 MB) copied, 2.54564 s, 4.1 MB/s
128 CFQ (Completely Fair Queuing) openSUSE Leap 42.3

10485760 bytes (10 MB) copied, 2.6411 s, 4.0 MB/s
10485760 bytes (10 MB) copied, 2.75171 s, 3.8 MB/s
10485760 bytes (10 MB) copied, 2.86162 s, 3.7 MB/s
10485760 bytes (10 MB) copied, 2.98453 s, 3.5 MB/s
10485760 bytes (10 MB) copied, 3.13723 s, 3.3 MB/s
10485760 bytes (10 MB) copied, 3.36399 s, 3.1 MB/s
10485760 bytes (10 MB) copied, 3.60018 s, 2.9 MB/s
10485760 bytes (10 MB) copied, 3.58151 s, 2.9 MB/s
10485760 bytes (10 MB) copied, 3.67385 s, 2.9 MB/s
10485760 bytes (10 MB) copied, 3.69471 s, 2.8 MB/s
10485760 bytes (10 MB) copied, 3.66658 s, 2.9 MB/s
10485760 bytes (10 MB) copied, 3.81495 s, 2.7 MB/s
10485760 bytes (10 MB) copied, 4.10172 s, 2.6 MB/s
10485760 bytes (10 MB) copied, 4.0966 s, 2.6 MB/s
real 0m3.505s
user 0m0.160s
sys 0m1.516s
Note that the time processes take to complete is spread much wider as processes are not
getting fair access. Some processes complete faster and exit, allowing the total workload
to complete faster, and some processes measure higher apparent I/O performance. It is
also important to note that this example may not behave similarly on all systems as the
results depend on the resources of the machine and the underlying storage.
It is important to emphasize that neither tuning option is inherently better than the other.
Both are best in different circumstances and it is important to understand the requirements
of your workload and tune accordingly.
12.2.2 NOOP
A trivial scheduler that only passes down the I/O that comes to it. Useful for checking whether
complex I/O scheduling decisions of other schedulers are causing I/O performance regressions.
This scheduler is recommended for setups with devices that do I/O scheduling themselves, such
as intelligent storage or in multipathing environments. If you choose a more complicated sched-
uler on the host, the scheduler of the host and the scheduler of the storage device compete with
each other. This can decrease performance. The storage device can usually determine best how
to schedule I/O.
For similar reasons, this scheduler is also recommended for use within virtual machines.
129 NOOP openSUSE Leap 42.3

The NOOP scheduler can be useful for devices that do not depend on mechanical movement,
like SSDs. Usually, the DEADLINE I/O scheduler is a better choice for these devices. However,
NOOP creates less overhead and thus can on certain workloads increase performance.
12.2.3 DEADLINE
DEADLINE is a latency-oriented I/O scheduler. Each I/O request is assigned a deadline. Usual-
ly, requests are stored in queues (read and write) sorted by sector numbers. The DEADLINE
algorithm maintains two additional queues (read and write) in which requests are sorted by
deadline. As long as no request has timed out, the “sector” queue is used. When timeouts occur,
requests from the “deadline” queue are served until there are no more expired requests. Gener-
ally, the algorithm prefers reads over writes.
This scheduler can provide a superior throughput over the CFQ I/O scheduler in cases where
several threads read and write and fairness is not an issue. For example, for several parallel
readers from a SAN and for databases (especially when using “TCQ” disks). The DEADLINE
scheduler has the following tunable parameters:
/sys/block/<device>/queue/iosched/writes_starved
Controls how many reads can be sent to disk before it is possible to send writes. A value
of 3 means, that three read operations are carried out for one write operation.
/sys/block/<device>/queue/iosched/read_expire
Sets the deadline (current time plus the read_expire value) for read operations in millisec-
onds. The default is 500.
/sys/block/<device>/queue/iosched/write_expire
/sys/block/<device>/queue/iosched/read_expire Sets the deadline (current time
plus the read_expire value) for read operations in milliseconds. The default is 500.
12.3 I/O Barrier Tuning
Most le systems (such as XFS, Ext3, Ext4, or reiserfs) send write barriers to disk after fsync or
during transaction commits. Write barriers enforce proper ordering of writes, making volatile
disk write caches safe to use (at some performance penalty). If your disks are battery-backed in
one way or another, disabling barriers can safely improve performance.
Sending write barriers can be disabled using the nobarrier mount option.
130 DEADLINE openSUSE Leap 42.3

Warning: Disabling Barriers Can Lead to Data Loss
Disabling barriers when disks cannot guarantee caches are properly written in case of
power failure can lead to severe le system corruption and data loss.
12.4 Enable blk-mq I/O Path for SCSI by Default
Block multiqueue (blk-mq) is a multi-queue block I/O queueing mechanism. Blk-mq uses per-
cpu software queues to queue I/O requests. The software queues are mapped to one or more
hardware submission queues. Blk-mq significantly reduces lock contention. In particular blk-mq
improves performance for devices that support a high number of input/output operations per
second (IOPS). Blk-mq is already the default for some devices, e.g. NVM Express devices.
Currently blk-mq has no I/O scheduling support (no CFQ, no deadline I/O scheduler). This lack
of I/O scheduling can cause significant performance degradation when spinning disks are used.
Therefore blk-mq is not enabled by default for SCSI devices.
If you have fast SCSI devices (e.g. SSDs) instead of spinning SCSI devices attached to your system
you might consider switching to blk-mq for SCSI. This is done using the kernel command line
option scsi_mod.use_blk_mq=1 .
131 Enable blk-mq I/O Path for SCSI by Default openSUSE Leap 42.3
13 Tuning the Task Scheduler
Modern operating systems, such as openSUSE® Leap, normally run many different tasks at the
same time. For example, you can be searching in a text le while receiving an e-mail and copying
a big le to an external hard disk. These simple tasks require many additional processes to be
run by the system. To provide each task with its required system resources, the Linux kernel
needs a tool to distribute available system resources to individual tasks. And this is exactly what
the task scheduler does.
The following sections explain the most important terms related to a process scheduling. They
also introduce information about the task scheduler policy, scheduling algorithm, description
of the task scheduler used by openSUSE Leap, and references to other sources of relevant infor-
mation.
13.1 Introduction
The Linux kernel controls the way that tasks (or processes) are managed on the system. The
task scheduler, sometimes called process scheduler, is the part of the kernel that decides which
task to run next. It is responsible for best using system resources to guarantee that multiple
tasks are being executed simultaneously. This makes it a core component of any multitasking
operating system.
13.1.1 Preemption
The theory behind task scheduling is very simple. If there are runnable processes in a system, at
least one process must always be running. If there are more runnable processes than processors
in a system, not all the processes can be running all the time.
Therefore, some processes need to be stopped temporarily, or suspended, so that others can be
running again. The scheduler decides what process in the queue will run next.
As already mentioned, Linux, like all other Unix variants, is a multitasking operating system. That
means that several tasks can be running at the same time. Linux provides a so called preemptive
multitasking, where the scheduler decides when a process is suspended. This forced suspension
is called preemption. All Unix flavors have been providing preemptive multitasking since the
beginning.
132 Introduction openSUSE Leap 42.3
13.1.2 Timeslice
The time period for which a process will be running before it is preempted is defined in advance.
It is called a timeslice of a process and represents the amount of processor time that is provided
to each process. By assigning timeslices, the scheduler makes global decisions for the running
system, and prevents individual processes from dominating over the processor resources.
13.1.3 Process Priority
The scheduler evaluates processes based on their priority. To calculate the current priority of a
process, the task scheduler uses complex algorithms. As a result, each process is given a value
according to which it is “allowed” to run on a processor.
13.2 Process Classification
Processes are usually classified according to their purpose and behavior. Although the borderline
is not always clearly distinct, generally two criteria are used to sort them. These criteria are
independent and do not exclude each other.
One approach is to classify a process either I/O-bound or processor-bound.
I/O-bound
I/O stands for Input/Output devices, such as keyboards, mice, or optical and hard disks.
I/O-bound processes spend the majority of time submitting and waiting for requests. They
are run very frequently, but for short time intervals, not to block other processes waiting
for I/O requests.
processor-bound
On the other hand, processor-bound tasks use their time to execute a code, and usually run
until they are preempted by the scheduler. They do not block processes waiting for I/O
requests, and, therefore, can be run less frequently but for longer time intervals.
Another approach is to divide processes by type into interactive, batch, and real-time processes.
133 Timeslice openSUSE Leap 42.3

Interactive processes spend a lot of time waiting for I/O requests, such as keyboard or
mouse operations. The scheduler must wake up such processes quickly on user request,
or the user will nd the environment unresponsive. The typical delay is approximately
100 ms. Office applications, text editors or image manipulation programs represent typical
interactive processes.
Batch processes often run in the background and do not need to be responsive. They usually
receive lower priority from the scheduler. Multimedia converters, database search engines,
or log les analyzers are typical examples of batch processes.
Real-time processes must never be blocked by low-priority processes, and the scheduler
guarantees a short response time to them. Applications for editing multimedia content are
a good example here.
13.3 Completely Fair Scheduler
Since the Linux kernel version 2.6.23, a new approach has been taken to the scheduling of
runnable processes. Completely Fair Scheduler (CFS) became the default Linux kernel scheduler.
Since then, important changes and improvements have been made. The information in this
chapter applies to openSUSE Leap with kernel version 2.6.32 and higher (including 3.x kernels).
The scheduler environment was divided into several parts, and three main new features were
introduced:
Modular Scheduler Core
The core of the scheduler was enhanced with scheduling classes. These classes are modular
and represent scheduling policies.
Completely Fair Scheduler
Introduced in kernel 2.6.23 and extended in 2.6.24, CFS tries to assure that each process
obtains its “fair” share of the processor time.
Group Scheduling
For example, if you split processes into groups according to which user is running them,
CFS tries to provide each of these groups with the same amount of processor time.
As a result, CFS brings optimized scheduling for both servers and desktops.
134 Completely Fair Scheduler openSUSE Leap 42.3

13.3.1 How CFS Works
CFS tries to guarantee a fair approach to each runnable task. To nd the most balanced way of
task scheduling, it uses the concept of red-black tree. A red-black tree is a type of self-balancing
data search tree which provides inserting and removing entries in a reasonable way so that
it remains well balanced. For more information, see the wiki pages of Red-black tree (http://
en.wikipedia.org/wiki/Red_black_tree) .
When CFS schedules a task it accumulates “virtual runtime” or vruntime. The next task picked
to run is always the task with the minimum accumulated vruntime so far. By balancing the red-
black tree when tasks are inserted into the run queue (a planned time line of processes to be
executed next), the task with the minimum vruntime is always the rst entry in the red-black
tree.
The amount of vruntime a task accrues is related to its priority. High priority tasks gain vruntime
at a slower rate than low priority tasks, which results in high priority tasks being picked to run
on the processor more often.
13.3.2 Grouping Processes
Since the Linux kernel version 2.6.24, CFS can be tuned to be fair to groups rather than to tasks
only. Runnable tasks are then grouped to form entities, and CFS tries to be fair to these entities
instead of individual runnable tasks. The scheduler also tries to be fair to individual tasks within
these entities.
The kernel scheduler lets you group runnable tasks using control groups. For more information,
see Chapter9, Kernel Control Groups.
13.3.3 Kernel Configuration Options
Basic aspects of the task scheduler behavior can be set through the kernel configuration op-
tions. Setting these options is part of the kernel compilation process. Because kernel compilation
process is a complex task and out of this document's scope, refer to relevant source of informa-
tion.
135 How CFS Works openSUSE Leap 42.3

Warning: Kernel Compilation
If you run openSUSE Leap on a kernel that was not shipped with it, for example on a self-
compiled kernel, you lose the entire support entitlement.
13.3.4 Terminology
Documents regarding task scheduling policy often use several technical terms which you need
to know to understand the information correctly. Here are some:
Latency
Delay between the time a process is scheduled to run and the actual process execution.
Granularity
The relation between granularity and latency can be expressed by the following equation:
gran = ( lat / rtasks ) - ( lat / rtasks / rtasks )
where gran stands for granularity, lat stand for latency, and rtasks is the number of running
tasks.
13.3.4.1 Scheduling Policies
The Linux kernel supports the following scheduling policies:
SCHED_FIFO
Scheduling policy designed for special time-critical applications. It uses the First In-First
Out scheduling algorithm.
SCHED_BATCH
Scheduling policy designed for CPU-intensive tasks.
SCHED_IDLE
Scheduling policy intended for very low prioritized tasks.
SCHED_OTHER
Default Linux time-sharing scheduling policy used by the majority of processes.
SCHED_RR
136 Terminology openSUSE Leap 42.3

Similar to SCHED_FIFO , but uses the Round Robin scheduling algorithm.
13.3.5 Changing Real-time Attributes ofProcesses with chrt
The chrt command sets or retrieves the real-time scheduling attributes of a running process,
or runs a command with the specified attributes. You can get or retrieve both the scheduling
policy and priority of a process.
In the following examples, a process whose PID is 16244 is used.
To retrieve the real-time attributes of an existing task:
root # chrt -p 16244
pid 16244's current scheduling policy: SCHED_OTHER
pid 16244's current scheduling priority: 0
Before setting a new scheduling policy on the process, you need to nd out the minimum and
maximum valid priorities for each scheduling algorithm:
root # chrt -m
SCHED_SCHED_OTHER min/max priority : 0/0
SCHED_SCHED_FIFO min/max priority : 1/99
SCHED_SCHED_RR min/max priority : 1/99
SCHED_SCHED_BATCH min/max priority : 0/0
SCHED_SCHED_IDLE min/max priority : 0/0
In the above example, SCHED_OTHER, SCHED_BATCH, SCHED_IDLE polices only allow for pri-
ority 0, while that of SCHED_FIFO and SCHED_RR can range from 1 to 99.
To set SCHED_BATCH scheduling policy:
root # chrt -b -p 0 16244
pid 16244's current scheduling policy: SCHED_BATCH
pid 16244's current scheduling priority: 0
For more information on chrt , see its man page ( man 1 chrt ).
13.3.6 Runtime Tuning with sysctl
The sysctl interface for examining and changing kernel parameters at runtime introduces im-
portant variables by means of which you can change the default behavior of the task scheduler.
The syntax of the sysctl is simple, and all the following commands must be entered on the
command line as root .
137 Changing Real-time Attributes ofProcesses with chrt openSUSE Leap 42.3

To read a value from a kernel variable, enter
sysctl VARIABLE
To assign a value, enter
sysctl VARIABLE=VALUE
To get a list of all scheduler related sysctl variables, enter
sysctl -A | grep "sched" | grep -v"domain"
root # sysctl -A | grep "sched" | grep -v "domain"
kernel.sched_cfs_bandwidth_slice_us = 5000
kernel.sched_child_runs_first = 0
kernel.sched_compat_yield = 0
kernel.sched_latency_ns = 24000000
kernel.sched_migration_cost_ns = 500000
kernel.sched_min_granularity_ns = 8000000
kernel.sched_nr_migrate = 32
kernel.sched_rr_timeslice_ms = 25
kernel.sched_rt_period_us = 1000000
kernel.sched_rt_runtime_us = 950000
kernel.sched_schedstats = 0
kernel.sched_shares_window_ns = 10000000
kernel.sched_time_avg_ms = 1000
kernel.sched_tunable_scaling = 1
kernel.sched_wakeup_granularity_ns = 10000000
Note that variables ending with “_ns” and “_us” accept values in nanoseconds and microseconds,
respectively.
A list of the most important task scheduler sysctl tuning variables (located at /proc/sys/
kernel/ ) with a short description follows:
sched_cfs_bandwidth_slice_us
When CFS bandwidth control is in use, this parameter controls the amount of run-time
(bandwidth) transferred to a run queue from the task's control group bandwidth pool.
Small values allow the global bandwidth to be shared in a ne-grained manner among
tasks, larger values reduce transfer overhead. See https://www.kernel.org/doc/Documenta-
tion/scheduler/sched-bwc.txt .
sched_child_runs_first
138 Runtime Tuning with sysctl openSUSE Leap 42.3

A freshly forked child runs before the parent continues execution. Setting this parameter
to 1 is beneficial for an application in which the child performs an execution after fork.
For example make -j<NO_CPUS> performs better when sched_child_runs_first is turned
o. The default value is 0.
sched_compat_yield
Enables the aggressive CPU yielding behavior of the old O(1) scheduler by moving the
relinquishing task to the end of the runnable queue (right-most position in the red-black
tree). Applications that depend on the sched_yield(2) syscall behavior may see perfor-
mance improvements by giving other processes a chance to run when there are highly
contended resources (such as locks). On the other hand, given that this call occurs in con-
text switching, misusing the call can hurt the workload. Only use it when you see a drop
in performance. The default value is 0.
sched_migration_cost_ns
Amount of time after the last execution that a task is considered to be “cache hot” in
migration decisions. A “hot” task is less likely to be migrated to another CPU, so increasing
this variable reduces task migrations. The default value is 500000 (ns).
If the CPU idle time is higher than expected when there are runnable processes, try reduc-
ing this value. If tasks bounce between CPUs or nodes too often, try increasing it.
sched_latency_ns
Targeted preemption latency for CPU bound tasks. Increasing this variable increases a CPU
bound task's timeslice. A task's timeslice is its weighted fair share of the scheduling period:
timeslice = scheduling period * (task's weight/total weight of tasks in the run queue)
The task's weight depends on the task's nice level and the scheduling policy. Minimum
task weight for a SCHED_OTHER task is 15, corresponding to nice 19. The maximum task
weight is 88761, corresponding to nice -20.
Timeslices become smaller as the load increases. When the number of runnable
tasks exceeds sched_latency_ns /sched_min_granularity_ns , the slice becomes num-
ber_of_running_tasks * sched_min_granularity_ns . Prior to that, the slice is equal to
sched_latency_ns .
This value also specifies the maximum amount of time during which a sleeping task is
considered to be running for entitlement calculations. Increasing this variable increases
the amount of time a waking task may consume before being preempted, thus increasing
scheduler latency for CPU bound tasks. The default value is 6000000 (ns).
sched_min_granularity_ns
139 Runtime Tuning with sysctl openSUSE Leap 42.3

Minimal preemption granularity for CPU bound tasks. See sched_latency_ns for details.
The default value is 4000000 (ns).
sched_wakeup_granularity_ns
The wake-up preemption granularity. Increasing this variable reduces wake-up preemp-
tion, reducing disturbance of compute bound tasks. Lowering it improves wake-up latency
and throughput for latency critical tasks, particularly when a short duty cycle load com-
ponent must compete with CPU bound components. The default value is 2500000 (ns).
Warning: Setting the Right Wake-up Granularity
Value
Settings larger than half of sched_latency_ns will result in no wake-up preemp-
tion. Short duty cycle tasks will be unable to compete with CPU hogs effectively.
sched_rr_timeslice_ms
Quantum that SCHED_RR tasks are allowed to run before they are preempted and put to
the end of the task list.
sched_rt_period_us
Period over which real-time task bandwidth enforcement is measured. The default value
is 1000000 (µs).
sched_rt_runtime_us
Quantum allocated to real-time tasks during sched_rt_period_us. Setting to -1 disables RT
bandwidth enforcement. By default, RT tasks may consume 95%CPU/sec, thus leaving
5%CPU/sec or 0.05s to be used by SCHED_OTHER tasks. The default value is 950000 (µs).
sched_nr_migrate
Controls how many tasks can be migrated across processors for load-balancing purposes.
Because balancing iterates the runqueue with interrupts disabled (softirq), it can incur
in irq-latency penalties for real-time tasks. Therefore increasing this value may give a
performance boost to large SCHED_OTHER threads at the expense of increased irq-latencies
for real-time tasks. The default value is 32 .
sched_time_avg_ms
This parameter sets the period over which the time spent running real-time tasks is aver-
aged. That average assists CFS in making load-balancing decisions and gives an indication
of how busy a CPU is with high-priority real-time tasks.
140 Runtime Tuning with sysctl openSUSE Leap 42.3

The optimal setting for this parameter is highly workload dependent and depends, among
other things, on how frequently real-time tasks are running and for how long.
13.3.7 Debugging Interface and Scheduler Statistics
CFS comes with a new improved debugging interface, and provides runtime statistics informa-
tion. Relevant les were added to the /proc le system, which can be examined simply with
the cat or less command. A list of the related /proc les follows with their short description:
/proc/sched_debug
Contains the current values of all tunable variables (see Section13.3.6, “Runtime Tuning with
sysctl”) that affect the task scheduler behavior, CFS statistics, and information about the
run queues (CFS, RT and deadline) on all available processors. A summary of the task
running on each processor is also shown, with the task name and PID, along with a number
of scheduler specific statistics. The rst being tree-key column, it indicates the task's
virtual runtime, and its name comes from the kernel sorting all runnable tasks by this
key in a red-black tree. The switches column indicates the total number of switches
(involuntary or not), and naturally the prio refers to the process priority. The wait-time
value indicates the amount of time the task waited to be scheduled. Finally both sum-
exec and sum-sleep account for the total amount of time (in nanoseconds) the task was
running on the processor or asleep, respectively.
root # cat /proc/sched_debug
Sched Debug Version: v0.11, 4.4.21-64-default #1
ktime : 23533900.395978
sched_clk : 23543587.726648
cpu_clk : 23533900.396165
jiffies : 4300775771
sched_clock_stable : 0
sysctl_sched
.sysctl_sched_latency : 6.000000
.sysctl_sched_min_granularity : 2.000000
.sysctl_sched_wakeup_granularity : 2.500000
.sysctl_sched_child_runs_first : 0
.sysctl_sched_features : 154871
.sysctl_sched_tunable_scaling : 1 (logaritmic)
cpu#0, 2666.762 MHz
.nr_running : 1
.load : 1024
141 Debugging Interface and Scheduler Statistics openSUSE Leap 42.3

.nr_switches : 1918946
[...]
cfs_rq[0]:/
.exec_clock : 170176.383770
.MIN_vruntime : 0.000001
.min_vruntime : 347375.854324
.max_vruntime : 0.000001
[...]
rt_rq[0]:/
.rt_nr_running : 0
.rt_throttled : 0
.rt_time : 0.000000
.rt_runtime : 950.000000
dl_rq[0]:
.dl_nr_running : 0
task PID tree-key switches prio wait-time [...]
------------------------------------------------------------------------
R cc1 63477 98876.717832 197 120 0.000000 ...
/proc/schedstat
Displays statistics relevant to the current run queue. Also domain-specific statistics for
SMP systems are displayed for all connected processors. Because the output format is not
user-friendly, read the contents of /usr/src/linux/Documentation/scheduler/sched-
stats.txt for more information.
/proc/PID/sched
Displays scheduling information on the process with id PID .
root # cat /proc/$(pidof gdm)/sched
gdm (744, #threads: 3)
-------------------------------------------------------------------
se.exec_start : 8888.758381
se.vruntime : 6062.853815
se.sum_exec_runtime : 7.836043
se.statistics.wait_start : 0.000000
se.statistics.sleep_start : 8888.758381
se.statistics.block_start : 0.000000
se.statistics.sleep_max : 1965.987638
[...]
se.avg.decay_count : 8477
policy : 0
prio : 120
142 Debugging Interface and Scheduler Statistics openSUSE Leap 42.3
clock-delta : 128
mm->numa_scan_seq : 0
numa_migrations, 0
numa_faults_memory, 0, 0, 1, 0, -1
numa_faults_memory, 1, 0, 0, 0, -1
13.4 For More Information
To get a compact knowledge about Linux kernel task scheduling, you need to explore several
information sources. Here are some:
For task scheduler System Calls description, see the relevant manual page (for example
man 2 sched_setaffinity ).
General information on scheduling is described in Scheduling (http://en.wikipedia.org/wi-
ki/Scheduling_(computing)) wiki page.
A useful lecture on Linux scheduler policy and algorithm is available in http://www.in-
f.fu-berlin.de/lehre/SS01/OS/Lectures/Lecture08.pdf .
A good overview of Linux process scheduling is given in Linux Kernel Development
by Robert Love (ISBN-10: 0-672-32512-8). See http://www.informit.com/articles/article.as-
px?p=101760 .
A very comprehensive overview of the Linux kernel internals is given in Understanding the
Linux Kernel by Daniel P. Bovet and Marco Cesati (ISBN 978-0-596-00565-8).
Technical information about task scheduler is covered in les under /usr/src/lin-
ux/Documentation/scheduler .
143 For More Information openSUSE Leap 42.3
14 Tuning the Memory Management Subsystem
To understand and tune the memory management behavior of the kernel, it is important to rst
have an overview of how it works and cooperates with other subsystems.
The memory management subsystem, also called the virtual memory manager, will subsequently
be called “VM”. The role of the VM is to manage the allocation of physical memory (RAM)
for the entire kernel and user programs. It is also responsible for providing a virtual memory
environment for user processes (managed via POSIX APIs with Linux extensions). Finally, the
VM is responsible for freeing up RAM when there is a shortage, either by trimming caches or
swapping out “anonymous” memory.
The most important thing to understand when examining and tuning VM is how its caches
are managed. The basic goal of the VM's caches is to minimize the cost of I/O as generated
by swapping and le system operations (including network le systems). This is achieved by
avoiding I/O completely, or by submitting I/O in better patterns.
Free memory will be used and lled up by these caches as required. The more memory is avail-
able for caches and anonymous memory, the more effectively caches and swapping will oper-
ate. However, if a memory shortage is encountered, caches will be trimmed or memory will
be swapped out.
For a particular workload, the rst thing that can be done to improve performance is to increase
memory and reduce the frequency that memory must be trimmed or swapped. The second thing
is to change the way caches are managed by changing kernel parameters.
Finally, the workload itself should be examined and tuned as well. If an application is allowed
to run more processes or threads, effectiveness of VM caches can be reduced, if each process is
operating in its own area of the le system. Memory overheads are also increased. If applications
allocate their own buers or caches, larger caches will mean that less memory is available for
VM caches. However, more processes and threads can mean more opportunity to overlap and
pipeline I/O, and may take better advantage of multiple cores. Experimentation will be required
for the best results.
14.1 Memory Usage
Memory allocations in general can be characterized as “pinned” (also known as “unre-
claimable”), “reclaimable” or “swappable”.
144 Memory Usage openSUSE Leap 42.3

14.1.1 Anonymous Memory
Anonymous memory tends to be program heap and stack memory (for example, >malloc() ).
It is reclaimable, except in special cases such as mlock or if there is no available swap space.
Anonymous memory must be written to swap before it can be reclaimed. Swap I/O (both swap-
ping in and swapping out pages) tends to be less efficient than pagecache I/O, because of allo-
cation and access patterns.
14.1.2 Pagecache
A cache of le data. When a le is read from disk or network, the contents are stored in page-
cache. No disk or network access is required, if the contents are up-to-date in pagecache. tmpfs
and shared memory segments count toward pagecache.
When a le is written to, the new data is stored in pagecache before being written back to a
disk or the network (making it a write-back cache). When a page has new data not written back
yet, it is called “dirty”. Pages not classified as dirty are “clean”. Clean pagecache pages can be
reclaimed if there is a memory shortage by simply freeing them. Dirty pages must rst be made
clean before being reclaimed.
14.1.3 Buffercache
This is a type of pagecache for block devices (for example, /dev/sda). A le system typically uses
the buffercache when accessing its on-disk metadata structures such as inode tables, allocation
bitmaps, and so forth. Buffercache can be reclaimed similarly to pagecache.
14.1.4 Buffer Heads
Buer heads are small auxiliary structures that tend to be allocated upon pagecache access. They
can generally be reclaimed easily when the pagecache or buffercache pages are clean.
14.1.5 Writeback
As applications write to les, the pagecache becomes dirty and the buffercache may be-
come dirty. When the amount of dirty memory reaches a specified number of pages in bytes
(vm.dirty_background_bytes), or when the amount of dirty memory reaches a specific ratio to total
145 Anonymous Memory openSUSE Leap 42.3
memory (vm.dirty_background_ratio), or when the pages have been dirty for longer than a speci-
fied amount of time (vm.dirty_expire_centisecs), the kernel begins writeback of pages starting with
les that had the pages dirtied rst. The background bytes and ratios are mutually exclusive
and setting one will overwrite the other. Flusher threads perform writeback in the background
and allow applications to continue running. If the I/O cannot keep up with applications dirtying
pagecache, and dirty data reaches a critical setting (vm.dirty_bytes or vm.dirty_ratio), then appli-
cations begin to be throttled to prevent dirty data exceeding this threshold.
14.1.6 Readahead
The VM monitors le access patterns and may attempt to perform readahead. Readahead reads
pages into the pagecache from the le system that have not been requested yet. It is done to
allow fewer, larger I/O requests to be submitted (more efficient). And for I/O to be pipelined
(I/O performed at the same time as the application is running).
14.1.7 VFS caches
14.1.7.1 Inode Cache
This is an in-memory cache of the inode structures for each le system. These contain attributes
such as the le size, permissions and ownership, and pointers to the le data.
14.1.7.2 Directory Entry Cache
This is an in-memory cache of the directory entries in the system. These contain a name (the
name of a le), the inode which it refers to, and children entries. This cache is used when
traversing the directory structure and accessing a le by name.
146 Readahead openSUSE Leap 42.3

14.2 Reducing Memory Usage
14.2.1 Reducing malloc (Anonymous) Usage
Applications running on openSUSE Leap 42.3 can allocate more memory compared to openSUSE
Leap 10. This is because of glibc changing its default behavior while allocating user space
memory. See http://www.gnu.org/s/libc/manual/html_node/Malloc-Tunable-Parameters.html for
explanation of these parameters.
To restore a openSUSE Leap 10-like behavior, M_MMAP_THRESHOLD should be set to
128*1024. This can be done with mallopt() call from the application, or via setting MAL-
LOC_MMAP_THRESHOLD environment variable before running the application.
14.2.2 Reducing Kernel Memory Overheads
Kernel memory that is reclaimable (caches, described above) will be trimmed automatically
during memory shortages. Most other kernel memory cannot be easily reduced but is a property
of the workload given to the kernel.
Reducing the requirements of the user space workload will reduce the kernel memory usage
(fewer processes, fewer open les and sockets, etc.)
14.2.3 Memory Controller (Memory Cgroups)
If the memory cgroups feature is not needed, it can be switched o by passing cgroup_dis-
able=memory on the kernel command line, reducing memory consumption of the kernel a bit.
There is also a slight performance benefit as there is a small amount of accounting overhead
when memory cgroups are available even if none are configured.
147 Reducing Memory Usage openSUSE Leap 42.3

14.3 Virtual Memory Manager (VM) Tunable
Parameters
When tuning the VM it should be understood that some changes will take time to affect the
workload and take full effect. If the workload changes throughout the day, it may behave very
differently at different times. A change that increases throughput under some conditions may
decrease it under other conditions.
14.3.1 Reclaim Ratios
/proc/sys/vm/swappiness
This control is used to define how aggressively the kernel swaps out anonymous memo-
ry relative to pagecache and other caches. Increasing the value increases the amount of
swapping. The default value is 60 .
Swap I/O tends to be much less efficient than other I/O. However, some pagecache pages
will be accessed much more frequently than less used anonymous memory. The right bal-
ance should be found here.
If swap activity is observed during slowdowns, it may be worth reducing this parameter.
If there is a lot of I/O activity and the amount of pagecache in the system is rather small,
or if there are large dormant applications running, increasing this value might improve
performance.
Note that the more data is swapped out, the longer the system will take to swap data back
in when it is needed.
/proc/sys/vm/vfs_cache_pressure
This variable controls the tendency of the kernel to reclaim the memory which is used for
caching of VFS caches, versus pagecache and swap. Increasing this value increases the rate
at which VFS caches are reclaimed.
It is difficult to know when this should be changed, other than by experimentation. The
slabtop command (part of the package procps ) shows top memory objects used by
the kernel. The vfs caches are the "dentry" and the "*_inode_cache" objects. If these are
consuming a large amount of memory in relation to pagecache, it may be worth trying to
increase pressure. Could also help to reduce swapping. The default value is 100 .
/proc/sys/vm/min_free_kbytes
148 Virtual Memory Manager (VM) Tunable Parameters openSUSE Leap 42.3

This controls the amount of memory that is kept free for use by special reserves including
“atomic” allocations (those which cannot wait for reclaim). This should not normally be
lowered unless the system is being very carefully tuned for memory usage (normally useful
for embedded rather than server applications). If “page allocation failure” messages and
stack traces are frequently seen in logs, min_free_kbytes could be increased until the errors
disappear. There is no need for concern, if these messages are very infrequent. The default
value depends on the amount of RAM.
/proc/sys/vm/watermark_scale_factor
Broadly speaking, free memory has high, low and min watermarks. When the low water-
mark is reached then kswapd wakes to reclaim memory in the background. It stays awake
until free memory reaches the high watermark. Applications will stall and reclaim memory
when the low watermark is reached.
The watermark_scale_factor defines the amount of memory left in a node/system be-
fore kswapd is woken up and how much memory needs to be free before kswapd goes back
to sleep. The unit is in fractions of 10,000. The default value of 10 means the distances
between watermarks are 0.1% of the available memory in the node/system. The maximum
value is 1000, or 10% of memory.
Workloads that frequently stall in direct reclaim, accounted by allocstall in /proc/
vmstat , may benefit from altering this parameter. Similarly, if kswapd is sleeping prema-
turely, as accounted for by kswapd_low_wmark_hit_quickly , then it may indicate that
the number of pages kept free to avoid stalls is too low.
14.3.2 Writeback Parameters
One important change in writeback behavior since openSUSE Leap 10 is that modification to
le-backed mmap() memory is accounted immediately as dirty memory (and subject to write-
back). Whereas previously it would only be subject to writeback after it was unmapped, upon
an msync() system call, or under heavy memory pressure.
Some applications do not expect mmap modifications to be subject to such writeback behavior,
and performance can be reduced. Berkeley DB (and applications using it) is one known exam-
ple that can cause problems. Increasing writeback ratios and times can improve this type of
slowdown.
/proc/sys/vm/dirty_background_ratio
149 Writeback Parameters openSUSE Leap 42.3

This is the percentage of the total amount of free and reclaimable memory. When the
amount of dirty pagecache exceeds this percentage, writeback threads start writing back
dirty memory. The default value is 10 (%).
/proc/sys/vm/dirty_background_bytes
This contains the amount of dirty memory at which the background kernel flusher threads
will start writeback. dirty_background_bytes is the counterpart of dirty_back-
ground_ratio . If one of them is set, the other one will automatically be read as 0.
/proc/sys/vm/dirty_ratio
Similar percentage value as for dirty_background_ratio . When this is exceeded, appli-
cations that want to write to the pagecache are blocked and wait for kernel background
flusher threads to reduce the amount of dirty memory. The default value is 20 (%).
/proc/sys/vm/dirty_bytes
This le controls the same tunable as dirty_ratio however the amount of dirty memory
is in bytes as opposed to a percentage of reclaimable memory. Since both dirty_ratio
and dirty_bytes control the same tunable, if one of them is set, the other one will auto-
matically be read as 0. The minimum value allowed for dirty_bytes is two pages (in
bytes); any value lower than this limit will be ignored and the old configuration will be
retained.
/proc/sys/vm/dirty_expire_centisecs
Data which has been dirty in-memory for longer than this interval will be written out next
time a flusher thread wakes up. Expiration is measured based on the modification time
of a le's inode. Therefore, multiple dirtied pages from the same le will all be written
when the interval is exceeded.
dirty_background_ratio and dirty_ratio together determine the pagecache writeback be-
havior. If these values are increased, more dirty memory is kept in the system for a longer
time. With more dirty memory allowed in the system, the chance to improve throughput by
avoiding writeback I/O and to submitting more optimal I/O patterns increases. However, more
dirty memory can either harm latency when memory needs to be reclaimed or at points of data
integrity (“synchronization points”) when it needs to be written back to disk.
14.3.3 Readahead Parameters
/sys/block/<bdev>/queue/read_ahead_kb
150 Readahead Parameters openSUSE Leap 42.3

If one or more processes are sequentially reading a le, the kernel reads some data in
advance (ahead) to reduce the amount of time that processes need to wait for data to be
available. The actual amount of data being read in advance is computed dynamically, based
on how much "sequential" the I/O seems to be. This parameter sets the maximum amount
of data that the kernel reads ahead for a single le. If you observe that large sequential
reads from a le are not fast enough, you can try increasing this value. Increasing it too
far may result in readahead thrashing where pagecache used for readahead is reclaimed
before it can be used, or slowdowns because of a large amount of useless I/O. The default
value is 512 (KB).
14.3.4 Transparent Huge Page Parameters
Transparent Huge Pages (THP) provide a way to dynamically allocate huge pages either on‑de-
mand by the process or deferring the allocation until later via the khugepaged kernel thread.
This method is distinct from the use of hugetlbfs to manually manage their allocation and
use. Workloads with contiguous memory access patterns can benefit greatly from THP. A 1000-
fold decrease in page faults can be observed when running synthetic workloads with contiguous
memory access patterns.
There are cases when THP may be undesirable. Workloads with sparse memory access patterns
may perform poorly with THP due to excessive memory usage. For example, 2 MB of memory
may be used at fault time instead of 4 KB for each fault and ultimately lead to premature page
reclaim. On releases older than openSUSE Leap 42.2, it was possible for an application to stall
for long periods of time trying to allocate a THP which frequently led to a recommendation of
disabling THP. Such recommendations should be re-evaluated for openSUSE Leap 42.3
The behavior of THP may be configured via the transparent_hugepage= kernel parameter
or via sysfs. For example, it may be disabled by adding the kernel parameter transparen-
t_hugepage=never , rebuilding your grub2 configuration, and rebooting. Verify if THP is dis-
abled with:
root # cat /sys/kernel/mm/transparent_hugepage/enabled
always madvise [never]
If disabled, the value never is shown in square brackets like in the example above. A value of
always will always try and use THP at fault time but defer to khugepaged if the allocation
fails. A value of madvise will only allocate THP for address spaces explicitly specified by an
application.
151 Transparent Huge Page Parameters openSUSE Leap 42.3

/sys/kernel/mm/transparent_hugepage/defrag
This parameter controls how much effort an application commits when allocating a THP. A
value of always is the default for openSUSE 42.1 and earlier releases that supported THP.
If a THP is not available, the application will try to defragment memory. It potentially
incurs large stalls in an application if the memory is fragmented and a THP is not available.
A value of madvise means that THP allocation requests will only defragment if the appli-
cation explicitly requests it. This is the default for openSUSE 42.2 and later releases.
defer is only available on openSUSE 42.2 and later releases. If a THP is not available, the
application will fall back to using small pages if a THP is not available. It will wake the
kswapd and kcompactd kernel threads to defragment memory in the background and a
THP will be allocated later by khugepaged .
The final option never will use small pages if a THP is unavailable but no other action
will take place.
14.3.5 khugepaged Parameters
khugepaged will be automatically started when transparent_hugepage is set to always or
madvise , and it'll be automatically shut down if it's set to never . Normally this runs at low
frequency but the behavior can be tuned.
/sys/kernel/mm/transparent_hugepage/khugepaged/defrag
A value of 0 will disable khugepaged even though THP may still be used at fault time.
This may be important for latency-sensitive applications that benefit from THP but cannot
tolerate a stall if khugepaged tries to update an application memory usage.
/sys/kernel/mm/transparent_hugepage/khugepaged/pages_to_scan
This parameter controls how many pages are scanned by khugepaged in a single pass.
A scan identifies small pages that can be reallocated as THP. Increasing this value will
allocate THP in the background faster at the cost of CPU usage.
/sys/kernel/mm/transparent_hugepage/khugepaged/scan_sleep_millisecs
khugepaged sleeps for a short interval specified by this parameter after each pass to limit
how much CPU usage is used. Reducing this value will allocate THP in the background
faster at the cost of CPU usage. A value of 0 will force continual scanning.
/sys/kernel/mm/transparent_hugepage/khugepaged/alloc_sleep_millisecs
This parameter controls how long khugepaged will sleep in the event it fails to allocate a
THP in the background waiting for kswapd and kcompactd to take action.
152 khugepaged Parameters openSUSE Leap 42.3

The remaining parameters for khugepaged are rarely useful for performance tuning but are
fully documented in /usr/src/linux/Documentation/vm/transhuge.txt
14.3.6 Further VM Parameters
For the complete list of the VM tunable parameters, see /usr/src/linux/Documenta-
tion/sysctl/vm.txt (available after having installed the kernel-source package).
14.4 Monitoring VM Behavior
Some simple tools that can help monitor VM behavior:
1. vmstat: This tool gives a good overview of what the VM is doing. See Section2.1.1, “vmstat”
for details.
2. /proc/meminfo : This le gives a detailed breakdown of where memory is being used. See
Section2.4.2, “Detailed Memory Usage: /proc/meminfo” for details.
3. slabtop : This tool provides detailed information about kernel slab memory usage.
buer_head, dentry, inode_cache, ext3_inode_cache, etc. are the major caches. This com-
mand is available with the package procps .
4. /proc/vmstat : This le gives a detailed breakdown of internal VM behaviour. The in-
formation contained within is implementation specific and may not always be available.
Some of the information is duplicated in /proc/meminfo and others can be presented in
a friendly fashion by utilities. For maximum utility, this le needs to be monitored over
time to observe rates of change. The most important pieces of information that are hard
to derive from other sources are as follows:
pgscan_kswapd_*, pgsteal_kswapd_*
These report respectively the number of pages scanned and reclaimed by kswapd
since the system started. The ratio between these values can be interpreted as the
reclaim efficiency with a low efficiency implying that the system is struggling to
reclaim memory and may be thrashing. Light activity here is generally not something
to be concerned with.
pgscan_direct_*, pgsteal_direct_*
153 Further VM Parameters openSUSE Leap 42.3

These report respectively the number of pages scanned and reclaimed by an applica-
tion directly. This is correlated with increases in the allocstall counter. This is
more serious than kswapd activity as these events indicate that processes are stalling.
Heavy activity here combined with kswapd and high rates of pgpgin , pgpout and/
or high rates of pswapin or pswpout are signs that a system is thrashing heavily.
More detailed information can be obtained using tracepoints.
thp_fault_alloc, thp_fault_fallback
These counters correspond to how many THPs were allocated directly by an appli-
cation and how many times a THP was not available and small pages were used.
Generally a high fallback rate is harmless unless the application is very sensitive to
TLB pressure.
thp_collapse_alloc, thp_collapse_alloc_failed
These counters correspond to how many THPs were allocated by khugepaged and
how many times a THP was not available and small pages were used. A high fallback
rate implies that the system is fragmented and THPs are not being used even when the
memory usage by applications would allow them. It is only a problem for applications
that are sensitive to TLB pressure.
compact_*_scanned, compact_stall, compact_fail, compact_success
These counters may increase when THP is enabled and the system is fragmented.
compact_stall is incremented when an application stalls allocating THP. The re-
maining counters account for pages scanned, the number of defragmentation events
that succeeded or failed.
154 Monitoring VM Behavior openSUSE Leap 42.3

15 Tuning the Network
The network subsystem is rather complex and its tuning highly depends on the system use sce-
nario and also on external factors such as software clients or hardware components (switches,
routers, or gateways) in your network. The Linux kernel aims more at reliability and low laten-
cy than low overhead and high throughput. Other settings can mean less security, but better
performance.
15.1 Configurable Kernel Socket Buffers
Networking is largely based on the TCP/IP protocol and a socket interface for communication;
for more information about TCP/IP, see Book “Reference”, Chapter13 “Basic Networking”. The Linux
kernel handles data it receives or sends via the socket interface in socket buers. These kernel
socket buers are tunable.
Important: TCP Autotuning
Since kernel version 2.6.17 full autotuning with 4 MB maximum buer size exists. This
means that manual tuning usually will not improve networking performance consider-
ably. It is often the best not to touch the following variables, or, at least, to check the
outcome of tuning efforts carefully.
If you update from an older kernel, it is recommended to remove manual TCP tunings
in favor of the autotuning feature.
The special les in the /proc le system can modify the size and behavior of kernel socket
buers; for general information about the /proc le system, see Section 2.6, “The /proc File
System”. Find networking related les in:
/proc/sys/net/core
/proc/sys/net/ipv4
/proc/sys/net/ipv6
General net variables are explained in the kernel documentation ( linux/Documenta-
tion/sysctl/net.txt ). Special ipv4 variables are explained in linux/Documentation/net-
working/ip-sysctl.txt and linux/Documentation/networking/ipvs-sysctl.txt .
155 Configurable Kernel Socket Buffers openSUSE Leap 42.3

In the /proc le system, for example, it is possible to either set the Maximum Socket Receive
Buer and Maximum Socket Send Buer for all protocols, or both these options for the TCP
protocol only (in ipv4 ) and thus overriding the setting for all protocols (in core ).
/proc/sys/net/ipv4/tcp_moderate_rcvbuf
If /proc/sys/net/ipv4/tcp_moderate_rcvbuf is set to 1, autotuning is active and
buer size is adjusted dynamically.
/proc/sys/net/ipv4/tcp_rmem
The three values setting the minimum, initial, and maximum size of the Memory Receive
Buer per connection. They define the actual memory usage, not only TCP window size.
/proc/sys/net/ipv4/tcp_wmem
The same as tcp_rmem , but for Memory Send Buer per connection.
/proc/sys/net/core/rmem_max
Set to limit the maximum receive buer size that applications can request.
/proc/sys/net/core/wmem_max
Set to limit the maximum send buer size that applications can request.
Via /proc it is possible to disable TCP features that you do not need (all TCP features are
switched on by default). For example, check the following les:
/proc/sys/net/ipv4/tcp_timestamps
TCP time stamps are defined in RFC1323.
/proc/sys/net/ipv4/tcp_window_scaling
TCP window scaling is also defined in RFC1323.
/proc/sys/net/ipv4/tcp_sack
Select acknowledgments (SACKS).
Use sysctl to read or write variables of the /proc le system. sysctl is preferable to cat
(for reading) and echo (for writing), because it also reads settings from /etc/sysctl.conf
and, thus, those settings survive reboots reliably. With sysctl you can read all variables and
their values easily; as root use the following command to list TCP related settings:
sysctl -a | grep tcp
156 Configurable Kernel Socket Buffers openSUSE Leap 42.3

Note: Side-Effects of Tuning Network Variables
Tuning network variables can affect other system resources such as CPU or memory use.
15.2 Detecting Network Bottlenecks and Analyzing
Network Traffic
Before starting with network tuning, it is important to isolate network bottlenecks and network
traffic patterns. There are some tools that can help you with detecting those bottlenecks.
The following tools can help analyzing your network traffic: netstat , tcpdump , and wire-
shark . Wireshark is a network traffic analyzer.
15.3 Netfilter
The Linux firewall and masquerading features are provided by the Netfilter kernel modules. This
is a highly configurable rule based framework. If a rule matches a packet, Netfilter accepts or
denies it or takes special action (“target”) as defined by rules such as address translation.
There are quite a lot of properties Netfilter can take into account. Thus, the more rules are
defined, the longer packet processing may last. Also advanced connection tracking could be
rather expensive and, thus, slowing down overall networking.
When the kernel queue becomes full, all new packets are dropped, causing existing connec-
tions to fail. The 'fail-open' feature allows a user to temporarily disable the packet inspection
and maintain the connectivity under heavy network traffic. For reference, see https://home.re-
git.org/netfilter-en/using-nfqueue-and-libnetfilter_queue/ .
For more information, see the home page of the Netfilter and iptables project, http://www.net-
filter.org
157 Detecting Network Bottlenecks and Analyzing Network Traffic openSUSE Leap 42.3

15.4 Improving the Network Performance with
Receive Packet Steering (RPS)
Modern network interface devices can move so many packets that the host can become the
limiting factor for achieving maximum performance. In order to keep up, the system must be
able to distribute the work across multiple CPU cores.
Some modern network interfaces can help distribute the work to multiple CPU cores through the
implementation of multiple transmission and multiple receive queues in hardware. However,
others are only equipped with a single queue and the driver must deal with all incoming packets
in a single, serialized stream. To work around this issue, the operating system must "parallelize"
the stream to distribute the work across multiple CPUs. On openSUSE Leap this is done via
Receive Packet Steering (RPS). RPS can also be used in virtual environments.
RPS creates a unique hash for each data stream using IP addresses and port numbers. The use of
this hash ensures that packets for the same data stream are sent to the same CPU, which helps
to increase performance.
RPS is configured per network device receive queue and interface. The configuration le names
match the following scheme:
/sys/class/net/<device>/queues/<rx-queue>/rps_cpus
<device> stands for the network device, such as eth0 , eth1 . <rx-queue> stands for the
receive queue, such as rx-0 , rx-1 .
If the network interface hardware only supports a single receive queue, only rx-0 will exist. If
it supports multiple receive queues, there will be an rx- N directory for each receive queue.
These configuration les contain a comma-delimited list of CPU bitmaps. By default, all bits are
set to 0. With this setting RPS is disabled and therefore the CPU that handles the interrupt will
also process the packet queue.
To enable RPS and enable specific CPUs to process packets for the receive queue of the interface,
set the value of their positions in the bitmap to 1. For example, to enable CPUs 0-3 to process
packets for the rst receive queue for eth0, set the bit positions 0-3 to 1 in binary: 00001111 .
This representation then needs to be converted to hex—which results in F in this case. Set this
hex value with the following command:
echo "f" > /sys/class/net/eth0/queues/rx-0/rps_cpus
If you wanted to enable CPUs 8-15:
1111 1111 0000 0000 (binary)
158
Improving the Network Performance with Receive Packet Steering (RPS) openSUSE Leap
42.3
15 15 0 0 (decimal)
F F 0 0 (hex)
The command to set the hex value of ff00 would be:
echo "ff00" > /sys/class/net/eth0/queues/rx-0/rps_cpus
On NUMA machines, best performance can be achieved by configuring RPS to use the CPUs on
the same NUMA node as the interrupt for the interface's receive queue.
On non-NUMA machines, all CPUs can be used. If the interrupt rate is very high, excluding the
CPU handling the network interface can boost performance. The CPU being used for the network
interface can be determined from /proc/interrupts . For example:
root # cat /proc/interrupts
CPU0 CPU1 CPU2 CPU3
...
51: 113915241 0 0 0 Phys-fasteoi eth0
...
In this case, CPU 0 is the only CPU processing interrupts for eth0 , since only CPU0 contains
a non-zero value.
On x86 and AMD64/Intel64 platforms, irqbalance can be used to distribute hardware inter-
rupts across CPUs. See man 1 irqbalance for more details.
15.5 For More Information
Eduardo Ciliendo, Takechika Kunimasa: “Linux Performance and Tuning Guidelines”
(2007), esp. sections 1.5, 3.5, and 4.7: http://www.redbooks.ibm.com/redpapers/ab-
stracts/redp4285.html
John Heffner, Matt Mathis: “Tuning TCP for Linux 2.4 and 2.6” (2006): http://www.psc.e-
du/networking/projects/tcptune/#Linux
159 For More Information openSUSE Leap 42.3

16 Tracing Tools
openSUSE Leap comes with several tools that help you obtain useful information about your sys-
tem. You can use the information for various purposes, for example, to debug and nd problems
in your program, to discover places causing performance drops, or to trace a running process
to nd out what system resources it uses.
Note: Tracing and Impact on Performance
While a running process is being monitored for system or library calls, the performance
of the process is heavily reduced. You are advised to use tracing tools only for the time
you need to collect the data.
16.1 Tracing System Calls with strace
The strace command traces system calls of a process and signals received by the process.
strace can either run a new command and trace its system calls, or you can attach strace
to an already running command. Each line of the command's output contains the system call
name, followed by its arguments in parentheses and its return value.
To run a new command and start tracing its system calls, enter the command to be monitored
as you normally do, and add strace at the beginning of the command line:
tux > strace ls
execve("/bin/ls", ["ls"], [/* 52 vars */]) = 0
brk(0) = 0x618000
mmap(NULL, 4096, PROT_READ|PROT_WRITE, MAP_PRIVATE|MAP_ANONYMOUS, -1, 0) \
= 0x7f9848667000
mmap(NULL, 4096, PROT_READ|PROT_WRITE, MAP_PRIVATE|MAP_ANONYMOUS, -1, 0) \
= 0x7f9848666000
access("/etc/ld.so.preload", R_OK) = -1 ENOENT \
(No such file or directory)
open("/etc/ld.so.cache", O_RDONLY) = 3
fstat(3, {st_mode=S_IFREG|0644, st_size=200411, ...}) = 0
mmap(NULL, 200411, PROT_READ, MAP_PRIVATE, 3, 0) = 0x7f9848635000
close(3) = 0
open("/lib64/librt.so.1", O_RDONLY) = 3
[...]
mmap(NULL, 4096, PROT_READ|PROT_WRITE, MAP_PRIVATE|MAP_ANONYMOUS, -1, 0) \
= 0x7fd780f79000
write(1, "Desktop\nDocuments\nbin\ninst-sys\n", 31Desktop
161 Tracing System Calls with strace openSUSE Leap 42.3

Documents
bin
inst-sys
) = 31
close(1) = 0
munmap(0x7fd780f79000, 4096) = 0
close(2) = 0
exit_group(0) = ?
To attach strace to an already running process, you need to specify the -p with the process
ID ( PID ) of the process that you want to monitor:
tux > strace -p `pidof cron`
Process 1261 attached
restart_syscall(<... resuming interrupted call ...>) = 0
stat("/etc/localtime", {st_mode=S_IFREG|0644, st_size=2309, ...}) = 0
select(5, [4], NULL, NULL, {0, 0}) = 0 (Timeout)
socket(PF_LOCAL, SOCK_STREAM|SOCK_CLOEXEC|SOCK_NONBLOCK, 0) = 5
connect(5, {sa_family=AF_LOCAL, sun_path="/var/run/nscd/socket"}, 110) = 0
sendto(5, "\2\0\0\0\0\0\0\0\5\0\0\0root\0", 17, MSG_NOSIGNAL, NULL, 0) = 17
poll([{fd=5, events=POLLIN|POLLERR|POLLHUP}], 1, 5000) = 1 ([{fd=5, revents=POLLIN|
POLLHUP}])
read(5, "\2\0\0\0\1\0\0\0\5\0\0\0\2\0\0\0\0\0\0\0\0\0\0\0\5\0\0\0\6\0\0\0"..., 36) = 36
read(5, "root\0x\0root\0/root\0/bin/bash\0", 28) = 28
close(5) = 0
rt_sigprocmask(SIG_BLOCK, [CHLD], [], 8) = 0
rt_sigaction(SIGCHLD, NULL, {0x7f772b9ea890, [], SA_RESTORER|SA_RESTART,
0x7f772adf7880}, 8) = 0
rt_sigprocmask(SIG_SETMASK, [], NULL, 8) = 0
nanosleep({60, 0}, 0x7fff87d8c580) = 0
stat("/etc/localtime", {st_mode=S_IFREG|0644, st_size=2309, ...}) = 0
select(5, [4], NULL, NULL, {0, 0}) = 0 (Timeout)
socket(PF_LOCAL, SOCK_STREAM|SOCK_CLOEXEC|SOCK_NONBLOCK, 0) = 5
connect(5, {sa_family=AF_LOCAL, sun_path="/var/run/nscd/socket"}, 110) = 0
sendto(5, "\2\0\0\0\0\0\0\0\5\0\0\0root\0", 17, MSG_NOSIGNAL, NULL, 0) = 17
poll([{fd=5, events=POLLIN|POLLERR|POLLHUP}], 1, 5000) = 1 ([{fd=5, revents=POLLIN|
POLLHUP}])
read(5, "\2\0\0\0\1\0\0\0\5\0\0\0\2\0\0\0\0\0\0\0\0\0\0\0\5\0\0\0\6\0\0\0"..., 36) = 36
read(5, "root\0x\0root\0/root\0/bin/bash\0", 28) = 28
close(5)
[...]
The -e option understands several sub-options and arguments. For example, to trace all at-
tempts to open or write to a particular le, use the following:
tux > strace -e trace=open,write ls ~
open("/etc/ld.so.cache", O_RDONLY) = 3
162 Tracing System Calls with strace openSUSE Leap 42.3

open("/lib64/librt.so.1", O_RDONLY) = 3
open("/lib64/libselinux.so.1", O_RDONLY) = 3
open("/lib64/libacl.so.1", O_RDONLY) = 3
open("/lib64/libc.so.6", O_RDONLY) = 3
open("/lib64/libpthread.so.0", O_RDONLY) = 3
[...]
open("/usr/lib/locale/cs_CZ.utf8/LC_CTYPE", O_RDONLY) = 3
open(".", O_RDONLY|O_NONBLOCK|O_DIRECTORY|O_CLOEXEC) = 3
write(1, "addressbook.db.bak\nbin\ncxoffice\n"..., 311) = 311
To trace only network related system calls, use -e trace=network :
tux > strace -e trace=network -p 26520
Process 26520 attached - interrupt to quit
socket(PF_NETLINK, SOCK_RAW, 0) = 50
bind(50, {sa_family=AF_NETLINK, pid=0, groups=00000000}, 12) = 0
getsockname(50, {sa_family=AF_NETLINK, pid=26520, groups=00000000}, \
[12]) = 0
sendto(50, "\24\0\0\0\26\0\1\3~p\315K\0\0\0\0\0\0\0\0", 20, 0,
{sa_family=AF_NETLINK, pid=0, groups=00000000}, 12) = 20
[...]
The -c calculates the time the kernel spent on each system call:
tux > strace -c find /etc -name xorg.conf
/etc/X11/xorg.conf
% time seconds usecs/call calls errors syscall
------ ----------- ----------- --------- --------- ----------------
32.38 0.000181 181 1 execve
22.00 0.000123 0 576 getdents64
19.50 0.000109 0 917 31 open
19.14 0.000107 0 888 close
4.11 0.000023 2 10 mprotect
0.00 0.000000 0 1 write
[...]
0.00 0.000000 0 1 getrlimit
0.00 0.000000 0 1 arch_prctl
0.00 0.000000 0 3 1 futex
0.00 0.000000 0 1 set_tid_address
0.00 0.000000 0 4 fadvise64
0.00 0.000000 0 1 set_robust_list
------ ----------- ----------- --------- --------- ----------------
100.00 0.000559 3633 33 total
To trace all child processes of a process, use -f :
tux > strace -f rcapache2 status
execve("/usr/sbin/rcapache2", ["rcapache2", "status"], [/* 81 vars */]) = 0
163 Tracing System Calls with strace openSUSE Leap 42.3

brk(0) = 0x69e000
mmap(NULL, 4096, PROT_READ|PROT_WRITE, MAP_PRIVATE|MAP_ANONYMOUS, -1, 0) \
= 0x7f3bb553b000
mmap(NULL, 4096, PROT_READ|PROT_WRITE, MAP_PRIVATE|MAP_ANONYMOUS, -1, 0) \
= 0x7f3bb553a000
[...]
[pid 4823] rt_sigprocmask(SIG_SETMASK, [], <unfinished ...>
[pid 4822] close(4 <unfinished ...>
[pid 4823] <... rt_sigprocmask resumed> NULL, 8) = 0
[pid 4822] <... close resumed> ) = 0
[...]
[pid 4825] mprotect(0x7fc42cbbd000, 16384, PROT_READ) = 0
[pid 4825] mprotect(0x60a000, 4096, PROT_READ) = 0
[pid 4825] mprotect(0x7fc42cde4000, 4096, PROT_READ) = 0
[pid 4825] munmap(0x7fc42cda2000, 261953) = 0
[...]
[pid 4830] munmap(0x7fb1fff10000, 261953) = 0
[pid 4830] rt_sigprocmask(SIG_BLOCK, NULL, [], 8) = 0
[pid 4830] open("/dev/tty", O_RDWR|O_NONBLOCK) = 3
[pid 4830] close(3)
[...]
read(255, "\n\n# Inform the caller not only v"..., 8192) = 73
rt_sigprocmask(SIG_BLOCK, NULL, [], 8) = 0
rt_sigprocmask(SIG_BLOCK, NULL, [], 8) = 0
exit_group(0)
If you need to analyze the output of strace and the output messages are too long to be inspected
directly in the console window, use -o . In that case, unnecessary messages, such as information
about attaching and detaching processes, are suppressed. You can also suppress these messages
(normally printed on the standard output) with -q . To add time stamps at the beginning of
each line with a system call, use -t :
tux > strace -t -o strace_sleep.txt sleep 1; more strace_sleep.txt
08:44:06 execve("/bin/sleep", ["sleep", "1"], [/* 81 vars */]) = 0
08:44:06 brk(0) = 0x606000
08:44:06 mmap(NULL, 4096, PROT_READ|PROT_WRITE, MAP_PRIVATE|MAP_ANONYMOUS, \
-1, 0) = 0x7f8e78cc5000
[...]
08:44:06 close(3) = 0
08:44:06 nanosleep({1, 0}, NULL) = 0
08:44:07 close(1) = 0
08:44:07 close(2) = 0
08:44:07 exit_group(0) = ?
The behavior and output format of strace can be largely controlled. For more information, see
the relevant manual page (man 1 strace).
164 Tracing System Calls with strace openSUSE Leap 42.3

16.2 Tracing Library Calls with ltrace
ltrace traces dynamic library calls of a process. It is used in a similar way to strace , and most
of their parameters have a very similar or identical meaning. By default, ltrace uses /etc/
ltrace.conf or ~/.ltrace.conf configuration les. You can, however, specify an alternative
one with the -F CONFIG_FILE option.
In addition to library calls, ltrace with the -S option can trace system calls as well:
tux > ltrace -S -o ltrace_find.txt find /etc -name \
xorg.conf; more ltrace_find.txt
SYS_brk(NULL) = 0x00628000
SYS_mmap(0, 4096, 3, 34, 0xffffffff) = 0x7f1327ea1000
SYS_mmap(0, 4096, 3, 34, 0xffffffff) = 0x7f1327ea0000
[...]
fnmatch("xorg.conf", "xorg.conf", 0) = 0
free(0x0062db80) = <void>
__errno_location() = 0x7f1327e5d698
__ctype_get_mb_cur_max(0x7fff25227af0, 8192, 0x62e020, -1, 0) = 6
__ctype_get_mb_cur_max(0x7fff25227af0, 18, 0x7f1327e5d6f0, 0x7fff25227af0,
0x62e031) = 6
__fprintf_chk(0x7f1327821780, 1, 0x420cf7, 0x7fff25227af0, 0x62e031
<unfinished ...>
SYS_fstat(1, 0x7fff25227230) = 0
SYS_mmap(0, 4096, 3, 34, 0xffffffff) = 0x7f1327e72000
SYS_write(1, "/etc/X11/xorg.conf\n", 19) = 19
[...]
You can change the type of traced events with the -e option. The following example prints
library calls related to fnmatch and strlen functions:
tux > ltrace -e fnmatch,strlen find /etc -name xorg.conf
[...]
fnmatch("xorg.conf", "xorg.conf", 0) = 0
strlen("Xresources") = 10
strlen("Xresources") = 10
strlen("Xresources") = 10
fnmatch("xorg.conf", "Xresources", 0) = 1
strlen("xorg.conf.install") = 17
[...]
To display only the symbols included in a specific library, use -l /path/to/library :
tux > ltrace -l /lib64/librt.so.1 sleep 1
clock_gettime(1, 0x7fff4b5c34d0, 0, 0, 0) = 0
clock_gettime(1, 0x7fff4b5c34c0, 0xffffffffff600180, -1, 0) = 0
165 Tracing Library Calls with ltrace openSUSE Leap 42.3
+++ exited (status 0) +++
You can make the output more readable by indenting each nested call by the specified number
of space with the -n NUM_OF_SPACES .
16.3 Debugging and Profiling with Valgrind
Valgrind is a set of tools to debug and profile your programs so that they can run both faster and
with less errors. Valgrind can detect problems related to memory management and threading,
or can also serve as a framework for building new debugging tools. It is well known that this
tool can incur high overhead, causing, for example, higher runtimes or changing the normal
program behavior under concurrent workloads based on timing.
16.3.1 Supported Architectures
openSUSE Leap supports Valgrind on the following architectures:
AMD64/Intel64
POWER
zSystems
16.3.2 General Information
The main advantage of Valgrind is that it works with existing compiled executables. You do not
need to recompile or modify your programs to use it. Run Valgrind like this:
valgrind VALGRIND_OPTIONS your-prog YOUR-PROGRAM-OPTIONS
Valgrind consists of several tools, and each provides specific functionality. Information in this
section is general and valid regardless of the used tool. The most important configuration option
is --tool . This option tells Valgrind which tool to run. If you omit this option, memcheck is
selected by default. For example, if you want to run find ~ -name .bashrc with Valgrind's
memcheck tools, enter the following in the command line:
valgrind --tool =memcheck nd ~ -name .bashrc
A list of standard Valgrind tools with a brief description follows:
memcheck
166 Debugging and Profiling with Valgrind openSUSE Leap 42.3

Detects memory errors. It helps you tune your programs to behave correctly.
cachegrind
Profiles cache prediction. It helps you tune your programs to run faster.
callgrind
Works in a similar way to cachegrind but also gathers additional cache-profiling infor-
mation.
exp-drd
Detects thread errors. It helps you tune your multi-threaded programs to behave correctly.
helgrind
Another thread error detector. Similar to exp-drd but uses different techniques for prob-
lem analysis.
massif
A heap profiler. Heap is an area of memory used for dynamic memory allocation. This tool
helps you tune your program to use less memory.
lackey
An example tool showing instrumentation basics.
16.3.3 Default Options
Valgrind can read options at start-up. There are three places which Valgrind checks:
1. The le .valgrindrc in the home directory of the user who runs Valgrind.
2. The environment variable $VALGRIND_OPTS
3. The le .valgrindrc in the current directory where Valgrind is run from.
These resources are parsed exactly in this order, while later given options take precedence over
earlier processed options. Options specific to a particular Valgrind tool must be prefixed with
the tool name and a colon. For example, if you want cachegrind to always write profile data to
the /tmp/cachegrind_PID.log , add the following line to the .valgrindrc le in your home
directory:
--cachegrind:cachegrind-out-file=/tmp/cachegrind_%p.log
167 Default Options openSUSE Leap 42.3

16.3.4 How Valgrind Works
Valgrind takes control of your executable before it starts. It reads debugging information from
the executable and related shared libraries. The executable's code is redirected to the selected
Valgrind tool, and the tool adds its own code to handle its debugging. Then the code is handed
back to the Valgrind core and the execution continues.
For example, memcheck adds its code, which checks every memory access. As a consequence,
the program runs much slower than in the native execution environment.
Valgrind simulates every instruction of your program. Therefore, it not only checks the code of
your program, but also all related libraries (including the C library), libraries used for graphi-
cal environment, and so on. If you try to detect errors with Valgrind, it also detects errors in
associated libraries (like C, X11, or Gtk libraries). Because you probably do not need these er-
rors, Valgrind can selectively, suppress these error messages to suppression les. The --gen-
suppressions=yes tells Valgrind to report these suppressions which you can copy to a le.
You should supply a real executable (machine code) as a Valgrind argument. If your application
is run, for example, from a shell or Perl script, you will by mistake get error reports related to
/bin/sh (or /usr/bin/perl ). In such cases, you can use --trace-children=yes to work
around this issue. However, using the executable itself will avoid any confusion over this issue.
16.3.5 Messages
During its runtime, Valgrind reports messages with detailed errors and important events. The
following example explains the messages:
tux > valgrind --tool=memcheck find ~ -name .bashrc
[...]
==6558== Conditional jump or move depends on uninitialised value(s)
==6558== at 0x400AE79: _dl_relocate_object (in /lib64/ld-2.11.1.so)
==6558== by 0x4003868: dl_main (in /lib64/ld-2.11.1.so)
[...]
==6558== Conditional jump or move depends on uninitialised value(s)
==6558== at 0x400AE82: _dl_relocate_object (in /lib64/ld-2.11.1.so)
==6558== by 0x4003868: dl_main (in /lib64/ld-2.11.1.so)
[...]
==6558== ERROR SUMMARY: 2 errors from 2 contexts (suppressed: 0 from 0)
==6558== malloc/free: in use at exit: 2,228 bytes in 8 blocks.
==6558== malloc/free: 235 allocs, 227 frees, 489,675 bytes allocated.
==6558== For counts of detected errors, rerun with: -v
==6558== searching for pointers to 8 not-freed blocks.
168 How Valgrind Works openSUSE Leap 42.3

==6558== checked 122,584 bytes.
==6558==
==6558== LEAK SUMMARY:
==6558== definitely lost: 0 bytes in 0 blocks.
==6558== possibly lost: 0 bytes in 0 blocks.
==6558== still reachable: 2,228 bytes in 8 blocks.
==6558== suppressed: 0 bytes in 0 blocks.
==6558== Rerun with --leak-check=full to see details of leaked memory.
The ==6558== introduces Valgrind's messages and contains the process ID number (PID). You
can easily distinguish Valgrind's messages from the output of the program itself, and decide
which messages belong to a particular process.
To make Valgrind's messages more detailed, use -v or even -v -v .
You can make Valgrind send its messages to three different places:
1. By default, Valgrind sends its messages to the le descriptor 2, which is the standard error
output. You can tell Valgrind to send its messages to any other le descriptor with the --
log-fd=FILE_DESCRIPTOR_NUMBER option.
2. The second and probably more useful way is to send Valgrind's messages to a le with --
log-file=FILENAME . This option accepts several variables, for example, %p gets replaced
with the PID of the currently profiled process. This way you can send messages to different
les based on their PID. %q{env_var} is replaced with the value of the related env_var
environment variable.
The following example checks for possible memory errors during the Apache Web server
restart, while following children processes and writing detailed Valgrind's messages to
separate les distinguished by the current process PID:
tux > valgrind -v --tool=memcheck --trace-children=yes \
--log-file=valgrind_pid_%p.log rcapache2 restart
This process created 52 log les in the testing system, and took 75 seconds instead of the
usual 7 seconds needed to run sudo systemctl restart apache2 without Valgrind,
which is approximately 10 times more.
tux > ls -1 valgrind_pid_*log
valgrind_pid_11780.log
valgrind_pid_11782.log
valgrind_pid_11783.log
[...]
valgrind_pid_11860.log
valgrind_pid_11862.log
169 Messages openSUSE Leap 42.3

valgrind_pid_11863.log
3. You may also prefer to send the Valgrind's messages over the network. You need to specify
the aa.bb.cc.dd IP address and port_num port number of the network socket with the
--log-socket=AA.BB.CC.DD:PORT_NUM option. If you omit the port number, 1500 will
be used.
It is useless to send Valgrind's messages to a network socket if no application is capable
of receiving them on the remote machine. That is why valgrind-listener , a simple
listener, is shipped together with Valgrind. It accepts connections on the specified port and
copies everything it receives to the standard output.
16.3.6 Error Messages
Valgrind remembers all error messages, and if it detects a new error, the error is compared
against old error messages. This way Valgrind checks for duplicate error messages. In case of
a duplicate error, it is recorded but no message is shown. This mechanism prevents you from
being overwhelmed by millions of duplicate errors.
The -v option will add a summary of all reports (sorted by their total count) to the end of the
Valgrind's execution output. Moreover, Valgrind stops collecting errors if it detects either 1000
different errors, or 10 000 000 errors in total. If you want to suppress this limit and wish to see
all error messages, use --error-limit=no .
Some errors usually cause other ones. Therefore, x errors in the same order as they appear and
re-check the program continuously.
16.4 For More Information
For a complete list of options related to the described tracing tools, see the corresponding
man page ( man 1 strace , man 1 ltrace , and man 1 valgrind ).
To describe advanced usage of Valgrind is beyond the scope of this document. It is
very well documented, see Valgrind User Manual (http://valgrind.org/docs/manual/manu-
al.html) . These pages are indispensable if you need more advanced information on Val-
grind or the usage and purpose of its standard tools.
170 Error Messages openSUSE Leap 42.3

17 Kexec and Kdump
Kexec is a tool to boot to another kernel from the currently running one. You can perform faster
system reboots without any hardware initialization. You can also prepare the system to boot to
another kernel if the system crashes.
17.1 Introduction
With Kexec, you can replace the running kernel with another one without a hard reboot. The
tool is useful for several reasons:
Faster system rebooting
If you need to reboot the system frequently, Kexec can save you significant time.
Avoiding unreliable rmware and hardware
Computer hardware is complex and serious problems may occur during the system start-
up. You cannot always replace unreliable hardware immediately. Kexec boots the kernel
to a controlled environment with the hardware already initialized. The risk of unsuccessful
system start is then minimized.
Saving the dump of a crashed kernel
Kexec preserves the contents of the physical memory. After the production kernel fails, the
capture kernel (an additional kernel running in a reserved memory range) saves the state
of the failed kernel. The saved image can help you with the subsequent analysis.
Booting without GRUB2 configuration
When the system boots a kernel with Kexec, it skips the boot loader stage. The normal
booting procedure can fail because of an error in the boot loader configuration. With Kexec,
you do not depend on a working boot loader configuration.
17.2 Required Packages
To use Kexec on openSUSE® Leap to speed up reboots or avoid potential hardware problems,
make sure that the package kexec-tools is installed. It contains a script called kexec-boot-
loader , which reads the boot loader configuration and runs Kexec using the same kernel op-
tions as the normal boot loader.
171 Introduction openSUSE Leap 42.3
To set up an environment that helps you obtain debug information in case of a kernel crash,
make sure that the package makedumpfile is installed.
The preferred method of using Kdump in openSUSE Leap is through the YaST Kdump module.
To use the YaST module, make sure that the package yast2-kdump is installed.
17.3 Kexec Internals
The most important component of Kexec is the /sbin/kexec command. You can load a kernel
with Kexec in two different ways:
Load the kernel to the address space of a production kernel for a regular reboot:
root # kexec -l KERNEL_IMAGE
You can later boot to this kernel with kexec -e .
Load the kernel to a reserved area of memory:
root # kexec -p KERNEL_IMAGE
This kernel will be booted automatically when the system crashes.
If you want to boot another kernel and preserve the data of the production kernel when the
system crashes, you need to reserve a dedicated area of the system memory. The production
kernel never loads to this area because it must be always available. It is used for the capture
kernel so that the memory pages of the production kernel can be preserved.
To reserve the area, append the option crashkernel to the boot command line of the produc-
tion kernel. To determine the necessary values for crashkernel , follow the instructions in Sec-
tion17.4, “Calculating crashkernel Allocation Size”.
Note that this is not a parameter of the capture kernel. The capture kernel does not use Kexec.
The capture kernel is loaded to the reserved area and waits for the kernel to crash. Then, Kdump
tries to invoke the capture kernel because the production kernel is no longer reliable at this
stage. This means that even Kdump can fail.
To load the capture kernel, you need to include the kernel boot parameters. Usually, the initial
RAM le system is used for booting. You can specify it with --initrd = FILENAME . With --
append = CMDLINE , you append options to the command line of the kernel to boot.
172 Kexec Internals openSUSE Leap 42.3

It is helpful to include the command line of the production kernel if these options are necessary
for the kernel to boot. You can simply copy the command line with --append = "$(cat /proc/
cmdline)" or add more options with --append = "$(cat /proc/cmdline) more_options" .
You can always unload the previously loaded kernel. To unload a kernel that was loaded with
the -l option, use the kexec -u command. To unload a crash kernel loaded with the -p
option, use kexec -p -u command.
17.4 Calculating crashkernel Allocation Size
To use Kexec with a capture kernel and to use Kdump in any way, RAM needs to be allocated
for the capture kernel. The allocation size depends on the expected hardware configuration of
the computer, therefore you need to specify it.
The allocation size also depends on the hardware architecture of your computer. Make sure to
follow the procedure intended for your system architecture.
PROCEDURE17.1:ALLOCATION SIZE ON AMD64/INTEL64
1. To nd out the base value for the computer, run the following in a terminal:
root # kdumptool calibrate
This command returns a list of values. All values are given in megabytes.
2. Write down the values of Low and High .
Note: Significance of Low and High Values
On AMD64/Intel64 computers, the High value stands for the memory reservation
for all available memory. The Low value stands for the memory reservation in the
DMA32 zone, that is, all the memory up to the 4 GB mark.
If the computer has less than 4 GB of RAM, the High memory reservation is allo-
cated and the Low memory reservation is ignored. If the computer has more than
4 GB of RAM, the Low memory reservation is allocated additionally.
173 Calculating crashkernel Allocation Size openSUSE Leap 42.3
3. Adapt the High value from the previous step for the number of LUN kernel paths (paths to
storage devices) attached to the computer. A sensible value in megabytes can be calculated
using this formula:
SIZE_HIGH = RECOMMENDATION + (LUNs / 2)
The following parameters are used in this formula:
SIZE_HIGH. The resulting value for High .
RECOMMENDATION. The value recommended by kdumptool calibrate for High .
LUNs. The maximum number of LUN kernel paths that you expect to ever create on
the computer. Exclude multipath devices from this number, as these are ignored.
Important: Adjust for Large Amounts of RAM
For machines that have multiple terabytes (!) of RAM, such as many servers running
SAP HANA, you may have to additionally adjust the amount of both Kdump High
and Low Memory.
Experience suggests that in such cases, you might be successful using the following
formulas:
SIZE_HIGH = (RECOMMENDATION * RAM_IN_TB) + (LUNs / 2)
SIZE_LOW = (RECOMMENDATION * RAM_IN_TB) + CUSTOM_DRIVER-
RESERVATION_ADJUSTMENT
4. If the drivers for your device make many reservations in the DMA32 zone, the Low value
also needs to be adjusted. However, there is no simple formula to calculate these. Finding
the right size can therefore be a process of trial and error.
For the beginning, use the Low value recommended by kdumptool calibrate .
5. The values now need to be set in the correct location.
If you are changing the kernel command line directly
Append the following kernel option to your boot loader configuration:
crashkernel=SIZE_HIGH,high crashkernel=SIZE_LOW,low
174 Calculating crashkernel Allocation Size openSUSE Leap 42.3

Replace the placeholders SIZE_HIGH and SIZE_LOW with the appropriate value
from the previous steps and append the letter M (for megabytes).
As an example, the following is valid:
crashkernel=36M,high crashkernel=72M,low
If you are using the YaST GUI:
Set Kdump Low Memory to the determined Low value.
Set Kdump High Memory to the determined High value.
If you are using the YaST command line interface:
Use the following command:
root # yast kdump startup enable alloc_mem=LOW,HIGH
Replace LOW with the determined Low value. Replace HIGH with the determined
HIGH value.
PROCEDURE17.2:ALLOCATION SIZE ON POWER AND ZSYSTEMS
1. To nd out the basis value for the computer, run the following in a terminal:
root # kdumptool calibrate
This command returns a list of values. All values are given in megabytes.
2. Write down the value of Low .
3. Adapt the Low value from the previous step for the number of LUN kernel paths (paths to
storage devices) attached to the computer. A sensible value in megabytes can be calculated
using this formula:
SIZE_LOW = RECOMMENDATION + (LUNs / 2)
The following parameters are used in this formula:
SIZE_LOW. The resulting value for Low .
RECOMMENDATION. The value recommended by kdumptool calibrate for Low .
LUNs. The maximum number of LUN kernel paths that you expect to ever create on
the computer. Exclude multipath devices from this number, as these are ignored.
175 Calculating crashkernel Allocation Size openSUSE Leap 42.3

4. The values now need to be set in the correct location.
If you are working on the command line
Append the following kernel option to your boot loader configuration:
crashkernel=SIZE_LOW
Replace the placeholder SIZE_LOW with the appropriate value from the previous step
and append the letter M (for megabytes).
As an example, the following is valid:
crashkernel=108M
If you are working in YaST
Set Kdump Memory to the determined Low value.
Tip: Excluding Unused and Inactive CCW Devices
on IBM zSystems
Depending on the number of available devices the calculated amount of memory specified
by the crashkernel kernel parameter may not be sufficient. Instead of increasing the
value, you may alternatively limit the amount of devices visible to the kernel. This will
lower the required amount of memory for the "crashkernel" setting.
1. To ignore devices you can run the cio_ignore tool to generate an appropriate
stanza to ignore all devices, except the ones currently active or in use.
tux > sudo cio_ignore -u -k
cio_ignore=all,!da5d,!f500-f502
When you run cio_ignore -u -k , the blacklist will become active and replace
any existing blacklist immediately. Unused devices are not being purged, so they
still appear in the channel subsystem. But adding new channel devices (via CP AT-
TACH under z/VM or dynamic I/O configuration change in LPAR) will treat them as
176 Calculating crashkernel Allocation Size openSUSE Leap 42.3

blacklisted. To prevent this, preserve the original setting by running sudo cio_ig-
nore -l rst and reverting to that state after running cio_ignore -u -k . As an
alternative, add the generated stanza to the regular kernel boot parameters.
2. Now add the cio_ignore kernel parameter with the stanza from above to
KDUMP_CMDLINE_APPEND in /etc/sysconfig/kdump , for example:
KDUMP_COMMANDLINE_APPEND="cio_ignore=all,!da5d,!f500-f502"
3. Activate the setting by restarting kdump :
systemctl restart kdump.service
17.5 Basic Kexec Usage
To verify if your Kexec environment works properly, follow these steps:
1. Make sure no users are currently logged in and no important services are running on the
system.
2. Log in as root .
3. Switch to the rescue target with systemctl isolate rescue.target
4. Load the new kernel to the address space of the production kernel with the following
command:
root # kexec -l /boot/vmlinuz --append="$(cat /proc/cmdline)" \
--initrd=/boot/initrd
5. Unmount all mounted le systems except the root le system with:
umount -a
Important: Unmounting the Root File System
Unmounting all le systems will most likely produce a device is busy warning
message. The root le system cannot be unmounted if the system is running. Ignore
the warning.
177 Basic Kexec Usage openSUSE Leap 42.3
6. Remount the root le system in read-only mode:
root # mount -o remount,ro /
7. Initiate the reboot of the kernel that you loaded in Step 4 with:
root # kexec -e
It is important to unmount the previously mounted disk volumes in read-write mode. The re-
boot system call acts immediately upon calling. Hard disk volumes mounted in read-write mode
neither synchronize nor unmount automatically. The new kernel may nd them “dirty”. Read-
only disk volumes and virtual le systems do not need to be unmounted. Refer to /etc/mtab
to determine which le systems you need to unmount.
The new kernel previously loaded to the address space of the older kernel rewrites it and takes
control immediately. It displays the usual start-up messages. When the new kernel boots, it skips
all hardware and rmware checks. Make sure no warning messages appear. All le systems are
supposed to be clean if they had been unmounted.
17.6 How to Configure Kexec for Routine Reboots
Kexec is often used for frequent reboots. For example, if it takes a long time to run through the
hardware detection routines or if the start-up is not reliable.
Note that rmware and the boot loader are not used when the system reboots with Kexec. Any
changes you make to the boot loader configuration will be ignored until the computer performs
a hard reboot.
17.7 Basic Kdump Configuration
You can use Kdump to save kernel dumps. If the kernel crashes, it is useful to copy the memory
image of the crashed environment to the le system. You can then debug the dump le to nd
the cause of the kernel crash. This is called “core dump”.
Kdump works similarly to Kexec (see Chapter17, Kexec and Kdump). The capture kernel is executed
after the running production kernel crashes. The difference is that Kexec replaces the production
kernel with the capture kernel. With Kdump, you still have access to the memory space of the
crashed production kernel. You can save the memory snapshot of the crashed kernel in the
environment of the Kdump kernel.
178 How to Configure Kexec for Routine Reboots openSUSE Leap 42.3

Tip: Dumps over Network
In environments with limited local storage, you need to set up kernel dumps over the
network. Kdump supports configuring the specified network interface and bringing it up
via initrd . Both LAN and VLAN interfaces are supported. Specify the network interface
and the mode (DHCP or static) either with YaST, or using the KDUMP_NETCONFIG option
in the /etc/sysconfig/kdump le.
Important: Target File System for Kdump Must Be
Mounted During Configuration
When configuring Kdump, you can specify a location to which the dumped images will be
saved (default: /var/crash ). This location must be mounted when configuring Kdump,
otherwise the configuration will fail.
17.7.1 Manual Kdump Configuration
Kdump reads its configuration from the /etc/sysconfig/kdump le. To make sure that Kdump
works on your system, its default configuration is sufficient. To use Kdump with the default
settings, follow these steps:
1. Determine the amount of memory needed for Kdump by following the instructions in
Section17.4, “Calculating crashkernel Allocation Size”. Make sure to set the kernel parameter
crashkernel .
2. Reboot the computer.
3. Enable the Kdump service:
root # systemctl enable kdump
4. You can edit the options in /etc/sysconfig/kdump . Reading the comments will help you
understand the meaning of individual options.
5. Execute the init script once with sudo systemctl start kdump , or reboot the system.
179 Manual Kdump Configuration openSUSE Leap 42.3

After configuring Kdump with the default values, check if it works as expected. Make sure that
no users are currently logged in and no important services are running on your system. Then
follow these steps:
1. Switch to the rescue target with systemctl isolate rescue.target
2. Restart the Kdump service:
root # systemctl start kdump
3. Unmount all the disk le systems except the root le system with:
root # umount -a
4. Remount the root le system in read-only mode:
root # mount -o remount,ro /
5. Invoke a “kernel panic” with the procfs interface to Magic SysRq keys:
root # echo c > /proc/sysrq-trigger
Important: Size of Kernel Dumps
The KDUMP_KEEP_OLD_DUMPS option controls the number of preserved kernel dumps (de-
fault is 5). Without compression, the size of the dump can take up to the size of the phys-
ical RAM memory. Make sure you have sufficient space on the /var partition.
The capture kernel boots and the crashed kernel memory snapshot is saved to the le sys-
tem. The save path is given by the KDUMP_SAVEDIR option and it defaults to /var/crash . If
KDUMP_IMMEDIATE_REBOOT is set to yes , the system automatically reboots the production ker-
nel. Log in and check that the dump has been created under /var/crash .
17.7.1.1 Static IP Configuration for Kdump
In case Kdump is configured to use a static IP configuration from a network device, you have to
add the network configuration to the KDUMP_COMMANDLINE_APPEND variable in /etc/syscon-
fig/kdump .
180 Manual Kdump Configuration openSUSE Leap 42.3

EXAMPLE17.1:KDUMP: EXAMPLE CONFIGURATION USING A STATIC IP SETUP
The following setup has been configured:
eth0 has been configured with the static IP address 192.168.1.1/24
eth1 has been configured with the static IP address 10.50.50.100/20
The Kdump configuration in /etc/sysconfig/kdump looks like:
KDUMP_CPUS=1
KDUMP_IMMEDIATE_REBOOT=yes
KDUMP_SAVEDIR=ftp://anonymous@10.50.50.140/crashdump/
KDUMP_KEEP_OLD_DUMPS=5
KDUMP_FREE_DISK_SIZE=64
KDUMP_VERBOSE=3
KDUMP_DUMPLEVEL=31
KDUMP_DUMPFORMAT=lzo
KDUMP_CONTINUE_ON_ERROR=yes
KDUMP_NETCONFIG=eth1:static
KDUMP_NET_TIMEOUT=30
Using this configuration, Kdump fails to reach the network when trying to write the dump
to the FTP server. To solve this issue, add the network configuration to KDUMP_COMMAN-
DLINE_APPEND in /etc/sysconfig/kdump . The general pattern for this looks like the
following:
KDUMP_COMMANDLINE_APPEND='ip=CLIENT IP:SERVER IP:GATEWAY IP:NETMASK:CLIENT
HOSTNAME:DEVICE:PROTOCOL'
For the example configuration this would result in:
KDUMP_COMMANDLINE_APPEND='ip=10.50.50.100:10.50.50.140:10.60.48.1:255.255.240.0:dump-
client:eth1:none'
17.7.2 YaST Configuration
To configure Kdump with YaST, you need to install the yast2-kdump package. Then either start
the Kernel Kdump module in the System category of YaST Control Center, or enter yast2 kdump
in the command line as root .
181 YaST Configuration openSUSE Leap 42.3
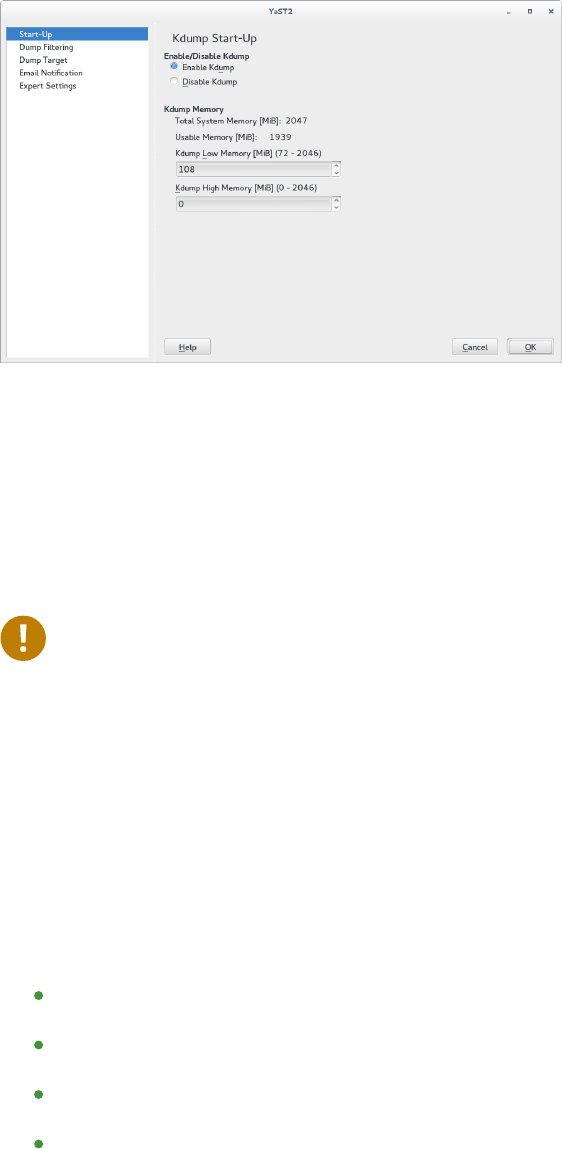
FIGURE17.1:YAST KDUMP MODULE: START-UP PAGE
In the Start-Up window, select Enable Kdump.
The values for Kdump Memory are automatically generated the rst time you open the window.
However, that does not mean that they are always sufficient. To set the right values, follow the
instructions in Section17.4, “Calculating crashkernel Allocation Size”.
Important: After Hardware Changes, Set Kdump
Memory Values Again
If you have set up Kdump on a computer and later decide to change the amount of RAM or
hard disks available to it, YaST will continue to display and use outdated memory values.
To work around this, determine the necessary memory again, as described in Section17.4,
“Calculating crashkernel Allocation Size”. Then set it manually in YaST.
Click Dump Filtering in the left pane, and check what pages to include in the dump. You do not
need to include the following memory content to be able to debug kernel problems:
Pages lled with zero
Cache pages
User data pages
Free pages
In the Dump Target window, select the type of the dump target and the URL where you want
to save the dump. If you selected a network protocol, such as FTP or SSH, you need to enter
relevant access information as well.
182 YaST Configuration openSUSE Leap 42.3
Tip: Sharing the Dump Directory with Other
Applications
It is possible to specify a path for saving Kdump dumps where other applications also
save their dumps. When cleaning its old dump les, Kdump will safely ignore other ap-
plications' dump les.
Fill the Email Notification window information if you want Kdump to inform you about its events
via e-mail and confirm your changes with OK after ne tuning Kdump in the Expert Settings
window. Kdump is now configured.
17.8 Analyzing the Crash Dump
After you obtain the dump, it is time to analyze it. There are several options.
The original tool to analyze the dumps is GDB. You can even use it in the latest environments,
although it has several disadvantages and limitations:
GDB was not specifically designed to debug kernel dumps.
GDB does not support ELF64 binaries on 32-bit platforms.
GDB does not understand other formats than ELF dumps (it cannot debug compressed
dumps).
That is why the crash utility was implemented. It analyzes crash dumps and debugs the running
system as well. It provides functionality specific to debugging the Linux kernel and is much
more suitable for advanced debugging.
If you want to debug the Linux kernel, you need to install its debugging information package in
addition. Check if the package is installed on your system with:
tux > zypper se kernel | grep debug
Important: Repository for Packages with
Debugging Information
If you subscribed your system for online updates, you can nd “debuginfo” packages
in the *-Debuginfo-Updates online installation repository relevant for openSUSE Leap
42.3. Use YaST to enable the repository.
183 Analyzing the Crash Dump openSUSE Leap 42.3
To open the captured dump in crash on the machine that produced the dump, use a command
like this:
crash /boot/vmlinux-2.6.32.8-0.1-default.gz \
/var/crash/2010-04-23-11\:17/vmcore
The rst parameter represents the kernel image. The second parameter is the dump le captured
by Kdump. You can nd this le under /var/crash by default.
Tip: Getting Basic Information from a Kernel Crash
Dump
openSUSE Leap ships with the utility kdumpid (included in a package with the same
name) for identifying unknown kernel dumps. It can be used to extract basic information
such as architecture and kernel release. It supports lkcd, diskdump, Kdump les and ELF
dumps. When called with the -v switch it tries to extract additional information such as
machine type, kernel banner string and kernel configuration flavor.
17.8.1 Kernel Binary Formats
The Linux kernel comes in Executable and Linkable Format (ELF). This le is usually called
vmlinux and is directly generated in the compilation process. Not all boot loaders support
ELF binaries, especially on the AMD64/Intel64 architecture. The following solutions exist on
different architectures supported by openSUSE® Leap.
17.8.1.1 AMD64/Intel64
Kernel packages for AMD64/Intel64 from SUSE contain two kernel les: vmlinuz and vmlin-
ux.gz .
vmlinuz . This is the le executed by the boot loader.
The Linux kernel consists of two parts: the kernel itself ( vmlinux ) and the setup code
run by the boot loader. These two parts are linked together to create vmlinuz (note the
distinction: z compared to x).
184 Kernel Binary Formats openSUSE Leap 42.3

In the kernel source tree, the le is called bzImage .
vmlinux.gz . This is a compressed ELF image that can be used by crash and GDB. The
ELF image is never used by the boot loader itself on AMD64/Intel64. Therefore, only a
compressed version is shipped.
17.8.1.2 POWER
The yaboot boot loader on POWER also supports loading ELF images, but not compressed ones.
In the POWER kernel package, there is an ELF Linux kernel le vmlinux . Considering crash ,
this is the easiest architecture.
If you decide to analyze the dump on another machine, you must check both the architecture
of the computer and the les necessary for debugging.
You can analyze the dump on another computer only if it runs a Linux system of the same
architecture. To check the compatibility, use the command uname -i on both computers and
compare the outputs.
If you are going to analyze the dump on another computer, you also need the appropriate les
from the kernel and kernel debug packages.
1. Put the kernel dump, the kernel image from /boot , and its associated debugging info le
from /usr/lib/debug/boot into a single empty directory.
2. Additionally, copy the kernel modules from /lib/modules/$(uname -r)/kernel/ and
the associated debug info les from /usr/lib/debug/lib/modules/$(uname -r)/ker-
nel/ into a subdirectory named modules .
3. In the directory with the dump, the kernel image, its debug info le, and the modules
subdirectory, start the crash utility:
tux > crash VMLINUX-VERSION vmcore
Regardless of the computer on which you analyze the dump, the crash utility will produce output
similar to this:
tux > crash /boot/vmlinux-2.6.32.8-0.1-default.gz \
/var/crash/2010-04-23-11\:17/vmcore
crash 4.0-7.6
Copyright (C) 2002, 2003, 2004, 2005, 2006, 2007, 2008 Red Hat, Inc.
185 Kernel Binary Formats openSUSE Leap 42.3

Copyright (C) 2004, 2005, 2006 IBM Corporation
Copyright (C) 1999-2006 Hewlett-Packard Co
Copyright (C) 2005, 2006 Fujitsu Limited
Copyright (C) 2006, 2007 VA Linux Systems Japan K.K.
Copyright (C) 2005 NEC Corporation
Copyright (C) 1999, 2002, 2007 Silicon Graphics, Inc.
Copyright (C) 1999, 2000, 2001, 2002 Mission Critical Linux, Inc.
This program is free software, covered by the GNU General Public License,
and you are welcome to change it and/or distribute copies of it under
certain conditions. Enter "help copying" to see the conditions.
This program has absolutely no warranty. Enter "help warranty" for details.
GNU gdb 6.1
Copyright 2004 Free Software Foundation, Inc.
GDB is free software, covered by the GNU General Public License, and you are
welcome to change it and/or distribute copies of it under certain conditions.
Type "show copying" to see the conditions.
There is absolutely no warranty for GDB. Type "show warranty" for details.
This GDB was configured as "x86_64-unknown-linux-gnu"...
KERNEL: /boot/vmlinux-2.6.32.8-0.1-default.gz
DEBUGINFO: /usr/lib/debug/boot/vmlinux-2.6.32.8-0.1-default.debug
DUMPFILE: /var/crash/2009-04-23-11:17/vmcore
CPUS: 2
DATE: Thu Apr 23 13:17:01 2010
UPTIME: 00:10:41
LOAD AVERAGE: 0.01, 0.09, 0.09
TASKS: 42
NODENAME: eros
RELEASE: 2.6.32.8-0.1-default
VERSION: #1 SMP 2010-03-31 14:50:44 +0200
MACHINE: x86_64 (2999 Mhz)
MEMORY: 1 GB
PANIC: "SysRq : Trigger a crashdump"
PID: 9446
COMMAND: "bash"
TASK: ffff88003a57c3c0 [THREAD_INFO: ffff880037168000]
CPU: 1
STATE: TASK_RUNNING (SYSRQ)
crash>
The command output prints rst useful data: There were 42 tasks running at the moment of the
kernel crash. The cause of the crash was a SysRq trigger invoked by the task with PID 9446. It
was a Bash process because the echo that has been used is an internal command of the Bash
shell.
186 Kernel Binary Formats openSUSE Leap 42.3

The crash utility builds upon GDB and provides many additional commands. If you enter bt
without any parameters, the backtrace of the task running at the moment of the crash is printed:
crash> bt
PID: 9446 TASK: ffff88003a57c3c0 CPU: 1 COMMAND: "bash"
#0 [ffff880037169db0] crash_kexec at ffffffff80268fd6
#1 [ffff880037169e80] __handle_sysrq at ffffffff803d50ed
#2 [ffff880037169ec0] write_sysrq_trigger at ffffffff802f6fc5
#3 [ffff880037169ed0] proc_reg_write at ffffffff802f068b
#4 [ffff880037169f10] vfs_write at ffffffff802b1aba
#5 [ffff880037169f40] sys_write at ffffffff802b1c1f
#6 [ffff880037169f80] system_call_fastpath at ffffffff8020bfbb
RIP: 00007fa958991f60 RSP: 00007fff61330390 RFLAGS: 00010246
RAX: 0000000000000001 RBX: ffffffff8020bfbb RCX: 0000000000000001
RDX: 0000000000000002 RSI: 00007fa959284000 RDI: 0000000000000001
RBP: 0000000000000002 R8: 00007fa9592516f0 R9: 00007fa958c209c0
R10: 00007fa958c209c0 R11: 0000000000000246 R12: 00007fa958c1f780
R13: 00007fa959284000 R14: 0000000000000002 R15: 00000000595569d0
ORIG_RAX: 0000000000000001 CS: 0033 SS: 002b
crash>
Now it is clear what happened: The internal echo command of Bash shell sent a character to
/proc/sysrq-trigger . After the corresponding handler recognized this character, it invoked
the crash_kexec() function. This function called panic() and Kdump saved a dump.
In addition to the basic GDB commands and the extended version of bt , the crash utility de-
fines many other commands related to the structure of the Linux kernel. These commands un-
derstand the internal data structures of the Linux kernel and present their contents in a human
readable format. For example, you can list the tasks running at the moment of the crash with
ps . With sym , you can list all the kernel symbols with the corresponding addresses, or inquire
an individual symbol for its value. With files , you can display all the open le descriptors of
a process. With kmem , you can display details about the kernel memory usage. With vm , you
can inspect the virtual memory of a process, even at the level of individual page mappings. The
list of useful commands is very long and many of these accept a wide range of options.
The commands that we mentioned reflect the functionality of the common Linux commands,
such as ps and lsof . If you want to nd out the exact sequence of events with the debugger,
you need to know how to use GDB and to have strong debugging skills. Both of these are out of
the scope of this document. In addition, you need to understand the Linux kernel. Several useful
reference information sources are given at the end of this document.
187 Kernel Binary Formats openSUSE Leap 42.3

17.9 Advanced Kdump Configuration
The configuration for Kdump is stored in /etc/sysconfig/kdump . You can also use YaST to
configure it. Kdump configuration options are available under System Kernel Kdump in YaST
Control Center. The following Kdump options may be useful for you.
You can change the directory for the kernel dumps with the KDUMP_SAVEDIR option. Keep in
mind that the size of kernel dumps can be very large. Kdump will refuse to save the dump if
the free disk space, subtracted by the estimated dump size, drops below the value specified by
the KDUMP_FREE_DISK_SIZE option. Note that KDUMP_SAVEDIR understands the URL format
PROTOCOL://SPECIFICATION , where PROTOCOL is one of file , ftp , sftp , nfs or cifs , and
specification varies for each protocol. For example, to save kernel dump on an FTP server,
use the following URL as a template: ftp://username:password@ftp.example.com:123/var/
crash .
Kernel dumps are usually huge and contain many pages that are not necessary for analysis. With
KDUMP_DUMPLEVEL option, you can omit such pages. The option understands numeric value
between 0 and 31. If you specify 0, the dump size will be largest. If you specify 31 , it will
produce the smallest dump. For a complete table of possible values, see the manual page of
kdump ( man 7 kdump ).
Sometimes it is very useful to make the size of the kernel dump smaller. For example, if you
want to transfer the dump over the network, or if you need to save some disk space in the dump
directory. This can be done with KDUMP_DUMPFORMAT set to compressed . The crash utility
supports dynamic decompression of the compressed dumps.
Important: Changes to the Kdump Configuration
File
You always need to execute systemctl restart kdump after you make manual changes
to /etc/sysconfig/kdump . Otherwise, these changes will take effect next time you re-
boot the system.
188 Advanced Kdump Configuration openSUSE Leap 42.3
17.10 For More Information
There is no single comprehensive reference to Kexec and Kdump usage. However, there are
helpful resources that deal with certain aspects:
For the Kexec utility usage, see the manual page of kexec ( man 8 kexec ).
IBM provides a comprehensive documentation on how to use dump tools on the zSys-
tems architecture at http://www.ibm.com/developerworks/linux/linux390/development_doc-
umentation.html .
You can nd general information about Kexec at http://www.ibm.com/developerworks/lin-
ux/library/l-kexec.html . Might be slightly outdated.
For more details on Kdump specific to openSUSE Leap, see http://ftp.suse.com/pub/peo-
ple/tiwai/kdump-training/kdump-training.pdf .
An in-depth description of Kdump internals can be found at http://lse.source-
forge.net/kdump/documentation/ols2oo5-kdump-paper.pdf .
For more details on crash dump analysis and debugging tools, use the following resources:
In addition to the info page of GDB ( info gdb ), you might want to read the printable
guides at http://sourceware.org/gdb/documentation/ .
A white paper with a comprehensive description of the crash utility usage can be found at
http://people.redhat.com/anderson/crash_whitepaper/ .
The crash utility also features a comprehensive online help. Use help COMMAND to display
the online help for command .
If you have the necessary Perl skills, you can use Alicia to make the debugging easier. This
Perl-based front-end to the crash utility can be found at http://alicia.sourceforge.net/ .
If you prefer to use Python instead, you should install Pykdump. This package helps you
control GDB through Python scripts and can be downloaded from http://sf.net/projects/
pykdump .
A very comprehensive overview of the Linux kernel internals is given in Understanding the
Linux Kernel by Daniel P. Bovet and Marco Cesati (ISBN 978-0-596-00565-8).
189 For More Information openSUSE Leap 42.3

18 Precision Time Protocol
For network environments, it is vital to keep the computer and other devices' clocks synchro-
nized and accurate. There are several solutions to achieve this, for example the widely used
Network Time Protocol (NTP) described in Book “Reference”, Chapter18 “Time Synchronization with
NTP”.
The Precision Time Protocol (PTP) is a protocol capable of sub-microsecond accuracy, which
is better than what NTP achieves. PTP support is divided between the kernel and user space.
The kernel in openSUSE Leap includes support for PTP clocks, which are provided by network
drivers.
18.1 Introduction to PTP
The clocks managed by PTP follow a master-slave hierarchy. The slaves are synchronized to
their masters. The hierarchy is updated by the best master clock (BMC) algorithm, which runs on
every clock. The clock with only one port can be either master or slave. Such a clock is called an
ordinary clock (OC). A clock with multiple ports can be master on one port and slave on another.
Such a clock is called a boundary clock (BC). The top-level master is called the grandmaster clock.
The grandmaster clock can be synchronized with a Global Positioning System (GPS). This way
disparate networks can be synchronized with a high degree of accuracy.
The hardware support is the main advantage of PTP. It is supported by various network switches
and network interface controllers (NIC). While it is possible to use non-PTP enabled hardware
within the network, having network components between all PTP clocks PTP hardware enabled
achieves the best possible accuracy.
18.1.1 PTP Linux Implementation
On openSUSE Leap, the implementation of PTP is provided by the linuxptp package. Install it
with zypper install linuxptp . It includes the ptp4l and phc2sys programs for clock syn-
chronization. ptp4l implements the PTP boundary clock and ordinary clock. When hardware
time stamping is enabled, ptp4l synchronizes the PTP hardware clock to the master clock.
With software time stamping, it synchronizes the system clock to the master clock. phc2sys is
needed only with hardware time stamping to synchronize the system clock to the PTP hardware
clock on the network interface card (NIC).
191 Introduction to PTP openSUSE Leap 42.3
18.2 Using PTP
18.2.1 Network Driver and Hardware Support
PTP requires that the used kernel network driver supports either software or hardware time
stamping. Moreover, the NIC must support time stamping in the physical hardware. You can
verify the driver and NIC time stamping capabilities with ethtool :
ethtool -T eth0
Time stamping parameters for eth0:
Capabilities:
hardware-transmit (SOF_TIMESTAMPING_TX_HARDWARE)
software-transmit (SOF_TIMESTAMPING_TX_SOFTWARE)
hardware-receive (SOF_TIMESTAMPING_RX_HARDWARE)
software-receive (SOF_TIMESTAMPING_RX_SOFTWARE)
software-system-clock (SOF_TIMESTAMPING_SOFTWARE)
hardware-raw-clock (SOF_TIMESTAMPING_RAW_HARDWARE)
PTP Hardware Clock: 0
Hardware Transmit Timestamp Modes:
off (HWTSTAMP_TX_OFF)
on (HWTSTAMP_TX_ON)
Hardware Receive Filter Modes:
none (HWTSTAMP_FILTER_NONE)
all (HWTSTAMP_FILTER_ALL)
Software time stamping requires the following parameters:
SOF_TIMESTAMPING_SOFTWARE
SOF_TIMESTAMPING_TX_SOFTWARE
SOF_TIMESTAMPING_RX_SOFTWARE
Hardware time stamping requires the following parameters:
SOF_TIMESTAMPING_RAW_HARDWARE
SOF_TIMESTAMPING_TX_HARDWARE
SOF_TIMESTAMPING_RX_HARDWARE
192 Using PTP openSUSE Leap 42.3

18.2.2 Using ptp4l
ptp4l uses hardware time stamping by default. As root , you need to specify the network
interface capable of hardware time stamping with the -i option. The -m tells ptp4l to print
its output to the standard output instead of the system's logging facility:
ptp4l -m -i eth0
selected eth0 as PTP clock
port 1: INITIALIZING to LISTENING on INITIALIZE
port 0: INITIALIZING to LISTENING on INITIALIZE
port 1: new foreign master 00a152.fffe.0b334d-1
selected best master clock 00a152.fffe.0b334d
port 1: LISTENING to UNCALIBRATED on RS_SLAVE
master offset -25937 s0 freq +0 path delay 12340
master offset -27887 s0 freq +0 path delay 14232
master offset -38802 s0 freq +0 path delay 13847
master offset -36205 s1 freq +0 path delay 10623
master offset -6975 s2 freq -30575 path delay 10286
port 1: UNCALIBRATED to SLAVE on MASTER_CLOCK_SELECTED
master offset -4284 s2 freq -30135 path delay 9892
The master offset value represents the measured offset from the master (in nanoseconds).
The s0 , s1 , s2 indicators show the different states of the clock servo: s0 is unlocked, s1
is clock step, and s2 is locked. If the servo is in the locked state ( s2 ), the clock will not be
stepped (only slowly adjusted) if the pi_offset_const option is set to a negative value in the
configuration le (see man 8 ptp4l for more information).
The freq value represents the frequency adjustment of the clock (in parts per billion, ppb).
The path delay value represents the estimated delay of the synchronization messages sent
from the master (in nanoseconds).
Port 0 is a Unix domain socket used for local PTP management. Port 1 is the eth0 interface.
INITIALIZING , LISTENING , UNCALIBRATED and SLAVE are examples of port states which
change on INITIALIZE , RS_SLAVE , and MASTER_CLOCK_SELECTED events. When the port state
changes from UNCALIBRATED to SLAVE , the computer has successfully synchronized with a PTP
master clock.
You can enable software time stamping with the -S option.
ptp4l -m -S -i eth3
You can also run ptp4l as a service:
systemctl start ptp4l
193 Using ptp4l openSUSE Leap 42.3

In this case, ptp4l reads its options from the /etc/sysconfig/ptp4l le. By default, this le
tells ptp4l to read the configuration options from /etc/ptp4l.conf . For more information
on ptp4l options and the configuration le settings, see man 8 ptp4l .
To enable the ptp4l service permanently, run the following:
systemctl enable ptp4l
To disable it, run
systemctl disable ptp4l
18.2.3 ptp4l Configuration File
ptp4l can read its configuration from an optional configuration le. As no configuration le
is used by default, you need to specify it with -f .
ptp4l -f /etc/ptp4l.conf
The configuration le is divided into sections. The global section (indicated as [global] ) sets
the program options, clock options and default port options. Other sections are port specific, and
they override the default port options. The name of the section is the name of the configured port
—for example, [eth0] . An empty port section can be used to replace the command line option.
[global]
verbose 1
time_stamping software
[eth0]
The example configuration le is an equivalent of the following command's options:
ptp4l -i eth0 -m -S
For a complete list of ptp4l configuration options, see man 8 ptp4l .
18.2.4 Delay Measurement
ptp4l measures time delay in two different ways: peer-to-peer (P2P) or end-to-end (E2E).
P2P
194 ptp4l Configuration File openSUSE Leap 42.3

This method is specified with -P .
It reacts to changes in the network environment faster and is more accurate in measuring
the delay. It is only used in networks where each port exchanges PTP messages with one
other port. P2P needs to be supported by all hardware on the communication path.
E2E
This method is specified with -E . This is the default.
Automatic method selection
This method is specified with -A . The automatic option starts ptp4l in E2E mode, and
changes to P2P mode if a peer delay request is received.
Important: Common Measurement Method
All clocks on a single PTP communication path must use the same method to measure
the time delay. A warning will be printed if either a peer delay request is received on a
port using the E2E mechanism, or an E2E delay request is received on a port using the
P2P mechanism.
18.2.5 PTP Management Client: pmc
You can use the pmc client to obtain more detailed information about ptp41 . It reads from
the standard input—or from the command line—actions specified by name and management
ID. Then it sends the actions over the selected transport, and prints any received replies. There
are three actions supported: GET retrieves the specified information, SET updates the specified
information, and CMD (or COMMAND ) initiates the specified event.
By default, the management commands are addressed to all ports. The TARGET command can
be used to select a particular clock and port for the subsequent messages. For a complete list
of management IDs, run pmc help .
pmc -u -b 0 'GET TIME_STATUS_NP'
sending: GET TIME_STATUS_NP
90f2ca.fffe.20d7e9-0 seq 0 RESPONSE MANAGMENT TIME_STATUS_NP
master_offset 283
ingress_time 1361569379345936841
cumulativeScaledRateOffset +1.000000000
scaledLastGmPhaseChange 0
gmTimeBaseIndicator 0
lastGmPhaseChange 0x0000'0000000000000000.0000
195 PTP Management Client: pmc openSUSE Leap 42.3

gmPresent true
gmIdentity 00b058.feef.0b448a
The -b option specifies the boundary hops value in sent messages. Setting it to zero limits the
boundary to the local ptp4l instance. Increasing the value will retrieve the messages also from
PTP nodes that are further from the local instance. The returned information may include:
stepsRemoved
The number of communication nodes to the grandmaster clock.
offsetFromMaster, master_offset
The last measured offset of the clock from the master clock (nanoseconds).
meanPathDelay
The estimated delay of the synchronization messages sent from the master clock (nanosec-
onds).
gmPresent
If true , the PTP clock is synchronized to the master clock; the local clock is not the
grandmaster clock.
gmIdentity
This is the grandmaster's identity.
For a complete list of pmc command line options, see man 8 pmc .
18.3 Synchronizing the Clocks with phc2sys
Use phc2sys to synchronize the system clock to the PTP hardware clock (PHC) on the network
card. The system clock is considered a slave, while the network card a master. PHC itself is
synchronized with ptp4l (see Section18.2, “Using PTP”). Use -s to specify the master clock by
device or network interface. Use -w to wait until ptp4l is in a synchronized state.
phc2sys -s eth0 -w
PTP operates in International Atomic Time (TAI), while the system clock uses Coordinated Universal
Time (UTC). If you do not specify -w to wait for ptp4l synchronization, you can specify the
offset in seconds between TAI and UTC with -O :
phc2sys -s eth0 -O -35
196 Synchronizing the Clocks with phc2sys openSUSE Leap 42.3

You can run phc2sys as a service as well:
systemctl start phc2sys
In this case, phc2sys reads its options from the /etc/sysconfig/phc2sys le. For more in-
formation on phc2sys options, see man 8 phc2sys .
To enable the phc2sys service permanently, run the following:
systemctl enable phc2sys
To disable it, run
systemctl dosable phc2sys
18.3.1 Verifying Time Synchronization
When PTP time synchronization is working properly and hardware time stamping is used, ptp4l
and phc2sys output messages with time offsets and frequency adjustments periodically to the
system log.
An example of the ptp4l output:
ptp4l[351.358]: selected /dev/ptp0 as PTP clock
ptp4l[352.361]: port 1: INITIALIZING to LISTENING on INITIALIZE
ptp4l[352.361]: port 0: INITIALIZING to LISTENING on INITIALIZE
ptp4l[353.210]: port 1: new foreign master 00a069.eefe.0b442d-1
ptp4l[357.214]: selected best master clock 00a069.eefe.0b662d
ptp4l[357.214]: port 1: LISTENING to UNCALIBRATED on RS_SLAVE
ptp4l[359.224]: master offset 3304 s0 freq +0 path delay 9202
ptp4l[360.224]: master offset 3708 s1 freq -28492 path delay 9202
ptp4l[361.224]: master offset -3145 s2 freq -32637 path delay 9202
ptp4l[361.224]: port 1: UNCALIBRATED to SLAVE on MASTER_CLOCK_SELECTED
ptp4l[362.223]: master offset -145 s2 freq -30580 path delay 9202
ptp4l[363.223]: master offset 1043 s2 freq -28436 path delay 8972
[...]
ptp4l[371.235]: master offset 285 s2 freq -28511 path delay 9199
ptp4l[372.235]: master offset -78 s2 freq -28788 path delay 9204
An example of the phc2sys output:
phc2sys[616.617]: Waiting for ptp4l...
phc2sys[628.628]: phc offset 66341 s0 freq +0 delay 2729
phc2sys[629.628]: phc offset 64668 s1 freq -37690 delay 2726
197 Verifying Time Synchronization openSUSE Leap 42.3

[...]
phc2sys[646.630]: phc offset -333 s2 freq -37426 delay 2747
phc2sys[646.630]: phc offset 194 s2 freq -36999 delay 2749
ptp4l normally writes messages very frequently. You can reduce the frequency with the sum-
mary_interval directive. Its value is an exponent of the 2^N expression. For example, to reduce
the output to every 1024 (which is equal to 2^10) seconds, add the following line to the /etc/
ptp4l.conf le:
summary_interval 10
You can also reduce the frequency of the phc2sys command's updates with the -u SUMMA-
RY-UPDATES option.
18.4 Examples of Configurations
This section includes several examples of ptp4l configuration. The examples are not full con-
figuration les but rather a minimal list of changes to be made to the specific les. The string
ethX stands for the actual network interface name in your setup.
EXAMPLE18.1:SLAVE CLOCK USING SOFTWARE TIME STAMPING
/etc/sysconfig/ptp4l :
OPTIONS=”-f /etc/ptp4l.conf -i ethX”
No changes made to the distribution /etc/ptp4l.conf .
EXAMPLE18.2:SLAVE CLOCK USING HARDWARE TIME STAMPING
/etc/sysconfig/ptp4l :
OPTIONS=”-f /etc/ptp4l.conf -i ethX”
/etc/sysconfig/phc2sys :
OPTIONS=”-s ethX -w”
No changes made to the distribution /etc/ptp4l.conf .
EXAMPLE18.3:MASTER CLOCK USING HARDWARE TIME STAMPING
/etc/sysconfig/ptp4l :
OPTIONS=”-f /etc/ptp4l.conf -i ethX”
198 Examples of Configurations openSUSE Leap 42.3
/etc/sysconfig/phc2sys :
OPTIONS=”-s CLOCK_REALTIME -c ethX -w”
/etc/ptp4l.conf :
priority1 127
EXAMPLE18.4:MASTER CLOCK USING SOFTWARE TIME STAMPING (NOT GENERALLY RECOMMENDED)
/etc/sysconfig/ptp4l :
OPTIONS=”-f /etc/ptp4l.conf -i ethX”
/etc/ptp4l.conf :
priority1 127
18.5 PTP and NTP
NTP and PTP time synchronization tools can coexist, synchronizing time from one to another
in both directions.
18.5.1 NTP to PTP Synchronization
When ntpd is used to synchronize the local system clock, you can configure the ptp4l to be
the grandmaster clock distributing the time from the local system clock via PTP. Include the
priority1 option in /etc/ptp4l.conf :
[global]
priority1 127
[eth0]
Then run ptp4l :
ptp4l -f /etc/ptp4l.conf
When hardware time stamping is used, you need to synchronize the PTP hardware clock to the
system clock with phc2sys :
phc2sys -c eth0 -s CLOCK_REALTIME -w
199 PTP and NTP openSUSE Leap 42.3
18.5.2 PTP to NTP Synchronization
You can configure ntpd to distribute the time from the system clock synchronized by ptp4l
or phc2sys by using the local reference clock driver. Moreover, you need to stop ntpd from
adjusting the system clock—do not specify any remote NTP servers in /etc/ntp.conf :
server 127.127.1.0
fudge 127.127.1.0 stratum 0
Note: NTP and DHCP
When the DHCP client command dhclient receives a list of NTP servers, it adds them
to NTP configuration by default. To prevent this behavior, set
NETCONFIG_NTP_POLICY=""
in the /etc/sysconfig/network/config le.
200 PTP to NTP Synchronization openSUSE Leap 42.3
AGNU Licenses
This appendix contains the GNU Free Docu-
mentation License version 1.2.
GNU Free Documentation License
Copyright (C) 2000, 2001, 2002 Free Software Foundation, Inc. 51 Franklin St, Fifth Floor,
Boston, MA 02110-1301 USA. Everyone is permitted to copy and distribute verbatim copies
of this license document, but changing it is not allowed.
0. PREAMBLE
The purpose of this License is to make a manual, textbook, or other functional and useful
document "free" in the sense of freedom: to assure everyone the effective freedom to copy
and redistribute it, with or without modifying it, either commercially or non-commercially.
Secondarily, this License preserves for the author and publisher a way to get credit for their
work, while not being considered responsible for modifications made by others.
This License is a kind of "copyleft", which means that derivative works of the document must
themselves be free in the same sense. It complements the GNU General Public License, which
is a copyleft license designed for free software.
We have designed this License to use it for manuals for free software, because free software
needs free documentation: a free program should come with manuals providing the same
freedoms that the software does. But this License is not limited to software manuals; it can
be used for any textual work, regardless of subject matter or whether it is published as a
printed book. We recommend this License principally for works whose purpose is instruction
or reference.
1. APPLICABILITY AND DEFINITIONS
This License applies to any manual or other work, in any medium, that contains a notice placed
by the copyright holder saying it can be distributed under the terms of this License. Such a
notice grants a world-wide, royalty-free license, unlimited in duration, to use that work under
the conditions stated herein. The "Document", below, refers to any such manual or work. Any
member of the public is a licensee, and is addressed as "you". You accept the license if you
copy, modify or distribute the work in a way requiring permission under copyright law.
A "Modified Version" of the Document means any work containing the Document or a portion
of it, either copied verbatim, or with modifications and/or translated into another language.
A "Secondary Section" is a named appendix or a front-matter section of the Document that
deals exclusively with the relationship of the publishers or authors of the Document to the
Document's overall subject (or to related matters) and contains nothing that could fall directly
within that overall subject. (Thus, if the Document is in part a textbook of mathematics, a
Secondary Section may not explain any mathematics.) The relationship could be a matter
of historical connection with the subject or with related matters, or of legal, commercial,
philosophical, ethical or political position regarding them.
The "Invariant Sections" are certain Secondary Sections whose titles are designated, as being
those of Invariant Sections, in the notice that says that the Document is released under this
License. If a section does not t the above definition of Secondary then it is not allowed to be
designated as Invariant. The Document may contain zero Invariant Sections. If the Document
does not identify any Invariant Sections then there are none.
The "Cover Texts" are certain short passages of text that are listed, as Front-Cover Texts or
Back-Cover Texts, in the notice that says that the Document is released under this License. A
Front-Cover Text may be at most 5 words, and a Back-Cover Text may be at most 25 words.
A "Transparent" copy of the Document means a machine-readable copy, represented in a for-
mat whose specification is available to the general public, that is suitable for revising the doc-
ument straightforwardly with generic text editors or (for images composed of pixels) generic
paint programs or (for drawings) some widely available drawing editor, and that is suitable
for input to text formatters or for automatic translation to a variety of formats suitable for
input to text formatters. A copy made in an otherwise Transparent le format whose markup,
or absence of markup, has been arranged to thwart or discourage subsequent modification
by readers is not Transparent. An image format is not Transparent if used for any substantial
amount of text. A copy that is not "Transparent" is called "Opaque".
Examples of suitable formats for Transparent copies include plain ASCII without markup, Tex-
info input format, LaTeX input format, SGML or XML using a publicly available DTD, and stan-
dard-conforming simple HTML, PostScript or PDF designed for human modification. Examples
of transparent image formats include PNG, XCF and JPG. Opaque formats include proprietary
formats that can be read and edited only by proprietary word processors, SGML or XML for
which the DTD and/or processing tools are not generally available, and the machine-generat-
ed HTML, PostScript or PDF produced by some word processors for output purposes only.
The "Title Page" means, for a printed book, the title page itself, plus such following pages as
are needed to hold, legibly, the material this License requires to appear in the title page. For
works in formats which do not have any title page as such, "Title Page" means the text near the
most prominent appearance of the work's title, preceding the beginning of the body of the text.
A section "Entitled XYZ" means a named subunit of the Document whose title either is precisely
XYZ or contains XYZ in parentheses following text that translates XYZ in another language.
(Here XYZ stands for a specific section name mentioned below, such as "Acknowledgements",
"Dedications", "Endorsements", or "History".) To "Preserve the Title" of such a section when
you modify the Document means that it remains a section "Entitled XYZ" according to this
definition.
The Document may include Warranty Disclaimers next to the notice which states that this
License applies to the Document. These Warranty Disclaimers are considered to be included
by reference in this License, but only as regards disclaiming warranties: any other implication
that these Warranty Disclaimers may have is void and has no effect on the meaning of this
License.
2. VERBATIM COPYING
You may copy and distribute the Document in any medium, either commercially or non-
commercially, provided that this License, the copyright notices, and the license notice saying
this License applies to the Document are reproduced in all copies, and that you add no other
conditions whatsoever to those of this License. You may not use technical measures to obstruct
or control the reading or further copying of the copies you make or distribute. However, you
may accept compensation in exchange for copies. If you distribute a large enough number of
copies you must also follow the conditions in section 3.
You may also lend copies, under the same conditions stated above, and you may publicly
display copies.
3. COPYING IN QUANTITY
If you publish printed copies (or copies in media that commonly have printed covers) of the
Document, numbering more than 100, and the Document's license notice requires Cover Texts,
you must enclose the copies in covers that carry, clearly and legibly, all these Cover Texts:
Front-Cover Texts on the front cover, and Back-Cover Texts on the back cover. Both covers
must also clearly and legibly identify you as the publisher of these copies. The front cover
must present the full title with all words of the title equally prominent and visible. You may
add other material on the covers in addition. Copying with changes limited to the covers, as
long as they preserve the title of the Document and satisfy these conditions, can be treated
as verbatim copying in other respects.
If the required texts for either cover are too voluminous to t legibly, you should put the
rst ones listed (as many as t reasonably) on the actual cover, and continue the rest onto
adjacent pages.
If you publish or distribute Opaque copies of the Document numbering more than 100, you
must either include a machine-readable Transparent copy along with each Opaque copy, or
state in or with each Opaque copy a computer-network location from which the general net-
work-using public has access to download using public-standard network protocols a complete
Transparent copy of the Document, free of added material. If you use the latter option, you
must take reasonably prudent steps, when you begin distribution of Opaque copies in quanti-
ty, to ensure that this Transparent copy will remain thus accessible at the stated location until
at least one year after the last time you distribute an Opaque copy (directly or through your
agents or retailers) of that edition to the public.
It is requested, but not required, that you contact the authors of the Document well before
redistributing any large number of copies, to give them a chance to provide you with an
updated version of the Document.
201 openSUSE Leap 42.3
4. MODIFICATIONS
You may copy and distribute a Modified Version of the Document under the conditions of
sections 2 and 3 above, provided that you release the Modified Version under precisely this
License, with the Modified Version filling the role of the Document, thus licensing distribution
and modification of the Modified Version to whoever possesses a copy of it. In addition, you
must do these things in the Modified Version:
A. Use in the Title Page (and on the covers, if any) a title distinct from that of the
Document, and from those of previous versions (which should, if there were any,
be listed in the History section of the Document). You may use the same title as a
previous version if the original publisher of that version gives permission.
B. List on the Title Page, as authors, one or more persons or entities responsible for
authorship of the modifications in the Modified Version, together with at least ve
of the principal authors of the Document (all of its principal authors, if it has fewer
than ve), unless they release you from this requirement.
C. State on the Title page the name of the publisher of the Modified Version, as the
publisher.
D. Preserve all the copyright notices of the Document.
E. Add an appropriate copyright notice for your modifications adjacent to the other
copyright notices.
F. Include, immediately after the copyright notices, a license notice giving the public
permission to use the Modified Version under the terms of this License, in the form
shown in the Addendum below.
G. Preserve in that license notice the full lists of Invariant Sections and required Cover
Texts given in the Document's license notice.
H. Include an unaltered copy of this License.
I. Preserve the section Entitled "History", Preserve its Title, and add to it an item
stating at least the title, year, new authors, and publisher of the Modified Version
as given on the Title Page. If there is no section Entitled "History" in the Document,
create one stating the title, year, authors, and publisher of the Document as given
on its Title Page, then add an item describing the Modified Version as stated in
the previous sentence.
J. Preserve the network location, if any, given in the Document for public access to
a Transparent copy of the Document, and likewise the network locations given in
the Document for previous versions it was based on. These may be placed in the
"History" section. You may omit a network location for a work that was published
at least four years before the Document itself, or if the original publisher of the
version it refers to gives permission.
K. For any section Entitled "Acknowledgements" or "Dedications", Preserve the Title
of the section, and preserve in the section all the substance and tone of each of the
contributor acknowledgements and/or dedications given therein.
L. Preserve all the Invariant Sections of the Document, unaltered in their text and
in their titles. Section numbers or the equivalent are not considered part of the
section titles.
M. Delete any section Entitled "Endorsements". Such a section may not be included
in the Modified Version.
N. Do not retitle any existing section to be Entitled "Endorsements" or to conflict in
title with any Invariant Section.
O. Preserve any Warranty Disclaimers.
If the Modified Version includes new front-matter sections or appendices that qualify as Se-
condary Sections and contain no material copied from the Document, you may at your option
designate some or all of these sections as invariant. To do this, add their titles to the list of
Invariant Sections in the Modified Version's license notice. These titles must be distinct from
any other section titles.
You may add a section Entitled "Endorsements", provided it contains nothing but endorse-
ments of your Modified Version by various parties--for example, statements of peer review
or that the text has been approved by an organization as the authoritative definition of a
standard.
You may add a passage of up to ve words as a Front-Cover Text, and a passage of up to 25
words as a Back-Cover Text, to the end of the list of Cover Texts in the Modified Version. Only
one passage of Front-Cover Text and one of Back-Cover Text may be added by (or through
arrangements made by) any one entity. If the Document already includes a cover text for the
same cover, previously added by you or by arrangement made by the same entity you are
acting on behalf of, you may not add another; but you may replace the old one, on explicit
permission from the previous publisher that added the old one.
The author(s) and publisher(s) of the Document do not by this License give permission to use
their names for publicity for or to assert or imply endorsement of any Modified Version.
5. COMBINING DOCUMENTS
You may combine the Document with other documents released under this License, under
the terms defined in section 4 above for modified versions, provided that you include in the
combination all of the Invariant Sections of all of the original documents, unmodified, and
list them all as Invariant Sections of your combined work in its license notice, and that you
preserve all their Warranty Disclaimers.
The combined work need only contain one copy of this License, and multiple identical Invari-
ant Sections may be replaced with a single copy. If there are multiple Invariant Sections with
the same name but different contents, make the title of each such section unique by adding
at the end of it, in parentheses, the name of the original author or publisher of that section if
known, or else a unique number. Make the same adjustment to the section titles in the list of
Invariant Sections in the license notice of the combined work.
In the combination, you must combine any sections Entitled "History" in the various original
documents, forming one section Entitled "History"; likewise combine any sections Entitled
"Acknowledgements", and any sections Entitled "Dedications". You must delete all sections
Entitled "Endorsements".
6. COLLECTIONS OF DOCUMENTS
You may make a collection consisting of the Document and other documents released under
this License, and replace the individual copies of this License in the various documents with a
single copy that is included in the collection, provided that you follow the rules of this License
for verbatim copying of each of the documents in all other respects.
You may extract a single document from such a collection, and distribute it individually under
this License, provided you insert a copy of this License into the extracted document, and follow
this License in all other respects regarding verbatim copying of that document.
7. AGGREGATION WITH INDEPENDENT WORKS
A compilation of the Document or its derivatives with other separate and independent docu-
ments or works, in or on a volume of a storage or distribution medium, is called an "aggregate"
if the copyright resulting from the compilation is not used to limit the legal rights of the com-
pilation's users beyond what the individual works permit. When the Document is included in
an aggregate, this License does not apply to the other works in the aggregate which are not
themselves derivative works of the Document.
If the Cover Text requirement of section 3 is applicable to these copies of the Document, then
if the Document is less than one half of the entire aggregate, the Document's Cover Texts
may be placed on covers that bracket the Document within the aggregate, or the electronic
equivalent of covers if the Document is in electronic form. Otherwise they must appear on
printed covers that bracket the whole aggregate.
8. TRANSLATION
Translation is considered a kind of modification, so you may distribute translations of the
Document under the terms of section 4. Replacing Invariant Sections with translations requires
special permission from their copyright holders, but you may include translations of some
or all Invariant Sections in addition to the original versions of these Invariant Sections. You
may include a translation of this License, and all the license notices in the Document, and
any Warranty Disclaimers, provided that you also include the original English version of this
License and the original versions of those notices and disclaimers. In case of a disagreement
between the translation and the original version of this License or a notice or disclaimer, the
original version will prevail.
If a section in the Document is Entitled "Acknowledgements", "Dedications", or "History", the
requirement (section 4) to Preserve its Title (section 1) will typically require changing the
actual title.
9. TERMINATION
You may not copy, modify, sublicense, or distribute the Document except as expressly pro-
vided for under this License. Any other attempt to copy, modify, sublicense or distribute the
Document is void, and will automatically terminate your rights under this License. However,
parties who have received copies, or rights, from you under this License will not have their
licenses terminated so long as such parties remain in full compliance.
202 openSUSE Leap 42.3

10. FUTURE REVISIONS OF THIS LICENSE
The Free Software Foundation may publish new, revised versions of the GNU Free Documen-
tation License from time to time. Such new versions will be similar in spirit to the present
version, but may differ in detail to address new problems or concerns. See http://www.gnu.org/
copyleft/ .
Each version of the License is given a distinguishing version number. If the Document specifies
that a particular numbered version of this License "or any later version" applies to it, you have
the option of following the terms and conditions either of that specified version or of any
later version that has been published (not as a draft) by the Free Software Foundation. If the
Document does not specify a version number of this License, you may choose any version ever
published (not as a draft) by the Free Software Foundation.
ADDENDUM: How to use this License for your documents
Copyright (c) YEAR YOUR NAME.
Permission is granted to copy, distribute
and/or modify this document
under the terms of the GNU Free
Documentation License, Version 1.2
or any later version published by the Free
Software Foundation;
with no Invariant Sections, no Front-Cover
Texts, and no Back-Cover Texts.
A copy of the license is included in the
section entitled “GNU
Free Documentation License”.
If you have Invariant Sections, Front-Cover Texts and Back-Cover Texts, replace the
“with...Texts.” line with this:
with the Invariant Sections being LIST
THEIR TITLES, with the
Front-Cover Texts being LIST, and with the
Back-Cover Texts being LIST.
If you have Invariant Sections without Cover Texts, or some other combination of the three,
merge those two alternatives to suit the situation.
If your document contains nontrivial examples of program code, we recommend releasing
these examples in parallel under your choice of free software license, such as the GNU General
Public License, to permit their use in free software.
203 openSUSE Leap 42.3
