Microsoft UWIG_Economicsx AW 7720/00 UWIG Economics
User Manual: AW 7720/00
Open the PDF directly: View PDF ![]() .
.
Page Count: 28
Distributed Renewable Economics
5/23/2013
1
Economics of Distributed
Renewable Projects
Wind Interconnection Workshop
Golden, CO
May 22, 2013
Tom McDermott, tom@meltran.com
MelTran, Inc.
2
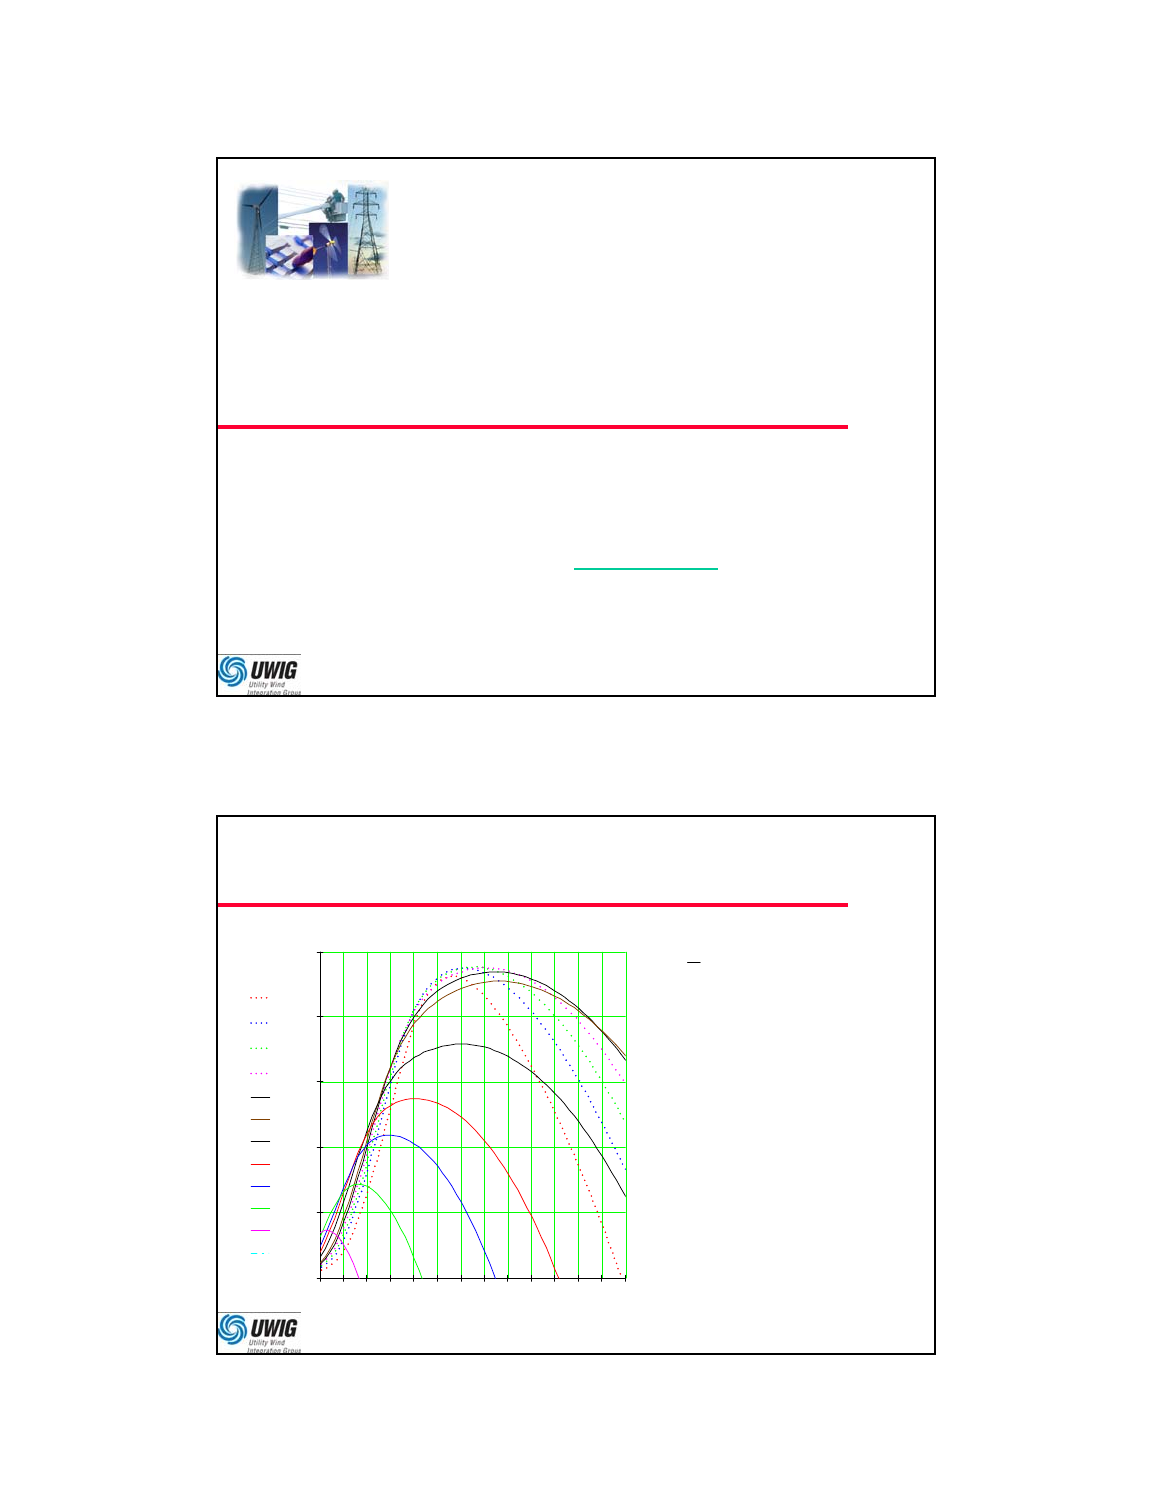
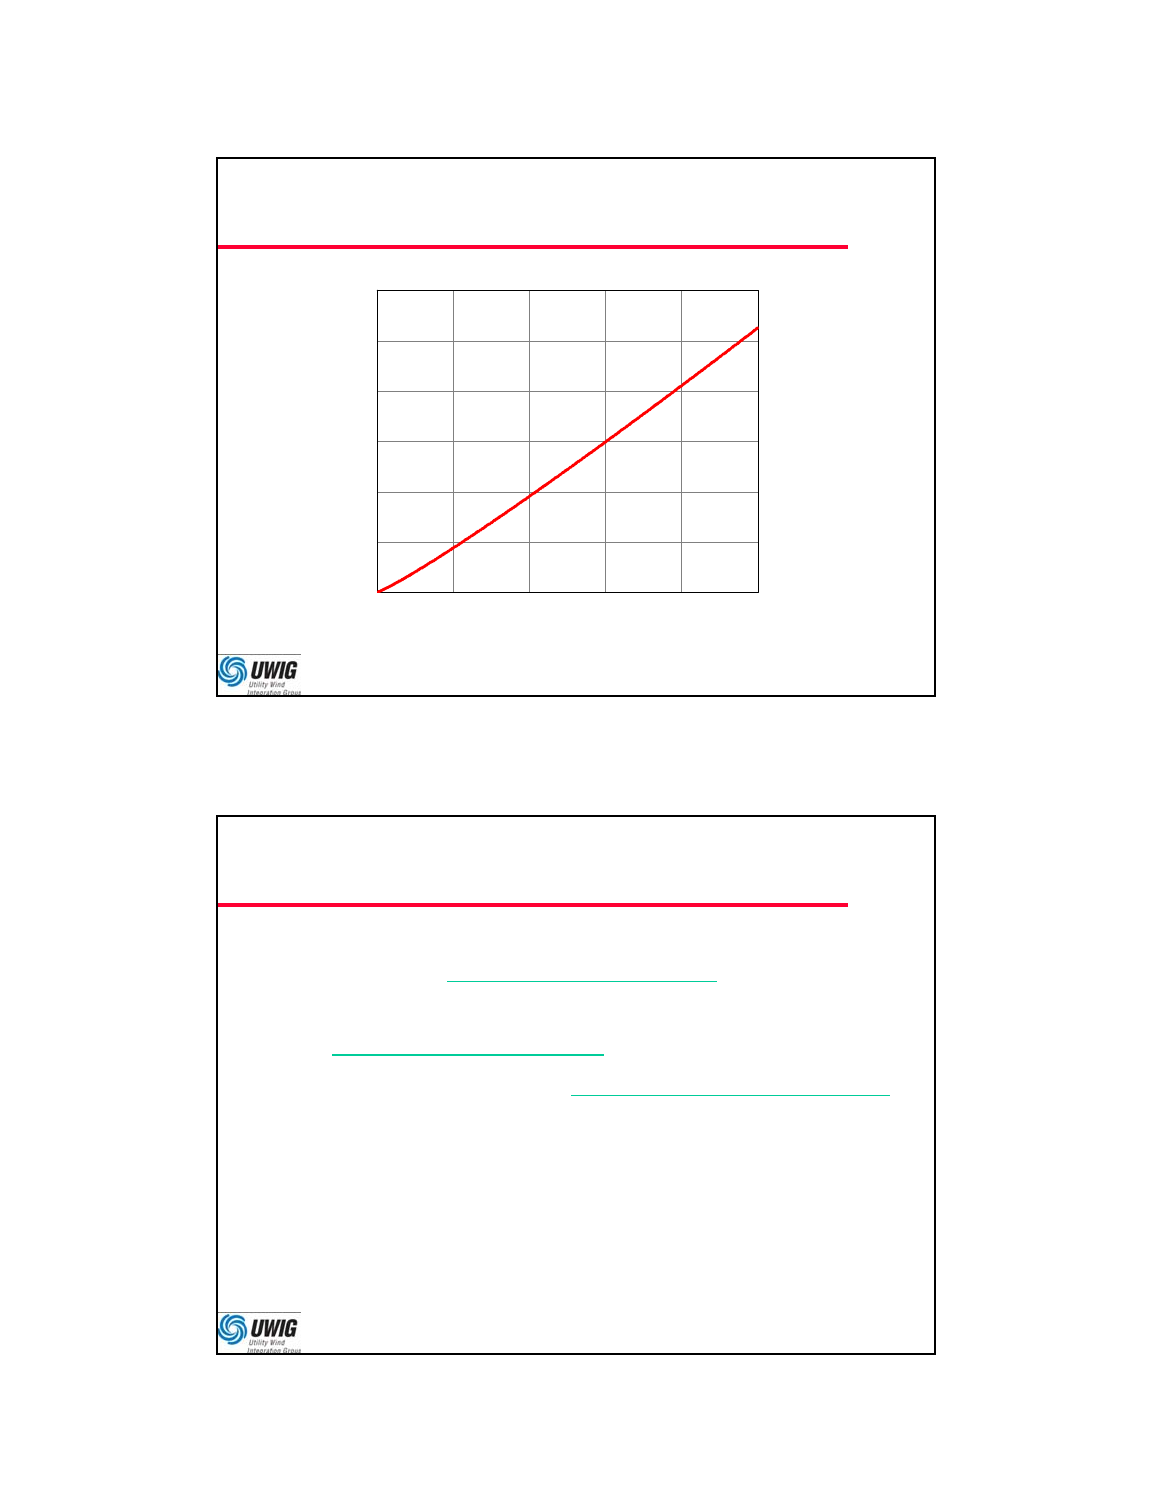
Power Wind Speed Cubed
= relative air density
R = swept area radius
v = wind speed
Cp= coefficient of
performance
G= generator eff.
B= bearings/gearbox eff.
-k= tip speed ratio
2 3 4 5 6 7 8 9 10 11 12 13 14 15
0.1
0.2
0.3
0.4
0.5
0.5
0
Cp-k4
Cp-k2
Cp-k1
Cp-k0
Cp-k1
Cp-k2
Cp-k5
Cp-k7.6
Cp-k10
Cp-k15
Cp-k25
Cp-k45
152 -
k
BGp
CRP
32
2
1
Distributed Renewable Economics
5/23/2013
2
3
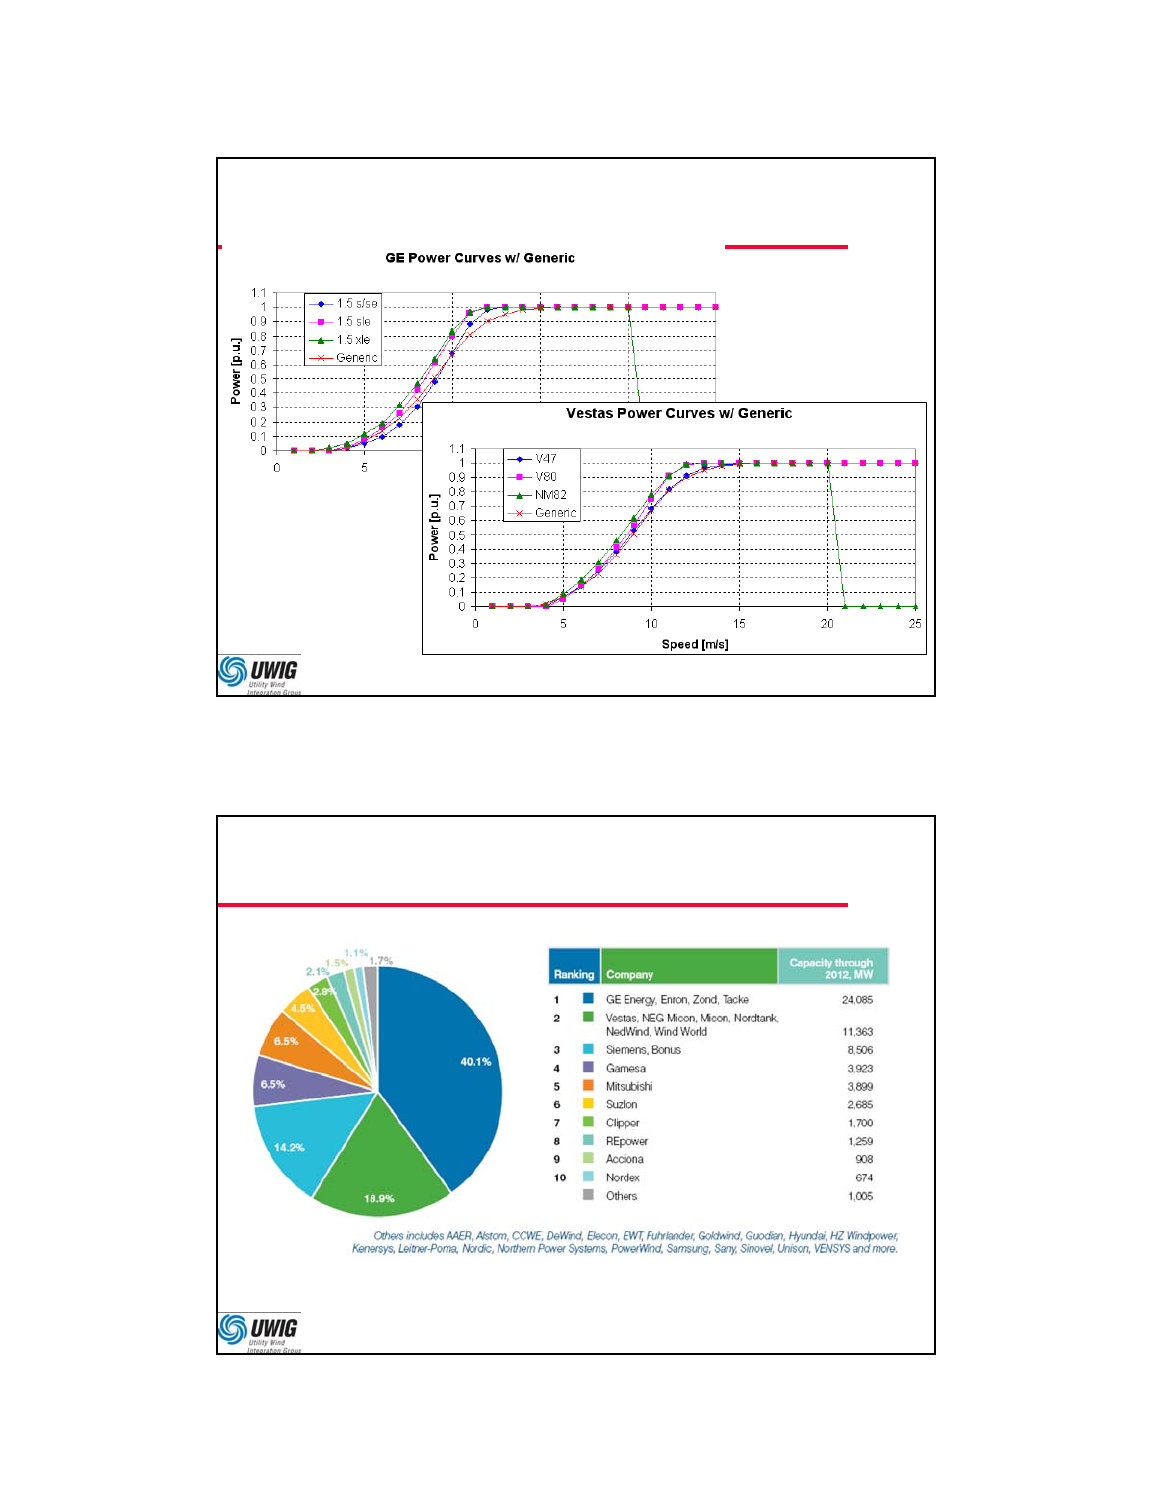
Sample WTG Power Curves
4
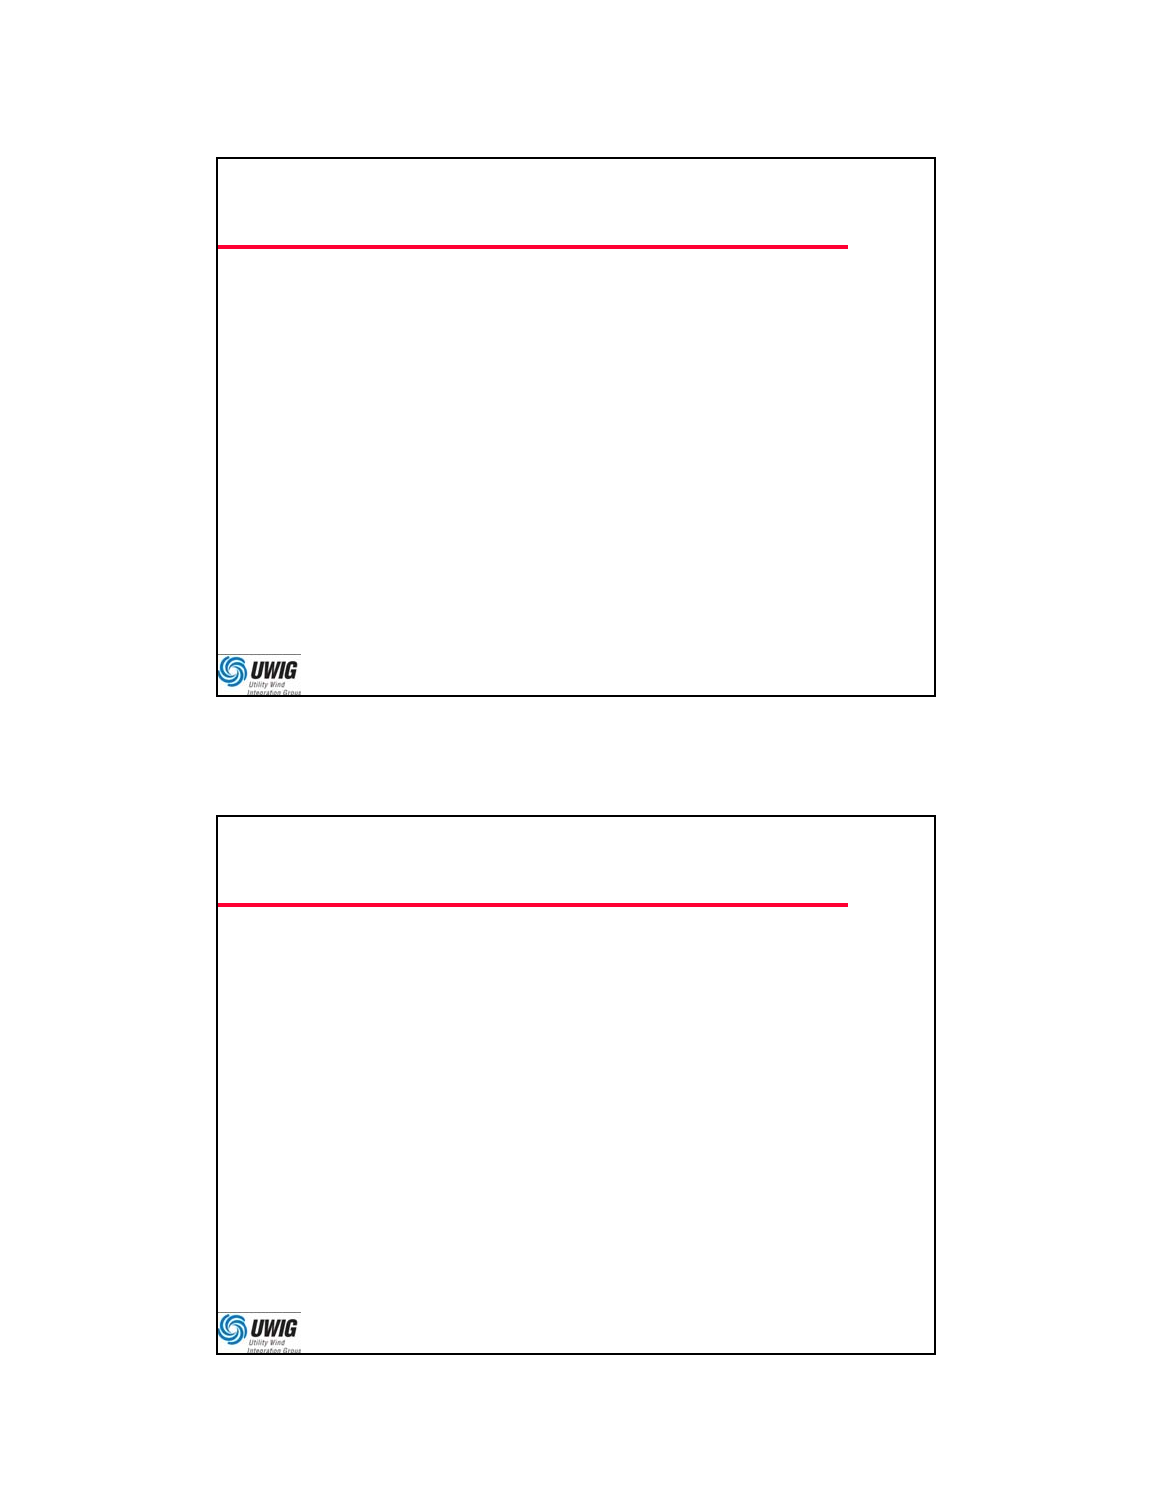
Top Turbine Suppliers
Source: AWEA 2012 Executive Summary Report

Distributed Renewable Economics
5/23/2013
3
5
Turbine Power Curve Library
Model kW Model kW Model kW
Acciona AW77 / 1500 1500 Gamesa G52-850 850 Northwind 100/19 100
AOC 15/50 65 Gamesa G80-2.0 2000 Northwind 100/20 100
Clipper C100 / 2500 2500 Gamesa G83-2.0 2000 NorthWind 100/21 100
Clipper C89 / 2500 2500 Gamesa G87-2.0 2000 RePower MD77 / 1500 1500
Clipper C93 / 2500 2500 GE 1.5 s/se 1500 RePower MM70 / 2000 2000
Clipper C96 / 2500 2500 GE 1.5 sle 1500 RePower MM82 / 2000 2000
Entegrity EW15 / 65 65 GE 1.5 xle 1500 RePower MM92 / 2000 2000
Fuhrlander 1500/70 1500 GE 2.5 xl 2500 Suzlon S64 / 1250 1250
Fuhrlander 1500/77 1500 MWT 92 / 2400 2400 Suzlon S64 / 950 950
Fuhrlander 2500/100 2500 MWT 95 / 2400 2400 Suzlon S66 / 1250 1250
Fuhrlander 2500/80 2500 NEG Micon 48 / 750 750 Suzlon S88 / 2100 2100
Fuhrlander 2500/90 2500 NEG Micon 52 / 900 900 SWT-1.3-62 1300
Fuhrlander FL100 100 NEG Micon 54 / 950 950 SWT-2.3-82 2300
Fuhrlander FL1250 1250 NEG Micon 72 / 1500 1500 Vestas NM82 / 1650 1650
Fuhrlander FL250 250 Nordex N100 / 2500 2500 Vestas V15 / 75 75
Fuhrlander FL30 30 Nordex N60 / 1300 1300 Vestas V27 / 225 225
Fuhrlander FL600 600 Nordex N80 / 2500 2500 Vestas V47 / 650 660
Fuhrlander MD 70 / 1500 1500 Nordex N90 / 2300 2300 Vestas V80 / 1800 1800
Fuhrlander MD 77 / 1500 1500 Nordex S70 / 1500 1500 Vestas V90-3.0 / 3000 3000
Nordex S77 / 1500 1500
Wind Production
Distributed Renewable Economics
5/23/2013
4
7
Distributed Wind Economics
•Capacity Factor: Determines Energy Production
•Look at Wind as an Energy Source, not Capacity
•Tax Incentives: Enhance the cash flow
– Production Tax Credit (PTC)
– Clean Renewable Energy Bonds (CREB)
•Grants and other incentives may be available
•Plus the usual considerations
– Debt and Equity financing
– Insurance, O&M, tax requirements
– Evaluate by net present value (NPV), internal rate of return (IRR),
payback period, etc.
8
Economic Screening Applet
•Based on NREL’s WindFinance
– http://analysis.nrel.gov/windfinance/login.asp
•UWIG Added:
– Power Curve download for the Feeder Simulator
– Sensitivity Analysis: 1 output vs. 2 inputs
– Almost 60 Power Curves
– Temperature Effect on Air Density
– Grant Effect on PTC and Depreciation
Distributed Renewable Economics
5/23/2013
5
9
Economics: Base Case
•7 Input
Screens
•Saves Data
on the
Server
•Sample
Files on the
Server
10
Wind Cost Guidelines
•Capital: $2.2 (+/- 50%) million per MW capacity
•O&M: either $15-25/kW, or $0.005-0.01/kwhr
•Site Royalty: either $2.5-4.0 thousand per MW, or
3% of annual revenues
•Insurance: 0.25-1.0% of capital cost, annually
•Property Tax: check state and local laws
•Local Incentives: enter a Grant Percentage under
“Financing Assumptions”
Distributed Renewable Economics
5/23/2013
6
11
Wind Capacity Factor
•Energy = CF * (8760 hrs/yr) * (kW rating)
•Wind speeds are variable
– Power depends on speed3
– Actual site measurements are best
•Electrical power output depends on the turbine
and interface design
– Complicated function of aerodynamics and controls
– Controls are generally considered proprietary
12
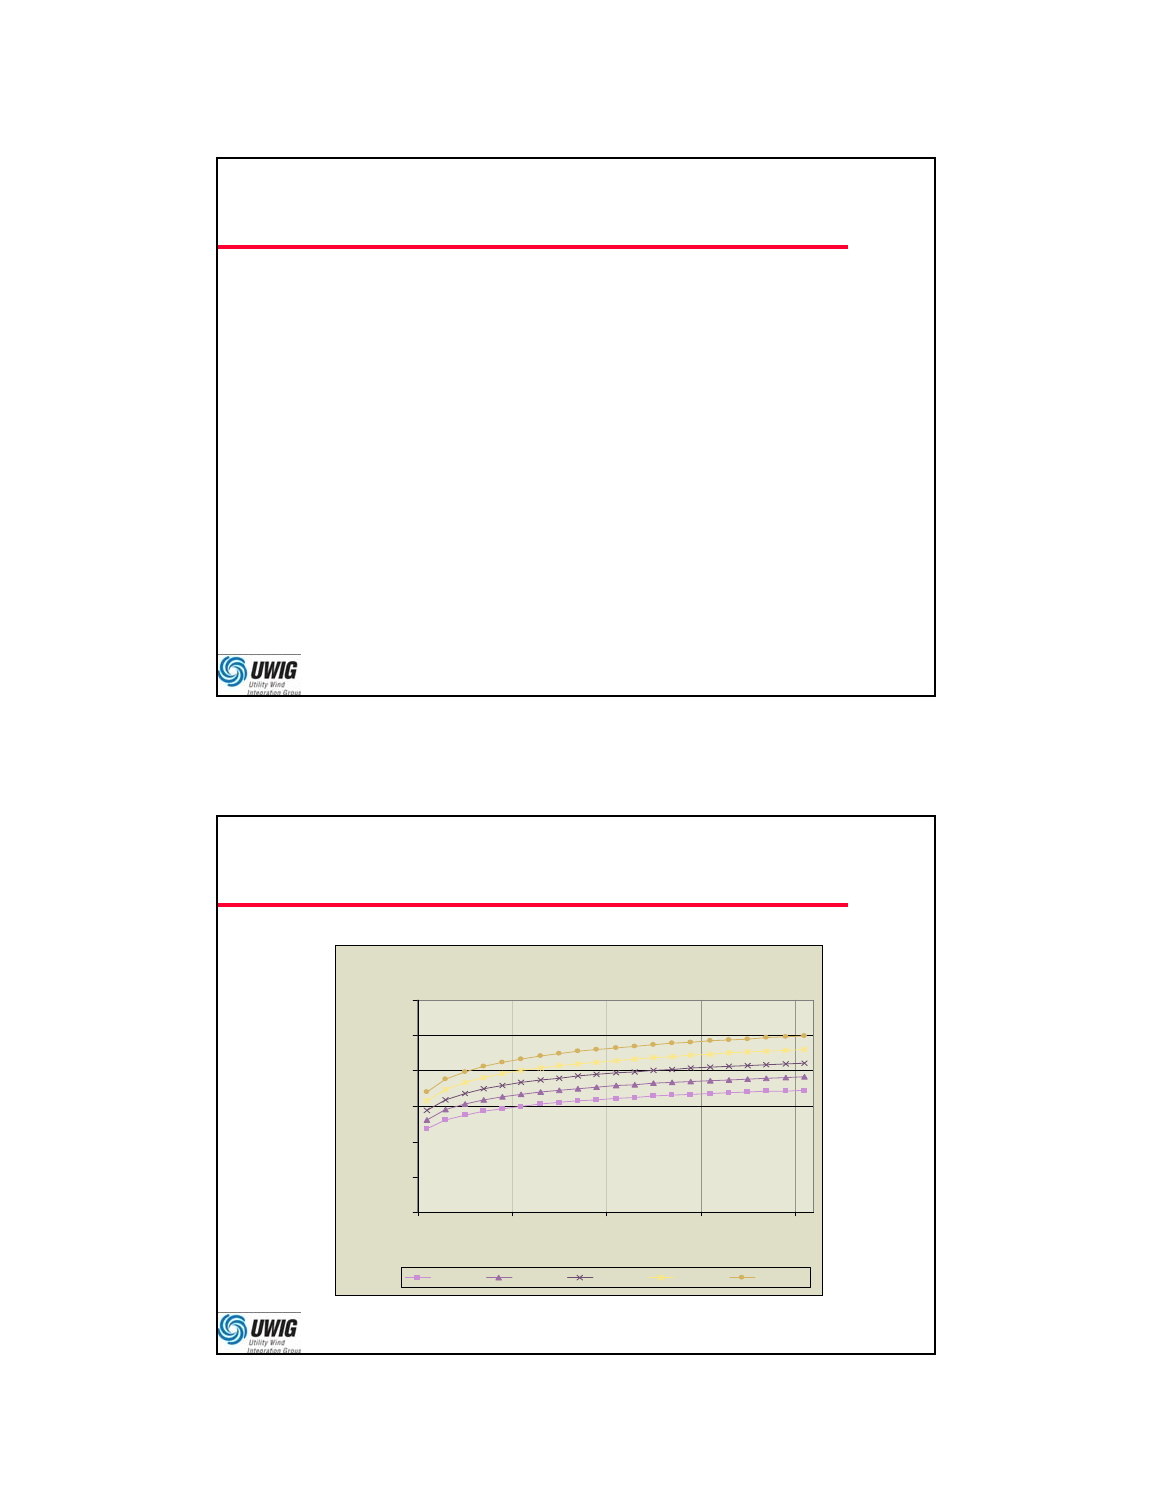
Wind Capacity Factor Projections
Capacity Factor by Installed Year and Wind Class
0.00
10.00
20.00
30.00
40.00
50.00
60.00
2000 2005 2010 2015 2020
Installed Year
Capacity Factor
Class 3 Class 4 Class 5 Class 6 Class 7
Distributed Renewable Economics
5/23/2013
7
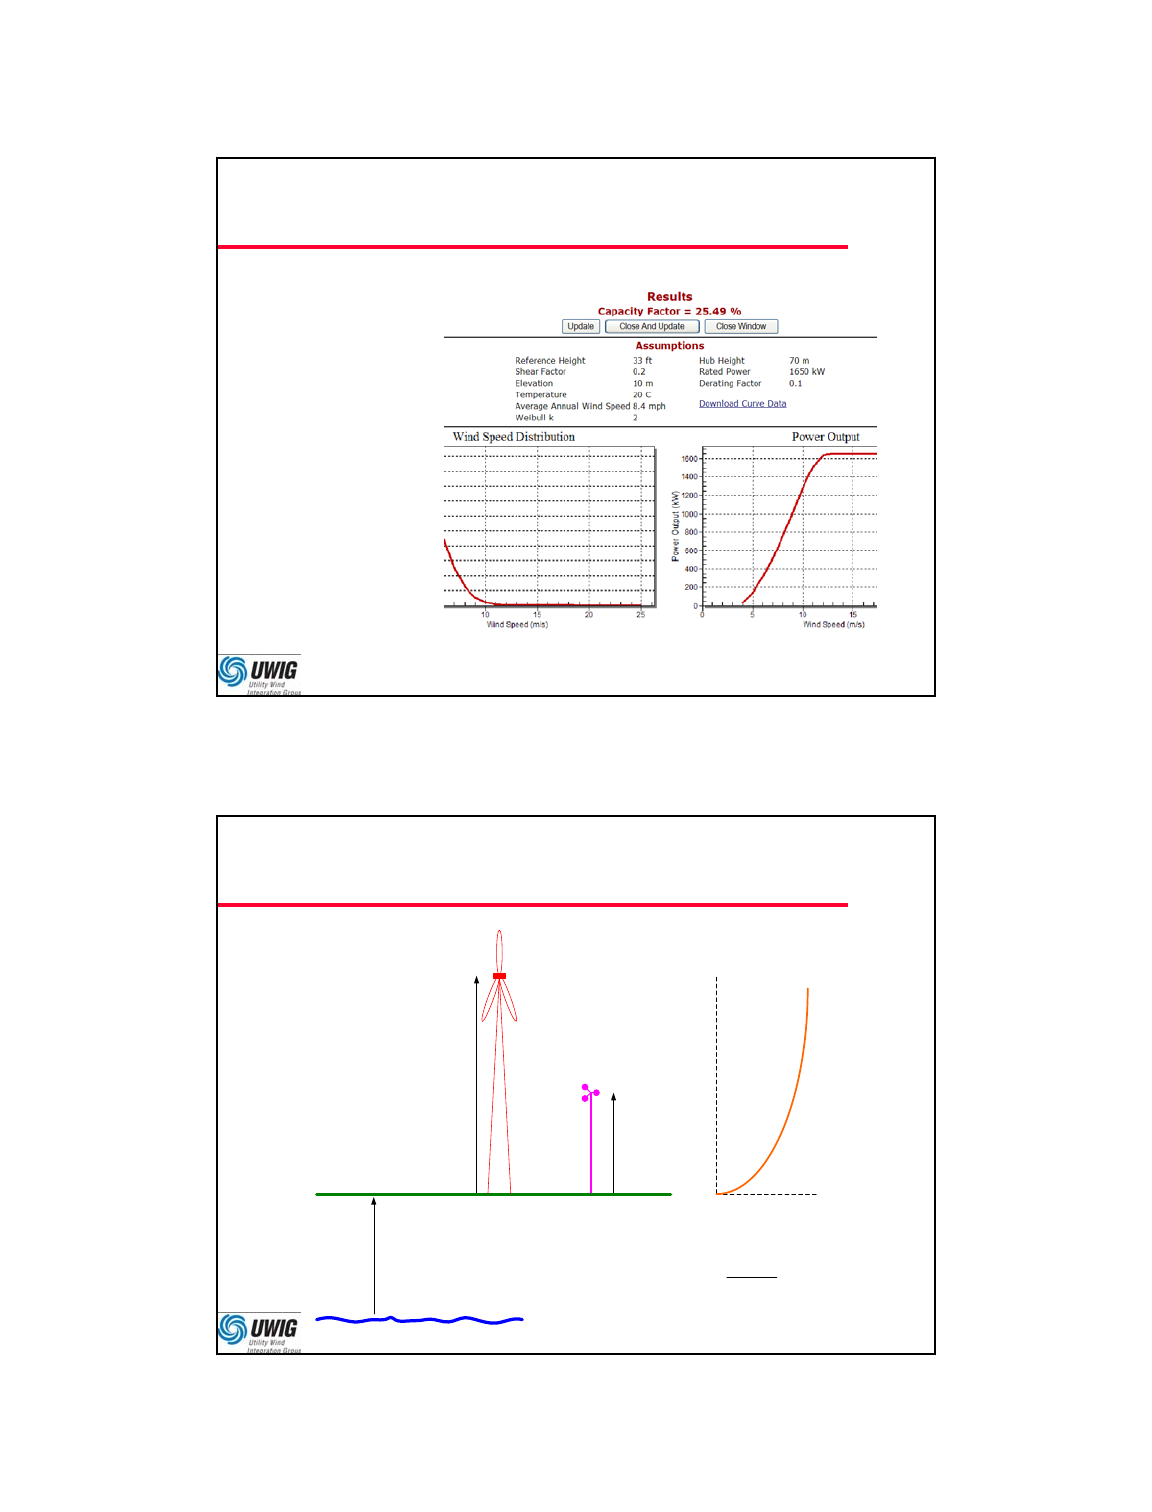
13
Wind Capacity Factor Module
•Wind Data:
– Actual Measured
Distribution
– Measured Average
Annual Speed
– Average Annual
Speed from a Map
•Power Curve:
– Specific
» From Library
» Uploaded
– Generic
14
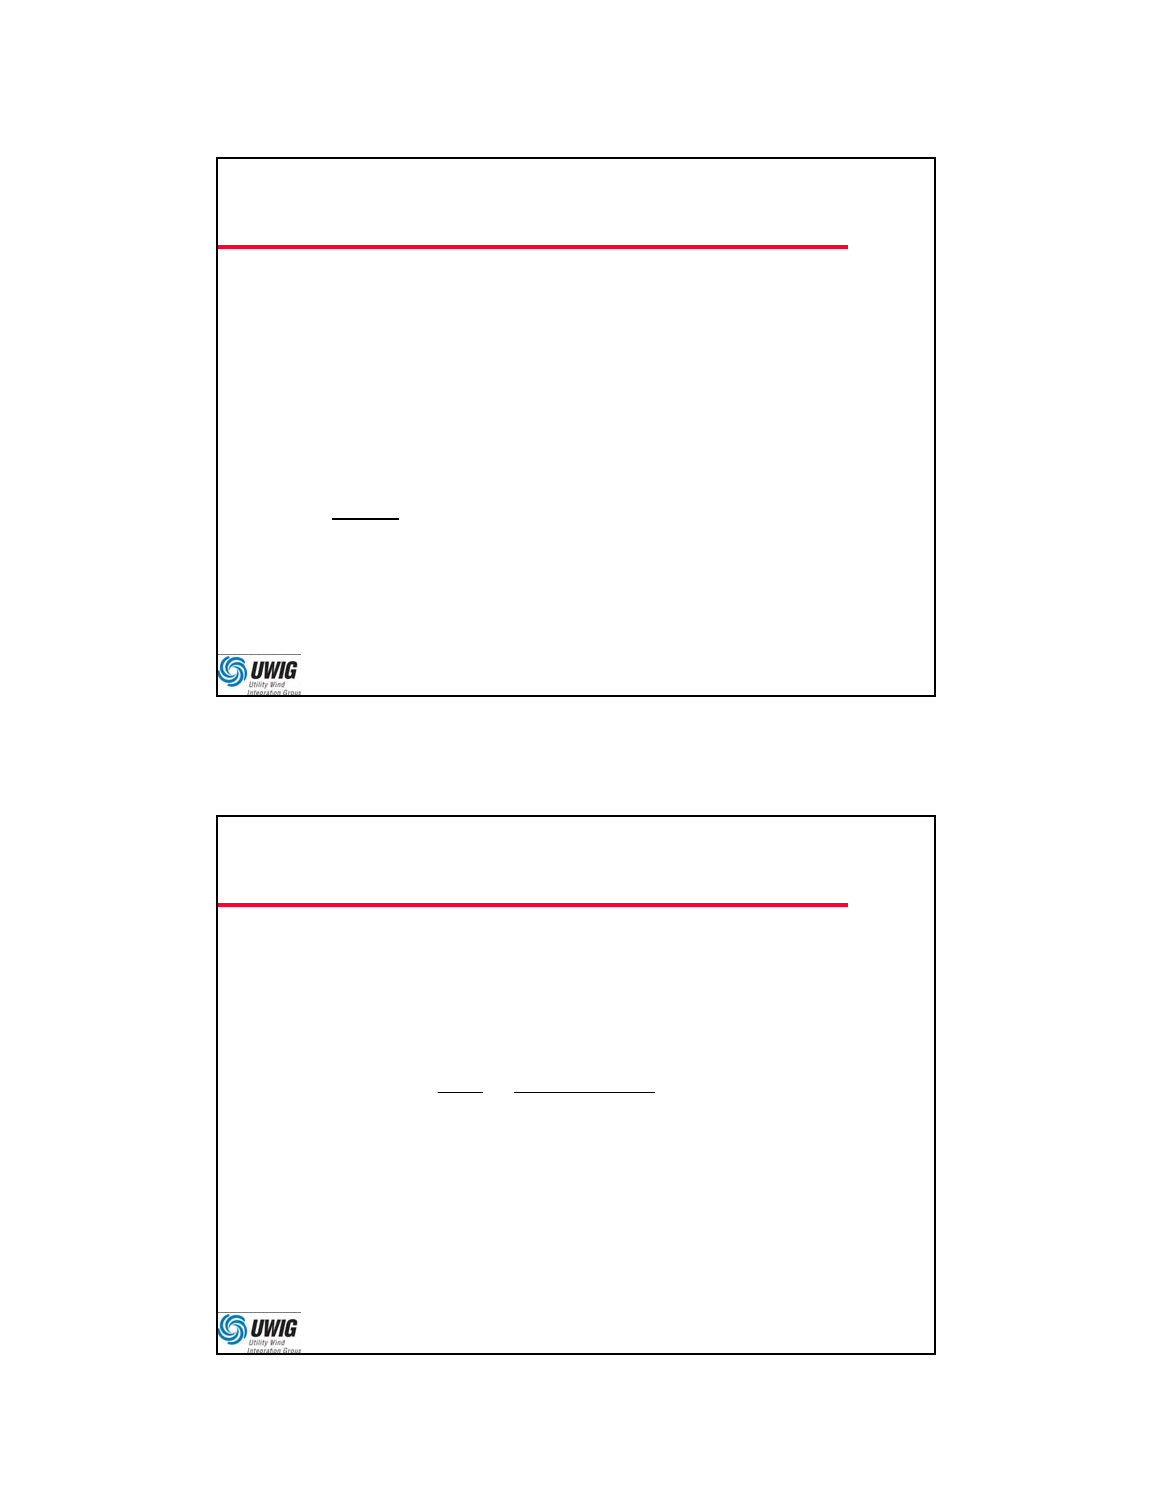
Heights, Elevation, and Shear Factor
Elevation (A) [km]
exp( /8.6)A
Wind Speed
Height
Shear
hub
hub ref
ref
H
VV
H
Hhub
Relative Air Density: Href
Distributed Renewable Economics
5/23/2013
8
15
Shear Factor Guidelines
•0.10 Water
•0.14 Low grass or steppe
•0.20 Rural with obstacles
•0.25 Suburbs and woodlands
•Measurements at 100 m reference height can look
much better than at 50 m reference height
16
Relative Air Density
•Power Curves are for standard 1.225 kg/m3
– Elevation is 0 m, Temperature 15 °C or 288.15 °K
•Correction for Elevation only:
5.2588
288.15 0.0065
1.225 288.15
h
•m) = 1.000
•m) = 0.887
•“Lapse Temperature” at 1000 m is 281.65 °K
•Earlier version used 4.256 exponent
–m) = 0.9074

Distributed Renewable Economics
5/23/2013
9
17
Effect of Temperature w/ Elevation
•Correction for both Elevation and Temperature:
exp
1.225
o
P
gh
R
TRT
•P0=101325, R=287.05, g=9.80665, T=273.15 + °C:
288.15exp 29.271
h
TT
Example T = 0 °C T = 15 °C
h = 0 m 1.0549 1.0000
h = 1000 m 0.9309 0.8882
18
www.windpoweringamerica.gov/pdfs/wind_maps/us_windmap.pdf
Distributed Renewable Economics
5/23/2013
10
19
Wind Capacity Factor Data Sources
•Wind Speeds
– www.nrel.gov/wind/resource_assessment.html
– Links to state maps, or national map if no state map
•Elevation
– earth.google.com (requires a download)
– www.earthtools.org (no download)
•Temperature
– www.weatherbase.com (by month)
•Turbine Power Curves
– Google for the vendor’s brochure
– www.inl.gov/wind/software/ (Excel spreadsheets)
Solar Production
Distributed Renewable Economics
5/23/2013
11
21
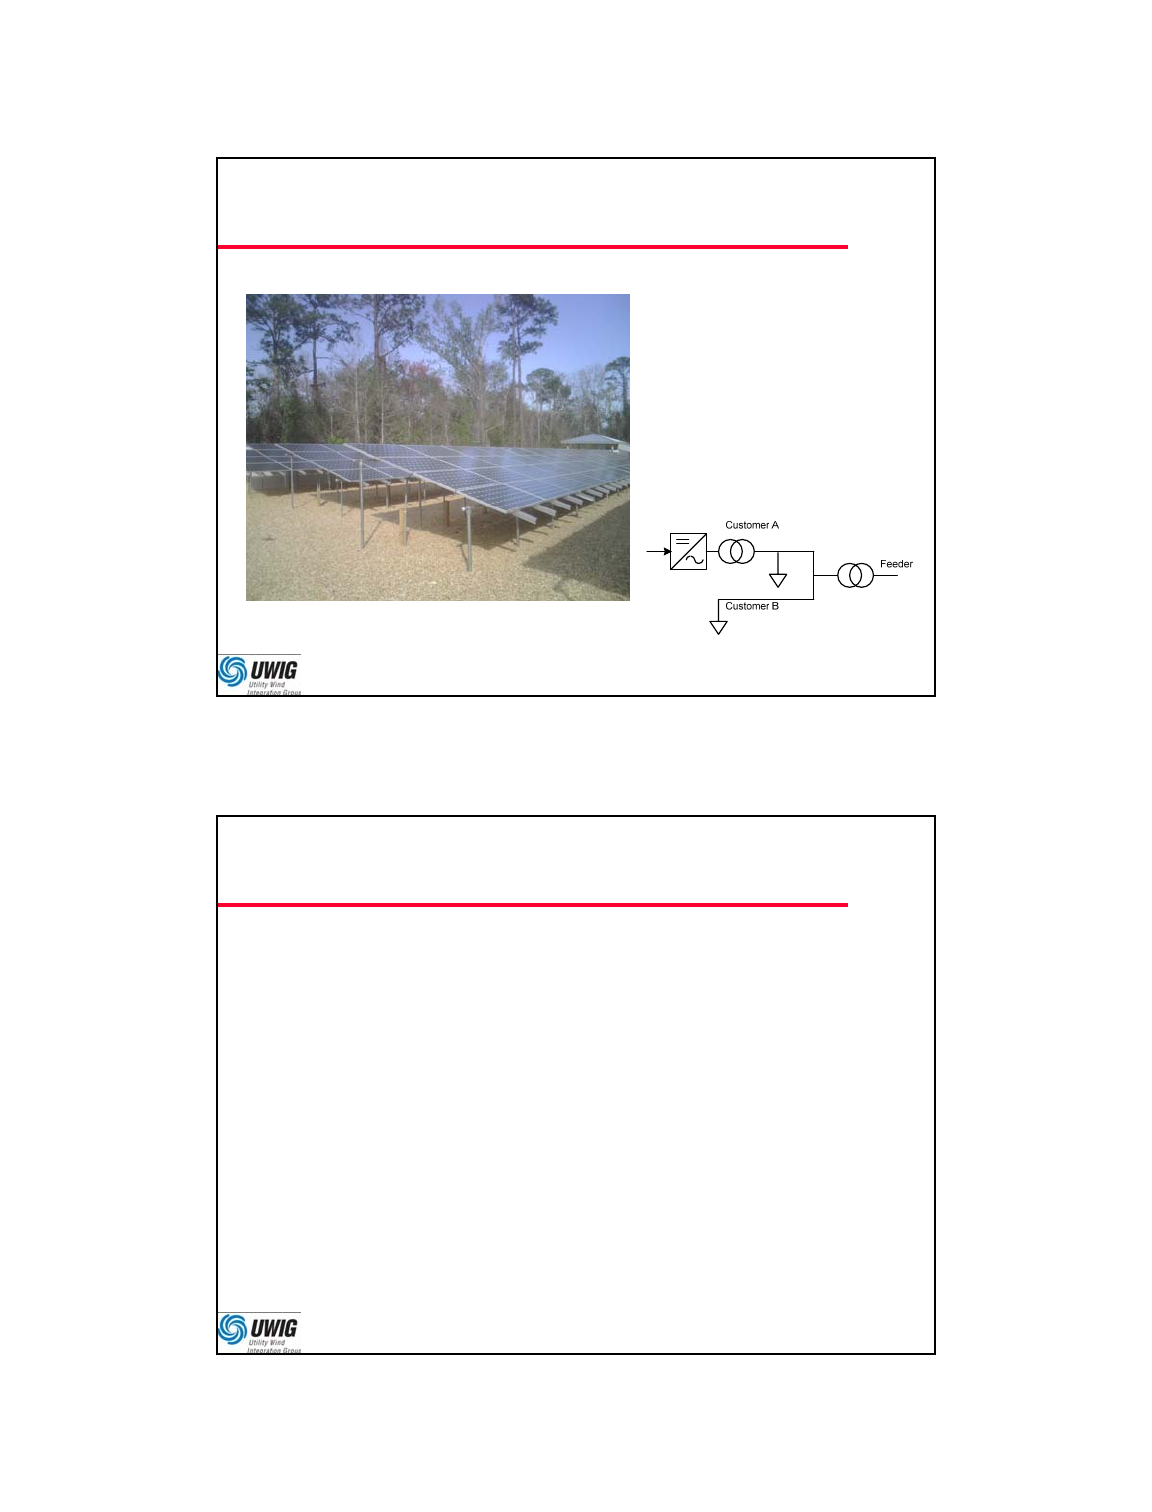
Photovoltaic Generation
Inverter Based Interface
•Control Interactions?
•Cloudy Day Variability
•Limit Secondary Unbalance
to 20% of Transformer Rating
Source: Charlie Williams, S&C
22
Distributed PV Economics
•“Capacity Factor” still crucial:
– Technology and cell type
– Latitude, azimuth, tracking systems
– Temperature dependence
– Summer peaking vs. typical winter peaking for wind
– Daytime peaking vs. typical night peaking for wind
•No Production Tax Credit
•Other Tax Credits May Apply
•Financing and Cash Flow Considerations
Distributed Renewable Economics
5/23/2013
12
23
24
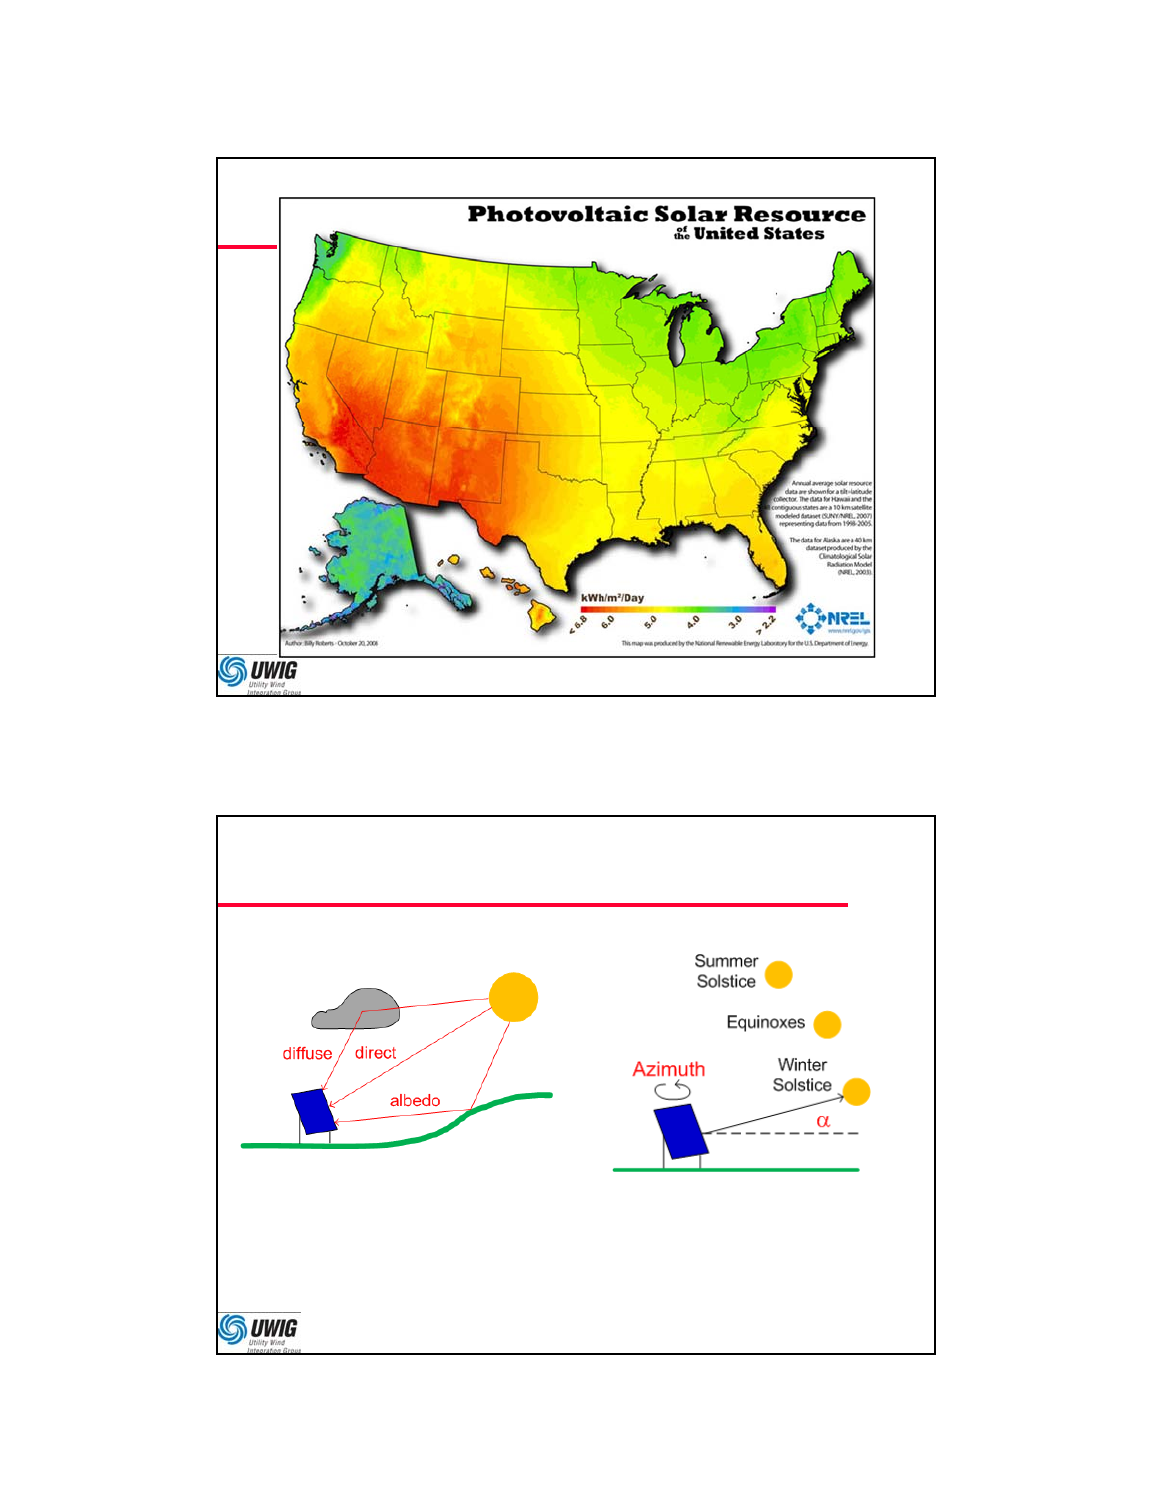
PV Angle Effects
•Best elevation depends on latitude and season
•Best azimuth depends on time of day
Distributed Renewable Economics
5/23/2013
13
25
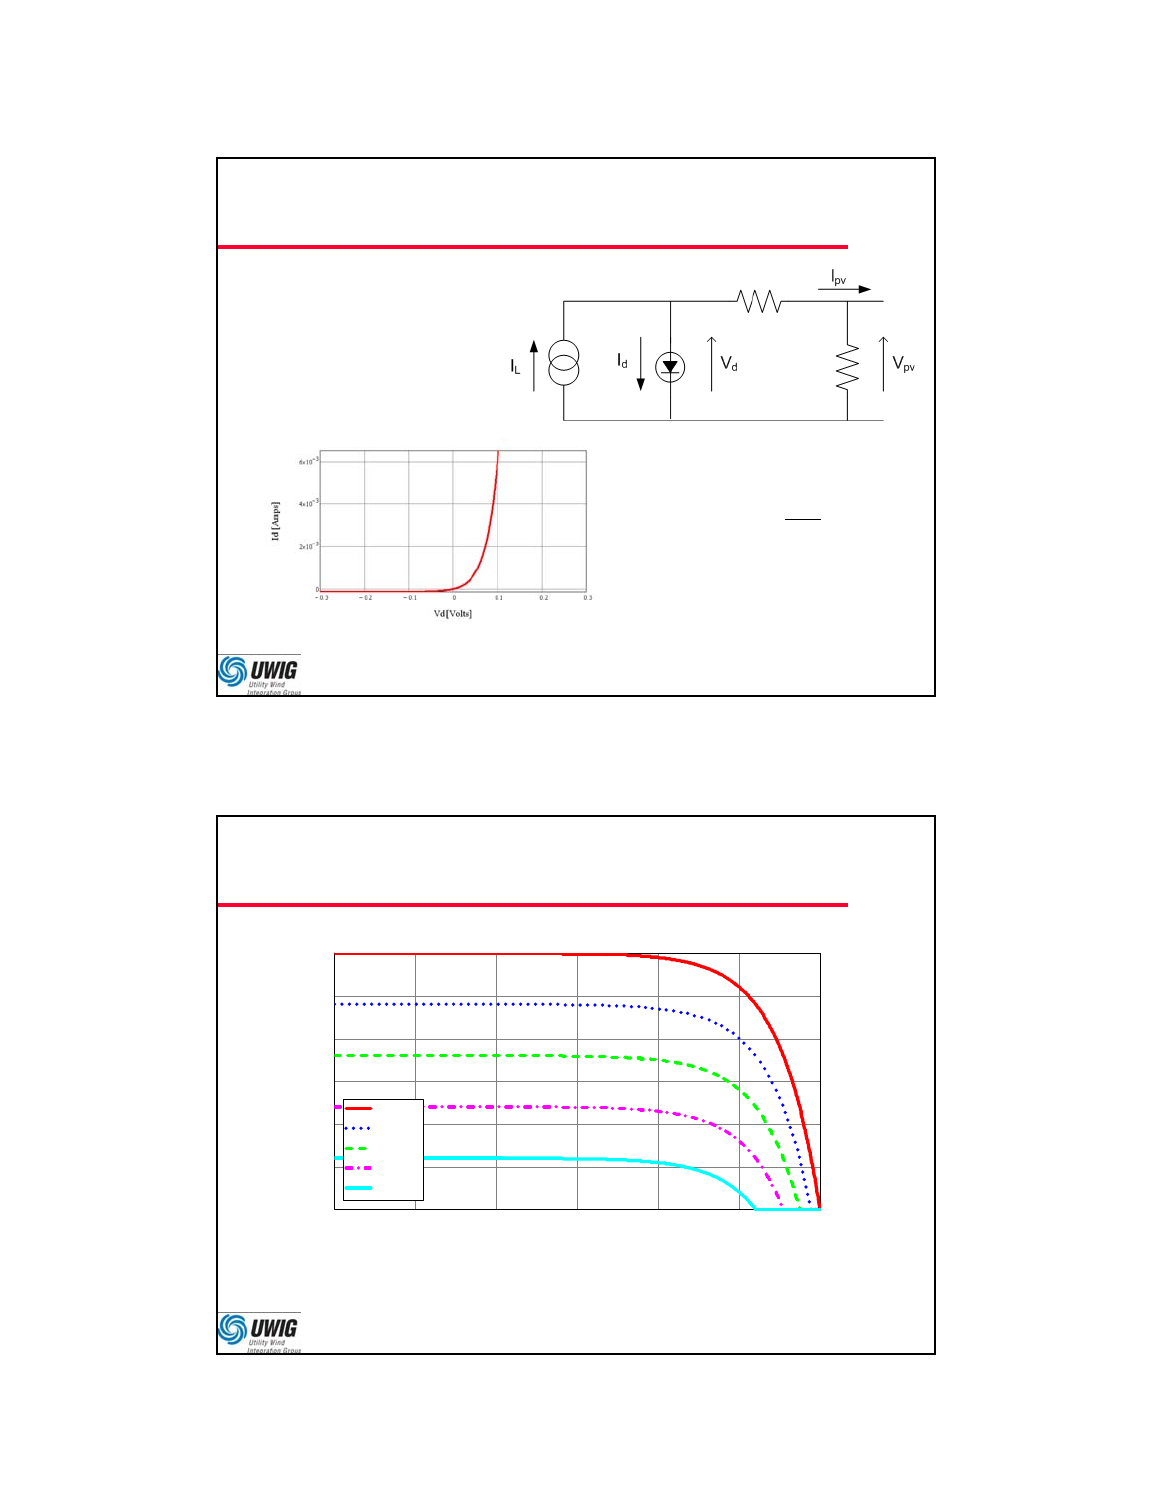
PV Cell
0exp 1
pv L
qV
III kT
•p-n junction (diode)
•Trapped photons
create electron/hole
pairs and current
26
Maximum Power Point Tracking
0 100 200 300 400 500 600
0
4
8
12
16
20
24
100%
80%
60%
40%
20%
Vpv [Volts]
Ipv [Amps]
Distributed Renewable Economics
5/23/2013
14
27
MPPT In Steady State
0 100 200 300 400 500 600
0
210
3
410
3
610
3
810
3
110
4
1.2 104
100%
80%
60%
40%
20%
Vpv [Volts]
Power [Watts]
28
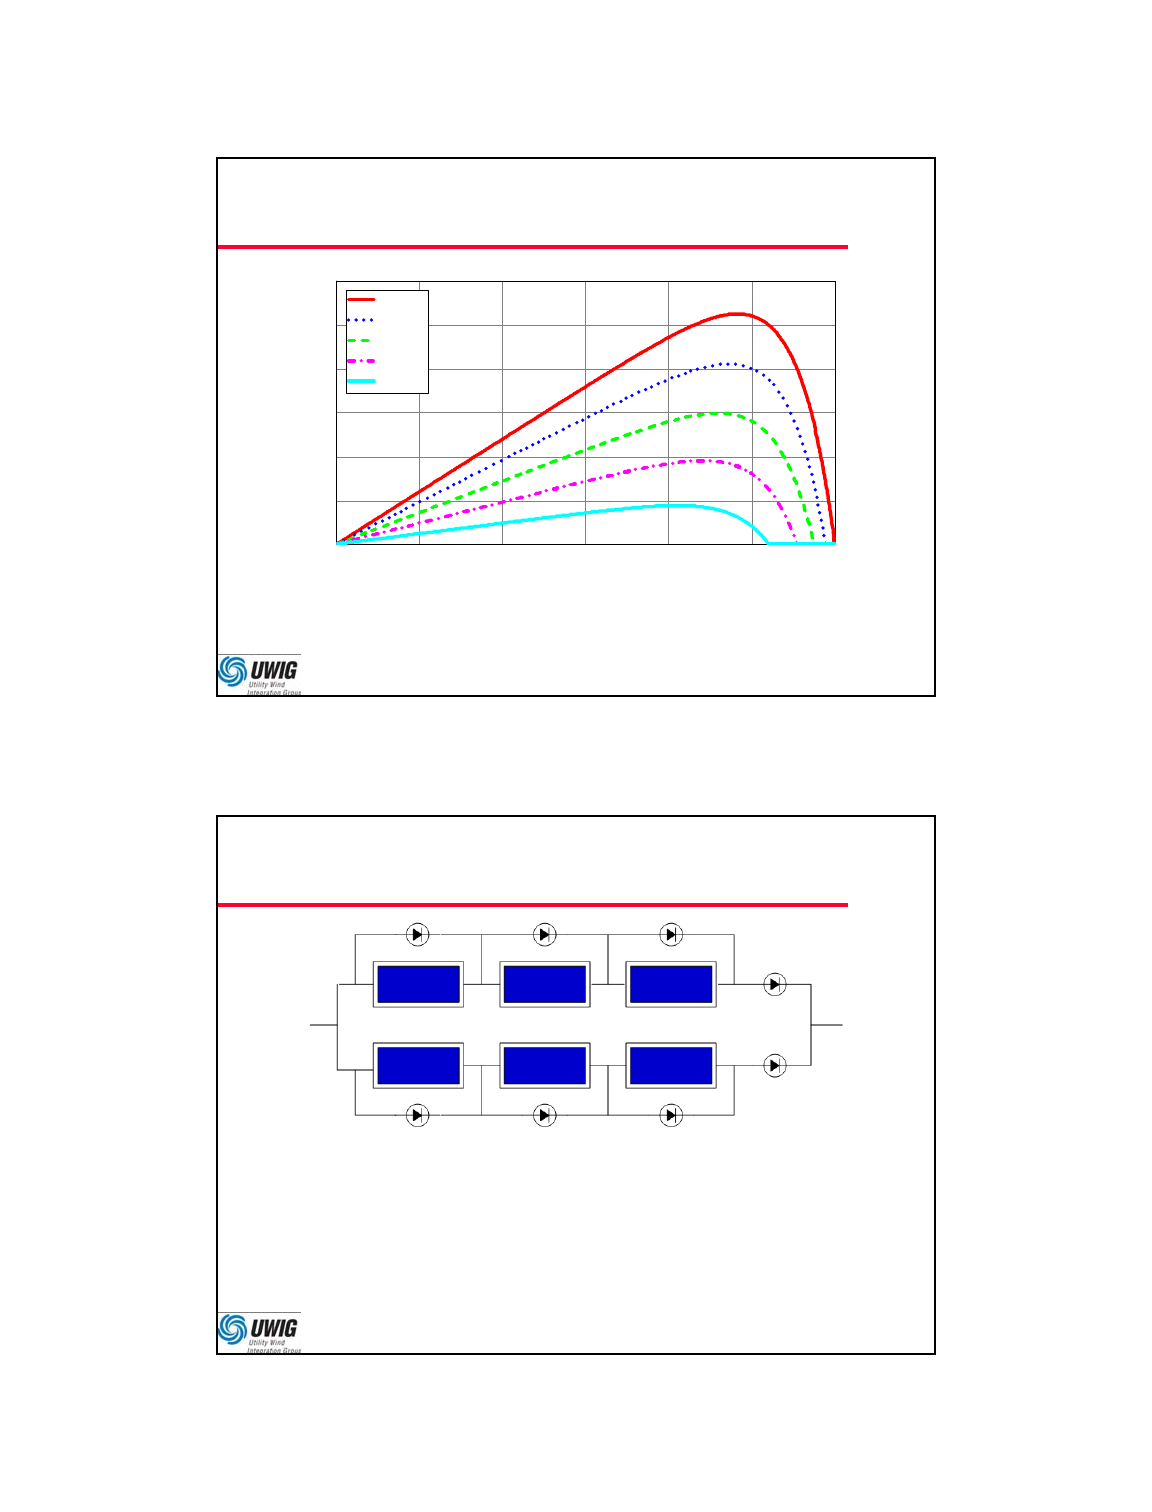
PV System
•Bypass failed modules and strings
•Performance degraded by temperature, shading, dirt
Distributed Renewable Economics
5/23/2013
15
29
MPPT Almost Linear Output
0 20 40 60 80 100
0
210
3
410
3
610
3
810
3
110
4
1.2 104
Irradiance [%]
Max Power [W]
30
PV Capacity Factor Data Sources
•HOMER, www.homerenergy.com
•NREL In My Back Yard (IMBY)
www.nrel.gov/eis/imby/
•SEPA Solar Tools at www.solarelectricpower.org
Distributed Renewable Economics
5/23/2013
16
Incentives
32
Types of Incentives
•Fixed Quantity
– United Kingdom, Australia, Italy, Netherlands
– State Renewable Portfolio Standards (RPS) would fall into this
category
•Fixed Price
– European “Feed-In” laws, guaranteed % of retail price
•Production Tax Credit
– United States at the Federal level
•Clean Renewable Energy Bond (CREB)
– For non-taxable entities, a zero-interest loan
•Grants – USDA and others
•Check state & local tax incentives
Distributed Renewable Economics
5/23/2013
17
33
Production Tax Credit (PTC)
•Energy Policy Act of 1992 – 1.5 ¢/kWhr
•Has been extended eight times
•Adjusted for inflation – currently 2.3 ¢/kWhr for Wind
•Lasts for 10 years
•Must pay federal income taxes in order to use the PTC
– Equivalent REPI for non-taxable entity, under-funded at about
$5M annually
•Currently expires on December 31, 2013
–Project must have started construction by that date
34
Renewable Energy Production
Incentive (REPI)
•Direct payment for public utilities that don’t pay
taxes, and would not benefit from PTC
•“Equivalent” to PTC, currently 2.1 ¢/kWhr
•Congress must appropriate REPI funds annually:
– Competes with other funding priorities
– May not be able to obtain the full REPI payments
– Tier 1 (Wind & Solar) 33% paid in 2009
– Tier 1 last paid 100% in 2003
•Varied from $3.7M to $5M from FY2000 through
FY2009

Distributed Renewable Economics
5/23/2013
18
35
Clean Renewable Energy Bonds
•A “tax credit bond” for municipals, cooperatives, tribal governments,
others who can’t use PTC
•Issuer pays no interest; instead the bondholder receives a Federal tax credit
•Energy Tax Incentives Act of 2005 authorized $800M for CREBs issued in
2006 and 2007
– Up to $500M for government organizations
– 786 Applications Filed by April 26, 2006
– 610 Approved; 112 for Wind and 434 for Solar
•Tax Relief and Health Care Act of 2006
– Extended CREB another $400M (Total $1.2B)
– Up to $750M for government organizations
– Extended CREB to December 31, 2008
– Applications Were Due at IRS by July 13, 2007
– Fully Allocated by the end of 2007
36
“New” CREBs
•Two 2008 Acts, plus 2009 Recovery Act
– $800M each for government, cooperatives, public power
– Reduced the payments; may need to offer at discount
•Applications due August 4, 2009; awards made:
– Government: $800M in 739 projects (smallest-to-largest
allocated from $3068M in 997 applications)
– Cooperatives: $609M in 31 projects (may have a followup)
– Public Power: $800M in 35 projects (pro rated from
$1446M in 38 applications)
– So, about $191M was left over (now gone)
Distributed Renewable Economics
5/23/2013
19
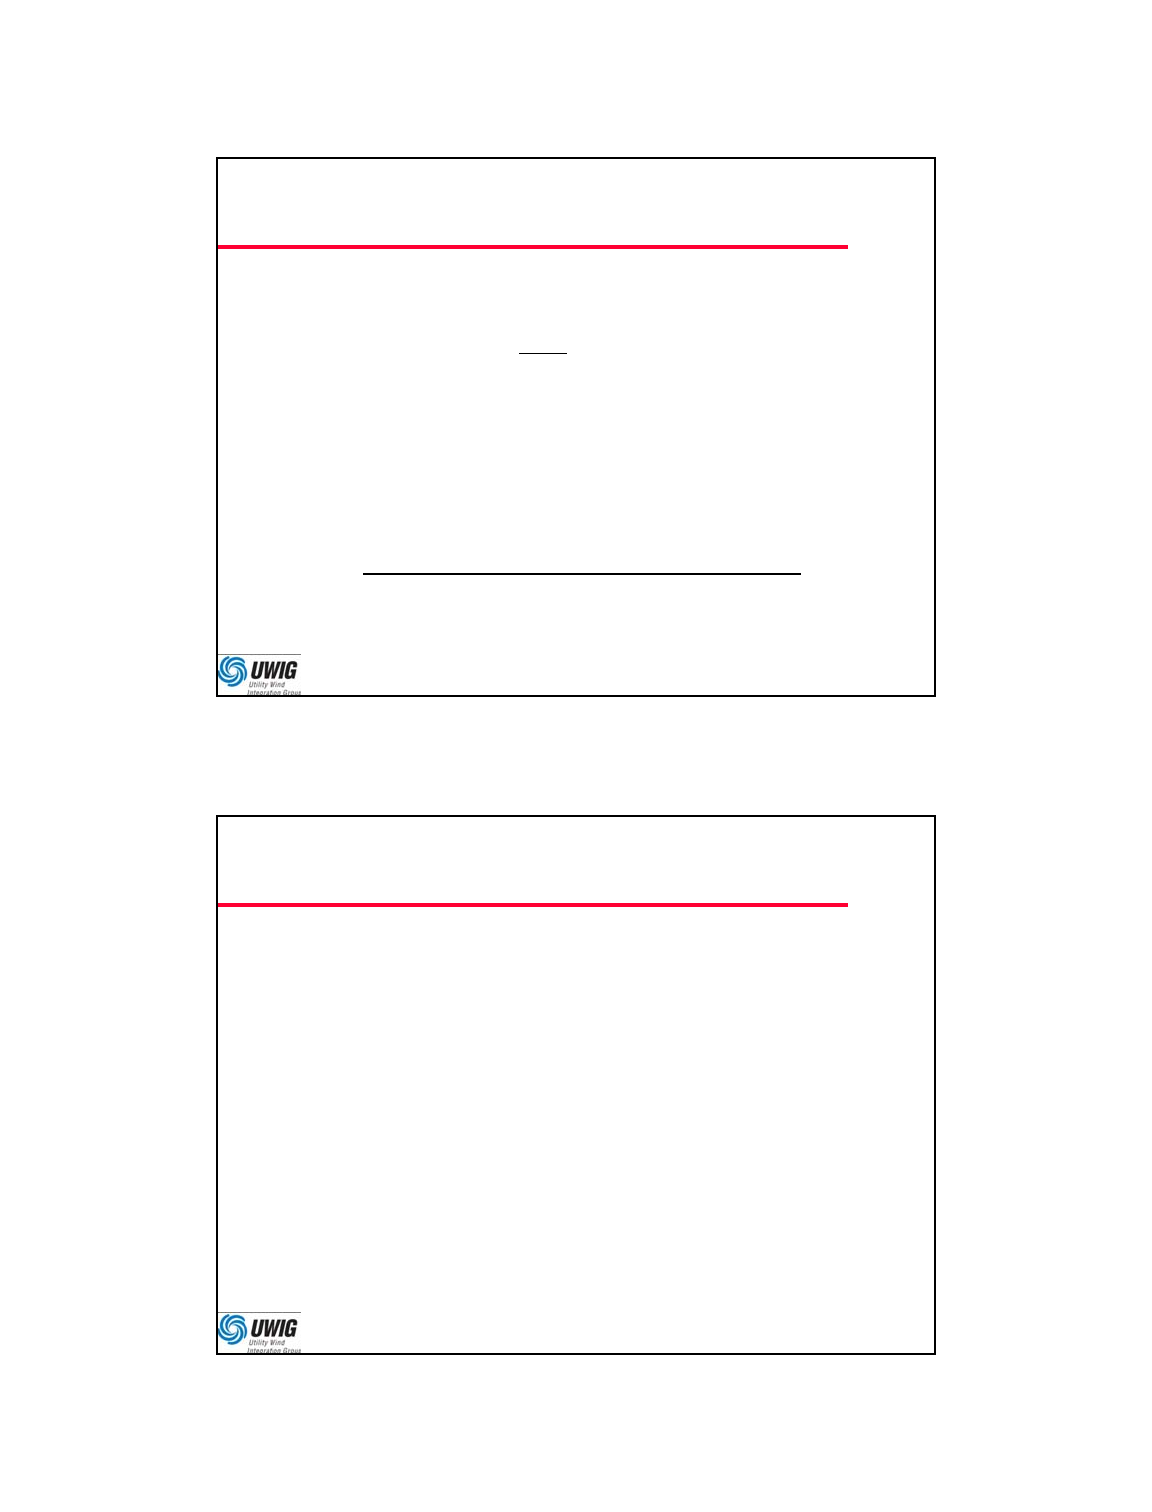
37
New CREB Credit Rate Schedules
https://
www.treasurydirect.gov/
GA-SL/SLGS/
selectCREBDate.htm
38
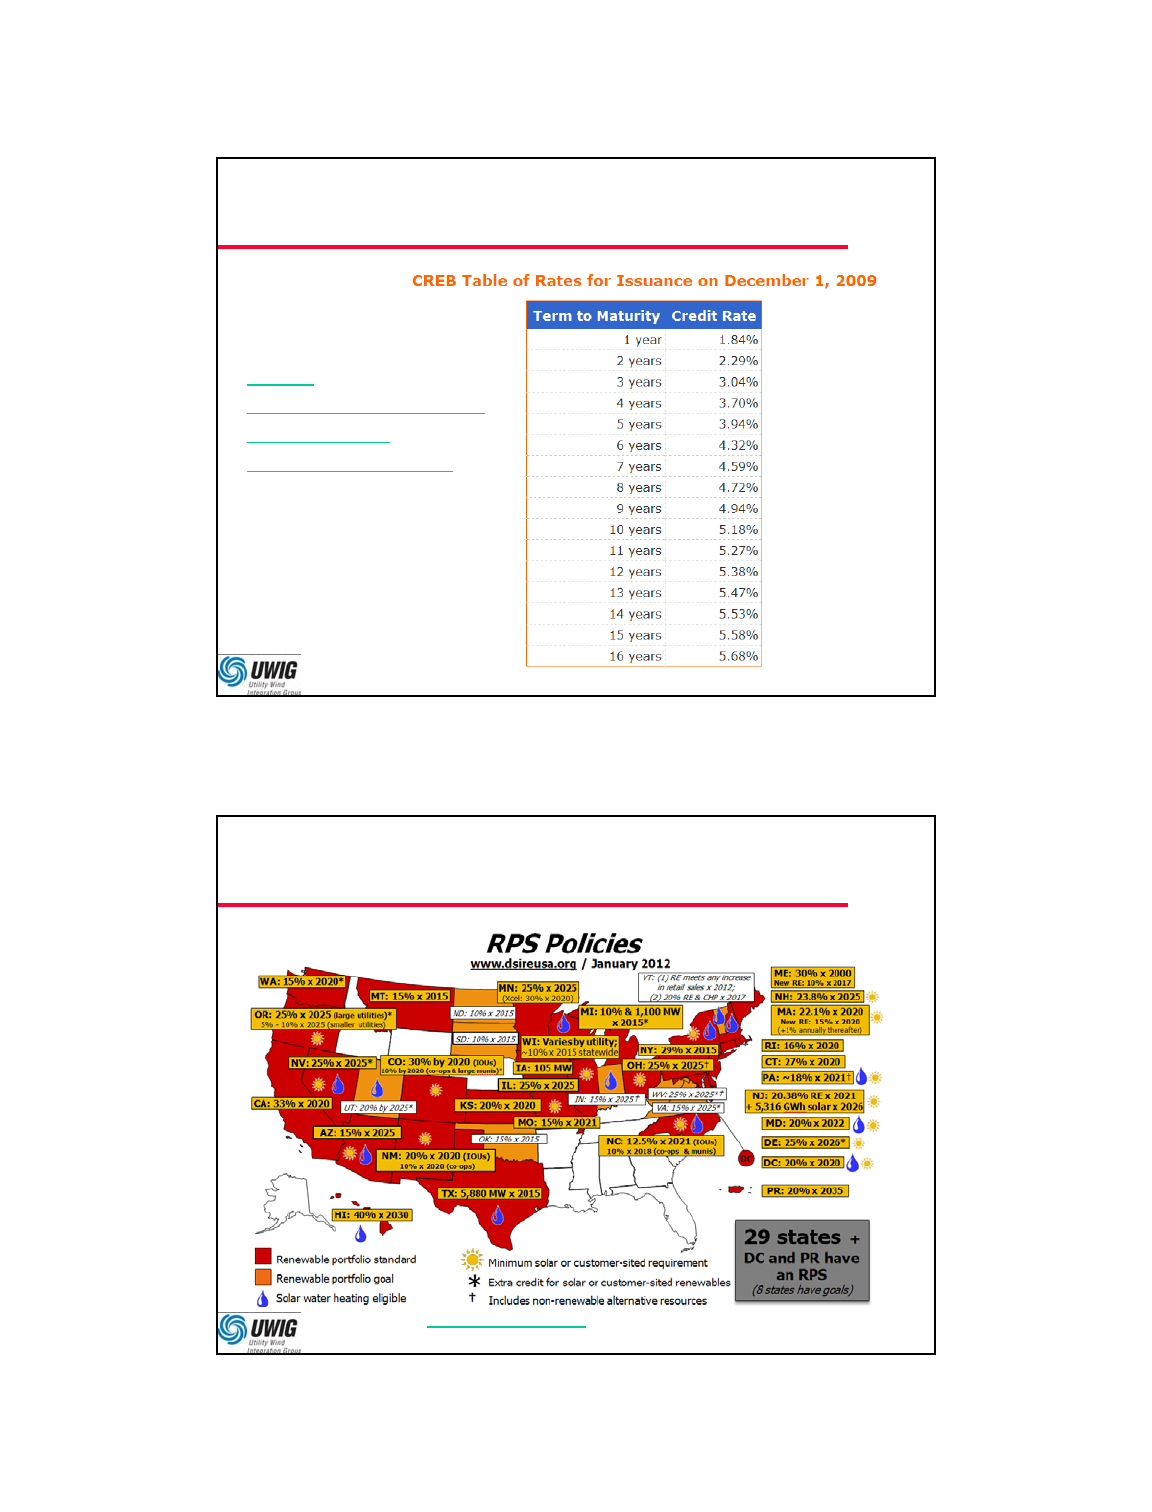
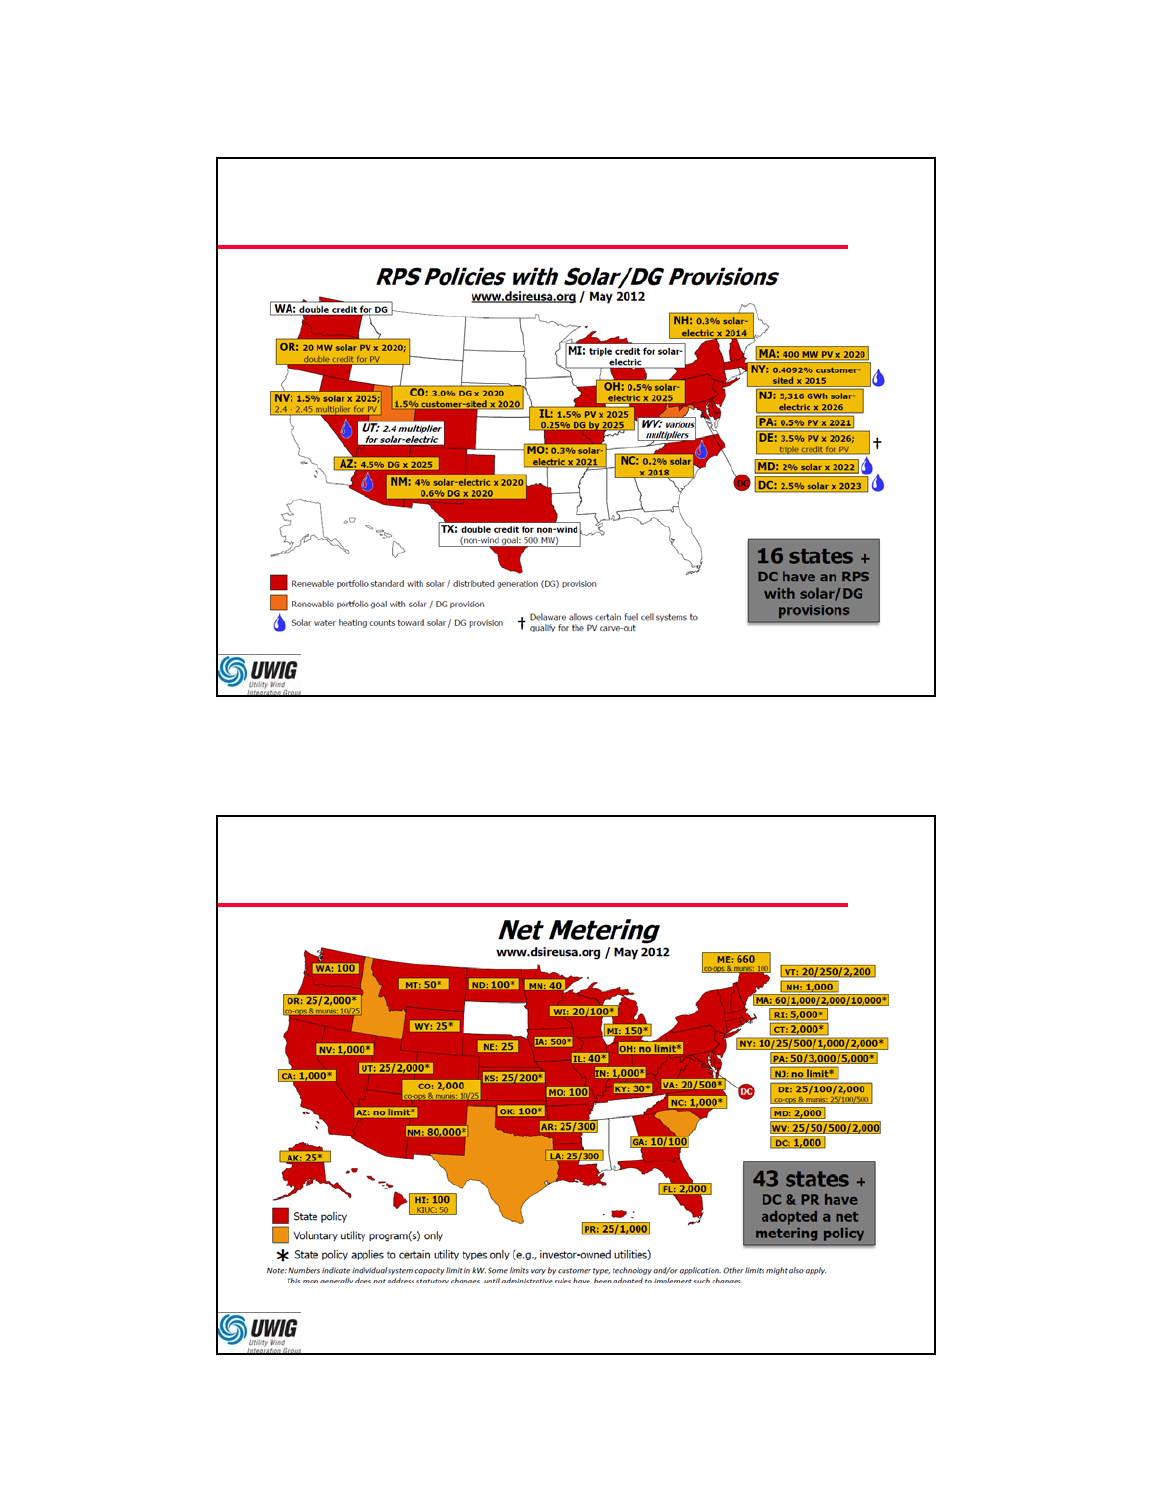
Renewable Portfolio Standards (RPS)
(www.dsireusa.org has summary maps of other incentives)
Distributed Renewable Economics
5/23/2013
20
39
RPS with Solar/DG Provisions
40
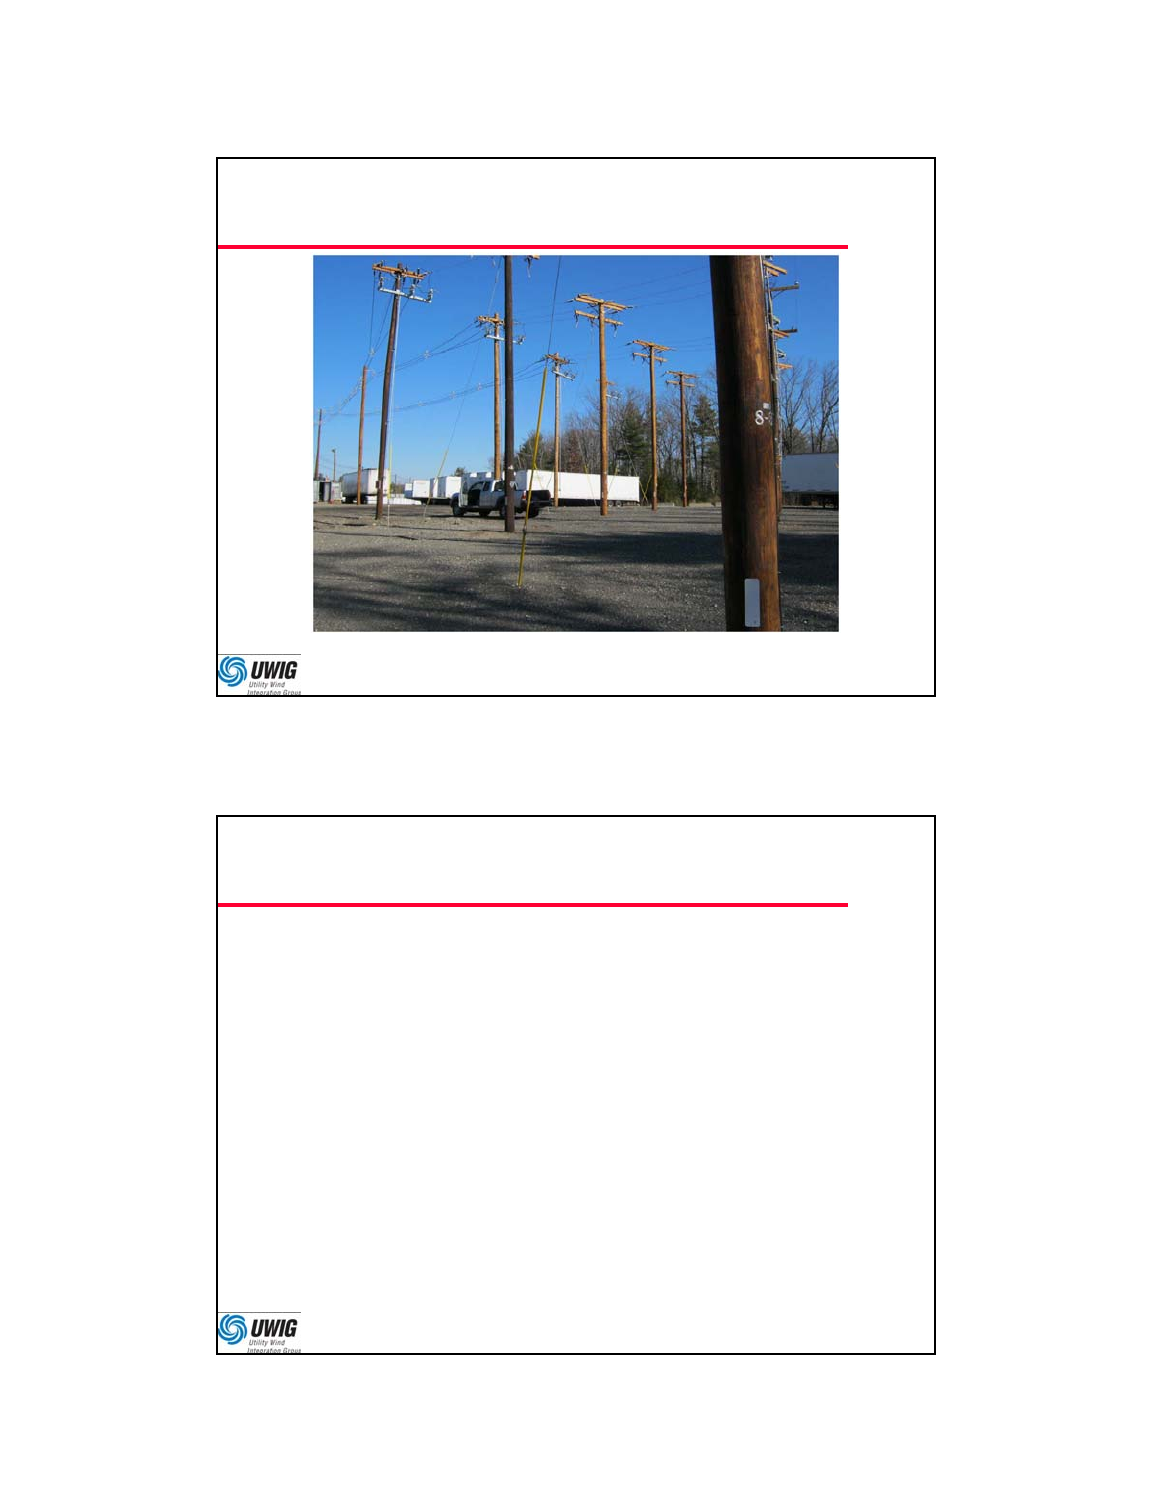
State Net Metering Policies
Distributed Renewable Economics
5/23/2013
21
41
3 MW 3 * 1 MW for Net Metering
Source: Neil LaBrake, Jr., National Grid
42
Performance Based Incentives
•MA – 400 MW Solar Carve Out
– Qualifying facilities sell Solar Renewable Energy
Certificates (SREC) with 30.0¢/kwhr floor price
– Solar Alternative Compliance Payment (SACP) for the
state RPS; 55.0¢ 36.5¢/kwhr over 10 years
•NY – Solar/Biogas Near NYC; Apply for up to 50%
installed costs, up to $3M per applicant
•NJ – has an SREC and SACP program for PV
– 10 – 20% up-front grant for wind, biogas, LFG
•CA – feed-in tariff for PV, around 1.4x CC gas

Distributed Renewable Economics
5/23/2013
22
43
Some Other MA Incentives
•Commonwealth Solar II Rebates: 40 – 85¢/W for
1 kW – 15 kW Residential/Commercial PV
•Personal Tax Credit: up to $1K for PV & Wind
•Property Tax Exemption: 20 years for PV, Wind
and Hydro
•Community Wind Grants: $30k for 2 MW, at least
3 turbines
•Sales Tax Exemption: Renewable Energy Equip.
Screening
Distributed Renewable Economics
5/23/2013
23
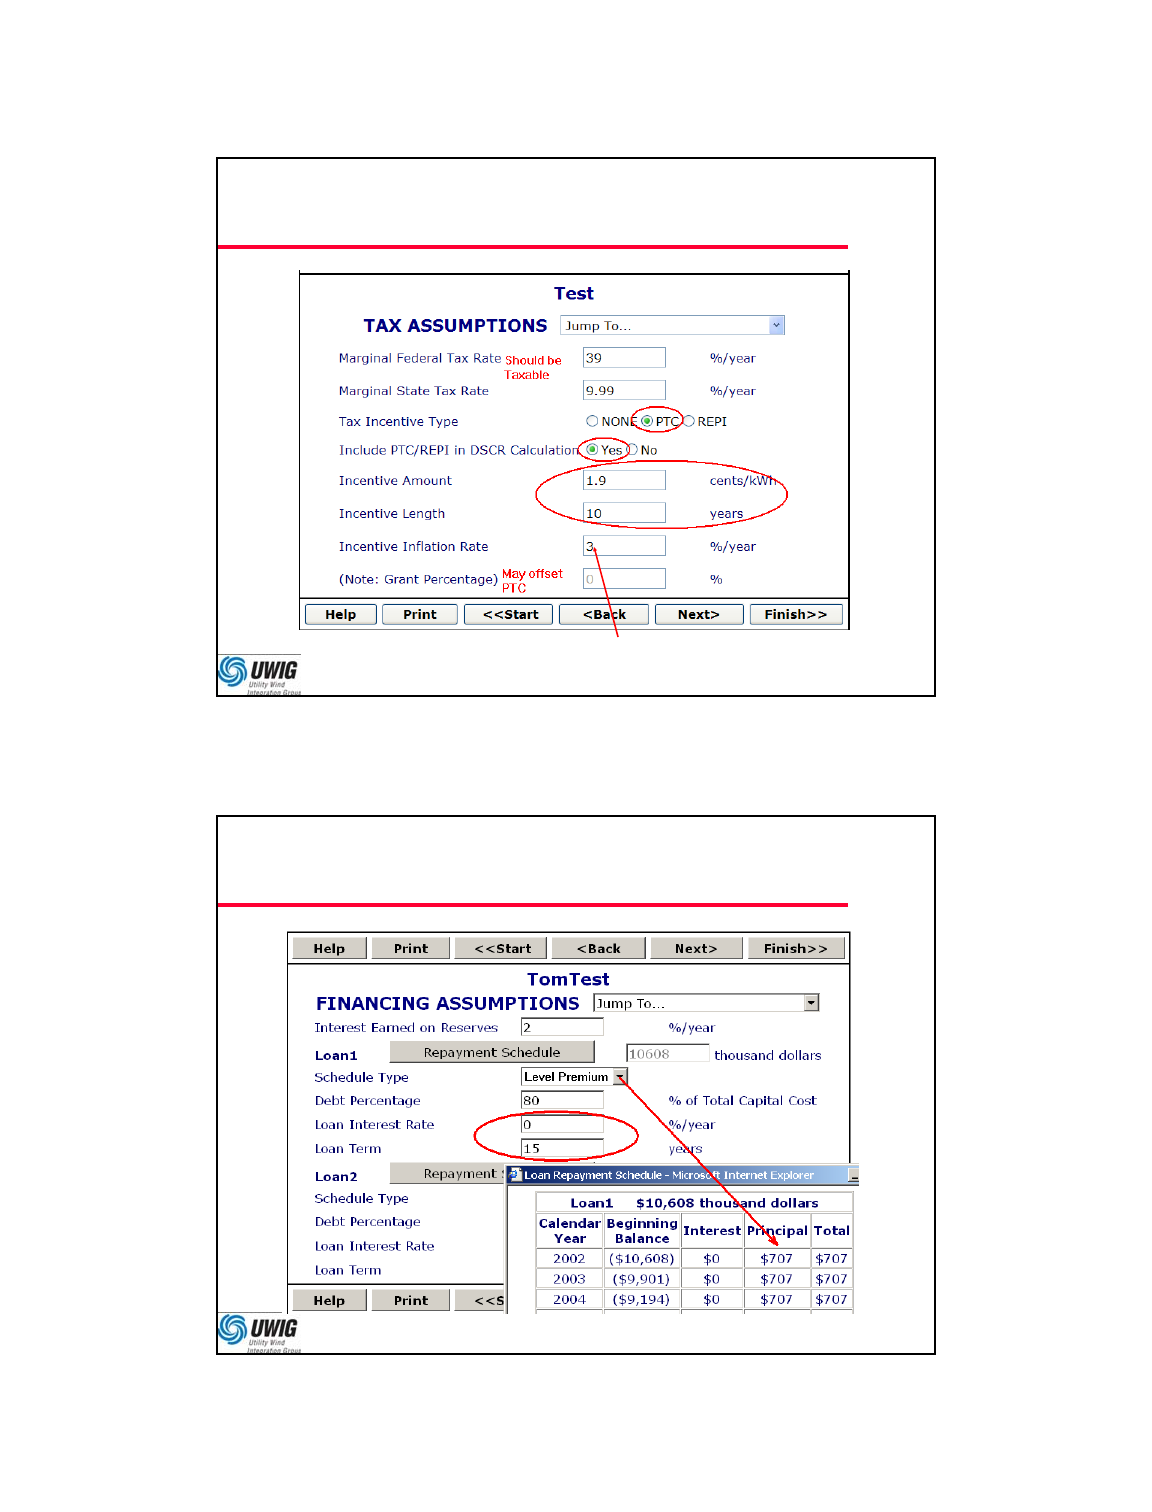
45
PTC In WindFinance
PTC used to be 1.9 cents, is now actually 2.3 cents / kWh
“Incentive Inflation Rate” approximates this growth
46
CREB In WindFinance
Distributed Renewable Economics
5/23/2013
24
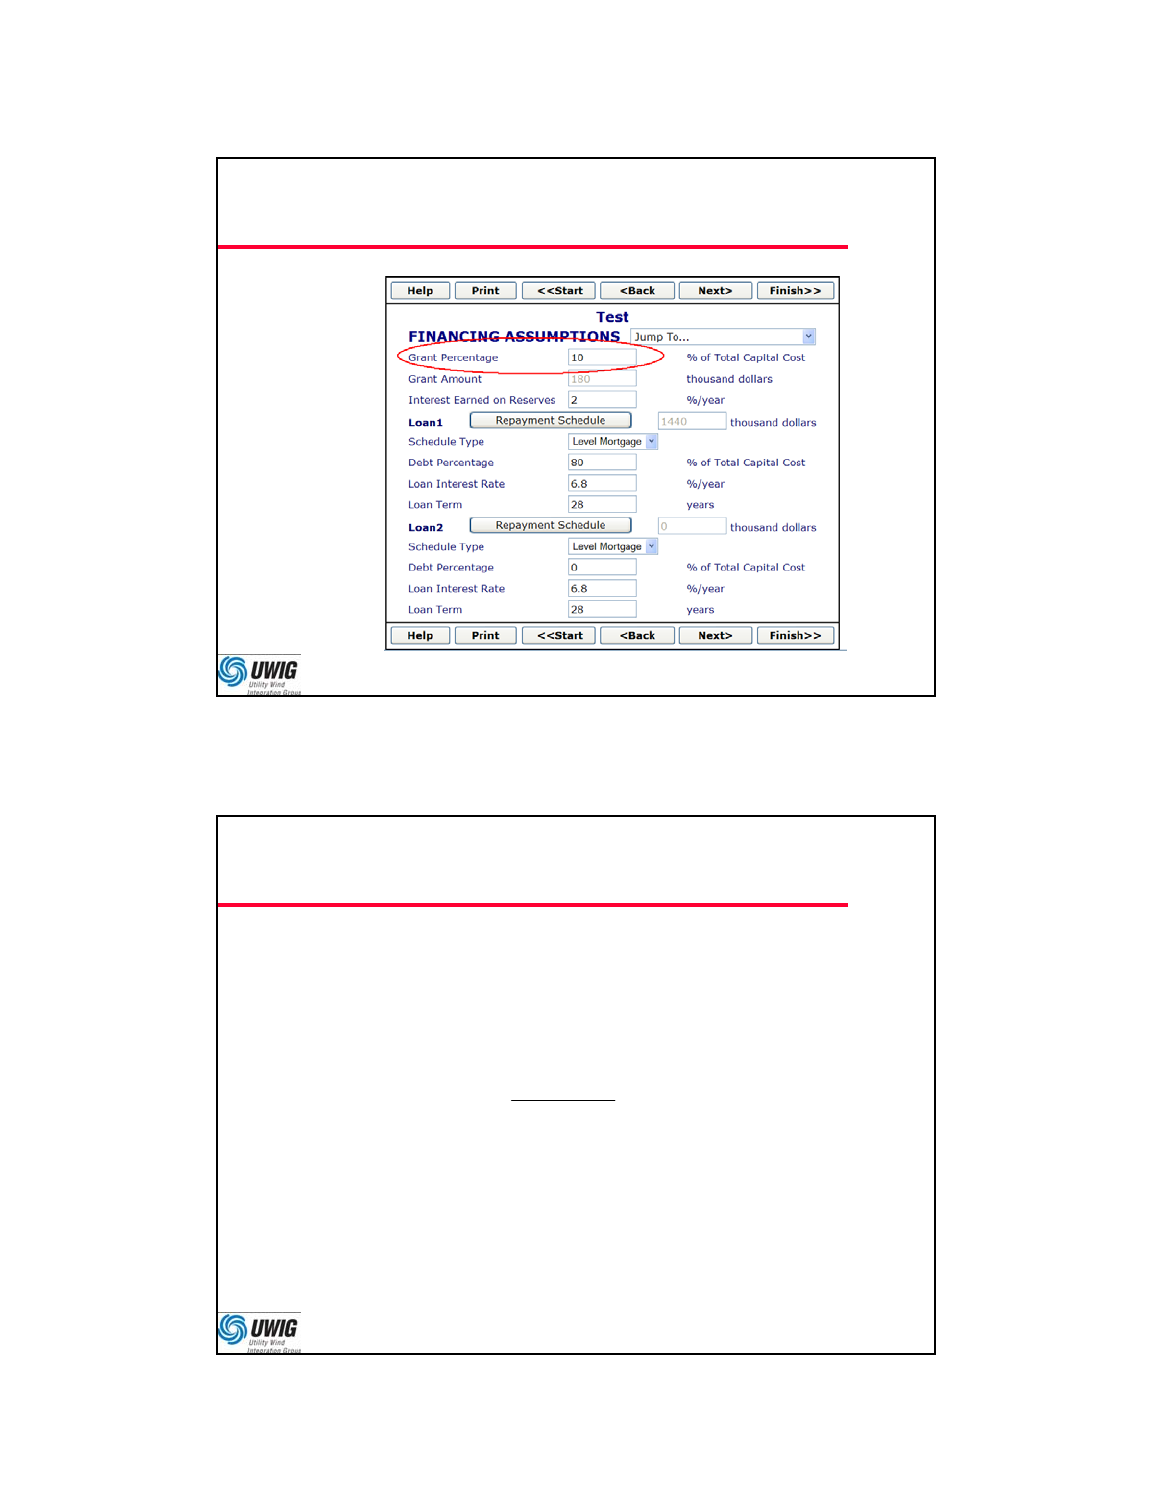
47
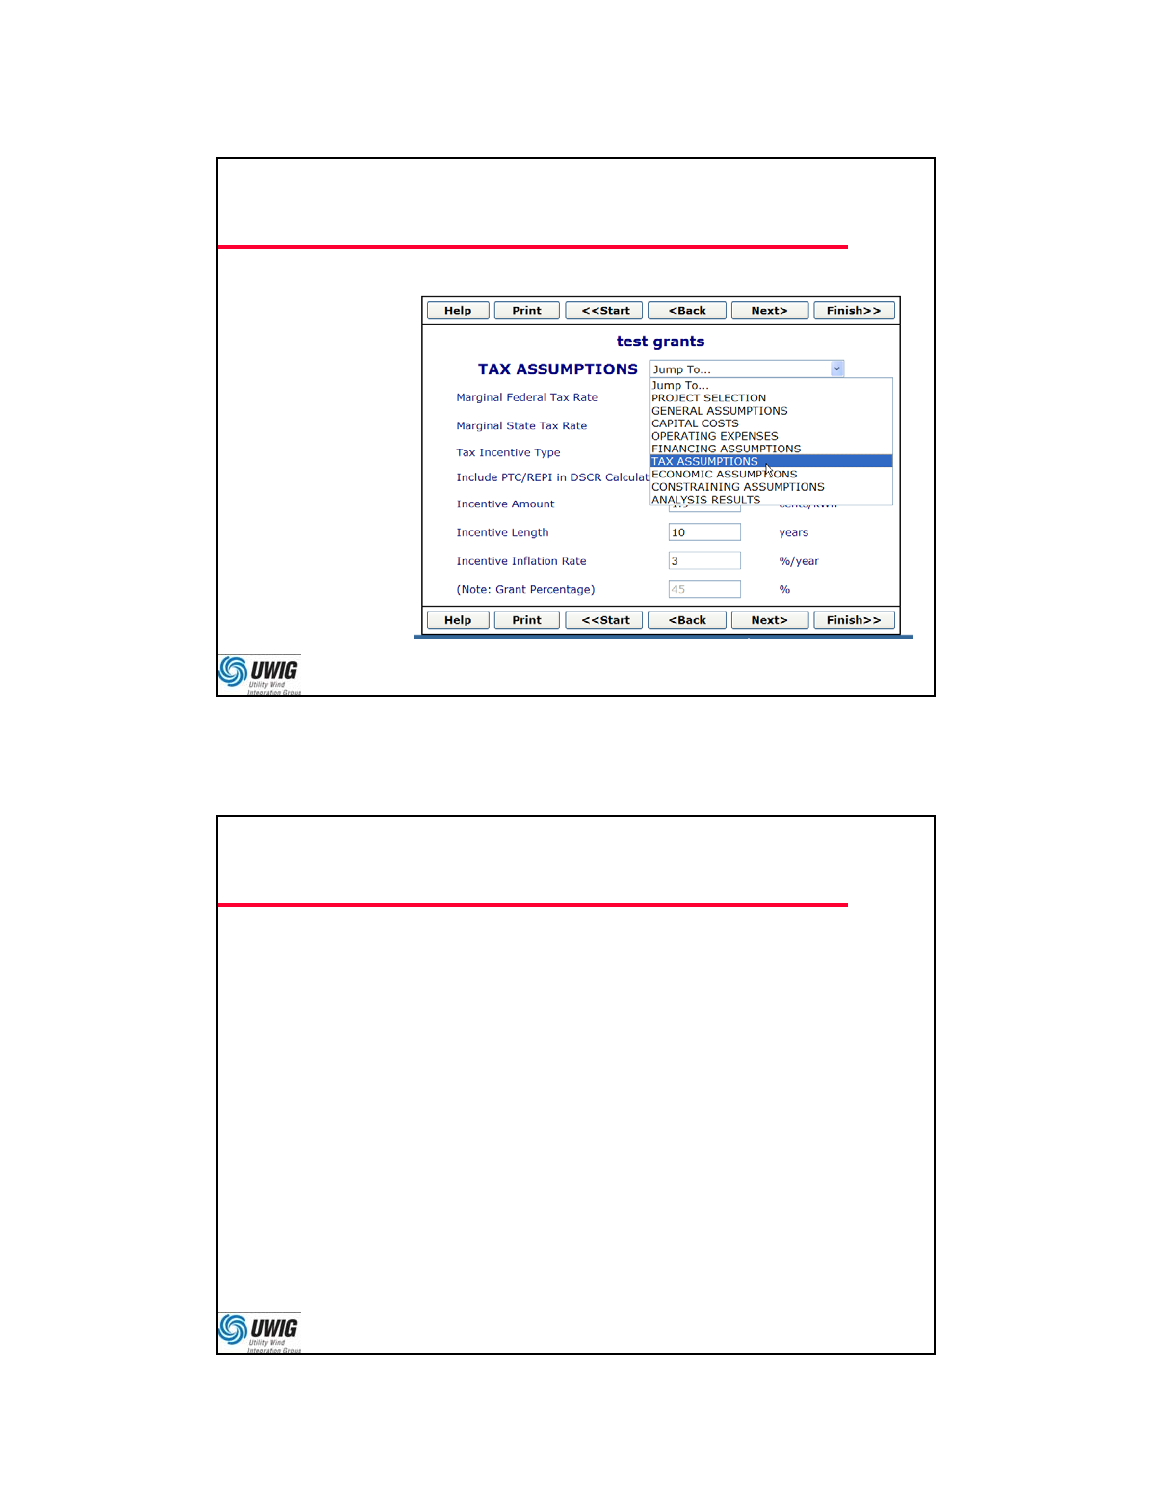
Grants in WindFinance
48
Effect of Grants on PTC
USDA and other Federal grants offset the PTC
– The PTC offset is capped at 50%
Example: project cost of $1.8M with $500K Grant
1800 500
2.1 1.52
1800
PTC
Most state grants don’t offset the PTC, so you have
to make this adjustment manually depending on the
type of grant
All grants reduce the depreciable basis for MACRS
Distributed Renewable Economics
5/23/2013
25
49
Discounted Cash Flow Analysis
Future Dollars Worth Less than Present Dollars
– You Could Have Earned Interest on Present Dollars
Net Present Value (NPV) is the sum of all future cash
flows back to the starting year
Internal Rate of Return (IRR) is the interest rate that
makes NPV Zero
Payback is the time period for zero NPV
(1 )n
FV
PV rate
50
Present Value Example
•10 years, 5% interest rate
•(1.05)10 = 1.6289
•FV – multiply by 1.6289
– $1000 today grows to $1628.90 in 10 years
•PV – divide by 1.6289
– $1000 in 10 years has a present value of $613.91 today
•IRR – if you invest $1000 today and then have
$1628.90 in 10 years, your internal rate of return
was 5%
Distributed Renewable Economics
5/23/2013
26
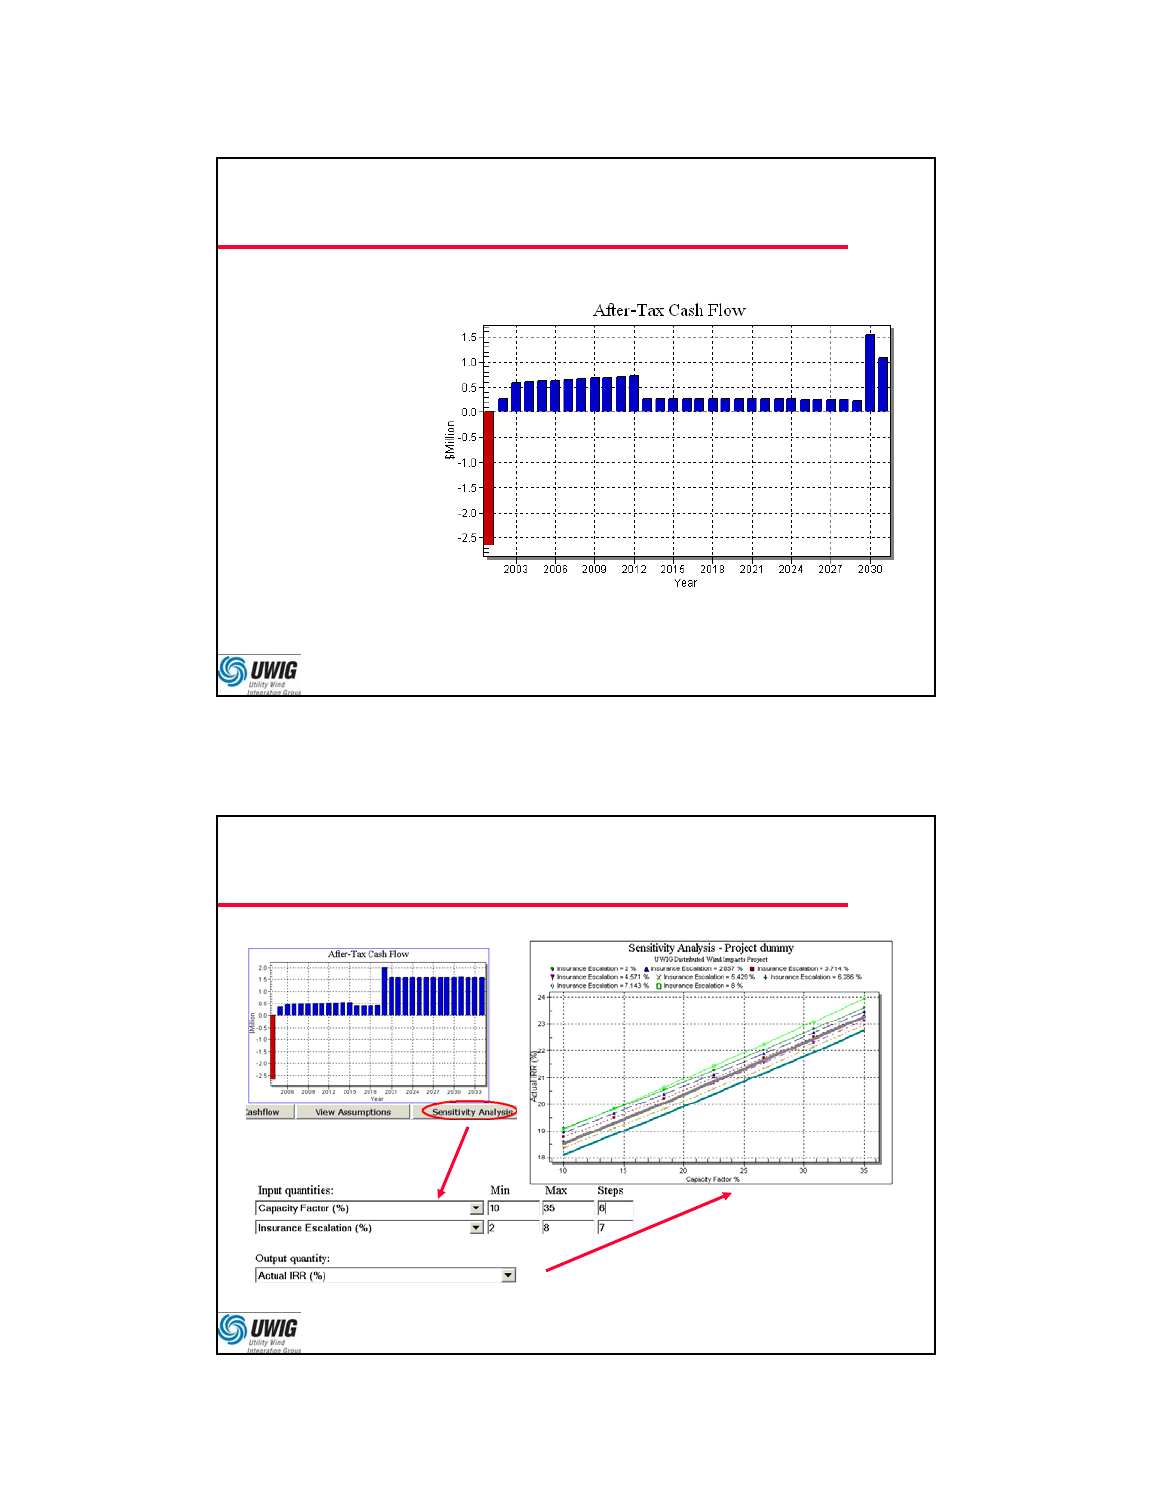
51
NPV, IRR, and Payback Example
•NPV
– $3,696K
– @ 15.22%
•Payback
– 5 years
– @ 15.22%
•IRR
– 19.46%
52
Economics: Sensitivity Analysis

Distributed Renewable Economics
5/23/2013
27
53
HOMER Modeling
•Started at NREL
•Spun off to www.homerenergy.com
•Free download version 2.68
•Capabilities:
– 8760-hour energy balance simulation of loads and
sources
– Optimization and sensitivity analysis of costs
– Models of PV output, wind output, batteries, and diesel
generator dispatching
– No electrical simulation, CREB or PTC analysis
54
When to Use WindFinance or Homer?
•WindFinance
– More detailed effects on Wind Capacity Factor
– Effects of PTC, CREB, Grants, Taxes, Loans, etc.
– Larger single projects
– More Turbines in the library
•HOMER
– 8760 Energy simulations with Load and Pricing
– How many wind turbines, PV arrays, batteries, etc.?
– PV Capacity Factor estimates
– Hydro, Biomass, and Fuel Cells
Distributed Renewable Economics
5/23/2013
28
55
NREL In My Back Yard (IMBY)
•http://www.nrel.gov/eis/imby/ and then click
•“Use IMBY Now”
– Find your home address, choose Solar energy
– Draw a PV panel on your rooftop, Run the simulation
– After the initial results appear, choose a nearby sample
load profile and Run the load profile
– Switch to Wind energy, place a Generic 3-kW wind
turbine nearby, and Run. The capacity factor is your
annual production, divided by (3*8760).
56
Workshop Links for Exercises
•http://www.uwig.org/distwind/Default.htm
•Your login credentials are based on the two-digit
computer number, on the “ETRAIN” label
– User Name = goldnguest??
– Password = guest??#
– Where ?? is the computer number, with a leading zero
if necessary (e.g. goldnguest02 and guest02#)
•For the new toolbox developmental version
–http://www.meltran.com/uwig/DGToolBox.html
