Traumatic Brain Injury In The United States TB2CI Blue Book
User Manual: TB2CI
Open the PDF directly: View PDF ![]() .
.
Page Count: 74
www.cdc.gov/TraumaticBrainInjury
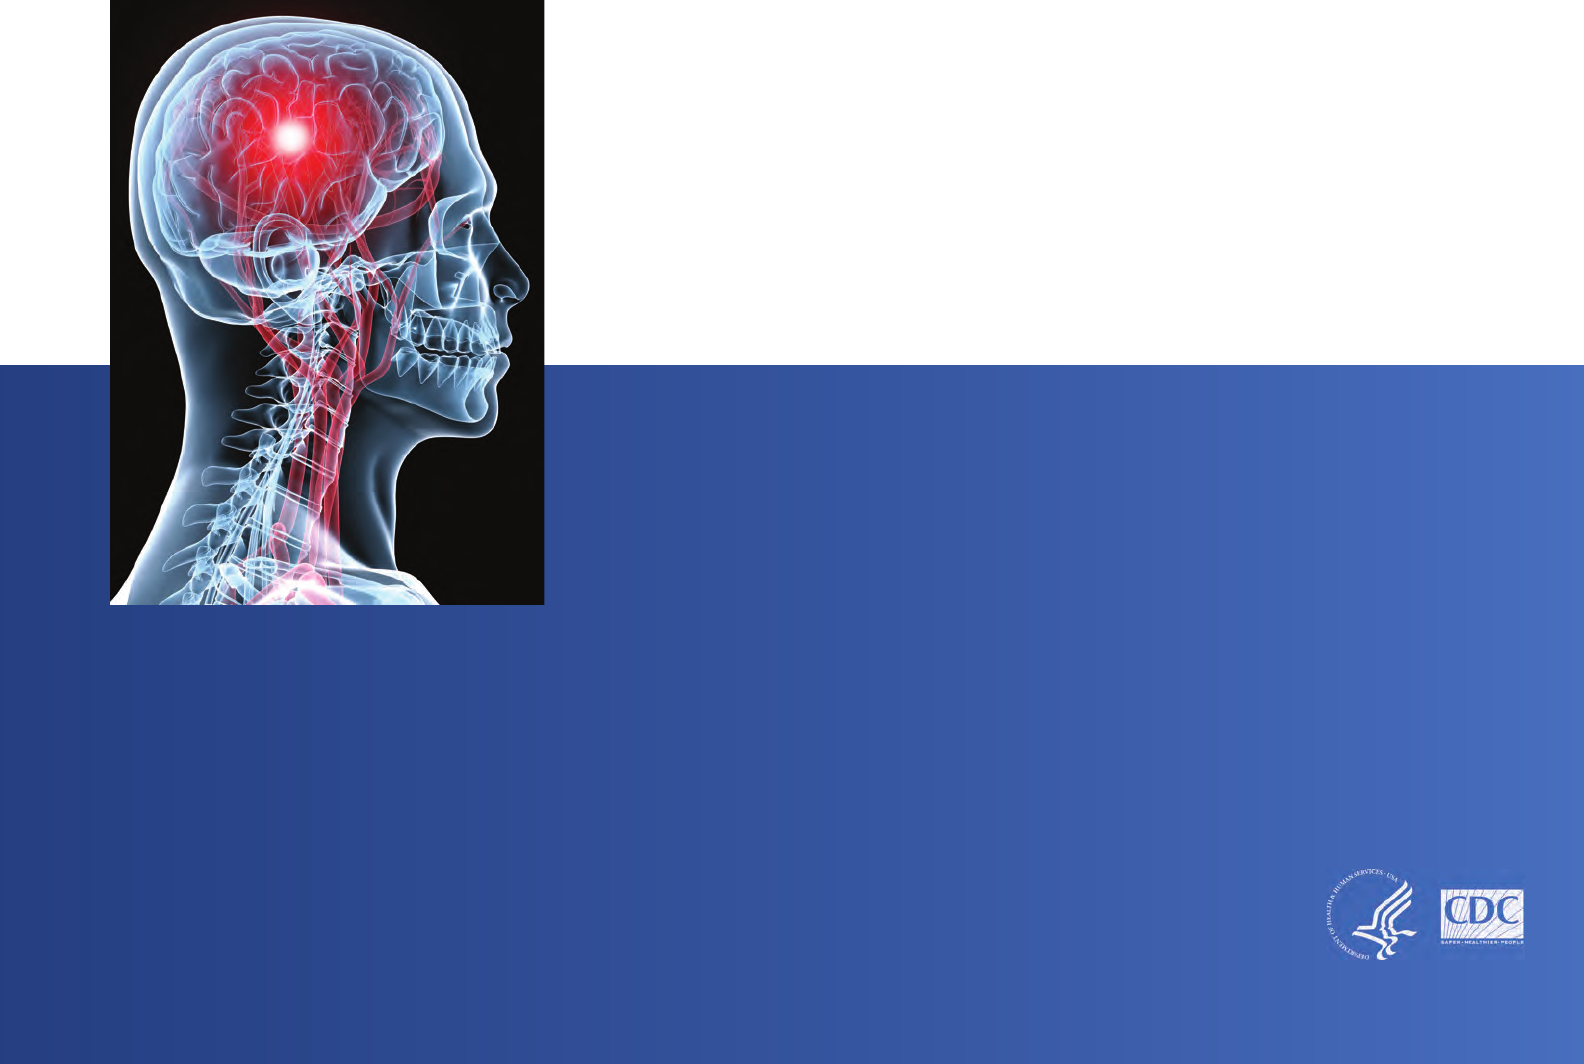
Traumatic
Brain Injury
IN THE UNITED STATES
Emergency Department Visits,
Hospitalizations and Deaths 2002–2006
U.S. Department of Health and Human Services
Centers for Disease Control and Prevention

Traumatic Brain Injury
IN THE UNITED STATES
Emergency Department Visits, Hospitalizations and Deaths 2002–2006
U.S. DEPARTMENT OF HEALTH AND HUMAN SERVICES
Centers for Disease Control and Prevention
National Center for Injury Prevention and Control
www.cdc.gov/TraumaticBrainInjury
MARCH

AUTHORS
Mark Faul, PhD, MS
National Center for Injury Prevention and Control
Division of Injury Response
Likang Xu, MD, MS
National Center for Injury Prevention and Control
Division of Injury Response
Marlena M. Wald, MPH, MLS
National Center for Injury Prevention and Control
Division of Injury Response
Victor G. Coronado, MD, MPH
National Center for Injury Prevention and Control
Division of Injury Response
ACKNOWLEDGMENTS
The authors would like to thank Vikas Kapil and Lisa McGuire for their
editorial comments, Karen Thomas for her programming assistance
and Michael Lionbarger. The authors also offer sincere appreciation
to the many advisors to this report, including Kevin Webb and
Dionne Williams, for their guidance.
Traumatic Brain Injury in the United States: Emergency
Department Visits, Hospitalizations and Deaths 2002–2006 is a
publication of the National Center for Injury Prevention and
Control, Centers for Disease Control and Prevention.
The findings and conclusions in this report are those of the
authors and do not necessarily represent the official position
of the Centers for Disease Control and Prevention (CDC).
SUGGESTED CITATION Faul M, Xu L, Wald MM, Coronado VG.
Traumatic Brain Injury in the United States: Emergency
Department Visits, Hospitalizations and Deaths 2002–2006.
Atlanta (GA): Centers for Disease Control and Prevention,
National Center for Injury Prevention and Control; 2010.
Centers for Disease Control and Prevention
Thomas R. Frieden, MD, MPH, Director
National Center for Injury Prevention and Control
Robin Ikeda, MD, MPA, Acting Director
Division of Injury Response
Richard C. Hunt, MD, FACEP, Director

The Power of Data 2
Traumatic Brain Injury in the United States
This body of work is a vital tool for those who devise the strategies for prevention and
treatment. However, a critical dimension will be lost if one sees it only as data, if one
does not try to put even a fleeting face behind the numbers. They represent people who
— if they survived — have had their lives significantly affected. Through research, we are
finding better ways to prevent injury and improve acute care. We who are injured may
experience improvement both in function and the quality of our lives when we have
access to rehabilitation and support to develop and utilize our remaining strengths and
abilities. With so many lives affected, we seek and have the potential for independence,
to have the chance to move beyond our disabilities and give back to society.
As a survivor, as a disabled physician, I applaud this publication as a step toward making
that possible.”
CLAUDIA L. OSBORN, DO, FACOI
COLLEGE OF OSTEOPATHIC MEDICINE, MICHIGAN STATE UNIVERSITY
“Society is more likely to take action against the ravages of traumatic brain injury if
it understands how pernicious, pervasive, and huge the problem is.
THE POWER OF DATA
A Message from a TBI Survivor
2

Table of Contents 3
Traumatic Brain Injury in the United States
Executive Summary 5
Key Findings 7
Background 8
Report Contents and Organization 9
Overview 11
Annual Number of TBIs 13
TBI as a Proportion of All Injuries 14
TBI by Age Group 15
TBI by Sex 16
TBI by External Cause 17
Summary of Findings External TBI Causes 21
Conclusion 21
Appendix A: Tables 23
Total TBI-Related Emergency Department Visits,
Hospitalizations, and Deaths 25
TBI-Related Emergency Department Visits
by Age Group and Disposition 26
TABLE OF CONTENTS
TBI-Related Emergency Department Visits
by Age Group and Sex 27
TBI-Related Emergency Department Visits
by Age Group and Race 28
TBI-Related Emergency Department Visits
by Age Group and External Cause 29
TBI-Related Emergency Department Visits
by Age Group and Motor – Vehicle Cause 30
TBI-Related Emergency Department Visits
by Age Group and Payment Source 31
TBI-Related Hospitalizations
by Age Group and Disposition 32
TBI-Related Hospitalizations by Age Group and Sex 33
TBI-Related Hospitalizations by Age Group and Race 34
TBI-Related Hospitalizations by Age Group
and External Cause 35
TBI-Related Hospitalizations by Age Group
and Motor – Vehicle Cause 36
TBI-Related Hospitalizations by Age Group
and Payment Source 37

Table of Contents 4
Traumatic Brain Injury in the United States
Appendix A: Tables continued
TBI-Related Deaths by Age Group and Sex 38
TBI-Related Deaths by Age Group and Race 39
TBI-Related Deaths by Age Group and External Cause 40
TBI-Related Deaths by Age Group
and Motor – Vehicle Cause 41
Annual Estimates of All TBI from 2002–2006 42
Annual Rate Estimates of Fall-Related TBI
Among Children Aged 0 – 14 Years 43
Annual Rate Estimates of Fall-Related TBI
Among Adults Aged 65 Years and Older 43
Appendix B: Methods and Data Sources 45
Data Sources 49
Identification of TBI Cases 51
External Cause of Injury 55
Population Data 57
Statistical Analysis 59
Limitations 61
Index of Tables and Figures 63
References 69

Executive Summary 5
Traumatic Brain Injury in the United States
Traumatic brain injury (TBI) is an important public health problem
in the United States. TBI is frequently referred to as the “silent
epidemic” because the complications from TBI, such as changes
affecting thinking, sensation, language, or emotions, may not be
readily apparent. In addition, awareness about TBI among the
general public is limited.
Through the TBI Act of 1996 (Public Law 104–166), Congress first
charged the Centers for Disease Control and Prevention (CDC) with
“determining the incidence and prevalence of traumatic brain
injury in all age groups in the general population of the United
States.” In response, CDC has produced, Traumatic Brain Injury in
the United States: Emergency Department Visits, Hospitalizations
and Deaths 2002–2006.
Population-based data on TBI are critical to understanding the
impact of TBI on the American people. This report presents data on
TBI-related emergency department visits, hospitalizations, and
deaths for the years 2002 through 2006 and can be used to
determine the number of TBIs occurring each year, groups most
affected, and the leading causes of TBI. This important information
can be used to document the need for TBI prevention, to identify
research and education priorities, and to support the need for
services among individuals living with a TBI.
This report is an update to CDC’s previously published report
released in 2004 and is intended as a reference for policymakers,
health care and service providers, educators, researchers,
advocates, and others interested in knowing more about the
impact of TBI in the United States.1
EXECUTIVE SUMMARY

6
Traumatic Brain Injury in the United States

Key Findings 7
Traumatic Brain Injury in the United States
TBI in the United States
●An estimated 1.7 million people sustain a TBI annually. Of them:
●52,000 die,
●275,000 are hospitalized, and
●1.365 million, nearly 80%, are treated and released from an
emergency department.
●TBI is a contributing factor to a third (30.5%) of all
injury-related deaths in the United States.
TBI by Age
●Children aged 0 to 4 years, older adolescents aged 15 to 19
years, and adults aged 65 years and older are most likely to
sustain a TBI.
●Almost half a million (473,947) emergency department visits for
TBI are made annually by children aged 0 to 14 years.
●Adults aged 75 years and older have the highest rates of
TBI-related hospitalization and death.
TBI by Sex
●In every age group, TBI rates are higher for males than for females.
●Males aged 0 to 4 years have the highest rates for
TBI-related emergency department visits, hospitalizations,
and deaths combined.
TBI by External Cause
●Falls are the leading cause of TBI. Rates are highest for children
aged 0 to 4 years and for adults aged 75 years and older.
●Falls result in the greatest number of TBI-related emergency
department visits (523,043) and hospitalizations (62,334).
●Motor vehicle–traffic injury is the leading cause of TBI-related
death. Rates are highest for adults aged 20 to 24 years.
Additional TBI Findings*
●There was an increase in TBI-related emergency department
visits (14.4%) and hospitalizations (19.5%) from 2002 to 2006.
●There was a 62% increase in fall-related TBI seen in emergency
departments among children aged 14 years and younger from
2002 to 2006.
●There was an increase in fall-related TBIs among adults aged 65
and older; 46% increase in emergency department visits,
34% increase in hospitalizations, and 27% increase in
TBI-related deaths from 2002 to 2006.
* Estimates based on one year of data can produce varied results.
KEY FINDINGS IN THIS REPORT

Background 8
Traumatic Brain Injury in the United States
Each year, traumatic brain injuries (TBI) contribute to substantial
number of deaths and cases of permanent disability. A TBI is caused
by a bump, blow or jolt to the head or a penetrating head injury
that disrupts the normal function of the brain. The severity of a TBI
may range from “mild” (a brief change in mental status or
consciousness) to “severe” (an extended period of unconsciousness
or amnesia after the injury).
BACKGROUND

Report Contents and Organization 9
Traumatic Brain Injury in the United States
This report presents data about TBI-related emergency
department visits, hospitalizations, and deaths in the United
States for the years 2002 through 2006. The findings are
organized into two main sections of Overview and Appendices.
The Overview summarizes and interprets key findings and the
Appendices present detailed data tables and a description of the
methods and limitations.
Average annual numbers of TBIs per year and annual rates are
both reported. While the annual numbers show the magnitude of
the problem, the rates show how a certain group is affected by
TBI by relating the number of TBIs to the size of the population.
For example, a relatively small number of TBIs occurring in a
small population would result in a higher TBI rate than if the
same number of TBIs occurred in a larger population. This report
helps to answer a variety of questions, such as: “Do males sustain
TBIs more often than females?; Are children more likely to sustain
a TBI than adults?; and, Are motor vehicle–traffic injuries a
substantial cause of TBI among older adults?”
Data in the report include:
●TBI as a Proportion of All Injuries
●TBI by Age
●TBI by Sex
●TBI by Race
●TBI by External Cause
●Additional TBI Findings
State-level data on TBI are not presented in this report. CDC’s
National Center for Injury Prevention and Control, Division of
Injury Response currently funds 30 states to conduct TBI
surveillance through the CORE State Injury Program.
For TBI-related death and hospitalization data by participating
states, download a copy of the State Injury Indicators Report:
Fourth Edition—2005 Data at no cost or search the Injury
Indicators Web-based Query System, both available at
www.cdc.gov/Injury.
Finally, neither this report nor the State Injury Indicators Report:
Fourth Edition—2005 Data include TBIs from federal, military, or
Veterans Affairs (VA) hospitals.
REPORT CONTENTS AND ORGANIZATION

For More Information 10
Traumatic Brain Injury in the United States
CDC’s Division of Injury Response works to reduce injuries and
their adverse health effects. For additional information on TBI,
including research, programs, and educational initiatives please
visit: www.cdc.gov/TraumaticBrainInjury.
For questions about this report, please contact
CDC-INFO@cdc.gov or call 1-800-CDC-INFO (1-800- 232-4636).
For media inquiries, please contact CDC’s Injury Center Press
Officer at (770) 488-4902 between 9:00 am and 5:00 pm EST. If there
is an after-hours emergency, please call (404) 639-2888 for
instructions on contacting the on-call press officer.
FOR MORE INFORMATION
Overview | Traumatic Brain Injuries by External Cause 11
Traumatic Brain Injury in the United States
Overview
Annual Number of TBIs 13
TBI as a Proportion of All Injuries 14
TBI by Age Group 15
TBI by Sex 16
TBI by External Cause 17
Summary of Findings
External TBI Causes 21
Conclusion 21

12
Traumatic Brain Injury in the United States 12
Overview | Annual Number of TBIs 13
Traumatic Brain Injury in the United States
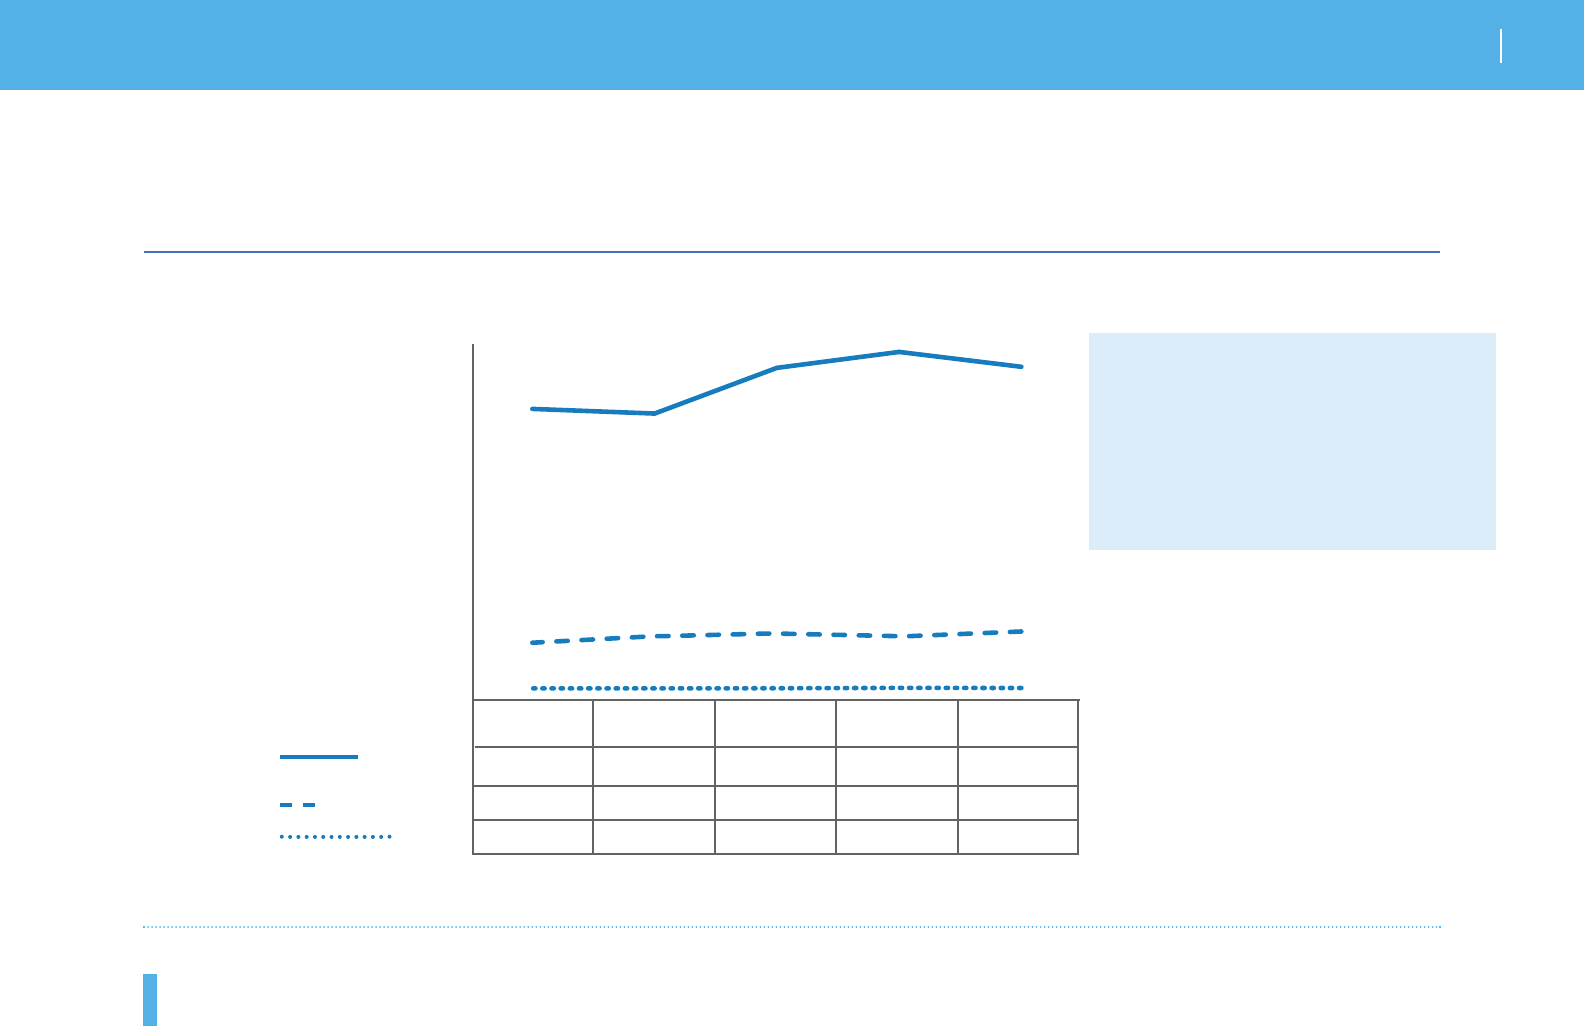
FIGURE 1: Estimated Average Annual Number of Traumatic Brain Injury-Related Emergency Department Visits,
Hospitalizations, and Deaths, United States, 2002–2006
,
Deaths
* Data for this category are not included in this report. See “Limitations” in Appendix B for more information.
Of the 1.7 million TBIs occurring each year in the United States, 80.7% were emergency department visits, 16.3% were
hospitalizations, and 3.0% were deaths.
An estimated 1.7 million TBIs occur
in the United States annually.
ANNUAL NUMBER OF TBIs
,
Hospitalizations
,,
Emergency Department Visits
Receiving Other Medical Care or No Care*

Overview | TBI as a Proportion of All Injuries 14
Traumatic Brain Injury in the United States
The estimated annual average number of emergency department visits, hospitalizations and deaths for all injuries is in Table
A. TBIs comprise 4.8% of all injuries seen in emergency department visits and 15.1% of all hospitalizations. Of all the injury-
related deaths in the United States, TBI was a contributing factor 30.5% of the time.
ALL INJURIES TBIs
OF OF ALL OF
ALL VISITS NUMBER ALL VISITS NUMBER INJURIES ALL VISITS
TABLE A: Estimated Percentage of All Injuries and Traumatic Brain Injury-Related Emergency Department Visits,
Hospitalizations, and Deaths, United States, 2002–2006
* Persons who were hospitalized, died, or transferred to another facility were excluded.
# In-hospital deaths and patients who transferred from another hospital were excluded.
+ 128 mortality records (from 2002−2006) were omitted because of missing age information.
ED Visits*96,839,411 28,697,028 29.6 1,364,797 4.8 1.4
Hospitalizations#36,693,646 1,826,548 5.0 275,146 15.1 0.7
Deaths 2,432,714 169,055 6.9 51,538+30.5 2.1
Total 135,965,771 30,692,631 22.6 1,691,481 5.5 1.2
TBI AS A PROPORTION OF ALL INJURIES

Overview | TBI by Age Group 15
Traumatic Brain Injury in the United States
TABLE B: Estimated Average Annual Numbers of
Traumatic Brain Injury-Related Emergency Department
Visits, Hospitalizations, and Deaths, by Age Group,
United States, 2002–2006
The estimated average annual number of TBIs that occur
among children aged 0 to 14 years is 511,257. In contrast the
number of TBIs in adults aged 65 years and older is 237,844.
TBI-related emergency department visits accounted for a larger
proportion in children (92.7%) than in older adults (59.7%).
COMPARING THE NUMBERS
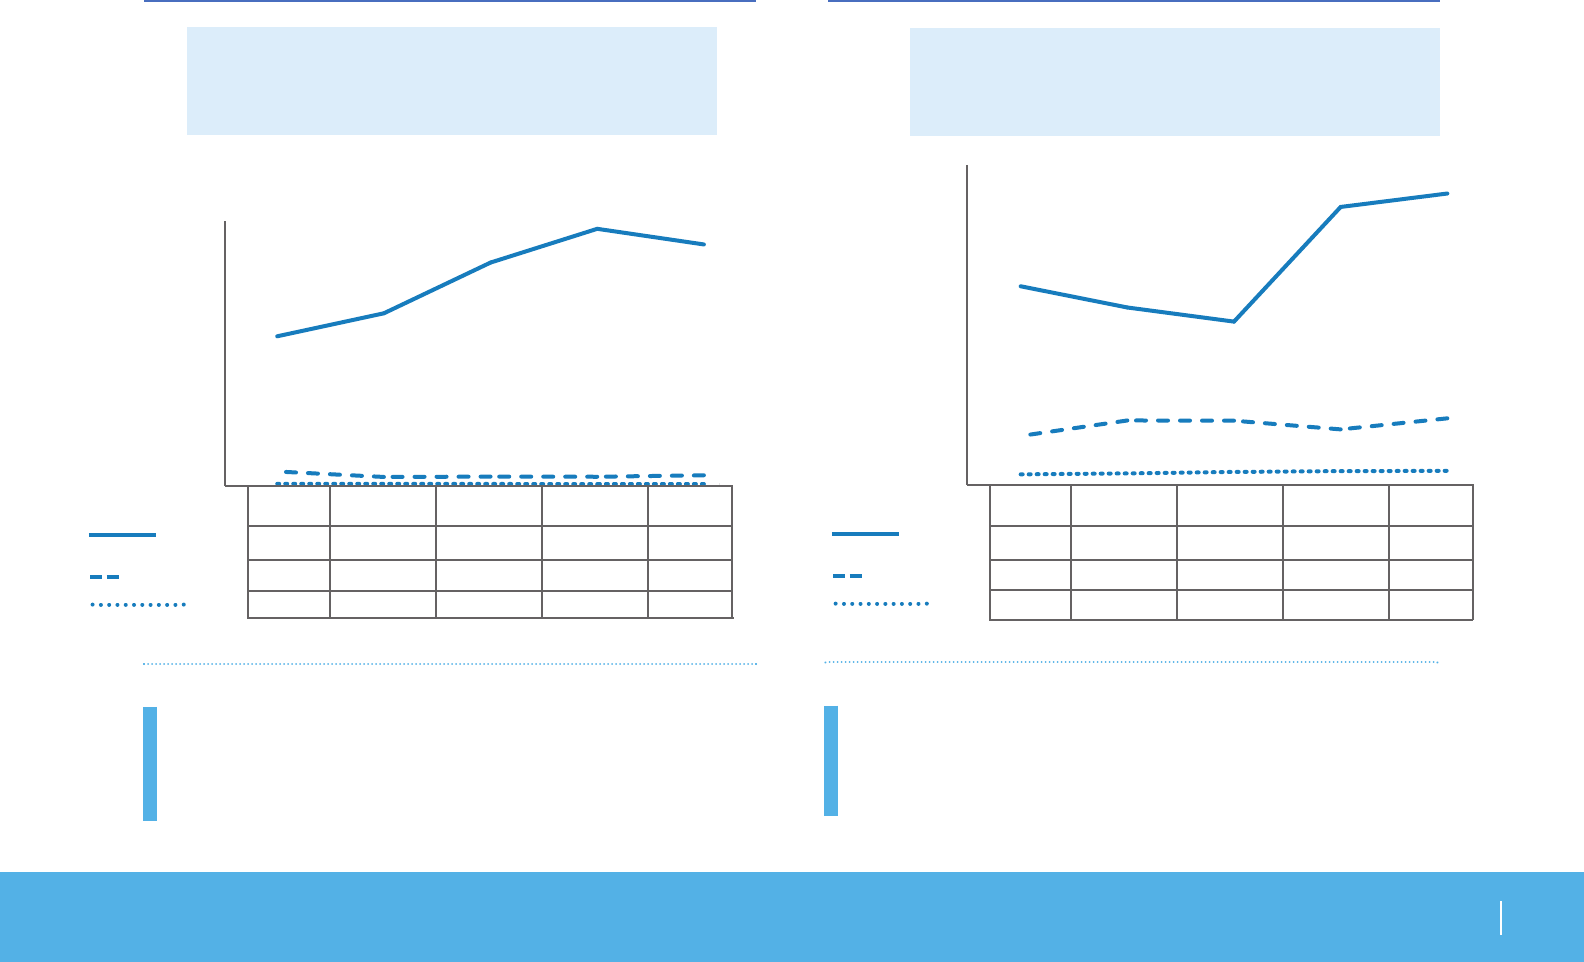
FIGURE 2: Estimated Average Annual Rates of
Traumatic Brain Injury-Related Emergency Department
Visits, Hospitalizations, and Deaths, by Age Group,
United States, 2002–2006
COMPARING THE RATES
Very young children aged 0 to 4 years had the highest rate of
TBI-related emergency department visits (1,256 per 100,000
population), followed by older adolescents aged 15 to 19 years
(757 per 100,000). However, the highest rates of TBI-related
hospitalization and death occurred among adults aged 75 years
and older (339 per 100,000 and 57 per 100,000, respectively).
0-4 5-9 10-14 15-19 20-24 25-34 35-44 45-54 55-64 65-74 >75
Age Group
1,400
1,200
1,000
800
600
400
200
0
Per 100,000
Children, older adolescents, and adults aged 65
years and older were more likely to sustain a TBI.
AGE GROUP VISITS HOSPITALIZATIONS DEATHS TOTAL
Children 473,947 35,136 2,174 511,257
(0−14 years)
Older Adults 141,998 81,499 14,347 237,844
( ≥ 65 years)
Emergency
Department Visits
Hospitalizations
Deaths
TBI BY AGE GROUP
EMERGENCY
DEPARTMENT

0-4 5-9 10-14 15-19 20-24 25-34 35-44 45-54 55-64 65-74 ≥75
Age Group
1,400
1,200
1,000
800
600
400
200
0
Per 100,000
Overview | TBI by Sex 16
Traumatic Brain Injury in the United States
COMPARING THE NUMBERS
TABLE C: Estimated Average Annual Numbers of
Traumatic Brain Injury–Related Emergency Department
Visits, Hospitalizations, and Deaths, by Sex,
United States, 2002–2006
FIGURE 3: Estimated Average Annual Rates of
Traumatic Brain Injury-Combined Emergency Department
Visits, Hospitalizations, and Deaths, by Sex,
United States, 2002–2006
COMPARING THE RATES
An estimated average annual number of 998,176 TBIs
occurred among males compared with 693,329 among
females. Overall, approximately 1.4 times as many TBIs
occurred among males as among females.
Male
Female
Among all age groups, TBI rates were
higher for males than for females.
Males aged 0 to 4 years had the highest rates of TBI-related
emergency department visits, hospitalizations and deaths
combined (1,451 per 100,000). Rates were also high for females
aged 0 to 4 (1,218 per 100,000), and for both males and females
aged 15 to 19 years (896 per 100,000), and 75 years and older
(932 per 100,000).
SEX VISITS HOSPITALIZATIONS DEATHS TOTAL
Male 789,925 170,257 37,994 998,176
Female 574,870 104,890 13,569 693,329
TBI BY SEX
EMERGENCY
DEPARTMENT
0-4 5-9 10-14 15-19 20-24 25-34 35-44 45-54 55-64 65-74 >75
Age Group
1,000
800
600
400
200
0
Per 100,000
Overview | TBI by External Cause 17
Traumatic Brain Injury in the United States
TABLE D: Estimated Average Annual Numbers of
Traumatic Brain Injury-Related Emergency Department
Visits, Hospitalizations, and Deaths, by External Cause,
United States, 2002–2006
An estimated average annual number of 595,095 are fall-
related TBIs, 292,202 are motor vehicle–traffic TBIs, 279,882 are
struck by/against events, and 169,625 are assault-related TBIs.
Motor vehicle–traffic resulted in the greatest number of TBI-
related deaths; however, falls resulted in the greatest number
of emergency department visits and hospitalizations.
FIGURE 4: Estimated Average Annual Rates of
Traumatic Brain Injury-Combined Emergency Department
Visits, Hospitalizations, and Deaths, by External Cause,
United States, 2002–2006
The rate of fall-related TBI was highest among children aged
0 to 4 years (839 per 100,000) and adults aged 75 years and older
(599 per 100,000). The rates for both motor vehicle–traffic and
assault-related TBI were highest among adults aged 20 to 24
years (261 per 100,000 and 175 per 100,000, respectively).
Falls
Struck By/Against
Motor Vehicle
Assault
Falls are the leading cause of TBI. Rates were
highest among children aged 0 to 4 and adults
aged 75 and older.
CAUSE VISITS HOSPITALIZATIONS DEATHS TOTAL
Falls 523,043 62,334 9,718 595,095
Struck 271,713 7,791 378 279,882
By/Against
Motor Vehicle- 218,936 56,864 16,402 292,202
Traffic
Assault 148,471 15,341 5,813 169,625
Other 108,467 27,536 19,252 155,255
Unknown 94,165 105,282 0 199,447
COMPARING THE NUMBERS COMPARING THE RATES
TBI BY EXTERNAL CAUSE
EMERGENCY
DEPARTMENT

18
Traumatic Brain Injury in the United States Overview | TBI by External Cause
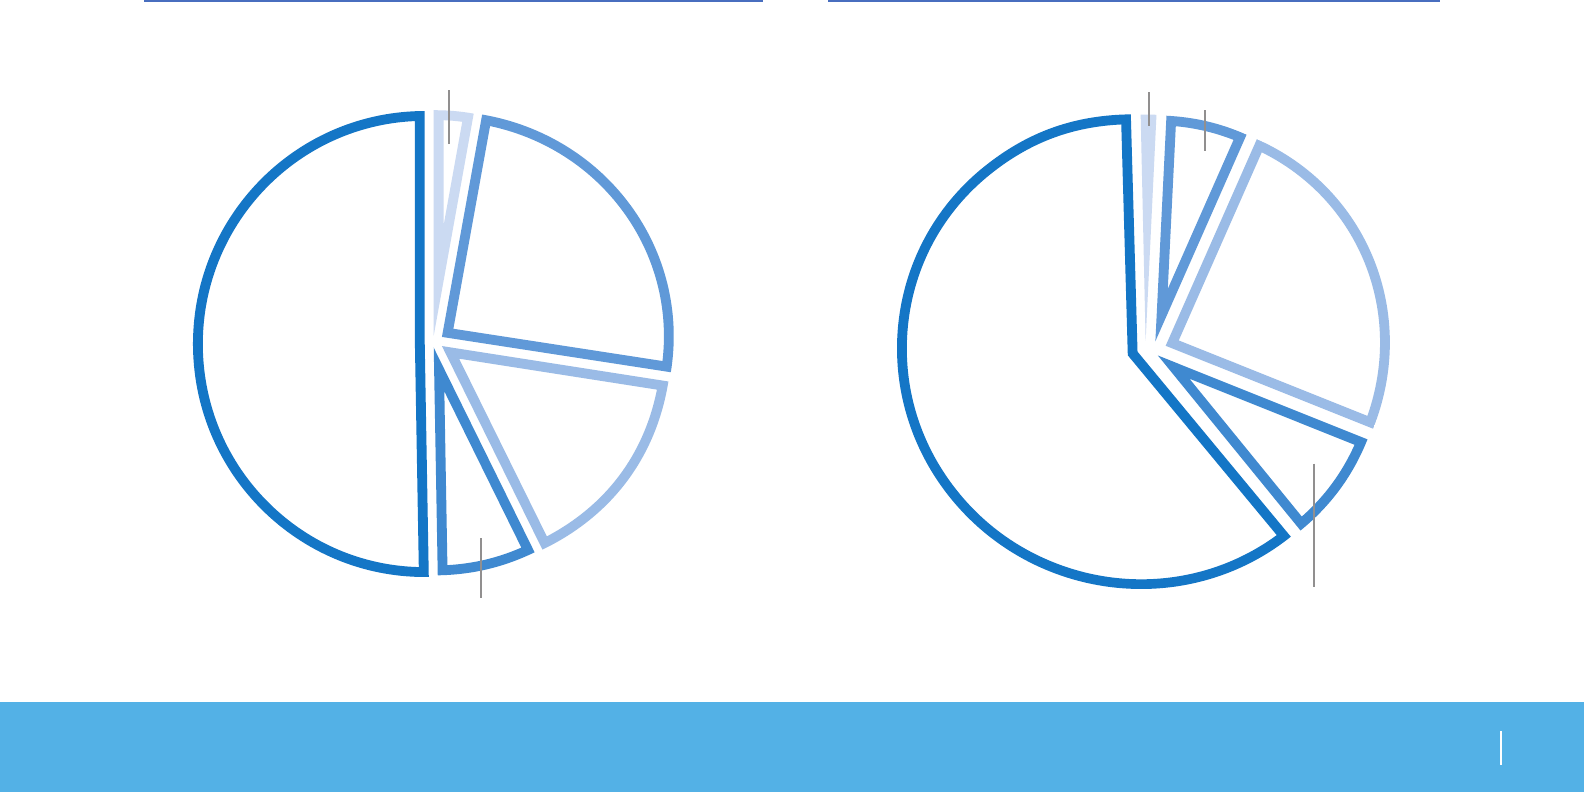
FIGURE 5: Estimated Average Percentage of Annual Traumatic Brain Injury-Combined Emergency Department Visits,
Hospitalizations, and Deaths, by External Cause, United States, 2002–2006
TBI BY EXTERNAL CAUSE
Assault
10%
Unknown/Other
21%
Motor Vehicle–Traffic
17.3%
Falls
35.2%
Struck By/Against
16.5%
COMPARING THE PERCENTAGES
Overview | TBI by External Cause 19
Traumatic Brain Injury in the United States
FIGURE 6: Estimated Average Percentage of Annual
Traumatic Brain Injury-Combined Emergency Department
Visits, Hospitalizations, and Deaths Among Children 0 to
14 Years, by External Cause, United States, 2002–2006
Struck By/Against
FIGURE 7: Estimated Average Percentage of Annual
Traumatic Brain Injury-Combined Emergency Department
Visits, Hospitalizations, and Deaths Among Adults 65 Years
and Older, by External Cause, United States, 2002–2006
24.8%
Unknown/
Other
15.3%
Falls
50.2%
Motor Vehicle–Traffic
6.8%
Assault
2.9%
Unknown/Other
24.7%
Falls
60.7%
Motor Vehicle–Traffic
7.9%
Assault
1%
Struck By/Against
5.7%
TBI BY EXTERNAL CAUSE
COMPARING THE PERCENTAGES BY AGE GROUPS

20
Traumatic Brain Injury in the United States

Falls
●Among all age groups, falls continued to be the leading cause
of TBI (35.2%). Falls cause approximately half (50.2%) of the
TBIs among children aged 0 to 14 years, compared with 60.7%
among adults aged 65 years and older.
Motor Vehicle–Traffic
●Among all age groups, motor vehicle–traffic was the second
leading cause of TBI (17.3%) and resulted in the largest per-
centage of TBI-related deaths (31.8%).
Struck By/Against Events
●Struck by/against events, which include colliding with a
moving or stationary object, were the second leading cause
of TBI among children aged 0 to 14 years (24.8%).
Assault
●Assaults produced 10% of TBIs in the general population;
they accounted for only 2.9% in children aged 0 to 14 years
and 1% in adults aged 65 years old and older.
SUMMARY OF
BY EXTERNAL TBI CAUSES Presenting data on TBI is critical to understanding the impact
of this important public health problem in the United States.
This information provides the building blocks to inform TBI
prevention strategies, identify research and education
priorities, and support the need for services among those
living with a TBI.
An estimated 1.7 million TBI-related emergency department
visits, hospitalizations, and deaths occur each year in the
United States. This is an increase from 1.4 million TBI-related
emergency department visits, hospitalizations, and deaths
from what was reported in the previous edition of Traumatic
Brain Injury in the United States: Emergency Department
Visits, Hospitalizations and Deaths, published by CDC in 2004.1
The increase in TBI-related injury was most apparent when
examining emergency department visits. There were large
increases in emergency department visits among children and
older adults. Other major reasons for the increase were more
fall-related TBIs and overall population growth. It is also likely
that the public’s awareness of TBI contributed to increased
treatment. Further research and education is needed to
explore how best to prevent traumatic brain injury.
Although this report provides data on a wide range of TBIs
occurring in this country, it is not currently possible to capture
all cases of TBI. There is no estimate for the number of people
with non-fatal TBI seen outside of an emergency department of
hospital or who receive no care at all.
CONCLUSION
Overview | Summary of Findings & Conclusion 21
Traumatic Brain Injury in the United States
SUMMARY OF FINDINGS

22
Traumatic Brain Injury in the United States
Overview |Summary of Findings & Conclusion 23
Traumatic Brain Injury in the United States
Appendix A: Tables
Total TBI-Related Emergency Department Visits,
Hospitalizations, and Deaths 25
TBI-Related Emergency Department Visits
by Age Group and Disposition 26
by Age Group and Sex 27
by Age Group and Race 28
by Age Group and External Cause 29
by Age Group and Motor – Vehicle Cause 30
by Age Group and Payment Source 31
TBI-Related Hospitalizations
by Age Group and Disposition 32
by Age Group and Sex 33
by Age Group and Race 34
by Age Group and External Cause 35
by Age Group and Motor – Vehicle Cause 36
by Age Group and Payment Source 37
TBI-Related Deaths
by Age Group and Sex 38
by Age Group and Race 39
by Age Group and External Cause 40
by Age Group and Motor – Vehicle Cause 41
Annual Estimates of All TBI from 2002–2006 42
Annual Rate Estimates of Fall-Related TBI
Among Children Aged 0 – 14 Years 43
Among Adults Aged 65 Years and Older 43

24
Traumatic Brain Injury in the United States

Appendix A | Total TBIs 25
Traumatic Brain Injury in the United States
EMERGENCY DEPARTMENT VISITS■HOSPITALIZATIONS◊DEATHS* TOTAL
TABLE 1: Estimated Average Annual Numbers, Rates, and Percentages of Traumatic Brain Injury-Related
Emergency Department Visits, Hospitalizations, and Deaths, by Age Group, United States, 2002–2006
■Persons who were hospitalized, died, or transferred to another facility were excluded.
◊ In-hospital deaths and patients who transferred from another hospital were excluded.
* 128 mortality records (2002–2006) were omitted because of missing age information.
►Average annual rate per 100,000 population.
¶ Age-adjusted to the 2000 U.S. standard population.
Numbers subject to rounding error.
0-4 251,546 1256.2 93.9 15,239 76.1 5.7 998 5.0 0.4 267,783 1337.3
5-9 105,015 532.9 91.9 8,799 44.7 7.7 450 2.3 0.4 114,264 579.9
10-14 117,387 559.8 90.8 11,098 52.9 8.6 726 3.5 0.6 129,211 616.2
15-19 157,198 757.0 84.5 24,896 119.9 13.4 3,995 19.2 2.1 186,089 896.2
20-24 136,079 655.8 84.1 20,683 99.7 12.8 5,048 24.3 3.1 161,810 779.8
25-34 174,811 438.3 83.0 28,953 72.6 13.7 6,826 17.1 3.2 210,591 528.0
35-44 123,436 279.9 75.8 32,310 73.3 19.9 6,995 15.9 4.3 162,741 369.1
45-54 99,715 239.7 73.4 29,068 69.9 21.4 7,125 17.1 5.2 135,908 326.7
55-64 57,612 198.2 67.6 22,600 77.7 26.5 5,028 17.3 5.9 85,240 293.2
65-74 46,365 250.2 64.7 20,990 113.3 29.3 4,252 22.9 5.9 71,607 386.4
≥ 75 95,633 536.2 57.5 60,510 339.3 36.4 10,095 56.6 6.1 166,237 932.0
Total 1,364,797 465.4 80.7 275,146 93.8 16.3 51,538 17.6 3.0 1,691,481 576.8
Adjusted¶468.0 93.6 17.4 579.0
AGE YRS NUMBER RATE►ROW NUMBER RATE►ROW NUMBER RATE►ROW NUMBER RATE►
DISPOSITION

Appendix A | Emergency Department Visits by Age & Disposition 26
Traumatic Brain Injury in the United States
TREATED AND RELEASED OTHER* TOTAL
AGE YRS NUMBER ROW NUMBER ROW NUMBER
TABLE 2: Estimated Average Annual Numbers and Percentages of Traumatic Brain Injury-Related
Emergency Department Visits, by Age Group and Disposition, United States, 2002–2006
* Includes people who were hospitalized, died, or transferred to another facility. These records were excluded from the remaining
emergency department tables.
† Sample size is 30−59; the value of the estimate was reported but may not be stable.
§ Sample size is less than 30; the value of the estimate was also reported, but it is not considered stable.
Numbers subject to rounding error.
0-4 251,546 92.9 19,106†7.1†270,652
5-9 105,015 86.1 16,940§13.9§121,955
10-14 117,387 92.4 9,617§7.6§127,004
15-19 157,198 88.6 20,131†11.4†177,329
20-24 136,079 85.6 22,949†14.4†159,028
25-34 174,811 92.1 15,005†7.9†189,816
35-44 123,436 83.8 23,936†16.2†147,372
45-54 99,715 78.8 26,898†21.2†126,613
55-64 57,612 74.6 19,623§25.4§77,235
65-74 46,365 78.9 12,394§21.1§58,759
≥ 75 95,633 66.3 48,681 33.7 144,314
Total 1,364,797 85.3 235,280 14.7 1,600,077

Appendix A | Emergency Department Visits by Age & Sex 27
Traumatic Brain Injury in the United States
MALE FEMALE TOTAL
AGE YRS NUMBER RATE►ROW NUMBER RATE►ROW NUMBER RATE►
TABLE 3: Estimated Average Annual Numbers, Rates, and Percentages of Traumatic Brain Injury-Related
Emergency Department Visits, by Age Group and Sex, United States, 2002–2006
►Average annual rate per 100,000 population.
† Sample size is 30−59; the value of the estimate was reported but may not be stable.
¶ Age-adjusted to the 2000 U.S. standard population.
Note: Persons who were hospitalized, died, or transferred to another facility were excluded.
Numbers subject to rounding error.
0-4 139,001 1357.4 55.3 112,545 1150.3 44.7 251,546 1256.2
5-9 68,671 681.2 65.4 36,343 377.6 34.6 105,014 532.9
10-14 90,221 840.0 76.9 27,166†265.6†23.1†117,387 559.8
15-19 98,761 926.6 62.8 58,437 578.2 37.2 157,198 757.0
20-24 86,669 812.2 63.7 49,410 490.3 36.3 136,079 655.8
25-34 97,845 483.8 56.0 76,966 391.5 44.0 174,811 438.3
35-44 68,527 311.4 55.5 54,909 248.6 44.5 123,436 279.9
45-54 50,941 249.2 51.1 48,775 230.5 48.9 99,716 239.7
55-64 32,226†230.2†55.9†25,386†168.4†44.1†57,612 198.2
65-74 23,146†273.7†49.9†23,218†230.5†50.1†46,364 250.2
≥ 75 33,917†504.4†35.5†61,716 555.4 64.5 95,633 536.2
Total 789,925 547.6 57.9 574,871 385.9 42.1 1,364,796 465.4
Adjusted ¶543.9 388.6 468.0

Appendix A | Emergency Department Visits by Age & Race 28
Traumatic Brain Injury in the United States
AMERICAN INDIAN, ALASKA NATIVE, OTHER/
WHITE BLACK ASIAN, OR PACIFIC ISLANDER UNKNOWN TOTAL
AGE YRS NUMBER RATE►ROW NUMBER RATE►ROW NUMBER RATE►ROW NUMBER ROW NUMBER RATE►
TABLE 4: Estimated Average Annual Numbers, Rates, and Percentages of Traumatic Brain Injury-Related
Emergency Department Visits, by Age Group and Race, United States, 2002–2006
0-4 180,880 1160.8 71.9 56,942 1746.6 22.6 13,576†1148.5†5.4†147§0.1§251,545 1256.2
5-9 76,588 499.5 72.9 22,994†718.5†21.9†5,433§463.1§5.2§-- -- 105,015 532.9
10-14 84,096 517.2 71.6 27,156†775.0†23.1†5,509§456.5§4.7§625§0.5§117,386 559.8
15-19 128,896 793.1 82.0 23,049†696.5†14.7†4,586§380.8§2.9§666§0.4§157,197 757.0
20-24 105,796 647.4 77.7 27,030†867.5†19.9†3,253§251.9§2.4§-- -- 136,079 655.8
25-34 137,732 438.3 78.8 29,968†542.9†17.1†6,445§218.9§3.7§666§0.4§174,811 438.3
35-44 103,176 289.7 83.6 14,158†247.0†11.5†5,767§209.9§4.7§334§0.3§123,435 279.9
45-54 76,966 223.4 77.2 20,040†407.3†20.1†2,710§121.2§2.7§-- -- 99,716 239.7
55-64 47,644 192.2 82.7 7,385§253.7§12.8§2,584§187.9§4.5§-- -- 57,613 198.2
65-74 36,979 230.9 79.8 5,236§300.9§11.3§3,196§411.4§6.9§954§2.1§46,365 250.2
≥ 75 88,260 553.4 92.3 4,626§342.0§4.8§2,748§512.6§2.9§-- -- 95,634 536.2
Total 1,067,013 448.3 78.2 238,584 618.6 17.5 55,807 334.7 4.1 3,392 0.2 1,364,796 465.4
Adjusted ¶456.6 568.7 345.2 468.0
►Average annual rate per 100,000 population.
† Sample size is 30−59; the value of the estimate was reported but may not be stable.
§ Sample size is less than 30; the value of the estimate was also reported, but it is not considered stable.
¶ Age-adjusted to the 2000 U.S. standard population.
-- No data for these cells.
Note: Persons who were hospitalized, died, or transferred to another facility were excluded.
Numbers subject to rounding error.

Appendix A | Emergency Department Visits by Age & External Cause 29
Traumatic Brain Injury in the United States
MOTOR VEHICLE
TRAFFIC* FALLS ASSAULT STRUCK BY/AGAINST OTHER/UNKNOWN TOTAL
AGE YRS NUMBER RATE►ROW NUMBER RATE►ROW NUMBER RATE►ROW NUMBER RATE►ROW NUMBER RATE►ROW NUMBER RATE►
TABLE 5: Estimated Average Annual Numbers, Rates, and Percentages of Traumatic Brain Injury-Related
Emergency Department Visits, by Age Group and External Cause, United States, 2002–2006
* Motor vehicle–traffic includes the following external cause of injury:
occupant, motorcyclist, pedal cyclist, pedestrian, other and unspecified
person involved in a motor vehicle–traffic incident.
►Average annual rate per 100,000 population.
† Sample size is 30−59; the value of the estimate was reported but
may not be stable.
§ Sample size is less than 30; the value of the estimate was also
reported, but it is not considered stable.
¶ Age-adjusted to the 2000 U.S. standard population.
Note: Persons who were hospitalized, died, or transferred to another
facility were excluded.
Numbers subject to rounding error.
0-4 12,852§64.2§5.1§161,455 806.3 64.2 362§1.8§0.1§53,922 269.3 21.4 22,954†114.6†9.1†251,545 1256.2
5-9 7,310§37.1§7.0§42,371 215.0 40.3 1,033§5.2§1.0§35,583†180.6†33.9†18,718†95.0†17.8†105,015 532.9
10-14 6,529§31.1§5.6§42,843†204.3†36.5†11,385§54.3§9.7§34,572 164.9 29.5 22,057†105.2†18.8†117,386 559.8
15-19 40,466 194.9 25.7 32,740†157.7†20.8 22,272†107.3†14.2†36,512 175.8 23.2 25,207†121.4†16.0†157,197 757.0
20-24 44,209 213.1 32.5 19,845†95.6†14.6†33,360†160.8†24.5†19,205§92.6§14.1§19,459§93.8§14.3§136,078 655.8
25-34 42,213†105.8†24.1†31,794†79.7†18.2†36,385†91.2†20.8†30,464†76.4†17.4†33,954†85.1†19.4†174,810 438.3
35-44 19,687†44.6†15.9†34,510†78.3†28.0†20,775†47.1†16.8†21,689†49.2†17.6†26,776†60.7†21.7†123,437 279.9
45-54 20,210†48.6†20.3†33,779†81.2†33.9†14,610§35.1§14.7§17,216§41.4§17.3§13,900§33.4§13.9§99,715 239.7
55-64 14,454§49.7§25.1§16,485†56.7†28.6†6,548§22.5§11.4§10,015§34.4§17.4§10,110§34.8§17.5§57,612 198.2
65-74 5,904§31.9§12.7§28,698†154.9†61.9†1,329§7.2§2.9§7,123§38.4§15.4§3,311§17.9§7.1§46,365 250.2
≥ 75 5,102§28.6§5.3§78,523 440.2 82.1 411§2.3§0.4§5,412§30.3§5.7§6,185§34.7§6.5§95,633 536.2
Total 218,936 74.7 16.0 523,043 178.4 38.3 148,470 50.6 10.9 271,713 92.7 19.9 202,631 69.1 14.8 1,364,793 465.4
Adjusted ¶74.0 180.2 50.2 93.9 69.7 468.0

Appendix A | Emergency Department Visits by Age & MVT Cause 30
Traumatic Brain Injury in the United States
MVT OTHER
MVTOCCUPANT MVT MOTORCYCLE MVT PEDAL CYCLE MVT PEDESTRIAN OR UNSPECIFIED TOTAL
AGE YRS NUMBER RATE►ROW NUMBER RATE►ROW NUMBER RATE►ROW NUMBER RATE►ROW NUMBER RATE►ROW NUMBER RATE►
TABLE 6: Estimated Average Annual Numbers, Rates, and Percentages of Traumatic Brain Injury-Related
Emergency Department Visits, by Age Group and Specific Motor Vehicle–Traffic (MVT) External Causes,
United States, 2002–2006
0-4 9,498§47.4§73.9§-- -- -- -- -- -- -- -- -- 3,355§16.8§26.1§12,853§64.2§
5-9 1,427§7.2§19.5§-- -- -- 513§2.6§7.0§514§2.6§7.0§4,856§24.6§66.4§7,310§37.1§
10-14 2,455§11.7§37.6§787§3.8§12.1§-- -- -- 2,959§14.1§45.3§328§1.6§5.0§6,529§31.1§
15-19 18,828†90.7†46.5†568§2.7§1.4§-- -- -- 324§1.6§0.8§20,745§99.9§51.3§40,465 194.9
20-24 24,985†120.4†56.5†3,110§15.0§7.0§37§0.2§0.1§1,420§6.8§3.2§14,657§70.6§33.2§44,209 213.1
25-34 18,786§47.1§44.5§4,847§12.2§11.5§563§1.4§1.3§-- -- -- 18,017§45.2§42.7§42,213†105.8†
35-44 6,632§15.0§33.7§189§0.4§1.0§-- -- -- 307§0.7§1.6§12,559§28.5§63.8§19,687†44.6†
45-54 12,616§30.3§62.4§304§0.7§1.5§-- -- -- 1,233§3.0§6.1§6,057§14.6§30.0§20,210†48.6†
55-64 6,450§22.2§44.6§133§0.5§0.9§-- -- -- 169§0.6§1.2§7,701§26.5§53.3§14,453§49.7§
65-74 2,689§14.5§45.6§-- -- -- -- -- -- 1,000§5.4§16.9§2,214§12.0§37.5§5,903§31.9§
≥ 75 -- -- -- -- -- -- -- -- -- -- -- -- 5,102§28.6§100.0§5,102§28.6§
Total 104,366 35.6 47.7 9,938§3.4§4.5§1,113§0.4§0.5§7,926§2.7§3.6§95,591 32.6 43.7 218,934 74.7
Adjusted ¶35.0 3.3 0.4 2.7 32.5 74.0
►Average annual rate per 100,000 population.
† Sample size is 30−59; the value of the estimate was reported but
may not be stable.
§ Sample size is less than 30; the value of the estimate was also
reported, but it is not considered stable.
¶ Age-adjusted to the 2000 U.S. standard population.
-- No data for these cells.
Note: Persons who were hospitalized, died, or transferred to
another facility were excluded.
Numbers subject to rounding error.

Appendix A | Emergency Department Visits by Age & Payment Source 31
Traumatic Brain Injury in the United States
PRIVATE MEDICAID MEDICARE WORKERS COMPENSATION OTHER/UNKNOWN* TOTAL
AGEYRS NUMBER ROW NUMBER ROW NUMBER ROW NUMBER ROW NUMBER ROW NUMBER
TABLE 7: Estimated Average Annual Numbers and Percentages of Traumatic Brain Injury-Related
Emergency Department Visits, by Age Group and Expected Source of Payment, United States, 2002–2006
0-4 121,610 48.3 87,911 34.9 1,025§0.4§-- -- 40,999†16.3†251,545
5-9 58,430 55.6 23,720†22.6†797§0.8§-- -- 22,068†21.0†105,015
10-14 74,107 63.1 24,978†21.3†670§0.6§-- -- 17,631†15.0†117,386
15-19 91,028 57.9 14,309†9.1†3,190§2.0§695§0.4§47,975 30.5 157,197
20-24 52,094 38.3 5,093§3.7§-- -- 8,737§6.4§70,154 51.6 136,078
25-34 73,054 41.8 17,148†9.8†2,348§1.3§12,895§7.4§69,366 39.7 174,811
35-44 54,807 44.4 16,854†13.7†7,118§5.8§7,542§6.1§37,114 30.1 123,435
45-54 46,457 46.6 12,355§12.4§4,426§4.4§6,219§6.2§30,259†30.3†99,716
55-64 24,566†42.6†6,412§11.1§3,802§6.6§4,201§7.3§18,631§32.3§57,612
65-74 6,558§14.1§3,424§7.4§29,249†63.1†1,773§3.8§5,361§11.6§46,365
≥ 75 5,636§5.9§10,461§10.9§70,994 74.2 1,571§1.6§6,971§7.3§95,633
Total 608,347 44.6 222,665 16.3 123,619 9.1 43,633 3.2 366,529 26.9 1,364,793
* Includes self pay, no charge, other government, other, and unknown.
† Sample size is 30−59; the value of the estimate was reported but may not be stable.
§ Sample size is less than 30; the value of the estimate was also reported, but it is not considered stable.
-- No data for these cells.
Note: Persons who were hospitalized, died, or transferred to another facility were excluded.
Numbers subject to rounding error.
Appendix A | Hospitalizations by Age & Disposition 32
Traumatic Brain Injury in the United States
HOME TRANSFERRED* OTHER/UNKNOWN┼INHOSPITAL DEATHS‡TOTAL
AGE YRS NUMBER ROW NUMBER ROW NUMBER ROW NUMBER ROW NUMBER
TABLE 8: Estimated Average Annual Numbers and Percentages of Traumatic Brain Injury-Related
Hospitalizations, by Age Group and Disposition, United States, 2002–2006
0-4 15,564 87.8 855§4.8§903†5.1†406§2.3§17,728
5-9 8,996 89.8 283§2.8§281§2.8§461§4.6§10,021
10-14 10,855 89.4 326§2.7§429†3.5†535§4.4§12,145
15-19 21,971 78.9 2,064†7.4†2,459 8.8 1,356†4.9†27,850
20-24 18,261 79.8 1,567†6.9†1,776 7.8 1,277†5.6†22,881
25-34 23,239 75.7 1,976 6.4 4,295 14.0 1,199†3.9†30,709
35-44 25,192 73.9 3,154 9.3 4,864 14.3 881†2.6†34,091
45-54 23,042 72.4 3,166 9.9 3,782 11.9 1,827 5.7 31,817
55-64 16,359 64.6 4,223 16.7 3,112 12.3 1,617†6.4†25,311
65-74 13,331 55.7 5,670 23.7 2,969 12.4 1,983 8.3 23,953
≥ 75 24,751 34.7 30,302 42.4 9,453 13.2 6,926 9.7 71,432
Total 201,561 65.5 53,586 17.4 34,323 11.1 18,468 6.0 307,938
DISCHARGED ALIVE‡
┼Includes patients who left against medical advice and who were discharged alive (but no disposition stated), and patients with
unknown disposition.
* Includes both long- and short-term care facilities.
‡ In-hospital deaths and patients who transferred from another hospital were excluded from the remaining hospitalization tables.
† Sample size is 30−59; the value of the estimate was reported but may not be stable.
§ Sample size is less than 30; the value of the estimate was also reported, but is not considered stable.
Numbers subject to rounding error.

Appendix A | Hospitalizations by Age & Sex 33
Traumatic Brain Injury in the United States
MALE FEMALE TOTAL
AGE YRS NUMBER RATE►ROW NUMBER RATE►ROW NUMBER RATE►
TABLE 9: Estimated Average Annual Numbers, Rates, and Percentages of Traumatic Brain Injury-Related
Hospitalizations, by Age Group and Sex, United States, 2002–2006
0-4 9,019 88.1 59.2 6,220 63.6 40.8 15,239 76.1
5-9 5,296 52.5 60.2 3,503 36.4 39.8 8,799 44.7
10-14 7,407 69.0 66.7 3,691 36.1 33.3 11,098 52.9
15-19 17,189 161.3 69.0 7,708 76.3 31.0 24,897 119.9
20-24 16,341 153.1 79.0 4,343 43.1 21.0 20,684 99.7
25-34 22,438 110.9 77.5 6,516 33.1 22.5 28,954 72.6
35-44 22,417 101.9 69.4 9,893 44.8 30.6 32,310 73.3
45-54 20,085 98.2 69.1 8,983 42.5 30.9 29,068 69.9
55-64 15,269 109.1 67.6 7,331 48.6 32.4 22,600 77.7
65-74 11,437 135.2 54.5 9,553 94.8 45.5 20,990 113.3
≥ 75 23,360 347.4 38.6 37,150 334.3 61.4 60,510 339.3
Total 170,258 118.0 61.9 104,891 70.4 38.1 275,149 93.8
Adjusted ¶121.0 66.2 93.6
►Average annual rate per 100,000 population.
¶ Age-adjusted to the 2000 U.S. standard population.
Note: In-hospital deaths and patients who transferred from another hospital were excluded.
Numbers subject to rounding error.
Appendix A | Hospitalizations by Age & Race 34
Traumatic Brain Injury in the United States
AMERICAN INDIAN, ALASKA NATIVE, OTHER/
WHITE BLACK ASIAN, OR PACIFIC ISLANDER UNKNOWN TOTAL
AGE YRS NUMBER RATE►ROW NUMBER RATE►ROW NUMBER RATE►ROW NUMBER ROW NUMBER RATE►
TABLE 10: Estimated Average Annual Numbers, Rates, and Percentages of Traumatic Brain Injury-
Related Hospitalizations, by Age Group and Race, United States, 2002–2006
0-4 9,361 60.1 61.4 2,075 63.6 13.6 530§44.8§3.5§3,274 21.5 15,240 76.1
5-9 5,412 35.3 61.5 1,126 35.2 12.8 151§12.9§1.7§2,110 24.0 8,799 44.7
10-14 6,278 38.6 56.6 1,669 47.6 15.0 388§32.2§3.5§2,763 24.9 11,098 52.9
15-19 15,243 93.8 61.2 2,413 72.9 9.7 893§74.1§3.6§6,348 25.5 24,897 119.9
20-24 11,676 71.4 56.5 2,272 72.9 11.0 841§65.1§4.1§5,894 28.5 20,683 99.7
25-34 15,981 50.9 55.2 4,044 73.3 14.0 682§23.2§2.4§8,247 28.5 28,954 72.6
35-44 18,916 53.1 58.5 4,456 77.8 13.8 953§34.7§3.0§7,985 24.7 32,310 73.3
45-54 16,648 48.3 57.3 4,369 88.8 15.0 479§21.4§1.6§7,572 26.0 29,068 69.9
55-64 14,064 56.7 62.2 1,829 62.8 8.1 1,165§84.7§5.2§5,543 24.5 22,601 77.7
65-74 13,455 84.0 64.1 1,679 96.5 8.0 899§115.7§4.3§4,957 23.6 20,990 113.3
≥ 75 42,735 268.0 70.6 2,644 195.5 4.4 1,370†255.5†2.3†13,761 22.7 60,510 339.3
Total 169,769 71.3 61.7 28,576 74.1 10.4 8,351 50.1 3.0 68,454 24.9 275,150 93.8
Adjusted ¶69.8 78.7 58.2 93.6
►Average annual rate per 100,000 population.
† Sample size is 30−59; the value of the estimate was reported but may not be stable.
§ Sample size is less than 30; the value of the estimate was also reported, but it is not considered stable.
¶ Age-adjusted to the 2000 U.S. standard population.
Note: In-hospital deaths and patients who transferred from another hospital were excluded.
Numbers subject to rounding error.

Appendix A | Hospitalizations by Age & External Cause 35
Traumatic Brain Injury in the United States
MOTOR VEHICLE
TRAFFIC* FALLS ASSAULT STRUCK BY/AGAINST OTHER/UNKNOWN TOTAL
AGE YRS NUMBER RATE►ROW NUMBER RATE►ROW NUMBER RATE►ROW NUMBER RATE►ROW NUMBER RATE►ROW NUMBER RATE►
TABLE 11: Estimated Average Annual Numbers, Rates, and Percentages of Traumatic Brain Injury-
Related Hospitalizations, by Age Group and External Cause, United States, 2002–2006
0-4 2,182 10.9 14.3 6,458 32.2 42.4 893†4.5†5.9†867†4.3†5.7†4,840 24.2 31.8 15,240 76.1
5-9 2,566 13.0 29.2 1,733 8.8 19.7 10§0.1§0.1§543†2.8†6.2†3,946 20.0 44.8 8,798 44.7
10-14 2,111 10.1 19.0 1,892 9.0 17.0 520§2.5§4.7§1,244†5.9†11.2†5,331 25.4 48.0 11,098 52.9
15-19 9,598 46.2 38.6 2,119 10.2 8.5 1,622†7.8†6.5†1,069†5.1†4.3†10,488 50.5 42.1 24,896 119.9
20-24 7,571 36.5 36.6 1,251†6.0†6.1†1,998 9.6 9.7 237§1.1§1.1§9,626 46.4 46.5 20,683 99.7
25-34 9,208 23.1 31.8 3,391 8.5 11.7 3,496 8.8 12.1 888§2.2§3.1§11,970 30.0 41.3 28,953 72.6
35-44 7,744 17.6 24.0 4,738 10.7 14.7 3,529 8.0 10.9 996†2.3†3.1†15,303 34.7 47.4 32,310 73.3
45-54 6,712 16.1 23.1 5,332 12.8 18.3 1,736 4.2 6.0 459§1.1§1.6§14,829 35.6 51.0 29,068 69.9
55-64 3,217 11.1 14.2 5,559 19.1 24.6 1,134§3.9§5.0§515§1.8§2.3§12,176 41.9 53.9 22,601 77.7
65-74 1,918 10.3 9.1 7,392 39.9 35.2 68§0.4§0.3§467§2.5§2.2§11,145 60.1 53.1 20,990 113.3
≥ 75 4,038 22.6 6.7 22,468 126.0 37.1 334§1.9§0.6§504§2.8§0.8§33,164 185.9 54.8 60,508 339.3
Total 56,865 19.4 20.7 62,333 21.2 22.7 15,340 5.2 5.6 7,789 2.7 2.8 132,818 45.3 48.3 275,145 93.8
Adjusted ¶19.4 21.2 5.2 2.7 45.1 93.6
* Motor vehicle–traffic includes the following external cause of injury:
occupant, motorcyclist, pedal cyclist, pedestrian, other and
unspecified person involved in a motor vehicle–traffic incident.
►Average annual rate per 100,000 population.
† Sample size is 30−59; the value of the estimate was reported but
may not be stable.
§ Sample size is less than 30; the value of the estimate was also
reported, but it is not considered stable.
¶ Age-adjusted to the 2000 U.S. standard population.
Note: In-hospital deaths and patients who transferred from another
hospital were excluded.
Numbers subject to rounding error.

Appendix A | Hospitalizations by Age & MVT Cause 36
Traumatic Brain Injury in the United States
MVT OTHER
MVTOCCUPANT MVT MOTORCYCLE MVT PEDAL CYCLE MVT PEDESTRIAN OR UNSPECIFIED TOTAL
AGE YRS NUMBER RATE►ROW NUMBER RATE►ROW NUMBER RATE►ROW NUMBER RATE►ROW NUMBER RATE►ROW NUMBER RATE►
0-4 1,426†7.1†65.3†-- -- -- -- -- -- 744§3.7§34.1§12§0.1§0.6§2,182 10.9
5-9 1,487†7.5†57.9†100§0.5§3.9§147§0.7§5.7§677†3.4†26.4†156§0.8§6.1§2,567 13.0
10-14 984†4.7†46.6†91§0.4§4.3§360†1.7†17.0†650†3.1†30.8†26§0.1§1.2§2,111 10.1
15-19 6,802 32.8 70.9 1,182§5.7§12.3§243§1.2§2.5§650§3.1§6.8§722§3.5§7.5§9,599 46.2
20-24 5,567 26.8 73.5 614§3.0§8.1§143§0.7§1.9§703§3.4§9.3§543§2.6§7.2§7,570 36.5
25-34 6,048 15.2 65.7 1,428†3.6†15.5†357§0.9§3.9§792†2.0†8.6†583§1.5§6.3§9,208 23.1
35-44 5,216 11.8 67.4 1,299†2.9†16.8†66§0.1§0.8§852§1.9§11.0§311§0.7§4.0§7,744 17.6
45-54 4,263 10.2 63.5 1,114†2.7†16.6†131§0.3§1.9§697§1.7§10.4§506§1.2§7.5§6,711 16.1
55-64 1,872 6.4 58.2 434§1.5§13.5§49§0.2§1.5§498§1.7§15.5§364§1.3§11.3§3,217 11.1
65-74 1,374 7.4 71.6 88§0.5§4.6§28§0.2§1.5§212§1.1§11.1§215§1.2§11.2§1,917 10.3
≥ 75 3,009 16.9 74.5 -- -- -- -- -- -- 741§4.2§18.3§289§1.6§7.2§4,039 22.6
Total 38,048 13.0 66.9 6,350 2.2 11.2 1,524 0.5 2.7 7,216 2.5 12.7 3,727 1.3 6.6 56,865 19.4
Adjusted ¶12.9 2.2 0.5 2.5 1.3 19.4
TABLE 12: Estimated Average Annual Numbers, Rates, and Percentages of Traumatic Brain Injury-
Related Hospitalizations, by Age Group and Specific Motor Vehicle–Traffic (MVT) External Causes,
United States, 2002–2006
►Average annual rate per 100,000 population.
† Sample size is 30−59; the value of the estimate was reported but may not be stable.
§ Sample size is less than 30; the value of the estimate was also reported, but it is not considered stable.
¶ Age-adjusted to the 2000 U.S. standard population.
-- No data for these cells.
Note: In-hospital deaths and patients who transferred from another hospital were excluded.
Numbers subject to rounding error.

Appendix A | Hospitalizations by Age & Payment Source 37
Traumatic Brain Injury in the United States
PRIVATE MEDICAID MEDICARE WORKERS COMPENSATION OTHER/UNKNOWN* TOTAL
AGEYRS NUMBER ROW NUMBER ROW NUMBER ROW NUMBER ROW NUMBER ROW NUMBER
0-4 7,029 46.1 6,339 41.6 54§0.4§-- -- 1,818 11.9 15,240
5-9 4,823 54.8 2,659 30.2 -- -- -- -- 1,317 15.0 8,799
10-14 6,690 60.3 3,031 27.3 -- -- -- -- 1,376 12.4 11,097
15-19 14,619 58.7 4,863 19.5 193§0.8§331§1.3§4,891 19.6 24,897
20-24 9,097 44.0 3,319 16.0 407§2.0§861†4.2†6,998 33.8 20,682
25-34 12,715 43.9 4,479 15.5 848§2.9§1,337 4.6 9,574 33.1 28,953
35-44 13,062 40.4 4,051 12.5 2,495 7.7 1,899 5.9 10,804 33.4 32,311
45-54 13,743 47.3 3,516 12.1 2,702 9.3 1,648†5.7†7,459 25.7 29,068
55-64 11,306 50.0 2,795 12.4 3,893 17.2 1,188†5.3†3,419 15.1 22,601
65-74 3,847 18.3 728†3.5†14,735 70.2 400§1.9§1,279†6.1†20,989
≥ 75 7,045 11.6 500§0.8§51,278 84.7 23§0.0§1,663 2.7 60,509
Total 103,976 37.8 36,280 13.2 76,605 27.8 7,687 2.8 50,598 18.4 275,147
TABLE 13: Estimated Average Annual Numbers and Percentages of Traumatic Brain Injury-Related
Hospitalizations, by Age Group and Expected Source of Payment, United States, 2002–2006
* Includes self pay, no charge, other government, other, and unknown.
† Sample size is 30−59; the value of the estimate was reported but may not be stable.
§ Sample size is less than 30; the value of the estimate was also reported, but it is not considered stable.
-- No data for these cells.
Note: In-hospital deaths and patients who transferred from another hospital were excluded.
Numbers subject to rounding error.

Appendix A | Deaths by Age & Sex 38
Traumatic Brain Injury in the United States
MALE FEMALE TOTAL*
AGE YRS NUMBER RATE►ROW NUMBER RATE►ROW NUMBER RATE►
0-4 574 5.6 57.5 424 4.3 42.5 998 5.0
5-9 259 2.6 57.6 191 2.0 42.4 450 2.3
10-14 477 4.4 65.7 249 2.4 34.3 726 3.5
15-19 2,977 27.9 74.5 1,018 10.1 25.5 3,995 19.2
20-24 4,140 38.8 82.0 908 9.0 18.0 5,048 24.3
25-34 5,551 27.4 81.3 1,275 6.5 18.7 6,826 17.1
35-44 5,428 24.7 77.6 1,567 7.1 22.4 6,995 15.9
45-54 5,592 27.4 78.5 1,533 7.2 21.5 7,125 17.1
55-64 3,913 28.0 77.8 1,115 7.4 22.2 5,028 17.3
65-74 3,125 36.9 73.5 1,128 11.2 26.5 4,253 22.9
≥ 75 5,935 88.3 58.8 4,160 37.4 41.2 10,095 56.6
Total 37,971 26.3 73.7 13,568 9.1 26.3 51,539 17.6
Adjusted ¶27.1 8.6 17.4
TABLE 14: Average Annual Numbers, Rates, and Percentages of Traumatic Brain Injury-Related Deaths,
by Age Group and Sex, United States, 2002–2006
* 128 mortality records (2002−2006) were omitted because of missing age information.
►Average annual rate per 100,000 population.
¶ Age-adjusted to the 2000 U.S. standard population.
Numbers subject to rounding error.

Appendix A | Deaths by Age & Race 39
Traumatic Brain Injury in the United States
AMERICAN INDIAN, ALASKA NATIVE,
WHITE BLACK ASIAN, OR PACIFIC ISLANDER TOTAL*
AGE YRS NUMBER RATE►ROW NUMBER RATE►ROW NUMBER RATE►ROW NUMBER RATE►
0-4 693 4.4 69.4 253 7.8 25.3 52 4.4 5.2 998 5.0
5-9 336 2.2 74.6 90 2.8 20.1 24 2.0 5.3 450 2.3
10-14 568 3.5 78.2 129 3.7 17.8 29 2.4 4.0 726 3.5
15-19 3,179 19.6 79.6 653 19.7 16.4 163 13.5 4.1 3,995 19.2
20-24 3,841 23.5 76.1 1,000 32.1 19.8 207 16.0 4.1 5,048 24.3
25-34 5,202 16.6 76.2 1,366 24.7 20.0 259 8.8 3.8 6,827 17.1
35-44 5,795 16.3 82.8 976 17.0 13.9 224 8.2 3.2 6,995 15.9
45-54 6,108 17.7 85.7 813 16.5 11.4 204 9.1 2.9 7,125 17.1
55-64 4,440 17.9 88.3 444 15.3 8.8 144 10.5 2.9 5,028 17.3
65-74 3,830 23.9 90.1 301 17.3 7.1 122 15.7 2.9 4,253 22.9
≥ 75 9,409 59.0 93.2 431 31.9 4.3 255 47.5 2.5 10,095 56.6
Total 43,401 18.2 84.2 6,456 16.7 12.5 1,683 10.1 3.3 51,540 17.6
Adjusted ¶17.7 17.3 11.2 17.4
TABLE 15: Average Annual Numbers, Rates, and Percentages of Traumatic Brain Injury-Related Deaths,
by Age Group and Race, United States, 2002–2006
* 128 mortality records (2002−2006) were omitted because of missing age information.
►Average annual rate per 100,000 population.
¶ Age-adjusted to the 2000 U.S. standard population.
Numbers subject to rounding error.

Appendix A | Deaths by Age & External Cause 40
Traumatic Brain Injury in the United States
MOTOR VEHICLE
TRAFFIC* FALLS ASSAULT STRUCK BY/AGAINST OTHER/UNKNOWN TOTAL┼
AGE YRS NUMBER RATE►ROW NUMBER RATE►ROW NUMBER RATE►ROW NUMBER RATE►ROW NUMBER RATE►ROW NUMBER RATE►
0-4 395 2.0 39.6 37 0.2 3.7 364 1.8 36.4 22 0.1 2.2 180 0.9 18.1 998 5.0
5-9 303 1.5 67.5 10 0.0 2.1 48 0.2 10.7 12 0.1 2.7 76 0.4 17.0 449 2.3
10-14 436 2.1 60.0 15 0.1 2.0 86 0.4 11.9 10 0.0 1.3 180 0.9 24.8 727 3.5
15-19 2,344 11.3 58.7 52 0.3 1.3 634 3.1 15.9 14 0.1 0.4 951 4.6 23.8 3,995 19.2
20-24 2,444 11.8 48.4 95 0.5 1.9 979 4.7 19.4 22 0.1 0.4 1,509 7.3 29.9 5,049 24.3
25-34 2,740 6.9 40.1 182 0.5 2.7 1,315 3.3 19.3 46 0.1 0.7 2,543 6.4 37.3 6,826 17.1
35-44 2,458 5.6 35.1 414 0.9 5.9 982 2.2 14.0 59 0.1 0.8 3,083 7.0 44.1 6,996 15.9
45-54 2,110 5.1 29.6 760 1.8 10.7 712 1.7 10.0 67 0.2 0.9 3,476 8.4 48.8 7,125 17.1
55-64 1,281 4.4 25.5 896 3.1 17.8 349 1.2 6.9 49 0.2 1.0 2,454 8.4 48.8 5,029 17.3
65-74 832 4.5 19.6 1,375 7.4 32.3 169 0.9 4.0 37 0.2 0.9 1,839 9.9 43.2 4,252 22.9
≥ 75 1,053 5.9 10.4 5,882 33.0 58.3 164 0.9 1.6 40 0.2 0.4 2,956 16.6 29.3 10,095 56.6
Total 16,396 5.6 31.8 9,718 3.3 18.9 5,802 2.0 11.3 378 0.1 0.7 19,247 6.6 37.3 51,541 17.6
Adjusted ¶5.6 3.3 2.0 0.1 6.5 17.4
TABLE 16: Average Annual Numbers, Rates, and Percentages of Traumatic Brain Injury-Related Deaths,
by Age Group and External Cause, United States, 2002–2006
* Motor vehicle–traffic includes the following external cause of injury: occupant, motorcyclist, pedal cyclist, pedestrian, other and
unspecified person involved in a motor vehicle–traffic incident.
┼128 mortality records (2002−2006) were omitted because of missing age information.
►Average annual rate per 100,000 population.
¶ Age-adjusted to the 2000 U.S. standard population.
Numbers subject to rounding error.

Appendix A | Deaths by Age & MVT Cause 41
Traumatic Brain Injury in the United States
MVT OTHER
MVTOCCUPANT MVT MOTORCYCLE MVT PEDAL CYCLE MVT PEDESTRIAN OR UNSPECIFIED TOTAL*
AGE YRS NUMBER RATE►ROW NUMBER RATE►ROW NUMBER RATE►ROW NUMBER RATE►ROW NUMBER RATE►ROW NUMBER RATE►
0-4 174 0.9 43.9 0 ‡ 0.1 2‡0.6 97 0.5 24.6 122 0.6 30.8 395 2.0
5-9 131 0.7 43.2 3‡0.9 21 0.1 7.1 60 0.3 19.6 89 0.4 29.2 304 1.5
10-14 200 1.0 45.9 14 0.1 3.1 38 0.2 8.7 76 0.4 17.3 109 0.5 25.0 437 2.1
15-19 1,300 6.3 55.5 87 0.4 3.7 26 0.1 1.1 119 0.6 5.1 812 3.9 34.7 2,344 11.3
20-24 1,245 6.0 50.9 219 1.1 9.0 17 0.1 0.7 132 0.6 5.4 832 4.0 34.1 2,445 11.8
25-34 1,268 3.2 46.3 345 0.9 12.6 34 0.1 1.2 208 0.5 7.6 885 2.2 32.3 2,740 6.9
35-44 1,044 2.4 42.5 373 0.8 15.2 54 0.1 2.2 262 0.6 10.7 726 1.6 29.5 2,459 5.6
45-54 856 2.1 40.6 353 0.8 16.7 56 0.1 2.7 263 0.6 12.5 582 1.4 27.6 2,110 5.1
55-64 530 1.8 41.4 162 0.6 12.6 33 0.1 2.6 181 0.6 14.2 375 1.3 29.2 1,281 4.4
65-74 369 2.0 44.3 45 0.2 5.5 18 0.1 2.2 139 0.8 16.7 260 1.4 31.3 831 4.5
≥ 75 464 2.6 44.1 13 0.1 1.3 13 0.1 1.3 202 1.1 19.2 360 2.0 34.2 1,052 5.9
Total 7,581 2.6 46.2 1,614 0.5 9.8 312 0.1 1.9 1,739 0.6 10.6 5,152 1.7 31.4 16,398 5.6
Adjusted ¶2.6 0.5 0.1 0.6 1.7 5.6
TABLE 17: Average Annual Numbers, Rates, and Percentages of Traumatic Brain Injury-Related Deaths,
by Age Group and Specific Motor Vehicle–Traffic (MVT) External Causes, United States, 2002–2006
* 33 mortality records (2002−2006) were omitted because of missing age information.
►Average annual rate per 100,000 population.
¶ Age-adjusted to the 2000 U.S. standard population.
‡ Sample size was less than 20 for the 5 years combined, so the rate was suppressed.
Numbers subject to rounding error.
Appendix A | Annual TBI Estimates 2002–2006 42
Traumatic Brain Injury in the United States
1,500,000
1,250,000
1,000,000
750,000
500,000
250,000
0
2002 2003 2004 2005 2006
1,248,660 1,228,731 1,424,548 1,492,879 1,429,159
246,381 274,596 285,778 274,426 294,556
50,566 50,736 51,164 52,860 52,365
Emergency
Department Visits
Hospitalizations
Deaths
FIGURE 8: Annual Estimates of All Traumatic Brain Injury-Related Emergency Department Visits,
Hospitalizations, and Deaths, United States, 2002–2006
From 2002 to 2006, there was
an increase in TBI-related
emergency department
visits and hospitalizations.
During the period 2002 through 2006, TBI-related emergency department visits increased by 14.4%, hospitalizations increased by 19.5%,
and deaths increased by 3.5%. The estimated population in the United States increased by 3.8% during the same period.
Number of Visits
Emergency
Department Visits
Hospitalizations
Deaths
Appendix A | Annual Fall-Related TBI Estimates By Age 43
Traumatic Brain Injury in the United States
500
400
300
200
100
0
2002 2003 2004 2005 2006
290 335.2 434.9 501.2 470.5
24.3 13.6 14.3 14 16.9
0.1 0.1 0.1 0.1 0.1
FIGURE 9: Annual Rate Estimates of Fall–Related Traumatic
Brain Injury-Related Emergency Department Visits,
Hospitalizations, and Deaths Among Children Aged 0–14,
United States, 2002–2006
From 2002 to 2006, there was an increase in fall-
related TBIs in emergency department visits among
children aged 14 years and younger.
Per 100,000
From 2002 to 2006, there was a 62% increase in fall-related
TBIs in emergency department visits among children aged 14
years and younger. Hospitalizations decreased by 30% and
deaths remained the same.
FIGURE 10: Annual Rate Estimates of Fall–Related
Traumatic Brain Injury-Related Emergency Department
Visits, Hospitalizations, and Deaths Among Adults Aged 65
and older, United States, 2002–2006
From 2002 to 2006, there was an increase in fall-
related TBIs in emergency department visits among
adults aged 65 years and older.
From 2002 to 2006, fall-related TBI rates increased in the older
adult population. There were large increases in emergency
department visits (46%), hospitalizations (34%), and deaths
(27%) among this age group.
400
350
300
250
200
150
100
50
0
2002 2003 2004 2005 2006
263.7 235.9 217.4 367.6 385.2
67.6 87.9 87.6 76.2 90.7
17.3 18.5 20.5 21.5 21.9
Per 100,000
Emergency
Department Visits
Hospitalizations
Deaths

44
Traumatic Brain Injury in the United States

Overview | Traumatic Brain Injuries by External Cause 45
Traumatic Brain Injury in the United States
Appendix B:
Methods and
Data Sources
Data Sources 49
Identification of TBI Cases 51
External Cause of Injury 55
Population Data 57
Statistical Analysis 59
Limitations 61

46
Traumatic Brain Injury in the United States

Appendix B | Methods & Data Sources 47
Traumatic Brain Injury in the United States
APPENDIX B METHODS AND DATA SOURCES
The data presented in this report were based on three different
national data sources: the National Hospital Discharge Survey
(NHDS), the National Hospital Ambulatory Medical Care Survey
(NHAMCS) and the National Vital Statistics System (NVSS).
These data sources were selected because national estimates
for traumatic brain injuries can be calculated using visits to
emergency departments, hospitalizations, and deaths. Data for
the years of 2002 to 2006 were used to obtain the most recent
estimates of the burden of traumatic brain injuries and to
increase the stability of the estimated numbers and rates for
hospitalizations and emergency department visits.

48
Traumatic Brain Injury in the United States

Appendix B | Data Sources 49
Traumatic Brain Injury in the United States
Emergency Department Visits
The National Hospital Ambulatory Medical Care Survey
(NHAMCS), conducted by CDC’s National Center for Health
Statistics (NCHS), was used to characterize TBIs treated in
emergency departments in the United States. The target
population of the NHAMCS was in-person visits made in the
United States to emergency departments and outpatient
departments of nonfederal, short-stay hospitals (hospitals with
an average stay of less than 30 days), hospitals that specialize in
general medicine or surgical procedures, and children’s hospitals.
Of the NHAMCS data, only emergency department visits were
included in this report. The NHAMCS used a four-stage
probability design with the stages being primary sampling units
(PSUs), hospitals within PSUs, clinics or emergency departments
within hospitals, and patient visits within clinics or emergency
departments. Hospital staff were asked to complete patient
record forms for a systematic random sample of patient visits
occurring during a randomly assigned four-week reporting
period. Each visit was assigned a sample weight based on the
inverse probability of selection with adjustments for non-
response. The individual sample weights were summed to
produce national estimates of TBI-related emergency
department visits. For age, sex, and race, missing values were
imputed by randomly assigning a value from a record with
similar emergency department volume, geographic region,
immediacy with which the patient should be seen, and primary
diagnosis. Additional information about the NHAMCS emergency
department component is available elsewhere.2
For this report, TBI-related cases were selected if one of the three
diagnosis fields contained an ICD-9-CM diagnosis code for TBI6(see
Table 18). The external cause of injury (E-code) was assigned based
on the first E-code field. Emergency department patients who
died in the emergency department, who were later hospitalized
or transferred to another facility were excluded from the analysis
of emergency department visits. During 2002 to 2006, the number
of hospitals that participated in the survey ranged from 352 to 406
(more than 91% of eligible, sampled hospitals each year), with the
total number of unweighted emergency department visits ranged
from 33,605 to 40,253. The annual number of unweighted TBI-
related emergency department visits identified in the sample
ranged from 412 to 460 for a total of 2,198 TBI-related emergency
department visits sampled during 2002 to 2006.
Hospitalizations
The National Hospital Discharge Survey (NHDS) of the NCHS
was used to estimate annual number and rates of TBI-related
hospitalizations. The NHDS provided data on discharges from
nonfederal, short-stay hospitals (those with an average length
of stay for all patients of less than 30 days), general (medical or
DATA SOURCES

Appendix B | Data Sources 50
Traumatic Brain Injury in the United States
surgical) hospitals, or children’s general hospitals in the United
States. The NHDS used a modified, three-stage probability
designed to select records, with the stages being PSUs, hospitals
within the PSUs, and discharges within the hospitals. The
modification of the design involved selection with certainty of the
largest PSUs and hospitals. Demographic and medical data were
collected for the selected discharges, and weights were assigned
based on the inverse probability of selection with adjustments for
non-response. The individual record weights were summed to
produce estimates of TBI-related hospitalizations each year for the
total United States population. Additional information about the
NHDS data is available elsewhere.7
For this report, TBI-related cases were selected if one of the
diagnosis fields contained an ICD-9-CM diagnosis code for TBI3
(see Table 18). External Cause codes, or E-codes, were contained
within the seven diagnosis fields, and the external cause of injury
was classified using the first E-code that appeared in the list of
codes. Hospitalized patients who died during hospitalization or
were transferred to another hospital were excluded from the
analysis. During 2002 to 2006, the number of hospitals that
provided data for the survey ranged from 426 to 445 (88.9% to
93.9% of eligible, sampled hospitals), and the total number of
unweighted discharges ranged from 319,530 to 376,328. The annual
number of unweighted TBI-related hospitalizations identified in
the sample ranged from 2,104 to 2,583 for a total of 11,880
unweighted TBI-related discharges sampled during 2002 to 2006.
Deaths
Multiple cause-of-death data from the mortality files of the
National Vital Statistics System (NVSS) were used to describe
TBI-related deaths. In the United States, state laws require
completion of death certificates for all deaths; federal law
mandates national collection and publication of deaths and
other vital statistics. The NVSS, the federal compilation of these
data, is the result of cooperation between NCHS and the states to
provide access to statistical information from death certificates.
Additional information about these data is available elsewhere.4
For this report, TBI-related cases were selected if an ICD-10
diagnosis code5(see Table 19) for TBI appeared
in Part I of the death certificate. The E-code was obtained from
the underlying cause of death field.

Appendix B | Identification of TBI Cases 51
Traumatic Brain Injury in the United States
For all data sources, TBI cases were identified using CDC’s case
definition.6,7 All NHDS and NHAMCS records that contained in one
or more of the diagnosis data fields the ICD-9-CM diagnosis codes
in the appropriate range, as shown in Table 18, were identified as
a TBI emergency department visit or hospitalization. All records
that contained in Part I of the death certificate the ICD-10
diagnosis codes (for years 2002–2006) in the appropriate range, as
shown in Table 19, were identified as a TBI death.
A record was counted only once regardless of the number of
diagnosis codes that met the criteria for TBI. The increased use
of 959.015was accompanied by a corresponding drop in the use
of 854.
3Thus, to avoid underestimating TBIs, cases coded as
959.01 were included. This is consistent with a previous CDC
publication on TBI8and the current CDC TBI case definition.6,7
IDENTIFICATION OF
TRAUMATIC BRAIN INJURY CASES

52
Traumatic Brain Injury in the United States

Appendix B | Identification of TBI Cases 53
Traumatic Brain Injury in the United States
ICDCM
DESCRIPTION EMERGENCY DEPARTMENT VISITS AND HOSPITALIZATIONS
TABLE 18: ICD-9-CM Codes for Traumatic Brain Injury-Related Emergency Department Visits and
Hospitalizations (2002–2006)
Fracture of the vault or base of the skull 800.0−801.9
Other and unqualified multiple fractures of the skull 803.0−804.9
Intracranial injury, including concussion, contusion, laceration, and hemorrhage 850.0−854.1
Injury to optic nerve and pathways 950.1−950.3
Shaken baby syndrome 995.55
Head injury, unspecified 959.01

Appendix B | Identification of TBI Cases 54
Traumatic Brain Injury in the United States
DESCRIPTION ICD DEATHS
TABLE 19: ICD-10 Codes for Traumatic Brain Injury-Related Deaths (2002–2006)
Open wound of the head S01.0−S01.9
Fracture of the skull and facial bones S02.0, S02.1, S02.3, S02.7−S02.9
Injury to optic nerve and pathways S04.0
Intracranial injury S06.0−S06.9
Crushing injury of head S07.0, S07.1, S07.8, S07.9
Other unspecified injuries of head S09.7−S09.9
Open wounds involving head with neck T01.0
Fractures involving head with neck T02.0
Crushing injuries involving head with neck T04.0
Injuries of brain and cranial nerves with injuries of nerves and spinal cord at neck level T06.0
Sequelae of injuries of head T90.1, T90.2, T90.4, T90.5, T90.8, T90.9
Appendix B | External Cause of Injury 55
Traumatic Brain Injury in the United States
External cause of injury categorization was based on E-codes and
classified using categories adapted from CDC’s recommended
frameworks for presenting injury data.9,10 The categories used are
presented in Table 20.
Several changes occurred in the classification of external cause of
injury between ICD-9 and ICD-10, including the prefixes used to
distinguish external cause (from E-codes for ICD-9 to codes
beginning with V, W, X, Y, and *U [terrorism] for ICD-10) and the
organization of transport incident codes (based on type of vehicle
in ICD-9 and characteristics of the injured person in ICD-10). For this
report, the external cause of injury categories were motor
vehicle–traffic, unintentional falls, assaults, and struck by/against.
Struck by/against events are those in which a person was struck
unintentionally by another person or an object, such as falling
debris or objects, struck against an object, such as a wall or
another person. For this report, only unintentional and
undetermined struck by/ against events were included. Struck
by/against events related to assaults were in the assault category.
Struck by/against events were reported for all age groups, even
though sometimes small sample sizes produced estimates that
were not considered stable.
EXTERNAL CAUSE OF INJURY

Appendix B | External Cause of Injury 56
Traumatic Brain Injury in the United States
DESCRIPTION ICDCM ICD
TABLE 20: External Cause of Injury Categorization for ICD-9-CM Codes (Emergency Department Visits and
Hospitalizations, 2002–2006) and ICD-10 Codes (Deaths, 2002–2006)
Motor vehicle traffic−related (unintentional) E810−E819 V02−V04 (.1, .9), V09.2, V12−V14 (.3−.9), V19 (.4−.6),
V20−V28 (.3−.9), V29 (.4−.9), V30−V79 (.4−.9), V80 (.3−.5),
V81.1, V82.1, V83−V86 (.0−.3), V87 (.0−.8), V89.2
Occupant E810−E819 (.0, .1) V30−V79 (.4−.9), V81.1, V82.1, V83−V86 (.0−.3)
Motorcycle E810−E819 (.2, .3) V20−V28 (.3−.9), V29 (.4−.9)
Pedal cycle E810−E819 (.6) V12−V14 (.3−.9), V19 (.4−.6)
Pedestrian E810−E819 (.7) V02−V04 (.1, .9), V09.2
Other and unspecified E810−E819 (.4, .5, .8, .9) V80 (.3−.5), V87 (.0−.8), V89.2
Falls (unintentional and undetermined) E880−E886, E888, E987 W00−W19, Y30
Assault (includes firearm and other) E960−E969 X85−Y09, Y87.1
Struck by and against E916, E917 W20−W22, W50−W52, Y29
Other and unspecified All other E-codes All other cause codes

Appendix B | Population Data 57
Traumatic Brain Injury in the United States
This report uses the United States’Census bridged race population
estimates from 2002 to 2006 obtained from NCHS.11 The average
annual population, derived by dividing the total population by five,
is presented in Table 21. The 2000 standard population from the U.S.
Bureau of the Census was used to calculate the age-adjusted rates
by using the direct method.12 The weights applied to the average
annual population from the 2000 standard population are also
presented in Table 21.
POPULATION DATA

Appendix B | Population Data 58
Traumatic Brain Injury in the United States
AMERICAN INDIAN,
ALASKA NATIVE, ASIAN,
AGE YRS MALE FEMALE WHITE BLACK PACIFIC ISLANDER TOTAL WEIGHTS*
0-4 10,240,416 9,784,061 15,582,248 3,260,109 1,182,120 20,024,477 0.0691356496
5-9 10,081,063 9,624,631 15,332,058 3,200,397 1,173,239 19,705,694 0.0725328983
10-14 10,740,169 10,229,818 16,259,412 3,503,737 1,206,837 20,969,987 0.0730317441
15-19 10,658,609 10,106,668 16,251,474 3,309,403 1,204,400 20,765,277 0.0721687774
20-24 10,671,421 10,077,694 16,341,821 3,115,714 1,291,580 20,749,115 0.0664775665
25-34 20,226,113 19,659,025 31,421,296 5,519,693 2,944,149 39,885,138 0.1355731628
35-44 22,007,839 22,085,520 35,614,403 5,731,205 2,747,751 44,093,359 0.1626127865
45-54 20,443,508 21,159,542 34,445,963 4,920,675 2,236,412 41,603,050 0.1348339972
55-64 13,997,124 15,075,707 24,786,789 2,911,295 1,374,746 29,072,831 0.0872470269
65-74 8,458,345 10,072,055 16,013,437 1,740,204 776,758 18,530,399 0.0660369801
≥ 75 6,724,189 11,112,062 15,947,766 1,352,384 536,101 17,836,250 0.0603494104
Total 144,248,796 148,986,783 237,996,667 38,564,816 16,674,093 293,235,577
SEX RACE
TABLE 21: Estimated Average Annual 2002–2006 Population by Age Group, Sex, and Race; Weights
for 2000 Standard Population by Age Group
* Based on the 2000 standard population.
Numbers subject to rounding error.

Appendix B | Statistical Analysis 59
Traumatic Brain Injury in the United States
SAS software13 was used to calculate average annual numbers,
rates, row percentages, age-adjusted rates, and total numbers.
Average annual numbers were calculated by adding the numbers
for all five years and dividing the totals by 5. Average annual
rates were calculated by dividing the total number for all five
years by the total population for all five years. Row percentages
were calculated by dividing each number by the total number for
all five years. Because numbers, rates, and row percentages were
all calculated before rounding and were based on the totals for
all five years and not the annual average, some results may not
be consistent across tables.
An age adjustment rate was made using the direct method to
eliminate differences in observed rates that result from age
differences in the population distribution. This adjustment
was done to allow more accurate comparisons of two or more
populations at one point in time or a single population at two
or more points in time.
Age-adjusted rates were calculated by the direct method
as follows:
Age adjustment by the direct method requires use of a standard
age distribution; in this report, the year 2000 standard
population was selected (see Table 21).
Based on the complex sample design of the NHDS and the
NHAMCS, estimates of the number and rate of TBIs requiring
emergency department treatment or hospitalization were
reported based on the NCHS guidelines below: 2
●If the sample size was less than 30, the value of the estimates was
reported, but it was not considered stable.
●If the sample size was 30 to 59, the value of the estimate was
reported, but it may not be stable.
For the death data, if the sample size was less than 20 for the 5
years combined, the rates were suppressed because the data
were not considered stable.12
STATISTICAL ANALYSIS
Where ri= age-specific rates for the population of interest,
Wi= age-specific weight based on the 2000 U.S. standard population, and
n= total number of age groups over the age range of the age-adjusted rate.
n
( rixwi)
i=1
∑

60
Traumatic Brain Injury in the United States

Appendix B | Limitations 61
Traumatic Brain Injury in the United States
●Three different data sources were used. Results should be
interpreted with caution because differences in study methods
may have influenced the findings. The NHDS and NHAMCS
were based on a sample of inpatients who were discharged
from nonfederal short-stay hospitals (NHDS) and emergency
department visits (NHAMCS), while multiple cause-of-death
data (NVSS) included all deaths.
●The potential for sampling bias exists with any survey. NHDS
and NHAMCS procedures assure this possibility is reduced
by using stratified sampling of hospitals, random selection
of discharges within hospitals and visits within emergency
departments, and even distribution of sampling throughout
the year.
●The overall burden of TBI in the United States was
underestimated. An estimated 439,000 TBIs treated by physicians
during office visits and 89,000 treated in outpatient settings
were not included in this report.14 In addition, TBIs with no
medical advice sought, an estimated 25% of all mild and moder-
ate TBIs, were not included.15
●This report does not include TBIs from federal, military, or
Veterans Administration (VA) hospitals.
●The lack of external cause of injury coding (E-coding) was
potentially problematic. For the NHDS data, one third of cases
were missing an E-code. Increased E-code reporting could
increase the rates by external cause. Only data by external cause
for the leading causes of TBI (falls, struck by/against, motor–
vehicle/traffic and assault) for the three data sets combined
were reported. The actual leading causes varied among
emergency department visits, hospitalizations, and deaths.
Causes beyond those were combined as other/unknown due to
limitations in sample size and consistency among all three data
sources. As a result, some causes were not included individually,
such as firearm injuries, which is a factor in some TBI deaths.16,17
These types of injuries were included in the “other” category.
●E-codes may not capture all of the injuries attributable to a
particular cause or intent, especially controversial ones such
as assault. Among children, 25% of all injuries resulting from
assaults may not be accounted for by E-codes.18 Assaults may
not be clinically recognized, especially in vulnerable
populations, such as children19 and older adults.20
●Injury severity was not included in this report for two reasons.
First, a measure of severity could not be uniformly applied to
all three data sets. ICDMAP-90,21 a computer algorithm that
converts ICD-9-CM diagnosis codes to a 6-level score
approximating the Abbreviated Injury Scale (AIS), was only
applicable to NHDS and NHAMCS data. Second, the ICDMAP- 90
has not been updated to include the ICD code 959.01, which is
now part of the TBI ICD coded definition.
LIMITATIONS

Appendix B | Limitations 62
Traumatic Brain Injury in the United States
●The NHDS and NHAMCS data are based on hospitalizations
and visits to emergency departments — not on
individual persons. It is not possible to unduplicate cases
in which individuals were hospitalized or treated in
emergency departments more than once for the same
injury. This limitation precludes calculating the true
incidence of TBI; however, the effects on the data are
assumed to be quite small. Specifically, data from a
population-based follow-up study in South Carolina
indicated a readmission rate to the hospital of
approximately 4% and a readmission rate to the
emergency department of 5% to 6%.22 Patients who
transferred from another hospital were excluded in the
hospitalization tables. Patients who have been
hospitalized and later died from their injuries could be
another source of over-counting. However, deaths that
occurred among patients hospitalized or treated at
emergency departments were excluded based on
information available in the hospital discharge and
emergency department data sets. Patients who were
seen in the emergency department and later hospitalized
could also be double counted; however, documented
hospitalizations were excluded from those counted as
seen in the emergency department. Emergency department
patients reported to have been transferred were also
excluded to help limit double counting. Because none
of these data sets are mutually exclusive, the combined
number or rate of TBI might be overestimated because
some cases could still be double counted (see Figure 11).
Deaths
Hospitalizations
Emergency
Department
Visits
HOSPITAL READMISSIONS
Hospital readmission rates are estimated at 4% of hospital
admissions based on South Carolina TBI surveillance data.
TRANSFER BETWEEN HOSPITALS
Transfers from another hospital were deleted.
HOSPITALIZED EMERGENCY DEPARTMENT PATIENTS
Emergency department visits for patients admitted to the
hospital or transferred to different hospital were deleted.
EMERGENCY DEPARTMENT READMISSIONS
Emergency department readmission rates were estimated
at 5% to 6% of emergency department admissions based
on South Carolina TBI surveillance data.
INHOSPITAL DEATHS
In-hospital deaths (and deaths occurring in the emergency
department) were deleted.
FIGURE 11: Sources of Potential Case Duplication When
Combining Traumatic Brain Injury-Related Emergency
Department Visits, Hospitalizations, and Deaths
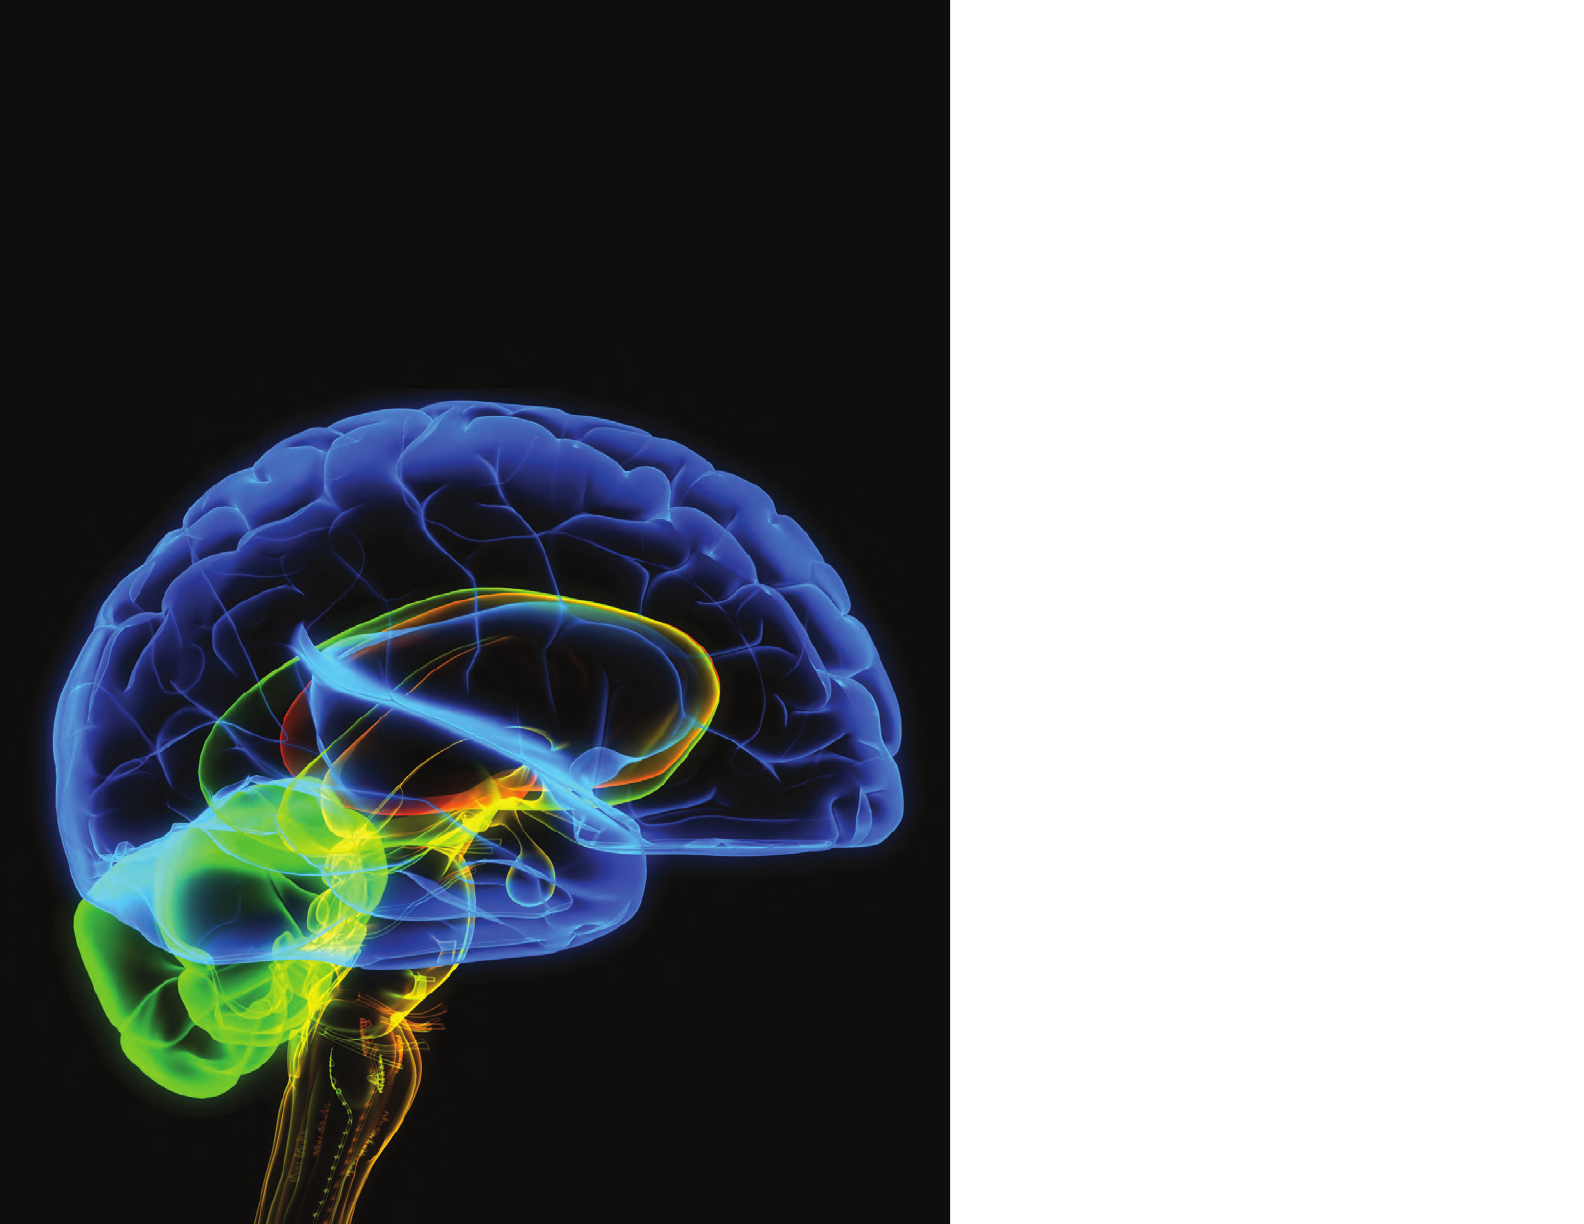
Overview | Traumatic Brain Injuries by External Cause 63
Index of Tables
and Figures

64
Traumatic Brain Injury in the United States

Index of Tables and Figures 65
Traumatic Brain Injury in the United States
Overview 11
Figure 1: Estimated Average Annual Number of Traumatic Brain Injury-Related Emergency Department Visits,
Hospitalizations, and Deaths, United States, 2002–2006 13
Table A: Estimated Percentage of All Injuries and Traumatic Brain Injury-Related Emergency Department Visits,
Hospitalizations, and Deaths, United States, 2002–2006 14
Table B: Estimated Average Annual Numbers of Traumatic Brain Injury-Related Emergency Department Visits,
Hospitalizations, and Deaths, by Age Group, United States, 2002–2006 15
Figure 2: Estimated Average Annual Rates of Traumatic Brain Injury-Related Emergency Department Visits,
Hospitalizations, and Deaths, by Age Group, United States, 2002–2006 15
Table C: Estimated Average Annual Numbers of Traumatic Brain Injury-Related Emergency Department Visits,
Hospitalizations, and Deaths, by Sex, United States, 2002–2006 16
Figure 3: Estimated Average Annual Rates of Traumatic Brain Injury-Combined Emergency Department Visits,
Hospitalizations, and Deaths, by Sex, United States, 2002–2006 16
Table D: Estimated Average Annual Numbers of Traumatic Brain Injury-Related Emergency Department Visits,
Hospitalizations, and Deaths, by External Cause, United States, 2002–2006 17
Figure 4: Estimated Average Annual Rates of Traumatic Brain Injury-Combined Emergency Department Visits,
Hospitalizations, and Deaths, by External Cause, United States, 2002–2006 17
Figure 5: Estimated Average Percentage of Annual Traumatic Brain Injury-Combined Emergency Department Visits,
Hospitalizations, and Deaths, by External Cause, United States, 2002–2006 18
Figure 6: Estimated Average Percentage of Annual Traumatic Brain Injury-Combined Emergency Department Visits,
Hospitalizations, and Deaths Among Children 0 to 14 Years, by External Cause, United States, 2002–2006 19
Figure 7: Estimated Average Percentage of Annual Traumatic Brain Injury-Combined Emergency Department Visits,
Hospitalizations, and Deaths Among Adults 65 Years and Older, by External Cause, United States, 2002–2006 19
INDEX OF TABLES AND FIGURES

Index of Tables and Figures 66
Traumatic Brain Injury in the United States
Appendix A: Tables 23
Table 1: Estimated Average Annual Numbers, Rates, and Percentages of Traumatic Brain Injury-Related
Emergency Department Visits, Hospitalizations, and Deaths, by Age Group, United States, 2002 – 2006 25
Table 2: Estimated Average Annual Numbers and Percentages of Traumatic Brain Injury-Related
Emergency Department Visits, by Age Group and Disposition, United States, 2002 – 2006 26
Table 3: Estimated Average Annual Numbers, Rates, and Percentages of Traumatic Brain Injury-Related
Emergency Department Visits, by Age Group and Sex, United States, 2002 – 2006 27
Table 4: Estimated Average Annual Numbers, Rates, and Percentages of Traumatic Brain Injury-Related
Emergency Department Visits, by Age Group and Race, United States, 2002 – 2006 28
Table 5: Estimated Average Annual Numbers, Rates, and Percentages of Traumatic Brain Injury-Related
Emergency Department Visits, by Age Group and External Cause, United States, 2002 – 2006 29
Table 6: Estimated Average Annual Numbers, Rates, and Percentages of Traumatic Brain Injury-Related Emergency
Department Visits, by Age Group and Specific Motor Vehicle – Traffic (MVT) External Causes, United States, 2002 – 2006 30
Table 7: Estimated Average Annual Numbers and Percentages of Traumatic Brain Injury-Related
Emergency Department Visits, by Age Group and Expected Source of Payment, United States, 2002 – 2006 31
Table 8: Estimated Average Annual Numbers and Percentages of Traumatic Brain Injury-Related Hospitalizations,
by Age Group and Disposition, United States, 2002 – 2006 32
Table 9: Estimated Average Annual Numbers, Rates, and Percentages of Traumatic Brain Injury-Related Hospitalizations,
by Age Group and Sex, United States, 2002 – 2006 33
Table 10: Estimated Average Annual Numbers, Rates, and Percentages of Traumatic Brain Injury-Related Hospitalizations,
by Age Group and Race, United States, 2002 – 2006 34
Table 11: Estimated Average Annual Numbers, Rates, and Percentages of Traumatic Brain Injury-Related Hospitalizations,
by Age Group and External Cause, United States, 2002 – 2006 35
Table 12: Estimated Average Annual Numbers, Rates, and Percentages of Traumatic Brain Injury-Related Hospitalizations,
by Age Group and Specific Motor Vehicle – Traffic (MVT) External Causes , United States, 2002 – 2006 36
Table 13: Estimated Average Annual Numbers and Percentages of Traumatic Brain Injury-Related Hospitalizations,
by Age Group and Expected Source of Payment, United States, 2002 – 2006 37

Index of Tables and Figures 67
Traumatic Brain Injury in the United States
Appendix A: Tables continued
Table 14: Average Annual Numbers, Rates, and Percentages of Traumatic Brain Injury-Related Deaths, by Age Group and Sex,
United States, 2002 – 2006 38
Table 15: Average Annual Numbers, Rates, and Percentages of Traumatic Brain Injury-Related Deaths, by Age Group and Race,
United States, 2002 – 2006 39
Table 16: Average Annual Numbers, Rates, and Percentages of Traumatic Brain Injury-Related Deaths, by Age Group and
External Cause, United States, 2002 – 2006 40
Table 17: Average Annual Numbers, Rates, and Percentages of Traumatic Brain Injury-Related Deaths, by Age Group and
Specific Motor Vehicle – Traffic (MVT) External Causes , United States, 2002 – 2006 41
Figure 8: Annual Estimates of All Traumatic Brain Injury-Related Emergency Department Visits, Hospitalizations, and Deaths,
United States, 2002 – 2006 42
Figure 9: Annual Rate Estimates of Fall-Related Traumatic Brain Injury-Related Emergency Department Visits,
Hospitalizations, and Deaths Among Children Aged 0 – 14, United States, 2002 – 2006 43
Figure 10: Annual Rate Estimates of Fall-Related Traumatic Brain Injury-Related Emergency Department Visits,
Hospitalizations, and Deaths Among Adults Aged 65 and Older, United States, 2002 – 2006 43
Appendix B: Methods and Data Sources 45
Table 18: ICD-9-CM Codes for Traumatic Brain Injury-Related Emergency Department Visits and Hospitalizations (2002 – 2006) 53
Table 19: ICD-10 Codes for Traumatic Brain Injury-Related Deaths (2002 – 2006) 54
Table 20: External Cause of Injury Categorization for ICD-9-CM Codes
(Emergency Department Visits and Hospitalizations, 2002 – 2006) and ICD-10 (Deaths, 2002 – 2006) 56
Table 21: Estimated Average Annual 2002 – 2006 Population by Age Group, Sex, and Race;
Weights for 2000 Standard Population by Age Group 58
Figure 11: Sources of Potential Case Duplication When Combining Traumatic Brain Injury-Related
Emergency Department Visits, Hospitalizations, and Deaths 62

68
Traumatic Brain Injury in the United States
Overview | Traumatic Brain Injuries by External Cause 69
References

70
1. Traumatic Brain Injury in the United States: Emergency
Department Visits, Hospitalizations and Deaths. Atlanta (GA):
Centers for Disease Control and Prevention, National Center
for Injury Prevention and Control; 2004.
2. McCaig LF, McLemore T. Plan and Operation of the National
Hospital Ambulatory Medical Care Survey. Centers for Disease
Control and Prevention, National Center for Health Statistics.
Vital Health Stat 1994;1(34).
3. International Classification of Diseases: 9th Revision, Clinical
Modification, 3rd ed. (ICD-9-CM). Washington (DC): Department
of Health and Human Services (US); 1989.
4. Arias E, Anderson RN, Hsiang-Ching K, Murphy SL, Kochanek
KD. Deaths: Final Data for 2001. Centers for Disease Control
and Prevention, National Center for Health Statistics. Natl
Vital Stat Rep 2003;52(3).
5. International Classification of Diseases, 10th Revision (ICD-10).
Geneva (Switzerland): World Health Organization; 2001.
6. Marr A, Coronado V, editors. Central Nervous System Injury
Surveillance Data Submission Standards—2002. Atlanta (GA):
Centers for Disease Control and Prevention, National Center
for Injury Prevention and Control; 2004.
7. Thurman DJ, Sniezek JE, Johnson D, Greenspan A, Smith S.
Guidelines for Surveillance of Central Nervous System Injury.
Atlanta (GA): Centers for Disease Control and Prevention,
National Center for Injury Prevention and Control; 1995.
8. Coronado VG, Thomas KE, Sattin RW, Johnson RL. The CDC
Traumatic Brain Injury Surveillance System: Characteristics
of Persons Aged 65 Years and Older Hospitalized with a TBI.
J Head Trauma Rehab. 20(3): 215–228, 2005.
9. Langlois J, Kegler S, Butler J, Gotsch K, Johnson R, Reichard A,
et al. Traumatic Brain Injury-Related Hospital Discharges:
Results from a 14-State Surveillance System, 1997. MMWR
Surveill Summ 2003;52 (No. SS-4):1–20.
10. Recommended Framework of E-code Groupings for
Presenting Injury Mortality and Morbidity Data. Atlanta (GA):
Centers for Disease Control and Prevention, National Center
for Injury Prevention and Control; 2001. Available at:
http://www.cdc.gov/injury/wisqars/ecode_matrix.html
11. U.S. Census Populations with Bridged Race Categories.
Hyattsville (MD): Centers for Disease Control and Prevention,
National Center for Health Statistics; 2003. Available at:
http://www.cdc.gov/nchs/nvss/bridged_race.htm
REFERENCES
ReferencesTraumatic Brain Injury in the United States

References 71
Traumatic Brain Injury in the United States
12. Miniño AM, Anderson RN, Fingerhut LA, Boudreault MA,
Warner M. Deaths: Injuries – 2002. Centers for Disease Control
and Prevention, National Center for Health Statistics;
Natl Vital Stat Rep 2006; 54(10).
13. SAS Institute Inc. SAS/STAT User’s Guide, Version 9.2. Cary (NC):
SAS Institute Inc.; 2008.
14. Schootman M, Fuortes LJ. Ambulatory Care for Traumatic
Brain Injuries in the U.S., 1995–1997. Brain Inj 2000; 14:373–81.
15. Sosin DM, Sniezek JE, Thurman DJ. Incidence of Mild
and Moderate Brain Injury in the United States, 1991.
Brain Inj 1996;10:47–54.
16. Adekoya N, Thurman D, White D, Webb K. Surveillance for
Traumatic Brain Injury Deaths—United States, 1989–1998.
MMWR Surveill Summ 2002;51(No. SS-10):1–16.
17. Sosin DM, Sniezek JE, Waxweiler RJ. Trends in Death
Associated with Traumatic Brain Injury, 1979–1992.
Success and Failure. JAMA 1995;273(22):1778–80.
18. Winn DW, Agran PF, Anderson CL. Sensitivity of Hospitals’
E-coded Data in Identifying Causes of Children’s Violence-
Related Injuries. Public Health Rep 1995;110:277–81.
19. U.S. Advisory Board on Child Abuse and Neglect. A Nation’s
Shame: Fatal Child Abuse and Neglect in the United States.
Report No. 5. Washington (DC): Department of Health and
Human Services (US), Administration for Children and
Families; 1995.
20. The National Elder Maltreatment Incidence Study—
Final Report. Washington (DC): Department of Health
and Human Services (US), Administration for Children,
Administration on Aging; 1998.
21. MacKenzie EJ, Steinwachs DM, Shankar BS. Classifying
Trauma Severity Based on Hospital Discharge Diagnoses:
Validation of an ICD-9-CM to AIS-85 Conversion Table.
Med Care 1989;27:412–22.
22. Pickelsimer EE, Selassie AW, GU JK, Langlois JA. A Population-
Based Outcomes Study of Persons Hospitalized with
Traumatic Brain Injury: Operations of the South Carolina
Traumatic Brain Injury Follow-Up Registry. J Head Trauma
Rehab 2006;21(6):491–504.

www.cdc.gov/TraumaticBrainInjury
U.S. Department of Health and Human Services
Centers for Disease Control and Prevention
