MDK4_ Pdf Mdk 2010
User Manual: keil -
Open the PDF directly: View PDF ![]() .
.
Page Count: 6

MDK-ARM
Microcontroller Development Kit
JTAG & Serial Wire Debug
plus Real-Time Trace
Full Featured Royalty-Free
RTX RTOS Kernel
MDK-ARM
The MDK-ARM Microcontroller Development
Kit offers a complete development environment
for ARM and Cortex-M devices.
The Keil Microcontroller Development Kit (MDK) is the
®
complete software development environment for all ARM
™
and Cortex -M processor-based microcontrollers.
®
It combines the µVision 4 IDE/Debugger with the
industry leading ARM Compilation Tools, to provide
developers with an easy to use, feature-rich environment
optimized for ARM-Powered devices.
MDK provides many unique features designed to help you
quickly develop your project.
MDK is based on the ARM compilation tools, which deliver
the tightest, highest performing code for all ARM-Powered
devices. Further code size savings can be gained by selecting
the MicroLib, which has been specifically developed and
optimized for microcontrollers.
™
Keil
Save time by using the
Device Database which automatically configures device
and project parameters. Optimize and verify your
applications with new Trace and Analysis Tools, enabling
you to measure performance and code coverage. Bring
resource management to your applications by using the
fully functional RTX Real-Time operating system.
Visit for more information.
ARM Compiler Performance
www.keil.com/arm/mdk.asp
Powerful Debugger with
Real-Time Analysis Tools
µVision4 IDE Supports
Complete Development Cycle
ARM C/C++ Compilation
Tools with MicroLib
By using MicroLib, the library code sizes can be significantly reduced,
enabling product memory and cost savings.
0
5
10
15
20
25
ARM Mode Thumb Mode Cortex-M3
Standard Library MicroLib
Code Size (KBytes)
Dhrystone 2.0 Benchmark
MDK-ARM
Microcontroller Development Kit
Examples and Templates
ARM C/C++ Compiler
RTX RTOS Kernel
µVision
Device Database & IDE
µVision
Debugger & Analysis Tools
Device Peripheral Simulation
www.keil.com
Installation
2
MDK-ARM Microcontroller Development Kit
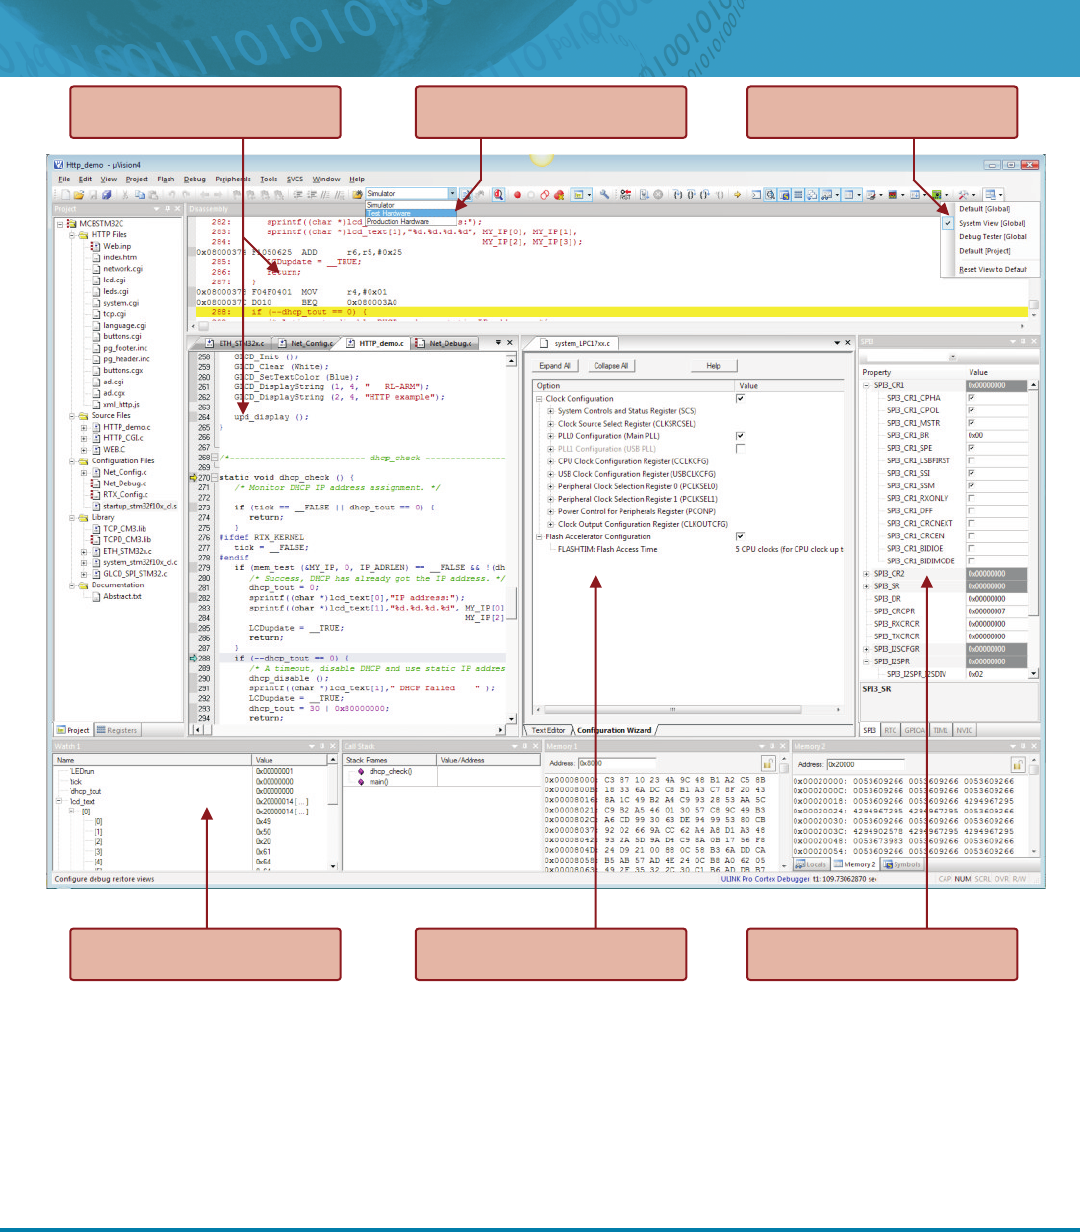
The µVision IDE incorporates a Device Database of
supported ARM-Powered microcontrollers. In µVision
projects, required options are set automatically when you
select the device from the Device Database. µVision displays
only those options that are relevant to the selected device.
The Flexible Window Management System enables you
to drag and drop individual windows anywhere on the visual
surface. This interface allows you to make better use of your
screen space and to organise multiple windows.
The Editor includes all the standard features you expect in
a professional editor. Workflow is optimized with intuitive
toolbars providing quick access to editor functions, most of
which are also available while debugging for easy source
code changes.
The integrated Source Browser provides access to all
application symbols, together with name, type, and class
information. It allows you to instantly navigate to the
definition and references of any symbol.
Debug Restore Views allow you to
save multiple window layouts.
Each project may contain multiple
target configurations
The Disassembly and Source
windows are fully synchronized
The System Viewer provides
information of peripheral registers
The Configuration Wizard simplifies
tool and device setup
µVision allows you to have multiple
Watch and Memory windows
µVision Project Management
3
Debugger and Simulator
Debug Windows
The Debugger can be configured as a Simulator or as a
Target Debugger. It provides one environment in which you
may test your application.
The µVision Debugger simulates a complete ARM-Powered
MCU including the instruction set and on-chip peripherals.
The Debugger provides windows and dialogs to help you
monitor and control your system. These include:
n
Memory Window - used to review and modify memory
contents.
n
Watch Window - view and modify program variables
and lists the current function call nesting.
n
Symbol Window - view debug symbol information of
the application program.
n
Disassembly Window - synchronized with the Source
Windows making program debugging easier.
n
Call Stack Window - view current call nesting including
variable values.
n
Breakpoints - allows you to define stop conditions for
program execution.
n
Browse Window - search for objects in your code.
ULINKpro ULINK2
Features
Run control debug (ARM & Cortex-M)
Memory + Breakpoint (while running)
Data Trace (Cortex-M3/M4)
Instruction Trace (Cortex-M3/M4)
Performance
CPU Clock speed
JTAG Clock speed
Memory read/write
Data Trace streaming (UART mode)
Data Trace streaming (Manchester mode)
ETM Trace streaming
Analysis Tools
Logic Analyzer
Performance Analyzer
Execution Profiler
Code Coverage
Yes
Yes
Yes
-
200MHz
10MHz
25KByte/s
1Mbit/s
-
-
Yes
-
-
-
Yes
Yes
Yes
Yes
200MHz
50MHz
1MByte/s
-
100Mbit/s
800Mbit/s
Yes
Yes
Yes
Yes
ULINK2 and ULINKpro Adapters
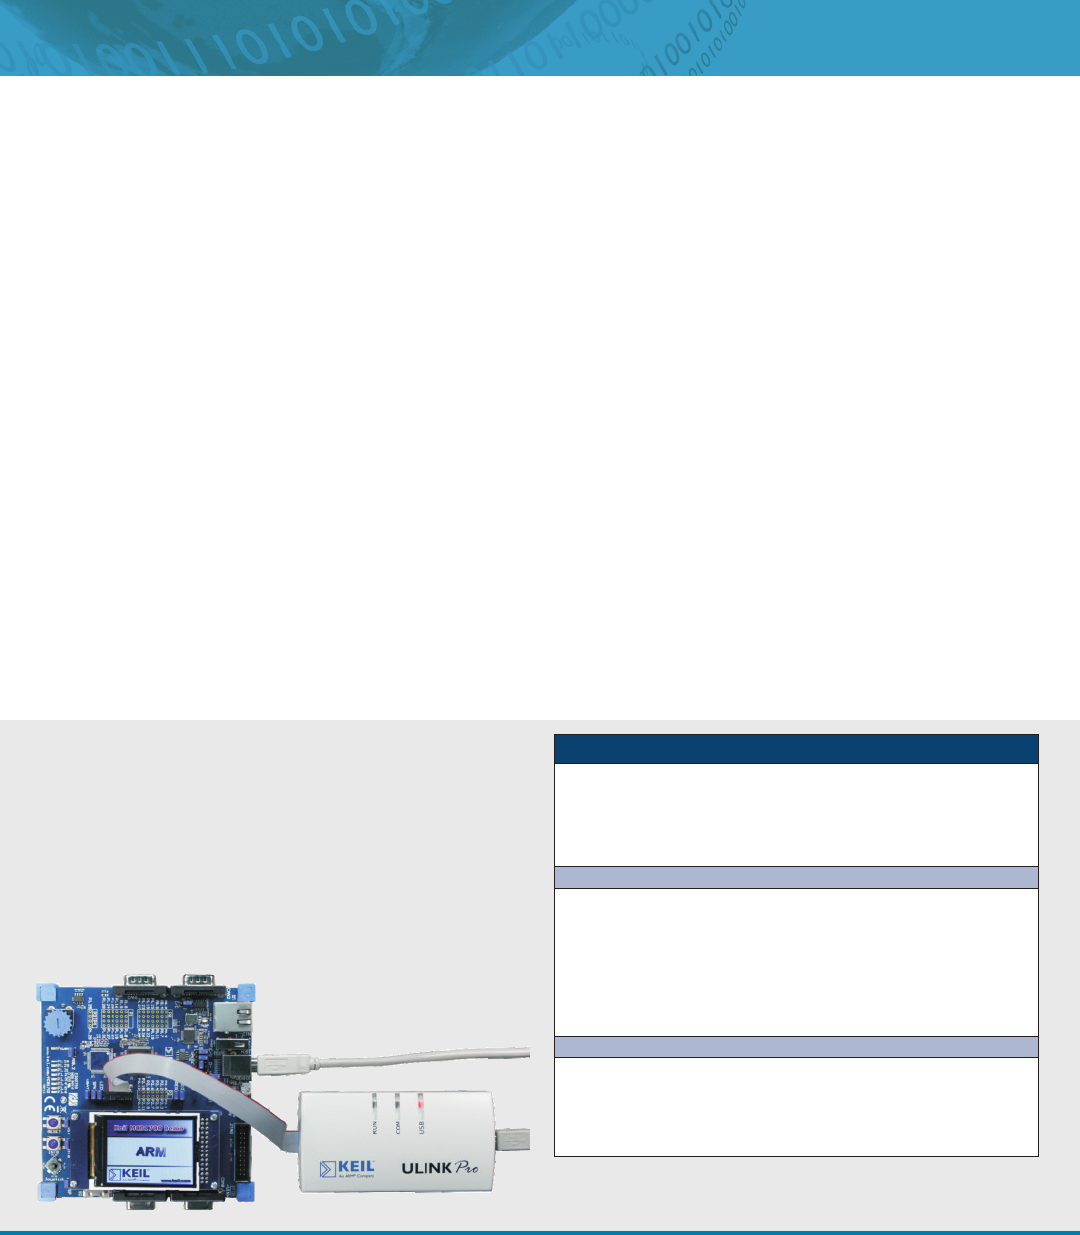
The ULINK family of USB-JTAG Adapters connect your PC's
USB port to your target system (via JTAG or SWD), allowing
you to debug and analyze embedded programs running on
target hardware.
The new ULINKpro provides unique streaming trace directly
to your PC, enabling advanced analysis and optimization of
your applications.
System Viewer
Analysis Tools
The System Viewer
Further information at:
provides an advanced method of
viewing and modifying peripheral registers. Detailed status
information is displayed while the processor runs, and can be
changed directly from within the System Viewer window.
The advanced analysis tools work with the simulator or with
target hardware via the ULINKpro streaming trace adapter.
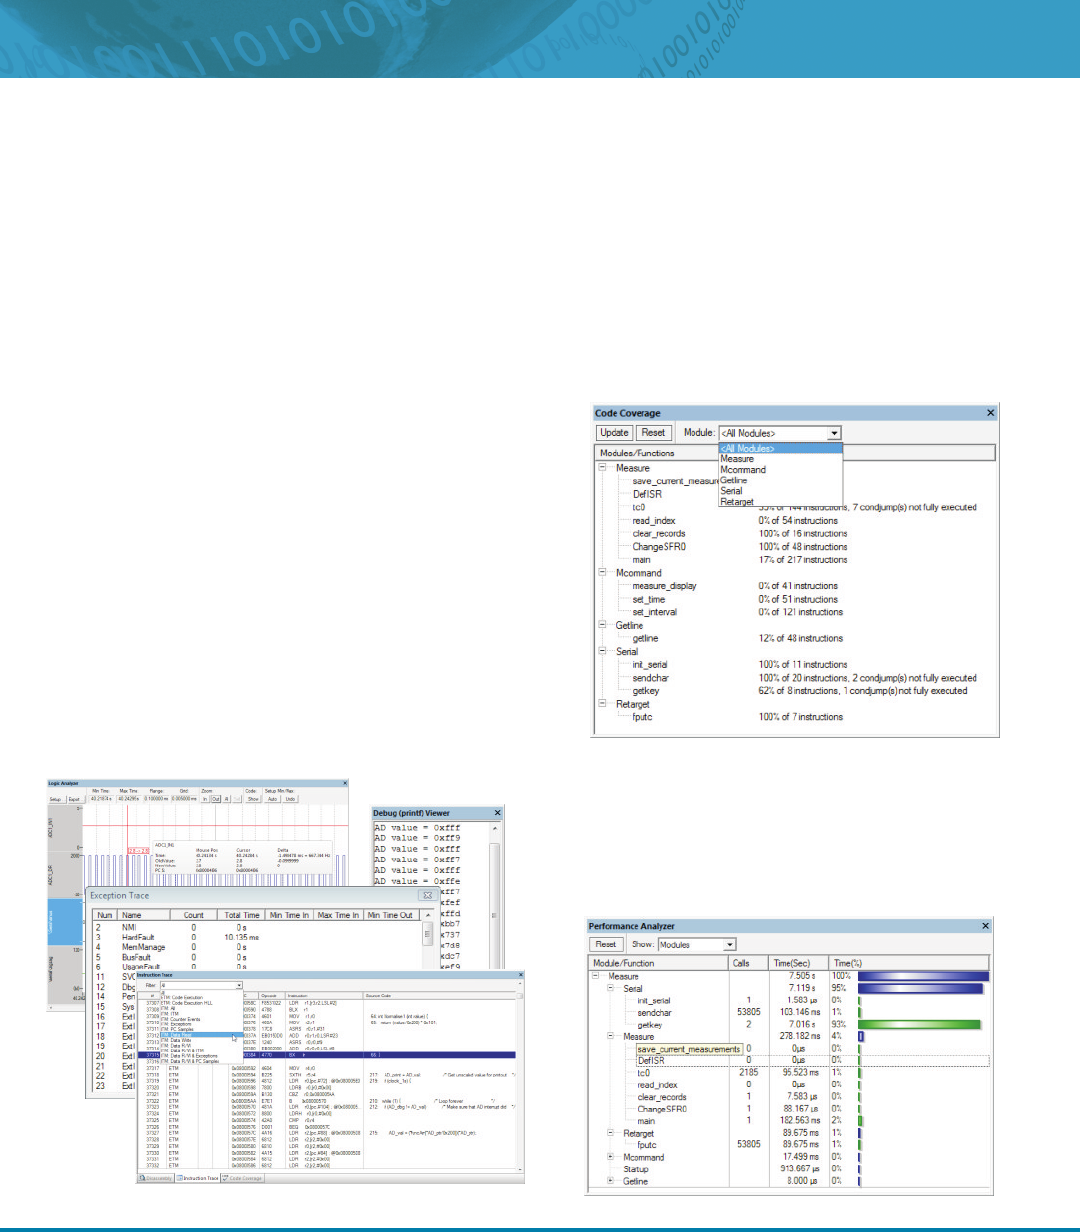
The configurable Logic Analyzer provides a graphical
display of signals and variables. You may click on variable
changes to display the instructions that caused that change
in the source code editor window.
The Debugger provides Code Coverage statistics to verify
applications that require certification testing and validation.
Color coding highlights the execution status of instructions
helping you to refine your testing.
The Performance Analyzer displays the execution time
recorded for functions in your application. Bar graphs display
the time spent in a function, and the number of calls to it.
The Execution Profiler records execution statistics for
each CPU instruction, including the execution count and
execution time for each instruction. These can be reviewed
in the editor and disassembler windows.
www.keil.com/ULINK
µVision Program Debugging and Simulation
MDK-ARM Microcontroller Development Kit
4
Cortex-M CoreSight
Data and Event Trace
™
All Cortex-M based devices feature the ARM CoreSight
technology with advanced debug and trace capabilities.
MDK, together with a ULINK adapter, uses these features to
enable you to debug your program. You are able to:
n
Control the CPU allowing program start/stop.
n
Single Step one source or assembler line.
n
Set breakpoints while the processor is running.
n
Read/write memory and peripheral registers on-the-fly,
while it is running at full-speed.
All Cortex-M3 and Cortex-M4 devices provide data and
event trace. MDK provides a number of ways to analyze this
information while your system is running:
n
Trace Window - Display program flow by capturing
timestamps, PC samples, and Read/Write accesses.
n
Debug (printf) Viewer - Displays the printf-style output
of the Instrumented Trace (ITM).
n
Exceptions window - Displays statistical information
about program exceptions and interrupts.
n
Event Counters - Display real-time values of specific
event counters providing performance indications.
n
Logic Analyzer - Graphically displays variable changes in
captured data trace.
InstructionTrace
All Cortex-M devices with ETM provide instruction trace.
The Keil ULINKpro is the only Trace adapter which
streams instruction trace directly to your PC. This enables
debugging of historical sequences, execution profiling, and
code coverage analysis.
The virtually unlimited stream of trace information enables
MDK to provide complete Code Coverage of your
program. Code coverage identifies every instruction that
has been executed, ensuring thorough testing of your
application. This is an essential requirement for complete
software verification and certification.
ULINKpro allows applications to be run for long periods of
time while collecting trace information. This can be used
by the Execution Profiler and Performance Analyzer
to identify program bottlenecks, optimize your application,
and to isolate problems.
The performance analyzer displays time spent in each part of your program.
Code Coverage shows the percentage of instructions that have executed.
Data Trace Windows provide information from the running target for program
data, exceptions, variables, and printf-style outputs
Target Debugging and System Analysis
MDK-ARM Microcontroller Development Kit
5
MDK-ARM Microcontroller Development Kit
RTX Real-Time Kernel Specifications
General Specifications
Defined Tasks (max) Unlimited
Active Tasks (max) 254
Task Priority Levels 1 - 254
Signals / Events 16 per task
User Timers Unlimited
Semaphores / Mailboxes / Mutexes Unlimited
Context Switch <4 S
Memory Requirements
CODE Space <4KB
RAM Space (Kernel) ~500 Bytes
RAM Space (Task) TaskStackSize + 52 Bytes
Typical Timing Performance (based on a Cortex-M running at 72MHz)
Initialize system, start task 22.1
Create defined task, (no task switch) 8.1
Create defined task, (with task switch) 9.3
Delete task 4.8
Task switch (by os_tsk_pass) 3.9
Set event (no task switch) 1.9
Send semaphore (no task switch) 1.6
Send message (no task switch) 2.5
µ
µs
µs
µs
µs
µs
µs
µs
µs
RTX Kernel
Kernel-Aware Debugging
Today, microcontroller applications often require
simultaneous execution of multiple tasks in a real-time
environment.
RTX is a royalty-free, real-time kernel specifically developed
for the ARM and Cortex-M feature-sets. RTX provides
features to manage system resources:
n
Applications separated into independent tasks (threads).
n
Extensive time control (scheduling, time delay/intervals).
n
Deterministic execution times and task scheduling.
n
Inter-task communication, resource sharing, and memory
allocation features with message pools.
n
Supports development with error checking, debug and
test facilities.
RTX is provided as fully configurable object code within
MDK, and as source code in RL-ARM Real-Time Library.
Visit for more information.
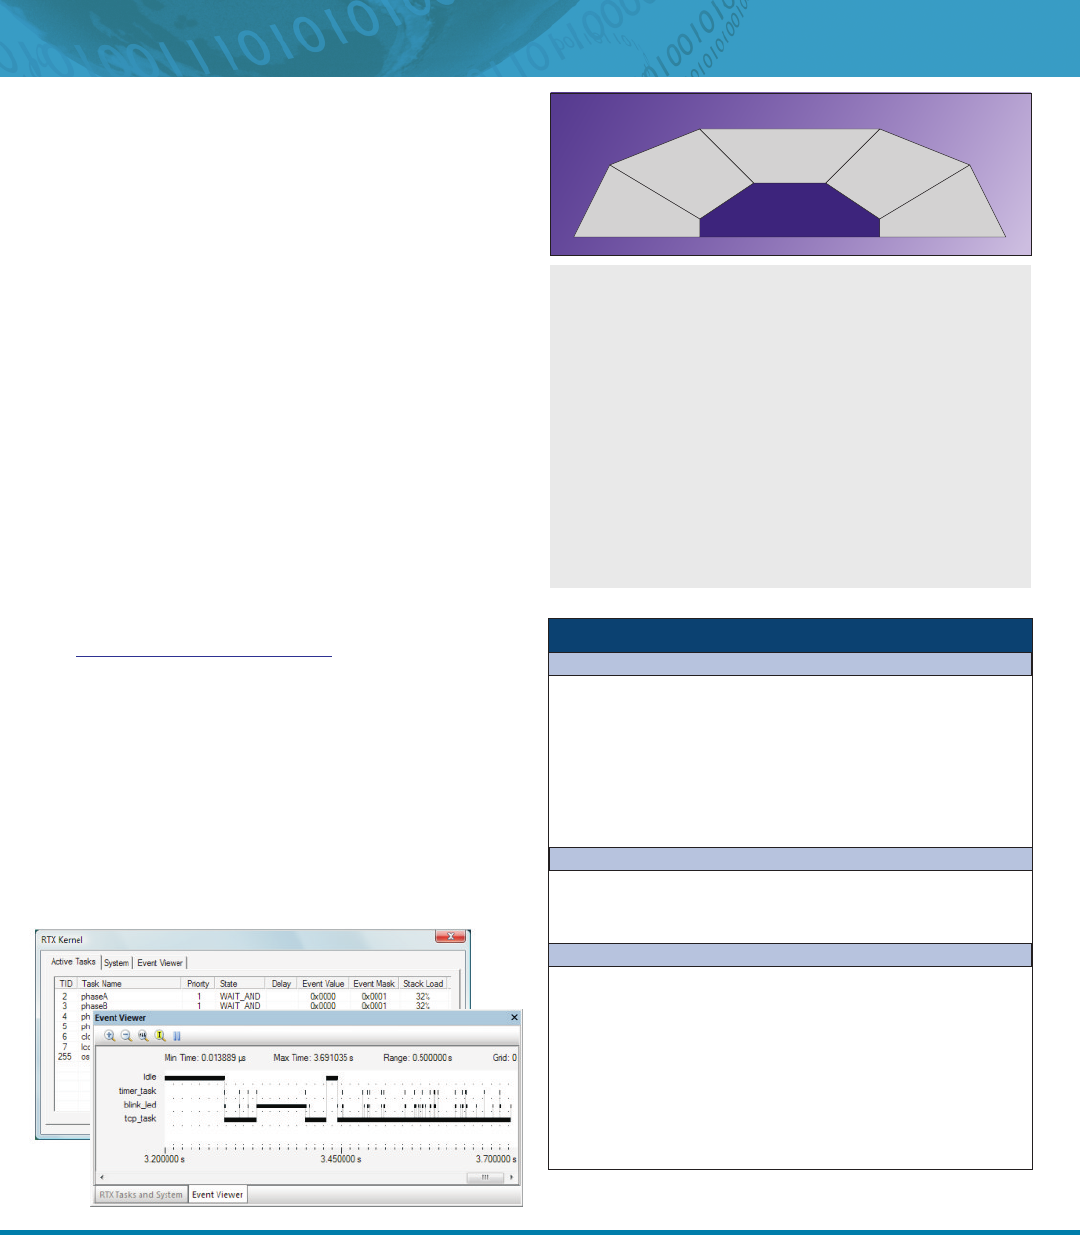
RTX is fully integrated in the ision Debugger making it
easy to monitor task status and kernel activity.
The kernel-aware dialog is available in simulation and also
when running on target hardware. It displays information
about all aspects of the kernel and the running tasks. This
enables you to view statistics about the active tasks, stack
loading, and system resource usage.
While it is possible to implement an embedded program
without using a real-time kernel, the proven Keil RTX allows
you to focus on application development, enabling you to
save time, and produce a more reliable, expandable system.
www.keil.com/rl-arm/kernel.asp
µV
RTX Kernel Function Overview
n
Task Management Functions allows you to
create and delete tasks. RTX supports up to 254
active tasks, each with 254 priority levels.
n
Task Stacks are allocated from a stack memory
pool or can be supplied when a task is created.
n
Fast Memory Pool Management allows you to
create an unlimited number of fixed size pools.
n
Event Flag Management allows synchronization
with up to 16 event flags per task.
n
Time Management and Timer Callback
Functions provide task time delays/intervals.
Scheduler
Mutex
Delay &
Interval
Mailbox
Event &
Semaphore
Memory
Pool
RTX Kernel
Task and event timing is conveniently displayed in the Event Viewer.
CODE and RAM space depend on which RTX functions are used. Detailed
performance figures are available at www.keil.com/support/man/docs/rlarm.
RTX RTOS Kernel
6
Europe: United States:
Keil Keil
Bretonischer Ring 16 4965 Preston Park Road
85630 Grasbrunn Suite 650
Germany Plano TX 75093
Phone +49 89 / 45 60 40 - 20 Phone +1 800 348 8051
Support +49 89 / 45 60 40 - 24 +1 972 312 1107
FAX +49 89 / 46 81 62 FAX +1 972 312 1159
Email sales.intl@keil.com Email sales.us@keil.com
support.intl@keil.com support.us@keil.com
All brand names or product names are the property of their respective holders. Neither the whole nor any part of the information contained in, or the product described in, this document may be adapted or reproduced in any material form except
with the prior written permission of the copyright holder. The product described in this document is subject to continuous developments and improvements. All particulars of the product and its use contained in this document are given in good faith.
All warranties implied or expressed, including but not limited to implied warranties of satisfactory quality or fitness for purpose are excluded. This document is intended only to provide information to the reader about the product. To the extent
permitted by local laws ARM shall not be liable for any loss or damage arising from the use of any information in this document or any error or omission in such information.
Program examples and detailed technical information are available from your distributor and our web site (www.keil.com).
Information in this data sheet is subject to change
without notice and does not represent a
commitment on the part of Keil or ARM.
Keil 0223-3/01.10
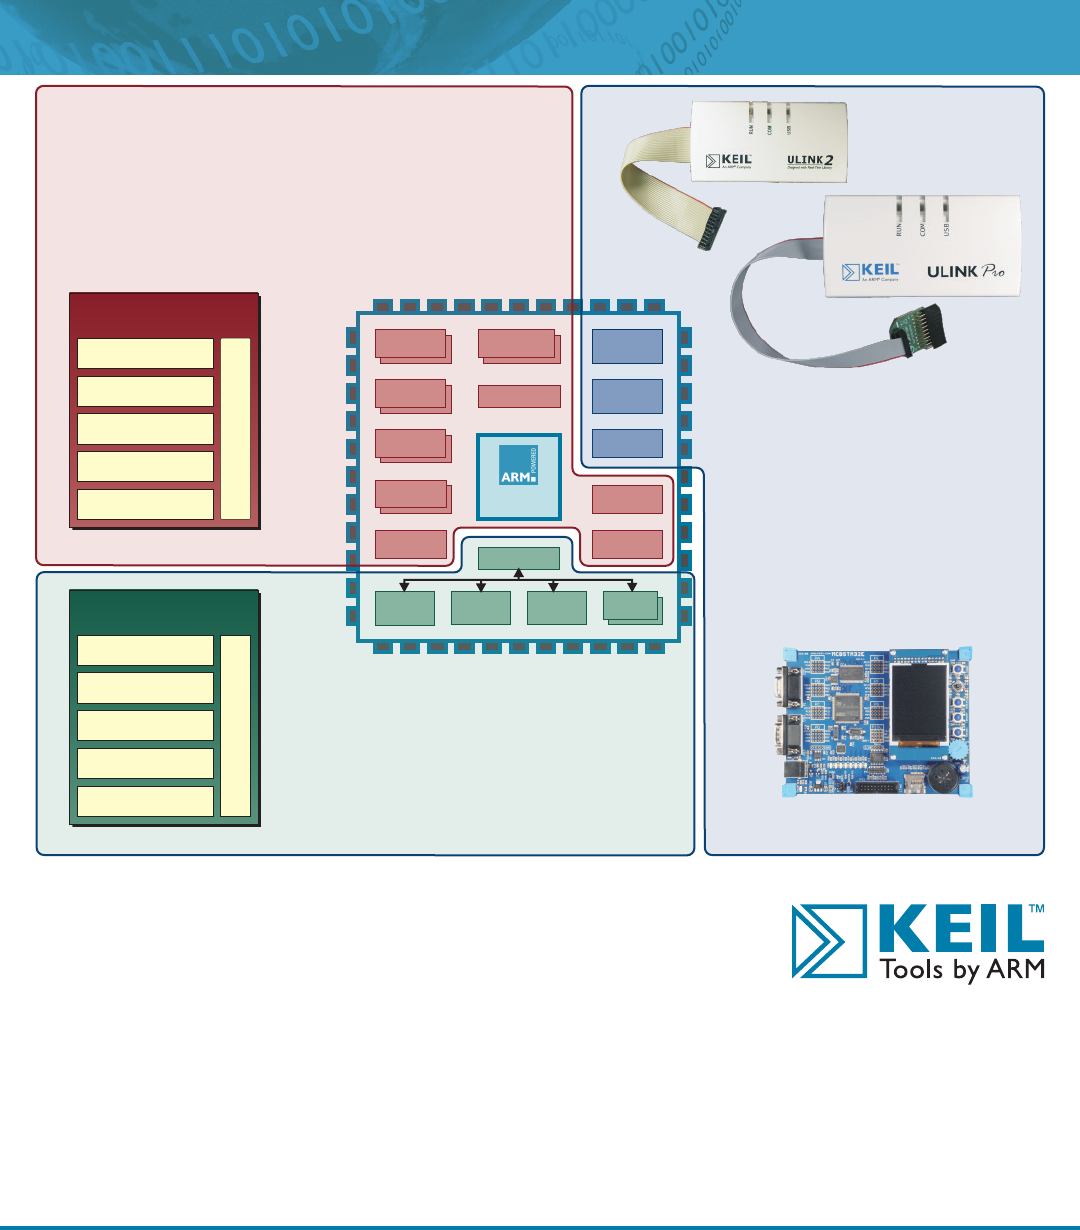
CPU
Timer/Counter
PWM
UART
2
I C/SPI
Real-Time
Clock
RAM
Debug
Channel
Flash ROM
Interrupt System
DMA
SD/MMC
Interface
CAN
Ethernet
USB
A/D Converter
I/O Ports
Debug
Run-Control
MDK-ARM
Microcontroller Development Kit
ARM C/C++ Compilers
Royalty-Free RTX RTOS
µVision
Device Database & IDE
µVision
Debugger & Analysis Tools
Device Peripheral Simulation
Examples and Templates
RL-ARM
Real-Time Library
RTX RTOS Source Code
TCPnet Networking Suite
Flash File System
USB Device Interface
CAN Interface
Examples and Templates
RTOS and Middleware
n
RTX Real-Time OS with Source Code.
n
TCP/IP Suite with Server Applications.
n
File System for ROM and Memory Cards.
n
Direct suport for USB and CAN interfaces.
Microcontroller Development Kit (MDK)
n
Best-in-class ARM C/C++ Compilation Tools.
®
n
Genuine Keil µVision 4 IDE/Debugger/Simulator.
n
Royalty-free RTX Real-Time Operating System.
n
Easy device configuration with Device Database support
for more than 500 ARM-Powered devices.
Evaluation Boards
Keil provides a wide range of evaluation boards
for 8, 16 and 32-bit devices
®
ULINK USB Adapters
n
JTAG & Serial Wire Interface.
n
Flash Programming.
n
On-the-fly Target Debugging.
n
Real-Time Data Trace.
n
ETM Instruction Trace (ULINKpro).
MDK-ARM Microcontroller Development Kit
ARM Microcontroller Development Tools