EPA Sector Notebook Project Profile Of The Plastic Resin And Manmade Fiber Industries Plastics
User Manual: plastics-epa Fante's Kitchen Shop
Open the PDF directly: View PDF ![]() .
.
Page Count: 190 [warning: Documents this large are best viewed by clicking the View PDF Link!]
- Plastic Resign and Manmade Fiber
- Sector Notebook Contacts
- Table of Contacts
- List of Figures
- List of Tables
- List of Acronyms
- I. Introduction to the Sector Notebook Project
- II. Introduction to the Plastic Resin and Manmade Fiber Industries
- III. Industrial Process Description
- IV. Chemical Release and Transfer Profile
- V. Pollution Prevention Opportunities
- VI. Summary of Applicable Federal Statutes and Regulations
- VII. Compliance and Enforcement Profile
- VIII. Compliance Activities and Initiatives
- IX. Contacts/Acknowledgments/References
- References

Plastic Resin and Manmade Fiber Sector Notebook Project
EPA/310/R-97/006
EPA Office of Compliance Sector Notebook Project:
Profile of the Plastic Resin and Manmade Fiber Industries
September 1997
Office of Compliance
Office of Enforcement and Compliance Assurance
U.S. Environmental Protection Agency
401 M St., SW
Washington, DC 20460

Plastic Resin and Manmade Fiber Sector Notebook Project
This report is one in a series of volumes published by the U.S. Environmental Protection Agency
(EPA) to provide information of general interest regarding environmental issues associated with
specific industrial sectors. The documents were developed under contract by Abt Associates
(Cambridge, MA), Science Applications International Corporation (McLean, VA), and Booz-Allen
& Hamilton, Inc. (McLean, VA). This publication may be purchased from the Superintendent of
Documents, U.S. Government Printing Office. A listing of available Sector Notebooks and document
numbers is included on the following page.
All telephone orders should be directed to:
Superintendent of Documents
U.S. Government Printing Office
Washington, DC 20402
(202) 512-1800
FAX (202) 512-2250
8:00 a.m. to 4:30 p.m., EST, M-F
Using the form provided at the end of this document, all mail orders should be directed to:
U.S. Government Printing Office
P.O. Box 371954
Pittsburgh, PA 15250-7954
Complimentary volumes are available to certain groups or subscribers, such as public and
academic libraries, Federal, State, and local governments, and the media from EPA’s National
Center for Environmental Publications and Information at (800) 490-9198. For further
information, and for answers to questions pertaining to these documents, please refer to the
contact names and numbers provided within this volume.
Electronic versions of all Sector Notebooks are available free of charge at the following web
address: www.epa.gov/oeca/sector. Direct technical questions to the “Feedback” button at the
bottom of the web page.
Cover photograph by Steve Delaney, U.S. EPA. Photograph courtesy of Vista Chemicals,
Baltimore, Maryland. Special thanks to Dave Mahler.
Sector Notebook Project ii September 1997

Plastic Resin and Manmade Fiber Sector Notebook Project
Sector Notebook Contacts
The Sector Notebooks were developed by the EPA’s Office of Compliance. Questions relating to the
Sector Notebook Project can be directed to:
Seth Heminway, Coordinator, Sector Notebook Project
US EPA Office of Compliance
401 M St., SW (2223-A)
Washington, DC 20460
(202) 564-7017
Questions and comments regarding the individual documents can be directed to the appropriate specialists
listed below.
Document Number Industry
EPA/310-R-95-001. Dry Cleaning Industry
EPA/310-R-95-002. Electronics and Computer Industry*
EPA/310-R-95-003. Wood Furniture and Fixtures Industry
EPA/310-R-95-004. Inorganic Chemical Industry*
EPA/310-R-95-005. Iron and Steel Industry
EPA/310-R-95-006. Lumber and Wood Products Industry
EPA/310-R-95-007. Fabricated Metal Products Industry*
EPA/310-R-95-008. Metal Mining Industry
EPA/310-R-95-009. Motor Vehicle Assembly Industry
EPA/310-R-95-010. Nonferrous Metals Industry
EPA/310-R-95-011. Non-Fuel, Non-Metal Mining Industry
EPA/310-R-95-012. Organic Chemical Industry*
EPA/310-R-95-013. Petroleum Refining Industry
EPA/310-R-95-014. Printing Industry
EPA/310-R-95-015. Pulp and Paper Industry
EPA/310-R-95-016. Rubber and Plastic Industry
EPA/310-R-95-017. Stone, Clay, Glass, and Concrete Industry
EPA/310-R-95-018. Transportation Equipment Cleaning Ind.
EPA/310-R-97-001. Air Transportation Industry
EPA/310-R-97-002. Ground Transportation Industry
EPA/310-R-97-003. Water Transportation Industry
EPA/310-R-97-004. Metal Casting Industry
EPA/310-R-97-005. Pharmaceuticals Industry
EPA/310-R-97-006. Plastic Resin and Man-made Fiber Ind.
EPA/310-R-97-007. Fossil Fuel Electric Power Generation Ind.
EPA/310-R-97-008. Shipbuilding and Repair Industry
EPA/310-R-97-009. Textile Industry
EPA/310-R-97-010. Sector Notebook Data Refresh-1997
EPA/310-R-98-001. Aerospace Industry
EPA/310-R-98-002. Agricultural Chemical, Pesticide, and
Fertilizer Industry
EPA/310-R-98-003. Agricultural Crop Production Industry
EPA/310-R-98-004. Agricultural Livestock Production Ind.
EPA/310-R-98-005. Oil and Gas Exploration and Production
Industry
EPA/310-R-98-008. Local Government Operations
*Spanish translations available.
Contact Phone (202)
Joyce Chandler 564-7073
Steve Hoover 564-7007
Bob Marshall 564-7021
Walter DeRieux 564-7067
Maria Malave 564-7027
Seth Heminway 564-7017
Scott Throwe 564-7013
Jane Engert 564-5021
Anthony Raia 564-6045
Jane Engert 564-5021
Rob Lischinsky 564-2628
Walter DeRieux 564-7067
Tom Ripp 564-7003
Ginger Gotliffe 564-7072
Seth Heminway 564-7017
Maria Malave 564-7027
Scott Throwe 564-7013
Virginia Lathrop 564-7057
Virginia Lathrop 564-7057
Virginia Lathrop 564-7057
Virginia Lathrop 564-7057
Jane Engert 564-5021
Emily Chow 564-7071
Sally Sasnett 564-7074
Rafael Sanchez 564-7028
Anthony Raia 564-6045
Belinda Breidenbach 564-7022
Seth Heminway 564-7017
Anthony Raia 564-6045
Amy Porter 564-4149
Ginah Mortensen (913)551-7864
Ginah Mortensen (913)551-7864
Dan Chadwick 564-7054
John Dombrowski 564-7036
Sector Notebook Project iii September 1997
Page iv intentionally left blank.

Plastic Resin and Manmade Fiber Sector Notebook Project
PLASTIC RESIN AND MANMADE FIBER INDUSTRIES
(SIC 2821, 2823, and 2824)
TABLE OF CONTENTS
LIST OF FIGURES ......................................................... vii
LIST OF TAB L ES ........................................................ viii
LIST OF ACRONYMS...................................................... ix
I. INTRODUCTION TO THE SECTOR NOTEBOOK PROJECT ......................1
A . Summ a ry of the Sec tor Notebook Project .................................1
B. A dditional In form ation ...............................................2
II. INTRODUCTION TO THE PLASTIC RESIN AND MANMADE FIBER INDUSTRIES . . 3
A . History of the Plasti c Resin a nd Ma nma de Fib er Industri es ....................3
B. Introduction, Bac kground, an d Scope of th e Notebook .......................6
C. Characteri za ti on of the Pl a s ti c Resin and Manmade Fiber Industri es.............. 9
1. Product Characteri z ation ........................................9
2. Indus try Characterizati on .......................................13
3. Economic Outl ook ............................................18
III. INDUSTRIAL PROCESS DESCRIPTION ...................................23
A . Industria l Processes i n the Pl as ti c Resins and Man made Fibers Indus tri es ......... 23
1. Preparing Reactants ...........................................24
2. Poly meri z ation ...............................................25
3. Poly mer Recovery ............................................36
4. Poly mer Extrusi on ............................................37
5. Supporting Operations .........................................37
B. Indus tri a l Processes Speci fic to the Man made Fiber Industry .................. 41
1. Poly meri z ation ...............................................41
2. Spin ning ....................................................42
3. Fibe r Processing ..............................................47
4. Supporting Operations .........................................49
C. Raw Materi a l In puts and Pollution Outputs i n the Producti on Line ............. 50
D. Poll uti on Control Sy s tems ............................................56
E. Man age ment of Chemicals i n th e Production Process ........................58
IV. CHEMICA L RELEASE AND TRANSF ER PROF ILE ...........................63
A. EPA Toxic Release Inventory for the Plastic Resin and Manmade Fiber Industries . . 66
B. Summ ary of Sel e cted Chemical s Released ................................93
C. Other Data Sources .................................................97
D. Com parison of Toxic Release Inventory Between Sel e cted In dus trie s ........... 99
Sector Notebook Project v September 1997

Plastic Resin and Manmade Fiber Sector Notebook Project
V. POLL UTION PREVENTION OPPORTUNITIES ..............................103
VI. SUMMARY OF A PPLICABLE FEDERA L STATUTES AND REGULA TIONS ..... 127
A . General De sc ripti on of Major Statutes .................................. 127
B. Indus try Specific Requirements .......................................139
C. Pen ding and Proposed Regulatory Requirements ..........................144
VII. COMPLIA NC E AND ENFOR CEMENT PROFILE ...........................145
A . Pla s ti c Resin and Manmade Fiber Industri es Compl ianc e His tory .............. 150
B. Comparison of Enforcem e nt Activ ity Between Sel ec ted Indus tri es ............. 152
C. Review of Major Legal Acti ons .......................................157
1. Rev iew of Major Cases ........................................ 157
2. Supplementary Environmental Projects (SEPs) ......................158
VIII. COMPLIANCE ACTIVITIES AND INITIATIVES ........................... 159
A . Sector-Related Env ironmen tal Program s and A ctiv ities ..................... 159
B. EPA Voluntary Programs ...........................................159
C. Trade Ass ociati on/In dus try Sponsored Acti vity ...........................167
1. Env ironmen tal Program s ....................................... 167
2. Summary of Trade Ass ociati ons .................................168
IX. CONTACTS/A C KNOWLEDGM ENTS/REFERENCES ........................173
Sector Notebook Project vi September 1997

Plastic Resin and Manmade Fiber Sector Notebook Project
LIST OF FIGURES
Figure 1: Pl as ti c Resins: From raw ma teri al to f inish e d product .........................7
Figure 2: U.S. Manmade Fiber Industry: Principal raw materials, producer types, major
products, and pri nci pal en d uses ...........................................8
Figure 3: Percentage Distribution of Plastic Resins: Sales and Captive Use, 1994 ........... 10
Figure 4: U.S. Fiber Consumption: Percentage distribution by principal fibers, 1993 ........ 12
Figure 5: Geographic Distribution of Plastic Resin (SIC 2821) and Manmade Fiber (SIC 2823,
2824) Manufacturing Facilities ...........................................16
Figure 6: U.S. Production of Selected Resins, in millions of pounds .....................18
Figure 7: Manmade Fiber Production Data for Selected Fibers 1970-1995 ................ 20
Figure 8: Gas-Phase Fluid-Bed Reactor for Production of Polyethylene .................. 27
Figure 9: Typical Loop Reactor for Production of Polyethylene ........................28
Figure 10: Hi gh-Den s ity Polyethyl e ne Process Flow Di a gram .........................31
Figure 11: Fluid Reactors Used for Making Polypropylene ............................ 32
Figure 12: Typi ca l Process Flow Di a gram f or Suspen s ion Polymeri za ti on of PVC .......... 34
Figure 13: Typi ca l Pneumatic Conv eying Sy s tem in a Pel let Blending Operation ........... 40
Figure 14: General Process Diagram for Melt, Dry, an d Wet Spun Syn thetic Fibers ......... 43
Figure 15: Typi ca l Process Flowch art for Sy nthesis of Rayon Fibers .................... 46
Figure 16: Potenti a l Em ission s from Pl as tic Resin Manufacturi ng Operations .............. 52
Figure 17: VOC Emis s ions f rom Fiber Processing Operations .........................54
Figure 18: Sum mary of TRI Releases and Tran s fers by In dustry ....................... 100
Sector Notebook Project vii September 1997

Plastic Resin and Manmade Fiber Sector Notebook Project
LIST OF TABLES
Table 1: Introducti on of Selected Pla s ti c Resins and Man made Fibers .................... 3
Table 2: Pl a stics Materi a ls, Syntheti c Resins, and Non vulcanizab le Elastome rs ............. 9
Table 3: Man made Fibers..................................................... 11
Table 4: Si z e and Reve nue f or the Pl as tic Resin an d Man made Fiber Industri e s ............ 13
Table 5: Establishment Size and Geographic Distribution of the Plastic Resin and
Manmade Fib er Industri e s ..............................................14
Table 6: Top U.S. Compan ies in the Plastic Resin an d Manmade Fibe r Industri es ........... 17
Table 7: Gene ral Pol ymeri zation Param eters for Selected Pol ymers ..................... 30
Table 8: Ty pical Fiber Spinning Param e ters for Selected Fib ers ........................44
Table 9: Summary of Potential Releases Emitted During Plastic Resin and Manmade Fiber
Manufacturing .......................................................51
Table 10: Source Reduction and Recycli ng Acti vi ty f or th e Plastic Resin Indus try .......... 59
Table 11: Source Reduction and Recycli ng Acti vi ty f or th e Manmade Fib er Industry ........ 61
Table 12: 1995 TRI Releases for Plastic Resin Manufacturing Facilities (SIC 2821) ......... 70
Table 13: 1995 TRI Transfers for Plastic Resin Manufacturing Facilities ................. 76
Table 14: 1995 TRI Releases for Manmade Fiber Manufacturing Facilities ................ 82
Table 15: 1995 TRI Transfers for Manmade Fiber Manufacturing Facilities ............... 86
Table 16: Top 10 TRI Releasing Plastic Resin Manufacturing Facilities .................. 91
Table 17: Top 10 TRI Releasing Facilities Reporting Plastic Resin Manufacturing SIC
Codes to TRI .......................................................91
Table 18: Top 10 TRI Releasing Manmade Fiber Manufacturing Facilities ................ 92
Table 19: Top 10 TRI Releasing Facilities Reporting Manmade Fiber Manufacturing SIC
Codes to TRI .......................................................92
Table 20: Air Poll utant Releases by Industry Sector .................................98
Table 21: Toxics Release Inv entory Data for Selected Indus tri es ...................... 101
Table 22: Process/Product Modificati ons Create Pol lution Preven tion Opportunities....... 111
Table 23: Modificati ons to Equi pmen t Can Also Prevent Pol lution .................... 120
Table 24: Five-Year Enforcement and Compliance Summary for the Plastic Resin and Manmade
Fibe r Industri es .....................................................151
Table 25: Five-Year Enforcem e nt and Com pliance Summary for Selected Indus tri e s ....... 153
Table 26: One-Yea r Enforcement an d Com pliance Summ ary f or Selected Indus tri es ....... 154
Table 27: Five-Year Inspection and Enforcement Summary by Statute for Selected Industries 155
Table 28: One-Year Inspection and Enforcement Summary by Statute for Selected Industries 156
Table 29: Plastic Resin and Manmade Fiber Industries Participation in the 33/50 Program . . . 160
Sector Notebook Project viii September 1997

Plastic Resin and Manmade Fiber Sector Notebook Project
LIST OF ACRONYMS
AFS - AIRS Facility Subsystem (CAA database)
AIRS - Aerometric Information Retrieval System (CAA database)
BIFs - Boilers and Industrial Furnaces (RCRA)
BOD - Biochemical Oxygen Demand
CAA - Clean Air Act
CAAA - Clean Air Act Amendments of 1990
CERCLA - Comprehensive Environmental Response, Compensation and Liability Act
CERCLIS - CERCLA Information System
CFCs - Chlorofluorocarbons
CO - Carbon Monoxide
COD - Chemical Oxygen Demand
CSI - Common Sense Initiative
CWA - Clean Water Act
D&B - Dun and Bradstreet Marketing Index
ELP - Environmental Leadership Program
EPA - United States Environmental Protection Agency
EPCRA - Emergency Planning and Community Right-to-Know Act
FIFRA - Federal Insecticide, Fungicide, and Rodenticide Act
FINDS - Facility Indexing System
HAPs - Hazardous Air Pollutants (CAA)
HSDB - Hazardous Substances Data Bank
IDEA - Integrated Data for Enforcement Analysis
LDR - Land Disposal Restrictions (RCRA)
LEPCs - Local Emergency Planning Committees
MACT - Maximum Achievable Control Technology (CAA)
MCLGs - Maximum Contaminant Level Goals
MCLs - Maximum Contaminant Levels
MEK - Methyl Ethyl Ketone
MSDSs - Material Safety Data Sheets
NAAQS - National Ambient Air Quality Standards (CAA)
NAFTA - North American Free Trade Agreement
NAICS - North American Industrial Classification System
NCDB - National Compliance Database (for TSCA, FIFRA, EPCRA)
NCP - National Oil and Hazardous Substances Pollution Contingency Plan
NEIC - National Enforcement Investigation Center
NESHAP - National Emission Standards for Hazardous Air Pollutants
NO2 - Nitrogen Dioxide
NOV - Notice of Violation
NOx - Nitrogen Oxides
NPDES - National Pollution Discharge Elimination System (CWA)
NPL - National Priorities List
NRC - National Response Center
NSPS - New Source Performance Standards (CAA)
Sector Notebook Project ix September 1997

Plastic Resin and Manmade Fiber Sector Notebook Project
OAR - Office of Air and Radiation
OECA - Office of Enforcement and Compliance Assurance
OPA - Oil Pollution Act
OPPTS - Office of Prevention, Pesticides, and Toxic Substances
OSHA - Occupational Safety and Health Administration
OSW - Office of Solid Waste
OSWER - Office of Solid Waste and Emergency Response
OW - Office of Water
P2 - Pollution Prevention
PCS - Permit Compliance System (CWA Database)
POTW - Publicly Owned Treatments Works
RCRA - Resource Conservation and Recovery Act
RCRIS - RCRA Information System
SARA - Superfund Amendments and Reauthorization Act
SDWA - Safe Drinking Water Act
SEPs - Supplementary Environmental Projects
SERCs - State Emergency Response Commissions
SIC - Standard Industrial Classification
SO2 - Sulfur Dioxide
SOx - Sulfur Oxides
SPI - Society of Plastics Industry
TOC - Total Organic Carbon
TRI - Toxic Release Inventory
TRIS - Toxic Release Inventory System
TCRIS - Toxic Chemical Release Inventory System
TSCA - Toxic Substances Control Act
TSS - Total Suspended Solids
UIC - Underground Injection Control (SDWA)
UST - Underground Storage Tanks (RCRA)
VOCs - Volatile Organic Compounds
Sector Notebook Project x September 1997

Plastic Resin and Manmade Fiber Sector Notebook Project
I. INTRODUCTION TO THE SECTOR NOTEBOOK PROJECT
I.A. Summary of the Sector Notebook Project
Integrated environmental policies based upon comprehensive analysis of air,
water and land pollution are a logical supplement to traditional single-media
approaches to environmental protection. Environmental regulatory agencies
are beginning to embrace comprehensive, multi-statute solutions to facility
permitting, enforcement and compliance assurance, education/ outreach,
research,and regulatory development issues. The central concepts driving the
new policydirectionare that pollutant releases to each environmentalmedium
(air, water and land) affect each other, and that environmental strategies must
activelyidentifyand address these inter-relationships by designing policies for
the "whole" facility. One way to achieve a whole facility focus is to design
environmental policies for similar industrial facilities. By doing so,
environmental concerns that are common to the manufacturing of similar
products can be addressed in a comprehensive manner. Recognition of the
need to develop the industrial “sector-based” approach within the EPA Office
of Compliance led to the creation of this document.
The Sector Notebook Project was originally initiated by the Office of
Compliance within the Office of Enforcement and Compliance Assurance
(OECA) to provide its staff and managers with summary information for
eighteen specific industrial sectors. As other EPA offices, states, the regulated
community, environmental groups, and the public became interested in this
project, the scope of the original project was expanded to its current form.
The ability to design comprehensive, common sense environmental protection
measures for specific industries is dependent on knowledge of several inter-
related topics. For the purposes of this project, the key elements chosen for
inclusion are: general industry information (economic and geographic); a
description of industrial processes; pollution outputs; pollution prevention
opportunities; Federal statutory and regulatory framework; compliance
history; and a description of partnerships that have been formed between
regulatory agencies, the regulated community and the public.
For any given industry, each topic listed above could alone be the subject of
a lengthy volume. However, in order to produce a manageable document, this
project focuses on providing summary information for each topic. This
format provides the reader with a synopsis of each issue, and references where
more in-depth information is available. Text within each profile was
researched from a variety of sources, and was usually condensed from more
detailed sources pertaining to specific topics. This approach allows for a wide
coverage of activities that can be further explored based upon the citations
and references listed at the end of this profile. As a check on the information
included, each notebook went through an external review process. The Office
of Compliance appreciates the efforts of all those that participated in this
Sector Notebook Project 1 September 1997

Plastic Resin and Manmade Fiber Sector Notebook Project
process and enabled us to develop more complete, accurate and up-to-date
summaries. Many of those who reviewed this notebook are listed as contacts
in Section IX and may be sources of additional information. The individuals
and groups on this list do not necessarily concur with all statements within this
notebook.
I.B. Additional Information
Providing Comments
OECA’s Office of Compliance plans to periodically review and update the
notebooks and will make these updates available both in hard copy and
electronically. If you have any comments on the existing notebook, or if you
would like to provide additional information, please send a hard copy and
computer disk to the EPA Office of Compliance, Sector Notebook Project,
401 M St., SW (2223-A), Washington, DC 20460. Comments can also be
uploaded to the Enviro$en$e World Wide Web for general access to all users
of the system. Follow instructions in Appendix A for accessing this system.
Once you have logged in, procedures for uploading text are available from the
on-line Enviro$en$e Help System.
Adapting Notebooks to Particular Needs
The scope of the industry sector described in this notebook approximates the
national occurrence of facility types within the sector. In many instances,
industries within specific geographic regions or states may have unique
characteristics that are not fully captured in these profiles. The Office of
Compliance encourages state and local environmental agencies and other
groups to supplement or re-package the information included in this notebook
to include more specific industrial and regulatory information that may be
available. Additionally, interested states may want to supplement the
"Summary of Applicable Federal Statutes and Regulations" section with state
and local requirements. Compliance or technical assistance providers may
also want to develop the "Pollution Prevention" section in more detail. Please
contact the appropriate specialist listed on the opening page of this notebook
if your office is interested in assisting us in the further development of the
information or policies addressed within this volume. If you are interested in
assisting in the development of new notebooks for sectors not already
covered, please contact the Office of Compliance at 202-564-2395.
Sector Notebook Project 2 September 1997

Plastic Resin and Manmade Fiber Introduction
II. INTRODUCTION TO THE PLASTIC RESIN AND MANMADE FIBER INDUSTRIES
This section provides background information on the size, geographic
distribution, employment, production, sales, and economic condition of the
plastic resin and manmade fiber industries. Facilities described within this
document are described in terms of their Standard Industrial Classification
(SIC) codes.
II.A. History of the Plastic Resin and Manmade Fiber Industries
The Origin of Plastic Resins
Plastics today are one of the most used materials in U.S. industrial and
commercial life. Table 1 lists selected plastic resins and synthetic fibers by
year of development and their principal uses. The first plastics were invented
in the 1800s when people experimented to produce everyday objects out of
alternative materials. The first plastic was developed in 1851 when hard
rubber, or ebonite, was synthesized. This was the first material that involved
a distinct chemical modification of a natural material.
Table 1: Introduction of Selected Plastic Resins and Manmade Fibers
Year Material Example
1868 Cellulose Nitrate Eyeglass frames
1900 Viscose Rayon Lining in clothing, curtains
1909 Phenol-Formaldehyde Telephone Handset
1927 Cellulose Acetate Toothbrushes, lacquers
1927 Polyvinyl Chloride Wall Covering, pipe, siding
1936 Acrylic Brush Backs, display signs
1938 Polystyrene Housewares, toys
1939 Nylon Fibers, films, gears
1942 Low Density Polyethylene Packaging, squeeze bottles
Unsaturated Polyester Boat Hulls
1952 Polyethylene terephthalate Clothing, fiberfill
1957 Polypropylene Safety Helmets
1964 Polyimide Bearings
1970 Thermoplastic Polyester Electrical/Electronic Parts
1978 Linear Low Density Polyethylene Extruded Film
1985 Liquid Crystal Polymers Electrical/Electronic Parts
Source: This table has been adapted from Facts and Figures of the U.S. Plastics
Industry, (1995 Edition) prepared annually by The Society of the Plastics
Industry, Inc., Washington, DC. lease refer to that document for a more
complete listing of plastic resin development.
P
Sector Notebook Project 3 September 1997

Plastic Resin and Manmade Fiber Introduction
The first plastics in the U.S. were developed while John Wesley Hyatt was
experimenting to produce a billiard ball from materials other than ivory. In
1870, John and his brother Isaiah took out a patent for a process producing
a horn-like material using cellulose nitrate and camphor.
Another important precursor to modern plastics was the development of
formaldehyde resins. Early experiments to produce white chalkboards in
Germany around the turn of the 20th century led to the development of
formaldehyde resins. These resins were first produced by reacting casein
(milk protein) with formaldehyde.
During the 1930s, the initial commercial development of today’s major
thermoplastics took place. These included polyvinyl chloride, low density
polyethylene, polystyrene, and polymethyl methacrylate. Demand for plastics
escalated during World War II when substitutes for scarce natural materials,
like rubber, were in high demand. Large-scale production for synthetic
rubbers triggered extensive research into polymer chemistry and new plastic
materials.
In the 1940s, polypropylene and high density polyethylene were developed,
and in 1978, linear low density polyethylene was developed. Large-scale
production of these materials reduced their cost substantially, which allowed
these new plastics materials to compete with traditional materials like wood
and metal. The introduction of alloys and blends of various polymers has
made it possible to tailor properties to fit certain performance requirements
that a single resin could not provide. Demand for plastics has steadily
increased, and now plastics are accepted as basic materials along with the
more traditional materials in designs and engineering plans (SPI, 1995).
The Origin of Manmade Fibers
In 1664, Robert Hooke first suggested that manmade yarn could be produced.
He speculated, in Micrographia, that synthetic fibers could be patterned after
the excretion of silk by silkworms.
And I have often thought, that probably there might be a way, found out,
to make an artificial glutinous composition, much resembling, if not full
as good, nay better, than the Excrement, or whatever other substances it
be out of which, the Silk-worm winds and draws his clew. If such a
composition were found, it were certainly an easier matter to find very
quick ways of drawing it into small wires for use (Linton, 1966).
During the 19th century, scientists were busy making precursor solutions of
the first manmade fibers, cellulosic fibers. In 1840, F. Gottlob Keller of
Germany devised a technique for making pulp for paper by squeezing
powdered wood taken from a grindstone. This enabled the future production
of rayon and other cellulosic items. During that same year, Louis Schwabe,
Sector Notebook Project 4 September 1997

Plastic Resin and Manmade Fiber Introduction
an English silk manufacturer, developed the first spinnerette through which a
spinning solution could be extruded (Linton, 1966).
The first manmade fibers commercially manufactured in the U.S. were the
cellulosics, led by rayon in 1910 and acetate in 1924. Cellulosic fibers are
manufactured by first treating cellulose with chemicals, dissolving, and then
regenerating the fibers. Cellulose is an abundant naturally occurring organic
compound which makes up a large portion of the world’s vegetable matter.
Often referred to as artificial silk, rayon retained many of the same physical
properties as cotton, such as high moisture absorption and subsequent
swelling of the fibers. While cellulose acetate was first developed as a plastic
in 1865, it was not successfully spun into a fiber until the 1920s. The first
U.S. acetate production took place at the Cumberland, Maryland plant of
British Celanese (now Hoechst Celanese).
In 1926, Du Pont Laboratories began a chemical research program that led to
the advent of the synthetic, or noncellulosic, fiber industry. Unlike cellulosic
fibers, synthetic fibers are wholly compounded from chemicals. The first
synthetic fiber that Du Pont developed was Fiber 66. Now known as nylon-
6,6, the fiber began widespread production for markets, such as nylon hosiery,
in 1939. During World War II, nylon was used in producing parachutes,
uniforms, and a host of other military equipment. Started primarily as a
hosiery yarn, the use of nylon spread after the war into other applications like
carpeting and woven fabrics.
Wrinkle-resistant and strong, the first polyester fiber, Terylene, was developed
by a British scientist group called the Calico Printers Association. In 1946,
Du Pont secured exclusive rights to produce this polyester fiber in the U.S.
In December 1950, Du Pont announced plans to build its first plant at
Kinston, North Carolina at a capacity of 36 million pounds a year and a cost
of $40 million. Du Pont first unveiled the new fiber, named Dacron, at a
famous press conference where it was displayed in a swimsuit that had been
worn 67 days continuously without ironing. After polyester fibers were first
produced commercially in the U.S. in 1953, the fibers were rapidly used to
make men’s suits, women’s blouses, and men’s shirts.
Since then, most technological advances in manmade fibers have occurred in
synthetics, which now make up almost all of the U.S. production of manmade
fibers. Synthetic fibers have many advantages to cellulosic fibers, such as
controlled shrinkage, crease retention, and wrinkle resistance. Synthetic fibers
have developed to seem more natural, softer, easier to care for, more lustrous,
and more comfortable.
Sector Notebook Project 5 September 1997

Plastic Resin and Manmade Fiber Introduction
II.B. Introduction, Background, and Scope of the Notebook
This notebook focuses on industrial processes and environmental issues
relevant to the plastic resin and manmade fiber industries. These industries
were chosen for this notebook because they have certain industrial processes
in common, such as polymerization and extrusion. Both the plastic resin
industry and the manmade fiber industry use refined petroleum products and
synthetic organic chemicals to make selected polymers, which are large
molecules made up of simple repeating chemical units. Facilities then process
the polymers into plastic pellets and manmade fibers. Figures 1 and 2 provide
an overview of the raw material inputs, products, and end uses of plastic resin
and manmade fiber.
The plastic resin industry is classified by the Office of Management and
Budget (OMB) as Plastics Materials and Resins, Standard Industrial
Classification (SIC) code 2821. This classification corresponds to SIC codes
which were established by the OMB to track the flow of goods and services
within the economy. SIC 2821 corresponds to facilities that manufacture
manmade resin, plastic materials, and nonvulcanizable elastomer. Table 2 lists
products that are classified under SIC 2821. The manmade fiber industry is
made up of two categories: Cellulosic Manmade Fibers, SIC 2823, and
Organic Fibers, Noncellulosic, SIC 2824. Cellulosic Manmade Fibers includes
facilities that make cellulosic fibers, like rayon and cellulose acetate. The
category, Organic Fibers, Noncellulosic, covers facilities that make other
manmade fiber, including nylon and polyester. Manmade fiber products that
fall under SIC Codes 2823 and 2824 are listed in Table 3.
OMB is in the process of changing the SIC code system to a system based on
similar production processes called the North American Industrial
Classification System (NAICS). In the NAIC system, the manufacturing of
plastic resins, synthetic rubber, artificial and synthetic fibers and filaments are
all classified as NAIC 3252. Resin and synthetic rubber manufacturing are
further classified as NAIC 32521, and artificial and synthetic fibers and
filaments manufacturing are further classified as NAIC 32522.
Only the manufacturing of plastic resin and manmade fiber is covered in this
notebook. Companies that perform upstream processing, such as synthesizing
reactants, and companies that perform downstream operations, such as
processing plastic resins into plastic bottles or processing manmade fibers into
fabric, are not covered in this notebook. For information on companies that
manufacture organic chemicals (SIC 286) used in plastic resin and manmade
fiber manufacture, refer to the Organic Chemicals Sector Notebook. For
facilities that process resins into plastic products of different shapes, sizes, and
physical properties, refer to the Rubber and Plastics Sector Notebook. Refer
to the Textiles Sector Notebook for information on facilities that process
manmade fibers into yarn and fabric. Note that compounding operations,
Sector Notebook Project 6 September 1997
Plastic Resin and Manmade Fiber Introduction
where additives are incorporated into polymers, are not covered in this
notebook.
Figure 1: Plastic Resins: From raw material to finished product
Oil & Natural Gas
Monom ers
Synthetic Resins
SIC 2821 Additives
Compounding
SIC 3087
Film & Sheet
SIC 3081 Plastic Shapes
SIC 3082
Laminated
Plastics
SIC 3083
Plastics Pipe
SIC 3084
Plastics
Bottles
SIC 3085
Plastic Foam
SIC 3086
Plumbing
Fixtures
SIC 3088
Plastics
Products, NEC
SIC 3089
Major Markets
Transportation A erospace, A utom otive, Aircraft, Marine, R ailroad, R ecreational
Packaging Closures, Coatings, Containers, Flexible packaging
Building materials, Pipe & fittings, Plumbing fixtures
Appliance, Batteries, Business machines, Communications, Records
Building/Construction
Electrical/Electronic
Furniture/Furnishings Bedding, Carpets (incl. backing), House furnishings, Rigid & flexible furniture
Cutlery, Lawn & garden, Luggage, Medical & healthcare, Toys & sporting goods
Engine parts, Farm & constr. equip., Mach. tools, Marine supplies, Signs & displays
Adhesives, Inks, Coatings
Exports
Consum er/Institutional
Industrial/Machinery
Other
Source: Facts and Figures of the U.S. Plastics Industry, (1995 Edition) prepared annually by The Society of thePlastics
Industry, Inc., Washington, DC.
Sector Notebook Project 7 September 1997

Plastic Resin and Manmade Fiber Introduction
Figure 2: U.S. Manmade Fiber Industry: Principal raw materials, producer types, major
products, and principal end uses
U.S. Manmade Fiber Industry
Principal
rawmaterials Producer types Major products Principal
end uses
SIC2823, 2824
Organic chemicals:
• Acrylonitrile
• Caprolactam
• Hexamethylene-
diamine (HMD)
• Adipic acid (AA)
• Glycols (ethylene,
propylene, etc.)
• Dimethyl Terephthalate
(DMT)
• Terephthalic acid (TPA)
Polymers:
• Polyester
• Nylon
• Polypropylene
Wood pulp
Chemical companies
Oil exploration and
recovery companies
Polymer converters
Fibers and yarns:
• Acetate
• Acrylic
• Aramid
• Nylon
• Polyester
• Polyolefin
• Rayon
•Spandex
• Apparel
• Home textiles
• Carpets and rugs
• Industrial textiles
(tires, ropes/cordage,
automotive upholstery,
and geotextiles)
• Miscellaneous consumer
goods (craft yarn,
sewing thread,
diapers,
sanitary napkins,
and tampons)
Source: Industry and Trade Summary: Manmade Fibers, U.S. International Trade Commission, Washington, DC,
1995.
Sector Notebook Project 8 September 1997

Plastic Resin and Manmade Fiber Introduction
II.C. Characterization of the Plastic Resin and Manmade Fiber Industries
II.C.1. Product Characterization
Plastic Resins
The plastic resin industry produces resins which are further treated in plastics
processing facilities and sold largely to the packaging, building and
construction, and consumer markets. Specific product formulations and
manufacturing parameters are often kept as trade secrets since the
competitiveness of many companies depends on the ability to produce resins
with different physical characteristics, such as strength, toughness, and
flexibility (Brydson, 1995).
Plastic resins are typically broken down into two categories: thermoplastics
and thermosets. Thermoplastic resins are resins that can be heated and
molded into shapes repeatedly, while thermoset resins are resins that can be
heated and molded only once. Thermoplastic resins dominate plastic resin
sales and production. In 1994, thermoplastics made up about 90 percent, or
Sector Notebook Project 9 September 1997

Plastic Resin and Manmade Fiber Introduction
Table 2: Plastics Materials, Synthetic Resins, and Nonvulcanizable Elastomers (as
listed under SIC 2821)
acetal resins
acetate, cellulose (plastics)
acrylic resins
acrylonitrile-butadiene-styrene
resins
alcohol resins, polyvinyl
alkyd resins
allyl resins
butadiene copolymers, containing
less than 50 percent
butadiene
carbohydrate plastics
casein plastics
cellulose nitrate resins
cellulose propionate (plastics)
coal tar resins
condensation plastics
coumarone-indene resins
cresol resins
cresol-furfural resins
dicyandiamine resins
diisocyanate resins
elastomers, nonvulcanizable
(plastics)
epichlorohydrin bisphenol
epichlorohydrin diphenol
epoxy resins
ester gum
ethyl cellulose plastics
ethylene-vinyl acetate resins
fluorohydrocarbon resins
ion exchange resins
ionomer resins
isobutylene polymers
lignin plastics
melamine resins
methyl acrylate resins
methyl cellulose plastics
methyl methacrylate resins molding
compounds, plastics
nitrocellulose plastics (pyroxylin)
nylon resins
petroleum polymer resins
phenol-furfural resins
phenolic resins
phenoxy resins
phthalic alkyd resins
phthalic anhydride resins
polyacrylonitrile resins
polyamide resins
polycarbonate resins
polyesters
polyethylene resins
polyhexamethylenediamine
adipamide resins
polyisbutylenes
polymerization plastics, except
fibers
polypropylene resins
polystyrene resins
polyurethane resins
polyvinyl chloride resins
polyvinyl halide resins
polyvinyl resins
protein plastics
pyroxylin
resins, synthetic
rosin modified resins
silicone fluid solution (fluid for
sonar transducers)
silicone resins
soybean plastics
styrene resins
styrene-acrylonitrile resins
tar acid resins
urea resins
vinyl resins
Source: Standard Industrial Classification Manual, Office of Management and Budget, 1987.
Sector Notebook Project 10 September 1997
Plastic Resin and Manmade Fiber Introduction
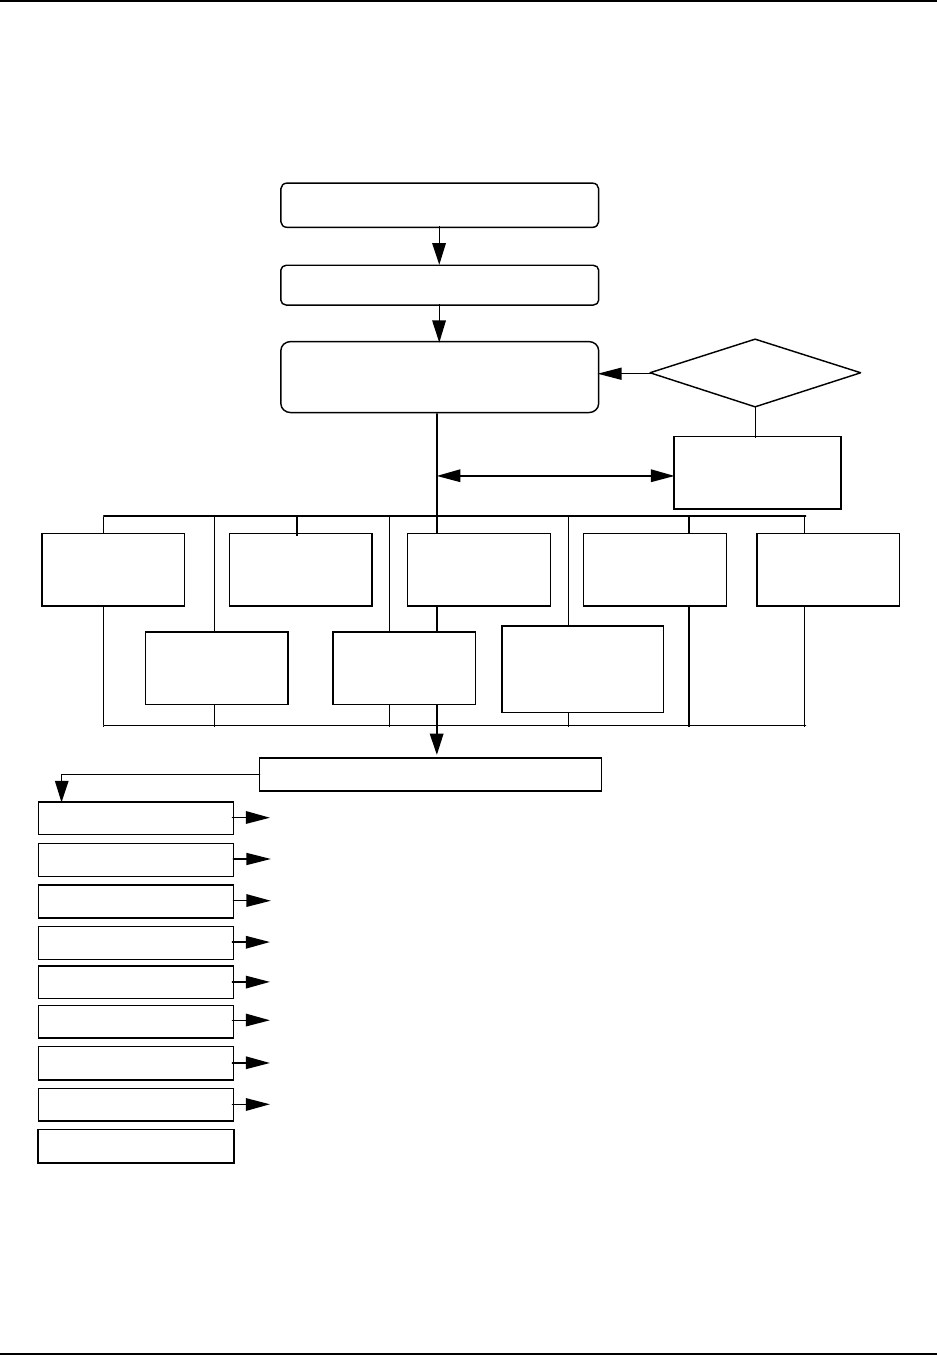
Figure 3: Percentage Distribution of Plastic Resins: Sales and Captive Use, 1994
Polypropylene
13%
Other
Thermoplastics
10%
LLDPE
8%
LDPE
10%
HDPE
15% Polystyrene
8%
PVC
14%
All Other Plastics
12%
Thermosets
10%
Source: SPI Committee on Resin Statistics as compiled by Association Services Group, LLC, 1995.
63.3 billion pounds, of plastic resin production by dry weight and accounted
for 82 percent, or $27.2 billion dollars of the total value of shipments for
plastic resin (SPI, 1995). Commercially important thermoplastics include
polyethylene (all forms), polyvinyl chloride, polypropylene, and polystyrene
and are shown in Figure 3. These four thermoplastics make up over 69
percent of plastic resin sales. These thermoplastics are considered general
purpose, or commodity plastics since they are usually manufactured in large
quantities using well established technology and are typically geared towards
a small number of high volume users.
In 1994, thermosets accounted for about 10 percent, or 7.5 billion pounds, of
plastic resin production by dry weight and 17 percent of the value of
Sector Notebook Project 11 September 1997

Plastic Resin and Manmade Fiber Introduction
shipments for the plastic resin industry. The leading thermosets in sales were
phenolic resins, urea resins, and unsaturated polyester resins. Specialtyplastic
resins, which often include thermosets, are produced on a customized basis
in small production runs and typically involve significant research and
development costs (Department of Commerce, 1994).
Manmade Fibers
Manmade fibers are produced primarily for use as raw materials for the textile
industry. In 1993, about 34 percent of manmade fibers were sold to the
carpets and rugs market, 28 percent was sold to the industrial and
miscellaneous consumer products market, and 25 percent was sold to the
apparel market (International Trade Commission, 1995). The increasing use
of manmade fibers in a variety of markets has enabled manmade fibers to
account for 57% of all fibers, natural and manmade, consumed in the U.S.
Figure 4 illustrates manmade fiber consumption with respect to other fibers
and shows the leading manmade fibers. The price and quality of manmade
fibers are important determinants in the quality and competitiveness of
apparel, home textiles, and industrial and consumer products (Department of
Commerce, 1994; AFMA, 1997).
There are two main types of manmade fibers: noncellulosic (SIC 2824) and
cellulosic (SIC 2823). Noncellulosic, or synthetic, fibers consist of fibers that
are formed by the polymerization and subsequent fiber formation of synthetic
organic chemicals and refined petroleum products.
Sector Notebook Project 12 September 1997

Plastic Resin and Manmade Fiber Introduction
Table 3: Manmade Fibers (as listed by SIC code)
Cellulosics (SIC 2823) Noncellulosics (SIC 2824)
Acetate fibers
Cellulose acetate monofilament, yarn, staple, or tow
Cellulose fibers, manmade
Cigarette tow, cellulosic fiber
Cuprammonium fibers
Fibers, rayon
Horsehair, artificial: rayon
Nitrocellulose fibers
Rayon primary products: fibers, straw, strips, and yarn
Rayon yarn, made in chemical plants
Regenerated cellulose fibers
Textured yarns and fibers, cellulosic: made in chemical
plants
Triacetate fibers
Viscose fibers, bands, strips, and yarn
Yarn, cellulosic: made in chemical plants
Acrylic fibers
Acrylonitrile fibers
Anidex fibers
Casein fibers
Elastomeric fibers
Fibers, manmade: except cellulosic
Fluorocarbon fibers
Horsehair, artificial: nylon
Linear esters fibers
Modacrylic fibers
Nylon fibers and bristles
Olefin fibers
Organic fibers, synthetic: except cellulosic
Polyester, fibers
Polyvinyl ester fibers
Polyvinylidene chloride fibers
Protein fibers
Saran fibers
Soybean fibers (manmade textile materials)
Textured fibers and yarns, noncellulosic: made in
chemical plants
Vinyl fibers
Vinylidene chloride fibers
Zein fibers
Source: Standard Industrial Classification Manual, Office of Management and Budget, 1987.
In 1992, noncellulosic fibers were responsible for 88 percent, or $11.1 billion
dollars, of the total value of shipments for the industry. Industry statistics
from the Fiber Economics Bureau reported $10.6 billion as the value of
shipments for the noncellulosic fiber industry for 1996 (ATMI, 1997b). Major
noncellulosic fibers include nylons, polyesters, polyolefins, and acrylics.
Polyolefins include polyethylene and polypropylene. Figure 4 shows a
breakdown of U.S. fiber consumption by material.
Most cellulosic fibers are formed by the conversion of the cellulose into a
soluble derivative, followed by reforming as filaments. Cellulose is an
abundant naturally occurring organic compound which makes up one-third of
the world’s vegetable matter. In some cases, the cellulose derivative is
retained in the new fiber (e.g., cellulose acetate), and sometimes the cellulose
derivative is degraded and cellulose is regenerated (e.g., rayon). Lyocel is a
new class of cellulosic fibers made by direct solution of cellulose (and not a
derivative) in organic solvents (e.g., amine oxides) and evaporation of the
solvent to form the new filaments. In 1992, the cellulosic fiber industry had
a value of shipments of $1.7 billion according to the U.S. Department of
Commerce. This is compared to $850 million for the 1996 value of shipments
for the cellulosic fiber industry as reported by the Fiber Economics Bureau
Sector Notebook Project 13 September 1997
Plastic Resin and Manmade Fiber Introduction
(ATMI, 1997b). Commercially important cellulosic fibers include rayon and
cellulose acetate.
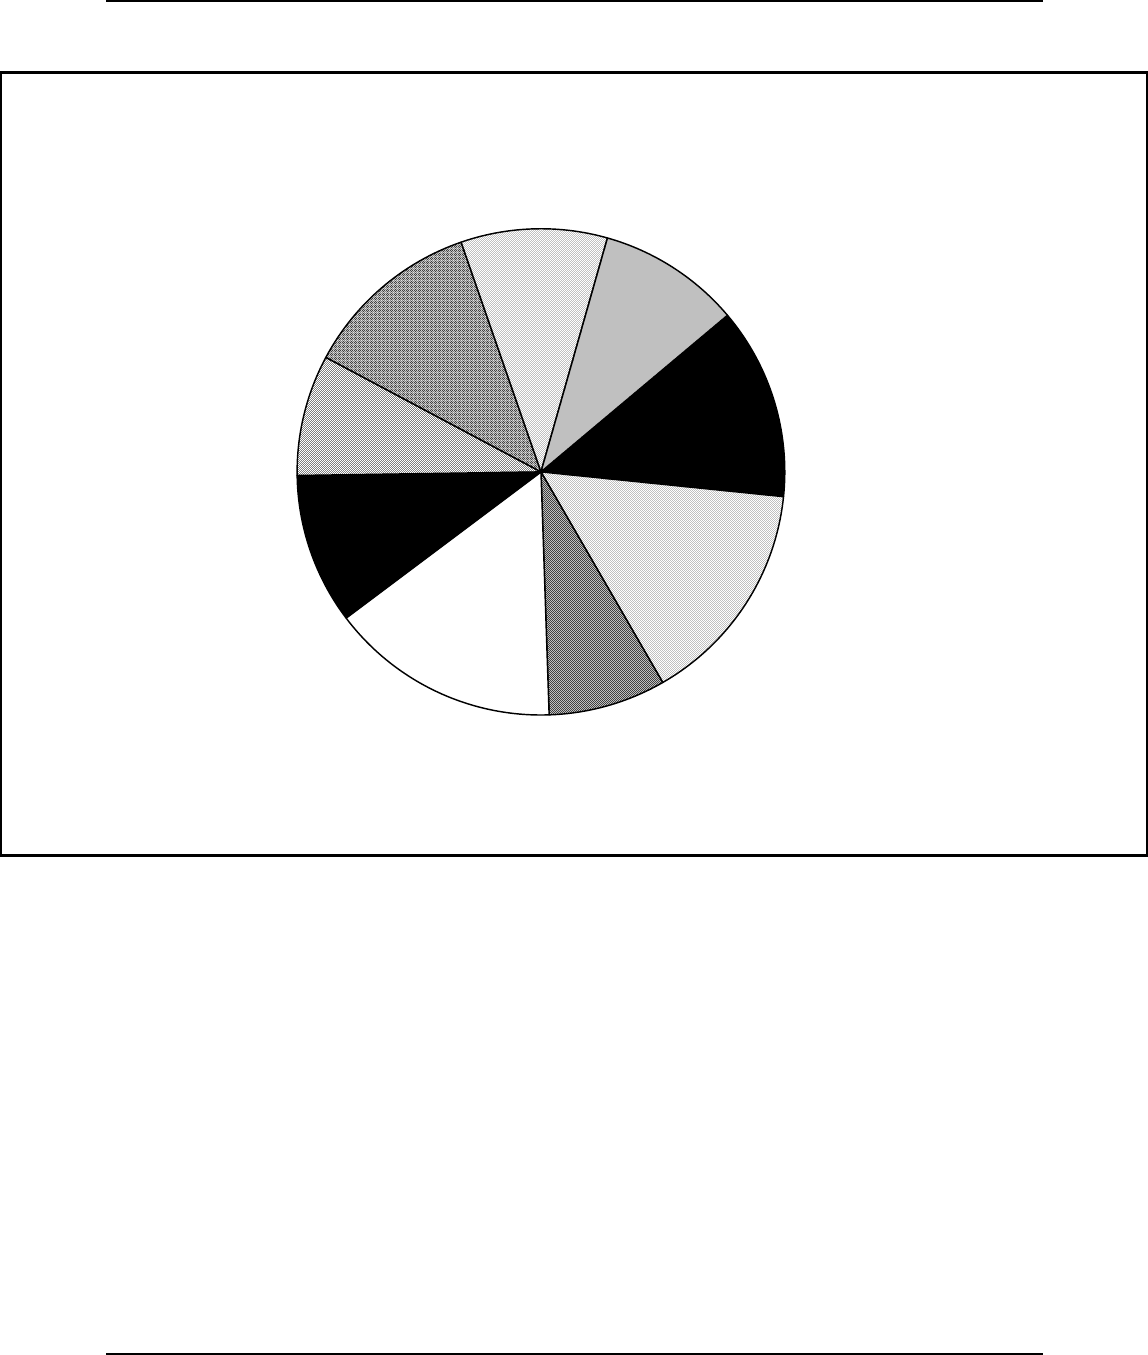
Figure 4: U.S. Fiber Consumption: Percentage distribution by principal fibers, 1993
Cotton
39%
Manmade
f ibers
57%
Other
4%
Polyolef in
22%
Nylon
28%
Acrylic
4%
Cellulosics
6%
Polyester
40%
All Fibers = 19.2 billion pounds Manmade Fibers = 11.0 billion pounds
Source: Industry and Trade Summary: Manmade Fibers, U.S. International Trade Commission, Washington, DC,
1995. II.C.2. Industry Characterization
Petroleum refining and synthetic organic chemical manufacturing facilities
produce the raw material feedstocks used to make plastic resin and manmade
fibers (except cellulosic fibers). In some cases, these facilities also make
plastic resins and manmade fibers. Because of integration between the
industries, the development of the petrochemical industry has contributed
strongly to the growth of the plastic resin and manmade fiber industries.
Plastic Resin Industry
In 1992, the Department of Commerce reported 240 plastic resin companies
and 449 establishments in 1992. The value of shipments for the industry was
$31.3 billion dollars. The largest four companies accounted for 24 percent of
the value of shipments, and the largest 20 companies accounted for 63
percent. Table 4 summarizes revenue and company size statistics for the
industry.
Sector Notebook Project 14 September 1997

Plastic Resin and Manmade Fiber Introduction
Table 4: Size and Revenue for the Plastic Resin and Manmade Fiber Industries
Item Plastic Resins Manmade Fibers
(SIC 2821) Cellulosic
(SIC 2823) Noncellulosic
(SIC 2824)
Establishments (no.) 449c 7d 71e
Companies (no.)a 240 5 42
Values of Shipments
(millions of dollars)b 31,303.9 1,748.1 11,113.7
Total Employees (000's) 60.4 11.0 44.4
Source: 1992 Census of Manufactures, Industry Series: Plastics Materials, Synthetic Rubber, and Manmade Fibers,
US Department of Commerce, Bureau of the Census, June 1995.
Note: 1992 Census of Manufacturers data are the most recent available. Changes in the number of facilities, location,
and employment figures since 1992 are not reflected in these data.
aDefined as a business organization consisting of one establishment or more under common ownership or control.
bValue of all products and services sold by establishments in the plastics and manmade fibers industries.
cDun and Bradstreet information reports 1553 facilities indicating SIC 2821 as one of their top five SIC codes.
dDun and Bradstreet information reports 29 facilities indicating SIC 2823 as one of their top five SIC codes.
eDun and Bradstreet information reports 152 facilities indicating SIC 2824 as one of their top five SIC codes.
Employment for the industry increased from 54,700 employees in 1982 to
60,400 employees in 1992. Most employees, about 60 percent, are
considered production workers. Although a small number of large, integrated
companies dominate sales and production, the majority of individual
establishments tend to be small. About 71 percent of establishments have less
than 100 employees. In terms of geographic distribution, four states - Texas,
Illinois, Michigan, and Pennsylvania - accounted for about 40 percent of
industry employment and 23 percent of establishments in 1992. Employment
and geographic distribution figures appear in Table 5.
Sector Notebook Project 15 September 1997

Plastic Resin and Manmade Fiber Introduction
Table 5: Establishment Size and Geographic Distribution of the Plastic Resin and
Manmade Fiber Industries
Item Plastic Resins Manmade Fibers
(SIC 2821) Cellulosic
(SIC 2823) Noncellulosic
(SIC 2824)
% of establishments with less than
20 employees 24 0 4.2
% of establishments with less than
100 employees 71 14 25
Major states in which industry is
concentrated, based on employment TX, PA, MI, LA TN, SC, VA, AL SC, NC, VA, TN
% of industry’s employment
attributable to four major states 40 100 77
Source: 1992 Census of Manufactures, Industry Series: Plastics Materials, Synthetic Rubber, and Manmade Fibers, US
Department of Commerce, Bureau of the Census, June 1995.
Note: 1992 Census of Manufacturers data are the most recent available. Changes in the number of facilities, location, and
employment figures since 1992 are not reflected in these data.
Manmade Fibers
The manmade fiber industry is dominated by a small number of large plants
that manufacture or purchase basic organic chemicals and then synthesize
them into fiber-forming polymers. These larger fiber producers often
manufacture polymer for internal use and to sell to smaller firms which only
process purchased polymers into fibers. The dominant firms tend to fall into
one of the following categories: 1) large, multi-product chemical companies;
2) highly integrated petrochemical companies, or 3) widely diversified
industrial firms with large chemicals- or materials-related segments (EPA,
1995). Few firms process fibers into end-use consumer products
(International Trade Commission, 1995).
In 1992, the Department of Commerce reported 5 companies involved in
cellulosic fiber manufacture and 42 companies involved in noncellulosic fiber
manufacture. The value of shipments for the industry was $12.8 billion
dollars in 1992. Noncellulosic fiber manufacturing accounted for 88 percent
of the value of shipments for the industry. Table 4 highlights industry
statistics, including value of shipments. Industry statistics reported by the
Fiber Economics Bureau indicated that the value of shipments for the
manmade fiber industry was $11.5 billion in 1996, with noncellulosic fiber
manufacturing accounting for 93 percent of the value of shipments for the
industry (ATMI, 1997b).
Sector Notebook Project 16 September 1997

Plastic Resin and Manmade Fiber Introduction
The U.S. manmade fiber industry is highly concentrated. According to the
U.S. International Trade Commission, nine firms accounted for roughly 70
percent of U.S. production capacity in 1994, while the remaining 30 percent
was held by about 85 other firms. The number of firms and level of industry
concentration varies by fiber type. In 1994, only two firms produced acrylic
and three produced rayon. Although roughly 30 produced polyester and
nylon and 60 produced polyolefins, seven producers accounted for about 85
percent of total U.S. nylon and polyester capacity, and three accounted for
over one-half of polyolefin capacity. Recently, the number of polyolefin
producers has increased to meet increasing demand and availability of low-
volume production equipment.
Since the mid-1980s, the manmade fiber industry has greatlyconsolidated and
reorganized. Facilities have tried to expand and diversify by purchasing
existing plants, enlarging capacity, or starting up new capacity in other parts
of the world. In an effort to improve profit margins and market share, several
companies have sold their smaller fiber businesses in order to concentrate on
their strongest fiber operations (International Trade Commission, 1995).
While numbers of companies and establishments remained steady from 1982
to 1992, employment for the industry dramatically decreased from 60,200
employees to 44,400 employees. Most employees, about 75 percent, are
considered production workers. Roughly 25 percent of establishments have
less than 100 employees. Most of the manmade fiber facilities are located in
the Southeast, where the main customer, the textile mill industry, is
concentrated. Three states - Tennessee, South Carolina, and Virginia -
accounted for about 62 percent of industry employment in 1992. Table 5
shows employment data for the industry. Figure 5 highlights those states
which have the largest number of plastic resin and manmade fiber
manufacturing facilities. Note that industry statistics from the Fiber
Economics Bureau indicated that there were 42,000 employees for the
manmade fiber industry in 1996. About 39,000 employees were employed by
the noncellulosic fiber industry, and 3,000 employees were employed by the
cellulosic fiber industry (ATMI, 1997b).
Sector Notebook Project 17 September 1997
Plastic Resin and Manmade Fiber Introduction
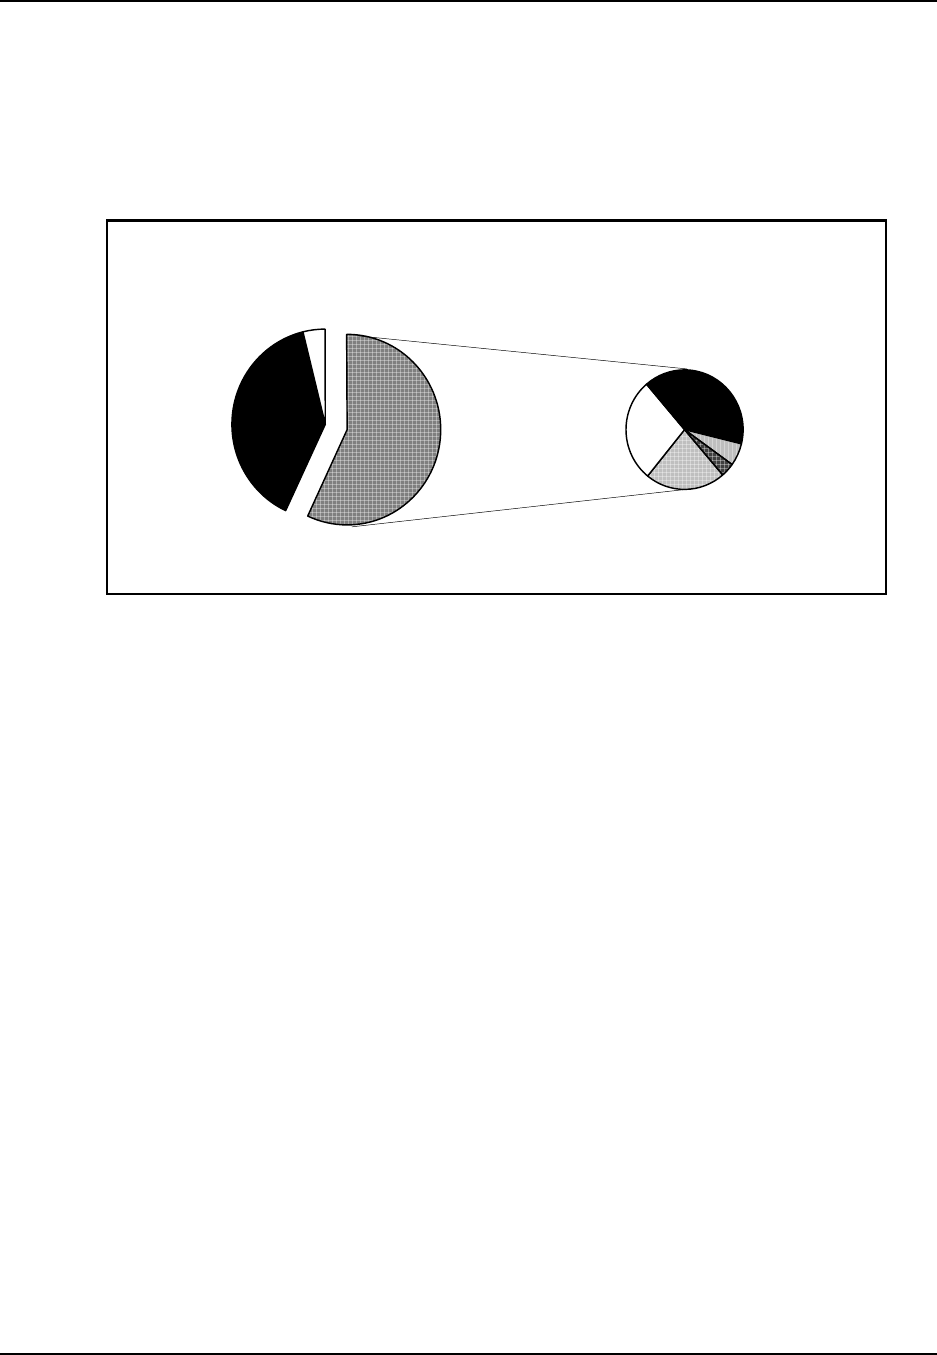
Figure 5: Geographic Distribution of Plastic Resin (SIC 2821) and Manmade Fiber (SIC
2823, 2824) Manufacturing Facilities
Source:
1992 Census of Manufactures, Industry Series: Plastics Materials, Synthetic Rubber, and Manmade Fibers, US Department
of Commerce, Bureau of the Census, June 1995.
Leading Companies for the Plastic Resin and Manmade Fiber Industries
Table 6 shows the top U.S. companies with plastic resin and manmade fiber
operations, according to the 1997 Dun & Bradstreet’s Million Dollar
Directory. This directory compiles financial data on U.S. companiesincluding
those operating within the plastic resin and manmade fiber industries. Dun
and Bradstreet’s ranks U.S. companies, whether they are a parent company,
subsidiary or division, by sales volume within their assigned 4-digit SIC code.
Readers should note that companies are assigned a 4-digit SIC code that most
closely resembles their principal industry and that sales figures include total
company sales, including subsidiaries and operations not related to plastic
resins and manmade fibers. Additional sources of company specific financial
information include Standard & Poor’s Stock Report Services, Moody’s
Manuals, and annual reports.
Sector Notebook Project 18 September 1997
Sector Notebook Project 19
Table 6: Top U.S. Companies in the Plastic Resin and Manmade Fiber Industries
Plastics Resins (SIC 2821) Manmade Fibers, Cellulosic and Noncellulosic (SIC 2823, 2824)
Rank Company 1996 Sales
(millions of
dollars)
4-digit SIC
code Rank Company 1996 Sales
(millions of
dollars)
4-digit
SIC code
1 Huntsman Chemical Corp.
Salt Lake City, UT 1,472 2821 1 Monsanto Company
Saint Louis, MO 8,962 2824
2 The Geon Company
Avon Lake, OH 1,268 2821 2 Hoechst Celanese Corp.
Bridgewater, NJ 7,395 2824,
2823
3 Albemarle Corp.
Baton Rouge, LA 1,244 2821 3 Wellman Inc.
Shrewsbury, NJ 1,109 2824
4 A Schulman, Inc.
Akron, OH 1,027 2821 4 Nan-Ya Plastics Corp.
Livingston, NJ 365 2824
5 Aristech Chemical Corp.
Pittsburgh, PA 945 2821 5 Cookson Fibers Inc.
Bristol, VA 175 2824
6 Condea Vista Company
Houston, TX 882 2821 6 Du Pont EI de Nemours and
Co.
Camden, SC
175 2824
7 Carlisle Companies Inc.
Syracuse, NY 823 2821 7 Allied Signal Inc.
Chester, VA 160 2824
8 Novacor Chemicals Inc.
Leominster, MA 756 2821 8 Amoco Performance Products
Alpharetta, GA 124 2824
9 Amoco Fabrics and Fibers Co.
Atlanta, GA 721 2821 9 BASF Corp.
Anderson, SC 123 2824
10 Shintech Inc.
Houston, TX 700 2821 10 Lenzing Fibers Corp.
Lowland, TN 120 2823
Source: Dun & Bradstreet’s Million Dollar Directory, 1997.
Plastic Resin and Manmade Fiber
September 1997
Introduction
Plastic Resin and Manmade Fiber Introduction
II.C.3. Economic Outlook
Plastic Resin Industry
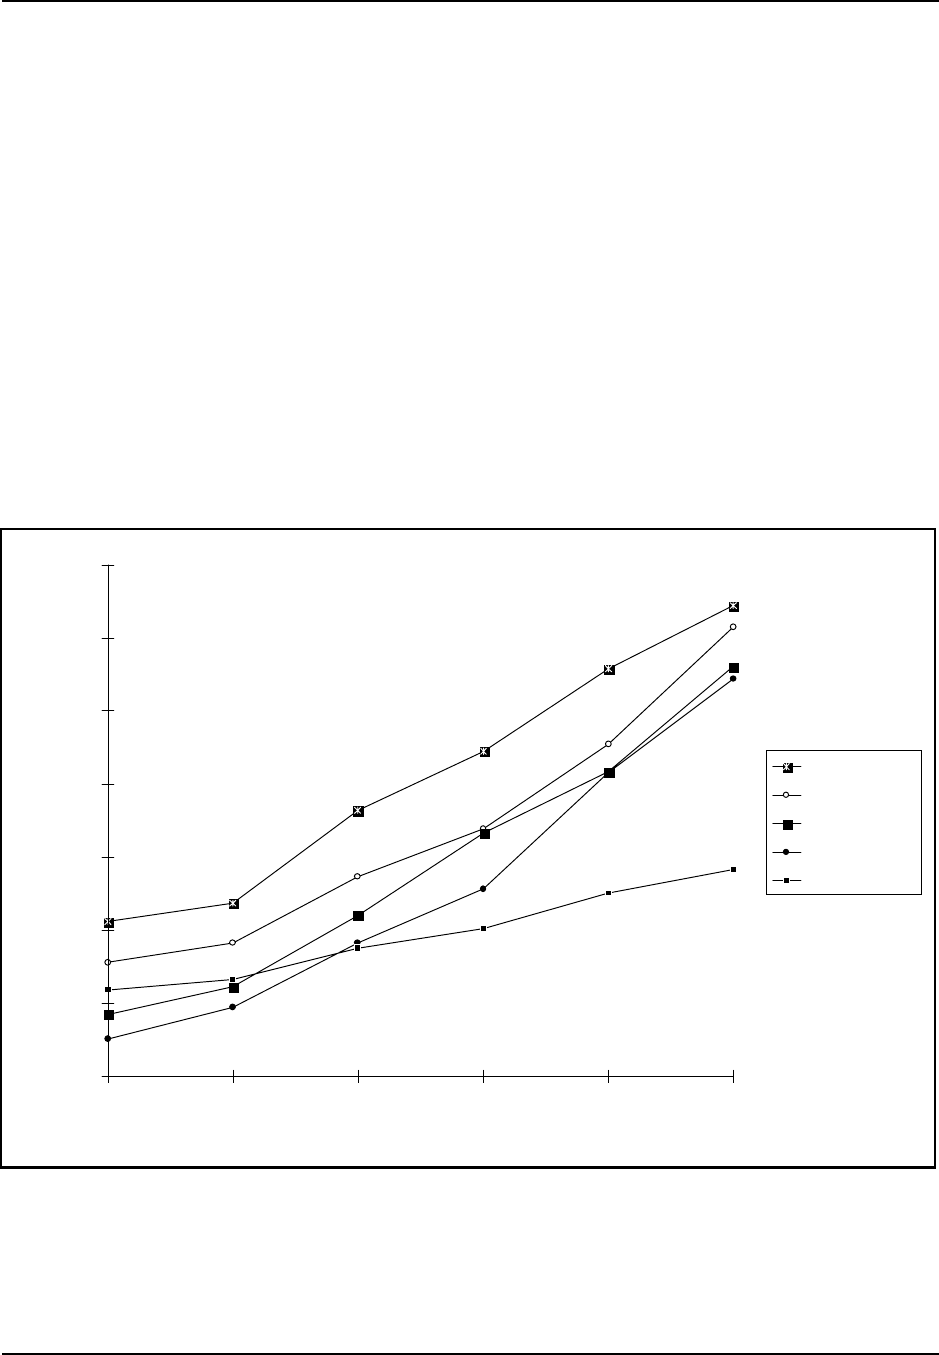
The U.S. is a major exporter of plastics. Figure 6 shows trends in U.S.
production of selected plastic resins for the past 25 years. Trade with Canada
and Mexico accounted for about one-third of total U.S. plastics exports in
1992. Chronic worldwide overcapacity in plastics has continued to depress
and slow growth rates. Since the industry is mature, the plastic resin industry
was greatly affected by the depression in the global economy in the early
1990s. Plant closures and capacity cutbacks were partly successful in
preventing further price declines during this period (Department of
Commerce, 1994). From 1993 to 1998, global consumption of plastic resins
is projected to increase 4 percent annually.
Figure 6: U.S. Production of Selected Resins, in millions of pounds
0
2000
4000
6000
8000
10000
12000
14000
1970 1975 1980 1985 1990 1995
Year
Production (in millions of pounds
)
LDPE/LLDPE
PVC
HDPE
Polypropylene
Polystyrene
Source: U.S. Tariff Commission (for 1970 data); SPI Committee on Resin Statistics as compiled by the Association
Services Group (for 1975-1995 data).
Sector Notebook Project 20 September 1997

Plastic Resin and Manmade Fiber Introduction
As the global economy rebounds from the recession of the early 1990s,
growth is expected to be stimulated by upswings in the packaging, building,
and construction markets. This growth is expected to occur primarily in
countries along the Pacific Rim and in Latin America as these countries
continue rapid industrialization, increased consumer spending, and
substitution of other materials by plastics. Plastic resin production capacity
is also increasing in these regions in response to the high demand.
The U.S. represents the largest single plastics market in the world, based on
factors such as large domestic markets, readily available capital and
technology, and relatively inexpensive raw material and energy costs. In the
U.S., consumption and production are not experiencing high growth rates.
This is, in part, the high level of substitution of traditional materials (like
wood or metal) for plastics currently in place and the fact that the commodity
plastics market is well-developed. As a result, major plastic resin
manufacturers are merging and swapping production lines. Large
multinational chemical companies are arranging licensing agreements as a way
to tap into foreign markets. The plastic resin industry is also focusing on
upgrading its production to higher-value-added and specialty resins tailored
for niche markets. Research on plastic resins has started to focus on refining
existing resins through blends and alloys and also improving catalyst
technology to produce new grades of polymers. For instance, several
companies are planning to produce specialty grades of polypropylene using
new metallocene catalysts (McGraw-Hill, 1994).
Advances in plastic resin properties is expected to spur growth and foster the
development of new end-use markets. For instance, the cost, low weight, and
versatility advantages of newer plastic resins will make them more attractive
in the autoassemblyindustries. Environmental regulations and concerns have
an impact on many facets of the plastic resin industry. The demand for
recycled and biodegradable plastic resins is expected to continue and drive
development of more economical recycling technologies (Department of
Commerce, 1994).
Manmade Fiber Industry
One-half of all fibers consumed are manmade. In 1992, global demand for
manmade fibers increased by 3 percent. In the past, developed countries have
dominated the manmade fiber industry. Between 1980 and 1993, the
developing countries of Asia led by China, Taiwan, and Korea have accounted
for most of the growth in manmade fiber production. During that period,
these countries increased their aggregate share of world production from 15
to 42 percent. Developing countries are expected to continue increasing
production and capability as their consumption and demand levels increase.
Sector Notebook Project 21 September 1997
Plastic Resin and Manmade Fiber Introduction
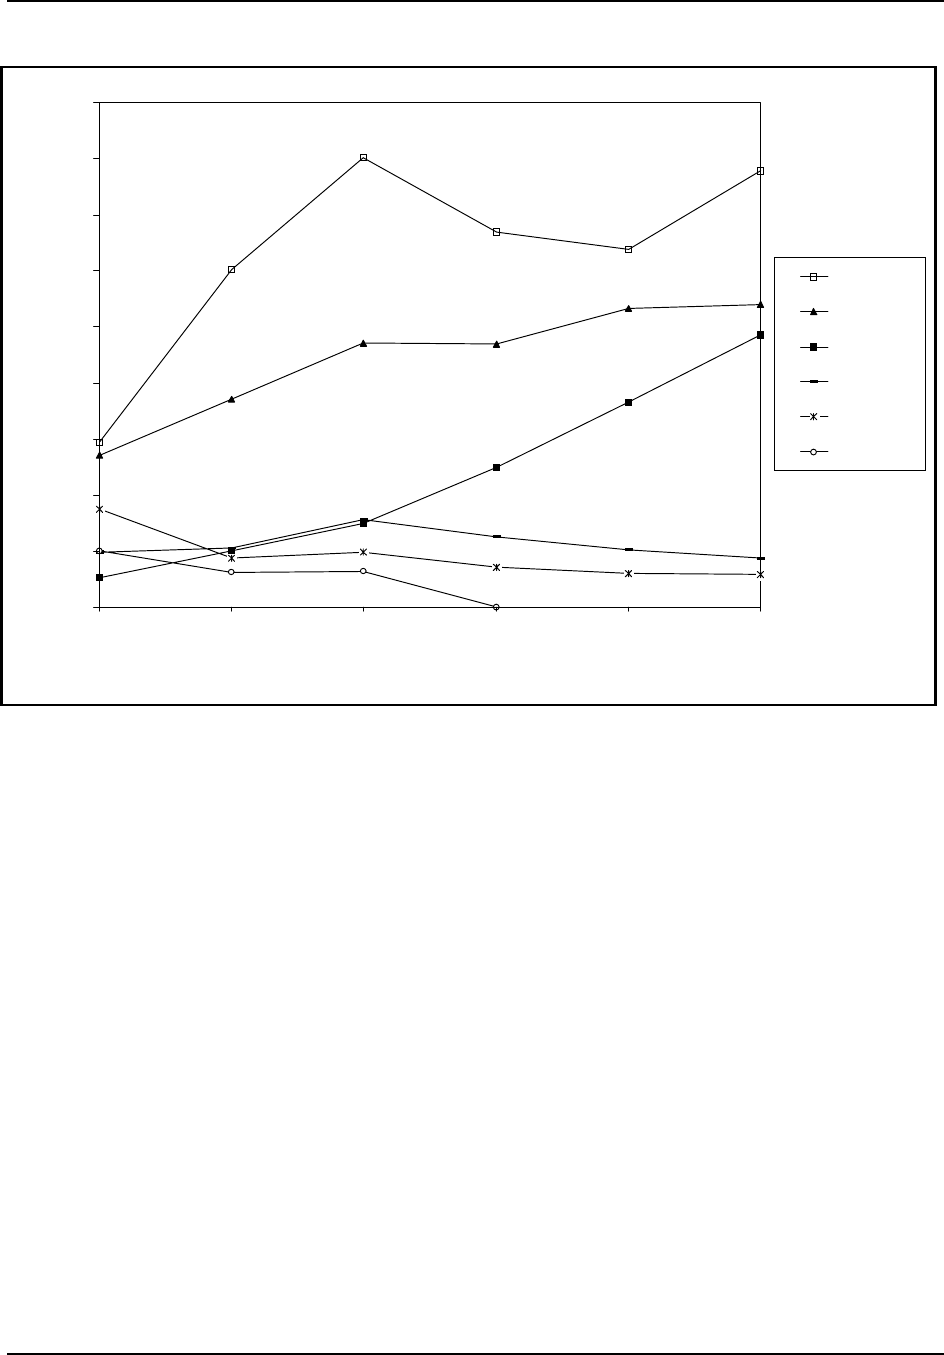
Figure 7: Manmade Fiber Production Data for Selected Fibers 1970-1995
0
500
1000
1500
2000
2500
3000
3500
4000
4500
1970 1975 1980 1985 1990 1995
Year
Production (in million pounds)
Polyester
Nylon
Olefin
Acrylic
Rayon
Acetate
Source: Fiber Economics Bureau, Inc., 1996.
On the other hand, production in the U.S. has remained relatively stagnant.
Figure 7 shows U.S. production trends from 1970 to 1995 for selected
cellulosic and noncellulosic fibers. Figure 7 shows that production of
polyester and nylon fibers was significantly greater than the production of
cellulosic fibers, such as acetate and rayon. Note that numbers for acetate
production and rayon yarn production were not available for 1985 to the
present since the industries have shrunk to only a few companies. As a result,
data do not appear for acetate from 1985 to 1995, and data for rayon
represent rayon yarn and staple production for the period from 1970 to 1980
and rayon staple production only from 1985 to 1995.
In 1993, U.S. manmade fiber imports rose 11 percent due to increases in
noncellulosic fiber imports. U.S. exports decreased 1 percent in 1993.
Meanwhile, domestic shipments of noncellulosic fibers, such as nylon and
polyester, increased by 2 percent. U.S. shipments of cellulosic fibers
increased 14 percent to $1.8 billion primarily due to growth in rayon staple
fiber demand and production. Rayon production has recently undergone
Sector Notebook Project 22 September 1997

Plastic Resin and Manmade Fiber Introduction
extensive renovation to achieve additional environmental benefits and become
more competitive with noncellulosic fibers (U.S. Department of Commerce,
1994).
Barriers to entry into the manmade fiber industry are considerable, since
production is highly capital intensive and requires significant technical
expertise and economies of scale. Since the mid-1980s, the manmade fiber
industry has undergone extensive consolidation and reorganization. During
1989-1993, several fiber companies sold off smaller fiber operations in order
to concentrate on their strongest fiber operations, which produced higher
value-added products. In addition, large companies, which traditionally
produce commodity fibers, have looked to the sale of specialty fibers (e.g.
heat-resistant or high-strength fibers) as a way to increase overall profits
(Department of Commerce, 1994). Back-integration of the carpet industry,
has resulted in the establishment of many new, small fiber producers (AFMA,
1997).
Because the manmade fiber industry is highly developed, the industry’s most
promising growth is expected to occur through these improvements in fiber
characteristics. For instance, the U.S. Industrial Outlook states that
microfiber yarns and fabrics have enabled manmade fibers to compete more
directly with luxury fibers, such as silk and cashmere, in fashion apparel.
Fabrics made with these finer fibers are usually more comfortable and softer
than other fibers and can be used in a variety of finished apparel. The industry
also predicts that lyocel, a new fiber which can be produced with particular
environmental benefits, will contribute to cellulosic fiber growth (Department
of Commerce, 1994). In addition, the industrial and technical products
market is expected to continue to be dominated by manmade fibers (AFMA,
1997). Geotextiles, or manmade fibers used to reinforce civil engineering
projects, biological filters, and military uses are end-uses that may create more
opportunities for manmade fiber products.
Sector Notebook Project 23 September 1997
Page 24 intentionally left blank.

Plastic Resin and Manmade Fiber Industrial Process Description
III. INDUSTRIAL PROCESS DESCRIPTION
This section describes the major industrial processes used within the plastic
resin and manmade fiber industries, including the materials and equipment
used, and the processes employed. The section is designed for those interested
in gaining a general understanding of the industry, and for those interested in
the interrelationship between the industrial process and the topics described
in subsequent sections of this profile -- pollutant outputs, pollution prevention
opportunities, and Federal regulations. This section does not attempt to
replicate published engineering information that is available for this industry.
Refer to Section IX for a list of reference documents that are available.
This section specifically contains a description of commonly used production
processes, associated raw materials, the byproductsproduced or released, and
the materials either recycled or transferred off-site. This discussion, coupled
with schematic drawings of the identified processes, provide a concise
description of where wastes may be produced in the process. The first
subsection, III.A., discusses polymerization processes common to the plastics
resins and manmade fibers industries. The following subsection, III.B.,
discusses subsequent processing steps specific to manmade fiber manufacture.
This section concludes with a description of the potential fate (via air, water,
and soil pathways) of process-specific waste products.
III.A. Industrial Processes in the Plastic Resins and Manmade Fibers Industries
The plastic resin and manmade fiber industries both use and manufacture
polymers. Polymers are large organic molecules (molecular weight ~104-107)
that consist of small repeating molecules. Polymers used in the plastic resin
and manmade fiber industries either occur naturally, such as cellulose, or are
formed during polymerization when bond-forming reactions cause small
repeating molecules to join together. Polymers are typically made from one
type of simple chemical unit, or monomer. However, sometimes another
compound, or comonomer, is used with the monomer to make a copolymer.
Comonomers can be used to make copolymers with random chemical
structures, called random copolymers, or organized chemical structures, called
impact copolymers.
Polymers are central to plastic resin and manmade fiber manufacture. Many
grades of different polymers are produced, each with different physical
characteristics such as strength and ease of flow when melted. These different
physical characteristics are achieved by changing operating parameters or by
using different polymerization processes to change properties, such as
polymer density and molecular weight. Polymers which have been dried and
shaped into pellets are called plastic resins. These resins are further processed
at plastics processing facilities which create plastic products of different
shapes, sizes, and physical properties. (Refer to the EPA Rubber and Plastics
Sector Notebook Project 25 September 1997

Plastic Resin and Manmade Fiber Industrial Process Description
Sector Notebook for more information on plastics processing.) Polymers can
also be used to make synthetic fibers, which are commonly used to make
manmade textile products. Some synthetic fiber manufacturers synthesize
polymers on-site, while some purchase plastic resins for use in their fiber
operations. Fiber formation processes, including the use of natural polymers
to make cellulosic fibers, and particular textile fiber operations will be covered
later in this section.
There are several steps that are important to polymerization. First, reactants
are purified prior to polymerization. During polymerization, catalysts, heat,
pressure, and reaction time are all optimized to maximize polymer conversion
and speed the reaction. The polymer is often then separated from the reaction
mass through a series of separation and drying steps. (Exceptions to this are
acrylic polymers, (AFMA, 1997b).) Finally, the polymer is extruded and
pelletized for packaging and shipment. Various supporting steps are
important to note because of their potential effect on the environment. These
supporting steps include unloading and storage of chemicals and equipment
cleaning. Note that methods used to recover raw materials and control
pollution are covered in Section III.D. Although there are thousands of types
of resins and fibers that may be produced during polymerization, the basic
industrial processes are similar. These processes are summarized below:
1) preparation of reactants
2) polymerization
3) polymer recovery
4) polymer extrusion
5) supporting operations
This section briefly describes the processes involved in the manufacture of
plastic resins and noncellulosic manmade fibers. These processes vary by
facility. For instance, some manufacturers purchase reactants in pure form,
while others may synthesize reactants on-site. Other facilities compound or
incorporate additives into the finished polymers. Facilities that specialize
primarily in compounding polymers are listed under SIC Code 3087 and are
not covered in this notebook.
III.A.1. Preparing Reactants
Many chemicals can be used to make polymers. The most important chemicals
are monomers, catalysts, and solvents. Monomers are the basic building
blocks of polymers. They can be simple in structure (e.g. ethylene CH2CH2)
or complex (e.g. ester of a dihydric alcohol and terephthalic acid -
HOCH2CH2OCOC6H4COOH). Catalysts are chemicals used to speed up or
initiate the polymerization reaction. Common catalysts include Ziegler
catalysts (titanium chloride and aluminum alkyl compounds), chromium-
containing compounds, and organic peroxides. Details of commercially-used
Sector Notebook Project 26 September 1997

Plastic Resin and Manmade Fiber Industrial Process Description
catalysts are highly guarded secrets since small differences in catalyst
preparation can lead to huge differences in polymerization costs and polymer
properties (Kroschwitz, 1986). Solvents are sometimes used to dissolve or
dilute the monomer or reactants. The use of solvents facilitates polymer
transport through the plant, increases heat dissipation in the reactor, and
promotes uniform mixing in the reactor. Other chemicals used in
polymerization include suspending and emulsifying agents which disperse
monomer in solution.
Reactants, particularly monomers, must be sufficiently pure before they can
be charged to the polymerization reactor. Trace amounts of contaminants in
monomer, such as water, oxygen, and sulfur compounds in part per million
quantities, can impede polymerization and decrease product yield. Most
monomers and solvents can be purchased in sufficient purity for
polymerization, however, sometimes reactants must be purified to remove
contaminants. Facilities may use different purification methods, such as
distillation or selective adsorption, to increase monomer purity. Some
companies manufacture monomer and other reactants at different chemical
facilities and transport them to plastic resin and manmade fiber facilities where
the chemicals can be further processed to a sufficient purity level. For
example, the nylon-6 monomer, E-caprolactam, is often made on-site,
prepared, and charged to the polymerization reactors.
In addition to purification steps, reactants are often diluted, premixed, or
otherwise treated before being sent to the reactors. The preparation and
charging of reactants often varies by polymerization method. For instance,
Ziegler-type catalysts are usually diluted with dry inert solvent and premixed
before injection into the polymerization reactor. For suspension and emulsion
polymerization, the catalyst, emulsifier, suspending agents, modifier, and
activator are dissolved in water and adjusted to the proper concentration
before polymerization. In some continuous processes, two agitated make-up
tanks are often run in parallel so that catalysts can simultaneously be mixed
and charged to the polymerization vessel from one tank while a fresh solution
is prepared in the other.
III.A.2. Polymerization
Polymerization is the major process involved in the synthesis of plastic resins
and manmade fibers. Two types of polymerization, addition polymerization
and polycondensation, are commonly used to make plastic resins and
manmade fibers. These two methods use different chemical steps to make
polymers.(McKetta, 1992) In addition polymerization, monomer is
polymerized using a free radical catalyst (a highly reactive molecule having
one or more unpaired electrons) or a coordination catalyst (e.g. Ziegler type)
to activate the monomer molecules and trigger polymerizationreactions.With
polycondensation reactions, typically two or more reactants are first combined
Sector Notebook Project 27 September 1997

Plastic Resin and Manmade Fiber Industrial Process Description
in a prepolymerizer reactor to form a monomer before polymerization. During
polymerization, two reacting monomers are linked together in condensation
reactions where water molecules are split off of the reacting monomers
(Lewis, 1993). In polycondensation reactions, water is typically removed by
vacuum to speed the reaction. Because addition polymerization processes are
widely used to make plastic resins and manmade fibers, this section focuses
primarily on addition polymerization processes.
Continuous versus Batch Processes
Chemical modifiers are often injected into the reactor to give polymers
specific characteristics. Temperature and pressure have a profound effect on
polymerization processes and may be varied in order to control conversion,
reaction rate and end properties of the polymer produced. Addition
polymerization is a highly exothermic reaction, and reactor conditions are
tightly monitored to control heat production and reaction stability. Continuous
processes are typically used for large-volume, or commodity, polymerizations,
while batch or semibatch processes are used for low-volume, or specialty,
polymerizations. In continuous processes, the feed is continuously charged
into the reactor and effluent is continuously removed. In batch processes, all
reagents are added to the reactor and remain in the reactor for the same
amount of time. In semibatch processes, some reactants are added at intervals
while some byproducts are removed (Kroschwitz, 1986).
Types of Reactors
Two main reactor types are used in polymerization: stirred tank reactors and
linear-flow reactors. Stirred-tank reactors (or autoclaves) are usually made
of stainless steel and range in size from 1,400-2,800 ft3 (40-80 m3), although
some reactors as large as 7,000 ft3 (200 m3) are in commercial use. The
reactors usually consist of a jacketed cylindrical vessel with an agitator and
have highly polished stainless steel linings which are noncorrosive and
minimize polymer deposits left on walls (Kroschwitz, 1986). Stirred-tank
reactors also have thick walls to withstand high pressures and support low
heat transfer capacity. Temperature is controlled by heat transfer to the
jacket, internal cooling coils, water cooled impellers, external reflux
condensers, and external heat exchangers. Typical temperatures range from
160- 570F (70-300C) , and conversion rates ranges from a low of 2 percent
to 85 percent (McKetta, 1992). Due to their versatility, stirred-tank reactors
operated for batch processing are used to produce a large portion of polymers
in the United States. Often two or more reactors of similar size are used in
series to increase monomer to polymer conversion rates, to make maximum
use of catalyst productivities, and to reduce separation costs of removing
monomer from the diluent. The first reactor is sometimes referred to as the
prepolymerizer since monomer conversion rates are low (McKetta, 1992).
Sector Notebook Project 28 September 1997
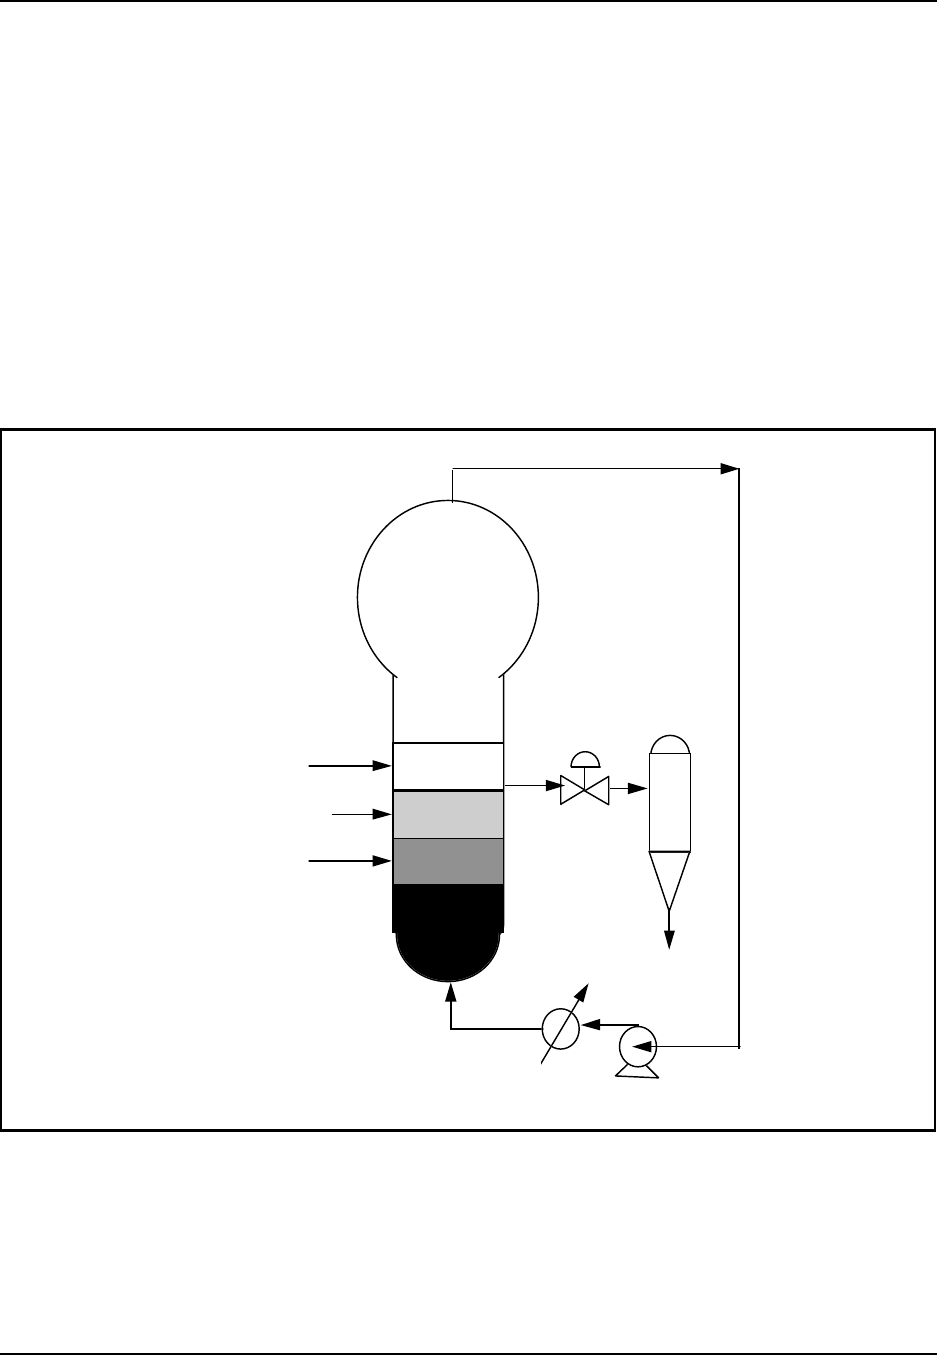
Plastic Resin and Manmade Fiber Industrial Process Description
Continuous processes are typically operated in gas-phase fluid-bed reactors
or linear-flow reactors. Gas-phase fluid-bed reactors are widely used in
polymerizing ethylene and propylene by way of coordination catalysts. The
reactor is a vertical cylinder containing a bed of solid polymer powder
maintained in a fluidized state by passing a stream of reaction gas up from the
base of the reactor. Catalyst and monomer are added through the sides of the
reactor. The reaction gas is withdrawn from the top of the reactor and heat of
reaction is removed with a compressor and cooler before being recirculated
back up through the polymer powder. The solid polymer powder is removed
periodically as it builds up in the base of the reactor by opening a discharge
valve that blows the product powder into a disengaging system. (SRI, 1995)
Figure 8 shows a simplified diagram of a gas-phase fluid-bed reactor.
Figure 8: Gas-Phase Fluid-Bed Reactor for Production of Polyethylene
Ethylene
Comonomer
Catalyst
Cooler Compressor
PE
Diluent
Hot Reaction Gas
Source: SRI International 1995.
Linear-flow reactors are tubular and jacketed with a heat transfer fluid, like
Dowtherm® or water (Kroschwitz, 1986). The tubes may be several hundred
meters in length, but are often coiled in helix-like structures as a way to save
space and avoid buildup of polymer in elbows. Typical residence time in the
Sector Notebook Project 29 September 1997
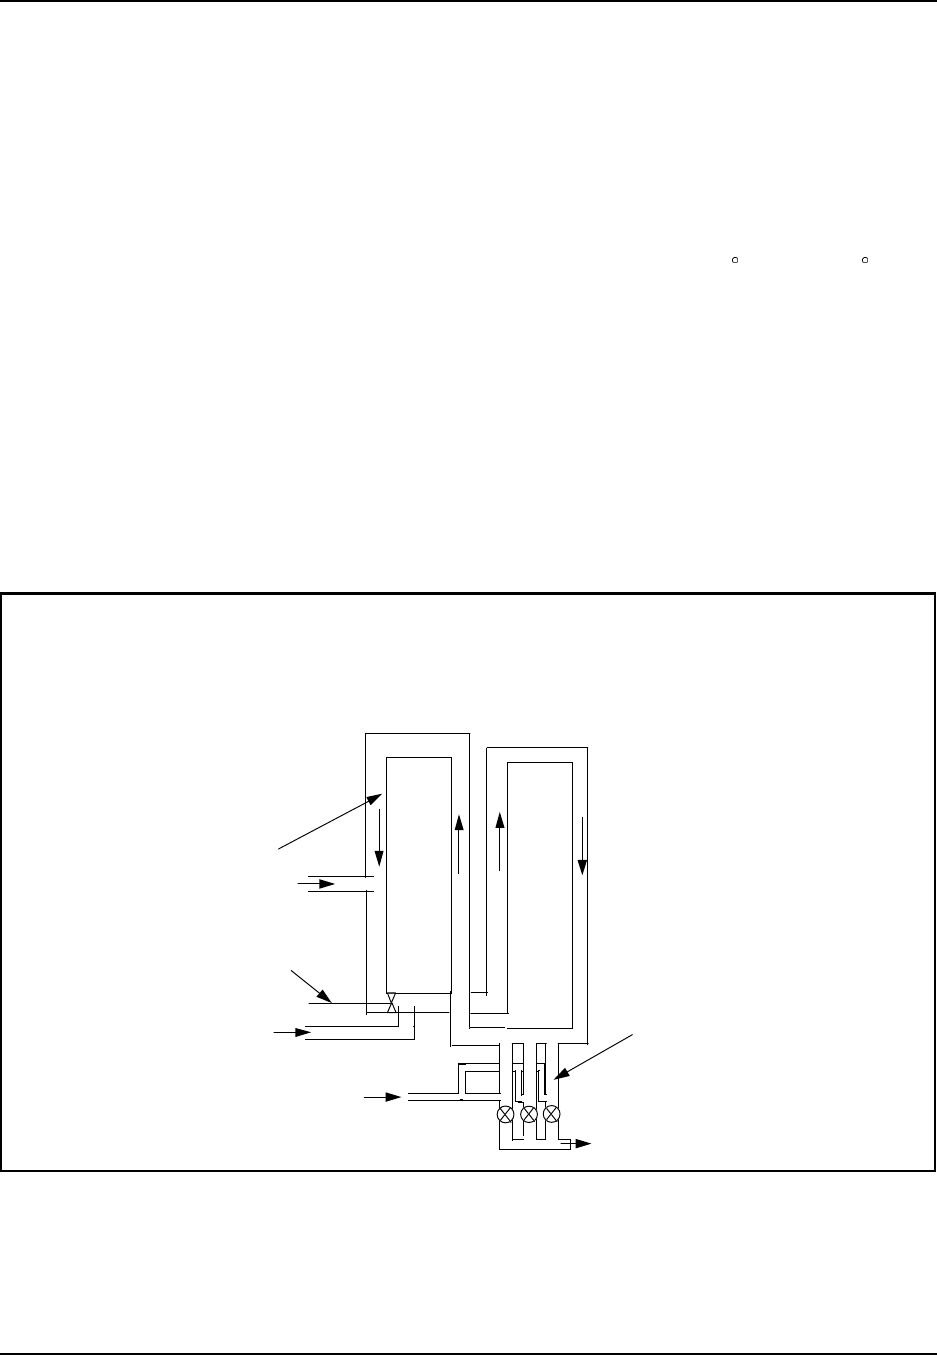
Plastic Resin and Manmade Fiber Industrial Process Description
reactors varies from 30 to 60 seconds. The reactors have three different
zones used for preheating, polymerization, and cooling.
Loop reactors are the most common linear-flow reactors. Loop reactors have
long straight lengths of tubing interjected with short bends and are typically
490-540 ft (150-165 m) long. The reaction slurry is circulated around the
loop at speeds of 10-30 ft/s (3.3-10 m/s) by axial flow pumps. The residence
time of the reactants in the loop reactors ranges from 45 to 60 seconds, and
polymerization temperatures range from 390-480F (200-250C) . A
schematic diagram of a typical loop reactor is shown in Figure 9. Polymer
slurries containing 20-70 percent solid polymer particles are collected in
settling legs located at the base of the reactor. When two loop reactors are
used in series, a portion of the slurry in the first loop is continuously
withdrawn and pumped into the second reactor, from which polymer is
removed as a slurry. Emissions and wastes generated during polymerization
include VOC emissions from leaks and spills, solid wastes from off-
specification polymer, and spent solvent from incomplete polymerization
(Kroschwitz, 1986).
Figure 9: Typical Loop Reactor for Production of Polyethylene
Coolant is provided
in jacket of loop
reactor
Ethylene,
comonomer,
and solvent
Catalyst
Impeller
Product
slurry
Settling legs
Optional additional
solvent (often not
used)
Source: Encyclopedia of Chemical Processing and Design. Volume 39. J.J. McKetta (ed.), Marcel Dekker,
Inc., New York, 1992.
Sector Notebook Project 30 September 1997

Plastic Resin and Manmade Fiber Industrial Process Description
Methods of Polymerization
The specific polymerization method used is key to polymer manufacturing.
Different polymerization conditions and processes are used to synthesize
different polymers and to create different grades of a givenpolymer (McKetta,
1992). Addition polymerization methods are covered primarily in this section.
Five general methods are used commercially for polymerization: bulk,
solution, suspension, emulsion, and polycondensation. Table 7 lists typical
polymerization method and reactants for leading commercial plastic resins.
Note that distinctions between these methods are not well-defined and that
some companies use a combination of polymerization methods. In addition,
details of specific processes are often protected by manufacturers since small
process variations can result in significant reductions in operating costs and
unique changes in polymer characteristics.
Sector Notebook Project 31 September 1997

---
--- ---
---
Sector Notebook Project 32 September 1997
Table 7: General Polymerization Parameters for Selected Polymers
Polymer Polymerization
Method Monomer Catalyst Solvent Other Possible
Reactants
HDPE solution, suspension ethylene Ziegler-type catalysts isobutane, hexane
LDPE bulk, suspension ethylene organic peroxides,
peroxyesters hydrocarbons
LLDPE solution ethylene Ziegler-type or
Phillips chromium
oxide catalysts
octene, butene, or
hexene
Polypropylene bulk, solution,
suspension propylene Ziegler-Natta catalysts hexane, heptane, or
liquid propylene
Polystyrene bulk, suspension,
solution styrene heat, organic peroxides styrene, ethylbenzene
PVC suspension vinyl chloride azo compounds,
organic peroxides water polyvinyl alcohols
(suspending agent)
Acrylic/
Modacrylic solution,
suspension,
emulsion
acrylonitrile organic peroxides, azo
compounds, inorganic
redox initiators
dimethylacetamide
or aqueous inorganic
salt solutions
Nylon-6 bulk;
polycondensation -caprolactam water acetic acid
(molecular weight
regulator)
Nylon-6,6 bulk;
polycondensation hexamethylene
diammonium
adipate
adipic acid (viscosity
stabilizer),
polyphosphoric acid
(reaction accelerator)
Polyester
(Polyethylene
terephthalate)
bulk;
polycondensation terephthalic acid
and ethylene
glycol
antimony oxides and
derivatives
Source: Encyclopedia of Polymer Science and Engineering, volume 12, J.I. Kroschwitz (ed.), John Wiley and Sons, New York, 1986;
Encyclopedia of Chemical Processing and Design, volume 39, J.J. McKetta (ed.), Marcel Dekker, Inc., New York, 1992; AFMA, 1997.
Plastic Resin and Manmade Fiber Industrial Process Description
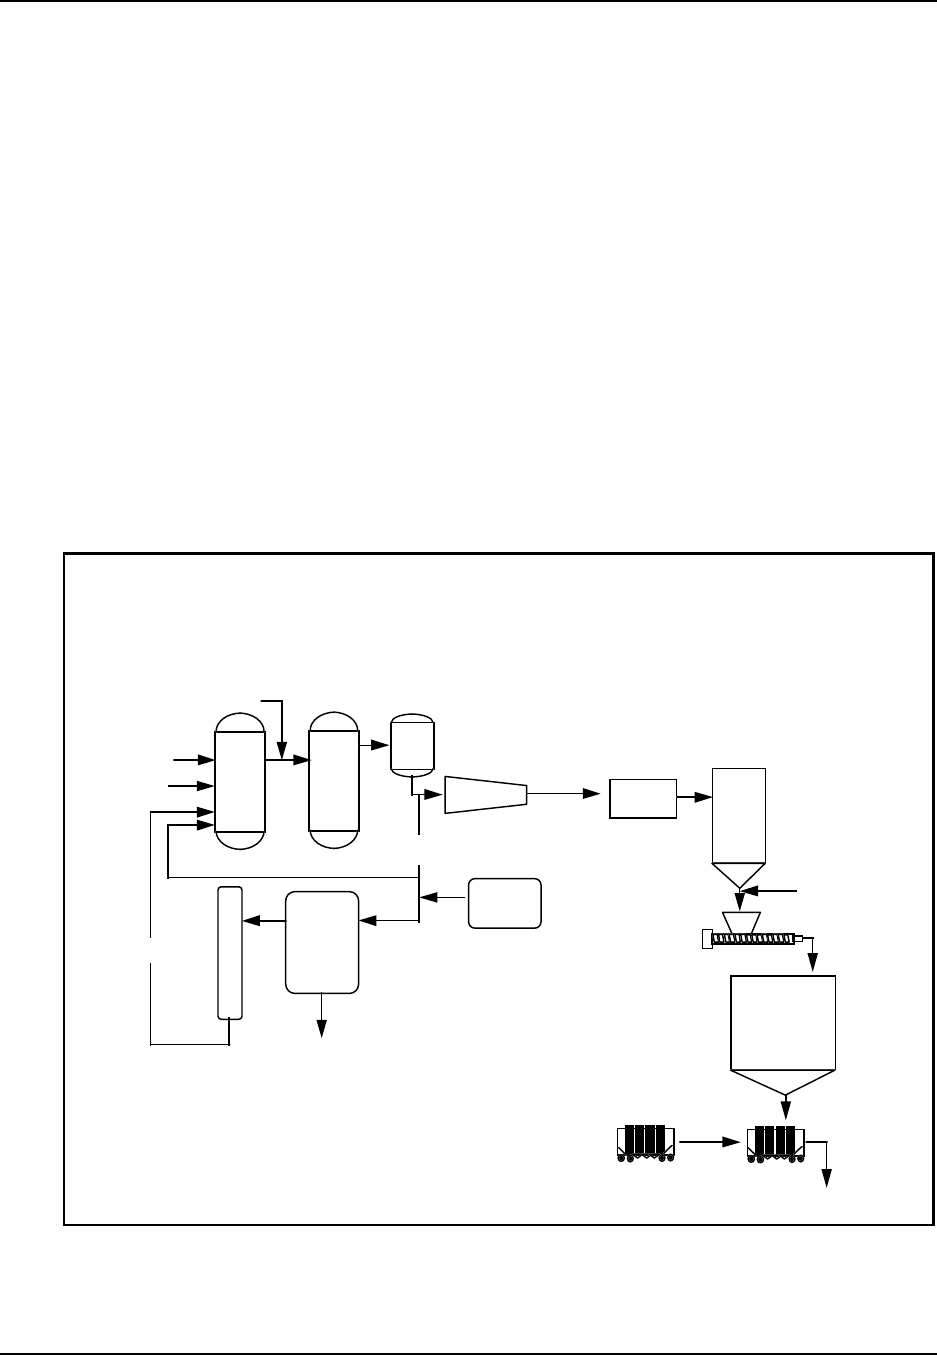
Plastic Resin and Manmade Fiber Industrial Process Description
Bulk Polymerization
In bulk polymerization, primarily monomer and a catalyst are used to make
polymer. Two reactor vessels are often used to complete polymer conversion
and recycle unreacted monomer. Because few solvents or other chemicals are
used, bulk processes typically produce purer polymers and generate less
pollutants than those produced by other processes. Separation procedures of
polymer and reactants are also simplified, reducing expensive solvent recovery
equipment costs. Figure 10 shows a flow chart for a high density polyethylene
process with simplified separation steps. In the figure, high density
polyethylene is separated from the monomer in the flash drum and goes
through a series of recovery and finishing steps. The monomer is recovered
using a stripper and a dehydrator. Increased conversion rates and decreased
recovery costs have made bulk processes increasingly favored in the industry
(McKetta, 1992). Note that bulk processes used for polycondensation
reactions are discussed later in this section.
Figure 10: High-Density Polyethylene Process Flow Diagram
Catalysts
R
E
A
C
T
O
R
R
E
A
C
T
O
R
Ethylene
Ethylene
FLASH
DRUM
CENTRIFUGE
POLYMER
MOTHER
LIQUOR
D
E
H
Y
D
R
A
T
O
R
DRYER
STRIPPER
TOWER
WAXES
NEW
SOLVENT
DRYER FEED
BIN
EXTRUDER
Additives
PELLET
BLENDERS
WASH/INSPECT HC’S LOAD HC’S
CUSTOMERS
Source: Exxon Chemical Company’s Mont Belvieu Plastics Plant Brochure.
Sector Notebook Project 33 September 1997
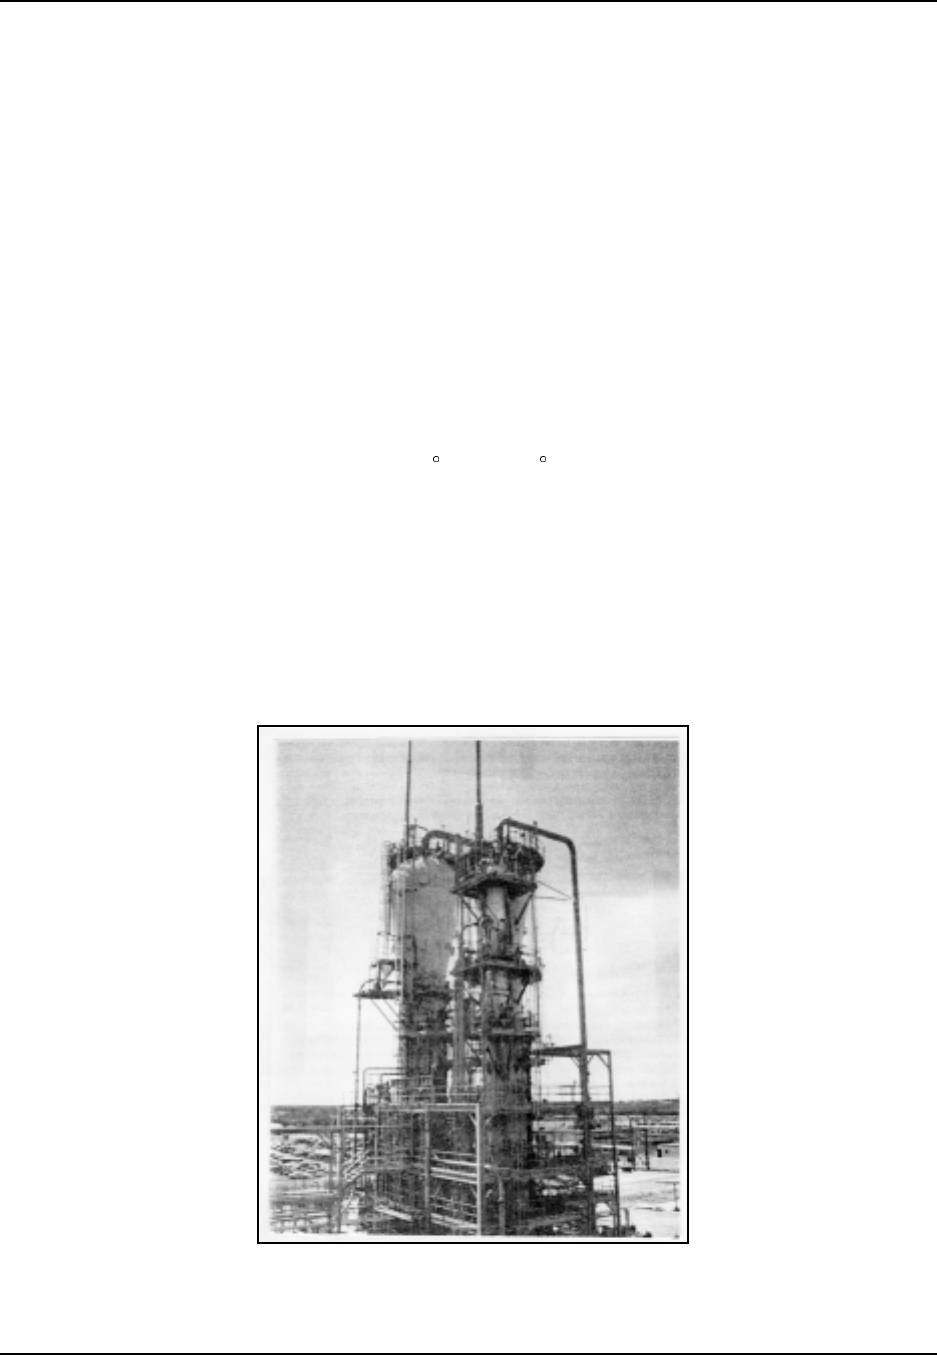
Plastic Resin and Manmade Fiber Industrial Process Description
Bulk processes can be divided into two types based on whether or not the
monomer and polymer are soluble in each other. If the monomer and polymer
are not soluble in each other, polymer slurries are formed which consist of
solid polymer particles mixed with either liquid or gaseous monomer.
Polyester and nylon are among many polymers produced in continuous-flow
bulk polymerization systems.
Gas-phase polymerization is a type of bulk polymerization primarily used to
synthesize polyethylene and polypropylene. Gaseous monomer and
comonomer are fed continuously into a reactor that is filled with fluidized
polymer particles. Figure 11 shows a photo of two fluid reactors used for
making polypropylene. In the Unipol process, up flowing monomer reacts
with granular polymer particles suspended in a vertical cylindrical reactor.
The bed is typically 40-50 ft (12-15 m) high and 15-16 ft (4.5-5 m) in
diameter. Pressures range from 265 to 310 psi (18-21 atm), and temperatures
range from 176 to 212F (80-100C) . A distributor plate is attached to the
bottom of the reactor to maintain uniform flow of monomer and even
distribution of polymer and catalyst throughout the bed. Monomer gas is
cooled and partially condensed in an external cooler to remove reaction heat.
Only 2 percent of monomer reacts per pass, so large volumes of gas are
recycled. Large polymer particles collect in the bottom of the reactor where
they are semicontinuously removed (McKetta, 1992).
Figure 11: Fluid Reactors Used for Making Polypropylene
Source: Principals of Polymer Systems, 4th Edition, Ferdinand Rodriguez, Taylor and Francis,
Washington, DC, 1996. Reproduced with permission. All rights reserved.
Sector Notebook Project 34 September 1997

Plastic Resin and Manmade Fiber Industrial Process Description
Solution Polymerization
Solution polymerization is commonly used to make plastic resins and textile
fibers. In solution polymerization, a solvent is mixed with monomer in the
reactor. Use of solvents reduces reaction mass viscosity, improves heat
transfer rates, and increases mixing efficiency during polymerization. Choice
of solvent can have a large effect on polymer properties and the rate of
polymerization. Because solution polymerization requires additional
processing and recovery steps, companies typically try to optimize solvent to
monomer ratios to reduce polymerization costs and emissions (Kroschwitz,
1986). Reactors are often operated in series for continuous operations.
In solution polymerization, the polymer may be soluble or insoluble in the
solvent. When the polymer is insoluble in the solvent, a slurry is formed of
solid polymer particles dispersed in solvent. Slurry processes can be divided
into two categories, light slurry and heavy slurry, based on the molecular
weight of the solvent. Slurry processes are commonly used in the continuous
production of high-density polyethylene, linear low-density polyethylene, and
polypropylene. Polymers are typically formed at temperatures of 320-480F
(160-250C ), with a dissolved polymer content of usually 10-15 percent.
Loop reactors are often used, although some companies use a series of stirred
autoclaves as polymerization vessels. Typical solvents used include isobutane
(light slurry) and hexane (heavy slurry). Typical slurry composition byweight
is 30 percent particulates, 68 percent solvent, and 2 percent monomers.
Reaction pressure is about 650 psi (44 atm) and reaction temperature is about
225F (107C) . Typical polymer concentrations are 50-70 percent (McKetta,
1992).
Suspension Polymerization
In suspension polymerization, agitation and suspending agents are used to
suspend monomer and polymer particles in water. The suspending agents also
maximize heat transfer, maintain uniform mixing, and prevent polymer
clumping in the suspension. Catalysts are added to initiate the reaction and
typicallyinclude azo compounds, organic peroxides, or peroxydic carbonates.
In suspension processes, polymerization is initiated in the monomer droplets
and proceeds as miniature bulk reactions. The polymer droplets, usually
0.006-0.20 in (0.15-5 mm) in diameter, settle out of solution as soon as
agitation is stopped. Figure 12 shows the typical flow diagram for the
suspension polymerization of polyvinyl chloride (PVC). Note that monomers
and polymers produced by suspension and emulsion processes undergo
additional recovery steps than those produced by bulk or solution processes.
For example, Figure 12 shows that the polymer slurry is centrifuged and
separated following polymerization. Monomer undergoes additional recovery
and drying steps to remove water from the monomer.
Sector Notebook Project 35 September 1997
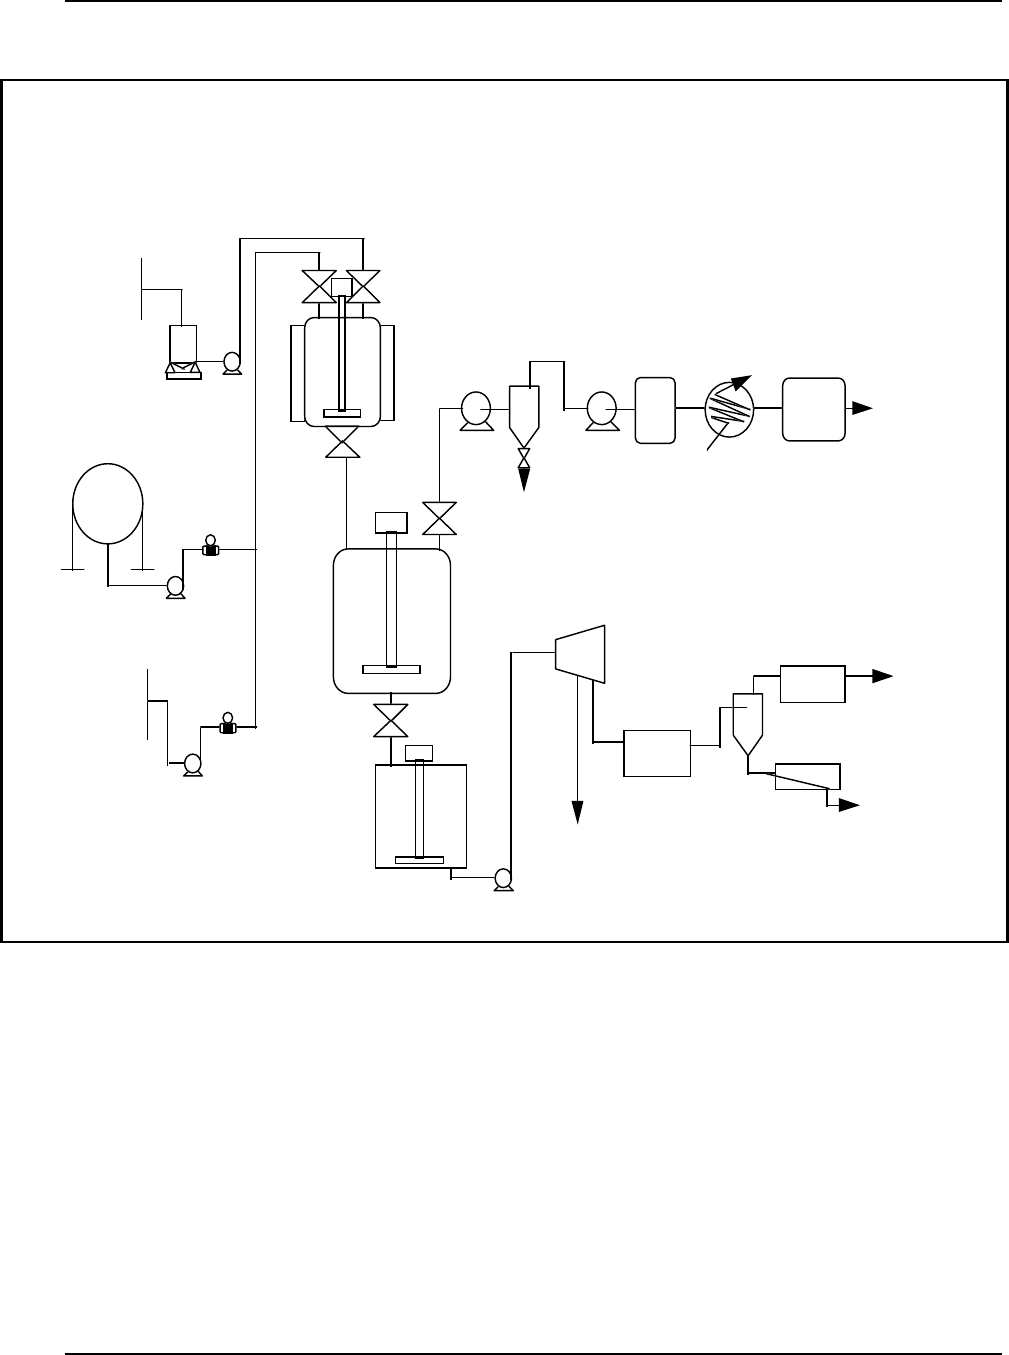
Plastic Resin and Manmade Fiber Industrial Process Description
Figure 12: Typical Process Flow Diagram for Suspension Polymerization of PVC
Suspending
agents and
catalyst
Raw material
weigh tank
VCM Monomer
Storage Sphere
VCM
VCM
Charge
Meter
Deionized and
Demineralized
Water
Water
Charge
Meter
Monomer
Recovery
Tank
Reactor
Polymer
Slurry
Tank
Centrifuge
Dryer
Rotary Air,
2-Stage Flash
or Combination
To PVC
Bagger or
Storage Silo
Screener
Cyclone
Separator
Dust
Collector
Moist
Air
Vacuum
Pump
Water
Separator
Compressor
Surge
Tank
Crude VCM
Storage
Tank
To
Recovery
and
Recycle
Condenser
Source: Encyclopedia of Chemical Processing and Design, Volume 40, J.J. McKetta (ed.), Marcel Dekker, Inc., New
York, 1992.
Sector Notebook Project 36 September 1997

Plastic Resin and Manmade Fiber Industrial Process Description
Industrial suspension processes generally use batch reactors. Suspension
polymerization processes are used for about 90 % of all PVC produced.
Stirred-tank reactors for PVC production range in size from 1,000-50,000
gallons, and reaction temperatures typically range from 110-160F (45-70C) .
Note that polymers produced by suspension processes must undergo
additional monomer and polymer recovery steps than those produced by bulk
and solution processes (Kroschwitz, 1986).
Emulsion Polymerization
Emulsion polymerization is similar in method to suspension polymerization
but uses smaller monomer and polymer particles. Emulsion polymerization
uses emulsifiers and additives to suspend monomer and polymer particles in
water. In emulsion polymerization, surfactant accumulates around monomer
particles, forming micelles that act as tiny polymerization vessels. Polymers
form as more monomers react. Agitation optimizes reaction rate by
dispersing monomer, catalyst, and polymer and by transporting heat to the
reactor surface. Emulsion processes typically produce moderately viscous
reaction masses. About 10% of PVC and some polystyrene are produced by
emulsion processes. Emulsion polymerization methods typically produce
polymers that are smaller and more difficult to process than those produced
by suspension polymerization methods. Polymers produced by emulsion
processes are also characterized by high polymer viscosity, high heat transfer
rates, and more difficult transport and agitation of the polymer slurry. For
those reasons, emulsion processes are frequently replaced with suspension
polymerization methods (Kroschwitz, 1986).
Polycondensation
Polycondensation reactions are used to make polymers, such as polyesters,
polyamides (or nylons), polyurethanes, phenolics, urea resins, and epoxies.
Polycondensation is an equilibrium reaction that depends on temperature,
pressure, and the efficient removal of reactants and the catalyst (Kroschwitz,
1986). Typically, two or more reactants are first combined to form a
monomer. The monomer is then charged to a polymerizer where monomers
link together in condensation reactions. Condensation reactions occur when
two molecules are linked together from the splitting of water molecules from
the reacting molecules. Reaction temperatures range from 446 to 545F (230
to 285 C) for nylon-6,6 and polyester. These reactions are endothermic,
unlike addition polymerization reactions, and therefore, require the addition
of heat to complete polymerization (ATMI, 1997b).
For nylon-6,6, polycondensation of nylon salt is carried out continuously for
commodity nylon production and batchwise for special grade nylon
production. The reaction typically takes place in several stages. The first
stage takes place in a tank or tubes under pressure greater than 250 psig.
Sector Notebook Project 37 September 1997

Plastic Resin and Manmade Fiber Industrial Process Description
Water vapor is removed through a throttle valve or in a subsequent separator.
The last stage of the polycondensation occurs under atmospheric or
subatmospheric pressure to further facilitate water removal. Additives are
often introduced during polycondensation to impart desirable properties to
resins and chips. Viscosity stabilizers, such as acetic acid, are sometimes used
to limit the degree of polymerization. Reaction accelerators, such as
phosphoric acid, sometimes used to speed the reaction (McKetta, 1992).
III.A.3. Polymer Recovery
Once polymerization is completed, a reaction mixture is produced which
consists of polymer, monomer, and trace amounts of catalyst. Because
reaction mixture consistency varies according to which polymerization method
is used, different polymer separation and recovery steps are required of
different polymerization methods. To recover the polymer, the reaction
mixture typically goes through a series of three separation and purification
steps: 1) unreacted monomer is separated from the polymer; 2) liquids and
solids are separated; and 3) residual water or solvents trapped in the polymer
are purged by drying the polymer.
The first step in polymer recovery is flashing, in which solvents and unreacted
monomers are volatilized from the reaction mixture and drawn off for
recovery. Flashing is achieved bylowering the pressure in a staged separation
system, which causes monomers and solvents with low boiling points to
evaporate. A large portion of monomer and solvent is removed during this
step. Remaining monomer in the polymer can be removed in a low-pressure
degasser, as in bulk polymerization processes, or by gravity, as in gas-phase
processes. In some cases, combinations of heating, flashing, thin-film
evaporation, and vacuum stripping are used to separate residual solvent from
the polymer.
For reaction mixtures that contain heavy solvents or liquids, further steps are
used to separate the polymer from the reaction mixture. Typically, the
mixture is centrifuged or filtered to separate the solid polymer granules from
the liquids. The polymer is then washed and stripped of residual solvent and
monomers.
Most polymer recovery operationsinclude a drying step. Polymers are usually
solvent or water-wet and are dried after being centrifuged. Drying removes
water and residual solvents from the polymers. Flash drier-fluidized bed
systems with gas recycle are commonly used for polypropylene and high-
density polyethylene. Combination dryers, such as single and multistage
fluidized-bed systems, are also used. In the flash dryer-fluidized bed system,
the flash dryer removes surface water in a matter of seconds, while the
fluidized bed completes moisture removal by holding the polymer at drying
temperatures for about 30 minutes. In rotary dryers, a hot gas passes over the
Sector Notebook Project 38 September 1997

Plastic Resin and Manmade Fiber Industrial Process Description
polymer particles, transferring heat and vaporizing solvent and water
molecules. Rotary dryers and two-stage flash dryer-fluidized-bed systems
have also been used to dry the wet PVC cakes resulting from polymerization.
Polyester is often dried by hot, dry air or inert gas in tumble, column, or
fluidized-bed dryers at about 180C . Wastes generated from drying
operations include primarily VOC emissions (Kroschwitz, 1986).
III.A.4. Polymer Extrusion
Most polymers undergo further processing steps to form plastic pellets. The
polymer is usually extruded and pelletized before being packaged and
incorporated with additives to prevent product deterioration. After polymer
recovery, the polymer is fed to a screw extruder which melts the polymer.
The molten polymer is then fed to a pelletizer, which may be capable of
producing up to 5000 pounds of pellets per hour. The pelletizer extrudes
molten polymer out of small orifices, forming continuous strands 0.08-0.16
in (2-4 mm) in diameter. These strands are cooled and then cut using either
a fixed or rotating knife. The pellets are then dried to remove any dissolved
monomer that would exude from the pellets during storage. Additives are
often added directly to the extruder, to a blender prior to the extrusion step,
or later in a highly concentrated master batch. Often antioxidants are added
to prevent deterioration of product properties during storage, shipment, and
product fabrication. Other additives may be added to increase ultraviolet light
stability, reduce the tendency for static electrical charges, or add color and
pigment (McKetta, 1992).
III.A.5. Supporting Operations
Various supporting steps to the manufacture of plastic resins and manmade
fibers are important to note because of their effect on the environment.
Supporting steps include the unloading and storage of chemicals and
equipment cleaning. Some of these supporting processes are discussed below.
Note that supporting operations, such as raw material recovery and pollution
control, are mentioned in Section III.C.
Equipment Cleaning
Cleaning of equipment, such as reactors and storage vessels, is performed
periodically as routine maintenance on the plant. Polymerization reactors are
cleaned often to remove buildup of polymer on heat transfer surfaces which
can result in contamination between batch runs of different polymers or
different grades of polymers. Reactor cleaning is particularly important for
suspension and emulsion polymerization processes since the reaction mass is
very viscous. Deposits on reactors may consist of polymer gels or coagulum.
Spray rinse valves are often installed in the reactor top to facilitate washing
while the reactor is emptied. High pressure water-jet streams and hydraulic
Sector Notebook Project 39 September 1997

Plastic Resin and Manmade Fiber Industrial Process Description
reactor cleaners are also used to remove hard deposits. Solvents and manual
scraping are also sometimes used (Kroschwitz, 1986).
Cleaning of loading vehicles and storage vessels is performed both before and
after loading. Before plastic pellets can be loaded into rail hopper cars or bulk
trucks, the vehicles are cleaned to remove residual trapped and clinging pellets
as well as other contaminants that may be present. Pellets are removed first
using suctioning and then using wash water. The rinse water is collected into
the facility drainage and containment system where residual pellets are
recaptured via a series of dams, skimmers, and surface booms. Wastes from
equipment cleaning also include wastewater contaminated with dilute
concentrations of organics, acids, and salts (EPA, 1992).
Unloading and Storage of Reactants
Unloading and storing reactants is an important step in polymerization. These
operations are closely monitored to avoid contamination of reactants, runaway
or accidental polymerization, and fugitive emissions. To reduce fugitive
emissions, gaseous compounds are often unloaded from tank cars by
pressurizing the tank car with vapors from the storage tank. Compressor
valves are then reversed to remove and transfer vapor from tank cars to
storage tanks.
Chemicals are typically stored in large stainless steel storage tanks equipped
with both external and internal covers. Tank design is mostly concerned with
safety, since materials may be flammable, toxic, or autocatalytically
polymerized. Autocatalytic polymerization occurs when monomer starts
polymerizing spontaneously in the storage tank. Monomers are typically
stored in pressure vessels equipped with excess flow valves on the outlet
connection. These valves safeguard against complete discharge in the event
of pipe rupture. In addition, monomer storage tanks are often equipped with
systems to avoid unwanted polymerization including systems to inject inhibitor
into reactors to stop polymerization and insulation and coiling coils to prevent
polymerization.
Liquids with high boiling points are stored in vented atmospheric tanks.
Solvents are usually stored under a blanket of nitrogen gas to minimize air
contamination. Some catalysts, such as the Ziegler-type, are so explosive
when in contact with water and air that they are diluted with hydrocarbons for
easier handling (Kroschwitz, 1986). For these safety reasons, tanks are
usually located outdoors and away from production facilities. Because of
stringent dust and moisture standards for polymerization, unloading and
storage systems may have elaborate air conditioning and ventilation systems.
Emissions generated from storage operations include air emissions of VOCs
(EPA, 1993).
Sector Notebook Project 40 September 1997

Plastic Resin and Manmade Fiber Industrial Process Description
Conveyance
Charging reactants to reactors is one of the most important conveyance steps
in plastic resin and manmade fiber production. Charging reactants and
polymer must be controlled carefully to avoid producing off-spec product and
causing polymer buildup in the pipes. Polymerization feed is automatically
measured and charged into the reactors. Measuring and charging reactants
varies depending on whether the process is batch or continuous and what
accuracy of formulation is required. Batch methods use weigh tanks,
volumetric charge tanks, and flow meters to feed the polymerization vessels.
For continuous processes, reactants are fed continuously at a specific rate into
the reactor. Reactor heat-up, purge, evacuation, charge, and discharge are all
controlled by automatic control systems equipped with temperature and
pressure overrides.
Conveying systems are also used to move plastic pellets between plant
operations. An example of a pneumatic conveying system in a pellet blending
operation is shown in Figure 13. Pellets are conveyed using pneumatic or
mechanical systems to move pellets between the pelletizers and drying systems
and between storage silos and shipping containers. In pneumatic systems,
high-pressurized air can be used to transport pellets through the plant.
Mechanical systems are generally used to transport pellets across short
distances using rigid driven screws to force pellets through a conduit. Pellet
spills can occur during each conveyance and can be avoided by controlling the
rate of pellet entryand deliveryfromthe conveying system. Wastes generated
during conveying operations may includeVOCemissions from leaks and spills
(EPA, 1992).
Pellet Storage
Plastic pellets must be stored carefully to avoid product contamination or
accidental spills. EPA has identified preventive measures to minimize pellet
loss and entry into water streams which apply to plastic resin and manmade
fiber plants and downstream processing plants. After polymer finishing, the
plastic pellets are transferred to intermediate storage vessels consisting of
30,000 to 100,000 pound silos. The pellets are then transferred to silo lots
where they are sampled, bagged for shipment, and transferred to downstream
processes for hot-melt mixing and incorporation of additives. Pellets are
packaged in containers ranging from 50 pound bags to 100,000 pound railway
hopper cars. Wastes from pellet storage include solid wastes or wastewater
containing plastic pellets (EPA, 1992; SPI, 1994).
Sector Notebook Project 41 September 1997
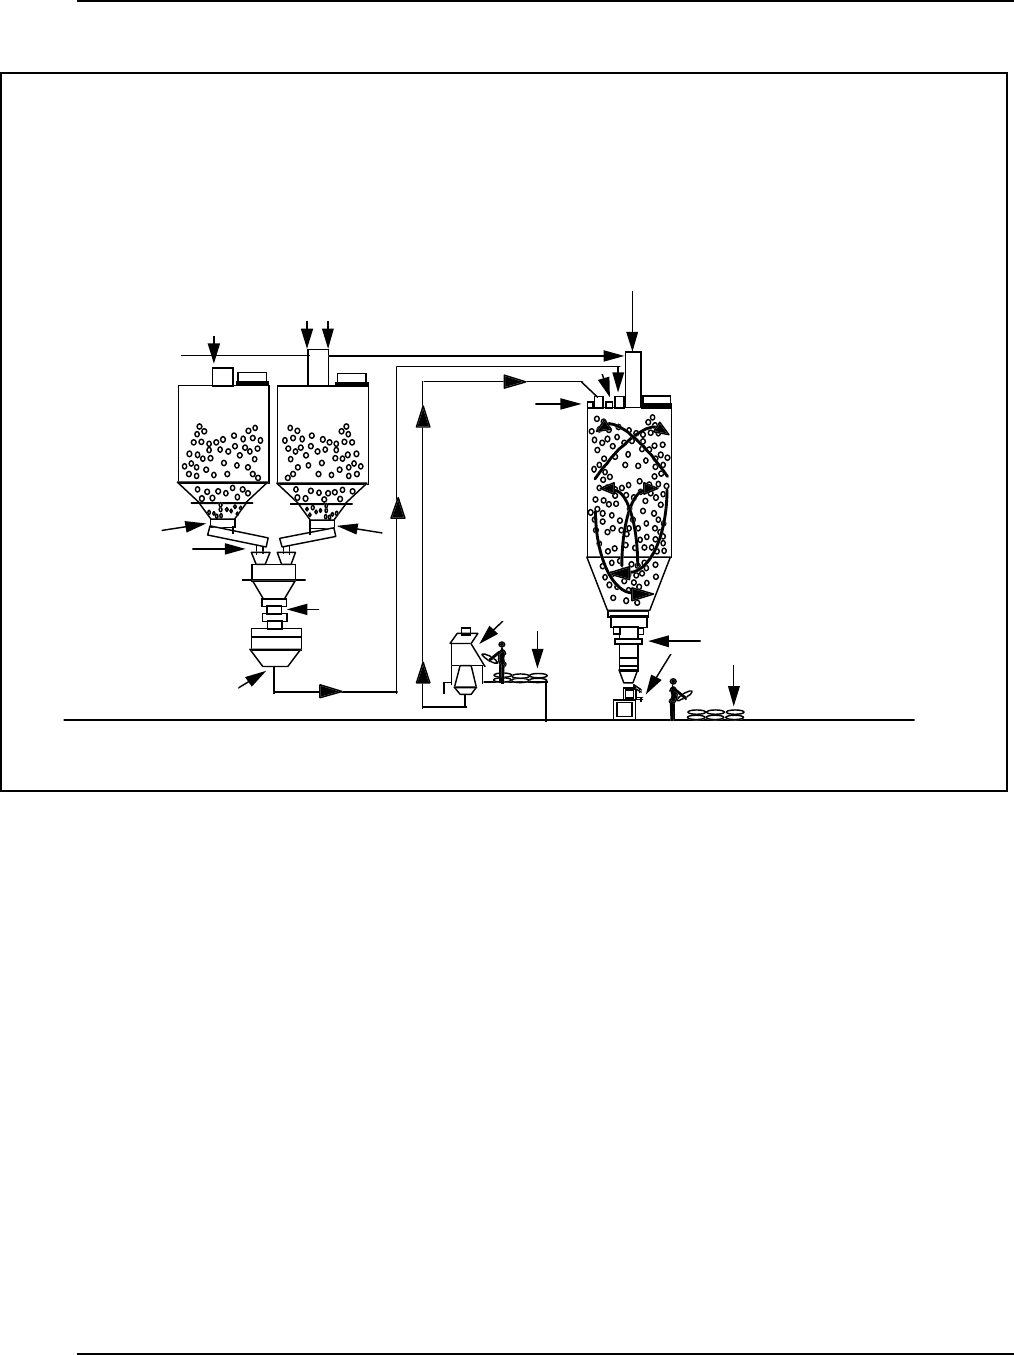
Plastic Resin and Manmade Fiber Industrial Process Description
Figure 13: Typical Pneumatic Conveying System in a Pellet Blending Operation
Storage Silo Storage Silo
Manual Feed
from Bags Bagging
Source: U.S. EPA, Plastic Pellets in the Aquatic Environment: Sources and Recommendations, Office of Water,
December 1992.
Sector Notebook Project 42 September 1997

Plastic Resin and Manmade Fiber Industrial Process Description
III.B. Industrial Processes Specific to the Manmade Fiber Industry
The manufacture of manmade fibers is closely linked with the synthesis of
plastic resins. Fibers are the fundamental unit of textiles and fabrics and can
be defined as a unit of matter having a length at least 100 times its width or
diameter (Rodriguez, 1996). Fiber spinning processes may be similar for
some noncellulosic fibers and cellulosic fibers. Manmade fibers can be
produced from polymers that have been continuously or batch polymerized,
or by dissolving cellulosic materials. The polymer or cellulosic solution is
then forced through tiny holes of spinnerets (which function much like
bathroom shower heads) and extruded into fibers (International Trade
Commission, 1995). In manmade fiber plants, polymerization of the fiber
polymer can occur at the same facility that produces the fiber, with continuous
polymerization equipment linked directly to a fiber spinning unit (EPA, 1995).
Subsequent processing steps typically include drawing, crimping, texturizing,
and twisting. The following sections will discuss polymerization, primary
methods of spinning, and fiber processing steps.
III.B.1. Polymerization
Many of the leading commercial manmade fibers, such as polyethylene
terephthalate (PET) and polypropylene, use polymers similar to those derived
from commodity plastic resins. Other manmade fibers are manufactured from
polymers formed using similar polymerization methods as those mentioned in
the preceding section. For instance, nylon and polyester are polymerized
using polycondensation or melt polymerization methods. Recall that some
manmade fibers are manufactured using natural polymers, such as cellulosic
fibers, and do not undergo polymerization.
In some plants, polymerization equipment is hooked up directly to fiber
spinning equipment. For continuous manufacture of polyester fiber,
terephthalic acid and ethylene glycol are first passed through primary and
secondary esterifiers to form the monomer. The melt is then passed to low
and high polymerizers to achieve higher conversion rates. The high
polymerizer is usually equipped with a high vacuum and high walls to allow
excess ethylene glycol to escape, promoting chain extension. The polymer is
then fed to several banks of direct fiber melt spinning heads or a solid polymer
chipping system (Kroschwitz, 1986). Wastes generated during polymerization
may include VOC emissions from leaks, spills, and vents; solid wastes from
off-specification polymer; and spent solvent from incomplete polymerization
(AFMA, 1997).
Sector Notebook Project 43 September 1997

Plastic Resin and Manmade Fiber Industrial Process Description
III.B.2. Spinning
Spinning, in terms of manmade fibers, refers to the overall process of polymer
extrusion and fiber formation. Fibers are formed by forcing a viscous fluid or
polymer solution through the small orifices of a spinneret and immediately
solidifying or precipitating the resulting filaments. Facilities typically produce
fibers of different thickness or denier, where denier is defined as the weight
in grams of 9,000 meters (9,846 yards) of filament yarn. Fiber denier can
range from less than one to 3,600 denier (McKetta, 1992).
The three primary methods of spinning are melt, dry solvent, and wet solvent,
which are shown in Figure 14. A fourth and less commonly used method is
reaction spinning. Table 8 lists the different types of spinning methods with
the fiber types and typical reactants used for each method. The spinning
process used for a particular polymer is determined by the polymer’s melting
point, melt stability, and solubility in organic and/or inorganic (salt) solvents,
as well as the end use of the fibers (AFMA, 1997; EPA, 1993). Spinning
processes involve spinning units which are made up of meter pumps, filter
packs, spinnerets, and quench cells. Meter pumps are used to transport
polymer through the spinning units at a constant rate. The polymer is passed
through a filter and a spinneret. Note that fibers may be colored by including
pigments prior to extrusion (AFMA, 1997).
The spinnerets are plates containing holes, of varying diameters and shapes,
through which molten or dissolved polymer is extruded. Pressures can reach
as high as 2900 psi (20 MPa). The spinnerets are usually made of stainless
steel or nickel alloy for melt and dry spinning processes, although for more
corrosive wet spinning processes they are usually made of glass or a platinum
alloy. The spinneret may be a recessed flat plate (melt spinning) or a
protruding thimble shape (dry and wet spinning). The spinnerets for molten
polymers are relatively thick 0.1-0.4 in (3-10 mm) and have hole diameters of
0.007-0.030 in (175-750 µm). For solution polymers, the spinnerets are
slightly thinner with smaller hole diameters.
The number of holes in a spinneret ranges from a few to several thousand.
These holes may be divided into groups to produce, for instance, two 30-
filament yarns from a 60-hole spinneret. The exit hole is usually circular,
however fibers may have lobed, dumbbell-, or dogbone-like cross-sections
(dry-spun fibers) or round, lobed, serrated, or bean-shaped cross-sections
(wet-spun fibers). Wastes generated during spinning operations include VOC
emissions and wastewater contaminated with solvents.
Sector Notebook Project 44 September 1997
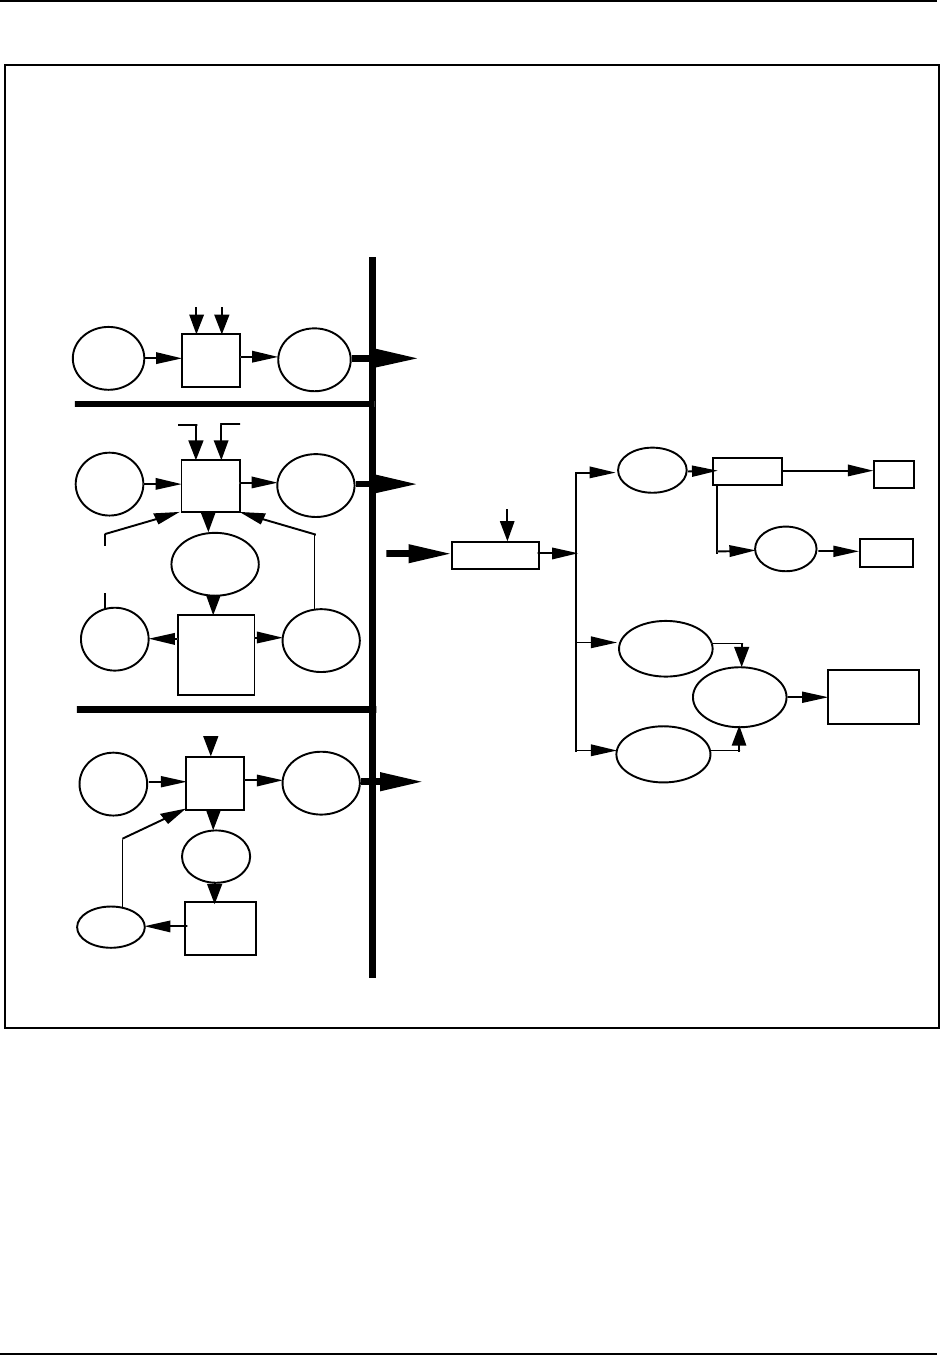
Plastic Resin and Manmade Fiber Industrial Process Description
Figure 14: General Process Diagram for Melt, Dry, and Wet Spun Synthetic Fibers
Spinnin
g
Po ly m e r
Ch ip s Me lt
Sp in n in g
Air Str e a m
S pun
F ila m e n ts
Po ly m e r
Ch ip s We t
Sp in n in g
Ma k e -u p
So lv e n t Ma k e -u p
C o ag u lan t
S pun
F ila m e n ts
So lv e n t
C o ag u lan t
M ixtur e
So lv e n t So lv e n t
Co a g u -
la n t
S e p a r a tio n
Co a g u -
la n t
Me l t
Spi nni ng
We t
Spi nni ng
Po ly m e r
Ch ip s Dr y
Sp in n in g
S pun
F ila m e n ts
M a ke -up S o lv e n t
So lv e n t
V a por s
So lv e n t So lv e n t
R eco v e r y
L u b r ic a tio n
L ubr ic a n t
Dr a w in g C rim ping To w
Sta p le
C u ttin g
Dr a w
T e x tu riz in g
Dr a w
T w is tin g
T w is tin g
an d
C oning
C ontinuou s
F ila m e n t
Ya r n
P r o cessin
g
Dr y
Spi nni ng
Source: U.S. EPA, AP-42, Office of Air and Radiation, 1993.
Sector Notebook Project 45 September 1997

Plastic Resin and Manmade Fiber Industrial Process Description
Table 8: Typical Fiber Spinning Parameters for Selected Fibers
Spinning Method Fiber Type Solvents or Other Reactants
Melt Spinning nylon-6
nylon-6,6
polyester
polyolefin
N/A
Solvent Spinning
Dry solvent spinning
Wet solvent spinning
acrylic/modacrylic
cellulose acetate/
cellulose triacetate
spandex
acrylic/modacrylic
dimethylacetamide
acetone or chlorinated hydrocarbon
di-isocyanate, ethylenediamine, monoamine
(stabilizer)
dimethylacetamide
Reaction Spinning spandex
rayon (viscose process) di-isocyanate, ethylenediamine, toluene
sodium hydroxide, carbon disulfide, sulfuric acid
Source: U.S. EPA, AP-42, Office of Air and Radiation, 1993; AFMA, 1997.
Types of Spinning
Melt Spinning
Melt spinning processes use heat to melt polymer which can then be extruded
through the spinneret. Spinning assemblies are fed by either electrically-
heated screw extruders, which convert powdered or chipped polymer into a
polymer melt, or directly from a continuous melt polymerization process.
Many nylon and polyester plants use continuous melt polymerization and send
molten polymer from polymerization units directly to the spinning units.
During polymerization or extrusion, various additives may be incorporated to
impart special properties to the fibers, such as heat stability, anti-static, and
eased dyeing.
Polymer chips or polymer melt is then passed through metering gear pumps,
which feed the molten polymer to a filter system at pressures of 500-1000 psi
(7,400-14,700 atm). The filter system screens out large solid or gel particles
through a series of metal gauzes interspersed in layers of graded sand (EPA,
1993). The filter may also screen out catalyst residues or precipitated
additives (McKetta, 1992). The filter may be enclosed in a Dowtherm-heated
manifold to maintain uniform temperature. After passing through the filter,
the molten polymer is fed to the spinneret (Kroschwitz, 1986). A narrow
zone below the spinneret may be filled with inert gas to prevent deposits of
degradation products around the holes for oxidation-sensitive polymers.
Sector Notebook Project 46 September 1997

Plastic Resin and Manmade Fiber Industrial Process Description
Extruded filaments are quenched by a cool, filtered airstream which solidifies
the filaments.
Dry Spinning
Dry spinning is typically used for easily dissolved polymers such as cellulose
acetate, acrylics, and modacrylics. In dry spinning processes, the polymer is
first dissolved in an organic solvent. The solution (or spinning dope) is then
blended with additives, filtered, and charged to a spin cell. The spin cell
contains a feed vessel, a heat exchanger, a spinneret, and a quench cell. The
spin cell may be 5-10 m (5.5-11 yards) long and 13-23 cm (5.1-9.1 in) in
diameter (Grayson, 1984). The solution is heated to a temperature above the
solvent boiling point and is then extruded through the spinneret into a zone of
heated gas. The solvent evaporates into the gas stream, leaving solidified
filaments. The heated gas stream is typically air although inert gas, such as
nitrogen and super-heated solvents, can also be used. Fibers are then passed
through baths to wash residual solvent from the fibers. To reduce costs and
pollution, the wash water from these baths is typically recycled. These baths
may be followed by activated carbon systems used to adsorb solvent from
process air (AFMA, 1997). Fibers produced by dry spinning contain less void
space than those produced by melt spinning and therefore have higher
densities and lower dyeability than those produced by other methods
(Kroschwitz, 1986). Of the three primary spinning methods, dry spinning
operations have the largest potential VOC emissions `to the air (EPA, 1993).
Wet Spinning
Wet spinning processes also use solvents, such as dimethylacetamide or
aqueous inorganic salt solutions, to prepare spinning dope (AFMA, 1997).
In wet spinning, the polymer is dissolved in solvent in a solution vessel and is
forced through a spinneret which is submerged in a coagulation bath. As the
polymer solution emerges in the coagulating bath, the polymer is either
precipitated or chemically regenerated. In precipitation, the fiber is formed
when solvent diffuses out of the thread and coagulant diffuses into the thread.
For some processes, a chemical reaction occurs during precipitation which
generates fibers. Coagulated filaments pass over a guide to godets or drive
rollers. Windup speeds are about 150 m/min. The yarn is then passed
through additional baths for washing and residual solvent removal
(Kroschwitz, 1986).
Reaction Spinning
Reaction spinning methods are typically used to make spandex and rayon.
The process begins with the preparation of a viscous spinning solution
containing a dissolved low molecular weight polymer, such as polyester, in a
suitable solvent and a reactant, such as di-isocyanate. The spinning solution
Sector Notebook Project 47 September 1997
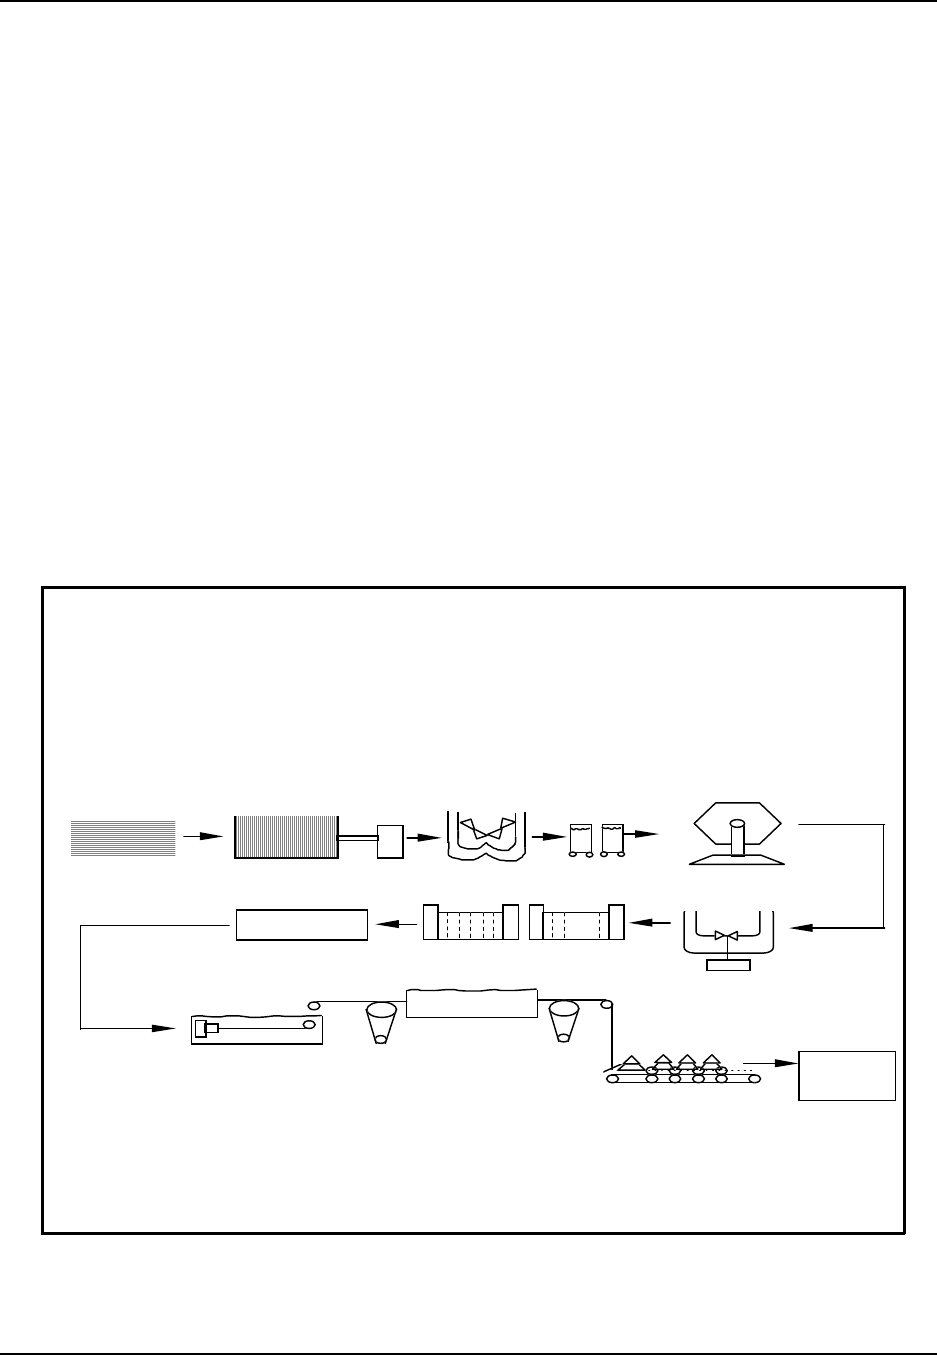
Plastic Resin and Manmade Fiber Industrial Process Description
is then forced through spinnerets into a solution containing a diamine (similar
to wet spinning) or is combined with a third reactant and then dry spun. The
primary distinguishing characteristic of reaction spinning processes is that the
final cross-linking between the polymer molecule chains in the filament occurs
after the fibers have been spun. The fiber is then transported from the bath to
an oven, where solvent is evaporated (EPA, 1993).
In the U.S., most rayon is made by the viscose process. This process is worth
noting because it is typically associated with a large volume of air emissions.
Shown in Figure 15, the viscose process converts cellulose from one form
(dissolved pulp) to another (rayon). Although the manufacturing process
further purifies the cellulose, alters the physical form of the fiber, and modifies
the molecular orientation within the fiber and its degree of polymerization, the
product is essentially the same chemical as the raw material. Since the
product retains the same chemical structure, all other chemicals used in the
process and all byproducts formed in the process must be removed.
Figure 15: Typical Process Flowchart for Synthesis of Rayon Fibers Using the Viscose Process
1 8 W T % Na OH
C E L L UL OS E
S H E ETS
S T EEPI N G
PR E S S I N G S HRE DDI NG AGI NG
CS
2
XANT HAT I O N
R I P E NI NG
DE AE RA T I ON
F I LT RA T I ON DI S S OL VI NG
DI L U T E
Na O H
R E GE NE R A T I ON
AC I D B A T H
S T R E T CHI N G CU T T I N G
FI N I SH I N G
DR YI NG
OP E N I N G
BA L I NG
Source: U.S. EPA, AP-42, Office of Air and Radiation, 1993.
Sector Notebook Project 48 September 1997

Plastic Resin and Manmade Fiber Industrial Process Description
The series of chemical reactions in the viscose process used to make rayon
consists of the following stages. First, purified cellulose pulp is steeped in a
solution of sodium hydroxide and water, producing an alkali cellulose slurry.
The excess sodium hydroxide solution is removed from the slurry, producing
alkali cellulose crumb. The crumb is shredded and fed into silos for aging, a
process which controls the degree of polymerization of the cellulose
molecules. After aging, the alkali cellulose is reacted in large reactors with
carbon disulfide, producing sodiumcellulosexanthate, which is then dissolved
in dilute aqueous sodium hydroxide. That solution is known as viscose.
The viscose solution is then aged (ripened), during which a series of chemical
reactions takes place. The most important of these reactions is the splitting
off of carbon disulfide and the regeneration of cellulose. These include the
redistribution of the carbon disulfide on the cellulose molecules and the
formation of small amounts of sulfur byproducts. The viscose is filtered
several times and deaerated prior to spinning. The viscose is then extruded
through spinnerettes, typically containing thousands of very small holes, into
a spinning bath of dilute sulfuric acid, sodium sulfate, zinc sulfate, various
spinning aids, and water. The cellulose xanthate, in the viscose, reacts with
the acidic spinning bath, forming an unstable xantheic acid derivative which
loses carbon disulfide to yield regenerated cellulose. The carbon disulfide is
released from the xanthate, and the sulfur byproducts created during aging
react to form hydrogen sulfide.
After spinning the fibers are collected together, stretched to orient the
cellulose molecules along the axis of the fibers, processed to remove the
residual chemicals from the cellulose, finished, dried, and packaged. The
fibers may be cut after stretching but prior to further processing, producing
rayon staple (cut) fiber, or they may be processed without cutting, producing
rayon filament or tow (AFMA, 1997; EPA, 1993).
III.B.3. Fiber Processing
In most cases, the extruded product from melt, dry, wet, or reaction spinning
is further processed to impart particular qualities to the fibers and facilitate
downstream processing. Fibers can be processed as filament yarn or as staple.
Figure 14 illustrates general fiber processing steps.
After fibers have been formed, spin finish is usually applied by collecting the
extruded filaments on a grooved ceramic guide or rotating roller coated with
spin finish. The spin finish, which includes lubricants and finishing oils,
facilitates further processing steps by reducing friction and static, and
improving further mechanical processing (AFMA, 1997). Mineral oils have
historically been used as lubricants, and organic compounds have been used
to reduce static. Spin finishes vary according to fiber type and are critical to
Sector Notebook Project 49 September 1997

Plastic Resin and Manmade Fiber Industrial Process Description
the processing of fibers into yarns and fabrics. Insufficient lubrication of fibers
can lead to strains in the fabric which may produce uneven dyeing, decreased
strength, or unpleasing aesthetic qualities (Grayson, 1984).
Filament Yarn
After finish is applied, a thread guide converges the individual filaments to
produce a continuous filament yarn that contains between 15 and 1000
filaments (AFMA, 1997). The spun yarn is then either immediately wound
onto bobbins and collected in cans or is further treated to impart special fiber
qualities (EPA, 1993). Filaments are typically drawn to align and orient the
polymer molecules and strengthen the filament. In melt spinning operations,
companies have moved towards high-speed spinning processes which combine
spinning and drawing operations. Filaments may be forwarded at speeds of
300 to 6,000 m/min for subsequent processing. For polyester, the different
commercial melt-spinning processes are classified according to the degree of
molecular orientation in the fiber. For instance, polyester spinning processes
operating at speeds of 500 to 1,500 m/min give low oriented spun yarn
(LOY), while processes operating at between 4,000 and 6,000 m/min give
partially oriented yarn (POY) (Kroschwitz, 1986).
Thermoplastic fibers can be further modified by thermomechanical annealing
treatments, including texturing. Texturing uses curling, crimping, and tangling
apparatuses togivestraight, rod-like filament fibers the appearance, structure,
and feel of natural fibers (EPA, 1995). Filaments may be mechanically
distorted by compressing the fibers in a stuffing box or between rolls or by
false twisting, where twisting is followed by heat setting and releasing or
reversing the twist. Textured yarns are either fine denier (15-200 denier) for
woven, knitted stretch and textured fabrics for apparel or heavy (1,000-3,600
denier) for carpet (McKetta, 1992). Recall that denier is the weight in grams
of 9,000 meters (9,846 yards) of yarn.
Staple
Many manmade fiber operations produce staple, or yarn that is cut into
specific lengths, for use by textile manufacturers. To make staple, a tow is
formed by collecting thousands of continuous filaments into large rope-like
bundles. These bundles are combined from all the spinning positions and
thrown into a large “creel can” at speeds of 1,000 to 2,000 m/min. This
bundle of filaments is 50,000 to 250,000 total denier, with as-spun denier
ranging from 2.5 to 9.0 (Dekker, 1992). The bundles are then spread out into
a flat band winding over the feed rolls and draw rolls of the draw machine.
After drawing, the fiber may be heat set and crimped to change the tensile
properties. The tow can be shipped for further processing, or it can be
converted into staple-length fiber by simply cutting it into specified lengths,
usually an inch to severalinches long. Whenmanmade fibers are produced for
Sector Notebook Project 50 September 1997

Plastic Resin and Manmade Fiber Industrial Process Description
blending with natural fibers, they are cut into similar lengths as the natural
fibers, typically 1.5-5.0 in (3.8-12.5 cm) (Kroschwitz, 1986). A baling unit
following the cutting machine collects and bales the cut fiber (Kent, 1992).
Wastes generated during fiber processing operations arise from the spin finish
application and drying steps (Wellman, 1997). During processing, fiber
finishes can be sources of volatile and hazardous air pollutants that may be
emitted into the air and into wastewater (AFMA, 1997).
III.B.4. Supporting Operations
Solvent Recovery
Solvents used in spinning processes are typically recovered by distillation.
Other recovery systems include gas adsorption and condensation and are
specific to either fiber type or spinning method. Dry spinning processes
typically use condenser or scrubbers for recovering solvent from the spin cell.
Distillation columns are used to recover solvent from the condenser, scrubber,
and wash water. Efficient solvent recovery is particularly important in dry
spinning since solvent is used at three to five times the quantity of polymer.
Wet spinning processes typically use distillation to recover solvent from the
spinning bath, drawing, and washing operations. Scrubbers and condensers
are used to recover solvent emissions from the spinning cells and the dryers.
Carbon adsorption is used to recover emissions from storage tank vents and
from mixing and filtering operations (EPA, 1993). Refer to Section III.A. for
a more detailed discussion of pollution control equipment.
Sector Notebook Project 51 September 1997

Plastic Resin and Manmade Fiber Industrial Process Description
III.C. Raw Material Inputs and Pollution Outputs in the Production Line
Raw material inputs to plastic resin and manmade fibers industries primarily
consist of synthetic organic chemicals, such as ethylene glycol and
acrylonitrile, and refined petroleum products, such as ethylene. The majority
of these chemicals are used either as monomers or as monomer precursors.
Other uses are as solvents, catalysts, and additives. Because chemical
processes rarely convert 100 percent of raw materials to desired products,
byproducts and unreacted monomer may constitute a large part of facilities’
wastestreams. Pollutant outputs generally include VOCs, off-spec or
contaminated polymer, and wastewater from equipment cleaning. Typical
wastestreams associated with processes involved in plastic resin and manmade
fiber manufacture are listed in Table 9. Wastestreams vary depending on what
polymer is being synthesized, what fiber spinning method is used, and whether
a batch or continuous process is used. Small-scale batch facilities that make
polymers to order often have complex and variable wastestreams (New Jersey
Hazardous Waste Facilities Siting Commission, 1987).
Air Emissions
Over 70 percent of TRI releases for plastic resin and manmade fiber plants are
in the form of air emissions. Commonly released chemicals include carbon
disulfide, methanol and other volatile solvents and monomers. Typical
chemicals released are listed in the following section on TRI releases and
transfers. Air emissions from plastic resin and manmade fiber plants arise
from point sources and fugitive emission sources, such as valves, pumps,
tanks, compressors, etc. Point sources of air emissions may include monomer
storage and feed dissolver tanks and reactors.
While individual leaks are typically small, the sum of all fugitive leaks at a
plant can be one of its largest emission sources. Fugitive emissions can be
emitted continuously or intermittently. Continuous air emissions may be
emitted from monomer recovery systems, dryer stacks and miscellaneous solid
handling vents, centrifuge vents, and blending operations. Fugitive emissions
can also result from volatilization of monomers, solvents, and other volatile
organic compounds during polymerization; sublimation of solids during resin
production; wastewater treatment; and volatilization of solvents during
storage and handling of resins. These emissions are largely controlled by
solvent and monomer recovery systems. Potential VOC emission release
points for a typical polymerization method are shown in Figure 16. In the
figure, volatile organic compounds emitted from particular operations are
shown as dashed lines, and solid wastes and water wastes are shown by
bolded arrows.
Sector Notebook Project 52 September 1997

Plastic Resin and Manmade Fiber Industrial Process Description
Table 9: Summary of Potential Releases Emitted During Plastic Resin
and Manmade Fiber Manufacturing
Process Air Emissions Process Wastewater Residual Wastes
Preparing Reactants volatilized monomer,
solvents little or no wastewater
produced raw material drum
residuals
Polymerization volatilized monomer,
solvents, reaction
byproducts
little or no wastewater
produced off-specification or
contaminated polymer,
reaction byproducts, spent
equipment oil, spent
solvent, catalyst
manufacture waste, gas
purification catalyst waste
Polymer Recovery volatilized solvents and
unreacted monomer little or no wastewater
produced little or no residual waste
produced
Polymer Extrusion volatilized solvents and
unreacted monomer extruder quench water off-specification or
contaminated polymer
Equipment Cleaning volatilized solvents and
unreacted monomer reactor and floor wash water
contaminated with organics,
acids, and salts; equipment
rinse water
little or no residual waste
produced
Unloading and Storage
of Reactants
volatilized monomer and
solvents Rinse water from cleaning
out transport vehicles
containing solvents,
monomers, and other
reactants
little or no residual waste
produced
Conveyance and
Pellet Storage
volatilized residual
monomer or solvents from
plastic pellets
little or no wastewater
produced plastic pellets from leaks
or spills
Spinning volatilized residual
monomer
solvents, additives, other
organics, volatilized finishes
water contaminated with
residual monomer solvents,
additives, other organics,
finishes
off-spec polymer, off-spec
fiber, and residual finishes
Fiber Processing volatilized residual
monomer
solvents, additives, other
organics, volatilized finishes
water contaminated with
residual monomer, solvents,
additives, other organics
residual monomer and
solvents; off-spec fibers
Pollution Control
Systems
volatilized solvents and
unreacted monomer water contaminated with
residual solvents and
unreacted monomer; air
stripper water
little or no residual waste
produced
Source: U.S. EPA, AP-42, Office of Air and Radiation, 1993; U.S. EPA, Best Management Practices for
Pollution Prevention in the Textile Industry, Office of Research and Development, 1995; SOCMA Pollution
Prevention Study, Prepared for SOCMA, Washington, DC, 1993; Randall, P.M., “Pollution Prevention
Strategies for Minimizing of Industrial Wastes in the Vinyl Chloride Monomer - Polyvinyl Chloride
Industry,” in Environmental Progress, volume 13, no. 4, November 1994; AFMA, 1997; Wellman, 1997.
Sector Notebook Project 53 September 1997
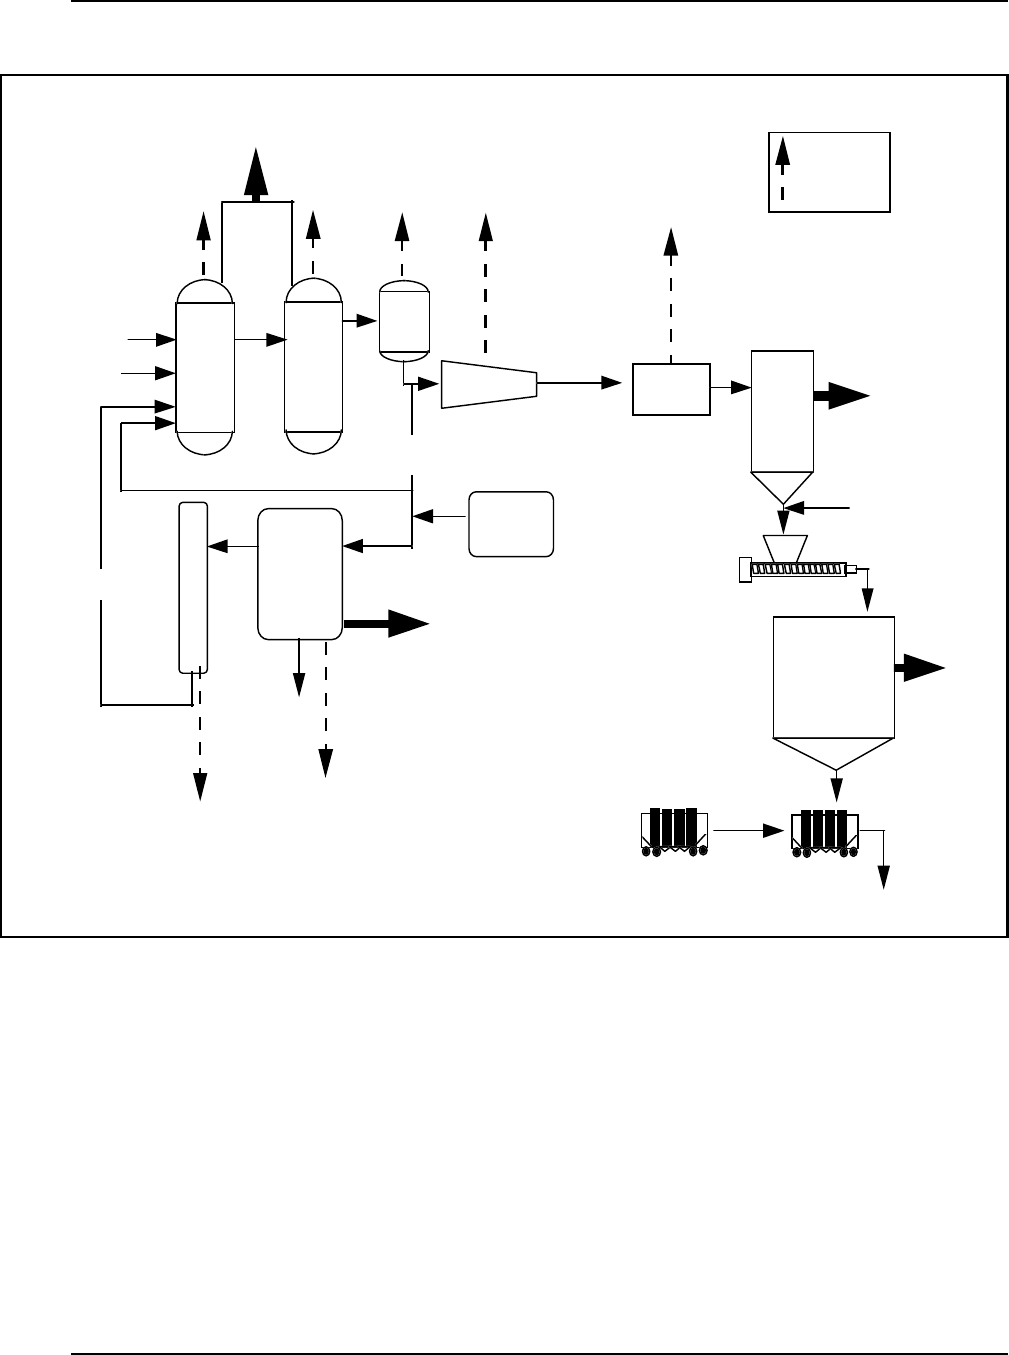
Plastic Resin and Manmade Fiber Industrial Process Description
Figure 16: Potential Emissions from Plastic Resin Manufacturing Operations
Contaminated pellets
Catalysts
R
E
A
C
T
O
R
R
E
A
C
T
O
R
Monomer
FLASH
DRUM
CENTRIFUGE
POLYMER
MOTHER
LIQUOR
D
E
H
Y
D
R
A
T
O
R
DRYER
STRIPPER
TOWER
WAXES
NEW
SOLVENT
DRYER FEED
BIN
EXTRUDER
Additives
PELLET
BLENDERS
WASH/INSPECT HC’S LOAD HC’S
CUSTOMERS
Off-spec or contaminated polymer
Contaminated
pellets
Water contaminated with
solvents or monomers
VOC
EMISSIONS
Adapted from Exxon Chemical Company’s Mont Belvieu Plastics Plant Brochure; Synthetic Organic Chemical
Manufacturers Association, SOCMA Pollution Prevention Study, Prepared for SOCMA, Washington, DC, 1993;
Randall, P.M., “Pollution Prevention Strategies for Minimizing of Industrial Wastes in the Vinyl Chloride Monomer -
Polyvinyl Chloride Industry,” in Environmental Progress, volume 13, no. 4, November 1994; U.S. EPA, AP-42, Office
of Air and Radiation, 1993.
Sector Notebook Project 54 September 1997

Plastic Resin and Manmade Fiber Industrial Process Description
Sources of intermittent air emissions typically include unloading and charging
operations, reactors, safety valves, stripping towers, pumps, flanges, filters,
strainers, and seals (Randall, 1994). Fugitive emissions can be reduced
through a number of techniques, including installing leak resistant equipment
such as sealless pumps and bellows valves, reducing the number of tanks and
other potential sources, and in the case of light liquid or vapor systems,
implementing an ongoing leak detection and repair program (Wellman, 1997).
In addition to pollutants emitted during polymerization, fiber finishes are
sources of volatile and hazardous air pollutants emitted from manmade fiber
processing operations. Because melt spinning does not require the use of
solvents, melt spinning emits significantly less VOCs than dry or wet spinning
processes. Dry spinning typically emits the largest amounts of VOC per
pound of fiber produced of the three main spinning methods. Dry spinning
can emit from 5 to 150 kg total non-methane organic carbons (TNMOC) per
Mg of product, while melt spinning can emit less than 5 kg TNMOC per Mg
product. Wet spun fibers typically emit 5 to 20 kg TNMOC per MG product.
Air pollutant emissions include volatilized residual monomer, fiber lubricants,
organic solvents, additives, and other organic compounds used in fiber
processing (EPA, 1993).
Unrecovered solvent accounts for some of the VOC emissions from fiber
spinning processes, particularly for acetate production. Typically, 94 to 98
percent of the solvents used in fiber spinning processes is recovered. The
largest amounts of unrecovered solvent are emitted from the fiber spinning
and drying steps. Other emission sources include dope preparation (dissolving
the polymer, blending the spinning solution, and filtering the dope), fiber
processing (drawing, washing, crimping), and solvent recovery. Figure 17
illustrates the potential release points of VOCs in a typical fiber spinning
operation (EPA, 1993). Other pollutants emitted during manufacturing
include air pollutants emitted during combustion. Criteria air pollutants, such
as SOx, NOx, CO, and CO2, are emitted from combustion equipment used to
heat reactors, dryers, and other process equipment.
Sector Notebook Project 55 September 1997
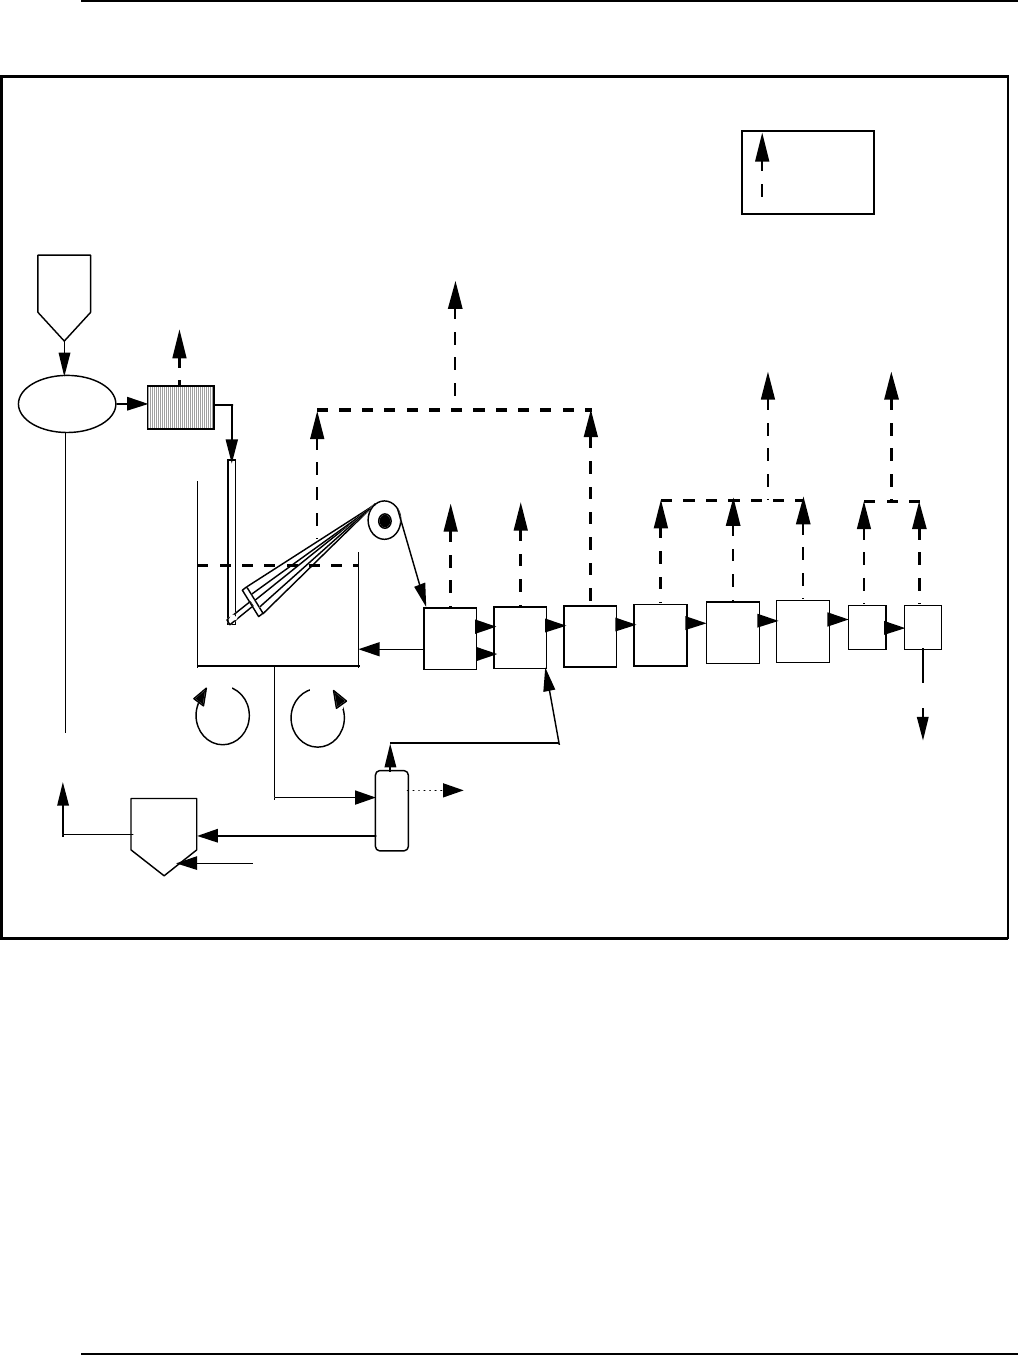
Plastic Resin and Manmade Fiber Industrial Process Description
Figure 17: VOC Emissions from Fiber Processing Operations
(PY)
Polymer
Storage
Blending and
Dissolving
Filtration
Spin
Bath
Washing Drawing Finish
Application Drying Crimping Setting
Dryer
Cutting Baling
Fiber
Out
Solvent
Loop Water
Loop
Solvent Recovery
(Distillation)
VOC Emissions
Solvent
Storage
Make Up
Solvent
Total
Solvent
Source: U.S. EPA, AP-42, Office of Air and Radiation, 1993.
Sector Notebook Project 56 September 1997

Plastic Resin and Manmade Fiber Industrial Process Description
Wastewater
Plastic resin and manmade fiber facilities generate relatively large amounts of
wastewater fromprocesses, cooling operations, utilities and maintenance, and
air pollution control systems. Unless solvents are used in polymerization
processes, wastewater contaminants are usually restricted to off-spec polymer,
polymer, and raw materials (EPA, 1987). Wastewater streams from
polymerization operations typically contain dilute concentrations of organics,
acids, and salts. Process wastewater may be generated from water that comes
into direct contact with raw materials, intermediate products, finished
products, byproducts, or waste product. Process wastewater may also be
generated from indirect contact process water discharged from vacuum jets
and steam ejectors. Cooling water makes up a large portion of water used in
the industries and can either be generated from water that contains
contaminants or from water used in noncontact processes, such as water
treatment wastes and boiler blowdown (EPA, 1987).
Effluent containing contaminants may also be discharged from batch
operations during equipment cleaning. Wastes generated from cleaning
operations include vessel wash waters, floor wash waters, equipment draining,
sump draining, and air stripper water effluent. These discharges can be
minimized by initiating water conservation programs and by cleaning reactors
using high-pressure water or process solvents which can be recycled into the
reactor (SOCMA, 1993).
Wastewater is also generated during monomer and polymer recovery
processes, such as centrifuging, monomer stripping, and slurry tanks. Process
sources generate liquid wastes with relatively high concentrations of
contaminants, including equipment oil, spent solvent, and raw material drum
residuals. Leaks and spills also generate waste and often occur at pumps,
flanges, valves, and agitator seals. Loading/unloading operations and bag
filling operations also are common sources of leaks and spills (Randall, 1994).
In addition to pollutants emitted during polymerization, fiber finishes are
sources of volatile and hazardous pollutants found in manmade fiber plant
wastewater. Spin finishes may increase biological oxygen demand (BOD)
and chemical oxygen demand (COD) and some may be toxic to aquatic life
(EPA, 1995).
Residual Wastes
Residual wastes make up a significant portion of wastes from plastic resin and
manmade fiber facilities. Unless solvents are used in polymerization
processes, residual wastes are usually restricted to off-spec polymer, polymer,
and raw material chemicals (EPA, 1987). Typical contaminants include
contaminated polymer, catalyst manufacture waste, gas purification catalyst
waste, reaction by-products, waste oil, and general plant wastes (Clements
Sector Notebook Project 57 September 1997

Plastic Resin and Manmade Fiber Industrial Process Description
and Thompson, 1993). Although properly run and maintained plants with
new technology may be capable of obtaining 95 percent or higher polymer
yields, off-spec and contaminated polymer is still generated and makes up a
sizeable portion of the wastestream. Unreacted or improperly reacted
polymer synthesis or regeneration residues may include monomers, oligomers,
metals, degradation products, solvents, and coagulants (EPA, 1995). Other
sources of residual waste include cleanup absorbents, spent activated carbon,
laboratory wastes, and air pollution control residues (SOCMA, 1993).
Process-related residual waste can be reduced by implementing better
inventory control practices, personnel training, and enhanced process control
systems. Process changes and raw material substitutions can also be used to
reduce residual waste pollution.
III.D. Pollution Control Systems
Recovery of raw materials, such as solvents and monomers, is widely
practiced in the industries and is highly integrated into industrial processes as
a means to reduce costs associated with raw materials and subsequent
treatment of waste. During the polymer separation step, often solvent and
monomers are flashed from the reaction mixture. The flashed monomer and
solvent are then condensed into liquids using a compressor and separated
using vacuum distillation. Monomer and comonomer are passed through a
series of distillation columns to increase purity. These chemicals may then be
sent to either a monomer recovery unit or an incinerator to be burned as fuel
or to reduce air emissions through thermal destruction. Wastewater can be
generated during monomer and polymer recovery processes, such as
centrifuging, monomer stripping, and slurry tanks (AFMA, 1997; EPA, 1987).
Selected equipment and methods used by the industries to recover raw
materials and reduce air and water pollution are described below.
Air Pollution Control Systems
Condensers. Condensers are widely used in the plastic resin and manmade
fiber industries to recover monomers and solvents from process operations (a
process condenser) and as air pollution control devices to remove VOCs from
vented gases. Process condensers differ from condensers used as air pollution
control devices as the primary purpose of a process condenser is to recover
material as an integral part of a unit operation. The process condenser is the
first condenser located after the process equipment and supports a vapor-to-
liquid phase change for the vapors produced in the process equipment.
Examples of process condensers include distillation condensers, reflux
condensers, process condensers in line before the vacuum source, and process
condensers used in stripping or flashing operations (EPA, 1978). Vents on
condensers can be sources of VOC emissions.
Sector Notebook Project 58 September 1997

Plastic Resin and Manmade Fiber Industrial Process Description
Adsorption. Adsorption is another method for removing VOCs from
individual process wastestreams through organic vapor recovery. This
method can be used to filter out and recover solvents by passing process
streams through a packed column of activated carbon or any other porous
surface which has a microcrystalline structure. As the gas stream passes
through the column, the VOCs adsorb to the column surface. Eventually, the
adsorption material in the column becomes clogged with adsorbed
contaminants and must be either regenerated or disposed (Masters, 1991;
EPA, 1987; CMA, 1989).
Scrubbers. Scrubbers or gas absorbers are used to remove one or more
constituents from a gas stream by treatment with a liquid. When using a
scrubber as an air pollution control device, the solubility of the constituents
in the gas stream in the absorbing liquid must be determined. The main types
of scrubbers are the packed tower, plate or tray tower, venturi scrubber, and
spray tower (EPA, 1978).
Combustion or Incineration. Another method for controlling VOC
emissions is combustion or incineration. Although combustion systems can
achieve high removal efficiencies, these systems are typically more expensive
to install, operate, and maintain and have secondary emissions associated with
their operation. Additionally, scrubbers may be required to control inorganic
gases produced as byproducts of combustion (EPA, 1978).
Water Pollution Control Systems
Distillation. Distillation is used to separate liquids for recovery. Two widely
used types of distillation are batch and continuous (or fractionation). Batch
distillation is used when components’ vapor pressures vary widely. In batch
distillation, solvent waste is first placed inside a container where heat is
applied and condensed overhead vapor is removed simultaneously.
Continuous distillation is commonly used to separate multiple fluids from a
wastestream and uses a column that contains multiple trays or packing
materials to provide high vapor-liquid surface area. Vapors that rise to the
top of the heated column are condensed and removed, while a portion is
returned to the column for further fractionation. Lower boiling solvents
progressively enter the vapor, leaving a liquid with less volatile contaminants
at the bottom of the column (CMA, 1989).
Gas Stripping (Air and Steam). Stripping can be used to remove relatively
volatile components that are dissolved or emulsified in wastewater. This is
achieved through the passage of air, steam, or other gas through the liquid.
The stripped volatiles are usually processed by further recovery or
incineration. In air stripping processes, a liquid containing dissolved gases
is brought into contact with air in a stripping tower, causing an exchange of
Sector Notebook Project 59 September 1997

Plastic Resin and Manmade Fiber Industrial Process Description
gases between the air and the solution. If the concentrations of gases are low,
the gases can be emitted directly to the air. If the concentrations are high,
these gases are passed to air pollution control devices.
In steamstripping processes, volatile components are distilled by fractionation
from a wastewater stream. Steam stripping towers operate by passing
preheated wastewater downward through the distillation column.
Superheated steam and organic vapors flow countercurrent to the wastewater
stream, rising up from the bottom of the column. Contact between the two
streams progressively reduces the concentrations of VOCs in the wastewater
as it approaches the bottom of the column. Reflux condensing may be used
to alter the composition of the vapor stream taken from the stripping column
(EPA, 1987).
III.E. Management of Chemicals in the Production Process
The Pollution Prevention Act of 1990 (PPA) requires facilities to report
information about the management of Toxics Release Inventory (TRI)
chemicals in waste and efforts made to eliminate or reduce those quantities.
These data have been collected annually in Section 8 of the TRI reporting
Form R beginning with the 1991 reporting year. The data summarized below
cover the years from 1994 through 1997 and are meant to provide a basic
understanding of the quantities of waste handled by the industries, the
methods typically used to manage this waste, and recent trends in these
methods. TRI waste management data can be used to assess trends in source
reduction within individual industries and facilities, and for specific TRI
chemicals. This information could then be used as a tool in identifying
opportunities for pollution prevention compliance assistance activities.
While the quantities reported for 1994 and 1995 are estimates of quantities
already managed, the quantities reported for 1996 and 1997 are projections
only. The PPA requires these projections to encourage facilities to consider
future waste generation and source reduction of those quantities as well as
movement up the waste management hierarchy. Future-year estimates are not
commitments that facilities reporting under TRI are required to meet.
Table 10 shows that the TRI reporting plastic resin manufacturing facilities
managed about 1.4 billion pounds of production related wastes (total quantity
of TRI chemicals in the waste from routine production operations in column
B) in 1995. The yearly data in column B indicate that plastic resin
manufacturing facilities substantially lowered the amount of production-
related waste managed between 1994 and 1995. Projections for production-
related waste management indicate slight increases between 1995 and 1996
followed by a slight decrease in 1997. Values in column C are intended to
reveal the percentage of TRI chemicals that are either transferred off-site or
released to the environment. Column C is calculated by dividing the total TRI
Sector Notebook Project 60 September 1997

Plastic Resin and Manmade Fiber Industrial Process Description
transfers and releases (reported in Sections 5 and 6 of the TRI Form R) by the
total quantity of production-related waste (reported in Section 8). The
percentage of TRI chemicals transferred off-site or released to the
environment by the plastic resin industry increased more than three fold
between 1994 and 1995.
The data indicate that about 82 percent of the TRI wastes are managed onsite
through recycling, energy recovery, or treatment (columns D, E, and F,
respectively) in 1995. About 13 percent of the wastes were managed off-site.
The remaining portion of TRI chemical wastes (about 5 percent), shown in
column J, were released to the environment through direct discharges to air,
land, water, and underground injection, or were disposed off-site. The overall
proportions of wastes managed onsite (columns G, H, and I) and off-site
(columns D, E, and F) are expected to remain relatively constant between
1995 and 1997. Note that between 1994 and 1995 the proportion of waste
treated on-site decreased by 12.5 percent and the proportion of waste
recycled on-site increased by almost 16 percent.
Table 10: Source Reduction and Recycling Activity for the Plastic Resin Industry (SIC 2821)
as Reported Within TRI
A B C On-Site Off-Site J
Year
Quantity of
Production-
Related
Waste
(106 lbs.)a
% Released
and
Transferred
b
% Released
and
Transferredb
D E F G H I
%
Recycled % Energy
Recovery % Treated %
Recycled % Energy
Recovery % Treated
1994 4,116 5.1 23.5 11.8 43.2 1.7 7.4 3.7 8.8
1995 1,363 18.8 39.3 11.9 30.6 6.2 4.4 2.6 5.1
1996p 1,448 N/A 36.1 15.8 27.7 7.3 3.8 2.1 7.2
1997p 1,432 N/A 37.0 15.2 28.3 7.4 3.6 2.0 6.5
Source: U.S. EPA, Toxic Release Inventory Database, 1995.
a Within this industry sector, non-production related waste < 1% of production related wastes for 1995.
b Total TRI transfers and releases as reported in Section 5 and 6 of Form R as a percentage of production related
wastes.
c Percentage of production related waste released to the environment and transferred off-site for disposal.
p Represents projected wastes for 1996 and 1997.
Sector Notebook Project 61 September 1997

Plastic Resin and Manmade Fiber Industrial Process Description
Table 11 shows that the TRI reporting manmade fiber manufacturing facilities
managed about 689 million pounds of production related wastes (total
quantity of TRI chemicals in the waste from routine production operations in
column B) in 1995. The yearly data in column B indicate that fiber
manufacturing facilities project yearly increases in production-related waste
between 1994 and 1997. Values in column C are intended to reveal the
percentage of TRI chemicals that are either transferred off-site or released to
the environment. Column C is calculated by dividing the total TRI transfers
and releases (reported in Sections 5 and 6 of the TRI Form R) by the total
quantity of production-related waste (reported in Section 8). The percentage
of TRI chemicals transferred off-site or released to the environment by the
manmade fiber industry decreased slightly between 1994 and 1995.
The data indicate that about 79 percent of the TRI wastes are managed onsite
through recycling, energy recovery, or treatment (columns D, E, and F,
respectively) in 1995. About 7 percent of the wastes were managed off-site.
The remaining portion of TRI chemical wastes (about 14 percent), shown in
column J, were released to the environment through direct discharges to air,
land, water, and underground injection, or were disposed off-site. The overall
proportions of wastes managed onsite (columns G, H, and I) are expected to
increase by 7.3 percent between 1995 and 1997. The overall proportions of
wastes managed off-site (columns D, E, and F) are expected to decrease by
1.9 percent between 1995 and 1997. Note that between 1995 and 1997 the
proportion of waste treated on-site is expected to decrease by 12.3 percent
and the proportion of waste recycled on-site is expected to increase by about
20 percent.
Sector Notebook Project 62 September 1997

Plastic Resin and Manmade Fiber Industrial Process Description
Table 11: Source Reduction and Recycling Activity for the Manmade Fiber Industry (SIC
2823, 2824) as Reported Within TRI
A B C On-Site Off-Site J
Year
Quantity of
Production-
Related
Waste
(106 lbs.)a
% Released
and
Transferred
b
% Released
and
Transferredb
D E F G H I
% Recycled %
Energy
Recovery %
Treated
%
Recycled % Energy
Recovery % Treated
1994 634 21.0 23.0 0.70 55.5 7.6 0.50 0.13 12.9
1995 689 20.8 30.5 0.75 48.0 6.2 0.23 0.29 14.2
1996p 814 N/A 43.5 0.65 39.7 4.8 0.13 0.29 10.9
1997p 908 N/A 50.3 0.56 35.7 4.3 0.13 0.40 8.6
Source: U.S. EPA, Toxic Release Inventory Database, 1995.
a Within this industry sector, non-production related waste < 1% of production related wastes for 1995.
b Total TRI transfers and releases as reported in Section 5 and 6 of Form R as a percentage of production related
wastes.
c Percentage of production related waste released to the environment and transferred off-site for disposal.
p Represents projected wastes for 1996 and 1997.
Sector Notebook Project 63 September 1997
Page 64 intentionally left blank.

Plastic Resin and Manmade Fiber Release and Transfer Profile
IV. CHEMICAL RELEASE AND TRANSFER PROFILE
This section is designed to provide background information on the pollutant
releases that are reported by this industry. The best source of comparative
pollutant release information is the Toxic Release Inventory (TRI). Pursuant
to the EmergencyPlanning and Community Right-to-Know Act, TRI includes
self-reported facility release and transfer data for over 600 toxic chemicals.
Facilities within SIC Codes 20 through 39 (manufacturing industries) that
have more than 10 employees, and that are above weight-based reporting
thresholds are required to report TRI on-site releases and off-site transfers.
The information presented within the sector notebooks is derived from the
most recently available (1995) TRI reporting year (which includes over 600
chemicals), and focuses primarily on the on-site releases reported by each
sector. Because TRI requires consistent reporting regardless of sector, it is
an excellent tool for drawing comparisons across industries. TRI data provide
the type, amount and media receptor of each chemical released or transferred.
Although this sector notebook does not present historical information
regarding TRI chemical releases over time, please note that in general, toxic
chemical releases have been declining. In fact, according to the 1995 Toxic
Release Inventory Public Data Release, reported onsite releases of toxic
chemicals to the environment decreased by 5 percent (85.4 million pounds)
between 1994 and 1995 (not including chemicals added and removed from the
TRI chemical list during this period). Reported releases dropped by 46
percent between 1988 and 1995. Reported transfers of TRI chemicals to off-
site locations increased by 0.4 percent (11.6 million pounds) between 1994
and 1995. More detailed information can be obtained from EPA's annual
Toxics Release Inventory Public Data Release book (which is available
through the EPCRA Hotline at 800-535-0202), or directly from the Toxic
Release Inventory System database (for user support call 202-260-1531).
Wherever possible, the sector notebooks present TRI data as the primary
indicator of chemical release within each industrial category. TRI data
provide the type, amount and media receptor of each chemical released or
transferred. When other sources of pollutant release data have been obtained,
these data have been included to augment the TRI information.
TRI Data Limitations
Certain limitations exist regarding TRI data. Release and transfer reporting
are limited to the approximately 600 chemicals on the TRI list. Therefore, a
large portion of the emissions from industrial facilities are not captured by
TRI. Within some sectors, (e.g. dry cleaning, printing and transportation
equipment cleaning) the majority of facilities are not subject to TRI reporting
because they are not considered manufacturing industries, or because they are
Sector Notebook Project 65 September 1997

Plastic Resin and Manmade Fiber Release and Transfer Profile
below TRI reporting thresholds. For these sectors, release information from
other sources has been included. In addition, many facilities report more than
one SIC code reflecting the multiple operations carried out onsite. Therefore,
reported releases and transfers may or may not all be associated with the
industrial operations described in this notebook.
The reader should also be aware that TRI "pounds released" data presented
within the notebooks is not equivalent to a "risk" ranking for each industry.
Weighting each pound of release equally does not factor in the relative
toxicity of each chemical that is released. The Agency is in the process of
developing an approach to assign toxicological weightings to each chemical
released so that one can differentiate between pollutants with significant
differences in toxicity. As a preliminary indicator of the environmental impact
of the industry's most commonly released chemicals, the notebook briefly
summarizes the toxicological properties of the top five chemicals (by weight)
reported by each industry.
Definitions Associated With Section IV Data Tables
General Definitions
SIC Code -- the Standard Industrial Classification (SIC) is a statistical
classification standard used for all establishment-based Federal economic
statistics. The SIC codes facilitate comparisons between facility and industry
data.
TRI Facilities -- are manufacturing facilities that have 10 or more full-time
employees and are above established chemical throughput thresholds.
Manufacturing facilities are defined as facilities in Standard Industrial
Classification primary codes 20-39. Facilities must submit estimates for all
chemicals that are on the EPA's defined list and are above throughput
thresholds.
Data Table Column Heading Definitions
The following definitions are based upon standard definitions developed by
EPA’s Toxic Release Inventory Program. The categories below represent the
possible pollutant destinations that can be reported.
RELEASES -- are an on-site discharge of a toxic chemical to the
environment. This includes emissions to the air, discharges to bodies of
water, releases at the facility to land, as well as contained disposal into
underground injection wells.
Sector Notebook Project 66 September 1997

--
Plastic Resin and Manmade Fiber Release and Transfer Profile
Releases to Air (Point and Fugitive Air Emissions) Include all air
emissions from industry activity. Point emissions occur through confined air
streams as found in stacks, vents, ducts, or pipes. Fugitive emissions include
equipment leaks, evaporative losses from surface impoundments and spills,
and releases from building ventilation systems.
Releases to Water (Surface Water Discharges) -- encompass any releases
going directly to streams, rivers, lakes, oceans, or other bodies of water.
Releases due to runoff, including storm water runoff, are also reportable to
TRI.
Releases to Land -- occur within the boundaries of the reporting facility.
Releases to land include disposal of toxic chemicals in landfills, land
treatment/application farming, surface impoundments, and other land disposal
methods (such as spills, leaks, or waste piles).
Underground Injection -- is a contained release of a fluid into a subsurface
well for the purpose of waste disposal. Wastes containing TRI chemicals are
injected into either Class I wells or Class V wells. Class I wells are used to
inject liquid hazardous wastes or dispose of industrial and municipal
wastewaters beneath the lowermost underground source of drinking water.
Class V wells are generally used to inject non-hazardous fluid into or above
an underground source of drinking water. TRI reporting does not currently
distinguish between these two types of wells, although there are important
differences in environmental impact between these two methods of injection.
TRANSFERS -- is a transfer of toxic chemicals in wastes to a facility that is
geographically or physically separate from the facility reporting under TRI.
Chemicals reported to TRI as transferred are sent to off-site facilities for the
purpose of recycling, energy recovery, treatment, or disposal. The quantities
reported represent a movement of the chemical away from the reporting
facility. Except for off-site transfers for disposal, the reported quantities do
not necessarily represent entry of the chemical into the environment.
Transfers to POTWs -- are wastewaters transferred through pipes or sewers
to a publicly owned treatments works (POTW). Treatment or removal of a
chemical from the wastewater depends on the nature of the chemical, as well
as the treatment methods present at the POTW. Not all TRI chemicals can
be treated or removed by a POTW. Some chemicals, such as metals, may be
removed, but are not destroyed and may be disposed of in landfills or
discharged to receiving waters.
Sector Notebook Project 67 September 1997

--
Plastic Resin and Manmade Fiber Release and Transfer Profile
Transfers to Recycling -- are sent off-site for the purposes of regenerating
or recovery by a variety of recycling methods, including solvent recovery,
metals recovery, and acid regeneration. Once these chemicals have been
recycled, they may be returned to the originating facility or sold commercially.
Transfers to Energy Recovery -- are wastes combusted off-site in industrial
furnaces for energy recovery. Treatment of a chemical by incineration is not
considered to be energy recovery.
Transfers to Treatment -- are wastes moved off-site to be treated through
a variety of methods, including neutralization, incineration, biological
destruction, or physical separation. In some cases, the chemicals are not
destroyed but prepared for further waste management.
Transfers to Disposal are wastes taken to another facility for disposal
generally as a release to land or as an injection underground.
IV.A. EPA Toxic Release Inventory for the Plastic Resin and Manmade Fiber Industries
This section summarizes TRI data of plastic resin and manmade fiber
manufacturing facilities reporting SIC codes 2821, 2823, or 2824 as the
primary SIC code for the facility.
According to the 1995 Toxics Release Inventory (TRI) data, 444 plastic resin
and manmade fiber manufacturing facilities reporting SIC2821, 2823, or 2824
released (to the air, water, or land) and transferred (shipped off-site or
discharged to sewers) a total of 399 million pounds of toxic chemicals during
calendar year 1995. This represents approximately seven percent of the 5.7
billion pounds of releases and transfers from all manufacturers (SICs 20-39)
reporting to TRI that year. The top three chemicals released by volume are
carbon disulfide, nitrate compounds, and ethylene. These three account for
about 51 percent (82 million pounds) of the industries’ total releases.
Ethylene glycol, used in making polyester, accounts for 45 percent (107
million pounds) of the total TRI chemicals transferred by the industries. The
variability in facilities’ TRI chemical profiles may be attributed to the variety
of processes and products in the industries. Note that over half of the
chemicals were reported by fewer than ten facilities.
Plastic Resins
Releases
Table 12 presents the number and volumes of chemicals released by plastic
resin manufacturing facilities reporting SIC 2821 in 1995. About 410 plastic
Sector Notebook Project 68 September 1997

Plastic Resin and Manmade Fiber Release and Transfer Profile
resin facilities reported TRI emissions for 184 chemicals in 1995. The total
volume of releases was 64.1 million pounds or 25 percent of the total volume
of chemicals reported to TRI by the plastic resin industry (i.e. releases and
transfers). The top five chemicals released by this industry, in terms of
volumes, include: ethylene, methanol, acetonitrile, propylene, and ammonia.
The very volatile nature of these chemicals is apparent in the fact that about
74 percent (48 million pounds) of the industry’s releases are to the air. About
49 percent (31.4 million pounds) of all the TRI chemicals released by the
plastic resin industry were released to air in the form of point source
emissions, and 25 percent (16.3 million pounds) were released as fugitive air
emissions. Roughly 21 percent (13.3 million pounds) of releases were by
underground injection. The remaining five percent were released as water
discharges and disposals to land.
Sector Notebook Project 69 September 1997

Plastic Resin and Manmade Fiber Release and Transfer Profile
Transfers
Table 13 presents the number and volumes of chemicals transferred by plastic
resin manufacturing facilities reporting SIC 2821, in 1995. The total volume
of transfers was 192 million pounds or 75 percent of the total volume of
chemicals reported to TRI by the plastic resin industry (i.e. releases and
transfers). Transfers to recycling and energy recovery accounted for the
largest amount, 46 percent (88.5 million pounds) and 31 percent (60.2 million
pounds), respectively. About 16 percent (30.5 million pounds) was
transferred off-site for treatment, with the remaining seven percent (13.2
million pounds) transferred for either disposal or POTW treatment. Four
chemicals (ethylene glycol, N-hexane, xylene (mixed isomers), and vinyl
acetate) accounted for about 59 percent of the 192 million pounds of total
transfers for this industry. Ethylene glycol alone accounted for about 34
percent (65.0 million pounds) of the total transfers and was primarily recycled.
Manmade Fibers
Releases
Table 14 presents the number and volumes of chemicals released by manmade
fiber manufacturing facilities reporting SIC 2823 or 2824 in 1995. Thirty-four
manmade fiber facilities reported TRI emissions for 116 chemicals in 1995.
The total volume of releases was 95.9 million pounds or 67 percent of the
total volume of TRI chemicals reported by the manmade fiber industry (i.e.
releases and transfers). The top five chemicals released by this industry, in
terms of volumes, include: carbon disulfide, nitrate compounds, hydrochloric
acid, formic acid, and methanol.
A typical manmade fiber facility averaged 2.8 million pounds of releases and
1.4 million pounds of transfers. The high release average is attributed largely
to the release of carbon disulfide by four facilities. Carbon disulfide, used in
making rayon, accounted for about 62 percent (59.5 million pounds) of TRI
releases for the industry. Even eliminating carbon disulfide from the average
release calculation reveals that manmade fiber facilities still average about 1.1
million pounds of releases per facility. These relatively high releases and
transfers per facility may reflect the large volumes of material processed at a
relatively small number of facilities.
About 72 percent (69.5 million pounds) of all the chemicals released by the
manmade fiber industry were released to air in the form of point source
emissions, and six percent (6.3 million pounds) were released as fugitive air
emissions. Roughly 19 percent (17.9 million pounds) of releases were by
underground injection. The remaining three percent were released as water
discharges and disposals to land.
Sector Notebook Project 70 September 1997

Plastic Resin and Manmade Fiber Release and Transfer Profile
Transfers
Table 15 presents the number and volumes of chemicals transferred by
manmade fiber manufacturing facilities reporting SIC 2823 or 2824, in 1995.
The total volume of transfers off-site was 47.3 million pounds or 33 percent
of the total volume of chemicals reported to TRI by the manmade fiber
industry (i.e. releases and transfers). Transfers to recycling accounted for 90
percent of all transfers (42.5 million pounds). The remaining 10 percent (4.8
million pounds) was transferred for disposal, treatment, energy recovery, or
to a POTW. Ethylene glycol accounted for about 90 percent of the industry’s
transfers (42.5 million pounds), and was primarily recycled.
Sector Notebook Project 71 September 1997
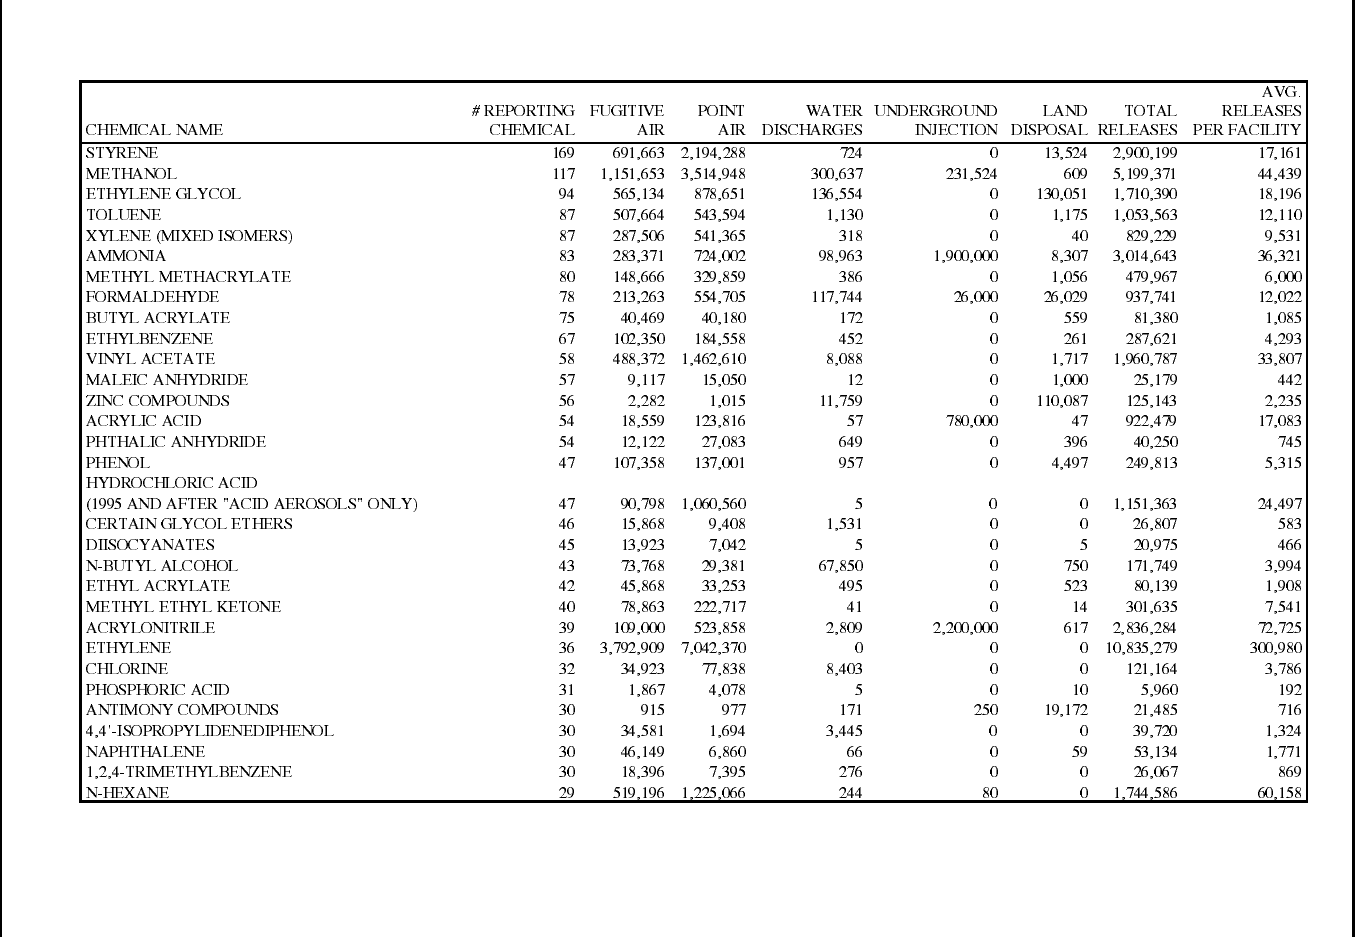
Sector Notebook Project 72 September 1997
Plastic Resin and Manmade Fiber
Table 12: 1995 TRI Releases for Plastic Resin Manufacturing Facilities (SIC 2821),
by Number of Facilities Reporting (in pounds/year)
Release and Transfer Profile
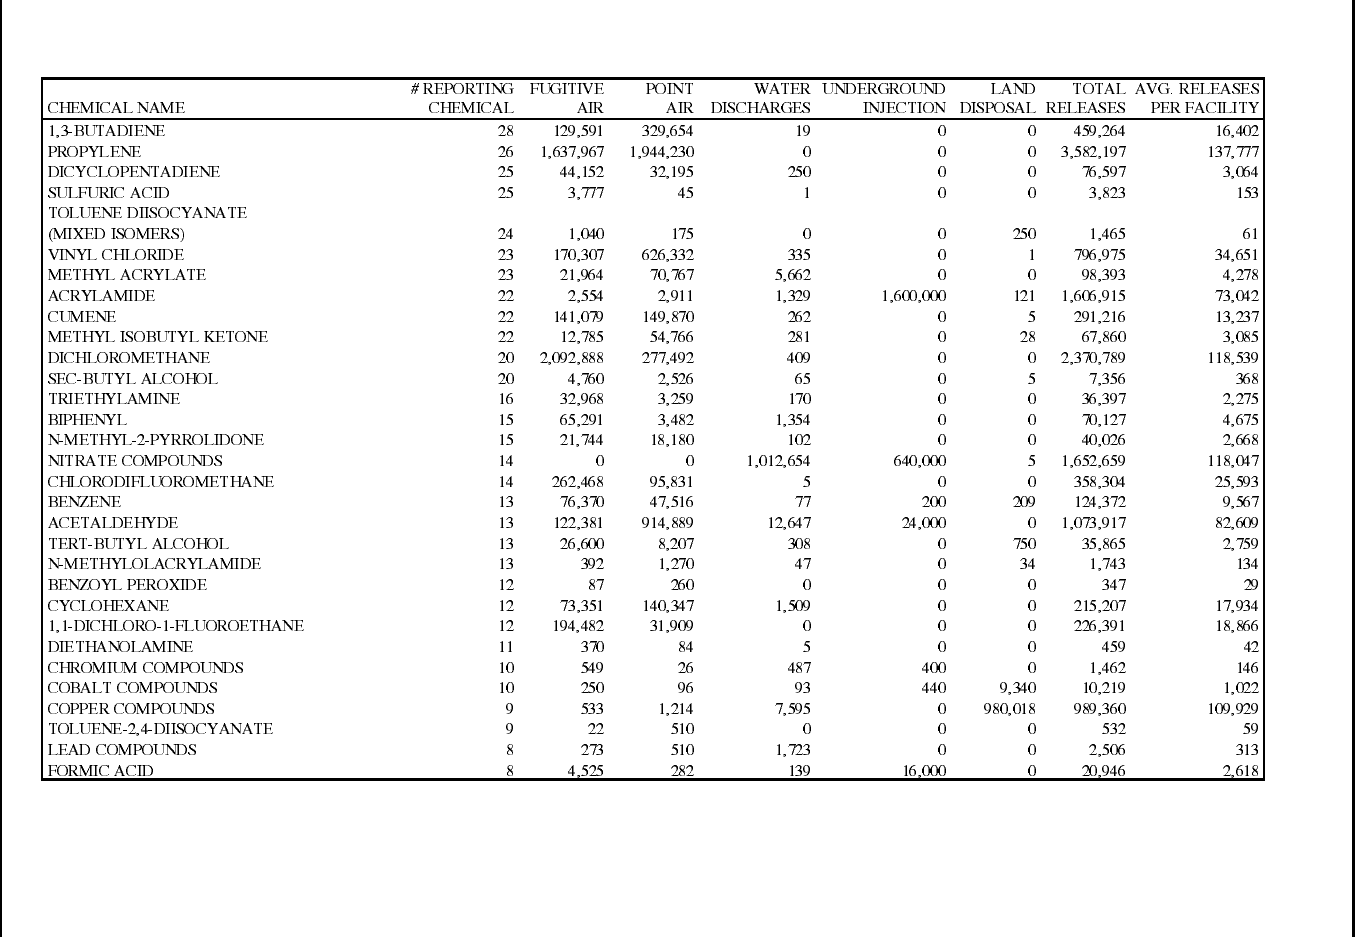
Sector Notebook Project 73 September 1997
Plastic Resin and Manmade Fiber
Table 12 (cont.): 1995 TRI Releases for Plastic Resin Manufacturing Facilities (SIC 2821),
by Number of Facilities Reporting (in pounds/year)
Release and Transfer Profile

Sector Notebook Project 74 September 1997
Plastic Resin and Manmade Fiber
Table 12 (cont.): 1995 TRI Releases for Plastic Resin Manufacturing Facilities (SIC 2821),
by Number of Facilities Reporting (in pounds/year)
CHEMICAL NAME # REPORTING
CHEMICAL FUGITIVE
AIR POINT
AIR WATER
DISCHARGES UNDERGROUND
INJECTION LAND
DISPOSAL TOTAL
RELEASES AVG. RELEASES
PER FACILITY
N,N-DIMETHYLFORMAMIDE 8 5,533 30,083 255 0 5 35,876 4,485
PROPYLENE OXIDE 8 4,689 17,257 250 0 250 22,446 2,806
EPICHLOROHYDRIN 8 7,782 2,247 0 0 0 10,029 1,254
NITRIC ACID 8 9,986 1,892 0 0 1 11,879 1,485
CHLOROMETHANE 7 37,052 220,010 571 0 5 257,638 36,805
HYDROQUINONE 7 636 128 19 43,000 0 43,783 6,255
DECABROMODIPHENYL OXIDE 7 2,698 387 250 0 0 3,335 476
CRESOL (MIXED ISOMERS) 7 5,730 3,692 30 0 0 9,452 1,350
TITANIUM TETRACHLORIDE 7 182 135 0 0 0 317 45
1,1,1-TRICHLOROETHANE 6 14,203 17,473 48 0 0 31,724 5,287
CHLOROETHANE 6 412,746 329,336 121 0 0 742,203 123,701
1-CHLORO-1,1-DIFLUOROETHANE 6 67,266 1,223,217 1 0 0 1,290,484 215,081
TRICHLOROETHYLENE 6 76,245 8,795 0 0 0 85,040 14,173
DI(2-ETHYLHEXYL) PHTHALATE 6 271 310 15 0 0 596 99
HYDROGEN FLUORIDE 6 1,766 146,625 0 0 0 148,391 24,732
NICKEL COMPOUNDS 5 250 5 322 11,000 0 11,577 2,315
ETHYLENE OXIDE 5 5,085 7,118 250 0 5 12,458 2,492
PHOSGENE 5 123 20 0 0 0 143 29
O-XYLENE 5 68,038 41,387 0 0 0 109,425 21,885
1,2-DICHLOROETHANE 5 98,265 116,224 273 0 0 214,762 42,952
1,4-DIOXANE 5 3,810 1,763 17,246 0 22 22,841 4,568
BARIUM COMPOUNDS 4 255 255 0 0 0 510 128
CARBON TETRACHLORIDE 4 10 140 80 0 0 230 58
CARBON DISULFIDE 4 110,755 958,275 0 0 0 1,069,030 267,258
VINYLIDENE CHLORIDE 4 4,542 97,440 5 0 0 101,987 25,497
TRICHLOROFLUOROMETHANE 4 6,227 1,522 0 0 0 7,749 1,937
CUMENE HYDROPEROXIDE 4 112 1,169 5 0 0 1,286 322
ALLYL ALCOHOL 4 331 7,529 0 55,000 0 62,860 15,715
N,N-DIMETHYLANILINE 4 1,065 0 0 0 0 1,065 266
PROPIONALDEHYDE 4 24,914 16,094 0 0 0 41,008 10,252
CARBONYL SULFIDE 4 7,720 47,748 0 0 0 55,468 13,867
BORON TRIFLUORIDE 4 3,079 165 0 0 0 3,244 811
Release and Transfer Profile

Sector Notebook Project 75 September 1997
Plastic Resin and Manmade Fiber
Table 12 (cont.): 1995 TRI Releases for Plastic Resin Manufacturing Facilities (SIC 2821),
by Number of Facilities Reporting (in pounds/year)
CHEMICAL NAME # REPORTING
CHEMICAL FUGITIVE
AIR POINT
AIR WATER
DISCHARGES UNDERGROUND
INJECTION LAND
DISPOSAL TOTAL
RELEASES AVG. RELEASES
PER FACILITY
CYANIDE COMPOUNDS 3 0 16 1,232 770,000 0 771,248 257,083
MANGANESE COMPOUNDS 3 250 271 290 250 2,420 3,481 1,160
ANILINE 3 4,036 13,848 2 0 0 17,886 5,962
CHLOROFORM 3 556 5,905 392 0 0 6,853 2,284
HYDROGEN CYANIDE 3 25,000 34,700 0 0 0 59,700 19,900
PROPYLENEIMINE 3 555 0 0 0 0 555 185
FREON 113 3 11,667 219,650 38 0 0 231,355 77,118
DIBUTYL PHTHALATE 3 250 827 0 0 0 1,077 359
TOLUENE-2,6-DIISOCYANATE 3 5 13 0 0 0 18 6
O-CRESOL 3 500 3,746 5 0 0 4,251 1,417
4,4'-METHYLENEDIANILINE 3 685 48 0 0 0 733 244
ACROLEIN 3 56 1,978 0 3,500 0 5,534 1,845
1,3-PHENYLENEDIAMINE 3 1,215 25 0 0 0 1,240 413
CHLOROBENZENE 3 256,001 159,000 6 0 0 415,007 138,336
2-METHOXYETHANOL 3 5,760 3,665 6,000 0 0 15,425 5,142
BUTYRALDEHYDE 3 17,399 35,115 263 0 0 52,777 17,592
DIMETHYL PHTHALATE 3 939 34 29 0 0 1,002 334
HYDRAZINE 3 6 47 0 0 0 53 18
ZINC (FUME OR DUST) 3 5 354 0 0 0 359 120
CADMIUM COMPOUNDS 2 5 6 5 0 0 16 8
DIETHYL SULFATE 2 3,407 19 0 0 0 3,426 1,713
DICHLORODIFLUOROMETHANE 2 49,194 4,404 0 0 0 53,598 26,799
DIMETHYL SULFATE 2 5 6 0 0 0 11 6
ISOBUTYRALDEHYDE 2 1,824 1,677 0 0 0 3,501 1,751
O-TOLUIDINE 2 6,480 1,560 5 0 5 8,050 4,025
ACETOPHENONE 2 3,190 2,100 640 0 0 5,930 2,965
4,4'-METHYLENEBIS(2-CHLOROANILINE) 2 0 0 0 0 0 0 0
ALLYL CHLORIDE 2 870 2,311 0 0 0 3,181 1,591
2-ETHOXYETHANOL 2 575 9,908 0 0 0 10,483 5,242
PYRIDINE 2 2,773 3,250 314 140,000 0 146,337 73,169
ANTHRACENE 2 179 12 2 0 0 193 97
TETRACHLOROETHYLENE 2 628 4,500 0 0 0 5,128 2,564
Release and Transfer Profile

Sector Notebook Project 76 September 1997
Plastic Resin and Manmade Fiber
Table 12 (cont.): 1995 TRI Releases for Plastic Resin Manufacturing Facilities (SIC 2821),
by Number of Facilities Reporting (in pounds/year)
CHEMICAL NAME # REPORTING
CHEMICAL FUGITIVE
AIR POINT
AIR WATER
DISCHARGES UNDERGROUND
INJECTION LAND
DISPOSAL TOTAL
RELEASES AVG. RELEASES
PER FACILITY
TETRACHLOROETHYLENE 2 628 4,500 0 0 0 5,128 2,564
NICKEL 2 65 0 0 0 0 65 33
COPPER 2 0 0 0 0 0 0 0
SODIUM NITRITE 2 0 0 0 0 0 0 0
ARSENIC COMPOUNDS 1 0 0 0 200 0 200 200
SILVER COMPOUNDS 1 0 0 0 0 0 0 0
PIPERONYL BUTOXIDE 1 0 0 0 0 0 0 0
ACETAMIDE 1 5 0 0 490,000 0 490,005 490,005
THIOUREA 1 0 0 12 0 0 12 12
ISOPROPYL ALCOHOL (MANUFACTURING,
STRONG-ACID PROCESS ONLY, NO SUPPLIE 1 250 250 0 0 0 500 500
HEXACHLOROETHANE 1 1 2 0 0 0 3 3
BROMOMETHANE 1 8,600 370,000 3 0 0 378,603 378,603
ACETONITRILE 1 9,000 20,000 0 4,300,000 0 4,329,000 4,329,000
TRICHLOROACETYL CHLORIDE 1 0 1 0 0 0 1 1
DICHLOROTETRAFLUOROETHANE (CFC-114) 1 0 44,035 . 0 0 44,035 44,035
1,2-DICHLOROPROPANE 1 11,818 146,880 1,056 0 0 159,754 159,754
1,1,2-TRICHLOROETHANE 1 898 0 0 0 0 898 898
1,1,2,2-TETRACHLOROETHANE 1 0 0 0 0 0 0 0
1,2-DICHLOROBENZENE 1 91,000 14,000 170 0 100 105,270 105,270
4,4'-DIAMINODIPHENYL ETHER 1 5 17 0 0 0 22 22
2,4-DIMETHYLPHENOL 1 90 150 5 0 0 245 245
P-XYLENE 1 84,000 63,000 0 0 0 147,000 147,000
P-CRESOL 1 250 250 250 0 0 750 750
1,4-DICHLOROBENZENE 1 7,342 435 11 0 0 7,788 7,788
P-PHENYLENEDIAMINE 1 3,200 0 12 0 0 3,212 3,212
CHLOROMETHYL METHYL ETHER 1 2 2,854 10 0 0 2,866 2,866
M-CRESOL 1 250 250 5 0 0 505 505
CYCLOHEXANOL 1 0 0 0 0 0 0 0
2-METHYLPYRIDINE 1 5 0 0 20,000 0 20,005 20,005
PROPOXUR 1 0 5 0 0 0 5 5
CHLORENDIC ACID 1 0 6 0 0 0 6 6
Release and Transfer Profile

Sector Notebook Project 77 September 1997
Plastic Resin and Manmade Fiber
Table 12 (cont.): 1995 TRI Releases for Plastic Resin Manufacturing Facilities (SIC 2821),
by Number of Facilities Reporting (in pounds/year)
CHEMICAL NAME # REPORTING
CHEMICAL FUGITIVE
AIR POINT
AIR WATER
DISCHARGES UNDERGROUND
INJECTION LAND
DISPOSAL TOTAL
RELEASES AVG. RELEASES
PER FACILITY
DIPHENYLAMINE 1 1,029 2,197 0 0 0 3,226 3,226
DIMETHYLAMINE 1 0 70 0 0 0 70 70
METHACRYLONITRILE 1 0 0 0 990 0 990 990
CHLOROPRENE 1 125 0 0 0 0 125 125
POTASSIUM DIMETHYLDITHIOCARBAMATE 1 0 0 0 0 0 0 0
METHYL PARATHION 1 0 192 0 0 0 192 192
1-CHLORO-1,1,2,2-TETRAFLUOROETHANE 1 0 502,000 . 0 0 502,000 502,000
1,2-DICHLOROETHYLENE 1 253 1,408 0 0 0 1,661 1,661
LITHIUM CARBONATE 1 0 0 0 0 0 0 0
2,6-DIMETHYLPHENOL 1 1,720 780 12 0 0 2,512 2,512
C.I. BASIC RED 1 1 0 0 0 0 0 0 0
MOLYBDENUM TRIOXIDE 1 250 0 0 38,000 0 38,250 38,250
ASBESTOS (FRIABLE) 1 1 1 0 0 0 2 2
ALUMINUM OXIDE (FIBROUS FORMS) 1 0 640 0 0 0 640 640
2-CHLORO-1,1,1,2-TETRAFLUOROETHANE 1 0 127,700 . 0 0 127,700 127,700
CROTONALDEHYDE 1 0 0 0 1,500 0 1,500 1,500
LEAD 1 0 0 0 0 0 0 0
ANTIMONY 1 0 64 110 0 7,544 7,718 7,718
CADMIUM 1 0 5 0 0 0 5 5
CHROMIUM 1 0 120 0 0 0 120 120
COBALT 1 0 0 340 0 2,900 3,240 3,240
TETRAMETHRIN 1 0 0 0 0 0 0 0
PHOSPHORUS (YELLOW OR WHITE) 1 0 0 0 0 0 0 0
BROMINE 1 0 29 0 0 0 29 29
DIAMINOTOLUENE (MIXED ISOMERS) 1 5 5 250 0 5 265 265
OXYFLUORFEN 1 0 0 3 0 0 3 3
PERMETHRIN 1 0 0 0 0 0 0 0
____ _________ _________ _________ __________ _________ _________ ________
410 16,247,638 31,388,839 1,842,689 13,292,334 1,324,533 64,096,033 156,332
Release and Transfer Profile
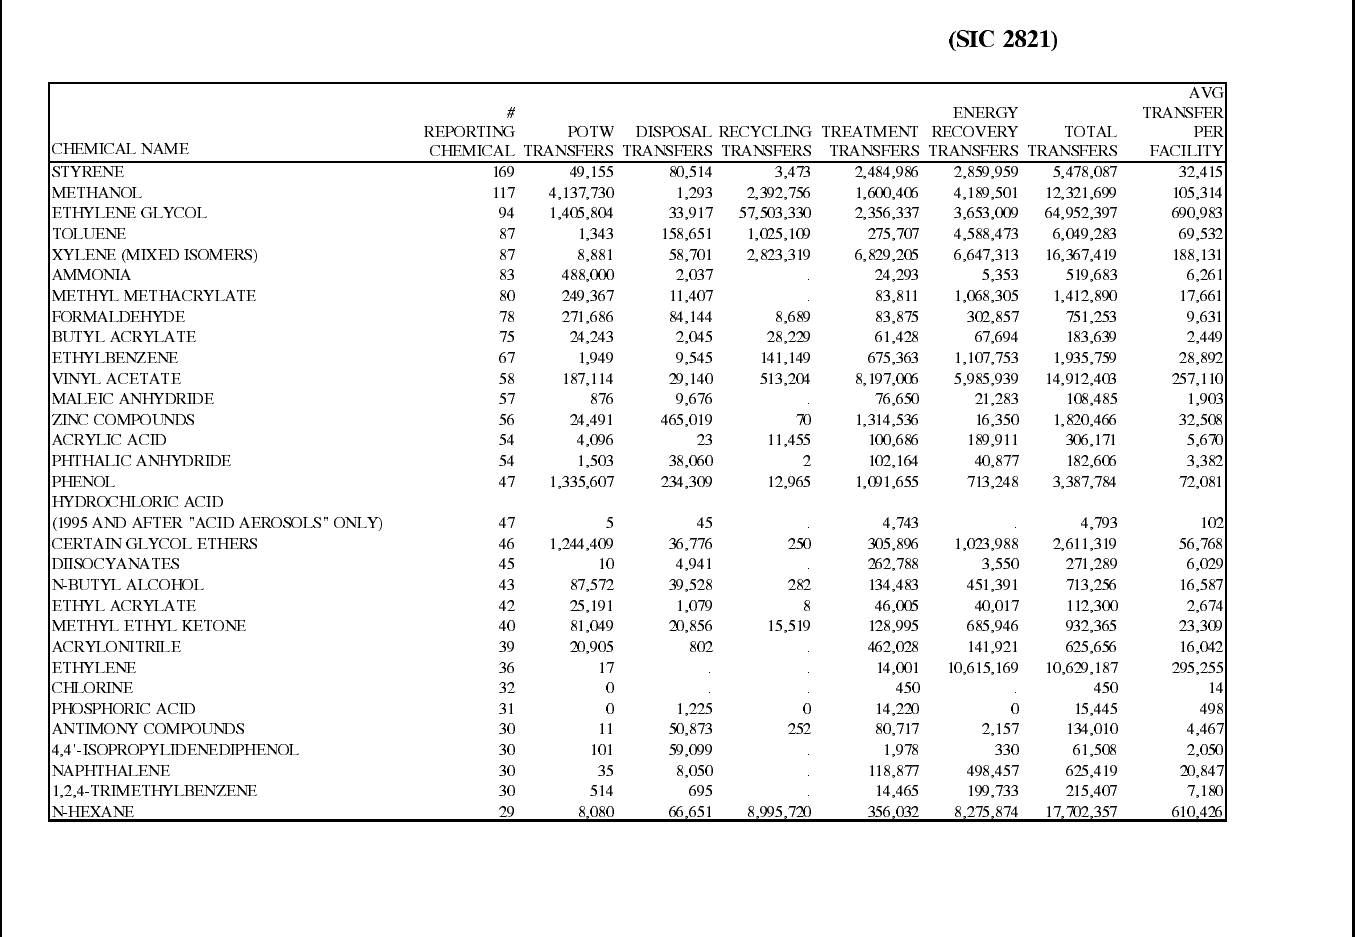
Sector Notebook Project 78 September 1997
Plastic Resin and Manmade Fiber
Table 13: 1995 TRI Transfers for Plastic Resin Manufacturing Facilities ,
by Number of Facilities Reporting (in pounds/year)
Release and Transfer Profile
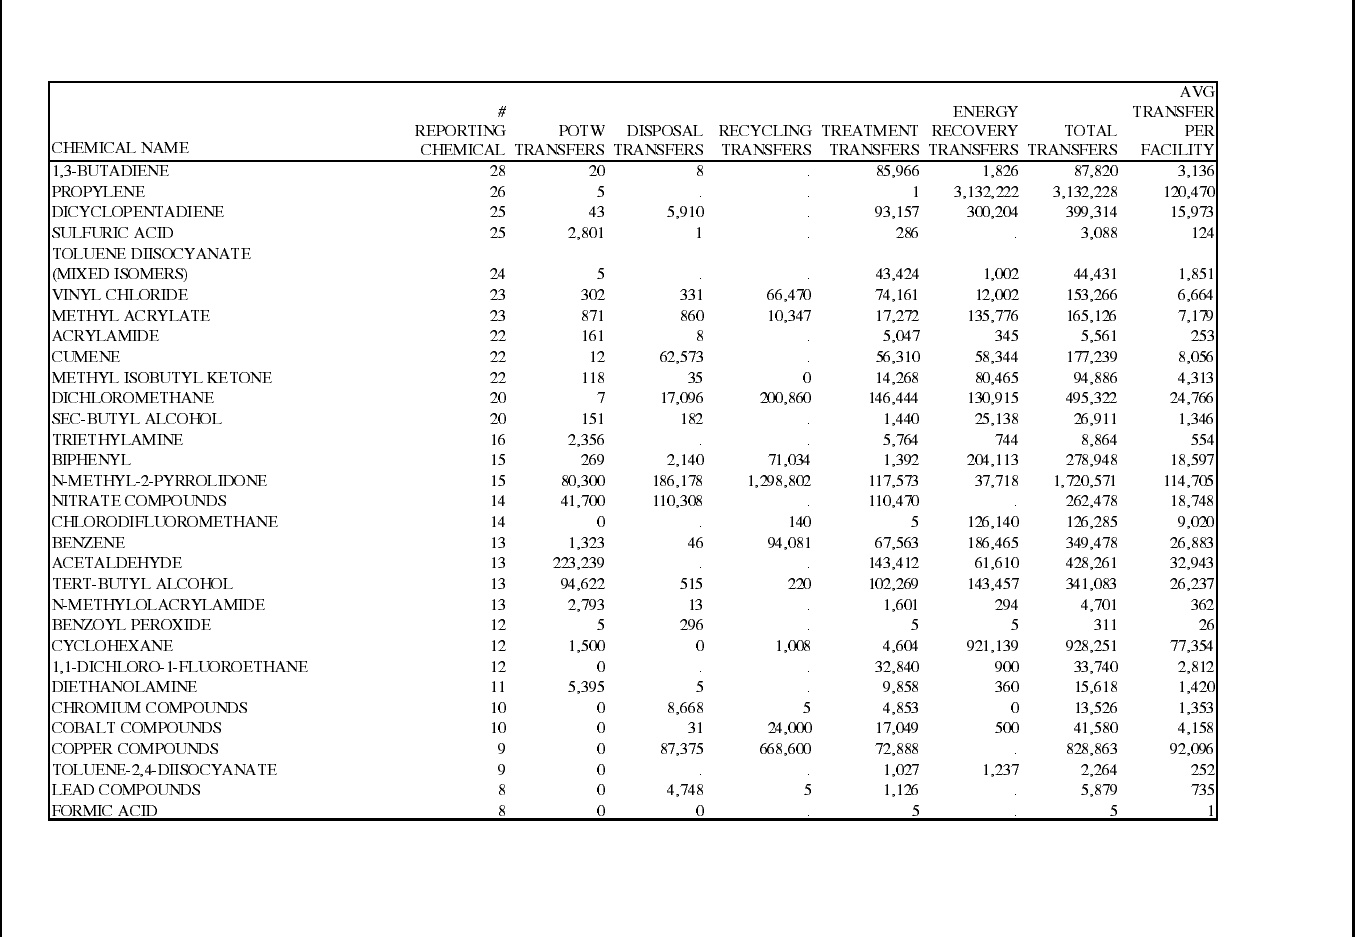
Sector Notebook Project 79 September 1997
Plastic Resin and Manmade Fiber
Table 13 (cont.): 1995 TRI Transfers for Plastic Resin Manufacturing Facilities (SIC 2821),
by Number of Facilities Reporting (in pounds/year)
Release and Transfer Profile

Sector Notebook Project 80 September 1997
Plastic Resin and Manmade Fiber
Table 13 (cont.): 1995 TRI Transfers for Plastic Resin Manufacturing Facilities (SIC 2821),
by Number of Facilities Reporting (in pounds/year)
CHEMICAL NAME
#
REPORTING
CHEMICAL POTW
TRANSFERS DISPOSAL
TRANSFERS RECYCLING
TRANSFERS TREATMENT
TRANSFERS
ENERGY
RECOVERY
TRANSFERS TOTAL
TRANSFERS
AVG
TRANSFER
PER
FACILITY
N,N-DIMETHYLFORMAMIDE 8 106,238 . . 53,890 488,482 648,610 81,076
PROPYLENE OXIDE 8 177,100 160 . 9 4 177,273 22,159
EPICHLOROHYDRIN 8 9,888 . . 5,563 . 15,451 1,931
NITRIC ACID 8 0 0 . 8,450 . 8,450 1,056
CHLOROMETHANE 7 250 . . 486 . 736 105
HYDROQUINONE 7 119 74 . 377 7 577 82
DECABROMODIPHENYL OXIDE 7 5 32,360 . 4,436 . 36,801 5,257
CRESOL (MIXED ISOMERS) 7 0 . . 2,361 42,453 44,814 6,402
TITANIUM TETRACHLORIDE 7 0 32,282 129,127 0 . 161,409 23,058
1,1,1-TRICHLOROETHANE 6 0 3,088 . 24,340 720 28,148 4,691
CHLOROETHANE 6 0 . 2,726 . . 2,726 454
1-CHLORO-1,1-DIFLUOROETHANE 6 0 . . . . 0 0
TRICHLOROETHYLENE 6 12 . 143,735 21,073 1,960 166,780 27,797
DI(2-ETHYLHEXYL) PHTHALATE 6 0 3,036 . 11,673 1,404 16,113 2,686
HYDROGEN FLUORIDE 6 0 . 210 5,400 8,840 14,450 2,408
NICKEL COMPOUNDS 5 502 576 . 27,426 . 28,504 5,701
ETHYLENE OXIDE 5 250 162 . . . 412 82
PHOSGENE 5 0 . . . . 0 0
O-XYLENE 5 2,104 . 16,000 177,450 76,531 272,085 54,417
1,2-DICHLOROETHANE 5 1,766 . 5,876,308 2,766 3,371 5,884,211 1,176,842
1,4-DIOXANE 5 0 271 . 12,655 11,990 24,916 4,983
BARIUM COMPOUNDS 4 251 1,401 . 16 10 1,678 420
CARBON TETRACHLORIDE 4 0 4,000 355,475 72,370 10 431,855 107,964
CARBON DISULFIDE 4 13,260 1,820 0 12,130 610 27,820 6,955
VINYLIDENE CHLORIDE 4 0 250 . 33,323 . 33,573 8,393
TRICHLOROFLUOROMETHANE 4 0 250 . 5 . 255 64
CUMENE HYDROPEROXIDE 4 5 0 . . 0 5 1
ALLYL ALCOHOL 4 191,310 . . 79,933 430 271,673 67,918
N,N-DIMETHYLANILINE 4 5 . . 550 517 1,072 268
PROPIONALDEHYDE 4 87,434 0 . . 5,565 92,999 23,250
CARBONYL SULFIDE 4 0 . . 16,000 . 16,000 4,000
BORON TRIFLUORIDE 4 0 . . 10 . 10 3
Release and Transfer Profile

Sector Notebook Project 81 September 1997
Plastic Resin and Manmade Fiber
Table 13 (cont.): 1995 TRI Transfers for Plastic Resin Manufacturing Facilities (SIC 2821),
by Number of Facilities Reporting (in pounds/year)
CHEMICAL NAME
#
REPORTING
CHEMICAL POTW
TRANSFERS DISPOSAL
TRANSFERS RECYCLING
TRANSFERS TREATMENT
TRANSFERS
ENERGY
RECOVERY
TRANSFERS TOTAL
TRANSFERS
AVG
TRANSFER
PER
FACILITY
CYANIDE COMPOUNDS 3 1,048 . . 89,925 . 90,973 30,324
MANGANESE COMPOUNDS 3 0 259 2,000 12,028 . 14,287 4,762
ANILINE 3 8,182 5 . 3,300 44,229 55,716 18,572
CHLOROFORM 3 0 1 126,776 3,774 . 130,551 43,517
HYDROGEN CYANIDE 3 87 . . . . 87 29
PROPYLENEIMINE 3 0 . . . . 0 0
FREON 113 3 0 . 106,088 16,570 . 122,658 40,886
DIBUTYL PHTHALATE 3 5 5 . 505 129 644 215
TOLUENE-2,6-DIISOCYANATE 3 0 . . . 178 178 59
O-CRESOL 3 0 . . 0 . 0 0
4,4'-METHYLENEDIANILINE 3 5 122 . 17,400 . 17,527 5,842
ACROLEIN 3 0 . . 4,035 35,301 39,336 13,112
1,3-PHENYLENEDIAMINE 3 5 80 . . . 85 28
CHLOROBENZENE 3 0 4,205 614,904 528,000 117,000 1,264,109 421,370
2-METHOXYETHANOL 3 0 . . 1,565 11,279 12,844 4,281
BUTYRALDEHYDE 3 440 41 . 2,200 . 2,681 894
DIMETHYL PHTHALATE 3 600 5 . 18,639 5 19,249 6,416
HYDRAZINE 3 0 . . 274 . 274 91
ZINC (FUME OR DUST) 3 250 5,420 . 5 . 5,675 1,892
CADMIUM COMPOUNDS 2 0 9 5 . . 14 7
DIETHYL SULFATE 2 158 . . . . 158 79
DICHLORODIFLUOROMETHANE 2 0 . . . . 0 0
DIMETHYL SULFATE 2 0 . . . . 0 0
ISOBUTYRALDEHYDE 2 0 0 . 31 0 31 16
O-TOLUIDINE 2 1,463 . . . 90,221 91,684 45,842
ACETOPHENONE 2 0 1 . . 500 501 251
4,4'-METHYLENEBIS(2-CHLOROANILINE) 2 0 . . . 234 234 117
ALLYL CHLORIDE 2 5 . . 85 . 90 45
2-ETHOXYETHANOL 2 0 . . 160 1,200 1,360 680
PYRIDINE 2 0 . . 88,282 66,595 154,877 77,439
ANTHRACENE 2 0 . . 1,593 40,576 42,169 21,085
TETRACHLOROETHYLENE 2 0 . 712,881 290 1,650 714,821 357,411
Release and Transfer Profile

Sector Notebook Project 82 September 1997
Plastic Resin and Manmade Fiber
Table 13 (cont.): 1995 TRI Transfers for Plastic Resin Manufacturing Facilities (SIC 2821),
by Number of Facilities Reporting (in pounds/year)
CHEMICAL NAME
#
REPORTING
CHEMICAL POTW
TRANSFERS DISPOSAL
TRANSFERS RECYCLING
TRANSFERS TREATMENT
TRANSFERS
ENERGY
RECOVERY
TRANSFERS TOTAL
TRANSFERS
AVG
TRANSFER
PER
FACILITY
NICKEL 2 14 8,309 12,960 . . 21,283 10,642
COPPER 2 142 2,104 33,192 . . 35,438 17,719
SODIUM NITRITE 2 250 . . 505 . 755 378
ARSENIC COMPOUNDS 1 0 . . 5 . 5 5
SILVER COMPOUNDS 1 0 . 97,000 . . 97,000 97,000
PIPERONYL BUTOXIDE 1 250 . . 15,148 . 15,398 15,398
ACETAMIDE 1 0 . . 250 . 250 250
THIOUREA 1 0 495 . . . 495 495
ISOPROPYL ALCOHOL (MANUFACTURING,
STRONG-ACID PROCESS ONLY, NO SUPPLIE 1 0 . . . 500 500 500
HEXACHLOROETHANE 1 0 . . . 75,132 75,132 75,132
BROMOMETHANE 1 0 . . . 380 380 380
ACETONITRILE 1 0 . . 1,750 . 1,750 1,750
TRICHLOROACETYL CHLORIDE 1 0 . . . . 0 0
DICHLOROTETRAFLUOROETHANE (CFC-114) 1 0 . . . . 0 0
1,2-DICHLOROPROPANE 1 0 404 . . . 404 404
1,1,2-TRICHLOROETHANE 1 0 . 4,026,507 . . 4,026,507 4,026,507
1,1,2,2-TETRACHLOROETHANE 1 0 . 72,142 . . 72,142 72,142
1,2-DICHLOROBENZENE 1 0 14,010 . 25,690 124,087 163,787 163,787
4,4'-DIAMINODIPHENYL ETHER 1 5 120 . . . 125 125
2,4-DIMETHYLPHENOL 1 0 . . . 2,000 2,000 2,000
P-XYLENE 1 0 . . . . 0 0
P-CRESOL 1 0 . . . . 0 0
1,4-DICHLOROBENZENE 1 0 . . 498,408 48 498,456 498,456
P-PHENYLENEDIAMINE 1 0 . . . . 0 0
CHLOROMETHYL METHYL ETHER 1 0 70 . . . 70 70
M-CRESOL 1 0 . . . . 0 0
CYCLOHEXANOL 1 0 . . . . 0 0
2-METHYLPYRIDINE 1 0 . . 5 . 5 5
PROPOXUR 1 250 . . 750 . 1,000 1,000
CHLORENDIC ACID 1 0 . . 488 . 488 488
Release and Transfer Profile

Sector Notebook Project 83 September 1997
Plastic Resin and Manmade Fiber
Table 13 (cont.): 1995 TRI Transfers for Plastic Resin Manufacturing Facilities (SIC 2821),
by Number of Facilities Reporting (in pounds/year)
CHEMICAL NAME
#
REPORTING
CHEMICAL POTW
TRANSFERS DISPOSAL
TRANSFERS RECYCLING
TRANSFERS TREATMENT
TRANSFERS
ENERGY
RECOVERY
TRANSFERS TOTAL
TRANSFERS
AVG
TRANSFER
PER
FACILITY
DIPHENYLAMINE 1 5 . . . 9,417 9,422 9,422
DIMETHYLAMINE 1 0 . . . . 0 0
METHACRYLONITRILE 1 0 . . . . 0 0
CHLOROPRENE 1 0 . 254,406 . . 254,406 254,406
POTASSIUM DIMETHYLDITHIOCARBAMATE 1 160,000 . . . . 160,000 160,000
METHYL PARATHION 1 0 . . . . 0 0
1-CHLORO-1,1,2,2-TETRAFLUOROETHANE 1 0 . . . . 0 0
1,2-DICHLOROETHYLENE 1 0 . . . . 0 0
LITHIUM CARBONATE 1 0 860 . . . 860 860
2,6-DIMETHYLPHENOL 1 0 . . 200 . 200 200
C.I. BASIC RED 1 1 250 668 . 250 250 1,418 1,418
MOLYBDENUM TRIOXIDE 1 0 . . 330 . 330 330
ASBESTOS (FRIABLE) 1 0 191,000 . . . 191,000 191,000
ALUMINUM OXIDE (FIBROUS FORMS) 1 0 . . . 3,424 3,424 3,424
2-CHLORO-1,1,1,2-TETRAFLUOROETHANE 1 0 . . . . 0 0
CROTONALDEHYDE 1 0 . . . . 0 0
LEAD 1 0 . 3,000 . . 3,000 3,000
ANTIMONY 1 0 7,544 . . . 7,544 7,544
CADMIUM 1 0 . . 5 . 5 5
CHROMIUM 1 0 . . 0 . 0 0
COBALT 1 0 . . 4 . 4 4
TETRAMETHRIN 1 0 . . 750 . 750 750
PHOSPHORUS (YELLOW OR WHITE) 1 0 . . . . 0 0
BROMINE 1 0 . . . . 0 0
DIAMINOTOLUENE (MIXED ISOMERS) 1 250 . . 110 990 1,350 1,350
OXYFLUORFEN 1 3,135 . . 11,268 . 14,403 14,403
PERMETHRIN 1 0 . . 505 . 505 505
____ __________ _________ __________ __________ __________ ___________ _______
__410 10,885,040 2,311,895 88,496,795 30,453,640 60,227,508 192,374,893 469,207
Release and Transfer Profile
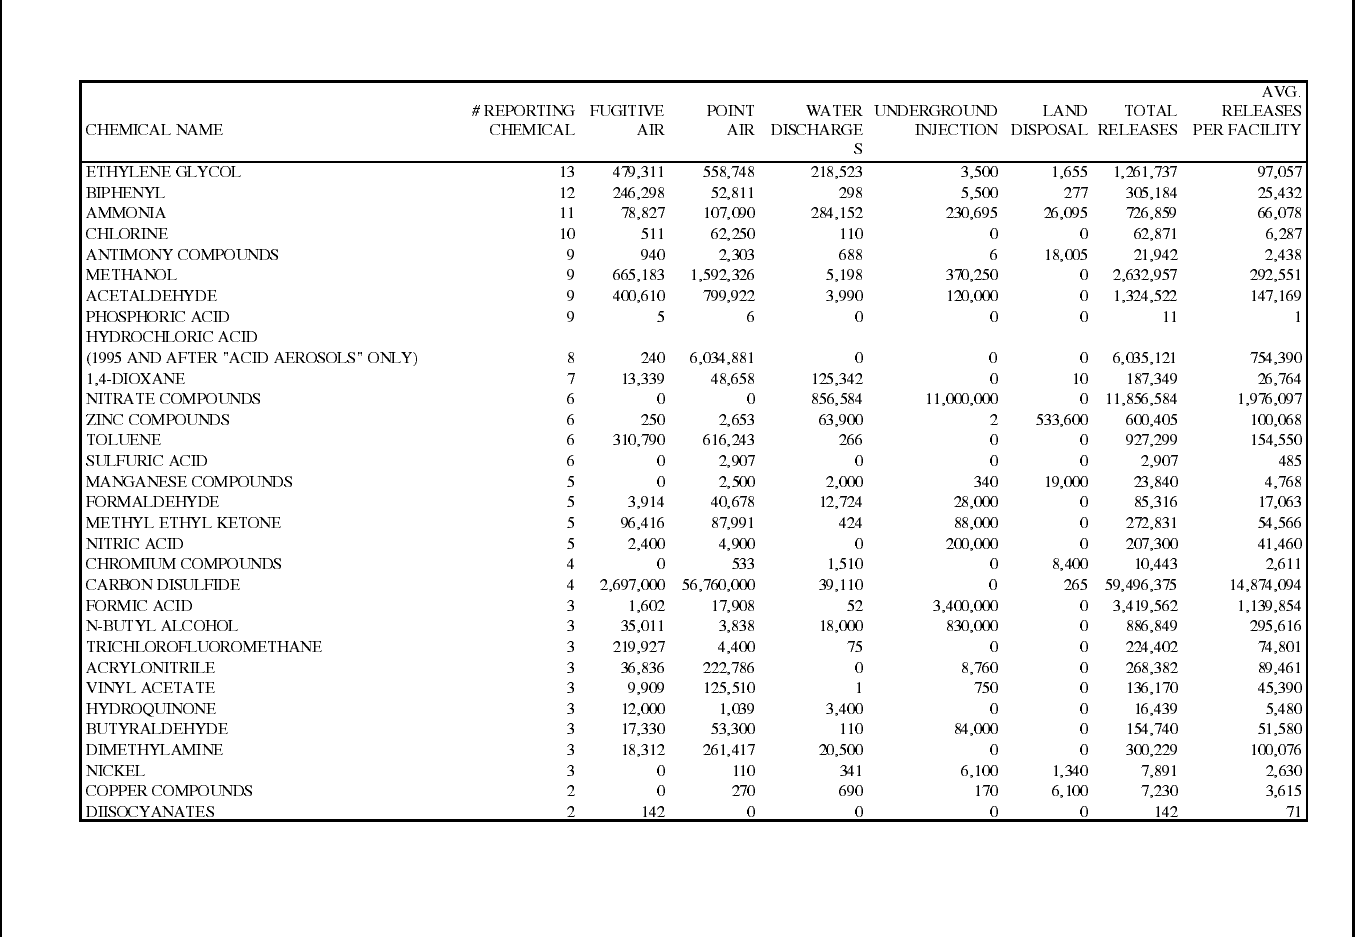
Sector Notebook Project 84 September 1997
Plastic Resin and Manmade Fiber
Table 14: 1995 TRI Releases for Manmade Fiber Manufacturing Facilities (SIC 2823 & 2824),
by Number of Facilities Reporting (in pounds/year)
Release and Transfer Profile
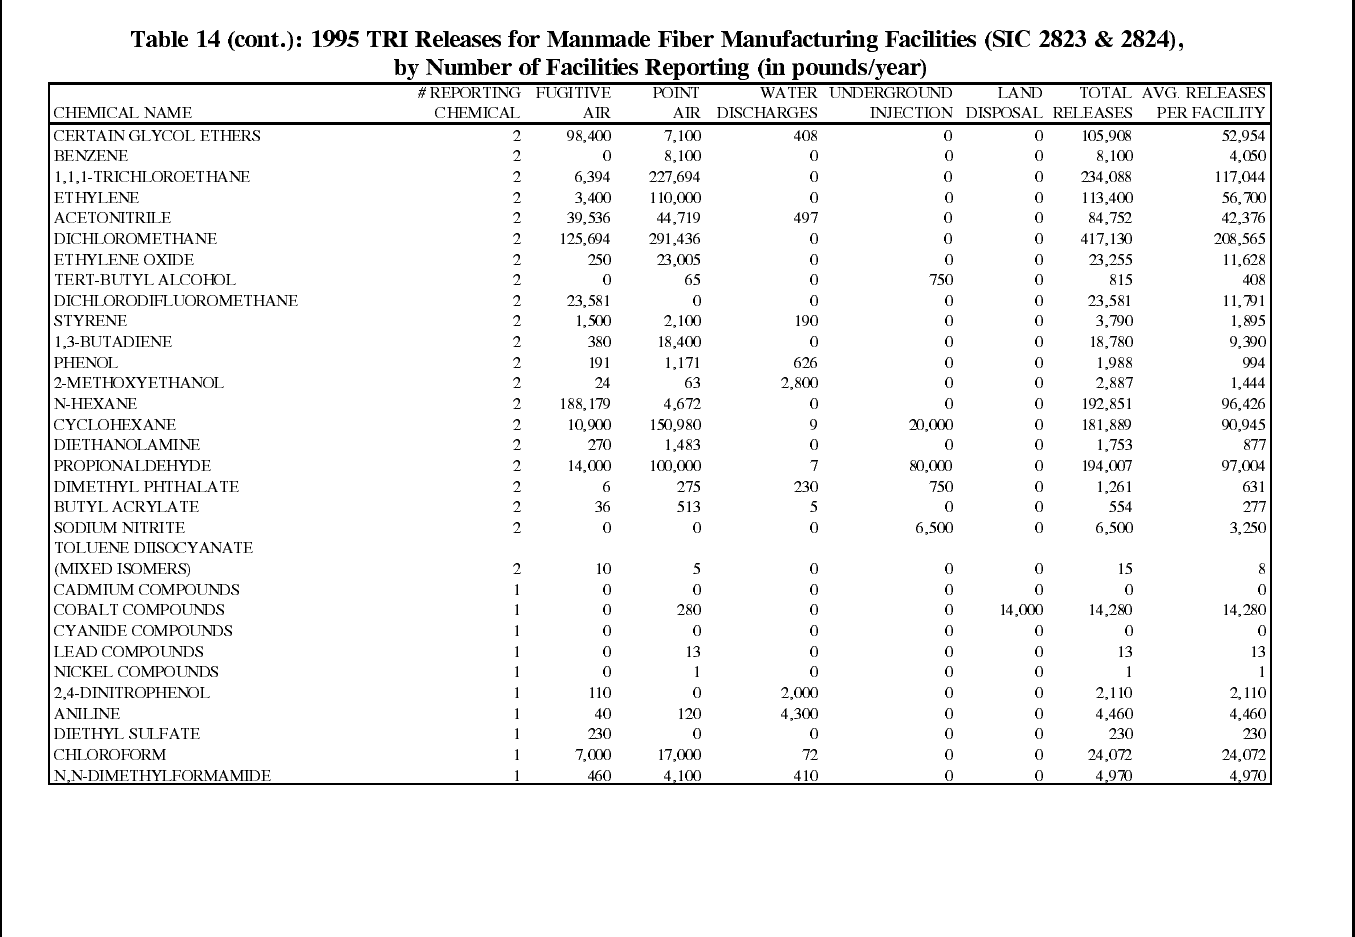
Sector Notebook Project 85 September 1997
Plastic Resin and Manmade Fiber
Release and Transfer Profile

Sector Notebook Project 86 September 1997
Plastic Resin and Manmade Fiber
Table 14 (cont.): 1995 TRI Releases for Manmade Fiber Manufacturing Facilities (SIC 2823 & 2824),
by Number of Facilities Reporting (in pounds/year)
CHEMICAL NAME # REPORTING
CHEMICAL FUGITIVE
AIR POINT
AIR WATER
DISCHARGES UNDERGROUND
INJECTION LAND
DISPOSAL TOTAL
RELEASES AVG. RELEASES
PER FACILITY
BROMOMETHANE 1 720 210,000 11 0 0 210,731 210,731
METHYL IODIDE 1 4,000 16 0 0 0 4,016 4,016
HYDROGEN CYANIDE 1 27,200 44,410 0 0 0 71,610 71,610
VINYLIDENE CHLORIDE 1 190 5,900 0 0 0 6,090 6,090
CHLORODIFLUOROMETHANE 1 5,790 0 0 0 0 5,790 5,790
FREON 113 1 167,230 30,375 0 0 0 197,605 197,605
DICHLOROTETRAFLUOROETHANE
(CFC-114) 1 8,244 0 0 0 0 8,244 8,244
DIMETHYL SULFATE 1 0 0 0 0 0 0 0
ISOBUTYRALDEHYDE 1 20,000 7,300 0 0 0 27,300 27,300
SEC-BUTYL ALCOHOL 1 0 0 0 48,000 0 48,000 48,000
ACRYLIC ACID 1 3 1,087 20 0 0 1,110 1,110
1,1,2,2-TETRACHLOROETHANE 1 160 250 0 0 0 410 410
4,4'-ISOPROPYLIDENEDIPHENOL 1 0 0 0 0 0 0 0
METHYL METHACRYLATE 1 750 750 0 0 0 1,500 1,500
DIBUTYL PHTHALATE 1 7,000 190 85 0 0 7,275 7,275
PHTHALIC ANHYDRIDE 1 3,900 1,100 0 0 0 5,000 5,000
PICRIC ACID 1 0 0 0 25,000 0 25,000 25,000
O-ANISIDINE 1 460 10 0 0 0 470 470
2-PHENYLPHENOL 1 0 59 0 0 0 59 59
O-XYLENE 1 17,000 35,000 2 0 0 52,002 52,002
O-TOLUIDINE 1 460 0 0 0 0 460 460
METHYL ACRYLATE 1 3 817 0 0 0 820 820
DICHLORAN 1 0 0 0 0 0 0 0
P-NITROANILINE 1 3 0 2 0 0 5 5
BENZYL CHLORIDE 1 0 0 0 0 0 0 0
P-XYLENE 1 6,400 63,000 0 0 0 69,400 69,400
P-PHENYLENEDIAMINE 1 0 0 . 0 0 0 0
QUINONE 1 3,800 3,300 1,500 0 0 8,600 8,600
METHYL ISOBUTYL KETONE 1 44,000 100,000 4,000 0 0 148,000 148,000
MALEIC ANHYDRIDE 1 0 0 0 0 0 0 0
M-XYLENE 1 1,000 1,000 0 0 0 2,000 2,000
Release and Transfer Profile

Sector Notebook Project 87 September 1997
Plastic Resin and Manmade Fiber
Table 14 (cont.): 1995 TRI Releases for Manmade Fiber Manufacturing Facilities (SIC 2823 & 2824),
by Number of Facilities Reporting (in pounds/year)
CHEMICAL NAME # REPORTING
CHEMICAL FUGITIVE
AIR POINT
AIR WATER
DISCHARGES UNDERGROUND
INJECTION LAND
DISPOSAL TOTAL
RELEASES AVG. RELEASES
PER FACILITY
1,3-PHENYLENEDIAMINE 1 0 0 . 0 0 0 0
CHLOROBENZENE 1 290 1,500 1 0 0 1,791 1,791
CYCLOHEXANOL 1 92 3,600 0 1,300,000 0 1,303,692 1,303,692
PYRIDINE 1 41 2 190 0 0 233 233
PROPYLENE 1 540 14,000 0 0 0 14,540 14,540
DI(2-ETHYLHEXYL) PHTHALATE 1 8,300 2 230 0 0 8,532 8,532
TRIETHYLAMINE 1 280 12,000 13 0 0 12,293 12,293
N,N-DIMETHYLANILINE 1 0 0 0 0 0 0 0
TETRACHLOROETHYLENE 1 420 3,280 . 0 0 3,700 3,700
ETHYL ACRYLATE 1 2 844 0 0 0 846 846
P-NITROSODIPHENYLAMINE 1 24 0 0 0 0 24 24
BIS(CHLOROMETHYL) ETHER 1 0 0 0 0 0 0 0
VINYL BROMIDE 1 220 8,000 0 0 0 8,220 8,220
N-METHYL-2-PYRROLIDONE 1 84 1 8,000 0 0 8,085 8,085
DECABROMODIPHENYL OXIDE 1 0 1 0 11 0 12 12
XYLENE (MIXED ISOMERS) 1 30,000 33,000 270 0 0 63,270 63,270
CROTONALDEHYDE 1 35,000 55,000 680 0 0 90,680 90,680
ANTIMONY 1 0 5 250 0 250 505 505
CADMIUM 1 0 0 71 0 71 142 142
COPPER 1 0 0 620 29,000 0 29,620 29,620
BORON TRIFLUORIDE 1 0 0 0 0 0 0 0
HYDROGEN FLUORIDE 1 0 340,000 0 0 0 340,000 340,000
CHLORINE DIOXIDE 1 0 0 0 0 0 0 0
___ _________ _________ __________ __________ _______ _________ __________
34 6,261,300 69,457,072 1,685,487 17,886,084 629,068 95,919,011 2,821,147
Release and Transfer Profile
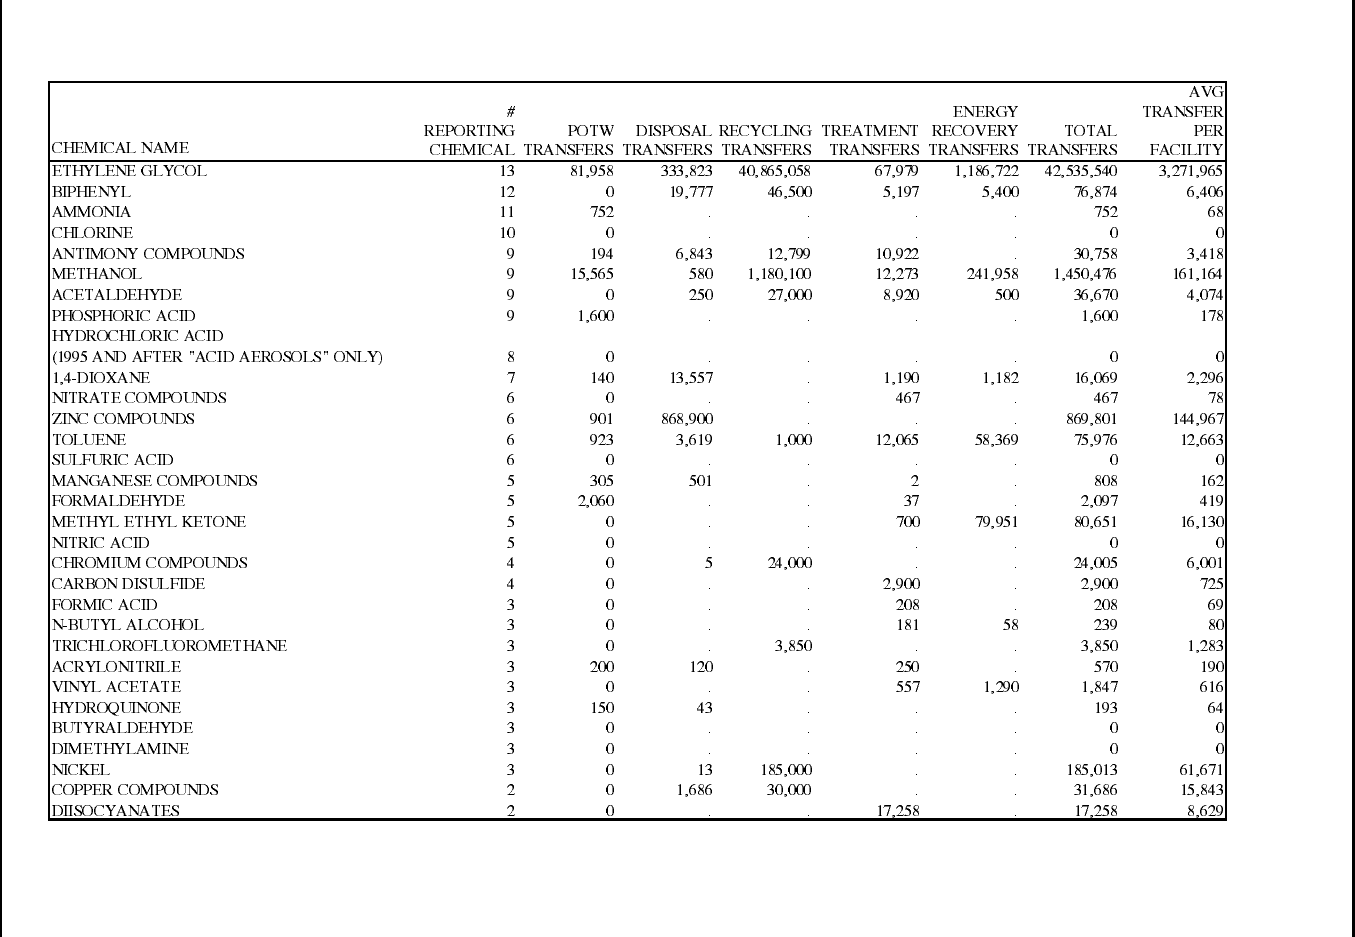
Sector Notebook Project 88 September 1997
Plastic Resin and Manmade Fiber
Table 15: 1995 TRI Transfers for Manmade Fiber Manufacturing Facilities (SIC 2823 & 2824),
by Number of Facilities Reporting (in pounds/year)
Release and Transfer Profile
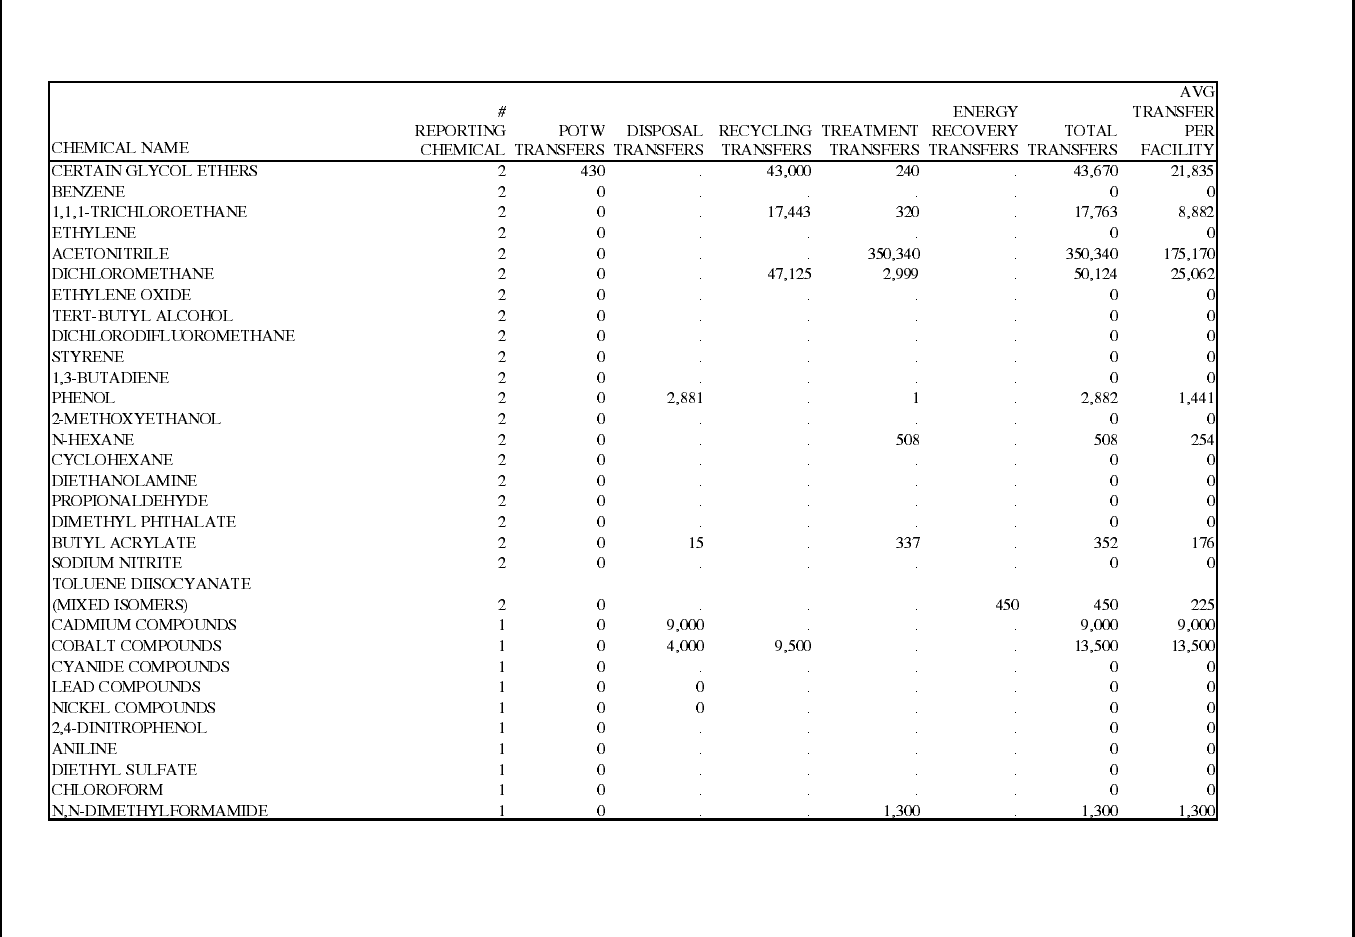
Sector Notebook Project 89 September 1997
Plastic Resin and Manmade Fiber
Table 15 (cont.): 1995 TRI Transfers for Manmade Fiber Manufacturing Facilities (SIC 2823 & 2824),
by Number of Facilities Reporting (in pounds/year)
Release and Transfer Profile

Sector Notebook Project 90 September 1997
Plastic Resin and Manmade Fiber
Table 15 (cont.): 1995 TRI Transfers for Manmade Fiber Manufacturing Facilities (SIC 2823 & 2824),
by Number of Facilities Reporting (in pounds/year)
CHEMICAL NAME
#
REPORTING
CHEMICAL POTW
TRANSFERS DISPOSAL
TRANSFERS RECYCLING
TRANSFERS TREATMENT
TRANSFERS
ENERGY
RECOVERY
TRANSFERS TOTAL
TRANSFERS
AVG
TRANSFER
PER
FACILITY
BROMOMETHANE 1 0 . . . . 0 0
METHYL IODIDE 1 0 . . . . 0 0
HYDROGEN CYANIDE 1 0 . . . . 0 0
VINYLIDENE CHLORIDE 1 0 . . . . 0 0
CHLORODIFLUOROMETHANE 1 0 . . . . 0 0
FREON 113 1 250 . . 500 . 750 750
DICHLOROTETRAFLUOROETHANE
(CFC-114) 1 0 . . . . 0 0
DIMETHYL SULFATE 1 0 . . . . 0 0
ISOBUTYRALDEHYDE 1 0 . . . . 0 0
SEC-BUTYL ALCOHOL 1 0 . . . . 0 0
ACRYLIC ACID 1 0 . . 287 . 287 287
1,1,2,2-TETRACHLOROETHANE 1 0 . . . . 0 0
4,4'-ISOPROPYLIDENEDIPHENOL 1 0 . . . . 0 0
METHYL METHACRYLATE 1 0 . . . . 0 0
DIBUTYL PHTHALATE 1 0 . . . . 0 0
PHTHALIC ANHYDRIDE 1 0 . . 1,000 . 1,000 1,000
PICRIC ACID 1 0 . . . . 0 0
O-ANISIDINE 1 0 . . . . 0 0
2-PHENYLPHENOL 1 0 . . . . 0 0
O-XYLENE 1 0 . . . . 0 0
O-TOLUIDINE 1 0 . . . . 0 0
METHYL ACRYLATE 1 0 . . 78 . 78 78
DICHLORAN 1 0 . . . . 0 0
P-NITROANILINE 1 0 . . . . 0 0
BENZYL CHLORIDE 1 0 . . . . 0 0
P-XYLENE 1 0 . . . . 0 0
P-PHENYLENEDIAMINE 1 0 . . 3,200 . 3,200 3,200
QUINONE 1 0 . . . . 0 0
METHYL ISOBUTYL KETONE 1 0 . . . . 0 0
MALEIC ANHYDRIDE 1 0 . . . . 0 0
M-XYLENE 1 0 . . . . 0 0
Release and Transfer Profile
Sector Notebook Project 91 September 1997
Plastic Resin and Manmade Fiber
CHEMICAL NAME
#
REPORTING
CHEMICAL POTW
TRANSFERS DISPOSAL
TRANSFERS RECYCLING
TRANSFERS TREATMENT
TRANSFERS
ENERGY
RECOVERY
TRANSFERS TOTAL
TRANSFERS
AVG
TRANSFER
PER
FACILITY
1,3-PHENYLENEDIAMINE 1 0 . . 104,000 . 104,000 104,000
CHLOROBENZENE 1 0 . . . . 0 0
CYCLOHEXANOL 1 0 . . . . 0 0
PYRIDINE 1 0 . . . . 0 0
PROPYLENE 1 0 . . . . 0 0
DI(2-ETHYLHEXYL) PHTHALATE 1 0 . . 8,500 . 8,500 8,500
TRIETHYLAMINE 1 0 . . 600 . 600 600
N,N-DIMETHYLANILINE 1 0 . . . . 0 0
TETRACHLOROETHYLENE 1 0 . . 2,400 . 2,400 2,400
ETHYL ACRYLATE 1 0 . . 354 . 354 354
P-NITROSODIPHENYLAMINE 1 0 . . . 15,000 15,000 15,000
BIS(CHLOROMETHYL) ETHER 1 0 . . . . 0 0
VINYL BROMIDE 1 0 . . . . 0 0
N-METHYL-2-PYRROLIDONE 1 0 . . 398,000 . 398,000 398,000
DECABROMODIPHENYL OXIDE 1 0 3,700 . . . 3,700 3,700
XYLENE (MIXED ISOMERS) 1 0 370 . 800,029 13,000 813,399 813,399
CROTONALDEHYDE 1 0 . . . . 0 0
ANTIMONY 1 0 500 . 12,150 . 12,650 12,650
CADMIUM 1 0 8,400 11,000 . . 19,400 19,400
COPPER 1 0 . . . . 0 0
BORON TRIFLUORIDE 1 0 . . . . 0 0
HYDROGEN FLUORIDE 1 0 . . . . 0 0
CHLORINE DIOXIDE 1 0 . . . . 0 0
___ ________ __________ ___________ _________ _________ __________ ________
34 105,428 1,278,583 42,503,375 1,828,249 1,603,880 47,319,515 1,391,750
Release and Transfer Profile

Plastic Resin and Manmade Fiber Release and Transfer Profile
Top 10 TRI Releasing Plastic Resin and Manmade Fiber Companies
The TRI database contains a detailed compilation of self-reported, facility-
specific chemical releases. The top reporting facilities for the plastic resin
manufacturing sector and manmade fiber manufacturing sector, based on
pounds of TRI chemicals released, are listed in Tables 16 and 18, respectively.
Facilities that have reported only plastic resin SIC codes (SIC 2821) appear
in Table 16, and facilities that have reported only manmade fiber SIC codes
(SIC 2823 or 2824) appear in Table 18. Tables 17 and 19 contain additional
facilities that have reported plastic resin and manmade fiber SIC codes, and
one or more that may have also reported SIC codes that are not within the
scope of this notebook. Therefore, Tables 17 and 19 may include facilities
that conduct multiple operations -- some that are under the scope of this
notebook, and some that are not. Currently, the facility-level data do not
allow pollutant releases to be broken apart by industrial process.
Sector Notebook Project 92 September 1997
1
2
3
4
5
6
7
8
9
10
Plastic Resin and Manmade Fiber Release and Transfer Profile
Table 16: Top 10 TRI Releasing Plastic Resin Manufacturing Facilities (SIC 2821)1
Rank Facility Total Releases in Pounds
BP Chemicals Inc. - Lima, OH 13,566,795
Rexene Corp. - Odessa, TX 2,558,214
Quantum Chemical Corp. - Clinton, IA 2,508,685
GE Plastics Co. - Mount Vernon, IN 2,344,168
Du Pont - Washington, WV 2,281,027
Quantum Chemical Corp. - La Porte, TX 2,225,186
Shell Chemical Co. - Apple Grove, WV 1,529,579
Carolina Eastman Div. - Columbia, SC 1,487,312
GE Co. - Waterford, NY 1,366,735
Exxon Chemical Co. - Baton Rouge, LA 1,365,101
TOTAL 31,232,802
Source: U.S. EPA, Toxics Release Inventory Database, 1995.
1Being included on this list does not mean that the releases are associated with noncompliance with
environmental laws.
Note: TRI Releases shown in this table are associated with all manufacturing activities at a facility and not just
those associated with plastic resin manufacturing activities.
Table 17: Top 10 TRI Releasing Facilities Reporting Plastic Resin Manufacturing SIC
Codes to TRI 1
Rank SIC Codes Reported in
TRI Facility Total Releases in
Pounds
1 2821, 2824, 2824, 2869,
2865 Monsanto Co. - Cantonment, FL 18,058,737
2 2821, 2869 BP Chemicals Inc. - Lima, OH 13,566,795
3 2821, 2823, 2869, 2865,
2893 Tennessee Eastman Div. - Kingsport, TN 7,481,378
4 2821, 2812, 2813, 2819,
2822, 2865 Dow Chemical Co. - Freeport, TX 6,120,977
5 2821, 2911, 2869, 2865 Shell Oil Co. - Deer Park, TX 4,757,517
6 2821, 2869 Eastman Chemical Co. - Longview, TX 3,908,702
7 2821, 2865, 2824 Du Pont - Leland, NC 3,653,612
8 2821, 2611, 2631 2653 Union Camp Corp. - Savannah, GA 3,121,612
9 2821, 2869, 2819 ELF Atochem N.A. Inc. - Calvert City, KY 3,082,676
10 2821, 2869 Celanese Eng. Resins Inc. - Bishop, TX 3,049,800
TOTAL 66,801,806
Source: U.S. EPA, Toxics Release Inventory Database, 1995.
1Being included on this list does not mean that the releases are associated with noncompliance with
environmental laws.
Note: TRI Releases shown in this table are associated with all manufacturing activities at a facility and not just
those associated with plastic resin manufacturing activities.
Sector Notebook Project 93 September 1997
1
2
3
4
5
6
7
8
9
10
Plastic Resin and Manmade Fiber Release and Transfer Profile
Table 18: Top 10 TRI Releasing Manmade Fiber Manufacturing Facilities
(SIC 2823, 2824)1
Rank Facility Total Releases in Pounds
Courtaulds Fibers Inc. - Axis, AL 34,018,200
Lenzing Fibers Corp. - Lowland, TN 23,231,860
Monsanto Co. - Cantonment, FL 18,058,737
Tennessee Eastman Div. - Kingsport, TN 7,481,378
North American Rayon Corp. - Elizabethton, TN 2,960,770
Monsanto Co. - Decatur, AL 1,580,530
Du Pont - Camden, SC 1,105,503
Du Pont - Seaford, DE 774,488
Hoechst Celanese Corp. - Spartanburg, SC 754,912
Hoechst Celanese Corp. - Rock Hill, SC 754,174
TOTAL 90,720,552
Source: U.S. EPA, Toxics Release Inventory Database, 1995.
1Being included on this list does not mean that the releases are associated with noncompliance with
environmental laws.
Note: TRI Releases shown in this table are associated with all manufacturing activities at a facility and not just
those associated with manmade fiber manufacturing activities.
Table 19: Top 10 TRI Releasing Facilities Reporting Manmade Fiber Manufacturing
SIC Codes to TRI 1
Rank SIC Codes Reported in
TRI Facility Total Releases in
Pounds
1 2823, 2819 Courtaulds Fibers Inc. - Axis, AL 34,018,200
2 2823 Lenzing Fibers Corp. - Lowland, TN 23,231,860
3 2824, 2869, 2821, 2865 Monsanto Co. - Cantonment, FL 18,058,737
4 2823, 2821, 2869, 2865,
2893 Tennessee Eastman Div. - Kingsport, TN 7,481,378
5 2824, 2865, 2821 Du Pont - Leland, NC 3,653,612
6 2823 North American Rayon Corp. - Elizabethton,
TN 2,960,770
7 2824, 2821, 2869 Du Pont - Washington, WV 2,281,027
8 2824, 2869 Monsanto Co. - Decatur, AL 1,580,530
9 2824, 2821 Du Pont - Camden, SC 1,105,503
10 2824, 2821 Du Pont - Seaford, DE 774,488
TOTAL 95,146,105
Source: U.S. EPA, Toxics Release Inventory Database, 1995.
1Being included on this list does not mean that the releases are associated with noncompliance with
environmental laws.
Note: TRI Releases shown in this table are associated with all manufacturing activities at a facility and not just
those associated with manmade fiber manufacturing activities.
Sector Notebook Project 94 September 1997

Plastic Resin and Manmade Fiber Release and Transfer Profile
IV.B. Summary of Selected Chemicals Released
The following is a synopsis of current scientific toxicity and fate information
for the top chemicals (by weight) that plastic resin and manmade fiber facilities
released to the environment in 1995. Ethylene glycol is mentioned also
because it accounts for a large portion of the transfers for the industries. The
top chemicals were selected based on TRI release data that facilities self-
reported. Because this section is based on self-reported release data, it does
not attempt to provide information on management practices employed by the
sector to reduce the release of these chemicals. Information regarding
pollutant release reductions over time may be available from EPA’s TRI and
33/50 programs, or directly from the industrial trade associations that are
listed in Section IX of this document. Since these descriptions are cursory,
please consult the sources described in this section, and the chemicals that
appear on the full list of TRI chemicals appearing in Section IV.A.
The brief descriptions provided below were taken from the 1994 Toxics
Release Inventory Public Data Release (EPA, 1995), the Hazardous
Substances Data Bank (HSDB), and the Integrated Risk Information System
(IRIS), both accessed via TOXNET.1 The discussions oftoxicitydescribe the
range of possible adverse health effects that have been found to be associated
with exposure to these chemicals. These adverse effects may or may not
occur at the levels released to the environment. Individuals interested in a
more detailed picture of the chemical concentrations associated with these
adverse effects should consult a toxicologist or the toxicity literature for the
chemical to obtain more information.
Acetonitrile (CAS: 75-05-8)
Sources. Acetonitrile may be generated as a byproduct of acrylonitrile
manufacture and may be used as a solvent in butadiene extraction processes.
Toxicity. Toxicity may be caused through ingestion, inhalation, or dermal
exposure. Exposure to acetonitrile may lead to cyanide poisoning by
metabolic release of cyanide after absorption. Toxicity can be prolonged.
1 TOXNET is a computer system run by the National Library of Medicine that includes a number of toxicological
databases managed by EPA, National Cancer Institute, and the National Institute for Occupational Safety and
Health. For more information on TOXNET, contact the TOXNET help line at 800-231-3766. Databases included
in TOXNET are: CCRIS (Chemical Carcinogenesis Research Information System), DART (Developmental and
Reproductive Toxicity Database), DBIR (Directory of Biotechnology Information Resources), EMICBACK
(Environmental Mutagen Information Center Backfile), GENE-TOX (Genetic Toxicology), HSDB (Hazardous
Substances Data Bank), IRIS (Integrated Risk Information System), RTECS (Registry of Toxic Effects of Chemical
Substances), and TRI (Toxic Chemical Release Inventory). HSDB contains chemical-specific information on
manufacturing and use, chemical and physical properties, safety and handling, toxicity and biomedical effects,
pharmacology, environmental fate and exposure potential, exposure standards and regulations, monitoring and
analysis methods, and additional references.
Sector Notebook Project 95 September 1997

Plastic Resin and Manmade Fiber Release and Transfer Profile
Individuals exposed to slight concentrations may develop nausea, vomiting,
headache and lassitude. Severely poisoned patients may develop extreme
weakness or lassitude, respiratory depression, shock, coma, and seizures.
Pulse may become rapid, weak, and sometimes irregular. Lactic acidosis is
common after oral ingestion, as a result of the conversion to cyanide.
Chronically exposed patients may develop headache, lack of appetite,
dizziness, weakness, and dermatitis. In one study, exposures of 40 to 160
ppm for four hours resulted in no symptoms or only mild symptoms. A dose
of 0.006 mg of acetonitrile per kg body weight per day is expected to result
in no adverse effects if an individual is exposed to this dose for a lifetime.
This dose level was determined from a studywhich found decreased red blood
cell counts and hematocrit, and hepatic lesions in mice exposed to acetonitrile
for 90 days.
Carcinogenicity. There is currently no long-term human or animal data to
suggest that this chemical is carcinogenic in humans.
Environmental Fate and Potential for Human Exposure. Biodegradation
is likely to occur if it is released to soil. It is also mobile in soil and may
evaporate from the surface of soil. In water, the major loss process is
biodegradation. Acetonitrile will persist in the troposphere for a long time
and may be transported a long distance from the source of its release. Wet
deposition may remove some of the atmospheric acetonitrile.
Carbon Disulfide (CAS: 75-15-0)
Sources. Carbon disulfide is used in a variety of industrial applications
including the manufacture of regenerated cellulose rayon and cellophane, and
in the production of rubber.
Toxicity. Short-term (acute) exposure of humans to carbon disulfide can
cause headache, dizziness, fatigue, and irritation of eye, nose, and throat.
Exposure to high concentrations may result in trouble breathing or respiratory
failure. Contact with skin can cause severe burns.
Long-term (chronic) exposure to high levels in excess of regulatory standards
may result in peripheral nerve damage (involving the nerves that control feet,
legs, hands, and arms) and cardiovascular effects. A few studies contend that
chronic exposure may also result in potential reproductive effects.
Carcinogenicity. There are no long-term human or animal data to suggest
that this chemical is carcinogenic in humans.
Environmental Fate. If released on land, carbon disulfide will be primarily
lost to volatilization and it may leach into the ground where it would be
expected to biodegrade. The chemical will also volatilize if released to water
Sector Notebook Project 96 September 1997

Plastic Resin and Manmade Fiber Release and Transfer Profile
and does not adsorb to sediment. In air, carbon disulfide reacts with atomic
oxygen to produce hydroxyl radicals with half-lives of a few days. Carbon
disulfide gas is adsorbed and degraded by soil, which demonstrates that soil
may be a natural sink for this chemical. The general population may be
exposed to carbon disulfide primarily from ambient air as it is released not
only from industrial sources, but also from a wide variety of natural sources.
Ethylene (CAS: 74-85-1)
Sources. Ethylene is used to make polyethylene, polypropylene, polystyrene,
polyester, and polyvinyl chloride resins. Ethylene is the monomer used to
make high-density polyethylene, low-density polyethylene, and linear low-
density polyethylene.
Toxicity. Ethylene has been used as an anaesthetic; the effects reported here
are related to its properties as an anaesthetic. Asphyxia may occur from
breathing ethylene in enclosed spaces and in cases where the atmospheric
oxygen has been displaced to about 15 to 16 percent or less.
Carcinogenicity. According to the International Agency for Research on
Cancer, there is inadequate evidence in humans and animals to suggest
carcinogenicity in humans.
Environmental Fate. In the air, ozone, nitrate radicals, and hydroxyl radicals
may degrade ethylene. In water and soil, ethylene may be oxidized to produce
ethylene oxide, and the chemical may permeate soil and sediment. The major
environmental fate process is volatilization. The most probable way humans
are exposed is by inhaling ethylene from contaminated air.
Ethylene Glycol (CAS: 74-85-1)
Sources. Ethylene glycol is used to make polyethylene terephthalate (PET).
It is also used in the manufacture of alkyd resins and as a solvent mixture for
cellulose esters and ethers. Over 75 percent of ethylene glycol releases are by
means of point and fugitive air emissions.
Toxicity. Long-term inhalation exposure to low levels of ethylene glycol may
cause throat irritation, mild headache and backache. Exposure to higher
concentrations may lead to unconsciousness. Liquid ethylene glycol is
irritating to the eyes and skin.
Toxic effects from ingestion of ethylene glycol include damage to the central
nervous system and kidneys, intoxication, conjunctivitis, nausea and vomiting,
abdominal pain, weakness, low blood oxygen, tremors, convulsions,
respiratory failure, and coma. Renal failure due to ethylene glycol poisoning
can lead to death.
Sector Notebook Project 97 September 1997

Plastic Resin and Manmade Fiber Release and Transfer Profile
Environmental Fate. Ethylene glycol readily biodegrades in water. No data
are available that report its fate in soils; however, biodegradation is probably
the dominant removal mechanism. Should ethylene glycol leach into the
groundwater, biodegradation may occur.
Ethylene glycol in water is not expected to bioconcentrate in aquatic
organisms, adsorb to sediments or volatilize. Atmospheric ethylene glycol
degrades rapidly in the presence of hydroxyl radicals.
Hydrochloric Acid (CAS: 7647-01-1)
Sources. Hydrochloric acid can be generated during plastic resin
manufacture.
Toxicity. Hydrochloric acid is primarily a concern in its aerosol form. Acid
aerosols have been implicated in causing and exacerbating a variety of
respiratory ailments. Dermal exposure and ingestion of highly concentrated
hydrochloric acid can result in corrosivity.
Ecologically, accidental releases of solution forms of hydrochloric acid may
adversely affect aquatic life through a transient lowering of the pH (i.e.
increasing the acidity) of surface waters.
Carcinogenicity. There is currently no evidence to suggest that this chemical
is carcinogenic.
Environmental Fate. Releases of hydrochloric acid to surface waters and
soils will be neutralized to an extent due to the buffering capacities of both
systems. The extent of these reactions will depend on the characteristics of
the specific environment.
Physical Properties. Concentrated hydrochloric acid is highly corrosive.
Methanol (CAS: 67-56-1)
Sources. Methanol can be used as a solvent in plastic resin manufacture.
Methanol is used in some processes to make polyester, although many
companies have converted to newer process methods that do not use
methanol (AFMA, 1997b).
Toxicity. Methanol is readily absorbed from the gastrointestinal tract and the
respiratory tract, and is toxic to humans in moderate to high doses. In the
body, methanol is converted into formaldehyde and formic acid. Methanol is
excreted as formic acid. Observed toxic effects at high dose levels generally
include central nervous system damage and blindness. Long-term exposure
to high levels of methanol via inhalation cause liver and blood damage in
Sector Notebook Project 98 September 1997

Plastic Resin and Manmade Fiber Release and Transfer Profile
animals.
Ecologically, methanol is expected to have low toxicity to aquatic organisms.
Concentrations lethal to half the organisms of a test population are expected
to exceed one mg methanol per liter water. Methanol is not likely to persist
in water or to bioaccumulate in aquatic organisms.
Carcinogenicity. There is currently no evidence to suggest that this chemical
is carcinogenic.
Environmental Fate. Liquid methanol is likely to evaporate when left
exposed. Methanol reacts in air to produce formaldehyde which contributes
to the formation of air pollutants. In the atmosphere it can react with other
atmospheric chemicals or be washed out by rain. Methanol is readily
degraded by microorganisms in soils and surface waters.
Physical Properties. Methanol is highly flammable.
IV.C. Other Data Sources
The toxic chemical release data obtained from TRI captures the vast majority
of facilities in the plastic resin and manmade fiber industries. It also allows for
a comparison across years and industry sectors. Reported chemicals are
limited however to the 316 reported chemicals. Most of the hydrocarbon
emissions from organic chemical facilities are not captured by TRI. The EPA
Office of Air Quality Planning and Standards has compiled air pollutant
emission factors for determining the total air emissions of priority pollutants
(e.g., total hydrocarbons, SOx, NOx, CO, particulates, etc.) from many
chemical manufacturing sources.
The EPA Office of Air’s Aerometric Information Retrieval System (AIRS)
contains a wide range of information related to stationary sources of air
pollution, including the emissions of a number of air pollutants which may be
of concern within a particular industry. With the exception of volatile organic
compounds (VOCs), there is little overlap with the TRI chemicals reported
above. Table 20 summarizes annual releases of carbon monoxide (CO),
nitrogen dioxide (NO2), particulate matter of 10 microns or less (PM10), total
particulate (PT), sulfur dioxide (SO2), and volatile organic compounds
(VOCs).
Sector Notebook Project 99 September 1997
Plastic Resin and Manmade Fiber Release and Transfer Profile
Table 20: Air Pollutant Releases by Industry Sector (tons/year)
Industry Sector CO NO2 PM10 PT SO2 VOC
Metal Mining 4,670 39,849 63,541 173,566 17,690 915
Nonmetal Mining 25,922 22,881 40,199 128,661 18,000 4,002
Lumber and Wood
Production 122,061 38,042 20,456 64,650 9,401 55,983
Furniture and Fixtures 2,754 1,872 2,502 4,827 1,538 67,604
Pulp and Paper 566,883 358,675 35,030 111,210 493,313 127,809
Printing 8,755 3,542 405 1,198 1,684 103,018
Inorganic Chemicals 153,294 106,522 6,703 34,664 194,153 65,427
Organic Chemicals 112,410 187,400 14,596 16,053 176,115 180,350
Petroleum Refining 734,630 355,852 27,497 36,141 619,775 313,982
Rubber and Misc. Plastics 2,200 9,955 2,618 5,182 21,720 132,945
Stone, Clay and Concrete 105,059 340,639 192,962 662,233 308,534 34,337
Iron and Steel 1,386,461 153,607 83,938 87,939 232,347 83,882
Nonferrous Metals 214,243 31,136 10,403 24,654 253,538 11,058
Fabricated Metals 4,925 11,104 1,019 2,790 3,169 86,472
Electronics and Computers 356 1,501 224 385 741 4,866
Motor Vehicles, Bodies,
Parts and Accessories 15,109 27,355 1,048 3,699 20,378 96,338
Dry Cleaning 102 184 3 27 155 7,441
Ground Transportation 128,625 550,551 2,569 5,489 8,417 104,824
Metal Casting 116,538 11,911 10,995 20,973 6,513 19,031
Pharmaceuticals 6,586 19,088 1,576 4,425 21,311 37,214
Plastic Resins and
Manmade Fibers 16,388 41,771 2,218 7,546 67,546 74,138
Textiles 8,177 34,523 2,028 9,479 43,050 27,768
Power Generation 366,208 5,986,757 140,760 464,542 13,827,511 57,384
Shipbuilding and Repair 105 862 638 943 3,051 3,967
Source: U.S. EPA Office of Air and Radiation, AIRS Database, 1997.
Sector Notebook Project 100 September 1997

Plastic Resin and Manmade Fiber Release and Transfer Profile
IV.D. Comparison of Toxic Release Inventory Between Selected Industries
The following information is presented as a comparison of pollutant release
and transfer data across industrial categories. It is provided to give a general
sense as to the relative scale of releases and transfers within each sector
profiled under this project. Please note that the following figure and table do
not contain releases and transfers for industrial categories that are not
included in this project, and thus cannot be used to draw conclusions
regarding the total release and transfer amounts that are reported to TRI.
Similar information is available within the annual TRI Public Data Release
Book.
Figure 18 is a graphical representation of a summary of the 1995 TRI data for
the plastic resin and manmade fibers industries and the other sectors profiled
in separate notebooks. The bar graph presents the totalTRI releases and total
transfers on the vertical axis. The graph is based on the data shown in Table
21 and is meant to facilitate comparisons between the relative amounts of
releases, transfers, and releases per facility both within and between these
sectors. The reader should note, however, that differences in the proportion
of facilities captured by TRI exist between industry sectors. This can be a
factor of poor SIC matching and relative differences in the number of facilities
reporting to TRI from the various sectors. In the case of the plastic resin and
manmade fiber industries, the 1995 TRI data presented here covers 469
facilities. Only those facilities listing SIC Codes falling within SIC 2821, 2823,
and 2824 were used.
Sector Notebook Project 101 September 1997
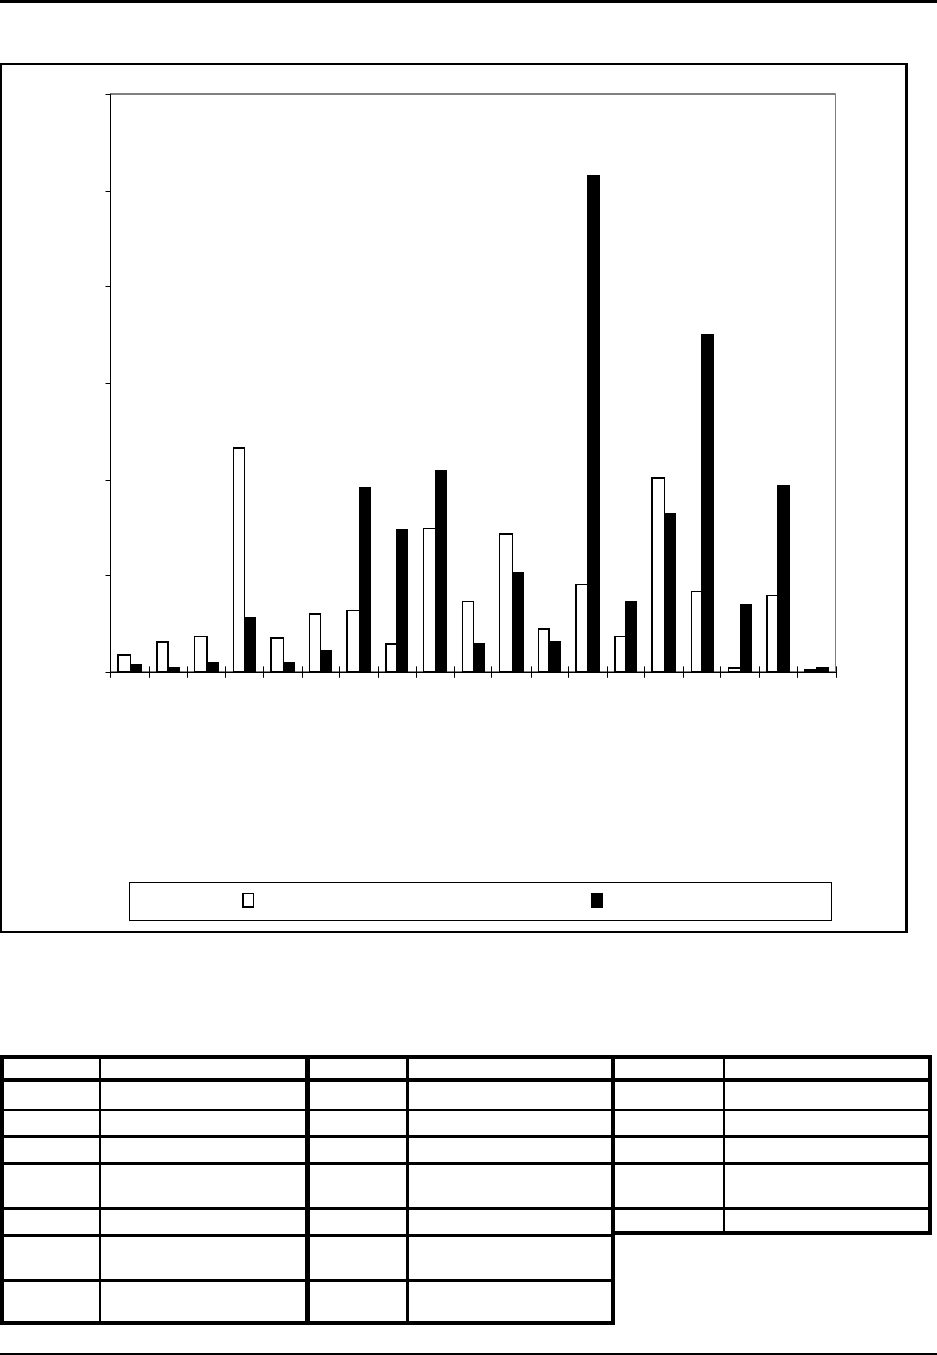
Plastic Resin and Manmade Fiber Release and Transfer Profile
Figure 18: Summary of TRI Releases and Transfers by Industry
0
100
200
300
400
500
600
22
24
25
2611-2631
2711-2789
2812-2819
2821, 2823, 2824
2833, 2834
2861-2869
2911
30
32
331
332, 336
333, 334
34
36
371
3731
SIC Range
Total Pounds (millions)
Total Releases Total Transfers
Source: US EPA 1995 Toxics Release Inventory Database.
SIC Range Industry Sector SIC Range Industry Sector SIC Range Industry Sector
22 Textiles 2833, 2834 Pharmaceuticals 333, 334 Nonferrous Metals
24 Lumber and Wood Products 2861-2869 Organic Chem. Mfg. 34 Fabricated Metals
25 Furniture and Fixtures 2911 Petroleum Refining 36 Electronic Equip. and Comp.
2611-2631 Pulp and Paper 30 Rubber and Misc. Plastics 371 Motor Vehicles, Bodies,
Parts, and Accessories
2711-2789 Printing 32 Stone, Clay, and Concrete 3731 Shipbuilding
2812-2819 Inorganic Chemical
Manufacturing 331 Iron and Steel
2821,
2823, 2824 Plastic Resins and
Manmade Fibers 332, 336 Metal Casting
Sector Notebook Project 102 September 1997
Sector Notebook Project 103 September 1997
Plastic Resin and Manmade Fiber
Industry Sector
Table 21: Toxics Release Inventory Data for Selected Industries
SIC
Range # TRI
Facilities
TRI Releases TRI Transfers
Total Releases
+Transfers
(million lbs.)
Average Releases +
Transfers per Facility
(pounds)
Total
Releases
(million lbs.)
Ave.
Releases per
Facility
(pounds)
Total
Transfers
(million lbs.)
Ave. Trans.
per Facility
(pounds)
Textiles 22 339 17.8 53,000 7.0 21,000 24.8 74,000
Lumber and Wood Products 24 397 30.0 76,000 4.1 10,000 34.1 86,000
Furniture and Fixtures 25 336 37.6 112,000 9.9 29,000 47.5 141,000
Pulp and Paper 2611-2631 305 232.6 763,000 56.5 185,000 289.1 948,000
Printing 2711-2789 262 33.9 129,000 10.4 40,000 44.3 169,000
Inorganic Chem. Mfg. 2812-2819 413 60.7 468,000 21.7 191,000 438.5 659,000
Plastic Resins and
Manmade Fibers 2821,2823,
2824 410 64.1 156,000 192.4 469,000 256.5 625,000
Pharmaceuticals 2833, 2834 200 29.9 150,000 147.2 736,000 177.1 886,000
Organic Chemical Mfg. 2861-2869 402 148.3 598,000 208.6 631,000 946.8 1,229,000
Petroleum Refining 2911 180 73.8 410,000 29.2 162,000 103.0 572,000
Rubber and Misc. Plastics 30 1,947 143.1 73,000 102.6 53,000 245.7 126,000
Stone, Clay, and Concrete 32 623 43.9 70,000 31.8 51,000 75.7 121,000
Iron and Steel 331 423 90.7 214,000 513.9 1,215,000 604.6 1,429,000
Metal Casting 332, 336 654 36.0 55,000 73.9 113,000 109.9 168,000
Nonferrous Metals 333, 334 282 201.7 715,000 164 582,000 365.7 1,297,000
Fabricated Metals 34 2,676 83.5 31,000 350.5 131,000 434.0 162,000
Electronic Equip. and
Comp. 36 407 4.3 11,000 68.8 169,000 73.1 180,000
Motor Vehicles, Bodies,
Parts, and Accessories 371 754 79.3 105,000 194 257,000 273.3 362,000
Shipbuilding 3731 43 2.4 56,000 4.1 95,000 6.5 151,000
Release and Transfer Profile
Source: US EPA Toxics Release Inventory Database, 1995.
Page 104 intentionally left blank.

Plastic Resin and Manmade Fiber Pollution Prevention
V. POLLUTION PREVENTION OPPORTUNITIES
The best way to reduce pollution is to prevent it in the first place. Some
companies have creatively implemented pollution prevention techniques that
improve efficiency and increase profits while at the same time minimizing
environmental impacts. This can be done in many ways such as reducing
material inputs, re-engineering processes to reuse by-products, improving
management practices, and substituting benign chemicals for toxic ones.
Some smaller facilities are able to get below regulatory thresholds just by
reducing pollutant releases through aggressive pollution prevention policies.
The Pollution Prevention Act of 1990 established a national policy of
managing waste through source reduction, which means preventing the
generation of waste. The Pollution Prevention Act also established as national
policy a hierarchy of waste management options for situations in which source
reduction cannot be implemented feasibly. In the waste management
hierarchy, if source reduction is not feasible the next alternative is recycling
of wastes, followed by energy recovery, and waste treatment as a last
alternative.
In order to encourage these approaches, this section provides both general
and company-specific descriptions of some pollutionprevention advances that
have been implemented within the plastic resin and manmade fiber industries
and the chemical industry as a whole. While the list is not exhaustive, it does
provide core information that can be used as the starting point for facilities
interested in starting their own pollution prevention projects. This section
provides information from real activities that can, or are being implemented
by this sector -- including a discussion of associated costs, time frames, and
expected rates of return.
This section provides summary information from activities that may be, or are
being implemented by this sector. When possible, information is provided that
gives the context in which the technique can be effectively used. Please note
that the activities described in this section do not necessarily apply to all
facilities that fall within this sector. Facility-specific conditions must be
carefully considered when pollution prevention options are evaluated, and the
full impacts of the change must examine how each option affects air, land and
water pollutant releases.
Substitute raw materials. The substitution or elimination of some of the raw
materials used in the manufacturing of plastic resins and manmade fibers can
result in substantial waste reductions and cost savings. Raw materials can be
substituted with less water soluble materials to reduce water contamination
and less volatile materials to reduce fugitive emissions. Sometimes certain
raw materials can be eliminated all together. The need for raw materials that
end up as wastes should be reexamined to determine if raw materials can be
Sector Notebook Project 105 September 1997

Plastic Resin and Manmade Fiber Pollution Prevention
eliminated by modifying the process and improving process control.
A specialty batch polymer plant in the Northeast avoids highly toxic and
hazardous substances in the facility’s proprietary products and formulations.
The company also minimizes waste by using water-based chemistry in place
of organic-based chemistry wherever possible (SOCMA, 1993).
Du Pont substituted coal with butadiene in the production of nylon and
substituted terephthalic acid for dimethyl terephthalate in the production of
polyester. The substitutions eliminated generation of by-products, such as
liquid methanol (North Carolina Department of Environment, Health, and
Natural Resources, 1995).
A manmade fibers and organic chemicals manufacturer eliminated benzene
from its manufacturing processes. As a result, the facility simplified its
compliance and recordkeeping procedures since it is no longer subject to the
benzene NESHAP (EPA, 1993).
Improve catalyst. The catalyst plays a critical role in the effectiveness of
chemical conversion in the reactor. Alternative catalyst chemical makeups
and physical characteristics can lead to substantial improvements in the
effectiveness and life of a catalyst. Different catalysts can also eliminate
byproduct formation. Using a more active catalyst and purchasing catalysts
in the active form can reduce catalyst consumption and decrease emissions
generated during catalyst activation. Catalyst activity can also be optimized
by limiting catalyst residence time in the charge lines (Smith, 1964).
Optimize processes. Process changes that optimize reactions and raw
materials use can reduce chemical releases. Developing more reliable reactor
operations with fewer upsets can reduce air emissions and pollution from
unreacted reactants. Modifications may include improved process control
systems, optimized use of chemicals, or equipment modifications. Many
larger facilities are using computer controlled systems which analyze the
process continuously and respond more quickly and accurately than manual
control systems. These systems are often capable of automatic startups,
shutdowns and product changeover which can bring the process to stable
conditions quickly, minimizing the generation of off-spec wastes. Textile fiber
manufacturers can optimize use of chemicals and minimize hazardous waste
from fiber finishes by improving control of finish add-on and selection of finish
components (EPA, 1995).
Processes can also be optimized through equipment retrofits and
replacements. For instance, dedicated piping can isolate certain types of
solvents from others, avoiding offgrade product and waste production.
Equipment and process changes can also minimize byproduct waste and
improve product yield by lowering polymer conversion rate in the reactors.
Sector Notebook Project 106 September 1997

Plastic Resin and Manmade Fiber Pollution Prevention
Rationalizing the equipment used for high pressure pumping and installing
interlocking raw material valves to gain better recipe control can minimize
offgrade product (Clements and Thompson, 1993).
BP Chemicals switched from a series of programmable controllers and
analog controllers to a distributed control system. The new control system
has greater ability to report what is occurring in the reaction tank and
provides operators withmore opportunity to improve reaction consistency or
correct small problems before they become big ones. This results in less
reactor downtime and off-spec product (Elley, 1991).
Du Pont’s Wilmington, North Carolina polyester plant reduced its releases
and transfers of 33/50 chemicals by 55 percent, or more than 1 million lb/yr
between 1988 and 1993. By simplifying manufacturing processes, Du Pont
eliminated use of ortho-xylene and generation of methanol and ethylene
glycol by-products. This change resulted in savings of over $1 million /yr.
Theplant also made innovative process modifications which reduced process
temperatures and VOC emissions (North Carolina Department of
Environment, Health, and Natural Resources, 1995).
While increasing production in 1990 and 1991, Monsanto’s Pensacola,
Florida plant implemented process modifications and operational changes in
its nylon operations that reduced TRI releases by 74 percent and cyclohexane
releases by 96 percent. The plant changed processes and reduced the amount
of ammonia required to neutralize nitric acid, a by-product of nylon
production. This reduced the amount of ammonium nitrate the company
disposed of in deep wells by 18 million pounds. The facility also made
process modifications and operational changes from 1989 to 1991 which cut
cyclohexane releases by 96 percent and installed a new ammonia storage
tank which increased safety and reduced air emissions (CMA, 1992).
Reichhold Chemicals made equipment improvements to reduce waste from
product sampling. Special canisters were permanently fixed to production
tanks which enabled smaller samples to be taken and later returned to the
tanks.
A manmade fibers and hydrocarbon resins facility implemented four
process modifications to reduce waste. The plant changed to closed purge
systems to eliminate emissions in sampling operations, flushed pumps
through equipment to process vessels to avoid discharging wastewater,
optimized the wetting agent amount needed for fibers to reduce oxygen
demand in upstream effluent, and modified procedures to require flushing of
the system between product grades to minimize off-grade product. These
steps reduced waste generated due to off-spec quality by 40 percent (Kikta,
1994).
Sector Notebook Project 107 September 1997

Plastic Resin and Manmade Fiber Pollution Prevention
Adopt good operating practices. Companies can improve production
efficiency and maintain low operating costs by incorporating pollution
prevention codes into their management procedures. These codes can include
a written commitment by senior management to ongoing waste reduction at
each of the company’s facilities, inclusion of pollution prevention objectives
in research and new facility design, or implementation of employee training
and incentive programs. In addition, establishing training programs and
improving recordkeeping are other ways that companies can prevent
pollution without changing industrial processes. Employee involvement
groups can also be used to identify and implement waste minimization projects
within their operational areas, and wastes from lab, maintenance and off-spec
materials can be minimized through better housekeeping practices and
personnel training (Smith, 1987), (http://es.inel.gov/techinfo/facts/cma/cma-
fs3.html, 7/96).
A specialty batch polymer facility established a facility-wide monetary
bonus program aimed at reducing waste on a monthly basis. The company
also gave the reactor operator the ability to alter production schedule and
recipe parameters to ensure product quality and prevent offgrade production
(SOCMA, 1993).
Du Pont targeted, tracked and reported tabulated wastes. Du Pont defined
its “tabulated waste” as RCRA-defined waste, solid waste treated or
disposed of on-site or off-site, waste-derived fuels, some recycled materials,
deep well injection wastes, and wastewater effluents. The company also
chose an environmental coordinator for each waste-generating site,
established training programs, and reduced waste through use of belt filters.
Du Pont also saved over $12.5 million by implementing a company wide
energy efficiency program. Improvements included shutdown of spare or
unneeded equipment, tune-up and optimization of systems and processes,
renegotiation of fuel, electricity and service contracts, waste heat and
condensate return, electrical peak management, fuels inventory reduction,
HVAC system management improvements, improved steam trap maintenance
program, and system or process improvements (Cleenger and Hassell,1994).
At the Du Pont Kinston, North Carolina plant, lube oil waste was
significantly reduced through preventative maintenance programs and
installation of longer-life oils in certain equipment (North Carolina
Department of Environment, Health, and Natural Resources, 1995).
Modify product. Product modification can eliminate the use of hazardous
chemicals, reduce emissions from manufacturing processes, and also decrease
emissions from final products. Improvements in product packaging systems
and materials can be used to cut back disposal of contaminated product.
Sector Notebook Project 108 September 1997

Plastic Resin and Manmade Fiber Pollution Prevention
A batch specialty polymer facility has encouraged its customers to eliminate
the use of hazardous chemicals wherever possible in their batch
specifications (SOCMA, 1993).
A manmade fiber and hydrocarbon resin plant reduced product waste from
the mechanical failure of its sheet-forming dewatering machine. The
company achieved this by rectifying the inadequate design and writing better
operating procedures for the machine (Kikta, 1994).
PPG Industries introduced resins for industrial paints with lower VOC
emissions and reduced solvent waste by modifying plant equipment and
processes. Processes were modified to reformulate resins and eliminate
extraneous solvents. These changes made recovery and recycle of solvent
easier.
Prevent leaks and spills. The elimination of sources of leaks and spills can
be a very cost effective pollution prevention opportunity. Leaks and spills can
be prevented by adopting a preventative maintenance program, maintaining
a leak detection program, and installing seamless pumps and other “leakless”
equipment. Vapor recovery lines can also be used to reduce monomer vapors
generated during polymerization and VOCs emitted during unloading of bulk
raw materials from tank trucks. Additionally, process water can be used to
clean out unloading vehicles and be recycled back into the processes (CMA,
1993).
Novacor Chemicals replaced three 100,000 gallon monomer storage tanks
at its Springfield, MA site and reduced VOC emissions by 8,800 lbs/ year.
The new tanks are equipped with vapor recovery systems and use a nitrogen
gas blanket in the tank head space to prevent volatilization of monomer.
Additionally, the tanks are better equipped for fire protection and spill
containment (in person interview, M. Garvey, Novacor, 11/96).
At Texas Eastman’s Longview plant, employees monitored thousands of
leaking valves and reduced air emissions from those valves by 99 percent,
through the development of new valve packing materials
(http://es.inel.gov/studies/eastx-d.html, 7/96).
A specialty batch polymer plant initiated an intensive maintenance program
to improve wetting agent pump seals and installed curbs around pumps to
contain leaks. Refrigerant releases were also lowered by pumping equipment
down to very low pressure prior to maintenance (Kikta, 1994).
Optimize cleaning practices. Modifying equipment cleaning practices can
reduce wastewater discharges and reduce solvent use. Substituting cleaning
solvents with less toxic solvents can reduce hazardous waste generation and
can simplify treatment of wastewater. Many facilities have switched from
using ozone-depleting chemicals to non-ozone-depleting ones. Wastes can
also be minimized by either washing out piping and transfer hoses after use or
Sector Notebook Project 109 September 1997

Plastic Resin and Manmade Fiber Pollution Prevention
by purchasing dedicated hoses for each product loaded into tankers.
Techniques used to minimize fouling on the reactor walls include maintaining
a high polish on reactors, using less water-soluble and more active catalysts,
and using reflux condensers and water-cooled baffles.
Monsanto’s Pensacola, Florida plant eliminated CFC and methyl chloroform
releases by substituting solvents used in its degreasing and cleaning
operations (CMA, 1992). In addition, both Du Pont and Monsanto switched
from solvents to high-pressure water washing to clean vessels of polymer
buildup. This eliminated 180,000 lbs of TRI waste discharged annually to
publicly owned treatment works by Monsanto’s Indian Orchard plant in
Massachusetts.
Du Pont’s Chambers Works plant in New Jersey reduced cleaning waste by
98%. The company turned to experts in waterjet engineering, used in the
mining industry, to design a special water lance and nozzle. This change cut
turnaround time and saved money (http://es.inel.gov/techinfo/facts/cma/cma-
fs3.html, 7/96).
Improve inventory management and storage. Good inventory
management can reduce waste by preventing materials from exceeding their
shelf life, preventing materials from being left over or not needed, and
reducing the likelihood of accidental releases of stored material. Designating
a materials storage area, limiting traffic through the area, and giving one
person the responsibility to maintain and distribute materials can reduce
materials use and contamination and dispersal of materials.
At its polyethylene facility in Victoria, Australia, Commercial Polymers
adopted a comprehensive water conservation program. Workers read over
20 water meters on a daily basis and adopted water intake minimization
strategies based on usage. Water usage has been reduced by 30 percent to
about 500 m3 per day (Clements and Thompson, 1993).
Recycling, Recovery and Reuse
Although not pollution prevention as defined by the Pollution Prevention Act
of 1990, recovery, recycling and reuse can be effective tools for minimizing
pollutant releases to the environment. By recovering solvents and raw
materials, plastic resin and manmade fiber manufacturers can reduce pollution
without modifying existing processes and can reduce raw materials costs.
Solvents are widely used in the industries for activities ranging from
polymerization and fiber spinning to degreasing and cleaning. Raw materials
can also be recycled, such as unreacted monomer, catalyst and additives.
Recover Solvents. Capturing, purifying and recycling solvents can be an
effective method of reducing pollution. Facilities can reduce TRI chemical
Sector Notebook Project 110 September 1997

Plastic Resin and Manmade Fiber Pollution Prevention
releases and save money by recycling solvents used in polymerization, fiber
manufacture and supporting operations. Common methods used in solvent
recovery are evaporation, distillation and carbon adsorption.
Hoechst installed carbon adsorption solvent recovery units to recover and
recycle acetone back to the acetate fiber spinning process. Using carbon
adsorption, overall plant acetone recovery efficiency reaches nearly 99
percent. Hoechst plans to achieve additional reductions by revamping air
handling and ventilation systems to improve acetone capture.
A phenol formaldehyde resin manufacturer used distillation and reuse of
alcohol wash liquid to reduce waste generation and off-site disposal by 67%.
The plant had generated 6,000 gal/yr of reactor wash solution containing
50% alcohol, phenol formaldehyde resin and water. By recycling the alcohol
wash solution, the plant saves $15,000 annually in material and treatment
costs (http://es.inel.gov/studies/cs435.html, 7/96).
A specialty batch polymer plant switched to a cryogenic vapor recovery
system to minimize the amount of residual solvent trapped by fibers and
released with downstream processing (Kikta, 1994).
Recover Raw Materials. By capturing, purifying and recycling raw
materials, companies can reduce pollution and raw materials costs. Many
companies recycle unreacted monomer back to reactor vessels. This saves
money by reducing monomer costs and treatment and disposal costs. Some
companies save money by recycling catalyst components.
Allied Signal’s high-density polyethylene plant (Baton Rouge,
Louisiana) implemented a chromium recovery process, which uses an
ion exchange resin, to reduce the plant’s hazardous catalyst waste.
The company installed a chromium recovery unit at a cost of
$265,000 and saved $500,000 that year in hazardous waste disposal
costs.
Hoechst Celanese recovers Freon, used in the quality control
laboratories, for reuse via a glassware batch distillation system. The
recovery and reuse of Freon in the laboratory has saved Celanese's
Greenville plant over $1,800 a year in disposal and raw material costs.
Contaminated heat transfer fluid (Dowtherm) is sent to an off-site
distillation facility for recovery and returned for reuse in production.
Recycling of heat recovery fluid saves the plant about $164,000 per
year in disposal and raw material costs.
Du Pont recycled pump out solution wastes (polymer and acid) from
polyarymide fiber production, saving the company disposal, treatment
and handling costs.
Sector Notebook Project 111 September 1997

Plastic Resin and Manmade Fiber Pollution Prevention
Borden Chemical Company recycled phenolic resins and modified its
reactor rinse procedures to reduce waste volume and toxicity. Borden
switched from a one-rinse system to a two-rinse system. Previously,
the plant used 20,000 gallons of water to rinse the reactors. Now, the
reactors are first rinsed with 500-1000 gallons of water and then
rinsed again. The wastewater from the first rinse has a high
concentration of resins, which are filtered, rinsed, and recycled back
into the process as raw materials. The filtered wastewater is reused
for rinsing (http://es.inel.gov/studies/cs20.html, 7/96).
American Enka used an alternative two-stage precipitation process to
recover zinc, which is used in the acid spinning bath process. Zinc is
precipitated, treated and returned to the spinning bath. Zinc recycling
can be an economical solution that conserves limited resources and
reduces waste disposal (http://es.inel.gov/studies/hml10053.html,
7/96).
CMA’s Responsible Care® Program
The leaders in the plastics and manmade fibers industries, similar to those in
the chemical industry as a whole, have been promoting pollution prevention
through various means. The most visible of these efforts is the Responsible
Care® initiative of the Chemical Manufacturers Association (CMA).
Responsible Care® is mandatory for CMA members who must commit to act
as stewards for products through use and ultimate reuse or disposal. One of
the guiding principles of this initiative is the inclusion of waste and release
prevention objectives in research and in design of new or modified facilities,
processes and products.
The following tables, Table 22 and Table 23, are adapted from the CMA
“Designing Pollution Prevention into the Process” manual. These tables
cover, in greater detail, those activities which afford the greatest opportunity
to utilize source reduction and/or recycle versus treatment as a way to manage
waste. The first table covers pollution prevention methods that require
process or product modification. The second table describes pollution
prevention options that involve changes in equipment design and operation.
Sector Notebook Project 112 September 1997
Plastic Resin and Manmade Fiber Pollution Prevention
Table 22: Process/Product Modifications Create Pollution Prevention Opportunities
Area Potential Problem Possible Approach
By-products
Co-products
Quantity and
Quality
Uses and Outlets
Process inefficiencies result in the
generation of undesired by-products and
co-products. Inefficiencies will require
larger volumes of raw materials and
result in additional secondary products.
Inefficiencies can also increase fugitive
emissions and wastes generated through
material handling.
By-products and co-products are not
fully utilized, generating material or
waste that must be managed.
Increase product yield to reduce by-
product and co-product generation and
raw material requirements.
Identify uses and develop a sales outlet.
Collect information necessary to firm up a
purchase commitment such as minimum
quality criteria, maximum impurity levels
that can be tolerated, and performance
criteria.
Catalysts
Composition
Preparation and
Handling
The presence of heavy metals in
catalysts can result in contaminated
process wastewater from catalyst
handling and separation. These wastes
may require special treatment and
disposal procedures or facilities. Heavy
metals can be inhibitory or toxic to
biological wastewater treatment units.
Sludge from wastewater treatment units
may be classified as hazardous due to
heavy metals content. Heavy metals
generally exhibit low toxicity thresholds
in aquatic environments and may
bioaccumulate.
Emissions or effluents are generated
with catalyst activation or regeneration.
Catalyst attrition and carryover into
product requires de-ashing facilities
which are a likely source of wastewater
and solid waste.
Catalysts comprised of noble metals,
because of their cost, are generally
recycled by both onsite and offsite
reclaimers.
Obtain catalyst in the active form.
Provide insitu activation with
appropriate processing/activation
facilities.
Develop a more robust catalyst or
support.
Sector Notebook Project 113 September 1997

Plastic Resin and Manmade Fiber Pollution Prevention
Table 22 (cont.): Process/Product Modifications Create Pollution Prevention Opportunities
Area Potential Problem Possible Approach
Catalysts (cont.)
Preparation and
Handling (cont.)
Effectiveness
Catalyst is spent and needs to be
replaced.
Pyrophoric catalyst needs to be kept
wet, resulting in liquid contaminated
with metals.
Short catalyst life.
Catalyzed reaction has by-product
formation, incomplete conversion and
less-than-perfect yield.
Catalyzed reaction has by-product
formation, incomplete conversion and
less-than perfect yield.
In situ regeneration eliminates
unloading/loading emissions and effluents
versus offsite regeneration or disposal.
Use a nonpryrophoric catalyst.
Minimize amount of water required to
handle and store safely.
Study and identify catalyst deactivation
mechanisms. Avoid conditions which
promote thermal or chemical deactivation.
By extending catalyst life, emissions and
effluents associated with catalyst handling
and regeneration can be reduced.
Reduce catalyst consumption with a
more active form. A higher concentration
of active ingredient or increased surface
area can reduce catalyst loadings.
Use a more selective catalyst which will
reduce the yield of undesired by-products.
Improve reactor mixing/contacting to
increase catalyst effectiveness.
Develop a thorough understanding of
reaction to allow optimization of reactor
design. Include in the optimization,
catalyst consumption and by-product yield.
Intermediate
Products
Quantity and
Quality Intermediate reaction products or
chemical species, including trace levels
of toxic constituents, may contribute to
process waste under both normal and
upset conditions.
Intermediates may contain toxic
constituents or have characteristics that
are harmful to the environment.
Modify reaction sequence to reduce
amount or change composition of
intermediates.
Modify reaction sequence to change
intermediate properties.
Use equipment design and process
control to reduce releases.
Sector Notebook Project 114 September 1997
Plastic Resin and Manmade Fiber Pollution Prevention
Table 22 (cont.): Process/Product Modifications Create Pollution Prevention Opportunities
Area Potential Problem Possible Approach
Process Conditions/
Configuration
Temperature High heat exchange tube temperatures
cause thermal cracking/decomposition
of many chemicals. These lower
molecular weight by-products are a
source of “light ends” and fugitive
emissions. High localized temperature
gives rise to polymerization of reactive
monomers, resulting in “heavies” or
“tars.” such materials can foul heat
exchange equipment or plug fixed-bed
reactors, thereby requiring costly
equipment cleaning and production
outage.
Higher operating temperatures imply
“heat input” usually via combustion
which generates emissions.
Heat sources such as furnaces and
boilers are a source of combustion
emissions.
Vapor pressure increases with
increasing temperature. Loading/
unloading, tankage and fugitive
emissions generally increase with
increasing vapor pressure.
Select operating temperatures at or near
ambient temperature whenever possible.
Use lower pressure steam to lower
temperatures.
Use intermediate exchangers to avoid
contact with furnace tubes and walls.
Use staged heating to minimize product
degradation and unwanted side reactions.
Use superheat of high-pressure steam in
place of furnace.
Monitor exchanger fouling to correlate
process conditions which increase fouling,
avoid conditions which rapidly foul
exchangers.
Use online tube cleaning technologies to
keep tube surfaces clean to increase heat
transfer.
Use scraped wall exchangers in viscous
service.
Use falling film reboiler, pumped
recirculation reboiler or high-flux tubes.
Explore heat integration opportunities
(e.g., use waste heat to preheat materials
and reduce the amount of combustion
required.)
Use thermocompressor to upgrade low-
pressure steam to avoid the need for
additional boilers and furnaces.
If possible, cool materials before sending
to storage.
Use hot process streams to reheat feeds.
Sector Notebook Project 115 September 1997
Plastic Resin and Manmade Fiber Pollution Prevention
Table 22 (cont.): Process/Product Modifications Create Pollution Prevention Opportunities
Area Potential Problem Possible Approach
Process Conditions/
Configuration
(cont.)
Temperature (cont.)
Pressure
Corrosive
Environment
Batch vs.
Continuous
Operations
Water solubility of most chemicals
increases with increasing temperature.
Fugitive emissions from equipment.
Seal leakage potential due to pressure
differential.
Gas solubility increases with higher
pressures.
Material contamination occurs from
corrosion products. Equipment failures
result in spills, leaks and increased
maintenance costs.
Increased waste generation due to
addition of corrosion inhibitors or
neutralization.
Vent gas lost during batch fill.
Waste generated by cleaning/purging
of process equipment between
production batches.
Add vent condensers to recover vapors
in storage tanks or process.
Add closed dome loading with vapor
recovery condensers.
Use lower temperature (vacuum
processing).
Equipment operating in vacuum service
is not a source of fugitives; however, leaks
into the process require control when
system is degassed.
Minimize operating pressure.
Determine whether gases can be
recovered, compressed, and reused or
require controls.
Improve metallurgy or provide coating
or lining.
Neutralize corrosivity of materials
contacting equipment.
Use corrosion inhibitors.
Improve metallurgy or provide coating
or lining or operate in a less corrosive
environment.
Equalize reactor and storage tank vent
lines.
Recover vapors through condenser,
adsorber, etc.
Use materials with low viscosity.
Minimize equipment roughness.
Sector Notebook Project 116 September 1997
Plastic Resin and Manmade Fiber Pollution Prevention
Table 22 (cont.): Process/Product Modifications Create Pollution Prevention Opportunities
Area Potential Problem Possible Approach
Process Conditions/
Configuration
(cont.)
Batch vs.
Continuous
Operations (cont.)
Process
Operation/Design
Process inefficiencies lower yield and
increase emissions.
Continuous process fugitive emissions
and waste increase over time due to
equipment failure through a lack of
maintenance between turnarounds.
Numerous processing steps create
wastes and opportunities for errors.
Nonreactant materials (solvents,
absorbants, etc.) create wastes. Each
chemical (including water) employed
within the process introduces additional
potential waste sources; the composition
of generated wastes also tends to become
more complex.
High conversion with low yield results
in wastes.
Optimize product manufacturing
sequence to minimize washing operations
and cross-contamination of subsequent
batches.
Sequence addition of reactants and
reagents to optimize yields and lower
emissions.
Design facility to readily allow
maintenance so as to avoid unexpected
equipment failure and resultant release.
Keep it simple. Make sure all
operations are necessary. More operations
and complexity only tend to increase
potential emission and waste sources.
Evaluate unit operation or technologies
(e.g., separation) that do not require the
addition of solvents or other nonreactant
chemicals.
Recycle operations generally improve
overall use of raw materials and
chemicals, thereby both increasing the
yield of desired products while at the same
time reducing the generation of wastes. A
case-in-point is to operate at a lower
conversion per reaction cycle by reducing
catalyst consumption, temperature, or
residence time. Many times, this can
result in a higher selectivity to desired
products. The net effect upon recycle of
unreacted reagents is an increase in
product yield, while at the same time
reducing the quantities of spent catalyst
and less desirable by-products.
Sector Notebook Project 117 September 1997

Plastic Resin and Manmade Fiber Pollution Prevention
Table 22 (cont.): Process/Product Modifications Create Pollution Prevention Opportunities
Area Potential Problem Possible Approach
Process Conditions/
Configuration
(cont.)
Process
Operation/Design Non-regenerative treatment systems
result in increased waste versus
regenerative systems.
Regenerative fixed bed treating or
desiccant operation (e.g., aluminum oxide,
silica, activated carbon, molecular sieves,
etc.) will generate less quantities of solid
or liquid waste than nonregenerative units
(e.g., calcium chloride or activated clay).
With regenerative units though, emissions
during bed activation and regeneration can
be significant. Further, side reactions
during activation/regeneration can give
rise to problematic pollutants.
Product
Process Chemistry
Product
Formulation
Insufficient R&D into alternative
reaction pathways may miss pollution
opportunities such as waste reduction or
eliminating a hazardous constituent.
Product based on end-use performance
may have undesirable environmental
impacts or use raw materials or
components that generate excessive or
hazardous wastes.
R&D during process conception and
laboratory studies should thoroughly
investigate alternatives in process
chemistry that affect pollution prevention.
Reformulate products by substituting
different material or using a mixture of
individual chemicals that meet end-use
performance specifications.
Raw Materials
Purity Impurities may produce unwanted by-
products and waste. Toxic impurities,
even in trace amounts, can make a waste
hazardous and therefore subject to strict
and costly regulation.
Excessive impurities may require
more processing and equipment to meet
product specifications, increasing costs
and potential for fugitive emissions,
leaks, and spills.
Specifying a purity greater than
needed by the process increases costs
and can result in more waste generation
by the supplier.
Use higher purity materials.
Purify materials before use and reuse if
practical.
Use inhibitors to prevent side reactions.
Achieve balance between feed purity,
processing steps, product quality and
waste generation.
Specify a purity no greater than what the
process needs.
Sector Notebook Project 118 September 1997
Plastic Resin and Manmade Fiber Pollution Prevention
Table 22 (cont.): Process/Product Modifications Create Pollution Prevention Opportunities
Area Potential Problem Possible Approach
Raw Materials
(cont.)
Purity (cont.)
Vapor Pressure
Water Solubility
Impurities in clean air can increase
inert purges.
Impurities may poison catalyst
prematurely resulting in increased
wastes due to yield loss and more
frequent catalyst replacement.
Higher vapor pressures increase
fugitive emissions in material handling
and storage.
High vapor pressure with low odor
threshold materials can cause nuisance
odors.
Toxic or nonbiodegradable materials
that are water soluble may affect
wastewater treatment operation,
efficiency, and cost.
Higher solubility may increase
potential for surface and groundwater
contamination and may require more
careful spill prevention, containment,
and cleanup (SPCC) plans.
Higher solubility may increase
potential for storm water contamination
in open areas.
Process wastewater associated with
water washing or hydrocarbon/water
phase separation will be impacted by
containment solubility in water.
Appropriate wastewater treatment will
be impacted.
Use pure oxygen.
Install guard beds to protect catalysts.
Use material with lower vapor pressure.
Use materials with lower vapor pressure
and higher odor threshold.
Use less toxic or more biodegradable
materials.
Use less soluble materials.
Use less soluble materials.
Prevent direct contact with storm water
by diking or covering areas.
Minimize water usage.
Reuse wash water.
Determine optimum process conditions
for phase separation.
Evaluate alternative separation
technologies (coalescers, membranes,
distillation, etc.)
Sector Notebook Project 119 September 1997
Plastic Resin and Manmade Fiber Pollution Prevention
Table 22 (cont.): Process/Product Modifications Create Pollution Prevention Opportunities
Area Potential Problem Possible Approach
Raw Materials
(cont.)
Toxicity
Regulatory
Form of Supply
Handling and
Storage
Community and worker safety and
health concerns result from routine and
nonroutine emissions. Emissions
sources include vents, equipment leaks,
wastewater emissions, emergency
pressure relief, etc.
Surges or higher than normal
continuous levels of toxic materials can
shock or miss wastewater biological
treatment systems resulting in possible
fines and possible toxicity in the
receiving water.
Hazardous or toxic materials are
stringently regulated. They may require
enhanced control and monitoring;
increased compliance issues and
paperwork for permits and record
keeping; stricter control for handling,
shipping, and disposal; higher sampling
and analytical costs; and increased
health and safety costs.
Small containers increase shipping
frequency which increases chances of
material releases and waste residues
from shipping containers (including
wash waters).
Nonreturnable containers may
increase waste.
Physical state (solid, liquid, gaseous)
may raise unique environmental, safety,
and health issues with unloading
operations and transfer to process
equipment.
Use less toxic materials.
Reduce exposure through equipment
design and process control. Use systems
which are passive for emergency
containment of toxic releases.
Use less toxic material.
Reduce spills, leaks, and upset
conditions through equipment and process
control.
Consider effect of chemicals on
biological treatment; provide unit
pretreatment or diversion capacity to
remove toxicity.
Install surge capacity for flow and
concentration equalization.
Use materials which are less toxic or
hazardous.
Use better equipment and process design
to minimize or control releases; in some
cases, meeting certain regulatory criteria
will exempt a system from permitting or
other regulatory requirements.
Use bulk supply, ship by pipeline, or use
“jumbo” drums or sacks.
In some cases, product may be shipped
out in the same containers the material
supply was shipped in without washing.
Use returnable shipping containers or
drums.
Use equipment and controls appropriate
to the type of materials to control releases.
Sector Notebook Project 120 September 1997
Plastic Resin and Manmade Fiber Pollution Prevention
Table 22 (cont.): Process/Product Modifications Create Pollution Prevention Opportunities
Area Potential Problem Possible Approach
Raw Materials
(cont.)
Handling and
Storage (cont.)
Large inventories can lead to spills,
inherent safety issues and material
expiration.
Minimize inventory by utilizing just-in-
time delivery.
Waste Streams
Quantity and
Quality
Composition
Properties
Disposal
Characteristics and sources of waste
streams are unknown.
Wastes are generated as part of the
process.
Hazardous or toxic constituents are
found in waste streams. Examples are:
sulfides, heavy metals, halogenated
hydrocarbons, and polynuclear
aromatics.
Environmental fate and waste
properties are not known or understood.
Ability to treat and manage hazardous
and toxic waste unknown or limited.
Document sources and quantities of
waste streams prior to pollution prevention
assessment.
Determine what changes in process
conditions would lower waste generation
of toxicity.
Determine if wastes can be recycled back
into the process.
Evaluate whether different process
conditions, routes, or reagent chemicals
(e.g., solvent catalysts) can be substituted
or changed to reduce or eliminate
hazardous or toxic compounds.
Evaluate waste characteristics using the
following type properties: corrosivity,
ignitability, reactivity, BTU content
(energy recovery), biodegradability,
aquatic toxicity, and bioaccumulation
potential of the waste and of its degradable
products, and whether it is a solid, liquid,
or gas.
Consider and evaluate all onsite and
offsite recycle, reuse, treatment, and
disposal options available. Determine
availability of facilities to treat or manage
wastes generated.
Source: Chemical Manufacturers Association, Designing Pollution Prevention into the Process, Research,
Development and Engineering, Washington, DC, 1993.
Sector Notebook Project 121 September 1997

Plastic Resin and Manmade Fiber Pollution Prevention
Table 23: Modifications to Equipment Can Also Prevent Pollution
Equipment Potential
Environment Problem
Possible Approach
Design
Related Operational
Related
Compressors,
blowers, fans Shaft seal leaks,
piston rod seal leaks,
and vent streams
Seal-less designs
(diaphragmatic, hermetic or
magnetic)
Design for low emissions
(internal balancing, double inlet,
gland eductors)
Shaft seal designs (carbon
rings, double mechanical seals,
buffered seals)
Double seal with barrier fluid
vented to control device
Preventive maintenance
program
Concrete
pads, floors,
sumps
Leaks to groundwater Water stops
Embedded metal plates
Epoxy sealing
Other impervious sealing
Reduce unnecessary purges,
transfers, and sampling
Use drip pans where
necessary
Controls Shutdowns and start-
ups generate waste and
releases
Improve on-line controls
On-line instrumentation
Automatic start-up and
shutdown
On-line vibration analysis
Use “consensus” systems (e.g.,
shutdown trip requires 2 out of 3
affirmative responses)
Continuous versus batch
Optimize on-line run time
Optimize shutdown interlock
inspection frequency
Identify safety and
environment critical instruments
and equipment
Distillation Impurities remain in
process streams Increase reflux ratio
Add section to column
Column intervals
Change feed tray
Change column operating
conditions
- reflux ratio
- feed tray
-temperature
- pressure
-etc.
Sector Notebook Project 122 September 1997
Plastic Resin and Manmade Fiber Pollution Prevention
Table 23 (cont.): Modifications to Equipment Can Also Prevent Pollution
Equipment Potential
Environment Problem
Possible Approach
Design
Related Operational
Related
Distillation
(cont.) Impurities remain in
process streams (cont.)
Large amounts of
contaminated water
condensate from stream
stripping
Insulate to prevent heat loss
Preheat column feed
Increase vapor line size to
lower pressure drop
Use reboilers or inert gas
stripping agents
Clean column to reduce
fouling
Use higher temperature steam
General
manufacturin
g equipment
areas
Contaminated
rainwater
Contaminated
sprinkler and fire water
Leaks and emissions
during cleaning
Provide roof over process
facilities
Segregate process sewer from
storm sewer (diking)
Hard-pipe process streams to
process sewer
Seal floors
Drain to sump
Route to waste treatment
Design for cleaning
Design for minimum rinsing
Design for minimum sludge
Provide vapor enclosure
Drain to process
Return samples to process
Monitor stormwater discharge
Use drip pans for maintenance
activities
Rinse to sump
Reuse cleaning solutions
Heat
exchangers Increased waste due to
high localized
temperatures
Use intermediate exchangers to
avoid contact with furnace tubes
and walls
Use staged heating to
minimize product degradation
and unwanted side reactions.
(waste heat >>low pressure
steam >>high pressure steam)
Select operating temperatures
at or near ambient temperature
when-ever possible. These are
generally most desirable from a
pollution prevention standpoint
Use lower pressure steam to
lower temperatures
Sector Notebook Project 123 September 1997

Plastic Resin and Manmade Fiber Pollution Prevention
Table 23 (cont.): Modifications to Equipment Can Also Prevent Pollution
Equipment Potential
Environment Problem
Possible Approach
Design
Related Operational
Related
Heat
exchangers
(cont.)
Increased waste due to
high localized
temperatures (cont.)
Contaminated
materials due to tubes
leaking at tube sheets
Furnace emissions
Use scraped wall exchangers in
viscous service
Using falling film reboiler,
piped recirculation reboiler or
high-flux tubes
Use lowest pressure steam
possible
Use welded tubes or double
tube sheets with inert purge.
Mount vertically
Use superheat of high-pressure
steam in place of a furnace
Monitor exchanger fouling to
correlate process conditions
which increase fouling, avoid
conditions which rapidly foul
exchangers
Use on-line tube cleaning
techniques to keep tube surfaces
clean
Monitor for leaks
Piping Leaks to groundwater;
fugitive emissions Design equipment layout so as
to minimize pipe run length
Eliminate underground piping
or design for cathodic protection
if necessary to install piping
underground
Welded fittings
Reduce number of flanges and
valves
All welded pipe
Secondary containment
Spiral-wound gaskets
Use plugs and double valves for
open end lines
Change metallurgy
Use lined pipe
Monitor for corrosion and
erosion
Paint to prevent external
corrosion
Sector Notebook Project 124 September 1997
Plastic Resin and Manmade Fiber Pollution Prevention
Table 23 (cont.): Modifications to Equipment Can Also Prevent Pollution
Equipment Potential
Environment Problem
Possible Approach
Design
Related Operational
Related
Piping (cont.) Releases when
cleaning or purging
lines
Use “pigs” for cleaning
Slope to low point drain
Use heat tracing and insulation
to prevent freezing
Install equalizer lines
Flush to product storage tank
Pumps Fugitive emissions
from shaft seal leaks
Fugitive emissions
from shaft seal leaks
Residual “heel” of
liquid during pump
maintenance
Injection of seal flush
fluid into process
stream
Mechanical seal in lieu of
packing
Double mechanical seal with
inert barrier fluid
Double machined seal with
barrier fluid vented to control
device
Seal-less pump (canned motor
magnetic drive)
Vertical pump
Use pressure transfer to
eliminate pump
Low point drain on pump
casing
Use double mechanical seal
with inert barrier fluid where
practical
Seal installation practices
Monitor for leaks
Flush casing to process sewer
for treatment
Increase the mean time
between pump failures by:
- selecting proper seal material;
- good alignment;
- reduce pipe-induced stress
- Maintaining seal lubrication
Reactors Poor conversion or
performance due to
inadequate mixing
Static mixing
Add baffles
Change impellers
Add ingredients with optimum
sequence
Sector Notebook Project 125 September 1997

Plastic Resin and Manmade Fiber Pollution Prevention
Table 23 (cont.): Modifications to Equipment Can Also Prevent Pollution
Equipment Potential
Environment Problem
Possible Approach
Design
Related Operational
Related
Reactors
(cont.) Poor conversion
(cont.)
Waste by-product
formation
Add horsepower
Add distributor
Provide separate reactor for
converting recycle streams to
usable products
Allow proper head space in
reactor to enhance vortex effect
Optimize reaction conditions
(temperature, pressure, etc.)
Relief Valve Leaks
Fugitive emissions
Discharge to
environment from over
pressure
Frequent relief
Provide upstream rupture disc
Vent to control or recovery
device
Pump discharges to suction of
pump
Thermal relief to tanks
Avoid discharge to roof areas
to prevent contamination of
rainwater
Use pilot operated relief valve
Increase margin between
design and operating pressure
Monitor for leaks and for
control efficiency
Monitor for leaks
Reduce operating pressure
Review system performance
Sampling Waste generation due
to sampling (disposal,
containers, leaks,
fugitives, etc.)
In-line insitu analyzers
System for return to process
Closed loop
Drain to sump
Reduce number and size of
samples required
Sample at the lowest possible
temperature
Cool before sampling
Tanks Tank breathing and
working losses Cool materials before storage
Insulate tanks
Vent to control device (flare,
condenser, etc.)
Vapor balancing
Floating roof
Optimize storage conditions to
reduce losses
Sector Notebook Project 126 September 1997
Plastic Resin and Manmade Fiber Pollution Prevention
Table 23 (cont.): Modifications to Equipment Can Also Prevent Pollution
Equipment Potential
Environment Problem
Possible Approach
Design
Related Operational
Related
Tanks (cont.) Tank breathing and
working losses (cont.)
Leak to groundwater
Large waste heel
Higher design pressure
All aboveground (situated so
bottom can routinely be checked
for leaks)
Secondary containment
Improve corrosion resistance
Design for 100% de-inventory
Monitor for leaks and
corrosion
Recycle to process if practical
Vacuum
Systems Waste discharge from
jets Substitute mechanical vacuum
pump
Evaluate using process fluid for
powering jet
Monitor for air leaks
Recycle condensate to process
Valves Fugitive emissions
from leaks Bellow seals
Reduce number where practical
Special packing sets
Stringent adherence to
packing procedures
Vents Release to
environment Route to control or recovery
device Monitor performance
Source: Chemical Manufacturers Association, Designing Pollution Prevention into the Process, Research,
Development and Engineering, Washington, DC, 1993.
Sector Notebook Project 127 September 1997
Page 128 intentionally left blank.

Plastic Resin and Manmade Fiber Statutes and Regulations
VI. SUMMARY OF APPLICABLE FEDERAL STATUTES AND REGULATIONS
This section discusses the Federal regulations that may apply to this sector.
The purpose of this section is to highlight and briefly describe the applicable
Federal requirements, and to provide citations for more detailed information.
The three following sections are included:
Section VI.A contains a general overview of major statutes
Section VI.B contains a list of regulations specific to this industry
Section VI.C contains a list of pending and proposed regulations
The descriptions within Section VI are intended solely for general
information. Depending upon the nature or scope of the activities at a
particular facility, these summaries may or may not necessarily describe all
applicable environmental requirements. Moreover, they do not constitute
formal interpretations or clarifications of the statutes and regulations. For
further information readers should consult the Code of Federal Regulations
and other state or local regulatory agencies. EPA Hotline contacts are also
provided for each major statute.
VI.A. General Description of Major Statutes
Resource Conservation and Recovery Act
The Resource Conservation And Recovery Act (RCRA) of 1976 which
amended the Solid Waste Disposal Act, addresses solid (Subtitle D) and
hazardous (Subtitle C) waste management activities. The Hazardous and
Solid Waste Amendments (HSWA) of 1984 strengthened RCRA’s waste
management provisions and added Subtitle I, which governs underground
storage tanks (USTs).
Regulations promulgated pursuant to Subtitle C of RCRA (40 CFR Parts
260-299) establish a “cradle-to-grave” system governing hazardous waste
from the point of generation to disposal. RCRA hazardous wastes include the
specific materials listed in the regulations (commercial chemical products,
designated with the code "P" or "U"; hazardous wastes from specific
industries/sources, designated with the code "K"; or hazardous wastes from
non-specific sources, designated with the code "F") or materials which exhibit
a hazardous waste characteristic (ignitability, corrosivity, reactivity, or toxicity
and designated with the code "D").
Regulated entities that generate hazardous waste are subject to waste
accumulation, manifesting, and record keeping standards. Facilities must
obtain a permit either from EPA or from a State agency which EPA has
authorized to implement the permitting program if they store hazardous
Sector Notebook Project 129 September 1997

Plastic Resin and Manmade Fiber Statutes and Regulations
wastes for more than 90 days before treatment or disposal. Facilities may
treat hazardous wastes stored in less-than-ninety-day tanks or containers
without a permit. Subtitle C permits contain general facility standards such
as contingency plans, emergency procedures, record keeping and reporting
requirements, financial assurance mechanisms, and unit-specific standards.
RCRA also contains provisions (40 CFR Part 264 Subpart S and §264.10) for
conducting corrective actions which govern the cleanup of releases of
hazardous waste or constituents from solid waste management units at
RCRA-regulated facilities.
Although RCRA is a Federal statute, many States implement the RCRA
program. Currently, EPA has delegated its authority to implement various
provisions of RCRA to 47 of the 50 States and two U.S. territories.
Delegation has not been given to Alaska, Hawaii, or Iowa.
Most RCRA requirements are not industry specific but apply to any company
that generates, transports, treats, stores, or disposes of hazardous waste.
Here are some important RCRA regulatory requirements:
Identification of Solid and Hazardous Wastes (40 CFR Part 261)
lays out the procedure every generator must follow to determine
whether the material in question is considered a hazardous waste,
solid waste, or is exempted from regulation.
Standards for Generators of Hazardous Waste (40 CFR Part 262)
establishes the responsibilities of hazardous waste generators including
obtaining an EPA ID number, preparing a manifest, ensuring proper
packaging and labeling, meeting standards for waste accumulation
units, and recordkeeping and reporting requirements. Generators can
accumulate hazardous waste for up to 90 days (or 180 days depending
on the amount of waste generated) without obtaining a permit.
Land Disposal Restrictions (LDRs) (40 CFR Part 268) are
regulations prohibiting the disposal of hazardous waste on land
without prior treatment. Under the LDRs program, materials must
meet LDR treatment standards prior to placement in a RCRA land
disposal unit (landfill, land treatment unit, waste pile, or surface
impoundment). Generators of waste subject to the LDRsmust provide
notification of such to the designated TSD facility to ensure proper
treatment prior to disposal.
Used Oil Management Standards (40 CFR Part 279) impose
management requirements affecting the storage, transportation,
burning, processing, and re-refining of the used oil. For parties that
merely generate used oil, regulations establish storage standards. For
a party considered a used oil processor, re-refiner, burner, or marketer
Sector Notebook Project 130 September 1997

Plastic Resin and Manmade Fiber Statutes and Regulations
(one who generates and sells off-specification used oil), additional
tracking and paperwork requirements must be satisfied.
RCRA contains unit-specific standards for all units used to store,
treat, or dispose of hazardous waste, including Tanks and
Containers. Tanks and containers used to store hazardous waste
with a high volatile organic concentration must meet emission
standards under RCRA. Regulations (40 CFR Part 264-265, Subpart
CC) require generators to test the waste to determine the
concentration of the waste, to satisfy tank and container emissions
standards, and to inspect and monitor regulated units. These
regulations apply to all facilities that store such waste, including large
quantity generators accumulating waste prior to shipment off-site.
Underground Storage Tanks (USTs) containing petroleum and
hazardous substances are regulated under Subtitle I of RCRA.
Subtitle I regulations (40 CFR Part 280) contain tank design and
release detection requirements, as well as financial responsibility and
corrective action standards for USTs. The UST program also
includes upgrade requirements for existing tanks that must be met by
December 22, 1998.
Boilers and Industrial Furnaces (BIFs) that use or burn fuel
containing hazardous waste must comply with design and operating
standards. BIF regulations (40 CFR Part 266, Subpart H) address
unit design, provide performance standards, require emissions
monitoring, and restrict the type of waste that may be burned.
EPA's RCRA, Superfund and EPCRA Hotline, at (800) 424-9346, responds
to questions and distributes guidance regarding all RCRA regulations. The
RCRA Hotline operates weekdays from 9:00 a.m. to 6:00 p.m., ET, excluding
Federal holidays.
Comprehensive Environmental Response, Compensation, and Liability Act
The Comprehensive Environmental Response, Compensation, and Liability
Act (CERCLA), a 1980 law known commonly as Superfund, authorizes EPA
to respond to releases, or threatened releases, of hazardous substances that
may endanger public health, welfare, or the environment. CERCLA also
enables EPA to force parties responsible for environmental contamination to
clean it up or to reimburse the Superfund for response costs incurred by EPA.
The Superfund Amendments and Reauthorization Act (SARA) of 1986
revised various sections of CERCLA, extended the taxing authority for the
Superfund, and created a free-standing law, SARA Title III, also known as the
Emergency Planning and Community Right-to-Know Act (EPCRA).
Sector Notebook Project 131 September 1997

Plastic Resin and Manmade Fiber Statutes and Regulations
The CERCLA hazardous substance release reporting regulations (40 CFR
Part 302) direct the person in charge of a facility to report to the National
Response Center (NRC) any environmental release of a hazardous substance
whichequals or exceeds a reportable quantity. Reportable quantities are listed
in 40 CFR §302.4. A release report may trigger a response by EPA, or by one
or more Federal or State emergency response authorities.
EPA implements hazardous substance responses according to procedures
outlined in the National Oil and Hazardous Substances PollutionContingency
Plan (NCP) (40 CFR Part 300). The NCP includes provisions for permanent
cleanups, known as remedial actions, and other cleanups referred to as
removals. EPA generally takes remedial actions only at sites on the National
Priorities List (NPL), which currently includes approximately 1300 sites.
Both EPA and states can act at sites; however, EPA provides responsible
parties the opportunity to conduct removal and remedial actions and
encourages community involvement throughout the Superfund response
process.
EPA's RCRA, Superfund and EPCRA Hotline, at (800) 424-9346, answers
questions and references guidance pertaining to the Superfund program.
The CERCLA Hotline operates weekdays from 9:00 a.m. to 6:00 p.m., ET,
excluding Federal holidays.
Emergency Planning And Community Right-To-Know Act
The Superfund Amendments and Reauthorization Act (SARA) of 1986
created the Emergency Planning and Community Right-to-Know Act
(EPCRA, also known as SARA Title III), a statute designed to improve
community access to information about chemical hazards and to facilitate the
development of chemical emergency response plans by State and local
governments. EPCRA required the establishment of State emergency
response commissions (SERCs), responsible for coordinating certain
emergency response activities and for appointing local emergency planning
committees (LEPCs).
EPCRA and the EPCRA regulations (40 CFR Parts 350-372) establish four
types of reporting obligations for facilities which store or manage specified
chemicals:
EPCRA §302 requires facilities to notify the SERC and LEPC of the
presence of any extremely hazardous substance (the list of such
substances is in 40 CFR Part 355, Appendices A and B) if it has such
substance in excess of the substance's threshold planning quantity, and
directs the facility to appoint an emergency response coordinator.
EPCRA §304 requires the facility to notify the SERC and the LEPC
Sector Notebook Project 132 September 1997

Plastic Resin and Manmade Fiber Statutes and Regulations
in the event of a release equaling or exceeding the reportable quantity
of a CERCLA hazardous substance or an EPCRA extremely
hazardous substance.
EPCRA §311 and §312 require a facility at which a hazardous
chemical, as defined by the Occupational Safety and Health Act, is
present in an amount exceeding a specified threshold to submit to the
SERC, LEPC and local fire department material safety data sheets
(MSDSs) or lists of MSDS's and hazardous chemical inventory forms
(also known as Tier I and II forms). This information helps the local
government respond in the event of a spill or release of the chemical.
EPCRA §313 requires manufacturing facilities included in SIC codes
20 through 39, which have ten or more employees, and which
manufacture, process, or use specified chemicals in amounts greater
than threshold quantities, to submit an annual toxic chemical release
report. This report, known commonly as the Form R, covers releases
and transfers of toxic chemicals to various facilities and environmental
media, and allows EPA to compile the national Toxic Release
Inventory (TRI) database.
All information submitted pursuant to EPCRA regulations is publicly
accessible, unless protected by a trade secret claim.
EPA's RCRA, Superfund and EPCRA Hotline, at (800) 424-9346, answers
questions and distributes guidance regarding the emergency planning and
community right-to-know regulations. The EPCRA Hotline operates
weekdays from 9:00 a.m. to 6:00 p.m., ET, excluding Federal holidays.
Clean Water Act
The primary objective of the Federal Water Pollution Control Act, commonly
referred to as the Clean Water Act (CWA), is to restore and maintain the
chemical, physical, and biological integrity of the nation's surface waters.
Pollutants regulated under the CWA include "priority" pollutants, including
various toxic pollutants; "conventional" pollutants, such as biochemical
oxygen demand (BOD), total suspended solids (TSS), fecal coliform, oil and
grease, and pH; and "non-conventional" pollutants, including any pollutant not
identified as either conventional or priority.
The CWA regulates both direct and indirect discharges. The National
Pollutant Discharge Elimination System (NPDES) program (CWA §502)
controls direct discharges into navigable waters. Direct discharges or "point
source" discharges are from sources such as pipes and sewers. NPDES
permits, issued by either EPA or an authorized State (EPA has authorized 42
Sector Notebook Project 133 September 1997

Plastic Resin and Manmade Fiber Statutes and Regulations
States to administer the NPDES program), contain industry-specific,
technology-based and/or water quality-based limits, and establish pollutant
monitoring requirements. A facility that intends to discharge into the nation's
waters must obtain a permit prior to initiating its discharge. A permit
applicant must provide quantitative analytical data identifying the types of
pollutants present in the facility's effluent. The permit will then set the
conditions and effluent limitations on the facility discharges.
A NPDES permit may also include discharge limits based on Federal or State
water quality criteria or standards, that were designed to protect designated
uses of surface waters, such as supporting aquatic life or recreation. These
standards, unlike the technological standards, generally do not take into
account technological feasibility or costs. Water quality criteria andstandards
vary from State to State, and site to site, depending on the use classification
of the receiving body of water. Most States follow EPA guidelines which
propose aquatic life and human health criteria for many of the 126 priority
pollutants.
Storm Water Discharges
In 1987 the CWA was amended to require EPA to establish a program to
address storm water discharges. In response, EPA promulgated the NPDES
storm water permit application regulations. These regulations require that
facilities with the following storm water discharges apply for an NPDES
permit: (1) a discharge associated with industrial activity; (2) a discharge
from a large or medium municipal storm sewer system; or (3) a discharge
which EPA or the State determines to contribute to a violation of a water
quality standard or is a significant contributor of pollutants to waters of the
United States.
The term "storm water discharge associated with industrial activity" means a
storm water discharge from one of 11 categories of industrial activity defined
at 40 CFR 122.26. Six of the categories are defined by SIC codes while the
other five are identified through narrative descriptions of the regulated
industrial activity. If the primary SIC code of the facility is one of those
identified in the regulations, the facility is subject to the storm water permit
application requirements. If any activity at a facility is covered by one of the
five narrative categories, storm water discharges from those areas where the
activities occur are subject to storm water discharge permit application
requirements.
Those facilities/activities that are subject to storm water discharge permit
application requirements are identified below. To determine whether a
particular facility falls within one of these categories, consult the regulation.
Category i: Facilities subject to storm water effluent guidelines, new source
Sector Notebook Project 134 September 1997

Plastic Resin and Manmade Fiber Statutes and Regulations
performance standards, or toxic pollutant effluent standards.
Category ii: Facilities classified as SIC 24-lumber and wood products
(except wood kitchen cabinets); SIC 26-paper and allied products (except
paperboard containers and products); SIC 28-chemicals and allied products
(except drugs and paints); SIC 291-petroleum refining; and SIC 311-leather
tanning and finishing, 32 (except 323)-stone, clay, glass, and concrete, 33-
primary metals, 3441-fabricated structural metal, and 373-ship and boat
building and repairing.
Category iii: Facilities classified as SIC 10-metal mining; SIC 12-coal
mining; SIC 13-oil and gas extraction; and SIC 14-nonmetallic mineral
mining.
Category iv: Hazardous waste treatment, storage, or disposal facilities.
Category v: Landfills, land application sites, and open dumps that receive or
have received industrial wastes.
Category vi: Facilities classified as SIC 5015-used motor vehicle parts; and
SIC 5093-automotive scrap and waste material recycling facilities.
Category vii: Steam electric power generating facilities.
Category viii: Facilities classified as SIC 40-railroad transportation; SIC 41-
local passenger transportation; SIC 42-trucking and warehousing (except
public warehousing and storage); SIC 43-U.S. Postal Service; SIC 44-water
transportation; SIC 45-transportation by air; and SIC 5171-petroleum bulk
storage stations and terminals.
Category ix: Sewage treatment works.
Category x: Construction activities except operations that result in the
disturbance of less than five acres of total land area.
Category xi: Facilities classified as SIC 20-food and kindred products; SIC
21-tobacco products; SIC 22-textile mill products; SIC 23-apparel related
products; SIC 2434-wood kitchen cabinets manufacturing; SIC 25-furniture
and fixtures; SIC 265-paperboard containers and boxes; SIC 267-converted
paper and paperboard products; SIC 27-printing, publishing, and allied
industries; SIC 283-drugs; SIC 285-paints, varnishes, lacquer, enamels, and
allied products; SIC 30-rubber and plastics; SIC 31-leather and leather
products (except leather and tanning and finishing); SIC 323-glass products;
SIC 34-fabricated metal products (except fabricated structural metal); SIC
35-industrial and commercial machinery and computer equipment; SIC 36-
electronic and other electrical equipment and components; SIC 37-
Sector Notebook Project 135 September 1997

Plastic Resin and Manmade Fiber Statutes and Regulations
transportation equipment (except ship and boat building and repairing); SIC
38-measuring, analyzing, and controlling instruments; SIC 39-miscellaneous
manufacturing industries; and SIC 4221-4225-public warehousing and
storage.
Pretreatment Program
Another type of discharge that is regulated by the CWA is one that goes to
a publicly-owned treatment works (POTWs). The national pretreatment
program (CWA §307(b)) controls the indirect discharge of pollutants to
POTWs by "industrial users." Facilities regulated under §307(b) must meet
certain pretreatment standards. The goal of the pretreatment program is to
protect municipal wastewater treatment plants from damage that may occur
when hazardous, toxic, or other wastes are discharged into a sewer system
and to protect the quality of sludge generated by these plants. Discharges to
a POTW are regulated primarily by the POTW itself, rather than the State or
EPA.
EPA has developed technology-based standards for industrial users of
POTWs. Different standards apply to existing and new sources within each
category. "Categorical" pretreatment standards applicable to an industry on
a nationwide basis are developed by EPA. In addition, another kind of
pretreatment standard, "local limits," are developed by the POTW in order to
assist the POTW in achieving the effluent limitations in its NPDES permit.
Regardless of whether a State is authorized to implement either the NPDES
or the pretreatment program, if it develops its own program, it may enforce
requirements more stringent than Federal standards.
Spill Prevention, Control and Countermeasure Plans
The 1990 Oil Pollution Act requires that facilities that could reasonably be
expected to discharge oil in harmful quantities prepare and implement more
rigorous Spill Prevention Control and Countermeasure (SPCC) Plan required
under the CWA (40 CFR §112.7). There are also criminal and civil penalties
for deliberate or negligent spills of oil. Regulations covering response to oil
discharges and contingency plans (40 CFR Part 300), and Facility Response
Plans to oil discharges (40 CFR §112.20) and for PCB transformers and PCB-
containing items were revised and finalized in 1995.
EPA’s Office of Water, at (202) 260-5700, will direct callers with questions
about the CWA to the appropriate EPA office. EPA also maintains a
bibliographic database of Office of Water publications which can be
accessed through the Ground Water and Drinking Water resource center, at
(202) 260-7786.
Sector Notebook Project 136 September 1997

Plastic Resin and Manmade Fiber Statutes and Regulations
Safe Drinking Water Act
The Safe Drinking Water Act (SDWA) mandates that EPA establish
regulations to protect human health from contaminants in drinking water.
The law authorizes EPA to develop national drinking water standards and to
create a joint Federal-State system to ensure compliance with these standards.
The SDWA also directs EPA to protect underground sources of drinking
water through the control of underground injection of liquid wastes.
EPA has developed primary and secondary drinking water standards under its
SDWA authority. EPA and authorized States enforce the primary drinking
water standards, which are, contaminant-specific concentration limits that
apply to certain public drinking water supplies. Primary drinking water
standards consist of maximum contaminant level goals (MCLGs), which are
non-enforceable health-based goals, and maximum contaminant levels
(MCLs), which are enforceable limits set as close to MCLGs as possible,
considering cost and feasibility of attainment.
The SDWA Underground Injection Control (UIC) program (40 CFR Parts
144-148) is a permit program which protects underground sources ofdrinking
water by regulating five classes of injection wells. UIC permits include
design, operating, inspection, and monitoring requirements. Wells used to
inject hazardous wastes must also comply with RCRA corrective action
standards in order to be granted a RCRA permit, and must meet applicable
RCRA land disposal restrictions standards. The UIC permit program is
primarily State-enforced, since EPA has authorized all but a few States to
administer the program.
The SDWA also provides for a Federally-implemented Sole Source Aquifer
program, which prohibits Federal funds from being expended on projects that
may contaminate the sole or principal source of drinking water for a given
area, and for a State-implemented Wellhead Protection program, designed to
protect drinking water wells and drinking water recharge areas.
EPA’s Safe Drinking Water Hotline, at (800) 426-4791, answers questions
and distributes guidance pertaining to SDWA standards. The Hotline
operates from 9:00 a.m. through 5:30 p.m., ET, excluding Federal holidays.
Toxic Substances Control Act
The Toxic Substances Control Act (TSCA) granted EPA authority to create
a regulatory framework to collect data on chemicals in order to evaluate,
assess, mitigate, and control risks which may be posed by their manufacture,
processing, and use. TSCA provides a variety of control methods to prevent
chemicals from posing unreasonable risk.
Sector Notebook Project 137 September 1997

Plastic Resin and Manmade Fiber Statutes and Regulations
TSCA standards may apply at any point during a chemical’s life cycle. Under
TSCA §5, EPA has established an inventory of chemical substances. If a
chemical is not already on the inventory, and has not been excluded by TSCA,
a premanufacture notice (PMN) must be submitted to EPA prior to
manufacture or import. The PMN must identify the chemical and provide
available information on health and environmental effects. If available data
are not sufficient to evaluate the chemicals effects, EPA can impose
restrictions pending the development of information on its health and
environmental effects. EPA can also restrict significant new uses of chemicals
based upon factors such as the projected volume and use of the chemical.
Under TSCA §6, EPA can ban the manufacture or distribution in commerce,
limit the use, require labeling, or place other restrictions on chemicals that
pose unreasonable risks. Among the chemicals EPA regulates under §6
authority are asbestos, chlorofluorocarbons (CFCs), and polychlorinated
biphenyls (PCBs).
EPA’s TSCA Assistance Information Service, at (202) 554-1404, answers
questions and distributes guidance pertaining to Toxic Substances Control
Act standards. The Service operates from 8:30 a.m. through 4:30 p.m., ET,
excluding Federal holidays.
Clean Air Act
The Clean Air Act (CAA) and its amendments, including the Clean Air Act
Amendments (CAAA) of 1990, are designed to “protect and enhance the
nation's air resources so as to promote the public health and welfare and the
productive capacity of the population.” The CAA consists of six sections,
known as Titles, which direct EPA to establish national standards for ambient
air quality and for EPA and the States to implement, maintain, and enforce
these standards through a variety of mechanisms. Under the CAAA, many
facilities will be required to obtain permits for the first time. State and local
governments oversee, manage, and enforce many of the requirements of the
CAAA. CAA regulations appear at 40 CFR Parts 50-99.
Pursuant to Title I of the CAA, EPA has established national ambient air
quality standards (NAAQSs) to limit levels of "criteria pollutants," including
carbon monoxide, lead, nitrogen dioxide, particulate matter, volatile organic
compounds (VOCs), ozone, and sulfur dioxide. Geographic areas that meet
NAAQSs for a given pollutant are classified as attainment areas; those that do
not meet NAAQSs are classified as non-attainment areas. Under section 110
of the CAA, each State must develop a State Implementation Plan (SIP) to
identify sources of air pollution and to determine what reductions are required
to meet Federal air quality standards. Revised NAAQSs for particulates and
ozone were proposed in 1996 and may go into effect as early as late 1997.
Sector Notebook Project 138 September 1997

Plastic Resin and Manmade Fiber Statutes and Regulations
Title I also authorizes EPA to establish New Source Performance Standards
(NSPSs), which are nationally uniform emission standards for new stationary
sources falling within particular industrial categories. NSPSs are based on the
pollution control technology available to that category of industrial source.
Under Title I, EPA establishes and enforces National Emission Standards for
Hazardous Air Pollutants (NESHAPs), nationallyuniform standards oriented
towards controlling particular hazardous air pollutants (HAPs). Title I,
section 112(c) of the CAA further directed EPA to develop a list of sources
that emit any of 189 HAPs, and to develop regulations for these categories of
sources. To date EPA has listed 174 categories and developed a schedule for
the establishment of emission standards. The emission standards will be
developed for both new and existing sources based on "maximum achievable
control technology" (MACT). The MACT is defined as the control
technology achieving the maximum degree of reduction in the emission of the
HAPs, taking into account cost and other factors.
Title II of the CAA pertains to mobile sources, such as cars, trucks, buses,
and planes. Reformulated gasoline, automobile pollution control devices, and
vapor recovery nozzles on gas pumps are a few of the mechanisms EPA uses
to regulate mobile air emission sources.
Title IV of the CAA establishes a sulfur dioxide nitrous oxide emissions
program designed to reduce the formation of acid rain. Reduction of sulfur
dioxide releases will be obtained by granting to certain sources limited
emissions allowances, which, beginning in 1995, will be set below previous
levels of sulfur dioxide releases.
Title V of the CAA of 1990 created a permit program for all "major sources"
(and certain other sources) regulated under the CAA. One purpose of the
operating permit is to include in a single document all air emissions
requirements that apply to a given facility. States are developing the permit
programs in accordance with guidance and regulations from EPA. Once a
State program is approved by EPA, permits will be issued and monitored by
that State.
Title VI of the CAA is intended to protect stratospheric ozone by phasing out
the manufacture of ozone-depleting chemicals and restrict their use and
distribution. Production of Class I substances, including 15 kinds of
chlorofluorocarbons (CFCs) and chloroform, were phased out (except for
essential uses) in 1996.
EPA's Clean Air Technology Center, at (919) 541-0800, provides general
assistance and information on CAA standards. The Stratospheric Ozone
Information Hotline, at (800) 296-1996, provides general information about
regulations promulgated under Title VI of the CAA, and EPA's EPCRA
Sector Notebook Project 139 September 1997

Plastic Resin and Manmade Fiber Statutes and Regulations
Hotline, at (800) 535-0202, answers questions about accidental release
prevention under CAA §112(r). In addition, the Clean Air Technology
Center’s website includes recent CAA rules, EPA guidance documents, and
updates of EPA activities (www.epa.gov/ttn then select Directory and then
CATC).
Sector Notebook Project 140 September 1997

Plastic Resin and Manmade Fiber Statutes and Regulations
VI.B. Industry Specific Requirements
The plastic resin and manmade fiber industries are affected by nearly all
federal environmental statutes. In addition, the industries are subject to
numerous laws and regulations from state and local governments designed to
protect and improve the nation’s health, safety, and environment. A summary
of the major federal regulations affecting the plastic resin and manmade fiber
industry follows.
Clean Air Act
The original CAA authorized EPA to set limits on plastic resin and manmade
fiber plant emissions. In its new source performance standards (NSPS) for
polymer manufacturing facilities (40 CFR Part 60 Subpart DDD), EPA set
minimum standards for the lowest achievable emissions rates (LAER) and
best available control technologies (BACT). The NSPS for Polymers requires
air emission controls on new and existing facilities that manufacture
polypropylene, polyethylene, polystyrene and poly(ethylene terephthalate).
Included are standards on controlling intermittent and continuous sources of
emissions from processes. EPA also published an NSPS for synthetic fiber
production facilities (40 CFR Part 60 Subpart HHH). The NSPS for
Synthetic Fibers regulates VOC emissions from facilities that use solvents in
manufacturing fibers. There are additional NSPS that apply to plastic resin
and synthetic fiber manufacturers including those for flares (40 CFR Part 60
Subpart A), storage vessels (40 CFR Part 60 Subpart K), equipment leaks (40
CFR Part 60 Subpart VV), air oxidation processes (40 CFR Part 60 Subpart
III), distillation operations (40 CFR Part 60 Subpart NNN), and reactor
processes (40 CFR Part 60 Subpart RRR).
The Clean Air Act Amendments of 1990 set National Emission Standards for
Hazardous Air Pollutants (NESHAP) from industrial sources for 41 pollutants
to be met by 1995 and for 148 other pollutants to be reached by 2003.
Several provisions affect the plastic resin and manmade fiber industries. In
April 1994, the EPA published Hazardous Organic National Emissions
Standards for Hazardous Air Pollutants, also known as HON, in a rule aimed
at reducing air toxics emissions from chemical and allied product plants. This
rule, which consists of four subparts, affects hundreds of plastic resin and
manmade fiber plants and thousands of chemical process units since potential
organic hazardous air pollutants are widely used as reactants. Processes
covered include heat exchange systems and maintenance operations (40 CFR
Part 63 Subpart F); process vents, storage vessels, transfer operations, and
wastewater (40 CFR Part 63 Subpart G); equipment leaks (40 CFR Part 63
Subpart H); and equipment leaks for polycarbonate plants (40 CFR Part 63
Subpart I). Another NESHAP that may affect plastic resin and manmade
fiber manufacturers is that for treatment, storage, and disposal facilities (40
Part CFR 63 Subpart AA). The HON also includes innovative provisions such
Sector Notebook Project 141 September 1997

Plastic Resin and Manmade Fiber Statutes and Regulations
as emissions trading, that offer industry flexibility in complying with the rule's
emissions goals.
Subsets of the plastic resin and manmade fiber industries are regulated under
other NESHAPs. EPA published a final rule for epoxy resins and non-nylon
polyamide resins in March 1995. The rule was expected to reduce
epichlorohydrin emissions from process vents and storage tank emissions. In
September 1996, EPA published a final rule for Group I Polymers and Resins
(61 FR 46906) under 40 CFR part 63, Subpart U. This rule focused on
reducing emissions from facilities that make certain elastomers used in the
manufacture of synthetic rubber products. The rule was expected to reduce
emissions of styrene, hexane, toluene, and other toxics. Provisions on
pollution prevention, as well as a market-based provision on emissions
averaging, were also included in the rule.
In September 1996, EPA also published a final rule for Designated Group IV
Polymers and Resins (61 FR 48208) under 40 CFR part 63, Subpart JJJ. This
rule was expected to reduce emissions of air toxics from poly(ethylene
terephlate), nitrile, and styrene-based resins facilities. The rule was expected
to reduce styrene, butadiene, and methanol emissions from storage vessels,
process vents, equipment leaks, and wastewater operations. A direct final
notice (62 FR 1869) was published on January 14, 1997, which extended the
heat exchange system compliance date for the Group I rule and the equipment
leak compliance dates for both the Group I and Group IV rules. Other
NESHAPs that apply to the industry cover vinyl chloride manufacturers (40
CFR Part 61 Subpart F), benzene equipment leaks (40 CFR Part 61 Subpart
J), fugitive emissions (40 CFR Part 61 Subpart V), benzene emissions from
benzene storage vessels (40 CFR Part 61 Subpart Y), benzene emissions from
benzene transfer operations (40 CFR Part 61 Subpart BB), and benzene waste
operations (40 CFR Part 61 Subpart FF).
Clean Water Act
The Clean Water Act, first passed in 1972 and amended in 1977 and 1987,
gives EPA the authority to regulate effluents from sewage treatment works,
chemical plants, and other industrial sources into waters. The act sets “best
available” technology standards for treatment of wastes for both direct and
indirect (discharged to a Publicly Owned Treatment Work (POTW))
discharges. EPA originally promulgated effluent limitations guidelines and
standards for the plastic resin and manmade fiber industries in two phases.
Phase I, covering 13 products and processes, was promulgated on April 5,
1974 (39 FR 12502), and Phase II, covering eight additional products and
processes, was promulgated on January 23, 1975 (40 FR 3716). In 1976,
these regulations were challenged and eventually remanded by the federal
circuit court in FMC Corp. versus Train, 539F.2d 973 (4th Cir. 1976). As
Sector Notebook Project 142 September 1997

Plastic Resin and Manmade Fiber Statutes and Regulations
a result, EPA withdrew both the Phase I and II plastic resin and manmade
fiber regulations on August 4, 1976 (41 FR 32587) (EPA, 1987).
On November 5, 1987, EPA proposed final effluent guidelines (52FR42522)
for the organic chemical, plastics, and synthetic fiber industries (OCPSF) (40
CFR Part 414). The effluent guidelines include limits for biological oxygen
demand (BOD), total suspended solids (TSS), and acidity (pH). In this rule,
limits are specified for facilities that manufacture rayon fibers, other synthetic
fibers, thermoplastic resins, and thermoset resins.
The majority of this rule was upheld by the federal courts in 1989 when the
Chemical Manufacturers Association sued the EPA. The Court left the rule
in effect pending further rulemaking but remanded three aspects of the
OCPSF guidelines. The Court remanded the New Source Performance
Standards (NSPS) and the Pretreatment Standards for New Sources (PSNS)
for consideration of whether zero discharge limits were appropriate for the
industries; the subcategorization of the industries into two subcategories
imposing differing limitations based on Best Available Technology
Economically Achievable (BAT); and limitations for BAT Subpart J
pollutants that were based upon in-plant biological treatment technology.
The EPA decided not to revise the NSPS and PSNS standards or the BAT
subcategorization scheme and promulgated two sets of amendments to the
rule in 1992 and 1993. On September 11, 1992, EPA promulgated a first set
of amendments (57 FR 41836) to the OCPSF rule. These amendments
allowed regulatory authorities to establish alternative cyanide limitations and
standards for cyanide resulting from complexing of cyanide at the process
source and establish alternative metals limitations and standards to
accommodate low background levels of metals in non-“metal-bearing waste
streams.” These amendments also allowed regulatory authorities to specify
the method for determining five-day biochemical oxygen demand and total
suspended solids effluent limitations for direct discharge plants (FR,
September 11, 1992).
On July 9, 1993, EPA promulgated the remaining portions of the OCPSF rule
in second set of amendments (58 FR 36872) which added Subpart J
limitations based on BAT and NSPS for 19 additional pollutants. These
amendments also established Pretreatment Standards for Existing Sources
(PSES) and PSNS for 11 of these 19 pollutants. EPA also corrected the
criteria for designating “metal-” and “cyanide-bearing” waste streams. In this
rulemaking, phenol and 2,4-dimethylphenol pretreatment standards were not
promulgated since EPA concluded that they did not pass through POTWs.
The implementation of the guidelines is left to the states who issue NPDES
permits for each facility. The compliance date for PSES was no later than
July 23, 1996 (FR, July 9, 1993).
Sector Notebook Project 143 September 1997

Plastic Resin and Manmade Fiber Statutes and Regulations
The Storm Water Rule (40 CFR §122.26(b)(14) Subparts (i, ii)) requires the
capture and treatment of stormwater at facilities producing chemicals and
allied products, including plastic resin and synthetic fiber manufacture.
Required treatment will remove from stormwater flows a large fraction of
both conventional pollutants, such as suspended solids and biological oxygen
demand (BOD), as well as toxic pollutants, such as certain metals and organic
compounds.
Resource Conservation and Recovery Act
Products, intermediates, and off-specification products generated at plastic
resin and synthetic fiber facilities that are considered hazardous wastes are
listed in 40 CFR Part 261.33(f). Some of the handling and treatment
requirements for RCRA hazardous waste generators are covered under 40
CFR Part 262 and include the following: determining what constitutes a
RCRA hazardous waste (Subpart A); manifesting (Subpart B); packaging,
labeling, and accumulation time limits (Subpart C); and recordkeeping and
reporting (Subpart D).
Many plastic resin and synthetic fiber facilities store some hazardous wastes
at the facility for more than 90 days, and therefore, are a storage facility under
RCRA. Storage facilities are required to have a RCRA treatment, storage,
and disposal facility (TSDF) permit (40 CFR Part 262.34). Some plastic resin
and synthetic fiber facilities are considered TSDF facilities and are subject to
the following regulations covered under 40 CFR Part 264: contingency plans
and emergency procedures (40 CFR Part 264 Subpart D); manifesting,
recordkeeping, and reporting (40 CFR Part 264 Subpart E); use and
management of containers (40 CFR Part 264 Subpart I); tank systems (40
CFR Part 264 Subpart J); surface impoundments (40 CFR Part 264 Subpart
K); land treatment (40 CFR Part 264 Subpart M); corrective action of
hazardous waste releases (40 CFR Part 264 Subpart S); air emissions
standards for process vents of processes that process or generate hazardous
wastes (40 CFR Part 264 Subpart AA); emissions standards for leaks in
hazardous waste handling equipment (40 CFR Part 264 Subpart BB); and
emissions standards for containers, tanks, and surface impoundments that
contain hazardous wastes (40 CFR Part 264 Subpart CC).
A number of RCRA wastes have been prohibited from land disposal unless
treated to meet specific standards under the RCRA Land Disposal Restriction
(LDR) program. The wastes covered by the RCRA LDRs are listed in 40
CFR Part 268 Subpart C and include a number of wastes commonly generated
at plastic resin and synthetic fiber facilities. Standards for the treatment and
storage of restricted wastes are described in Subparts D and E, respectively.
Many plastic resin and synthetic fiber facilities are also subject to the
underground storage tank (UST) program (40 CFR Part 280). The UST
Sector Notebook Project 144 September 1997

Plastic Resin and Manmade Fiber Statutes and Regulations
regulations apply to facilities that store either petroleum products or
hazardous substances (except hazardous waste) identified under the
Comprehensive Environmental Response, Compensation, and Liability Act.
UST regulations address design standards, leak detection, operating practices,
response to releases, financial responsibility for releases, and closure
standards.
Toxic Substances Control Act
The Toxic Substances Control Act (TSCA), passed in 1976, gives the
Environmental Protection Agency comprehensive authority to regulate any
chemical substance whose manufacture, processing, distribution in commerce,
use or disposal may present an unreasonable risk of injury to human health or
the environment. Four sections are of primary importance to the plastic resin
and manmade fiber industries. TSCA §5 (new chemicals) mandates that
plastic resin and manmade fiber companies submit pre-manufacture notices
that provide information on health and environmental effects for each new
product and test existing products for these effects (40 CFR Part 720).
TSCA §4 (existing chemicals) authorizes the EPA to require testing of certain
substances (40 CFR Part 790). TSCA §6 gives the EPA authority to prohibit,
limit or ban the manufacture, process and use of chemicals (40 CFR Part
750). For certain chemicals, TSCA §8 also imposes record-keeping and
reporting requirements including substantial risk notification; record-keeping
for data relative to adverse reactions; and periodic updates to the TSCA
Chemical Inventory.
Under §5(h)(4), which grants EPA authority to promulgate rules granting
exemptions to some or all of the premanufacture requirements for new
chemicals, EPA published an exemption rule in 1984 and an amendment to
the rule in 1995. The amendment, entitled Premanufacture Notification
Exemptions (PMN) rule, contained a section on polymers (40 CFR Part
723.250) that allowed polymers that met certain restrictions to be exempt
from some of the reporting requirements for new chemicals. Two exemptions
{40 CFR Part 723.250(e)(1) and (e)(2)} exempt polymersbased onmolecular
weight and oligomer content. The third exemption (40 CFR Part
723.250(e)(3)) exempts certain polyester polymers which use particular
monomers and reactants.
In addition to meeting the specific criteria of one of the three exemption
types, the new polymer must also not fall into one of the prohibited
categories. This section (40 CFR Part 723.250(d)) excludes certain polymers
from reduced reporting requirements, namely: certain cationic polymers;
polymers that do not meet elemental restrictions; polymers that are reasonably
predicted to decompose, degrade, or depolymerize; and polymers which are
produced from monomers and/or other reactants which are not on the TSCA
inventory or otherwise exempted from reporting under a §5 exemption.
Sector Notebook Project 145 September 1997

Plastic Resin and Manmade Fiber Statutes and Regulations
VI.C. Pending and Proposed Regulatory Requirements
Clean Air Act
NESHAP for Formaldehyde-based Resin Manufacturers
Presumptive MACT standards were published for amino, phenolic, and acetal
resins in July 1996. These resins use formaldehyde as their primary building
block. A NESHAP for amino and phenolic resins is expected to be proposed
in 1997 and will reduce emissions, primarily, of formaldehyde and methanol.
Over 100 facilities are expected to be affected by this rule. EPA is also
expecting to propose a NESHAP for acetal resins which will affect 3 facilities.
For more information, please contact John Schaefer at 919-541-0296.
NESHAP for Polyether Polyols
A proposed rule for polyether polyols is expected to be published in 1997.
Roughly 50 major sources in the United States are expected to be affected by
this regulation. For more information, please contact David Svendsgaard at
919-541-2380.
NESHAP for Polycarbonate Resin Manufacturers
This rule, scheduled to be proposed in 1997, will reduce emissions from
polycarbonate resin facilities. It is anticipated that only two major sources in
the United States will be affected by this regulation. For more information,
please contact Mark Morris at 919-541-5416.
NESHAP for Acrylic and Modacrylic Fiber Manufacturers
EPA is working on a rule to reduce emissions from acrylic and modacrylic
fiber manufacturers. This rule is scheduled to be proposed in 1997 and is
expected to primarily reduce emissions of acrylonitrile and vinylacetate. Only
two major sources in the United States will be affected by this regulation. For
more information, contact Leonardo Ceron at 404-562-9129.
Sector Notebook Project 146 September 1997

Plastic Resin and Manmade Fiber Compliance and Enforcement Profile
VII. COMPLIANCE AND ENFORCEMENT PROFILE
Background
Until recently, EPA has focused much of its attention on measuring
compliance with specific environmental statutes. This approach allows the
Agency to track compliance with the Clean Air Act, the Resource
Conservation and Recovery Act, the Clean Water Act, and other
environmental statutes. Within the last several years, the Agency has begun
to supplement single-media compliance indicators with facility-specific,
multimedia indicators of compliance. In doing so, EPA is in a better position
to track compliance with all statutes at the facility level, and within specific
industrial sectors.
A major step in building the capacity to compile multimedia data for industrial
sectors was the creation of EPA's Integrated Data for Enforcement Analysis
(IDEA) system. IDEA has the capacity to "read into" the Agency's single-
media databases, extract compliance records, and match the records to
individual facilities. The IDEA system can match Air, Water, Waste,
Toxics/Pesticides/EPCRA, TRI, and Enforcement Docket records for a given
facility, and generate a list of historical permit, inspection, and enforcement
activity. IDEA also has the capability to analyze data by geographic area and
corporate holder. As the capacity to generate multimedia compliance data
improves, EPA will make available more in-depth compliance and
enforcement information. Additionally, sector-specific measures of success
for compliance assistance efforts are under development.
Compliance and Enforcement Profile Description
Using inspection, violation and enforcement data from the IDEA system, this
section provides information regarding the historical compliance and
enforcement activity of this sector. In order to mirror the facility universe
reported in the Toxic Chemical Profile, the data reported within this section
consists of records only from the TRI reporting universe. With this decision,
the selection criteria are consistent across sectors with certain exceptions.
For the sectors that do not normally report to the TRI program, data have
been provided from EPA's Facility Indexing System (FINDS) which tracks
facilities in all media databases. Please note, in this section, EPA does not
attempt to define the actual number of facilities that fall within each sector.
Instead, the section portrays the records of a subset of facilities within the
sector that are well defined within EPA databases.
As a check on the relative size of the full sector universe, most notebooks
contain an estimated number of facilities within the sector according to the
Bureau of Census (See Section II). With sectors dominated by small
businesses, such as metal finishers and printers, the reporting universe within
Sector Notebook Project 147 September 1997

Plastic Resin and Manmade Fiber Compliance and Enforcement Profile
the EPA databases may be small in comparison to Census data. However, the
group selected for inclusion in this data analysis section should be consistent
with this sector's general make-up.
Following this introduction is a list defining each data column presented
within this section. These values represent a retrospective summary of
inspections and enforcement actions, and reflect solely EPA, State, and local
compliance assurance activities that have been entered into EPA databases.
To identify any changes in trends, the EPA ran two data queries, one for the
past five calendar years (April 1, 1992 to March 31, 1997) and the other for
the most recent twelve-month period (April 1, 1996 to March 31, 1997). The
five-year analysis gives an average level of activity for that period for
comparison to the more recent activity.
Because most inspections focus on single-media requirements, the data
queries presented in this section are taken from single media databases. These
databases do not provide data on whether inspections are state/local or EPA-
led. However, the table breaking down the universe of violations does give
the reader a crude measurement of the EPA's and states' efforts within each
media program. The presented data illustrate the variations across EPA
Regions for certain sectors.2 This variation may be attributable to state/local
data entry variations, specific geographic concentrations, proximity to
population centers, sensitive ecosystems, highly toxic chemicals used in
production, or historical noncompliance. Hence, the exhibited data do not
rank regional performance or necessarily reflect which regions may have the
most compliance problems.
Compliance and Enforcement Data Definitions
General Definitions
Facility Indexing System (FINDS) -- this system assigns a common facility
number to EPA single-media permit records. The FINDS identification
number allows EPA to compile and review all permit, compliance,
enforcement and pollutant release data for any given regulated facility.
Integrated Data for Enforcement Analysis (IDEA) -- is a data integration
system that can retrieve information from the major EPA program office
databases. IDEA uses the FINDS identification number to link separate data
records from EPA’s databases. This allows retrieval of records from across
media or statutes for any given facility, thus creating a ma ster list” of
2 EPA Regions include the following states: I (CT, MA, ME, RI, NH, VT); II (NJ, NY, PR, VI); III (DC, DE, MD,
PA, VA, WV); IV (AL, FL, GA, KY, MS, NC, SC, TN); V (IL, IN, MI, MN, OH, WI); VI (AR, LA, NM, OK,
TX); VII (IA, KS, MO, NE); VIII (CO, MT, ND, SD, UT, WY); IX (AZ, CA, HI, NV, Pacific Trust Territories); X
(AK, ID, OR, WA).
Sector Notebook Project 148 September 1997

Plastic Resin and Manmade Fiber Compliance and Enforcement Profile
records for that facility. Some of the data systems accessible through IDEA
are: AIRS (Air Facility Indexing and Retrieval System, Office of Air and
Radiation), PCS (Permit Compliance System, Office of Water), RCRIS
(Resource Conservation and Recovery Information System, Office of Solid
Waste), NCDB (National Compliance Data Base, Office of Prevention,
Pesticides, and Toxic Substances), CERCLIS (Comprehensive Environmental
and Liability Information System, Superfund), and TRIS (Toxic Release
Inventory System). IDEA also contains information from outside sources
such as Dun and Bradstreet and the Occupational Safety and Health
Administration (OSHA). Most data queries displayed in notebook sections
IV and VII were conducted using IDEA.
Data Table Column Heading Definitions
Facilities in Search -- are based on the universe of TRI reporters within the
listed SIC code range. For industries not covered under TRI reporting
requirements (metal mining, nonmetallic mineral mining, electric power
generation, ground transportation, water transportation, and dry cleaning), or
industries in which only a very small fraction of facilities report to TRI (e.g.,
printing), the notebook uses the FINDS universe for executing data queries.
The SIC code range selected for each search is defined by each notebook's
selected SIC code coverage described in Section II.
Facilities Inspected --- indicates the level of EPA and state agency
inspections for the facilities in this data search. These values show what
percentage of the facility universe is inspected in a one-year or five-year
period.
Number of Inspections -- measures the total number of inspections
conducted in this sector. An inspection event is counted each time it is
entered into a single media database.
Average Time Between Inspections -- provides an average length of time,
expressed in months, between compliance inspections at a facility within the
defined universe.
Facilities with One or More Enforcement Actions -- expresses the number
of facilities that were the subject of at least one enforcement action within the
defined time period. This category is broken down further into federal and
state actions. Data are obtained for administrative, civil/judicial, and criminal
enforcement actions. Administrative actions include Notices of Violation
(NOVs). A facility with multiple enforcement actions is only counted once
in this column, e.g., a facility with 3 enforcement actions counts as 1 facility.
Total Enforcement Actions -- describes the total number of enforcement
actions identified for an industrial sector across all environmental statutes. A
Sector Notebook Project 149 September 1997

Plastic Resin and Manmade Fiber Compliance and Enforcement Profile
facility with multiple enforcement actions is counted multiple times, e.g., a
facility with 3 enforcement actions counts as 3.
State Lead Actions -- shows what percentage of the total enforcement
actions are taken by state and local environmental agencies. Varying levels
of use by states of EPA data systems may limit the volume of actions
recorded as state enforcement activity. Some states extensively report
enforcement activities into EPA data systems, while other states may use their
own data systems.
Federal Lead Actions -- shows what percentage of the total enforcement
actions are taken by the United States Environmental Protection Agency.
This value includes referrals from state agencies. Many of these actions result
from coordinated or joint state/federal efforts.
Enforcement to Inspection Rate -- is a ratio of enforcement actions to
inspections, and is presented for comparative purposes only. This ratio is a
rough indicator of the relationship between inspections and enforcement. It
relates the number of enforcement actions and the number of inspections that
occurred within the one-year or five-year period. This ratio includes the
inspections and enforcement actions reported under the Clean Water Act
(CWA), the Clean Air Act (CAA) and the Resource Conservation and
Recovery Act (RCRA). Inspections and actions from the TSCA/FIFRA/
EPCRA database are not factored into this ratio because most of the actions
taken under these programs are not the result of facility inspections. Also,
this ratio does not account for enforcement actions arising from non-
inspection compliance monitoring activities (e.g., self-reported water
discharges) that can result in enforcement action within the CAA, CWA, and
RCRA.
Facilities with One or More Violations Identified -- indicates the
percentage of inspected facilities having a violation identified in one of the
following data categories: In Violation or Significant Violation Status
(CAA); Reportable Noncompliance, Current Year Noncompliance, Significant
Noncompliance (CWA); Noncompliance and Significant Noncompliance
(FIFRA, TSCA, and EPCRA); Unresolved Violation and Unresolved High
Priority Violation (RCRA). The values presented for this column reflect the
extent of noncompliance within the measured time frame, but do not
distinguish between the severity of the noncompliance. Violation status may
be a precursor to an enforcement action, but does not necessarily indicate that
an enforcement action will occur.
Media Breakdown of Enforcement Actions and Inspections -- four
columns identify the proportion of total inspections and enforcement actions
within EPA Air, Water, Waste, and TSCA/FIFRA/EPCRA databases. Each
Sector Notebook Project 150 September 1997

Plastic Resin and Manmade Fiber Compliance and Enforcement Profile
column is a percentage of either the T otal Inspections,” or the To tal
Actions” column.
Sector Notebook Project 151 September 1997

Plastic Resin and Manmade Fiber Compliance and Enforcement Profile
VII.A. Plastic Resin and Manmade Fiber Industries Compliance History
Table 24 provides an overview of the reported compliance and enforcement
data for the plastic resin and manmade fiber industries over the past five years
(April 1992 to April 1997). These data are also broken out by EPA Region
thereby permitting geographical comparisons. A few points evident from the
data are listed below.
The majority of plastic resin and manmade fiber facilities (about 60%)
and inspections over the past five years were in Regions IV, V, and
VI.
Regions III and II had the second and third largest number of
inspections, respectively, although they ranked fourth and fifth in
terms of number of facilities, respectively.
Region VI had a high ratio of enforcement actions to inspections
(0.25) compared to other Regions. Region VI also had the highest
number of enforcement actions and facilities with enforcement
actions.
Region II had the second largest number of enforcement actions (52),
but ranks fifth in number of facilities.
Sector Notebook Project 152 September 1997
Sector Notebook Project 153 September 1997
Table 24: Five-Year Enforcement and Compliance Summary for the Plastic Resin and
Manmade Fiber Industries
A B C D E F G H I J
Region Facilities
in
Search
Facilities
Inspecte
d
Number of
Inspections Average
Months
Between
Inspections
Facilities
with 1 or
More
Enforcement
Actions
Total
Enforcemen
t Actions
Percent
State
Lead
Actions
Percent
Federal
Lead
Actions
Enforcement
to Inspection
Rate
I 24 16 73 20 4 8 50% 50% 0.11
II 31 30 366 5 17 52 81% 19% 0.14
III 38 36 418 5 10 21 90% 10% 0.05
IV 90 78 864 6 22 46 78% 22% 0.05
V 55 40 311 11 5 9 67% 33% 0.03
VI 51 43 309 10 28 76 71% 29% 0.25
VII 6 5 20 18 1 1 0% 100% 0.05
VIII 4 1 11 22 1 1 100% 0% 0.09
IX 25 10 41 37 4 3 100% 0% 0.07
X 5 4 17 18 1 2 100% 0% 0.12
TOTA
L 329 263 2,430 8 93 219 76% 24% 0.09
Plastic Resin and Manmade Fiber Compliance and Enforcement Profile

Plastic Resin and Manmade Fiber Compliance and Enforcement Profile
VII.B. Comparison of Enforcement Activity Between Selected Industries
Tables 25 and 26 allow the compliance history of the plastic resin and
manmade fiber industries to be compared with the other industries covered by
the industry sector notebooks. Comparisons between Tables 25 and 26
permit the identification of trends in compliance and enforcement records of
the industries by comparing data covering the last five years (April 1992 to
April 1997) to that of the past year (April 1996 to April 1997). Some points
evident from the data are listed below.
The ratio of enforcement actions to inspections for plastic resin and
manmade fiber manufacturing facilities over the past five years (0.09)
was very close to the average across the industries shown (0.08).
Over the past five years, the average number of months between
inspections was relatively low (8 months) for plastic resin and
manmade fiber facilities. The average across the industries shown was
22 months indicating that, on average, facilities in the plastic resin and
manmade fiber industry are inspected more frequently than facilities
in many other industries.
While the average enforcement to inspection rate across industries fell
from 0.08 over the past five years to 0.06 over the past year, the
enforcement to inspection rate for plastic resin and manmade fiber
facilities remained at 0.09.
Only three of the industries shown (petroleum refining, lumber and
wood, and water transportation) had a higher percent of facilities
inspected with enforcement actions over the past year.
Tables 27 and 28 provide a more in-depth comparison between the plastic
resin and manmade fiber industries and other sectors by breaking out the
compliance and enforcement data by environmental statute. As in Tables 25
and 26, the data cover the last five years (Table 27) and the last one year
(Table 28) to facilitate the identification of recent trends. A few points
evident from the data are listed below.
While the percentage of RCRA inspections remained the same
between the past five years and past year, the percent of enforcement
actions taken under RCRA dropped from 23 percent to 5 percent.
The Clean Air Act accounted for the largest share of enforcement
actions over the past five years (43 percent) and the past year (51
percent).
Sector Notebook Project 154 September 1997
Plastic Resin and Manmade Fiber Compliance and Enforcement Profile
Table 25: Five-Year Enforcement and Compliance Summary for Selected Industries
J
Enforcement
to
Inspection
Rate
0.07
0.04
0.05
0.05
0.06
0.10
0.04
0.10
0.06
0.08
0.09
0.10
0.11
0.08
0.25
0.06
0.08
0.07
0.08
0.11
0.08
0.06
0.07
0.13
0.06
0.09
0.10
0.06
0.02
I
Percent
Federal
Lead
Actions
47%
11%
21%
23%
10%
30%
19%
20%
12%
26%
24%
20%
35%
26%
32%
18%
25%
29%
29%
22%
25%
20%
18%
16%
16%
39%
12%
24%
5%
H
Percent
State Lead
Actions
53%
89%
79%
77%
90%
70%
81%
80%
88%
74%
76%
80%
65%
74%
68%
82%
75%
71%
71%
78%
75%
80%
82%
84%
84%
61%
88%
76%
95%
G
Total
Enforcement
Actions
111
132
309
622
83
265
91
478
428
235
219
122
468
102
763
276
277
305
191
174
600
251
413
32
774
70
97
789
66
F
Facilities with 1
or More
Enforcement
Actions
63
88
149
385
53
134
65
150
238
89
93
35
153
47
124
178
97
121
113
68
365
150
253
20
375
36
48
403
55
E
Average
Months
Between
Inspections
46
52
46
25
15
15
13
6
46
9
8
8
6
12
3
25
11
5
16
7
22
17
13
9
36
38
27
14
95
D
Number of
Inspections
1,600
3,748
6,071
12,826
1,465
2,767
2,379
4,630
7,691
3,087
2,430
1,201
4,294
1,293
3,081
4,383
3,474
4,476
2,535
1,640
7,914
4,500
5,912
243
12,904
816
973
14,210
3,813
C
Facilities
Inspected
378
741
1,902
2,803
267
473
386
430
2,092
286
263
129
355
164
148
981
388
275
424
161
1,858
863
927
37
3,263
192
231
2,166
2,360
B
Facilities
in
Search
1,232
3,256
4,676
5,256
355
712
499
484
5,862
441
329
164
425
263
156
1,818
615
349
669
203
2,906
1,250
1,260
44
7,786
514
444
3,270
6,063
A
Industry Sector
Metal Mining
Coal Mining
Oil and Gas Extraction
Non-Metallic Mineral Mining
Textiles
Lumber and Wood
Furniture
Pulp and Paper
Printing
Inorganic Chemicals
Resins and Manmade Fibers
Pharmaceuticals
Organic Chemicals
Agricultural Chemicals
Petroleum Refining
Rubber and Plastic
Stone, Clay, Glass and Concrete
Iron and Steel
Metal Castings
Nonferrous Metals
Fabricated Metal Products
Electronics
Automobile Assembly
Shipbuilding and Repair
Ground Transportation
Water Transportation
Air Transportation
Fossil Fuel Electric Power
Dry Cleaning
Sector Notebook Project 155 September 1997
Sector Notebook Project 156 September 1997
Compliance and Enforcement Profile
Table 26: One-Year Enforcement and Compliance Summary for Selected Industries
A B C D E F G H
Industry Sector Facilities in
Search Facilities
Inspected Number of
Inspections
Facilities with 1 or More
Violations Facilities with 1 or more
Enforcement Actions Total
Enforcement
Actions Enforcement to
Inspection RateNumber Percent* Number Percent*
Metal Mining 1,232 142 211 102 72% 9 6% 10 0.05
Coal Mining 3,256 362 765 90 25% 20 6% 22 0.03
Oil and Gas Extraction 4,676 874 1,173 127 15% 26 3% 34 0.03
Non-Metallic Mineral Mining 5,256 1,481 2,451 384 26% 73 5% 91 0.04
Textiles 355 172 295 96 56% 10 6% 12 0.04
Lumber and Wood 712 279 507 192 69% 44 16% 52 0.10
Furniture 499 254 459 136 54% 9 4% 11 0.02
Pulp and Paper 484 317 788 248 78% 43 14% 74 0.09
Printing 5,862 892 1,363 577 65% 28 3% 53 0.04
Inorganic Chemicals 441 200 548 155 78% 19 10% 31 0.06
Resins and Manmade Fibers 329 173 419 152 88% 26 15% 36 0.09
Pharmaceuticals 164 80 209 84 105% 8 10% 14 0.07
Organic Chemicals 425 259 837 243 94% 42 16% 56 0.07
Agricultural Chemicals 263 105 206 102 97% 5 5% 11 0.05
Petroleum Refining 156 132 565 129 98% 58 44% 132 0.23
Rubber and Plastic 1,818 466 791 389 83% 33 7% 41 0.05
Stone, Clay, Glass and Concrete 615 255 678 151 59% 19 7% 27 0.04
Iron and Steel 349 197 866 174 88% 22 11% 34 0.04
Metal Castings 669 234 433 240 103% 24 10% 26 0.06
Nonferrous Metals 203 108 310 98 91% 17 16% 28 0.09
Fabricated Metal 2,906 849 1,377 796 94% 63 7% 83 0.06
Electronics 1,250 420 780 402 96% 27 6% 43 0.06
Automobile Assembly 1,260 507 1,058 431 85% 35 7% 47 0.04
Shipbuilding and Repair 44 22 51 19 86% 3 14% 4 0.08
Ground Transportation 7,786 1,585 2,499 681 43% 85 5% 103 0.04
Water Transportation 514 84 141 53 63% 10 12% 11 0.08
Air Transportation 444 96 151 69 72% 8 8% 12 0.08
Fossil Fuel Electric Power 3,270 1,318 2,430 804 61% 100 8% 135 0.06
Dry Cleaning 6,063 1,234 1,436 314 25% 12 1% 16 0.01
Plastic Resin and Manmade Fiber
*Percentages in Columns E and F are based on the number of facilities inspected (Column C). Percentages can exceed 100% because violations and actions can
occur without a facility inspection.
Plastic Resin and Manmade Fiber Compliance and Enforcement Profile
Table 27: Five-Year Inspection and Enforcement Summary by Statute for Selected Industries
FIFRA/TSCA/
EPCRA/Other
% of
Total
Actions
17%
1%
3%
3%
6%
16%
14%
4%
4%
5%
6%
5%
6%
11%
7%
11%
4%
8%
14%
10%
13%
7%
9%
3%
3%
4%
0%
5%
0%
% of Total
Inspections
1%
1%
0%
0%
2%
1%
1%
2%
1%
1%
4%
5%
4%
5%
2%
2%
1%
1%
2%
1%
2%
2%
2%
5%
1%
1%
0%
1%
0%
RCRA
% of
Total
Actions
12%
8%
18%
4%
14%
31%
43%
10%
29%
30%
23%
20%
28%
30%
21%
34%
30%
31%
31%
31%
43%
50%
43%
47%
45%
33%
48%
10%
71%
% of Total
Inspections
8%
4%
8%
3%
18%
44%
34%
15%
35%
34%
38%
45%
44%
28%
36%
35%
31%
28%
32%
33%
45%
47%
43%
42%
29%
37%
48%
11%
41%
Clean Water Act
% of
Total
Actions
52%
28%
14%
13%
25%
6%
0%
28%
3%
21%
28%
25%
25%
20%
13%
11%
9%
26%
10%
17%
11%
11%
9%
25%
11%
34%
20%
26%
6%
% of Total
Inspections
52%
38%
16%
14%
22%
6%
3%
32%
5%
27%
23%
15%
16%
24%
20%
12%
13%
26%
11%
18%
12%
13%
8%
14%
12%
23%
27%
32%
3%
Clean Air Act
% of
Total
Actions
19%
64%
65%
81%
54%
47%
42%
59%
64%
44%
43%
49%
42%
39%
59%
44%
57%
35%
44%
43%
33%
32%
39%
25%
41%
29%
32%
59%
23%
% of Total
Inspections
39%
57%
75%
83%
58%
49%
62%
51%
60%
38%
35%
35%
37%
43%
42%
51%
56%
45%
55%
48%
40%
38%
47%
39%
59%
39%
25%
57%
56%
Total
Enforcement
Actions
111
132
309
622
83
265
91
478
428
235
219
122
468
102
763
276
277
305
191
174
600
251
413
32
774
70
97
789
66
Total
Inspections
1,600
3,748
6,071
12,826
1,465
2,767
2,379
4,630
7,691
3,087
2,430
1,201
4,294
1,293
3,081
4,383
3,474
4,476
2,535
1,640
7,914
4,500
5,912
243
12,904
816
973
14,210
3,813
Facilities
Inspected
378
741
1,902
2,803
267
473
386
430
2,092
286
263
129
355
164
148
981
388
275
424
161
1,858
863
927
37
3,263
192
231
2,166
2,360
Industry Sector
Metal Mining
Coal Mining
Oil and Gas Extraction
Non-Metallic Mineral Mining
Textiles
Lumber and Wood
Furniture
Pulp and Paper
Printing
Inorganic Chemicals
Resins and Manmade Fibers
Pharmaceuticals
Organic Chemicals
Agricultural Chemicals
Petroleum Refining
Rubber and Plastic
Stone, Clay, Glass and Concrete
Iron and Steel
Metal Castings
Nonferrous Metals
Fabricated Metal
Electronics
Automobile Assembly
Shipbuilding and Repair
Ground Transportation
Water Transportation
Air Transportation
Fossil Fuel Electric Power
Dry Cleaning
Sector Notebook Project 157 September 1997
Plastic Resin and Manmade Fiber Compliance and Enforcement Profile
Table 28: One-Year Inspection and Enforcement Summary by Statute for Selected Industries
FIFRA/TSCA/
EPCRA/Other
% of
Total
Actions
30%
0%
0%
0%
0%
40%
9%
1%
0%
6%
5%
0%
0%
9%
10%
0%
0%
0%
0%
7%
0%
5%
0%
0%
1%
9%
0%
0%
0%
% of Total
Inspections
0%
0%
0%
0%
0%
0%
0%
0%
0%
0%
0%
0%
0%
0%
0%
0%
0%
0%
0%
0%
0%
0%
0%
0%
0%
0%
0%
0%
0%
RCRA
% of
Total
Actions
30%
5%
24%
2%
8%
25%
45%
7%
23%
25%
5%
14%
34%
36%
15%
23%
30%
24%
35%
30%
57%
53%
47%
50%
44%
45%
25%
5%
38%
% of Total
Inspections
8%
4%
9%
3%
17%
44%
32%
14%
33%
39%
38%
45%
47%
30%
34%
35%
28%
26%
30%
41%
43%
43%
41%
35%
26%
38%
57%
9%
30%
Clean Water Act
% of
Total
Actions
40%
14%
9%
9%
17%
5%
0%
19%
0%
9%
38%
14%
13%
0%
8%
13%
7%
29%
8%
20%
2%
5%
6%
50%
10%
36%
42%
21%
6%
% of Total
Inspections
40%
40%
10%
10%
17%
6%
2%
32%
4%
26%
24%
11%
13%
22%
17%
10%
10%
23%
10%
15%
11%
14%
7%
11%
11%
24%
15%
32%
1%
Clean Air Act
% of
Total
Actions
0%
82%
68%
89%
75%
30%
45%
73%
77%
59%
51%
71%
54%
55%
67%
64%
63%
47%
58%
43%
41%
37%
47%
0%
46%
9%
33%
73%
56%
% of Total
Inspections
52%
56%
82%
87%
66%
51%
66%
54%
63%
35%
38%
43%
40%
48%
49%
55%
62%
52%
60%
44%
46%
44%
53%
54%
64%
38%
28%
59%
69%
Total
Enforcement
Actions
10
22
34
91
12
52
11
74
53
31
36
14
56
11
132
41
27
34
26
28
83
43
47
4
103
11
12
135
16
Total
Inspections
211
765
1,173
2,451
295
507
459
788
1,363
548
419
209
837
206
565
791
678
866
433
310
1,377
780
1,058
51
2,499
141
151
2,430
1,436
Facilities
Inspected
142
362
874
1,481
172
279
254
317
892
200
173
80
259
105
132
466
255
197
234
108
849
420
507
22
1,585
84
96
1,318
1,234
Industry Sector
Metal Mining
Coal Mining
Oil and Gas Extraction
Non-Metallic Mineral Mining
Textiles
Lumber and Wood
Furniture
Pulp and Paper
Printing
Inorganic Chemicals
Resins and Manmade Fibers
Pharmaceuticals
Organic Chemicals
Agricultural Chemicals
Petroleum Refining
Rubber and Plastic
Stone, Clay, Glass and Concrete
Iron and Steel
Metal Castings
Nonferrous Metals
Fabricated Metal
Electronics
Automobile Assembly
Shipbuilding and Repair
Ground Transportation
Water Transportation
Air Transportation
Fossil Fuel Electric Power
Dry Cleaning
Sector Notebook Project 158 September 1997

Plastic Resin and Manmade Fiber Compliance and Enforcement Profile
VII.C. Review of Major Legal Actions
Major Cases/Supplemental Environmental Projects
This section provides summary information about major cases that have
affected this sector, and a list of Supplemental Environmental Projects
(SEPs).
VII.C.1. Review of Major Cases
As indicated in EPA’s Enforcement Accomplishments Report, FY1995 and
FY1996 publications, four significant enforcement actions were resolved
between 1995 and 1996 for the metal casting industry.
Teknor Apex Company: A September 30, 1996 consent agreement and order
resolved TSCA violations by Teknor Apex of Pawtucket, RI. Teknor Apex
had failed to report the identities and volumes of several chemicals
manufactured in 1989, as required by EPA’s Inventory Update rule. Teknor
Apex manufactures organic plasticizers, vinyl resins, garden hose, plastic
sheeting, and color pigments. The violations, which occurred at facilities in
Attleboro, MA, and in Brownsville, TN, hampered EPA’s efforts to assess the
health and environmental risks of chemical manufacture and distribution. The
settlement provides for a penalty of $52,950 and implementation of SEPs
costing $300,000. Four SEPs at the Attleboro facility will reduce toxic
emissions, reduce and improve the quality of wastewater discharges, and
reduce the volume of industrial wastewater processed at Teknor’s on-site
wastewater treatment plant.
Union Carbide Chemicals and Plastics (South Charleston, WV): On May
16, 1995, the Regional Administrator signed a consent order resolving a
RCRA administrative penalty action against Union Carbide Chemicals and
Plastics Company, Inc. (UCC), for violations of the BIF Rule (Boiler and
Industrial Furnace Rule) at UCC’s South Charleston, West Virginia, plant.
The complaint alleged failure to: continuously monitor and record operating
parameters; accurately analyze the hazardous waste fed into the boiler; and
properly mark equipment. Under the settlement terms UCC is required to pay
a $195,000 civil penalty and comply with the requirements of the BIF Rule.
Formosa Plastics Co.: On May 31, 1995, a Class I CERCLA 103(a) and
EPCRA 304(a) consent agreement and consent order (CACO) was entered
with Formosa Plastics for numerous releases of vinyl chloride from its Point
Comfort, Texas, facility between February 1989 and August 1992 that were
not reported to the National Response Center (NRC) in a timely manner
following the release. Additionally, the respondent experienced a release of
ethylene dichloride in September 1990, and a release of hydrochloric acid in
July 1991. Formosa did not report these releases to the NRC, State
Sector Notebook Project 159 September 1997

Plastic Resin and Manmade Fiber Compliance and Enforcement Profile
Emergency Response Commission (SERC), and Local Emergency Planning
Committee (LEPC) in a timely manner. Formosa agreed to pay a civil
penalty of $50,000 and agreed to construct and maintain a secondary
containment system which will prevent large pressure releases of vinyl
chloride from the facility. The system cost is estimated to be $1.68 million
with an anticipated start-up date of January 1996. Additionally, as part of a
SEP, Formosa agreed to complete the following actions: (1) implement a
chemical safety project for the citizens of Point Comfort, Texas at a cost of
$10,000; (2) permit a chemical safety audit to be performed by a team led by
EPA personnel to review facility emergency response procedures and plans;
(3) develop and implement a risk management program; and (4) provide
funding ($35,000) to support a Region-wide LEPC conference.
VII.C.2. Supplementary Environmental Projects (SEPs)
Supplemental environmental projects (SEPs) are enforcement options that
require the non-compliant facility to complete specific projects. Information
on SEP cases can be accessed via the Internet at EPA’s Enviro$en$e website:
http://es.inel.gov/sep.
Sector Notebook Project 160 September 1997

Plastic Resin and Manmade Fiber Compliance Activities and Initiatives
VIII. COMPLIANCE ACTIVITIES AND INITIATIVES
This section highlights the activities undertaken by this industry sector and
public agencies to voluntarily improve the sector's environmental
performance. These activities include those independently initiated by
industrial trade associations. In this section, the notebook also contains a
listing and description of national and regional trade associations.
VIII.A. Sector-Related Environmental Programs and Activities
Chemical Manufacturer’s Association and EPA have developed training
modules, self-audit manuals, and compliance guides for Section 608 of the
Clean Air Act, which covers leak detection and repair. They are discussing
developing plant level compliance guides, auditing protocols, and training
materials for RCRA Subpart CC and other areas.
VIII.B. EPA Voluntary Programs
33/50 Program
The 33/50 Program is a ground breaking program that has focused on
reducing pollution from seventeen high-priority chemicals through voluntary
partnerships with industry. The program's name stems from its goals: a 33%
reduction in toxic releases by 1992, and a 50% reduction by 1995, against a
baseline of 1.5 billion pounds of releases and transfers in 1988. The results
have been impressive: 1,300 companies have joined the 33/50 Program
(representing over 6,000 facilities) and have reached the national targets a
year ahead of schedule. The 33% goal was reached in 1991, and the 50%
goal -- a reduction of 745 million pounds of toxic wastes -- was reached in
1994. The 33/50 Program can provide case studies on many of the corporate
accomplishments in reducing waste (Contact 33/50 Program Director David
Sarokin -- 260-6396).
Table 29 lists those companies participating in the 33/50 program that
reported the SIC codes 2821, 2823, or 2824 to TRI. Many of the companies
shown listed multiple SIC codes and, therefore, are likely to carry out
operations in addition to plastic resin and manmade fiber manufacturing. In
addition, the number of facilities within each company that are participating
in the 33/50 program and that report SIC 2821, 2823, or 2824 to TRI are
shown. Finally, where available and quantifiable against 1988 releases and
transfers, each company’s 33/50 goals for 1995 and the actual total releases,
transfers and percent reduction between 1988 and 1994 are presented.
Sector Notebook Project 161 September 1997

---
---
---
---
Plastic Resin and Manmade Fiber Compliance Activities and Initiatives
Table 29: Plastic Resin and Manmade Fiber Industries Participation in the 33/50 Program
Parent Company
(Headquarters Location) Company-
Owned
Facilities
Reporting
33/50
Chemicals
Company-
Wide %
Reduction
Goal1
(1988 to
1995)
1988 TRI
Releases and
Transfers of
33/50
Chemicals
(pounds)
1994 TRI
Releases and
Transfers of
33/50
Chemicals
(pounds)
Actual %
Reduction for
Facilities
(1988-1994)
AIR PRODUCTS AND CHEMICALS
ALLENTOWN, PA 1 50 0 411
AKZO NOBEL INC
CHICAGO, IL 1 13 158,650 87,268 45
ALBEMARLE CORPORATION
RICHMOND, VA 6 51 960,620 1,181,712 -23
ALLIED-SIGNAL INC
MORRISTOWN, NJ 1 50 0 10
AMERICAN PLASTIC
TECHNOLOGIES
MIDDLEFIELD, OH
1 50 750 0 100
AMOCO CORPORATION
CHICAGO, IL 1 50 0 30
ARISTECH CHEMICAL
CORPORATION
PITTSBURGH, PA
7 18 1,648,348 159,614 90
ASHLAND OIL INC
RUSSELL, KY 2 50 207,440 4,632 98
ATLANTIC RICHFIELD COMPANY
LOS ANGELES, CA 1 2 47,543 3,158 93
B F GOODRICH COMPANY
AKRON, OH 6 50 31,478 864 97
BASF CORPORATION
MOUNT OLIVE, NJ 3 50 241,760 45,195 81
BORDEN CHEM & PLAS LTD
PARTNR
COLUMBUS, OH
1 *** 11,781 26,393 -124
BORDEN INC
NEW YORK, NY 2 * 105 161 -53
BULK MOLDING COMPOUNDS INC
SAINT CHARLES, IL 1 40 48,555 0 100
CAPITAL RESIN CORPORATION
COLUMBUS, OH 1 50 42,480 14,077 67
CARGILL DETROIT CORPORATION
CLAWSON, MI 5 40 165,288 23,836 86
CHEVRON CORPORATION
SAN FRANCISCO, CA 1 50 56,216 72,044 -28
COURTAULDS FIBERS
AXIS, AL 1 *** 0 3,250
CYTEC INDUSTRIES
WEST PATERSON, NJ 3 50 226,059 56,230 75
Sector Notebook Project 162 September 1997

----
---
---
---
Plastic Resin and Manmade Fiber Compliance Activities and Initiatives
Parent Company
(Headquarters Location) Company-
Owned
Facilities
Reporting
33/50
Chemicals
Company-
Wide %
Reduction
Goal1
(1988 to
1995)
1988 TRI
Releases and
Transfers of
33/50
Chemicals
(pounds)
1994 TRI
Releases and
Transfers of
33/50
Chemicals
(pounds)
Actual %
Reduction for
Facilities
(1988-1994)
DOCK RESINS CORPORATION
LINDEN, NJ 1 *** 10,100 2,370 77
DOW CHEMICAL COMPANY
MIDLAND, MI 20 50 6,202,765 1,761,522 72
E. I. DU PONT DE NEMOURS & CO
WILMINGTON, DE 2 50 599,530 176,040 71
ETHYL CORPORATION
RICHMOND, VA 1 46 29,174 0 100
EXXON CORPORATION
IRVING, TX 3 50 10,548 11,696 -11
FINA INC
DALLAS, TX 1 40 0 294
GENERAL ELECTRIC COMPANY
FAIRFIELD, CT 6 50 7,710,278 1,798,408 77
GEORGIA-PACIFIC CORPORATION
ATLANTA, GA 1 50 0 35
GLASGO PLASTICS INC
SPRINGFIELD, OH 1 50 12,630 0 100
GLOBE MANUFACTURING CO
FALL RIVER, MA 1 45 957,417 161,523 83
GRIFFITH POLYMERS
HILLSBORO, OR 1 ** 29,491 0 100
H & N CHEMICAL CO INC
TOTOWA, NJ 1 *** 10,700 2,807 74
HERCULES INCORPORATED
WILMINGTON, DE 3 50 551,064 137,808 75
HERESITE PROTECTIVE COATINGS
MANITOWOC, WI 1 50 2,100 0 100
HOECHST CELANESE
CORPORATION
CORPUS CHRISTY, TX
21 50 4,836,469 1,463,490 70
ILLINOIS TOOL WORKS INC
GLENVIEW, IL 1 *** 0 500
INTERNATIONAL PAPER
COMPANY
PURCHASE, NY
3 50 138,072 531,258 -285
JAMES RIVER CORP VIRGINIA
RICHMOND, VA 1 53 0 0
LIBERTY POLYGLAS INC
WEST MIFFLIN, PA 1 * 48,401 20,295 58
LYONDELL PETROCHEMICAL CO
HOUSTON, TX 1 57 6,901 0 100
Sector Notebook Project 163 September 1997

---
---
Plastic Resin and Manmade Fiber Compliance Activities and Initiatives
Parent Company
(Headquarters Location) Company-
Owned
Facilities
Reporting
33/50
Chemicals
Company-
Wide %
Reduction
Goal1
(1988 to
1995)
1988 TRI
Releases and
Transfers of
33/50
Chemicals
(pounds)
1994 TRI
Releases and
Transfers of
33/50
Chemicals
(pounds)
Actual %
Reduction for
Facilities
(1988-1994)
MILES INC
PITTSBURGH, PA
MOBIL CORPORATION
FAIRFAX, VA
20
1
37
50
2,069,780
11,922
1,410,749
800
32
93
MONSANTO COMPANY
SAINT LOUIS, MO 19 25 5,554,821 1,977,399 64
MORTON INTERNATIONAL INC
CHICAGO, IL 1 20 0 0
NEWPORT ADHESIVES &
COMPOSITES
FOUNTAIN VALLEY, CA
1 50 139,000 0 100
NORTH AMERICAN PLASTICS INC.
PRAIRIE, MS 2 * 4 12 -200
OCCIDENTAL PETROLEUM CORP
LOS ANGELES, CA 6 19 1,670,197 702,818 58
PHILLIPS PETROLEUM COMPANY
BARTLESVILLE, OK 1 50 0 168
PLASTICS ENGINEERING
COMPANY
SHEBOYGAN, WI
1 * 3,685 0 100
PPG INDUSTRIES INC
PITTSBURGH, PA 2 50 580,992 161,719 72
PREMIX INC
N KINGSVILLE, OH 2 23 41,200 750 98
QUANTUM CHEMICAL
CORPORATION
ISELIN, NJ
7 50 391,086 177,588 55
RANBAR TECHNOLOGY INC
GLENSHAW, PA 1 52 26,900 5,693 79
REVLIS CORPORATION
AKRON, OH 1 50 1,500 1,870 -25
REXENE CORPORATION
DALLAS, TX 1 50 347,520 103,401 70
ROGERS CORPORATION
ROGERS, CT 5 *** 243,173 82,483 66
ROHM AND HAAS COMPANY
PHILADELPHIA, PA 3 50 319,380 37,660 88
SARTORIUS NORTH AMERICA INC
BRENTWOOD, NY 1 50 377,320 77,750 79
SOLVAY AMERICA INC
HOUSTON, TX 2 * 9,800 21,000 -114
TEXTILE RUBBER & CHEMICAL CO
DALTON, GA 1 * 7,150 0 100
Sector Notebook Project 164 September 1997

Plastic Resin and Manmade Fiber Compliance Activities and Initiatives
Parent Company
(Headquarters Location) Company-
Owned
Facilities
Reporting
33/50
Chemicals
Company-
Wide %
Reduction
Goal1
(1988 to
1995)
1988 TRI
Releases and
Transfers of
33/50
Chemicals
(pounds)
1994 TRI
Releases and
Transfers of
33/50
Chemicals
(pounds)
Actual %
Reduction for
Facilities
(1988-1994)
UNION CAMP CORPORATION
WAYNE, NJ
UNION CARBIDE CORPORATION
DANBURY, CT
UNOCAL CORPORATION
LOS ANGELES, CA
1
2
1
50
54
50
136,301
810,702
44,750
1,434
1,337
0
99
100
100
VALSPAR CORPORATION
MINNEAPOLIS, MN 4 50 111,244 71,238 36
VISTA CHEMICAL COMPANY
HOUSTON, TX 5 50 553,331 61,068 89
W R GRACE & CO INC
BOCA RATON, FL 1 50 10,980 43,300 -294
ZENECA HOLDINGS INC
WILMINGTON, DE 1 * 2,639 1,774 33
TOTAL 209 38,468,090 12,688,942 39
Source: U.S. EPA 33/50 Program Office, 1996.
1 Company-Wide Reduction Goals aggregate all company-owned facilities which may include facilities not
manufacturing plastic resins or manmade fibers.
* = Reduction goal not quantifiable against 1988 TRI data.
** = Use reduction goal only.
***= No numeric reduction goal.
--- = Actual reduction not quantifiable against 1988 TRI data.
Environmental Leadership Program
The Environmental Leadership Program (ELP) is a national initiative
developed by EPA that focuses on improving environmental performance,
encouraging voluntary compliance, and building working relationships with
stakeholders. EPA initiated a one year pilot program in 1995 by selecting 12
projects at industrial facilities and federal installations that demonstrate the
principles of the ELP program. These principles include: environmental
management systems, multimedia compliance assurance, third-party
verification of compliance, public measures of accountability, community
involvement, and mentor programs. In return for participating, pilot
participants receive public recognition and are given a period of time to
correct any violations discovered during these experimental projects.
EPA is making plans to launch its full-scale Environmental Leadership
Program in 1997. The full-scale program will be facility-based with a 6-year
participation cycle. Facilities that meet certain requirements will be eligible
Sector Notebook Project 165 September 1997

Plastic Resin and Manmade Fiber Compliance Activities and Initiatives
to participate, such as having a community outreach/employee involvement
programs and an environmental management system (EMS) in place for 2
years. (Contact: http://es.inel.gov/elp or Debby Thomas, ELP Deputy
Director, at 202-564-5041)
Project XL
Project XL was initiated in March 1995 as a part of President Clinton’s
Reinventing Environmental Regulation initiative. The projects seek to
achieve cost effective environmental benefits by providing participants
regulatory flexibility on the condition that they produce greater environmental
benefits. EPA and program participants will negotiate and sign a Final Project
Agreement, detailing specific environmental objectives that the regulated
entity shall satisfy. EPA will provide regulatory flexibility as an incentive for
the participants’ superior environmental performance. Participants are
encouraged to seek stakeholder support from local governments, businesses,
and environmental groups. EPA hopes to implement fifty pilot projects in
four categories, including industrial facilities, communities, and government
facilities regulated by EPA. Applications will be accepted on a rolling basis.
For additional information regarding XL projects, including application
procedures and criteria, see the May 23, 1995 Federal Register Notice.
(Contact: Fax-on-Demand Hotline 202-260-8590, Web:
http://www.epa.gov/ProjectXL, or Christopher Knopes at EPA’s Office of
Policy, Planning and Evaluation 202-260-9298)
Climate Wise Program
Climate Wise is helping US industries turn energy efficiency and pollution
prevention into a corporate asset. Supported by the technical assistance,
financing information and public recognition that Climate Wise offers,
participating companies are developing and launching comprehensive
industrial energy efficiency and pollution prevention action plans that save
money and protect the environment. The nearly 300 Climate Wise companies
expect to save more than $300 million and reduce greenhouse gas emissions
by 18 million metric tons of carbon dioxide equivalent by the year 2000.
Some of the actions companies are undertaking to achieve these results
include: process improvements, boiler and steam system optimization, air
compressor system improvements, fuel switching, and waste heat recovery
measures including cogeneration. Created as part of the President’s Climate
Change Action Plan, Climate Wise is jointly operated by the Department of
Energy and EPA. Under the Plan many other programs were also launched
or upgraded including Green Lights, WasteWi$e and DoE’s Motor Challenge
Program. Climate Wise provides an umbrella for these programs which
encourage company participation by providing information on the range of
partnership opportunities available. (Contact: Pamela Herman, EPA, 202-
260-4407 or Jan Vernet, DoE, 202-586-4755)
Sector Notebook Project 166 September 1997

Plastic Resin and Manmade Fiber Compliance Activities and Initiatives
Energy Star Buildings Program
EPA’s ENERGY STAR Buildings Program is a voluntary, profit-based program
designed to improve the energy-efficiency in commercial and industrial
buildings. Expanding the successful Green Lights Program, ENERGY STAR
Buildings was launched in 1995. This program relies on a 5-stage strategy
designed to maximize energy savings thereby lowering energybills, improving
occupant comfort, and preventing pollution -- all at the same time. If
implemented in every commercial and industrial building in the United States,
ENERGY STAR Buildings could cut the nation’s energy bill by up to $25 billion
and prevent up to 35% of carbon dioxide emissions. (This is equivalent to
taking 60 million cars of the road). ENERGY STAR Buildings participants
include corporations; small and medium sized businesses; local, federal and
state governments; non-profit groups; schools; universities; and health care
facilities. EPA provides technical and non-technical support including
software, workshops, manuals, communication tools, and an information
hotline. EPA’s Office of Air and Radiation manages the operation of the
ENERGY STAR Buildings Program. (Contact: Green Light/Energy Star Hotline
at 1-888-STAR-YES or Maria Tikoff Vargas, EPA Program Director at 202-
233-9178 or visit the ENERGY STAR Buildings Program website at
http://www.epa.gov/appdstar/buildings/)
Green Lights Program
EPA’s Green Lights program was initiated in 1991 and has the goal of
preventing pollution by encouraging U.S. institutions to use energy-efficient
lighting technologies. The program saves money for businesses and
organizations and creates a cleaner environment by reducing pollutants
released into the atmosphere. The program has over 2,345 participants which
include major corporations, small and medium sized businesses, federal, state
and local governments, non-profit groups, schools, universities, and health
care facilities. Each participant is required to survey their facilities and
upgrade lighting wherever it is profitable. As of March 1997, participants had
lowered their electric bills by $289 million annually. EPA provides technical
assistance to the participants through a decision support software package,
workshops and manuals, and an information hotline. EPA’s Office of Air and
Radiation is responsible for operating the Green Lights Program. (Contact:
Green Light/Energy Star Hotline at 1-888-STARYES or Maria TikoffVargar,
EPA Program Director, at 202-233-9178 the )
WasteWi$e Program
The WasteWi$e Program was started in 1994 by EPA’s Office of Solid Waste
and Emergency Response. The program is aimed at reducing municipal solid
wastes by promoting waste prevention, recycling collection and the
manufacturing and purchase of recycled products. As of 1997, the program
Sector Notebook Project 167 September 1997

Plastic Resin and Manmade Fiber Compliance Activities and Initiatives
had about 500 companies as members, one third of whom are Fortune 1000
corporations. Members agree to identify and implement actions to reduce
their solid wastes setting waste reduction goals and providing EPA with
yearly progress reports. To member companies, EPA, in turn, provides
technical assistance, publications, networking opportunities, and national and
regional recognition. (Contact: WasteWi$e Hotline at 1-800-372-9473 or
Joanne Oxley, EPA Program Manager, 703-308-0199)
NICE3
The U.S. Department of Energy is administering a grant program called The
National Industrial Competitiveness through Energy, Environment, and
Economics (NICE3). By providing grants of up to 45 percent of the total
project cost, the program encourages industry to reduce industrial waste at its
source and become more energy-efficient and cost-competitive through waste
minimization efforts. Grants are used by industry to design, test, and
demonstrate new processes and/or equipment with the potential to reduce
pollution and increase energy efficiency. The program is open to all
industries; however, priority is given to proposals from participants in the
forest products, chemicals, petroleum refining, steel, aluminum, metal casting
and glass manufacturing sectors. (Contact: http//www.oit.doe.gov/access/
nice3, Chris Sifri, DOE, 303-275-4723 or Eric Hass, DOE, 303-275-4728)
Design for the Environment (DfE)
DfE is working with several industries to identify cost-effective pollution
prevention strategies that reduce risks to workers and the environment. DfE
helps businesses compare and evaluate the performance, cost, pollution
prevention benefits, and human health and environmentalrisks associated with
existing and alternative technologies. The goal of these projects is to
encourage businesses to consider and use cleaner products, processes, and
technologies. For more information about the DfE Program, call (202) 260-
1678. To obtain copies of DfE materials or for general information about
DfE, contact EPA’s Pollution Prevention Information Clearinghouse at (202)
260-1023 or visit the DfE Website at http://es.inel.gov/dfe.
Sector Notebook Project 168 September 1997

Plastic Resin and Manmade Fiber Compliance Activities and Initiatives
VIII.C. Trade Association/Industry Sponsored Activity
VIII.C.1. Environmental Programs
The Global Environmental Management Initiative (GEMI) is made up of
a group of leading companies dedicated to fostering environmentalexcellence
by business. GEMI promotes a worldwide business ethic for environmental
management and sustainable development, to improve the environmental
performance of business through example and leadership. In 1994, GEMI’s
membership consisted of about 30 major corporations including Union
Carbide Corporation and Dow Chemical.
Center for Waste Reduction Technologies under the aegis of the American
Institute of Chemical Engineers sponsored research on innovative
technologies to reduce waste in the chemical processing industries. The
primary mechanism is through funding of academic research.
The American Plastics Council is working on a life-cycle study to examine
the emissions released from plastics and resins manufacturing facilities. The
study will compare emissions from plastics and resins manufacturing with
manufacturing of other materials, such as wood products.
The National Science Foundation and the Environmental Protection
Agency's Office of Pollution Prevention and Toxics signed an agreement in
January of 1994 to coordinate the two agencies’ programs of basic research
related to pollution prevention. The collaboration will stress research in the
use of less toxic chemical and synthetic feedstocks, use of photochemical
processes instead of traditional ones that employ toxic reagents, use of
recyclable catalysts to reduce metal contamination, and use of natural
feedstocks when synthesizing chemicals in large quantities.
The Chemical Manufacturer’s Association funds research on issues of
interest to their members particularly in support of their positions on proposed
or possible legislation. They recently funded a study to characterize the
environmental fate of organochlorine compounds.
The Responsible Care® Initiative of the Chemical Manufacturer’s
Association requires all members and partners to continuously improve their
health, safety, and environmental performance in a manner that is responsive
to the public. Launched in 1988, the Responsible Care® concepts are now
being applied in 36 countries around the world. Responsible Care® is a
comprehensive, performance-oriented initiative composed of ten progressive
Guiding Principles and six board Codes of Management Practices. These
Management Practices cover all aspects of the chemical industry's operations,
from research to manufacturing, distribution, transportation, sales and
marketing, and to downstream users of chemical products. Through
Sector Notebook Project 169 September 1997

Plastic Resin and Manmade Fiber Compliance Activities and Initiatives
Responsible Care®, CMA members and partners gain insight from the public
through, among other means, a national Public Advisory Panel and over 250
local Community Advisory Panels. This, coupled with the fact that
participation in Responsible Care® is an obligation of membership with the
Chemical Manufacturer’s Association, make this performance improvement
initiative unique. The Synthetic Organic Chemical Manufacturer’s Association
whose membership consists of smaller batch and custom chemical
manufacturers with typically fewer than 50 employees and less than $50
million in annual sales, encourages its members to achieve continuous
performance improvement in theirhealth, safety, and environmental programs
through implementation of the chemical industry’s Responsible Care®
initiative. SOCMA is a partner in Responsible Care®.
The Society of the Plastics Industry has implemented two programs aimed
at reducing plastic pellet loss. In 1991, SPI’s Polymeric Materials Producers
Division developed and endorsed a “Pellet Retention Environmental Code.”
Companies that sign the code commit themselves to the total containment of
plastic pellets throughout the pellets’ lifespan and to operating in full
compliance with environmental laws and regulations pertaining to pellet
containment (SPI, 1994). In 1992, SPI expanded the program to include a
processor’s pledge to uphold six principles to prevent the loss of resin pellets
into the environment.
ISO 9000 is a series of international total quality management guidelines.
After a successful independent audit of their management plans, firms are
qualified to be ISO 9000 registered. In June of 1993, the International
Standards Organization created a technical committee to work on new
standards for environmental management systems.
VIII.C.2. Summary of Trade Associations
American Chemical Society
1155 16th Street, NW
Washington, D.C. 20036 Members: 150,000 individuals
Phone: 202-872-4600 Staff: 1950
Fax: 202-872-4615 Budget: $192,000,000
The American Chemical Society (ACS) has aneducationaland research focus.
The ACS produces approximately thirty different industry periodicals and
research journals, including Environmental Science and Technology and
Chemical Research in Toxicology. In addition to publishing, the ACS
presently conducts studies and surveys; legislation monitoring, analysis, and
reporting; and operates a variety of educational programs. The ACS library
and on-line information services are extensive. Some available on-line
services are Chemical Journals Online, containing the full text of 18 ACS
journals, 10 Royal Society of Chemistry journals, five polymer journals and
Sector Notebook Project 170 September 1997

Plastic Resin and Manmade Fiber Compliance Activities and Initiatives
the Chemical Abstracts Service, CAS, which provides a variety of information
on chemical compounds. Founded in 1876, the ACS is presently comprised
of 184 local groups and 843 student groups nationwide.
American Fiber Manufacturers Association, Inc.
1150- 17th Street, NW, Suite 310
Washington, DC 22036 Members: 18 companies
Phone: 202-296-6508 Staff: 6
Fax: 202-296-3052 Budget: $2,000,000
E-mail: afma@aol.com
Previously known as the Man-Made Fiber Producers Association up until
1988, the American Fiber Manufacturers Association, Inc. (AFMA) is a
domestic trade organization representing U.S. producers of more than 90
percent of domestic production of manufactured fibers, filaments, and yarns.
AFMA manages programs on government relations, international trade policy,
the environment, technical issues, and educational services. Committees of
experts from member companies work on each of these subjects. The group
publishes fact books and economic profiles, Fiber Organon, and recently
published an environmental life cycle study.
Chemical Manufacturers Association
1300 Wilson Boulevard
Arlington, VA 22209
Phone: 703-741-5224
Fax: 703-741-6224
Members: 185 companies
Staff: 246
Budget: $36,000,000
A principal focus of the Chemical Manufacturer’s Association (CMA) is on
regulatory issues facing chemical manufacturers at the local, state, and federal
levels. At its inception in 1872, the focus of CMA was on serving chemical
manufacturers through research. Research is still ongoing at CMA. Member
committees, task groups, and work groups routinely sponsor research and
technical data collection that is then provided to the public in support of
CMA’s advocacy. Much additional research takes place through the
CHEMSTAR® program. CHEMSTAR® consists of a variety of self-funded
panels working on single-chemical research agendas. This research fits within
the overall regulatory focus of CMA; CHEMSTAR® study results are
provided to both CMA membership and regulatory agencies. Other initiatives
include the Responsible Care® program, which includes six codes of
management practices designed to go beyond simple regulatory compliance.
CMA is currently developing measurement and appropriate verification
systems for these codes. CMA also conducts workshops and technical
symposia, promotes in-plant safety, operates a chemical emergency center
(CHEMTREC®) which offers guidance in chemical emergency situations, and
Sector Notebook Project 171 September 1997

Plastic Resin and Manmade Fiber Compliance Activities and Initiatives
operates the Chemical Referral Center which provides chemical health and
safety information to the public. Publications include the annual U.S.
Chemical Industry Statistical Handbook, containing detailed data on the
industry; Responsible Care in Action, the 1993-94 progress report on
implementing Responsible Care®; and Preventing Pollution in the Chemical
Industry: A Progress Report (1988-1993), summarizing waste generationand
reduction data for the years 1988-93. CMA holds an annual meeting for its
membership in White Sulphur Springs, WV.
Polyurethane Manufacturers Association
800 Roosevelt Road, Bldg.C, Ste. 20 Members: 116 companies
Glen Ellyn, IL 60137-5833 Staff: 4
Phone: 708-858-2670 Budget: $500,000
Fax: 708-790-3095
This group includes manufacturers, suppliers, distributors and sales agents of
raw materials, additives, or processing equipment; processors of solid cast,
microcellular, RIM and thermoplastic urethane elastomers; and individuals or
companies providing publishing, education, research, or consulting services
to the industry. The association publishes the bimonthly Polytopics.
Society of Plastics Engineers
14 Fairfield Drive
Brookfield, CT 06804-0403 Members: 37,000 individuals
Staff: 38
Budget: $6,100,000
Phone: 203-775-0471
Fax: 203-775-8490
Society of Plastics Engineers (SPE) is a group dedicated to promoting the
knowledge and education of plastics and polymers worldwide and strives to
be the leading technology society for the plastics industry. SPE is made up
of over 37,500 members around the world involved in engineering, design,
production and processing, research and development, consulting, marketing
and sales, purchasing, education, and all levels of management. SPE publishes
journals, including Plastics Engineering and Polymer Engineering and
Science, and sponsors a large range of technical conferences on polymer and
plastics processing.
Society of the Plastics Industry, Inc.
1801 K Street, NW, Suite 600K
Washington, DC 20006-1301
Phone: 202-974-5200
Fax: 202-296-7005
Web: www.socplas.org
Members: 1900 companies
Staff: 130
Budget: $30,000,000
Sector Notebook Project 172 September 1997

Plastic Resin and Manmade Fiber Compliance Activities and Initiatives
SPI is a principal trade association for the U.S. plastics industry. Comprised
of 2,000 members, SPI has representatives from all segments of the plastics
industry, including materials suppliers, processors, machinery manufacturers,
moldmakers, distributors, and other industry-related groups and individuals.
SPI publishes an annual report on market trends called Facts and Figures of
the U.S. Plastics Industry. In addition to its general services -- Government
and Technical Affairs, Communications, Trade Shows, Membership, and
Finance Administration -- SPI has 28 business units as well as numerous key
services offering programs specifically geared to the interests of particular
industry segments. These special purpose groups include the Degradable
Polymers Council, which acts as a clearinghouse for research in the
degradable plastics industry, and the Polymeric Materials Producers Division,
which includes manufacturers of basic polymers or prepolymers for the
plastics industry. Other industry segment groups which focus on particular
plastic resins include the Fluoropolymers Division, Naphthalate Polymers
Council, the Phenolic Division, the Polyurethane Division, the Styrene
Information and Research Center, and the Vinyl Institute. SPI also has an
affiliation with the American Plastics Council which includes U.S. resin and
monomer producers, plastics processers, and suppliers. Contact information
for these groups is listed below.
American Plastics Council, Red Cavaney, President, 202-974-5400
Composites Institute, Catherine Randazzo, Executive Director, 212-351-5410
Degradable Polymers Council, John Malloy, Director of Packaging Services,
202-974-5245,dpc@socplas.org
Fluoropolymers Division, Allen Weidman, Director, 202-974-5233
Naphthalate Polymers Council, John Malloy, Director of Packaging Services, 202-974-5245
Phenolic Division, Allen Weidman, Director, 202-974-5233
Polymeric Materials Producers Division, Betsy Shirley, Executive Director, 202-974-5319,
pmd@socplas.org
Polyurethane Division, Fran Lichtenberg, Executive Director, 212-351-5242,
polyu@socplas.org
Styrene Information and Research Center, BetsyShirley, Executive Director, 202-974-5319
sirc@socplas.org
The Vinyl Institute, Robert Burnett, Executive Director, 201-898-6633, vi@socplas.org
Sector Notebook Project 173 September 1997

Plastic Resin and Manmade Fiber Compliance Activities and Initiatives
Synthetic Organic Chemicals Manufacturer’s Association
1100 New York Avenue, NW
Washington, D.C. 20005 Members: 250
Phone: 202-414-4100 Staff: 50
Fax: 202-289-8584 Budget: $12,000,000
Synthetic Organic Chemicals Manufacturer’s Association (SOCMA) is the
national trade association representing the legislative, regulatory, and
commercial interests of some 250 companies that manufacture, distribute, or
market organic chemicals. Most of SOCMA’s members are batch and custom
chemical manufacturers who are the highly innovative, entrepreneurial and
customer-driven sector of the U.S. chemical industry. The majority of
SOCMA’s members are small businesses with annual sales of less than $50
million and fewer than 50 employees. SOCMA assists its members in
improving their environmental, safety, and health performance through
various programs focusing on continuous improvement. A bi-monthly
newsletter provides information on legislative and regulatory developments,
as well as on education and training opportunities. SOCMA holds an annual
meeting in May and also sponsors INFORMEX, the largest custom chemical
trade show in the U.S. In addition, SOCMA’s Association Management
Center includes two dozen self-funded groups that focus on single chemical
issues.
Sector Notebook Project 174 September 1997
Plastic Resin and Manmade Fiber Contacts/References
IX. CONTACTS/ACKNOWLEDGMENTS/REFERENCES
For further information on selected topics within the plastic resin and
manmade fiber industries, a list of publications and contacts are provided
below.
Contacts3
Name Organization Telephone Subject
Sally Sasnett EPA, Office of
Compliance 202-564-7074 Compliance assistance
Bob Rosensteel EPA, OAQPS 919-541-5608 Industrial processes and regulatory
requirements (CAA)
George Jett EPA, Office of Water 202-260-7151 Industrial processes and effluent guidelines
Bob Barker AFMA 202-296-6508 Industrial processes
Lucinda Schofer CMA 703-741-5231 Industrial resources and regulatory
requirements
David Gustafson Dow Chemical 517-636-2953 Regulatory requirements and polyethylene
manufacture
John Dege Du Pont 302-773-0900 Regulatory requirements and synthetic
fiber manufacture
Bob Lambour Exxon 713-870-6017 Regulatory requirements, polyethylene and
polypropylene manufacture
Brent Smith NC State 919-515-6548 Manmade fibers processes and pollution
prevention methods
Jim Kachtick Occidental Chemical 713-215-7602 Regulatory requirements and PVC
manufacture
Lynne Harris SPI 202-974-5217 Industrial resources and regulatory
requirements
AFMA: American Fiber Manufacturers Association
CMA: Chemical Manufacturers Association
CAA: Clean Air Act
OAQPS: Office of Air Quality Planning and Standards
SPI: Society of the Plastics Industry
3 Many of the contacts listed below have provided valuable background information and comments during
development of this document. EPA appreciates this support and acknowledges that the individuals listed do not
necessarily endorse all statements made within this notebook.
Sector Notebook Project 175 September 1997

Plastic Resin and Manmade Fiber References
References
Section II - Introduction
1) American Fiber Manufacturers Association, Inc. Comments on draft of this document, AFMA,
1997.
2) Brydson, J.A., Plastics Materials, 6th edition, Butterworth-Heinemann Ltd., Oxford, 1995.
3) Linton, G. E. Natural and Manmade Textile Fibers: Raw material to finished fabric. Duell,
Sloan and Pearce, New York, 1966.
4) Modern Plastics Encyclopedia, Mid-November 1994 Issue, volume 71, no. 12, McGraw-Hill,
Inc., New York, 1994.
5) Society of the Plastics Industry, Inc., Facts and Figures of the U.S. Plastics Industry, 1995
edition, SPI, Washington, DC, 1995.
6) U.S. Department of Commerce, United States Industrial Outlook 1994, US Department of
Commerce, Washington, DC, 1994.
7) U.S. Environmental Protection Agency, Best Management Practices for Pollution Prevention in
the Textile Industry, EPA, Office of Research and Development, Washington, DC.,
September, 1995.
8) U.S. International Trade Commission, Industry and Trade Summary: Manmade Fibers, US ITC,
Washington, DC., April, 1995, USITC Publication #2874.
9) U.S. Office of Management and Budget, Standard Industrial Classification Manual, U.S. OMB,
1987.
10) Ward’s Business Directory of U.S. Private and Public Companies, Gale Research, Inc., 1996.
Section III - Industrial Process Description
1) American Fiber Manufacturers Association, Comments on draft of this document, 1997.
2) Clements, J.W. and Thompson, J.P., Cleaner Production: An Industrial Example, Journal of
Cleaner Production, volume 1, no. 1, 1993.
3) Chemical Manufacturers Association, CMA Waste Minimization Resource Manual, CMA,
Washinton, DC, 1989.
4) Grayson, M. (ed.), Encyclopedia of Textiles, Fibers, and Nonwoven Fabrics, John Wiley and
Sector Notebook Project 176 September 1997

Plastic Resin and Manmade Fiber References
Sons, New York, 1984.
5) Kent, J.A. (ed.), Riegel’s Handbook of Industrial Chemistry, Van Nostrand Reinhold, New York,
1992.
6) Kroschwitz, J.I. (ed.), Encyclopedia of Polymer Science and Engineering, volume 12, John Wiley
and Sons, New York, 1986.
7) Lewis, Sr., R.J. Hawley’s Condensed Chemical Dictionary, Van Nostrand Reinhold Company,
New York, 1993.
8) Masters, G.M. Introduction to Environmental Engineering and Science. Prentice-Hall, Inc., New
York, 1991.
9) McKetta, J.J. (ed.), Encyclopedia of Chemical Processing and Design, volume 39, Marcel
Dekker, Inc., New York, 1992.
10) New Jersey Hazardous Waste Facilities Sitings Commission, AStudy of Hazardous Waste Source
Reduction and Recycling in Four Industry Groups in New Jersey, Commissioned by New
Jersey Hazardous Waste Facilities Sitings Commission, Trenton, NJ, April, 1987.
11) Randall, P.M., “Pollution Prevention Strategies for Minimizing of Industrial Wastes in the Vinyl
Chloride Monomer - Polyvinyl Chloride Industry,” Environmental Progress, volume 13, no.
4, November, 1994.
12) Rodriguez, F., Principles of Polymer Systems, fourth edition, Taylor and Francis, Washington,
DC., 1996.
13) Smith, W.M. (ed.), Manufacture of Plastics: Volume 1, Reinhold Publishing Corporation, New
York, 1964.
14) Society of the Plastics Industry, Comments on draft of this document, 1997.
15) Society of the Plastics Industry, Operation Clean Sweep: A Manual on Preventing Pellet Loss.
SPI, Washington, DC, 1994.
16) Synthetic Organic Chemical Manufacturers Association, SOCMA Pollution Prevention Study.
Prepared for SOCMA, Washington, DC, January 1993.
17) U.S. Environmental Protection Agency, Best Management Practices for Pollution Prevention
in the Textile Industry, EPA, Office of Research and Development, September, 1995.
18) U.S. Environmental Protection Agency, AP-42, EPA, Office of Air and Radiation, 1993.
19) U.S. Environmental Protection Agency, Plastic Pellets in the Aquatic Environment: Sources and
Recommendations,EPA, Office of Water, Washington, DC., December, 1992.
Sector Notebook Project 177 September 1997

Plastic Resin and Manmade Fiber References
20) U.S. Environmental Protection Agency, Development Document for Effluent Limitations
Guidelines and Standards for the Organic Chemicals, Plastics, and Synthetic Fibers, Point
Source Category, Volumes 1 and 2, EPA, Office of Water Regulations and Standards,
October 1987.
21) U.S. Environmental Protection Agency, Control of Volatile Organic Emissions from
Manufacture of Synthesized Pharmaceutical Products, EPA, Office of Air Quality Planning
and Standards, 1978.
22) U.S. International Trade Commission, Industry and Trade Summary: Manmade Fibers, USITC,
Washington, DC., Publication # 2874, April, 1995.
23) Wellman, Inc. Comments on draft of this document, 1997.
Section IV - Releases and Transfers Profile
1) Lewis, Sr., R.J. Hawley’s Condensed Chemical Dictionary, Van Nostrand Reinhold Company,
New York, 1993.
Section V - Pollution Prevention
1) Chemical Manufacturers Association, Designing Pollution Prevention in to the Process: Research
Developmentand Engineering, Chemical Manufacturers Association, Washington, DC, 1993.
2) Chemical Manufacturers Association, Preventing Pollution in the Chemical Industry: Five Years
of Progress, CMA, Washington, DC, 1992.
3) Clements, J.W. and Thompson, J.P., Cleaner Production: An Industrial Example, Journal of
Cleaner Production, volume 1, no. 1, 1993.
4) Clevenger, L. and Hassell, J., Case Study: From Jump Start to High Gear - How Du Pont is
Cutting Costs by Boosting Energy Efficiency, Pollution Prevention Review, Summer 1994.
5) Elley, D., DCS’s On-line Information Improves resin Process Consistency, Instrumentation and
Control Systems, volume 64, no. 11, 1991.
6) Kikta, A. J., Case Study: Using a Six-Step Organizational Framework to establish a Facility P2
Program, Pollution Prevention Review, Spring 1994.
7) Manufacture of Plastics: Volume 1, W.M. Smith (ed.), Reinhold Publishing Corporation, New
York, 1964.
8) North Carolina Department of Environment, Health, and Natural Resources, Case Studies: A
Sector Notebook Project 178 September 1997

Plastic Resin and Manmade Fiber References
Compilation of Successful Waste Reduction Projects Implemented by North Carolina
Businesses and Industries, NC DEHNR, Office of Waste Reduction, Industrial Pollution
Prevention Program, Raleigh, NC, December 1995.
9) Smith, G.M., IV, Polyester Film Division’s Waste Minimization/Detoxification Activities,
Chemical Manufacturers Association Waste Minimization Workshop Proceedings,
Washington, DC, 1987.
10) Synthetic Organic Chemical Manufacturers Association, SOCMA Pollution Prevention Study.
Prepared for SOCMA, Washington, DC, January 1993.
11) U.S. Environmental Protection Agency, Best Management Practices for Pollution Prevention
in the Textile Industry, EPA, Office of Research and Development, Washington, DC,
September, 1995.
12) U.S. Environmental Protection Agency, Retrospective Analysis of Compliance Strategies and
Pollution Prevention in the Organic Chemicals, Plastics and Synthetic Fibers Industry, EPA,
Office of the Administrator, Washington, DC, December, 1993, (EPA Contract No. 68-C3-
0302).
13) Better Housekeeping and Training of Operating Personnel Reduces Liability,
http://es.inel.gov/studies/cs382.html.
14) Monomer Storage and Handling Improvements Reduce Emissions at Novacor Chemicals, Inc.,
http://nben.org/otacases/novacor.html.
15) New Value Packing Material Reduces Leaking Control Valves at Texas Eastman in Longview,
http://es.inel.gov/studies/eastx-d.html.
16)Fact Sheet: Source Reduction and Recycling Lead to P2 Efforts,
http://es.inel.gov/techinfo/facts/cma/cma-fs3.html.
17) On-Site Recycle and Reuse of Alcohol Wash Solution, http://es.inel.gov/studies/cs435.html.
18) Modifying Rinse Procedures for Phenolic Batch Reactors Reduced Virgin Phenolic Resin,
http://es.inel.gov/studies/cs20.html.
19) Plastics Industry Emphasizes Need for Research in Recycling of Hazardous Waste,
http://es.inel.gov/studies/hml10053.html.
Sector Notebook Project 179 September 1997

Plastic Resin and Manmade Fiber References
Section VI - Statutes and Regulations
1) Federal Register, Vol. 57, No. 177, September 11, 1992.
2) Federal Register, Vol. 58, No. 130, July 9, 1993.
3) U.S. Environmental Protection Agency, Draft Polymer Exemption Guidance Manual, EPA, Office
of Pollution Prevention and Toxics, March 29, 1995.
4) U.S. Environmental Protection Agency, Development Document for Effluent Limitations
Guidelines and Standards for the Organic Chemicals, Plastics, and Synthetic Fibers, Point
Source Category, Volumes 1 and 2, EPA, Office of Water Regulations and Standards,
October 1987.
Section VIII - Compliance Activities and Initiatives
1) Society of the Plastics Industry, Operation Clean Sweep: A Manual on Preventing Pellet Loss.
SPI, Washington, DC, 1994.
Sector Notebook Project 180 September 1997
