What Is The Current Income Mix Of City? 178704 Plus20140213 1a
User Manual: 178704
Open the PDF directly: View PDF ![]() .
.
Page Count: 14

Seattle City Council – Workforce and
Affordable Housing Program Review:
Existing Conditions
Existing Conditions: Workforce and
Affordable Housing
Acknowledgments: The Seattle Planning Commission, Office of Housing,
Department of Planning and Development, and Cornerstone Partnership.
1

Existing Conditions
•How much do lower income households earn?
•How many housing units are in Seattle and how many are
rent-restricted?
•What is the current income mix of Seattle households?
•For rented and owned housing:
–What can lower income households afford to pay?
–Is existing housing accessible to lower income households?
–What is available in the marketplace?
•How many households will Seattle add over the next two
decades?
•What will be the future demand for affordable housing?
Existing Conditions: Workforce and
Affordable Housing 2
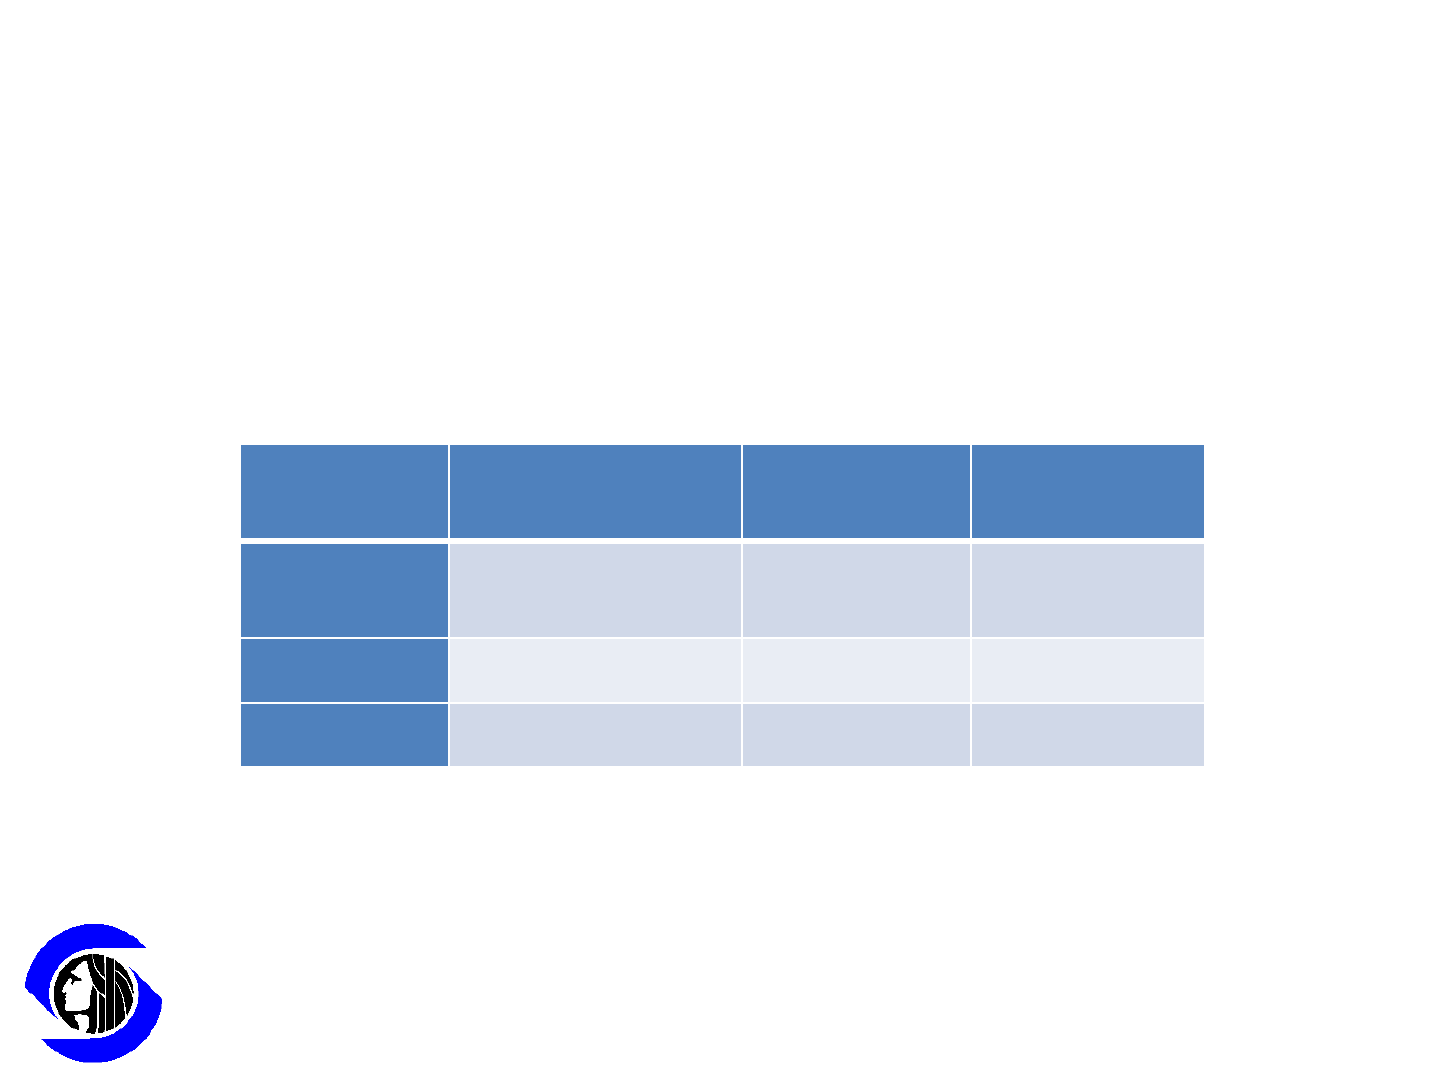
How much do lower income households
earn?
Names
Household Incomes
1 Person Household
Income Ranges
4 Person Household
Income Ranges
Extremely Low
Income
Less than 30 percent of the
median family income
(MFI)
< $18,200
< $26,000
Very Low Income
Between 30
and
50 percent
of the MFI
$18,201
- $30,350
$26,000
- $43,350
Low Income
Between 50 and 80 percent
of MFI
$30,351
- $45,100
$43,351
- $64,400
Existing Conditions: Workforce and
Affordable Housing 3
Source and notes: HUD 2013.
Housing affordable to households earning between 60-80% of HUD Area Median Family Income (MFI) are sometimes referred
to as “workforce housing.” Additionally, the term “lower income” often refers to all people making less than 80% of the MFI.
2013 Seattle Income Categories
A one person lower income household earns between less than $18,200 and
$45,100 per year. An entry-level teacher in the Seattle School District earns
approximately $42,000 and would be considered low income.
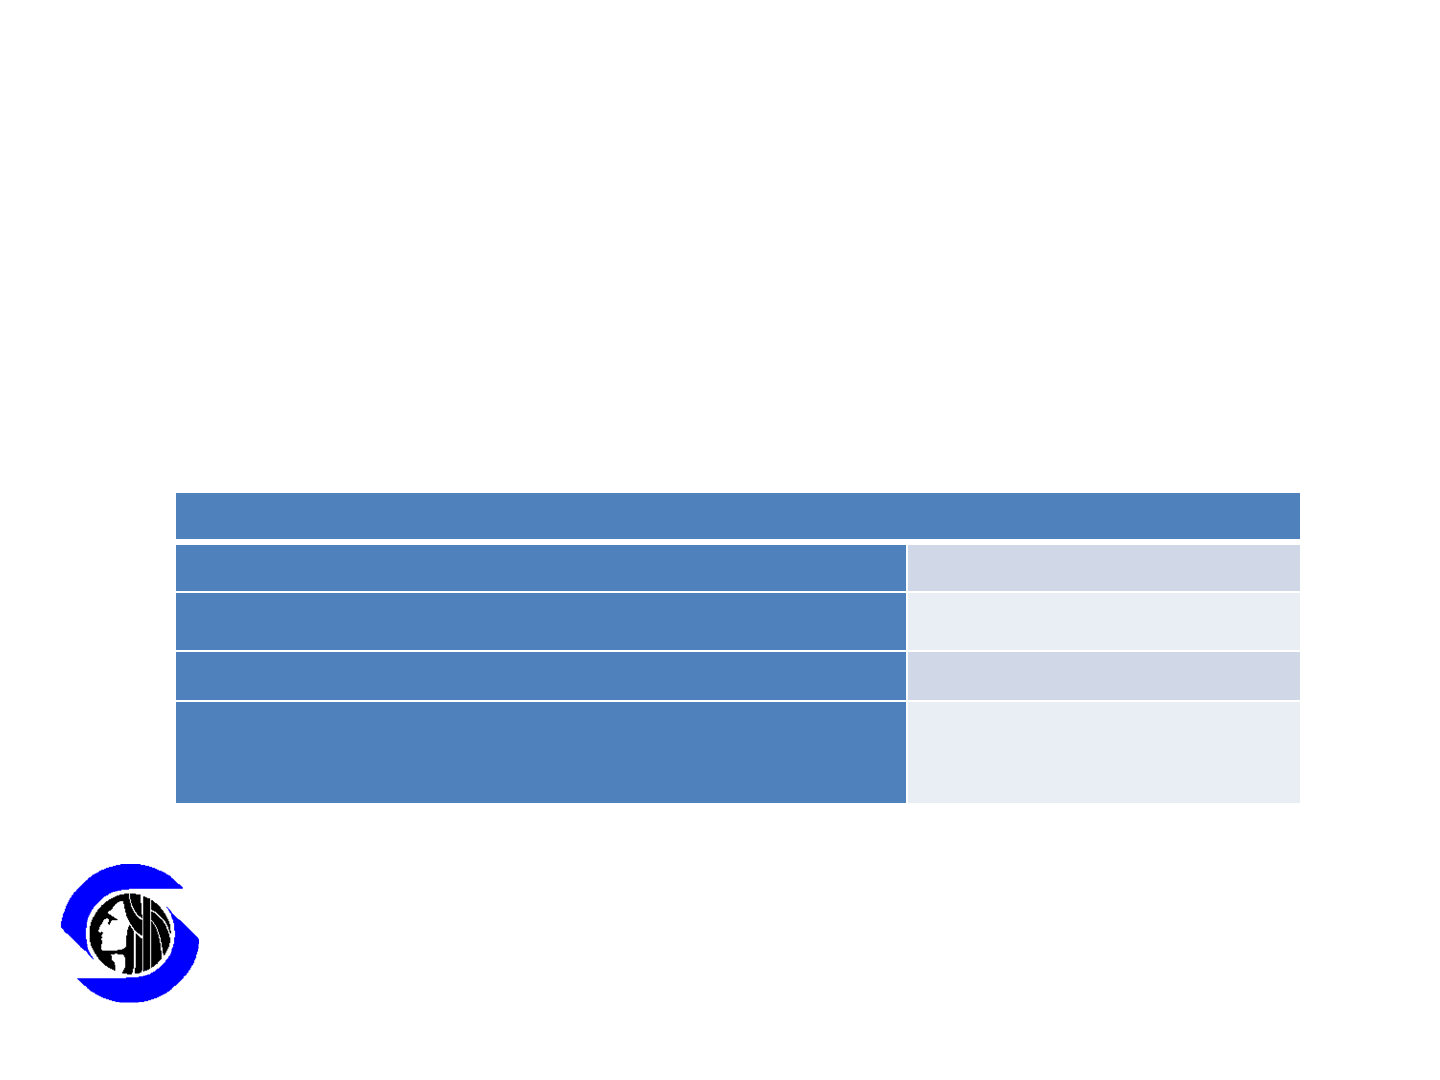
How many housing units are in Seattle and how
many are rent restricted?
Existing Conditions: Workforce and
Affordable Housing 4
Between 2005 and 2012, Seattle added about 29,000 net new housing units. There are
approximately 14,000 anticipated additional units that have received building permits but have not
yet been built.
The City of Seattle and the Seattle Housing Authority have about 24,000 rent restricted units. This is
approximately 8% of the total inventory of housing units. Some of these units are occupied by
seniors and the disabled, many of whom are not workforce participants.
Snapshot of Housing Inventory
OFM Estimate of Housing Units in Seattle in 2012
312,853
Net New Housing Units Added between 2005 and 2012
29,330
Units That Have Been Permitted But Not Yet Built
13,760
Estimate of Existing
Rent Restricted Affordable Housing
Created by City
Programs
or in the Seattle Housing Authority’s Inventory
23,773*
* Includes units created through the Multifamily Tax Exemption Program. Does not include tenant-based vouchers.
Sources: The Washington State Office of Financial Management, the Department of Planning and Development, the
Office of Housing, and the Seattle Housing Authority.
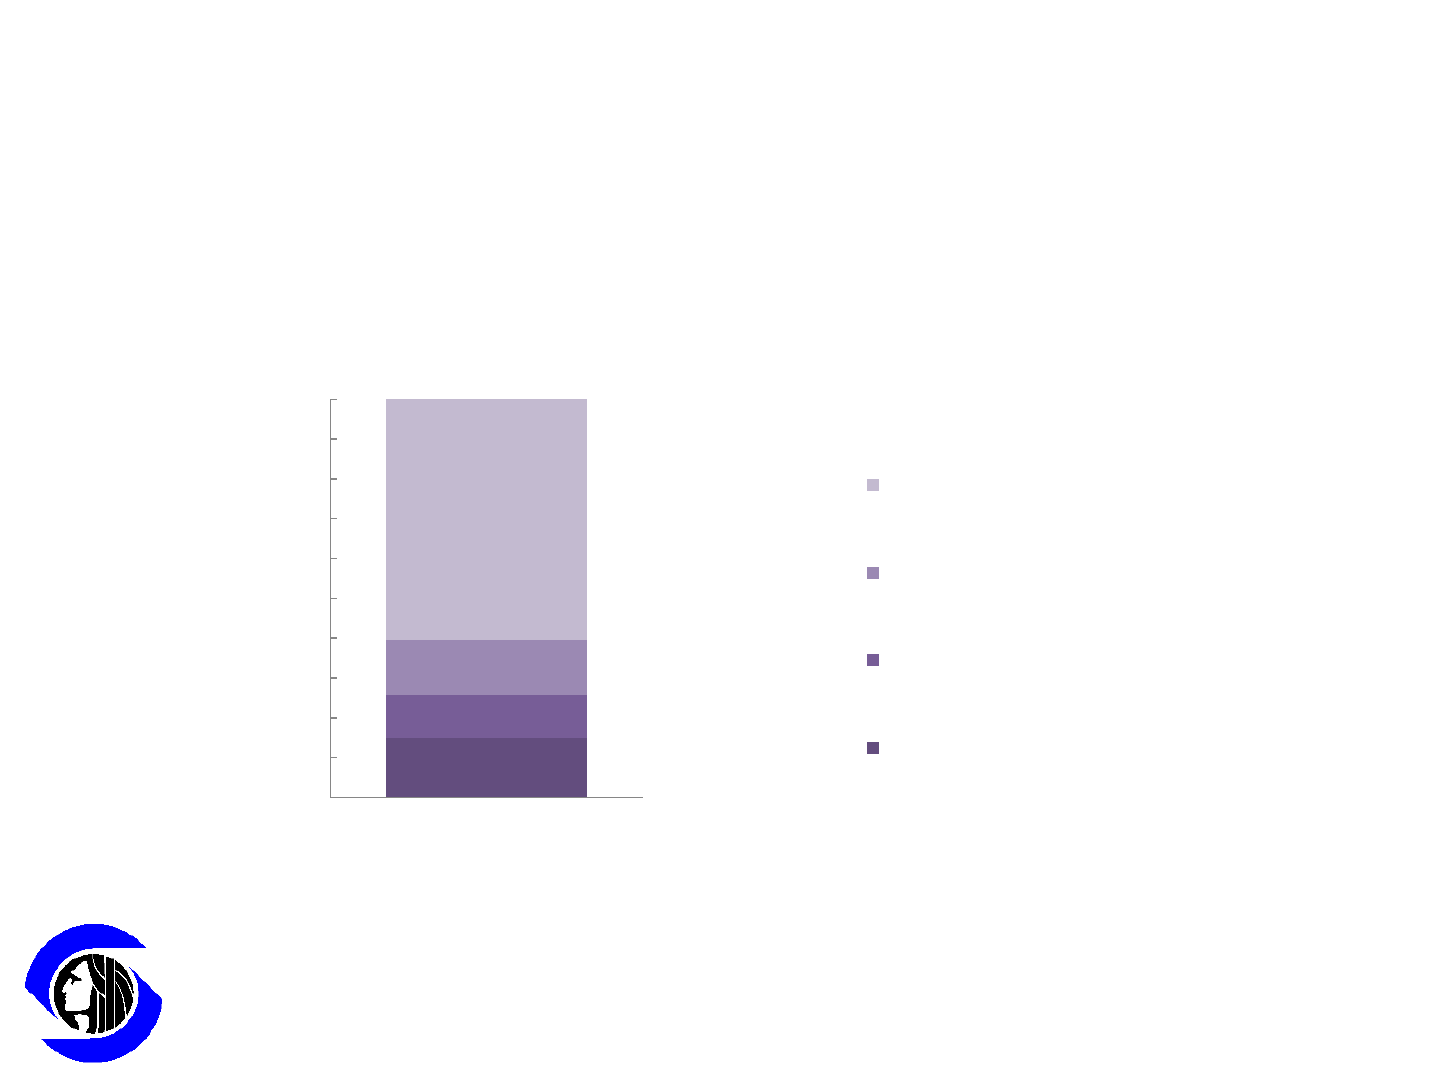
What is the current income mix of households
in the City?
Existing Conditions: Workforce and
Affordable Housing 5
15%
11%
14%
60%
0%
10%
20%
30%
40%
50%
60%
70%
80%
90%
100%
Households by Income Category
Share of
Households
Share of Existing Households within
Seattle by Income Category
greater than 80% of
HAMFI
greater than 50% but
less than or equal to
80% of HAMFI
greater than 30% but
less than or equal to
50% of HAMFI
less than or equal to
30% of HAMFI
Data source and notes:
Estimates for household income distribution are from the HUD "CHAS" dataset obtained from the Census Bureau's American
Community Survey (ACS) 5-year period (2006-2010). ACS estimates are based on a sample and carry margins of error.
Income categories are based on HUD Area Median Family Income (HAMFI) and are adjusted by household size.
The 2010 Census counted 283,510 households in Seattle. (As of 2014, there are roughly 298,000 households in the city.)
Income Categories:
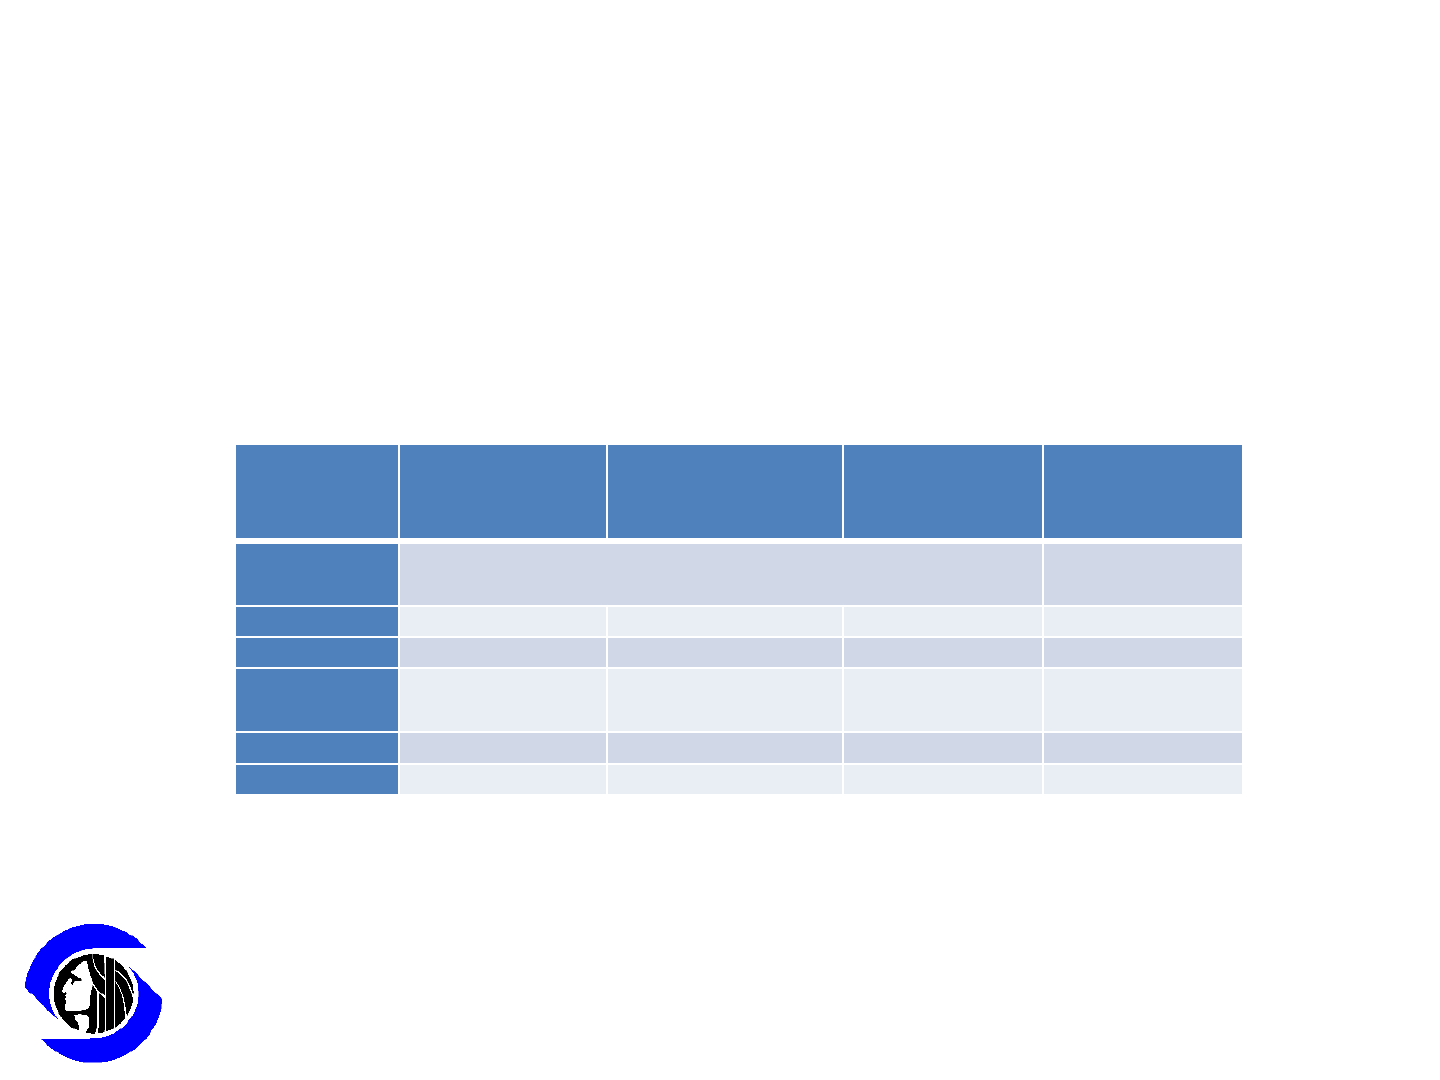
What rent can lower income households afford
to pay?
Extremely Low
Income
(<30% MFI)
Very Income
(30-50% MFI)
Low Income
(50-80% MFI)
Average Rents
(Seattle)
Includes basic utilities Excludes basic
utilities
0 bedroom
$455 $758 $1,127 $1,057
1 bedroom
$487 $813 $1,208 $1,279
2 bedroom
$585 $976 $1,450 $1,466 one bath
$1,958 two bath
3 bedroom
$676 $1,127 $1,675 $2,310
4 bedroom
$755 $1,257 $1,868
Data not available
Existing Conditions: Workforce and
Affordable Housing
Sources: Rent Limits based on 2013 Income Limits for Seattle-Bellevue HMFA (HUD Metro Fair Market Rent Area)
Dupre+Scott Apartment Advisors, Apartment Vacancy Report, Fall 2013 (20+ unit multifamily rental buildings).
Note: The average rents do not reflect cost of basic utilities, which is a component of housing affordability.
Affordable Rent by Income Level and Average Rent by Number of
Bedrooms
6
While the average rent of studios may be affordable to some lower income households,
average rents for units with one or more bedrooms exceed affordable rents for all lower
income household categories.
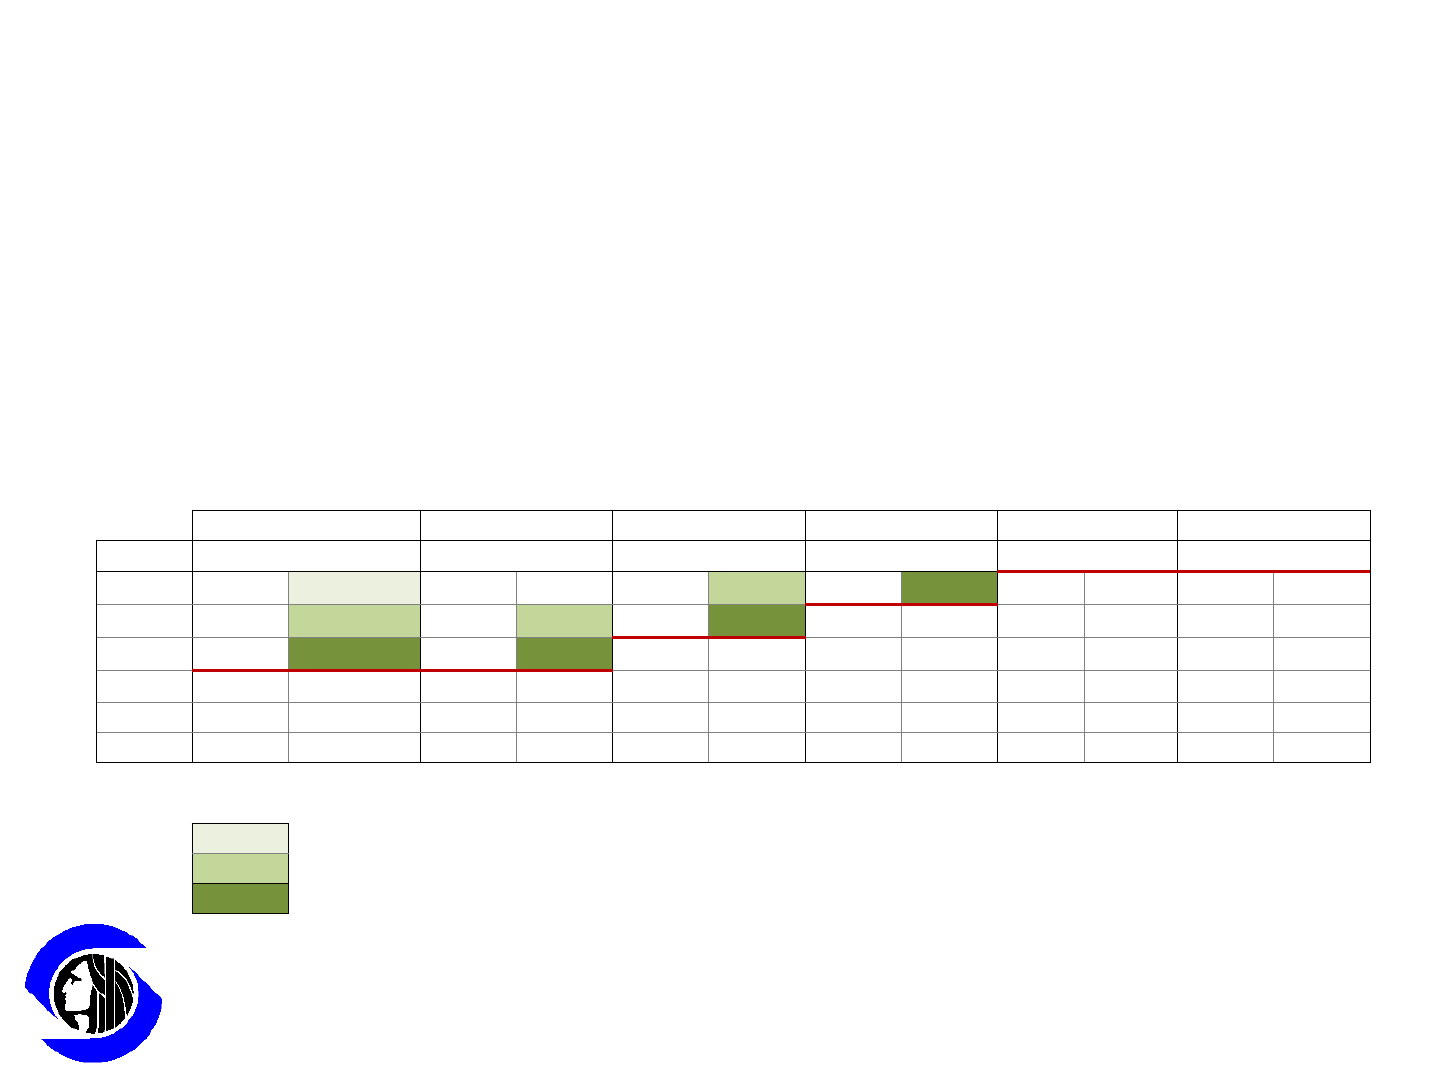
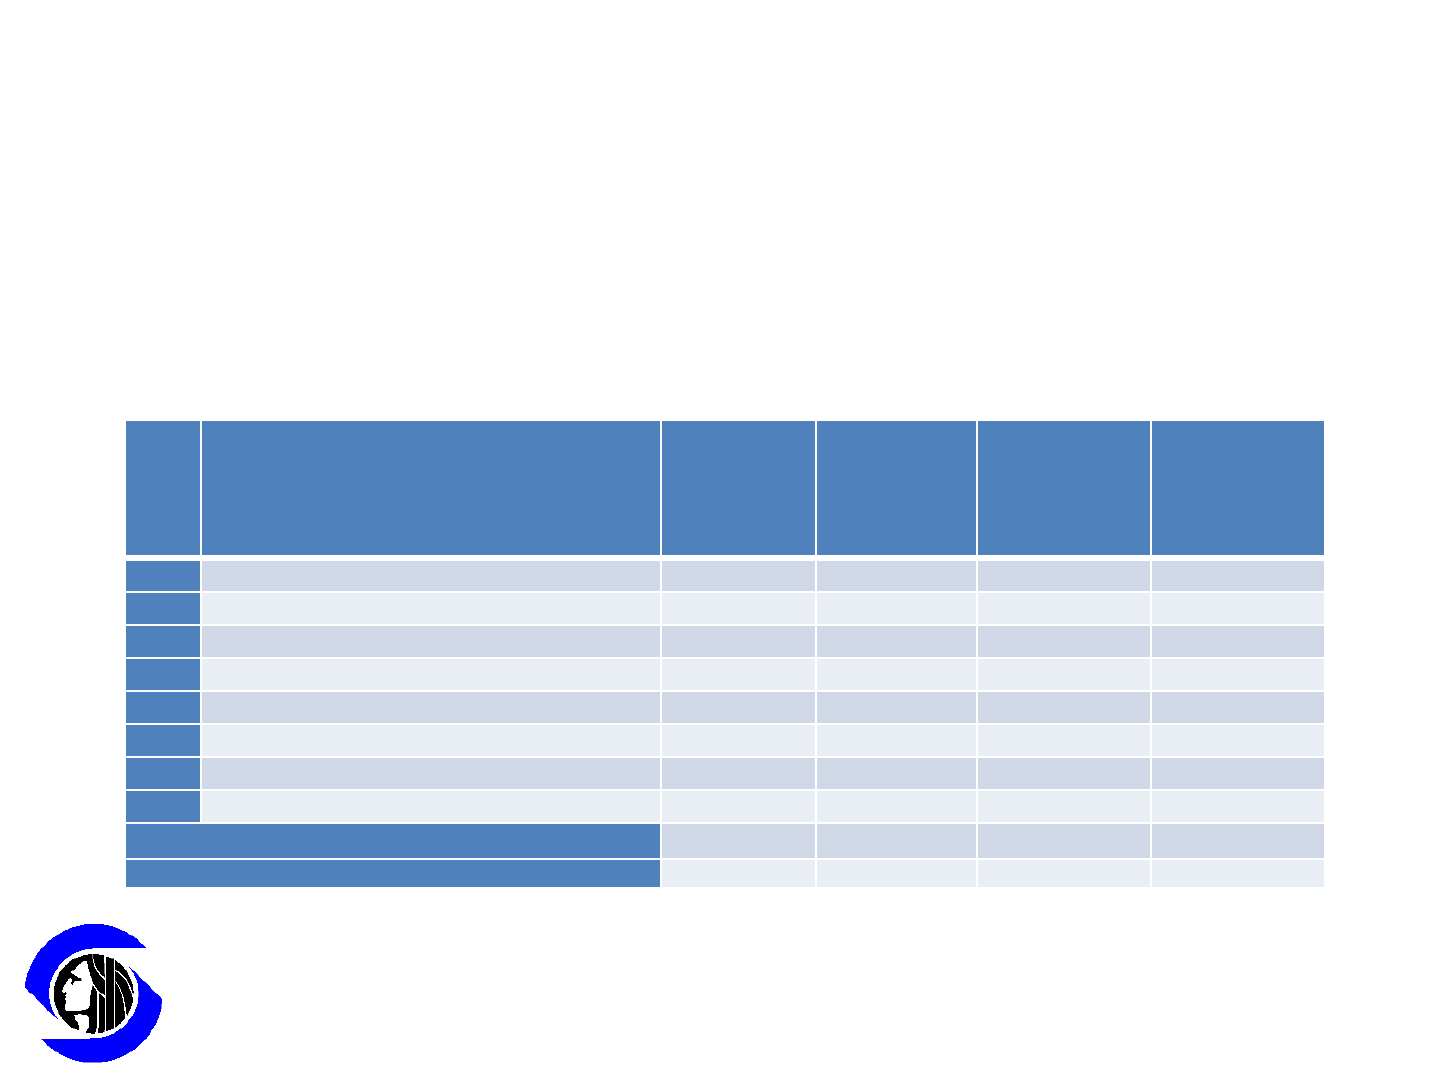
What type of multifamily rental housing – by
price and size – does the market provide?
2013 Data - 1+ Unit Properties - Adjusted for time and utilities where needed. City of Seattle data only.
Studios 1 Bedroom 2 Bedroom 3 Bedroom 4 Bedroom 5+ Bedrooms
Quartile
# Units
Rent
# Units
Rent
# Units
Rent
# Units
Rent
# Units
Rent
# Units
Rent
Lowest
$430
$575
$640
$960
$1,000
$1,968
25%
2,956 $887 7,434 $981 3,899
$1,262
334
$1,742
54
$2,148
15
$2,792
50%
5,912 $1,060 14,869
$1,188
7,798
$1,540
667
$2,065
108
$2,587
30
$3,473
75%
8,868 $1,327 22,304
$1,569
11,697
$2,003
1,001
$2,465
161
$3,161
45
$4,019
100%
11,822
$1,704 29,739
$2,614
15,595
$3,986
1,334
$5,278
215
$6,032
59
$5,846
# Bldgs
754 1596 2,009 712 210 59
Source: Dupre+Scott Apartment Rent & Vacancy Survey - 2013. Shading overlayed by City staff.
Legend
Affordable to extremely low income (<30% MFI)
Affordable to very low income (30
-50% AMI)
Affordable to low income (50
-80% AMI)
Existing Conditions: Workforce and
Affordable Housing 7
The multifamily rental housing market does provide some studio, one-bedroom, and
even two bedroom units at rents affordable to lower income households.
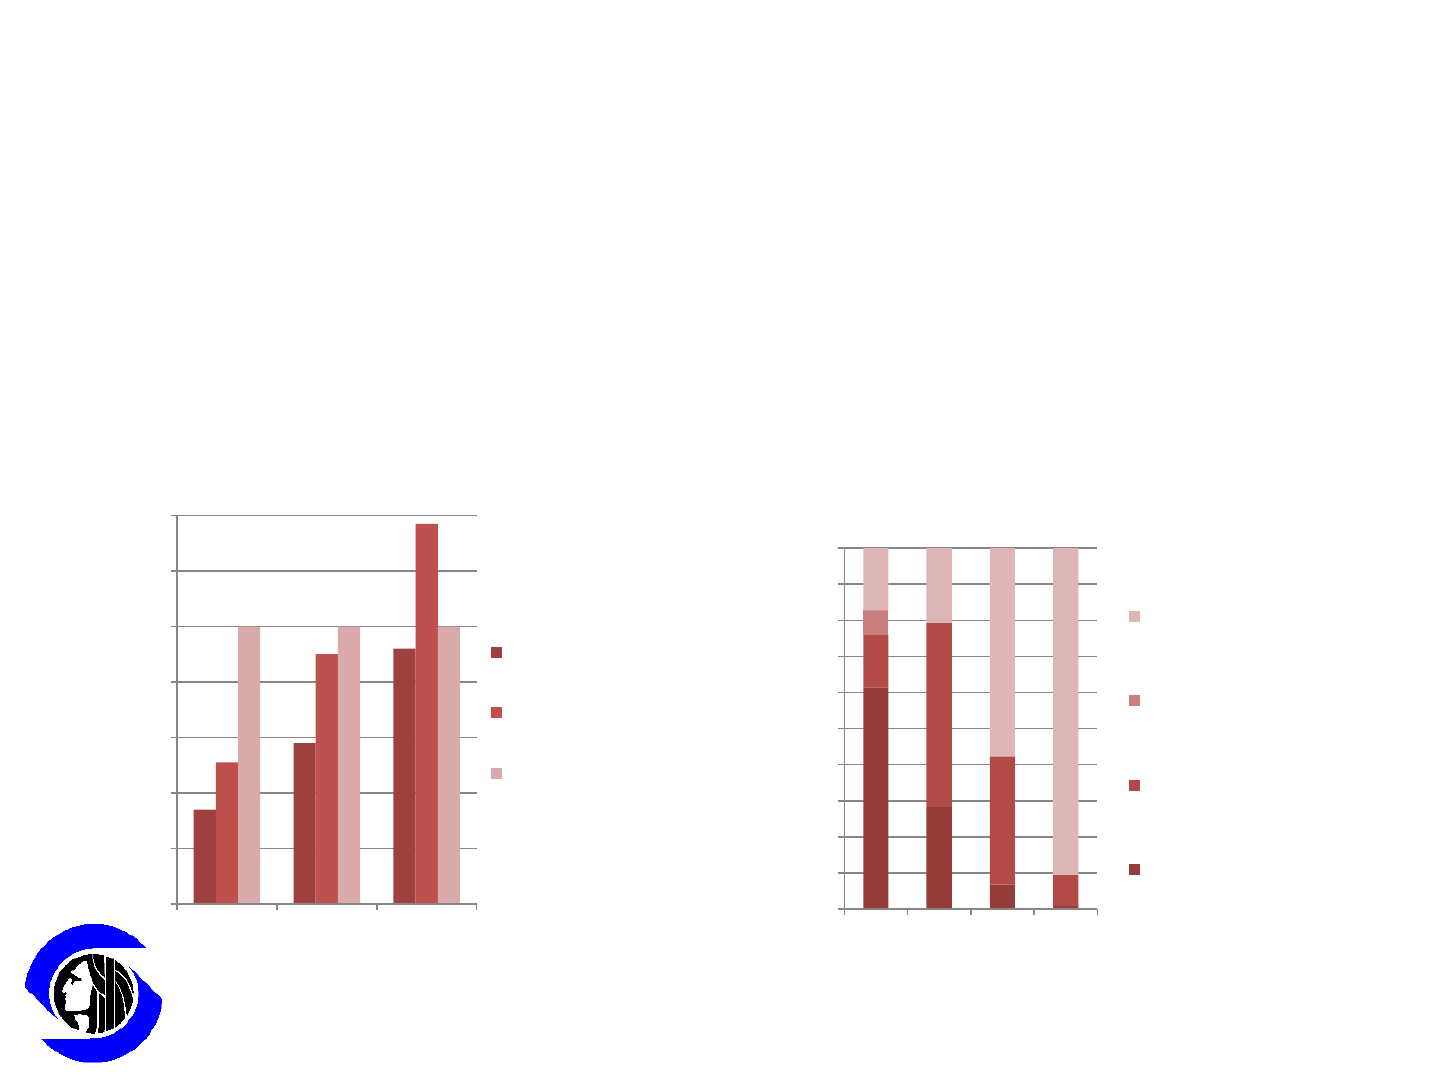
Is existing affordable rental housing accessible to
lower income households?
Existing Conditions: Workforce and
Affordable Housing
0%
10%
20%
30%
40%
50%
60%
70%
80%
90%
100%
≤ 30%
AMI
> 30 ≤
50%
AMI
> 50 ≤
80%
AMI
> 80%
AMI
Housing Cost Burden by
Income - Renters
Not Cost Burdened
Negative or No
Income (Not
Computed)
Cost Burdened
Severely Cost
Burdened
0
20
40
60
80
100
120
140
≤ 30% AMI
≤ 50% AMI
≤ 80% AMI
Affordable & Available Units
Per 100 Renter Households
Affordable &
Available Units
Affordable Units
Households
8
However, affordable units on the market are not always available to lower income
households. Consequently, many lower income households are cost burdened. A
household is considered “cost burdened” when housing costs, including utilities, are
more than 30% of monthly household income.
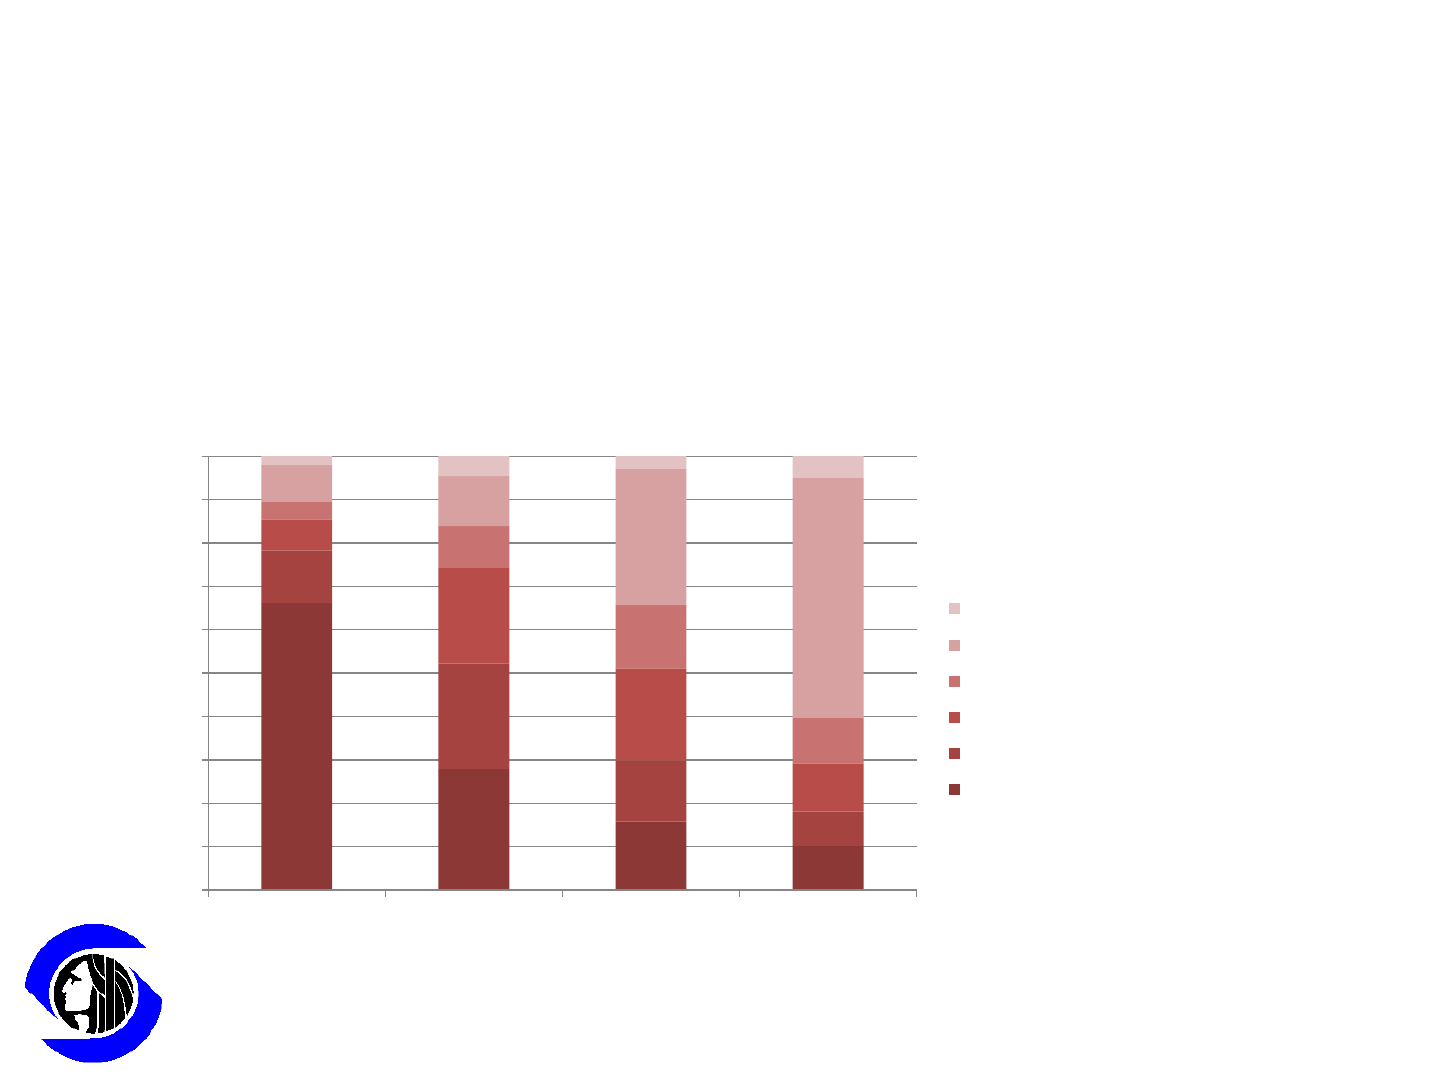
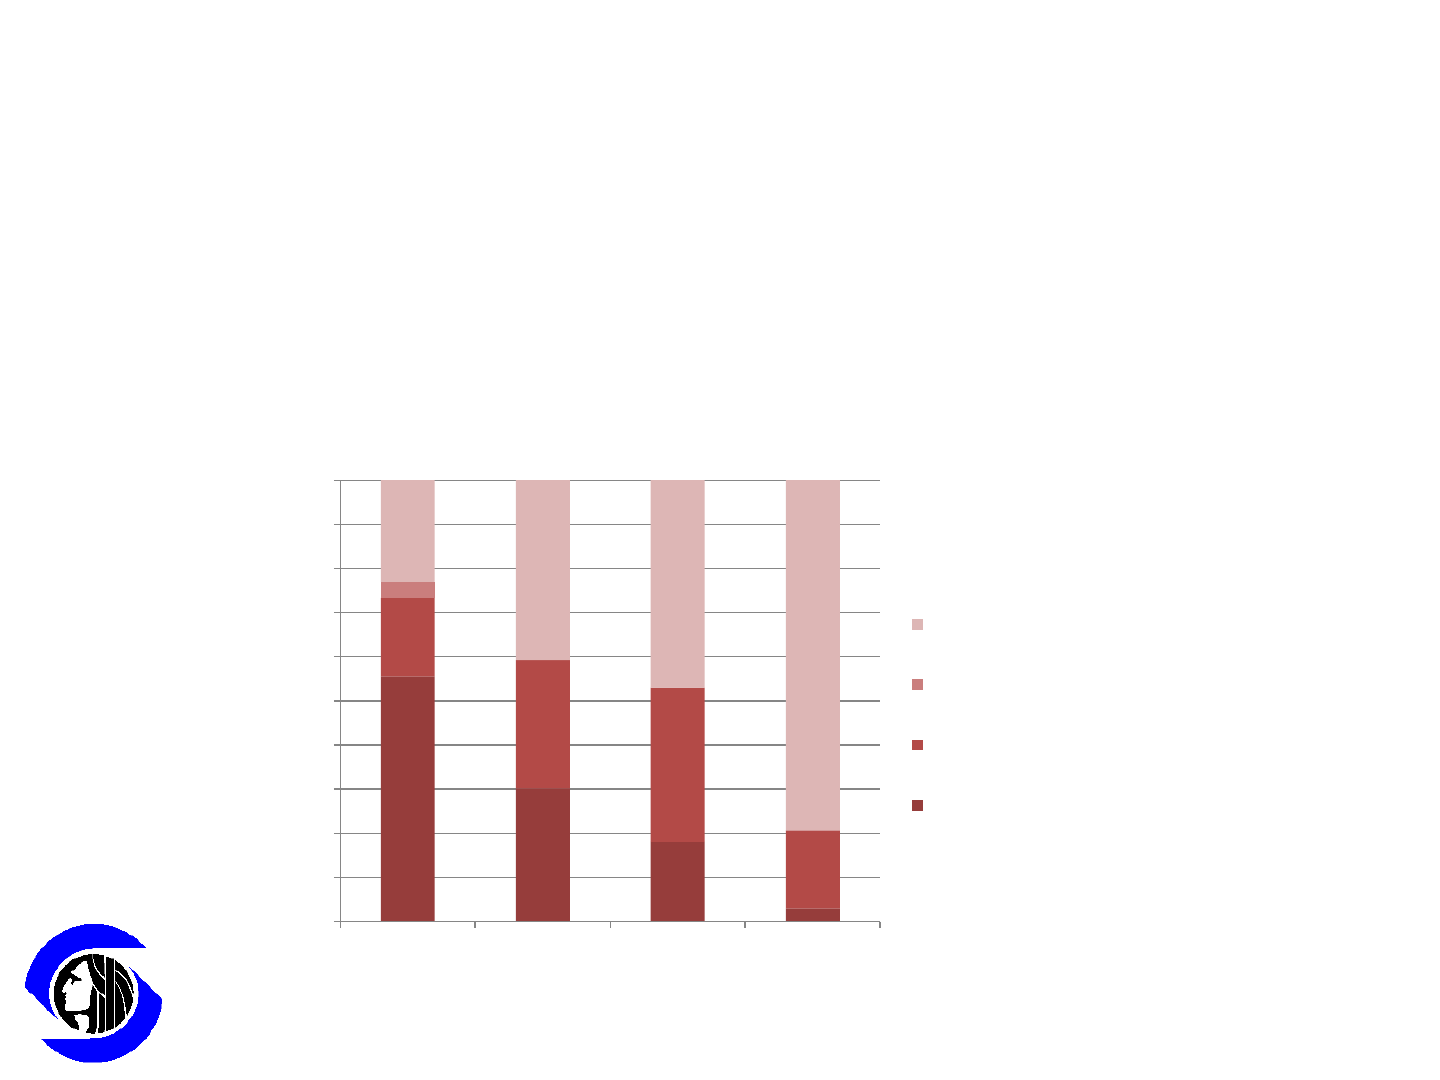
What are the income characteristics of the
households occupying affordable rental units?
0%
10%
20%
30%
40%
50%
60%
70%
80%
90%
100%
≤RHUD30 Units >RHUD30 ≤RHUD5
Units
>RHUD50 ≤RHUD80
Units
>RHUD80 Units
Rental Units by Affordability
Total Vacant Units
HH with incomes > 100% of HAMFI
HH with incomes > 80% and ≤ 100% of HAMFI
HH with incomes > 50% and ≤ 80% of HAMFI
HH with incomes > 30% and ≤ 50% of HAMFI
HH with incomes ≤ 30% of HAMFI
Existing Conditions: Workforce and
Affordable Housing 9
Households that are not lower income households, including households earning
more than the area median income, occupy a significant share of affordable
housing provided by the market.
What can lower income households afford
to own?
Ext Low Income
(<30% MFI)
Very Low Income
(30-50% MFI)
Low Income
(50-80% MFI)
0 bedroom $67,300 $112,100 $166,700
1 bedroom $72,000 $120,270 $178,704
2 bedroom $86,541 $144,383 $214,504
3 bedroom $100,003 $166,722 $247,789
4 bedroom $111,690 $185,953 $276,341
Existing Conditions: Workforce and
Affordable Housing
Affordable Home Price by Income Level
Notes and sources: Assumptions are 30 year fixed mortgage, property tax 1%, insurance/PMI/HOA
0.5%, 28% front end ratio, 50% of annual salary as down payment. Cornerstone Partnership
Calculation. Income levels adjusted by presumed household size based on number of bedrooms.
10
What type of ownership housing – by price and
location – does the market provide?
Area
All Residential
Residential New
Construction
Only
All Condominium
Condominium
New Construction
Only
140
West Seattle
$375,000
$439,500
$269,000
$295,929
380
Central Seattle SE, Leschi, Mt Baker, Seward Park
$354,500
$465,800
$198,770
385
Central Seattle SW, Beacon Hill
$320,000
$399,975
$195,000
390
Central Seattle, Madison Park, Capitol Hill
$619,000
$650,000
$287,500
$246,900
700
Queen Anne, Magnolia
$651,000
$552,000
$290,000
$780,000
701
Downtown Seattle
$715,000
$415,000
$889,500
705
Ballard, Greenlake, Greenwood
$466,000
$554,000
$250,000
$317,245
710
North Seattle
$470,000
$672,500
$175,000
$239,500
Median Sale Price (Weighted Average) =
$468,400
$532,075
$292,025
$584,700
Percent change vs. 2012 = 10.6% 21.8% 8.0% 23.4%
Existing Conditions: Workforce and
Affordable Housing
Source: Northwest Multiple Listing Service, January 2014 (Note, “condominium” is a subset of “residential”).
Median Home Prices in Seattle
11
Depending on the neighborhood, some condominiums are affordable to lower
income households.
Is existing affordable ownership housing
accessible to lower income households?
0%
10%
20%
30%
40%
50%
60%
70%
80%
90%
100%
≤ 50% AMI > 50 ≤ 80% AMI > 80 ≤ 100%
AMI
> 100% AMI
Housing Cost Burden by Income - Owners
Not Cost Burdened
Negative or No Income (Not
Computed)
Cost Burdened
Severely Cost Burdened
Existing Conditions: Workforce and
Affordable Housing 12
However, lower income households are more likely to consist of cost
burdened homeowners.
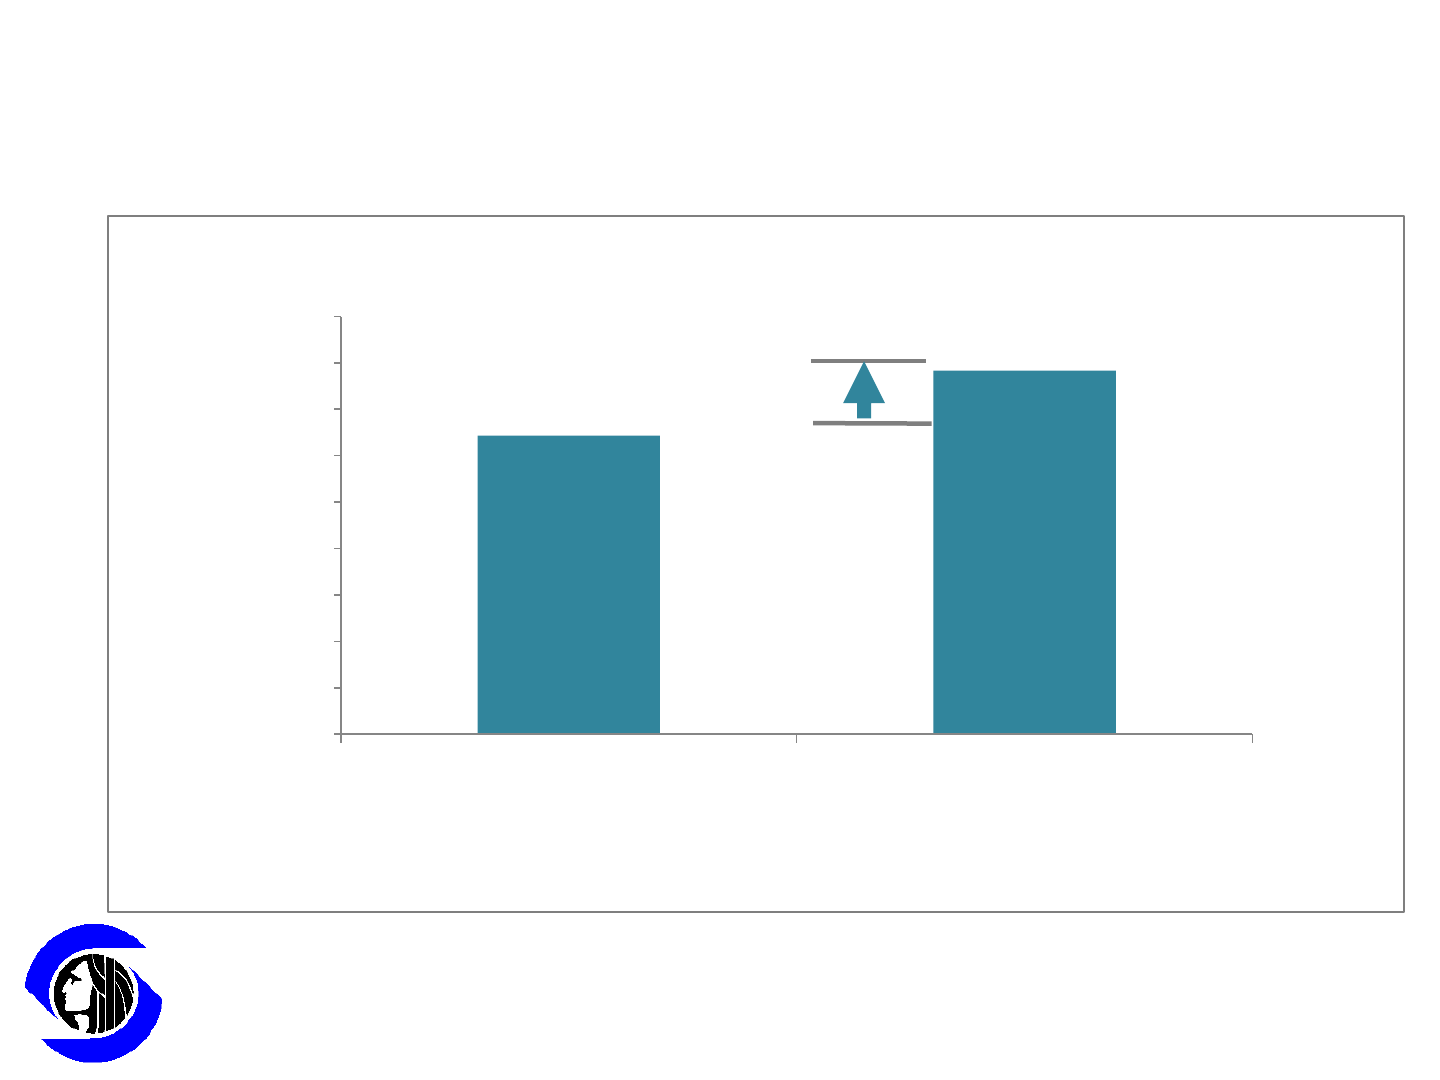
How many households will Seattle add over the
next 20 years?
Existing Conditions: Workforce and
Affordable Housing
321,700
391,700
2014 in 20 years
Total
Housing
Units
Growth:
70,000
Housing
Units
Seattle expects the number of housing units in the city to grow by about 70,000 over the
next two decades.
Notes: 2014 estimate is as of beginning of year; includes DPD's estimate of net new housing units since the 2010 Census. The
expectation for the addition of approximately 70,000 housing units over the next 20 years is based on the growth projection being using
for the Major Update of the Comprehensive Plan.
13
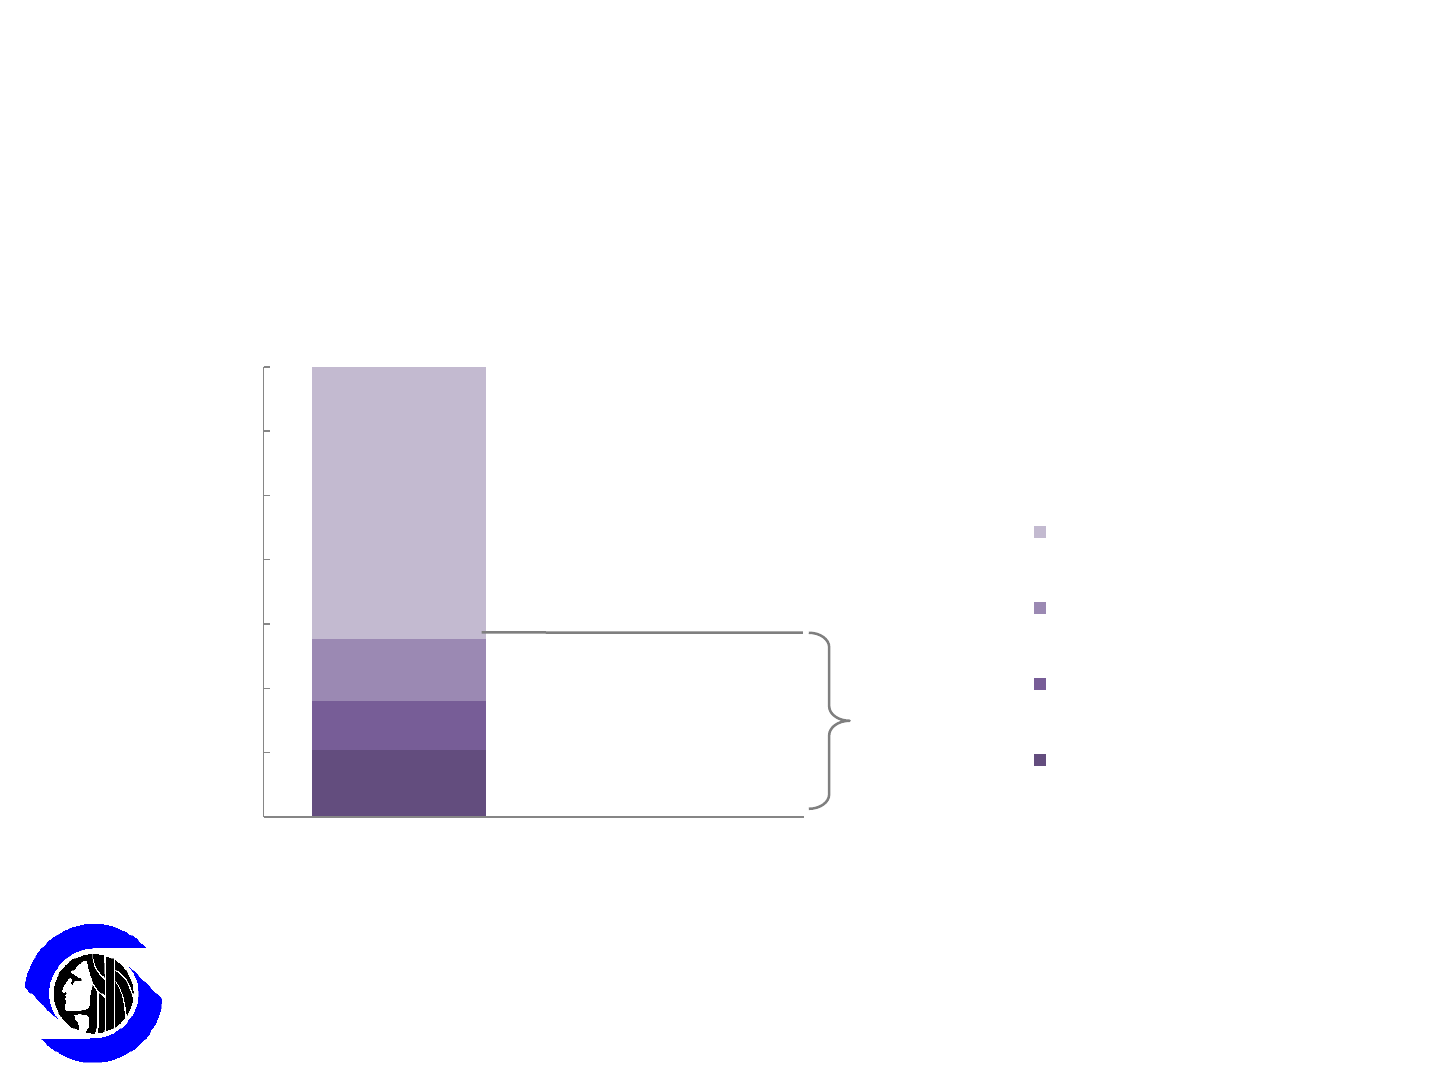
What will be the future demand for affordable
housing?
Existing Conditions: Workforce and
Affordable Housing 14
15% or 10,505
11% or 7,592
14% or 9,586
60% or 43,218
0
10,000
20,000
30,000
40,000
50,000
60,000
70,000
70,000 Total Additional
Housing Units in Next 20
Years
Housing
Units
greater than 80% of
HAMFI
greater than 50% but less
than or equal to 80% of
HAMFI
greater than 30% but less
than or equal to 50% of
HAMFI
less than or equal to 30%
of HAMFI
40%
or
27,683
units
at or below
80% of HAMFI
Data source and notes: This chart applies income distribution for Seattle from HAMFI income estimates from 2006-
2010 ACS "CHAS" data to the 70,000 net new housing units the City expects in Seattle in the next 20 years.
HAMFI stands for HUD Area Median Family Income. HAMFI-based income categories include adjustments for household
size. Evaluation of the affordability of actual housing units added to Seattle's housing stock would also need to take the
size of the unit into account.
Assuming that the household income distribution remains the same, Seattle would need
to add approximately 28,000 new affordable units over the next 20 years to meet future
demand.
Income-based
Housing Affordability
Categories:
