Power Bi Guide S
power-bi--guide-s
power-bi--guide-s
User Manual:
Open the PDF directly: View PDF ![]() .
.
Page Count: 32
- Power BI The Complete Guide
- Power BI Desktop
- Workflow of Power BI Desktop
- The Query Editor
- Power BI Desktop – Query Editor
- The Star Schema
- The Star Schema
- Our Project – Current structure
- Out Project turned into a Star Schema
- Query: Duplicate vs. Reference
- Merge Queries - Join Kind
- Import data into the data model
- Data View & Relationships
- Power BI Desktop – Data Model
- Query Editor vs. Data Model
- Power BI Desktop – Data Model
- Let‘s bring our Data Model to live
- One to many (1:*) & Many to one (*:1)
- One to one (1:1)
- Power BI Desktop – Data Model
- One tool - Two languages
- Course interim conclusion
- Calculated Columns vs. Measures
- Report View
- Power BI Desktop – Report View
- Power BI Service & Power BI Mobile
- Ways to continue
- Questions to be answered
- Changes in 2017
- Publishing our project data to Power BI Service
- Collaboration
- How can we share our results from the App workspace?

Power BI
The Complete Guide

Power BI Desktop
What the Desktop application is perfect for
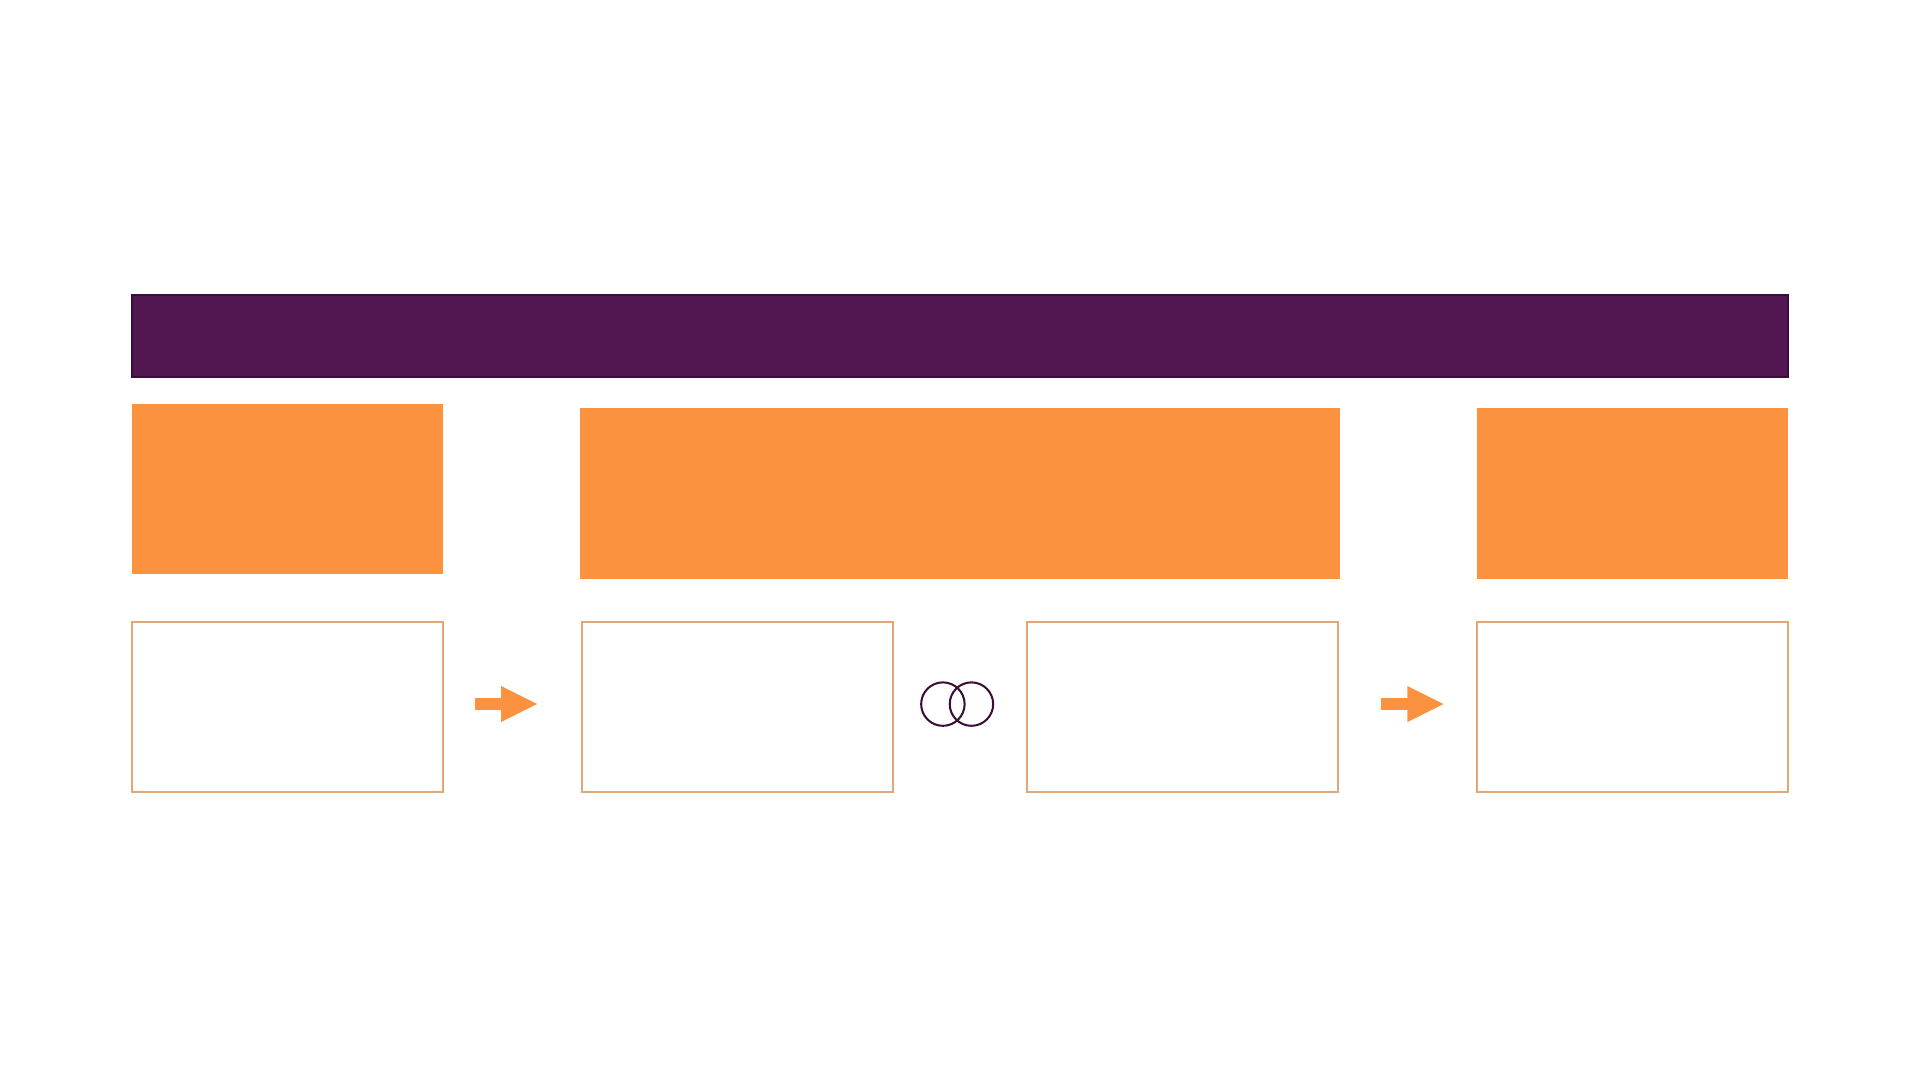
Workflow of Power BI Desktop
Power BI Desktop
Query
Editor
Data
View
Report
View
Data
preparation Data modelling Data
visualization
Relationship
View

The Query Editor
How we import and prepare our data
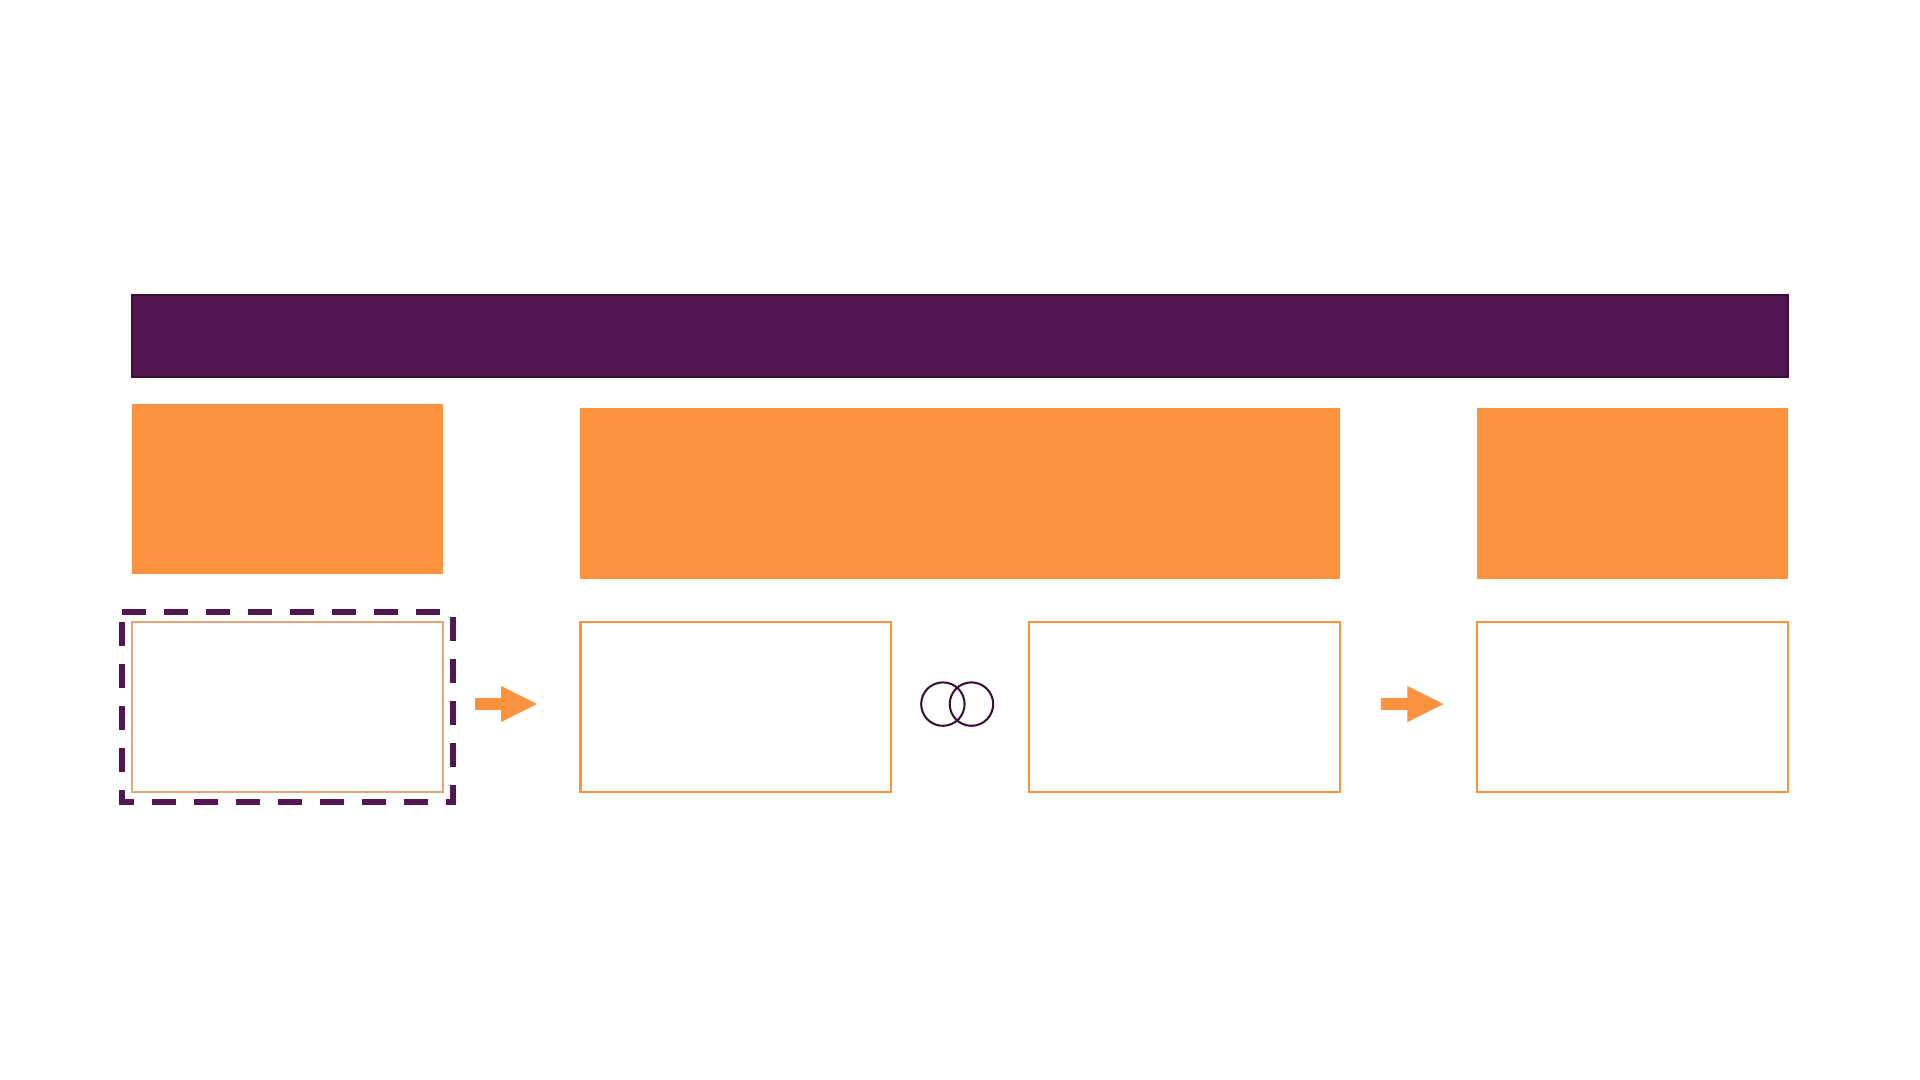
Power BI Desktop –Query Editor
Power BI Desktop
Query
Editor
Data
View
Report
View
Relationship
View
Data
preparation Data modelling Data
visualization

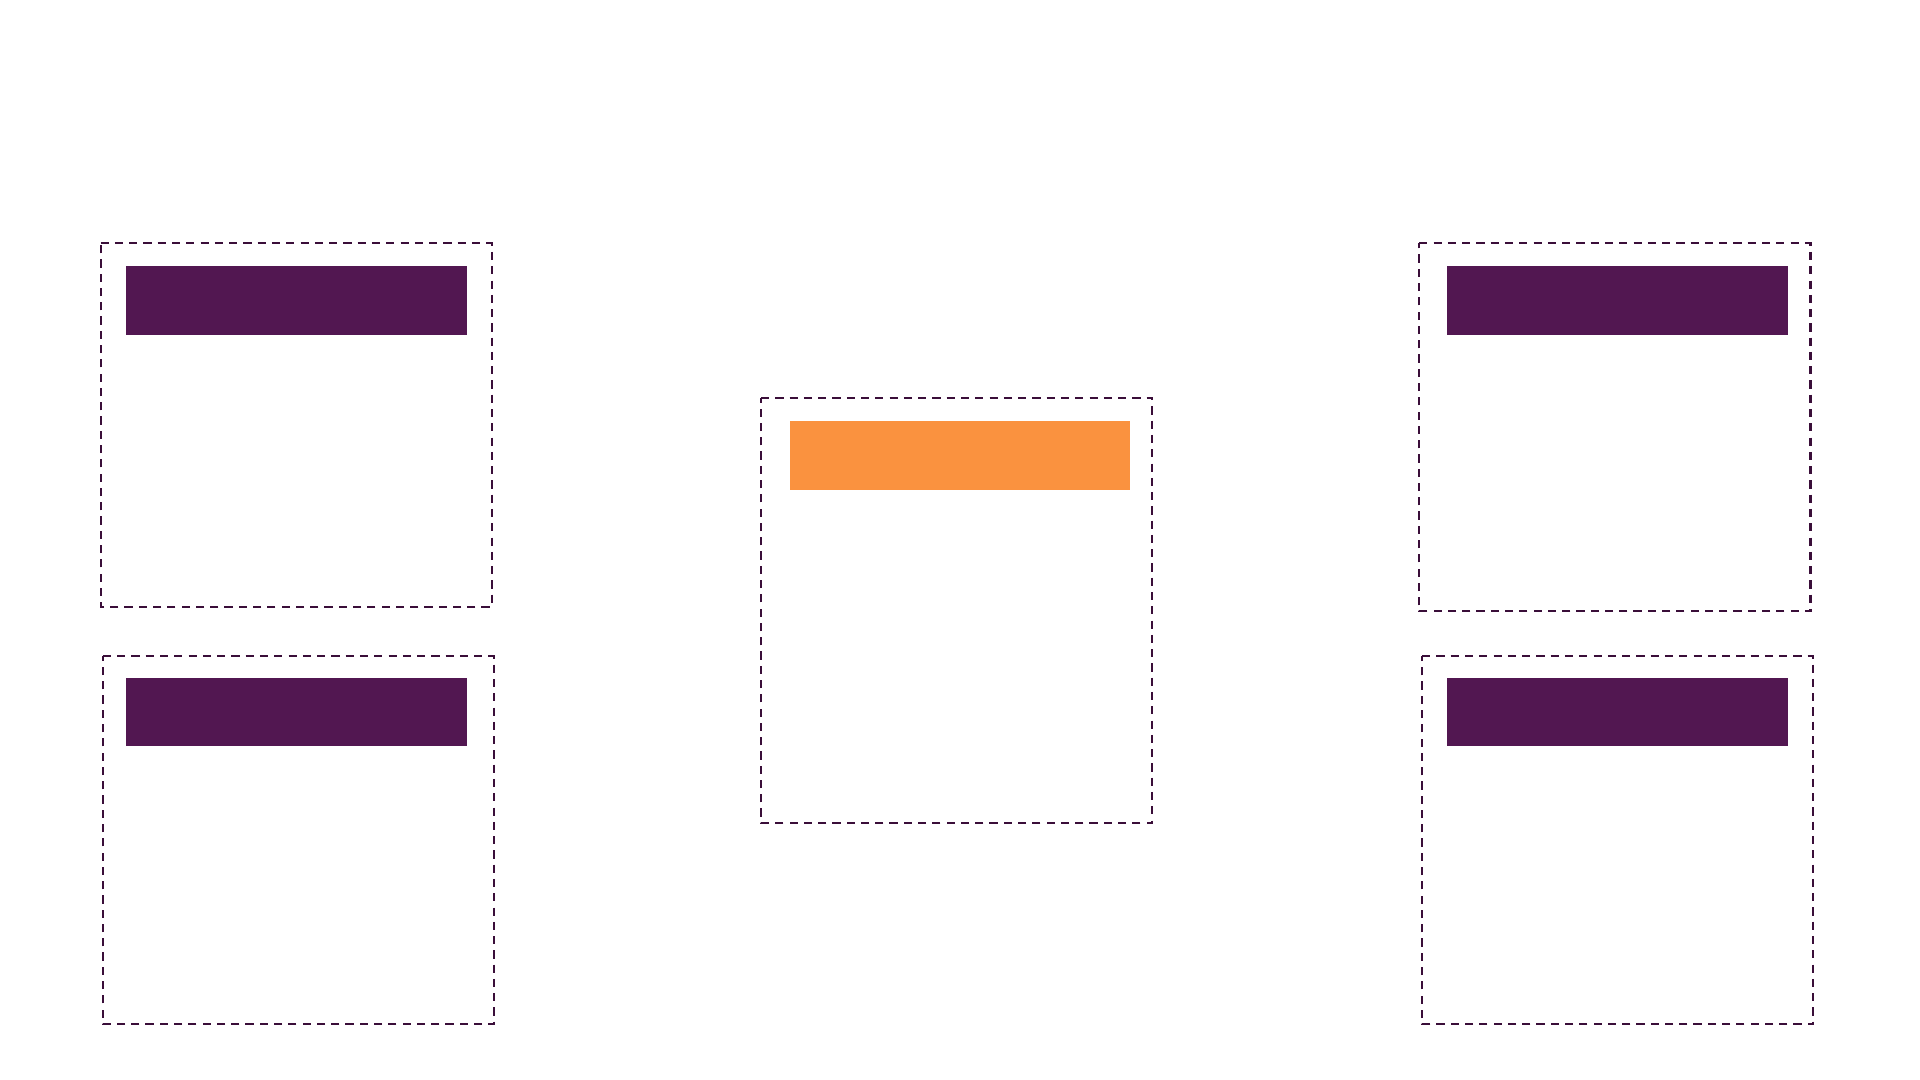
The Star Schema
FACT TABLE DIM TABLE
VS
The Star Schema
Sales
Customers
SalesPointTime
•IdentifierCust
•FirstName
•SecondName
•Age
•Gender
•IdentifierGeo
•Continent
•Country
•City
•IdentifierProd
•IdentifierDate
•IdentifierCust
•IdentifierGeo
•UnitsSold
•TotalSales
•TotalCost
Products
•IdentifierProd
•ProductType
•PricePerUnit
•CostperUnit
•IdentifierDate
•Year
•Quarter
•Month
•Week
•Day
DIM TABLE DIM TABLE
FACT TABLE

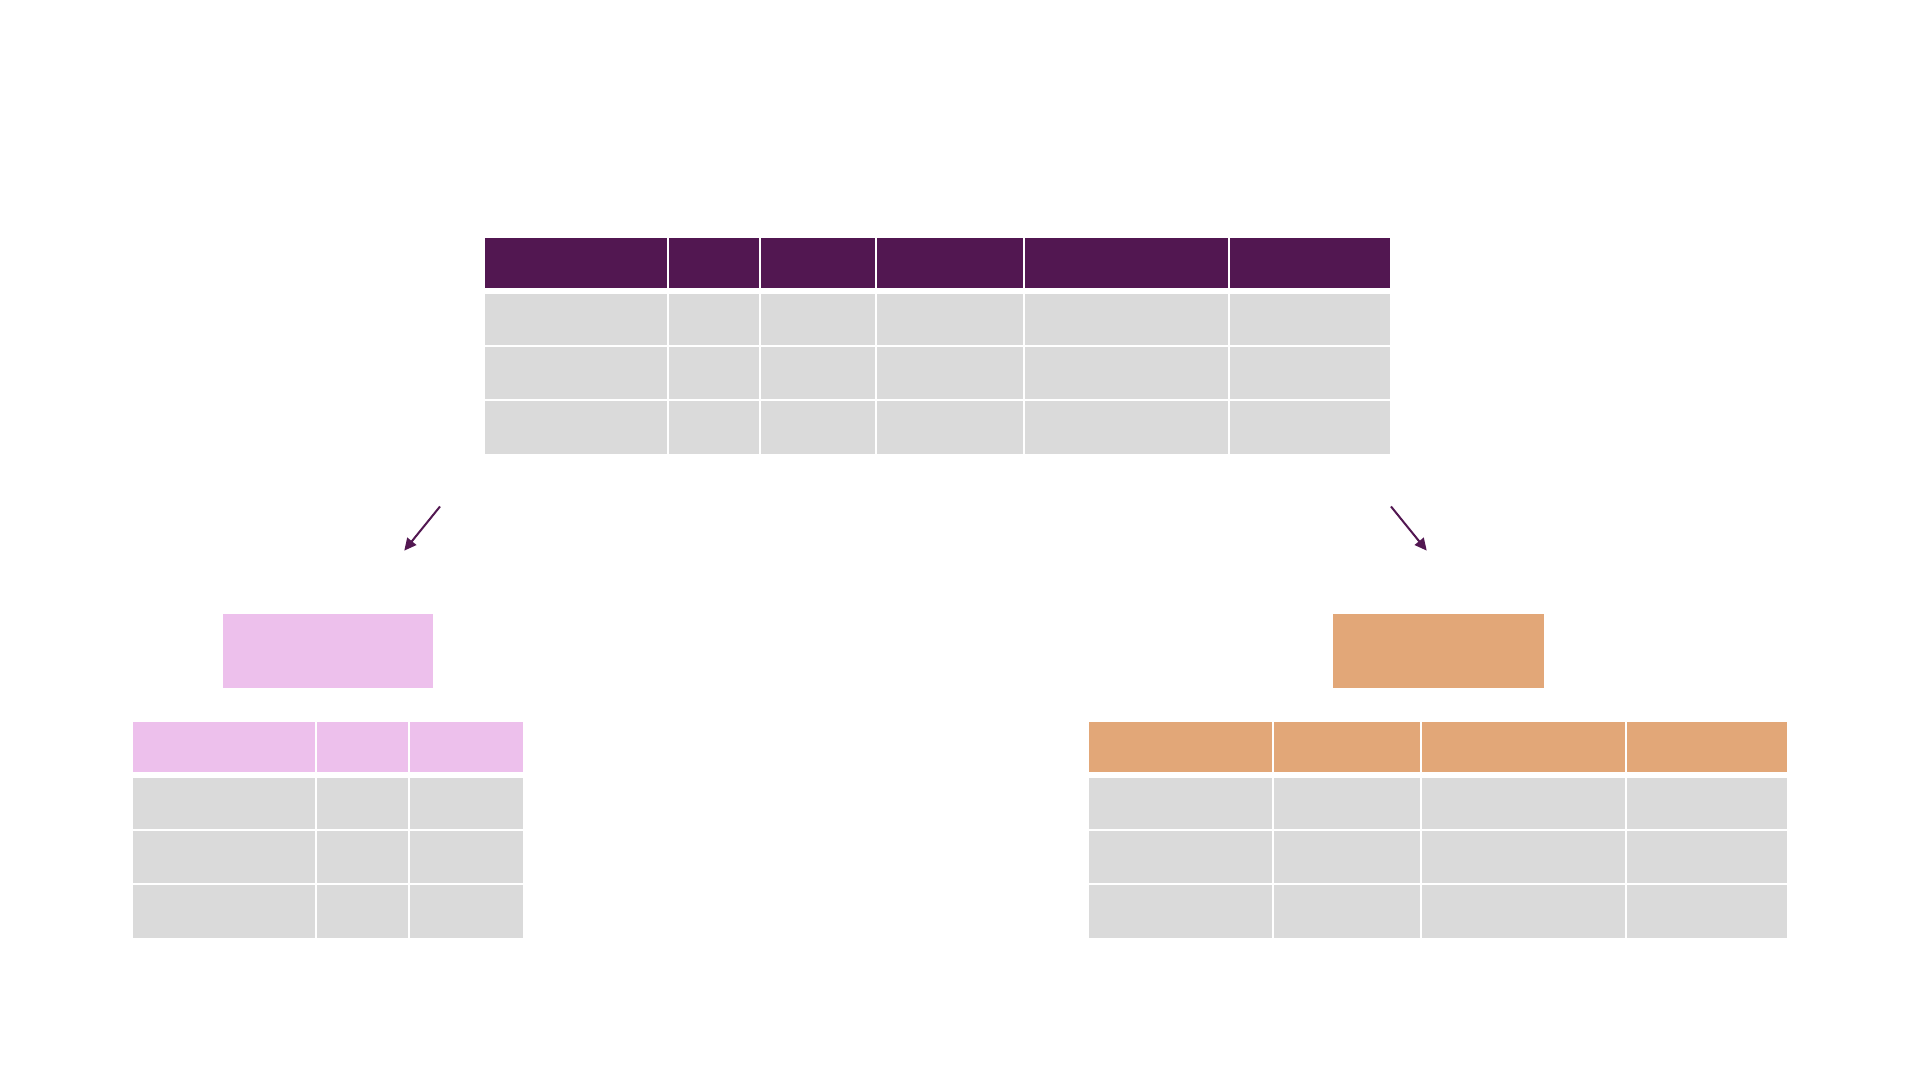
Our Project – Current structure
Population-Combined
•Country-ID
•Country
•Year
•AgeGroup
•Gender
•Population

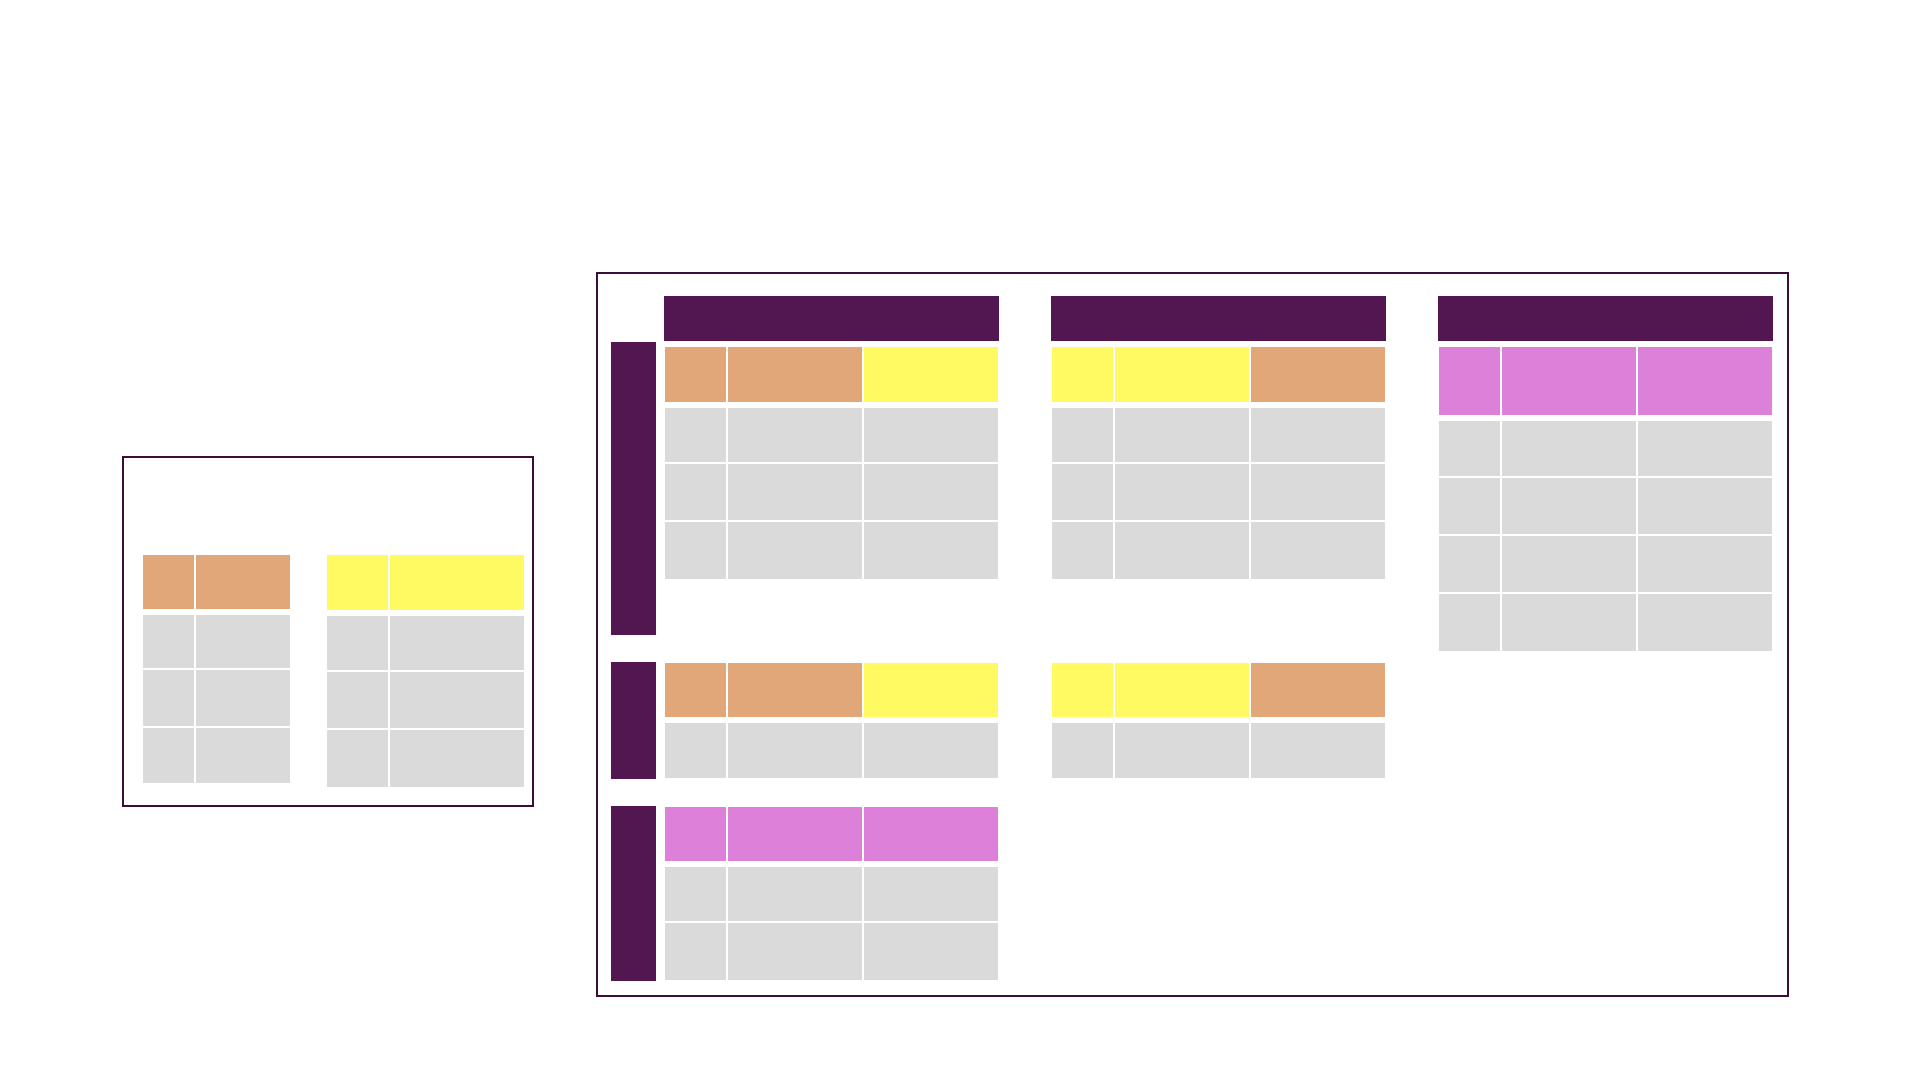
Out Project turned into a Star Schema
Population Age
•AgeGroup-ID
•AgeGroup
•Category
•Country-ID
•AgeGroup-ID
•Year
•Gender
•Population
Region
•Country-ID
•Country
•Region
DIM TABLE DIM TABLE
FACT TABLE
Query: Duplicate vs. Reference
Source
file
Query Editor
Query 2
(Duplicate of Query 1)
Query 2
(Reference to Query 1)
A
B
C
Query 1
(Created in Query Editor)
A
B
A
B
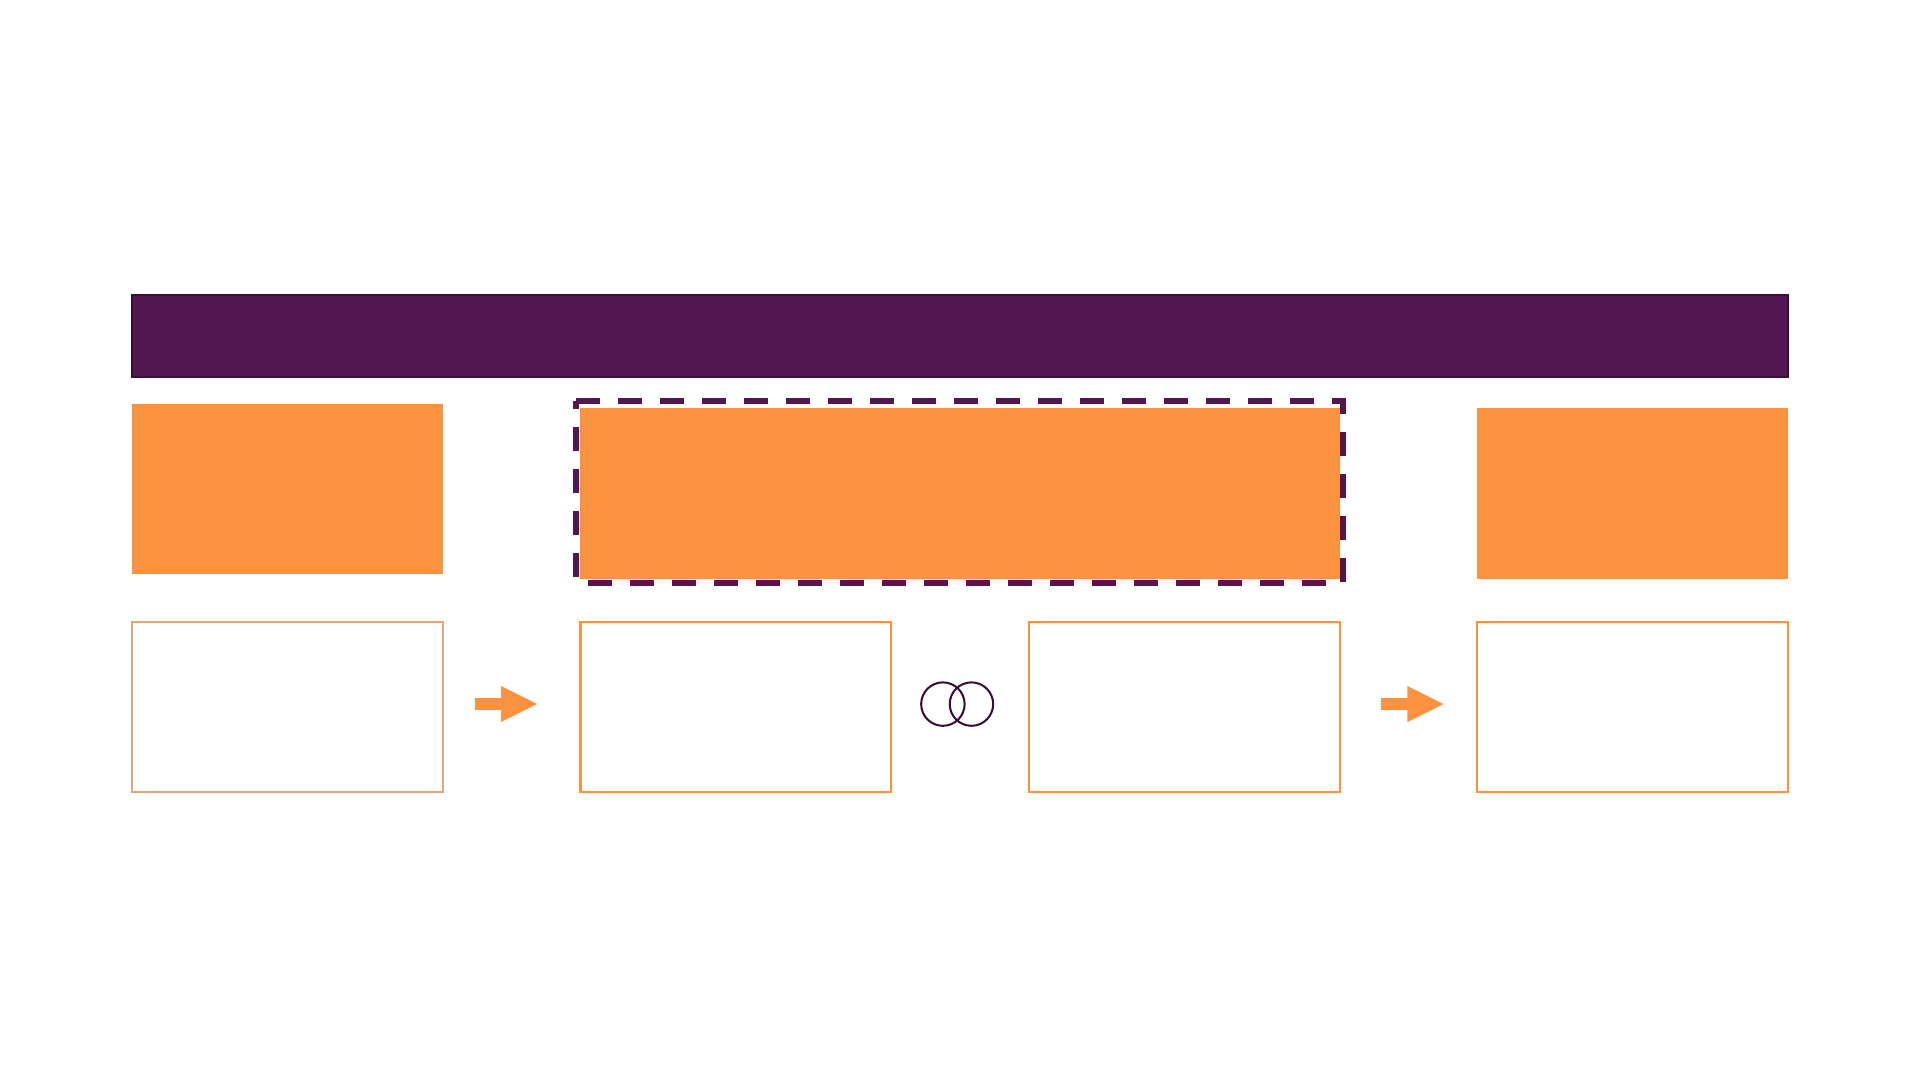
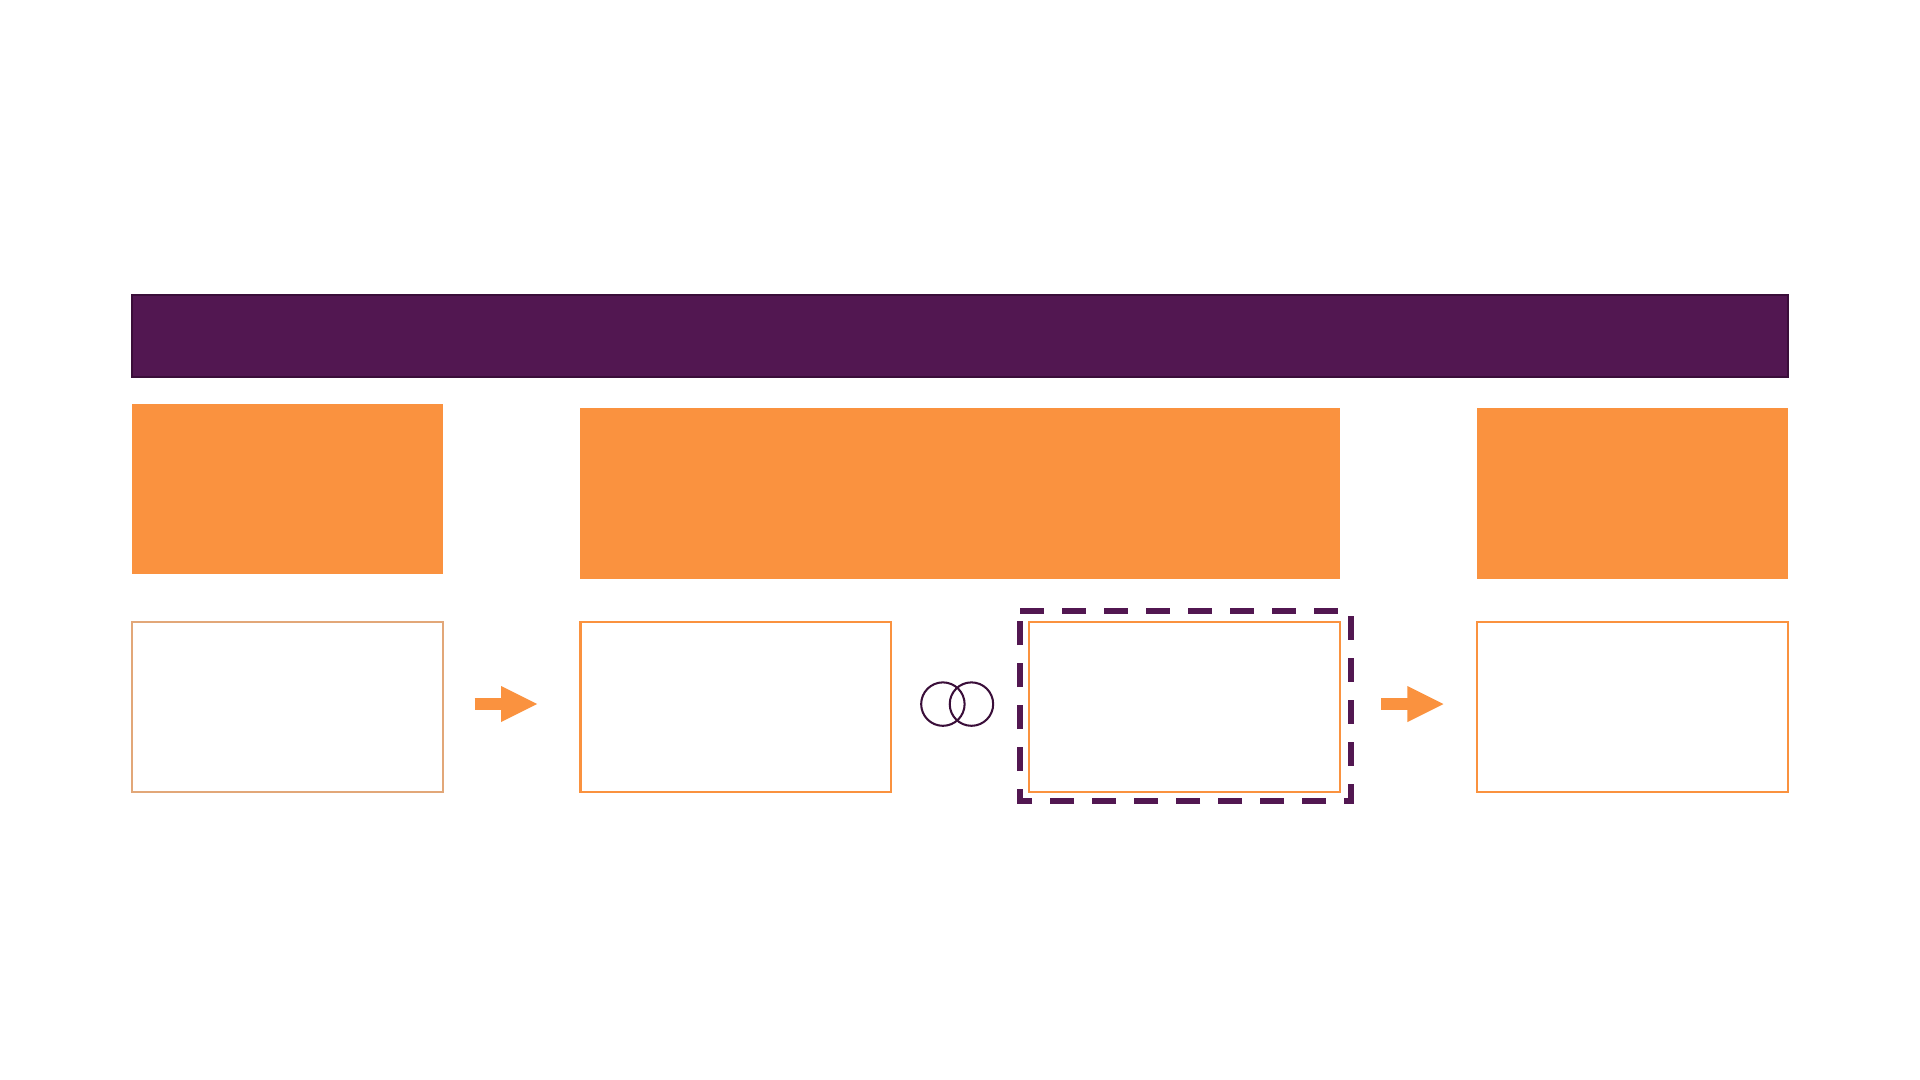
Merge Queries - Join Kind
Outer
Inner Anti
ID Sales
A10
B50
C20
Query 1
LEFT
Query 2
RIGHT
ID Sales Region
A10 USA
B50 n/a
C20 Asia
ID Region Sales
AUSA 10
BB Europe n/a
CAsia 20
ID Sales Region
A10 USA
B50 n/a
C20 Asia
BB n/a Europe
ID Sales Region
B50 n/a
ID Region Sales
BB Europe n/a
ID Sales Region
A10 USA
C20 Asia
LEFT RIGHT FULL
ID Region
AUSA
BB Europe
CAsia
Separate Queries
Merged Queries
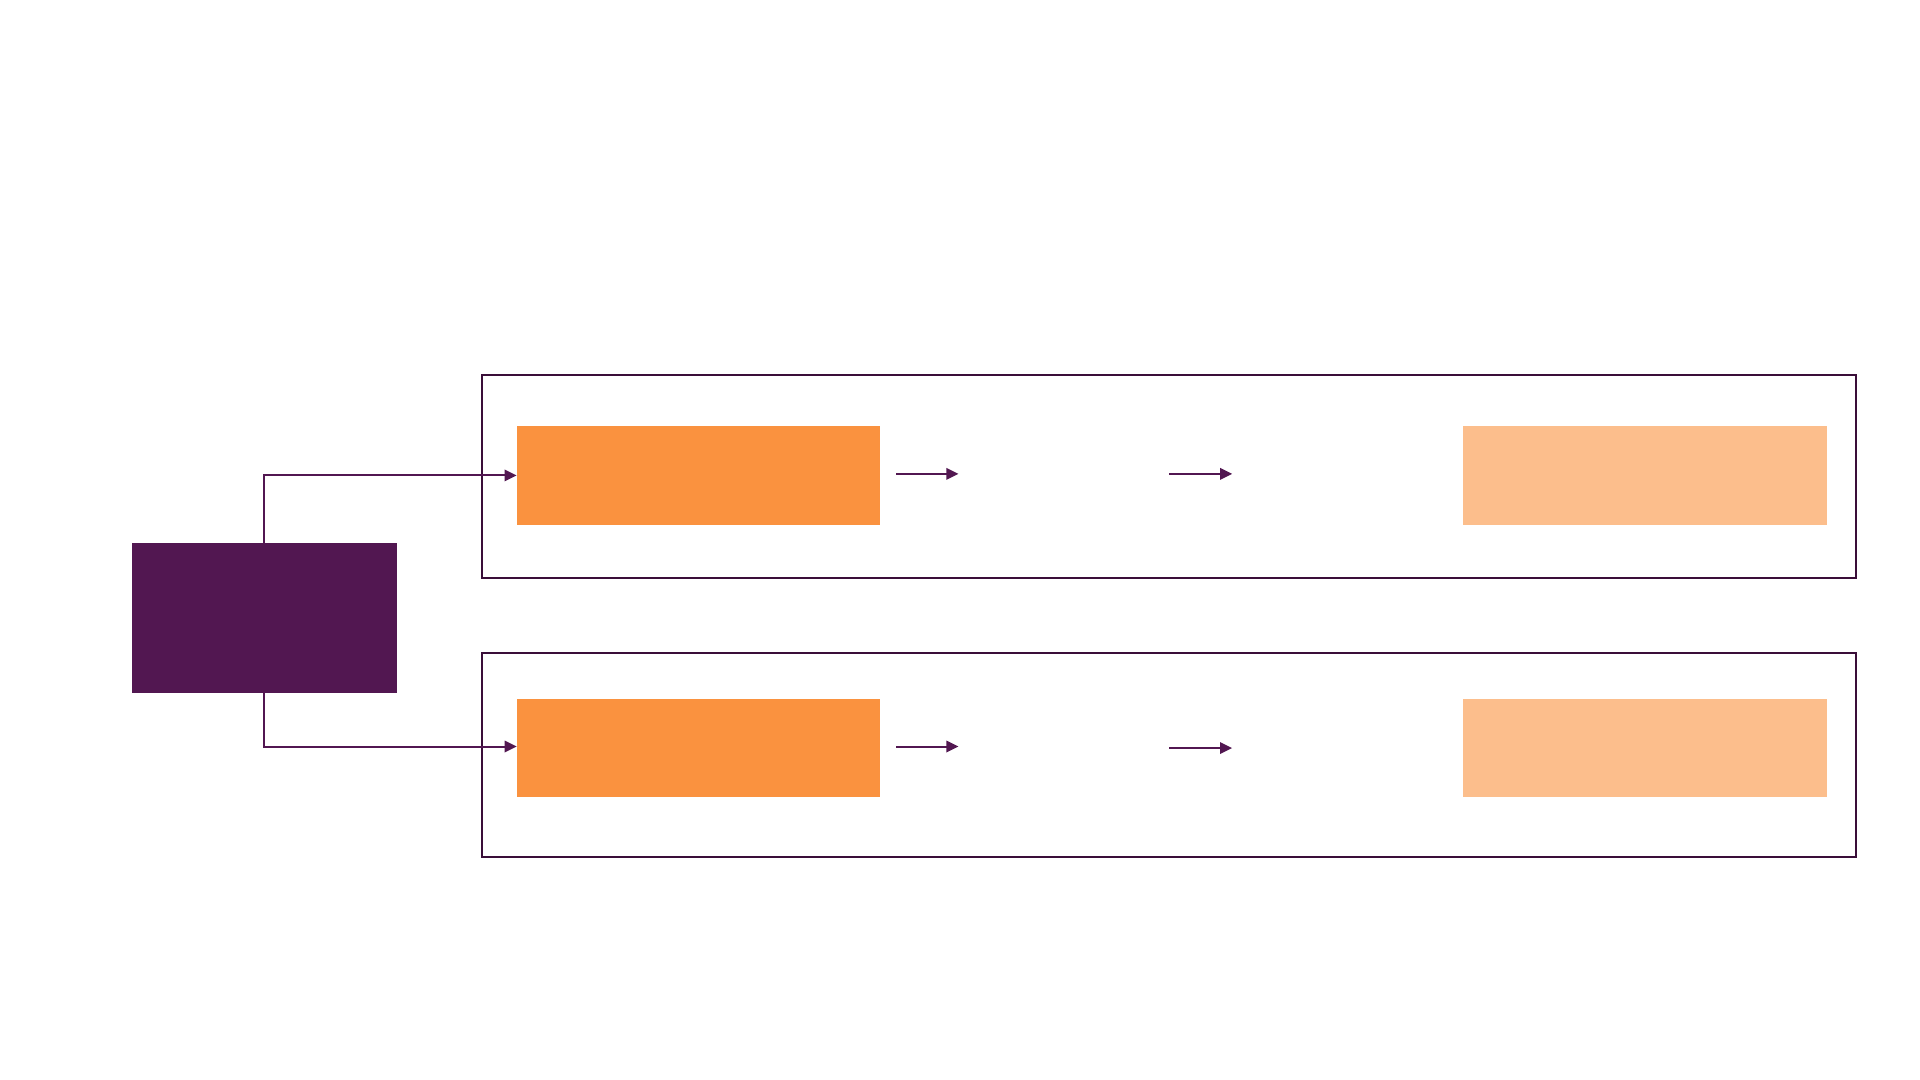
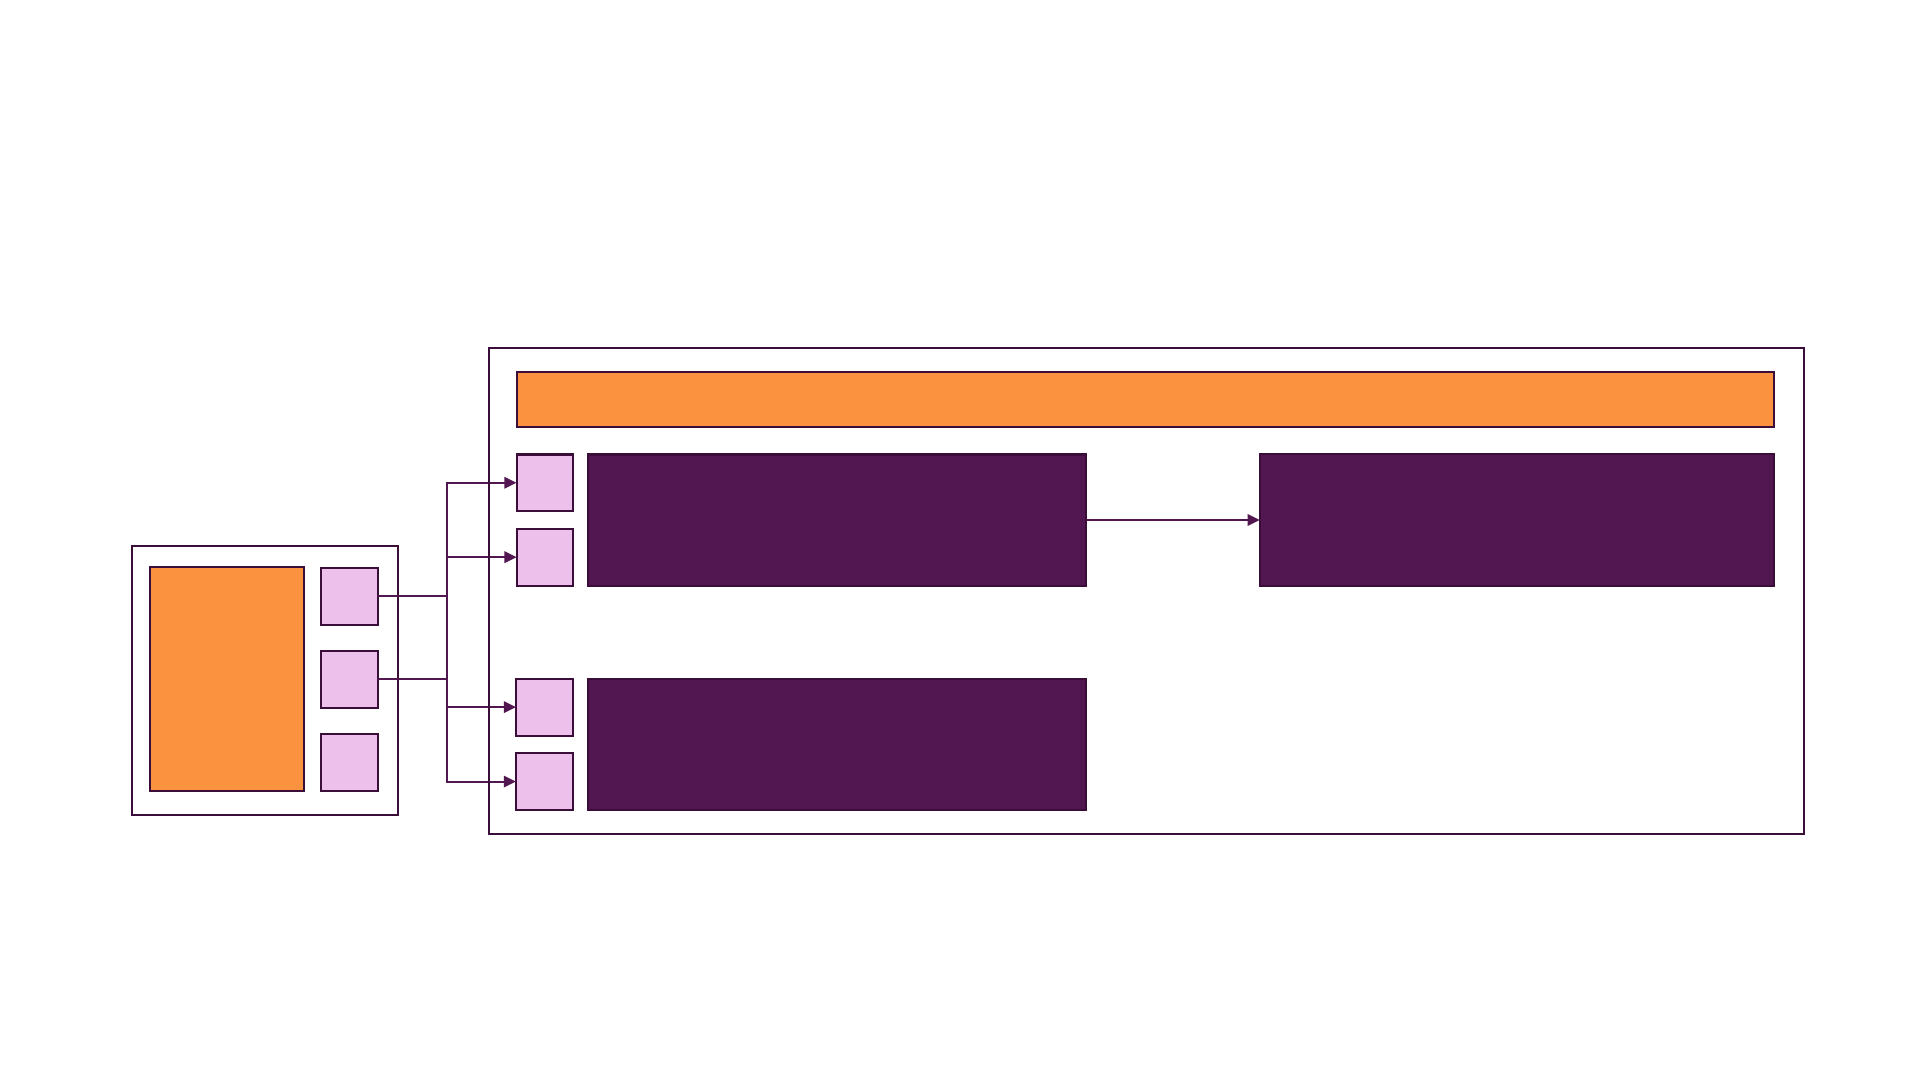
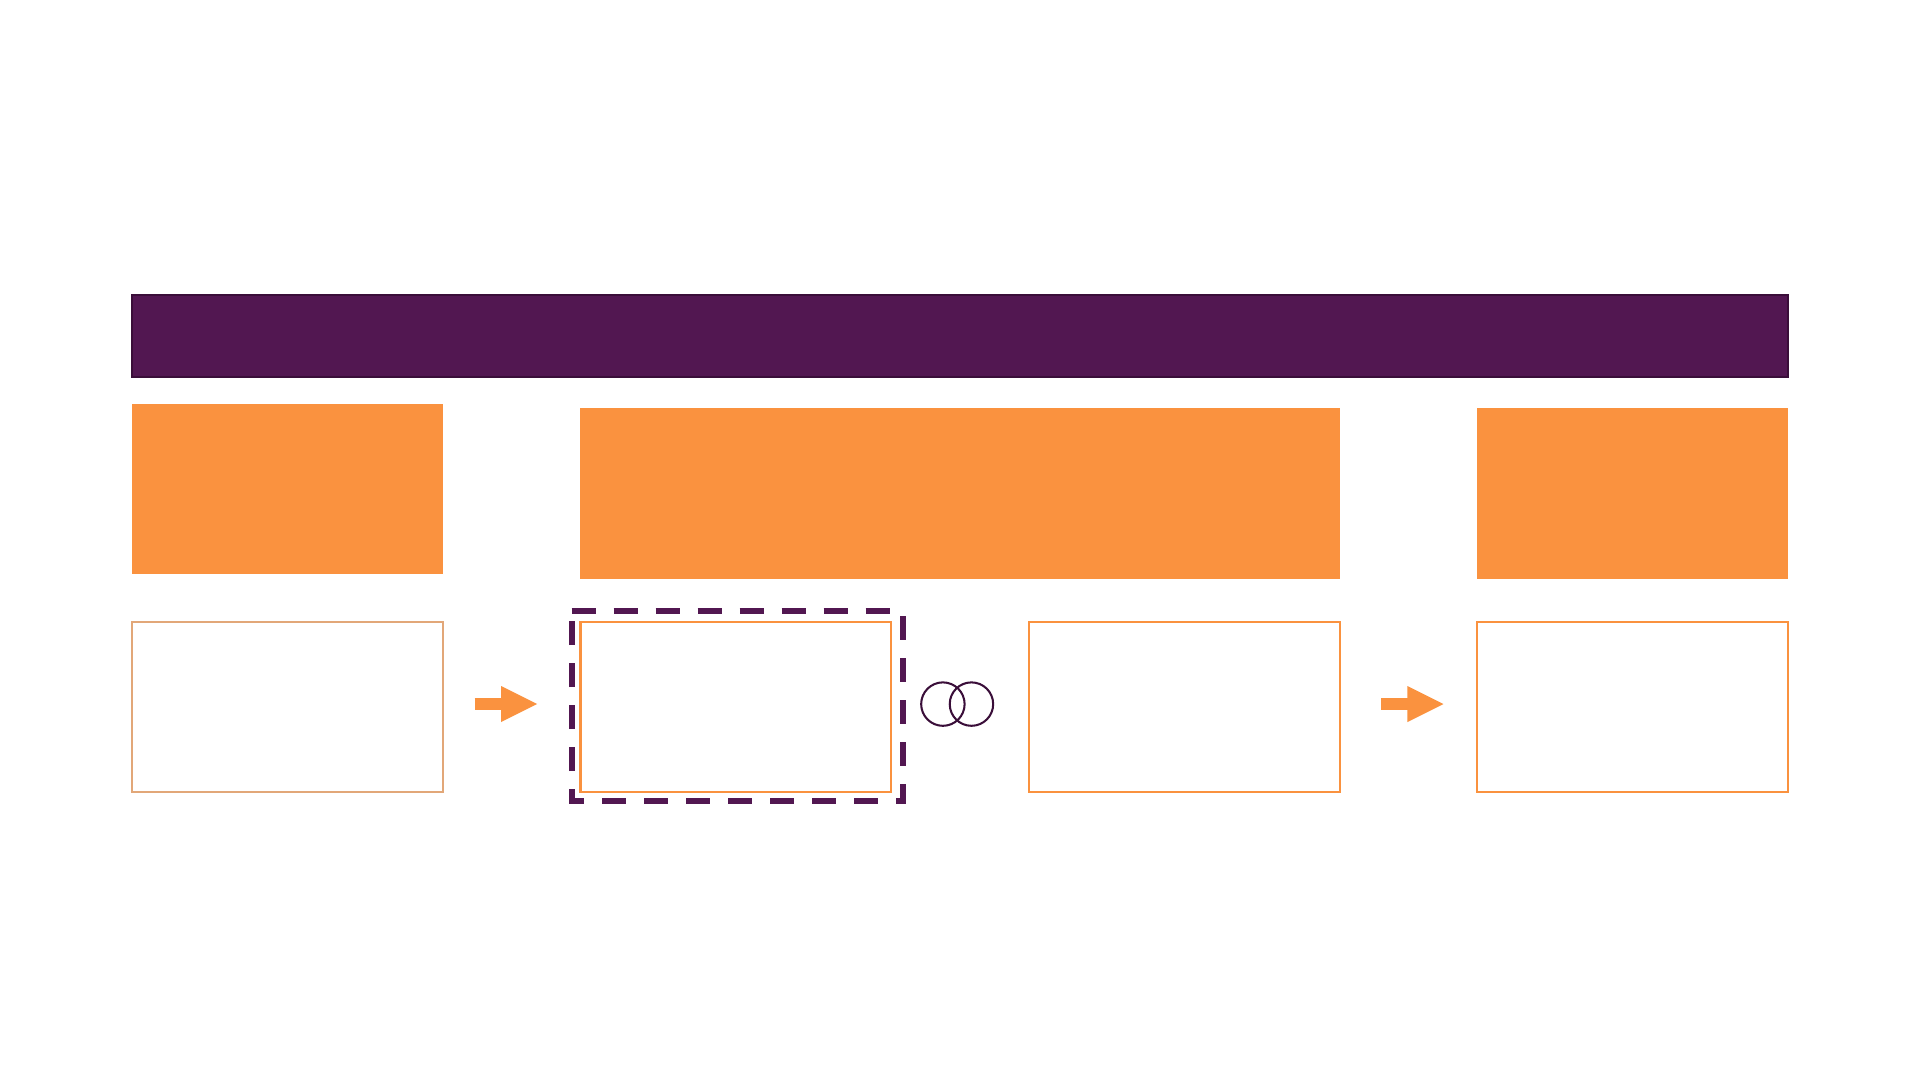
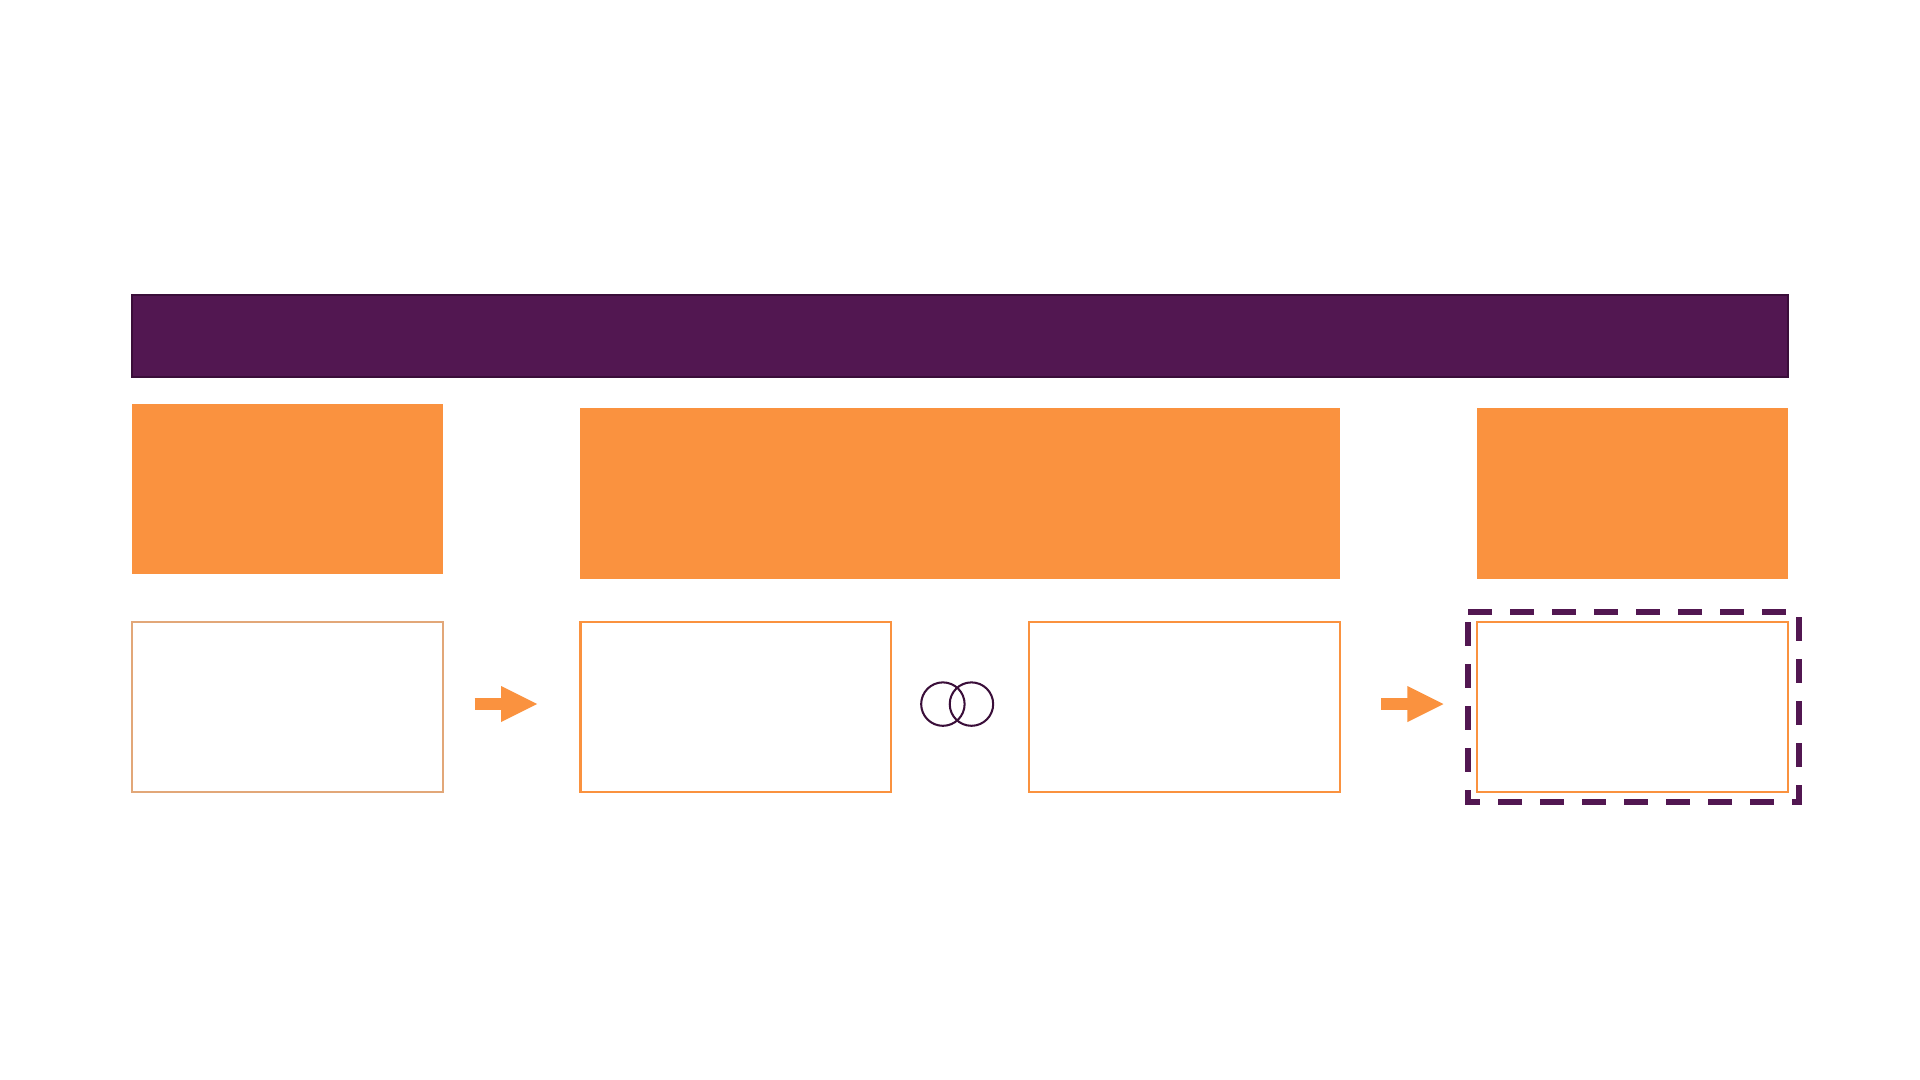
Import data into the data model
Data preparation
Query Editor
Data model
Data View/Report View
Source files
Data preparation
Query Editor
Data model
Data View/Report View
Import data
Query 1
Query 2 Default =
Enable load is
set for all
queries
Import data
Query 1
Query 2
Enable load is
only selected
for Query 1
Query 1 &
Query 2 are
loaded into the
data model
Query 1 is
loaded into the
data model

Data View & Relationships
How we model our data
Power BI Desktop –Data Model
Power BI Desktop
Query
Editor
Data
View
Report
View
Relationship
View
Data
preparation Data modelling Data
visualization

Query Editor vs. Data Model
Query Editor Data Model
Connect to source files
Clean data
Shape data
Structure + prepare data
Add relationships
Add calculated columns
Add measures
Analyse data
Power BI Desktop –Data Model
Power BI Desktop
Query
Editor
Data
View
Report
View
Relationship
View
Data
preparation Data modelling Data
visualization

Let‘s bring our Data Model to live
Cardinality Cross Filter Direction Active Properties
= „Type of relationship“

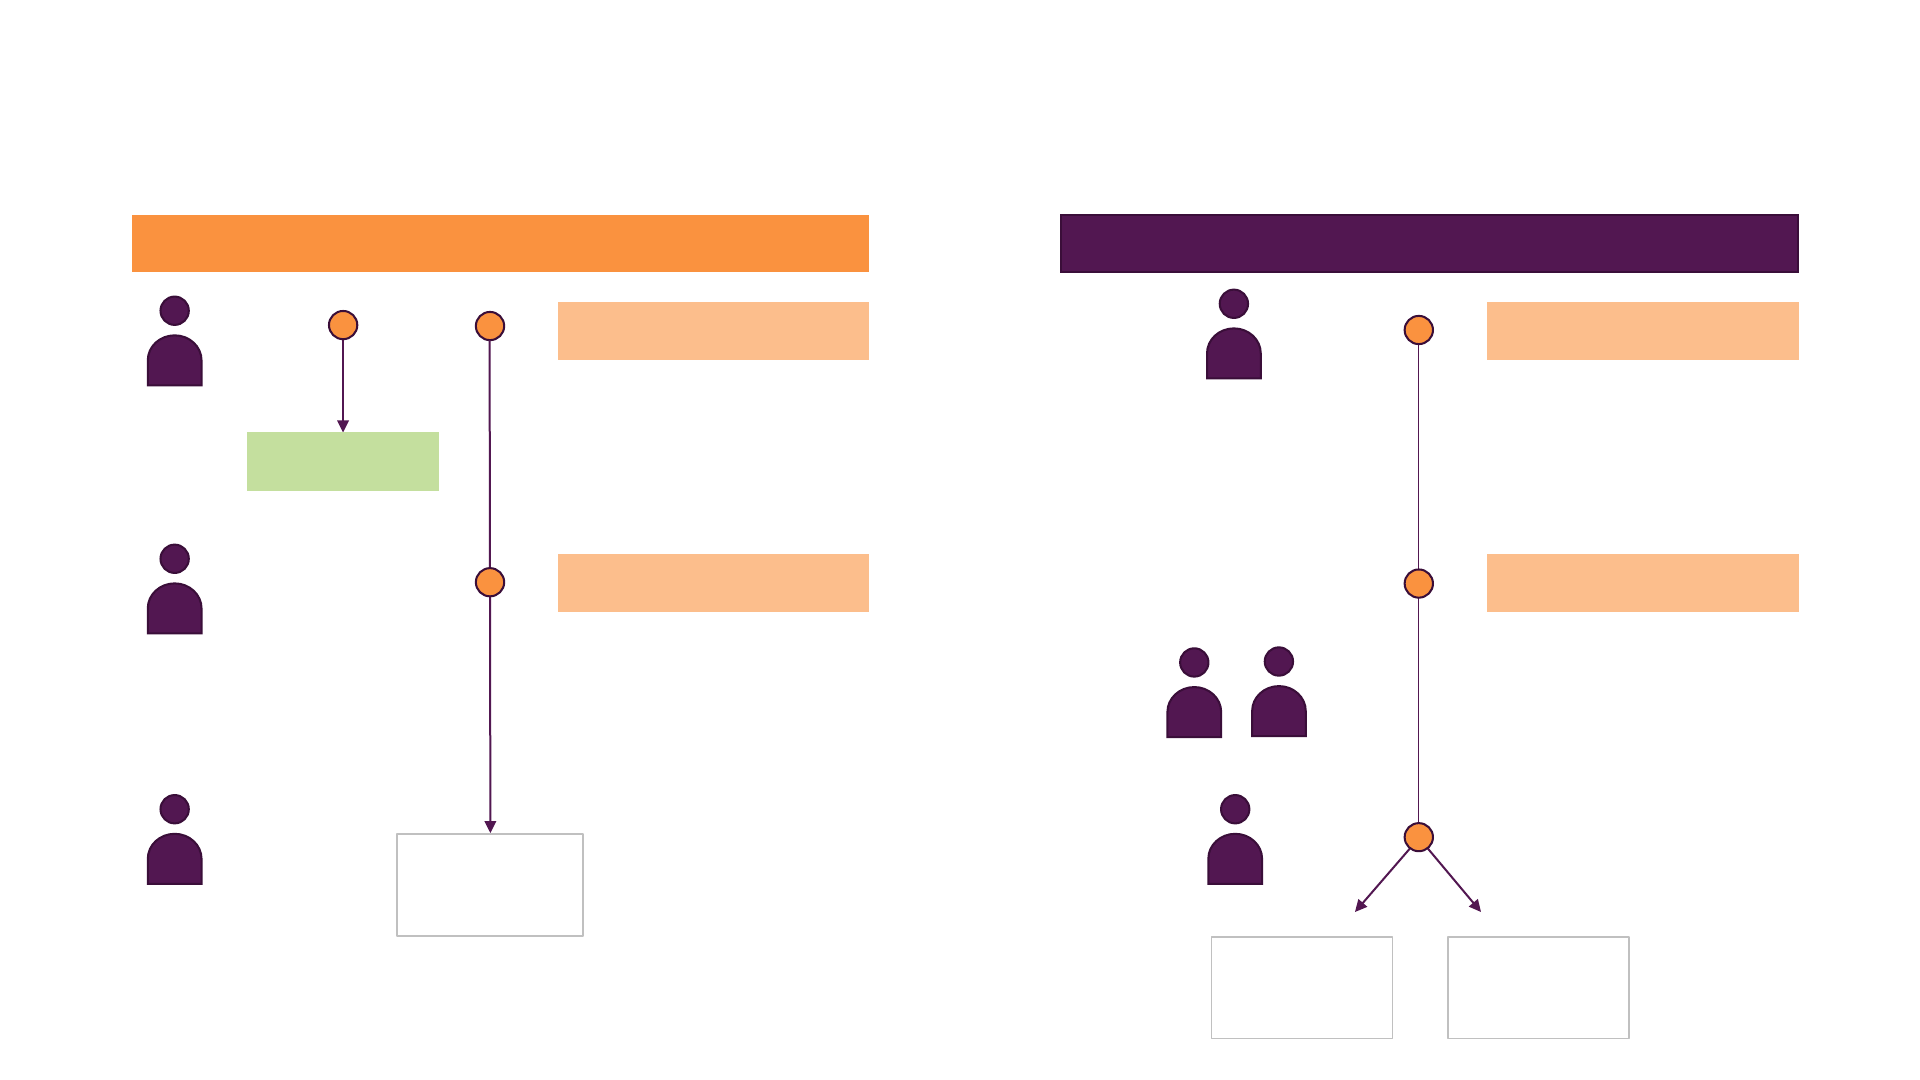
One to many (1:*) & Many to one (*:1)
Customers Orders
ID-Customer FirstName SecondName
1Maximilian Schwarzmueller
2John Meyer
3 Linda Belle
4Manuel Lorenz
ID-Order OrderDate ID-Customer
A01 Jan 2017 1
B08 Jan 2017 2
C15 Jan 2017 1
D25 Jan 2017 1
E05 Feb 2017 3
F15 Feb 2017 4
Each customer is unique Each customer can have
multiple orders
One to one (1:1)
Passport Person
ID-Passport Valid Issued FirstName SecondName Country
12025 2005 Maximilian Schwarzmueller Germany
22019 1999 John Meyer USA
32017 1997 Linda Belle Japan
ID-Passport FirstName Second Name Country
1Maximilian Schwarzmueller Germany
2John Meyer USA
3 Linda Belle Japan
ID-Passport Valid Issued
12025 2005
22019 1999
32017 1997
Power BI Desktop –Data Model
Power BI Desktop
Query
Editor
Data
View
Report
View
Relationship
View
Data
preparation Data modelling Data
visualization

One tool - Two languages
M-Language
DAX-Language
Power Query Formula Language
Data Analysis Expression Language
Description Application areas
Independent from
each other
Prepare your data before you load
them into the data model
Create formulas for an in-depth
analysis in the Data View
Data transformation
Analytical data calculation
Comparable to Excel functions

Course interim conclusion
MDAX
OR
This course

Calculated Columns vs. Measures
Return a single result of a calculation or an aggregated value (e.g. Averages)
Perform an operation that generates results for each row of your table Calculated Column
Measure

Report View
Let‘s create beautiful charts and tables
Power BI Desktop – Report View
Power BI Desktop
Query
Editor
Data
View
Report
View
Relationship
View
Data
preparation Data modelling Data
visualization

Power BI Service & Power BI Mobile
We finished our work locally, what now?
Ways to continue
Power BI Desktop
Power BI Service
Share
YOU
Publish
ITYOU
Collaborate
Marketing
Power BI
Service
Power BI
Mobile
-
-
OrganizationSingle User
YOU
Power BI Desktop
STOP Publish
-
Power BI Service
Access
-
Power BI
Mobile
YOU
YOU

Questions to be answered
How can we publish our data to Power BI Service?
How can we collaborate in Power BI Service?
How can we share data and specify what we want to share?
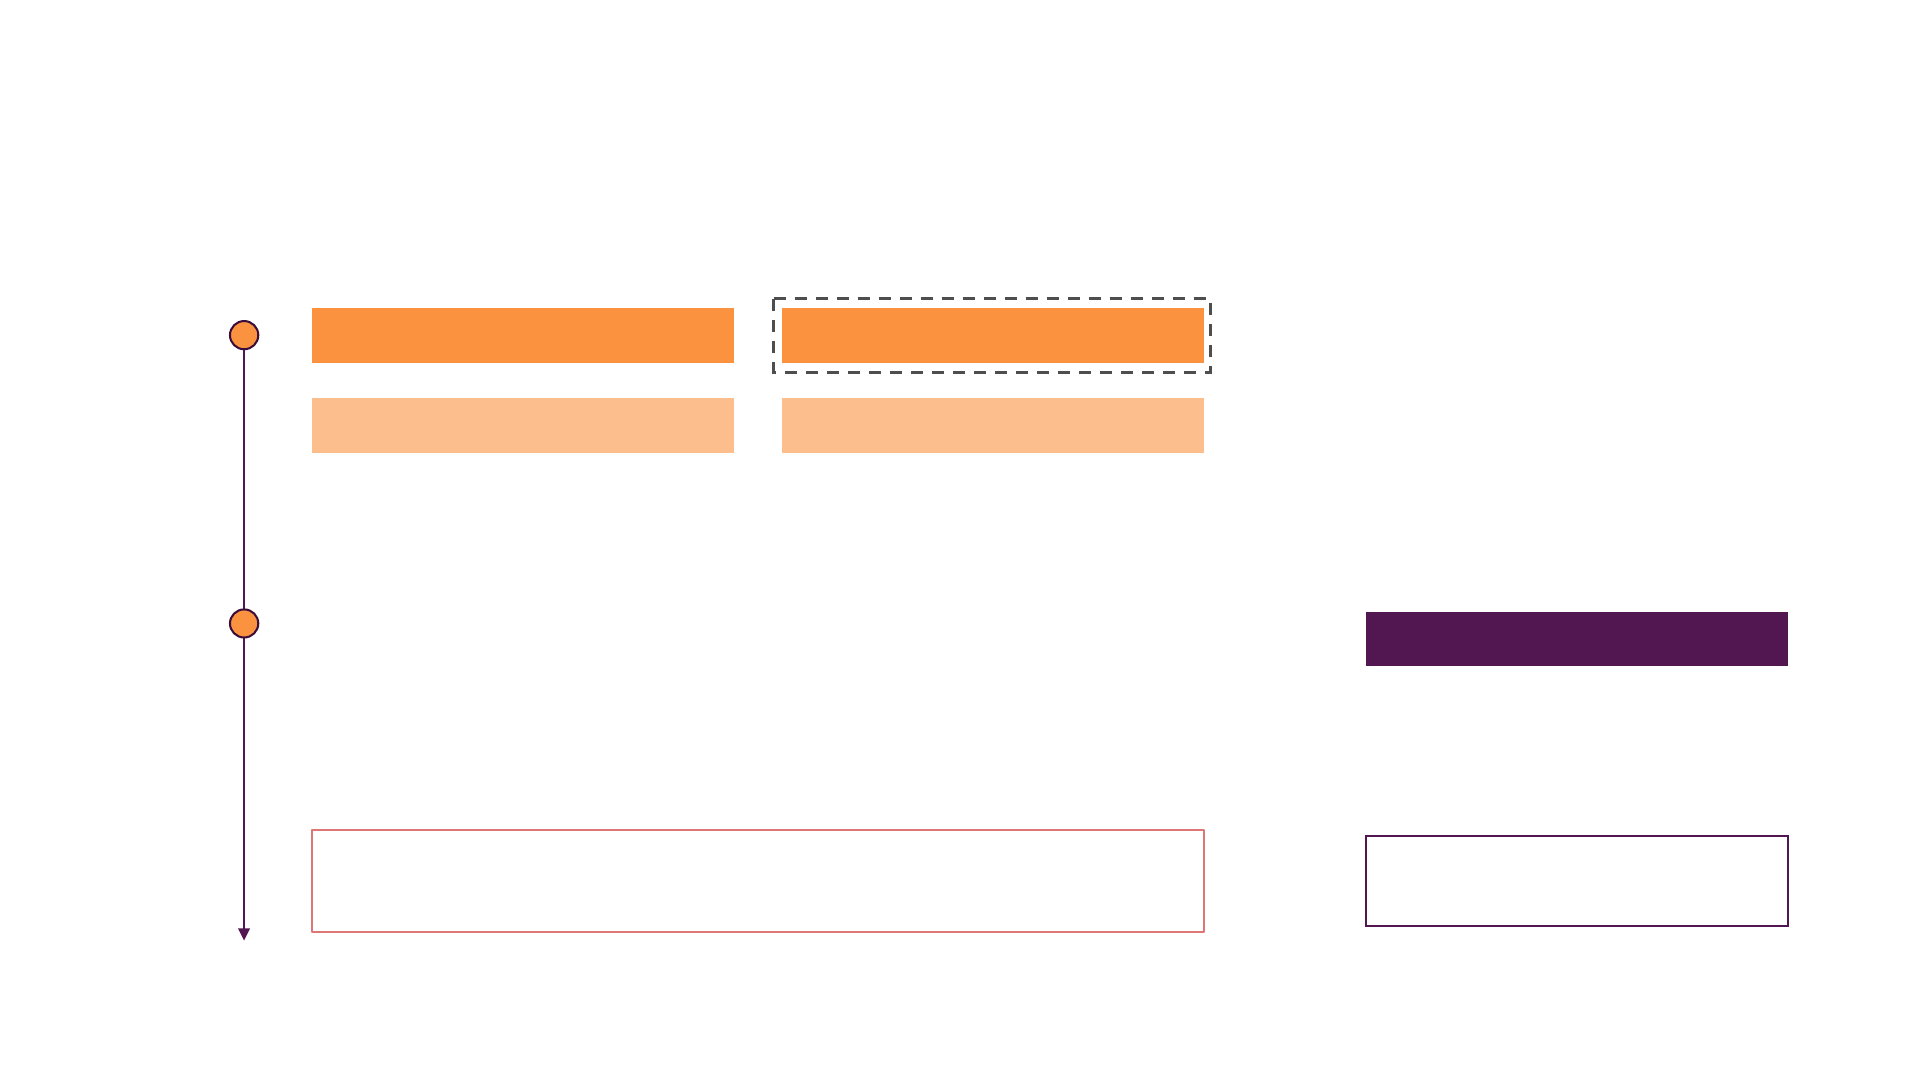
Changes in 2017
Power BI Free Power BI Pro
Power BI Premium
Large Scale BI
deployments
Personal users Collaboration
Until
31 May
01 June
2017
Functional alignment with remaining differences in
sharing and collaboration
•Access to all Pro
Databases
•Increased Workspace
Storage
•Improved refresh-
rates
+

Publishing our project data to Power BI Service
Power BI Desktop
Dataset & Report
Your computer
Server
Publish/
Connect to
File
Personal
Gateway
Power BI Service
On-Premises
Gateway Power BI Service
Collaboration
Power BI Service
Create Dashboards
Create Dashboards
YOU
ITYOU
App Workspace
Dataset & Report from
Power BI Desktop

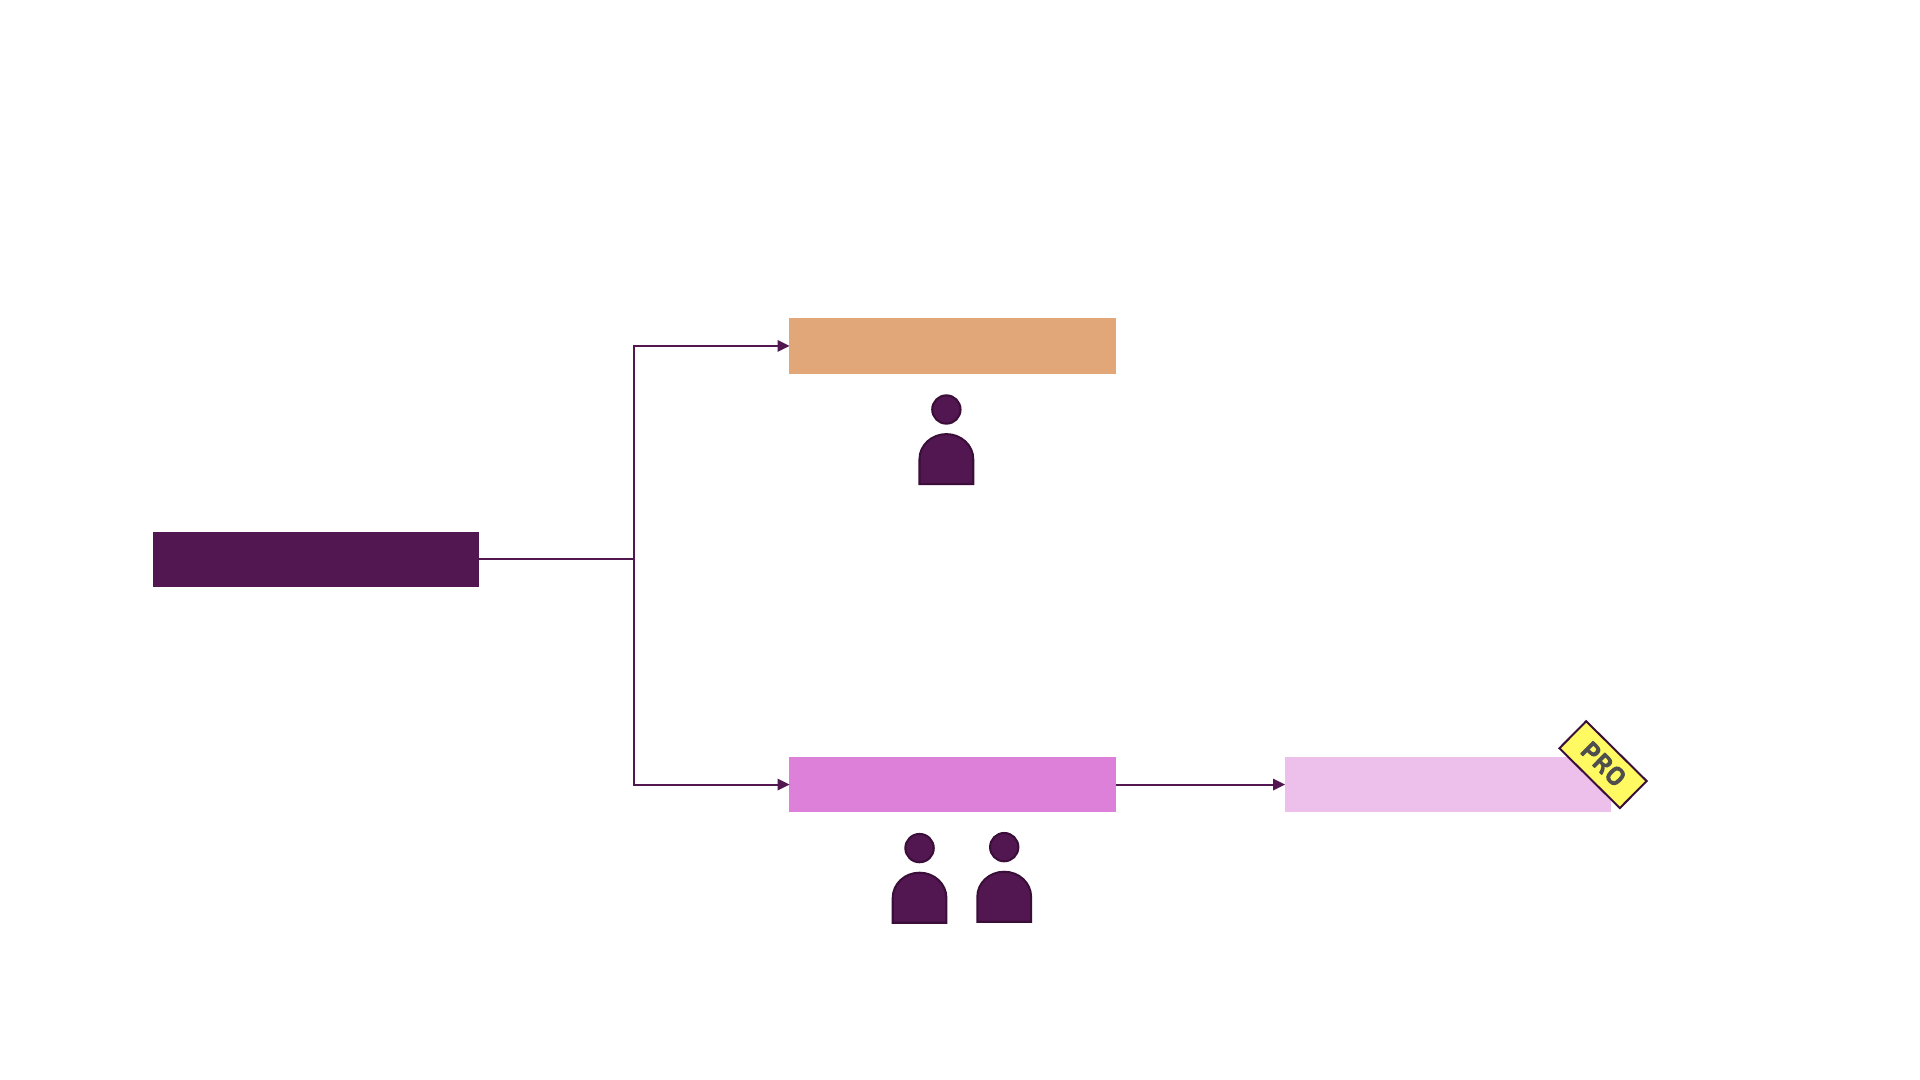
How can we share our results from the App workspace?
Power BI Service
Dashboard, Report &
Dataset
Dashboard
Report
Report
PRO Data created using Pro features, can only be shared with Power BI Pro Users!
Publish App
Publish to Web
Dataset
