Qualcomm® Snapdragon™ Profiler User Guide Snapdragon Oct2018
User Manual:
Open the PDF directly: View PDF ![]() .
.
Page Count: 44
Qualcomm Technologies, Inc.
Qualcomm Snapdragon is a product of Qualcomm Technologies, Inc. Other Qualcomm products referenced herein are products of Qualcomm
Technologies, Inc. or its other subsidiaries.
Qualcomm and Snapdragon are trademarks of Qualcomm Incorporated, registered in the United States and other countries. Other product
and brand names may be trademarks or registered trademarks of their respective owners.
This technical data may be subject to U.S. and international export, re-export, or transfer (“export”) laws. Diversion contrary to U.S. and
international law is strictly prohibited.
Qualcomm Technologies, Inc.
5775 Morehouse Drive
San Diego, CA 92121
U.S.A.
© 2016 Qualcomm Technologies, Inc. All rights reserved.
Qualcomm® Snapdragon™ Profiler
User Guide
September 21, 2018

MAY CONTAIN U.S. AND INTERNATIONAL EXPORT CONTROLLED INFORMATION 2
Revision history
Revision
Date
Description
A
June 2016
Initial release
B
October 2016
Various updates throughout.
C
October 2017
Added sampling capture.
D
September 2018
Added Vulkan snapshot.

MAY CONTAIN U.S. AND INTERNATIONAL EXPORT CONTROLLED INFORMATION 3
Contents
1 Overview ................................................................................................................................ 5
1.1 Data capture modes................................................................................................................................... 5
2 System Requirements .......................................................................................................... 7
3 Install, Launch, and Connect ............................................................................................... 8
3.1 Install Snapdragon Profiler ......................................................................................................................... 8
3.1.1 Microsoft Windows installation .................................................................................................. 8
3.1.2 Mac OS X installation ............................................................................................................... 8
3.1.3 Ubuntu Linux installation........................................................................................................... 8
3.2 Launch Snapdragon Profiler ...................................................................................................................... 9
3.3 Connect to a device ................................................................................................................................. 10
4 User Interface .......................................................................................................................13
4.1 Start Page ................................................................................................................................................ 13
4.2 Views ....................................................................................................................................................... 13
4.2.1 Realtime window .................................................................................................................... 13
4.2.2 Trace Capture window ............................................................................................................ 14
4.2.3 Snapshot Capture window ...................................................................................................... 14
4.2.4 Sampling Capture window ...................................................................................................... 15
4.3 Navigation ................................................................................................................................................ 15
5 Data Capture Modes ............................................................................................................16
5.1 Realtime ................................................................................................................................................... 16
5.1.1 Realtime basics ...................................................................................................................... 18
5.2 Trace Capture .......................................................................................................................................... 23
5.2.1 Additional requirements .......................................................................................................... 23
5.2.2 Launch applications ................................................................................................................ 23
5.2.3 Trace Capture basics ............................................................................................................. 24
5.2.4 Measure DSP performance .................................................................................................... 27
5.2.5 Capture OpenCL applications ................................................................................................. 27
5.2.6 Capture Vulkan applications ................................................................................................... 29
5.2.7 Analytics ................................................................................................................................. 30
5.3 Snapshot Capture .................................................................................................................................... 32
5.3.1 Additional requirements .......................................................................................................... 32
5.3.2 Launch applications ................................................................................................................ 32
5.3.3 Snapshot Capture basics........................................................................................................ 33
5.3.4 Vulkan Snapshot Capture ....................................................................................................... 36
5.4 Sampling Capture .................................................................................................................................... 38
5.4.1 Additional requirements .......................................................................................................... 38
5.4.2 Sampling Capture basics ........................................................................................................ 39
6 Saving Captures ...................................................................................................................42
7 Troubleshooting ...................................................................................................................43

Qualcomm® Snapdragon™ Profiler User Guide Contents
MAY CONTAIN U.S. AND INTERNATIONAL EXPORT CONTROLLED INFORMATION 4
Figures
Figure 4-1 Realtime window ......................................................................................................................................... 13
Figure 4-2 Trace Capture window ................................................................................................................................ 14
Figure 4-3 Snapshot Capture window .......................................................................................................................... 14
Figure 4-4 Sampling Capture window .......................................................................................................................... 15
Figure 5-1 Realtime mode ............................................................................................................................................ 17
Figure 5-2 Trace Capture mode ................................................................................................................................... 23
Figure 5-3 Launch Application window ......................................................................................................................... 30
Figure 5-4 Analytics window ........................................................................................................................................ 31
Figure 5-5 Snapshot Capture mode ............................................................................................................................. 32
Figure 5-6 Sampling Capture mode ............................................................................................................................. 38
Tables
Table 2-1 System requirements ..................................................................................................................................... 7
Table 4-1 Navigation actions ........................................................................................................................................ 15

Qualcomm® Snapdragon™ Profiler User Guide Overview
MAY CONTAIN U.S. AND INTERNATIONAL EXPORT CONTROLLED INFORMATION 5
1 Overview
Qualcomm® Snapdragon™ Profiler is system profiling software for Windows, Macintosh, and
Linux computers.
Snapdragon Profiler allows developers to analyze CPU, GPU, DSP*, memory, power, thermal,
and network data, so they can find and fix performance bottlenecks.
■ GPU APIs: OpenGL ES 3.1, Open CL 2.1, and Vulkan 1.0**
* Requires a Snapdragon 820 (or later) processor
** Requires Android N (or Android 6.0 device with a graphics driver that supports Vulkan)
1.1 Data capture modes
Snapdragon Profiler provides four data capture modes offering different views of device
performance: Realtime, Trace Capture, Snapshot Capture, and Sampling Capture.
Realtime
Realtime view makes it easy to correlate system resource usage on a timeline.
■ Analyze CPU, GPU, DSP*, memory, power, thermal, and network data metrics
■ Select from over 150 different hardware performance counters in 22 categories
* Requires a Snapdragon 820 (or later) processor
Trace Capture
Trace Capture mode allows you to visualize kernel and system events on a timeline to analyze
low-level system events across the CPU, GPU, and DSP. View CPU scheduling and GPU stage
data to see where your application is spending its time.
Snapshot Capture
Snapshot Capture mode allows you to capture and debug a rendered frame from an OpenGL ES
or Vulkan application:
■ Step through and replay a rendered frame draw call-by-draw call
■ View and edit shaders and preview the results on your device (preview for OpenGL ES only)
■ View and debug pixel history (OpenGL ES only)
■ Capture and view GPU metrics per draw call

Qualcomm® Snapdragon™ Profiler User Guide Overview
MAY CONTAIN U.S. AND INTERNATIONAL EXPORT CONTROLLED INFORMATION 6
NOTE: Snapdragon Capture mode requires a mobile device with a Qualcomm Snapdragon 805 (or
later) processor and Android 6.0 (or later). Snapshot of Vulkan applications requires
Android 8.0 (or later).
Sampling Capture
Sampling Capture mode allows you to record the call graph for an application to analyze
consumed CPU time. The call graph is visualized as a flame graph.
Qualcomm® Snapdragon™ Profiler User Guide System Requirements
MAY CONTAIN U.S. AND INTERNATIONAL EXPORT CONTROLLED INFORMATION 7
2 System Requirements
Table 2-1 lists the Snapdragon Profiler system requirements.
Table 2-1 System requirements
Hardware
▪ PC running Microsoft Windows 7, 8.x, or 10
▪ Mac running OS X 10.10 (Yosemite) or later
▪ PC running Ubuntu Linux 14.04 (Trusty Tahr) or later
Software
▪ Windows PC
Android Debug Bridge (ADB) 1.0.32 or later.
GTK# 2.12.25 for .NET at http://www.mono-project.com/download/download-win
Microsoft .NET Framework 4.5 at https://www.microsoft.com/en-
us/download/details.aspx?id=42643
▪ Mac OS X
Android Debug Bridge (ADB) 1.0.32 or later
Latest Mono Framework at http://www.mono-project.com/download/#download-mac
▪ Linux Ubuntu
Android Debug Bridge (ADB) 1.0.32 or later
Latest Mono Framework at http://www.mono-project.com/download/#download-lin
Latest libc++ C++ Runtime
Java JRE 1.7.0_79 or later
Devices
▪ Any Android 5.0 (or later) device powered by a Snapdragon processor; a Nexus device
is recommended; Snapdragon Capture mode requires a mobile device with a Qualcomm
Snapdragon 805, (or later) processor.
▪ Different device configurations have different metrics available in Snapdragon Profiler.
NOTE: Snapdragon Profiler is designed to work best with devices powered by Snapdragon
processors. Although some limited functionality may exist on non-Snapdragon devices, not
all profiling metrics will be available.

Qualcomm® Snapdragon™ Profiler User Guide Install, Launch, and Connect
MAY CONTAIN U.S. AND INTERNATIONAL EXPORT CONTROLLED INFORMATION 8
3 Install, Launch, and Connect
3.1 Install Snapdragon Profiler
3.1.1 Microsoft Windows installation
1. Run the Snapdragon Profiler installer on the host machine. It is recommended to run the
Installer with Administrator privileges.
2. The Installer displays the required steps and prompts for any dependencies it cannot find.
3.1.2 Mac OS X installation
1. Download and install the latest Mono Framework for Mac OS X at:
http://www.mono-project.com/download
2. Once the Mono Framework is installed, click the Snapdragon Profiler .dmg image in the
Finder to mount it.
3. Drag and drop the SnapdragonProfiler.app to the Applications folder.
3.1.3 Ubuntu Linux installation
1. Download and install the latest Mono Framework for Ubuntu Linux at:
http://www.mono-project.com/download
2. Install the libc++ C++ Standard library with sudo apt-get install libc++1.
3. Install Java Runtime 1.7.0_79 or later with sudo apt-get install default-jre.
4. Download the Android SDK and set up the paths accordingly.
5. Extract the Snapdragon Profiler tarball to the preferred directory with tar zxvf
SnapdragonProfiler_release_External_Linux.tar.gz.
Qualcomm® Snapdragon™ Profiler User Guide Install, Launch, and Connect
MAY CONTAIN U.S. AND INTERNATIONAL EXPORT CONTROLLED INFORMATION 9
3.2 Launch Snapdragon Profiler
NOTE: Start with Step 5 if the mobile device is already connected to a computer and
communicating via ADB.
1. Connect the Android device to a computer where Snapdragon Profiler is installed.
2. Choose Android Settings > Developer Options to ensure the device has Developer Options
enabled.
a. If Developer Options is not visible, go to Android Settings > About phone > Software
info, and continuously tap the Build number until Developer Options is enabled.
b. Go back one step to Android Settings to confirm that the Developer Options menu item
is available.
3. If you don’t have ADB in your path, in Snapdragon Profiler go to File > Settings and set the
ADB path on the Android tab.
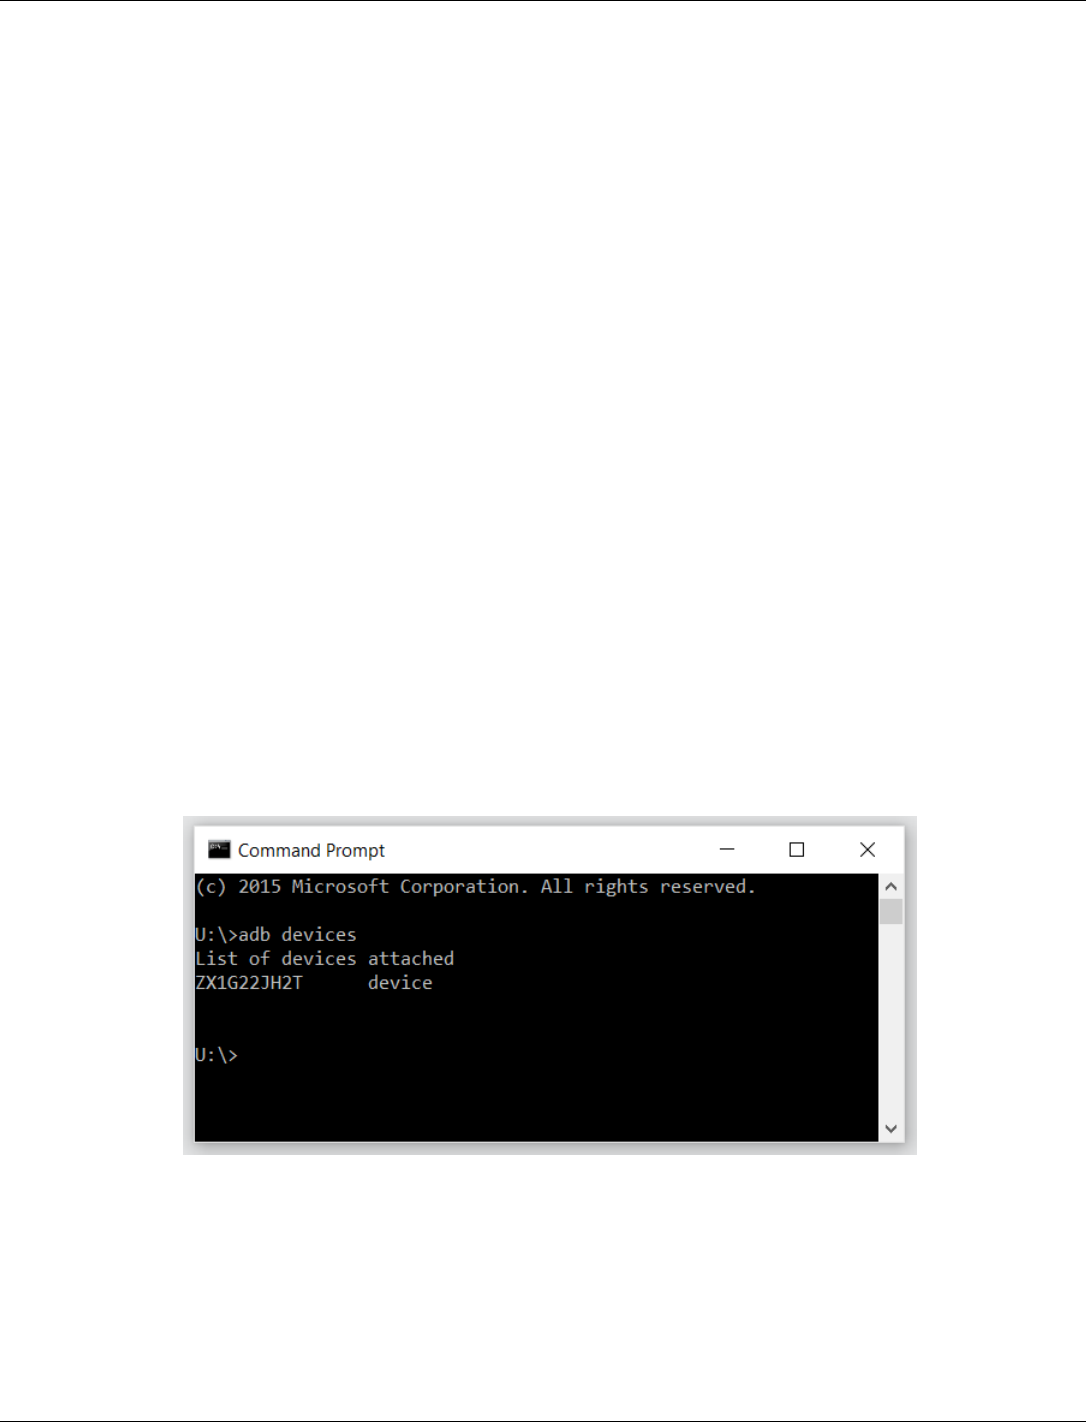
4. On a Windows PC (or terminal on OS X or Linux), open a command prompt and run the
adb devices command to confirm that the device is recognized (appears in the List of devices
attached).
a. If ADB does not recognize the device, confirm that the USB connection is in place or
ADB has been set up over Wi-Fi. Also verify that the latest ADB USB drivers for the
device are installed.
b. If you have problems connecting, confirm that ADB 1.0.32 (or later) is installed. You can
check this by typing 'adb version' in the cmd prompt.
c. If ADB recognizes the device, but it shows as Unauthorized, authorize the computer
through a pop-up authorization window on the device.
Qualcomm® Snapdragon™ Profiler User Guide Install, Launch, and Connect
MAY CONTAIN U.S. AND INTERNATIONAL EXPORT CONTROLLED INFORMATION 10
5. Launch Snapdragon Profiler:
a. For Windows, go to Start > Programs > Qualcomm > Snapdragon Profiler or double-
click the Snapdragon Profiler desktop icon.
b. For Mac OS X, go to Finder > Applications folder, and double-click Snapdragon
Profiler.
c. For Ubuntu Linux, execute the run_sdp.sh script from the root Snapdragon Profiler
directory.
6. Click Yes if asked whether to allow Snapdragon Profiler to send anonymous user statistics.
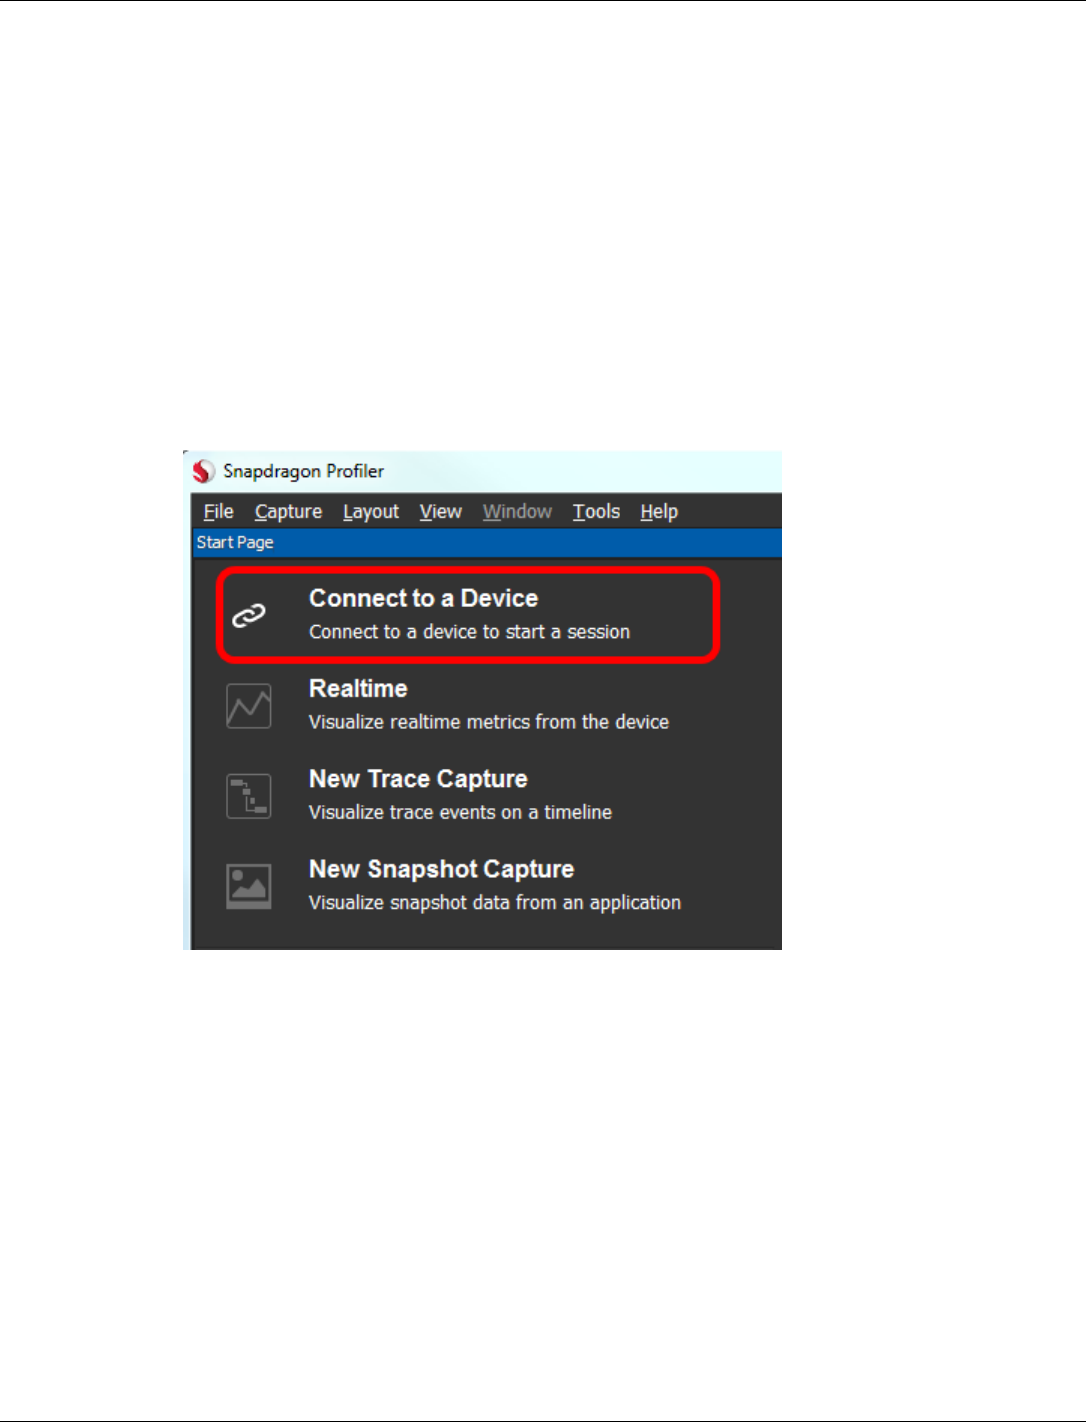
3.3 Connect to a device
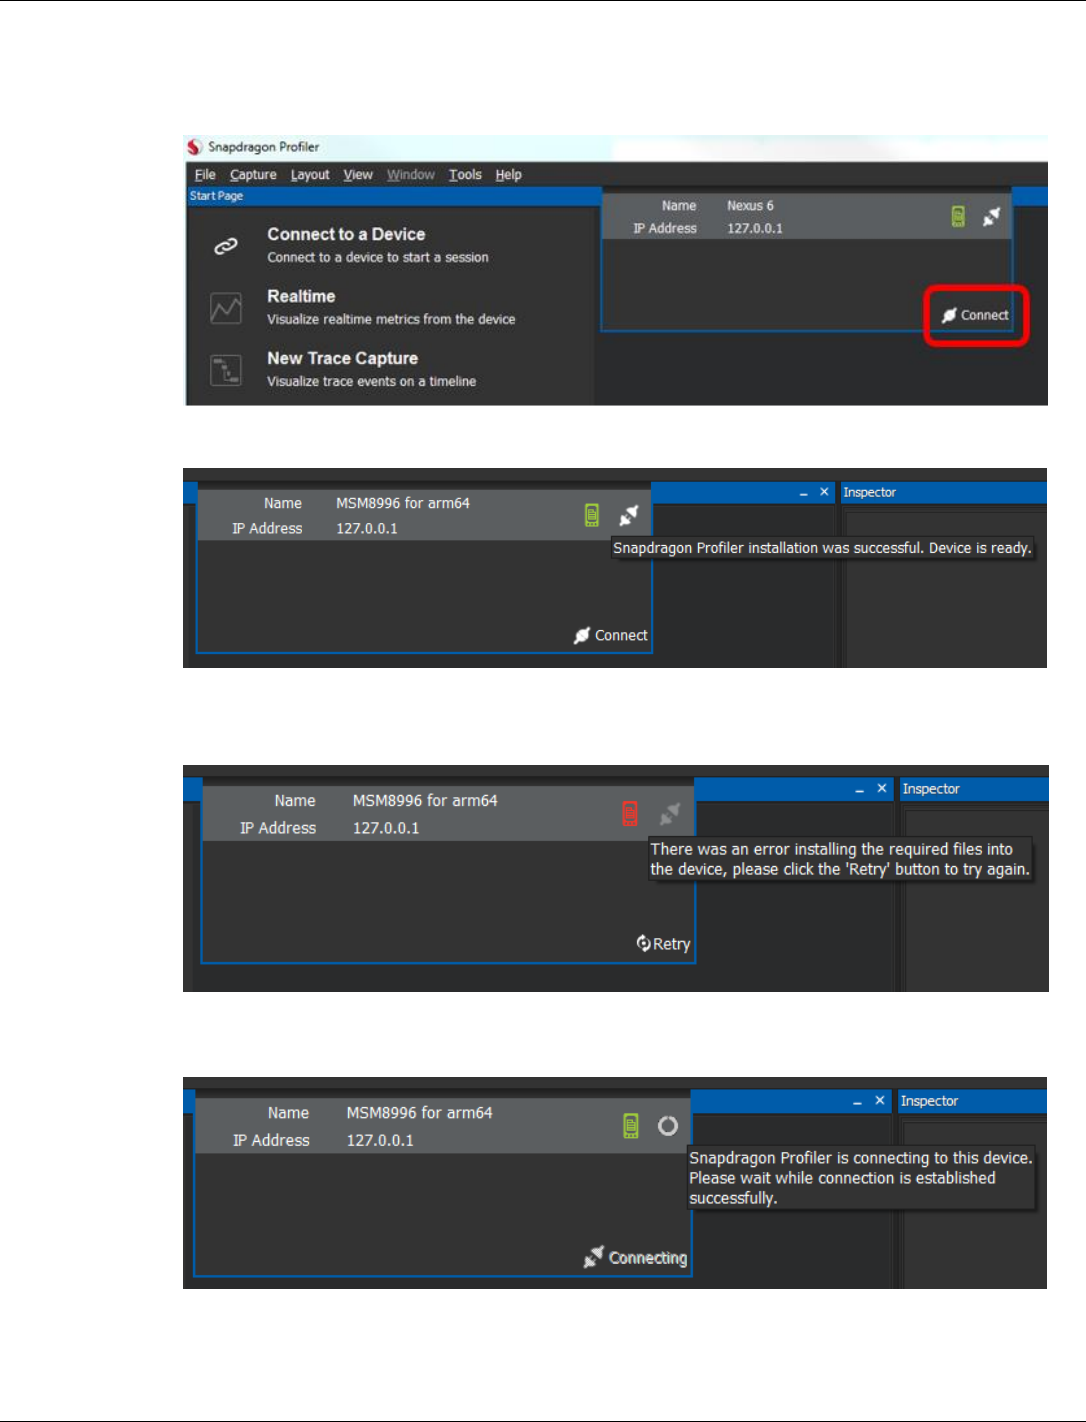
1. After launching Snapdragon Profiler, go to File > Connect, or from the Start Page click the
icon to the left of Connect to a Device to connect to a device to start a session.
Qualcomm® Snapdragon™ Profiler User Guide Install, Launch, and Connect
MAY CONTAIN U.S. AND INTERNATIONAL EXPORT CONTROLLED INFORMATION 11
2. The Connection window slides from the top of the main window. Snapdragon Profiler auto-
detects any devices connected to the computer via ADB, over USB or Wi-Fi, and begins
installing the service on the device.
3. If the installation is successful, the Device icon is green and the Connect button is enabled.
If the installation fails, the Device icon is red and the Retry button is enabled. Click Retry to
try installing the service again.
4. Click Connect to connect to the device. A progress wheel displays while Snapdragon
Profiler is connecting to the device:
Qualcomm® Snapdragon™ Profiler User Guide Install, Launch, and Connect
MAY CONTAIN U.S. AND INTERNATIONAL EXPORT CONTROLLED INFORMATION 12
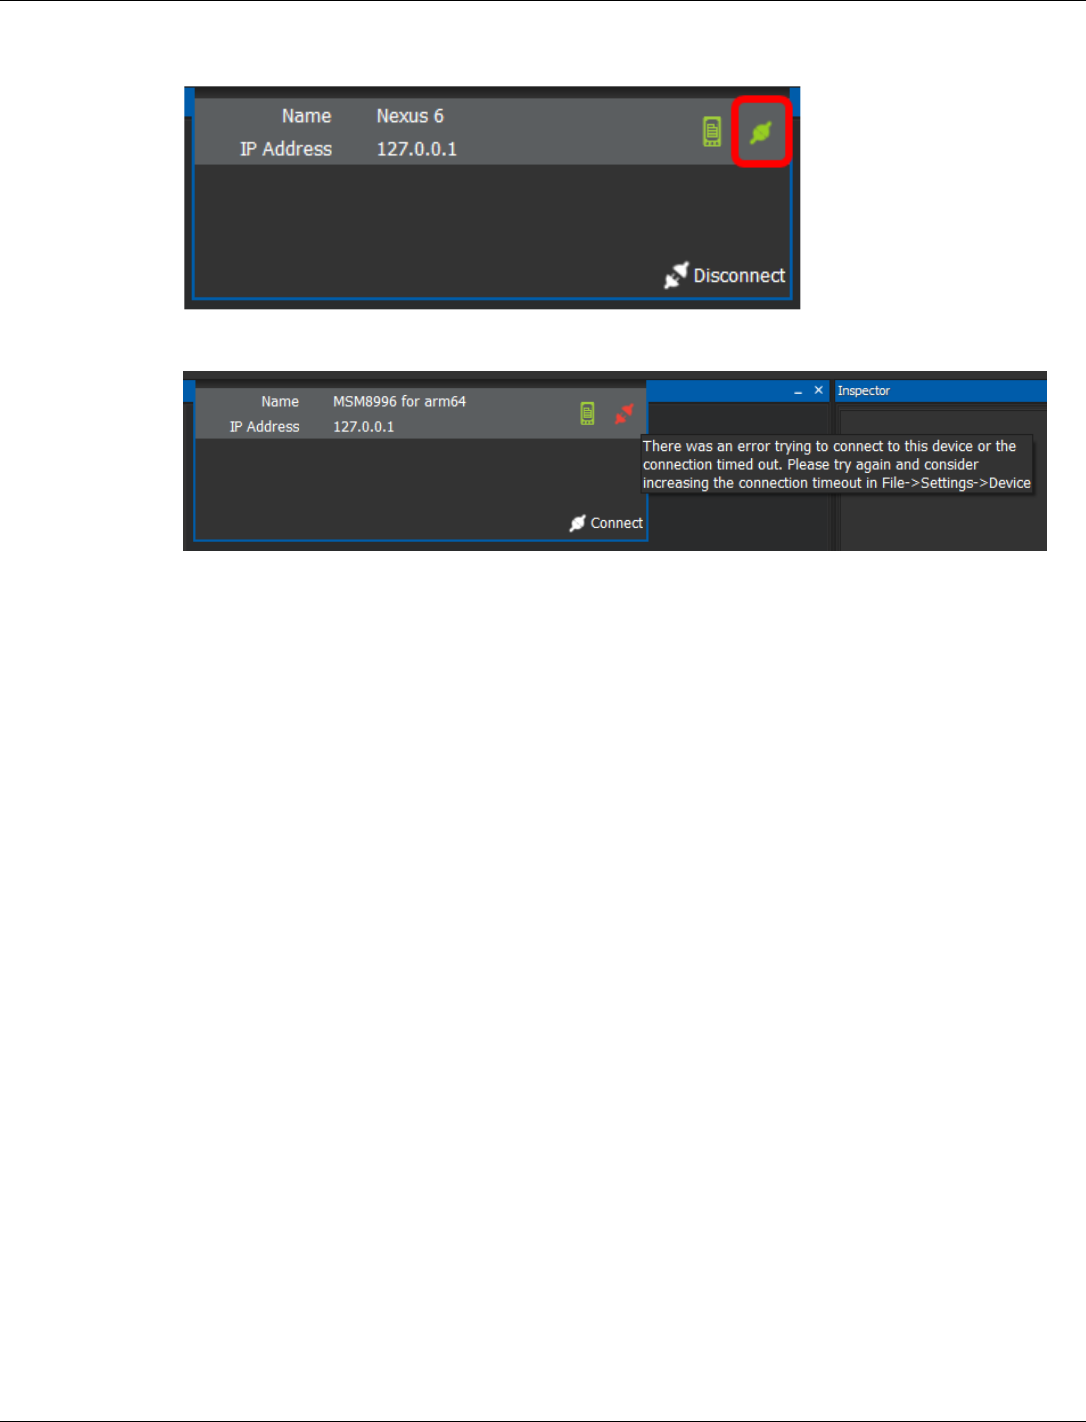
5. If the connection is successful, the Connection icon is green:
If you receive a connection error (the Connection icon is red), click Connect to try again.
NOTE: Mouse over the red Connection icon to get specific details about the error.
3. Once connected, Snapdragon Profiler can be used in three data capture modes: Realtime,
Trace Capture, and Snapshot Capture. See Chapter 5 for details on each of these modes.
NOTE: If you have problems connecting, make sure you have ADB 1.0.32 (or later) installed.
Qualcomm® Snapdragon™ Profiler User Guide User Interface
MAY CONTAIN U.S. AND INTERNATIONAL EXPORT CONTROLLED INFORMATION 13
4 User Interface
Snapdragon Profiler provides pre-defined metrics and layouts for one-click setup that lets users
quickly capture and view profiled data.
Snapdragon Profiler also enables user-defined metrics and dockable views for customization of
the user interface.
4.1 Start Page
Similar to Visual Studio, the Snapdragon Profiler Start Page provides easy access to the primary
Profiler functions:
■ Connect to a Device
■ Realtime profiling
■ New Trace Capture
■ New Snapshot Capture
4.2 Views
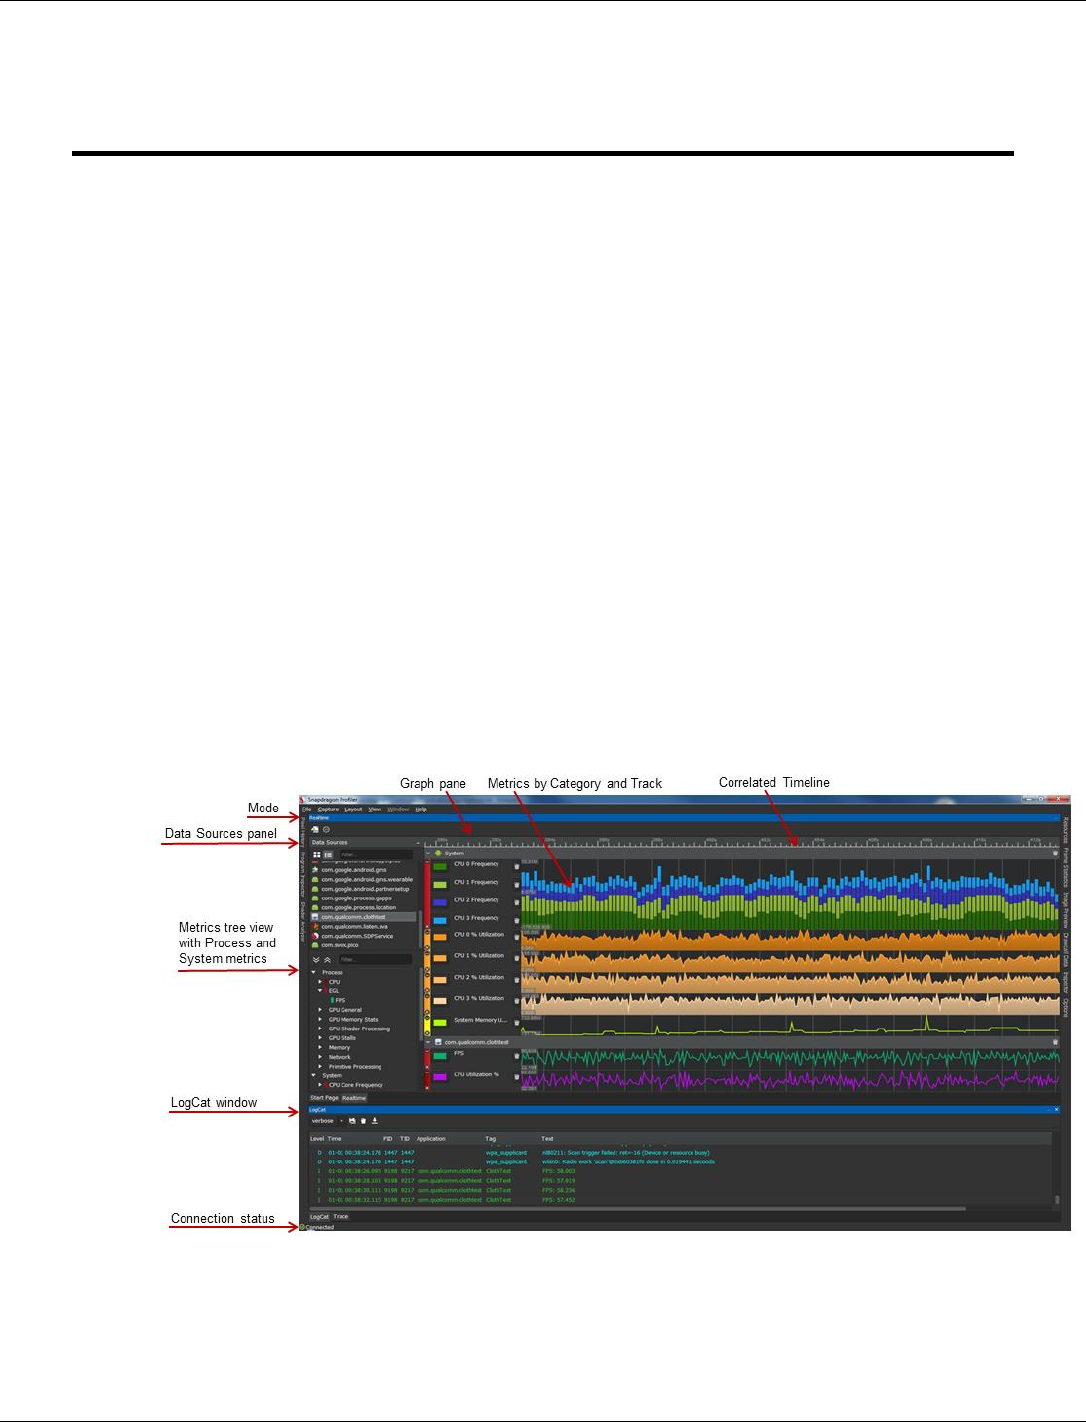
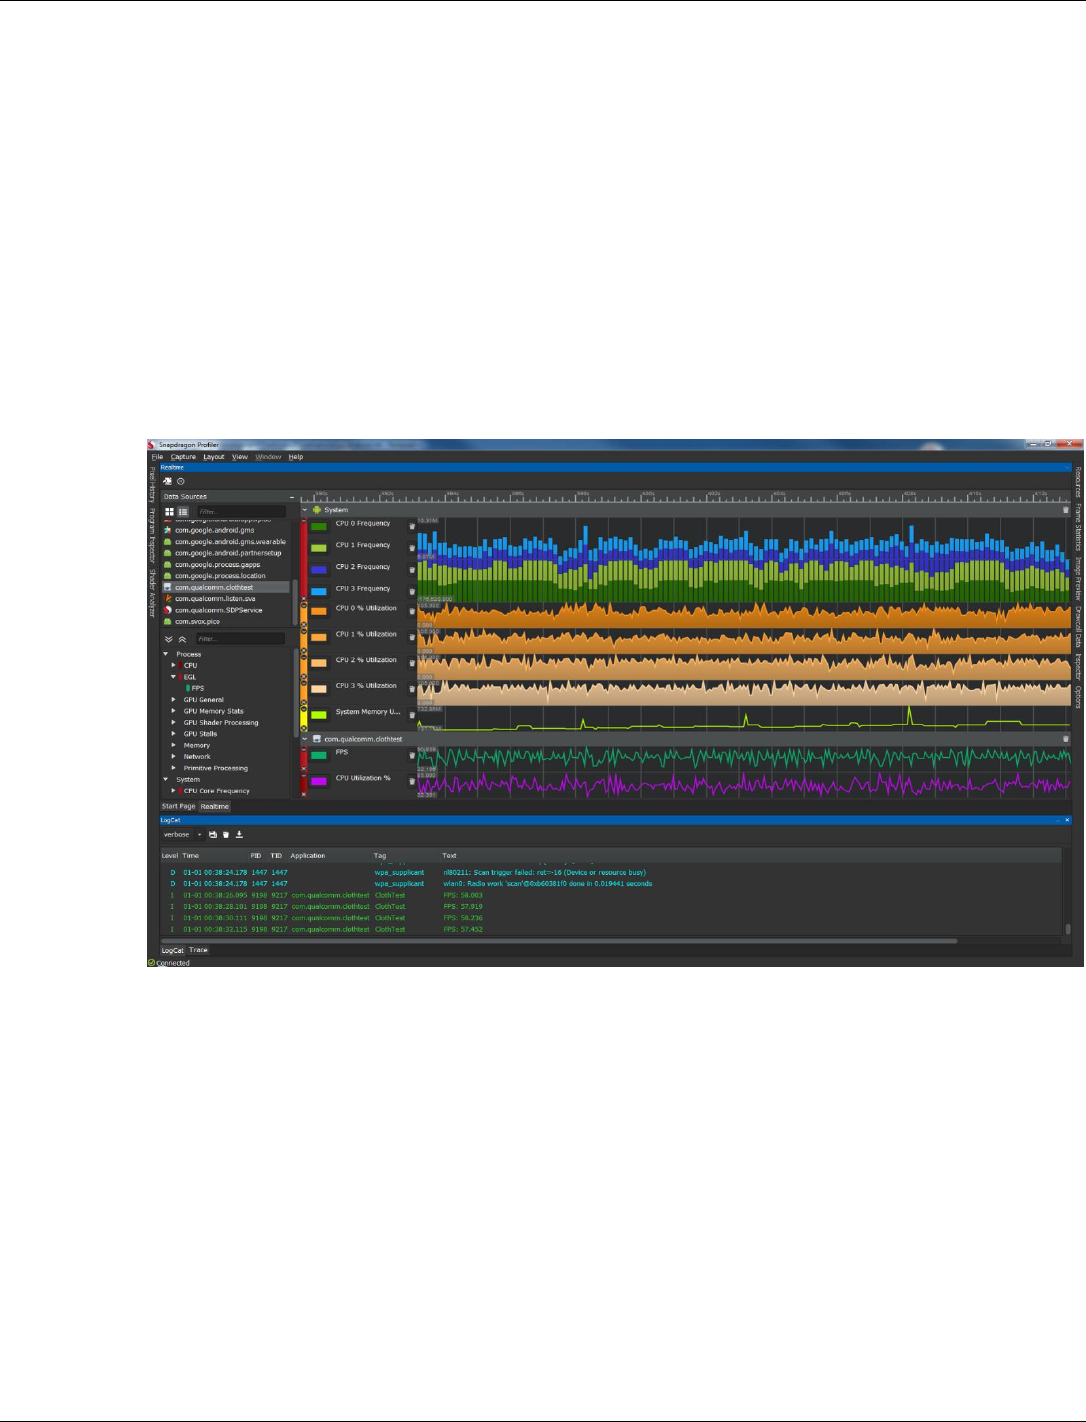
4.2.1 Realtime window
Figure 4-1 Realtime window
NOTE: The LogCat window is now hidden by default.
Qualcomm® Snapdragon™ Profiler User Guide User Interface
MAY CONTAIN U.S. AND INTERNATIONAL EXPORT CONTROLLED INFORMATION 14
4.2.2 Trace Capture window
Figure 4-2 Trace Capture window
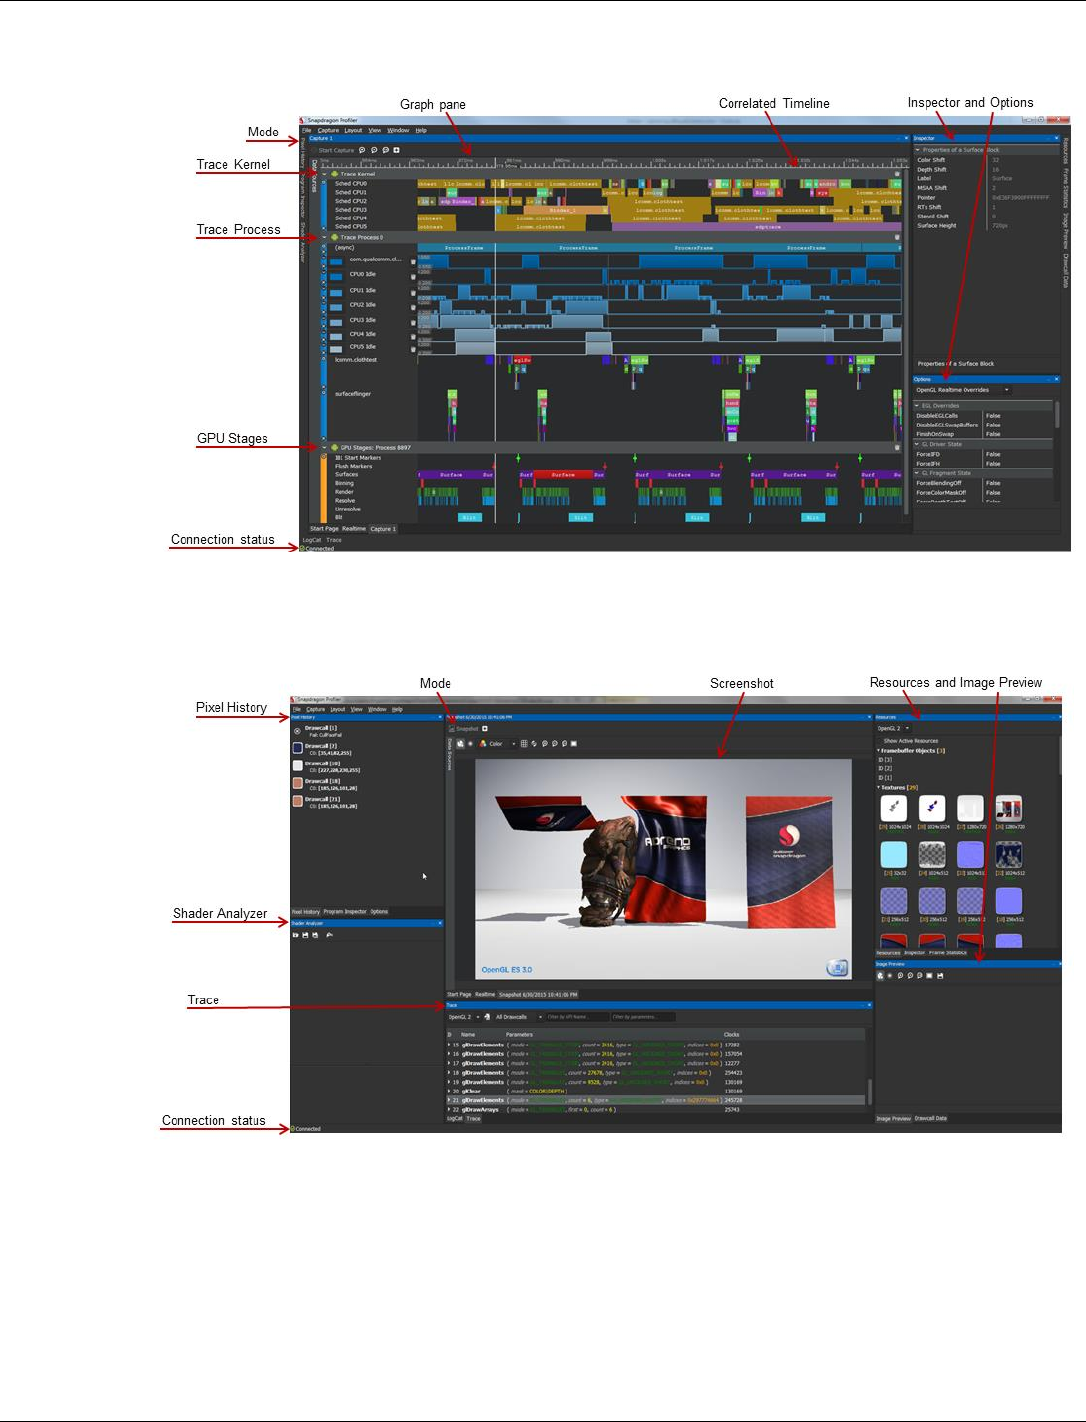
4.2.3 Snapshot Capture window
Figure 4-3 Snapshot Capture window
Qualcomm® Snapdragon™ Profiler User Guide User Interface
MAY CONTAIN U.S. AND INTERNATIONAL EXPORT CONTROLLED INFORMATION 15
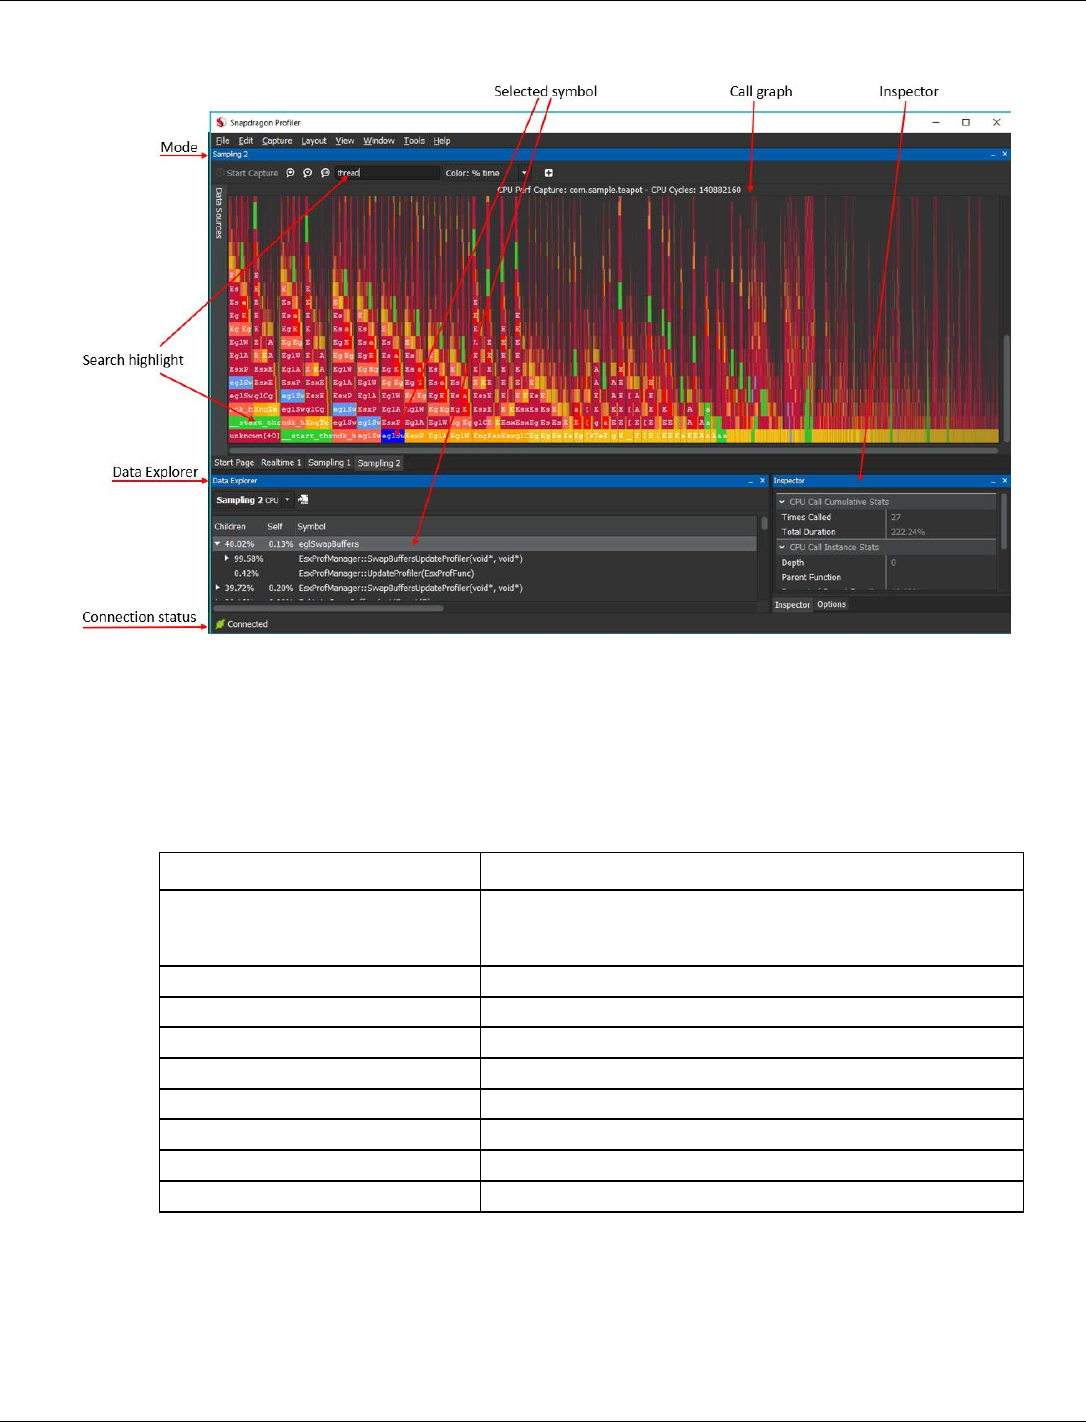
4.2.4 Sampling Capture window
Figure 4-4 Sampling Capture window
4.3 Navigation
Table 4-1 describes Snapdragon Profiler user interface navigation.
Table 4-1 Navigation actions
Navigation Action
Purpose/Result
Drag and drop
To select a category or individual metric to view in the Graph
pane
To rearrange categories and tracks in the Graph pane
Turn the mouse wheel
To zoom in/out
Left-click, hold, and move the mouse
To pan
Click the Timeline
To visualize the time correlation across elements
Double-click System Metric heading
To add all System metrics to the graph pane and begin profiling
Ctrl + W
To zoom in on Realtime or Trace Capture mode
Ctrl + S
To zoom out on Realtime or Trace Capture mode
Ctrl + A
To pan left when paused in Realtime or Trace Capture mode
Ctrl + D
To pan right when paused in Realtime or Trace Capture mode

Qualcomm® Snapdragon™ Profiler User Guide Data Capture Modes
MAY CONTAIN U.S. AND INTERNATIONAL EXPORT CONTROLLED INFORMATION 16
5 Data Capture Modes
This chapter provides an overview of the Realtime, Trace Capture, and Snapshot Capture modes
including features and functionality.
5.1 Realtime
Realtime mode, shown in Figure 5-1, allows streaming and viewing real-time performance
metrics while an application is running on the Snapdragon-powered device.
Realtime mode plots real-time GPU and system performance data streaming from the embedded
graphics driver, including system and process metrics.
System Metrics (categories)
■ CPU Core Frequency
■ CPU Core Load
■ CPU Core Utilization
■ Additional CPU metrics may be available for some devices.
■ GPU General
■ GPU Memory Stats
■ GPU Shader Processing
■ GPU Stalls
■ Network - Cellular
■ Network – Wi-Fi
■ Power
■ Primitive Processing
■ System Memory
■ Thermal
Qualcomm® Snapdragon™ Profiler User Guide Data Capture Modes
MAY CONTAIN U.S. AND INTERNATIONAL EXPORT CONTROLLED INFORMATION 17
Process Metrics (categories)
■ CPU
■ EGL (not available for every process)
■ GPU General (not available for every process)
■ GPU Memory Stats (not available for every process)
■ GPU Shader Processing (not available for every process)
■ GPU Stalls (not available for every process)
■ Memory
■ Network
■ Primitive Processing (not available for every process)
Figure 5-1 Realtime mode
Qualcomm® Snapdragon™ Profiler User Guide Data Capture Modes
MAY CONTAIN U.S. AND INTERNATIONAL EXPORT CONTROLLED INFORMATION 18
5.1.1 Realtime basics
1. Check that the Android device is connected to the computer where Snapdragon Profiler is
installed and launch the Profiler (see Section 3.2).
2. Choose File > Connect, or from the Start Page, click the icon to the left of Connect to a
Device to connect to a device to start a session (see Section 3.3).
3. From the Start Page, click Realtime, or click the Realtime tab to see real-time metrics for
an application or device. Real-time metrics can be gathered for CPU, GPU, memory,
network, thermal, and power as shown in this view of the Realtime tab:
Qualcomm® Snapdragon™ Profiler User Guide Data Capture Modes
MAY CONTAIN U.S. AND INTERNATIONAL EXPORT CONTROLLED INFORMATION 19
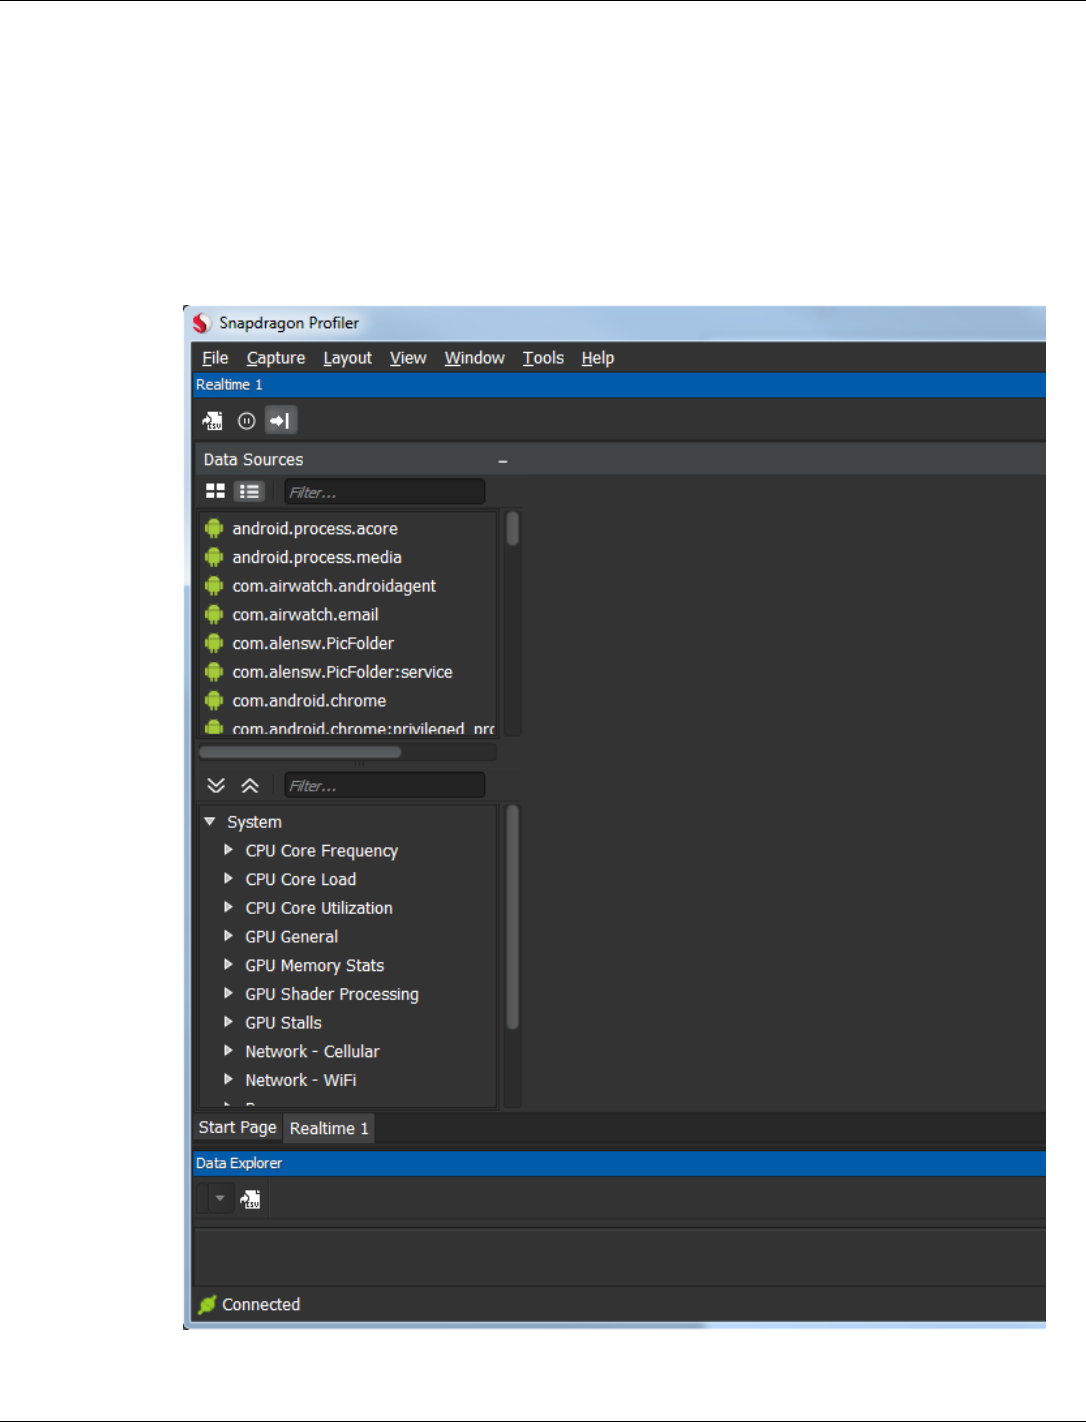
4. On the left of the Realtime tab, System metrics can be chosen from the Metrics tree view in
the Data Sources panel.
To add a new metric graph, double-click the category (to add all the metrics in a category) or
individual metric, or drag-and-drop the category or metric into the Graph pane on the right.
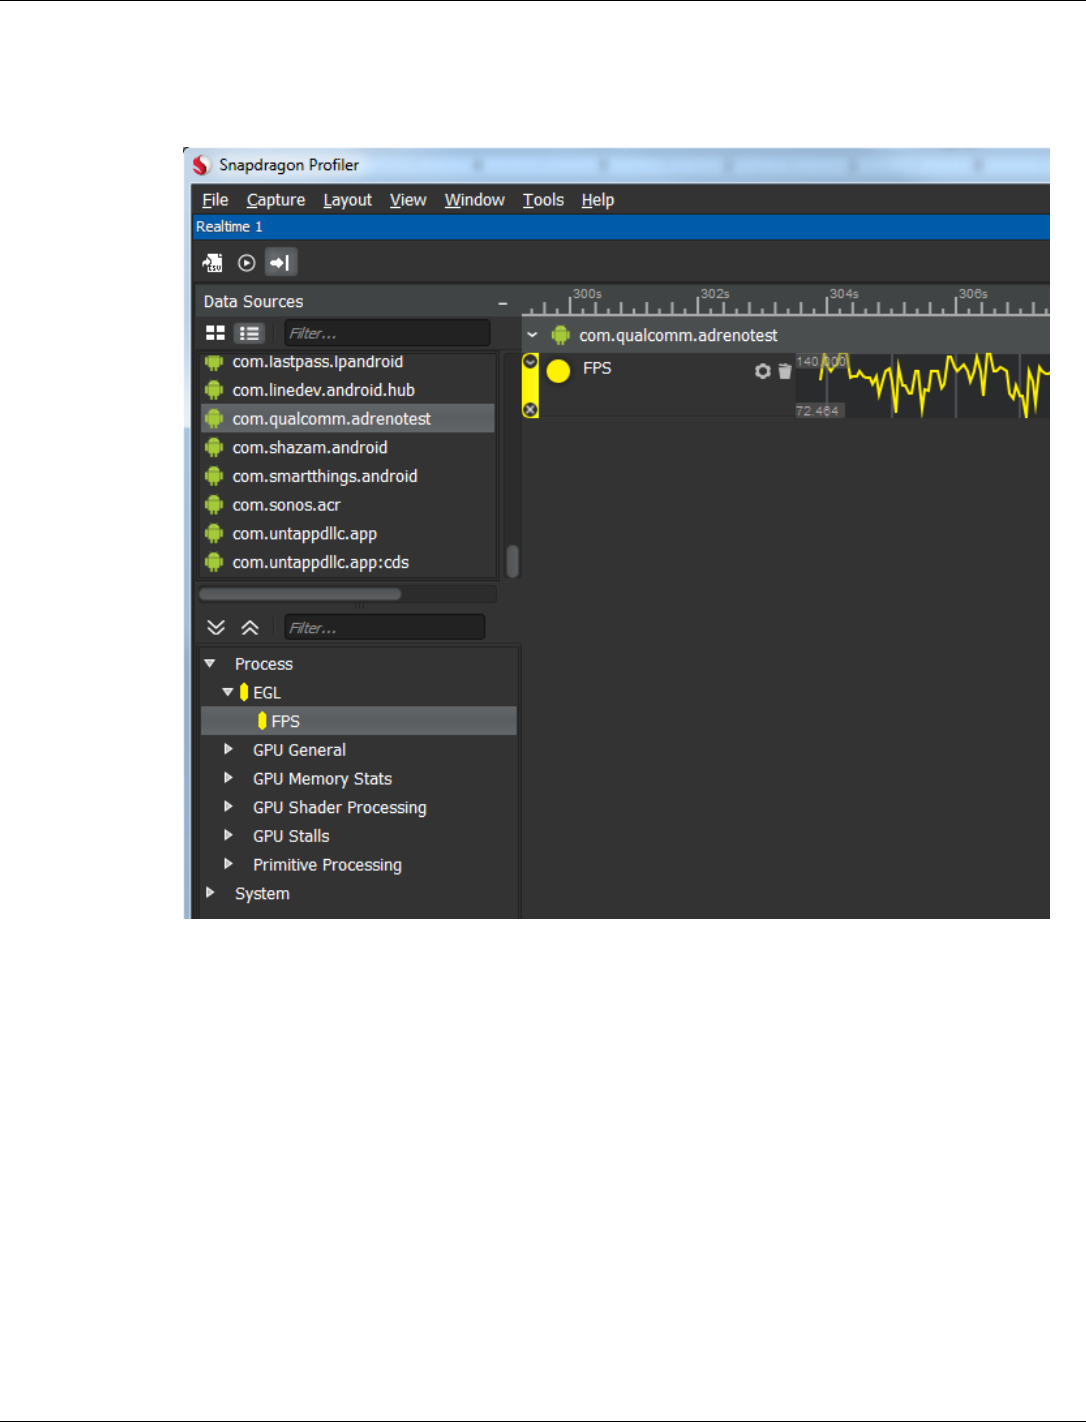
5. Application, or per-process, metrics can be viewed by first clicking on a process in the
Process list shown in the top area of the Data Sources panel. The Process list shows all
active user processes.
NOTE: Not all metrics are available for every process.
Qualcomm® Snapdragon™ Profiler User Guide Data Capture Modes
MAY CONTAIN U.S. AND INTERNATIONAL EXPORT CONTROLLED INFORMATION 20
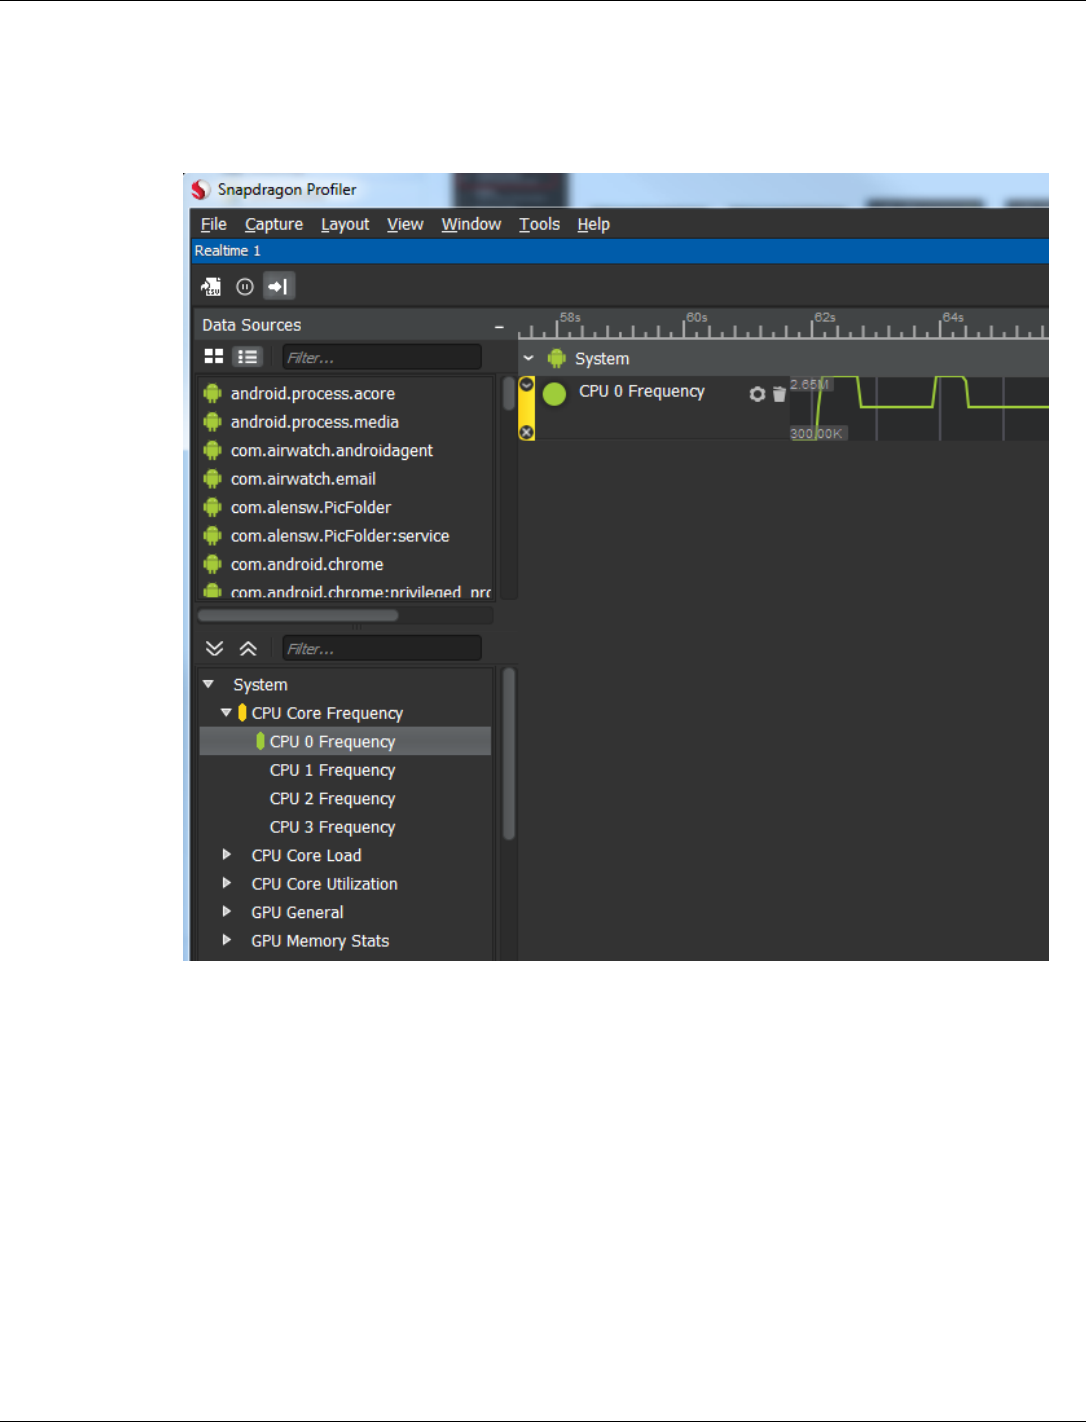
6. Select a process to see all the metrics available for that process in the Metrics list.
Adding process metrics to the Graph pane is the same as with system metrics – double-click,
or drag-and-drop, the category or individual metric into the pane.
Qualcomm® Snapdragon™ Profiler User Guide Data Capture Modes
MAY CONTAIN U.S. AND INTERNATIONAL EXPORT CONTROLLED INFORMATION 21
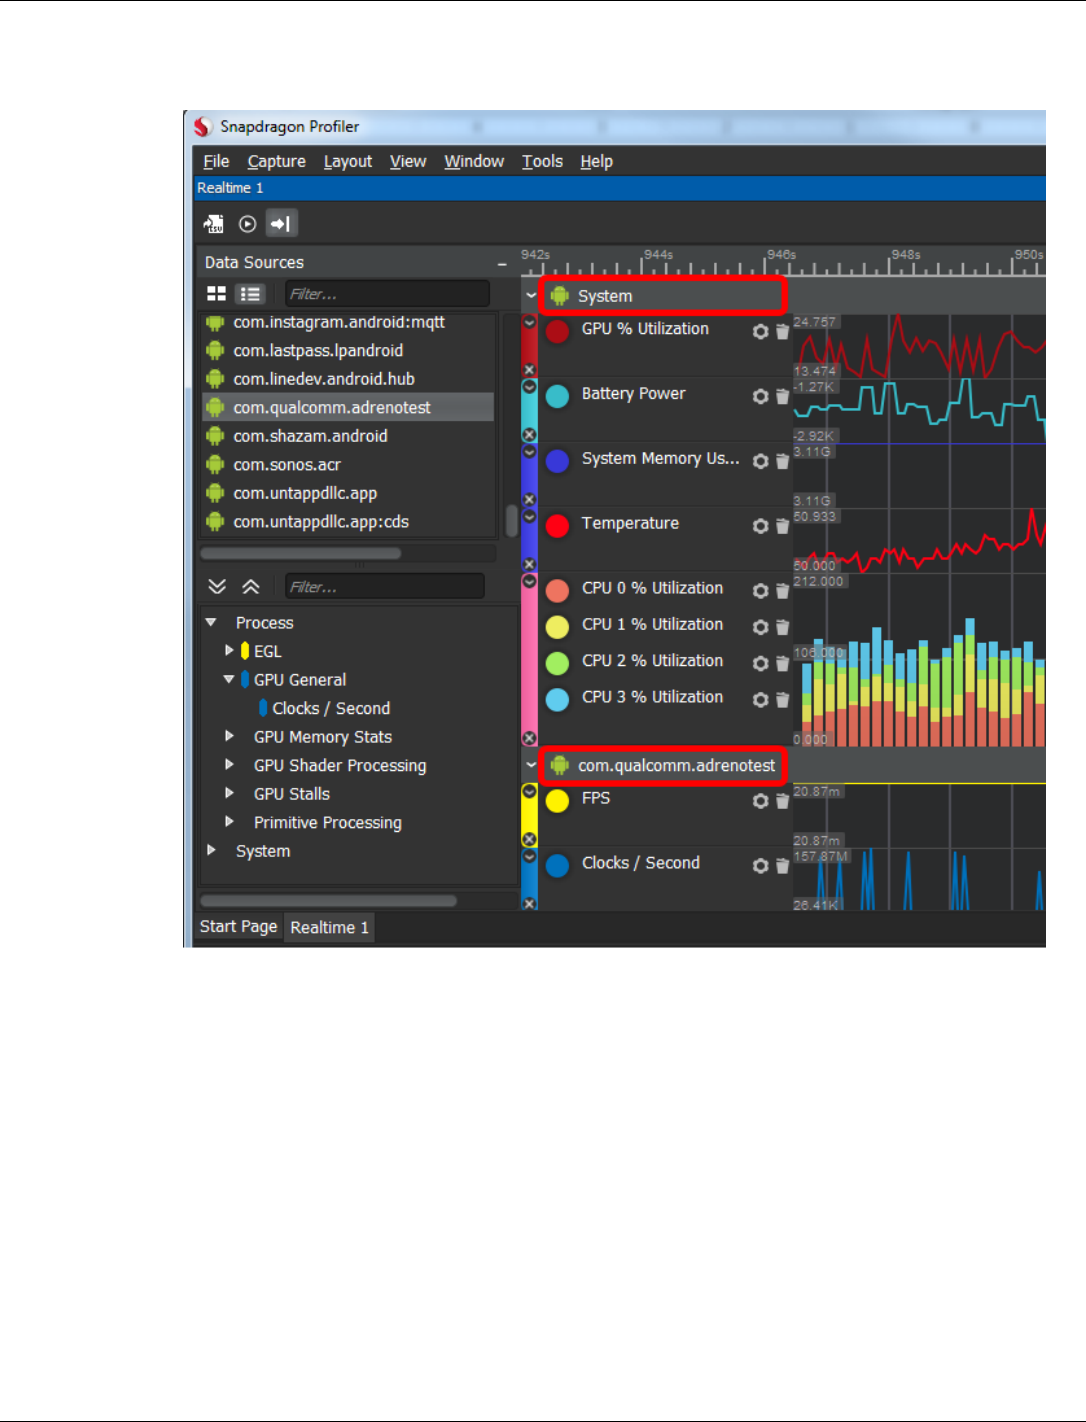
7. System and process metrics can be viewed in the Graph pane at the same time. Multiple
processes can also be viewed.
NOTE: The more metrics selected and displayed, the more intrusive Snapdragon Profiler is
on application performance.
Qualcomm® Snapdragon™ Profiler User Guide Data Capture Modes
MAY CONTAIN U.S. AND INTERNATIONAL EXPORT CONTROLLED INFORMATION 22
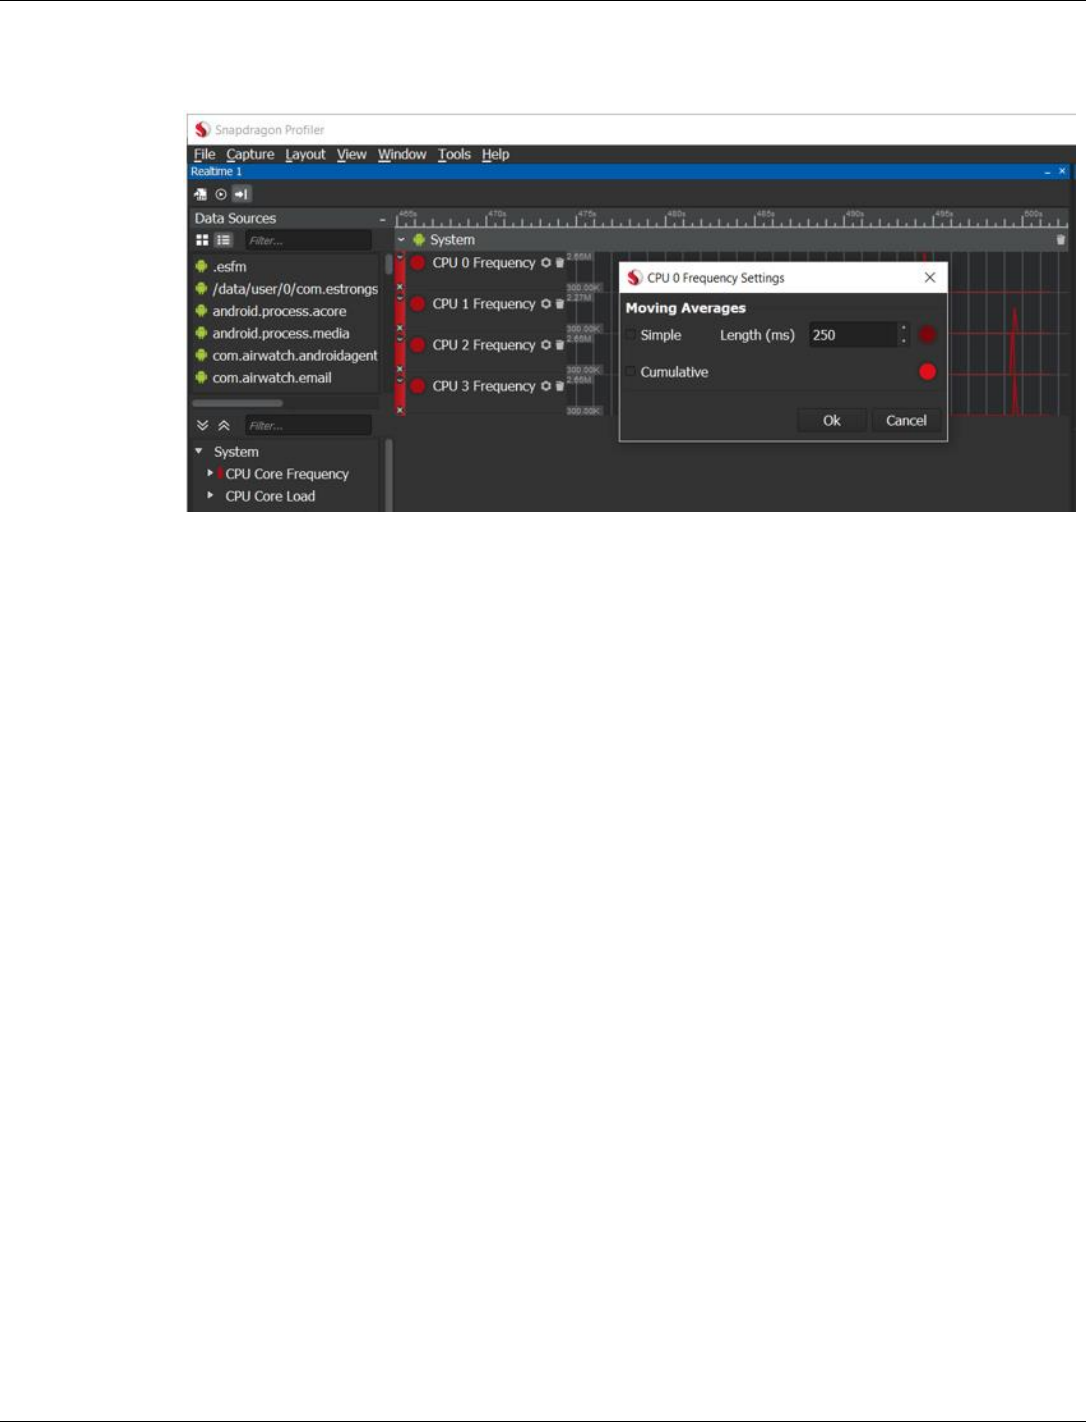
8. If desired, click the gear icon in the Graph pane and select Simple and/or Cumulative to
display a moving average.
Qualcomm® Snapdragon™ Profiler User Guide Data Capture Modes
MAY CONTAIN U.S. AND INTERNATIONAL EXPORT CONTROLLED INFORMATION 23
5.2 Trace Capture
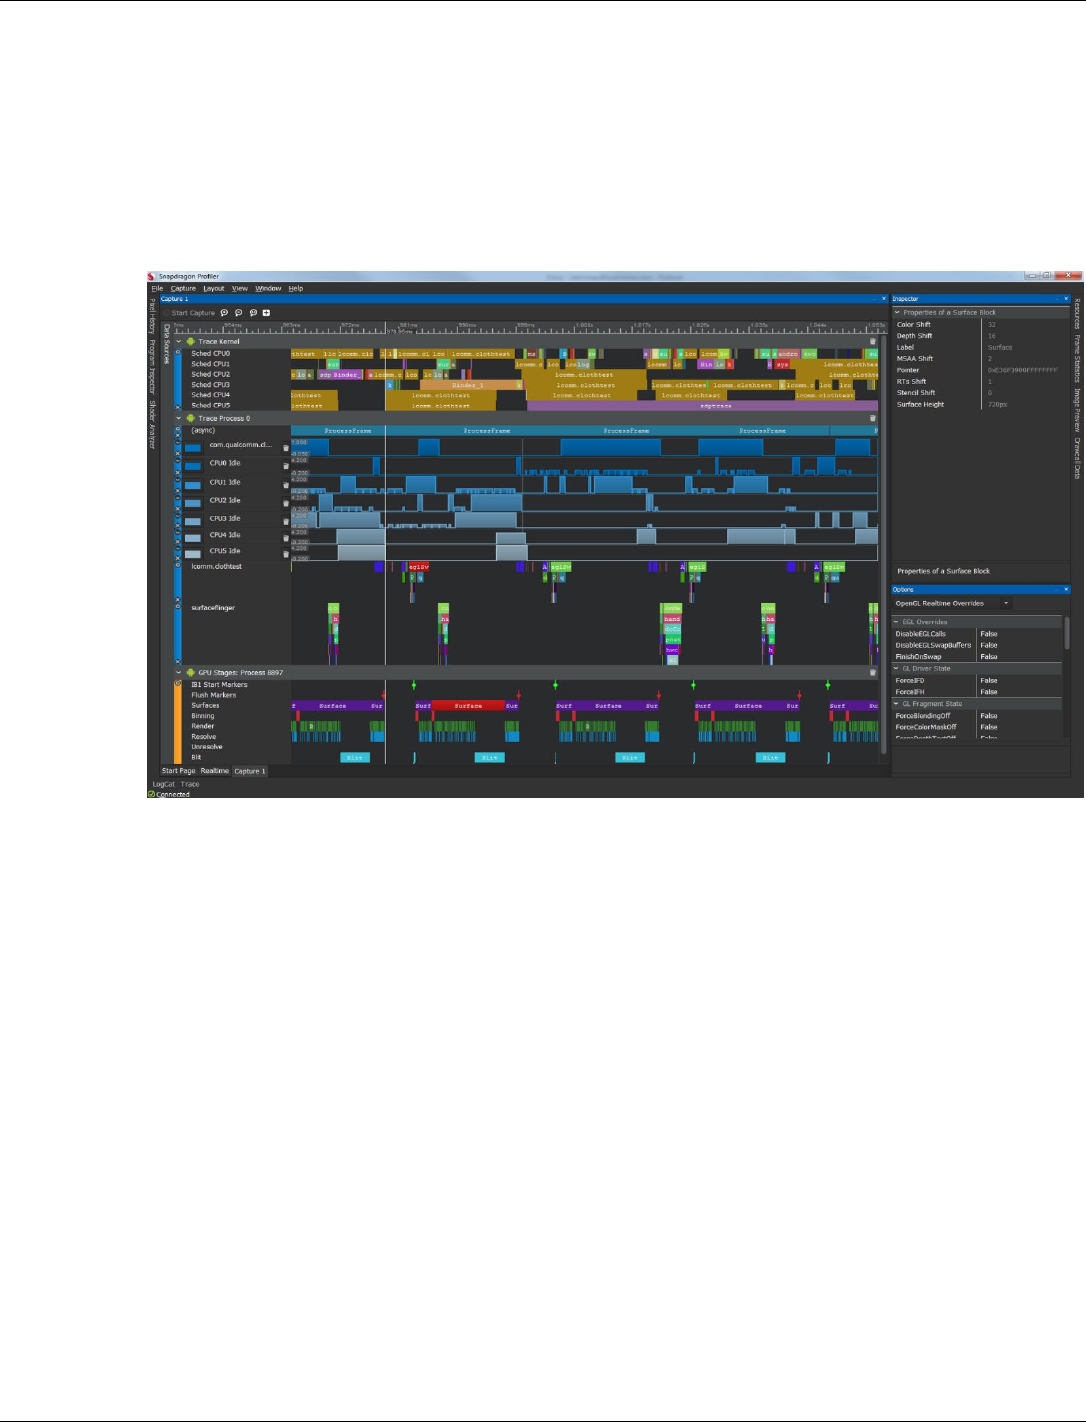
Trace Capture mode, shown in Figure 5-2, captures trace events and data available on
Snapdragon-powered devices. Once captured, the call trace can be used to:
■ Collect and display important performance statistics
■ See how threads are scheduled on each of the CPU cores in the Kernel
■ See the correlation between CPU, DSP, and GPU activity on the same timeline
Figure 5-2 Trace Capture mode
5.2.1 Additional requirements
OpenGL ES, Vulkan, and OpenCL apps must include android.permission.INTERNET in the
app’s AndroidManifest.xml to enable API tracing and GPU metrics.
5.2.2 Launch applications
The Launch Application button in the Trace Capture panel can be used to launch any
application installed on the target device. The implications of using this button depend on the type
of app being launched.
■ Vulkan apps must be launched using the button to enable capture of Vulkan trace metrics.
■ Using the button for OpenGL ES apps will allow Snapdragon Profiler to load the most
current version of its OpenGL API interceptor library, which will enable optimal profiling
functionality. When OpenGL ES apps are launched on the device without using the button,
the API interceptor library that is pre-installed on the device will be used. Depending on the
age of that library it may lack functionality or contain bugs that have been fixed in the current
version.
Qualcomm® Snapdragon™ Profiler User Guide Data Capture Modes
MAY CONTAIN U.S. AND INTERNATIONAL EXPORT CONTROLLED INFORMATION 24
■ All other apps behave the same whether they are launched from the device or with the button.
Launching an app using the Launch Application button makes uses of the Java Debug Wire
Protocol. Therefore, it is recommended to disable other debugging and profiling tools which use
JDWP when using this functionality.
5.2.3 Trace Capture basics
1. Check that the Android device is connected to the computer where Snapdragon Profiler is
installed and launch the Profiler (see Section 3.2).
2. Choose File > Connect, or from the Start Page, click Connect to a Device to connect to a
device to start a session (see Section 3.3).
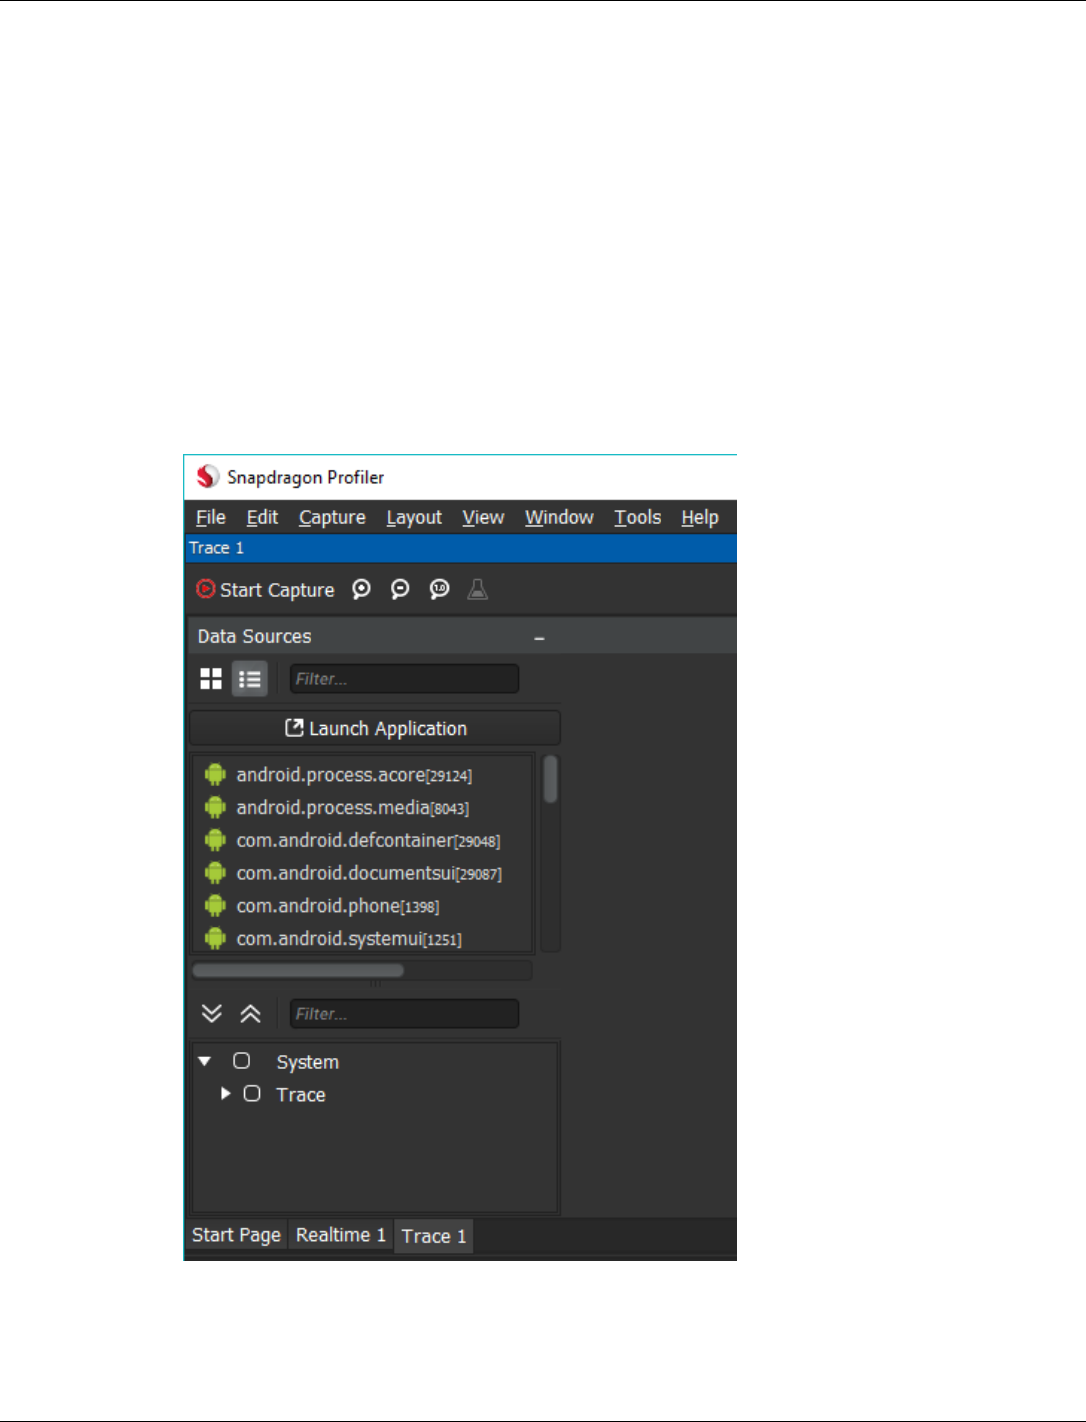
3. From the Start Page, click New Trace Capture, or choose Capture > New Trace
4. A new Capture tab is created. When this tab is selected, a view similar to Realtime is
displayed except traces have Start Capture and Stop Capture buttons.
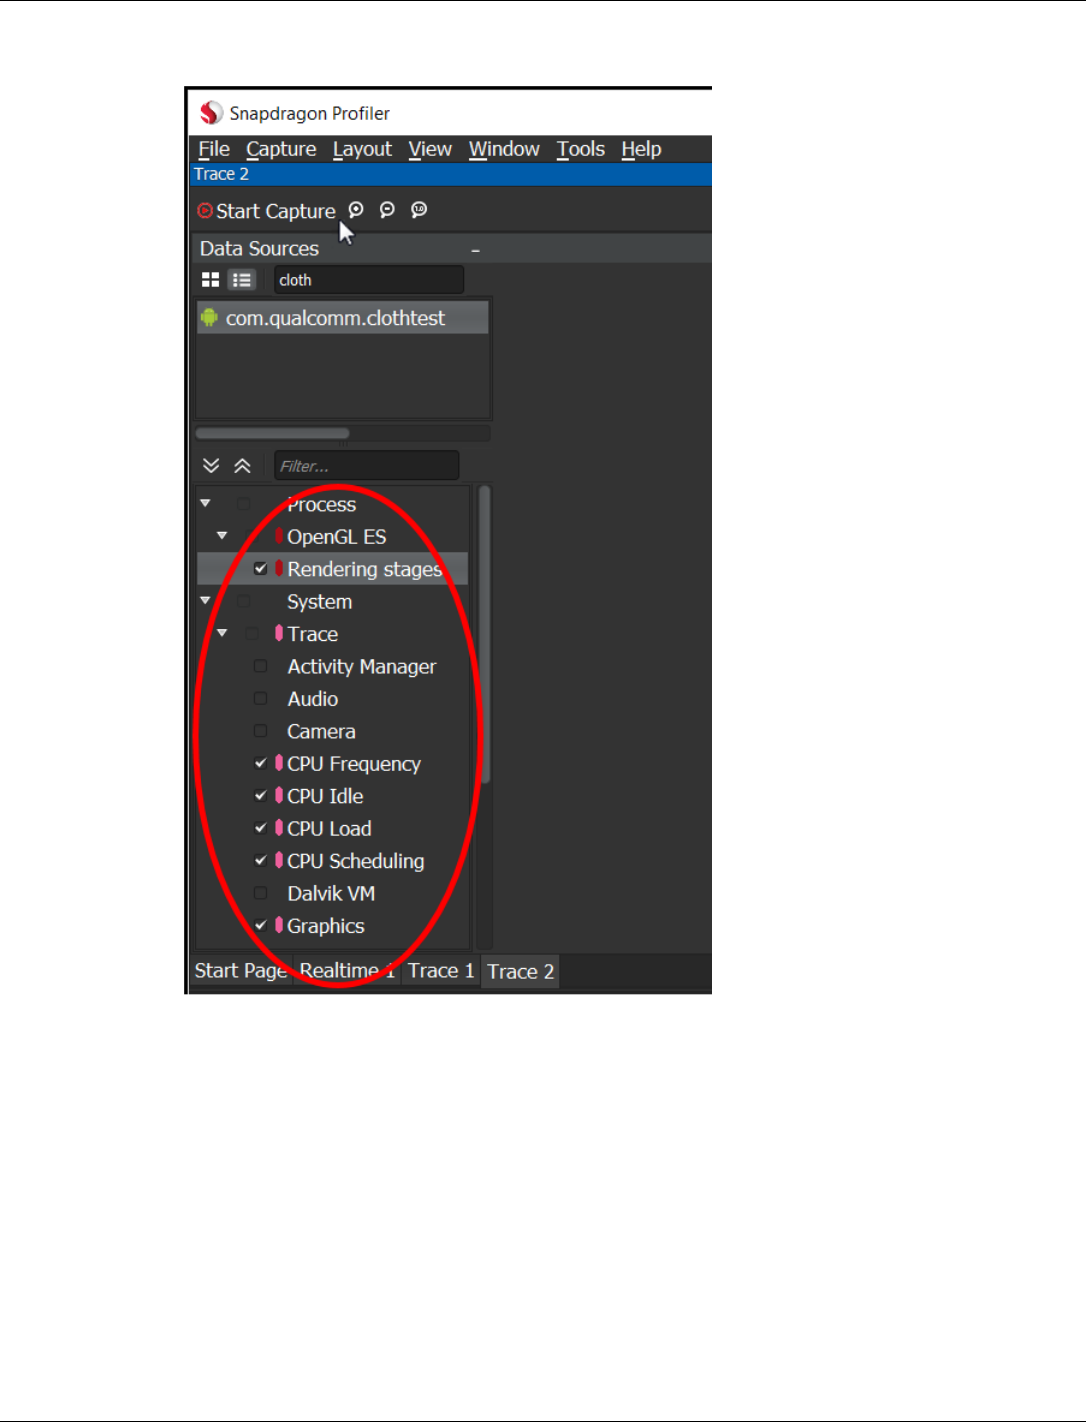
5. From the Data Sources panel, choose the metrics to view. Choose a process from the
Process list to view metrics specific to that process, if any exist.
Qualcomm® Snapdragon™ Profiler User Guide Data Capture Modes
MAY CONTAIN U.S. AND INTERNATIONAL EXPORT CONTROLLED INFORMATION 25
6. Click Start Capture to start the capture.
Qualcomm® Snapdragon™ Profiler User Guide Data Capture Modes
MAY CONTAIN U.S. AND INTERNATIONAL EXPORT CONTROLLED INFORMATION 26
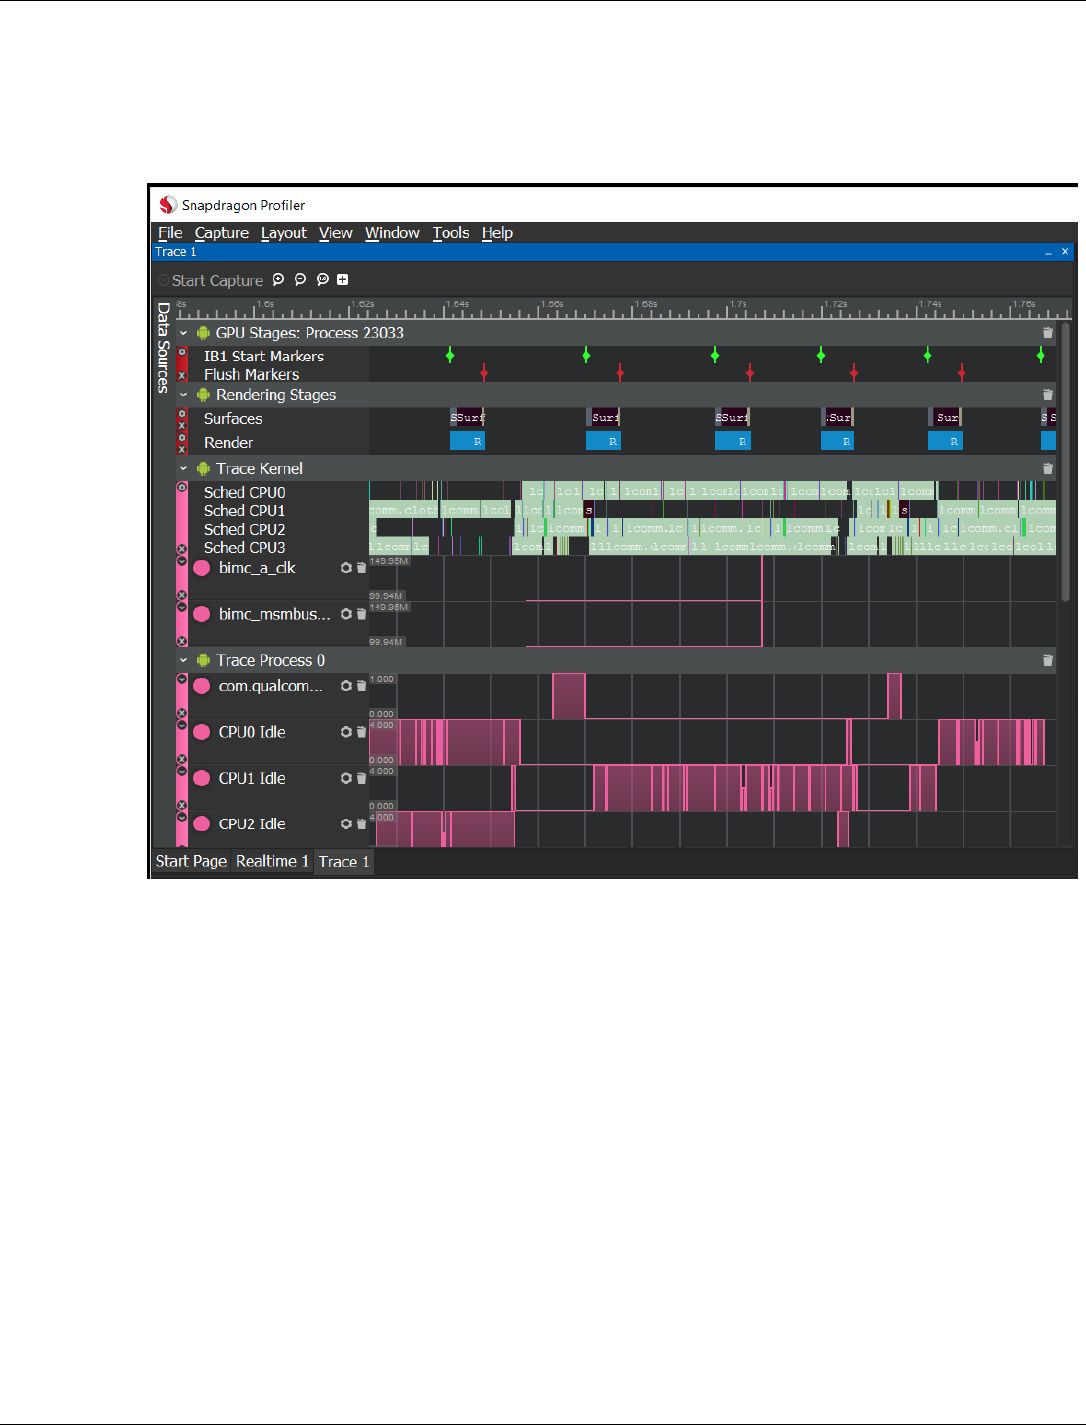
7. Click Stop Capture to stop the capture after a few seconds. Snapdragon Profiler processes and
displays the trace data in the Graph pane.
NOTE: Snapdragon Profiler does not allow trace captures longer than 10 seconds.

Qualcomm® Snapdragon™ Profiler User Guide Data Capture Modes
MAY CONTAIN U.S. AND INTERNATIONAL EXPORT CONTROLLED INFORMATION 27
5.2.4 Measure DSP performance
To collect DSP data, a device with a Snapdragon 820 processor such as a Samsung Galaxy S7
must be used.
1. Check that the Android device is connected to the computer where Snapdragon Profiler is
installed and launch the Profiler (see Section 3.2).
2. Choose File > Connect, or from the Start Page click Connect to a Device to connect to a
device to start a session (see Section 3.3).
3. From the Start Page, click New Trace Capture, or choose Capture > New Trace to view
trace-level performance data for the application or device.
4. From the Metrics window, expand the System category if needed, two subcategories are
displayed: Trace and DSP. Trace collects data from the Android system trace and DSP
collects data from the device DSP.
5. Select the metrics for the capture:
a. Expand the DSP subcategory to view the available metrics. Scroll to DSP % Utilization
and check the box to enable this metric.
b. Expand the Trace subcategory and enable the CPU Frequency and HW Modules metrics.
Collecting DSP and Trace metrics will demonstrate Profiler’s ability to correlate Timeline
information across different processor subsystems.
NOTE: To see a change in the DSP % Utilization, an app that produces audio needs to be
turned on during the capture.
6. Click Start Capture in the top left corner to start the capture.
7. A few seconds into the capture, turn on the audio on.
8. Let the audio play for a few seconds and then click Stop Capture. The capture can be
continued, however it automatically stops capturing after 10 seconds.
9. The capture data displays in the main Profiler window.
□ Notice that a few seconds into the capture, the DSP % Utilization increased due to the
audio activity.
□ Notice the activity increase in the Trace data during the time the audio was running.
10. Use the bookmark feature to easily see correlation across timelines.
5.2.5 Capture OpenCL applications
Use Trace Capture to understand how an OpenCL application performs on a device powered by a
Snapdragon processor.
NOTE: Not all mobile devices support OpenCL. Use an app like OpenCL Info to see if OpenCL is
supported on your device. Depending on the application being captured and the preferred
behavior, additional setup steps may be required before running an app.

Qualcomm® Snapdragon™ Profiler User Guide Data Capture Modes
MAY CONTAIN U.S. AND INTERNATIONAL EXPORT CONTROLLED INFORMATION 28
1. Check that the Android device is connected to the computer where Snapdragon Profiler is
installed and launch the Profiler (see Section 3.2).
2. Choose File > Connect, or from the Start Page click Connect to a Device to connect to a
device to start a session (see Section 3.3).
3. If the application to be captured is command line, and capture from the beginning is
preferred, the Enable Blocking option must be set before running the application. Once set,
the application pauses execution until the capture begins.
NOTE: An OpenCL preset layout is available for easy access to all OpenCL-relevant views.
4. From the Start Page, click New Trace Capture, or choose Capture > New Trace to view
trace-level performance data for an application or device.
5. From the Process list, choose the application. An OpenCL Trace metric appears in the
Metrics tree view.
6. Enable the OpenCL Trace metric and the other OpenCL metrics to capture.
7. Click Start Capture in the top left corner to start the capture.
NOTE: If the app being captured is command line, execution resumes on the given app.
8. Click Stop Capture to end the capture. If the application finishes executing, the capture stops
automatically.
9. The data is then transferred and processed. A progress indicator displays in the bottom right
corner of the Profiler window.
10. When processing completes, the Trace Capture data displays in the main Profiler window,
organized by thread on the host, and by context and device on the GPU.
□ Event links
Correlation links are shown between calls that either wait or complete events.
□ Trace elements
Select trace elements to view detailed information about the element in Trace view.
□ Buffer visualization
If buffer and image data transmission was enabled, an additional track displays with
markers where data bound to the given buffers might have been modified.
□ Buffer snapshots track
Click a marker to view this data and look at the selected buffer data on the buffer or
image viewer.
□ Buffer viewer
The Buffer viewer can be customized to suit the data being viewed. The number of rows
and columns per page can be modified to align the data and the display format can be
changed to match the most common use cases.
□ Trace view
Trace data with API calls return values, parameters and metric calculations appears in the
Trace view. Metrics are only calculated on relevant calls.
Qualcomm® Snapdragon™ Profiler User Guide Data Capture Modes
MAY CONTAIN U.S. AND INTERNATIONAL EXPORT CONTROLLED INFORMATION 29
□ Resources and Inspector views
The Resources view lists all resources gathered during the capture. Click a resource to
display details about the resource in Inspector view.
Programs display static code analysis within Inspector view as well as the containing
kernels within the source view.
5.2.6 Capture Vulkan applications
To capture Vulkan trace metrics for a Vulkan application, the application must be launched from
the Trace Capture panel of Snapdragon Profiler. Additionally, Vulkan trace metrics require your
app to be debuggable (except on rooted devices). Set the android:debuggable flag to true in the
app’s AndroidManifest.xml.
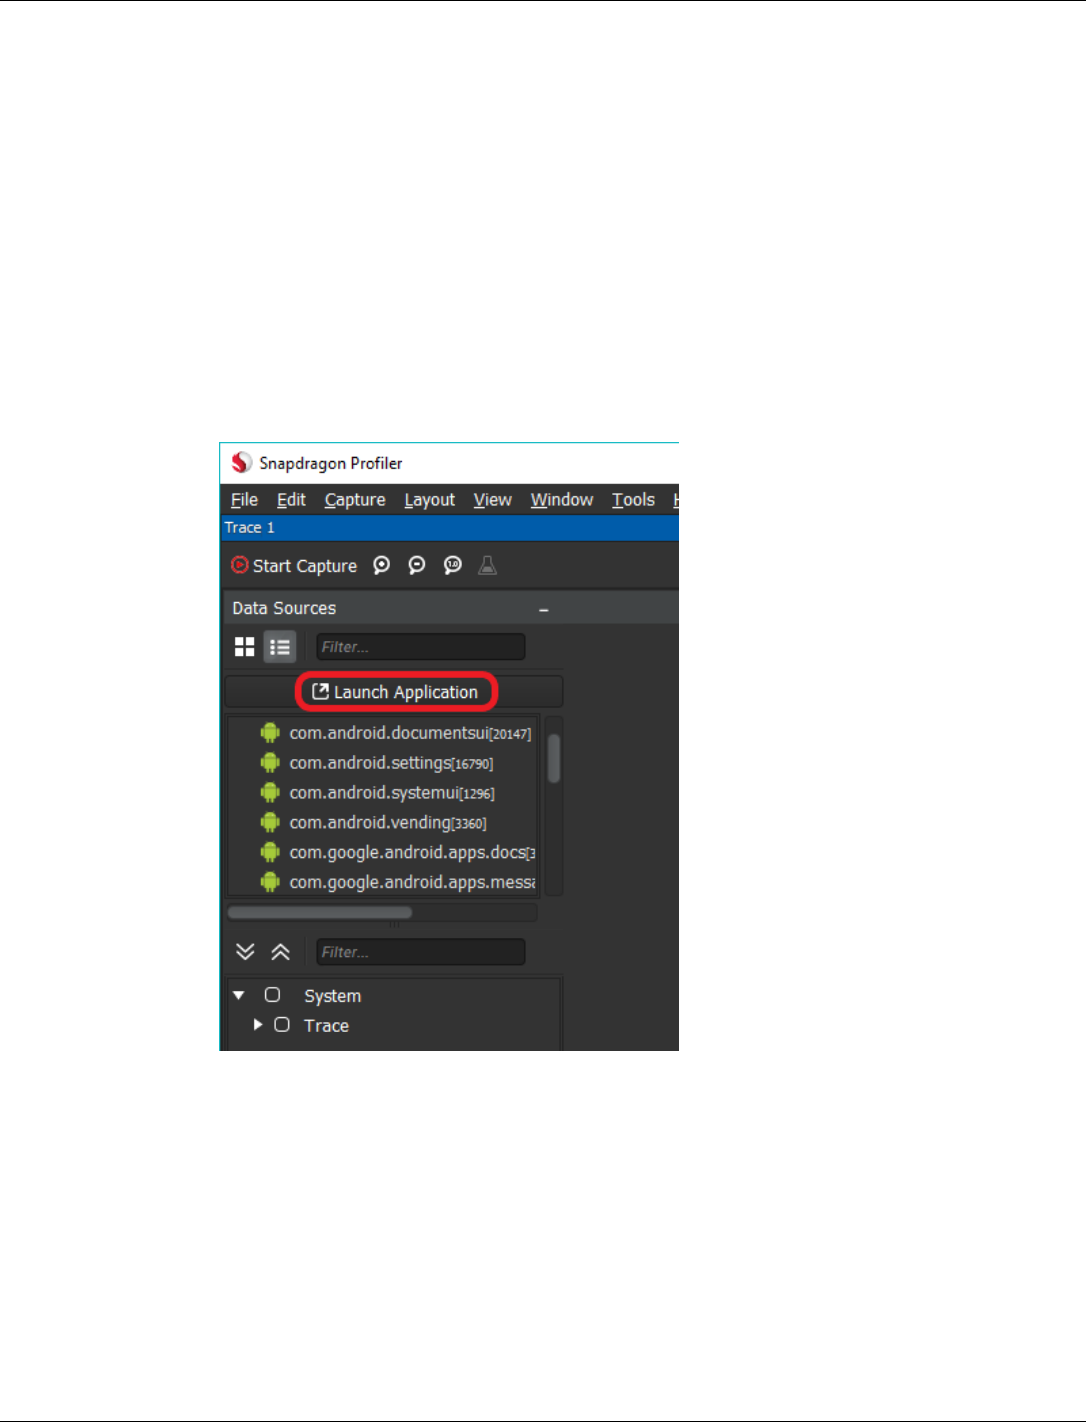
1. Follow steps 1-4 of Trace Capture basics to connect and open a new Trace Capture tab,
then click the Launch Application button in the Data Sources panel:
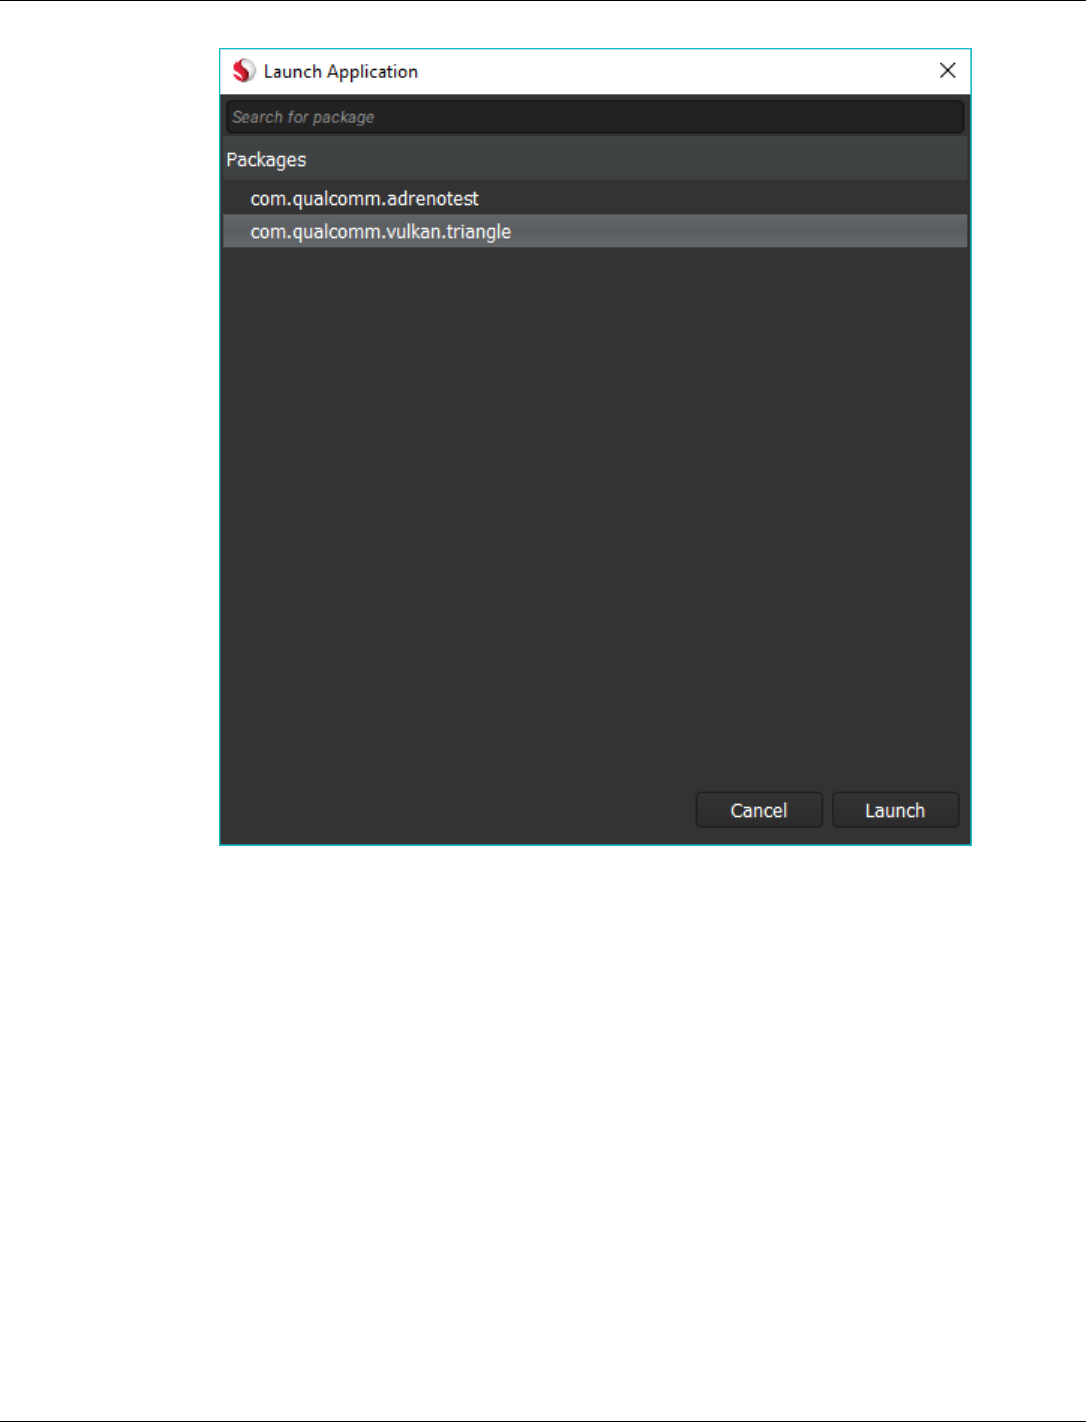
2. The Launch Application window is shown in Figure 5-3. Select an application from the
list of installed packages and click Launch. If the application is already running, it will
restart with Vulkan trace profiling enabled.
Qualcomm® Snapdragon™ Profiler User Guide Data Capture Modes
MAY CONTAIN U.S. AND INTERNATIONAL EXPORT CONTROLLED INFORMATION 30
Figure 5-3 Launch Application window
3. Proceed from step 5 of Trace Capture basics to select metrics and start a capture.
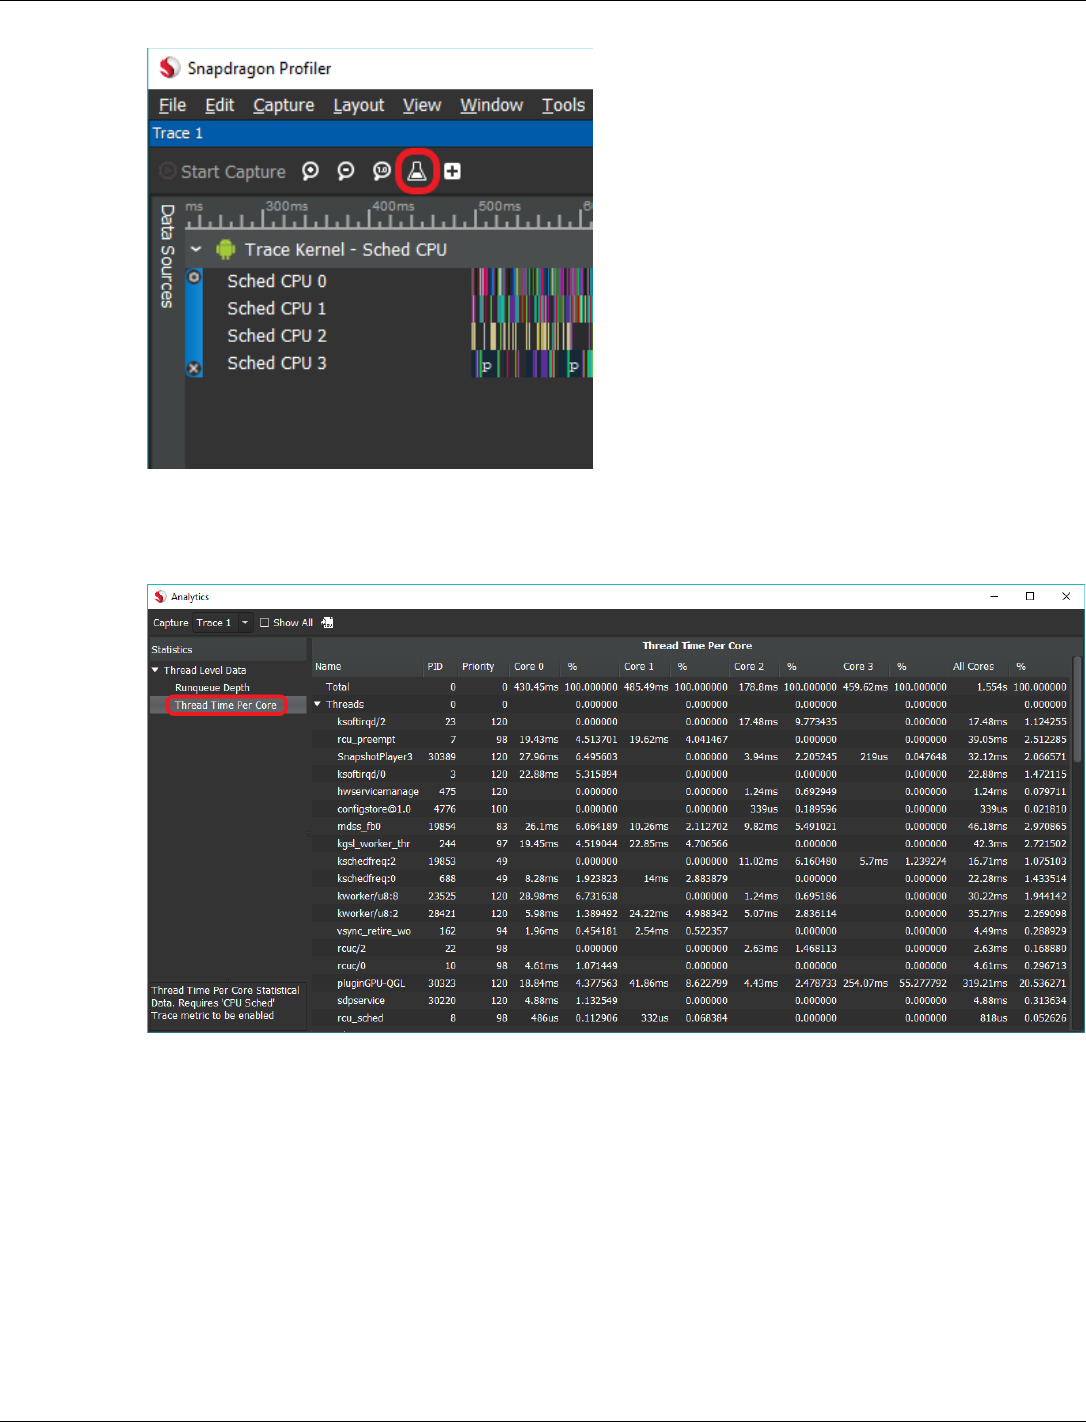
5.2.7 Analytics
Some trace metrics support additional analytics. After a trace has been captured, click the
Analytics button on the toolbar if it is enabled.
Qualcomm® Snapdragon™ Profiler User Guide Data Capture Modes
MAY CONTAIN U.S. AND INTERNATIONAL EXPORT CONTROLLED INFORMATION 32
5.3 Snapshot Capture
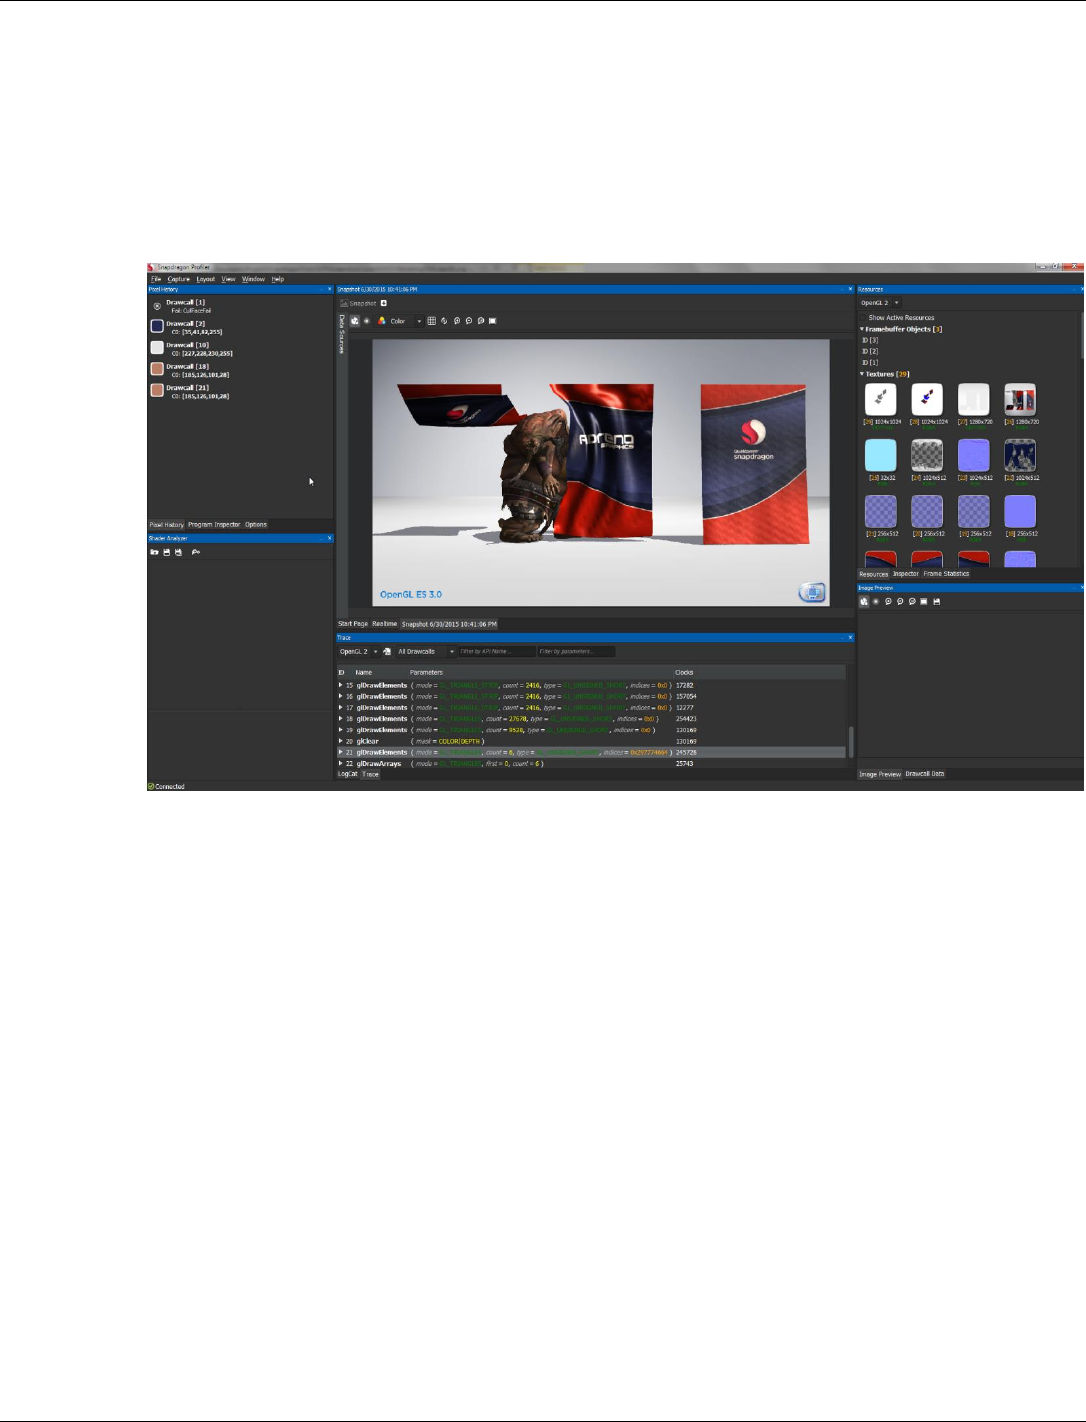
Snapshot Capture mode, shown in Figure 5-5, allows the capture of a single frame of a graphics
application. Snapshot Capture shows in detail how a scene is being rendered on the CPU.
In Snapshot Capture, choose a process to see the available metrics. Then select the metrics to
view and take a snapshot. Once the frame is captured, view the captured data and step through the
frame rendering draw call-by-draw call.
Figure 5-5 Snapshot Capture mode
5.3.1 Additional requirements
Both OpenGL ES and Vulkan apps must include android.permission.INTERNET and
android.permission.WRITE_EXTERNAL_STORAGE in the app’s AndroidManifest.xml.
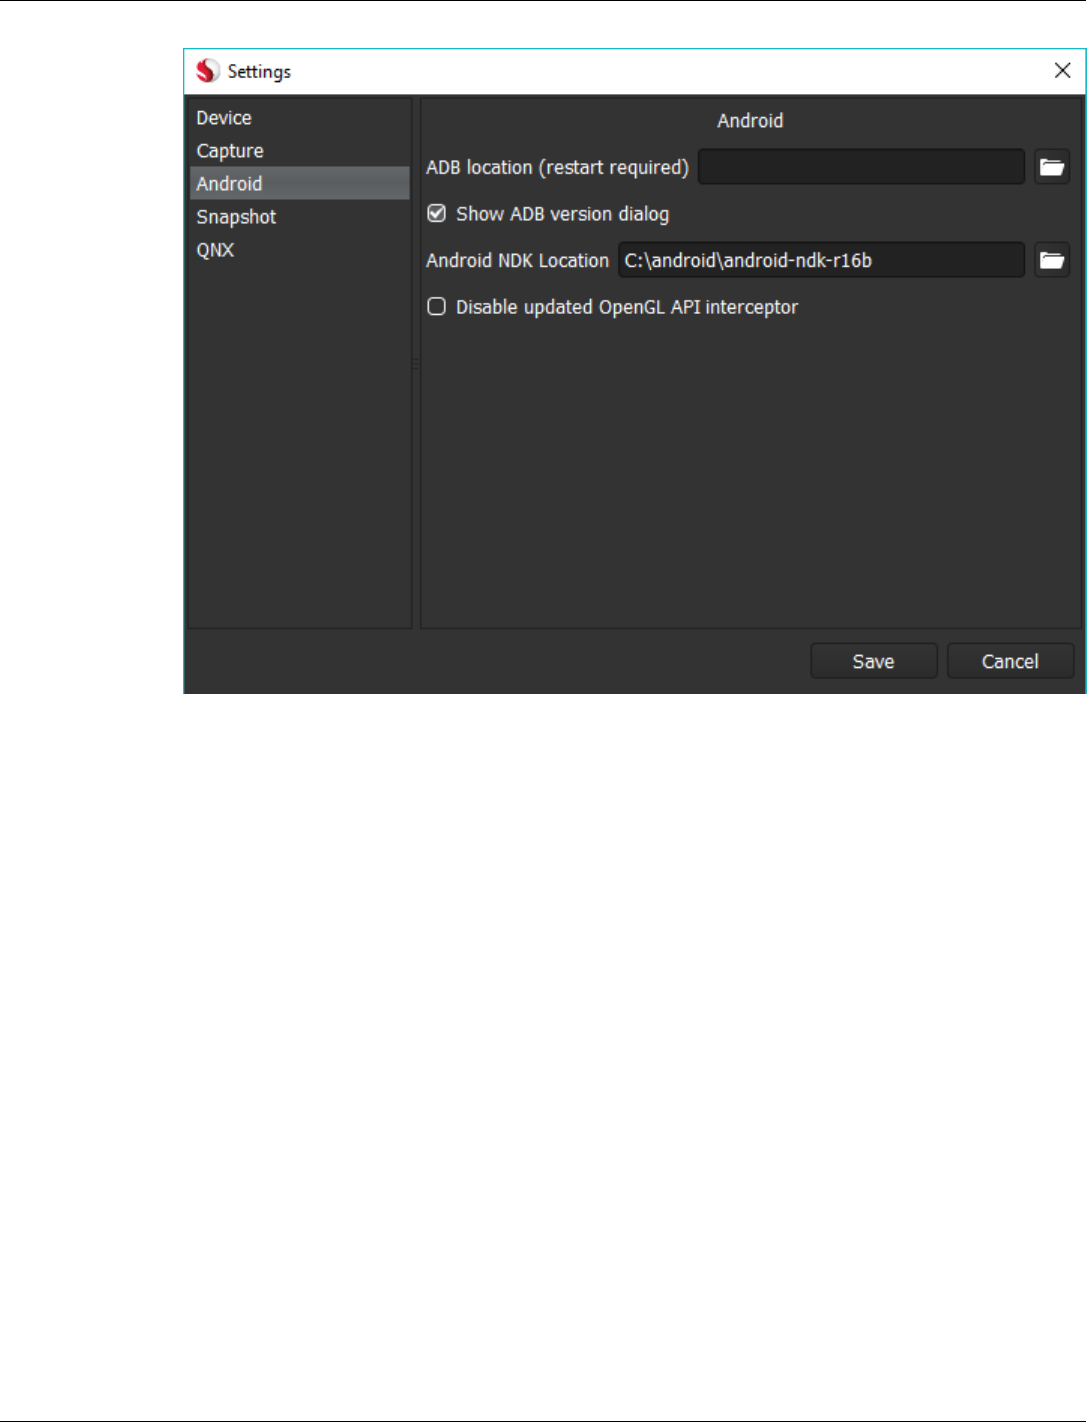
If you wish to view SPIR-V assembly in the Shader Analyzer panel for Vulkan apps, install the
Android NDK version 13b or above on the host machine and set its location in File > Settings >
Android > Android NDK Location.
5.3.2 Launch applications
The Launch Application button in the Snapshot Capture panel can be used to launch any
application installed on the target device. The implications of using this button depend on the type
of app being launched.
■ Vulkan apps must be launched using the button to enable capture of Vulkan snapshots.
■ Using the button for OpenGL ES apps will allow Snapdragon Profiler to load the most
current version of its OpenGL API interceptor library, which will enable optimal capture
functionality. When OpenGL ES apps are launched on the device without using the button,

Qualcomm® Snapdragon™ Profiler User Guide Data Capture Modes
MAY CONTAIN U.S. AND INTERNATIONAL EXPORT CONTROLLED INFORMATION 33
the API interceptor library that is pre-installed on the device will be used. Depending on the
age of that library it may lack functionality or contain bugs that have been fixed in the current
version.
■ All other apps behave the same whether they are launched from the device or with the button.
Launching an app using the Launch Application button makes uses of the Java Debug Wire
Protocol. Therefore, it is recommended to disable other debugging and profiling tools which use
JDWP when using this functionality.
5.3.3 Snapshot Capture basics
1. Check that the Android device is connected to the computer where Snapdragon Profiler is
installed and launch the Profiler (see Section 3.2).
NOTE: Snapdragon Capture mode currently only works on mobile devices with a Qualcomm
Snapdragon 805 (or later) processor and Android 6.0 (or later).
2. Choose File > Connect, or from the Start Page, click Connect to a Device to connect to a
device to start a session (see Section 3.3).
3. From the Start Page, click New Snapshot Capture, or choose Capture > New Snapshot.
Qualcomm® Snapdragon™ Profiler User Guide Data Capture Modes
MAY CONTAIN U.S. AND INTERNATIONAL EXPORT CONTROLLED INFORMATION 34
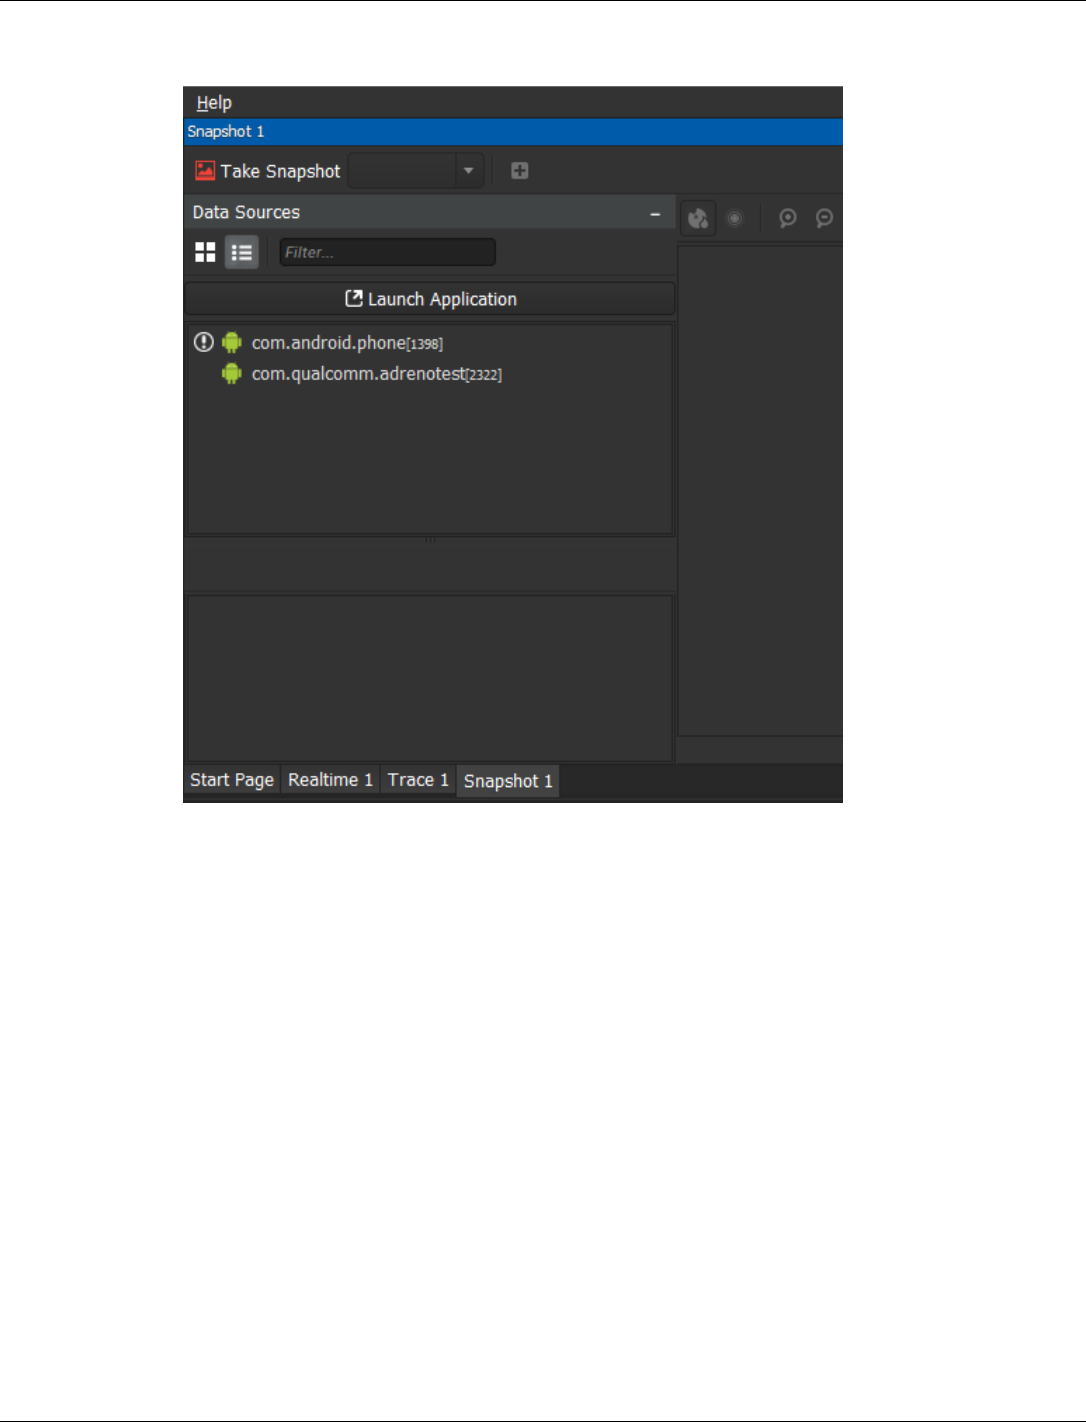
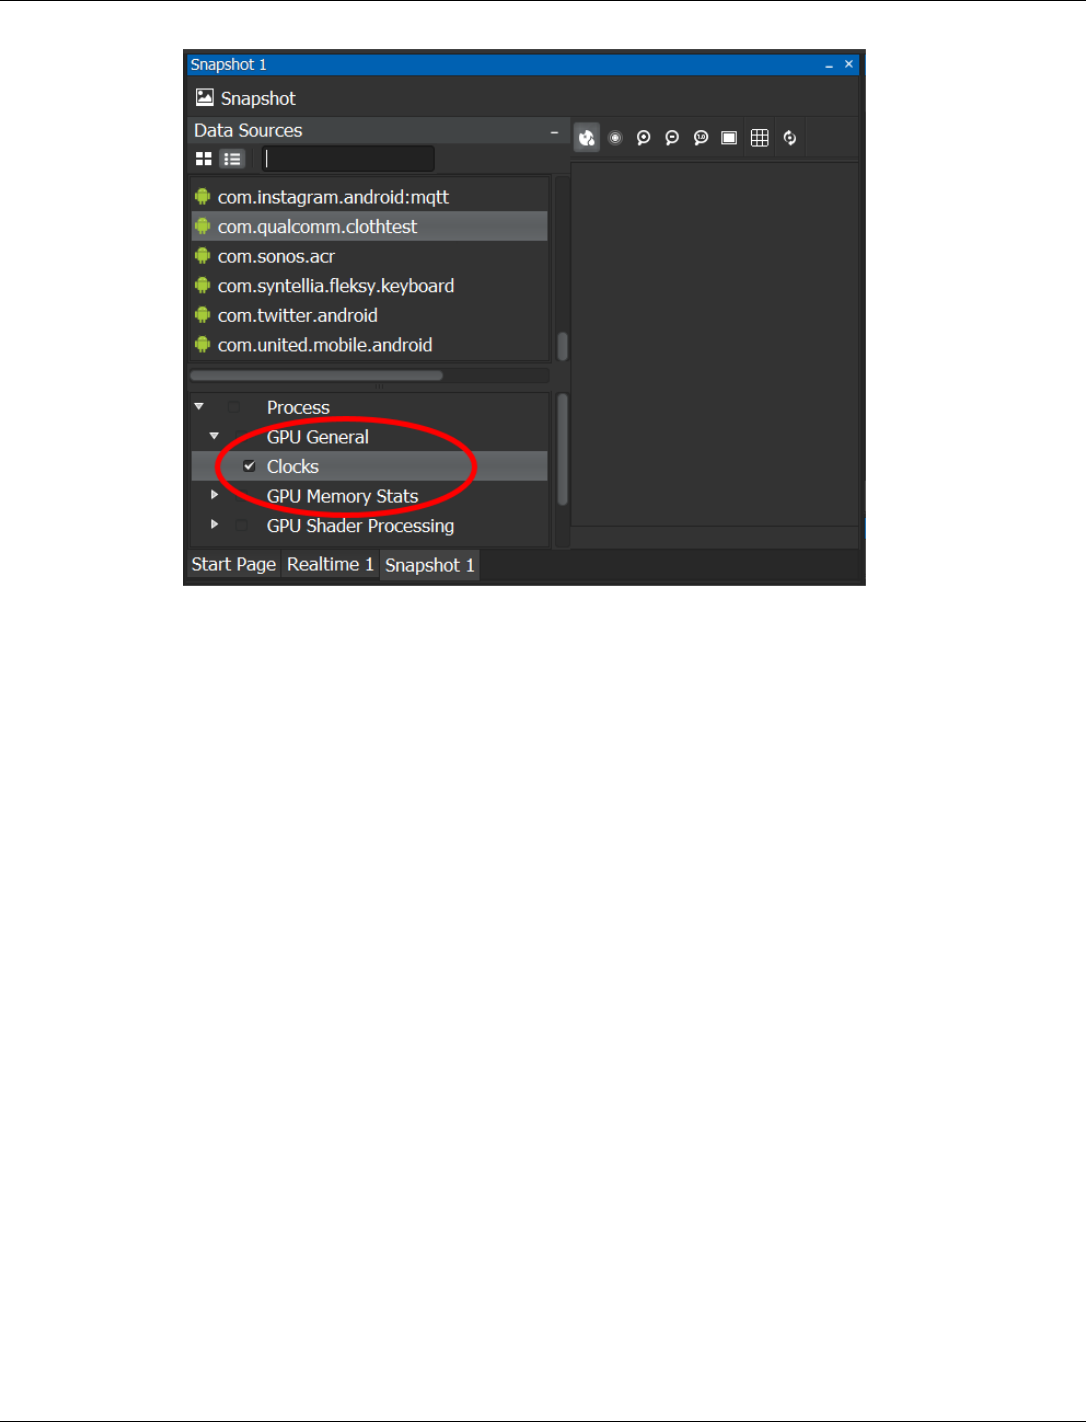
4. A new Snapshot tab is displayed:
5. From the Snapshot tab, scroll through the Data Sources list and choose a process.
6. The metrics available for the process appear in the Processes list on the lower left.
Qualcomm® Snapdragon™ Profiler User Guide Data Capture Modes
MAY CONTAIN U.S. AND INTERNATIONAL EXPORT CONTROLLED INFORMATION 35
NOTE: Vulkan Snapshot metrics for compute and secondary command buffers are not yet supported.
7. Click the metric to view in the snapshot, then click Take Snapshot to capture the frame.
8. An orange bar indicates the Profiler is retrieving the snapshot.
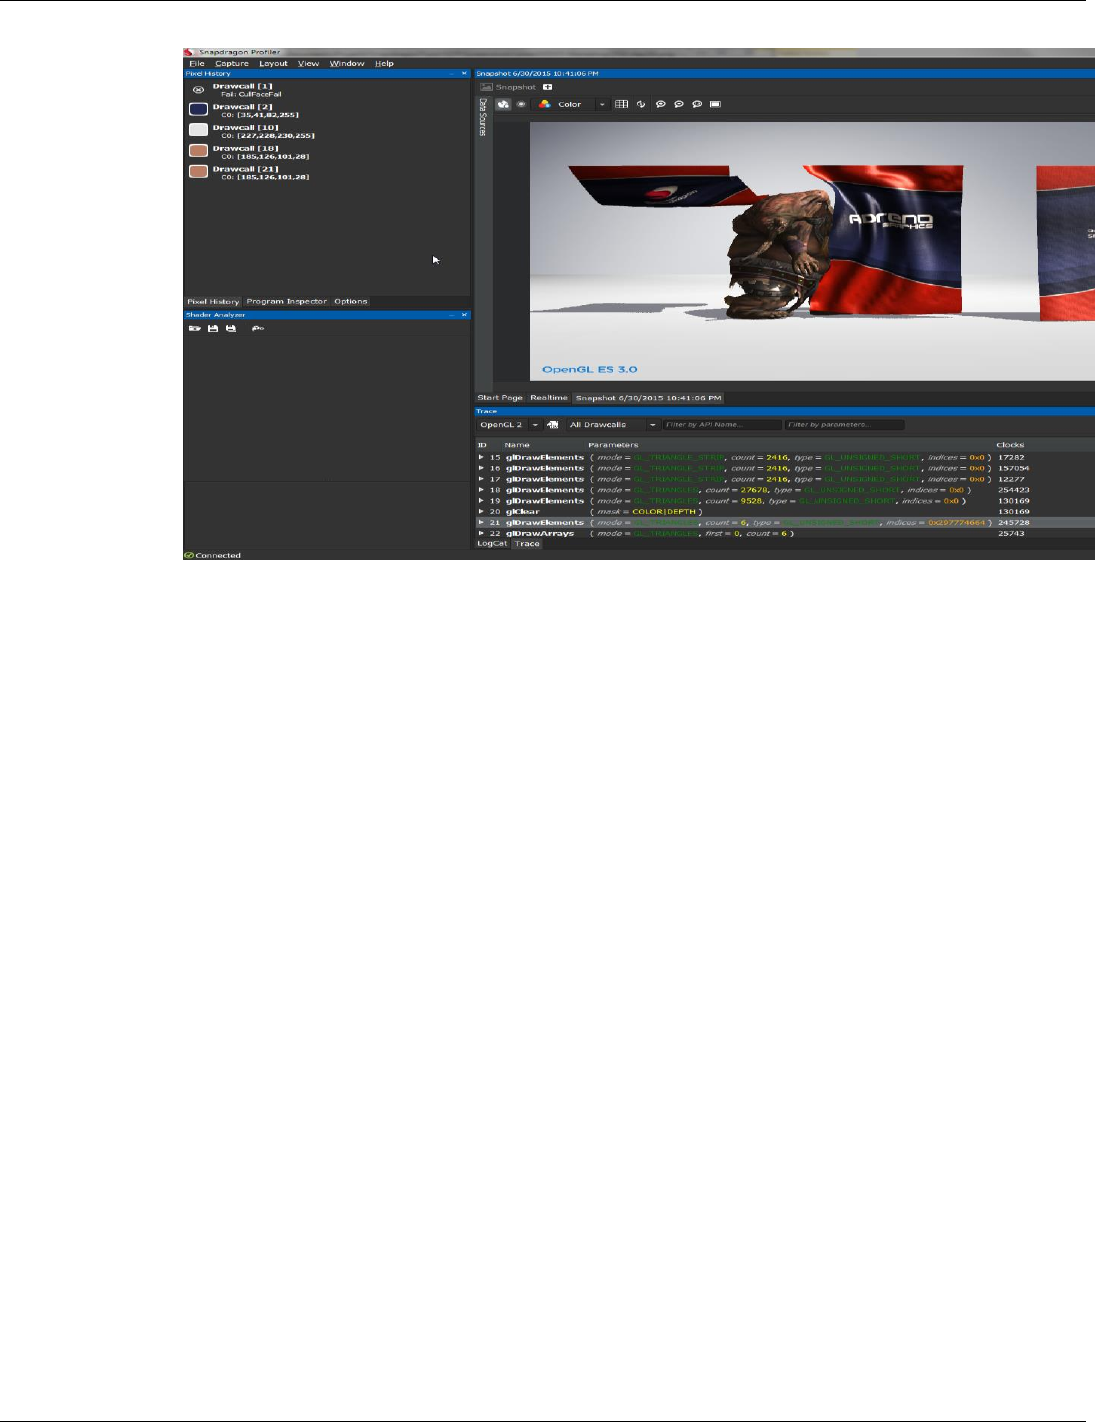
9. Once captured, view the captured data and step through the frame rendering drawcall-by-
drawcall.
Qualcomm® Snapdragon™ Profiler User Guide Data Capture Modes
MAY CONTAIN U.S. AND INTERNATIONAL EXPORT CONTROLLED INFORMATION 36
NOTE: Multiple snapshots can be taken in a session; however, Pixel History, Drawcall Replay,
and Frame Statistics are only available for the most recent Snapshot Capture.
5.3.4 Vulkan Snapshot Capture
To capture a snapshot of a Vulkan application, the application must be launched from the
Snapshot Capture panel of Snapdragon Profiler. Additionally, Vulkan Snapshot requires your
app to be debuggable (except on rooted devices). Set the android:debuggable flag to true in the
app’s AndroidManifest.xml.
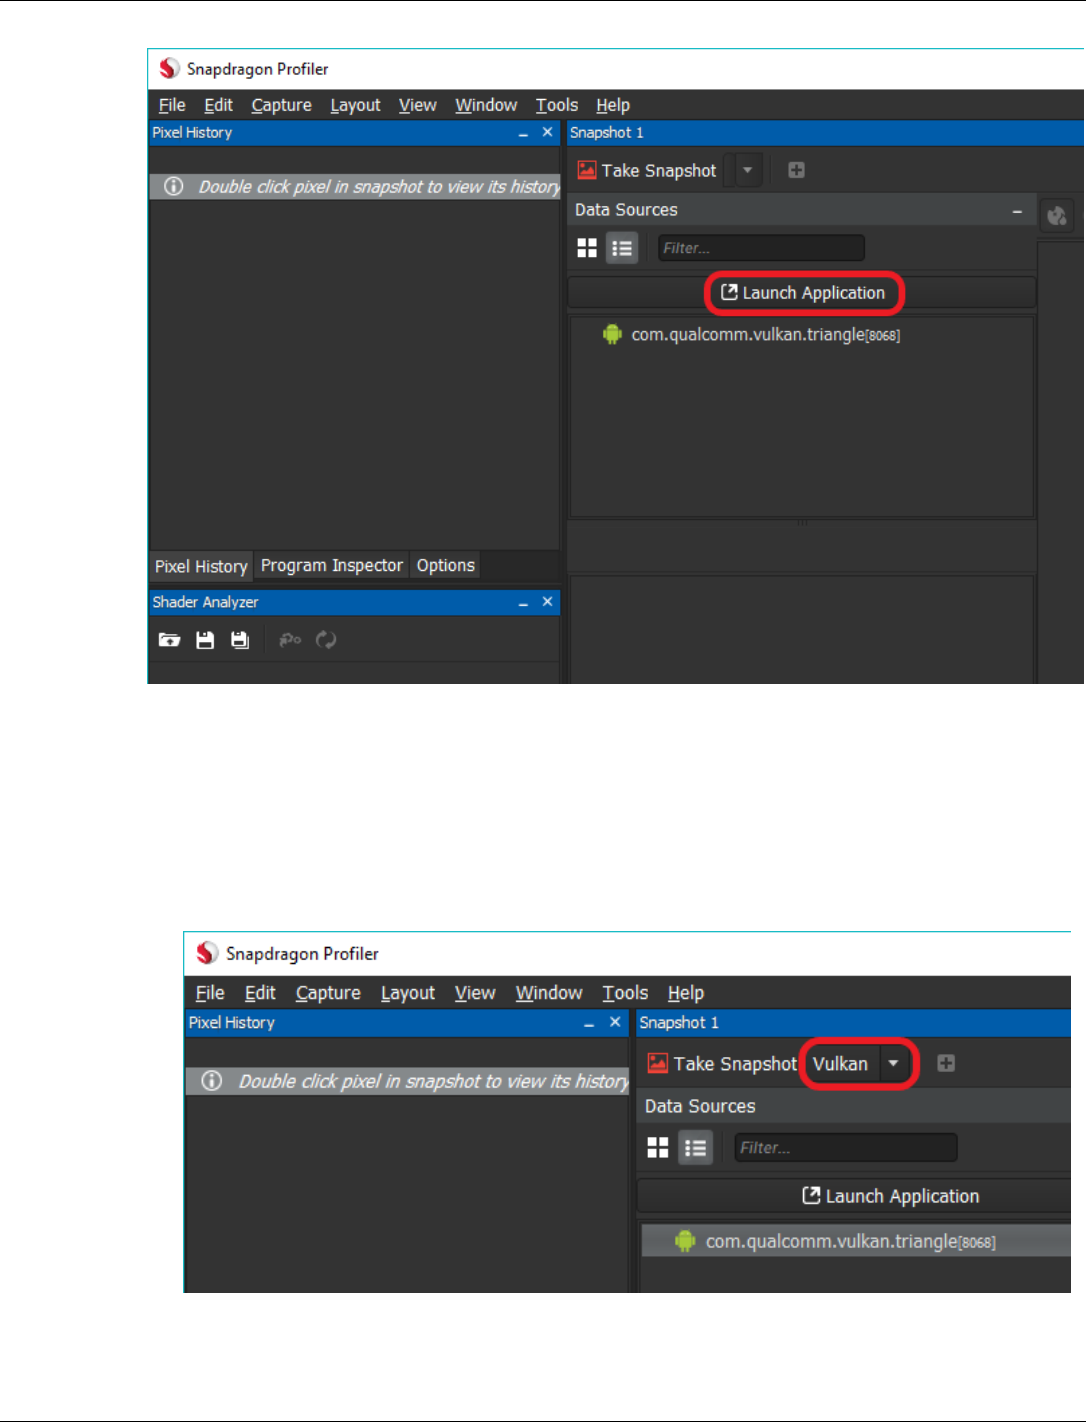
1. Follow steps 1-4 of Snapshot Capture basics to connect and open a new Snapshot Capture
tab, then click the Launch Application button in the Data Sources panel.
Qualcomm® Snapdragon™ Profiler User Guide Data Capture Modes
MAY CONTAIN U.S. AND INTERNATIONAL EXPORT CONTROLLED INFORMATION 37
2. The Launch Application window is shown in Figure 5-3. Select an application from the list
of installed packages and click Launch. If the application is already running, it will restart
with Vulkan snapshot profiling enabled.
3. Continue with step 5 of Snapshot Capture basics to select metrics and start a capture.
NOTE: If the selected application uses both OpenGL ES and Vulkan, select the graphics API you
wish to capture in the combo box next to the Take Snapshot button.
Qualcomm® Snapdragon™ Profiler User Guide Data Capture Modes
MAY CONTAIN U.S. AND INTERNATIONAL EXPORT CONTROLLED INFORMATION 38
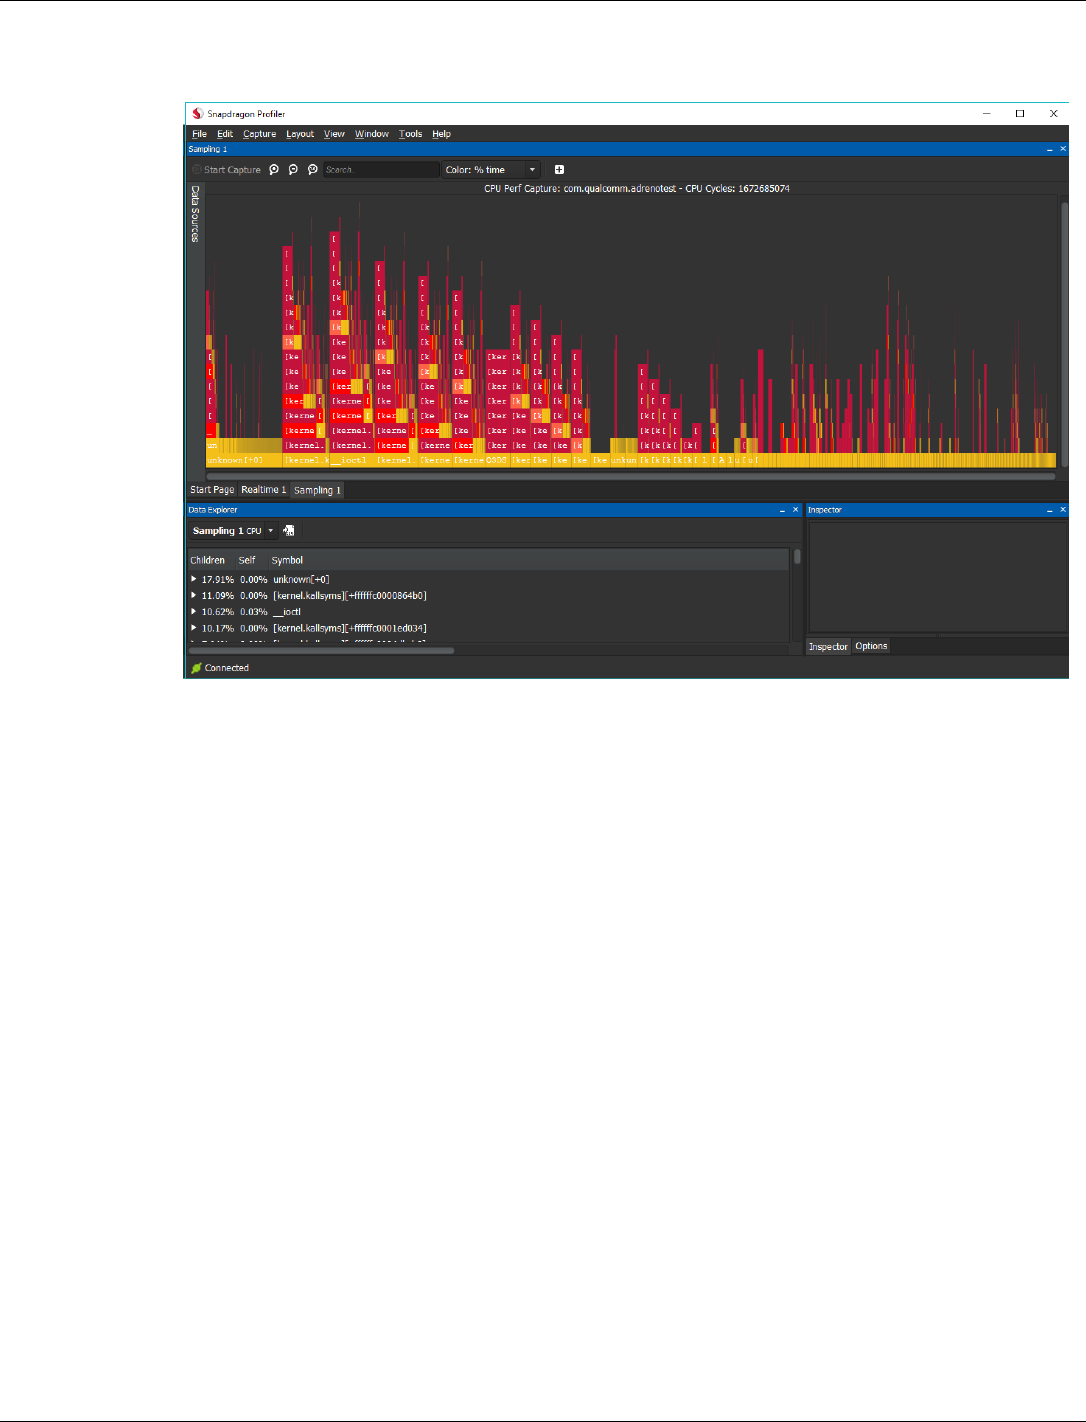
5.4 Sampling Capture
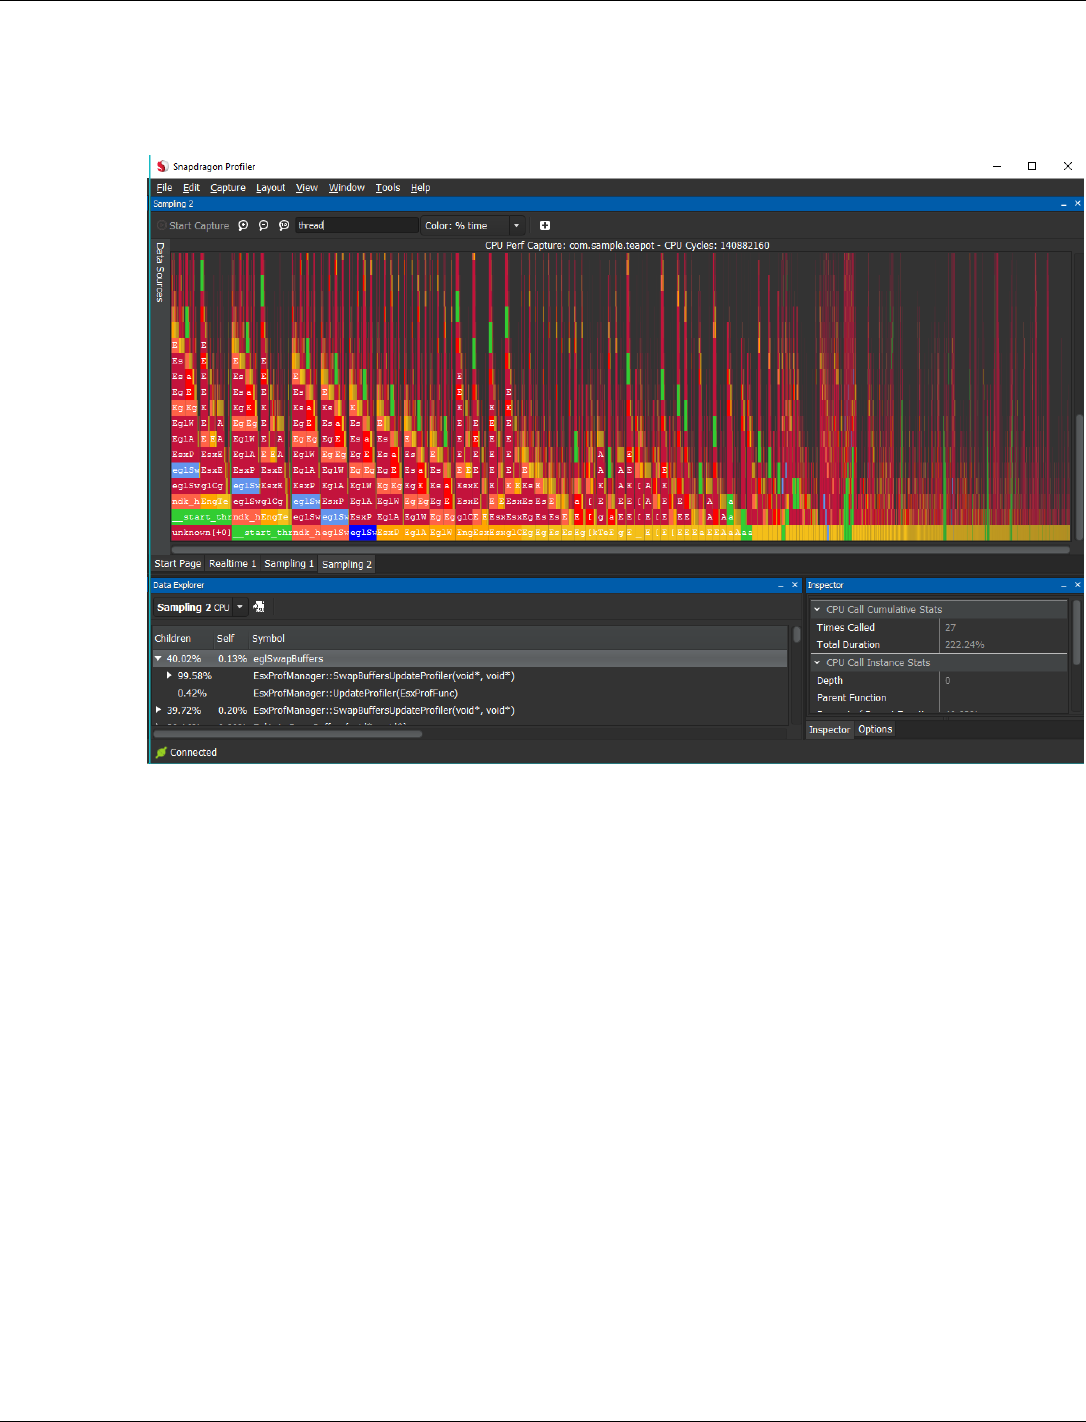
Sampling Capture mode, shown in Figure 5-6, captures a call graph for an application running on
Snapdragon powered devices.
Figure 5-6 Sampling Capture mode
5.4.1 Additional requirements
Sampling Capture requires simpleperf, which is distributed through the Android NDK starting
with revision r13b.
1. Install the Android NDK version 13b or above on the host machine.
2. Set the path to the Android NDK in the Snapdragon Profiler Settings (File > Settings >
Android > Android NDK Location) and restart Snapdragon Profiler.
Qualcomm® Snapdragon™ Profiler User Guide Data Capture Modes
MAY CONTAIN U.S. AND INTERNATIONAL EXPORT CONTROLLED INFORMATION 39
1. Simpleperf requires your app to be debuggable. Set the android:debuggable flag to true in
the app’s AndroidManifest.xml.
NOTE: Rooted Android devices do not require apps to have this flag.
5.4.2 Sampling Capture basics
1. Check that the Android device is connected to the computer where Snapdragon Profiler is
installed and launch the Profiler.
NOTE: Snapdragon Capture mode currently only works on Android 7.0 (or later)
2. Choose File > Connect, or from the Start Page, click Connect to a Device to connect to a
device to start a session.
3. From the Start Page, click New Sampling Capture, or choose Capture > New Sampling.
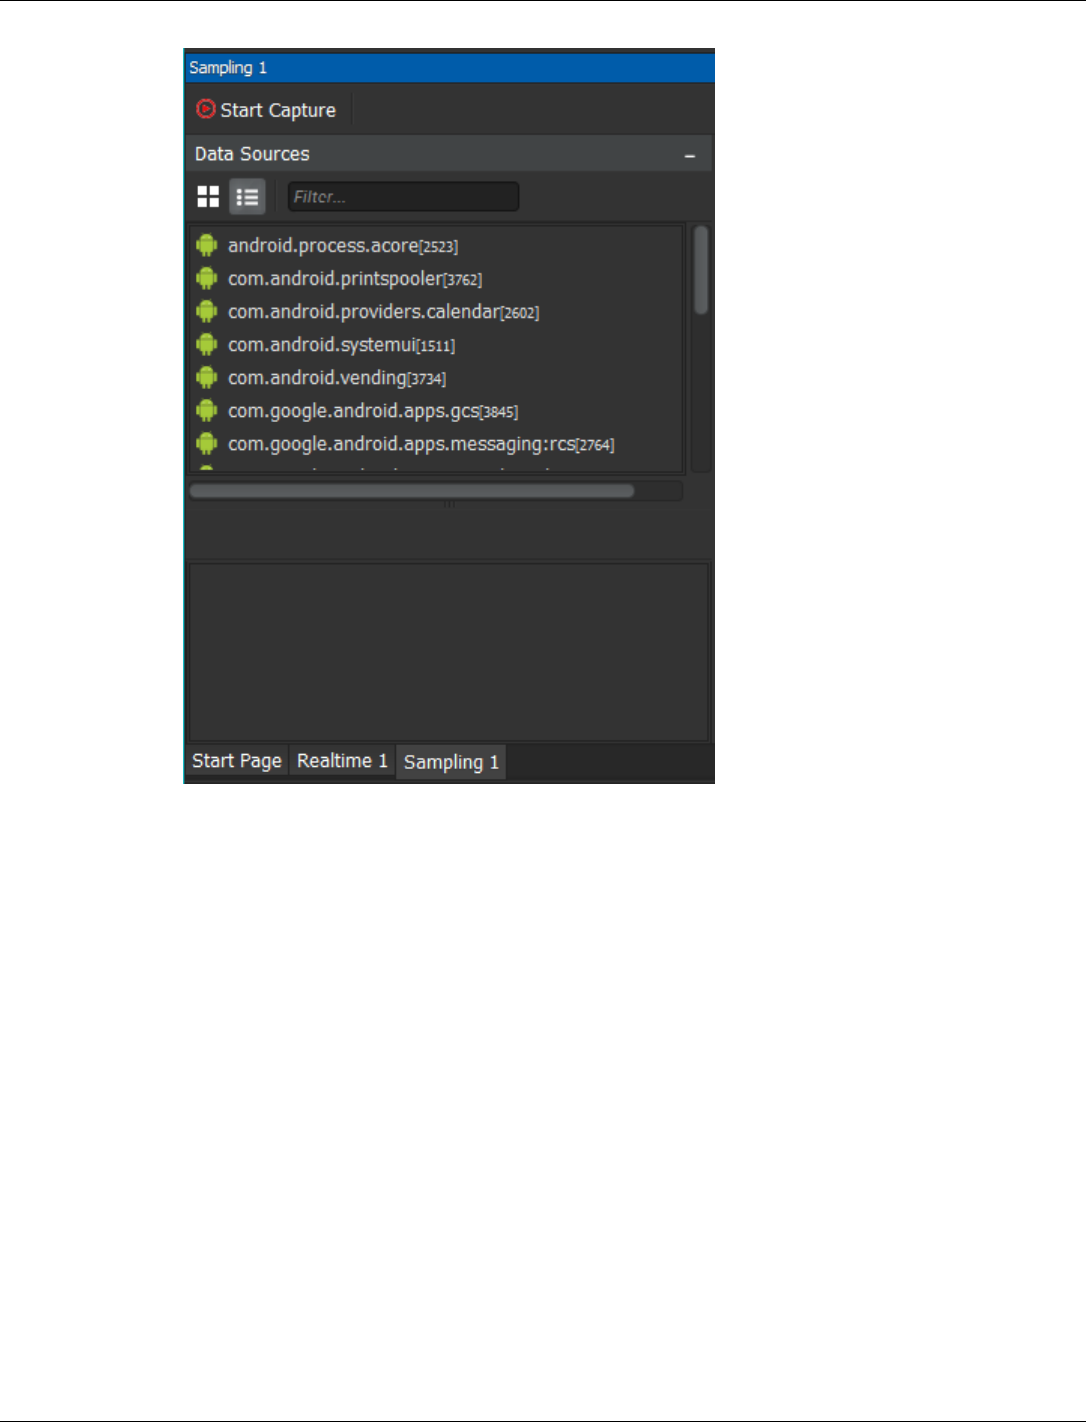
4. A new Sampling Capture tab is displayed:
Qualcomm® Snapdragon™ Profiler User Guide Data Capture Modes
MAY CONTAIN U.S. AND INTERNATIONAL EXPORT CONTROLLED INFORMATION 40
5. From the Data Sources panel, choose a process from the Process list. Also choose a Metric
specific to that process.
6. Click Start Capture to start the capture.
Qualcomm® Snapdragon™ Profiler User Guide Data Capture Modes
MAY CONTAIN U.S. AND INTERNATIONAL EXPORT CONTROLLED INFORMATION 41
7. Click Stop Capture to stop the capture after a few seconds. Snapdragon Profiler processes
and displays the call graph data in the main profiler window.

Qualcomm® Snapdragon™ Profiler User Guide Saving Captures
MAY CONTAIN U.S. AND INTERNATIONAL EXPORT CONTROLLED INFORMATION 42
6 Saving Captures
Realtime, Trace, and Snapshot Captures may be saved to disk.
1. Choose File > Save.
2. Enter a file name and select a location. Click the Save button. All captures in the session are
saved to a file with the specified name. The default extension is .sdp.
To open a saved file:
1. Choose File > Open.
2. Select a Snapdragon Profiler capture file.
3. If the file contains a single capture, it will load automatically. Otherwise, a window will open,
displaying a list of captures in the saved session. Select the capture you wish to load and click
the Open button.
4. Repeat steps 1-3 to load additional captures in a Snapdragon Profiler capture file.
NOTE: A device must be connected to open a snapshot capture. Realtime and trace captures may
be opened without a device connection.

Qualcomm® Snapdragon™ Profiler User Guide Troubleshooting
MAY CONTAIN U.S. AND INTERNATIONAL EXPORT CONTROLLED INFORMATION 43
7 Troubleshooting
This chapter provides answers to common questions about using Snapdragon Profiler. If the issue
is not addressed here, submit a question on the Qualcomm Developer Network, Snapdragon
Profiler Support Forum at: https://developer.qualcomm.com/forums/software/snapdragon-profiler
Why can’t I connect to my device?
To resolve this issue:
1. Open a command prompt or terminal and confirm that the device is set up for ADB by
running the adb devices command,
2. The device should display in the List of devices attached with a status of device (see
Section 3.2).
3. Type adb version in the command prompt to confirm that ADB version 1.0.32 or later is
installed.
Snapdragon Profiler relies on ADB to discover the connected devices. If ADB connection has
been eliminated as the issue, contact us on the Qualcomm Developer Network, Snapdragon
Profiler Support Forum at: https://developer.qualcomm.com/forums/software/snapdragon-
profiler
Why doesn’t the track have any data when I choose a real-time metric?
If a metric is chosen that doesn’t trigger system events to generate data, Snapdragon Profiler
doesn’t display any data.
Why does nothing happen when I choose my application and run a
Snapshot Capture?
Snapdragon Profiler interfaces with the graphics driver to query the information gathered in a
Snapshot for a rendered frame. Some devices may not have the driver updates required to
gather this data and properly support snapshots. Android 6.0 (or later) is required to use this
feature.

Qualcomm® Snapdragon™ Profiler User Guide Troubleshooting
MAY CONTAIN U.S. AND INTERNATIONAL EXPORT CONTROLLED INFORMATION 44
Why don’t I see FPS on my device?
To view the FPS:
1. Select the process to see new categories in the Metrics list.
2. Expand the EGL category and FPS should be one of the metric options.
NOTE: FPS only works on OpenGL ES apps running on Snapdragon 805 (or later) mobile
devices.
Why don’t I see Vulkan metrics?
To resolve this issue:
□ Confirm the device is a supported device running Android N (or an Android 6.0 device
with a graphics driver that supports Vulkan)
□ Start the app using the Launch Application button in the Trace Capture panel or
Snapshot Capture panel after connecting to Snapdragon Profiler.
Why do I see unknown symbols when I run a Sampling Capture?
Make sure to build the app to include debuggable symbols. Also, kernel symbols are not
available to user processes. More information is available in the Simpleperf Android
Developers Guide at https://developer.android.com/ndk/guides/simpleperf.html, including
how to profile Java code and apps build with Unity.
I [do not see/am getting a warning about] my Vulkan application in the Data
Sources window of Trace or Snapshot Capture.
□ Vulkan Trace metrics and Vulkan Snapshot require your app to be debuggable. Set the
android:debuggable flag to true in the app’s AndroidManifest.xml. Rooted devices do
not require apps to be debuggable. Both OpenGL ES and Vulkan apps must include
android.permission.INTERNET in the app’s AndroidManifest.xml.
□ Snapdragon Profiler makes uses of the Java Debug Wire Protocol to run an updated
graphics shim on the device. We recommend disabling Android Studio and other
debugging tools that use JDWP when starting an application from the Launch
Application window.
□ To take a Vulkan Snapshot, start (or restart) the app using the Launch Application
button in the Snapshot Capture panel after connecting to Snapdragon Profiler. Apps
launched from the Trace Capture panel must be restarted to take a snapshot.
□ To take a Trace Capture with Vulkan metrics, start (or restart) the app using the Launch
Application button in the Trace Capture panel after connecting to Snapdragon Profiler.
Apps launched from the Snapshot Capture panel must be restarted to capture Vulkan
Trace metrics.
