Freescale Semiconductor XSUWBWDK User Manual Evaluation Kit Users Guide
Freescale Semiconductor, Inc. Evaluation Kit Users Guide
UserManual.wiki
>
Freescale Semiconductor
>
XSUWBWDK User Manual
User Manual
Navigation menu
Upload a User Manual
Namespaces
Wiki Guide
HTML
PDF
Info
Views
User Manual
Discussion / Help
Navigation
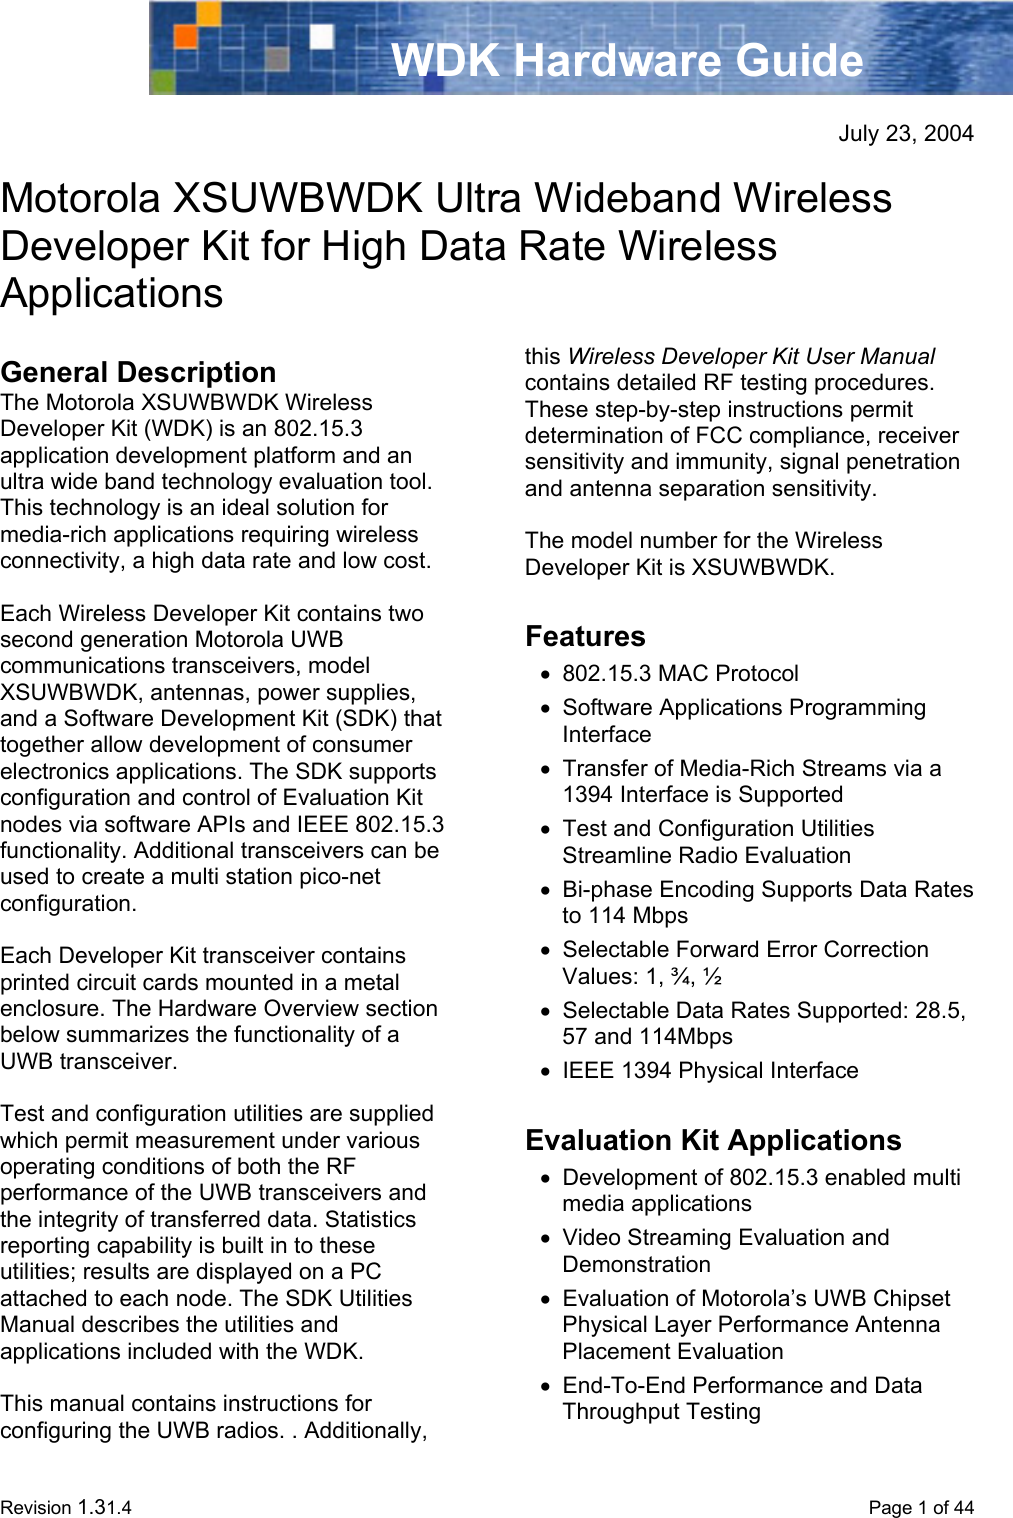

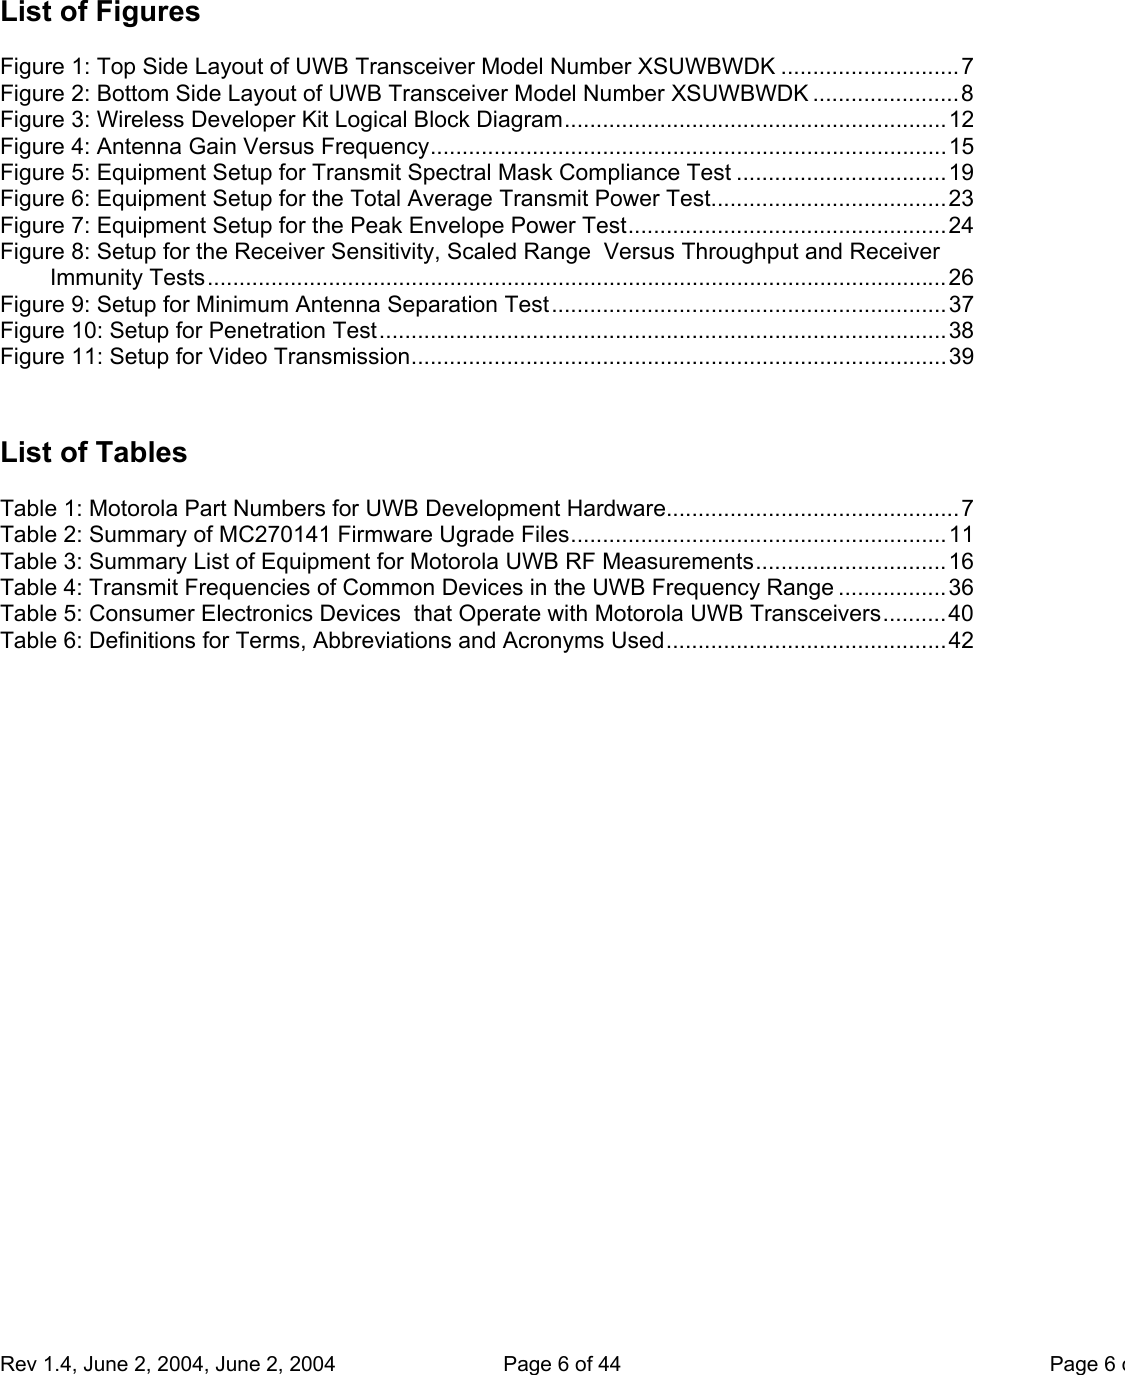
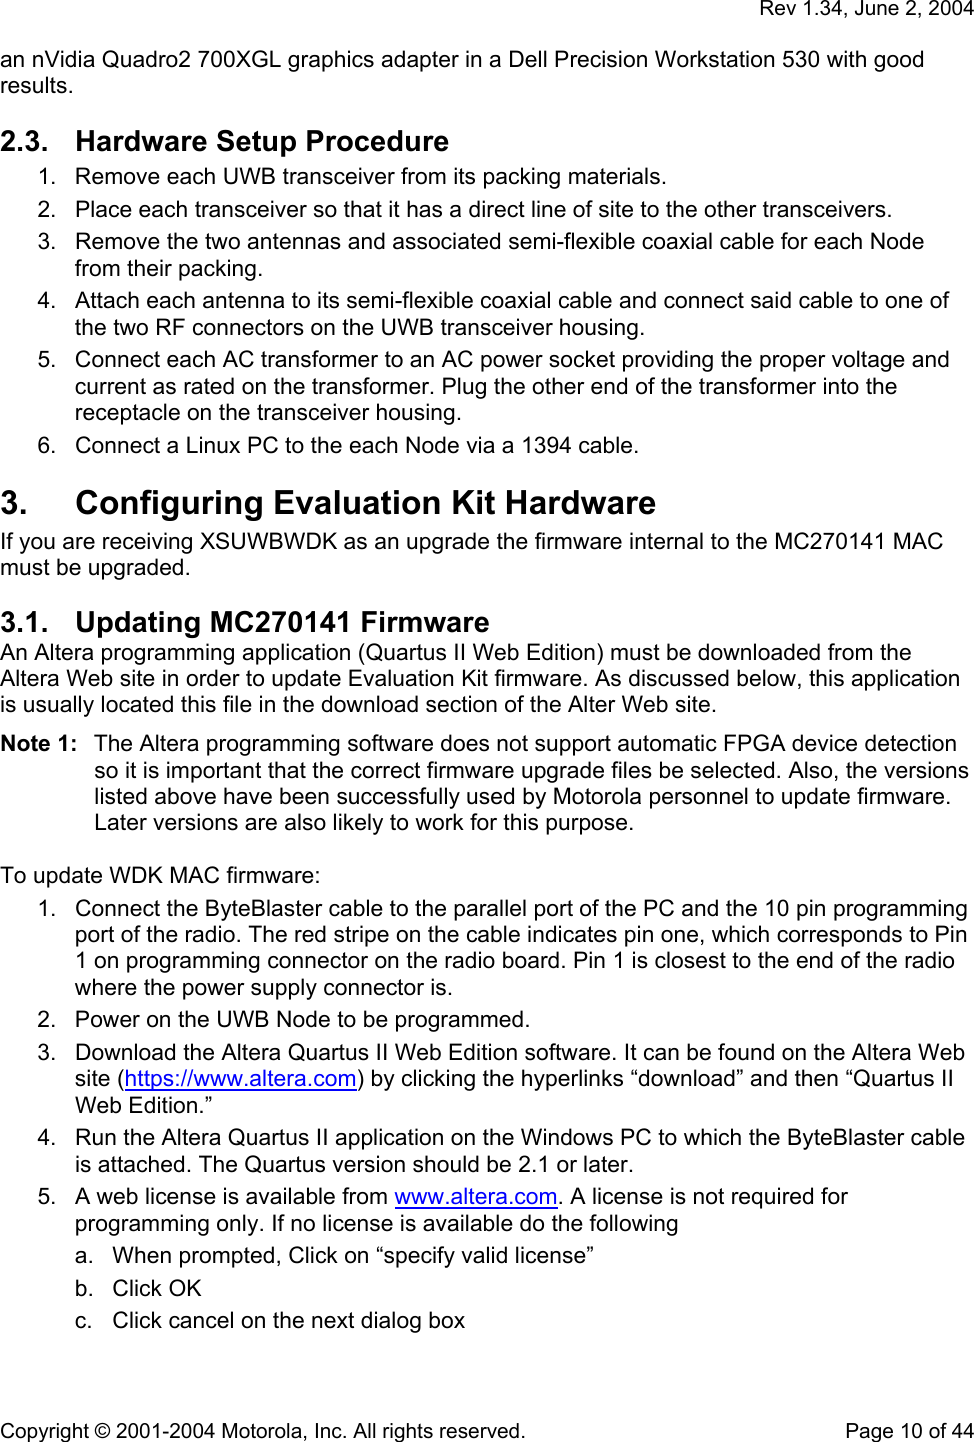
![Rev 1.34, June 2, 2004 Copyright © 2001-2004 Motorola, Inc. All rights reserved. Page 11 of 44 6. Respond No when prompted to create a new project. 7. Select Tools-> Programmer. A programming dialog box will appear. 8. Click the “Auto Detect” icon (third icon down on the vertical icon bar) on the programming dialog to cause Quartus II to query for Altera devices via JTAG. 9. Quartus II should find 2 devices and display them in the programming dialog. One will be an FPGA and the other will be an EPC16 configurator/Flash ROM. The EPC16/4/8 is used on both the 1106 and 1116 boards from Motorola/XtremeSpectrum. The PC board in a UWB Node is either an 1106 or an 1116.] The MC270141 device will be an EP1S40 on an 1116 board, or an EP20K1000C/E on an 1106 board. Note which FPGA device is present. 10. The File column for each device should say “<none>.” 11. Right click on the top listed Device (EP1S40 or EP20K1000C/E ) to bring up a context menu and select the “Change File…” entry. 12. Browse to the directory where the desired .sof and .pof files are located. Select dummy file for the top (FPGA) device. The file name will be of the form dummy_xxxx.sof file where xxxx is the number of the radio board type (either 1106 or 1116). 13. The second device should be Device EPC16/4/8 14. Right click on the second device ( EPC16/4/8) to display a context menu and select the “Change File…” entry. 15. Select one of two .pof files based on whether an EP20K1000C/E (1106 board in the UWB Node) or an EP1S40 (1116 board in the UWB Node) was listed in the programming dialog. For an EP20K1000C/E FPGA use the file named output_file_1000_tx.pof. For an EP1S40 FPGA, use the file named output_file_S40_tx.pof . 16. Click on the Program/configure check box for both devices 17. Click on the Verify box for the EPC16/4/8. 18. Click the “Start Programming” icon (top icon on the vertical bar). 19. The response should indicate success at the bottom of the screen. 20. The status of programming will be updated continuously at the bottom of the Quartus window. The programming process should take no longer than approximately three to four minutes. When it completes successfully the status will read Programming Succeeded. If programming fails, reboot the Windows PC and cycle power on the UWB Node then repeat steps 3 through 19. Table 2: Summary of MC270141 Firmware Ugrade Files Model XSUWBWDK Transceiver EPC16 Config File FPGA Config File dummy_1116.sof output_file_S40_tx.pof 3.2. Updating Evaluation Kit EEPROMs Each model XSUWBWDK Transceiver contains an EEPROM used to configure its 1394 interface and another EEPROM used during MC270141 bootup. Each of these is discussed briefly below.](https://usermanual.wiki/Freescale-Semiconductor/XSUWBWDK/User-Guide-453345-Page-11.png)