Freescale Semiconductor XSUWBWDK User Manual Evaluation Kit Users Guide
Freescale Semiconductor, Inc. Evaluation Kit Users Guide
User Manual

Revision 1.31.4 Page 1 of 44
WDK Hardware Guide
July 23, 2004
Motorola XSUWBWDK Ultra Wideband Wireless
Developer Kit for High Data Rate Wireless
Applications
General Description
The Motorola XSUWBWDK Wireless
Developer Kit (WDK) is an 802.15.3
application development platform and an
ultra wide band technology evaluation tool.
This technology is an ideal solution for
media-rich applications requiring wireless
connectivity, a high data rate and low cost.
Each Wireless Developer Kit contains two
second generation Motorola UWB
communications transceivers, model
XSUWBWDK, antennas, power supplies,
and a Software Development Kit (SDK) that
together allow development of consumer
electronics applications. The SDK supports
configuration and control of Evaluation Kit
nodes via software APIs and IEEE 802.15.3
functionality. Additional transceivers can be
used to create a multi station pico-net
configuration.
Each Developer Kit transceiver contains
printed circuit cards mounted in a metal
enclosure. The Hardware Overview section
below summarizes the functionality of a
UWB transceiver.
Test and configuration utilities are supplied
which permit measurement under various
operating conditions of both the RF
performance of the UWB transceivers and
the integrity of transferred data. Statistics
reporting capability is built in to these
utilities; results are displayed on a PC
attached to each node. The SDK Utilities
Manual describes the utilities and
applications included with the WDK.
This manual contains instructions for
configuring the UWB radios. . Additionally,
this Wireless Developer Kit User Manual
contains detailed RF testing procedures.
These step-by-step instructions permit
determination of FCC compliance, receiver
sensitivity and immunity, signal penetration
and antenna separation sensitivity.
The model number for the Wireless
Developer Kit is XSUWBWDK.
Features
• 802.15.3 MAC Protocol
• Software Applications Programming
Interface
• Transfer of Media-Rich Streams via a
1394 Interface is Supported
• Test and Configuration Utilities
Streamline Radio Evaluation
• Bi-phase Encoding Supports Data Rates
to 114 Mbps
• Selectable Forward Error Correction
Values: 1, ¾, ½
• Selectable Data Rates Supported: 28.5,
57 and 114Mbps
• IEEE 1394 Physical Interface
Evaluation Kit Applications
• Development of 802.15.3 enabled multi
media applications
• Video Streaming Evaluation and
Demonstration
• Evaluation of Motorola’s UWB Chipset
Physical Layer Performance Antenna
Placement Evaluation
• End-To-End Performance and Data
Throughput Testing

Rev 1.31.4, June 2, 2004 Page 2 of 44
Revision Table
Rev Date Person Description
0.7 Aug 1, 2003 EHB Document redone to become combined SDK & transceiver User
Manual.
0.8 Aug 4, 2003 EHB Added DME, and video sender commands in sections 4.3.4 and 4.4.
4. Modified section 1.5, Linux Installation Procedures. Updated all
figures
0.9 Aug 15, 2003 EHB Corrected DME explanations. Removed DIP switch configuration.
0.9.2 Oct 5, 2003 EHB Corrected networking description. Added descriptions of recvfile,
sendchk, recvchk applications.
1.0 Oct 24, 2003 MSG Revised section describing SDK applications including sendfile,
recvfile, sendchk, recvchk, dme, stats, mode, config, etc.
1.1 Jan 30, 2004 MSG Placed descriptions of configuration and control utilities into
separate SDK Utilities Guide. Updated hardware description to
cover 1106- and 1116-based WEKs and added appropriate
diagrams. Added Motorola part numbers for WDK. Added to and
edited glossary and references sections.
1.2 Feb 5, 2004 MSG/EHB Changed XSI, XtremeSpectrum and associated terminology to
Motorola. Updated part numbers. Updated expected results in
sections Spectral Mask Compliance, Average Transmit Power, Peak
Envelope Power, and Video Transmission/Reception test sections.
Changed “FCC Non-Compliance Statement” section to “FCC
Compliance Statement” and updated the text.
1.3 June 2, 2004 MSG Updated firmware download description in section 3.1 to use
Quartus II Web edition. Corrected dme map_send_stream and
dme map_receive_stream syntax descriptions. Fixed usage of
mode and config commands (config works only in bridge mode)
in PHY evaluation procedures. Updated list of CE devices that work
with UWB Nodes. Corrected UWB chipset part numbers in Figure 3.
Assigned part number MC270141 to MAC FPGA. Suggested use of
a Motorola antenna in section 4.3 to assure FCC compliance. Added
ESIB to Table 3 and notes regarding frequency domain
measurements using the ESIB to section 5.4. Edited FCC
compliance statement. Added additional references to section 12.
Changed connector labels in Figure 1 & Figure 2 to reverse SMA,
1.4 July 23, 2004 MLS Corrected manual to comply with FCC written comments received
July 21, 2004. Section 4.3 was amended to allow use of only FCC
approved antennas with this product; confidential markings were
removed; the available software was re-verified to ensure device
may not operate any differently than what is approved (statement
also added in Section 8); a Declaration of Conformity (DOC) was
added to Section 8; complete calculation of the peak measurement
at the frequency of the highest emission (Fm, 4.1556 GHz) showing
all correction factors (antenna, distance ….) in the receiver for this
frequency was provided separately; and compliance with Section
15.517(a)5 was indicated in Section 4.1.
Rev 1.4, June 2, 2004, June 2, 2004 Page 3 of 44 Page 3
o
Copyright © 2001-2004 Motorola, Inc. All rights reserved.
XtremeSpectrumTM and the XtremeSpectrum logo are trademarks of XtremeSpectrum, Inc.
Sony is either a registered trademark or trademark of Sony Corporation in the United States
and/or other countries. JVC is either a registered trademark or trademark of Victor Company of
Japan, Limited in the United States and/or other countries. nVIDIA® is a registered trademark
and Quadro is a trademark of nVIDIA Corporation. DirectX®, Microsoft® and Windows® are
either registered trademarks or trademarks of Microsoft Corporation in the United States and/or
other countries. Altera, ByteBlaster and MAX+PLUS are either trademarks or registered
trademarks of Altera Corporation.
Rev 1.4, June 2, 2004, June 2, 2004 Page 4 of 44 Page 4
o
Table of Contents
1. Overview .............................................................................................................................................. 7
1.1. Explanation of Model and Part Numbers ............................................................................... 7
1.2. Mechanical Layout ....................................................................................................................7
1.3. Applicability of This Manual....................................................................................................8
2. Installation and Setup ......................................................................................................................... 8
2.1. Items Supplied by Motorola .....................................................................................................8
2.2. User Supplied Items .................................................................................................................. 9
2.2.1. PC Attributes Used for PHY Testing Only......................................................................... 9
2.2.2. PC Attributes Used for Streaming Video Display .............................................................. 9
2.3. Hardware Setup Procedure .................................................................................................... 10
3. Configuring Evaluation Kit Hardware.............................................................................................10
3.1. Updating MC270141 Firmware .............................................................................................10
3.2. Updating Evaluation Kit EEPROMs..................................................................................... 11
3.2.1. 1394 Configuration EEPROM..........................................................................................12
3.2.2. MAC Serial Boot EEPROM ............................................................................................. 12
4. Evaluation Kit Hardware Description .............................................................................................. 12
4.1. MAC Subsystem Overview ..................................................................................................... 13
4.2. PHY Subsystem Overview ...................................................................................................... 14
4.3. The Motorola Antenna............................................................................................................14
4.4. Enclosure .................................................................................................................................. 15
5. PHY Evaluation Using the Wireless Developer Kit ......................................................................... 15
5.1. Summary List of Test Hardware and Software Required................................................... 15
5.2. Equipment Handling ............................................................................................................... 18
5.2.1. Attaching and Detaching SMA Connectors......................................................................18
5.2.2. Avoiding Equipment Damage Due to Electrostatic Discharge.........................................18
5.2.3. Attaching the Motorola Antenna to a Transceiver............................................................ 18
5.3. Guidelines for Running Tests ................................................................................................. 18
5.3.1. Order of Configuration and Test Command Execution.................................................... 18
5.3.2. Statistics Display on a PC Connected to a Transceiver .................................................... 19
5.4. Transmit Spectral Mask Compliance Test............................................................................ 19
5.5. Total Average Transmit Power Test...................................................................................... 23
5.6. Peak Envelope Power Test...................................................................................................... 24
5.7. Receiver Sensitivity and Scaled Ranged Versus Throughput Test ..................................... 25
5.8. Receiver Immunity Test..........................................................................................................33
5.9. Minimum Antenna Separation Test ......................................................................................36
Rev 1.4, June 2, 2004, June 2, 2004 Page 5 of 44 Page 5
o
5.10. Penetration Test....................................................................................................................... 38
5.11. Video Transmission and Reception........................................................................................ 38
6. Operating Conditions and Characteristics ....................................................................................... 40
6.1. AC Power Consumption ......................................................................................................... 40
6.2. Temperature Range and Humidity Conditions .................................................................... 40
6.3. IEEE 1394 Modes Supported ................................................................................................. 40
7. Support............................................................................................................................................... 41
8. FCC Compliance Statement/Declaration of Conformity................................................................. 41
9. License Agreement ............................................................................................................................ 42
10. Warranty Disclaimer..................................................................................................................... 42
11. Glossary ......................................................................................................................................... 42
12. References ..................................................................................................................................... 43
13. Appendix A – Sources for Leasing of Test Equipment................................................................ 44
Rev 1.4, June 2, 2004, June 2, 2004 Page 6 of 44 Page 6
o
List of Figures
Figure 1: Top Side Layout of UWB Transceiver Model Number XSUWBWDK ............................7
Figure 2: Bottom Side Layout of UWB Transceiver Model Number XSUWBWDK .......................8
Figure 3: Wireless Developer Kit Logical Block Diagram............................................................12
Figure 4: Antenna Gain Versus Frequency.................................................................................15
Figure 5: Equipment Setup for Transmit Spectral Mask Compliance Test .................................19
Figure 6: Equipment Setup for the Total Average Transmit Power Test.....................................23
Figure 7: Equipment Setup for the Peak Envelope Power Test..................................................24
Figure 8: Setup for the Receiver Sensitivity, Scaled Range Versus Throughput and Receiver
Immunity Tests....................................................................................................................26
Figure 9: Setup for Minimum Antenna Separation Test..............................................................37
Figure 10: Setup for Penetration Test.........................................................................................38
Figure 11: Setup for Video Transmission....................................................................................39
List of Tables
Table 1: Motorola Part Numbers for UWB Development Hardware..............................................7
Table 2: Summary of MC270141 Firmware Ugrade Files...........................................................11
Table 3: Summary List of Equipment for Motorola UWB RF Measurements..............................16
Table 4: Transmit Frequencies of Common Devices in the UWB Frequency Range .................36
Table 5: Consumer Electronics Devices that Operate with Motorola UWB Transceivers..........40
Table 6: Definitions for Terms, Abbreviations and Acronyms Used............................................42
Rev 1.4, June 2, 2004, June 2, 2004
Copyright © 2001-2004 Motorola, Inc. All rights reserved. Page 7 of 44
1. Overview
1.1. Explanation of Model and Part Numbers
The model XSUWBWDK UWB transceiver contains a single PC board in an aluminum
enclosure approximately 6 X 4.5 X 1.25 inches in size. Table 1 gives Motorola part numbers and
descriptions.
Table 1: Motorola Part Numbers for UWB Development Hardware
Motorola Part Number Description
XSUWBAR A single UWB transceiver plus associated components such as antenna and
IEEE1394 cables, UWB antennas, etc.
XSUWBWDK Two UWB transceivers and associated components such as antenna and
IEEE1394 cables, antennas, CDROM, etc.
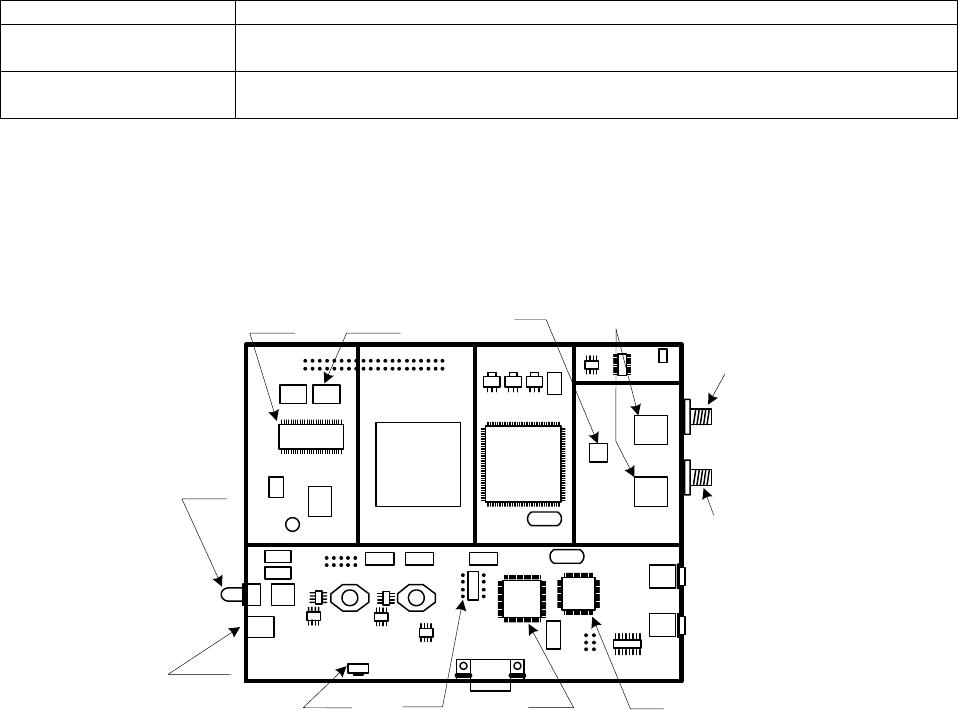
1.2. Mechanical Layout
Figure 1 shows a top view of a model XSUWBWDK UWB transceiver with the top cover
removed. It is shown in this manner only for reference. There is generally no reason to remove
the top cover.
Reverse
SMA
Connectors
XSI123
MC270141
MAC
1394 Section
Power
Supply
RS232
Port
1394 Config
EEPROM
1394
Link IC
1394
PHY IC
MAC
Serial
Boot
EEPROM
XSI113 RF
Transceiver Filters
PLL
1394
Connectors
SRAM
Reset
Switch
Power
LED
5 VDC
Input
Ant1
(Receive Only)
Ant2
(Receive and
Transmit)
Figure 1: Top Side Layout of UWB Transceiver Model Number XSUWBWDK
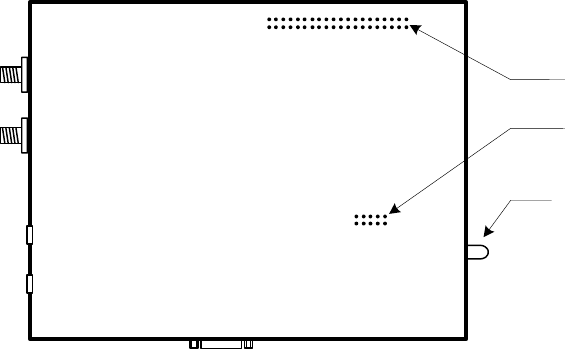
Figure 2 depicts the bottom of a model XSUWBWDK UWB transceiver with the bottom cover in
place. There is no reason to remove the bottom cover.
Rev 1.34, June 2, 2004
Copyright © 2001-2004 Motorola, Inc. All rights reserved. Page 8 of 44
Power
LED
JTAG
Connector
Reverse
SMA
Connectors
1394
Connectors
RS232
Port
Reserved
Connector
Figure 2: Bottom Side Layout of UWB Transceiver Model Number XSUWBWDK
1.3. Applicability of This Manual
This WDK Hardware Guide is intended for use with:
• UWB transceivers having a model number of XSUWBWDK.
• Version 2.0 or later of the Motorola XtremeSpectrum Software Development Kit.
2. Installation and Setup
2.1. Items Supplied by Motorola
A single Wireless Developer Kit contains the following items:
• Two model XSUWBWDK UWB transceivers in metal enclosures.
• Four UWB antennas.
• Four semi-flexible coaxial cables for connection of the Motorola antenna to a UWB
transceiver.
• Two +5 VDC power supplies that accept 110 – 240 VAC input.
• Two IEEE1394 cables, each with four pin connectors on the ends.
• An SDK CDROM.. For the content of this CDROM, see the XtremeSpectrum Software
• Motorola UWB Software Development Kit Utilities Guide.
• A special cable for updating firmware used by the MC270141 MAC internal to the
Evaluation Kit. This ByteBlasterTM cable is manufactured by Altera Corporation. Note that
this cable is supplied only to customers who have not received one previously from
Motorola.
The minimum, and default, system configuration shipped by Motorola consists of two UWB
transceivers. Additional transceivers can be purchased to form a multi-point configuration. Setup
and use of such a configuration is covered in more detail in section 3.
Note: The expression “Wireless Developer Kit”, or WDK, refers to the complete set of
hardware and software deliverables from Motorola. The expression “Software
Rev 1.34, June 2, 2004
Copyright © 2001-2004 Motorola, Inc. All rights reserved. Page 9 of 44
Developer Kit”, or SDK, specifically refers to the 802.15.3 SAPs and applications
located in the directory ../XSUWBWDK-m.n.bxy/SDK.
2.2. User Supplied Items
• Two Linux PCs. If the transceiver will be used for PHY testing only, see section 2.2.1 for
PC attributes. If the transceiver will decode and display streaming video, see section
2.2.2.
• Unencrypted video clips encoded in an MPEG-2 HD transport stream format.
• RF cables and associated test equipment with attributes as specified in Table 3.
• Two dual-male SMA barrels.
• The following items if MC270141 firmware internal to the Evaluation Kit will be upgraded:
A parallel port extension cable.
A PC running Windows XP, 2000, NT 4.0 or 98.
2.2.1. PC Attributes Used for PHY Testing Only
Minimal functionality is required if the transceiver will be used for PHY testing only. In this case
a single PC can be used since it is only configuring a transceiver node and displaying statistics.
The minimum hardware and software required are:
• 500 MHz CPU speed or faster.
• Linux Redhat 7.3 with 2.4.20-uwb or 2.4.20-XSI Kernels
• VGA-compatible video card and associated monitor with minimum resolution of
800X600.
• 128 Mbytes RAM minimum.
• A hard disk with 50 Mbytes free space on the C: drive.
• A CDROM drive.
2.2.2. PC Attributes Used for Streaming Video Display
Decoding and displaying streaming MPEG-2 video in real time places a heavy processing load
on a PC and also requires a sophisticated video subsystem. If the WDK will be used for this
purpose, each PC that decodes and displays video (and thus is connected to the destination
transceiver) will require the following minimum hardware and software:
• 2.2 GHz CPU speed or faster.
• Linux Redhat 7.3 with 2.4.20-uwb or 2.4.20-XSI Kernels
• 256 Mbytes RAM minimum.
• A hard disk with 50 Mbytes free space on the C: drive.
• A CDROM drive.
• VGA-compatible video card and associated monitor with minimum resolution of
1024X768.
• A 1394 interface device permitting data transfer to/from an IEEE 1394 bus.
• Unencrypted video clips encoded in an MPEG-2 HD transport stream format.
Specific video subsystem requirements are dependent on the quality of the MPEG-2 transport-
stream. To display a single MPEG-2 720 or 1180 HD-quality stream, a minimum of 128 Mbytes
of high-performance video RAM on a 4x AGP2.0 interface is recommended. Motorola has used

Rev 1.34, June 2, 2004
Copyright © 2001-2004 Motorola, Inc. All rights reserved. Page 10 of 44
an nVidia Quadro2 700XGL graphics adapter in a Dell Precision Workstation 530 with good
results.
2.3. Hardware Setup Procedure
1. Remove each UWB transceiver from its packing materials.
2. Place each transceiver so that it has a direct line of site to the other transceivers.
3. Remove the two antennas and associated semi-flexible coaxial cable for each Node
from their packing.
4. Attach each antenna to its semi-flexible coaxial cable and connect said cable to one of
the two RF connectors on the UWB transceiver housing.
5. Connect each AC transformer to an AC power socket providing the proper voltage and
current as rated on the transformer. Plug the other end of the transformer into the
receptacle on the transceiver housing.
6. Connect a Linux PC to the each Node via a 1394 cable.
3. Configuring Evaluation Kit Hardware
If you are receiving XSUWBWDK as an upgrade the firmware internal to the MC270141 MAC
must be upgraded.
3.1. Updating MC270141 Firmware
An Altera programming application (Quartus II Web Edition) must be downloaded from the
Altera Web site in order to update Evaluation Kit firmware. As discussed below, this application
is usually located this file in the download section of the Alter Web site.
Note 1: The Altera programming software does not support automatic FPGA device detection
so it is important that the correct firmware upgrade files be selected. Also, the versions
listed above have been successfully used by Motorola personnel to update firmware.
Later versions are also likely to work for this purpose.
To update WDK MAC firmware:
1. Connect the ByteBlaster cable to the parallel port of the PC and the 10 pin programming
port of the radio. The red stripe on the cable indicates pin one, which corresponds to Pin
1 on programming connector on the radio board. Pin 1 is closest to the end of the radio
where the power supply connector is.
2. Power on the UWB Node to be programmed.
3. Download the Altera Quartus II Web Edition software. It can be found on the Altera Web
site (https://www.altera.com) by clicking the hyperlinks “download” and then “Quartus II
Web Edition.”
4. Run the Altera Quartus II application on the Windows PC to which the ByteBlaster cable
is attached. The Quartus version should be 2.1 or later.
5. A web license is available from www.altera.com. A license is not required for
programming only. If no license is available do the following
a. When prompted, Click on “specify valid license”
b. Click OK
c. Click cancel on the next dialog box
Rev 1.34, June 2, 2004
Copyright © 2001-2004 Motorola, Inc. All rights reserved. Page 11 of 44
6. Respond No when prompted to create a new project.
7. Select Tools-> Programmer. A programming dialog box will appear.
8. Click the “Auto Detect” icon (third icon down on the vertical icon bar) on the
programming dialog to cause Quartus II to query for Altera devices via JTAG.
9. Quartus II should find 2 devices and display them in the programming dialog. One will be
an FPGA and the other will be an EPC16 configurator/Flash ROM. The EPC16/4/8 is
used on both the 1106 and 1116 boards from Motorola/XtremeSpectrum. The PC board
in a UWB Node is either an 1106 or an 1116.] The MC270141 device will be an EP1S40
on an 1116 board, or an EP20K1000C/E on an 1106 board. Note which FPGA device is
present.
10. The File column for each device should say “<none>.”
11. Right click on the top listed Device (EP1S40 or EP20K1000C/E ) to bring up a context
menu and select the “Change File…” entry.
12. Browse to the directory where the desired .sof and .pof files are located. Select dummy
file for the top (FPGA) device. The file name will be of the form dummy_xxxx.sof file
where xxxx is the number of the radio board type (either 1106 or 1116).
13. The second device should be Device EPC16/4/8
14. Right click on the second device ( EPC16/4/8) to display a context menu and select the
“Change File…” entry.
15. Select one of two .pof files based on whether an EP20K1000C/E (1106 board in the
UWB Node) or an EP1S40 (1116 board in the UWB Node) was listed in the
programming dialog. For an EP20K1000C/E FPGA use the file named
output_file_1000_tx.pof. For an EP1S40 FPGA, use the file named
output_file_S40_tx.pof .
16. Click on the Program/configure check box for both devices
17. Click on the Verify box for the EPC16/4/8.
18. Click the “Start Programming” icon (top icon on the vertical bar).
19. The response should indicate success at the bottom of the screen.
20. The status of programming will be updated continuously at the bottom of the Quartus
window. The programming process should take no longer than approximately three to
four minutes. When it completes successfully the status will read Programming
Succeeded. If programming fails, reboot the Windows PC and cycle power on the
UWB Node then repeat steps 3 through 19.
Table 2: Summary of MC270141 Firmware Ugrade Files
Model XSUWBWDK Transceiver
EPC16 Config File FPGA Config File
dummy_1116.sof output_file_S40_tx.pof
3.2. Updating Evaluation Kit EEPROMs
Each model XSUWBWDK Transceiver contains an EEPROM used to configure its 1394
interface and another EEPROM used during MC270141 bootup. Each of these is discussed
briefly below.
Rev 1.34, June 2, 2004
Copyright © 2001-2004 Motorola, Inc. All rights reserved. Page 12 of 44
3.2.1. 1394 Configuration EEPROM
The 1394 configuration EEPROM can be located using Figure 1. The label on this device should
read “X100”.
3.2.2. MAC Serial Boot EEPROM
This EEPROM is used each time the MC270141 MAC is reset or powered on. Its content is set
at the factory. Its location can be determined using Figure 1.
4. Evaluation Kit Hardware Description
The Wireless Developer Kit (WDK) contains two UWB transceivers. Additional transceivers can
be purchased to increase the size of a 802.15.3 piconet. Each node connects to a Linux PC for
reporting of statistics, and is powered from an AC outlet via the supplied DC power supply. A
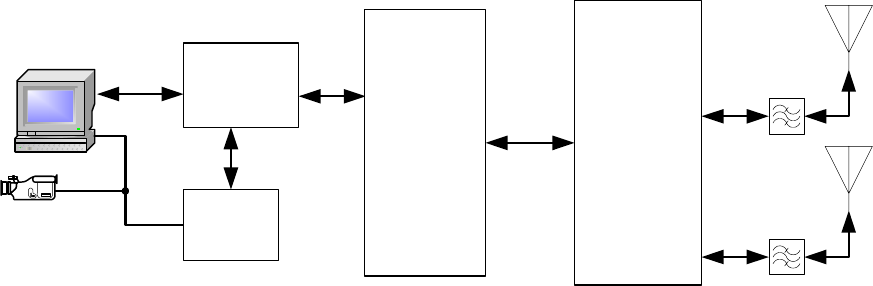
logical block diagram of a transceiver is depicted in Figure 3.
Linux
PC
RS232
1394
MC270141
MAC
MC270123
BaseBand
Controller
MC270113
RF
Transceiver
Video 1394
Chipset
Figure 3: Wireless Developer Kit Logical Block Diagram
As can be seen in Figure 3, each transceiver contains three main subsystems as follows:
• A MAC subsystem.
• A PHY (physical layer) subsystem consisting of the XSI123 Base Band Controller and
the XSI113 RF Transceiver components.
• Two antennas.
These subsystems are implemented on a single printed circuit. A summary describing
interaction of these subsystems is provided here while each is described in slightly more detail
below.
The MAC subsystem configures the PHY subsystem (Base Band Controller and RF-
Transceiver) and implements an 802.15.3-like MAC layer. Included in this MAC layer are
functions such as data buffering, framing and transfer, hardware retransmission, CRC
generation or checking, etc. The MAC also collects performance metrics from the PHY
subsystem and reports them to a host PC.
The PHY subsystem implements two RF processing channels, each called a finger. The
presence of two fingers permits one channel to search for a stronger signal while the other
receives data. The Base Band Controller in the PHY subsystem performs signal processing as
well as forward error correction (FEC) in both receive and transmit modes. In receive mode it
Rev 1.34, June 2, 2004
Copyright © 2001-2004 Motorola, Inc. All rights reserved. Page 13 of 44
also acquires and tracks the incoming signal to extract correct bit values. The RF-Transceiver
modulates or demodulates the UWB signal for each of the two fingers. It also supplies data and
control signals to (transmit mode) or receives them from (receive mode) the Base Band
Controller.
In the receive state, the RF Transceiver accepts the UWB signal from the antenna, filters and
amplifies it, then extracts data and data and error (control) signals and supplies these to the
XSI123 Base Band Controller for further processing.
UWB transceivers operate in one of three modes:
• Continuous transmit mode. A single header and one very long frame (one long payload)
are sent in this mode. This mode is used only for FCC compliance testing.
• Bridge mode. In bridge mode the MAC transfers data or “bridges” between the 1394 bus
and the radio link. Frames are sent by a source transceiver and acknowledged by a
destination transceiver in this mode. This is the standard mode of operation. Frames in
this context refer to Motorola radio frames.
• PERT mode. The PERT, or Packet Error Rate Test, mode is used for sending and
receiving test frames and reporting associated statistics. This mode is used to measure
the performance of a radio link. The MAC generates UWB radio frames that contain
pseudo random data. The UWB frames is transmitted only once to a receiver and must
be acknowledged. There are no frame retries. The receiver station validates the contents
of the frame.
See the Motorola UWB Software Development Kit Utilities Guide for additional information about
the software used to operate a UWB transceiver in one of these three modes.
4.1. MAC Subsystem Overview
The Motorola UWB transceiver contains an 802.15.3-like MAC implemented using an Altera
FPGA, the MC270141. In addition to the MC270141, the MAC subsystem has flash ROM,
SRAM, a serial boot EEPROM and a memory used to configure the MC270141 after every reset
or power-on. Two serial ports are implemented on the MC270141 as is DMA and other control
circuitry. The serial ports are brought to the external RS-232 connector that protrudes through
the WDK enclosure.
As stated above, the MAC protocol built into the WDK is defined by the IEEE 802.15.3
standard, which is a TDMA (Time Division Multiple Access) based MAC. When the WDK is
powered on, it remains quiet until the application enables the radio to “wake-up” because the
user desires to communicate with another device. In wake-up mode, the radio listens and scans
to see if there are other piconets that it might connect to. If none is found, it assumes the role of
“piconet node controller” (PNC). In this role, it transmits a short coded-sequence
synchronization signal (“beacon” – on the order of 0.5 millisecond) and then listens for a much
longer period of time (on the order of 50 milliseconds) to effectively poll for other devices
wanting to join the piconet. The PNC manages the piconet by accepting/authenticating devices
into the piconet, assigning communication time slots to the various devices in the piconet, and
by passing the role of PNC to another device, as appropriate. Therefore, each radio is only
transmitting during: (1) it’s brief beacon period and (2) its communication time slot. A device in a
piconet that does not have data to pass is not assigned a time slot, so it simply sleeps until the
next beacon period. By virtue of this protocol, the requirements of Section 15.517(a)5 of the
FCC Rules are met.
Rev 1.34, June 2, 2004
Copyright © 2001-2004 Motorola, Inc. All rights reserved. Page 14 of 44
The configuration memory, an Altera EPC16, can be reloaded using the JTAG connector
internal to the enclosure. Directions for doing so are provided in section 3.1.
In future versions of UWB transceivers the MC270141 will be replaced by a much smaller
custom ASIC, or both the MAC and Baseband chips will be consolidated into a single chip.
An SDK is typically supplied with the WDK to permit configuration, control and statistics
reporting. Sample applications that use the 802.15.3 API are included with the SDK.
The MAC subsystem implements a 1394 Firewire interface that is exposed on the outside of the
enclosure as two 4-pin connectors. A single 1394 chipset is used to implement this external
interface. Either PCs or consumer electronics devices can be connected to the 1394 interface
on the UWB transceiver.
A single +5 VDC supply is used to power each UWB transceiver. An on-board DC-to-DC
converter generates supply voltages from this input.
4.2. PHY Subsystem Overview
The physical layer is accomplished using two VLSI devices developed by XtremeSpectrum, the
XSI123 Base Band Controller and the XSI113 RF Transceiver, plus a filter.
When receiving, the Base Band Controller provides analog-to-digital conversion of the
demodulated signals. It converts the data and synchronization signals from the RF Transceiver
to time correction values for each of the fingers. These time correction values are fed back to
the RF Transceiver to cause the receiver to remain locked to the incoming data stream. The
Base Band Controller also contains circuitry that implements channel equalization and FEC
processing, and framing.
On transmit the Base Band Controller provides one-bit-wide transmitted data to the RF-
Transceiver. This data is then encoded by the RF Transceiver before being sent to one of the
antennas.
The RF Transceiver provides amplification, modulation, demodulation, and generation of a
synchronized clock.. The XSI113 RF Transceiver connects to the antennas via a bandpass
filter. The characteristics of the filter along with the waveform generated by the RF Transceiver
guarantee compliance with the FCC emission limits, as long as the supplied antennas are used.
The characteristic impedance of each antenna connection is 50 Ω.
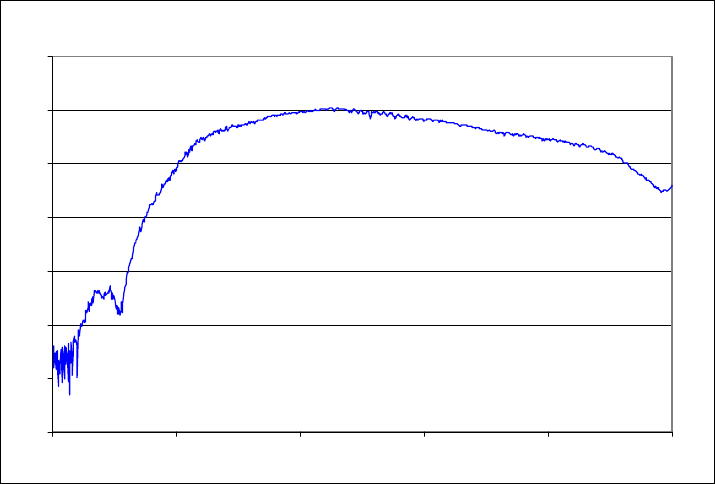
4.3. Antenna
Each antenna is a printed circuit board. The antenna connects to the transceiver housing via
semi-flexible coaxial cable. The frequency response function for this antenna as measured in an
anechoic chamber is supplied on the distribution CDROM that accompanies each Wireless
Evaluation Kit. The data graphed in Figure 4 is representative of the antenna’s response but
should not be used for precise calculations.
Rev 1.34, June 2, 2004
Copyright © 2001-2004 Motorola, Inc. All rights reserved. Page 15 of 44
Antenna Gain - dBi
-60
-50
-40
-30
-20
-10
0
10
0.0E+00 2.0E+09 4.0E+09 6.0E+09 8.0E+09 1.0E+10
Figure 4: Antenna Gain Versus Frequency
Only FCC ApprovedmayThe WDK is FCC certification is valid only when the antennas supplied
with the WDK antennas are used. The WDK is not FCC approved if any other antenna is
attached.this product. If use of a different antenna is desired, MotorolaFreescale will assist in
obtaining a new FCC certification to cover the attachment of the alternative antenna as
commercially practicable.
4.4. Enclosure
The Evaluation Kit is housed in a milled aluminum box with two covers. The covers should
always be installed during operation to prevent unwanted radiation through the air and to
eliminate interference. Figure 1 depicts the layout of components inside the enclosure as well as
the location of external connections.
5. PHY Evaluation Using the Wireless Developer Kit
5.1. Summary List of Test Hardware and Software Required
Table 3 summarizes the test equipment and associated devices (cables, terminators, etc.) that
would typically be used to make RF and other measurements with the Evaluation Kit. The
settings and connections for each are provided in more detail when each test is described.
Equivalent devices can be used in place of those specified in the table if the substituted device
has the same specifications.
For a list of firms from which test equipment can be rented or leased, see section 13.

Rev 1.3, June 2, 2004
Copyright © 2001-2004 Motorola, Inc. All rights reserved. Page 16 of 44
Table 3: Summary List of Equipment for Motorola UWB RF Measurements
Quantity Manufacturer and Model Description Tests Requiring This
Equipment
Comment
8 Belden 1673J Coaxial Cable or
equivalent
Coaxial cable length with SMA
connectors attached. Cables must
be low-loss and phase-stable.
Use 3.5 mm SMA connectors.
Various To connect Motorola Nodes
to test equipment. Use same
coax,equal length and
identical connectors. Do not
use to connect antennas.
4 Inmet 3016 or equivalent 1 Watt, 50 Ω terminator with SMA
connector
Various Flat frequency response to 12
GHz minimum, 18 GHz
preferred.
2 Agilent 11667B or equivalent DC to 26.5 GHz wideband power
splitter, passive, 50 Ω impedance
Receiver Sensitivity
Receiver Immunity
2 Belden 1637A semi-flexible coaxial
cable OR RG402 rigid coaxial cable
Coaxial cable length with SMA
connectors attached.
Various To connect Motorola Nodes
to antennas. Use same
coax,equal length and
identical connectors.
2 Inmet 5020 OR
Inmet 5044 or equivalent
Dual male SMA barrels, DC to 18
GHz
Scaled Range Versus
Throughput
2 Various Linux PC with 1394 interface All RF Tests and PC-
Sourced 1394
Transmission & Reception
Sources and displays MPEG-
2 HD data streams. Attributes
specified in section 2.1.
2 Various RS-232C Cables Various See section 2.1 for pinout.
2 Inmet 5009 or equivalent Type “N” male to SMA female RF
adapter, DC to 18GHz.
Various
1 Tektronix SMT06 or equivalent OR
Agilent 8665B or equivalent
5 kHz to 6 GHz Signal Generator Receiver Sensitivity
Receiver Immunity
Output power must be +12
dBm minimum.
1 Agilent 8494B Attenuator attached to
Agilent 8495B Attenuator with
Agilent 11716C Interconnect Kit or
another equivalent manual
attenuator.
Manual attenuator with both
coarse (10 dB) and fine (1 dB)
increments.
Receiver Sensitivity
Receiver Immunity
Penetration
Scaled Range versus
Throughput
Models specified have SMA
connections. Attenuator with
type “N” connectors may be
more available in which case
more type “N” male to SMA
female adapters are needed.
1 Agilent E4418B power meter with
Agilent 8481A Power Sensor
attached
power meter and attached Power
Sensor. 10 MHz – 18 GHz,
1 µWatt – 100 mW
Total Average Transmit
Power

Rev 1.3, June 2, 2004
Copyright © 2001-2004 Motorola, Inc. All rights reserved. Page 17 of 44
Quantity Manufacturer and Model Description Tests Requiring This
Equipment
Comment
1 Inmet 18B-10 OR
Inmet 18AH-10 OR
Inmet 18DH-10 or equivalent
10 dB inline fixed attenuator Receiver Sensitivity
Receiver Immunity
Penetration
Scaled Range versus
Throughput
Rohde & Schwarz FSU26 with
FS-K3 noise figure software,
FSU-B4 reference frequency and
FSU-B25 Attenuator with
preamplifier
20Hz-26.5 GHz Spectrum
Analyzer
with 50 MHz resolution
bandwidth.
FCC Transmit Spectral
Mask Compliance
50MHz resolution bandwidth
required for a particular FCC
compliance test. ** See notes
1 & 2 in section 5.4
Rhode & Schwarz ESIB 20 Hz to 26 GHz EMI Receiver &
Spectrum Analyzer
Alternative to FSU26
above
** See notes 1 & 2 in section
5.4
Agilent 86100B Frame, with
54754 TDR-TDT Plug-in or
Tektronix CSA8000 & 80E04 TDR
Sampling Module
20 GHz dual channel digital
sampling oscilloscope with dual
channel TDR module
Peak to Average Transmit
Power Ratio
A 20 GHz electrical plug-in
can replace the TDR for the
Peak to Average Transmit
Power Ratio measurement.
1 Various Four foot by eight foot sheet of ½
inch thick gypsum drywall.
Penetration
1 Huber + Suhner 742-0-0-21 or
equivalent
1.0 Newton-Meter torque wrench Various Can use a wrench rated for 8
inch-pounds.
Various MPEG-2 HD video source
supplied via 1394 interface
Non-PC-Sourced 1394
Transmission & Reception
Isochronous packets only on
channel 63. See Table 5.
Various Unencrypted MPEG-2 HD video
clips.
PC-Sourced 1394
Transmission & Reception
Rev 1.34, June 2, 2004
Copyright © 2001-2004 Motorola, Inc. All rights reserved. Page 18 of 44
5.2. Equipment Handling
5.2.1. Attaching and Detaching SMA Connectors
The impedance characteristics of SMA connectors can degrade rapidly if they are not handled
properly. Such degradation will almost certainly affect measured tests results. To ensure the
accuracy of test results, follow these guidelines when attaching and detaching SMA connectors:
• Align center conductors carefully before mating connectors to prevent degradation.
• Never force a connection between two connectors that do not mate easily.
• Support cables or devices that are being connected to prevent lateral forces that can
damage connectors.
• Regularly inspect connectors with a magnifying glass. Replace any that are damaged to
prevent degradation of mating connectors. Damage may include: excessive thread wear
or deformation, corrosion, misalignment, rounding off of edges, contamination or
discoloration.
• Use a torque wrench (see Table 3) on the male side and a small open-ended wrench on
the female side.
• Prevent rotation of SMA center conductors. Do this by holding the female stationary with
an open-ended wrench while turning the hex nut on the male with a torque wrench while
simultaneously preventing rotation of the cable attached to the male.
CAUTION: Turning the center conductor of an SMA female connector may permanently
damage the connector and possibly invalidate any subsequent test results using it.
5.2.2. Avoiding Equipment Damage Due to Electrostatic Discharge
The center conductor of the Evaluation Kit’s antenna input connects directly to a highly sensitive
receiver circuit. As a result, avoid any static discharge into the antenna port since it can severely
damage a UWB transceiver.
CAUTION: Take proper precautions to prevent electrostatic discharge while working with the
WDK transceivers. All personnel working in or around the equipment should be
properly grounded, as should all electronic or other equipment used during testing.
Do not touch the antenna center conductor, particularly by wiping or brushing
across it, as this may permanently damage internal circuitry.
5.2.3. Attaching the Antenna to a Transceiver
Use the a calibrated tourque wrench designed for SMA connectors when attaching the antenna
to a transceiver and thereby decrease the likelihood of loosening the antenna when it is
positioned during testing.
5.3. Guidelines for Running Tests
5.3.1. Order of Configuration and Test Command Execution
The order in which test and configuration commands are run can affect the accuracy of results.
To ensure accurate results, follow the guidelines below:
• Always configure a UWB Node acting as a receiver before configuring a Node acting as
a transmitter when running one of the tests specified below.
Rev 1.34, June 2, 2004
Copyright © 2001-2004 Motorola, Inc. All rights reserved. Page 19 of 44
5.3.2. Statistics Display on a PC Connected to a Transceiver
The procedures in this section assume that a single Linux PC is connected to each transceiver.
To decode and display streaming MPEG-2 video, follow the guidelines for PC selection in
section 2.2.2.
5.4. Transmit Spectral Mask Compliance Test
Summary Description: This test nominally* confirms that Motorola UWB equipment complies
with FCC spectral mask specifications and that the transmit power spectrum is within the
limitations necessary to prevent interference with other frequencies. It has four components as
follows:
• A wideband compliance test that checks the EIRP compliance of UWB emission
between 960 MHz and 12 GHz. The power for each frequency band within this range is
specified in paragraph (c) of section 15.517 of the CFR 47, Part 15 (Code of Federal
Regulations. See section 12 for a full citation).
• A narrowband GPS interference test that considers the EIRP between 1164 – 1610
MHz. The power for each frequency band within this range is specified in paragraph (e)
of section 15.517 of the CFR 47, Part 15.
• A peak to average power test that considers the peak emitted power per MHz over a 50
MHz resolution bandwidth about the center frequency in which a UWB device emits the
greatest of power. The specification of this test can be found in paragraph (f) of section
15.517 of the CFR 47, Part 15.
• Adjustment of the above measurements for the antenna gain*.
During this test the UWB transceiver sends a continuous bit stream in unframed mode. In other
words, a single, very long frame is sent containing only one header and one payload.
Prerequisites:
• None.
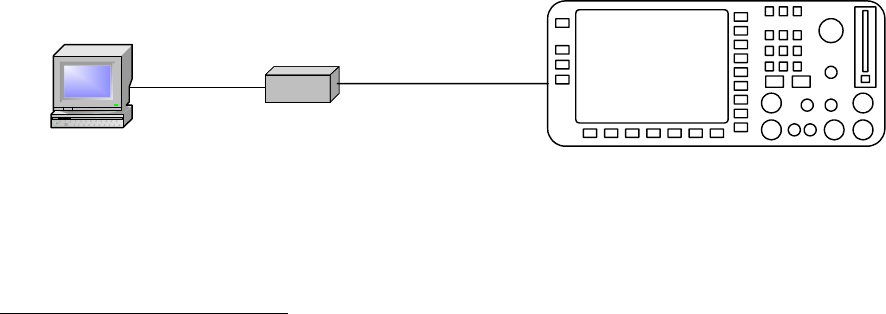
Connection Diagram
Linux PC
1394
Firewire
UWB
Transceiver Spectrum Analyzer
XtremeSpectrum
Antenna cable
Figure 5: Equipment Setup for Transmit Spectral Mask Compliance Test
* Note that a measurement through wire and then adjusting for the antenna gain is not accepted by the
FCC, which requires open air tests that includes all antenna effects. Since open-air tests require an
outdoor test site and are far more time consuming and difficult, the approach outlined here is meant to
provide a nominal indication of compliance that can be done quickly in a lab environment.
Rev 1.34, June 2, 2004
Copyright © 2001-2004 Motorola, Inc. All rights reserved. Page 20 of 44
Test Procedure:
1. Set up equipment as indicated in Figure 5. Follow the guidelines in section 5.2.1 when
making or breaking RF connections.
2. Turn on all test equipment and allow it to warm up for the length of time specified by the
manufacturer.
3. Verify that the UWB transceiver is powered on.
4. Open a command window on the Linux PC.
5. Use the cd command as necessary on the Linux PC to move to the directory containing
the mode application supplied with the Motorola SDK.
6. Run the following command in the Linux PC command window opened as explained
above:
./mode BT
See the Motorola UWB Software Development Kit Utilities Guide for definitions of the
parameters used with the mode command.
7. While determining transceiver RF power output levels in steps 9 through 17 below, note
the frequency of the highest RF output power. This frequency is called fc and will be
used later in this procedure.
8. Set the spectrum analyzer as follows:
a. Measurement type: RF Power in dBm
b. Sweep range: 900 MHz to 1700 MHz
c. Sweep points: 10001
d. Resolution bandwidth: 1 MHz
e. Video bandwidth: Auto
f. Detector selection: RMS
g. Input attenuation: 0
h. Markers: 960 MHz and 1610 MHz
i. Input coupling: AC
j. Trigger source: internal, free running
9. Note the RF power output of the transceiver between the two marked frequencies (960
MHz and 1610 MHz) and verify that it is below the –75.3 dBm ceiling specified in
paragraph (c) of section 15.517 of the CFR 47, Part 15.
10. Change the spectrum analyzer settings as follows:
a. Sweep range: 1500 MHz to 2100 MHz
b. Markers: 1610 MHz and 1990 MHz
11. Note the RF power output of the transceiver between the two marked frequencies (1610
MHz and 1990 MHz) and verify that it is below the –53.3 dBm ceiling specified in
paragraph (c) of section 15.517 of the CFR 47, Part 15.
12. Change the spectrum analyzer settings as follows:
a. Sweep range: 1800 MHz to 3200 MHz
b. Markers: 1990 MHz and 3100 MHz
13. Note the RF power output of the transceiver between the two marked frequencies (1990
MHz and 3100 MHz) and verify that it is below the –51.3 dBm ceiling specified in
paragraph (c) of section 15.517 of the FCC CFR 47, Part 15.
Rev 1.34, June 2, 2004
Copyright © 2001-2004 Motorola, Inc. All rights reserved. Page 21 of 44
14. Change the spectrum analyzer settings as follows:
a. Sweep range: 3000 MHz to 11000 MHz
b. Markers: 3100 MHz and 10600 MHz
15. Note the RF power output of the transceiver between the two marked frequencies (3100
MHz and 10600 MHz) and verify that it is below the –41.3 dBm ceiling specified in
paragraph (c) of section 15.517 of the FCC CFR 47, Part 15. The transmit spectrum
should be below -51.3 dBm above 4.9 GHz.
16. Change the spectrum analyzer settings as follows:
a. Sweep range: 10000 MHz to 12000 MHz
b. Markers: 10600 MHz
17. Note the RF power output of the transceiver above the marked frequency (10600 MHz)
and verify that it is below the –51.3 dBm ceiling specified in paragraph (c) of section
15.517 of the FCC CFR 47, Part 15.
18. Change the spectrum analyzer settings as follows:
a. Sweep range: 1164 MHz to 1169.067 MHz
b. Resolution bandwidth setting: 1 kHz
Note 1: A digital spectrum analyzer such as the FSU26 measures RF power contained in
a frequency span specified with the resolution bandwidth value. A digital spectrum
analyzer takes this measurement by determining the power at many discrete points
(called sweep points) between start and stop frequencies (the sweep span). The
instrument divides the sweep span into a number of slices one resolution bandwidth
wide, measures the power in each slice and plots the result. Note that sections of
the sweep span will be missed (i.e. have no data points) if the sweep range divided
by the number of sweep points exceeds the resolution bandwidth. The plot of
resulting measured values would be meaningless. To prevent generation of such
meaningless results, the measurements made in steps 18 through 23 of this
procedure must be broken into sweep points that are about 4/10ths of a resolution
bandwidth. For example, in the GPS band, the 1164 MHz to 1240 MHz span (sweep
span = 76 MHz), 15 separate measurements (5.0667 MHz per measurement with
10001 points means 507 Hz per point) are made to provide approximately two data
points per resolution bandwidth slice. For the 1559 MHz through 1610 MHz span
(sweep span = 51 MHz), 10 separate measurements (5.1 MHz per measurement
with 10001 points means 510 Hz per point) are made to provide approximately two
data points per resolution bandwidth slice.
Note-2: An alternative to the FSU-26 is the ESIB which is designed to automatically
make certified accurate EMI measurements. With general purpose analyzers,
there is no guarantee the results are accurate -- it can be difficult to get known
accurate results due to the flexibility and interaction of the various sweep
parameters that are all under user control. The ESIB forces the steps of
.4*RBW to insure that highly accurate results are obtained and no spectral
peak is lost. It also has the following advantages:
(1) Built in transducer tables as well as a calibrated low-noise (9 dB NF)
preamp, and multiple detectors including an RMS detector. These allow
accurate measurements of the low signal levels in open-air tests because it
allows a real-time display that is calibrated for all antenna and cabling
effects. The real-time display allows frequencies and peak-levels at
Rev 1.34, June 2, 2004
Copyright © 2001-2004 Motorola, Inc. All rights reserved. Page 22 of 44
different angles to the DUT to be identified as positioners are rotated and
stopped at a peak-emission angle.
(2) The tests in the GPS bands require 1 kHz RBW resulting in 400 Hz steps
covering 76 MHz (190k points) in one band and 51 MHz (127k points) in the
other. The ESIB allows 250k points in a band, which allows each GPS band
to be measured with a single sweep, significantly reducing the workload
and time required to take document these measurements. The capture time
is very important because even with the ESIB, it takes about 2 hours for
each polarization (4 hours per UWB-code), and there are several codes that
must be measured. – In addition to the raw speed, the ESIB can be
configured to do this test easily on the front panel. So there is no need for
a special script.
(3) 10 MHz RBW is built in, allowing somewhat better characterization of peak
levels than the 1 or 3 MHz limit in many other instruments. While the FSU-
26 was originally chosen because it had a 50 MHz RBW, it does not
accurately measure peak and RMS levels at 50 MHz RBW due to the way it
processes the signal (it uses a pulse stretching approach beyond a 10 MHz
RBW). So the FSU-26 is only good to 10 MHz, and lacks all the other
benefits of the ESIB.
19. Note the RF power output of the transceiver in the sweep range and verify that it is
below the –85.3 dBm ceiling specified in paragraph (e) of section 15.517 of the CFR 47,
Part 15.
20. Repeat steps 18 and 19 for each of the other 14 sweep ranges between 1169.067 MHz
and 1240 MHz (each range is 5.0667 MHz wide). Setup files for the FSU26 and trace
files are supplied for each of these ranges on the WDK distribution CDROM.
21. Change the spectrum analyzer settings as follows:
a. Sweep range: 1559 MHz to 1564.1 MHz
b. Resolution bandwidth setting: 1 kHz
22. Note the RF power output of the transceiver in the sweep range and verify that it is
below the –85.3 dBm ceiling specified in paragraph (e) of section 15.517 of the CFR 47,
Part 15.
23. Repeat steps 21 and 22 for each of the other 9 sweep ranges between 1564.1 MHz and
1610 MHz (each range is 5.1 MHz wide). Setup files for the FSU26 and trace files are
supplied for each of these ranges on the WDK distribution CDROM.
24. Change the spectrum analyzer settings as follows:
a. Sweep range: 500 MHz on either side of the frequency, fc, with the highest output
power as found in steps 9 through 17.
b. Markers: 250 MHz above fc and 250 MHz below fc
c. Resolution bandwidth setting: 50 MHz
25. Note the RF power output of the transceiver between the two marked frequencies (250
MHz above fc and 250 MHz below fc) and verify that it is below the 0 dBm ceiling
specified in paragraph (f) of section 15.517 of the CFR 47, Part 15.
26. Correct all measured results using the Motorola antenna frequency response data on the
CDROM supplied with the WDK.

Rev 1.34, June 2, 2004
Copyright © 2001-2004 Motorola, Inc. All rights reserved. Page 23 of 44
Expected Results:
Contact the Motorola factory if the results of this test are not approximately those indicated in
the text above.
5.5. Total Average Transmit Power Test
Summary Description: This test determines the total average transmitted RF power across the
entire frequency band from a Motorola UWB transceiver. Note that this measurement is NOT
conducted in the same fashion as that used for determining FCC UWB spectral mask
compliance (see section 5.3.2), nor does it yield the same result. The average transmitted RF
power, together with the receive sensitivity value, can help with link budget estimations and with
determination of the useful range of UWB radios. The transceiver is run in continuous, unframed
transmit mode during this test.
Prerequisites:
• Run the Transmit Spectral Mask Compliance Test (see section 5.3.2), if you have not
already done so, before starting this test.
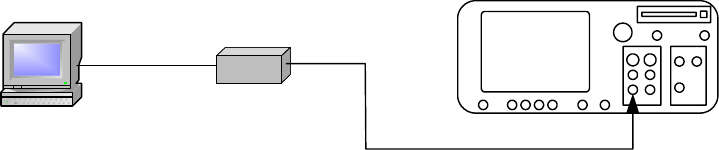
Connection Diagram
Power Meter with
Power Sensor
Linux PC
1394
Firewire
UWB
Transceiver
XtremeSpectrum
Antenna cable
Figure 6: Equipment Setup for the Total Average Transmit Power Test
Test Procedure:
1. Set up equipment as indicated in Figure 6. Follow the guidelines in section 5.2.1 when
making or breaking RF connections.
2. Turn on all test equipment and allow it to warm up for the length of time specified by the
manufacturer.
3. Set the power meter measurement range to 0 dBm.
4. Verify that the transceiver is powered on.
5. Open a command window on the Linux PC.
6. Use the cd command as necessary on the Linux PC to move to the directory containing
the mode application supplied with the Motorola SDK.
7. Run the following command in the Linux PC command window opened as explained
above:
./mode BT
See the Motorola UWB Software Development Kit Utilities Guide for definitions of the
parameters used with the mode command.
8. Disconnect the power meter, run its zero calibration procedure, then reconnect it.
Rev 1.34, June 2, 2004
Copyright © 2001-2004 Motorola, Inc. All rights reserved. Page 24 of 44
9. Note the reading on the power meter. It should be approximately -10 to -8 dBm. Save
this value as it will also be used for computing the Peak to Average Transmit Power ratio
as described in section 5.6.
Expected Results:
The power meter reading should be between -10 and – 8dBm.
5.6. Peak Envelope Power Test
Summary Description: This test computes the peak envelope power (PEP) of a transceiver.
The peak-to-peak amplitude of the transceiver output is measured in this procedure then the
PEP is determined using the equation below. This is a wired test that uses a 20 GHz bandwidth
sampling oscilloscope with a time domain reflectometer plug-in. The transceiver is run in
continuous, unframed transmit mode during this test. This test has no relationship to the FCC’s
narrow bandwidth peak test.
Note: Peak envelope power is a standard term used to measure transmitter power. It is
defined as the emitted power averaged over the RF cycle having the greatest
amplitude during a transmission. In other words, it is the power that a continuous sine
wave would deliver to the load if the peak amplitude of that sine wave matched that of
the largest RF cycle that ever occurs during a transmission.
Prerequisites:
• Run the Transmit Spectral Mask Compliance Test (see section 5.3.2) and Total Average
Transmit Power Test (see section 5.5), if you have not already done so, before starting
this test.
Connection Diagram
Linux PC
1394
Firewire
UWB
Transceiver Antenna Cable
20 GHz Oscilloscope
with TDR Plug-in
Figure 7: Equipment Setup for the Peak Envelope Power Test
Test Procedure
1. Set up equipment as indicated in Figure 7. Follow the guidelines in section 5.2.1 when
making or breaking RF connections.
2. Turn on all test equipment and allow it to warm up for the length of time specified by the
manufacturer.
3. Verify that the transceiver is powered on.
4. Open a command window on the Linux PC.

Rev 1.34, June 2, 2004
Copyright © 2001-2004 Motorola, Inc. All rights reserved. Page 25 of 44
5. Use the cd command as necessary on the Linux PC to move to the directory containing
the mode application supplied with the Motorola SDK.
6. Run the following command in the Linux PC command window opened as explained
above:
./mode BT
See the Motorola UWB Software Development Kit Utilities Guide for definitions of the
parameters used with the mode command.
7. Set the oscilloscope electrical plug-in as follows:
a. Time base: 1 nsec per division.
b. Vertical scale: 100 mV per division.
c. Trigger: free running.
d. Persistence: 5 seconds.
e. TDR Module Stimulus: off.
f. Markers: Set to permit reading minimum and maximum voltage to permit
computation of peak to peak amplitude.
8. Read the peak-to-peak voltage of the transmitter output signal on the oscilloscope. It
should be approximately 300 mV.
9. Compute the peak envelope power out of the transceiver using the formula: 400
2
pp
t
V
P=
where:
Pt is the peak envelope power emitted by the transceiver in Watts (i.e. the power
dissipated in a 50Ω load by a sine wave with peak to peak amplitude Vpp).
Vpp is the peak-to-peak amplitude in Volts at the antenna terminals.
Note: The equation above represents peak envelope power (PEP). It is derived from
the expression R
E2
, where E is the voltage and R is the load impedance. Computing this
involves summing the power in a single cycle (integrating from zero to one) using the
following peak envelope power (PEP) expression: dt
t
Vpp
∫⎟
⎠
⎞
⎜
⎝
⎛
1
0
2
2sin
2
50
1
π
.
Expected Results
The peak-to-peak voltage should be approximately 300 mV.
5.7. Receiver Sensitivity and Scaled Ranged Versus Throughput Test
Summary Description: This test determines the sensitivity of the UWB receiver by measuring
the minimum signal detected for frame error rates (FER) of 1%, 5% and 10%. Together the
transmit power and Rx sensitivity values are useful in determining the link budget of a UWB
subsystem. Both UWB transceivers are run in continuous, framed mode during this test.
Rev 1.34, June 2, 2004
Copyright © 2001-2004 Motorola, Inc. All rights reserved. Page 26 of 44
In addition, this test has two other purposes. First, it determines the throughput (bits per second
of payload) from UWB transmitter to UWB receiver for various FEC and raw channel rate
settings in a line of sight (LOS) environment using a range of scaled antenna separation
distances as simulated with a manual attenuator. This test also measures the effect on FER of
various channel rate and FEC settings. Sample measurements are provided.
Prerequisites:
• Run the Transmit Spectral Mask Compliance Test see (section 5.3.2), if you have not
already done so, before starting this test.
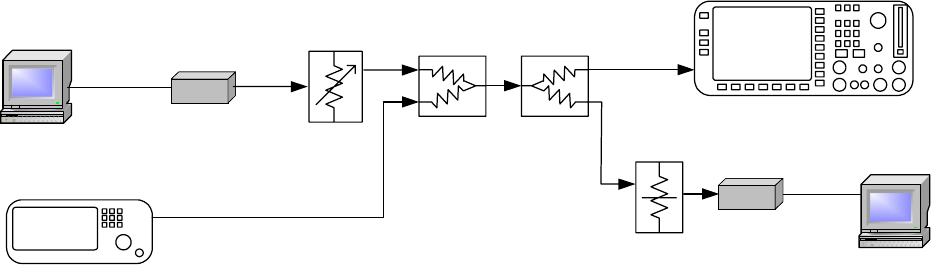
Connection Diagram
Linux PC
UWB
Destination
Transceiver
Linux PC
1394
Firewire
1394
Firewire
10 dB
Inline
Attenuator
Cables should be matched (same coax manufacturer,
same connector manufacturer, same length).
Male to male SMA barrel.
UWB Source
Transceiver
Signal Generator
Manual Step
Attenuator
Power
Splitter
Power
Splitter
Spectrum Analyzer
Figure 8: Setup for the Receiver Sensitivity, Scaled Range
Versus Throughput and Receiver Immunity Tests
Test Procedure:
1. Set up equipment as indicated in Figure 8. Follow the guidelines in section 5.2.1 when
making or breaking RF connections.
2. Turn on all test equipment except the signal generator and allow it to warm up for the
length of time specified by the manufacturer.
3. Verify that the signal generator is off. It will not be used in this test.
4. Set the manual attenuator to 20 dB.
5. Set the spectrum analyzer as follows:
a. Measurement type: RF Power in dBm
b. Sweep range: 500 MHz on either side of the frequency, fc, with the highest output
power as found in steps 9 through 17 of the Transmit Spectral Mask Test described
in section 5.3.2.
c. Markers: 250 MHz above fc and 250 MHz below fc
d. Resolution bandwidth setting: 50 MHz
e. Detector selection: RMS
f. Video bandwidth: Auto
Rev 1.34, June 2, 2004
Copyright © 2001-2004 Motorola, Inc. All rights reserved. Page 27 of 44
g. Input attenuation: 0
h. Input coupling: AC
i. Trigger source: internal, free running
6. Verify that both UWB transceivers are powered on.
7. Open a command window on each of the Linux PCs depicted in Figure 8.
8. Use the cd command as necessary on each Linux PC to move to the directory
containing the mode application supplied with the Motorola SDK.
9. Run the following commands on the Linux PC connected to the UWB destination
transceiver:
./config 1 114 NONE 16k 0
./mode PR
./stats FRAM MACAddress
See the Motorola UWB Software Development Kit Utilities Guide for definitions of the
parameters used with the mode, config and stats commands. Be sure to replace the
parameter MACAddress with the proper value for the destination transceiver.
10. Run the following commands on the Linux PC connected to the UWB source transceiver
(replace the MACAddress parameter with the proper value for the source transceiver):
./config 1 114 NONE 16k 0
./mode PT
./stats FRAM MACAddress
11. Verify that the FER reported at the destination transceiver is approximately 2%.
12. Adjust the manual attenuator setting (i.e. change the signal reaching the destination
transceiver) until an FER of 10% (1X10⁻¹) is reached as reported by the statistics.
13. Record the power on the spectrum analyzer at fc in the dBm/MHz column associated
with a 10% FER, 114 Mbps raw channel rate and a FEC rate of 1.
14. Repeat steps 12 and 13 for an FER value of 2% (2X10⁻²). This lower FER value will be
achieved by decreasing the loss in the manual attenuator.
15. Terminate the stats command running on the Linux machine connected to the
destination UWB transceiver. Then run the following commands in a Linux terminal
window on the same PC:
./mode B
./config 0.75 114 NONE 16k 0
./mode PR
./stats FRAM MACAddress
16. Terminate the stats command running on the Linux machine connected to the source
UWB transceiver. Then run the following commands in a Linux terminal window on the
same PC:
./mode B
./config 0.75 114 NONE 16k 0
./mode PT
./stats FRAM MACAddress
17. Adjust the manual attenuator setting until an FER of 10% (1X10⁻¹) is reached as reported
on the destination transceiver.
Rev 1.34, June 2, 2004
Copyright © 2001-2004 Motorola, Inc. All rights reserved. Page 28 of 44
18. Record the power on the spectrum analyzer at fc in the dBm/MHz column associated
with a 10% FER, 114 Mbps raw channel rate and a FEC rate of ¾.
19. Repeat steps 17 and 18 for an FER value of 2% (2X10⁻²). This lower FER value will be
achieved by decreasing the loss in the manual attenuator.
20. Terminate the stats command running on the Linux machine connected to the
destination UWB transceiver. Then run the following commands in a Linux terminal
window on the same PC:
./mode B
./config 0.5 114 NONE 16k 0
./mode PR
./stats FRAM MACAddress
21. Terminate the stats command running on the Linux machine connected to the source
UWB transceiver. Then run the following commands in a Linux terminal window on the
same PC:
./mode B
./config 0.5 114 NONE 16k 0
./mode PT
./stats FRAM MACAddress
22. Adjust the manual attenuator setting until an FER of 10% (1X10⁻¹) is reached as reported
on the destination transceiver.
23. Record the power on the spectrum analyzer at fc in the dBm/MHz column associated
with a 10% FER, 114 Mbps raw channel rate and a FEC rate of ½.
24. Repeat steps 22 and 23 for an FER value of 2% (2X10⁻²).
25. Terminate the stats command running on the Linux machine connected to the
destination UWB transceiver. Then run the following commands in a Linux terminal
window on the same PC:
./mode B
./config 1 57 NONE 16k 0
./mode PR
./stats FRAM MACAddress
26. Terminate the stats command running on the Linux machine connected to the source
UWB transceiver. Then run the following command in a Linux terminal window on the
same PC:
./mode B
./config 1 57 NONE 16k 0
./mode PT
./stats FRAM MACAddress
27. Adjust the manual attenuator setting until an FER of 10% (1X10⁻¹) is reached as reported
on the destination transceiver.
28. Record the power on the spectrum analyzer at fc in the dBm/MHz column associated
with a 10% FER, 57 Mbps raw channel rate and a FEC rate of 1.
29. Repeat steps 27 and 28 for an FER value of 2% (2X10⁻²).
Rev 1.34, June 2, 2004
Copyright © 2001-2004 Motorola, Inc. All rights reserved. Page 29 of 44
30. Terminate the stats command running on the Linux machine connected to the
destination UWB transceiver. Then run the following commands in a Linux terminal
window on the same PC:
./mode B
./config 0.75 57 NONE 16k 0
./mode PR
./stats FRAM MACAddress
31. Terminate the stats command running on the Linux machine connected to the source
UWB transceiver. Then run the following commands in a Linux terminal window on the
same PC:
./mode B
./config 0.75 57 NONE 16k 0
./mode PT
./stats FRAM MACAddress
32. Adjust the manual attenuator setting until an FER of 10% (1X10⁻¹) is reached as reported
on the destination transceiver.
33. Record the power on the spectrum analyzer at fc in the dBm/MHz column associated
with a 10% FER, 57 Mbps raw channel rate and a FEC rate of ¾.
34. Repeat steps 32 and 33 for an FER value of 2% (2X10⁻²).
35. Terminate the stats command running on the Linux machine connected to the
destination UWB transceiver. Then run the following commands in a Linux terminal
window on the same PC:
./mode B
./config 0.5 57 NONE 16k 0
./mode PR
./stats FRAM MACAddress
36. Terminate the stats command running on the Linux machine connected to the source
UWB transceiver. Then run the following commands in a Linux terminal window on the
same PC:
./mode B
./config 0.5 57 NONE 16k 0
./mode PT
./stats FRAM MACAddress
37. Adjust the manual attenuator setting until an FER of 10% (1X10⁻¹) is reached as reported
at the destination transceiver.
38. Record the power on the spectrum analyzer at fc in the dBm/MHz column associated
with a 10% FER, 57 Mbps raw channel rate and a FEC rate of ½.
39. Repeat steps 37 and 38 for an FER value of 2% (2X10⁻²).
40. Terminate the stats command running on the Linux machine connected to the
destination UWB transceiver. Then run the following commands in a Linux terminal
window on the same PC:
./mode B
./config 1 28.5 NONE 16k 0
Rev 1.34, June 2, 2004
Copyright © 2001-2004 Motorola, Inc. All rights reserved. Page 30 of 44
./mode PR
./stats FRAM MACAddress
41. Terminate the stats command running on the Linux machine connected to the source
UWB transceiver. Then run the following commands in a Linux terminal window on the
same PC:
./mode B
./config 1 28.5 NONE 16k 0
./mode PT
./stats FRAM MACAddress
42. Adjust the manual attenuator setting until an FER of 10% (1X10⁻¹) is reached as reported
on the destination transceiver.
43. Record the power on the spectrum analyzer at fc in the dBm/MHz column associated
with a 10% FER, 28.5 Mbps raw channel rate and a FEC rate of 1.
44. Repeat steps 42 and 43 for an FER value of 2% (2X10⁻²).
45. Terminate the stats command running on the Linux machine connected to the
destination UWB transceiver. Then run the following commands in a Linux terminal
window on the same PC:
./mode B
./config 0.75 28.5 NONE 16k 0
./mode PT
./stats FRAM MACAddress
46. Terminate the stats command running on the Linux machine connected to the source
UWB transceiver. Then run the following commands in a Linux terminal window on the
same PC:
./mode B
./config 0.75 28.5 NONE 16k 0
./mode PT
./stats FRAM MACAddress
47. Adjust the manual attenuator setting until an FER of 10% (1X10⁻¹) is reached as reported
on the destination transceiver.
48. Record the power on the spectrum analyzer at fc in the dBm/MHz column associated
with a 10% FER, 28.5 Mbps raw channel rate and a FEC rate of ¾.
49. Repeat steps 47 and 48 for an FER value of 2% (2X10⁻²).
50. Terminate the stats command running on the Linux machine connected to the
destination UWB transceiver. Then run the following commands in a Linux terminal
window on the same PC:
./mode B
./config 0.5 28.5 NONE 16k 0
./mode PR
./stats FRAM MACAddress
51. Terminate the stats command running on the Linux machine connected to the source
UWB transceiver. Then run the following commands in a Linux terminal window on the
same PC:
Rev 1.34, June 2, 2004
Copyright © 2001-2004 Motorola, Inc. All rights reserved. Page 31 of 44
./mode B
./config 0.5 28.5 NONE 16k 0
./mode PT
./stats FRAM MACAddress
52. Adjust the manual attenuator setting until an FER of 10% (1X10⁻¹) is reached as reported
on the destination transceiver.
53. Record the power on the spectrum analyzer at fc in the dBm/MHz column associated
with a 10% FER, 28.5 Mbps raw channel rate and a FEC rate of ½.
54. Repeat steps 52 and 53 for an FER value of 2% (2X10⁻²).
55. Terminate the stats command running on the Linux machine connected to the
destination UWB transceiver. Then run the following commands in a Linux terminal
window on the same PC:
./mode B
./config 1 114 HIGH 16k 0
./mode PR
./stats FRAM MACAddress
56. Terminate the stats command running on the Linux machine connected to the source
UWB transceiver. Then run the following commands in a Linux terminal window on the
same PC:
./mode B
./config 1 114 HIGH 16k 0
./mode PT
./stats FRAM MACAddress
57. Adjust the manual attenuator setting until an FER of 10% (1X10⁻¹) is reached as reported
on the destination transceiver.
58. Record the power on the spectrum analyzer at fc in the dBm/MHz column associated
with a 10% FER, 28.5 Mbps signal acquisition rate, 114 Mbps raw channel rate, FEC
rate of 1 and a high SNR setting.
59. Repeat steps 57 and 58 for an FER value of 2% (2X10⁻²).
60. Terminate the stats command running on the Linux machine connected to the
destination UWB transceiver. Then run the following commands in a Linux terminal
window on the same PC:
./mode B
./config 0.75 114 HIGH 16k 0
./mode PR
./stats FRAM MACAddress
61. Terminate the stats command running on the Linux machine connected to the source
UWB transceiver. Then run the following commands in a Linux terminal window on the
same PC:
./mode B
./config 0.75 114 HIGH 16k 0
./mode PT
./stats FRAM MACAddress

Rev 1.34, June 2, 2004
Copyright © 2001-2004 Motorola, Inc. All rights reserved. Page 32 of 44
62. Adjust the manual attenuator setting until an FER of 10% (1X10⁻¹) is reached as reported
on the destination transceiver.
63. Record the power on the spectrum analyzer at fc in the dBm/MHz column associated
with a 10% FER, 28.5 Mbps signal acquisition rate, 114 Mbps raw channel rate, FEC
rate of ¾ and a high SNR setting.
64. Repeat steps 62 and 63 for an FER value of 2% (2X10⁻²).
65. Terminate the stats command running on the Linux machine connected to the
destination UWB transceiver. Then run the following commands in a Linux terminal
window on the same PC:
./mode B
./config 0.5 114 HIGH 16k 0
./mode PR
./stats FRAM MACAddress
66. Terminate the stats command running on the Linux machine connected to the source
UWB transceiver. Then run the following commands in a Linux terminal window on the
same PC:
./mode B
./config 0.5 114 HIGH 16k 0
./mode PT
./stats FRAM MACAddress
67. Adjust the manual attenuator setting until an FER of 10% (1X10⁻¹) is reached as reported
on the destination transceiver.
68. Record the power on the spectrum analyzer at fc in the dBm/MHz column associated
with a 10% FER, 28.5 Mbps signal acquisition rate, 114 Mbps raw channel rate, FEC
rate of ½ and a high SNR setting.
69. Repeat steps 67 and 68 for an FER value of 2% (2X10⁻²).
Manual attenuator setting versus distance values were based on one of the following two free
space equations:
2
=
R
4
π
ett
r
AGP
P
OR
R
GP
Ett
r
30
=
where:
Pr is the power seen at the receiver input in Watts/MHz.
Pt is the power emitted by the transmitter in Watts/MHz.
Gt is the gain of the transmitting antenna in (1 = isotropic).
Rev 1.34, June 2, 2004
Copyright © 2001-2004 Motorola, Inc. All rights reserved. Page 33 of 44
Ae is the effective aperture area of the receiving antenna in square meters.
R is the distance between the transmitting antenna and the receiving antenna in meters.
Er is the electric field at the receiving antenna in volts per meter at range R.
5.8. Receiver Immunity Test
Summary Description: This test determines the tolerance of the MOTOROLA UWB
implementation to other RF technologies (IEEE 802.11b, IEEE 802.11a, cell phones, Microwave
ovens etc.) using the same frequency bands. It uses the same setup as the Receiver Sensitivity
test. This is a wired test that uses a power splitter and injects tones of various frequencies from
a signal generator into the UWB receiver input then measures the power level of the interfering
signal.
During this test the source transceiver operates in framed mode. In other words, numerous
UWB frames, each with a header and payload, are sent.
Prerequisites:
• Run the Transmit Spectral Mask Compliance Test (see section 5.3.2) and Receiver
Sensitivity Test (see section 5.6), if you have not already done so, before starting this
test.
Connection Diagram
• Use the setup specified in Figure 8.
Test Procedure
1. Set up equipment as indicated in Figure 8. Follow the guidelines in section 5.2.1 when
making or breaking RF connections.
2. Turn on all test equipment except the signal generator and allow it to warm up for the
length of time specified by the manufacturer.
3. Verify that the signal generator is off or set it to no output.
4. Set the manual attenuator to 20 dB.
5. Set the spectrum analyzer as follows:
a. Measurement type: RF Power in dBm
b. Sweep range: 800 MHz to 1000 MHz.
c. Marker: 900 MHz
d. Resolution bandwidth setting: 1 MHz
e. Detector selection: RMS
f. Video bandwidth: Auto
g. Input attenuation: 0
h. Input coupling: AC
i. Trigger source: internal, free running
6. Verify that both the source transceiver and the destination transceiver are powered on.
7. Open a command window on each of the Linux PCs depicted in Figure 8.
Rev 1.34, June 2, 2004
Copyright © 2001-2004 Motorola, Inc. All rights reserved. Page 34 of 44
8. Use the cd command as necessary on each Linux PC to move to the directory
containing the mode application supplied with the Motorola SDK.
9. Run the following commands on the Linux PC connected to the UWB destination
transceiver:
./mode B
./config 1 114 NONE 16k 0
./mode PR
./stats FRAM MACAddress
See the Motorola UWB Software Development Kit Utilities Guide for definitions of the
parameters used with the mode , config and stats commands. Be sure to replace the
parameter MACAddress with the proper value for the destination transceiver.
10. Run the following commands on the Linux PC connected to the UWB source transceiver
(replace the MACAddress parameter with the proper value for the source transceiver):
./mode B
./config 1 114 NONE 16k 0
./mode PT
./stats FRAM MACAddress
11. Adjust the manual attenuator so that the FER reported on the destination transceiver is
2%.
12. Note the RF power reading on the spectrum analyzer at the marker frequency and
correct it for the insertion loss of the manual step attenuator and the two power splitters
(approximately 14 dB for the splitters). This RF power is the output level for the source
transceiver at the interfering frequency.
13. Change the spectrum analyzer settings as follows:
a. Sweep range: 1800 MHz to 2000 MHz
b. Marker: 1900 MHz
14. Note the RF power reading on the spectrum analyzer at the marker frequency and
correct it as discussed in step 12. This is the output level for the source transceiver at
the interfering frequency.
15. Change the spectrum analyzer settings as follows:
a. Sweep range: 2300 MHz to 2500 MHz
b. Marker: 2400 MHz
16. Note the RF power reading on the spectrum analyzer at the marker frequency and
correct it as discussed in step 12. This is the output level for the source transceiver at
the interfering frequency.
17. Change the spectrum analyzer settings as follows:
a. Sweep range: 2800 MHz to3000 MHz
b. Marker: 2900 MHz
18. Note the RF power reading on the spectrum analyzer at the marker frequency and
correct it as discussed in step 12. This is the output level for the source transceiver at
the interfering frequency.
19. Change the spectrum analyzer settings as follows:
a. Sweep range: 5300 MHz to 5500 MHz
Rev 1.34, June 2, 2004
Copyright © 2001-2004 Motorola, Inc. All rights reserved. Page 35 of 44
b. Marker: 5400 MHz
20. Note the RF power reading on the spectrum analyzer at the marker frequency and
correct it as discussed in step 12. This is the output level for the source transceiver at
the interfering frequency.
21. Terminate the stats command running on the Linux machine connected to the source
UWB transceiver. Then run the following command on the PC connected to the source
transceiver:
./mode B
22. Turn on the signal generator and wait for it to warm up the length of time specified by the
manufacturer.
23. Change the spectrum analyzer settings as follows:
a. Sweep range: 800 MHz to1000 MHz
b. Marker: 900 MHz
24. Set the signal generator as follows:
a. Frequency: 900 MHz
b. Output level: -100 dBm (or the minimum for the instrument)
c. Sweep: Off
d. Modulation: None
e. Pulse generation: Off
25. Run the following commands on the Linux PC connected to the UWB source transceiver:
./mode B
./config 1 114 NONE 16k 0
./mode PT
./stats FRAM MACAddress
26. Increase the output level on the signal generator until an FER of 10% (1X10⁻¹) is
reported on the destination transceiver.
27. Terminate the stats command running on the Linux machine connected to the source
UWB transceiver. Then run the following command on the PC connected to the source
transceiver:
./mode B
28. Note the RF power reading on the spectrum analyzer at the marker frequency and
correct it for the insertion loss of the two power splitters (approximately 14 dB) and the
fixed in-line attenuator (10 dB). This is the output level for an interfering source at the
frequency specified on the signal generator that is required to change the error rate from
2% to 10%.
29. Change the signal generator settings as follows:
a. Frequency: 1900 MHz
b. Output level: -100 dBm (or the minimum for the instrument)
30. Change the spectrum analyzer settings as follows:
a. Sweep range: 1800 MHz to 2000 MHz
b. Marker: 1900 MHz
31. Repeat steps 25 through 30 for this new interfering frequency (1900 MHz).
32. Change the signal generator settings as follows:
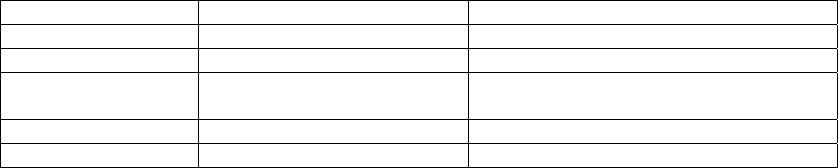
Rev 1.34, June 2, 2004
Copyright © 2001-2004 Motorola, Inc. All rights reserved. Page 36 of 44
a. Frequency: 2400 MHz
b. Output level: -100 dBm (or the minimum for the instrument)
33. Change the spectrum analyzer settings as follows:
a. Sweep range: 2300 MHz to 2500 MHz
b. Marker: 2400 MHz
34. Repeat steps 25 through 30 for this new interfering frequency (2400 MHz).
35. Change the signal generator settings as follows:
a. Frequency: 2900 MHz
b. Output level: -100 dBm (or the minimum for the instrument)
36. Change the spectrum analyzer settings as follows:
a. Sweep range: 2800 MHz to 3000 MHz
b. Marker: 2900 MHz
37. Repeat steps 25 through 30 for this new interfering frequency (2900 MHz).
38. Change the signal generator settings as follows:
a. Frequency: 5400 MHz
b. Output level: -100 dBm (or the minimum for the instrument)
39. Change the spectrum analyzer settings as follows:
a. Sweep range: 5300 MHz to 5500 MHz
b. Marker: 5400 MHz
40. Repeat steps 25 through 30 for this new interfering frequency (5400 MHz).
Table 4: Transmit Frequencies of Common Devices in the UWB Frequency Range
Frequency Range Source Comment
900 MHz Cell phone/Cordless phone
1900 MHz Cell phone
2400 MHz Cordless phone, microwave
oven, 802.11b, 802.11g
2900 MHz Weather radar
5400 MHz Uniband 802.11a
Expected Results
5.9. Minimum Antenna Separation Test
Summary Description: This test determines the effect on FER of subjecting the Motorola UWB
receiver to a very strong input signal. Perform this test by moving the source transceiver
antenna close to the destination transceiver antenna until a desired FER level is achieved. Then
measure the physical separation of these two antennas.
During this test the source transceiver operates in framed mode. In other words, numerous
UWB frames, each with a header and payload, are sent.
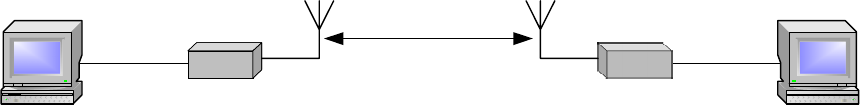
Rev 1.34, June 2, 2004
Copyright © 2001-2004 Motorola, Inc. All rights reserved. Page 37 of 44
Prerequisites:
• Run the Transmit Spectral Mask Compliance Test (see section 5.3.2) and Receiver
Sensitivity Test (see section 5.6), if you have not already done so, before starting this
test.
Connection Diagram
Linux PC
1394
Firewire
UWB Source
Transceiver
XtremeSpectrum
UWB Antenna
Start Test at 1 Meter
Antenna Separation
Linux PC
1394
Firewire
UWB
Destination
Transceiver
XtremeSpectrum
UWB Antenna
Figure 9: Setup for Minimum Antenna Separation Test
Test Procedure
1. Set up equipment as indicated in Figure 9. Follow the guidelines in section 5.2.1 when
making or breaking RF connections.
2. Verify that both the source transceiver and the destination transceiver are powered on.
3. Open a command window on each of the Linux PCs depicted in Figure 9.
4. Use the cd command as necessary on each Linux PC to move to the directory
containing the mode application supplied with the Motorola SDK.
5. Run the following commands on the Linux PC connected to the UWB destination
transceiver:
./mode B
./config 1 114 NONE 16k 0
./mode PR
./stats FRAM MACAddress
See the Motorola UWB Software Development Kit Utilities Guide for definitions of the
parameters used with the mode , config and stats commands. Be sure to replace the
parameter MACAddress with the proper value for the destination transceiver.
6. Run the following commands on the Linux PC connected to the UWB source transceiver
(replace the MACAddress parameter with the proper value for the source transceiver):
./mode B
./config 1 114 NONE 16k 0
./mode PT
./stats FRAM MACAddress
7. Note the FER reported on the PC connected to the destination transceiver. It should be
approximately.
8. Gradually move the UWB source transceiver closer to the destination transceiver (or
vice versa) while noting the FER.
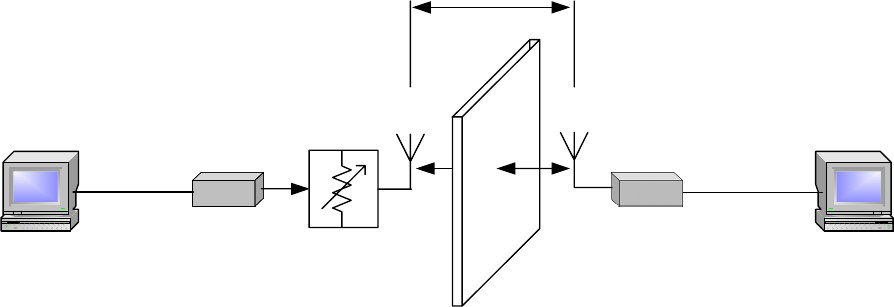
Rev 1.34, June 2, 2004
Copyright © 2001-2004 Motorola, Inc. All rights reserved. Page 38 of 44
Expected Results
The Motorola UWB platform is not sensitive to a strong signal source, so antenna separation
has no effect on the frame error rate experienced.
5.10. Penetration Test
Summary Description: This test introduces a single piece of ½” gypsum drywall between the
transmit and receive antennas. As a result it simulates transmission through an interior wall.
During this test the source transceiver operates in framed mode. In other words, numerous
UWB frames, each with a header and payload, are sent.
Prerequisites:
• Run the Total Average Transmit Power Test (see section 5.5).
Connection Diagram
Linux PC
1394
Firewire
UWB Source
Transceiver
XtremeSpectrum
UWB Antenna
1 Meter
Antenna Separation
Linux PC
1394
Firewire
UWB
Destination
Transceiver
XtremeSpectrum
UWB Antenna
½ Inch Drywall
Manual
Attenuator
Figure 10: Setup for Penetration Test
Test Procedure
1. Set up equipment as indicated in Figure 10. Follow the guidelines in section 5.2.1 when
making or breaking RF connections.
2. Make measurements that simulate the environment in which the final product will be
operated. No specific procedure steps are provided here due to the wide variety of
possible setups and associated results.
5.11. Video Transmission and Reception
Summary Description: This setup demonstrates the ability of the Motorola UWB
implementation to transfer one or more video data streams from a source transceiver to one or
more destination transceivers. Video data is input to the source transceiver via an IEEE 1394-
compatible input port. Each destination transceiver has its 1394 port connected to a 1394
enabled television, PC, or camcorder display.
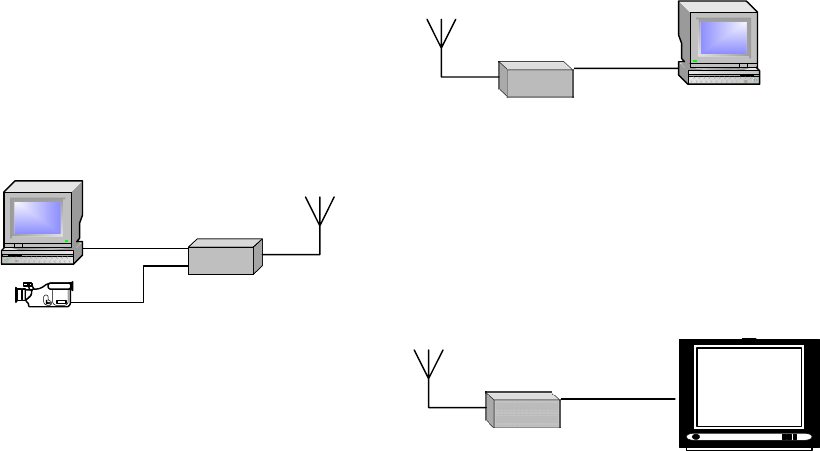
Rev 1.34, June 2, 2004
Copyright © 2001-2004 Motorola, Inc. All rights reserved. Page 39 of 44
Connection Diagram
Linux PC
1394
UWB Source
Transceiver
XtremeSpectrum
UWB Antenna
Linux PC
1394
UWB
Destination
Transceiver
XtremeSpectrum
UWB Antenna
1394
Video
or VCR
1394
UWB
Destination
Transceiver
XtremeSpectrum
UWB Antenna
Television
Figure 11: Setup for Video Transmission
Test Procedure
1. Set up equipment as indicated in Figure 11. Follow the guidelines in section 5.2.1 when
making or breaking RF connections. When connecting a device that either sources or
displays MPEG-2 data via the 1394 bus (i.e. the camera icon in Figure 11), be sure to
use one of the devices listed in Table 5.
2. Verify that all transceivers are powered on.
3. Setup a piconet using the dme command described in the Motorola UWB Software
Development Kit Utilities Guide.
4. Reset all transceivers.
5. At the source transceiver run the following command in a terminal window:
./dme join 0:2:3:4:5:6:7:8 56000
Since this is the first transceiver to join the piconet it becomes PNC.
6. At one of the destination transceivers run the following command in a terminal window to
cause a transceiver to join the piconet as DEV 1:
./dme join 1:2:3:4:5:6:7:8 56000
7. At the other destination transceiver run the following command in a terminal window to
cause a transceiver to join the piconet as DEV 2:
./dme join 2:2:3:4:5:6:7:8 56000
8. At the source transceiver run the following command in a terminal window to allocate a
stream to DEV 1:
./dme allocate_stream 1:2:3:4:5:6:7:8 1 31
Rev 1.34, June 2, 2004
Copyright © 2001-2004 Motorola, Inc. All rights reserved. Page 40 of 44
9. At the source transceiver run the following command in a terminal window to allocate a
stream to DEV 2:
./dme allocate_stream 2:2:3:4:5:6:7:8 2 31
10. At the source transceiver run the following command in a terminal window to map a
stream to DEV 1:
./dme map_send_stream 1 163 0 63 50 15000 -1
11. At the source transceiver run the following command in a terminal window to map a
stream to DEV 2:
./dme map_send_stream 2 162 0 62 50 15000 -1
12. At destination transceiver, DEV 1, run the following command in a terminal window to
map its receive stream:
./dme map_receive_stream 163 0 63 250000 1
13. At destination transceiver, DEV 2, run the following command in a terminal window to
map its receive stream:
./dme map_receive_stream 162 0 62 250000 1
Start the device(s) that will transmit an MPEG-2 stream via 1394 to the source
transceiver (depicted on the right side of Figure 11) so that it begins to transmit. For the
figure above, the camcorder or VCR will transmit on 1394 channel 63 by default. On the
Linux PC open a terminal window and use the sendfile command to read an HD file from
the hard disk and send it to the transceiver over the 1394 port.
./sendfile 62 filename 1 3
6. Operating Conditions and Characteristics
6.1. AC Power Consumption
The Evaluation Kit is supplied with an AC transformer that requires 100-240VAC as input and
draws 1.2 Amps.
6.2. Temperature Range and Humidity Conditions
The Evaluation Kit is meant to be operated between +10 degrees C and +35 degrees C ambient
air temperature under non-condensing humidity conditions.
6.3. IEEE 1394 Modes Supported
The transceivers support transfer of isochronous and asynchronous data. 1394 bus
enumeration is not supported. Only the devices listed in Table 5 have been tested and found to
operate with the Evaluation Kit.
Table 5: Consumer Electronics Devices
that Operate with Motorola UWB Transceivers
Manufacturer Model Number &
Description
Comment
Sony
Electronics
DCR-IP5 Camcorder
JVC HM-DH30000U VCR http://www.jvc.com/product.jsp?modelId=MODL026758
JVC HM-DH40000U VCR http://www.jvc.com/product.jsp?modelId=MODL027070

Rev 1.34, June 2, 2004
Copyright © 2001-2004 Motorola, Inc. All rights reserved. Page 41 of 44
Manufacturer Model Number &
Description
Comment
Samsung LTN226W 22 inch HDTV
LCD and S1R-T165 HDTV
Tuner
http://www.samsungusa.com/SamsungUSA/PRODUCT
/20030603/sirts165.pdf
http://www.samsungusa.com/SamsungUSA/PRODUCT
/20030924/ltn226w.pdf
Pioneer PDP-4340HD 43 inch HDTV
Plasma TV with Media
Receiver
http://www.pioneerelectronics.com/pna/product/detail/0,
,2076_4123_17600334,00.html
JVC GR-HD1US High Definition
Camcorder
This supersedes the model JY-HD10u HD Camcorder.
Mitsubishi WS-55511 55 inch HDTV
Rear Projection System
http://www.mitsubishi-tv.com/55511title.jpg
Sharp Aquos LC-22AD1 22 inch
HDTV LCD
http://www.sharp.co.jp/products/lc22ad1
7. Support
For additional support related to this device or document, please contact your local Motorola
sales office or the Motorola XtremeSpectrum UWB operation at:
Email: uwbsupport@xtremespectrum.com
Fax: (703) 749-0248
8. FCC Compliance Statement
NOTE: This equipment has been tested and found to comply with the limits for a Class B digital
device, pursuant to Part 15 of the FCC Rules. These limits are designed to provide reasonable
protection against harmful interference in a residential installation. This equipment radiates radio
frequency energy and therefore has the potential, though it is unlikely to cause harmful
interference to other electronic devices. If this equipment does cause harmful interference to
radio or television reception, which can be determined by turning the equipment off and on, the
user is encouraged to eliminate the interference by one or more of the following measures:
• Reorient or relocate the antennas of either the device being interfered with or this
equipment.
• Increase the separation between the device being interfered with and this equipment.
• Connect the equipment into an outlet on a circuit different from that to which the device
being interfered with is connected.
• Consult the dealer or an experienced radio/TV technician for help.
Changes or modifications not expressly approved by the manufacturer could void the user’s
authority to operate this equipment legally under the FCC rules. The software provided will not
allow the device to operate differently or with emissions that are higher than what was approved
in the FCC certification process.
Declaration of Conformity
NOTE: This device complies with Part 15 of the FCC Rules. Operation is subject to the
following two conditions: (1) This device may not cause harmful interference, and (2) this device

Rev 1.34, June 2, 2004
Copyright © 2001-2004 Motorola, Inc. All rights reserved. Page 42 of 44
must accept any interference received, including interference that may cause undesired
operation.
9. License Agreement
The Motorola XSUWBWDK Wireless Development Kit is provided on loan for use in the United
States of America for the purpose of engineering evaluation only. It shall at all times remain the
property of Motorola and shall not be conveyed by the customer receiving it directly from
XtremeSpectrum, Inc. to any other individual, company or third-party outside said original
customer without the express written consent of Motorola.
10. Warranty Disclaimer
The Motorola XSUWBWDK Wireless Development Kit is supplied in as-is condition for the
purpose of engineering evaluation only. It is not a commercial product nor is it meant to be used
as one.
Motorola makes no warranty, either express or implied, with regard to the operational
characteristics, merchantability or fitness for a particular purpose of said Wireless Evaluation
Kit, including but not limited to its hardware, software, physical components.
11. Glossary
Table 6: Definitions for Terms, Abbreviations and Acronyms Used
Term, Abbreviation or Acronym Definition
Bit Error Rate The number of received bits that are in error divided by the total
number of bits received, including those in error.
BER See Bit Error Rate.
bridge mode A mode in which the MAC transfers data or “bridges” between the
1394 bus and the air link.
CFR 47, Part 15 Code of Federal Regulations 47, Part 15. Describes FCC rules for
devices that emit Ultra-Wideband signals.
continuous mode A transceiver mode in which a single header and single, long
payload are transmitted. It applies only to a transmitter; a UWB Node
is never placed into continuous receive mode. This mode is only
used for FCC compliance testing as discussed in section 5.
destination transceiver An Evaluation Kit Transceiver that has been configured so that it can
receive frames from a source transceiver and display statistics
associated with them.
DEV A UWB Node in a piconet that is not acting as a PNC.
EIRP Effective Isotropic Radiated Power
FEC See Forward Error Correction.
FER See Frame Error Rate.
Forward Error Correction Redundancy built into a data stream being transmitted over lossy
media such as through the atmosphere to reduce end-to-end error
rates by enhancing e. The transceiver implements FEC with soft-
decision convolutional encoding and Viterbi decoding.
Frame Error Rate The number of received frames that have either a header check
sequence (HCS) error or a frame check sequence (FCS) error
divided by the total number of frames received, including those in
error.

Rev 1.34, June 2, 2004
Copyright © 2001-2004 Motorola, Inc. All rights reserved. Page 43 of 44
Term, Abbreviation or Acronym Definition
framed mode A transceiver mode in which data is formatted into a continuous
stream of frames, each with a header and payload, that are
transmitted or received.
GPS Global Positioning System
HD High Density.
Mbps Millions of bits per second.
MPEG-2 HD An MPEG-2 high density image.
MPEG-2 SD An MPEG-2 standard density image.
PERT Packet error rate test.
PERT mode A mode in which the MAC sends and receives test frames and
reports associated statistics.
PNC Piconet coordinator. This node in a piconet allocates bandwidth for
all piconet traffic and sends out beacon frames to all other nodes the
provide a time reference and specify transmit times for all DEVs
requesting bandwidth.
radio frame A proprietary data structure containing a header and payload that is
used to package transferred data. The default frame size is 16320
bytes.
SDK Motorola UWB Software Development Kit. This is a collection of
utilities and applications used to configure, control and move data to
and from Motorola UWB Nodes.
source transceiver An Evaluation Kit Transceiver that has been configured so that it can
transmit frames to a destination transceiver and display statistics
associated with them.
UWB An acronym for ultra wideband.
UWB frame See radio frame.
UWB Node A station capable of transmitting and receiving UWB frames.
UWB transceiver A station capable of transmitting and receiving UWB frames.
WDK Wireless Development Kit. This consists of two WEKs and
associated components such as antennas, cables, etc. as well as an
SDK.
WEK Wireless Evaluation Kit. A single UWB Node.
Wireless Development Kit
Wireless Evaluation Kit A UWB Node. See the WDK Hardware Guide for additional
information about model and part numbers.
wired test An RF test in which a source transceiver is connected to a
destination transceiver with cables. No antennas are used. Test
equipment may also be used in such a configuration.
12. References
Code of Federal Regulations
• CFR 47, Part 15 Subpart F – Ultra Wideband Operation
Motorola Documentation
• Motorola UWB Software Development Kit Utilities Guide
• XtremeSpectrum Software Development Kit Programmer’s Guide

Rev 1.34, June 2, 2004
Copyright © 2001-2004 Motorola, Inc. All rights reserved. Page 44 of 44
IEEE 802.15.3 Standard
• IEEE Standard for Information Technology – 802.15.3 Wireless Medium Access Control
(MAC) and Physical Layer (PHY) Specifications for High Rate Wireless Personal Area
Networks (WPANs). IEEE Std 802.15.3-2003.
13. Appendix A – Sources for Leasing of Test Equipment
The companies below rent the types of test equipment specified in Table 3. The availability of
particular instruments will vary, so check directly with each supplier. The leasing cost per month
is typically the equipment’s list price divided by twelve.
CIT Technologies Corporation
Phone: (800) 874-7123
http://www.trsonesource.com/trs/default.asp
Continental Resources, Inc.
Phone: (800) 937-4688
http://www.conres.com/tm/T&M.html
Electro Rent Corporation
Phone: (800) 688-1111
http://www.electrorent.com/
Metric Equipment Sales
Phone: (800) 432-3424
http://www.metrictest.com
RenTelco
Phone: (800) 233-5807
http://www.rentelco.com
Telogy, Inc.
Phone: (800) 835-6494
http://www.tecentral.com/
TestEquity Inc.
Phone: (800) 732-3457
http://www.testequity.com