Furuno Far3210Bb Operators Manual
FAR-3220-BB to the manual bd5cd713-3177-4399-a73c-cef74382846f
2015-08-11
: Furuno Furuno-Far3210Bb-Operators-Manual-800965 furuno-far3210bb-operators-manual-800965 furuno pdf
Open the PDF directly: View PDF ![]() .
.
Page Count: 463 [warning: Documents this large are best viewed by clicking the View PDF Link!]
- IMPORTANT NOTICES
- SAFETY INSTRUCTIONS
- TABLE OF CONTENTS
- FOREWORD
- SYSTEM CONFIGURATIONS
- 1. OPERATIONAL OVERVIEW
- 1.1 Units of the System
- 1.2 How to Turn the System On/Off
- 1.3 How to Select a Color Palette
- 1.4 How to Adjust the Display Brilliance (FURUNO monitor)
- 1.5 Operating Modes
- 1.6 Display Screens
- 1.7 Status Bar
- 1.8 InstantAccess Bar
- 1.9 Sensor Information, Datum Box
- 1.10 Menu Overview
- 1.11 Context-Sensitive Menus in the Radar Mode
- 1.12 Cursor Position
- 1.13 How to Select Sensor Settings
- 1.14 How to Enter Ship Speed
- 1.15 How to Enter Heading
- 1.16 How to Mark MOB Position
- 1.17 How to Offset Position
- 1.18 How to Select Time Format, Set Local Time
- 1.19 How to Take a Screenshot of the Display
- 1.20 The Settings Menu
- 1.21 User Profiles for Radar, Chart Radar
- 1.22 How to View Chart Software Version No., Chart System Information, and Operator's Manual
- 1.23 Tips (operational guidance)
- 2. RADAR, CHART RADAROPERATION
- 2.1 How to Transmit
- 2.2 How to Tune the Radar Receiver
- 2.3 Pulse Length
- 2.4 How to Adjust the Sensitivity
- 2.5 How to Suppress Sea Clutter
- 2.6 How to Suppress Rain Clutter
- 2.7 Interference Rejector
- 2.8 Echo Stretch
- 2.9 Echo Averaging
- 2.10 Automatic Clutter Elimination (ACE) Function
- 2.11 Noise Rejector
- 2.12 Wiper
- 2.13 How to Preset Controls for Specific Navigation Purpose
- 2.14 How to Suppress Second-trace Echoes
- 2.15 Presentation Modes
- 2.16 How to Select the Range Scale
- 2.17 How to Measure the Range to a Target
- 2.18 How to Measure the Bearing to a Target
- 2.19 Collision Assessment by Offset EBL
- 2.20 How to Measure the Range and Bearing Between Two Targets
- 2.21 How to Off-center the Display
- 2.22 Target Trails
- 2.23 Parallel Index (PI) Lines
- 2.23.1 How to display, erase a PI line
- 2.23.2 How to adjust PI line orientation, PI line interval
- 2.23.3 How to select the number of PI lines to display
- 2.23.4 How to select the bearing reference for the PI line
- 2.23.5 How to select the PI lines orientation
- 2.23.6 How to reset PI lines
- 2.23.7 How to adjust PI line length
- 2.24 Zoom
- 2.25 Markers
- 2.26 How to Adjust Brilliance of Screen Data
- 2.27 Watch Alert
- 2.28 Information Box
- 2.29 Interswitch
- 2.30 Dual Radar (B-type only)
- 2.31 Performance Monitor
- 2.32 Magnetron Reset (For A- and B-types)
- 2.33 CCRP (Common Consistent Reference Point)
- 2.34 Drop Mark
- 2.35 Anchor Watch
- 2.36 SART
- 2.37 Alert Box, Alert List
- 2.38 Echo Area
- 2.39 Echo Color
- 2.40 Icing Prevention
- 2.41 Chart Radar Functions
- 2.42 Radar Observation
- 3. TARGET TRACKING (TT)
- 3.1 About TT
- 3.2 How to Show, Hide the TT Display
- 3.3 How to Input Your Ship's Speed
- 3.4 Automatic Acquisition
- 3.5 Manual Acquisition
- 3.6 How to Stop Tracking Targets (including reference targets)
- 3.7 TT Symbols and TT Symbol Attributes
- 3.8 How to Display TT Data
- 3.9 Vector Modes
- 3.10 Past Position Display
- 3.11 How to Enter Set and Drift
- 3.12 TT CPA/TCPA Alarm
- 3.13 TT Lost Target Alert
- 3.14 Trial Maneuver
- 3.15 TT Simulation Mode
- 3.16 TT Alerts
- 3.17 Criteria for Selecting Targets for Tracking
- 3.18 Factors Affecting Target Tracking
- 4. AIS OPERATION
- 4.1 How to Deactivate the AIS Function
- 4.2 How to Show, Hide the AIS Display
- 4.3 AIS Symbols
- 4.4 How to Filter Sleeping AIS Targets
- 4.5 How to Activate Targets
- 4.6 How to Sleep Targets
- 4.7 How to Display AIS Target Data
- 4.8 AIS CPA/TCPA Alarm
- 4.9 AIS Symbol Brilliance
- 4.10 AIS Symbol Color
- 4.11 AIS Lost Targets
- 4.12 How to Display AIS Target Past Positions
- 4.13 How to Display True or Relative Speed Vectors
- 4.14 Association of TT and AIS Targets
- 4.15 Voyage Data
- 4.16 AIS Messages
- 4.17 Other AIS Features
- 5. RADAR MAP AND TRACK
- 5.1 What is a Radar Map?
- 5.2 Presentation Modes
- 5.3 How to Show, Hide the Radar Map Display
- 5.4 How to Enter Radar Map Marks and Lines
- 5.5 How to Find Number of Map Points Used
- 5.6 How to Select the Radar Map to Display
- 5.7 How to Attach a Comment to a Radar Map, Find Comment for a Map
- 5.8 How to Erase Radar Map Marks and Lines
- 5.9 How to Copy Radar Map Marks and Lines
- 5.10 How to Export Radar Map
- 5.11 How to Import Radar Map
- 5.12 How to Show, Hide Radar Map Features
- 5.13 Track
- 5.14 Route Display
- 5.15 User Chart Display
- 6. CHART OVERVIEW
- 6.1 Chart Screen Overview
- 6.1.1 Electronic chart area
- 6.1.2 Status bar
- 6.1.3 InstantAccess bar
- 6.1.4 Sensor information box
- 6.1.5 Own ship functions box
- 6.1.6 Route information box
- 6.1.7 Overlay/NAV Tools box
- 6.1.8 Alert box
- 6.1.9 Permanent warning box
- 6.1.10 EBL, VRM boxes
- 6.1.11 Context-sensitive menus
- 6.1.12 How to enter alphanumeric data
- 6.2 How to Select the Operating Mode
- 6.3 How to Select the Chart Operating Mode
- 6.4 How to Select the Chart Scale
- 6.5 How to Select the Presentation Mode
- 6.6 Cursor Position Box
- 6.7 The Standby Mode
- 6.8 True Motion Reset
- 6.9 How to Control Route and User Charts in Voyage Navigation and Voyage Planning Modes
- 6.10 How to Use the VRM and EBL
- 6.11 Split Screen
- 6.12 Datum
- 6.13 How to Select Sensor Settings
- 6.14 How to Enter Ship Speed
- 6.15 How to Enter Heading
- 6.16 Set up Before Departure
- 6.1 Chart Screen Overview
- 7. HOW TO MANAGE CHARTS
- 7.1 How to Install Public Keys for ENC Charts
- 7.2 How to Install ENC Licenses, Charts
- 7.3 How to Delete ENC Licenses
- 7.4 How to Install C-MAP Charts
- 7.5 How to Delete a C-MAP Database
- 7.6 How to Install C-MAP DL (Dynamic Licensing) Charts
- 7.7 How to Export a List of Charts
- 7.8 How to Export a List of Specific Licenses
- 7.9 How to Show the ENC Permit
- 7.10 How to Backup, Restore Licenses
- 7.11 How to View Permit Expiration Date
- 7.12 How to Display Install/Update History
- 7.13 Catalog of Chart Cells
- 7.14 How to Open Charts
- 7.15 How to Print Chart List, Cell Status List
- 7.16 How to Delete Charts
- 7.17 How to Show Publishers Notes for ENC Charts
- 7.18 How to Find the Chart Type
- 7.19 How to Update ENC, C-MAP Charts Manually
- 7.20 How to Synchronize Chart Data
- 7.21 How to Reconvert All SENC Charts
- 8. HOW TO CONTROL CHARTOBJECTS
- 9. VECTOR (S57) CHARTS
- 10. C-MAP CHARTS
- 11. CHART ALERTS
- 12. ROUTES
- 13. USER CHARTS
- 14. HOW TO MONITOR ROUTES
- 14.1 How to Select Route Monitoring
- 14.2 How to Stop Route Monitoring (Manual, Auto)
- 14.3 How to Select What Parts of a Route to Display
- 14.4 How to View Waypoint Information
- 14.5 How to View User Chart Information
- 14.6 How to Change Monitored Route to Planned Route
- 14.7 How to Use Instant Track to Return to or Deviate from Monitored Route
- 14.7.1 Safe off track mode
- 14.7.2 Back to track mode
- 14.7.3 Instant track messages
- 14.7.4 Instant track details
- 14.7.5 How to monitor, stop monitoring an instant track route
- 14.7.6 How to change a monitored route when following an instant track route (safe off track mode only)
- 14.7.7 Button label and equipment state
- 15. NAVIGATION TOOLS
- 16. NAVIGATION SENSORS
- 17. AIS SAFETY, NAVTEXMESSAGES
- 18. TT AND AIS DISPLAYS
- 19. RECORDING FUNCTIONS
- 20. ALERTS
- 21. PARAMETERS
- 22. SETTINGS MENU
- 23. COMMON REFERENCE SYSTEM
- 24. MAINTENANCE AND TROUBLESHOOTING
- APPENDIX 1 MENU TREE
- APPENDIX 2 ABBREVIATIONS, SYMBOLS
- APPENDIX 3 DATA COLOR AND MEANING
- SPECIFICATIONS
- INDEX
- Declaration of Conformity

OPERATOR'S MANUAL
www.furuno.com
CHART RADAR
FAR-3210
FAR-3220
FAR-3230S
FAR-3230S-SSD
FAR-3310
FAR-3320
FAR-3330S
FAR-3330S-SSD
FAR-3320W
FAR-3330SW
FAR-3210-BB
FAR-3220-BB
FAR-3230S-BB
FAR-3230S-SSD-BB
FAR-3220W-BB
FAR-3230SW-BB
Model
(Product Name: MARINE RADAR)

The paper used in this manual
is elemental chlorine free.
・FURUNO Authorized Distributor/Dealer
9-52 Ashihara-cho,
Nishinomiya, 662-8580, JAPAN
A
:
APR
2014
.
Printed in Japan
All rights reserved.
B2
:
DEC
.
15, 2014
Pub. No.
OME-36160-B2
(
YOTA
)
FAR-3000SERIES
0 0 0 1 7 8 0 2 7 1 1

i
IMPORTANT NOTICES
General
How to discard this product
Discard this product according to local regulations for the disposal of industrial waste. For disposal
in the USA, see the homepage of the Electronics Industries Alliance (http://www.eiae.org/) for the
correct method of disposal.
How to discard a used battery
Some FURUNO products have a battery(ies). To see if your product has a battery, see the chapter
on Maintenance. Follow the instructions below if a battery is used. Tape the + and - terminals of
battery before disposal to prevent fire, heat generation caused by short circuit.
In the European Union
The crossed-out trash can symbol indicates that all types of batteries
must not be discarded in standard trash, or at a trash site. Take the
used batteries to a battery collection site according to your national
legislation and the Batteries Directive 2006/66/EU.
In the USA
The Mobius loop symbol (three chasing arrows) indicates that Ni-Cd
and lead-acid rechargeable batteries must be recycled. Take the used
batteries to a battery collection site according to local laws.
In the other countries
There are no international standards for the battery recycle symbol. The number of symbols can
increase when the other countries make their own recycle symbols in the future.
• This manual has been authored with simplified grammar, to meet the needs of international users.
• The operator of this equipment must read and follow the descriptions in this manual. Wrong oper-
ation or maintenance can cancel the warranty or cause injury.
• Do not copy any part of this manual without written permission from FURUNO.
• If this manual is lost or worn, contact your dealer about replacement.
• The contents of this manual and equipment specifications can change without notice.
• The example screens (or illustrations) shown in this manual can be different from the screens you
see on your display. The screens you see depend on your system configuration and equipment
settings.
• Save this manual for future reference.
• Any modification of the equipment (including software) by persons not authorized by FURUNO will
cancel the warranty.
• All brand and product names are trademarks, registered trademarks or service marks of their re-
spective holders.
• “C-MAP” means “C-MAP by Jeppesen” in this manual.
• Windows is a registered trademark of the Microsoft Corporation of the USA and other countries.
Cd
Ni-Cd Pb
ii
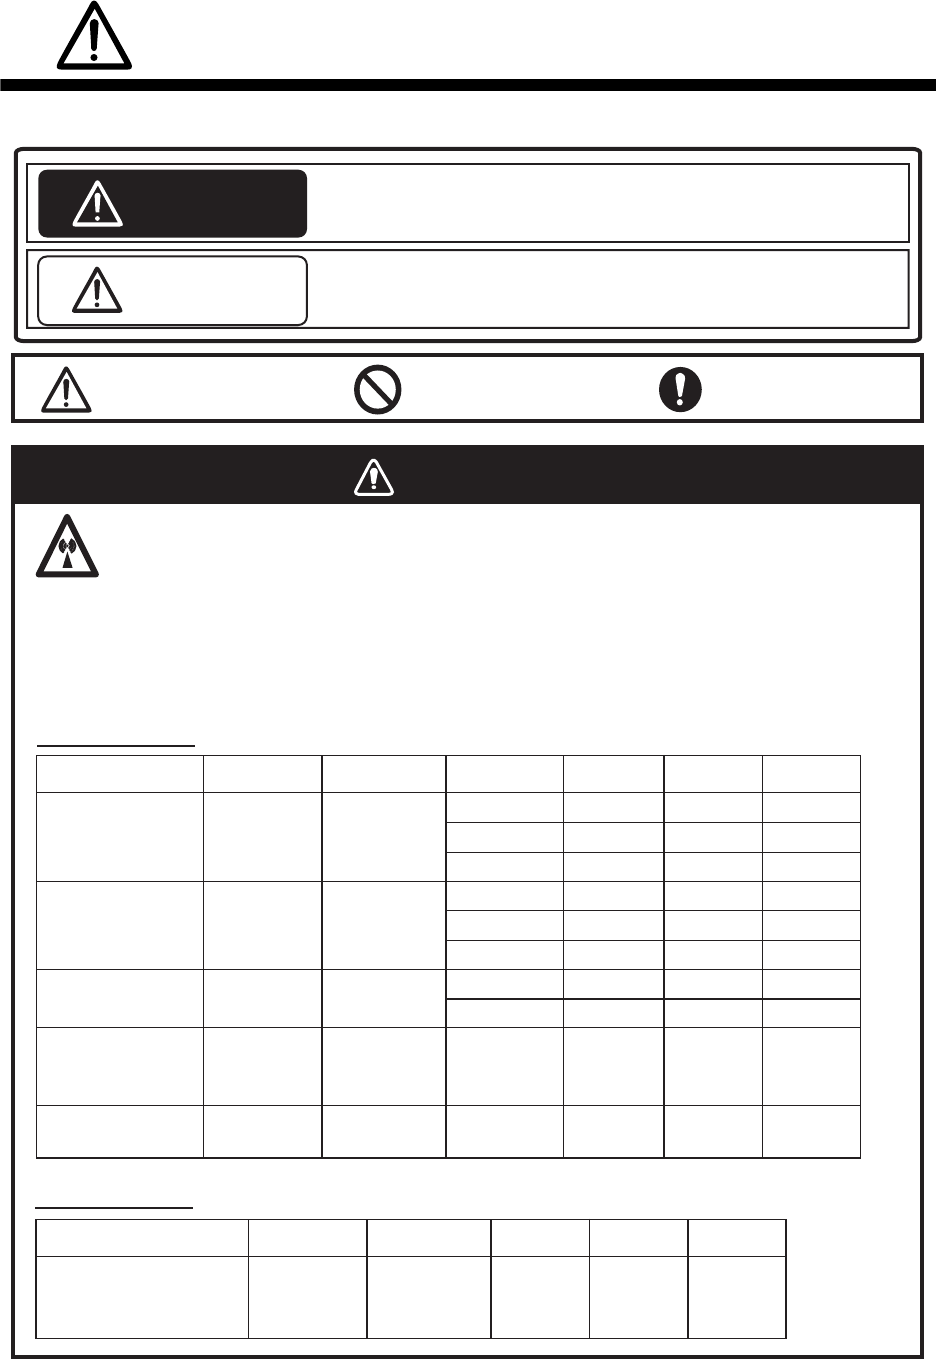
SAFETY INSTRUCTIONS
The operator must read the safety instructions before attempting to operate the equipment.
The radar antenna emits electromagnetic radio frequency (RF) energy that can be harmful,
particularly to your eyes. Never look directly into the antenna aperture from a close distance
while the radar is in operation or expose yourself to the transmitting antenna at a close
distance. Distances at which RF radiation level of 100, 50 and 10 W/m
2
are given in the table
below.
Indicates a potentially hazardous situation which, if not avoided,
could result in death or serious injury.
Indicates a potentially hazardous situation which, if not avoided,
could result in minor or moderate injury.
100W/m
2
Radar model
FAR-3220/
FAR-3320/
FAR-3220-BB
FAR-3210/
FAR-3310/
FAR-3210-BB
FAR-3230S/
FAR-3330S/
FAR-3230S-BB
FAR-3330SW/
FAR-3230SW-BB
FAR-3320W/
FAR-3220W-BB
Transceiver Magnetron Antenna 10W/m
2
50W/m
2
Warning, Caution Prohibitive Action Mandatory Action
Radio Frequency Radiation Hazard
WARNING
CAUTION
WARNING
RTR-105 FNE1201 XN12CF
XN20CF
XN24CF
RTR-106 MG5436 XN12CF
XN20CF
XN24CF
RTR-108 MG5436 XN20CF
XN24CF
RTR-107 MG5223F SN36CF
RTR-109 MG5223F SN36CF
Magnetron radar
100W/m
2
Radar model
FAR-3230S-SSD/
FAR-3330S-SSD/
FAR-3230S-SSD-BB
Transceiver Antenna 10W/m
2
50W/m
2
RTR-111 SN36CF
Solid state radar
N/A
N/A N/A 1.0 m
0.5 m 4.6 m
0.6 m 1.4 m 4.4 m
0.4 m 0.9 m 3.0 m
0.3 m 0.6 m 2.5 m
1.3 m 2.7 m 9.5 m
1.0 m 1.7 m 6.8 m
0.7 m 1.3 m 5.5 m
N/A 0.26 m 2.3 m
0.5 m 1.2 m 5.5 m
0.3 m 0.9 m 4.0 m
SAFETY INSTRUCTIONS
iii
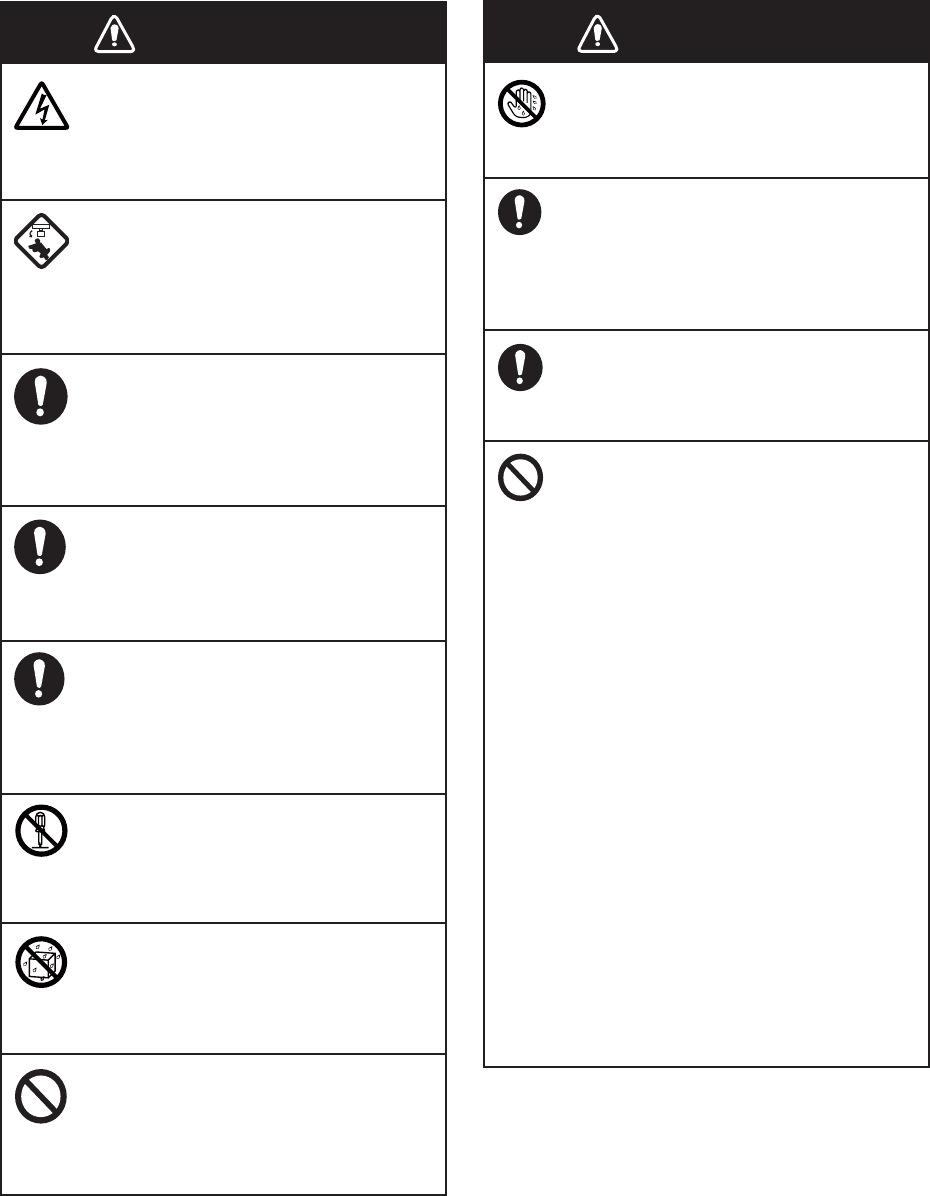
WARNING
Do not open the equipment.
The equipment uses high voltage that
can cause electrical shock. Refer any
repair work to a qualified technician.
Before turning on the radar, be sure
no one is near the antenna.
Prevent the potential risk of being
struck by the rotating antenna, which
can result in serious injury or death.
If water leaks into the equipment or
something is dropped into the
equipment, immediately turn off the
power at the switchboard.
Fire or electrical shock can result.
If the equipment is giving off smoke
or fire, immediately turn off the
power at the switchboard.
Fire or electrical shock can result.
If you feel the equipment is acting
abnormally or giving off strange
noises, immediately turn off the
power at the switchboard and
contact a FURUNO service techni-
cian.
Do not disassemble or modify the
equipment.
Fire, electrical shock or serious injury
can result.
Make sure no rain or water splash
leaks into the equipment.
Fire or electrical shock can result if
water leaks into the equipment.
Do not place liquid-filled containers
on or near the equipment.
Fire or electrical shock can result if a
liquid spills into the equipment.
Do not operate the equipment with
wet hands.
Electrical shock can result.
Keep objects away from the open-
type antenna unit, so as not to
impede rotation of the antenna.
Fire, electrical shock or serious injury
can result.
Use the proper fuse.
Use of the wrong fuse can cause fire or
damage the equipment.
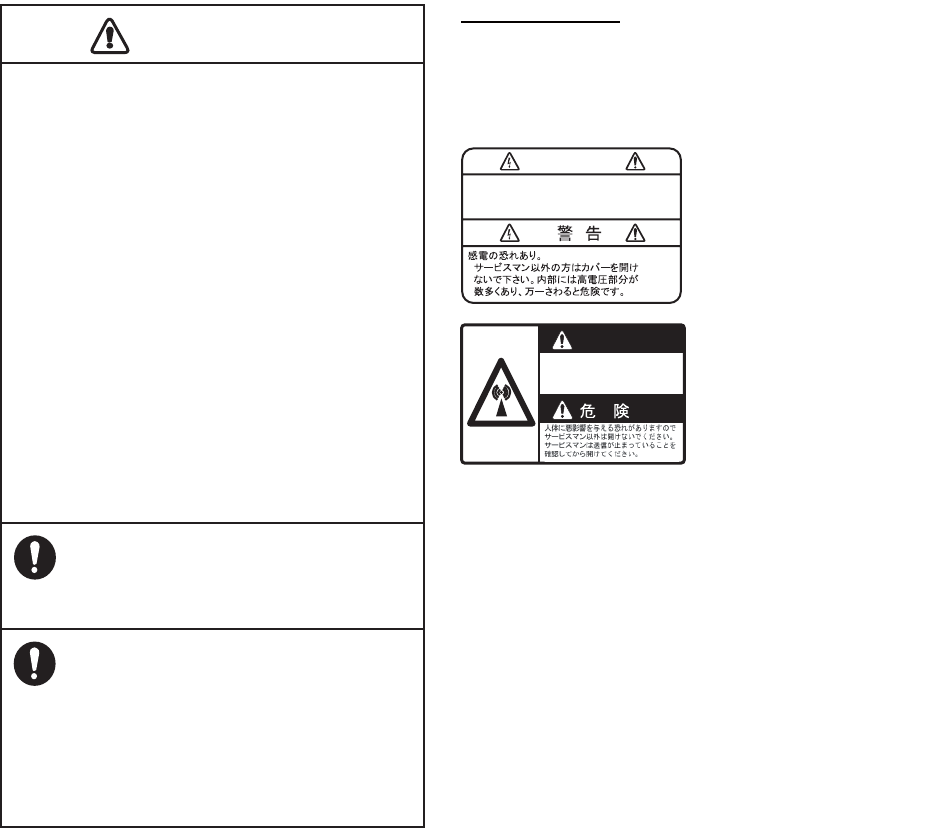
The TT function is a valuable aid to
navigation. However, the navigator
must check all aids available to
avoid collision.
- The TT automatically tracks an
automatically or manually acquired
radar target and calculates its course
and speed, indicating them with a
vector. Since the data generated by
the TT depends on the selected radar
targets, the radar must be optimally
tuned for use with the TT, to ensure
required targets will not be lost or
unnecessary targets, like sea returns
and noise, will not be acquired and
tracked.
- A target is not always a landmass,
reef, ship, but can also be returns
from the sea surface and from clutter.
As the level of clutter changes with
the environment, the operator must
correctly adjust the sea and rain
clutter controls and the gain control so
that the target echoes do not dis-
appear from the radar screen.
WARNING WARNING
SAFETY INSTRUCTIONS
iv
The plotting accuracy and response of this
TT meets IMO standards. Tracking accuracy
is affected by the following:
•
Tracking accuracy is affected by course
change. One to two minutes is required to
restore vectors to full accuracy after an
abrupt course change. (The actual amount
depends on gyrocompass specifications.)
•
The amount of tracking delay is inversely
proportional to the relative speed of the
target. Delay is approx. 15-30 seconds for
the higher relative speed; approx. 30-60
seconds for the lower relative speed. The
following factors can affect accuracy:
- Echo intensity
- Radar transmission pulse length
- Radar bearing error
- Gyrocompass error
- Course change (own ship and targets)
Handle the LCD carefully.
The LCD is made of glass, which can
cause injury if broken.
The data presented by this equipment
is intended as a source of navigation
information.
The prudent navigator never relies
exclusively on any one source of
navigation information, for safety of
vessel and crew.
WARNING
To avoid electrical shock, do not
remove cover. No user-serviceable
parts inside.
WARNING
Radiation hazard. Only qualified
personnel should work inside scanner.
Confirm that TX has stopped before
opening scanner.
Name: Warning Label 1
Type: 86-003-1011-1
Code No.: 100-236-231
Name: Warning Sticker
Type: 0
3-142-3201-0
Code No.:
100-266-890
Warning Label(s)
Warning label(s) is(are) attached to the
equipment. Do not remove the label(s). If a
label is missing or damaged, contact a
FURUNO agent or dealer about replacement.
CAUTIO
CAUTION

v
TABLE OF CONTENTS
FOREWORD................................................................................................................ xvii
SYSTEM CONFIGURATIONS...................................................................................... xxi
1. OPERATIONAL OVERVIEW.................................................................................1-1
1.1 Units of the System ....................................................................................................1-1
1.1.1 Radar Control Unit RCU-025..........................................................................1-1
1.1.2 Trackball Control Unit RCU-026.....................................................................1-4
1.1.3 Processor Unit EC-3000.................................................................................1-5
1.2 How to Turn the System On/Off .................................................................................1-5
1.3 How to Select a Color Palette.....................................................................................1-6
1.4 How to Adjust the Display Brilliance (FURUNO monitor) ...........................................1-7
1.5 Operating Modes........................................................................................................1-8
1.5.1 How to select an operating mode...................................................................1-8
1.5.2 Limitations when using the chart radar mode.................................................1-8
1.6 Display Screens..........................................................................................................1-9
1.6.1 Radar display .................................................................................................1-9
1.6.2 Chart radar display .......................................................................................1-11
1.6.3 Chart display ................................................................................................1-12
1.7 Status Bar.................................................................................................................1-13
1.7.1 Status bar for radar, chart radar mode .........................................................1-13
1.7.2 How to operate the buttons, slider bars on the Status bar ...........................1-14
1.8 InstantAccess Bar.....................................................................................................1-15
1.8.1 How to operate the buttons, slider bars on the InstantAccess bar ...............1-17
1.9 Sensor Information, Datum Box ...............................................................................1-18
1.10 Menu Overview.........................................................................................................1-19
1.10.1 Basic menu operation...................................................................................1-19
1.10.2 Menu history feature.....................................................................................1-20
1.10.3 How to enter numeric data ...........................................................................1-21
1.10.4 How to enter alphanumeric character data ..................................................1-21
1.11 Context-Sensitive Menus in the Radar Mode...........................................................1-22
1.11.1 Context-sensitive menus available with buttons and boxes .........................1-22
1.11.2 Context-sensitive menus in the display area in the radar
and chart radar modes .................................................................................1-24
1.12 Cursor Position.........................................................................................................1-25
1.13 How to Select Sensor Settings.................................................................................1-25
1.14 How to Enter Ship Speed .........................................................................................1-26
1.15 How to Enter Heading ..............................................................................................1-28
1.16 How to Mark MOB Position ......................................................................................1-29
1.17 How to Offset Position ..............................................................................................1-29
1.18 How to Select Time Format, Set Local Time ............................................................1-30
1.19 How to Take a Screenshot of the Display ................................................................1-30
1.20 The Settings Menu ...................................................................................................1-31
1.21 User Profiles for Radar, Chart Radar .......................................................................1-31
1.21.1 How to create a profile .................................................................................1-31
1.21.2 How to disable a profile ................................................................................1-31
1.21.3 How to activate a profile ...............................................................................1-31
1.21.4 How to restore a profile to the default settings .............................................1-32
1.21.5 How to change the settings on the current display
to the recommended settings .......................................................................1-32
1.22 How to View Chart Software Version No., Chart System Information,
and Operator's Manual.............................................................................................1-33
1.23 Tips (operational guidance) .....................................................................................1-34
TABLE OF CONTENTS
vi
2. RADAR, CHART RADAR OPERATION................................................................2-1
2.1 How to Transmit......................................................................................................... 2-1
2.2 How to Tune the Radar Receiver............................................................................... 2-1
2.2.1 Tuning for magnetron radar ........................................................................... 2-1
2.3 Pulse Length .............................................................................................................. 2-2
2.3.1 How to select a pulse length ..........................................................................2-2
2.3.2 How to change the pulse length..................................................................... 2-3
2.4 How to Adjust the Sensitivity...................................................................................... 2-3
2.5 How to Suppress Sea Clutter..................................................................................... 2-3
2.5.1 How to reduce sea clutter automatically ........................................................ 2-4
2.5.2 How to reduce sea clutter manually............................................................... 2-4
2.6 How to Suppress Rain Clutter.................................................................................... 2-5
2.6.1 How to reduce rain clutter automatically ........................................................ 2-5
2.6.2 How to reduce rain clutter manually............................................................... 2-6
2.7 Interference Rejector.................................................................................................. 2-7
2.8 Echo Stretch............................................................................................................... 2-7
2.9 Echo Averaging.......................................................................................................... 2-8
2.10 Automatic Clutter Elimination (ACE) Function ........................................................... 2-9
2.10.1 How to turn the Automatic Clutter Elimination (ACE) function on/off .............2-9
2.10.2 How to adjust the gain in the Automatic Clutter Elimination (ACE) mode...... 2-9
2.10.3 Automatic Clutter Elimination (ACE) menu .................................................. 2-10
2.10.4 How to get the high sensitivity...................................................................... 2-10
2.10.5 How to suppress the false echoes ............................................................... 2-10
2.11 Noise Rejector.......................................................................................................... 2-11
2.12 Wiper........................................................................................................................2-12
2.13 How to Preset Controls for Specific Navigation Purpose ......................................... 2-12
2.13.1 How to select a customized echo................................................................. 2-14
2.13.2 How to edit a customized echo .................................................................... 2-14
2.13.3 How to restore a user customized echo to the saved settings.....................2-15
2.13.4 How to restore a user customized echo to the factory default settings........ 2-15
2.14 How to Suppress Second-trace Echoes ..................................................................2-16
2.15 Presentation Modes ................................................................................................. 2-16
2.15.1 How to select a presentation mode.............................................................. 2-17
2.15.2 Description of presentation modes............................................................... 2-18
2.16 How to Select the Range Scale ............................................................................... 2-20
2.17 How to Measure the Range to a Target ................................................................... 2-20
2.17.1 How to measure the range by using a VRM ................................................2-21
2.17.2 How to set VRM attributes ........................................................................... 2-22
2.18 How to Measure the Bearing to a Target ................................................................. 2-23
2.18.1 How to measure the bearing........................................................................ 2-23
2.18.2 How to select bearing reference ..................................................................2-24
2.19 Collision Assessment by Offset EBL........................................................................ 2-24
2.19.1 How to assess risk of collision .................................................................... 2-24
2.19.2 Point of reference for origin point of offset EBL ........................................... 2-25
2.20 How to Measure the Range and Bearing Between Two Targets............................. 2-26
2.21 How to Off-center the Display .................................................................................. 2-27
2.22 Target Trails............................................................................................................. 2-28
2.22.1 Target trails-related indications.................................................................... 2-28
2.22.2 True or relative target trails .......................................................................... 2-28
2.22.3 Trail time ...................................................................................................... 2-29
2.22.4 How to reset target trails .............................................................................. 2-29
2.22.5 How to temporarily remove all target trails from the display ........................ 2-29
2.22.6 Trail stabilization in true motion.................................................................... 2-29
2.22.7 Target trail attributes on the TRAIL menu .................................................... 2-30
2.23 Parallel Index (PI) Lines ........................................................................................... 2-30
2.23.1 How to display, erase a PI line..................................................................... 2-31
TABLE OF CONTENTS
vii
2.23.2 How to adjust PI line orientation, PI line interval ..........................................2-31
2.23.3 How to select the number of PI lines to display............................................2-31
2.23.4 How to select the bearing reference for the PI line ......................................2-31
2.23.5 How to select the PI lines orientation ...........................................................2-32
2.23.6 How to reset PI lines ....................................................................................2-32
2.23.7 How to adjust PI line length..........................................................................2-32
2.24 Zoom ........................................................................................................................2-33
2.25 Markers.....................................................................................................................2-34
2.25.1 Heading line .................................................................................................2-34
2.25.2 Stern marker.................................................................................................2-34
2.25.3 North marker ................................................................................................2-34
2.25.4 Own ship marker ..........................................................................................2-34
2.25.5 Vectors .........................................................................................................2-35
2.25.6 Barge marker................................................................................................2-35
2.25.7 Antenna marker............................................................................................2-36
2.25.8 Cursor...........................................................................................................2-36
2.26 How to Adjust Brilliance of Screen Data...................................................................2-37
2.27 Watch Alert...............................................................................................................2-38
2.28 Information Box ........................................................................................................2-39
2.28.1 Information box contents ..............................................................................2-39
2.28.2 How to show the information box .................................................................2-40
2.28.3 How to turn NAV data on/off.........................................................................2-41
2.29 Interswitch ................................................................................................................2-42
2.29.1 Displaying antenna information ....................................................................2-42
2.29.2 How to preset antenna and display combinations........................................2-43
2.29.3 How to select an antenna.............................................................................2-44
2.30 Dual Radar (B-type only)..........................................................................................2-45
2.30.1 How to enable or disable the dual radar display ..........................................2-46
2.30.2 Operating considerations for the dual radar display.....................................2-46
2.31 Performance Monitor................................................................................................2-48
2.32 Magnetron Reset (For A- and B-types) ....................................................................2-50
2.33 CCRP (Common Consistent Reference Point).........................................................2-51
2.34 Drop Mark.................................................................................................................2-53
2.34.1 How to show, hide the drop mark box ..........................................................2-53
2.34.2 How to inscribe a drop mark.........................................................................2-53
2.34.3 Drop mark bearing reference .......................................................................2-53
2.34.4 How to erase a drop mark ............................................................................2-54
2.35 Anchor Watch ...........................................................................................................2-54
2.36 SART ........................................................................................................................2-55
2.36.1 What is an SART?........................................................................................2-55
2.36.2 How to receive an SART ..............................................................................2-55
2.37 Alert Box, Alert List...................................................................................................2-56
2.37.1 Alert box .......................................................................................................2-56
2.37.2 Alert list.........................................................................................................2-57
2.37.3 Changing priority of primary alerts ...............................................................2-57
2.38 Echo Area.................................................................................................................2-58
2.39 Echo Color................................................................................................................2-58
2.40 Icing Prevention........................................................................................................2-59
2.41 Chart Radar Functions .............................................................................................2-60
2.41.1 How to switch between radar and chart radar modes ..................................2-60
2.41.2 How to show or hide chart objects ...............................................................2-60
2.41.3 How to create and recall custom sets of chart display objects.....................2-62
2.41.4 Chart database information ..........................................................................2-63
2.41.5 Chart scale indications .................................................................................2-63
2.41.6 Chart status ..................................................................................................2-63
2.41.7 Chart alert function .......................................................................................2-64
TABLE OF CONTENTS
viii
2.41.8 Notes details ................................................................................................ 2-64
2.42 Radar Observation ...................................................................................................2-65
2.42.1 General ........................................................................................................ 2-65
2.42.2 False echoes................................................................................................2-66
2.42.3 RACON ........................................................................................................ 2-68
2.42.4 Radar Target Enhancer (RTE).....................................................................2-68
2.42.5 Solid state radar...........................................................................................2-69
3. TARGET TRACKING (TT) .....................................................................................3-1
3.1 About TT ....................................................................................................................3-1
3.2 How to Show, Hide the TT Display ............................................................................ 3-1
3.3 How to Input Your Ship's Speed ................................................................................ 3-2
3.3.1 Echo-referenced speed input......................................................................... 3-2
3.4 Automatic Acquisition................................................................................................. 3-3
3.4.1 How to enable auto acquisition ......................................................................3-3
3.4.2 How to set an automatic acquisition zone...................................................... 3-4
3.5 Manual Acquisition ..................................................................................................... 3-5
3.5.1 How to set manual acquisition conditions ......................................................3-5
3.5.2 How to manually acquire a target................................................................... 3-6
3.6 How to Stop Tracking Targets (including reference targets)...................................... 3-6
3.6.1 How to cancel tracking on individual tracked targets ..................................... 3-6
3.6.2 How to cancel tracking on all TTs .................................................................. 3-7
3.7 TT Symbols and TT Symbol Attributes ...................................................................... 3-7
3.7.1 TT symbols..................................................................................................... 3-7
3.7.2 TT symbol brilliance ....................................................................................... 3-8
3.7.3 Color for TT symbol........................................................................................ 3-8
3.8 How to Display TT Data ............................................................................................. 3-9
3.8.1 How to display target data for individual TT ................................................... 3-9
3.8.2 TT pop-up information..................................................................................3-10
3.8.3 Target list ..................................................................................................... 3-10
3.9 Vector Modes...........................................................................................................3-11
3.9.1 Description of vectors................................................................................... 3-11
3.9.2 Vector motion and length .............................................................................3-13
3.10 Past Position Display ............................................................................................... 3-13
3.10.1 How to enable/disable the past position display,
select past position reference ...................................................................... 3-14
3.10.2 Past position points ...................................................................................... 3-14
3.11 How to Enter Set and Drift .......................................................................................3-14
3.12 TT CPA/TCPA Alarm ............................................................................................... 3-16
3.12.1 How to set the CPA and TCPA limits...........................................................3-16
3.12.2 How to enable, disable the TT CPA/TCPA alarm ........................................3-16
3.12.3 How to acknowledge the TT CPA/TCPA alarm............................................3-16
3.13 TT Lost Target Alert ................................................................................................. 3-17
3.13.1 How to enable, disable the TT lost target alert............................................. 3-17
3.13.2 How to set the TT lost target filter ................................................................ 3-17
3.14 Trial Maneuver ......................................................................................................... 3-18
3.14.1 Types of trial maneuvers.............................................................................. 3-18
3.14.2 How to do a trial maneuver ..........................................................................3-19
3.15 TT Simulation Mode ................................................................................................. 3-20
3.16 TT Alerts...................................................................................................................3-21
3.17 Criteria for Selecting Targets for Tracking ............................................................... 3-22
3.18 Factors Affecting Target Tracking ............................................................................ 3-24
4. AIS OPERATION ...................................................................................................4-1
4.1 How to Deactivate the AIS Function .......................................................................... 4-2
4.2 How to Show, Hide the AIS Display ........................................................................... 4-3
TABLE OF CONTENTS
ix
4.3 AIS Symbols...............................................................................................................4-3
4.4 How to Filter Sleeping AIS Targets ............................................................................4-5
4.5 How to Activate Targets .............................................................................................4-5
4.5.1 How to activate specific target........................................................................4-5
4.5.2 How to automatically activate targets.............................................................4-6
4.6 How to Sleep Targets .................................................................................................4-6
4.6.1 How to sleep an activated AIS target .............................................................4-6
4.6.2 How to sleep all activated AIS targets............................................................4-7
4.7 How to Display AIS Target Data.................................................................................4-7
4.7.1 AIS pop-up information...................................................................................4-7
4.7.2 Basic AIS target data......................................................................................4-7
4.7.3 Expanded AIS data ........................................................................................4-9
4.8 AIS CPA/TCPA Alarm ..............................................................................................4-10
4.9 AIS Symbol Brilliance ...............................................................................................4-10
4.10 AIS Symbol Color .....................................................................................................4-11
4.11 AIS Lost Targets.......................................................................................................4-11
4.11.1 How to enable, disable the AIS lost target alert ...........................................4-11
4.11.2 How to set the AIS lost target filter ...............................................................4-12
4.12 How to Display AIS Target Past Positions................................................................4-12
4.12.1 How to enable/disable the past position display,
select past position reference.......................................................................4-12
4.12.2 Past position points ......................................................................................4-13
4.13 How to Display True or Relative Speed Vectors ......................................................4-13
4.14 Association of TT and AIS Targets...........................................................................4-13
4.14.1 How to select association method................................................................4-13
4.14.2 How to set the conditions for association .....................................................4-14
4.15 Voyage Data.............................................................................................................4-14
4.16 AIS Messages ..........................................................................................................4-15
4.16.1 How to create and transmit a new AIS message .........................................4-15
4.16.2 How to transmit a saved AIS message ........................................................4-16
4.16.3 How to display received AIS messages .......................................................4-16
4.17 Other AIS Features...................................................................................................4-18
5. RADAR MAP AND TRACK ...................................................................................5-1
5.1 What is a Radar Map?................................................................................................5-1
5.2 Presentation Modes....................................................................................................5-1
5.3 How to Show, Hide the Radar Map Display ...............................................................5-1
5.4 How to Enter Radar Map Marks and Lines.................................................................5-2
5.5 How to Find Number of Map Points Used ..................................................................5-3
5.6 How to Select the Radar Map to Display....................................................................5-4
5.7 How to Attach a Comment to a Radar Map, Find Comment for a Map......................5-4
5.7.1 How to attach a comment to a radar map ......................................................5-4
5.7.2 How to find the comment for a map ...............................................................5-4
5.8 How to Erase Radar Map Marks and Lines................................................................5-5
5.8.1 How to erase individual radar map marks and lines.......................................5-5
5.8.2 How to erase map marks and lines in an area ...............................................5-5
5.8.3 How to erase all radar map marks and lines in a map file..............................5-6
5.9 How to Copy Radar Map Marks and Lines.................................................................5-7
5.9.1 How to copy individual radar map mark and line to another map file.............5-7
5.9.2 How to copy radar map marks and lines within an area to another map file..5-7
5.9.3 How to copy all radar map marks and lines in a map file to another map file 5-8
5.10 How to Export Radar Map ..........................................................................................5-9
5.11 How to Import Radar Map ........................................................................................5-10
5.12 How to Show, Hide Radar Map Features.................................................................5-13
5.13 Track.........................................................................................................................5-13
5.13.1 How to set up ship's track.............................................................................5-13
TABLE OF CONTENTS
x
5.13.2 How to erase track ....................................................................................... 5-14
5.14 Route Display........................................................................................................... 5-14
5.15 User Chart Display ................................................................................................... 5-15
6. CHART OVERVIEW...............................................................................................6-1
6.1 Chart Screen Overview .............................................................................................. 6-1
6.1.1 Electronic chart area ...................................................................................... 6-2
6.1.2 Status bar....................................................................................................... 6-3
6.1.3 InstantAccess bar........................................................................................... 6-5
6.1.4 Sensor information box .................................................................................. 6-8
6.1.5 Own ship functions box.................................................................................. 6-8
6.1.6 Route information box.................................................................................... 6-9
6.1.7 Overlay/NAV Tools box................................................................................ 6-10
6.1.8 Alert box....................................................................................................... 6-10
6.1.9 Permanent warning box ............................................................................... 6-10
6.1.10 EBL, VRM boxes.......................................................................................... 6-10
6.1.11 Context-sensitive menus.............................................................................. 6-11
6.1.12 How to enter alphanumeric data ..................................................................6-12
6.2 How to Select the Operating Mode .......................................................................... 6-13
6.3 How to Select the Chart Operating Mode ................................................................ 6-13
6.4 How to Select the Chart Scale ................................................................................. 6-14
6.5 How to Select the Presentation Mode...................................................................... 6-15
6.6 Cursor Position Box ................................................................................................. 6-16
6.7 The Standby Mode...................................................................................................6-16
6.8 True Motion Reset.................................................................................................... 6-17
6.9 How to Control Route and User Charts in Voyage Navigation
and Voyage Planning Modes ...................................................................................6-18
6.10 How to Use the VRM and EBL.................................................................................6-19
6.10.1 How to hide/show an EBL, VRM.................................................................. 6-19
6.10.2 How to measure the range and bearing.......................................................6-19
6.10.3 How to select bearing reference ..................................................................6-19
6.10.4 EBL, VRM functions available with the context-sensitive menu...................6-20
6.11 Split Screen.............................................................................................................. 6-21
6.12 Datum.......................................................................................................................6-21
6.12.1 General ........................................................................................................ 6-21
6.12.2 Paper charts.................................................................................................6-21
6.12.3 Electronic sea charts.................................................................................... 6-21
6.12.4 Positioning devices and datum ....................................................................6-21
6.12.5 Chart radar and datum.................................................................................6-21
6.13 How to Select Sensor Settings................................................................................. 6-22
6.14 How to Enter Ship Speed.........................................................................................6-22
6.15 How to Enter Heading.............................................................................................. 6-24
6.16 Set up Before Departure .......................................................................................... 6-26
6.16.1 Updates before departure ............................................................................ 6-26
6.16.2 Create or update a route..............................................................................6-27
6.16.3 How to check and prepare route to monitor................................................. 6-28
6.16.4 Check configuration of navigation sensors .................................................. 6-30
6.16.5 How to reset odometer and trip meter..........................................................6-31
7. HOW TO MANAGE CHARTS ................................................................................7-1
7.1 How to Install Public Keys for ENC Charts ................................................................ 7-1
7.2 How to Install ENC Licenses, Charts ......................................................................... 7-2
7.2.1 How to install an ENC license........................................................................ 7-2
7.2.2 How to install ENC charts .............................................................................. 7-3
7.3 How to Delete ENC Licenses..................................................................................... 7-5
7.4 How to Install C-MAP Charts ..................................................................................... 7-6
TABLE OF CONTENTS
xi
7.4.1 How to register the eToken ............................................................................7-6
7.4.2 How to install the C-MAP database................................................................7-6
7.4.3 How to install C-MAP licenses .......................................................................7-8
7.4.4 How to generate and order an update file ......................................................7-9
7.4.5 How to apply the update file...........................................................................7-9
7.5 How to Delete a C-MAP Database.............................................................................7-9
7.6 How to Install C-MAP DL (Dynamic Licensing) Charts.............................................7-10
7.6.1 How to generate and order an update file ....................................................7-10
7.6.2 How to apply the update file.........................................................................7-10
7.6.3 How to enable and set up the C-MAP DL ....................................................7-11
7.7 How to Export a List of Charts..................................................................................7-11
7.8 How to Export a List of Specific Licenses.................................................................7-12
7.9 How to Show the ENC Permit ..................................................................................7-12
7.10 How to Backup, Restore Licenses............................................................................7-12
7.11 How to View Permit Expiration Date.........................................................................7-13
7.12 How to Display Install/Update History ......................................................................7-14
7.13 Catalog of Chart Cells ..............................................................................................7-15
7.13.1 How to group chart cells...............................................................................7-16
7.13.2 How to view status of chart cells ..................................................................7-18
7.14 How to Open Charts.................................................................................................7-18
7.15 How to Print Chart List, Cell Status List....................................................................7-19
7.15.1 How to print the chart list..............................................................................7-19
7.15.2 How to print the cell status list......................................................................7-20
7.16 How to Delete Charts ...............................................................................................7-20
7.17 How to Show Publishers Notes for ENC Charts.......................................................7-21
7.18 How to Find the Chart Type......................................................................................7-22
7.19 How to Update ENC, C-MAP Charts Manually.........................................................7-22
7.19.1 How to insert update symbols ......................................................................7-23
7.19.2 How to delete update symbols .....................................................................7-24
7.19.3 How to modify existing update symbols .......................................................7-24
7.20 How to Synchronize Chart Data ...............................................................................7-25
7.20.1 How to select the units to synchronize .........................................................7-25
7.20.2 How to check synchronization status ...........................................................7-26
7.20.3 Manual updates and synchronization...........................................................7-27
7.21 How to Reconvert All SENC Charts .........................................................................7-27
8. HOW TO CONTROL CHART OBJECTS ..............................................................8-1
8.1 How to Browse Your Charts .......................................................................................8-1
8.2 How to Control Visibility of Chart Objects...................................................................8-1
8.2.1 How to set value for shallow contour, safety depth, safety contour
and deep contour ...........................................................................................8-1
8.2.2 Basic Setting menu ........................................................................................8-3
8.2.3 Chart Display menu........................................................................................8-4
8.2.4 Display base...................................................................................................8-5
8.3 How to Control Visibility of Symbols, Features...........................................................8-5
8.3.1 General page..................................................................................................8-5
8.3.2 Tracking page.................................................................................................8-7
8.3.3 Route page.....................................................................................................8-8
8.3.4 Mariner page ..................................................................................................8-8
8.3.5 Targets page ..................................................................................................8-9
8.4 Control of Predefined IMO Chart Display Settings ...................................................8-10
9. VECTOR (S57) CHARTS.......................................................................................9-1
9.1 Introduction to S57 Charts..........................................................................................9-1
9.1.1 Definitions of terms.........................................................................................9-2
9.1.2 Chart legend for S57 charts ...........................................................................9-2
TABLE OF CONTENTS
xii
9.1.3 Permanent warnings for S57 charts............................................................... 9-3
9.2 Chart Viewing Dates and Seasonal Features of the S57 Chart ................................. 9-4
9.2.1 Introduction .................................................................................................... 9-4
9.2.2 How to approve and highlight S57 chart updates .......................................... 9-4
9.2.3 How to set Display date and Approved until dates......................................... 9-5
9.2.4 About chart viewing date dependency of S57 standard................................. 9-5
9.3 Symbology Used in S57 Charts ................................................................................. 9-6
9.3.1 Presentation library used for S57 chart features............................................ 9-6
9.4 How to Find Information About S57 Chart Objects .................................................... 9-7
9.5 Admiralty Information Overlay (AIO) .......................................................................... 9-8
9.5.1 Installation ...................................................................................................... 9-8
9.5.2 How to display the AIO................................................................................... 9-8
9.5.3 Catalog of AIO cells ....................................................................................... 9-9
9.5.4 How to find AIO chart object information........................................................ 9-9
9.5.5 How to select the information to display....................................................... 9-10
10. C-MAP CHARTS..................................................................................................10-1
10.1 C-MAP Cartographic Service...................................................................................10-1
10.2 How to Register the System at C-MAP Norway....................................................... 10-1
10.3 How to Order Charts ................................................................................................ 10-1
10.4 How to Apply for Licenses........................................................................................ 10-1
10.5 Troubleshooting ....................................................................................................... 10-2
10.6 Chart Subscription Services..................................................................................... 10-2
10.6.1 C-MAP services ........................................................................................... 10-2
10.6.2 What is ENC delivery? ................................................................................. 10-2
10.7 Chart Display............................................................................................................ 10-3
10.7.1 Introduction .................................................................................................. 10-3
10.8 Permanent Warnings ...............................................................................................10-4
11. CHART ALERTS..................................................................................................11-1
11.1 Chart Alerts .............................................................................................................. 11-2
11.1.1 How to set safety contour............................................................................. 11-2
11.1.2 How to select objects used in chart alerts.................................................... 11-3
11.2 How to Activate Own Ship Check ............................................................................ 11-4
11.3 Route Planning.........................................................................................................11-5
11.3.1 Chart alerts for route planning...................................................................... 11-5
11.4 Route Monitoring...................................................................................................... 11-7
12. ROUTES...............................................................................................................12-1
12.1 Route Planning Overview.........................................................................................12-1
12.2 Main Menu for Route Planning.................................................................................12-2
12.3 How to Create a New Route .................................................................................... 12-2
12.3.1 How to use the Waypoints page ..................................................................12-4
12.3.2 How to use the User Chart page..................................................................12-5
12.3.3 How to use the Optimize page..................................................................... 12-6
12.3.4 How to use the Alert Parameters page ........................................................ 12-6
12.3.5 How to use the Check Results page ............................................................ 12-8
12.4 How to Modify an Existing Route ............................................................................. 12-8
12.4.1 How to change waypoint position................................................................. 12-8
12.4.2 How to change other waypoint data.............................................................12-9
12.4.3 How to add a new waypoint at the end of a route........................................12-9
12.4.4 How to insert a waypoint.............................................................................. 12-9
12.4.5 How to delete a waypoint ............................................................................. 12-9
12.4.6 Geometry check of route............................................................................ 12-10
12.5 SAR Operations ..................................................................................................... 12-10
12.6 Route Bank ............................................................................................................ 12-13
TABLE OF CONTENTS
xiii
12.7 Route Optimization.................................................................................................12-14
12.7.1 Available route optimization strategies.......................................................12-14
12.7.2 How to optimize a route..............................................................................12-15
12.7.3 How to plan a speed profile........................................................................12-16
12.8 How to Import Routes.............................................................................................12-17
12.8.1 How to import FMD-3xx0, FCR-2xx9, FAR-3xx0 route data ......................12-17
12.8.2 How to import FEA-2x07 route data ...........................................................12-17
12.8.3 How to import csv, ASCII format route data ...............................................12-18
12.9 How to Export Route Data......................................................................................12-18
12.9.1 How to export FAR-3xx0 route data ...........................................................12-18
12.9.2 How to export route data in FEA-2x07, csv, ASCII format .........................12-19
12.10How to Delete Routes............................................................................................12-19
12.11Reports ..................................................................................................................12-20
13. USER CHARTS ...................................................................................................13-1
13.1 Introduction...............................................................................................................13-1
13.1.1 Objects of user charts ..................................................................................13-1
13.2 How to Create a User Chart .....................................................................................13-2
13.3 How to Import a User Chart Created with ECDIS FEA-2x07....................................13-6
13.4 How to Edit Objects on a User Chart........................................................................13-7
13.4.1 How to edit objects on the chart area...........................................................13-7
13.4.2 How to edit objects from the User Chart dialog box .....................................13-7
13.5 How to Delete Objects from a User Chart ................................................................13-7
13.6 How to Select the User Chart Objects to Display .....................................................13-8
13.7 How to Delete User Charts.......................................................................................13-8
13.8 User Chart Reports...................................................................................................13-9
14. HOW TO MONITOR ROUTES.............................................................................14-1
14.1 How to Start Route Monitoring .................................................................................14-1
14.2 How to Stop Route Monitoring (Manual, Auto).........................................................14-3
14.3 How to Select What Parts of a Route to Display ......................................................14-3
14.4 How to View Waypoint Information...........................................................................14-4
14.5 How to View User Chart Information ........................................................................14-5
14.6 How to Change Monitored Route to Planned Route ................................................14-5
14.7 How to Use Instant Track to Return to or Deviate from Monitored Route ................14-6
14.7.1 Safe off track mode ......................................................................................14-6
14.7.2 Back to track mode.......................................................................................14-7
14.7.3 Instant track messages ................................................................................14-8
14.7.4 Instant track details ......................................................................................14-9
14.7.5 How to monitor, stop monitoring an instant track route ..............................14-10
14.7.6 How to change a monitored route when following an instant track route
(safe off track mode only)...........................................................................14-11
14.7.7 Button label and equipment state...............................................................14-12
15. NAVIGATION TOOLS .........................................................................................15-1
15.1 How to Access the Nav Tools in the Overlay/NAV Tools Box ..................................15-1
15.2 Parallel Index (PI) Lines ...........................................................................................15-2
15.2.1 How to activate, deactivate PI lines..............................................................15-2
15.2.2 PI line bearing reference ..............................................................................15-2
15.2.3 Number of PI lines to display........................................................................15-2
15.2.4 PI line mode .................................................................................................15-2
15.2.5 How to adjust PI line orientation, PI line interval ..........................................15-3
15.2.6 How to reset the PI lines ..............................................................................15-3
15.2.7 How to adjust PI line length..........................................................................15-4
15.3 Check Area...............................................................................................................15-4
15.4 Ring ..........................................................................................................................15-5
TABLE OF CONTENTS
xiv
15.5 Predictor...................................................................................................................15-5
15.6 Anchor Watch........................................................................................................... 15-6
15.7 UKC (Under Keel Clearance)...................................................................................15-7
15.7.1 UKC overview .............................................................................................. 15-7
15.7.2 How to set UKC............................................................................................ 15-7
15.7.3 UKC window................................................................................................. 15-8
15.8 Mini Conning Display ............................................................................................... 15-9
15.9 Divider .................................................................................................................... 15-10
15.9.1 How to use the divider................................................................................ 15-10
15.9.2 Usage characteristics, limitations............................................................... 15-11
15.9.3 How to deactivate and erase the divider....................................................15-11
16. NAVIGATION SENSORS.....................................................................................16-1
16.1 CCRS.......................................................................................................................16-1
16.2 How to Select Navigation Sensors........................................................................... 16-2
16.2.1 Sensors menu description............................................................................16-2
16.3 Source of Position .................................................................................................... 16-6
16.4 Primary and Secondary Positions of Own Ship .......................................................16-7
16.5 Source of Navigation Data ....................................................................................... 16-8
16.6 Switching of Sensor and Indication ........................................................................16-10
16.7 Filter Status ............................................................................................................ 16-10
16.8 Position Alignment ................................................................................................. 16-12
16.8.1 How to align position.................................................................................. 16-12
16.8.2 How to cancel position alignment............................................................... 16-13
16.9 Wind Sensor........................................................................................................... 16-13
16.10Depth Sensor......................................................................................................... 16-14
17. AIS SAFETY, NAVTEX MESSAGES...................................................................17-1
17.1 AIS Safety Messages............................................................................................... 17-1
17.1.1 How to send an AIS safety message ...........................................................17-1
17.1.2 How to display received and sent AIS safety messages.............................. 17-2
17.1.3 How to delete received and sent AIS safety messages ............................... 17-3
17.2 Navtex Messages.....................................................................................................17-3
17.2.1 How to receive Navtex messages................................................................17-3
17.2.2 How to delete received Navtex messages ................................................... 17-4
18. TT AND AIS DISPLAYS.......................................................................................18-1
18.1 TT Display ................................................................................................................ 18-1
18.1.1 TT symbols................................................................................................... 18-1
18.1.2 TT symbol color and size ............................................................................. 18-1
18.1.3 How to display tracked target data............................................................... 18-2
18.1.4 Past position point attributes........................................................................ 18-3
18.1.5 How to set the TT lost target filter ................................................................ 18-3
18.1.6 TT recording functions ................................................................................. 18-3
18.2 AIS Display............................................................................................................... 18-4
18.2.1 AIS symbols ................................................................................................. 18-4
18.2.2 Voyage data................................................................................................. 18-4
18.2.3 How to filter AIS targets ............................................................................... 18-5
18.2.4 How to set conditions for automatic activation of sleeping targets...............18-5
18.2.5 How to sleep all activated targets ................................................................ 18-6
18.2.6 How to set the AIS lost target filter............................................................... 18-6
18.2.7 How to display AIS target data..................................................................... 18-7
18.2.8 How to display own ship data....................................................................... 18-9
18.3 Association............................................................................................................... 18-9
18.3.1 How to select association method................................................................18-9
18.3.2 How to set the conditions for association...................................................18-10
TABLE OF CONTENTS
xv
19. RECORDING FUNCTIONS .................................................................................19-1
19.1 How to Record User, Position Events ......................................................................19-1
19.1.1 User events ..................................................................................................19-1
19.1.2 Position events .............................................................................................19-2
19.2 Details Log................................................................................................................19-5
19.3 Voyage Log ..............................................................................................................19-6
19.3.1 How to set conditions of logging...................................................................19-8
19.4 Chart Usage Log ......................................................................................................19-8
19.5 Danger Targets Log................................................................................................19-10
19.5.1 How to set the conditions for logging danger targets .................................19-11
20. ALERTS ...............................................................................................................20-1
20.1 What is an Alert? ......................................................................................................20-1
20.2 Alert Box...................................................................................................................20-2
20.3 How to Temporarily Silence the Buzzer for an Alarm or Warning ............................20-5
20.4 How to Acknowledge an Alarm or Warning..............................................................20-5
20.5 Alert List....................................................................................................................20-6
20.6 Alert Log ...................................................................................................................20-7
20.7 Alert Reception from Connected Sensors ................................................................20-8
20.8 List of Alerts..............................................................................................................20-8
21. PARAMETERS ....................................................................................................21-1
21.1 Ship and Route Parameters .....................................................................................21-1
21.2 Instant Track Parameters .........................................................................................21-2
21.3 Cost Parameters.......................................................................................................21-3
22. SETTINGS MENU................................................................................................22-1
22.1 How to Access the Settings Menu............................................................................22-1
22.2 File Export ................................................................................................................22-2
22.3 File Import.................................................................................................................22-3
22.4 File Maintenance ......................................................................................................22-4
22.5 Self Test ...................................................................................................................22-5
22.6 Data Sharing.............................................................................................................22-6
22.7 Customize.................................................................................................................22-7
22.8 Display Test..............................................................................................................22-8
22.9 Keyboard Test ..........................................................................................................22-9
22.10Screenshots...........................................................................................................22-11
22.10.1How to export screenshots.........................................................................22-12
22.10.2How to delete screenshots .........................................................................22-12
22.11User Default...........................................................................................................22-13
22.12CCRP.....................................................................................................................22-14
23. COMMON REFERENCE SYSTEM......................................................................23-1
23.1 Installation of the System .........................................................................................23-1
23.2 Accuracy of the System............................................................................................23-1
24. MAINTENANCE AND TROUBLESHOOTING.....................................................24-1
24.1 Maintenance.............................................................................................................24-2
24.2 How to Replace the Fuses .......................................................................................24-3
24.3 Trackball Maintenance .............................................................................................24-4
24.4 How to Clean the Filter in the Processor Unit...........................................................24-4
24.5 Troubleshooting........................................................................................................24-5
24.6 Consumable Parts ....................................................................................................24-7
24.7 Color Differentiation Test for S57 Charts..................................................................24-8
24.8 Fallback Arrangements.............................................................................................24-9
TABLE OF CONTENTS
xvi
APPENDIX 1 MENU TREE .......................................................................................AP-1
APPENDIX 2 ABBREVIATIONS, SYMBOLS ...........................................................AP-9
APPENDIX 3 DATA COLOR AND MEANING........................................................AP-22
SPECIFICATIONS .....................................................................................................SP-1
INDEX.......................................................................................................................... IN-1
xvii
FOREWORD
Congratulations on your choice of the FURUNO FAR-3xx0 Series Marine Radar. We are confident
you will see why the FURUNO name has become synonymous with quality and reliability.
Since 1948, FURUNO Electric Company has enjoyed an enviable reputation for innovative and
dependable marine electronics equipment. This dedication to excellence is furthered by our ex-
tensive global network of agents and dealers.
This equipment is designed and constructed to meet the rigorous demands of the marine environ-
ment. However, no machine can perform its intended function unless installed, operated and
maintained properly. Please carefully read and follow the recommended procedures for operation
and maintenance.
Features
This radar series meets the requirements of IEC 62388 (Marine navigation and radiocommunica-
tion equipment and systems - Shipborne radar - Performance requirements, method of testing and
required test results) and IMO MSC.192(79), IMO Resolution A.817(19), and IEC 61174. This ra-
dar displays radar targets, electronic charts, nav lines, Tracked Target (TT) data, AIS targets and
other navigation data on a display.
The main features of this series are
• The FAR-3xx0 series consists of the following models and configurations:
Magnetron radar
Solid state radar
*: Viewing distance: 1020 mm
Model Frequency
band
Size of
monitor unit*
Output
power
Transceiver
location
FAR-3210
X-band
19.0” 12 kW Antenna unit
FAR-3210-BB Local supply 12 kW Antenna unit
FAR-3310 23.1” 12 kW Antenna unit
FAR-3220 19.0” 25 kW Antenna unit
FAR-3220-BB Local supply 25 kW Antenna unit
FAR-3320 23.1” 25 kW Antenna unit
FAR-3320W 23.1” 25 kW Transceiver unit
FAR-3220W-BB Local supply 25 kW Transceiver unit
FAR-3230S
S-band
19.0” 30 kW Antenna unit
FAR-3230S-BB Local supply 30 kW Antenna unit
FAR-3330S 23.1” 30 kW Antenna unit
FAR-3330SW 23.1” 30 kW Transceiver unit
FAR-3230SW-BB Local supply 30 kW Transceiver unit
Model Frequency
band
Size of
monitor unit*
Output
power
Transceiver
location
FAR-3230S-SSD
S-band
19.0” 250 W Antenna unit
FAR-3330S-SSD 23.1” 250 W Antenna unit
FAR-3230S-SSD-BB Local supply 250 W Antenna unit

FOREWORD
xviii
• New HMI (Human Machine Interface) gives improved operability.
• Accepts SXGA, UXGA video inputs.
• SOLAS category 1 compatible display (23.1”), SOLAS category 2 compatible display (19.0”).
• Radar, chart and chart radar modes. (The chart radar mode does not meet the criteria for nav-
igation aid for Japanese flag vessels as defined by Japanese law.)
• Many warning features to support safer and more efficient navigation.
• Grounding warnings, safe depth contours.
• Chart database loaded and updated using CD-ROMs.
• Tracked Target (TT) data and AIS data to aid in collision avoidance.
• AIS messaging.
• Route created in chart mode can be displayed on the radar.
• Route planning and route monitoring facilities in the chart mode.
Signal Processing Functions
This radar has the signal processing functions described in the table below. All signal processing
functions are set with the picture preset feature.
Standards Used in this Manual
• Three types of Control Units are available: Radar Control Unit RCU-025 (radar controls with
trackball module), ECDIS Control Unit RCU-024 (alphabet keyboard, controls, trackball mod-
ule) and Trackball Control Unit RCU-026 (trackball module only). Unless noted otherwise, “Con-
trol Unit” refers to the RCU-025.
• The system can be operated with the controls of the Radar Control Unit, ECDIS Control Unit or
a trackball module. The descriptions in this manual use the trackball module.
• Unless noted otherwise, "click" means to push the left button on a trackball module.
• The keys and controls of the Radar Control Unit are shown in bold face; for example, the EN-
TER key.
Signal processing function Description Section
Interference rejector Suppress interference transmitted by other radars. Inter-
ference received simultaneously from many radars can
be difficult to reduce.
2.7
Echo stretch Enlarge target echoes, especially small echoes. Sup-
press interference, sea clutter and rain clutter before us-
ing echo stretch, to prevent the enlargement of unwanted
echoes.
2.8
Echo averaging The radar samples echoes with each scan. Targets that
show a large change with each scan are judged as clutter
and are reduced to display only echoes from legitimate
targets.
2.9
Automatic clutter elimination Discriminate the clutter from the radar echo then reduce
the clutter automatically.
2.10
Noise rejector Reduce the white noise then improves the on-screen S/N
ratio by processing the weighted moving average filter for
the received echoes in the range direction. Use this func-
tion with caution. Weak target echoes may disappear
from the screen or the range resolution may worsen.
2.11
FOREWORD
xix
• The buttons on the InstantAccess bar, Status bar and menu items are shown in brackets; for
example, the [TUNE] button.
• Context-sensitive menus are available with many buttons, and boxes and objects. Right-click
an item to display the related context-sensitive menu.
• This radar is available in three types of specifications: IMO, A, or B. This manual provides the
descriptions for the B type, of which some functions are not available with the IMO or A type.
See the menu tree in Appendix 1 for function availability.
• “C-MAP” means “C-MAP by Jeppesen”.
• The display colors mentioned in this manual are those with the color palette setting “Day-Gray”.
Program Number
Please access the following URL if you need software information:
http://www.furuno.com/en/business_product/merchant/product/chartradar/software.html
xx: Minor change
Virus Prevention
This equipment is not equipped with a virus checker. This equipment operates in real time; there-
fore, having a virus checker that periodically checks the equipment for viruses would increase the
processing load, which can affect operation. However, you can avoid viruses by following the in-
structions in this section.
When you update a chart
The PC and medium (USB flash memory, etc.) used to download and store an update for an ex-
isting chart or a new chart may be infected with a virus. Check the PC and the medium for viruses
with a commercial virus checker - BEFORE you connect them to the ECDIS. Be sure the virus
checker contains the latest virus definition files.
Network connection
The ECDIS receives and displays information from various navigation equipment and radar via a
LAN. A PC and other equipment connected to a network can carry viruses. To prevent the intro-
duction of a virus to the LAN, DO NOT connect the ECDIS or HUB to an external network, includ-
ing other shipboard LAN.
Do not install 3rd party programs in the ECDIS
Programs installed via an external network can carry viruses that can cause the ECDIS to mal-
function. Do not install any Windows® software.
System Program no. Version no. Remarks
Antenna unit
SPU 0359281 01.xx For magnetron radar
SPU 0359286 01.xx For solid state radar
MTR-DRV 0359293 01.xx
PM 0359296 01.xx
RF-Converter 0359302 01.xx For solid state radar
Power supply unit
PSU-Control 0359299 01.xx
Processor Unit: EC-3000
Main 0359266 02.xx
FOREWORD
xx
Open Source Software
This product includes software to be licensed under the GNU General Public License (GPL), GNU
Lesser General Public License (LGPL), BSD, Apache, MIT and others. The program(s) is/are free
software(s), and you can copy it and/or redistribute it and/or modify it under the terms of the GPL
or LGPL as published by the Free Software Foundation. Please access to the following URL if you
need source codes: https://www.furuno.co.jp/cgi/cnt_oss_e01.cgi
This product uses the software module that was developed by the Independent JPEG Group.
Reverse engineering
Reverse engineering (reverse assemble, reverse compiler) of the software of this equipment is
prohibited.
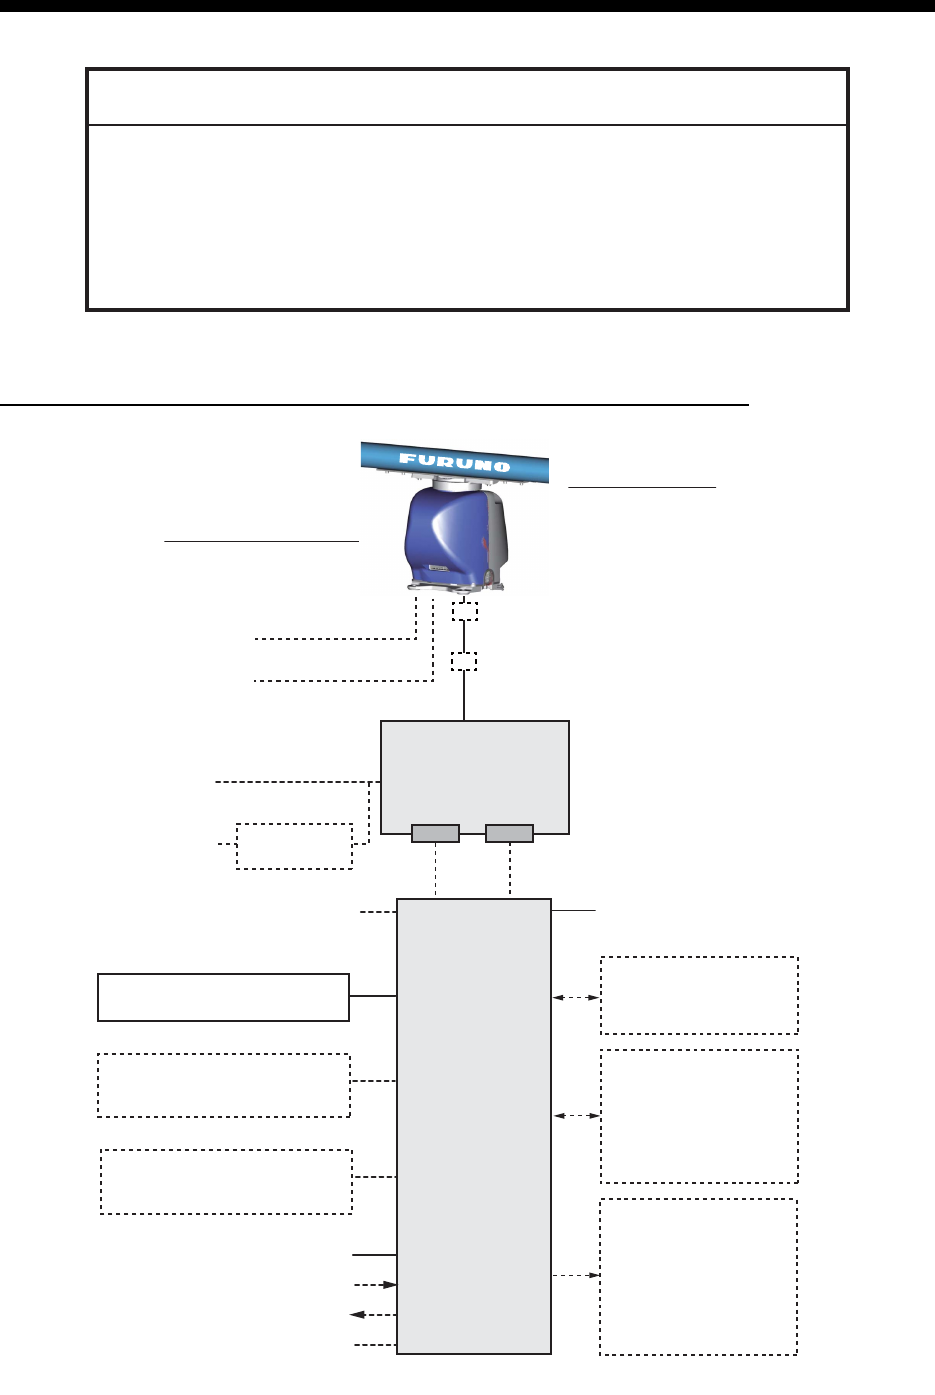
xxi
SYSTEM CONFIGURATIONS
Basic configuration is shown with solid line.
FAR-3210/FAR-3220/FAR-3310/FAR-3320/FAR-3210-BB/FAR-3220-BB
NOTICE
The radar(s) must be interconnected to the following type approved sensors:
Gyrocompass meeting the requirements of the IMO resolution A.424(XI).
EPFS meeting the requirements of the IMO resolution MSC.112(73).
SDME meeting the requirements of IMO resolution MSC.96(72).
The radar may be interconnected via HUB-3000 to other FURUNO processing
units having approved LAN ports.
100-115/220-230 VAC
1ø, 50-60 Hz
PSU-014
POWER SUPPLY
UNIT
EC-3000
PROCESSOR
UNIT
Serial 1, 2
IEC 61162-2
(Gyrocompass*
1
, AIS)
Serial 3 - 7
IEC 61162-1
(EPFS*
2
(Navigator),
SDME
(Speed Log),
Echo Sounder, Wind,
Alarm*
5
, Navtex, etc.)
Digital Out 1 - 6*
5
1: System Fail
2: Power Fail
3: Normal Close 1
4: Normal Close 2
5: Normal Open 1
6: Normal Open 2
100-230 VAC
1ø, 50-60 Hz
Transformer
RU-1803
440 VAC
1ø, 50-60 Hz
Sensor Adapter*
4
or Switching HUB
HUB-100
ANTENNA UNIT
(w/Performance Monitor PM-32A)
XN12CF-RSB-128
XN20CF-RSB-128
XN24CF-RSB-128
TRANSCEIVER UNIT
RTR-105 (12 kW)
RTR-106 (25 kW)
Sub display
LAN Serial
Select one
Select one
Select one
100-115/220-230 VAC
1ø, 50-60 Hz
(for de-icer)
Radar Control Unit RCU-025
Trackball Control Unit RCU-026
ECDIS Control Unit RCU-024
Radar Control Unit RCU-025
Trackball Control Unit RCU-026
ECDIS Control Unit RCU-024
Radar Control Unit RCU-025
Trackball Control Unit RCU-026
Monitor Unit MU-190*
3
MU-231*
3
Digital In (ACK IN)
VDR
Intelligent Hub HUB-3000
*
: See the notes on page xxvi.
Junction box
*
6
RJB-001
Junction box
*
6
RJB-001
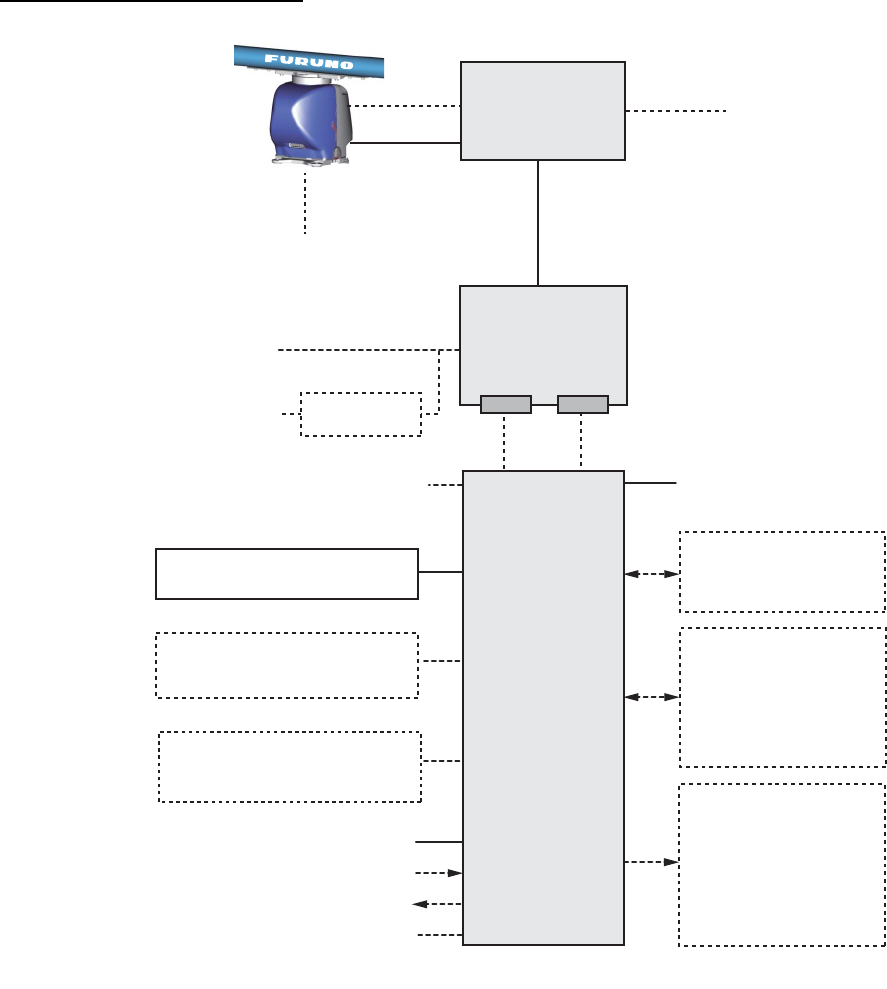
SYSTEM CONFIGURATIONS
xxii
FAR-3320W/FAR-3220W-BB
100-115/220-230 VAC
1ø, 50-60 Hz
Serial 1, 2
IEC 61162-2
(Gyrocompass
*
1
, AIS)
Serial 3 - 7
IEC 61162-1
(EPFS
*
2
(Navigator),
SDME
(Speed Log),
Echo Sounder, Wind,
Alarm
*
5
, Navtex, etc.)
Digital Out 1 - 6
*
5
1: System Fail
2: Power Fail
3: Normal Close 1
4: Normal Close 2
5: Normal Open 1
6: Normal Open 2
100-230 VAC
1ø, 50-60 Hz
Transformer
RU-1803
440 VAC
1ø, 50-60 Hz
Sensor Adapter
*
4
or Switching HUB
HUB-100
ANTENNA UNIT
(w/Performance Monitor
PM-32A)
XN20CF-RSB-130
XN24CF-RSB-130
Sub display
EC-3000
PROCESSOR
UNIT
PSU-014
POWER
SUPPLY UNIT
LAN Serial
Select one
Select one
Select one
TRANSCEIVER
UNIT
RTR-108
100-115/220-230 VAC
1ø, 50-60 Hz (for de-icer)
Waveguide
Antenna Cable
Radar Control Unit RCU-025
Trackball Control Unit RCU-026
ECDIS Control Unit RCU-024
Radar Control Unit RCU-025
Trackball Control Unit RCU-026
ECDIS Control Unit RCU-024
Radar Control Unit RCU-025
Trackball Control Unit RCU-026
Monitor Unit MU-231
*
3
Digital In (ACK IN)
VDR
Intelligent Hub HUB-3000
*
: See the notes on page xxvi.

SYSTEM CONFIGURATIONS
xxiii
FAR-3230S/FAR-3330S/FAR-3230S-BB
100-115/220-230 VAC
1ø, 50-60 Hz
EC-3000
PROCESSOR
UNIT
Serial 1, 2
IEC 61162-2
(Gyrocompass
*
1
, AIS)
Serial 3 - 7
IEC 61162-1
(EPFS
*
2
(Navigator),
SDME
(Speed Log),
Echo Sounder, Wind,
Alarm
*
5
, Navtex, etc.)
Digital Out 1 - 6
*
5
1: System Fail
2: Power Fail
3: Normal Close 1
4: Normal Close 2
5: Normal Open 1
6: Normal Open 2
100-230 VAC
1ø, 50-60 Hz
Transformer
RU-1803
440 VAC
1ø, 50-60 Hz
Sensor Adapter
*
4
or Switching HUB
HUB-100
ANTENNA UNIT
(w/Performance Monitor PM-52A)
SN36CF-RSB-129
TRANSCEIVER UNIT
RTR-107
Sub display
Antenna Cable
LAN Serial
Select one
Select one
Select one
PSU-014 or PSU-015
POWER SUPPLY
UNIT
100-115/220-230 VAC
1ø, 50-60 Hz
(for de-icer)
Radar Control Unit RCU-025
Trackball Control Unit RCU-026
ECDIS Control Unit RCU-024
Radar Control Unit RCU-025
Trackball Control Unit RCU-026
ECDIS Control Unit RCU-024
Radar Control Unit RCU-025
Trackball Control Unit RCU-026
Monitor Unit MU-190
*
3
MU-231
*
3
Digital In (ACK IN)
VDR
Intelligent Hub HUB-3000
*
: See the notes on page xxvi.
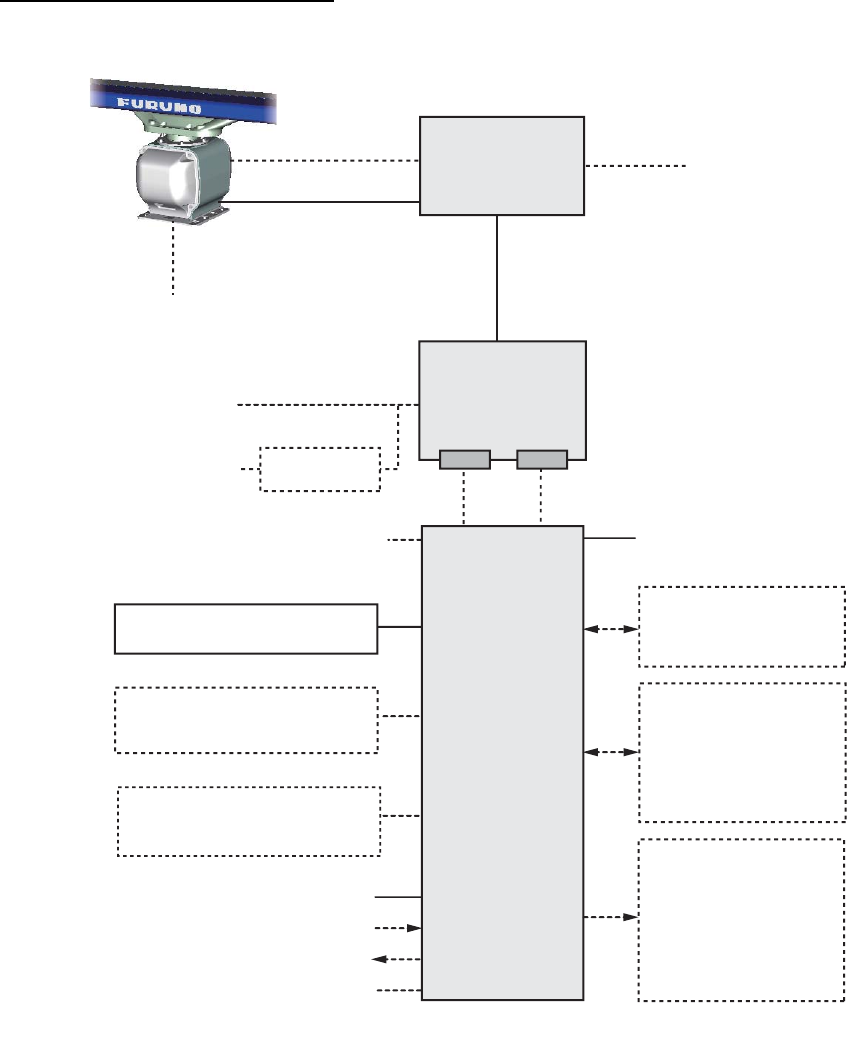
SYSTEM CONFIGURATIONS
xxiv
FAR-3330SW/FAR-3230SW-BB
100-115/220-230 VAC
1ø, 50-60 Hz
Serial 1, 2
IEC 61162-2
(Gyrocompass*
1
, AIS)
Serial 3 - 7
IEC 61162-1
(EPFS*
2
(Navigator),
SDME
(Speed Log),
Echo Sounder, Wind,
Alarm*
5
Navtex, etc.)
Digital Out 1 - 6*
5
1: System Fail
2: Power Fail
3: Normal Close 1
4: Normal Close 2
5: Normal Open 1
6: Normal Open 2
100-230 VAC
1ø, 50-60 Hz
Transformer
RU-1803
440 VAC
1ø, 50-60 Hz
Sensor Adapter*
4
or Switching HUB
HUB-100
ANTENNA UNIT (w/Performance Monitor PM-52A)
SN36CF-RSB-131
Sub display
EC-3000
PROCESSOR
UNIT
LAN Serial
PSU-014 or PSU-015
POWER SUPPLY
UNIT
Select one
Select one
Select one
TRANSCEIVER
UNIT
RTR-109
100-115/220-230 VAC
1ø, 50-60 Hz
(for de-icer)
Coaxial cable
Antenna Cable
Radar Control Unit RCU-025
Trackball Control Unit RCU-026
ECDIS Control Unit RCU-024
Radar Control Unit RCU-025
Trackball Control Unit RCU-026
ECDIS Control Unit RCU-024
Radar Control Unit RCU-025
Trackball Control Unit RCU-026
Monitor Unit MU-231*
3
Digital In (ACK IN)
VDR
Intelligent Hub HUB-3000
*
: See the notes on page xxvi.
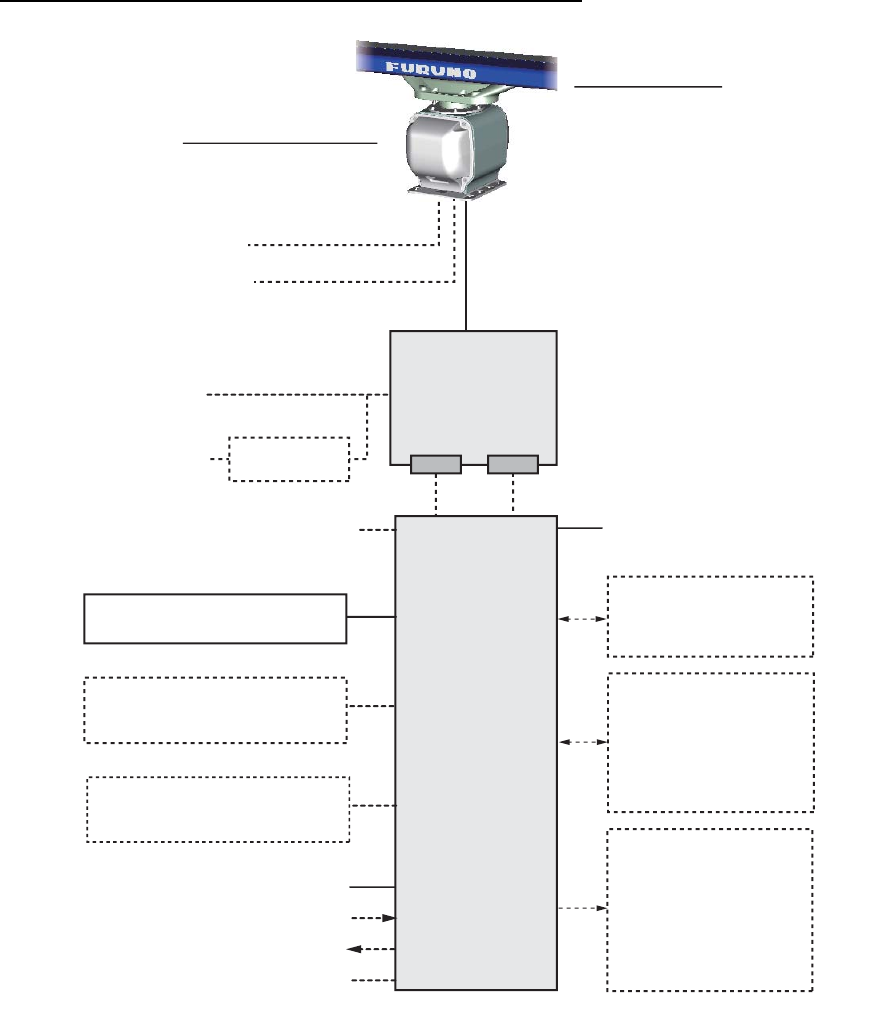
SYSTEM CONFIGURATIONS
xxv
FAR-3230S-SSD/FAR-3330S-SSD/FAR-3230S-SSD-BB
100-115/220-230 VAC
1ø, 50-60 Hz
PSU-016 or PSU-018
POWER SUPPLY
UNIT
EC-3000
PROCESSOR
UNIT
Serial 1, 2
IEC 61162-2
(Gyrocompass*1, AIS)
3Serial 3 - 7
IEC 61162-1
(EPFS*2 (Navigator),
SDME (Speed Log),
Echo Sounder, Wind,
Alarm*5, Navtex, etc.)
Digital Out 1 - 6*5
1: System Fail
2: Power Fail
3: Normal Close 1
4: Normal Close 2
5: Normal Open 1
6: Normal Open 2
100-230 VAC
1ø, 50-60 Hz
Transformer
RU-1803
440 VAC
1ø, 50-60 Hz
Sensor Adapter*4 or Switching HUB
HUB-100
ANTENNA UNIT
(w/Performance Monitor PM-52B)
SN36CF-RSB-133
TRANSCEIVER UNIT
RTR-111
Sub display Antenna Cable
LAN Serial
Select one
Select one
Select one
100-115/220-230 VAC
1ø, 50-60 Hz
(for de-icer)
Radar Control Unit RCU-025
Trackball Control Unit RCU-026
ECDIS Control Unit RCU-024
Radar Control Unit RCU-025
Trackball Control Unit RCU-026
ECDIS Control Unit RCU-024
Radar Control Unit RCU-025
Trackball Control Unit RCU-026
Monitor Unit MU-190
*3 MU-231*3
Digital In (ACK IN)
VDR
Intelligent Hub HUB-3000
*
: See the notes on page xxvi.

SYSTEM CONFIGURATIONS
xxvi
Category of units
Antenna units: Exposed to the weather
Other units: Protected from the weather
Notes
1. The gyrocompass must be type approved for compliance with IMO resolution A.424(XI) (and/
or resolution A.821(19) for installation on HSC). The gyrocompass must also have an update
rate that is adequate for the ship’s rate of turn. The update rate must be better than 40 Hz
(HSC) or 20 Hz (conventional vessel).
2. The EPFS must be type approved for compliance with IMO resolution MSC.96(72).
3. These monitors have been approved by the IMO, MU-190 for CAT 2C and CAT 2HC, MU-231
for CAT 1C and CAT 1HC. If a different monitor is to be used on IMO vessels, its effective
diameter must meet the applicable Category requirements:
• CAT 1C and CAT 1HC: effective diameter 320 mm or higher
• CAT 2C and CAT 2HC: effective diameter 250 mm or higher
For installation, operation and viewing distance of other monitor, see its manuals.
For BB type, a monitor unit is prepared by user.
4. The sensor adapters are Control Serial MC-3000S, Analog IN MC-3010A, Digital IN
MC-3020D and Digital OUT MC-3030D.
5. Characteristics of contact output for Alarm:
• (Load current) 250 mA
• (Polarity) Normally Open: 2 ports, Normally Close: 2 ports
• Serial I/O for alarm is also possible, which complies with IEC 61162-1.
6. Junction boxes are required for antenna cable length greater than 100 m. Max. cable length
is 400 m.
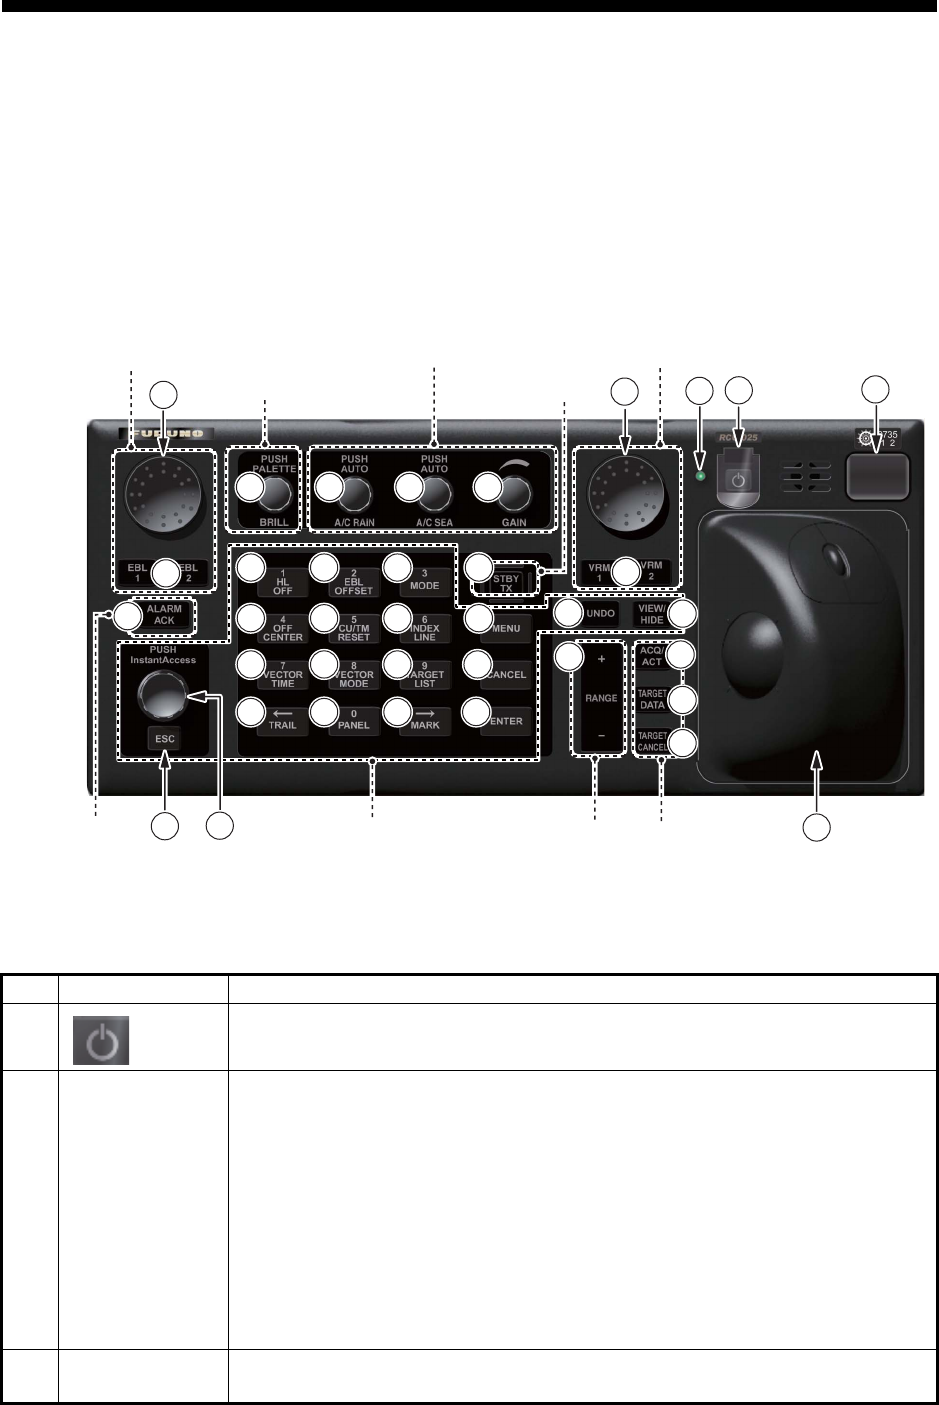
1-1
1. OPERATIONAL OVERVIEW
1.1 Units of the System
1.1.1 Radar Control Unit RCU-025
The Radar Control Unit RCU-025 consists of various controls and a trackball module
(trackball, scrollwheel and left and right buttons). The trackball module functions like
a PC mouse. The user rolls the trackball and operates the left and right buttons and
the scrollwheel to do various functions.
When you press the correct key, a single beep sounds to alert you to correct opera-
tion. For wrong operation, several beeps sound. You can select the loudness of the
beep or deactivate the beep on the [Customize] menu.
No. Control Description
1 Turns the system on or off. (With a FURUNO monitor unit, the monitor is
also turned on or off with this switch.)
2 Status LED The color and state of the LED change according to system or alert status.
Green, lighting: Normal operation status; no alerts generated.
Green, flashing: The heater on the CPU board is on, because ambient
temperature is not at least 0°C. The heater takes about two minutes to
warm the equipment. The LED lights green after the heater goes off.
Red, lighting: Acknowledged alert or SYSTEM FAIL. SYSTEM FAIL oc-
curs when there is trouble in the Processor Unit or communication failure
between the Processor Unit and a Control Unit. Each Control Unit detects
trouble and its lamp flashes in red and the buzzer sounds. If this condition
occurs at the No. 1 Control Unit, the SYSTEM FAIL signal is output.
Red, flashing: Unacknowledged alert or SYSTEM FAIL.
3
4
Rotary control,
EBL1, EBL2
Rotary control: Adjusts the active EBL.
EBL1, EBL2: Activates or deactivates the respective EBL.
4
4
8
8
9
9
10
10
11
11
12
12
13
13
14
14
16
16
17
17
18
18
20
20
21
21
22
22
23
23
24
24
25
25
26
26
27
27
29
29
30
30
37
37
1
1
2
2
28
28
3
3
36
36
32
32
15
15
5
5
33
33
34
34
35
35
19
19
31
31
7
7
6
6
Navigation tool
Display control
Radar signal processing
Radar system
Navigation tool
Target
Range
A
lert Menu control

1. OPERATIONAL OVERVIEW
1-2
5 ALARM ACK • Acknowledges unacknowledged alert.
• Silences the audio alarm.
6 InstantAccess
knob
Selects the buttons on the InstantAccess bar.
7 ESC Goes back one step in current operating sequence on the InstantAccess
bar.
8BRILL Rotate: Adjusts the brilliance of the display (FURUNO-supplied monitor
only).
Push: Selects a color palette.
9 A/C RAIN Rotate: Suppresses rain clutter.
Push: Toggles between manual and automatic rain clutter adjustment.
10 A/C SEA Rotate: Suppresses sea clutter.
Push: Toggles between manual and automatic sea clutter adjustment.
11 GAIN Adjusts the sensitivity of the radar receiver.
12 HL OFF • Temporarily erases everything except radar echoes when pressed and
held down.
• Enters the numeric 1.
• Selects like-numbered menu item.
13 EBL OFFSET • Activates or deactivates the offset EBL.
• Enters the numeric 2.
• Selects like-numbered menu item.
14 MODE • Selects a presentation mode.
• Enters the numeric 3.
• Selects like-numbered menu item.
15 STBY/TX Toggles the radar between standby and TX.
16 OFF CENTER • Puts sweep origin at the cursor location.
• Enters the numeric 4.
• Selects like-numbered menu item.
17 CU/TM RESET • Course-up: Resets heading line to 000°.
• True motion: Moves own ship position 75% of the radius in stern direc-
tion.
• Enters the numeric 5.
• Selects like-numbered menu item.
18 INDEX LINE • Selects an index line (in the PI line box).
• Long-press to activate or deactivate selected index line.
• Enters the numeric 6.
• Selects like-numbered menu item.
19 MENU Opens, closes the menu.
20 VECTOR TIME • Sets the vector time (length) for TT and AIS targets.
• Enters the numeric 7.
• Selects like-numbered menu item.
21 VECTOR
MODE
• Sets the vector mode (relative, true) for TT and AIS targets.
• Enters the numeric 8.
• Selects like-numbered menu item.
22 TARGET LIST • Displays AIS, TT data in the target list.
• Enters the numeric 9.
• Selects like-numbered menu item.
23 CANCEL Cancels the changes made on the currently selected menu.
24 TRAIL • Goes back one page in the menu.
• Moves cursor leftward in text box.
• Turns the echo trail display on or off.
• Long-press to reset all trails.
No. Control Description

1. OPERATIONAL OVERVIEW
1-3
25 PANEL • Adjusts the backlighting of the keys.
• Enters the numeric 0.
• Selects like-numbered menu item.
26 MARK • Goes forward one page in the menu.
• Moves cursor rightward in text box.
• Inputs selected mark on the radar screen, at the position selected.
27 ENTER Confirms selection on menu.
28
29
Rotary control,
VRM1, VRM2
Rotary control: Adjusts the diameter of the active VRM.
VRM1, VRM2: Activates or deactivates the respective VRM.
30 UNDO Undoes edit or text input when creating a radar map, route, user chart.
31 VIEW/HIDE Radar mode, chart radar mode: Shows or hides the AZ box, Drop mark
boxes, Mark box, PI line box, Trial box.
Chart mode: Shows or hides the EBLs, InstantAccess bar, [Overlay/NAV
Tools] box, [Route information] box, VRMs.
32 RANGE Selects radar range (radar and chart radar modes), chart scale (chart
mode).
33 ACQ/ACT • TT: Acquires cursor-selected target, for target tracking.
• AIS: Activates cursor-selected sleeping AIS target.
34 TARGET DATA Displays the detailed data for selected TT, AIS target, in the TT/AIS infor-
mation box.
35 TARGET
CANCEL
• TT: Stops tracking cursor-selected tracked target.
• AIS: Sleeps cursor-selected activated AIS target.
• Long-press to erase all displayed TT target data.
36 Trackball
module
The trackball module is the same as that used in the Trackball Control Unit
RCU-026. See the description in the next section.
37 USB port For connection of USB flash memory (FAT16 or FAT32 format). Do not con-
nect a USB HDD or PC keyboard. The DVD drive (Maker: TEAC, Type: PU-
DRV10) is for chart updates.
No. Control Description
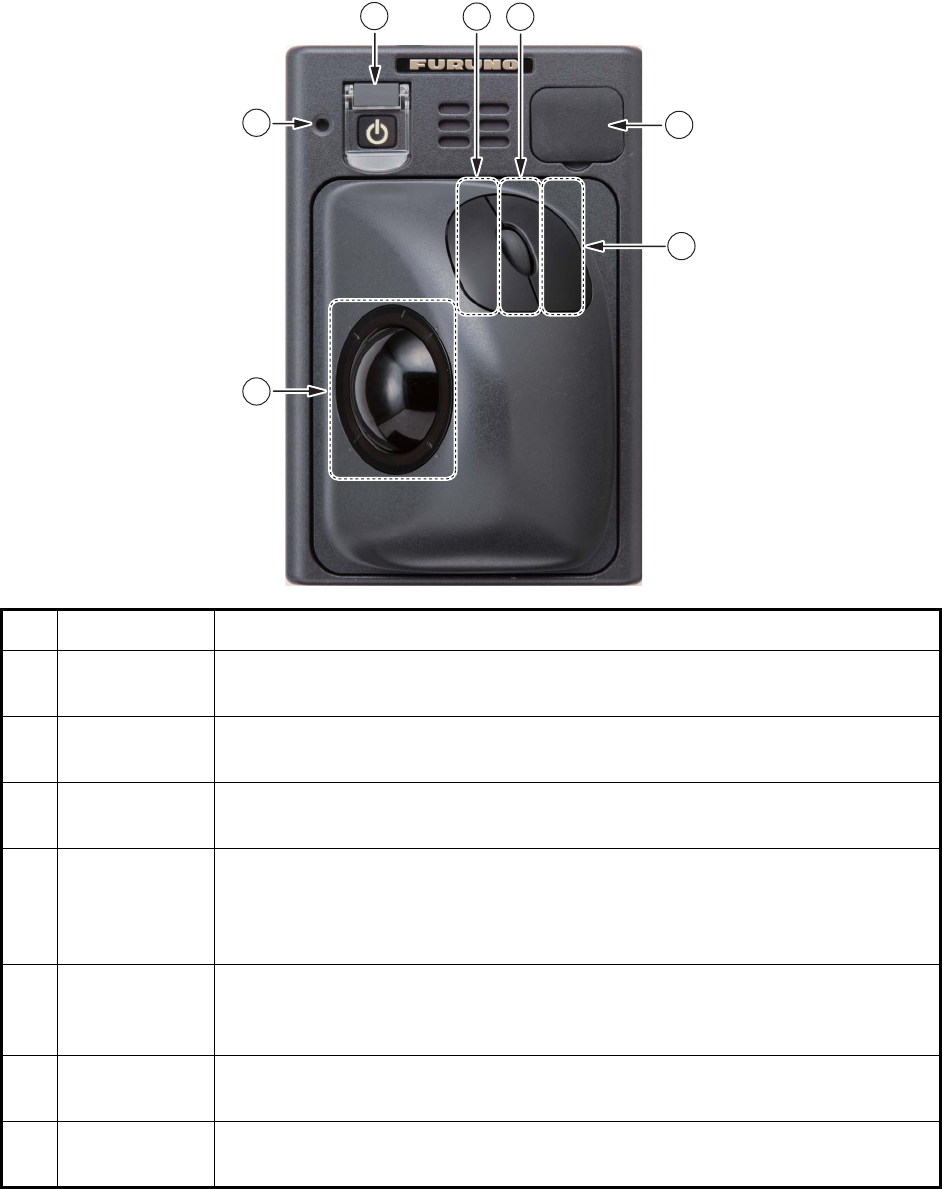
1. OPERATIONAL OVERVIEW
1-4
1.1.2 Trackball Control Unit RCU-026
The Trackball Control Unit RCU-026 has a power switch, a trackball module (trackball,
scrollwheel and left and right mouse buttons), a status LED, and a USB port. The
trackball module functions like a PC mouse; the user rolls the trackball and operates
the left and right buttons and the scrollwheel to do various functions.
No. Control Description
1 Power switch Turns the system on or off. (With a FURUNO monitor unit, the monitor is also
turned on or off with this switch.)
2 Status LED The color and state of the LED change according to system or alert status.
See the Status LED description on page 1-1.
3 Left button • Does the operation related to the object selected.
• Confirms the operation done for the object selected.
4 Scrollwheel • Selects menu options.
• Selects chart scale.
• Sets numeric data.
(The scrollwheel does not have a "push" function.)
5 Right button • Displays context-sensitive menu when the cursor is put in the display
area.
• Cancels operation done on the object selected.
6 Trackball • Moves the cursor.
• Selects an object.
7 USB port For connection of USB flash memory (FAT16 or FAT32 format). Do not con-
nect a USB HDD or PC keyboard.
1
1
3
3
6
6
7
7
4
4
5
5
2
2
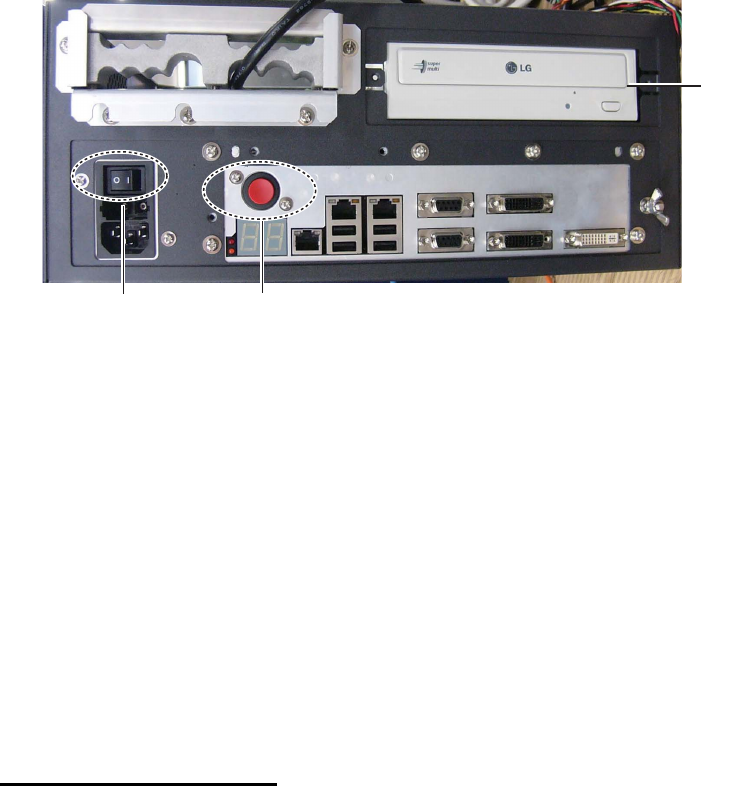
1. OPERATIONAL OVERVIEW
1-5
1.1.3 Processor Unit EC-3000
The Processor Unit is the heart of the chart system, and is mainly responsible for the
chart management, route planning and route navigation.
The Processor Unit has two power switches. The Mains switch controls the power
from the switchboard, and the Power switch controls the power to the chart radar sys-
tem.
Note 1: Do not operate the chart radar with a DVD or CD inserted in the DVD drive,
to prevent damage to the drive and media. Remove media from the drive after usage.
Insert media only to update charts. After completion of an update, remove the media
from its drive and store it in its case. Store media out of direct sunlight, in a place
where temperature and humidity are moderate and stable.
Note 2: To keep the system stable, restart the unit at least once every two weeks.
Note 3: Close the lid of the DVD drive when the drive is not in use.
1.2 How to Turn the System On/Off
Normally, leave the power switches at the front of the Processor Unit on and control
the power with the power switch on a Control Unit (RCU-025, RCU-026). The monitor
unit is powered independently.
How to power the system
Push the mains switch on the Processor Unit for the "I" position. Turn on the power
switch on the Processor Unit or a Control Unit. The start-up display appears on the
monitor.
After the power is applied, the program starts up and about one minute later the bear-
ing scale appears. The radar then goes into three minutes of warm-up time to warm
the magnetron, which transmits radar pulses. The timer at the center of the screen
counts the time remaining for warm-up. When the timer shows 0:00, the indication
"ST-BY" appears at the screen center. The radar is now ready to transmit radar puls-
es. In the stand-by condition, no radar pulses are transmitted and TT nor AIS is active.
The settings on the menus are stored in a non-volatile memory (hard disk) and are
preserved when the power is turned off.
Note 1: The solid state radar does not have a magnetron, therefore it has no warming
period.
Power switch
DVD
drive
Mains switch
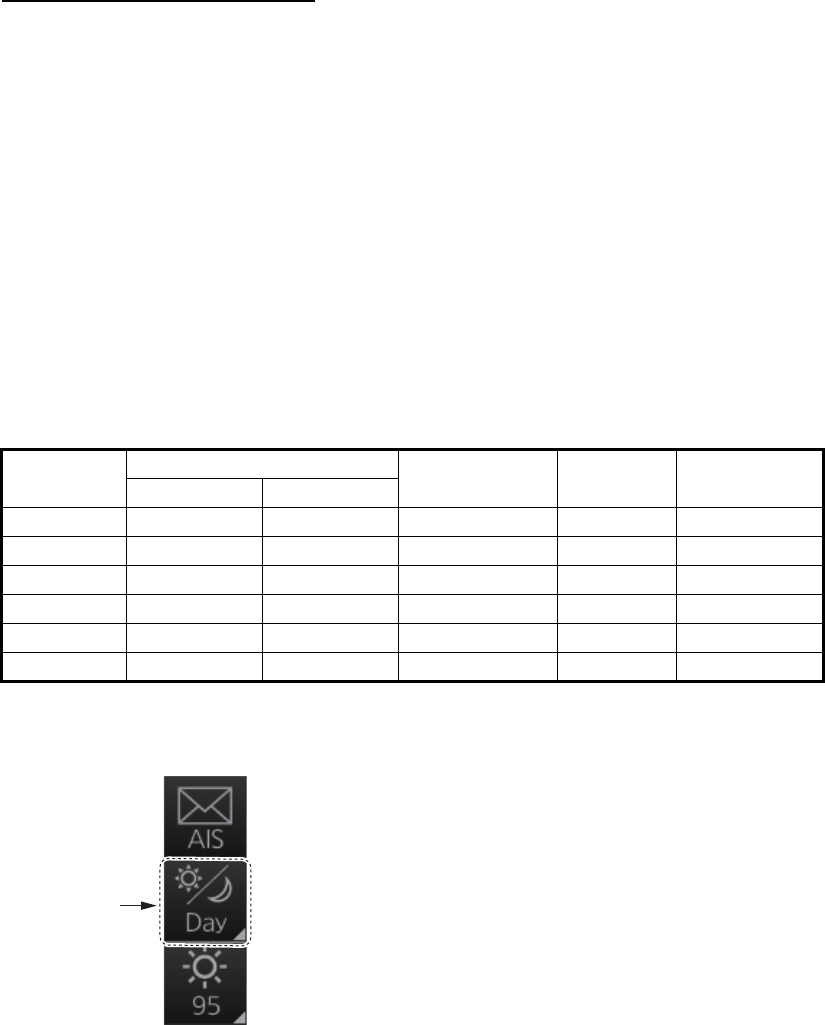
1. OPERATIONAL OVERVIEW
1-6
Note 2: If the ambient temperature is less than 0°C (32°F) when the power is applied,
nothing appears on the display and the Status LED on the Control Unit flashes. This
is because the heater is warming the unit. The display appears in approx. two minutes.
How to power off the system
Press the power switch on the Processor Unit or a Control Unit. Push the Mains switch
for the "O" position.
Note: Provided that the radar was once in use with the transmitter tube (magnetron)
still warm, you can put the radar in transmit state without three minutes of warm-up. If
the Power switch was turned off by mistake or the like and you wish to restart the radar
promptly, turn on the Power switch not later than 10 seconds after power-off.
1.3 How to Select a Color Palette
This radar provides three sets of color and brilliance sets (palette), day, dusk and
night, to match any ambient lighting condition. The default specifications of each pal-
ette are as shown in the table below. The panel dimmer setting is automatically
changed, and the number of steps depends on the color palette selected.
To select a palette, do the following:
1. Click the [Palette] button.
Palette Brilliance Panel dimmer
(step)
Text
color
Background
color
MU-190 MU-231
Day-gray 86 88 15 White Gray
Day-blue 86 88 15 White Blue
Dusk-gray 77 79 7 Light gray Dark gray
Dusk-blue 77 79 7 Light gray Dark blue
Night-gray 53 53 3 Orange Dark gray
Night-blue 53 53 3 Light gray Dark blue
[Palette]
button
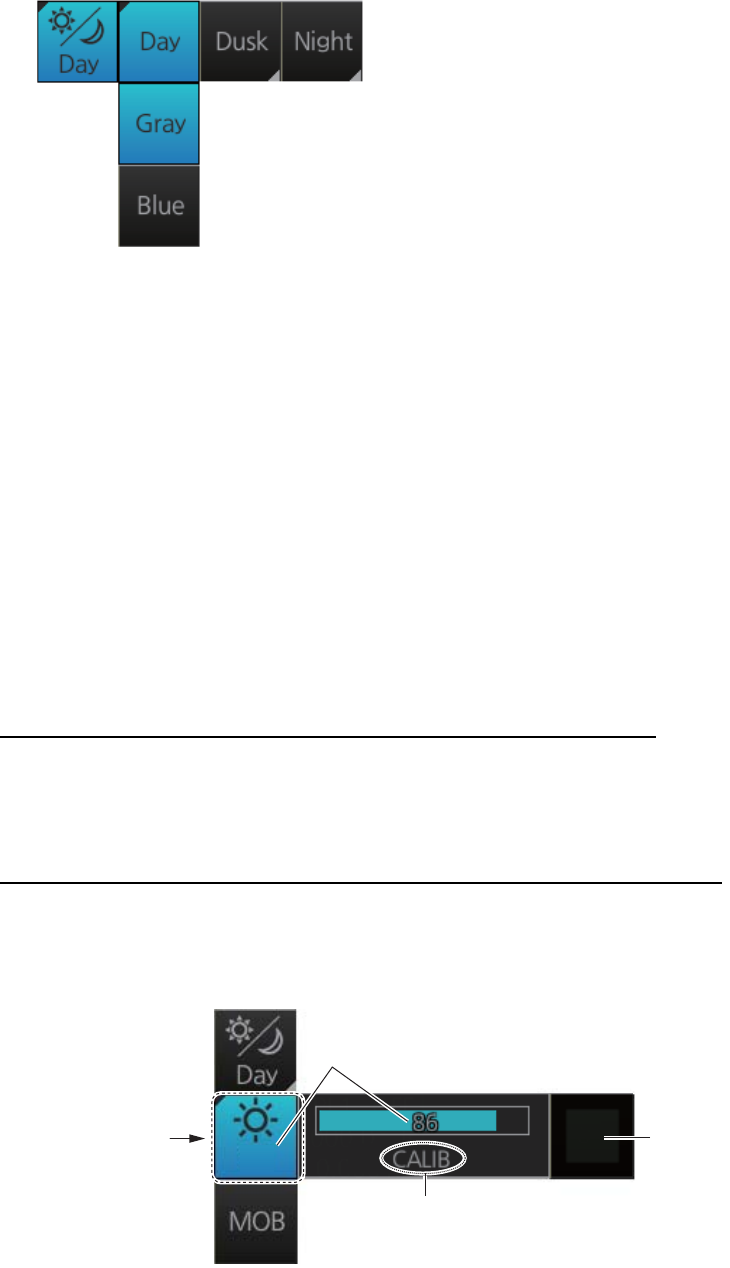
1. OPERATIONAL OVERVIEW
1-7
2. Click [Day], [Dusk] or [Night] as appropriate. For example, select [Day] to show its
options.
3. Click the palette (gray, blue) desired.
Note: A palette can also be selected by pushing the BRILL control on the Control Unit.
1.4 How to Adjust the Display Brilliance (FURUNO
monitor)
The brilliance setting is defined according to the color palette setting (see section 1.3).
However, manual adjustment of the brilliance is also possible.
Note 1: The brilliance of the FURUNO monitor can only be adjusted from the Control
Unit. Use a serial cable for brilliance adjustment to make the connection between the
Processor Unit and the Control Unit.
Note 2: Improper brilliance may affect the visibility of information, especially on the
night display.
How to adjust the brilliance manually with the BRILL control
Operate the BRILL control to adjust brilliance. Turn it clockwise to increase the bril-
liance; counterclockwise to decrease the brilliance. Watch the brilliance level indica-
tion on the [BRILL] button (see the illustration below) to see the current brilliance level.
How to adjust the brilliance manually with the InstantAccess knob
1. Push the InstantAccess knob.
2. Rotate the knob to select the [BRILL] button then push the knob to show the bril-
liance adjustment window.
3. Push the knob, rotate the knob to set the brilliance then push the knob to confirm
the setting. The calibration state indication changes to "UNCALIB".
4. To restore the default setting, rotate the knob to select the [CALIB] button then
push the knob. The calibration state indication changes to "CALIB".
86
Current brilliance level
[CALIB]
button
[BRILL]
button
Calibration state
CALIB: Default setting
UNCALIB: Manual setting

1. OPERATIONAL OVERVIEW
1-8
How to adjust the brilliance manually using the trackball module
1. Click the [BRILL] button on the InstantAccess bar to show the brilliance adjust-
ment window.
2. For coarse adjustment, put the cursor on a location within the slider bar area
then push the left button. For fine adjustment, put the cursor on the end of the
slider bar and roll the trackball while holding down the left button.
3. Release the left button to confirm setting. The calibration state indication changes
to "UNCALIB".
4. To restore the default setting, click the [CALIB] button. The calibration state indi-
cation changes to "CALIB".
1.5 Operating Modes
This chart radar has the following operating modes:
1.5.1 How to select an operating mode
Click the [Operating Mode] button to select desired mode from the pull-down list. Se-
lect [RADAR] for the radar or chart radar mode or [CHART for RADAR] for the chart
mode.
1.5.2 Limitations when using the chart radar mode
The presentation mode for the chart radar mode can be course-up RM, north-up RM,
or north-up TM. The presentation mode is automatically switched to north-up RM if the
mode is head-up at the time the chart radar mode is selected.
• [RADAR]: - The radar mode provides the traditional radar display.
- The chart radar mode overlays the electronic chart on the radar image.
• [CHART for RADAR]: The chart mode shows the electronic charts.
[Operating Mode]
button
RADAR
RADAR
CHART
for RADAR
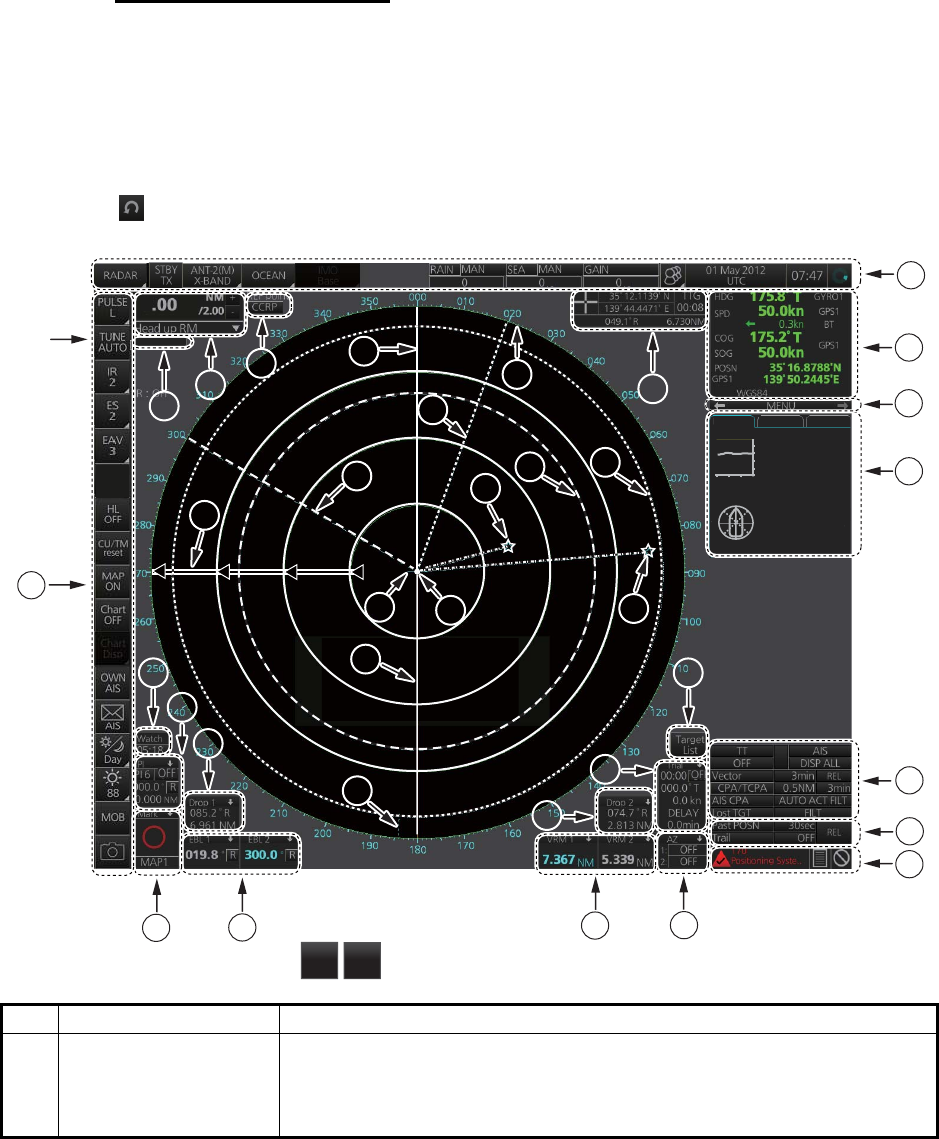
1. OPERATIONAL OVERVIEW
1-9
1.6 Display Screens
All display screens have operational buttons, boxes and indications, and display mark-
ers. Click a button or indication to execute the related operation. Context-sensitive
menus are available with several boxes and objects. Right-click the appropriate box
or object to show the related context-sensitive menu.
Monitor viewing distance
The optimal viewing distance for the FURUNO-supplied monitors is 1020 mm.
1.6.1 Radar display
The illustration below shows the markers, data, etc. as they appear on the FURUNO
19-inch monitor unit. The layout for the 23-inch monitor unit is partially different - the
button appears on the bottom of the InstantAccess bar.
No. Name Description
1 Status bar • Selects an antenna.
• Selects the operating mode.
• Adjusts the radar picture.
• Displays radar operational messages. See section 1.7.
Depth : 22.5 m
Water
TEMP : 10.5°C
REL : 006.3°R
Wind : 12.1 m/s
Current : 121.3°R
1.7 kn
NAV data Route 1 Route 2
N
E
S
W
0
10
20
30
40
50
-30 -20 -10 min m
Indication
area
*
*: For solid state radar,
TX CH
1
TX CH
2
OFF
18
18
14
14
13
13
8
8
9
9
5
5
6
6
7
7
1
1
2
2
3
3
4
4
1515
16
1717
34
33
3232 31
35
2626
1919
20
2121 22
2323
2525
24
29
28 27
3030
1010
11
1212
ACE
6

1. OPERATIONAL OVERVIEW
1-10
2 Sensor information,
datum box
Shows your ship's heading, heading source, ship's speed, water
tracking speed, speed source, course over ground, speed over
ground, course and speed source, ship's position, position source,
chart datum.
Note: Position source shall meet the requirements of IMO
MSC.112(73).
3 Menu Drop-down menu with various radar and chart functions.
4 Information box Provides various navigation data and route information.
5 TT/AIS setting box Sets the parameters for TT and AIS targets.
6 Trail box Sets the parameters for the target trails.
7 Alert box Shows alert messages by alert name and alert number.
• Unacknowledged or regenerated alerts flash in red (alarm) or yel-
low-orange (warning).
• Acknowledged alerts are shown in normal video.
8 Acquisition zone box Sets an acquisition zone for TT, AIS.
9 VRM boxes Shows the range and TTG to the VRM1, VRM2.
10 Target list button Displays the TT and AIS target list.
11 Trial maneuver box Sets the parameters for the trial maneuver.
12 Drop mark 2 box Shows the bearing and range to the drop mark 2.
13 EBL boxes Shows the bearing to the EBL1, EBL2.
14 Mark box Selects the mark to inscribe on the radar display.
15 Drop mark1 box Shows the bearing and range to the drop mark 1.
16 PI line box • Adjusts the direction and width of the parallel index lines.
• Activates or deactivates the parallel index lines.
17 Watch box Counts down the time remaining until the buzzer sounds to alert the
operator to view the radar picture.
18 InstantAccess bar Quick access to often-used radar, chart radar and chart functions. For
radar and chart radar functions, see section 1.8. For chart functions,
see paragraph 6.1.3.
19 Tuning bar Shows tuning status. (No function with solid state radar.)
20 Range/Presentation
mode box
• Selects the radar range.
• Selects the presentation mode.
21 REF point box Selects the reference point (antenna or CCRP) for measurements
(range, bearing, etc.) and markers (position, etc.)
22 Heading line Indicates ship's heading.
23 Bearing scale The bearing scale provides an estimate of the bearing to a target.
24 Cursor position box This box shows
• Latitude and longitude of the cursor position.
• Range and bearing to the cursor position.
• TTG to the cursor position.
25 EBL1 Measures the bearing to a target.
26 EBL2
27 VRM1 Measures the range to a target.
28 VRM2
29 Drop mark 1 Finds the range and bearing to drop mark position.
30 Drop mark 2
31 Antenna marker A cross marks antenna position.
32 Own ship marker An inverted “T” marks your ship’s position.
33 Stern marker Marks location of stern.
34 North marker Marks North.
35 Range rings Provide an estimate of the range to a target.
No. Name Description
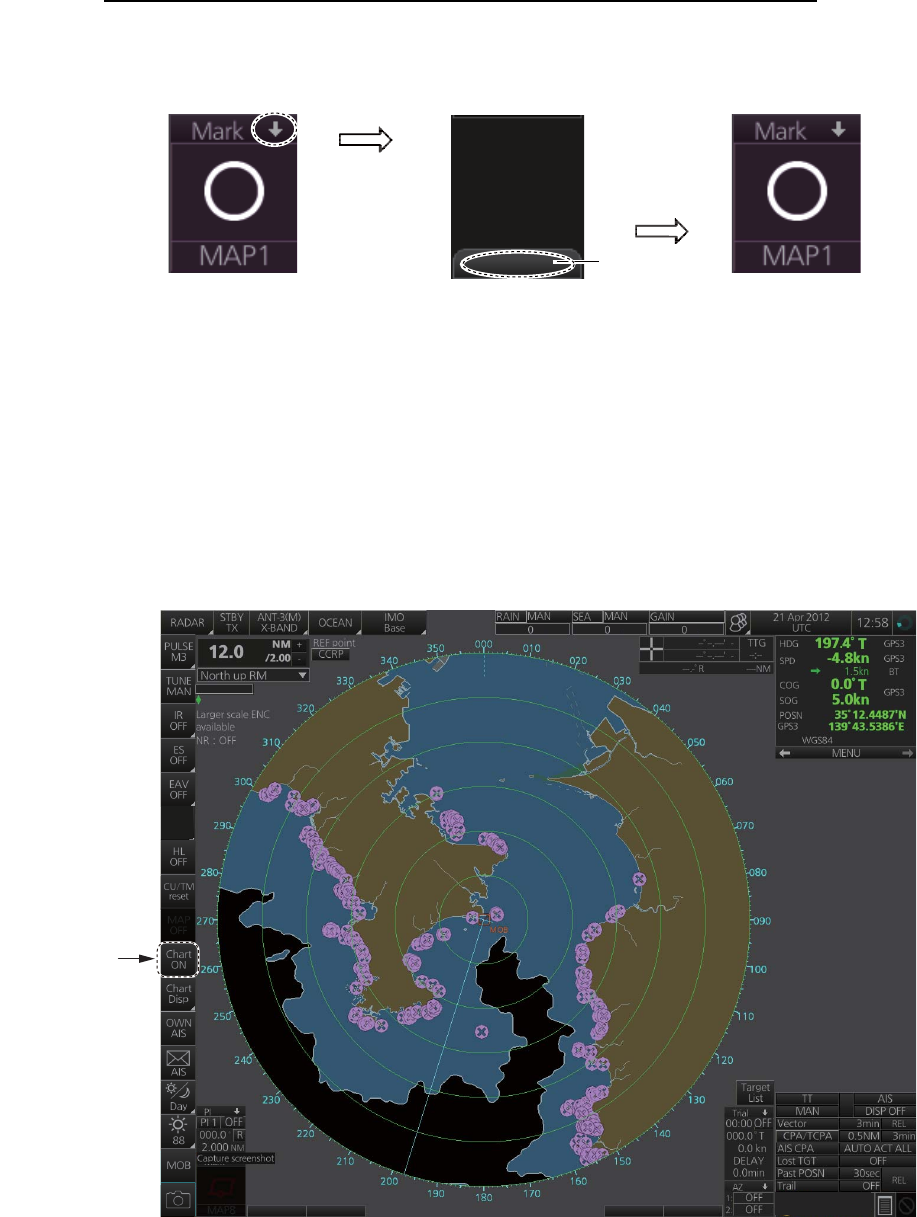
1. OPERATIONAL OVERVIEW
1-11
How to minimize, maximize the boxes at the bottom of the screen
The boxes at the bottom of the screen that contain an arrow can be minimized. Click
the arrow to minimize the box. To restore maximum size, click the minimized box.
Example: Mark box
Note: The respective VRM or EBL is erased from the screen when the corresponding
VRM or EBL box is minimized.
1.6.2 Chart radar display
The chart radar display overlays an electronic chart on the radar picture. To switch be-
tween the radar and chart radar displays, click the [Chart ON/OFF] button on the In-
stantAccess bar.
Click arrow
to minimize.
Click here to
maximize.
Click to hide,
show chart.
OFF
ACE
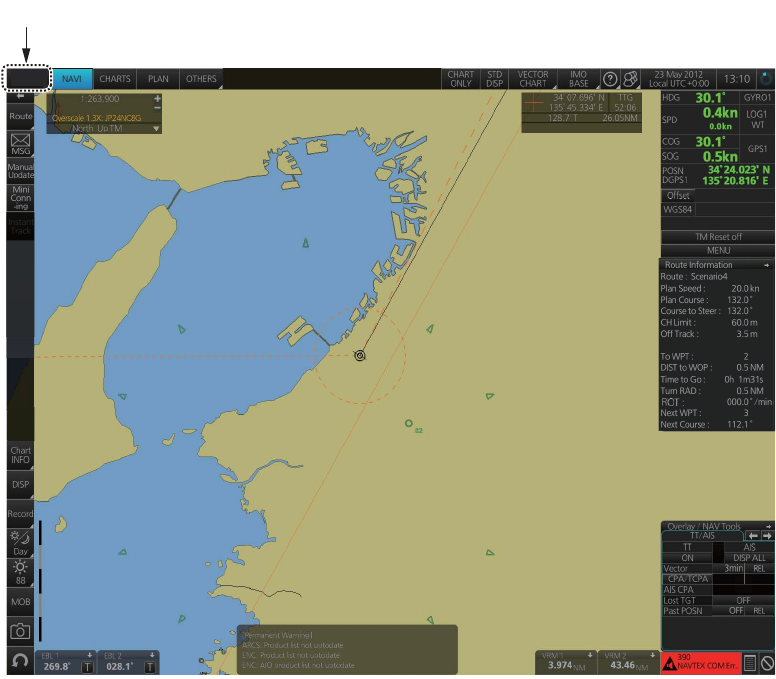
1. OPERATIONAL OVERVIEW
1-12
1.6.3 Chart display
The chart display shows only the electronic chart. Click the [Operating Mode] button
to select [CHART for RADAR] to activate this display. See chapter 6 for a description
of the chart display.
Select [CHART for RADAR].
CHART
for RADAR
0.5NM 4min
AUTO ACT FILT
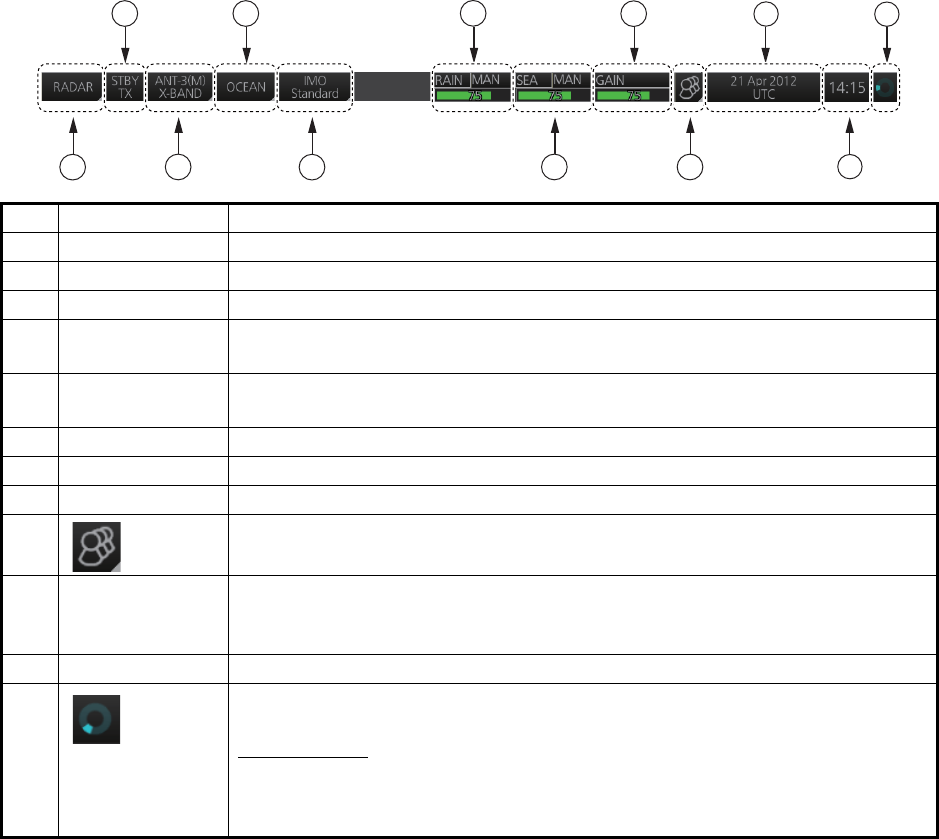
1. OPERATIONAL OVERVIEW
1-13
1.7 Status Bar
The Status bar is displayed at the top of screen in all modes. This bar provides, in the
radar and chart radar modes, buttons for selection of the mode, antenna and chart da-
tabase, and adjustment of the radar picture.
For a description of the Status bar used in the chart mode, see paragraph 6.1.2.
1.7.1 Status bar for radar, chart radar mode
*: The indication is grayed out when the Automatic Clutter Elimination (ACE) function
is [ON].
No. Button name Description
1 Operating Mode Selects a mode: RADAR or CHART for RADAR.
2 STBY TX Toggles the radar between stand-by and transmit.
3 Antenna Selects an antenna.
4Customize
Echo
Presets the radar controls for specific navigation purpose; for example,
congested waters.
5 Chart database Selects the IMO chart database (base, primary, standard or all). Available
in the chart radar mode.
6 RAIN* Reduces rain clutter.
7 SEA* Reduces sea clutter.
8 GAIN Adjusts the gain of the radar receiver.
9 Settings Manages user profiles; opens the Settings menu.
10 Date • Displays the date.
• Selects the time to use, local or UTC.
• Sets the time difference between local and UTC (to use local time).
11 Time Displays the time, local or UTC.
12 Working
Indicator
Rotates clockwise if the system is working properly.
Picture freeze
If the picture freezes, the picture is not updated. After the picture freezes,
the buzzer sounds and the Status LED blinks in red. Reset the power to re-
store normal operation.
1
12
11
10
2
3
46
7
8
9
5
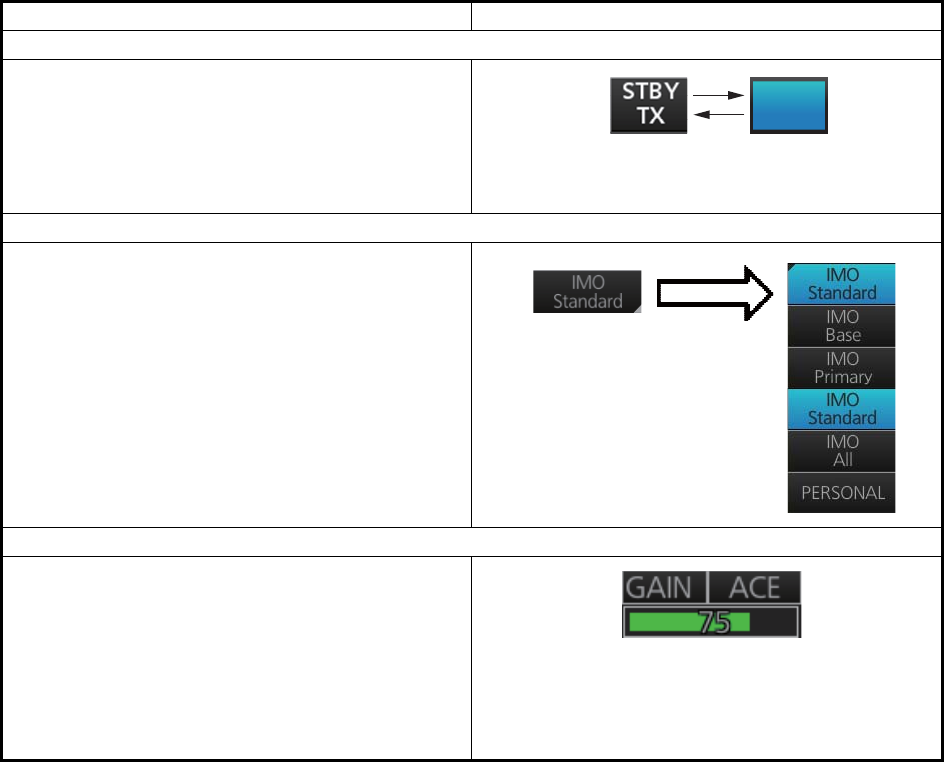
1. OPERATIONAL OVERVIEW
1-14
1.7.2 How to operate the buttons, slider bars on the Status bar
The Status bar has three types of controls: toggle button, drop-down list button and
slider bar. You operate the buttons and bars with the trackball module.
Control type Example of control
Toggle button
A toggle button alternately selects one of two
functions assigned to a button. For example, the
[STBY TX] button toggles the radar between
stand-by and TX. The background color of the
[STBY TX] button momentarily changes to light-
blue when switching from stand-by to TX.
Drop-down list button
A drop-down list button provides a list from which
to select an option related to the label on the but-
ton. A drop-down list button is identified by a tri-
angle on the button’s bottom-right corner. The
[Chart database] button, shown in the right figure,
is an example of a drop-down list button.
Slider bar
The slider bars provide for adjustment of the ra-
dar picture. [RAIN], [SEA] and [GAIN] are slider
bar buttons. To adjust the bar coarsely, put the
cursor at any location within the slider bar area
then push the left button. For fine adjustment, put
the cursor at the end of the slider bar and roll the
trackball while holding down the left button. Re-
lease the button to finish.
STBY
TX
Click button to show
drop-down list.
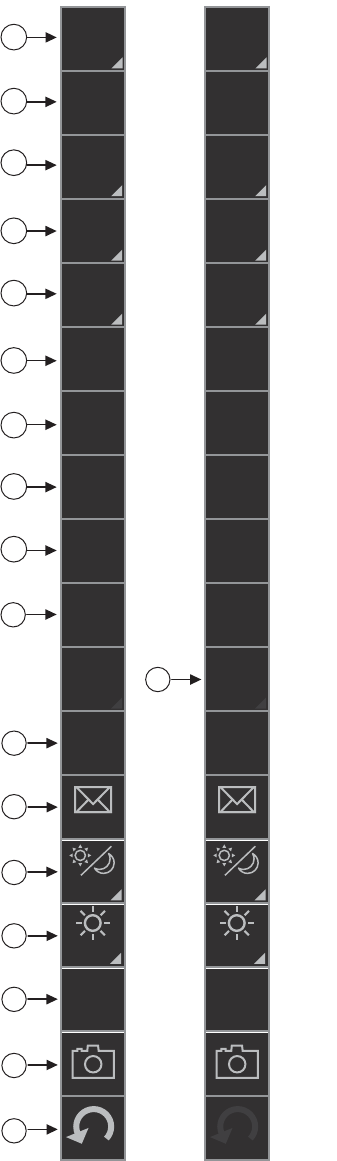
1. OPERATIONAL OVERVIEW
1-15
1.8 InstantAccess Bar
The InstantAccess bar runs vertically along the
left edge of the screen and is displayed always.
This bar provides, in the radar and chart radar
modes, buttons for adjustment of the radar picture
and chart, AIS operations, display brilliance con-
trol (FURUNO monitor only), MOB, screenshot,
etc.
For a description of the InstantAccess bar used in
the chart mode, see paragraph 6.1.3.
*1: For solid state radar, [TX CH] icon is displayed
instead of [TUNE].
*2: This button is not displayed on the FURUNO
19-inch monitor unit.
Radar
mode,
map
ON
Radar
mode,
chart
ON
1
12
11
10
2
3
4
6
7
8
9
5
13
14
15
16
17
18
*2
*1
IR
OFF
ES
OFF
EAV
OFF
HL
OFF
CU/TM
reset
PULSE
M3
TUNE
MAN
MAP
OFF
Chart
ON
Chart
Disp
OWN
AIS
AIS
Day
88
MOB
IR
OFF
ES
OFF
EAV
OFF
HL
OFF
CU/TM
reset
PULSE
M3
TUNE
MAN
MAP
ON
Chart
OFF
Chart
Disp
OWN
AIS
AIS
Day
88
MOB
ACE
OFF
ACE
OFF
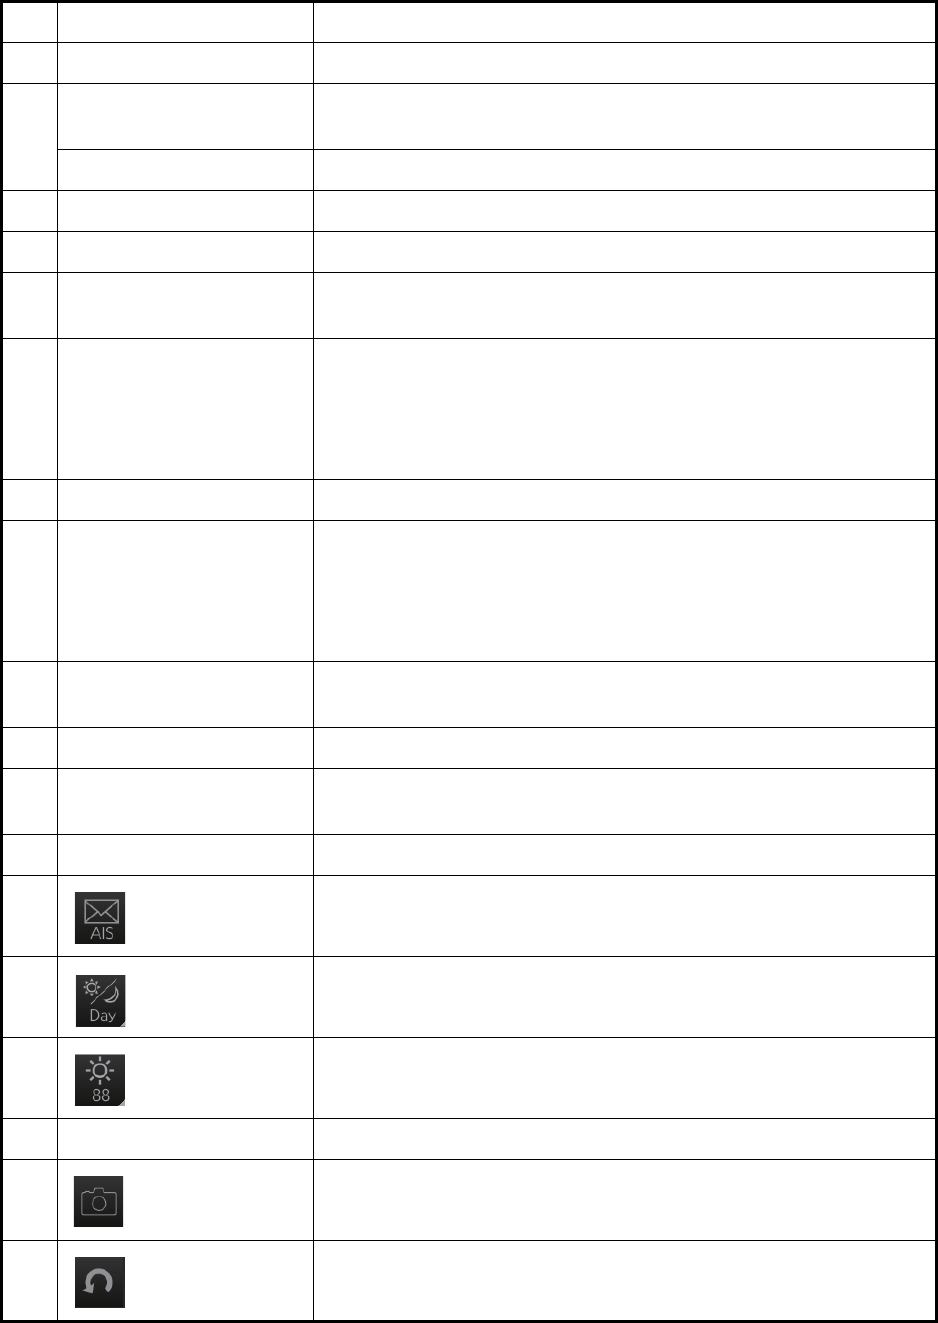
1. OPERATIONAL OVERVIEW
1-16
No. Button name Description
1 PULSE Selects the radar pulse length.
2 TUNE Selects the radar receiver tuning method, automatic or manual,
and manually tunes the radar receiver.
TX CH Selects the transmit frequency from [TX CH 1] or [TX CH 2].
3 IR Activates or deactivates the interference rejector.
4 ES Activates or deactivates the echo stretch.
5 EAV Activates or deactivates the echo averaging when Automatic Clut-
ter Elimination (ACE) function is off.
6 ACE Activates or deactivates the Automatic Clutter Elimination (ACE)
function.
Automatic Clutter Elimination (ACE) automatically sets the gain,
rain and sea clutter controls according to the sea and rain clutter
states.
7 HL OFF Temporarily erases everything but radar echoes.
8 CU/TM reset • Puts the ship’s heading at the top of the screen in course-up
mode the moment this button is pressed.
• Resets the ship's position to a point of 75% radius opposite to
the extension of the heading line passing through the display
center in true motion modes.
9 MAP ON/OFF Shows or hides the radar map marks on the radar display, in the
radar mode.
10 CHART ON/OFF Shows or hides the electronic chart.
11 Chart Disp Shows or hides various chart objects. Shown in the chart radar
mode. See paragraph 2.41.2.
12 OWN AIS Shows the [VOYAGE DATA] menu, to set your ship’s AIS data.
13 AIS message Displays screen for “received AIS messages”.
14 Palette Selects a color palette.
15 BRILL Adjusts the brilliance of a FURUNO monitor.
16 MOB Enters a MOB mark at the current position.
17 Capture Takes a screenshot.
18 UNDO Restores previous condition in radar map and text input.
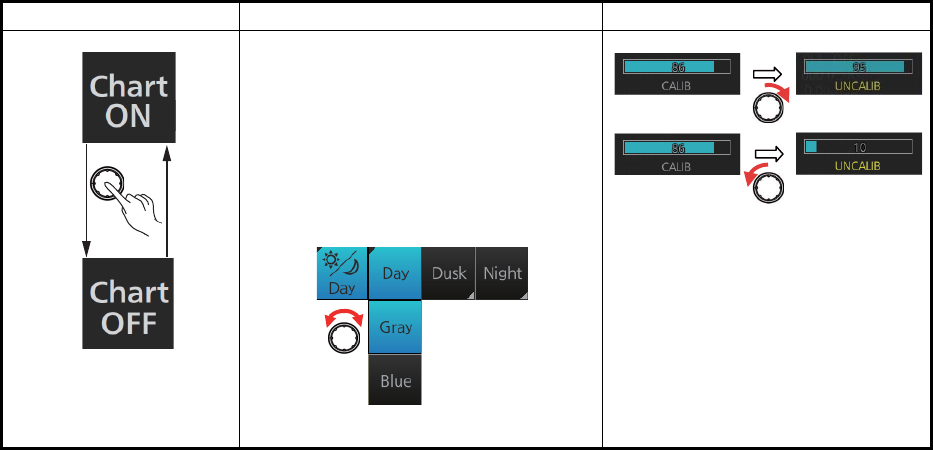
1. OPERATIONAL OVERVIEW
1-17
1.8.1 How to operate the buttons, slider bars on the InstantAccess
bar
The InstantAccess bar has three types of controls: toggle button, drop-down list button
and slider bar. (The MOB and Capture buttons are special buttons.) You operate the
buttons and bars with the trackball module or the InstantAccess knob. This section
shows you how to use the InstantAccess knob.
1. Push the InstantAccess knob to enable its use with the InstantAccess bar.
2. Rotate the InstantAccess knob to select a button. The background color of the
button selected is light-blue.
3. Do one of the following depending on button type.
1) Toggle button: Push the knob to select setting.
2) Drop-down list button or slider bar: Push the knob then rotate the knob to
select an item or adjust the slider bar. Push the knob to confirm your selection.
Note: You can use the ESC key to go back one step in the current operating
sequence.
Toggle button Drop-down list button Slider bar
A drop-down list button provides a list
from which to select an option related
to the label on the button. A drop-
down list button is identified by a tri-
angle on the button’s bottom-right
corner.
[Palette]
button
Palette list
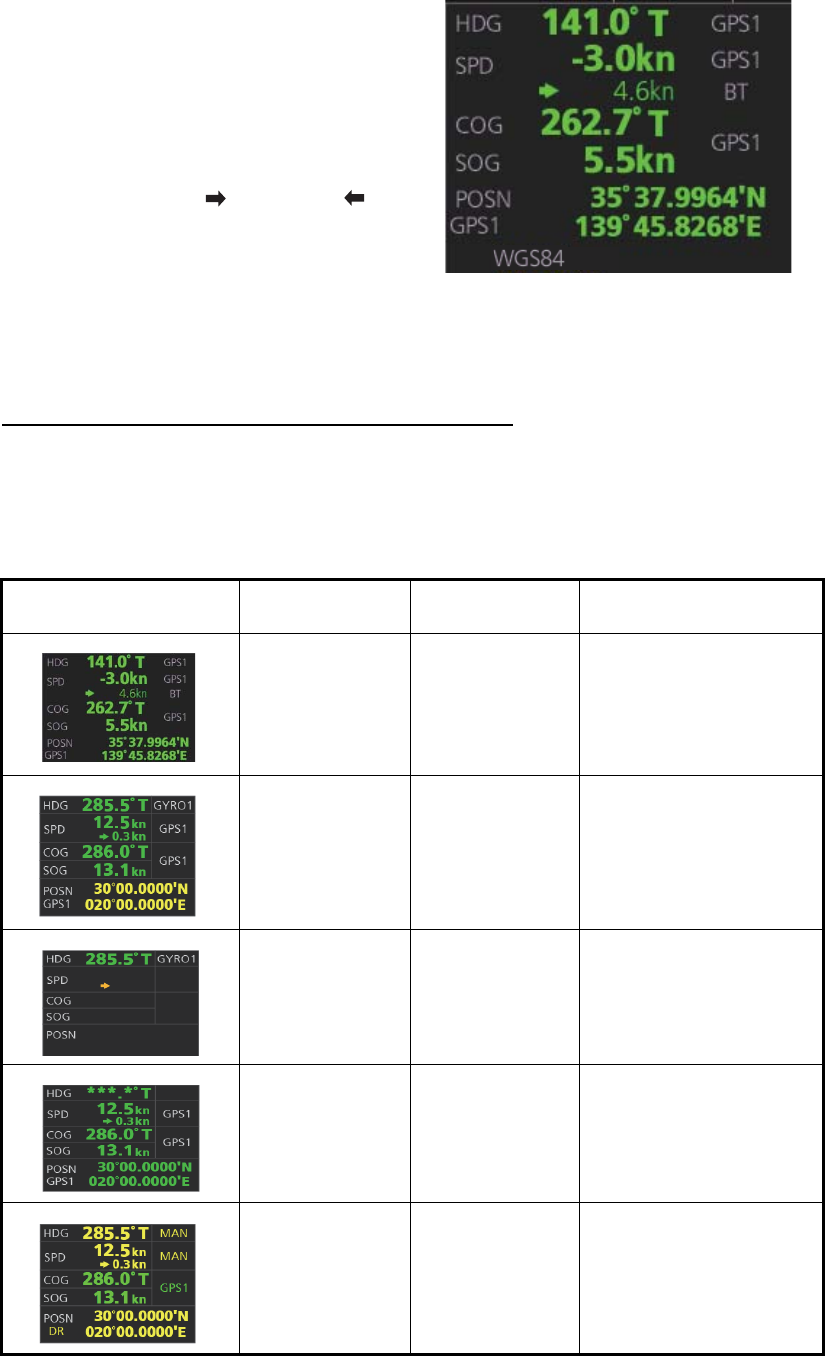
1. OPERATIONAL OVERVIEW
1-18
1.9 Sensor Information, Datum Box
Color of nav data indications and sensor name
The color of the nav data indications and sensor names changes according to the
state of the sensor data. The table shown below provides basic indication and color
meanings. For detailed information, see Appendix 3. When no sensor data is received,
the sensor source indication is blank and the related indication shows asterisks.
Sensor information, datum box displays the
sensor data and the name of the datum in
use. The sensor indications and names are
colored according to sensor state. See the ta-
ble below.
• HDG: Heading and its source.
• SPD: Longitudinal speed and its source.
The direction of transverse speed is indi-
cated with arrows, , Starboard, , Port.
• COG: Course over ground and its source.
• SOG: Speed over ground and its source.
• POSN: Latitude and longitude position of
own ship and its source.
• Datum: Chart datum (WGS84, WGS72,
etc.) in use. No datum appears when there
is no datum sentence.
Note: The position source shall meet
the requirements of IMO MSC.112(73).
Nav data indication Color of nav
data indication
Color of
sensor name State
Green White Sensor is normal.
Yellow White Validity of data is low or
offset is applied.
Yellow-orange Yellow-orange Data is invalid.
Green, data
shown with as-
terisks (***.*)
No display Data is not being re-
ceived.
Yellow Yellow Data is input manually
(manual heading, gyro
correction, manual
speed, dead reckoning).
12.5
kn
0.3kn
GPS1
GPS1
286.0°T
13.1
kn
GPS1
30°00.0000'N
020°00.0000'E
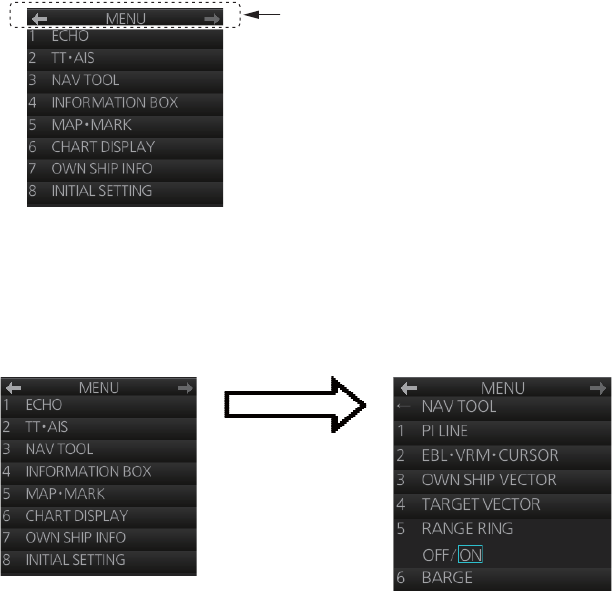
1. OPERATIONAL OVERVIEW
1-19
1.10 Menu Overview
The menu consists of eight main menus and several sub menus. You can operate the
menu with the Radar Control Unit or trackball module. The system closes open menus
whenever there is no menu operation for 30 seconds.
1.10.1 Basic menu operation
1. Open the main menu.
Control Unit: Press the MENU key.
Trackball module: Click the menu title bar at the right side of the display.
2. Select a menu.
Control Unit: Press the corresponding numeric key. For example, press the 3 key
to show the [NAV TOOL] menu.
Trackball module: Click the menu desired. The current selection is highlighted in
blue.
3. Select a menu item.
Control Unit: Press the corresponding numeric key.
Trackball module: Click the menu item desired. The current selection is highlight-
ed in blue.
4. Select a menu option.
Control Unit: Press the corresponding numeric key. The current selection is high-
lighted in orange.
Trackball module: Spin the scrollwheel. The current selection is highlighted in or-
ange.
5. Confirm your selection.
Control Unit: Press the ENTER key.
Trackball module: Push the left button.
Note: Hereafter, "select" in a menu operating procedure means to press the applica-
ble numeric key on the Control Unit or push the left button on the trackball module.
Menu title bar
Click [3 NAV TOOL]
or press the 3 key.
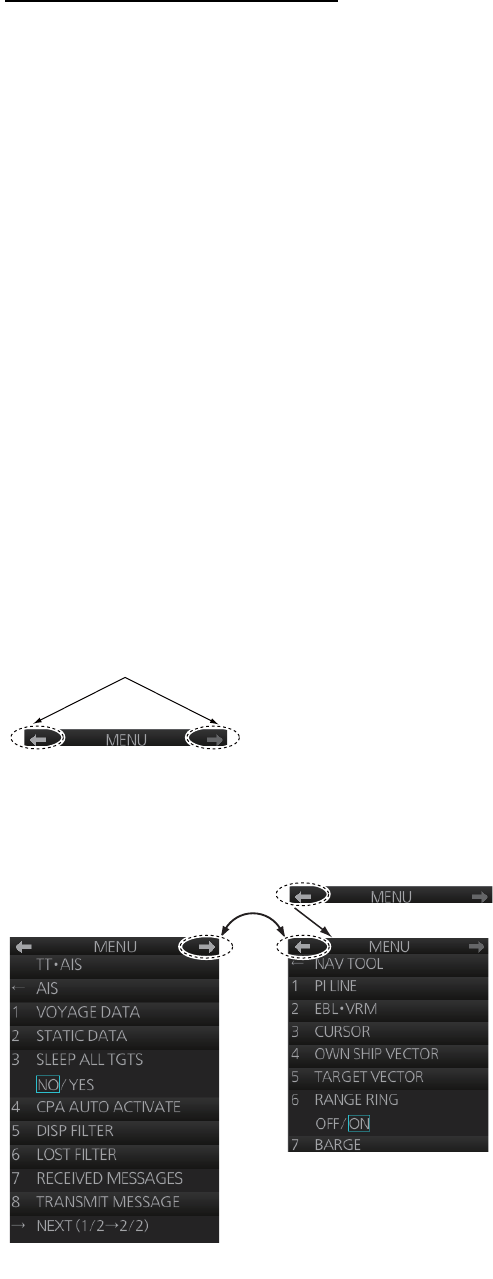
1. OPERATIONAL OVERVIEW
1-20
Keys, buttons to use in menus
Control Unit
MENU key: Open main menu, or close menu.
CANCEL key: Go back one layer in menu, or close menu when main menu is dis-
played.
←key: Return to main menu, in no. 2 layer or higher.
Trackball module
Right button: Go back one layer, or close menu when main menu is displayed.
Left button: (1) Click menu title bar to go back one layer, or close menu when main
menu is displayed, (2) Click the left arrow on the menu title bar to return to the main
menu, in no.2 layer or higher.
1.10.2 Menu history feature
This chart radar remembers the 10 last-used menus to help you go to recently used
menus quickly. The memorized menus are cleared when the power is turned off. In-
stallation- and service-related menus and menus where no operation occurred are not
memorized. Menus accessed multiple times are counted as one menu.
Click the memory history buttons on the menu title bar to navigate through the last-
used menus.
For example, the last two used menus are [NAV TOOL] and [AIS].
Menu history buttons
History back
button
History forward
button
Memorized menu no. 1
Memorized menu no. 2
Click
Click
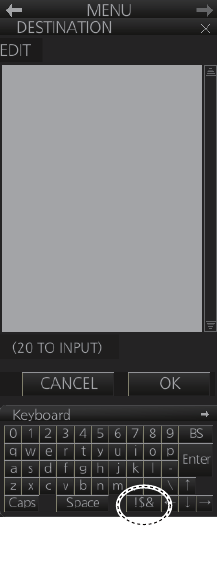
1. OPERATIONAL OVERVIEW
1-21
1.10.3 How to enter numeric data
Select the numeric data, then do one of the following:
Control Unit: Use the ten keys to enter data.
Trackball module: Spin the scrollwheel to set data then push the left button.
1.10.4 How to enter alphanumeric character data
Some operations display a software keyboard to enter alphanumeric character data.
To enter characters, click applicable characters on the software keyboard. You can
switch between letter input and symbol input by clicking the key circled in the illustra-
tion above.
Click to switch between
letters and symbols.
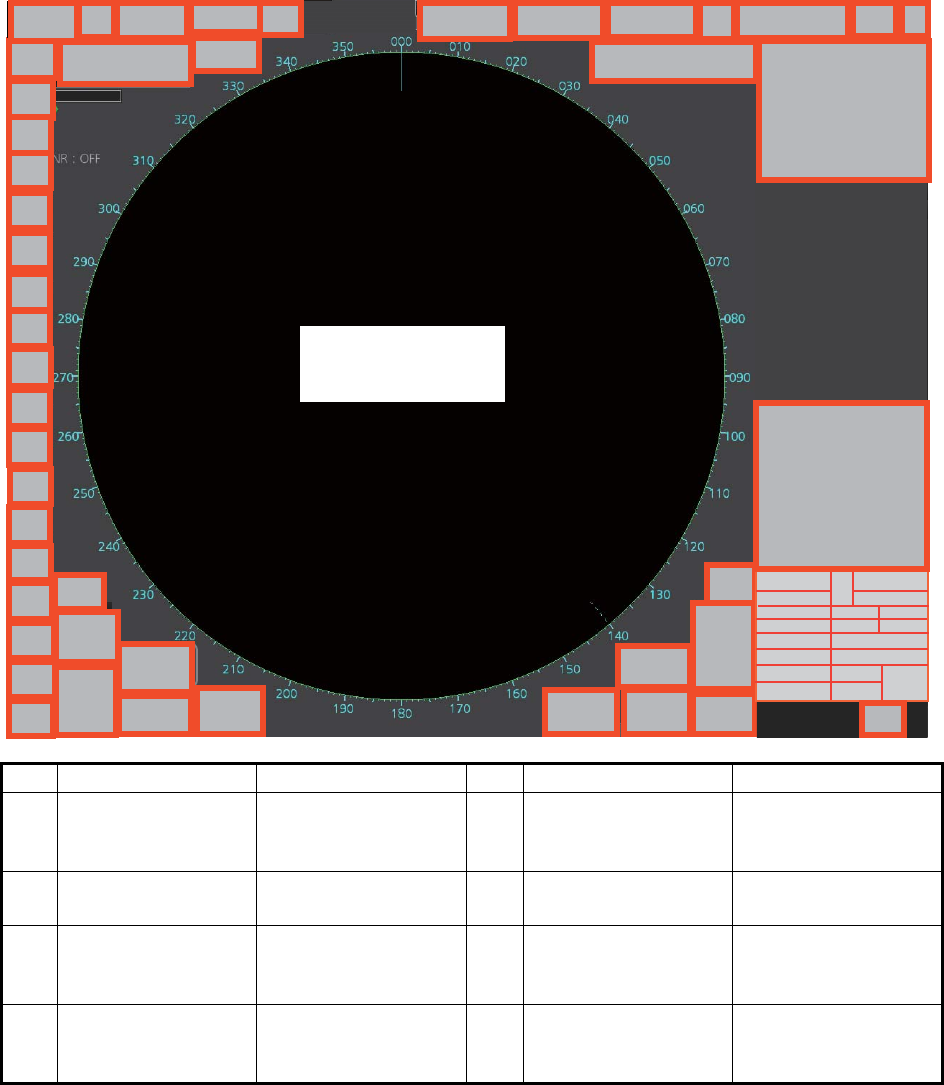
1. OPERATIONAL OVERVIEW
1-22
1.11 Context-Sensitive Menus in the Radar Mode
Context-sensitive menus are available with many of the boxes and buttons surround-
ing the display area and objects within the display area. Right-click the boxes and but-
tons marked with numerals in the illustration below to show the related context-
sensitive menus. If a menu is not operated within 30 seconds, it is automatically
closed.
For context-sensitive menus in the chart mode, see the chapter on chart overview.
1.11.1 Context-sensitive menus available with buttons and boxes
No. Box name Menu No. Box name Menu
1 Adjust Local Time Adjust Local Time 2 Cursor Position Range-Bearing Po-
sition, X-Y Position,
Cursor Menu
3 Sensor Informa-
tion, Datum Box
Select Sensor, OS
Info Menu
4 AIS Info Expanded AIS Data,
AIS Message
5 Association Association OFF/
TT/AIS, Association
Menu
6 TT OFF / MAN / AUTO /
MAN/AUTO,TT
Menu, Symbol Menu
7 AIS DISP OFF / FILT /
ALL, AIS Menu,
Symbol Menu
8 Vector OS Vector Menu,
Target Vector Menu
240.8
°
3229
°
0.088
42
3
20
23
28
29
31
32
39
38
36
35
34 57
8
14
16
15
2
1
30
21
40
610
13
17 18
11
33
9
4
2019
22
24
25
2627
12
41
Context-sensitive menus
on the radar echoes
(see paragraph 1.11.2)
37

1. OPERATIONAL OVERVIEW
1-23
*: For solid state radar, this menu is not displayed.
9 Vector Time Vector Time (30 s -
60 min), OS Vector
Menu, Target Vector
Menu
10 Vector Reference True-G(S), REL, OS
Vector Menu, Target
Vector Menu
11 CPA Range CPA Range
(0.5 - 20 NM)
12 CPA time CPA Time
(1 - 60 min)
13 AIS CPA Auto Activate Menu 14 Auto Activate OFF, AUTO ACT
FILT, AUTO ACT
ALL, Auto Activate
Menu
15 Lost TGT TT Lost Filter Menu,
AIS Lost Filter Menu
16 Lost TGT Filter OFF, FILT, ALL, TT
Lost Filter Menu,
AIS Lost Filter Menu
17 Past POSN Past POSN Menu 18 Past POSN time Past POSN Time
(OFF, 30 s - 6 min),
Past POSN Menu
19 Trail Trail All Clear, Trail
Menu
20 Trail Time Trail Time (OFF, 15
s - 30 min, CONT),
Trail Menu
21 Trail/Past POSN
Reference
True-G(S), REL,
Past POSN Menu,
Trail Menu
22 Alert List Alert List/Log Win-
dow
23 Trial Trial Mode, Trial
Maneuver Menu
24 AZ Acquisition Zone
Menu
25 Drop Mark 2 Drop2 Off 26 VRM 2 VRM2 Off,
EBL•VRM Menu
27 VRM 1 VRM1 Off,
EBL•VRM Menu
28 EBL 2 EBL2 Off,
EBL•VRM Menu
29 EBL 1 EBL1 Off,
EBL•VRM Menu
30 Drop Mark 1 Drop1 Off
31 Mark Mark Color (B-type
only), Mark Position,
MAP File, Edit Map
Comment,
Map•Mark Menu
32 PI Line Number of PI Line,
Reset PI Line,
PI Menu
33 Watch Watch Time
(OFF, 6 - 20 min)
34 Brill Menu Brill Menu
35 Chart ON/OFF Chart Display Menu 36 MAP ON/OFF Radar Map Menu,
Route Menu, Event
Menu, User Chart
Menu
37 ACE Automatic Clutter
Elimination (ACE)
Menu
38* TUNE Tune Initialize
39 PULSE Pulse Menu 40 RANGE Range Scales
(0.125 - 96.0 NM)
41 Antenna Selection Dual Radar,
ANT Select Menu
42 Customize Echo Customize Echo
Menu
No. Box name Menu No. Box name Menu
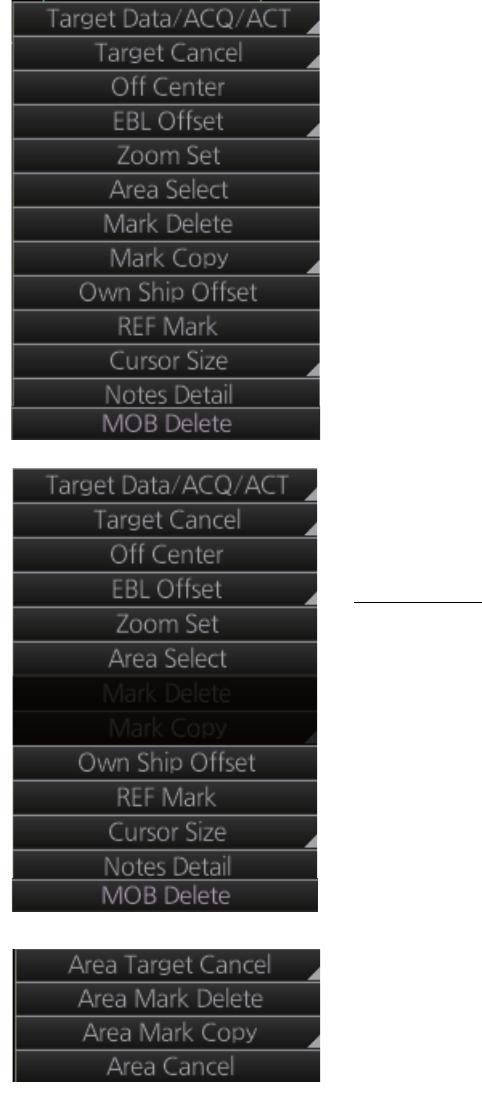
1. OPERATIONAL OVERVIEW
1-24
1.11.2 Context-sensitive menus in the display area in the radar and
chart radar modes
Right-click anywhere in the display area in the radar and chart radar modes to show
the context-sensitive menu.
[Target Data/ACQ/ACT]: For cursor-selected TT or
AIS target, display target data, acquire target for TT,
or activate sleeping AIS target.
[Target Cancel]: Cancel tracking on selected tracked
target (erase target), sleep activated AIS target.
[Off Center]: Off center the display.
[EBL Offset]: Offset EBL1, EBL2 (to measure range
and bearing between two targets).
[Zoom Set]: Select zoom area.
[Area Select]: Specify the area where to delete, copy
marks.
[Mark Delete]: Delete cursor-selected mark. Grayed
out when radar map is off.
[Mark Copy]: Copy cursor-selected mark. Grayed out
when radar map is off.
[Own Ship Offset]: Apply an offset to own ship
position.
[REF Mark]: Make cursor-selected target a reference
target (for use in TT). Grayed out unless TT is active.
[Cursor Size]: Select cursor size, large or small.
[Notes Detail]: Show details about cursor-selected
Notes.
[MOB Delete]: Delete selected MOB mark.
Area selected
This context-sensitive menu is available when an
area is created to cancel tracking on specific targets,
or delete or copy marks.
[Area Target Cancel]: Cancel tracking on targets
within the area selected.
[Area Mark Delete]: Delete all marks within the area
selected.
[Area Mark Copy]: Copy all marks within the area se-
lected.
[Area Cancel]: Cancel the area created.
Radar mode, map ON
Radar mode, map OFF or chart ON
Radar mode, map ON, area selected
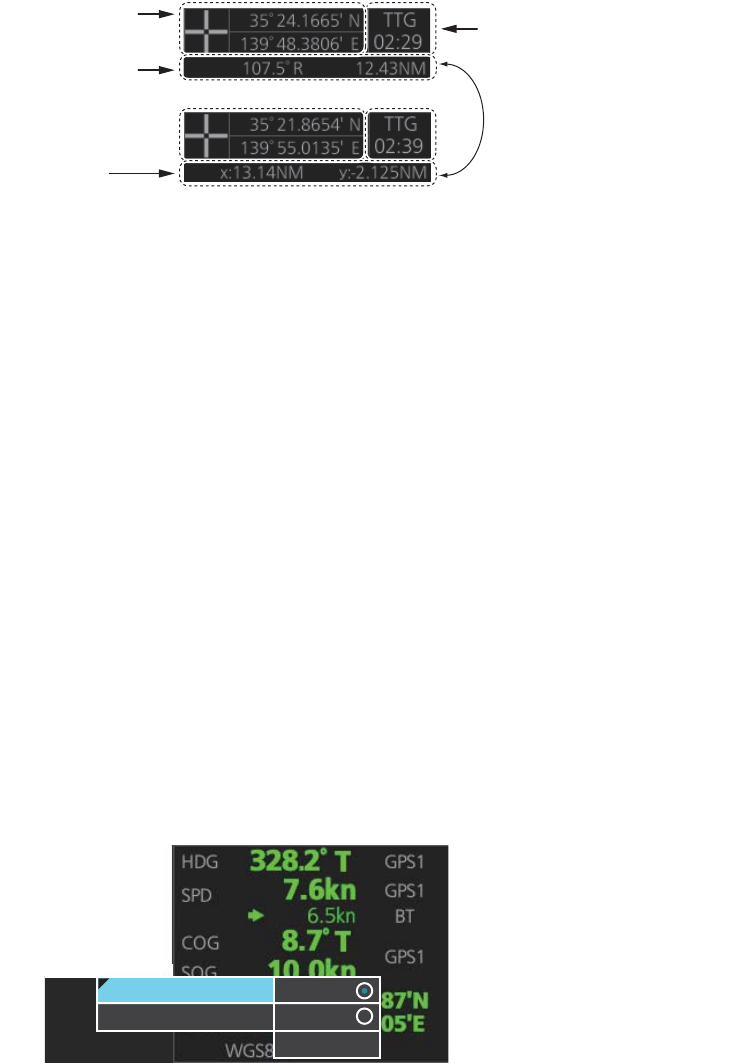
1. OPERATIONAL OVERVIEW
1-25
1.12 Cursor Position
Cursor data appears in the cursor position box at the top-right position on the display.
The appearance of the box is slightly different between the 23-inch and 19-inch dis-
plays, although the content is the same.
For the cursor position box that appears in the chart mode, see section 6.6.
The indication below the cursor position can show the range and bearing to the cursor
or x-y coordinates of the cursor position. Click that indication and select [Range-Bear-
ing Position] or [X-Y Position] as appropriate. For the x-y coordinate display, the y-axis
is the heading line, right/top is "plus" and left/lower is "minus".
Note 1: The cursor bearing can be selected to true or relative with [1 CURSOR BEAR-
ING] in the [CURSOR] menu. Right-click the indication and select [Cursor Menu] to
open the [CURSOR] menu.
Note 2: The cursor position is shown as "---.-" when the cursor is not within the effec-
tive display area.
1.13 How to Select Sensor Settings
This radar system accepts navigation data input two ways: System or Local. System
shares sensor data among multiple radars in a network. Sensor priority is also com-
monly shared among the radars. Local selects a sensor outside the network.
1. Right-click anywhere in the Sensor information, datum box to show the context-
sensitive menu.
2. Click [Select Sensor].
3. Click [System] or [Local].
Note: The sensor system can also be selected in the chart mode through this pro-
cedure and through the menu. Open the menu then select [7 OWN SHIP INFO]
followed by [1 SENSOR].
Cursor position
(lat/lon)
Bearing and
range to cursor
position
Time to go to
cursor position
x and y
coordinates of
cursor position
Click indication to switch
between bearing and range
and x and y coordinates.
System
Local
[Setting]
System
Local
Select Sensor
[OS Info Menu]
[Setting]
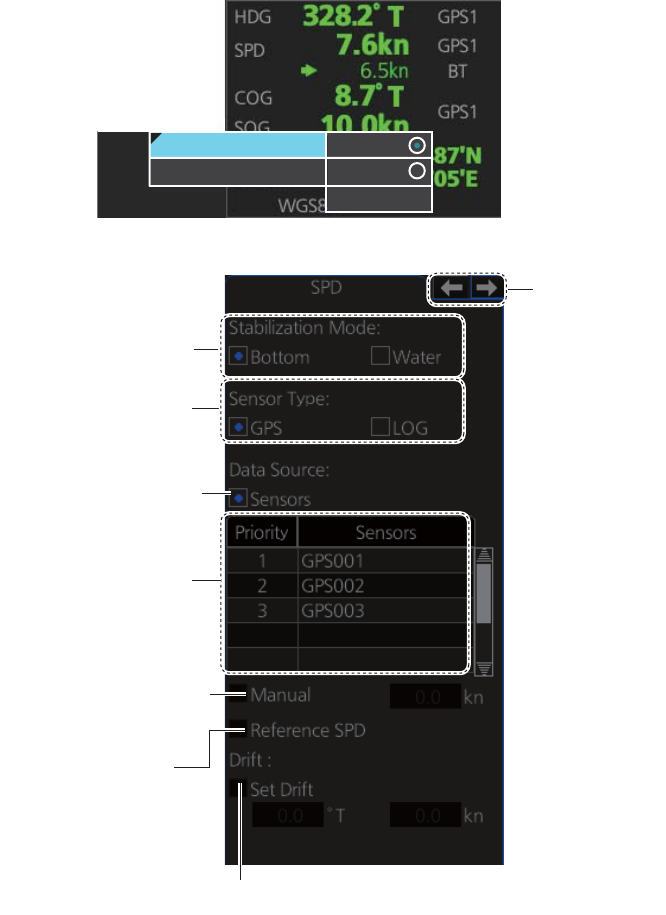
1. OPERATIONAL OVERVIEW
1-26
1.14 How to Enter Ship Speed
The TT and azimuth stabilized presentation modes require own ship speed input and
compass signal. The speed can be entered automatically from a speed log (STW,
SOG) or GPS (SOG), or manually on the menu. Note that the FURUNO GPS Naviga-
tor GP-150 provides COG and SOG.
1. Right-click anywhere in the Sensor information, datum box to show the context-
sensitive menu.
2. Click [Select Sensor] then click [Setting].
3. Use the arrow buttons to select the [SPD] page.
4. For automatic input, follow the procedure below. For manual input, go to
step 5.
1) Check [Sensors].
2) Set the priority for the speed sensors in case of Local sensor. Click the triangle
on any line then select the sensor to set as the primary source of speed. All
other sensors are then set as secondary source. Only one sensor can be pri-
mary while the others can be secondary. If a speed sensor is changed from
secondary to primary state and another speed sensor was selected as prima-
System
Local
[Setting]
System
Local
Select Sensor
[OS Info Menu]
[Setting]
Sensor type
selection
Speed
sensor
list
Check for manual
speed input
Check for automatic
speed input
Stablilization
mode
Select to use radar
as source for speed
and course
Set speed and course of drift
Arrow buttons

1. OPERATIONAL OVERVIEW
1-27
ry, then that sensor previously selected to primary state is then automatically
selected to secondary state.
3) Select [Bottom] or [Water] at [Stabilization Mode] to set the stabilization meth-
od. Select [Bottom] for GPS or [Water] for a speed log.
4) Check [GPS] or [LOG] at [Sensor Type] to select the source of speed data.
5) Go to step 6.
5. For manual input, set the stabilization mode for [Water] and check [Manual].
Click the manual box to show the up and down arrows. Click the arrows to set
speed.
Note: For [Set Drift], see page 16-3.
6. Click the [OK] button to save the settings then click the [MENU] bar to close the
menu.
Notes on speed input
• IMO Resolution A.823(19) for TT requires that a speed log to be interfaced with a
TT should be capable of providing through-the-water speed (forward speed).
• A single-axis water log cannot measure speed when the wind is coming from the
leeway direction.
• When AIS is active, [Manual], [Reference SPD] and [Set Drift] are shown in gray to
indicate that they are not available for selection.
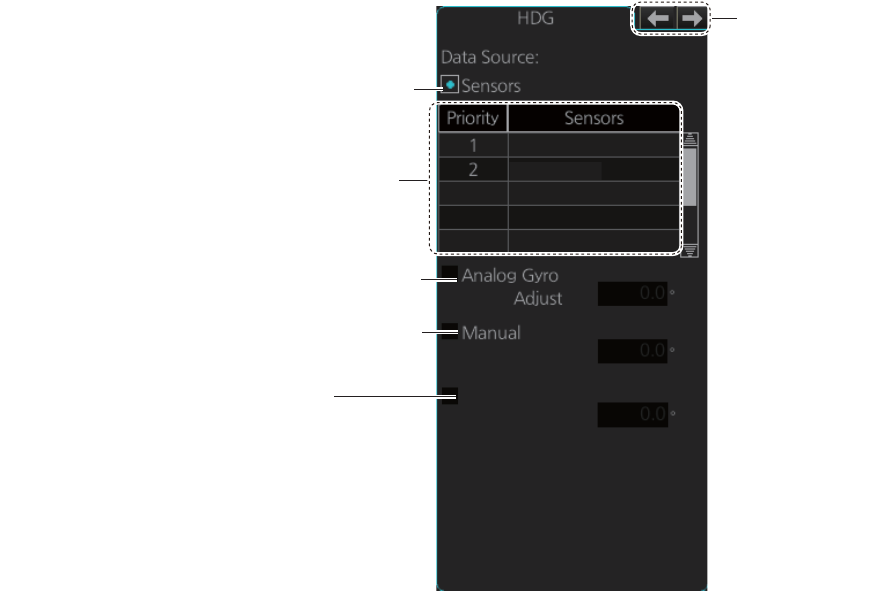
1. OPERATIONAL OVERVIEW
1-28
1.15 How to Enter Heading
Select manual or automatic heading input as follows:
1. Right-click anywhere in the Sensor information, datum box to show the context-
sensitive menu.
2. Click [Select Sensor] then click [Setting].
3. Use the arrow buttons to select the [HDG] page.
4. For automatic input, follow the procedure below. For manual input, go to
step 5.
1) Check [Sensors].
2) Set the priority for the heading sensors. Click the triangle on any line then se-
lect the sensor to set as the primary source of heading. All other sensors are
then set as secondary source. Only one sensor can be primary while the oth-
ers can be secondary. If a heading sensor is changed from secondary to pri-
mary state and another heading sensor was selected as primary, then that
sensor previously selected to primary state is then automatically selected to
secondary state.
3) Go to step 6.
5. For manual input, check the [Manual] box. Click the heading input box to show
the up and down arrows. Click the arrows to set heading.
6. Click the [OK] button to save the settings then click the [MENU] bar to close the
menu.
Heading sensor list
Analog gyro heading
Check for automatic heading input
GY001
GY002
Manual heading input (not shown on IMO type)
Gyro Correction
[Gyro Correction] is not shown
●
when [SYSTEM] is selected in the
[OWN SHIP INFO] - [SENSOR] menu.
[Gyro Correction] is grayed out
●
when manual heading is in use.
Arrow buttons
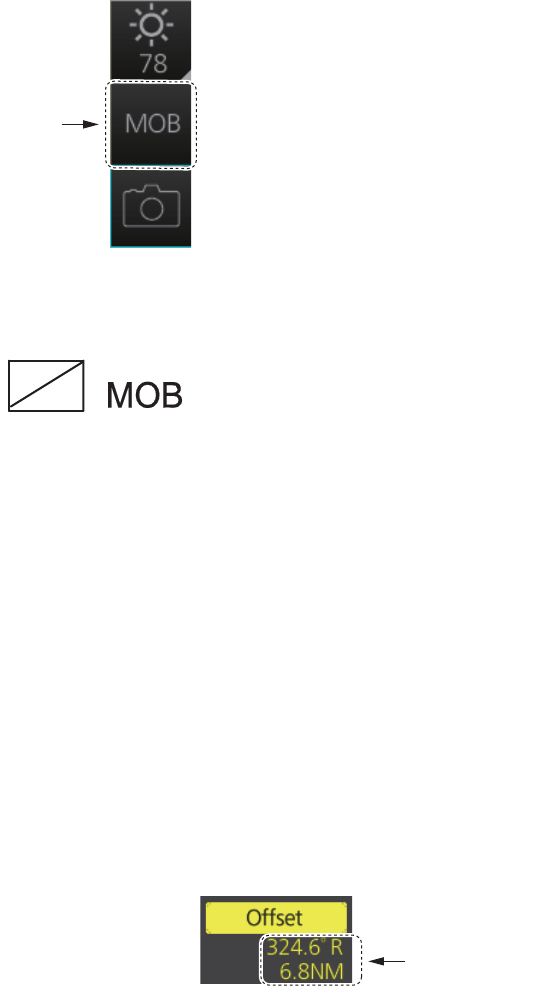
1. OPERATIONAL OVERVIEW
1-29
1.16 How to Mark MOB Position
Use the MOB (man overboard) feature to mark the position of man overboard on the
display screen. Click the [MOB] button (in any mode) on the InstantAccess bar.
The MOB mark instantly appears at the geographical position of your ship when the
button is clicked.
Up to 100 MOB marks can be saved. When the capacity for MOB marks is reached,
the oldest mark is automatically erased to make room for the latest.
To delete an MOB mark, right-click the mark to show the context-sensitive menu then
select [MOB Delete].
Exercise caution when using this feature in strong tide or current. The person will not
be at the MOB position for a very long time.
1.17 How to Offset Position
The position shown in the Sensor information, datum box (section 1.9) may be differ-
ent from the actual position. This error affects the positioning accuracy of radar ech-
oes, radar map and TT and AIS symbols. If there is a difference, apply an offset to
position as shown below to compensate for the error.
1. Right-click the display area to show the
context-sensitive menu.
2. Select [Own Ship Offset] and push the
left button. The color of the cursor be-
comes blue.
3. Roll the trackball until the cursor is at the "correct position".
4. Push the left button to confirm.
To cancel the offset, show the context-sensitive menu then select [Reset Own Ship
Offset]. The indication [Offset] and the offset values are then erased from the display.
[MOB]
button
Offset value
(range, bearing)
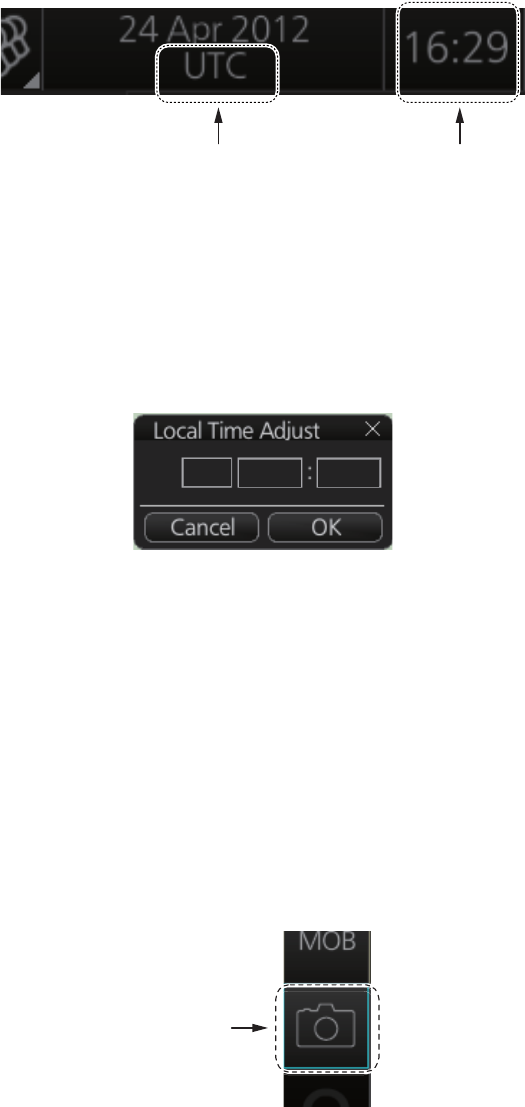
1. OPERATIONAL OVERVIEW
1-30
1.18 How to Select Time Format, Set Local Time
The GPS navigator feeds time and date data to the chart radar and they appear on the
Status bar. Neither the time nor the date can be adjusted, however you can select be-
tween UTC time (default) and local time. You can switch between the local time and
the UTC time by left-clicking the Current time format indication.
To use the local time, enter the time difference between the local time and the UTC
time as shown below.
1. Right-click the Current time format indication to show the context-sensitive menu
then click [Adjust Local Time] to display the [Local Time Adjust] dialog box.
2. Enter the time difference between the local time and the UTC time, in hours and
minutes. Use the button on the left to select the time offset direction. Select "+" if
the local time is ahead of the UTC time, or "-" if it is behind the UTC time.
1.19 How to Take a Screenshot of the Display
Click the [Capture] button on the InstantAccess bar to take a screenshot and save it
to the SSD (Solid State Drive). You can save a maximum of 100 screenshots. When
the capacity for screenshots is reached, the oldest screenshot is automatically deleted
to make room for the latest. You cannot take a screenshot when a menu or a dialog
box is opened.
Screenshots can be copied to a USB flash memory. For how to process screenshots,
see section 22.10.
Current time format
Left click: Switch between local
and UTC times
Right click: Adjust local time
Time
+00
[Capture]
button
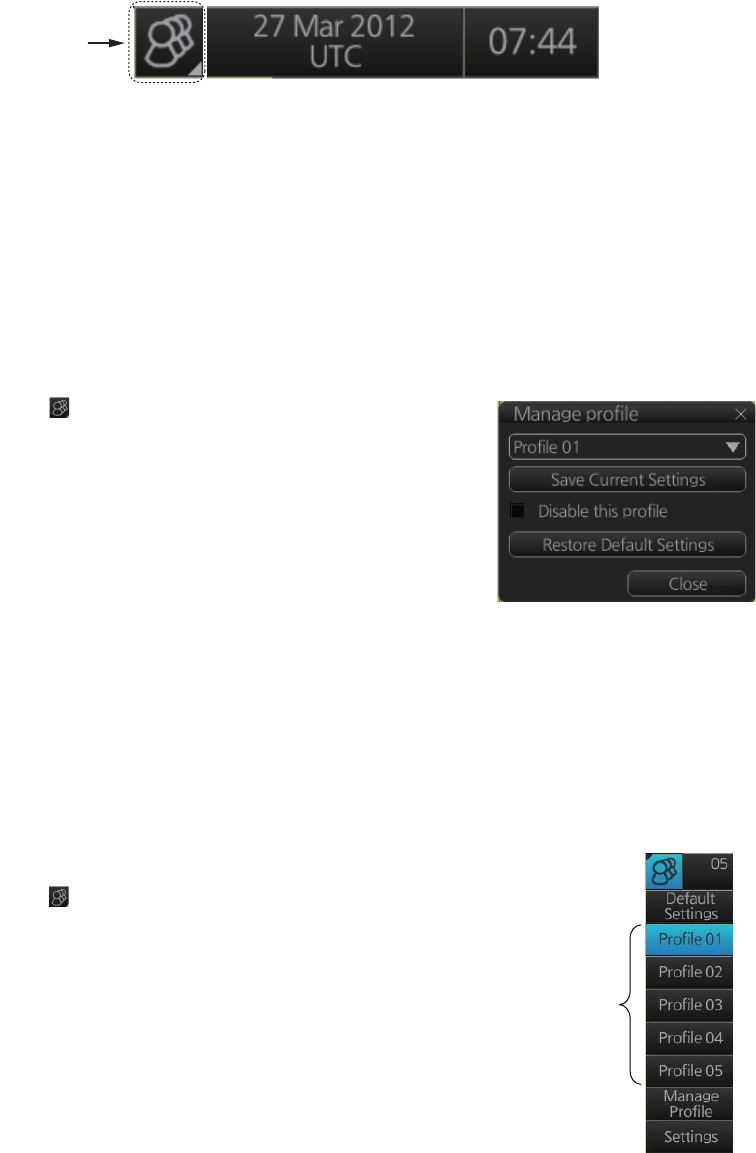
1. OPERATIONAL OVERVIEW
1-31
1.20 The Settings Menu
The [Settings] button gives you access to the user profiles and the [Settings] menu.
The [Settings] menu has facilities for screenshot management, file management, di-
agnostic tests and customizing. See chapter 22.
1.21 User Profiles for Radar, Chart Radar
The [Settings] button lets you store ten sets of custom settings and color settings (ech-
oes, TT and AIS symbols and echo trails). This allows individual users to quickly set
the system according to their preferences.
1.21.1 How to create a profile
1. Set the settings (echoes, TT and AIS symbols, echo trail, etc.) as desired.
2. Click [ ] on the Status bar then click [Manage
Profile].
3. Select a profile number from the “Profile” drop-
down list.
Note: Profiles 06-10 are disabled in the default set-
ting. To enable a disabled profile, select the profile
to enable from the “Profile” drop-down list then un-
check [Disable this profile].
4. Click [Save Current Settings].
1.21.2 How to disable a profile
Select the profile to disable from the “Profile” drop-down list then check [Disable this
profile]. Profile 01 cannot be disabled.
1.21.3 How to activate a profile
1. Click [ ] on the Status bar.
2. Click the profile number to activate. The confir-
mation message "Attention: Settings will be
changed to Profile XX. Do you wish to contin-
ue?" appears.
3. Click [Yes].
[Settings]
button
Profiles
(enabled)

1. OPERATIONAL OVERVIEW
1-32
1.21.4 How to restore a profile to the default settings
1. Click [ ] on the Status bar then click [Manage Profile].
2. Select a profile number from the “Profile” drop-down list.
3. Click [Restore Default Settings]. The confirmation message "Attention: This profile
will be restored to the default. Do you wish to continue?" appears.
4. Click [Yes].
Note: This setting for the default is available when selecting a profile to activate next
time (see paragraph 1.21.3).
1.21.5 How to change the settings on the current display to the rec-
ommended settings
1. Click [ ] on the Status bar.
2. Click [Default Settings]. The confirmation message "Attention: Settings will be
changed to the default. Do you wish to continue?" appears.
3. Click [Yes]. The settings on the following table are changed to the recommended
settings.
Note: This function is not available when using the interswitch function (see
section 2.29).
Items Settings
RAIN, SEA AUTO
GAIN, EAV No change
Automatic Clutter Elimina-
tion (ACE)
OFF
TUNE (other than solid
state radar)
TUNE AUTO
TX CH (for solid state ra-
dar)
No change
RANGE 6 NM, 6 SM, 6 km, 6 kyd
VRM1 0.25 NM, 0.25 SM, 0.25 km, 0.25 kyd
VRM2 OFF (No change)
EBL1 ON (No change)
EBL2 OFF (No change)
Presentation mode North-up TM
Note: Head-up RM with no heading or position data.
Off Center The ship’s position is put beyond 75% of the range scale.
Trail Trail time: 6 min, Trail mode: True-G
Past POSN OFF
Lost TGT OFF
TT ACQ No change
Note: TT OFF with no heading data.
Vector Vector time: 6 min, Vector reference: REL
AZ1, AZ2 (acquisition
zone)
OFF
AIS DISP ALL
Note: FUNC OFF with no heading or position data.
Association TT (>)
CPA/TCPA CPA: 2 NM, TCPA: 12 min
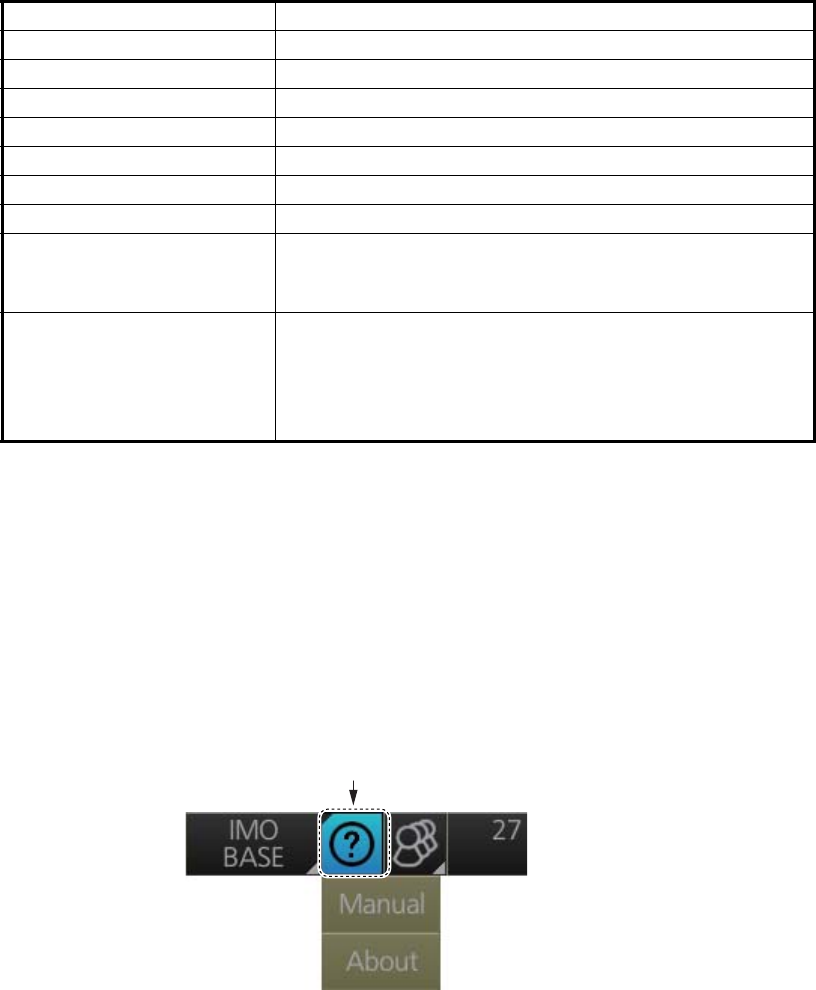
1. OPERATIONAL OVERVIEW
1-33
1.22 How to View Chart Software Version No., Chart
System Information, and Operator's Manual
You can show chart program no., chart system information, and the operator's manual
as follows:
1. Click the [Operating Mode] button at the left end of the Status bar to select [Chart
for Radar].
2. Click the [?] button on the Status bar.
3. Select [Manual] to show the operator's manual, or [About] to show chart and sys-
tem information.
On the [About] screen, click the [Version] tab to show the chart software version no.,
conning software version no., S52 presentation library version, ENC user permit no.,
and C-MAP SDK software version no. Click the [System 1] tab to show system infor-
mation: CPU type, RAM capacity, SSD free/SSD capacity, Equipment ID and dongle
information. [Function] shows the system’s capabilities. Click the [System 2] tab to
show the startup time for this equipment.
AIS CPA AUTO ACT ALL
Operating mode RADAR
MAP (Radar map) No change
Route No change
Alert AZ1/AZ2: OFF, Lost TGT: OFF
Antenna connection status No change
RANGE RING OFF
PI LINE PI1 to PI6: OFF
Number of PI line, mode, bearing range truncate: No
change
SPD (Own Ship Sensor
Setting)
Stabilization Mode: Bottom*
Sensor Type: GPS*
Sensor Setting: No change (System or Local)
*: These settings can not be applied, the settings are
changed according to the priority order of SPD.
Items Settings
[?] button
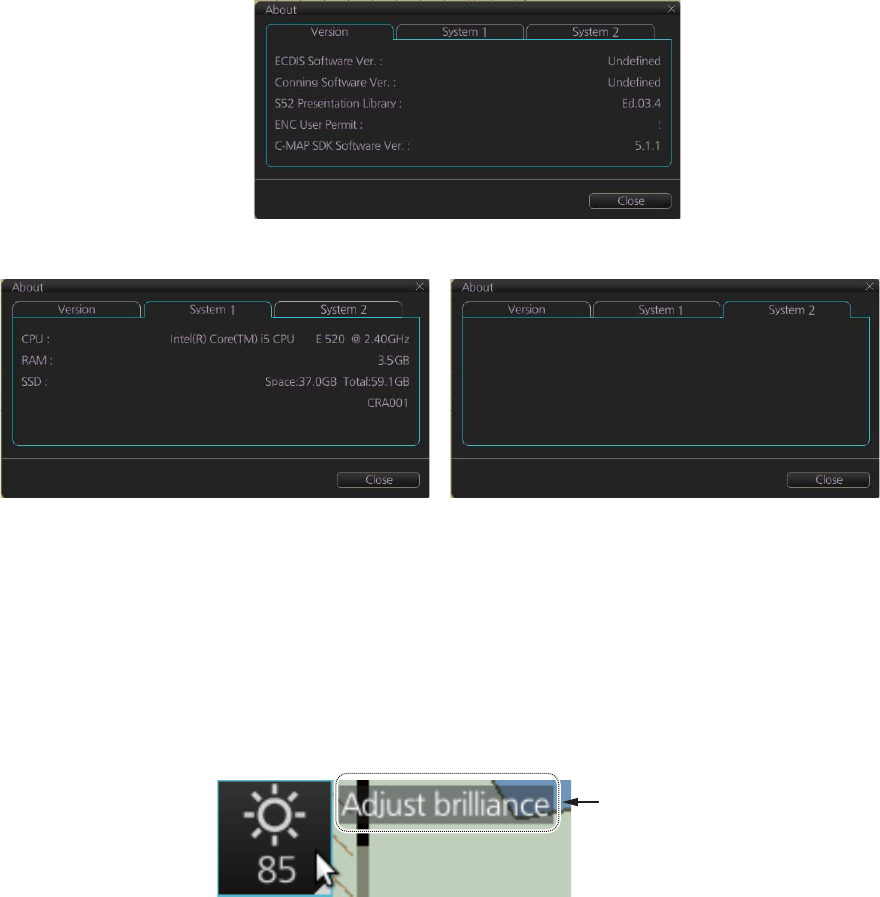
1. OPERATIONAL OVERVIEW
1-34
The information shown in the following illustration may be different from those on your
system.
1.23 Tips (operational guidance)
This chart radar provides operational tips for the display area, InstantAccess bar and
Mark box. To get a tip, simply put the cursor on the object. For example, put the cursor
on the [BRILL] button on the InstantAccess bar. The tip "Adjust brilliance" appears.
If you do not need the tips, you can turn them off with [TIPS GUIDANCE] in the [INI-
TIAL SETTING] menu.
XXXXXXXXXXXXXXXXXXXXXXXXXXXX
[Version] tab
[System 1] tab [System 2] tab
Startup Time : 06 Jan 2014 09:23:20
Equipment ID :
Function : ecdis,radar
Tip
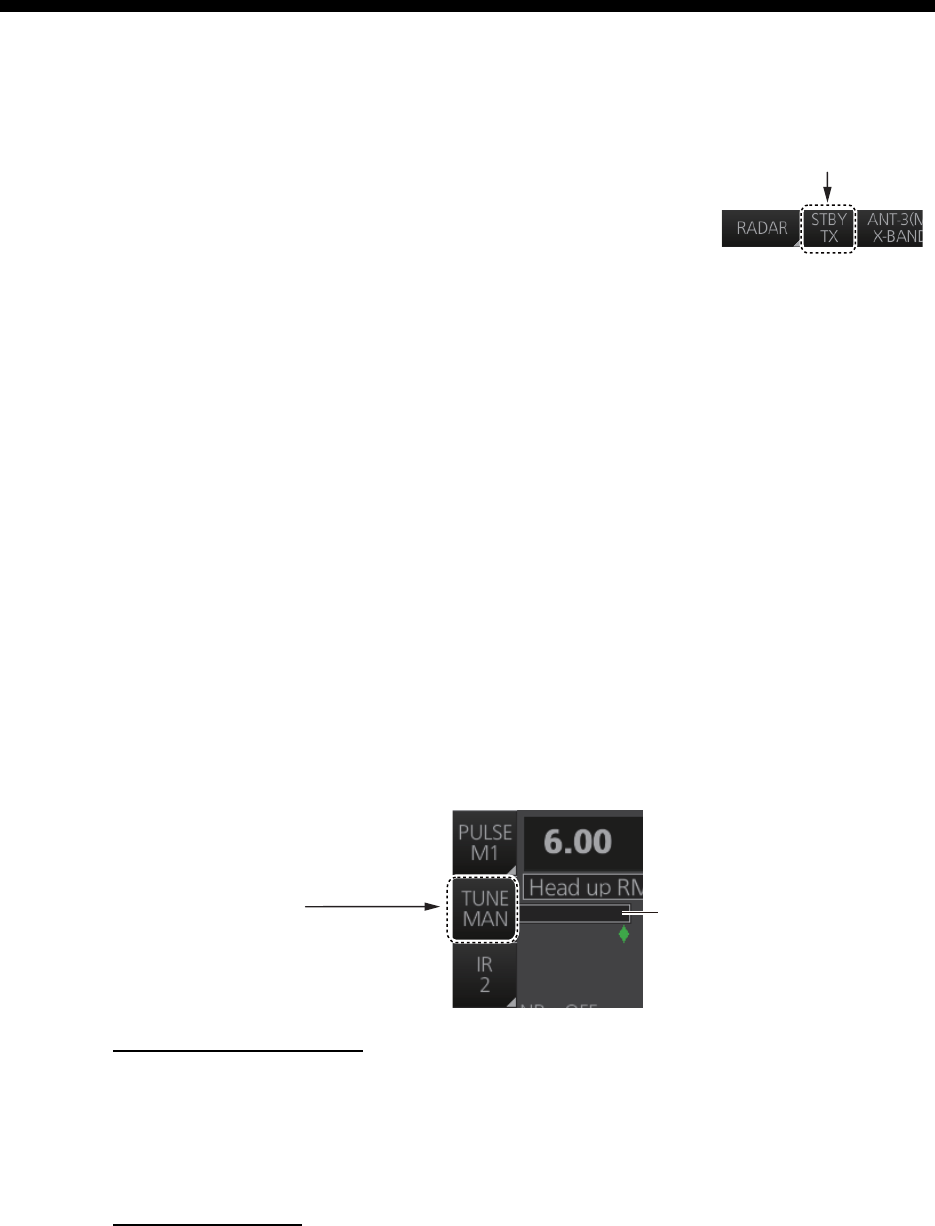
2-1
2. RADAR, CHART RADAR
OPERATION
2.1 How to Transmit
After the power is turned on and the magnetron has
warmed*, "ST-BY" appears at the screen center, meaning
the radar is ready to transmit radar pulses. You can transmit
by pushing the STBY/TX key on the Control Unit, or clicking
the [STBY TX] button on the Status bar.
*: The solid state radar does not have a magnetron, therefore it has no warming peri-
od.
The radar is initially set to previously used range and pulse length. Other settings such
as brilliance levels, VRMs, EBLs and menu option selections are also set to previous
settings.
The STBY/TX key (or [STBY TX] button) toggles the radar between STBY and
TRANSMIT state. The antenna is stopped in stand-by and rotates in transmit. Set the
radar in standby when its use is not required, to conserve the life of the magnetron.
2.2 How to Tune the Radar Receiver
After the radar is transmitting, adjust the receiver to the exact frequency of the trans-
mitter.
2.2.1 Tuning for magnetron radar
How to initialize tuning
Automatic tuning is initialized during the installation. However, if you feel that automat-
ic tuning is not working properly try re-initializing the tuning. Right-click the [TUNE] but-
ton then select [Tune Initialize] to start the initialization. The indication [Tune INI]
appears during initialization.
Automatic tuning
Click the [TUNE] button on the InstantAccess bar to display [TUNE AUTO].
[STBY TX] button
[TUNE] button
TUNE MAN: Manual tuning
TUNE AUTO: Automatic tuning
Tuning bar
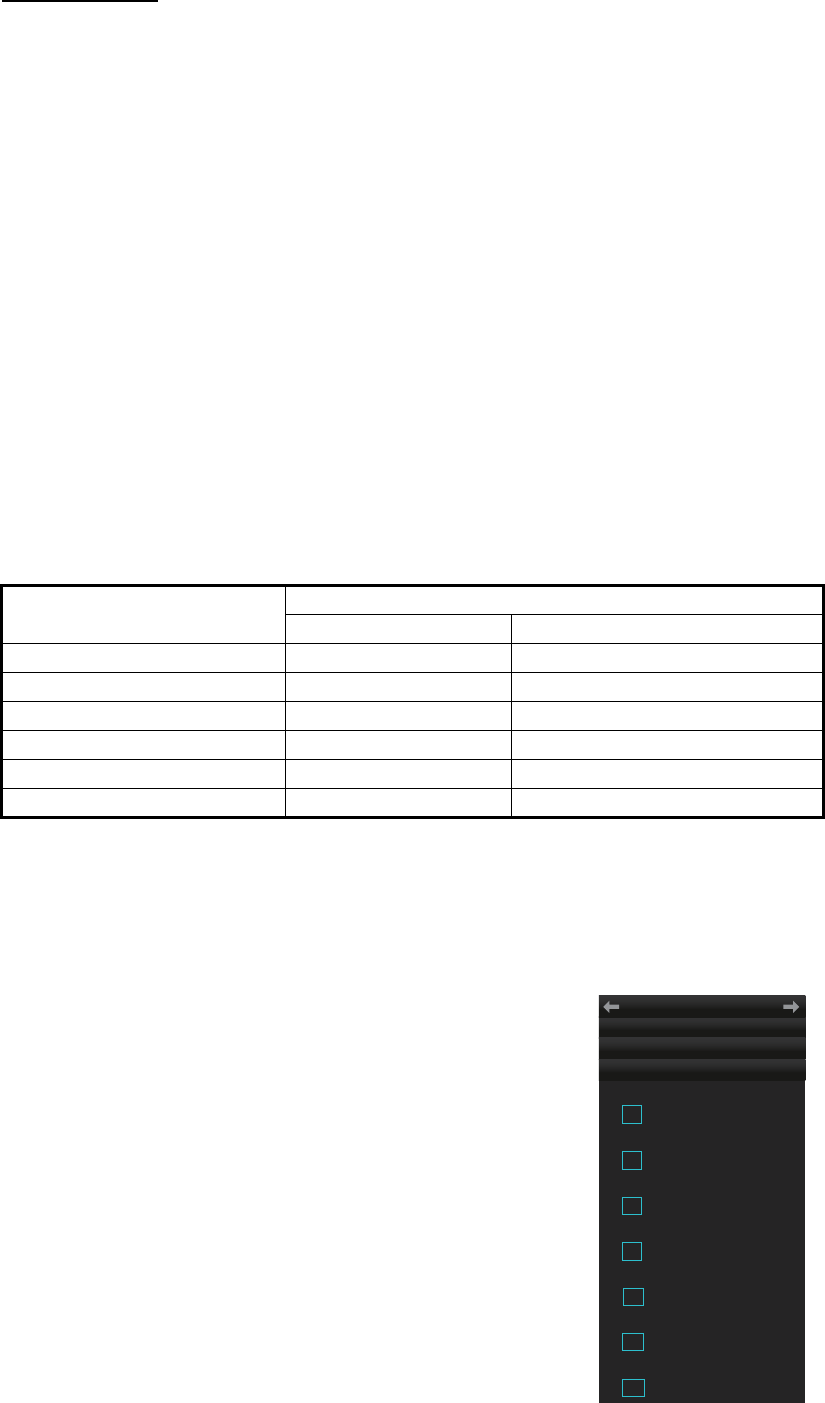
2. RADAR, CHART RADAR OPERATION
2-2
Manual tuning
To tune the radar, start by setting the brilliance to a comfortable level, adjusting the
gain until the background speckle just disappears, and selecting the 48 NM range.
Then, do the following:
1. Select a weak contact somewhere near the edge of the screen and concentrate
on that, while adjusting the gain control in small steps - allowing at least two sec-
onds between each step - until the chosen contact is as big, bright and consistent
as possible.
2. Click the [TUNE] button on the InstantAccess bar to display [TUNE MAN].
3. Put the cursor on the tuning bar.
4. Spin the scrollwheel to tune. The best tuning point is where the bar swings maxi-
mum. The arrow below the bar shows the tuning control position; not the tuning
condition.
2.3 Pulse Length
The pulse length in use is displayed at the top-left position on the screen, using the
indications shown in the table below.
Appropriate pulse lengths are preset to individual range scales and function keys. If
you are not satisfied with the current pulse length settings, you can change them as
shown below.
2.3.1 How to select a pulse length
You can select the pulse length for the 0.5 to 24 NM range
scales as shown below.
1. Open the menu then select [1 ECHO], [1 CUSTOM-
IZE ECHO] and [8 PULSE] menus to show the
[PULSE] menu.
2. Do one of the following:
Control Unit: Press appropriate numeric key to select
corresponding item number.
Trackball module: Click appropriate item.
3. Select desired option by pressing the numeric key
pressed at step 2 or spinning the scrollwheel.
4. To confirm selection, press the ENTER key on the
Control Unit, or push the left button.
Pulse length indication Pulse length (μs)
Magnetron radar Solid state radar (P0N/Q0N)
S1 0.07 0.07/5.0
S2 0.15 0.18/7.5
M1 0.3 0.3/12.5
M2 0.5 0.5/17.5
M3 0.7 0.7/18.3
L 1.2 1.2/18.3
1 0.5NM
S1 / S2
2 0.75NM
S1 / S2 / M1
3 1.5NM
S1 / S2 / M1 / M2
4 3NM
S2 / M1 / M2 / M3
5 6NM
M1 / M2 / M3 / L
6 12NM
M1 / M2 / M3 / L
7 24NM
M2 / M3 / L
ECHO
CUSTOMIZE ECHO
← PULSE
MENU
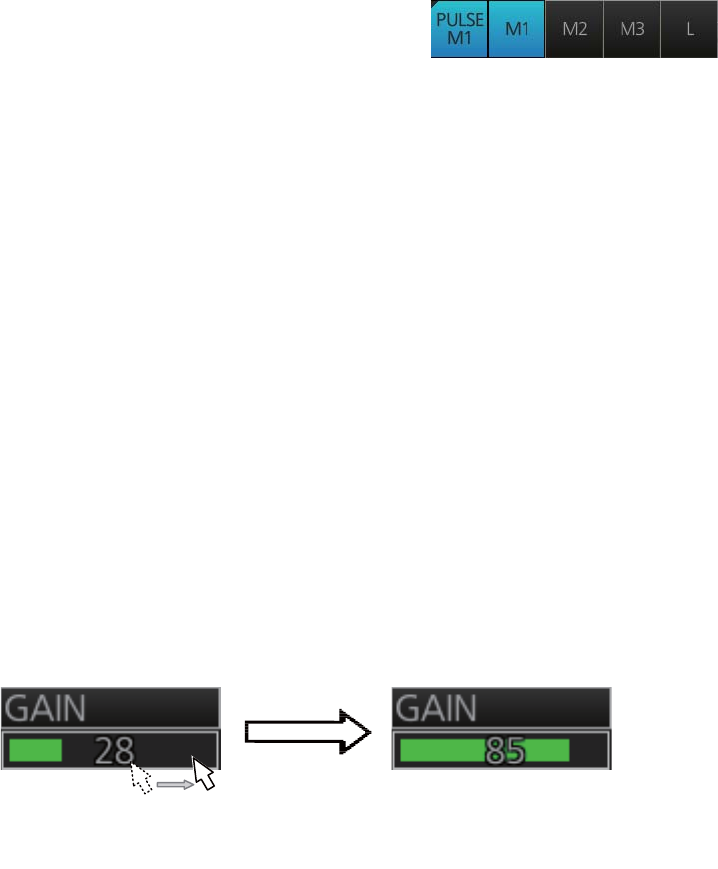
2. RADAR, CHART RADAR OPERATION
2-3
2.3.2 How to change the pulse length
1. Click the [Pulse] button at the top of the
InstantAccess bar.
2. Click a pulse length.
2.4 How to Adjust the Sensitivity
The GAIN control (or [Gain] button) adjusts the sensitivity of the receiver. The proper
setting is such that the background noise is just visible on the screen. If you set up for
too little sensitivity, weak echoes may be missed. On the other hand excessive sensi-
tivity yields too much background noise; strong targets may be missed because of the
poor contrast between desired echoes and the background noise on the screen.
Adjust the gain so background noise is just visible on the screen.
Note: For adjustment of gain when the Automatic Clutter Elimination (ACE) function
is ON, see paragraph 2.10.2.
To adjust the sensitivity, do one of the following:
Control Unit: While monitoring the radar image and the gain slider bar, operate the
GAIN control to adjust the sensitivity.
Trackball module: For coarse adjustment, put the cursor within the slider bar area
then push the left button. For fine adjustment, put the cursor at the end of the slider
bar then roll the trackball while pushing and holding down the left button. Release the
button to finish.
2.5 How to Suppress Sea Clutter
Echoes from waves cover the central part of the display with random signals known
as sea clutter. The higher the waves, and the higher the antenna above the water, the
further the clutter will extend. When sea clutter masks the picture, suppress it with the
A/C SEA control (or [SEA] on the Status bar), either manually or automatically.
When both sea clutter and rain clutter are reduced, the sensitivity is decreased more
than when only one is adjusted. For that reason adjust them carefully.
The echo average (see section 2.9) is useful for reducing reflections from the sea sur-
face. However, high-speed targets are harder to detect than stationary ones when the
echo average is active.
Put cursor on slider bar and push and
hold left button. Drag cursor to new
location then release left button.
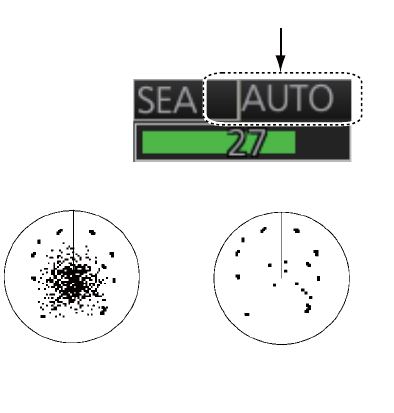
2. RADAR, CHART RADAR OPERATION
2-4
2.5.1 How to reduce sea clutter automatically
Auto A/C SEA allows for fine-tuning of the A/C SEA circuit, within ±20 dB. Lower the
auto A/C SEA level because the average value of the original input echo is low in ar-
eas where there are no see surface reflections. For example, when the ship is along-
side a quay and the radar picture shows echoes from both land and sea, you can
observe the size of echoes because the STC curve is different depending size of ech-
oes.
To get automatic adjustment of sea clutter, do one of the following:
Control Unit: Push the A/C SEA control to display [AU-
TO] on the SEA mode indication on the Status bar.
Trackball module: Click the SEA mode indication on
the Status bar to display [AUTO].
2.5.2 How to reduce sea clutter manually
The A/C SEA control reduces the ampli-
fication of echoes at short ranges (where
clutter is the greatest) and progressively
increases amplification as the range in-
creases, so amplification will be normal
at those ranges where there is no sea
clutter.
The proper setting of the A/C SEA
should be such that the clutter is broken up into small dots, and small targets become
distinguishable. If the setting is set too low, targets will be hidden in the clutter, while
if the setting is too high, both sea clutter and targets will disappear from the display. In
most cases adjust the control until clutter has disappeared to leeward, but a little is still
visible windward.
Be careful not to remove all sea clutter, because you may erase weak echoes. Fur-
ther, the possibility of losing weak echoes is greater when you use both A/C SEA and
A/C RAIN to reduce clutter.
To reduce sea clutter manually, do one of the following:
Control Unit: Push the A/C SEA control to display [MAN] on the SEA mode indication
on the Status bar. Rotate the A/C SEA control to adjust the sea clutter.
Trackball module: Click the SEA mode indication on the Status bar to display [MAN].
For coarse adjustment, put the cursor within the slider bar area then push the left but-
ton. For fine adjustment, put the cursor at the end of the slider bar then roll the trackball
while pushing and holding down the left button. Release the button to finish.
SEA mode indication
Sea clutter at
screen center
A/C SEA adjusted; sea
clutter suppressed
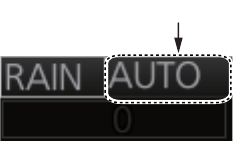
2. RADAR, CHART RADAR OPERATION
2-5
2.6 How to Suppress Rain Clutter
The vertical beam width of the antenna is designed to see surface targets even when
the ship is rolling. However, by this design the unit will also detect rain clutter (rain,
snow, or hail) in the same manner as normal targets.
The A/C RAIN control adjusts the receiver sensitivity as the A/C SEA control does but
rather in a longer time period (longer range). The higher the setting, the greater the
anti-clutter effect. When echoes from precipitation mask solid targets, adjust the A/C
RAIN control to split up these unwanted echoes into a speckled pattern, making rec-
ognition of solid targets easier.
Be careful not to remove all rain clutter, because you can erase weak echoes. Further,
the possibility of losing weak echoes is greater when you use both A/C RAIN and A/C
SEA to reduce clutter.
When both sea clutter and rain clutter are reduced the sensitivity is decreased more
than when only one is adjusted. For that reason adjust them carefully.
The echo average (see section 2.9) is useful for reducing reflections from the sea sur-
face. However, high-speed targets are harder to detect than stationary ones when the
echo average is active.
2.6.1 How to reduce rain clutter automatically
Control Unit: Push the A/C RAIN control to display [AU-
TO] on the RAIN mode indication on the Status bar.
Trackball module: Click the RAIN mode indication on
the Status bar to display [AUTO].
RAIN mode indication
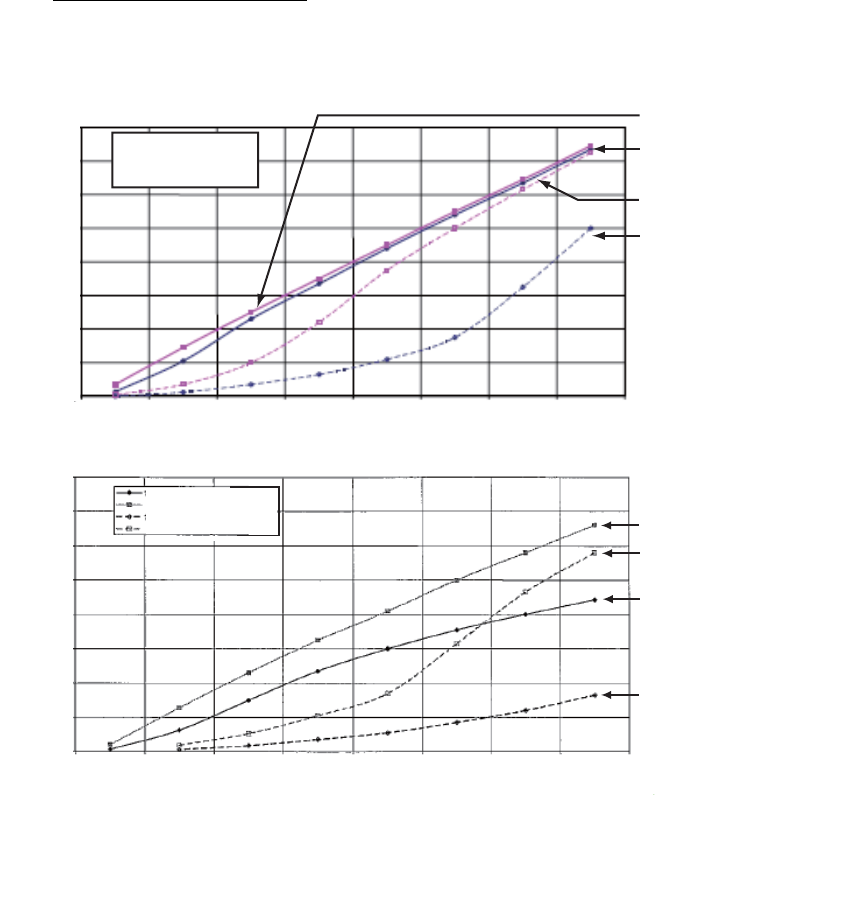
2. RADAR, CHART RADAR OPERATION
2-6
2.6.2 How to reduce rain clutter manually
Control Unit: Push the A/C RAIN control to display [MAN] on the RAIN mode indica-
tion on the Status bar. While watching the radar picture, adjust the A/C RAIN control
to reduce the clutter.
Trackball module: Click the RAIN mode indication on the Status bar to show [MAN].
For coarse adjustment, put the cursor within the slider bar area then push the left but-
ton. For fine adjustment, put the cursor at the end of the slider bar then roll the trackball
while pushing and holding down the left button. Release the button to finish.
Note: The detection range is reduced when the RAIN is used to show targets in rain.
Generally, the amount of rain, TX pulse length and TX frequency are factors in deter-
mining how the detection range is affected. The figures shown below illustrate this oc-
currence.
How to interpret the graph
Using the X-band graph as an example, a radar target originally detected on the 8 NM
range can only be detected in rain at ranges shown below:
Accordingly the short pulse may be preferable in rain on ranges < 10NM.
Reduction of range of first detection (NM)
16 mm/h rain - short pulse
4 mm/h rain - short pulse
16 mm/h rain - long pulse
4 mm/h rain - long pulse
14
16
12
10
8
6
4
2
0
0 2 4 6 8 10 12 14 16
16
12
10
8
6
4
2
0
14
0 2 4 6 8 10 12 14 16
4 mm/h rain (short pulse)
16 mm/h rain (short pulse)
4 mm/h rain (long pulse)
16 mm/h rain (long pulse)
4 mm/h rain (short pulse)
16 mm/h rain (short pulse)
4 mm/h rain (long pulse)
16 mm/h rain (long pulse)
Original range of first detection (NM)
Original range of first detection (NM)
16 mm/h rain - short pulse
4 mm/h rain - short pulse
16 mm/h rain - long pulse
4 mm/h rain - long pulse
16 mm/h rain - short pulse
4 mm/h rain - short pulse
16 mm/h rain - long pulse
4 mm/h rain - long pulse
Reduction of rain to first detection due to rain at S-band
Reduction of rain to first detection due to rain at X-band
The author thanks the International Electrotechnical Commission (IEC) for permission to reproduce Information from its Interantional
Standard IEC 62388 ed.1.0 (2007). All such extracts are copyright of IEC, Geneva, Switzerland. All rights reserved. Further
information on the IEC is available from www.iec.ch. IEC has no responsibility for the placement and context in which the extracts
and contents are reproduced by the author, or is IC in any way responsible for the other content or accuracy therein.
Reduction of Range of First Detection (NM)Reduction of Range of First Detection (NM)
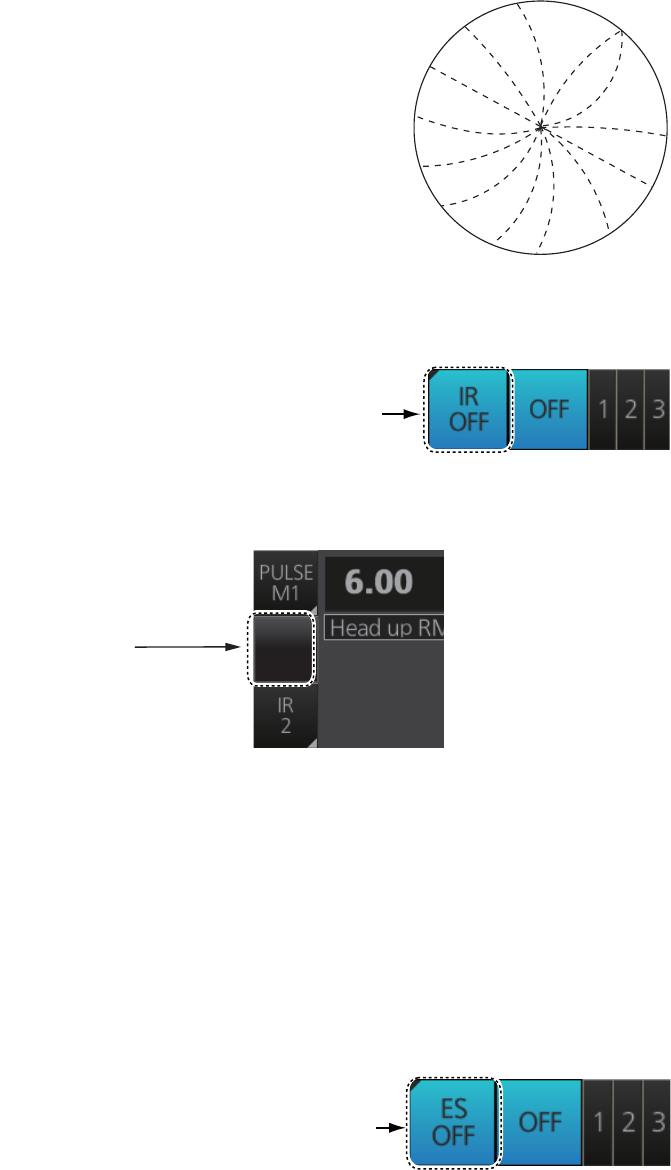
2. RADAR, CHART RADAR OPERATION
2-7
2.7 Interference Rejector
Mutual radar interference may occur in the vicinity of an-
other shipborne radar operating in the same frequency
band. It is seen on the screen as a number of bright
spikes either in irregular patterns or in the form of usual-
ly curved spoke-like dotted lines extending from the cen-
ter to the edge of the picture. Activating the interference
rejector circuit can reduce this type of interference.
The interference rejector is a kind of signal correlation
circuit. It compares the received signals over successive
transmissions and reduces randomly occurring signals.
There are three levels of interference rejection depending on the number of transmis-
sions that are correlated.
Click the [IR] button on the InstantAccess bar
then click desired rejection level. The higher the
number the greater the degree of interference re-
jection.
For solid state radar: When there are a lot of interference, switch the [TX CH]. Click
the [TX CH] button on the InstantAccess bar then click [1] or [2].
2.8 Echo Stretch
The echo stretch feature enlarges targets in the range and bearing directions to make
them easier to see, and it is available on any range. There are three levels of echo
stretch, 1, 2 and 3. The higher the number the greater the amount of stretching.
The echo stretch magnifies not only small target pips but also returns from the sea sur-
face, rain and radar interference. For this reason, suppress those types of interference
before activating the echo stretch.
Click the [ES] button on the InstantAccess
bar then click desired echo stretch level.
[IR]
button
[TX CH] button
([TX CH 1] or [TX CH 2])
TX CH
1
[ES] button
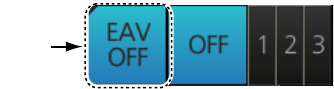
2. RADAR, CHART RADAR OPERATION
2-8
2.9 Echo Averaging
The echo averaging feature, which requires heading, position and speed data, effec-
tively reduces sea clutter. Echoes received from stable targets such as ships appear
on the screen at almost the same position every rotation of the antenna. On the other
hand, unstable echoes such as sea clutter appear at random positions.
To distinguish real target echoes from sea clutter, echoes are averaged over succes-
sive picture frames. If an echo is solid and stable over successive frames, it is present-
ed in its normal intensity. Sea clutter is averaged over successive scans and its
brilliance reduced, making it easier to discriminate real targets from sea clutter.
Echo averaging uses scan-to-scan signal correlation technique based on the true mo-
tion over the ground of each target. Thus, small stationary targets such as buoys will
be shown while reducing random echoes such as sea clutter. True echo averaging is
not however effective for picking up small targets running at high speeds over the
ground.
Note 1: With echo average active it is harder to detect high-speed targets than sta-
tionary ones.
Note 2: Do not use echo averaging under heavy pitching and rolling; loss of targets
can result.
Note 3: When the heading sensor signal is lost, [EAV] is turned OFF and the indication
is grayed out.
Before using the echo averaging function, reduce sea clutter with the A/C SEA control.
Leave a little sea clutter on the screen so as not to erase weak targets. Then, do as
follows:
Click the [EAV] button on the InstantAccess bar
then click desired setting.
OFF: Echo averaging is OFF.
1, 2: Detects targets hidden in sea clutter. "2" is
more effective than "1" in detecting targets hidden in strong sea clutter. However, "1"
is more effective than "2" in displaying high-speed targets. Select the setting best suit-
ed to your objective.
3: Stably displays unstable targets; distinguishes high-speed craft from sea clutter.
When the Automatic Clutter Elimination (ACE) function is ON (see section 2.10), the
indication for the EAV button is grayed out.
Note: When [PERFORMANCE MON] (see section 2.31) or [SART] (see section 2.36)
is ON, [EAV] is OFF and the indication is grayed out.
[EAV]
button
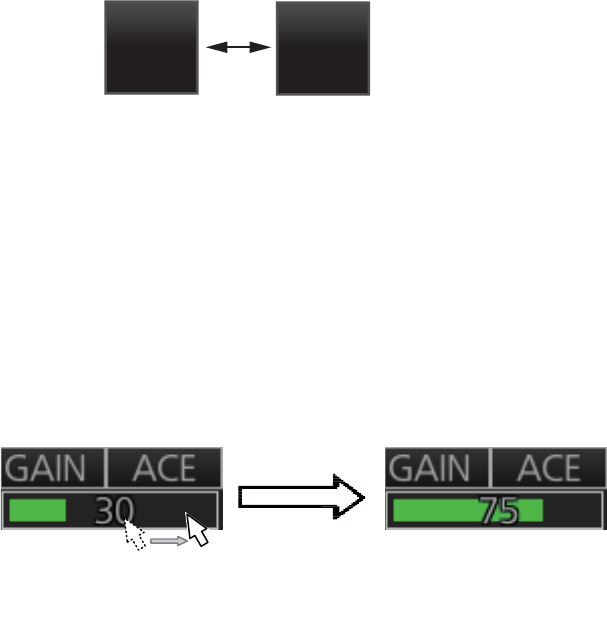
2. RADAR, CHART RADAR OPERATION
2-9
2.10 Automatic Clutter Elimination (ACE) Function
This radar has the Automatic Clutter Elimination (ACE) function. This function detects
sea and rain clutter from received echoes’ range and bearing trend and automatically
reduces sea and rain clutter according to the Automatic Clutter Elimination (ACE)
threshold setting.
Note: Use this function with caution. Weak target echoes may disappear from the
screen.
2.10.1 How to turn the Automatic Clutter Elimination (ACE) function
on/off
Click the [ACE] button on the InstantAccess bar to turn the Automatic Clutter Elimina-
tion (ACE) function on or off. When the Automatic Clutter Elimination (ACE) function
is [ON], the indications for [RAIN] and [SEA] on the Status bar are grayed out.
Note: When [PERFORMANCE MON] (see section 2.31) or [SART] (see section 2.36)
is ON, [ACE] is OFF and the indication is grayed out.
2.10.2 How to adjust the gain in the Automatic Clutter Elimination
(ACE) mode
Control Unit: Rotate the GAIN control to adjust the sensitivity.
Trackball module: For coarse adjustment, put the cursor within the slider bar area on
the Status bar then push the left button. For fine adjustment, put the cursor at the end
of the slider bar then roll the trackball while pushing and holding down the left button.
Release the button to finish.
ON OFF
ACE ACE
Put cursor on slider bar and push and
hold left button. Drag cursor to new
location then release left button.
2. RADAR, CHART RADAR OPERATION
2-10
2.10.3 Automatic Clutter Elimination (ACE) menu
Open the menu then select the [ECHO] and [ACE] menus to show the [ACE] menu.
2.10.4 How to get the high sensitivity
When Automatic Clutter Elimination (ACE) function is [ON], the high sensitivity mode
operates while pushing the GAIN control. You can select the level for the high sensi-
tivity mode as follows:
1. Open the menu then select [1 ECHO].
2. Select [0 ACE] (B type) or [9 ACE] (IMO and A types), and [2 SIGNAL ENHANCE-
MENT].
3. Select the level from [1], [2] or [3].
4. Close the menu.
2.10.5 How to suppress the false echoes
The echo signals can appear on the screen at positions where there is no target or
disappear when there are targets (see paragraph 2.42.2). You can suppress the false
echoes.
1. Open the menu then select [1 ECHO].
2. Select [0 ACE] (B type) or [9 ACE] (IMO and A types), and [3 SUPPRESS SEC-
TOR].
3. Select [START] then set the start angle from which you can suppress the false
echoes.
4. Select [ANGLE] then set the angle range to which you can suppress the false ech-
oes.
5. Close the menu.
• [ADJUST]: No use.
• [SIGNAL ENHANCEMENT]: Set the level for the high sensitivity
mode (see paragraph 2.10.4).
• [SUPPRESS SECTOR]: Set the angular range for suppression
of false echoes (see paragraph 2.10.5).
1 ADJUST
OFF / ON
2 SIGNAL ENHANCEMENT
2
3 SUPPRESS SECTOR
START
0°
ANGLE
0°
ECHO
← ACE
MENU
OFF / ON
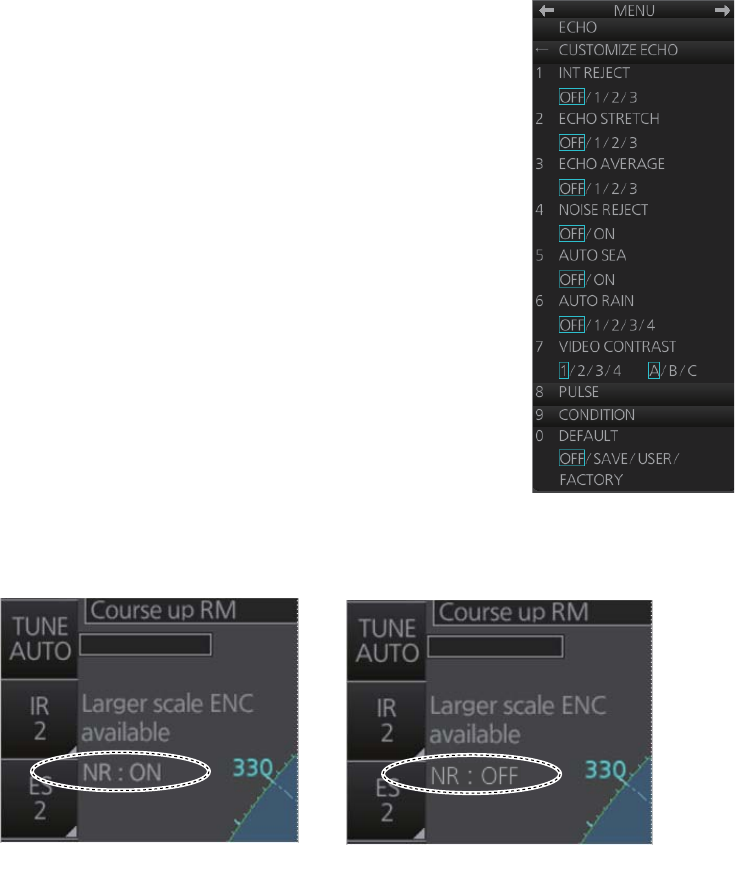
2. RADAR, CHART RADAR OPERATION
2-11
2.11 Noise Rejector
White noise may show itself on the screen as random "speckles" spread over the en-
tire radar image. This equipment reduces the white noise then improves the on-screen
S/N ratio by processing the weighted moving average filter for the received echoes in
the range direction.
Note: Use this function with caution. Weak target echoes may disappear from the
screen or the range resolution may worsen.
You can remove this noise as follows:
1. Open the menu then select [1 ECHO].
2. Select [1 CUSTOMIZE ECHO] menus to show the
[CUSTOMIZE ECHO] menu.
3. Select [4 NOISE REJECT].
4. Select [OFF] or [ON] as appropriate.
5. Close the menu.
The status of the noise rejector is indicated at the top-left position, [NR: ON] or [NR:
OFF].
Noise Rejector ON Noise Rejector OFF

2. RADAR, CHART RADAR OPERATION
2-12
2.12 Wiper
The wiper feature automatically reduces the brilliance of unwanted weak echoes, such
as noise, sea clutter and rain clutter, to clear the picture. There are two wiper settings,
1 and 2. The difference between 1 and 2 is that the brilliance is lowered more slowly
in 2.
To use the wiper feature, do the following:
1. Open the menu then select [1 ECHO].
2. Select [8 WIPER] (B type) or [7 WIPER] (IMO and A types).
3. Select [OFF], [1] or [2] as appropriate.
4. Close the menu.
2.13 How to Preset Controls for Specific Navigation
Purpose
Every time your navigating environment or task changes, you must adjust the radar,
which can be a nuisance in a busy situation. Instead of changing radar settings case
by case, it is possible to assign the function keys to provide optimum settings for often-
encountered situations.
The radar's internal computer offers several picture preset options to be assigned to
each function key for your specific navigating requirements. For instance, one of the
presets is labelled [HARD RAIN], and is designed to be used in heavy rain.
Two user-programmable presets are also provided (labeled [CUSTOM1],
[CUSTOM2]), so that you can have the radar automatically adjusted to those condi-
tions that are not covered by the provided setup options.
Below are the preset options provided with this radar.
Each picture option defines a combination of several radar settings for achieving op-
timum setup for a particular navigating situation. These include interference rejector,
echo stretch, echo average, noise rejector, automatic anti-sea and anti-rain clutters,
video contrast, pulse length and sea and radar conditions.
Adjusting these features from the [CUSTOMIZE ECHO] menu changes the original
function key settings. To restore the original settings for a particular customize option,
it is necessary to select the default setting. For this reason, we recommended that you
Label Description Label Description
OCEAN Optimum setting for long
range detection, on a range
scale of 6 NM or larger.
ROUGH SEA Optimum setting for operation
in rough seas.
CANAL Optimum setting for operating
in a canal.
HARD RAIN Optimum setting for rough
weather or heavy rain.
BERTHING Optimum setting when
berthing.
CUSTOM1 User-defined custom
settings.
CONGESTION Optimum setting for short
range navigation (for exam-
ple, a harbor) using a range
scale of 1.5 NM or less.
CUSTOM2 User-defined custom
settings.
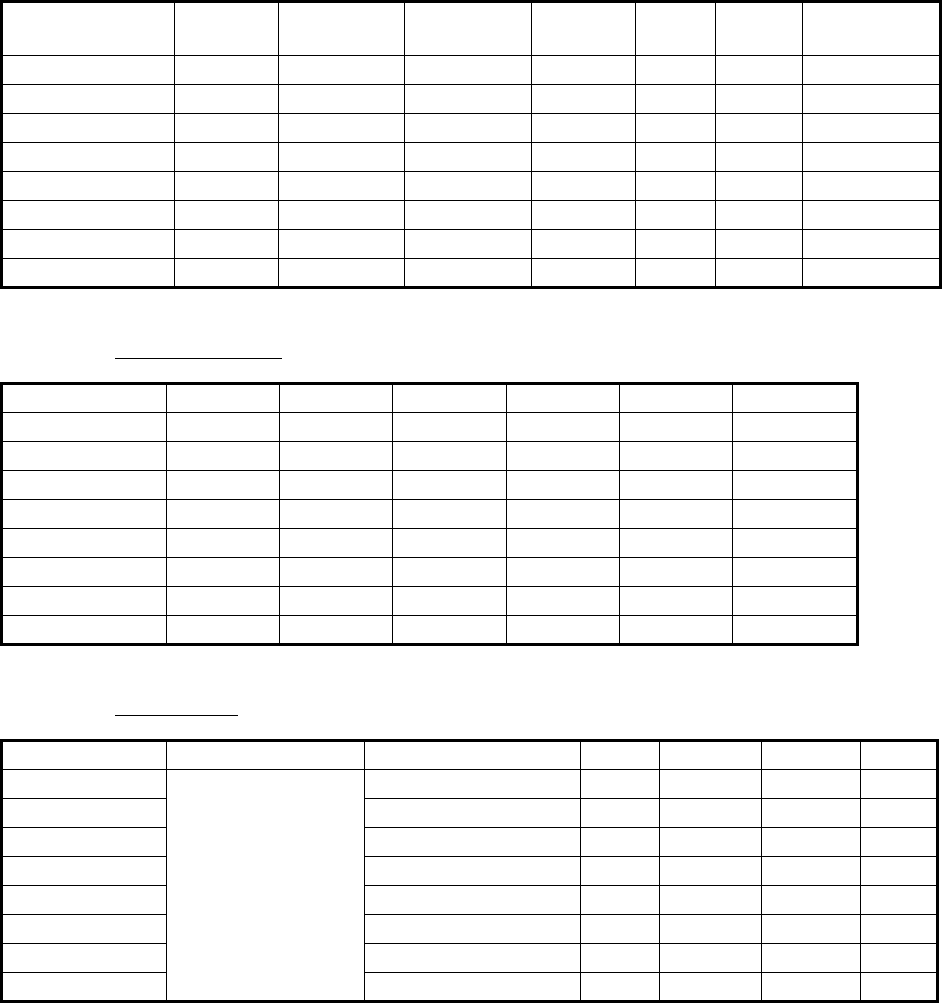
2. RADAR, CHART RADAR OPERATION
2-13
use the user-programmable presets ([CUSTOM1] or [CUSTOM2]) when frequent ad-
justment of the radar image is necessary.
*: Manual
PULSE LENGTH
*: S2 for solid state radar.
CONDITION
INT
REJECT
ECHO
STRETCH
ECHO
AVERAGE
NOISE
REJECT
AUTO
SEA
AUTO
RAIN
VIDEO
CONTRAST
OCEAN 2 2 3 ON OFF* OFF* 3-B
CANAL 2 OFF OFF OFF OFF* OFF* 2-B
BERTHING 2 OFF OFF OFF OFF* OFF* 2-B
CONGESTION 2 OFF 2 OFF OFF* OFF* 1-B
ROUGH SEA 2 OFF 2 OFF OFF* OFF* 2-A
HARD RAIN 2 OFF OFF OFF OFF* ON 2-A
CUSTOM1 2 OFF OFF OFF OFF* OFF* 1-B
CUSTOM2 2 2 1 OFF OFF* OFF* 2-B
0.5 NM 0.75 NM 1.5 NM 3 NM 6 NM 12, 24 NM
OCEAN S2 M1* M1 M3 L L
CANAL S1 S2 M1 M2 M3 L
BERTHING S1 S1 S2 M1 M3 L
CONGESTION S1 S2 S2 M1 M2 L
ROUGH SEA S1 S1 S2 M1 M2 M3
HARD RAIN S1 S2 S2 M1 M2 L
CUSTOM1 S1 S2 S2 M1 M1 L
CUSTOM2 S2 S2 M1 M2 M3 L
STC ANT HEIGHT LOW LEVEL ECHO GAIN SEA RAIN ACE
OCEAN Set at installation 0 80 MAN-30 MAN-0 OFF
CANAL 0 80 MAN-30 MAN-0 OFF
BERTHING 0 80 MAN-30 MAN-0 OFF
CONGESTION 0 80 MAN-30 MAN-0 OFF
ROUGH SEA 0 80 MAN-60 MAN-0 OFF
HARD RAIN 0 80 MAN-60 MAN-0 OFF
CUSTOM1 0 80 MAN-30 MAN-0 OFF
CUSTOM2 0 80 MAN-30 MAN-0 OFF
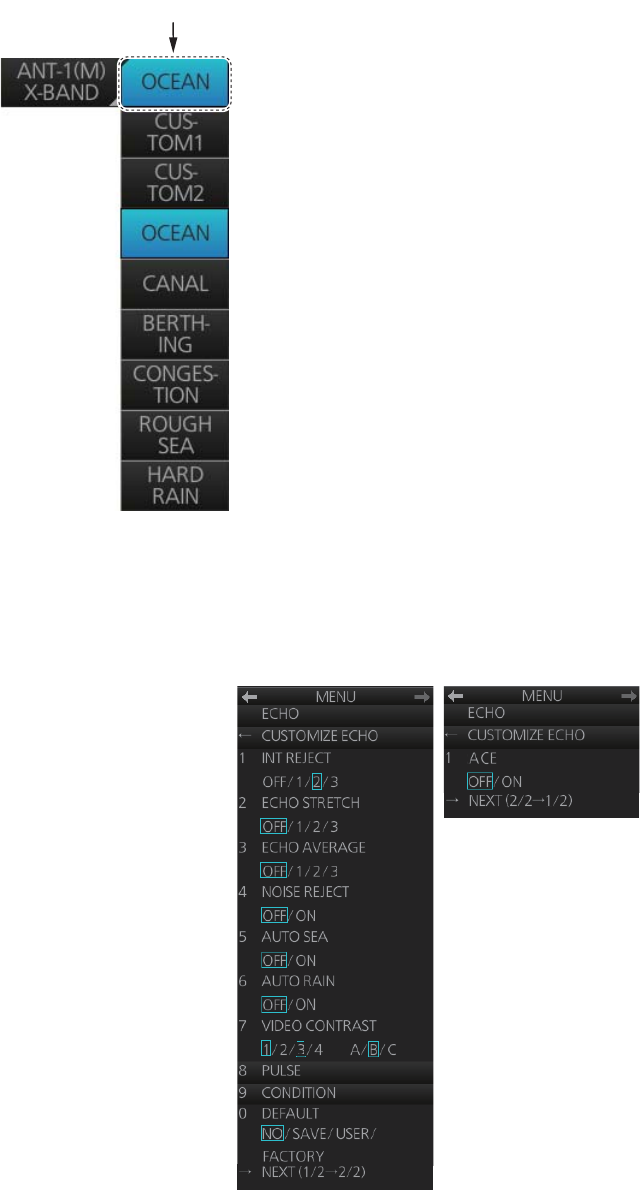
2. RADAR, CHART RADAR OPERATION
2-14
2.13.1 How to select a customized echo
Click the [Customize Echo] button on the Status bar to select a customize echo option
from the drop-down list.
2.13.2 How to edit a customized echo
You can edit a customized echo as below.
1. Select a customize echo option to edit (see paragraph 2.13.1).
2. Right-click the [Customize Echo]
button on the Status bar then click
[Customize Echo Menu].
3. Set the items below referring to the
sections shown.
[INT REJECT]: section 2.7
[ECHO STRETCH]: section 2.8
[ECHO AVERAGE]: section 2.9
[NOISE REJECT]: section 2.11
[AUTO SEA]: section 2.5
[AUTO RAIN]: section 2.6
[PULSE]: section 2.3
[ACE]: section 2.10
4. Click [7 VIDEO CONTRAST].
Click to show
drop-down list.
[Customize Echo] button
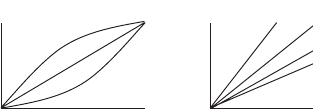
2. RADAR, CHART RADAR OPERATION
2-15
5. Spin the scrollwheel to select 1, 2, 3 or 4 (Dynamic Range) or A, B, C (Curve) as
appropriate then push the left button. Refer to the description and illustration be-
low.
1-4: Control dynamic range. 1 provides the widest dynamic range; 4 is the narrow-
est dynamic range.
A: The mid-level in the curve is low, so this setting is suitable for suppressing rain
clutter.
B: Curve between A and C.
C: The mid-level in the curve is high, so this setting is suitable for detecting distant
targets.
6. Click [9 CONDITION].
7. Click [1 STC ANT HEIGHT].
8. Spin the scrollwheel to select appropriate radar antenna height (above the water-
line) then push the left button.
9. If necessary, select [2 LOW LEVEL ECHO] to reject low level echoes. The setting
range is 0-8. The higher the figure, the stronger the low level echo that is erased.
10. To save the custom settings, select [SAVE] from [0 DEFAULT].
2.13.3 How to restore a user customized echo to the saved settings
If you get lost in operation while adjusting the settings for a user customized echo, you
can easily restore the settings for that user customized echo saved at
paragraph 2.13.2).
1. Right-click the [Customize Echo] button on the Status bar then click [Customize
Echo Menu].
2. Click [0 DEFAULT].
3. Select [USER].
2.13.4 How to restore a user customized echo to the factory default
settings
You can erase a customized echo options to restore its factory default options (see
the tables on pages 2-12 and 2-13).
1. Click the [Customize Echo] button on the Status bar to select [CUSTOM1] or
[CUSTOM2] for which you want to restore its factory default settings.
2. Right-click the [Customize Echo] button on the Status bar then click [Customize
Echo Menu].
3. Click [0 DEFAULT].
4. Select [FACTORY].
CONTRAST
CB
A
CONTRAST
321
4
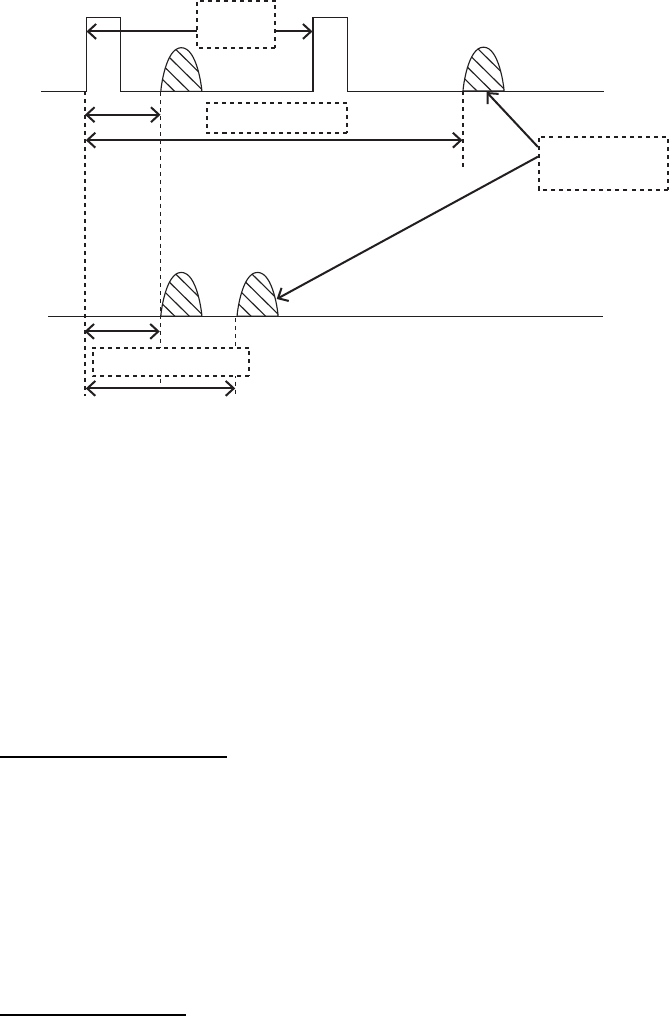
2. RADAR, CHART RADAR OPERATION
2-16
2.14 How to Suppress Second-trace Echoes
In certain situations, echoes from very far distance targets may appear as false ech-
oes (second-trace echoes) on the screen. This occurs when the return echo is re-
ceived one transmission cycle later, or after a next radar pulse has been transmitted.
This equipment lengthens the pulse repetition period to reject the false echoes.
Note: This function decreases the number of echoes hits. Carefully use this function
so that the possibility of detecting small targets and high-speed craft does not lessen.
To reject second-trace echoes, open the [1 ECHO] menu then set [5 2ND ECHO REJ]
(B type) or [4 2ND ECHO REJ] (IMO and A types) to [ON] then close the menu.
2.15 Presentation Modes
This radar has the following presentation modes in the radar mode:
Relative Motion (RM)
Head-up: Unstabilized.
STAB Head-up: Head-up with compass-stabilized bearing scale (True Bearing)
where the bearing scale rotates with the compass reading.
Course-up: Compass-stabilized relative to ship's orientation at the time of selecting
course-up.
North-up: Compass-stabilized with reference to North.
Stern-up: Unstabilized.
True Motion (TM)
North-up: Ground- or sea-stabilized with compass and speed inputs.
Pulse
interval
Actual ranges
Second-trace
echo
Measured ranges
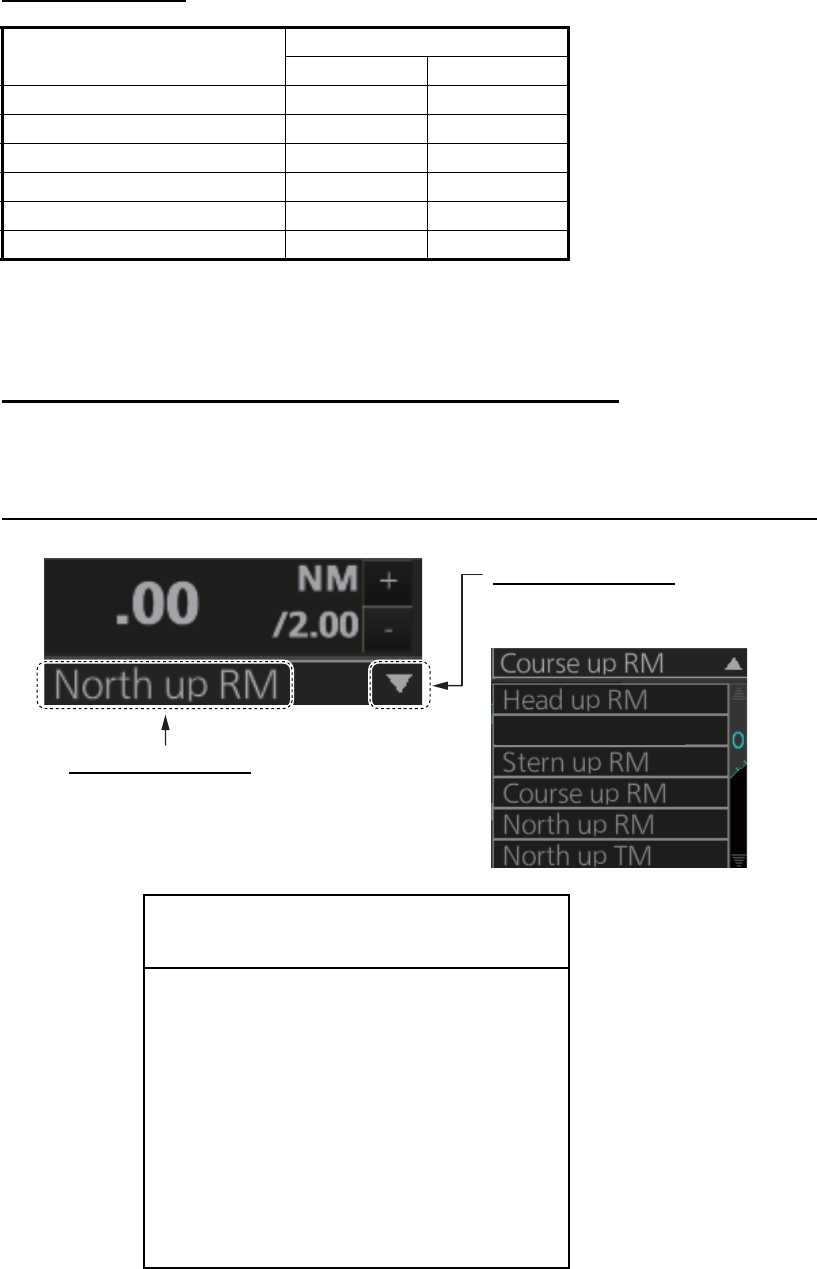
2. RADAR, CHART RADAR OPERATION
2-17
Mode availability
*: Not available with IMO or A type.
2.15.1 How to select a presentation mode
How to select a presentation mode from the Control Unit
Push the MODE key consecutively to select radar presentation mode desired. The
Range/Presentation mode box shows the current presentation mode.
How to select a presentation mode from the Range/Presentation mode box
Presentation mode Availability
Radar Chart radar
Course-up RM Yes Yes
Head-up RM Yes No
STAB Head-up RM Yes No
North-up RM Yes Yes
North-up TM Yes Yes
Stern-up RM* Yes No
IMPORTANT
Loss of gyrocompass signal
When the gyrocompass signal is lost, the Alert
“Gyro xxx COM1 Error” (xxx=a number be-
tween 250 and 259 according to gyro no.) ap-
pears in the [Alert] box. After all signals are lost,
the Alert 450 “Heading Sensor Not Available”
appears, the presentation mode becomes
head-up and all TT and AIS are erased. Check
the gyrocompass and select the presentation
mode with the MODE key or the Range/Pre-
sentation mode box.
Selection method 1
Click indication to select mode.
Selection method 2
Click to show drop-down list.
Click desired mode on list.
STAB H UP RM
6
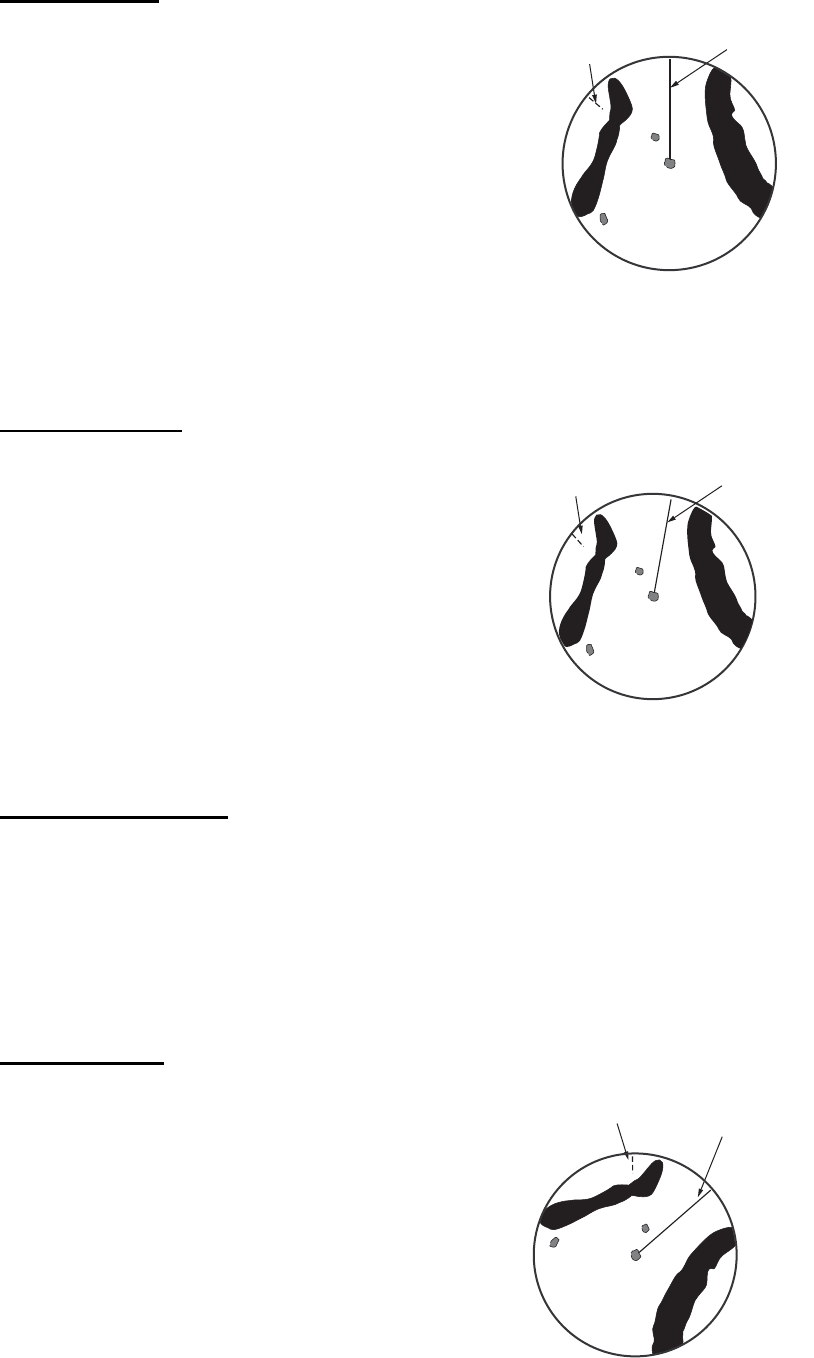
2. RADAR, CHART RADAR OPERATION
2-18
2.15.2 Description of presentation modes
Head-up mode
The head-up mode is a display in which the line
connecting own ship and the top of the display in-
dicates own ship's heading.
The target pips are painted at their measured dis-
tances and in their directions relative to own ship's
heading.
The short line on the bearing scale is the north
marker, which indicates heading sensor north. A
failure of all the heading sensor inputs will cause
the heading readout to disappear, and the Alert 450 "Heading Sensor Not Available"
or "Gyro xxx COM1 Error" (a number between 250-259 according to gyro no.) appears
in the [Alert] box.
Course-up mode
The course-up mode is an azimuth stabilized dis-
play in which a line connecting the center with the
top of the display indicates own ship's intended
course (namely, own ship's previous heading just
before this mode has been selected).
Target pips are painted at their measured dis-
tances and in their directions relative to the in-
tended course, which is maintained at the 0-
degree position. The heading line moves in ac-
cordance with ship's yawing and course change. This mode is useful for avoiding
smearing of the picture during course change.
STAB Head-up mode
Radar echoes are shown in the same way as in the head-up mode. The difference
from the normal head-up presentation lies in the orientation of the bearing scale. The
bearing scale is heading sensor stabilized. That is, it rotates in accordance with the
heading sensor signal, enabling you to know own ship's heading at a glance.
This mode is available when the radar is interfaced with a gyro heading sensor. If the
gyro heading sensor fails, the bearing scale returns to the state of head-up mode.
North-up mode
The north-up mode paints target pips at their mea-
sured distances and in their true (heading sensor) di-
rections from own ship, north bearing maintained at
the top of the screen. The heading line changes its
direction according to the ship's heading. Requires
heading signal.
If the compass fails, the presentation mode changes
to head-up and the north marker disappears. A fail-
ure of the heading sensor input will cause the head-
ing readout to disappear, and the Alert 450 "Heading
North marker Heading
line
North marker Heading
line
North marker
Heading
line
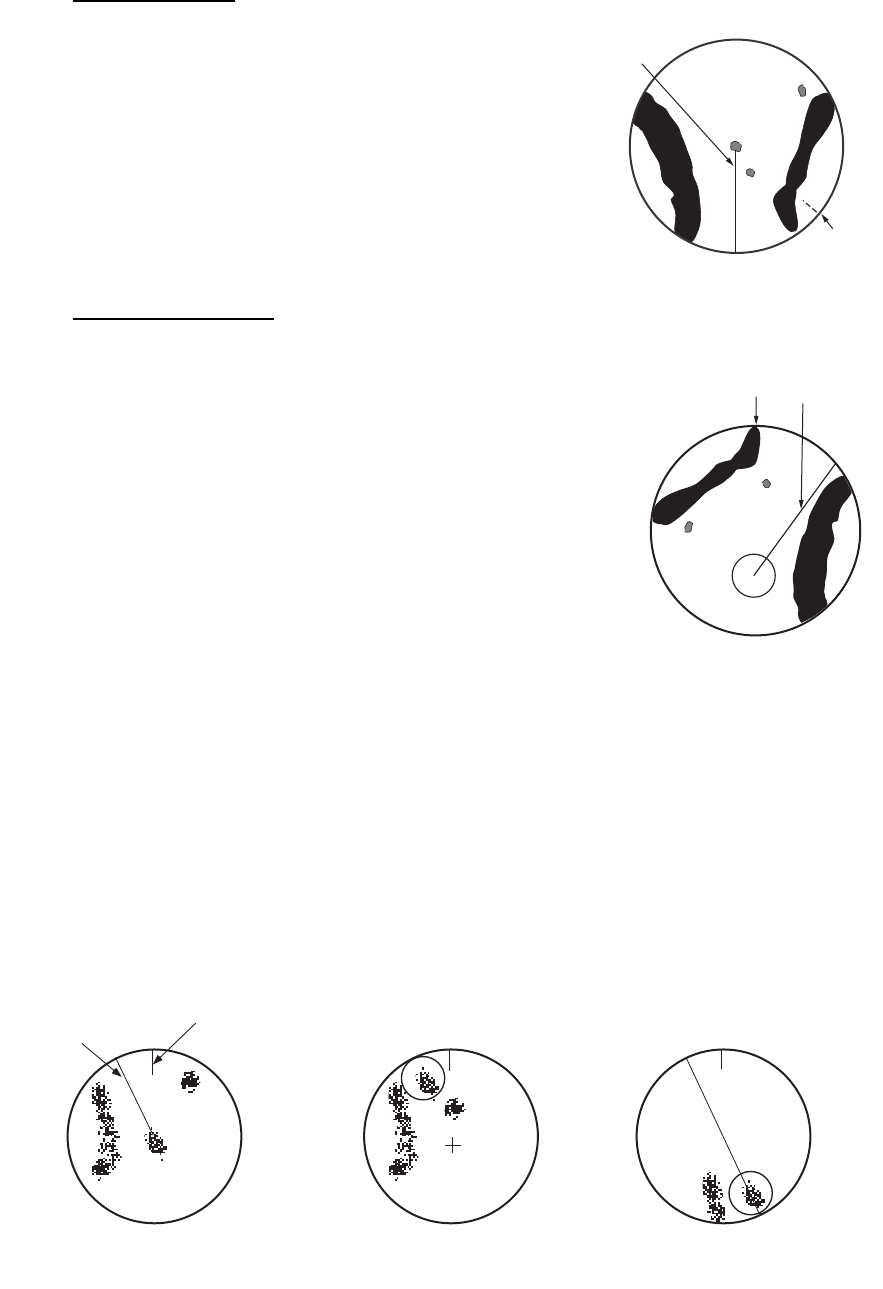
2. RADAR, CHART RADAR OPERATION
2-19
Sensor Not Available" or "Gyro COM1 Error" (a number between 250-259 according
to gyro no.) appears in the [Alert] box.
Stern-up mode
The stern-up mode is a display in which the line
connecting own ship and the top of the display in-
dicates own ship's stern.
The target pips are painted at their measured dis-
tances and in their directions relative to own ship's
stern.
The short line on the bearing scale is the north
marker, which indicates stern sensor north.
True motion mode
Own ship and other moving objects move in accordance
with their true courses and speed. In ground stabilized
TM, all fixed targets, such as landmasses, appear as
stationary echoes. In the sea stabilized TM without set
and drift inputs, the landmass can move on the screen.
Note that true motion is not available on the 96 NM or
higher range scale range scale. If COG and SOG (both
over the ground) are not available on the TM mode, en-
ter the set (tide direction) and drift (tide speed) manually
referring to a Tide Table.
If the position of the CCRP results in a part of the bearing
scale not being distinguishable, that part of the bearing scale is indicated with appro-
priate reduced detail.
A failure of the heading sensor input will cause the heading readout to disappear, and
the Alert 450 "Heading Sensor Not Available" or "Gyro COM1 Error" (a number be-
tween 250-259 according to gyro no.) appears in the [Alert] box.
When own ship reaches a point corresponding to 50% of the radius of the display, own
ship position is automatically reset to a point of 75% radius opposite to the extension
of the heading line passing through the display center. You can also reset the own ship
symbol manually by pushing the CU/TM RESET key, or click the [CU/TM reset] button
on the InstantAccess bar.
North
marker
Heading
line
North marker Heading
line
North marker
Heading
line
(a) True motion
is selected
(b) Own ship has reached a
point 50% of display radius
(c) Own ship is automatically
reset to 75% of display radius
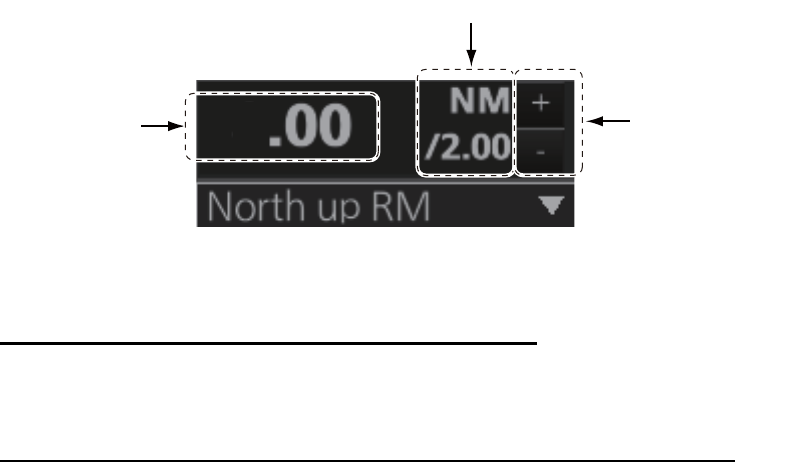
2. RADAR, CHART RADAR OPERATION
2-20
2.16 How to Select the Range Scale
The selected range scale and range ring interval are shown at the top-left position on
the screen. When a target of interest comes closer, reduce the range scale so that it
appears in 50-90% of the display radius.
Note: The IMO- and A-type radars do not have the 1 NM, 2 NM, 4 NM, 8 NM, 16 NM,
32 NM and 120 NM ranges.
How to select a range scale from the Control Unit
Use the RANGE key to select range desired. Hit the "+" part of the key to raise the
range; the "-" part to lower the range.
How to select a range scale from the Range/Presentation mode box
Method 1: Click the range scale indication.
Method 2: Click the range selection buttons. Click the "+" button to raise the range;
the "-" button to lower the range.
Method 3: Right-click the range scale indication to show a drop-down list of available
ranges then click a range.
2.17 How to Measure the Range to a Target
The range to a target may be measured three ways: with the fixed range rings, with
the cursor, or with the VRM.
Use the range rings to obtain a rough estimate of the range to a target. They are the
concentric solid circles about own ship, or the sweep origin. The number of rings is
automatically determined by the selected range scale and their interval is displayed in
the Range/Presentation mode box at the top-left position on the screen. Count the
number of rings between the center of the display and the target. Check the range ring
interval and judge the distance of the echo from the inner edge of the nearest ring.
The range rings can be turned on/off with [RANGE RING] on the [NAV TOOL] menu.
Range scale
Range ring interval
Range selection
buttons
6
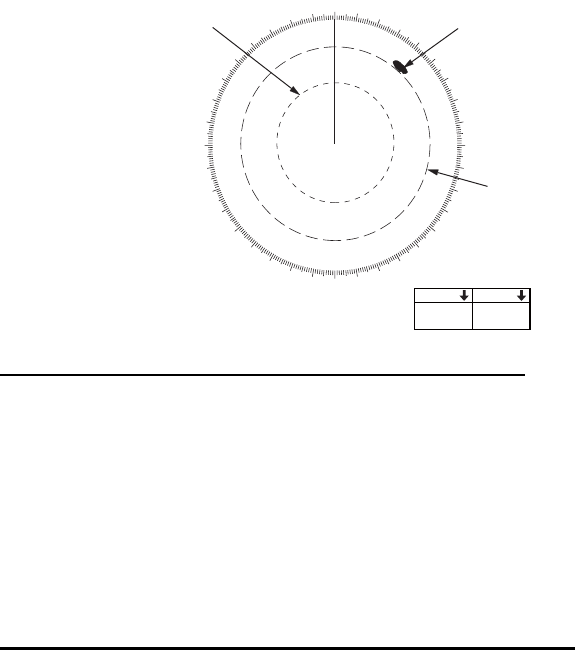
2. RADAR, CHART RADAR OPERATION
2-21
2.17.1 How to measure the range by using a VRM
There are two VRMs, No. 1 and No. 2, which appear as dashed rings so that you can
distinguish them from the fixed range rings. The two VRMs can be distinguished from
each other by the different lengths of their dashes; the dashes on the No. 2 VRM are
longer.
How to measure the range from the Control Unit
1. Press the VRM 1 or VRM 2 key to display desired VRM.
2. Rotate the VRM rotary control to align the active variable range marker with the
inner edge of the target of interest and read its distance at the bottom-right posi-
tion on the screen. Each VRM remains at the same geographical distance when
you operate the range control. This means that the apparent radius of the VRM
ring changes in proportion to the selected range scale.
To erase a VRM, press the VRM 1 or VRM 2 key to erase corresponding VRM.
How to measure the range from the trackball module
1. Click the title bar on a VRM box to activate the corresponding VRM.
2. Spin the scrollwheel or use the trackball to align the active variable range marker
with the inner edge of the target of interest and read its distance at the bottom-
right position on the screen. Each VRM remains at the same geographical dis-
tance when you operate the range control. This means that the apparent radius of
the VRM ring changes in proportion to the selected range scale set the outer edge
of the VRM on the inner edge of the target.
3. To anchor the VRM, push the left button.
To turn off a VRM, click the arrow in the applicable VRM box. The VRM disappears
and the VRM box is minimized.
000 010 020
030
040
050
060
070
080
090
100
110
120
130
140
150
160
170
180
190
200
210
220
230
240
250
260
270
280
290
300
310
320
330
340 350
Tar ge t
VRM 2
V
RM 1
VRM 1 VRM 2
TTG 45:02 TTG 99:59
0.660 1.180
NM NM
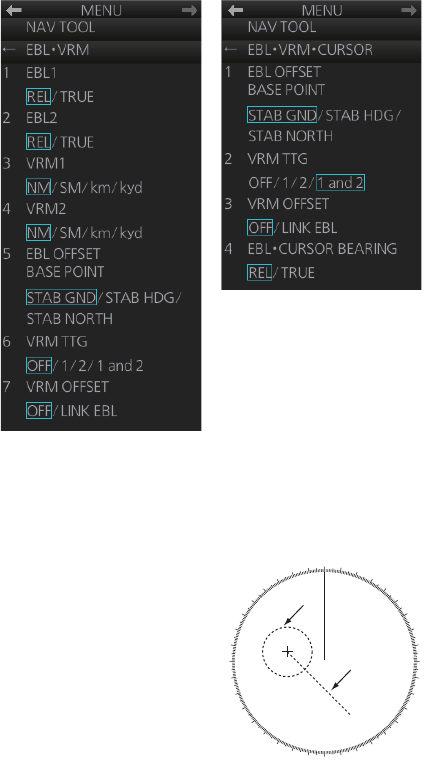
2. RADAR, CHART RADAR OPERATION
2-22
2.17.2 How to set VRM attributes
You can customize the VRMs to suit
your needs.
1. Open the menu then select [3
NAV TOOL] and [2 EBL•VRM] (B
type) or [2 EBL•VRM•CURSOR]
(IMO and A types) to display the
[EBL•VRM] menu
([EBL•VRM•CURSOR] menu for
the IMO and A types).
2. For the B-type radar, select [3
VRM1] or [4 VRM2] as appropri-
ate. Spin the scrollwheel to se-
lect desired unit then push the
left button.
3. Select [6 VRM TTG] (B type) or
[2 VRM TTG] (IMO and A types) and then select the VRM(s) that are to show/hide
the TTG indication. [OFF] shows no TTG indication.
4. The [LINK EBL] option for [7 VRM OFFSET] automati-
cally activates the corresponding VRM when the offset
EBL is enabled.
5. Close the menu.
B-type radar
IMO- and A-type radars
000 010 020
030
040
050
060
070
080
090
100
110
120
130
140
150
160
170
180
190
200
210
220
230
240
250
260
270
280
290
300
310
320
330
340 350
Offset
EBL
VRM
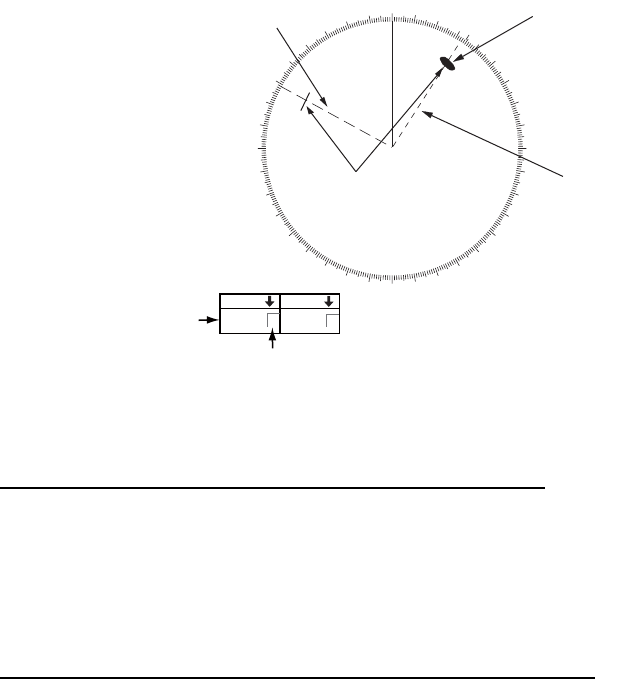
2. RADAR, CHART RADAR OPERATION
2-23
2.18 How to Measure the Bearing to a Target
Use the Electronic Bearing Lines (EBLs) to take bearings of targets. There are two
EBLs, No. 1 and No. 2. Each EBL is a straight dashed line extending from the own
ship position up to the circumference of the radar picture. The two EBLs can be dis-
tinguished from each other by the different lengths of their dashes; the dashes on the
No. 2 EBL are longer.
Each EBL carries a range marker, or a short line crossing the EBL at right angles. Its
distance from the EBL origin is indicated at the VRM readout whether or not the cor-
responding VRM is displayed. The range marker changes its position along the EBL
with the rotation of the VRM control. To operate this marker, rotate the VRM rotary
control on the Control Unit, or put the cursor in the applicable VRM box and roll the
scrollwheel.
2.18.1 How to measure the bearing
How to measure the bearing from the Control Unit
1. Press the EBL 1 or EBL 2 key to display desired EBL.
2. Rotate the EBL rotary control to bisect the target with the EBL. Read the bearing
to the target at the appropriate EBL box.
To erase an EBL, press the EBL 1 or EBL 2 key to erase corresponding EBL.
How to measure the bearing from the trackball module
1. Click the title bar on a EBL box to activate the corresponding EBL.
2. Spin the scrollwheel or use the trackball to bisect the target with the EBL.
3. To anchor the EBL, push the left button.
To turn off an EBL, click the arrow in applicable EBL box. The EBL disappears and the
EBL box is minimized.
000 010 020
030
040
050
060
070
080
090
100
110
120
130
140
150
160
170
180
190
200
210
220
230
240
250
260
270
280
290
300
310
320
330
340 350
Target
EBL 2
EBL 1
Range marker
EBL bearing RR
EBL reference
EBL 1 EBL 2
128.0°100.8°

2. RADAR, CHART RADAR OPERATION
2-24
2.18.2 How to select bearing reference
An EBL box has an "R" (relative) if the EBL bearing is relative to own ship's heading;
"T" (true) if it is referenced to the north. True or relative indication is available regard-
less of presentation mode.
To change the bearing reference, click the EBL reference indication to display R or T
as appropriate. The bearing reference can also be selected on the [EBL•VRM] menu
([EBL•VRM•CURSOR] menu with the IMO- and A-type radars).
Note: When the gyrocompass heading changes, the EBL and its indication change as
follows:
2.19 Collision Assessment by Offset EBL
The origin of the EBL can be placed anywhere with the trackball to enable measure-
ment of range and bearing between two targets. This function is also useful for as-
sessment of the potential risk of collision. It is possible to read CPA (Closest Point of
Approach) by using a VRM as shown in Figure (a) on the next page. If the EBL passes
through the sweep origin (own ship) as illustrated in Figure (b), the target ship is on a
collision course.
2.19.1 How to assess risk of collision
How to assess risk of collision from the Control Unit
1. Press the EBL 1 or EBL 2 key to activate an EBL.
2. Put the cursor on a target that appears as a threatening target (A in the figure on
the next page).
3. Press the EBL OFFSET key to shift the EBL origin to the cursor location.
4. Wait approx. three minutes. Operate the EBL rotary control to bisect the target at
the new position (A'). The EBL indication shows the target ship's course, which
may be true or relative depending on the EBL bearing reference setting.
5. If relative motion is selected, it is also possible to read CPA by using a VRM as
shown in the left figure on the next page. If the EBL passes through the sweep
origin (own ship) as illustrated in the right figure on the next page, the target ship
is on a collision course.
To return the EBL origin to the center of the screen, press the EBL OFFSET key.
Course-up, relative:
Course-up, true:
Head-up, relative:
Head-up, true:
North-up, relative:
North-up, true:
EBL indication remains the same, EBL moves.
EBL indication and EBL remain unchanged.
EBL indication and EBL remain unchanged.
EBL indication remains the same; EBL moves.
EBL indication remains the same, EBL moves.
EBL indication and EBL remain unchanged.
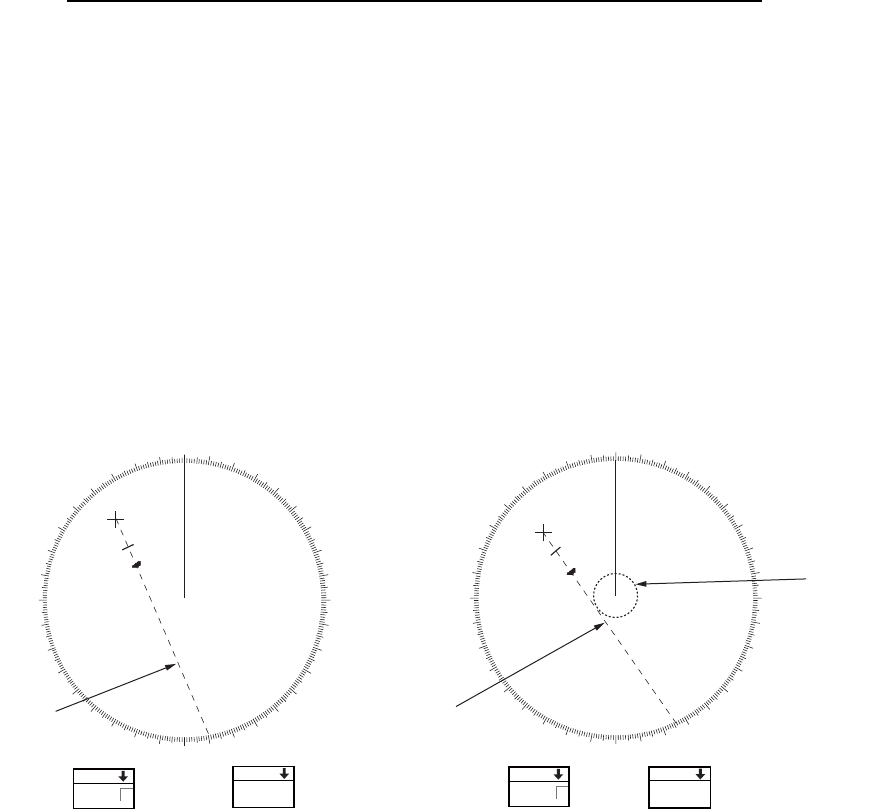
2. RADAR, CHART RADAR OPERATION
2-25
How to assess risk of collision from the context-sensitive menu
1. Right-click the display area to show the context-sensitive menu.
2. Select [EBL Offset] and then [EBL 1] or [EBL 2].
3. Put the cursor on a target that appears as a threat (A in the figure below).
4. Push the left button to shift the EBL origin to the cursor location.
5. Spin the scrollwheel or use the trackball to bisect the target at the new position
(A'). The EBL indication shows the target ship's course, which may be true or rel-
ative depending on the EBL bearing reference setting.
6. It is also possible to read CPA by using a VRM as shown in left-hand figure below.
If the EBL passes through the sweep origin (own ship) as illustrated in the right-
hand figure below, the target ship is on a collision course.
To return the EBL origin to the center of the screen, put the cursor on the EBL origin
then right-click.
2.19.2 Point of reference for origin point of offset EBL
The origin point of the offset EBL can be ground stabilized (geographically fixed), north
stabilized (true) or referenced to your ship's heading (relative).
1. Open the menu then select the [3 NAV TOOL] and [2 EBL•VRM] (B type) or [2
EBL•VRM•CURSOR] (IMO and A types) menus to display the [2 EBL•VRM] (B
type) or [2 EBL•VRM•CURSOR] (IMO and A types) menu.
2. Select [5 EBL OFFSET BASE POINT] (B type) or [1 EBL OFFSET BASE POINT]
(IMO and A types).
3. Select [STAB GND], [STAB HDG], or [STAB NORTH] as appropriate.
STAB GND: Reference to latitude and longitude. Origin position is always fixed
regardless of your ship's movement.
STAB HDG: Reference to heading. The relationship of relative bearing between
origin position and own position is kept always.
STAB NORTH: Reference to North. The relationship of true bearing between or-
igin position and own position is kept always.
4. Close the menu.
000 010 020
030
040
050
060
070
080
090
100
110
120
130
140
150
160
170
180
190
200
210
220
230
240
250
260
270
280
290
300
310
320
330
340 350
000 010 020
030
040
050
060
070
080
090
100
110
120
130
140
150
160
170
180
190
200
210
220
230
240
250
260
270
280
290
300
310
320
330
340 350
A
A’
A
A’ VRM1
EBL1
EBL1
(a) (b)
T
EBL 1
138.2
°
VRM 1
TTG 10:00
0.850
NM
T
EBL 1
150.3
°
VRM 1
TTG 10:00
0.850
NM
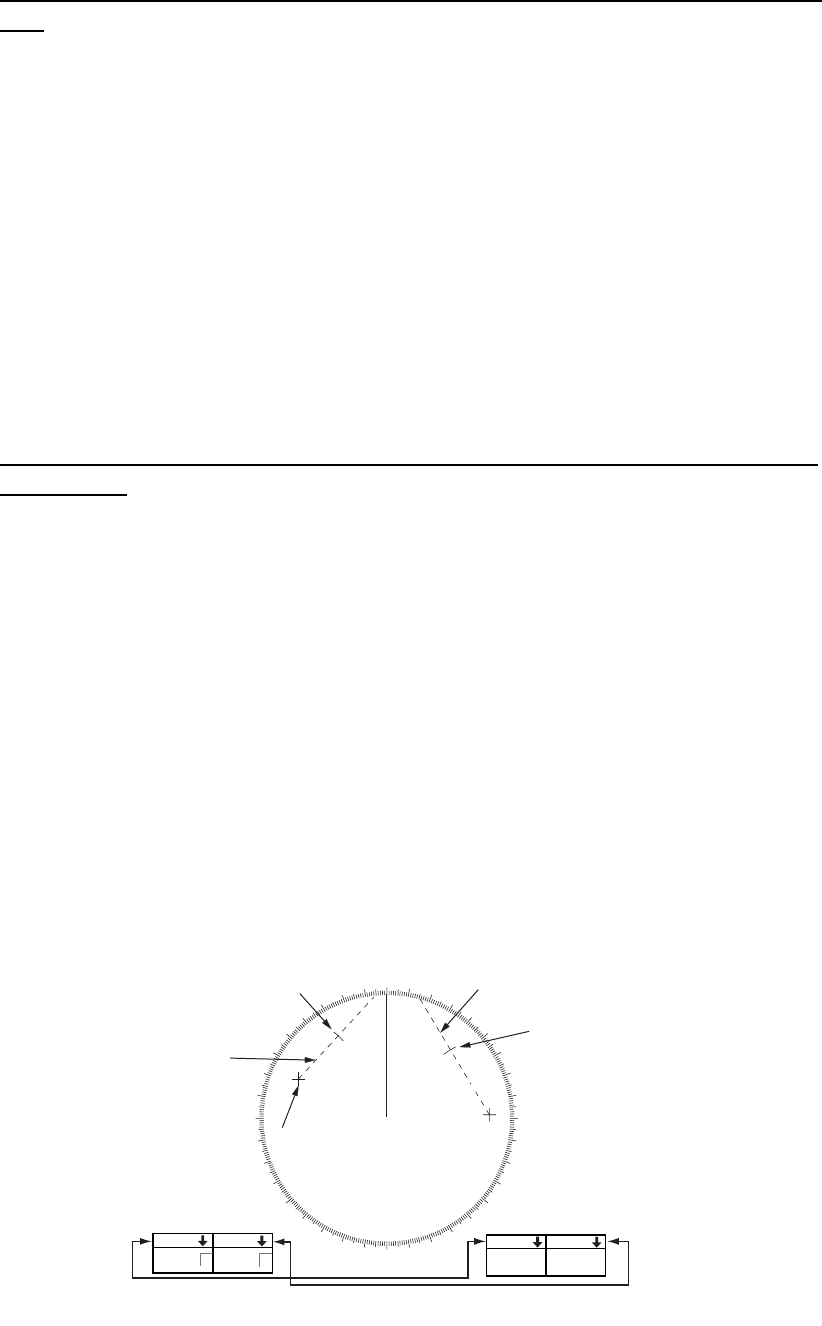
2. RADAR, CHART RADAR OPERATION
2-26
2.20 How to Measure the Range and Bearing Between
Two Targets
How to measure the range and bearing between two targets from the Control
Unit
1. Press the EBL 1 key to activate EBL1.
2. Operate the trackball to place the origin of the EBL 1 on a target of interest.
3. Press the EBL OFFSET key.
4. Operate the EBL rotary control to bisect the other target of interest.
5. Press the VRM 1 key to activate VRM 1.
6. Operate the VRM rotary control until the range marker on the EBL is on the inside
edge of target 2.
You can repeat the same procedure on third and fourth targets (targets 3 and 4) by
using the EBL 2 and the VRM 2.
Bearing is shown relative to own ship with suffix "R" or as a true bearing with suffix "T".
To return the EBL origin to the screen center, push the EBL OFFSET key.
How to measure the range and bearing between two targets from the track-
ball module
1. Right-click the display area to show the context-sensitive menu.
2. Select [EBL Offset] then [EBL 1].
3. Put the origin of the EBL on a target of interest.
4. Push the left button to anchor the EBL.
5. Put the cursor on the EBL 1 box then spin the scrollwheel or use the trackball to
bisect the other target of interest.
6. Put the cursor on the VRM 1 box then spin the scrollwheel to put the range marker
on the EBL on the inside edge of target 2.
You can repeat the same procedure on third and fourth targets (targets 3 and 4) by
using the EBL 2 and the VRM 2.
Bearing is shown relative to own ship with suffix "R" or as a true bearing with suffix "T".
To return the EBL to its origin, open the context-sensitive menu then select [Reset
EBL].
000 010 020
030
040
050
060
070
080
090
100
110
120
130
140
150
160
170
180
190
200
210
220
230
240
250
260
270
280
290
300
310
320
330
340 350
Range/bearing between
targets 3 and 4
Range/bearing between
targets 1 and 2
Range marker
EBL 2
EBL 1
Target 1
Target 2
Target 3
Target 4
EBL origin
Range marker
VRM 1 VRM 2
TTG 45:02 TTG 99:59
0.500 0.980
NM NM
R
EBL 1 EBL 2
140.0°335.2°R
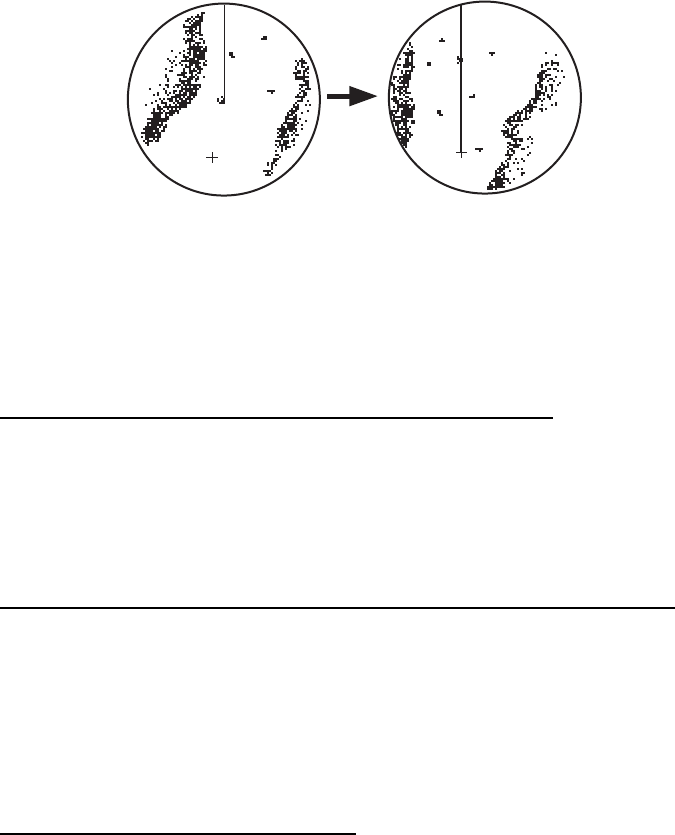
2. RADAR, CHART RADAR OPERATION
2-27
2.21 How to Off-center the Display
Own ship position, or sweep origin, can be displaced to expand the view field without
switching to a larger range scale. The sweep origin can be off-centered to the cursor
position, but not more than 75% of the range in use; if the cursor is put beyond 75%
of the range scale, the sweep origin will be off-centered to the point of 75% of the limit.
This feature is available on the ranges between 0.125 and 48 NM and any presenta-
tion mode other than true motion.
If the position of the CCRP results in a part of the bearing scale not being distinguish-
able, that part of the bearing scale is indicated with appropriate reduced detail.
How to off-center the display from the Control Unit
1. Put the cursor on the position within the display area where you want to move the
sweep origin.
2. Press the OFF CENTER key to move the sweep origin to the cursor position.
To cancel off-centering, press the OFF CENTER key again.
How to off-center the display from the context-sensitive menu
1. Put the cursor in the display area then right-click to show the context-sensitive
menu.
2. Select [Off Center].
3. Put the cursor where to put the sweep origin, and push the left button.
To cancel the off-center display, do steps 1 and 2 above, then click the display area.
If you cannot cancel off-center…
When the conditions shown below are met, off-center cannot be cancelled. This is be-
cause the radar antenna position is located at a position greater than 75% of the ef-
fective radar display.
• Own ship marker is large.
• The distance between the antenna position and the conning position is large.
• Short-distance display range.
To cancel the off-center in the above-mentioned conditions, first select a larger range,
then cancel the off-center.
Normal display Off-centered display
Cursor
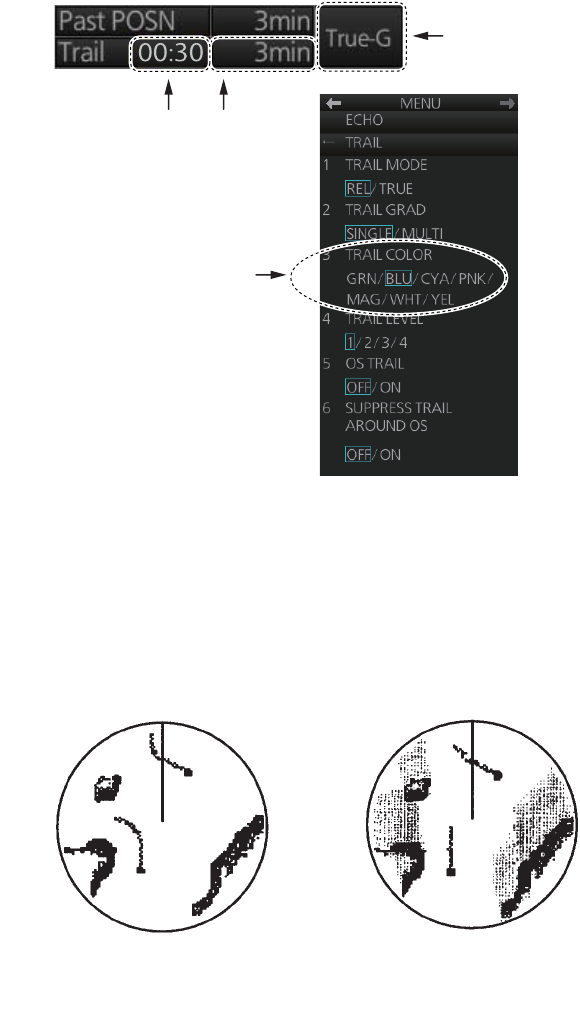
2. RADAR, CHART RADAR OPERATION
2-28
2.22 Target Trails
The trails of the radar echoes of targets may be displayed in the form of synthetic af-
terglow. Target trails are selected either relative or true and may be sea or ground sta-
bilized. True motion trails require a compass signal, and position and speed inputs.
2.22.1 Target trails-related indications
Trail-related indications are located at the bottom-right position on the screen. Several
trail-related operations can be done from the [TRAIL] menu, which you can show by
right-clicking the Trail time indication.
2.22.2 True or relative target trails
You may display echo trails in true or relative motion. Relative trails show relative
movements between targets and own ship. True motion trails present true target
movements in accordance with their over-the-ground speeds and courses.
Click the Trail mode indication to select [True-G], [True-S] or [REL] as appropriate.
Trail mode
Trail time
Right-click to
show the
TRAIL menu.
TRAIL COLOR not available
with IMO or A type.
Elapsed trail time
True target trails
(No smearing of
stationary targets)
Relative target trails
(Targets moving
relative to own ship)
2. RADAR, CHART RADAR OPERATION
2-29
2.22.3 Trail time
Trail time, the trail plotting interval, can be selected with the scrollwheel, left button or
right button.
The trail timer counts up the trail time and is erased once the terminal count is
reached. For example, if the trail time is six minutes, the timer is erased when trails
have been plotted six minutes. The maximum time of count up for continuous plotting
is 29:59.
Caution: The correctness of the target trails is uncertain until the trail timer count does
not reach the trail time.
How to select a trail time
Four controls are available to select a trail time.
• Control Unit: Push the TRAIL key.
• Trackball module: Put the cursor on the Trail time indication at the bottom-right po-
sition then operate the control (left button or scrollwheel). For the right button, a con-
text-sensitive menu appears. Click the desired time.
The times available depend on the control used as shown in the table below.
2.22.4 How to reset target trails
All trails can be erased (including those in the memory) and restarted to start trails
fresh.
Control Unit: Press and hold down the TRAIL key until trails disappear.
Context-sensitive menu: Right-click the Trail box to show the context-sensitive
menu then select [Trail All Clear].
2.22.5 How to temporarily remove all target trails from the display
You can temporarily remove all trails from the display. Trails are removed but are con-
tinued internally.
Control Unit: Press the TRAIL key to show [OFF] in the trail time indication.
Trackball module: Click the trail time indication to display [OFF].
2.22.6 Trail stabilization in true motion
True motion trails can be ground stabilized or sea stabilized. The [Trail time] indication
shows current stabilization as [True-G] or [True-S]. To change the stabilization mode,
open the [SPEED] menu and set [SHIP SPEED] to [BT] (ground stabilization) or [WT]
(sea stabilization).
Control Available setting
Left button, right button,
TRAIL key
OFF, 15 sec, 30 sec, 1 min, 3 min, 6 min, 15 min, 30 min,
CONT(inuous)
Scrollwheel OFF, 15 sec, 30 sec, 1-30 min (30 sec intervals), CONT(inu-
ous)
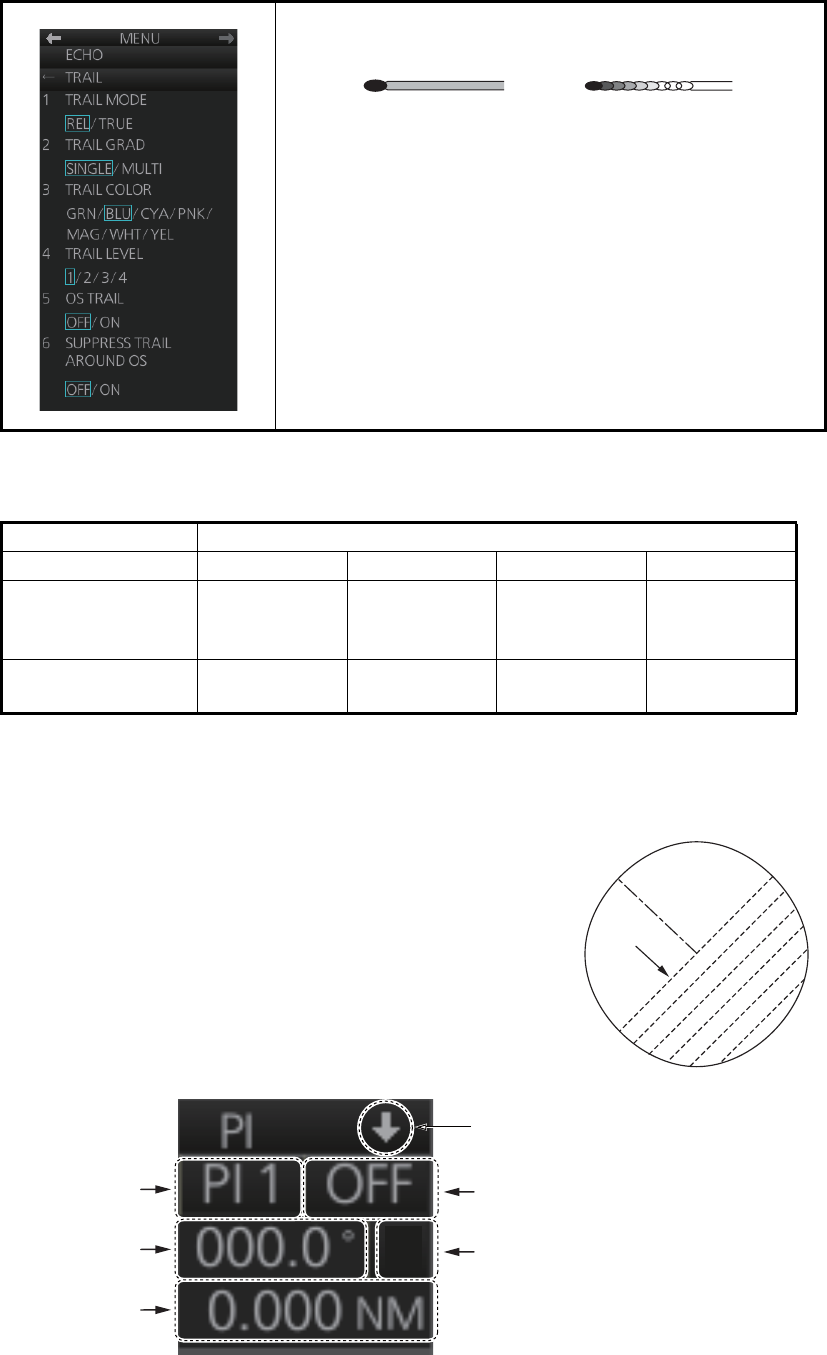
2. RADAR, CHART RADAR OPERATION
2-30
2.22.7 Target trail attributes on the TRAIL menu
Note: [SUPPRESS TRAIL AROUND OS] is automatically turned on when [OS TRAIL]
is activated. The possible ON/OFF combinations between [OS TRAIL] and [SUP-
PRESS TRAIL AROUND OS] are as shown in the table below.
2.23 Parallel Index (PI) Lines
PI lines are useful for keeping a constant distance be-
tween own ship and a coastline or a partner ship when
navigating. Up to six sets of PI lines are available depend-
ing on the maximum number of PI lines selected on the
menu.
Control of the orientation and interval of the PI lines is
done from the PI line box, which is at the bottom-left posi-
tion.
[TRAIL GRAD]: The afterglow of the target trails can be
shown in a single tone or gradual shading.
[TRAIL COLOR]: The trail color can be selected from the
colors shown in the left figure. This feature is not available
with the IMO or A type.
[TRAIL LEVEL]: The level (intensity) of the afterglow that
extends from radar targets can be adjusted. The higher
the number the greater the intensity of the afterglow.
[OS TRAIL]: Show or hide trail for own ship.
[SUPPRESS TRAIL AROUND OS]: You can prevent the
display of sea clutter in true trails about your ship, to clear
the radar picture.
Setting ON/OFF pairings available
OS TRAIL OFF ON OFF ON
SUPPRESS
TRAIL AROUND
OS
OFF ON ON OFF
Remarks No OS trail - - Setting not
possible
Monotone
(SINGLE)
Gradual shading
(MULTI)
PI
lines
PI line no. PI line status indication (ON, OFF)
PI line angle PI line reference
PI line interval
Minimize button
T
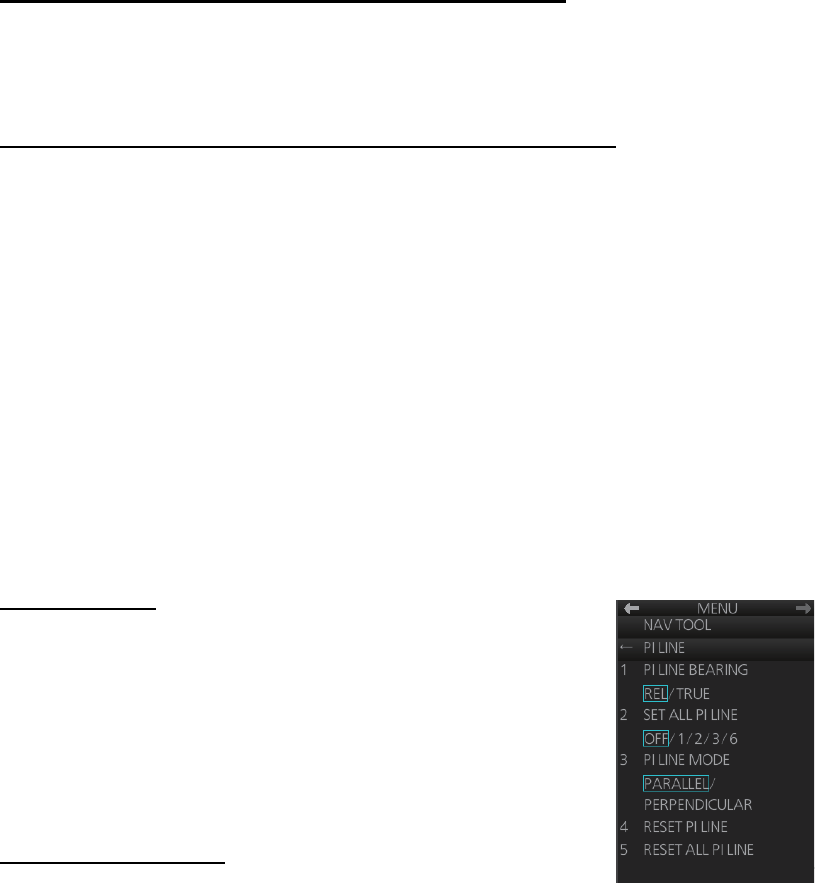
2. RADAR, CHART RADAR OPERATION
2-31
2.23.1 How to display, erase a PI line
How to display, erase a PI line from the Control Unit
Displaying a PI line: Press the INDEX LINE key until desired PI line no. appears.
Erasing a PI line: Press the INDEX LINE key until desired PI line no. appears. Press
and hold down the INDEX LINE key to erase the PI line.
How to display, erase a PI line from the trackball module
Click the PI line no. indication to select a PI line. Click the PI line status indication (ON,
OFF) to display or erase a PI line.
2.23.2 How to adjust PI line orientation, PI line interval
1. If not already displayed, display a PI line.
2. Put the cursor on the PI line angle indication then spin the scrollwheel to set the
angle (000 to 359.9).
3. Put the cursor on the PI line interval indication then spin the scrollwheel to adjust
the PI line interval.
2.23.3 How to select the number of PI lines to display
You can select the number of PI lines to display among 1, 2, 3 or 6.
For all PI lines
1. Open the menu.
2. Select [3 NAV TOOL] and [1 PI LINE] to show the [PI
LINE] menu.
3. Select [2 SET ALL PI LINE] and the desired number of PI
lines among [1], [2], [3] or [6].
4. Close the menu.
For individual PI line
1. Select the PI line no. to set the number of PI lines referring
to paragraph 2.23.1.
2. Right-click the PI line box to show the context-sensitive menu then select [Number
of PI Line].
3. Select the desired number of PI lines among [1], [2], [3] or [6].
Note: The actual number of lines visible can be less depending on line interval.
2.23.4 How to select the bearing reference for the PI line
PI line bearing reference can be relative to your ship's heading (Relative) or refer-
enced to North (True).
Note: This function is not available with IMO type. The setting is fixed to [True].
1. Open the menu.
2. Select [3 NAV TOOL] and [1 PI LINE] to show the [PI LINE] menu.
3. Select [1 PI LINE BEARING].
6
TRUNCATE
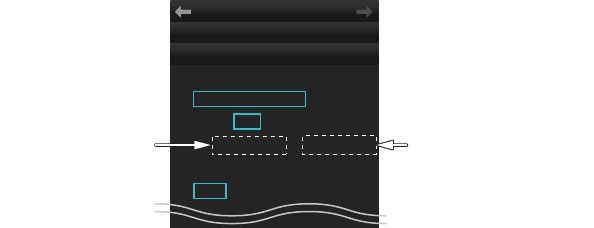
2. RADAR, CHART RADAR OPERATION
2-32
4. Select [REL] or [TRUE].
5. Close the menu.
2.23.5 How to select the PI lines orientation
1. Open the menu.
2. Select [3 NAV TOOL] and [1 PI LINE] to show the [PI LINE] menu.
3. Select [3 PI LINE MODE].
4. Select [PARALLEL] or [PERPENDICULAR].
[PARALLEL]: PI lines are displayed in parallel to your ship's heading when PI line
angle is set to 0°.
[PERPENDICULAR]: PI lines are displayed in perpendicular to your ship's head-
ing when PI line angle is set to 0°.
5. Close the menu.
2.23.6 How to reset PI lines
You can automatically return all or selected PI lines to default orientation, 0-degrees
for parallel orientation, 90-degrees for perpendicular orientation. This is faster than do-
ing it manually.
1. Open the menu.
2. Select [3 NAV TOOL] and [1 PI LINE] to show the [PI LINE] menu.
3. Select [4 RESET PI LINE] (reset currently displayed line) or [5 RESET ALL PI
LINE] as appropriate. The confirmation message "Attention: Do you wish to reset
PI No.x line setting?" or "Attention: Do you wish to reset all PI line settings?" ap-
pears. Click the [OK] button to reset the PI line(s).
4. Close the menu.
2.23.7 How to adjust PI line length
You can adjust the length of each PI line. This function is available when [2 SET ALL
PI LINE] is set to [1].
1. If not already displayed, display a PI line to adjust the length referring to
paragraph 2.23.1.
2. Open the menu.
3. Select [3 NAV TOOL] and [1 PI LINE] to show the [PI LINE] menu.
4. Select [6 TRUNCATE].
5. Select [ON] in [PI 1 (or 2, 3, 4, 5, 6) TRUNCATE].
1 PI 1 TRUNCATE
OFF / ON
24.000NM 24.000NM
2 PI 2 TRUNCATE
OFF / ON
NAV TOOL
← TRUNCATE
MENU
PI LINE
A
djust the length
forward a PI line.
Adjust the length
backward a PI line.
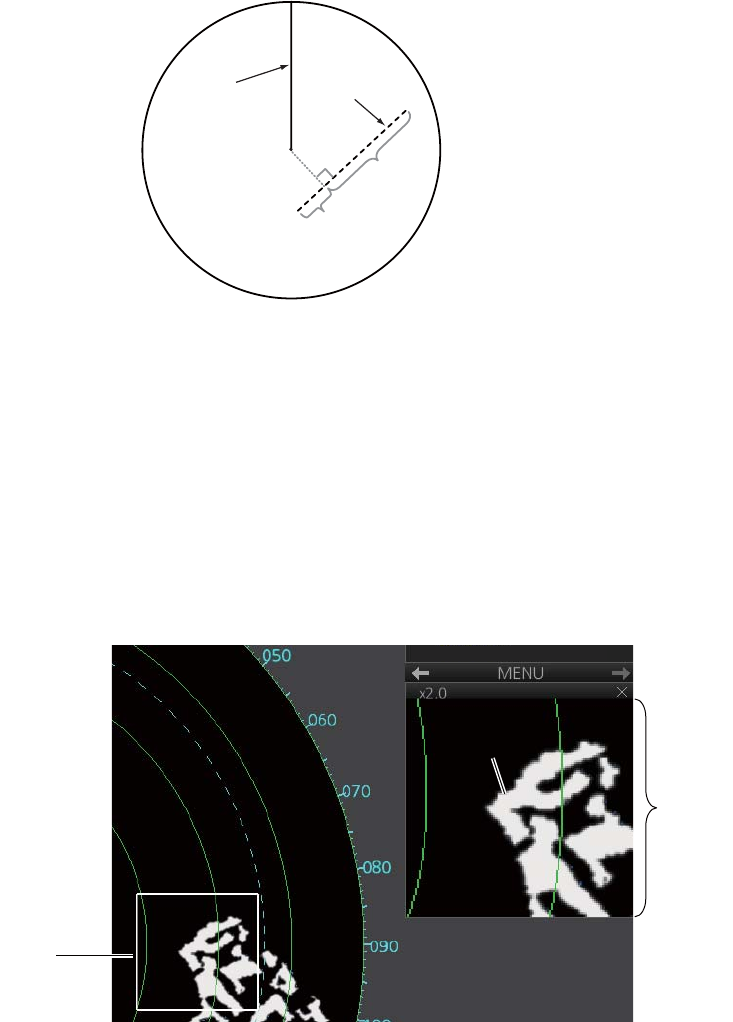
2. RADAR, CHART RADAR OPERATION
2-33
6. Set the length (setting range: 0.000 to 24.000 NM).
7. Close the menu.
2.24 Zoom
The zoom function enlarges an area of interest in the information area (magnification
range: 1.0, 1.5, 2.0, 2.5, 3.0; 2.0 is default). To use the zoom display, right-click the
operational area to show the context-sensitive menu then select [Zoom Set]. Roll the
trackball to put the zoom cursor on the area to zoom. Spin the scrollwheel to change
the magnification then push the left button to confirm the magnification and the posi-
tion. See the zoom display at the right side of the screen.
To deactivate the zoom function, right-click the operational area to show the context-
sensitive menu then select [Zoom Off].
Heading line
Heading line
Own ship position
Own ship position
PI line
PI line
Adjust the length
forward a PI line.
Adjust the length
forward a PI line.
Adjust the length
backward a PI line.
Adjust the length
backward a PI line.
Zoom
cursor
Zoomed
echo
Zoom
display

2. RADAR, CHART RADAR OPERATION
2-34
2.25 Markers
2.25.1 Heading line
The heading line indicates the ship's heading in all presentation modes. The heading
line is a line from the own ship position to the outer edge of the radar display area and
appears at zero degrees on the bearing scale in head-up mode. It changes its orien-
tation in the north-up and true motion modes according to orientation.
Temporarily erasing the heading line
To temporarily extinguish the heading line (and anything but radar echoes within the
display area) to look at targets existing dead ahead of own ship, push the HL OFF key
on the Control Unit, or click the [HL OFF] button on the InstantAccess bar. Release
the respective control to redisplay the heading line, etc.
2.25.2 Stern marker
The stern marker, which is a dotted line, appears opposite to the heading line and
marks your ship’s stern. To display or erase this marker, do the following:
1. Open the menu then select [5 MAP•MARK] and [1 MARK SETTING].
2. Select [6 STERN MARK] (B type) or [5 STERN MARK] (IMO and A types).
3. Select [ON] or [OFF] as appropriate.
2.25.3 North marker
The north marker appears as a short dashed line. In the head-up mode, the north
marker moves around the bearing scale in accordance with the compass signal.
2.25.4 Own ship marker
The own ship marker is displayed at your ship's position. It can be turned on or off and
its configuration selected from the [MARK SETTING] menu. Two configurations are
available: minimized marker and scaled marker. The scaled marker is scaled accord-
ing to the length and beam of the vessel. If the beam width or length of the marker (set
at installation) gets smaller than 3 mm, the marker is replaced with the minimized
marker. Ship's dimensions should be entered at installation to use the scaled marker.
1. Open the menu then select [5 MAP•MARK] and [1 MARK SETTING].
2. Select [4 OWN SHIP MARK] (B type) or [3 OWN SHIP MARK] (IMO and A types).
3. Select [MIN] or [SCALED] as appropriate.
MIN: Show the minimized own ship marker.
SCALED: Show the scaled own ship marker.
Scaled marker
Minimized marker
Heading line
Beam line
X
Antenna
position
Heading line
Beam line
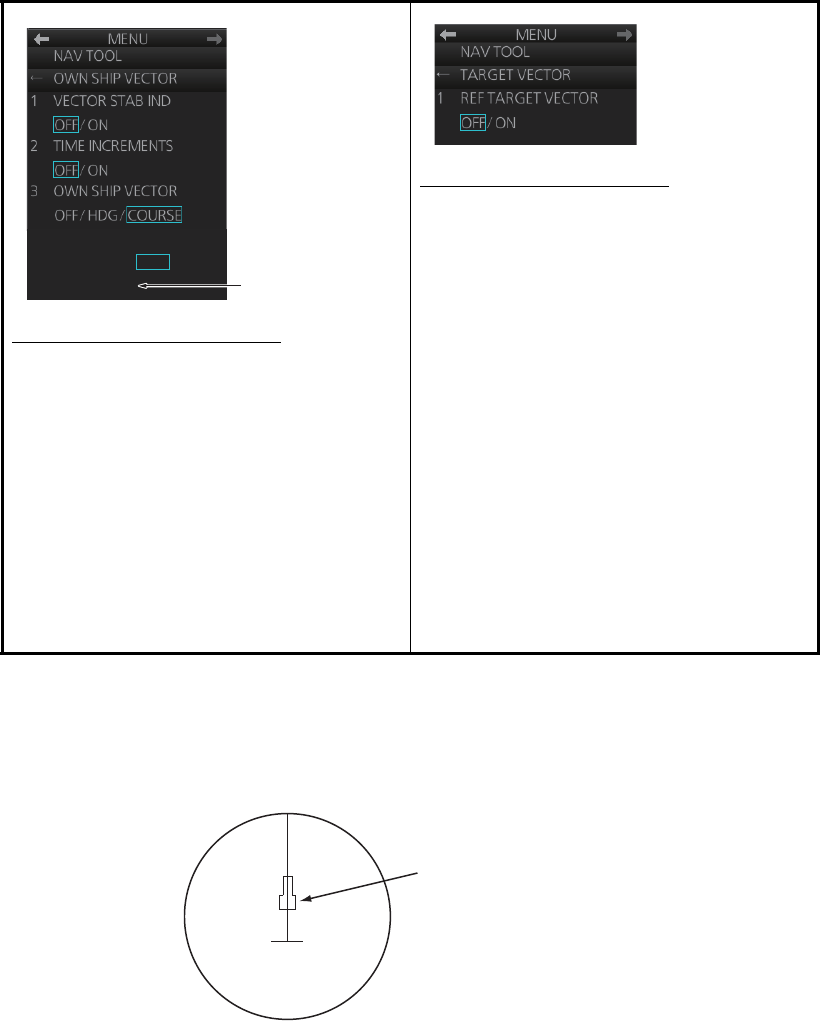
2. RADAR, CHART RADAR OPERATION
2-35
2.25.5 Vectors
You can show or hide the vector for own ship and reference targets, on the [NAV
TOOL] menu.
2.25.6 Barge marker
The length and breadth of the total barge size can be displayed as a simple rectangle
on the radar display. Up to five rows of barges and nine barges per row can be shown.
This feature is available with an installation preset. Set up barge information as fol-
lows:
1. Open the menu then select [3 NAV TOOL].
[OWN SHIP VECTOR] menu
[VECTOR STAB IND]: Turn ON to show
double arrow for ground tracking; single
arrow for water tracking.
[TIME INCREMENTS]: A short horizontal
line can be marked on the own ship vector
in one-minute intervals to show approxi-
mate later positions.
[OWN SHIP VECTOR]: Turn vector OFF,
or show ship's heading or course with a
vector.
[VECTOR COLOR]: Set the vector color
for own ship.
[TARGET VECTOR] menu
[REF TARGET VECTOR]: Turn the vector
for the reference target on or off.
4
VECTOR COLOR
GRN / BLU / CYA /
MAG / WHT
WHT is replaced
with RED with A
and B types.
Barge mark
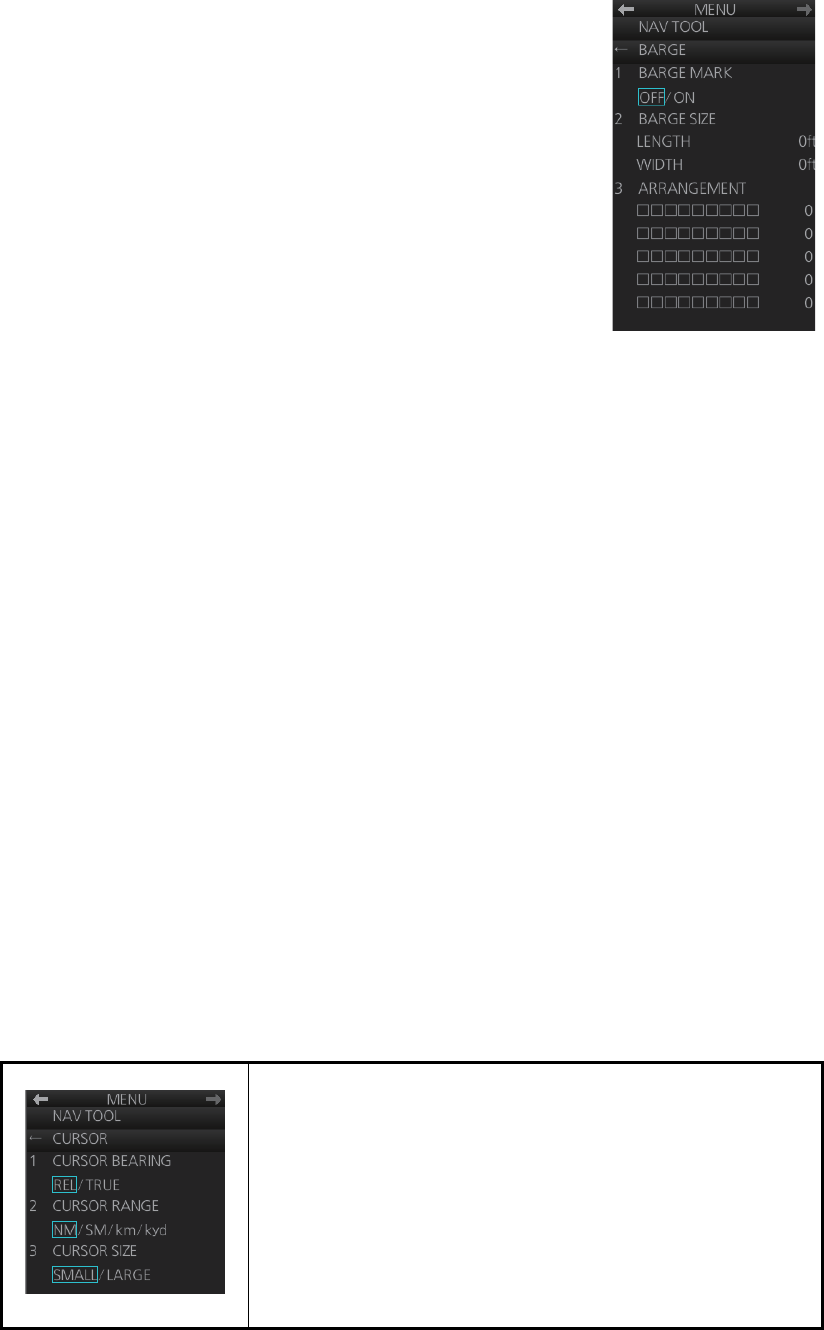
2. RADAR, CHART RADAR OPERATION
2-36
2. Select [7 BARGE] (B type) or [6 BARGE] (IMO and A
types).
3. Select [1 BARGE MARK].
4. Select [ON] to turn on the barge mark.
5. At [2 BARGE SIZE], enter length (three digits) and width
(two digits) of the total number of barges.
6. Select [3 ARRANGEMENT].
7. Enter the number of barges that will be in front of your
vessel, row by row:
1) Select a barge row.
2) Spin the scrollwheel to set the number of barges in
the row. (The maximum number is nine.) The numerical indication to the right
of the squares changes with scrollwheel operation.
3) Push the left button to confirm your selection. The squares on the row are
“filled” according to the number of barges selected at step 2.
8. Close the menu.
The radar display now shows the barge mark on the display.
2.25.7 Antenna marker
The antenna marker appears as a blue cross at the antenna location. The marker can
be shown or hidden as follows:
1. Open the menu then select [5 MAP•MARK] and [1 MARK SETTING].
2. Select [5 ANTENNA MARK] (B type) or [4 ANTENNA MARK] (IMO and A types).
3. Select [ON] or [OFF] as appropriate.
2.25.8 Cursor
The cursor measures the range and bearing to an object, selects menu items, selects
location for mark entry, etc. For the B-type radar, you can select cursor attributes
(bearing reference, range unit and size for the cursor) on the [CURSOR] menu in the
[NAV TOOL] menu. For the IMO- and A-type radars you can select only the cursor
bearing reference, with [EBL•CURSOR BEARING] in the [EBL•VRM•CURSOR] menu
of the [NAV TOOL] menu.
[CURSOR BEARING]: Show cursor bearing reference in
true or relative.
[CURSOR RANGE]: Show the cursor range indication in the
NM, SM, km or kyd. Not available with either IMO- or A-type
radar.
[CURSOR SIZE]: Select the cursor size for small or large.
The large cursor covers the entire echo area. Not available
with either IMO- or A-type radar.
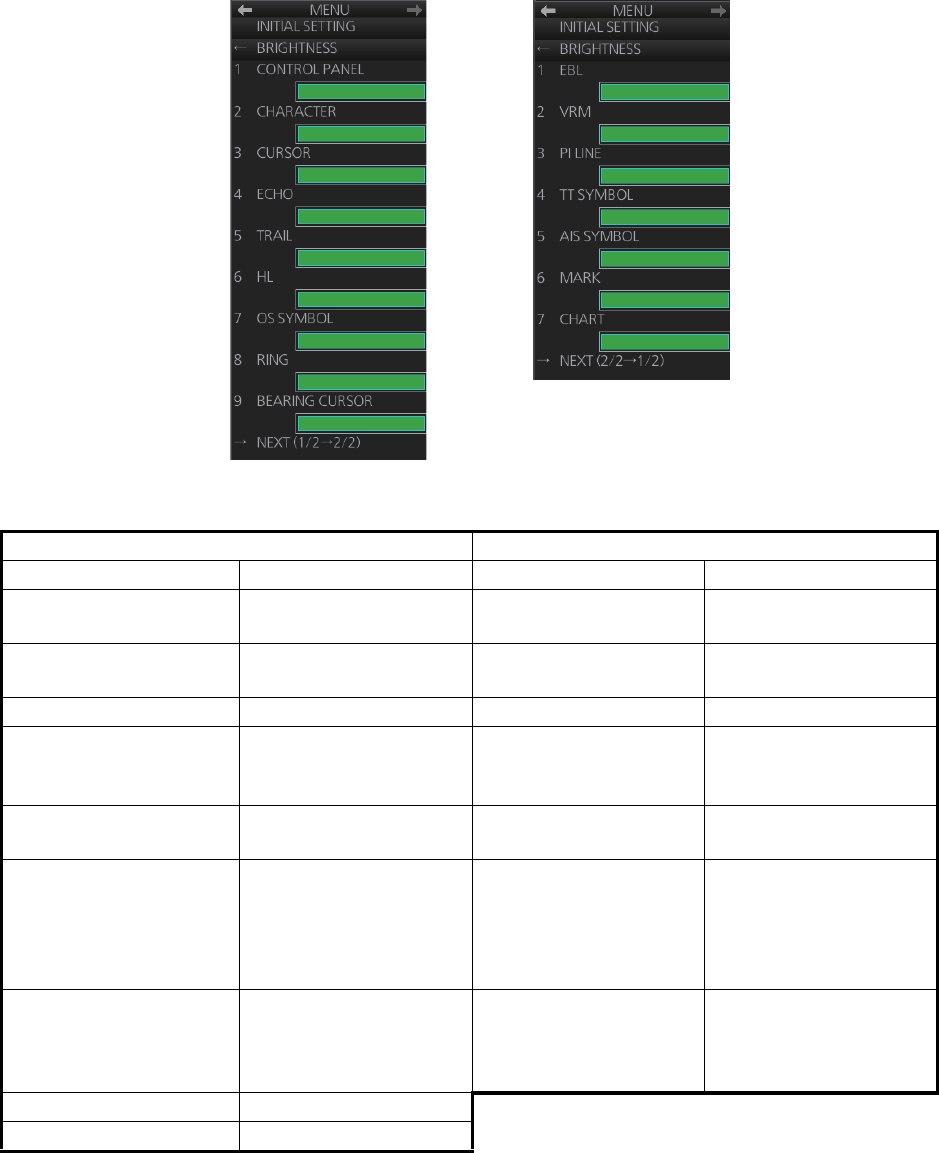
2. RADAR, CHART RADAR OPERATION
2-37
2.26 How to Adjust Brilliance of Screen Data
You can adjust the relative brilliance levels of various markers and alphanumeric read-
outs displayed on the screen.
1. Right-click the [BRILL] button on the InstantAccess bar then select [Brill Menu].
2. Click the brilliance adjustment bar of the item to adjust.
3. Spin the scrollwheel to set brilliance level.
4. Close the menu.
Page 1 Page 2
Item Adjust brightness of Item Adjust brigtness of
[1 CONTROL PANEL] backlighting of keys on
Control Unit
[1 EBL] EBLs, blind sector
[2 CHARACTER] Alphanumeric charac-
ters
[2 VRM] VRMs
[3 CURSOR] Cursor [3 PI LINE] PI lines
[4 ECHO] Radar echoes [4 TT SYMBOL] TT symbols, AZ area,
TT vector, TT past
posn
[5 TRAIL] Target trails [5 AIS SYMBOL] AIS symbols, AIS vec-
tor, AIS past posn
[6 HL] Heading line, stern line [6 MARK] Radar map marks,
route, waypoint/MOB
mark, anchor watch,
drop1/2, zoom, north
mark, user chart
[7 OS SYMBOL] Own ship symbol,
barge mark, antenna
mark, own ship track,
own ship vector
[7 CHART] Chart-related objects
[8 RING] Fixed range rings
[9 BEARING CURSOR] Bearing cursor
[BRIGHTNESS] menu, page 1
[BRIGHTNESS] menu, page 2
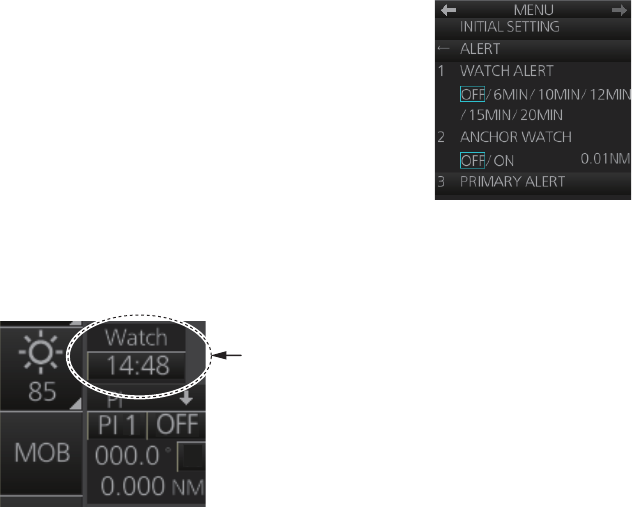
2. RADAR, CHART RADAR OPERATION
2-38
2.27 Watch Alert
The watch alert provides a flashing visual alert at regular in-
tervals to remind you to monitor the radar picture for safety or
other purposes.
To enable the watch alert, open the [8 INITIAL SETTING]
menu followed by the [4 ALERT] menu. Select [1 WATCH
ALERT] and set desired watch interval. The [Watch] box ap-
pears at the bottom-left position. (The watch interval can also
be selected from the [Watch] box when the watch alert fea-
ture is active. Right-click the time indication in the [Watch] box to show a drop-down
list of watch intervals. Select a watch interval from the list.)
The timer counts down from the interval set and when the time interval elapses;
• the buzzer sounds
• the visual alert 500 “Watch Alert” flashes in yellow in the [Alert] box
• the watch alert timer freezes at "0:00."
Stop the flashing visual alert with the ALARM ACK key on the Control Unit or click the
[Alert] box. If the alert is not acknowledged within one minute, the alert category
changes to “warning” (the Alert 500 flashes in red in the [Alert] box and the buzzer
sounds).
After the alert is acknowledged the count-down sequence is repeated.
Note: The countdown can be restarted, before the count reaches 0:00, by clicking the
countdown indication in the watch box.
Watch box
T
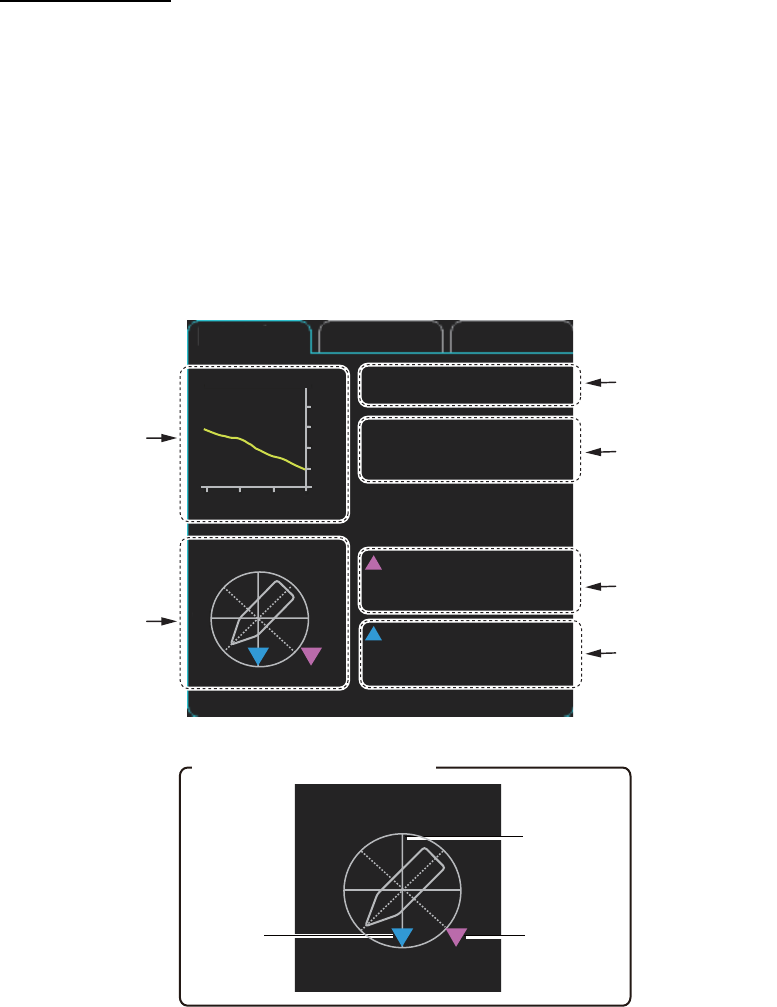
2. RADAR, CHART RADAR OPERATION
2-39
2.28 Information Box
The information box shows navigation data and, when following a route set on the
chart display, route information is also shown.
2.28.1 Information box contents
Navigation data
• Depth, analog and graph
• Current (tide) direction and speed
• Wind direction and speed
• Water temperature
• Current and wind gauge
Nav data requires appropriate navigation sensors and IEC 61162-1/2 sentences out-
put from the sensor. If there is no sentence or data input, asterisks (**) appear at the
corresponding indication.
Depth graph
Current direction
and speed
Wind direction
and speed
Current and
wind gauge
(See inset.)
Depth : 403 m
Water
TEMP : 3.7°C
Wind True-North
20.1 kn
Current
25.9 kn
NAV data Route 1 Route 2
N
E
S
W
0
100
200
300
400
500
-30 -20 -10 min m
Depth
Water
temperature
Current and wind gauge
Heading
Wind
direction
N
E
S
W
Current
direction
124.5°
177.6°T
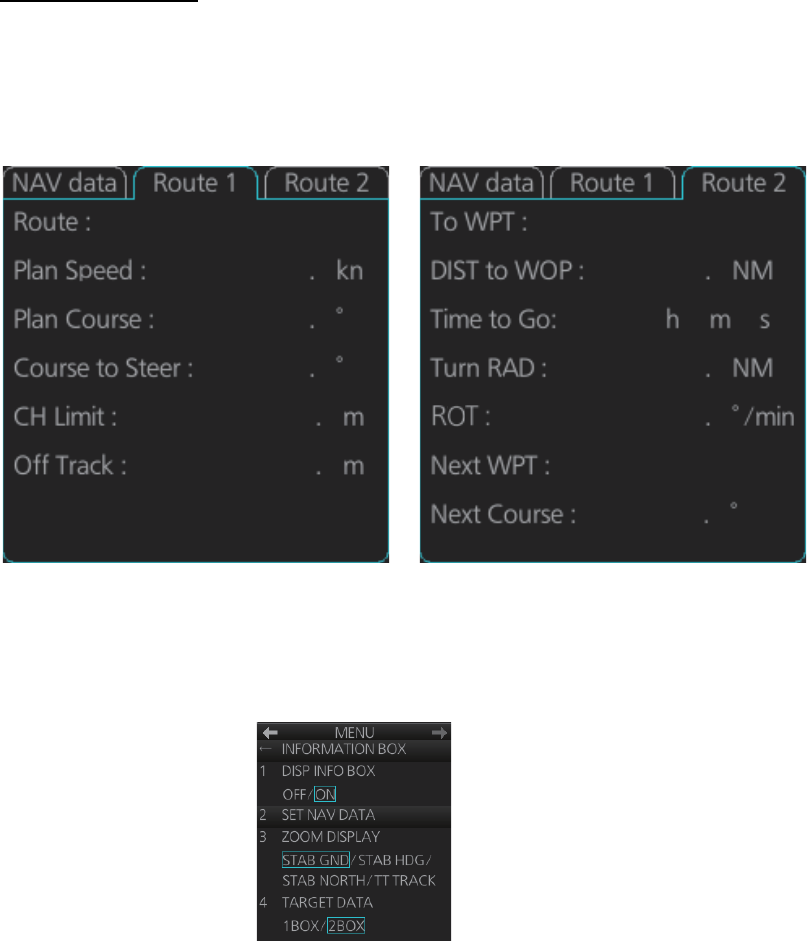
2. RADAR, CHART RADAR OPERATION
2-40
Route information
The route 1 information displays route name, plan speed, plan course, course to steer,
channel limit, and off track. The route 2 information displays waypoint no., distance to
WOP (wheel over point), time to go, planning turn radius, turn rate, next waypoint no.,
bearing to next waypoint. Click the [Route 1] or [Route 2] tab to find route information.
2.28.2 How to show the information box
1. Open the menu and select [4 INFORMATION BOX].
2. Select [1 DISP INFO BOX] then [ON].
3. Close the menu.
Route 1 Route 2
10 2
123 2
T
123 2
T
250 2
45 4
ROUTE10 2
1 7
0 8
0 0
3
0
10 27
123 7
T
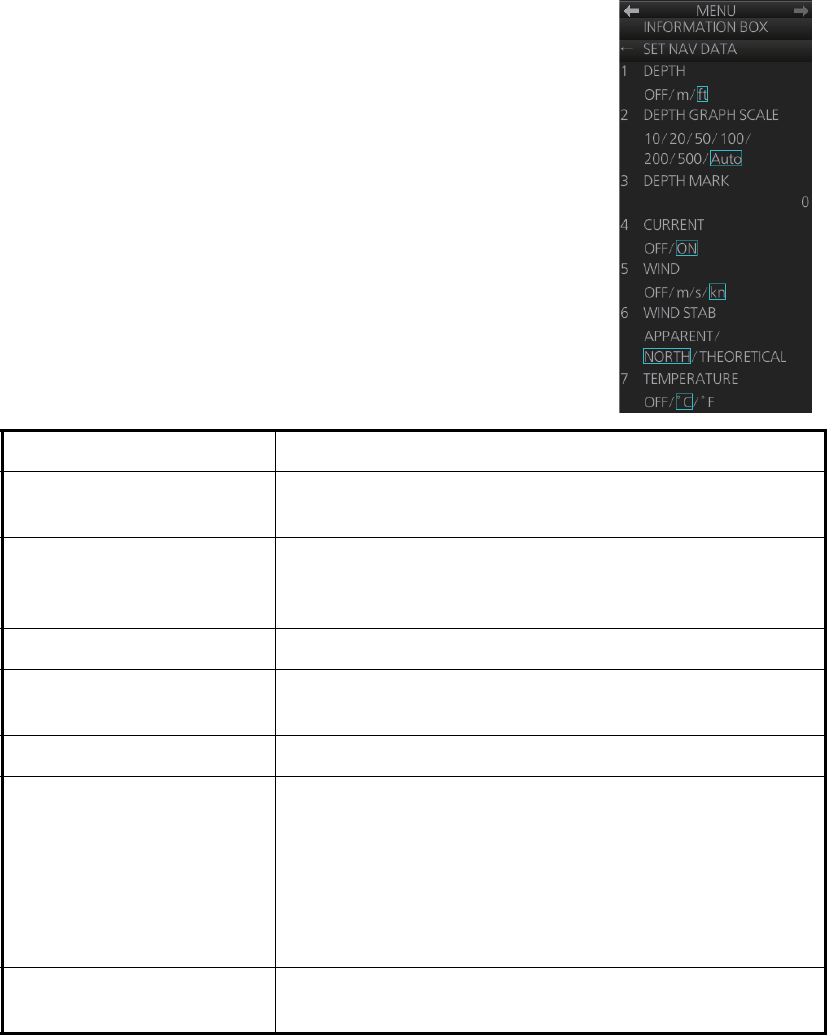
2. RADAR, CHART RADAR OPERATION
2-41
2.28.3 How to turn NAV data on/off
Wind, depth, ocean current and water temperature may be
set up as follows:
1. Open the menu then select [4 INFORMATION BOX].
2. Select [2 SET NAV DATA].
3. Set up the nav data referring to the table below.
Note: Appropriate sensors are required to display any data. The wind vector
shows a direction from which the wind blows in, relative to own ship heading, and
is labeled "T *". Wind velocity is a true wind speed as a result of compensating for
own ship's speed and orientation. Ocean current (tide) is shown relative to bow in
head-up, cursor gyro and course-up, and reference to North in north-up and true
motion.
4. Close the menu.
Item Description
[1 DEPTH] Selects the unit of depth measurement, or turn depth indi-
cation off.
[2 DEPTH GRAPH SCALE] Selects depth scale range. The depth for the last 30 min-
utes is plotted with a yellow line. The [Auto] setting auto-
matically adjusts the scale according to depth.
[3 DEPTH MARK] Selects the depth at which to show the depth mark.
[4 CURRENT] Turns the current (tide) display on (current relative to
North) or off.
[5 WIND] Selects the unit of wind speed measurement.
[6 WIND STAB] Selects Wind vector format, among three choices:
[APPARENT]: Apparent wind measured by wind meter,
with ship's bow as reference.
[NORTH]: Apparent wind minus ship's movement, with
North as reference.
[THEORETICAL]: Apparent wind minus ship's movement,
with ship's bow as reference.
[7 TEMPERATURE] Selects the unit of water temperature measurement, or
turns water temperature indication off.
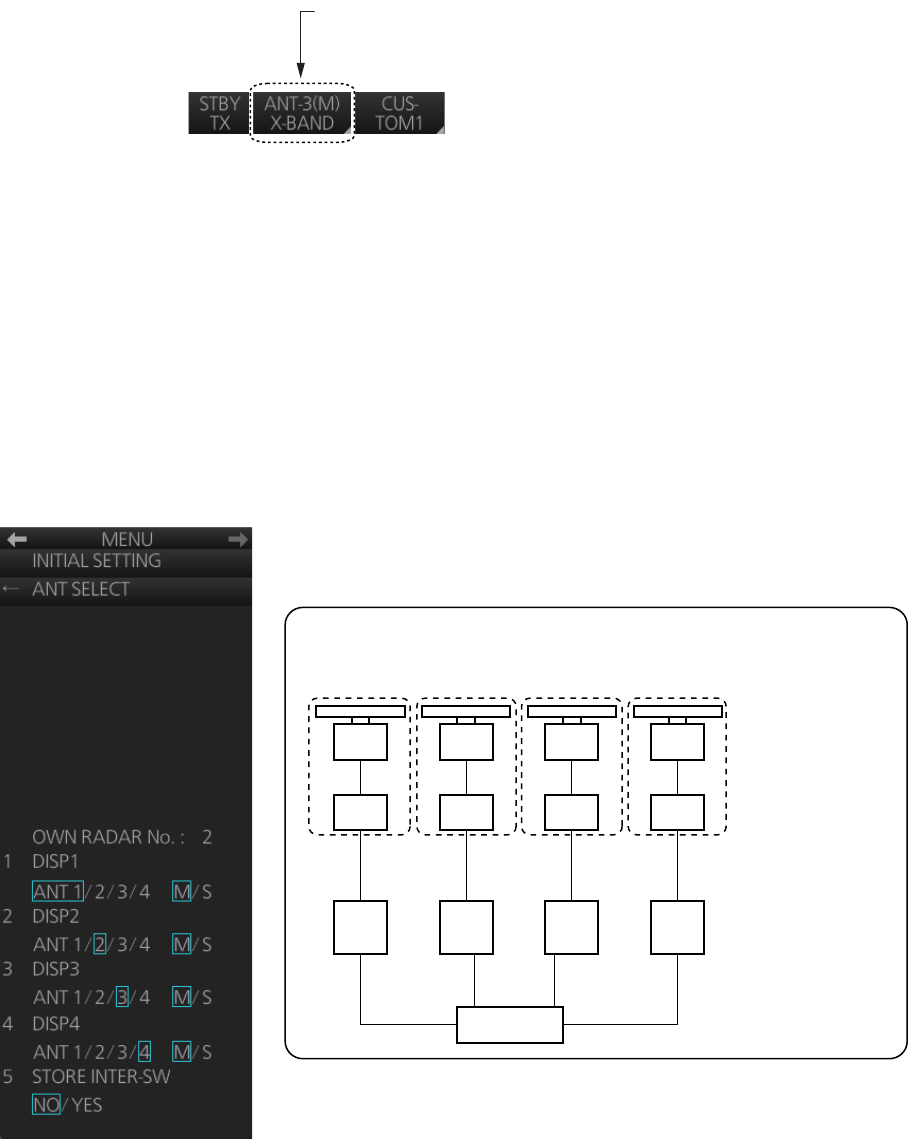
2. RADAR, CHART RADAR OPERATION
2-42
2.29 Interswitch
The interswitch uses a network to transfer multiple radar signals to the monitor units
connected in the network. A master/slave relation can be set for a single radar signal
and that signal can be shown on multiple displays. Up to four antennas and four dis-
play units can be connected. Set the radar display and antenna groups from the [An-
tenna] button on the Status bar.
When you switch to a different antenna, the heading skew and timing adjustment (set
at installation) for that antenna are automatically applied.
The [Antenna] button on the Status bar shows current antenna selection.
Note: Switch to a different antenna or change the interswitch settings in the standby
mode.
2.29.1 Displaying antenna information
The [ANT SELECT] menu shows:
• Radar band, output power and antenna position of each antenna currently powered.
(If an antenna is not powered, its data area is blank.)
• Current antenna and display combinations.
To show antenna information, open the menu then select the [8 INITIAL SETTING]
and [5 ANT SELECT] menus.
[Antenna] button
- ANT-3(M): Antenna no. 3, (M)=Master (or (S)=Slave)
- X-BAND (or S-BAND)
←
←
←
ANT 1 : X-BAND
25UP Main Top
ANT 2 : S-BAND
30UP Main 2nd
ANT 3 : X-BAND
12 Fore
ANT 4 : X-BAND
12 Aft
Using the information displayed in this example the antenna system configuration would
look something like this.
ANT1 ANT2 ANT3 ANT4
Antenna Unit
Power Supply Unit
Processor Unit
HUB-3000
DISP1 DISP2 DISP3 DISP4

2. RADAR, CHART RADAR OPERATION
2-43
2.29.2 How to preset antenna and display combinations
You can preset the antenna and display combinations for each antenna and display
in the radar system. As an example, the procedure below shows how to select the no.
1 antenna unit for the no. 2 display unit.
1. Open the menu then select the [8 INITIAL SETTING] and [5 ANT SELECT]
menus.
2. Select the display unit for which to select an antenna (at the next step). For exam-
ple, select [DISP2] to select the no. 2 display unit.
3. Select [ANT 1] and [M].
4. Repeat steps 2 and 3 to set other display and antenna combinations.
5. Click [STORE INTER-SW] and select [YES] to save your selections.
6. Close the menu.
Antenna selection considerations
• An antenna unit cannot be controlled from multiple display units. Select one Master
display unit for one antenna unit. If two antenna units are set as masters, the display
last-set as master becomes the master and all other displays are automatically
changed to slave.
• An antenna unit without a Master display cannot be selected on the sub display
units. If there is no antenna unit set as master, the lowest number display is auto-
matically set as master.
• If the Alert 750 “EXT Radar COM Error” appears, do one of the following as appli-
cable:
• If only your antenna is not displayed on the [ANT SELECT] display, the LAN line
in the Processor Unit may be faulty. In this case, use the standalone mode.
• If the antenna that was in use does not appear on the [ANT SELECT] display, the
LAN line in other Processor Unit may be faulty. In this case, see the preceding
page for how to select a different antenna unit.
• When the Network fails, the Interswitch does not work, but standalone operation is
possible.
• Radar functions are controlled independently, dependently or commonly depending
on selection as Master or Slave (see the table on the next page).
• When connecting with the FAR-2xx7 series radar, the maximum number of ac-
quired targets ([NUMBER OF TT]) should be set to 100 in the [RADAR INSTALLA-
TION] menu. For details, see the installation manual.
• Do not use the interswitch function when the icing prevention feature (see
section 2.40) is active.
Compatibility of display and operation
• When connecting with FCR-2xx9 series radar
The FCR-2xx9 is compatible with the FAR-3xx0 in display and operation. For exam-
ple, when switching the antenna from FAR-3xx0 to FCR-2xx9, the image for FCR-
2xx9 is displayed on the screen and each function is operative, and vice versa.

2. RADAR, CHART RADAR OPERATION
2-44
• When connecting with FAR-2xx7 series radar
When switching the antenna from FAR-3xx0 to FAR-2xx7, the image for FAR-2xx7
is displayed on the screen and each function is operative. However, when switching
the antenna from FAR-2xx7 to FAR-3xx0, the following functions are not operative.
• Automatic Clutter Elimination (ACE) function
• Selection of the transmit frequency by the [TX CH] button for solid state radar
2.29.3 How to select an antenna
For the ship that carries multiple antennas, you can select the antenna to use. Click
the [Antenna] button to select the antenna.
Radar Functions Control Master Display Option Slave Display Option
AIS function
Independent
Desired value can be set
Desired value can be set
Brilliance
Echo trails
EBL
Lat/long data
Orientation mode
Speed data
TT, AIS on/off
TT, AIS track interval
Vector mode
Vector time
VRM
Range
Reference Point
A/C SEA
A/C RAIN
Auto Rain
Gain
Echo stretch
Echo averaging
IR
Automatic Clutter
Elimination (ACE)
Picture setting
(Customize echo)
Dependent control Cannot control
Performance monitor
SART
STBY/TX
Tuning
TT Lost alert
Common control Item commonly controlled Item commonly controlled
TT CPA/TCPA alert
TT ALARM ACK
TT acquire
TT/AIS AZ
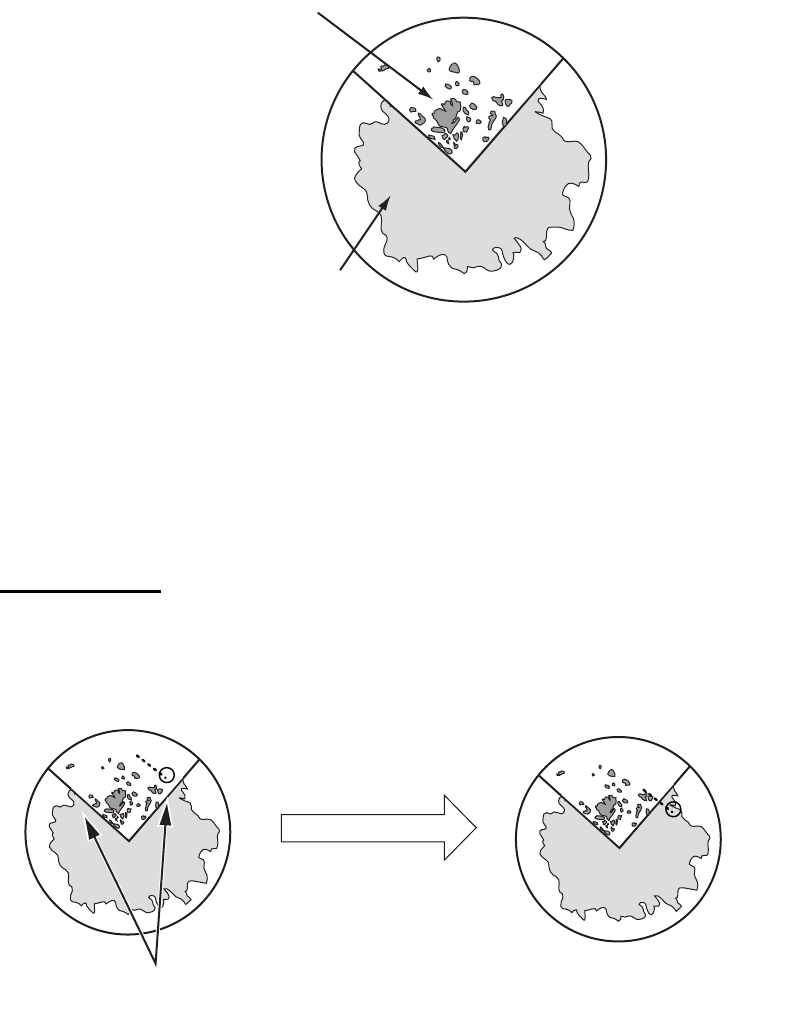
2. RADAR, CHART RADAR OPERATION
2-45
2.30 Dual Radar (B-type only)
When installing two FAR-3xx0 series radars, the image from both radars (main radar
and external radar) may be shown together on one radar display. This allows you to
take advantage of the best characteristics each type of radar has to offer. The dual
radar function is available only for the B type.
Example image of dual radar
The following should be done from the [RADAR INSTALLATION] menu at the time of
installation in order to enable the dual radar display:
• Set the display area on both the main radar and the external radar ([2 COMBINE
SECTOR], [3 COMBINE RANGE]).
• Select the number of external radar to use ([4 EXT RADAR]).
• Turn the dual radar function on ([5 COMBINE FUNC] is set to [ON]).
TT information
When a TT target crosses over the boundary line of the display area, its information is
passed to the other radar display. Tracking on the TT continues. The number of the
antenna which acquires a TT target is displayed in front of the TT number.
Image from main radar
Image from external radar
TT
TT
Boundary lines of display area TT information is passed to the
other radar display. Tracking on
the TT continues.
TT target crosses over the
boundary line of the display area.
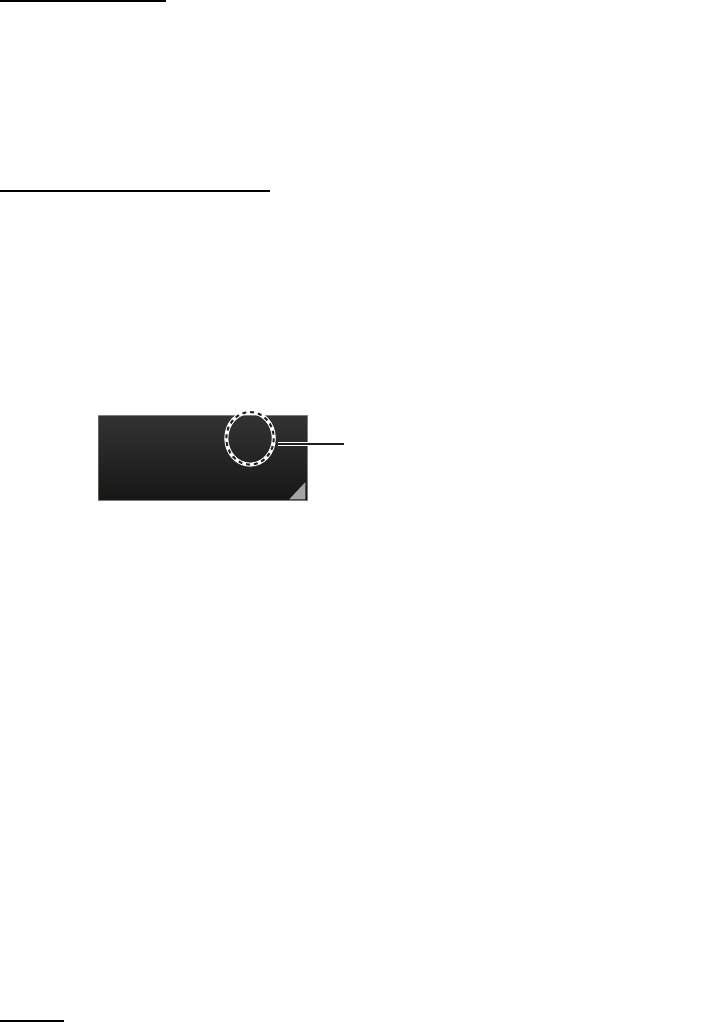
2. RADAR, CHART RADAR OPERATION
2-46
2.30.1 How to enable or disable the dual radar display
Turn on the power of main radar and external radar to set them in standby. The dual
radar function is not available when one of two radars is in TX (transmit) state or turned
off.
From the menu
1. Open the menu then select [1 ECHO] and [9 DUAL RADAR].
2. Select [COMBINE] to enable the dual radar display. To disable the dual radar dis-
play, select [OFF].
3. Close the menu.
From the antenna button
1. Right-click the [Antenna] button on the Status bar to show the context-sensitive
menu.
2. Select [Dual Radar].
3. Select [Combine]. To disable the dual radar display, select [Off].
"(D)" appears in the [Antenna] button on the Status bar when the dual radar display is
enabled.
2.30.2 Operating considerations for the dual radar display
In the dual radar mode, you can operate the antenna displayed in the [Antenna] button
on the Status bar. To operate the other antenna, select it in the [Antenna] button on
the Status bar.
You can toggle each radar between standby and TX in the dual radar display. When
switching to the standby mode, the Alert 730 "EXT Radar STBY" appears and the ra-
dar echoes are not displayed.
The following functions are based on the settings in the radar which enables the dual
radar display. These settings are common with two radars.
Notes
• The dual radar function is available between two FAR-3xx0 series radars using the
LAN. FAR-2xx7 and FCR-2xx9 are not available.
• When a transmission error occurs between two radars in the dual radar mode, the
Alert 750 "EXT Radar COM Error" appears and the dual radar function is turned off.
• The dual radar display is not available on the external radar which overlays the main
radar image even though the dual radar is turned on.
• If TT data (two places) are passed between two radars (see page 2-45), TT targets
are lost in the external equipment using TT informations (TTM) of this equipment.
• Off-center display • CU/TM reset
• Range scale • Trail settings
• Presentation mode • TT lost target filter
• Electronic chart on/off
ANT-1(D)
X-BAND
"(D)" appears on the [Antenna] button
when the dual radar display is enabled.

2. RADAR, CHART RADAR OPERATION
2-47
Restrictions
The followings are the restrictions of the dual radar function.
• A REF (reference) mark can be entered on the display of the main radar but not the
external radar.
• TT targets can be acquired manually. [TT SELECT] is set to manual acquisition.
• The reference position is set to [CCRP] (see section 2.33). Set the same CCRP po-
sition between two radars at the time of installation.
• [ECHO AREA] is set to [CIRCLE] (see section 2.38).
• The following functions are not available in the dual radar mode.
• Performance monitor • TT simulation mode
• SART • Icing prevention
• Tune initialize • Interswitch
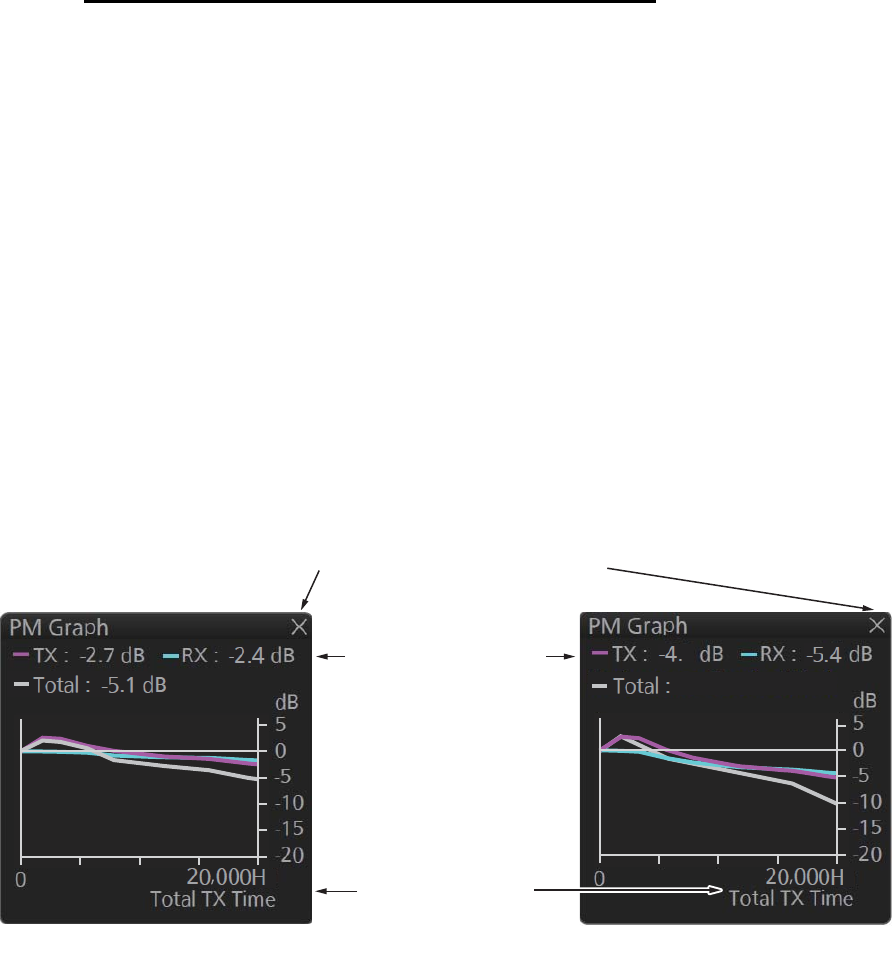
2. RADAR, CHART RADAR OPERATION
2-48
2.31 Performance Monitor
The performance monitor, installed in the antenna unit, produces a visual indication
on the radar display screen when the radar transmitter power and the radar receiver
sensitivity and tuning are within the prescribed limits. A graph is also provided and it
shows degradation of TX/RX/Power over time.
How to activate, deactivate the performance monitor
To activate, deactivate the performance monitor, do the following.
Note: Activate, deactivate the performance monitor in TX (transmit) state.
1. Set the radar in TX (transmit) state.
2. Open the menu then select the [1 ECHO] menu.
3. Select [6 PERFORMANCE MON] (B type) or [5 PERFORMANCE MON] (IMO and
A types).
4. Select [ON] or [GRAPH ONLY] as appropriate.
[ON]: Activate the performance monitor. The performance monitor graph is dis-
played.
[GRAPH ONLY]: Display the performance monitor graph. (The performance mon-
itor is not executed.)
5. Select [0], [2], [3], [5] or [6] in [ARC] (see "How to set the number of arcs" on
page 2-49).
6. Close the menu after 30 seconds.
7. When selecting [ON] or [GRAPH ONLY], the performance monitor graph is dis-
played in the information box.
8. Open the menu then select the [1 ECHO] menu.
9. Select [6 PERFORMANCE MON] (B type) or [5 PERFORMANCE MON] (IMO and
A types).
10. Select [OFF] to deactivate the performance monitor.
11. Close the menu. The icon "PM" appears in the indication area (see
paragraph 1.6.1) when the performance monitor is active.
Note: If the blind sector and the direction of the PM antenna overlap one another, turn
off the blind sector in order to display echoes correctly.
A total of 10 dB loss
Value for degradation
of transmission/
reception/total power
Graph for transmission/
reception/total power
Click [X] to close the PM graph.
Total transmission
time
8
-10.2 d
B

2. RADAR, CHART RADAR OPERATION
2-49
The radar is automatically set as follows when the performance monitor is activated.
*1 Gain is automatically set according to [PM GAIN ADJ] if it was adjusted at installa-
tion.
*2 North-up RM is selected when the mode is North-up TM.
*3 The setting is not memorized.
*4 The performance monitor is deactivated if the range is changed.
How to check radar performance
The range scale is automatically set to 24 NM. The radar screen will show arcs. You
can set the number of arcs. If the radar transmitter and receiver are in good working
order in as much as the original state when the monitor was turned on, the innermost
arc should appear between 8.0 NM and 19.8 NM. The performance monitor can ob-
serve a total of 10 dB loss in the transmitter and receiver.
Note 1: The location of the arcs changes with the setting of [ARC].
Note 2: When [ARC] (the number of arcs) is set to [0] (see "How to set the number of
arcs" below), there are no arc indications. Only the performance monitor graph is dis-
played in the information box.
How to set the number of arcs
1. Open the menu then select the [1 ECHO] menu. Select [6 PERFORMANCE MON]
(B type) or [5 PERFORMANCE MON] (IMO and A types).
2. Select [0], [2], [3], [5] or [6] in [ARC].
Item Setting at activation
of PM
Adjustable while PM
is active
Setting at deactivation
of PM
CONDITION Setting stored No Setting before activation
CUSTOMIZE
ECHO
Grayed out, setting
stored
No Return to active display
EAV OFF No Setting before activation
ES OFF No Setting before activation
GAIN 70 *1Yes*3Setting before activation
IR OFF No Setting before activation
LOW LEVEL
ECHO
Setting stored No Setting before activation
NOISE
REJECT
OFF No Setting before activation
OFF center OFF Yes Setting at deactivation
Presentation Mode Setting stored *2Yes Setting at deactivation
PULSE LONG No Setting before activation
RAIN 0 No Setting before activation
RAIN AUTO MAN No Setting before activation
RANGE 24 NM, 24 SM,
48 km, 48 kyd Yes *4Setting at deactivation
SEA 0 No Setting before activation
SEA AUTO MAN No Setting before activation
TUNE AUTO No Setting before activation
VIDEO
CONTRAST
4B No Setting before activation
WIPER OFF No Setting before activation
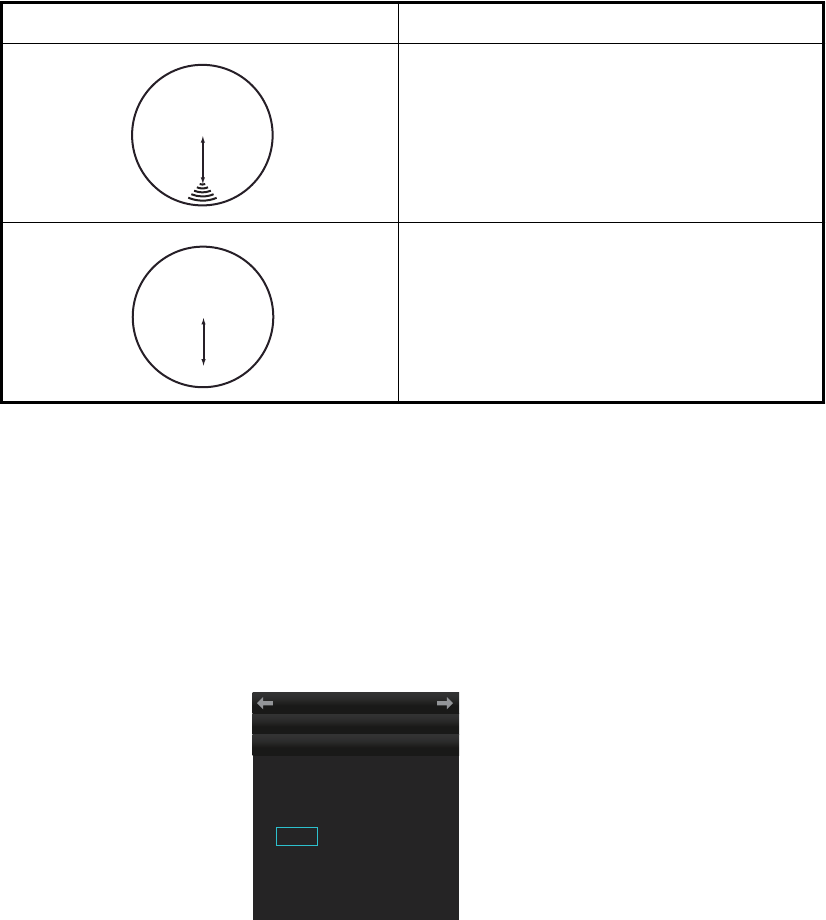
2. RADAR, CHART RADAR OPERATION
2-50
3. Close the menu.
Note: The lengths and location of the arcs may change with the direction in which the
antenna unit is installed. Judge the strength of the echo that appears within 60° from
arc location to confirm if the radar is working properly or not.
Turn off the performance monitor when finished.
The following illustrations in the table are the examples when [ARC] is set to [5].
Note: The location of the arcs changes with the setting of [ARC].
2.32 Magnetron Reset (For A- and B-types)
After replacing the magnetron for the antenna unit, reset the TX time then adjust the
PM gain as follows:
1. Open the menu then select [8 INITIAL SETTING].
2. Select [9 MAGNETRON RESET].
3. Select [1 TX TIME] then set the transmit time to 000000.0H.
4. Select [2 PM GAIN ADJ].
5. Select [AUTO] or [MANUAL].
[AUTO]: PM gain is automatically adjusted. Go to step 7.
[MANUAL]: Set PM gain manually. Go to step 6.
6. Adjust the PM gain manually as follows:
Note: If the blind sector and the direction of the PM antenna overlap one another,
turn off the blind sector before adjusting the PM gain.
Display Transmitter, receiver state
Transmitter: Normal
Receiver: Normal
Transmitter and receiver:
No arc indicates 10 dB loss.
Contact your dealer for advice. (For a mag-
netron radar, have a technician check the
magnetron.)
8.1 NM to
10.1 NM
8.1 NM to
10.1 NM
1 TX TIME
4000H
2 PM GAIN ADJ
AUTO/ 0
INITIAL SETTING
← MAGNETRON RESET
MENU
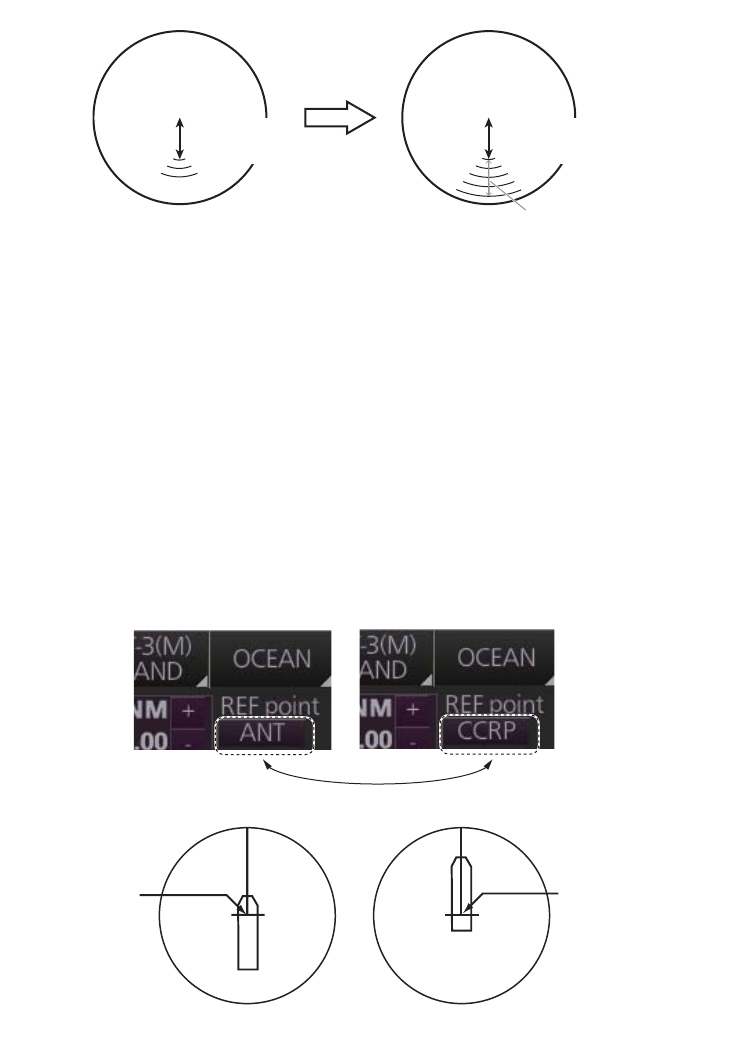
2. RADAR, CHART RADAR OPERATION
2-51
1) Set the radar settings as follows:
2) Adjust the gain so that a slight amount of white noise appears on the screen.
Arcs for the performance monitor appear on the screen.
3) Set [PM GAIN ADJ] so that the outer arc faintly appears. The setting range is
0 to 255. Wait at least eight scans then adjust. The following illustration is an
example when [ARC] is set to [5] (see "How to set the number of arcs" on
page 2-49).
Note: The location of the arcs changes with the setting of [ARC].
7. Close the menu.
2.33 CCRP (Common Consistent Reference Point)
The reference position for measurements (range, bearing, etc.) and markers (heading
line, stern mark, etc.) can be the antenna position or CCRP, which is a location on own
ship to which all horizontal measurements, for example range, bearing, relative
course, relative speed, closest point of approach (CPA) or time to closest point of ap-
proach (TCPA), are normally referenced.
To select the reference position, click the button below [REF point] at the top-left po-
sition to select [ANT] or [CCRP] as appropriate.
The position of the own ship marker changes according to reference position as
above. If the CCRP is positioned outside of the effective display area, the bearing
scale is indicated with the appropriate reduced detail.
• Range: 24 NM • A/C RAIN: OFF (turn off manually)
• Pulse Length: Long • Echo Averaging (EAV): OFF
• A/C SEA: OFF (turn off manually) • Video Contrast: 2-B
Before setup
Before setup
After setup
After setup
Approx. 12.1 NM (10 dB)
8.1 NM to
10.1 NM
8.1 NM to
10.1 NM
Click button to switch
Conning position set
at center of display
Radar antenna
position set at
center of display
ANT position CCRP position

2. RADAR, CHART RADAR OPERATION
2-52
Range and bearing are measured and graphics are drawn according to reference
point as shown in the table below.
Category Item Reference point
CCRP Antenna position
Range and bear-
ing measurement
EBL Range and bearing
measured from
CCRP
Range and bearing
measured from an-
tenna position
VRM
Cursor
PI line
Range ring
Drop mark
Graphics Heading line Drawn from CCRP Drawn from antenna
position
Stern mark
Beam line
Own ship vector
Own ship track
Bearing cursor Drawn with CCRP at
center
Drawn with antenna
position at center
Course, speed Calculated with
CCRP at center
Calculated with an-
tenna position at
center
CPA, TCPA Calculated with
CCRP at center
Calculated with an-
tenna position at
center
BCR, BCT Calculated from bow position
Own ship data Heading Data from sensor, regardless of reference
point selected
Speed
Course over ground
Speed over ground
Own L/L Location of the CCRP
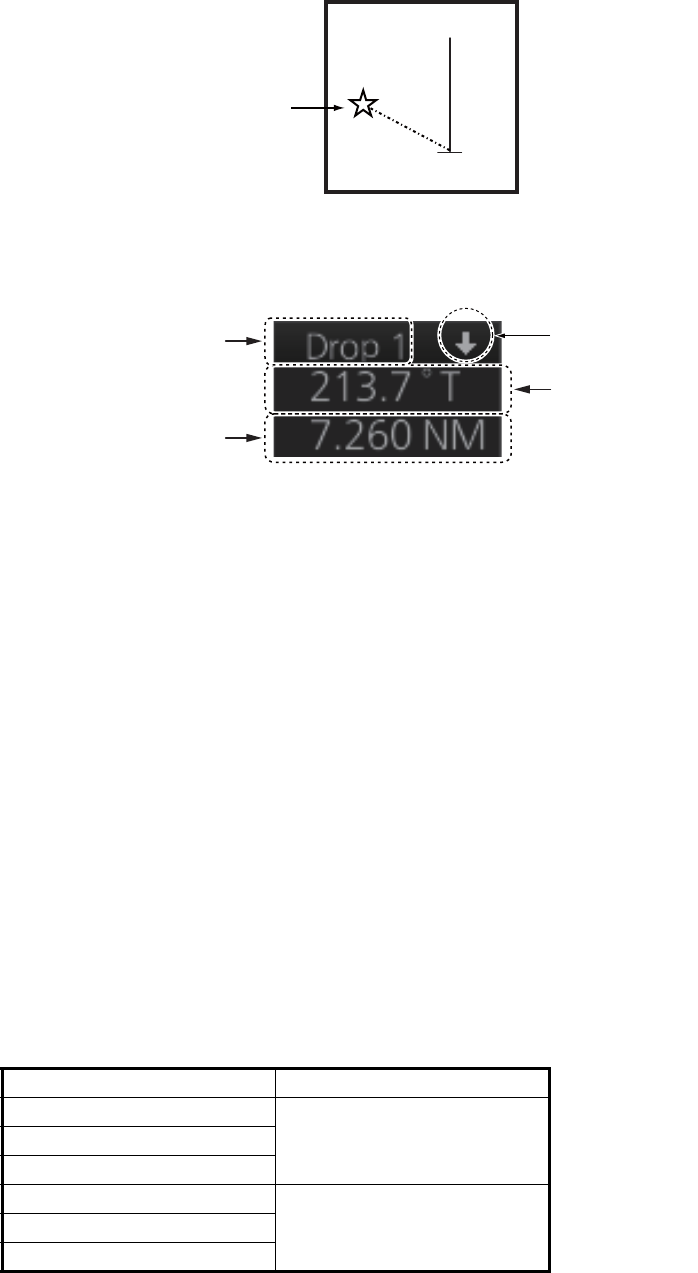
2. RADAR, CHART RADAR OPERATION
2-53
2.34 Drop Mark
The drop mark is used to find the angle and distance from a point to your ship. This
can be useful for marking a point to avoid while navigating to a destination. The drop
marks can be shown or hidden on the screen.
The Drop mark box shows the angle and distance between the drop mark and your
ship.
Note: The drop mark feature is inoperative when position data is lost.
2.34.1 How to show, hide the drop mark box
The drop mark box can be shown or hidden by trackball.
OFF: Click the arrow on the [Drop mark] box or right-click the box and select
[DROPx Off] (x=Drop mark no.).
ON: Click the minimize box.
2.34.2 How to inscribe a drop mark
Click the desired Drop mark box at the bottom of the screen. Click a position on the
display area where to put a drop mark, and a drop mark is inscribed at the position
selected. The angle and distance to the point appear in the corresponding Drop mark
box.
2.34.3 Drop mark bearing reference
The bearing of a drop mark is automatically referenced to True or Relative according
to the orientation mode.
Orientation mode Bearing reference
Head-up RM Relative
STAB Head-up RM
Stern-up RM
Course-up RM True
North-up RM
North-up TM
Drop mark
Drop mark no.
(1 or 2)
Drop angle
Drop distance
Minimize button
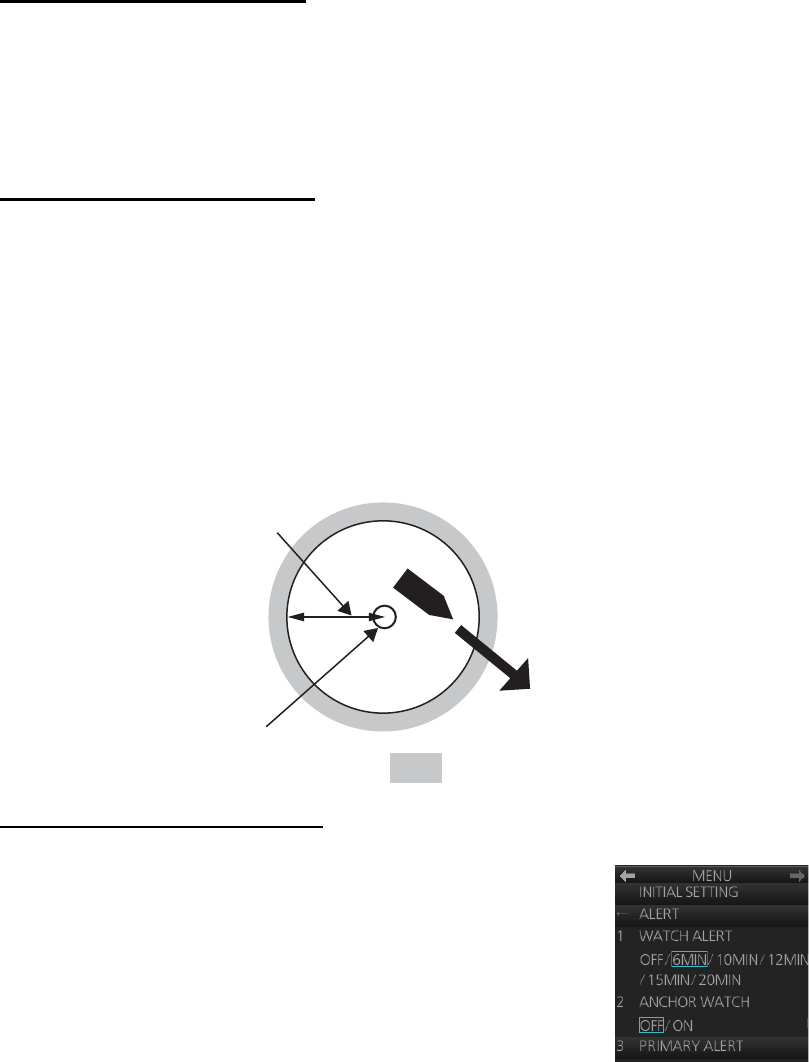
2. RADAR, CHART RADAR OPERATION
2-54
2.34.4 How to erase a drop mark
Erase drop mark from menu
1. Open the menu then select the [5 MAP•MARK] and [1 MARK SETTING] menus.
2. Select [7 DROP MARK] (B type) or [6 DROP MARK] (IMO and A types).
3. Select [ON] or [OFF].
4. Close the menu.
Erase drop mark by trackball
Right-click the applicable Drop mark box to show the context-sensitive menu then se-
lect [Drop1 Off] (or [Drop2 Off]). The drop mark and its data are erased.
2.35 Anchor Watch
The anchor watch is used to monitor if the ship is staying at anchor. If your vessel trav-
els more than the distance set here, the Alert 495 "Anchor Watch Error" appears in the
[Alert] box and the audio alarm sounds.
How to activate anchor watch
1. Open the menu then select [8 INITIAL SETTING] and [4
ALERT] menus.
2. Select [2 ANCHOR WATCH].
3. Select [ON]. Use the scrollwheel to set the alarm radius
(0.01 to 9.99 NM).
4. Close the menu.
Your ship's position, where
you start the anchor watch.
Alarm
setting
: Alarm triggered
0.01NM
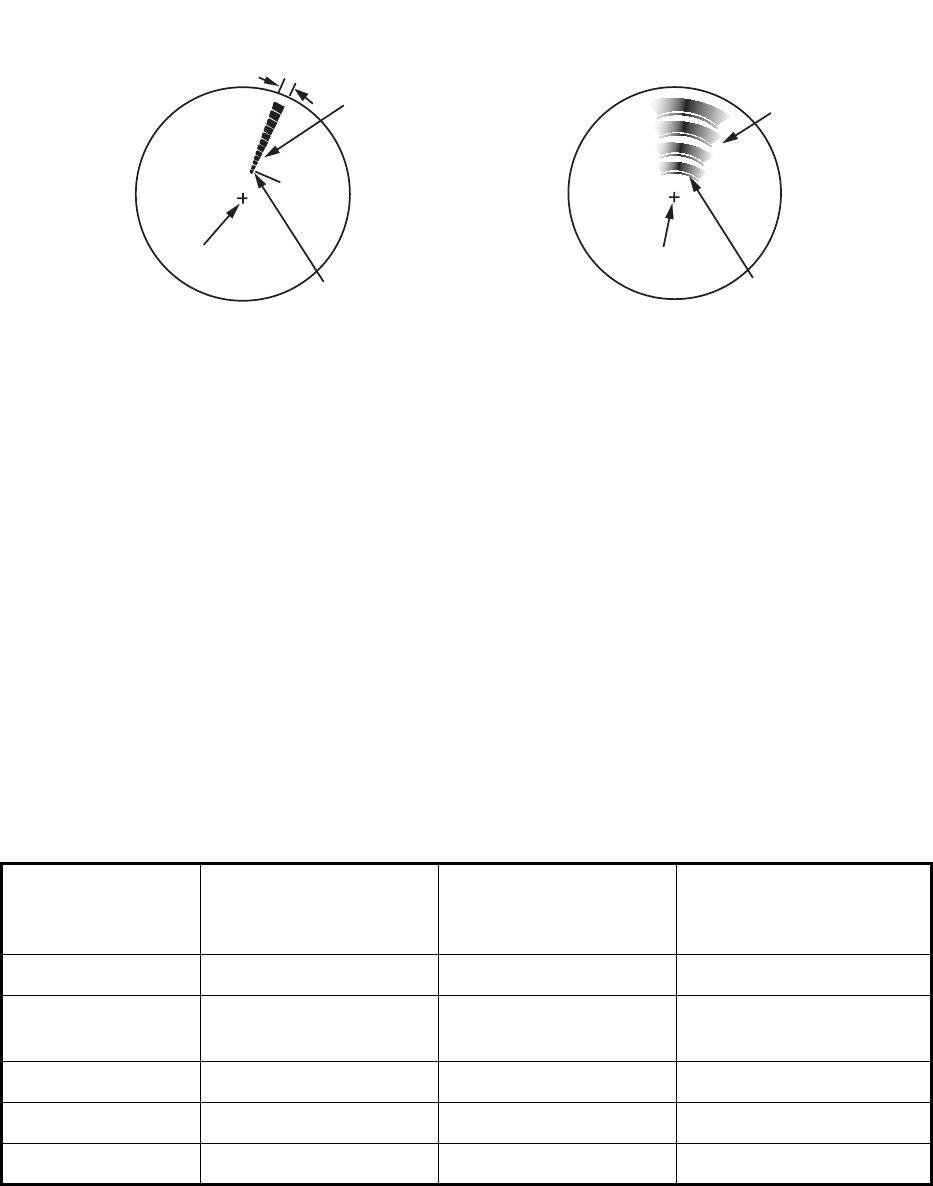
2. RADAR, CHART RADAR OPERATION
2-55
2.36 SART
2.36.1 What is an SART?
A Search and Rescue Transponder (SART) may be triggered by any X-band (3 cm)
radar within a range of approximately 8 NM. Each radar pulse received causes it to
transmit a response which is swept repetitively across the complete radar frequency
band.
2.36.2 How to receive an SART
This radar is equipped with a feature that optimally sets up the radar for SART detec-
tion. This feature automatically detunes the radar receiver out of its best tuning condi-
tion. This erases or weakens all normal radar echoes, but the SART marks are not
erased because the SART response signal scans over all frequencies in the 9 GHz
band. When the radar approaches the SART in operation, the SART marks will en-
large to large arcs, blurring a large part of the screen.
Note: For solid state radar, the SART function is not available.
1. Open the menu then select the [1 ECHO] menu.
2. Select [7 SART] (B type) or [6 SART] (IMO and A types).
3. Select [ON].
4. Close the menu. The icon "SART" appears in the indication area (see
paragraph 1.6.1) when the SART function is active.
When the SART is activated the radar controls are automatically set as follows.
Item Setting at activation
of SART feature
Adjustable during
activation of SART
feature
Setting at deactivation
of SART feature
CONDITION Setting stored Yes Setting at deactivation
CUSTOMIZE
ECHO
Grayed out, setting
stored
No Return to active display
EAV OFF No Setting before activation
ES OFF No Setting before activation
GAIN Setting stored Yes Setting at deactivation
Radar antenna beamwidth
Screen A: When SART is distant Screen B: When SART is close
Position of SART
24 NM 1.5 NM
Own ship position
Own ship position
Echo from SART
(Lines of 12 dots
are displayed in
concentric arcs.)
Own ship position
Own ship position
Position of SART
Echo from SART
(Lines of 12 dots
are displayed in
concentric arcs.)
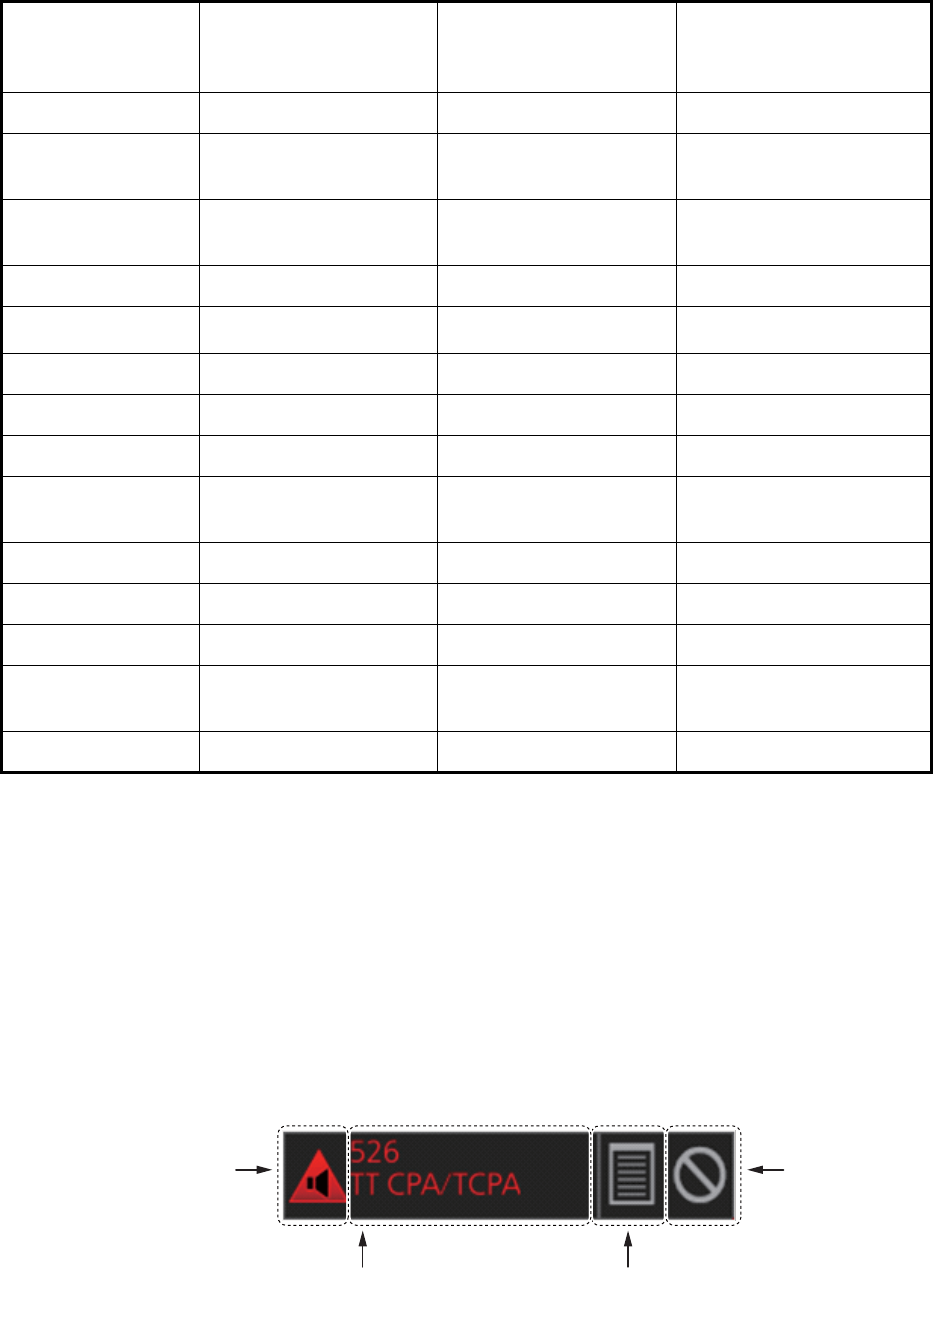
2. RADAR, CHART RADAR OPERATION
2-56
*1 North-up RM selected when the mode is North-up TM.
*2 The SART feature is deactivated if the range is changed.
2.37 Alert Box, Alert List
2.37.1 Alert box
When an alert condition is found, the applicable alert message and alert ID appear in
the [Alert] box. For the alarm- and warning-type alerts a buzzer sounds. The [Alert] box
is composed of the four items shown in the figure below. See chapter 20 for details.
IR OFF No Setting before activation
LOW LEVEL
ECHO
Setting stored Yes Setting at deactivation
NOISE
REJECT
OFF No Setting before activation
OFF center OFF Yes Setting at deactivation
Presentation Mode Setting stored *1Yes Setting at deactivation
PULSE LONG No Setting at deactivation
RAIN Setting stored Yes Setting at deactivation
RAIN AUTO MAN No Setting before activation
RANGE 12 NM, 12 SM, 24 km,
24 kyd Yes *2Setting at deactivation
SEA Setting stored Yes Setting at deactivation
SEA AUTO Setting stored Yes Setting at deactivation
TUNE Setting stored Yes Setting at deactivation
VIDEO
CONTRAST
Setting stored Yes Setting at deactivation
WIPER Setting stored Yes Setting at deactivation
Item Setting at activation
of SART feature
Adjustable during
activation of SART
feature
Setting at deactivation
of SART feature
Alert message
(Alert ID and alert name)
Alert list/log icon
(Click to display.)
Buzzer stop
icon (Click to
stop buzzer
temporarily.)
A
lert state
icon
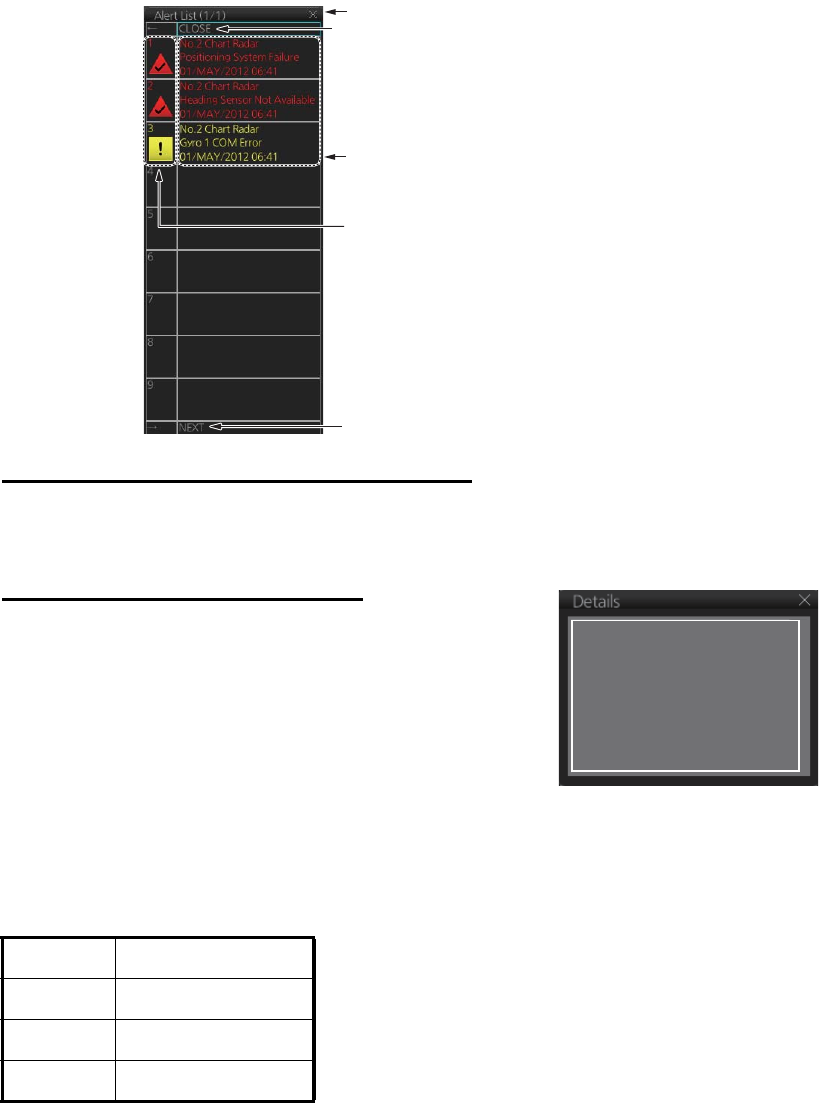
2. RADAR, CHART RADAR OPERATION
2-57
2.37.2 Alert list
The [Alert List] displays the status of the latest 900 system alerts, in order of genera-
tion, latest to the earliest. To display the list, click the Alert list/log icon in the [Alert]
box. The Alert list/log icon is light-blue when the list is displayed. A maximum of nine
alerts are shown per page. Unacknowledged alerts are displayed in flashing red
(alarm) or flashing yellow-orange (warning). The ZDA sentence is required to display
time in the list.
How to acknowledge or rectify from the list
Control Unit: Press appropriate numeric key.
Trackball module: Click alarm name.
How to find details about an alert
Click the status icon in the list to show details about an
alert.
2.37.3 Changing priority of primary alerts
Alerts are categorized and prioritized as shown below.
If desired, you can specify the events that are to have the same priority as “Alarm”.
1. Open the menu then select the [8 INITIAL SETTINGS] and [4 ALERT] menus.
Priority Alert category
High Alarm
Middle Warning
Low Caution
• Click to close list. (Press ← on the
Control Unit to close list.)
• [BACK] shown when there are two
or more pages. Switch to previous
page in multiple page displays.
Switch to next page in multiple page
displays. (Not shown when only one
page exists.)
The name of the alert not
acknowledged or not rectified.
Status icon
Click to close list.
Alert Number : 255
Source: No. 2 Chart Radar
Description: Gyro 1 COM Error
Detail : Gyro 1 COM Error
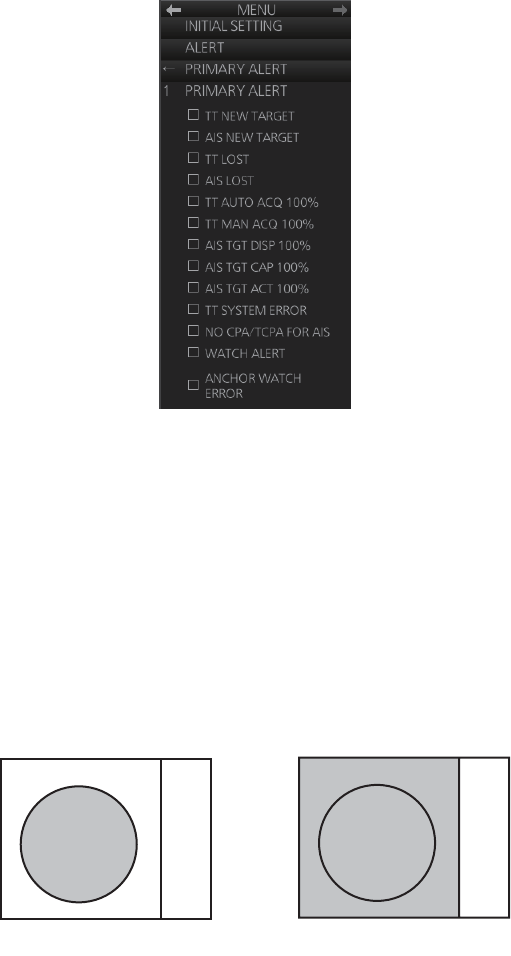
2. RADAR, CHART RADAR OPERATION
2-58
2. Select [3 PRIMARY ALERT].
3. Click the box to the left of an alarm name to show a circle to give that alarm the
same priority as the alert category "Alarm."
4. Close the menu.
Note: The priority is immediately changed for an inactive alert. For an active alert, the
priority selected becomes effective when the alert is acknowledged and regenerated.
2.38 Echo Area
The echo display area for the B-type radar can be selected for [CIRCLE] or [WIDE].
To select the echo display area type to use, open the menu, select the [1 ECHO] menu
then set [2 ECHO AREA] to [CIRCLE] or [WIDE] as appropriate.
2.39 Echo Color
The default echo color is yellow. Echo color is also available in the following colors:
B type: Yellow, green, white, amber, and “color”. “Color” displays echoes in red, yel-
low or green corresponding to the signal levels of strong, medium and weak.
IMO and A types: Yellow, green and white.
To select the echo color, open the [1 ECHO] menu then select desired color from [3
ECHO COLOR] (B type) or [2 ECHO COLOR] (IMO and A types).
CIRCLE WIDE
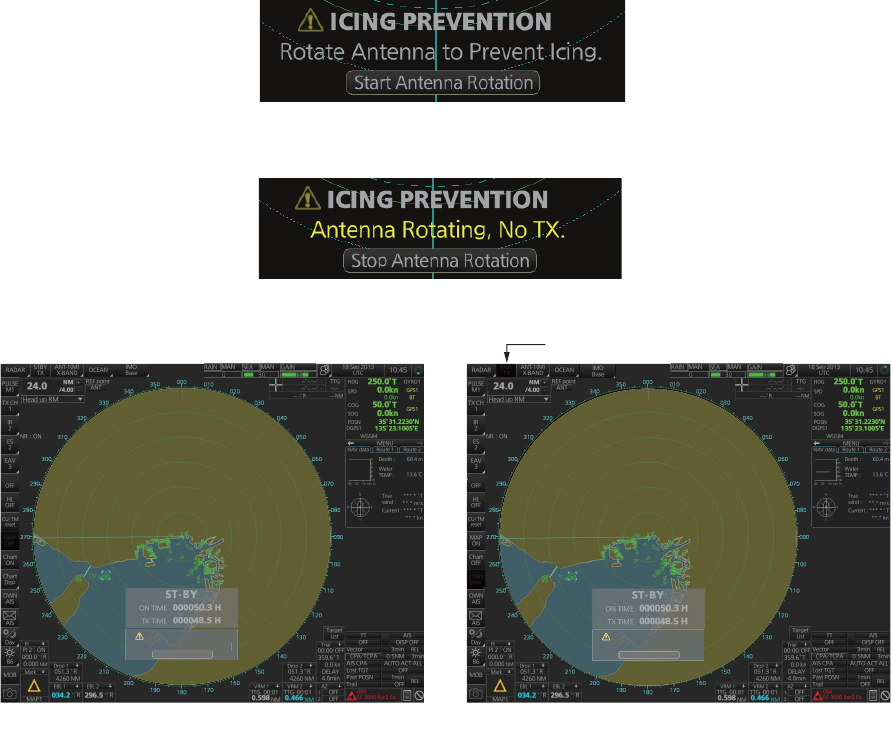
2. RADAR, CHART RADAR OPERATION
2-59
2.40 Icing Prevention
You can rotate the antenna (24 rpm) without transmission to keep the antenna from
freezing.
1. Open the menu then select the [8 INITIAL SETTING] menu. Select [9 ICING PRE-
VENTION] (IMO type) or [0 ICING PREVENTION] (A and B types).
2. Select [ON]. The following message appears at the bottom of the screen.
3. Click [Start Antenna Rotation] to rotate the antenna without transmission. The
message changes as follow.
To stop the antenna rotation, click [Stop Antenna Rotation].
With this feature active and the antenna stopped, pushing the STBY/TX key on the
Control Unit or click the [STBY TX] button on the Status bar rotates the antenna and
transmits pulses. Operating one of the above-mentioned controls again stops trans-
mission but the antenna rotates.
When the antenna stops When the antenna rotates
[STBY TX] is grayed out.
ICING PREVENTION
Rotate Antenna to Prevent Icing.
Start Antenna Rotation
ICING PREVENTION
Antenna Rotating, No TX.
Stop Antenna Rotation
ACE ACE
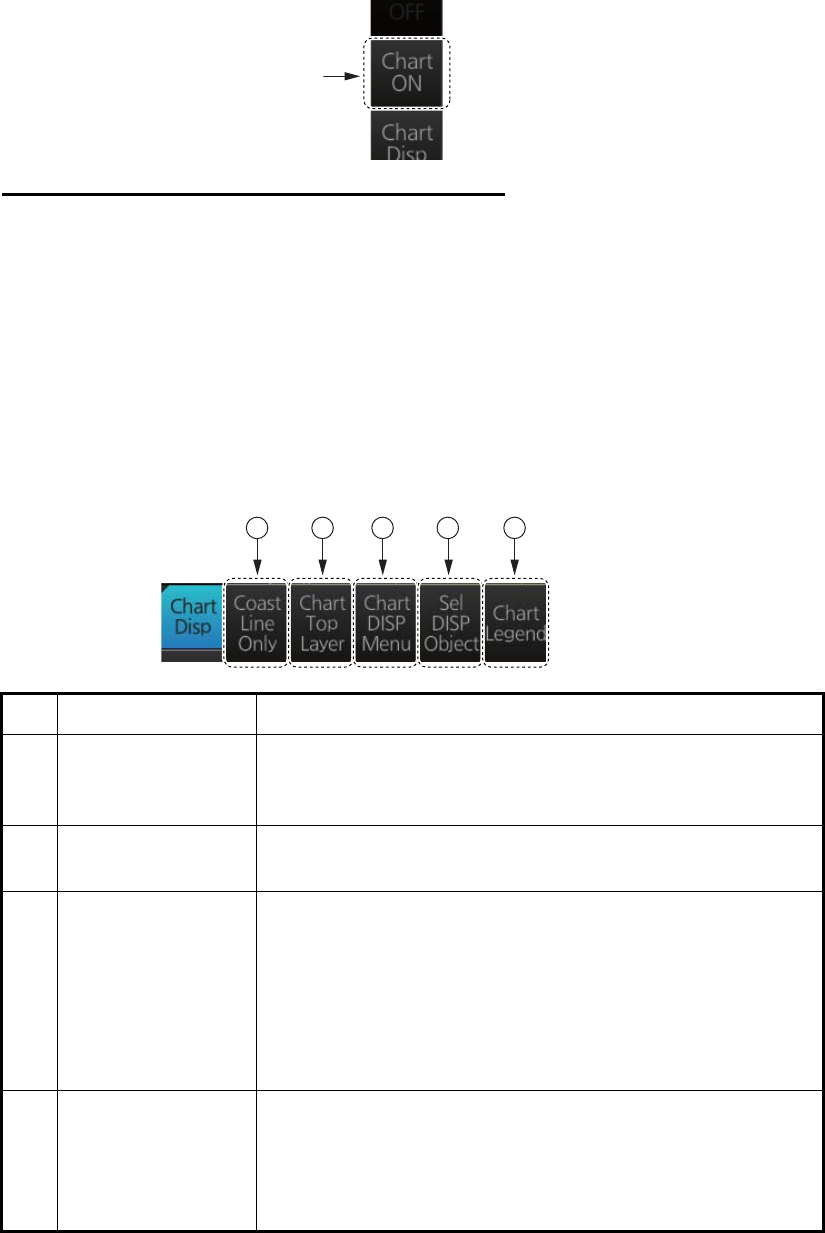
2. RADAR, CHART RADAR OPERATION
2-60
2.41 Chart Radar Functions
2.41.1 How to switch between radar and chart radar modes
Click the [CHART ON/OFF] button on the InstantAccess bar to show or hide the chart.
Indication on button and corresponding mode
[Chart ON]: Chart radar mode active. (Chart and radar picture are displayed.)
[Chart OFF]: Radar mode active. (Only the radar picture is displayed.)
When the GPS position is lost, the chart radar mode cannot be used. When this oc-
curs, the label on the button shows [Chart OFF] and the button is grayed out.
2.41.2 How to show or hide chart objects
The [Chart Disp] button on the InstantAccess bar has several buttons which control
chart object visibility.
No. Item Function
1 [Coast Line Only] Hold down the left button to temporarily display only the
coastline. Chart symbols (depth contours, navigation buoys,
etc.) are temporarily erased from the screen.
2 [Chart Top Layer] Hold down the left button to temporarily put the chart objects
(buoy, lighthouse, etc.) on the top layer.
3 [Chart DISP Menu] Show the [CHART DISPLAY] menu, where you set safety
contours, safety depth, etc. See the figure on the next page
for the content of this menu and see section 8.2 "How to
Control Visibility of Chart Objects" for details.
Note: This menu can also be shown by right-clicking the
[CHART ON/OFF] button and selecting [Chart Display
Menu].
4 [Sel DISP Object] Show the [SEL DISPLAY OBJECT] menu, where you can
select the chart objects and text to show or hide. See the
next page for the menus and see section 8.3 "How to Con-
trol Visibility of Symbols, Features" (symbol display) for de-
tails.
[Chart
ON/OFF]
button
1 2 3 4 5
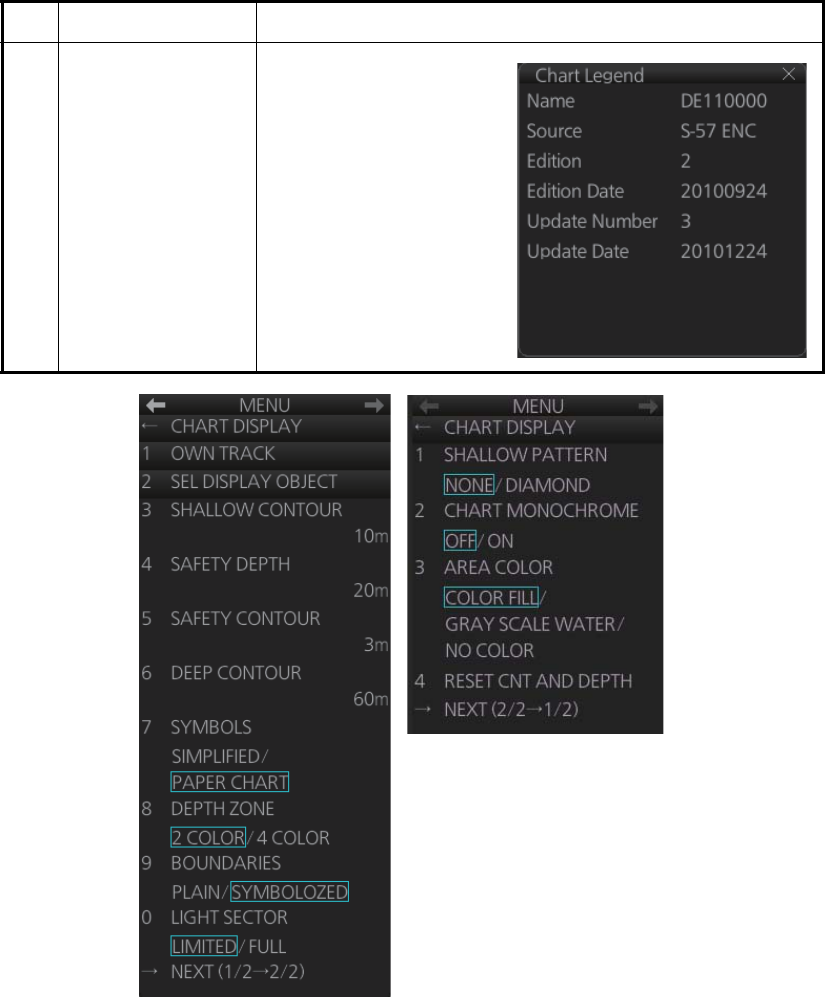
2. RADAR, CHART RADAR OPERATION
2-61
[CHART DISPLAY] menu
5 [Chart Legend] Show the chart legend
for the current chart. See
chapters 9 and 10 for a
description of the chart
legends.
No. Item Function
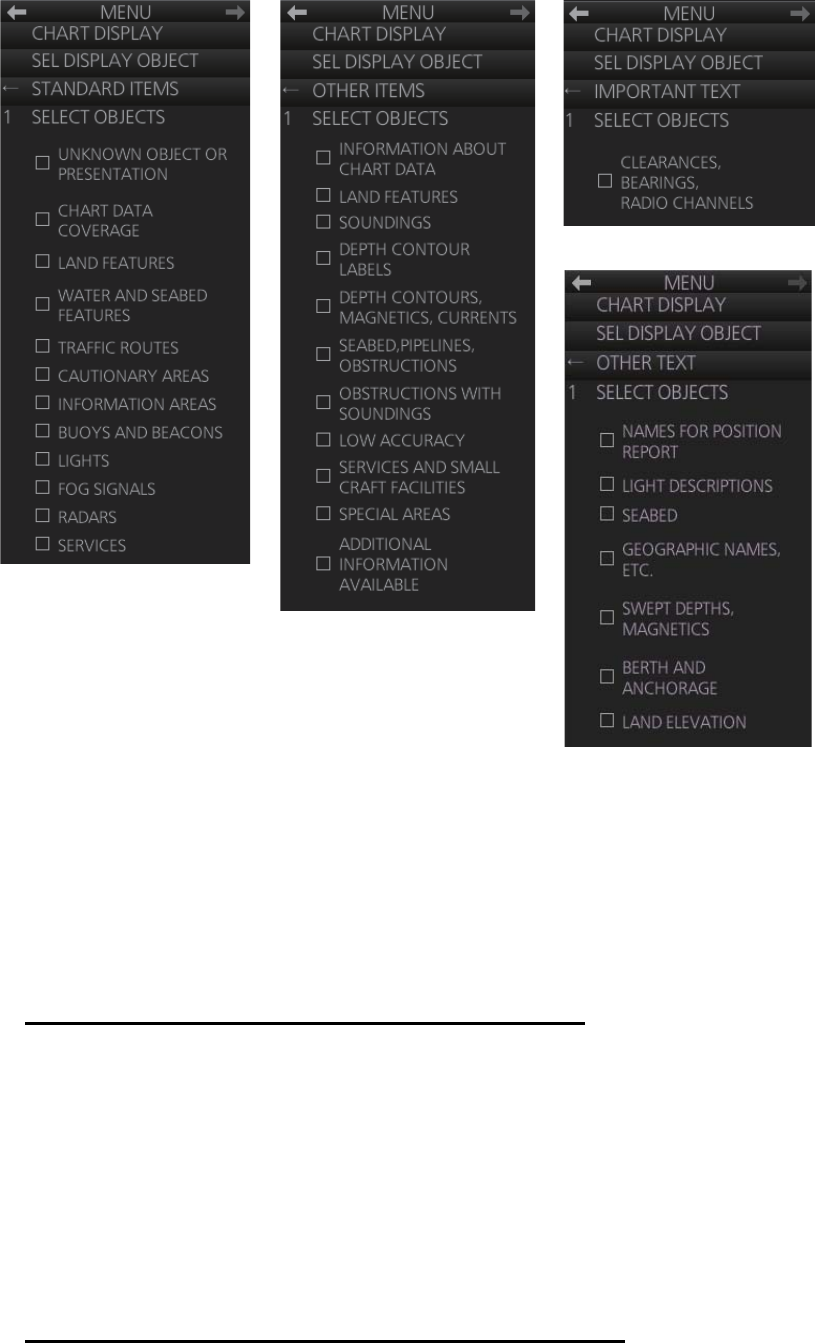
2. RADAR, CHART RADAR OPERATION
2-62
[SEL DISPLAY OBJECT] menu
2.41.3 How to create and recall custom sets of chart display objects
You can create one custom set of chart display objects and recall them when required.
For example, you can create a custom set of chart display objects to display when you
navigate a certain coastline.
How to create a custom set of chart display objects
1. Open the menu then select the [6 CHART DISPLAY] and [2 SEL DISPLAY OB-
JECT] menus.
2. Open the [2 STANDARD ITEMS], [3 OTHER ITEMS], [4 IMPORTANT TEXT] and
[5 OTHER TEXT] menus and turn objects and text on or off as appropriate.
3. Click [SEL DISPLAY OBJECT] on the menu.
4. Select [1 SAVE TO PERSONAL] to save the settings. The confirmation message
"Attention: Do you wish to overwrite current settings to PERSONAL?" appears.
5. Click the [OK] button to save the settings.
How to activate the custom set of chart display objects
Click the [Chart database] button (see paragraph 2.41.4) on the Status bar then select
[PERSONAL].
[STANDARD ITEMS]
[OTHER ITEMS]
[OTHER TEXT]
[IMPORTANT TEXT]
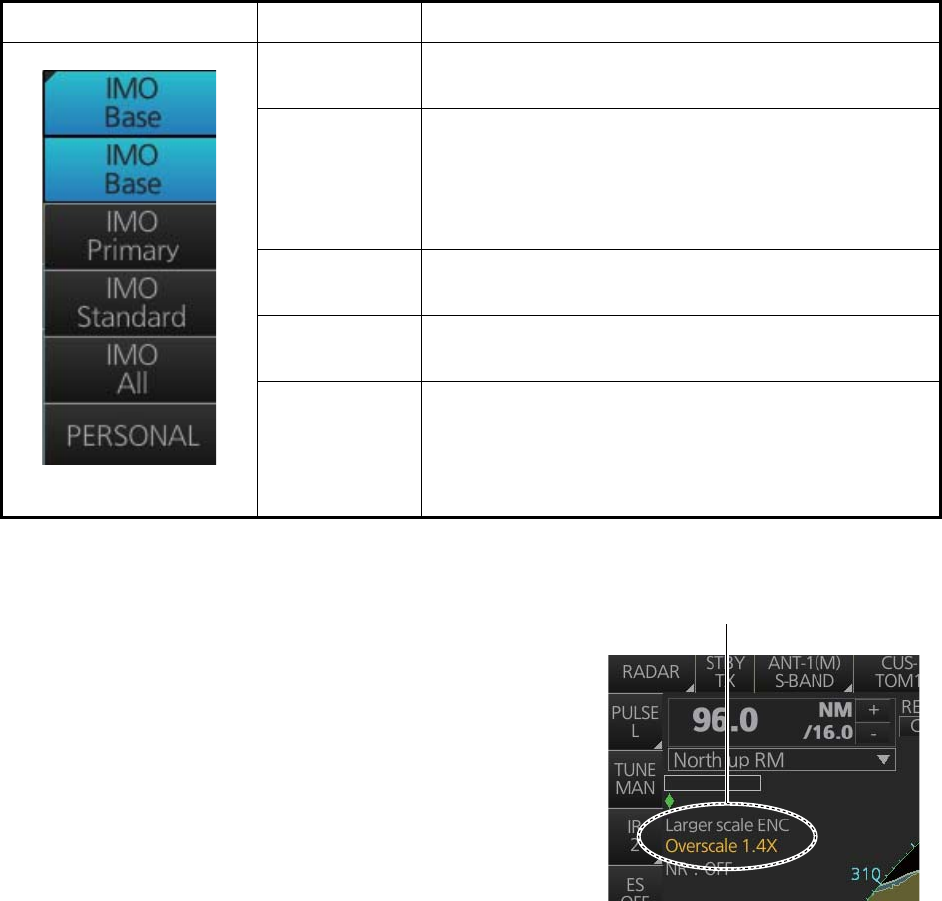
2. RADAR, CHART RADAR OPERATION
2-63
2.41.4 Chart database information
You can select the quantity of objects and text to display on the chart radar screen,
with the [Chart database] button on the Status bar. There are four different pre-defined
settings available and one user-definable ([PERSONAL]). Indication of selected set-
ting appears on the label of the [Chart database] button. The [Chart ON/OFF] button
(on the InstantAccess bar) must be ON to show the [Chart database] button. The
[Chart database] button is grayed out if the [Chart ON/OFF] button is OFF.
2.41.5 Chart scale indications
The system alerts you to the availability of larger
scale ENC and overscale, at the top-left posi-
tion.
When the radar display range is higher than the
chart scale of the ENC chart, the indication,
"Larger scale ENC" is displayed. For example,
the radar range is 24 NM and the range avail-
able with the ENC chart is less than 12 NM.
When the radar display range is lower than the
chart scale of the ENC chart, the indication
"Overscale x.xx" (x.xx=overscale factor). For ex-
ample, the radar range is 0.25 NM and the chart scale is 0.5 NM.
If both conditions exist, both indications are displayed.
2.41.6 Chart status
The indication "Chart Status" appears at the top-right position on the screen when the
display date for the currently displayed chart has passed.
[Chart database] button Selection Setting in [SEL DISP OBJECT] menu
[IMO Base] Nothing checked in [STANDARD ITEMS], [OTHER
ITEMS] or [IMPORTANT TEXT].
[IMO Primary] Nothing else checked but [BUOYS AND BEACONS] in
[STANDARD ITEMS]. This is the "Primary Chart Infor-
mation Set (PCIS)", based on IEC 62388 Ed.2
section12.1.5.1, IEC61174 and IMO Resolution
MSC.232(82).
[IMO Standard] All objects checked in [STANDARD ITEMS]; nothing
checked in [OTHER ITEMS] or [IMPORTANT TEXT].
[IMO All] Everything checked in [STANDARD ITEMS], [OTHER
ITEMS] and [IMPORTANT TEXT].
[PERSONAL] Use the settings recorded for [STANDARD ITEMS],
[OTHER ITEMS], [IMPORTANT TEXT] and [OTHER
TEXT].
Location of chart scale indications
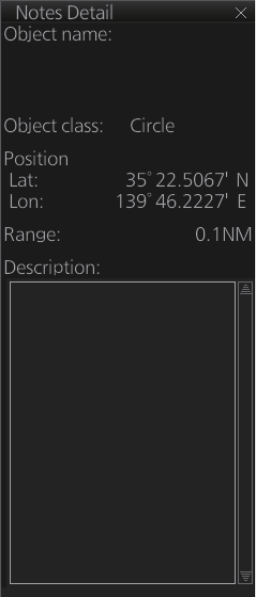
2. RADAR, CHART RADAR OPERATION
2-64
2.41.7 Chart alert function
The chart alert function operates in chart mode only. There are two types of chart
alerts: your ship's predicted course, and route alert. See chapter 11 for details.
For the ship's predicted course alert, the operator sets a safety contour. (See
paragraph 8.2.1 for how to set a safety contour suitable for the ship.) The operator
also sets the parameters for own ship predicted movement. (See section 11.2 "How
to Activate Own Ship Check".)
For the route alert, route planning (see section 12.3 "How to Create a New Route")
and route monitoring (see section 14.1 "How to Select the Route to Monitor") functions
are available.
2.41.8 Notes details
"Notes" provides messages for the operator relative to a specific ship position. The
chart radar compares the Notes position and own ship position and displays the Notes
when own ship is at the distance from the Notes specified in route planning. To display
the Notes at other times, right-click the display area to show the context-sensitive
menu, then select [Notes Detail]. In the example below the Notes about a wreck are
shown.
• [Object name]: The name assigned to the Notes.
• [Object class]: The type of object (point, line, area or
circle) linked to the Notes.
• [Position]: Position of the object in latitude and
longitude.
• [Range]: The range to the object.
• [Description]: A description of the object, input in the
Voyage planning mode.
Wreck area
Wreck within circle

2. RADAR, CHART RADAR OPERATION
2-65
2.42 Radar Observation
2.42.1 General
Minimum range
The minimum range is defined by the shortest distance at which, using a scale of 1.5
or 0.75 NM, a target having an echoing area of 10 m2 is still shown separate from the
point representing the antenna position.
It is mainly dependent on the pulse length, antenna height, and signal processing such
as main bang suppression and digital quantization. It is a good practice to use a short-
er range scale as far as it gives favorable definition or clarity of picture. The IMO Res-
olution MSC.192(79) requires the minimum range to be less than 40 m, respectively.
This series of radars satisfy this requirement.
Maximum range
The maximum detecting range of the radar, Rmax, varies considerably depending on
several factors such as the height of the antenna above the waterline, the height of the
target above the sea, the size, shape and material of the target, and the atmospheric
conditions.
Under normal atmospheric conditions, the maximum range is equal to the radar hori-
zon or a little shorter. The radar horizon is longer than the optical one by about 6%
because of the diffraction property of the radar signal. The Rmax is given in the follow-
ing equation.
For example, if the height of the antenna above the waterline is 9 meters and the
height of the target is 16 meters, the maximum radar range is;
It should be noted that the detection range is reduced by precipitation (which absorbs
the radar signal).
X-band and S-band
In fair weather, the equation on the previous page does not give a significant differ-
ence between X- and S-band radars. However, in heavy precipitation condition, an S-
band radar would have better detection than an X-band radar.
Radar resolution
There are two important factors in radar resolution (discrimination): bearing resolution
and range resolution.
Rmax= 2.2 x ( h1 + h2 )
w
here Rmax: radar horizon (NM)
h1: antenna height (m)
h2: target height (m)
Radar horizon
Optical horizon
R = 2.2 x ( 9 + 16 ) = 2.2 x (3 + 4) = 15.4 NM
max
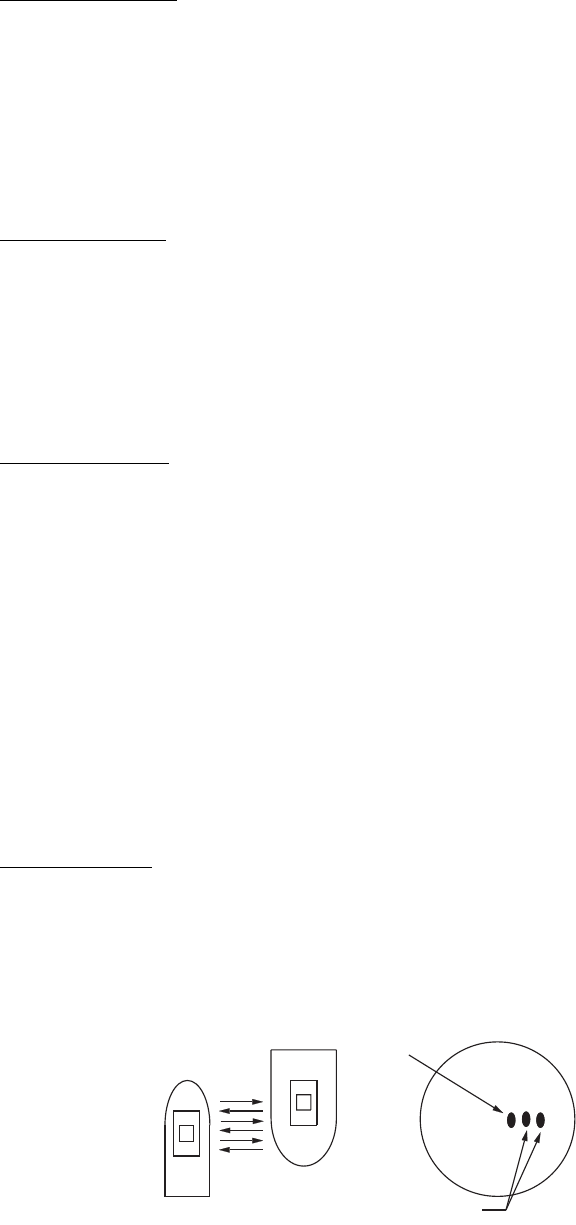
2. RADAR, CHART RADAR OPERATION
2-66
Bearing resolution
Bearing resolution is the ability of the radar to display as separate pips the echoes re-
ceived from two targets which are at the same range and close together. It is propor-
tional to the antenna length and reciprocally proportional to the wavelength. The
length of the antenna radiator should be chosen for a bearing resolution better than
2.5° (IMO Resolution). This condition is normally satisfied with a radiator of 1.2 m (4
ft) or longer in the X-band. The S-band radar requires a radiator of about 12 feet (3.6
m) or longer.
Range resolution
Range resolution is the ability to display as separate pips the echoes received from
two targets which are on the same bearing and close to each other. This is determined
by pulse length only. Practically, a 0.08 microsecond pulse offers the discrimination
better than 40 m as do so with all FURUNO radars. Test targets for determining the
range and bearing resolution are radar reflectors having an echoing area of 10 m2 (X-
band) or 1 m2 (S-band).
Bearing accuracy
One of the most important features of the radar is how accurately the bearing of a tar-
get can be measured. The accuracy of bearing measurement basically depends on
the narrowness of the radar beam. However, the bearing is usually taken relative to
the ship's heading, and thus, proper adjustment of the heading line at installation is an
important factor in ensuring bearing accuracy. To minimize error when measuring the
bearing of a target, put the target echo at the extreme position on the screen by se-
lecting a suitable range.
2.42.2 False echoes
Occasionally echo signals appear on the screen at positions where there is no target
or disappear even if there are targets. They are, however, recognized if you under-
stand the reason why they are displayed. Typical false echoes are shown below.
Multiple echoes
Multiple echoes occur when a transmitted pulse returns from a solid object like a large
ship, bridge, or breakwater. A second, a third or more echoes may be observed on the
display at double, triple or other multiples of the actual range of the target as shown
below. Multiple reflection echoes can be reduced and often removed by decreasing
the gain (sensitivity) or properly adjusting the sea clutter.
Own ship
Target
True
echo
Multiple echo
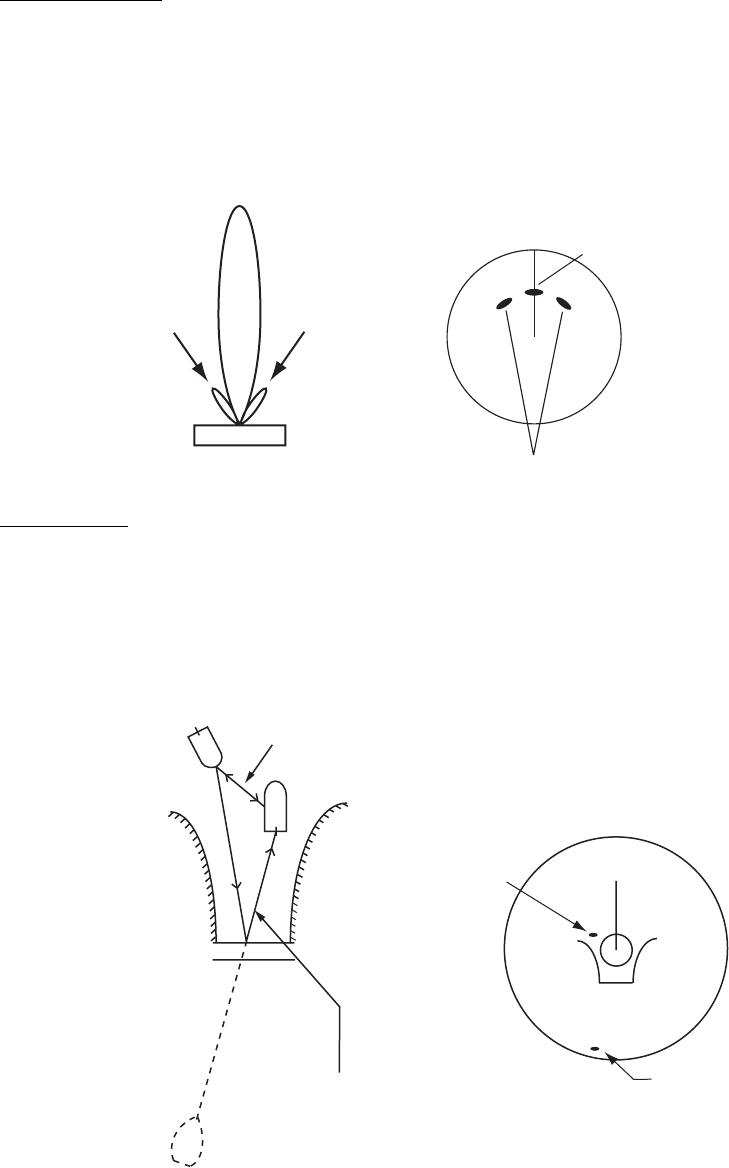
2. RADAR, CHART RADAR OPERATION
2-67
Sidelobe echoes
Every time the radar pulse is transmitted, some radiation escapes on each side of the
beam, called "sidelobes." If a target exists where it can be detected by the side lobes
as well as the main lobe, the side echoes may be represented on both sides of the true
echo at the same range. Side lobes show usually only on short ranges and from strong
targets. They can be reduced through careful reduction of the gain or sea clutter.
Virtual image
A relatively large target close to your ship may be represented at two positions on the
screen. One of them is the true echo directly reflected by the target and the other is a
false echo which is caused by the mirror effect of a large object on or close to your
ship as shown in the figure below. If your ship comes close to a large metal bridge, for
example, such a false echo may temporarily be seen on the screen.
Mainlobe (beam)
Sidelobe
Sidelobe
Antenna
True target
False echoes by sidelobes
True
echo
False
echo
Own ship
Target ship
Mirror image
of target ship
Bridge
Route for direct reflection
Route for indirect reflection
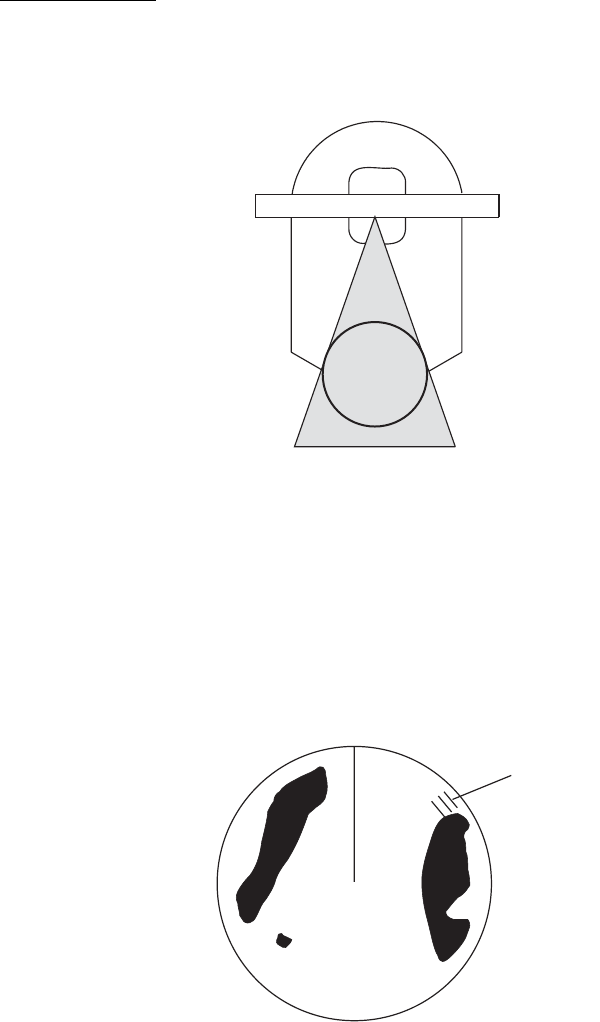
2. RADAR, CHART RADAR OPERATION
2-68
Shadow sectors
Funnels, stacks, masts, or derricks in the path of the antenna block the radar beam. If
the angle subtended at the antenna is more than a few degrees, a non-detecting sec-
tor may be produced. Within this sector targets can not be detected.
2.42.3 RACON
A RACON is a radar beacon which emits radar receivable signals in the radar frequen-
cy spectrum (X- or S-band). There are several signal formats; in general, the RACON
signal appears on the radar screen as a rectangular echo originating at a point just
beyond the position of the radar beacon. It has a Morse coded pattern. Note that the
position on the radar display is not accurate.
2.42.4 Radar Target Enhancer (RTE)
An RTE is a radar transponder that is mounted on navigation buoys and masts of
small crafts to significantly improve their detection by radar. Unlike a SART or RA-
CON, which are passive, the RTE receives a radar signal, amplifies it and re-transmits
it, with the intention of making the target's signal look larger on a radar display. The
RTE can be detected on both X-band and S-band radars.
Radar
antenna
Shadow sector
Radar
mast
RACON
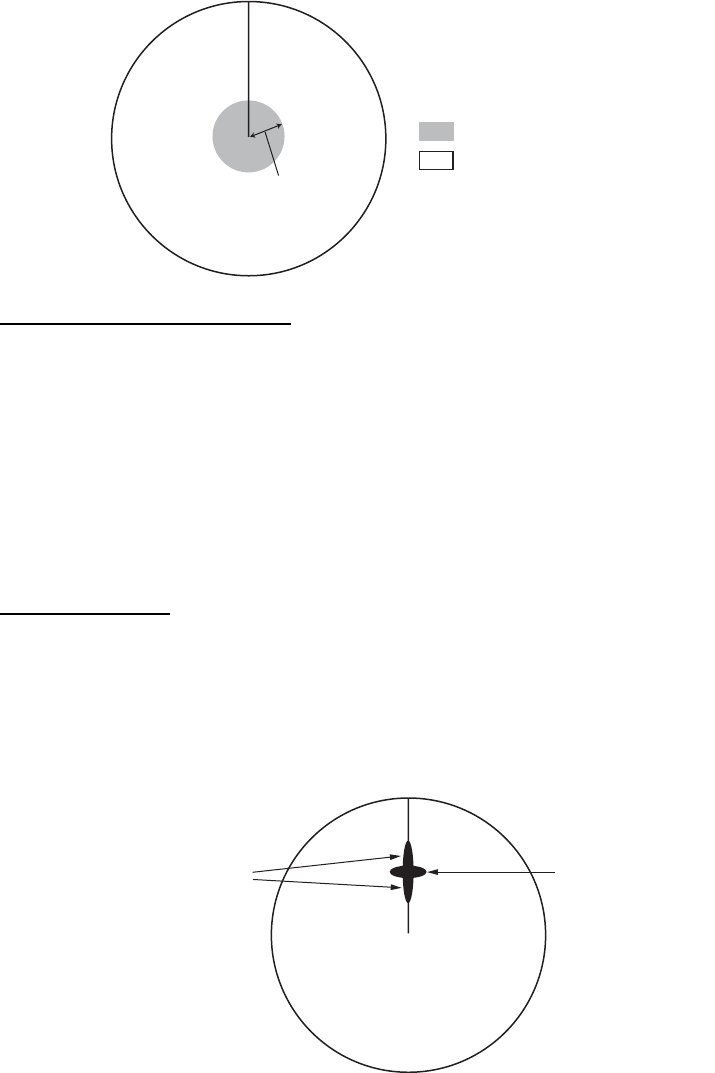
2. RADAR, CHART RADAR OPERATION
2-69
2.42.5 Solid state radar
A solid state radar transmits and receives using pulse compression beyond synthesis
distance (approx. 0.5 NM to 2 NM (depending on the pulse length)), and using non-
compression within synthesis distance. The radar echoes of a solid state radar are
synthesized echoes using these two methods. The objects may be displayed differ-
ently when compared to the echoes from a magnetron radar.
Range and signal intensity
When the range is beyond synthesis distance using pulse compression, the signal in-
tensity is equivalent to a magnetron radar, although the transmission power is lower.
When the range is within synthesis distance using non-compression, the signal inten-
sity (including sea clutter and rain clutter) is lower than a magnetron radar because of
the transmission power difference.
When an object enters to the synthesis distance, it is displayed with lower signal in-
tensity.
Range sidelobe
As a result of pulse compression, range sidelobes may appear to the front and rear of
a strong reflected echo. When the direction of the echo changes, the reflection weak-
ens and the range sidelobes may disappear. Range sidelobes can also be removed
by reducing the gain.
Synthesis
distance*
: Non-compression
: Pulse compression
*: Approx. 0.5 NM to 2 NM
(depending on the pulse length)
Echo
Range sidelobes
2. RADAR, CHART RADAR OPERATION
2-70
This page is intentionally left blank.

3-1
3. TARGET TRACKING (TT)
3.1 About TT
The TT tracks and plots the movement of up to 200 radar targets and fully complies
with IMO standards for TT.
The TT automatically tracks an automatically or manually acquired radar target and
calculates its course and speed, indicating them with a vector. Since the data gener-
ated by the TT depends on the radar targets selected, the radar must be optimally
tuned for use with the TT, to ensure required targets will not be lost or unnecessary
targets like sea returns and noise will not be acquired and tracked.
Tracking accuracy is affected by course change. One to two minutes is required to re-
store vectors to full accuracy after an abrupt course change. (The actual amount de-
pends on gyrocompass specifications.)
The amount of tracking delay is inversely proportional to the relative speed of the tar-
get. Delay is approx. 15-30 seconds for the higher relative speed; approx. 30-60 sec-
onds for the lower relative speed. The following factors can affect accuracy:
• Echo intensity
• Radar transmission pulse length
• Radar bearing error
• Gyrocompass error
• Course change (own ship and targets)
3.2 How to Show, Hide the TT Display
Click the TT mode indication at the bottom-right position
to show [OFF] to hide the TT display, or [AUTO]*,
[MAN]* or [MAN/AUTO]* to show the TT display. You
can right-click the TT mode indication to show a context-
sensitive menu with the choices shown above. In this
case, click the applicable option.
* The indication shown depends on the setting of [TT
SELECT] in the [TT•AIS] menu.

3. TARGET TRACKING (TT)
3-2
3.3 How to Input Your Ship's Speed
The TT requires own ship's speed and heading data. The speed can be STW, SOG,
or echo-referenced speed (based on 3 max. stationary objects) taken from this radar.
Manual input is also possible.
For automatic or manual speed input, see section 1.14. For echo-referenced speed
input see the next section.
3.3.1 Echo-referenced speed input
The use of echo-referenced speed is recommended when:
• The speed log is not operating properly or not connected to the radar.
• The vessel has no device that can measure ship's leeward movement (doppler so-
nar, speed log, etc.) when leeward movement cannot be disregarded.
If you select echo-referenced speed, the TT calculates own ship's speed relative to a
fixed reference target. The number of targets may be 1, 2 or 3. They appear as tracked
targets, each denoted with a small circle. When a plural number of objects are select-
ed, the mean value is used.
Note: This feature is not available when the AIS is active.
1. Right-click the display area to show the context-sensitive menu then select [REF
Mark].
2. Select a small fixed island or any radar prominent point located at 0.1 to 24 NM
from own ship.
3. Use the trackball to put the cursor (+) on the target selected at step 2.
4. Push the left button to insert the reference mark.
5. Repeat steps 2-4 to continue entering reference marks. Three may be entered.
6. Right click the Sensor information, datum box then select [Select Sensor] and
[Setting]. Open the [SPD] page and put a checkmark at [Reference SPD]. Click
the [OK] button to finish.
Notes on speed input by reference target
• Reference targets are only used for the calculation of true speed.
• Do not use reference target generated true speed to calculate relative speed. Rel-
ative speed data is not accurate because response to speed change is slow, ham-
pering the TT's ability to accurately judge the possibility of collision.
• Select a stationary target as a reference target to calculate own ship speed as
ground tracking speed. Do not choose a moving target as a reference target. A mov-
ing target produces error in the vector for TT and AIS, which results in wrong colli-
sion avoidance information. Further, an unstable stationary target produces
inaccurate speed data and the target itself may become lost.
• When a reference target is lost or goes out of the acquisition range, the reference
target mark flashes and the Alert 528 "REF Target Lost" appears in the [Alert] box.
If all reference targets are lost, the speed indication disappears. Select a different
reference target if the currently selected one is lost.
Changes to in three minutes
R01 R01

3. TARGET TRACKING (TT)
3-3
• When all tracked targets are deleted, the reference target mark is also deleted and
the target-based speed becomes invalid.
• Loss of reference target will affect the calculation of true speed and true course of
targets. Further, own ship speed will be inaccurate.
How to cancel echo-referenced speed input
Right click the Sensor information, datum box then select [Select Sensor] and [Set-
ting]. Open the [SPD] page and select a speed sensor.
3.4 Automatic Acquisition
This radar can automatically acquire and track a maximum of 200 targets. The maxi-
mum number of acquired targets ([NUMBER OF TT]) is set at the time of installation.
The options are 200 ([MAX]) and 100.
The number of automatically and manually acquired targets is determined by the set-
ting of [TT SELECT] in the [TT] menu.
A target just acquired automatically is marked with a dashed circle and a vector ap-
pears within one minute to indicate the target's motion trend. Within three minutes, the
initial tracking stage is finished and the target becomes ready for stable tracking. At
this time, the dashed circle changes to a solid circle.
Note: When connecting with the FAR-2xx7 series radar, the maximum number of ac-
quired targets ([NUMBER OF TT]) should be set to 100 in the [RADAR INSTALLA-
TION] menu. For details, see the installation manual.
3.4.1 How to enable auto acquisition
1. Right-click the TT mode indication then select [TT Menu] to show the [TT] menu.
2. Select [1 TT SELECT] and the acquisition condition.
3. Close the menu.
Note 1: The TT indication in the TT/AIS setting box shows [AUTO], [MAN/AUTO] or
[MAN] depending on the acquisition condition selected.
Note 2: When the menu-set number of automatically acquired targets have been ac-
quired, the Alert 523 "TT Auto ACQ 100%" appears in the [Alert] box.
[NUMBER OF TT] is [MAX] [NUMBER OF TT] is [100]
Menu setting Acquisition condition Menu setting Acquisition condition
[MANUAL 200] 200 targets manually,
Not available for auto acquisi-
tion
[MANUAL 100] 100 targets manually,
Not available for auto acquisi-
tion
[AUTO 50] 50 targets automatically,
150 targets manually
[AUTO 25] 25 targets automatically,
75 targets manually
[AUTO 100] 100 targets automatically,
100 targets manually
[AUTO 50] 50 targets automatically,
50 targets manually
[AUTO 150] 150 targets automatically,
50 targets manually
[AUTO 75] 75 targets automatically,
25 targets manually
[AUTO 200] 200 targets automatically, Not
available for manual acquisition
[AUTO 100] 100 targets automatically, Not
available for manual acquisition
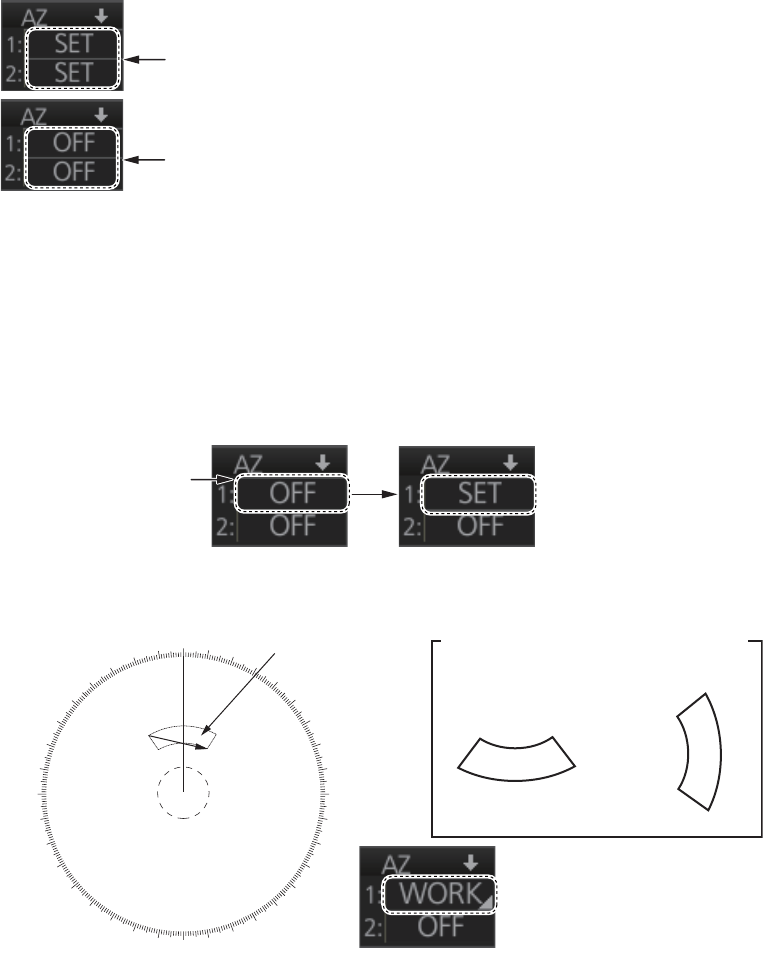
3. TARGET TRACKING (TT)
3-4
3.4.2 How to set an automatic acquisition zone
You can set an automatic acquisition zone to automatically track any targets entering
the zone. The acquisition zone can be fan-shaped or polygonal. The maximum track-
ing range is set during the installation.
Fan-shaped zone of AZ1: The range is fixed at 3 - 6 NM (width 0.5 - 1.0 NM).
Fan-shaped zone of AZ2: The range is available between 0.7 - 24 (or 32) NM (width
0.5 - 1.0 NM)
Polygon zone of AZ2: The zone can be set within the range of 0.125 NM to 120 NM.
Note: When processing two acquisition zones, create the zones in numerical order
and turn them off in reverse numerical order.
When a target enters an acquisition zone, the following occurs:
1. Click one of the boxes AZ1 or AZ2 at the right side of the screen. The indication
in the AZ box changes from [OFF] to [SET].
2. Click point A.
3. Click point B. The indication in the AZ box changes from [SET] to [WORK].
Note 1: You are alerted when the capacity for automatic acquisition is 95% and 100%.
These alerts are 522 "TT Auto ACQ 95%" and 523 "TT Auto ACQ 100%".
Note 2: If the range scale is changed to less than half of the acquisition zone, the AZ
box shows [OUT]. If the left button is pushed in this state, the acquisition alarm zone
goes into [SLEEP] state (inactive).
• the buzzer sounds
• the Alert 521 "TT New Target" appears in the [Alert] box
• the symbol of the target is red and flashes
• the AIS function is automatically turned on if it is off
To set the zone for AZ2, first set the zone for AZ1.
To turn off the zone for AZ1, first turn off the zone for AZ2.
For example,
click here for
A
Z1.
000 010 020
030
040
050
060
070
080
090
100
110
120
130
140
150
160
170
180
190
200
210
220
230
240
250
260
270
280
290
300
310
320
330
340 350
ABX
X
X
X
Acquisition zone
Point A
Point A
Point B
Other acquisition zone examples
Point B

3. TARGET TRACKING (TT)
3-5
How to sleep, deactivate an acquisition zone
Use the trackball to select the appropriate AZ box. Sleep or deactivate the acquisition
zone as appropriate:
Sleep acquisition zone: Push the left button momentarily to remove the acquisition
zone from the screen. The indication in the AZ box changes from [WORK] to [SLEEP].
To reactivate and display the acquisition zone, repeat this procedure to display
[WORK].
Deactivate acquisition zone: Click applicable AZ box and select [OFF].
How to acknowledge the acquisition zone audio alarm
Press the ALARM ACK key, or click the [Alert] box.
Acquisition zone stabilization
The acquisition zone may be referenced to heading or North. Open the menu then se-
lect the [TT•AIS] and [1 ACQUISITION ZONE] menus. Set [1 AZ STAB] to [STAB
HDG] or [STAB NORTH] as appropriate. For a polygon acquisition zone, stabilization
can be selected to [2 AZ POLYGON].
3.5 Manual Acquisition
This radar can manually acquire and track a maximum of 200 targets. The maximum
number of acquired targets ([NUMBER OF TT]) is set at the time of installation. The
options are 200 ([MAX]) and 100.
The number of automatically and manually acquired targets is determined by the set-
ting of [TT SELECT] in the [TT] menu.
Note: When connecting with the FAR-2xx7 series radar, the maximum number of ac-
quired targets ([NUMBER OF TT]) should be set to 100 in the [RADAR INSTALLA-
TION] menu. For details, see the installation manual.
3.5.1 How to set manual acquisition conditions
1. Right-click the TT mode indication then select [TT Menu] to show the [TT] menu.
2. Select [1 TT SELECT] and the acquisition condition.
3. Close the menu.
[NUMBER OF TT] is [MAX] [NUMBER OF TT] is [100]
Menu setting Acquisition condition Menu setting Acquisition condition
[MANUAL 200] 200 targets manually,
Not available for auto acquisi-
tion
[MANUAL 100] 100 targets manually,
Not available for auto acquisi-
tion
[AUTO 50] 50 targets automatically,
150 targets manually
[AUTO 25] 25 targets automatically,
75 targets manually
[AUTO 100] 100 targets automatically,
100 targets manually
[AUTO 50] 50 targets automatically,
50 targets manually
[AUTO 150] 150 targets automatically,
50 targets manually
[AUTO 75] 75 targets automatically,
25 targets manually
[AUTO 200] 200 targets automatically, Not
available for manual acquisition
[AUTO 100] 100 targets automatically, Not
available for manual acquisition

3. TARGET TRACKING (TT)
3-6
3.5.2 How to manually acquire a target
Acquire a target from the Control Unit
Use the trackball to put the cursor on the target you want to acquire. Push the ACQ/
ACT key.
Acquire a target by the trackball module
1. When the target to acquire and the AIS symbol overlap one another, push the right
button to show the context-sensitive menu then select [Target Data/ACQ/ACT]
and [TT Only] to acquire the target.
2. Put the cursor on the target to acquire then push the left button.
The plotting symbol is drawn by a dashed circle during the initial acquisition stage. A
vector appears approximately one minute after acquisition. The vector indicates the
motion trend of the target. If the target is consistently detected for three minutes, the
plotting symbol changes to a solid circle. If acquisition fails, the target symbol blinks.
Note 1: For successful acquisition, the target should be within 24 NM (or 32 NM, de-
pending on initial setting) from own ship and not obscured by sea or rain clutter.
Note 2: You are alerted when the capacity of manual acquisition is 95% and 100%.
These alerts are Alert 524 "TT MAN ACQ 95%" and Alert 525 "TT MAN ACQ 100%".
If the capacity is 100% you cannot acquire more targets. Cancel tracking of non-
threatening targets if you wish to acquire additional targets manually.
Note 3: When a target being tracked nears another target being tracked, the targets
may be "swapped". When two targets acquired either automatically or manually come
close to each other, one of the two may become a lost target. If this occurs, manual
re-acquisition of the lost target may be necessary after the two have separated.
Note 4: You can reuse a target number. This is useful when you acquire the “wrong”
target. Drag and drop the symbol onto the correct target.
3.6 How to Stop Tracking Targets (including refer-
ence targets)
When the TT has acquired the menu-set number of targets, the Alert 523 "TT AUTO
ACQ 100%" (automatic acquisition) or 525 "TT MAN ACQ 100%" (manual acquisition)
appears in the [Alert] box and no more auto or manual acquisition occurs unless tar-
gets are lost. Should this happen, cancel tracking of less important targets to acquire
new targets.
3.6.1 How to cancel tracking on individual tracked targets
Cancel tracking on a target from the Control Unit
1. Use the trackball to put the cursor (+) on the TT or reference target to cancel track-
ing.
2. Push the TARGET CANCEL key.
Cancel tracking on a target by the trackball module
1. Right-click the target to show the context-sensitive menu.
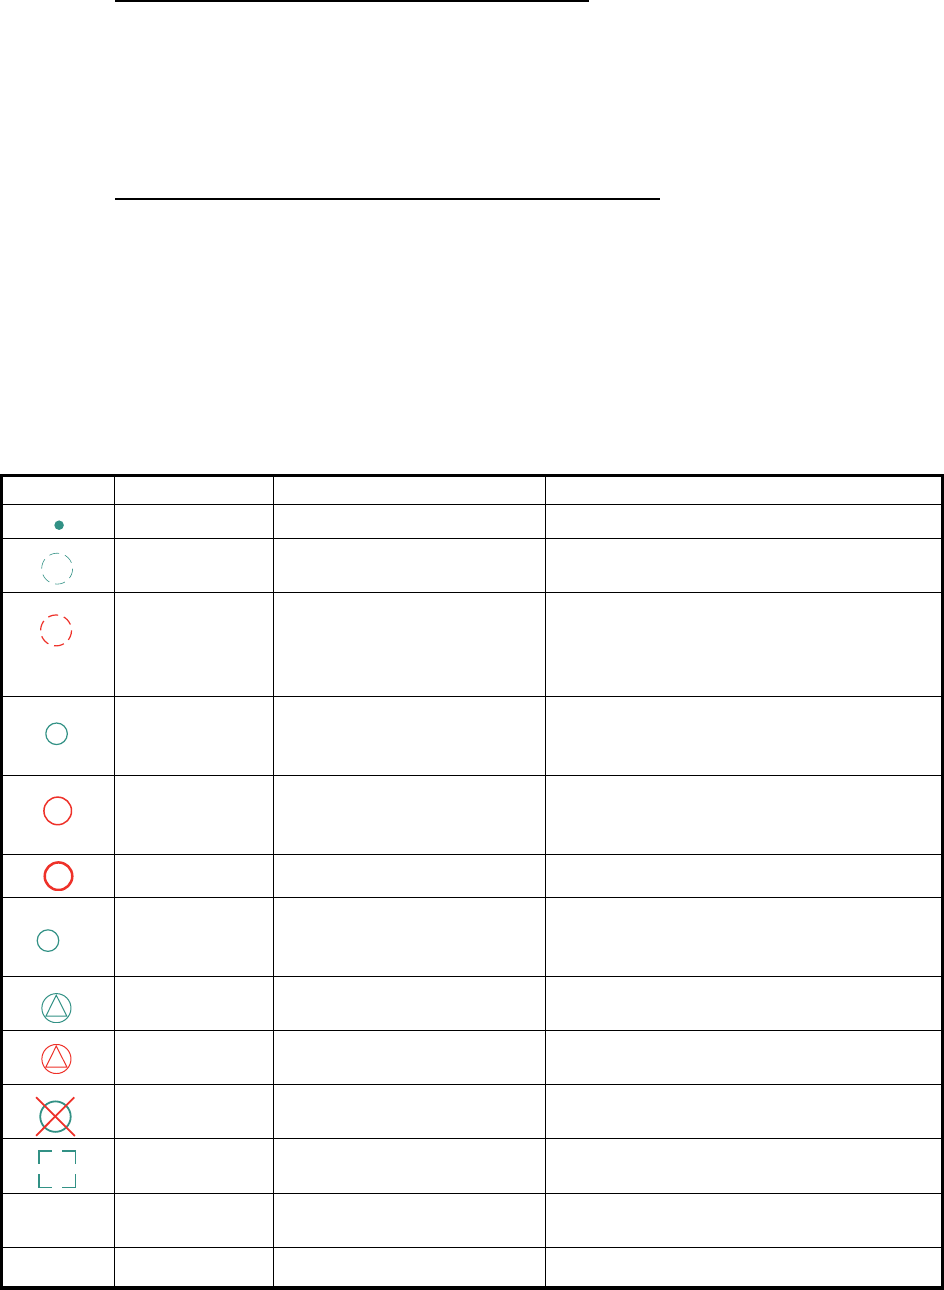
3. TARGET TRACKING (TT)
3-7
2. Select [Target Cancel] and [Any] or [TT Only] as applicable.
3. Click the TT or reference target to cancel tracking.
3.6.2 How to cancel tracking on all TTs
Cancel tracking on all target from the menu
1. Right-click the TT mode indication then select [TT Menu] to show the [TT] menu.
2. Select [2 ALL CANCEL].
3. Select [YES].
4. Close the menu.
Cancel tracking on all target from the Control Unit
Long-press the TARGET CANCEL key to erase all displayed TT target data.
3.7 TT Symbols and TT Symbol Attributes
3.7.1 TT symbols
The symbols used in this equipment comply with IEC 62288.
Symbol Default color Name Description
Green Past position marker Past position point
Green Target under acquisition Plotting symbol selected for a target ac-
quired manually is shown in broken lines.
Red Target under automatic ac-
quisition
Thick, broken circle around an echo to in-
dicate the target under acquisition and
initial stage of tracking, before steady-
state tracking.
Green Acquired target Solid circle with vector indicating steady
state tracking (within three minutes after
acquisition)
Red Acquired target in ACQ
zone (before acknowledg-
ment)
Solid circle with vector indicating steady
state tracking (within three minutes after
acquisition)
Red Dangerous target Dangerous TT (thick, solid circle)
Green Reference target Used to calculate own ship’s over-the-
ground speed (echo-referenced speed)
for ground stabilization.
Green Association target Association TT is shown in AIS symbol
and TT data.
Red Association dangerous tar-
get
Association dangerous TT is shown in
AIS symbol and TT data.
Red Lost target Lost TT is shown with cross mark.
Green Target selected TT selected to show its data.
White Trial maneuver Displayed (flashing) during trial maneu-
ver test.
White TT test Displayed (flashing) during TT test.
R01
T
S
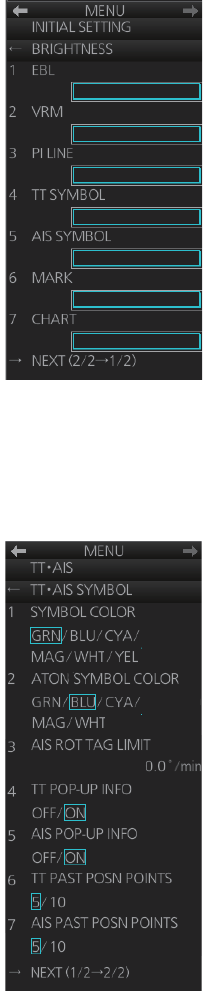
3. TARGET TRACKING (TT)
3-8
3.7.2 TT symbol brilliance
1. Right-click the [BRILL] button on the InstantAccess bar then select [Brill Menu].
2. Go to page 2, select [TT SYMBOL] then spin the scrollwheel to adjust the bril-
liance.
3.7.3 Color for TT symbol
You can select the color for the TT symbol as follows:
1. Right-click the TT mode indication then select [Symbol Menu] to show that menu.
2. Select [1 SYMBOL COLOR] and desired color. (Yellow is available with the A- and
B-type.)
㪈㪌
㪈㪌
㪈㪌
㪈㪌
㪈㪌
㪈㪌
㪈㪌
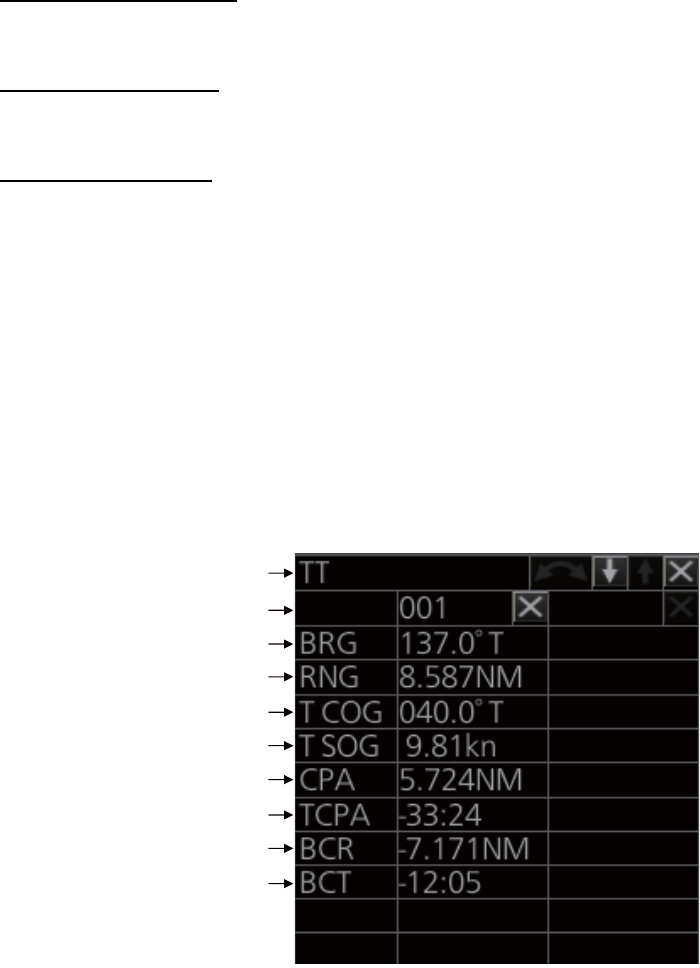
3. TARGET TRACKING (TT)
3-9
3.8 How to Display TT Data
The TT mode provides the full functionality of TT as required by the IMO MSC.192(79)
and IEC 62288, including display of range, bearing, course, speed, CPA and TCPA of
all tracked targets.
The target bearing is show in relative bearing in the head-up mode and true bearing
in the course-up, north-up and true motion modes, with the suffix "R" (Relative) or "T"
(True).
The target speed and course are shown as speed over the ground or speed through
the water depending on speed source.
3.8.1 How to display target data for individual TT
You can show the data for two (19-inch display) or three (23-inch display) tracked tar-
gets in the TT information window.
From the Control Unit
Put the cursor on a target then push the TARGET DATA key.
By trackball module
Click the target for which you want to show its data.
Tracked target data
zTo erase data from a data box, click the appropriate close data button.
zThe basic target data display for a TT consists of the following information:
• TT no. Target numbering starts from "1". When a target is erased the number will
not be reused until the power is re-set or more than 200 targets are acquired.
• Bearing (BRG) and distance (RNG) of the target from own ship
• True speed over the ground (SOG) and true course over the ground (COG) of
the target
• CPA and TCPA. A negative TCPA value means that you have already passed
the closest point and the TT is going away from own ship.
• Bow Crossing Range (BCR) and Bow Crossing Time (BCT)
Title bar
TT no.
Bearing
Range
Course over ground
Speed over ground
CPA
TCPA
Bow crossing range
Bow crossing time
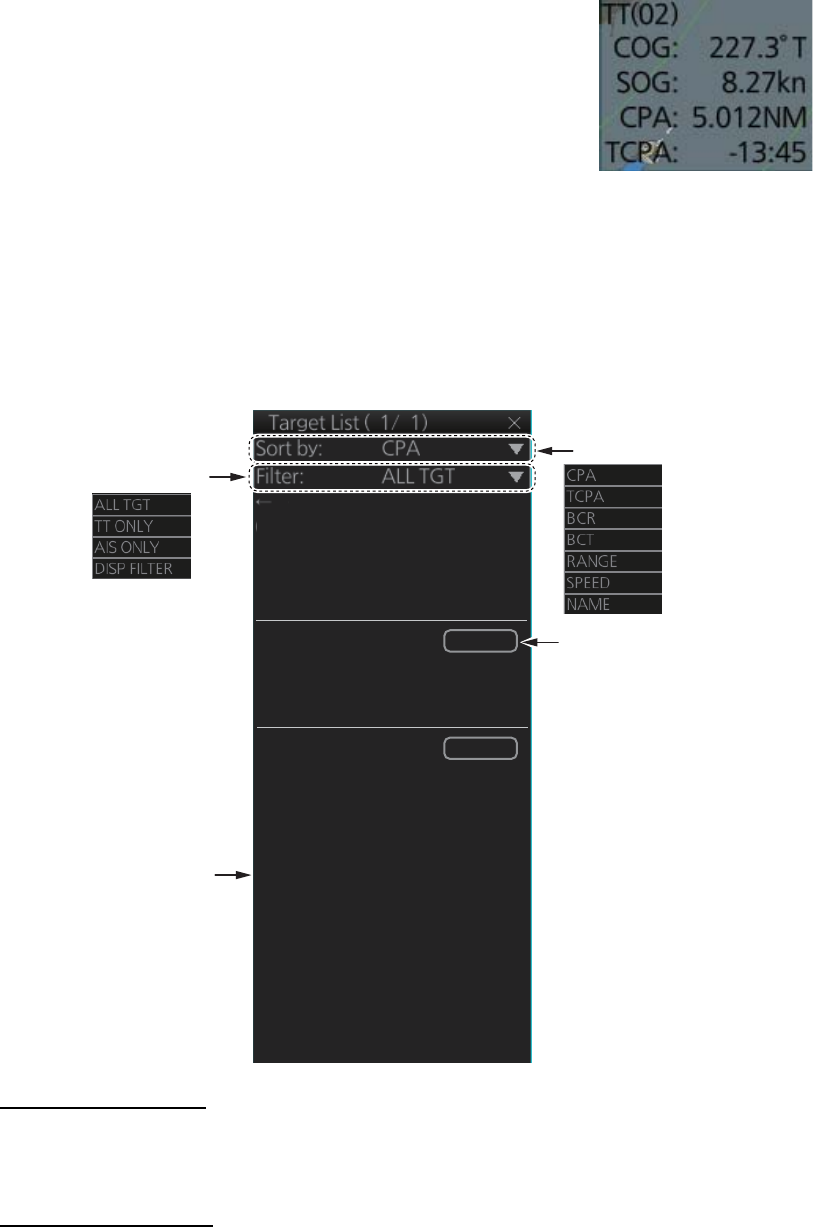
3. TARGET TRACKING (TT)
3-10
3.8.2 TT pop-up information
The TT pop-up shows abbreviated TT data (target no.,
COG, SOG, CPA and TCPA) for the selected TT. Simply put
the cursor on the TT symbol to show the pop-up. The pop-
up can be enabled or disabled with [TT POP-UP INFO] in
the [TT•AIS SYMBOL] menu.
3.8.3 Target list
The target list shows the data for all tracked targets and AIS targets. To show the list,
click the [Target List] button at the right side of the screen or press the TARGET LIST
key on the Control Unit. (The button is light-blue when the target list is displayed.)
To close the list, click the Close button (X) on the list or press the TARGET LIST key.
How to sort the list
You can sort the list by CPA, TCPA, BCR, BCT, RANGE, SPEED or NAME, with the
[Sort by] drop-down list.
How to filter the list
The list shows all tracked targets and AIS targets received. If you do not need to see
all targets you can filter unnecessary ones. Use the [Filter] drop-down list to select
what targets to filter: Show all targets, TT only, AIS targets only, or show only the AIS
targets that meet the criteria set on the [DISP FILTER] menu.
Filter targets:
Click to refresh data
CLOSE
1 TT Target
No. 21
BRG: 125.5°T RNG 3.434NM
CPA: 2.923NM TCPA: 12:00
2 AIS Target INFO: A
FURUNO
BRG: 120.2°T RNG: 5.211NM
CPA: 3.345NM TCPA: 14:30
3 AIS Target INFO: B
VOYAGER
BRG: 88.2°T RNG: 7.321NM
CPA: 3.662NM TCPA: 16:25
0 Refresh data
→ Next
Sort targets by:
AIS transponder class*
(A, B, C)
*Click “AIS Target” on
the list to show or hide
the indication.

3. TARGET TRACKING (TT)
3-11
3.9 Vector Modes
Target vectors can be displayed relative to own ship's heading (Relative) or North
(True).
Note: IMO recommends the use of the true vector mode in sea stabilization or relative
vector mode for collision avoidance.
3.9.1 Description of vectors
Stabilization modes
It is important to select the optimum stabilization mode for the radar display. To assess
risk of collision the relative motion of a target gives the clearest indication of CPA and
may be monitored by observing either the direction of the target's relative trail, or the
CPA predicted by the relative vector. By default, relative motion displays relative target
trails and true motion displays true target trails. Where true target trails is selected, a
sea stabilized display will indicate all targets' motion through the water. A ground sta-
bilized display will indicate all targets' motion over the ground.
In coastal, estuarial and river waters where a significant set and drift may be experi-
enced, a sea stabilized display will produce significant target trails from all fixed (sta-
tionary) objects possibly producing an unacceptably high level of clutter and masking.
In such circumstances a ground stabilized display may reduce its effect and enable
the observer to detect clearly the trails of moving targets, thus enhancing the observ-
er's situational awareness.
However, the display should be considered only as an approximation of the course
and speed made good over the ground. Among other factors, the accuracy of the
ground-stabilization is affected by inaccuracies in speed and heading inputs as well
as radar measurement imprecision and will require the display to be readjusted peri-
odically. The information displayed should be interpreted with due regard to these fac-
tors.
Note: It should be noted that in determining a target's aspect by radar; the calculation
of its true track is dependent on the choice and accuracy of the own ship's course and
speed input. A ground-stabilized target plot may accurately calculate the ground track
of the target, but the target's heading may be significantly different from its track when
experiencing set, drift or leeway. Similarly, a sea stabilized target plot may be inaccu-
rate when own ship and the target, are experiencing different rates of set, drift or lee-
way.
Ground stabilization and sea stabilization
Target vectors can be ground stabilized or sea stabilized in the True Motion mode. To
select speed over the ground or speed through the water data, open the page from the
menu. Select for ground stabilization or for sea stabilization. The Vector mode indica-
tion shows the stabilization mode in the true motion as [True-G] or [True-S].
Sea stabilization is a mode where own ship and all targets are referenced to the sea
using a compass heading and single-axis log water speed inputs in the true motion
mode. Ground stabilization is a mode where own ship and all targets are referenced
to the ground using the ground track or set and drift inputs. If the accuracy seems un-
satisfactory, enter set and drift corrections. Note that set and drift should not be used
when the radar is displaying AIS targets.
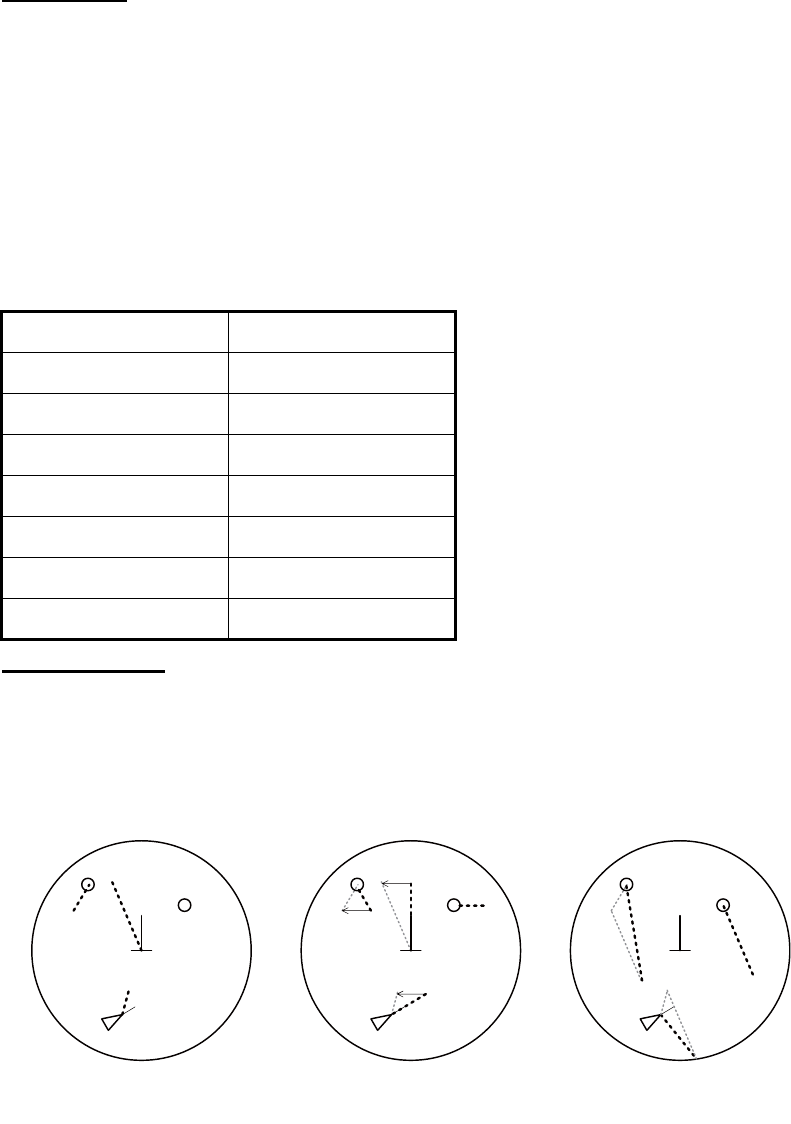
3. TARGET TRACKING (TT)
3-12
True vector
In the true motion mode, all fixed targets such as land, navigational marks and ships
at anchor remain stationary on the radar screen with vector length zero. But in the
presence of wind and/or current, the vectors appear on fixed targets representing the
reciprocal of set and drift affecting own ship unless set and drift values are properly
entered.
In the true vector mode, there are two types of stabilization: ground stabilization (True-
G) and sea stabilization (True-S). The stabilization mode is automatically selected ac-
cording to speed selection, as shown in the table below. Manual selection is available
with [Stabilization Mode] in the [SPD] page in the [Sensor Settings] menu.
Relative vector
Relative vectors on targets that are not moving over the ground such as land, naviga-
tional marks and ships at anchor will represent the reciprocal of own ship's ground
track. A target whose vector passes through own ship is on a collision course. (Dotted
lines in the figure are for explanation only.)
Speed selection True vector mode
LOG(WT) True-S
LOG(WTC) True-G
LOG(BT) True-G
GPS(BT) True-G
REF(BT) True-G
MAN(WT) True-S
MAN(WTC) True-G
Buoy
Own Ship
True vectors in ground
stabilization
AIS
Buoy
Own Ship
True vectors in sea
stabilization
TT
AIS
TT
Buoy
Own Ship
Relative vectors
AIS
TT
Current
(Set and drift)
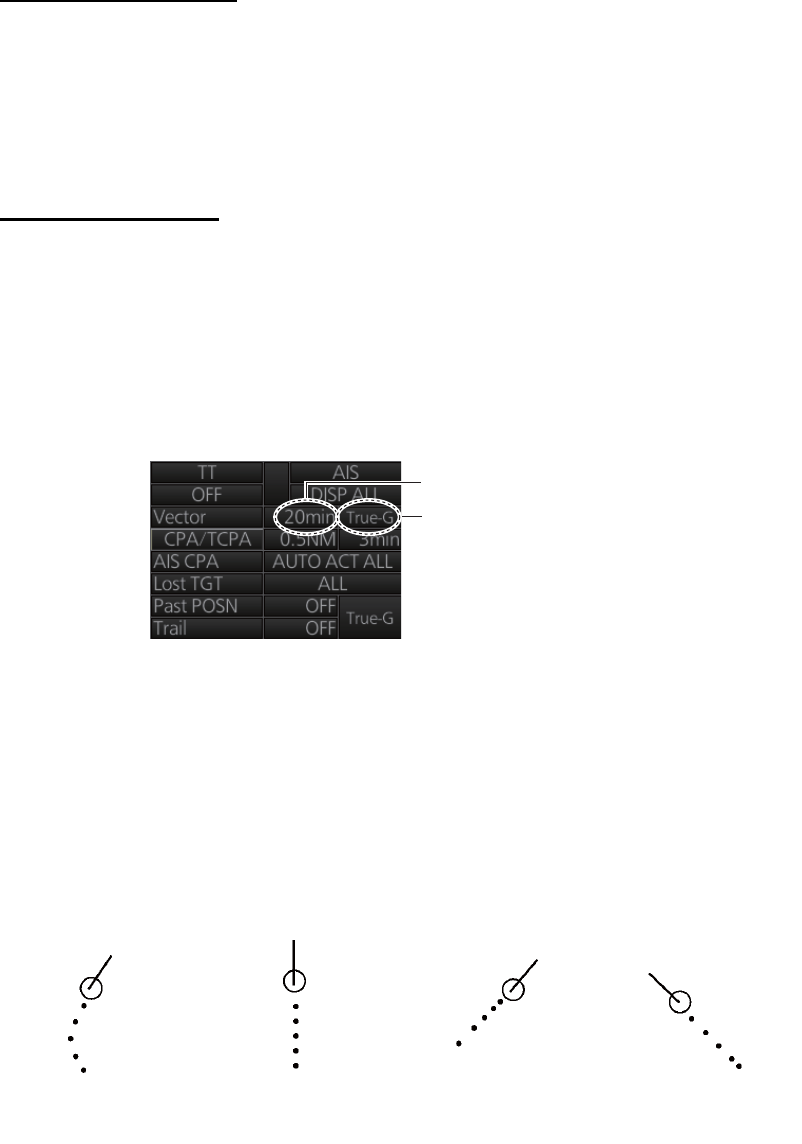
3. TARGET TRACKING (TT)
3-13
3.9.2 Vector motion and length
Vectors may be displayed in true or relative motion. Vector time (or the length of vec-
tors) can be set between 30 seconds and 60 minutes.
The vector tip shows an estimated position of the target after the selected vector time
elapses. It can be valuable to extend the vector length to evaluate the risk of collision
with any target.
From the Control Unit
Vector motion: Push the VECTOR MODE key consecutively to select relative or true
vector mode. Your selection is shown in the Vector mode indication.
Vector length: Push the VECTOR TIME key consecutively to select vector time,
among 30 seconds, 1 minute, 3 minutes, 5 minutes, 6 minutes, 10 minutes, 20 min-
utes, 30 minutes, 45 minutes and 60 minutes.
By trackball module
Vector motion: Click the vector motion indication at the right side of the screen to se-
lect relative or true vector mode.
Vector length: Click the vector time indication at the right side of the screen to select
time among 30 seconds, 1 minute, 3 minutes, 5 minutes, 6 minutes, 10 minutes, 20
minutes, 30 minutes, 45 minutes and 60 minutes. Or, spin the scrollwheel to select the
length from 30 seconds or 1 - 60 minutes, in one-minute intervals.
3.10 Past Position Display
The past position display shows equally time-spaced dots marking the past positions
of any targets being tracked.
If a target changes its speed, the spacing will be uneven. If it changes the course, its
plotted course will not be a straight line. See the illustration below for dot pattern and
ship status.
Vector length
Vector motion
(a) Ship turning (b) Ship running
straight
(c) Ship reduced
speed
(d) Ship increased
speed
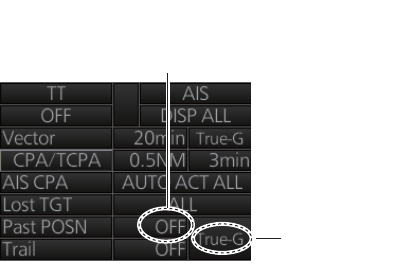
3. TARGET TRACKING (TT)
3-14
3.10.1 How to enable/disable the past position display, select past
position reference
Click the indications circled in the figure below to set the plot interval (or disable the
display) and the past position reference (true or relative).
3.10.2 Past position points
You can show 5 or 10 past position points per tracked target. Right-click the past po-
sition indication then select [Past POSN Menu] to show that menu. Set [6 TT PAST
POSN POINTS] to [5] or [10].
3.11 How to Enter Set and Drift
Set, the direction in which a water current flows, can be manually entered in 0.1-de-
gree steps. Drift, the speed of the tide, can also be entered manually in 0.1 knot steps.
When course through water and speed through water are available, activate set and
drift to get course over ground and speed over ground.
Set and drift corrections are beneficial for increasing the accuracy of vectors and tar-
get data. Refer to the tide table on board the ship for setting information. These values
are applied to all targets. If stationary targets have vectors, set and drift values should
be adjusted until they lose vectors.
Note: For the IMO type, turn off the AIS function in order to enter set and drift.
To enter set and drift do the following:
1. Right-click the speed indication then select [OS Info Menu] to show the [OWN
SHIP INFO] menu.
2. Select [2 SYSTEM SETTING] or [3 LOCAL SETTING] as appropriate.
Past position
reference
Plot interval, past
position display
ON/OFF
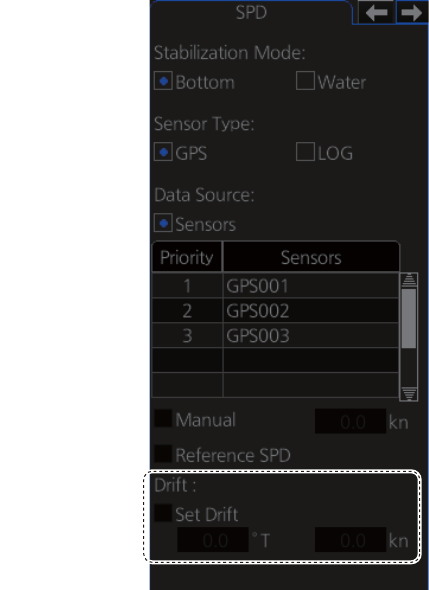
3. TARGET TRACKING (TT)
3-15
3. Use the right and left arrow buttons to select the [SPD] page.
4. Set [Stabilization Mode] to [Water].
5. Click the [Set Drift] box to show a checkmark in the box.
6. Put the cursor in the course input box then spin the scrollwheel to select the set.
7. Put the cursor in the drift input box then spin the scrollwheel to select the drift.
8. Close the menu.
Note: Set and drift should be checked periodically for correctness.
Set speed and
course of drift
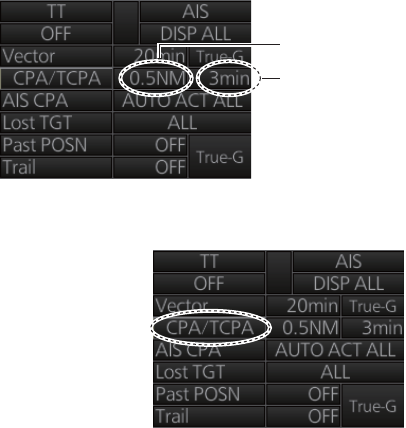
3. TARGET TRACKING (TT)
3-16
3.12 TT CPA/TCPA Alarm
The TT continuously monitors the predicted range at the Closest Point of Approach
(CPA) and predicted time to CPA (TCPA) of each TT. When the predicted CPA of any
TT becomes smaller than the preset CPA range and its predicted TCPA less than the
preset TCPA limit, the audio alarm sounds and the Alert 526 "TT CPA/TCPA" appears
in the [Alert] box. In addition, the symbol of the offending TT is red and flashes together
with its vector.
This feature, when used correctly, helps prevent the risk of collision by alerting you to
threatening targets. It is important that the gain, sea clutter and rain clutter and other
radar controls are properly adjusted.
The accuracy of TT calculations is a function of several variables including target glint,
clutter conditions and signal-to-noise ratio. The design of the TT minimizes the effects
of these variables but you must be aware that such errors will produce inaccuracies in
the derived CPA and TCPA in particular during the initial tracking period.
CPA and TCPA settings must be set up properly taking into consideration the size,
tonnage, speed, turning performance and other characteristics of own ship.
The TT CPA/TCPA alarm should not be solely relied upon to warn you of collision sit-
uations. The operator should check all aids to navigation to monitor possible collision
situations.
3.12.1 How to set the CPA and TCPA limits
To set the CPA and TCPA ranges, do the following:
1. If the values for CPA and TCPA are
blank, click [CPA/TCPA] to show
them.
2. Click the CPA indication to select
desired CPA range (0.1-20 NM).
3. Click the TCPA indication to select
desired TCPA time (1-60 minutes).
3.12.2 How to enable, disable the TT CPA/TCPA
alarm
The TT CPA/TCPA alarm can be enabled or disabled
from the TT/AIS box. Click the indication shown in the
right figure to enable or disable the TT CPA/TCPA
alarm. The alarm is disabled when the CPA and TCPA
settings are not shown.
3.12.3 How to acknowledge the TT CPA/TCPA alarm
When the CPA or TCPA of a target is within the CPA and TCPA limits, the Alert 526
"TT CPA/TCPA" appears in the [Alert] box and the audio alarm sounds. To acknowl-
edge the alarm and silence the buzzer, push the ALARM ACK key on the Control Unit,
or click the alert indication in the [Alert] box.
CPA setting
TCPA setting
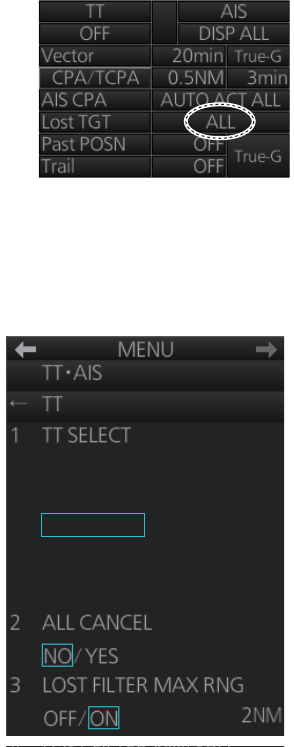
3. TARGET TRACKING (TT)
3-17
The alert in the [Alert] box and the flashing of the plotting symbol and vector continue
until the dangerous situation is gone or you intentionally terminate tracking of the tar-
get.
3.13 TT Lost Target Alert
Tracked targets not detected in nine consecutive scans become "lost targets". When
this occurs;
• A red X is put on the TT symbol (flashing) of the lost target. (The lost target symbol
disappears after the lost target alert is acknowledged.)
• The audio alert sounds and the Alert 527 "TT Lost" appears in the [Alert] box.
3.13.1 How to enable, disable the TT lost target alert
The [Lost TGT] indication at the bottom-right position en-
ables, disables the lost target alert. Click the indication to
select [OFF], [FILT] or [ALL] as appropriate.
[OFF]: Disable the alert.
[FILT]: Get the alert against the targets whose criteria
meet the settings made in section 3.13.2.
[ALL]: Get the alert against all lost targets.
Note: The [Lost TGT] setting is shared commonly between TT and AIS.
3.13.2 How to set the TT lost target filter
If you are in an area where tracked targets are lost
frequently, you may want to disable the lost target
alert against certain tracked targets, by maximum
range.
1. Right-click the TT mode indication then select
[TT Menu] to show that menu.
2. Select [3 LOST FILTER MAX RNG].
3. Select [ON]. Select the range setting then spin
the scrollwheel to set the range. Any TT lost tar-
gets beyond this range will not trigger the TT lost
target alert.
4. Close the menu.
MANUAL 200/
AUTO 50/
AUTO 100/
AUTO 150/
AUTO 200
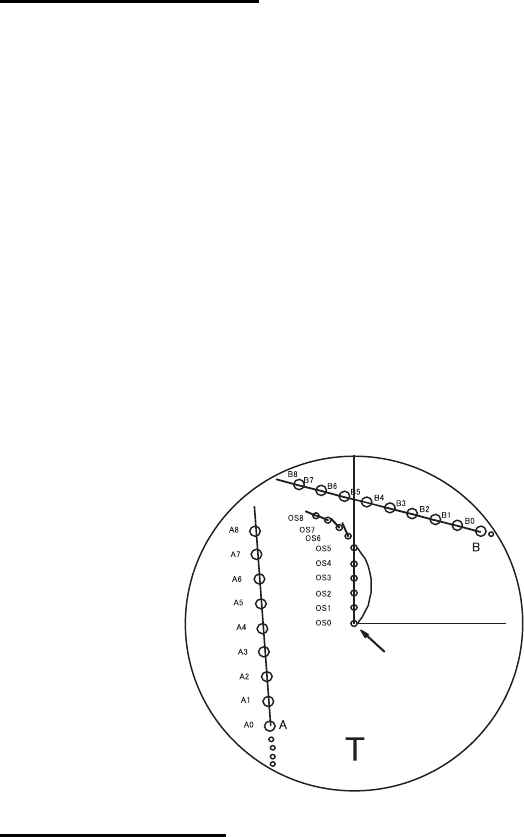
3. TARGET TRACKING (TT)
3-18
3.14 Trial Maneuver
The trial maneuver feature simulates the effect of own ship's movement against all
tracked targets, without interrupting the updating of target information. It is available
for use with the TT and AIS functions. For more accurate results, use relative motion
and sea stabilization (water tracking).
3.14.1 Types of trial maneuvers
There are two types of trial maneuvers: dynamic and static.
Dynamic trial maneuver
A dynamic trial maneuver displays predicted positions of the tracked targets and own
ship. You enter own ship's intended speed and course with a certain "delay time." As-
suming that all tracked targets maintain their present speeds and courses, the targets'
and own ship's future movements are simulated in one-second increments indicating
their predicted positions in 30-second intervals as illustrated below.
The delay time represents the time lag from the present time to the time when own
ship will actually start to change her speed and/or course. You should therefore take
into consideration own ship's maneuvering characteristics such as rudder delay, turn-
ing delay and acceleration delay. This is particularly important on large vessels. How
much the delay is set the situation starts immediately and ends in a minute.
In the example shown below, own ship will advance straight ahead (even after a ma-
neuver) for a delay time of 2:30 and alters speed and course until operator-specified
intended speed and course are achieved (position OS7 in this example).
Static trial maneuver
The static trial maneuver shows the relationship between your ship and tracked tar-
gets at the completion of the trial maneuver. Enter expected course and speed and
delay time until start of a maneuver and the expected position of your ship and TTs at
the end of the trial maneuver are shown on the display.
By shortening and extending the trial time you can find the safe time to make a ma-
neuver. Thus, the static trial maneuver will be convenient when you wish to know the
maneuver result immediately.
Delay time = 2 m 30 s.
Current position
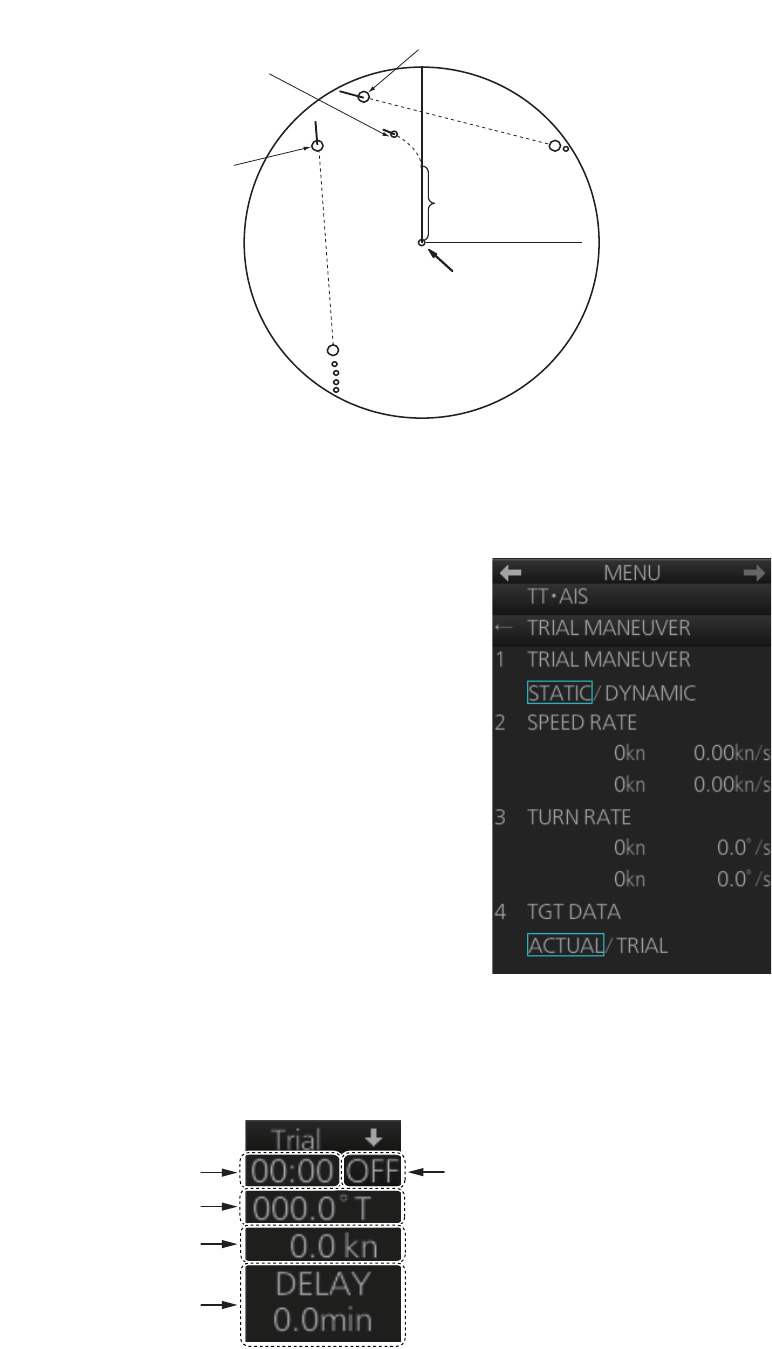
3. TARGET TRACKING (TT)
3-19
3.14.2 How to do a trial maneuver
To do a trial maneuver:
1. Right click the DELAY setting in the [Trial] box
(see step 7) then select [Trial Maneuver Menu].
2. Select [1 TRIAL MANEUVER] then select
[STATIC] or [DYNAMIC] as appropriate.
3. Select [2 SPEED RATE] then set the speed rate
with the scrollwheel.
4. Select [3 TURN RATE] then set the turn rate
with the scrollwheel.
Note: Two sets of trial speed and trial turn rate
combinations are provided. This is done to pro-
vide accurate trial maneuver results for various
ship's speeds and turn rates.
5. For the B-type radar, select [4 TGT DATA] then
select whether to use [ACTUAL] or [TRIAL] da-
ta. (Skip this step if your radar is the IMO or A
type.)
6. Close the menu.
7. Find the [Trial] box at the right side of the screen.
8. Right-click the Trial title bar, select [Trial Mode] then select a trial mode, [Static] or
[Dynamic].
A
B
Current
position
Delay time
T
Course and speed changes
completed; position where
course and speed are changed
Position of target B at end
of trial maneuver
Position of target A at end
of trial maneuver
Trial time
Trial course
Trial speed
Trial delay time
Trial ON/OFF

3. TARGET TRACKING (TT)
3-20
9. Click the Trial ON/OFF indication to show [ON].
10. Click the Trial course indication. Spin the scrollwheel to set the trial course.
11. Click the Trial speed indication. spin the scrollwheel or use the Control Unit to set
the trial speed.
12. Click the [DELAY] indication. Spin the scrollwheel to set the amount of delay. This
is the time after which own ship takes a new situation, not the time the simulation
begins. Change the delay time according to own ship loading condition, etc.
The time indication depends on trial mode:
Dynamic mode: The position of your ship and TTs is updated and displayed every 30
seconds.
Static mode: The position of your ship and TTs when set course and speed are
reached are displayed. The progress time until the position is reached is indicated on
the display. The trial time can be changed from the Trial time indication. Put the cursor
in the Trial time indication and roll the scrollwheel. The position of targets at the end
of selected time is shown. Increase or decrease the time to get a safe maneuver.
When the cursor is removed from the box the original positions of your ship and TTs
are restored. If a maneuver is unsafe, change speed, course and delay until it is safe.
The trial maneuver takes place with the letter "T" displayed at the bottom of the screen.
The time appears at the top-right position on the display. If any TT is predicted to be
on a collision course with own ship (that is, the target ship comes within preset CPA/
TCPA limits), the target plotting symbol flashes. If this happens, change own ship's tri-
al speed, course or delay time to obtain a safe maneuver.
Terminating a trial maneuver
The termination method depends on the trial mode as follows:
Dynamic mode: The trial is terminated when 60 minutes is shown in the Trial time in-
dication.
Static mode: The trial is terminated when you terminate the trial maneuver manually.
To terminate the trial maneuver manually, click the Trial ON/OFF indication to show
[OFF].
3.15 TT Simulation Mode
You can simulate the risk of collision by using the TT simulation mode and the trial ma-
neuver together.
1. Execute the TT simulation mode as follows:
1) Open the menu then select [8 INITIAL SETTING] and [8 TT SIMULATION
MODE].
2) The confirmation message "Attention: Do you wish to start TT SIMULATION
MODE?" appears. Click the [OK] button to start the test.
2. The normal operation is suspended then three simulated targets appear on the
display.
The indication "S" appears at the bottom of the effective display area during the
simulation mode. The simulation may be terminated any time by going to the
STBY mode.
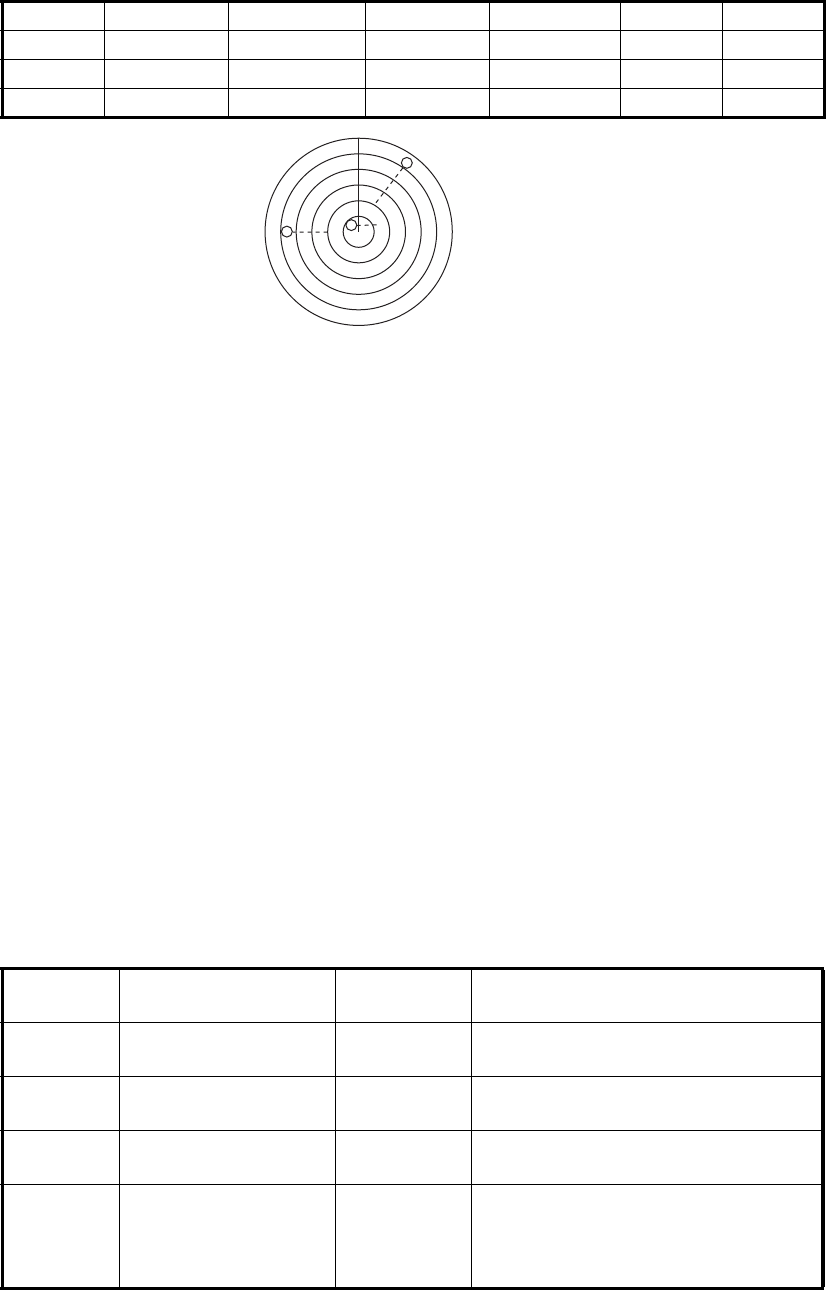
3. TARGET TRACKING (TT)
3-21
Three simulated targets move as the following table. The simulated target is au-
tomatically generated with the relative movement in the following table based on
own ship's movement at the start of simulation mode.
Note: If own ship moves after the start of simulation mode, the movement of the
simulated target is not matched with the values in the following table.
3. Acquire the simulated targets after the TT simulation mode is performed. The
tracking state changes from unstable to stable and the vector appears. You can
simulate the movement of each function with changing true/relative vector, stabi-
lization through the water/over the ground, range or length of vector.
4. After the target B crosses in front of own ship, that is the target B is not a danger-
ous target, you can simulate the risk of collision by using the trial maneuver as fol-
lows:
1) Set the TT CPA/TCPA alarm. For example, set 0.5 nm for CPA, 30 min for
TCPA.
2) Execute the trial maneuver (see section 3.14). In the static mode, the move-
ments of own ship and the target after the time set as the trial time elapses are
displayed. If the target is dangerous after the time set as the trial time elapses,
its symbol is the one for the dangerous target. Adjust the trial course and trial
delay time so the target symbol does not become the dangerous symbol when
executing the trial maneuver.
3.16 TT Alerts
There are nine situations that cause the TT to trigger visual and audio alerts. To ac-
knowledge the audio alerts, push the ALARM ACK key, or click the [Alert] box.
Range (R) Bearing (R) Speed (R) Course (R) CPA TCPA
Target A 9.5 NM 270.0° 20.0 kn 90.0° 0.0 NM 28.5 min
Target B 1.1 NM 333.0° 10.2 kn 90.2° 1.0 NM 2.9 min
Target C 9.3 NM 45.0° 19.9 kn 225.1° 0.0 NM 28.0 min
Alert
No. Message Category Description
520 TT System Error Warning TT system is inoperative. Checking
heading sensor, antenna.
521 TT New Target Warning Tracked target entered the acquisi-
tion zone.
522 TT Auto ACQ 95% Caution The capacity for auto acquisition
has reached 95%.
523 TT Auto ACQ 100% Warning The capacity for auto acquisition
has reached 100% and no more tar-
get acquisition is possible. Cancel
tracking on unnecessary targets.
A
S
C
B

3. TARGET TRACKING (TT)
3-22
3.17 Criteria for Selecting Targets for Tracking
The FURUNO TT video processor detects targets in midst of noise and discriminates
radar echoes on the basis of their size. Target whose echo measurements are greater
than those of the largest ship in range or tangential extent are usually land and are
displayed only as normal radar video. All smaller ship-sized echoes that are less than
this dimension are further analyzed and regarded as ships and displayed as small cir-
cles superimposed over the video echo.
When a target is first displayed, it is shown as having zero true speed but develops a
course vector as more information is collected. In accordance with the IMO require-
ments for TT, an indication of the motion trend should be available within 20 scans of
antenna and full vector accuracy within 60 scans. The FURUNO TT complies with
these requirements.
Echo detection (quantization)
The entire picture is converted to a digital from called "Quantized Video." A sweep
range is divided into small segments and each range element is "1" if there is radar
echo return above a threshold level, or "0" if there is no return.
The digital radar signal is then analyzed by a ship-sized echo discriminator. As the an-
tenna scans, if there are five consecutive radar pulses with 1's indicating an echo pres-
ence at the exact same range, a target "start" is initiated. Since receiver noise is ran-
dom, it is not three-bang correlated, and it is filtered out and not classified as an echo.
The same is true of radar interference. Electronic circuits track both the closest and
most distant edges of the echo. At the end of the scanning of the echo, the discrimi-
nator indicates the measured maximum range extent and total angular extent sub-
tended by the echo. If the echo is larger than a ship-sized echo in range extent and/or
angular width, adjusted as a function of range, it is declared to be a land. This land
echo is not used by TT acquisition and tracking process. All smaller echoes are de-
clared to be ship sized and the middle of the leading edge is used to provide precise
range and bearing coordinates of each echo on every scan. This range/bearing data
is matched to previous data and analyzed from scan-to-scan for consistency. When it
is determined to be as consistent as a real target, automatic acquisition occurs and
tracking is initiated. Continued tracking and subsequent calculation develop the rela-
tive course and speed of the target.
524 TT Man ACQ 95% Caution The capacity for manual acquisition
has reached 95%.
525 TT Man ACQ 100% Warning The capacity for manual acquisition
has reached 100% and no more tar-
get acquisition is possible. Cancel
tracking on unnecessary targets.
526 TT CPA/TCPA Alarm Tracked target on collision course.
Take evasive action.
527 TT Lost Warning Tracked target lost. Check target.
528 REF Target Lost Warning Tracked target used for speed input
is lost. To continue using reference
target for speed input, select anoth-
er tracked target.
Alert
No. Message Category Description

3. TARGET TRACKING (TT)
3-23
Acquisition
A target that is hit by five consecutive radar pulses is judged to be a radar echo. Man-
ual acquisition is done by designating a detected echo with the trackball. Automatic
acquisition is done in the acquisition areas when a target is detected 5-7 times contin-
uously depending upon the congestion.
Tracking
The range and bearing of an echo are found from the relative distance of the target
from the radar antenna. The distance a tracked target moves between radar antenna
rotations is used to calculate the relative speed of the tracked target. However, be-
cause of calculation error, smoothing is applied to get stable target speed and course
data. When a target changes course, smoothing is reduced in order to quickly follow
target movement.
Tracking is achieved when the target is clearly distinguishable on the display for 5 out
of 10 consecutive scans, whether acquired automatically or manually.
Required tracking facilities are available within 0.1-32 nm on range scales including 3,
6, 12 nm, full plotting information is available within one scan when the range scale is
changed. Targets not detected in nine consecutive scans become "lost targets."
The true course and speed of own ship are computed from own ship's gyro and speed
inputs, and the resulting course and speed of each tracked target is easily computed
by vector summing of the relative motion with own ship's course and speed. The re-
sulting true or relative vector is displayed for each of the TTs. This process is updated
continually for each target on every scan of the radar.
The REF point for tracked target calculation can be the radar antenna position or the
CCRP. For CCRP, the displayed value includes the distance between the CCRP and
the antenna position. Therefore, when switching the REF point, the range, bearing,
CPA and TCPA of the tracked targets change.
Qualitative description of tracking error
The FURUNO TT's accuracy complies with or exceeds IMO standards.
Own ship maneuvers
For slow turns there is no effect. For very high turning rates (greater than 150°/minute,
depending on gyro), then all tracked targets revert to full accuracy.
Other ship maneuvers
Target ship courses; lag 15 to 30 seconds at high relative speed, or 3 to 6 seconds at
low (near 0) relative speed. It is less accurate during a turn due to lag, but accuracy
recovers quickly.

3. TARGET TRACKING (TT)
3-24
3.18 Factors Affecting Target Tracking
Sea returns
If the radar anti-clutter control is adjusted properly, there is no serious effect because
distant wave clutter, not eliminated by this control, is filtered out by more than one
bang correlation and scan-to-scan matching of data.
Rain and snow
Rain clutter can be acquired and tracked as targets. Adjust the rain clutter control to
suppress the clutter. If it is heavy rain, switch to S-band if provided, or switch on the
interference rejector on the radar. If heavy clutter still exists, switch to manual acqui-
sition. Accuracy can be affected.
Low clouds
Usually no affect. If necessary, adjust the rain clutter control.
Non-synchronous emissions
No effect.
Low gain
Insufficient or low radar receiver gain will result in some targets not being acquired at
long distance. The TT display will be missing on one or more targets that could only
be visible if the radar sensitivity control (GAIN control) were increased.
The setting of the correct radar receiver gain is not critical but the target should be on
the radar PPI and be clearly visible and well defined.
Manual acquisition is done if a target is positively displayed more than once. Automat-
ic acquisition is done when the target is detected 5-7 times continuously.
Tracking continues if a return echo is received at least once in nine antenna rotations.
However, the fewer the return echoes the lower the accuracy. If no return echo is re-
ceived within nine antenna rotations the target is declared a lost target.
Second trace echoes
When the radar beam is super refracted, strong echoes may be received at such long
ranges that they appear on a different timebase sweep than the transmitted pulse.
This gives an incorrect range indication. Second- and third-trace echoes can be
tracked if they are consistent enough to meet acquisition and tracking criteria but tar-
get course and speed data will be in error.
Blind and shadow sectors
Radar shadow or blind areas caused by obstructions aboard the ship, for example,
funnels and masts, in the path of the radar beam can result in reduction of radar beam
intensity in that particular direction. This may eliminate the detection of some targets.
The TT system will lose track of targets shortly after they are lost on the radar picture
and if they remain in a blind zone. These targets will however be acquired and tracked
when they pass out of the blind zone and again present normal radar echo. The an-
gular width and bearing of any shadow sector should be determined for their influence
on the radar. In certain cases false echoes in the shadow sector cause the TT system
to acquire, track, and vector them. Shadow sectors should be avoided.

3. TARGET TRACKING (TT)
3-25
Indirect echoes
A target at close range is usually picked up directly, but it can also be received as re-
flection from a large, flat surface. This will result in the radar presenting two or more
echoes on the display, each at a different range. The TT system can acquire and track
a false echo if it is detected in five consecutive scans. Reduction in radar gain can
eliminate the multiple echoing but care should be taken as range detection also will be
reduced.
Radar interference
If interference is extreme due to another radar operating at close range, spiral "dotting"
and/or false targets may appear momentarily. The interference rejector can clear the
display.
Delay of sensor input
If the refresh rate of the gyrocompass signal is too slow, error in target bearing occurs
when own ship turns. To prevent this error, the refresh rate of the gyrocompass signal
must be as indicated in the System Configuration drawings.
3. TARGET TRACKING (TT)
3-26
This page is intentionally left blank.

4-1
4. AIS OPERATION
An AIS transponder can be connected to this radar to overlay AIS targets on the radar
display. The radar can store up to 2,000 AIS targets in its storage buffer. When this
buffer becomes full of AIS targets, the Alert 533 "AIS Target Capacity 100%" is gen-
erated to alert you to full storage buffer. The storage buffer contains automatic dead
reckoning for all AIS targets, which is based on reported Speed Over the Ground
(SOG), Course Over the Ground (COG), Rate Of Turn (ROT) and heading. The stor-
age buffer also contains calculation of range, bearing, CPA, TCPA, etc. The CPA and
TCPA limits set for dangerous targets are common for TT and AIS targets.
This radar can activate 500 AIS targets. The Alert 535 "AIS Target Activate 100%" is
generated when 500 AIS targets are activated.
This radar can display a maximum of 1,000 AIS targets. The Alert 531 "AIS Target Dis-
play 100%" is generated when 1,000 AIS targets, which includes both activated and
sleeping targets, are displayed.
The frequency for update of AIS transponder-sent data depends on speed and course
of tracked AIS target. The table below shows the IMO standardized reporting rates for
the AIS transponder. Based on the table below, the radar defines which AIS targets
are in tracking or lost. When you acknowledge a lost target alert, the corresponding
AIS symbol will be removed from the display.
An AIS transponder "sees" all ships fitted with an AIS transponder belonging to either
a Class A or Class B AIS. Additionally, the AIS transponder receives messages from
ships and non-ships (AIS SAR aircraft, AIS aid to navigation, AIS base station, and
AIS search and rescue transmitter).
Type of Ship
IMO
nominal
reporting
interval
Lost target
indication
(reporting
interval >)
Class A: Navigation status is “anchor” or “not under
command” or “moored” or “aground”, and SOG ≤ 3kn
3 min 10 min
Class A: Navigation status is “anchor” or “not under
command” or “moored” or “aground”, and SOG > 3kn
10 s 50 s
Class A: 0kn ≤ SOG < 14kn 10 s 50 s
Class A: 14kn ≤ SOG ≤ 23kn 6 s 30 s
Class A: SOG > 23kn 2 s 10 s
Class B: “CS” SOG < 2kn 3 min 10 min
Class B: “CS” SOG ≥ 2kn 30 s 150 s
Class B: “SO” 0 kn ≤ SOG < 2kn 3 min 10 min
Class B: “SO” 2 kn ≤ SOG < 14kn 30 s 150 s
Class B: “SO” 14 kn ≤ SOG ≤ 23kn 15 s 75 s
Class B: “SO” SOG > 23kn 5 s 25 s
Class A and Class B: no SOG available N/A 10 min
AIS SAR aircraft 10 s 50 s
AIS aid to navigation 3 min 10 min
AIS base station 10 s 50 s
AIS search and rescue transponder N/A 10 min
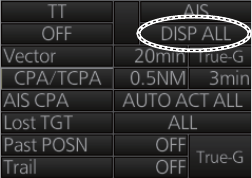
4. AIS OPERATION
4-2
There can be several hundreds or several thousands of AIS targets, and of those only
a few will be significant for your ship. To remove unnecessary AIS targets from the ra-
dar display, the feature "active and sleeping AIS targets" is available. Initially any new
AIS target received by an AIS transponder is not active (="sleeping"). Such sleeping
targets are shown with a small triangle. The operator can pick any AIS target and
change it from sleeping to active. Active AIS targets are shown with a large triangle
with speed vector, headline, ROT indicator, etc. Further, the operator can pick active
AIS targets and change their status to sleeping.
An indication of AIS target activated capacity limit is given well before it is reached.
When 95% of 500 targets are activated, the Alert 534 "AIS Target Activate 95%" ap-
pears. When 500 targets are activated, the Alert 535 "AIS Target Activate 100%" ap-
pears.
An indication of AIS target display capacity limit is given well before it is reached.
When 95% of 1,000 targets are displayed, the Alert 530 "AIS Target Display 95%" ap-
pears. When 1,000 targets are displayed, the Alert 531 "AIS Target Display 100%" ap-
pears.
An indication of AIS target processing capacity limit is given well before it is reached.
The Alert 532 "AIS Target Capacity 95%" will be given when 95% of 2,000 targets are
in the storage buffer and the Alert 533 "AIS Target Capacity 100%" appears when
2,000 targets are in the storage buffer.
This radar generates AIS-related alerts. These are Alert 536 "AIS CPA/TCPA" and
Alert 537 "AIS Lost". Only active AIS targets generate alerts. The operator can acti-
vate or sleep AIS target alerts as desired. The feature "active and sleeping AIS tar-
gets" is very effective for focusing on only those AIS targets that need supervision.
This radar further eases the task of the operator by automatically changing non-active
targets to active targets, if their CPA and TCPA are within a preset limit.
4.1 How to Deactivate the AIS Function
Long-click the AIS status indication at the bottom-right position to display [FUNC OFF]
to deactivate the AIS function (sleep all AIS targets) and AIS messaging facility. To
activate AIS, push the left button again.
Note: You cannot enable AIS if any of the items listed below are active.
• Manual speed
• Manual set & drift
• Speed is calculated from reference targets
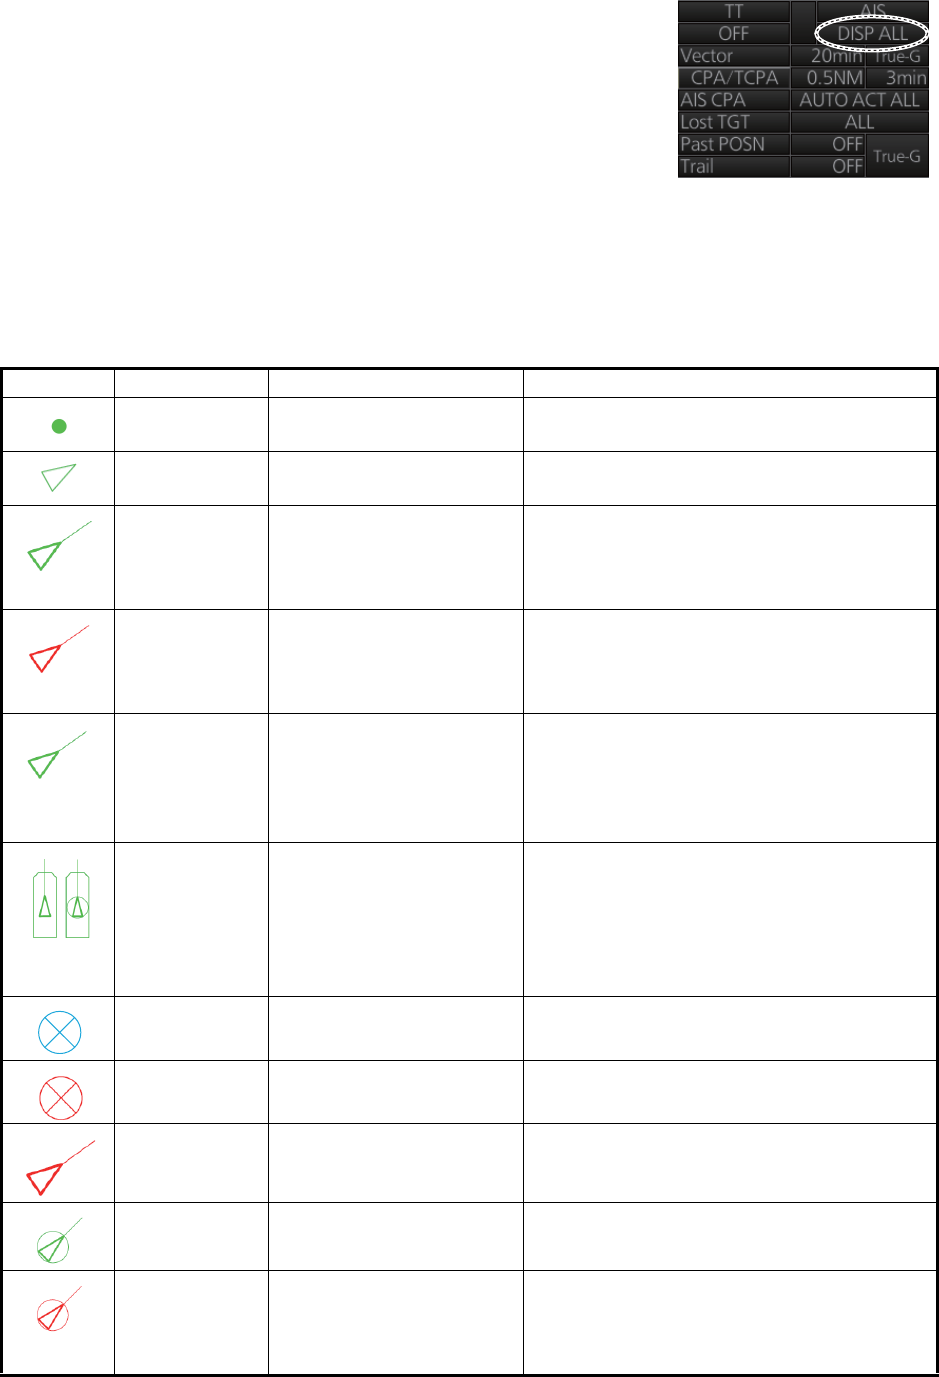
4. AIS OPERATION
4-3
4.2 How to Show, Hide the AIS Display
Targets that are being tracked by an AIS transponder
can also be displayed on the display. Click the AIS sta-
tus indication to select [DISP OFF], [DISP FILT] or
[DISP ALL].
[DISP OFF]: Turn off the AIS display. (Tracking contin-
ues internally.)
[DISP FILT]: Filter AIS targets according to the settings
of the AIS target filter. See section 4.4.
[DISP ALL]: Display all AIS targets.
4.3 AIS Symbols
Symbol Default color Name Description
Green AIS tracked target past
position point
Mark past position.
Green Sleeping AIS target Denote sleeping AIS symbol. (Lines are
thinner than Active AIS symbol.)
Green Activated AIS target Denote active AIS target, with vector for
course and speed. (Lines are thicker than
sleeping AIS symbol.) Color can be
changed with the menu.
Red (fixed) Activated target in AZ
(without acknowledg-
ment)
Unacknowledged active AIS target in ac-
quisition zone, with vector for course and
speed. (Lines are thicker than sleeping AIS
symbol.)
Green Activated target in AZ
(with acknowledgment)
Acknowledged active AIS target in acquisi-
tion zone, with vector for course and
speed. (Lines are thicker than sleeping AIS
symbol.) Color can be changed with the
menu.
Green Activated target, true
scale symbol
Active AIS target with symbol shown in true
scale. Association AIS symbol or activate
AIS symbol is displayed within the ship’s
symbol when activated. This symbol disap-
pears when the size of the true scale sym-
bol is smaller than 3 mm on the display.
Blue AIS SART test Denote AIS SART (search and rescue ra-
dar transponder) test.
Red (fixed) AIS SART active Denote AIS SART (search and rescue ra-
dar transponder) active.
Red (fixed) Dangerous AIS target Target’s CPA and TCPA are within the
CPA and TCPA settings. Vector shown.
The symbol flashes until acknowledgment.
Green Association AIS target AIS and TT target declared as "association
target". AIS symbol and AIS data are used.
Red (fixed) Association AIS danger-
ous target
AIS and TT target declared as "association
target". AIS symbol and AIS data are used.
Target's CPA and TCPA are within limits
set.
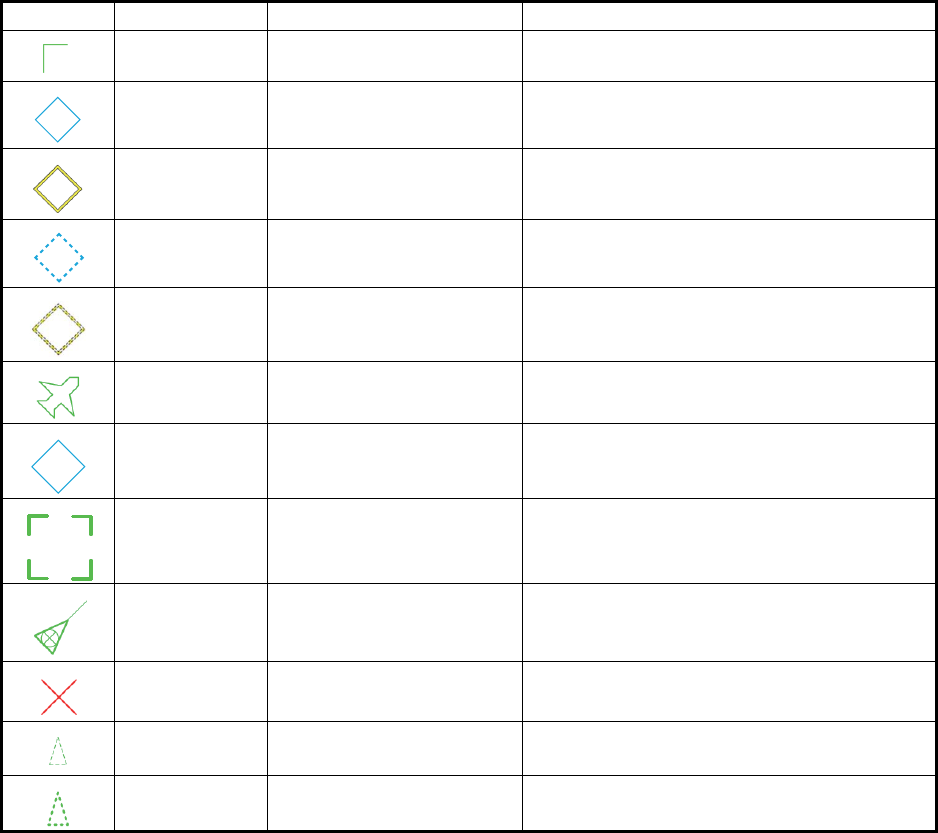
4. AIS OPERATION
4-4
Note 1: The equipment continues to process AIS targets when the AIS feature is
switched off. When the AIS is again turned on, symbols are immediately displayed.
Note 2: AIS symbols are momentarily erased after the screen is redrawn when the
heading is changed from the head-up mode.
Note 3: When no AIS data is received, the Alert 380 "AIS COM Error" appears in the
[Alert] box. Check the AIS transponder.
Note 4: An AIS target is declared a lost target if it is not detected in five consecutive
reporting periods (see the table on page 4-1).
Green Heading-turn indicator Show target’s direction of turning.
Blue Physical (real) AIS ATON AIS aid to navigation
Yellow Physical AIS ATON Off
Position
AIS aid to navigation with off position
Blue Virtual AIS ATON Virtual AIS aid to navigation
Yellow Virtual AIS ATON Off Po-
sition
Virtual AIS aid to navigation with off posi-
tion
Green SAR Aircraft Denote SAR aircraft.
Blue AIS base station Denote AIS base station.
Green AIS select symbol Target selected to display its data.
Green SAR vessel SAR (search and rescue) vessel
Red (fixed) AIS lost symbol X is superimposed on the AIS target sym-
bol and is flashing.
Green Non HDG/COG sleeping
AIS target
Denote sleeping AIS symbol without HDG
and COG. Dashed line.
Green Non HDG/COG activated
AIS target
Denote active AIS symbol without HDG
and COG. Dashed line.
Symbol Default color Name Description
BS
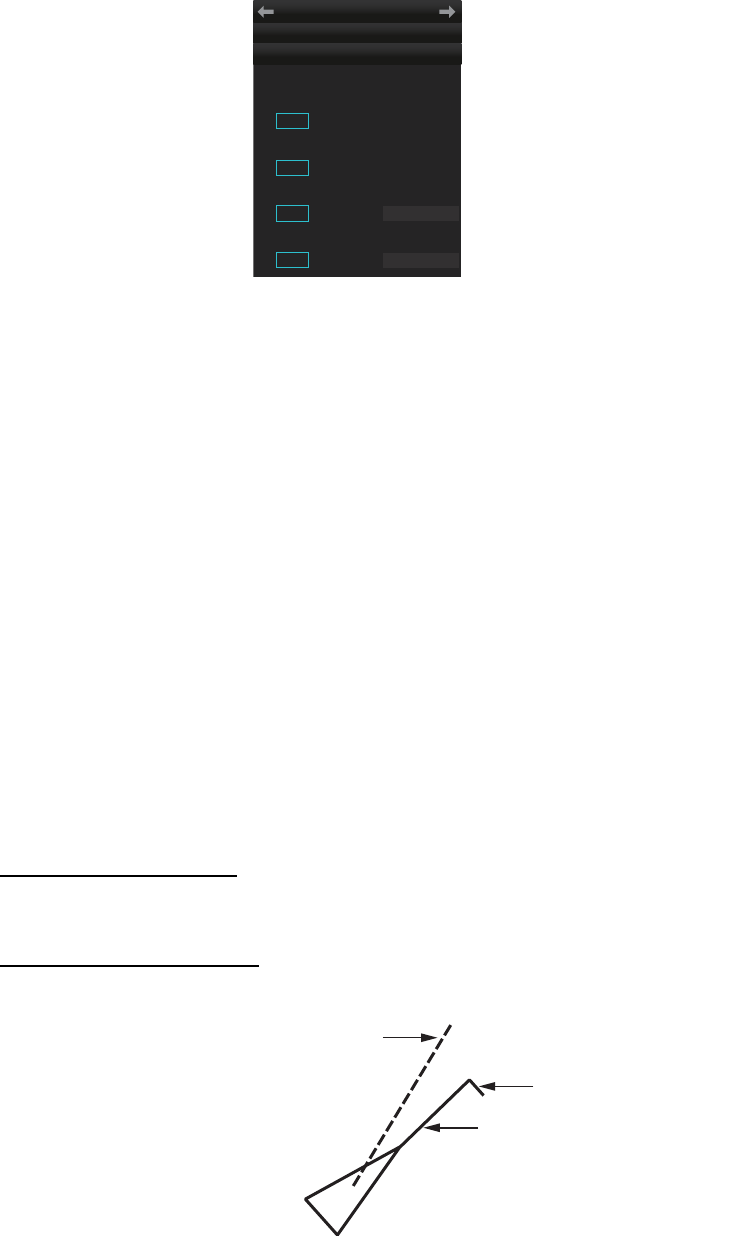
4. AIS OPERATION
4-5
4.4 How to Filter Sleeping AIS Targets
If the screen becomes cluttered with AIS targets, you can filter out unnecessary sleep-
ing AIS targets, from the [DISP FILTER] menu.
1. Right-click the AIS mode indication then click [AIS Menu] to show that menu.
2. Open the [5 DISP FILTER] menu.
3. At [1 SLEEPING CLASS A] - [2 SLEEPING CLASS B], disable or enable tracking
of respective item as appropriate.
4. Select [3 MAX RANGE] and set the maximum range to display a sleeping AIS tar-
get. A sleeping AIS target not within the range set here is not displayed.
5. Set the minimum ship speed for sleeping AIS targets, with [4 MIN SHIP SPEED].
Any sleeping AIS target whose speed is slower than that set here will not be dis-
played.
6. Close the menu.
Note: This function is not available for an activated target.
4.5 How to Activate Targets
When you convert a sleeping target to an activated target, an activated target's course
and speed are shown with a vector. You can easily judge target movement by moni-
toring the vector.
4.5.1 How to activate specific target
From the Control Unit
Select the target with the cursor then press the ACQ/ACT key.
By the trackball module
Click the AIS target symbol.
TT
• AIS
AIS
MENU
← DISP FILTER
1 SLEEPING CLASS A
OFF / ON
2 SLEEPING CLASS B
OFF / ON
3 MAX RANGE
OFF / ON 12NM
4 MIN SHIP SPEED
OFF / ON 1.0kn
SOG (Speed Over the Ground) and COG
(Course Over the Ground) vector
*1
*1
Vector shows STW (speed
through the water) and CTW
(course through the water)
when sea stabilized mode is
selected at the radar.
Turning direction (ROT)
Heading line
*2
*2
Line points in direction of
COG when there is no
heading data.
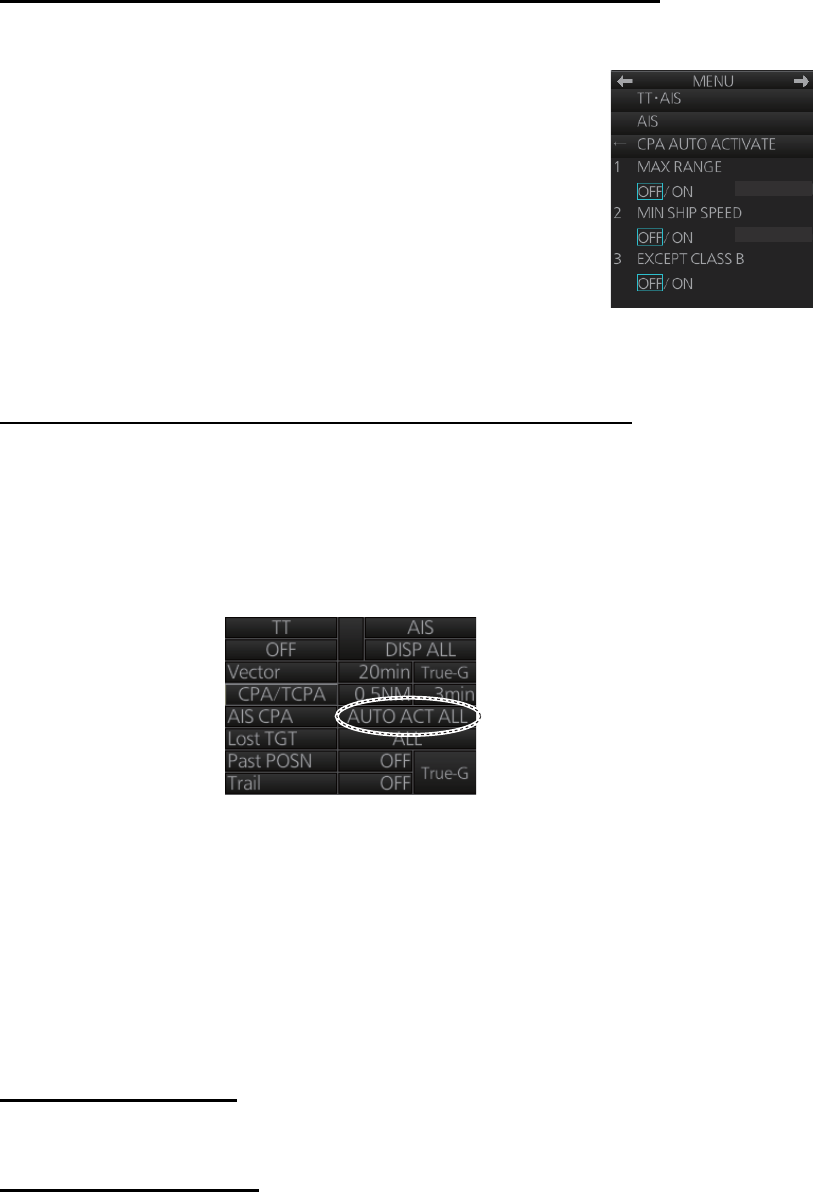
4. AIS OPERATION
4-6
4.5.2 How to automatically activate targets
You can get automatic activation of a sleeping AIS target when its CPA/TCPA are
within a preset limit. The CPA/TCPA alarm must be active to use this feature.
How to set conditions for automatic activation of AIS targets
1. Right-click the AIS mode indication then click [AIS Menu] to show that menu.
2. Open the [4 CPA AUTO ACTIVATE] menu.
3. Set each menu item, referring to the description below.
[1 MAX RANGE]: Set the maximum range to use. Any AIS
target at a distance greater than set here will not be acti-
vated.
[2 MIN SHIP SPEED]: Set the minimum speed to use.
Any AIS target whose speed is slower than set here will
not be activated.
[3 EXCEPT CLASS B]: Select [ON] to exclude class B
AIS targets.
4. Close the menu.
How to enable, disable automatic activation of AIS targets
Click the location circled in the figure below to select one of the following:
[AUTO OFF]: Disable automatic activation of AIS target by CPA.
[AUTO ACT FILT]: Activate AIS targets that fulfil the requirements set on the [CPA
AUTO ACTIVATE] menu.
[AUTO ACT ALL]: Activate all AIS targets within the CPA range set.
4.6 How to Sleep Targets
4.6.1 How to sleep an activated AIS target
You can "sleep" an activated AIS target as shown below when the screen becomes
filled with targets that might prevent important radar and AIS targets from being iden-
tified. The targets that have been activated automatically cannot be "slept."
From the Control Unit
Put the cursor on the AIS target to sleep then press the TARGET CANCEL key.
By the trackball module
1. Right-click the screen to show the context-sensitive menu.
2. Select [Target Cancel] and [Any] or [AIS Only] as applicable.
3. Click the AIS target to sleep.
1.0kn
0NM
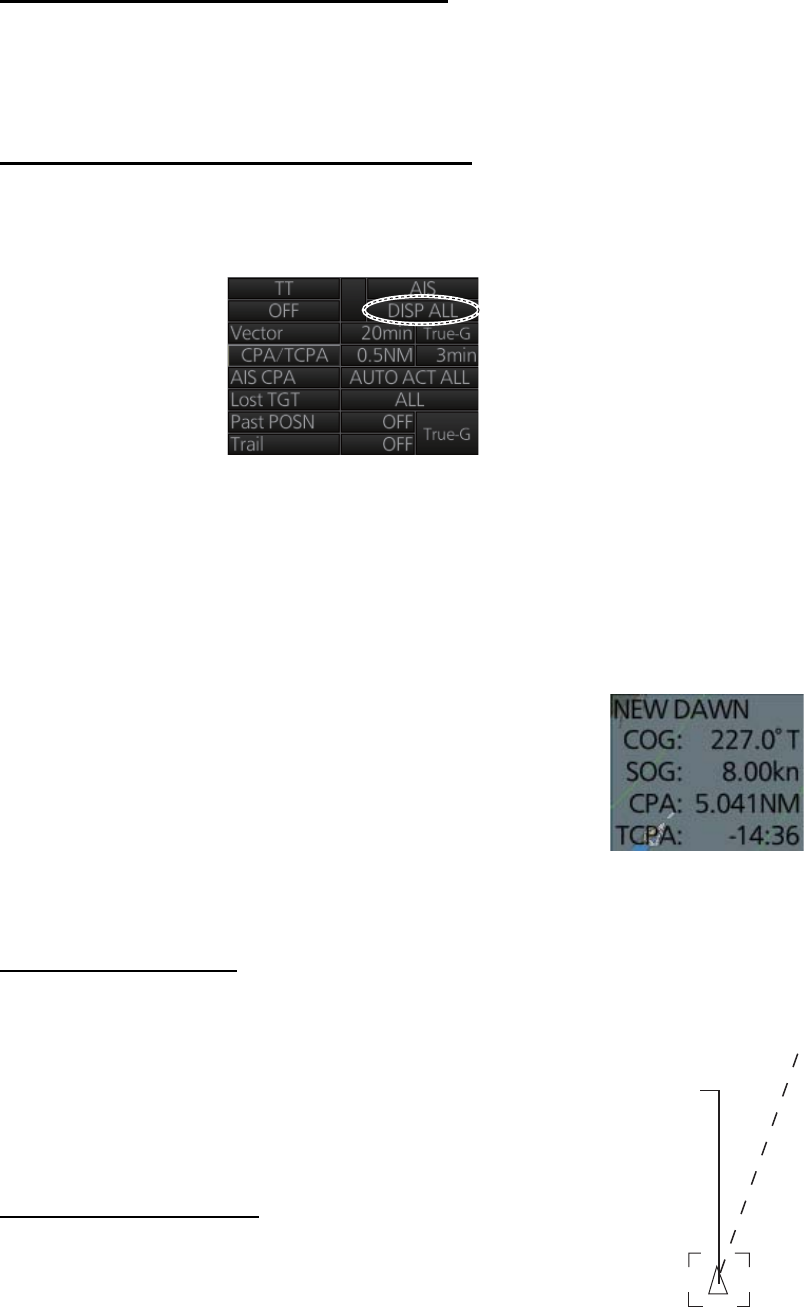
4. AIS OPERATION
4-7
4.6.2 How to sleep all activated AIS targets
Sleep all activated targets from the menu
1. Open the menu then select [2 TT•AIS] and [4 AIS].
2. Select [3 SLEEP ALL TGTS] then [YES].
3. Close the menu.
Sleep all activated targets from the AIS box
Long-click the AIS status indication at the bottom-right position to display [FUNC OFF]
then click [DISP ALL] to sleep all AIS targets redisplayed.
4.7 How to Display AIS Target Data
You can display an AIS target's data by selecting it on the display.
4.7.1 AIS pop-up information
The AIS pop-up shows abbreviated AIS data (COG, SOG,
CPA and TCPA) for the selected AIS target. Simply put the
cursor on the AIS target to show the pop-up. The pop-up can
be enabled or disabled with [AIS POP-UP INFO] in the
[TT•AIS SYMBOL] menu.
4.7.2 Basic AIS target data
From the Control Unit
1. Use the trackball to put the cursor on the activated AIS target
symbol you want to know its data.
2. Press the TARGET DATA key.
3. The selected target is marked with a broken square and AIS
data is shown in the AIS data box when the target is correctly
selected.
By the trackball module
Click the activated AIS target symbol. The selected target is
marked with a broken square and AIS data is shown in the AIS
data box when the target is correctly selected.
A
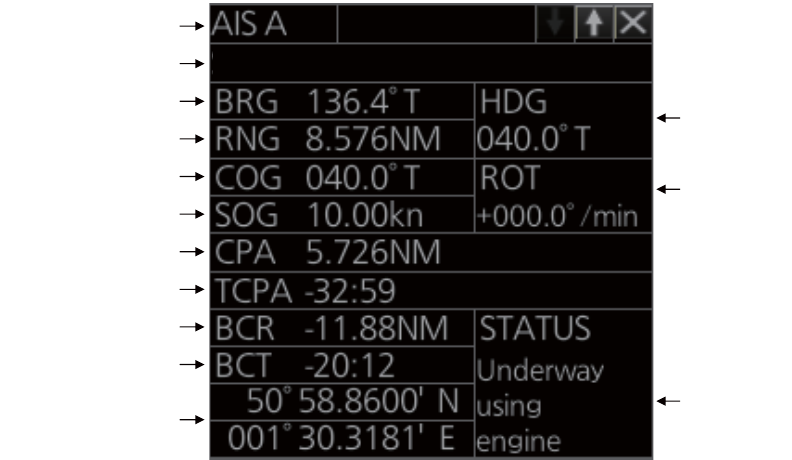
4. AIS OPERATION
4-8
Note 1: AIS is not available in dead reckoning when the radar type is selected to [IMO]
on the [INSTALLATION] menu.
Note 2: If the TCPA value is negative, this means that you have already passed the
closest point and the AIS target is going away from your ship.
AIS no. (information
display order)
Vessel name
Bearing
Range
Course over ground
Speed over ground
CPA
TCPA
Bow crossing range
Bow crossing time
Position
Heading
Navigation
status
Rate of turn
FURUNO
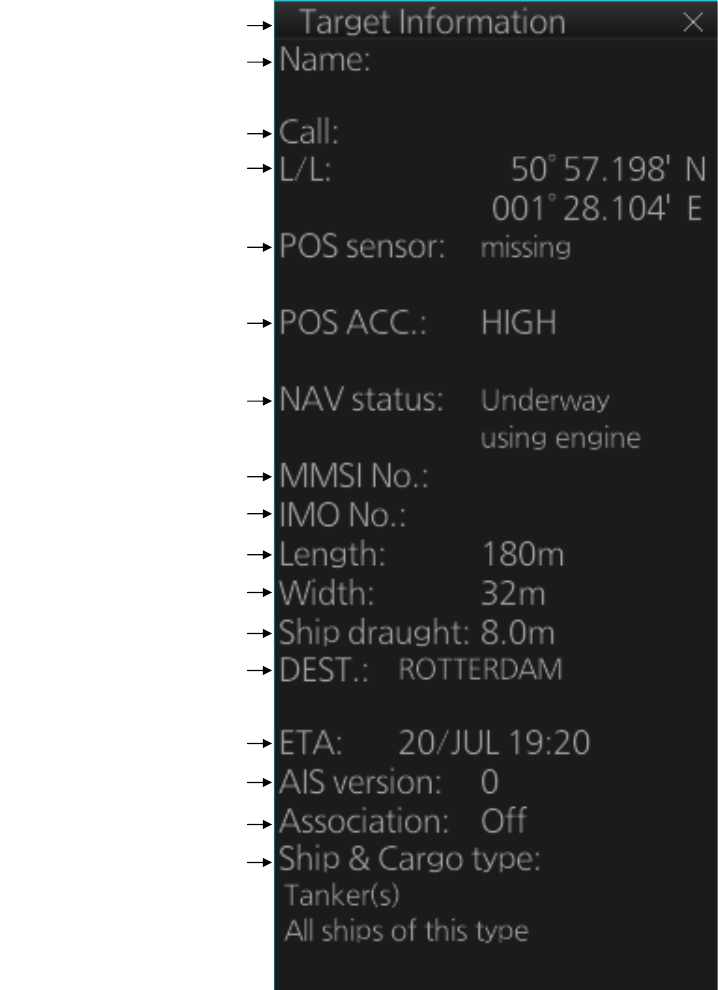
4. AIS OPERATION
4-9
4.7.3 Expanded AIS data
The expanded AIS data display provides additional information about an AIS target,
including call sign, MMSI No., IMO No., etc. To display expanded AIS data, show the
basic data for a target, right-click the target data display then select [Expanded AIS
Data].
If data for an item is unknown, "missing" appears. In the example above, the name of
the position sensor is “missing”.
Title bar
Vessel name
Length of vessel
Position
Navigation status
Call sign
Type of position sensor
Position accuracy
(HIGH or LOW)
MMSI No.
IMO No.
Width of vessel
Draught of vessel
Destination
ETA at destination
Version of AIS transponder
Association (On or Off)
Ship and cargo type
FURUNO
WG27CQ
0023555552
2324433222
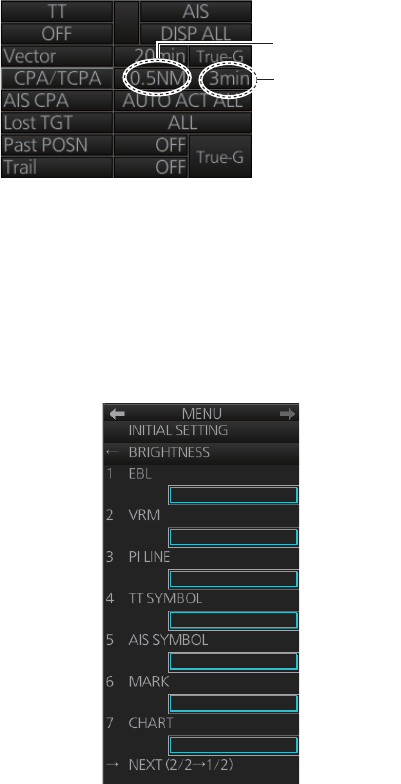
4. AIS OPERATION
4-10
4.8 AIS CPA/TCPA Alarm
This radar calculates CPA and TCPA by using own ship and relative target positions.
An AIS dangerous target is one whose CPA and TCPA are within the range of the CPA
and TCPA limits set in the TT/AIS box. The AIS symbol of an AIS dangerous target is
red and flashing, and is announced with the Alert 536 "AIS CPA/TCPA". After the alert
is acknowledged the target symbol is displayed in red color.
To set the CPA and TCPA ranges, do the following:
1. If the CPA and TCPA settings are not shown, click [CPA/TCPA].
Note: When clicking [CPA/TCPA], the CPA/TCPA alarm function is off.
2. Click the CPA indication to select desired CPA range.
3. Click the TCPA indication to select desired TCPA setting.
4.9 AIS Symbol Brilliance
1. Right-click the [BRILL] button on the InstantAccess bar then select [Brill Menu].
2. Go to page 2, select [5 AIS SYMBOL] then spin the scrollwheel to adjust the bril-
liance.
3. Close the menu.
CPA setting
TCPA setting
㪈㪌
㪈㪌
㪈㪌
㪈㪌
㪈㪌
㪈㪌
㪈㪌
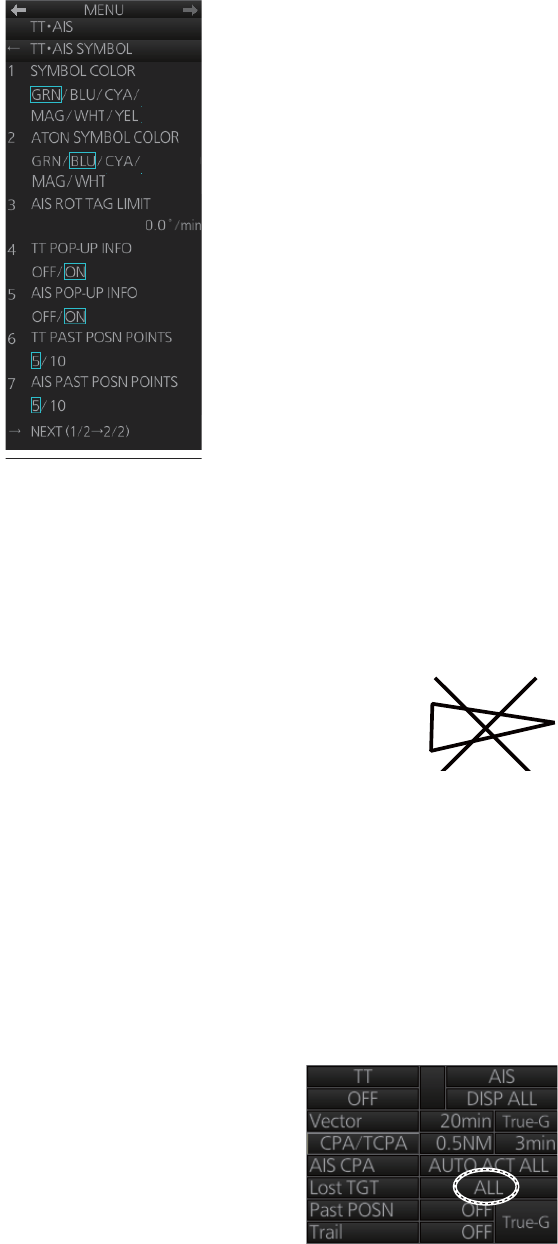
4. AIS OPERATION
4-11
4.10 AIS Symbol Color
1. Right-click the AIS mode indication then click [Symbol Menu] to show that menu.
2. Select [1 SYMBOL COLOR] and desired color. (Yellow is not available with the
IMO type.)
3. Close the menu.
4.11 AIS Lost Targets
An AIS target is declared a lost target when it fails to produce data
for intervals which are based on the table on page 4-1. When this oc-
curs, the target is marked with the lost target symbol (flashing),
shown in the right figure, the buzzer sounds (for activated targets
only) and the Alert 537 "AIS Lost" appears.
To acknowledge a lost target, push the ALARM ACK key or click the [Alert] box.
Note: The AIS data transmission interval depends on target's speed. For example, the
data is transmitted every 10 seconds on the ship speed of 0 to 14 kn and every two
seconds on the ship speed of more than 23 knots. For details, see the owner's manual
of the AIS transponder.
4.11.1 How to enable, disable the AIS lost target alert
The[ Lost TGT] indication (at the bottom-right position)
enables, disables the lost target alert. Click the indica-
tion to select [OFF], [FILT] or [ALL] as appropriate.
[OFF]: Disable the lost target alert.
[FILT]: Get the alert against the targets whose criteria
meet the settings made in section 4.11.2.
[ALL]: Get the alert against all lost targets.
Note: The [Lost TGT] setting is shared commonly between TT and AIS.
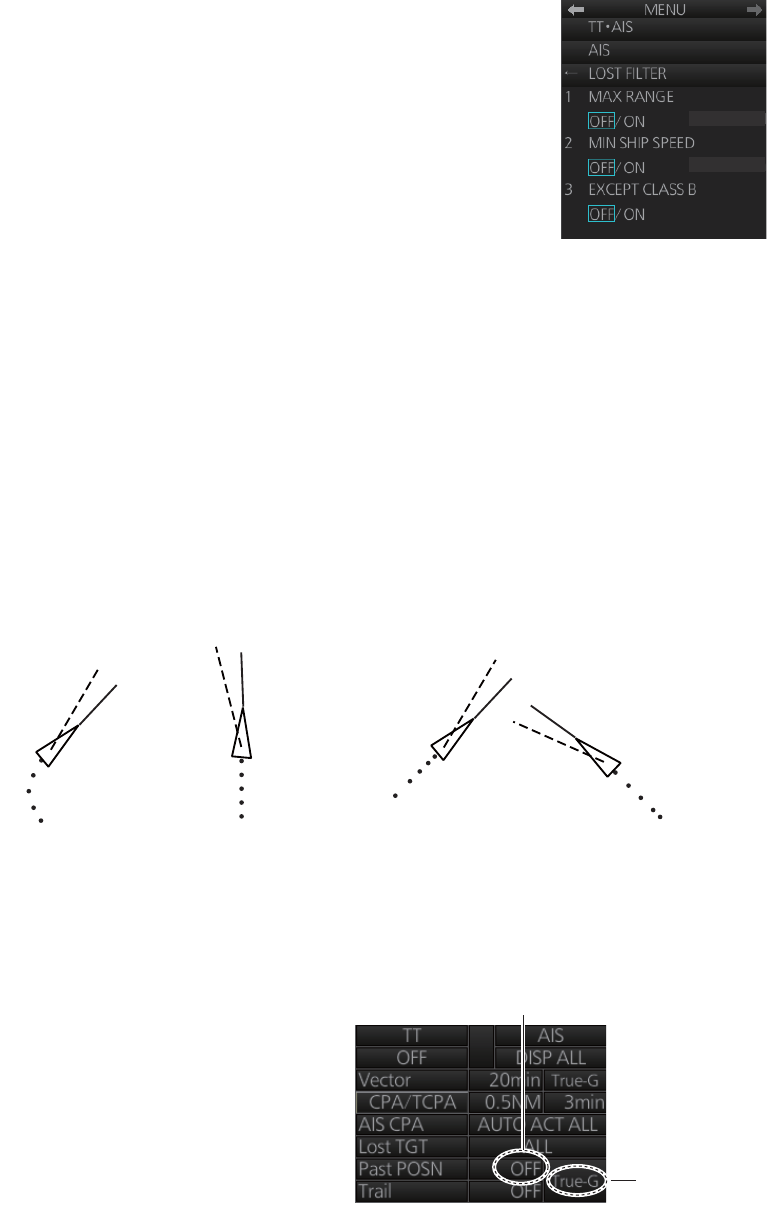
4. AIS OPERATION
4-12
4.11.2 How to set the AIS lost target filter
If you are in an area where AIS targets often become lost, the lost target alert may ac-
tivate frequently. In this case, you may want to specify which targets to classify as lost
targets, to prevent frequent triggering of the lost target alert.
1. Right-click the AIS mode indication then click [AIS Menu]
to show that menu.
2. Open the [6 LOST FILTER] menu.
3. Set each menu item, referring to the description below.
[1 MAX RANGE]: Set the maximum range to use. Any
AIS target at a distance greater than set here will not trig-
ger the lost target alert.
[2 MIN SHIP SPEED]: Set the minimum speed to use.
Any AIS target whose speed is slower than set here will
not trigger the lost target alert.
[3 EXCEPT CLASS B]: Select [ON] to exclude class B AIS targets from the lost
target alert.
4. Close the menu.
4.12 How to Display AIS Target Past Positions
The past position display shows equally time-spaced dots marking past positions of
activated AIS targets. If a target changes its speed, the spacing will be uneven. If it
changes course, its plotted course will not be a straight line.
Below are sample past position displays.
4.12.1 How to enable/disable the
past position display, select
past position reference
Click the indications circled in the figure
below to set the plot interval (or disable
the display) and the past position refer-
ence (true or relative).
1.0kn
0NM
(a) Ship turning (b) Ship running
straight
(c) Ship reduced
speed
(d) Ship increased
speed
Past position
reference
Plot interval, past
position display
ON/OFF
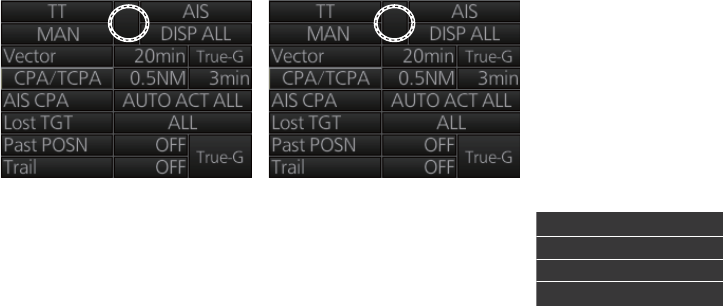
4. AIS OPERATION
4-13
4.12.2 Past position points
You can show 5 or 10 past position points per AIS target. Right-click the past position
indication then click [Past POSN Menu] to show that menu. Set [6 AIS PAST POSN
POINTS] to [5] or [10].
4.13 How to Display True or Relative Speed Vectors
AIS targets vector can be displayed relative to your ship's heading (relative) or with
reference to the North (True).
Vector time (or the length of vectors) and presentation mode can be set at the bottom-
right position on the screen. For further information, see section 3.9.
4.14 Association of TT and AIS Targets
An AIS-equipped ship is usually displayed by two symbols on the radar display. This
is because the AIS ship position is measured by a GPS navigator (L/L) whereas the
radar detects the same ship by PPI principle (range and bearing relative to own ship
radar antenna).
To avoid the presentation of two target symbols for the same physical target, use the
"association" function. If target data from both AIS and TT are available and if the as-
sociation criteria are fulfilled, either the AIS or TT symbol is presented according to the
association method selected.
Association will not happen between AIS and TT if the AIS target is sleeping or the AIS
target is lost.
All association settings, including ON/OFF, can also be controlled from the chart for
radar mode, with the [TT/AIS] page in the [Overlay/NAV Tools] box. All settings are
mutually shared.
4.14.1 How to select association method
Click the location circled below to show "<" to select AIS symbol for associated target,
or ">" to select TT symbol for associated target. This setting overrides the correspond-
ing item on the [TT•AIS] menu. To turn off association, click the location to remove the
arrow.
Note: You can also select the method by right-cllcking the loca-
tion. Click desired association method.
<
<>
Association: OFF
Association: TT
Association: AIS
[Association Menu]
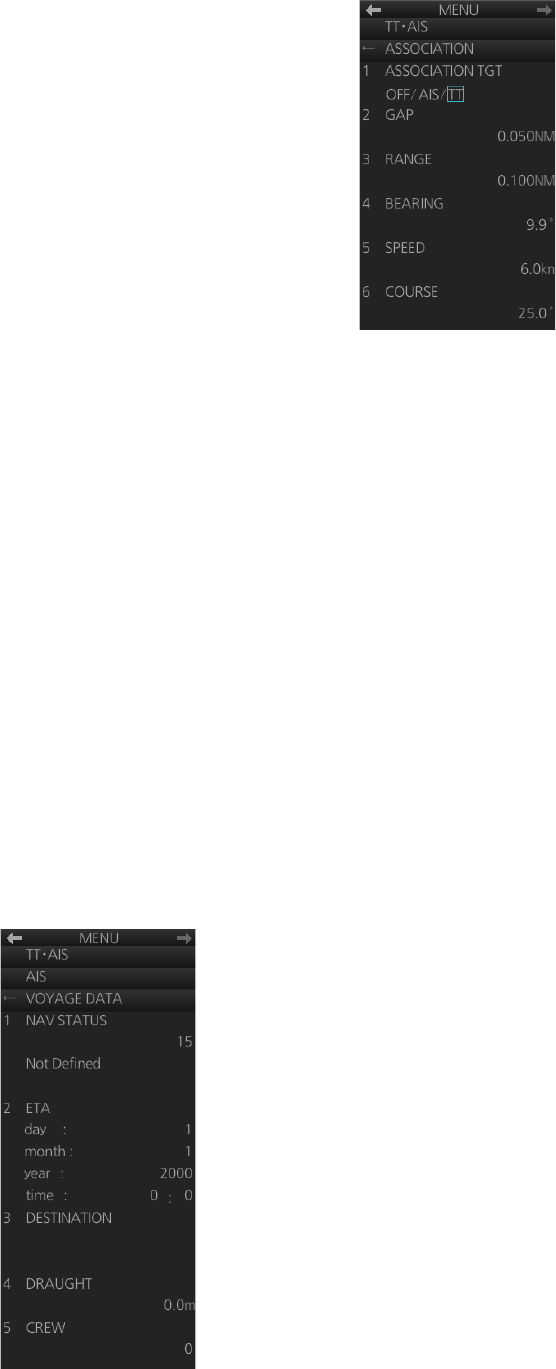
4. AIS OPERATION
4-14
4.14.2 How to set the conditions for association
1. Open the menu then select [TT•AIS] and [6 ASSOCIA-
TION].
2. Enter the association conditions, referring to the follow-
ing:
[ASSOCIATION TGT]: Disable Association with [OFF], or
select [AIS] or [TT]. [AIS] selects the AIS symbol for asso-
ciation target; [TT] selects the TT symbol for the associa-
tion target.
[GAP]: Range between AIS target and TT.
Setting range: 0.000-0.999(NM)
[RANGE]: Enter the range difference from own ship to AIS
target and TT.
setting range: 0.000-0.999(NM)
[BEARING]: Enter the bearing difference from own ship to AIS target and TT.
Setting range: 0.0-99.9(°)
[SPEED]: Enter the speed difference between AIS target and TT.
Setting range: 0.0-9.9(kn)
[COURSE]: Enter the course difference between AIS target and TT.
Setting range: 0.0-99.9(°)
When the association criteria are met
• either the AIS or TT symbol is erased according to association made in
section 4.14.1.
• the Alert 560 "Association" appears in the [Alert] box.
4.15 Voyage Data
Before you embark on a voyage, set your navigation status, ETA, destination, draught
and crew, on the [VOYAGE DATA] menu.
1. Click the [OWN AIS] button on the InstantAccess bar to show the [VOYAGE DA-
TA] menu.
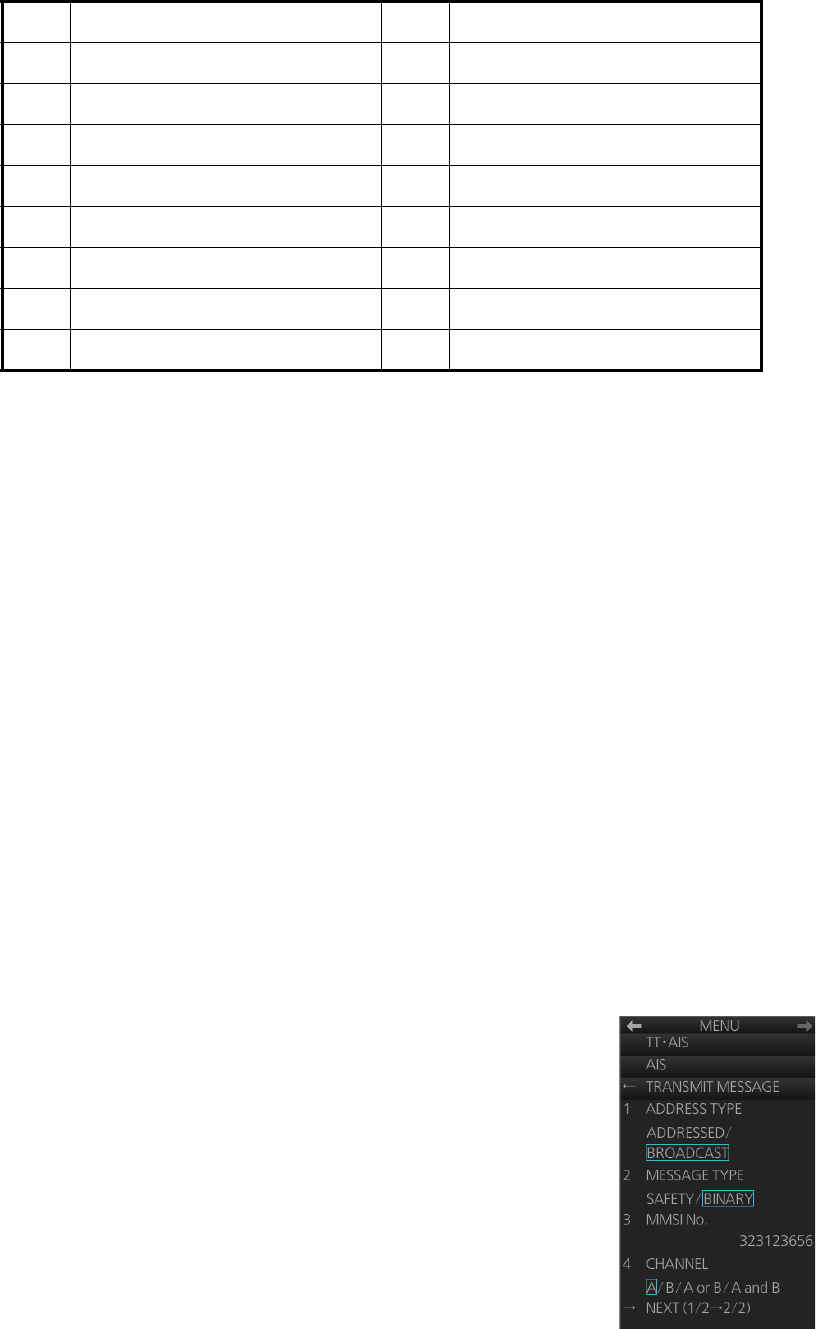
4. AIS OPERATION
4-15
2. Select [1 NAV STATUS] then use the scrollwheel to set the applicable two-digit
nav status code, referring to the table below.
3. Select [2 ETA] then use the scrollwheel to enter ETA: day (two digits), month (two
digits), year (four digits) and time (four digits).
4. Select [3 DESTINATION] then use the software keyboard to enter the name of
your destination, using a maximum of 20 characters.
5. Select [4 DRAUGHT] then use the scrollwheel to enter ship's draft (0.0 - 25.5 (m)).
6. Select [5 CREW] then use the scrollwheel to enter the number of crew (0000-
8191).
7. Close the menu.
4.16 AIS Messages
You can send and receive messages via the VHF link, to a specified destination (MM-
SI) or all AIS-equipped ships within communication range of your ship. Messages can
be sent to warn of safety of navigation, for example, an iceberg sighted. Routine mes-
sages are also permitted. Short safety-related messages are only an additional means
to broadcast safety information. They do not remove the requirements of the GMDSS.
4.16.1 How to create and transmit a new AIS message
You can create and send an AIS message as follows:
1. Right-click the AIS mode indication then click [AIS Menu]
to show that menu.
2. Open the [8 TRANSMIT MESSAGE] menu.
3. At [1 ADDRESS TYPE], select [ADDRESSED] to send
the message to a specific AIS-equipped ship, or [BROAD-
CAST] to send the message to all AIS-equipped ships
within VHF communication range. For [ADDRESSED],
enter MMSI of ship at [3 MMSI No.].
4. At [2 MESSAGE TYPE], select [SAFETY] for safety mes-
sage, or [BINARY] for routine message.
No. Nav status No. Status
00 Underway using engine 08 Under way Sailing
01 At anchor 09 Reserved for high speed craft
02 Not under command 10 Reserved for wing in ground
03 Restricted Maneuverability 11 Reserved for future use
04 Constrained by her draft 12 Reserved for future use
05 Moored 13 Reserved for future use
06 Aground 14 AIS SART
07 Engaged in fishing 15 Not Defined
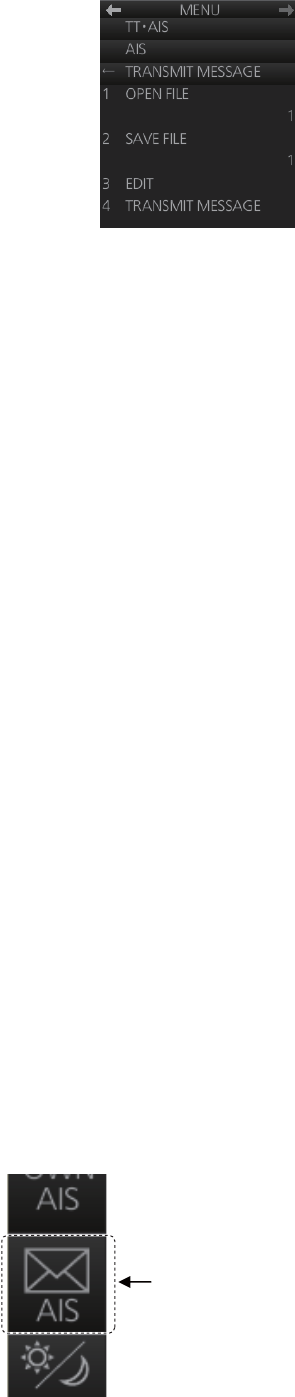
4. AIS OPERATION
4-16
5. At [4 CHANNEL], select the channel over which to broad-
cast your message. The choices are [A], [B], [A or B] or [A
and B].
6. Click [NEXT] to go to the next page.
7. Select [3 EDIT]. A text input box appears together with the
software keyboard. Use the software keyboard to enter
your message. The number of characters that may be en-
tered depends on message type, and the number of char-
acters available appears below the text box.
Safety message broadcast: 161 characters
Binary message broadcast: 156 characters
Safety message addressed to MMSI: 156 characters
Binary message addressed to MMSI: 151 characters
8. To save the file, select [2 SAVE FILE].
9. To transmit the message, click [4 TRANSMIT MESSAGE]. The confirmation mes-
sage "Attention: Do you wish to transmit AIS message?" appears. Click the [OK]
button to transmit the message.
The Alert 542 "AIS Transmitting" appears in the [Alert] box while the message is being
transmitted. If the message could not be transmitted, the Alert 541 "AIS Message
Transmit Error" appears.
4.16.2 How to transmit a saved AIS message
If you have saved some previously transmitted AIS messages, you can edit one and
send it as follows:
1. Right-click the AIS mode indication then click [AIS Menu] to show that menu.
2. Open the [8 TRANSMIT MESSAGE] menu.
3. Go to page 2 of the menu, select [1 OPEN FILE] then select the number of the
message to transmit.
4. Select [3 EDIT] to edit the message.
5. To save the message, select [2 SAVE FILE].
6. To transmit the message, select [4 TRANSMIT MESSAGE]. The confirmation
message "Attention: Do you wish to transmit AIS message?" appears. Click the
[OK] button to transmit the message.
4.16.3 How to display received AIS messages
When you receive an AIS message, the Alert 539 "AIS Message Received" appears.
To display the message, click the [AIS message]
button on the InstantAccess bar.
[AIS message]
button
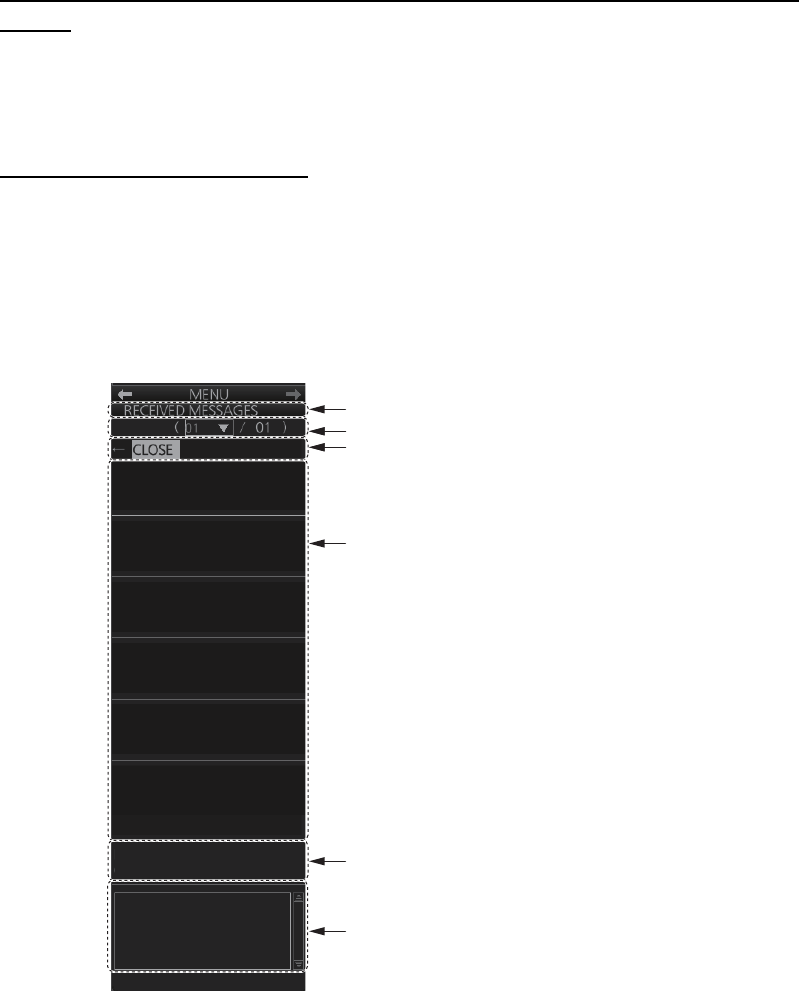
4. AIS OPERATION
4-17
How to get notification of AIS message reception with the [AIS message]
button
Right-click the AIS mode indication then click [AIS Menu] to show that menu. Go to
page 2 and set [1 AUTO DISP MESSAGE] to [ON]. When you receive an AIS mes-
sage, the [AIS message] button is displayed in orange.
AIS Received Messages list
Received AIS messages are stored in the AIS received message list. A maximum of
200 messages are saved over 50 pages for FURUNO 19-inch monitor unit, 34 pages
for FURUNO 23-inch monitor unit.
1. Right-click the AIS mode indication then click [AIS Menu] to show that menu.
2. Select [7 RECEIVED MESSAGES].
3. Click an AIS message in the list to show its contents.
4. Click the [CLOSE] window button to close the window.
1 10/APR/2012 08:21
ADDRESSED SAFETY
MMSI: 431060309
2 10/APR/2012 10:45
ADDRESSED BINARY
MMSI: 303056302
NAME: FURUNO
CALL: 098657334
<OSAKA MARTIS R41-5-
1>TEST:INFORMATRIOIN
SW 2M/S WEATHER
RAINY VISIBILITY -5000M
Title bar
Page no./total no. of pages
Close current window
AIS message list
Ship’s name and call sign
Message content
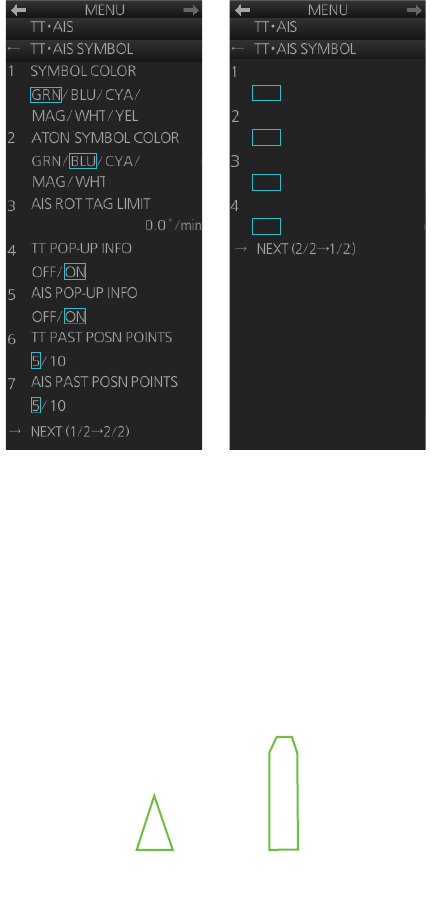
4. AIS OPERATION
4-18
4.17 Other AIS Features
The [TT•AIS] menu additionally provides the features described below.
[ATON SYMBOL COLOR]: Select the ATON symbol color.
[AIS ROT TAG LIMIT]: The ROT marker appears on the heading line of an AIS target
and points in the direction of the turn when the ship's rate of turn is greater than that
set here.
[AIS SCALED SYMBOL]: The AIS target symbol can be shown as a simple triangle or
a symbol scaled according to a vessels's dimensions. Select [ON] to show the scaled
symbol.
[AIS BASE STATION]: Select [ON] to show the AIS base stations.
[AIS PHYSICAL ATON]: Select [ON] to show the physical AIS ATON.
[AIS VIRTUAL ATON]: Select [ON] to show the virtual AIS ATON.
Page 2
AIS SCALED SYMBOL
OFF
/
ON
AIS BASE STATION
OFF
/
ON
AIS PHYSICAL ATON
OFF
/
ON
AIS VIRTUAL ATON
OFF
/
ON
Page 1
Standard
AIS symbol
AIS scaled
symbol
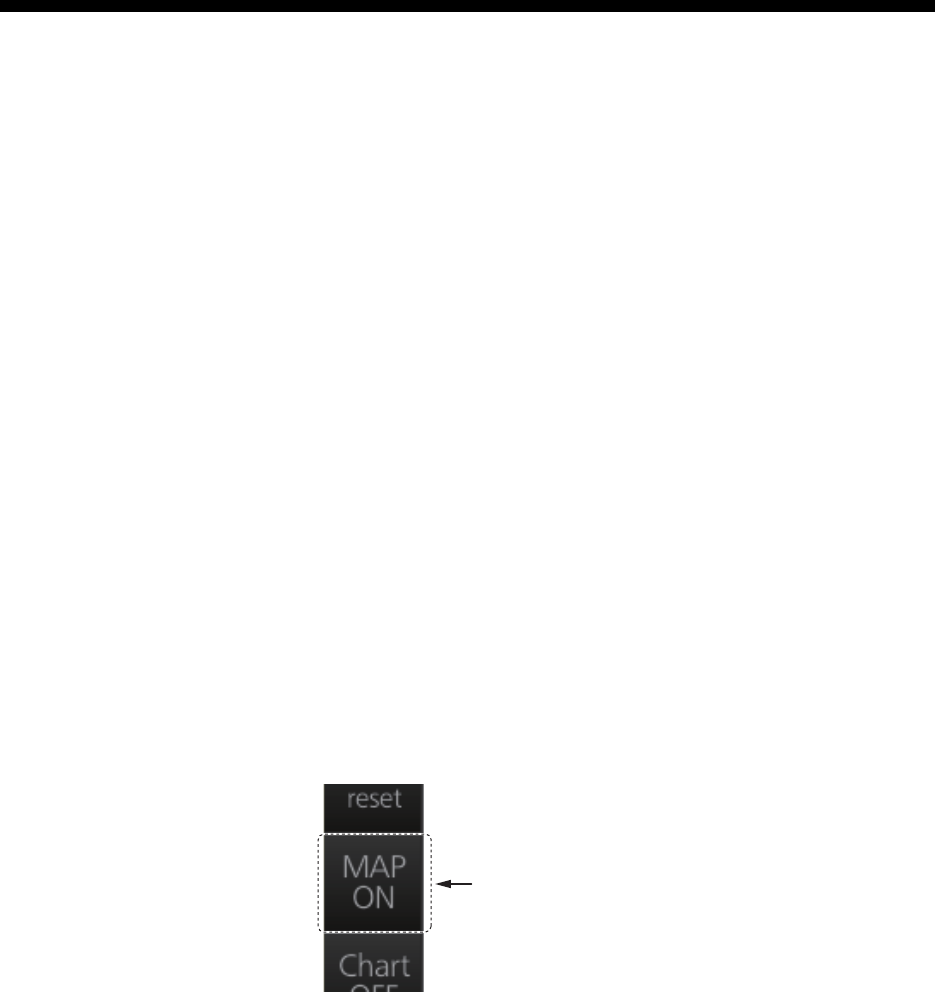
5-1
5. RADAR MAP AND TRACK
5.1 What is a Radar Map?
A radar map consists of a layer of marks and lines overlaid on the radar display. A map
is intended for indicating safety-related areas and objects. Ten radar maps can be
made and each map can have a total of 4,000 lines and marks. The map data can be
saved to facilitate repeated use on a routine navigation area. The user can create a
radar map in real time while using the radar for navigation or at leisure time at anchor
or while the radar is not being used. Waypoints, events and user charts from the chart
can be shown or hidden on the radar map display.
The radar map does not affect any radar function.
5.2 Presentation Modes
Six presentation modes are available: North-up, Course-up, Head-up, STAB Head-up,
Stern-up and North-up TM. To select a mode, use the MODE key on the Control Unit
or click the [Range/Presentation mode] box.
Note: Chart data is not displayed in the Head-up and STAB Head-up modes.
5.3 How to Show, Hide the Radar Map Display
Click the [MAP ON/OFF] button to display [MAP ON] or [MAP OFF] as appropriate.
[MAP ON/OFF]
button
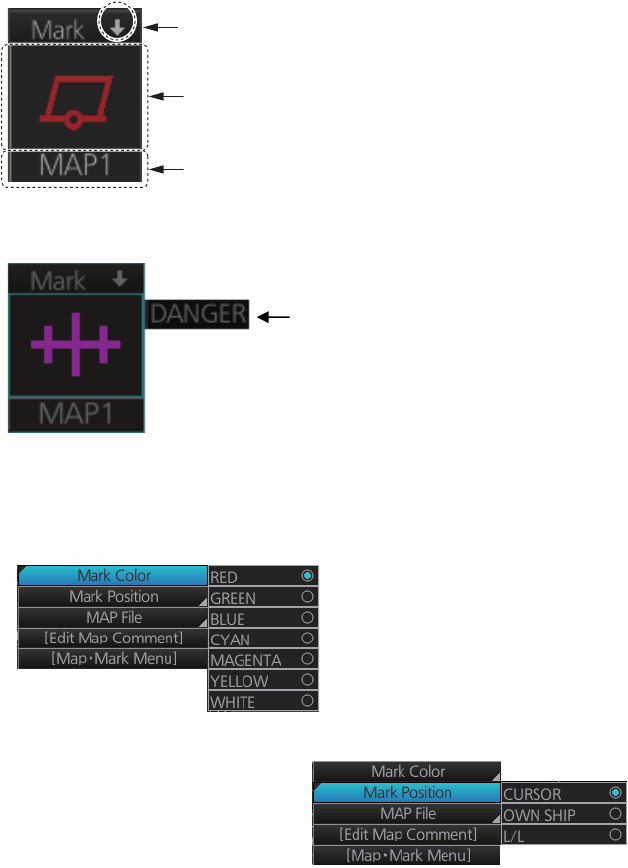
5. RADAR MAP AND TRACK
5-2
5.4 How to Enter Radar Map Marks and Lines
Marks and lines can be entered in the radar mode. (Marks cannot be entered in the
chart radar mode.) These marks and lines can be displayed in red, green, blue, cyan,
magenta, yellow or white. (Some marks, lines and colors may not be available de-
pending on the specifications of your radar.)
The capacity for map storage is 10 maps/4,000 points per map. When 4,000 marks
and lines have been entered into a map, the message "MARK FULL" replaces the
mark icon in the [Mark] box and no more marks and lines can be entered into that map.
In this case save the marks/lines to another map file or erase some marks from the full
map file in order to save the mark.
The procedure below shows how to enter a mark, including mark selection, mark entry
method, and save location. You can skip steps in the procedure where it is not neces-
sary to complete the corresponding action.
1. Put the cursor on the mark shown in the [Mark] box at the bottom-left position on
the display.
2. Spin the scrollwheel to select a mark. The name of the mark appears to the right
of the mark.
3. Select mark color (B-type only), mark position, and where to save the mark as fol-
lows:
1) Right-click the [Mark] box to show the context-sensitive menu then click [Mark
Color].
2) Click the mark color desired.
3) At the context-sensitive menu, click [Mark
Position] to select the mark input method.
The choices are [CURSOR], [OWN SHIP]
and [L/L].
For L/L, the mark is entered at the L/L po-
sition entered at [MAP MARK L/L] on the [MAP•MARK] menu.
Minimize button
Selected mark
Map file number
Name of mark
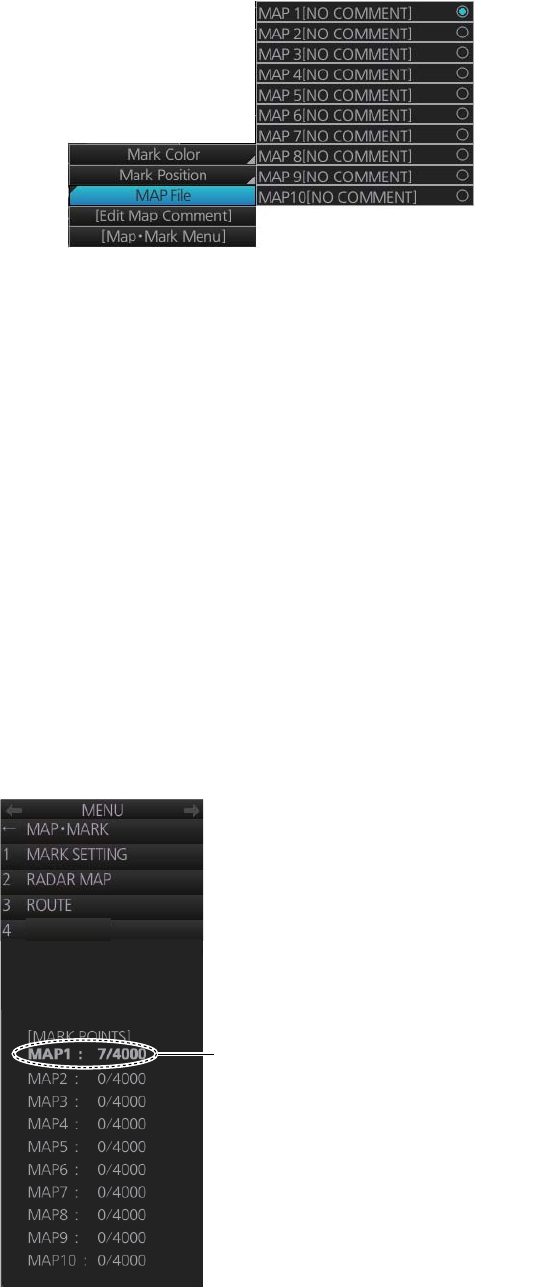
5. RADAR MAP AND TRACK
5-3
4) At the context-sensitive menu, click [MAP File] then click the map file number
where to save the mark.
4. For entry with the cursor, use the trackball to put the cursor on the location de-
sired. (You can see the range and bearing from own ship to the cursor location by
monitoring the Cursor position box.) Push the left button or the MARK key on the
Control Unit to inscribe the mark or line point.
Note: To continue entering the same mark or line under the same conditions, do the
following at the next time of entry.
Entry by cursor: Click the location where to put a mark.
Entry by ship's position, or manual input of latitude and longitude: Click the mark
icon.
5.5 How to Find Number of Map Points Used
You can show the number of points used in each radar map file.
Right-click the [Mark] box then select [Map•Mark Menu]. See [MARK POINTS] at the
bottom of the menu to see how many mark points have been used per map file. In the
example below 7 points out of 4,000 points have been used in Map 1.
Map no., no. of points used/total no.
of points
EVENT
5 USER CHART
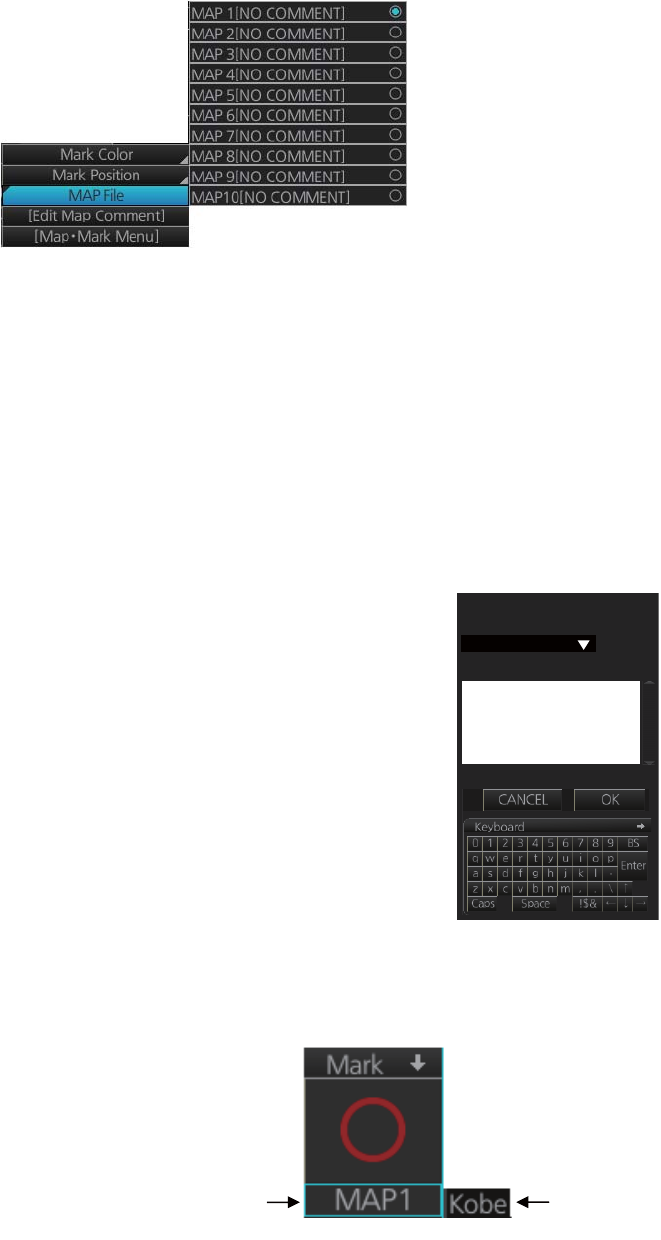
5. RADAR MAP AND TRACK
5-4
5.6 How to Select the Radar Map to Display
1. Right-click the [Mark] box to show the context-sensitive menu.
2. Click [MAP File] and then click the map no. you want to display.
5.7 How to Attach a Comment to a Radar Map, Find
Comment for a Map
5.7.1 How to attach a comment to a radar map
You can attach a comment to radar maps you have created, to help you distinguish
your maps.
1. Right-click the [Mark] box to show the context-sensitive menu.
2. Click [Edit Map Comment]. A text input box appears to-
gether with the software keyboard, as shown in the right
figure.
3. Select the map no. with the [Radar map file] drop-down
list.
4. Enter your comment in the text input box. The number of
characters available appears below the box.
5. Click the [OK] button to finish.
5.7.2 How to find the comment for a map
Put the cursor on the map no.
indication. The comment is
displayed to the right of the
map no. In the example below
the comment is "Kobe".
Radar map file
MAP 1
Edit comment
53 up input
Edit map comment
X
Location of
comment
Map no.
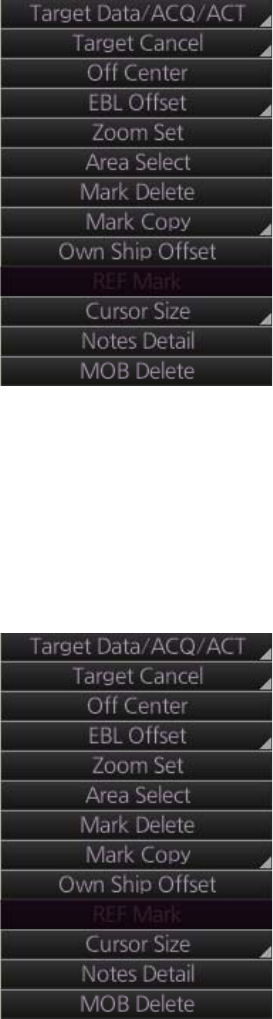
5. RADAR MAP AND TRACK
5-5
5.8 How to Erase Radar Map Marks and Lines
A total of 4,000 marks and lines is allotted per map. When this amount is exceeded in
a map, no more map marks or lines may be entered into the map unless you erase
some unnecessary marks or lines.
5.8.1 How to erase individual radar map marks and lines
1. Right-click the display area to show the context-sensitive menu.
2. Click [Mark Delete].
3. Click the mark or line to erase.
5.8.2 How to erase map marks and lines in an area
You can erase all marks and lines within an area as follows:
1. Right-click the display area to show the context-sensitive menu.
2. Click [Area Select].
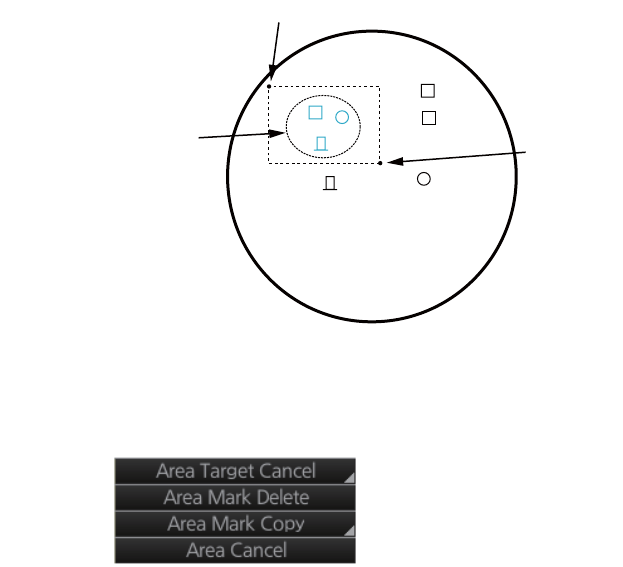
5. RADAR MAP AND TRACK
5-6
3. Specify the area as follows:
1) Put the cursor on the start point and push the left button.
2) Drag the cursor diagonally to the end point and push the left button.
All marks and lines within the area selected are highlighted in cyan (A and B
types only).
4. Right-click the display area to show the context-sensitive menu.
5. Click [Area Mark Delete] to delete the marks and lines in the area selected.
5.8.3 How to erase all radar map marks and lines in a map file
You can erase all radar map marks and lines in the map file currently displayed. Be
absolutely sure you want to erase the marks and lines - erased marks and lines cannot
be restored.
1. Right-click the [Mark] box, select [Map•Mark Menu] and [1 MARK SETTING].
2. Select [8 MAP MARK ALL DELETE] (B type) or [7 MAP MARK ALL DELETE]
(IMO and A types). The confirmation message "Attention: Do you wish to delete
all map mark?" appears. Click the [OK] button to erase all marks and lines.
3. Close the menu.
Start point
End point
Marks within the area
are colored cyan
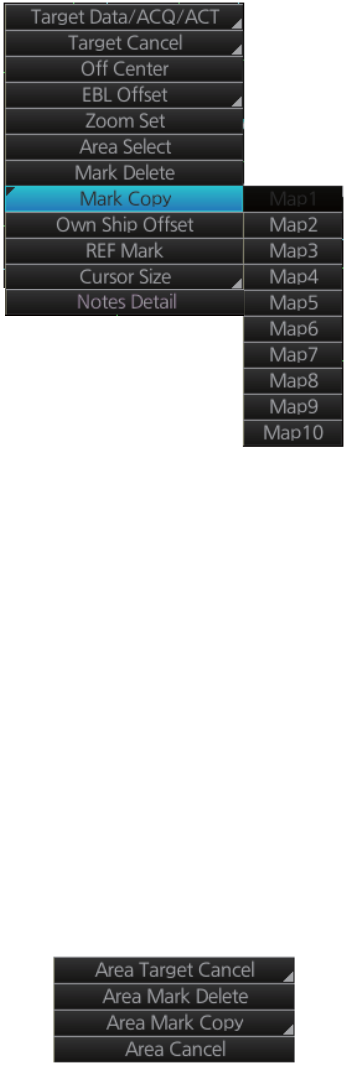
5. RADAR MAP AND TRACK
5-7
5.9 How to Copy Radar Map Marks and Lines
5.9.1 How to copy individual radar map mark and line to another
map file
You can copy individual mark and line from the currently displayed radar map to the
radar map file of your choice.
1. Right-click the display area to show the context-sensitive menu.
2. Click [Mark Copy] then click the map file no. where to copy the mark.
3. Put the (light-blue) cursor on the mark or line then click.
5.9.2 How to copy radar map marks and lines within an area to an-
other map file
You can copy radar map marks and lines within an area of the currently displayed ra-
dar map to the radar map file of your choice.
1. Right-click the display area to show the context-sensitive menu.
2. Click [Area Select].
3. Specify the area as follows.
1) Put the cursor on the start point and push the left button.
2) Drag the cursor diagonally to the end point and push the left button.
All marks and lines within the area selected are highlighted in blue (A and B
types only).
4. Right-click to show the context-sensitive menu.
5. Click [Area Mark Copy] then click the map file number where to copy the marks
and lines.
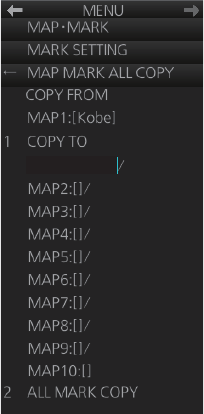
5. RADAR MAP AND TRACK
5-8
5.9.3 How to copy all radar map marks and lines in a map file to an-
other map file
You can copy all radar map marks and lines in the currently displayed radar map to
the radar map file of your choice.
1. Display the map file of which to copy all its marks and lines. See section 5.6.
2. Right-click the [Mark] box then click [Map•Mark Menu].
3. Select [1 MARK SETTING].
4. Select [9 MAP MARK ALL COPY] (B type) or [8 MAP MARK ALL COPY] (IMO and
A types).
5. Select [1 COPY TO] then select where to copy the map marks and lines.
6. Select [2 ALL MARK COPY]. The confirmation message "Attention: Do you wish
to copy all map mark?" appears. Click the [OK] button to copy.
7. Close the menu.
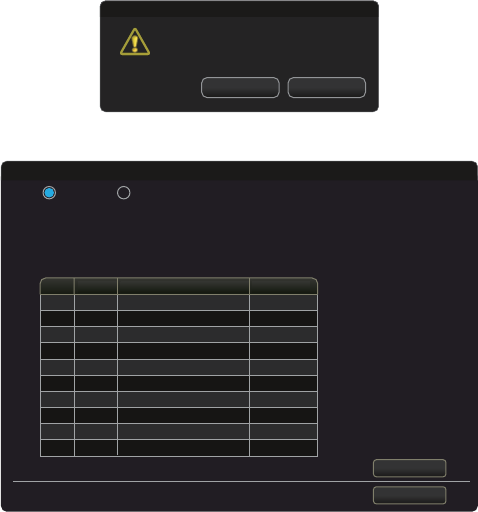
5. RADAR MAP AND TRACK
5-9
5.10 How to Export Radar Map
You can export a radar map to a USB flash memory.
1. Set the USB flash memory in the USB port on the Control Unit.
2. Open the menu then select the [5 MAP•MARK] and [1 MARK SETTING] menus.
3. Go to page 2 of the menu, select [1 MAP MARK MANAGE]. The confirmation
message appears.
4. Click the [OK] button to show the [Map Convert] dialog box.
5. Check [Export] at the top-left position of the dialog box.
6. Check the radar map(s) (Map1 to Map10) to export.
7. Click the [Export] button to show the [Save file] dialog box.
8. Select the USB flash memory as the destination to save then click the [Save] but-
ton. After the data export is completed, the message "x file(s) have exported suc-
cess." appears (x is the number of the radar map(s)).
9. Click the [OK] button.
Attention
Do you wish to open
map convert window?
Cancel OK
X
No.
Map1
Map2
Map3
Map4
Map5
Map6
Map7
Map8
Map9
Map10
NO COMMENT
NO COMMENT
NO COMMENT
NO COMMENT
NO COMMENT
NO COMMENT
NO COMMENT
NO COMMENT
NO COMMENT
NO COMMENT
Comment Points
100/4000
Export Import
Export
Exit
Map Convert
100/4000
100/4000
100/4000
100/4000
100/4000
100/4000
100/4000
100/4000
100/4000
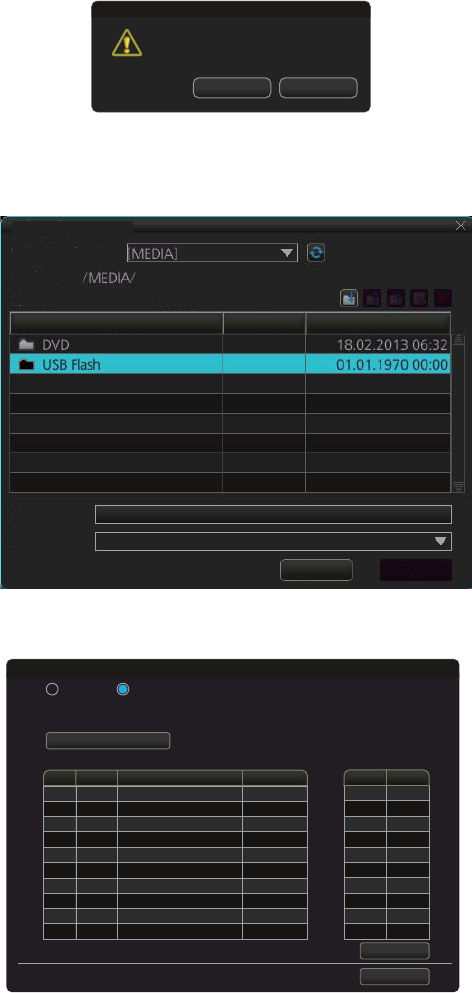
5. RADAR MAP AND TRACK
5-10
5.11 How to Import Radar Map
You can import a radar map created on another equipment (FAR-3xx0 or FAR-2xx7).
Copy the radar maps to a USB flash memory.
1. Set the USB flash memory that contains the radar map(s) to import in the USB port
on the Control Unit.
2. Open the menu then select the [5 MAP•MARK] and [1 MARK SETTING] menus.
3. Go to page 2 of the menu, select [1 MAP MARK MANAGE]. The confirmation
message appears.
4. Click the [OK] button to show the [Map Convert] dialog box.
5. Check [Import] at the top-left position of the dialog box then click the [Select file to
import] button to show the [Select file] dialog box.
6. Select the folder that contains the file to import then click the [Open] button to
show the [Map Convert] dialog box.
7. Check the radar map(s) (Map1 to Map10) to which the data created on another
equipment are imported.
8. Click the [Import] button to import the data to the radar map(s) selected at step 7.
Note: When importing a radar map created on another FAR-2xx7, the radar maps
marks and lines are converted. See the tables on pages 5-11 and 5-12.
Attention
Do you wish to open
map convert window?
Cancel OK
X
Select file
Volume select:
Lock in:
Space: Total
Name Size Modified
File Name:
File Type:
Cancel
Open
Export File(*.mrk;*.MRK)
From ToNo.
Map1
Map2
Map3
Map4
Map5
Map6
Map7
Map8
Map9
Map10
NO COMMENT
NO COMMENT
NO COMMENT
NO COMMENT
NO COMMENT
NO COMMENT
NO COMMENT
NO COMMENT
NO COMMENT
NO COMMENT
Comment Points
0/4000
0/4000
0/4000
0/4000
0/4000
0/4000
0/4000
0/4000
0/4000
0/4000
Select file to import
Import file: 2107000.MRK
Points: 76
Export Import
Import
Exit
Map Convert
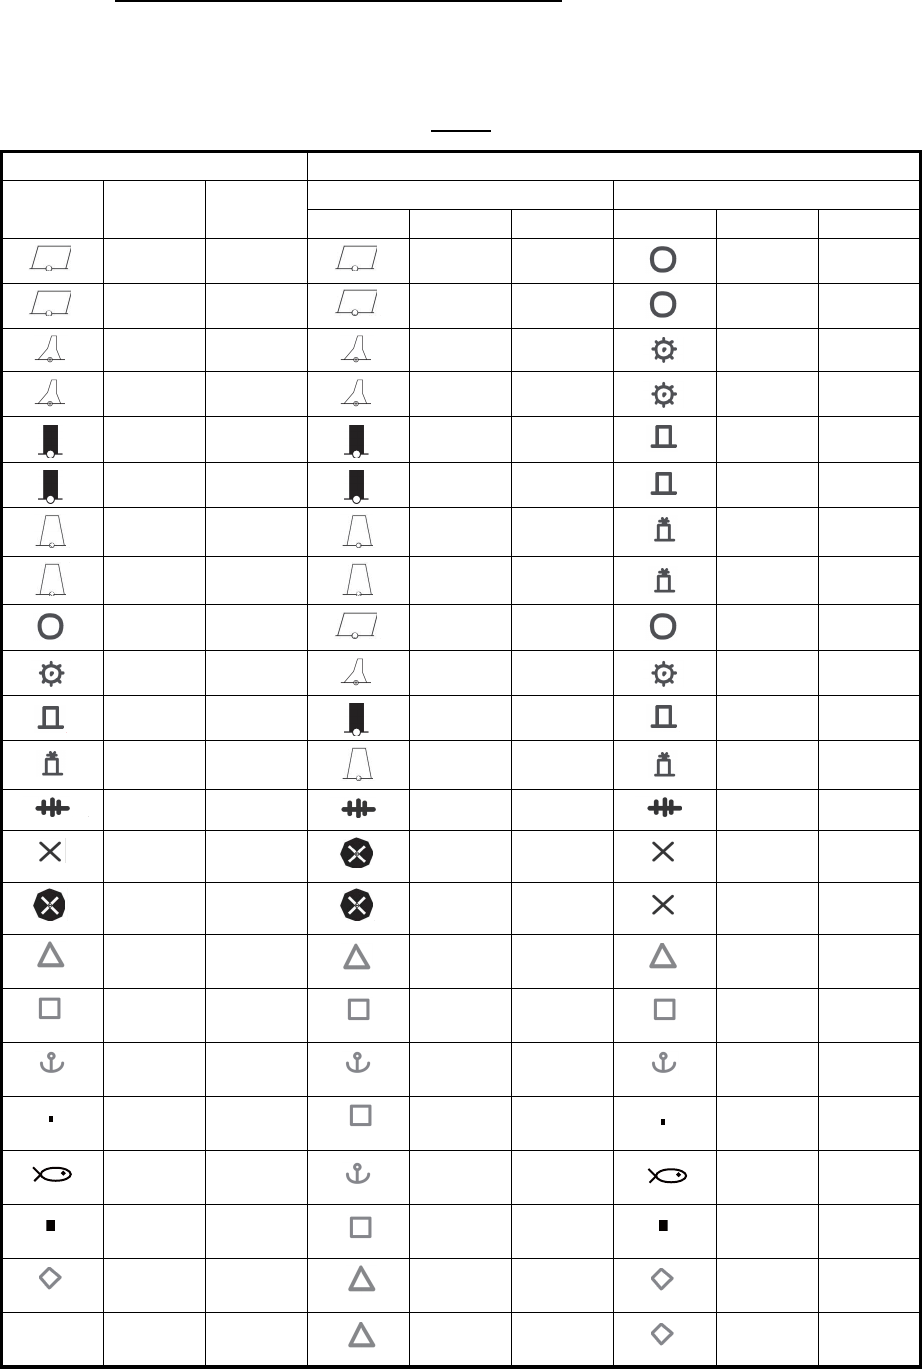
5. RADAR MAP AND TRACK
5-11
The list of the radar map marks and lines
The radar map marks and lines created on another FAR-2xx7 are converted to ones
on the FAR-3xx0 series as below.
Marks
*: The display color is selectable. See "Contrast table for the display colors" on page 5-
12.
FAR-2xx7 FAR-3xx0
Symbol Color Name IMO or A type B type
Symbol Color Name Symbol Color Name
Red Buoy Red Buoy Red Buoy
Green Buoy Green Buoy Green Buoy
Red Buoy Red Buoy Red Buoy
Green Buoy Green Buoy Green Buoy
Red Buoy Red Buoy Red Buoy
Green Buoy Green Buoy Green Buoy
Red Buoy Red Buoy Red Buoy
Green Buoy Green Buoy Green Buoy
* Buoy Red Buoy * Buoy
* Buoy Red Buoy * Buoy
* Buoy Red Buoy * Buoy
* Buoy Red Buoy * Buoy
* Danger Purple Danger * Danger
* Danger Purple Danger * Danger
Purple Danger Purple Danger Purple Danger
*Mark Yellow-
orange Mark * Mark
*Mark Yellow-
orange Mark * Mark
*Mark Yellow-
orange Mark * Mark
*Mark Yellow-
orange Mark * Mark
*Mark Yellow-
orange Mark * Mark
*Mark Yellow-
orange Mark * Mark
*Mark Yellow-
orange Mark * Mark
Other - - Yellow-
orange Mark * Mark
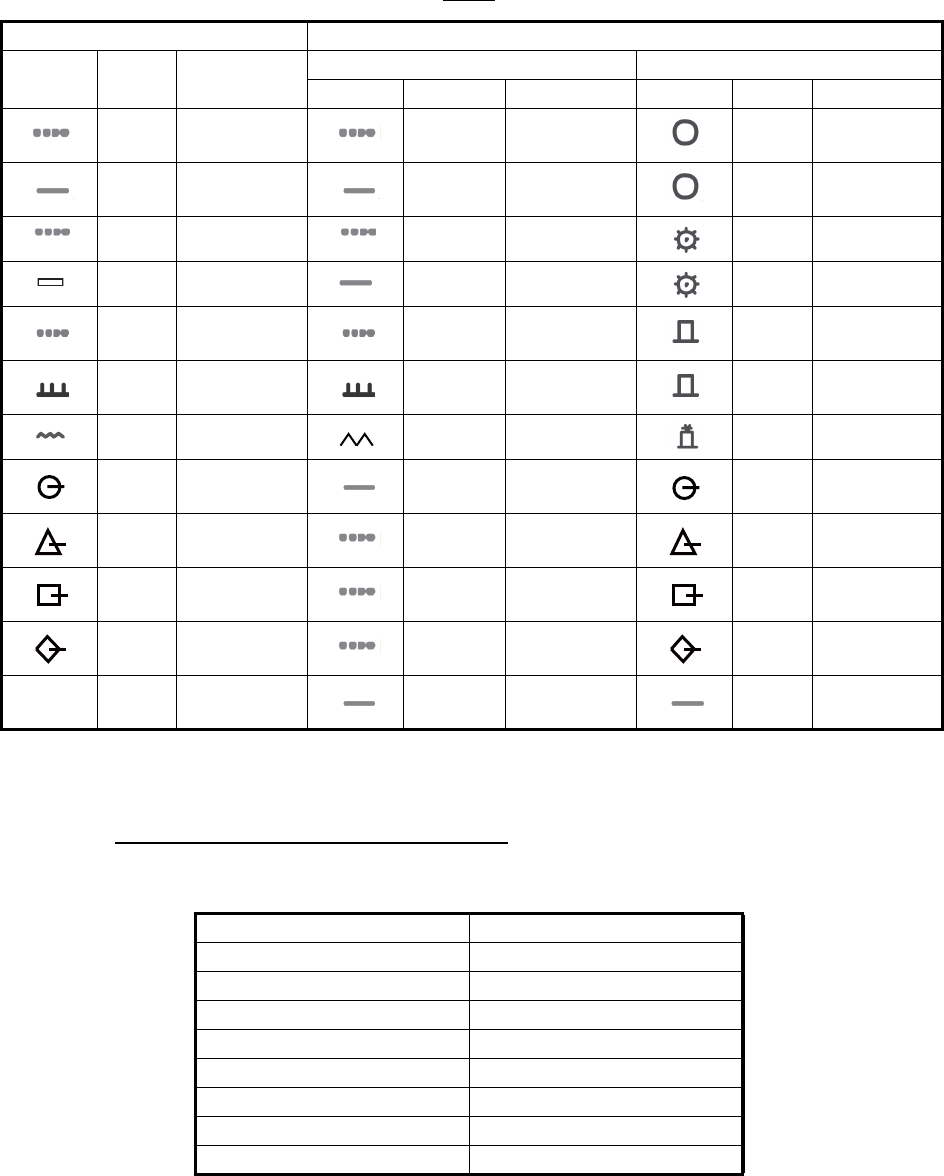
5. RADAR MAP AND TRACK
5-12
Lines
*: The display color is selectable. See "Contrast table for the display colors" on this
page.
Contrast table for the display colors
Below is the contrast table for the display colors of the radar map marks and lines.
FAR-2xx7 FAR-3xx0
Symbol Color Name IMO or A type B type
Symbol Color Name Symbol Color Name
*Mark Yellow-
orange Buoy * Mark
*Mark Yellow-
orange Buoy * Mark
* Nav Line Purple Buoy * Nav Line
* Coast Line White Buoy * Coast Line
*Contour
Line Gray Buoy * Contour
Line
*Prohibited
Area Purple Prohibited
Area *Prohibited
Area
* Danger Purple Danger * Danger
* Line Buoy Yellow-
orange Line Mark * Line Buoy
* Line Buoy Yellow-
orange Line Mark * Line Buoy
* Line Mark Yellow-
orange Line Mark * Line Mark
* Line Mark Yellow-
orange Line Mark * Line Mark
Other - - Yellow-
orange Line Mark * Mark
FAR-2xx7 FAR-3xx0
Red Red
Yellow Yellow
Green Green
Cyan Cyan
Magenta Magenta
Blue Blue
White White
Other Green
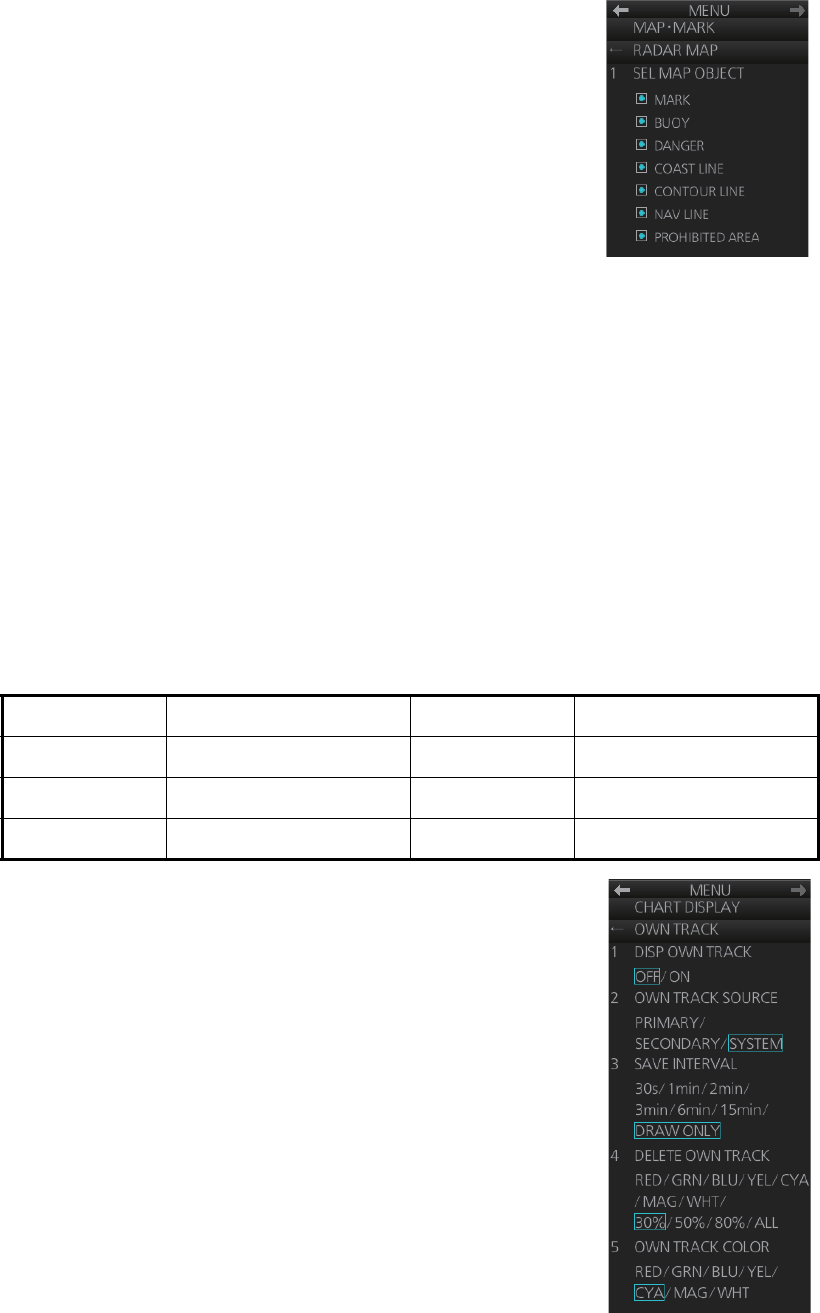
5. RADAR MAP AND TRACK
5-13
5.12 How to Show, Hide Radar Map Features
You can show or hide radar map objects as follows:
1. Right-click the [Mark] box then select [Map•Mark Menu]
and [2 RADAR MAP].
2. Turn objects on or off as appropriate.
3. Close the menu.
5.13 Track
5.13.1 How to set up ship's track
The track traces your ship's movement. This radar records track at the interval you set
on the [OWN TRACK] menu, and the recording interval determines the maximum re-
cording time. The longer the interval the longer the recording time, as shown in the
table below.
When the memory for track becomes full, the oldest track is deleted to make room for
the latest. For that reason you may want to adjust the recording interval so as to keep
the track on the display for a longer time.
1. Open the menu then select the [6 CHART DISPLAY] and
[1 OWN TRACK] menus.
2. Select [1 DISP OWN TRACK].
3. Select [ON] to show your ship's track or [OFF] to hide the
track.
4. Select [2 OWN TRACK SOURCE].
5. Select the navigation sensor that is to feed the position
data to use to plot your ship's track, among [PRIMARY],
[SECONDARY] and [SYSTEM].
[PRIMARY]: Navigation sensor having first priority.
[SECONDARY]: Navigation sensor having second prior-
ity.
[SYSTEM]: Plot own ship's track using system-fed posi-
tion.
6. Select [3 SAVE INTERVAL].
7. Select how often to save your ship's track, among [30s], [1min], [2min], [3min],
[6min] and [15min]. [DRAW ONLY] draws the track but does not save it.
Save Interval Max. Recording Time Save Interval Max. Recording Time
30 s 6 days 22 hr 40 min 3 min 41 days 16 hr
1 min 13 days 21 hr 20 min 6 min 83 days 8 hr
2 min 27 days 18 hr 40 min 15 min 208 days 5 hr
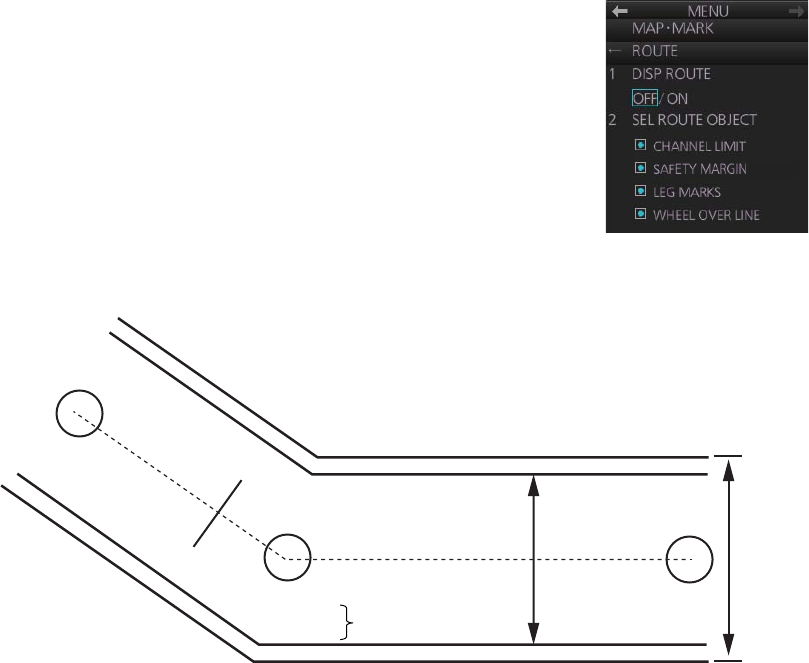
5. RADAR MAP AND TRACK
5-14
8. For the B-type radar, you can select the color for the track with [5 OWN TRACK
COLOR].
9. Close the menu.
5.13.2 How to erase track
When the display becomes filled with track, for example, your ship traces the same
route several times, you may want to delete some or all of your track from the display.
1. Open the menu then select the [6 CHART DISPLAY] and [1 OWN TRACK]
menus.
2. Select [5 DELETE OWN TRACK] (A and B types) or [4 DELETE OWN TRACK]
(IMO type).
3. Select the color to delete (A and B types), or the percentage of track to delete
among [30%], [50%], [80%] and [ALL].
4. Close the menu.
5.14 Route Display
The route selected for navigation (in the chart mode) (see
chapter 12) can be shown on the radar display. You can
show or hide the entire route, and show or hide elements of
the route (channel limits, safety margin, leg marks and wheel
over line).
1. Right-click the [Mark] box then select [Map•Mark Menu]
and [3 ROUTE].
2. Turn the route display on or off at [1 DISP ROUTE].
3. Turn the channel limit, safety margin, leg marks and
wheel over line displays on or off at [2 SEL ROUTE OBJECT].
4. Close the menu.
Channel
limit
Wheel over
line
Leg mark
Safety
margin
WPT1
124.8°
0.8NM
WPT2
87.9°
1.2NM
WPT3
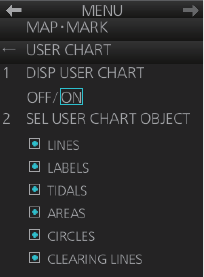
5. RADAR MAP AND TRACK
5-15
5.15 User Chart Display
The active user chart can be shown in the chart radar mode. See chapter 13 for a de-
scription of the user chart.
1. Right-click the [Mark] box then select [Map•Mark Menu]
and [5 USER CHART].
2. Show or hide the user chart on the radar display with [1
DISP USER CHART].
3. Show or hide the user chart objects on the radar display
with [2 SEL USER CHART OBJECT].
4. Close the menu.
5. RADAR MAP AND TRACK
5-16
This page is intentionally left blank.
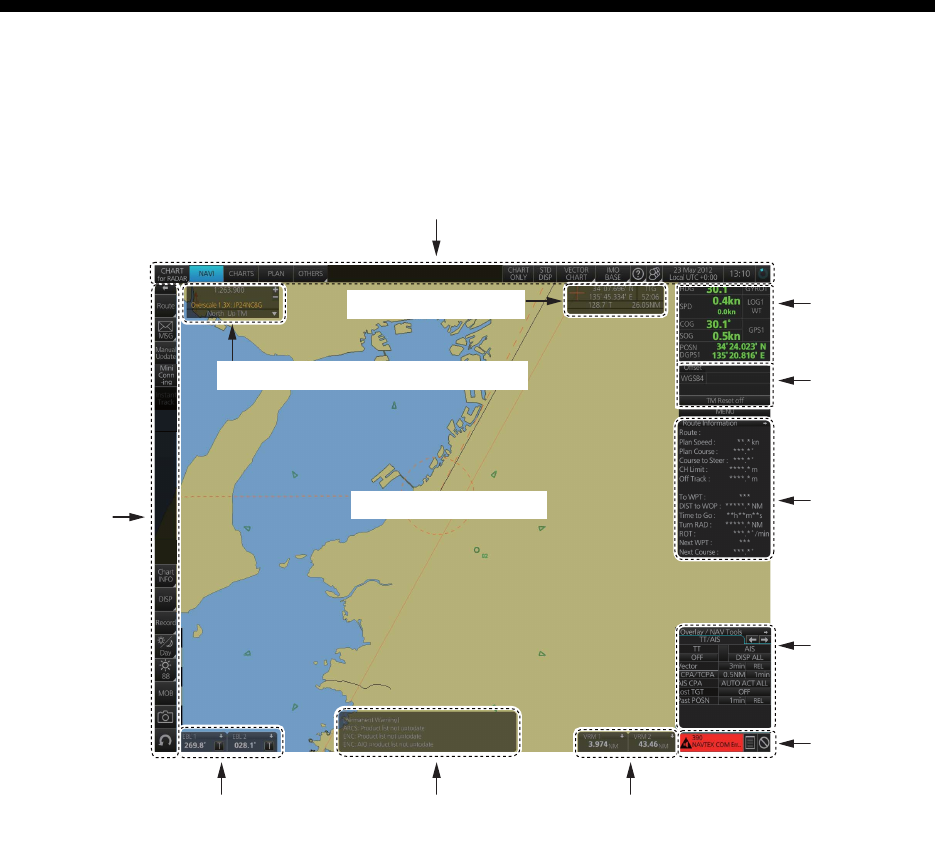
6-1
6. CHART OVERVIEW
6.1 Chart Screen Overview
The chart screen is divided into several areas, as illustrated below.
• The Status bar provides for selection of operating mode, chart format, IMO chart dis-
play; one-click restoration of IMO standard display, etc.
• The Sensor information box displays ship's speed, course and position and selects
sensors.
• The Own ship functions box applies offset to the chart.
• The Route information box shows route and waypoint data, when a route is select-
ed for navigation.
• The Overlay/NAV Tools box provides for setup of navigation-related functions.
• The Alert box shows operational and system alert messages.
• The VRM boxes measure the range to an object.
• The Permanent warning box displays chart-related warning messages.
• The EBL boxes measure the bearing to an object.
• The InstantAccess bar provides quick access to functions such as brilliance adjust-
ment, display palette and the chart-related menu. The contents change according to
the operating mode selected.
• The Chart scale/presentation mode box selects the chart scale and presentation
mode.
• The Cursor position box shows the latitude and longitude position of the cursor and
the TTG to the cursor.
• The Electronic chart area shows the chart.
Status bar
Sensor
information
box
Alert
box
EBL1 box, EBL2 box
Instant
A
ccess
bar
VRM1 box, VRM2 box
Electronic chart area
Own ship
functions
box
Route
information
box
Permanent
warning box
Cursor position box
Chart scale/presentation mode box
Overlay/
NAV
Tools box

6. CHART OVERVIEW
6-2
6.1.1 Electronic chart area
This chart radar can use the following types of charts:
• S-57 (IHO)
• S-63 (IHO) (S-63 encrypted)
• CM-ENC (C-MAP by Jeppesen)
• CM-93/3 (C-MAP by Jeppesen)
The following information can also be displayed:
• Cursor (moved by trackball)
• Planned route
• EBL (Electronic Bearing Line) and VRM
• Own ship symbol with speed vector
• TT-acquired target from radar
• AIS target
Electronic charts
The electronic navigational charts, S57ed3 ENC or CM-93 vector format, are dis-
played in the electronic chart area.
The chart radar combines chart and navigational information. It should be noted that
modern navigation systems (e.g., differential GPS) may offer more accurate position-
ing than what was used to position some of the surveys from which the electronic nav-
igational chart was derived.
This chart radar is compatible with S57 release 3 ENC format charts. ENC charts are
converted to SENC for use with the chart radar.
When you open a chart, it is displayed with the default scale, called the compilation
scale. The details for the chart are displayed in the electronic chart area and these can
be modified. You can change the chart scale with the ZOOM IN and ZOOM OUT func-
tions, and the scale range is 1:1,000 - 1:70,000,000.
CM-93 vector format
The CM-93 charts require a contract with applicable provider. These charts are from
a private source and they cannot be used as a substitute for paper charts under any
condition. To emphasize this point these charts are called "Non-ENC" charts in this
manual. Note that some eToken dongles from the FEA-2xx7 can be used. These are
labeled "JeT FURUNO XXXXX".
This chart radar accepts the following C-MAP chart types: CM-ENC, Professional,
Profes and Jeppesen Primary ECDIS Service.
C-MAP produced official ENC chart that complies with the IHO's (International Hydro-
graphic Organization's) S-57 Edition 3 product specification. When used in the chart
radar, the ENC data improves the safety of navigation at sea.
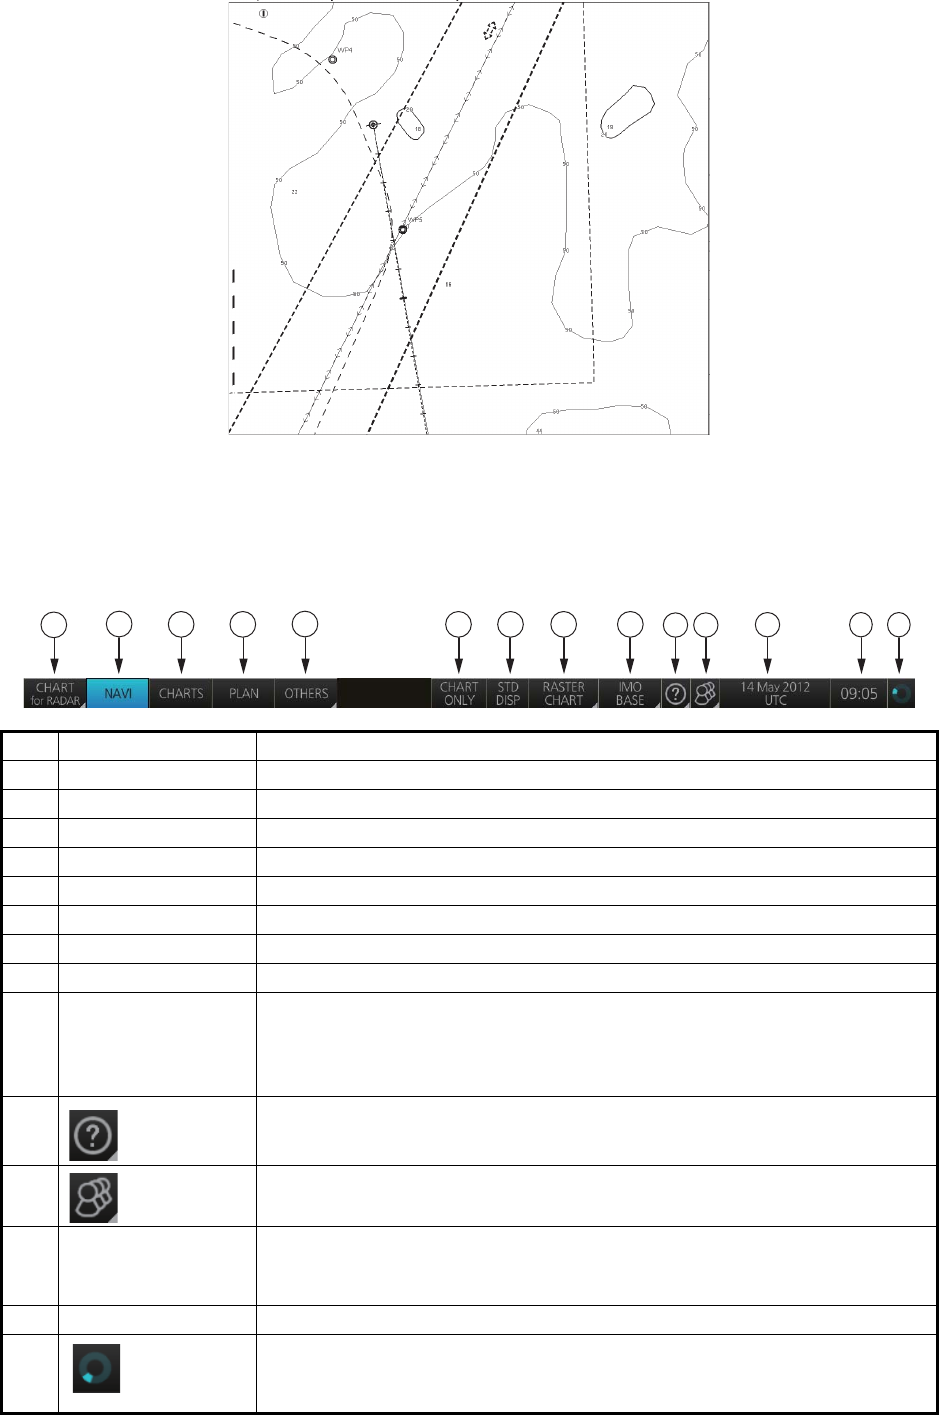
6. CHART OVERVIEW
6-3
6.1.2 Status bar
The Status bar mainly provides for selection of operating mode, chart type and IMO
chart display setting.
No. Button name Description
1 Operating mode Selects a mode: RADAR or CHART for RADAR.
2 NAVI Selects the Voyage navigation mode.
3 CHARTS Goes to the Chart maintenance mode.
4 PLAN Selects the Voyage planning mode.
5 OTHERS Sets system in standby.
6 CHART ONLY Shows only the chart, when left button is pressed and held down.
7 STD DISP Restores the IMO standard display instantly.
8 Chart priority No use.
9 Chart database Selects the pre-defined presentations of ENC content: IMO BASE, IMO
STD or IMO ALL. CUSTOM appears when the symbols selected or de-
selected on the [Chart Display] menu do not match the preset conditions
for IMO BASE, IMO STD or IMO ALL.
10 Displays the operator's manual, chart program no. and system informa-
tion.
11 Settings Manages user profiles; opens the Settings menu.
12 Date • Displays the date.
• Selects the time to use, local or UTC.
• Sets the time difference between local and UTC (to use local time).
13 Time Displays the time, local or UTC.
14 Working
Indicator
Rotates clockwise if the system is working properly. If it is not spinning
the system is not working. Shortly after it stops spinning the buzzer
sounds. Reset the power to restore normal operation.
NAVI
1
1110
23 4 6 7 8 9
5
12
13 14
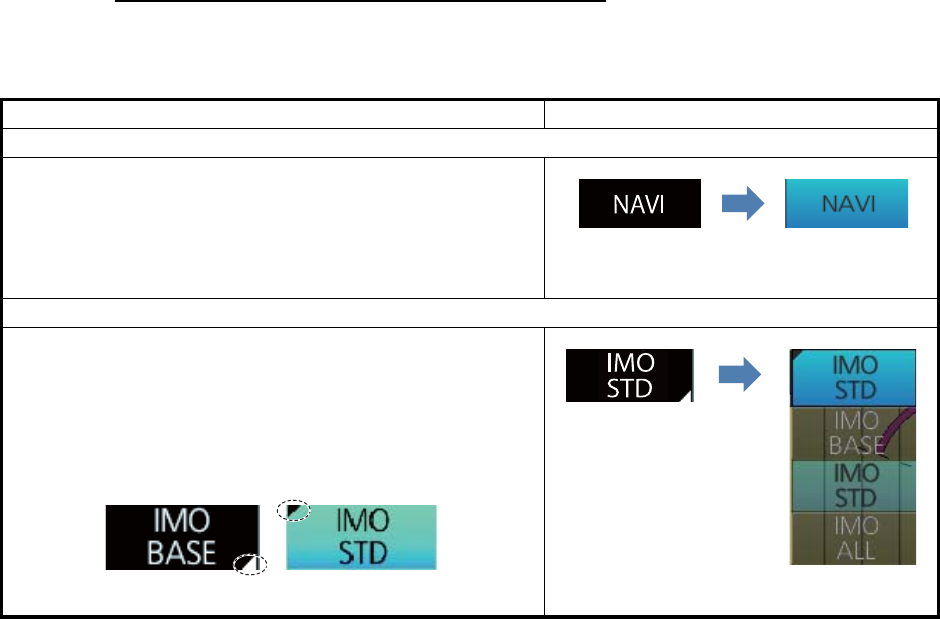
6. CHART OVERVIEW
6-4
How to operate the buttons on the Status bar
The Status bar has two types of controls: toggle button and drop-down list button. You
operate the buttons with the trackball module.
Button type Operating procedure
Mode button
A mode button selects the operating mode (see
section 6.3). The background color of a mode button is
light-blue when its operating mode is enabled; gray when
disabled. The [NAVI] button is an example of a mode but-
ton.
Drop-down list button
A drop-down list button provides a list from which to se-
lect an option related to the label on the button. The
[Chart Database] button is an example of a drop-down list
button. See the right figure. A drop-down list button has a
list status indicator (a triangle) whose position changes
according to list status.
OFF
(gray)
ON
(light-blue)
Click
button.
List closed List opened
Click
button.
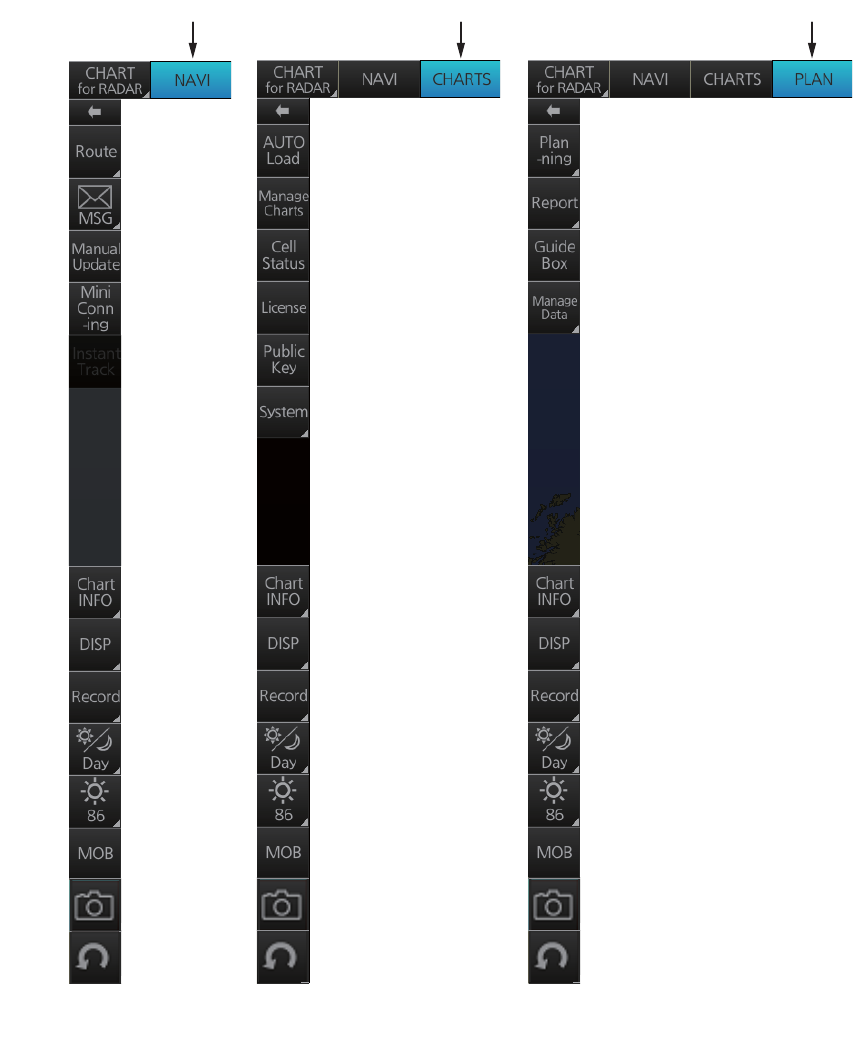
6. CHART OVERVIEW
6-5
6.1.3 InstantAccess bar
The InstantAccess bar contains all the operating functions related to the chart operat-
ing mode (Voyage navigation, Chart maintenance and Voyage planning) selected.
The bar is divided into two sections, upper and lower. The buttons in the upper section
change according to the mode selected. The buttons in the lower section are static for
all modes.
Chart maintenance
mode bar
[NAVI] button
activated
[CHARTS] button
activated
[PLAN] button
activated
Voyage planning
mode bar
Voyage navigation
mode bar
Instant
Track
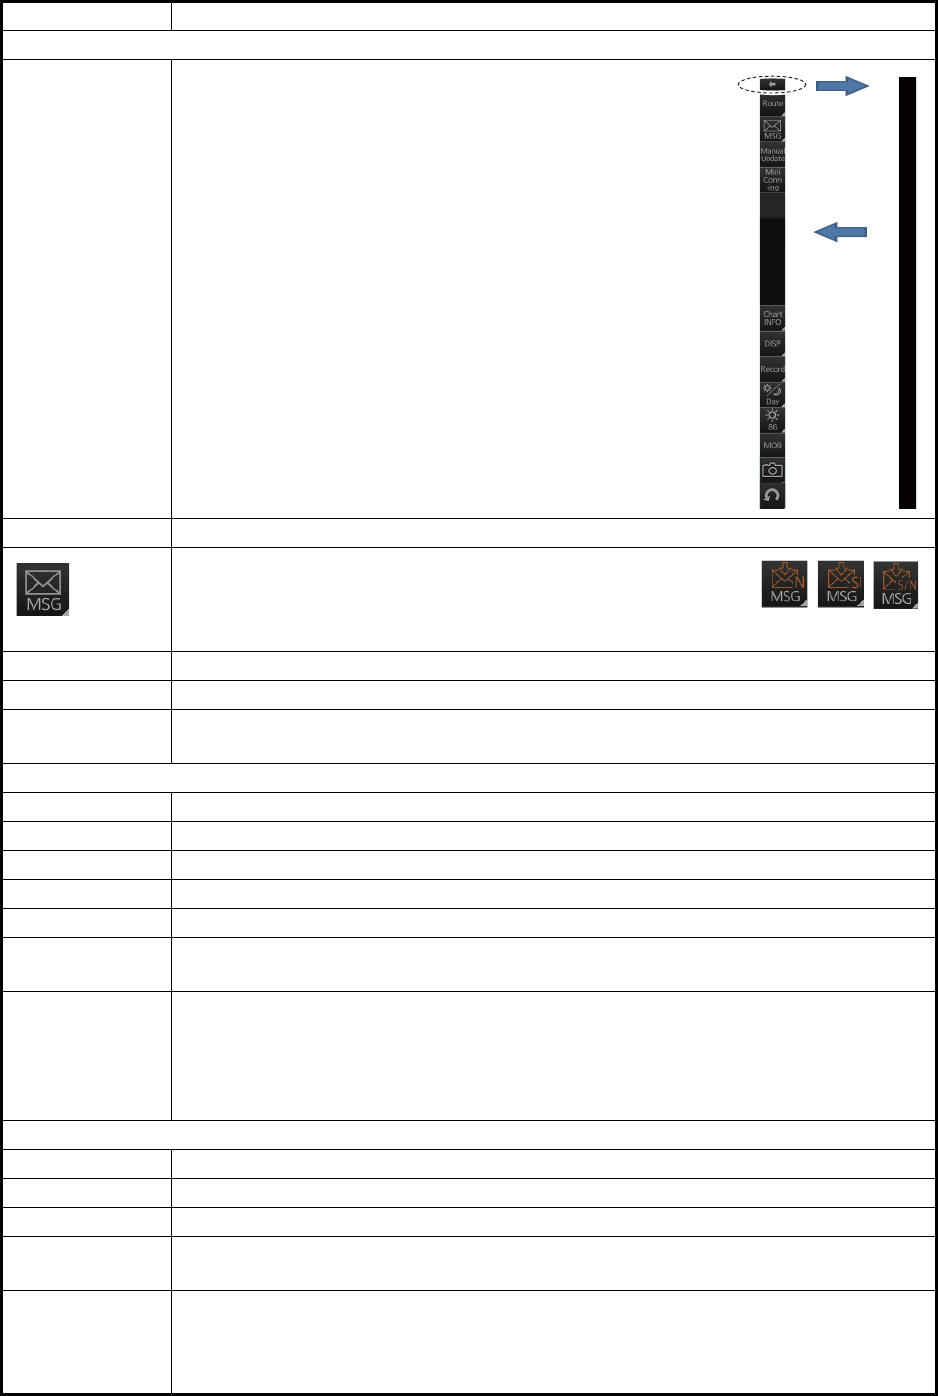
6. CHART OVERVIEW
6-6
Button name Description
Voyage navigation mode bar
←Minimize the InstantAccess bar. To restore the maximized
bar, click anywhere on the bar.
Route Route functions: select route, deselect route, move route to plan, monitor route.
Processes AIS Safety and Navtex messages. If you have un-
read Navtex or Safety messages, the icon changes as shown
right; "N" for unread Navtex, "S" for unread Safety, "S/N" for
unread Safety and Navtex.
Manual Update Shows the menu for manual update of chart objects.
Mini Conning Shows or hides the mini conning display.
Instant Track Creates a temporary track to return to or make a temporary detour from the mon-
itored course.
Chart maintenance mode bar
←Minimizes the InstantAccess bar.
AUTO Load Loads charts automatically.
Manage Charts Deletes charts; installs charts manually.
Cell Status Finds cell status.
License Enters license information.
Public Key Shows the current public key. The public key changes each time a new one is
installed.
System Functions for chart synchronization.
[Sync Config]: Selects the ECDIS units to synchronize.
[Sync Status]: Checks synchronization status.
[Reconvert]: Reconverts outdated SENC charts to the corresponding current
ones.
Voyage planning mode bar
←Minimizes the InstantAccess bar.
Planning Creates and edits routes and user charts.
Report Displays route and user chart reports.
Guide Box Shows or hides the guide box, which provides range and bearing measurement
between waypoints when creating a route.
Manage Data Manages routes and user charts.
[Route]: Imports, exports, deletes routes.
[User Chart]: Deletes user charts.
[Data Import]: Imports route, user chart created with FEA-2x07 ECDIS.
Click
arrow
Click
anywhere
on the bar
Instant
Track
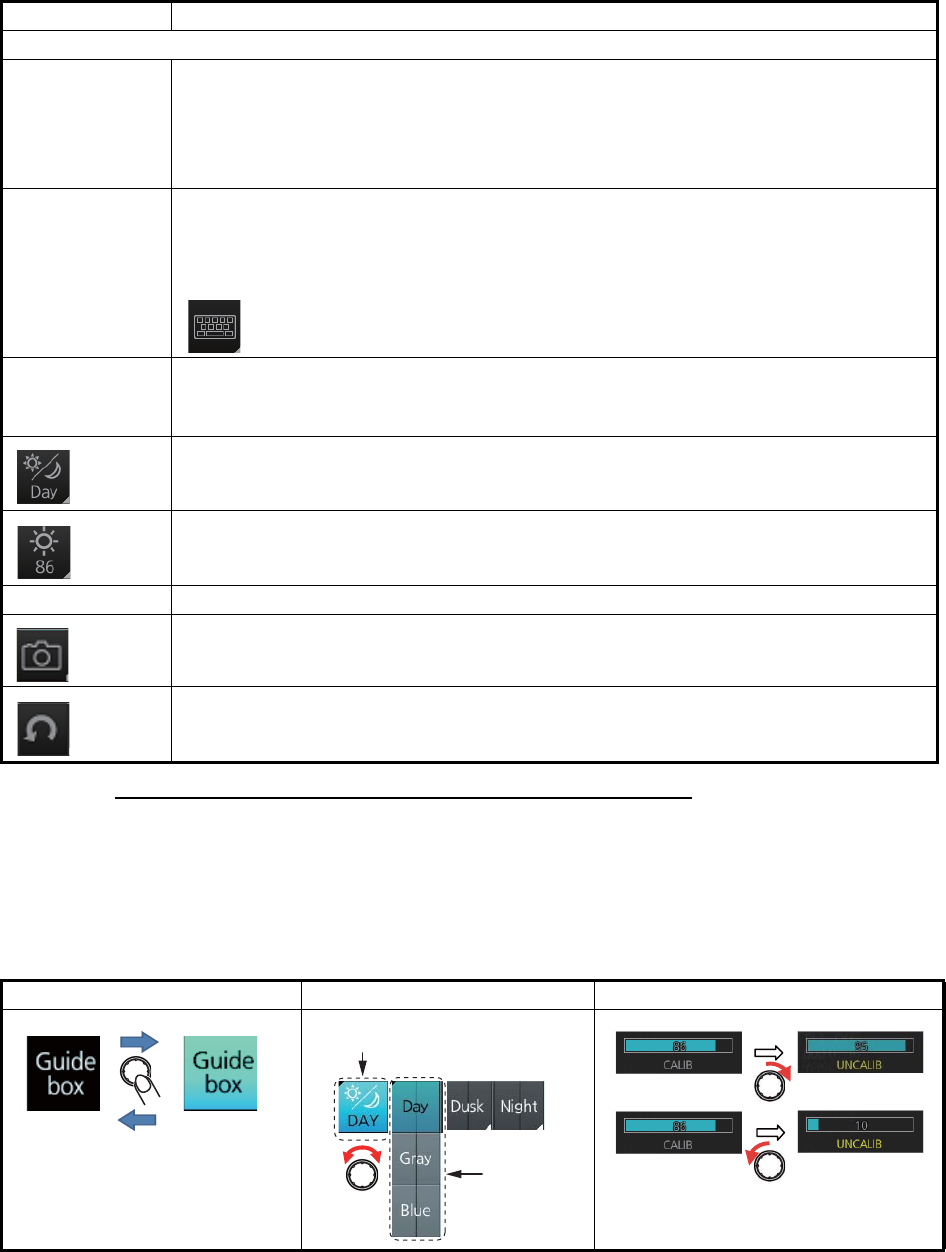
6. CHART OVERVIEW
6-7
How to operate the buttons on the InstantAccess bar
The InstantAccess bar has four types of buttons: toggle button, drop-down list button,
slider bar button, and speciality button. (The [MOB], [Capture] and [UNDO] buttons are
specialty buttons that provide a single-action function.) The buttons can be operated
with the trackball module or the InstantAccess knob. This section shows you how to
operate the buttons with the InstantAccess knob.
1. Push the InstantAccess knob to enable its use with the InstantAccess bar.
2. Rotate the InstantAccess knob to select a button. The background color of the
button selected is light blue.
3. Do one of the following depending on button type.
• Toggle button: Push the knob to select setting.
Common bar
Chart INFO Provides chart information.
[Chart Legend]: Shows chart legend, in the Voyage navigation and Voyage plan-
ning modes.
[Viewing Dates]: Sets Display date and Approved until dates.
[Chart 1]: Displays an overview of ECDIS chart symbols.
DISP [SET]: Shows the [Basic Setting] menu, [Chart Display] menu, [Symbol Display]
menu, [Chart Alert] dialog box.
[TWO DISP]: This function is currently unavailable.
[AIO]: Shows or hides the AIO overlay.
: Shows or hides the software keyboard.
Record Displays Chart log (ENC, C-MAP), Event log* (user event, POSN event), NAV log
(Voyage, Details, Chart Usage), Target log (Danger Target).
Voyage navigation and Voyage planning modes.
Selects a color palette, day, dusk or night.
Adjusts the brilliance of a FURUNO monitor unit.
MOB Inscribes the MOB (ManOverBoard) mark.
Takes a screenshot.
Restores previous condition in route and user chart creation.
Toggle button Drop-down list button Slider bar button
Button name Description
Palette
BRILL
Capture
UNDO
OFF
(gray)
ON
(light-blue)
[Palette] button
Palette
choices
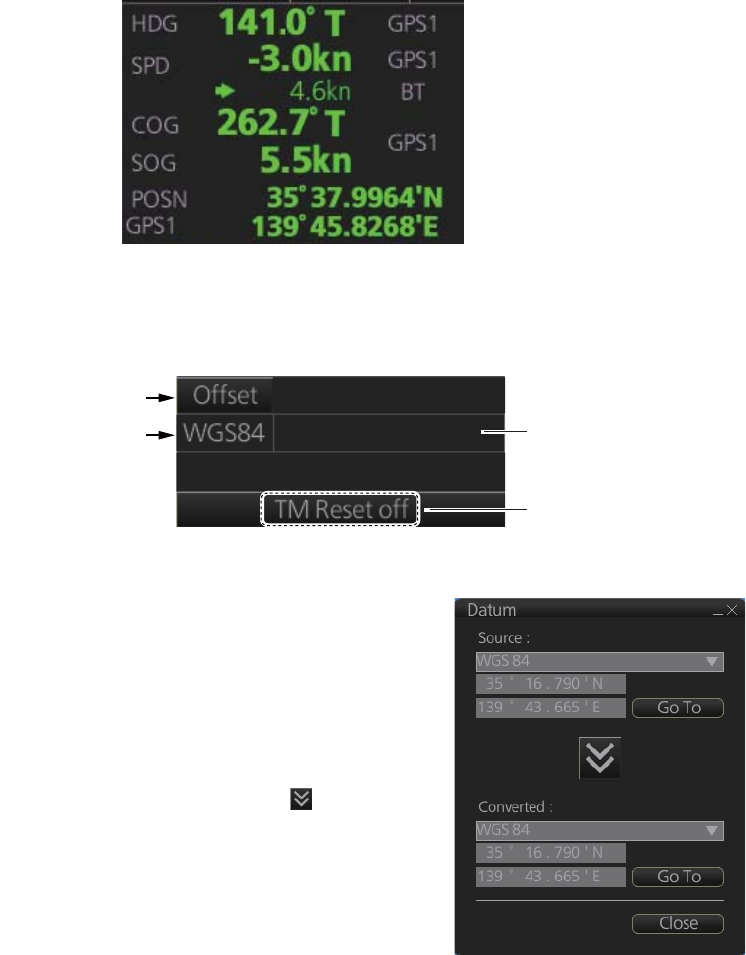
6. CHART OVERVIEW
6-8
• Drop-down list button or slider bar: Rotate the knob to select an item or ad-
just the slider bar. Push the knob to confirm your selection or setting.
Note 1: You can use the ESC key to go back one step in the current operating
sequence.
Note 2: The InstantAccess knob can only adjust the slider bar on the
InstantAccess bar.
6.1.4 Sensor information box
Sensor information box displays the sensor data. When the user-selected sensor fails,
the system automatically selects another sensor. When this occurs, the color of the
sensor name changes from green to yellow. For details, see section 1.9.
6.1.5 Own ship functions box
The own ship functions box shows information about own ship, enables offset and TM
reset.
• [Offset] button: See section 16.8.1.
• [WGS 84] button: Convert position data between
datum; go to selected position on the current
chart. Click the button to display the dialog box
shown in the right figure. To convert a position
from one datum to another, select the datum
source at the [Source] pull-down list and enter po-
sition. Select the datum to convert to at the [Con-
verted] pull-down list then click the button. The
position on the chart selected is shown below the
[Converted] pull-down list. To go to a position,
click a [Go To] button.
TM/CU status
[Offset] button
ENC info
appears here.
[WGS84] button
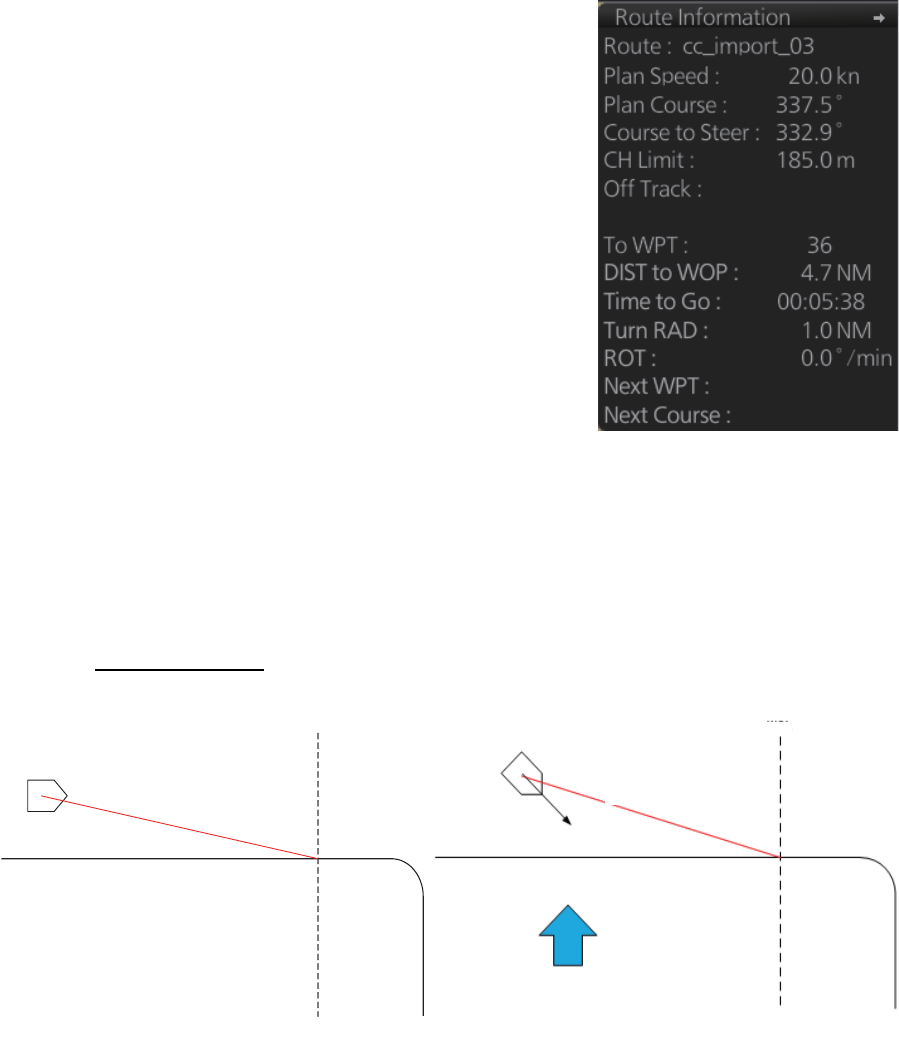
6. CHART OVERVIEW
6-9
• ENC info: ENC chart info appears here.
No indication: ENC chart is currently displayed.
"Non-ENC data": Non-official ENC material, in yellow characters. See section 7.18.
• TM/CU status:
"TM/CU Reset": True motion reset is active. (Chart is stationary and own ship
moves on the chart.)
"TM Reset off": When dragging the chart; true motion is OFF. To restart true motion,
click the indication.
"Ship off screen": Ship is out of the display area.
6.1.6 Route information box
Course to steer
Asterisks appear in data locations when no route
is selected for navigation.
• [Route]: Name of monitored route.
• [Plan Speed]: Planned speed to approach "To
WPT".
• [Plan Course]: Planned course between previ-
ous WPT and "To WPT".
• [Course to Steer]: Calculated set course to fol-
low the monitored route, including off track, drift
and gyro error compensation.
• [CH Limit]: Planned width of channel to ap-
proach "To WPT".
• [Off Track]: Perpendicular distance the ship is
from the intended track.
• [To WPT]: The waypoint that the ship is ap-
proaching.
• [DIST to WOP] (Wheel Over Point): Distance to
the point where rudder order for course change
at "To WPT" is given.
• [Time to Go]: Time to go to WOP (hh:mm:ss).
• [Turn RAD]: Planned turning radius at "To
WPT".
• [ROT]: Calculated rate of turn that is based on
current speed and planned turning radius.
• [Next WPT]: The WPT following the "To WPT".
• [Next Course]: Next course (in degrees).
0.9 m
37
341.2°
WOL (Wheel Over Line)
Course to steer: 110°
Planned course: 90°
Current
Course to steer: 120°
WOL
Planned course: 90°
No current Current present
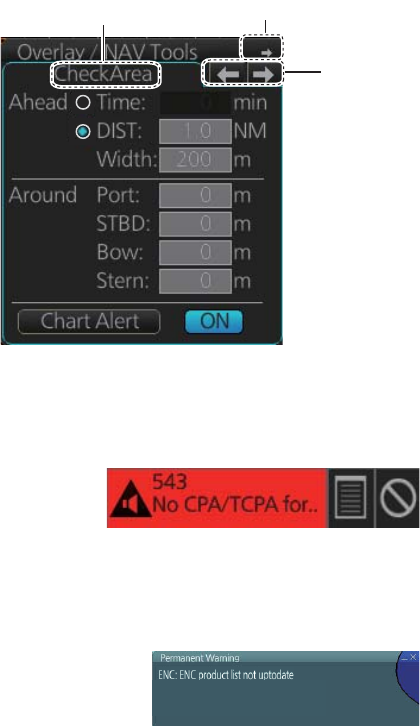
6. CHART OVERVIEW
6-10
6.1.7 Overlay/NAV Tools box
6.1.8 Alert box
6.1.9 Permanent warning box
6.1.10 EBL, VRM boxes
The EBL measures the bearing to an object, and the VRM measures the range to an
object. See section 6.10.
The [Overlay/NAV Tools] box sets up
the following objects and consists of
the following pages.
• TT/AIS
• Parallel index lines
• Range rings
• Predictor (predicts ship’s future
movements)
• Under the keel clearance graphic
• Anchor watch
• Check area
See chapter 15 for information about
objects other than TT/AIS.
The [Alert] box shows operational and system
alert messages, with alert ID no. and alert mes-
sage. See chapter 20.
The permanent warning box displays chart-related
warning messages. The box cannot be closed or min-
imized.
Page
selection
buttons
Minimize button
Page name
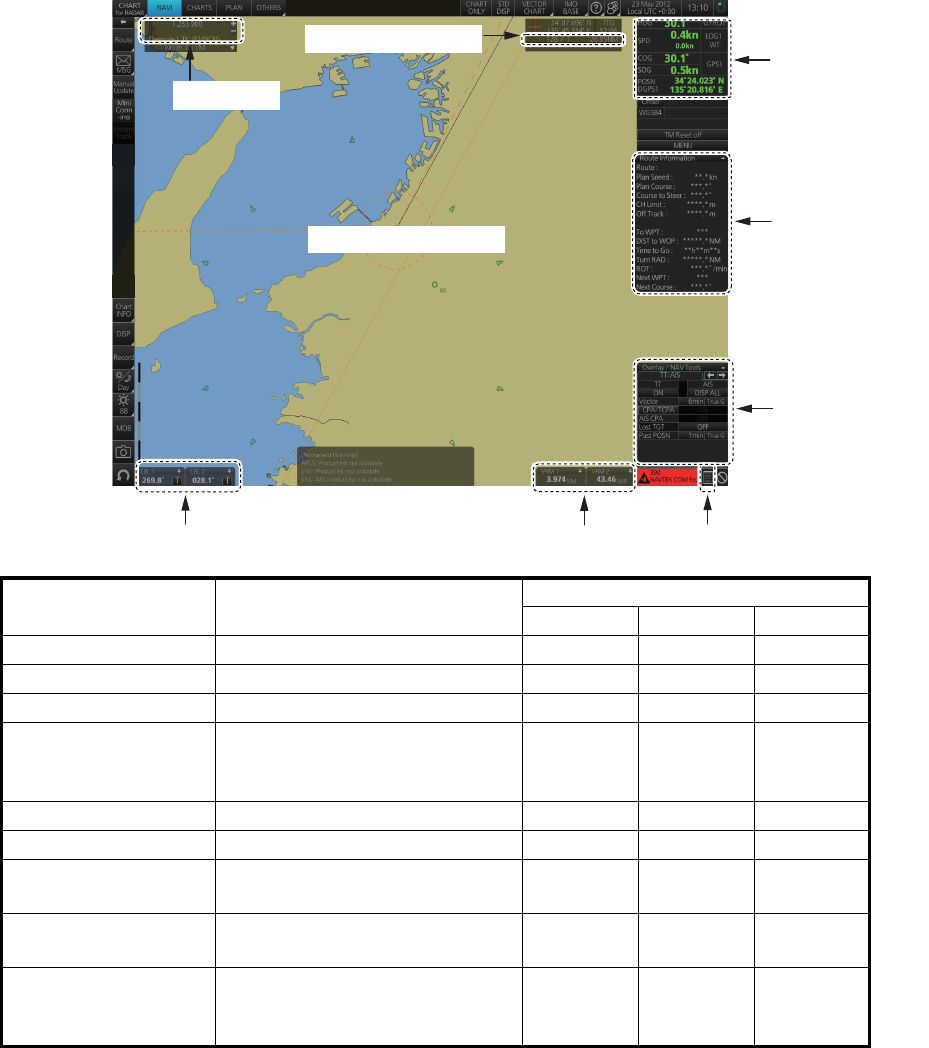
6. CHART OVERVIEW
6-11
6.1.11 Context-sensitive menus
Context-sensitive menus are available at the locations shown below. Right-click the
applicable area then select the appropriate item from the menu. The availability of the
context-sensitive menu depends on the mode in use, as shown in the table below.
* Hide MOB only
Item Functions Mode and availability
NAVI CHARTS PLAN
Chart scale Drop-down list of chart scales. Yes Yes Yes
Cursor info display Switch cursor displays. Yes Yes Yes
Sensor selection Select sensors. Yes Yes Yes
Route selection,
route information
Select route; unselect route;
move route to plan; show route
info.
Yes No No
TT, AIS page Access TT, AIS functions. Yes Yes Yes
Alert list, Alert log Open alert list, alert log. Yes Yes Yes
VRM reference Select VRM reference; offset
(heading or north).
Yes Yes Yes
EBL reference Select EBL reference; offset
(heading or north).
Yes Yes Yes
Electronic chart area Ship offcentering, centering;
object info; chart legend; man-
ual update; divider; hide MOB.
Yes No Yes*
Sensor
selection
EBL reference
Route selection,
route information
TT/AIS
page
Alert list, Alert log
VRM reference
Electronic chart area
Cursor info display
Chart scale
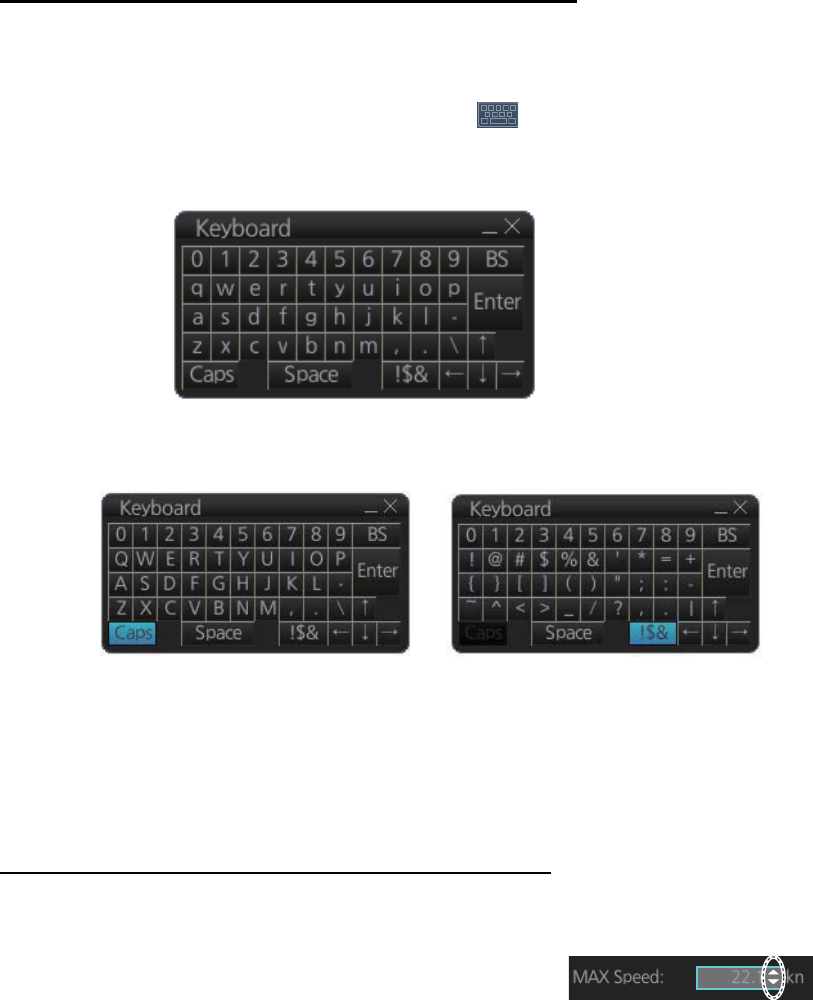
6. CHART OVERVIEW
6-12
6.1.12 How to enter alphanumeric data
On some screens it is necessary to enter alphanumeric data. The data can be input
two ways: software keyboard or trackball.
Alphanumeric data entry from the software keyboard
A software keyboard is also available for entry of alphanumeric data. Do as follows to
use the software keyboard. Display the keyboard before opening menus.
1. On the InstantAccess bar, press the [DISP], [ ] and [ON] buttons to show the
software keyboard. The [BS], [Enter], [↑], [↓],[ ←], [→] and [Space] on the key-
board function the same as those keys on the keyboard of the Control Unit.
2. To switch between the alphabet keyboard and symbols keyboard, click the [!$&]
key.
3. Click the input box.
4. Click appropriate keys and finally click the [Enter] key.
To erase the software keyboard, click the X button at the top right corner of the key-
board.
Alphanumeric data entry with the trackball module
The trackball module can also be used to enter alphanumeric data.
1. Put the cursor in the input box. Up and down arrows
appear at the right side of the box.
2. Enter data by one of the methods shown below.
• Spin the scrollwheel to set data. Upward to decrease the value; downward to
increase the value.
• Click S to increase the value; T to decrease the value.
Alphabet keyboard Symbols keyboard
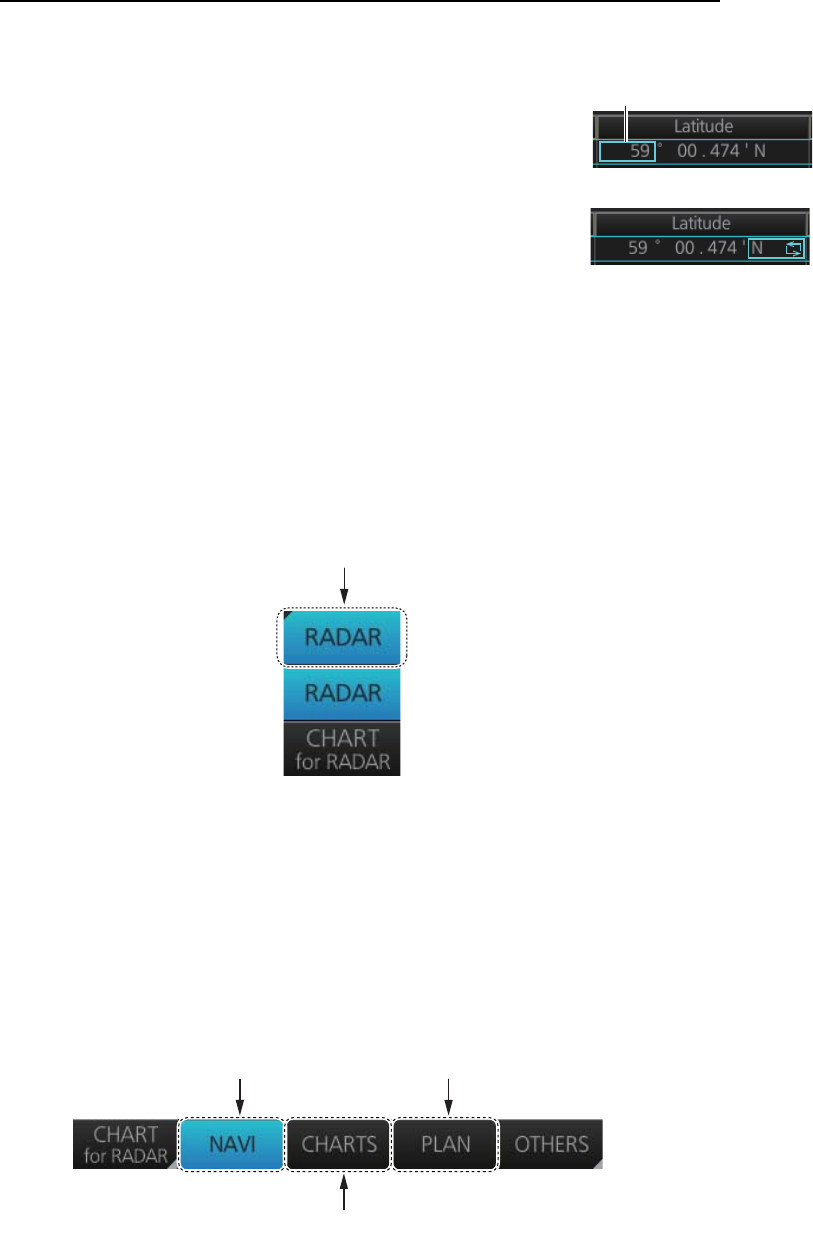
6. CHART OVERVIEW
6-13
How to enter latitude and longitude data with the trackball module
The trackball module can also be used to enter latitude and longitude data.
1. Put the cursor in the input box. A selection cursor (light-
blue) appears.
2. Enter data by spinning the scrollwheel. Upward to de-
crease the value; downward to increase the value.
3. To switch coordinate between N and S and vice versa,
put the cursor at the right edge of the input box. Dual ar-
rows appear
4. Click to switch the coordinates. The method to switch E to W and vice versa is the
same.
6.2 How to Select the Operating Mode
Click the [Operating Mode] button at the far left side of the Status bar then click
[CHART for RADAR] to activate the chart mode.
6.3 How to Select the Chart Operating Mode
The chart display has three chart operating modes: Voyage navigation, Chart mainte-
nance and Voyage planning. Select a mode from the Status bar with the [NAVI],
[CHARTS] and [PLAN] buttons. The background of the button of the active mode is
light-blue.
Note 1: When switching between the Voyage navigation and Chart maintenance
modes it may take several minutes to read the chart when using C-Map charts or there
are many charts installed.
Note 2: If the equipment accepts no key operation after switching to the Chart main-
tenance mode, reset the power.
Selection cursor
[Operating Mode] button
For Voyage navigation
mode
For Voyage planning
mode
For Chart maintenance
mode
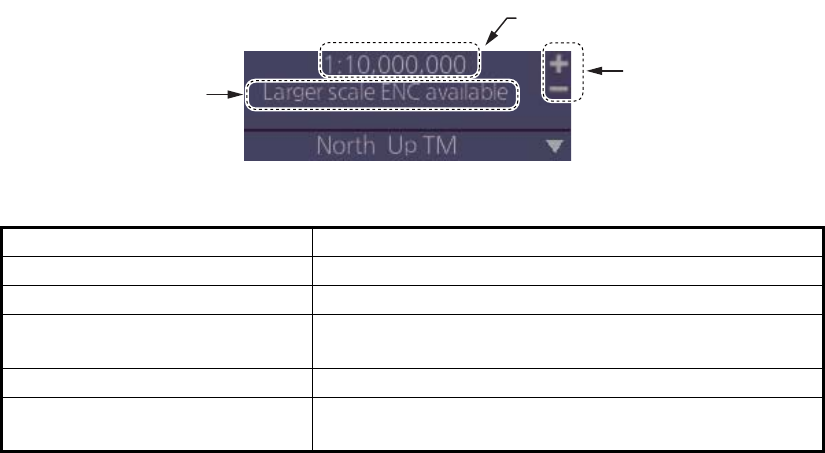
6. CHART OVERVIEW
6-14
6.4 How to Select the Chart Scale
When you open a chart it is displayed with the default scale, called the compilation
scale. To change the chart scale, do one of the procedures shown below. The scale
range is 1:1,000 to 1:70,000,000.
• Click the chart scale selection buttons in the Chart scale/presentation mode box.
• Right-click anywhere inside the Chart scale/presentation mode to show a drop-
down list of chart scales.
• Put the cursor anywhere on the chart and spin the scrollwheel.
The table below lists the chart related messages and their meanings.
Message Meaning
Display date is not current Displayed date is not the current date.
Non-ENC data ENC non-compatible chart in use.
Large scale ENC available Larger scale available at current position (TM reset
ON) or cursor location (TM reset OFF).
Overscale Scale too large.
RM(OFF) Relative motion turned off when the chart is scrolled
or the trackball is operated.
Chart scale indication
Chart scale
selection buttons
Chart related
message
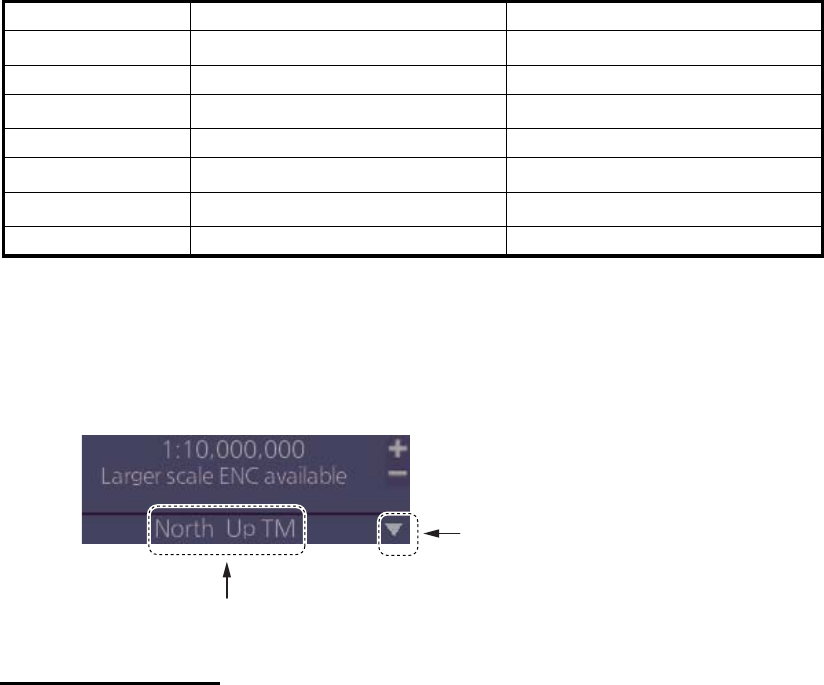
6. CHART OVERVIEW
6-15
6.5 How to Select the Presentation Mode
The presentation mode depends on the chart operating mode, as shown in the table
below.
*1When monitoring a route.
*2Motion mode (TM) is not shown. For example, “North up”.
To select a presentation mode, click the presentation mode indication to cycle through
the presentation mode choices or click the triangle to show the drop-down list of pre-
sentation modes.
Presentation modes
North up: North (0 degrees) is at the top of the display.
Course up: The course is put at the top of the screen the moment it is selected.
Route up: The planned course is put at the top of the screen, in route monitoring.
When route monitoring is canceled, the course up presentation mode is automatically
selected.
Head-up: Heading is put at the top of the display.
TM (True Motion): Own ship mark follows ship’s movement. The chart is fixed.
RM (Relative Motion): Own ship mark is put at the screen center and is fixed. The
chart moves relative to own ship movement.
Voyage navigation mode Voyage planning mode
North up TM Yes Yes*2
North up RM Yes No
Course up TM Yes Yes*2
Course up RM Yes No
Route up TM*1 No Yes*2
Route up RM*1 Yes No
Head up RM Yes No
Presentation mode
Click to show drop-down list of
presentation mode choices
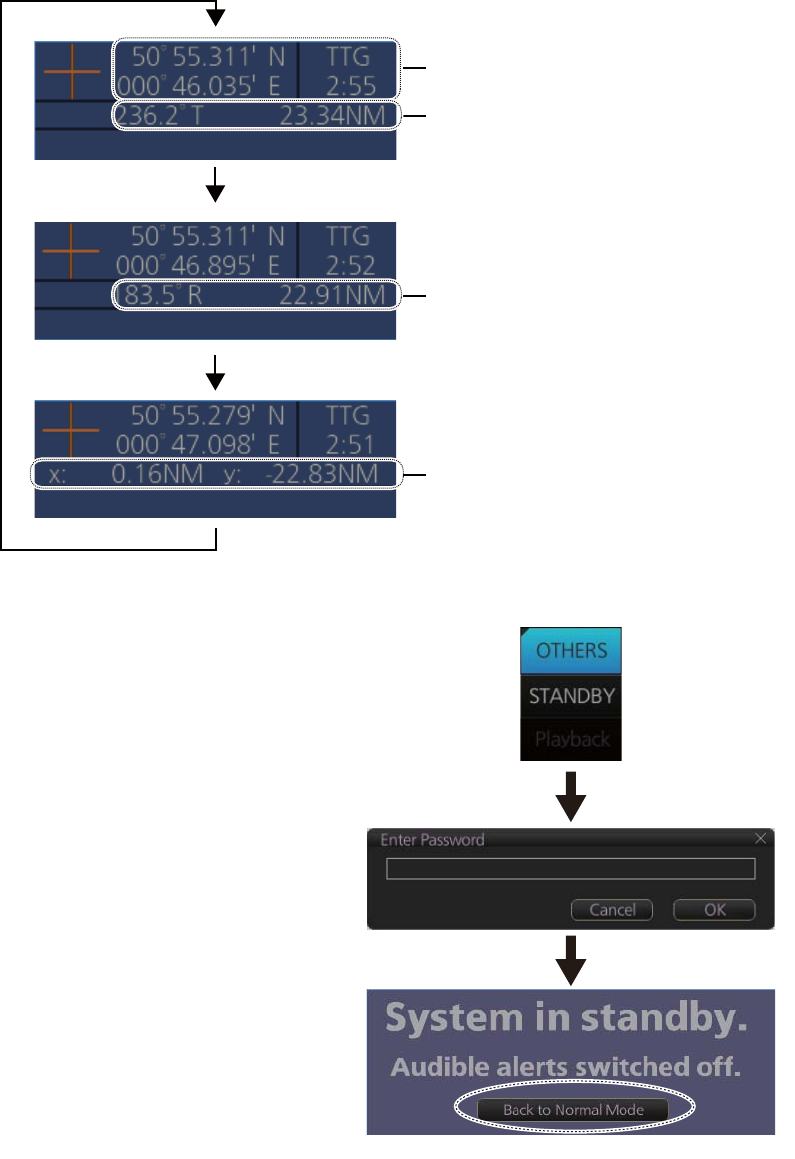
6. CHART OVERVIEW
6-16
6.6 Cursor Position Box
The Cursor position box shows
• Cursor position in latitude and longitude
• Time to go to the cursor position
• The bearing (True or Relative) and range to the cursor position, or x-y coordinates
of cursor position. Click the bearing and range indication or x-y coordinates indica-
tion to switch the indication, in the sequence shown below.
6.7 The Standby Mode
The standby mode, which requires a
password to activate, deactivates the
audio alarms from the chart system.
Use this mode when the chart system
is not required, like in a harbor. To go
to the standby mode, first click the
[OTHERS] button on the Status bar
then click [STANDBY]. Have the
holder of the password enter the
password then click the [OK] button.
To return to normal operation, click
[Back to Normal Mode].
Cursor position, Time to go
to cursor position
Bearing(T) and range to cursor position
Bearing(R) and range to cursor position
x-y coordinates of cursor position
Enter password;
click [OK] button.
Click to return to normal operation.
Click [OTHERS],
[STANDBY].
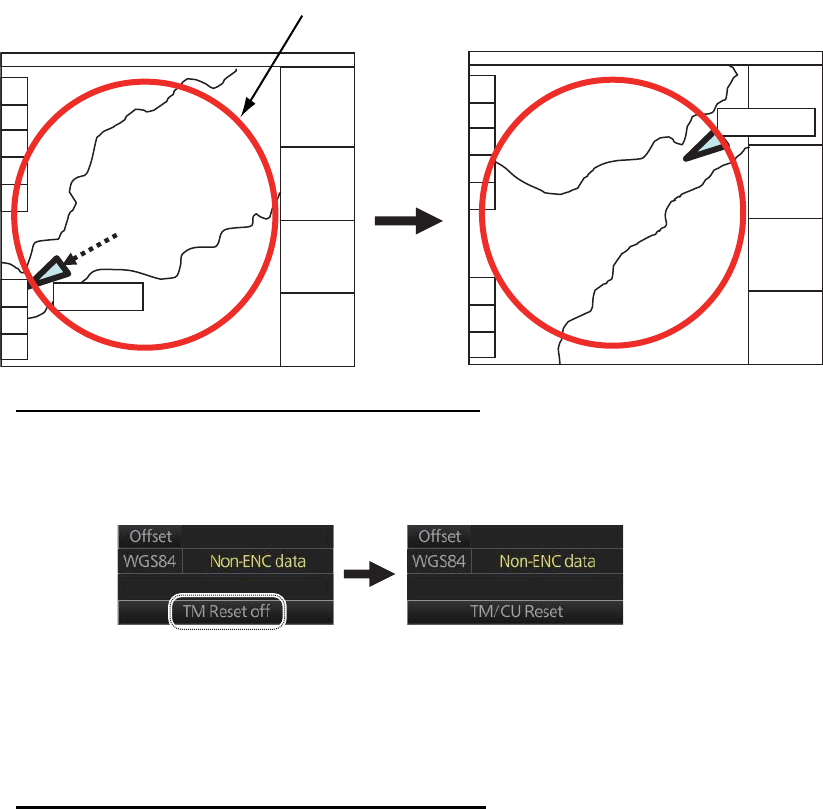
6. CHART OVERVIEW
6-17
6.8 True Motion Reset
In the true motion mode, the chart is stationary and own ship moves on the screen.
With TM reset active, own ship moves until it reaches the true motion reset border-
line(s), then the chart is redrawn and own ship jumps back to an opposite position on
screen based on its course. (This resetting can also be done manually by clicking the
[TM/CU Reset] button.) When the TM reset function is active, "TM/CU Reset" appears
at the right side of the display.
How to enable, disable automatic TM reset
To enable automatic TM reset, click the [TM Reset off] indication at the right side of
the display to show [TM/CU Reset].
When the TM reset is disabled, change the chart scale with the scrollwheel and scroll
the chat by drag and drop. The own ship functions box shows [TM Reset off]. When
own ship moves off the screen the box shows [Ship off screen].
How to set the true motion reset borderline
You can set the limit for TM reset (in percentage) on the [Basic Setting] page. See
section 8.2.2.
OWN SHIP
OWN SHIP
TM
Reset
TM reset borderline setting
(Ring does not appear on the display.)
Click
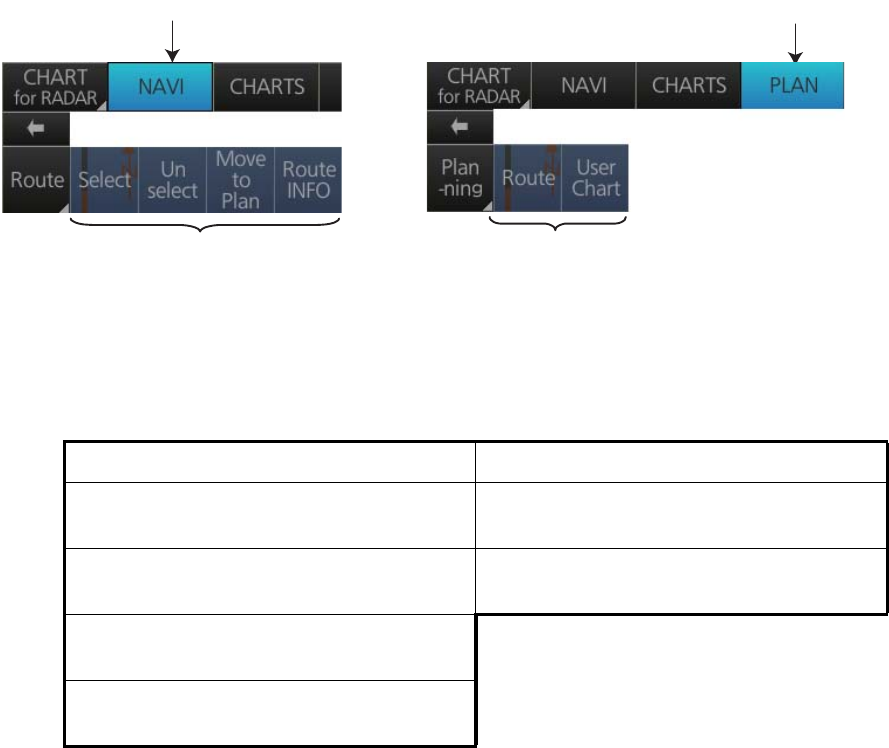
6. CHART OVERVIEW
6-18
6.9 How to Control Route and User Charts in Voyage
Navigation and Voyage Planning Modes
Click the appropriate chart mode button [NAVI] or [PLAN] at the top of the display to
go to respective mode. For the Voyage navigation mode, click the [Route] button then
click the button corresponding to the action to take. For the Voyage planning mode,
click the [Planning] button followed by the [Route] button to select a route, or [User
Chart] button to select a user chart.
Voyage navigation mode functions Voyage planning mode functions
[Select]: Selects the route to use in the
Voyage navigation mode.
[Route]: Shows the [Route Plan] dialog
box to create or edit a route.
[Unselect]: Deselects active route. [User Chart]: Shows the [User Chart] dia-
log box to create or edit a user chart.
[Move to Plan]: Moves active route to Voy-
age planning mode.
[Route INFO]: Shows the [Route Informa-
tion] dialog box.
Click for Voyage navigation mode Click for Voyage planning mode
Functions in Voyage navigation mode Functions in Voyage planning mode
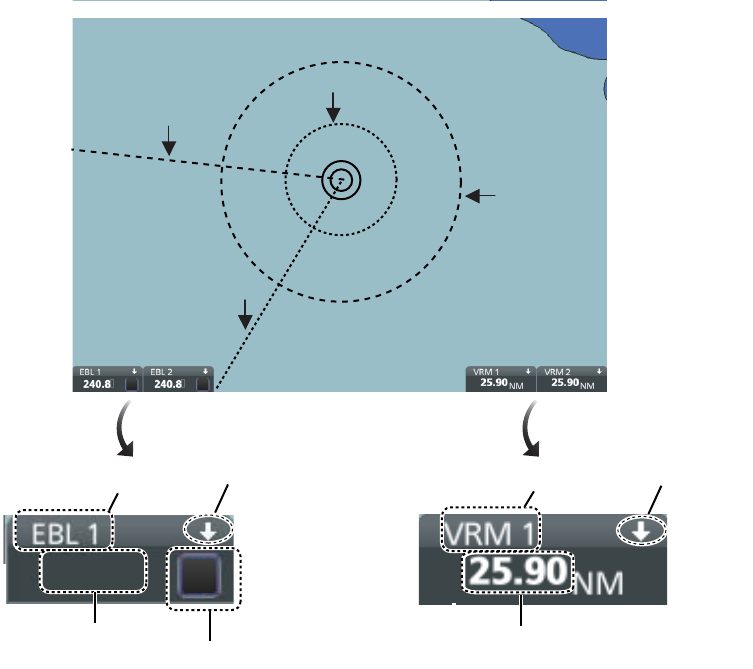
6. CHART OVERVIEW
6-19
6.10 How to Use the VRM and EBL
The VRM measures the range to an object and the EBL measures the bearing to an
object. There are two each of VRMs and EBLs. The lengths of the dashes on the EBL2
and VRM2 are longer than those of the EBL1 and VRM1 to distinguish them. The color
of the VRMs and EBLs is orange.
6.10.1 How to hide/show an EBL, VRM
Control Unit: Press the EBL or VRM key to hide or show respective marker.
Trackball module: Click the arrow on an EBL or VRM box to hide the respective
marker. To redisplay the marker, click the minimized box.
6.10.2 How to measure the range and bearing
Range: Put the cursor on the VRM then drag the cursor until the VRM is on the inner
edge of the object.
Bearing: Put the cursor on the EBL then drag the cursor until the EBL bisects the ob-
ject.
6.10.3 How to select bearing reference
The EBL bearing reference can be true or relative. Click the EBL reference indication
to display T (True) or R (Relative).
EBL1
EBL2
VRM2
VRM1
240.8°
EBL reference
EBL bearing
EBL no. EBL On/Off
VRM range
VRM no. VRM On/Off
T
TT
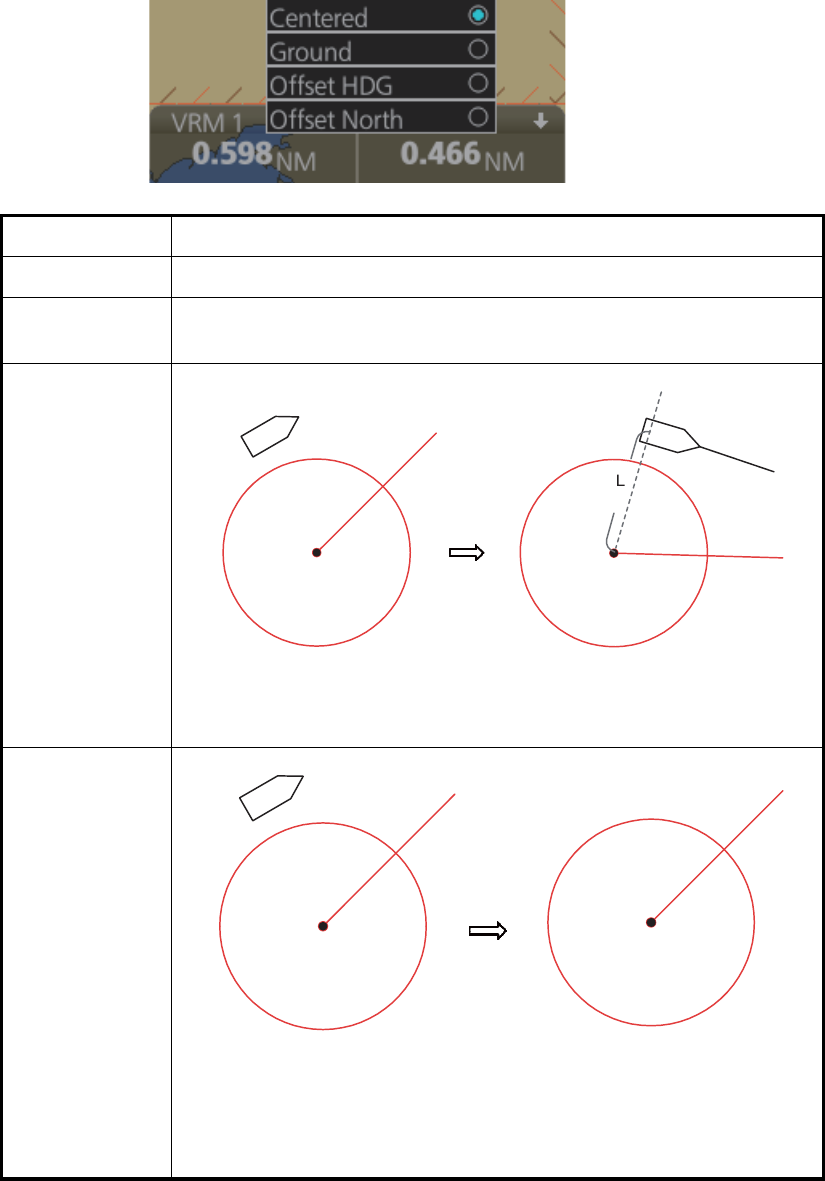
6. CHART OVERVIEW
6-20
6.10.4 EBL, VRM functions available with the context-sensitive menu
The EBLs and VRMs have additional functions that are accessed from the context-
sensitive menu. Right-click any VRM or EBL box to show the context-sensitive menu.
Function Description
[Centered] Centers the origin of the EBL and VRM on the current position.
[Ground] Anchors the EBL and VRM to ground; neither the EBL or VRM move
with ship's movement.
[Offset HDG]
[Offset North]
Select
[Offset
HDG].
Drag and drop EBL, VRM
on desired location.
When vessel changes course, the
EBL, VRM move so that the range (L)
to their centers stays fixed.
Drag and drop EBL, VRM
on desired location.
The EBL, VRM move to keep the
angle from North to the center of the
EBL, VRM, even if the vessel
changes course. The distance to the
center of the EBL, VRM is fixed.
Select
[Offset
North].
6. CHART OVERVIEW
6-21
6.11 Split Screen
This function is currently unavailable.
6.12 Datum
6.12.1 General
Datum is a mathematical model of the earth based on which a sea chart is produced.
If the datum of a position sensor and that of a sea chart are different, a transformation
has to be made somewhere in the system. Not doing so can result in errors of several
sea miles. The difference between two datum is never constant, but depends on po-
sition. This means that the difference between WGS-84 and local datum, generally
used in paper charts, is not generally valid with electronic sea charts.
6.12.2 Paper charts
Datum used in paper charts have been traditionally national datum for historical rea-
sons. Many paper charts do not have a marked datum, therefore compatibility with
electronic charts may be complicated. In some paper charts, the correction terms are
printed in lieu of datum, for correction of the WGS-84 system satellite locations. The
correction terms are usable but only with the paper chart in question.
6.12.3 Electronic sea charts
The ENC vector material has to be produced by a National Hydrographic Office in the
WGS-84 datum.
6.12.4 Positioning devices and datum
In early days of electronic positioning devices, datum received little attention because
the commonly used systems utilized special charts (like Decca charts). Later on, data
output was added to these systems, but still no attention was paid to datum and the
position errors were considered as an inaccuracy of the system. With the spread of
the GPS, however, datum has become better known. An accurate position is of no val-
ue if co-ordinates are in a wrong datum. GPS satellites utilize the WGS-84 datum.
6.12.5 Chart radar and datum
The chart radar uses ENC material, produced to standards using WGS-84 datum. Po-
sitioning devices connected to the chart radar must work in the WGS-84 datum. IMO
requires that the chart must give an alert if the datum of a positioning device is not the
WGS-84.
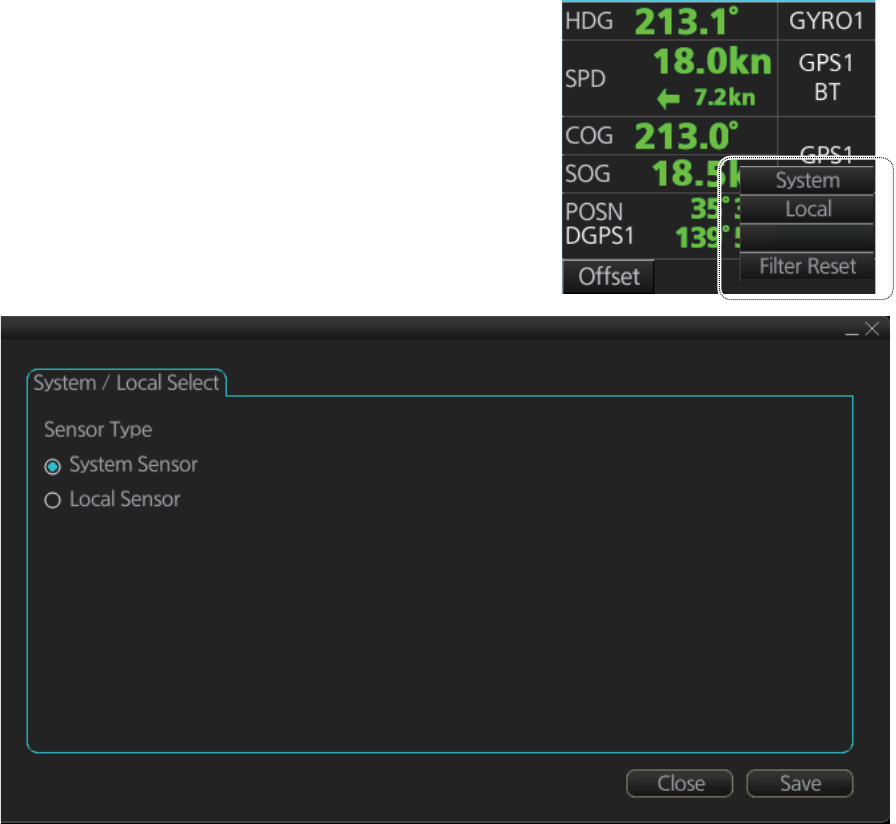
6. CHART OVERVIEW
6-22
6.13 How to Select Sensor Settings
Sensor settings can also be selected in the chart for radar mode. Settings are mutually
changed between the radar and chart for radar modes.
This chart radar system accepts navigation data input two ways: [System] or [Local].
[System] shares sensor data among multiple chart radars in network. Sensor priority
is also commonly shared among the chart radar. [Local] selects a sensor outside the
network.
1. Right-click anywhere in the Sensor infor-
mation box to show the context-sensitive
menu.
2. Click [Local] or [System].
Note: Sensor system can also be selected
from the menu. Open the menu and click
[System/Local Select] on the [Sensor]
menu. Click the circle next to [System Sen-
sor] or [Local Sensor] then click the [Save]
button.
6.14 How to Enter Ship Speed
Speed can also be entered in the chart for radar mode. Settings are mutually changed
between the radar and chart for radar modes.
The speed can be entered from a log (STW) or GPS (SOG), or manually on the menu.
Note that FURUNO GPS Navigator GP-150 provides both COG and SOG.
Speed data is checked for integrity (see section 16.7 for details), and the data is
judged as [Passed], [Doubtful], [Failed], [Excluded] or [Not Available]. The results of
the check appear on the [SPD] page, shown below.
Open MENU
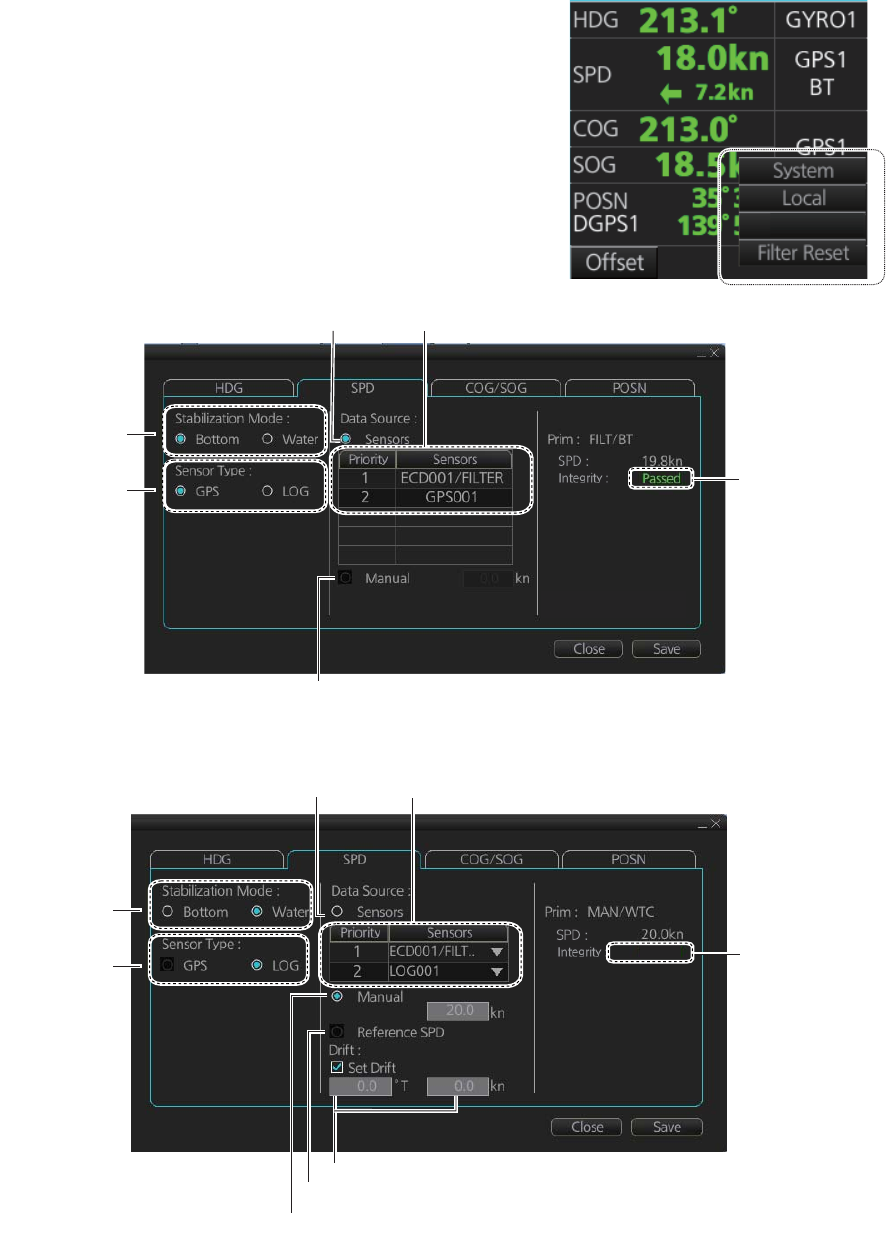
6. CHART OVERVIEW
6-23
[Passed] (green): Data is available for comparison and data is normal.
[Doubtful] (yellow): Data is not available for comparison, but data is normal.
[Failed] (orange): Data is quite away from predicted value based on a comparison.
[Excluded] (orange): Data is greatly changed compared with predicted value.
[Not Available] (orange): Sentence status or mode indicator is abnormal.
1. Right-click anywhere in the Sensor information
box to show the context-sensitive menu.
2. Click [Open MENU].
3. Click [System Sensor Settings] or [Local Sen-
sor Settings].
4. Click the [SPD] tab.
[SPD] page, system sensor
[SPD] page, local sensor
Open MENU
Speed sensor list
LOG/GPS
selection
Stablilization
mode
Check for automatic speed input
Check for manual speed input
Integrity
check
result
LOG/GPS
selection
Speed sensor list
Stablilization
mode
Check to use radar as source for speed and course
Set course and speed of drift
Integrity
check
result
Check for automatic speed input
Check for manual speed input
Not Available

6. CHART OVERVIEW
6-24
5. For automatic input, follow the procedure below. For manual input, go to
step 6.
1) Check [Sensors].
2) Set the priority for the speed sensors in case of Local sensor. Click the triangle
on the Priority1 line to select the sensor to be the Priority1 sensor. Do the
same for the Priority2. Only one sensor can be Priority1; all others are priority
2. If a speed sensor is changed from Priority2 to Priority1, then that sensor pre-
viously selected to Priority1 is then automatically selected to Priority2 state.
3) Check [LOG] or [GPS] at [Sensor Type].
4) Select [Bottom] or [Water] at [Stabilization Mode]. Select [Bottom] if GPS is the
source of speed data, or [Water] if a speed log is the source of speed data.
5) Go to step 7.
6. For manual input, set the stabilization mode for [Water] and check [Manual]. En-
ter the speed using the scrollwheel, the software keyboard or the keyboard on the
Control Unit.
Note: For set and drift, see page 16-3.
7. Click the [Save] button to save settings then click the [Close] button to close the
menu.
Notes on speed input
• Be sure not to select a LOG option when a speed log is not connected. If the log
signal is lost, the GPS sensor is used. In the event of GPS loss, the SPD is shown
as "**.* kn".
• The SPD is shown as "**.* kn", and the label "LOG" is erased if no log signal is pres-
ent for a certain amount of time. The timeout varies according to ship.
• If SOG is changed to STW, the label "LOG" (in orange) appears. If log signal is lost
"LOG" is colored yellow.
• A single-axis water log cannot measure speed when the wind is coming from the
leeway direction.
6.15 How to Enter Heading
Heading can also be entered in the chart for radar mode. Settings are mutually
changed between the radar and chart for radar modes.
Heading can be entered manually or automatically. Heading data is checked for integ-
rity (see section 16.7 for details), and the data is judged as [Passed], [Doubtful],
[Failed], [Excluded] or [Not Available]. The integrity check results appear on the [HDG]
page, shown below.
[Passed] (green): Data is available for comparison and data is normal.
[Doubtful] (yellow): Data is not available for comparison, but data is normal.
[Failed] (orange): Data is quite away from predicted value based on a comparison.
[Excluded] (orange): Data is greatly changed compared with predicted value.
[Not Available] (orange): Sentence status or mode indicator is abnormal.
Note: If there is only one gyro connected to the chart radar, heading data is compared
to COG from GPS. When the speed is 10 knots or less, and COG is unstable when it
is compared to heading data, the data integrity is judged as [Doubtful]. When the
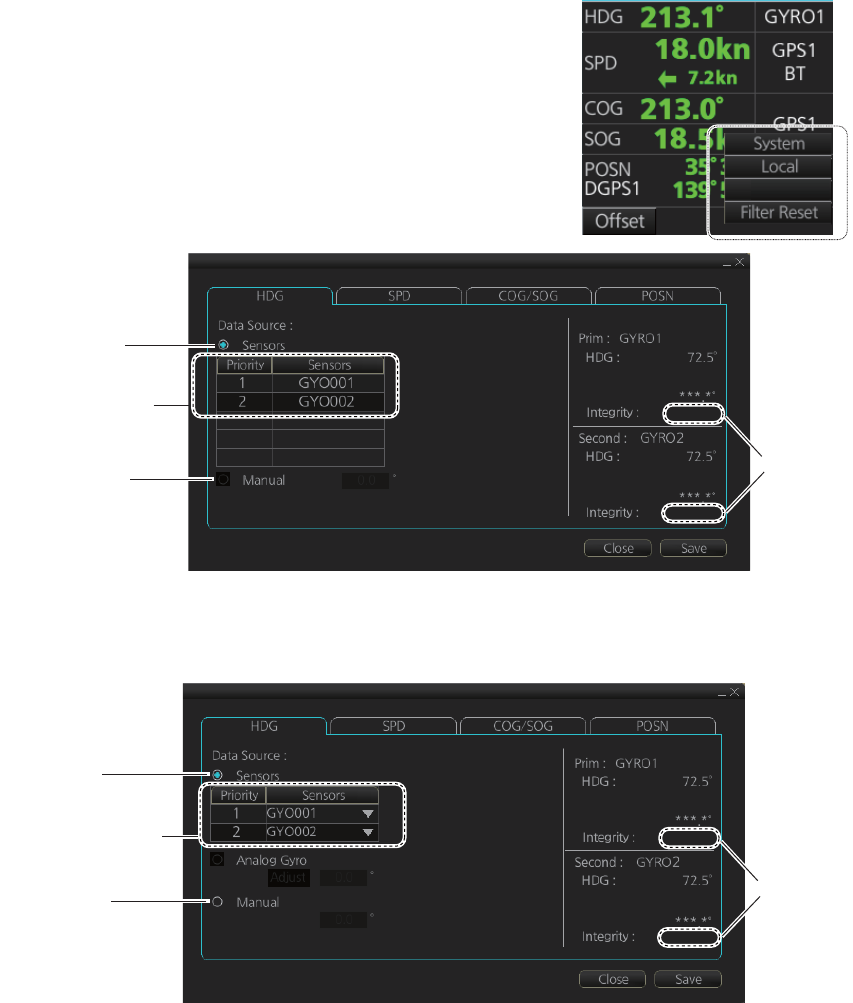
6. CHART OVERVIEW
6-25
ship’s speed becomes greater than 10 knots and COG stabilizes, the data integrity au-
tomatically changes to [Passed].
1. Right-click anywhere in the Sensor information
box to show the context-sensitive menu.
2. Click [Open MENU].
3. Click [System Sensor Settings] or [Local Sensor
Settings].
4. Click the [HDG] tab.
[HDG] page, system sensor
[HDG] page, local sensor
5. For automatic input, follow the procedure below. For manual input, go to
step 6.
1) Check [Sensors].
2) For local system settings, set the priority for each sensor connected, referring
to section 6.14.
3) Go to step 7.
6. For manual input, check [Manual]. Enter the heading using the scrollwheel, the
software keyboard or the keyboard on the Control Unit.
7. Click the [Save] button to save settings then click the [Close] button to close the
menu.
Open MENU
Sensor
list
Check for
manual input*
Integrity
check
result
Passed
Corr.: Not Available
Passed
Corr.: Not Available
Check for
automatic input
*: This is not available with the [System Sensor Settings] menu.
This is not shown on IMO type.
Integrity
check
result
Passed
Corr.: Not Available
Passed
Corr.: Not Available
*: This is not shown
on IMO type.
Sensor
list
Check for
manual input*
Check for
automatic input
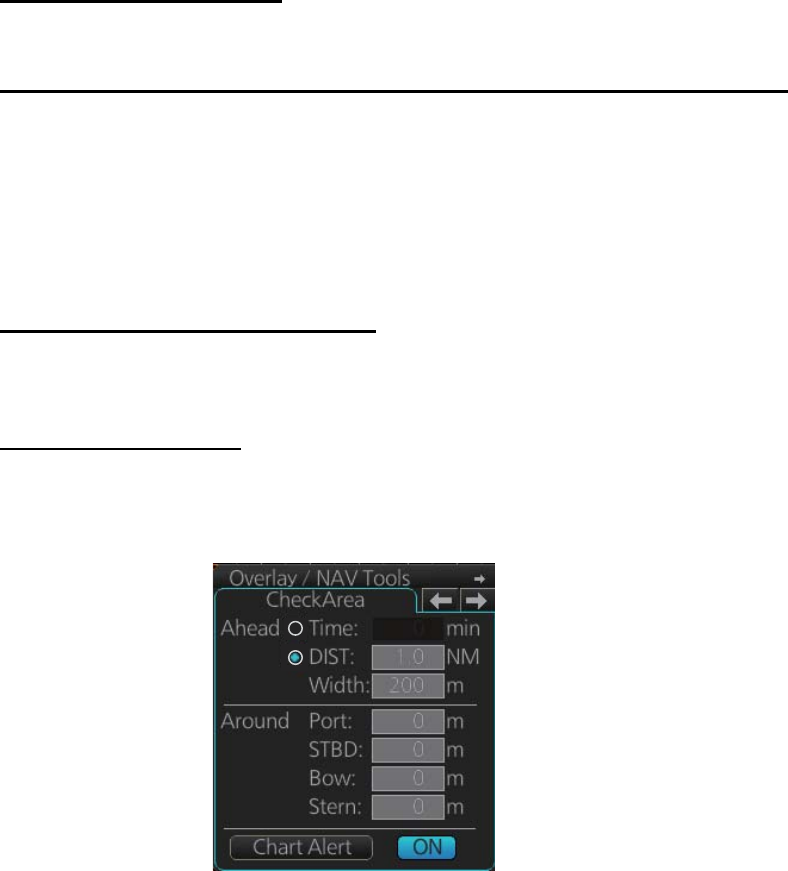
6. CHART OVERVIEW
6-26
6.16 Set up Before Departure
6.16.1 Updates before departure
Update S57 chart material
Update your S57 chart material before embarking on a new voyage. See section 7.19.
Display date and approve until dates for S57 charts and manual updates
Note: It is very important that you set the Display and Approved until dates for charts
as the current date.
There may be features that require chart viewing dates or seasonal dates in charts.
Accordingly, if you have not set Display date and Approved until dates as the current
date, there is a possibility that you can get a wrong presentation or some feature may
be absent. See section 9.2.
Create or update user chart, Notes
If necessary, create a new user chart and Notes or modify existing ones. See
chapter 13.
Chart alert calculation
Set chart alert areas suitable for your coming voyage, on the [CheckArea] page in the
[Overlay/NAV Tools] box. See section 11.2.
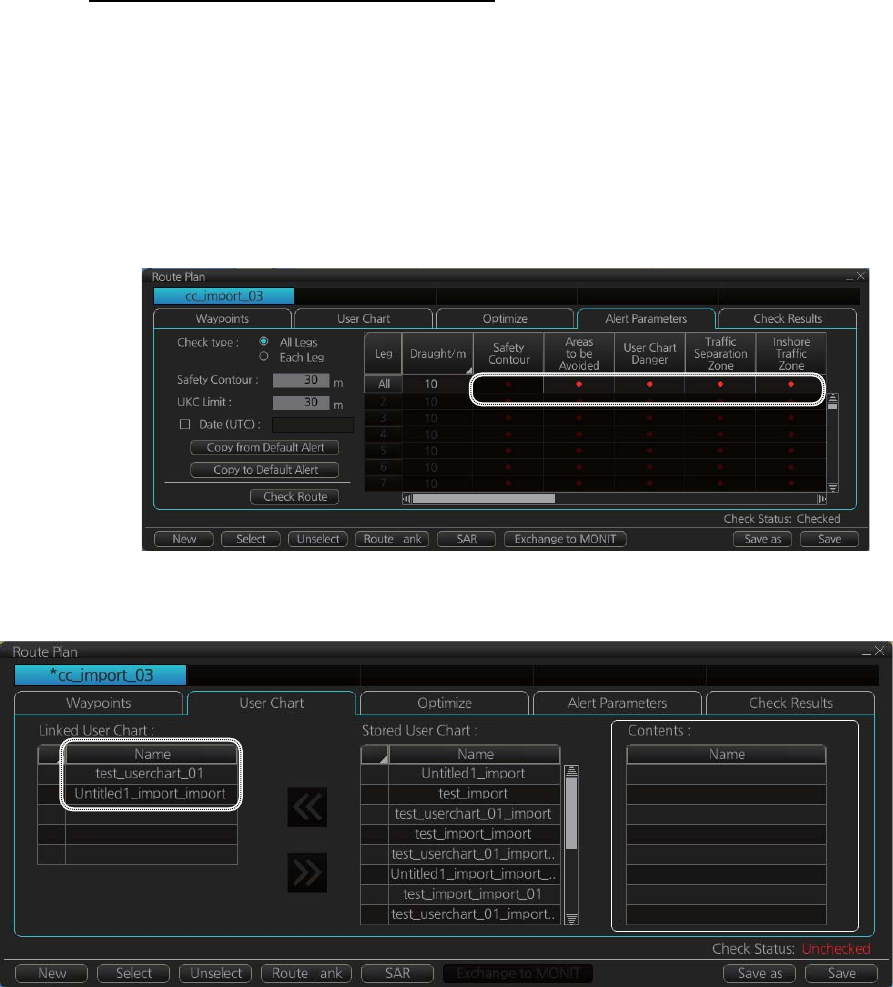
6. CHART OVERVIEW
6-27
6.16.2 Create or update a route
Create a new route or modify an existing one. See chapter 12.
Check your route against chart alerts
Before you sail your route, you should always check your route against chart alerts.
This is important because your S57 charts and manual updates may contain chart
viewing dates information. You can check chart alerts from the [Check Results] page
on the [Route Plan] dialog box.
The following information is stored with the monitoring route plan:
• Conditions for chart alerts during route monitoring, which includes safety contour
and other chart alerts, on the [Alert Parameters] page of the [Route Plan] dialog box.
• Name of the user chart to be used during route monitoring together with this planned
route, on the [User Chart] page of the [Route Plan] dialog box.
B
B
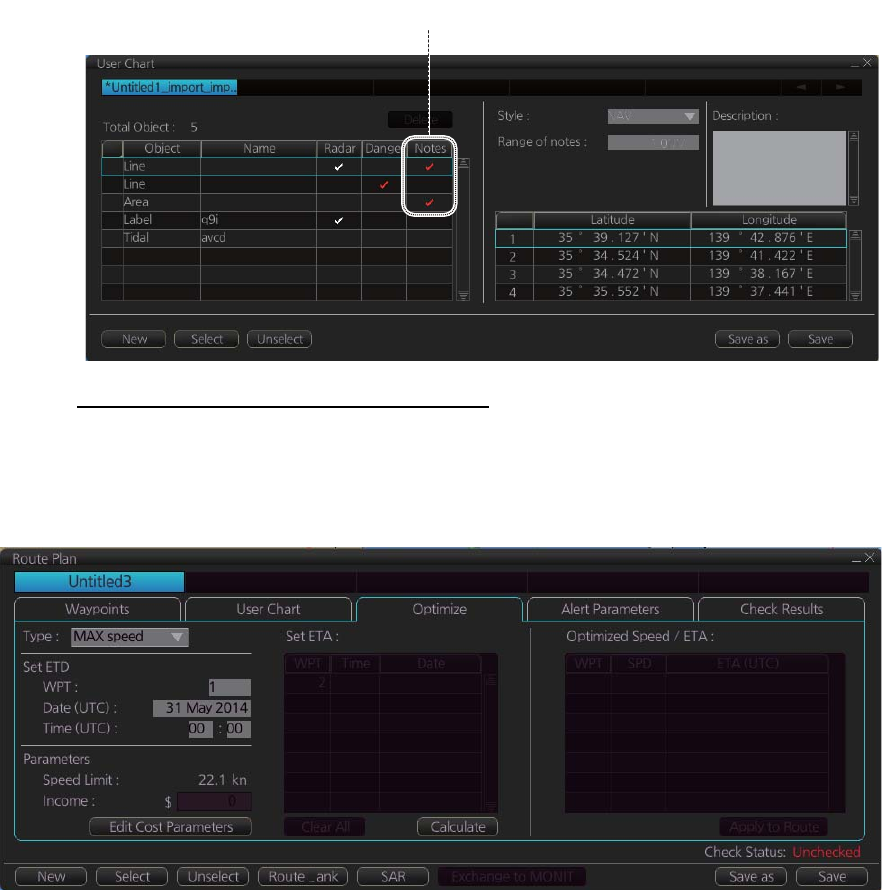
6. CHART OVERVIEW
6-28
• Name of the Notes to be used during route monitoring together with this planned
route, on the [User Chart] dialog box (click the [Planning] button then click the [User
Chart] button).
Recalculate timetable and ETA values
Timetable and ETA values can be recalculated from the [Optimize] page in the [Route
Plan] dialog box. Minimally set ETD to equal departure time, and set optimization val-
ues.
6.16.3 How to check and prepare route to monitor
Select a route for the voyage: In the Voyage navigation mode, click the [Route] button
followed by the [Select] button, or right-click the route indication in the [Route Informa-
tion] box (right edge of screen) then select [Select Route]. See chapter 12.
Note: A route cannot be opened if its planned settings are different from its navigation
settings. The reason is given on the [Select Route] dialog box. In this case, open the
route in the Voyage planning mode and click the [Check Route] button, on the [Alert
Parameters] page. Adjust the route as necessary.
The To WPT can be selected, however WPT 01 cannot be selected.
Check in Notes column indicates Notes is used with route monitoring and planned route.
B
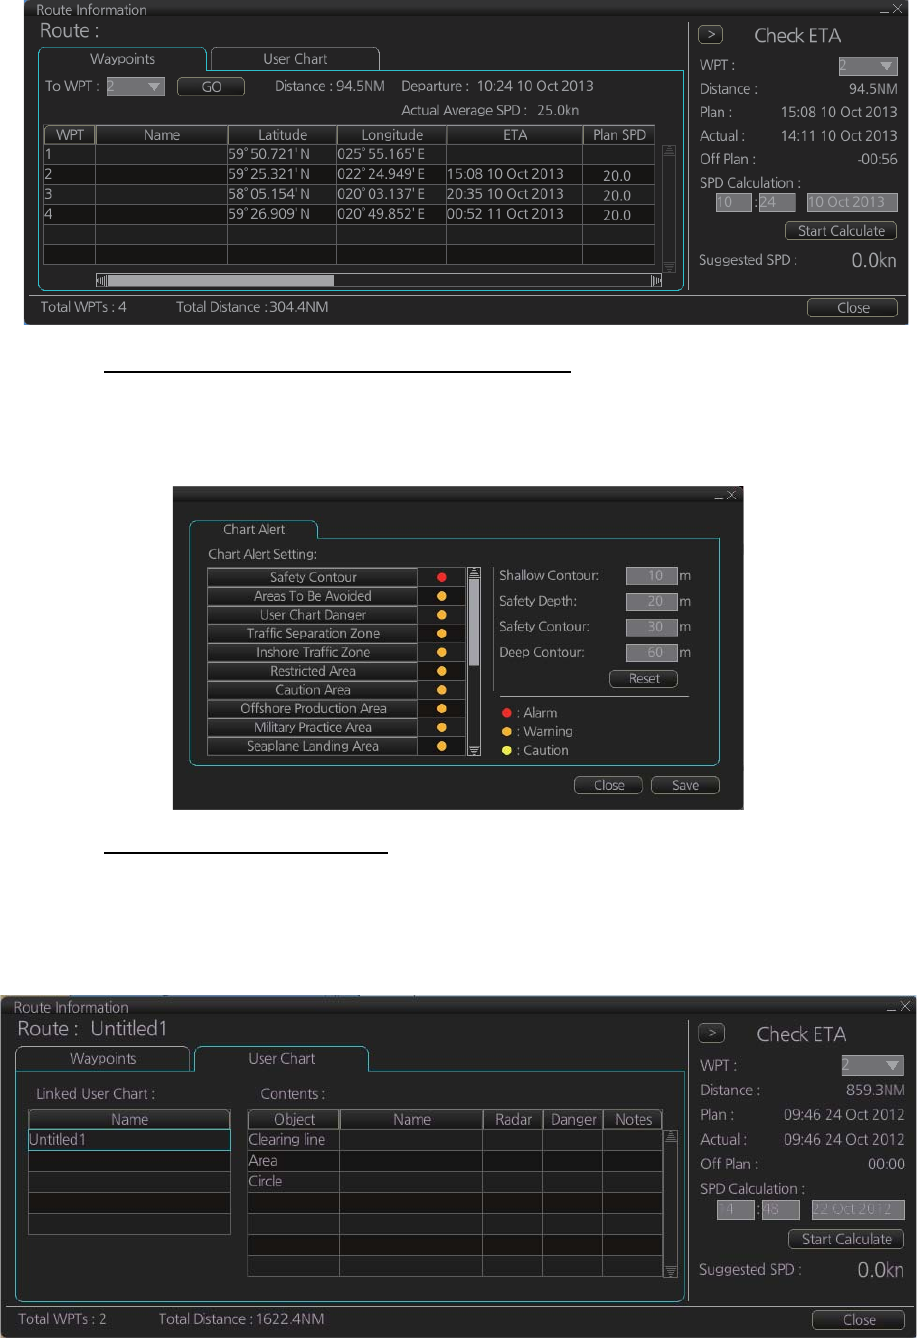
6. CHART OVERVIEW
6-29
Select confirm conditions of the route plan
Check the setting on the [Chart Alert] dialog box; click the [DISP], [SET] and [Chart
Alert] buttons to show that dialog box.
Planned user chart, Notes
To check what planned user chart is selected, open the [Route Information] dialog box
and click the [User Chart] tab. The name of the user chart(s) to be used is in the
[Linked User Chart] window.
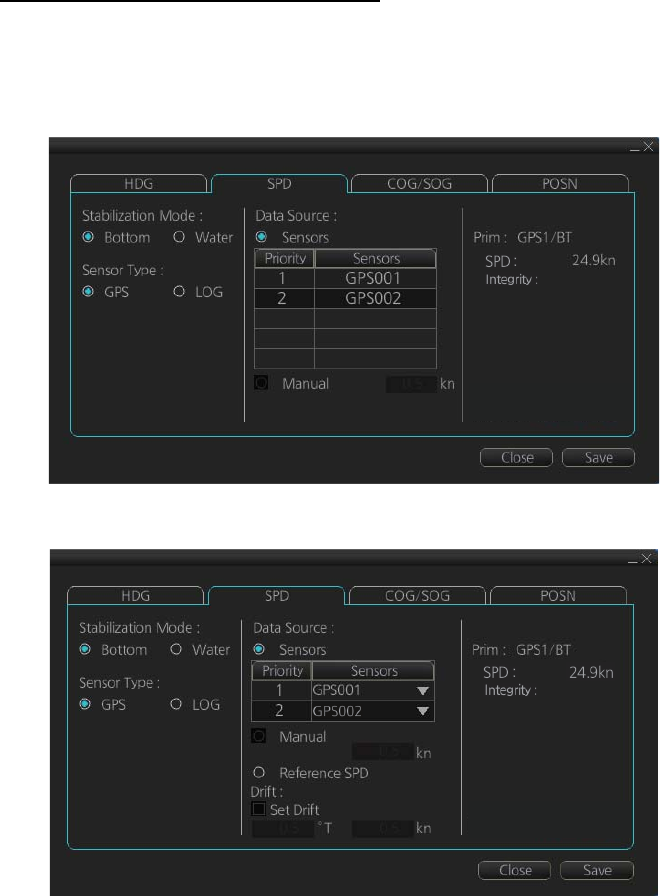
6. CHART OVERVIEW
6-30
6.16.4 Check configuration of navigation sensors
You can check the configuration of your navigation sensors.
Check speed settings ([SPD] page)
Open the menu and click the [SPD] tab in the [System Sensor Settings] page or [Local
Sensor Settings] page of the [Sensor] menu. The user can select navigation sensors
for use in navigation and view their current values.
[SPD] page, system sensor
[SPD] page, local sensor
Checkbox status shows whether the sensor is used for integrated navigation or not. If
there is no value shown for a sensor, it indicates that the sensor is not valid. Note that
the content of these pages depends on the sensors that are in use on the ship.
Select the available dual logs.
Note that manual speed should only be used in an emergency, when no other speed
reference is available. Remember that position sensors are also available as speed
sources. If no dual log is available, check [Reference SPD] (local sensor page) to use
a reference target from the radar as the source for speed and course.
Passed
Passed
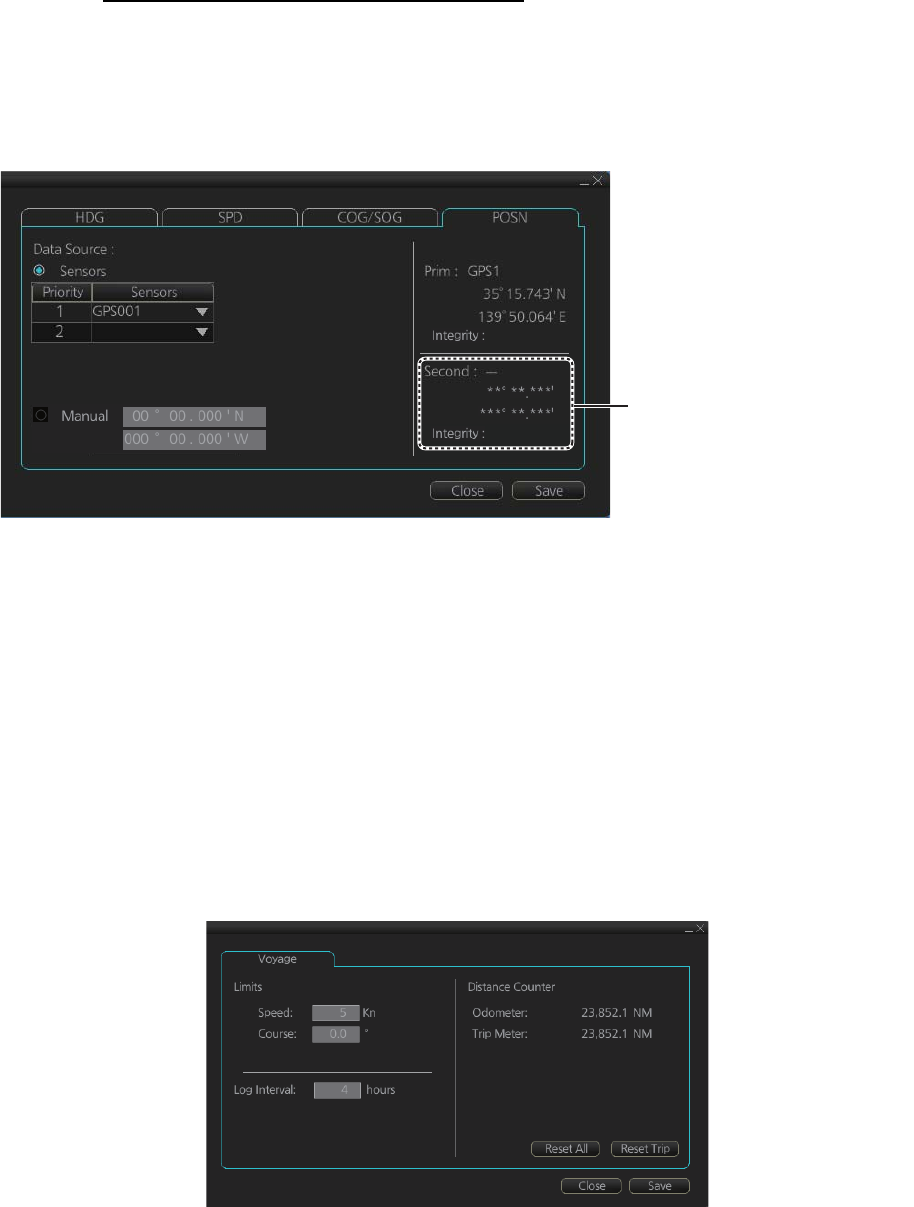
6. CHART OVERVIEW
6-31
Check position sensors ([POSN] page)
Open the menu and click the [POSN] tab in the [System Sensor Settings] page or [Lo-
cal Sensor Settings] page of the [Sensor] menu. The [Prim] and [Second] labels indi-
cate the type of the position sensor. (In the figure below the [Prim] label shows GPS1.)
[Prim] and [Second] indicate sensor status and priority.
Only one sensor can be primary while the others can be secondary or off position. Af-
ter a sensor is turned off, its status is changed to Secondary state. When a position
sensor state is changed to primary and another sensor was primary, the sensor for-
merly primary becomes secondary.
Select the "Primary" navigation sensor as the sensor that is considered to be most ac-
curate and reliable. Set all other navigation sensors as "Secondary".
6.16.5 How to reset odometer and trip meter
To reset the odometer and/or trip meter do as follows:
1. Open the menu and select the [Voyage] menu from the [NAVI Log] menu in the
[Record] menu.
2. Click one of the following buttons.
[Reset All]: Reset both the odometer and the trip meter.
[Reset Trip]: Reset the trip distance.
3. Click the [Close] button to finish.
Passed
LAT:
LON:
Not Available
LAT:
LON:
Second shows Integrity as
“Not Available” when only one
position-fixing equipment is
connected.
6. CHART OVERVIEW
6-32
This page is intentionally left blank.
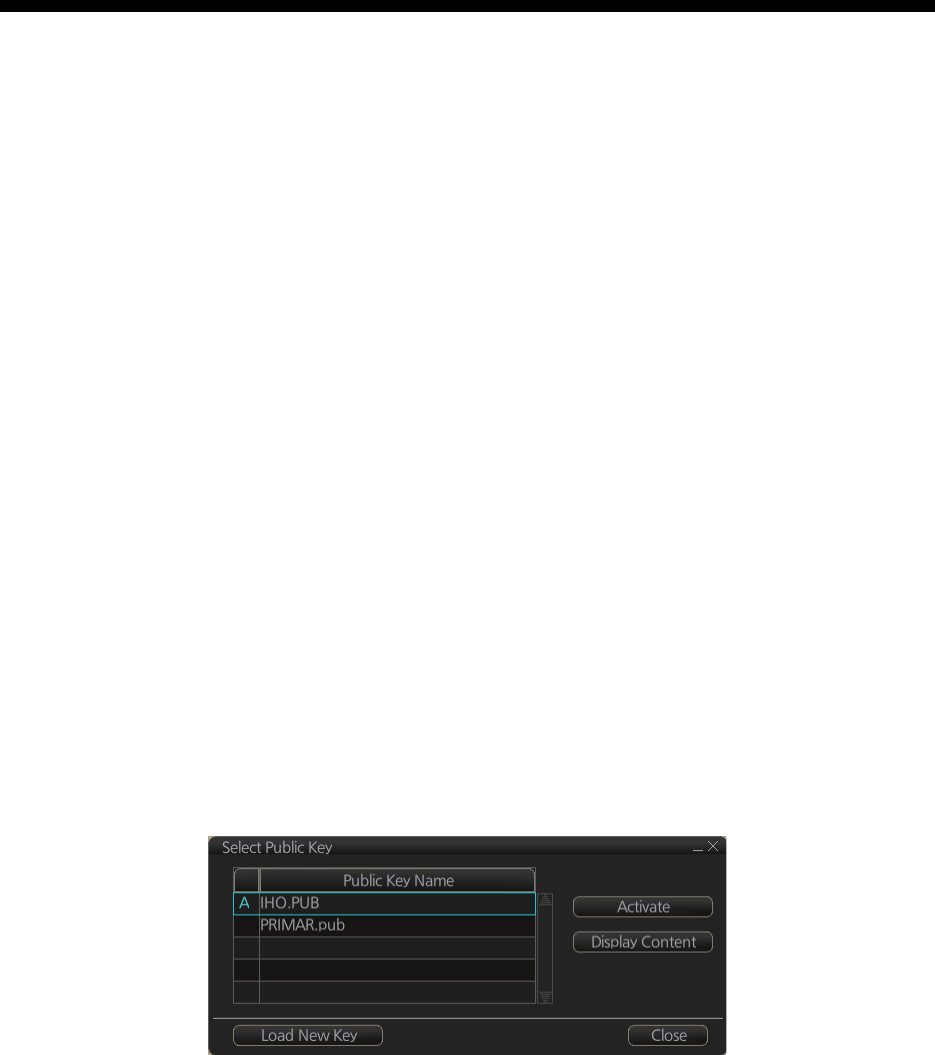
7-1
7. HOW TO MANAGE CHARTS
This chapter mainly shows you how to install the public keys, licenses and charts,
manually update chart objects, and synchronize charts among chart radars. All chart-
related operations begin from the Chart maintenance mode, which you access by
clicking the [CHARTS] button on the Status bar.
Note 1: Charts, routes and user charts are shared with other FMD-3xx0, FCR-2xx9
and FAR-3xx0 units, via LAN. Data is shared automatically; no operation is required.
Note 2: Chart processing (installation, deletion, etc.) may take several minutes de-
pending on the number of charts to be processed.
Note 3: If, when attempting to install charts, nothing appears on the display at the start
of the procedure, reset the power and try again.
7.1 How to Install Public Keys for ENC Charts
Public keys authenticate the source and integrity of the ENC chart materials used in
this chart system. Before you install a new ENC chart, confirm that the corresponding
public key is installed.
Generally, there are two types of public keys:
• IHO (file name: IHO.PUB)
• Primar (file name: PRIMAR.pub)
1. Set the medium (DVD, USB flash memory, etc.) that contains the public key. (The
IHO public key is preinstalled.)
2. Get into the Chart maintenance mode then click the [Public Key] button on the
InstantAccess bar.
3. Click the [Load New Key] button to show the [Open file] dialog box.
4. Find the .pub file then click the [Open] button. The [Select Public Key] dialog box
reappears.
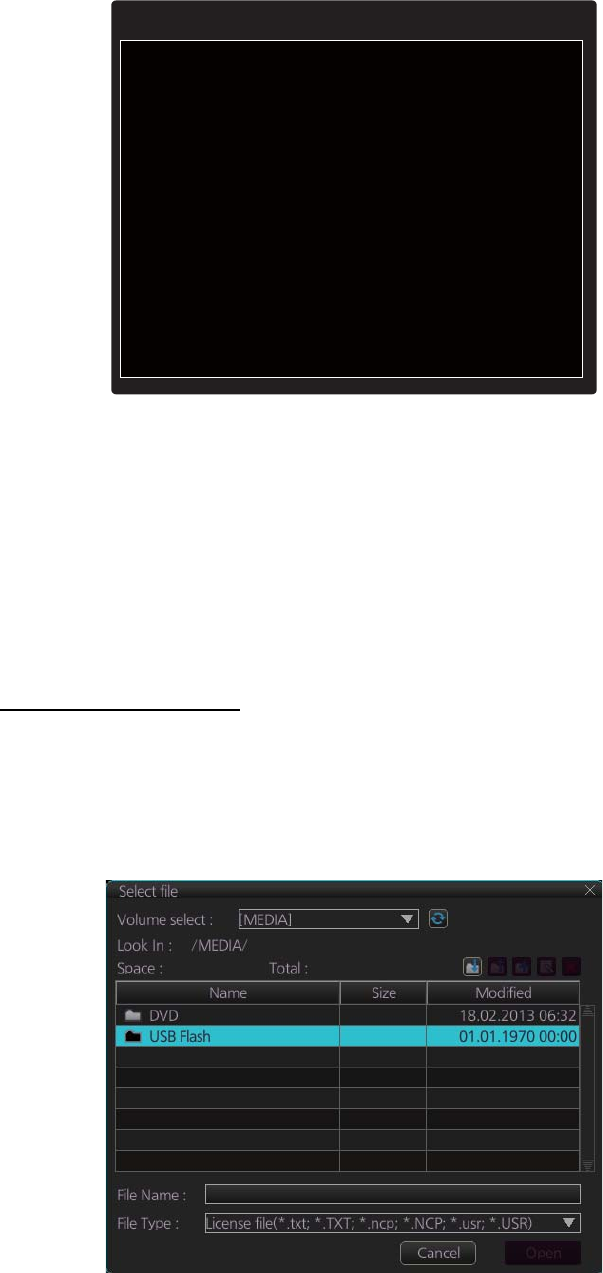
7. HOW TO MANAGE CHARTS
7-2
5. Click the [Display Content] button on the [Select Public Key] dialog box to show
the display contents.
6. To accept the contents, click the [Activate] button on the [Select Public Key] dialog
box.
7.2 How to Install ENC Licenses, Charts
Install your ENC licenses and charts, in that order.
7.2.1 How to install an ENC license
Automatic installation
1. Insert the medium (DVD, USB flash memory, etc.) that contains the ENC license.
2. Get into the Chart maintenance mode then click the [License] button on the
InstantAccess bar to show the [Licenses] dialog box.
3. Click the [Install Licenses] button.
4. Select the medium that contains the license then click the [Open] button.
//BIG p
FCA6 82SE 8E12 CABA 26EF CCF7 110E 526D
B078 B05E DECB CD1E B4A2 08F3 AE16 17AE
01F3 5B91 A47E 6DF6 3413 C5E1 2ED0 8998
CD13 2ACD 50D9 9151 BDC4 3EE7 3579 2E17
//BIG q
FCA6 82SE 8E12 CABA 26EF CCF7 110E 526D
B078 B05E DECB CD1E B4A2 08F3 AE16 17AE
01F3 5B91 A47E 6DF6 3413 C5E1 2ED0 8998
CD13 2ACD 50D9 9151 BDC4 3EE7 3579 2E17
Public Key content
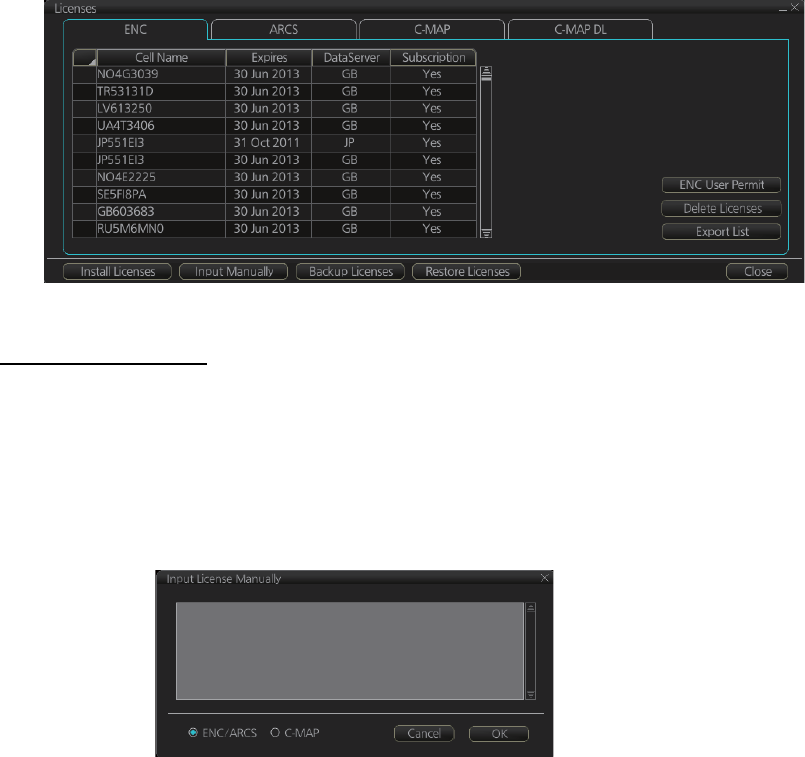
7. HOW TO MANAGE CHARTS
7-3
5. Find the license (permit.txt) then click the [OK] button to install the license.
The [Licenses] dialog box then shows cell name, date of expiration, data server
name and subscription type of the license.
6. Click the [Close] button to finish.
Manual installation
If you do not have the medium which has your ENC license, you can enter the license
number manually.
1. Click the [CHARTS] button on the Status bar to go the Chart maintenance mode,
then click the [License] button on the InstantAccess bar.
2. Click the [Input Manually] button to show the [Input License Manually] box.
3. Select the type [ENC/ARCS] at the bottom of the screen.
4. Enter the license number(s) then click the [OK] button.
7.2.2 How to install ENC charts
When you install charts from a medium, the system first loads a catalog, which stores
certain information into your SSD such as cell IDs, their position, and edition number,
from the install medium. Then, the system asks which charts you want to install from
the chosen medium. After building the catalog, you can view the contents of it by click-
ing the [Cell Status] button on the InstantAccess bar.
Note: Do not click the [Cancel] button during the installation of a chart. If you get an
error message, try to install the charts again.
1. Set the medium that contains the ENC charts.
2. Get into the Chart maintenance mode then click the [AUTO Load] button on the
InstantAccess bar. The confirmation message "Attention: This process takes time
to complete, and the operation speed of the system will decline. Do you wish to
continue?" appears. Click the [OK] button to continue. A message informs you that
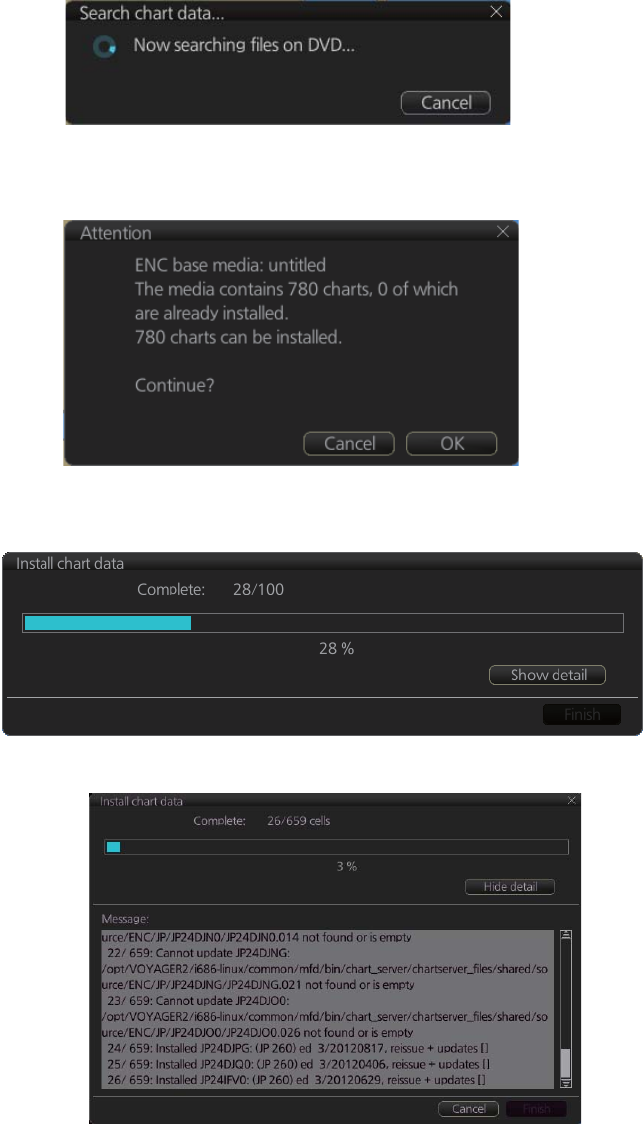
7. HOW TO MANAGE CHARTS
7-4
the system is searching the medium (in the figure below the medium is a DVD) for
chart data.
The results of the search are displayed, an example of which is shown below. To
cancel the installation, click the [Cancel] button.
3. Click the [OK] button to install the charts. The [Install chart data] window appears
and shows the percentage of completion, with digital and analog indications.
To show details during the installation, click the [Show detail] button.
To close the [Message] window, click the [Hide detail] button.
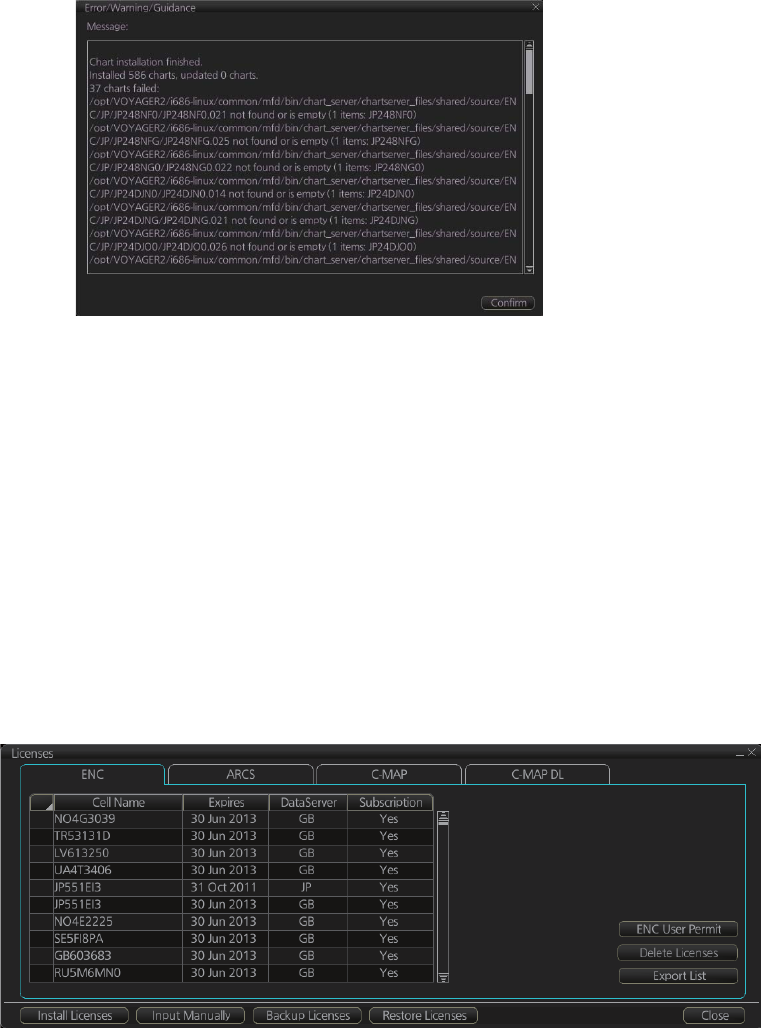
7. HOW TO MANAGE CHARTS
7-5
4. When the installation is completed, information about the installation appears in
the [Error/Warning/Guidance] window. Click the [Confirm] button to finish.
5. If applicable, set the next sequential medium then repeat steps 2-4 to install the
next database.
Note 1: When many charts are installed, the chart system checks for error in the in-
stalled chart data at the next power up. This is not an indication of malfunction.
Note 2: Previous versions of charts cannot be displayed if installed after installing the
latest versions.
7.3 How to Delete ENC Licenses
1. Get into the Chart maintenance mode.
2. Click the [License] button on the InstantAccess bar.
3. Click the [ENC] tab as appropriate to show a list of licenses.
4. Put a checkmark next to the license(s) to delete.
5. Click the [Delete Licenses] button to delete the license(s) selected.
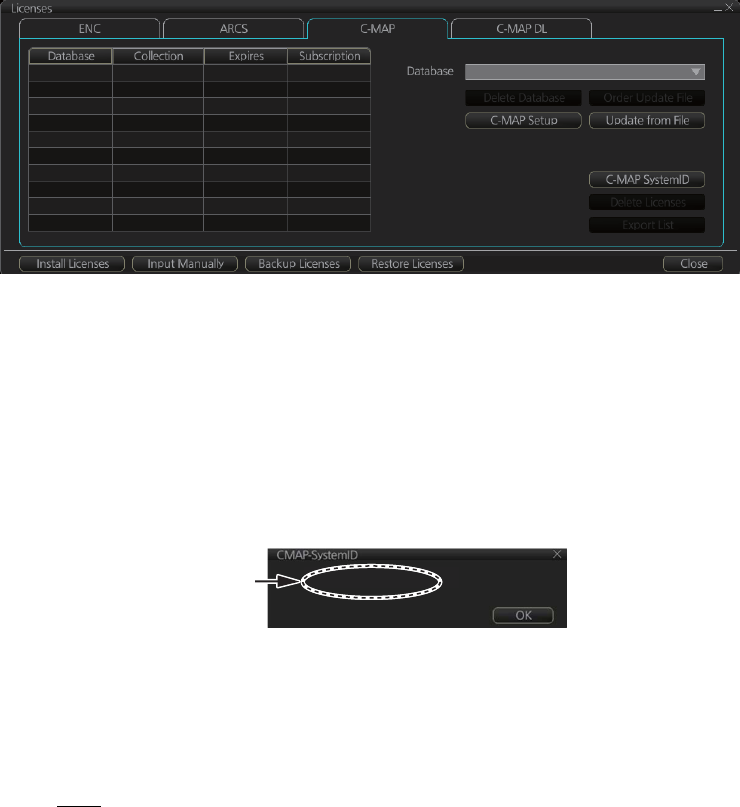
7. HOW TO MANAGE CHARTS
7-6
7.4 How to Install C-MAP Charts
Synchronize chart data before you install C-MAP charts, grouping the chart radar units
to synchronize, otherwise the chart data cannot be shared. See the procedure in
paragraph 7.20.1 for how to synchronize chart data. If C-MAP charts are not synchro-
nized after installation, delete all C-MAP charts, and do the above procedure again.
7.4.1 How to register the eToken
The eToken is a hardware mechanism (installed inside the processor unit) used for
password authentication. Registration of the eToken is required only once, before you
install the C-MAP database.
1. Get into the Chart maintenance mode then click the [License] button on the
InstantAccess bar to show the [License] dialog box.
2. Click the [C-MAP] tab to the show the [Licenses] dialog box for C-MAP.
3. Click the [C-MAP Setup] button.
4. The confirmation message "Attention: C-MAP eToken will be initialized. Do you
wish to continue?" appears. Click the [OK] button to continue and register the eTo-
ken.
Note 1: "CMAP: No connection to eToken" disappears from the Permanent warning
box after completion of the registration.
Note 2: You can show your C-MAP system ID by clicking the [C-MAP SystemID] but-
ton on the [Licenses] dialog box for C-MAP.
7.4.2 How to install the C-MAP database
When you install the C-MAP database from a medium, all data is saved to the SSD.
Note 1: If several chart radar units are installed, synchronize C-MAP charts among
the units after you have installed the database.
Note 2: The installation of a chart cannot be cancelled while it is in progress. If you get
an error message, try to install the charts again.
Note 3: Disable the Chart Alert function at the [CheckArea] page of the [Overlay/NAV
Tools] box (see section 11.2) before removing any C-MAP charts.
Note 4: The C-MAP database in the units selected for synchronization are synchro-
nized at the successful completion of the database installation.
C-MAP system ID
appears here.
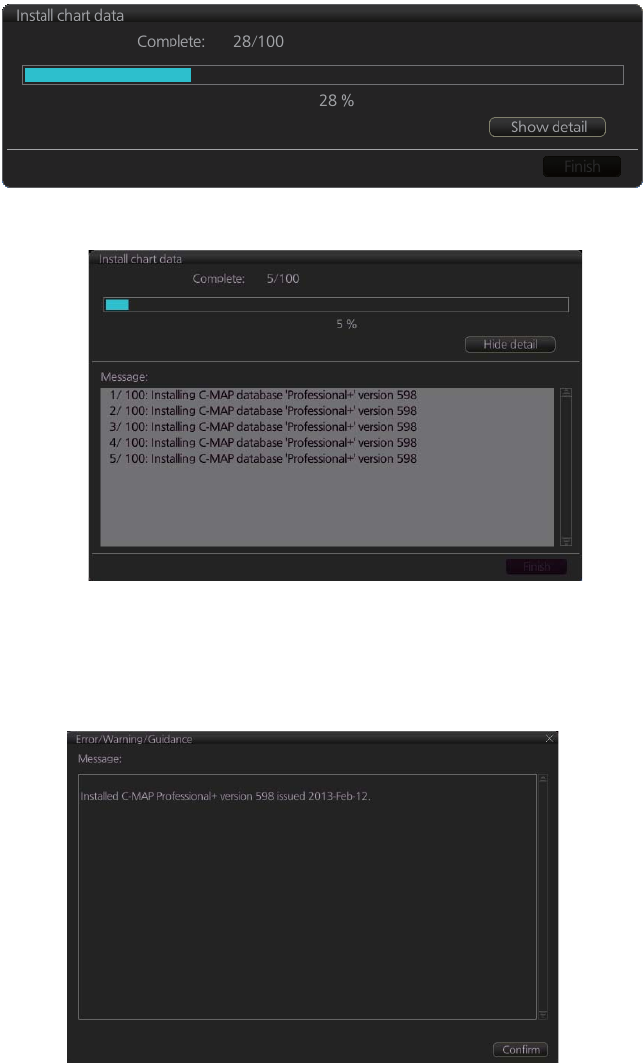
7. HOW TO MANAGE CHARTS
7-7
1. Insert the medium that contains the C-MAP database.
2. Get into the Chart maintenance mode then click the [AUTO Load] button on the
InstantAccess bar.
3. The [Install chart data] window appears and shows the percentage of completion,
with digital and analog indications.
To show details during the installation, click the [Show detail] button.
To close the [Message] window, click the [Hide detail] button.
4. When the installation is completed, information about the chart database installed
appears in the [Error/Warning/Guidance] window. Click the [Confirm] button to fin-
ish.
5. If applicable, set the next sequential medium and repeat steps 2-3 to install the
next databases.
Note 1: If, after installation, C-MAP Pro+ charts do not appear, delete all correspond-
ing charts and then reinstall them.
Note 2: Synchronization is not done for charts which could not be installed success-
fully. Reinstall failed charts.
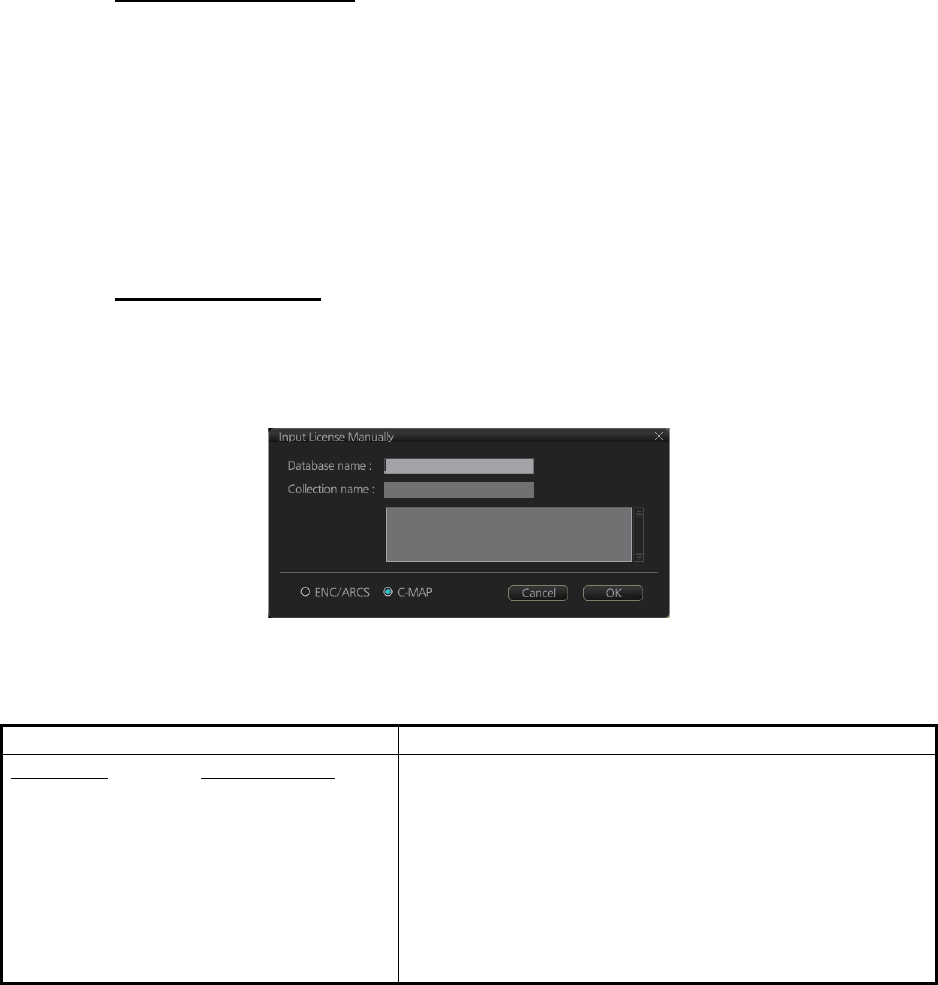
7. HOW TO MANAGE CHARTS
7-8
7.4.3 How to install C-MAP licenses
A C-MAP license can be installed automatically or manually.
Automatic installation
1. Set the medium (DVD, USB flash memory, etc.) that contains the C-MAP license.
2. Get into the Chart maintenance mode then click the [License] button on the
InstantAccess bar.
3. Click the [Install Licenses] button.
4. Select the medium that contains the license then click the [Open] button.
5. Click the [OK] button to install the license.
6. Click the [Close] button to finish.
Manual installation
1. Click the [CHARTS] button on the Status bar to go the Chart maintenance mode,
then click the [License] button on the InstantAccess bar.
2. Click the [Input Manually] button to show the [Input License Manually] box.
3. Select the type [C-MAP] at the bottom of the window.
4. Enter the [Database name] and [Collection name] information as shown in the ta-
ble below. Enter the names exactly as shown to ensure correct installation.
5. Enter the license (max. 16 characters) in the bottommost window.
6. Click the [OK] button to install the license.
7. Click the [Close] button to finish.
Database name Collection name
Chart type Name to enter
Professional: World
Professional+: Professional+
CM-ENC: ENC
JeppesenPRIMAR: JeppesenPRIMAR
Enter the contracted zone number according to chart
type as follows:
Professional/Professional+: Enter "Zone *"
(without quotations)
Ex. Zone 0
CM-ENC/JeppesenPRIMAR: Enter "Zone * ENC"
(without quotations)
Ex. Zone 0 ENC
* = Zone no.
7. HOW TO MANAGE CHARTS
7-9
7.4.4 How to generate and order an update file
To update the C-MAP chart database, you have to generate an update file, and e-mail
the file directly to C-MAP. The update file defines coverage of charts you can display
on your chart system.
1. Connect a USB flash memory to the USB port on the Control Unit.
2. Get into the Chart maintenance mode then click the [License] button on the
InstantAccess bar.
3. Click the [C-MAP] tab to show the [Licenses] dialog box for C-MAP.
4. Click the [Order Update File] button. A file name (C-MAP system ID and chart
type) is automatically created, with the extension .ord.
5. Select the USB flash memory.
6. Click the [Save] button to save the order file to the USB flash memory.
7. Send the order file to updates@c-map.no.
Within a few minutes you will receive a file that includes the terms for using the chart
service and the chart updates. Save the file to a USB flash memory and apply it as
shown in the next section.
7.4.5 How to apply the update file
1. Insert the USB flash memory that contains the update file (.ans extension) into the
USB port on the Control Unit.
2. Get into the Chart maintenance mode then click the [License] button on the
InstantAccess bar.
3. Click the [C-MAP] tab to show the [Licenses] dialog box for C-MAP.
4. Click the [Update from File] button.
5. Find the update file on the USB flash memory then click the [Open] button.
7.5 How to Delete a C-MAP Database
1. Get into the Chart maintenance mode then click the [License] button on the
InstantAccess bar.
2. Click the [C-MAP] tab to show the [Licenses] dialog box for C-MAP.
3. Select the database to delete with the [Database] pull-down list.
4. Click the [Delete Database] button.
7. HOW TO MANAGE CHARTS
7-10
7.6 How to Install C-MAP DL (Dynamic Licensing)
Charts
Register the eToken if it has not already been registered. See section 7.4.1.
7.6.1 How to generate and order an update file
To update the C-MAP chart database, you have to create an update file and e-mail the
file directly to C-MAP. The update file defines coverage of charts you can display on
your chart system.
1. Insert a USB flash memory to the USB port on the Control Unit.
2. Get into the Chart maintenance mode then click the [License] button on the
InstantAccess bar.
3. Click the [C-MAP] tab to show the [Licenses] dialog box for C-MAP.
4. Click the [Order Update File] button. A file name (C-MAP system ID and chart
type) is automatically created, with the extension .ord.
5. Select the USB flash memory.
6. Click the [Save] button to save the order file to the USB flash memory.
7. Send the order file to updates@c-map.no.
Within a few minutes you will receive a file that includes the terms for using the chart
service and the chart updates. Save the file to a USB flash memory and apply it as
shown in the next section.
7.6.2 How to apply the update file
1. Insert the USB flash memory that contains the update file (.ans extension) into the
USB port on the Control Unit.
2. Get into the Chart maintenance mode then click the [License] button on the
InstantAccess bar.
3. Click the [C-MAP] tab to show the [Licenses] dialog box for C-MAP.
4. Click the [Update from File] button.
5. Find the update file on the USB flash memory then click the [Open] button.
Note: If the .ans file does not update the status of all shared C-MAP DL charts, reset
the power of all processor units.
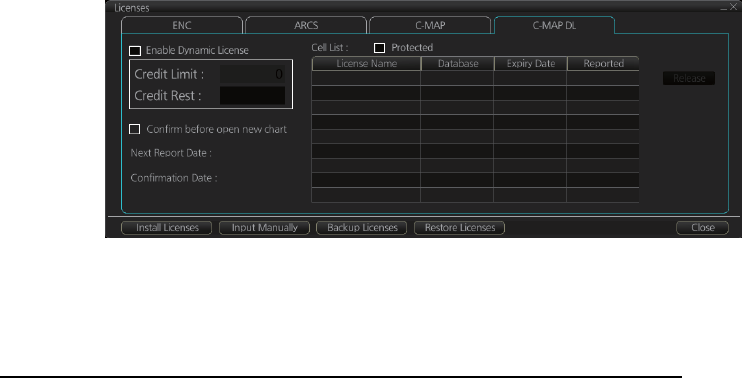
7. HOW TO MANAGE CHARTS
7-11
7.6.3 How to enable and set up the C-MAP DL
1. Get into the Chart maintenance mode then click the [License] button on the
InstantAccess bar.
2. Click the [C-MAP DL] tab to show the [Licenses] dialog box for C-MAP DL.
3. Check [Enable Dynamic License] to enable the dynamic licensing.
You now have access to all the charts contained within the selected subscription
zones - both already licensed charts and new charts.
Settings, indications on the Licenses dialog box for C-MAP DL
• Set your annual credit limit with [Credit Limit]. A permanent warning is given if your
credit goes below this value. A new chart cannot be enabled if it causes the credit
to go below this value.
• [Credit Rest] shows the amount of credit remaining and is updated each time you
receive a confirmation answer for your request via e-mail.
• [Next Report Date] is the date when the next report should be sent to Jeppesen. If
charts are not reported before the mandatory report date, access to all non-reported
charts is discontinued and can be resumed only after the confirmation answer al-
lowing use of the charts is received via e-mail.
• [Confirmation Date] is the date when you receive the confirmation answer for your
request via e-mail.
• [Confirm before open new chart], if checked, a confirmation window asks for confir-
mation before opening charts that require issuing a new license. A chart denied is
added to the list of protected charts, so the confirmation request will not be repeated
for that chart. Those charts cannot be opened until they are removed from the list
of protected charts.
• [Protected], if checked, shows the protected charts in the cell list. To remove a chart
from protection, select it then click the [Release] button. Then, when an attempt is
made to open that chart, the confirmation window appears. Note that multiple con-
firmation windows open when releasing multiple charts from protection.
7.7 How to Export a List of Charts
Get into the Chart maintenance mode, click the [Manage Charts] button on the
InstantAccess bar to show the [Manage Charts] dialog box. Check the charts to add
to the list. Click the [Export List] button to export the checked charts to a USB flash
memory, in .txt format.
C1210011 ENC 01 Jun 2012 Unissued
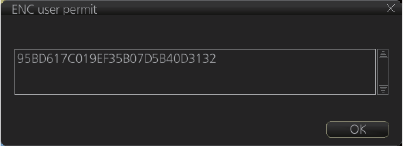
7. HOW TO MANAGE CHARTS
7-12
7.8 How to Export a List of Specific Licenses
You can export a list of your ENC or C-MAP (excluding C-MAP DL) licenses to a USB
flash memory, in .txt format.
1. Set a USB flash memory in the USB port on the Control Unit.
2. Get into the Chart maintenance mode then click the [License] button.
3. Click the [ENC] or [C-MAP] tab.
4. Click the [Export List] button.
5. Change the file name at [File Name] if desired.
6. Select the USB flash memory then click the [Save] button.
7. Click the [OK] button to finish.
7.9 How to Show the ENC Permit
1. Get into the Chart maintenance mode then click the [License] button.
2. Click the [ENC] tab.
3. Click the [ENC User Permit] button to show the ENC permit.
4. Click the [OK] button to finish.
7.10 How to Backup, Restore Licenses
You can make backup copies of your ENC and AVCS (AIO) licenses and save them
to a USB flash memory. If re-installation of the licenses becomes necessary, you can
re-install them from the USB flash memory. The backup and restore functions are not
available with C-MAP charts.
To backup licenses:
1. Insert a USB flash memory into the USB port on the Control Unit.
2. Get into the Chart maintenance mode, then click the [License] button on the
InstantAccess bar to show the [Licenses] dialog box.
3. Click the [Backup Licenses] button.
4. Select the USB flash memory then click the [OK] button to save the licenses.
To restore licenses:
1. Insert the USB flash memory that has the licenses into the USB port on the Control
Unit.
2. Get into the Chart maintenance mode, then click the [License] button on the
InstantAccess bar to show the [Licenses] dialog box.
3. Click the [Restore Licenses] button.
4. Select the licenses from the USB flash memory then click the [OK] button.
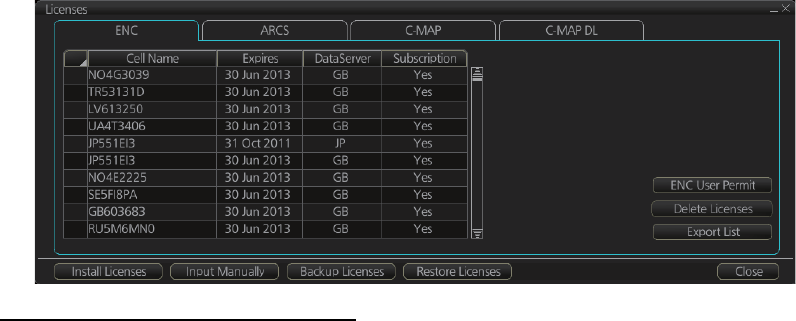
7. HOW TO MANAGE CHARTS
7-13
7.11 How to View Permit Expiration Date
Permits are used to control the right to use chart data in this chart system. A permit is
connected to the edition of a chart. Permits are issued in two different types:
• Subscription permit: This type of permit includes updates for subsequent 3, 6, 9
or 12 months.
• One-Off permit: This type of permit includes only updates up to the issue date of
the permit.
The expiry date of a permit controls the installation of Base charts and their updates
to the chart. The system will warn you when you are installing charts or updates that
are issued less than 30 days before the expiration date of a permit. If a permit has ex-
pired, it is impossible to install a chart or its update that was issued after the expiration
date of the permit. The user has a right to view a chart forever, except C-MAP charts
that have viewing periods which end two months after the expiry date of the license.
If the charts are not updated regularly it will not complete the requirements for having
up-to-date charts. To view the permit status of a chart, click the [License] button on the
InstantAccess bar and then click the applicable "chart" tab ([ENC], [C-MAP] or [C-MAP
DL]).
The example below shows the status of ENC charts. The expiration date of each cell
appears in the [Expires] window.
Subscription warnings for RENC
If you have at least one subscription-type permit, the system will automatically warn
you about the expiration date of your subscription license, in the Permanent warning
box.
Note: If you change service provider for some reason, it is recommended that you
remove all the charts from this chart system before installing new charts of new ser-
vice provider.
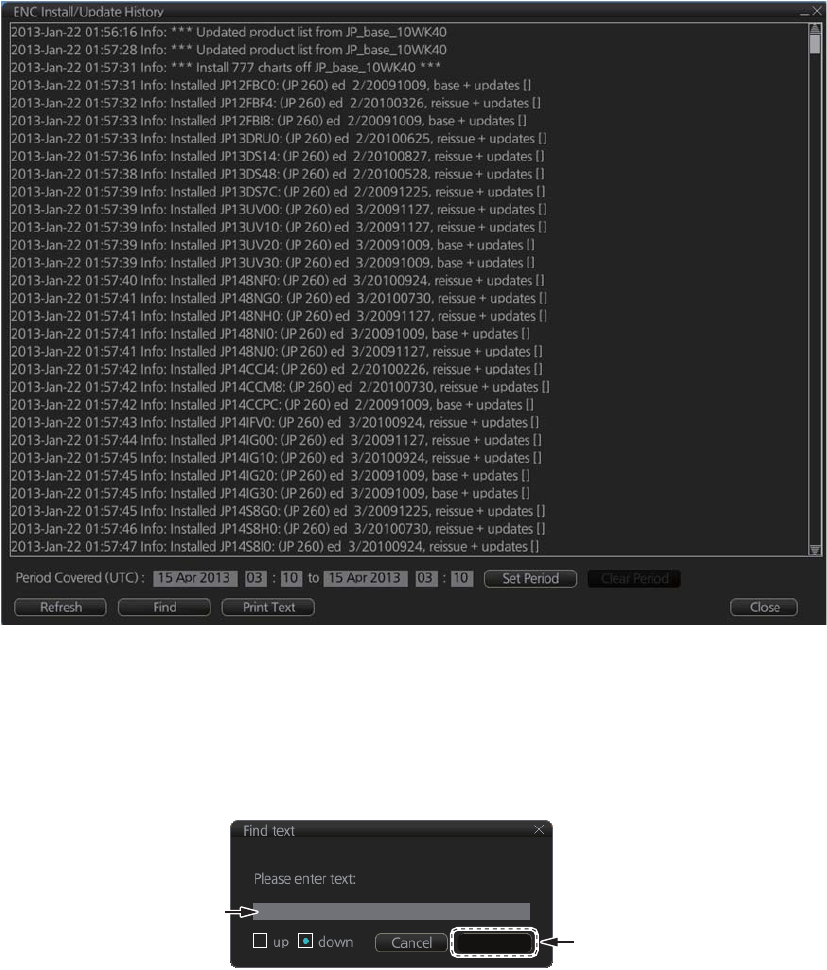
7. HOW TO MANAGE CHARTS
7-14
7.12 How to Display Install/Update History
You can see a history of chart installations and updates. On the InstantAccess bar,
click the [Record] and [Chart Log] buttons followed by the [ENC] or [C-MAP] button.
The example below shows the install/update history for ENC charts.
You can filter the log with [Period Covered (UTC)]. Enter the period to display then
click the [Set Period] button. Click the [Clear Period] button to display all entries. The
[Refresh] button updates the list. [Print Text] prints hard copy of the history.
The [Find] button searches required text string as follows:
1. Click the [Find] button to show the [Find text] box.
2. Click the input box then enter the text to search.
3. Select the search direction with the [up] or [down] radio button.
4. Click the [Find] button. The first matching text is highlighted in yellow at the top of
the screen.
5. To continue the search click the [Find] button. To cancel the search, click the
[Cancel] button.
Find
Input box
Enter text in box and
[Find] button appears.
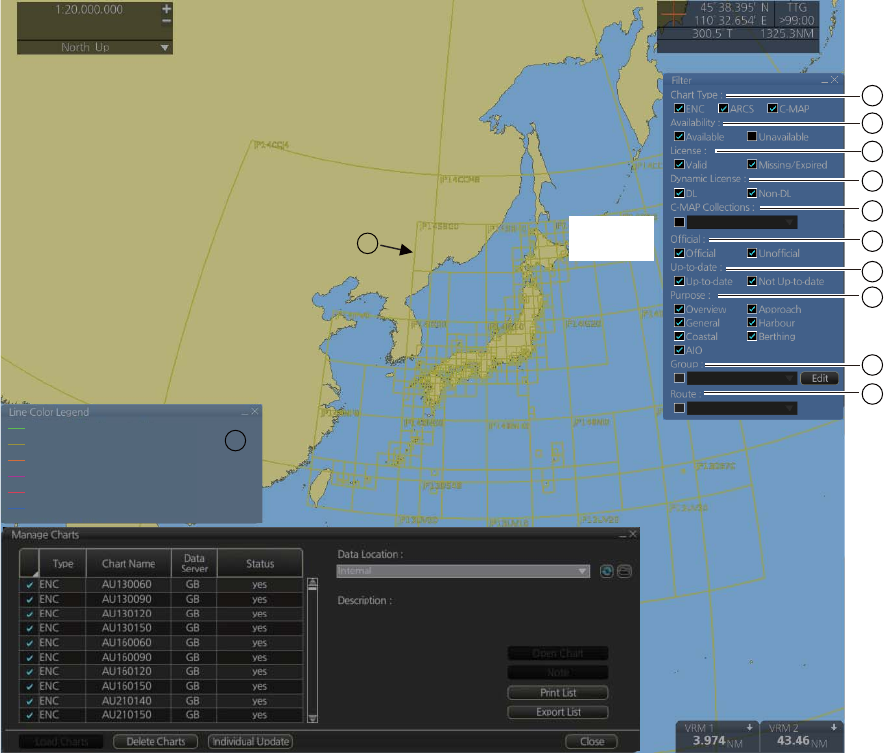
7. HOW TO MANAGE CHARTS
7-15
7.13 Catalog of Chart Cells
A catalog is used to view graphical coverage of the charts stored in your SSD, avail-
able in a named "medium". Available charts are displayed using their limits of charts.
Note that sometimes the real coverage of the charts may be considerably less than
the declared limits of it.
To display the catalog, get into the Chart maintenance mode then click the [Manage
Charts] button on the InstantAccess bar. The [Filter] window lets you select what to
display. Check or uncheck items as appropriate.
1) [Chart Type]
[ENC]: Display ENC charts.
[ARCS]: Display ARCS charts (no use).
[C-MAP]: Display C-MAP charts.
2) [Availability]
Display available or unavailable charts.
3) [License]
[Valid]: Cell with valid license.
[Missing/Expired]: Cell with missing or expired license.
[Valid] + [Missing/Expired]: Display cell regardless of license.
Uncheck both: Hide all cells.
4) [Dynamic License]
Display DL or non-DL C-MAP charts.
[Filter]
window
yes
yes
yes
yes
yes
yes
yes
yes
yes
yes
Not up-to-date
1
2
3
4
5
6
7
8
9
10
11
12
License ok, chart is up-to-date
DL issued, not reported
License ok, chart is not up-to-date
License available, chart not installed
Not available or expired
Canceled chart
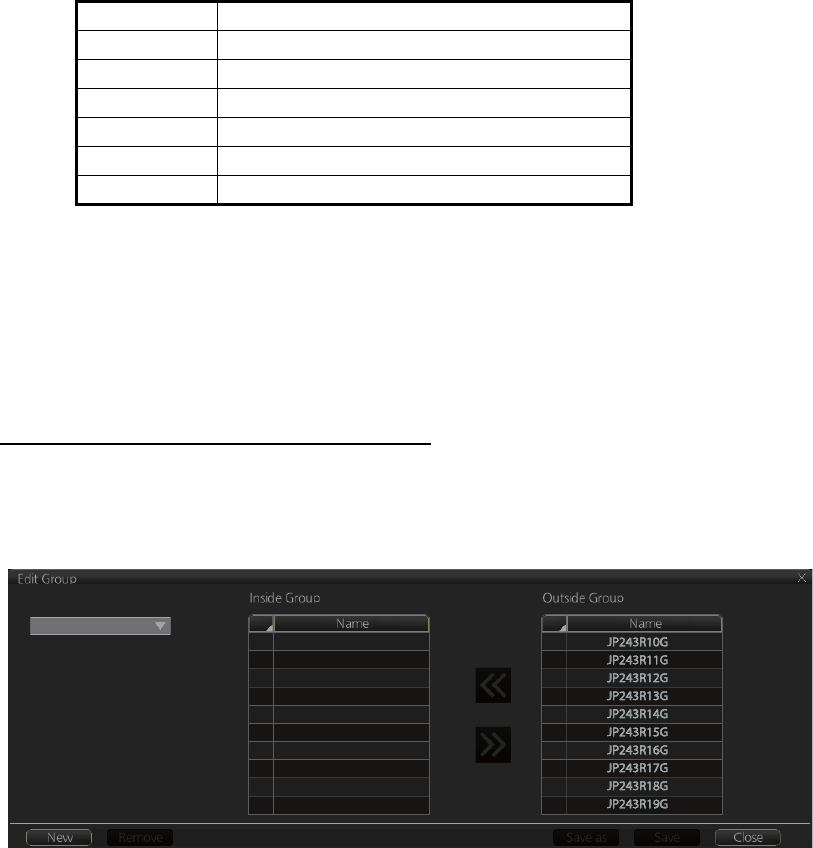
7. HOW TO MANAGE CHARTS
7-16
5) [C-MAP Collections]
A collection is a pre-defined dataset, the contents of which can be defined by zone,
individual chart or any of those combinations. Applicable to C-MAP charts also.
6) [Official]
Display official or unofficial charts.
7) [Up-to-date]
Display charts which are or are not up to date.
8) [Purpose]
Display chart according to its purpose - [Overview], [General], [Coastal], [AIO],
[Approach], [Harbour], [Berthing].
9) [Group]
See the next section for how to group charts.
10)[Route]
Show or hide chart area with route.
11)Chart boundary boxes
Define the area covered by a chart and are color-coded according license and per-
mit status.
12) [Line Color Legend]
The line color legend provides information about license validity.
7.13.1 How to group chart cells
You can define groups of like-format chart cells. This means you can collect related
charts, for example, all cells that cover a route from Liverpool to New York or all cells
available from a National Hydrographic Office.
You can make a group and define charts from the [Edit Group] dialog box.
How to make a new group of chart cells
1. In the Chart maintenance mode, click the [Manage Charts] button on the
InstantAccess bar.
2. Click the [Edit] button in the [Filter] window to show the [Edit Group] dialog box.
Color Message
Green License ok, chart is up-to-date
Yellow DL issued, not reported
Orange License ok, chart is not up-to-date
Magenta License available, chart not installed
Red Not available or expired
Blue Canceled chart
Group Name:

7. HOW TO MANAGE CHARTS
7-17
3. Click the [New] button.
4. In the [Outside Group] window, click the box to the left of the chart cell you want
to add to the group to show a checkmark. (A context-sensitive menu with [Select
All] and [Deselect All] functions is available by right-clicking the box to the left of
[Name], in either window.)
5. After you have selected the cells to add to the group, click the [<<] button to move
the names of the selected cells to the [Inside Group] window. If you want to re-
move a chart from the group, select it then click the [>>] button.
6. Click the [Save] button.
7. Enter a name for the group, using the keyboard on the Control Unit or software
keyboard, then click the [OK] button.
8. Click the [Close] button to finish.
How to edit a group of chart cells
You can edit a group of chart cells from a group as follows:
1. In the Chart maintenance mode, click the [Manage Charts] button on the
InstantAccess bar to show the [Filter] window.
2. Click the [Edit] button.
3. Select the name of the group with the pull-down list at the item [Group Name].
4. In the [Inside Group] window, click the box to the left of the chart cell you want to
remove from the group to show a checkmark. (A context-sensitive menu with [Se-
lect All] and [Deselect All] functions is available by right-clicking the box to the left
of [Name].)
5. After you have selected the charts to remove to the group, click the [>>] button to
remove the selected charts cells from the group.
6. Click the [Save] button.
7. Click the [Close] button to finish.
How to delete a group of chart cells
You can delete group of chart cells as follows:
1. In the Chart maintenance mode, click the [Manage Charts] button on the
InstantAccess bar to show the [Filter] window.
2. Click the [Edit] button.
3. Select the name of the group with the pull-down list at the item [Group Name].
4. Click the [Remove] button.
5. Click the [OK] button.
6. Click the [Close] button to finish.
How to select the group to view
1. In the Chart maintenance mode, click the [Manage Charts] button on the
InstantAccess bar to show the [Filter] window.
2. Select the group to view from the pull-down list at [Group].
3. Click the [Close] button to finish.
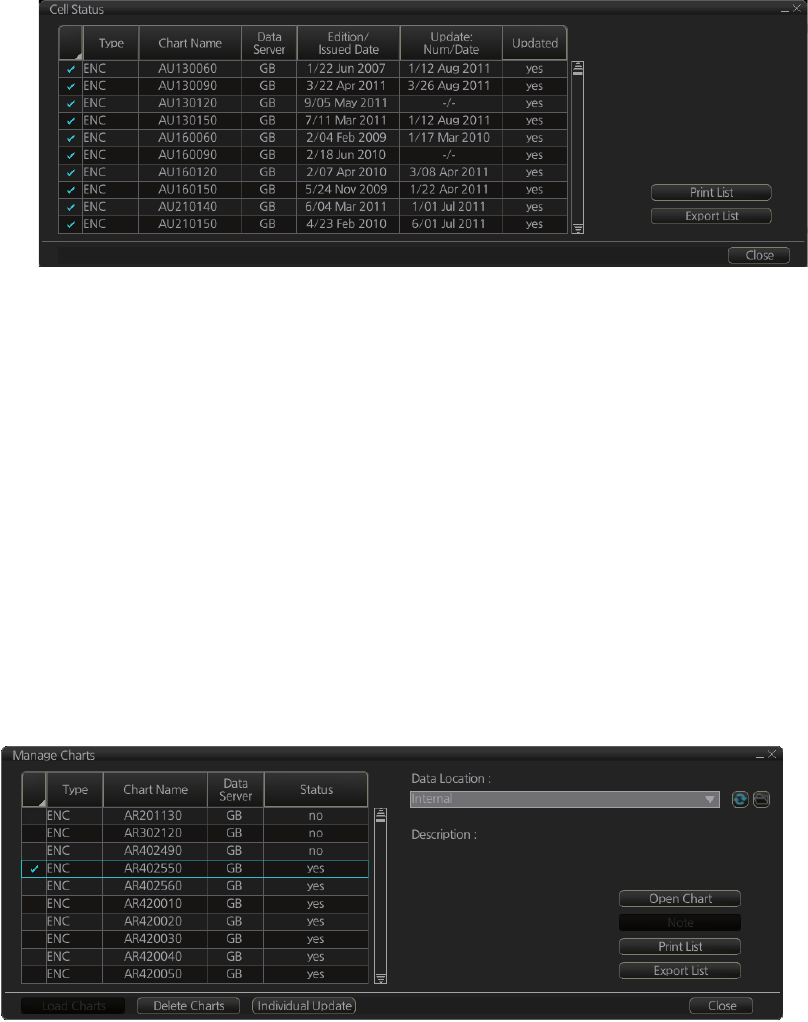
7. HOW TO MANAGE CHARTS
7-18
7.13.2 How to view status of chart cells
The [Cell Status] dialog box shows the status of the chart cells stored in the system.
To show this dialog box, get into the Chart maintenance mode then click the [Cell Sta-
tus] button on the InstantAccess bar.
• [Type]: Type of chart cell, ENC or C-MAP.
• [Chart Name]: Chart name
• [Data Server]: The name of the data server where the chart was downloaded from.
• [Edition/Issued Date]: Edition no. and issued date of the chart cell.
• [Update: Num/Date]: No. and date of the update of the chart cell.
• [Updated]: [yes] is shown if the cell is up-to-date, [no] if the cell is not up-to-date,
[maybe] means the cell has not been updated from more than one month.
7.14 How to Open Charts
In the Chart maintenance mode, click the [Manage Charts] button on the
InstantAccess bar to display the dialog box shown below. Select the chart to open then
click the [Open Chart] button.
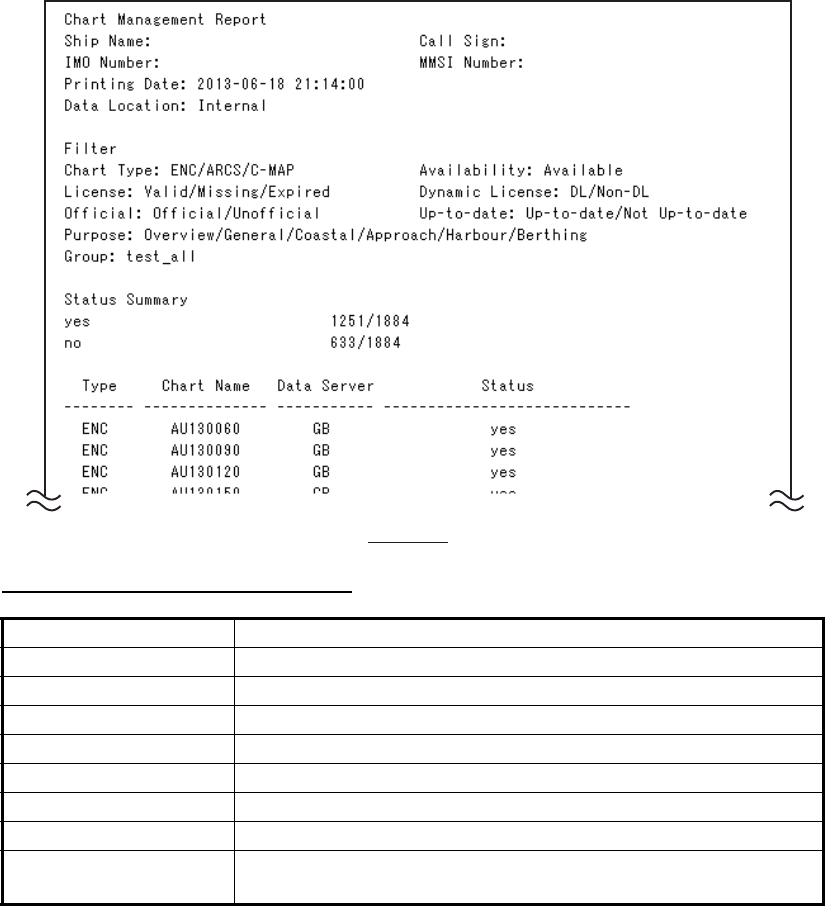
7. HOW TO MANAGE CHARTS
7-19
7.15 How to Print Chart List, Cell Status List
7.15.1 How to print the chart list
1. In the Chart maintenance mode, click the [Manage Charts] button on the
InstantAccess bar to show the [Manage Charts] dialog box.
2. Check the charts to print.
3. On the [Filter] window, check the information to print.
4. Click the [Print List] button to print. (If you have selected more than 30 charts, the
message "The number of page is 1. Do you want to continue?." appears. Click the
[OK] button to continue, or the [Cancel] button to escape.)
Description of chart list printout
Item Description
[Ship Name] Name of ship
[IMO Number] Ship’s IMO number
[Call Sign] Ship’s call sign
[MMSI Number] Ship’s MMSI number
[Printing Date] Date list printed
[Data Location] Location of charts; normally [Internal].
[Filter] Settings of the items in the [Filter] window.
[Status Summary] [yes]: charts with yes status/total number of charts
[no]: charts with no status/total number of charts
Example
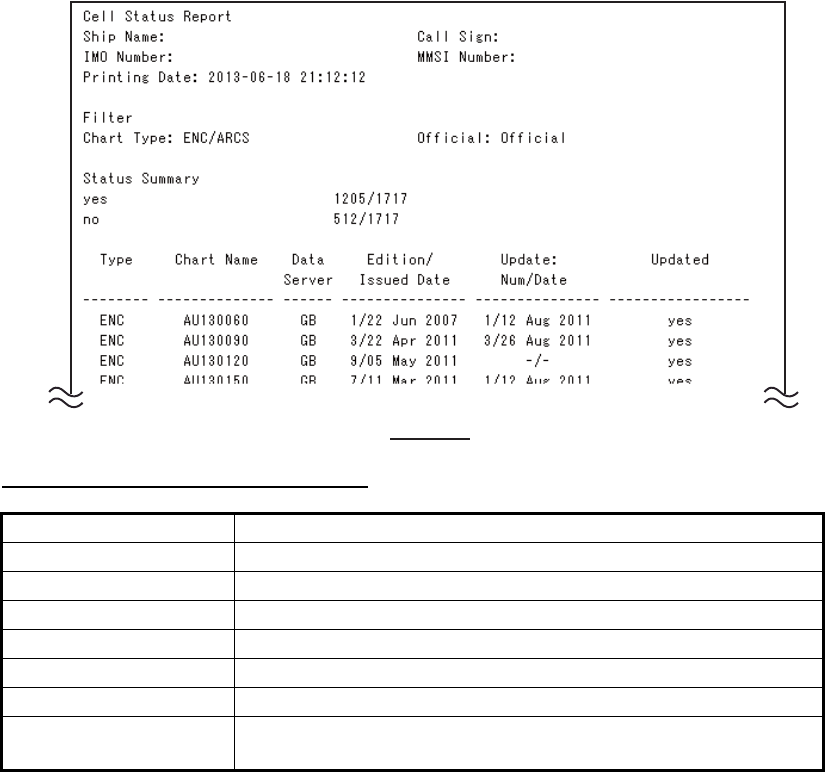
7. HOW TO MANAGE CHARTS
7-20
7.15.2 How to print the cell status list
1. In the Chart maintenance mode, click the [Cell Status] button on the
InstantAccess bar to show the [Cell Status] dialog box.
2. Check the charts to print.
3. On the [Filter] window, check the information to print.
4. Click the [Print List] button to print. (If you have selected more than 30 charts, the
message "The number of page is 1. Do you want to continue?." appears. Click the
[OK] button to continue, or the [Cancel] button to escape.)
Description of cell status printout
7.16 How to Delete Charts
1. Click the [Manage Charts] button to show the [Manage Charts] dialog box.
2. Click the block to the left of the chart to remove to show a checkmark. A context-
sensitive menu with [Select All] and [Deselect All] functions is available by right-
clicking the block to the left of [Type].
3. Click the [Delete Charts] button to delete the charts selected.
4. Click the [Close] button to finish.
Item Description
[Ship Name] Name of ship
[IMO Number] Ship’s IMO number
[Call Sign] Ship’s call sign
[MMSI Number] Ship’s MMSI number
[Printing Date] Date list printed
[Filter] Settings of the items in the [Filter] window.
[Status Summary] [yes]: charts with yes status/total number of charts
[no]: charts with no status/total number of charts
Example
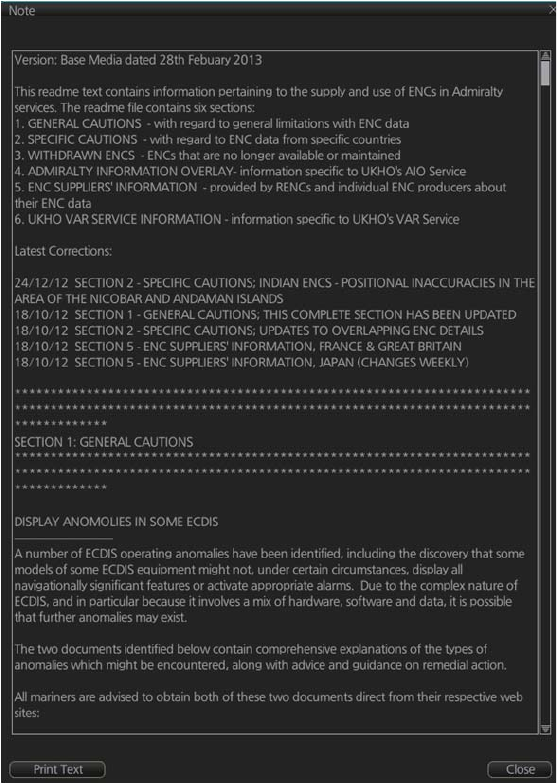
7. HOW TO MANAGE CHARTS
7-21
7.17 How to Show Publishers Notes for ENC Charts
You should read the text file associated with each catalog, which you can view when
installing a chart from a medium. Click the [Note] button in the [Manage Charts] dialog
box. You can print a hard copy with the [Print Text] button.
7. HOW TO MANAGE CHARTS
7-22
7.18 How to Find the Chart Type
The electronic chart system can display more than one ENC chart cell at a time. This
feature is called multi-cell display. If one ENC chart cell does not cover the whole dis-
play, the system opens more ENC chart cells for display, if appropriate cells for the
displayed area are available. The Own ship functions box shows information about
ENC chart cells displayed on the electronic chart display area. When automatic TM
reset is active, the information is displayed with reference to your ship's position. If TM
reset is OFF, the information is displayed with reference to current cursor position.
7.19 How to Update ENC, C-MAP Charts Manually
Manual update may include deleting an already existing object, modifying a position
or other characteristics of an already existing object or inserting of a new object. In this
system, manual updates are stored in a common database.
Mariners cannot permanently remove any of the official objects from the chart display.
If a mariner needs to make obsolete any of the official objects, he “deletes” them.
Then, in practice, the deleted objects are still visible, but a diagonal line on the object
indicates it is a deleted object.
However, a mariner can remove objects that he has inserted himself.
Note that the manual updates have no automatic connection to any automatic update
received later for charts. If a manual update itself became obsolete, because the offi-
cial chart has been updated to include the update defined as a manual update, the
mariner must himself delete the obsolete manual update in question.
The system records complete usage of manual updates. All deletions, modifications
and insertions are recorded and time stamped. If the mariner wishes to see what kind
of manual updates he had in the past, for example, two weeks ago, he uses Update
History to specify the relevant date range. For information on how to set Display date
and Approved until dates, see paragraph 9.2.3.
Chart type indication
No indication (Official ENC chart)
“Non-ENC data” (Unofficial ENC chart, indication in yellow)
“ENC data available” (Currently, RNC chart is in use, but
ENC material is available. Indication shown in yellow.)
ENC info
appears here.
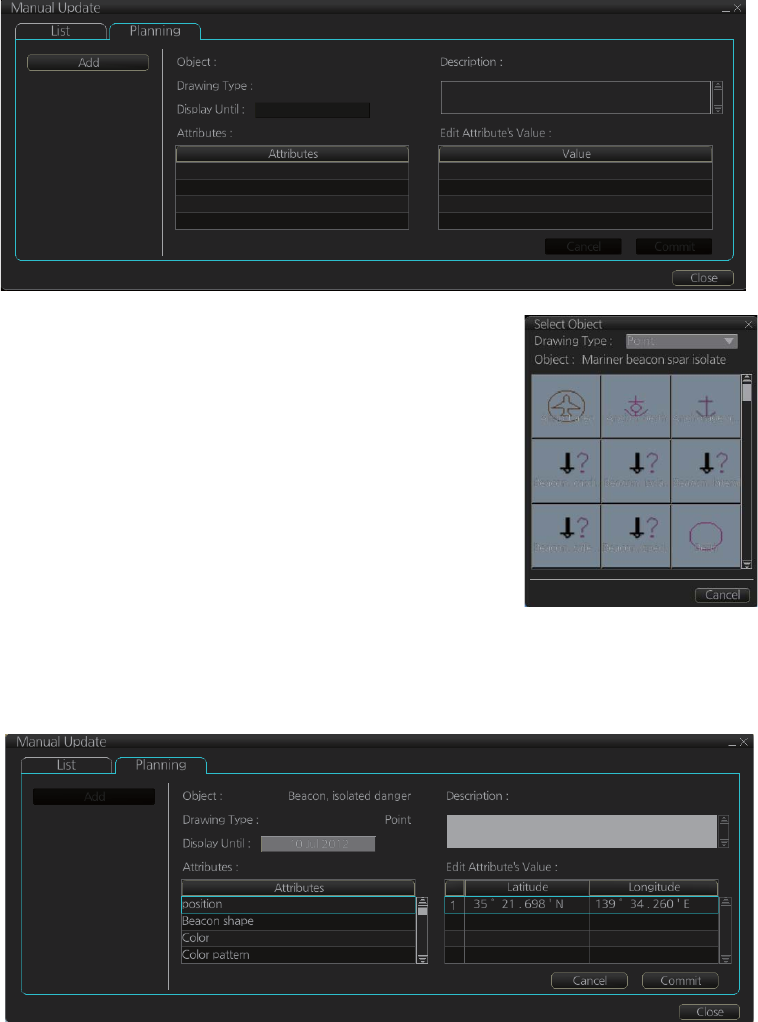
7. HOW TO MANAGE CHARTS
7-23
7.19.1 How to insert update symbols
An update symbol can be added as shown in the procedure below.
Note 1: If the system freezes when updating the drawing type [Area], reset the power.
Note 2: An update symbol that straddles the international date line cannot be edited.
In this case, insert the same symbol on each side of the line.
1. Go to the Voyage navigation mode.
2. Click the [Manual Update] button on the InstantAccess bar to open the [Manual
Update] dialog box.
3. Click the [Planning] tab.
4. Click the [Add] button.
Note: This window can also be shown from the con-
text-sensitive menu. Right-click the display area then
select [Manual Update] and [Add New].
5. Use the [Drawing Type] pull-down list to select draw-
ing type: [Point], [Line] or [Area].
6. Click desired object.
7. Put the cursor on the location where to insert the
symbol then left click. The [Manual Update] dialog
box shows:
- [Object]
- [Drawing Type]
- [Display Until] (display until date*) * Set as desired; default setting is three
months from date of entry.
8. You can add a comment related to a manual update object in the [Description]
box.
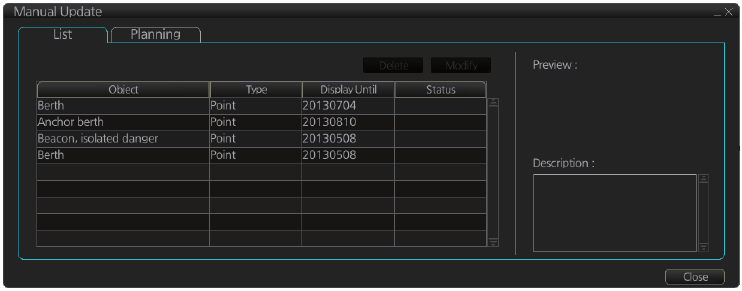
7. HOW TO MANAGE CHARTS
7-24
9. To add textual information to an attribute, select the attribute from the [Attributes]
window then add text in the [Edit Attribute’s Value] window.
10. Click the [Commit] button to add all selected objects to the chart.
Note: A manual update object is displayed until the display until date entered for it has
passed. If the object remains on the screen after the display until date, do some oper-
ation on the screen to refresh the screen to erase the object.
7.19.2 How to delete update symbols
Manually entered update symbols cannot be deleted until the display until date arrives
or is changed. However, you can mark the symbol to indicate that it can be ignored.
1. Put the cursor on the symbol then right-click to show the context-sensitive menu.
2. Select [Manual Update] and [Delete].
The symbol is marked with a diagonal line.
Note: A symbol can also be deleted from the [Manual Update] dialog box. Follow
steps 1-2 in paragraph 7.19.1, click the [List] tab, select the symbol to delete then click
the [Delete] button.
7.19.3 How to modify existing update symbols
The position, display until date and description of an update symbol can be modified.
A symbol that is marked as “deleted” cannot be modified.
1. Follow steps 1-2 in paragraph 7.19.1 to display the [Manual Update] dialog box.
2. Click the [List] tab.
3. Select the object to modify then click the [Modify] button. The [Planning] dialog
box appears.
4. Modify the object referring to steps 8-9 in paragraph 7.19.1.
5. Click the [Commit] button.
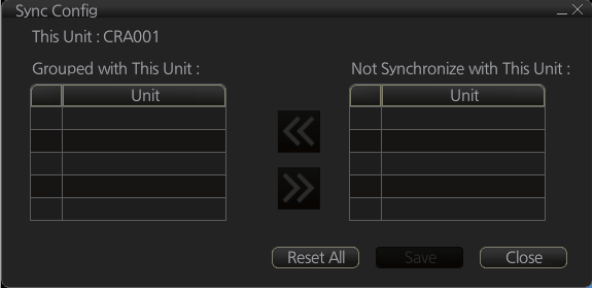
7. HOW TO MANAGE CHARTS
7-25
7.20 How to Synchronize Chart Data
This section shows you how to synchronize chart data between FMD-3xx0 and FAR-
3xx0 units, so that all units share the same chart data. Synchronization can be done
automatically or manually (see paragraph 7.20.2), however all units selected for syn-
chronization must be powered to complete the synchronization. Synchronization in-
cludes the following actions:
• Synchronize public keys
• Synchronize chart permits and licenses
• Synchronize chart data
• Synchronize manual updates
Note 1: Before synchronizing chart data, confirm that all units selected for synchroni-
zation are powered. (Do not turn off a unit during synchronizing.) If a unit is turned off
during the synchronizing, do the following on the unit which contains the medium:
• Open the [Sync Status] dialog box then click the [Disable Sync] button to disable
synchronization. Power all units registered for synchronization, then click the [Urge
Sync] button on the [Sync Status] dialog box on the unit containing the media to
forcibly synchronize.
• Make a group of all the units currently powered, referring to paragraph 7.20.1, and
register the group with [Grouped with This Unit]. Reset the power on all units select-
ed for synchronization.
Note 2: C-MAP charts are not automatically synchronized. C-MAP charts are only
synchronized immediately after installing or updating the C-MAP database. If the sys-
tem has several FCRs or FMDs, make a group of associated units before you install
C-MAP charts.
7.20.1 How to select the units to synchronize
Do as follows to select the units to synchronize.
1. Get into the Chart maintenance mode. On the InstantAccess bar, click [System]
followed by [Sync Config] to show the [Sync Config] dialog box.
[Grouped with This Unit]: This window shows the units currently selected for syn-
chronization.
[Not Synchronize with This Unit]: This windows shows the units not selected for
synchronization.
2. To select a unit for synchronization: Put a checkmark next to the unit’s name
in the [Not Synchronize with This Unit] window then click the [<<] button. That
CRA002
CRA003
CRA004
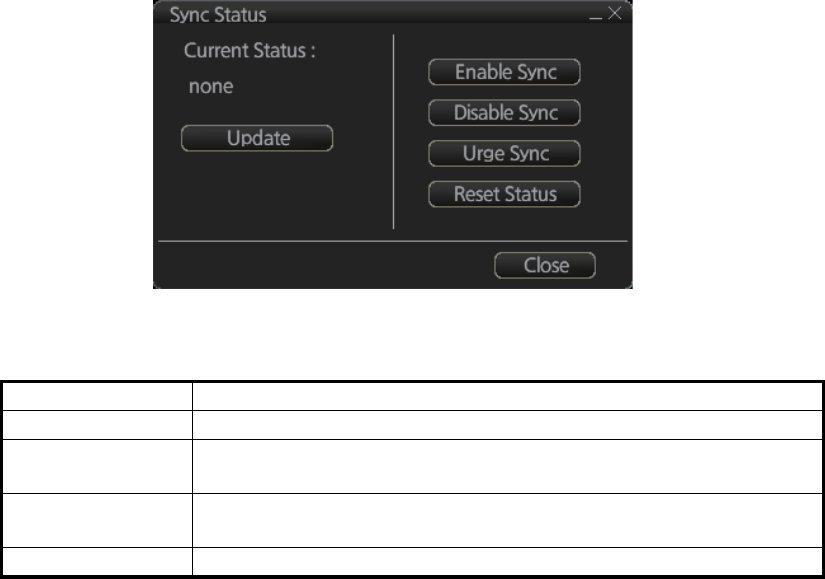
7. HOW TO MANAGE CHARTS
7-26
unit’s name is moved to the [Grouped with This Unit] window.
To deselect a unit from synchronization: Put a checkmark next to the unit’s
name in the [Grouped with This Unit] window then click the [>>] button. That unit’s
name is moved to the [Not Synchronize with This Unit] window.
To deselect all units, click the [Reset All] button.
3. Click the [Save] button to finish.
4. Restart the power on applicable units to apply synchronization configuration
changes.
7.20.2 How to check synchronization status
You can check chart synchronization status on the [Sync Status] dialog box. Chart
synchronization operations also are available from this dialog box. Normally, chart
synchronization is done automatically, according to the sync settings on the [Sync
Config] dialog box. Use the [Sync Status] dialog box to manually synchronize chart
data when there is network failure, for example.
Get into the Chart maintenance mode. On the InstantAccess bar, click [System] fol-
lowed by [Sync Status] to show the [Sync Status] dialog box.
[Current Status]: Displays current synchronization status. The table below shows all
the synchronization status messages.
[Update] button: Click this button to update [Current Status].
[Enable Sync] button: Enables synchronization. The confirmation message "Attention:
Do you want to enable sync?" appears. Click the [OK] button to enable synchroniza-
tion. Synchronization is always enabled when chart radar starts. A progress bar indi-
cates progress in synchronization. The bar is erased within five minutes after
completion of synchronization.
[Disable Sync] button: Disables synchronization function temporarily. Use this feature
to enable chart administration in case of network failure, for example. The confirmation
message "Attention: Do you want to disable sync?" appears. Click the [OK] button to
temporarily disable synchronization.
Sync status Meaning
[disabled] Synchronization is disabled.
[must receive] This chart radar will receive chart data from another FMD-3xx0 or
FAR-3xx0 series.
[must send] This chart radar will send chart data to another FMD-3xx0 or FAR-
3xx0 series.
[none] No synchronization task ready.
7. HOW TO MANAGE CHARTS
7-27
Note 1: In normal operation do not disable synchronization. If you accidentally disable
synchronization, try to synchronize by clicking the [Enable Sync] button. If that does
not work, reset the power of all units selected for synchronization then click the [Urge
Sync] button to synchronize.
Note 2: With synchronization disabled, the message "Synchronization disabled" may
appear twice when installing a license. This does not affect installation of a license.
[Urge Sync] button: Does immediate synchronization. The confirmation message "At-
tention: Chart data in other units will be overwritten by this unit. Do you wish to contin-
ue?" appears. Click the [OK] button to synchronize. If synchronization is not
successful, restart applicable units and try again.
[Reset Status] button: Reset synchronization status to recover from synchronization
status conflict. The confirmation message "Attention: Do you want to reset sync sta-
tus? This unit may be synchronized from the other unit." appears. Click the [OK] button
to reset.
7.20.3 Manual updates and synchronization
If you are synchronizing multiple FAR-3xx0 units while manual updating is being done
on one of the units, the message "File not found" may appear, meaning the manual
update data was deleted. If this occurs, follow the procedure below to synchronize the
FAR-3xx0 units. The procedure uses CRA001 and CRA002 as an example.
1. At the CRA001, get into the Chart maintenance mode, then click [System] and
[Sync Config] on the InstantAccess bar.
2. Add CRA002 to [Grouped with This Unit] then click the [Save] button.
3. Reset the power on the CRA001 and CRA002.
4. At the CRA001, get into the Chart maintenance mode, then click the [System] and
[Sync Status] buttons on InstantAccess bar to show the [Sync Status] dialog box.
5. Click the [Urge Sync] button to synchronize charts between CRA001 and
CRA002.
6. To confirm synchronization, do as follows:
1) At the CRA001, get into the Voyage navigation mode, then click the [Manual
Update] button on the InstantAccess bar to open the [Manual Update] dialog
box.
2) Click the [Planning] tab followed by the [Add] button.
3) Insert an object at the CRA001.
4) At the CRA002, move the cursor or change the chart scale. Confirm that the
chart is updated.
7.21 How to Reconvert All SENC Charts
If you unintentionally installed outdated SENC charts, you can reconvert those charts
to the latest SENC charts. Click the [System] and [Reconvert] buttons on the
InstantAccess bar to reconvert all your SENC charts.
Note: All manual updates are removed in the reconversion.
7. HOW TO MANAGE CHARTS
7-28
This page is intentionally left blank.

8-1
8. HOW TO CONTROL CHART
OBJECTS
This chapter provides the information necessary for controlling chart features.
8.1 How to Browse Your Charts
You can view your charts using different positions and different scales. The basic tools
for browsing charts are the RANGE key, chart offcenter, and scroll.
RANGE - and RANGE + change the chart scale. (The scrollwheel also can change
the chart scale. Spin to change.) If true motion reset is active, ZOOM IN and ZOOM
OUT keep the relative position of your ship with respect to the display. If true motion
reset is off, ZOOM IN and ZOOM OUT keep the relative position pointed by the cursor
with respect to the display. The system automatically selects next larger or smaller
scale. If a chart with larger compilation scale is available at your current viewing posi-
tion, the message "Larger scale ENC available" appears.
The own ship position can be easily relocated to the screen center in the Navigation
voyage and Navigation planning modes. Further, in the Navigation voyage mode, the
own ship position can be put at the cursor position.
To move the own ship mark to the screen center, put the cursor in the chart area
and right-click [Ship on center]. To move the own ship mark to a location, right-click
the position on the chart where to put the own ship mark then right-click [Ship off cen-
ter]. ([Ship off center] is not available in the Voyage planning mode.)
To scroll your chart, simply drag and drop.
8.2 How to Control Visibility of Chart Objects
The [Chart Display] menu has several pages of chart features that you may show or
hide as appropriate. To display this menu, click the [DISP], [SET] and [Chart DISP]
buttons on the InstantAccess bar.
8.2.1 How to set value for shallow contour, safety depth, safety con-
tour and deep contour
You can set values for shallow contour, safety depth, safety contour and deep contour,
on the [Chart Alert] dialog box (sequence: [DISP], [SET], [Chart Alert]). Colors used
for depth presentation on the electronic chart are controlled by setting values for shal-
low contour, safety depth, safety contour and deep contour. Soundings on the elec-
tronic chart, which are equal to or less than the value of safety depth, are highlighted.
See the illustrations on the next page for multi-color presentation and two-color pre-
sentation. Selection of multi- and two-color presentations can be done by selecting
from list box of [Depths] on the [Basic Setting] menu.
Note: The shallow contour cannot be set higher than the safety contour.
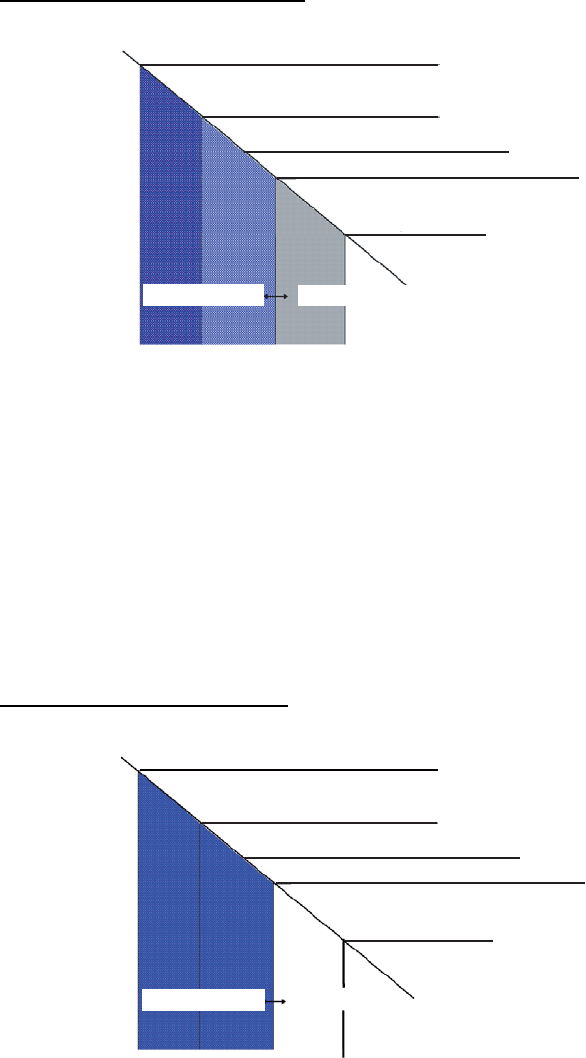
8. HOW TO CONTROL CHART OBJECTS
8-2
MULTI-COLOR presentation
In the multi-color presentation four colors are used for depths. If the value entered as
the safety contour does not exist in the electronic chart, the system automatically se-
lects the next available deeper depth contour as the safety contour. For example, the
input value is 8 m, but there is no 8 m depth contour in the electronic chart. Then, the
system automatically selects the next available deeper depth contour (10 m) as the
safety contour. The depth contour value of 10 m is used as the safety contour in the
electronic chart.
Shallow contour shows visual color change inside an unsafe water area. An unsafe
water area is all areas shallower than the safety contour. Set the value for the shallow
contour less than the value of the safety contour.
TWO-COLOR presentation
In the two-color presentation, unsafe water is shown in blue and safe water is shown
in white. The safety contour is used to qualify unsafe water (depth shallower than safe-
ty contour) and safe water (depths deeper than safety contour).
If the value entered as the safety contour does not exist in the electronic chart, the sys-
tem automatically selects the next deeper available depth contour as the safety con-
tour, the same as with the multi-color presentation.
Chart zero
Shallow contour
Safety contour (input value)
Safety contour (exisiting in ENC)
Deep contour
Non-navigable area Navigable area
Non-navigable area
Chart zero
Shallow contour
Safety contour (input value)
Deep contour
Safety contour (exisiting in ENC)
Navigable area
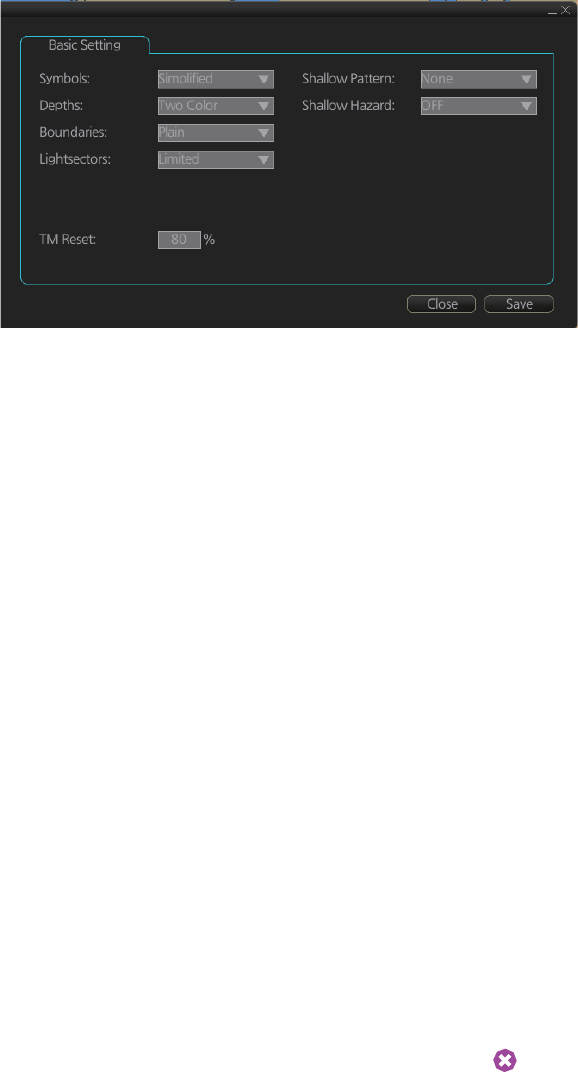
8. HOW TO CONTROL CHART OBJECTS
8-3
8.2.2 Basic Setting menu
To display this menu, click [DISP], [SET] and [Basic Setting] on the InstantAccess bar.
[Symbols]: Select how to display chart symbols. The options are:
[Simplified]: The shape of symbols is of modern design and the sea mark symbols are
filled in a color.
[Paper Chart]: The shape of symbols imitates traditional symbols used in paper
charts.
[Depths]: Set how to display different depth zones on the chart display.
[Two Color]: The chart display uses only two colors:
• Deeper than safety contour
• Shallower than safety contour
[Multi Color]: The chart display uses four different colors for contours:
• Deeper than user-selected deep contour
• Between deep contour and user-selected safety contour
• Between safety contour and user-selected shallow water contour
• Between shallow water contour and coastline
[Boundaries]: Set how to display boundaries of some chart features. The options are:
[Plain]: The line styles are limited to plain solid and dashed lines.
[Symbolized]: Some of the line styles use symbols to highlight the purpose of a line.
[Lightsectors]: Set how to display light sectors. The options are:
[Limited]: The length of a light sector is fixed at 25 mm independently of the displayed
scale.
[Full]: The length of a light sector represents its nominal range as defined by the chart
producer.
[Shallow Pattern]: Set how to display shallow water area. The options are:
[None]: Shallow water areas are not shown.
[Diamond]: Provided to distinguish shallow water at night.
[Shallow Hazard]: Show or hide the shallow hazard symbols ( ).
[TM Reset]: In the true motion mode, own ship moves until it reaches the true motion
reset borderline (set here), and then it jumps back to an opposite position on screen
based on its course. Set the limit for TM reset (in percentage). For example, "80" resets
the position when the own ship marker is at a location which is 80% of the range.
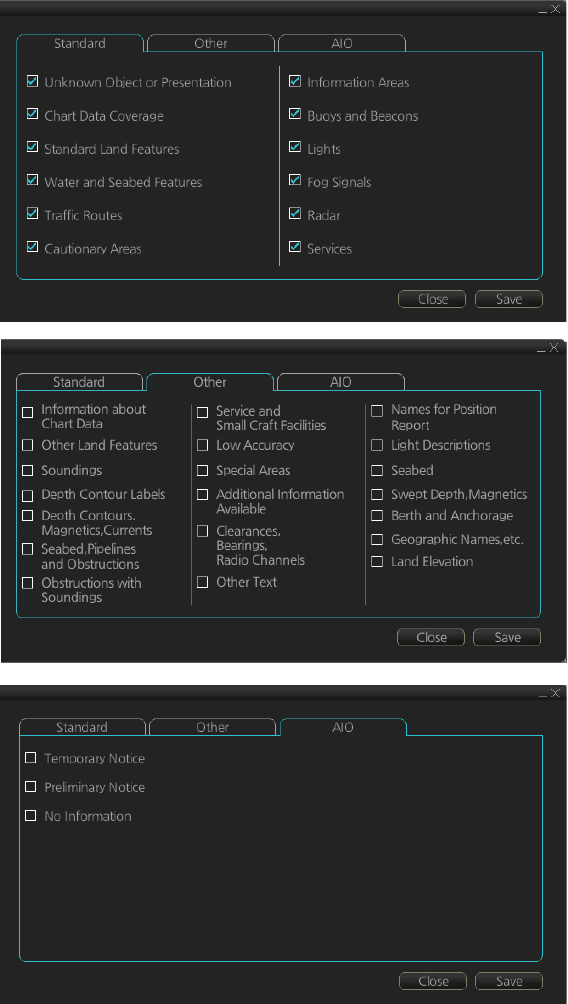
8. HOW TO CONTROL CHART OBJECTS
8-4
8.2.3 Chart Display menu
To access this menu and its pages, click [DISP], [SET] and [Chart DISP] on the Instan-
tAccess bar then open the [Standard], [Other] or [AIO] page as appropriate.
The [Standard] page contains chart features defined by IMO that comprise a standard
display. You can recall the standard display at any time in a single action; click the
[STD DISP] button on the Status bar to get the standard display.
The [Other] page contains chart features for which you can control visibility and that
are not part of IMO-defined standard display.
The [AIO] page controls what to display on the Admiralty Information Overlay.
Note: To display the information for the cursor-selected object, the associated chart
feature must be turned on from the [Standard], [Other] or [AIO] page.
AIO
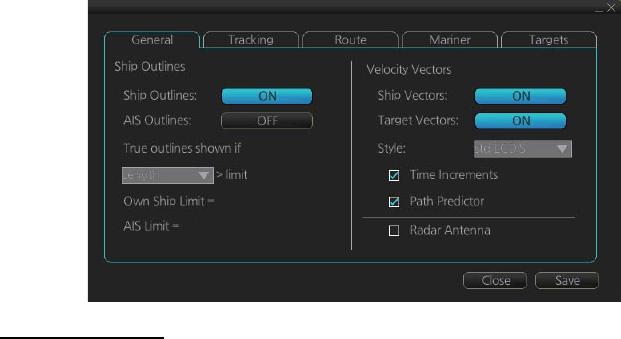
8. HOW TO CONTROL CHART OBJECTS
8-5
8.2.4 Display base
A subset of chart features is called the “display base”. As required by IMO, these fea-
tures cannot be made invisible. To get the display base, uncheck all items on the
[Standard] and [Other] pages in the [Chart Display] menu.
The display base consists of the following chart features:
• Coastline (high water)
• Own ship's safety contour, which is selected by the user
• Indication of isolated underwater dangers of depths less than the safety contour that
lie within the safe waters defined by the safety contour
• Indication of isolated dangers that lie within the safe water defined by the safety con-
tour such as bridges, overhead wires, etc., and including buoys and beacons wheth-
er or not these are being used as aids to navigation.
• Traffic routine systems
• Scale, range, orientation and operating mode
• Units of depth and height
8.3 How to Control Visibility of Symbols, Features
Control of symbols and features is divided into five pages in the [Symbol Display]
menu, which you can access by clicking the [DISP], [SET] and [Symbol DISP] buttons
on the InstantAccess bar.
[General] page: Controls own ship and target related items.
[Tracking] page: Controls past tracks and some other features.
[Route] page: Controls planned and monitored route.
[Mariner] page: Controls user charts.
[Targets] page: Controls TT and AIS targets.
The user can define settings for chart details that are displayed over the chart area.
8.3.1 General page
[Ship Outlines]
[Ship Outlines]: Select [OFF] or [ON] to show minimized or scaled symbol, respective-
ly.
[AIS Outlines]: Select [OFF] or [ON] to show AIS targets in same size or scaled sym-
bol, respectively.
3 mm
3 mm
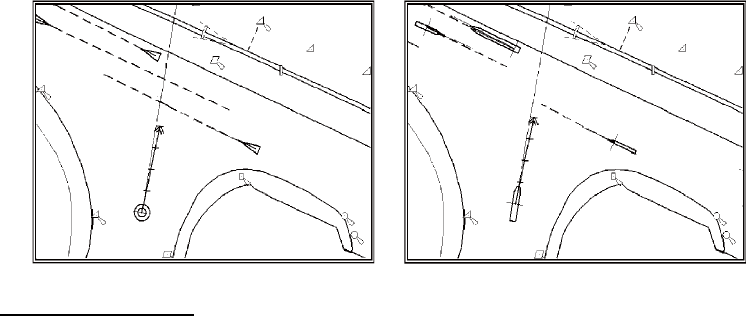
8. HOW TO CONTROL CHART OBJECTS
8-6
[True outlines shown if]: If the length or width of the own ship mark is greater than 3
mm, the own ship mark is shown with the true scale symbol. Select [Length] or [Beam
width].
The right illustration in the figure below shows own ship mark and AIS targets with
scaled symbols. The left illustrations shows own ship mark and AIS targets with point
symbol. AIS targets are displayed as true scale symbol if the displayed chart scale is
larger than set with "Outlines" limit (length>3 mm) on the [General] page in the [Sym-
bol Display] menu and your own ship are displayed as true symbol scale if the size of
the true scale symbol is larger than 3 mm on the chart display.
[Velocity Vectors]
[Ship Vectors]: Show or hide own ship vector.
[Target Vectors]: Show or hide target vectors.
[Style]: Select the vector style. The [std ECDIS] vector is a speed-referenced vector
symbol. [Conventional] is a simplified symbol.
[Time Increments]: Check to show ticks of velocity vector. This controls both own ship
and targets ticks. If ticks are too tightly spaced, they will be automatically removed
from the display, until spacing between ticks is sufficient to distinguish them separate-
ly. This depends on display scale and speed of vessel and target.
[Path Predictor]: Check to show the path predictor. The path predictor is a single
dashed line originating at the CCRP and drawn at a length to represent the distance
and path own ship will travel over the ground in the user-selected time interval for own
ship speed vector.
[Radar Antenna]: Check to mark position of radar antenna (with "x”).
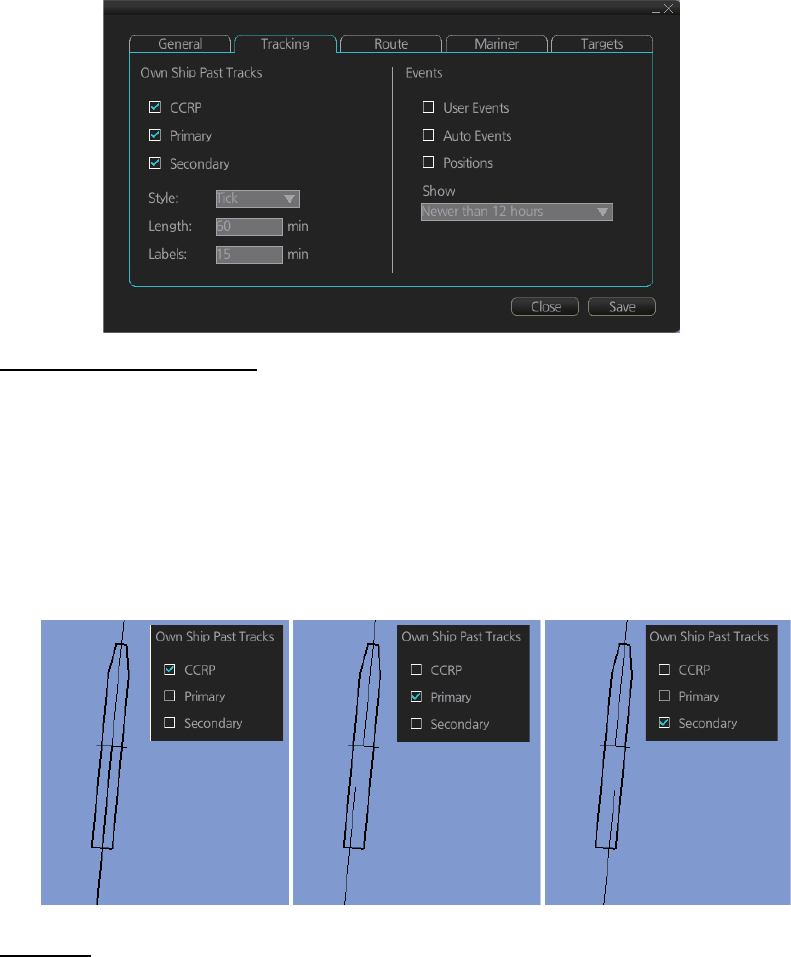
8. HOW TO CONTROL CHART OBJECTS
8-7
8.3.2 Tracking page
[Own Ship Past Tracks]
[CCRP]: Check to plot CCRP position.
[Primary]: Check to plot own ship's past track with position fed from sensor with high-
est priority.
[Secondary]: Check to plot own ship's past track with position fed from sensor with
second highest priority.
[Style]: Select time stamp position for past track (indicated by [Tick] or [Point]).
[Length]: Select length of past track.
[Labels]: Select label interval.
[Events]
Events marks are based on the [Voyage] log records.
[User Events]: Display event symbols on the chart. User events are recorded by click-
ing [Record], [Event Log] and [User Event] on the InstantAccess bar.
[Auto Events]: Display automatically entered event symbols, where the system has re-
corded an event based on conditions you have set. Auto events are recorded every 1-
4 hours.
[Positions]: Display the latitude and longitude of an event, recorded by clicking
[Record], [Event Log] and [POSN Event] on the InstantAccess bar.
Note 1: A MOB event is visible always.
Note 2: You can select the period of time to display event marks, from the [Show] list
box. [Newer than 12 hours], [Newer than 24 hours], [Newer than 1 week], [Newer than
2 weeks], [Newer than 1 month], [Newer than 3 months], or [All].
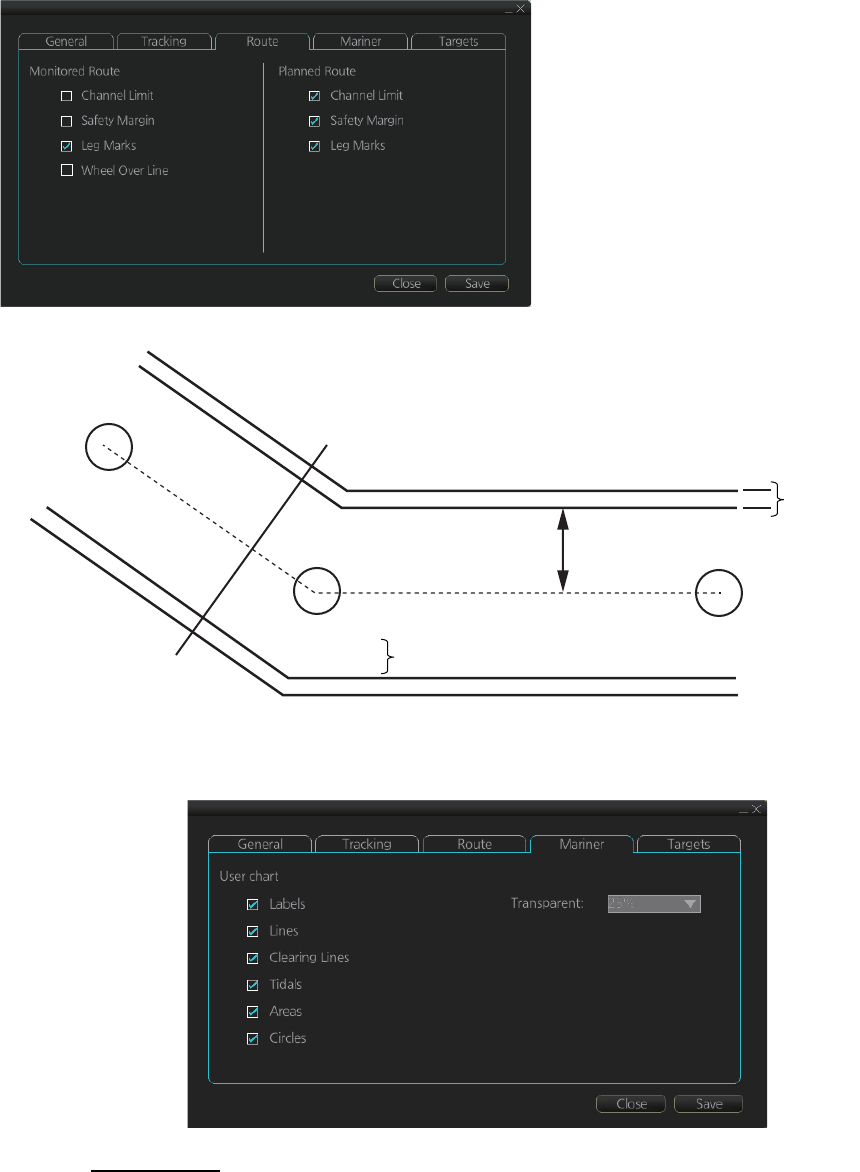
8. HOW TO CONTROL CHART OBJECTS
8-8
8.3.3 Route page
The [Route] page selects the route parts of the monitored and planned routes to show
on the chart.
8.3.4 Mariner page
[User chart]
[Labels]: Check to show labels on user charts.
[Lines]: Check to show lines on user charts.
[Clearing Lines]: Check to show clearing lines (for marking dangerous areas) on user
charts.
[Channel Limit]: The distance from
the centerline to one side of the nav
lane.
[Safety Margin]: The distance from
one side of the channel limit to the
safety margin distance.
[Leg Marks]: Indications of waypoint
no. and range and bearing to next
waypoint.
[Wheel Over Line]: The location
where the ship turns toward new
course.
WPT1
124.8°
0.8NM
WPT3
WPT2
87.9°
1.2NM
Channel
limit
Wheel
over line
Leg mark
Safety
margin
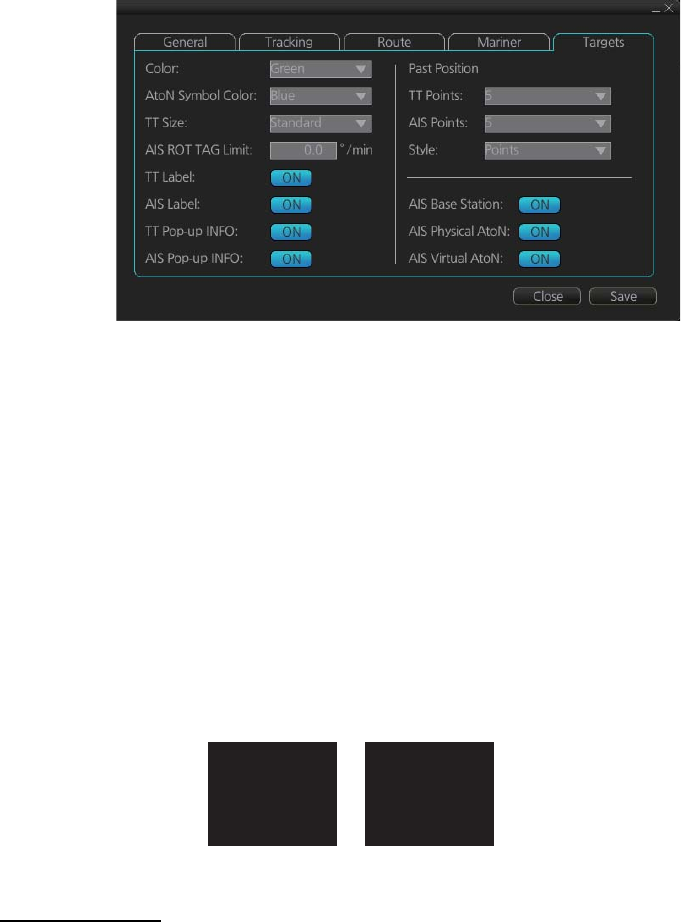
8. HOW TO CONTROL CHART OBJECTS
8-9
[Tidals]: Check to show symbols and tidals on user charts.
[Areas]: Check to show areas on the user charts.
[Circles]: Check to show circles on user charts.
[Transparent]: Set the degree of transparency for the user chart objects. Color fill for
the areas can be selected as transparent from 25%, 50%, 75% and as [No color fill].
If [No color fill] is selected, only the boundaries of the areas are visible.
8.3.5 Targets page
[Color]: Select color of target (TT and AIS, common) from the list box.
[AtoN Symbol Color]: Select the color for AtoN symbols.
[TT Size]: Select symbol size for tracked targets, [Standard] or [Small].
[AIS ROT TAG Limit]: ROT (°/min.), limit to display AIS target with curved speed vec-
tor. (Source of ROT must be ROT gyro on target vessel.)
[TT Label]: Show or hide the TT label (target no.).
[AIS Label]: Show or hide the AIS label (ship’s name).
[TT Pop-up INFO]: Show or hide the TT pop-up, which is shown by right-clicking a TT.
[AIS Pop-up INFO]: Show or hide the AIS pop-up, which is shown by right-clicking an
AIS target.
[AIS Base Station]: Show or hide AIS base stations.
[AIS Physical AtoN]: Show or hide AIS physical AtoN.
[AIS Virtual AtoN]: Show or hide AIS virtual AtoN.
[Past Position]
[TT Points]: Select the number of TT past position points to display.
[AIS Points]: Select the number of AIS past position points to display.
[Style]: Select style of presentation of target's past position.
NAME VOYA...
COG: 324.0°T
SOG: 8.1kn
CPA: 0.12NM
TCPA: -19:18
TT(04)
COG: 235.0°T
SOG: 6.1kn
CPA: 0.23NM
TCPA: -10:18
TT pop-up info AIS pop-up info
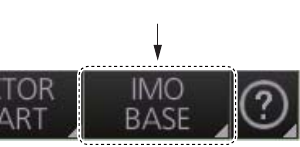
8. HOW TO CONTROL CHART OBJECTS
8-10
8.4 Control of Predefined IMO Chart Display Set-
tings
There are three sets of predefined chart display settings that can be used to display
charts with certain chart features. The predefined chart display settings are
• [IMO BASE]
• [IMO STD] (STANDARD)
• [IMO ALL]
You can change the chart display setting in use with the [Chart database] button on
the Status bar.
[Chart database] button

9-1
9. VECTOR (S57) CHARTS
Theoretically a chart can be coded for use on a computer as a vector chart. Vector-
coded charts are coded using a variety of techniques. One technique is called S57ed3
and it has been chosen by IMO as the only alternative for SOLAS compliant electronic
charts. If an S57ed3-coded chart is published by a government-authorized Hydro-
graphic Office, then it is called "ENC". You can read more about ENC and related legal
issues in this chapter. Hereafter, all references to vector chart material are referred to
as "S57 charts" regardless of their source.
Sometimes you may wish to manually add Notices to Mariners or Navtex warnings into
your S57 charts. This is called "manual updates". Also, manual updates are valid for
all scales so that you don't need to repeat them for charts published in different scales
from the same area.
9.1 Introduction to S57 Charts
An ENC chart is encrypted to prevent unauthorized use so the user needs a permit to
view the ENC. This permit could be entered manually from the Control Unit, loaded
from a USB flash memory.
Any new ENC must be loaded into the system. Some parts of the charts may be date
dependent, i.e., they are visible after a set date or they are visible only for a limited
period, etc. In the electronic chart system, you control all date-dependent objects with
Display date and Approved until dates. In the paper chart world, the Preliminary and
Temporary Notices to Mariners represent the date dependency described above for
S57 charts.
An important part of ENCs are the updates. Hydrographic Offices can issue two kinds
of updates:
1. Incremental updates, which are small additions to original base cells.
2. Reissues and new editions, which are complete replacements of previous base
cells and their updates.
All updates are date stamped and they may also contain date-dependent parts. You
control usage of updates in the electronic chart system from Display date and Ap-
proved until dates. Using Display date and Approved until dates, you can view your
charts correctly drawn on any date in the past or in the future.
Chart material will be stored in media such as DVD ROMs, CD ROMs and USB flash
memory or electronically through from LAN (Local Area Network) in which it could
have arrived in DVD ROMs, CD ROMs or USB flash memories. Such material can
contain only basic cells, cells and updates or only updates. The electronic chart sys-
tem contains as standard the software required to access a medium.
Each S57 chart may contain additional links to textual descriptions or pictures, besides
the chart itself. Typically additional textual descriptions and pictures contain important
sailing directions, tidal tables and other traditional paper chart features that do not
have any other method to be included into the S57 chart. This system copies these
textual descriptions and pictures into its SSD so the user may cursor-pick them for
viewing purposes.
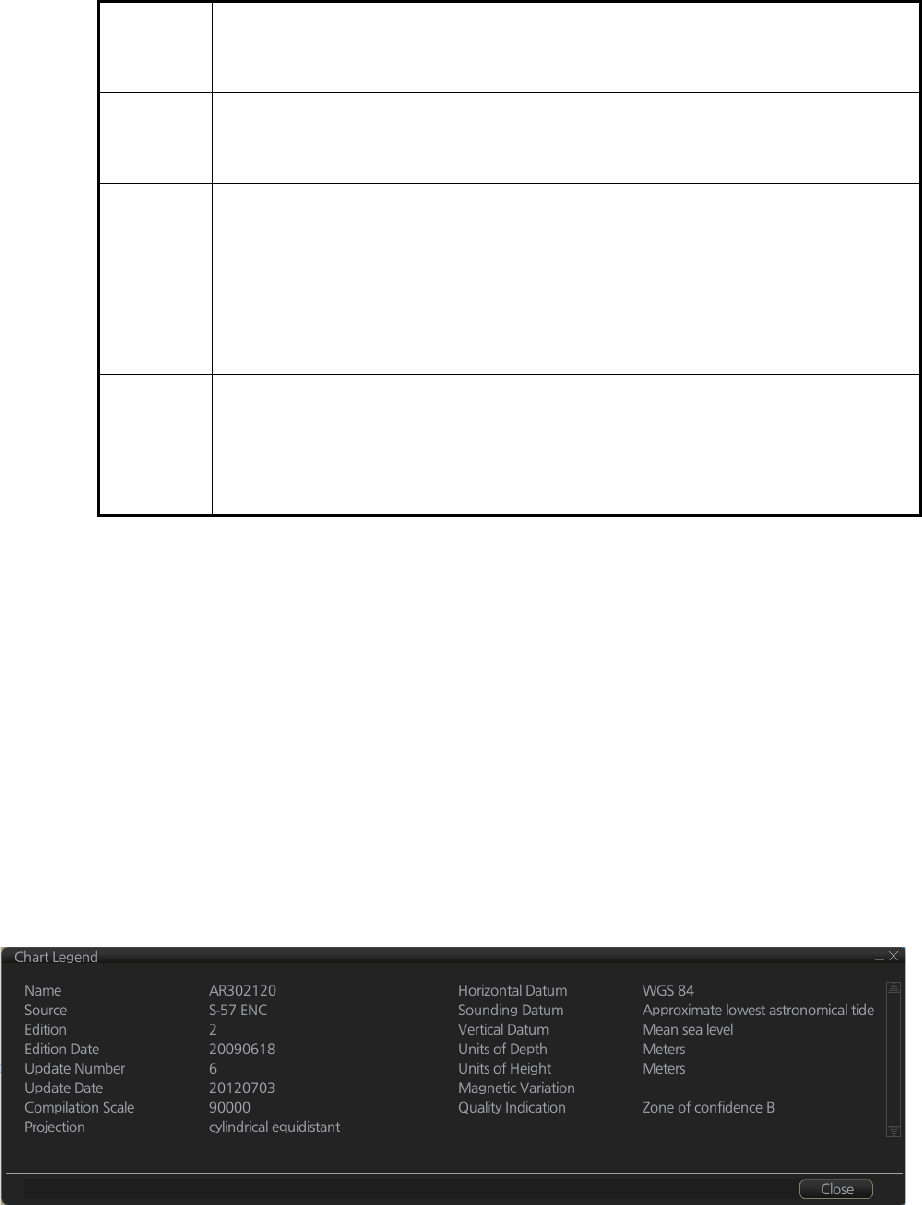
9. VECTOR (S57) CHARTS
9-2
9.1.1 Definitions of terms
9.1.2 Chart legend for S57 charts
The chart legend provides various data about the chart currently displayed. To find
info for current position, turn on TM reset, then click the [Chart INFO] button on the
InstantAccess bar followed by the [Chart Legend] button, in the Voyage planing mode
or Voyage navigation mode. To find info for a specific location, put the cursor on the
location then right-click and select [Chart Legend]. Click the [Close] button to close the
display.
This system is capable of showing more than one S57 chart at a time. This feature is
called the multi-chart display. If one S57 chart does not cover the whole display, the
system will open more S57 chart cells for display, if appropriate cells for the displayed
area are available. The chart legend shows information about S57 charts displayed on
the electronic chart display area.
[Name]: Name of chart.
[Source]: Source of chart.
[Edition]: Edition number of the chart.
[Edition Date]: Date the edition was published.
[Update Number]: Update number.
[Update Date]: Date of update.
Cell A cell is a geographical area containing ENC data and it is the smallest di-
vision of ENC data. Each cell has a separate unique name. Hydrographic
Offices divide their responsibility area by the cells that they publish.
S57 chart A database, standardized as to content, structure and format, is issued for
use with this system without any authority of government-authorized Hydro-
graphic Office.
ENC A database, standardized as to content, structure and format, is issued for
use with this system on the authority of government-authorized Hydro-
graphic Offices. The ENC contains all the chart information necessary for
safe navigation and may contain supplementary information in addition to
that contained in the paper chart (e.g., sailing directions) that may be con-
sidered necessary for safe navigation. The name of the coding standard for
ENC is S57ed3.
SENC A database resulting from the transformation of the ENC by the system for
appropriate use, updates to the ENC by appropriate means, and other data
added by the mariner. It is this database that is actually accessed by the
system for display and other navigational functions. The SENC may also
contain information from other sources.

9. VECTOR (S57) CHARTS
9-3
[Compilation Scale]: The scale of the original paper chart is shown here.
[Projection]: Projection of current chart.
[Horizontal Datum]: Horizontal datum used with current chart.
[Sounding Datum]: Datum used to create sounding data.
[Vertical Datum]: Vertical datum used with current chart.
[Units of Depth]: Unit of depth used with current chart.
[Units of Height]: Unit of measurement used to measure height of objects above sea
level.
[Magnetic Variation]: Amount of magnetic variation. A positive value indicates a
change in an easterly direction and a negative value indicates a change in a westerly
direction.
[Quality Indication]: Quantitative estimate of the accuracy of chart features, given by
the chart producer.
9.1.3 Permanent warnings for S57 charts
Permanent warnings help you keep the S57 charts up-to-date and these are shown at
the bottom of the screen. Permanent warnings appear if the system detects a condi-
tion that may cause a chart to be not up-to-date.
Note: The system can assist in keeping RENC-received charts up-to-date. For charts
that have been loaded from sources other than an RENC, the system is unable to
know the exact up-to-date situation.
Message Meaning, Remedy
Display date is not current Display date is not the current date. Set
Display date and Approved until date to the
current date.
ENC: permits have expired The system found an expired permit for a
chart. Remove the chart or renew sub-
scription for the permit.
ENC: Product list not up to date The product list is not up to date. Update
the product list.
ENC: AIO product list not up to date The AIO chart is not be up to date. Load
updated material.
No connection to dongle The dongle is not inserted. Insert the don-
gle to erase the message.
Not up to date (SSE 27): XXXXXXXX
(Chart name appears at location of Xs.)
At least one chart is not up to date. Load
updated material.
Permit expired (SSE 25): XXXXXXXX
(Chart name appears at location of Xs.)
You have an expired permit for a chart. Re-
move the chart or renew subscription for
the permit.
9. VECTOR (S57) CHARTS
9-4
9.2 Chart Viewing Dates and Seasonal Features of
the S57 Chart
9.2.1 Introduction
S57 charts contain date-dependent features. Updating in general, including reissues,
new editions and updates, creates date dependency. In addition to the obvious date
dependency, some features of the S57 charts create additional date dependency.
These features include "Date Start", "Date End", "Seasonal date start" and "Seasonal
date end". Hydrographic Offices use these features to publish Temporary and Prelim-
inary Notices to Mariners, as their paper chart equivalent updates are called. "Season-
al date start" and "Seasonal date end" are used for seasonal chart features such as
summer-only sea marks, seasonal yacht race areas, etc.
You can efficiently use chart viewing date dependency in order to use the valid data
for any given date applicable for your navigation or planning purposes. For example,
you can check for existence of changes and restrictions weeks before they became
valid. Date dependency is a part of the new electronic method to keep your chart up-
to-date and valid for your intended use. Normally you should set Display date and Ap-
proved until once per week to keep your chart up-to-date.
9.2.2 How to approve and highlight S57 chart updates
Before you approve updates, you can display (highlight) updates that are included into
S57 charts. Normally you have selected for automatic after the SENC conversion. In
this case, after all the SENC conversions have been finished, all updates are automat-
ically highlighted and you can view and approve them after viewing. See the next sec-
tion for how to set Display date and Approved until dates.
If you want to review updates after the initial approval of the updates do the following:
1. Use [Approved until] to set the begin date for the update highlight.
(See paragraph 9.2.3.)
2. Use [Display date] to set the end date for the update highlight.
(See paragraph 9.2.3.)
3. Review the changes. Added features are highlighted with orange circles. Re-
moved features are highlighted with orange slashes. Changed features are high-
lighted with both orange circles and slashes.
4. After reviewing, set [Approved until] and [Display date] back to the current system
date.
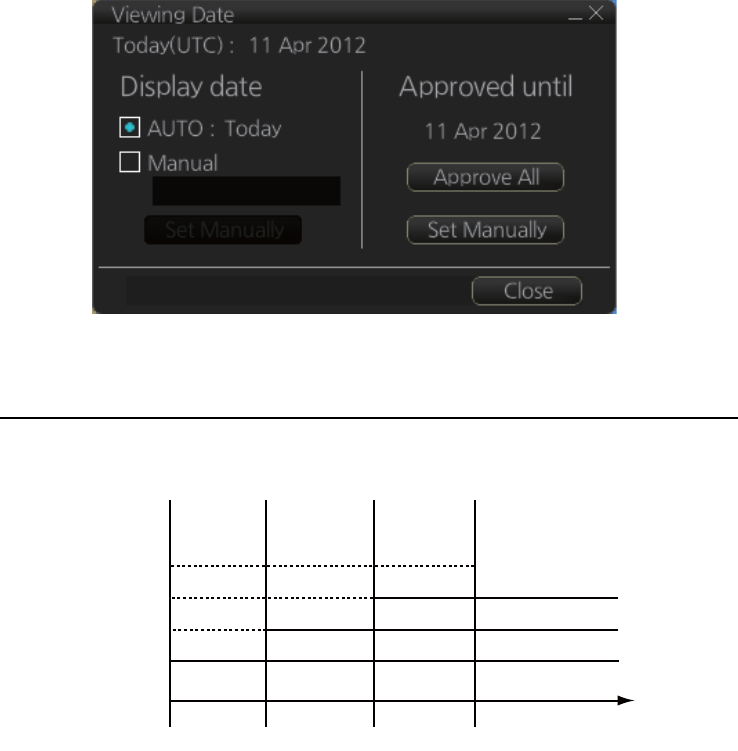
9. VECTOR (S57) CHARTS
9-5
9.2.3 How to set Display date and Approved until dates
Click the [Chart INFO] and [Viewing Dates] button on the InstantAccess bar to show
the [Viewing Date] dialog box. Set desired dates then click the [Close] button.
9.2.4 About chart viewing date dependency of S57 standard
How the issue date of updates changes the visibility of the changes
Study the example below to understand the behavior of updates relative to date.
The figure above shows how updates are dependent Chart viewing dates set in Dis-
play/Approved date settings by user. Actions 1 to 4 areas as follows:
1. Base cell including three updates is converted into SENC. Display date is set as
current date of the system. Approve date has to be set to current date.
2. The date in which update 1 was issued. Display and Approved dates have to be
set to correct date in order to see the chart with update 1.
3. The date in which update 2 was issued. Display and Approved dates have to be
set to correct date in order to see the chart with update 1 and update 2.
4. The date in which update 3 was issued. Display and Approve dates have to be set
to correct date in order to see the chart with update 1, update 2 and update 3.
Note 1: In order to display charts with correct updated situation, always use current
date during your voyage. If your voyage lasts more than one week, set current date at
least once per week during your voyage.
Note 2: In order to display charts with correct updated situation during route planning,
always use planned date of each waypoint to check your plan.
1 2 3 4
Update 3
Update 2
Update 1
Base cell
Date
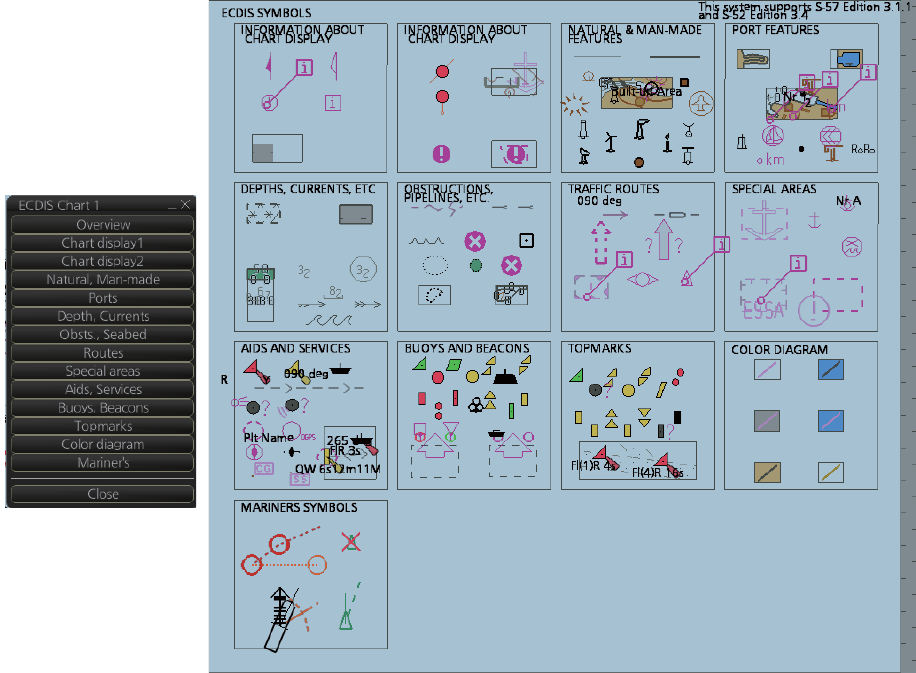
9. VECTOR (S57) CHARTS
9-6
9.3 Symbology Used in S57 Charts
You can familiarize yourself with the symbology used by browsing IHO Chart 1, which
is included in this system. Note that it behaves as any S57 chart and it follows your
selections. See section 8.2.
1. Click the [Chart INFO] and [Chart 1] buttons on the InstantAccess bar to show to
the [ECDIS Chart 1] menu, shown below.
2. Click a chart feature to show detailed information about the feature. Click [Over-
view] to show a compilation of all features, shown below.
9.3.1 Presentation library used for S57 chart features
The system uses the official IHO presentation library to draw S57 charts. The presen-
tation library is replaceable, but this feature is only intended to be used by qualified
service personnel and type approval authorities.
When this manual was published the official presentation library was "pslb03_4.dai",
known as "Official IHO presentation library for system Ed 3 revision 1, Edition: 3.4".
[ECDIS Chart 1] menu
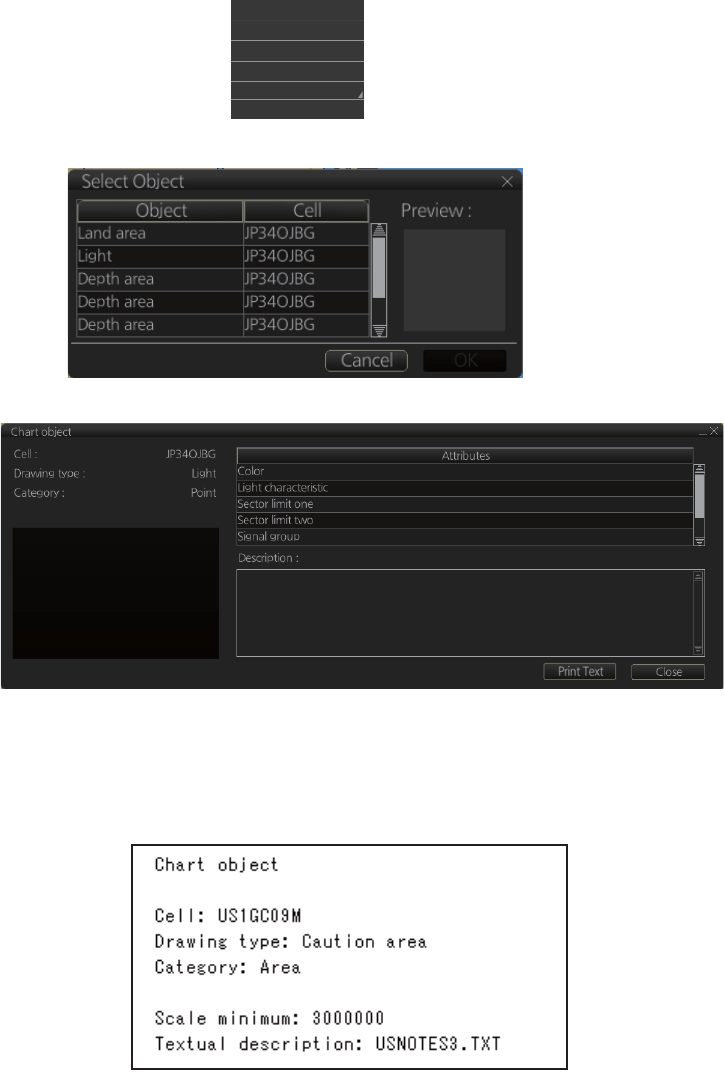
9. VECTOR (S57) CHARTS
9-7
9.4 How to Find Information About S57 Chart
Objects
The ability to cursor-pick an object to find additional information about the object is an
important function of the system. However, an unprocessed cursor pick, which does
not discriminate or interpret and merely dumps on the interface panel all the informa-
tion available at that point on the display, will normally result in pages of unsorted and
barely intelligible attribute information.
Do the following to find information about a chart object.
1. Get into the Voyage navigation mode or Voyage planning mode then rIght-click an
object to show the context-sensitive menu.
2. Click [Object INFO] to show the [Select Object] dialog box.
3. Click the object for which you want to know its details then click the [OK] button.
Note: If another window is active, the preview window may be partially obscured
by that window. Move the window to display the entire preview.
4. To print the chart object information, click the [Print Text] button. Below is a sam-
ple chart object printout.
Ship on center
Clear RADAR Info
Object INFO
Chart Legend
Manual Update
New Divider
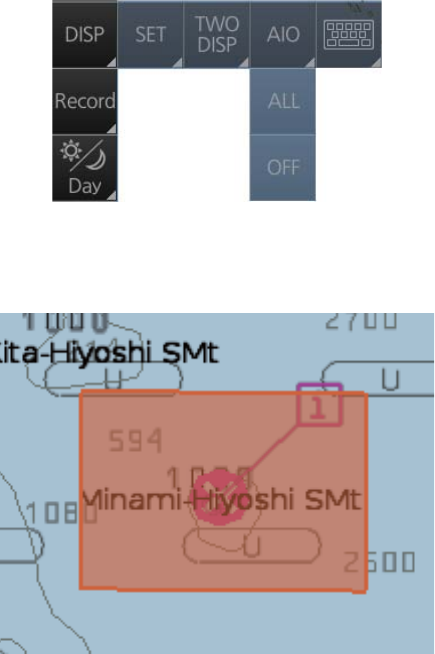
9. VECTOR (S57) CHARTS
9-8
9.5 Admiralty Information Overlay (AIO)
The Admiralty Information Overlay includes all Admiralty Temporary and Preliminary
Notices to Mariners (T&P NMs) and provides additional navigationally significant in-
formation from UKHO's ENC validation programme. The AIO is displayed as a single
layer on top of the basic ENC and is available free of charge as part of the Admiralty
S57 Chart Service and within Admiralty Value Added Resellers' services.
The AIO has been developed to ensure mariners can simply view the information they
need - in addition to the standard chart - to navigate safely and compliantly. By clearly
showing where important Temporary or Preliminary changes may impact a voyage,
the Admiralty Information Overlay will give seafarers the same consistent picture of
the maritime environment on their charts as they have always had.
The AIO license is free of charge for AVCS license holders.
9.5.1 Installation
Installation is the same as that for the ENC chart. See section 7.2.
9.5.2 How to display the AIO
Click the [DISP], [AIO] and [ALL] buttons to show the AIO. To hide the AIO, click the
[DISP], [AIO] and [OFF] buttons.
The area(s) that contain temporary or preliminary changes are marked with a hatched
red rectangle.
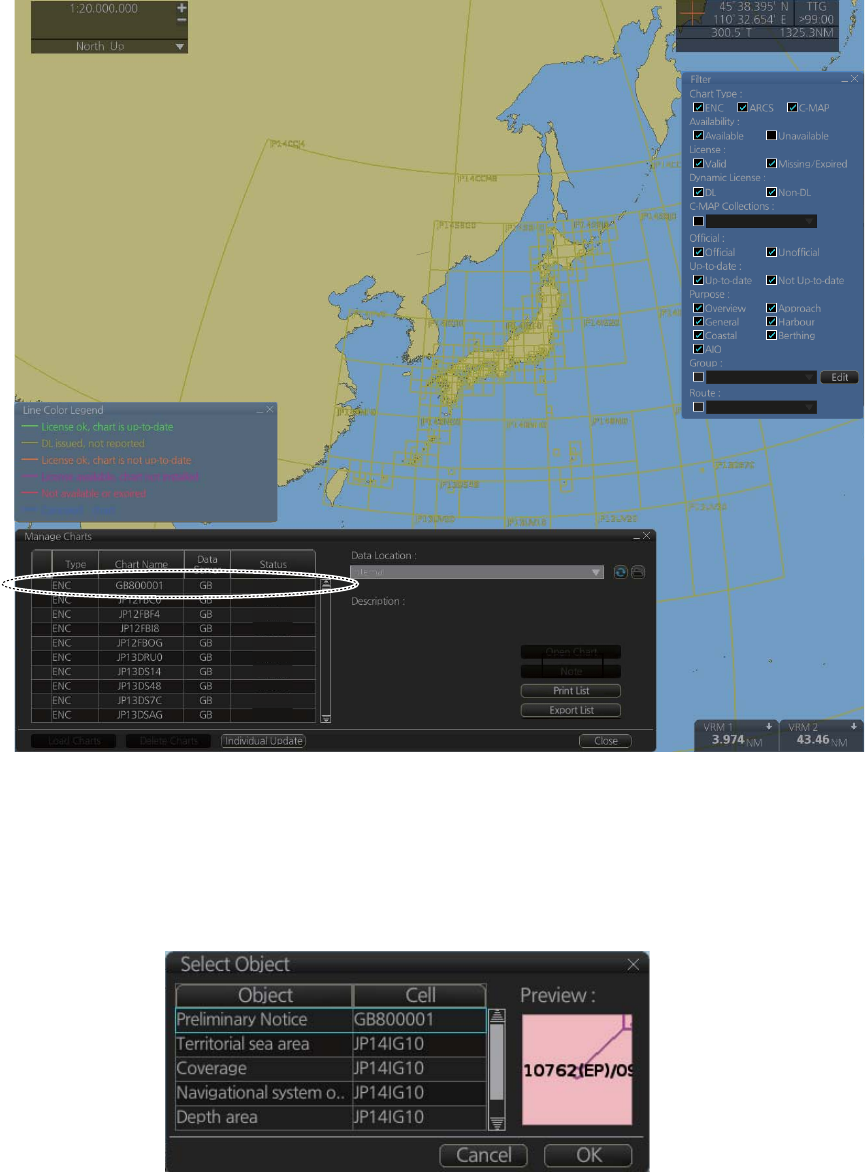
9. VECTOR (S57) CHARTS
9-9
9.5.3 Catalog of AIO cells
A catalog of AIO cells is maintained in the [Manage Charts] dialog box. To show this
box, get into the Chart maintenance mode then click the [Manage Charts] button on
the InstantAccess bar. The AIO cell is GB800001.
9.5.4 How to find AIO chart object information
Do the following to find chart object information contained in the AIO.
1. Right click a red hatched area in the chart area, then select [Object INFO] to show
the [Select Object] dialog box.
yes
yes
yes
yes
yes
yes
yes
yes
yes
yes
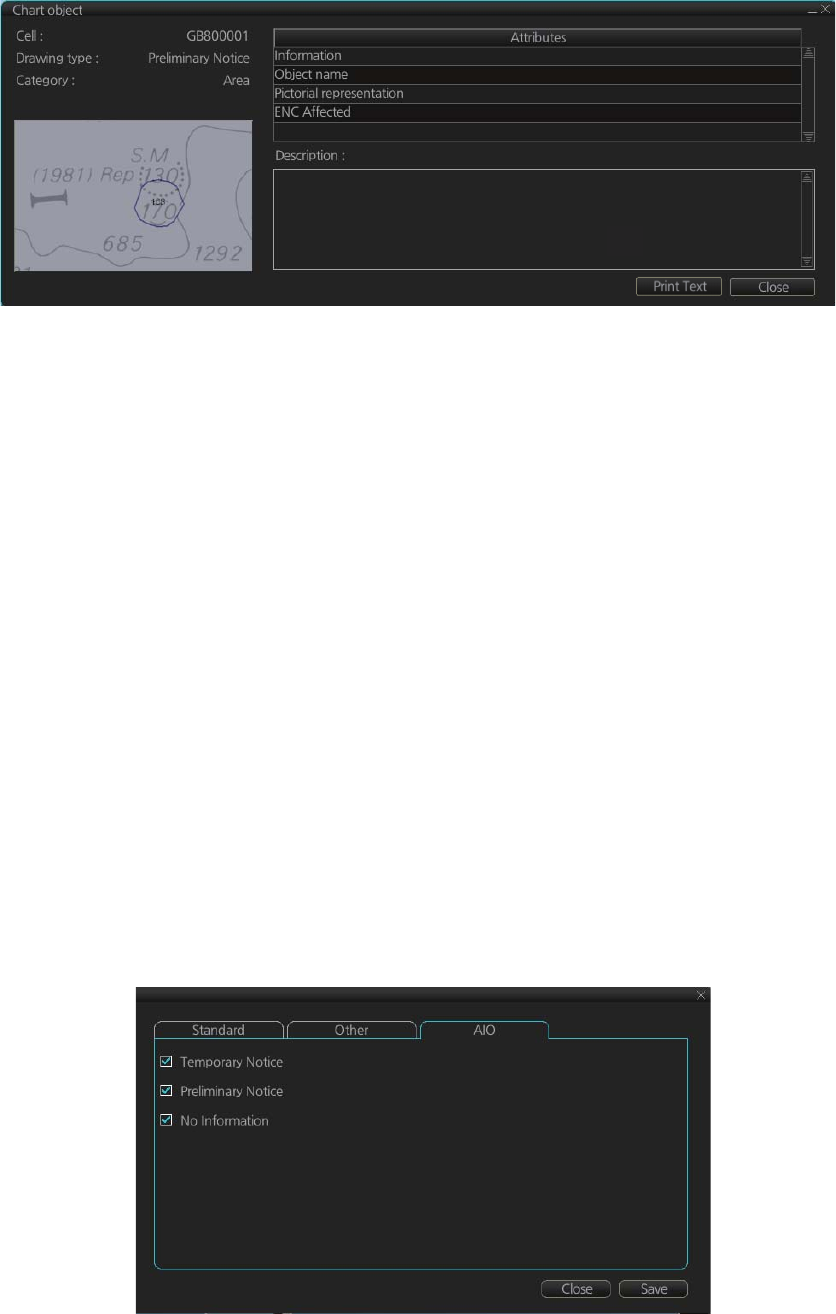
9. VECTOR (S57) CHARTS
9-10
2. Click [Preliminary Notice] in the dialog box to show the [Chart object] dialog box.
The [Chart object] dialog box shows the following information:
• Cell (name)
• Drawing type (Preliminary Notice, Temporary Notice)
• Category (AIO)
• The preview box provides a scaled-down image of the area selected. Click the im-
age to enlarge it.
• The [Attribute] window shows the attributes for the AIO area selected. To find infor-
mation about an attribute, click it to show its information in the [Description] box.
[Information]: Description of area (for example, danger area).
[Object name]: Object name (number)
[Pictorial representation]: Associated diagram when applicable.
[ENC affected]: ENC affected by the NM
Textual description: Full text of the Notice to Mariners (NM) appears below [ENC
Affected].
To print the chart object information, click the [Print Text] button.
9.5.5 How to select the information to display
Select what type of notices to display as follows:
1. Click the [DISP], [SET] and [Chart DISP] buttons on the InstantAccess bar.
2. Click the [AIO] tab.
3. Check or uncheck items as appropriate.
4. Click the [Save] button to save settings then click the [Close] button to close the
menu.

10-1
10. C-MAP CHARTS
The descriptions in this chapter apply to the CM-93/3 charts. (This system does not
support CM-93/2 charts.)
10.1 C-MAP Cartographic Service
Your chart system has the capability of using and displaying the latest C-MAP world-
wide vector chart database. These charts are fully compliant with the latest IHO S-57
3.1 specifications.
In order to prepare the system for use with the C-MAP database, there are a number
of things that must be done.
10.2 How to Register the System at C-MAP Norway
Your system has the capability to use the C-MAP database. To do so an Aladdin eTo-
ken (supplied by C-MAP) must be connected to the system. The eToken provides the
system with a unique System ID that enables C-MAP to issue correct licenses. The
actual System ID can be found on the eToken itself, on the back of the installation CD
box or on a sticker placed on the equipment. This ID must be provided on all chart or-
ders, by e-mail (license@C-MAP.no).
10.3 How to Order Charts
A chart order may be sent together with system registration as described above. It is
essential that the required information be sent to C-MAP when ordering charts for a
system. C-MAP issues order forms specifying the information that is required, and
contains vital information that will allows C-MAP to monitor and maintain your licenses
throughout the lifetime of the system. Charts can be ordered by Zone, Area or Cell and
these can be seen on the C-MAP web site or by downloading the Chart Product cata-
log also available on the web site. Price quotations can be obtained via your chart
dealer or direct from your local C-MAP office. Once the license order has been pre-
pared it should be emailed to license@C-MAP.no.
10.4 How to Apply for Licenses
Once the order has been received at C-MAP, a license will be generated and trans-
mitted back to the operator. This may be in the form of a single alphanumerical string
(16 characters), or in the form of a file called PASSWORD.USR. Once this license has
been received it should be input using the License Administrator software designed
and supplied by the chart manufacturer. There are two types of licenses, purchase
and subscription. Purchase licenses are valid indefinitely while subscription licenses
need to be renewed every 12 months from the start of the subscription. Failure to re-
new a subscription will result in the charts becoming unavailable.

10. C-MAP CHARTS
10-2
10.5 Troubleshooting
If you are having problems installing your software or charts please check the follow-
ing before contacting C-MAP:
• Check that the charts are available, with the chart management function.
• Check that the license is correctly installed, with the license function.
Contact Information: For information or help please call you're nearest C-MAP Office
(details can be found on the reverse side of the C-MAP chart CO box) or contact C-
MAP Norway. E-mail: technical@C-MAP.no
10.6 Chart Subscription Services
10.6.1 C-MAP services
The C-MAP DL service is an ENC service available on DVD or online, in C-MAP SENC
format. The C-MAP DL service ensures immediate access to ENC licenses whenever
they are needed. ENC licenses available in seconds automatically via online C-MAP
service providers. Cost is controlled via pre-set budgets and spending limits, giving
shipowners a true "pay-as-you-go" service. For further details about C-MAP DL, con-
tact a C-MAP provider.
Note 1: CM-ENC is available. If you change CD-ROM service to DVD service, you
need to also have a new license for the DVD service. Contact your chart agent or C-
MAP for details.
Note 2: PC and internet connection with e-mail are required. Further it is necessary to
access Jeppesen approx. once every two weeks.
10.6.2 What is ENC delivery?
ENCs can be distributed as ENC delivery or SENC delivery. Both deliveries can be
used in this system.
In ENC delivery, charts are distributed directly from source like PRIMAR, IC-ENC,
JHA, etc. They are delivered onboard in ENC format (using S-57 and S-63) then
charts are loaded into the system.
In SENC delivery, charts are converted from ENC to SENC before delivery to onboard
and loading to the system. A CM-ENC delivery is SENC delivery.
Important notices
• If you are using both services (ENC and SENC deliveries) having the same chart
name loaded into the system through both deliveries, priority of displaying the chart
is in ENC delivery.
• Chart updates for ENC delivery are only for charts of ENC delivery and chart up-
dates for SENC delivery is only for charts of SENC delivery. You have to keep
charts up-to-date separately.
• If you change from ENC delivery to SENC delivery, remove old charts from the sys-
tem before loading charts from new delivery.
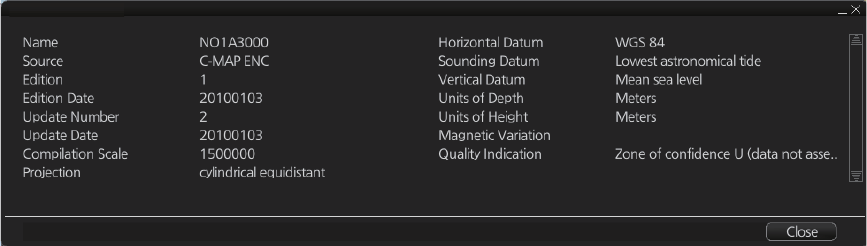
10. C-MAP CHARTS
10-3
10.7 Chart Display
10.7.1 Introduction
C-MAP charts are S57 charts displayed together with ENC (S57) and CM93/3 charts.
These charts have the priority order shown below.
1. CM- ENC
2. C-MAP 93/3 Prof and C-MAP 93/3 Prof+
If the same navigational purpose charts are available over an area, priority is as shown
above. Areas where ENC is not available CM-ENC charts are shown. Where C-MAP
Prof or CM93 Prof+ are available, CM 93/3 charts are displayed.
The chart legend provides various data about the chart currently displayed. To find
info for current position, click the [TM/CU Reset] button then click the [Chart INFO] but-
ton on the InstantAccess bar followed by the [Chart Legend] button. To find info for a
specific location, put the cursor on the location then right-click and select [Chart Leg-
end]. Click the [Close] button to close the display.
This system is capable of showing more than one chart at a time. This feature is called
the multi-chart display. If one chart does not cover the whole display, the system will
open more chart cells for display, if appropriate cells for the displayed area are avail-
able. The chart legend shows information about charts displayed on the electronic
chart display area.
[Name]: Name of chart.
[Source]: Source of chart.
[Edition]: Edition number of the chart.
[Edition Date]: Date the edition was published.
[Update Number]: Update number.
[Update Date]: Date of update.
[Compilation Scale]: The scale of the original paper chart is shown here.
[Projection]: Projection of current chart.
[Horizontal Datum]: Horizontal datum used with current chart.
[Sounding Datum]: Datum used to create sounding data.
[Vertical Datum]: Vertical datum used with current chart.
[Units of Depth]: Unit of depth used with current chart.
[Units of Height]: Unit of measurement used to measure height of objects above sea
level.
[Magnetic Variation]: Amount of magnetic variation. A positive value indicates a
change in an easterly direction and a negative value indicates a change in a westerly
direction.
[Quality Indication]: Quantitative estimate of the accuracy of chart features, given by
the chart producer.
Chart Legend

10. C-MAP CHARTS
10-4
10.8 Permanent Warnings
Permanent warnings help you keep the C-MAP up-to-date and these are shown at the
bottom of the screen. Permanent warnings appear if the system detects a condition
that may cause a chart to be not up-to-date.
Message Meaning, Remedy
CMAP: Database not up to date Database is not up to date. Update the
data base.
CMAP: Dynamic license reporting overdue The time for the “Next Report Date” has
passed. This occurs once every 12 hours if
the condition continues. Get into the Chart
maintenance mode then click the [License]
button. Click the [C-MAP] tab then the [Or-
der Update File] button.
CMAP: Dynamic licensing credit limit You have exceeded the allotted credit limit.
Raise credit limit.
CMAP: No connection to eToken eToken dongle is not connected (inside the
Processor Unit).
CMAP: permits have expired You have an expired permit for a chart. Re-
move the chart or renew subscription for
the permit.
No connection to dongle. Dongle not connected. Connect dongle.
Permit expired (SSE 25): XXXXXXXX
(Chart name replaces Xs.)
You have an expired permit for a chart. Re-
move the chart or renew subscription for
the permit.
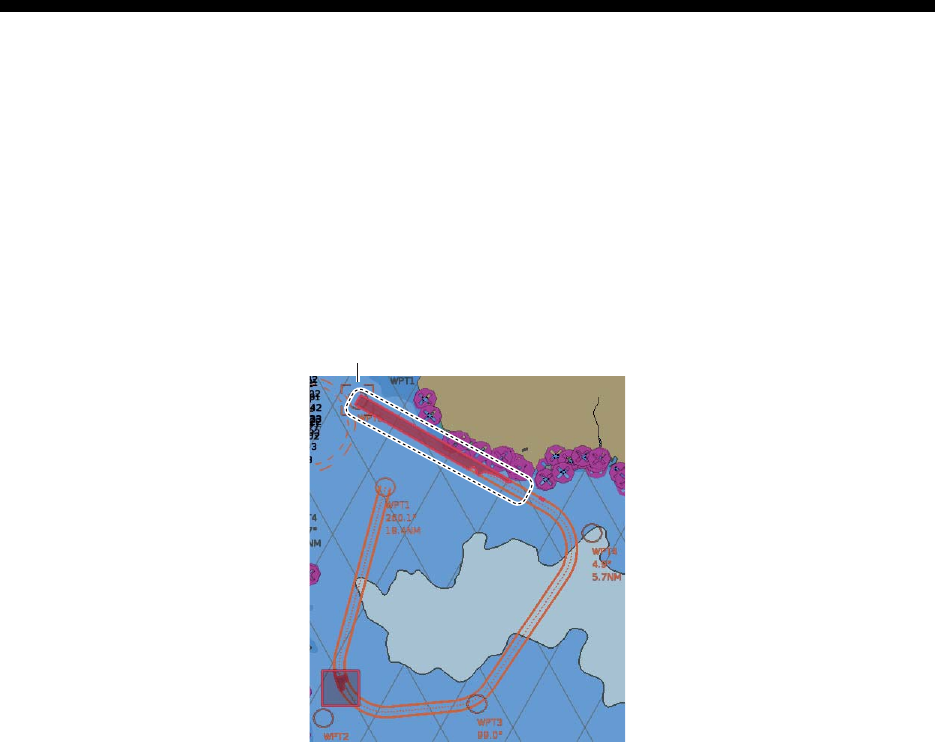
11-1
11. CHART ALERTS
The chart radar can detect areas where the depth is less than the safety contour or
detect an area where a specified condition exists. If prediction of own ship movement
goes across a safety contour or an area where a specified condition exists, the system
does the following:
• Highlights warning alert objects in red (route checked in route planning, and route
navigation)
• Provides visual alerts in the [Alert] box for warning alert objects (route navigation)
• Sounds an aural alarm for warning alert objects (route navigation)
For this function, the chart radar utilizes the chart database (S57 charts) stored on the
SSD in SENC format. Note that the chart radar calculates dangerous areas using
the largest scale chart available, which may not be the visualized chart.
You can select objects that are included for calculation of danger area (for example,
restricted areas). A dialog box lists the various areas that activate danger warnings.
You can also define your own safe area by creating a user chart area. The system can
utilize these areas when calculating chart alerts.
zThe system can check the following for you:
• Predicted movement area of own ship
• Planned route with an easy to use locator function to find dangerous areas
zThe system will highlight the following for you
• Dangerous areas inside predicted movement area of the own ship
• Dangerous areas inside your monitored route
• Dangerous areas inside your planned route
Warning (highlight) chart object
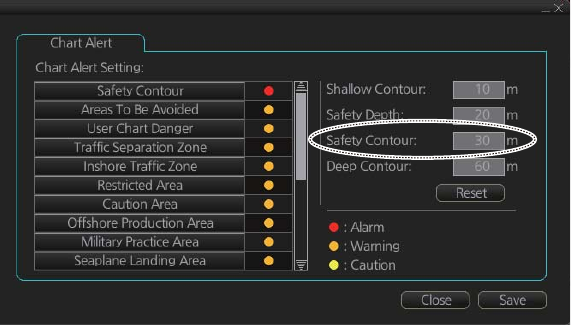
11. CHART ALERTS
11-2
11.1 Chart Alerts
Official S57 chart material contains depth contours that can be used for calculation of
chart alerts. A chart database also includes different types of objects that the operator
can use for chart alerts. The procedure for setting chart alerts is outlined below.
1. Select suitable safety contour for your own ship. See paragraph 11.1.1 for how to
set the safety contour.
2. In the Voyage planning mode, define a new route or select an existing one. Make
a chart alert calculation of the route if there are indications of danger areas in the
route. Modify your route if necessary and do the chart alert calculation again. To
modify an existing route see section 12.4.
3. Select route as monitored route.
4. Set check area for your own ship.
The system is now ready for chart alert calculation of monitored route and estimated
own ship position.
11.1.1 How to set safety contour
Select safety contour suitable for the own ship.
1. Click the [DISP], [SET] and [Chart Alert] buttons on the InstantAccess bar to show
the [Chart Alert] page.
2. Enter desired depth at [Safety Contour] then click the [Save] button.
A depth contour is created on the chart according to the safety contour value entered.
Note: If the chart does not contain chosen depth contour, the system will automatically
select next deeper contour.
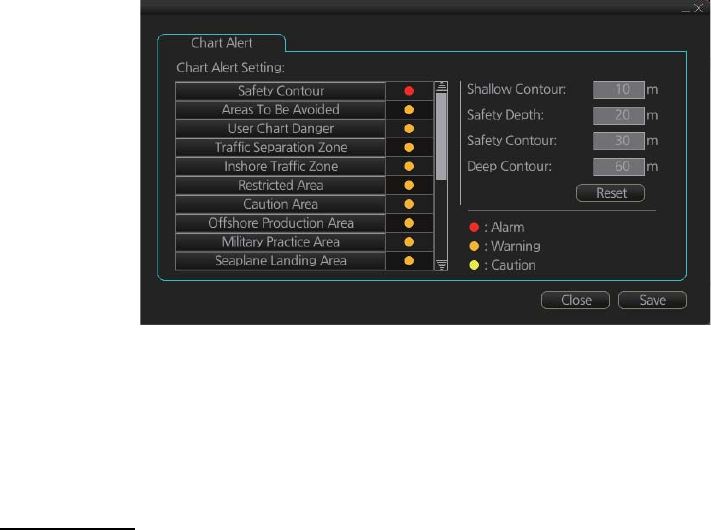
11. CHART ALERTS
11-3
11.1.2 How to select objects used in chart alerts
You can also include calculation areas that have to be noted when sailing (for exam-
ple, restricted areas). To include these areas in chart alerts, do the following:
1. Click the [DISP], [SET] and [Chart Alert] buttons on the InstantAccess bar to show
the [Chart Alert] page.
2. Click a checkmark to select the alert choice ([Warning] or [Caution]). In the exam-
ple above, [Restricted Area] and [Military Practice Area] are selected to [Caution]
and all other times are set for [Warning].
3. Click the [Save] button to finish.
Note: C-MAP Pro+ charts may take several minutes to identify danger areas.
List of areas
There are the areas that the chart radar detects and provides the audible alert and/or
visual alert if estimated own ship position or planned or monitored route crosses the
area defined on the [Chart Alert] page. You can select from the following areas:
• Safety Contour
• Areas To Be Avoided
• User Chart Danger
• Traffic Separation Zone
• Inshore Traffic Zone
• Restricted Area
• Caution Area
• Offshore Production Area
• Military Practice Area
• Seaplane Landing Area
• Submarine Transit Lane
• Anchorage Area
• Marine Farm/Aqua Culture
• PSSA Area
• UKC
• Non-official ENC
• No Vector Chart
• Not Up-to-date
• Permit Expired
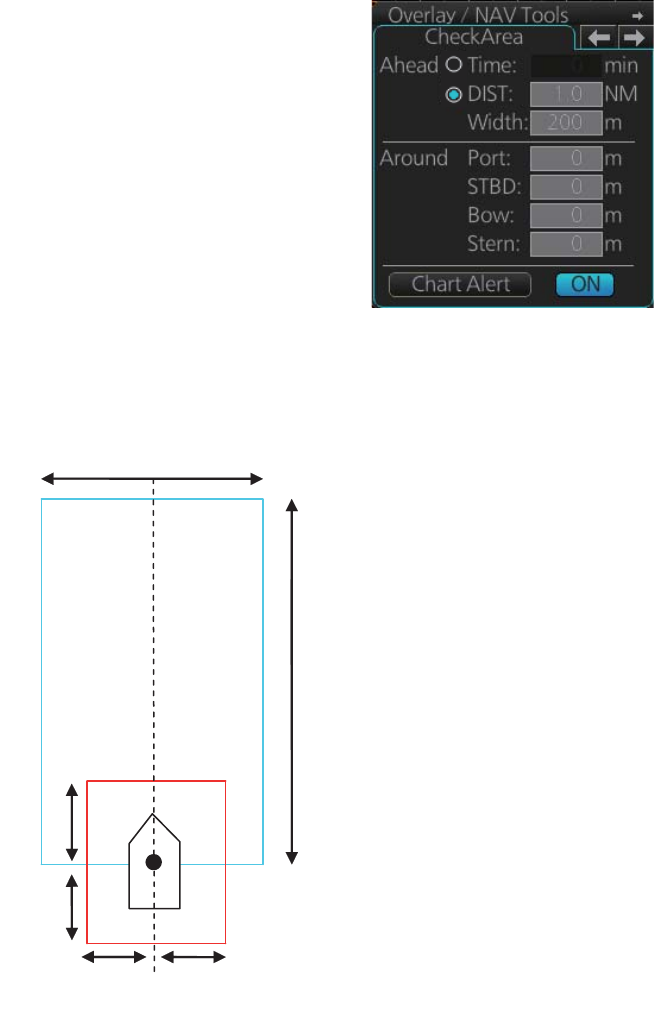
11. CHART ALERTS
11-4
11.2 How to Activate Own Ship Check
Calculation of own ship predicted movement area is
done using a check area about own ship position.
Set the check area as follows:
1. Select the [Check Area] page from the [Overlay/
NAV Tools] box.
Note: The [ON] button may not be shown de-
pending on installation setting.
2. Set the ahead time or distance and ahead width, referring to the figure below. Al-
so, set the "Around" figures: port, starboard, bow and stern check distance. The
reference point is the conning position (CCRP).
3. To select the objects to use in chart alerts, click the [Chart Alert] button and see
paragraph 11.1.2.
4. To show or hide the chart alert area figure, click the button ([ON] or [OFF]) to the
right of the [Chart Alert] button at the bottom of the [Check Area] page.
Note: When the button to the right of the [Chart Alert] button is not displayed, this
means that the own ship check is active always.
When an object having a Warning setting enters the Check Area, the object is high-
lighted in red and the aural alarm sounds.
Width
Distance
Ahead
Bow
Stern
Port Starboard
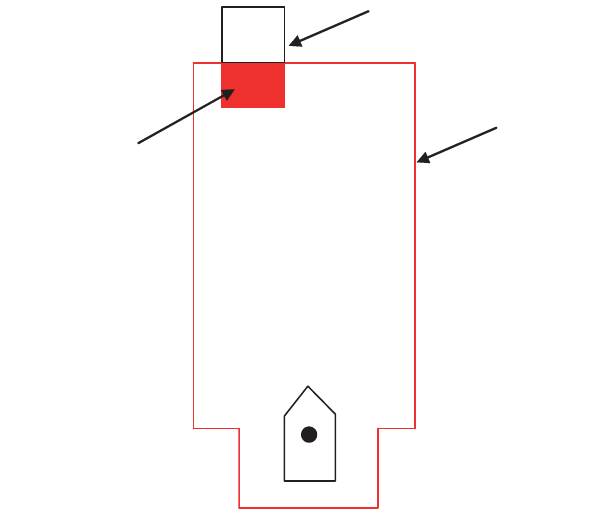
11. CHART ALERTS
11-5
11.3 Route Planning
The system will calculate chart alerts using user-defined channel limit for routes. Dan-
ger areas are shown highlighted if safety contour or user-chosen chart alert areas are
crossed by the planned route. For more information on route planning, see chapter 12.
Note: If your voyage is going to take a long time or you are planning it much earlier
than it is to take place, use the Display date and Approved until dates corresponding
to the dates you are going to sail.
11.3.1 Chart alerts for route planning
You can generate a list of chart alerts that cross by the planned route. This can be
done as follows:
1. Enter safety contour you want to use.
2. Plan a route; define waypoints and other necessary information. See chapter 12
for route planning.
3. Select dangerous objects to be monitored during route monitoring, on the [Alert
Parameters] page in the [Route Plan] dialog box, shown below.
a) Click the [PLAN], [Planning] and [Route] buttons.
b) Click the [Alert Parameters] tab.
c) Click the alert to process. Show a red circle for visual and aural alerts, or yel-
low circle for visual alert. Note that the safety contour is always shown in red.
Highlight (red)
Object selected
for Chart Alert
Check Area
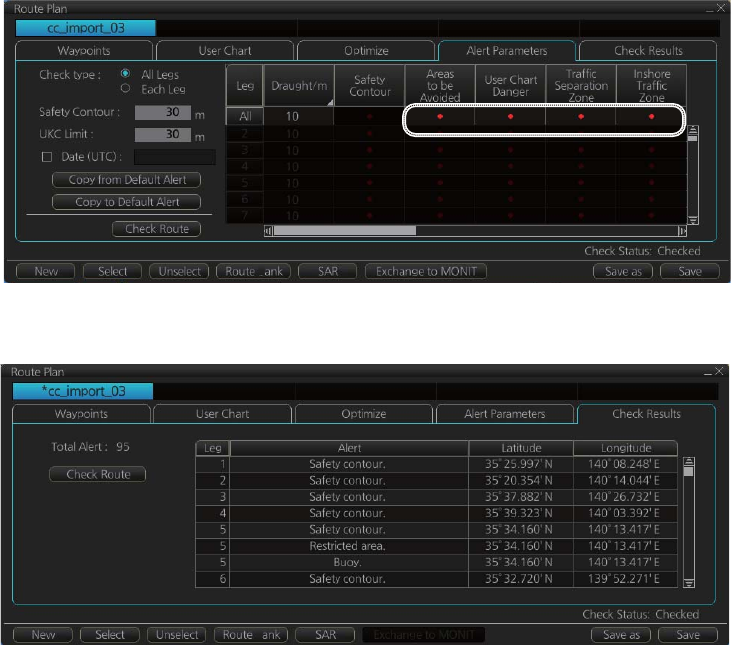
11. CHART ALERTS
11-6
4. Click the [Check Route] button to generate a list of chart alerts. The results appear
on the [Check Results] page.
The figure above shows the alerts to be monitored. If there are alerts included in
the planned route, check alerts leg by leg, or check alerts by using category of
alert.
B
B
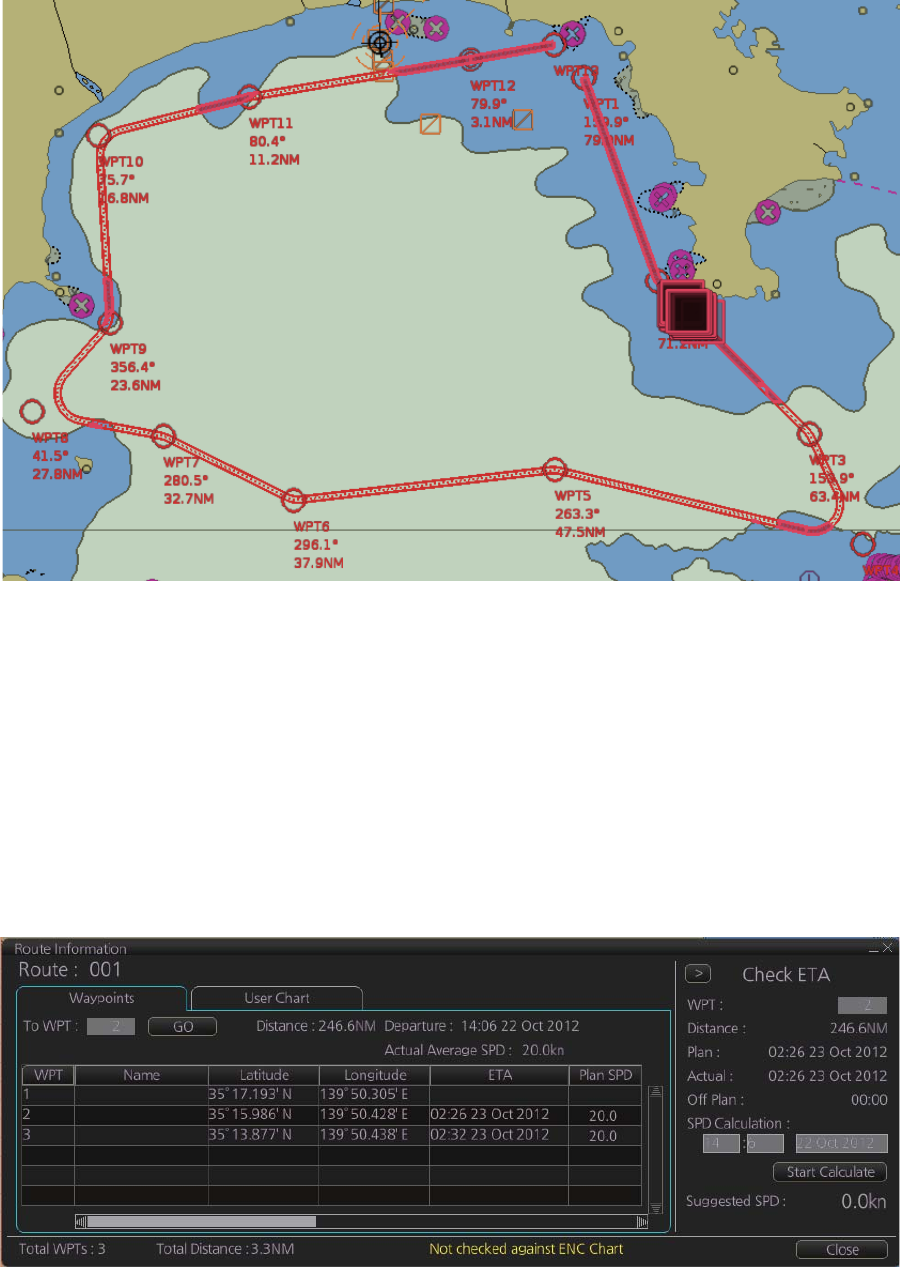
11. CHART ALERTS
11-7
11.4 Route Monitoring
• When the ship enters a check area specified as a caution alert, a visual alert is gen-
erated. Neither the object in the area or the route is highlighted.
• When the ship enters a check area specified as a warning alert, a visual alert is gen-
erated and the object and route are highlighted.
• A red box(es) indicates an area having several highlighted objects.
The system has a route monitor that facilitates safe use of routes. You can check your
route plan for safe water and you can attach a user chart and Notes that you intend to
use together with a route plan. To show the [Route Information] dialog box, get into
the Voyage navigation mode, then click the [Route] and [Route INFO] buttons. Click
the [Waypoints] tab.
11. CHART ALERTS
11-8
This page is intentionally left blank.

12-1
12. ROUTES
12.1 Route Planning Overview
A route plan defines the navigation plan from starting point to the final destination. The
plan includes:
Using the above-mentioned data, the system calculates speed, course and length for
each leg, ETAs for each waypoint, fuel consumption and WOP. It also calculates safe
water areas based on user-defined channel limits. The calculated data is displayed in
tabular form, which can be printed as a documented route plan and also stored in a
file for later use.
Note 1: If you have small scale chart(s) on display having the whole eastern/western
(0-180°E/0-180°W) hemisphere and a part of the other hemisphere on display, there
is a limitation to display a route. To avoid this, set chart center so that the whole east-
ern/western hemisphere is not on the display. A maximum of five routes can be edited
simultaneously.
Note 2: If a planned route's Safety Margin or Channel Limit contains excessive land
masses, the chart radar may freeze during a route check. If this occurs, reset the chart
radar, then adjust the Channel Limit and Safety Margin settings in the Route Plan di-
alog box's Waypoints so that land mass is not included in the route.
A route plan defines the navigation plan from starting point to the final destination. The
plan includes:
• Route name
• Name, latitude and longitude of each waypoint
• Radius of turn circle at each waypoint
• Safe channel limits
• Chart alarm calculation based on channel limits against chart database and user chart
danger
• UKC calculation
• Deadband width, nominal deadband width used for the chart operating modes with
moderate accuracy and economical sailing behavior
• Minimum and maximum speed for each leg
• The navigation method (rhumb line, great circle)
• Fuel saving
• ETD for the first waypoint
• ETA for the last waypoint
• Ship and environmental condition affecting the ship speed calculation
• Name of the user chart to use during route navigation together with the planned route
• Name of the Notes to use during route navigation together with this planned route, in
the user chart dialog box
Main functions of route planning are:
• Define waypoints
• Define turnings for each waypoint
• Define channel limits for each leg (a leg is the line connected between two waypoints).
The channel limits are used to detect chart alerts when you are planning or monitoring
your route.
• Define the speed for each leg
• Calculation for ETD and ETA
• Calculation for most economical sailing
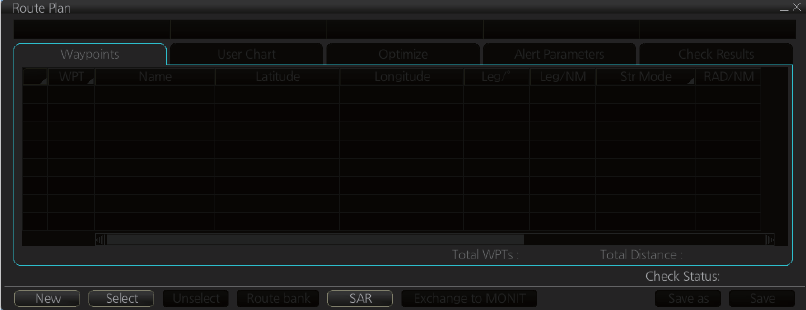
12. ROUTES
12-2
12.2 Main Menu for Route Planning
The main parameters for the route planning are:
• Latitude and longitude of the waypoint
• Channel limits to the waypoint
• Turning radius of the waypoint
• Maximum speed limit and planned speed for each leg
There are two phases for a route: Route Plan and Route Monitor. Route plan is used
for planning the route and route monitor is used to control a route for monitoring.
To complete route planning, do the following.
1. Create a new route or select an existing one. See section 12.3.
2. Modify your route if necessary. See section 12.4.
3. Make chart alert (safe water) calculation. See section 12.3.5.
4. Optimize your route. See section 12.7.
12.3 How to Create a New Route
To make a complete route for a voyage, do the following:
1. Click the [PLAN] button on the Status bar to activate the Voyage planning mode.
2. On the InstantAccess bar, click the [Planning] button followed by the [Route] but-
ton to open the [Route Plan] dialog box.
3. Click the [New] button.
4. Use the cursor to select a position for the first waypoint then push the left mouse
button. A waypoint mark appears on the position selected, and the latitude and
longitude of the position, etc. are entered into the [Route Plan] dialog box. After
entering a waypoint, edit Name, Steering mode ([Rhumbline] or [Greatcircle]), Ra-
dius, Channel limit, Plan SPD, SPD Max and Margin as appropriate in the [Route
Plan] dialog box, using the keyboard on the Control Unit or the software keyboard.
To change the settings of items other than L/L position: Put the cursor on an
item to show up and down arrows then click required arrow.
To change L/L position: Put the cursor on the digit to change and roll the scroll-
wheel.
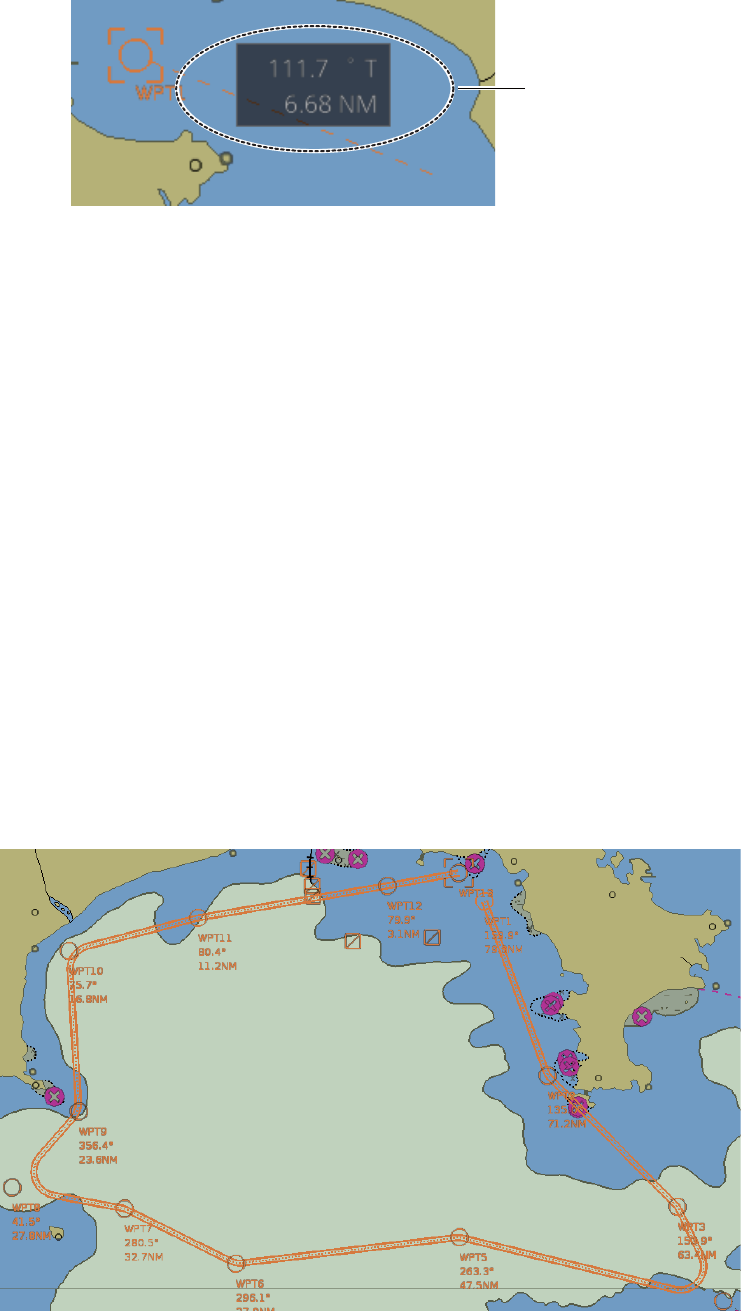
12. ROUTES
12-3
Note: A guide box that shows the range and bearing between waypoints as you
drag the cursor is available. You can show or hide the box with the [Guide Box]
button on the InstantAccess bar. Click the button to show its background color in
light-blue to display the guide box.
5. Repeat step 4 to enter other waypoints.
6. After you enter the final waypoint, right-click the display area to show the context-
sensitive menu then select [Finish].
7. Click the [Save] button. Enter a name (max. 53 alphanumeric characters) for the
route, using the keyboard on the Control Unit or the software keyboard. Click the
[OK] button to finish.
8. Use the [Alert Parameters] page to define the safety contour and other specified
conditions for checking the route. Click a "block" under a safety item to show a red
circle to get check boxes and highlights or yellow circle to get the highlight. A pa-
rameter can also be assigned globally to all legs from the context-sensitive menu.
See section 12.3.4 for how to use the [Alert Parameters] page.
9. Use the [Check Route] button on the [Alert Parameters] page to detect areas
where the depth is less than the safety contour or where specified conditions exist.
The results appear on the [Check Results] page. This system can examine chart
database against planned route to make a list of alerts where a route crosses a
safety contour or specified areas used in chart alerts.
10. Use the [User Chart] page to link, de-link a user chart(s) with the route. See
section 12.3.2.
11. Use the [Optimize] page to enter parameters for route optimization.See
section 12.3.3.
Guide box
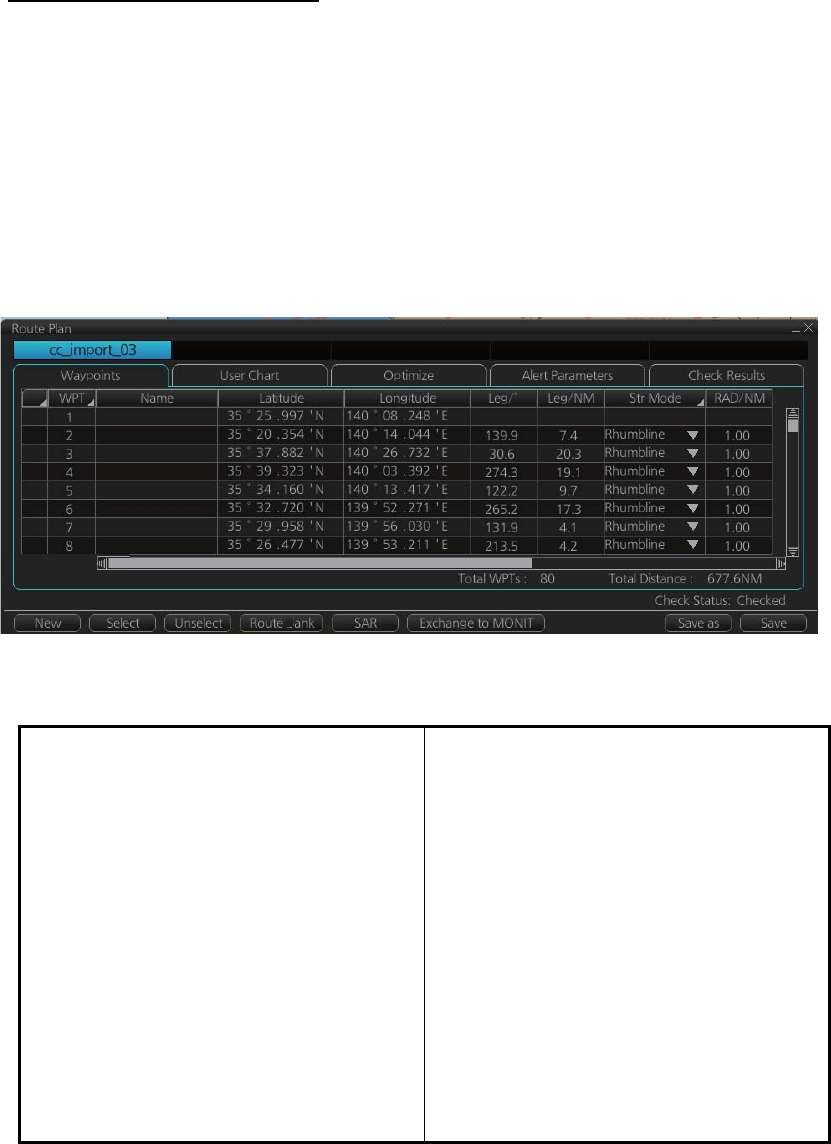
12. ROUTES
12-4
How to use the Undo feature
The Undo feature, available when creating a route and a user chart, can be accessed
from the [UNDO] button on the InstantAccess bar. In route creation the feature is used
with waypoint and text input as follows:
Waypoint input: Delete last-entered waypoint.
Text input: Erase last-entered character or character string.
Note: The [UNDO] button is not displayed on the FURUNO 19-inch monitor unit.
12.3.1 How to use the Waypoints page
The following fields and boxes can be found in the [Waypoints] page. Scroll the list
rightward to see hidden items.
[WPT]: Each waypoint has a number.
[Name]: You can name each waypoint.
[Latitude]: WPTs latitude coordinate is
displayed in WGS-84 datum.
[Longitude]: WPTs longitude coordinate is
displayed in WGS-84 datum.
[Leg/°]: Bearing of leg
[Leg/NM]: Length of leg (nm).
[Str Mode]: Define steering mode for each
leg - rhumb line or great circle. Click to se-
lect [Rhumbline] or [Greatcircle].
[RAD/NM]: Define turning radius for each
waypoint. To change a radius, put the cur-
sor in this column to show up and down
arrows. Click the arrows to set the radius.
[Ch Limit/m]: Define channel limit for each
leg.
[Plan SPD]: Define planned speed to use
with a leg.
[SPD Max]: Define maximum speed to
use with a leg.
[Margin/m]: Define extension for channel
to be checked against selected alerts.
[PL 1/m, PL 2/m]: One or two sets of par-
allel lines, colored orange, can be drawn
on a route. Set the distance (in meters) to
offset the lines from the route,
from -99999 to 99999. Parallel lines allow
the navigator to maintain a given distance
away from hazards. See the illustration on
the next page.
B
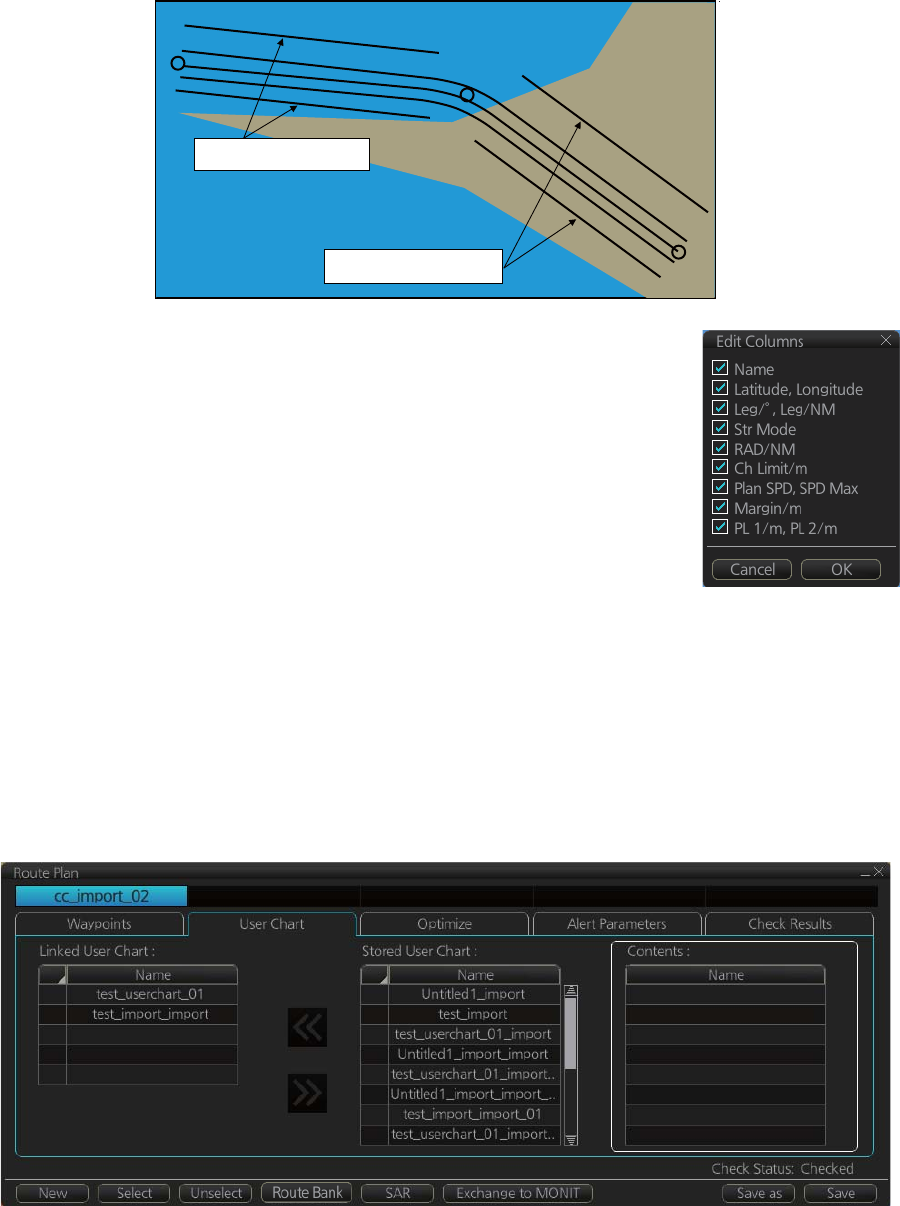
12. ROUTES
12-5
Note: You can select the route information data to display on
the [Waypoints] page with the context-sensitive menu. Right-
click an item from [WPT] to [PL 2/m] then select [Edit Columns]
to show the context-sensitive menu. Check or uncheck items
as appropriate then click the [OK] button.
12.3.2 How to use the User Chart page
The [User Chart] page lets you link user charts to routes. To link a user chart, click the
box to the left of the user chart name in the [Stored User Chart] list to show a check-
mark. Click the [<<] button to copy that name to the [Linked User Chart] list. To de-link
a user chart, click the box to the left of the user chart name in the [Linked User Chart]
list then click the [>>] button to erase the name. The contents of each user chart are
shown in the [Contents] window.
[Linked User Chart]: List of user charts linked with selected route.
[Stored User Chart]: List of stored user charts.
[<<] button: Link a stored used chart. Check the chart in the [Stored User Chart] list
then click this button. The user chart name is then copied to the [Linked User Chart]
list.
[>>] button: Click to remove selected (checkmarked) user chart from the [Linked User
Chart] list.
[Contents]: Lists the objects saved to the user chart selected.
WPT2
WPT1
WPT3
Parallel Line for Leg 1
Parallel Line for Leg 2

12. ROUTES
12-6
12.3.3 How to use the Optimize page
After all waypoints are inserted and you have made safe water calculation, you can
optimize your route, on the [Optimize] page. If not selected, then optimization will be
done automatically with max. speed. If you want do optimization with a specific strat-
egy, see section 12.7 for how to optimize a route.
[Type]: Select optimization strategy: maximum speed, time table, maximum profit, or
minimum cost.
[Set ETD]: Set date, time and waypoint to start from.
[Parameters]: Set the parameters for optimization, speed limit and income (max prof-
it).
[Edit Cost Parameters] button: Enter fuel consumption figures. See section 21.3.
[Set ETA]: For the type [Time table], set the date and time that you want to arrive at
the waypoint selected.
[Optimized Speed/ETA]: The optimized speed for the date and time entered at [Set
ETA] appears here, after clicking the [Calculate] button.
[Calculate] button: Click to calculate optimization.
12.3.4 How to use the Alert Parameters page
The [Alert Parameters] page sets the alert conditions to use when checking a route.
Put a red circle for an item to highlight. The relevant alerts are shown in the [Check
Results] page.
You can select the safety contour and chart alerts used to check the safety of the
route. This allows you to check the safety with conditions different from those selected
n for system use. This is useful when making a route for different loading or sailing
conditions.
Click each box to show
one of the following:
- Red circle (Item
highlighted in red)
- Yellow circle (No
highlight)

12. ROUTES
12-7
Context sensitive menus
A context-sensitive menu for setting the draught is available on the [Alert Parameters]
page. Right-click [Draught/m] to show the menu. [Set "ALL" setting to all legs] applies
the draught value of [Check type: All Legs] to all legs. [Clear setting] restores previous
settings for each leg.
Radio buttons, input boxes Alert items
Item Description Item Description
[Check
type]
Check how to apply the alerts,
to every leg or individual leg.
(Only [Draught] can be applied
to every leg.)
[Draught/m] Ship’s draught
[Safety
Contour]
Set the safety contour (in
meters).
[Safety Contour] Safety contour
[UKC Limit] Under keel clearance limit. [Areas to be
Avoided]
Areas to be avoided
[Date
(UTC)]
A chart may have date-depen-
dent features. Enter the actual
data of embarkation to know
date-dependent features.
[User Chart Dan-
ger]
User chart danger area
[Copy from
Default
Alert] button
Copy the default alert settings
to this route.
[Traffic Separa-
tion Zone]
Traffic separation zone
[Copy to
Default
Alert] button
Copy the alert settings for this
route as default alert settings.
[Inshore Traffic
Zone]
Inshore traffic zone
[Check
Route]
button
Click to check route for safe
navigation. The results appear
on the [Check Results] page.
[Restricted Area] Restricted area
[Leg] Leg number [Caution Area] Caution area
[Offshore Pro-
duction Area]
Offshore production area
[Military Practice
Area]
Military practice area
[Seaplane Land-
ing Area]
Seaplane landing area
[Submarine Tran-
sit Lane]
Submarine transit lane
[Anchorage Area] Anchorage area
[MarineFarm
Aquaculture]
Marine farm aquaculture
[PSSA Area] Particularly Sensitive Sea Area
[UKC Limit] Under keel clearance limit
[Non-official
ENC]
No official ENC data
[No Vector Chart] No vector chart for area
[Not Up-to-date] Chart not up to date.
[Permit Expired] Permit for chart has expired.
Set “ALL” setting to all legs
Clear setting
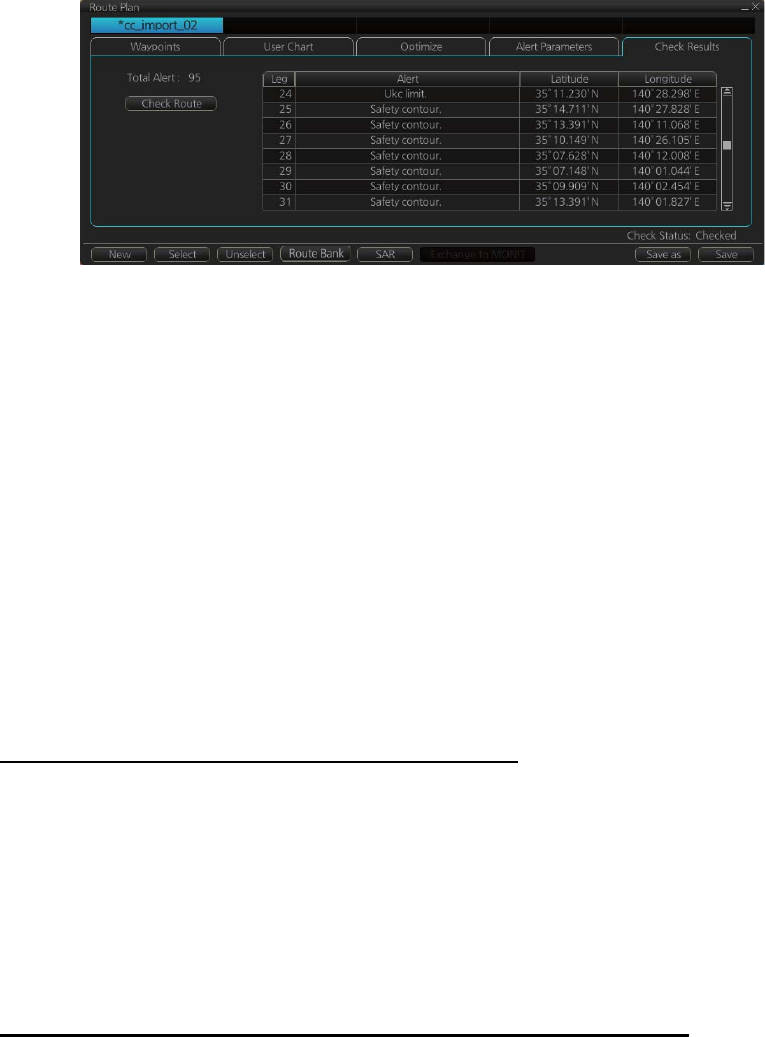
12. ROUTES
12-8
12.3.5 How to use the Check Results page
The [Check Results] page allows you to make safe water calculation for your route.
Click the [Check Route] button to do the check. After the button is operated, the alert
type and latitude and longitude position of the alert appear for applicable legs on the
route.
Note 1: In order to display charts with correct updated situation, always use current
date during your voyage. If your voyage lasts more than one week, set current date at
least once per week during your voyage.
Note 2: A route check can take longer with C-Map or CM-ENC charts. Wait until the
completion of the check.
12.4 How to Modify an Existing Route
12.4.1 How to change waypoint position
To change position of a waypoint you have the following choices:
• Drag and drop waypoint using the left button.
• Enter latitude and longitude on the [Waypoints] page in the [Route Plan] dialog box.
How to drag and drop waypoint to new position
1. Put the cursor on the route waypoint to move then push the right button to show
the context-sensitive menu.
2. Select [Edit].
3. Press and hold down the left button while rolling the trackball to move the cursor
to a desired position. Release the button when the cursor is at the desired posi-
tion. Right-click the display area to show the context-sensitive menu then select
[Finish].
How to change latitude and longitude from the Waypoints page
1. Show the [Waypoints] page.
2. Put the cursor on the digit to change in the Latitude or Longitude field.
3. Enter position from the Control Unit’s keyboard, or spin the scrollwheel.

12. ROUTES
12-9
12.4.2 How to change other waypoint data
Other data of a waypoint, such as name, steering mode, turning radius, min/max
speed, can be edited from the [Waypoints] page. Select the route to edit and open the
[Waypoints] page. Put the cursor on a desired field and spin the scrollwheel to change
data. (Push the left button to change steering mode.)
12.4.3 How to add a new waypoint at the end of a route
How to add a new waypoint at the end of a route from the electronic chart
area
1. Put the cursor on the current last waypoint of the route.
2. Right-click the display area to show the context-sensitive menu then click [Edit].
3. Put the cursor to the new location for the last waypoint then push the left button.
4. Right-click, then click [Finish].
How to add a new waypoint at the end of a route from the Waypoints page
Open the [Waypoints] page then right-click the last waypoint. Select [Insert after].
A waypoint is added at the end of the list. Edit the Latitude, Longitude, etc. as neces-
sary.
12.4.4 How to insert a waypoint
How to insert a waypoint between waypoints from the electronic chart area
1. Put the cursor anywhere on the route where you want to insert a waypoint.
2. Right-click to show the context-sensitive menu then click [Edit].
3. Put the cursor on the leg where you want to insert a waypoint.
4. Right-click, then click [Insert WPT].
5. Right-click, then click [Finish].
How to insert a waypoint from the Waypoints page
Open the [Waypoints] page then right-click the waypoint to process. Select [Insert af-
ter] or [Insert before] as appropriate. A waypoint is added after or before the waypoint
selected. Edit the Latitude, Longitude, etc. as necessary.
12.4.5 How to delete a waypoint
How to delete a waypoint from the electronic chart area
Put the cursor on the waypoint to delete. Push the right button to show the context-
sensitive menu then select [Edit] followed by [Delete WPT].
How to delete a waypoint from the Waypoints page
Open the [Waypoints] page. Right-click the waypoint you want to delete then select
[Delete WPT].
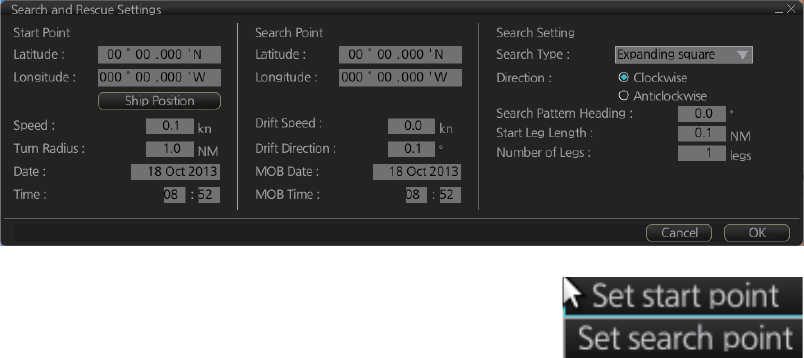
12. ROUTES
12-10
12.4.6 Geometry check of route
When you add a new waypoint, modify a waypoint or change other waypoint data, the
message "Impossible turn at WPT" may appear (in red). It means that the geometry
of route makes it impossible for the ship to sail along a certain leg. Typically it is
enough if you do the following, on the [Waypoints] page.
• Decrease the radius of turn of the waypoint or one of its neighbors.
• Increase the radius of turn of the waypoint or one of its neighbors.
• Change lat/lon position of the waypoint or one of its neighbors.
Note: If the above-mentioned remedies do not remove the "Impossible turn at WPT"
indication, try changing the planned speed.
12.5 SAR Operations
The SAR feature facilitates search and rescue operations for MOB.
To use the SAR feature, get into the Voyage planning mode then do the following:
1. Click the [Planning] and [Route] buttons on the InstantAccess bar to show the
[Route Plan] dialog box then click the [SAR] button.
2. Enter your start point. To enter current position, click
the [Ship Position] button. (The start point can also
be entered directly on the screen. Put the cursor on
the start point, right-click the chart to show the con-
text-sensitive menu shown right then click [Set start
point].)
3. Enter your ship's speed and turn radius, current UTC date and time.
4. At [Search Point], enter the estimated position of the object to search. (The search
point can also be entered directly on the screen. Put the cursor on the search
point, right-click the chart to show the context-sensitive menu shown at step 2
then click [Set search point].
5. Enter drift speed, drift direction, and the UTC date and time of the estimated po-
sition.
6. At the [Search Setting] window, select and set the search type, referring to the ta-
ble on the next page.
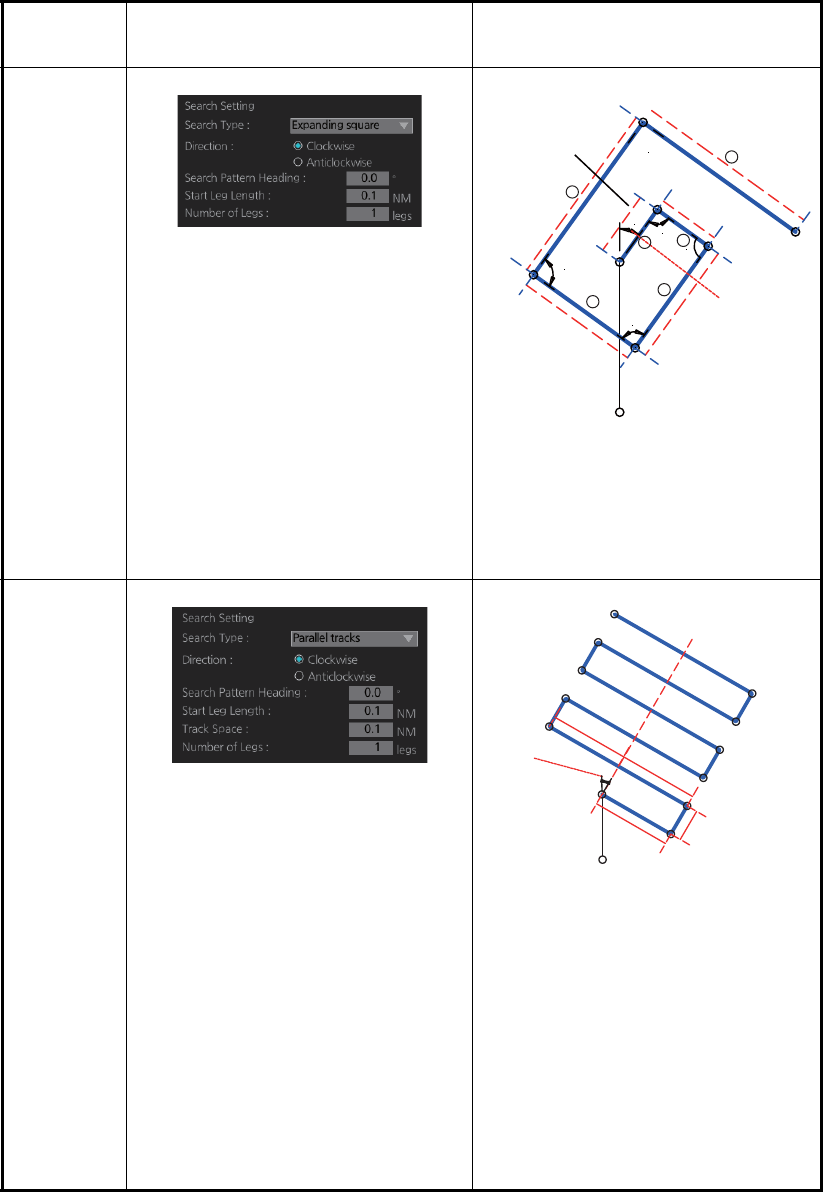
12. ROUTES
12-11
Search
type Options Sample pattern
[Expand-
ing square]
[Direction]: Set the direction to start
the search, [Clockwise] or [Anti-
clockwise].
[Search Pattern Heading]: See the
right figure.
[Start Leg Length]: Enter the start
leg length.
[Number of Legs]: Enter the num-
ber of legs to use.
Starting at the probable location of
the target, the search vessels ex-
pand outward in concentric
squares.
[Parallel
tracks]
[Direction]: Select the direction to
start the search, [Clockwise] or [An-
ticlockwise].
[Search Pattern Heading]: See the
right figure.
[Start Leg Length]: Enter the start
leg length.
[Track Space]: Enter the length of
the short legs in the route.
[Number of Legs]: Enter the num-
ber of legs to use.
The parallel tracks pattern is usual-
ly the first pattern used in undertak-
ing a search operation, since it
assumes that the object to be
searched.
Start Point
Start Leg
Length
Search
Pattern
Heading
WPT6
WPT5
WPT1
WPT2
WPT3
WPT4 WPT8
WPT7
90.00°
90.00°
90.00°
90°
6
5
2
1
3
4
Search
Pattern
Heading
(North ref.)
Start Leg
Length
Track space
Start Point
WPT13
WPT10
WPT9
WPT6
WPT5
WPT12
WPT11
WPT8
WPT7
WPT4
WPT3
WPT1
WPT2
Leg 6/6
Leg 5/6
Leg 4/6
Leg 3/6
Leg 2/6
Leg 1/6
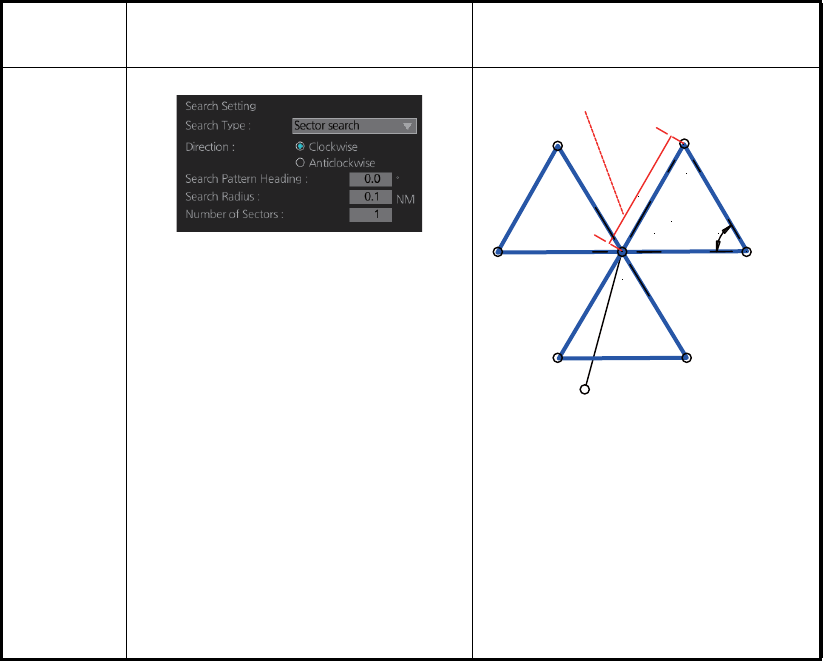
12. ROUTES
12-12
7. Click the [OK] button. The [Route Plan] dialog box appears and the system draws
the search and rescue route on the screen according to the search and rescue
settings.
8. To follow the route, click the [Exchange to MONIT] button.
Note: To monitor the route the following conditions must be met:
• The route must have at least two waypoints.
• The route must have no impossible turns.
• The route must have been checked.
9. To save the route, click the [Save] button and enter a name for the route, using
the keyboard on the Control Unit or the software keyboard.
If necessary you can drag waypoints to new position, like with an ordinary route.
[Sector
search]
[Direction]: Select the direction to
start the search, [Clockwise] or [An-
ticlockwise].
[Search Pattern Heading]: See the
right figure.
[Search Radius]: Enter the search
radius (in NM).
[Number of Sectors]: Enter the
number of sectors to use.
The sector search is used when the
position of the body is known accu-
rately and the search has to be
done over a small area. It is normal-
ly carried out in the area, where the
casualty or the object has been
sighted.
Search
type Options Sample pattern
Start Point
Search Pattern Heading
Search
radius
Sector #2 Sector #1
Sector #3
WPT7
WPT1
WPT8
WPT5 WPT2
WPT9 WPT4
WPT3
WPT6
60°
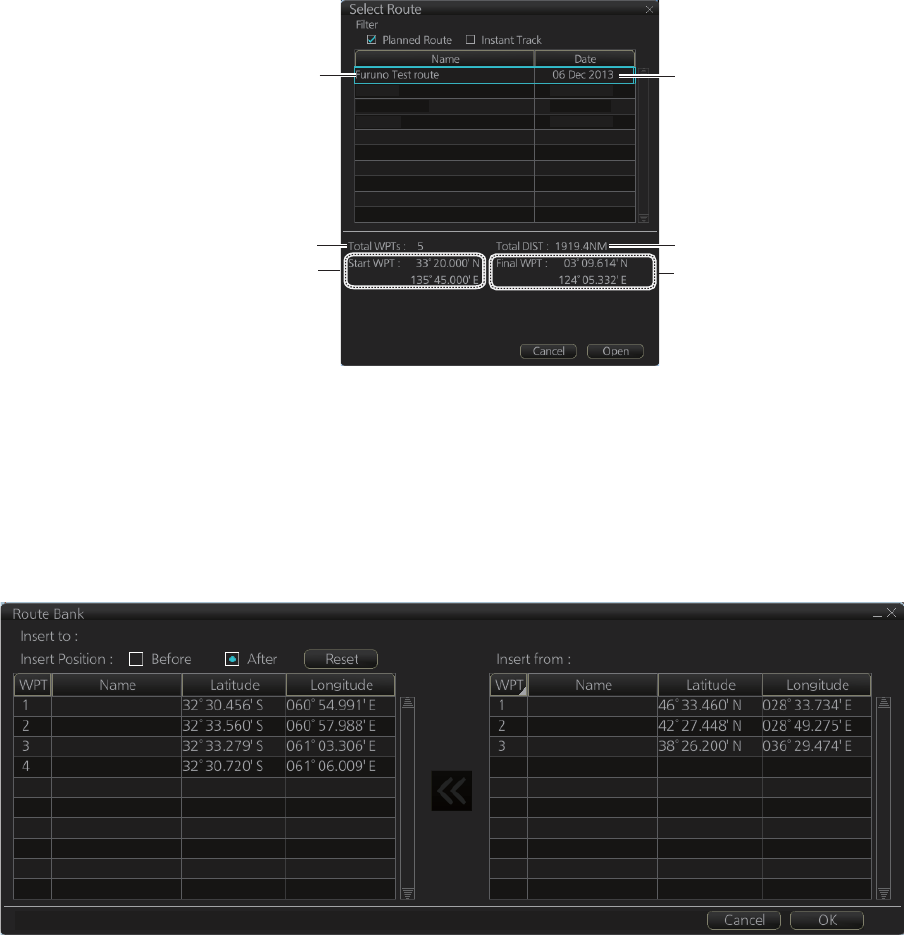
12. ROUTES
12-13
12.6 Route Bank
The route bank stores all the routes you have created. To show the route bank, in the
Voyage planning mode, select [Planning], [Route], [Route Bank] in [Route Plan] dialog
box:
In the Voyage planning mode, the waypoints of a route can be inserted into the route
currently selected.
1. Show the dialog box shown above.
2. Select the route for which you want to copy its waypoint(s) in the active route. For
example, select Route2.
3. Click the [Open] button.
4. At [Insert Position], select where you want to insert waypoints into the active route,
[Before] or [After] the waypoint selected in the next step. The [Reset] button re-
stores the route to the original condition.
5. In the left-hand column set the cursor on the waypoint where to insert waypoints
from the inactive route.
6. At the right-hand column, select the waypoint(s) to add to the active route. A con-
text-sensitive menu is available by right-clicking [WPT] in the inactive route. The
options available are [Select All], [Deselect All] and [Reverse] (reverse the order
of the waypoints in the inactive route).
Route32
AAAAAA
Route67
15 Nov 2013
15 Nov 2013
13 Nov 2013
Route name Date created or modified
Total distance of route
Position of final waypoint
Position of start waypoint
Total no. of waypoints
Route1
Route2
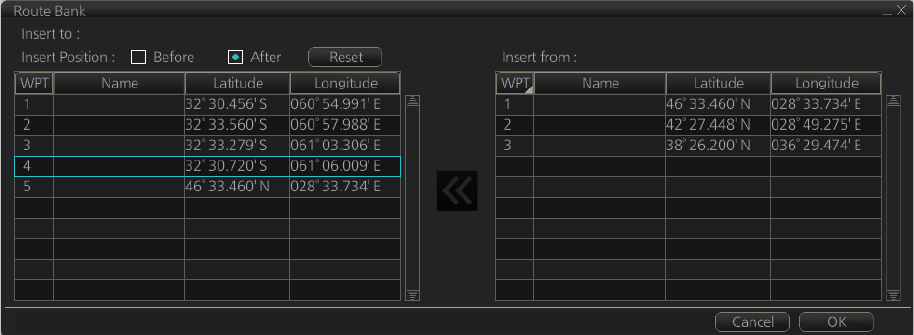
12. ROUTES
12-14
7. Click the [<<] button to insert the waypoint(s) from the inactive route to the active
route. In the example below, WPT1 of the inactive route is inserted at the end of
the active route, becoming its waypoint 5.
8. Click the [OK] button to finish.
12.7 Route Optimization
12.7.1 Available route optimization strategies
After all waypoints are inserted, the route is optimized from the [Optimize] page in the
[Route Plan] dialog box. If no optimization strategy is selected, the optimization is
done with "max. speed," defined in ship parameters. Optimization calculates all pa-
rameters for route steering (course and distance between two waypoints, maneuver-
ing start point, WOP, etc.). There are four methods for optimization:
[MAX speed]: This calculation uses the maximum speed defined in the ship parame-
ters and multiplies by all reduction factors (weather, ice, fouling, etc.) together with
speed limits given for each waypoint to generate ETA. ETA may be entered, however
it is calculated with user-entered ETD and speed limit.
[Time table]: Calculates the speed required in order to arrive at destination at required
ETA. Maximum speed is never exceeded. The user enters ETD and ETA to calculate
speed to use. If, the user-entered ETA is earlier than that found with the Max. Speed
calculation, the Max. speed -calculated ETA will be indicated below the Time Table
ETA calculation figure. The calculated speed is shown on the [Route Information] box
as [Plan Speed].
[MAX profit]: Based on ETD, this calculation takes in account the fuel cost and the
fixed cost of the ship and calculates the most profitable speed (highest profit per time
unit).
[MIN cost]: Based on ETD, this calculation takes in account the fuel cost and the fixed
cost of the ship and calculates the speed that gives the minimum total cost. You need
to set [Cost Parameters] beforehand to use this feature.
Route1
Route2
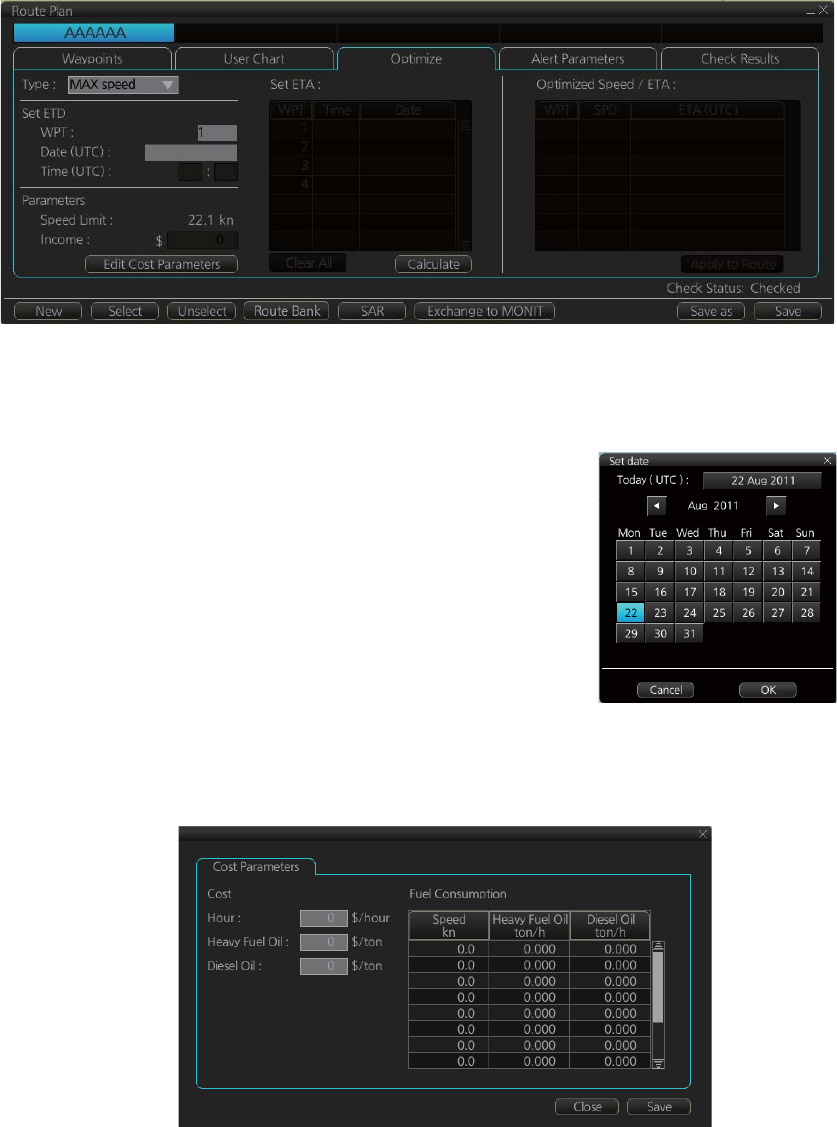
12. ROUTES
12-15
12.7.2 How to optimize a route
You can define Estimated Time of Departure (ETD), desired number of waypoints and
Estimated Time of Arrival (ETA) on the [Optimize] page in the [Route Plan] dialog box
to optimize your route.
1. Click the [Optimize] tab to open the [Optimize] page.
2. At [Type], click the drop-down list to select desired optimization strategy, referring
to paragraph 12.7.1 "Available route optimization strategies".
3. Do the following:
1) At the [Set ETD] window, enter starting WPT and
date and time of departure. For entry of the date,
the [Set date] window, shown right, appears. Click
the applicable date in the calendar if you are going
to depart during the current month, or click the ap-
plicable arrow on the month/year button to select
a different date. Click the [OK] button to save the
ETA and close the window.
2) At the [Waypoints] window in the [Route Plan] di-
alog box, enter the maximum speed to use. For
the Type [MAX profit], enter [Income] value.
If necessary, click the [Edit Cost Parameters] button to enter fuel consumption
values.
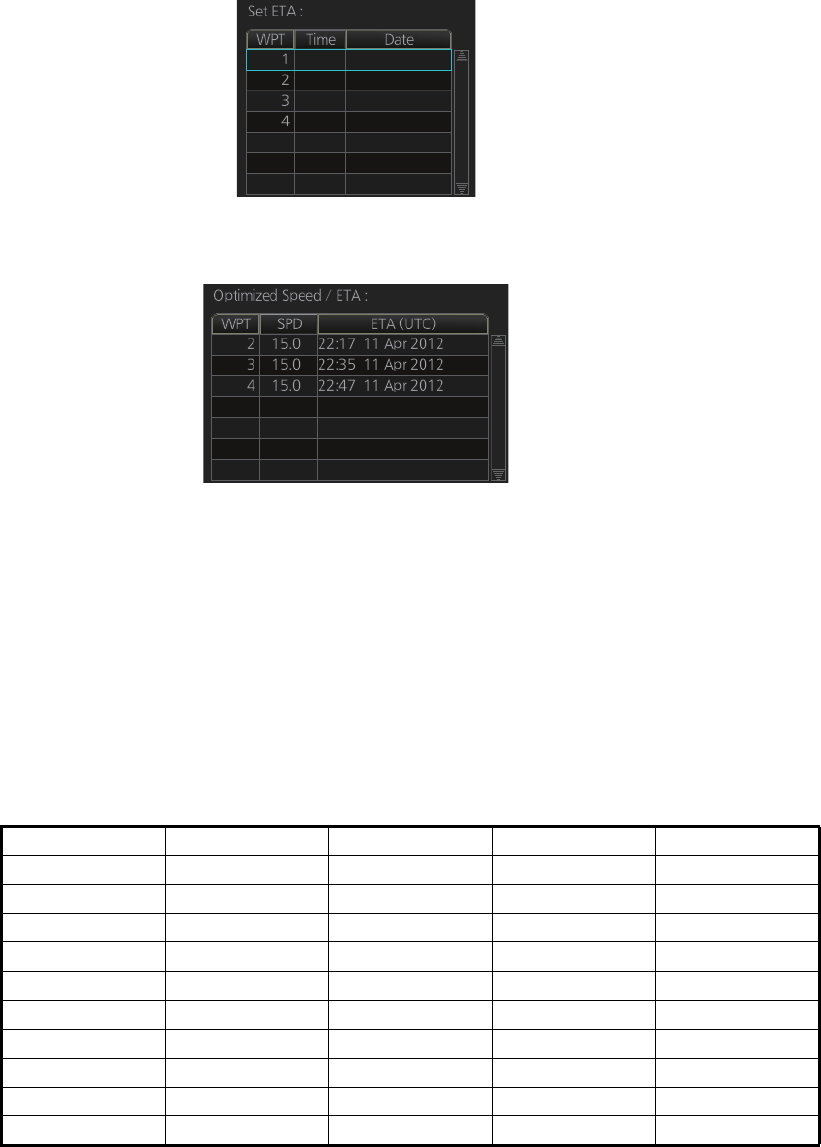
12. ROUTES
12-16
3) For [Time table], the [Set ETA] window appears. Set the ETA to use for each
waypoint. To enter the Time and Date, click the [Date] window to show the [Set
date] window. Click the appropriate date. The date entered appears in the [Set
ETA] window.
4. Click the [Calculate] button to calculate optimal route. The [Optimized Speed/ETA]
dialog box shows the results of the calculation.
5. To apply the information to the route, click the [Apply to Route] button.
6. To save all optimization settings, click the [Save] button.
Note that the ETA used in route reports is the first-entered ETA.
12.7.3 How to plan a speed profile
A speed profile is defined by general max. speed and optimization types. These val-
ues are given while planning a route. You can define speed limit and optimize type in
the [Optimize] page of the [Route Plan] dialog box and in the [Waypoints] page you
can give planned and max. speed for each leg. The table below demonstrate how dif-
ferent optimize types and speed limits influence speed.
WPT MIN cost MAX profit Time table MAX speed
1 4.8 10.9 10.0 10
2 4.8 12.9 15.0 15
3 4.8 12.9 16.2 20
4 4.8 12.9 16.2 20
5 6.0 12.9 15.0 15
6 6.0 12.9 16.2 20
7 4.8 12.9 16.2 20
8 4.8 12.9 16.2 20
9 6.0 12.9 16.2 17
10 4.8 8.0 8.0 8
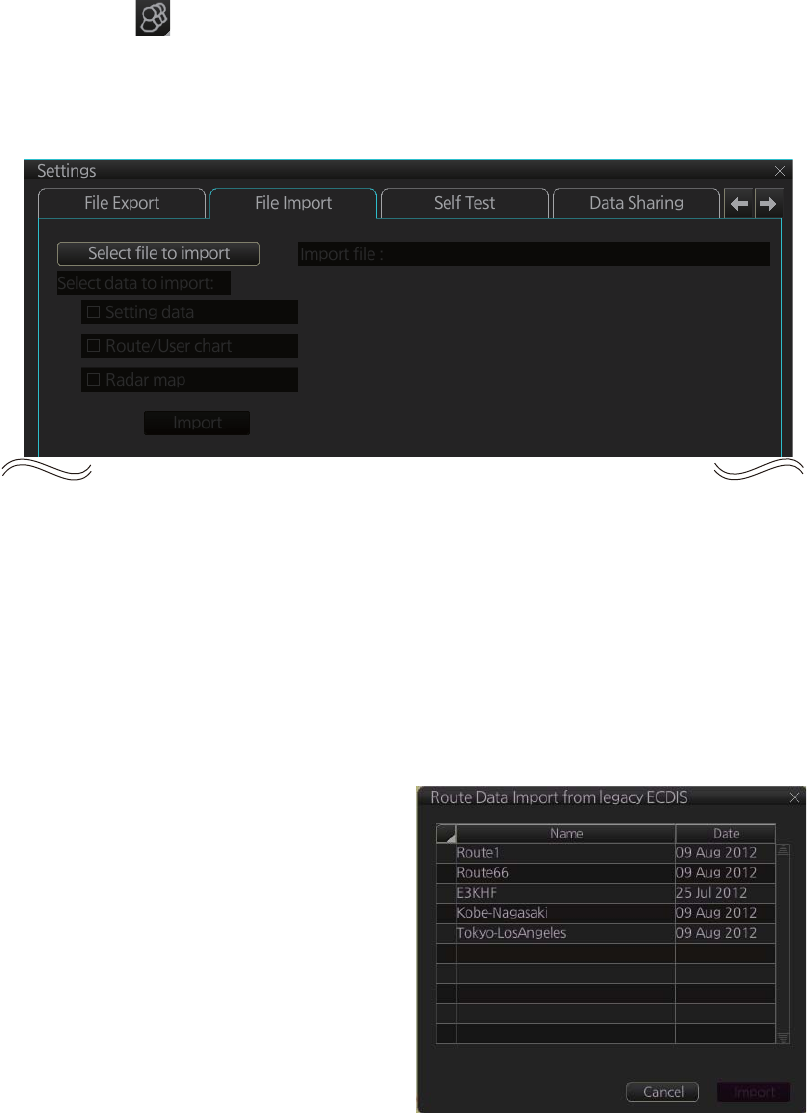
12. ROUTES
12-17
12.8 How to Import Routes
12.8.1 How to import FMD-3xx0, FCR-2xx9, FAR-3xx0 route data
You can import a route created on another FMD-3xx0, FCR-2xx9, FAR-3xx0.
1. Set the USB flash memory that contains the route data to import in the USB port
on the Control Unit.
2. Click the [ ] button on the Status bar and select [Settings]. The confirmation
message appears.
3. Click the [OK] button.
4. Click the [File Import] tab.
5. Click the [Select file to import] button to select the file to import.
6. Check the data to import, at [Select data to import].
7. Click the [Import] button.
12.8.2 How to import FEA-2x07 route data
Routes created at an ECDIS FEA-2x07 can easily be imported to this ECDIS. Copy
the routes to a folder in a USB flash memory then follow this procedure. Note that FEA-
2x05-created routes cannot be imported.
1. Set the USB flash memory to the
USB port on the Control Unit.
2. Activate the Voyage planning mode.
3. On the InstantAccess bar, click the
[Manage Data], [Data Import] and
[Route] buttons to show the [SELECT
DIRECTORY] dialog box.
4. Select the folder that contains the
route(s) to be imported then click the
[OK] button.
5. Check the route(s) to import then
click the [Import] button.
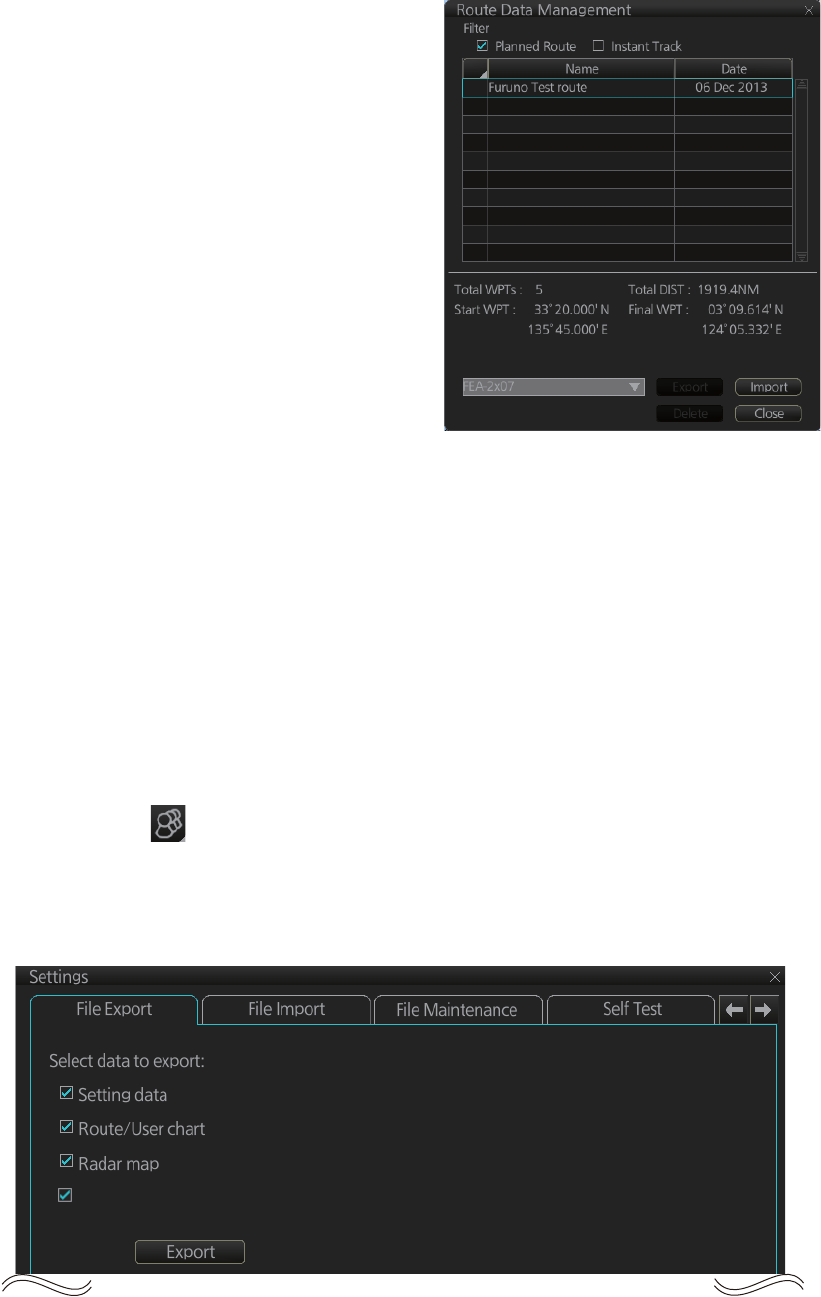
12. ROUTES
12-18
12.8.3 How to import csv, ASCII format route data
1. Set the USB flash memory to the USB
port on the Control Unit.
2. Activate the Voyage planning mode.
3. On the InstantAccess bar, click the
[Manage Data], [Route] and [Route
Data Management] buttons to show
the [Route Data Management] dialog
box.
4. At the drop-down list, select the im-
port format. The choices are [FEA-
2x07], [CSV Position], [ASCII WPT
Name Position], [ASCII Full], [CSV
Route Sheet], [RTE Format].
5. Click the [Import] button.
6. Select the file to import then click the
[Open] button.
7. Click the [Close] button to close the dialog box.
12.9 How to Export Route Data
12.9.1 How to export FAR-3xx0 route data
You can export route data to share the data with other FCR-2xx9, FMD-3xx0, FAR-
3xx0 units.
1. Set a USB flash memory in the USB port on the Control Unit.
2. Click the [ ] button on the Status bar and select [Settings]. The confirmation
message appears.
3. Click the [OK] button.
4. Click the [File Export] tab.
5. At [Select data to export], check only [Route/User chart].
6. Click the [Export] button to save the data to the USB flash memory.
Radar Installation
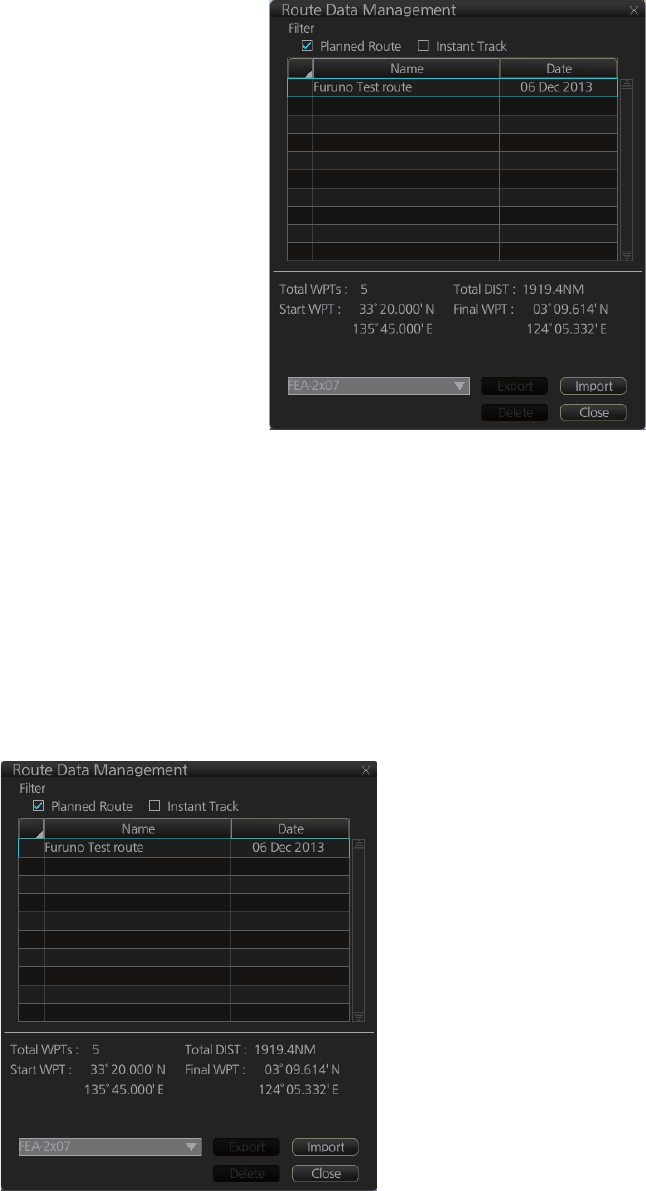
12. ROUTES
12-19
12.9.2 How to export route data in FEA-2x07, csv, ASCII format
1. Set the USB flash memory to the USB
port on the Control Unit.
2. Activate the Voyage planning mode.
3. On the InstantAccess bar, click the
[Manage Data], [Route] and [Route
Data Management] buttons to show
the [Route Data Management] dialog
box.
4. At the drop-down list, select the ex-
port format. The choices are [FEA-
2x07], [CSV Position], [ASCII WPT
Name Position], [ASCII Full], [CSV
Route Sheet], [RTE Format].
5. Check the route(s) to export then click
the [Export] button.
6. Click the [OK] button.
7. Click the [Close] button to close the dialog box.
12.10 How to Delete Routes
1. Click the [PLAN] button on the Status bar to get into the Planning navigation
mode.
2. Click the [Manage Data] button on the InstantAccess bar followed by the [Route]
button.
3. Put a checkmark in the check box to the left of the route name.
4. Click the [Delete] button. The confirmation message appears.
5. Click the [OK] button.
6. Click the [Close] button to close the dialog box.
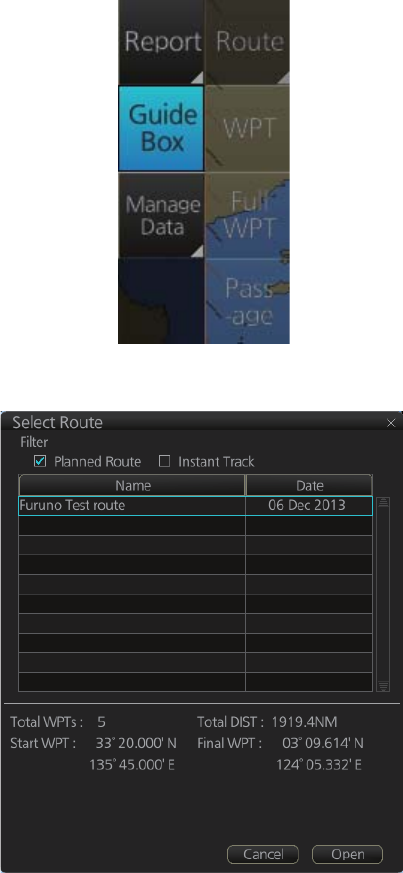
12. ROUTES
12-20
12.11 Reports
This chart radar generates reports for waypoints in the selected route. If connected to
a printer, reports can be printed by clicking the [Print Text] button. Text in reports can
be searched with the [Find] button.
To generate a report, do the following:
1. Click the [Plan] button to go to the Voyage planning mode.
2. Click the [Report] button followed by the [Route] button. Click applicable “report”
button.
The following dialog box appears.
3. Select the appropriate route then click the [Open] button to show the selected re-
port. See the next several pages for examples.
Route32
AAAAAA
Route67
15 Nov 2013
15 Nov 2013
13 Nov 2013
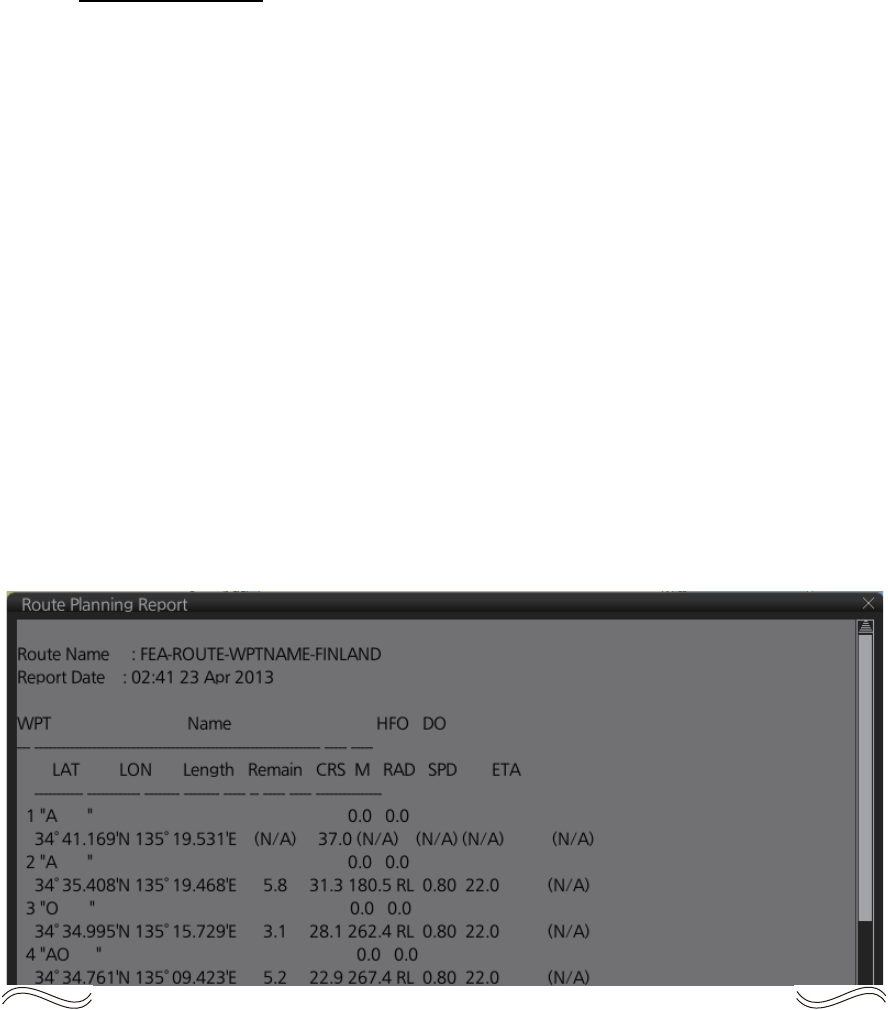
12. ROUTES
12-21
WPT table report
The WPT report contains the following information:
• Route name
• Date of report
• Waypoint no.
• Length of waypoint
• Distance remaining in route
• Position in latitude and longitude
• Planned courses and steering methods (RL (RhumbLine), GC (GreatCircle))
• Turning radius
• Planned speeds
• Estimated times of arrival (ETA)
• ETD from waypoint 1 (start point)
• ETA to waypoint “x” (final waypoint)
• Total length of route
• Estimated time required to run route using planned speeds and courses
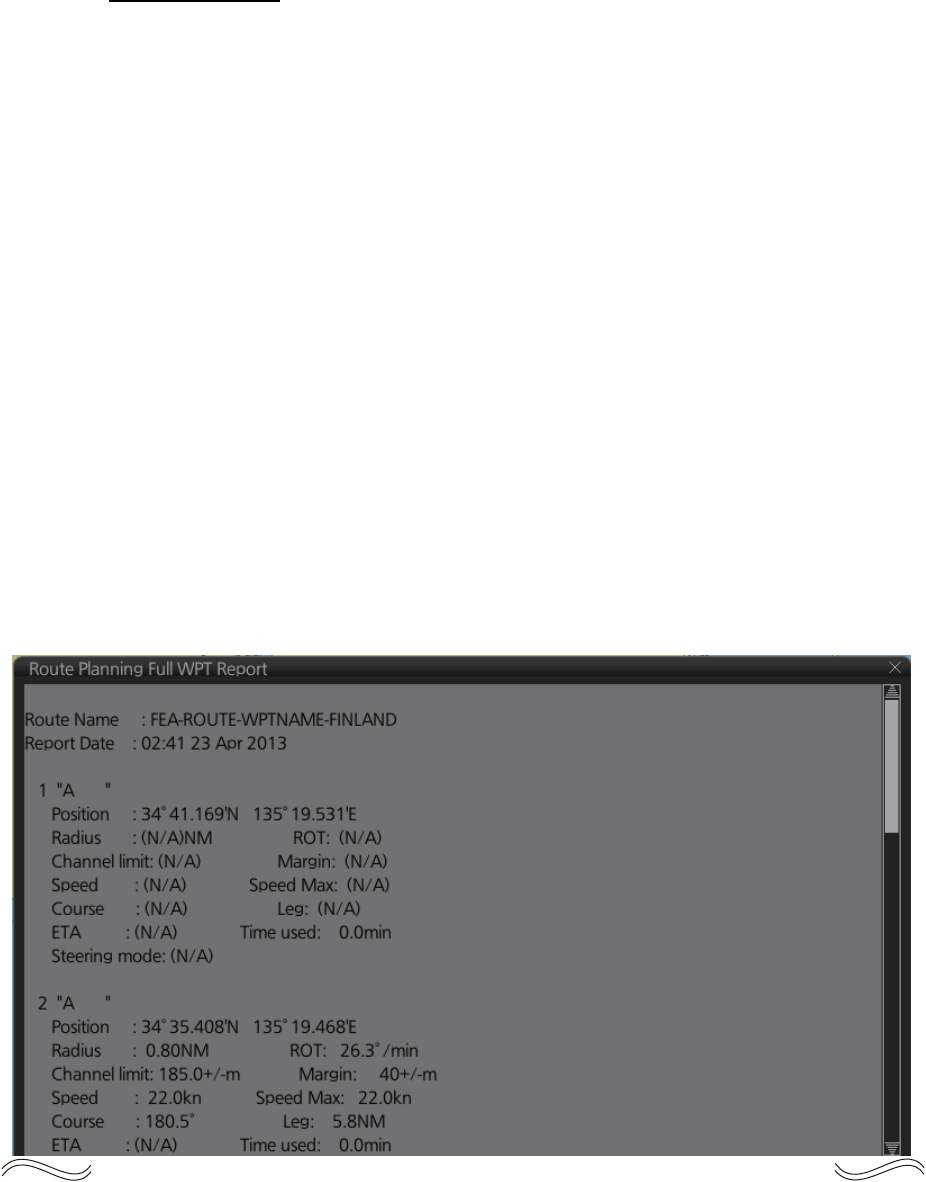
12. ROUTES
12-22
Full WPT report
You can generate a full waypoint report for the route selected. The report includes the
following for each waypoint.
• Route name
• Date of report
• Waypoint no.
• Position in latitude and longitude
• Planned radius
• Channel limit
• Planned speed
• Planned course
• ETA
• Steering mode (rhumb line or great circle) to each waypoint
• ROT
• Margin for channel limit
• Speed Max
• Leg length
• Time used
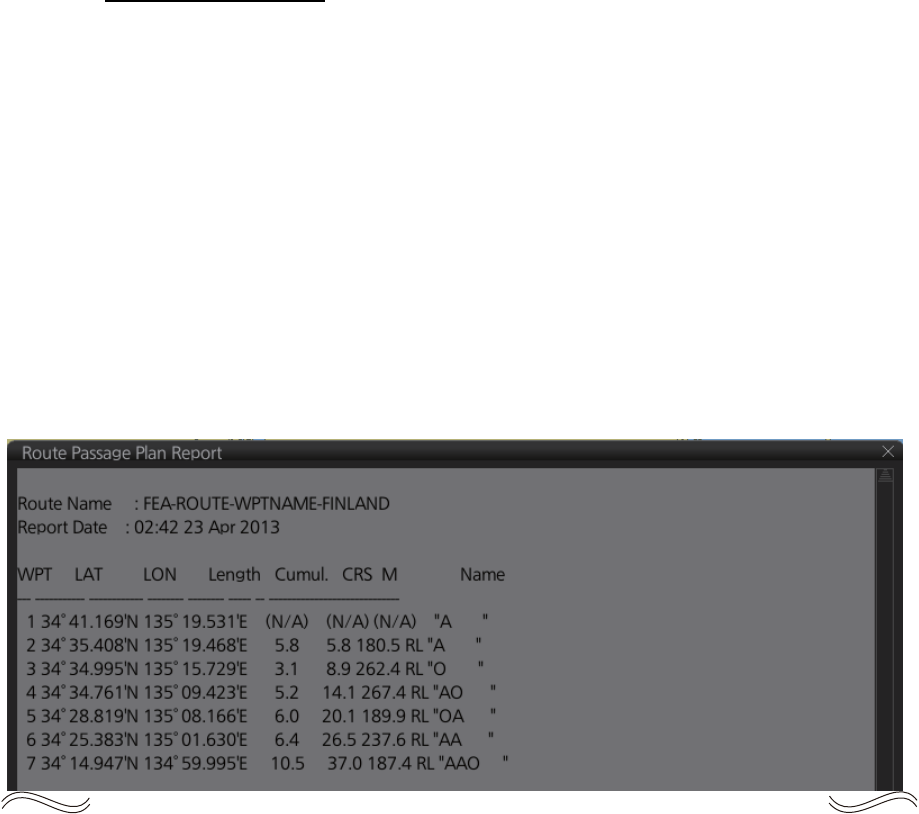
12. ROUTES
12-23
Passage plan report
The passage plan report generates waypoint information for each waypoint in the
route selected.
• Route name
• Date of report
• Waypoint no.
• Position in latitude and longitude
• Length
• Cumulative length
• Planned course
• Steering method (RL or GC)
• Name of waypoint
12. ROUTES
12-24
This page is intentionally left blank.

13-1
13. USER CHARTS
13.1 Introduction
User charts are overlays that the user creates to indicate safety-related objects and
areas. They can be displayed on both the radar display and the electronic chart. These
charts are intended for pointing out safety-related items like position of important nav-
igation marks, safe area for the ship, etc. User charts areas can be used to activate
alerts and indications based on user-defined danger symbols, lines and areas. When
route or own ship estimated position is going to cross a user chart symbol, line or area
that is defined as a dangerous one, an alert or indication is generated by the system.
See the chapter on chart alerts.
A user chart consists of various objects (points, lines, text, symbols, etc.). The maxi-
mum number of points per user chart is 200 (a circle is one point, a rectangle is four
points). You may link up to five user charts to a route, for a max. of 1,000 user chart
points per route.
The user chart is displayed on the radar display and its position and shape is based
on the ship's actual position. When own ship is moving in the area covered by the user
chart, the elements of the user chart are superimposed on the radar, with a maximum
of 80 of the nearest elements displayed.
13.1.1 Objects of user charts
Below is a description of the objects used in a user chart.
• Tidal: There are two types of tidals, current and predicted.
• Line: You can define four different types of lines. Lines can be used in chart alert
calculation and/or display on the radar:
• Navigation lines: Displayed on both the radar display and the chart display. Nav-
igation lines are reference lines for coast line.
• Coast line: Displayed on both the radar and the chart display. Coastal line is usu-
ally a well-defined (by chart digitizer) multi-segment line showing the coastline.
The user is able to create this type of line in case there is no suitable chart avail-
able over desired area in S57 format.
• Depth contour: Displayed on both the radar and chart display. Depth line shows
the chosen depth levels. The user is able to create this type of line in case there
is no suitable chart available over desired area in or S57 format.
• Route line: Displayed on both the radar display and the chart display. Route lines
are zones for anchoring, traffic separation lines, etc.
• Clearing line: A clearing line is used to define a line which a vessel can sail to avoid
navigational hazards. A clearing line can be of the NMT (Not More Than) or NLT
(Not Less Than) type. Displayed on the chart display only.
• Area: The operator can define closed areas, which the system can use to detect
safe water areas. If route or estimated ship position is going to cross the area, the
system generates a warning to the user. These areas can be used to specify safe
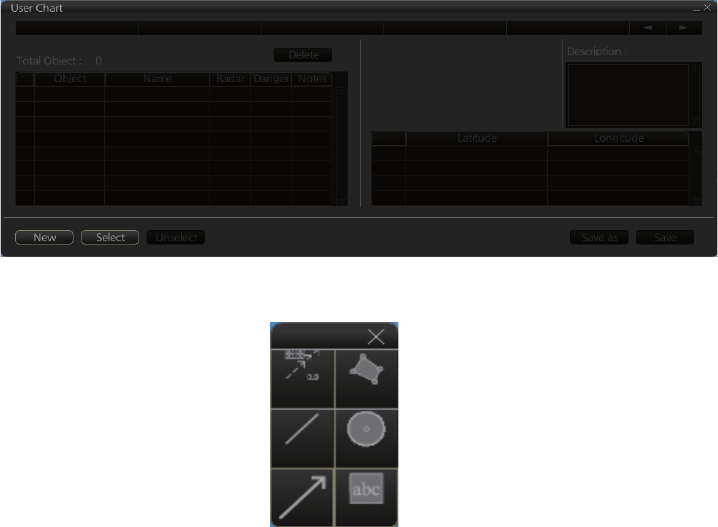
13. USER CHARTS
13-2
areas as defined by the master or by the policy of the ship's owner. They are always
available regardless of the type of chart material used.
• Circle: The operator can define an area with a circle, which can define a location to
avoid. If route or estimated ship position is going to cross the area, the system gen-
erates a warning to the user. These areas can be used to specify safe areas as de-
fined by the master or by the policy of the ship's owner. They are always available
regardless of the type of chart material used.
• Label: There are two types of labels: point and label. A "point" (i) is mainly used to
denote position of objects, such as buoys, light houses, fixed targets, wrecks, etc.
Points can be used in chart alert calculation. A "label" provides user-entered text to
show on the display.
13.2 How to Create a User Chart
You can create and modify a user chart in the Voyage planning mode.
To make a complete user chart, do the following:
1. Click the [PLAN] button on the Status bar to go to the Voyage planning mode.
2. Click the [Planning] and [User Chart] buttons on the InstantAccess bar to show the
user chart palette and the [User Chart] dialog box.
3. Click the [New] button on the [User Chart] dialog box to create a new chart.
4. Click the desired object (button) on the palette.The [Tidal], [Line], [Clearing line]
and [Label] buttons have multiple choices. Right-click the respective button to
show a context sensitive menu. The choices available for each object are shown
below.
Tidal: Current, Predicted
Line: Coast, Nav, Route, Depth
Clearing line: NMT (Not More Than), NLT (Not Less Than)
Label: Label, Point
Tidal
Line
Clearing
line
Area
Circle
Label
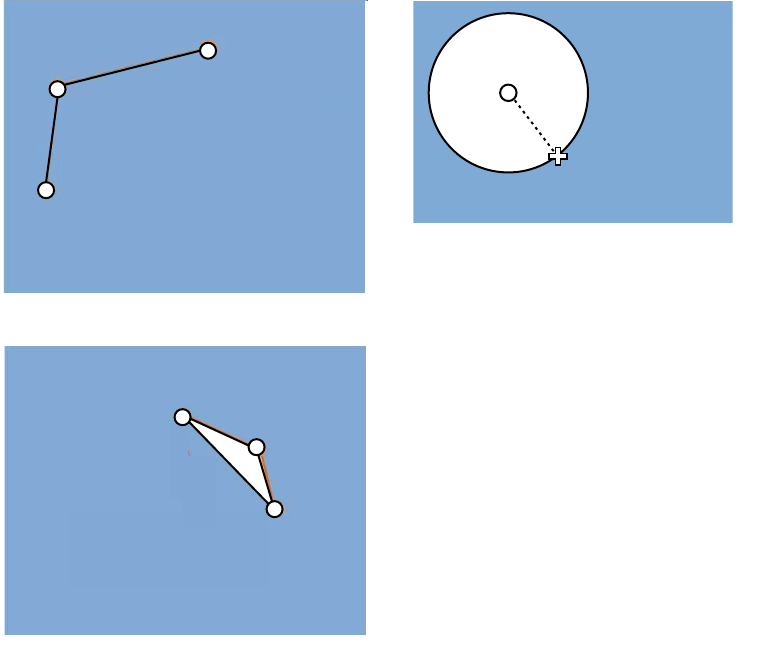
13. USER CHARTS
13-3
5. Put the cursor on the location to insert the object then push the left button. See
the figure below for how to construct lines, areas and circles. For the “Tidal” object,
you can set Orientation, Strength and Time from the dialog box. With the “Label”
object you can enter text and show that text on the screen.
Note: An object can also be put at the center of the screen. Do steps 1-4 in this
procedure. On the [User Chart] dialog box, right-click the box to the left of [Object]
then select [Add Object] from the pop-up menu.
6. When you insert an object, the following is done in the [User Chart] dialog box:
- Name of the object button appears in the [Object] window
- Latitude and longitude position of the object is displayed
- Total object count is updated
7. To enter a name for the object click the appropriate location in the [Name] window
then use the software keyboard on the Control Unit to enter a name.
8. To show the object on the radar display, click the corresponding box in the [Radar]
window to show a checkmark in the box.
For the label, line, clearing line, area and circle, click the corresponding box in
the [Danger] window to use or don't use the object in chart alert calculation. Show
a red checkmark to use the object in chart alert calculation.
For the area, circle and line, you can add Notes as shown below. See the de-
scription and figure below for a description of Notes.
1) Enter the text for the Notes in the [Description] box.
2) Click the box in the [Notes] window of the [User Chart] dialog box to show a
checkmark.
(3) Click
(2) Click
(1) Click
(4) Right-click;
select [Finish].
How to create a line
1) Put cursor where to locate center of circle
then click.
2) Drag cursor to set radius; double-click to set.
How to create a circle
(1) Click
(2) Click
(3) Click
How to create an area
(4) Right-click;
select [Finish].
(2) Drag cursor;
double-click to set.
(1) Click
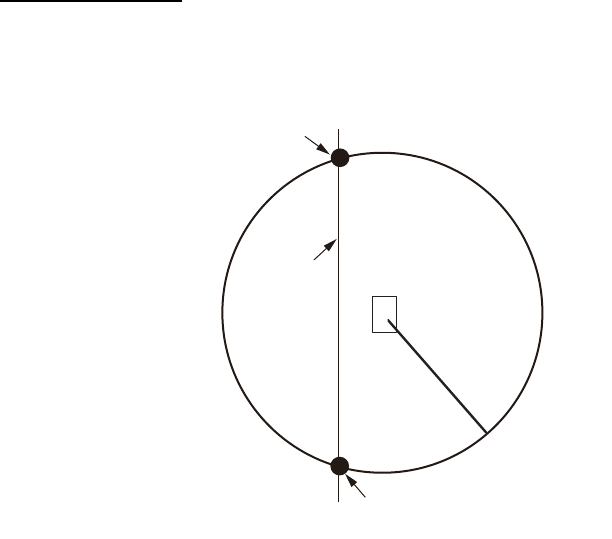
13. USER CHARTS
13-4
3) At the [Range of notes] (shown only for line) input box, enter the distance from
the Notes position at which to display the Notes.
Note: You cannot select both [Danger] and [Notes] for these symbols; select
either [Danger] or [Notes].
What are Notes?
"Notes" provides messages for the operator relative to your vessel’s position
in the Voyage navigation mode. The system compares Notes position and
when own ship is x miles from the Notes it generates a message.
9. To continue entering the same symbol, click a new location on the screen and do
step 3. To enter a different symbol, do steps 3 and 4.
10. After you have entered all necessary objects, click the [Save] button.
Note: If the [Save] button is not shown, update the user chart to show the button.
11. The [Save user chart] window appears. Enter a name for the user chart then click
the [Save] button.
The figure on the next page shows a user chart and the corresponding entries in the
[User Chart] dialog box.
Notes range
setting
Position of own ship
when Notes will
disappear
Location of
Notes
Position of own ship when
Notes will be activated
i
Your
vessel’s
track
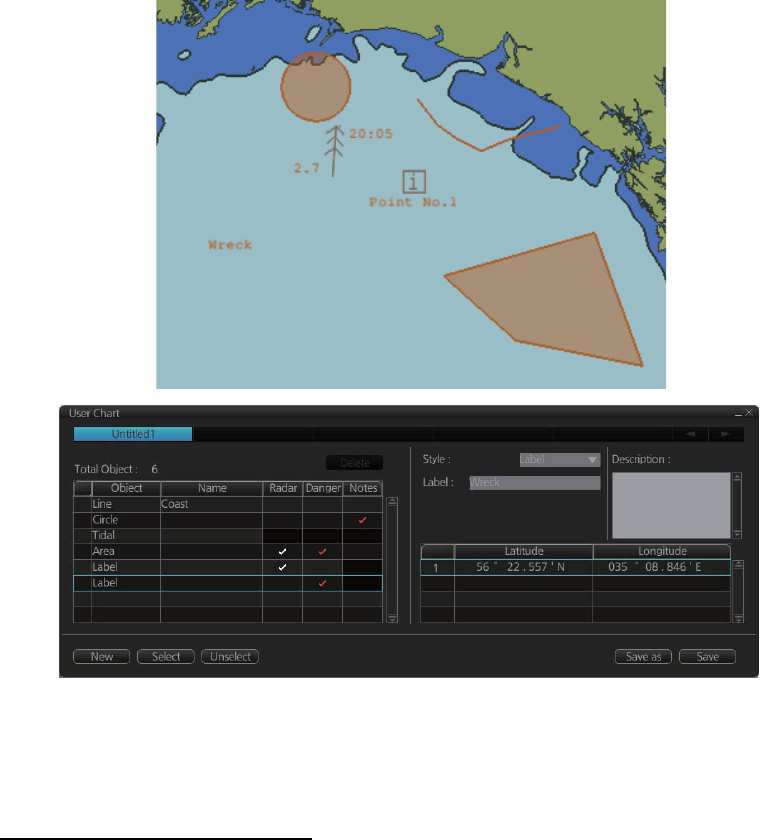
13. USER CHARTS
13-5
How to use the Undo feature
The Undo feature, available when creating a route and a user chart, can be accessed
from the [UNDO] button on the InstantAccess bar, use double-click, or the context-
sensitive menu. In user chart creation the feature is used with object and text input as
follows:
Tidal, Circle, Current, Label: Delete last-entered object.
Area, Line: Erase last-entered point. For [Area], the area must have at least four
points. And for a [Line], there must be at least three points.
Text input: Erase last-entered character or character string.
Note: The [UNDO] button is not displayed on the FURUNO 19-inch monitor unit.
• The Line with the name "Coast" is a coastline.
• The Circle has the Notes "Arrival No.1," which means the message "Arrival No.1" will
be shown on the screen when the ship is 1 NM from the position of the center of the
circle.
• The Tidal marks line marks a tidal (current).
• The Area has Radar and Danger checked. This means the area is shown on the radar
display and is used in chart alert calculation.
• The Label with the name "Point No. 1" is a point label and is also shown on the radar
display.
• The Label with the name "Wreck" is a common label and has Danger checked; it is
used in chart alert calculation.
Note: The following combinations of object and display are not allowed:
• Tidal object with Radar, Danger, Notes
• Clearing line with Radar, Notes
• Label with Notes
LINE (Coast)
TIDAL
LABEL (Point)
LABEL (Label)
CIRCLE
AREA
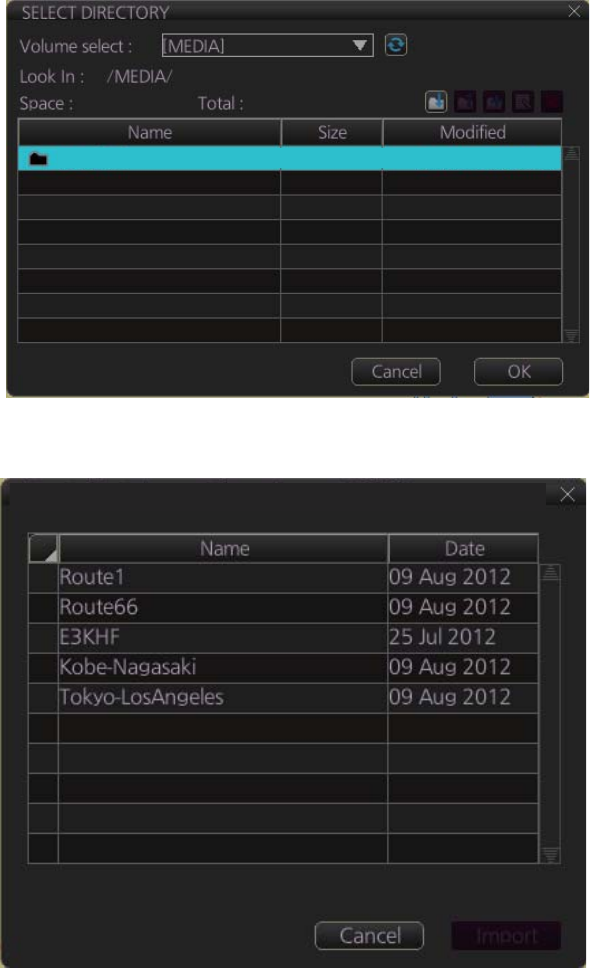
13. USER CHARTS
13-6
13.3 How to Import a User Chart Created with ECDIS
FEA-2x07
User charts created at the ECDIS FEA-2x07 can easily be imported to this ECDIS.
Copy the user charts to a folder (see chapter 17 in the operator’s manual of the FEA-
2x07) in a USB flash memory then do as follows. Note that FEA-2x05 created user
charts cannot be imported.
1. Set the USB flash memory to the USB port on the Control Unit.
2. Activate the Voyage planning mode.
3. Click the [Manage Data], [Data Import] and [User Chart] buttons to show the [SE-
LECT DIRECTORY] dialog box.
4. Select the folder that contains the user chart(s) to be imported then click the [OK]
button.
5. Check the user chart(s) to import then click the [Import] button.
USB Flash 04.04.2013 19:23
User Chart Data Import from legacy ECDIS
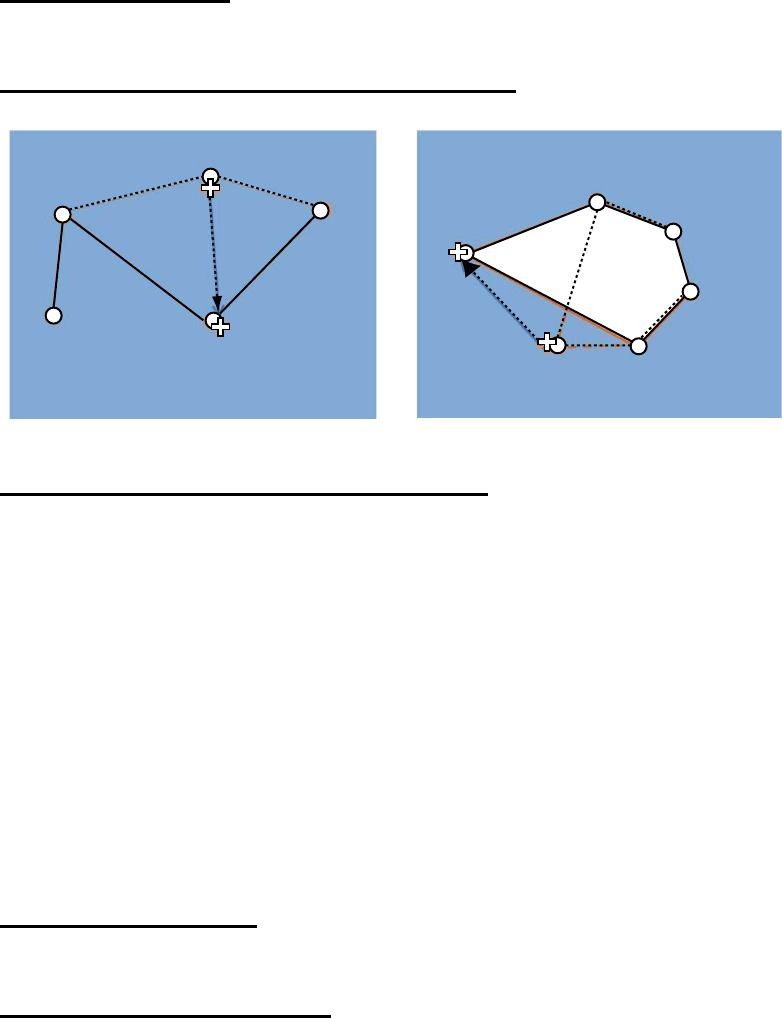
13. USER CHARTS
13-7
13.4 How to Edit Objects on a User Chart
Do steps 1 and 2 in section 13.2 to show the [User Chart] dialog box then click the [Se-
lect] button. Select the user chart to edit then click the [Open] button. Follow the ap-
propriate instructions below.
13.4.1 How to edit objects on the chart area
How to move objects
Drag and drop the object.
How to change corner points in lines and areas
How to insert a corner point on a line or area
Put the cursor on the location where to insert a corner point, right-click the display area
to show the context-sensitive menu then select [Insert].
13.4.2 How to edit objects from the User Chart dialog box
The latitude and longitude position, object name and description of an object can be
edited from the [User Chart] dialog box.
1. Open the [User Chart] dialog box (see steps 1 and 2 in section 13.2).
2. Double click the item to edit and use the scrollwheel to edit.
13.5 How to Delete Objects from a User Chart
How to delete an object
Right-click the object to show the context-sensitive menu and select [Delete].
How to delete a point on a line
Put the cursor on the point to delete then right-click to show the context-sensitive
menu. Select [Delete Point]. The line is redrawn.
How to change corner point on a line How to change corner point in an area
Drag point to
new location;
double-click
Drag point to
new location;
double-click
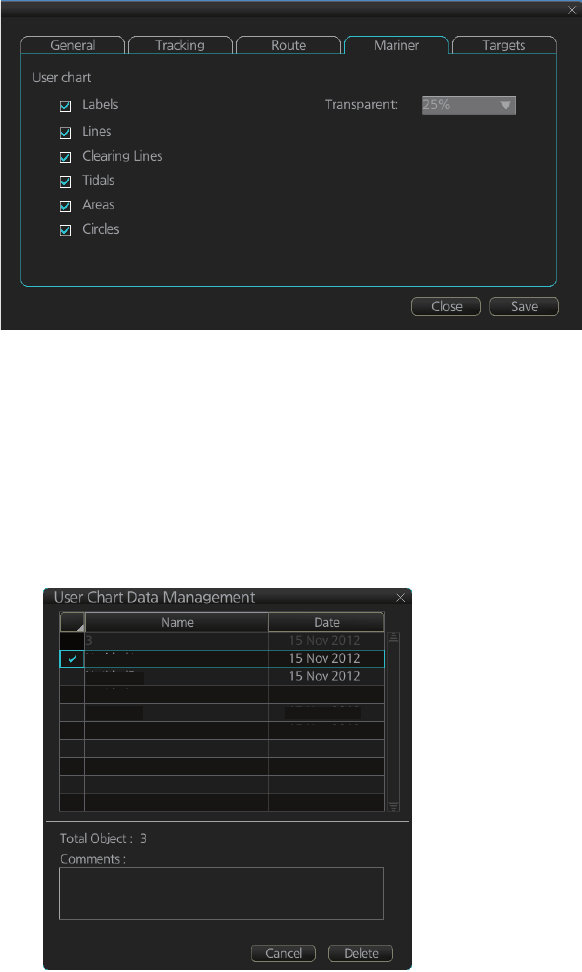
13. USER CHARTS
13-8
13.6 How to Select the User Chart Objects to Display
User charts can be displayed on the electronic chart. Open the [Mariner] page in the
[Symbol Display] menu and check the user chart items to display. Select the degree
of transparency for the objects with [Transparent].
Note: Alpha blending technology is used for transparency effects.
13.7 How to Delete User Charts
1. Click the [PLAN] button on the Status bar to get into the Planning navigation
mode.
2. Click the [Manage Data] button on the InstantAccess bar followed by the [User
Chart] button.
3. Check the user chart(s) to delete.
4. Click the [Delete] button.
UserChart1
UserChart2
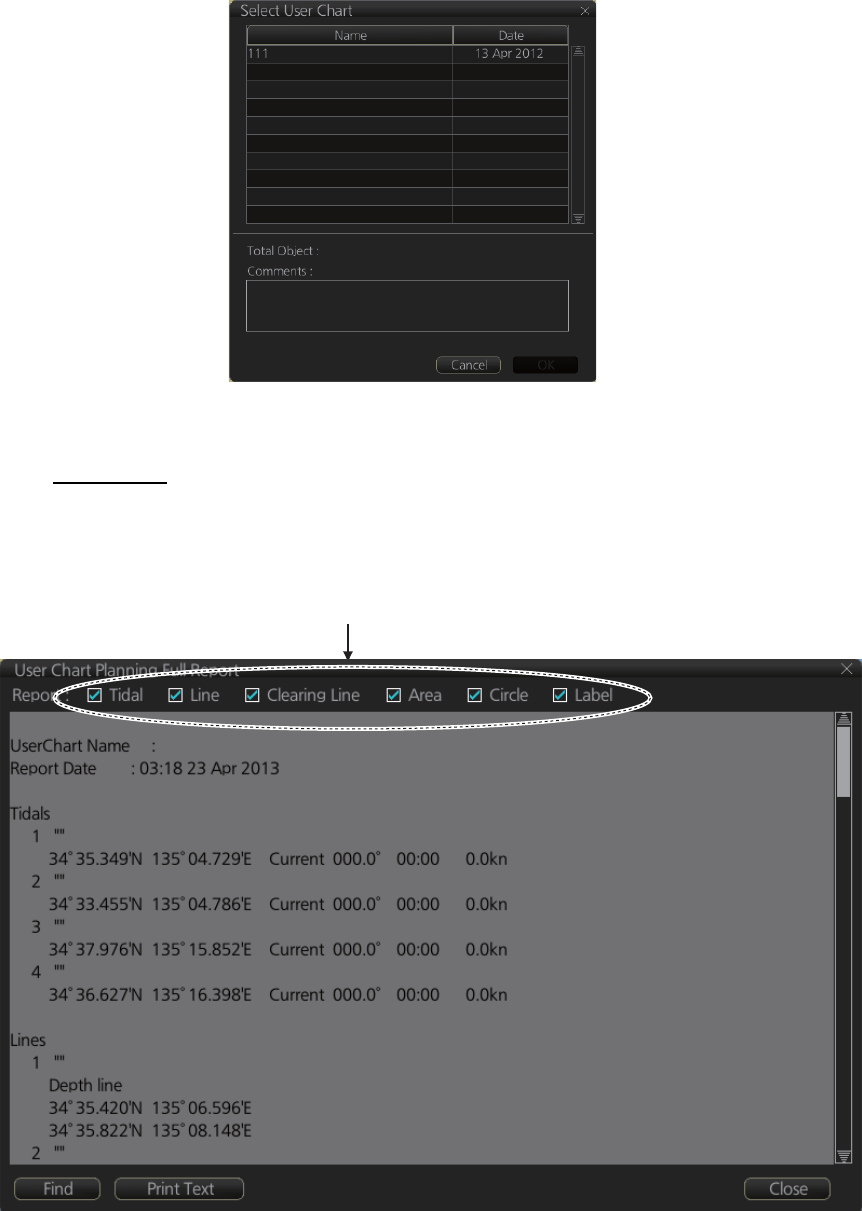
13. USER CHARTS
13-9
13.8 User Chart Reports
1. Click the [Plan] button to go to the Voyage planning mode.
2. Click the [Report] button followed by the [User Chart] button to show the [Select
User Chart] dialog box.
3. Select the appropriate user chart then click the [OK] button to show the selected
report. See the next several pages for examples of reports.
Full report
The full report contains information about each tidal, line, clearing line, area, circle and
label in the user chart selected. Check or uncheck the boxes at the top of the display
to select the report(s) to display.
Check the report(s) to display.
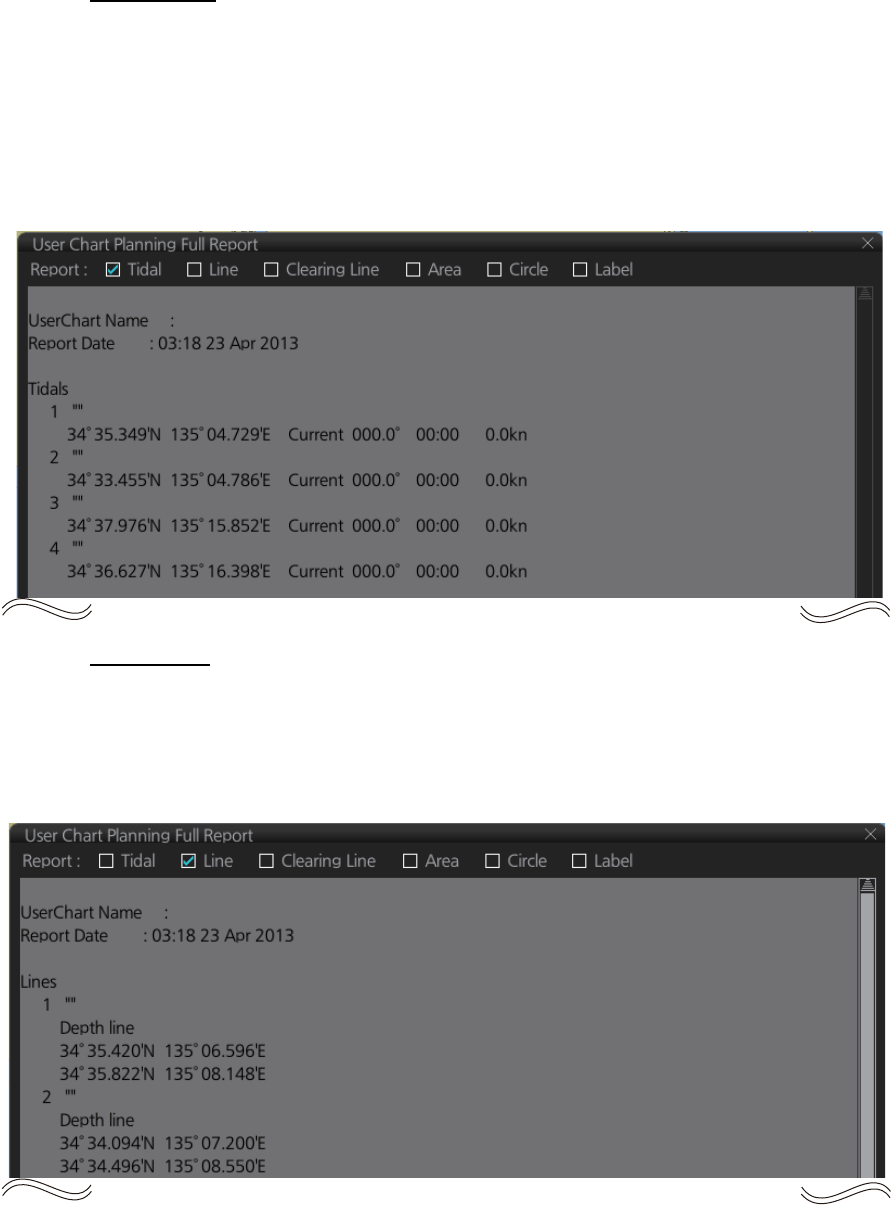
13. USER CHARTS
13-10
Tidal report
A tidal report provides
• Position of the tidal
• Type of tidal (current or predicted)
• Speed and direction of the tidal
• Time of the tidal
Line report
A line report provides
• Line name
• Latitude and longitude position of each point on the line
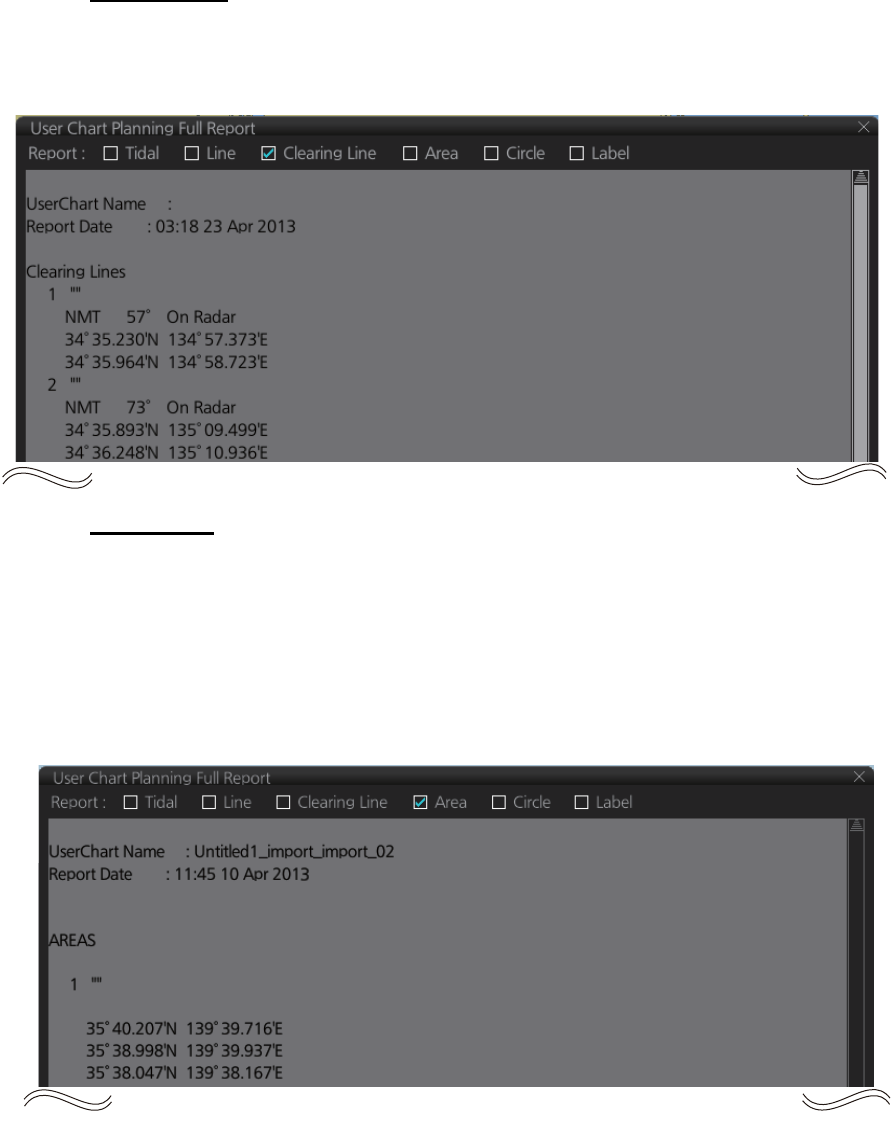
13. USER CHARTS
13-11
Clearing line
The Clearing line report shows the name and position of clearing lines entered on the
chosen user chart selected.
Area report
An area report provides
• Area no. and area name
• The latitude and longitude position of each point of the area
• The description of the area
• "On radar" is shown if the area is shown on the radar overlay.
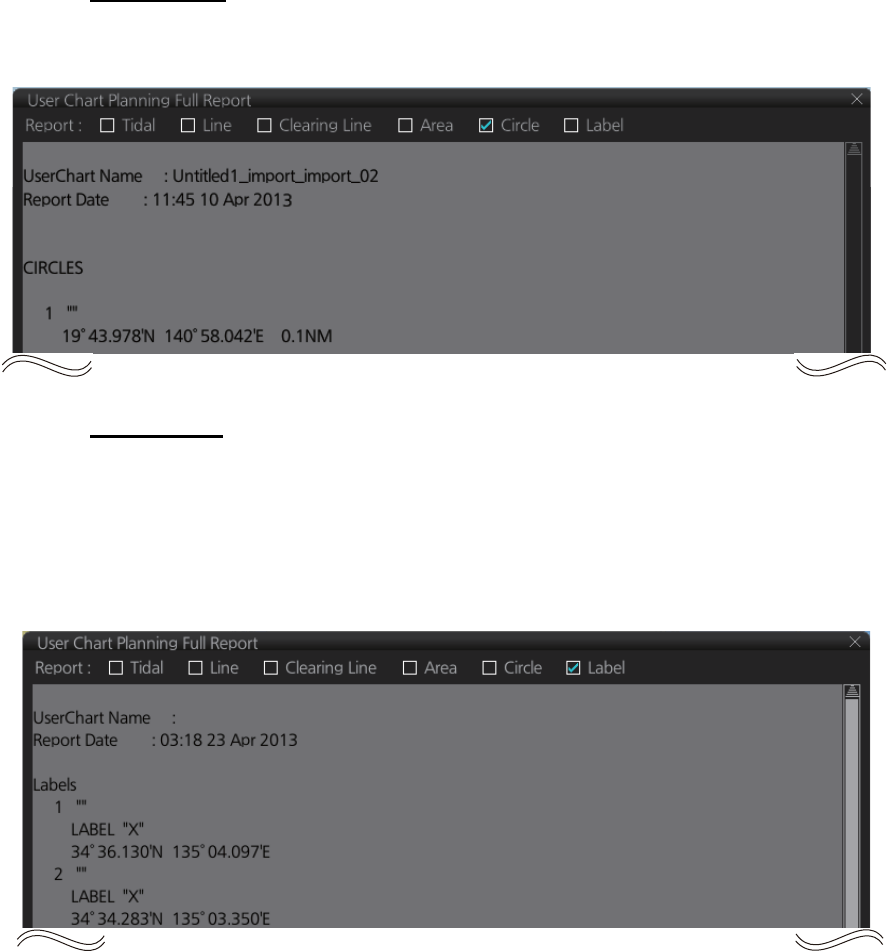
13. USER CHARTS
13-12
Circle report
The circle report provides the position and radius of circles drawn on a user chart.
Label report
A label report provides
• Latitude and longitude position of each label
• Name of each label
• “On radar" is shown if the label is shown on the radar overlay.
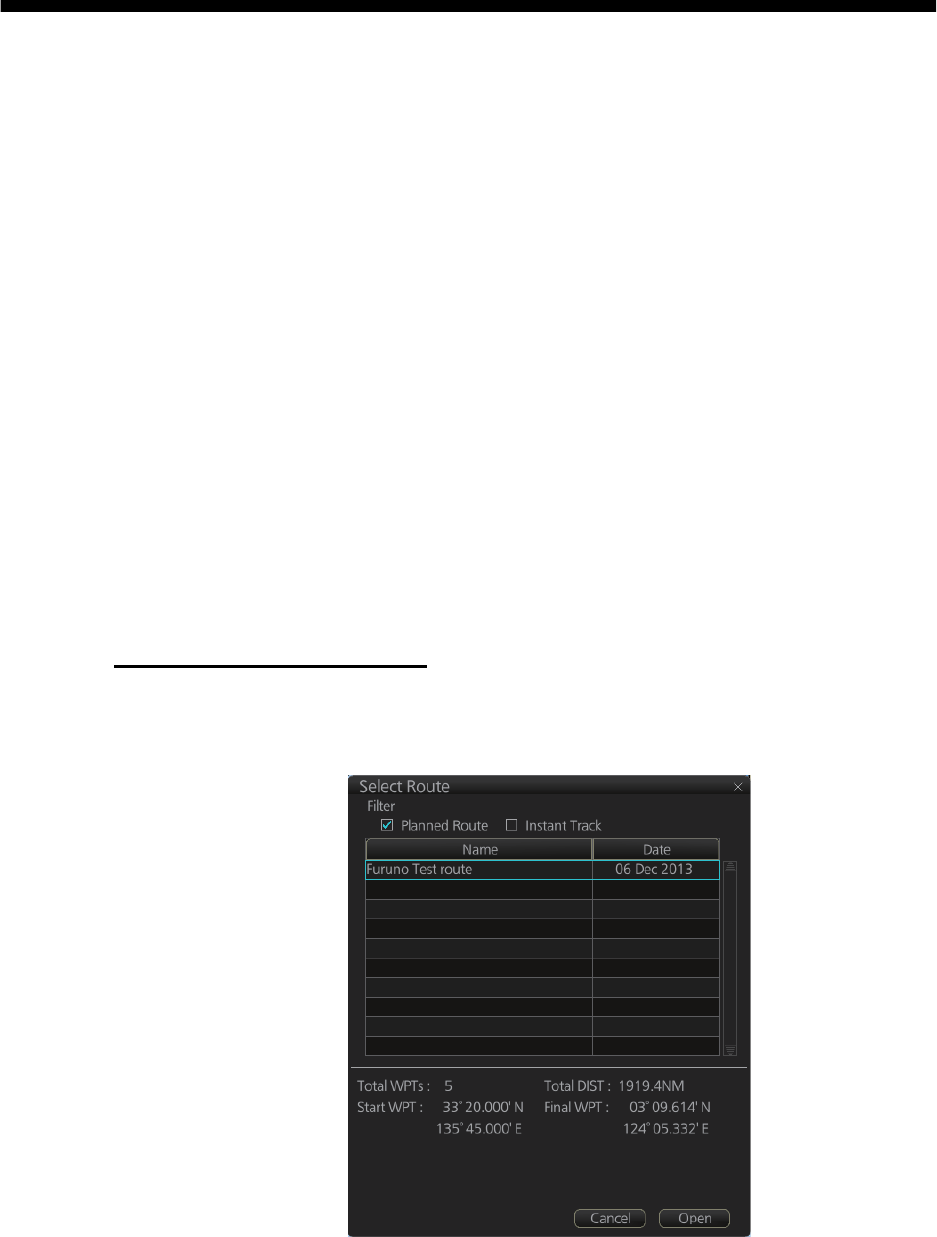
14-1
14. HOW TO MONITOR ROUTES
Route monitor is a means for permanent monitoring of the ship's behavior relative to
the monitored route. The [Route Information] box displays the data on the ship's posi-
tion relative to the monitored route. The monitored route consists of the following in-
formation, displayed in the electronic chart area:
• The route is displayed with red dots.
• The limits of channels of each leg are displayed with solid red lines. These limits are
used to detect chart alerts when you are monitoring the route. See chapter 11 for
how to set those limits.
• Each leg has information about planned speed, shown in the [Route Information]
box.
• Each leg has information about planned course to steer.
Note: In order to display charts with correctly updated situation, always use current
date as Approved until and Display date during your voyage. If your voyage lasts more
than one week, set current date at least once per week during your voyage. See
section 9.2 for how to set those dates.
14.1 How to Start Route Monitoring
Method 1: InstantAccess bar
In the Voyage navigation mode, click the [Route] and [Select] buttons on the
InstantAccess bar. Click a route then click the [Open] button.
Route32
AAAAAA
Route67
15 Nov 2013
15 Nov 2013
13 Nov 2013
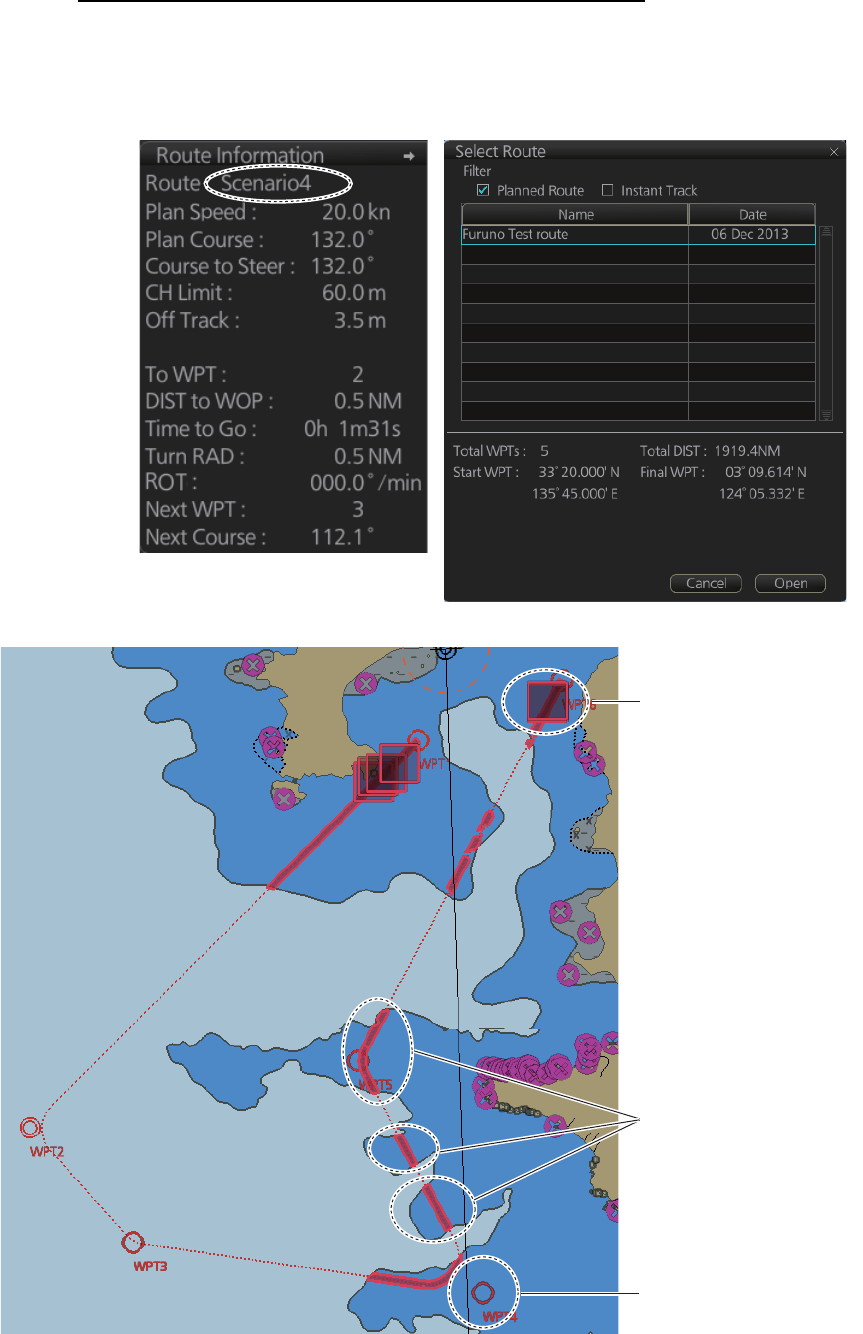
14. HOW TO MONITOR ROUTES
14-2
Method 2: Selection from the Route information box
Right-click the route name location in the [Route Information] box then select [Select
Route] to show the [Select Route] dialog box. Select a route then click the [Open] but-
ton.
Route32
AAAAAA
Route67
15 Nov 2013
15 Nov 2013
13 Nov 2013
Red box indicates
detailed information
available in larger scale.
Chart alert area
(warning)
Waypoint
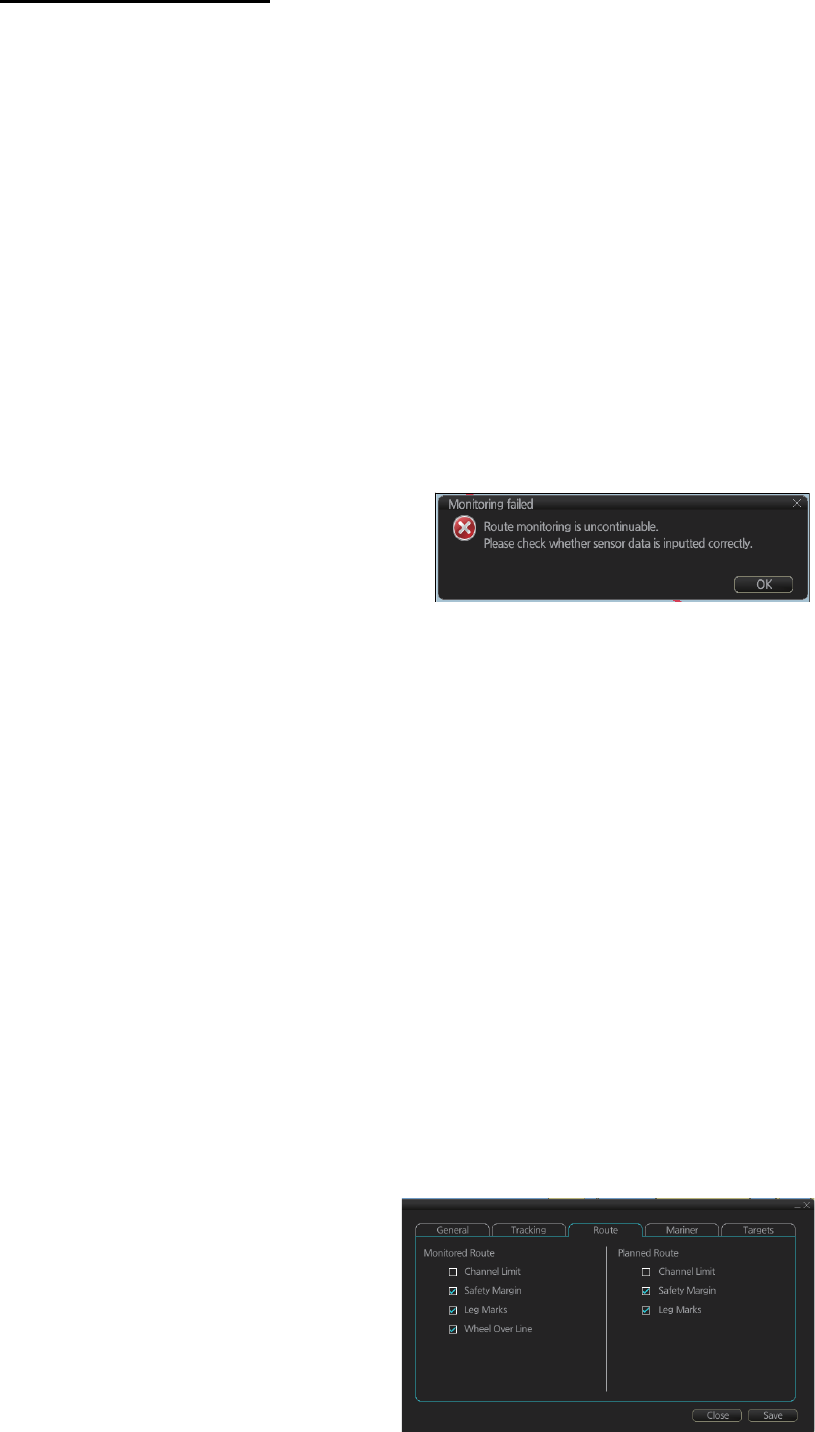
14. HOW TO MONITOR ROUTES
14-3
About monitoring routes
14.2 How to Stop Route Monitoring (Manual, Auto)
In the Voyage navigation mode, click the [Route] and [Unselect] buttons. Route mon-
itoring is also stopped automatically. See “route monitoring is stopped” in the Trouble-
shooting table in section 24.5 for details.
14.3 How to Select What Parts of a Route to Display
You can specify what parts of the
monitored route to display. Click the
[DISP], [SET] and [Symbol DISP]
buttons on the InstantAccess bar.
Click the [Route] tab.
-When you select a route for monitoring, the messages shown below appear, on the
[Select Route] dialog box or in a message window, when a route cannot be opened
for monitoring.
• "Impossible turn at waypoint XX" (XX=waypoint no.). Geometry of the route makes
it impossible for the ship to accomplish a turn. Modify the route to make the turn
possible.
• "Unchecked / Check condition differs". The route has not been checked. Check the
route, on the [Alert Parameters] page.
• "Monitored in the NAVI mode". The route is currently being monitored.
• "More than one WPT needed". The route has only one waypoint. Add more way-
points to the route.
• "Route monitoring cannot be started. Please check ship’s position and conditions."
Click the [OK] button to close the message. Check ship’s position and conditions
of the route.
-If you have small-scale chart(s) on display that have the whole eastern/western (0-
180°E/0-180°W) hemisphere and a part of the other hemisphere on display, there is
a limitation to display a route. To avoid this, set chart center so that the whole eastern/
western hemisphere is not on the screen.
-If, in the radar mode, route monitoring is
stopped, the alert 691 "RM Stop - Exceed
Max XTE", 692 "RM Stop - Disconnect
Sensors", or 693 "RM Stop - Other Caus-
es" appears. If this occurs, switch to the
Chart for Radar mode. The pop-up shown below appears. Click the OK button. Find
the reason why route monitoring was stopped and then restart route monitoring.
-Route monitoring is temporarily stopped (route is greyed out) and an alert appears
when position, speed or heading is lost. To restore route monitoring, change the sen-
sor system from System to Local (from the Sensor Information box), manually enter
the lost data, check [Set Drift], then switch to the DR mode.
-Route data is sent to the radar at the start of route monitoring or when the ship transits
a waypoint. If a route is not displayed on the radar, stop then restart monitoring at the
radar chart. A route is erased from the radar when route monitoring is stopped or the
radar chart is restarted. To redisplay the route, stop then restart monitoring at the ra-
dar chart.
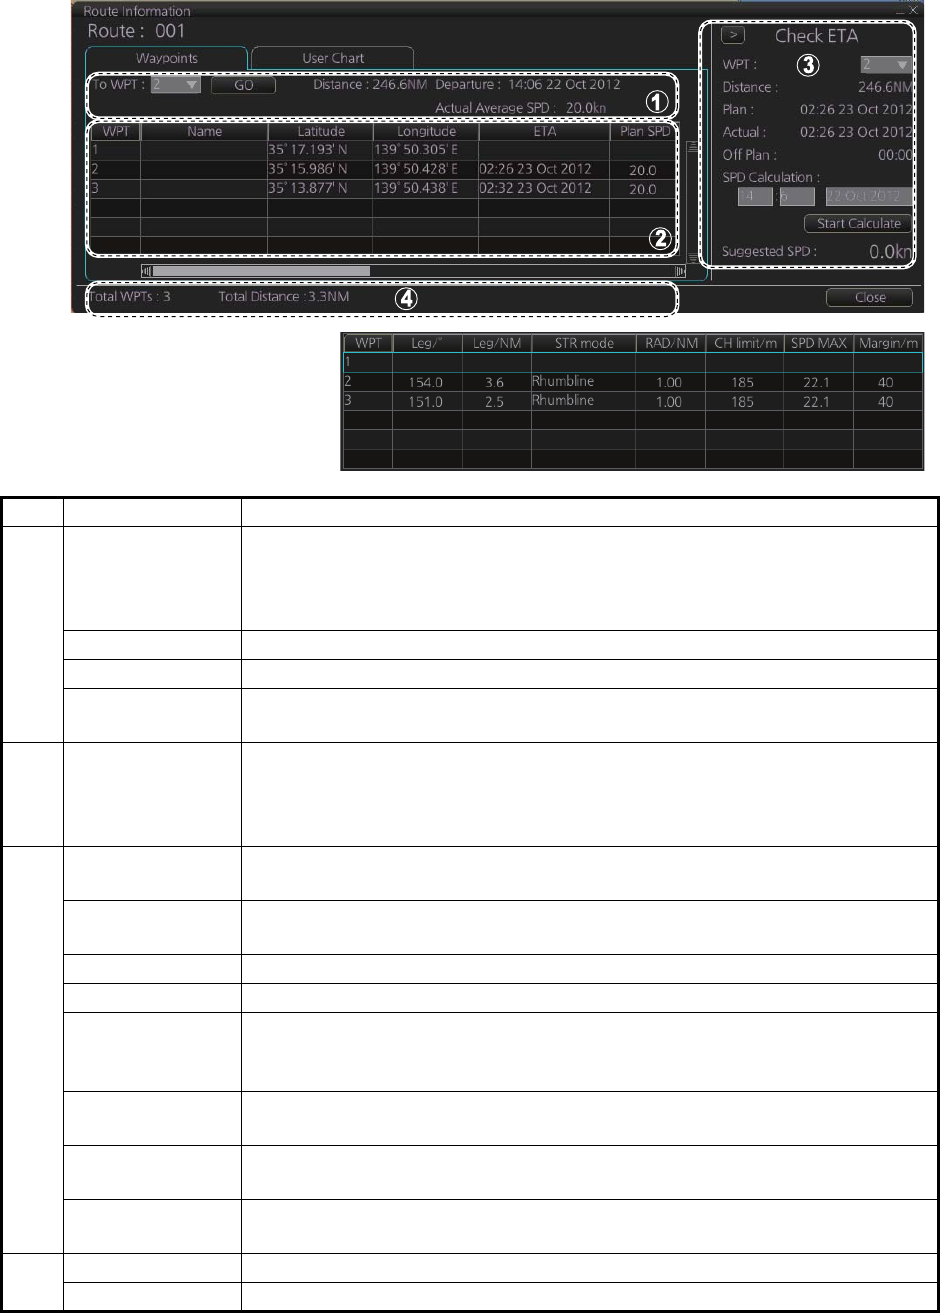
14. HOW TO MONITOR ROUTES
14-4
14.4 How to View Waypoint Information
Click the [Route] and [Route INFO] buttons on the InstantAccess bar to show the
[Route Information] dialog box. Click the [Waypoints] tab to show waypoint informa-
tion.
No. Item Description
1 [To WPT], [GO]
button
The system selects a next waypoint automatically. Check that the To way-
point is the desired one. The system will automatically advance to a next
waypoint when you pass the To waypoint. The default [To WPT] is WPT2.
If you desire a different one, select it here and the click the [GO] button.
[Distance] Distance from current position to selected waypoint.
[Departure] The time the route was selected for monitoring.
[Actual Average
SPD]
Actual speed
2 Waypoint list The waypoint list provides for each waypoint WPT no., name, latitude and
longitude position, ETA, plan speed, bearing and distance to leg, steering
mode ([Rhumbline] or [Greatcircle]), radius, channel limit, speed max, and
margin.
3 [Check ETA]
window
Parameters for checking ETA. The arrow to the left of [Check ETA] col-
lapse or display the [Waypoints] and [User Chart] tabs.
[WPT],
[Distance]
Select a WPT to find the distance to that waypoint from current position.
[Plan] The planned ETA to the selected waypoint.
[Actual] The actual ETA to the selected waypoint.
[Off Plan] The time difference between planned ETA and calculated ETA to final
WPT, when different. The indication is prefixed with "-" if earlier than
planned; "+" if later than planned.
[SPD Calcula-
tion]
Enter speed and ETA (time and date) to find the speed to use to arrive by
the ETA.
[Start Calculate]
button
Click to start calculation. The button label changes to [Stop Calculate].
[Suggested
SPD]
The system calculates suggested speed so that ETA to the WPT selected
would be same as planned ETA if type of optimization was "Time table".
4 [Total WPTs] The total number of waypoints in the route.
[Total Distance] The total distance of the route.
*
* Scroll list horizontally to view
items shown in the right figure.
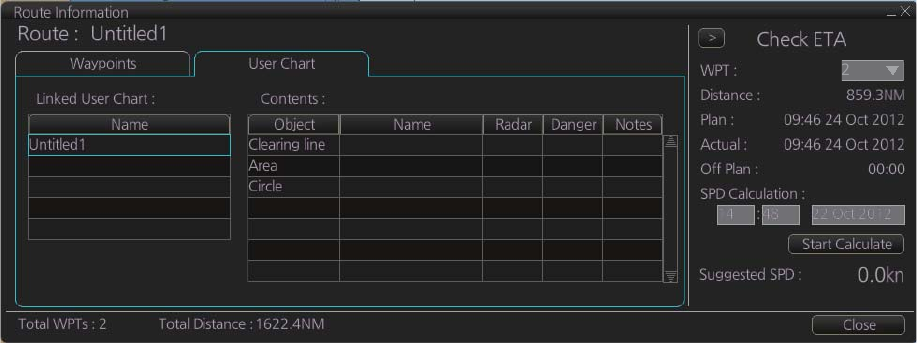
14. HOW TO MONITOR ROUTES
14-5
14.5 How to View User Chart Information
In the Voyage navigation mode, click the [Route] and [Select] buttons on the
InstantAccess bar, select a route, click the [Open] button, then click the [User Chart]
tab.
The [Linked User Chart] list shows all the user charts linked with the monitored route
and their contents. Click a user chart name to show the contents of the chart in the
[Contents] window. Items with a checkmark are activated. For the [Check ETA] win-
dow, see the preceding page.
14.6 How to Change Monitored Route to Planned
Route
The monitored route can be transferred to the Voyage planning mode. This is useful
when you don't need the route for monitoring but want to edit it. To transfer the moni-
tored route, click the [Route] and [Move to Plan] buttons on the InstantAccess bar.
Up to five planned routes can be shown on the display. If you try to display another
route, the route list appears. Deselect a route in order to transfer the monitored route
to the Voyage planning mode.
Note: When the monitored route is changed to a planned route, using the [Move to
Plan] function, the operating mode changes from the Navigation voyage mode to the
Voyage planning mode.
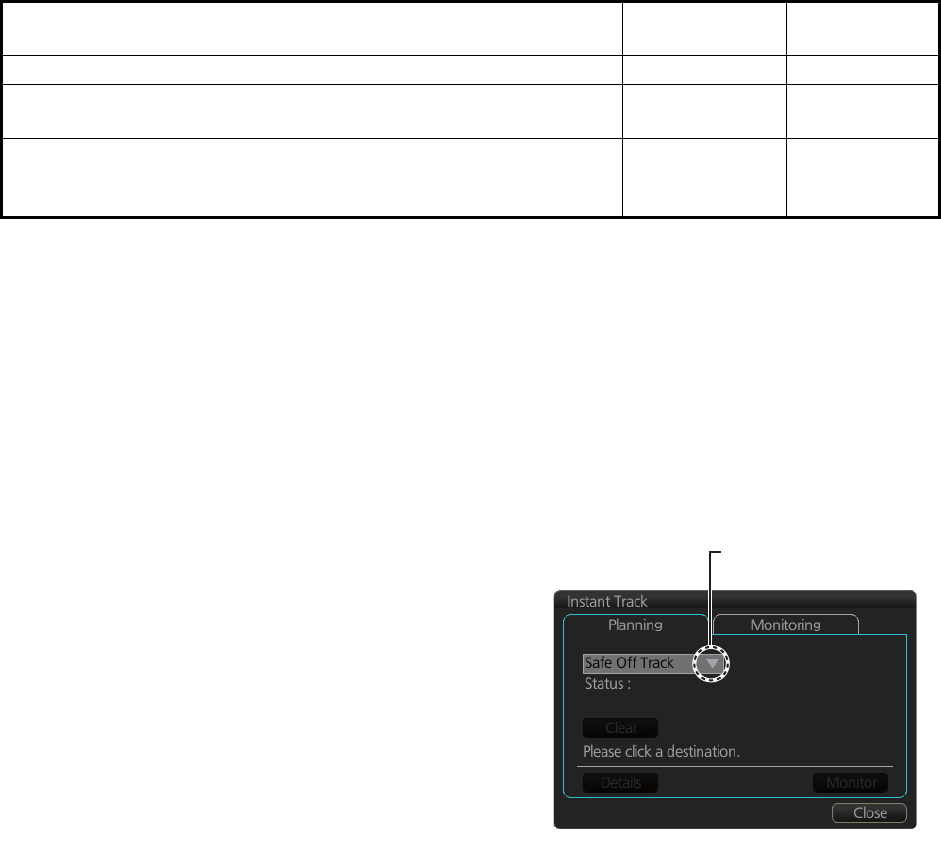
14. HOW TO MONITOR ROUTES
14-6
14.7 How to Use Instant Track to Return to or Deviate
from Monitored Route
The instant track feature provides a temporary track, consisting of four waypoints, to
return to or deviate from the monitored route. Correct data from navigation sensors is
essential to this function.
There are two instant track modes: [Safe Off Track] and [Back to Track].
[Safe Off Track]: This mode provides a track from the monitored route to a safe loca-
tion to avoid collision or the like.
[Back to Track]. This mode creates a track to follow to return to the monitored route
when the vessel goes outside the channel limits.
The mode is automatically selected according to whether a monitored route is active
or not and the amount of off course. Further, if a monitored route is active while follow-
ing the instant track route, the instant track mode can be changed manually.
* An additional instant track route can continuously be created and monitored while
monitoring the instant track route.
The parameters for the track (channel limit, turn radius, etc.) can be set on the [Instant
Track] page. See section 21.2.
14.7.1 Safe off track mode
If it becomes necessary to deviate from the monitored route; for example, to avoid col-
lision, use the [Safe Off Track] mode to create an instant track to a safe location. An
instant track can be created without a monitored route.
1. When the monitored route is active,
click the [Instant Track] button on the
InstantAccess bar to show the [Instant
Track] dialog box. The message
"Please click a destination." appears on
the [Planning] page.
Note 1: If a monitored route is active,
the [Back to Track] mode can also be
selected.
Note 2: If a monitored instant track
route is already active, an instant track
mode different from the currently active
one can be selected.
2. Click a destination. The location is marked with an orange circle and arrow. The
message "Please click a point to decide an angle." appears in the [Instant Track]
dialog box. The location must be within 50 NM of current position.
Condition Mode Manual mode
switching
Neither monitored route nor instant track route active.* [Safe Off Track] No
• Both monitored route and instant track route are active.*
• The absolute value of off track is within the channel limit setting.
[Safe Off Track] Yes
• Both monitored route and instant track route are active.*
• The absolute value of off track is outside the channel limit set-
ting.
[Back to Track] Yes
Click here to show drop
down list to select mode.
When monitored route is active
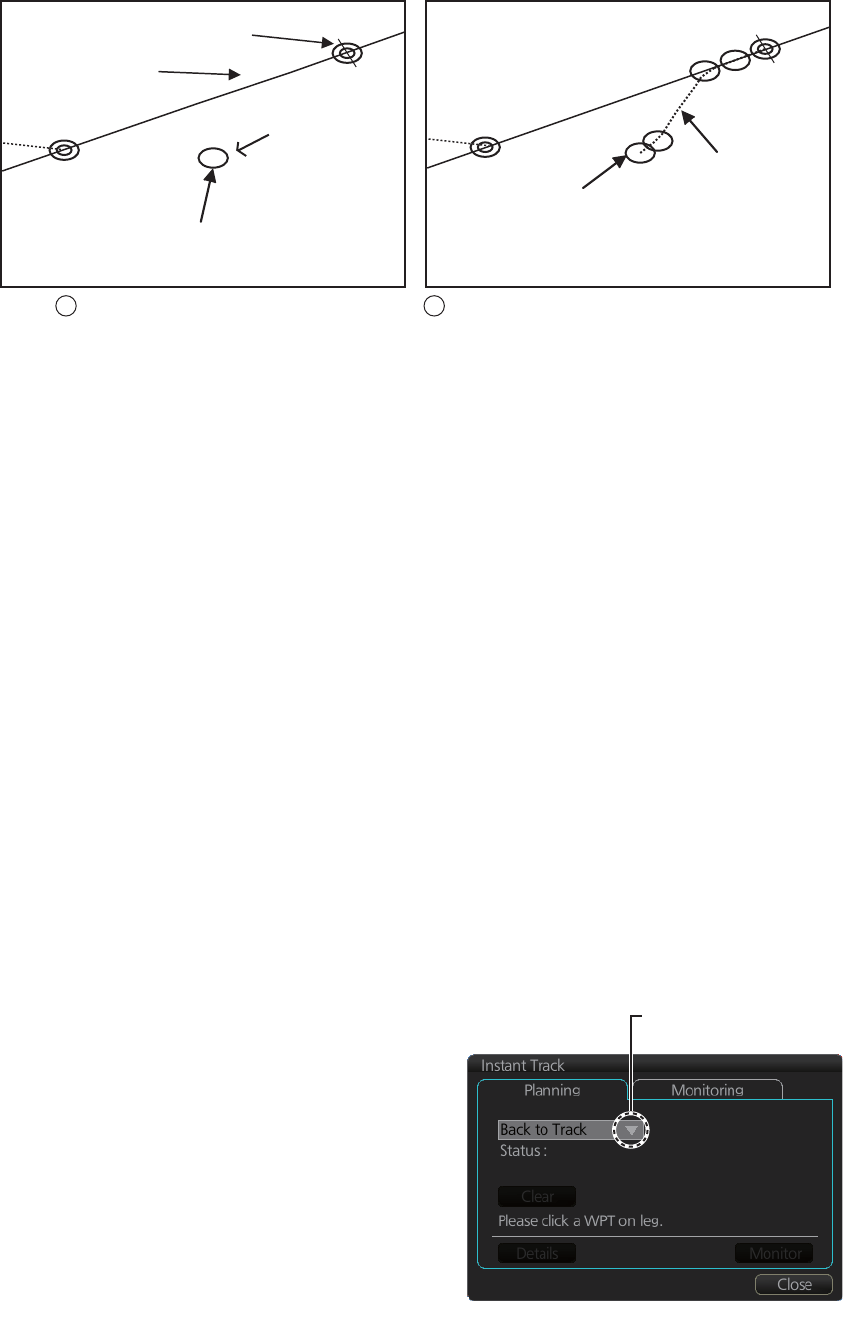
14. HOW TO MONITOR ROUTES
14-7
3. Roll the trackball to select the angle of approach to the destination then click.
The system uses ship position, speed, angle of approach to create an instant track
route. The track is also checked for hazardous objects and the like against the chart
alerts.
During the calculation, the [Instant Track] dialog box shows "Checking" in the [Status]
field. If, after completion of the calculation, the track is suitable, the message "OK" re-
places "Checking". The track and its waypoints, labeled [T1] - [T4], are colored or-
ange. The track is saved to the database as "InstantTrack_XXX" (XXX=001 - 400).
If clicking the [Clear] button while or after creating the track, the track is erased from
the screen.
If there is a problem with the track, an error message appears and the track is erased
from the screen. See section 14.7.3 for all the instant track messages and their mean-
ings.
To return to the monitored route, click a waypoint on a leg of the route to create an
instant track route to use to return to the monitored route.
14.7.2 Back to track mode
When the vessel goes off track, the alert "172 Off Track Alarm" appears in the [Alert]
box. To create an instant track to return to the monitored route, use the [Back to Track]
mode as follows:
1. When the monitored route is active,
click the [Instant Track] button on the
InstantAccess bar to show the [Instant
Track] dialog box. The message
"Please click a WPT on Leg." appears
on the [Planning] page.
Note 1: If a monitored route is active,
the [Safe Off Track] mode can also be
selected.
Note 2: If a monitored instant track
route is already active, an instant track
mode different from the currently active
one can be selected. Further, a com-
pletely new instant track route to the original monitored route can be created.
Click destination point .
A circle and arrow appear.
Click a location to set desired angle of approach.
Instant track is drawn.
Monitored route
Current position
Instant track
(orange)
Instant track
waypoints
(orange)
Destination
WPT2
T1
T2
WPT2 T3
T4
12
Click here to show drop
down list to select mode.
When monitored route is active
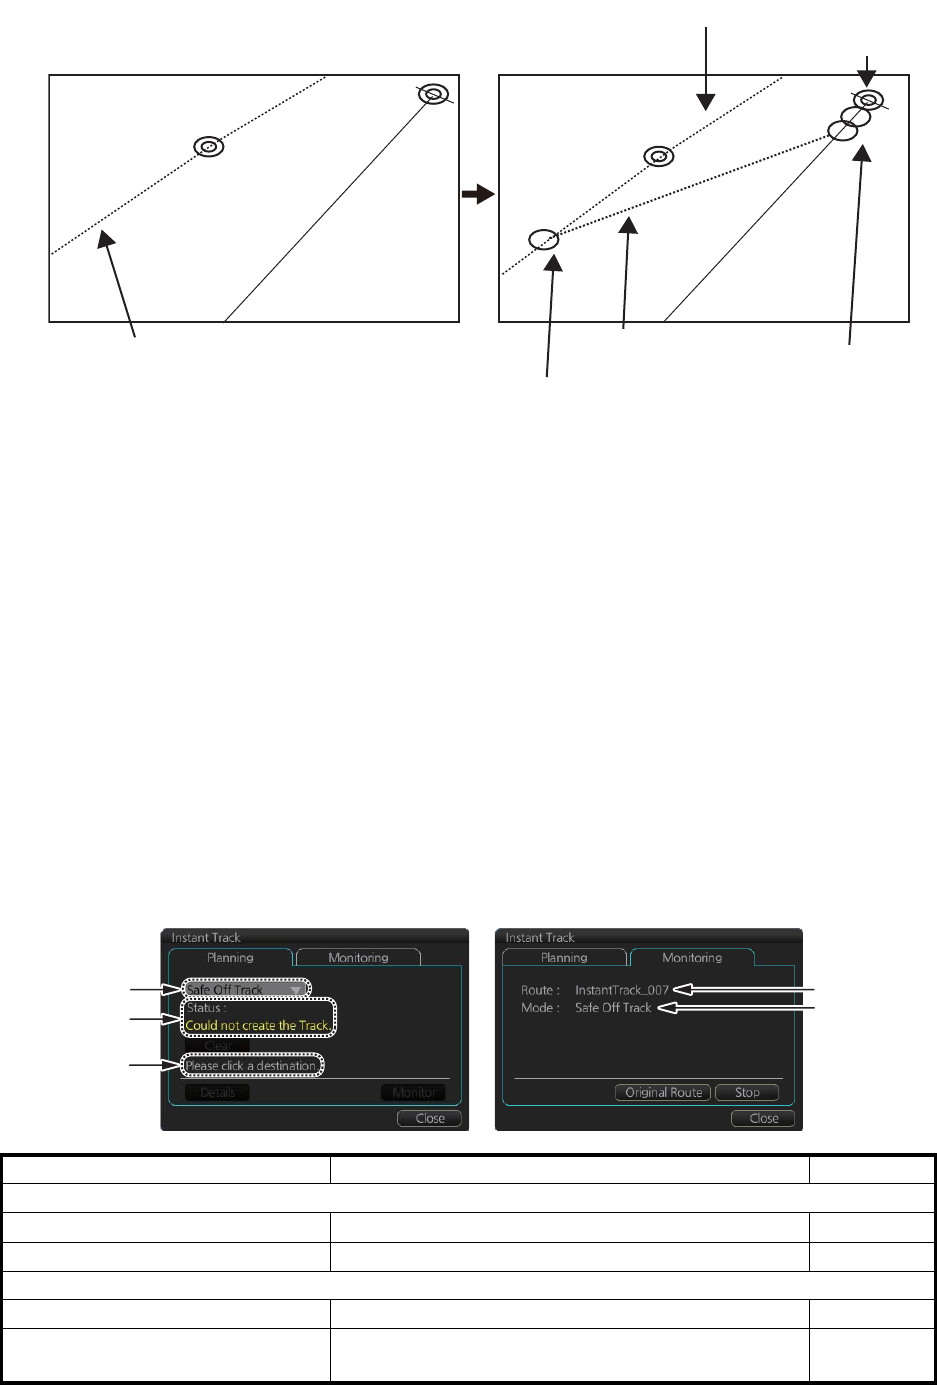
14. HOW TO MONITOR ROUTES
14-8
2. Click a leg or a waypoint on the monitored route. The location must be within 50
NM of current position.
The system uses ship position, speed and final waypoint to create a track. The track
is also checked for hazardous objects and the like against the chart alerts.
During the calculation, the [Instant Track] dialog box shows "Checking" in the [Status]
field. If, after completion of the calculation, the track is suitable, the message "OK" re-
places "Checking". The track and its waypoints, labeled [T1] - [T3], are colored or-
ange. The track is saved to the database as "InstantTrack_XXX" (XXX=001 - 400).
If clicking the [Clear] button while or after creating the track, the track is erased from
the screen.
If there is a problem with the track, an error message appears and the track is erased
from the screen. See section 14.7.3 for all the instant track messages and their mean-
ings.
14.7.3 Instant track messages
The table below shows all the instant track messages and their meanings.
Message Meaning Color
(1) Instant Track mode
"Back to Track" Back to track mode White
"Safe Off Track" Safe off track mode White
(2) Check result, error message
"Could not create the Track." The track could not be created. Yellow
"Too far destination from own
ship."
Selected destination is 50 NM or more from cur-
rent position.
Yellow
Current position
Monitored route
Click a leg on monitored route. Instant track
(orange) Instant track
waypoints
(orange)
Point of return to route
WPT2 WPT2
T1
T2
T3
(1)
(2)
(3)
(1)
(4)
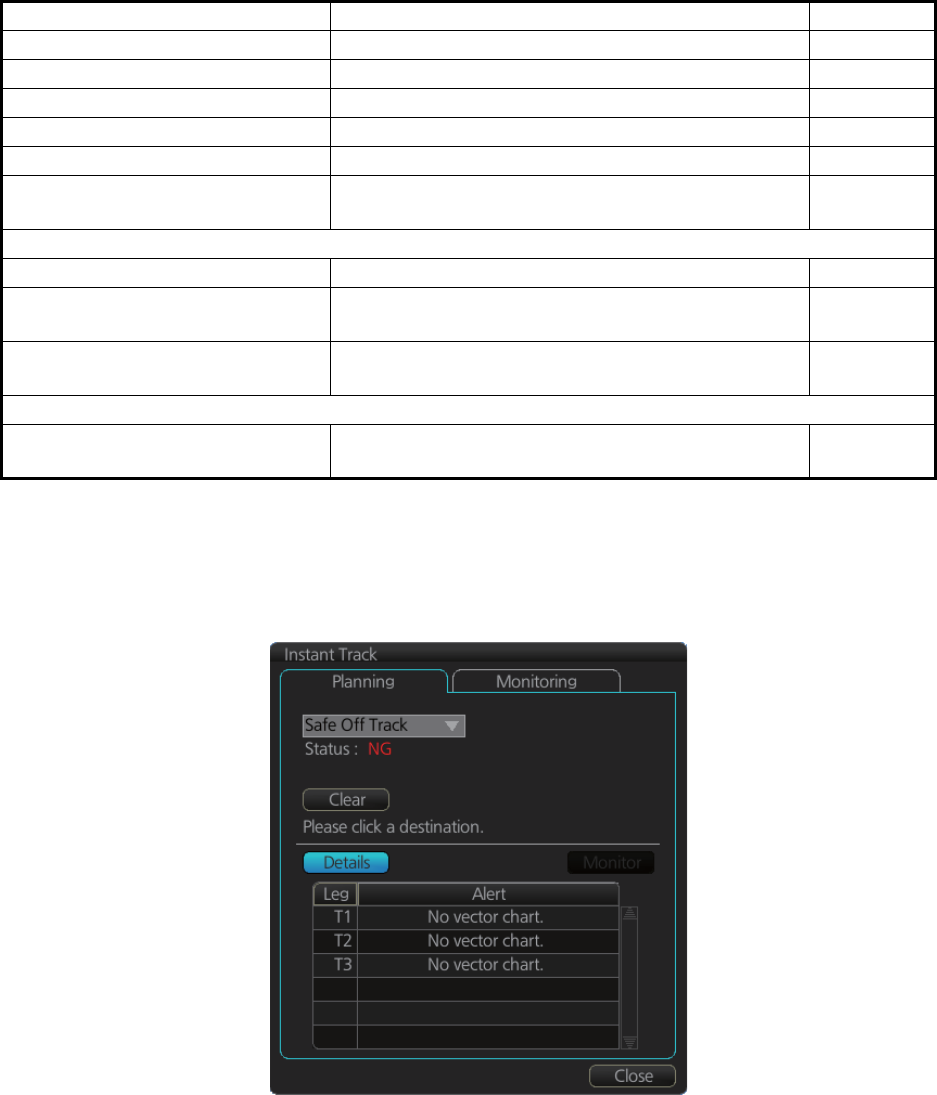
14. HOW TO MONITOR ROUTES
14-9
14.7.4 Instant track details
You can see the location and alert type found in an instant track by clicking the [De-
tails] button on the [Planning] page in the [Instant Track] dialog box.
"Checking..." Checking route. Red
"OK" Instant track checked and is suitable to follow. Green
"NG" Instant track check failed. Red
"Check error." Route check error. Red
"Instant Track is expired." Route monitor timeout. Red
"Too many WPTs in monitoring
route."
More than 190 waypoints are in the monitored
route. (Instant track cannot be created.)
Red
(3) User operation message
"Please click a destination." Select a destination in the [Safe Off Track] mode. White
"Please click a point to decide an
angle."
Set the angle of approach in the [Safe Off Track]
mode.
White
"Please click a WPT on leg." Click a waypoint on a leg in the [Back to Track]
mode
White
(4) Name of instant track route
InstantTrack_XXX
(XXX: 001 - 400)
Name of monitored instant track route White
Message Meaning Color
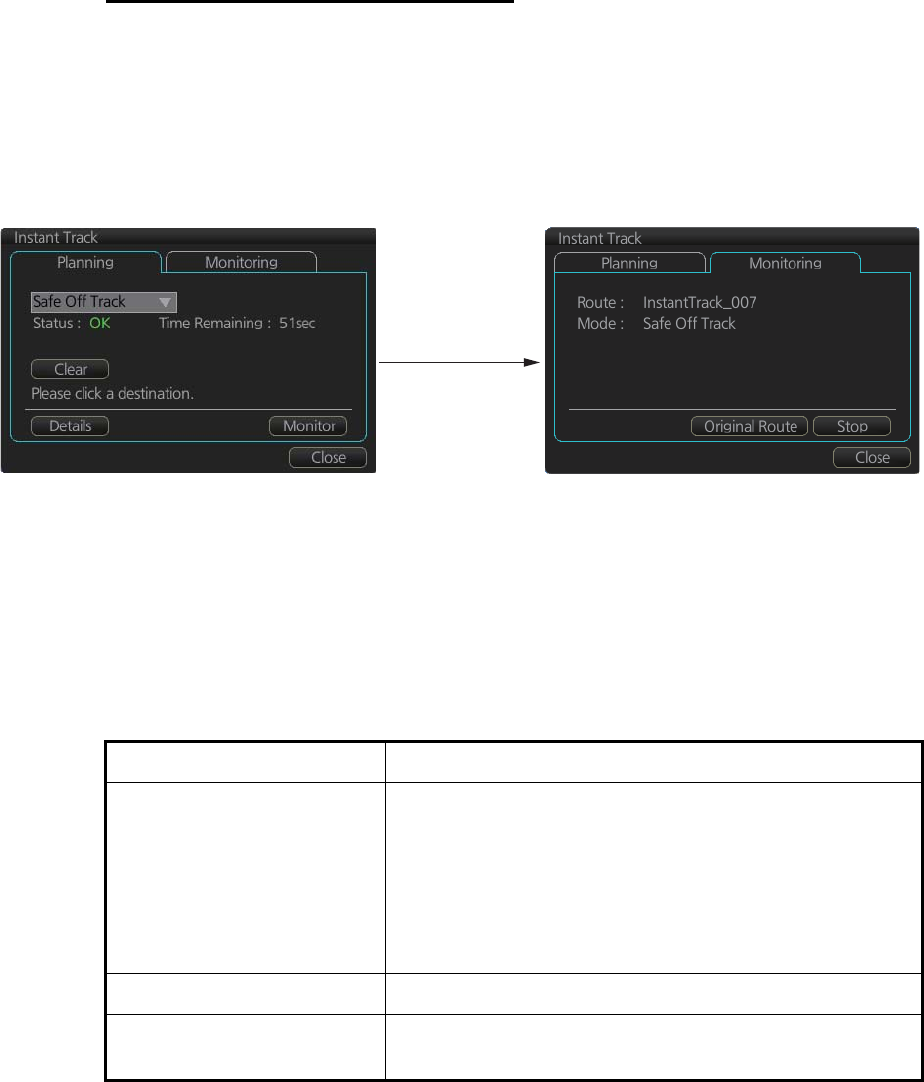
14. HOW TO MONITOR ROUTES
14-10
14.7.5 How to monitor, stop monitoring an instant track route
How to monitor an instant track route
If the route check results is "OK", click the [Monitor] button on the [Planning] page in
the [Instant Track] dialog box to start monitoring the instant track route. Click the but-
ton before the time remaining counts to zero, otherwise the instant track will be can-
celled, followed by the message "Instant Track is expired." After the [Monitor] button
is clicked the [Monitoring] page is opened. The [Monitoring] page shows the name of
the instant track and the instant track mode.
The vessel follows the instant track route in the same method as a monitored route,
which is grayed out to indicate it is inactive. For the instant track route connected to a
monitored route, the previous instant track route is also greyed out to show it is inac-
tive. Any additional instant track routes are erased.
To close the [Instant Track] dialog box, click the [Close] button. (The system continues
monitoring the instant track route.)
The following occurs when sensor data is lost while using the instant track function.
Monitoring condition Result
Instant track route monitor-
ing.
• An instant track route under creation is deleted. No
route can be created.
• The [Stop] button is pushed or the instant track route
is followed until its completion.
• After the instant track route is completed, an error
message appears and the [Instant Track] dialog box
closes.
No monitored route An instant track route under creation is deleted.
Monitored route active After the route is completed, an error message appears
and the [Instant Track] dialog box closes.
Click the
[Monitor] button.
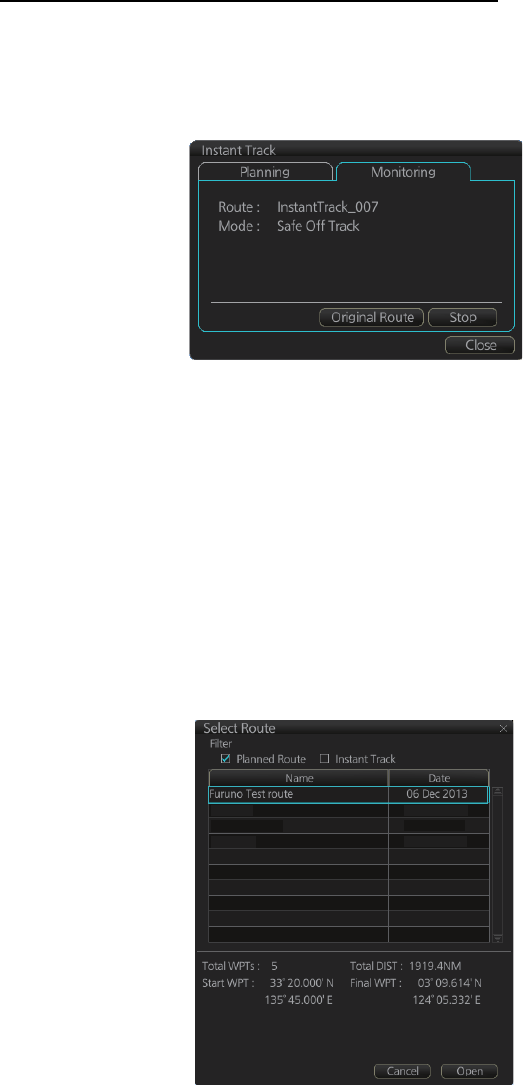
14. HOW TO MONITOR ROUTES
14-11
How to stop monitoring an instant track route
Click the [Stop] button on the [Monitoring] page in the [Instant Track] dialog box to stop
monitoring the instant track route. The system returns to monitoring the monitored
route and the [Planning] page of the [Instant Track] dialog box opens.
For the [Back to Track] mode, the instant track mode is canceled when the vessel re-
turns to the monitored route. The instant track is grayed out to show that is inactive.
14.7.6 How to change a monitored route when following an instant
track route (safe off track mode only)
Do the following to change a monitored route while following an instant track route.
1. While monitoring an instant track route, click the [Original Route] button on the
[Monitoring] page in the [Instant Track] dialog box to show the [Select Route] dia-
log box. Check [Planned Route] to show a list of planned routes, or check [Instant
Track] to show a list of instant track routes.
2. Select the route to use. The original route or the instant track route currently in use
cannot be selected.
3. Click the [Open] button to close the dialog box. The vessel starts following the
newly selected route.
When an instant track route is completed, the vessel starts following the route selected
at step 2.
Route32
AAAAAA
Route67
15 Nov 2013
15 Nov 2013
13 Nov 2013
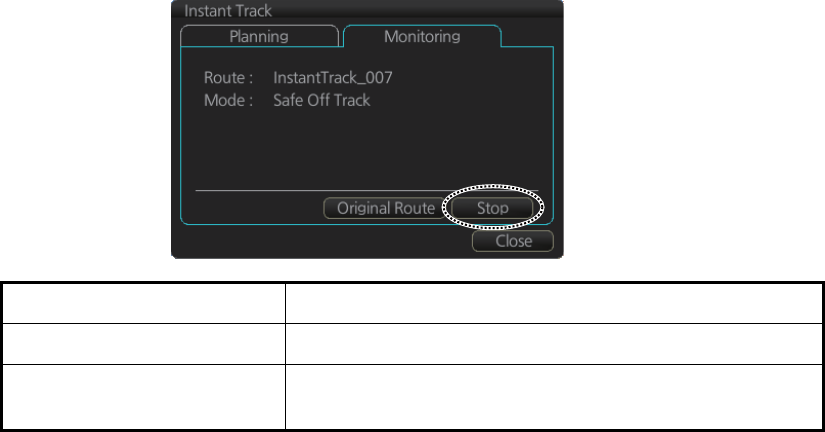
14. HOW TO MONITOR ROUTES
14-12
14.7.7 Button label and equipment state
The label on the button at the position circled in the figure below changes according
to the state of the instant track.
Instant track state Button label
Monitoring [Stop]
Return to original route after
back to track mode
[Reset] (Instant track route is erased - another instant
track route can be created.)
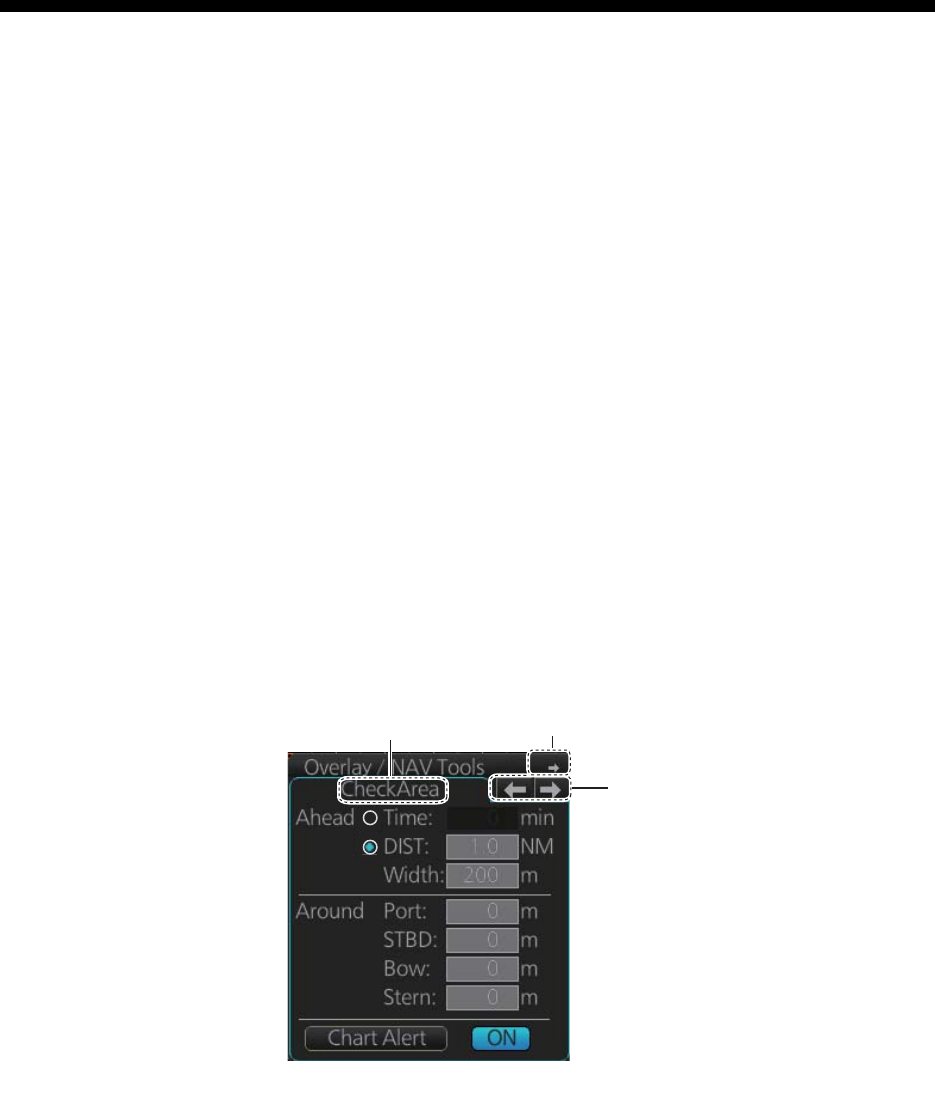
15-1
15. NAVIGATION TOOLS
This chapter presents the various navigation tools available with the system. With the
exception of the mini conning display and the divider, the tools listed below are in the
[Overlay/NAV Tools] box.
• TT/AIS (see chapters 3 and 4)
• Parallel index lines
• Check area
• Range rings
• Predictor
• Anchor watch
• Under keel clearance
• Mini conning display
• Divider
15.1 How to Access the Nav Tools in the Overlay/NAV
Tools Box
The [Overlay/NAV Tools] box is located at bottom-right position on the screen. Use the
page selection buttons to select desired page.
[Overlay/NAV Tools] box ([CheckArea] page)
Page
selection
buttons
Minimize button
Page name
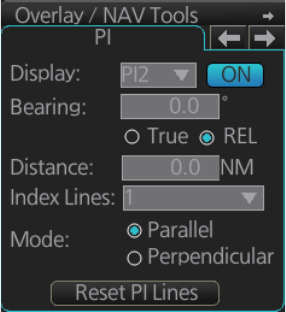
15. NAVIGATION TOOLS
15-2
15.2 Parallel Index (PI) Lines
The parallel index lines are useful for keeping a constant distance between own ship
and a coastline or a partner ship when navigating. Up to six sets of PI lines are avail-
able and as many as six can be shown. One, two, three or six lines can be shown.
(The actual number of lines shown depends on the line interval.)
The bearing can be set two ways: with the scrollwheel or dragging the PI line on the
screen.
15.2.1 How to activate, deactivate PI lines
Select the PI line set to activate or deactivate with the [Display] drop-down list. Acti-
vate or deactivate the set selected with the [ON/OFF] button. Only one set can be
shown.
15.2.2 PI line bearing reference
PI line bearing reference may be relative to own ship’s heading (Relative) or refer-
enced to North (True). Select [True] or [REL].
15.2.3 Number of PI lines to display
The maximum number of PI lines to display may be selected from 1, 2, 3 or 6 lines as
below. The actual number of lines visible may be less depending on line interval. Se-
lect the number of lines to display at [Index Lines].
15.2.4 PI line mode
The PI line mode can be set for parallel (0-degrees) or perpendicular (90-degrees).
Select [Parallel] or [Perpendicular] at [Mode].
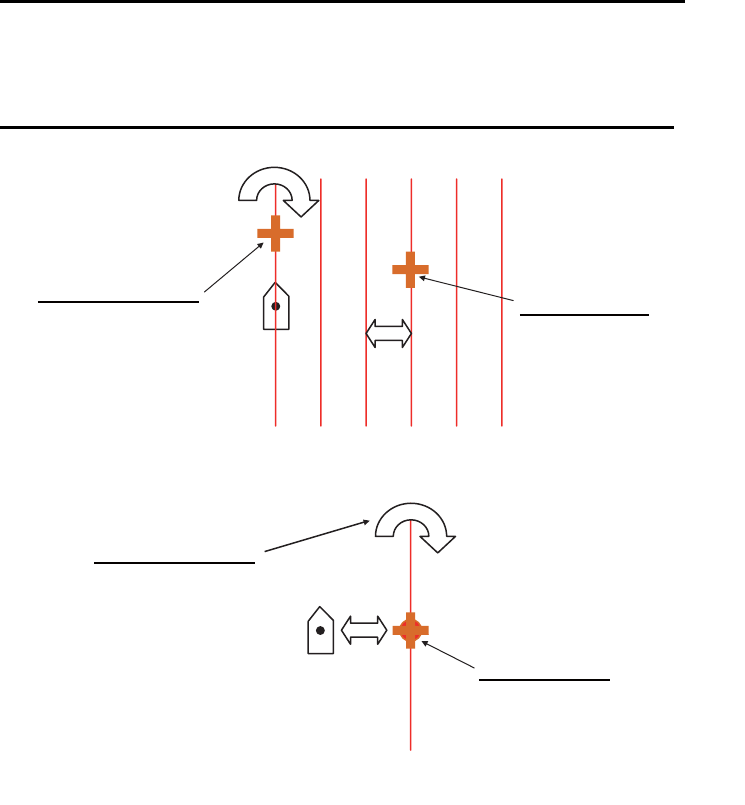
15. NAVIGATION TOOLS
15-3
15.2.5 How to adjust PI line orientation, PI line interval
There are two ways to adjust PI line orientation and PI line interval: through the menu
and on the screen.
How to adjust PI line orientation, PI line interval from the menu
1. Set the orientation with [Bearing].
2. Set the line interval with [Distance].
How to adjust PI line orientation, PI line interval on the screen
15.2.6 How to reset the PI lines
You can automatically return PI lines to default orientation, 0-degrees for parallel ori-
entation, 90-degrees for perpendicular orientation. This is faster than doing it manual-
ly. Click the [Reset PI Lines] button to reset the parallel lines.
How to adjust orientation and interval, multiple PI lines
Adjust interval:
Put cursor on any PI line
other than the one
bisecting own ship
marker then drag cursor.
A
djust orientation:
Put cursor on PI line
bisecting own ship
marker then drag cursor.
Adjust orientation:
Put cursor anywhere
on PI line (other than
own ship marker) then
drag cursor.
Adjust interval:
Put cursor on own
ship mark then
drag cursor.
How to adjust orientation and interval, single PI line
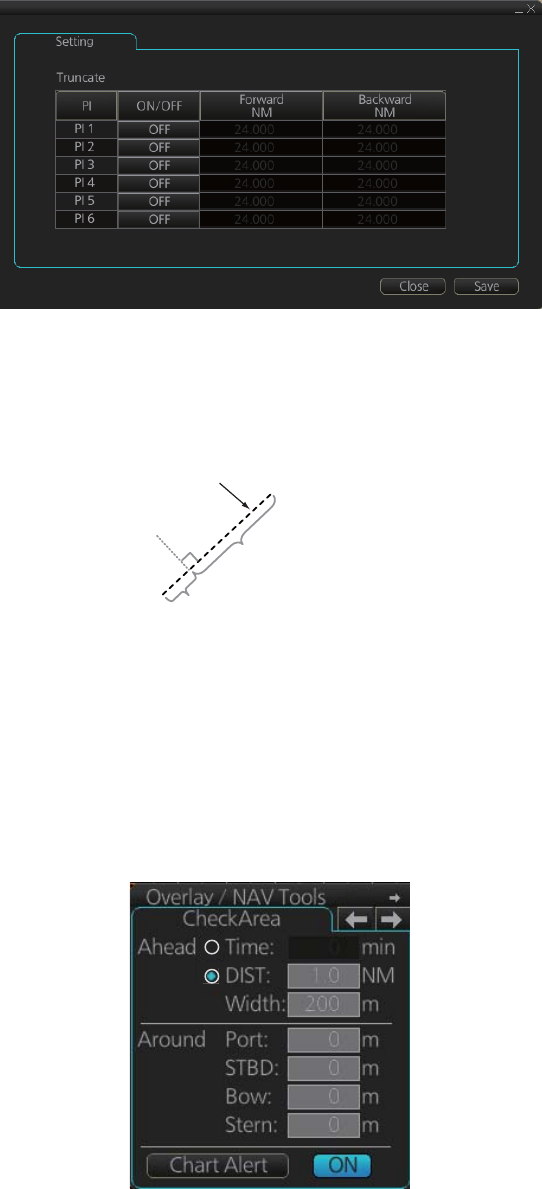
15. NAVIGATION TOOLS
15-4
15.2.7 How to adjust PI line length
You can adjust the forward and backward lengths of a PI line when [Index Lines] is set
to 1.
1. Open the MENU and select [NAV Tools], [PI Lines] and [Truncate].
2. If not already displayed, click the [ON/OFF] button to display the PI line whose
length you want to adjust.
3. Click the value in [Forward] and [Backward] columns to adjust their lengths, refer-
ring to the illustration below.
4. Click the [Save] button to finish.
15.3 Check Area
Check area sets the area ahead and around own ship for which to check for safe nav-
igation. See section 11.2 for how to activate own ship check.
PI line
PI line
Adjust the
forward length.
Adjust the
forward length.
Adjust the
backward length.
Adjust the
backward length.
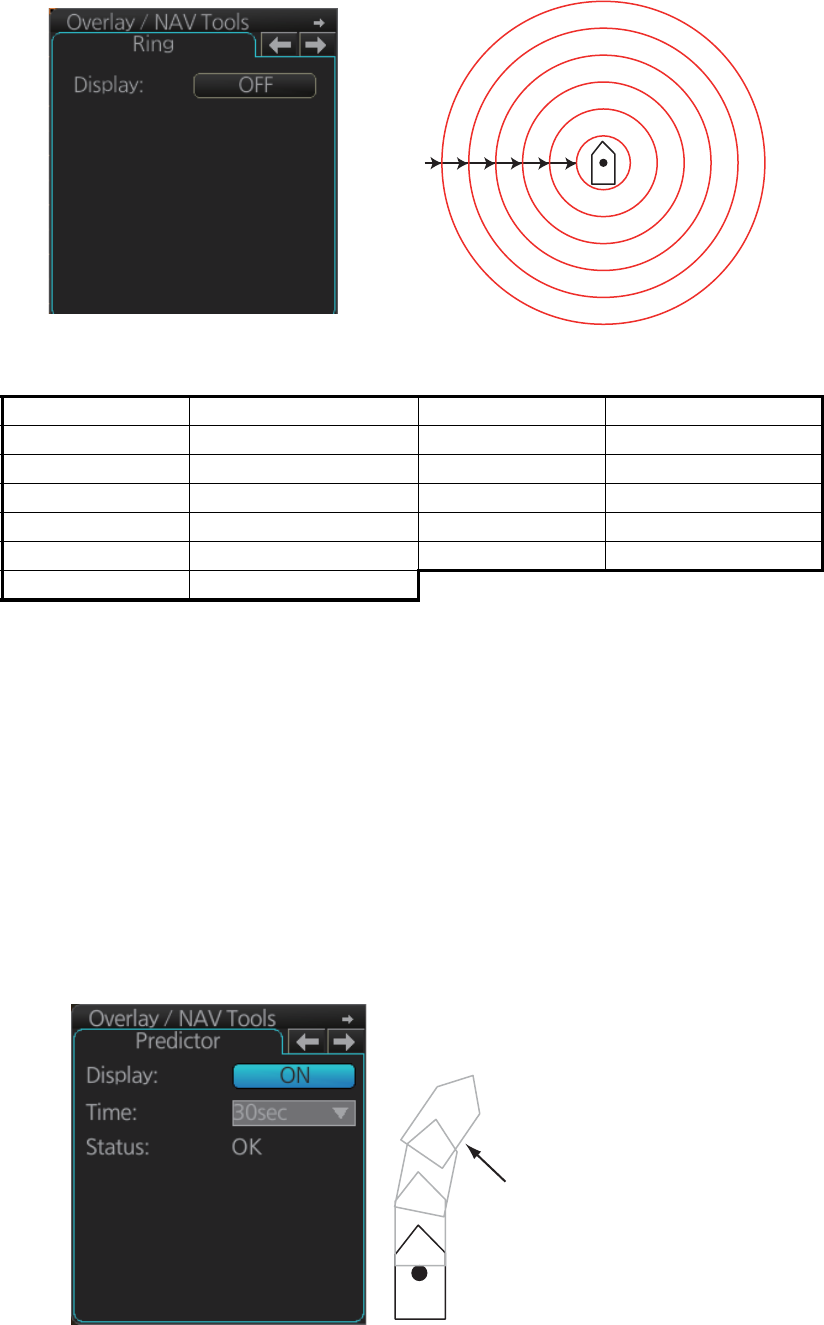
15. NAVIGATION TOOLS
15-5
15.4 Ring
The range rings are the concentric set of rings on the chart display. They provide an
estimation of the range to an object. You can turn them on or off from the [Ring] page.
The interval between rings changes with the chart scale as shown in the table below.
15.5 Predictor
The predictor is a tool for estimating your ship's future positions and behavior. The on-
screen predictor graphic consists of three pieces of your ship, drawn in true scale to
successive future positions. The position of the third symbol will be your approximate
position at the end of the time interval selected. The predictor is calculated using cur-
rent speed and rate of turn. Docking speed components (transversal bow speed,
transversal stern speed, transversal center speed and rate of turn) are assumed to be
stable during the prediction period. The predictor can be used in every steering-state,
including manual steering.
To activate and set the Predictor, show the [Predictor] page. Turn the display on or off
with [Display]. Set the time (30, 60, 90, 120, 150, 180 seconds), with [Time].
Chart scale Ring interval (nm) Chart scale Ring interval (nm)
1:1,000 0.025 1:100,000 2.0
1:2,000 0.05 1:200,000 4.0
1:5,000 0.10 1:500,000 8.0
1:10,000 0.25 1:1,000,000 16.0
1:20,000 0.5 1:2,000,000 20.0
1:50,000 1.0
Range
ring
Movement of
predictor
(three pieces)
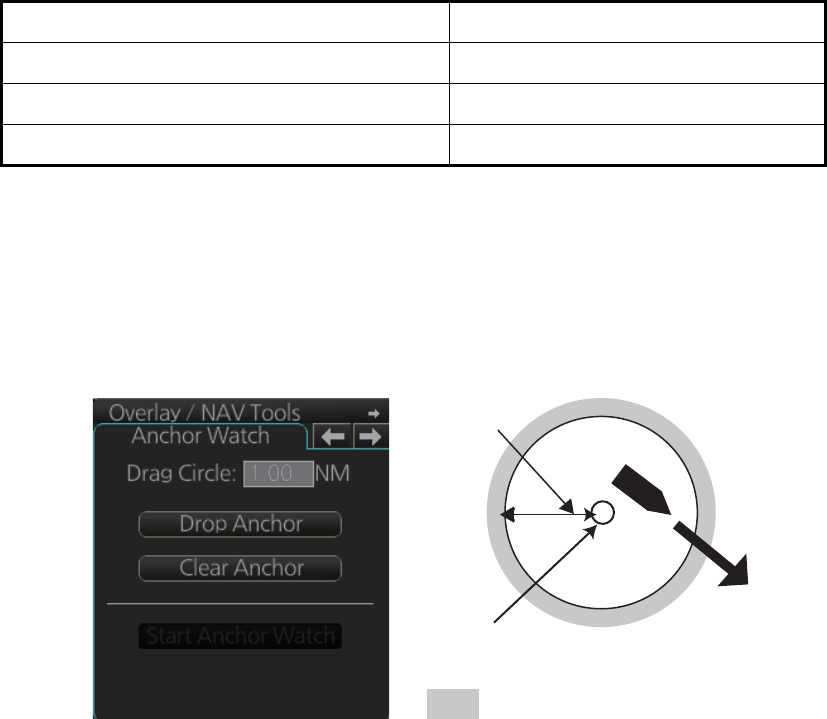
15. NAVIGATION TOOLS
15-6
The Predictor is updated every three seconds internally and the status of the predictor
is shown with [Status] as shown in the table below.
Note: The ship speed must be 0.5 kn or higher. The predictor may not be displayed
or may not work properly if the speed is lower than that value.
15.6 Anchor Watch
The anchor watch feature checks to see if your ship is drifting when it should be at rest.
To set the anchor watch:
1. Select the [Anchor Watch] page.
2. Set the alarm radius (in nautical miles) with [Drag Circle].
3. Drop the anchor then click the [Drop Anchor] button.
4. Click the [Start Anchor Watch] button to start the anchor watch.
If your vessel travels more than the distance set here, the corresponding caution is
generated.
To continue to use the anchor watch, click the [Clear Anchor] button to set the alarm
about your current position. To stop the anchor watch, click the [Stop Anchor Watch]
button. The caution is not generated even if your ship drifts more than the distance set
with [Drag Circle].
If your ship drifts more than the anchor watch setting, the Alert 495 “Anchor Watch
Setting” appears.
Indication Status
OK Speed is suitable (0.5 kn or higher).
Not Enough Speed Speed is too low to use the Predictor.
Not Available. Reset Filter May Restore. Predictor is not being received.
: Alarm triggered
Your ship's position, where you
start the anchor watch.
Alarm
setting
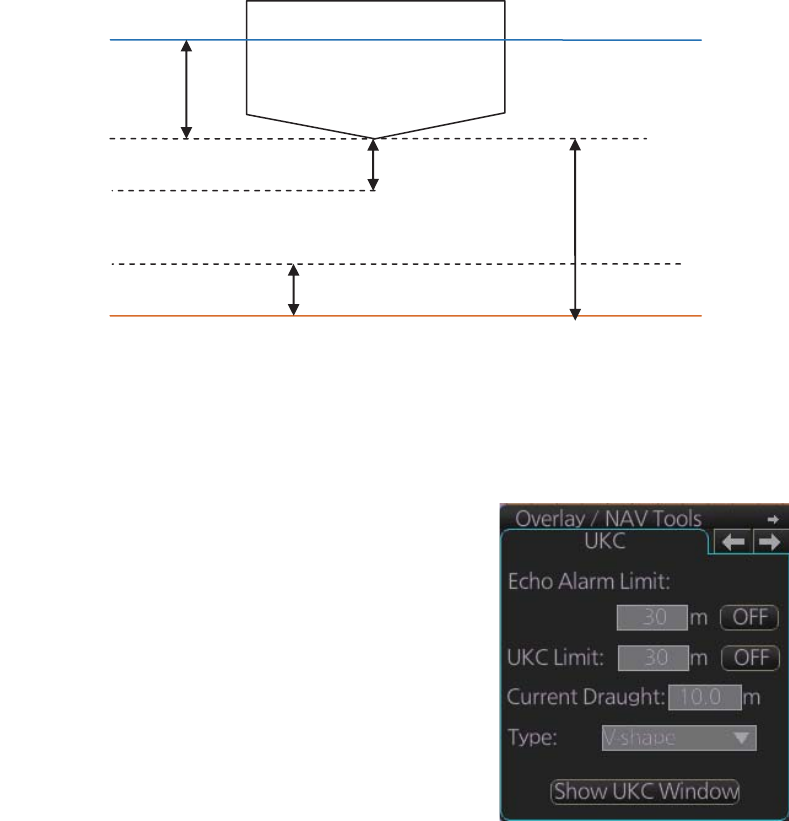
15. NAVIGATION TOOLS
15-7
15.7 UKC (Under Keel Clearance)
15.7.1 UKC overview
The UKC is the distance between the deepest point of the vessel's hull and the sea-
bed. The UKC feature continuously checks ship's draught setting (UKC), and actual
depth. When the depth gets shallower than the UKC, the Alert 634 "UKC Limit" is gen-
erated. And if the current depth is less than the echo alarm setting the echo alarm also
is generated. Depth data is required to use the UKC function.
Note: The sensor value shown is the depth to the transducer. Convert the value to the
distance to the keel.
15.7.2 How to set UKC
1. Select the [UKC] page from the [Overlay/NAV
Tools] box.
2. Use [Echo Alarm Limit] to set the distance for
the echo alarm. To activate the alarm, click the
[ON/OFF] button to show [ON].
3. At [UKC Limit], set ship's UKC limit. To activate
the UKC feature, click the [ON/OFF] button to
show [ON].
4. Use [Current Draught] to set your ship's draft.
Be sure to change the setting whenever the
draft changes.
5. Use [Type] to set the shape of your ship's hull
to show on the [UKC] window, [V-shape] or [Concave]. See the figure on the next
page.
Sea surface
Draft
Under keel clearance (UKC)
Seabed
Distance from keel
to seabed
Echo alarm setting
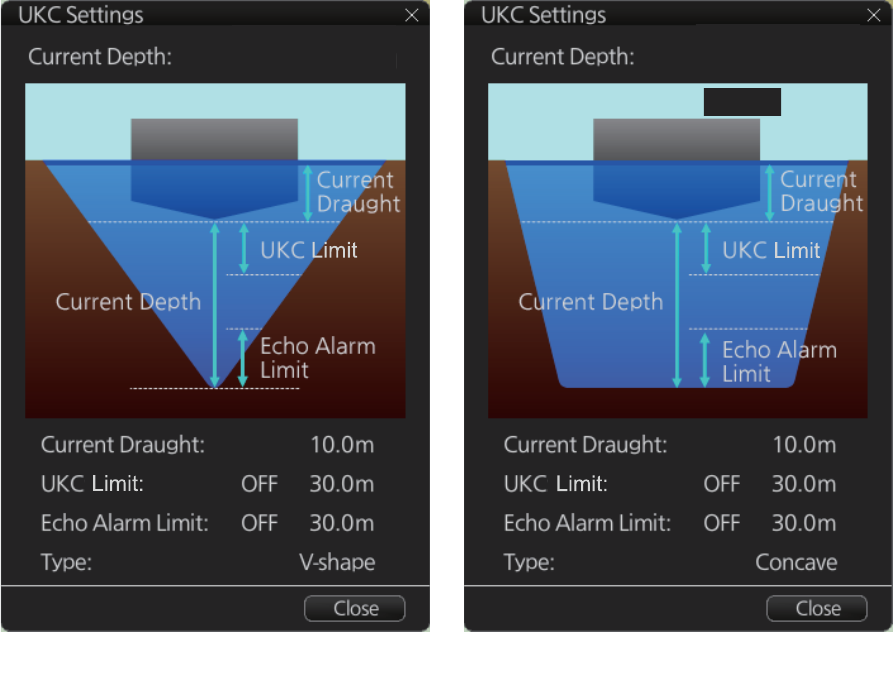
15. NAVIGATION TOOLS
15-8
15.7.3 UKC window
The UKC window provides a visual graphic of the relationship between UKC, draft and
current depth. The window can be shown or hidden as desired and located anywhere
within the electronic chart area. To show the window, click [Show UKC Window] on
the [UKC] page. To move the window, drag and drop.
V-shape hull presentation Concave hull presentation
100.2m 100.2m
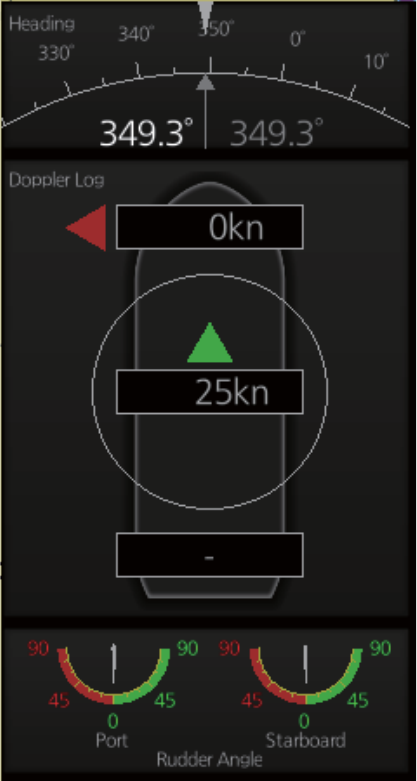
15. NAVIGATION TOOLS
15-9
15.8 Mini Conning Display
The mini conning display, available in the Voyage navigation mode, provides various
navigation information and is set during the installation. The display example below
shows heading, doppler log speed and rudder angle. To show or hide the mini conning
display, click the [Mini Conning] button on the InstantAccess bar.
To shift the mini conning display, right-click the mini conning display to show the con-
text-sensitive menu. Click an option: [Left Top], [Left Middle], [Left Bottom], [Right
Top], [Right Middle] or [Right Bottom].
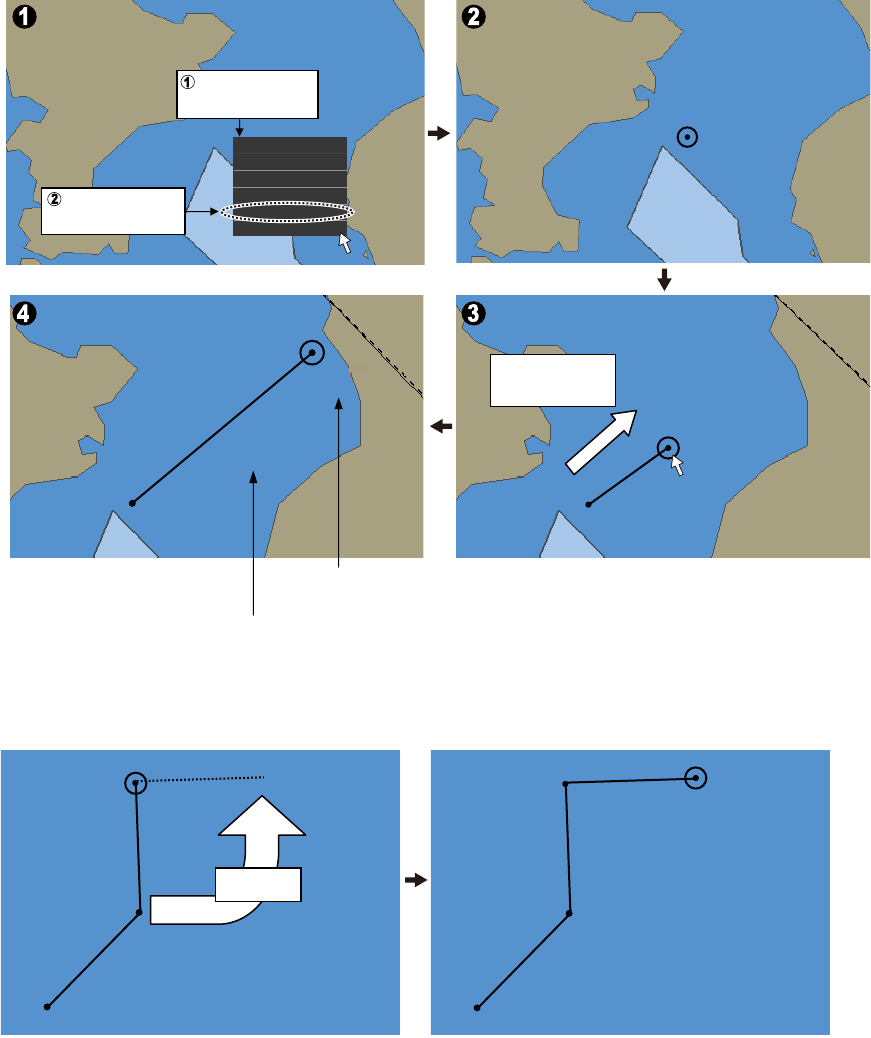
15. NAVIGATION TOOLS
15-10
15.9 Divider
The divider, available in the Voyage navigation and Voyage planning modes with
rhumb line navigation, measures the range, bearing and TTG between points, like us-
ing a dividers on a paper chart.
Only one divider can be displayed. The divider is neither saved nor shared among
chart radar units.
15.9.1 How to use the divider
Do as shown below to get the range, bearing and TTG between points.
You can also drag from an intermediate point to make another point.
00.00
00.00
2.6NM
055.1°
00.00
00.00
00:00
00:00
5.9NM
051.2°
00:07
00:07
Divider appears.
Range and bearing
between points
TTG between
points
Ship on center
Clear RADAR Info
Object INFO
Chart Legend
Manual Update
New Divider
Drag circle to
next point
Right-click
starting point
Select [New
Divider]
2.83NM
043.8°
2.75NM
087.9°
2.75NM
358.6°
2.83NM
043.8°
2.75NM
087.9°
Drag
15. NAVIGATION TOOLS
15-11
15.9.2 Usage characteristics, limitations
• The distance between points is shown to the hundredths decimal place up to 100
NM and to the tenths decimal place thereafter.
• A maximum of 50 points can be inserted, and the maximum measurable distance
between two points is 240.0 NM.
• The TTG value is rounded to the nearest decimal place. Therefore, the displayed
total TTG may not equal the sum of all the TTGs.
• The TTG is measurable to 99:00. If the TTG is higher, the TTG indication is
">99:00".
• The ship’s speed must be at least 0.5 kn to calculate TTG.
• The divider cannot be used in latitude higher than 85°.
15.9.3 How to deactivate and erase the divider
Get into the Voyage navigation or Voyage planning mode then
right-click the screen to show the context-sensitive menu. Se-
lect [Clear Divider].
Ship on center
Clear RADAR Info
Object INFO
Chart Legend
Manual Update
Clear Divider
15. NAVIGATION TOOLS
15-12
This page is intentionally left blank.
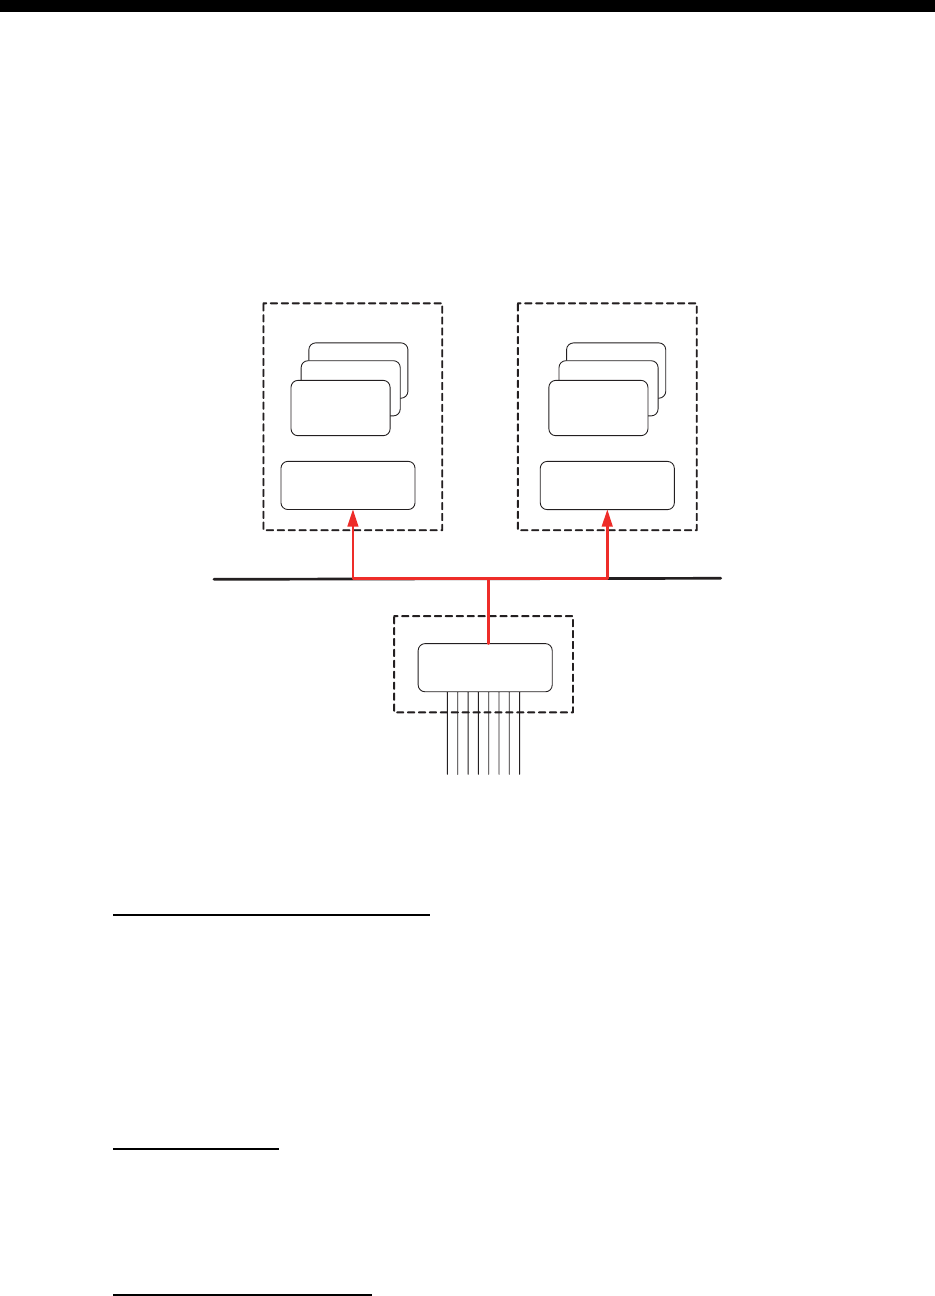
16-1
16. NAVIGATION SENSORS
16.1 CCRS
This chart radar employs a Consistent Common Reference System (CCRS) for the ac-
quisition, processing, storage and distribution of sensor information. The CCRS en-
sures that all parts of the system uses the same source and values, e.g., speed
through water, heading, etc. The illustration below shows the CCRS diagram.
The CCRS process NMEA0183 and IEC 61162-1 sentences. No other types of data
(video signals, etc.) are processed.
Check for validity, legitimacy
The system checks received sentences for validity and legitimacy.
Validity check: A sentences’s checksum, status (A/V), Mode indicator and setting
values are checked. (If checksum error is found, the sentence is disaffirmed.
Legitimacy check: The range and accuracy of a sentence is checked.)
If the check for both is OK a valid flag results. If either is invalid, the invalid flag is given.
Types of CCRS
There are two types of CCRS: System and Local. The System CCRS integrates all
navigation devices. In the Local CCRS each navigation device operates independent-
ly.
Representative sensors
If the system has multiple like sensors, the CCRS selects the representative sensor.
Generally, the system uses common representative sensors; however, independent
representative sensors (local representative sensors) can also be used.
Processor Unit Processor Unit
SENSOR
ADAPTER
Sensors
CCRS
CCRS
CCRS
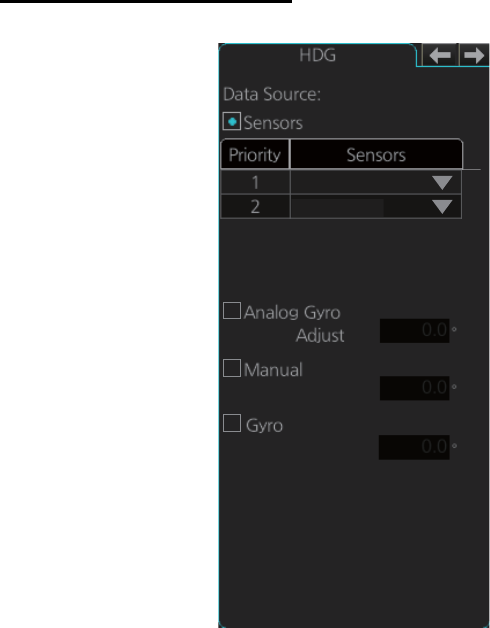
16. NAVIGATION SENSORS
16-2
16.2 How to Select Navigation Sensors
The operator can select navigation sensors to use for navigation and view their current
values on the applicable page in the [System Sensor Setting] and [Local Sensor Set-
ting] menus. To access these menus, right-click the Sensor information, datum box
then click [Select Sensor] followed by [Setting].
The descriptions in this section show the sensor menus in the radar mode. The sensor
menus in the chart mode mirror those in the radar mode, although the layout is differ-
ent. Any change made in a sensor menu is reflected to the companion sensor menu,
to synchronize the data between the modes.
16.2.1 Sensors menu description
[HDG] page (Local Sensor)
[Sensors]: Select the heading sensor to use.
[Analog Gyro]: No use.
[Manual]: Set heading manually when there is no heading sensor available. (Not
shown on IMO type.)
[Gyro Correction]: Set correction manually for the heading value. (Not available with
the [System Sensor Setting] menu.)
GYO001
GYO002
Correction
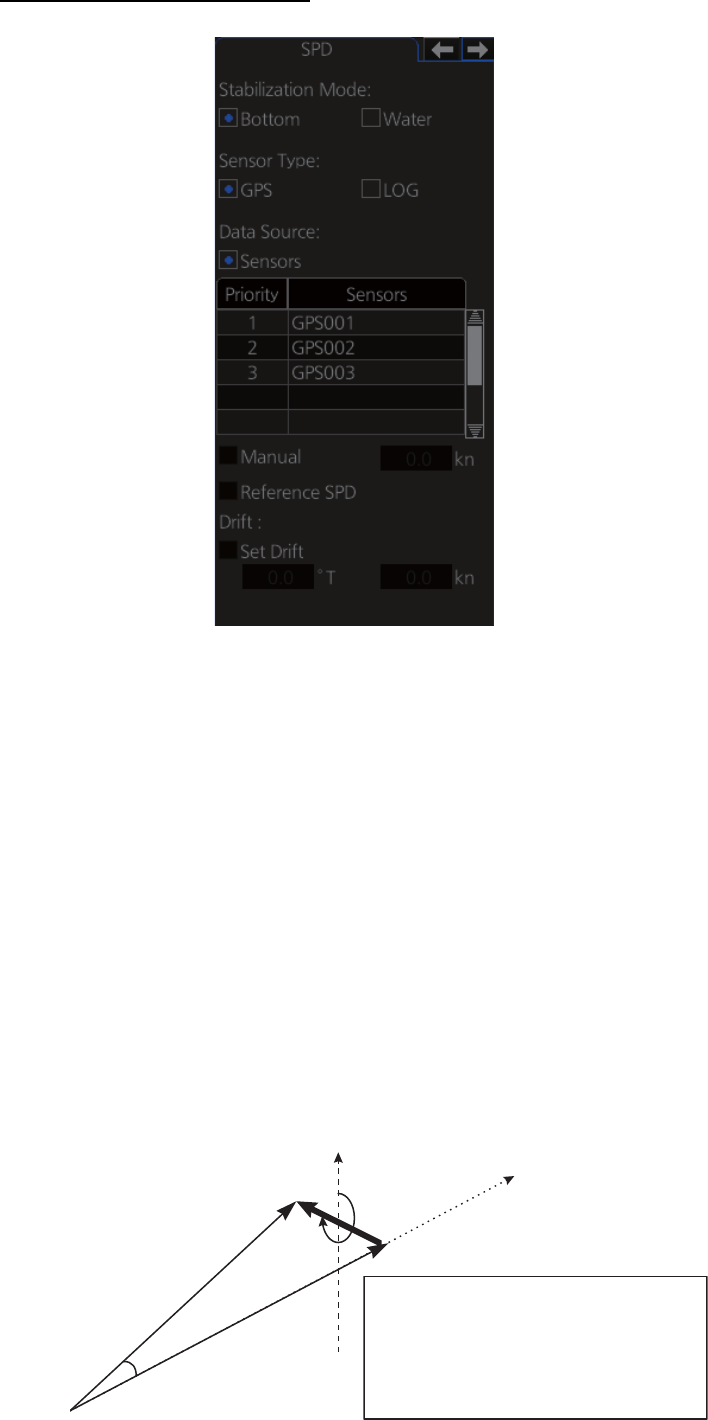
16. NAVIGATION SENSORS
16-3
[SPD] page (System Sensor)
[Stabilization Mode]: Select the water stabilization mode: Select [Bottom] for ground
stabilization, or select [Water] for sea stabilization.
[Sensor Type]: Select [GPS] in case of a GPS navigator, or [LOG] for speed log.
[Data Source]: Check [Sensors] to use a sensor in the [Sensors] list, or click [Manual]
to enter speed manually. Use [Manual] when no speed source is available.
[Manual]: Input speed manually. Check [Water] in [Stabilization Mode] and deactivate
the AIS function to enable entry.
[Reference SPD]: Check to use radar as the source for speed and course. (Only avail-
able with the Local Sensor Setting and checking [Bottom] in [Stabilization Mode].)
[Set Drift]: Check the [Set Drift] checkbox to manually set speed and course of drift.
Note that you can select manual drift only if you check [Water] in [Stabilization Mode].
Angle = Difference between heading and COG
Spd = Speed component of the drift vector
Cse = Course component of the drift vector
Vector defined by (SOG and COG) is equal to vector sum of vectors defined by (SPD
and HDG) and (set and drift).
HDG
spd
SOG
COG
cse
SPD: water speed
HDG heading of ship
SOG: speed over ground
COG: course over ground
spd: speed of drift
cse: course of drift
angle: difference between HDG and COG
North
SPD
angle
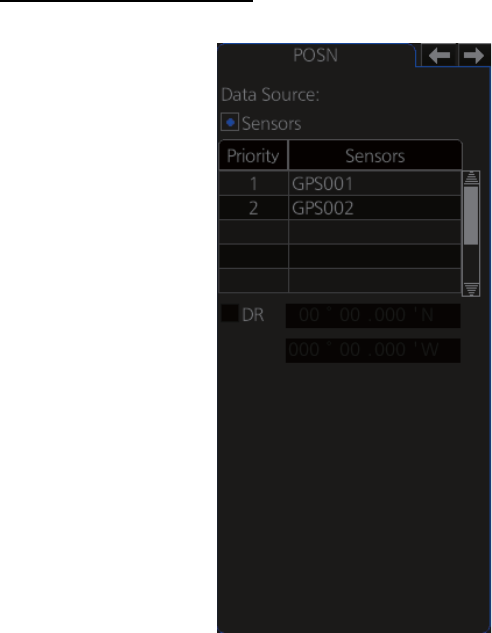
16. NAVIGATION SENSORS
16-4
[POSN] (Position) page
The sensor label (here, GPS001, GPS002) indicates the name of the sensor.
[Data Source]: Check [Sensors] to use a sensor in the [Sensors] list, or click [DR] to
enter position manually. When the position source is changed based on priorities and
signal validity to another position source, then you get the Alert 471 "Position Source
Change".
[DR]: Check [DR] when no position source is available.
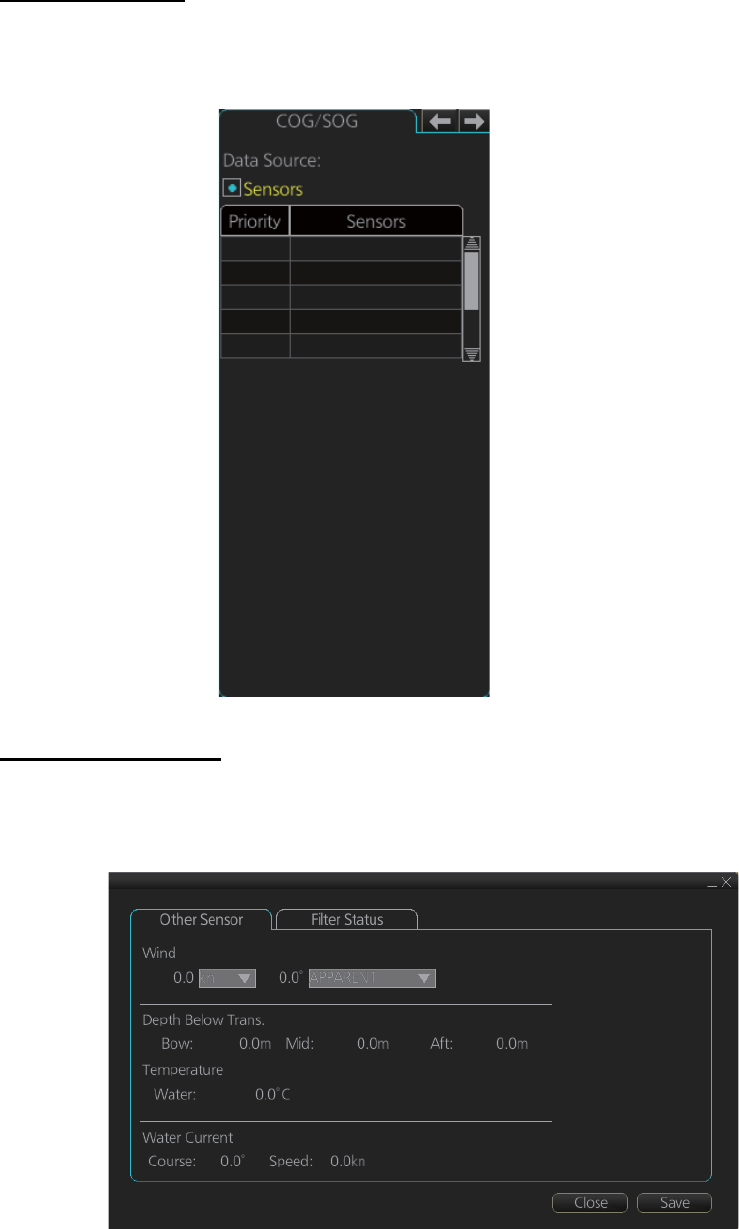
16. NAVIGATION SENSORS
16-5
[COG/SOG] page
Select the source (GPS receiver) for speed over the ground and course over the
ground.
[Other Sensor] page
To show the [Other Sensors] page, open the menu and select [Other Sensor Settings]
in the chart mode.
[Wind]: Wind (True, Theoretical or Apparent) speed (kn or m/s) and direction are dis-
played. See section 16.9.
[Depth Below Trans]: Depth from hull at bow and aft to bottom. A depth alert value may
be entered to alert you when the depth is within the value set.
[Temperature]: Water surface temperature.
[Water Current]: Tide at own ship’s position.
1 GPS001
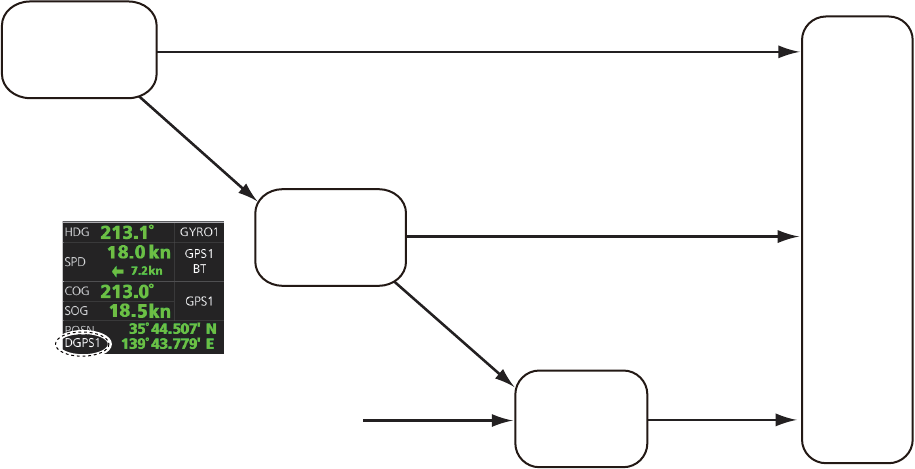
16. NAVIGATION SENSORS
16-6
16.3 Source of Position
The figure below shows how source for position is chosen. The position sensors have
either primary or secondary as input for their calculation. DGPS position sensors are
considered more accurate than other position sensors.
The latitude and longitude position is shown at the top-right position on the chart radar
display, and in the example below the position source is DGPS. Other indications that
may be displayed in the position area are as follows:
• [DR]: Shown in yellow when position source is dead reckoning.
• [DGPS], [GPS]: Name of position source.
If the system changes the source of position because of lost sensor data, the system
immediately generates the Alert 472 "Position Source Change".
Position sensor
selected as
high priority
Position sensor
selected as
low priority
Position
used by
this system
Valid data exists
Valid data exists
Selected Backup
dead
reckoning
No valid data exists
No valid data exists
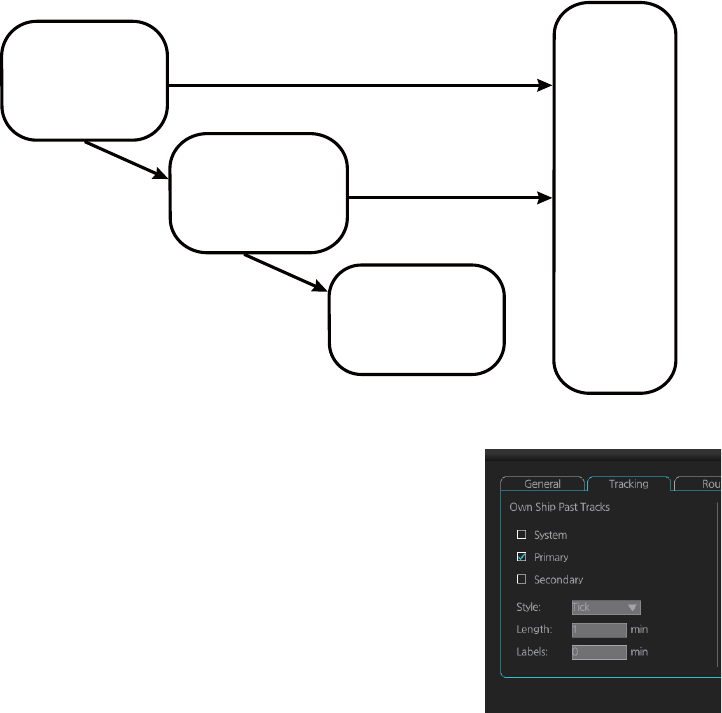
16. NAVIGATION SENSORS
16-7
16.4 Primary and Secondary Positions of Own Ship
The system has three different positions for own ship: System position, Primary posi-
tion and Secondary position.
• System position: CCRP
• Primary position: Position generated by position source with highest priority.
• Secondary position: Position generated by position source chosen as 2nd highest
priority.
The position source for primary position of own ship is chosen as Primary on the
[POSN] page of the [Sensor] menu.
The position source for secondary position of own ship is chosen as Secondary on the
[POSN] page of the [Sensor] menu. Secondary position of own ship is not available as
latitude/longitude value for the user.
System, primary and secondary positions of your ship
may be plotted on the chart radar display with the past
tracks feature. You can control their visibility, etc. from
the [Tracking] page of the [Symbol Display] menu,
shown in the right figure. In this example, past tracks
are plotted using the primary position-fixing equip-
ment.
Secondary
position of own
ship is not valid
Position sensor
selected as
Secondary
Valid data exists
Position sensor
selected as
priority lower than
Secondary
Secondary
position of
own ship
used by
this system
No valid data Valid data exists
No valid data
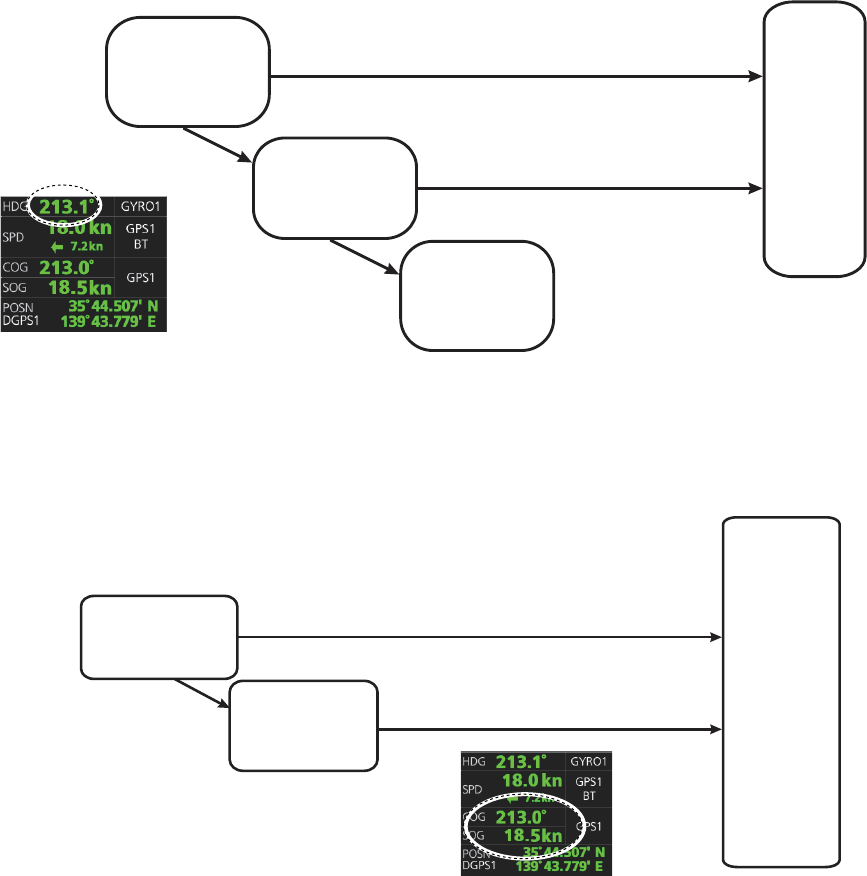
16. NAVIGATION SENSORS
16-8
16.5 Source of Navigation Data
The figure below shows how various sources of navigation data are chosen. "SOG,
COG" is speed over the ground and course over the ground, respectively. "SPD" is
speed through the water.”Drift” is the difference between speed through the water and
speed over ground.
Heading used by the system is shown at the top-right position on the chart radar dis-
play. In the example shown below, heading is received from a gyrocompass and it is
shown without additional text, meaning the value is referenced to true North.
SOG/COG used by the system is shown at the top-right position on the chart radar
display. In the example below, COG and SOG are from chosen position sensors and
this is indicated with the text "GPS*" or "LOG*" (* is the number of sensors).
Heading sensor
selected as
high priority
Alert 450
“Heading
Sensor Not
Available”
Heading
used by
this
system
Selected
Valid data exists
No valid
data exists
GPS1
No valid
data exists
Heading sensor
selected as low
priority
Valid data exists
Valid data exists
No valid
data exists
COG/SOG
calculated from
speed log
COG/SOG from
position sensor SOG/COG
used by
this system
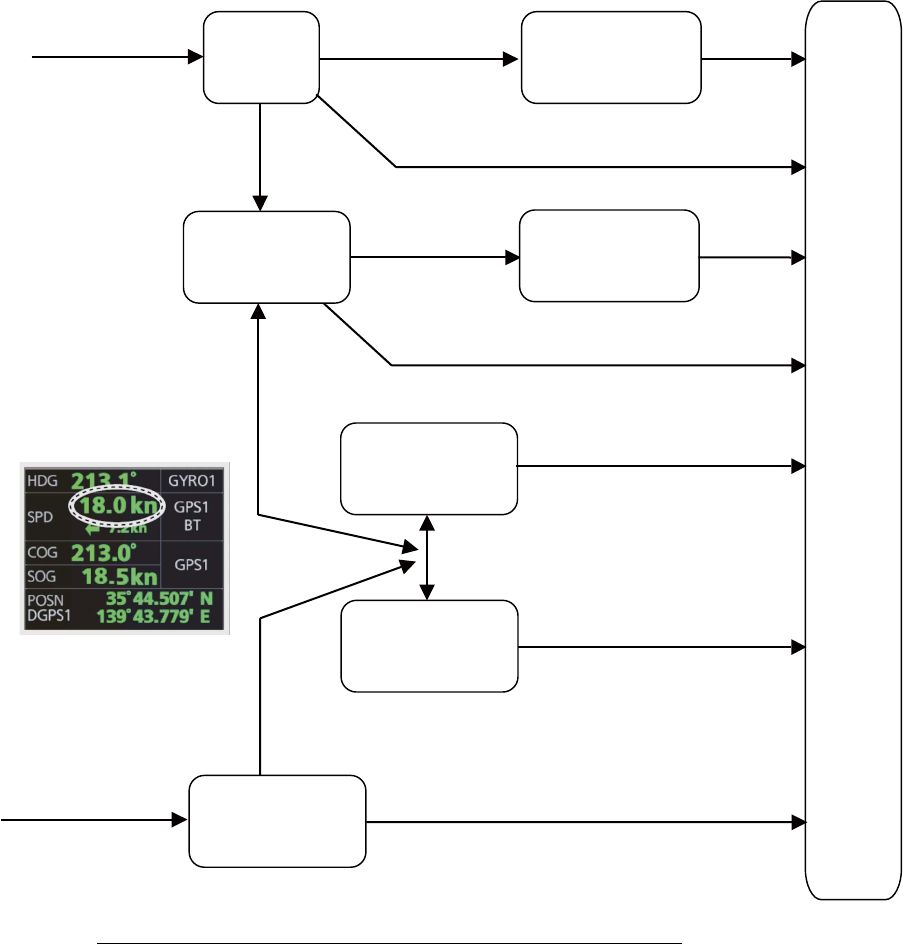
16. NAVIGATION SENSORS
16-9
Speed used by the system is shown at the top-right position on the chart radar dis-
play.The figure below shows the source of water speed is used for drift calculation.
Alert related to SOG, COG, speed and heading components
It is possible that the operator has not chosen any speed or heading sensors, or that
the chosen sensors do not have any valid values. This kind of a situation is critical for
the system, because it cannot even perform dead reckoning.
When no heading source is available, the system generates the Alert 450 "Heading
Sensor Not Available."
When no speed source is available, the system generates the Alert 453 "SDME Sen-
sor Not Available." When no COG/SOG data is available, the system generates the
Alert 279 "COG/SOG Not Available."
Speed
used by
this
system
Water Stabilization
Mode Selected Manual
speed
Selected and Manual
set drift exists Manual speed
+
Manual set drift
Selected and no manual set
drift exists
Selected and No manual set
drift exists
LOG
(Water speed)
Not selected
Selected
Selected
No valid data exists
Selected
Bottom Stabilization
Mode Selected
Not selected
No valid data exists
Selected and
Manual set drift
exists Manual speed
+
Manual set drift
LOG
(Ground speed)
GPS
Reference SPD
(local only)
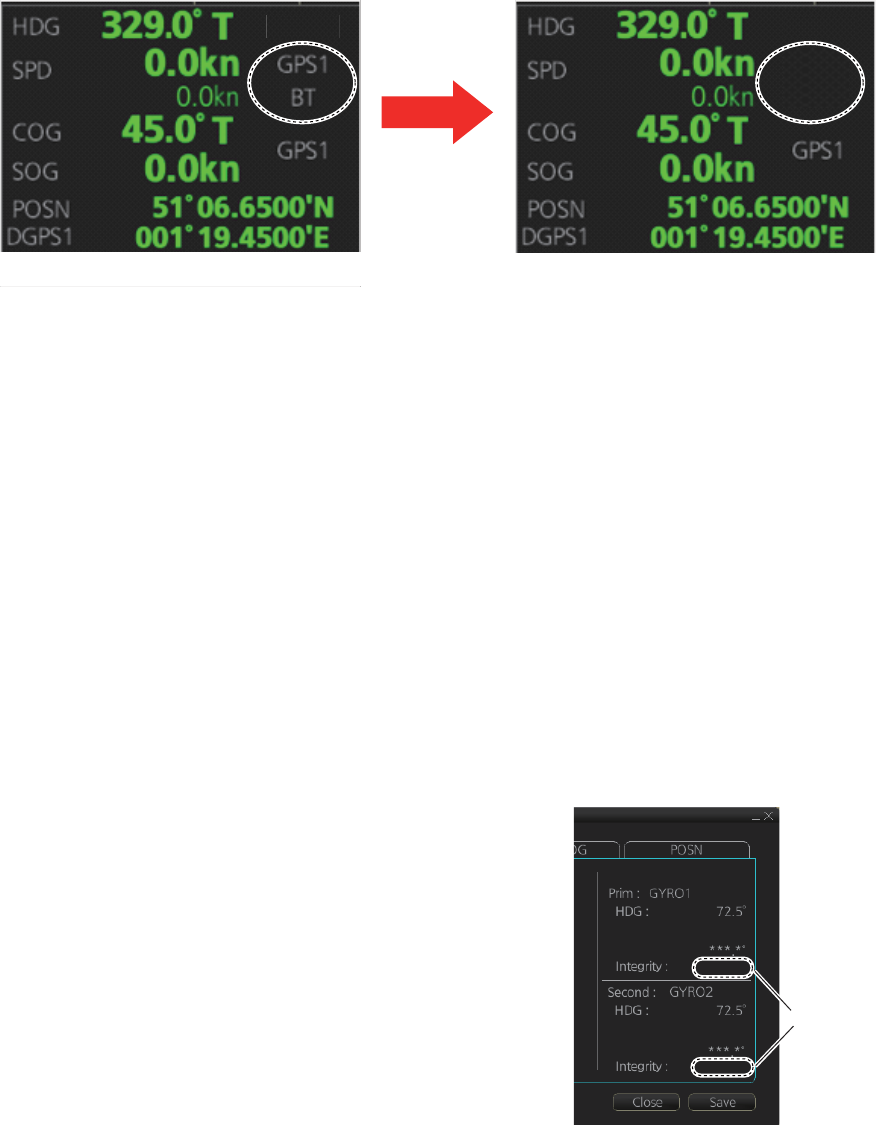
16. NAVIGATION SENSORS
16-10
16.6 Switching of Sensor and Indication
When a sensor cannot be used because of some problem, the system automatically
switches the sensor. When this occurs the name of the newly selected sensor appears
in yellow.
16.7 Filter Status
The ECDIS incorporates a filter that receives raw sensor data, checks sensor integrity
and processes multiple sensor data to produce a continuous estimate of ship’s posi-
tion and motion.
By default, the filter uses data from all available sensors for filtering and integrity mon-
itoring. The exception is heading data; only the selected heading device affects the
output of the filter, but other heading sensors (including magnetic compasses) are
used for integrity monitoring.
Sensors may be excluded manually or automatically. An excluded sensor participates
in neither integrity monitoring or filtering. The filter automatically excludes a sensor
from use if the sensor fails the first level of integrity check (for example, if a sudden
jump is detected). If the actual integrity check fails for some reason and the filter is able
to identify the faulty sensor, the faulty sensor is automatically excluded.
Sensor integrity is determined by: (1) monitoring
the statistical accuracy of each sensor inde-
pendently and analyzing the input values and using
the information of the type of sensor, and (2) mon-
itoring the difference between pairs of sensors.
The system checks heading, rate of turn, position,
COG/SOG and CTW/STW data for integrity, in ac-
cordance with INS regulations (IEC-61924-2). The
result is either [Passed], [Doubtful], [Failed], [Ex-
cluded] or [Not Available]. The integrity check re-
sult appears in the following locations:
• [Local Sensor Setting] and [System Sensor Set-
ting] menus. The right figure shows the result for
the heading sensor GYRO1.
• [Filter Status] page in the [Other Sensor Setting] menu. See the next page.
LOG
BT
Speed sensor
changed
G
YR
O1 G
YR
O1
Integrity
check
result
Passed
Corr.: Not Available
Passed
Corr.: Not Available
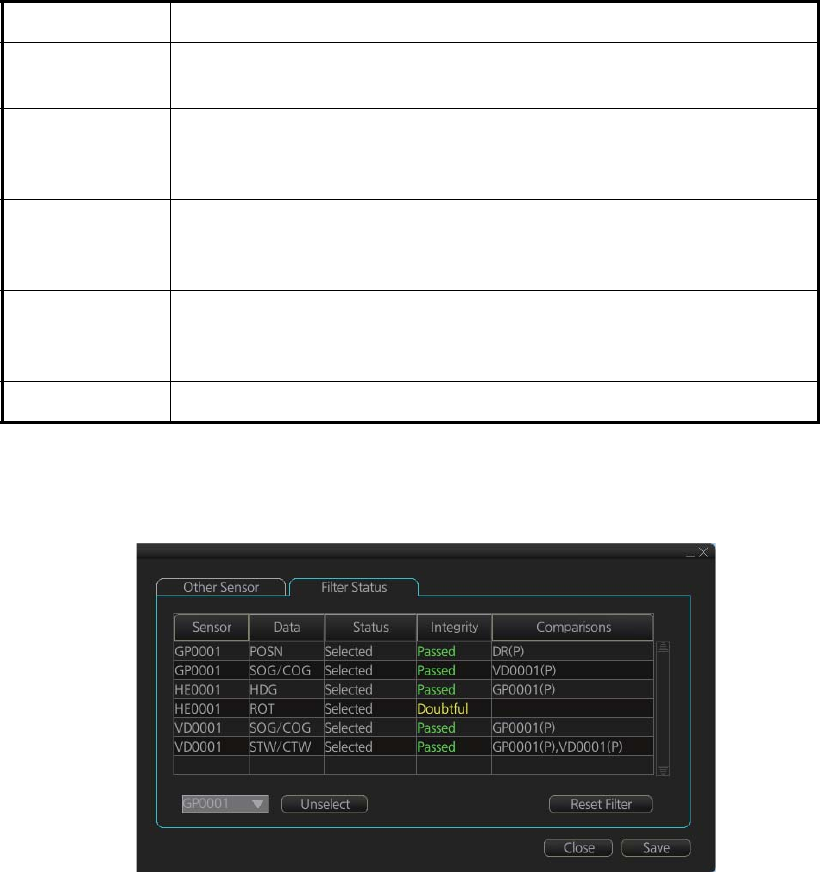
16. NAVIGATION SENSORS
16-11
[Passed] (green): Data is available for comparison and data is normal
[Doubtful] (yellow): Data is not available for comparison, but data is normal.
[Failed] (orange): Data is quite away from predicted value based on a comparison.
[Excluded] (orange): Data is greatly changed compared with predicted value.
[Not Available] (orange): Sentence status or mode indicator is abnormal.
For heading data, If there is only one gyro, the judgement is "Doubtful" when the ship
is stopped because there is no COG for comparison. When the ship begins to move,
the judgement is changed to "Passed" because there is COG for comparison.
The methods of integrity monitoring are outlined in the table below.
The status and integrity of all sensors can be monitored from the [Filter Status] page
in the [Other Sensor Settings] menu. Sensors can also be unselected and the filter re-
set from this page.
The [Status] column indicates sensor status as follows:
• [Selected] (sensor selected for use in filter)
• [Unselected] (sensor not used in filter)
• [Not Available] (no sensor information)
• [Excluded] (automatically excluded sensor)
The [Integrity] column indicates sensor integrity as either [Passed] (green characters)
or [Failed] (red characters). The integrity evaluation is [Doubtful] (yellow characters)
when there are no other sensors to compare with.
Sensor Comparison
Position • Comparison with other position sensors.
• Comparison with dead reckoning position.
Heading • Comparison with other heading sensors.
• Comparison with a COG sensor (used only if other heading sen-
sors are not available and if COG is high enough).
Speed over the
ground
• Comparison with other SOG sensors.
• Comparison with water speed sensors is a secondary option (used
only if other SOG sensors are not available).
Speed through
the water
• Comparison with other STW sensors.
• Comparison with STW sensors is a secondary option (used only if
other STW sensors are not available).
Rate of turn • Comparison with other rate of turn sensors.

16. NAVIGATION SENSORS
16-12
The [Comparisons] column shows the sensors compared and the integrity evaluation
of compared sensors in parentheses. Using the illustration above as an example,
SOG/COG data fed from GP0002 is compared with the sensors GP0001 and VD0001.
The integrity evaluation for the compared sensors is [Passed].
To unselect a sensor manually, select the sensor from the drop-down list at the bot-
tom left corner of the page, click the [Unselect] button then click the [Save] button. [Un-
selected] appears in the [Status] column. To reselect an unselected sensor, select the
sensor from the drop-down list, click the [Select] button. [Selected] appears in the [Sta-
tus] column
The [Reset Filter] button functions to recover from sensor failure. When the button is
operated:
• Automatically excluded sensors are re-included.
• All data history is erased.
• Output values are re-estimated using new data.
• Integrity monitoring is restarted using new data.
Note: The filter can also be reset from the context-sensitive menu. Right-click any-
where in the Sensor information box to show the context-sensitive menu then select
[Filter Reset].
16.8 Position Alignment
The position alignment feature functions to fine tune ship's position by using radar
echo target and chart material.
If position alignment is in use, the Alert 640 "Chart Align: Over 30 Min." is generated
every 30 minutes to remind the user to align position. The alert is automatically erased
in 10 seconds.
Note: This feature is effective with the chart radar unit whose data source for FILT is
assigned the highest priority.
16.8.1 How to align position
If the radar echo targets' symbols are not positioned correctly on the chart, there is ei-
ther position error or gyro error or some combination of these errors.
Position may be aligned on the chart radar display by moving own ship position or by
moving radar target position. To align position, get into the Voyage navigation mode,
click the [Offset] button at the top-right position on the screen, put the cursor on the
correct position then click. The amount of offset, in bearing and range, appears to the
right the [Offset] button.
The latitude and longitude position indication is shown in yellow characters when the
position align feature is active.
16. NAVIGATION SENSORS
16-13
16.8.2 How to cancel position alignment
Click the [Offset] button to cancel the position offset.
16.9 Wind Sensor
The chart radar can display and output wind data in the following three formats:
Apparent: Windmeter-measured wind speed and direction.
Wind angle reference: Heading
North: True wind angle, true wind speed
Wind angle reference: True North
Theoretical: True wind angle, true wind speed
Wind angle reference: Heading
The illustration below shows wind speed and direction with given ship data.
The wind values are as shown below.
Ship information:
COG: 60°
SOG: 8.7 kn
Heading: 45°
Wind angle Wind speed
Apparent: 345° 10 kn
North: 330° 5 kn
Theoretical: 285° 5 kn
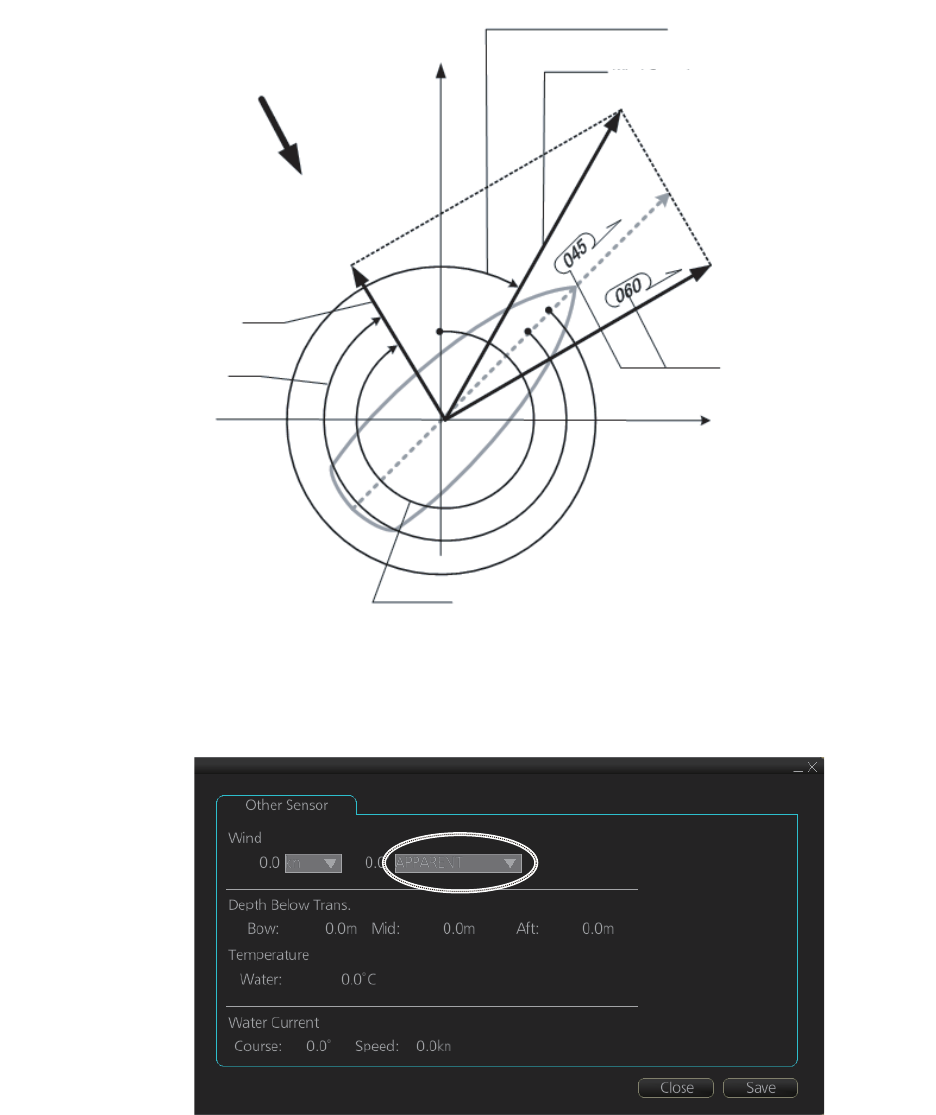
16. NAVIGATION SENSORS
16-14
Apparent, north or theoretical wind may be selected from the [Other Sensor Settings]
menu.
16.10 Depth Sensor
The depth output from a depth sensor (for example, echo sounder) is shown on the
[Other Sensor] page in the [Other Sensor Settings] menu.
The content of the [Other Sensor] page depends on sensors connected.
In this example there are three transducers (bow, mid and aft) installed.
Wind speed
(Apparent: 10 kn)
Apparent Wind
Heading
Angle (reference North)
Wind Angle
(North: 330°)
Wind Speed
(North/Theoretical: 5.0 kn)
Ship's Speed
(SOG: 8.7 kn)
True Wind
North
Wind from NNW (330°)
Wind Angle
(Apparent: 345°)
Wind Angle
(Theoretical: 285°)
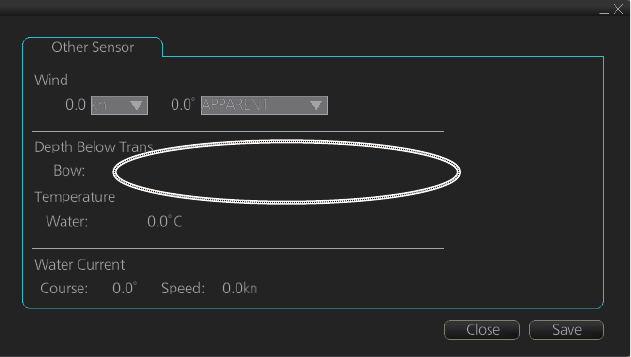
16. NAVIGATION SENSORS
16-15
The system displays depth value as depth below the transducer. If required, you can
get an alert when the measured depth is less than the "Echo Alarm Limit" setting at
the [UKC] page in the [Overlay/NAV Tools] box. The system generates the Alert 485
"Depth Limit".
130.7m Mid: 130.8m Aft: 130.8m
16. NAVIGATION SENSORS
16-16
This page is intentionally left blank.
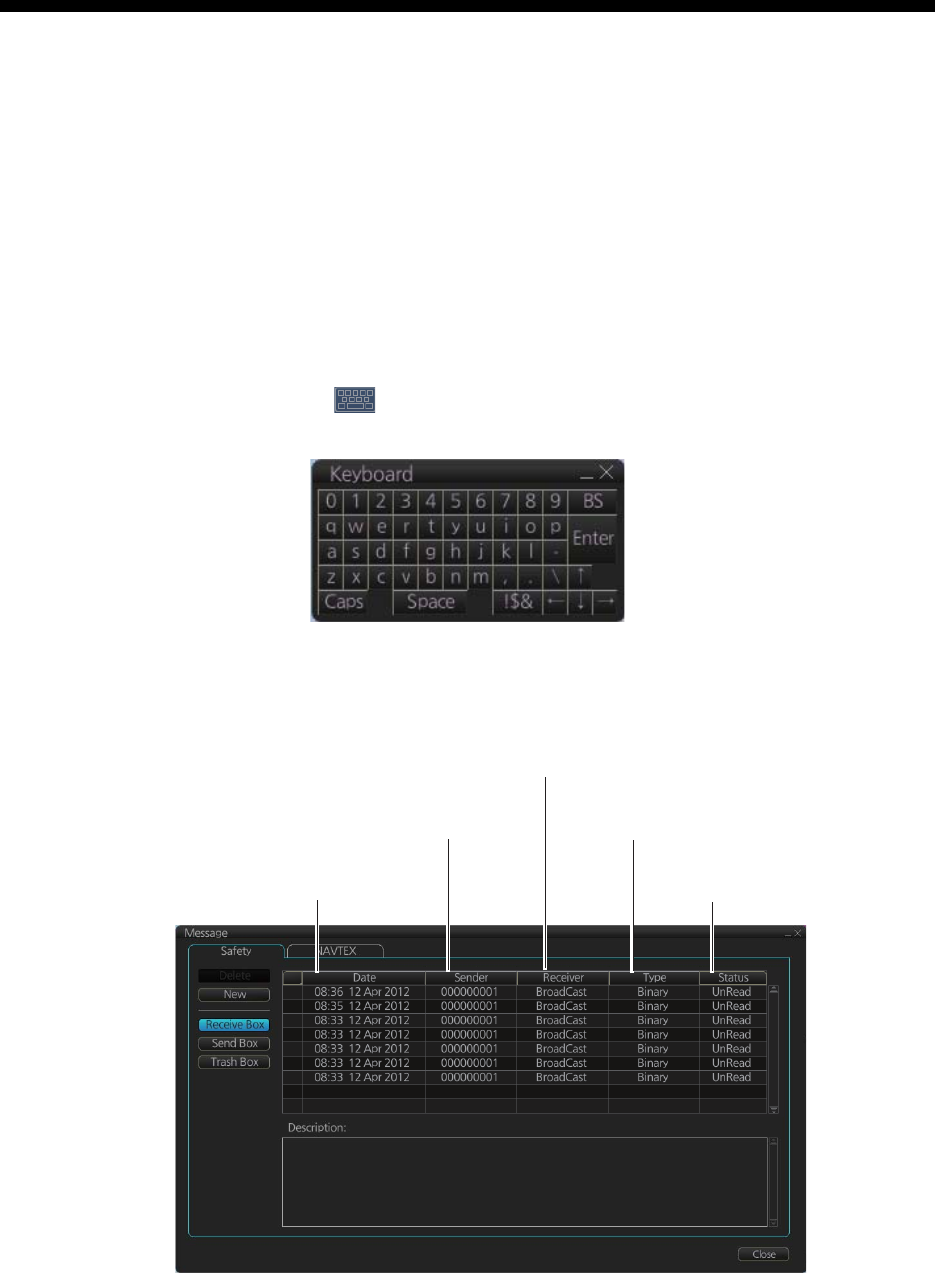
17-1
17. AIS SAFETY, NAVTEX
MESSAGES
17.1 AIS Safety Messages
You can send and receive messages via the VHF link, to a specified destination (MM-
SI) or all AIS-equipped ships within communication range of your ship. Messages can
be sent to warn of safety of navigation, for example, an iceberg sighted. Routine mes-
sages are also permitted. Short safety-related messages are only an additional means
to broadcast safety information. They do not remove the requirements of the GMDSS.
17.1.1 How to send an AIS safety message
Note: If you are using the Trackball Control Unit RCU-026, display the software key-
board ([DISP] button, [ ], [ON] on the InstantAccess bar) before starting this pro-
cedure.
1. In the Voyage navigation mode, click the [MSG] and [Safety MSG] buttons on the
InstantAccess bar to show the [Message] dialog box.
Type of message
(Binary, Safety)
Status of message
(Read, Unread)
MMSI of
sender
Date
received
MMSI of receiver
(MMSI or “Broadcast”)
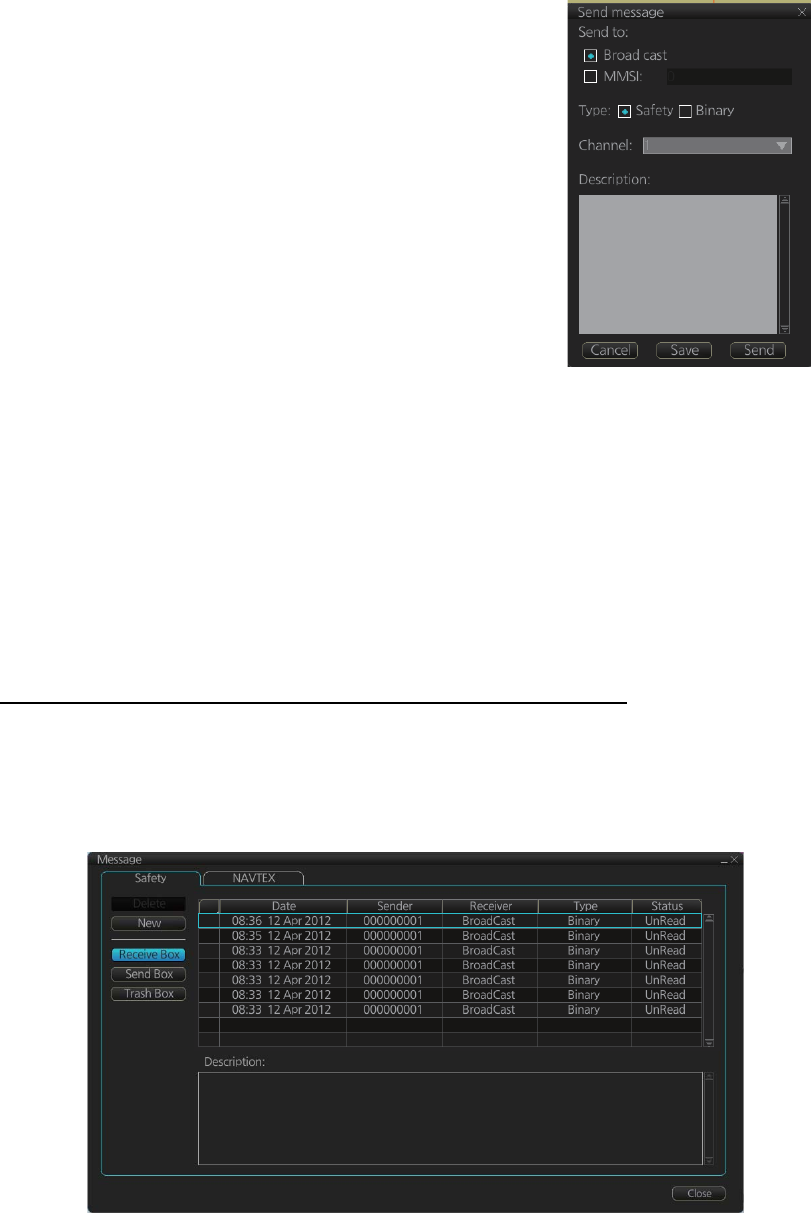
17. AIS SAFETY, NAVTEX MESSAGES
17-2
2. Click the [New] button.
3. At [Send to], select where to send the message. Se-
lect [Broadcast] to send the message to all AIS-
equipped ships within communication range, or se-
lect [MMSI] and enter the MMSI of the ship where to
send the message.
4. At [Type], select the type of message, [Safety] or [Bi-
nary] (routine).
5. At [Channel], select the channel to use to send the
message.
6. At [Description], enter the text of your message. The
no. of characters available depends on the type of
message.
Safety message broadcast: 161 characters
Binary message broadcast: 156 characters
Safety message addressed to MMSI: 156 characters
Binary message addressed to MMSI: 151characters
7. Click the [Send] button to send the message.
17.1.2 How to display received and sent AIS safety messages
When an AIS message is received, the Alert 539 "AIS Message Received" appears.
Do the following to view the message.
How to display the Messages dialog box, view a message
1. Click the [MSG] and [Safety MSG] buttons on the InstantAccess bar.
2. Click the [Receive Box] or [Send Box] button as appropriate.
3. Click a message to view its contents.
WELCOME TO FURUNO
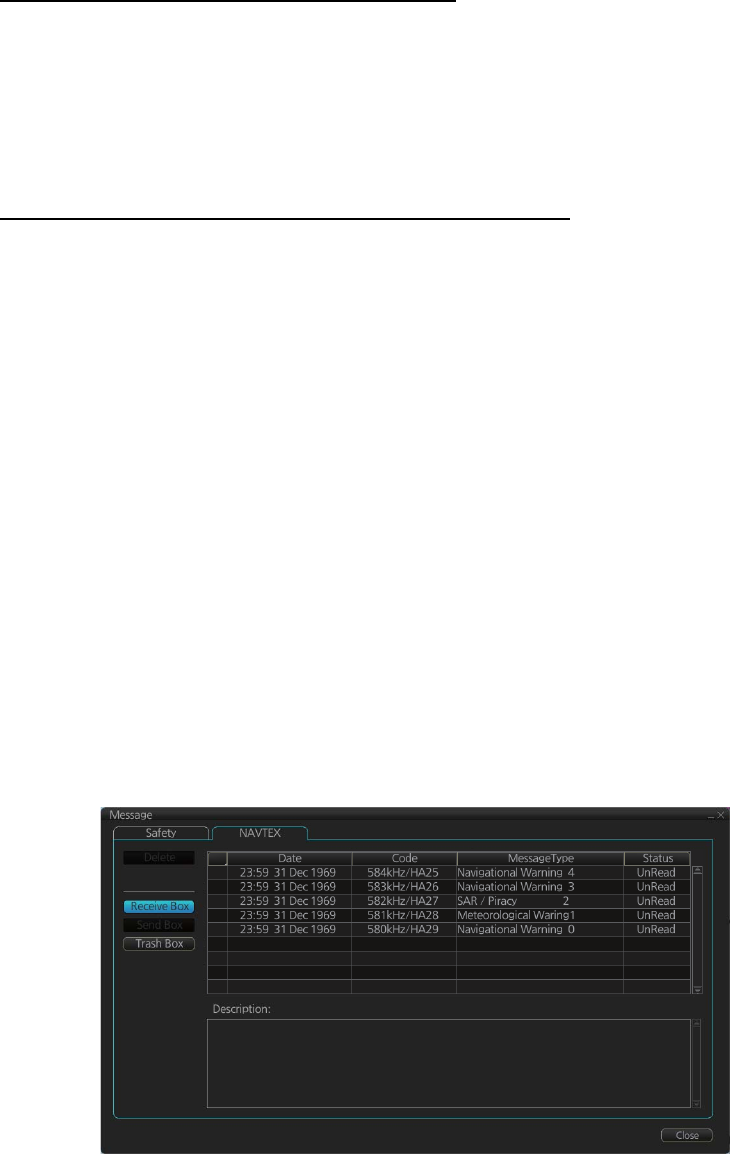
17. AIS SAFETY, NAVTEX MESSAGES
17-3
17.1.3 How to delete received and sent AIS safety messages
Note: A large amount of messages may take some time to delete.
How to delete a received or sent message
1. Click the [Receive Box] or [Send Box] as appropriate.
2. Click the box that is before the date to show a checkmark. (All messages can be
checked or unchecked with the context-sensitive menu. Right-click the box to the
left of "Date" then select [Check All] or [Uncheck All] as applicable.)
3. Click the [Delete] button.
How to delete received, sent messages permanently
1. Click the [Trash Box] button.
2. Click the box that is before the date to show a checkmark. (All messages can be
checked or unchecked with the context-sensitive menu. Right-click the box to the
left of "Date" then select [Check All] or [Uncheck All] as applicable.)
3. Click the [Delete] button.
17.2 Navtex Messages
Navtex (Navigational Telex) is an international automated medium frequency direct-
printing service for delivery of navigational and meteorological warnings and fore-
casts, as well as urgent marine safety information to ships.
Navtex messages can be received and read in the Voyage navigation mode.
17.2.1 How to receive Navtex messages
To display a received NAVTEX message, do the following:
1. Click the [MSG] and [NAVTEX MSG] buttons on the InstantAccess bar.
2. Click the message to view. The text of the message appears in the [Description]
box.

17. AIS SAFETY, NAVTEX MESSAGES
17-4
17.2.2 How to delete received Navtex messages
Note: A large amount of messages may take some time to delete.
How to delete received Navtex messages
1. Click the [MSG] and [NAVTEX MSG] buttons on the InstantAccess bar.
2. Click the [Receive Box] button.
3. Click the box that is before the date to show a checkmark in the box. (All messag-
es can be checked or unchecked with the context-sensitive menu. Right-click the
box to the left of "Date" then select [Select All] or [Deselect All] as applicable.)
4. Click the [Delete] button.
How to deleted received Navtex messages permanently
1. Click the [MSG] and [NAVTEX MSG] buttons on the InstantAccess bar.
2. Click the [Trash Box] button.
3. Click the box that is before the date to show a checkmark in the box. (All messag-
es can be checked or unchecked with the context-sensitive menu. Right-click the
box to the left of "Date" then select [Select All] or [Deselect All] as applicable.)
4. Click the [Delete] button.
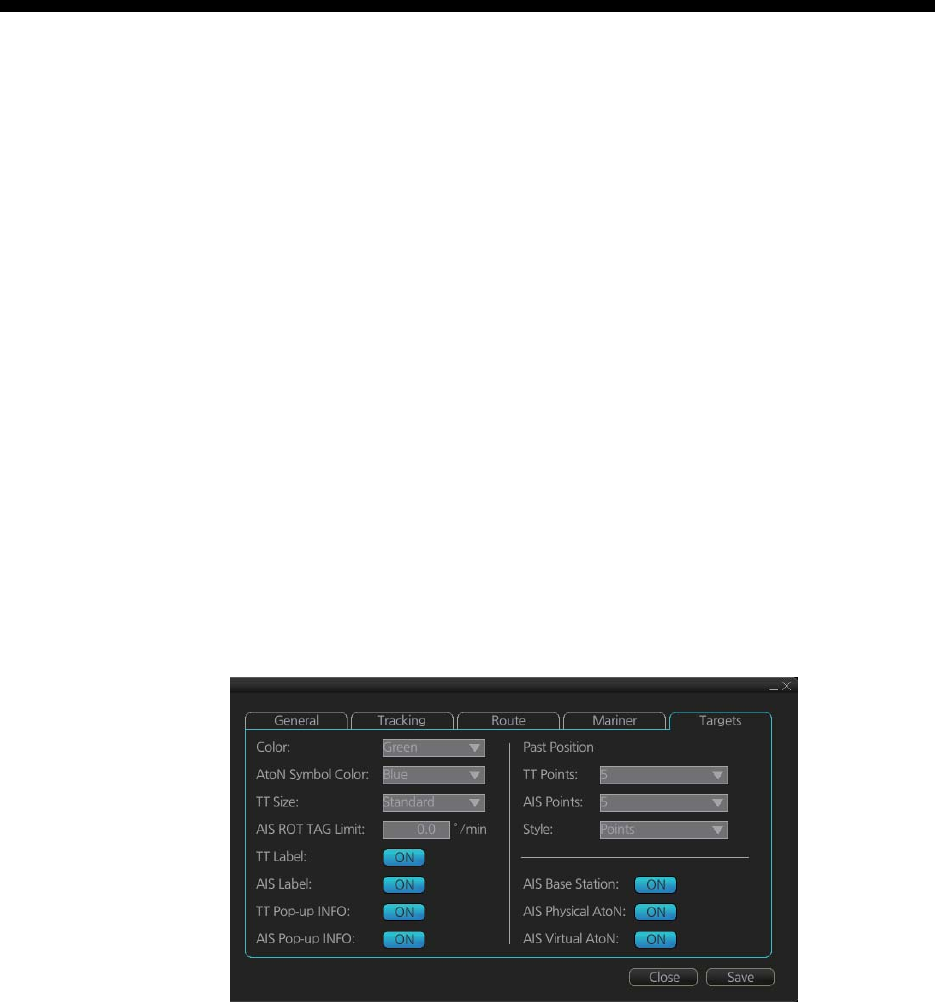
18-1
18. TT AND AIS DISPLAYS
Tracked targets and AIS targets can be overlaid on the chart. Only the differences be-
tween the radar and chart TT and AIS displays are described here.
The data of received radar-tracked targets must have reference to ground. If the data
does not meet that criteria, target vectors are not shown and the indications COG and
SOG in the TT info data box show [missing].
18.1 TT Display
18.1.1 TT symbols
Refer to paragraph 3.7.1.
18.1.2 TT symbol color and size
Do the following to select TT symbol color and size. Note that the color of the AIS sym-
bol is also changed.
1. Click the [DISP], [SET] and [Symbol DISP] buttons on the InstantAccess bar to
show the [Symbol Display] menu.
2. Click the [Targets] tab.
3. Select the color among, green, blue, black, magenta and brown, with the [Color]
pull-down list.
4. Select the size from standard or small, with the [TT Size] pull-down list.
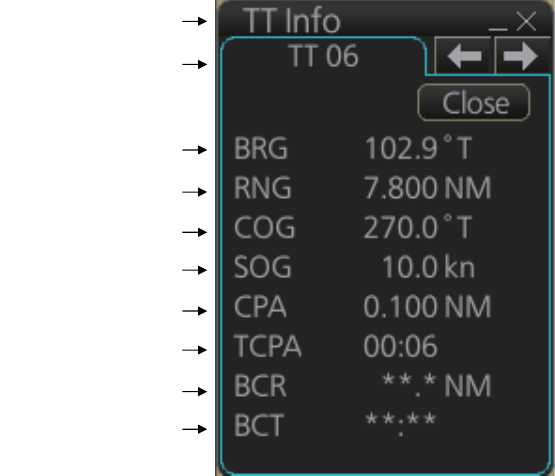
18. TT AND AIS DISPLAYS
18-2
18.1.3 How to display tracked target data
Control Unit: Put the cursor on a target then push the TARGET DATA key.
Trackball module: Click the target for which you want to show its data.
To erase data from a data box, click the appropriate close data button.
The basic target data display for a TT consists of the following information:
• Target's number. Target numbering starts from "01". When a target is erased the
number will not be reused until the power is re-set or more than 200 targets are ac-
quired.
• Bearing (BRG) and distance (RNG) of the target from own ship
• True speed (SOG) and true course (COG) of the target
• CPA and TCPA. A negative TCPA value means that you have already passed the
closest point and the TT is going away from own ship.
• Bow Crossing Range (BCR) and Bow Crossing Time (BCT)
Title bar
TT No.
Bearing
Range
Course over ground
Speed over ground
CPA
TCPA
Bow crossing range
Bow crossing time
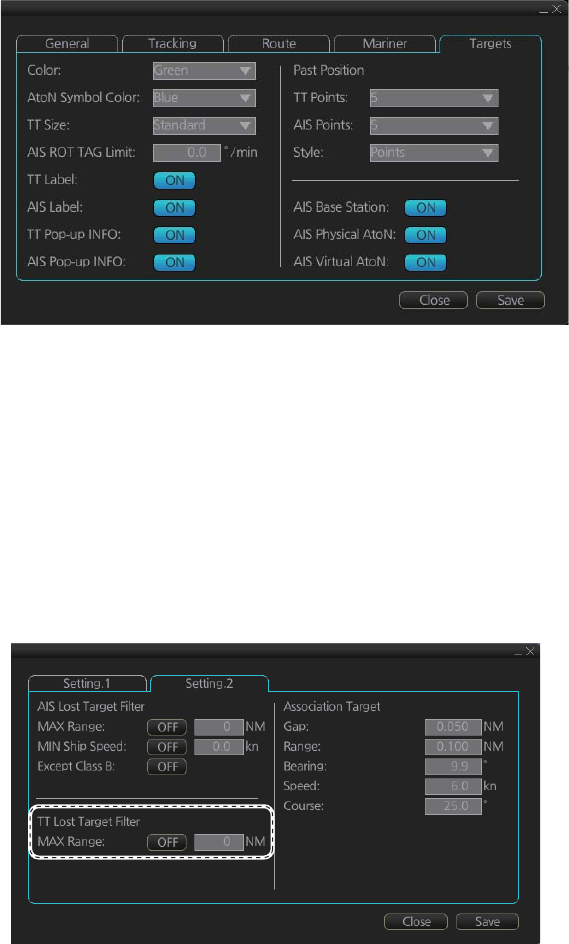
18. TT AND AIS DISPLAYS
18-3
18.1.4 Past position point attributes
You can define past position point attributes for tracked targets by points and style.
1. Click the [DISP], [SET] and [Symbol DISP] buttons on the InstantAccess bar to
show the [Symbol Display] menu.
2. Click the [Targets] tab.
3. At [TT Points], select the number of points to show.
4. At [Style], select the style for the past position points. The choices are [Points] and
[Points and Dots].
18.1.5 How to set the TT lost target filter
If you are in a congested area the lost target alert may sound against many AIS tar-
gets. In this case, you can prevent the alarm from sounding against TT that are be-
yond a certain range and/or smaller than a specific length.
1. Open the MENU and select [TT/AIS] and [Setting] then click the [Setting.2] tab.
2. In the [TT Lost Target Filter] window, set the maximum range to track a target.
[Max Range]: The maximum range at which to track a lost target. A tracked target
not within this range is not tracked.
3. Click the [ON/OFF] button to show ON or OFF as appropriate.
18.1.6 TT recording functions
Tracked target information is saved to the [Danger Targets] log. See section 19.5.
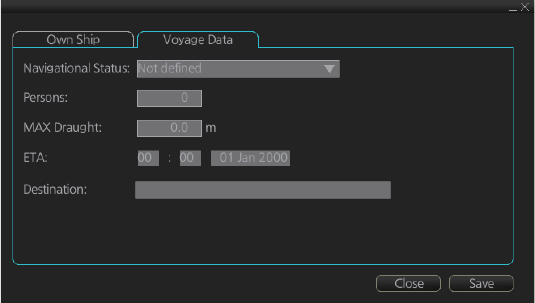
18. TT AND AIS DISPLAYS
18-4
18.2 AIS Display
18.2.1 AIS symbols
Refer to section 4.3.
18.2.2 Voyage data
Before you embark on a voyage, set your navigation status, ETA, destination, draught
and crew, on the [Voyage Data] page in the [NAV Status] menu. The data entered
here is reflected to the AIS transponder.
Note: [Persons], the total number of persons onboard, should be set at the AIS tran-
sponder. Some AIS transponders may not accept this input from the radar.
1. Open the MENU then click both [NAV Status] in the [TT/AIS] menu and the [Voy-
age Data] tab.
2. Click the [Navigational Status] drop-down list then select your navigational status,
from the list below.
3. Enter ship's draught (0.0 - 25.5 (m)) at [MAX Draught].
4. Enter your ETA at [ETA].
Day: two digits
Month: Three-character abbreviation
Year: Four digits
5. Enter your destination at [Destination], using a maximum of 20 characters.
6. Click the [Save] button to save the settings.
• [Underway using engine]
• [At anchor]
• [Not under command]
• [Restricted maneuverability]
• [Constrained by her draught]
• [Moored]
• [Aground]
• [Engaged in fishing]
• [Under way sailing]
• [Reserved for high speed craft]
• [Reserved for wing in ground]
• [Reserved for future use] (x3)
• [AIS-SART (active)]
• [Not defined]
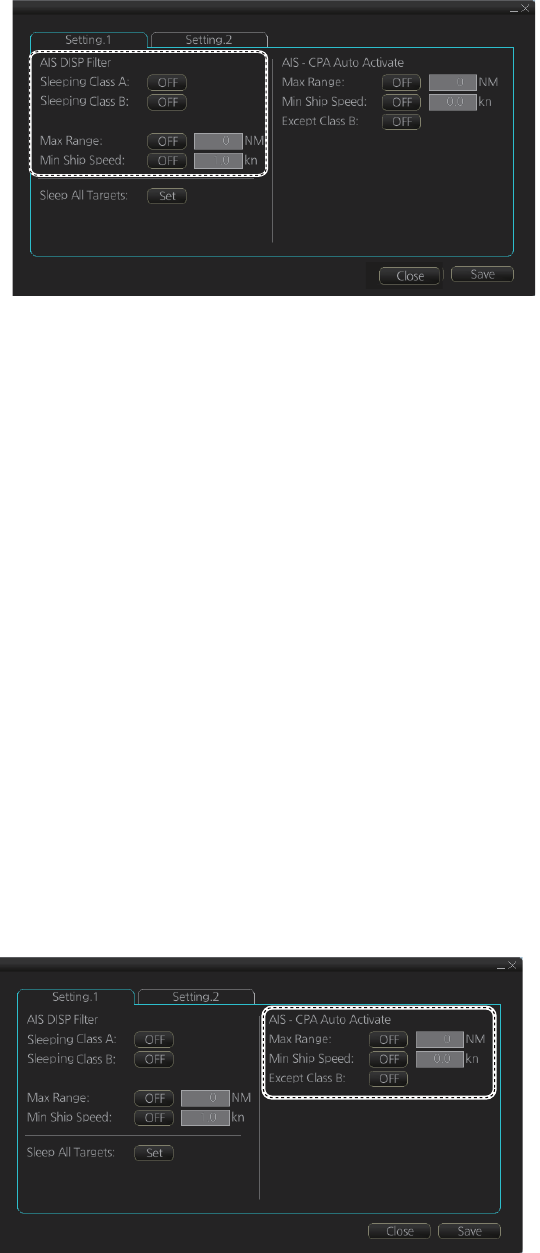
18. TT AND AIS DISPLAYS
18-5
18.2.3 How to filter AIS targets
1. Right-click [AIS] on the [TT/AIS] page in the [NAV Tools/Overlay box], select [Set-
ting] and open the [Setting.1] page.
(The [Setting.1] page can also be opened from the menu (MENU → [TT/AIS] →
[Setting] → [Setting.1].)
2. In the [AIS DISP Filter] window, set each item referring to the description below.
• Click the buttons of [Sleeping Class A] and [Sleeping Class B] to show [OFF] or
[ON] to hide or show those targets.
• Set the maximum range with [Max Range]. Any target beyond the range set
here will not be displayed.
• Set the ship speed for AIS targets, with [Min Ship Speed]. Any AIS target whose
speed is lower than that set here will not be displayed.
3. Click the [Save] button to save settings. Click the [Close] button to close the dialog
box.
Note: AIS and tracked target viewing limitations are as follows:
AIS and tracked targets are displayed on top of chart 1:1,000,001 for S57 charts.
18.2.4 How to set conditions for automatic activation of sleeping tar-
gets
The AIS target automatic activation feature is turned on or off from the [TT/AIS] page
in the [Overlay/NAV Tools] box. Set the conditions for automatic activation as shown
below. The CPA/TCPA alarm must be active to get automatic activation of AIS targets.
Right-click [AIS] on the [TT/AIS] page in the [NAV Tools/Overlay box], select [Setting]
and open the [Setting.1] page.
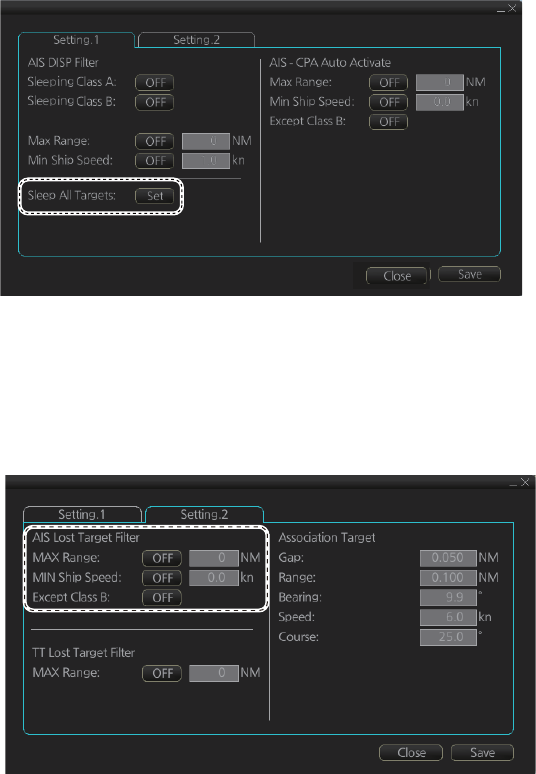
18. TT AND AIS DISPLAYS
18-6
18.2.5 How to sleep all activated targets
You can sleep all activated targets. Right-click [AIS] on the [TT/AIS] page in the [NAV
Tools/Overlay box], select [Setting] and open the [Setting.1] page. Click the [Sleep All
Targets] button to sleep all activated targets.
18.2.6 How to set the AIS lost target filter
You can select what AIS targets to exclude from the AIS lost target alert, on the [Set-
ting.2] page in the [TT/AIS] menu.
[Max Range]: Set the max. range at which a target must be to be declared a lost target.
[Min Ship Speed]: A tracked target whose speed is slower than set here does not trig-
ger the lost target alarm.
[Except Class B]: Exclude class B AIS targets from the AIS lost target alert.
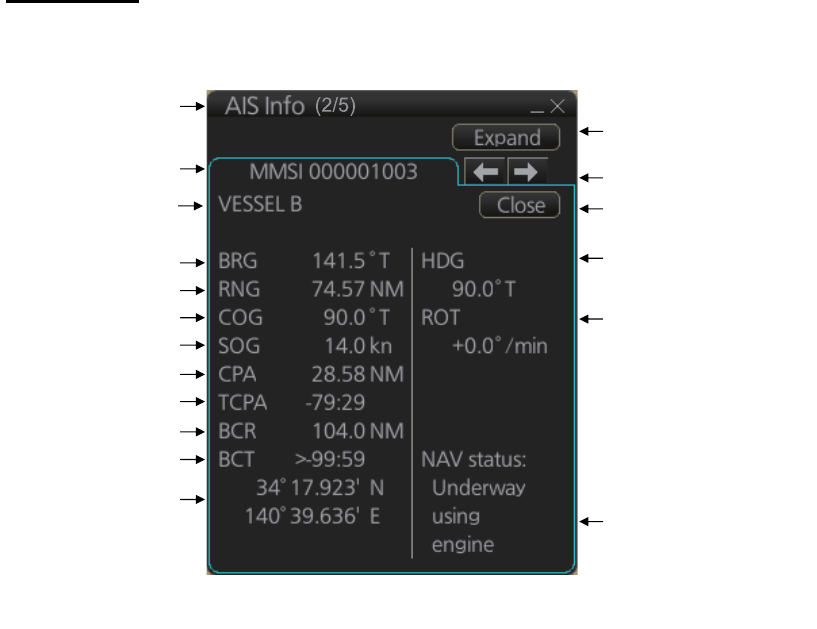
18. TT AND AIS DISPLAYS
18-7
18.2.7 How to display AIS target data
Normal data
Put the cursor on an AIS target then push the left button.
Title bar
MMSI
Bearing
Range
Course over ground
Speed over ground
CPA
TCPA
Bow crossing range
Bow crossing time
Position
“Level of detail” button
Heading
Navigation status
Rate of turn
Scroll buttons*
Close button
Vessel name
*: Scroll buttons appear when there are multiple AIS targets.
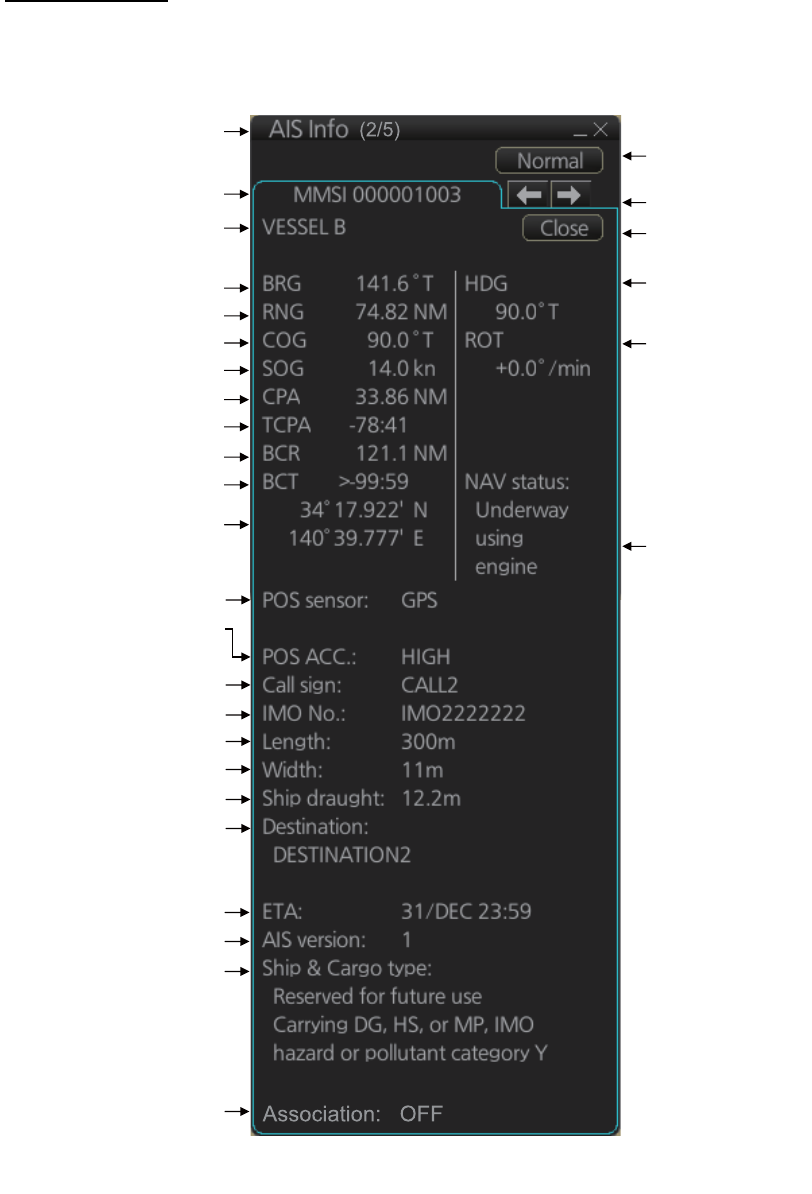
18. TT AND AIS DISPLAYS
18-8
Expanded data
Put the cursor on a desired AIS target then push the left button. Click the [Expand] but-
ton (level of detail) on the [AIS Info] box to show expanded AIS data.
Title bar
MMSI
Bearing
Range
Course over ground
Speed over ground
CPA
TCPA
Bow cross range
Bow cross time
Position
“Level of detail”
button
Heading
Navigation status
Rate of turn
Scroll buttons*
Close button
Position sensor
Position sensor accuracy
(HIGH, LOW)
Call sign
IMO No.
Length
Width
Draught
Destination
ETA
AIS version no.
Ship & Cargo type
Vessel name
Association condition
*: Scroll buttons appear when there are multiple AIS targets.
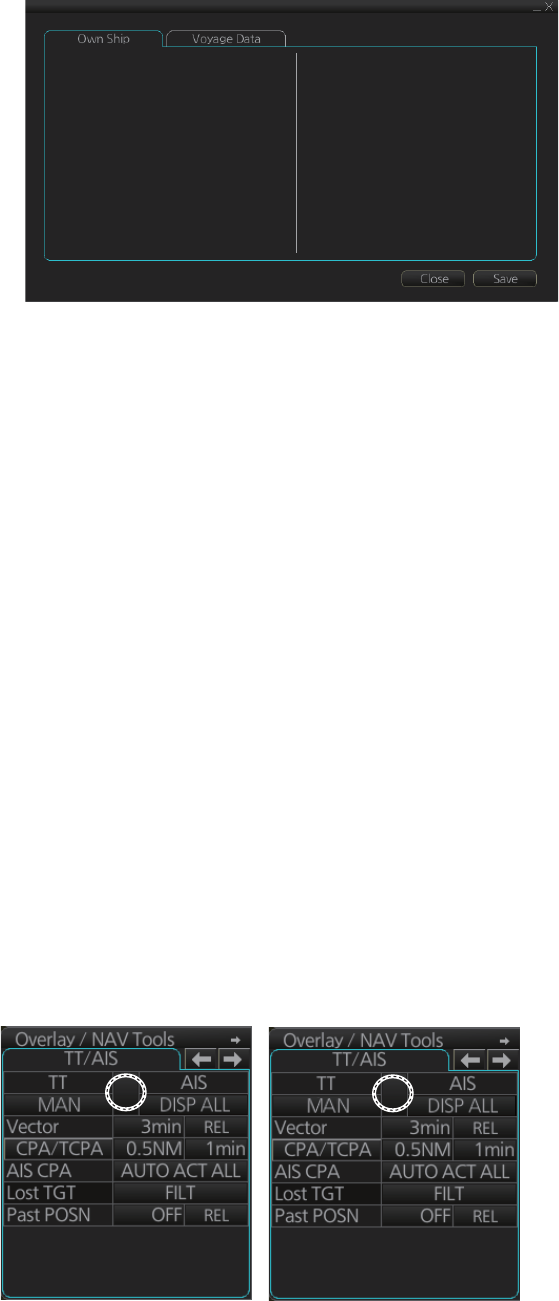
18. TT AND AIS DISPLAYS
18-9
18.2.8 How to display own ship data
You can see own ship's data on the [Own Ship] page in the [NAV Status] menu. Open
the menu then click both [NAV Status] in the [TT/AIS] menu and the [Own Ship] tab.
18.3 Association
An AIS-equipped ship is usually displayed by two symbols on the chart for radar dis-
play. This is because the AIS ship position is measured by a GPS navigator (L/L)
whereas the radar detects the same ship by PPI principle (range and bearing relative
to own ship radar antenna).
To avoid the presentation of two target symbols for the same physical target, use the
“association” function. If target data from both AIS and TT are available and if the as-
sociation criteria are fulfilled, either the AIS or TT symbol is presented according to the
association method selected.
Association will not happen between AIS and TT if the AIS target is sleeping or the AIS
target is lost.
All association settings, including ON/OFF, can also be controlled from the radar
mode, with the [TT/AIS] setting box (see section 4.14). All settings are mutually
shared.
18.3.1 How to select association method
Click the location circled below to show "<" to select AIS symbol for associated target,
or ">" to select TT symbol for associated target. This setting overrides the correspond-
ing item on the [TT/AIS] menu. To turn off association, click the location to remove the
arrow.
MMSI: 457804356
Name: FURUNO Voyager
Call Sign: JZ5890312
Type: 0
Description: All ships of this type
Length(LOA): 223.2 m
Width: 31.8 m
Ref Bow: 3.3 m
Ref Port: 2.8 m
<
<>
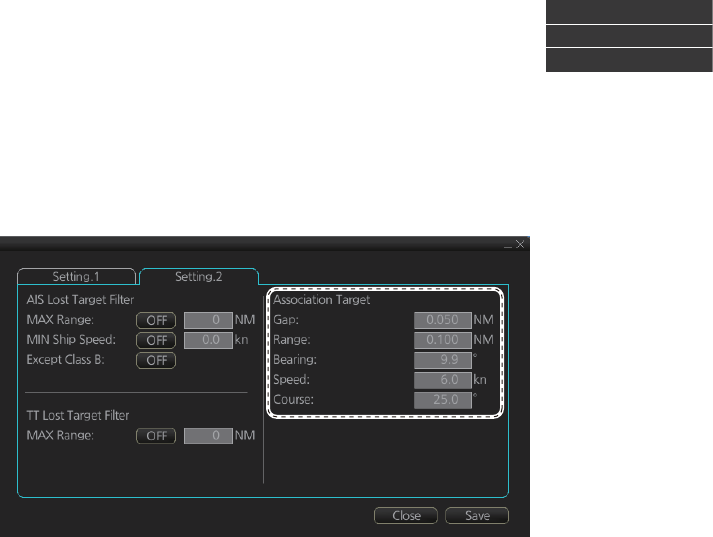
18. TT AND AIS DISPLAYS
18-10
Note: You can also select the method by right-clicking the loca-
tion. Click desired association method.
18.3.2 How to set the conditions for association
To set the criteria for association, right-click [AIS] on the [TT/AIS] page in the [NAV
Tools/Overlay] box, select [Setting] and open the [Setting.2] page. For setting details,
see paragraph 4.14.2.
Association: OFF
Association: TT
Association: AIS
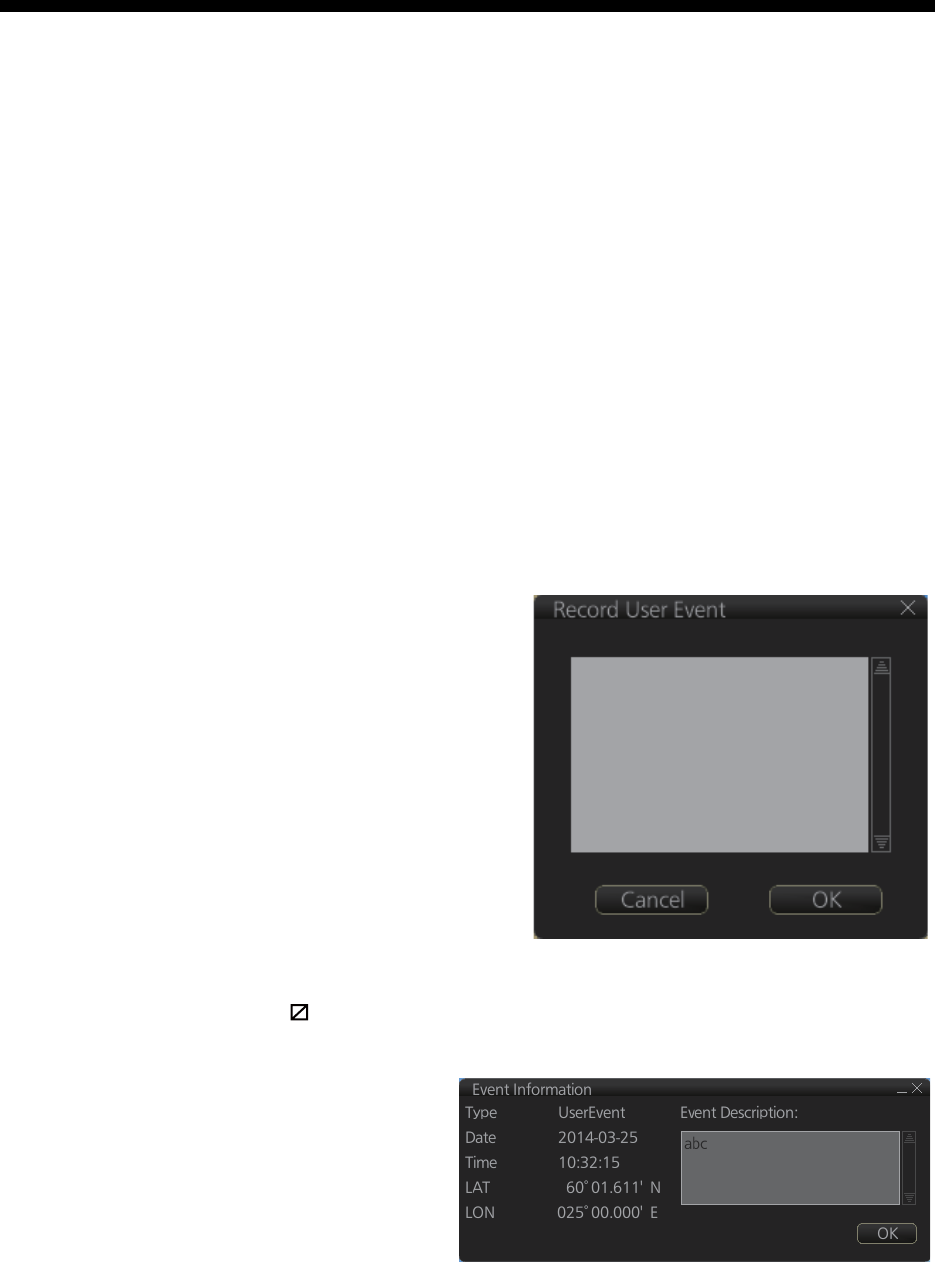
19-1
19. RECORDING FUNCTIONS
The chart radar records various voyage-related items like movement and position of
own ship and dangerous radar targets (from Radar). These items are recorded in the
following logs:
19.1 How to Record User, Position Events
19.1.1 User events
A user event is a comment about an event
(weather, etc.). You can show user events
on the chart area. Open the [Tracking]
page of the [Symbol Display] menu show
or hide the events.
To record a user event:
1. Get into the Voyage planning mode
then click the [Record], [Event Log]
and [User Event] buttons on the In-
stantAccess bar to show the [Record
User Event] window.
2. Enter a comment. Click the [OK] but-
ton to finish and close the text box.
An event marker ( ) appears at your position and the event is recorded to the [Voy-
age] log.
To view the comment entered for
an event, put the cursor on the
event then left click to show the
[Event Information] window. The
window shows the name of the
event ([UserEvent]), time and date
of entry, latitude and longitude po-
sition of the event and comment.
Note that the comment can be edited from this window. Edit the comment then click
the [OK] button to save.
Event log: Records user events and position events.
NAV log: Records entire voyage (i.e., a sailing of a route from first point to the last,
also MOB data), details (position, speed and course every minute), chart
usage (information on charts used for display).
Target log: Records dangerous TT.
Alert log: Records alerts generated by the system.
Chart log: Records the install and update history for the ENC and C-MAP charts.
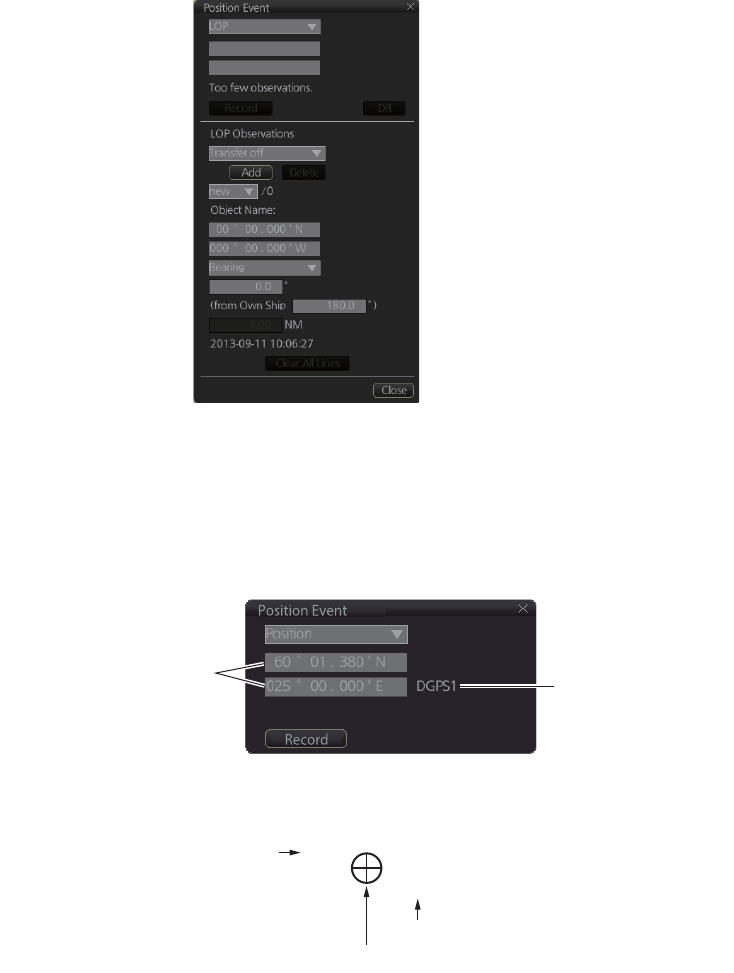
19. RECORDING FUNCTIONS
19-2
19.1.2 Position events
The operator may manually save positions to the [Event] log by position or LOP (Line
of Position):
To record a position, get into the Voyage navigation mode or Voyage planning mode
then do as follows:
1. Click the [Record], [Event Log] and [POSN Event] buttons on the InstantAccess
bar to show the [Position Event] dialog box.
2. At the list box at the top of the dialog box, select position type.
[Manual]: Manual input of ship’s position. Go to step 4.
[LOP]: Latitude and longitude position of a fixed object at ship's position. Go to
step 5.
[Position]: Ship’s position fed from navigator selected. Go to step 3.
3. For [Position], click the [Record] button.
The position event mark appears at the ship’s position. The position is recorded
to the [Voyage] log.
Ship’s position fed from
navigator selected Selected navigator
Navigator selected
Time of entry
1044
DGPS1
Position event mark
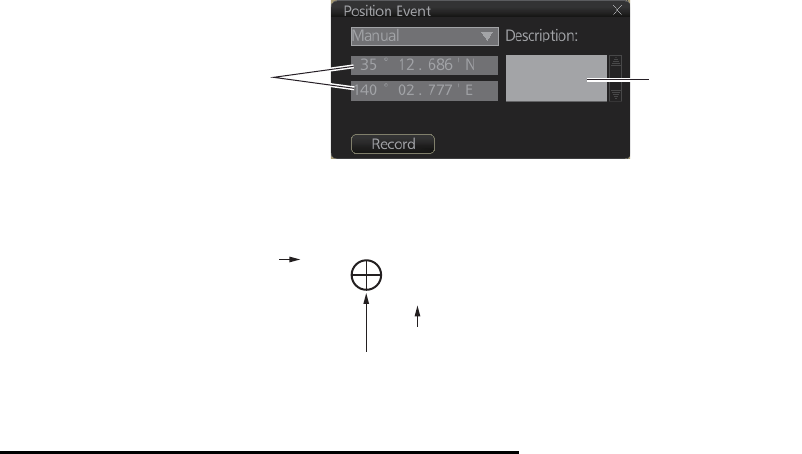
19. RECORDING FUNCTIONS
19-3
4. For [Manual], manually enter position, enter a comment if required, then click the
[Record] button.
The position event mark appears at the manual input position. The position is re-
corded to the [Voyage] log.
5. For [LOP], see the description below.
Position fixes defined by Line of Position (LOP)
A plotted line on which a vessel is located, determined by observation or measure-
ment of the range or bearing to an aid to navigation or other charted element. Two or
more simultaneous observations can be combined to produce an estimate of the
ship's current position. If the position is based on only two observations, it is an "esti-
mated position" (EP); otherwise it is called a fix. A maximum of 6 observations can be
entered to obtain a fix.
Basic operation: Coordinates of the aid to navigation can be entered into dialog box-
es or they can be selected graphically on the chart. Click on a charted object (beacon,
light, buoy etc.). Description of the object appears above coordinate boxes.
Default values for bearing and range are approximated from ship's current position in-
formation. The time of observation is stopped when the object is selected (or when the
[Add] button is clicked). Click the [Add] box to include the observation in the fix com-
putation. The counter shows "new/1", at the input of the second observation. The word
"new" indicates that the observation currently displayed is not yet included in the fix
computation, and it appears as a dashed line or ring on the chart. The added obser-
vations can be edited or deleted after selecting them at the counter. When at least two
measurements are entered, the EP or fix is computed and the coordinates are shown
in the top part of the dialog.To show a position symbol on the chart, click the [Record]
button. In the case of an EP, the letters EP are shown on the right side of the coordi-
nates. If a valid position estimate cannot be obtained, a message is displayed under
the coordinates. This may happen, for example, if the lines / circles have multiple
crossings that are far apart, or if two lines are nearly parallel or don't intersect at all.
The accuracy limit (estimated standard error) is 1.0 NM. If the estimate is valid, the
[Record] box can be clicked to record the current position estimate in the [Voyage] log.
Discrepancy between LOP result and ship position is also recorded in the log (this in-
formation may be viewed by Info query on the position event symbol on the chart -
which is displayed if position event display is on in chart display settings).
Enter position manually. Enter comment
here if required.
Navigator selected
Time of entry
1044
DGPS1
Position event mark
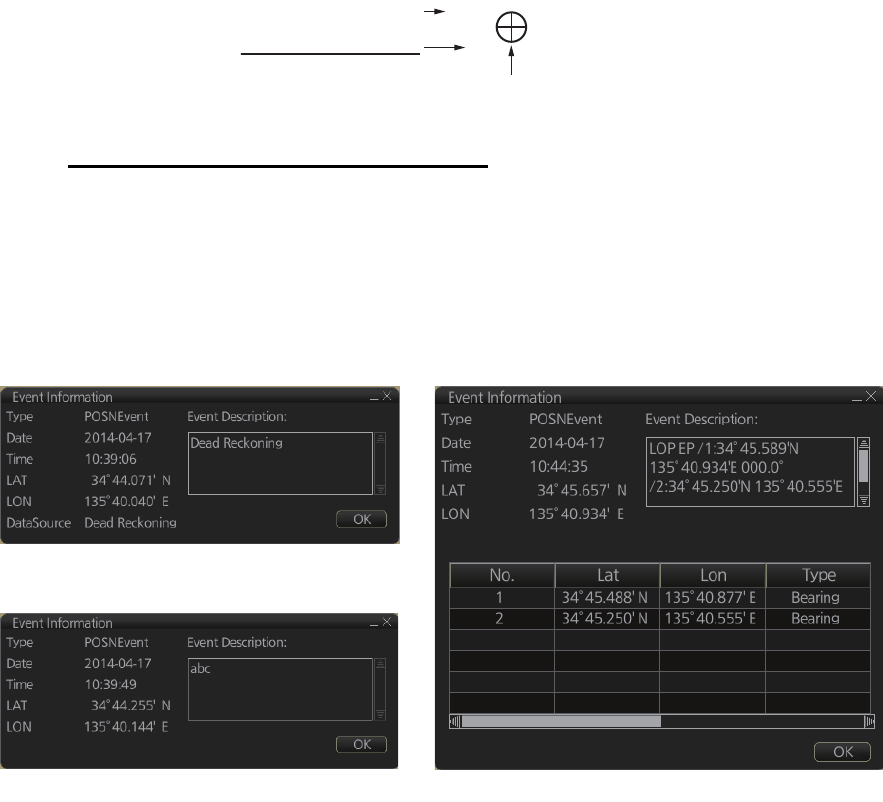
19. RECORDING FUNCTIONS
19-4
Time transfer: If the observations are not simultaneous, they should be transferred to
a common time. Transferring is based on dead reckoning of ship movement. If a po-
sition line (or ring) is transferred, the letters TPL are shown beside its timestamp on
the chart. The method of transfer may be selected in the bottom of the dialog. [Trans-
fer to latest] transfers the measurements as if they were all made at the time of the
newest measurement. [Continuous transfer] transfers all measurements to real time.
[Transfer off] can be used to check where the measurement origins are. The position
estimate and the record function follow the same logic, which means that Transfer off
shows a position that has no relevance and Transfer to latest sends an old position to
the [Voyage] log (timestamp in the log does not match the position).
If you are satisfied with the position shown in the latitude and longitude fields, then
click the [Record] button to save the position observation to the Voyage log. If you wish
you can also enter latitude and longitude values manually.
Timeouts: The observations cannot be used long after they were made because dead
reckoning is inaccurate.
Click the [Record] button to put a position event at the LOP-calculated position. The
position is recorded to the [Voyage] log.
How to find position event information
You can find information about a position event by putting the cursor on the event
mark then left click. The [Event Position] window shows event type (position event),
time of entry, event position, name of sensor ([Position] only), comment (automatic for
[LOP] and [Position]; user-entered comment* for [Manual]), and position line data
([LOP] only).
*Comment cannnot be changed from this window.
Time of entry
1044
EP LOP
Position event
mark
A
ccuracy of position
EP: Low accuracy
DR: High accuracy
Position event: Position
Position event: Manual Position event: LOP
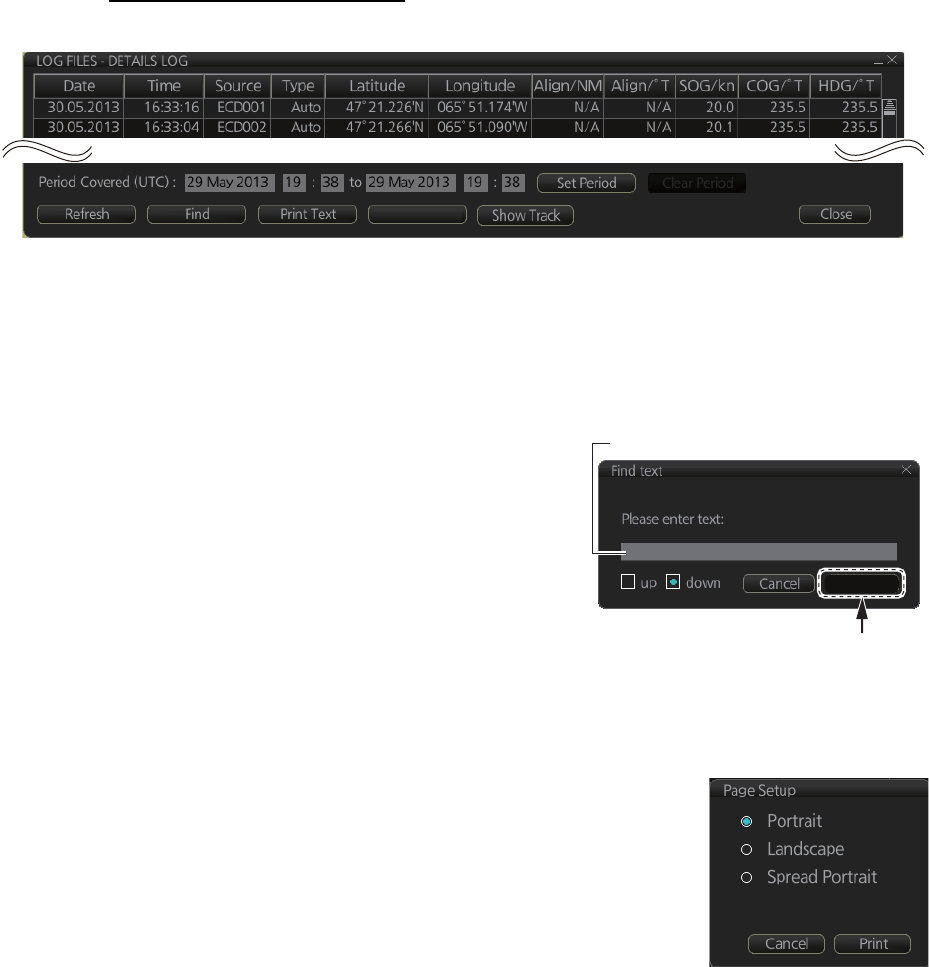
19. RECORDING FUNCTIONS
19-5
19.2 Details Log
The [Details] log contains voyage information, recorded once per minute.
How to view the Details log
Click the [Record], [NAV Log] and [Detail] buttons on the InstantAccess bar.
• To show the logs of a specific period, enter the period to show with [Period Cov-
ered (UTC)] then click the [Set Period] button. Use the [Clear Period] button to dis-
play all logs.
• To refresh the log, click the [Refresh] button.
• To search the log, do as follows:
1) Click the [Find] button to show the [Find
text] box.
2) Click the input box then enter the text to
search.
3) Select the search direction with the up or
down radio button.
4) Click the [Find] button. The first matching
text is highlighted in yellow at the top of the
screen.
5) To continue the search click the [Find] button. To cancel the search, click the
[Cancel] button.
• To print the log, click the [Print Text] button. Select print-
ing format then click the [Print] button. [Spread Portrait]
prints two pages of data on one page.
• To show track for the period selected, click the [Show
Track] button. Use the [Hide Track] button to erase the
track.
• To export the log, click the [Export File] button. The file is
named
DetailsLogYYYYMMDDhhmmss.csv.
• [Date]
• [Time]
• [Source]: No. of unit which generated log
• [Type]: Type of position data
• [Auto]: Automatic input of position
• [Latitude], [Longitude]: Position as output by selected sensor
• [Align/NM], [Align/°T]: Range, bearing offset, if used
• [SOG/kn]: Speed over the ground
• [COG/°T]: Course over the ground
• [HDG/°T]: Heading
• [CORR/°T]: Gyro correction value, if used
Export File
Find
Input box
Input text in box and
[Find] button appears.
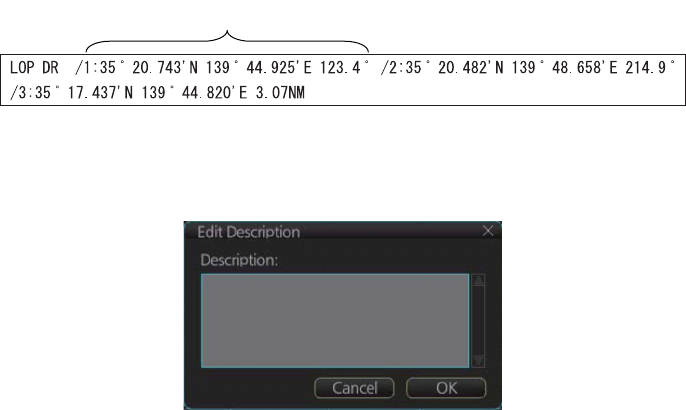
19. RECORDING FUNCTIONS
19-6
19.3 Voyage Log
The [Voyage] log records all voyage-related data of the past three months. Recorded
events are:
• [Date]: Date of entry
• [Time]: TIme of entry
• [Source]: No. of unit which generated log
• [Type]: Log entry types
• [Auto]: Automatic entry of ship position, in 1 to 4 hr intervals, set by operator.
• [Ship]: Logged if speed or course exceed operator-set values.
• [MOB]: MOB position, entered with [MOB] button.
• [User]: Operator-entered position. The information entered in the [Description] box
is logged.
• [Posdev]: Operator-entered GPS position or LOP. The information entered in the
[Description] box is logged.
• [Latitude], [Longitude]: Latitude and longitude position
• [SOG/kn], [COG/°T], [HDG/°T]: Speed over the ground, course over the ground,
heading.
• [CORR/°T]: Offset bearing, if used
• [Wind/kn], [Wind/°T]: Wind speed and angle
• [Dist/NM]: Offset distance
• [Depth/m]: Depth in meters
• [Description]: The latitude and longitude position and bearing (or distance) of a max-
imum of three objects are automatically recorded to each log entry. An object whose
position accuracy is low is not recorded. If an object has both a bearing and distance,
separate entries are made.
If desired the description can be edited. Click the applicable Description block to
show the [Edit Description] box. Edit the description as required then click the [OK]
button.
L/L position, bearing of object (no.1)
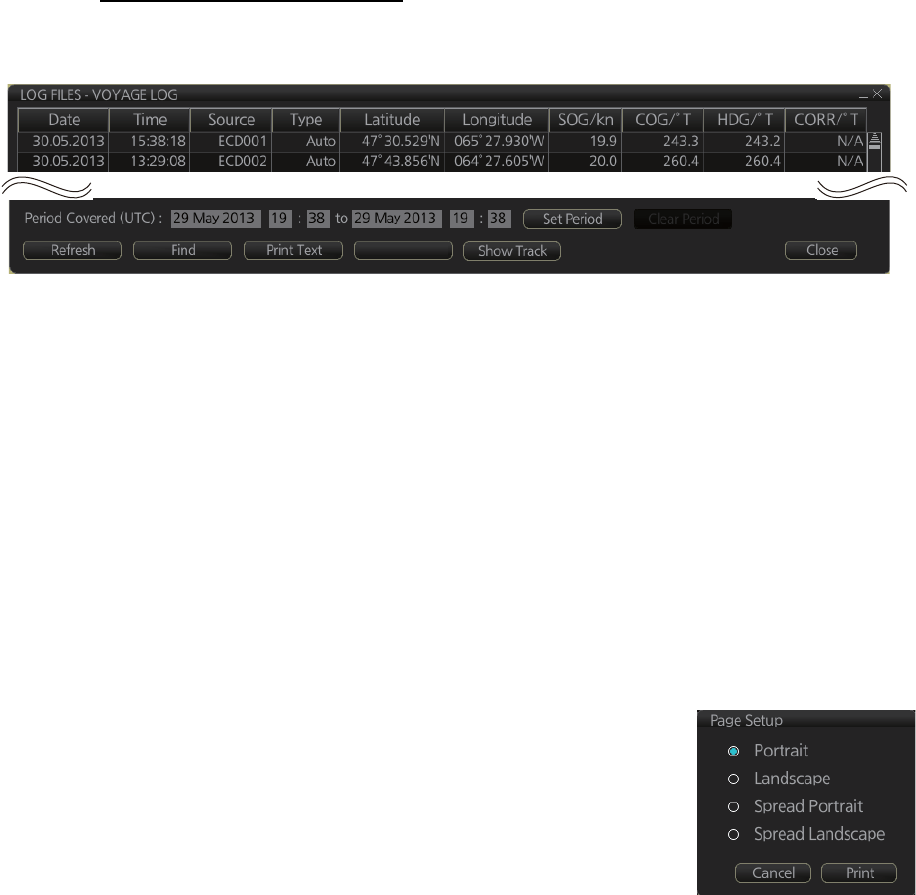
19. RECORDING FUNCTIONS
19-7
How to view the Voyage log
To open the Voyage log, click the [Record], [NAV Log] and [Voyage] buttons on the
InstantAccess bar.
• To show the logs of a specific period, enter the period to show with [Period Cov-
ered (UTC)] then click the [Set Period] button. Use the [Clear Period] button to dis-
play all logs.
• To refresh the log, click the [Refresh] button.
• To search the log, do as follows:
1) Click the [Find] button to show the [Find text] box.
2) Click the input box then enter the text to search.
3) Select the search direction with the up or down radio button.
4) Click the [Find] button. The first matching text is highlighted in yellow at the top
of the screen.
5) To continue the search click the [Find] button. To cancel the search, click the
[Cancel] button.
• To print the log, click the [Print Text] button. Select print-
ing format then click the [Print] button. [Spread Portrait]
and [Spread Landscape] print two pages of data on one
page.
• To show track for the period selected, click the [Show
Track] button. Use the [Hide Track] button to erase the
track.
• To export the log, click the [Export File] button. The file is named
VoyageLogYYYYMMDDhhmmss.csv.
Export File
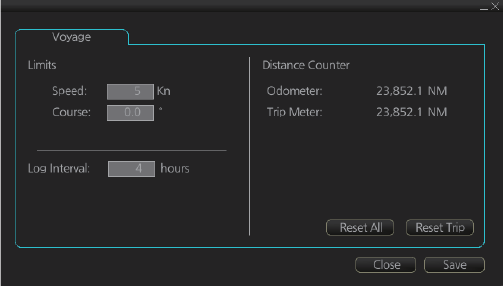
19. RECORDING FUNCTIONS
19-8
19.3.1 How to set conditions of logging
The operator can set the conditions for automatic voyage logging. When your speed
or course equals the amount set here, an entry is made in the [Voyage] log:
• Define the amount of course and speed change which creates a log entry.
• Set the interval of logging, regardless of speed and course change.
To set the conditions of logging, do as follows:
1. Open the menu and select the [Voyage] menu from the [NAVI Log] menu.
2. Set desired limits for speed, course and log interval.
[Speed]: 1 - 10 kn, 1 kn interval
[Course]: 0 - 30°, 1° interval
[Log Interval]: 1 - 4 hr, 1 hr interval
When your speed or course changes by the amount set here, an entry is made in the
[Voyage] log, at the interval selected.
19.4 Chart Usage Log
The [Chart Usage] log stores which charts were used in chart alerts. To open the log,
click [Record], [NAV Log] and [Chart Usage] on the InstantAccess bar. The following
information is recorded in the chart usage log:
• Date and time chart was displayed
• Chart ID
• Center position of display (Lat, Lon)
• Chart source
• Chart edition
• Display scale
• Compilation scale
• The latest update included to chart
• Chart base
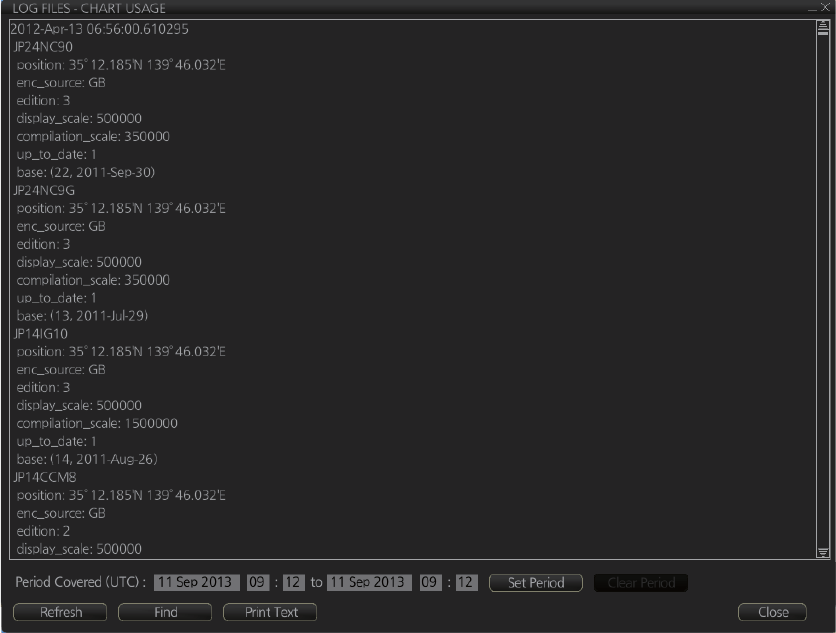
19. RECORDING FUNCTIONS
19-9
• To show the logs of a specific period, enter the period to show with [Period Cov-
ered (UTC)] then click the [Set Period] button. Use the [Clear Period] button to dis-
play all logs.
• To refresh the log, click the [Refresh] button.
• To search the log, do as follows:
1) Click the [Find] button to show the [Find text] box.
2) Click the input box then enter the text to search.
3) Select the search direction with the up or down radio button.
4) Click the [Find] button. The first matching text is highlighted in yellow at the top
of the screen.
5) To continue the search click the [Find] button. To cancel the search, click the
[Cancel] button.
• To print the log, click the [Print Text] button.
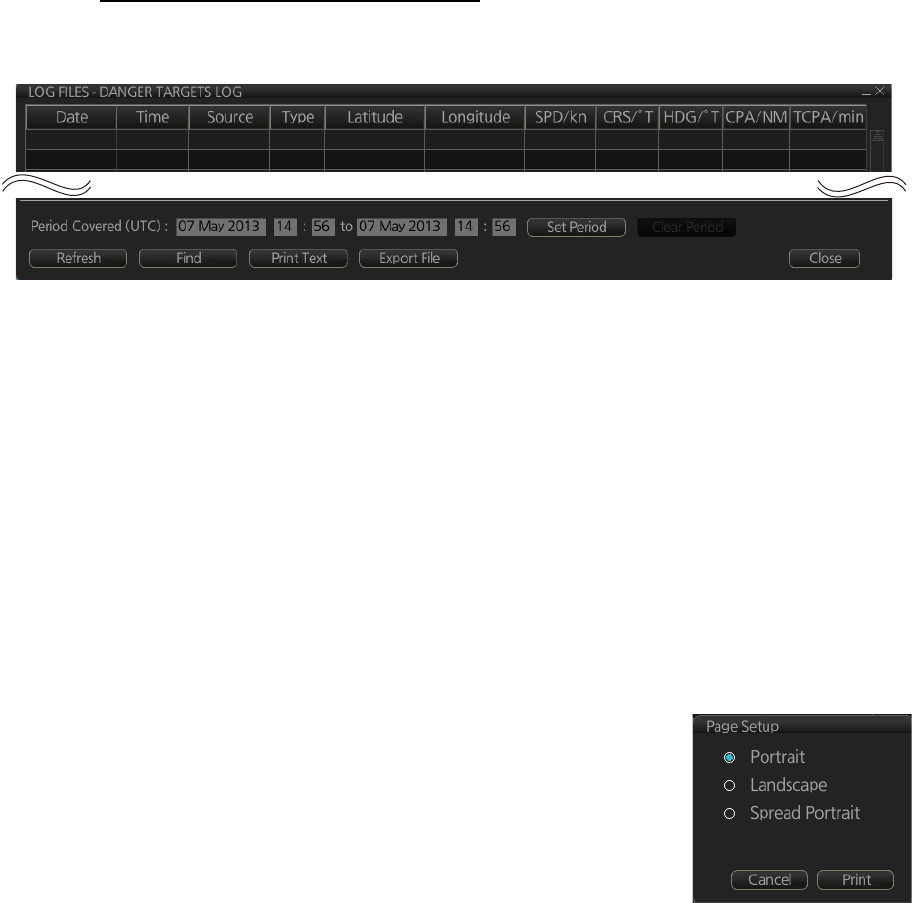
19. RECORDING FUNCTIONS
19-10
19.5 Danger Targets Log
The [Danger Targets] log stores information about dangerous targets that are re-
ceived from a radar (TTs) and/or targets that are received from an AIS transponder
(AIS targets).
If a TT or AIS target is within the set CPA (Closest Point of Approach) and TCPA (Time
to CPA), information of all TTs (including non-dangerous targets) are recorded into the
danger target log. This data is as follows:
How to view the danger targets log
To open the [Danger Targets] log, click the [Record], [Target Log] and [Danger Target]
buttons on the InstantAccess bar.
• To show the logs of a specific period, enter the period to show with [Period Cov-
ered (UTC)] then click the [Set Period] button. Use the [Clear Period] button to dis-
play all logs.
• To refresh the log, click the [Refresh] button.
• To search the log, do as follows:
1) Click the [Find] button to show the [Find text] box.
2) Click the input box then enter the text to search.
3) Select the search direction, with the up or down radio button.
4) Click the [Find] button. Matching text is highlighted in yellow at the top of the
screen.
5) To continue the search click the [Find] button. To cancel the search, click the
[Cancel] button.
• To print the log, click the [Print Text] button.
• To export the log, click the [Export File] button. The file
is namedDangerTargetLogYYYYMMDDhhmmss.csv.
• [Date]: Date of entry
• [Time]: Time of entry
• [Source]: Unit which generated log
• [Type]: Type of dangerous target
• [Latitude], [Longitude]: Latitude and longitude position of dangerous target
• [SPD/kn]: Speed of dangerous target
• [CRS/°T]: Course of dangerous target
• [HDG/°T]: Heading of dangerous target
• [CPA/NM], [TCPA/min]: CPA and TCPA of dangerous target
• [Index]: Radar target no. (TT), MMSI (AIS)
2013-05-08 13:55:59 ECD00
1 TT 35°38.164’N 139°49.842’E 15.1 193.3 N/A 1.3 0.7
2013-05-08 13:53:42 ECD00
1 TT 35°57.770’N 139°49.732’E 12.1 200.6 N/A 1.1 0.2
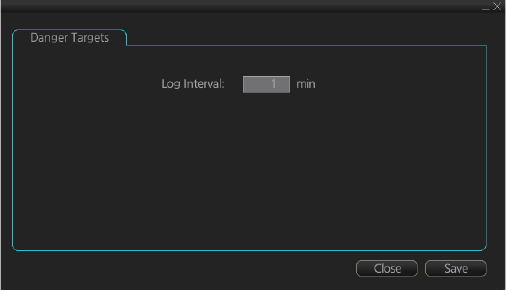
19. RECORDING FUNCTIONS
19-11
19.5.1 How to set the conditions for logging danger targets
The operator may set Closest Point of Arrival (CPA), Time for CPA (TCPA) and Log
interval for viewing dangerous TT and AIS targets on the chart radar display.
1. Open the menu and select the [RECORD], [Target Log], [Danger Target] menus.
2. Set how often to record dangerous TTs and AIS targets with [Log interval].
19. RECORDING FUNCTIONS
19-12
This page is intentionally left blank.

20-1
20. ALERTS
20.1 What is an Alert?
“Alert" is a generic name for a notice to any unusual or potentially dangerous situation
generated within the system.
Alerts are classified according to priority and category.
Alert priority
There are three alert priorities: alarm, warning and caution.
Alarm: Situations or conditions which require immediate attention, decision and (if
necessary) action by the bridge team to avoid any kind of hazardous situation and to
maintain the safe navigation of the ship.
Warning: Situations or conditions which require immediate attention for precautionary
reasons, to make the bridge team aware of conditions which are not immediately haz-
ardous, but may become so.
Caution: Awareness of a condition which continues to require attention out of the or-
dinary consideration of the situation or of given information.
Alert category
An alert is further classified by category, A, B or C, according to its degree of severity
or source.
Category Description
A Category A alerts include alerts indicating
• Danger of collision
• Danger of grounding
B Category B alerts are alerts where no additional information for decision
support is necessary. Category B alerts are all alerts not falling under
category A.
C IAS (Integrated Automation System) generated engine alert
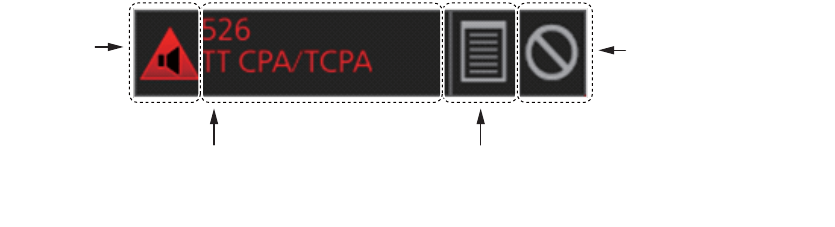
20. ALERTS
20-2
20.2 Alert Box
When an alert is generated, the related alert message and alert state icon appear in
the [Alert] box, which is at the bottom right corner on the screen. An audible alarm is
additionally generated for alarms and warnings.
In addition to the alert message and alert state icon, the [Alert] box has the buzzer stop
button and provides access to the [Alert List] and [Alert Log].
Alert state icon: The state of an alert is shown with an icon. See page 20-4.
Alert message: The number and name of all active alerts appear in the message ar-
ea, with the alert of the highest priority on top always. The color of both the message
and the background change according to alert priority and alert state. See the table on
the next page.
An alert can be acknowledged from the [Alert] box or [Alert List]. An alert remains in
the [Alert] box and [Alert List] until it is acknowledged and rectified. See section 20.5.
Alert List/Alert Log button: Right-click to select [Alert List Window] or [Alert Log Win-
dow]. The background color of the button is light blue when the list or log is open. See
sections 20.5 and 20.6 for a description of the list and log.
Buzzer stop button: Click to temporarily silence the buzzer, which sounds against
alarms and warnings. See page 20-4.
Alert message
(Number and name of alert)
Alert List/Alert Log button
(Right-click to select [Alert List Window]
or [Alert Log Window].)
Buzzer stop button
(Click to stop
buzzer temporarily.)
A
lert state
icon
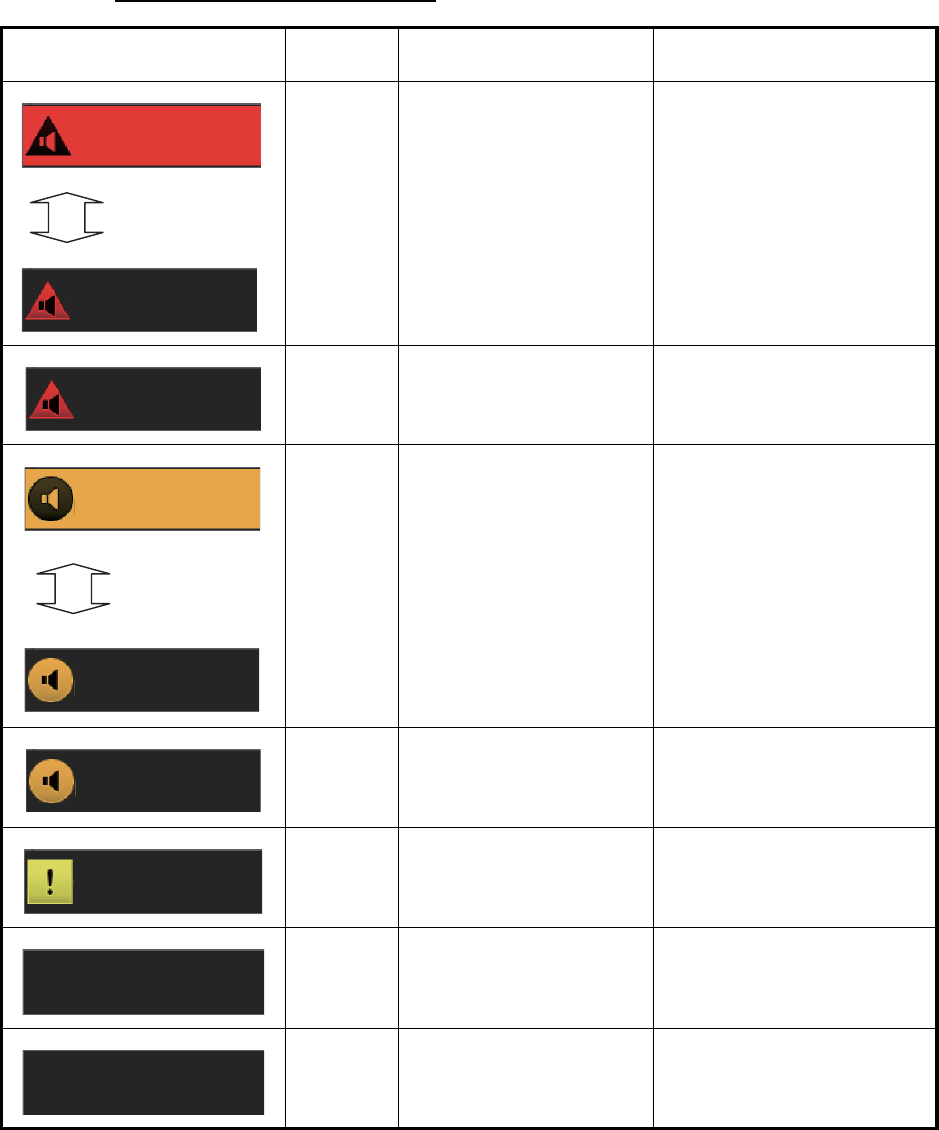
20. ALERTS
20-3
Alert message display format
Alert indication Priority
of alert Alert state Display state
Alarm - Not acknowledged/Not
rectified.
OR
- Not acknowledged/Rec-
tified.
Black characters on red
background.
Flashing interval
• 0.5 s, 0.5 s (Not rectified)
• 3 s, 1 s (Rectified)
Red characters on gray
background.
Alarm Acknowledged/Not recti-
fied.
Red characters on gray
background.
Warning - Not acknowledged/Not
rectified.
OR
Not acknowledged/Recti-
fied.
Black characters on yellow-
orange background.
Flashing interval
• 0.5 s, 0.5 s (Not rectified)
• 3 s, 1 s (Rectified)
Yellow-orange characters
on gray background.
Warning Acknowledged/Not recti-
fied.
Yellow-orange characters
on gray background.
Caution Not rectified. Yellow characters on gray
background.
Alarm/
Warning
Acknowledged/Rectified. No display.
Caution Rectified. No display.
526
526
Displayed
alternately
TT CPA/TCPA
TT CPA/TCPA
526
TT CPA/TCPA
008
008
Fan 2 No Rotati..
Displayed
alternately
Fan2 No Rotati..
008
Fan2 No Rotati..
362
Wind Sensor 3..
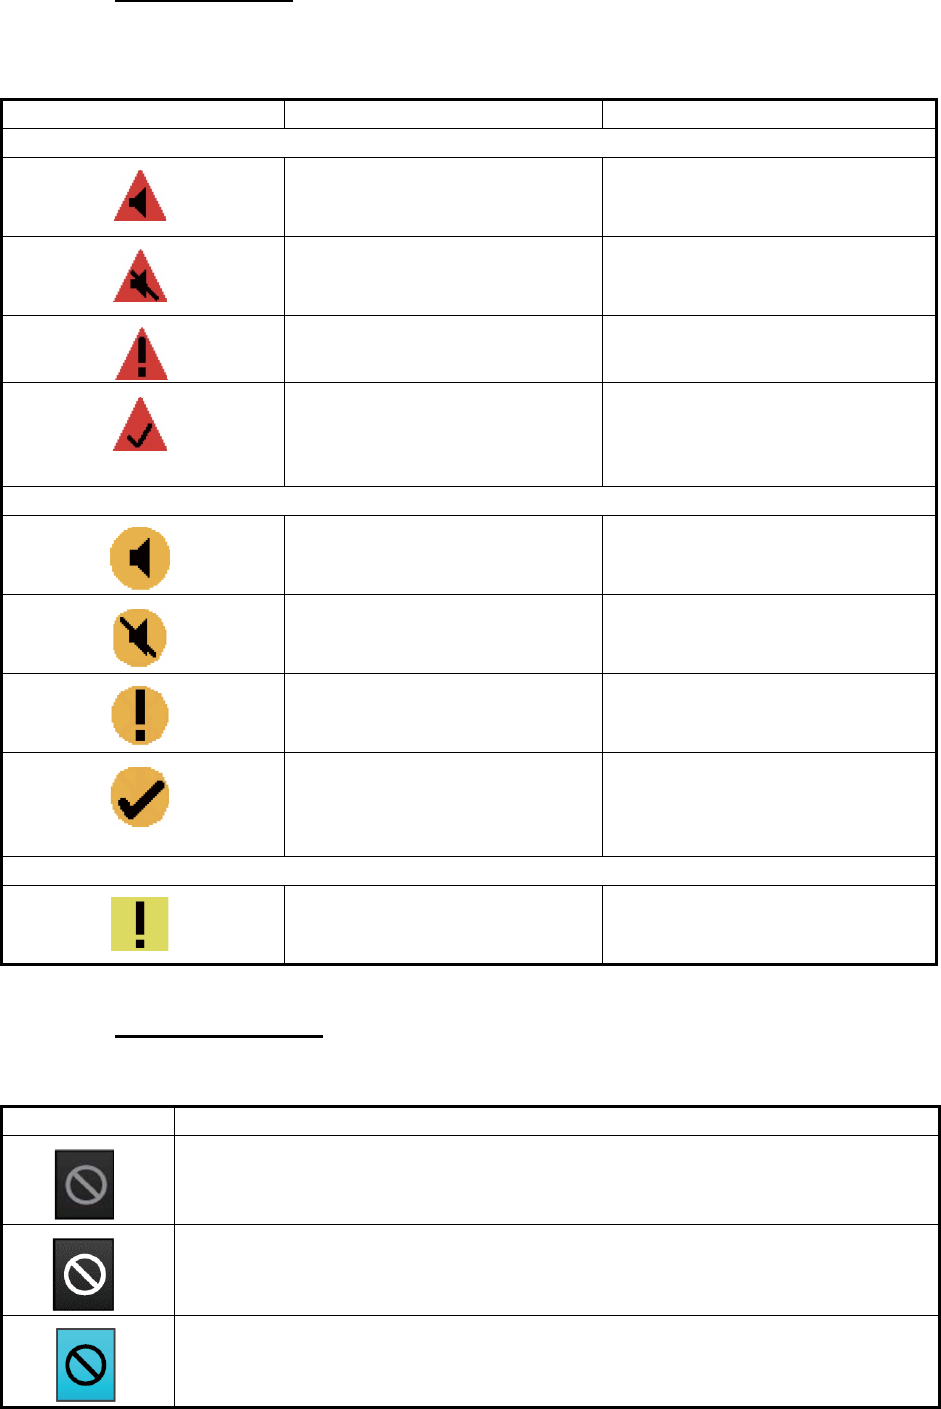
20. ALERTS
20-4
Alert state icons
The table shows the icons used to indicate the various alert states for the alarm, warn-
ing and caution alerts.
Buzzer stop button
The color of both the background and the icon change according to alert state.
Icon Alert state Icon description
Alert priority: Alarm
Not acknowledged/Not rectified Red triangle with black loudspeak-
er in center of triangle. Flashing
every 0.5 s.
Not acknowledged/Not rectified,
Buzzer temporarily silenced
Red triangle with crossed out
black loudspeaker in center of tri-
angle. Flashing every 0.5 s.
Acknowledged/Not rectified Red triangle with black exclama-
tion point in center of triangle.
Not acknowledged/Rectified Red triangle with black check
mark in center of triangle. The icon
flashes 3 s, goes off 1 s, repeats
the sequence.
Alert priority: Warning
Not acknowledged/Not rectified Yellow-orange circle with black
loudspeaker in center of circle.
Flashing every 0.5 s.
Not acknowledged/Not rectified,
Buzzer temporarily silenced
Yellow-orange circle with crossed
out black loudspeaker in center of
circle. Flashing every 0.5 s.
Acknowledged/Not rectified Yellow-orange circle with black
exclamation point in center of cir-
cle.
Not acknowledged/Rectified Yellow-orange circle with black
check mark in center of circle. The
icon flashes 3 s, goes off
1 s, repeats the sequence.
Alert priority: Caution
Caution Steadily displayed yellow square
with black exclamation point in
center of square.
Button state Description
No alert generated. The background is gray and the icon is grayed out.
An alarm or warning is being acknowledged. The background is gray and the icon
is white.
Button clicked to silence buzzer temporarily. The background is light-blue and the
icon is black.
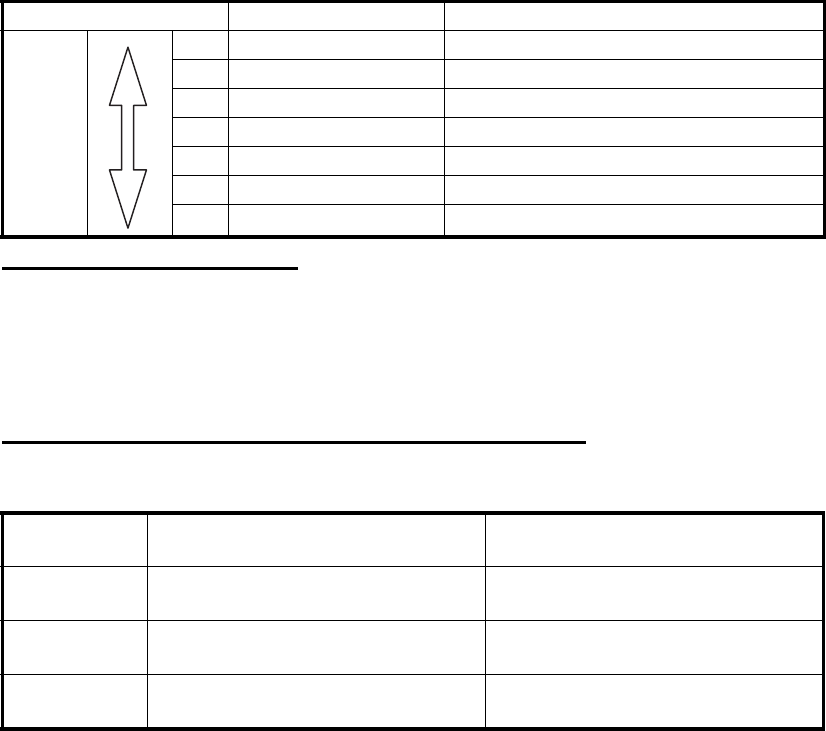
20. ALERTS
20-5
20.3 How to Temporarily Silence the Buzzer for an
Alarm or Warning
When the buzzer for an alarm or warning sounds, you can temporarily silence it by do-
ing one of the following:
• Click the buzzer stop button in the [Alert] box.
• In the [Alert List], click the [Silence] button.
The buzzer is stopped and the alert state changes. An alert message remains in the
[Alert] box and [Alert List] until acknowledged and rectified. If an alarm or warning is
not acknowledged within 30 seconds, the buzzer sounds again.
20.4 How to Acknowledge an Alarm or Warning
When an alarm or warning is generated, the buzzer sounds and the name of the alert
appears and flashes in the [Alert] box and [Alert List].
To acknowledge the alert, do one of the following:
• Press the ALARM ACK key.
• In the [Alert] box or [Alert List], click the unacknowledged alert.
After acknowledgement, the buzzer and the flashing for the alert message are stopped
and the priority of the alert changes as shown in the table below. The alert message
remains on the display until rectified.
Unacknowledged warnings
If a warning (Alert 150 "Early Course Change Indication" and 151 "Actual Course
Change Indication") is not acknowledged within 30 seconds then the priority changes
to alarm. If a warning (except for Alert 150 and 151) is not acknowledged within 60
seconds, the warning is generated again.
Category of alert and place of alert acknowledgement
The place of alert acknowledgement depends on the category of the alert.
Priority no. Priority of alert Alert state
High
Low
1 Alarm Not acknowledged/Not rectified
2 Warning Not acknowledged/Not rectified
3 Alarm Not acknowledged/Rectified
4 Warning Not acknowledged/Rectified
5 Alarm Acknowledged/Not rectified
6 Warning Acknowledged/Not rectified
7 Caution Not rectified
Category Where the alert is generated Place of alert
acknowledgement
A Equipment that generated the
alert.
Equipment that generated the
alert.
B Equipment that generated the
alert.
Equipment that generated the alert
or AMS.
C IAS (Integrated Automation Sys-
tem) generated engine alert
–
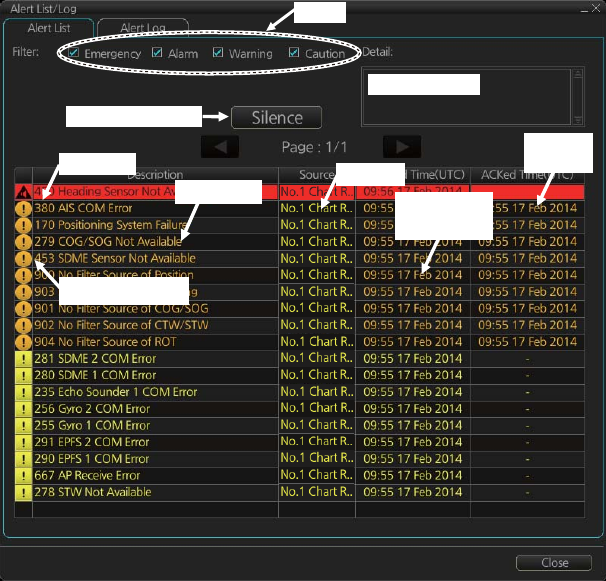
20. ALERTS
20-6
20.5 Alert List
The [Alert List] displays all active alerts, with unacknowledged alerts at the top, in pri-
ority order. To display the list, right-click the [Alert List/Alert Log] button in the [Alert]
box then select [Alert List/Log Window]. The ZDA sentence is required to display the
time in the list.
Note: The [Alert List] cannot be opened while the radar is transmitting.
The list shows
The background color of an unacknowledged alarm is red and flashing and unac-
knowledged warning is yellow-orange and flashing. An acknowledged alert is dis-
played steadily, in red for alarm and yellow-orange for warning. A caution is displayed
steadily in yellow.
The [Filter] checkboxes at the top of the window let you select what alerts to view.
Check or uncheck the boxes to show or hide the corresponding alerts.
To find details about an alert, click the applicable alert info icon at the left side of the
window to show the details in the [Detail] box at the top of the window. The box shows
the reason for the alert, how to handle the alert, etc.
An individual alarm or warning can be acknowledged by clicking it.
The [Silence] button silences the buzzer.
• Alert no.
• Alert text
• Source of alert
• Time (UTC) alert was generated
• Time (UTC) alert was acknowledged
• Details about the alert selected
Filter
Time
ACKed
Alert details
Silence buzzer
Time
generated
Alert text
Alert no.
Alert info icon
Source
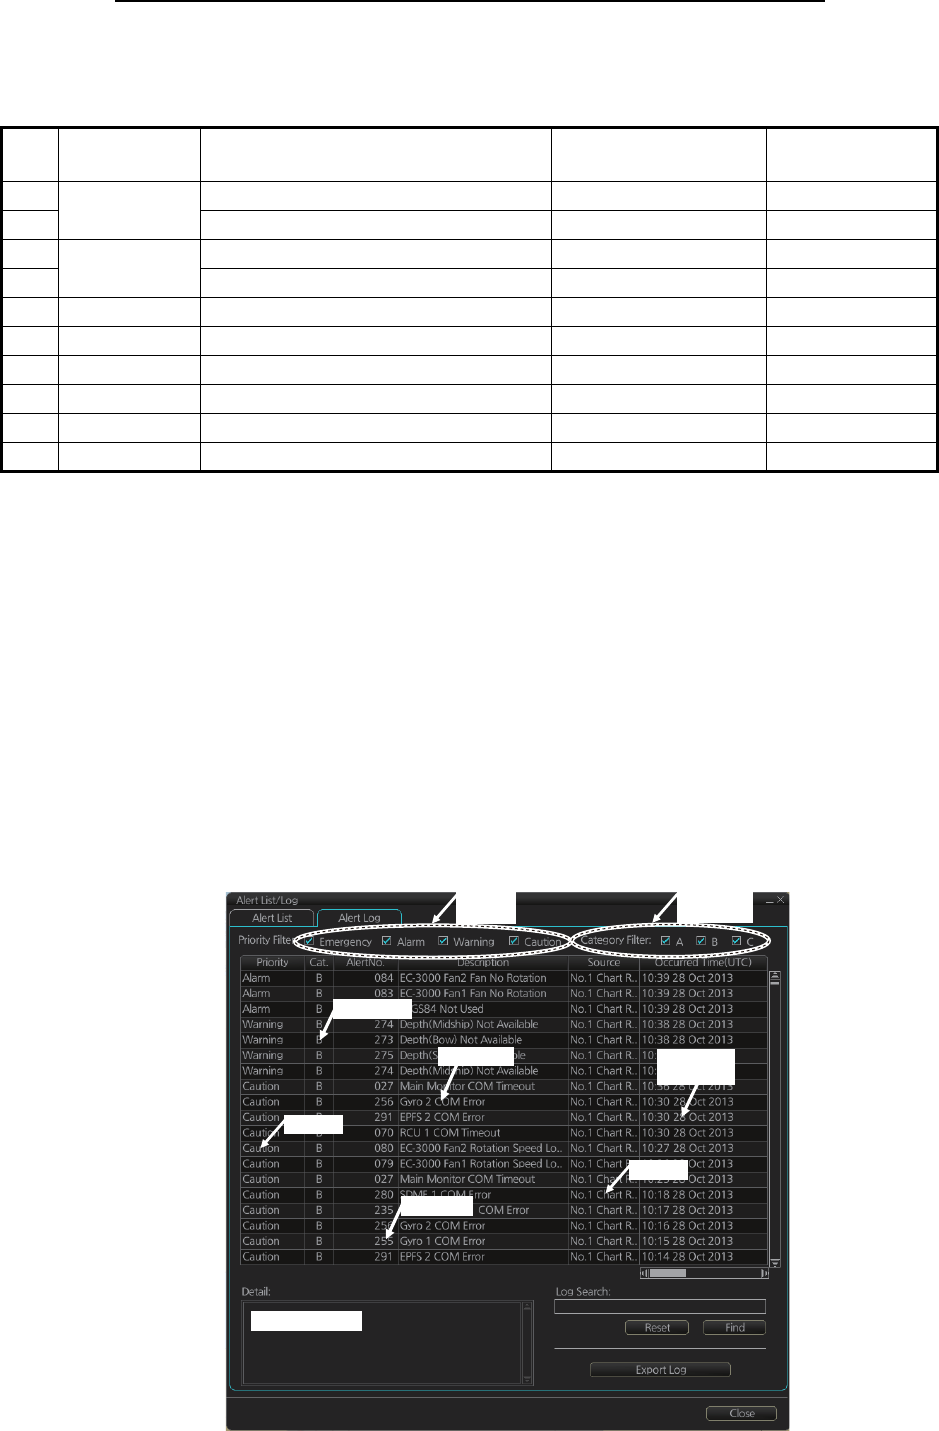
20. ALERTS
20-7
How the alert list is updated after acknowledgement, rectification
When you acknowledge an alert, its display method on the [Alert] list changes accord-
ing to alert category and alert state. Acknowledged and rectified alerts are immediately
removed from the list.
20.6 Alert Log
The [Alert] log stores and displays the latest 10,000 alerts. To display the log, right-
click the [Alert List/Alert Log] button then select [Alert List/Log Window].
Note: The [Alert Log] cannot be opened while the radar is transmitting.
The log shows the following information for each alert:
No. Alert
priority Alert state Display after
acknowledgement
Display after
rectification
1 Alarm Not acknowledged/Not rectified 5 2
2 Not acknowledged/Rectified 8 –
3 Warning Not acknowledged/Not rectified 6 4
4 Not acknowledged/Rectified 9 –
5 Alarm Acknowledged/Not rectified – 8
6 Warning Acknowledged/Not rectified – 9
7 Caution Not rectified – 10
8 Alarm Acknowledged/Rectified – –
9 Warning Acknowledged/Rectified – –
10 Caution Rectified – –
• Priority of alert (Alarm, Warning, Caution)
• Category of alert (A, B or C)
• Alert no.
• Alert description
• Source of alert
• Occurred Time (UTC)
• ACKed Time (UTC)
• Rectified Time (UTC)
• Alert details
Alarm Details
Priority
filter
Category
filter
Occured
time
Source
Alert no.
Alert text
Category
Priority

20. ALERTS
20-8
You can select what type of alerts to display with [Priority Filter] and [Category Filter]
at the top of the list. The list can be sorted by [Priority], [Cat.], [Alert No.], [Description],
[Occurred Time], [ACKed TIime] or [Rectified Time]. Click the corresponding column
title to sort. To find detailed information about an alert, select it to show detailed infor-
mation in the [Detail] box. To search the log, enter text in the [Log Search] box then
click the [Find] button. You can save the contents of the log to a USB flash memory,
in .dat format, by clicking the [Export Log] button.
20.7 Alert Reception from Connected Sensors
An "ALR receive and ACK transmit" communication is available for every serial line
input. The ALR message from the sensor includes information about alerts from the
sensor, and is presented though the normal alert system. When you acknowledge an
alert, an ACK message is sent to the sensor to do remote acknowledge.
This interface is based on IEC 61162-1 and IEC 80/520/INF.
20.8 List of Alerts
Below is a list of all available alerts and their default priorities. The priority of Alerts 620
to 638 can be switched between Caution and Warning on the [Chart Alert] page (see
paragraph 11.1.2).
No. Text Default
priority
001 Fan1 Rotation Speed Lowering Caution
002 Fan2 Rotation Speed Lowering Caution
003 Fan3 Rotation Speed Lowering Caution
004 Fan4 Rotation Speed Lowering Caution
005 LCD Unit Lifetime Over Warning
006 High Temperature Inside Monitor Warning
007 Fan1 No Rotation Warning
008 Fan2 No Rotation Warning
009 Fan3 No Rotation Warning
010 Fan4 No Rotation Warning
011 RS485 Communication Timeout Caution
012 No Signal Caution
013 Sentence Syntax Error Caution
014 Fan1 Rotation Speed Lowering Caution
015 Fan2 Rotation Speed Lowering Caution
016 Fan3 Rotation Speed Lowering Caution
017 Fan4 Rotation Speed Lowering Caution
018 LCD Unit Lifetime Over Warning
019 High Temperature Inside Monitor Warning
020 Fan1 No Rotation Warning
021 Fan2 No Rotation Warning
022 Fan3 No Rotation Warning
023 Fan4 No Rotation Warning
024 RS485 Communication Timeout Caution
025 No Signal Caution Caution

20. ALERTS
20-9
026 Sentence Syntax Error Caution
027 Main Monitor COM Timeout Caution
028 Sub Monitor COM Timeout Caution
030 Sensor Adapter 1 COM Timeout Caution
031 Sensor Adapter 2 COM Timeout Caution
032 Sensor Adapter 3 COM Timeout Caution
033 Sensor Adapter 4 COM Timeout Caution
034 Sensor Adapter 5 COM Timeout Caution
035 Sensor Adapter 6 COM Timeout Caution
036 Sensor Adapter 7 COM Timeout Caution
037 Sensor Adapter 8 COM Timeout Caution
038 Sensor Adapter 9 COM Timeout Caution
039 Sensor Adapter 10 COM Timeout Caution
070 RCU 1 COM Timeout Caution
071 RCU 2 COM Timeout Caution
072 RCU 3 COM Timeout Caution
073 EC-3000 CPU Temp High Caution
074 EC-3000 GPU Temp High Caution
075 EC-3000 CPU Board Temp High Caution
076 EC-3000 Remote 1 Temp High Caution
077 EC-3000 Remote 2 Temp High Caution
078 EC-3000 CPU Fan Rotation Speed Lowering Caution
079 EC-3000 Fan1 Rotation Speed Lowering Caution
080 EC-3000 Fan2 Rotation Speed Lowering Caution
082 EC-3000 CPU Fan No Rotation Warning
083 EC-3000 Fan1 Fan No Rotation Warning
084 EC-3000 Fan2 Fan No Rotation Warning
086 EC-3000 CPUboard 5V Power Error Warning
087 EC-3000 CPUboard 3.3V Power Error Warning
088 EC-3000 CPUboard 12V Power Error Warning
089 EC-3000 CPUboard Battery Power Error Caution
090 EC-3000 CPUboard Core Power Error Caution
094 Sensor Adapter 11 COM Timeout Caution
095 Sensor Adapter 12 COM Timeout Caution
096 Sensor Adapter 13 COM Timeout Caution
097 Sensor Adapter 14 COM Timeout Caution
098 Sensor Adapter 15 COM Timeout Caution
099 Sensor Adapter 16 COM Timeout Caution
150 Early Course Change Indication Warning
151 Actual Course Change Indication Warning
170 Positioning System Failure Warning
171 Crossing Safety Contour Alarm
172 Off Track Alarm Alarm
175 Different Geodetic Datum Warning
176 System Malfunction Warning
235 Echo Sounder 1 COM Error Caution
236 Echo Sounder 2 COM Error Caution
237 Echo Sounder 3 COM Error Caution
No. Text Default
priority

20. ALERTS
20-10
255 Gyro 1 COM Error Caution
256 Gyro 2 COM Error Caution
257 Gyro 3 COM Error Caution
258 Gyro 4 COM Error Caution
259 Gyro 5 COM Error Caution
260 Backup Navigator Alarm
272 UTC Time Not Available Warning
273 Depth(Bow) Not Available Caution
274 Depth(Midship) Not Available Caution
275 Depth(Stern) Not Available Caution
277 Wind Speed/Direction Not Available Warning
278 STW Not Available Caution
279 COG/SOG Not Available Warning
280 SDME 1 COM Error Caution
281 SDME 2 COM Error Caution
282 SDME 3 COM Error Caution
284 SOG Not Available Warning
290 EPFS 1 COM Error Caution
291 EPFS 2 COM Error Caution
292 EPFS 3 COM Error Caution
293 EPFS 4 COM Error Caution
294 EPFS 5 COM Error Caution
295 EPFS 6 COM Error Caution
296 EPFS 7 COM Error Caution
297 EPFS 8 COM Error Caution
298 EPFS 9 COM Error Caution
310 Other Sensor 1 COM Error Caution
311 Other Sensor 2 COM Error Caution
312 Other Sensor 3 COM Error Caution
313 Other Sensor 4 COM Error Caution
314 Other Sensor 5 COM Error Caution
315 Other Sensor 6 COM Error Caution
316 Other Sensor 7 COM Error Caution
317 Other Sensor 8 COM Error Caution
318 Other Sensor 9 COM Error Caution
319 Other Sensor 10 COM Error Caution
320 EC-3000 Ch.01 COM Timeout Caution
321 EC-3000 Ch.02 COM Timeout Caution
322 EC-3000 Ch.03 COM Timeout Caution
323 EC-3000 Ch.04 COM Timeout Caution
324 EC-3000 Ch.05 COM Timeout Caution
325 EC-3000 Ch.06 COM Timeout Caution
326 EC-3000 Ch.07 COM Timeout Caution
327 EC-3000 Ch.08 COM Timeout Caution
360 Wind Sensor 1 COM Error Caution
361 Wind Sensor 2 COM Error Caution
362 Wind Sensor 3 COM Error Caution
370 Water Current COM Error Caution
No. Text Default
priority

20. ALERTS
20-11
371 Water Temp COM Error Caution
380 AIS COM Error Warning
390 NAVTEX COM Error Caution
400 Network Printer Not Available Caution
401 Local Printer Not Available Caution
411 Other Sensor 11 COM Error Caution
412 Other Sensor 12 COM Error Caution
413 Other Sensor 13 COM Error Caution
414 Other Sensor 14 COM Error Caution
415 Other Sensor 15 COM Error Caution
416 Other Sensor 16 COM Error Caution
417 Other Sensor 17 COM Error Caution
418 Other Sensor 18 COM Error Caution
419 Other Sensor 19 COM Error Caution
420 Other Sensor 20 COM Error Caution
421 Other Sensor 21 COM Error Caution
422 Other Sensor 22 COM Error Caution
423 Other Sensor 23 COM Error Caution
424 Other Sensor 24 COM Error Caution
425 Other Sensor 25 COM Error Caution
426 Other Sensor 26 COM Error Caution
427 Other Sensor 27 COM Error Caution
428 Other Sensor 28 COM Error Caution
429 Other Sensor 29 COM Error Caution
430 Other Sensor 30 COM Error Caution
450 Heading Sensor Not Available Warning
451 Gyro CORR. Source Change Caution
453 SDME Sensor Not Available Warning
469 WGS84 Not Used Warning
470 Datum Change Caution
472 Position Source Change Warning
473 Heading Source Change Warning
474 COG/SOG Source Change Warning
475 CTW/STW Source Change Warning
485 Depth Limit Alarm
495 Anchor Watch Error Warning
500 Watch Alert Warning
520 TT System Error Warning
521 TT New Target Warning
522 TT Auto ACQ 95% Caution
523 TT Auto ACQ 100% Warning
524 TT MAN ACQ 95% Caution
525 TT MAN ACQ 100% Warning
526 TT CPA/TCPA Alarm
527 TT Lost Warning
528 REF Target Lost Warning
529 AIS New Target Warning
530 AIS Target Display 95% Caution
No. Text Default
priority

20. ALERTS
20-12
531 AIS Target Display 100% Warning
532 AIS Target Capacity 95% Caution
533 AIS Target Capacity 100% Warning
534 AIS Target Activate 95% Caution
535 AIS Target Activate 100% Warning
536 AIS CPA/TCPA Alarm
537 AIS Lost Warning
539 AIS Message Received Caution
541 AIS Message Transmit Error Caution
542 AIS Transmitting Caution
543 No CPA/TCPA for AIS Warning
550 Active AIS-SART/MOB/EPIRB Warning
560 Association Caution
620 User Chart Danger Area Warning
621 Traffic Separation Zone Warning
622 Inshore Traffic Zone Warning
623 Restricted Area Warning
624 Caution Area Warning
625 Offshore Production Area Warning
626 Military Practice Area Warning
627 Seaplane Landing Area Warning
628 Submarine Transit Lane Warning
629 Anchorage Area Warning
630 Marine Farm / Aquaculture Warning
631 PSSA Area Warning
632 Areas to be Avoided Warning
633 Buoy Warning
634 UKC Limit Warning
635 Non-official ENC Warning
636 No Vector Chart Warning
637 Not Up-to-date Warning
638 Permit Expired Warning
640 Chartalign: Over 30 min Caution
689 Drift Comp Error Warning
690 TC Start Timeout Alarm
691 RM Stop - Exceed Max XTE Alarm
692 RM Stop - No Valid Sensor Data Alarm
693 RM Stop - Other Causes Alarm
720 No ANT Heading Signal Warning
721 No ANT Azimuth Signal Warning
722 No ANT Trigger Signal Warning
723 No ANT Video Signal Warning
724 No RPU Gyro Signal Warning
725 No ANT Echo Signal Warning
726 RF Unit COM Error Warning
727 Radar Sensor COM Error Warning
728 Radar Sensor SW Version Error Warning
730 EXT Radar STBY Caution
No. Text Default
priority

20. ALERTS
20-13
740 EXT Radar No Signal Warning
750 EXT Radar COM Error Warning
760 Datum Mismatch Warning
770 SPU Error Warning
771 MTR-DRV Error Warning
772 PM Error Warning
773 RF-Converter Error Warning
774 PSU-Control Error Warning
820 NAVTEX Message Received Caution
851 EPFS 1 Sensor Banned Caution
852 EPFS 2 Sensor Banned Caution
853 EPFS 3 Sensor Banned Caution
854 EPFS 4 Sensor Banned Caution
855 EPFS 5 Sensor Banned Caution
856 EPFS 6 Sensor Banned Caution
857 EPFS 7 Sensor Banned Caution
858 EPFS 8 Sensor Banned Caution
859 EPFS 9 Sensor Banned Caution
860 EPFS 10 Sensor Banned Caution
861 SDME 1 Sensor Banned Caution
862 SDME 2 Sensor Banned Caution
863 SDME 3 Sensor Banned Caution
871 Gyro 1 Sensor Banned Caution
872 Gyro 2 Sensor Banned Caution
873 Gyro 3 Sensor Banned Caution
874 Gyro 4 Sensor Banned Caution
875 Gyro 5 Sensor Banned Caution
881 ROT Gyro 1 Sensor Banned Caution
882 ROT Gyro 2 Sensor Banned Caution
883 ROT Gyro 3 Sensor Banned Caution
891 Water Current Sensor Banned Caution
900 No Filter Source of Position Warning
901 No Filter Source of COG/SOG Warning
902 No Filter Source of CTW/STW Warning
903 No Filter Source of Heading Warning
904 No Filter Source of ROT Warning
950 HBT Timeout Caution
No. Text Default
priority
20. ALERTS
20-14
This page is intentionally left blank.
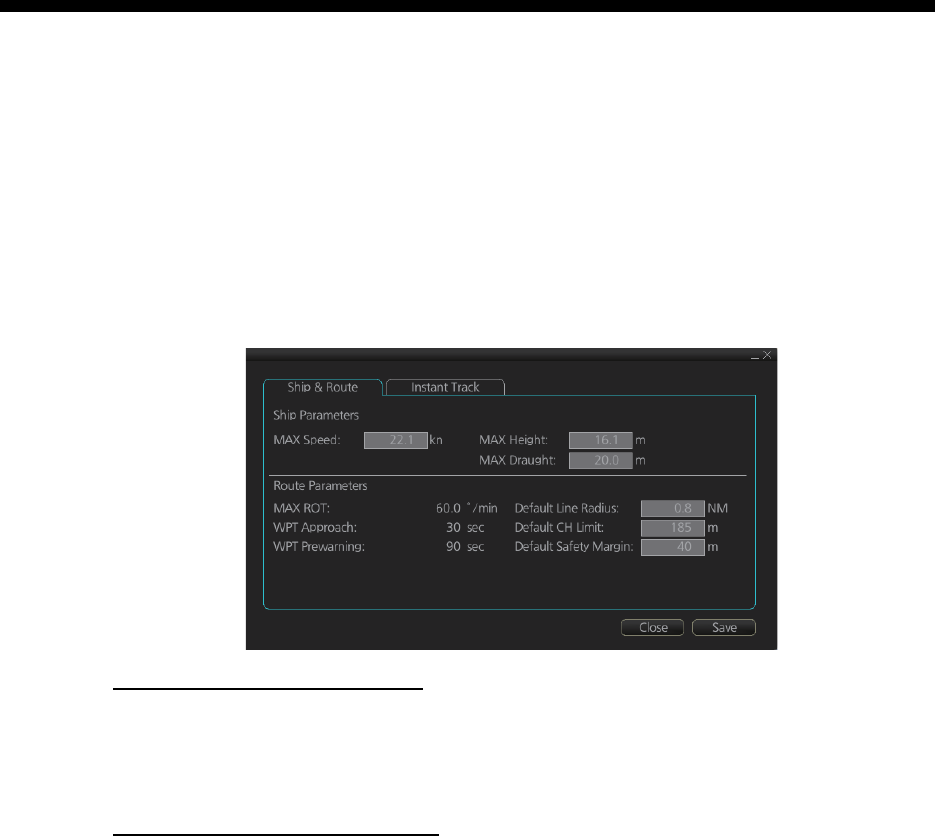
21-1
21. PARAMETERS
21.1 Ship and Route Parameters
The purpose of the ship and route parameters is set the basic parameters for the ship.
These parameters are relative to ship steering and they are very important to get cor-
rect function of the integrated navigation system. They must be maintained carefully.
Modification requires a good knowledge of the parameters' importance.
Open the menu and select [Ship & Route Parameters] from the [General] menu to
show the [Ship & Route] page. Set each item referring to the description below.
Ship parameters description
[MAX Speed]: Maximum speed the ship can do.
[MAX Height]: Max. height of ship above sea level.
[MAX Draught]: Max. draught of ship.
Route parameters description
[MAX R.O.T]*: The maximum rate of turn of the ship. Set at installation.
[WPT Approach]*: The alert time before reaching the wheel over point.
[WPT Prewarning]*: The alert time before reaching the wheel over point.
[Default Line Radius]: Define the default value of radius between waypoints during au-
tomatic route steering.
[Default CH Limit]: Define the default value of channel limit.
[Default Safety Margin]: Define the default value of extension for channel limits to be
checked against selected alerts.
* Set at installation and cannot be changed by the operator.
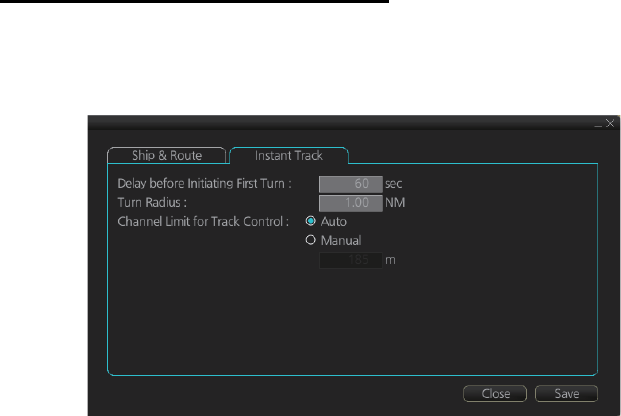
21. PARAMETERS
21-2
21.2 Instant Track Parameters
The instant track feature can create, in route monitoring, a simple route in the following
situations:
• Return to the monitored route when the vessel goes outside the channel limits.
• Temporarily deviate from the monitored route (avoid collision, etc.).
How to set instant track parameters
Set the parameters for the instant track ([MENU] → [General] → [Ship & Route Pa-
rameters] → [Instant Track] tab).
[Delay before Initiating First Turn]: Set the number of seconds (30 - 600 seconds) to
wait before initiating the first turn in the simple route.
[Turn Radius]: Set the turning radius (0.02 - 3.00 NM) to use between waypoints (four
waypoints) in the simple route.
[Channel Limit for Track Control]: Set the channel limit (10 - 1852 m) for the instant
track, automatically or manually. The [Auto] setting uses the channel limit set for the
monitored route.
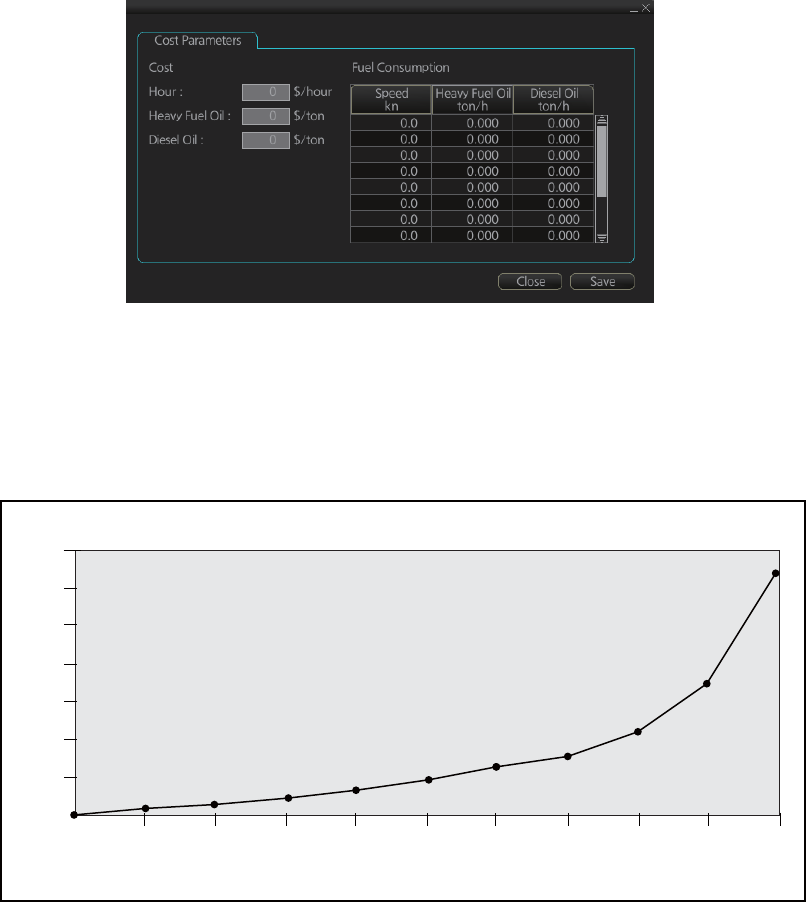
21. PARAMETERS
21-3
21.3 Cost Parameters
The cost parameters are used in the optimization calculation. Therefore define these
parameters before doing the calculation.
Open the menu and select [Cost Parameters] from the [General] menu to show the
[Cost Parameters] page. Set each item according to ship’s plan, etc.
At the [Cost] window, enter the cost/hour and cost/ton for heavy fuel oil and diesel oil.
At the [Fuel Consumption] window, define the fuel consumption figures for up to 12
different speeds. Before entering the data, plot the data on a graph, like the one shown
below. Use a second graph if, for example, diesel oil consumption is different from that
of heavy fuel oil. Reset the power to effect the settings.
7
6
5
4
3
2
1
0
0 1 2 4 6 8 10 12 14 16 20
FUEL CONSUMPTION
SHIP’S SPEED (kn)
TON/h
21. PARAMETERS
21-4
This page is intentionally left blank.
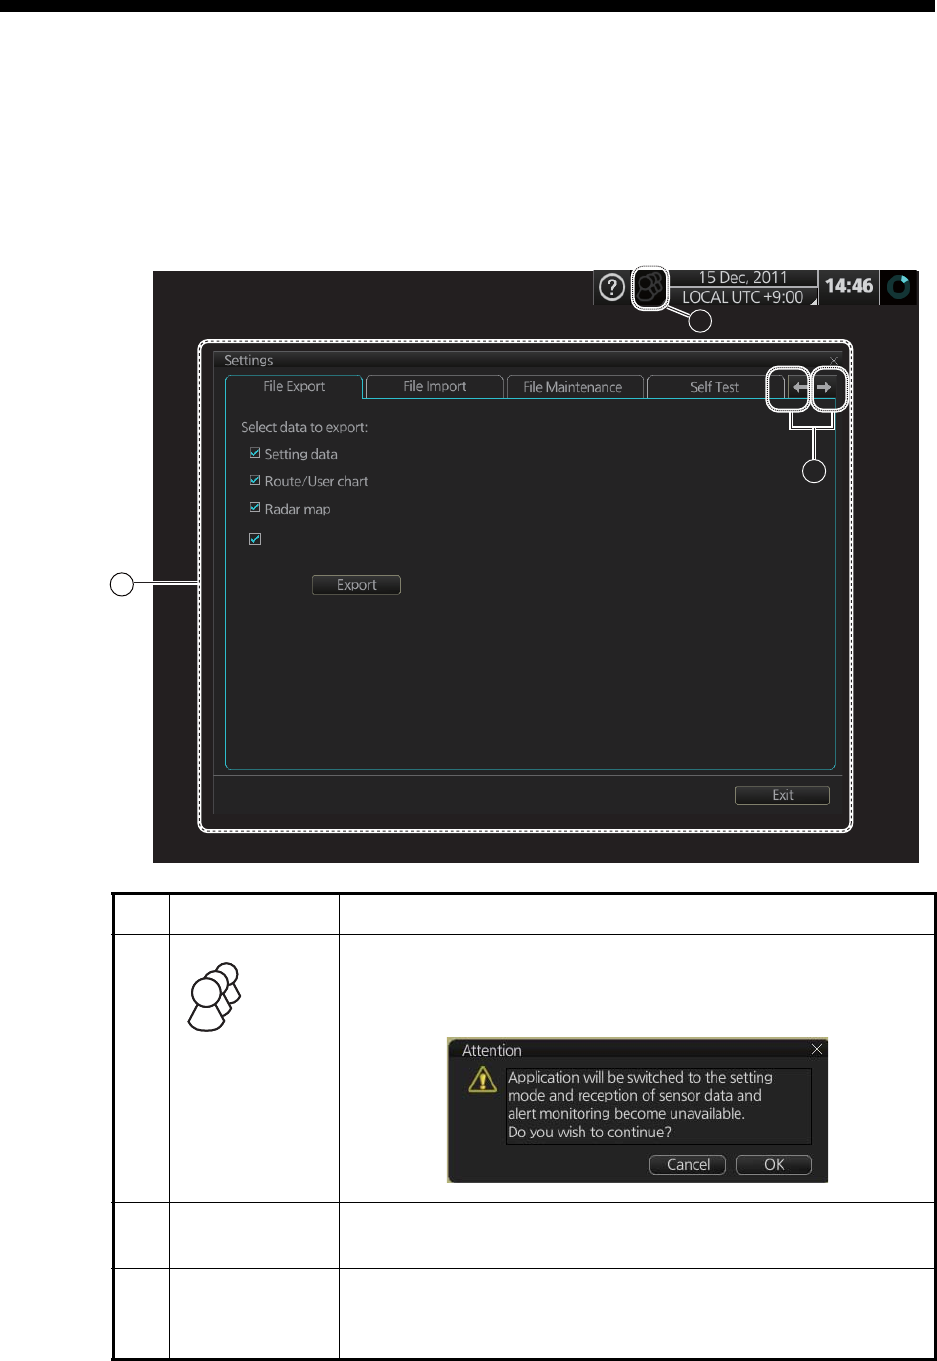
22-1
22. SETTINGS MENU
The [Settings] menu provides file import, export and maintenance, testing facilities
(display, keyboard, self test), customizing, screenshot processing, and CCRP selec-
tion.
22.1 How to Access the Settings Menu
No. Name Description
1
([Settings]
menu access
button)
Click the button then select [Settings] to open the [Settings]
menu. The message shown below appears. Click the [OK] but-
ton to open the [Settings] menu.
2 [Settings] menu
display area
The [Settings] menus appear here.
3 Page selection
buttons
To open a page, use the page selection buttons to select a
page then click the tab of the page required. The color of the
border of the page selected is light blue.
2
1
3
Radar Installation
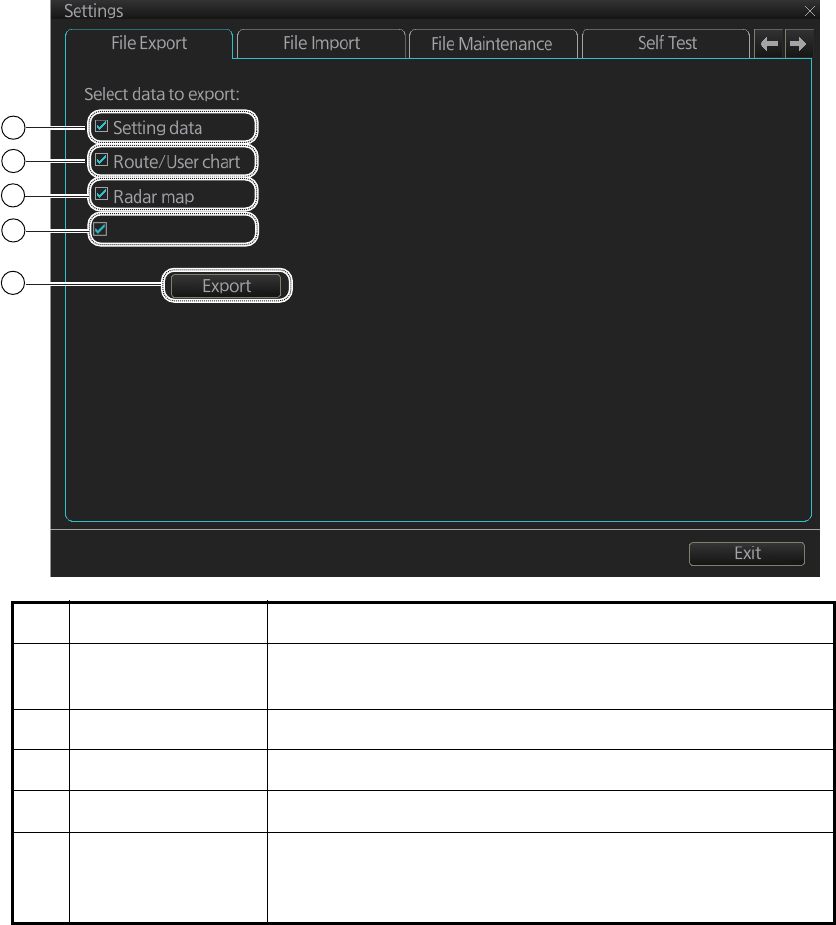
22. SETTINGS MENU
22-2
22.2 File Export
The [File Export] page lets you export setting data, routes, user charts, radar maps
and radar installation to a USB flash memory, in .zip file format.
Note 1: Item 5 does not appear until a object is selected.
Note 2: The message "Now processing" appears during the exporting. The message
"File export finished." appears upon completion of the exporting. Click the [OK] button.
No. Name Description
1 [Setting data] Check to export setting data (radar, chart, conning, com-
mon, performance monitor data) and ten user profile data.
2 [Route/User chart] Check to export all routes and user charts.
3 [Radar map] Check to export all radar maps.
4 [Radar Installation] Check to export all setting of radar installation.
5 [Export] button Click the button to open the [SAVE FILE] dialog box. Select
the destination to save then click the [Save] button to export
all selected objects.
1
2
3
Radar Installation
5
4
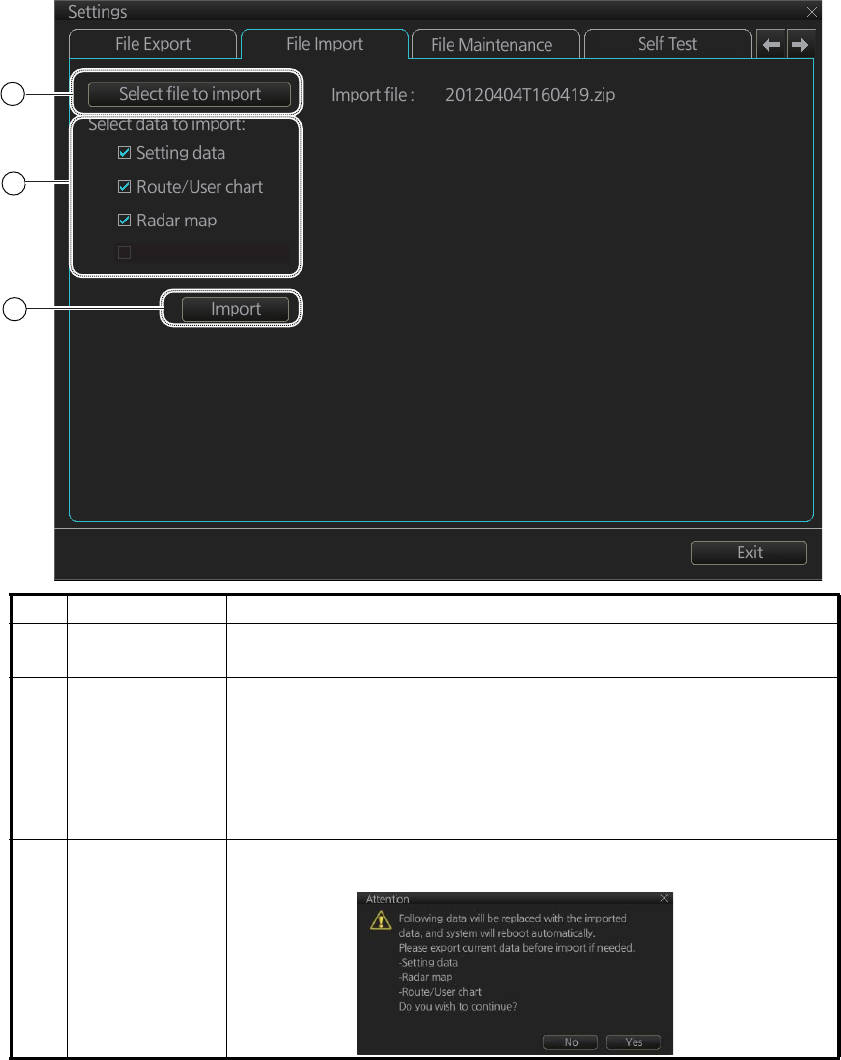
22. SETTINGS MENU
22-3
22.3 File Import
The [File Import] page lets you import setting data, routes, user charts, radar maps
and radar installation from an external media (USB flash memory, etc.).
Note 1: The system automatically restarts if setting data is imported.
Note 2: If importing could not be completed, first check if the USB flash memory is
properly inserted. If inserted properly, try importing again.
Note 3: Items 2 and 3 do not appear until a file is selected.
Note 4: The message "Now processing" appears during the importing. The message
"File import finished." appears upon completion of the importing. Click the [OK] button.
No. Name Description
1 [Select file to
import] button
Click to show the [OPEN FILE] dialog box, where you can select
the file to import.
2[Select data to
import]
Check the data to import, among [Setting data], [Route/User
chart] and [Radar map].
Note 1: Execute [User Default] (see section 22.11) before im-
porting [Setting data].
Note 2: [Radar Installation] is available only with the service
mode.
3 [Import] button Click to import the objects selected. The following message ap-
pears on the display.
1
2
3
Radar Installation
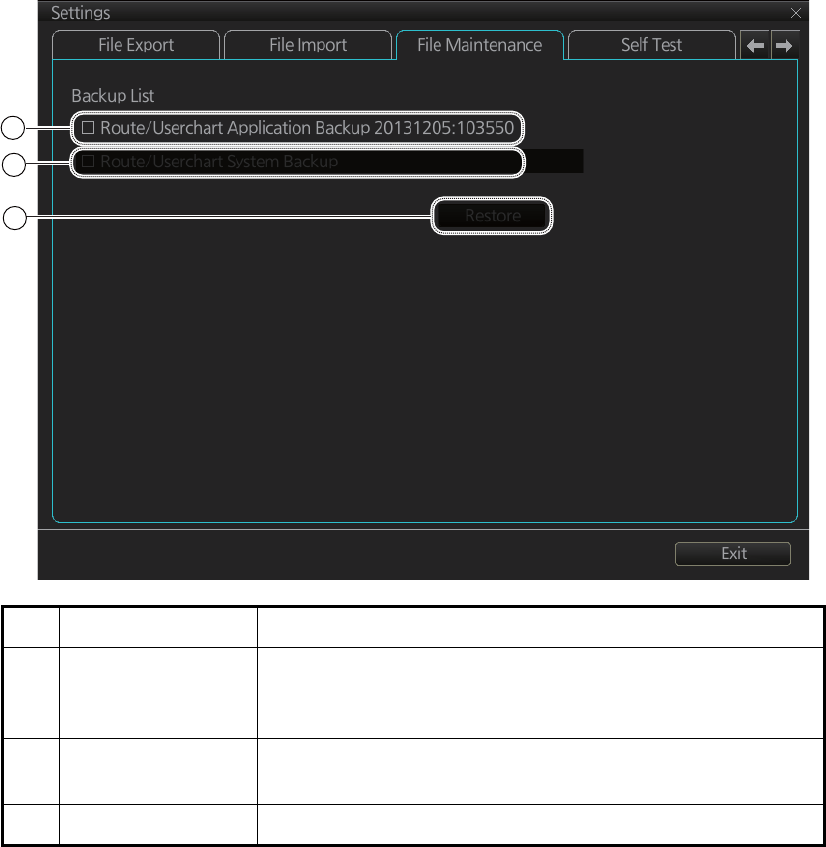
22. SETTINGS MENU
22-4
22.4 File Maintenance
The [File Maintenance] page lets you restore the last-saved route/user chart applica-
tion and route/user chart system.
Note: To back up route data, first check for the chart radar with the most recent route
list then do the restore from that chart radar.
No. Name Description
1 [Route/Userchart
Application Back-
up]
Click to restore last-saved route/userchart application.
2 [Route/Userchart
System Backup]
Click to restore last-saved route/userchart system.
3 [Restore] button Click to restore item selected.
1
2
3
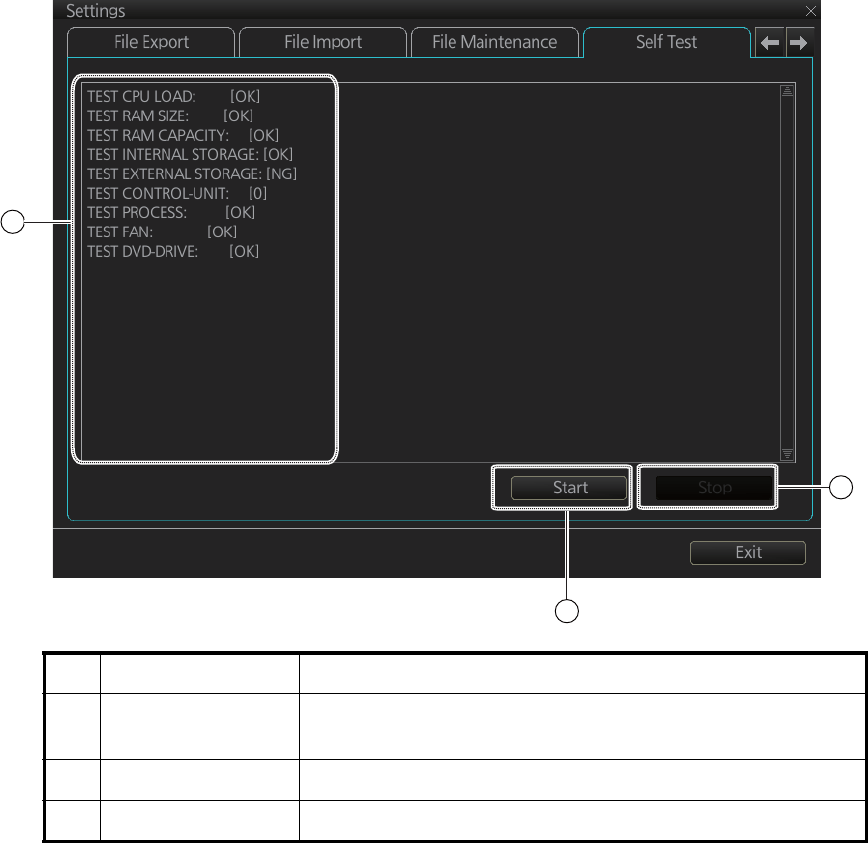
22. SETTINGS MENU
22-5
22.5 Self Test
The [Self Test] page is mainly for use by the service technician to check the equip-
ment. The chart radar is inoperative during the test.
No. Name Description
1 Test results, pro-
gram numbers
The results of the self test and the program numbers.
(xx=version number)
2 [Start] button Start the self test.
3 [Stop] button Stop the self test. (Shown during test.)
[EC-3000]
RADAR Software Version: 0359266-02.xx
[Radar Sensor]
SPU Software Version: 0359281-01.xx
[key1]
Software Version: 2450086-01.xx
[Dongle Information]
Function: ecdis,radar
ENC User Permit: ERROR
ARCS User Permit: ERROR
ARCS PIN: ERROR
1
2
3
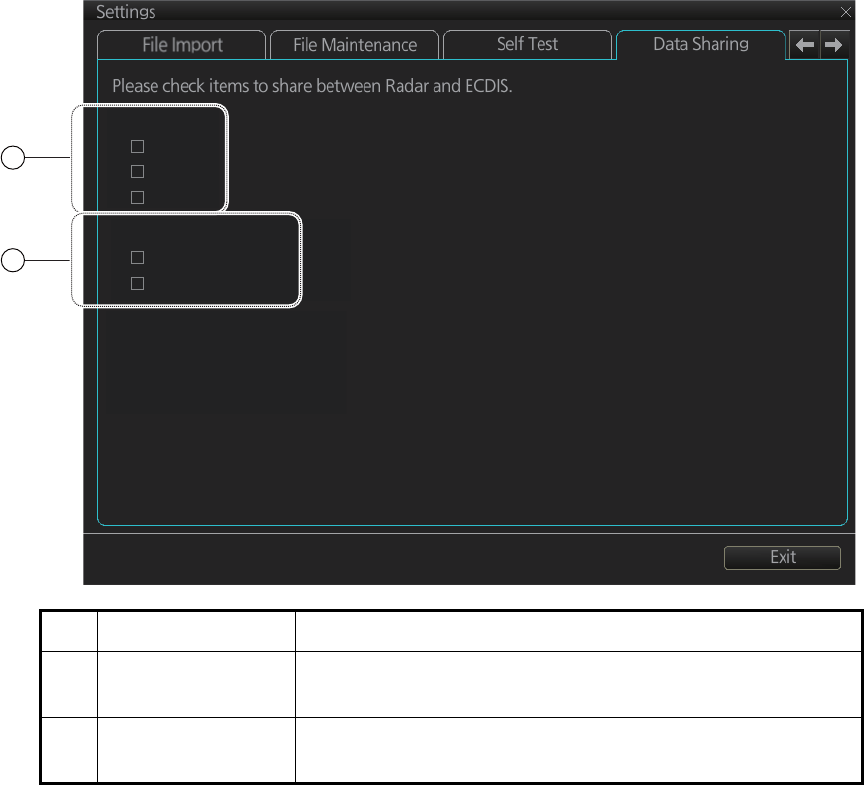
22. SETTINGS MENU
22-6
22.6 Data Sharing
The [Data Sharing] page selects the items to share between the radar and the chart
radar.
No. Name Description
1 [NAV Tools] Check the NAV tools items to share them between the chart
and the radar.
2 [Display Settings] Check the display setting items to share between the chart
and the radar.
NAV Tools
VRM
EBL
PI Line
Display Settings
Color Palette
Display Brilliance
1
2
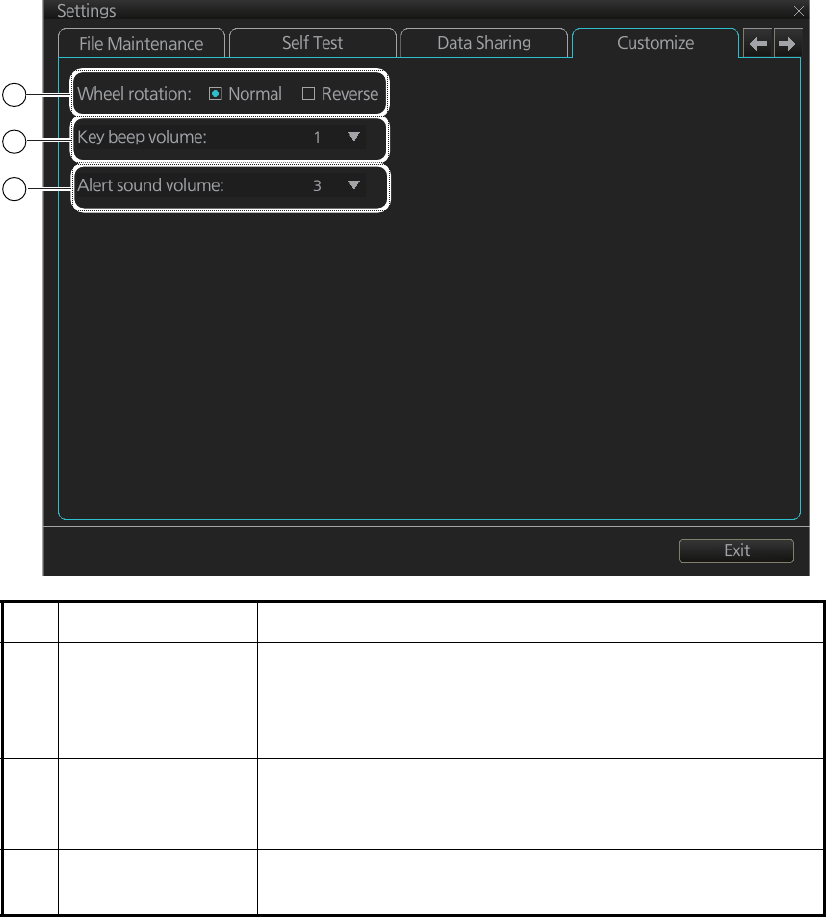
22. SETTINGS MENU
22-7
22.7 Customize
The [Customize] page lets you set buzzer volume, key beep volume, and scrollwheel
rotation direction.
No. Name Description
1 [Wheel rotation] Set the direction of scrollwheel rotation direction.
[Normal]: Downward to increase value, upward to decrease
value.
[Reverse]: Reverse of [Normal].
2 [Key beep volume] Set the loudness of the key beep that sounds for correct key
or mouse button operation.
0: No beep, 1: LOW, 2: MID, 3: HIGH
3 [Alert sound vol-
ume]
Set the loudness of the alert buzzer.
1: LOW, 2: MID, 3: HIGH
1
2
3
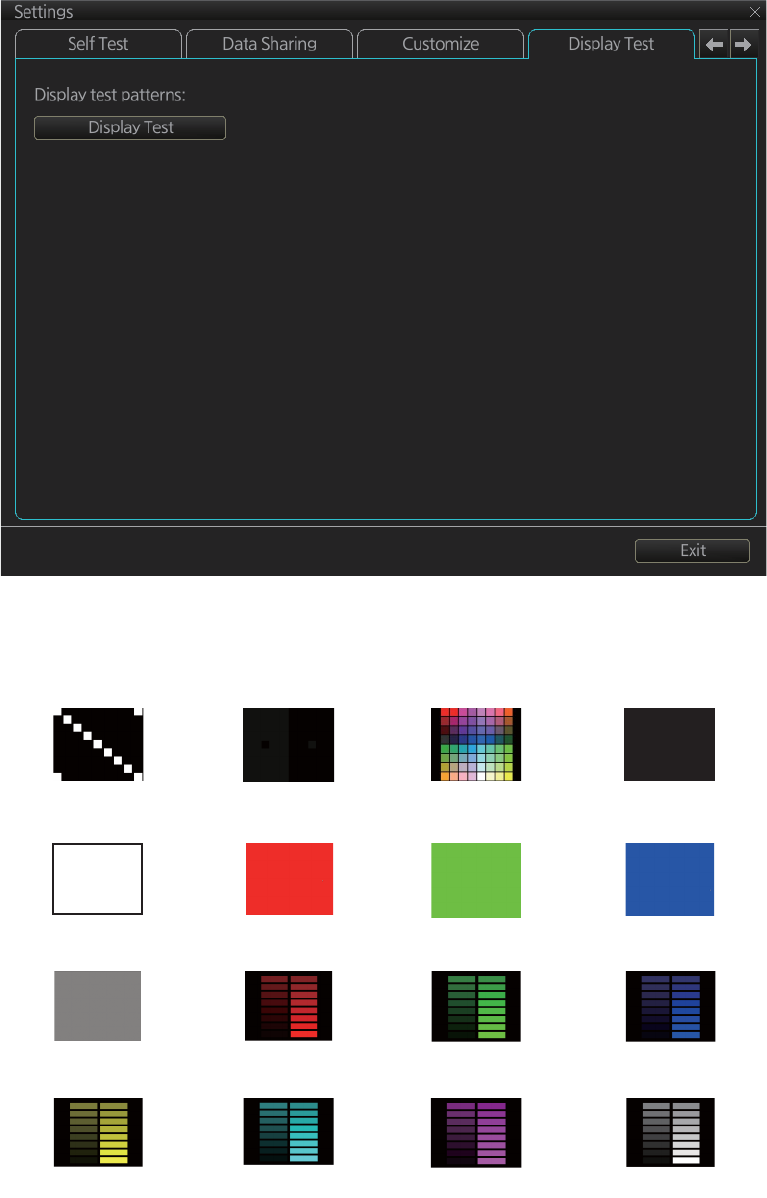
22. SETTINGS MENU
22-8
22.8 Display Test
The [DIsplay Test] page displays various test patterns to check the FURUNO-supplied
monitor for proper display of colors. Click the [Display Test] button to start the test. The
buzzer sounds when the display test starts.
Left-click to proceed in the numerical order shown below; right-click to proceed in re-
verse order.
To quit the display test at any time, press the ESC key on the applicable Control Unit.
(1) (2) (3) (4)
(5) (6) (7) (8)
(9) (10) (11) (12)
(13) (14) (15) (16)
Diagonal Gray and black All colors Black
White Red Green Blue
Gray Red bars Green bars Blue bars
Yellow bars Aqua bars Purple bars Gray bars
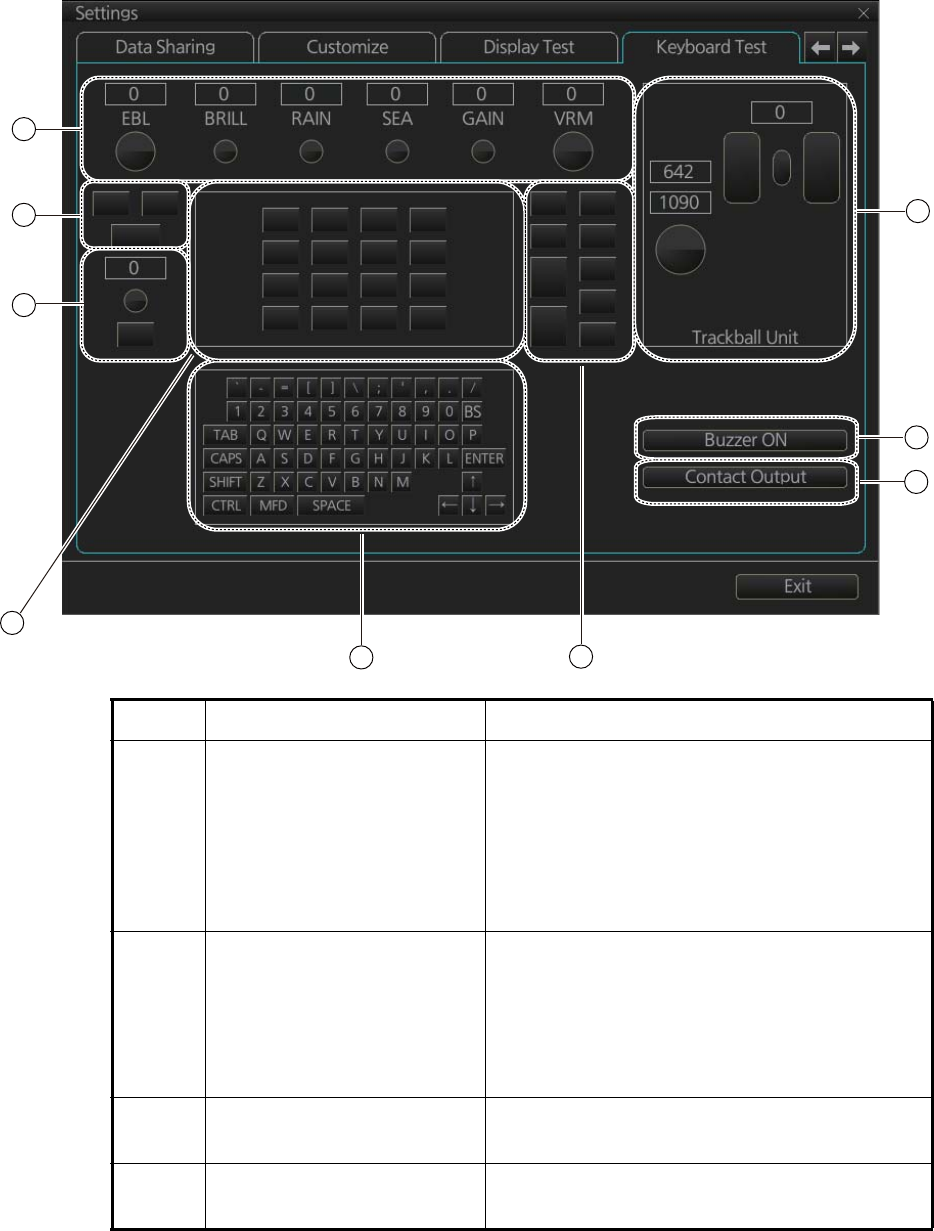
22. SETTINGS MENU
22-9
22.9 Keyboard Test
The [Keyboard Test] page checks the controls and keys on the Radar Control Unit and
the ECDIS Control Unit and the trackball module on the Radar Control Unit, ECDIS
Control Unit and Trackball Control Unit.
No. Name Description
1 Common controls Operate the corresponding controls on the Ra-
dar Control Unit and chart radar Control Unit.
Rotate a control and the window above the
control shows the setting value. Push a control
and the corresponding location on screen
lights in light blue. (The EBL and VRM controls
do not have a push function.)
2 InstantAccess knob/key Check the InstantAccess knob and key.
1) Rotate the knob and the setting value ap-
pears in the window.
2) Push the knob and the knob lights in light
blue.
3) Push the key and the key lights in blue.
3 Keys of the Radar Control
Unit
Operate each key. The key pressed lights in
light blue.
4 Keyboard of the chart radar
Control Unit
Operate each key. The key pressed lights in
light blue.
1
5
2
3
45
8
7
6

22. SETTINGS MENU
22-10
5 Keys of both the Radar Con-
trol Unit and chart radar
Control Unit
Operate each key. The pressed key lights in
light blue.
6 Trackball module Check the trackball module of a Control Unit:
1) Spin the scrollwheel and rotate the track-
ball. The indication above the operated
control shows the setting value.
2) Push each button. The window above a
pushed button lights in light blue.
3) Push the scrollwheel. The window above
the wheel lights in light blue.
7 [Buzzer ON] button Click the [Buzzer ON] button to sound the
buzzer. The buzzer sounds and the button
flashes (in red). Click the button again to can-
cel.
8 [Contact Output] button Click the [Contact Output] button to output the
System Failure contact signal from the Pro-
cessor Unit. Click the button again to cancel.
No. Name Description
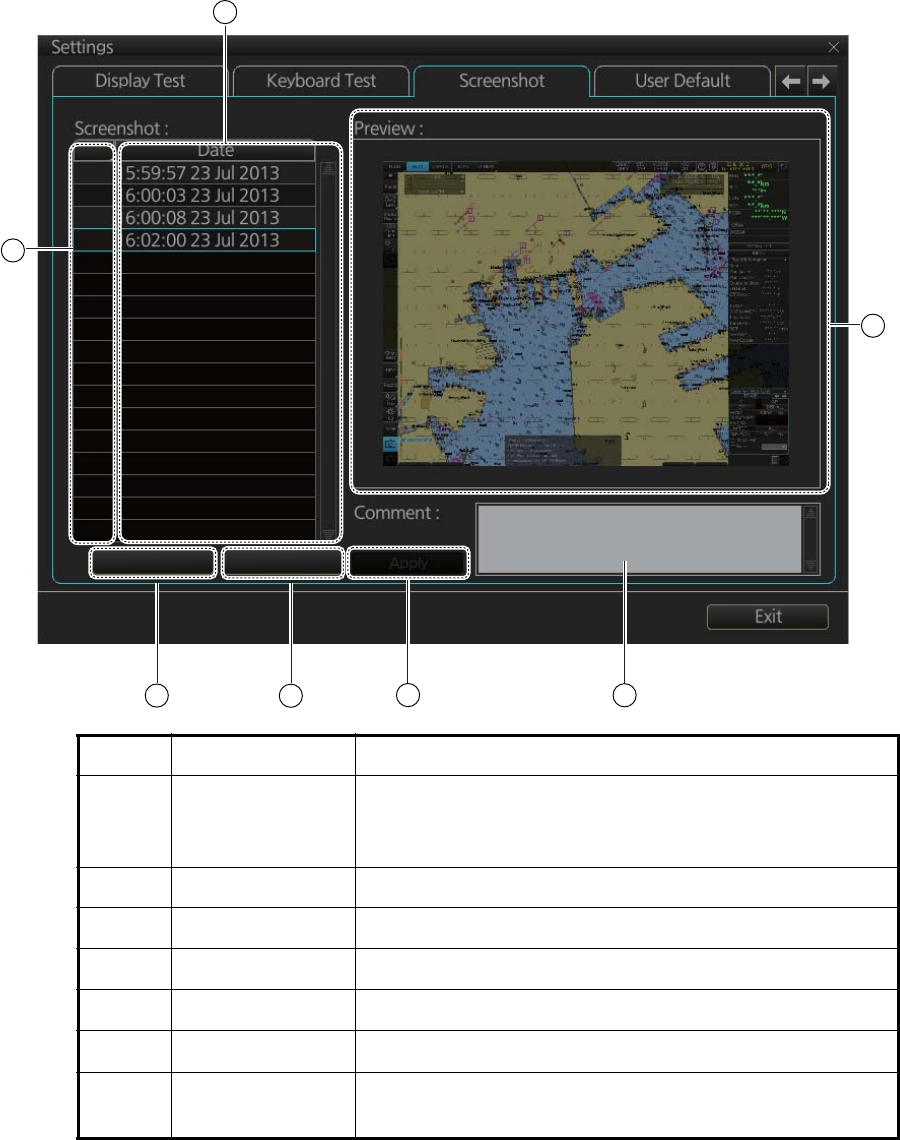
22. SETTINGS MENU
22-11
22.10 Screenshots
The [Screenshot] page handles the exporting (to a USB flash memory) and deleting
of screenshots from the SSD.
No. Name Description
1 List List of screenshots taken. Screenshots are automatically
assigned a file name consisting of the time and date the
screenshot was taken.
2 Check boxes Put a checkmark in the box of the screenshot to process.
3 [Preview] Preview of the screenshot selected.
4 [Delete] button Delete the screenshot(s) selected.
5 [Export] button Export selected screenshot(s) to a USB flash memory.
6 [Apply] button Save comment.
7 [Comment] box Enter comment for screenshot. Put a check in appropri-
ate checkbox then enter comment.
1
2
45
3
Delete Export
67
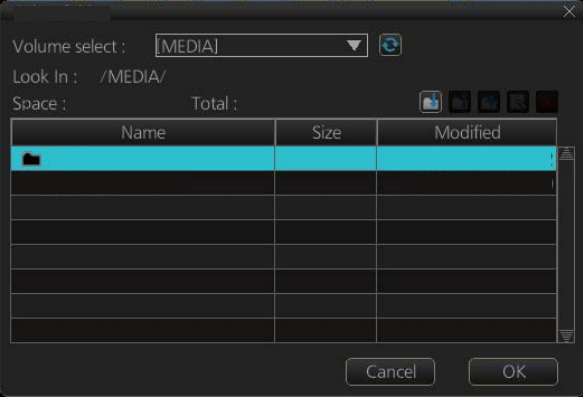
22. SETTINGS MENU
22-12
22.10.1 How to export screenshots
You can export screenshots to a USB flash memory as follows:
1. Insert a USB flash memory in the USB port on the Control Unit.
2. Open the [Screenshot] page.
3. Put a checkmark in the checkbox of the screenshot(s) to export.
4. Click the [Export] button.
5. Select the USB flash memory.
6. Click the [OK] button to export the screenshots selected.
7. If the exporting was successful, a window showing the number of files exported
appears. Click the [OK] button to finish.
22.10.2 How to delete screenshots
1. Select the [Screenshot] page.
2. Put a checkmark in the checkbox of the screenshot(s) to delete. To select all
screenshots, right-click the box to the left of the [Date] column then select [Select
all]. To clear all check marks, select [Clear all].
3. Click the [Delete] button. The confirmation message "Attention: Selected files will
be deleted. Do you wish to continue?" appears.
4. Click the [Yes] button to delete the screenshots selected. The message "File de-
letion succeeded" appears.
5. Click the [OK] button.
USB Flash 04.04.2012 19:23
SAVE FILE
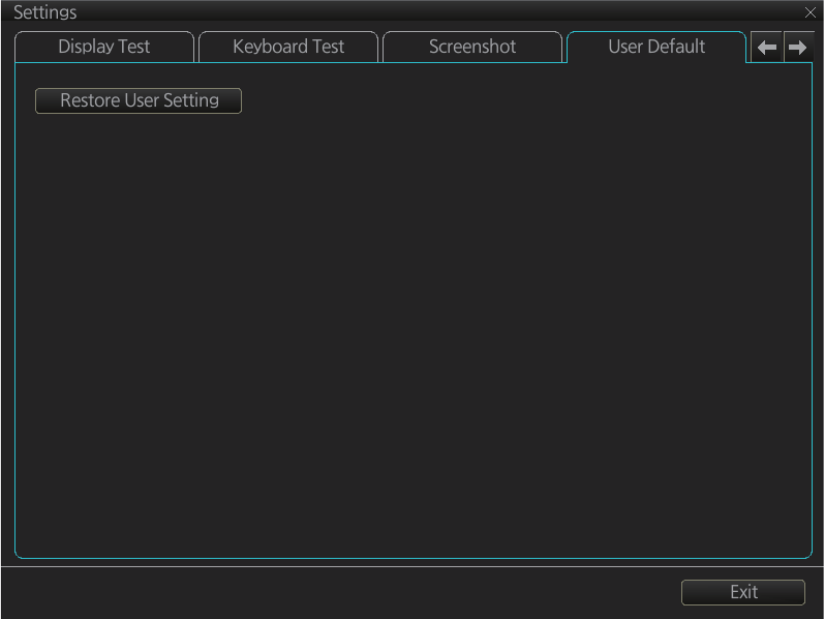
22. SETTINGS MENU
22-13
22.11 User Default
The [User Default] page restores all default settings for [Radar menu], [Chart menu],
[User profile] and [Setting menu]. Click the [Restore User Setting] button. The mes-
sage "All setting data will be restored to the default. Do you wish to continue?" ap-
pears. Click the [Yes] button to restore default settings and reset the power.
If you require the setting data, copy it to a USB flash memory (using the file export fea-
ture), BEFORE restoring user defaults.
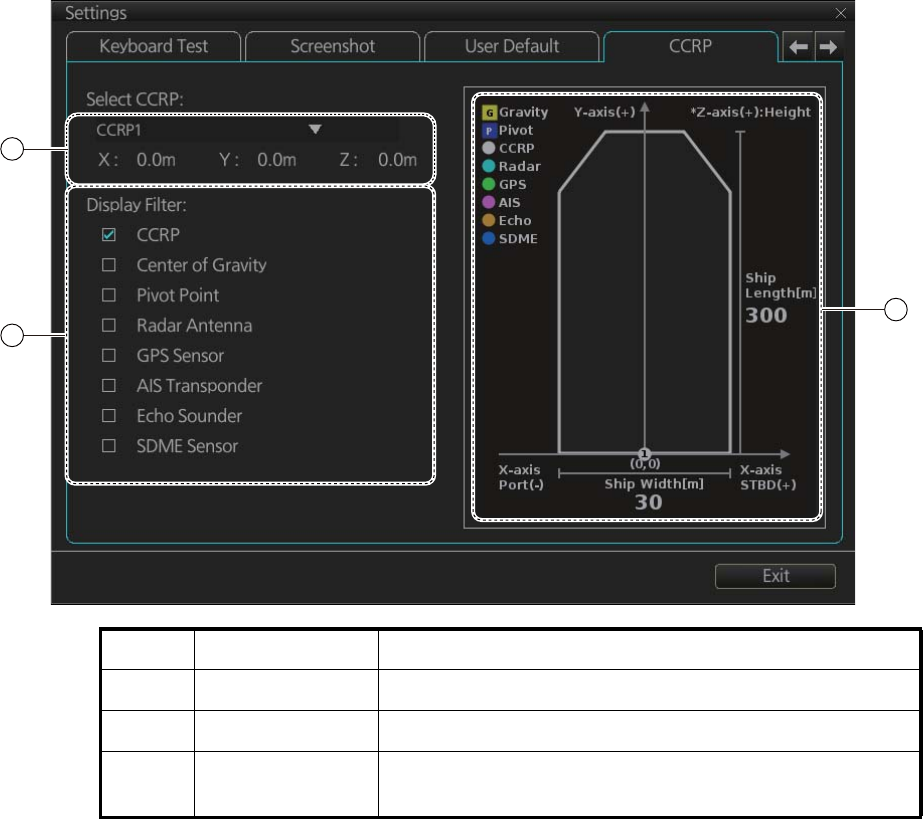
22. SETTINGS MENU
22-14
22.12 CCRP
The [CCRP] page provides for selection of CCRP (Consistent Common Reference
Point) and shows the location of various sensors.
No. Name Description
1 [CCRP] Select the CCRP to use in the case of multiple CCRPs.
2 [Display Filter] Check the items to show on the ship’s graphic.
3 Ship’s graphic Shows the location of the sensors selected at the [Dis-
play Filter].
1
2
3

23-1
23. COMMON REFERENCE SYSTEM
23.1 Installation of the System
Special attention of following topics is required to maintain the "Common Reference
System." The origin of the common reference system is the conning position on ves-
sel.
• The values of the center and conning positions depend on the size and geometry of
the ship.
• Offsets from the antenna position to the conning position of position sensors de-
pend on the location of the antennas of the position sensor.
• Offsets from the antenna position to the conning position of the radars depend on
the location of the radar antennas.
23.2 Accuracy of the System
Accuracy depends on the following conditions:
zGyro error referenced to chart orientation
zAccuracy of EPFS
zAccuracy of radar performance and display (see the specifications at the back of
this manual).
zAccuracy of setting of CCRP (see section 2.33)
The following items must be properly adjusted to meet the above conditions:
zTiming (Tx timing of radar echo). The procedure for adjustment is shown in "Timing
Adjust" in the Installation Manual.
z Heading (Adjustment of radar echo heading). The procedure for adjustment is
shown in "Heading Alignment" in the Installation Manual.
zRadar ANT position (Center of radar image is the radar antenna position). Radar
antenna position is input in the [Common Installation Setting] menu.
zConning position:
• The chart radar uses position data fed from a GPS navigator to calculate the lat-
itude and longitude position of the conning position.
• GPS antenna position and conning position are entered in the [Common Instal-
lation Setting] menu to calculate offset.
• The latitude and longitude position displayed at the top-right position on the
screen is the latitude and longitude position of the conning position.
• The chart datum used by the chart radar is recorded in geodetic datum WGS-84;
therefore, the geodetic datum setting on the GPS navigator must be WGS-84.
zGyro data:
• Serial format gyro data is fed directly from a gyrocompass, thus adjustment of
the heading indication on the chart radar is not necessary.
23. COMMON REFERENCE SYSTEM
23-2
• If synchro or stepper gyro data is fed to the chart radar, the heading indication
on the chart radar must be adjusted to match that of the gyro. For the adjustment
procedure, see section 1.15.
zSpeed data:
• Speed may be input from SDME or GPS.
• SDME may be single-axis water speed or dual-axis ground speed.
• GPS may be used to input COG/SOG.
• Ground speed may also be taken from TT reference target.
• Speed is entered from the [Setting] menu. For details, see section 1.14.
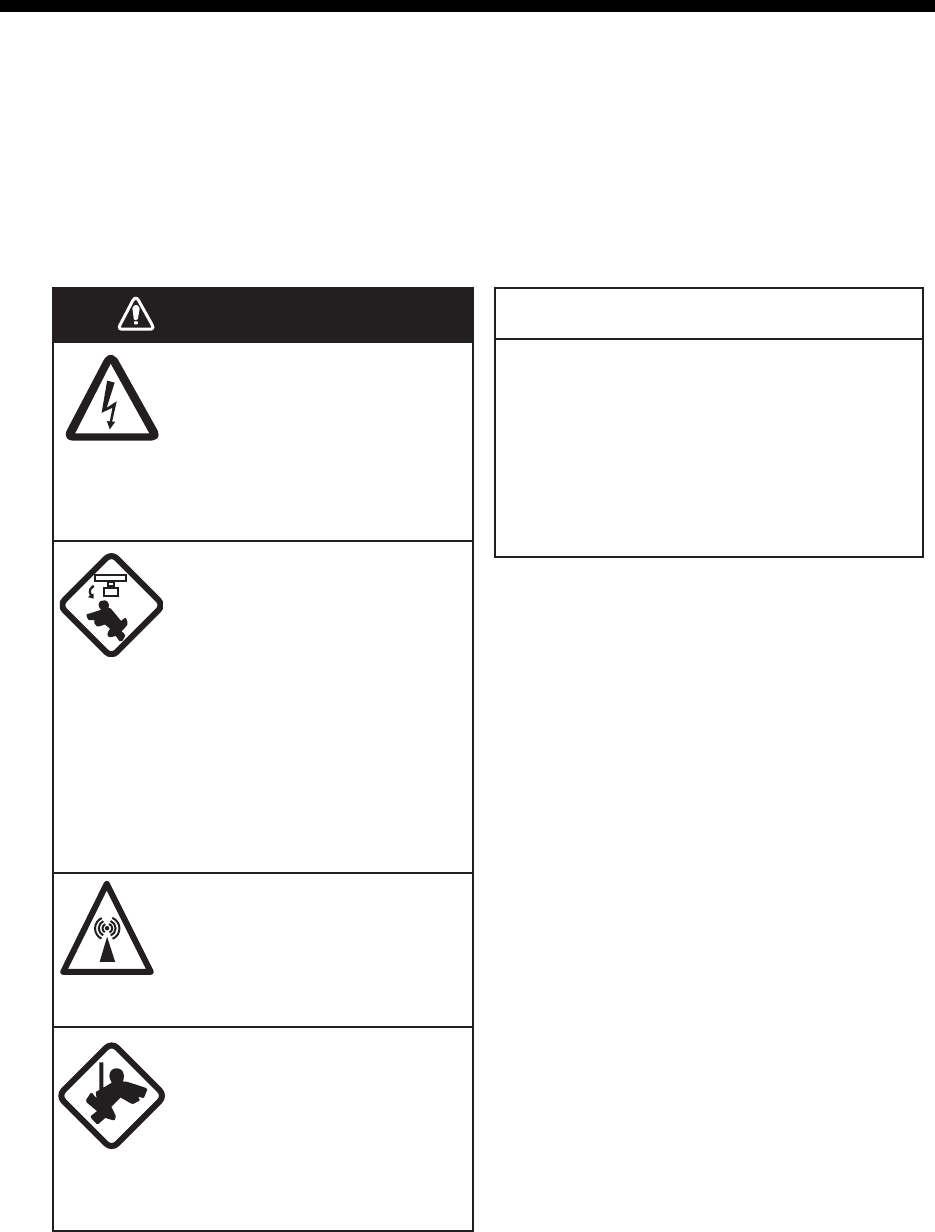
24-1
24. MAINTENANCE AND TROUBLE-
SHOOTING
Periodic checks and maintenance are important for proper operation of any electronic
system. This chapter contains maintenance and troubleshooting instructions to be fol-
lowed to obtain optimum performance and the longest possible life of the equipment.
Before attempting any maintenance or troubleshooting procedure please review the
safety information below. If you cannot restore normal operation after following the
troubleshooting procedures, do not attempt to check inside any unit; there are no user-
serviceable parts inside. Refer any repair work to a qualified technician.
Do not apply paint, anti-corrosive
sealant or contact spray to coating or
plastic parts of the equipment.
Those items contain organic solvents that
can damage coating and plastic parts,
especially plastic connectors.
WARNING NOTICE
Do not open the equipment.
Hazardous voltage which can
cause electrical shock exists
inside the equipment. Only
qualified personnel should
work inside the equipment.
Turn off the radar power
switch before servicing the
antenna unit. Post a
warning sign near the
switch indicating it should
not be turned on while the
antenna unit is being
serviced.
Prevent the potential risk of
being struck by the rotating
antenna.
A transmitting radar
antenna emits
electromagnetic waves,
which can be harmful,
particularly the eyes.
Wear a safety belt and hard
hat when working on the
antenna unit.
Serious injury or death can
result if someone falls from
the radar antenna mast.

24. MAINTENANCE AND TROUBLESHOOTING
24-2
24.1 Maintenance
Regular maintenance is essential to good performance. A regular maintenance pro-
gram should be established and should at least include the items shown in the table
below.
Maintenance schedule
Interval Check point Check and measures Remarks
When needed FURUNO-supplied
monitor unit and
Processor Unit
Dust or dirt may be removed
from a cabinet with a soft
cloth. Water-diluted mild de-
tergent may be used if de-
sired. DO NOT use chemical
cleaners to clean the display
unit; they may remove paint
and markings.
To clean the LCD, wipe the
LCD carefully to prevent
scratching, using tissue paper
and an LCD cleaner. To re-
move dirt or salt deposits, use
an LCD cleaner, wiping slowly
with tissue paper so as to dis-
solve the dirt or salt. Change
paper frequently so the salt or
dirt will not scratch the LCD.
Do not use solvents such as
thinner, acetone or benzene
for cleaning. Also, do not use
a degreaser or an antifog so-
lution, as they can strip the
coating from the LCD.
Do not use chemical-based
cleaners for cleaning. They
can remove paint and mark-
ings.
Filter inside Proces-
sor Unit
Have a technician clean the
filter if it is dusty. See
section 24.4.
5 years Antenna Unit If the grease dries out the V
ring may break, allowing water
to leak inside the antenna unit.
Have a qualified technician
apply the grease oil to the
antenna rotary.
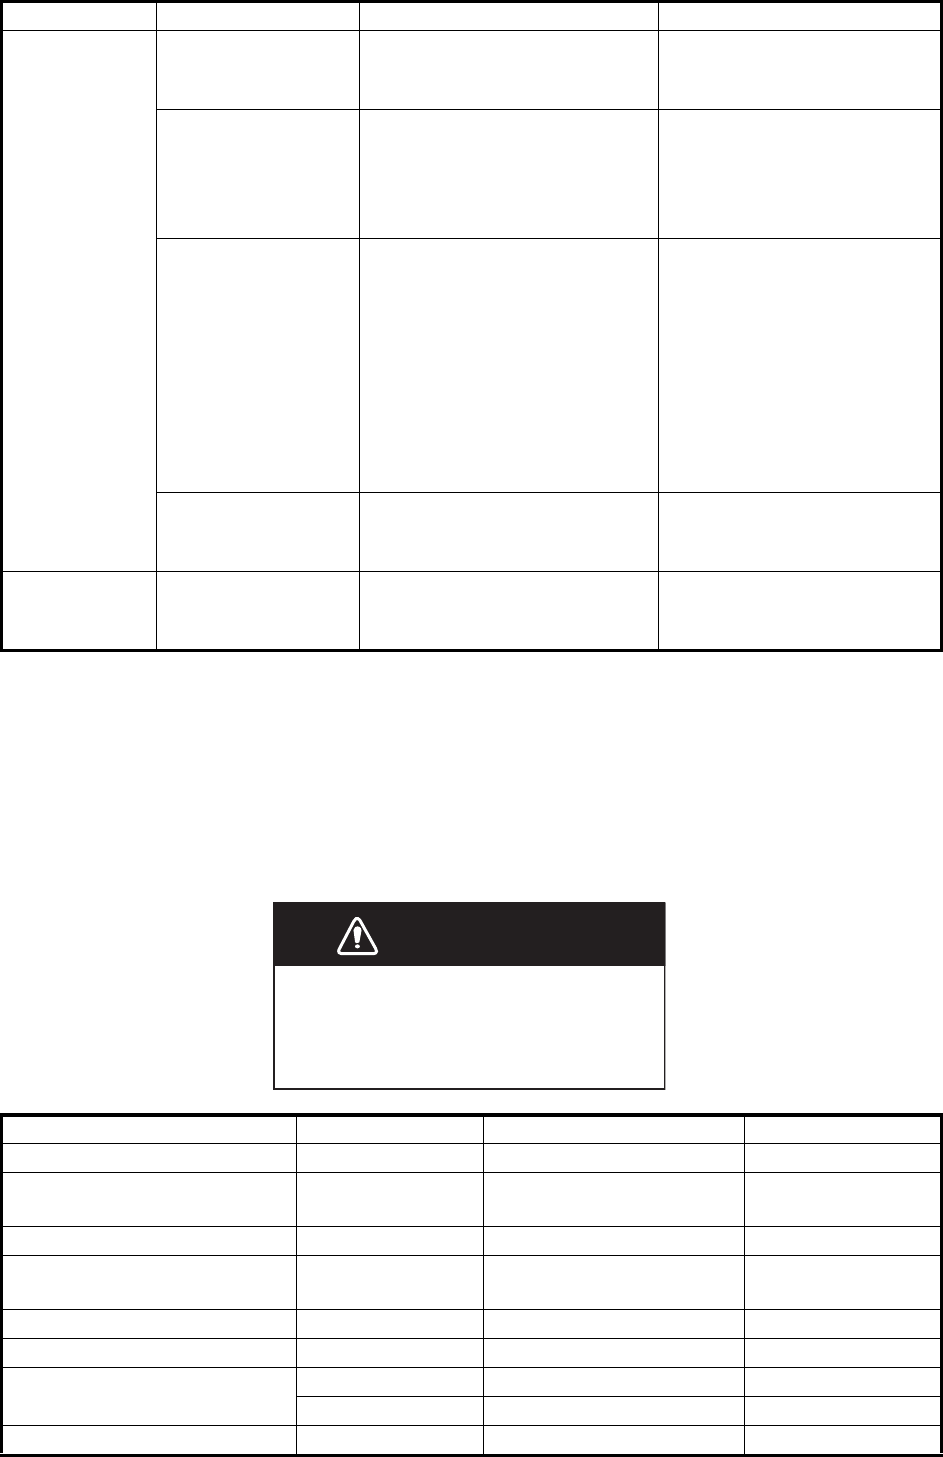
24. MAINTENANCE AND TROUBLESHOOTING
24-3
24.2 How to Replace the Fuses
The fuse in the Power Supply Unit, Processor Unit, monitor unit and sensor adapter
protects those units from overvoltage (overcurrent) and internal fault. If a unit cannot
be turned on, check if its fuse has blown. If the fuse has blown, find out the cause be-
fore replacing the fuse. If the fuse blows again after replacement, contact your dealer
for advice.
3 to 6 months Cabling Check that all cabling is firmly
connected and is not dam-
aged.
Exposed bolts and
nuts of antenna unit
Exposed bolts and nuts are
subject to corrosion. Further,
they may loosen by vibration.
Check that bolts and nuts
are not corroded and are se-
curely fastened. If corroded,
clean and coat with anticor-
rosive sealant.
Radiator Dust, dirt and salt deposits on
the radiator cause signal at-
tenuation, resulting in loss of
sensitivity. Wipe radiator with
a freshwater-moistened cloth.
The radiator is made of fiber-
glass reinforced plastic.
Therefore, do not used gas-
oline, benzene and the like
to clean the radiator.
If the radiator is iced, use a
wooden or plastic headed
hammer to remove the ice.
DO NOT use a steel ham-
mer.
Terminals, connec-
tors
Check that all terminals and
connectors on circuit boards
are securely fastened.
Have a qualified technician
check terminals and connec-
tors.
6 months to 1
year
Screws on terminal
boards in Proces-
sor Units
Check that all screws are
tightly fastened.
Have a qualified technician
check screws.
Unit Power supply Type Code no.
Power Supply Unit PSU-014 100-230 VAC F1: FGBO 250V 7A PBF 000-178-084-10
Power Supply Unit PSU-015 100-230 VAC F1: FGBO 250V 3A PBF
F2: FGBO 250V 7A PBF
000-155-841-10
000-178-084-10
Power Supply Unit PSU-016 100-230 VAC F1: FGBO 250V 5A PBF 000-155-840-10
Power Supply Unit PSU-018 100-230 VAC F1: FGBO 250V 3A PBF
F2: FGBO 250V 7A PBF
000-155-841-10
000-178-084-10
Monitor Unit MU-190 100-230 VAC FGBO 250V 1A PBF 000-155-828-10
Monitor Unit MU-231 100-230 VAC FGBO 250V 1.5A PBF 000-155-833-10
Processor Unit EC-3000 100-115 VAC FGMB 125V 10A PBF 000-157-470-10
220-230 VAC FGMB 250V 5A PBF 000-157-570-10
Sensor Adapter MC-3000S 24 VDC FGMB 125V 3A PBF 000-157-481-10
Interval Check point Check and measures Remarks
Use the proper fuse.
Use of a wrong fuse can damage the
equipment or cause fire.
WARNING
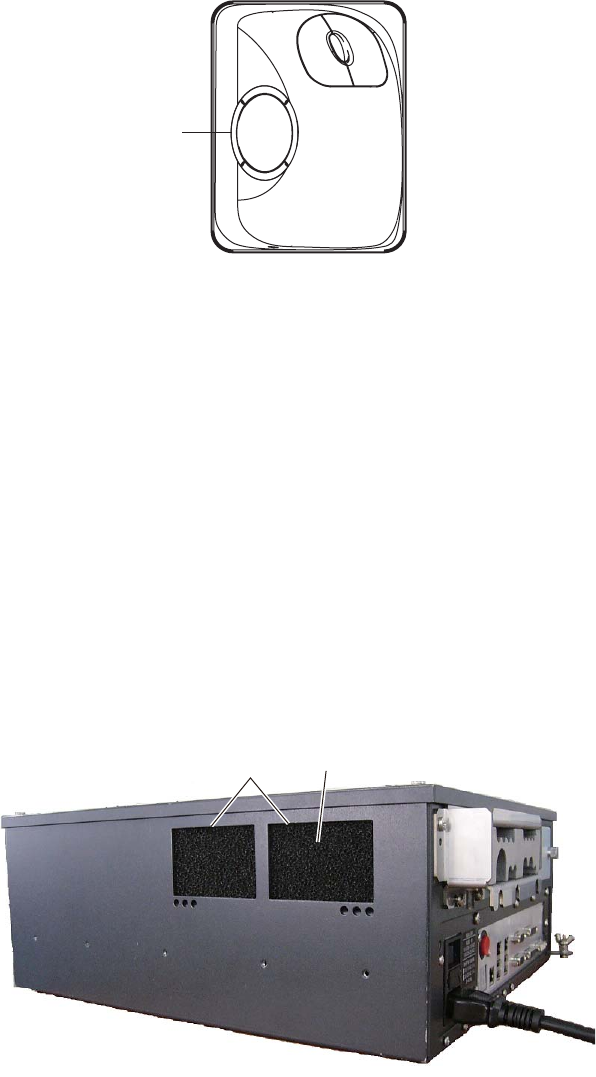
24. MAINTENANCE AND TROUBLESHOOTING
24-4
24.3 Trackball Maintenance
If the cursor moves abnormally, dust or dirt may be on the trackball. Clean the trackball
as shown below.
1. Turn the retaining ring on the trackball module counterclockwise 45° to unlock it.
2. Remove the retaining ring and ball.
3. Clean the ball with a soft, lint-free cloth. Blow carefully into the ball-cage to dis-
lodge dust and lint.
4. Look for a build-up of dirt on the metal rollers. If dirty, clean the rollers using a cot-
ton swab moistened lightly with isopropyl-rubbing alcohol.
5. Make sure that fluff from the swab is not left on the rollers.
6. Re-set the ball and retaining ring. Be sure the retaining ring is not inserted re-
versely.
24.4 How to Clean the Filter in the Processor Unit
Have a qualified technician clean the air inlet filter in the Processor Unit when it be-
comes dusty. Remove the filter and clean it with water and a mild detergent. Rinse the
filter, allow it filter to dry then return it to the Processor Unit.
Note 1: Be sure the air inlet is not blocked. A blocked inlet can cause the temperature
to rise inside the cabinet, which can lead to malfunction.
Note 2: The right side of the Processor Unit has an exhaust vent. Remove dust from
the vent as necessary.
Retaining
ring
Filter
Air inlet
Processor unit, left side

24. MAINTENANCE AND TROUBLESHOOTING
24-5
24.5 Troubleshooting
The troubleshooting table below provides common faults and the remedy with which
to restore normal operation.
Radar troubleshooting
If… then… Remedy
the radar echoes disappear and
the alert 727 "Radar Sensor
COM Error" appears
check the connection between
the EC-3000 and radar sensor.
Reconnect the cable (if loos-
ened) then restart the equip-
ment.
the alert 750 "EXT Radar COM
Error" appears
• check the connection be-
tween the EC-3000 of this
equipment and the EC-3000
in the LAN line.
• check the connection be-
tween the EC-3000 and ra-
dar sensor in the LAN line.
Reconnect the cable (if loos-
ened) then restart the equip-
ment.
the equipment cannot be turned
on
• power connector may have
loosened.
• ship's mains is off.
• fuse has blown.
• Check connector.
• Check ship's mains.
• Replace fuse.
the equipment can be turned on
but nothing appears on the dis-
play
• brilliance is too low.
• the ambient temperature is
less than 0°C (32°F).
• Adjust brilliance.
• The heater is warming the
EC-3000. The display ap-
pears in approx. 10 minutes.
key doesn't beep when operat-
ed
• key beep is turned off. • Turn on key beep from the
menu.
picture not updated or picture
freezes.
• If the picture freezes, the
buzzer sounds and the Sta-
tus LED blinks in red.
• Restart the equipment.
picture does not change even
though range is changed.
• suspect faulty the RANGE
key or video freeze.
• Hit the RANGE key several
times. If nothing happens, re-
start the equipment.
only two index lines are dis-
played
• check index line distance set-
ting.
• Refer to section 2.23.2 for
how to adjust index line dis-
tance.
range rings are not displayed • range rings are hid. • Turn on the range rings.
tracked target is not tracked
correctly
• sea clutter etc. are masking
tracked target.
• Adjust A/C SEA and A/C
RAIN to suppress sea and
rain clutters.
sensitivity is poor • suspect second-trace echo
or soiled radiator.
• Reject second-trace echo;
clean radiator.

24. MAINTENANCE AND TROUBLESHOOTING
24-6
Chart troubleshooting
If… then… Remedy
the message "No con-
nection to dongle" ap-
pears
• dongle is not connected to USB
port.
• Connect dongle.
the message "There is
no dongle or an error
has occurred in the
dongle. The system will
automatically shut
down." appears
• dongle is not connected.
• data in the dongle is corrupted.
• Connect dongle.
• Contact FURUNO for assistance.
monitored route is not
displayed
• route has not been selected.
• monitor route has not been se-
lected to be visible above the
chart.
• Select route to monitor.
• Open the [Route] page of the
[Symbol Display] menu and check
the monitored route parts to show.
planned route is not
displayed
• route has not been selected.
• planned route has not been se-
lected to be visible above the
chart.
• Select route as “planned”.
• Open [Route] page of [Symbol Dis-
play] menu and check the planned
route parts to show.
route monitoring is
stopped
• Alert 691: RM Stop - Exceed
Max XTE. Own ship is too far
away from the route.
• Alert 692: RM Stop - No Valid
Sensor Data. Chart radar inter-
nal error.
• Alert 693: RM Stop - Other
Causes. Required data (posi-
tion, SOG/COG) not found.
• Steer the ship back to the route
then restart route monitoring.
• Request service.
• Check sensor connections.
symbol of user chart
cannot be erased
• two or more symbols may be
superimposed on each other.
• Do the delete action several times.
position cannot be
found
• position sensor(s) is not select-
ed on the [POSN] page.
• position sensor is turned off.
• sensor cable has loosened.
• Check position sensor selections.
• Turn on position sensor.
• Check cable.
S57 chart cannot be
displayed
• No ENC chart for area.
• Dongle not connected.
• Open S57 chart from [Manage
Charts] dialog box
• Connect dongle.
past track is not
displayed
• past track is not selected to be
visible.
• Open [Tracking] page of [Symbol
Display] menu and select [Own
Ship Past Tracks] to [Primary] or
[Secondary] as appropriate.
monitored user chart is
not displayed on chart
display
• user chart is not selected to be
visible.
• Open [Mariner] page of [Symbol
Display] menu and select parts to
show.
user chart is not dis-
played on radar display
• user chart is not selected in
Voyage navigation mode.
• Select user chart in Voyage navi-
gation mode.
the message "Nearing
memory usage limit.
Click the Restart button
to restart the system to
prevent trouble." ap-
pears
• the memory usage limit for soft-
ware is close to capacity. Per-
formance may be affected.
If you need to save your work, click
the [Later] button then restart the
equipment. If you don't need to save
your work, click the [Restart] button.
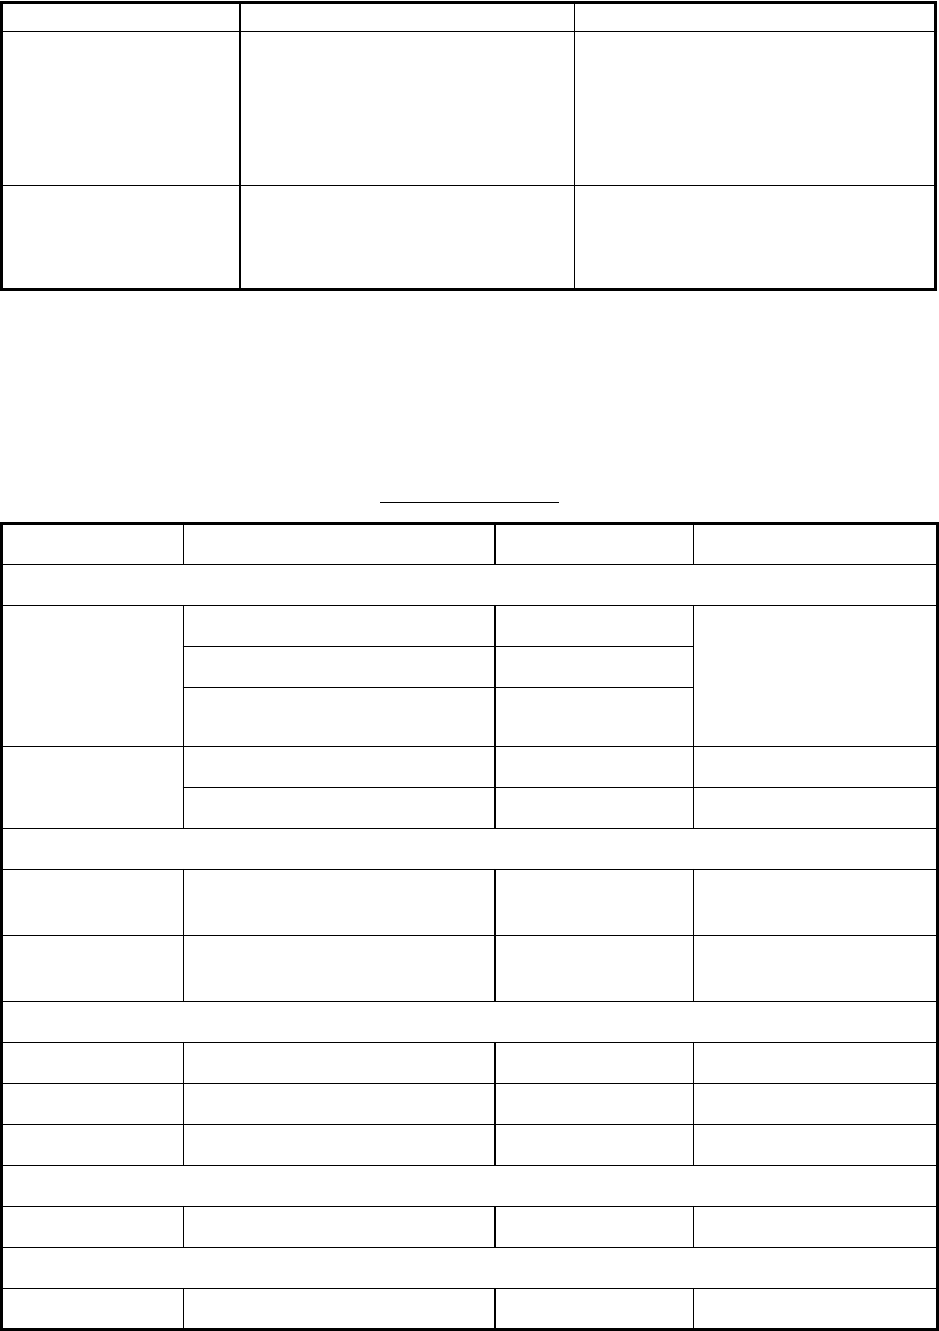
24. MAINTENANCE AND TROUBLESHOOTING
24-7
24.6 Consumable Parts
The table below lists the consumable parts in the antenna unit, Monitor Units, Proces-
sor Unit and Sensor Adapters. Replace the parts before their expected expirations.
Consumable parts
The expected lifetimes are typical values. Actual lifetime depends on usage and am-
bient temperature.
the message "Memory
usage limit reached.
Click the Restart button
to restart the system to
prevent trouble." ap-
pears
• the memory usage limit for soft-
ware is reached. Performance
may be affected.
Click the [Restart] button to reset the
power. No other operations are avail-
able than restart.
both the operating
mode buttons [RADAR]
and [CHART for RA-
DAR] are yellow
• the memory usage limit for soft-
ware is close to capacity. Per-
formance may be affected.
Stop all operations and restart the
equipment.
Part Type Lifetime Remarks
Antenna Unit
Magnetron FNE1201 5,000 hours Check number of hours
used at TX time. Reset
time then adjust the PM
gain after replacement
(see section 2.32).
MG5436 5,000 hours
MG5223F 7,000 hours
Motor VGLC22-15N400L4 (S) 10,000 hours
VGLC18-10N200L4 (X) 10,000 hours
Monitor Unit
BEZEL (19) &
LCD ASSEMBLY
MU-190 50,000 hours
BEZEL (23) &
LCD ASSEMBLY
MU-231 50,000 hours
Processor Unit EC-3000
CPU Fan 109R0612G429 8.5 years
Power Fan 109P0612H761 8.5 years
Chassis Fan 109P0612H761 8.5 years
Sensor Adapter MC-3000S
MC-CS Board 24P0114 8.5 years
Sensor Adapter MC-3010A
MC-ANLG Board 24P0115 7.0 years
If… then… Remedy
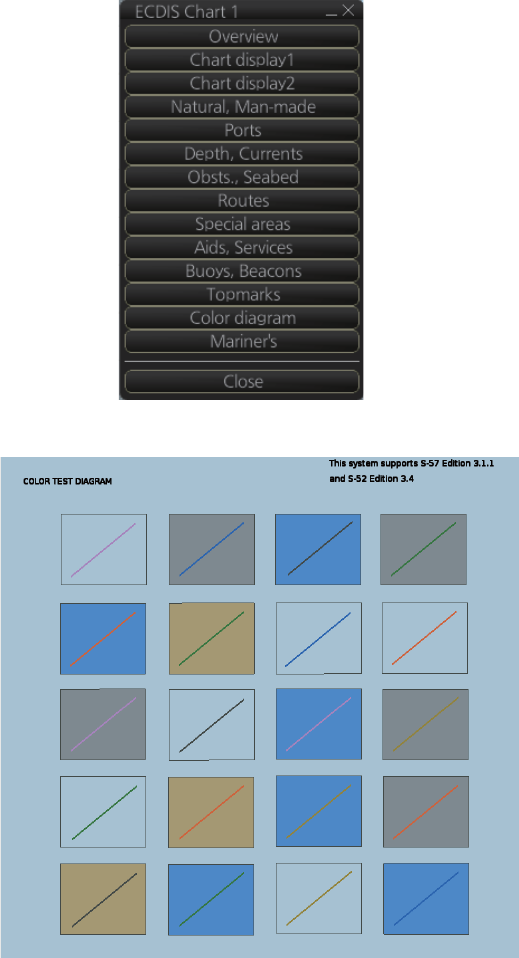
24. MAINTENANCE AND TROUBLESHOOTING
24-8
24.7 Color Differentiation Test for S57 Charts
The color differentiation checks if the chart radar monitor can distinguish between the
various color-coded areas, lines and symbols.
1. Click the [Chart INFO] and [Chart 1] buttons on the InstantAccess bar to show the
[ECDIS Chart 1] menu.
2. Click [Color diagram] to show the color test diagram.
If the colors are correct, the diagonal line will be distinguishable from its surroundings,
at any brilliance setting.

24. MAINTENANCE AND TROUBLESHOOTING
24-9
24.8 Fallback Arrangements
If the top priority sensor (e.g. GPS1) can not be used, this equipment automatically
uses the second priority sensor (e.g. GPS2) when the multiple sensors (e.g. GPS1
and GPS2) are installed. When all sensors can not be used, each function is limited
as follows:
Sensor Operation of this equipment
Heading sensor • The HDG indication reads "***.*°".
• The orientation mode is automatically set for head-up.
• TT, AIS, radar map, chart and echo averaging (EAV) are disabled.
Speed sensor When LOG(WT) is selected:
• The sensor used is automatically switched in the following priority order:
GPS(BT) > LOG(BT).
• The SPD indication reads "***.* kn" when both GPS(BT) and LOG(BT)
can not be used.
When LOG(BT) is selected:
• The sensor used is automatically switched in the following priority order:
GPS(BT) > LOG(WT).
• The SPD indication reads "***.* kn" when both GPS(BT) and LOG(WT)
can not be used.
When GPS(BT) is selected:
• The sensor used is automatically switched in the following priority order:
LOG(BT) > LOG(WT).
• The SPD indication reads "***.* kn" when both LOG(BT) and LOG(WT)
can not be used.
COG/SOG sensor • When the GPS sensor can not be used, the values of COG and SOG are
calculated from HDG and LOG(BT).
• Additionally when the heading sensor can not be used, the values of
SOG is calculated from LOG(BT). The COG indication reads "***.*°".
Position sensor • The POSN indication reads all asterisks.
• AIS, radar map and chart are disabled.
24. MAINTENANCE AND TROUBLESHOOTING
24-10
This page is intentionally left blank.
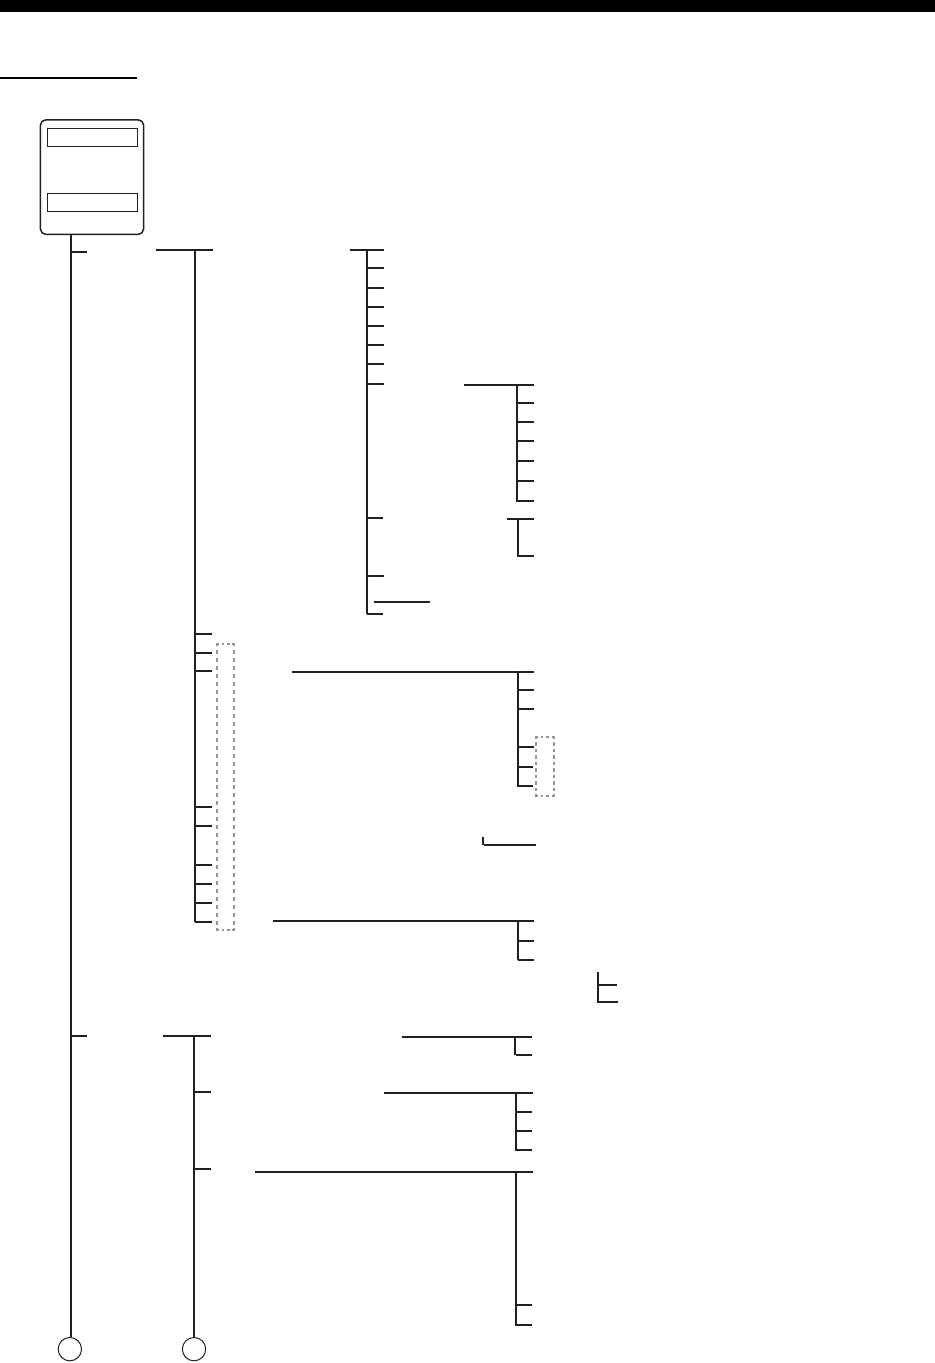
AP-1
APPENDIX 1 MENU TREE
Radar menu
1 ECHO 1 CUSTOMIZE
ECHO
2 ECHO AREA* (CIRCLE, WIDE)
3 ECHO COLOR (YEL, GRN, WHT, AMBER*, COLOR*)
4 TRAIL
5 2ND ECHO REJ (OFF, ON)
6 PERFORMANCE MON (OFF, ON, GRAPH ONLY)
7 SART (OFF, ON)
8 WIPER (OFF, 1, 2)
9 DUAL RADAR* (OFF, COMBINE)
0 ACE
1 INT REJECT (OFF, 1, 2, 3)
2 ECHO STRETCH (OFF, 1, 2, 3)
3 ECHO AVERAGE (OFF, 1, 2, 3)
4 NOISE REJECT (OFF, ON)
5 AUTO SEA (OFF, ON)
6 AUTO RAIN (OFF, ON)
7 VIDEO CONTRAST (1, 2, 3, 4; A, B, C)
8 PULSE
9 CONDITION
0 DEFAULT (NO, SAVE, USER, FACTORY)
1 0.5 NM (S1, S2)
2 0.75 NM (S1, S2, M1)
3 1.5 NM (S1, S2, M1, M2)
4 3 NM (S2, M1, M2, M3)
5 6 NM (M1, M2, M3, L)
6 12 NM (M1, M2, M3, L)
7 24 NM (M2, M3, L)
1 TRAIL MODE (REL, TRUE)
2 TRAIL GRAD (SINGLE, MULTI)
3 TRAIL COLOR* (GRN, BLU, CYA, PNK,
MAG, WHT, YEL)
4 TRAIL LEVEL (1, 2, 3, 4)
5 OS TRAIL (OFF, ON)
6 SUPPRESS TRAIL AROUND OS (OFF, ON)
2 TT•AIS 1 ACQUISITION ZONE
2 TRIAL MANEUVER
3 TT
1 AZ STAB (STAB HDG, STAB NORTH)
2 AZ POLYGON (OFF, STAB GND, STAB
HDG, STAB NORTH)
1 TRIAL MANEUVER (STATIC, DYNAMIC)
2 SPEED RATE
3 TURN RATE
4 TGT DATA* (ACTUAL, TRIAL)
1 TT SELECT
When [NUMBER OF TT] is [MAX]:
(MANUAL 200, AUTO 50, AUTO 100,
AUTO 150, AUTO 200),
When [NUMBER OF TT] is [100]:
(MANUAL 100, AUTO 25, AUTO 50,
AUTO 75, AUTO 100)
2 ALL CANCEL (NO, YES)
3 LOST FILTER MAX RNG (OFF, ON
(0 to 99, 12 NM))
Page 2
1 ACE (OFF, ON)
ARC (0, 2, 3, 5, 6)
1 ADJUST (OFF, ON)
2 SIGNAL ENHANCEMENT (1 to 3, 2)
3 SUPPRESS SECTOR
START (000 to 359, 0°)
ANGLE (000 to 180, 0°)
12
*: Not available with IMO or
A type.
The item numbers enclosed
in dashed rectangles are
renumbered.
(Continued on next page)
1 STC ANT HEIGHT (5, 7.5, 10, 15, 20, 25,
30, 35, 40, 45, more 45 m)
2 LOW LEVEL ECHO (0 to 8, 0)
MENU bar
(click)
MENU key
(press)
or
APPENDIX 1 MENU TREE
AP-2
1 VOYAGE DATA (NAV STATUS, ETA,
DESTINATION, DRAUGHT, CREW)
2 STATIC DATA
3 SLEEP ALL TGTS (NO, YES)
4 CPA AUTO ACTIVATE
5 DISP FILTER
6 LOST FILTER
7 RECEIVED MESSAGES
8 TRANSMIT MESSAGE
1 MAX RANGE (OFF, ON (0 to 99, 12 NM))
2 MIN SHIP SPEED (OFF, ON
(0 to 9.9, 1.0 kn))
3 EXCEPT CLASS B (OFF, ON)
1 ADDRESS TYPE (ADDRESSED,
BROADCAST)
2 MESSAGE TYPE (SAFETY, BINARY)
3 MMSI No.
4 CHANNEL (A, B, A or B, A and B)
1 OPEN FILE
2 SAVE FILE
3 EDIT
4 TRANSMIT MESSAGE
Page 2
4 AIS
5 TT•AIS SYMBOL
6 ASSOCIATION
1 SYMBOL COLOR (GRN, BLU, CYA, MAG,
WHT, YEL*
1
)
2 ATON SYMBOL COLOR (GRN, BLU, CYA,
MAG, WHT)
3 AIS ROT TAG LIMIT (0.0 to 720.0, 0.0°/min)
4 TT POP-UP INFO (OFF, ON)
5 AIS POP-UP INFO (OFF, ON)
6 TT PAST POSN POINTS (5, 10)
7 AIS PAST POSN POINTS (5, 10)
1 AIS SCALED SYMBOL (OFF, ON)
2 AIS BASE STATION (OFF, ON)
3 AIS PHYSICAL ATON (OFF, ON)
4 AIS VIRTUAL ATON (OFF, ON)
1 ASSOCIATION TGT (OFF, AIS, TT)
2 GAP (0.000 to 0.999, 0.050 NM)
3 RANGE (0.000 to 0.999, 0.100 NM)
4 BEARING (00.00 to 99.9, 9.9°)
5 SPEED (0.0 to 9.9, 6.0 kn)
6 COURSE (00.0 to 99.9, 25.0°)
3 NAV TOOL 1 PI LINE
2 EBL•VRM*
3
3 CURSOR
4 OWN SHIP VECTOR
5 TARGET VECTOR
6 RANGE RING*
2
(OFF, ON)
7 BARGE
1 PI LINE BEARING (REL, TRUE)
2 SET ALL PI LINE (OFF, 1, 2, 3, 6)
3 PI LINE MODE (PARALLEL, PERPEN-
DICULAR)
4 RESET PI LINE
5 RESET ALL PI LINE
6 TRUNCATE
1 EBL1*
2
(REL, TRUE)
2 EBL2*
2
(REL, TRUE)
3 VRM1*
2
(NM, SM, km, kyd)
4 VRM2*
2
(NM, SM, km, kyd)
5 EBL OFFSET BASE POINT (STAB GND,
STAB HDG, STAB NORTH)
6 VRM TTG (OFF, 1, 2, 1 and 2)
7 VRM OFFSET (OFF, LINK EBL)
1 CURSOR BEARING (REL, TRUE)
2 CURSOR RANGE (NM, SM, km, kyd)
3 CURSOR SIZE (SMALL, LARGE)
1 VECTOR STAB IND (OFF, ON)
2 TIME INCREMENTS (OFF, ON)
3 OWN SHIP VECTOR (OFF, HDG, COURSE)
4 VECTOR COLOR (GRN, BLU, CYA, MAG, WHT*
4
)
1 REF TARGET VECTOR (OFF, ON)
1 BARGE MARK (OFF, ON)
2 BARGE SIZE (LENGTH, WIDTH)
3 ARRANGEMENT
(Continued from previous page)
1 SLEEPING CLASS A (OFF, ON)
2 SLEEPING CLASS B (OFF, ON)
3 MAX RANGE (OFF, ON (0 to 99, 12 NM))
4 MIN SHIP SPEED (OFF, ON
(0 to 9.9 kn, 1.0 kn))
12
1 MAX RANGE (OFF, ON (0 to 99, 0 NM))
2 MIN SHIP SPEED (OFF, ON
(0 to 9.9, 1.0 kn))
3 EXCEPT CLASS B (OFF, ON)
*2: Not available with IMO or A type.
*3: EBL•VRM•CURSOR on IMO and
A types. EBL•CURSOR BEARING
(REL, TRUE) additionallly shown on
those types.
1
*4: WHT is replaced with
RED with A and B types.
(Continued on next page)
*1: Not available with IMO type.
Page 2
Page 2
1 AUTO DISP MESSAGE (OFF, ON)
PI 1 (to 6) TRUNCATE (OFF, ON)
APPENDIX 1 MENU TREE
AP-3
4 INFORMATION
BOX
1 DISP INFO BOX (OFF, ON)
2 SET NAV DATA
3 ZOOM DISPLAY (STAB GND,
STAB HDG, STAB NORTH,
TT TRACK)
4 TARGET DATA (1 BOX, 2 BOX,
3 BOX
#
)
1 DISP OWN TRACK (OFF, ON)
2 OWN TRACK SOURCE (PRIMARY,
SECONDARY, SYSTEM)
3 SAVE INTERNAL (30s, 1min, 2min, 3 min,
6min, 15min, DRAW ONLY)
4 DELETE OWN TRACK (NO, RED*
2
, GRN*
2
BLU*
2
, YEL*
2
, CYA*
2
, MAG*
2
, WHT*
2
, 30%,
50%, 80%, ALL)
5 OWN TRACK COLOR*
2
(RED, GRN, BLU,
YEL, CYA, MAG, WHT)
1 DEPTH (OFF, m, ft)
2 DEPTH GRAPH SCALE (10, 20, 50, 100,
200, 500, Auto)
3 DEPTH MARK
4 CURRENT (OFF, ON)
5 WIND (OFF, m/s, kn)
6 WIND STAB (APPARENT, NORTH,
THEORETICAL)
7 TEMPERATURE (OFF, °C, °F)
1 DISP ROUTE (OFF, ON)
2 SEL ROUTE OBJECT (CHANNEL LIMIT, SAFETY
MARGIN, LEG MARKS, WHEEL OVER LINE)
1 MARK SETTING
2 RADAR MAP
3 ROUTE
4 EVENT
5 USER CHART
5 MAP
•
MARK 1 MAP MARK POSN (CURSOR, OS, LL)
2 MAP MARK L/L
3 MAP MARK COLOR*
1
(RED, GRN, BLU, CYA,
MAG, YEL, WHT)
4 OWN SHIP MARK (MIN, SCALED)
5 ANTENNA MARK (OFF, ON)
6 STERN MARK (OFF, ON)
7 DROP MARK (OFF, ON)
8 MAP MARK ALL DELETE
9 MAP MARK ALL COPY
SEL MAP OBJECT (MARK, BUOY, DANGER,
COASTLINE, CONTOUR LINE, NAV LINE,
PROHIBITED AREA)
1 DISP USER CHART (OFF, ON)
2 SEL USER CHART OBJECT (LINES,
LABELS, TIDALS, AREAS, CIRCLES,
CLEARING LINES)
6 CHART DISPLAY 1 OWN TRACK
2 SEL DISPLAY OBJECT 1 SAVE TO PERSONAL
2 STANDARD ITEMS (UNKNOWN OBJECT OR
PRESENTATION; CHART DATA COVERAGE;
LAND FEATURES; WATER AND SEABED
FEATURES; TRAFFIC ROUTES; CAUTION-
ARY AREAS; INFORMATION AREAS;
BUOYS AND BEACONS; LIGHTS; FOG
SIGNALS; RADARS; SERVICES)
3 OTHER ITEMS (INFORMATION ABOUT
CHART DATA; LAND FEATURES;
SOUNDINGS; DEPTH CONTOUR LABELS;
DEPTH CONTOURS, MAGNETICS,
CURRENTS; SEABEDS, PIPELINES,
OBSTRUCTIONS; OBSTRUCTIONS WITH
SOUNDINGS; LOW ACCURACY;
SERVICES AND SMALL CRAFT FACILITIES;
SPECIAL AREAS; ADDITIONAL INFOR-
MATION AVAILABLE)
4 IMPORTANT TEXT (CLEARINGS, BEARINGS
RADIO CHANNELS)
5 OTHER TEXT (NAMES FOR POSITION
REPORT; LIGHT DESCRIPTIONS; SEABED;
GEOGRAPHIC NAMES, ETC.; SWEPT
DEPTHS, MAGNETICS; BERTH AND
ANCHORAGE; LAND ELEVATION)
1
12
(Continued from previous page)
(Continued on next page)
*2: Not available with IMO type.
#: 23-inch monitor
1 DISP EVENT (OFF, ON)
2 SEL EVENT OBJECT (USER EVENT, AUTO
EVENT, POS EVENT)
*1: Not available with IMO or
A type.
The item numbers enclosed
in dashed rectangle are
renumbered.
Page 2
1 MAP MARK MANAGE
APPENDIX 1 MENU TREE
AP-4
3 SHALLOW CONTOUR (0 to 99, 10 m)
4 SAFETY DEPTH (0 to 99, 30 m)
5 SAFETY CONTOUR (0 to 99, 30 m)
6 DEEP CONTOUR (0 to 99, 50 m)
7 SYMBOLS (SIMPLIFIED, PAPER CHART)
8 DEPTH ZONE (2 COLOR , 4 COLOR)
9 BOUNDARIES (PLAIN, SYMBOLIZED)
0 LIGHT SECTOR (LIMITED, FULL)
Page 2
1 SHALLOW PATTERN (NONE, DIAMOND)
2 CHART MONOCHROME (OFF, ON)
3 AREA COLOR (COLOR FILL, GRAY SCALE WATER, NO COLOR)
4 RESET CNT AND DEPTH
7 OWN SHIP INFO 1 SENSOR (SYSTEM, LOCAL)
2 SYSTEM SETTING (HDG, SPD, COG/SOG, POSN)
3 LOCAL SETTING (Same choices as 2 SYSTEM SETTING.)
8 INITIAL
SETTING 1 TUNE INITIALIZE*1
2 PALETTE (DAY-GRY, DAY-BLU, DUSK-GRY, DUSK-BLU,
NIGHT-GRY, NIGHT-BLU)
3 BRIGHTNESS 1 CONTROL PANEL
2 CHARACTER
3 CURSOR
4 ECHO
5 TRAIL
6 HL
7 OS SYMBOL
8 RING
9 BEARING CURSOR
Page 2
1 EBL
2 VRM
3 PI LINE
4 TT SYMBOL
5 AIS SYMBOL
6 MARK
7 CHART
1 WATCH ALERT (OFF, 6MIN, 10MIN,
12MIN, 15MIN, 20MIN)
2 ANCHOR WATCH (OFF, ON, 0.01 to
9.99 NM, 0.01 NM)
3 PRIMARY ALERT (TT NEW TARGET, AIS
NEW TARGET, TT LOST, AIS LOST, TT
AUTO ACQ 100%, TT MAN ACQ 100%,
AIS TGT DISP 100%, AIS TGT CAP 100%,
AIS TGT ACT 100%, TT SYSTEM ERROR,
NO CPA/TCPA FOR AIS, WATCH ALERT,
ANCHOR WATCH ERROR)
4 ALERT
1 DISP1 (ANT 1, 2, 3, 4; M, S)
2 DISP2 (ANT 1, 2, 3, 4; M, S)
3 DISP3 (ANT 1, 2, 3, 4; M, S)
4 DISP4 (ANT 1, 2, 3, 4; M, S)
5 STORE INTER-SW (NO, YES)
5 ANT SELECT
6 AUTO COURSE UP RESET (OFF, ON (22.5 to 45.0, 22.5°))
7 TIPS GUIDANCE (OFF, ON)
8 TT SIMULATION MODE
9 MAGNETRON RESET*2
0 ICING PREVENTION (OFF, ON)
(Default setting for all
brightness items is 15.)
12
*1: Not available with solid state radar.
*2: Not available with IMO type.
1 TX TIME (000000.0 to 999999.9, 000000.0 H)
2 PM GAIN ADJ (AUTO, MANUAL: 000 to 255, 0)
(Continued from previous page)
APPENDIX 1 MENU TREE
AP-5
Chart menu
General Ship &
Route
Parameters
Navigation
Parameter
TCS (No use)
Cost
Parameters
Sensor
Ship Parameters
Route Parameters
MAX Speed (0.8 to 80, 22.1 kn)
MAX Height (0.0 to 100, 16.1 m)
MAX Draught (0.0 to 100, 20.0 m)
MAX ROT (5 to 200, 60°/min)
WPT Approach (30 to 60, 30 sec)
WPT Prewarning (75 to 198, 90 sec)
Default Line Radius (0.1 to 3.0, 0.8 NM)
Default CH Limit (10 to 5000, 185 m)
Default Safety Margin (0 to 2000, 40 m)
Cost (Input values for Hour, Heavy Fuel Oil, Diesel Oil)
Fuel Consumption (Input values for Speed, Heavy Fuel Oil, Diesel Oil)
System/Local
Select
System
Sensor
Settings
Sensor Type (System Sensor, Local Sensor)
HDG Data Source (Sensors)
Stabilization Mode (Bottom, Water)
Sensor Type (GPS, LOG)
Data Source (Sensors, Manual)
SPD
COG/ Data Source (Sensors)
SOG
POSN Data Source (Sensors, Manual)
Local Sensor
Settings HDG
SPD
COG/ Data Source (Sensors)
SOG
POSN Data Source (Sensors, Manual)
Data Source (Sensors, Analog Gyro (No use), Manual*
2
,
Gyro Correction)
Prim*
1
, Second*
1
Stabilization Mode ( Bottom, Water)
Sensor Type (GPS, LOG)
Data Source (Sensors, Manual, Reference SPD, Drift)
Other Sensor
Settings
Wind
Depth
Below
Trans.
Temperature (Temperature of water surface)
Water Current (Course and speed of water current)
Speed (kn, m/s)
Reference (APPARENT, NORTH, THEORETICAL)
(Values for Bow, Mid and Aft)
Other
Sensor
Filter Status (Monitor status and integrity of sensors.)
1
(Continued on next page)
Ship &
Route
Instant
Track
Delay before Initiating First Turn (30 to 600, 60 sec)
Turn Radius (0.03 to 3.00, 1.00 NM)
Channel Limit for Trafic Control (Auto, Manual; 10 to 1852 m)
Forwarding Distance
Prim*
1
, Second*
1
*1: Display only
Prim*
1
Prim*
1
Prim*
1
, Second*
1
MENU bar
(click)
MENU key
(press)
or
*2: Not available
with IMO type.
APPENDIX 1 MENU TREE
AP-6
Standard*
1
(Checkbox for each of Unknown Object or Presentation; Chart
Data Coverage; Standard Land Features; Water and Seabed Features;
Traffic Routes; Cautionary Areas; Information Areas; Buoys and
Beacons; Lights; Fog Signals; Radar; Services)
Other*
2
(Checkbox for each of Information about Chart Data; Other Land
Features; Soundings; Depth Contour Labels; Depth Contours,
Magnetics, Currents; Seabed, Pipelines and Obstructions; Obstructions
with Soundings; Service and Small Craft Facilities; Low Accuracy;
Special Areas; Additional Information Available; Clearance, Bearings,
Radio Channels; Other Text; Names for Position Report; Light
Descriptions; Seabed; Swept Depth, Magnetics; Berth and Anchorage;
Geographic Names, etc.; Land Elevation)
AIO*
2
(Checkbox for Temporary Notice; Preliminary Notice; No Information)
DISP Basic
Setting
Symbols (Paper Chart, Simplified)
Depths (Two Color, Multi Color)
Boundaries (Plain, Symbolized)
Lightsectors (Limited, Full)
Shallow Pattern (None, Diamond)
Shallow Hazard (OFF, ON)
TM Reset (20 to 99, 80%)
General Ship Outlines
Chart
Display
Symbol
Display
Ship Vectors (ON, OFF)
Target Vectors (ON, OFF)
Style (std ECDIS, Conventional)
Time Increments (Checkbox unchecked)
Path Predictor (Checkbox unchecked)
Radar Antenna (Checkbox unchecked)
Tracking Own Ship
Past Tracks
CCRP (Checkbox unchecked)
Primary (Checkbox unchecked)
Secondary (Checkbox unchecked)
Style (Tick, Point)
Length (1-120 min, 1)
Labels (0-60 min, 0)
Events User Events (Checkbox unchecked)
Auto Events (Checkbox unchecked)
Positions (Checkbox unchecked)
Show (Newer than 12 hours, Newer
than 24 hours, Newer than 1 week,
Newer than 2 weeks, Newer than 1
month, Newer than 3 months, All)
Route Monitored
Route
Channel Limit (Checkbox unchecked)
Safety Margin (Checkbox unchecked)
Leg Marks (Checkbox unchecked)
Wheel Over Line (Checkbox unchecked)
Planned
Route
Channel Limit (Checkbox unchecked)
Safety Margin (Checkbox unchecked)
Leg Marks (Checkbox unchecked)
Mariner User Chart Labels (Checkbox unchecked)
Lines (Checkbox unchecked)
Clearing Lines (Checkbox unchecked)
Tidals (Checkbox unchecked)
Areas (Checkbox unchecked)
Circles (Checkbox unchecked)
Transparent (25%, 50%, 75%, No color fill)
Targets Color (Green, Blue, Black, Magenta, Brown)
AtoN Symbol Color (Green, Blue, Black, Magenta, Brown)
TT Size (Standard, Small)
AIS ROT TAG Limit (0.0°/min to 720.0°/min, 0.0)
TT Label (ON, OFF)
AIS Label (ON, OFF)
TT Pop-up INFO (ON, OFF)
AIS Pop-up INFO (ON, OFF)
Past Position
AIS Base Station (ON, OFF)
AIS Physical AtoN (ON, OFF)
AIS Virtual AtoN (ON, OFF)
TT Points (5, 10)
AIS Points (5, 10)
Style (Points, Points and dots)
*1: All checked
*2: All unchecked
1
12
(Continued from previous page)
(Continued on next page)
Setting
Ship Outlines (ON, OFF)
AIS Outlines (ON, OFF)
True outlines shown if (Set length and beamwidth.) > limit
Own Ship Limit*
3
= 3 mm
AIS Limit*
3
= 3 mm
Velocity Vectors
*3: Display only
APPENDIX 1 MENU TREE
AP-7
Navigational Status (Underway using engine, At anchor, Not under
command, Restricted maneuverability, Constrained by her
draught, Moored, Aground, Engaged in fishing, Under way sailing,
Reserved for high speed craft, Reserved for wing in ground,
Reserved for future use (x3), AIS-SART (active), Not defined)
Persons (0 to 8191, 0)
MAX Draught (0.0 to 25.5, 0.0 m)
ETA
Destination
RECORD
Chart
Alert
Set WARNING or CAUTION for Safety Contour, Areas To Be Avoided
User Chart Danger, Traffic Separation Zone, Inshore Traffic Zone,
Restricted Area, Caution Area, Offshore Production Area, Military
Practice Area, Seaplane Landing Area, Submarine Transit Lane,
Anchorage Area, Marine Farm / Aqua Culture, PSSA Area, UKC Limit,
Non-official ENC, No Vector Chart, Not Up-to-date, Permit Expired)
Shallow Contour (0-99, 10 m)
Safety Depth (0-99, 20 m)
Safety Contour (0-99, 30 m)
Deep Contour (0-99, 60 m)
AIS-CPA
Auto
Activate
Limits
Log Interval (1 to 100, 4 hours)
Distance Counter*
AIS DISP
Filter
Sleep All
Targets
Voyage
data
NAVI
Log
Voyage Speed (0 to 10, 5 kn)
Course (0.0 to 30.0, 0.0°)
Target
Log
Danger Target (Log Interval 1 to 100, 1 min)
TT/AIS Setting Setting.1 Sleeping Class A (ON, OFF)
Sleeping Class B (ON, OFF)
MAX Range (ON, OFF; 0 to 99 NM, 12 NM)
MIN Ship Speed (ON, OFF; 0.0 to 9.9 kn, 1.0 kn)
MAX Range (ON, OFF; 0 to 99 NM, 0 NM)
MIN Ship Speed (ON, OFF; 0.0 to 9.9 kn, 1.0 kn)
Except Class B (ON, OFF)
Setting.2 AIS Lost
Target
Filter
MAX Range (ON, OFF; 0 to 99 NM, 12 NM)
MIN Ship Speed (ON, OFF; 0.0 to 9.9 kn, 1.0 kn)
Except Class B (ON, OFF)
TT Lost
Target
Filter
MAX Range (ON, OFF; 0 to 99 NM, 12 NM)
NAV
Status
Own Ship (Shows own ship’s MMSI No., Name, Call Sign, Type, Description,
Length, Width, Ref Bow, and Ref Port.)
12
(Continued from previous page)
Association
Target
Gap (0.000 to 0.999 NM, 0.050 NM)
Range (0.000 to 0.999 NM, 0.100 NM)
Bearing (0.0 to 99.9°, 9.9°)
Speed (0.0 to 9.9 kn, 6.0 kn)
Course (0.0 to 99.9°, 25.0°)
NAV Tools PI Lines Truncate Setting (Set forward and backward lengths of each PI line.)
Odometer
Trip Meter *: Display only
APPENDIX 1 MENU TREE
AP-8
Settings menu
Settings
NAV
Tools
VRM (Checkbox checked)
EBL (Checkbox checked)
PI Line (Checkbox checked)
(Click)
File Export Select data to export (Setting data, Route/User chart, Radar map)
File Import Select file to import
Select data to import (Setting data, Route/User chart, Radar map)
File Maintenance Restore the last-saved route/user chart application and route/user
chart system
Self Test (Check various components of the system.)
Data Sharing
Display
settings
Color Palette (Checkbox checked)
Display Brilliance (Checkbox checked)
Customize Wheel rotation (Normal, Reverse)
Key beep volume (0 to 3, 1)
Alert sound volume (1 to 3, 3)
Display Test (Display test patterns.)
Keyboard Test (Test the Radar Control Unit, ECDIS Control Unit and Trackball
Control Unit.)
Screenshot (Manage screenshots.)
User Default (Restore all user default settings.)
CCRP Select CCRP
Display Filter (CCRP, Center of Gravity, Pivot Point, Radar Antenna,
GPS Sensor, AIS Transponder, Echo Sounder, SDME Sensor)

AP-9
APPENDIX 2 ABBREVIATIONS, SYM-
BOLS
Abbreviations
Abbreviation Meaning
A/C Anti Clutter
ACE Automatic Clutter Elimination
ACK Acknowledge
ACQ Acquire
ACT Activate
ADJ Adjustment
AIS Automatic Identification System
ALL All
ALARM Alarm
ANT Antenna
Apr April
ATON Aid To Navigation
Aug August
AUTO Automatic
BB Blackbox
BCR Bow Cross Range
BCT Bow Cross Time
BLU Blue
BRG Bearing
BRILL Brilliance
BT Bottom Tracking
CANCEL Cancel
Caps Capital (letters)
CAT Category
CCRP Common Consistent Reference Position
CH Channel
COG Course over the ground
CORRE Correlation
CPA Closest Point of Approach
CPU Central Processing Unit
CSE Course
CU/TM Course-up/True Motion
CYA CYAN
DATA Data
Dec December
DEMO Demonstration
DISP Display
DIST Distance
DR Dead Reckoning
EEnglish
EEast

APPENDIX 2 ABBREVIATIONS, SYMBOLS
AP-10
EAV Echo Average
EBL Electronic Bearing Line
ENTER Enter
ES Echo Stretch
ESC Escape
ETA Estimated Time of Arrival
EXT External
Feb February
FILT Filter
GAIN Gain
GPS Global Positioning System
GRN Green
GRY Gray
GYRO Gyrocompass
HDG Heading
HIDE Hide
HL Heading Line
IMO International Maritime Organization
IND Indication
INS Integrated Navigation System
IR Interference Rejection
J Japanese
Jan January
Jul July
Jun June
kyd kiloyard
L Long (pulse length)
L/L Latitude/Longitude
LAN Local Area Network
LIST List
LL Latitude, Longitude
LO Low
MAG Magnetic or Magenta
MAN Manual
Mar March
MARK Mark
MAX Maximum
MENU Menu
MID Middle
min minute
MIN Minimum
MMSI Maritime Mobile Service Identity
MOB Man Overboard
MODE Mode
MON Monitor
NAV Navigation
Navtex Navigational Telex
NM Nautical miles
NO. Number
Abbreviation Meaning

APPENDIX 2 ABBREVIATIONS, SYMBOLS
AP-11
NNorth
Nov November
Oct October
OFF Off
OFFSET Offset
OS Own Ship
OWN Own
PALETTE Palette
PANEL Panel Illumination
PC Personal Computer
PERPENDIC Perpendicular
PI Parallel Index (lines)
POSN Position
PULSE Pulse
RRelative
RAD Radius
RAIN Rain
RANGE Range
REF Reference
Rel Relative
RM Relative Motion
RNG Range
ROT Rate of Turn
SSouth
S1 (2) Short1(2) (pulse length)
SAR Search And Rescue
SART Search And Rescue Transponder
SEA Sea
SEL Select
Sep September
SM Statute Miles
SOG Speed Over the Ground
SPD Speed
SPEC Specification
SSD Solid State Drive, Solid State Device
STAB Stabilization
STBY Stand-by
SW Switch
TTrue
TARGET Target
TB True Bearing
TCPA Time to Closest Point of Approach
TEMP Temperature
TGT Target
TGT, TGTS Target, Targets
TIME Time
TM True Motion
TRAIL Trail
True-G True-ground
Abbreviation Meaning
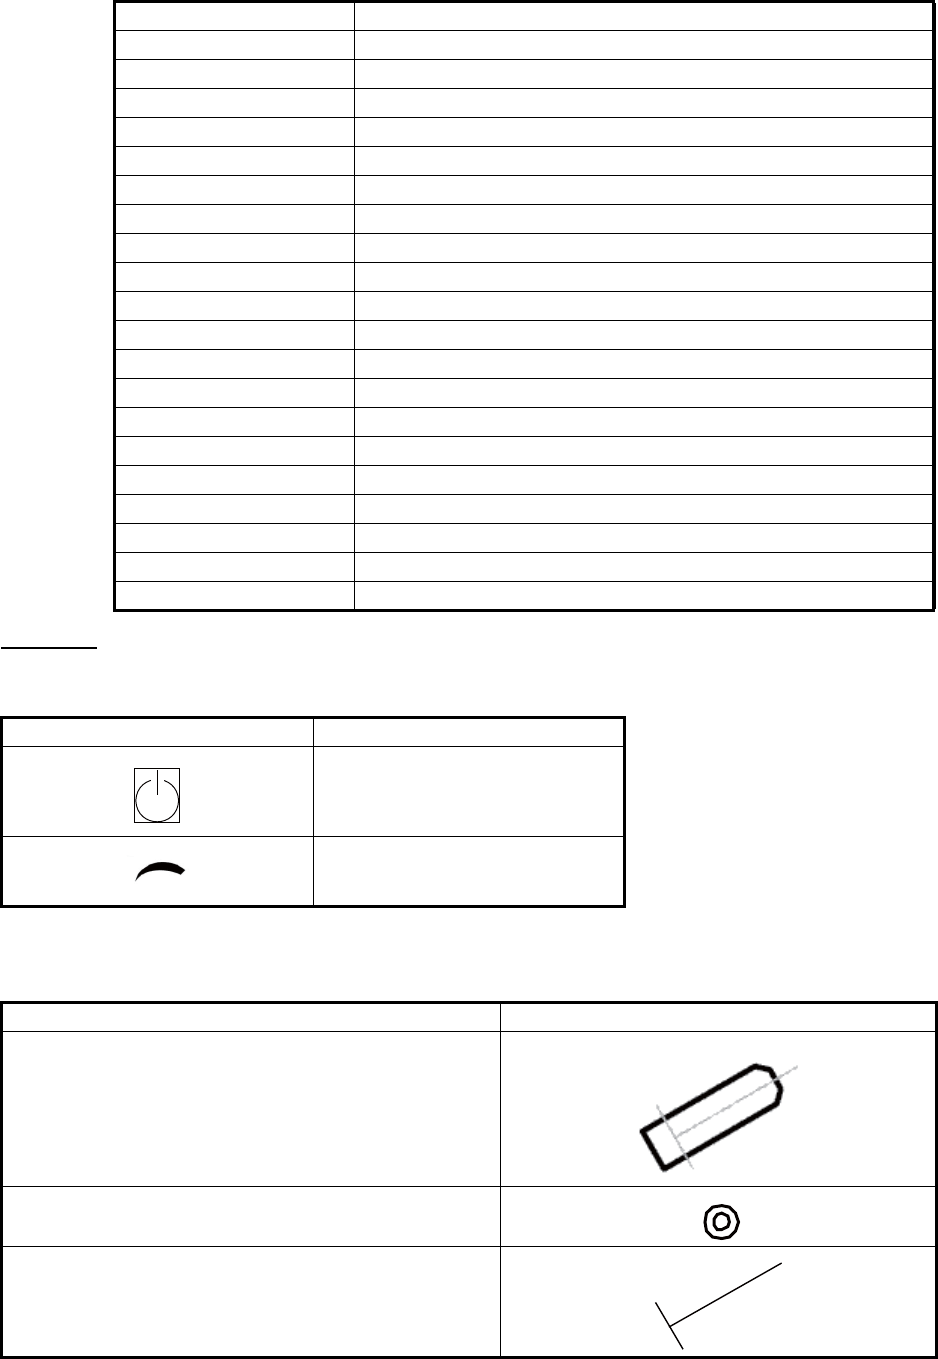
APPENDIX 2 ABBREVIATIONS, SYMBOLS
AP-12
Symbols
Symbols on Control Unit
Symbols on display
True-S True-sea
TT Tracked Target or Target Tracking
TTD Tracked Target Data
TTG Time to go
TTM Tracked Target Information
TUNE Tune
TX Transmit
UNDO Undo
UTC Universal Time, Coordinated
VECT Vector
VECTOR Vector
VIEW View
VRM Variable Range Marker
WWest
W/O Without
WHT White
WOP Wheel Over Point
WPT Waypoint
WT Water Tracking
YEL Yellow
Symbol Name
Power switch
Gain
Symbol name and description Symbol graphic(s)
Own ship - true scaled outline
This can be displayed when based on user selection
either beam width or length is more than 3 mm.
Own ship - simplified symbol
Own ship - minimized symbol
Abbreviation Meaning
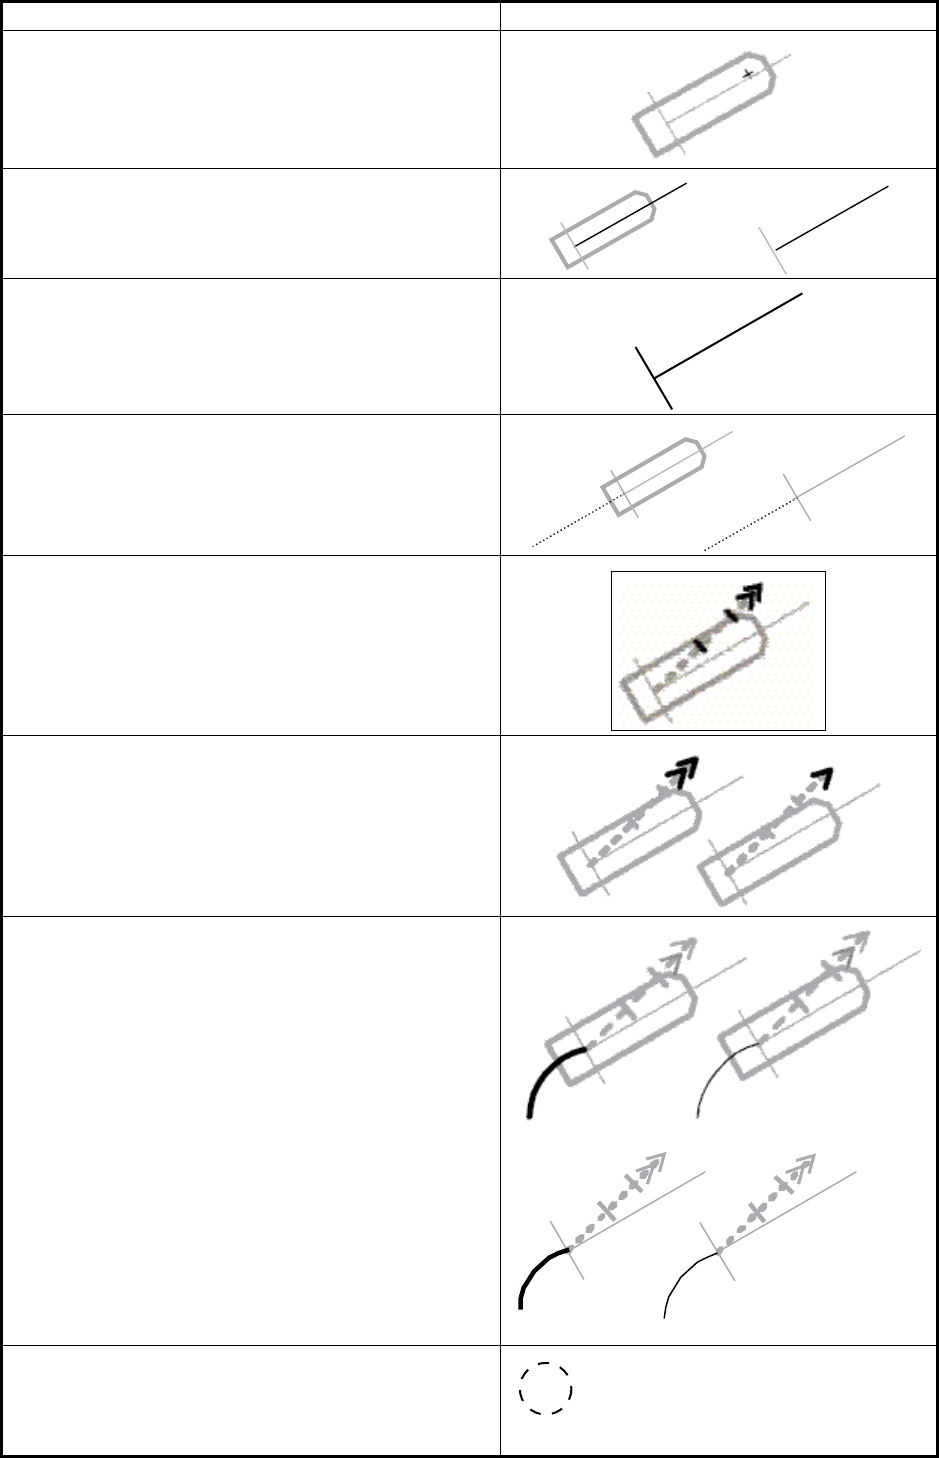
APPENDIX 2 ABBREVIATIONS, SYMBOLS
AP-13
Radar antenna position
This symbol indicates location of the radar antenna.
Select if position of radar antenna is displayed with
symbol + in [MARK SETTING] menu.
Own ship heading line
This line originates from CCRP or Radar antenna
position.
CCRP: Consistent Common Reference Point
Beam line
This line passes through the CCRP or radar antenna
position.
Stern line
Velocity vector - time increments
Velocity vector - stabilization indicator
Ground stabilization is indicated by double arrow-
head and water stabilization is indicated as single
arrowhead.
Past track
System past track is indicated by thick line. Raw
sensor primary past track is indicated by thin line.
Raw sensor secondary past track is indicated by
gray thin line.
Radar targets in acquisition state
5 mm in diameter
Symbol name and description Symbol graphic(s)
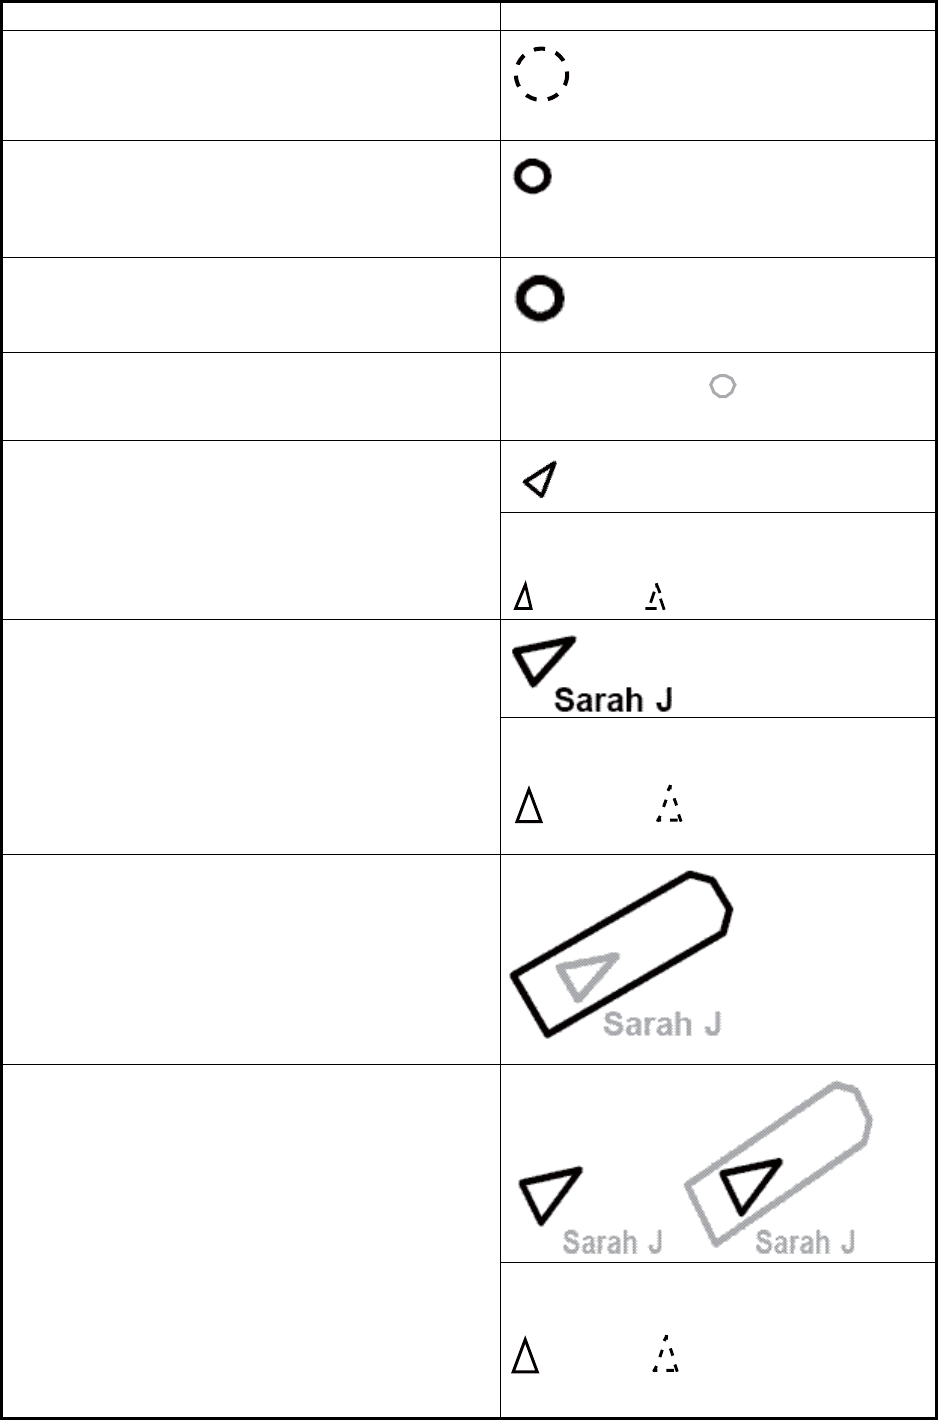
APPENDIX 2 ABBREVIATIONS, SYMBOLS
AP-14
Radar targets in acquisition state - automatically
detected
Automatically detected target symbol is red and it
flashes until acknowledged. 5 mm in diameter
Tracked radar targets
3 mm in diameter
Tracked radar targets - dangerous targets
Dangerous target symbol is red and it flashes until
acknowledged.
Reference targets
TT: Std or small user selection by Symbol Display.
Sleeping AIS targets
Orientation is towards heading (or COG if heading
unknown).
If both heading and COG are unknown the orienta-
tion is toward top of display.
Sleeping AIS target with neither reported
heading nor COG
Activated AIS targets
Orientation is towards heading (or COG if heading
unknown).
If both heading and COG are unknown the orienta-
tion is toward top of display.
Activated AIS target with neither reported
heading nor COG
Activated AIS targets - true scaled outlines
• This can be displayed when based on user selec-
tion either beam width or length is more than 3
mm.
• AIS outline: ON/OFF
Activated AIS targets - dangerous targets
Dangerous target symbol is red and it flashes until
acknowledged.
Activated AIS target with neither reported
heading nor COG
Symbol name and description Symbol graphic(s)
18
18
R4 18
Sarah J Sarah J
Sarah J Sarah J
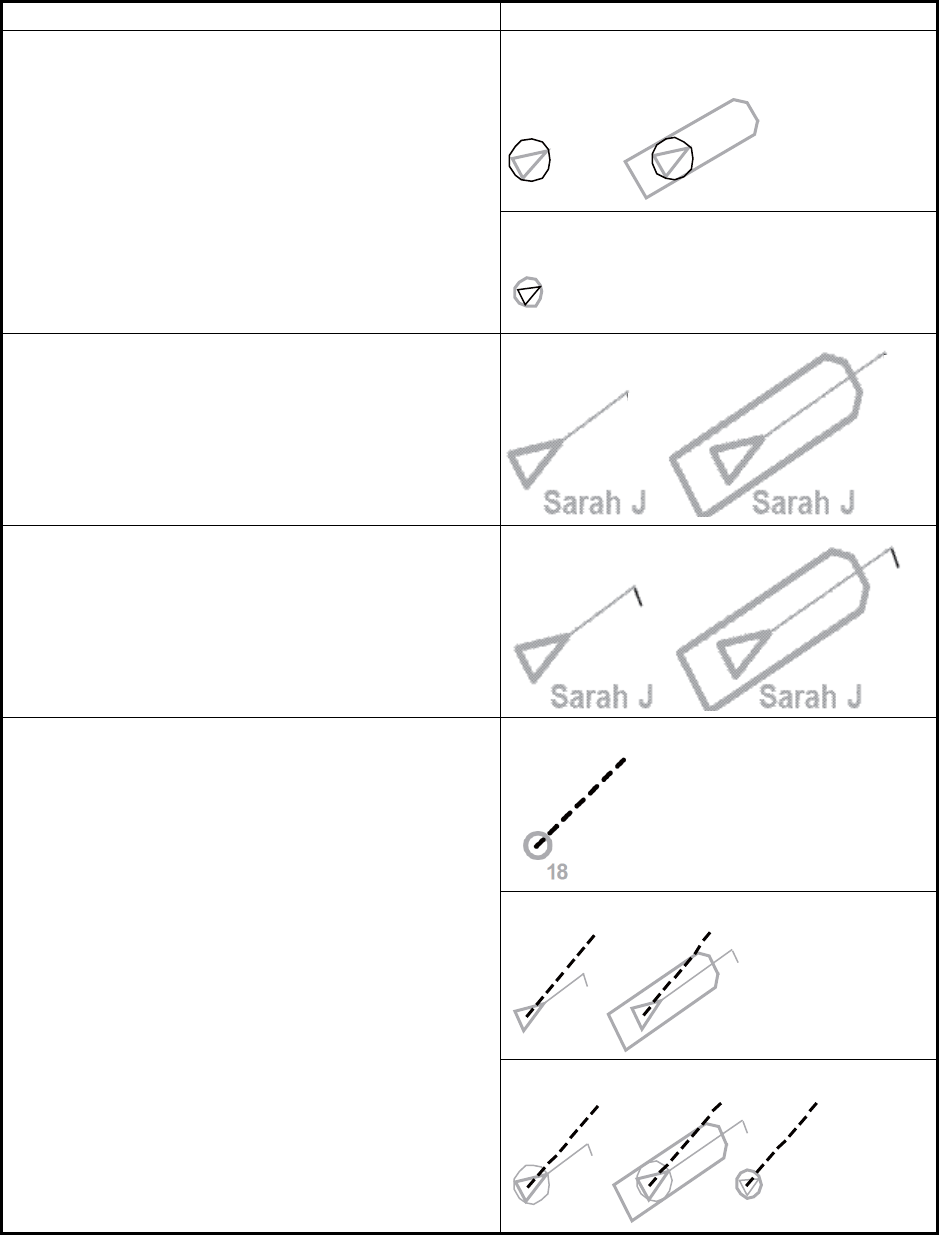
APPENDIX 2 ABBREVIATIONS, SYMBOLS
AP-15
Activated AIS targets - alternative Associated targets represented by AIS target
symbols
Associated targets represented by radar tar-
get symbols
Activated AIS targets - heading lines
Activated AIS targets - heading lines - turn indica-
tors
Velocity vectors Radar target velocity vectors
AIS target velocity vectors
Associated target velocity vectors
Symbol name and description Symbol graphic(s)
Sarah J Sarah J
18
Sarah J Sarah J
Sarah J Sarah J 18
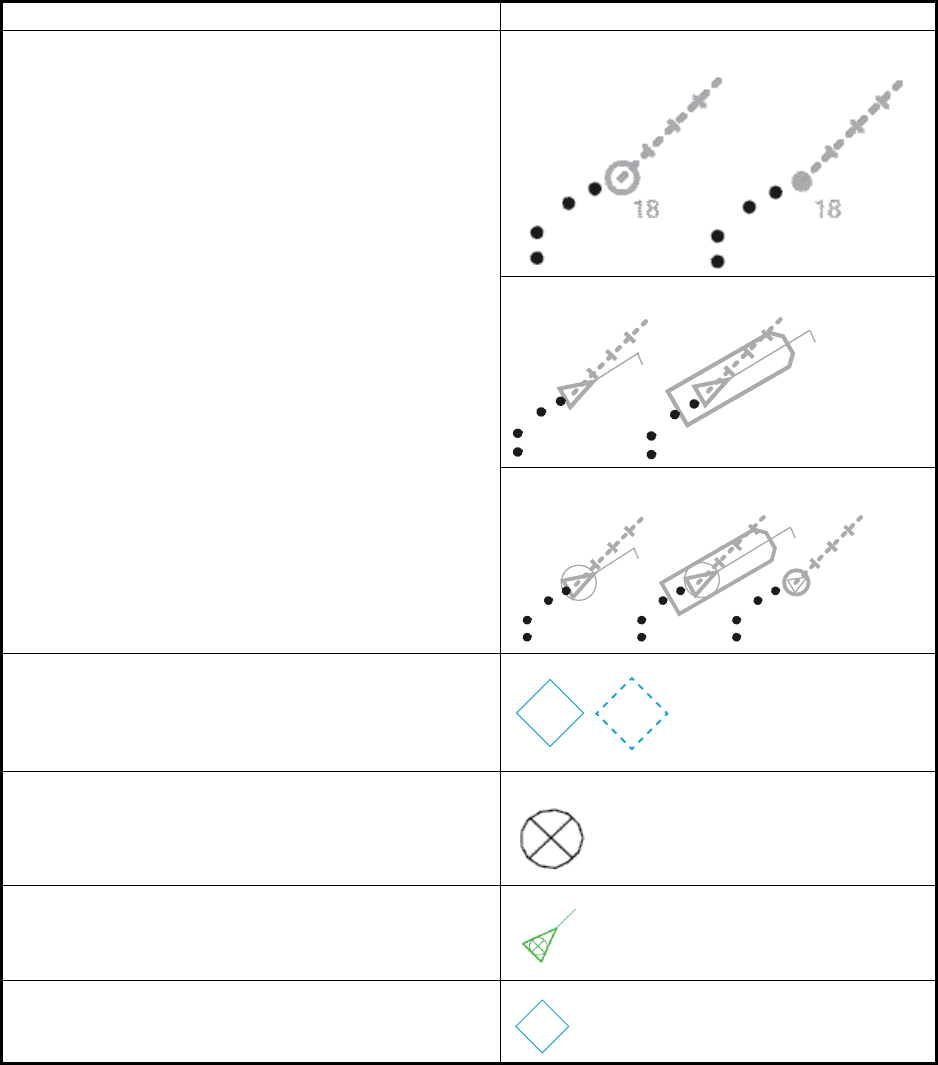
APPENDIX 2 ABBREVIATIONS, SYMBOLS
AP-16
Target past positions Radar target past positions
AIS target past positions
Associated target past positions
AIS aid to navigation (ATON)
Physical (real) ATON is solid line and virtual ATON
is dashed line.
An ATON in off position is yellow.
AIS search and rescue transmitter -SART
AIS SAR vessel
AIS base station
Symbol name and description Symbol graphic(s)
Sarah J Sarah J
Sarah J Sarah J 18
BS
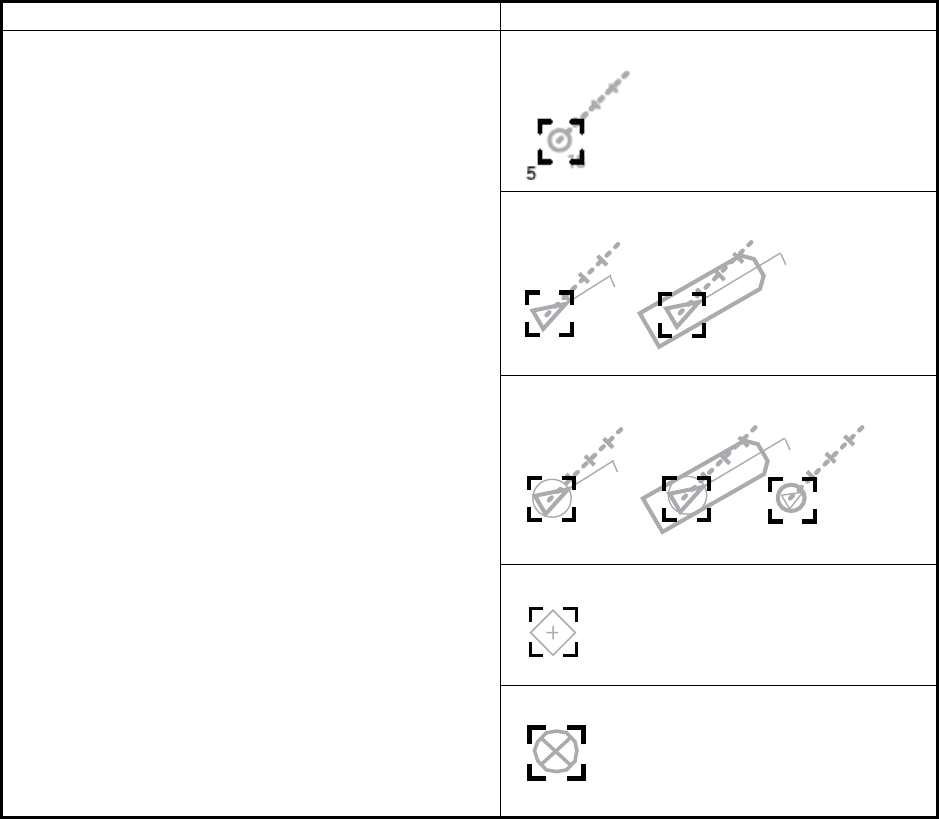
APPENDIX 2 ABBREVIATIONS, SYMBOLS
AP-17
Selected targets Selected radar targets
Selected AIS targets
Selected association targets
Selected AIS ATON
Selected AIS SART
Symbol name and description Symbol graphic(s)
Sarah J Sarah J
55
Sarah J Sarah J 18
55
5
5
5
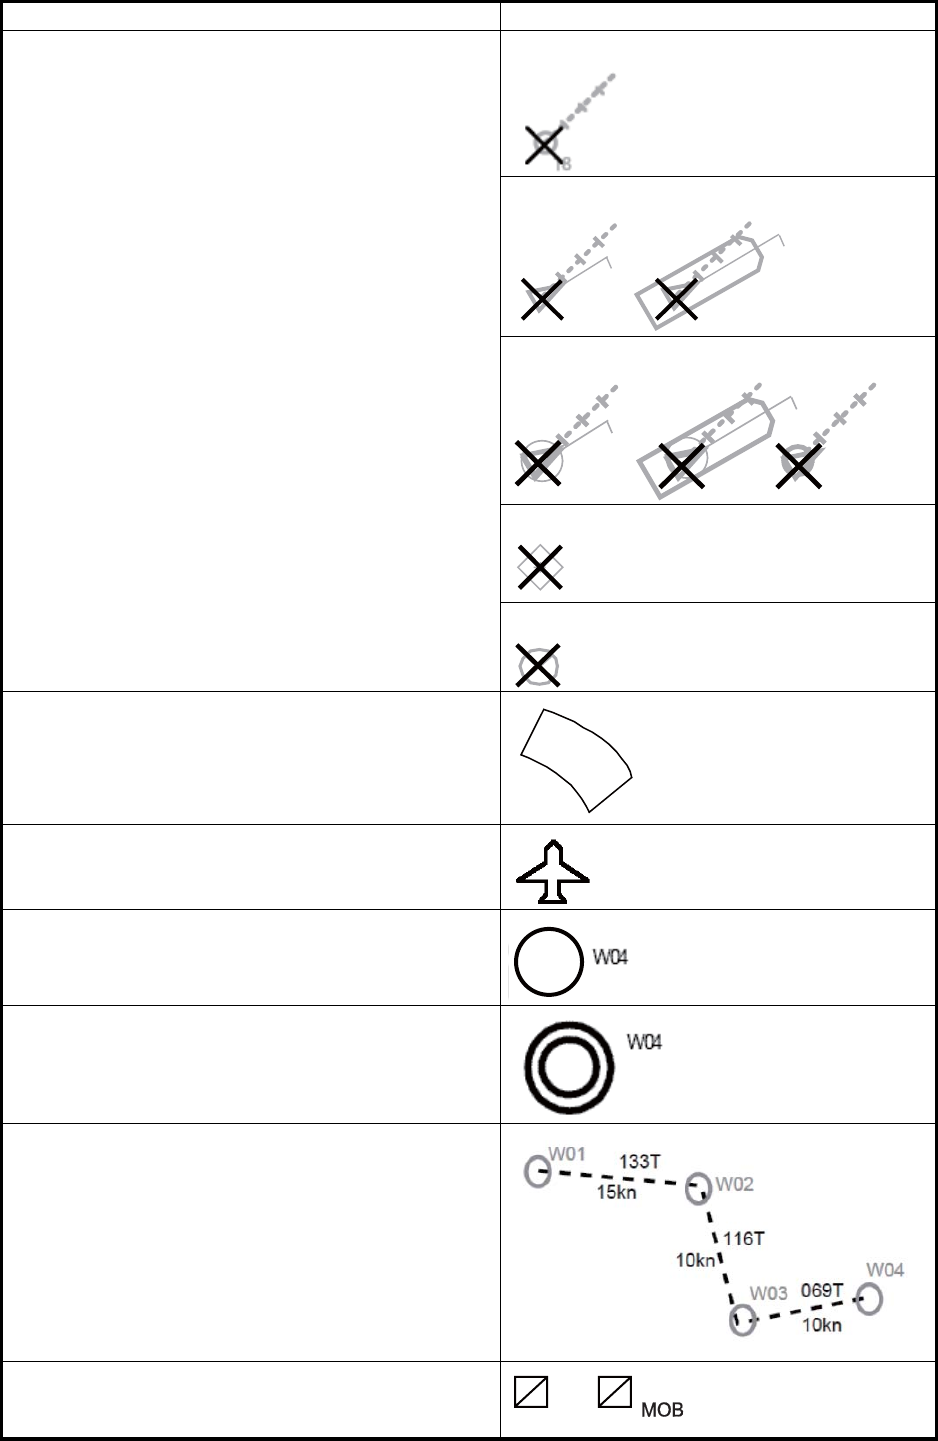
APPENDIX 2 ABBREVIATIONS, SYMBOLS
AP-18
Lost targets
Lost target symbol is red and it flashes until acknowl-
edged.
Lost radar targets
Lost AIS targets
Lost associated targets
LOST AIS ATON
Lost AIS SART
Radar and AIS target acquisition area
AIS SAR aircraft
Waypoint
Next waypoint
Routes
Event marker
Symbol name and description Symbol graphic(s)
Sarah J Sarah J
Sarah J Sarah J 18
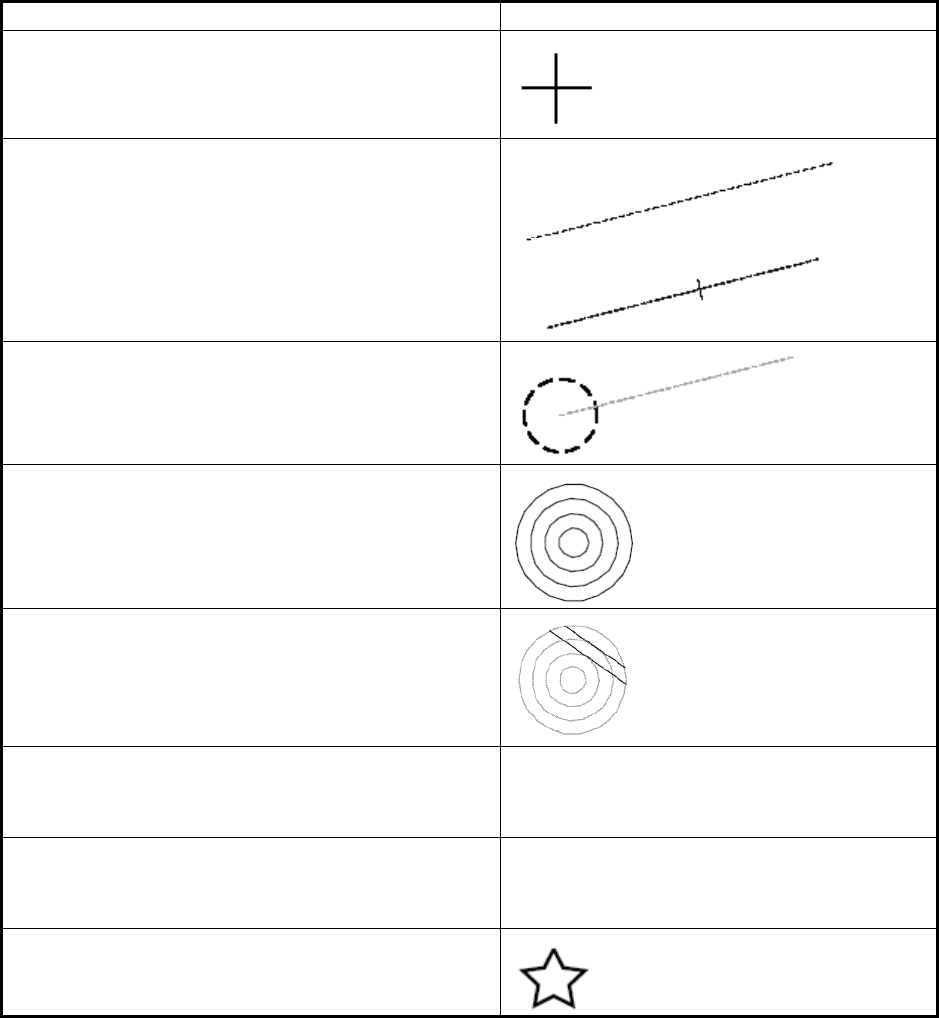
APPENDIX 2 ABBREVIATIONS, SYMBOLS
AP-19
User cursor
Electronic bearing line (EBL)
Second example show with range marker.
Variable range marker (VRM)
Range rings
Parallel index lines
Trial maneuver
Displayed (flashing) during trial maneuver.
Simulation mode
Displayed (flashing) during TT performance test.
Drop mark
Symbol name and description Symbol graphic(s)
T
S
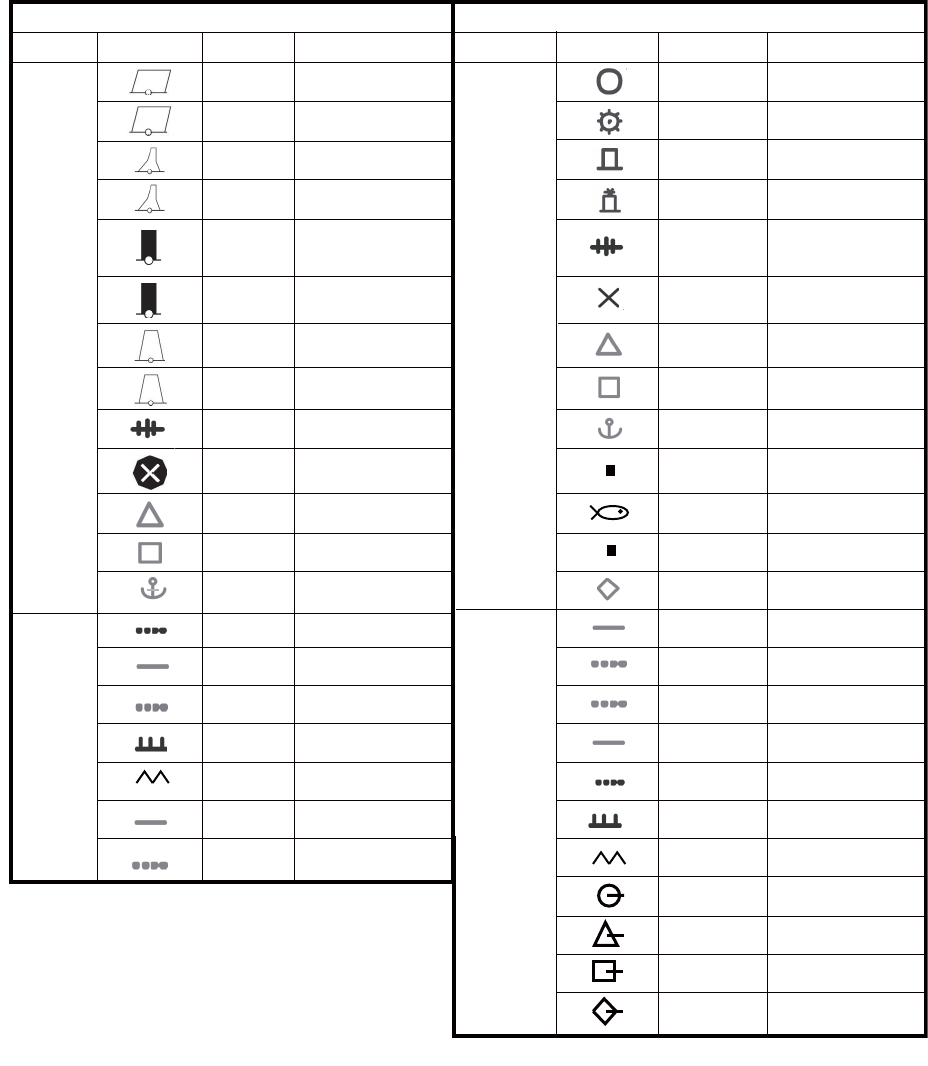
APPENDIX 2 ABBREVIATIONS, SYMBOLS
AP-20
Radar map symbols
IMO and A types B-type
Category Symbol Color* Name Category Symbol Color Name
Mark
Mark
Line
*Fixed
Line
Red
Red
Red
Red
Green
Green
Green
Green
Purple
Purple
Yellow-
Orange
Yellow-
Orange
Yellow-
Orange
Purple
White
Gray
Purple
Purple
Yellow-
Orange
Yellow-
Orange
Buoy
Buoy
Buoy
Buoy
Buoy
Buoy
Buoy
Buoy
Danger
Danger
Mark
Mark
Mark
Nav Line
Coast Line
Contour Line
Prohibited Area
Cable (Danger)
Line Mark
Line Mark
7 colors
7 colors
7 colors
7 colors
7 colors
7 colors
7 colors
7 colors
7 colors
7 colors
7 colors
7 colors
7 colors
7 colors
7 colors
7 colors
7 colors
7 colors
7 colors
7 colors
7 colors
7 colors
7 colors
7 colors
Buoy
Buoy
Buoy
Buoy
Danger
Danger
Mark
Mark
Mark
Mark
Mark
Mark
Mark
Mark
Mark
Nav Line
Coast Line
Contour Line
Prohibited Area
Cable (Danger)
Line Mark
Line Mark
Line Buoy
Line Mark
APPENDIX 2 ABBREVIATIONS, SYMBOLS
AP-21
Symbols on operating buttons
Symbol Meaning
Minimize button (on InstantAccess bar)
Access AIS, Navtex functions (chart mode)
Display received AIS message (radar mode)
Access user profile, common settings
Information (show program no., operator's manual)
Undo, redo
Note: This symbol is not displayed on the FURUNO 19-inch monitor unit.
Screenshot capture
Monitor brilliance (FURUNO monitor only)
Color palette selection
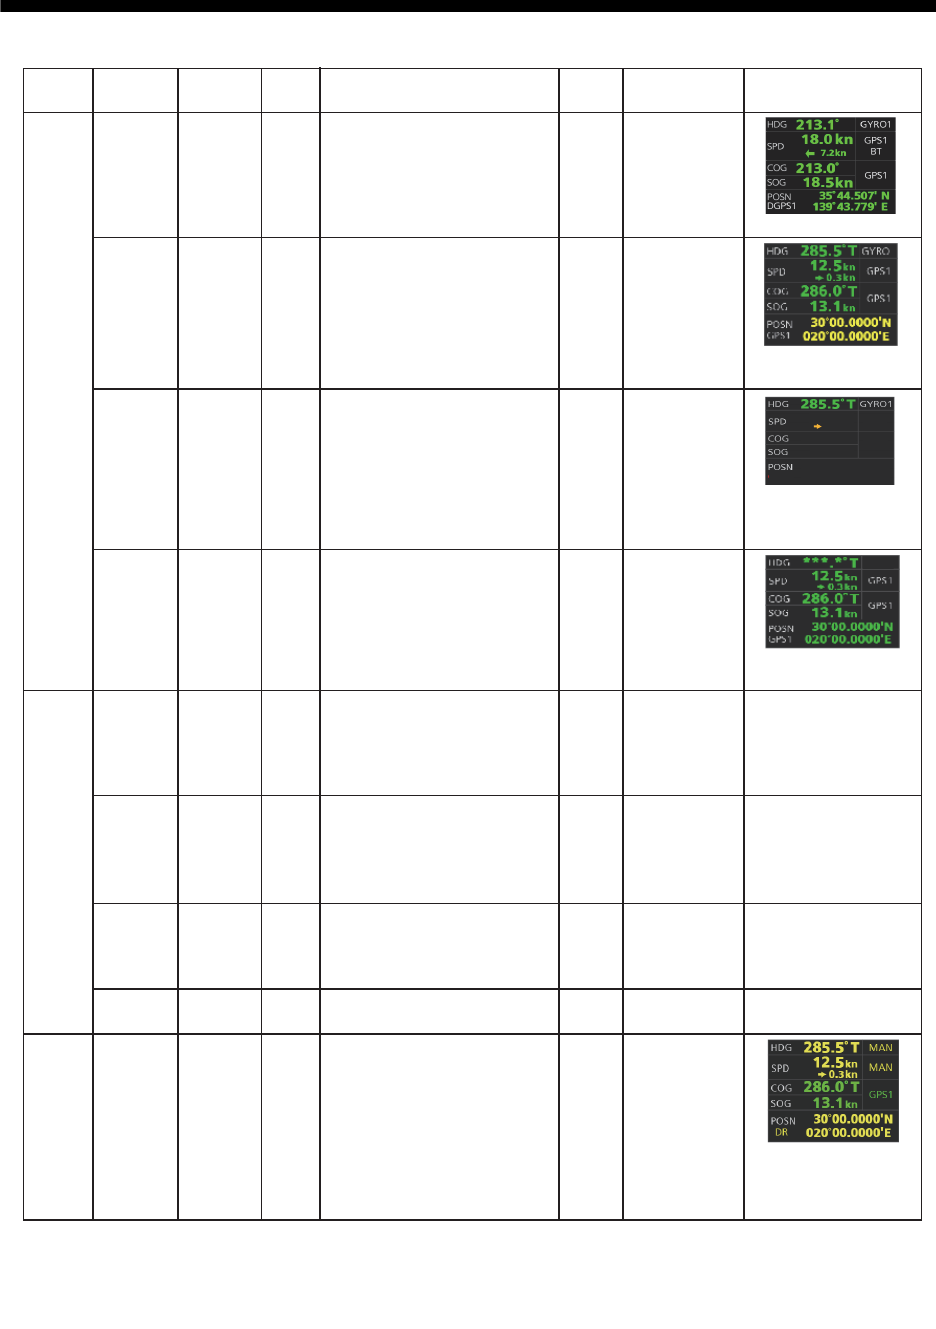
AP-22
APPENDIX 3 DATA COLOR AND
MEANING
Indication
color
Sensor
color
GNS-A,D,F,P,R
GGA-1,2,3,4,5
GLL-A,D and (status: A)
RMC-A,D,F,P,R and (status: A)
VBW-A
VHW
SYSTEM
LOCAL
MANUAL
Manual setting value
(Dead Reckoning)
DGPS update interval in GGA,
GNS sentence is higher than
10 seconds.
RAIM error in GBS sentence is
longer than 10 m.
GNS-M,S
GGA-7,8
GLL-M,S
RMC-M,S
GNS-A,D,F,P,R
GGA-1,2,3,4,5
GLL-A,D and (status: A)
RMC-A,D,F,P,R and (status: A)
THS-A
HDT
THS-E,
M, S, N
THS-A
HDT
Manual
setting
value
(Type
A or B)
Correction
setting
value
(Local
setting)
VBW-V
VBW-A
VHW
VBW-V
VTG-A,D,P
VTG-E,M,S
RMC-E,M,S or
(status: V)
VTG-A,D,P
DGPS update interval in GGA,
GNS sentence is higher than
10 seconds.
RAIM error in GBS sentence is
longer than 10 m.
GNS-M,S
GGA-7,8
GLL-M,S
RMC-M,S
All values in green.
Position in yellow
characters.
SPD, COG, SOG and
POSN values and pos.
source name in red.
HDG value shown
with asterisks.
Same as corresponding
indication in SYSTEM.
HDG, SPD and POSN
values and "MAN"*
5
in
yellow characters.
GNS-N, GGA-N, GLL-N,
RMC-N or (status: V)
VTG-N
*1: Navigational status in RMC, GNS sentence shown in “S” only (IEC 61162-1 ed4).
*2: Navigational status in RMC, GNS sentence shown in “C”, “U” only (IEC 61162-1 ed4).
*3: Navigational status in RMC, GNS sentence shown in “V” only (IEC 61162-1 ed4).
*4: Navigational status in RMC sentence shown in “V” only (IEC 61162-1 ed4).
*5: “CORR1” replaces “MAN” in case of heading offset.
VTG-N
RMC-N
HDG L/L SPD COG/SOG Display example
GRN
YEL
YEL-ORG
GRN
YEL
GRN
(***.*)
GRN
(***.*)
YEL
WHT
WHT
WHT
WHT
WHT
WHT
YEL
(MAN)
(DR)
THS-E,
M, S, N
GNS-N, GGA-N, GLL-N,
RMC-N or (status: V)
Manual
setting
value
Same as corresponding
indication in SYSTEM.
Same as corresponding
indication in SYSTEM.
Same as corresponding
indication in SYSTEM.
*1
*2
*3
*4
*1
*2
YEL-ORG VTG-E,M,S
RMC-E,M,S or
(status: V)
*3
12.5kn
0.3kn
GPS1
GPS1
286.0°T
13.1kn
GPS1
30°00.0000'N
020°00.0000'E
YEL-ORG
YEL-ORG
GNS-E
GGA-6
GLL-E
RMC-E
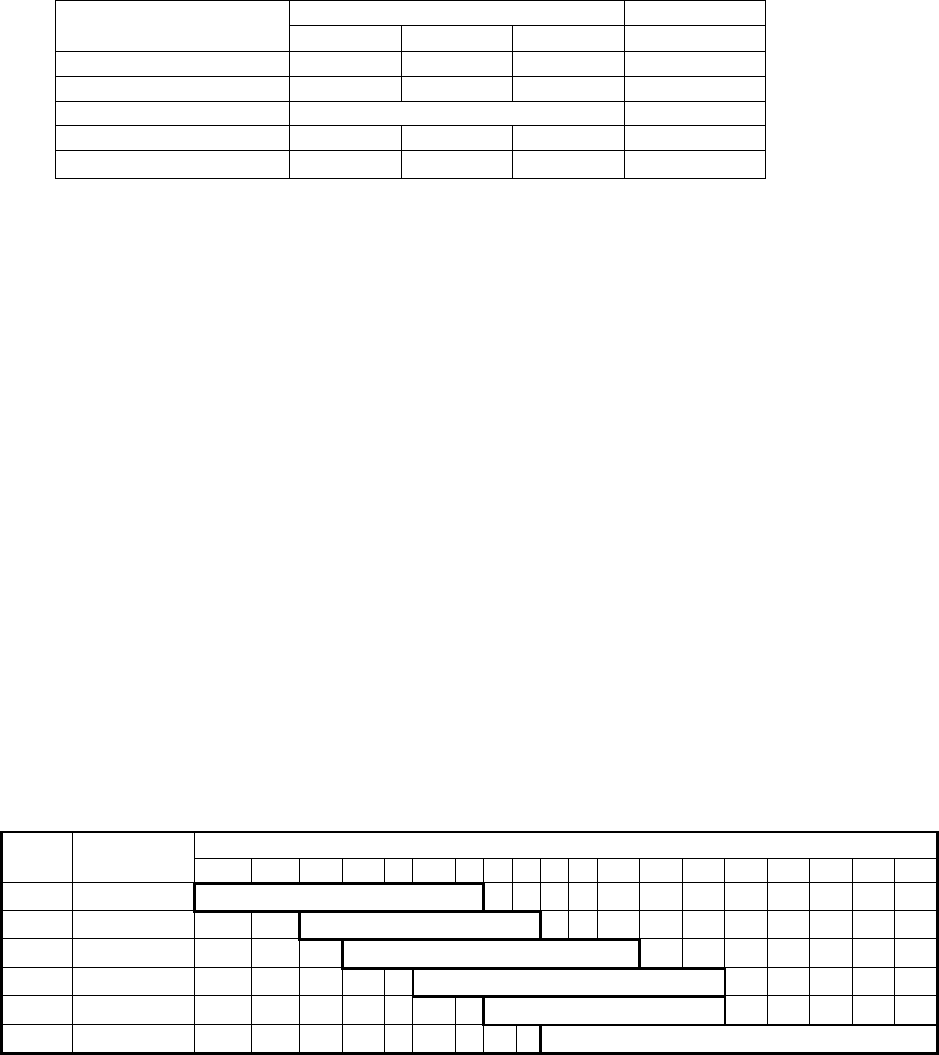
FURUNO
FAR-32x0/33x0 SERIES
SP - 1 E3616S01C-M
SPECIFICATIONS OF MARINE RADAR/ARPA
FAR-32x0/33x0 SERIES
1 ANTENNA RADIATOR
1.1 Type Slotted waveguide array
1.2 Beam width and sidelobe attenuation
Radiator type X-band S-band
XN12CF XN20CF XN24CF SN36CF
Length 4 ft 6.5 ft 8 ft 12 ft
Horizontal beam width 1.9° 1.23° 0.95° 1.8°
Vertical beam width 20° 25°
Sidelobe within ±10° -24 dB -28 dB -28 dB -24 dB
Sidelobe outside ±10° -30 dB -32 dB -32 dB -30 dB
1.3 Polarization Horizontal
1.4 Rotation 24 rpm or 42 rpm (for high speed craft)
2 TRANSCEIVER
2.1 TX Frequency and modulation
X-band (Magnetron) 9410 MHz ±30 MHz, P0N
S-band
Magnetron radar 3050 MHz ±30 MHz, P0N
Solid state radar CH1: 3043.75 MHz (P0N)/ 3063.75 MHz ±5 MHz (Q0N) or
CH2: 3053.75 MHz (P0N)/ 3073.75 MHz ±5 MHz (Q0N)
2.2 Output power
FAR-3210/3310 12 kW
FAR-3220/3320/3320W 25 kW
FAR-3230S/3330S/3330SW 30 kW
FAR-3230S-SSD/3330S-SSD 250 W (equivalent to magnetron radar 30 kW)
2.3 Transmitter
Magnetron radar FAR-3210/3310/3220/3320(W)/3230S/3330S(W)
Solid state radar FAR-3230S-SSD/3330S-SSD
2.4 Pulselength, Pulse Repetition Rate and Range scale
Magnetron radar:
Range
PRR
(Hz approx.)
Range scale (NM)
0.125 0.25 0.5 0.75 1 1.5 2 3 4 6 8 12 16 24 32 48 72 96 120
S1 3000* 0.07 μs
S2 3000* 0.15 μs
M1 1500 0.3 μs
M2 1200 0.5 μs
M3 1000 0.7 μs
L 600** 1.2 μs
1/2/4/8/16/32/72/120 NM ranges: non-IMO radar only
*: 2200 Hz with TT range on 32 NM.
**: 500 Hz on 96 NM range.
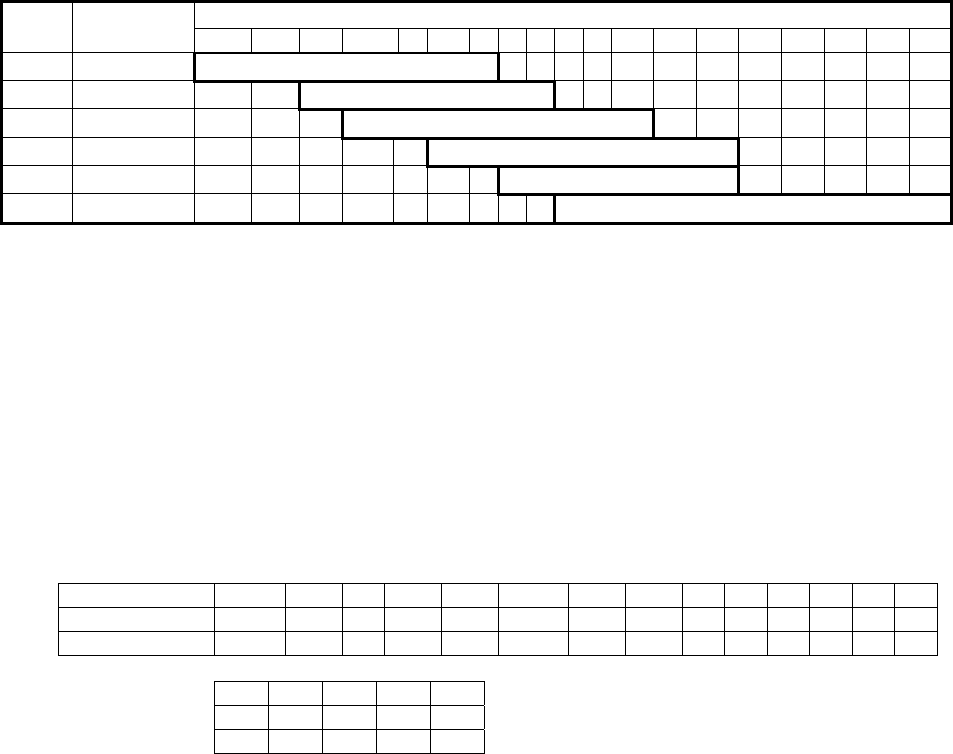
FURUNO
FAR-32x0/33x0 SERIES
SP - 2 E3616S01C-M
Solid state radar: Pulselength of P0N/Q0N
Range
PRR
(Hz approx.)
Range scale (NM)
0.125 0.25 0.5 0.75 1 1.5 2 3 4 6 8 12 16 24 32 48 72 96 120
S1 2400* 0.07/5.0 μs
S2 2000* 0.18/7.5 μs
M1 1500 0.3/12.5 μs
M2 1060 0.5/17.5 μs
M3 1000 0.7/18.3 μs
L 600 1.2/18.3 μs
1/2/4/8/16/32/72/120 NM ranges: non-IMO radar only
*: 1800 Hz (S1) and 1500 Hz (S2) with TT range on 32 NM.
3 PROCESSOR UNIT
3.1 Minimum range 22 m
3.2 Range discrimination 26 m
3.3 Range accuracy 1% of the maximum range of the scale in use or 10 m,
whichever is the greater
3.4 Bearing discrimination 2.1° (XN12CF), 1.5° (XN20CF), 1.2° (XN24CF), 2.0° (SN36CF)
3.5 Bearing accuracy ±1°
3.6 Range scale and Range ring interval (RI)
Range (NM) 0.125 0.25 0.5 0.75 1 1.5 2 3 4 6 8 12 16 24
RI (NM) 0.025 0.05 0.1 0.25 0.25 0.25 0.5 0.5 1 1 2 2 4 4
Number of rings 5 5 5 3 4 6 4 6 4 6 4 6 4 6
32 48 72 96 120
8 8 12 16 20
4 6 6 6 6
3.7 Warm-up time 3 min. approx. (solid state radar excluded)
3.8 Orientation mode Head-up RM, STAB head-up RM, Course-up RM, North-up RM
North-up TM, Stern-up RM
3.9 Stabilization mode Ground or sea stabilization
3.10 Target tracking (TT) Auto or manual acquisition: 200 targets in 32 NM
Auto tracking on all acquired targets,
Past position: 5/10 pts on all activated targets
Vector time: Off, 30 s, 1-60 min
3.11 AIS Capacity: 2000 targets,
Past position: 5/10 pts on all activated targets
Vector time: Off, 30 s, 1-60 min
3.12 Radar map 10 maps, 4,000 pts per map
3.13 Acquisition zone 2 zones
4 MONITOR UNIT
4.1 Display Color LCD, raster-scan non-interlace, daylight display
4.2 Screen size
MU-190 19-inch, 376.32 x 301.06 mm, SXGA (1280 x 1024 pixel)
MU-231 23.1-inch, 470.40 x 352.80 mm, UXGA (1600 x 1200 pixel)
4.3 Brightness 450 cd/m2 typical (MU-190), 400 cd/m2 typical (MU-231)
FURUNO
FAR-32x0/33x0 SERIES
SP - 3 E3616S01C-M
4.4 Effective radar diameter 264.6 mm (MU-190), 335.2 mm (MU-231)
4.5 Visible distance 1.02 m nominal
5 INTERFACE
5.1 Processor unit (EC-3000)
Serial I/O 7 ports (IEC61162-1/2: 2 ports, IEC61162-1: 5 ports)
Input ABK, ACK, ACM, ACN, ALR, CUR, DBT, DPT, DTM, GGA, GLL,
GNS, HBT, HDT, MTW, MWV, RMC, THS, VBW, VDM, VDO,
VDR, VHW, VTG, ZDA
Output ABM, ACK, ALC, ALF, ALR, ARC, BBM, EVE, HBT, OSD, RSD,
TLB, TTD, TTM, VSD
Digital input 1 channel: contact signal, 100 ohm max. or 24VDC input
Alarm output 6 channels: contact signal, load current 250 mA
Normal close: 2, Normal open: 2, System fail: 1, Power fail: 1
DVI output 2 ports: DVI-D (DVI 1/2), 1 port: DVI-I or RGB (DVI 3)
USB 4 ports (3 ports for control units)
LAN 2 ports: Ethernet 1000Base-T for network equipment and
sensor adapter
5.2 Sensor adapter (option)
MC-3000S (serial) 8 ports: I/O, IEC61162-1/2: 4 ports, IEC61162-1: 4 ports
MC-3010A (analog) 3 ports: Input, -10 to +10 V, 0 to 10 V or 4 to 20 mA
MC-3020D (digital-in) 3 ports: relay contact, logics set from program
MC-3030D (digital-out) 3 ports: relay contact, normal open and normal close available
6 POWER SUPPLY
6.1 Power supply unit (w/ antenna and transceiver unit)
FAR-3210/3310 (X-band, 12 kW)
PSU-014 (24rpm) 100-230 VAC: 2.0-1.0 A, 1 phase, 50-60 Hz
PSU-014 (42rpm) 100-230 VAC: 2.4-1.1 A, 1 phase, 50-60 Hz
FAR-3220/3320/3320W (X-band, 25 kW)
PSU-014 (24rpm) 100-230 VAC: 2.4-1.2 A, 1 phase, 50-60 Hz
PSU-014 (42rpm) 100-230 VAC: 3.7-1.6 A, 1 phase, 50-60 Hz
FAR-3230S/3330S/3330SW (S-band, magnetron)
PSU-014 (24rpm) 100-230 VAC: 3.7-1.6 A, 1 phase, 50-60 Hz
PSU-015 (42rpm) 100-230 VAC: 6.4-2.7 A, 1 phase, 50-60 Hz
FAR-3230S-SSD/3330S-SSD (S-band, SSD)
PSU-016 (24rpm) 100-230 VAC: 2.8-1.4 A, 1 phase, 50-60 Hz
PSU-018 (42rpm) 100-230 VAC: 5.6-2.5 A, 1 phase, 50-60 Hz
6.2 Processor unit (EC-3000) 100-115/220-230 VAC: 1.5/0.7 A, 1 phase, 50-60 Hz
6.3 Monitor unit
MU-190 100-230 VAC: 0.7-0.4 A, 1 phase, 50-60 Hz
MU-231 100-230 VAC: 1.0-0.6 A, 1 phase, 50-60 Hz
6.4 Sensor adapter (option) 24 VDC: 1.4 A (for 11 units), input to MC-3000S, the sources of
other sensor adapters are fed from MC-3000S
FURUNO
FAR-32x0/33x0 SERIES
SP - 4 E3616S01C-M
6.5 Switching HUB (option)
HUB-3000 100-230 VAC: 0.1 A max. 1 phase, 50/60 Hz
HUB-100 100-230 VAC: 0.1 A max. 1 phase, 50/60 Hz
6.6 Transformer (RU-1803, option) 440 VAC, 1 phase, 50/60 Hz
6.7 De-icer (option) 100-115/220-230 VAC: 2.6/1.3 A, 1 phase, 50-60 Hz
7 ENVIRONMENTAL CONDITIONS
7.1 Ambient temperature
Antenna unit -25°C to +55°C (storage: -25°C to +70°C)
Indoor units -15°C to +55°C
7.2 Relative humidity 95% or less at +40°C
7.3 Degree of protection
Antenna unit IP56
Processor unit IP20 (IP22: option)
Sensor adapter IP20 (IP22: option)
Transceiver unit IP20
HUB HUB-100: IP20, HUB-3000: IP22
Control/ monitor/ power supply unit IP22
7.4 Vibration IEC 60945 Ed.4
8 UNIT COLOR
8.1 Antenna unit N9.5
8.2 Power supply unit N2.5
8.3 Processor unit N2.5
8.4 Control/ monitor unit N2.5
8.5 Transceiver unit N2.5
8.6 HUB HUB-100: N3.0, HUB-3000: N2.5
9 PERFORMANCE MONITOR
9.1 PM-32 (X-band)
Frequency range 9380 to 9440 MHz
Input power +18 dBm to +30 dBm
Output power -21 dBm (1st pulse max. output), -41 dBm (1st pulse min. output)
Step level 8 to 12 dB (1st pulse to last pulse)
9.2 PM-52A (S-band, MAG)
Frequency range 3040 to 3080 MHz
Input power +25 dBm to +40 dBm
Output power -38 dBm (1st pulse max. output), -58 dBm (1st pulse min. output)
Step level 8 to 12 dB (1st pulse to last pulse)
9.3 PM-52B (S-band, SSD)
Frequency range 3063.75 ±2 MHz
Input power +5 dBm to +25 dBm
Output power -52 dBm (1st pulse max. output), -72 dBm (1st pulse min. output)
Step level 8 to 12 dB (1st pulse to last pulse)

IN-1
INDEX
A
A/C RAIN control....................................... 2-5
A/C SEA control ........................................ 2-3
ACQ/ACT key............................................ 4-5
Acquisition zone
acknowledging alarm for ......................... 3-5
deactivating ............................................. 3-5
sleeping................................................... 3-5
stabilization ............................................. 3-5
AIO
chart cells ................................................ 9-9
chart object information........................... 9-9
displaying ................................................ 9-8
information to display ............................ 9-10
AIS
association ............................................ 4-14
association, conditions for............ 4-13, 18-9
automatic activation of targets ................ 4-5
automatic target activation
(chart mode)....................................... 18-5
CPA/TCPA alarm .................................. 4-10
deleting received and sent
safety messages ................................ 17-3
filtering targets......................................... 4-5
filtering targets (chart mode) ................. 18-5
function off............................................... 4-2
hiding....................................................... 4-3
lost target .............................................. 4-11
lost target alert ...................................... 4-11
Lost target alert filter (chart mode) ........ 18-6
lost target filter....................................... 4-12
messages, displaying............................ 4-17
messages, receiving ............................. 4-16
messages, transmitting ................4-15, 4-16
own ship data (chart mode)................... 18-9
past position display.............................. 4-12
pop-up info .............................................. 4-7
received and sent
safety messages ....................... 17-2, 17-3
ROT tag limit ......................................... 4-18
scaled symbol ....................................... 4-18
sending safety messages...................... 17-1
showing ................................................... 4-3
sleeping activated targets
(chart mode)....................................... 18-6
sleeping targets ....................................... 4-6
symbol brilliance.................................... 4-10
symbol color .......................................... 4-11
symbols ................................................... 4-3
symbols (chart mode)............................ 18-4
target data (basic) ................................... 4-7
target data (chart mode)............... 18-7, 18-8
target data (expanded)............................ 4-9
vectors................................................... 4-13
voyage data..................................4-14, 18-4
voyage data (chart mode) ..................... 18-4
Alert box ............................... 2-56, 6-10, 20-2
Alert list ................................................... 20-6
Alert log ................................................... 20-7
Alert parameters page............................. 12-6
Alert state icon ........................................ 20-4
Alerts
acknowledging ...................................... 20-5
alert list.................................................. 20-6
alert log ................................................. 20-7
alert state icons ..................................... 20-4
buzzer silencing..................................... 20-5
buzzer stop button................................. 20-4
definition................................................ 20-1
list of ...................................................... 20-8
message format..................................... 20-3
Anchor watch ................................. 2-54, 15-6
Antenna marker....................................... 2-36
Approved until date ................................... 9-5
Area report ............................................ 13-11
Association..................................... 4-13, 18-9
Automatic Clutter Elimination (ACE)
function..................................................... 2-9
B
Barge marker .......................................... 2-35
Basic setting page..................................... 8-3
Bearing measurement
chart ...................................................... 6-19
radar, chart radar................................... 2-23
BRILL control ............................................ 1-7
Brilliance
AIS symbol ............................................ 4-10
AIS symbol brilliance............................. 4-10
monitor .................................................... 1-7
screen data ........................................... 2-37
TT symbol................................................ 3-8
Buzzer stop button .................................. 20-4
C
CCRP ...................................................... 2-51
CCRP page ........................................... 22-14
CCRS ...................................................... 16-1
Chart alerts
introduction............................................ 11-1
objects used in ...................................... 11-3
own ship check...................................... 11-4
route monitoring .................................... 11-7
route planning ....................................... 11-5
Chart cells
catalog of............................................... 7-15
deleting.................................................. 7-17
editing.................................................... 7-17
grouping ................................................ 7-16
INDEX
IN-2
status......................................................7-18
Chart database (chart radar)....................2-63
Chart database button .............................8-10
CHART DISP button ................................2-60
Chart display indications ..........................1-12
Chart legend
C-MAP....................................................10-3
S57...........................................................9-2
Chart objects (chart radar)
custom sets of ........................................2-62
CHART ON/OFF button ...........................2-60
Chart radar display indications.................1-11
Chart scale...............................................6-14
Chart scale indication (chart radar)..........2-63
Chart synchronization
select units to synchronize .....................7-25
synchronization status............................7-26
Chart usage log........................................19-8
Charts
approved until date...................................9-4
cell deleting ............................................7-17
cell editing ..............................................7-17
display date..............................................9-4
Check area page............................ 11-4, 15-4
Check results page ..................................12-8
Circle report ...........................................13-12
Clearing line report.................................13-11
C-MAP charts
cartographic services .............................10-1
catalog of chart cells ..............................7-15
chart cell grouping..................................7-16
chart cell status ......................................7-18
chart legend ...........................................10-3
database deletion.....................................7-9
database installation ................................7-6
deleting...................................................7-20
eToken registration ..................................7-6
export list of............................................7-11
install/update history ..............................7-14
license installation....................................7-8
opening ..................................................7-18
permit status...........................................7-13
subscription services..............................10-2
update file, applying .................................7-9
update file, generating..............................7-9
C-MAP DL charts
enabling..................................................7-11
update file, applying ...............................7-10
update file, generating............................7-10
COG/SOG page.......................................16-5
Color differentiation test (S57 charts) ......24-8
Context-sensitive menu
EBL, VRM on chart ................................6-20
radar.......................................................1-24
radar, chart radar ...................................1-22
Context-sensitive menus
chart .......................................................6-11
Controls......................................................1-1
Cost parameters.......................................21-3
Course-up mode ......................................2-18
CPA/TCPA alarm
AIS .........................................................4-10
TT...........................................................3-16
Cursor attributes.......................................2-36
Cursor position box
chart .......................................................6-16
radar, chart radar ...................................1-25
Customize page .......................................22-7
Customized echo
editing.....................................................2-14
restoring to factory default settings ........2-15
restoring to saved settings .....................2-15
selection .................................................2-14
D
Danger targets log
conditions for logging ...........................19-11
viewing .................................................19-10
Data sharing.............................................22-6
Deep contour .............................................8-1
Depth sensor..........................................16-14
Details log ................................................19-5
Display date ...............................................9-5
Display test page .....................................22-8
Divider
activating ..............................................15-10
characteristics ......................................15-11
limitations .............................................15-11
Drop mark
bearing reference ...................................2-53
erasing ...................................................2-54
hiding......................................................2-53
inscribing ................................................2-53
showing ..................................................2-53
Dual radar ................................................2-45
Dynamic trial maneuver ...........................3-18
E
EBL
bearing measurement on chart ..............6-19
bearing measurement on radar,
chart radar...........................................2-23
bearing reference on chart.....................6-19
bearing reference on radar,
chart radar...........................................2-24
context-sensitive menu on chart ............6-20
hiding on chart........................................6-19
offsetting on radar, chart radar...............2-24
showing on chart ....................................6-19
EBL OFFSET key........................... 2-24, 2-26
EBL, VRM boxes......................................6-10
Echo area.................................................2-58
Echo averaging ..........................................2-8
Echo color ................................................2-58
Echo stretch ...............................................2-7
Echo-referenced speed..............................3-2
INDEX
IN-3
ENC charts
AIO display.............................................. 9-8
catalog of chart cells ............................. 7-15
chart cell grouping................................. 7-16
chart cell status ..................................... 7-18
chart installation ...................................... 7-3
deleting.................................................. 7-20
ENC coverage indication....................... 7-22
ENC list export ...................................... 7-12
ENC permit display ............................... 7-12
export list of........................................... 7-11
install/update history ............................. 7-14
license backup ...................................... 7-12
license deletion ....................................... 7-5
license installation, automatic ................. 7-2
license installation, manual ..................... 7-3
license restore....................................... 7-12
manual updates..................................... 7-22
opening ................................................. 7-18
permit status.......................................... 7-13
publishers notes .................................... 7-21
reconverting .......................................... 7-27
F
Fallback arrangements............................ 24-9
File export page ...................................... 22-2
Filter status............................................ 16-10
Full user chart report ............................... 13-9
Full WPT report ..................................... 12-22
G
GAIN control.............................................. 2-3
General page ............................................ 8-5
H
Heading input .................................1-28, 6-24
Heading line ............................................ 2-34
Head-up mode ........................................ 2-18
Head-up TB mode................................... 2-18
HL OFF key............................................. 2-34
I
INDEX LINE key...................................... 2-31
Indications
chart display .......................................... 1-12
chart radar display................................. 1-11
radar display............................................ 1-9
Information box
nav data ................................................ 2-39
nav data selection ................................. 2-41
route information ................................... 2-40
Instant access bar
chart display ............................................ 6-5
radar, chart radar .................................. 1-15
Instant Track
parameters ............................................ 21-2
Instant track
back to track.......................................... 14-7
button label.......................................... 14-12
details.................................................... 14-9
messages.............................................. 14-8
monitoring ........................................... 14-10
safe off track.......................................... 14-6
stopping monitoring ............................. 14-11
Interference rejector .................................. 2-7
Interswitch ............................................... 2-42
K
Keyboard test page ................................. 22-9
L
Label report ........................................... 13-12
Line report ............................................. 13-10
Lost target alert ....................................... 3-17
AIS ........................................................ 4-12
M
Magnetron reset ...................................... 2-50
Mains switch.............................................. 1-5
Manual updates
deleting update symbols........................ 7-24
inserting new update symbols ............... 7-23
modifying existing update symbols........ 7-24
Mariner page ............................................. 8-8
Mini conning display................................ 15-9
MOB position........................................... 1-29
N
Navigation data ....................................... 16-8
Navtex
deleting messages ................................ 17-4
receiving messages............................... 17-3
Noise rejector .......................................... 2-11
North marker ........................................... 2-34
North-up mode ........................................ 2-18
Notes on radar, chart radar ..................... 2-64
O
odometer resetting .................................. 6-31
Off center display (radar) ........................ 2-27
OFF CENTER key................................... 2-27
Offset EBL
origin point............................................. 2-25
usage .................................................... 2-24
Operating mode ...................................... 6-13
Operator?s manual ................................. 1-33
Optimize page .............................. 12-6, 12-15
Other page ................................................ 8-4
Other sensors page................................. 16-5
Overlay/NAV Tools box
anchor watch ......................................... 15-6
check area page.................................... 15-4
PI (parallel index) page ......................... 15-1
predictor ................................................ 15-5
ring ........................................................ 15-5
UKC....................................................... 15-7
Overlay/Nav Tools box............................ 6-10
Own ship functions box ............................. 6-8
Own ship marker ..................................... 2-34
INDEX
IN-4
P
Palette button.............................................1-6
Parallel index lines
activating, deactivating...........................15-2
bearing reference......................... 2-31, 15-2
displaying ...............................................2-31
erasing ...................................................2-31
interval....................................................15-3
length adjustment......................... 2-32, 15-4
line interval .............................................2-31
line orientation........................................2-31
mode ............................................ 2-32, 15-2
number of lines to display ......................15-2
number to show......................................2-31
orientation ..............................................15-3
resetting ....................................... 2-32, 15-3
Passage plan report...............................12-23
Past position display
AIS .........................................................4-12
TT...........................................................3-13
Performance monitor ...............................2-48
Permanent warning box ...........................6-10
Permanent warnings
C-MAP charts.........................................10-4
S57 charts ................................................9-3
Permit status ............................................7-13
PI (parallel index) page ............................15-1
Position
alignment..............................................16-12
primary and secondary...........................16-7
source ....................................................16-6
Position events.........................................19-2
Position offset (radar)...............................1-29
POSN page..............................................16-4
Power switch..............................................1-5
Predictor...................................................15-5
Presentation library ....................................9-6
Presentation mode
chart .......................................................6-15
radar, chart radar ...................................2-17
Primary alert priority (radar) .....................2-57
Printing
cell status list..........................................7-20
chart list..................................................7-19
S57 chart object information ....................9-7
Processor Unit EC-3000 ............................1-5
Program nos. ...........................................1-33
Public key (ENC charts).............................7-1
Publishers notes ......................................7-21
Pulse length
changing...................................................2-3
selection ...................................................2-2
R
Radar Control Unit RCU-025 .....................1-1
Radar display indications ...........................1-9
Radar map
copying individual marks and lines...........5-7
copying marks and lines in an area..........5-7
copying marks and lines to
another map file ....................................5-8
erasing all marks and lines in a map file ..5-6
erasing individual marks and lines ...........5-5
erasing marks and lines in an area ..........5-5
exporting ..................................................5-9
features on/off ........................................5-13
hiding........................................................5-1
importing ................................................5-10
line entry...................................................5-2
map comment ..........................................5-4
map points used.......................................5-3
mark entry ................................................5-2
radar map no............................................5-4
route display...........................................5-14
showing ....................................................5-1
Rain clutter adjustment
automatic..................................................2-5
manual .....................................................2-6
Range and bearing between
two targets ..............................................2-26
Range measurement
chart .......................................................6-19
radar.......................................................2-20
radar, chart radar ...................................2-20
Range selection .......................................2-20
Range/Presentation mode box.................2-17
Recording
chart usage log.......................................19-8
danger targets log ................................19-10
details log...............................................19-5
position events .......................................19-2
user events.............................................19-1
voyage log..............................................19-6
Reports
area ......................................................13-11
circle.....................................................13-12
clearing line..........................................13-11
full user chart..........................................13-9
Full WPT ..............................................12-22
label......................................................13-12
line........................................................13-10
passage plan........................................12-23
tidal.......................................................13-10
WPT table ............................................12-21
Ring page.................................................15-5
Route bank.............................................12-13
Route information box................................6-9
Route page ................................................8-8
Routes
adding waypoints at end of route ...........12-9
changing waypoint position ....................12-8
creating new...........................................12-2
deleting.................................................12-19
deleting waypoints..................................12-9
exporting FAR-3xx0 data .....................12-18
exporting FEA-2x07, csv, ASCII data...12-19
INDEX
IN-5
full WPT report .................................... 12-22
importing csv, ASCII data.................... 12-18
importing FEA-2x07 data .................... 12-17
importing FMD-3xx0, FCR-2xx9 data.. 12-17
inserting waypoint ................................. 12-9
optimizing ............................................ 12-15
overview in planning.............................. 12-1
passage plan report ............................ 12-23
route bank ........................................... 12-13
SAR..................................................... 12-10
selecting for monitoring ......................... 14-1
selecting route components to display .. 14-3
stopping monitoring ............................... 14-3
switching monitored to planning............ 14-5
user chart page (route planning) ........... 12-5
user charts information in
route monitoring ................................. 14-5
Waypoints page (monitoring) ................ 14-4
waypoints page (route planning) ........... 12-4
WPT table ........................................... 12-21
S
S57 charts
approved until date.................................. 9-5
chart legend ................................... 9-2, 10-3
chart object information........................... 9-7
chart update approval ............................. 9-4
display date ............................................. 9-5
permanent warnings................................ 9-3
presentation library.................................. 9-6
symbols used in ...................................... 9-6
Safety contour ..................................8-1, 11-2
Safety depth .............................................. 8-1
SAR route.............................................. 12-10
SART
introduction............................................ 2-55
receiving................................................ 2-55
Screenshots
capturing screen.................................... 1-30
deleting................................................ 22-12
exporting ............................................. 22-12
Screenshots page ................................. 22-11
Sea clutter adjustment
automatic................................................. 2-4
manual .................................................... 2-4
Second-trace echoes .............................. 2-16
Self test page .......................................... 22-5
Sensor information box .................... 1-18, 6-8
Sensor information, datum box ............... 1-18
Sensor set (system, local)....................... 1-25
Sensors menu ......................................... 16-2
Set and drift............................................. 3-14
Settings menu ......................................... 1-31
accessing .............................................. 22-1
CCRP .................................................. 22-14
customize page ..................................... 22-7
display test page ................................... 22-8
file export page...................................... 22-2
file import page...................................... 22-3
file maintenance page ........................... 22-4
keyboard test page................................ 22-9
screenshots page ................................ 22-11
self test page......................................... 22-5
user default page ................................ 22-13
Shallow contour......................................... 8-1
Ship and route parameters...................... 21-1
SPD page................................................ 16-3
Speed input ....................................1-26, 6-22
Split screen ............................................. 6-21
Standard page........................................... 8-4
Static trial maneuver ............................... 3-18
Status bar
chart display ............................................ 6-3
radar, chart radar................................... 1-13
STBY TX button ........................................ 2-1
Stern marker ........................................... 2-34
T
TARGET DATA key .................................. 4-7
Target list (TT, AIS)................................. 3-10
TARGET LIST key .................................. 3-10
Targets page ............................................. 8-9
Tidal report ............................................ 13-10
Time ........................................................ 1-30
Tips ................................................1-34, 6-21
Track
erasing .................................................. 5-14
setup ..................................................... 5-13
Trackball Control Unit RCU-026................ 1-4
Tracking page ........................................... 8-7
TRAIL key ............................................... 2-29
Trails
color ...................................................... 2-30
indications ............................................. 2-28
level of afterglow ................................... 2-30
own ship?s ............................................ 2-30
resetting ................................................ 2-29
suppressing trails around own ship....... 2-30
trail stabilization in true motion .............. 2-29
trail time................................................. 2-29
true or relative ....................................... 2-28
Trial maneuver
dynamic trial .......................................... 3-18
procedure .............................................. 3-19
static trial ............................................... 3-18
terminating ............................................ 3-20
trip meter resetting .................................. 6-31
True motion mode ................................... 2-19
True motion reset .................................... 6-17
TT
acquisition zone ...............................3-4, 3-5
alert list.................................................. 3-21
association ................................. 4-14, 18-10
automatic acquisition............................... 3-3
automatic acquisition zone ...................... 3-4
CPA/TCPA alarm .................................. 3-16
data display ............................................. 3-9
hiding....................................................... 3-1
INDEX
IN-6
lost target alert .......................................3-17
lost target alert filter (chart mode) ..........18-3
manual acquisition ...................................3-5
past position display...............................3-13
past positions, attributes (chart mode)...18-3
pop-up info .............................................3-10
showing ....................................................3-1
simulation mode .....................................3-20
static trial maneuver ...............................3-18
symbol brilliance.......................................3-8
symbol color.............................................3-8
symbol color (chart mode)......................18-1
symbol size (chart mode) .......................18-1
symbols ....................................................3-7
symbols (chart mode).............................18-1
target data (chart mode).........................18-2
target list.................................................3-10
terminating a trial maneuver...................3-20
terminating tracking on target...................3-6
trial maneuver ........................................3-18
trial maneuver procedure .......................3-19
vector .....................................................3-13
TUNE button ..............................................2-1
Tuning
automatic..................................................2-1
initializing..................................................2-1
manual .....................................................2-2
U
UKC page
setting.....................................................15-7
UKC window...........................................15-8
UKC window ............................................15-8
Undo .............................................. 12-4, 13-5
User chart page
route planning ........................................12-5
User charts
area report............................................13-11
circle report ..........................................13-12
clearing line report................................13-11
creating ..................................................13-2
deleting...................................................13-8
deleting objects from ..............................13-7
editing objects on ...................................13-7
full report ................................................13-9
importing ................................................13-6
information in route monitoring...............14-5
label report ...........................................13-12
line report .............................................13-10
notes ......................................................13-4
selecting objects to display ....................13-8
tidal report ............................................13-10
User charts page
route monitoring .....................................14-5
User default page...................................22-13
User events..............................................19-1
User profiles.............................................1-31
V
VECTOR MODE key................................3-13
VECTOR TIME key..................................3-13
Vectors
own ship.................................................2-35
target......................................................2-35
Voyage log
conditions for logging .............................19-8
viewing ...................................................19-7
VRM
context-sensitive menu on chart ............6-20
hiding on chart........................................6-19
range measurement on chart .................6-19
range measurement on radar,
chart radar...........................................2-20
showing on chart ....................................6-19
W
Watch alert...............................................2-38
Waypoints page
route monitoring .....................................14-4
route planning ........................................12-4
Wind sensor ...........................................16-13
Wiper........................................................2-12
WPT table report.............12-21, 12-22, 12-23
Z
Zoom........................................................2-33