Gutermann Technology ZS820915AL2 Wireless Transceiver for data collection User Manual ZONESCAN NET Manual 2 1 Rev3 en
Gutermann Technology GmbH Wireless Transceiver for data collection ZONESCAN NET Manual 2 1 Rev3 en
Contents
- 1. user manual
- 2. user manual II
user manual II
38 I 72
Note! The sound files are only playable when the Measurement
Period is in daily mode and not averaging mode
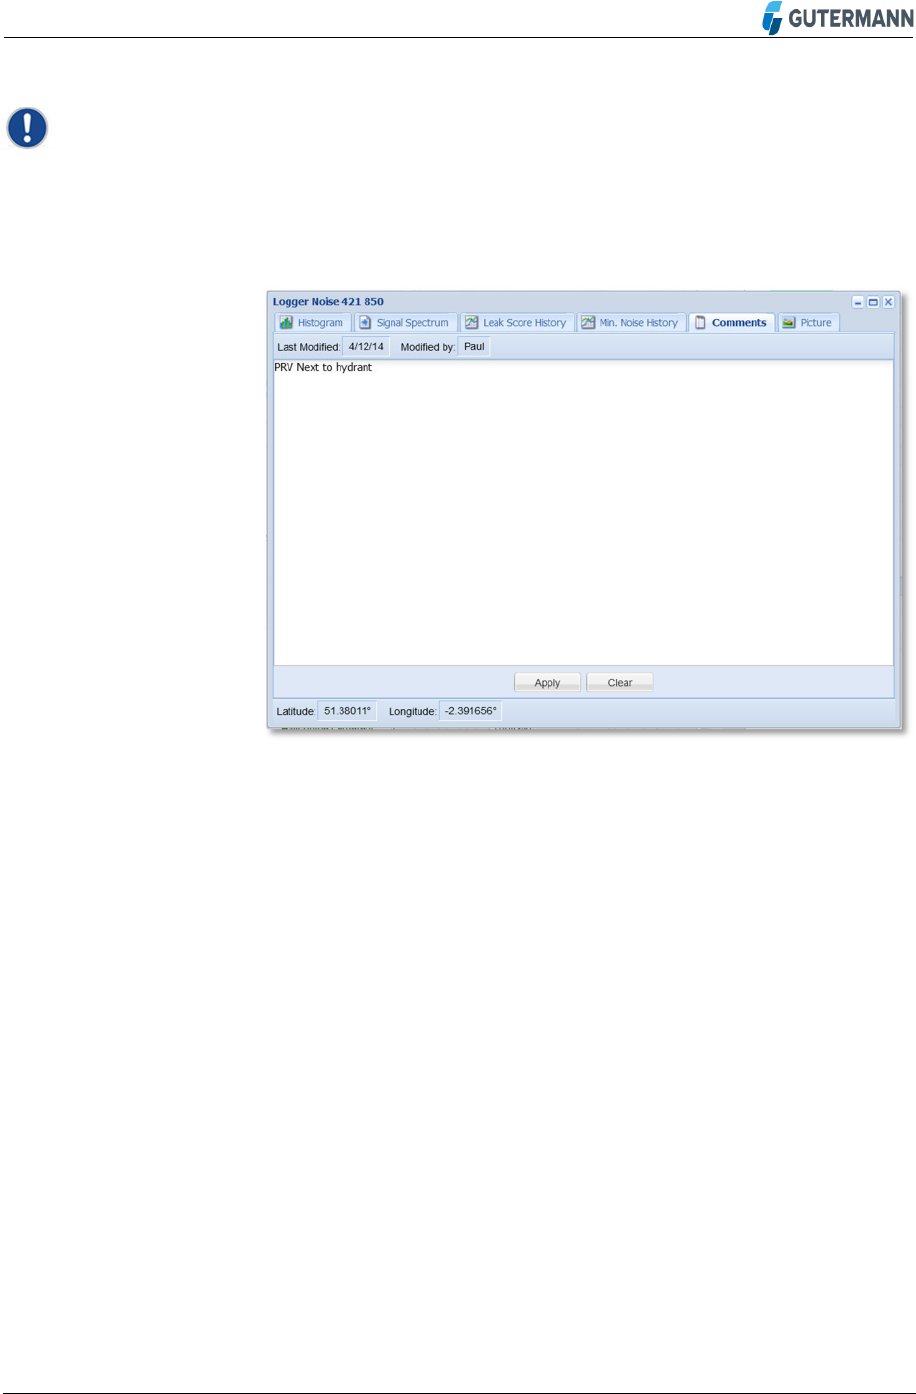
You can type any comment which will show in the comment line
next to the logger. Make sure the Apply button is clicked to save
the comment.
Figure 40: Comment Window
This opens up a picture of the installed logger onsite. For this
facility to be fully operational a photo must be taken during the
logger installation using the PDA (Personal Digital Assistant) and
ZONESCAN Mobile installation tool.
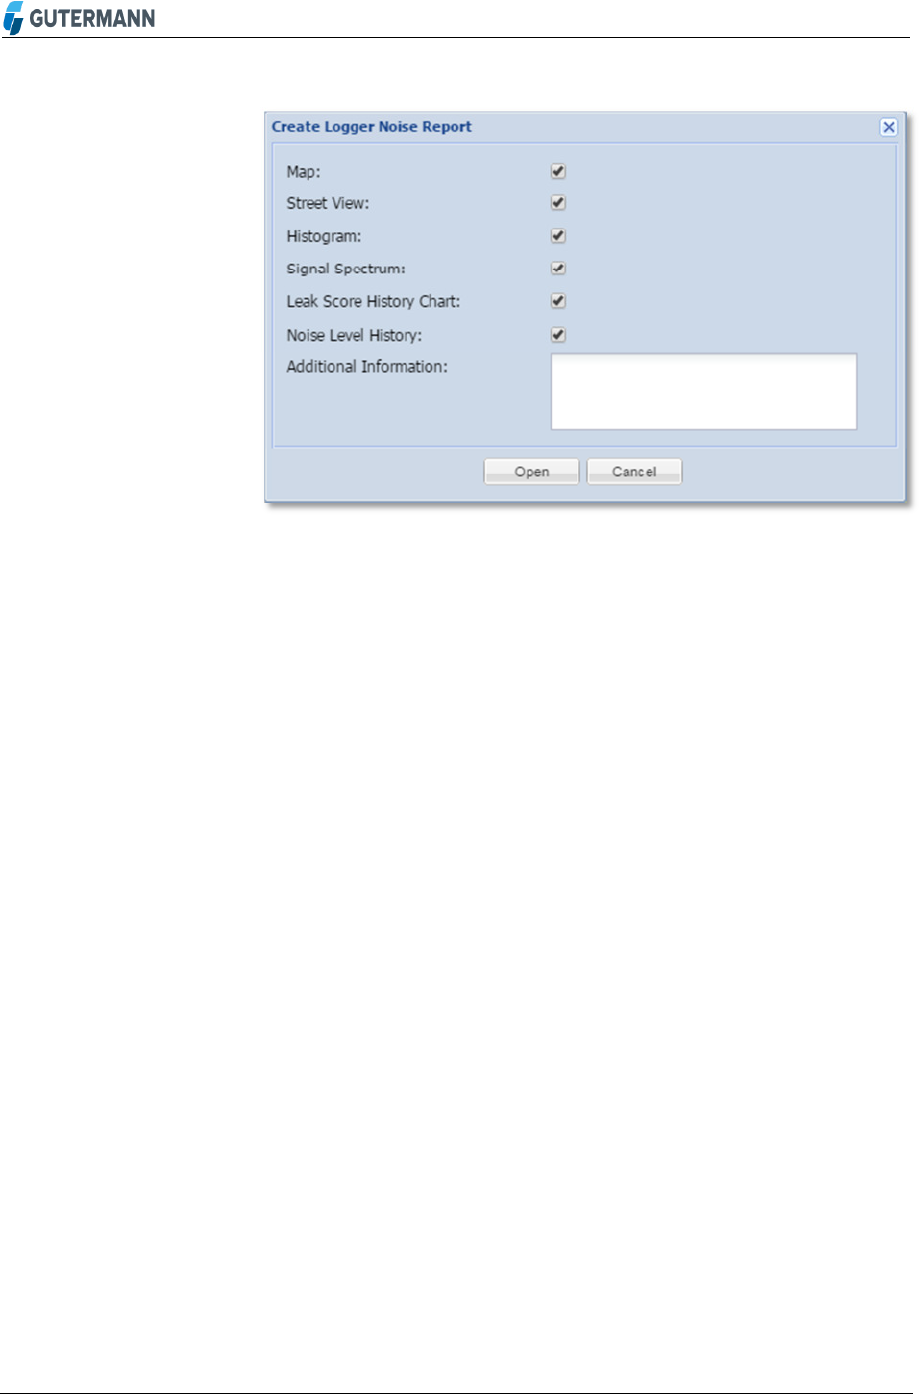
The Create a Logger Noise Report allows one to choose the
options in the window below before creating a report.
• Click Open and a separate window will open which then can be
sent to print
Comment
Picture
Logger Noise Report
39 I 72
Figure 41: Create a Logger Noise Report
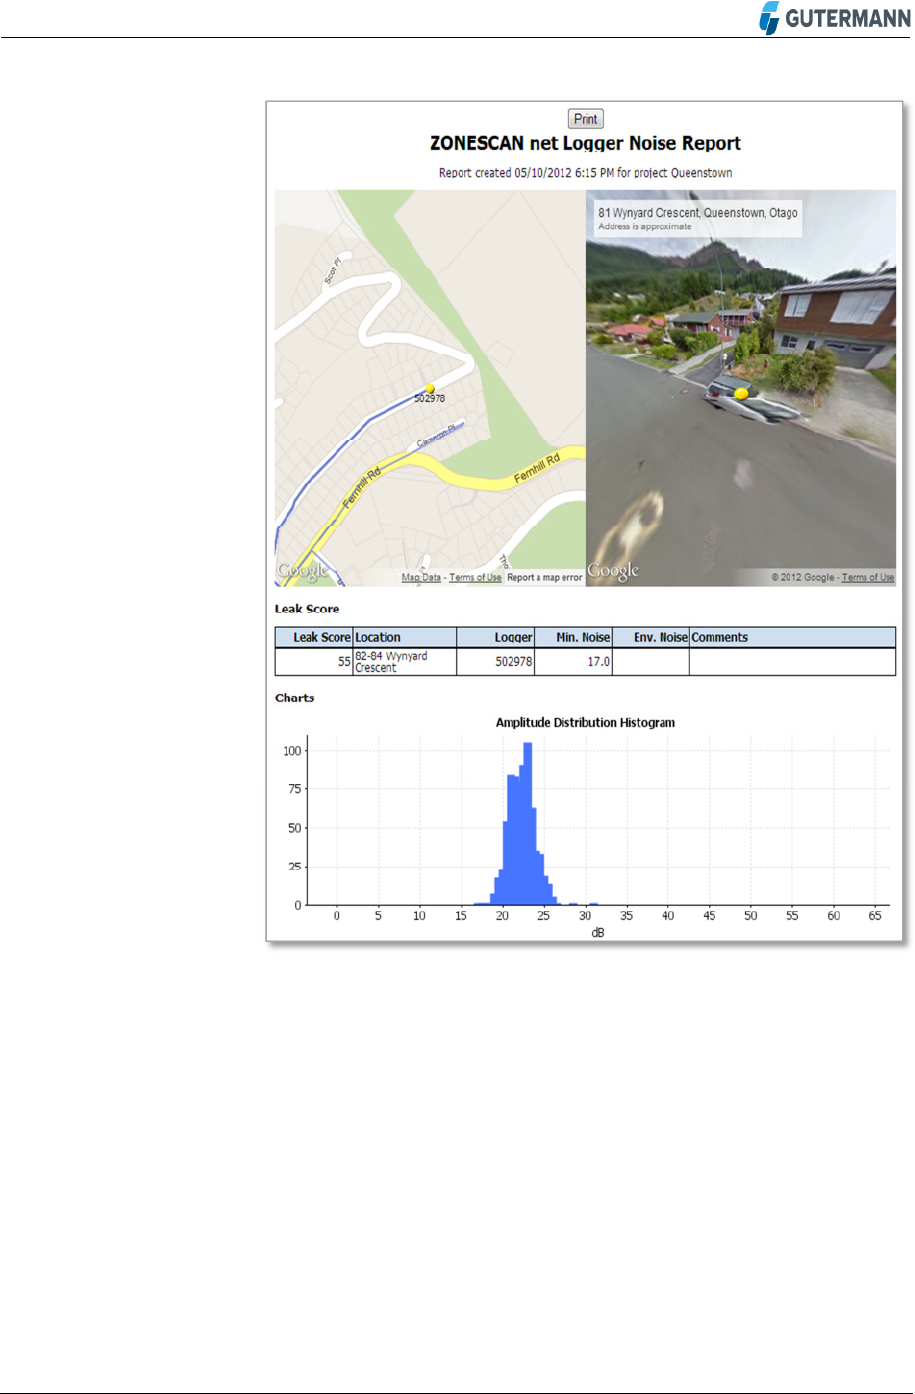
A separate window will open through the internet browser showing
the included options chosen.
• Press the print button to send the report to a printer or PDF file
40 I 72
Figure 42: The Logger Noise Report
41 I 72
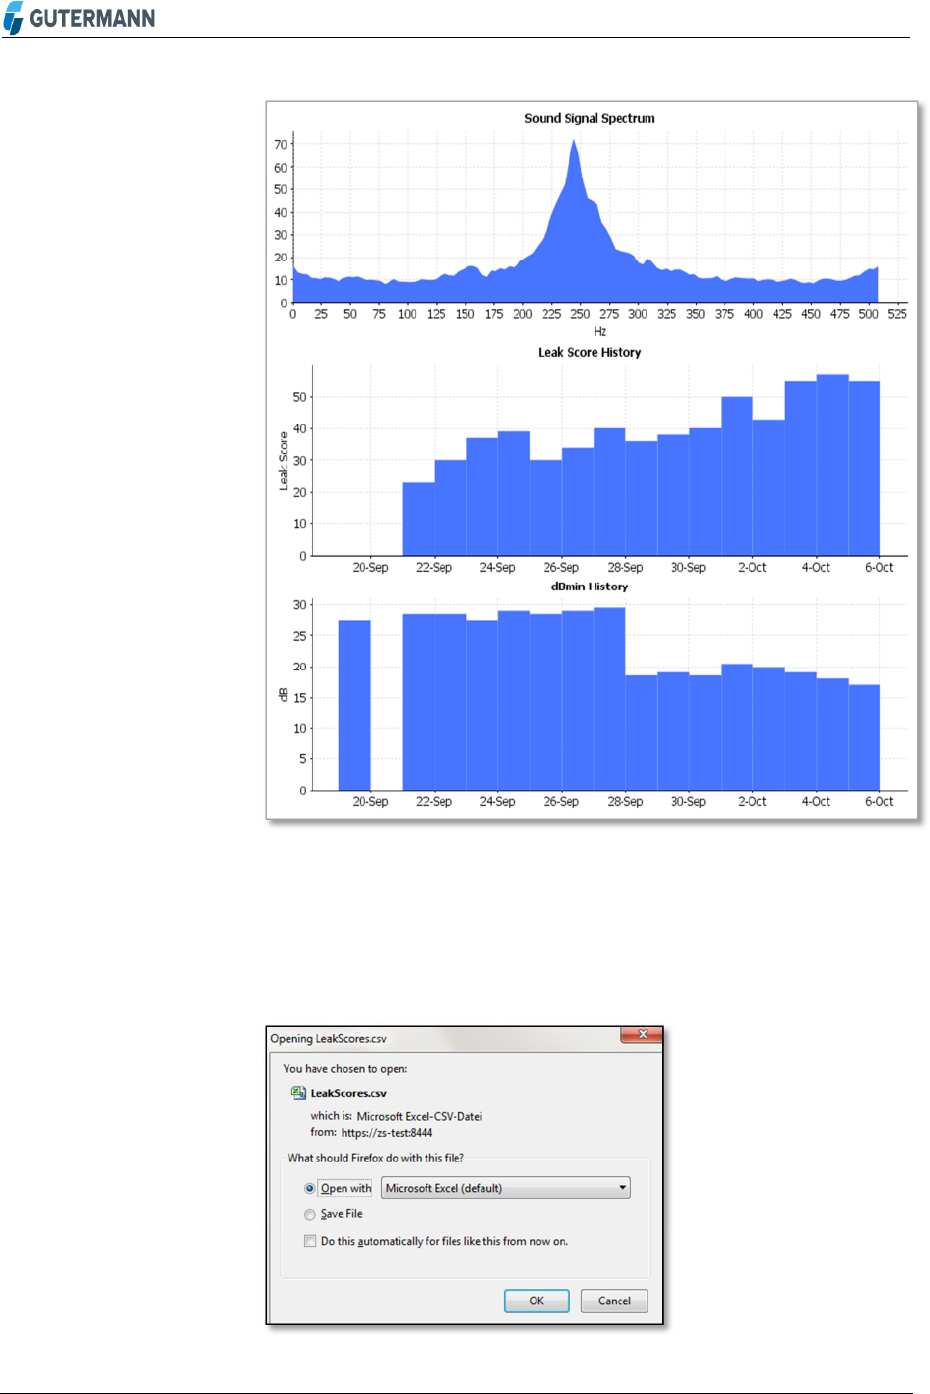
Figure 43: The Logger Noise Report – cont.
The Export to CSV (Comma-separated values) will download the
Loggers Leak Score into CSV file format and automatically open
Excel with the data.
Figure 44: Create a Measurement Report
Export to CSV
42 I 72
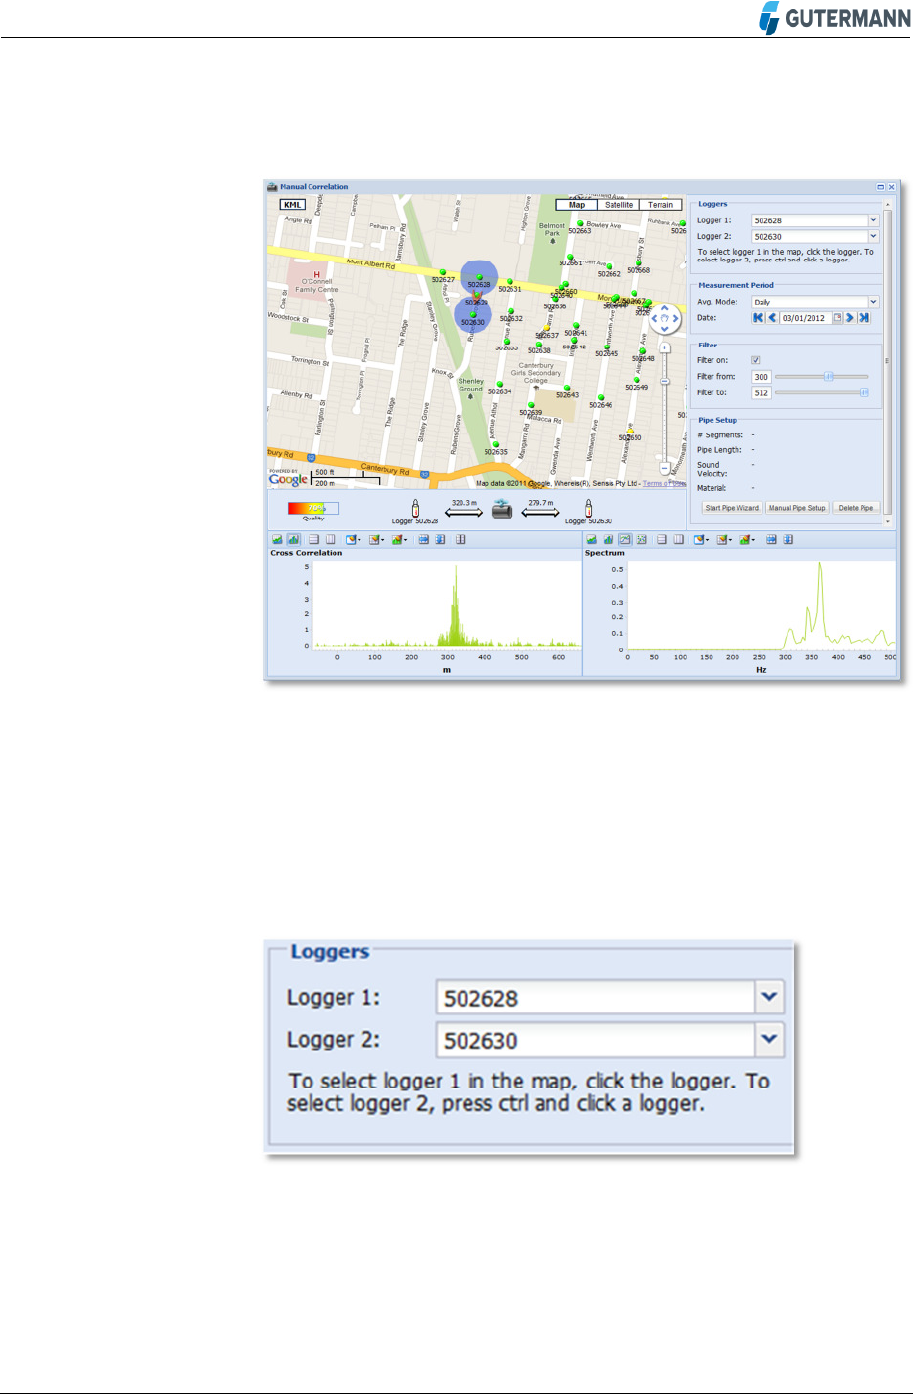
The Manual Correlation opens a separate window and allows the
user to pick any two loggers in the project to correlate between.
Figure 45: Manual Correlation Window
• Use the drop-down arrows in the Loggers’ section to select
your chosen Logger 1 and 2 or alternatively select logger 1 by
clicking on the Map and Logger 2 by pressing CTRL and click
on the Logger 2
Figure 46: Selecting the Loggers
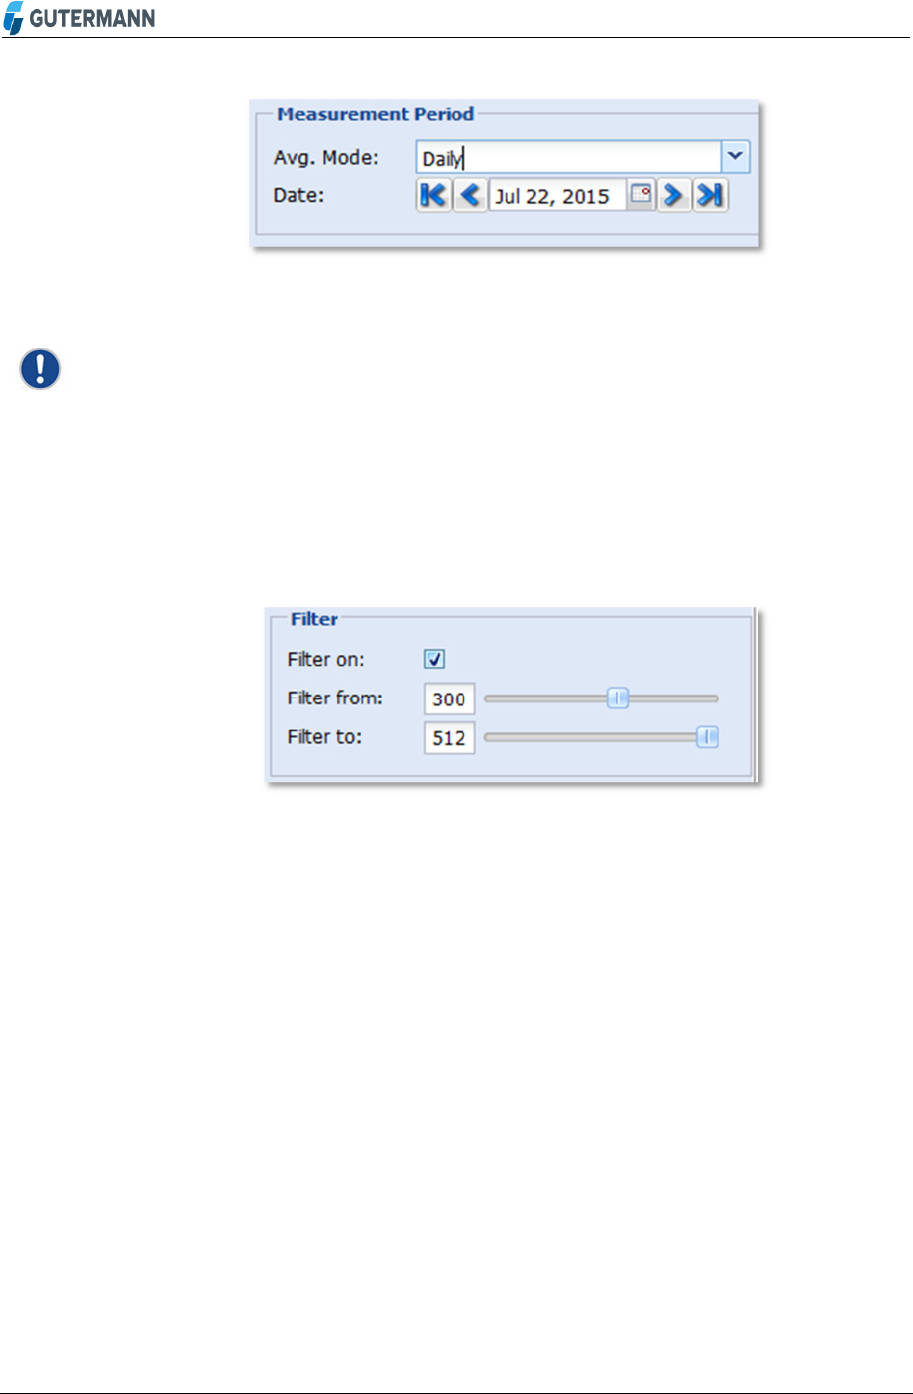
• Use the Measurement Period Average. Mode drop-down to
select either daily, Last 5 days and last 30 days. Select the
measurement date via the arrows or calendar
Manual Correlation
43 I 72
Figure 47: Selecting the Measurement Period
Note! Filters are a very important part of correlation, it’s
recommended that the Filter On is left ticked as it keeps the
correlation clean and helps remove unwanted noise
• The Filter from: is the low filter cut off and Filter to: is the high
filter cut off, click and hold either slider to increase or decrease
the filter to improve the correlation quality and graph. Filter
once the true pipe information has been entered as this gives
a better result
Figure 48: Selecting the Filter
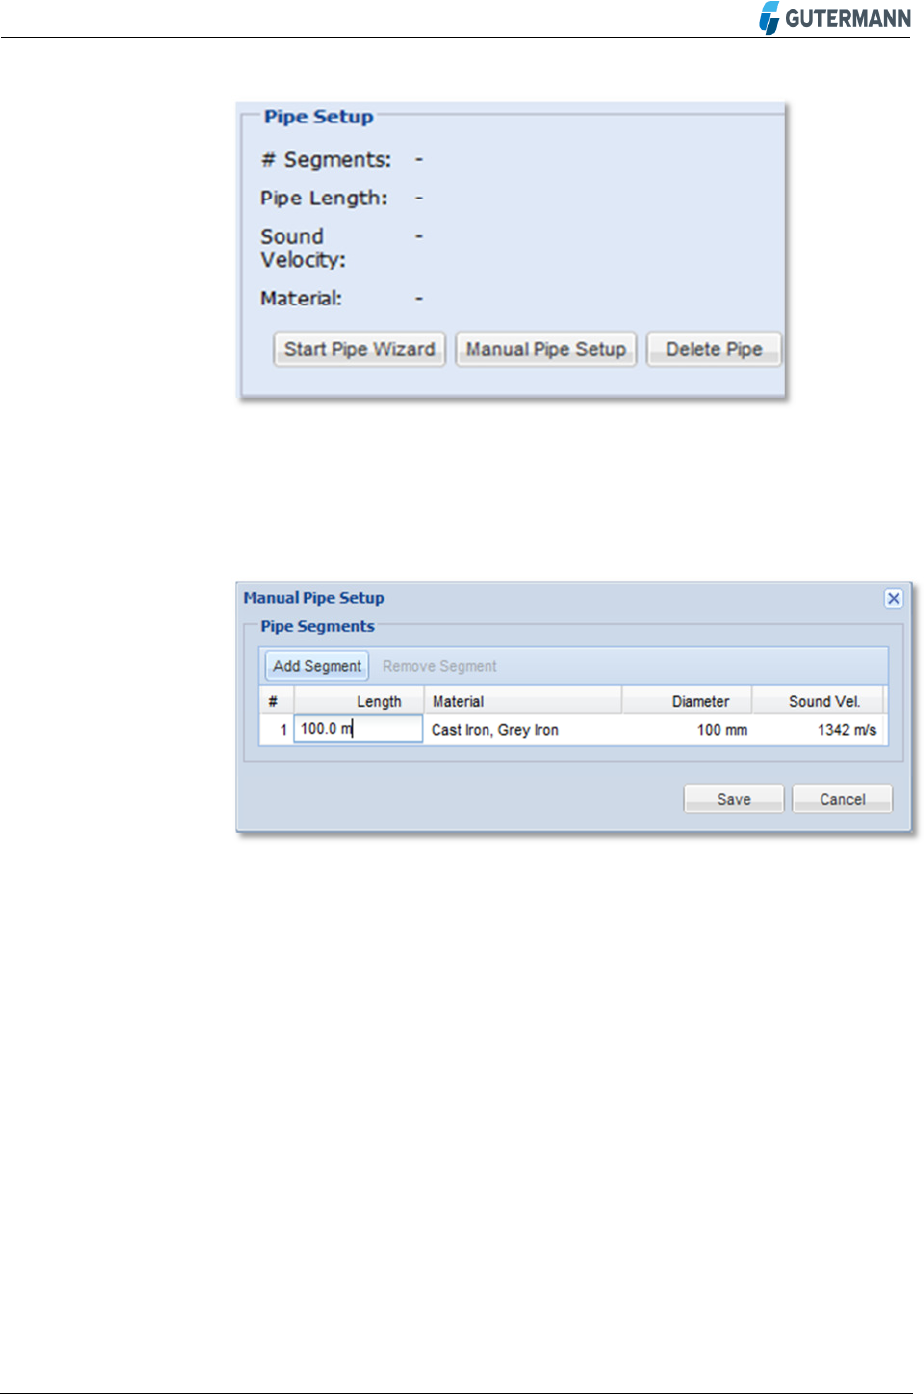
Figure 51 is the section where the pipe data is entered for the
correlation to give a true result. If no pipe data is entered then the
correlation result will be displayed in survey mode; a distance over
600m.
• If the pipe data is known then select Manual Pipe Setup to
enter the distance between the loggers, the pipe diameter and
material type. If the distance between the correlated loggers is
unknown then use Start Pipe Wizard to draw the pipe
44 I 72
Figure 49: Entering Data Pipe
• In the Manual Pipe Setup window click Add Segment to enter the
Length, Material and Diameter. When all segments are entered
click Save
Figure 50: Manual Pipe Setup
• There is also a Pipe Wizard available, refer to 3.2.3 Entering Pipe
Data with Pipe Wizard
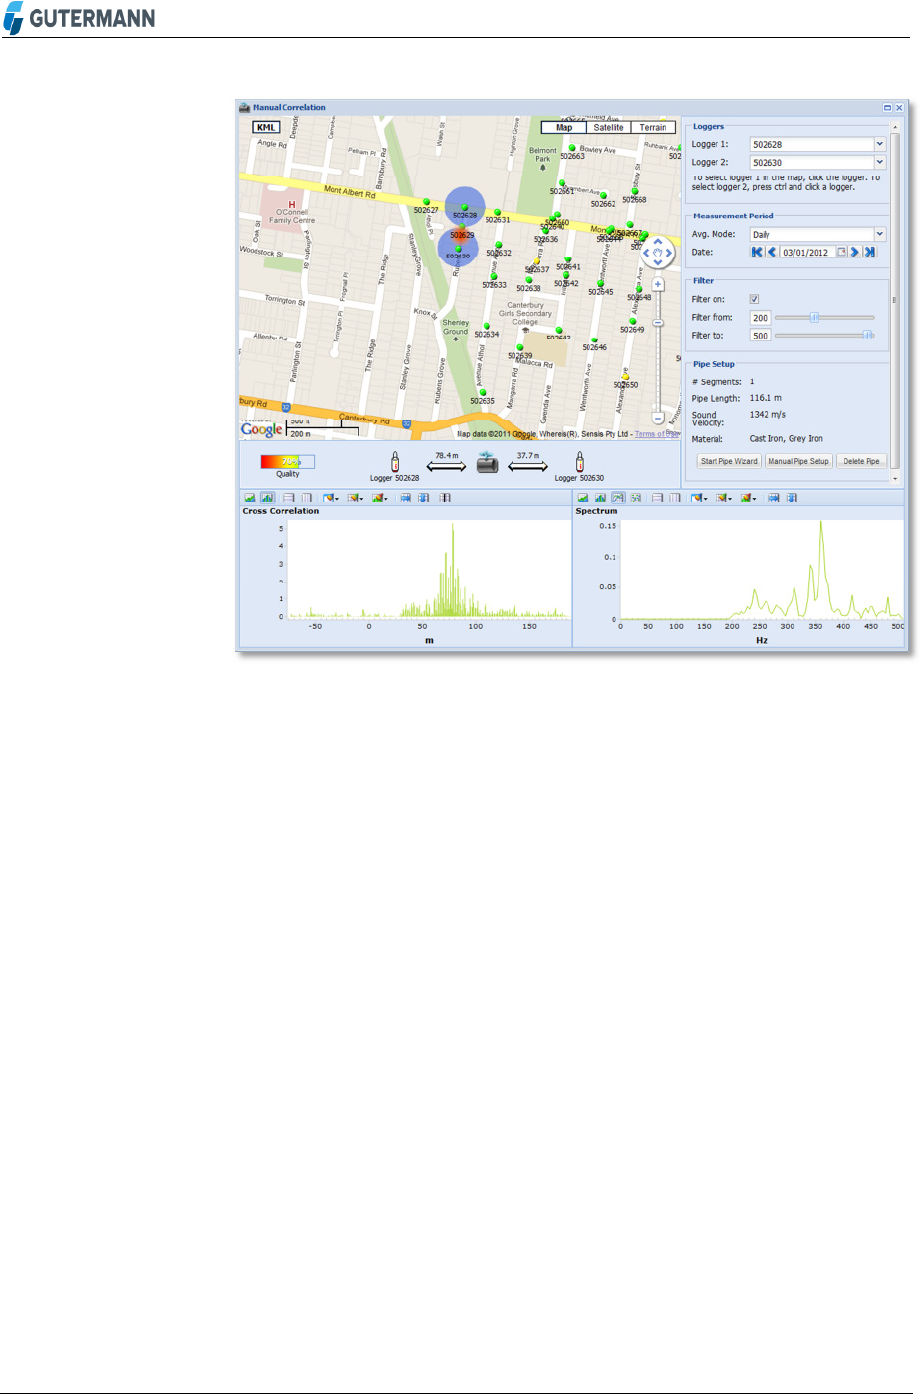
Once the Pipe Setup and Filtering is complete the Manual Correlation
Dashboard window will look similar to the screen below. In this
example a 70% correlation was achieved and the leak position is
depicted by an orange dot on the map and the diagram between the
cross correlation graph and the map.
• Use the signal spectrum as a guide to position the filters, in the
example below there is a concentration of sound between 300 and
400 Hz so this must be included
45 I 72
Figure 51: Manual Correlation Result
• If the Pipe information is incorrect then simply click the Delete Pipe
and repeat the Manual Correlation steps
46 I 72
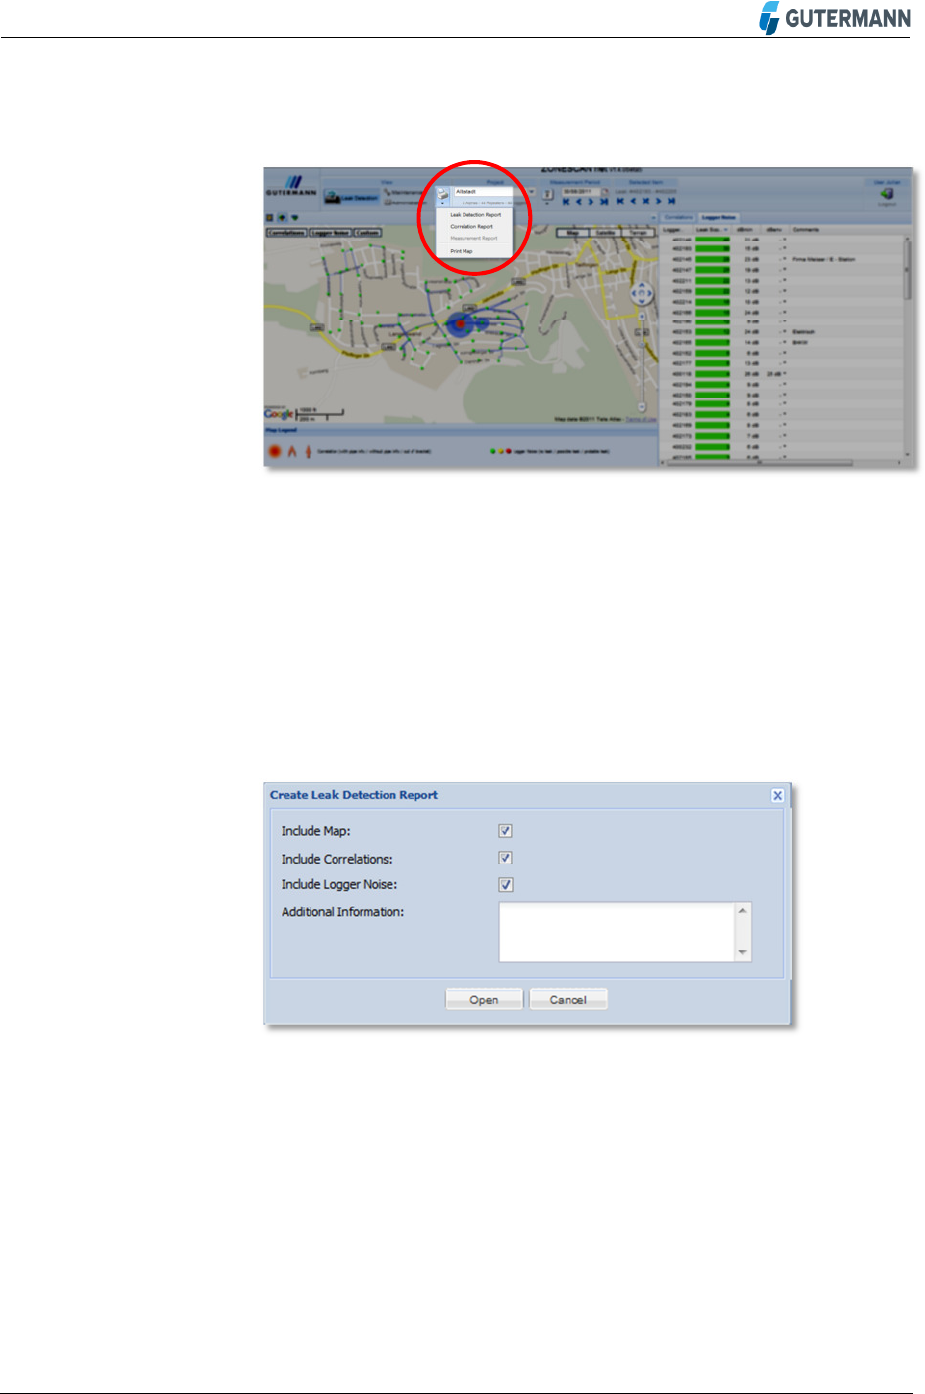
4 Print Menu
Figure 52: Print Menu
The print section has four options which include print Leak
Detection Report, Correlation Report, Measurement Report and
the Map.
The Leak Detection Report includes the Leak Scores, Correlations
and Map for the chosen date. A window will appear which gives
the user the option to remove correlations, Logger Noise or Map
before printing.
Figure 53: Print Report Window Options
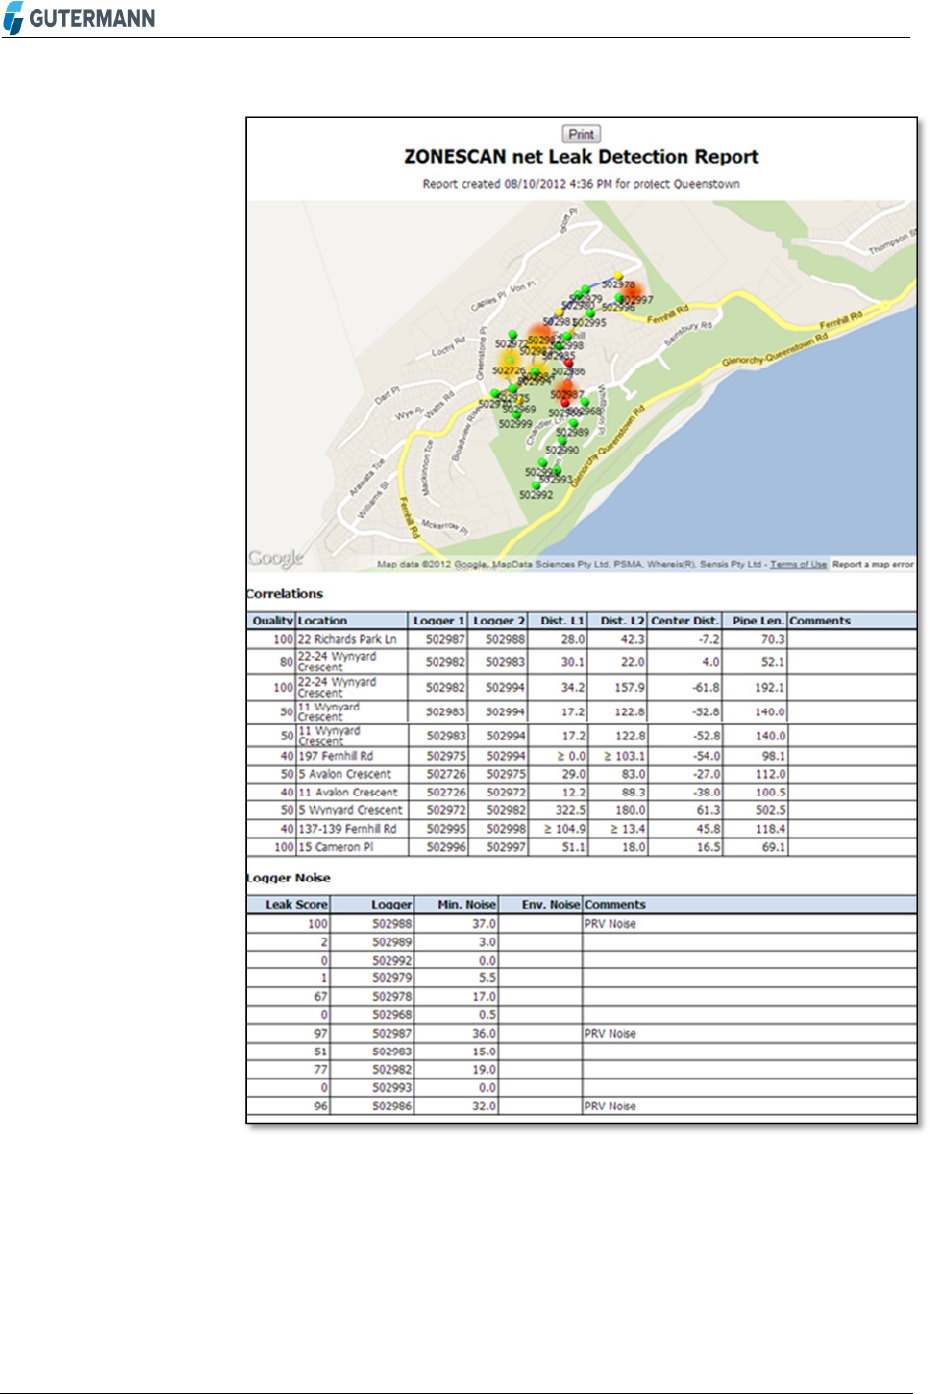
• A new browser window opens with the report; use the print
button on the browser
47 I 72
Figure 54: Print Report Page
48 I 72
5 Maintenance View
Figure 55: Maintenance View
Note! The following description assumes a fully activated map
menu
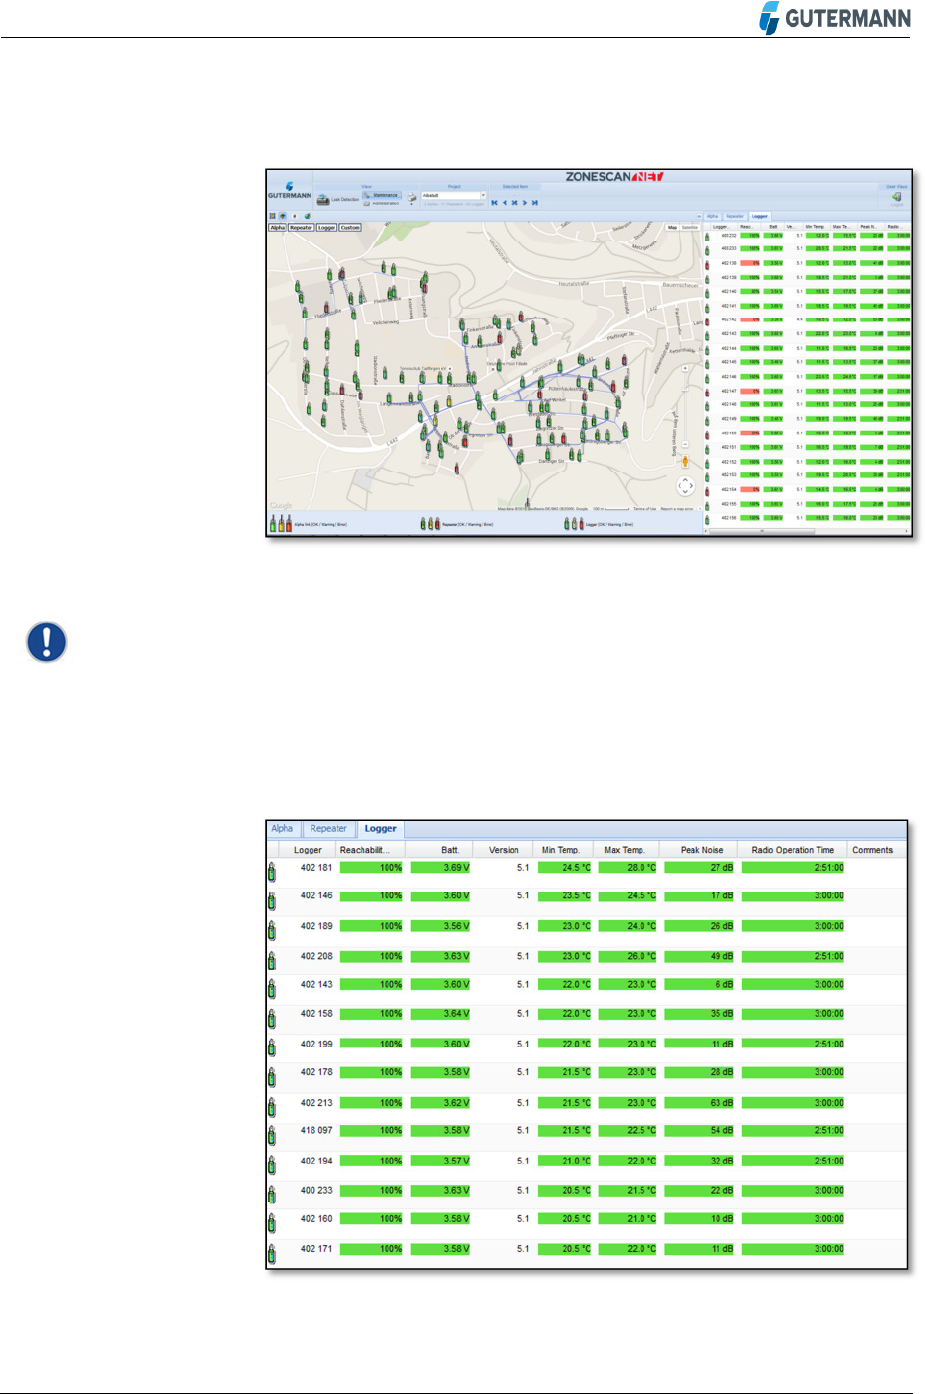
Logger Table
5.1
In the Logger Table, all Loggers of the current project are
displayed.
Figure 56: Logger Table
49 I 72
5.1.1 Table Fields
Reference number of the displayed Logger
The fraction or percentage the loggers were reached in the last 5
days
Current battery charge of the individual Loggers
Version of the respective Logger
The lowest temperature measured during the last measurement
The highest temperature measured during the last measurement
The largest dB value measured during the last measurement
It’s the time during which the logger can be reached for
communication. Warning: 6 hours or longer radio operation times
will reduce battery life
Comments is a text field with entries on, e.g. permanent noise
sources
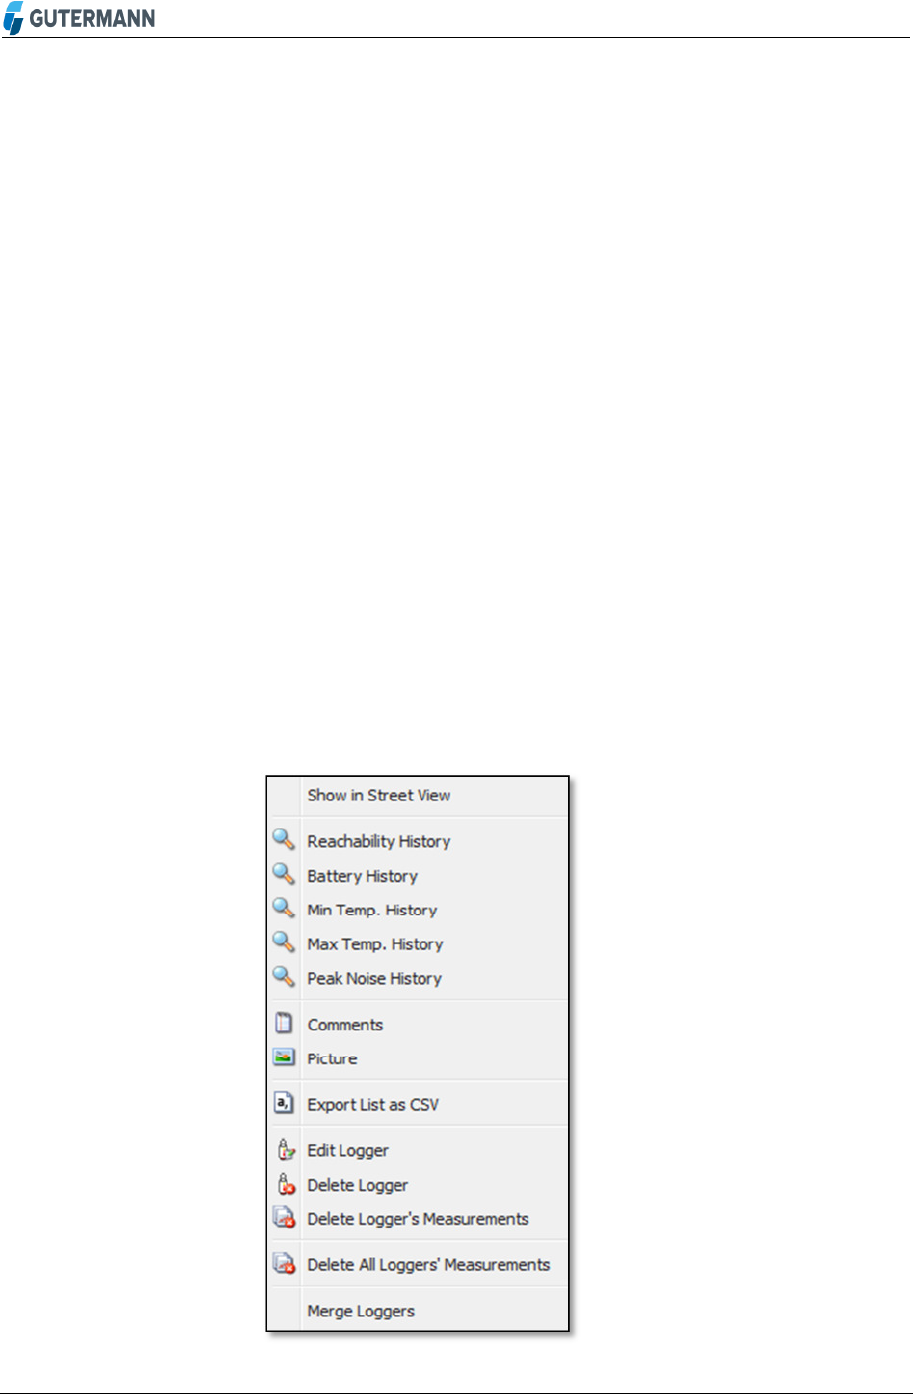
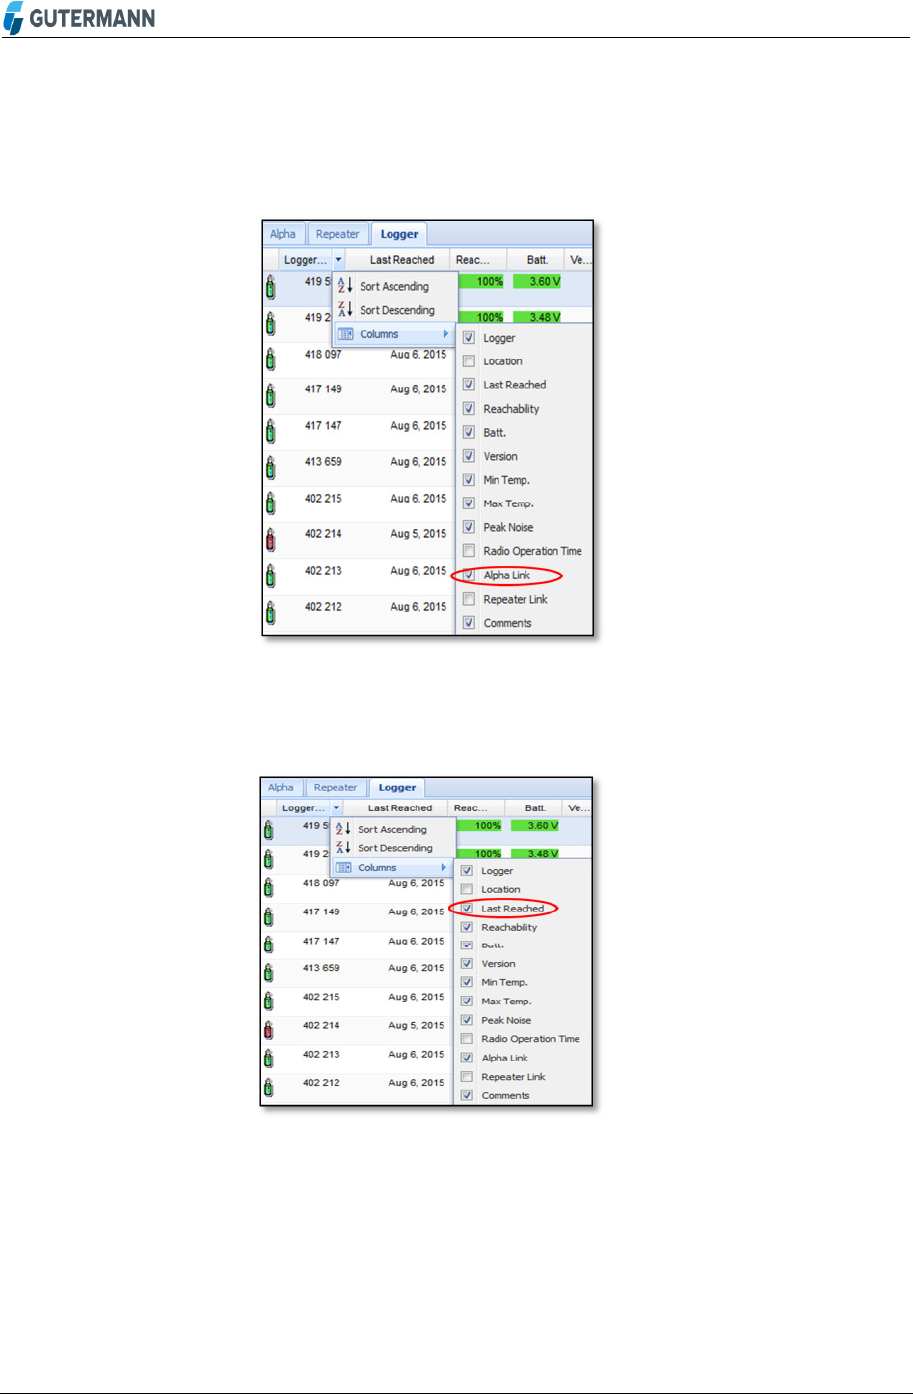
5.1.2 Context Menu
You can change the base settings of this table by right-clicking an
entry in the table
Figure 57: Logger Settings
Logger
Reachability
Batt.
Version
Min Temp.
Max T
emp.
Peak Noise
Radio Operation
Comments

50 I 72
To display the History of when the Logger had communication with
the ZONESCAN NET
To display the Minimum Temperature of the selected Logger, click
the Min Temp item
To display the Maximum Temperature of the selected Logger, click
the Max Temp item
To display the charge state of the selected Logger, click the
Battery History item
To add a comment about a Logger, select the Comments item.
Enter the desired comment in the text field that appears. Click
Apply to save the entered comment. The text is displayed in the
table in the Comments field
To view an available Picture of the selected Logger. The Picture
should have been taken and uploaded by ZONESCAN Mobile
during the installation process
To Print out a report for the selected Logger to include all the fields
in the Table
Click Add Logger to add a not-yet existing Logger to the list. In the
window that opens, enter the values for Logger No., Location,
Latitude and Longitude. After entering all values, confirm your
entries by clicking the Save button
To make changes to the base settings of existing Loggers, select
Edit Logger. Make the desired changes and then click Save
Loggers listed in the table can be deleted with the Delete Logger
item
To delete the measurement data of a Logger, click the Delete
Logger's Measurements item
Click Delete Logger's Sound Signals to delete the recorded signals
Use this item to delete all Loggers for the current project
The measurement data of all Loggers is deleted by clicking this
item
Click this item to delete the sound signals of all Loggers
Reachability History
Min Temp History
Max Temp History
Battery History
Comments
Picture
Maintenance
Add Logger
Edit Logger
Delete Logger
Delete Logger's
Measurements
Delete Logge
r's
Sound Signals
Delete All Loggers
Delete All Loggers'
Measurements
Delete All Loggers'
Sound Signals
51 I 72
Furthermore you have the options with context menus to select the Alpha Link and the Last
Reached
Indicates which Logger is connected
Figure 58: Alpha Link
Shows the date when the Logger was contacted
Figure 59: Logger Settings
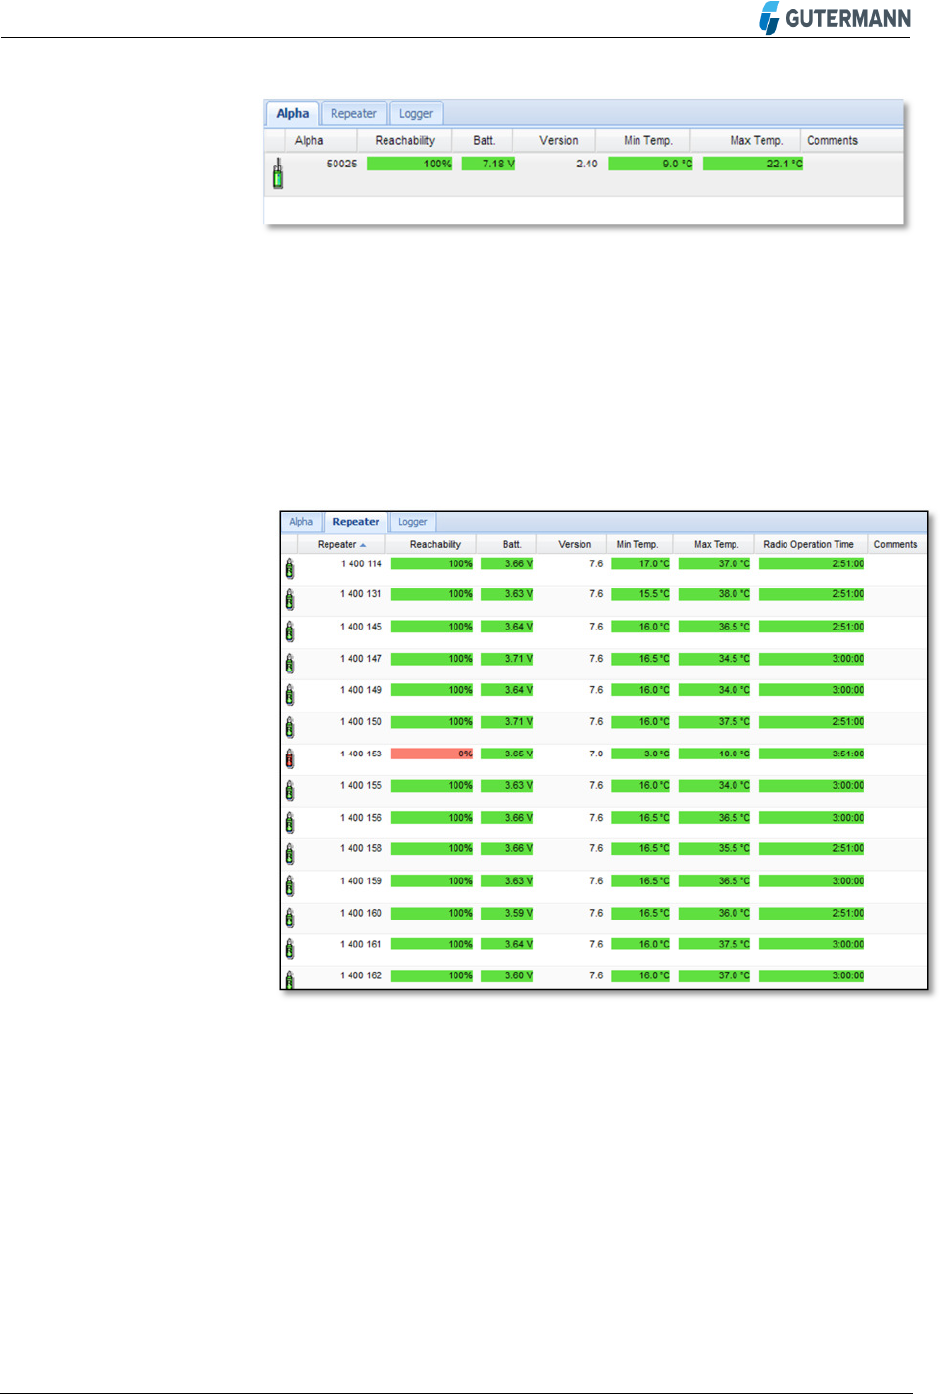
Alpha Table
5.2
In the Alpha Table, all Alphas of the current project are displayed.
Alpha Link
Last Reached
52 I 72
Figure 60: Alpha Table
5.2.1 Table Fields
Please refer to Tables and Settings of section Logger.
Repeater Table
5.3
In the Repeater Table, all Repeaters of the current project are displayed.
Figure 61: Repeater Table
5.3.1 Table Fields
Please refer to Tables and Settings of section Logger.
53 I 72
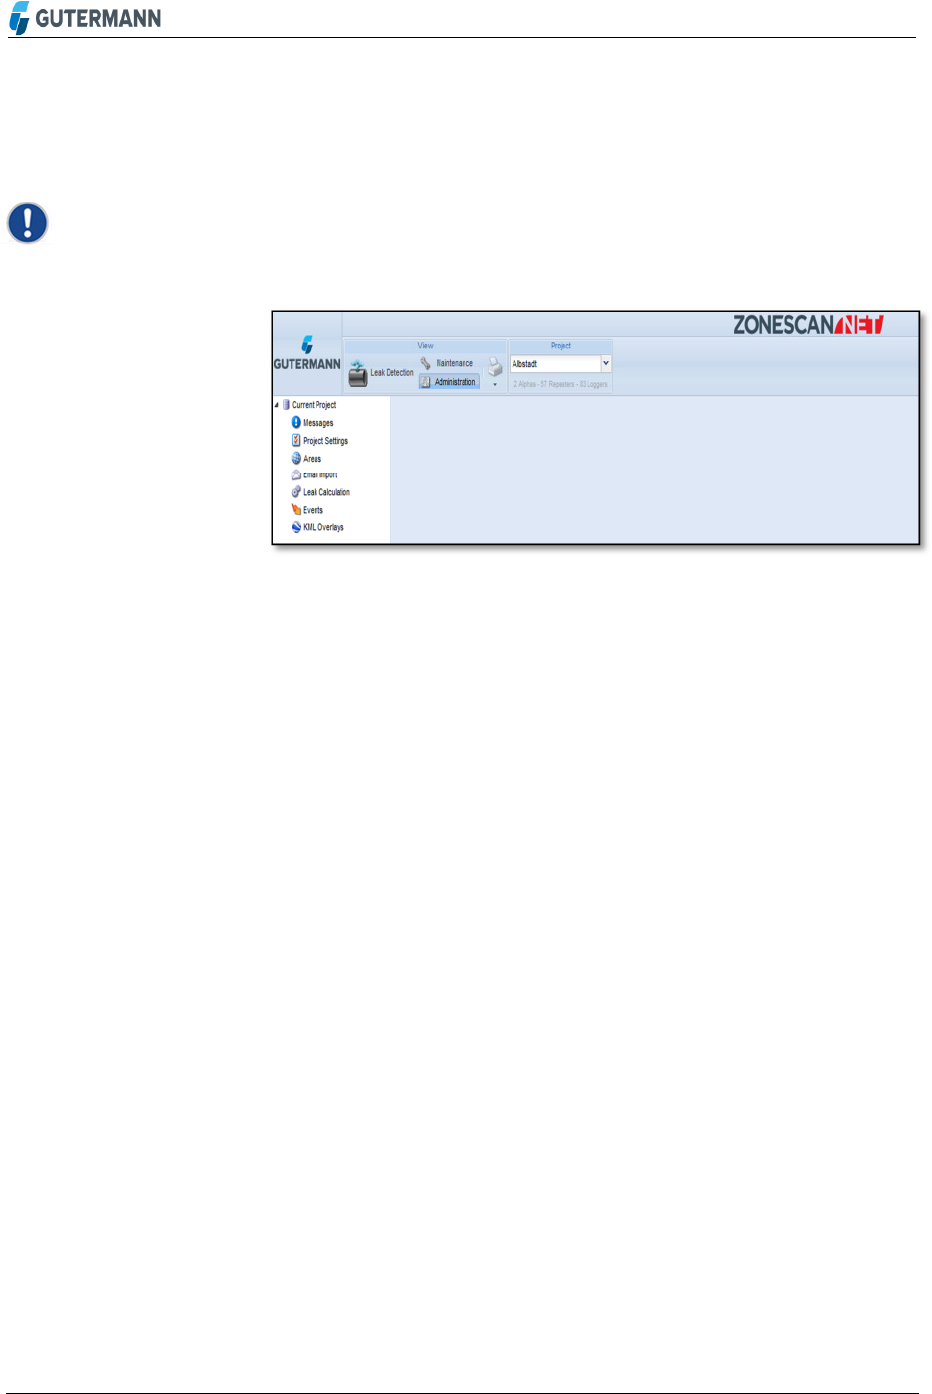
6 Administration View
Note! This section is only relevant for users with supervisor level
Figure 62: Administration
• To change the settings of an existing project, click
Administration in the View area of the menu bar. In the
Project area, select the project that is to be changed. In the
navigation bar, then click the Current Project > Settings
item
• To save your settings, click the Save button in the
respective table
54 I 72
Current Project Settings
6.1
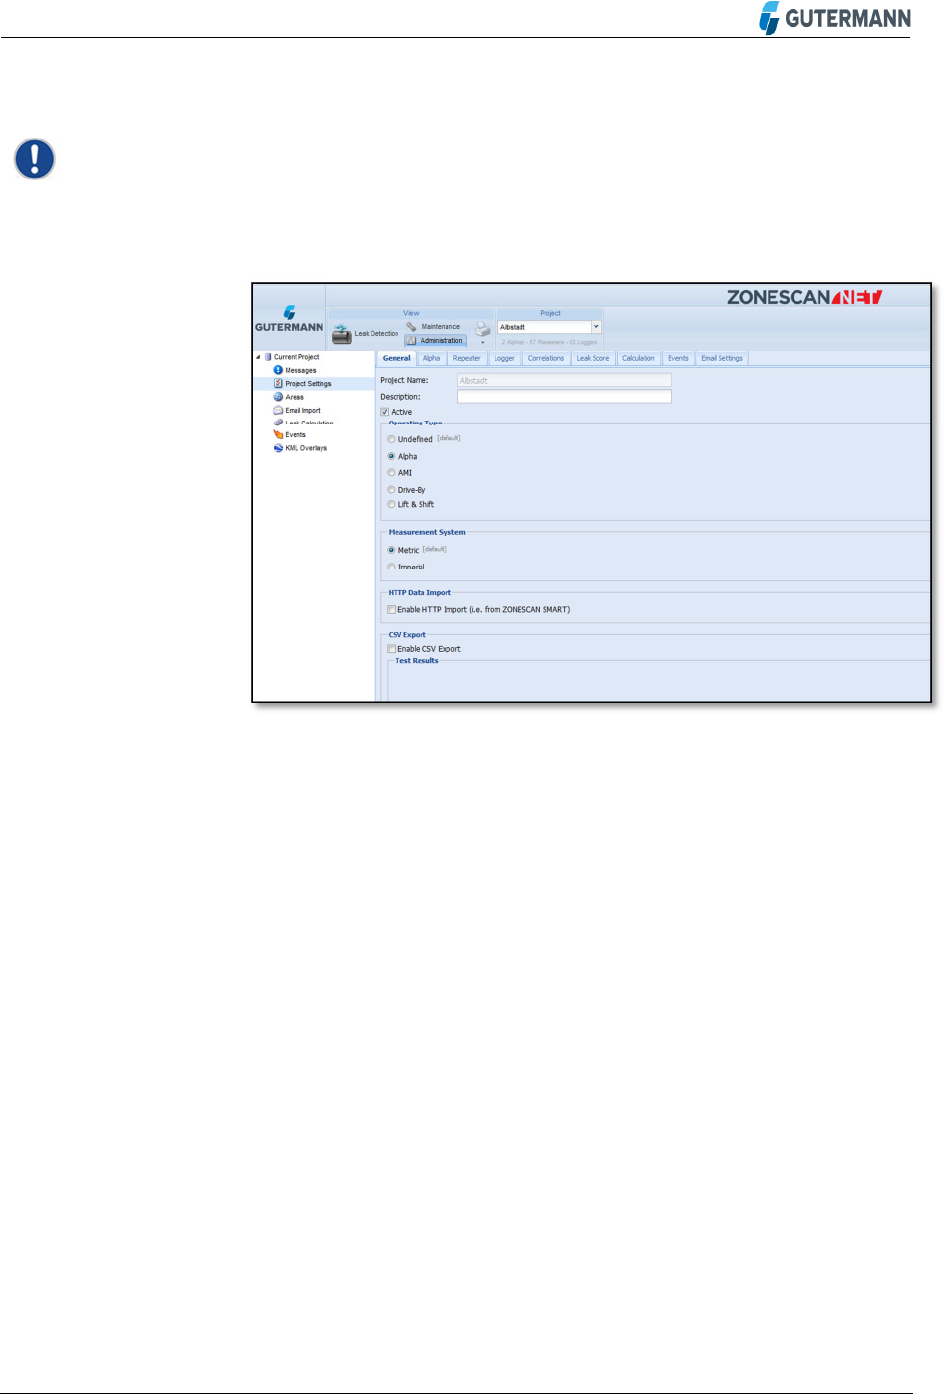
Note! The preset values are guide values and may vary
6.1.1 General Table
Figure 63: Settings > General
The name of the project is automatically taken over from the menu
bar
You can select the appropriate operating type according to
operating mode. The Alpha item is preset. If you are working in a
fixed network, click Fixed Network here. The data is then
integrated in your network
Project Name
Operating Type
55 I 72
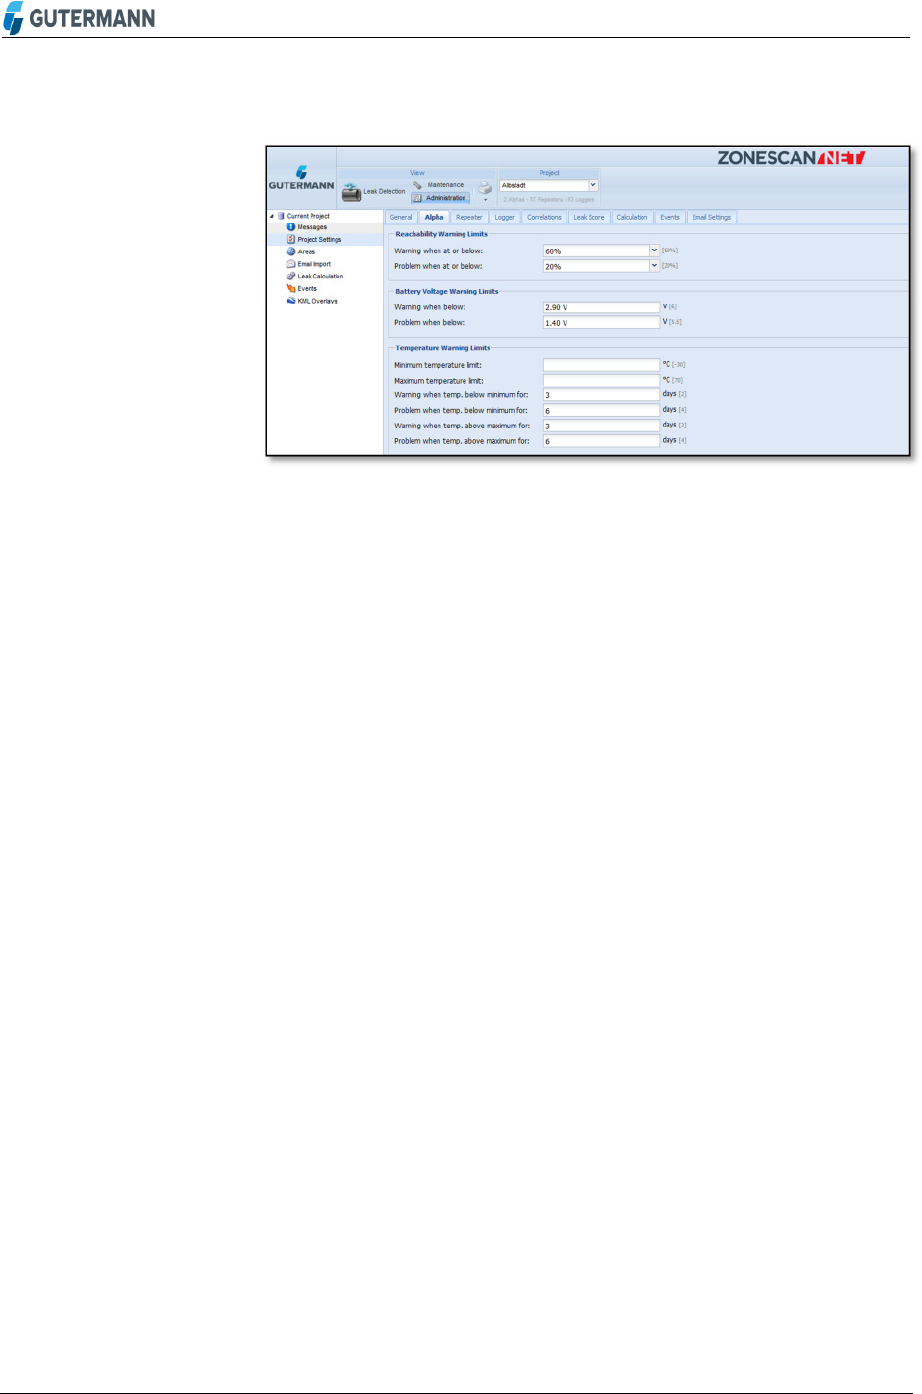
6.1.2 Alpha Table
Figure 64: Settings > Alpha
Warning when not reachable for: Define the number of days after
which a warning is displayed if an Alpha was not reached. Preset:
2 days
Problem when not reachable for: Define the number of days after
which an error is displayed if an Alpha was not reached. Preset: 4
days
Warning when below: Enter the charge state of the batteries of the
Alphas below which a warning is displayed. Preset: 6.00 V
Problem when below: Enter the charge state of the batteries of the
Alphas below which an error is displayed. Preset: 5.50 V
Minimum temperature limit:
Enter the lower temperature value below which a warning or an
error is displayed. Preset: -30.0°C
Maximum temperature limit:
Enter the upper temperature value above which a warning or an
error is displayed. Preset: 70.0°C
Warning when temp. below minimum for: Enter the number of days
after which a warning is displayed if the temperature measured at
the Alpha remains below the limit value entered above. Preset: 2
days
Problem when temp. below minimum for: Enter the number of days
after which an error is displayed if the temperature measured at
the Alpha remains below the limit value entered above. Preset: 4
days
Warning when temp. above maximum for: Enter the number of
days after which a warning is displayed if the temperature
measured at the Alpha remains above the limit value entered
above. Preset: 2 days
Reachability Warning
Limits
Battery
Voltage
Warning Limits
Temperature
Warning Limits
56 I 72
Problem when temp. above maximum for: Enter the number of
days after which an error is displayed if the temperature measured
at the Alpha remains above the limit value entered above. Preset:
4 days
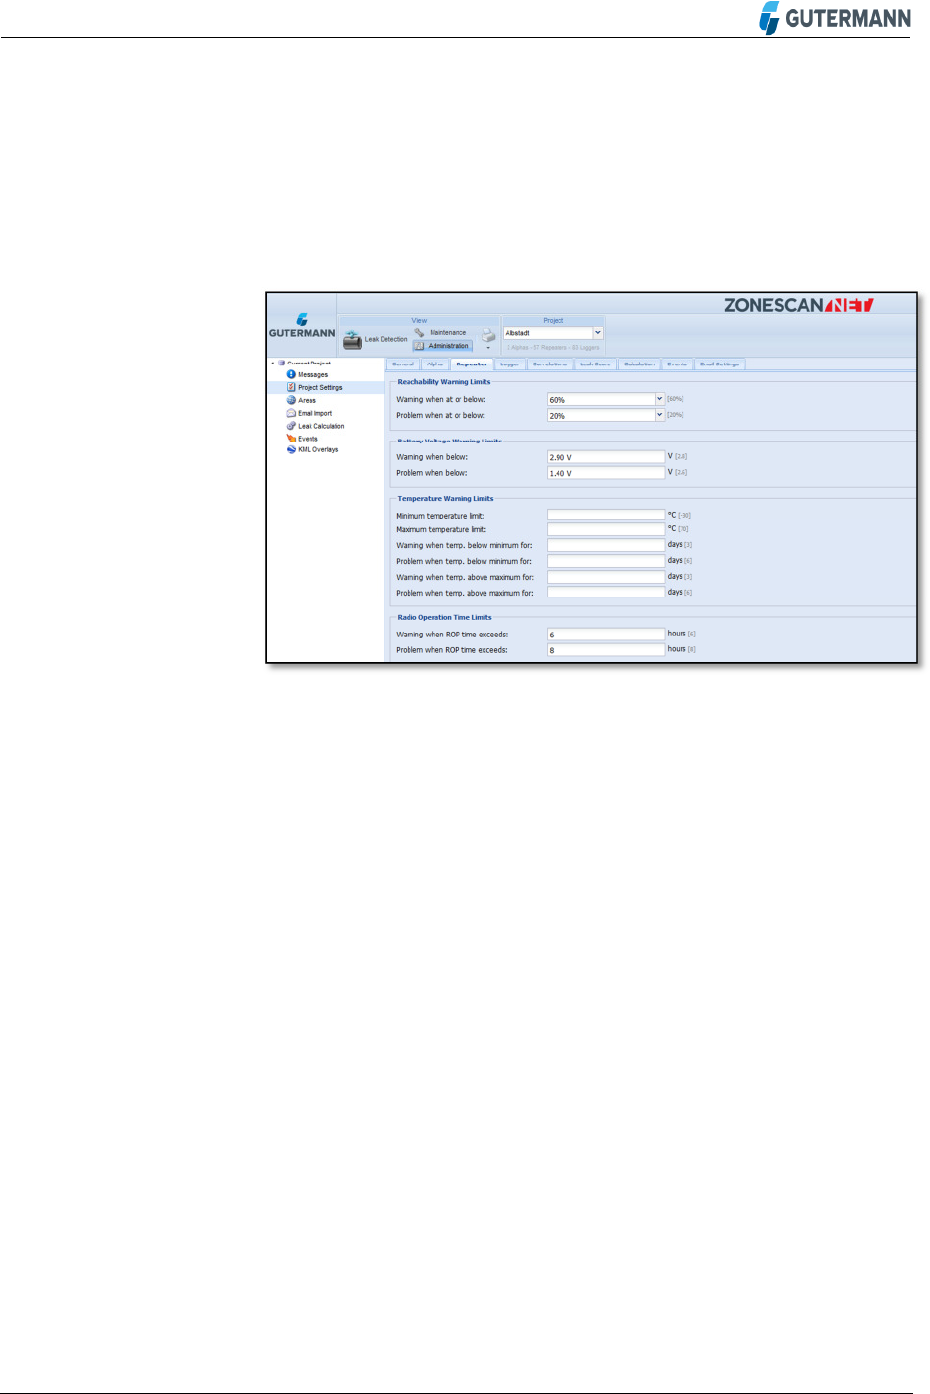
6.1.3 Repeater Table
Figure 65: Settings > Repeater
Warning when not reachable for: Define the number of days after
which a warning is displayed if a Repeater was not reached.
Preset: 3 days
Problem when not reachable for: Define the number of days after
which an error is displayed if a Repeater was not reached. Preset:
6 days
Warning when below: Enter the charge state of the batteries of the
Repeaters below which a warning is displayed. Preset: 2.80 V
Problem when below: Enter the charge state of the batteries of the
Repeaters below which an error is displayed. Preset: 2.60 V
Minimum temperature limit: Enter the lower temperature value
below which a warning or an error is displayed. Preset: -30.0°C
Maximum temperature limit: Enter the upper temperature value
above which a warning or an error is displayed. Preset: 70.0°C
Warning when temp. below minimum for: Enter the number of days
after which a warning is displayed if the temperature measured at
the Repeater remains below the limit value entered above. Preset:
3 days
Problem when temp. below minimum for: Enter the number of days
after which an error is displayed if the temperature measured at
Reachability Warning
Limits
Battery Voltage
Warning Limits
Temperature
Warning Limits
57 I 72
the Repeater remains below the limit value entered above. Preset:
6 days
Warning when temp. above maximum for: Enter the number of
days after which a warning is displayed if the temperature
measured at the Repeater remains above the limit value entered
above. Preset: 3 days
Problem when temp. above maximum for: Enter the number of
days after which an error is displayed if the temperature measured
at the Repeater remains above the limit value entered above.
Preset: 6 days
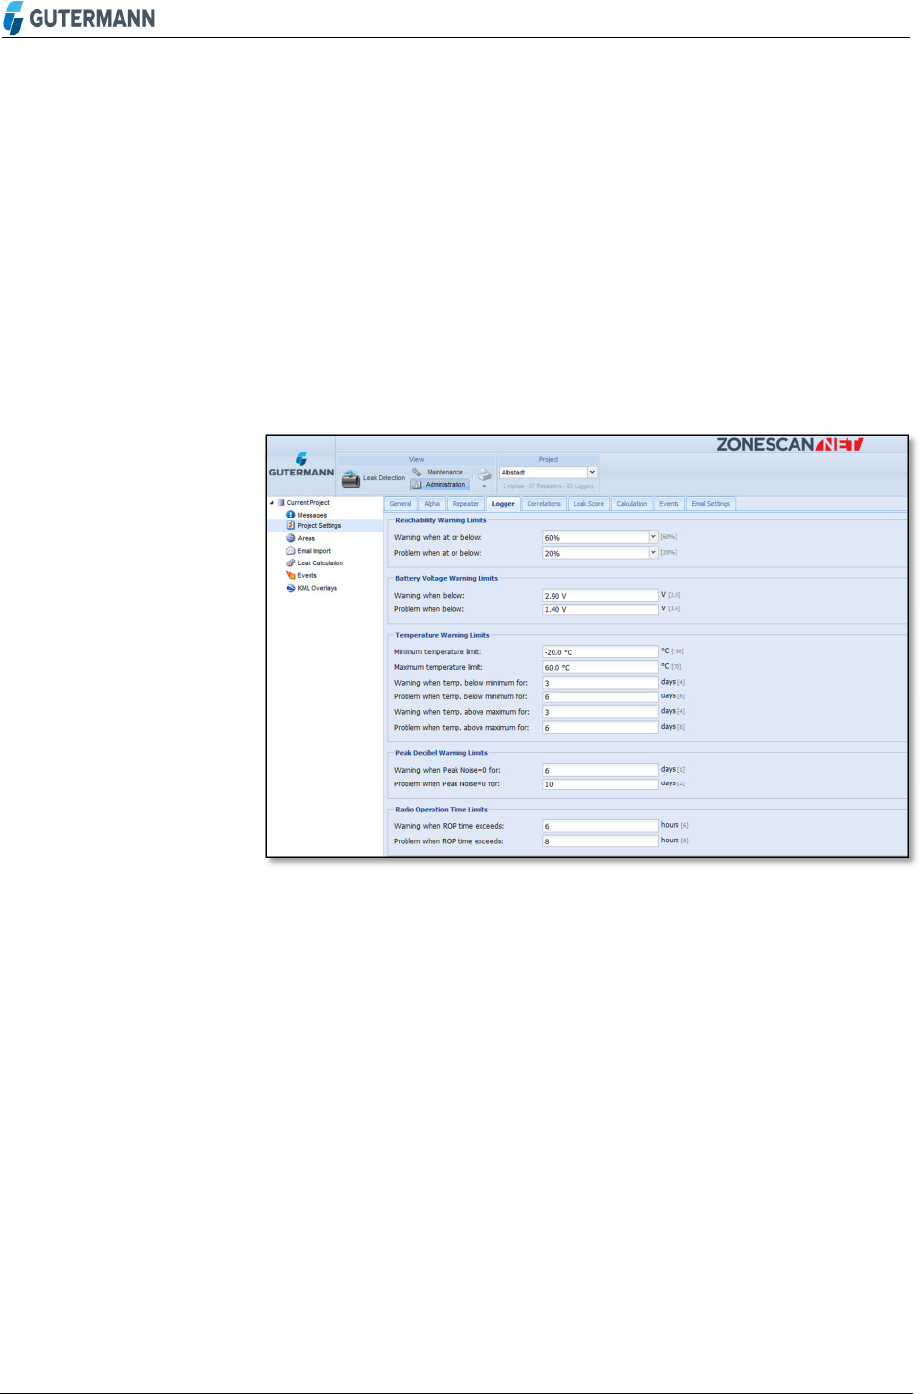
6.1.4 Logger Table
Figure 66: Settings > Logger
Possible leak: Enter the values based on experience for displaying
a possible leak. Preset: 40
Probable leak: Enter the values based on experience for displaying
a probable leak. Preset: 70
Warning when not reachable for: Define the number of days after
which a warning is displayed if a Logger was not reached. Preset:
4 days
Problem when not reachable for: Define the number of days after
which an error is displayed if a Logger was not reached. Preset: 8
days
Warning when below: Enter the charge state of the batteries of the
Loggers below which a warning is displayed. Preset: 2.90 V
Problem when below: Enter the charge state of the batteries of the
Loggers below which an error is displayed. Preset: 1.40 V
Leak Value Warning
Limits
Reachability Warning
Limits
Battery Voltage
Warning Limits

58 I 72
Minimum temperature limit: Enter the lower temperature value
below which a warning or an error is to be displayed. Preset
- 30.0°C
Maximum temperature limit: Enter the upper temperature value
above which a warning or an error is to be displayed. Preset:
70.0°C
Warning when temp. below minimum for: Enter the number of days
after which a warning is displayed if the temperature measured at
the Logger remains below the limit value entered above.
Preset: 4 days
Problem when temp. below minimum for: Enter the number of days
after which an error is displayed if the temperature measured at
the Logger remains below the limit value entered above. Preset: 8
days
Warning when temp. above maximum for: Enter the number of
days after which a warning is displayed if the temperature
measured at the Logger remains above the limit value entered
above. Preset: 4 days
Problem when temp. above maximum for: Enter the number of
days after which an error is displayed if the temperature measured
at the Logger remains above the limit value entered above. Preset:
8 days
Warning when dBmax=0 for: Enter the number of days after which
a warning is displayed if the highest dB value measured at the
Logger is equal to 0. Preset: 1 day
Problem when dBmax=0 for: Enter the number of days after which
an error is displayed if the highest dB value measured at the
Logger is equal to 0. Preset: 2 days
Temperature
Warning Limits
Peak Decibel
Warning Limits
59 I 72
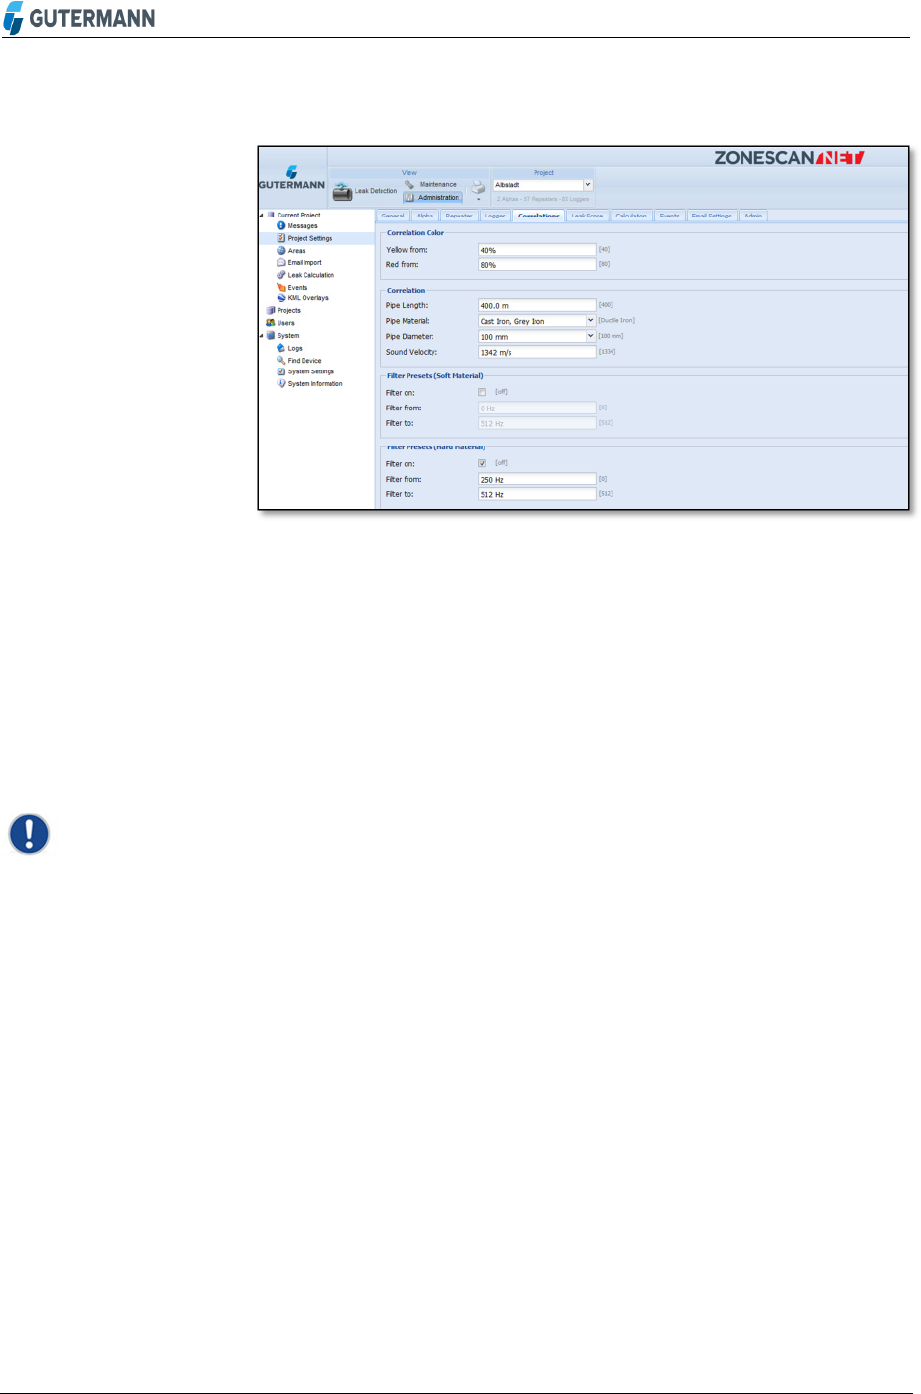
6.1.5 Correlations Table
Figure 67: Settings > Correlations
There are two levels of warning thresholds: yellow in the range of
40 - 79%, which indicates a possible, and red in the range of 80 -
100% indicates a probable leak. The green indicator (0 - 39%,
everything is in order) is here not shown. The default values are
40% and 80%
Pipe Length: Enter the distance between two Loggers. Preset:
600m
Note! Incorrect evaluations will result if the entered length is
shorter than the actual pipe length
Note! If not sure, enter a value that exceeds the actual distance
between the Loggers. Example: actual pipe length: 255m, entered
pipe length: 600m
Pipe - Material: Select the pipe material from the drop-down list.
Preset: Ductile Iron
Pipe - Diameter: Select the pipe diameter from the drop-down list.
Preset: 100mm
Sound Velocity: The sound velocity is dependent on the pipe
material and is automatically set by the system upon selection of
the pipe material. Preset: 1334 m/s
Filter on: Select the check box if your pipe is made of soft material
(e.g., PVC, PE)
Filter from: Enter the lower Hz value above which filtering is to be
performed. Preset: 0 Hz
Filter from: Enter the lower Hz value above which filtering is to be
performed. Preset: 512 Hz
Correlation Color
Pipe Presets
Filter Presets
(Soft Material)
60 I 72
Filter on: Select the check box if your pipe is made of hard material
Filter from: Enter the lower Hz value above which filtering is to be
performed. Preset: 120 Hz
Filter to: Enter the upper Hz value up to which filtering is to be
performed. Preset: 512 Hz
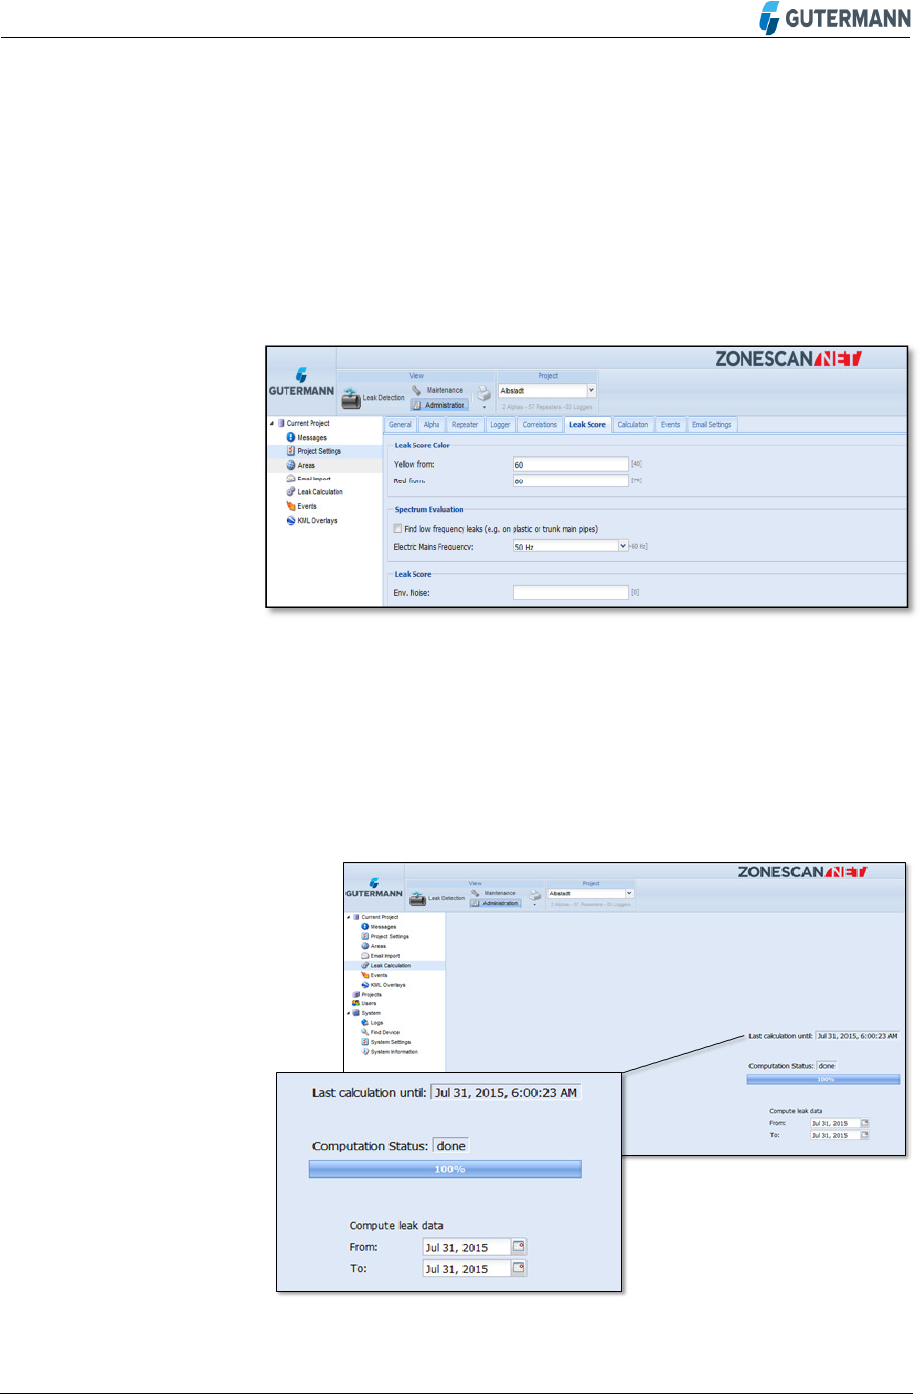
6.1.6 Leak Score Table
Figure 68: Settings > Leak Score
In this field, the measurement sensitivity of the logger can be
adjusted to the environmental sound intensity
6.1.7 Calculation Table
Figure 69: Settings > Calculation
Filter Presets
(Hard Material)
Env. Noise
61 I 72
Perform leak calculation manually
Interrupt leak calculation
Delete all leak scores
Check e-mail
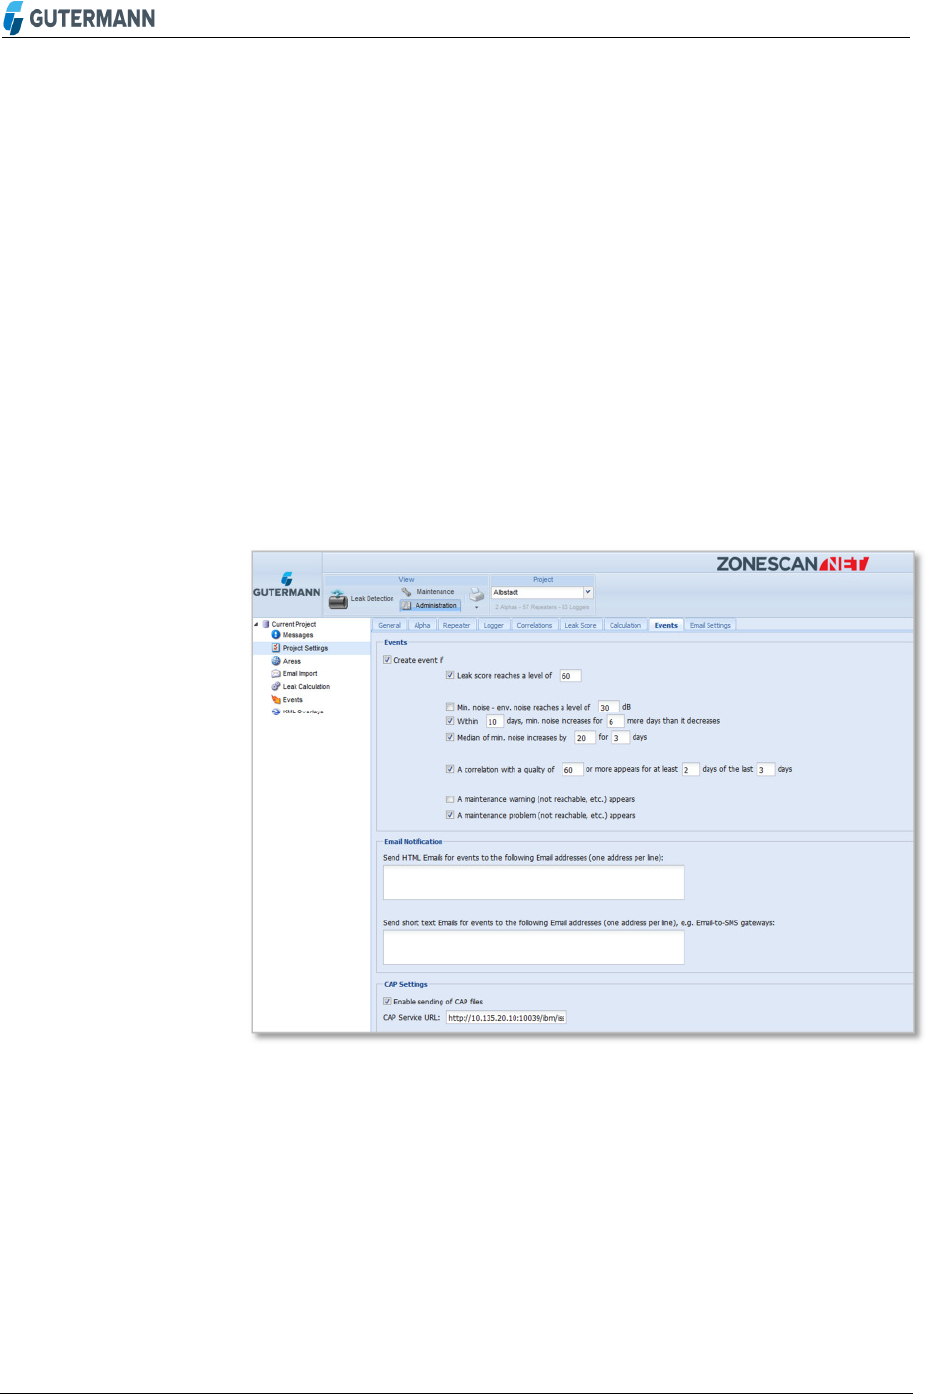
6.1.8 Events Table
Figure 70: Settings > Events
One of the essential additions to version 1.5.0 is the Events Table
where e-mail alarms can be set for the project. Within this table the
project administrators can setup the e-mail alarm parameters
including the e-mail addresses of the recipients. The settings are
designed to alert on a genuine leak rather than a false positive.
Start Leak
C
alculation
Interrupt Leak
Calculation
Delete Leak Scores
Refresh Data
62 I 72
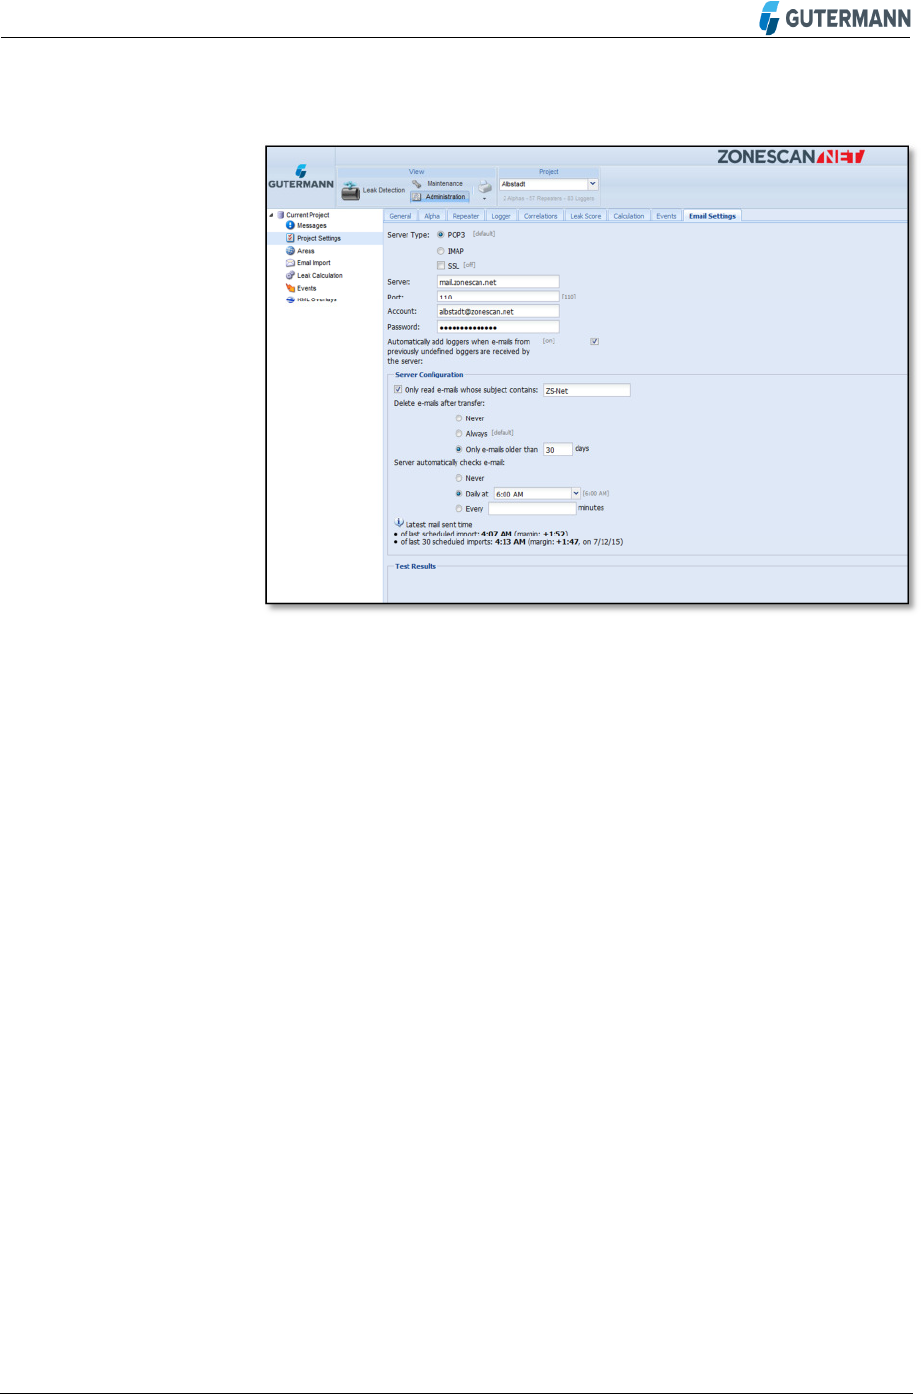
6.1.9 E-mail Settings Table
Figure 71: Settings > E-mail
Server Type: Click to define your server type. Select the SSL
(Secure Sockets Layer) check box if necessary. Preset: POP3
Server: Enter your server's name. Example: pop.1and1.com
Port: Enter the port enabled for e-mail reception. Preset: Port 110
Account: Enter the e-mail account that receives the data for the
project. Example: albstadt@zonescan.eu
Password: Enter the password for the e-mail account entered
above
Check the “Automatically add Loggers when e-mails from
previously undefined Loggers are received by the server” to avoid
having to manually set up new Loggers
Preset: check box is selected
“Only read e-mails whose subject contains:” Select the check box
and enter ZS-Net in the text field
Delete e-mails after transfer: Select whether and when the
transferred e-mails are deleted:
Never
Always
Server Configuration
63 I 72
Only e-mails older than N days
Enter the number of days after which e-mails are deleted
Preset: Always
“Server automatically checks e-mail:” Select whether and when the
server checks for new e-mail.
Never
Daily at
Select the desired time from the drop-down menu
Every N minutes
Enter the number of minutes after which the server checks for
new e-mail.
Preset: Daily at 5:00 AM
Note! When entering the time, note that the calculation is useful
only after e-mail has been checked. The time of the correlation
calculation can be defined in the Server Configuration table
If you test the e-mail settings with the Test e-mail settings button,
the test results appear here
Use the Test e-mail settings button to test whether your settings
are correct and e-mails can be received. The results of the test
appear in the Test Results field
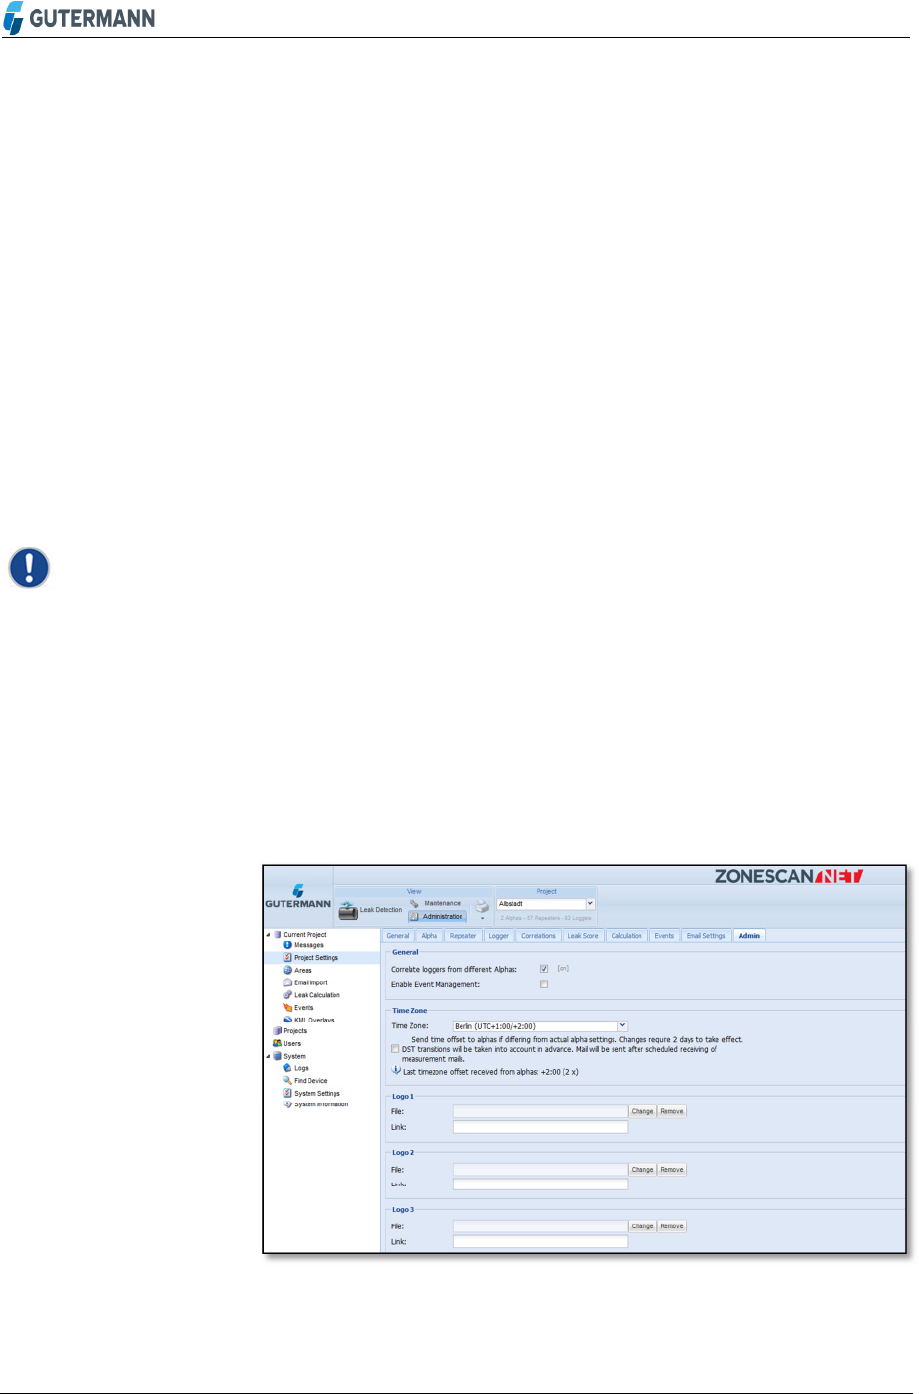
6.1.10 Administration Table
Figure 72: Settings > Administration
Test Results
64 I 72
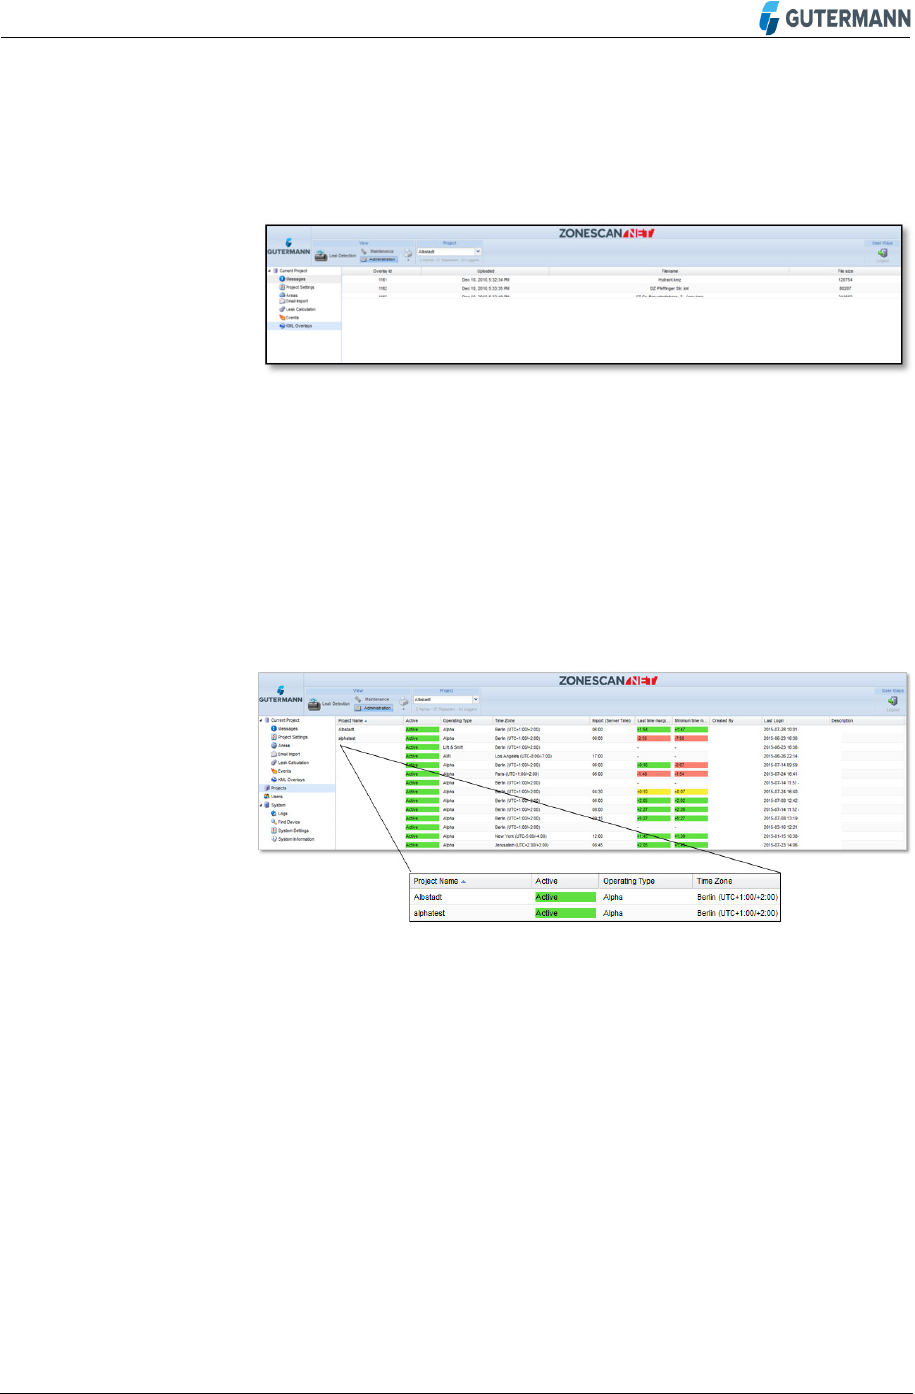
KML Overlays
6.2
The uploaded KML (Keyhole Markup Language) overlay files are
displayed here in a list:
Figure 73: List of the KML files
Click Import to upload the KML files stored on the PC
Click to delete a selected KML file from the list
Delete all KML files in the list
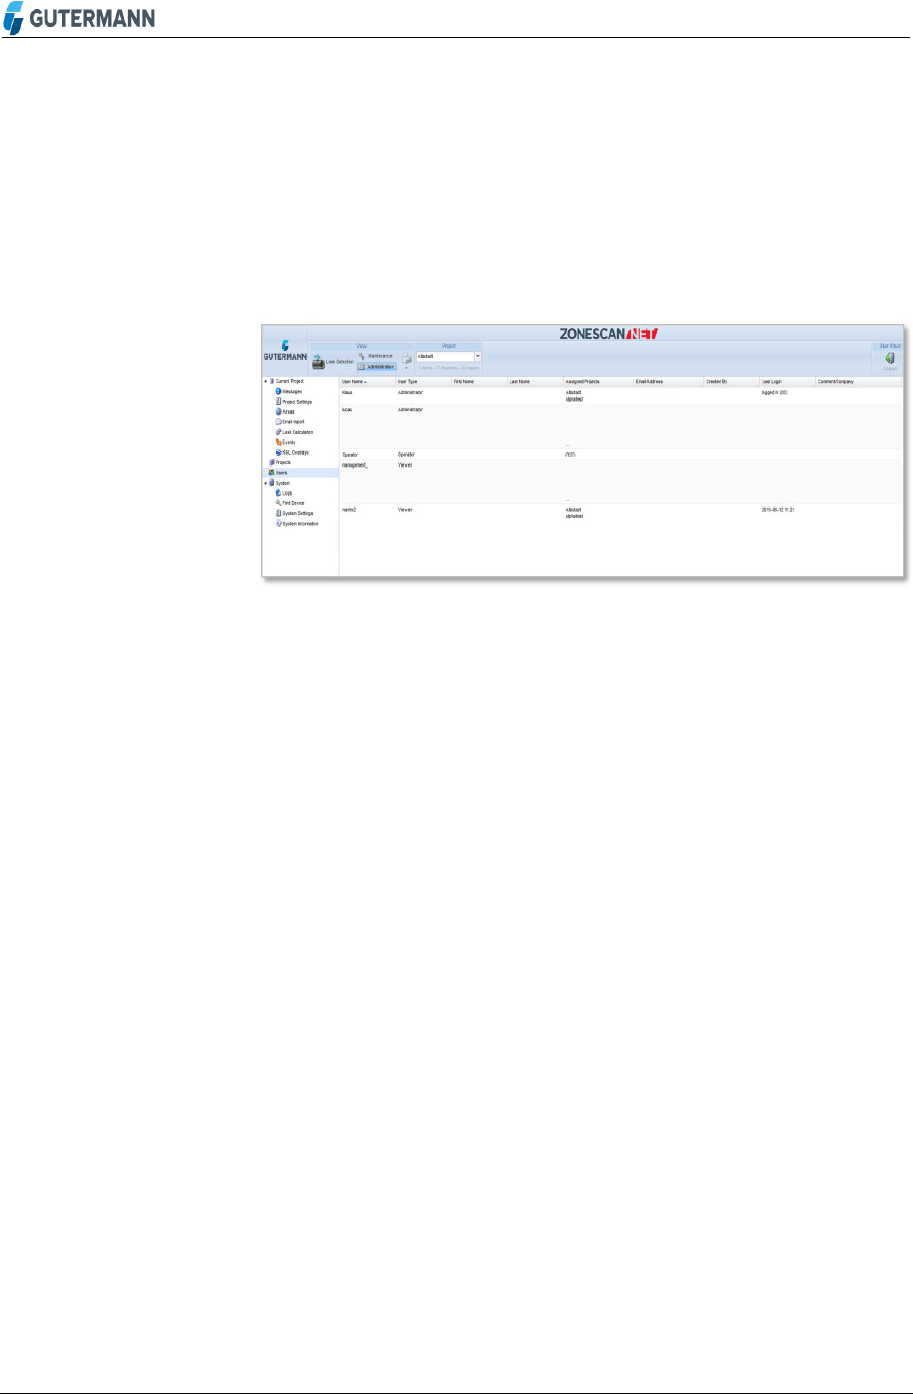
Projects
6.3
All currently running projects are displayed in a list:
Figure 74: Project List
Create a new project
Edit a project selected in the list
Delete a selected project from the list
An existing project stored on the PC is imported
To merge two projects, you need an (exported) project file that is
then imported into an already existing project. In the project list,
select the project into which the file is to be imported. Then click
Merge Project
All projects are exported
Import
Delete
Delete All
Add
Edit
Delete
Import Project
Merge Project
Export Project
65 I 72
Selected Loggers are imported
All Loggers contained in the project are exported
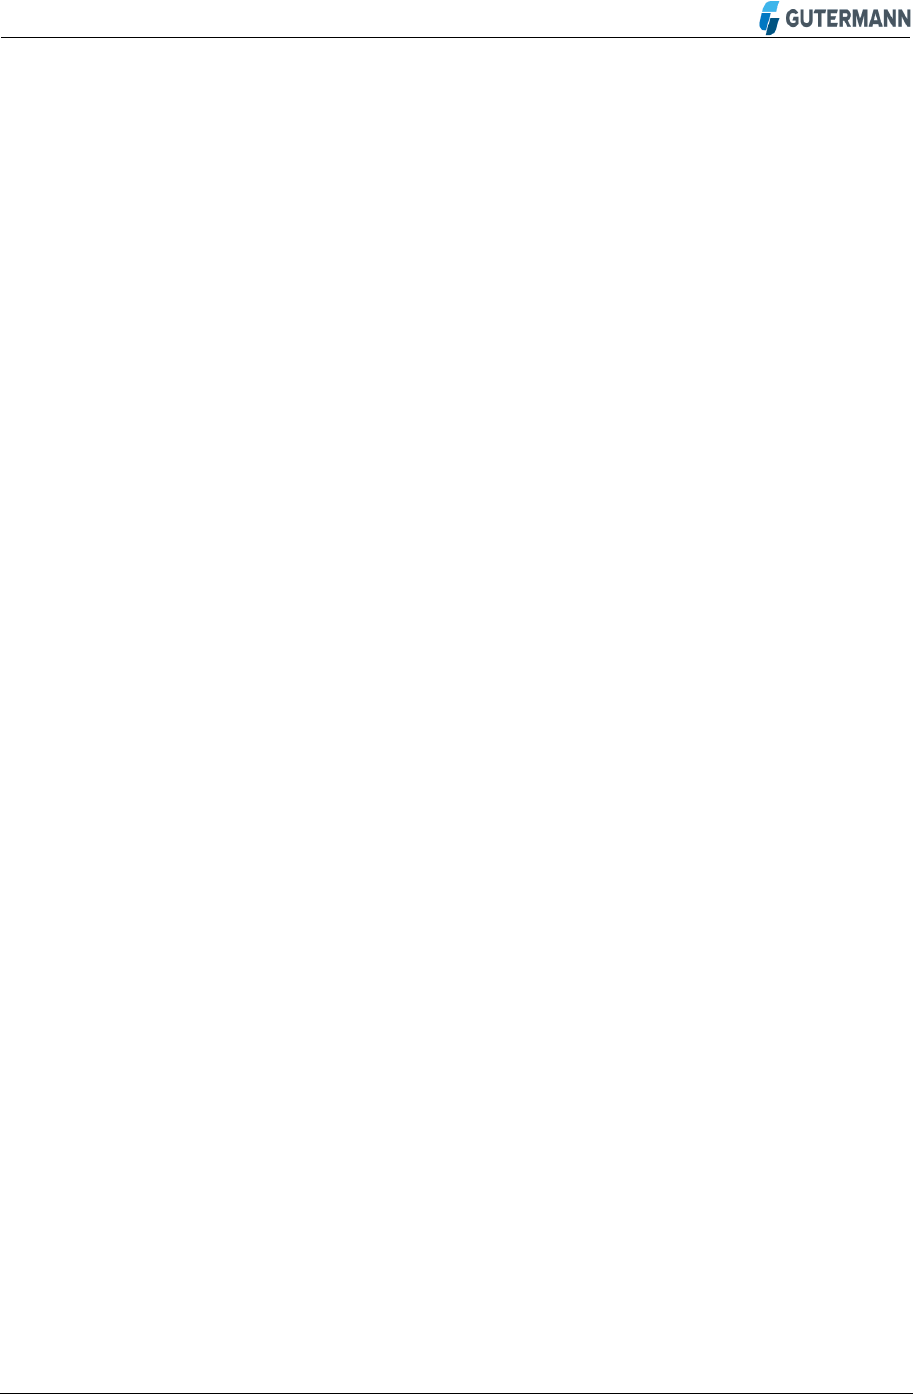
Users
6.4
All users and their assigned projects are displayed in this table:
Figure 75: Users
Click Add to create a new user. In the window that opens, enter
user name, password, user type as well as the first and last name.
Click to assign the user individual projects. Once all data has been
entered, click Save to activate the profile
Click the Edit button to edit an existing profile
Click Delete to remove an existing profile
System
6.5
The system category lists all information related to the
ZONESCAN NET server. This category is only available for
Administrators.
Import Loggers
Export Loggers
Add
Edit
Delete
66 I 72
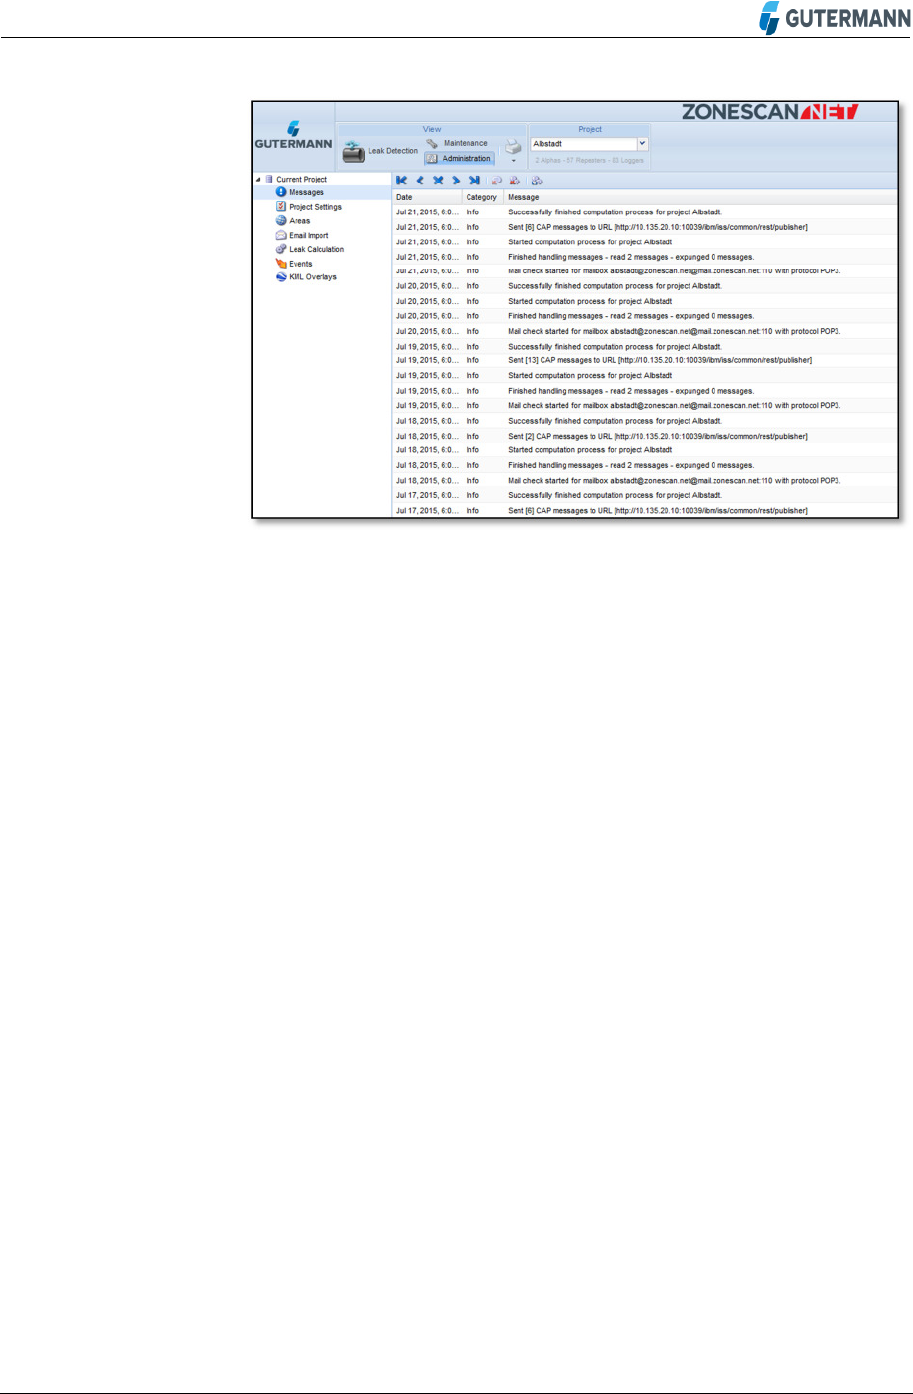
Figure 76: System Messages
6.5.1 Messages
There are two types of messages:
This is a simple status message about system activities and back-
ground processes
Please contact support if a message is displayed with the warning
status
Info
Warning

67 I 72
7 Appendices
Correction explained in detail
7.1
Leakage noise is generally a wild mixture of tones, each of which can be associated with
individual frequencies (tone pitches, oscillations). The distribution of this frequency content is
referred to as a spectrum.
First, the time series signal is recorded. These time series values can undergo a mathe-
matical transformation, Fourier analysis.
A particularly efficient computational technique of Fourier analysis is the FFT (Fast Fourier
Transform). This is used to calculate the frequency content and, in particular, identify the
presence of dominant individual frequencies. Using this information, it is possible, for
example, to draw conclusions on disturbances (e.g., electrical machines).
Frequencies are specified in units of Hz (Hertz) as the number of oscillations per second. For
leakage noises, one usually finds a uniform mixture of frequencies, primarily located in the
range from 50 to 1000 Hz.
The knowledge of the spectrum, i.e., of the frequency response, is particularly helpful for the
computational use of filters, by means of which one can separate the useful and the
interfering portions of the noise measurement spectra.
Correlation is a mathematical method for comparing two time series signals with one
another.
A leakage noise is simultaneously recorded by two sensors at different locations. The sound
emitted by the leak spreads in the water pipe at a defined sound velocity. If the acoustic
event were to be brief and occur only once, e.g., a blow with hammer, it would be simple to
measure the arrival at both receivers. In this case, one would only need to compare the
arrival times at the two receivers with one another. If these are the same, the sound has
traveled the same distance to the receivers, i.e., the sound source lies in the middle of the
pipe between the receivers.
If the arrival times are different, it is possible to calculate the distance to the two receivers
from the measured time difference. The sound arrives at the closer sensor before the more
distant sensor.
Leakage noise, however, is not a one-time acoustic event, but it is also not completely
monotonous. Small, irregular changes in sound intensity and frequency occur. These
changing signatures travel to the two receivers in the same way as a hammer blow and may
arrive at the sensors at different times.
Because the identification and comparison of an individual signature is not as simple as in
the case of a hammer blow, the two time series signals are first recorded for a period of time;
the time series includes many individually measured signal values.
The two time series signals are mathematically compared with one another, i.e., correlated
with one another. If the leakage sound arrived at the sensors simultaneously, the same
signatures are compared and the signals are then similar and the correlation is high.
68 I 72
In general, however, the respective signatures arrive at the sensors at different times and
simultaneously recorded signals do not correlate with one another. Because the signals were
digitally recorded and stored, it is possible to retroactively shift the signals with respect to one
another and re-correlate them with one another.
This is performed systematically. From the results, one obtains a correlation curve that
includes the individual correlation values over the respective computationally performed time
shift.
If, during this process, one reaches precisely the time shift that corresponds to the
propagation time difference from the sound source to the two receivers, the signal signatures
match and one obtains a correlation maximum at this point.
Because this is the comparison of two different signals, it is also called a cross correlation.
In the context of leakage noises, the goal of the correlation measurement is primarily to
determine the propagation time difference of two signals.
Because the correlation curve also includes spectral information, it is often of interest to
define the character of the leakage noise, particularly for distinguishing noises that are not
related to the leak, provided this can be detected by means of a frequency analysis (e.g.,
electrical noise). The correlation curve can also be mathematically filtered for the purpose of
retroactively separating such interfering noise to better identify the correlation maximum
caused by the leak.
69 I 72
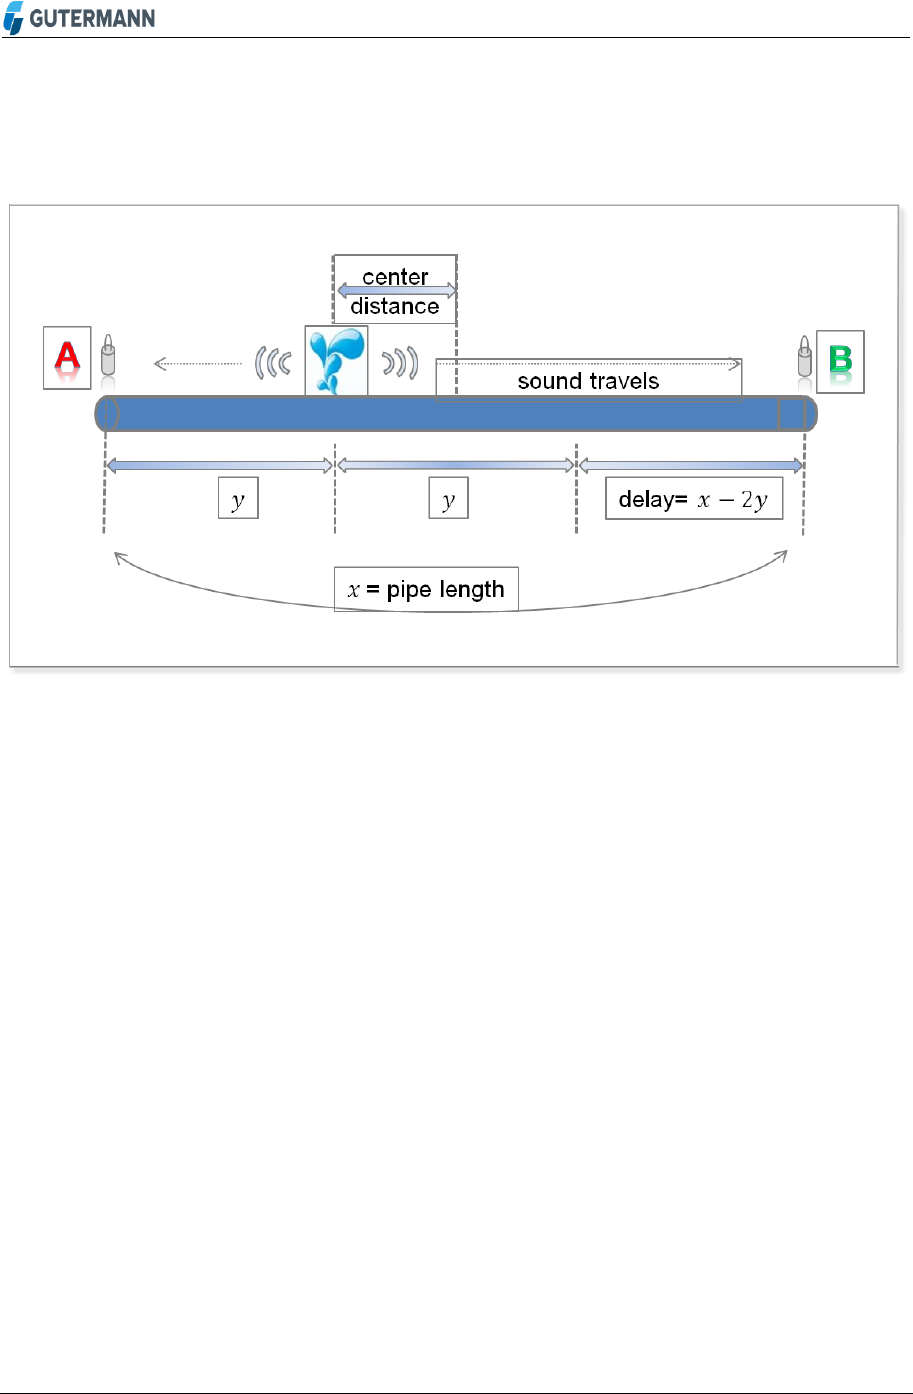
Center Correction explained in detail
7.2
With correlation we measure the time delay between the leak noise reaching both sensors:
Figure 77: Center Correlation
From this we can calculate the leak distance from both sensors, but only if we know the pipe
length between the sensors x. In practice, in ZONESCAN NET we often don’t know the pipe
length because it was not entered using the pipe wizard of manual pipe entry.
Even if we don’t know the pipe length however, we can always calculate the offset of the leak
from the center between the sensors using the default sound velocity. This is called center
distance.
70 I 72
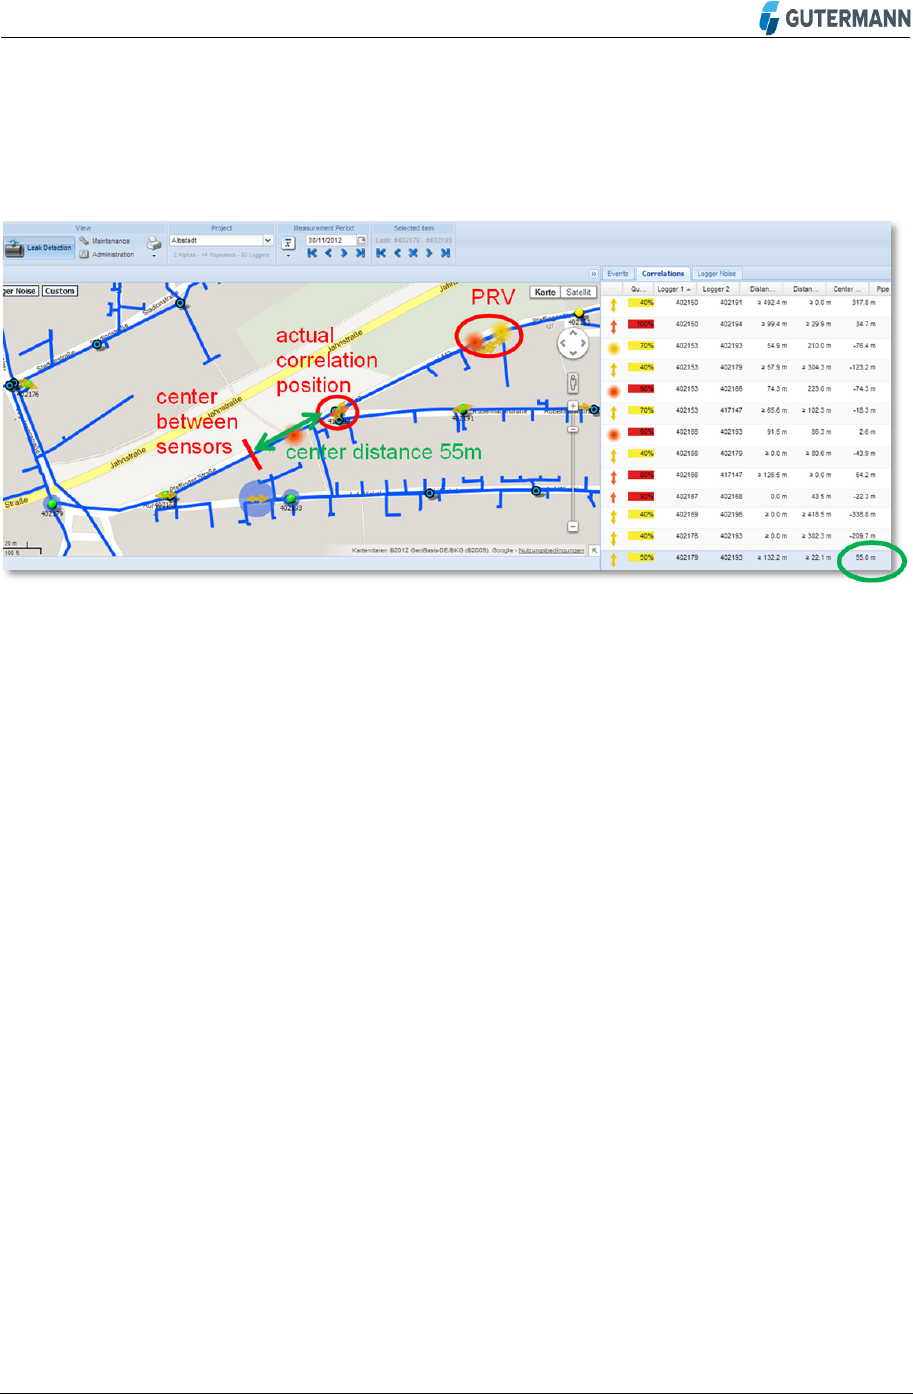
7.2.1 Example
The selected correlation between sensors 402179 and 402193 in project “Albstadt” below
seems to be left of sensor 402193.
Figure 78: Center Correlation – cont.
As we can see from the KML (Keyhole Markup Language) overlay this is not possible
because there is no direct pipe connection between the sensors. However, the center
distance of 55m tells us that the noise source is 55m from the center between the sensors
towards logger 402193 (if it was towards the first sensor, the center distance would be
negative). From this we can see that the correlation position is the junction with the pipe
coming from the PRV (Pressure Reduction Volve), which is also the cause for the correlation.

71 I 72
8 Hardware Description
Overview
8.1
As shown in Figure 1, the ZONESCAN system consists of the devices
• ZONESCAN 820 Logger
• Model 4-1-C1 (EU, internal antenna),
• Model 4-2-C1 (EU, external antenna),
• Model 5-1-C1 (North America, internal antenna)
• Model 5-2-C1 (North America, external antenna)
• ZONESCAN 820 Repeater
• Model 4-1-C1 (EU)
• Model 5-1-C1 (North America)
•
ZONESCAN Alpha communication unit
•
Model
S-ALPHA-4-0-A1 (EU)
•
Model
S-ALPHA-5-0-A1
(North America)
External Antenna types
• ZONESCAN 820 Logger
Impedance 50Ω
Antenna gain: 0dBi max.
Polarisation: linear; vertical
Example: C02+MT07-1+174U+SMA M from CHIN MORE
• Model
S-ALPHA
Impedance 50Ω
Antenna gain: 12dBi max.
Polarisation: linear; vertical
Example: YA9-11 from LAIRD TECHNOLOGY
72 I 72
Installation
8.2
The initial setup of the ZONESCAN system and/or specific training for the setup is provided
by a qualified Gutermann representative.
Conformity
8.3
This device complies with part 15 of the FCC Rules and with Industry Canada's licence-exempt RSSs.
Operation is subject to the following two conditions:
(1) This device may not cause harmful interference, and
(2) this device must accept any interference received, including interference that may cause undesired
operation.
Le présent appareil est conforme aux CNR d'Industrie Canada applicables aux appareils radio
exempts de licence. L'exploitation est autorisée aux deux conditions suivantes:
(1) l'appareil ne doit pas produire de brouillage, et
(2) l'appareil doit accepter tout brouillage radioélectrique subi, même si le brouillage est susceptible
d'en compromettre le fonctionnement.
Changes or modifications not expressly approved by the party responsible for compliance could void
the user's authority to operate the equipment.
9 Disposal
Never put electrical appliances, accumulators, and batteries in household waste bin.
Always collected separately and perform an environmentally friendly recycling. When
disposing of electrical appliances, accumulators, and batteries always comply with national
and regional waste disposal regulations. If an orderly disposal of our products is not possible,
send the unit to us. We dispose our products environmentally friendly. Address see imprint.
10 Imprint
Gutermann Technology GmbH
Gottlieb-Daimler-Str. 10
88214 Ravensburg, Germany
Phone: +49 751 3590 1682
Fax: +49 751 3590 1699
www.gutermann-water.com
E-mail: info@gutermann-water.com
Subject to alterations I Software Version 2.1 – Document 03/2017