HWM Water 031A Pcorr+ PR5US Leak Detector User Manual PermaNetPlus for Pcorr and Permalog
HWM-Water Ltd Pcorr+ PR5US Leak Detector PermaNetPlus for Pcorr and Permalog
UserManual.wiki
>
HWM Water
>
031A User Manual
User Manual
Navigation menu
Upload a User Manual
Namespaces
Wiki Guide
HTML
PDF
Info
Views
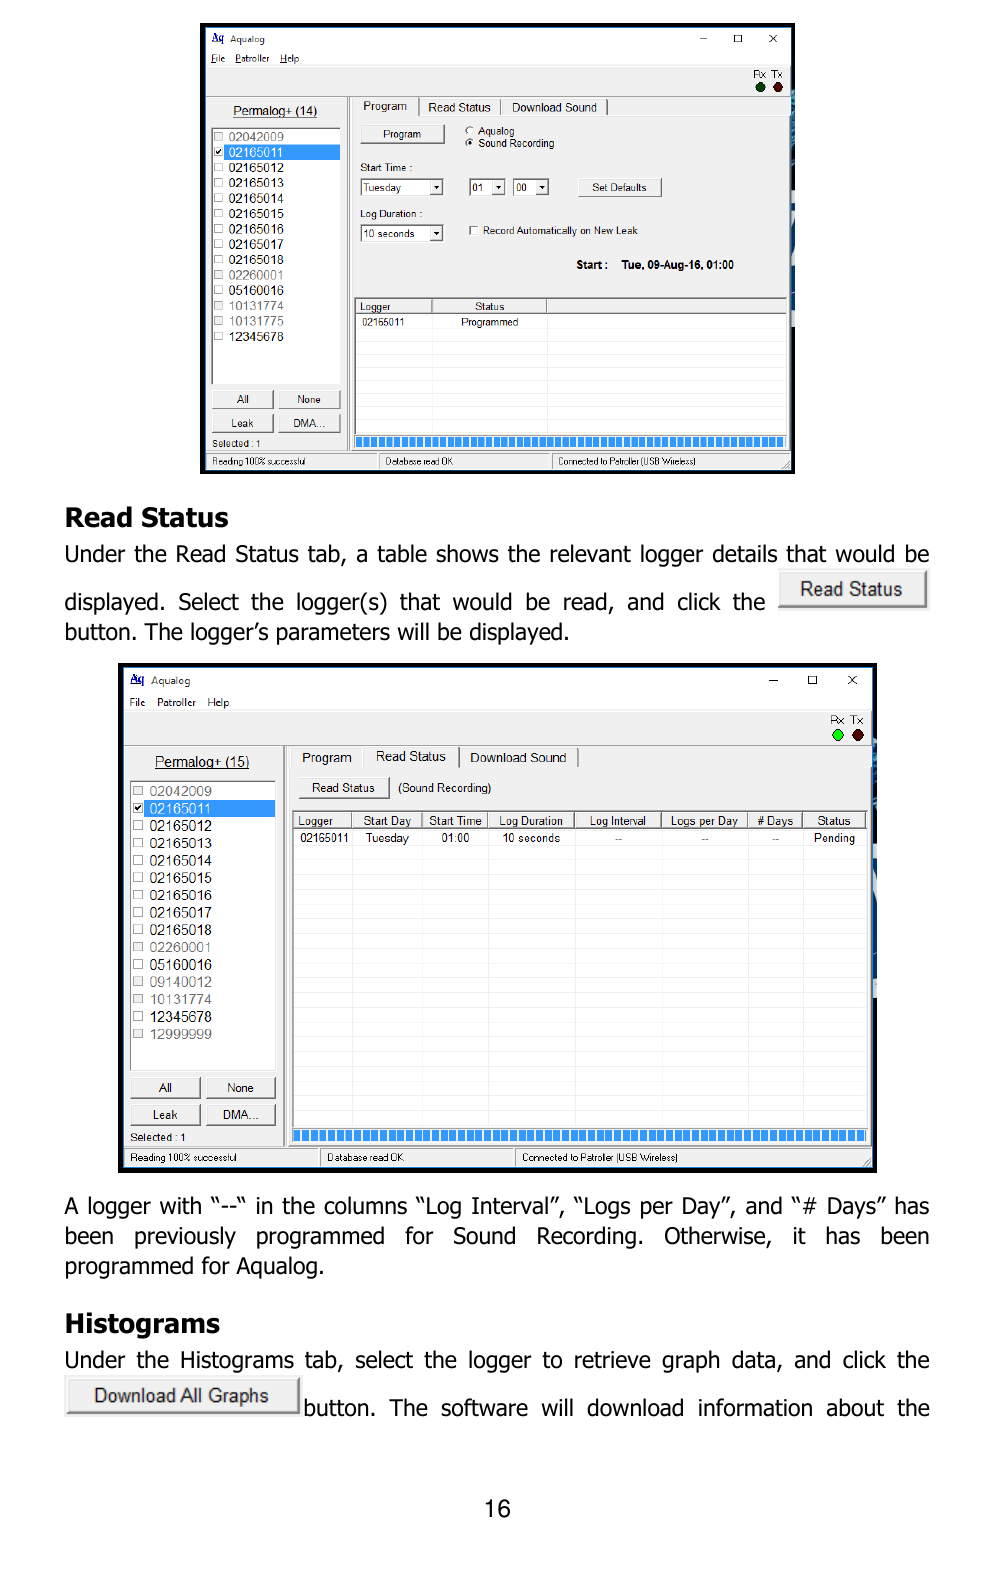
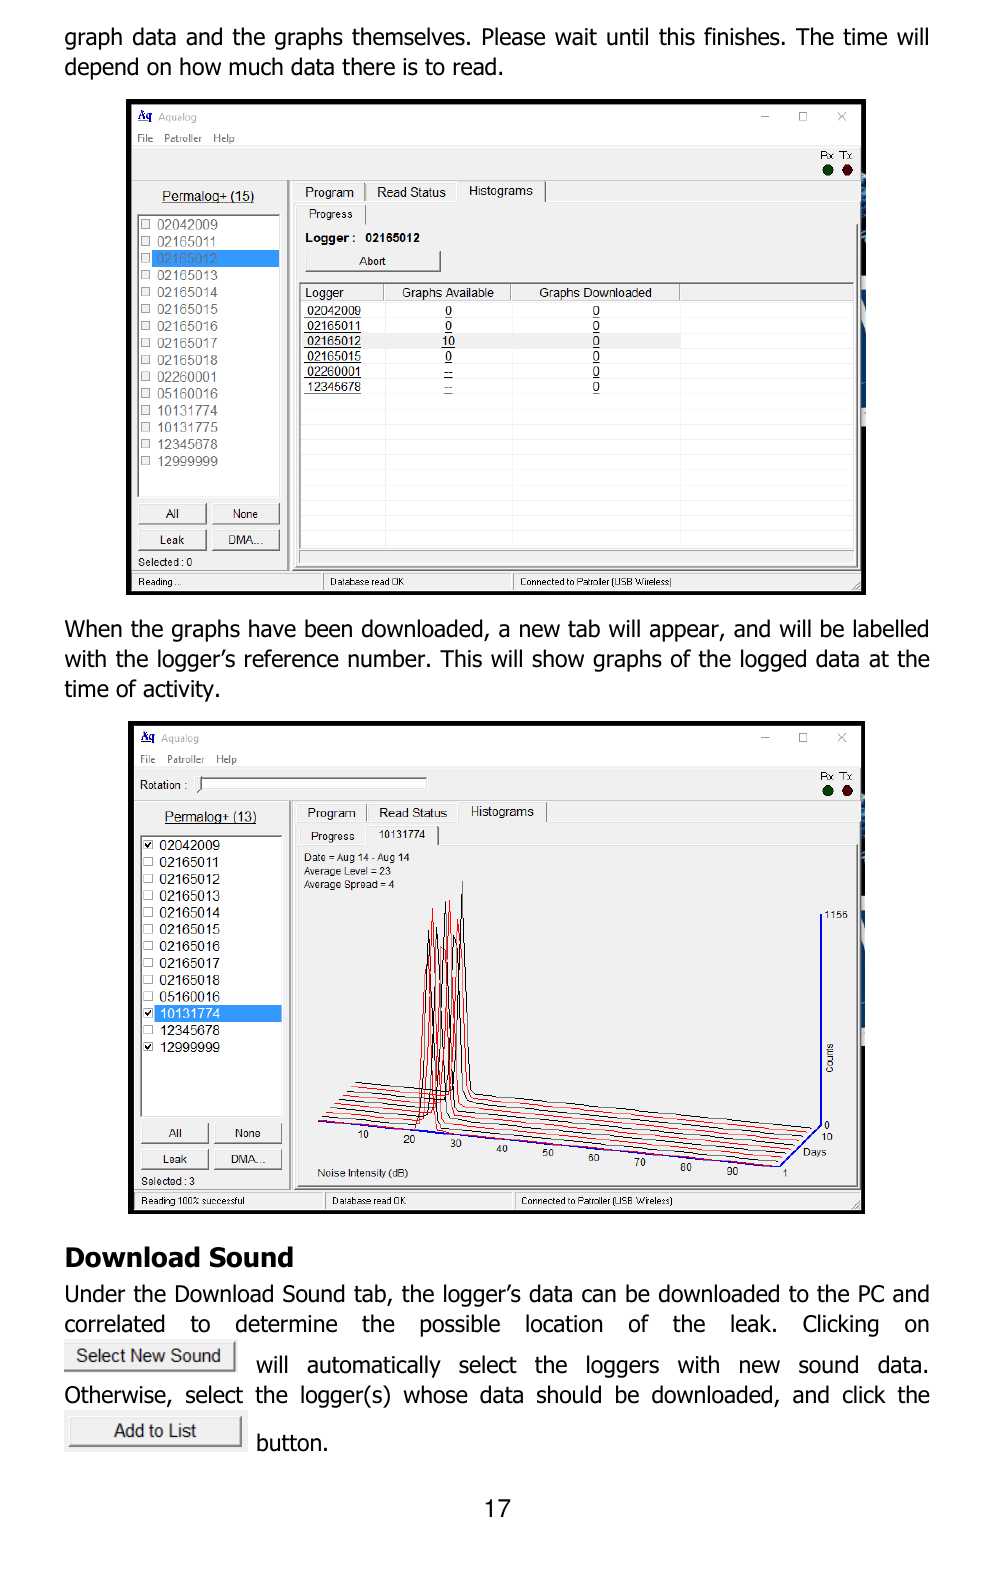
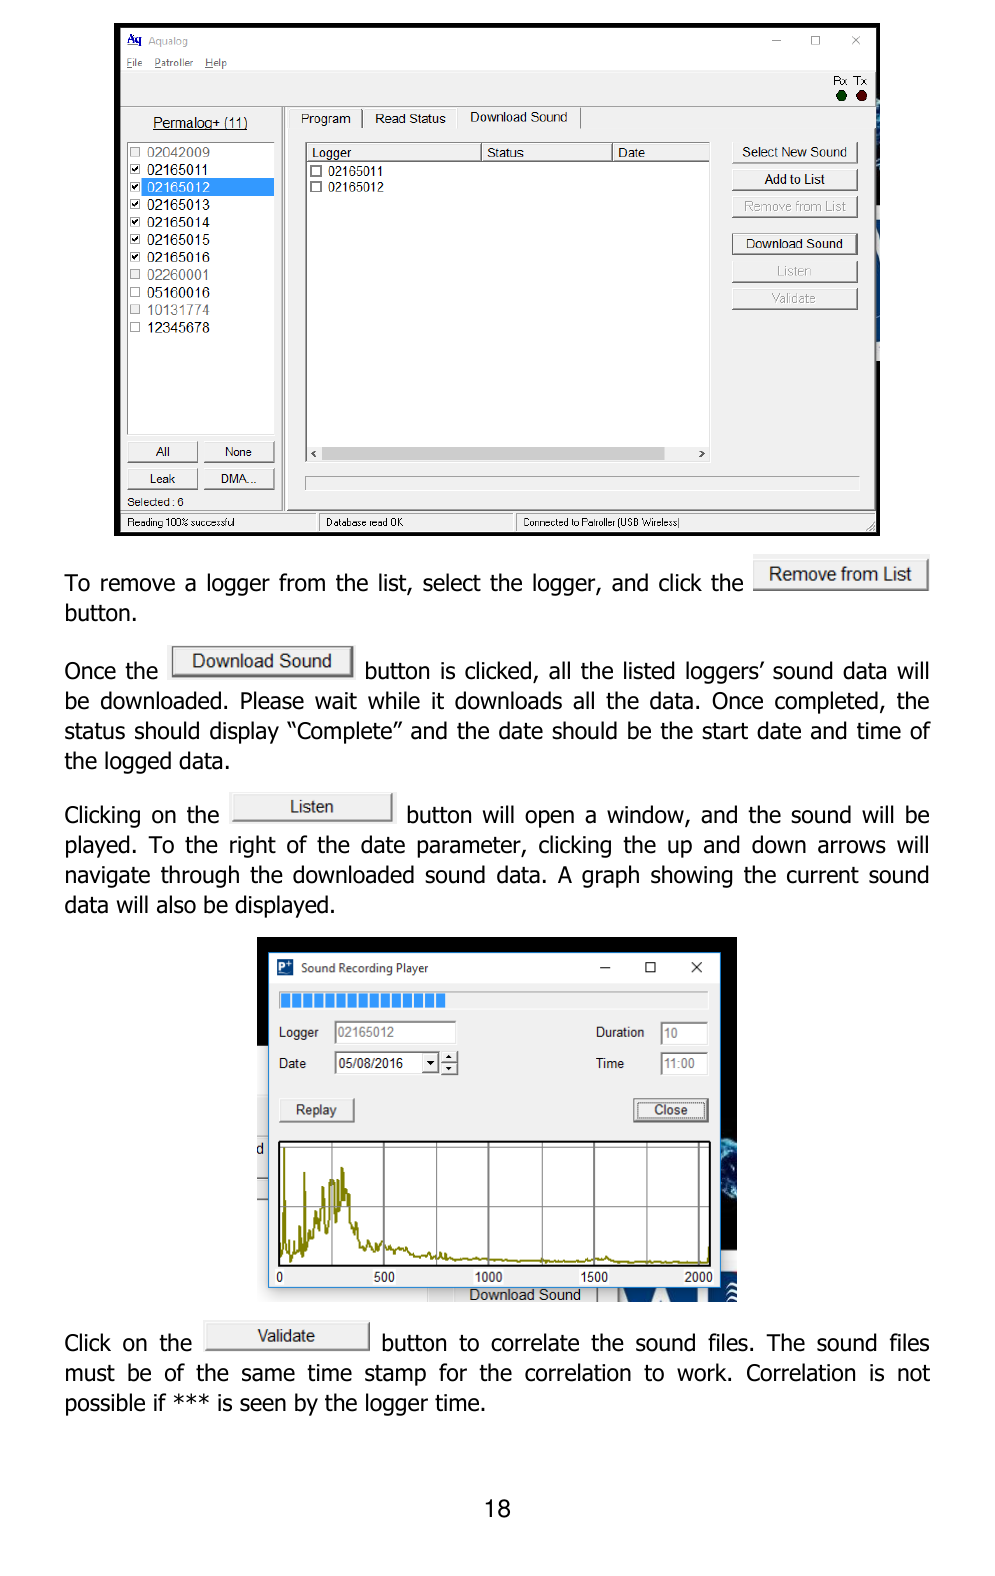
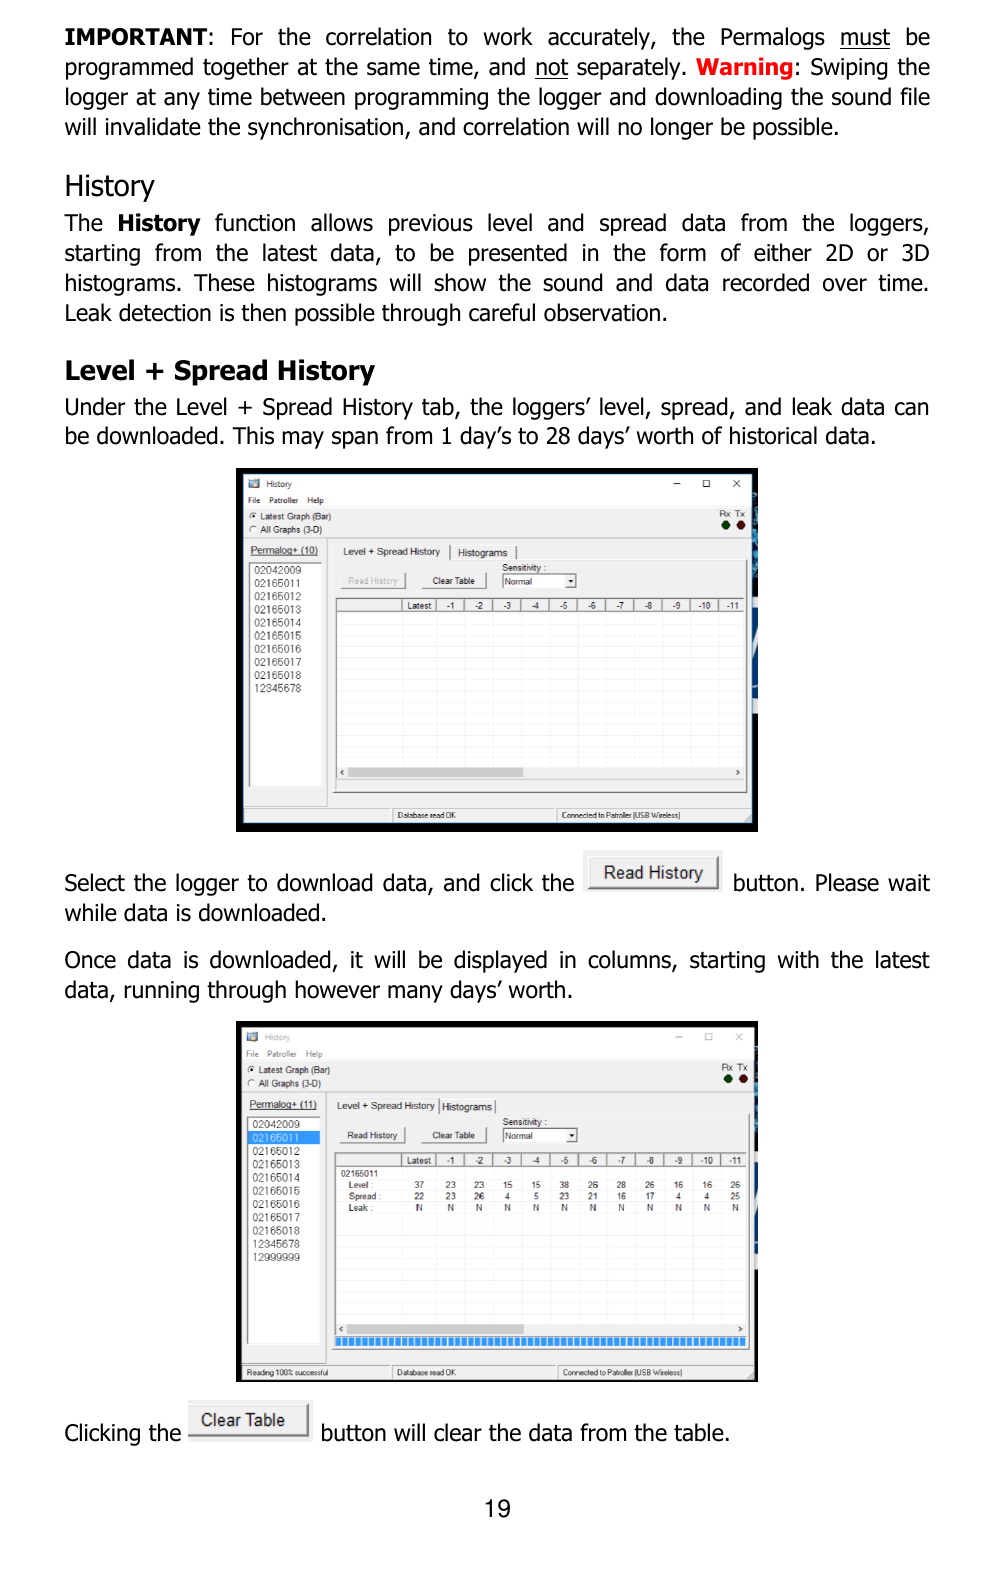
User Manual
Discussion / Help
Navigation