HWM Water 031A Pcorr+ PR5US Leak Detector User Manual PermaNetPlus for Pcorr and Permalog
HWM-Water Ltd Pcorr+ PR5US Leak Detector PermaNetPlus for Pcorr and Permalog
User Manual
Pcorr+ and Permalog+
User Manual
Version F

1
TABLE OF CONTENTS
INTRODUCTION .................................................................................. 3
Overview .................................................................................................................. 3
PERMANETPLUS .................................................................................. 4
Patrol ........................................................................................................................ 4
Drive-by Mode .............................................................................................................. 7
Fast Patrol ................................................................................................................ 8
DMA Management .................................................................................................... 8
Deploy....................................................................................................................... 8
Add New Logger ........................................................................................................... 9
Edit Existing Logger ...................................................................................................... 9
Data Analysis .......................................................................................................... 10
Lift + Shift .............................................................................................................. 11
Lift ............................................................................................................................. 12
Shift ........................................................................................................................... 13
Aqualog................................................................................................................... 14
Program ..................................................................................................................... 15
Read Status ................................................................................................................ 16
Histograms ................................................................................................................. 16
Download Sound ......................................................................................................... 17
History .................................................................................................................... 19
Level + Spread History ................................................................................................ 19
Histograms ................................................................................................................. 20
P+ Setup ................................................................................................................. 21
Program Loggers ........................................................................................................ 21
Read Loggers ............................................................................................................. 21
Utilities ....................................................................................................................... 23
Firmware Upgrade ...................................................................................................... 24
Patroller Setup ....................................................................................................... 26
Connections ............................................................................................................ 27
Patroller/USB Wireless ................................................................................................. 27
DataGate .................................................................................................................... 28
Local Folder (Toran) .................................................................................................... 28
Backup/Restore...................................................................................................... 28
Backup ....................................................................................................................... 29
Restore ...................................................................................................................... 29
Maps ....................................................................................................................... 30
About ...................................................................................................................... 31

2
PERMANETPLUS LLC ......................................................................... 32
Prerequisites .......................................................................................................... 32
Main Screen ............................................................................................................ 32
Importing Sound Data ............................................................................................ 32
Creating a Pipe Layout ........................................................................................... 33
Exporting Pipe Layouts........................................................................................... 35
Importing Pipe Layouts .......................................................................................... 36
Cross Correlation .................................................................................................... 37
No Leak Determined ................................................................................................... 39
Leak Determined ......................................................................................................... 39
FAQS .................................................................................................. 41
Troubleshooting ..................................................................................................... 41

3
Introduction
Thank you for choosing an HWM data device, we trust it will provide you with many
years of service.
This manual has been written using the PermaNetPlus version 2.41 and
PermaNetPlus LLC version 3.11, and as such the figures may look different to your
installation.
Overview
Pipeline leaks are a constant burden to water and gas industries, which can affect
the efficiency of the individual company’s performance. As well as reducing the
amount actually being delivered, leaks also impact the financial side of the business,
and the longer the leak is left, the larger the economic, and potentially
environmental, consequences. It is therefore safer and more beneficial to detect a
leak and repair the damage to the pipes before it causes more damage to the
business. At HWM, we pride ourselves in designing the best leak detection
equipment at an affordable price for the benefit of the water and gas companies.
Our Permalog+ product family (yellow) aims to detect when a leak is found, and it
has successfully done so for the last ten years of service. The Permalogs are
functioning microphones that can detect the sounds emitted from a potential leak.
To conserve battery life and increase their life expectancy, the loggers take one
reading every 24 hours, and once deployed, the Permalogs can be programmed and
read locally through radio communications.
Our SoundSens and Aqualog product ranges record the sounds detected along the
pipeline and correlate them to determine where the leak is located. They have
successfully detected leaks with a high accuracy, and helped companies find and
repair leaking pipes. In the past, these products were used when there may have
been leaks in pipes.
Our new PCorr+ system (Blue) combines the Permalog+ family with the SoundSens
and Aqualog products to not only detect, but also localise the leak. By combining
these products, the amount of hardware required for leak detection and localisation
is reduced.
The software has also been combined to deliver fast readouts from the loggers, and
also determine the location of the leak. With the new software you will be able to:
Determine whether a leak has been detected,
Configure the loggers to read and record sound data at a specified time,
View a map of the locations of the loggers,
Correlate the recorded sounds to determine a location of the leak, and
Analyse the sound recordings manually.
This document has been produced to help guide you through the features available
within this powerful software. Please read through this manual to understand how
the software works. Should you have any questions that are not covered by this
manual or FAQs provided online, please contact the HWM Technical Support team on
+44 (0) 1633 489479 and selecting option 2, or email cservice@hwm-water.com .
4
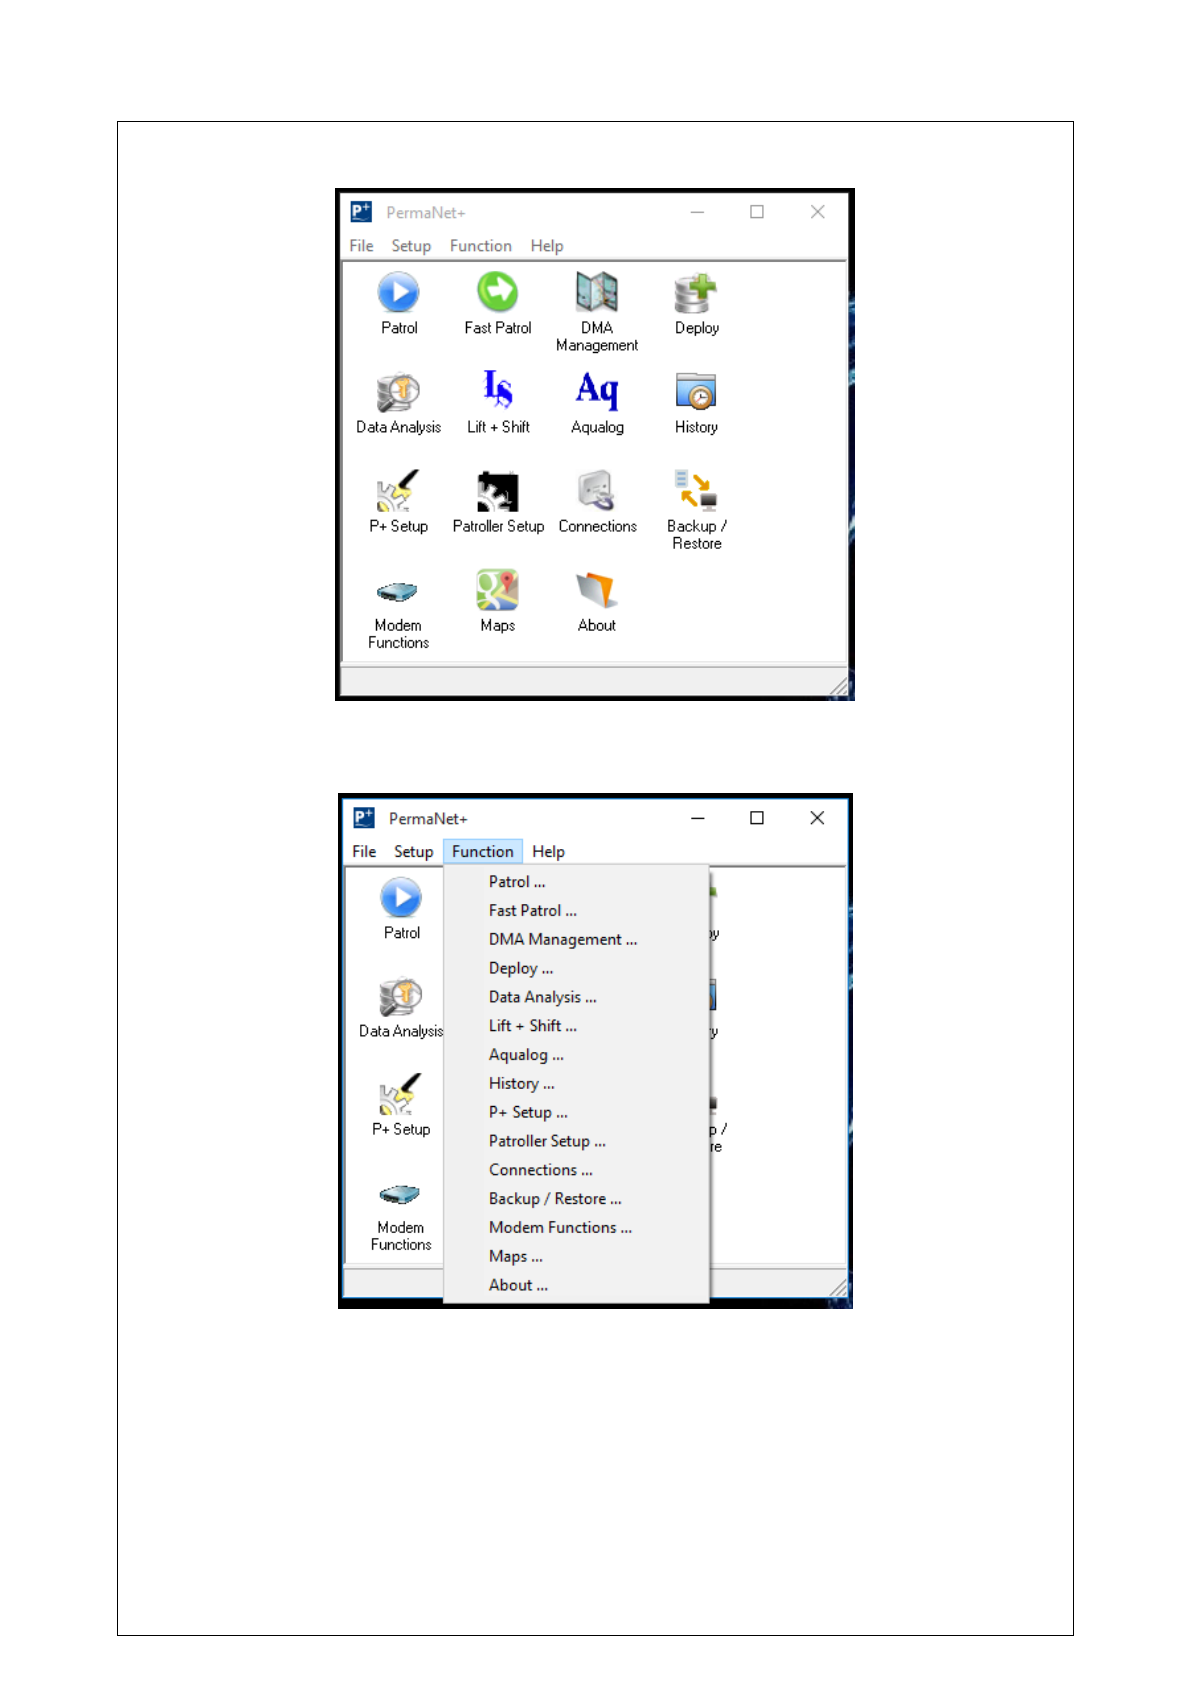
PermaNetPlus
The Main Screen contains a set of icons that will lead to the different functions of
the PermaNetPlus software. They can also be accessed by the Function menu.
The functions displayed in the picture will now be outlined.
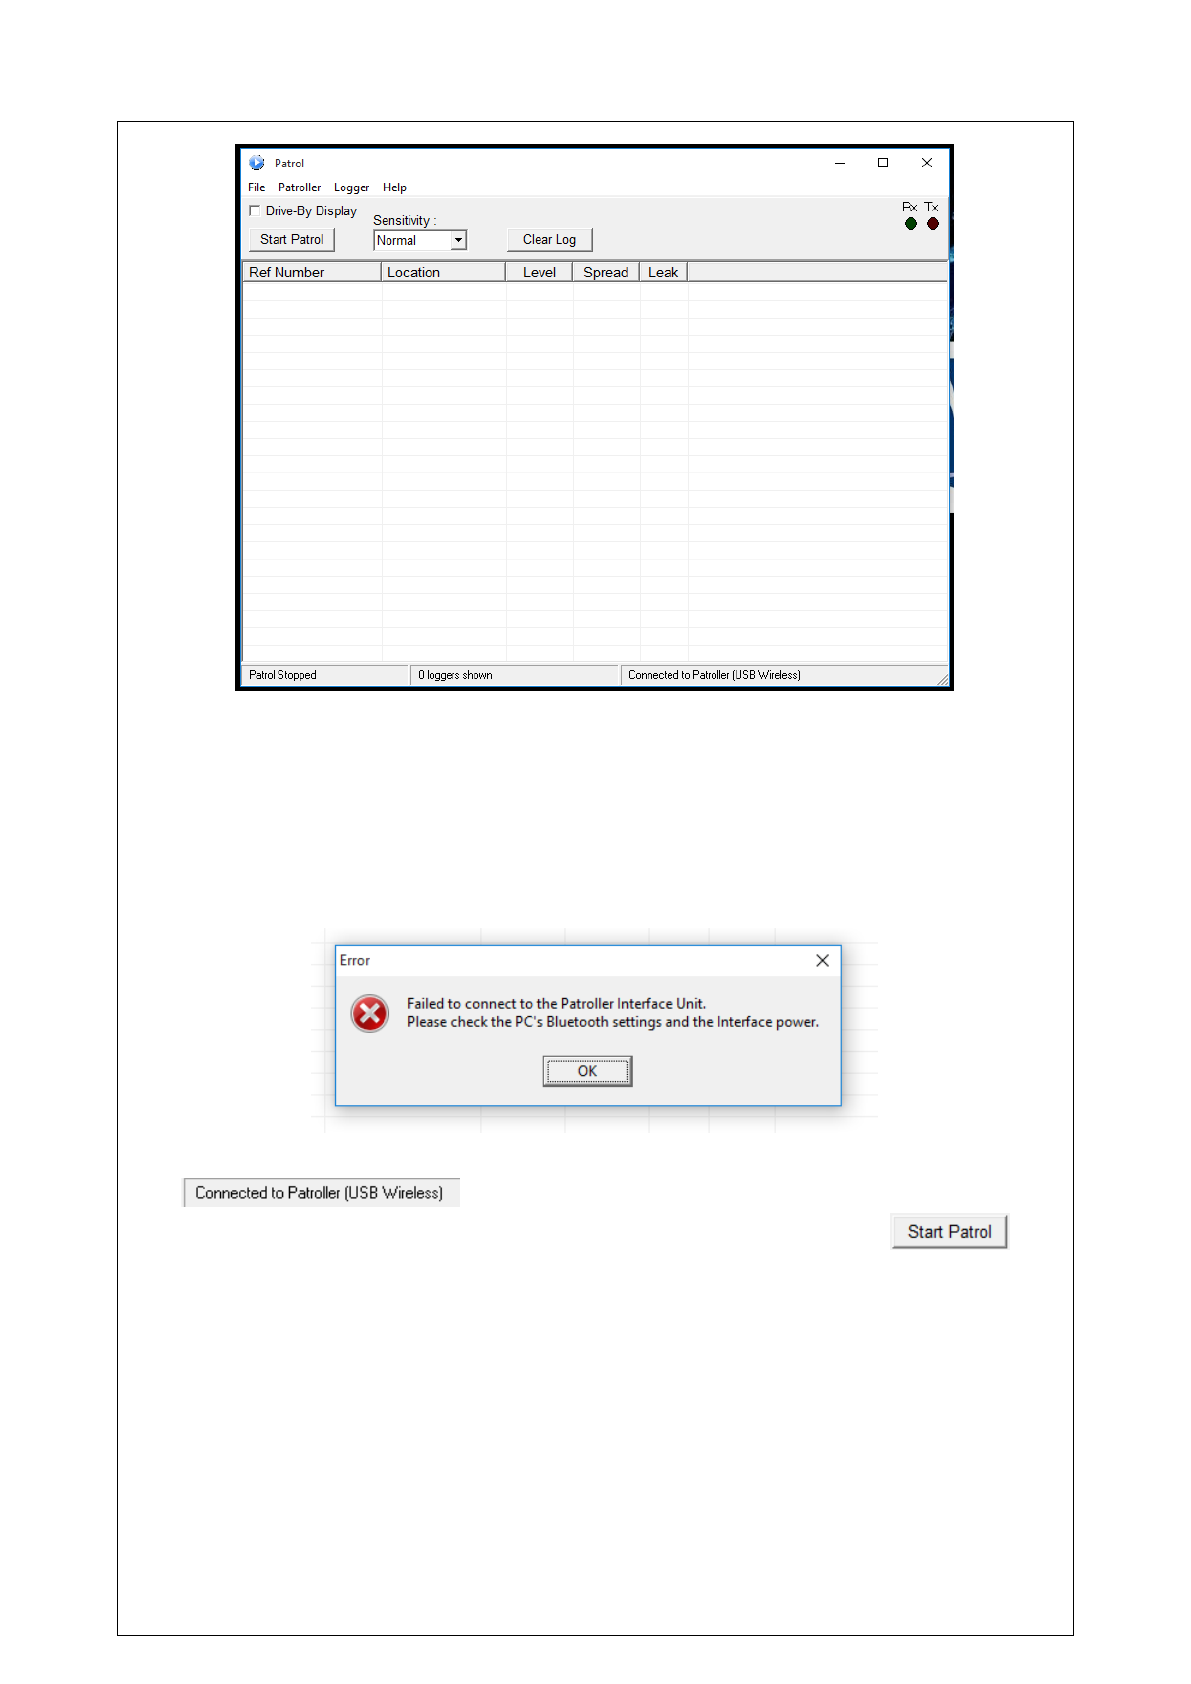
Patrol
The Patrol function reads data from the Loggers. When Patrol is clicked, a window
will open.
5
For this function to work, either a mobile Patroller unit or a wireless USB module
must be used.
Note: for the Patroller unit to be used, the computer must have Bluetooth enabled,
and must be connected to the Patroller unit.
If the computer does not detect either the Patroller or the wireless USB module, an
error message will appear. This means no logger can be read to the PC.
Once connected, the message box at the bottom right of the window will display
if connected to the USB module or the Patroller. If the
local loggers’ data are not read automatically, upon clicking on the
button, the loggers’ data will be read.
6
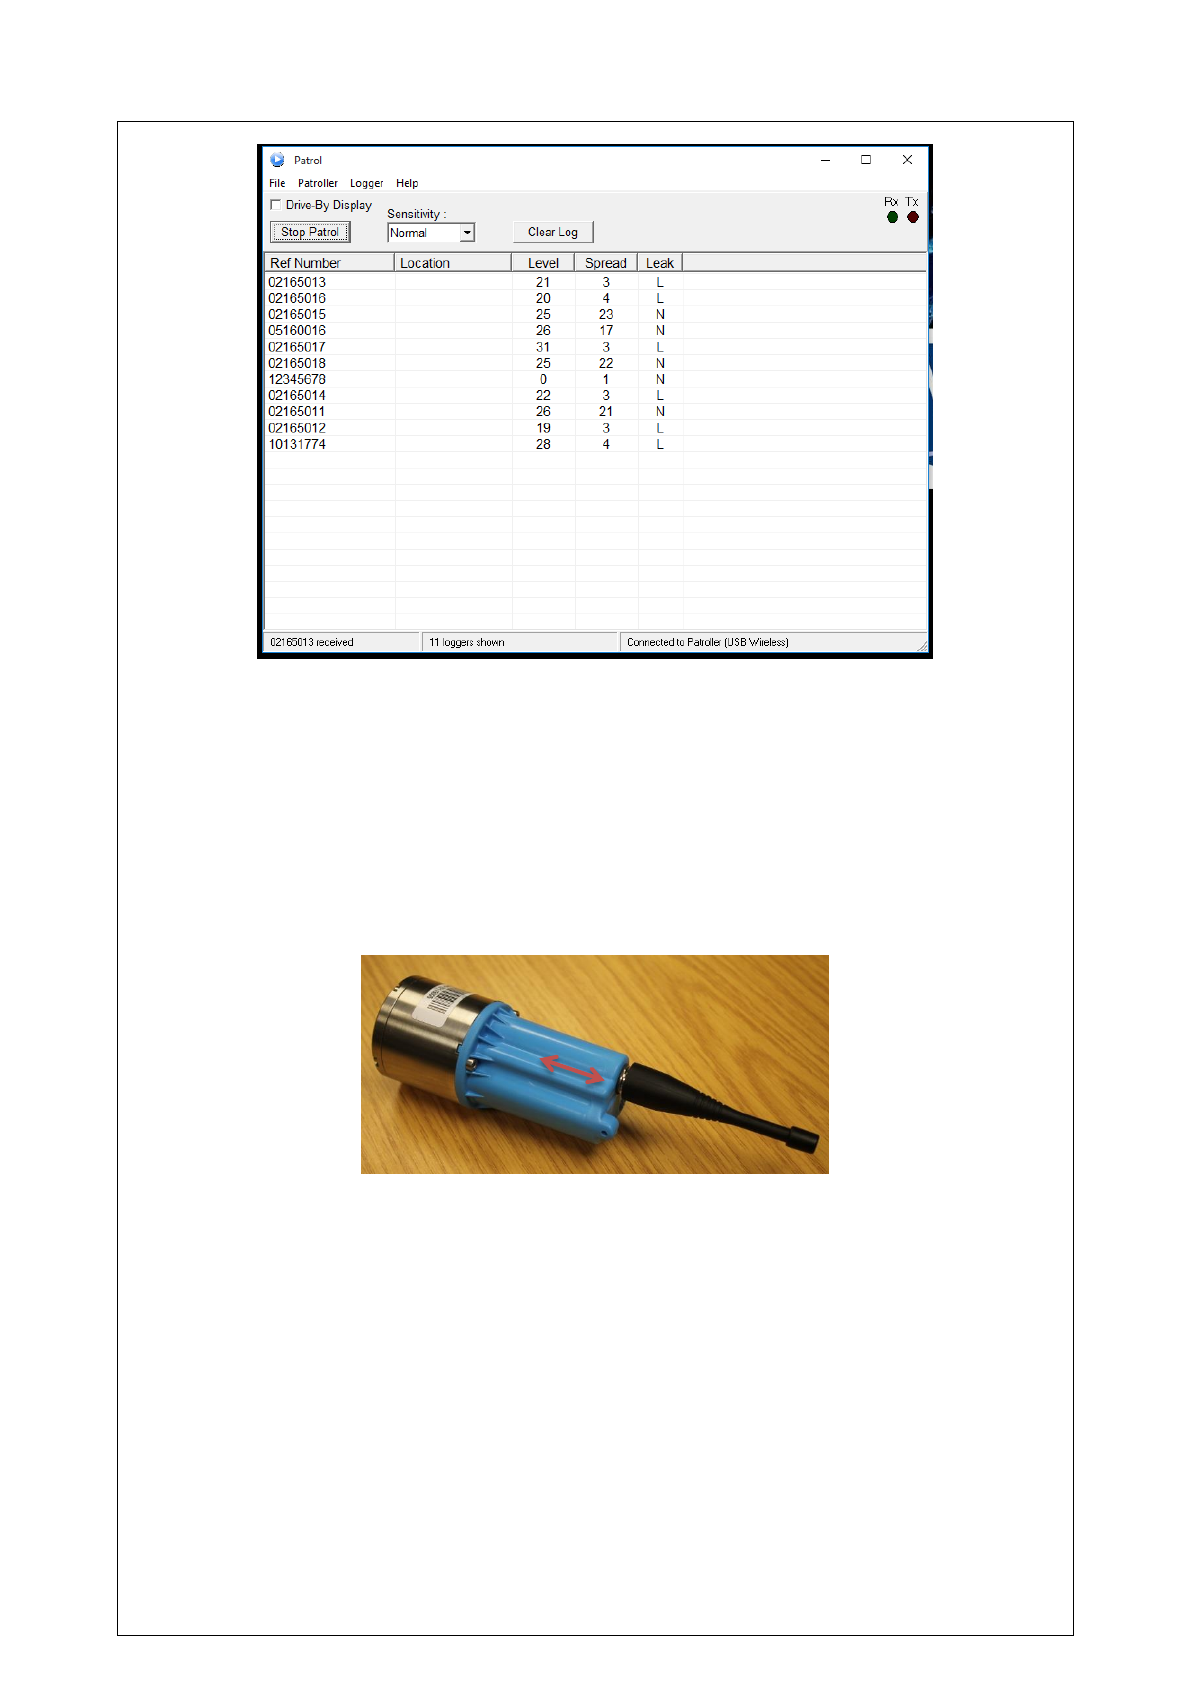
Note: for the Patroller unit (whether mobile or USB) to detect the logger, the radio
frequencies of Patroller or USB transceiver must match.
Note: some sections will appear blank (locations, GPS, Address etc). This is because
the loggers have not been configured with these details (see section Deploy on how
to configure).
Note: if the logger does not appear, try swiping the logger with a magnet along the
square ridge on the side of the case. Warning: Swiping the logger will invalidate
synchronisation for any sound recordings not yet downloaded.
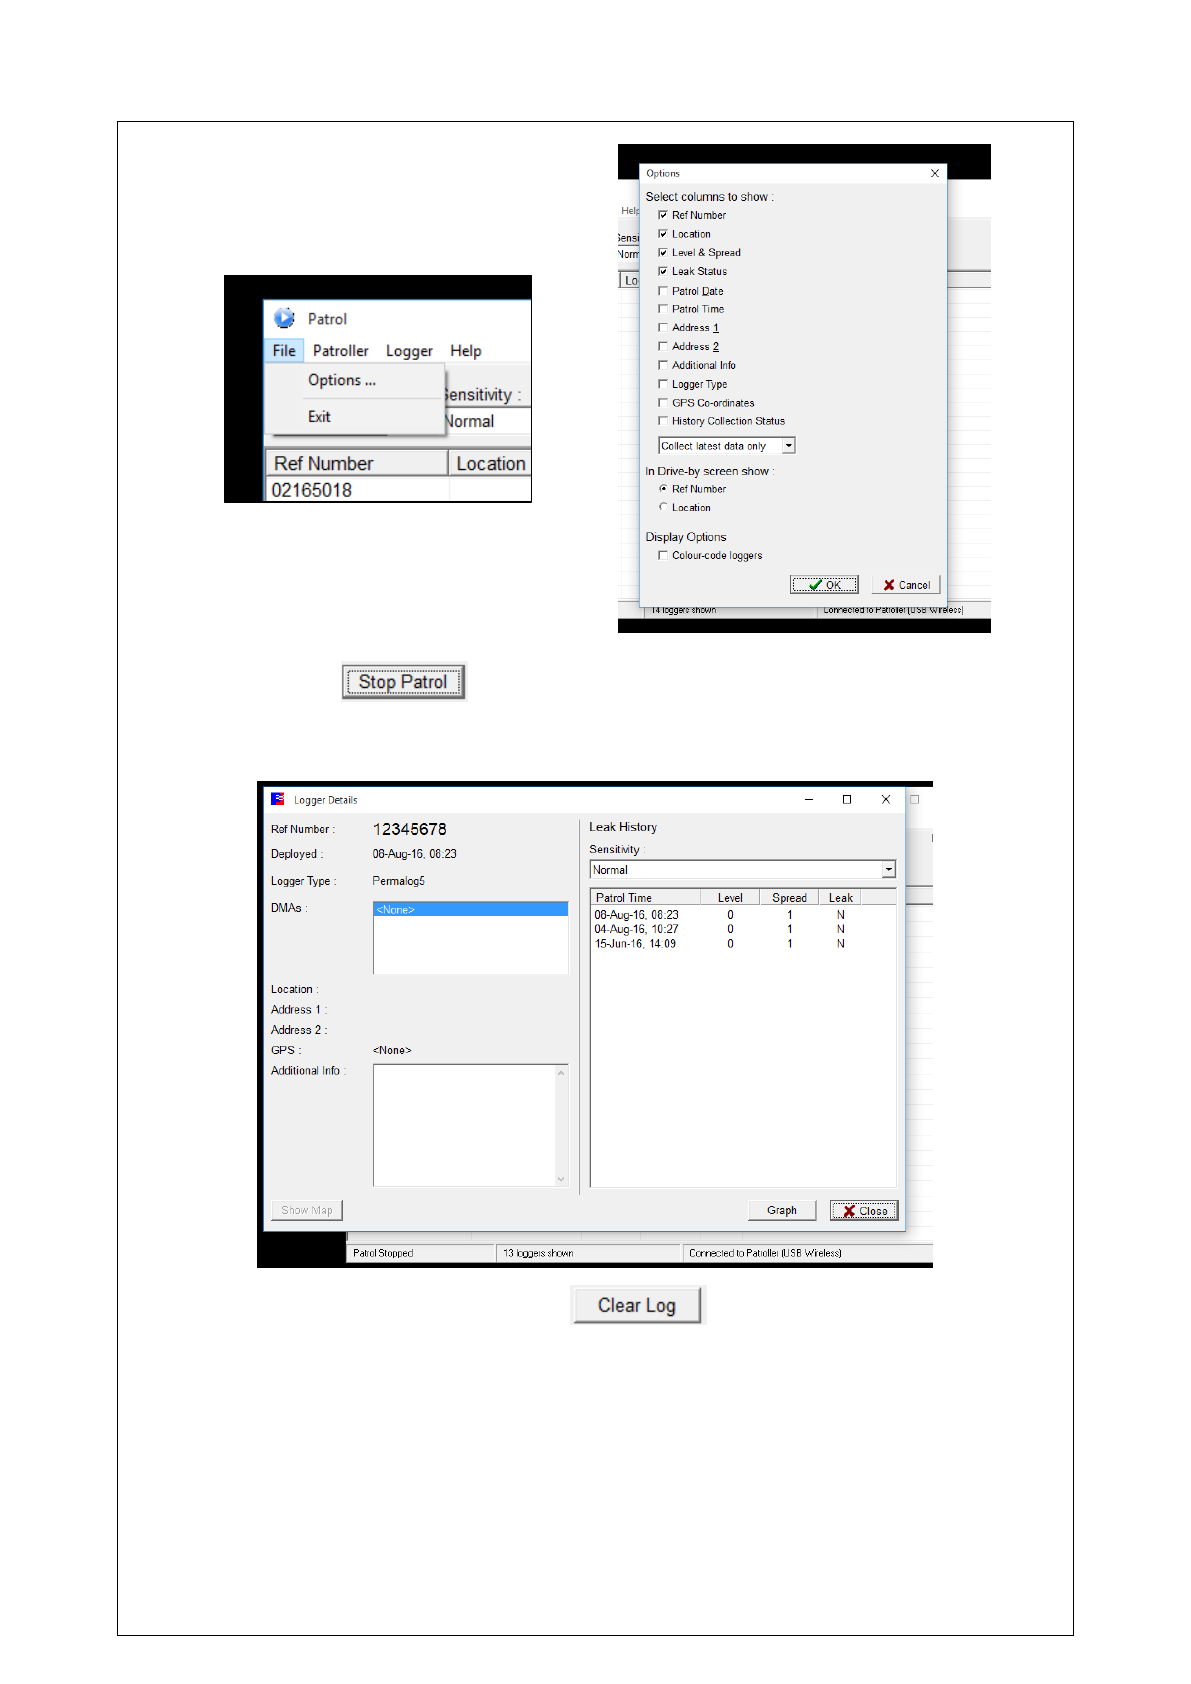
More options and information from the loggers can be seen by clicking on File ->
Options, and selecting the information of interest. The checkbox “Colour-code
loggers” introduces a colour bar denoting leak (red) or no leak (green) detected.
7
Clicking on the button will freeze the logger data in place. This will
allow the user to gather additional information about individual loggers by double-
clicking the logger of choice.
On the Patrol window, clicking on the button will clear the screen of
all data.
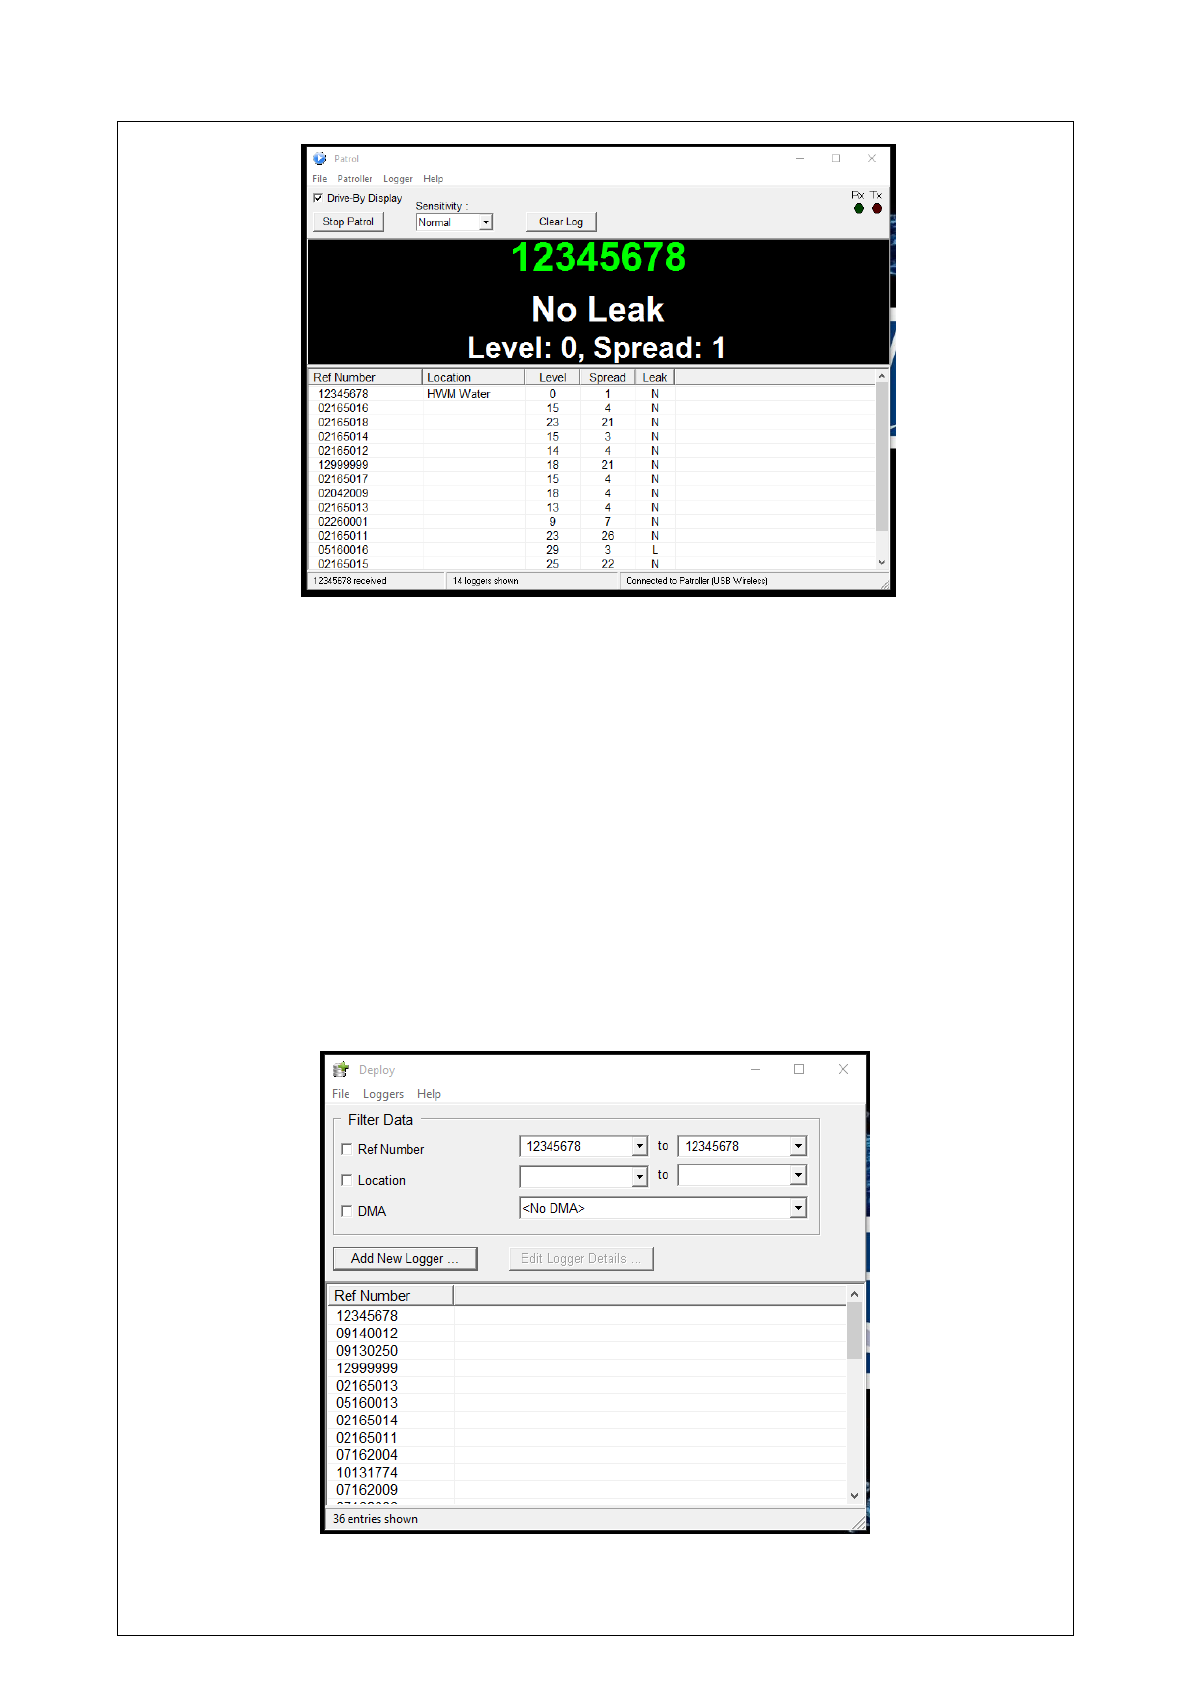
Drive-by Mode
By selecting Drive-By Display, the window will split between the loggers’ data screen
and the latest received logger leak information.
8
Fast Patrol
The Fast Patrol function allows for a fast drive-through patrol of the loggers in a
specific DMA, and functions in a similar way as the Patrol function in that it scans
for detectable loggers. However, Fast Patrol tends to be used for quick check-ups
on the loggers. It may be useful to turn Drive-By Patrol on.
DMA Management
Refer to FAQ 376 on the HWM website for details on creating and editing DMAs
using the DMA Management function.
Deploy
The Deploy function allows the loggers’ details to be modified.
9
Any unrelated loggers can be filtered out by using the options in the Filter Data sub-
box. If a box is unchecked, that filter will not be applied. The current version of
PermaNetPlus (v2.41) only filters by Reference Number (serial code), alphabetical
location, and DMA:
Reference
Number:
Show loggers whose reference number lies within the given
range.
Location:
Show loggers whose location lies within the given range. Note:
location is sorted in numerical and alphabetical order.
DMA:
Show loggers within the specific DMA deployment information.
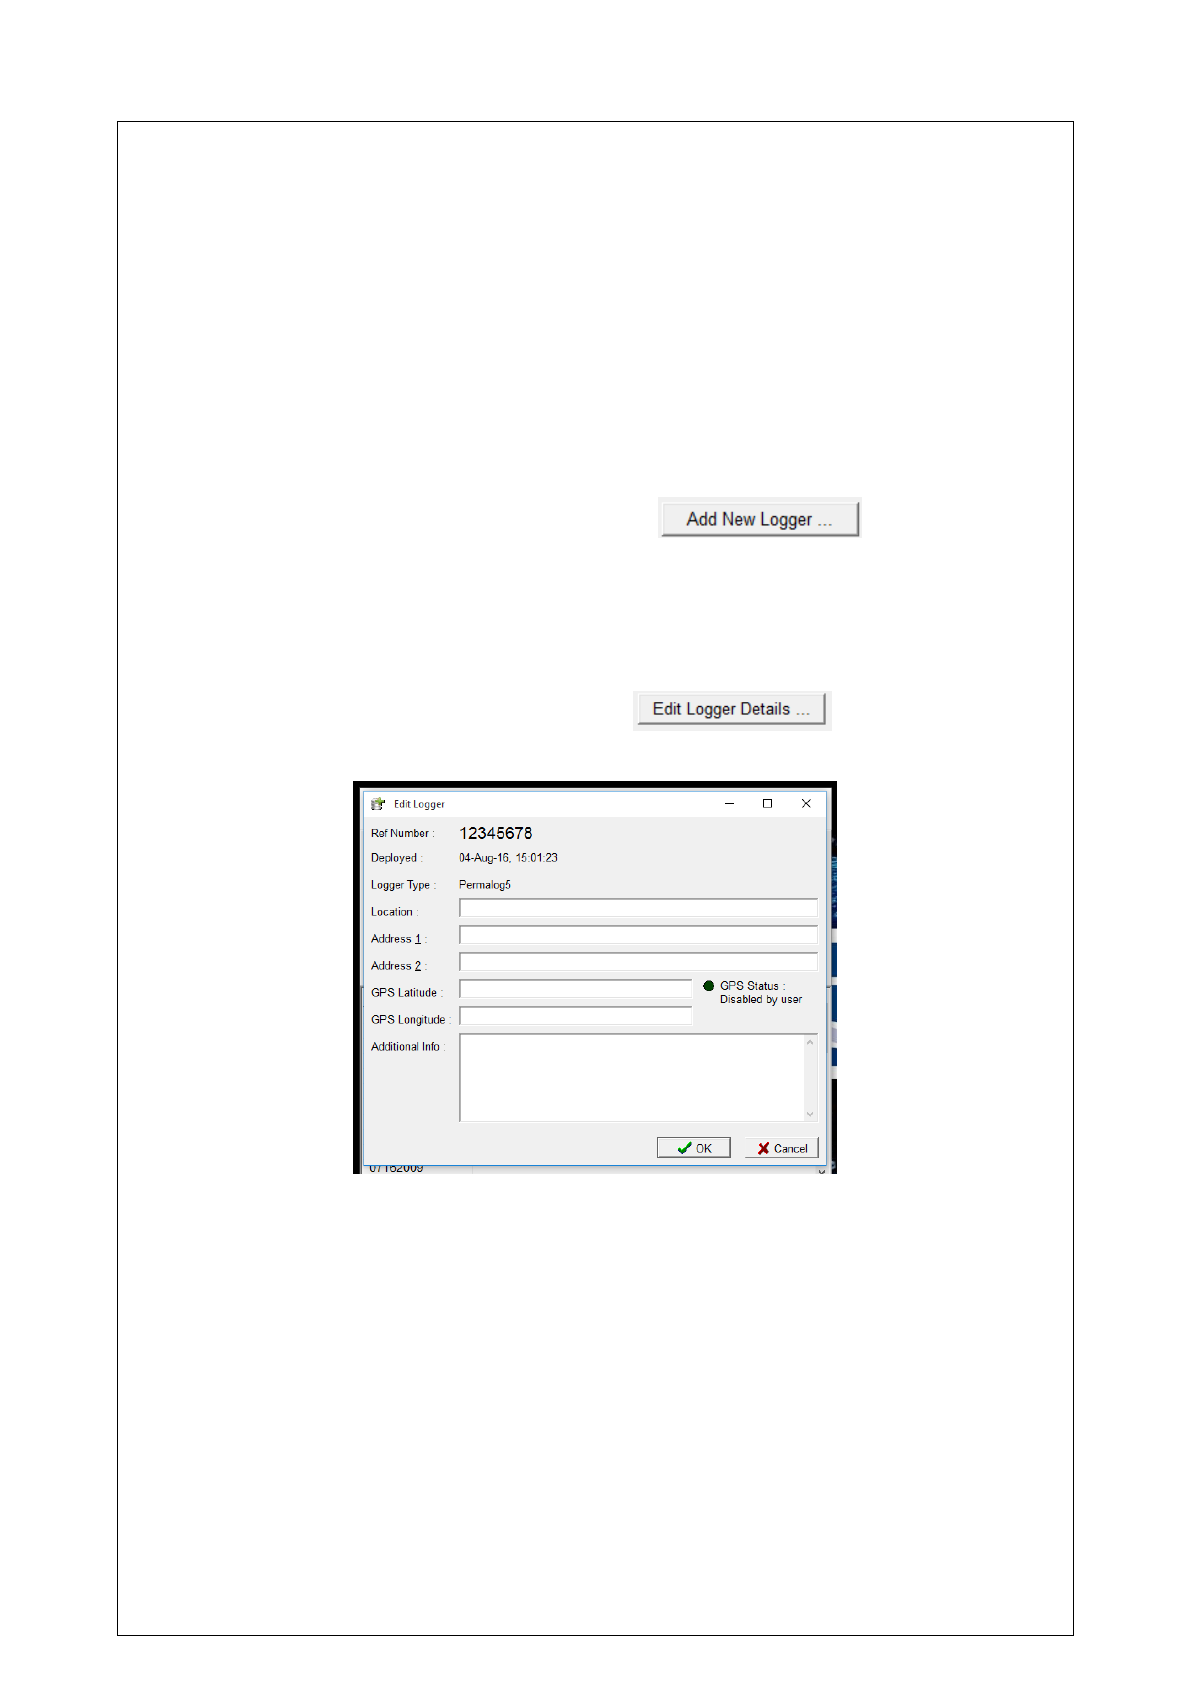
Add New Logger
To add a new logger to the database, click the button. In the
new window, add a reference number of choice. This may be the serial number or
the phone number associated to the logger, and it is the minimum required to add a
new logger to the database.
Edit Existing Logger
By selecting a specific logger and clicking the button, a window
will open to allow the logger’s details to be edited.
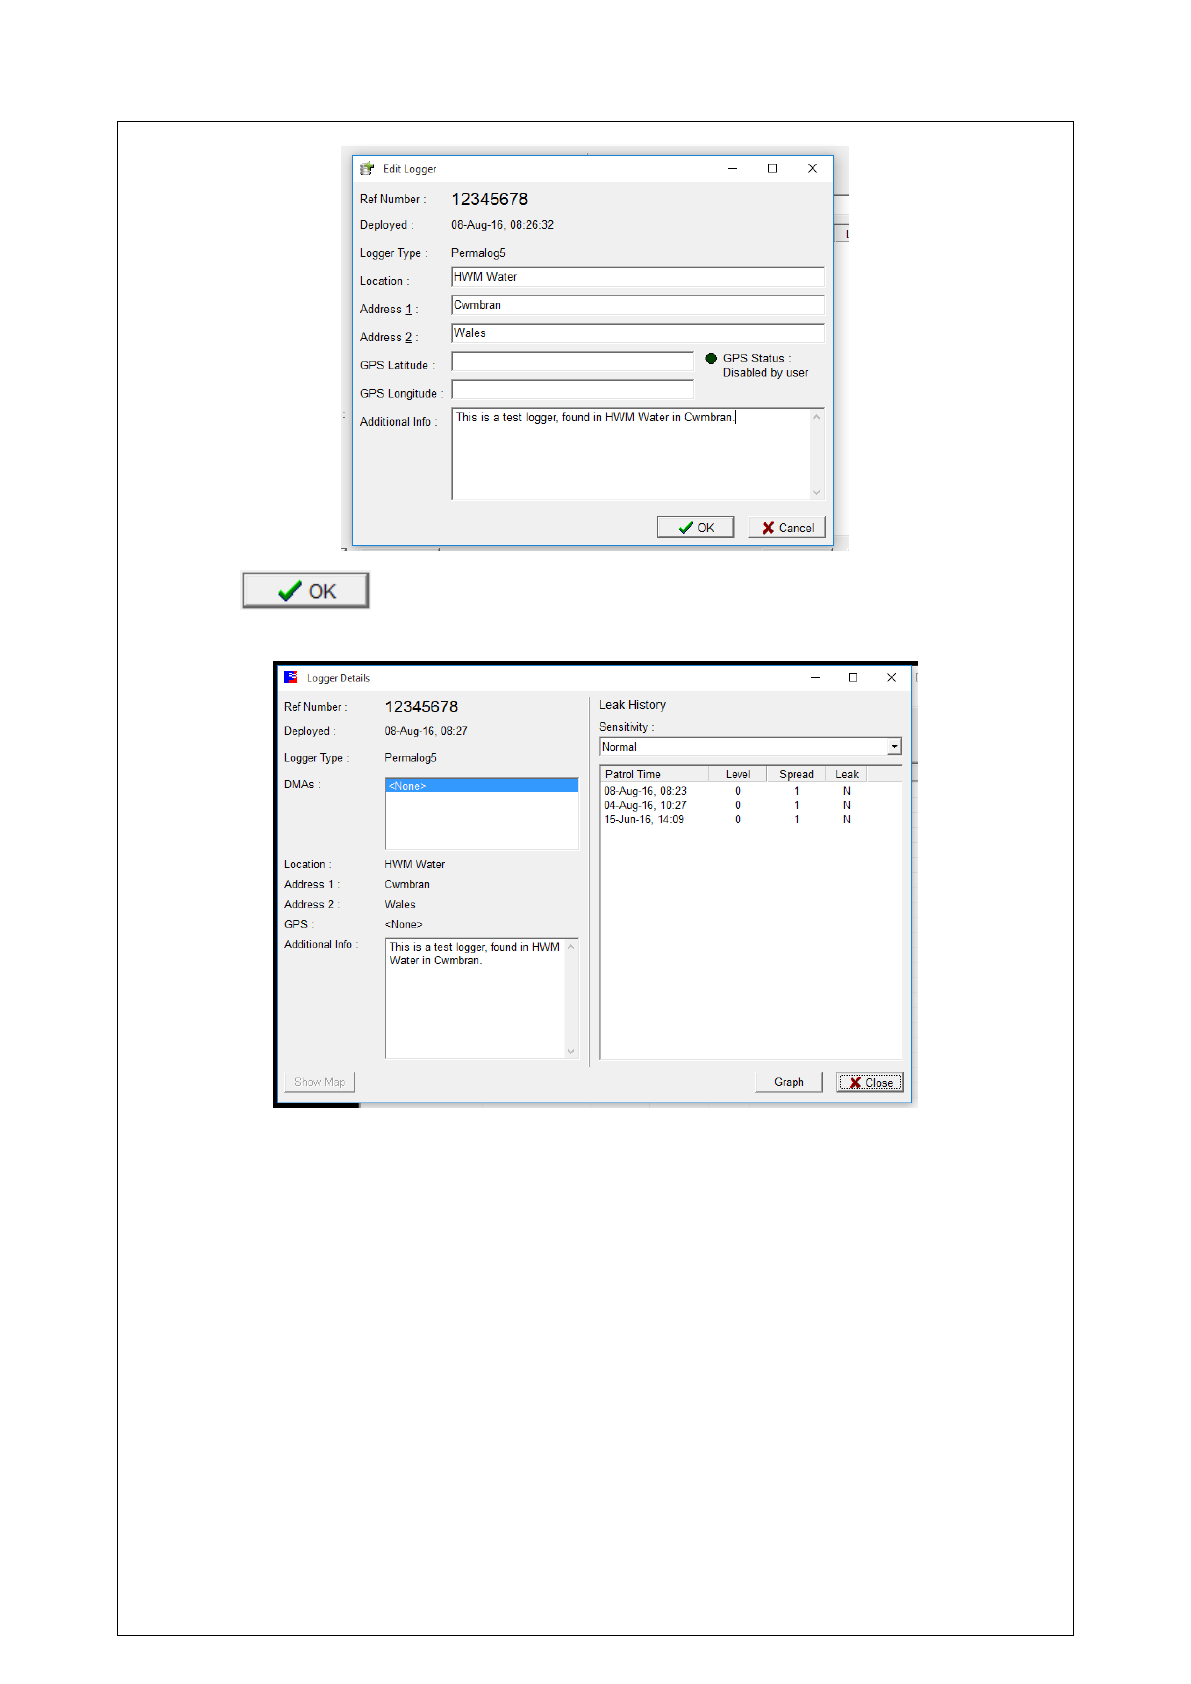
Any desired details can now be added.
10
Click to save these details. These details can be checked and
confirmed by double-clicking a logger.
Note: the GPS latitude and longitude coordinates must be relative to the map server
used in Maps. For example, if the map server uses Google Maps, the GPS
coordinates must be of the same structure and format as those used for Google
Maps.
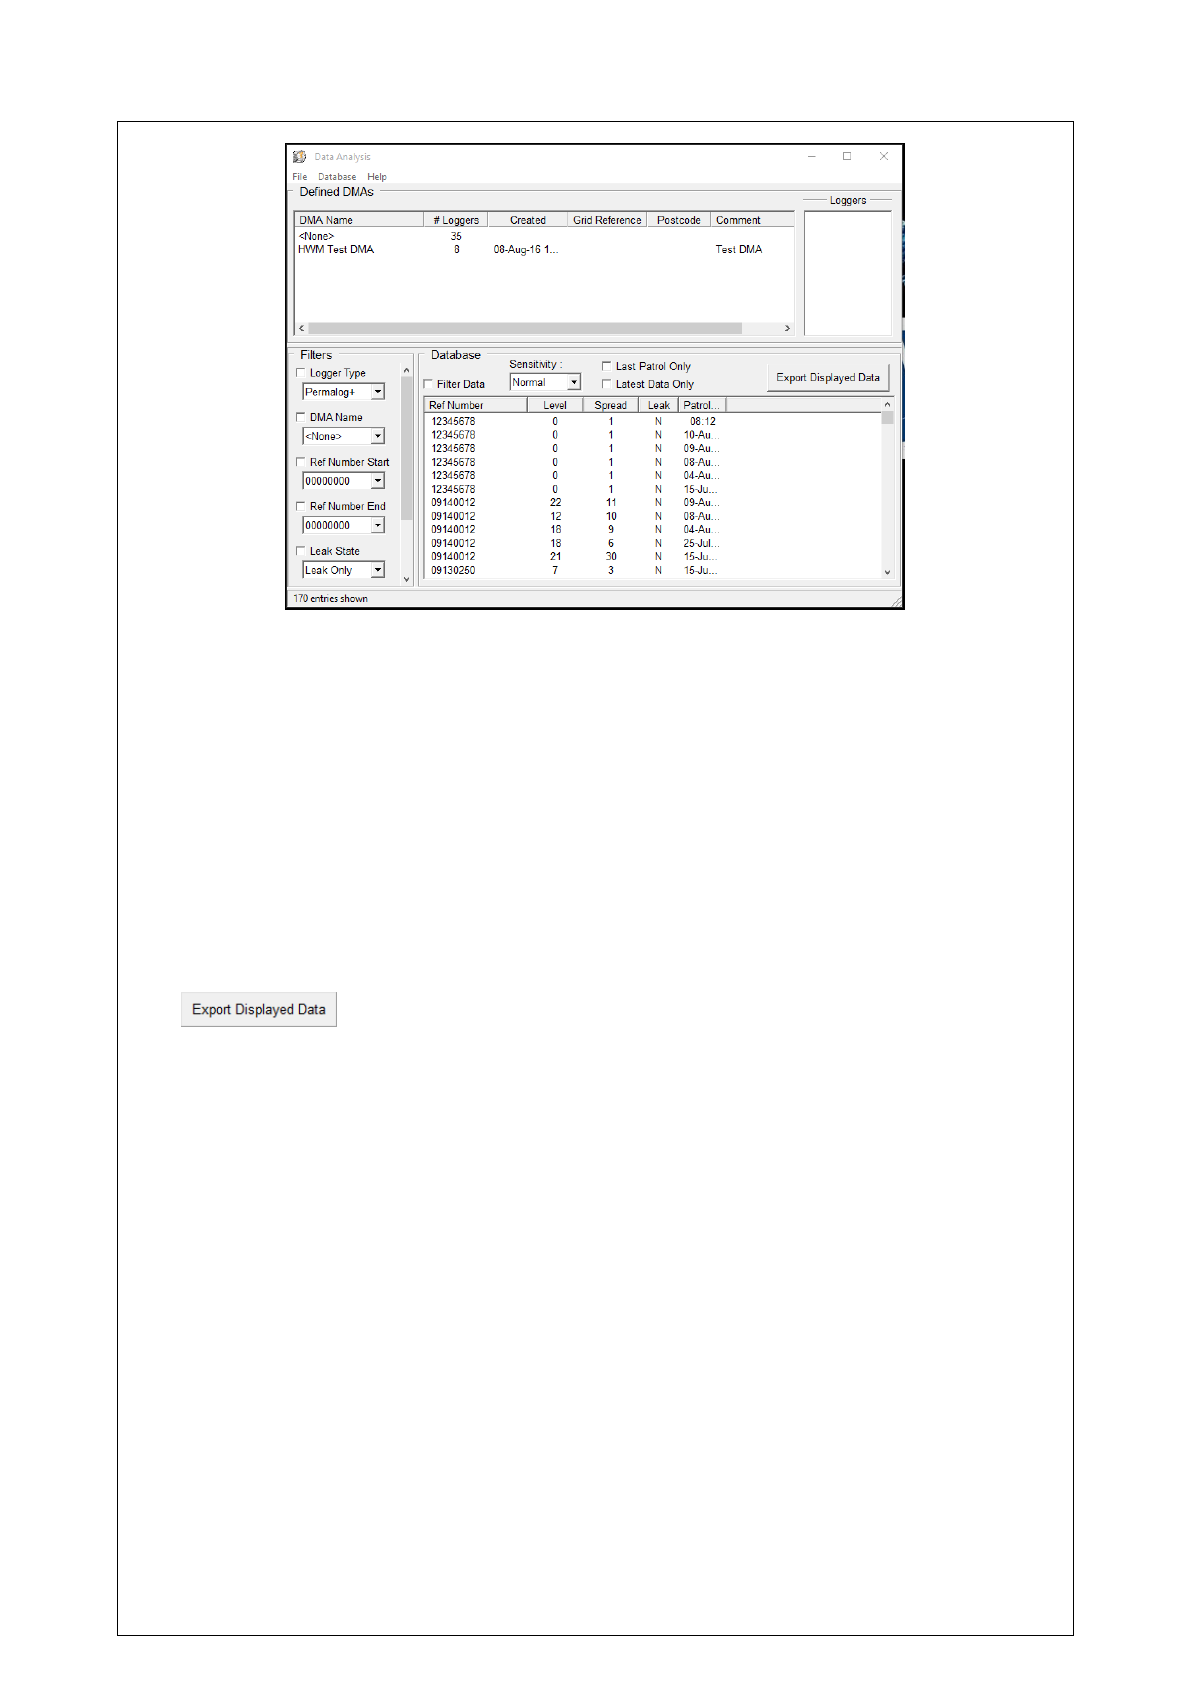
Data Analysis
The Data Analysis function looks at filtering out any unwanted loggers, and leaving
behind the loggers and their data that will be analysed. On opening Data Analysis,
a window will open up with the option to filter data.
11
Under ‘Defined DMAs’, DMAs can be chosen to see which database loggers belong
to. Loggers that do not belong to any DMA will be under <None>.
Under the ‘Filters’ section, loggers can be filtered out using the specific filter options.
To enable a chosen filter, tick the checkbox next to the filter name. Current filters
that can be enabled are: Logger type, DMA Name, Reference number range, Leak
state, and active Patrol date range.
Under the ‘Database’ section, chosen filters can be applied to the list of loggers and
their data by ticking the checkbox next to “Filter Data”. More columns can be added
to the list of t loggers to give more information for each logger by clicking on File ->
Options, and selecting the information desired.
The tabulated data can be exported to a .csv file by either clicking the
button, or by clicking File -> Create CSV File -> Export Currently-
Displayed Loggers.
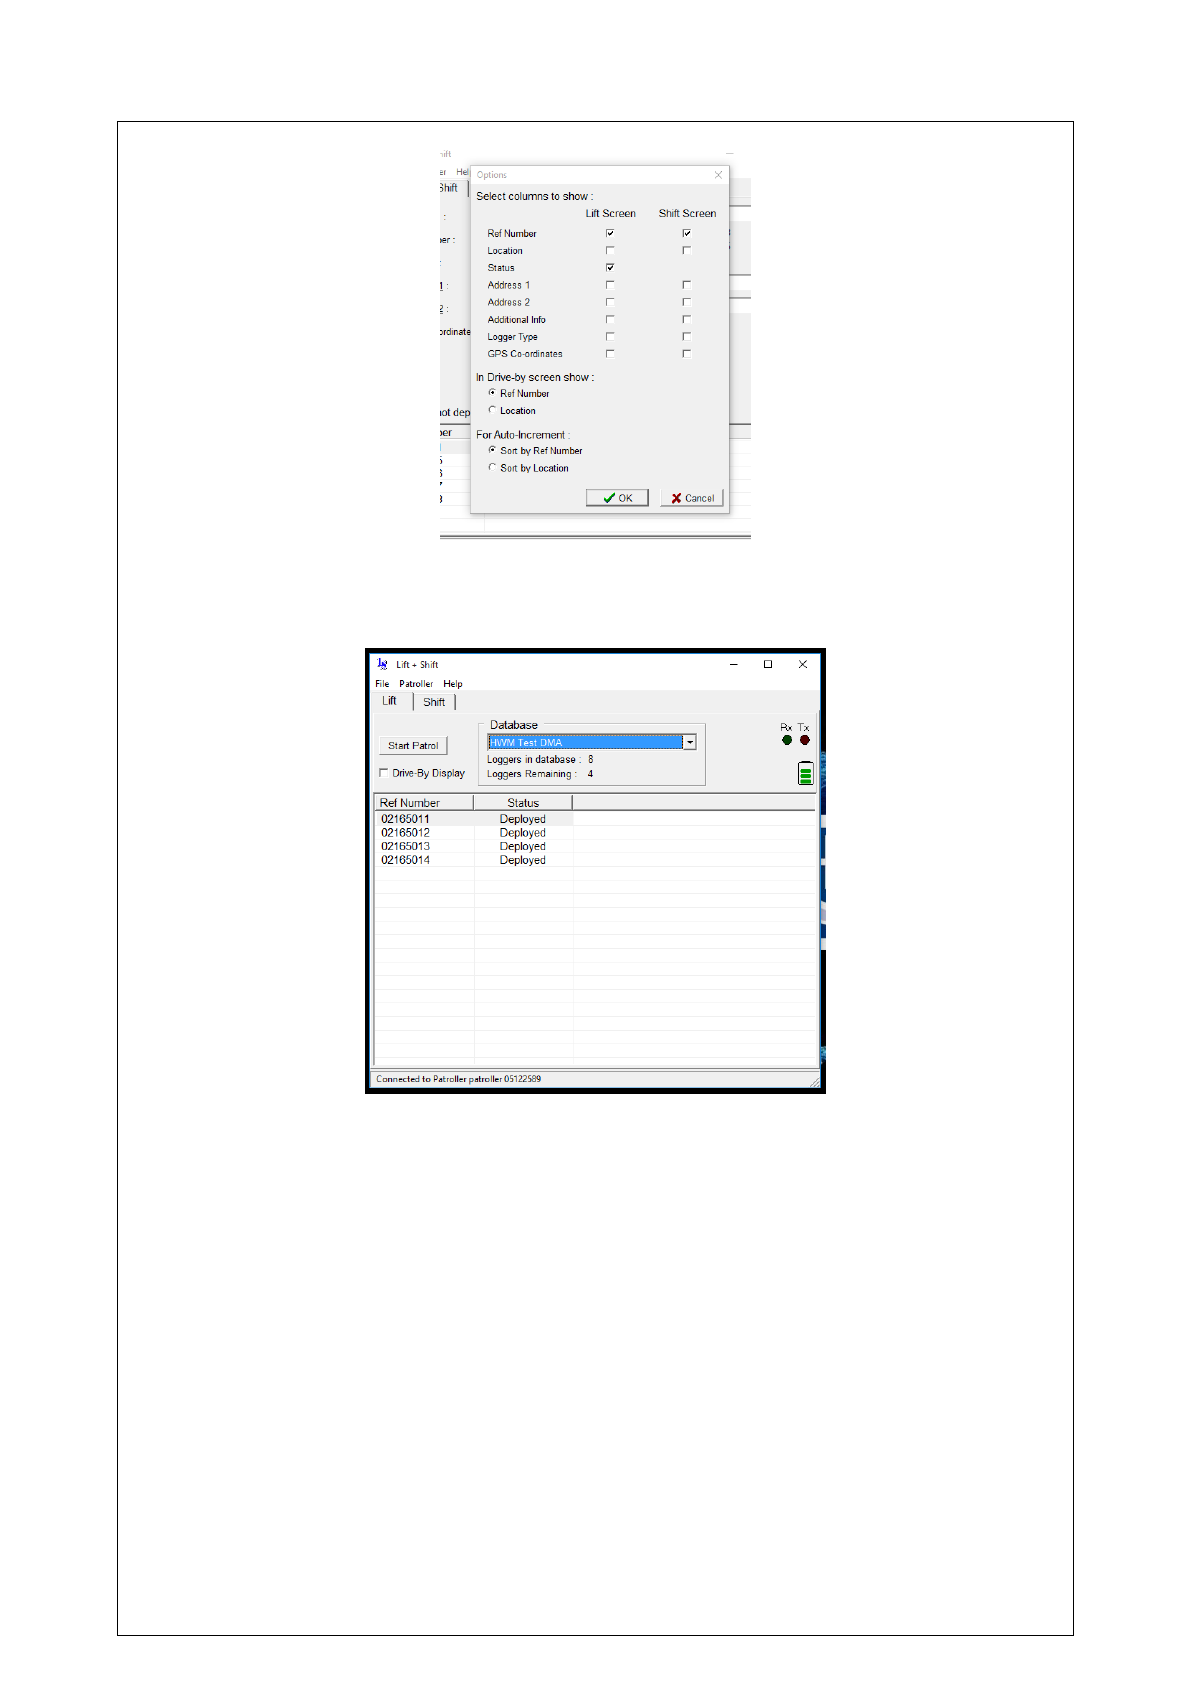
Lift + Shift
The Lift+Shift function is used for loggers who do not stay in the same place, and
take one measurement only at various locations. If at any point the list of loggers
does not appear, try the following:
- Ensure the correct database is selected. To do this click the Database
parameter, and select the correct database.
- Go to File -> Options, and ensure the Ref Number checkboxes are ticked for
both Lift Screen and Shift Screen.
12
Lift
To withdraw a logger to move it, select the Lift tab, and select the desired database.
Double-click the logger to withdraw.
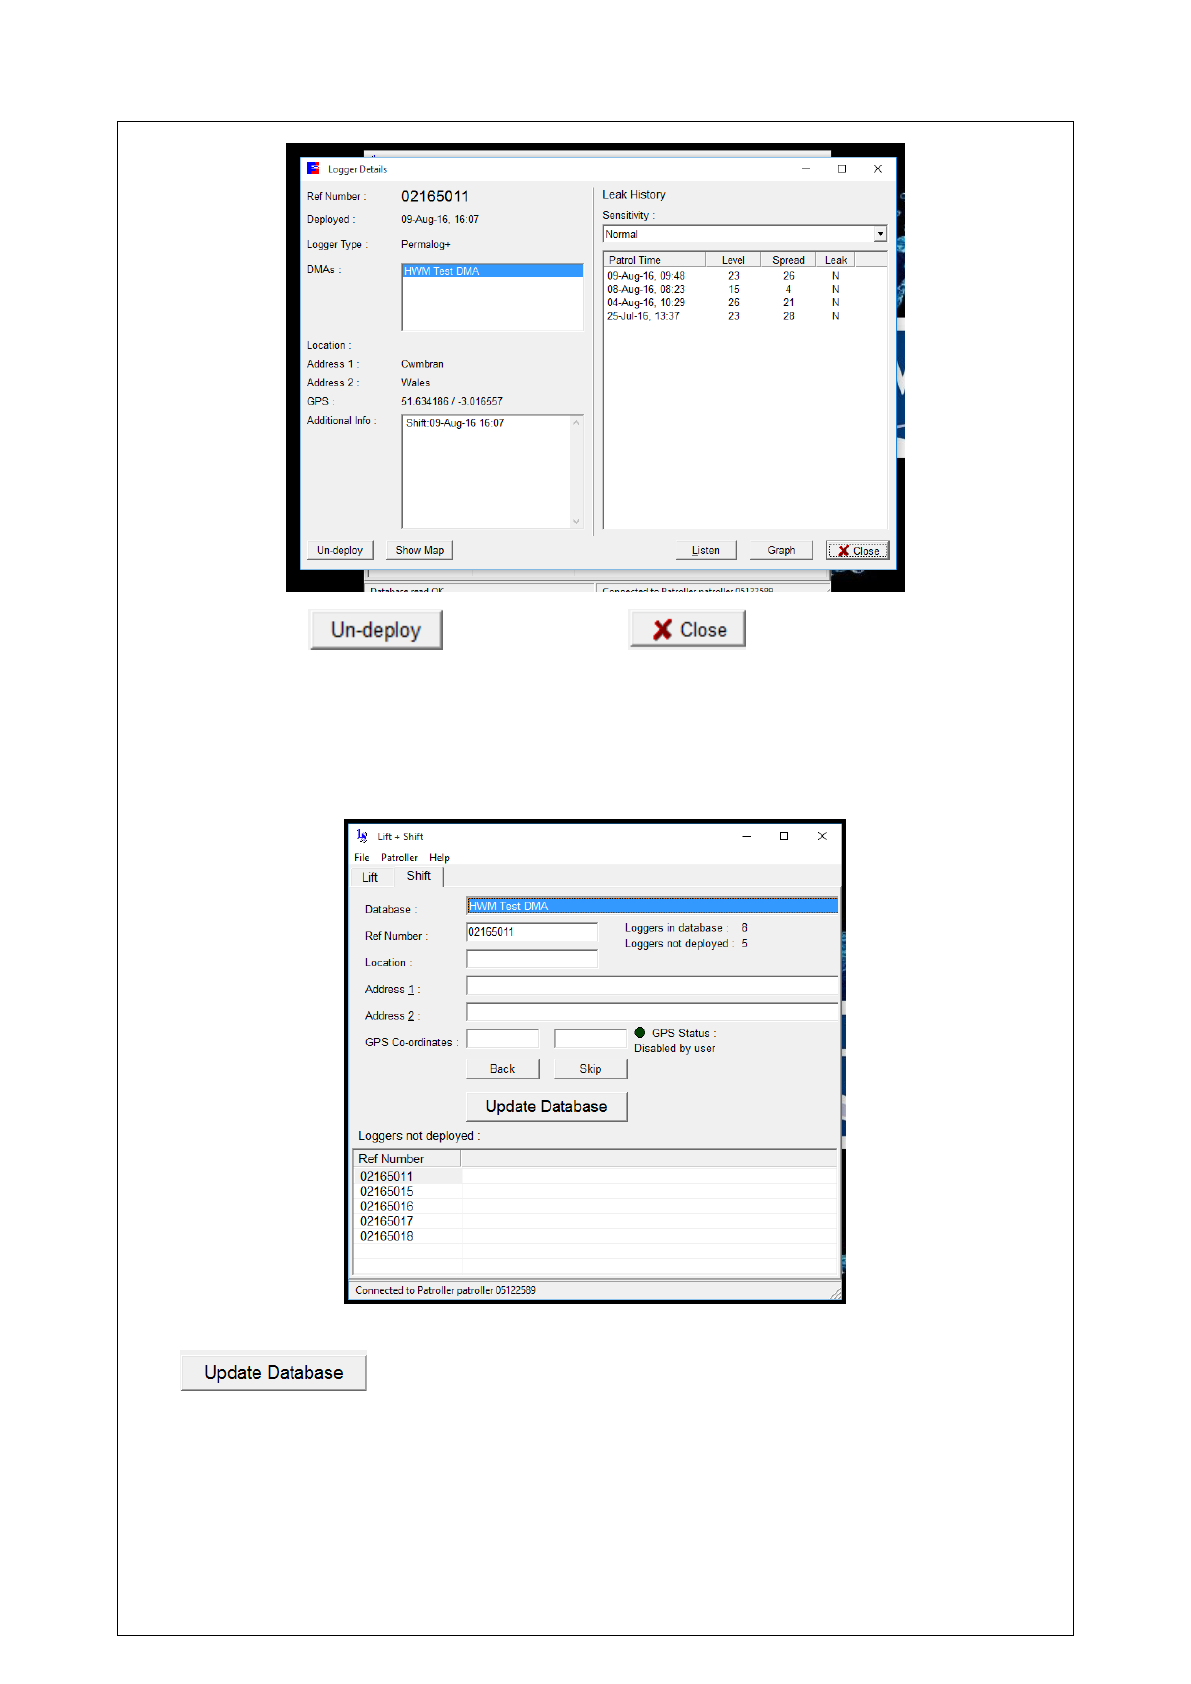
13
Click on the button, and click . Un-deploying the logger
will clear its location data, including any GPS and address data.
Shift
To deploy a logger, select the Shift tab, and select the logger that would be deployed
from the list of loggers available.
Select the desired logger, and fill in the details as required, and click the
button.
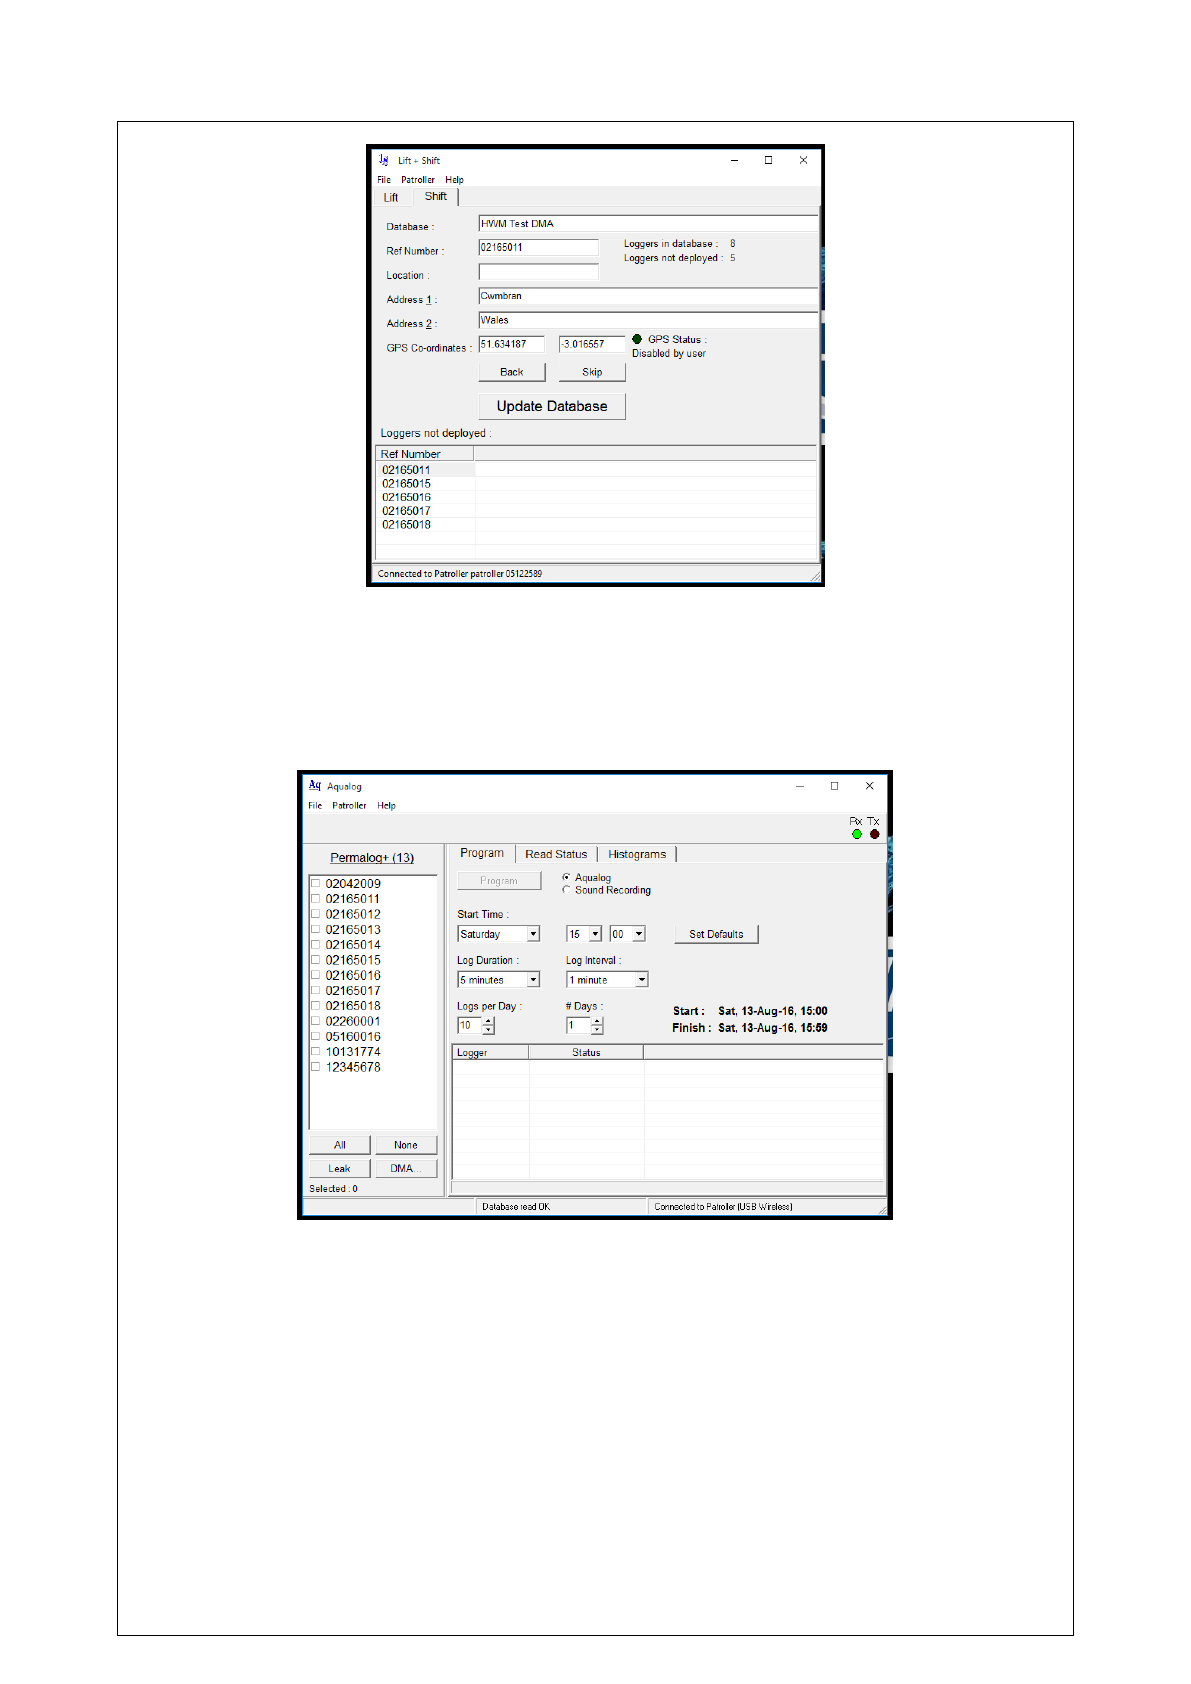
14
Aqualog
The Aqualog function is used to program and configure the loggers to either
Aqualogs or perform sound recordings. This varies from product to product.
On clicking the Aqualog icon, a window will open.
Under Permalog+, a list of detectable loggers will be continuously updated. This may
be in the form of the logger’s serial number or phone number. Once a logger
becomes unavailable or out of range, it will automatically be removed from the list.
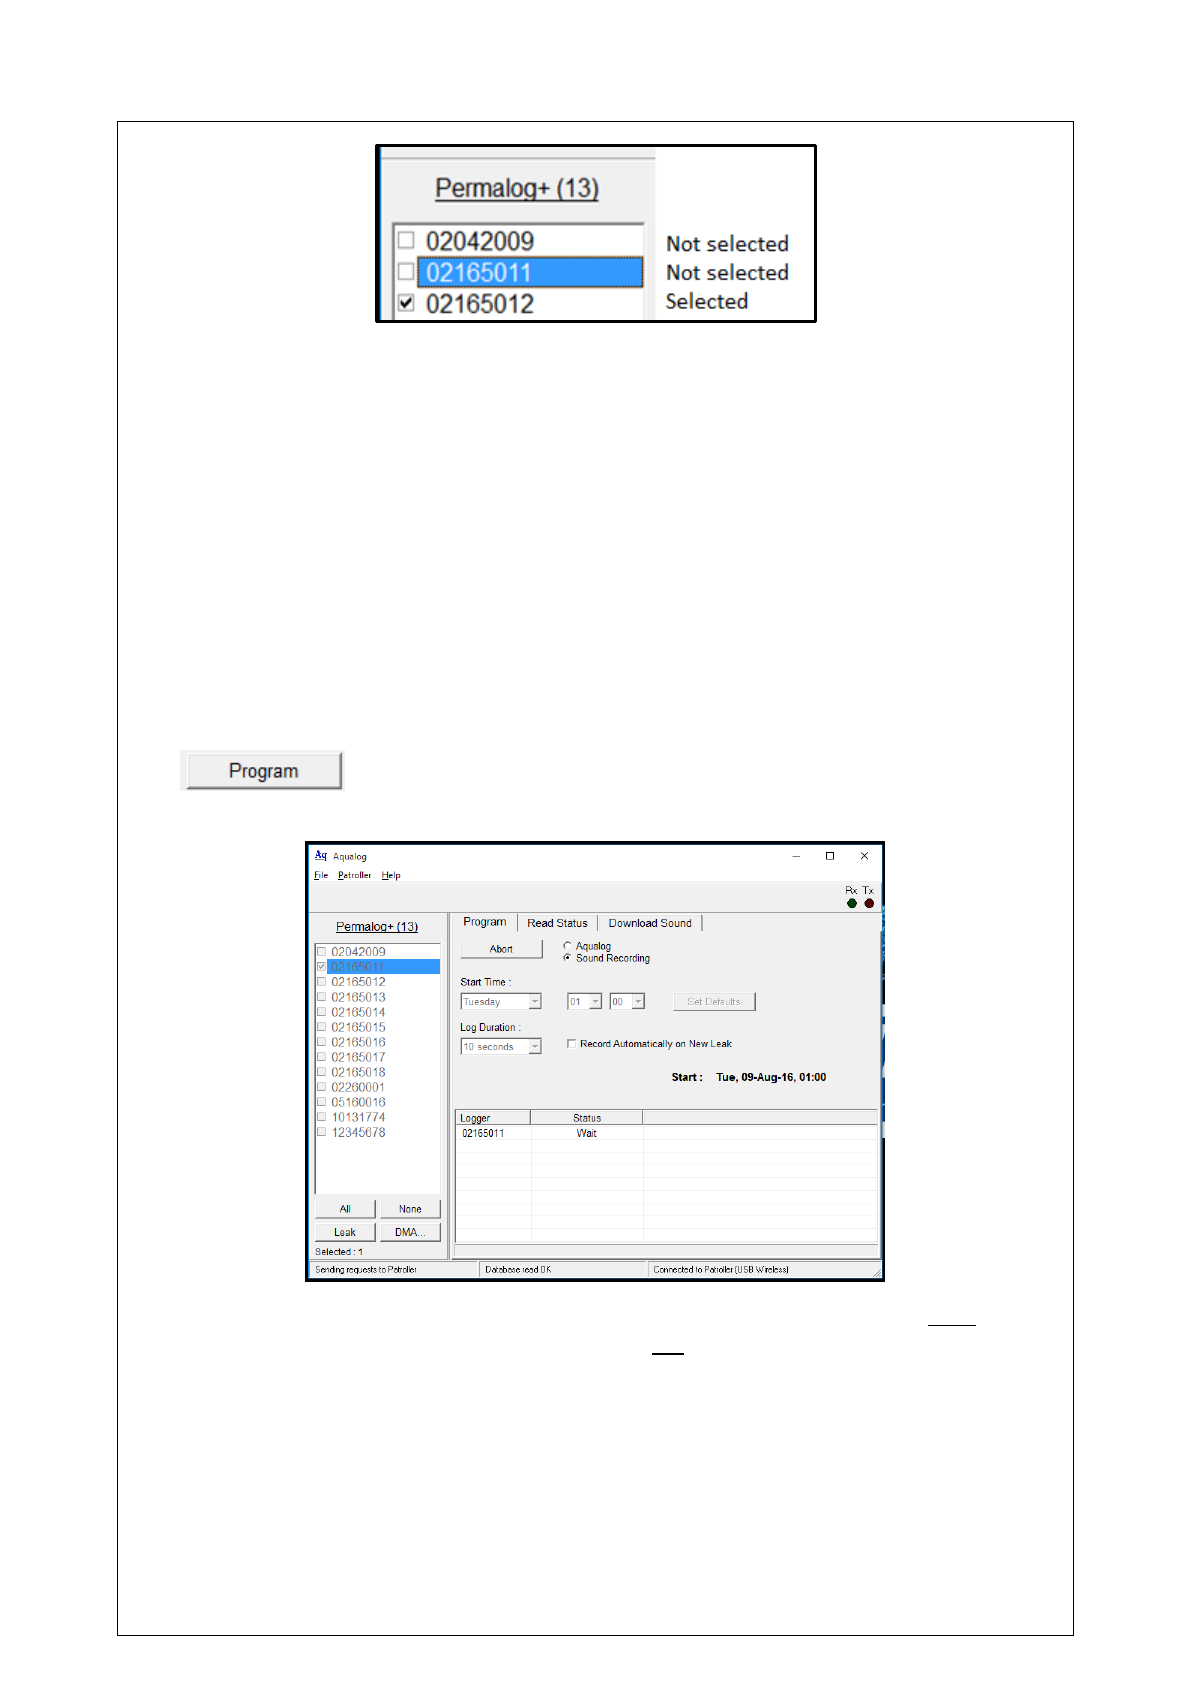
To program or read one (or more) logger, the desired logger(s) must be ticked in the
checkbox.
15
Program
Under the Program tab, any logger can be programmed for Aqualog, but only some
can be programmed for Sound Recording. Note: if Aqualog has been selected, the
third tab will display Histograms; if Sound Recording has been selected, the third tab
will read Download Sound. Below is an outline what each parameter setting does.
Start Time:
Sets the starting date and time of the logger (Note: Start Time
cannot be set in the past).
Log Duration:
Sets the length of time over which readings are taken.
Log Interval:
Sets the time between readings (Aqualog only).
Logs per Day:
Sets the number of logs taken per day (Aqualog only).
# Days:
Sets the number of days to be active for (Aqualog only).
Upon selecting the logger of choice, and setting the desired parameters, clicking the
button will start the programming sequence. The logger’s number
and programming status will appear in the table.
IMPORTANT: For accurate correlation of sound recordings, the loggers must be
programmed together at the same time, and not separately. The loggers can be
programmed and downloaded separately, but this will introduce an error of typically
5m per minute of time difference.
Once the logger has been programmed, the status will change from “Wait” to
“Initialising” to “Programmed”, and the message box in the bottom left corner will
display “Reading 100% successful”.
16
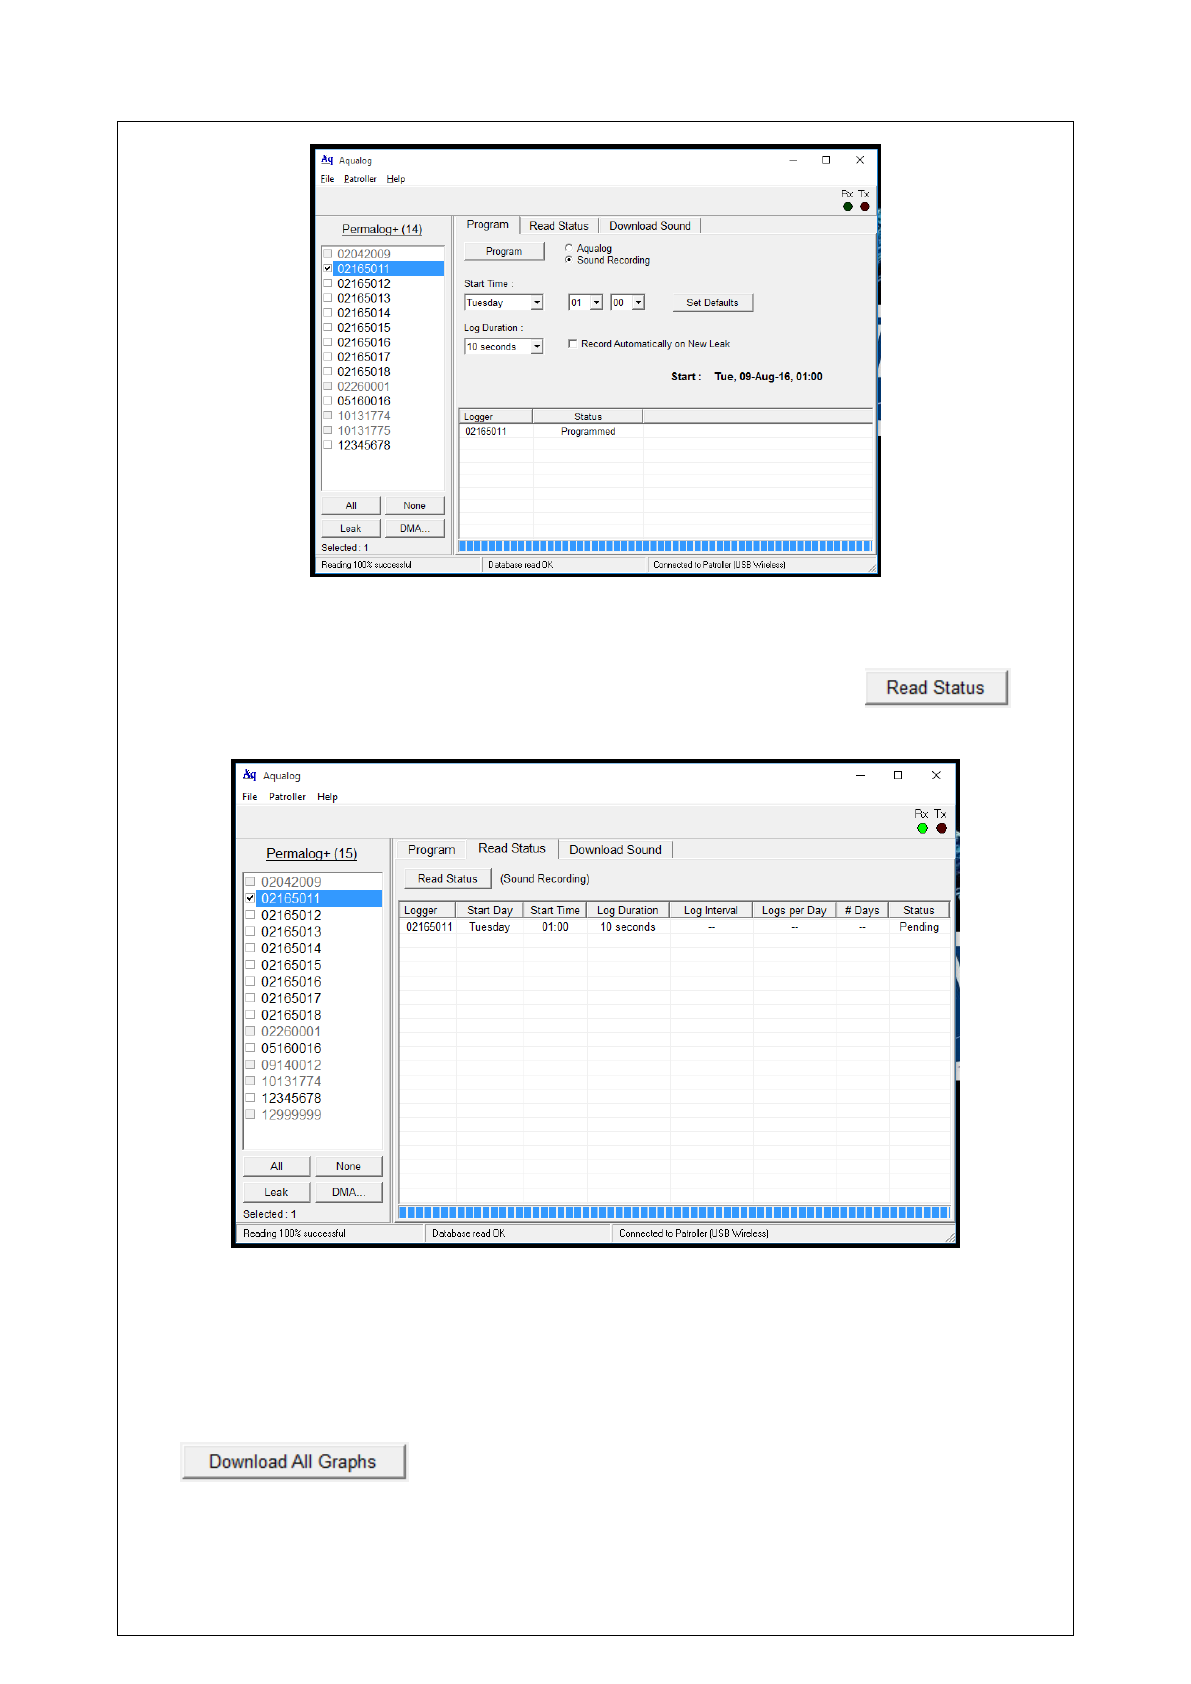
Read Status
Under the Read Status tab, a table shows the relevant logger details that would be
displayed. Select the logger(s) that would be read, and click the
button. The logger’s parameters will be displayed.
A logger with “--“ in the columns “Log Interval”, “Logs per Day”, and “# Days” has
been previously programmed for Sound Recording. Otherwise, it has been
programmed for Aqualog.
Histograms
Under the Histograms tab, select the logger to retrieve graph data, and click the
button. The software will download information about the
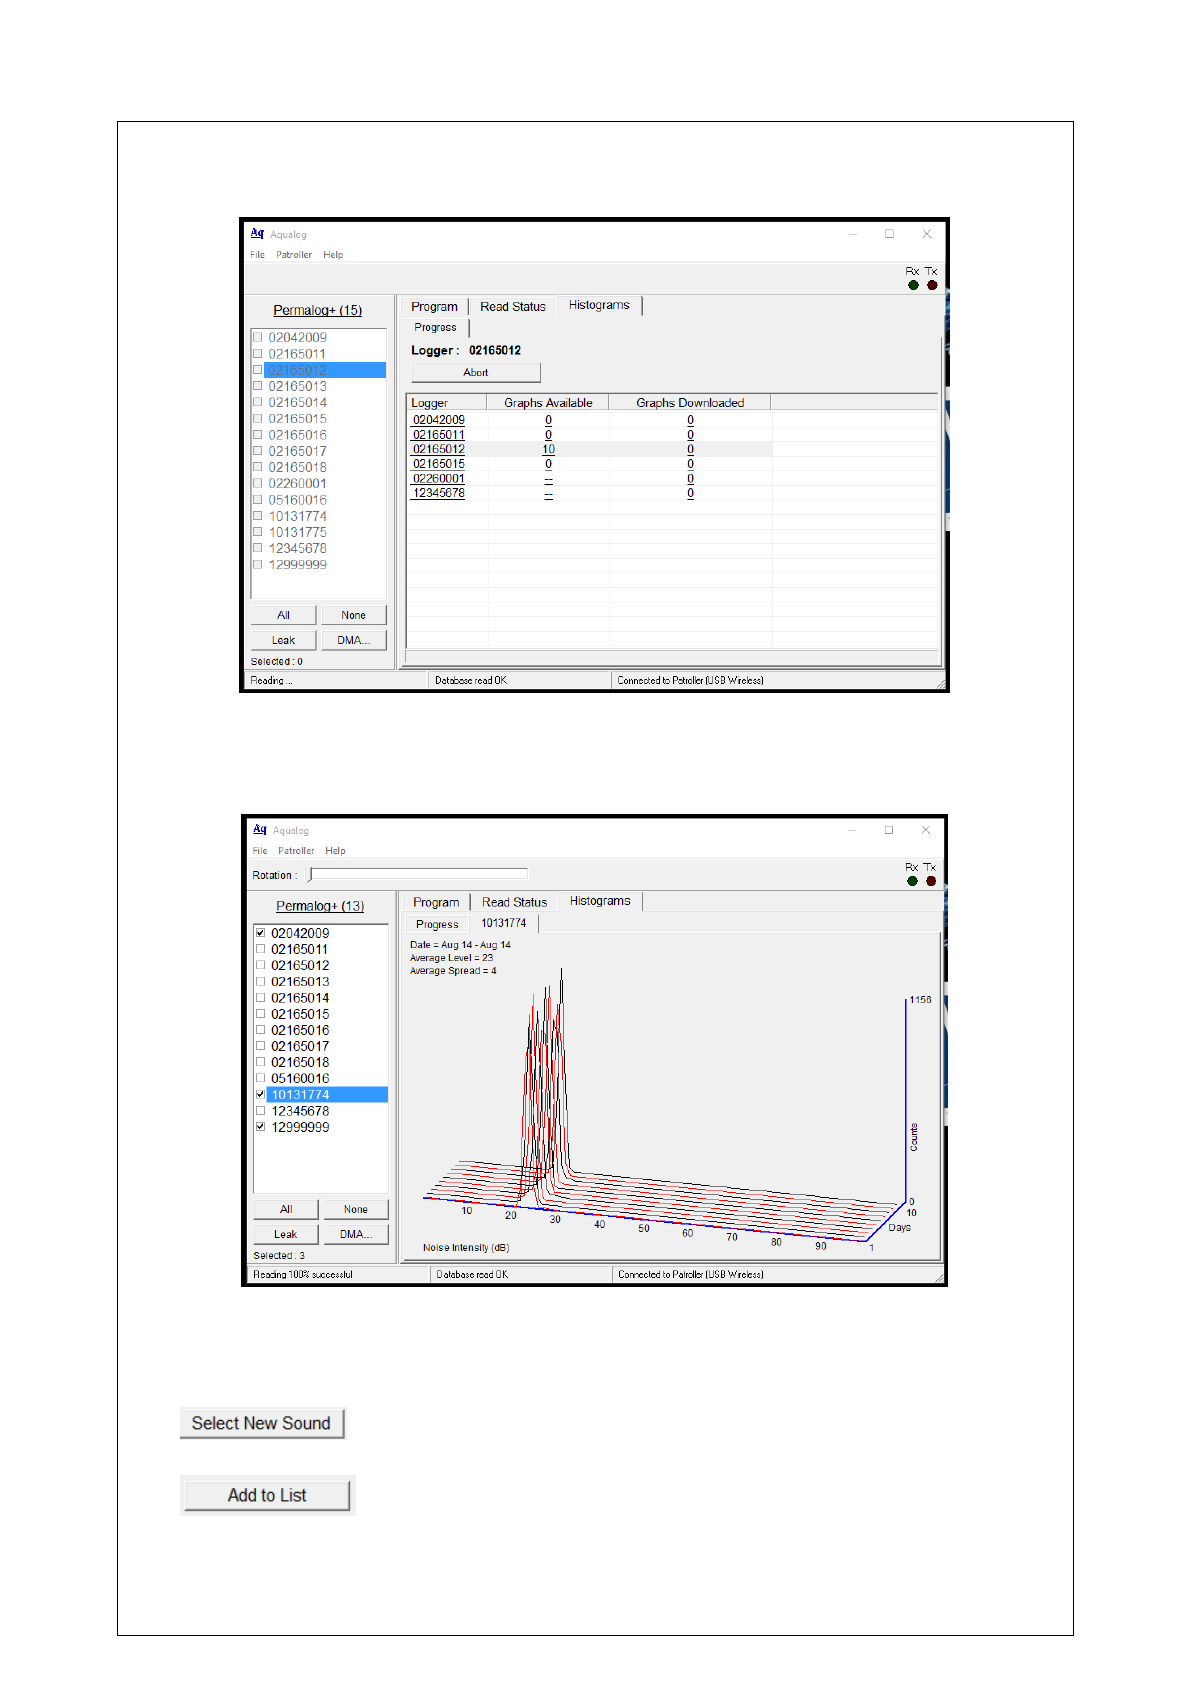
17
graph data and the graphs themselves. Please wait until this finishes. The time will
depend on how much data there is to read.
When the graphs have been downloaded, a new tab will appear, and will be labelled
with the logger’s reference number. This will show graphs of the logged data at the
time of activity.
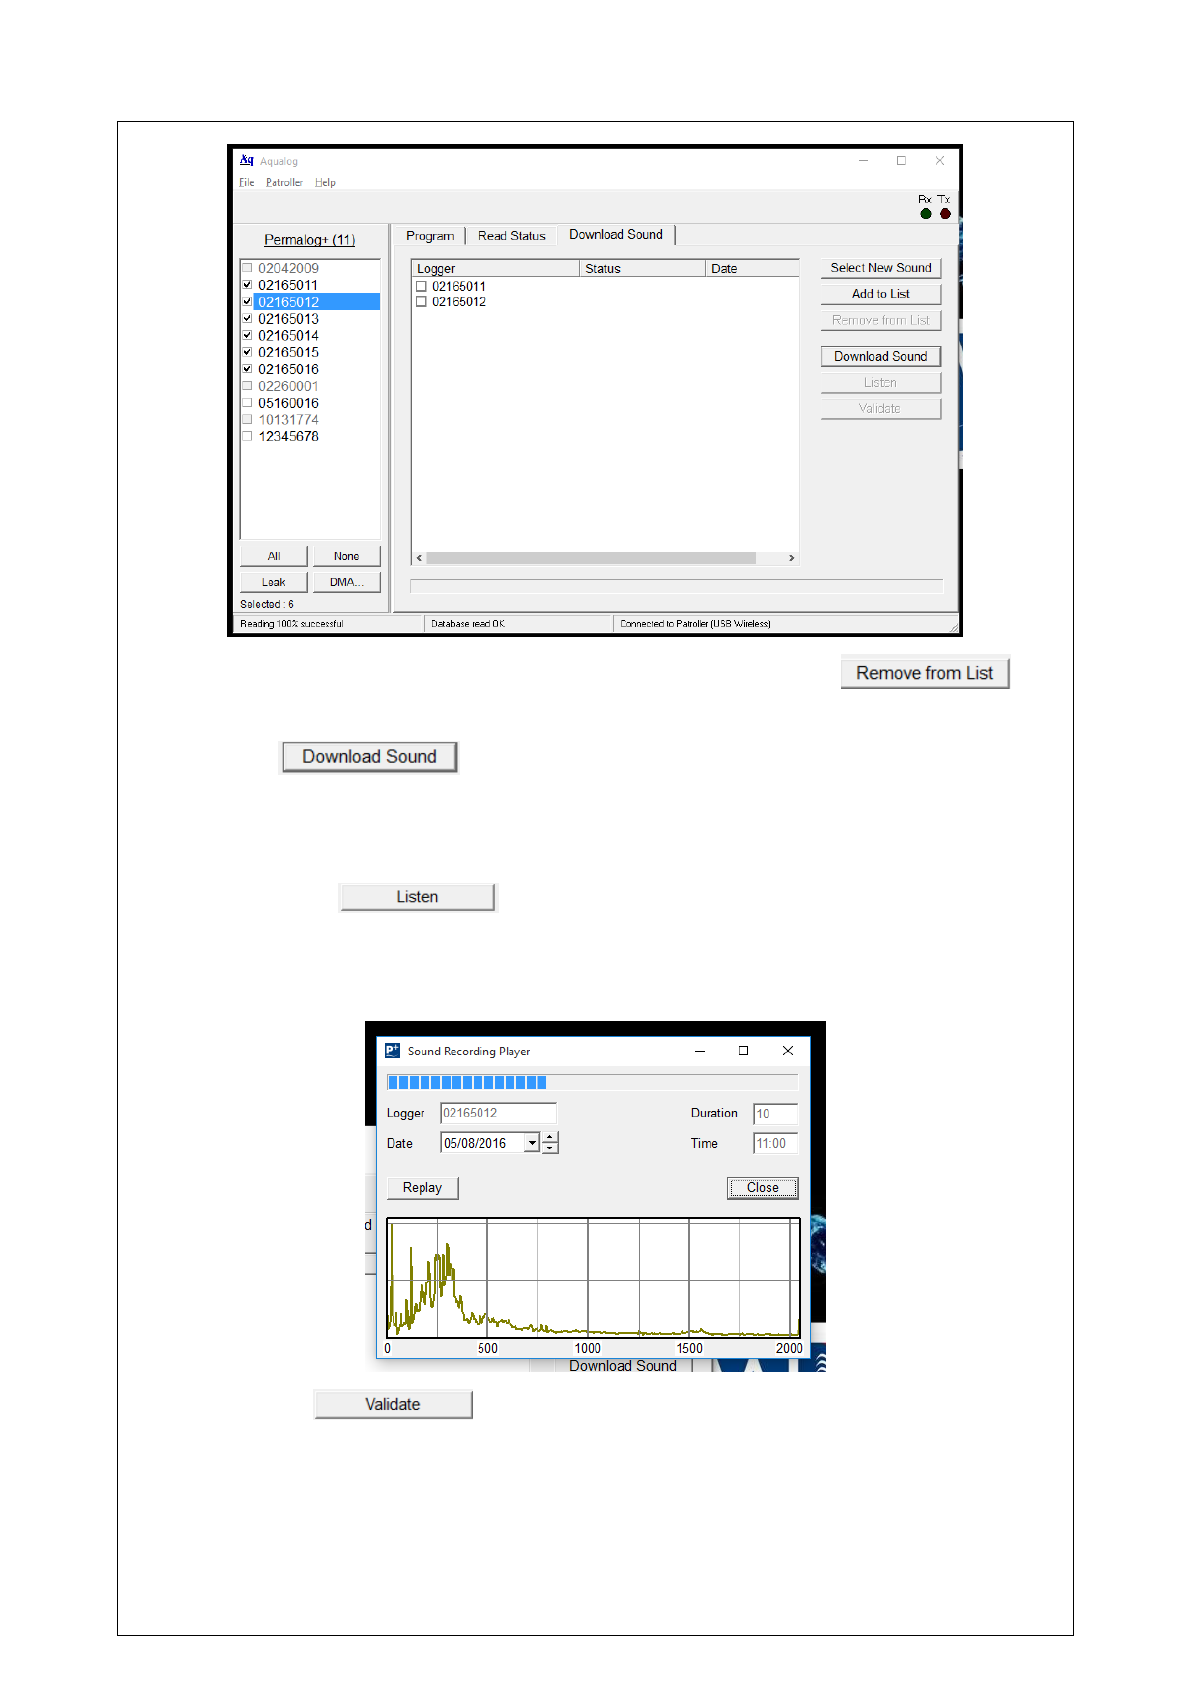
Download Sound
Under the Download Sound tab, the logger’s data can be downloaded to the PC and
correlated to determine the possible location of the leak. Clicking on
will automatically select the loggers with new sound data.
Otherwise, select the logger(s) whose data should be downloaded, and click the
button.
18
To remove a logger from the list, select the logger, and click the
button.
Once the button is clicked, all the listed loggers’ sound data will
be downloaded. Please wait while it downloads all the data. Once completed, the
status should display “Complete” and the date should be the start date and time of
the logged data.
Clicking on the button will open a window, and the sound will be
played. To the right of the date parameter, clicking the up and down arrows will
navigate through the downloaded sound data. A graph showing the current sound
data will also be displayed.
Click on the button to correlate the sound files. The sound files
must be of the same time stamp for the correlation to work. Correlation is not
possible if *** is seen by the logger time.
19
IMPORTANT: For the correlation to work accurately, the Permalogs must be
programmed together at the same time, and not separately. Warning: Swiping the
logger at any time between programming the logger and downloading the sound file
will invalidate the synchronisation, and correlation will no longer be possible.
History
The History function allows previous level and spread data from the loggers,
starting from the latest data, to be presented in the form of either 2D or 3D
histograms. These histograms will show the sound and data recorded over time.
Leak detection is then possible through careful observation.
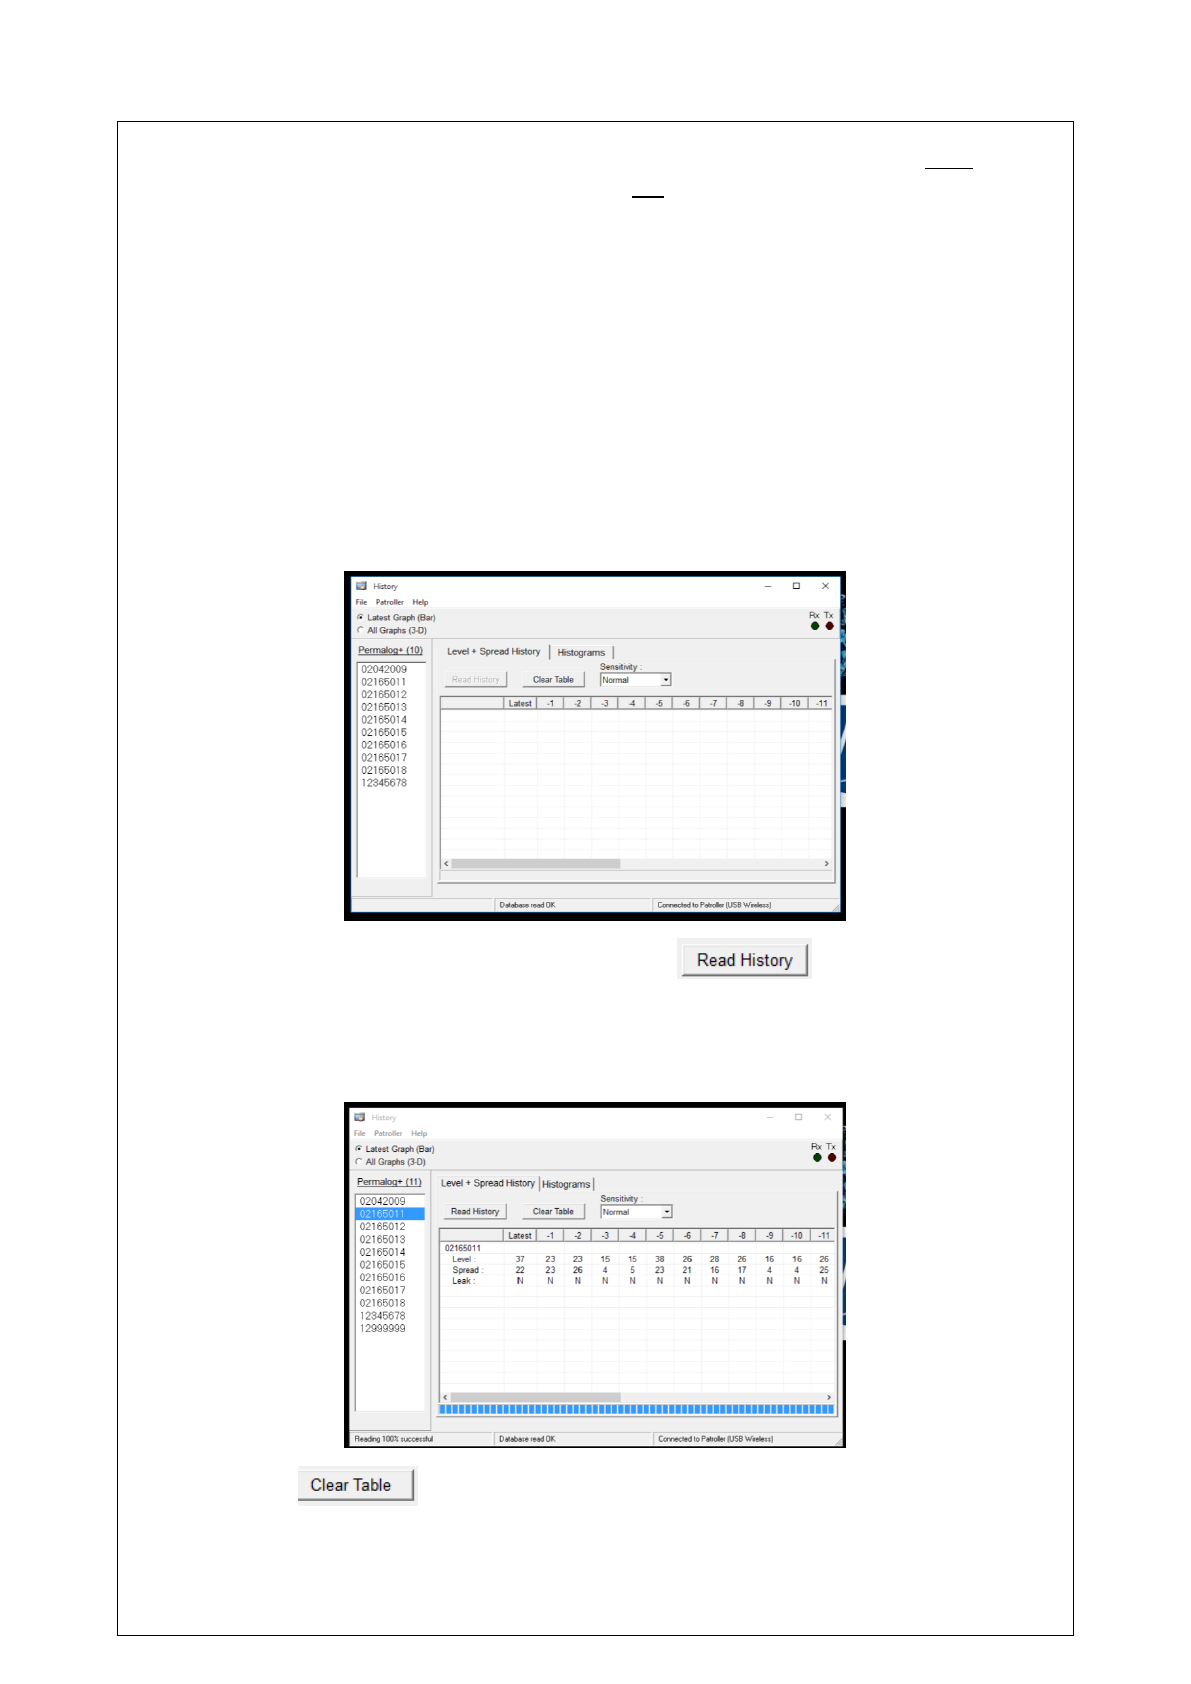
Level + Spread History
Under the Level + Spread History tab, the loggers’ level, spread, and leak data can
be downloaded. This may span from 1 day’s to 28 days’ worth of historical data.
Select the logger to download data, and click the button. Please wait
while data is downloaded.
Once data is downloaded, it will be displayed in columns, starting with the latest
data, running through however many days’ worth.
Clicking the button will clear the data from the table.
20
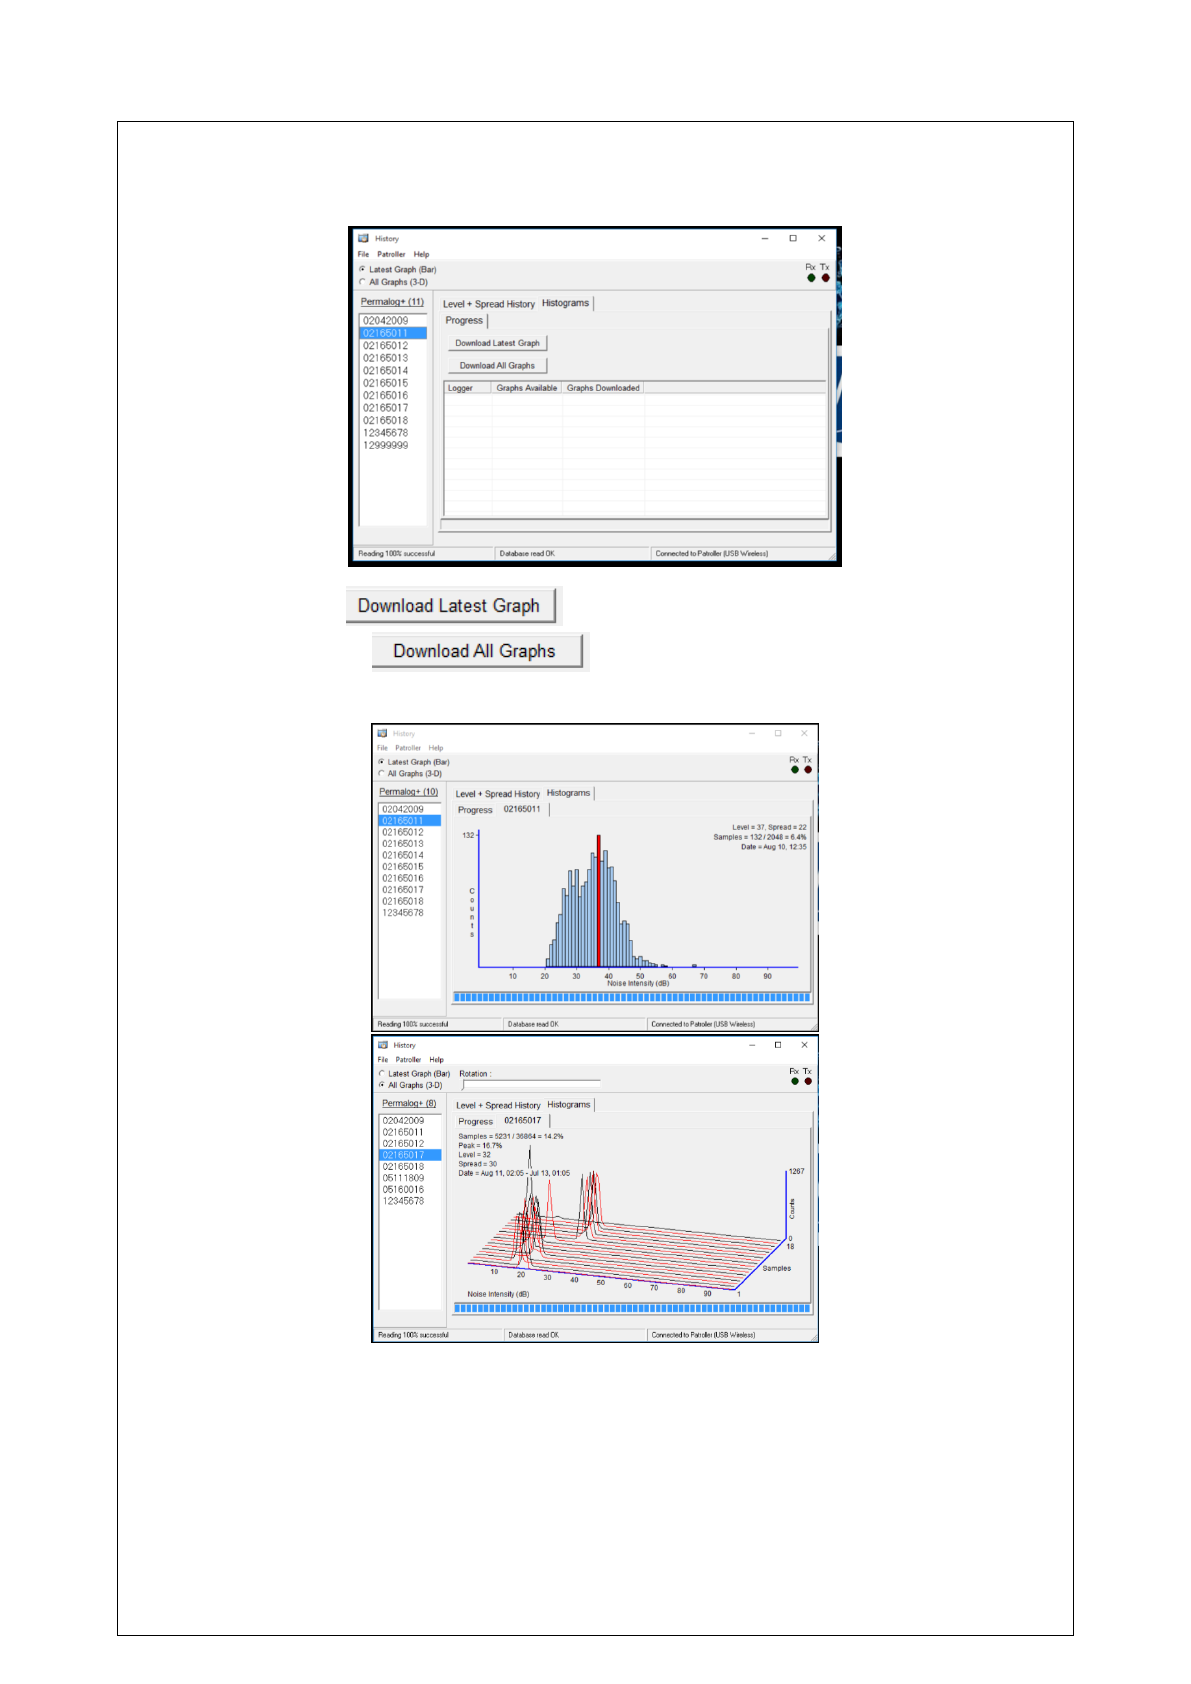
Histograms
Under the Histograms tab, graph data can be downloaded and analysed.
Clicking on the button will download the latest data only,
whilst clicking the button will download all the graph data
available in the logger. Please wait while data is downloaded.
Please refer to FAQ 204 on the HWM website, which covers understanding and
interpreting the graphical data.
These graphs can be downloaded and saved to the hard drive by clicking File ->
Save as CSV.
21
P+ Setup
The P+ Setup function sets the patrol times and the logging times of the loggers.
These times will determine when the loggers will be detectable by the Patroller unit,
and when they log data. Refer to FAQ 203 on configuring the logger to ‘Sleep
Mode’.
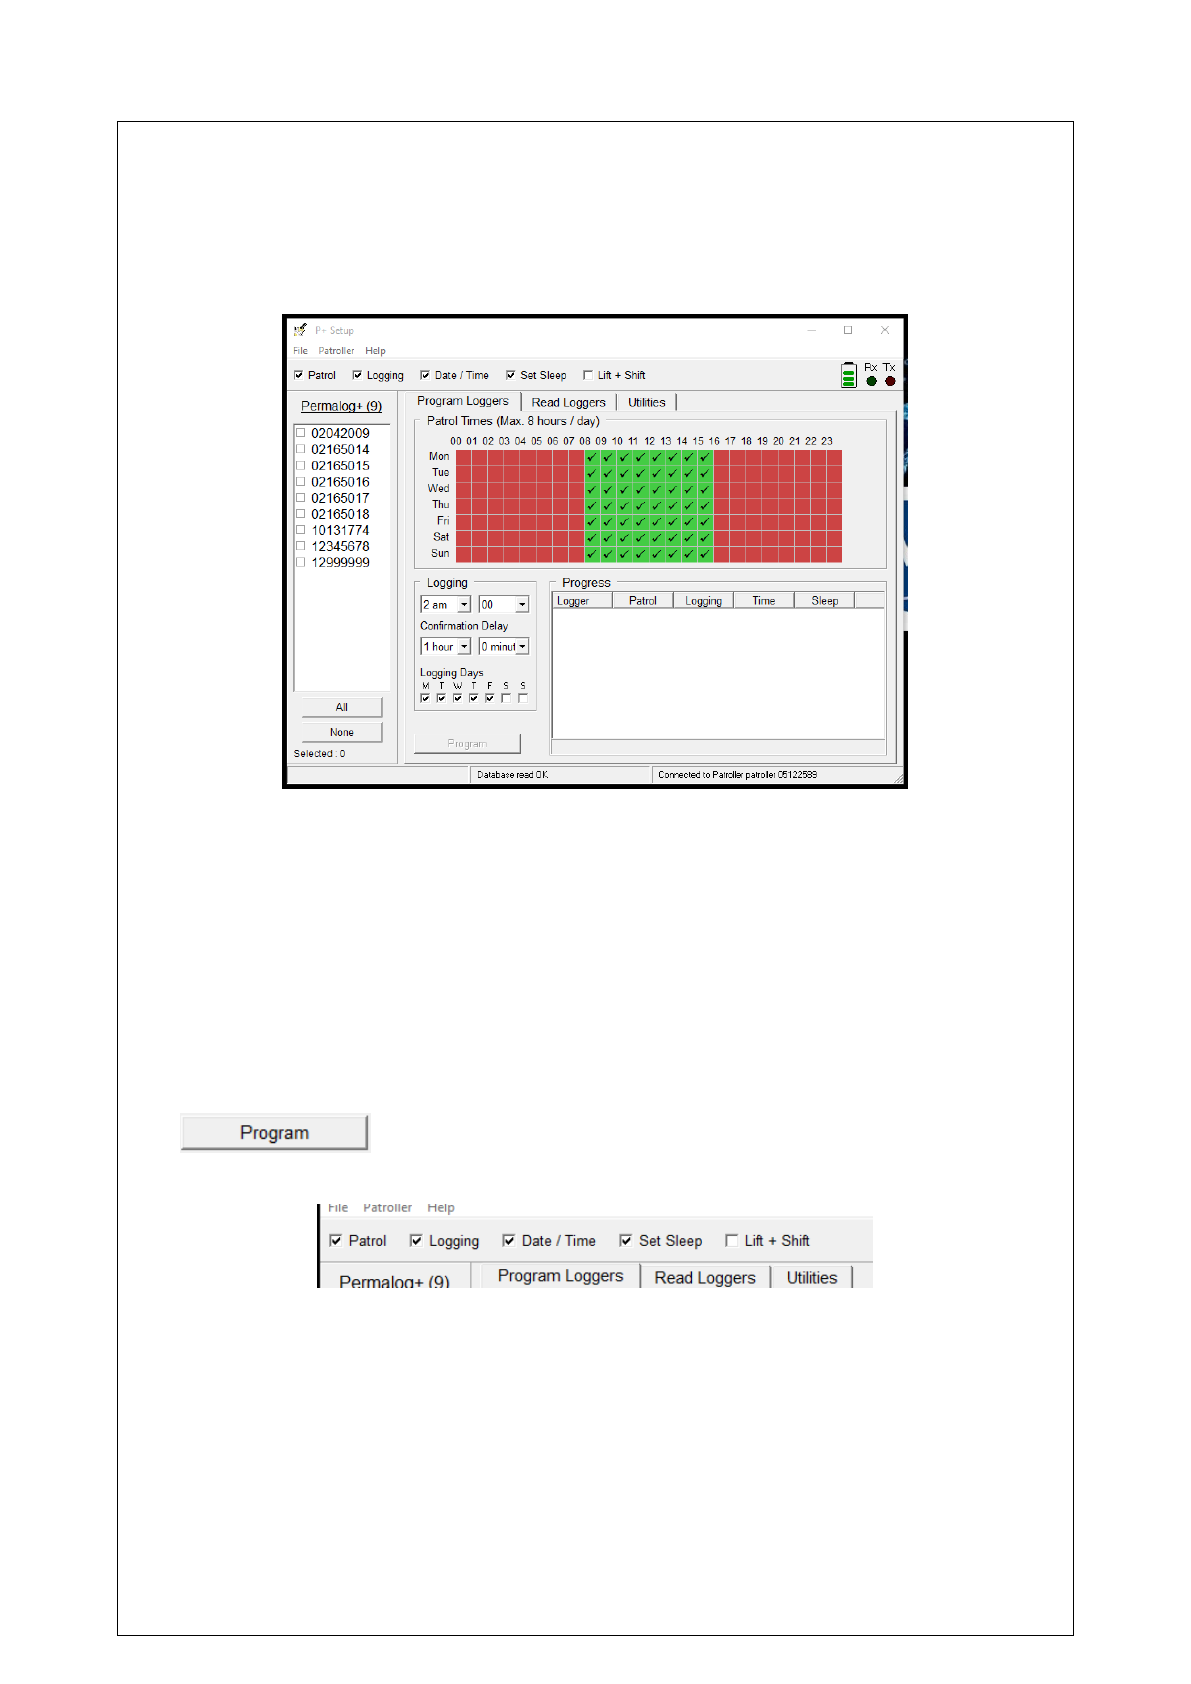
Program Loggers
Default settings only permit the loggers to be transmitting to a Patroller unit up to a
maximum of 8 hours per day. This can be changed using the distributor’s password
in the Options menu of the Main Screen. The times loggers are available to
Patroller units are denoted by the green ticks on the timetable, and can be changed
by simply clicking on the green or red tiles.
Logging times are set to once per day, at quarter-hour intervals. The Logging Days
parameter determines what days during the week the loggers take readings.
To program the loggers, select the desired logger by ticking the box, and clicking the
button. Be sure to enable or disable which parameters to
program by using the checklist at the top of the window.
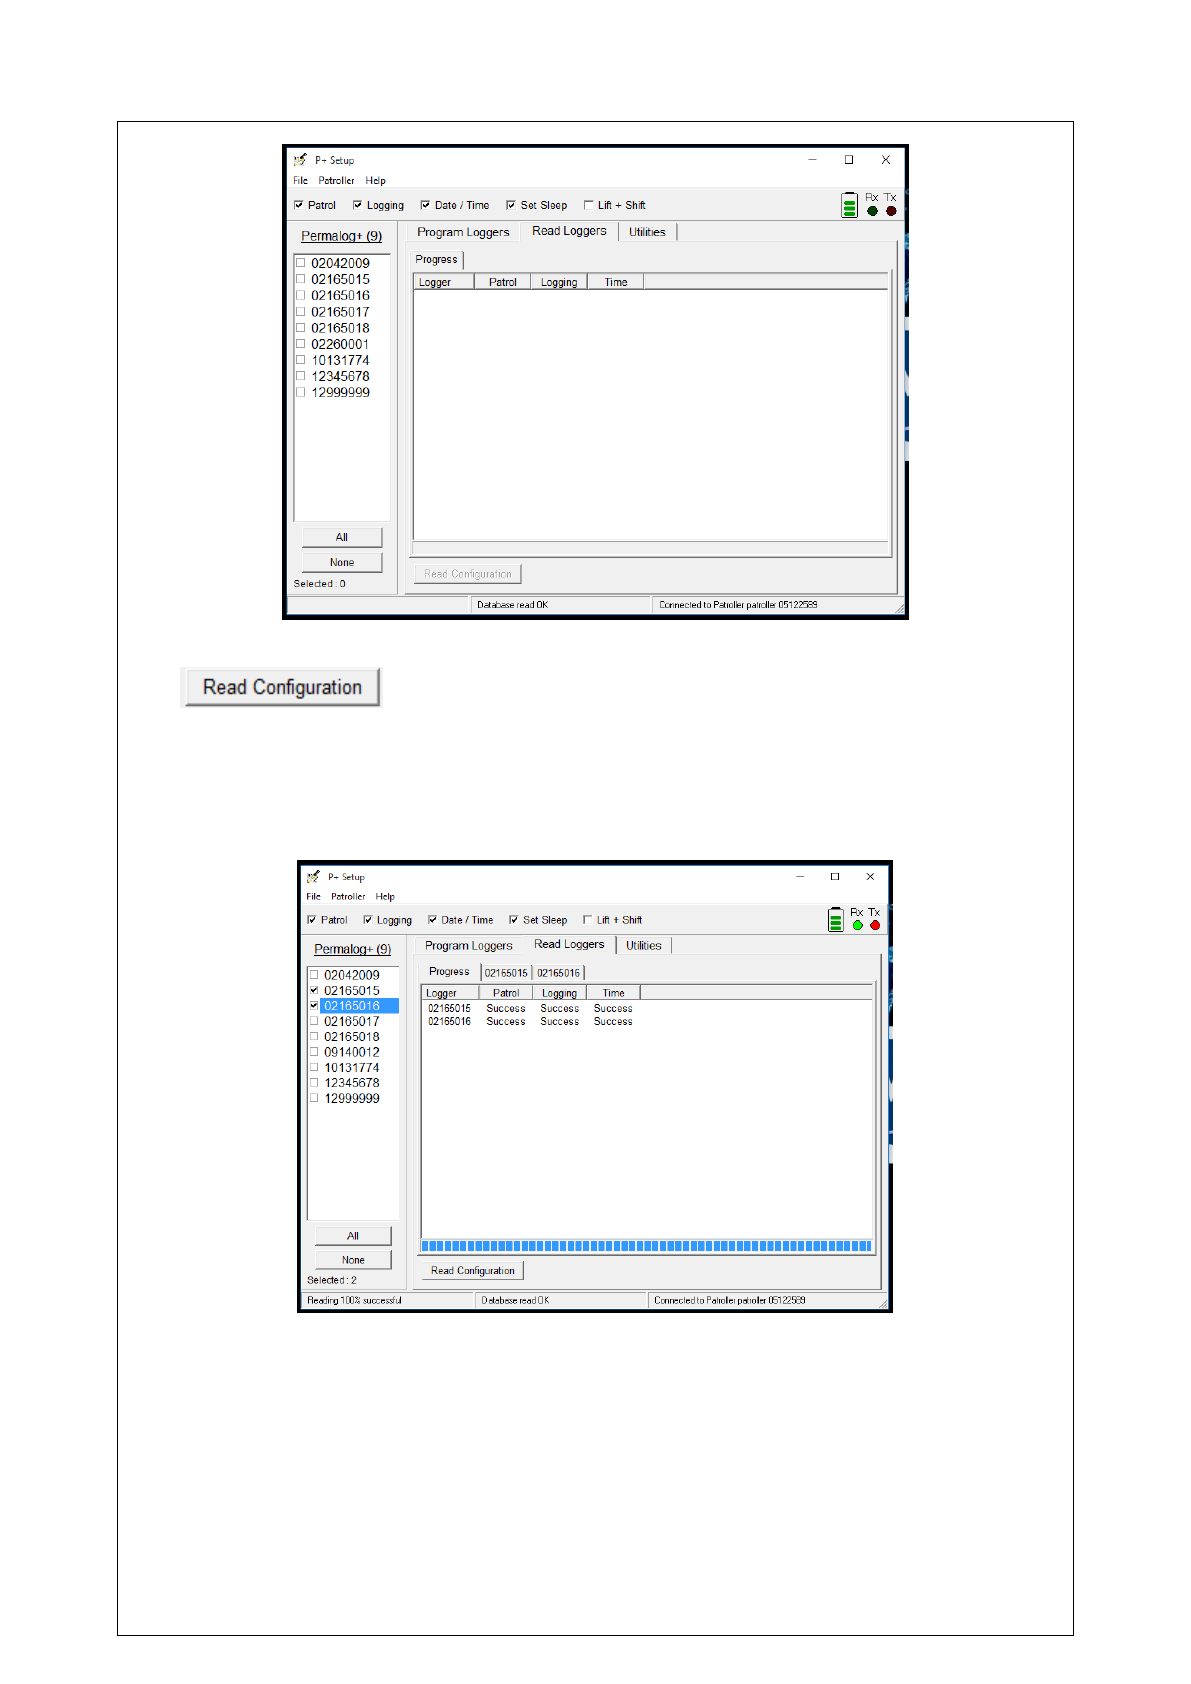
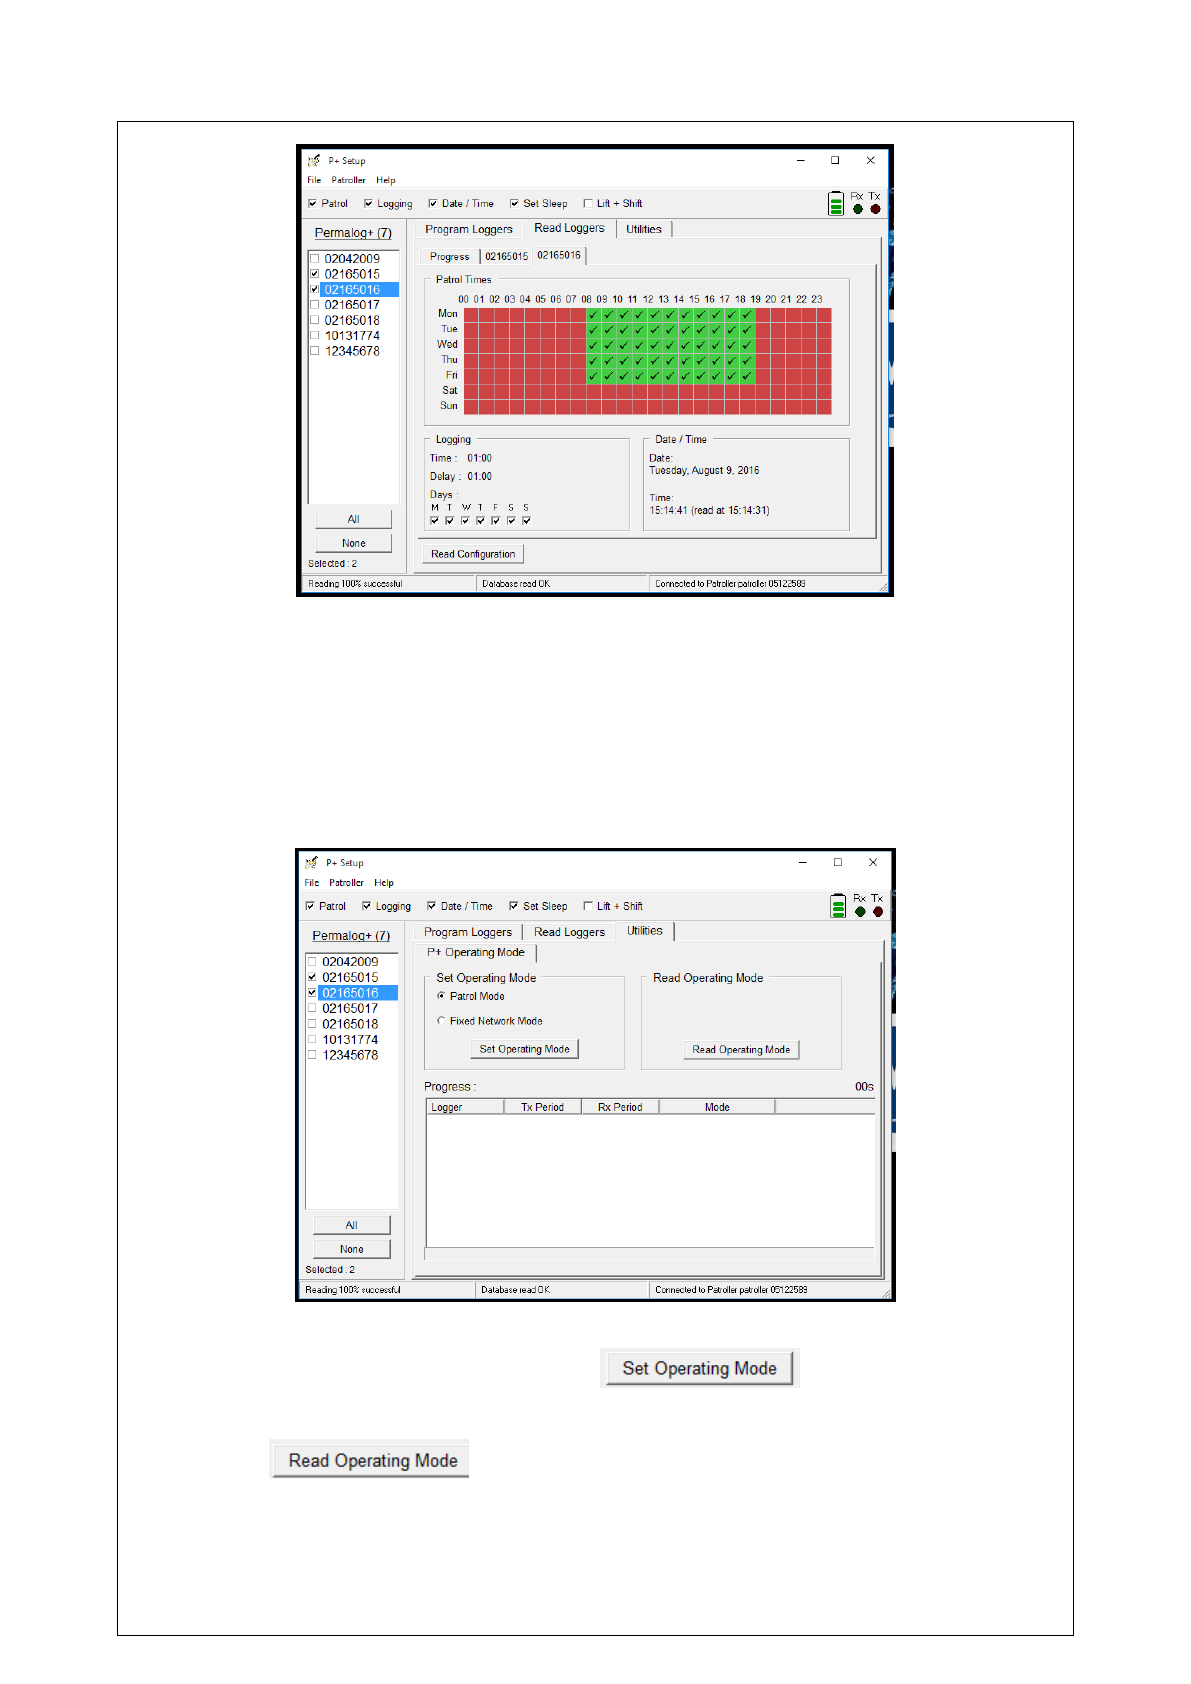
Read Loggers
Under the Read Loggers tab, the loggers of choice can be read, which will give their
current settings laid out.
22
To read the loggers’ current configuration, select the desired loggers, and click
button. This will initiate the reading process. Please wait until
this completes.
Once it does complete, there will be a new tab for every logger selected. Each tab
will show the current configuration for the loggers, including the patrolling times,
logging time, delay time, and their active days of the week.
23
Utilities
The Utilities tab configures the loggers to be set in Patrol Mode or Fixed Network
Mode. Patrol Mode is for loggers without a GSM option, and require a Patroller unit
to scan and read their data. Fixed Network Mode is for loggers with a GSM option
that do not need to be constantly scanned. These loggers can send their data to the
HWM server, where their readings will be stored. Refer to FAQ 208 on the HWM
website for more information on the operating modes.
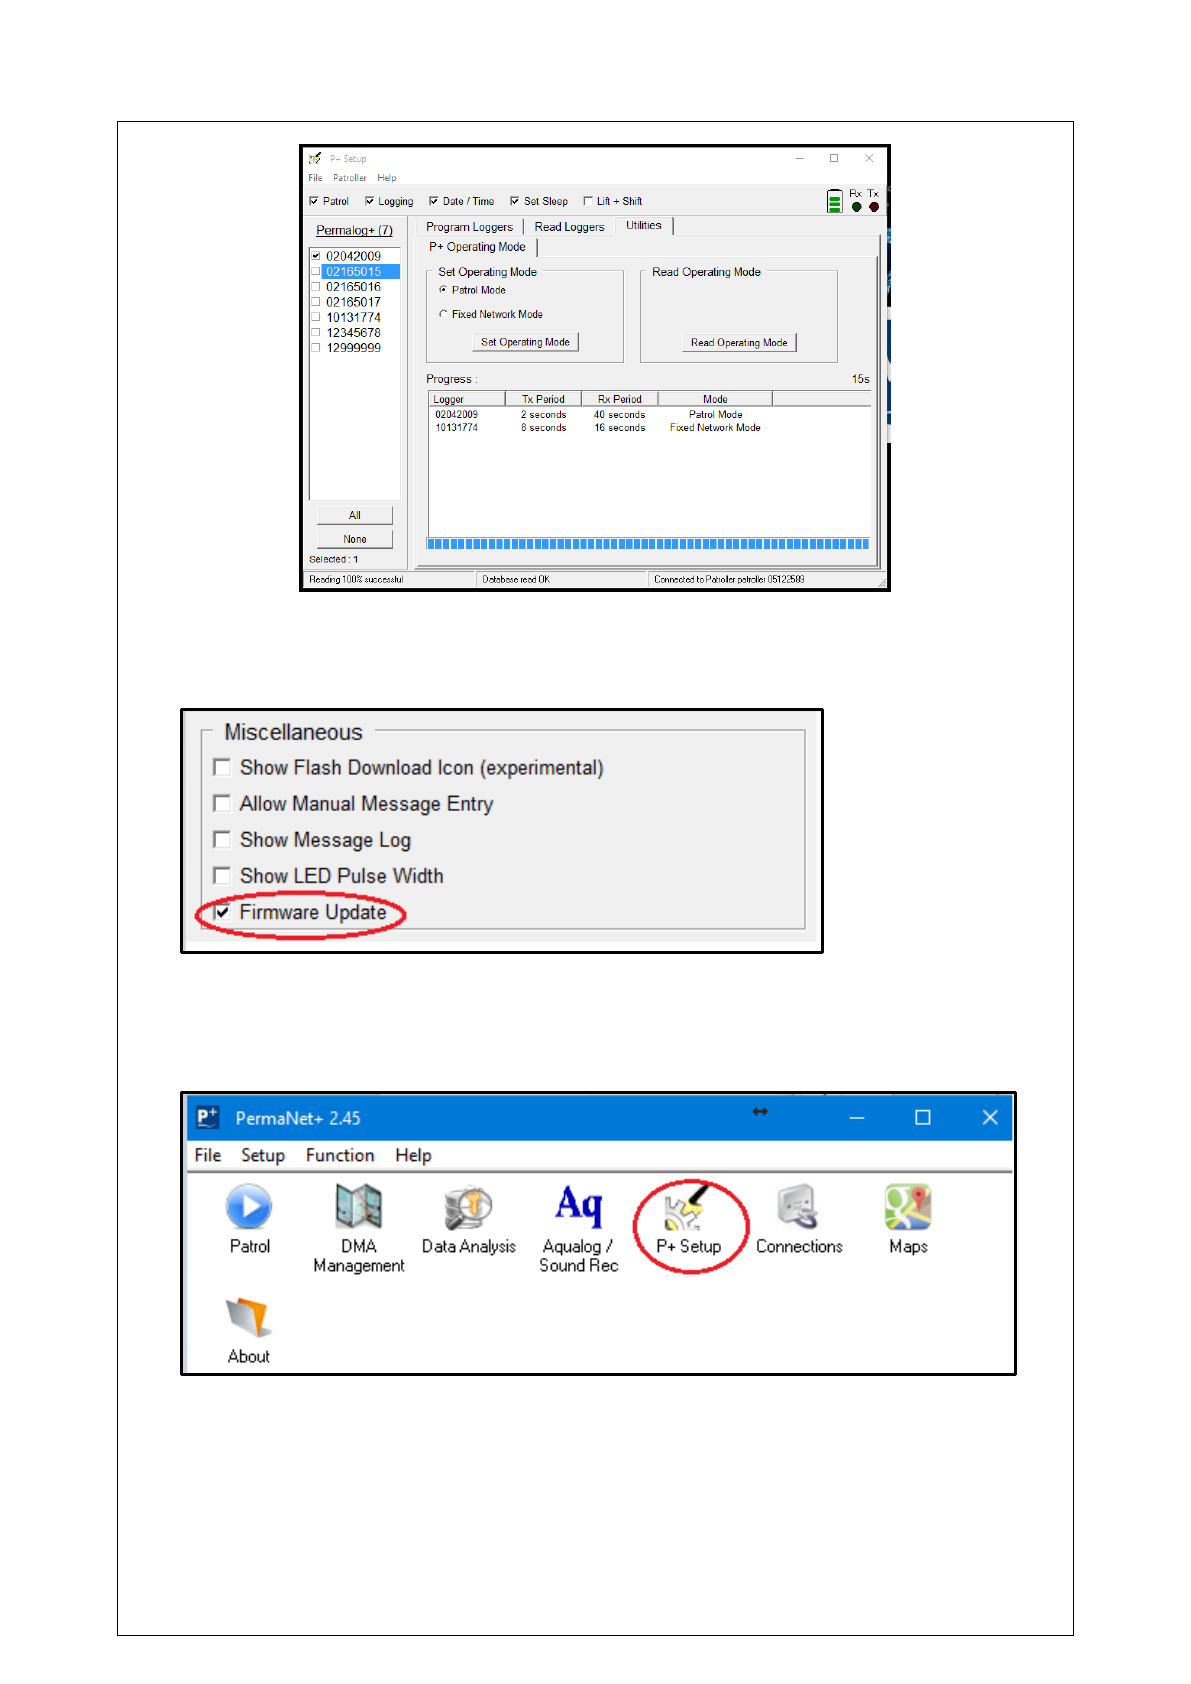
To set the logger’s operating mode, select the logger by ticking the checkbox, select
which operating mode to set, and click the button.
To see which mode a logger is set to, select the logger by ticking the checkbox, and
click the button. The loggers’ operating mode will be displayed
in the table.
24
Firmware Upgrade
Using the Main Screen, select Setup and Options (Note: the password is available
through your distributor). Ensure the Firmware Update checkbox is ticked:
Ensure your interface is configured using the wireless USB module (refer to section
Connections > Patroller/USB Wireless).
Select P+ Setup from the Main Screen.
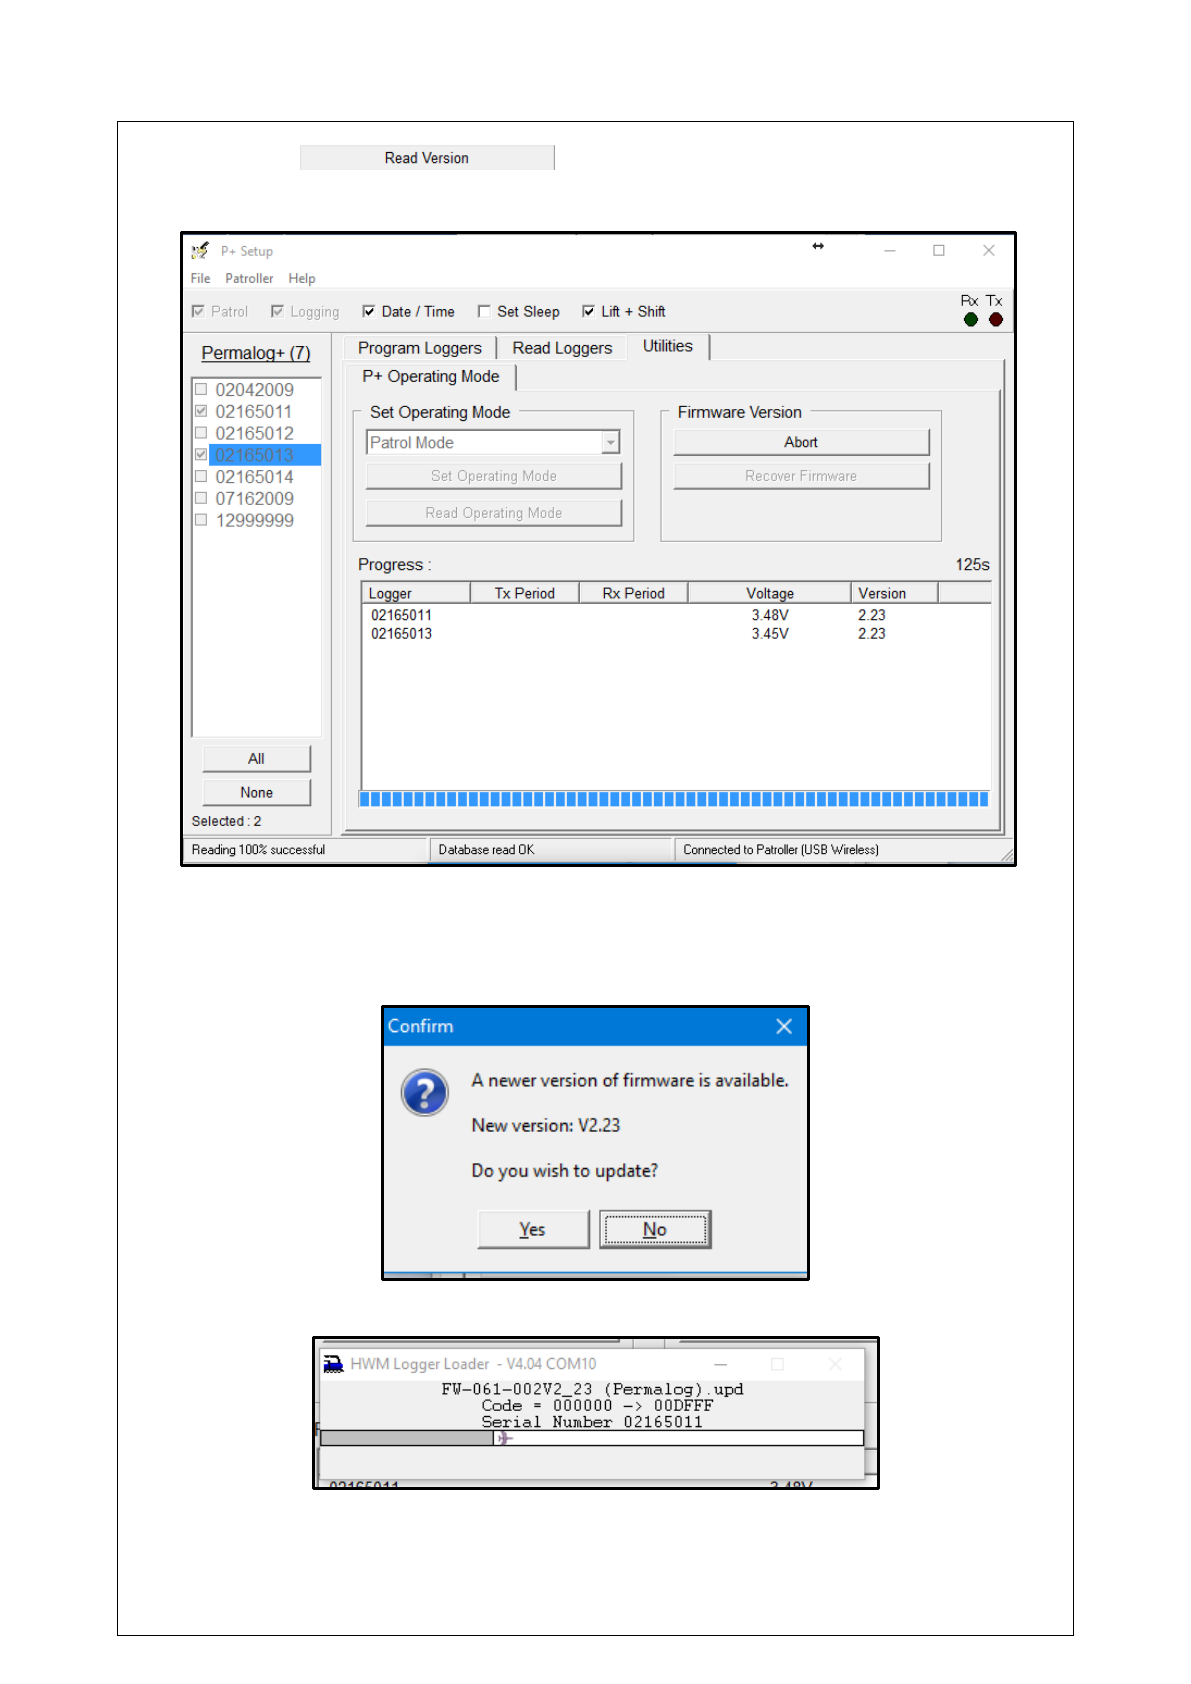
Navigate to the Utilities tab, and select the logger required for upgrade from list on
the left by ticking the logger’s checkbox.
25
Click on the button and wait for the logger to call in with
their current status:
If a new firmware update is available, a notification box will ask to update the
firmware. Selecting “Yes” will start the firmware upgrade procedure. Selecting “No”
will return to the Utilities tab.
When requested, swipe the logger to commence the firmware upgrade.
26
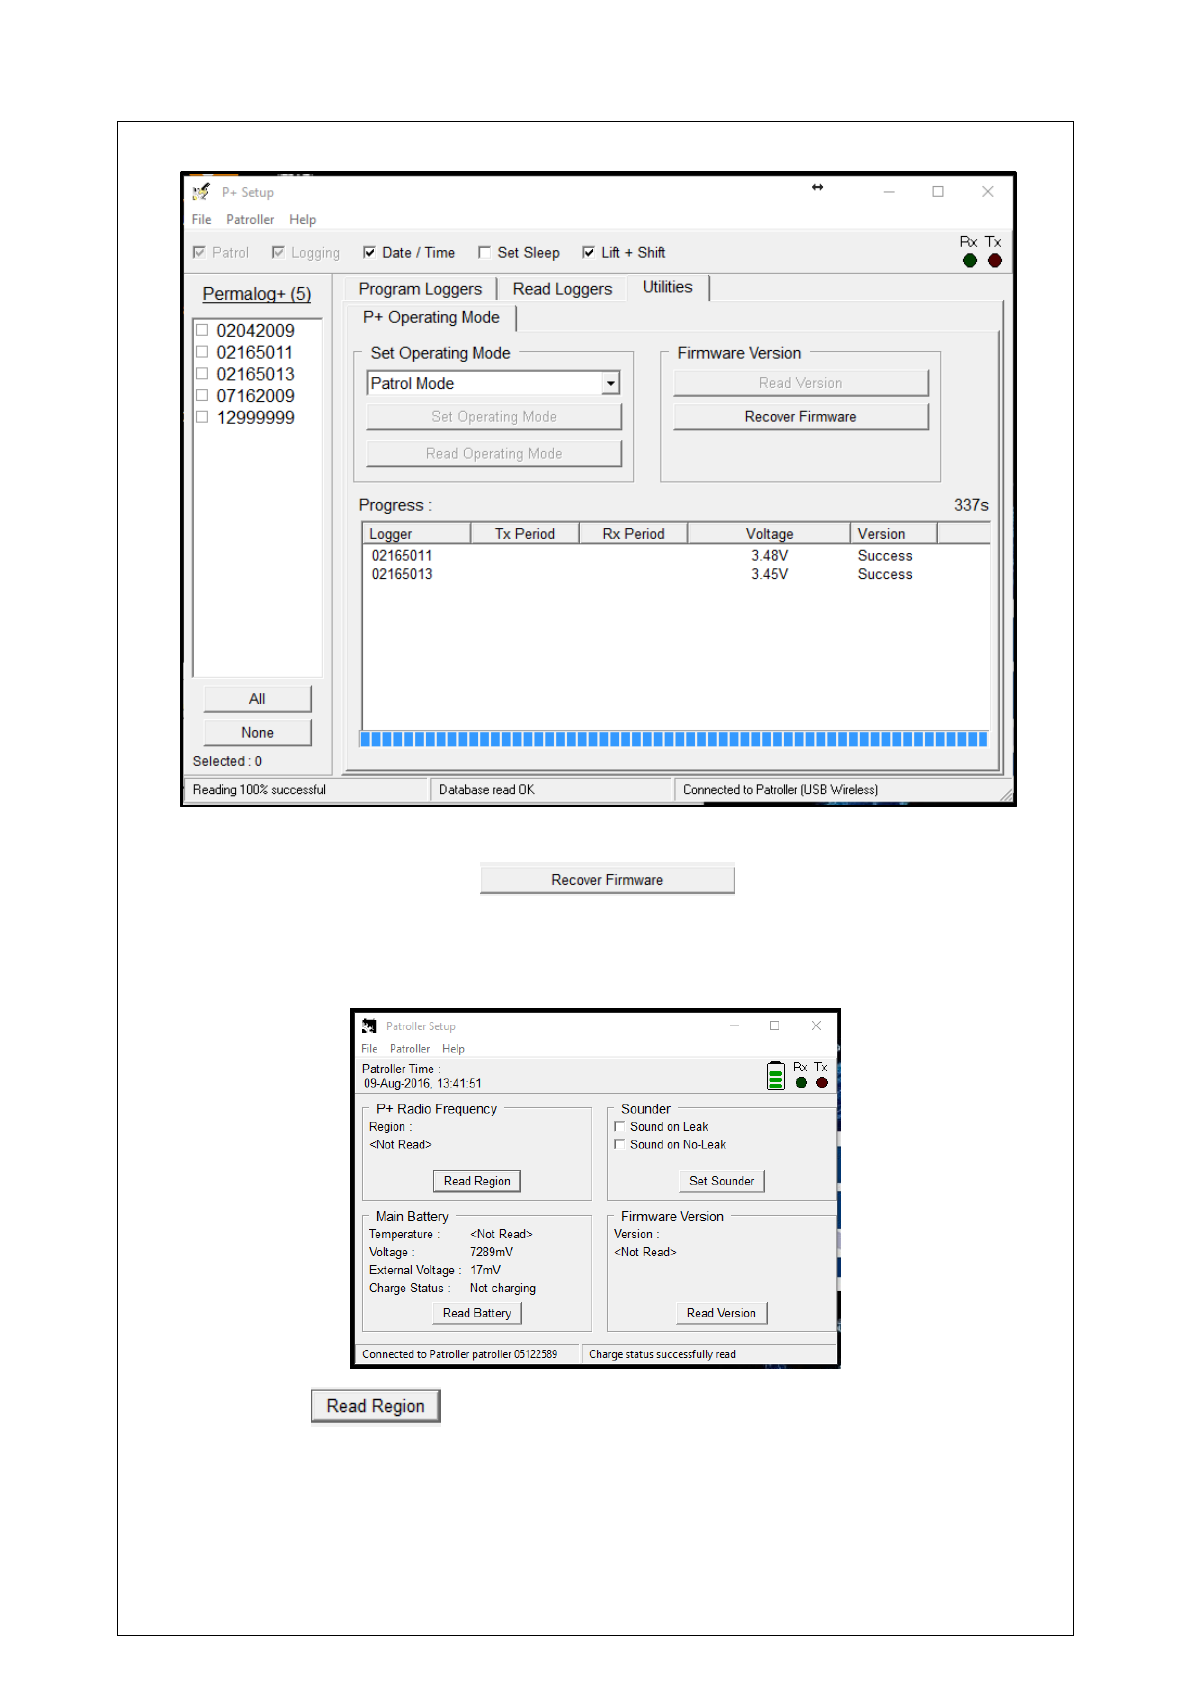
When the upgrade has completed, the status should be reported as a success.
If the upgrade fails, select the logger that failed to upgrade (by ticking the checkbox
of the logger) and click on the .
Patroller Setup
On clicking the Patroller Setup icon, a window will open up.
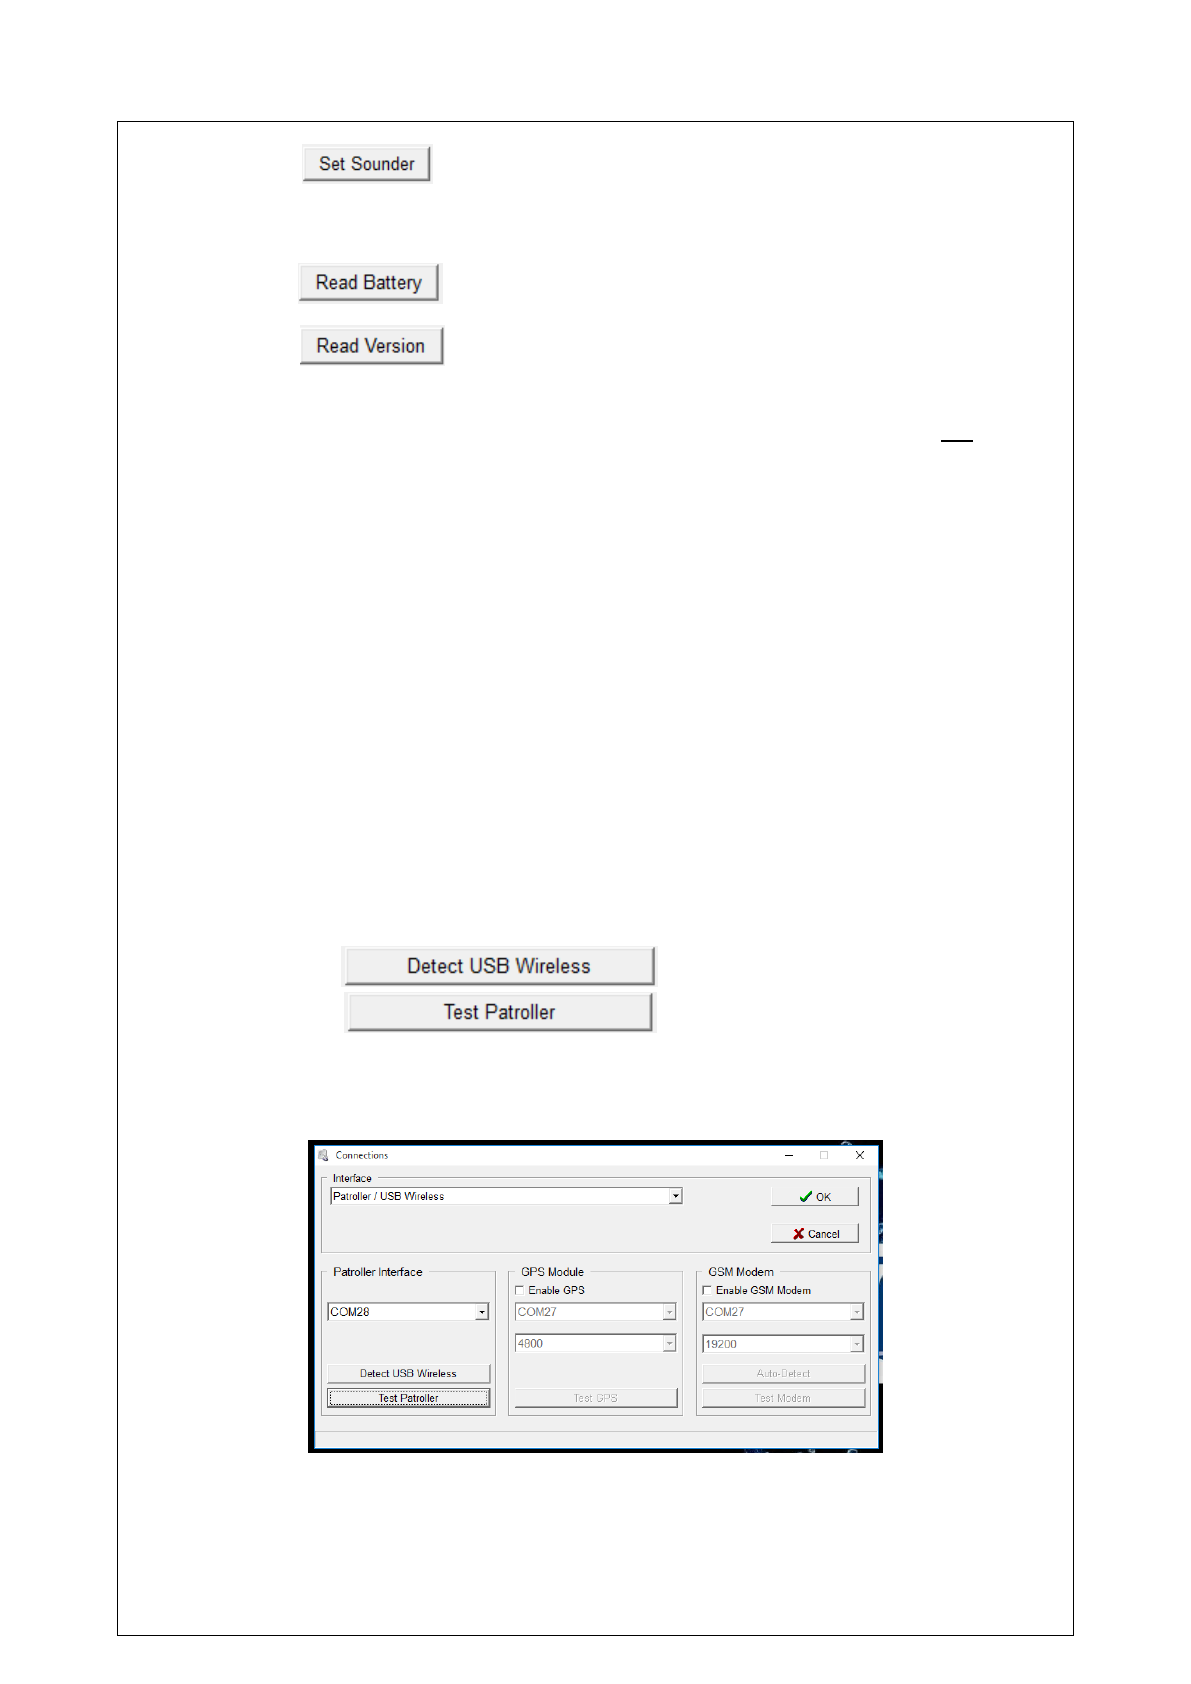
Clicking the button will detect the operating radio frequency, and
therefore the area which the loggers and Patroller unit are in use.
27
Clicking the button will configure the Patroller unit to toggle an alarm
when there is a leak and/or when there is not. This is not compulsory, and can be
left blank.
Clicking the button will give details of the Patroller unit’s battery.
Clicking the button will give the current version of the Patroller unit’s
firmware.
Note: the Patroller Setup is only available with a mobile Patroller unit, and not the
USB wireless module.
Connections
The Connections function sets up the connection between loggers and the
software. The logger data my come from the logger, the DataGate, or from a file
stored on the computer’s hard drive. The Connections window allows connections
to be tested to make sure data would be transmitted to the software, depending on
the interface.
Patroller/USB Wireless
The Patroller/USB Wireless interface uses either the Patroller unit or the USB
Wireless module.
Note: to connect to the Patroller unit, a Bluetooth connection must be made, and
may take several attempts at pairing before a successful connection is made.
To confirm there is a successful connection, select the port number of the
communications interface, GPS module (if used), and GSM modem (if used), and
click either the button (if using the USB Wireless
module), or the button (if using the Patroller unit).
Upon successfully connecting, a message should appear in the bottom left of the
window saying, “Connected to XX”, where XX is either the Patroller unit or the USB
Wireless module.
28
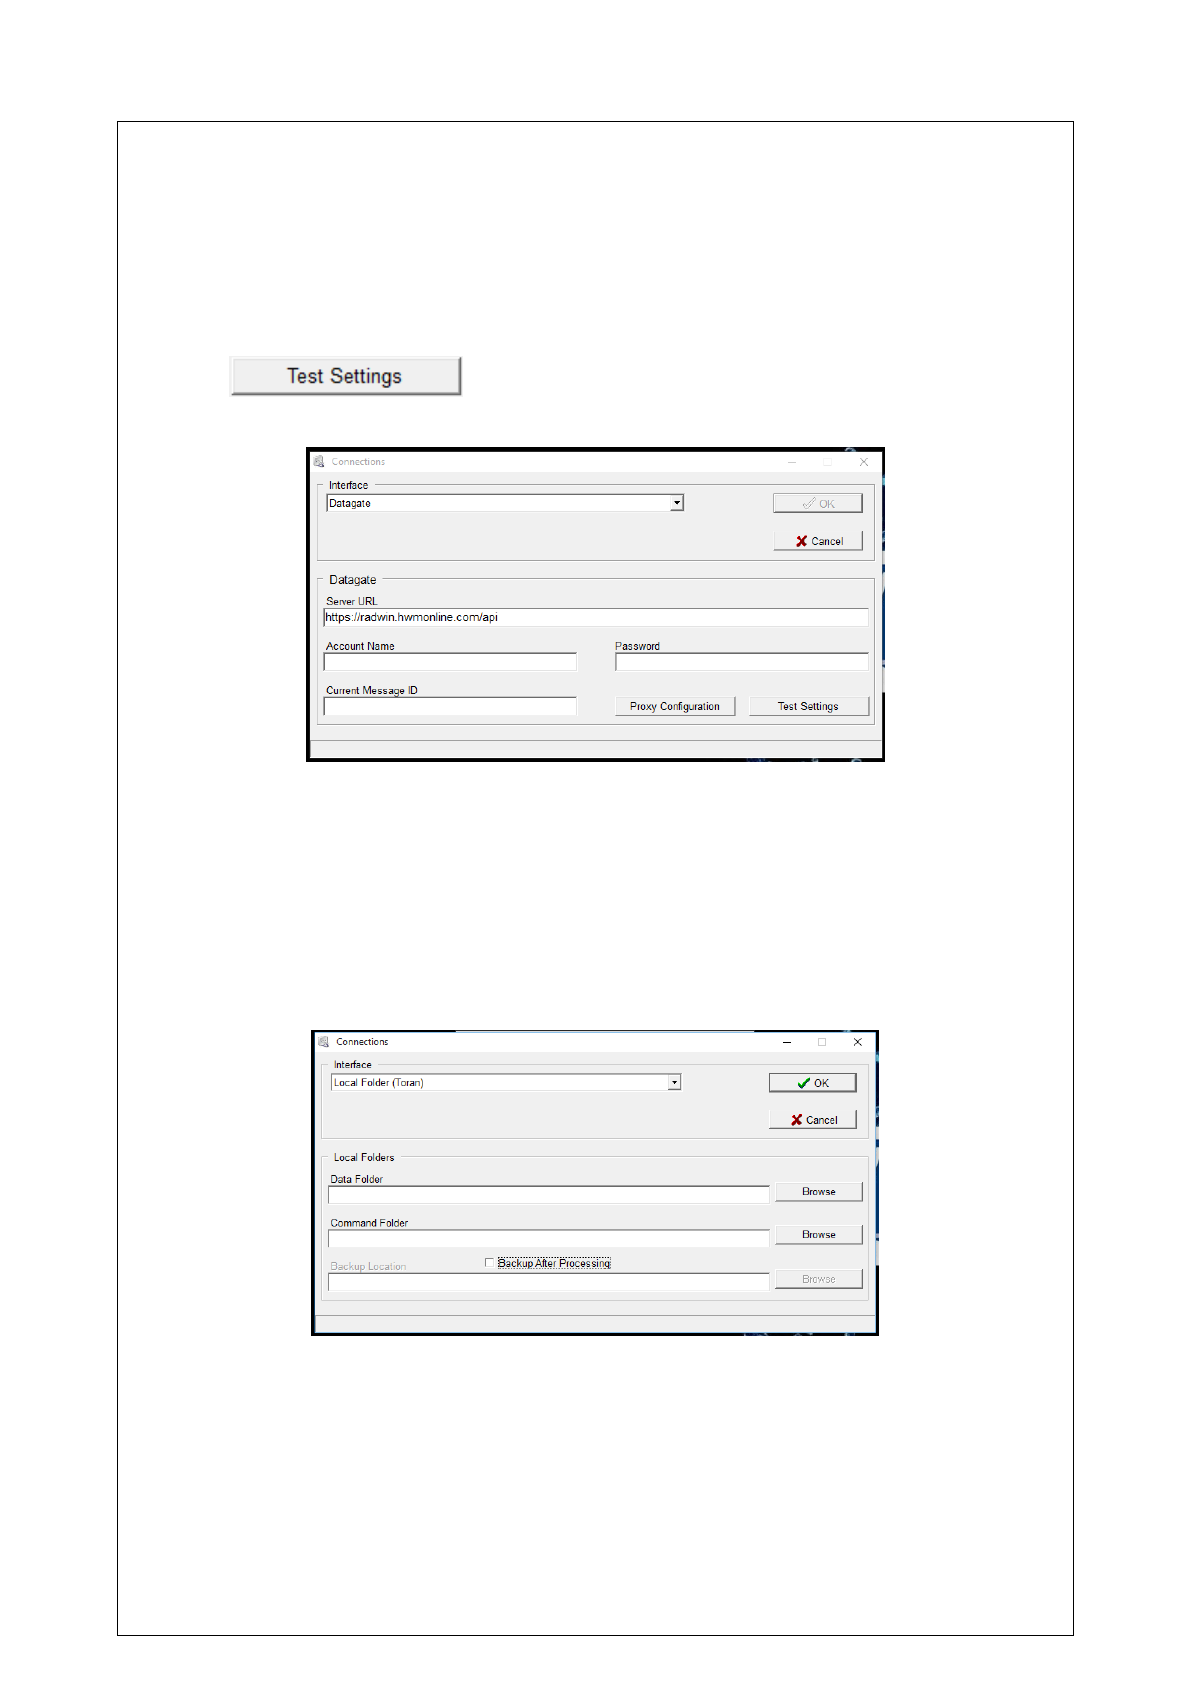
DataGate
The DataGate interface uses the logger data available on the HWM server to gather
data.
Note: there must be an active internet connection to access the HWM server.
Enter the Server URL, Account Name, Password, and Current Message ID. Configure
the proxy settings, if required, and check the connection is successful by pressing
the button. On successfully connecting, the message
“Connected to Datagate” will appear in the bottom left corner of the window.
Local Folder (Toran)
The Toran interface uses locally stored data to process the logger data. Enter the
path of the folder containing the data into the Data Folder parameter, and the path
of the folder containing the necessary commands into the Command Folder
parameter.
A backup of the original data can be made if “Backup After Processing” is ticked.
Enter the path of where the backup will be saved.
Backup/Restore
On clicking the Backup/Restore icon, a window will open, prompting to either
backup or restore the database.
29
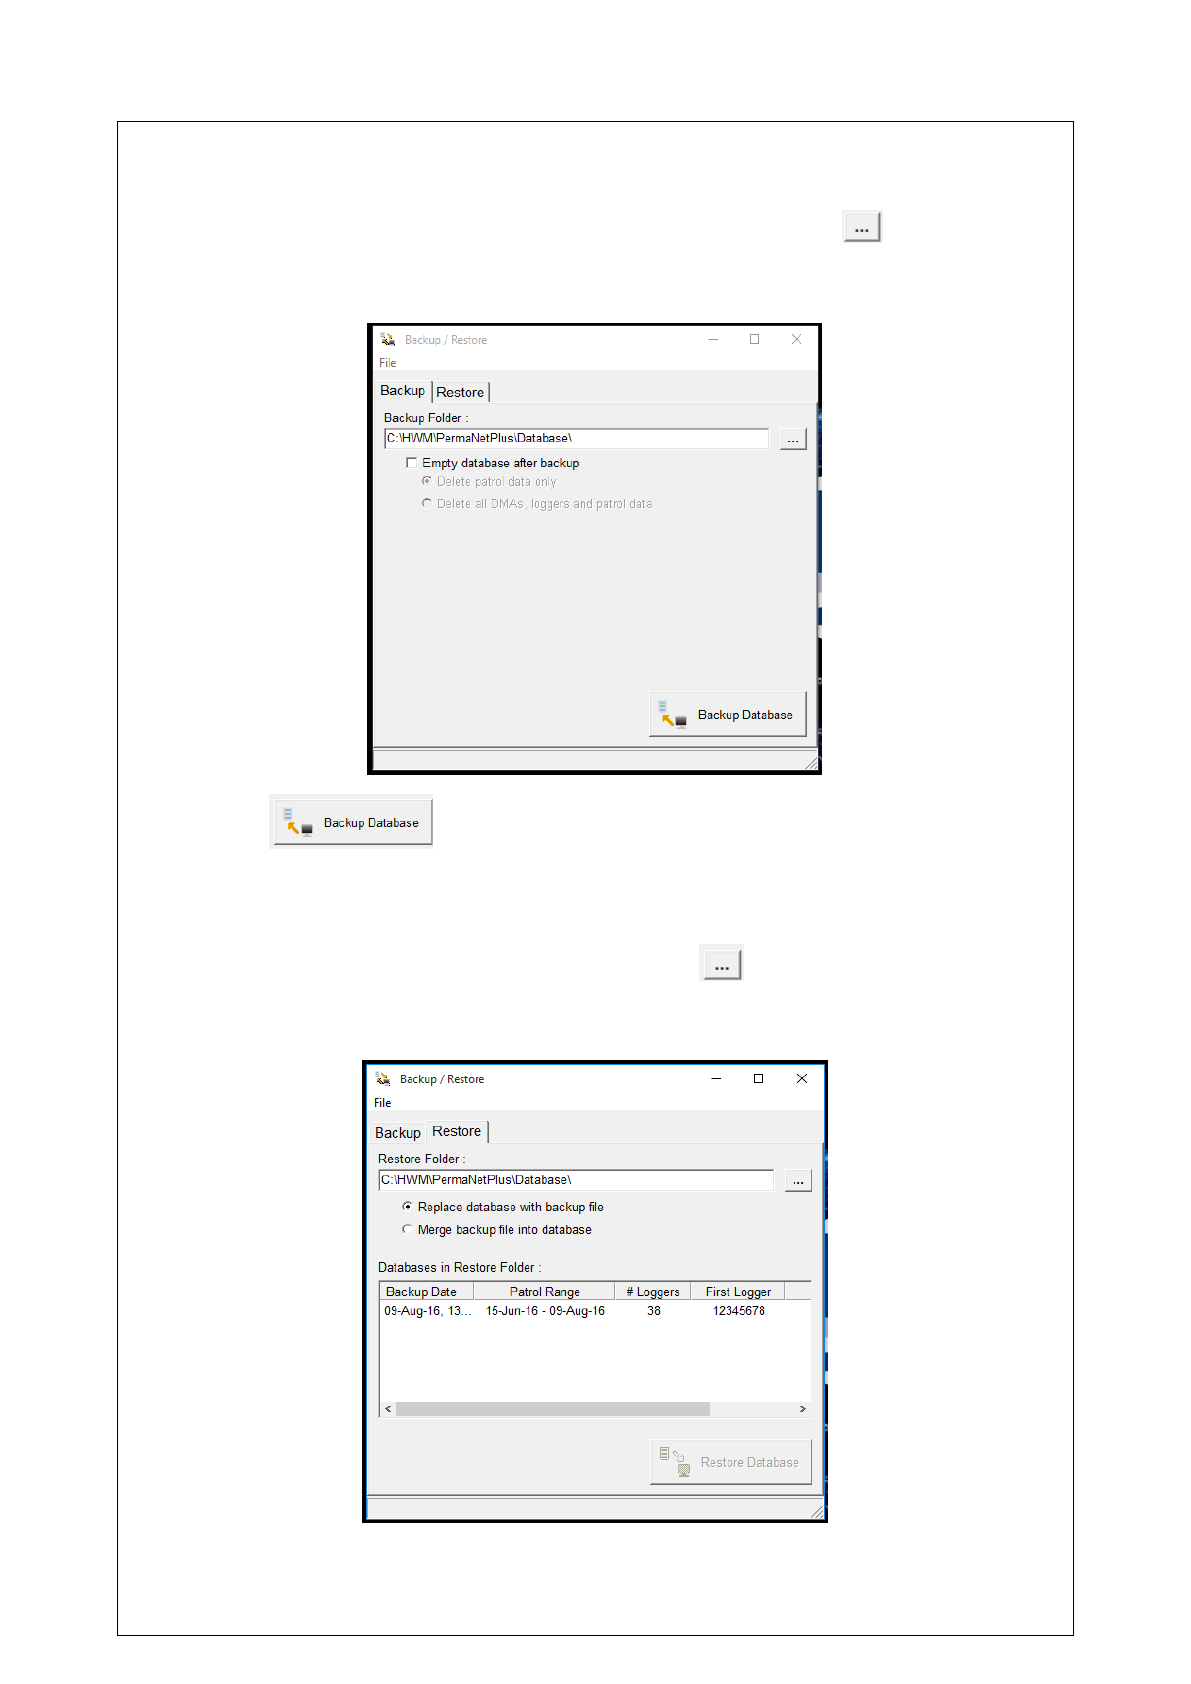
Backup
Select the Backup tab, and enter the folder location of where the backup will be
saved in the Backup Folder parameter. Alternatively, click the button and
navigate to the desired folder. The database may be cleared after the backup by
ticking the “Empty database after backup” checkbox.
Click the button to backup the database.
Restore
Select the Restore tab, and enter the folder location of where the restore is saved in
the Restore Folder parameter. Alternatively, click the button and navigate to the
desired folder. The new database may completely replace, or it may be merged with
the existing database.
30
The window will also display the databases present in the current folder. The correct
database must be chosen for the correct set of loggers.
Click the button to restore the database.
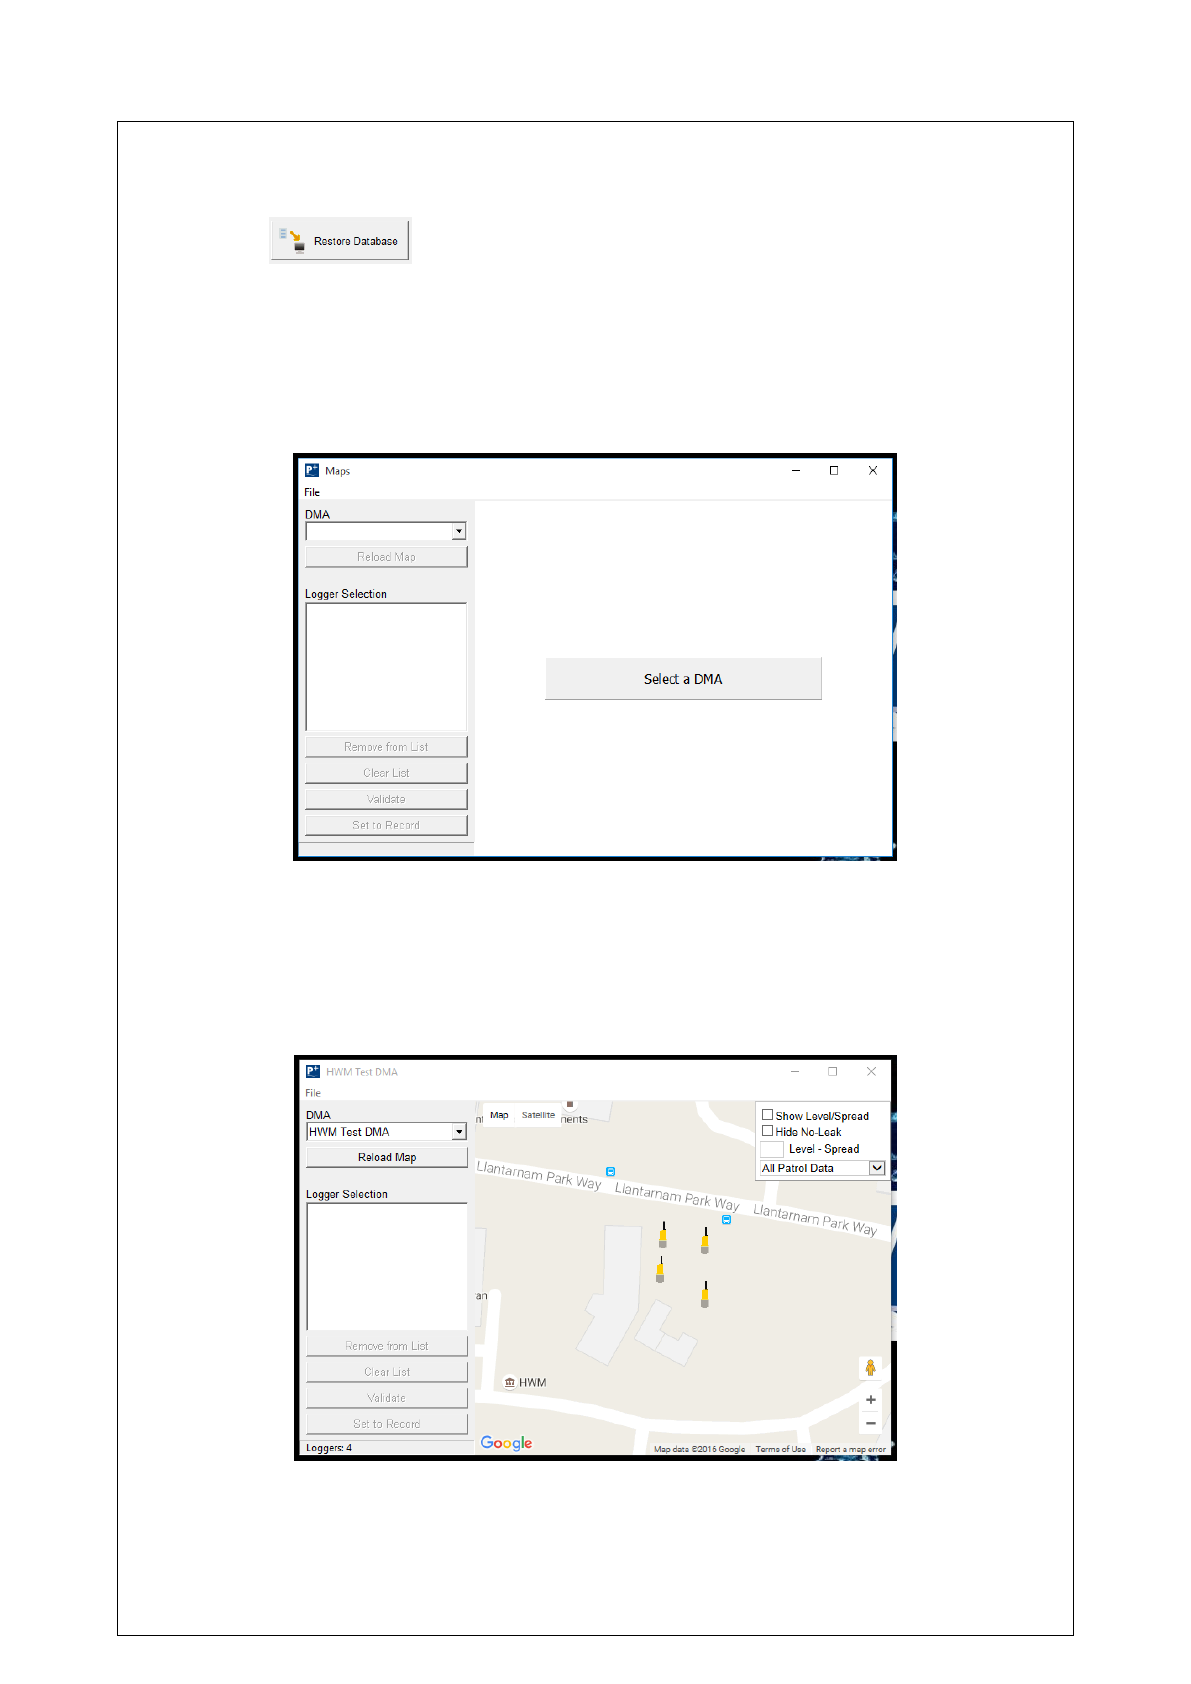
Maps
The Maps function shows the loggers’ locations on Google Maps. From there, the
loggers’ details may be retrieved.
On clicking the icon, a window will open.
For Maps to work, it needs a DMA (see section DMA Management). Select the
dropdown menu under “DMA”, and choose the DMA of choice. Upon selecting it, a
map will be generated with the loggers’ sites listed in the DMA.
Note: loggers will need a set of GPS coordinates to appear on the map. See section
Deploy to edit and configure loggers.
31
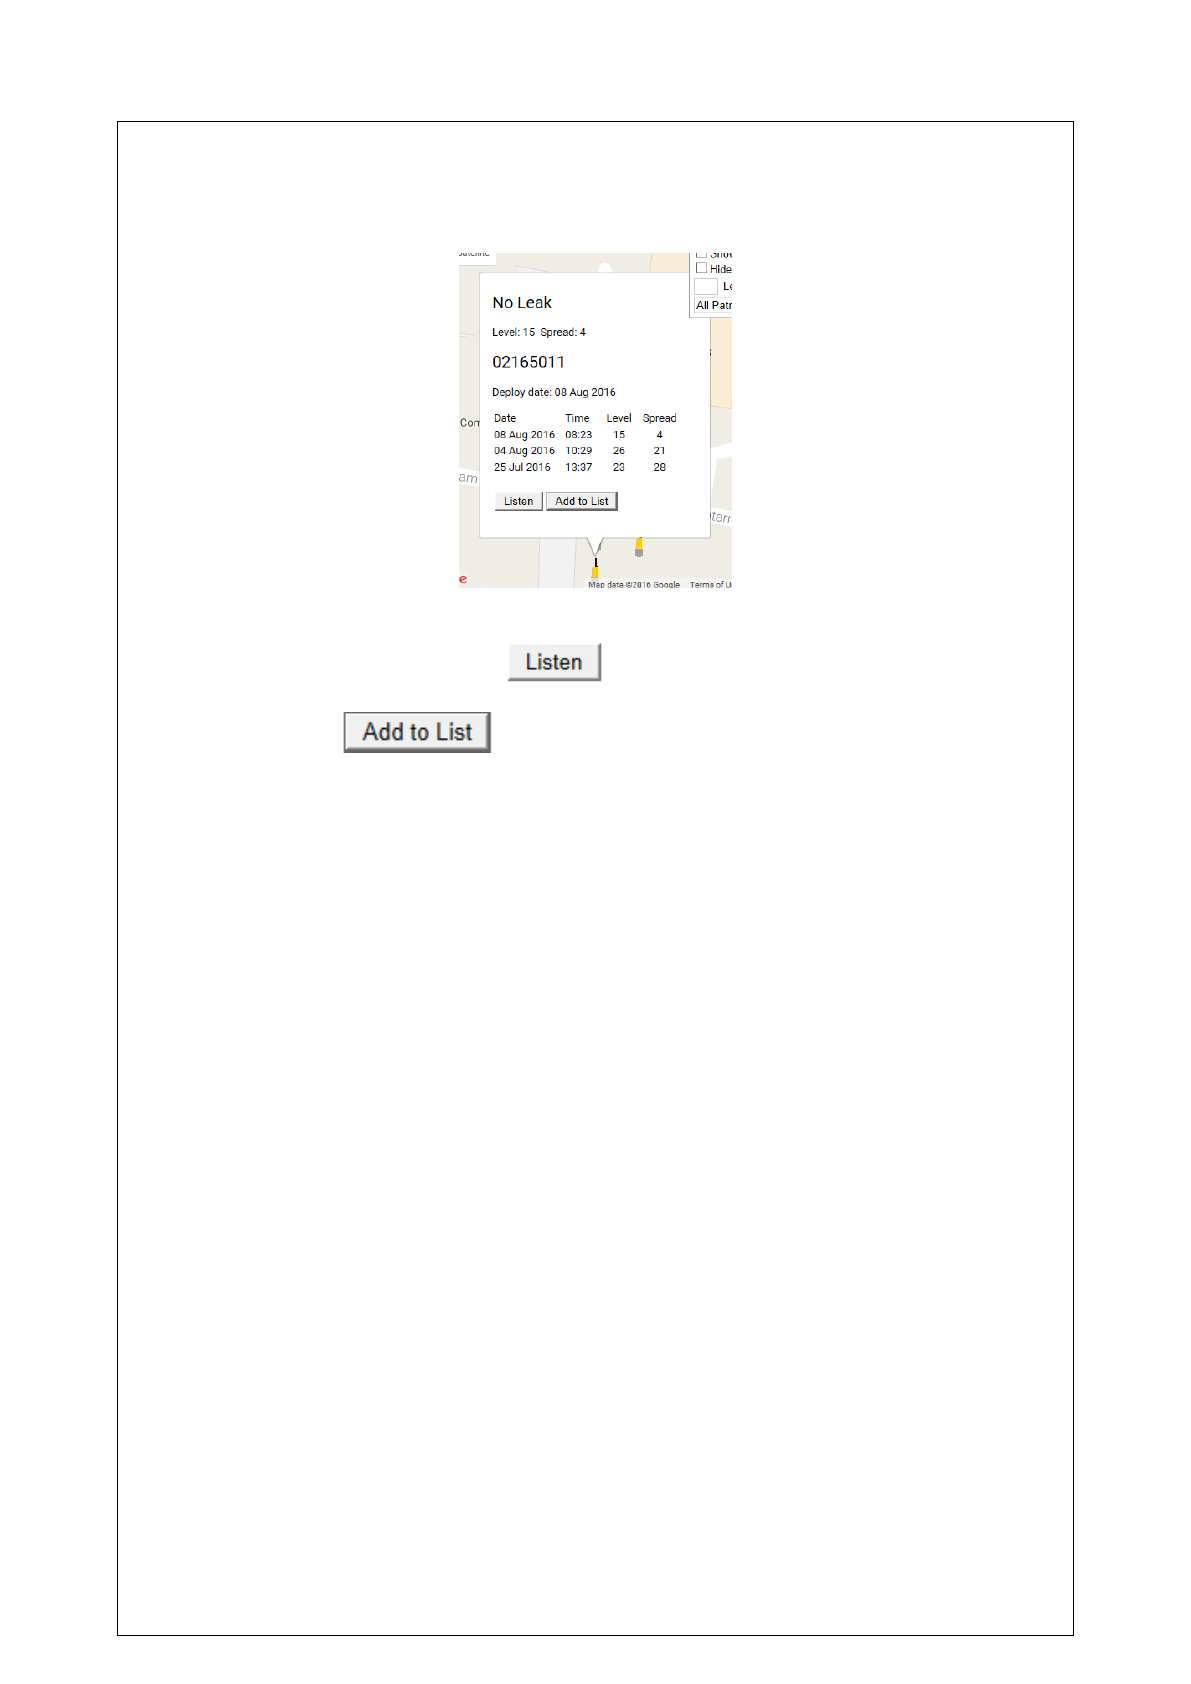
Sites in yellow denote no leak detected, whilst sites in red denote a possible leak.
Selecting “Show Level/Spread” will display the current level and spread at each site.
Selecting a site will give more details.
If the logger at the site has data, and the data has been downloaded in Aqualog, it
can be listened to by clicking the button.
On clicking the button, the logger at the site will be added to the
Logger Selection box for validation and correlation.
About
The About icon gives the current information about the PermaNetPlus software
package. It also contains the End User Software & Firmware License Agreement.
32
PermaNetPlus LLC
The PermaNetPlus LLC (Leak Location & Correlation) software is an addition to the
PermaNetPlus software which uses the data obtained by the loggers to determine
where a possible leak is. This section will outline the basics of the software and how
to interpret the results.
Prerequisites
In order for the LLC to function accordingly, recordings and data must have been
downloaded from the loggers prior to opening and running the software. Without the
data, the software will not be able to implement the loggers’ data.
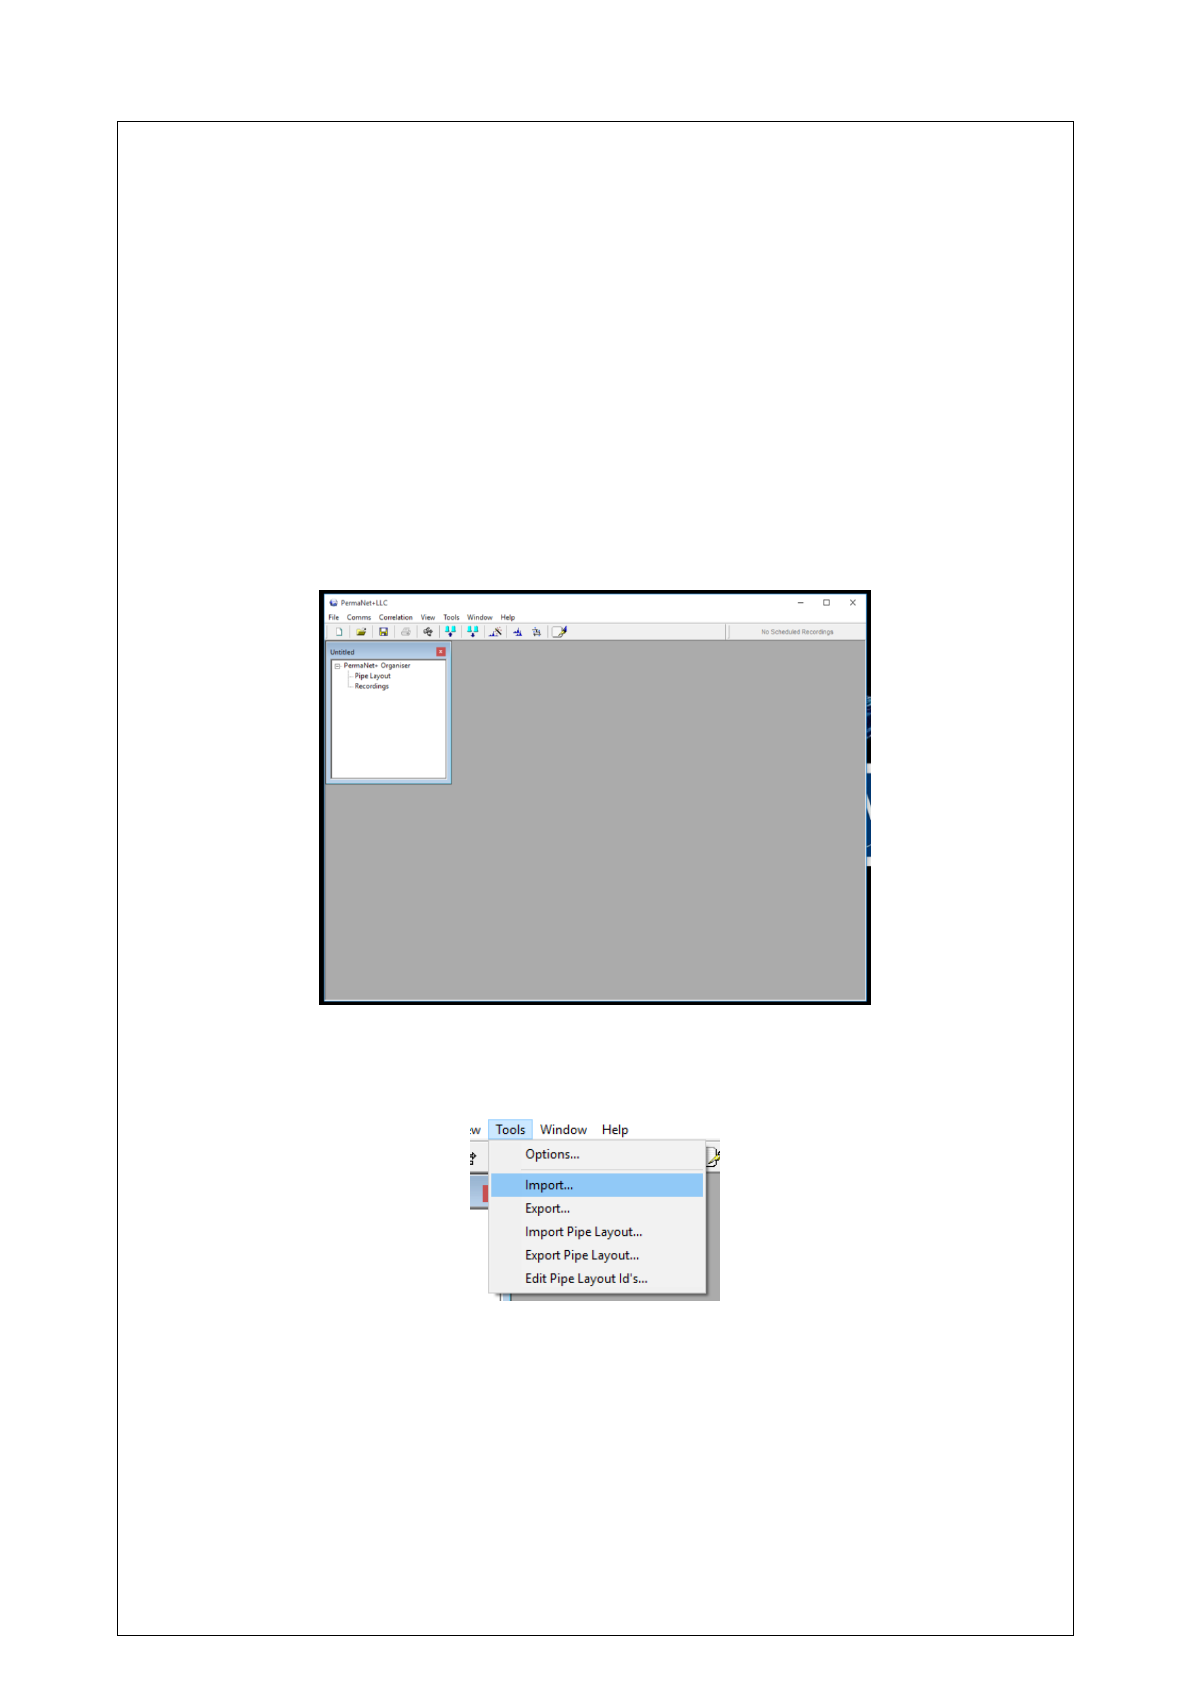
Main Screen
On opening the LLC, a new untitled project will automatically open. If it does not,
click on File -> New.
Importing Sound Data
To import data to cross correlate, click on Tools -> Import.
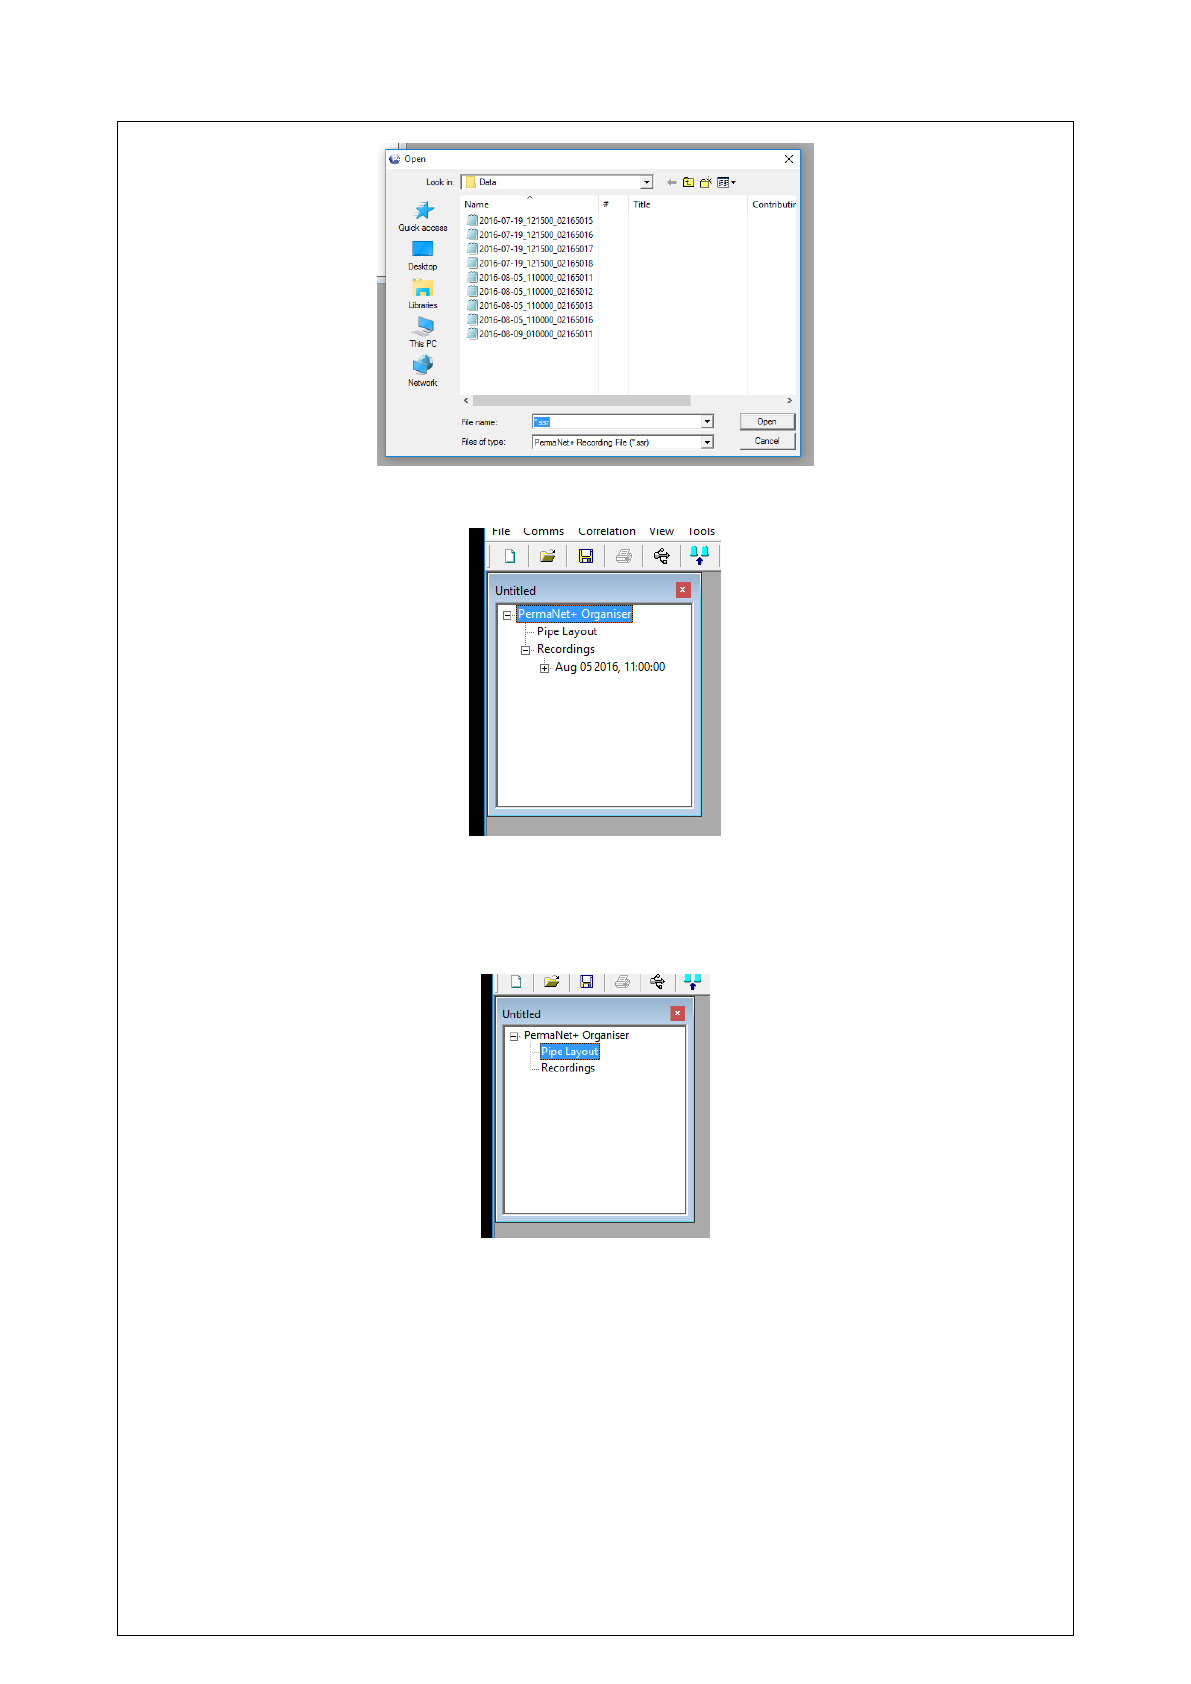
Select the data to import, and click Open. Multiple files may be selected by holding
down the Ctrl key and selecting the files.
33
This data will be put into the Recording menu, under PemaNet+ Organiser.
Creating a Pipe Layout
The LLC software can create pipe layouts for analysis. To create a pipe layout,
double-click Pipe Layout under PermaNet+ Organiser.
A window will open, with a pipe layout interface.
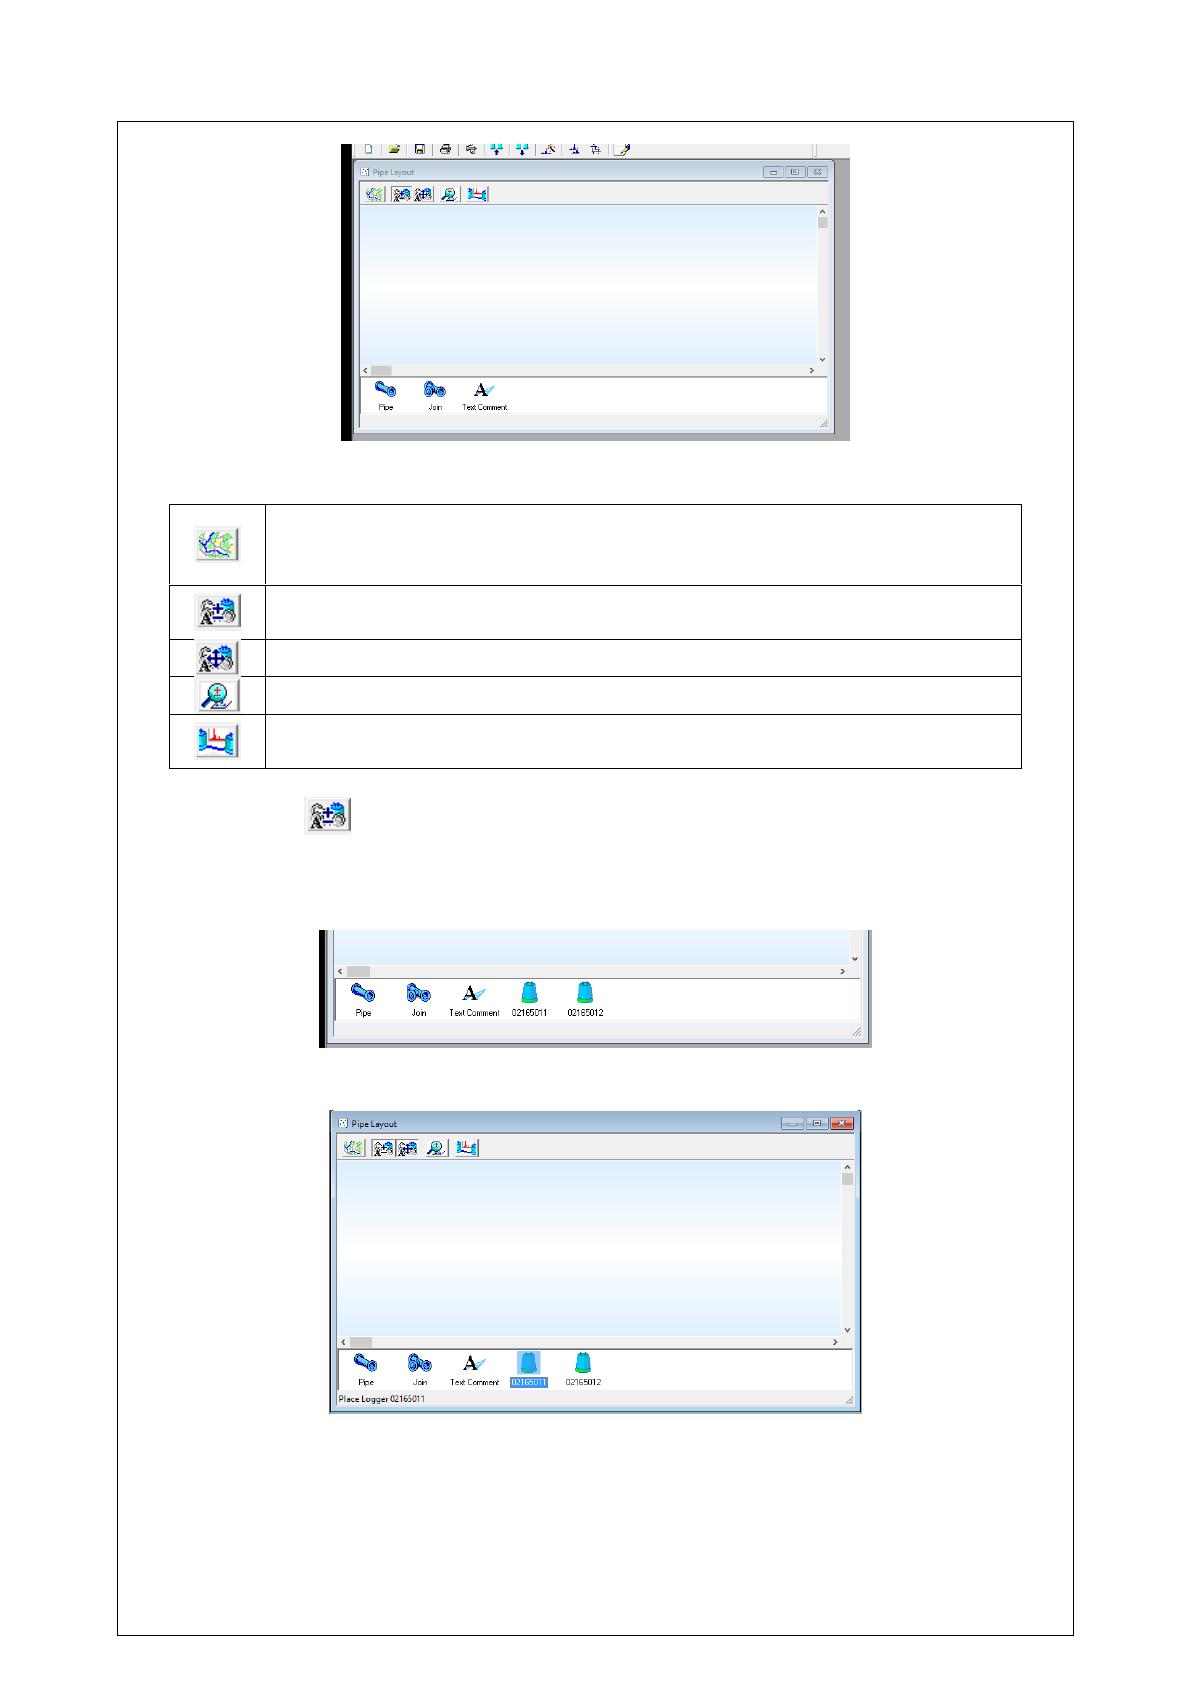
34
Below is an explanation of the buttons:
Map/Background. Sets the background image. The pipe layout will
overlay this image, and may make it easier to draw the layout with a map
image of the location. This is an optional feature.
Add/Remove Components. Gives you the option to add/remove
loggers, pipes, pipe joints, and text comments.
Move Components. Moves components to desired locations.
Zoom. Zooms in and out.
Cross Correlate. Performs a cross-correlation analysis on two or more
loggers. See section Cross Correlation for more information.
Click on the button. If logger data has not been imported, import logger data.
See section Importing Sound Data for further information.
Once imported, loggers will appear as components that can be placed in the layout.
To add components, click on the component icon, and then click on the layout.
35
Note: placing loggers will remove them from the components menu. This is because
loggers can only be placed once.
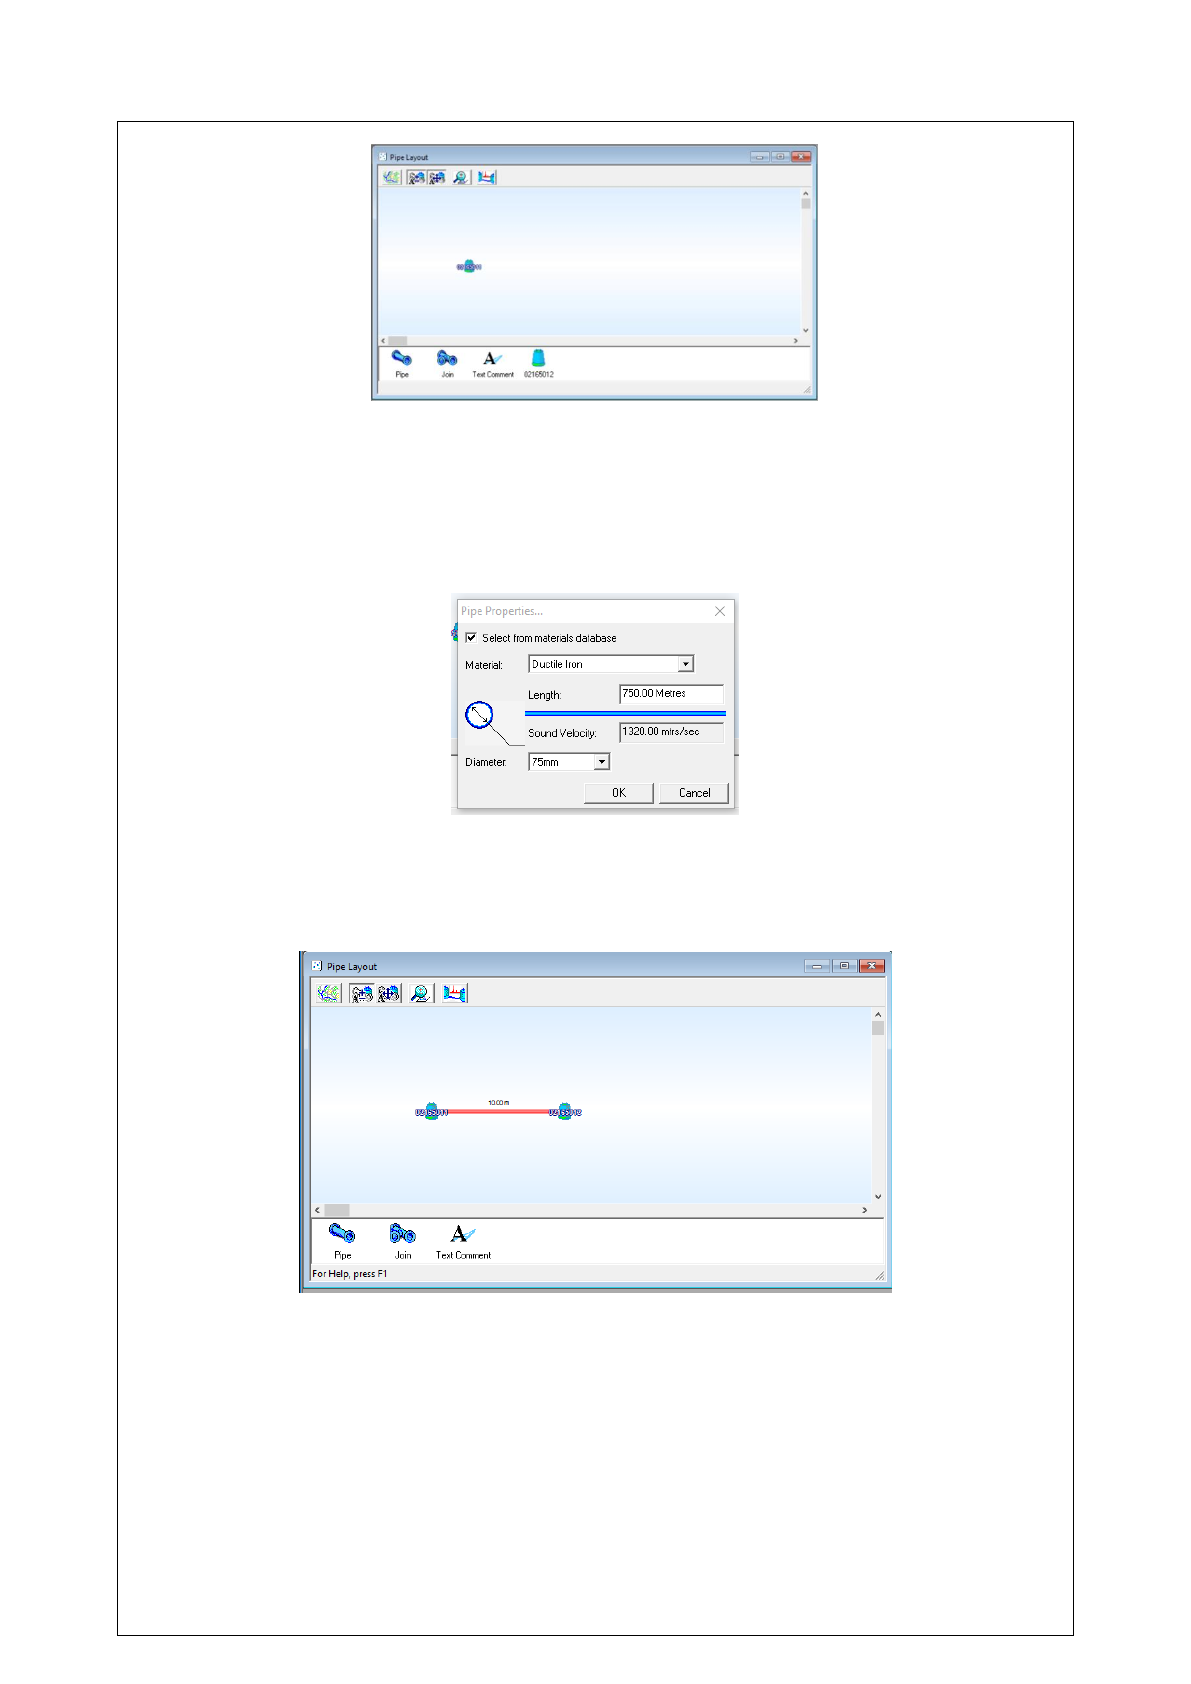
Once two or more loggers have been placed, a pipe can be drawn. Select the Pipe
icon and draw a line from one logger to the other. On releasing the mouse button, a
configuration box will appear.
Select the material the pipe is made from, the length of the pipe, and the diameter
of the pipe. Click OK.
Now the pipe has been drawn and configured.
Note: It is not necessary for the pipe layout to be a 1:1 scale. The pipes’ lengths are
set in the Pipe Properties box upon drawing a pipe, and can be changed by right-
clicking on the pipe, and selecting “Pipe Properties”.
Exporting Pipe Layouts
Once a layout has been drawn, it can be exported into a single file. Click Tools ->
Export Pipe Layout.

36
Save the file in a directory of choice.
Importing Pipe Layouts
If a previous pipe layout design was created and exported, it can be imported by
clicking Tools -> Import Pipe Layout.
Select the desired pipe layout, and click Open.
Under PermaNet+ Organiser, double-click “Pipe Layout”.
The pipe layout will appear.
37
Note: logger data will not be imported.
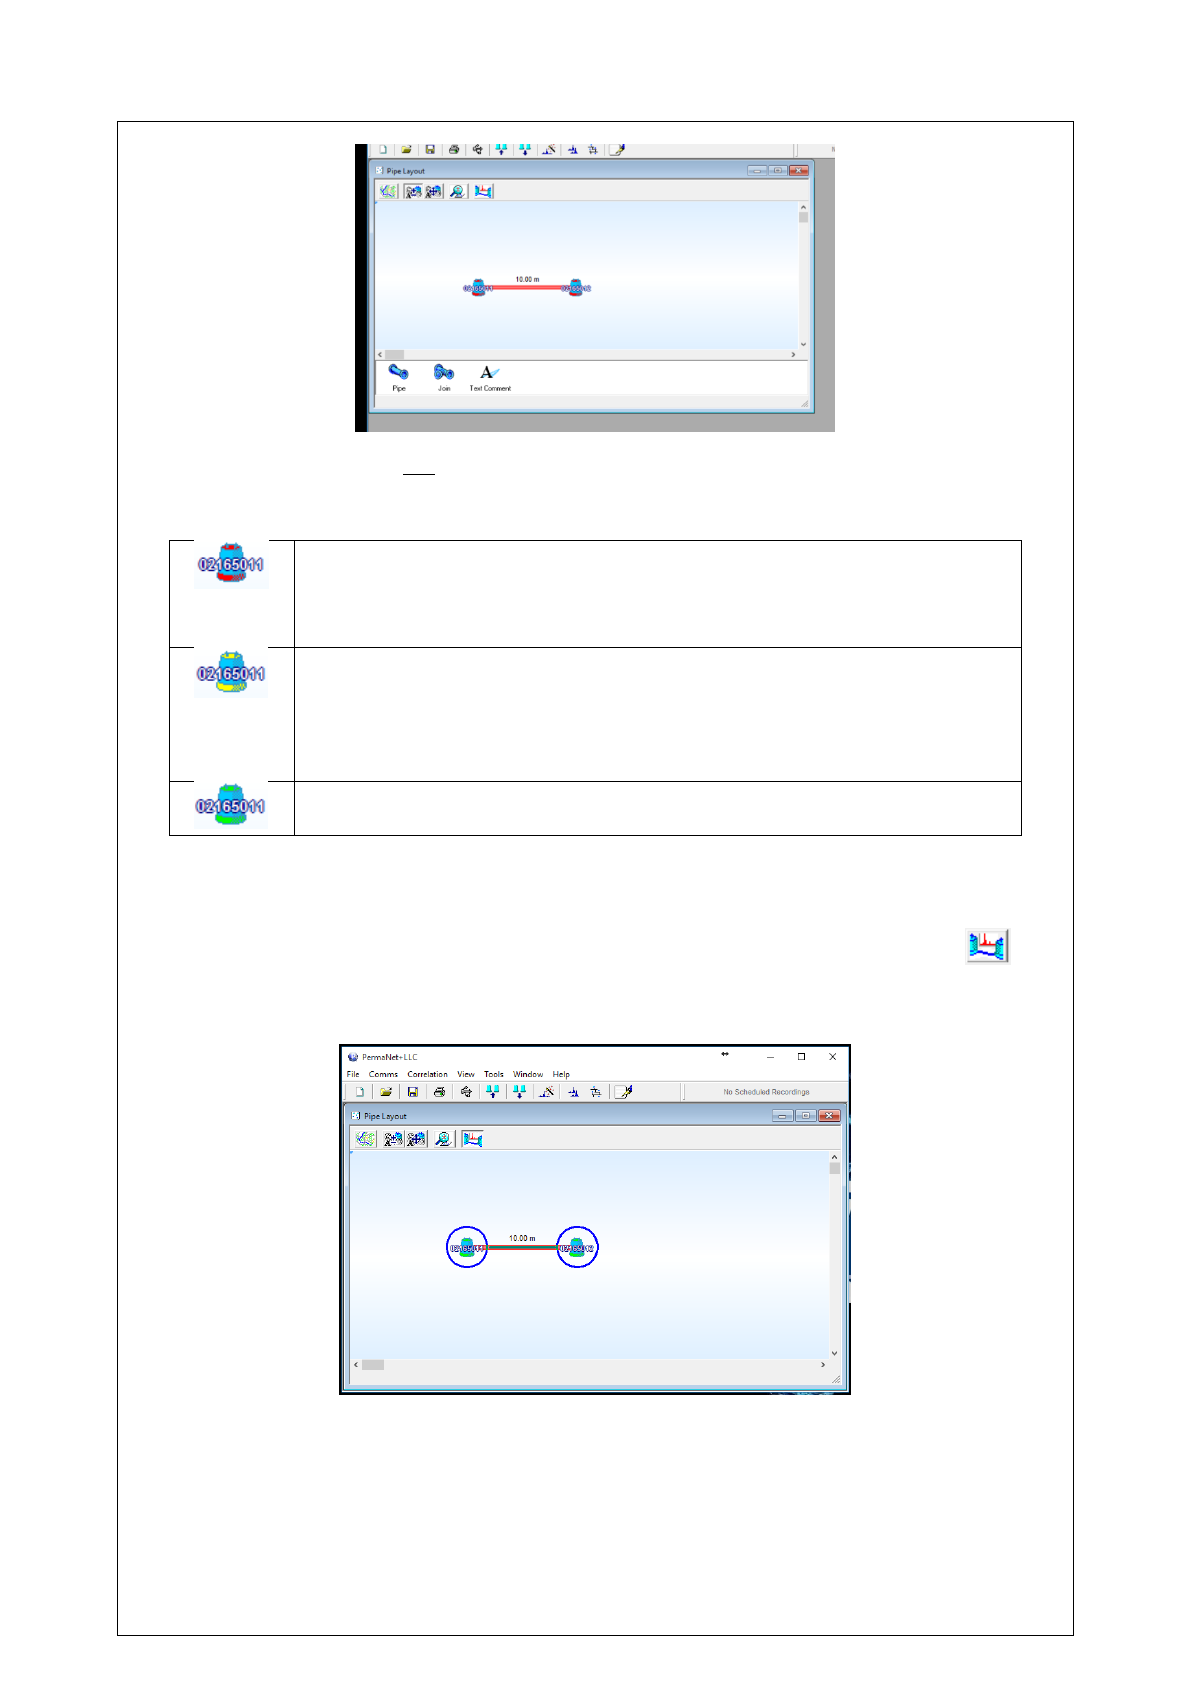
See below for details on logger icons:
Red Icons. This means that the software does not recognise the
logger, and the data must be imported. See section Importing Sound
Data to import data. Ensure that the imported data times match, and
that one logger’s data is not newer/older than the rest.
Yellow Icons. This means the software has recognised there is a
logger, but any data associated to it is not available for cross
correlation, most likely due to misalignment with the recording times.
Importing the correct logger data from the correct time stamp will fix
this.
Green Icons. This means the software has recognised there is a
logger, and data is readily available for cross correlation.
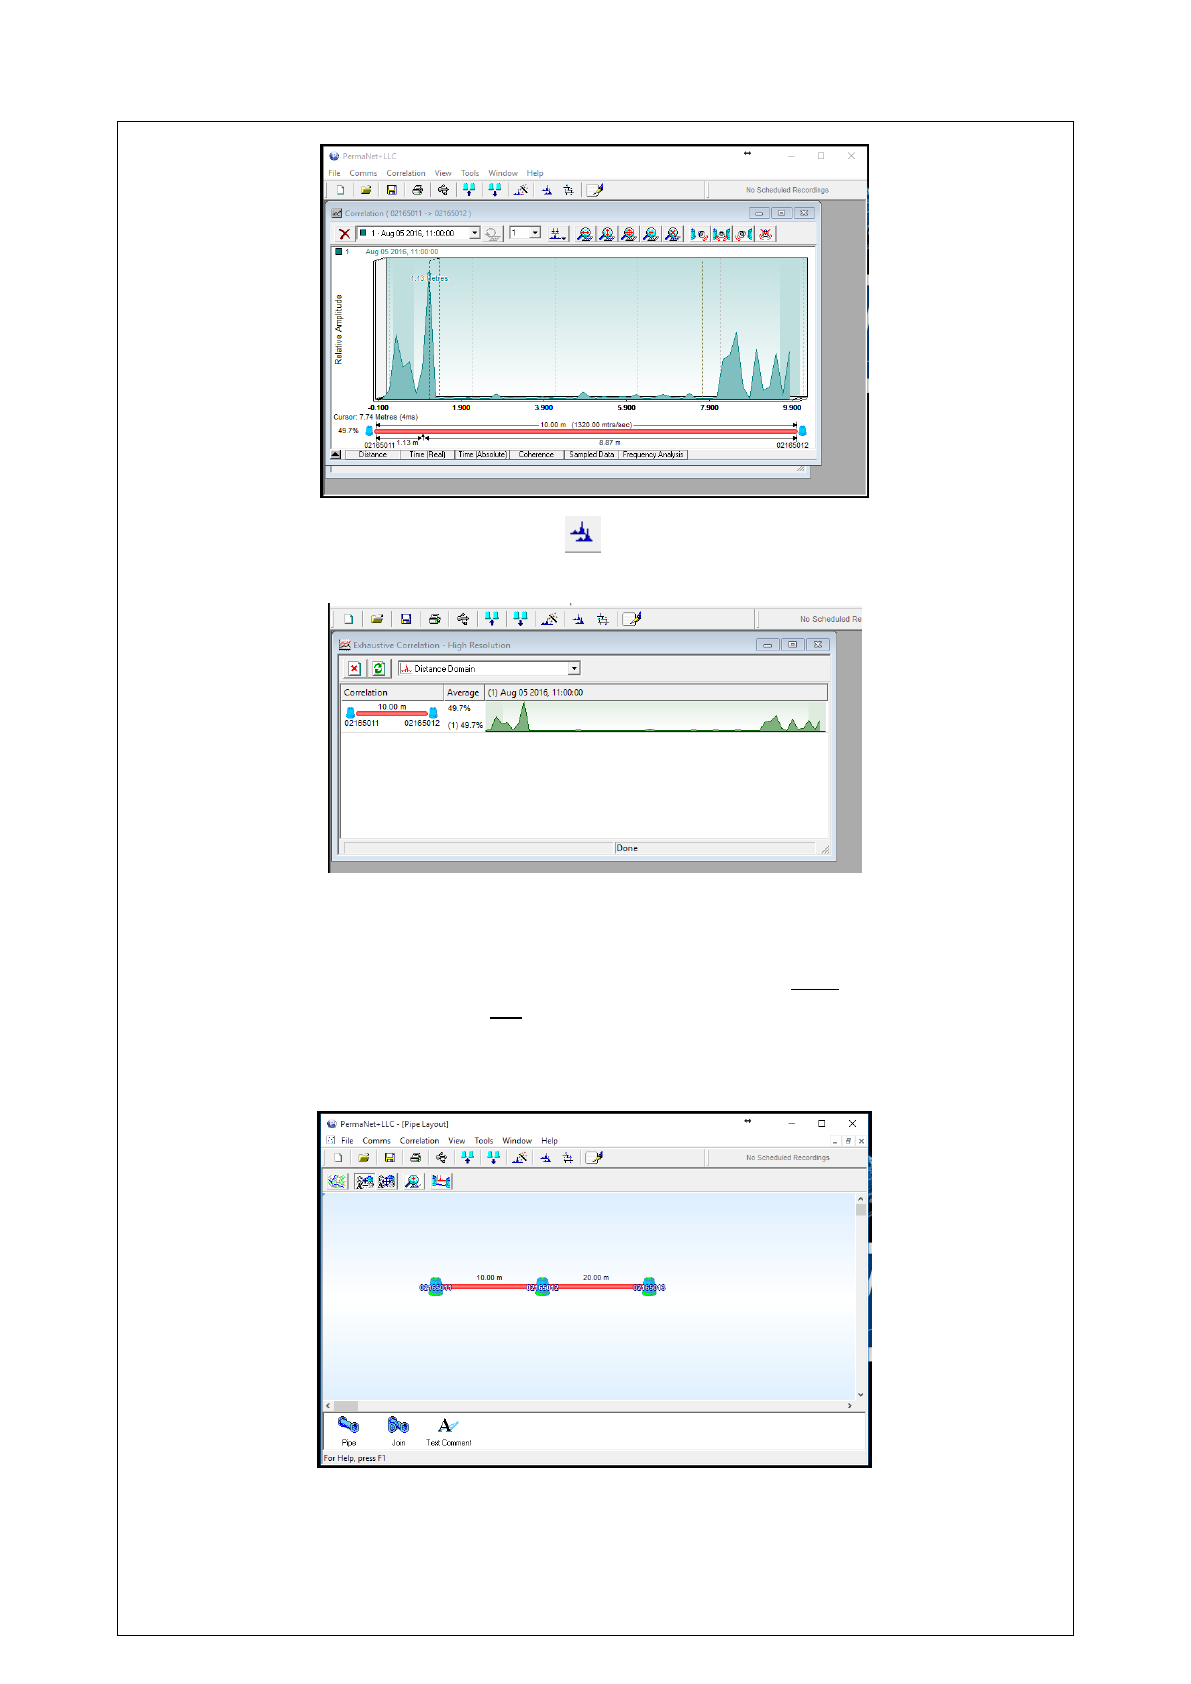
Cross Correlation
There are two methods for cross-correlation. For the first method, click on the
button. Then, click and hold on one logger, and drag the cursor to the second
logger.
The software will cross-correlate the data from the two loggers, and display the
estimated location of a possible leak in the correlation window.
38
For the second method, click on the button. This will display the correlation
between all the loggers.
Double-click on the correlation desired. This will open the correlation window, giving
an estimate of where a possible leak is.
IMPORTANT: For the correlation to work, the Permalogs must be programmed
together at the same time, and not separately.
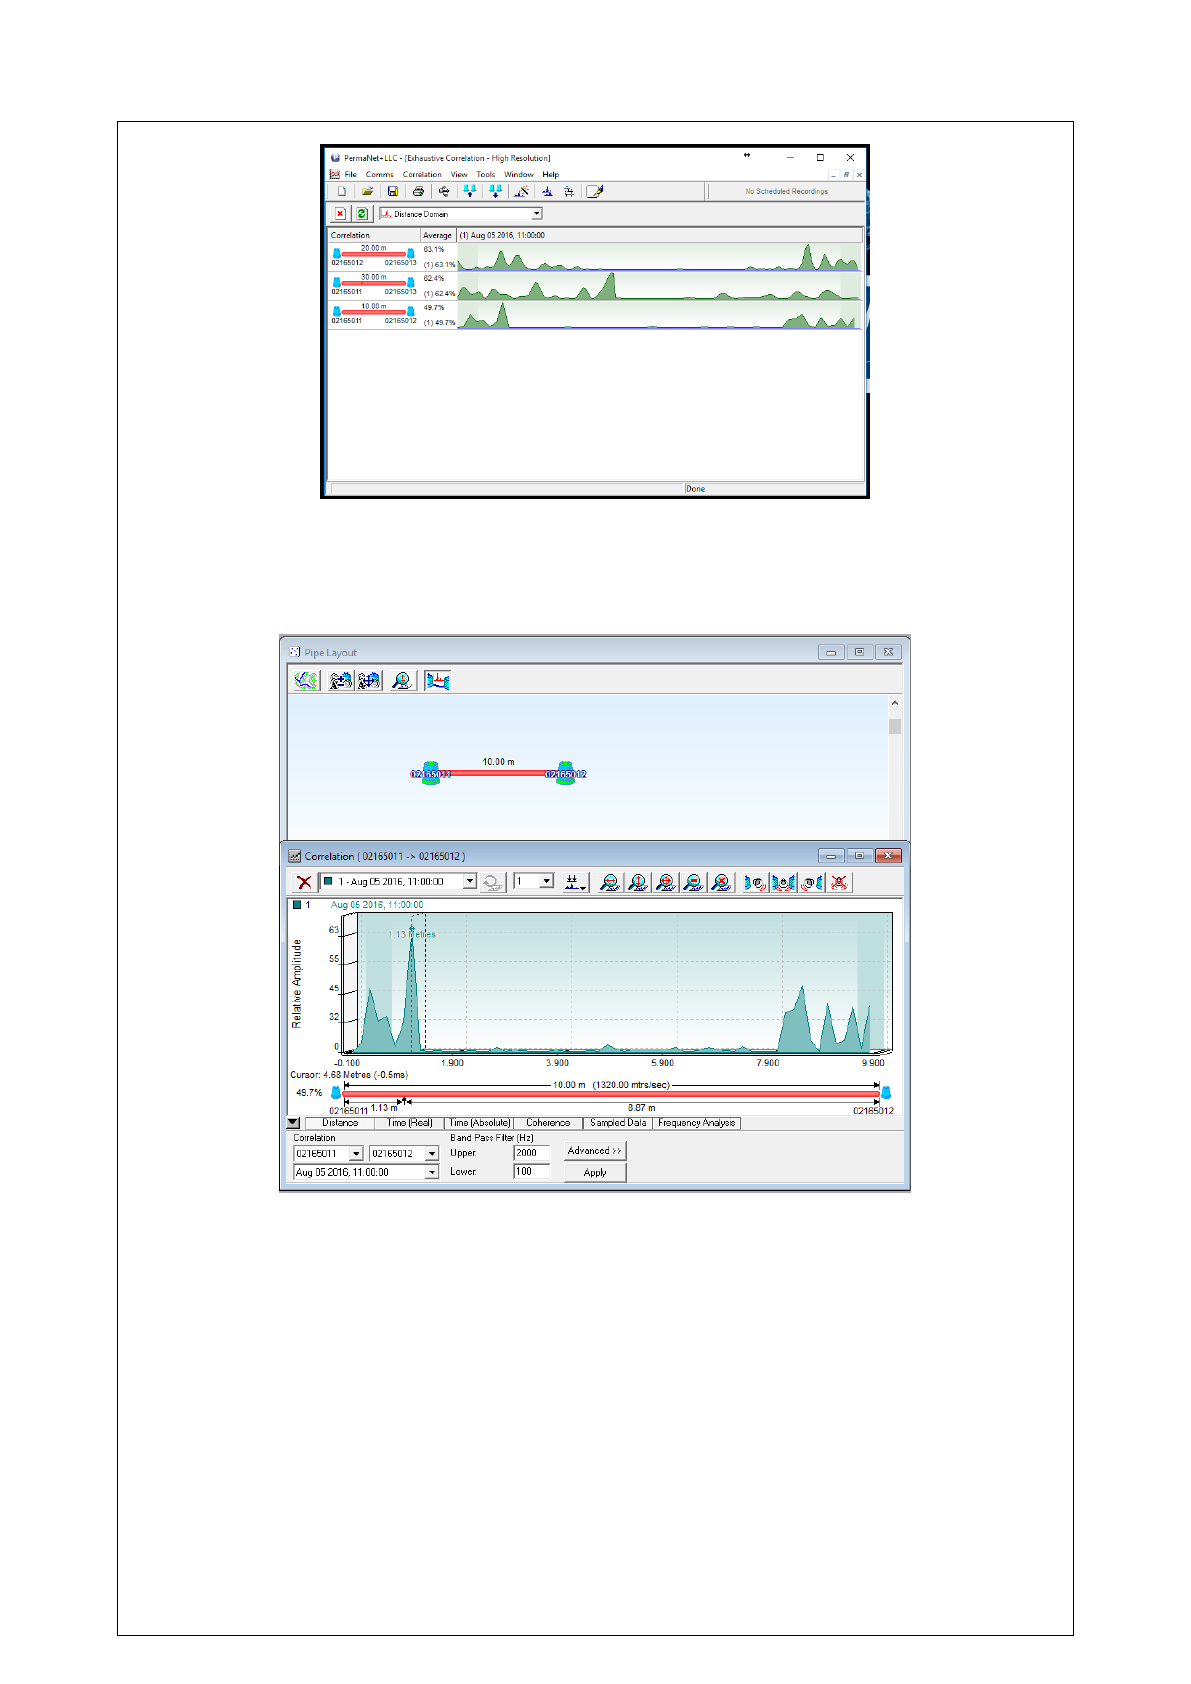
Note: if more than two loggers are on the pipe layout, the software will cross
correlation between all pairs of loggers:
39
No Leak Determined
If the software cannot determine or find a leak, a location of the highest peak
detected will be shown, with the likelihood of this peak being the location of a leak.
As the text and numbers under the graphical data is in black, the software has
concluded it is not a leak.
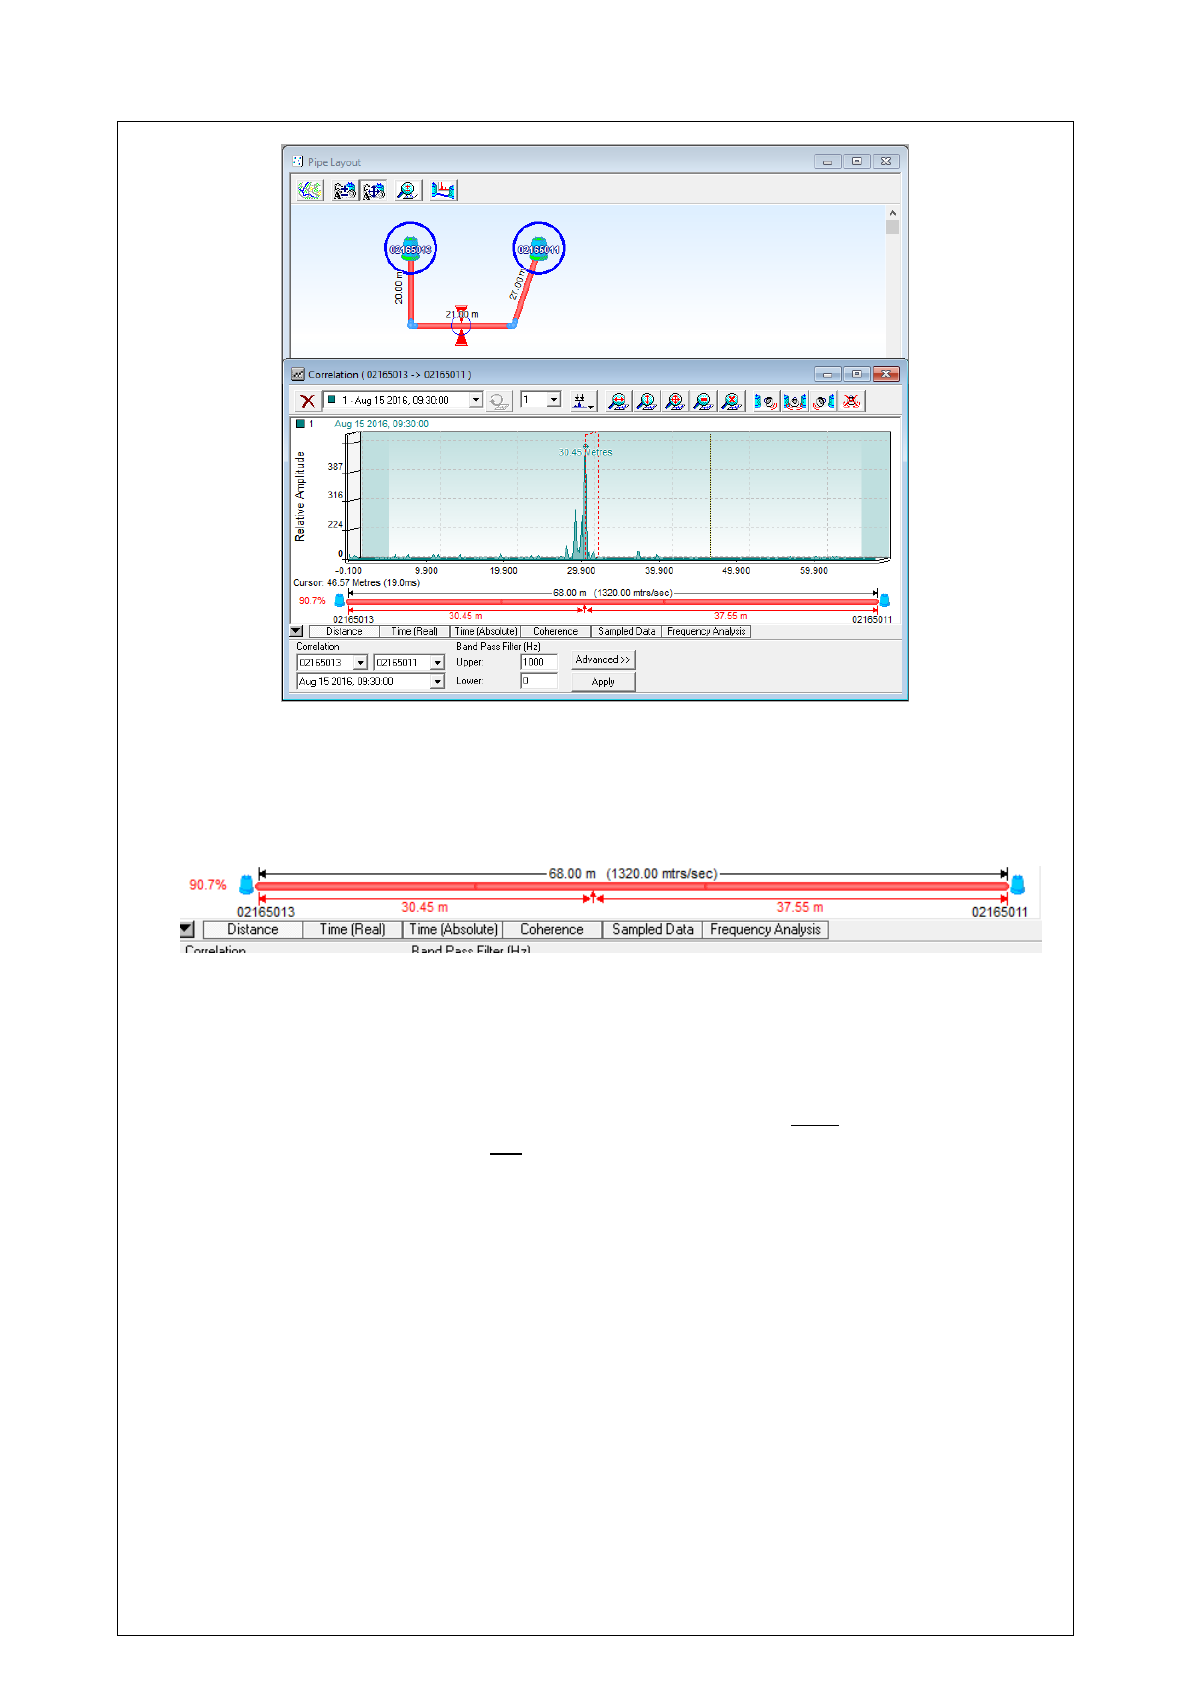
Leak Determined
If the software detects a leak, a pair of leak markers will appear on the pipe layout,
highlighting between which loggers the leak is suspected, and the text on the
correlation window will appear red.
40
The correlation window will display the results from the correlation algorithms and
the probable location of a possible leak.
WARNING: the results from the correlation are an estimate, and should not be
taken as the exact final result.
Note the numbers on the pipe diagram. These numbers give the approximate
location of the leak, with the percentage showing the leak certainty. In the image
above, the software has determined there is a 90.7% chance there is a leak located
30.45m from logger 02165013.
IMPORTANT: For the correlation to work, the Permalogs must be programmed
together at the same time, and not separately.

41
FAQs
For common queries with the software, please consult the frequently asked
questions (FAQs) section on the website.
Associated FAQs:
FAQ 037 – Interfacing Google Maps to the PermaNetPlus software.
FAQ 202 – How to Discover the logger using the Patroller and software.
FAQ 203 – How to put the logger into ‘sleep mode’.
FAQ 204 – Understanding and interpreting graph data.
FAQ 206 – Saving 29-day historical data.
FAQ 208 – Operating modes explained.
FAQ 372 – How to set auto data download.
FAQ 376 – Creating a new DMA.
Troubleshooting
To reduce the chances of problems occurring, please ensure the latest software has
been downloaded and installed. Newer software will have bug-fixes and optimised
algorithms that would not be available with older versions of the software.
The latest software can be downloaded from http://www.hwmglobal.com/help-and-
downloads/ .
For any problems, or more technical queries, please contact HWM Technical Support
on +44 (0) 1633 489479 and selecting option 2, or email cservice@hwm-water.com .
Our staff will always seek to resolve any technical enquires and are fully supported
by the HWM Engineering Team to guide you to a satisfactory outcome. In the rare
event that a product develops a defect within the warranty period, it will need to be
returned to HWM for inspection and repair.

42
Warnings:
FCC warning statement:
This device complies with Part 15 of the FCC Rules.
Operation is subject to the following two conditions:
(1) This device may not cause harmful interference, and
(2) This device must accept any interference received, including interference
that may cause undesired operation.
This equipment complies with FCC radiation exposure limits set forth for
an uncontrolled environment. End users must follow the specific operating
instructions for satisfying RF exposure compliance. This transmitter must
not be co-located or operating in conjunction with any other antenna or
transmitter.
Changes or modifications not expressly approved by the party responsible
for compliance could void the user's authority to operate the equipment
Under Industry Canada regulations, this radio transmitter may only operate using
an antenna of a type and maximum (or lesser) gain approved for the transmitter
by Industry Canada.
To reduce potential radio interference to other users, the antenna type and its
gain should be so chosen that the equivalent isotropically radiated power
(e.i.r.p.) is not more than that necessary for successful communication.
This device complies with Industry Canada licence-exempt RSS standard(s).
Operation is subject to the following two conditions: (1) this device may not
cause interference, and (2) this device must accept any interference, including
interference that may cause undesired operation of the device.
Conformément à la réglementation d'Industrie Canada, le présent émetteur radio
peut fonctionner avec une antenne d'un type et d'un gain maximal (ou inférieur)
approuvé pour l'émetteur par Industrie Canada.
Dans le but de réduire les risques de brouillage radioélectrique à l'intention des
autres utilisateurs, il faut choisir le type d'antenne et son gain de sorte que la
puissance isotrope rayonnée équivalente (p.i.r.e.) ne dépasse pas l'intensité
nécessaire à l'établissement d'une communication satisfaisante.
Le présent appareil est conforme aux CNR d'Industrie Canada applicables aux
appareils radio exempts de licence. L'exploitation est autorisée aux deux
conditions suivantes : (1) l'appareil ne doit pas produire de brouillage, et (2)
l'utilisateur de l'appareil doit accepter tout brouillage radioélectrique subi, même
si le brouillage est susceptible d'en compromettre le fonctionnement.

43
SIMPLIFIED DECLARATION OF CONFORMITY
This simplified EU declaration of conformity referred to in article 10(9) shall be
provided as follows:
Hereby, HWM Ltd declares that the radio equipment type transceiver is in
compliance with Directive 2014/53/EU.
The full text of the EU declaration of conformity is available at www.hwmglobal.com
HWM-Water Ltd
Ty Coch House
Llantarnam Park Way
Cwmbran
NP44 3AW
United Kingdom
+44 (0)1633 489479
www.hwmglobal.com
MAN-130-0003-F [Manual - Pcorr+ and Permalog+docx
©HWM-Water Limited. This document is the property of HWM-Water Ltd. and must not be copied or disclosed to a third party
without the permission of the company. Copyright reserved.