Leidos NORMARC7013 7013 Dual Frequency Localizer User Manual Installation and Commissioning Handbook Vol 1
Lockheed Martin Air Traffic Management 7013 Dual Frequency Localizer Installation and Commissioning Handbook Vol 1
Leidos >
Contents
- 1. Normarc 7000 Instr Landing Sys Installation and Commissioning Handbook Vol1
- 2. Normarc 7000 ILS Installation and Commissioning Handbook Vol2
- 3. Normarc 7000 ILS Installation and Commissioning Handbook Vol 1 and 2
- 4. Normarc 7013 ILS General Description
- 5. Normarc 7013 ILS Technical Handbook
Normarc 7000 Instr Landing Sys Installation and Commissioning Handbook Vol1

© 1999 Navia Aviation AS 21465-3.0
NORMARC 7000
INSTRUMENT LANDING SYSTEM
Installation & Commissioning Handbook Vol. 1


1250$5&
1DYLD$YLDWLRQ$6
,167$//$7,21&200,66,21,1*+$1'%22.
TABLE OF CONTENTS
Installation and Commissioning Handbook Vol. 1
NM 7000 Series
For further information, please look up Installation & Commissioning Handbook Volume 2,
containing drawings and parts lists.
SECTION 1 ANTENNA INSTALLATION PROCEDURES
SECTION 2 SHELTER INSTALLATION
SECTION 3 ANTENNA SYSTEMS ADJUSTMENTS PROCEDURES
Chapter 1 NM 3522 6-element Array
Chapter 2 NM 3523B 12-element Single Frequency Array
Chapter 3 NM 3524 12-element Dual Frequency Array
Chapter 4 NM 3525 24-element Array
Chapter 5 NM 3526 16-element Array
Chapter 6 NM 3543 Null-Reference Glide Path
Chapter 7 NM 3544 Sideband-Reference Glide Path
Chapter 8 NM 3545 M-array Glide Path
Chapter 9 NM 3561 Marker Beacon System
Chapter 10 NM 3562 Dual Antenna Marker Beacon
SECTION 4 EQUIPMENT TEST AND ADJUSTMENTS
SECTION 5 APPENDIX
Chapter 1 Ground commissioning document Localizer
Chapter 2 Ground commissioning document Glide Path
Chapter 3 Ground commissioning document Marker Beacon
Chapter 4 Ground commissioning document Far Field Monitor
SECTION 6 APPENDIX
Diagrams
Instructions for coax connectors

1250$5&
1DYLD$YLDWLRQ$6
,167$//$7,21&200,66,21,1*+$1'%22.
SECTION 1
ANTENNA INSTALLATION PROCEDURE
Table of contents
1 Civil Work Checks ....................................................................................................3
1.1 Unpacking ..........................................................................................................3
2 Localizer Antenna System Assembly.....................................................................5
2.1 Positioning of antenna frame work..................................................................... 5
2.2 Framework assembly ......................................................................................... 5
2.3 Cable duct assembly.......................................................................................... 6
2.4 Antenna assembly.............................................................................................. 6
2.5 Anntenna cables................................................................................................. 6
2.6 Near Field monitor antenna installation..............................................................9
2.7 Cable installation NF .......................................................................................... 9
3 Glidepath antenna system assembly/towers 10m and 15m .................................11
3.1 General............................................................................................................... 11
3.2 Bottom Section...................................................................................................12
3.2.1 Vertical Beams.............................................................................................12
3.2.2 Bottom Flange ............................................................................................. 12
3.2.3 Diagonal struts.............................................................................................13
3.2.4 Third vertical leg .......................................................................................... 13
3.2.5 Ladder.......................................................................................................... 13
3.2.6 Locking of nuts............................................................................................. 13
3.3 Middle section .................................................................................................... 13
3.3.1 Vertical legs ................................................................................................. 13
3.4 Top section......................................................................................................... 13
3.4.1 General........................................................................................................ 13
3.4.2 Horizontal struts...........................................................................................13
3.5 Obstruction light ................................................................................................. 13
3.5.1 Obstruction light bracket ..............................................................................13
3.5.2 Obstruction light...........................................................................................14
3.6 Antenna suport...................................................................................................14
3.6.1 Adjustment rails ........................................................................................... 14
3.6.2 Mounting of supports ...................................................................................14
3.6.3 Antenna assembly .......................................................................................14
3.7 Cable trunks ....................................................................................................... 14
3.7.1 Cable trunk brackets.................................................................................... 14
3.7.2 Antenna cables............................................................................................15
3.8 Antenna mast erection .......................................................................................15
3.8.1 Erection of the mast..................................................................................... 15
3.8.2 Locking of nuts............................................................................................. 15
3.9 Cable installation into shelter ............................................................................. 15
3.9.1 Cable tube ................................................................................................... 15
3.9.2 Cable installation ......................................................................................... 15
4 Near field monitor..................................................................................................... 17
4.1 Cable installation................................................................................................17
4.2 NF Monitor antenna assembly ...........................................................................17

1250$5&,167$//$7,21&200,66,21,1*+$1'%22.
1DYLD$YLDWLRQ$6
5 Marker beacon installation antenna assembly......................................................19
5.1 Antenna assembly.............................................................................................. 19
5.2 Antenna Cables installation................................................................................19
5.3 Antenna Mast erection .......................................................................................19

1250$5&
1DYLD$YLDWLRQ$6
,167$//$7,21&200,66,21,1*+$1'%22.
1 Civil Work Checks
Check that the civil work is carried out according to NM specifications.
• Correct positions for antenna foundation bolts.
• Correct dimensions and quality of bolts in concrete.
• Check note 4 and 5 on LLZ foundation drawing.
• Earth sticks/plates at shelter and antenna foundation.
• Shelter interior installations.
• Mains power installations in shelter and antenna assembly.
• Pulling rope in cable ducts.
• Remote control cables and terminals for RCU interface.
1.1 Unpacking
Equipment cases are carefully transported to the appropriate sites before unpacking.
Check each item toward packing list so as to detect any discrepancy before assemblies.
Parts to be installed in shelters shall be immediately brought inside.
Do not spread out loose isopore pieces


1250$5&
1DYLD$YLDWLRQ$6
,167$//$7,21&200,66,21,1*+$1'%22.
2 Localizer Antenna System Assembly
2.1 Positioning of antenna frame work
By means of a theodolite determine the exact position of the extended runway centre line and
mark the 90 degrees angle points on each concrete slab. See Figure 2-1.
Figure 2-1 Alignment of antenna frame work.
2.2 Framework assembly
See Vol. 2 Section 2 Chapter 6.
See also Figure 2-1
On middle aluminium bar mark exact centre. Position the bar accurately so the marks line up
with the extended centre line. Affix the two clamping angles.The remaining aluminium bars of
the front part can now be assembled across the concrete fundaments. Use junction plates
between each bar. On each fundament (left and right) adjust to the same distance between
the theodolite mark and the aluminium bar.
The al. Bars are numbered at each end on top side. The center bar is marked 1-1 and the next
bar on each side is marked 1-2. The third bar on each side is marked 2-3 and so on.
Figure 2-2
22 11 11 22 3

1250$5&,167$//$7,21&200,66,21,1*+$1'%22.
1DYLD$YLDWLRQ$6
Check antenna spacing after assembly. Repeat for the rear bars and
maintain correct spac-
ing distance between the front and rear bars.Tighten all clamping angles.
2.3 Cable duct assembly
See Vol. 2 Section 2 Chapter 6.
The cable duct sections are numbered and should be assembled according to the drawing.
Sections are joined together by means of blind rivets. When the assembly is complete drill
holes through to the concrete and fix the duct by means of plastic plugs and screws.The lids
should not be put on until cables are installed.
2.4 Antenna assembly
See Vol. 2 Section 2 Chapter 6.
Lay out all masts and stay on the frame work.
Place the bottom ends on al.bar and let all top ends point towards the runway. Notice that the
rear masts have a slot near the bottom end.
Before erecting, all monitor and antenna cables must be installed. Check that the cable mark-
ings are close to the connector. Roll off about one meter from the outer end and form it to a
straight line. Push the cable through the slot in the mast all the way to the top at the same time
as you roll off more of the cable. Gently turn the roll left/right to avoid the obstacles inside the
mast. Leave the rest of the roll in the cable duct.
After all cables are installed the masts can be erected. Secure masts with stays immediately
after erection. Depending on antenna mast height there will be one or two long stays between
front and rear rows.
Tighten all bolts at the mast bottom. Level the masts sideways and tighten the short stays.
Leave the long stays loose, to make it easier to install antennas.
Install the networks. Check the drawing for antenna system in question. Don’t forget the thick
alu.-washer behind the backplate ( pos 9 dwg 16361 A3 )
Install the antennas. The flange at the front can be tightened with all four bolts. Cables should
not be connected at this stage, just secure the rear flange with one bolt.
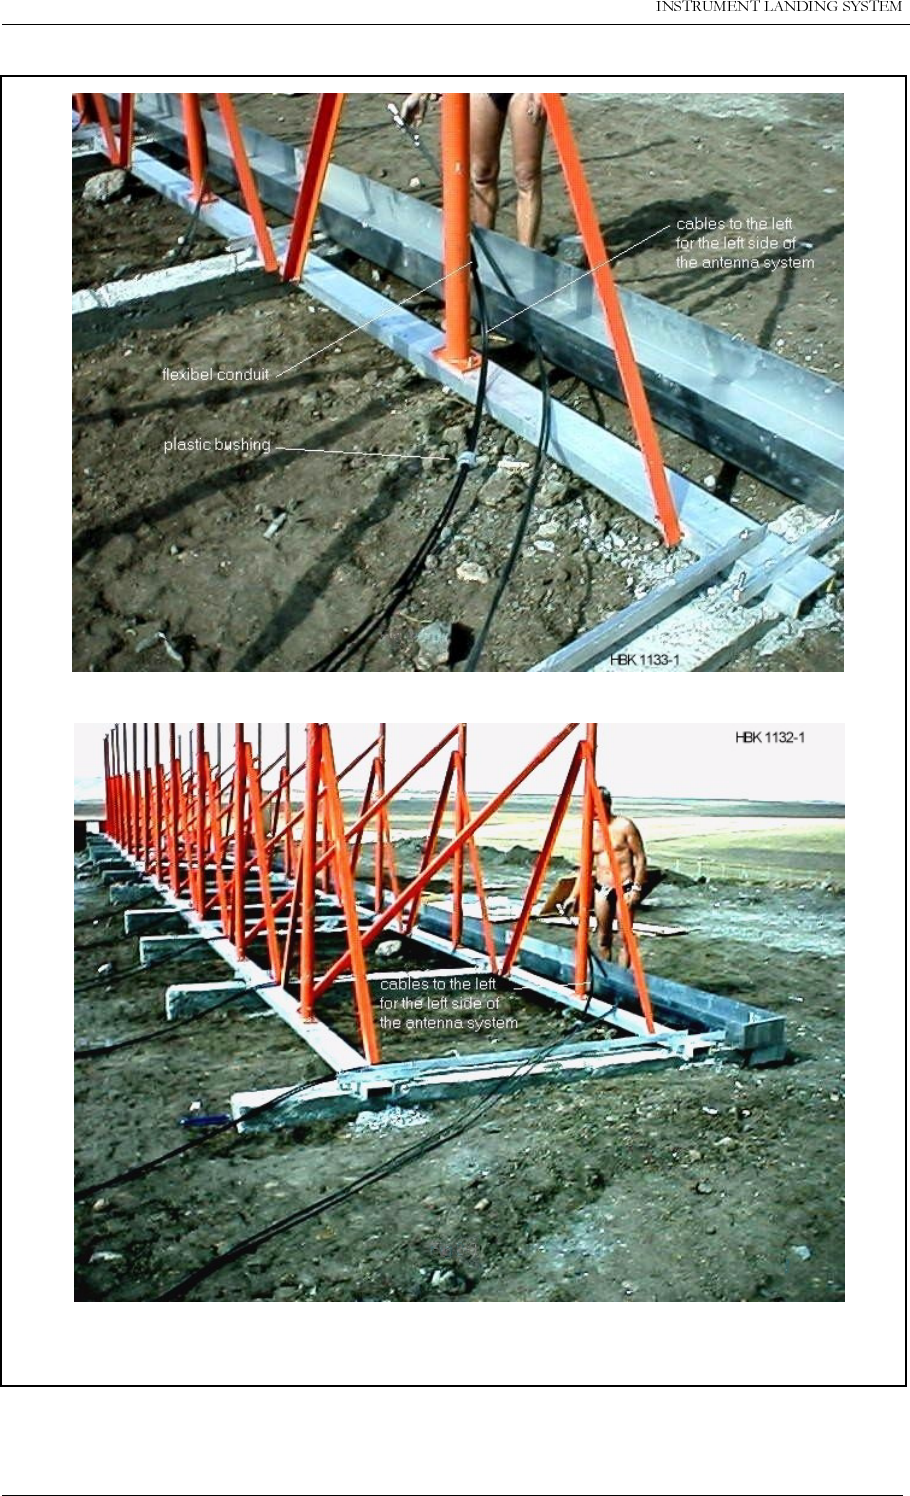
2.5 Anntenna cables
During this operation the connectors must be protected.
Carefully roll out the cables forward, through the antenna system and towards the runway. All
cables to the left of the centre should be brought to the left of respectively mast and of course
opposite for the other side (see figure 2-3 )
Cut appr. 0,5 m pieces of the flexible conduit, one for each antenna. Push them over the
cables and into the mast, leaving just a few cm outside. Also slide the plastic bushing all the
way to the mast. Pull the cables back and feed them through the hole in the cable duct. Lay
the cables in a loop inside the duct, and connect them to respectively network. Be observant
by pulling so the cables don’t hook on to any obstacles on the ground.

1250$5&
1DYLD$YLDWLRQ$6
,167$//$7,21&200,66,21,1*+$1'%22.
Now the cables can be connected to the antennas. Lift up the rear end 4-5 cm and put some-
thing between the flanges to keep them apart. Be careful don’t shake the mast. Connect the
cables, take away the support and tighten the flange.
Level the antenna masts backward/forward and tighten the long supports.

1250$5&
1DYLD$YLDWLRQ$6
,167$//$7,21&200,66,21,1*+$1'%22.
2.6 Near Field monitor antenna installation
The mast shall be assembled and installed at the extended runway centre line according to
dwg.no. 14256A3 Vol. 2 Section 2 Chapter 8.
The NF antenna shall be installed horizontally and point towards the centre of the LLZ
antenna array.
2.7 Cable installation NF
The NF Monitor cable is first carefully rolled out and positioned such that there is no risk for
damage during installation in the cable duct.
The cable is fixed to the pulling rope at the NF position end together with and extra rope for
maintenance purpose.
Connectors and cable labels must be protected against dust and water wear during pulling
operation.
The cable is pulled through the pipe into the shelter and installed and connected to the NF
Monitor Input of the Cabinet.
The coaxial cable shall be protected with flexible conduit tube and strapped along the mast.
The entrance of the cable tube shall be filled with expansion foam in order to prevent water
leakage into the cable tube.


1250$5&
1DYLD$YLDWLRQ$6
,167$//$7,21&200,66,21,1*+$1'%22.
3 Glidepath antenna system assembly/towers 10m and 15m
3.1 General
See Volume 2 Section 3 Chapter 6.
The site selected for the assembly of the GP mast framework should be of sufficient size to
accommodate either the 10 meter or the 15 meter mast.
It is also recommended to select a relatively well levelled site to avoid twists or bends in the
mast construction which may create difficulties in joining the parts.
To facilitate the work, four trestles are needed, made of timber from the transport crates or
other. See Vol. 2 Section 3 Chapter 6.
Align the trestles, one pair for the first section, parallel to each other, approximately 4 meters
apart. See marked-up drawing 16641A3/16642A3.
Before the work starts, the colours of the sections should be observed as follows:
Tightening and securing of bolts:
Recommended torque’s are: M12 - 75NM; M24 - 700NM (ungreased bolts). Preferred tighten-
ing method is “Turn of nut” method:
1. Snug tight using 0,6 x recommended torque. (0,36 x for greased bolts)
C1 (clearance length) = Distance between bolthead and nut. See fig. 3-1
10 meter mast: Top section: Orange
Bottom section: White
Ref. drawing 16641A3.
15 meter mast: Top section: Orange
Middle section: White
Bottom section: Orange
Ref. drawing 16642A3.
Turn nut - 1/3 turn if C1< 2x bolt dia.
1/2 turn if C1 is between 2 and 4x bolt dia.
2/3 turn if C1 is between 4x and 8x bolt dia.

1250$5&,167$//$7,21&200,66,21,1*+$1'%22.
1DYLD$YLDWLRQ$6
.
Figure 3-1
Securing: Bolts should be secured by either deformation of threads by use of a chisel or by the
use of lock-nuts (double nuts). Ref. Fig. 3-2 .
Figure 3-2
3.2 Bottom Section
3.2.1 Vertical Beams
Place two vertical main legs, pos. 1 dwg.16612A3 on the trestles.
3.2.2 Bottom Flange
Assemble vertical main legs and bottom flanges, pos. 8 DWG. 16612A3 and also junction
plates pos. 9.
HBK1130-1
SPRING W.
FLAT W.
C1
FLAT W.
SECURING N.
MAIN N.
ADJUST N.
Double Nut Method
Punching of Nut
flat and spring washers
MAIN NUT
FLAT W.
Recommended
ADJUST NUT
HBK 1131-1

1250$5&
1DYLD$YLDWLRQ$6
,167$//$7,21&200,66,21,1*+$1'%22.
3.2.3 Diagonal struts
Position and bolt diagonal struts, starting with the shorter, pos. 2, and continuing with the
longer pos. 3 in accordance with pos. 2, 3, and 4, DWG. 16612A3.
3.2.4 Third vertical leg
Repeat the procedure as for 3.2.2 and 3.2.3. Bolt third leg to end of diagonal struts of the
other two legs.
3.2.5 Ladder
Hoist/lift the ladder pos. 20 into the centre of the section, assemble 8 PC’s of brackets pos: 11
and connect them to the ladder acc. dwg. 16612A3. Lift up the ladder, and connect pos. 11 as
shim between the bracing. Don't tighten up the bolts before all brackets are connected and
adjusted.
3.2.6 Locking of nuts
Torque - load nuts as follows: According to general instructions Chapter 3.1 M-12: 75 Nm.
3.3 Middle section
3.3.1 Vertical legs
Repeat procedure as for 3.2.1 and onwards, (except 3.2.2 bottom flanges)
127(
7KHVHFRQGPLGGOHVHFWLRQZLOORQDPPDVWEHWKHWRSVHFWLRQ
3.4 Top section
3.4.1 General
Follow steps described under MIDDLE SECTION, except for "section joints" which in this case
is pos. 10.
3.4.2 Horizontal struts
Position and bolt horizontal struts pos 5 at the top of the upper mast section. Ref. dwg.
16612A3.
3.5 Obstruction light
3.5.1 Obstruction light bracket
The obstruction light bracket (pos. 7) is fixed to two of the horizontal struts at the top, pos. 5.
Dwg. 16612A3.

1250$5&,167$//$7,21&200,66,21,1*+$1'%22.
1DYLD$YLDWLRQ$6
3.5.2 Obstruction light
The obstruction light is mounted on the bracket (pos. 7) and the power cable is fixed with
cable ties to the rear side of the ladder or inside the cable trunking if space is available.
3.6 Antenna suport
3.6.1 Adjustment rails
As support for the antennas, the mast is equipped with rails for vertical adjustment, see Dwg.
No.: 16643A3
3.6.2 Mounting of supports
The vertical adjustment rails are mounted in the mast structure in accordance with drawing
dwg. 16643A3. The rails should be offset according to calculation made for the site in ques-
tion. They should be positioned horizontally such that the centre of the rail lines up with the
antenna offset given by the site data, and vertically so the centre lines up with the antenna
height. See example Dwg. No.: 16641A3/16642A3.
If the offset is too wide to be adjusted with the vertical rail, position the rail as far as possible to
the side and do the rest of the adjustment by sliding the antenna in the bracket pos. 2 dwg.
16792A3.
3.6.3 Antenna assembly
The antenna assembly, which comprises the radom and the antenna, is mounted to the verti-
cal adjustment rail. See dwg. 16792A3.
If NM antennas are supplied, see dwg. 10039A3.
From site data determine the exact distance between the antennas and to the ground. Adjust
the vertical antenna positions according to these data. Tolerance: +/-5 mm.
From site data determine the antenna offsets, i.e. the relative horizontal displacements
between the antennas. Adjust the offsets. Tolerance: +/-5 mm.
From site data determine the antenna forward shift i.e. relative vertical displacement. Adjust
the forward shift. Tolerance ± 2mm.
3.7 Cable trunks
3.7.1 Cable trunk brackets
All cable trunk brackets are prepared with 3 evenly spaced holes of 3.2 mm for cable trunk
fixes.
Brackets are mounted to the ladders in accordance with dwg. 16612A3.
Cable trunks are mounted to the brackets with rivets.

1250$5&
1DYLD$YLDWLRQ$6
,167$//$7,21&200,66,21,1*+$1'%22.
3.7.2 Antenna cables
Antenna cables and monitor cables are carefully laid out in the cable trays such that equal
length of all cables is sufficient to be guided into the shelter. However, the excess cables shall
be neatly bundled and temporarily fixed to the antenna mast, and protected from damage dur-
ing later mast erection.
Connect the cable end connectors to the antenna receptacle temporarily in order to avoid dust
and water problems.
3.8 Antenna mast erection
3.8.1 Erection of the mast
A mobile crane will be needed in erecting the mast into the vertical position and placed onto
the concrete foundation. Ref. dwg. 16641A3/16642A3.
The vertical position of the mast must be checked after erection. Adjustment of the mast is
made by means of the lower nuts ref. dwg. 7084A3 on the retaining bolts. The tolerance is +/
-0,02 degrees. (Top of mast should be within +/- 5 mm referred to vertical centreline.)
3.8.2 Locking of nuts
Torque-load nuts as follows:
M24: 700 Nm and secure them according to Chapter 3.1.
3.9 Cable installation into shelter
3.9.1 Cable tube
A cable tube is installed from the upper part of the shelter to the antenna mast, such that the
tube ending in the mast is positioned a few centimetres lower than the other end in the shelter.
(Prevents water from entering into the shelter).
3.9.2 Cable installation
Carefully unwind the antenna cable coils and feed the cables through the cable tube. Install
the cables inside the shelter ending at the Antenna distribution unit and Monitoring combining
unit. The excess cables are pulled back through the cable tube and fixed in the antenna mast.
The power cable is installed through the cable tube to the Mains Distribution box.


1250$5&
1DYLD$YLDWLRQ$6
,167$//$7,21&200,66,21,1*+$1'%22.
4 Near field monitor
4.1 Cable installation
The NF Monitor cable is first carefully rolled out and positioned such that there is no risk for
damage during installation in the cable duct.
The cable is fixed to the pulling rope at the NF position end together with and extra rope for
maintenance purpose.
Connectors and cable labels must be protected against dust, water and wear during the pull-
ing operation.
The cable is pulled through the duct into the shelter and installed and connected to the NF
Monitor Input of the cabinet.
4.2 NF Monitor antenna assembly
The mast and antenna is assembled complete in horizontally position according to dwg.no.
7058 A3.
The antenna element is positioned as accurate as possible according to site date for NF mon-
itor antenna height.
Install a gasket in the top cover.
On the NF monitor cable remove the connector and thread the cable from the bottom of the
mast through the gasket.
The mast is erected by three persons. Make sure that the cable at the bottom end is not bent
excessively during mast erection.
The vertical position of the mast must be checked after the erection. Adjustments of the mast
is made by means of the lower nuts of the base section.
The cable is installed from the top along the mast leaving adequate excess for antenna height
adjustments.(Estimated adjustments: +/-60 cm.)


1250$5&
1DYLD$YLDWLRQ$6
,167$//$7,21&200,66,21,1*+$1'%22.
5 Marker beacon installation antenna assembly
5.1 Antenna assembly
See Volume 2 Section 4.
The LPDA is first mounted to the antenna mast, horizontally on the ground.
Position the assembly such that the base is close to the foundation bolts.
5.2 Antenna Cables installation
For Dual Antenna system the Distribution Network is preferably installed inside shelter.
Antenna- and monitor cables are then carefully rolled out and positioned such that there is no
risk for damage during installation.
Install the cables through the hole below the end of the LPDA and out through the bottom of
the mast.
Fit the cable connectors into the appropriate A and M marked N-connectors in the LPDA.
Carefully thread/pull the cables further into the shelter so there is no loop between the
antenna mast base and the fundament.
5.3 Antenna Mast erection
A crane is needed to erect the antenna mast assembly.
Install the antenna in direction with the elements parallel to the runway.
During erection make sure that there will be no twist or strain to the cables near the antenna
base as the mast is lowered onto the base. If necessary carefully pull the cables from the
shelter end to account for the excess cable length inside the base.


1250$5&
1DYLD$YLDWLRQ$6
,167$//$7,21&200,66,21,1*+$1'%22.
SECTION 2
SHELTER INSTALLATION
Table of contents
1 General ...................................................................................................................... 3
2 Mechanical installation LLZ/GP ..............................................................................5
2.1 Mounting Kit MK1343A.......................................................................................5
2.2 Moving RF Connectors.......................................................................................6
3 Electrical Installation LLZ/GP..................................................................................9
3.1 Connection Overview ......................................................................................... 9
3.2 Power and Battery.............................................................................................. 10
3.3 RF Inputs............................................................................................................ 12
3.4 RF Outputs......................................................................................................... 12
3.5 DC Loop (Localizer only)....................................................................................13
3.6 Remote Control ( CABINET) ..............................................................................14
3.7 PC and Modem ..................................................................................................15
3.8 DME (localizer only) ........................................................................................... 16
3.9 Analog Inputs ..................................................................................................... 18
3.10 Digital Inputs and Outputs..................................................................................19
3.11 Battery Warning.................................................................................................. 20
4 Mechanical Installation Marker Beacon .................................................................21
4.1 Marker beacon Cabinet......................................................................................21
5 Electrical installation marker beacon .....................................................................23
5.1 Marker beacon cabinet.......................................................................................23
5.1.1 Connection Overview..................................................................................23
5.2 RF In and Out.....................................................................................................24
5.3 Battery................................................................................................................ 24
5.4 Mains.................................................................................................................. 26
5.5 Remote Control cabinet...................................................................................... 27
5.6 PC and Modem ..................................................................................................28
5.7 Analogue Inputs .................................................................................................30
5.8 Digital Inputs and Outputs..................................................................................31
6 Remote Control Connections (TWR) ......................................................................33
6.1 Remote Master Connection................................................................................33
6.2 Power Supply Connection.................................................................................. 34
6.3 Remote slave connection...................................................................................35
6.4 Interlock switch connection ................................................................................36


1250$5&
1DYLD$YLDWLRQ$6
,167$//$7,21&200,66,21,1*+$1'%22.
1 General
Equipments are installed according to interior drawings. All electrical equipment including
antenna systems and monitor antennas must be connected to a common earth point. See
Volume 2 Chapters «Grounding» for resp. Equipment.
Cables are routed the shortest distance in the cable trunks. Use terminal shoes at the cable
ends before connecting them to cabinet terminals.
Coax cables must be carefully formed along the trunking to avoid damage.
Line transient absorbers must be installed at the entrance of the remote control lines, both in
the shelter and the tower.


1250$5&
1DYLD$YLDWLRQ$6
,167$//$7,21&200,66,21,1*+$1'%22.
2 Mechanical installation LLZ/GP
The «NM7000» cabinet is constructed for mounting on a wall. For easy operation, the key-
board/display section should be in eye/shoulder height (140-160cm). The RF connectors may
be mounted either on the cabinet top or the cabinet bottom. The free space required around
the cabinet is approximately one by one meter, see figure 2-1
Figure 2-1 «NM7000» required mounting space (top view).
2.1 Mounting Kit MK1343A
NAVIA AVIATION supplies a wall mounting kit, MK1343A. This kit is dimensioned for stan-
dard 60 cm space between studs. For easy mounting, place the cabinet on the rest screws
(B) before entering the mounting screws (A). This is shown in the enlarged view in figure 2-2.
0.9m
1.0m
HBK594-2

1250$5&,167$//$7,21&200,66,21,1*+$1'%22.
1DYLD$YLDWLRQ$6
Figure 2-2 «NM7000» mounted on wall with MK1343A.
2.2 Moving RF Connectors
If desired the RF connectors may be moved from the cabinet top to the bottom or vice versa,
as illustrated in figure 2-3. The back section (F) of the main cabinet consists of a connector
plate and a blind plate that are interchangeable. These plates are identical, except for the
connectors.
POWER POWER
Adjustment screw
11
Flat washer M8
Split lock washer M8
Screw M8x25
B
A
A
A
A
HBK597-1

1250$5&
1DYLD$YLDWLRQ$6
,167$//$7,21&200,66,21,1*+$1'%22.
To interchange the plates, follow these instructions:
• Release the nuts (A), washers (B) and flanges (C) on the plates.
• Release the ground connections (D) on the connector plate and (H) on the blind plate.
• Interchange the plates.
• Remount the nuts, washers and flanges in the order shown.
• Remount the ground connections (D) and (H). Make shore they are located on the hinge
(G) side of the cabinet.
Figure 2-3 Moving the RF connectors to the cabinet top.
CL
D
NF
C
A
B
A
B
CSB CLRCLR DS SBO CLR
E
SBO CSB
A
F
BC
G
H
HBK596-1

1250$5&
1DYLD$YLDWLRQ$6
,167$//$7,21&200,66,21,1*+$1'%22.
3 Electrical Installation LLZ/GP
This paragraph describes the external electrical connections of the «NMnr» main cabinet.
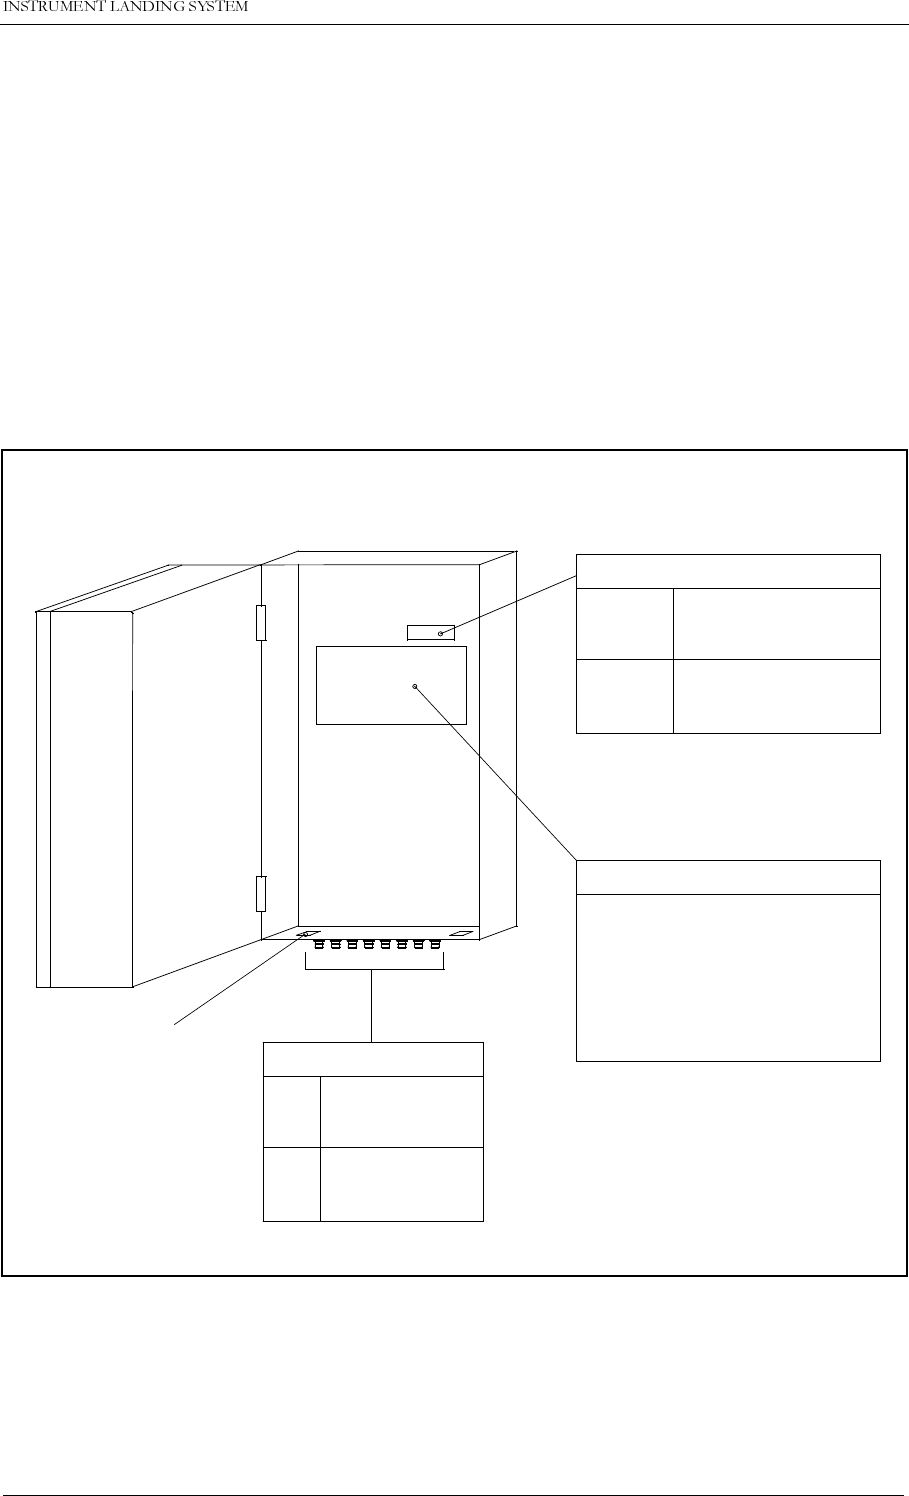
3.1 Connection Overview
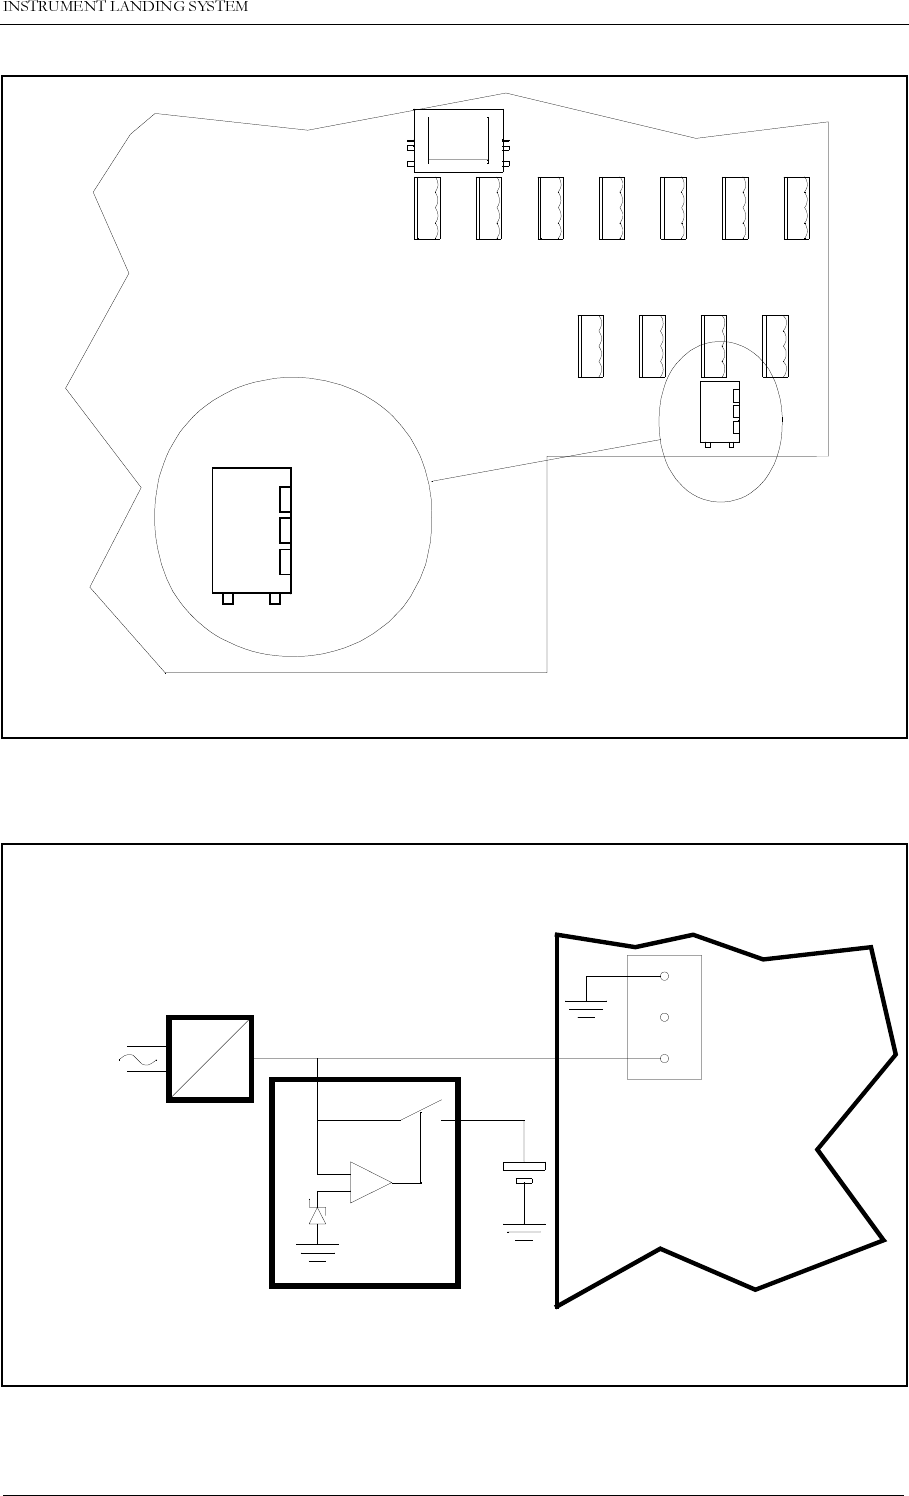
The ILS main cabinet consists of three connector sites, illustrated in Figure 3-1.
• The ILS RF signals to and from the antenna system are connected at the top of the main
cabinet. These connectors may be moved to the top, see
Mechanical Installation
.
• The power supply (supplies) and the backup battery are connected to the power connector
rail inside the cabinet back section.
• All other external connections are sited on the CI1210A connection interface board inside
the cabinet back section
.
Figure 3-1 ILS main cabinet connection overview.
RF CONNECTIONS
CABLE FEEDTHROUGH
COU/SBO
CLR/SBO
CLR/CSB
OUT
COU/CSB
CLR
DS
NF
IN CL
1 AC LEVEL MEASUREMENT
CI 1210A CONNECTIONS
8 DIGITAL INPUT/OUTPUT
3 DIFFERENTIAL ANALOG
2 TEMP SENSORS
1 DME
1 REMOTE CONTROL
3 RS 232
4 DC LOOPS
BATTERY +27V
0V
POWER RAIL CONNECTIONS
SUPPLY
POWER +27V
0V
HBK574-2

1250$5&,167$//$7,21&200,66,21,1*+$1'%22.
1DYLD$YLDWLRQ$6
3.2 Power and Battery
The power supply and the backup battery are connected to the power connector rail inside the
cabinet back section as shown in Figure 3-2 and 3-3. If two power supplies are used, these
are parallel coupled inside one of the power supplies (see Dwg.no.: 17370A3). The cables
used should have 6mm2 intersection.
Figure 3-2 Power and backup battery connections.
Battery
0V +27V
Power Supply
0V +27V
HBK576-2

1250$5&
1DYLD$YLDWLRQ$6
,167$//$7,21&200,66,21,1*+$1'%22.
Figure 3-3 Power Supply connections.
234 819675NLG
++ - -
Current
sharing
+
NL G12 54376 98
-+-
To equipment
0V
+27V Power supply
Battery warning 1
Battery warning 2
220V
FuseX FuseY
220V
CHARGER 1 CHARGER 2
POWER SUPPLY CONNECTIONS
sharing
Current
1250$5&,167$//$7,21&200,66,21,1*+$1'%22.
1DYLD$YLDWLRQ$6
3.3 RF Inputs
The RF inputs are:
• Course Line - CL.
• Near Field Antenna - NF.
• Displacement Sensitivity - DS.
• Clearance - CLR (two frequency applications only).
These are connected as shown in Figure 3-4 (front view)
.
Figure 3-4 RF input connections.
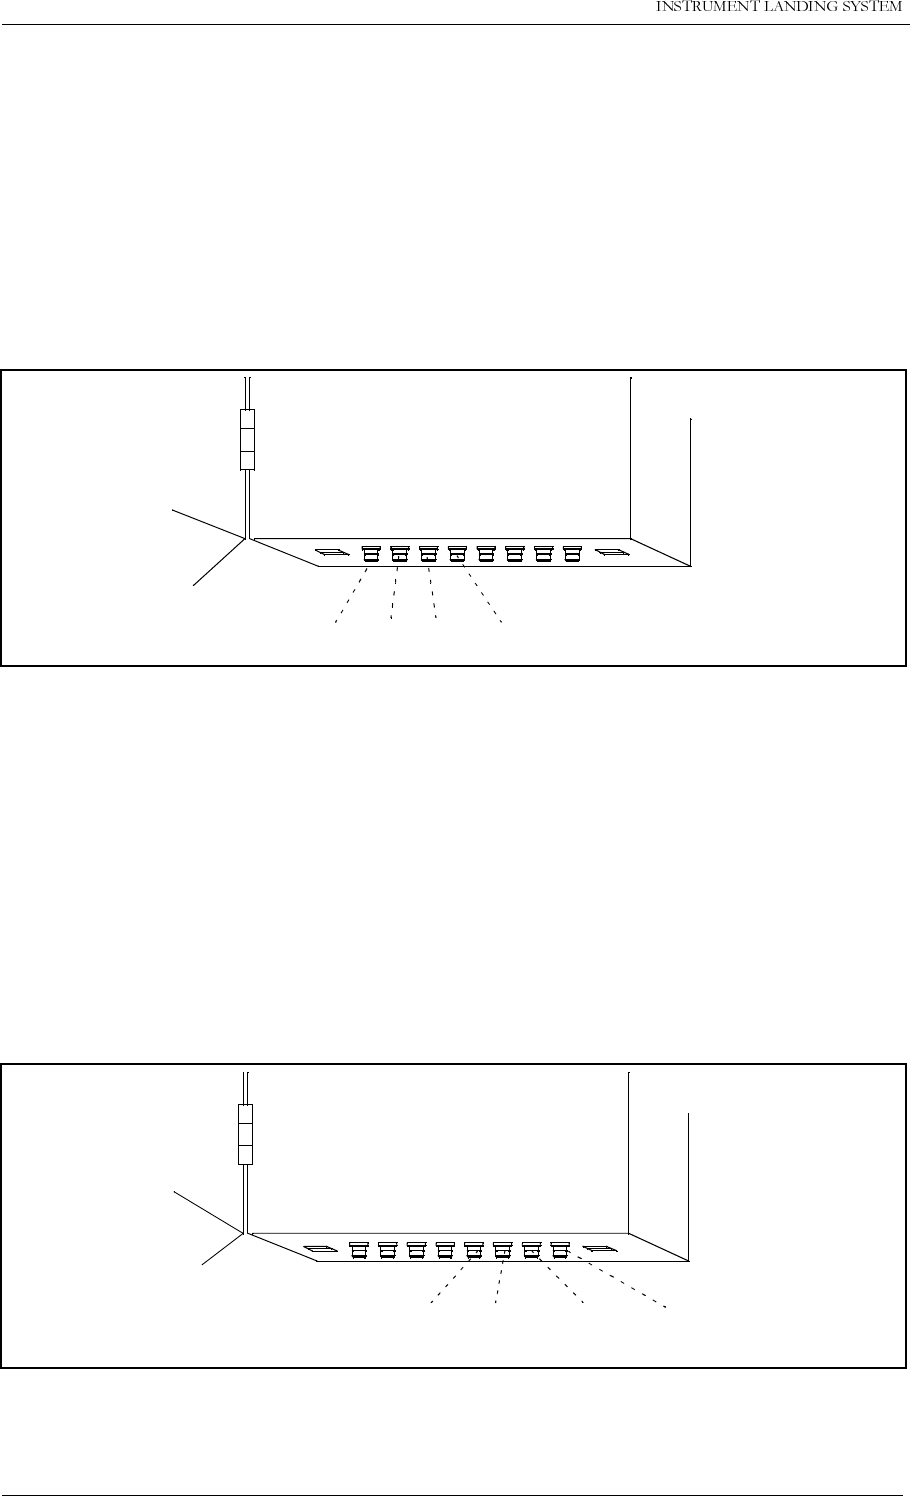
3.4 RF Outputs
The RF outputs are sited at the cabinet top as illustrated in Figure 3-5. The connections are:
All applications:
• COU SBO - COUrse Tx SideBand Only.
• COU CSB - COUrse Tx Carrier and SideBand.
Two frequency applications:
• CLR SBO - CLeaRance Tx SideBand Only.
• CLR CSB - CLeaRance Tx Carrier and SideBand
.
Figure 3-5 RF output connections.
NF CL CLR DS
HBK577-2
COU
CSB
COU
SBO
CLR
CSB
CLR
SBO
HBK578-2

1250$5&
1DYLD$YLDWLRQ$6
,167$//$7,21&200,66,21,1*+$1'%22.
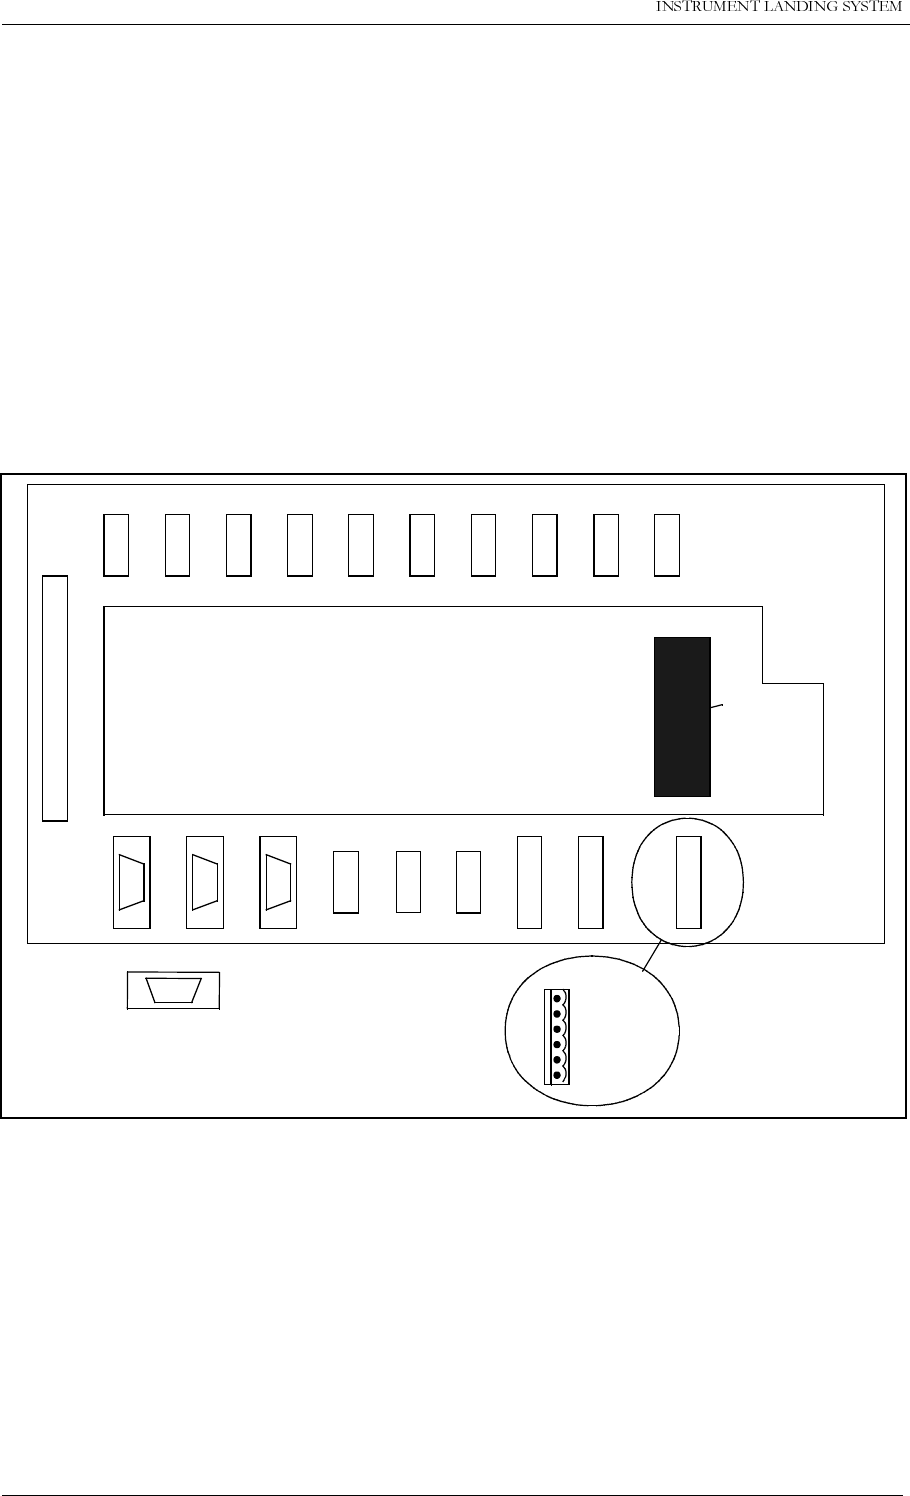
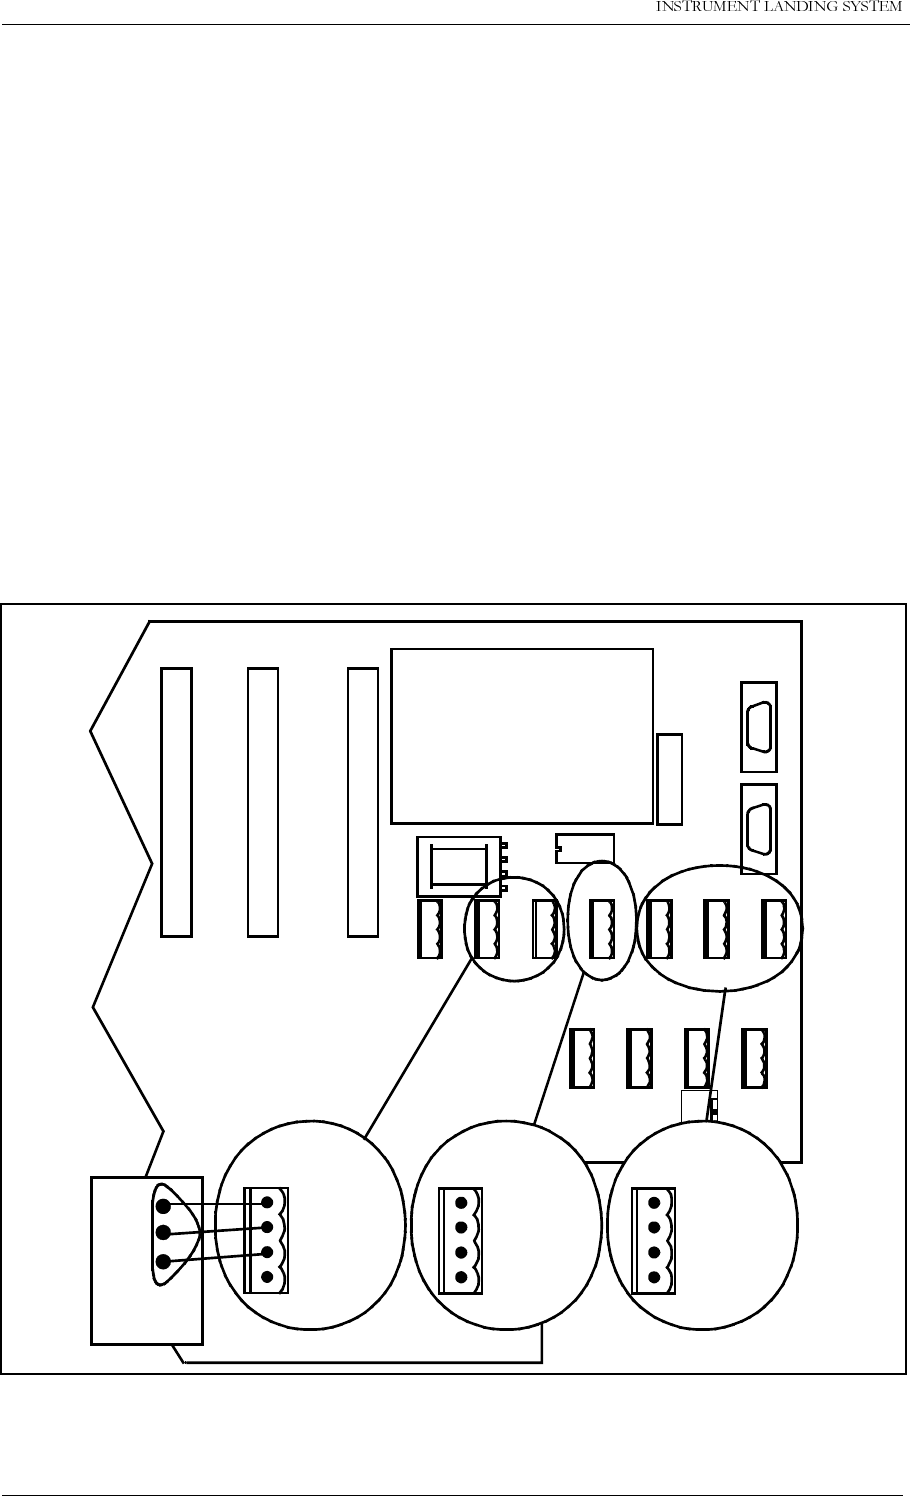
3.5 DC Loop (Localizer only)
The DC loops are connected to the CI1210A connection interface board in the cabinet back
section. Placement and pin out are illustrated in Figure 3-6.
•
DL_REF*
are the reference voltages from the main cabinet.
•
DL_DETECT*
are the return voltages from the antennas.
•
GND
is main cabinet ground.
Suitable female connectors are Weidemüller
BLZ-5.08/6
or equivalent.
Figure 3-6 DC loop connections.
TEMP
INDOOR TEMP
OUTDOOR AC
LEVEL ANALOG
CH.1 ANALOG
CH.2 ANALOG
CH.3 DIGITAL
PORT A DIGITAL
PORT B DIGITAL
PORT C DIGITAL
PORT D
TO MB1203
RS232 RS232 RS232 REMOTE
CONTROL
DC-LOOP DC-LOOP DME
LOCAL REMOTE 2 REMOTE 1 CH.1&2 CH.3&4
1
6
DC-LOOP
CH.1&2
DC-LOOP
CH.3&4
1 - Ch 1 In
2 - Ch 1 Out
3 - GND
4 - Ch 2 In
5 - Ch 2 Out
6 - GND
CI 1210A
1 - Ch 3 In
2 - Ch 3 Out
3 - GND
4 - Ch 4 In
5 - Ch 4 Out
6 - GND
1
6
BATTERY
WARNING
HBK579-2
RADIO LINK

1250$5&,167$//$7,21&200,66,21,1*+$1'%22.
1DYLD$YLDWLRQ$6
3.6 Remote Control ( CABINET)
The remote control is connected to the CI1210A connection interface board as illustrated in
Figure 3-7. The connection of the remote control, remote slave panel and interlock switch is
done at the remote control site and covered in Section 2 6.1-6.4.
•
FSK_[P,N]
is the modem line pair.
•
GND
is main cabinet ground.
For normal FSK modem operation the straps S9-11 on CI1210A should be mounted.
A suitable female connector is Weidemüller
BLZ-5.08/4
or equivalent.
Figure 3-7 Remote control connection.
TEMP
INDOOR TEMP
OUTDOOR AC
LEVEL ANALOG
CH.1 ANALOG
CH.2 ANALOG
CH.3 DIGITAL
PORT A DIGITAL
PORT B DIGITAL
PORT C DIGITAL
PORT D
TO MB1203
RS232 RS232 RS232 REMOTE
CONTROL
DC-LOOP DC-LOOP DME
LOCAL REMOTE 2 REMOTE 1 CH.1&2 CH.3&4
REMOTE
CONTROL
1 - GND
2 - FSK_P
3 - FSK_N
4 - GND
CI1210A
1
4
S9-14
BATTERY
WARNING
HBK580-1
RADIO LINK

1250$5&
1DYLD$YLDWLRQ$6
,167$//$7,21&200,66,21,1*+$1'%22.
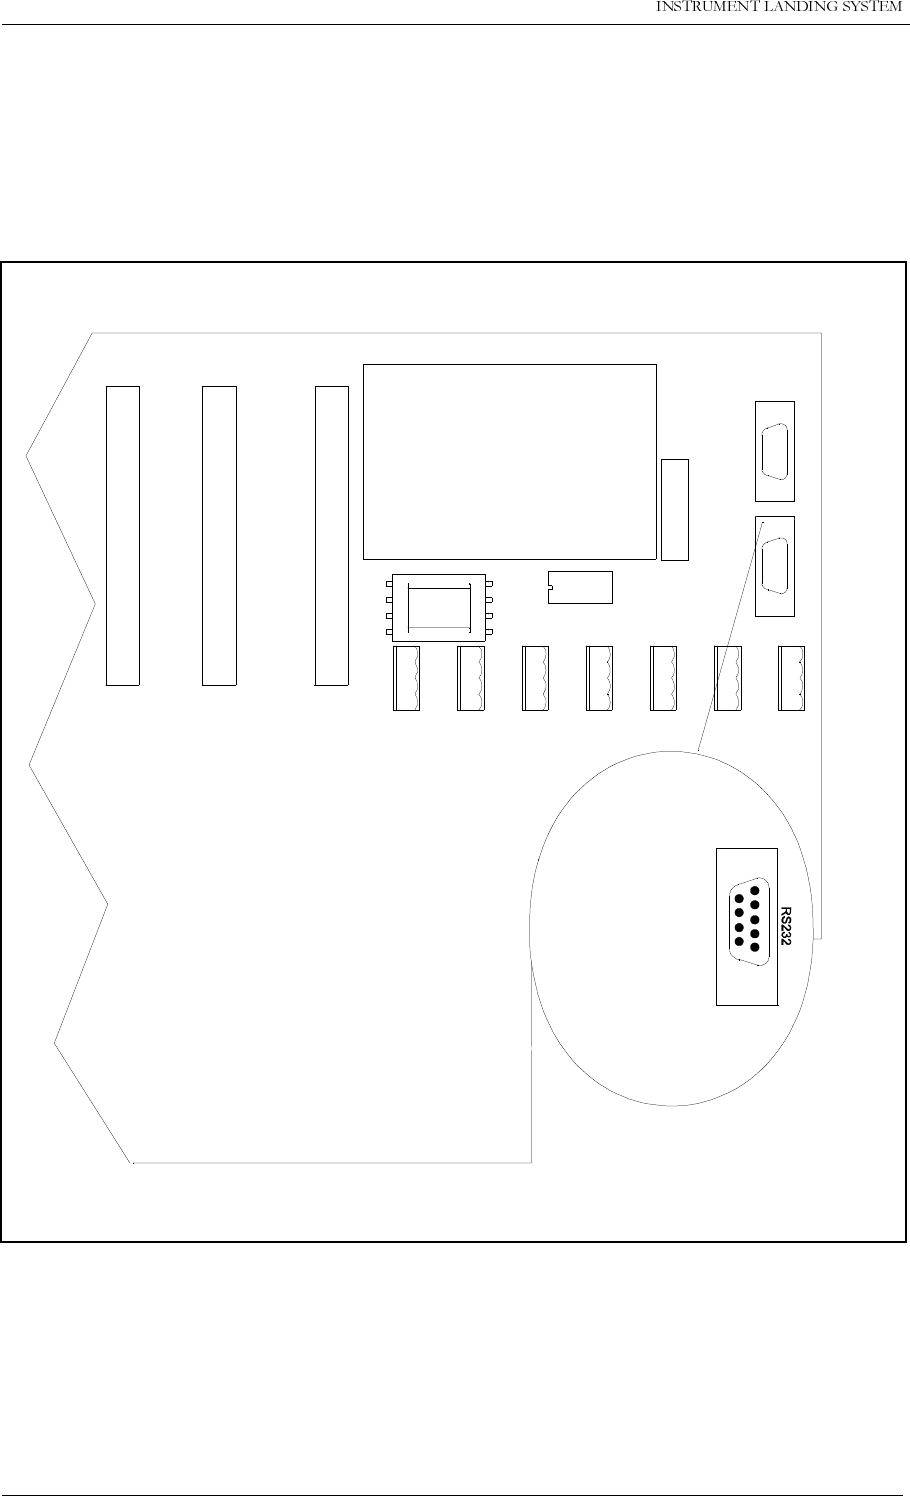
3.7 PC and Modem
PC terminals and modems are connected to the standard pin out RS232, 9 pins DSUB con-
nectors on the CI1210A connection interface board as illustrated in Figure 3-8. Recom-
mended connections are:
• LOCAL - the PC located at the ILS main cabinet site.
• REMOTE 2 - distant PC terminals connected through a modem.
• REMOTE 1 - the PC located at the airport technical maintainance site
.
Figure 3-8 PC and modem connections.
TEMP
INDOOR TEMP
OUTDOOR AC
LEVEL ANALOG
CH.1 ANALOG
CH.2 ANALOG
CH.3 DIGITAL
PORT A DIGITAL
PORT B DIGITAL
PORT C DIGITAL
PORT D
TO MB1203
RS232 RS232 RS232 REMOTE
CONTROL
DC-LOOP DC-LOOP DME
LOCAL REMOTE 2 REMOTE 1 CH.1&2 CH.3&4
CI1210A
1
5
6
9
1 - CD (REMOTE 2 only)
2 - RXD
3 - TXD
4 - DTR (REMOTE 2 only)
5 - GND
6 - DSR (REMOTE 2 only)
7 - RTS
8 - CTS
9 - Not connected
BATTERY
WARNING
HBK581-1
RADIO LINK
1250$5&,167$//$7,21&200,66,21,1*+$1'%22.
1DYLD$YLDWLRQ$6
3.8 DME (localizer only)
Distance Measurement Equipment DME is connected to the CI1210A connection interface
board as illustrated in Figure 3-9.
•
ACT_DME[P,N]
is the positive and negative terminal of the DME active signal from the
DME, respectively.
•
IN_DME[P,N]
is the positive and negative terminal of the morse code envelope signal from
the DME, respectively.
•
OUT_DME[P,N]
is the positive and negative terminal of the morse code envelope signal to
the DME, respectively.
A suitable female connector is Weidemüller
BLZ-5.08/6
or equivalent.
Figure 3-9 DME connections.
TEMP
INDOOR
TEMP
OUTDOOR
AC
LEVEL
ANALOG
CH.1
ANALOG
CH.2
ANALOG
CH.3
DIGITAL
PORT A
DIGITAL
PORT B
DIGITAL
PORT C
DIGITAL
PORT D
TO MB1203
RS232 RS232 RS232 REMOTE
CONTROL
DC-LOOP DC-LOOP DME
LOCAL REMOTE 2 REMOTE 1 CH.1&2 CH.3&4
1 - ACT_DMEP
2 - ACT_DMEN
3 - IN_DMEP
4 - IN_DMEN
CI1210A
1
6
S1-8
DME
5 - OUT_DMEP
6 - OUT_DMEN
BATTERY
WARNING
HBK582-1
RADIO LINK

1250$5&
1DYLD$YLDWLRQ$6
,167$//$7,21&200,66,21,1*+$1'%22.
Figure 3-10 DME master connections.
If the DME shall be used as ident master, connect as shown in Figure 3-10. In the RMM pro-
gram,
CLR modulation and DME interface
dialogue (see Operators Manual), set DME as
master and DME active signal to OPEN. The LLZ will now transmit the DME dictated morse
code. If the LLZ does not receive any ident signal for approximately 20 seconds, the LLZ will
start to transmit its own programmed morse code. When the DME signal returns, the LLZ will
start to transmit the DME code instantaneously
.
Figure 3-11 LLZ master connections.
If the LLZ shall be used as ident master, connect as shown in Figure 3-11. In the RMM pro-
gram,
CLR modulation and DME interface
dialogue (see Operators Manual), set LLZ as mas-
ter and the DME active signal according to the DME’s manual. When the DME is active, the
LLZ will send every forth ident word to the DME. When the DME is inactive the LLZ will be
keying four out of four words. If the LLZ shall be keying three out of four words whether the
DME is active or not, disconnect the DME ACTIVE wires and program the DME active signal
to OPEN.
123
123
123
123
123
123
123
123
S1
S2
S3
S4
S5
S6
S7
S8
DME ILS
CI1210A
P8
IDENT FROM DME
2.7K
2.7K
1
2
3
4
5
6
HBK770-1
123
123
123
123
123
123
123
123
S1
S2
S3
S4
S5
S6
S7
S8
DME ILS
CI1210A
P8
DME ACTIVE
IDENT TO DME
2.7K
2.7K
1
2
3
4
5
6
HBK771-1

1250$5&,167$//$7,21&200,66,21,1*+$1'%22.
1DYLD$YLDWLRQ$6
3.9 Analog Inputs
The analog inputs are connected to the CI1210A connection interface board as illustrated in
Figure 3-12. The inputs are:
• ANALOG CH.1-3 - three differential DC analog inputs, P is the positive and N is the nega-
tive terminal.
Maximum voltage:
±
15V.
Input impedance: 10kohms.
• TINDOOR, TOUTDOOR - temperature measurement inputs with interface to an LM35 tem-
perature sensor.
Maximum voltage:
±
15V.
Input impedance: 10kohms.
• AC LEVEL - AC level measurement input. Intended for use with a battery eliminator (i.e.
220/9VAC) to monitor the mains voltage.
Maximum voltage: 24Vpp.
Input impedance: 10kohms.
Suitable female connectors are Weidemüller
BLZ-5.08/4
or equivalent
.
Figure 3-12 Analog input connections.
TEMP
INDOOR TEMP
OUTDOOR AC
LEVEL ANALOG
CH.1 ANALOG
CH.2 ANALOG
CH.3 DIGITAL
PORT A DIGITAL
PORT B DIGITAL
PORT C DIGITAL
PORT D
TO MB1203
RS232 RS232 RS232 REMOTE
CONTROL
DC-LOOP DC-LOOP DME
LOCAL REMOTE 2 REMOTE 1 CH.1&2 CH.3&4
TEMP
*
1 - VDD
2 - T*DOOR
3 - GND
4 - Not connected
CI1210A
1
4
LM35
Bottom
view
1 - VACP
2 - GND
3 - VACN
4 - Not connected
AC
LEVEL
1 - ANLG*P
2 - GND
3 - ANLG*N
4 - Not connected
ANALOG
CH.*
1
4
1
4
1
4
1
4
1
4
V+
Vtemp
GND
BATTERY
WARNING
HBK583-1
RADIO LINK

1250$5&
1DYLD$YLDWLRQ$6
,167$//$7,21&200,66,21,1*+$1'%22.
3.10 Digital Inputs and Outputs
Eight bidirectional digital channels (numbered 0-7) are sited on the CI1210A connection inter-
face board as illustrated in Figure 3-13.
Logic levels: TTL.
Input impedance: 560ohms.
Suitable female connectors are Weidemüller
BLZ-5.08/4
or equivalent.
Figure 3-13 Digital input/output connections.
TEMP
INDOOR TEMP
OUTDOOR AC
LEVEL ANALOG
CH.1 ANALOG
CH.2 ANALOG
CH.3 DIGITAL
PORT A DIGITAL
PORT B DIGITAL
PORT C DIGITAL
PORT D
TO MB1203
RS232 RS232 RS232 REMOTE
CONTROL
DC-LOOP DC-LOOP DME
LOCAL REMOTE 2 REMOTE 1 CH.1&2 CH.3&4
CI1210A
1 - USER_DIG5
2 - GND
3 - USER_DIG4
4 - GND
1
4
1
4
1
4
1
4
DIGITAL
PORT C
1 - USER_DIG3
2 - GND
3 - USER_DIG2
4 - GND
DIGITAL
PORT B
1 - USER_DIG1
2 - GND
3 - USER_DIG0
4 - GND
DIGITAL
PORT A
1 - USER_DIG7
2 - GND
3 - USER_DIG6
4 - GND
DIGITAL
PORT D
BATTERY
WARNING
HBK575-1
RADIO LINK

1250$5&,167$//$7,21&200,66,21,1*+$1'%22.
1DYLD$YLDWLRQ$6
3.11 Battery Warning
Two inputs for main power supply failure (backup battery active) are sited on the CI 1210A
connection interface board as illustrated in Figure 3-14. See also Figure 3-3.
Logic levels: Normally high (5V) ( 0V =battery warning).
Input impedance: 10kohms.
Suitable female connectors are Weidemüller
BLZ-5.08/4
or equivalent
.
Figure 3-14 Battery warning connections.
TEMP
INDOOR TEMP
OUTDOOR AC
LEVEL ANALOG
CH.1 ANALOG
CH.2 ANALOG
CH.3 DIGITAL
PORT A DIGITAL
PORT B DIGITAL
PORT C DIGITAL
PORT D
TO MB1203
RS232 RS232 RS232 REMOTE
CONTROL
DC-LOOP DC-LOOP DME
LOCAL REMOTE 2 REMOTE 1 CH.1&2 CH.3&4
BATTERY
WARNING
1 - BATT.WARN. CHARGER 1
2 - GND
3 - BATT.WARN. CHARGER 2
4 - GND
CI 1210A
1
4
BATTERY
WARNING
HBK602-2
RADIO LINK

1250$5&
1DYLD$YLDWLRQ$6
,167$//$7,21&200,66,21,1*+$1'%22.
4 Mechanical Installation Marker Beacon
This chapter gives a brief instruction on the mechanical installation of the Marker Beacon cab-
inet and antenna.
4.1 Marker beacon Cabinet
The NM7050 cabinet is constructed for mounting on a wall. For easy operation, the keyboard
and display section should be in eye/shoulder height (140-160cm).
The ventilation holes at the bottom of the cabinet should be kept uncovered to ensure proper
cooling.
The cabinet is 45 cm wide, 34 cm deep and 27 cm height and weighs about 5 kg.
When mounting the cabinet on a wall, do the following:
• First drill the holes according to Figure 4-1.
• Mount the upper screws. Leave 6 mm distance from the screw head to the wall.
• Hang the cabinet on these screws, using the key holes on the mounting rails
• Mount the lower screws
• Tighten all screws
•
Figure 4-1 Mounting the cabinet on a wall.
MARKER BEACON
ON
OFFOFF
BATTERY
ON
LOCAL RS232
POWER
MAINS
REMOTE
LOCAL
AUTO
MANUAL
WRITE
PROTECT
MAIN
TX TO AIR
+
ON/
OFF
STBY
MAINT
BATT
DISAGR
PARAM
ALARM
WARNING
OVER
CHANGE
NORMAL
SERVICE TX1
ESC
-
PREV NEXT
READ
TX2
QUICK
ENTER
405
Hex lag screw 6x50
Hex lag screw 6x50
Washer M6
Washer M6
340
451 mm
5
HBK 860-1


1250$5&
1DYLD$YLDWLRQ$6
,167$//$7,21&200,66,21,1*+$1'%22.
5 Electrical installation marker beacon
5.1 Marker beacon cabinet
5.1.1 Connection Overview
All electrical connections except the local PC connection, the mains connection and the RF IN
and OUT connections are on the CI1376 connection interface board inside the cabinet.
Figure 5-1 Marker Beacon main cabinet connection overview
GND
L
N
RF INRF OUT
ON ON
OFF
24V DC OFF
POWER
MAINS
ON/
OFF
LOCAL RS232
DISAGR
STBY
MAINT
BATT
PARAM
REMOTE AUTO
LOCAL MANUAL
CHANGE
OVER
PROTECT
WRITE
TX1/
TX2
MAIN
TX TO AIR
NORMAL
WAR NING
ALARM
SERVICE
TX1 TX2
MARKER BEACON SYSTEM
ESC PREV NEXT ENTER
CABINET UNDERSIDE
FRONT VIEW WITH FRONT PLATE
FRONT VIEW WITHOUT FRONT PLATE RF IN AND OUT
MAINS POWER
LOCAL PC (RS 232)
REMOTE CONTROL (RS 232)
REMOTE PC (RS 232)
3 ANALOGUE CHANNELS
AC LEVEL
4 DIGITAL PORTS
TEMP. INDOOR AND OUTDOOR
BATTERY
A
N
T
I
S
T
A
T
HBK784/1

1250$5&,167$//$7,21&200,66,21,1*+$1'%22.
1DYLD$YLDWLRQ$6
5.2 RF In and Out
• The output signal RF OUT is connected to the antenna with N-connectors and 50 Ω coaxial
cable.
• The input signal RF IN is connected to the antenna probe with N-connectors and 50 Ω
coaxial cable
.
Figure 5-2 RF cable connection
5.3 Battery
The external backup battery is connected between Batt Gnd (-) and Batt +24V (+) on the con-
nector marked Battery on CI 1376.
A 16Ah battery gives approximately six hours backup time with 5-8 hours charging time
dependent on model. For longer backup time an external charger is required to be able to
charge the battery within a reasonable time. An external battery protection circuit (like Nor-
marcs BP 543) has to be connected between the Ext. Charger (+) and BATT GND (-) input. In
addition Mains directly on NM 7050 has to be disconnected. Figure 5-4 shows the connec-
tions schematically.
RF OUT RF IN
HBK785/1
1250$5&
1DYLD$YLDWLRQ$6
,167$//$7,21&200,66,21,1*+$1'%22.
Figure 5-3 Battery connection
Figure 5-4 External charger connection
CI 1376
REMOTE
CONTROL
LINE
TEMP
OUTDOOR
TEMP
INDOOR
AC LEVEL ANA CHA1 ANA CHA2 ANA CHA3
DIG PORT A DIG PORT B DIG PORT C DIG PORT D
BATT GND
EXT CHARGE
BATT +24V
1
2
3
BATTERY
BATT GND
EXT CHARGE
BATT +24V
BATTERY
HBK786/1
AC
DC
BP 543
BATTERY
EXT.CHARGE
BATT +24V
BATT GND
MAINS
EXTERNAL
CHARGER
BATTERY
PROTECTION
NM 7050
HBK863/1

1250$5&,167$//$7,21&200,66,21,1*+$1'%22.
1DYLD$YLDWLRQ$6
5.4 Mains
The mains power cable connections are underneath the cabinet. They are covered by a alu-
minium plate fastened with four screws. The cable itself is threaded through the cable gland
and the three wires are connected to the terminals N, L and GND shown below in Figure 5-5.
Figure 5-5 Power connection
MAINS POWER
GND
L
N
GROUND CABLE CONNECTION
HBK787/1

1250$5&
1DYLD$YLDWLRQ$6
,167$//$7,21&200,66,21,1*+$1'%22.
5.5 Remote Control cabinet
The remote line and remote controis connected to the CI 1376 connection interface board as
illustrated in Figure 5-6.
• FSK_[A,B] is the modem line pair.
• GND is main cabinet ground
A suitable female connector for the remote line is Weidemüller
BLZ-5.08/4
or equivalent.
Alternatively the remote control connection is done with a RS 232 interface, standard pin out 9
pins DSUB.
Figure 5-6 Remote control connection
CI 1376
PB 1378
REMOTE
CONTROL
LINE
TEMP
OUTDOOR
TEMP
INDOOR
AC LEVEL ANA CHA1 ANA CHA2 ANA CHA3
REMOTE RMM
RS232
REMOTE CONTOL
RS232
CONFIGURATION
1 - GND
2 - RC_LINE B
4 - Not used
1 - Not used
3 - RXD
2 - TXD
4 - Not used
5 - GND
6 - Not used
7 - Not used
8 - Not used
9 - Not used
REMOTE
CONTROL
REMOTE
CONTROL
LINE
RS-232
HBK788/3
2 - RC_LINE A
1250$5&,167$//$7,21&200,66,21,1*+$1'%22.
1DYLD$YLDWLRQ$6
5.6 PC and Modem
Modem connections for remote PC are the standard pin out RS232, 9 pins DSUB connector
on the CI1376 connection interface board marked remote-rmm as illustrated in Figure 5-7.
For local PC connection use the RS232 on front panel Figure 5-7
.
Figure 5-7 Modem and modem battery backup connection
CI 1376
PB1378
REMOTE
CONTROL
LINE
TEMP
OUTDOOR
TEMP
INDOOR
AC LEVEL ANA CHA1 ANA CHA2 ANA CHA3
REMOTE RMM
RS232
REMOTE CONTOL
RS232
CONFIGURATION
DIG PORT A DIG PORT B DIG PORT C DIG PORT D
1-CD
2-RXD
3-TXD
4-DTR
5-GND
6-Not used
7-RTS
9-CTS
9-Not used
REMOTE RMM
61
95
HBK789/1

1250$5&,167$//$7,21&200,66,21,1*+$1'%22.
1DYLD$YLDWLRQ$6
5.7 Analogue Inputs
The analogue inputs are connected to the CI1376 connection interface board as illustrated in
Figure 5-9.
The inputs are:
• Analogue Channel 1-3 - three differential DC analogue inputs, P (pin-1) is the positive and
N (pin-3) is the negative terminal, and pin 2 is GND.
Maximum voltage:
±
15V
Input impedance: 10k
Ω
• Temp Indoor and Outdoor - temperature measurement inputs with interface to an LM35
temperature sensor.
Maximum voltage:
±
15V
Input impedance: 10k
Ω
• AC Level - AC level measurement input. Intended for use with a battery eliminator to moni-
tor the mains voltage.
Maximum voltage: 24Vpp
Input impedance: 10 k
Ω
Figure 5-9 Analogue input connections
CI 1376
PB 1378
REMOTE
CONTROL
LINE
TEMP
OUTDOOR
TEMP
INDOOR
AC LEVEL ANA CHA1 ANA CHA2 ANA CHA3
REMOTE RMM
RS232
REMOTE CONTOL
RS232
CONFIGURATION
DIG PORT A DIG PORT B DIG PORT C DIG PORT D
1-ANLG*P
2-GND
3-ANLG*N
4-Not used
ANALOGUE
CHANNEL 1-3
1-VACP
2-GND
3-VACN
4-Not used
AC LEVEL
1-VDD
2-T*DOOR
3-GND
4-Not used
TEMP *
V+
Vtemp
GND
LM 35
Bottom view
HBK791/1

1250$5&
1DYLD$YLDWLRQ$6
,167$//$7,21&200,66,21,1*+$1'%22.
5.8 Digital Inputs and Outputs
Eight bi-directional digital channels (numbered 0-7) are sited on the CI1376 connection inter-
face board as illustrated in Figure 5-10.
Logical levels: TTL
Input impedance: 560Ω.
A suitable female connector is Weidemüller
BLZ-5.08/4
or equivalent
.
Figure 5-10 Digital input/output connections
1- DIGIN 1
2- GND
3- DIGIN 0
4-GND
1- DIGIN 3
2- GND
3- DIGIN 2
4-GND
1- DIGIN 5
2- GND
3- DIGIN 4
4-GND
1- DIGOUT 0
2- GND
3- DIGOUT 1
4-GND
DIGITAL PORTS
A
B
CD
CI 1376
PB 1378
REMOTE
CONTROL
LINE
TEMP
OUTDOOR
TEMP
INDOOR
AC LEVEL ANA CHA1 ANA CHA2 ANA CHA3
REMOTE RMM
RS232
REMOTE CONTOL
RS232
CONFIGURATION
DIG PORT A DIG PORT B DIG PORT C DIG PORT D
HBK792/1


1250$5&
1DYLD$YLDWLRQ$6
,167$//$7,21&200,66,21,1*+$1'%22.
6 Remote Control Connections (TWR)
6.1 Remote Master Connection
The remote control is connected to the corresponding ILS by connecting the REMOTE CON-
TROL connector on CI1210 (ILS) or CI1376 (Marker Beacon) to P9 on MB1346 as shown in
figure 6-1.
Suitable female connectors are Weidemüller
BLZ-5.08/4
or equivalent. 600 ohms cable
should be used.
Figure 6-1 Remote control to ILS connection
REMOTE
CONTROL
1 - GND
2 - FSK_P
3 - FSK_N
4 - GND
J2 P3
P6
P7
P4
P5
P9
P10
P8
NORMARC
OPTO OUT
2-ALARM (E)
1-ALARM (C)
4-NORM (E)
5-WARN (C)
6-WARN (E)
7-STBAL (C)
8-STBAL (E)
3-NORM (C)
GND
5V
24V
V_DIM
GND
5V
24V
V_DIM
POWER OUT POWER IN
AUX IN/OUT
SLAVE
DIRECT
INTERLOCK
TXOFF
ALARM
LINE A
LINE B
RX A
RX B
TX A
TX B
SLAVE RS485
J1
ABC
1
5
30
20
25
15
10
ALT.LINK
MB1346
P9
1 - TXOFF
2 - ALARM
3 - LINE_A
4 - LINE_B
CI 1210
on
corresponding
ILS
or
CI 1376
on
corresponding
Marker Beacon
HBK 1135-2
1250$5&,167$//$7,21&200,66,21,1*+$1'%22.
1DYLD$YLDWLRQ$6
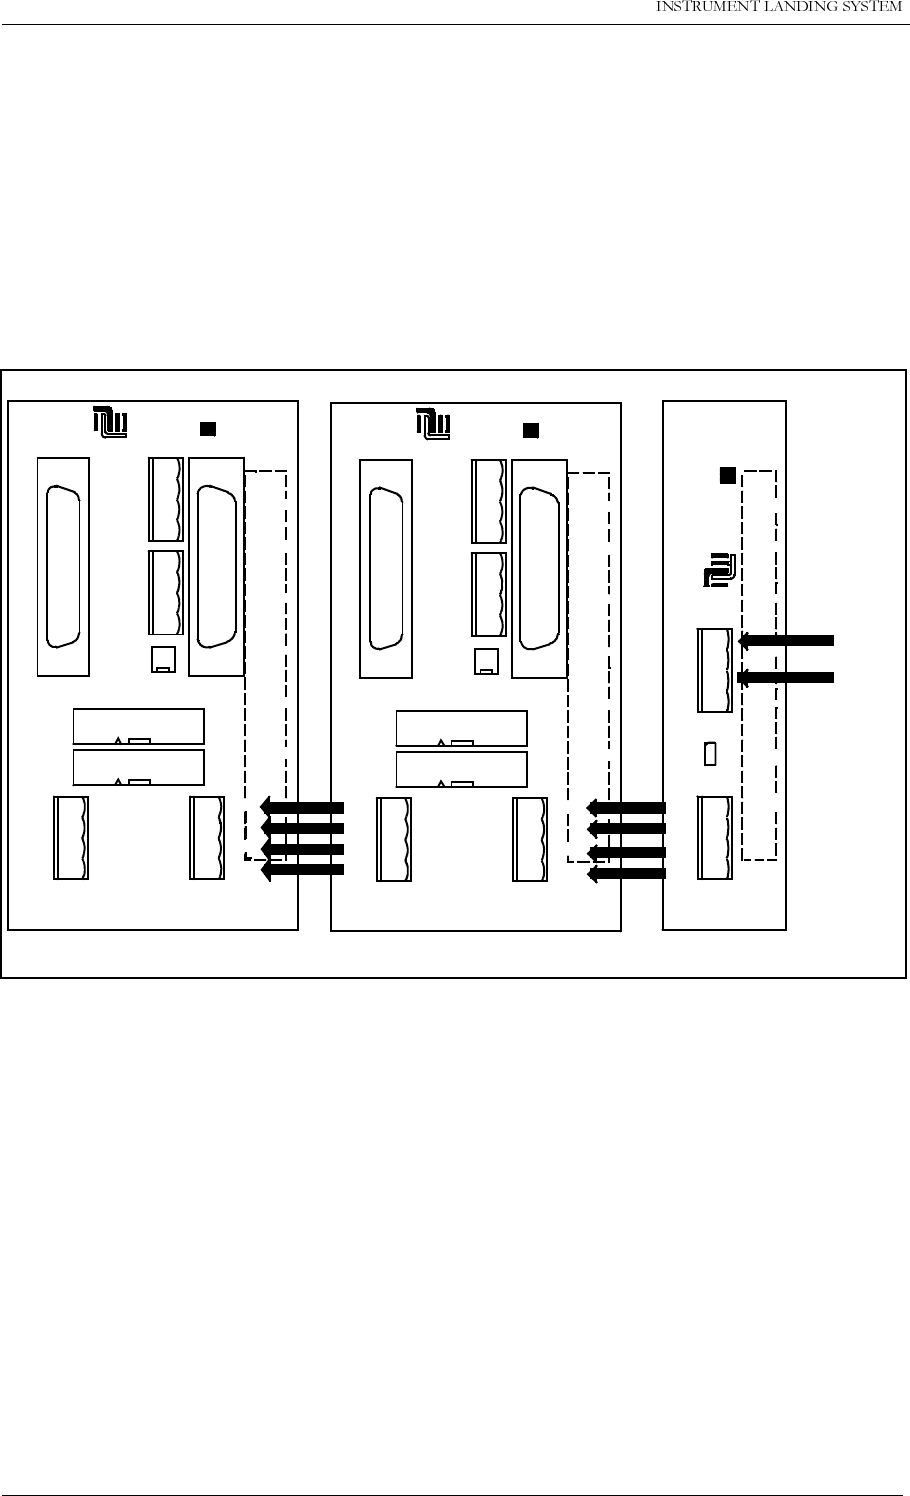
6.2 Power Supply Connection
The power supply to the remote control is connected according to Figure 6-2. The battery
charger is connected to P2 on the MB1347 - power supply motherboard. Output connector P3
on MB1347 is connected to input connector P4 on MB1346 - remote control motherboard.
Several MB1346’s are serial linked by connecting P5 on one board to P4 on the next.
Suitable female connectors are Weidemüller
BLZ-5.08/4
or equivalent.
Figure 6-2 Remote control power supply connections
J2 P3
P6
P7
P4
P5
P9
P10
P8
NORMARC
OPTO OUT
2-ALARM (E)
1-ALARM (C)
4-NORM (E)
5-WARN (C)
6-WARN (E)
7-STBAL (C)
8-STBAL (E)
3-NORM (C)
GND
5V
24V
V_DIM
GND
5V
24V
V_DIM
POWER OUT POWER IN
AUX IN/OUT
SLAVE
DIRECT
INTERLOCK
TXOFF
ALARM
LINE A
LINE B
RX A
RX B
TX A
TX B
SLAVE RS485
J1
ABC
1
5
30
20
25
15
10
ALT.LINK
MB1346
P2
P3
S1
GND
24V
POWER IN
GND
5V
24V
V_DIM
POWER OUT
V_DIM=24V
MB1347
NORMARC
30
25
20
15
10
5
1
AB
J1
J2 P3
P6
P7
P4
P5
P9
P10
P8
NORMARC
OPTO OUT
2-ALARM (E)
1-ALARM (C)
4-NORM (E)
5-WARN (C)
6-WARN (E)
7-STBAL (C)
8-STBAL (E)
3-NORM (C)
GND
5V
24V
V_DIM
GND
5V
24V
V_DIM
POWER OUT POWER IN
AUX IN/OUT
SLAVE
DIRECT
INTERLOCK
TXOFF
ALARM
LINE A
LINE B
RX A
RX B
TX A
TX B
SLAVE RS485
J1
ABC
1
5
30
20
25
15
10
ALT.LINK
MB1346
From
24VDC
power
supply
HBK 1136-1

1250$5&
1DYLD$YLDWLRQ$6
,167$//$7,21&200,66,21,1*+$1'%22.
6.3 Remote slave connection
The remote slave panel SF1344 is connected to the corresponding remote control’s mother-
board by connecting P3 on MB1346 to P1 on SF1344. P10 on MB1346 is not used. See Fig-
ure 6-3.
Suitable connectors are standard 25 pins female DSUB (Harting 0967 025 0442 and 0967
225 4704 or equivalent), connected by a 10 wire 1:1 cable
.
Figure 6-3 Remote slave connection
J2 P3
P6
P7
P4
P5
P9
P10
P8
NORMARC
OPTO OUT
2-ALARM (E)
1-ALARM (C)
4-NORM (E)
5-WARN (C)
6-WARN (E)
7-STBAL (C)
8-STBAL (E)
3-NORM (C)
GND
5V
24V
V_DIM
GND
5V
24V
V_DIM
POWER OUT POWER IN
AUX IN/OUT
SLAVE
DIRECT
INTERLOCK
TXOFF
ALARM
LINE A
LINE B
RX A
RX B
TX A
TX B
SLAVE RS485
J1
ABC
1
5
30
20
25
15
10
ALT.LINK
MB1346
1:1
To P1
on
SF1344
1
13
14
25
1 - GND
2 - ALARM
3 - WARNING
4 - NORMAL
7 - GND
15 - V24P
19 - ON_OFF
21 - SILENCE
23 - INTERLOCK (if used)
25 - BUZZER
HBK 1137-1
1250$5&,167$//$7,21&200,66,21,1*+$1'%22.
1DYLD$YLDWLRQ$6
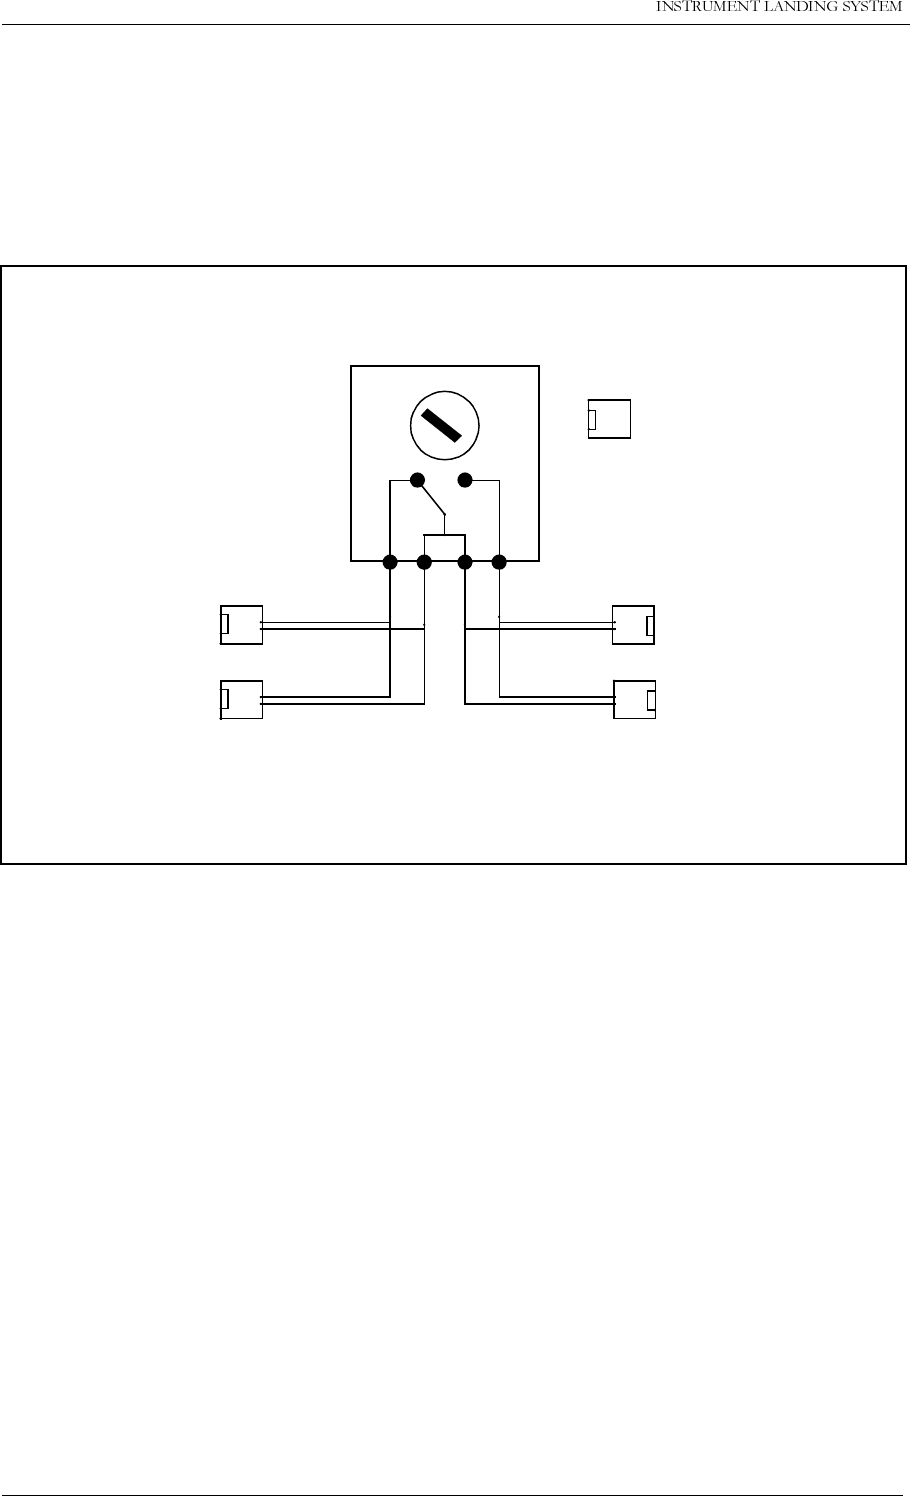
6.4 Interlock switch connection
The interlock switch is either connected to P8 on MB1346 (remote control motherboard) or to
P2 on SF1344 (remote slave panel), see Figure 6-4.
Figure 6-4 Interlock switch connection
2
1
MB1346 / P8
OR
SF1344 / P2
INTERLOCK
SWITCH
RWYA RWYB
2
1
1
2
1
2
INTERLOCK
GND
1
2
54 21
LLZ runway A
GP runway A
LLZ runway B
GP runway B
HBK775-2

SECTION 3
ANTENNA SYSTEMS ADJUSTMENTS PROCEDURE
Table of contents
1 NM 3522 6 elements antenna system adjustments - LLZ .....................................7
1.1 Mechanical alignment of antenna array .............................................................7
1.1.1 Right angle points with reference to runway center line .............................. 7
1.1.2 Spacing distance between LPDA’s..............................................................7
1.1.3 Vertical alignment of LPDA support masts ..................................................7
1.1.4 Azimuth alignment of LPDA’s ......................................................................7
1.2 Electrical measurements....................................................................................7
1.2.1 CSB and SBO cables ..................................................................................7
1.2.2 CSB/SBO phasing .......................................................................................8
1.2.3 Antenna cable lengths (Electrical phase equality).......................................8
1.2.4 Antenna pair phasing................................................................................... 8
1.2.5 Phase and amplitude transfer measurement............................................... 10
1.2.6 Antenna return loss......................................................................................11
1.3 Course sector width adjustment......................................................................... 11
1.3.1 DDM check of ADU O/P (output port)..........................................................12
1.3.2 DDM field check...........................................................................................13
1.4 Monitor combining unit (MCU) adjustments ....................................................... 13
1.4.1 Course Line ................................................................................................. 13
1.4.2 Course Sector.............................................................................................. 13
1.5 Near field monitor adjustments...........................................................................13
1.5.1 Mechanical alignment ..................................................................................13
1.5.2 Final electrical position adjustment.............................................................. 13
1.6 DC-Loop adjustment and testing........................................................................14
1.6.1 DC-LOOP adjustment.................................................................................. 14
1.6.2 Antenna fault condition testing.....................................................................14
2 NM 3523B 12 Elements antenna system adjustments - LLZ (Single frequency)15
2.1 Mechanical alignments of antenna array............................................................15
2.1.1 Right angle points with reference to runway centre line .............................. 15
2.1.2 Spacing distance between LPDA’s..............................................................15
2.1.3 Vertical alignment of LPDA support masts ..................................................15
2.1.4 Azimuth alignment of LPDA’s ......................................................................15
2.2 Electrical measurements....................................................................................15
2.2.1 CSB and SBO cables ..................................................................................15
2.2.2 CSB/SBO phasing .......................................................................................16
2.2.3 Antenna cable lengths (Electrical phase equality).......................................16
2.2.4 Antenna pair phasing................................................................................... 16
2.2.5 Phase and amplitude transfer measurement............................................... 18
2.2.6 Antenna return loss......................................................................................18
2.3 Course sector adjustment ..................................................................................19
2.3.1 DDM check of ADU O/P ..............................................................................19
2.3.2 DDM field check...........................................................................................20
2.4 Monitor combining unit (MCU) adjustments ....................................................... 21
2.4.1 Course Line ................................................................................................. 21
2.4.2 Course Sector.............................................................................................. 21
2.5 Near field monitor adjustments...........................................................................21

2.5.1 Mechanical alignment ..................................................................................21
2.5.2 Final electrical position adjustment.............................................................. 21
2.6 DC-Loop adjustment and testing........................................................................21
2.6.1 DC-LOOP adjustment.................................................................................. 21
2.6.2 Antenna fault condition testing.....................................................................21
3 NM 3524 12 Elements antenna system adjustments - LLZ (Dual frequency).....23
3.1 Mechanical alignment of antenna array .............................................................23
3.1.1 Right angle points with reference to runway centre line .............................. 23
3.1.2 Spacing distance between LPDA’s..............................................................23
3.1.3 Vertical alignment of LPDA support masts ..................................................23
3.1.4 Azimuth alignment of LPDA’s ......................................................................23
3.2 Electrical measurements....................................................................................23
3.2.1 CSB and SBO cables ..................................................................................23
3.2.2 CSB/SBO phasing .......................................................................................24
3.2.3 Antenna cable lengths (Electrical phase equality).......................................24
3.2.4 Antenna pair phasing................................................................................... 25
3.2.5 Phase and amplitude transfer measurement............................................... 26
3.2.6 Antenna return loss......................................................................................27
3.3 Course sector width adjustment......................................................................... 27
3.3.1 DDM check of ADU O/P ..............................................................................28
3.3.2 Clearance SBO power ................................................................................. 29
3.3.3 DDM field check...........................................................................................29
3.4 Monitor combining unit (MCU) adjustments ....................................................... 29
3.4.1 Course Line ................................................................................................. 29
3.4.2 Course Sector.............................................................................................. 29
3.4.3 Clearance ....................................................................................................29
3.5 Near field monitor adjustments...........................................................................29
3.5.1 Mechanical alignment ..................................................................................30
3.5.2 Final electrical position adjustment.............................................................. 30
3.6 DC-Loop adjustment and testing........................................................................30
3.6.1 DC-LOOP adjustment.................................................................................. 30
3.6.2 Antenna fault condition testing.....................................................................30
4 NM 3525 24 Elements antenna system adjustments - LLZ...................................31
4.1 Mechanical alignments of antenna array............................................................31
4.1.1 Right angle points with reference to runway centre line .............................. 31
4.1.2 Spacing distance between LPDA’s..............................................................31
4.1.3 Vertical alignment of LPDA support masts ..................................................31
4.1.4 Azimuth alignment of LPDA’s ......................................................................31
4.2 Electrical measurements....................................................................................31
4.2.1 CSB and SBO cables ..................................................................................31
4.2.2 CSB/SBO phasing .......................................................................................32
4.2.3 Antenna cable lengths (Electrical phase equality).......................................32
4.2.4 Antenna pair phasing................................................................................... 33
4.2.5 Phase and amplitude transfer measurement............................................... 34
4.2.6 Antenna return loss......................................................................................35
4.3 Course sector width adjustments ....................................................................... 35
4.3.1 DDM check of ADU O/P ..............................................................................35
4.3.2 Clearance SBO power ................................................................................. 37
4.3.3 DDM field check...........................................................................................37
4.4 Monitor combining unit (MCU) adjustments ....................................................... 37
4.4.1 Course Line ................................................................................................. 37
4.4.2 Course Sector.............................................................................................. 37

4.4.3 Clearance ....................................................................................................37
4.5 Near field monitor adjustments...........................................................................37
4.5.1 Mechanical alignment ..................................................................................37
4.5.2 Final electrical position adjustment.............................................................. 38
4.6 DC-Loop adjustment and testing........................................................................38
4.6.1 DC-LOOP adjustment.................................................................................. 38
4.6.2 Antenna fault condition testing.....................................................................38
5 NM 3526 16 Elements antenna system adjustments - LLZ...................................39
5.1 Mechanical alignments of antenna array............................................................39
5.1.1 Right angle points with reference to runway centre line .............................. 39
5.1.2 Spacing distance between LPDA’s..............................................................39
5.1.3 Vertical alignment of LPDA support masts ..................................................39
5.1.4 Azimuth alignment of LPDA’s ......................................................................39
5.2 Electrical measurements....................................................................................39
5.2.1 CSB and SBO cables ..................................................................................39
5.2.2 CSB/SBO phasing .......................................................................................40
5.2.3 Antenna cable lengths (Electrical phase equality).......................................40
5.2.4 Antenna pair phasing................................................................................... 41
5.2.5 Phase and amplitude transfer measurement............................................... 42
5.2.6 Antenna return loss......................................................................................43
5.3 Course sector width adjustment......................................................................... 44
5.3.1 DDM check of ADU O/P ..............................................................................44
5.3.2 Clearance SBO power ................................................................................. 45
5.3.3 DDM field check...........................................................................................45
5.4 Monitor combining unit (MCU) adjustments ....................................................... 45
5.4.1 Course Line ................................................................................................. 45
5.4.2 Course Sector.............................................................................................. 45
5.4.3 Clearance ....................................................................................................46
5.5 Near field monitor adjustments...........................................................................46
5.5.1 Mechanical alignment ..................................................................................46
5.5.2 Final electrical position adjustment.............................................................. 46
5.6 DC-Loop adjustment and testing........................................................................46
5.6.1 DC-LOOP adjustment.................................................................................. 46
5.6.2 Antenna fault condition testing.....................................................................46
6 NM 3543 Null reference antenna system adjustments - Glide path.....................47
6.1 Mechanical alignment of mast and antennas.....................................................47
6.1.1 Preparation of mechanical- and electrical data............................................ 47
6.1.2 Forward shift (FWD) ....................................................................................47
6.1.3 Antenna heights...........................................................................................47
6.1.4 Antenna offsets............................................................................................47
6.2 Electrical measurements....................................................................................47
6.2.1 Antenna cable lengths (Electrical phase equality).......................................47
6.2.2 Monitor return cable length.......................................................................... 48
6.2.3 Phase and amplitude transfer measurement............................................... 48
6.2.4 Antenna return loss......................................................................................49
6.3 CSB/SBO Phasing and sector width adjustment................................................49
6.3.1 CSB/SBO phasing .......................................................................................49
6.3.2 Sector Width adjustment.............................................................................. 50
6.4 Monitoring combining unit (MCU) adjustments .................................................. 51
6.4.1 Procedure ....................................................................................................51
6.5 Location of near field antenna position............................................................... 51
6.5.1 Near Field Monitor Position Search ............................................................. 51

7 NM 3544 Sideband reference antenna system adjustment - Glide path............53
7.1 Mechanical alignment of mast and antennas.....................................................53
7.1.1 Preparation of mechanical- and electrical data............................................ 53
7.1.2 Forward shift (FWD) ....................................................................................53
7.1.3 Antenna heights...........................................................................................53
7.1.4 Antenna offsets............................................................................................53
7.2 Initial electrical measurements........................................................................... 53
7.2.1 Antenna cable lengths (Electrical phase equality).......................................53
7.2.2 Monitor return cable length.......................................................................... 54
7.2.3 Phase and amplitude transfer measurement............................................... 54
7.2.4 Antenna return loss......................................................................................55
7.3 CSB/SBO Phasing .............................................................................................55
7.3.1 CSB and SBO cables ..................................................................................55
7.3.2 CSB/SBO phasing .......................................................................................56
7.4 Sector width adjustment.....................................................................................56
7.4.1 SBO power adjustment................................................................................56
7.5 Monitor combining unit (MCU) adjustments ....................................................... 56
7.5.1 Procedure for horizontal terrain (FSL = 0°).................................................. 56
7.5.2 Procedure for sloping terrain (1° > FSL > -1°) .............................................56
7.6 Location of near field antenna position............................................................... 57
7.6.1 Near Field Monitor Position Search ............................................................. 58
7.7 Antenna distribution unit (ADU) phase and amplitude check.............................59
7.7.1 Preparation ..................................................................................................59
7.7.2 Procedure ....................................................................................................59
8 NM 3545 M-Array antenna system adjustments - Glide path ...............................61
8.1 Mechanical alignment of mast and antennas.....................................................61
8.1.1 Preparation of mechanical- and electrical data............................................ 61
8.1.2 Forward shift (FWD) ....................................................................................61
8.1.3 Antenna heights...........................................................................................61
8.1.4 Antenna offsets............................................................................................61
8.2 Initial electrical measurements........................................................................... 61
8.2.1 Antenna cable lengths (Electrical phase equality).......................................61
8.2.2 Monitor return cable length.......................................................................... 62
8.2.3 Phase and amplitude transfer measurement............................................... 62
8.2.4 Antenna return loss......................................................................................63
8.3 CSB/SBO Phasing .............................................................................................63
8.3.1 CSB and SBO cables ..................................................................................63
8.3.2 CSB/SBO phasing .......................................................................................63
8.4 Sector width adjustment.....................................................................................64
8.4.1 SBO power adjustment................................................................................64
8.5 Monitor combining unit (MCU) MOA 338D adjustments ....................................64
8.5.1 Adjustments procedure................................................................................ 65
8.6 Location of near field antenna position............................................................... 65
8.6.1 Near Field Monitor Position Search ............................................................. 65
8.7 Antenna distribution unit (ADU) DIA 346A phase and amplitude check.............66
8.7.1 Preparation ..................................................................................................66
8.7.2 Procedure ....................................................................................................67
9 NM 3561 Single antenna system adjustments - MKR............................................69
9.1 Mechanical alignment.........................................................................................69
9.1.1 Antenna mast............................................................................................... 69
9.2 Electrical measurements....................................................................................69
9.2.1 Antenna return loss......................................................................................69

10 NM 3562 Dual antenna system adjustments - MKR...............................................71
10.1 Mechanical alignment.........................................................................................71
10.1.1Antenna mast...............................................................................................71
10.2 Electrical measurements.................................................................................... 71
10.2.1Antenna cable lengths (Electrical phase equality)....................................... 71
10.2.2Monitor return cable length..........................................................................72
10.2.3Phase and amplitude transfer measurement...............................................72


1 NM 3522 6 elements antenna system adjustments - LLZ
1.1 Mechanical alignment of antenna array
1.1.1 Right angle points with reference to runway center line
The alignment of the antenna array perpendicular to the runway centreline should be carried
out to an accuracy of 0.03°.
This corresponds to within 4 mm accuracy at positions antenna 1 and antenna 6. A theodolite
should be utilised.
1.1.2 Spacing distance between LPDA’s
Check that the spacing between each LPDA is according to dimensions given in dwg.no.
7106A3.
Tolerance: ±5 mm.
1.1.3 Vertical alignment of LPDA support masts
On each rear support mast for LPDA check with waterlevel that mast is vertically aligned in
both planes.
1.1.4 Azimuth alignment of LPDA’s
Determine a fixed point as far as possible along the extended centreline not less than approx-
imately 3000 m from the antenna array.
On each LPDA utilise the top horizontal line composed of the two half sections of the radome
to point toward the fixed point.
If necessary adjust the LPDA horizontally by adjusting the mast supports on the front mast, so
that the extended radome top line ends at the fixed point.
1.2 Electrical measurements
1.2.1 CSB and SBO cables
The CSB and SBO cable between the cabinet and MCU must be of equal electrical length.
Utilise a vector voltmeter or network analyser in a test set-up as in Figure 1-1.
Measure open cable return phase for each cable.
Refer to CSB cable as zero phase and measure the return phase for the SBO cable. The
cable pair must be matched within ±3.0° return phase, equal to ±1.5° true phase

.
Figure 1-1 Cable phasing measurements set-up.
1.2.2 CSB/SBO phasing
127(
$VFHUWDLQWKDWWKH7[PRGXODWRUXVHGLVRSWLPDOO\FDOLEUDWHG
Connect the NM3710 Field Test Set to the monitor BNC test connector in the ADU. (Use
20..30 dB attenuator at the I/P of the Field Test Set.)
Adjust SBO phaser in the Cabinet (associated with Tx to air) to obtain 0.0% DDM reading.
Repeat the phasing procedure for the other transmitter.
1.2.3 Antenna cable lengths (Electrical phase equality)
Each antenna cable should be electrically checked before the end connector is terminated in
the LPDA.
Utilise a vector voltmeter or network analyser. Establish antenna cable (A1) (leftmost seen
from rear) return phase as 0° reference phase.
Measure return phase for each of the remaining antenna cables (A2...A6).
Tolerance: ±1.0° true electrical cable length.
See measurement set-up diagram Figure 1-1.
1.2.4 Antenna pair phasing
127(
%HIRUHWKHDQWHQQDSDLUSKDVLQJSURFHGXUHLVFRPPHQFHGDVFHUWDLQWKDWWKH7[PRGXODWRUXVHGLV
RSWLPDOO\FDOLEUDWHG
20dB
AB
VECTOR VOLTMETER
From cabinet
CSB BNC o/
p
CABLE UNDER TEST
OPEN END
DIR. COUPL.

Connect the antenna cables A1 and A6 to the ADU outputs labelled A1 and A6 respectively.
Connect all other ADU outputs to dummy load. Use the NM3710 with portable test antenna.
On the the runway establish a point officially marked as the centre line for DDM measure-
ments. Ascertain that the measurement point is not affected by reflected signals degrading the
direct received signals from the antenna pairs. This can be tested by moving the test antenna
a few meters back and fourth while observing the DDM reading. If the value is not changing
significantly then the measurement position is OK.
Take a note of the DDM reading first from antenna pair A1/A6.
Connect pair A2/A5 to ADU outputs A2/A5 and disconnect pair A1/A6, dummyload A1/A6
ADU.
Take a note of the DDM reading.
Carry out this procedure until all antenna pairs DDM readings have been noted.
If any antenna pair measures DDM different from zero, one of the antenna pair feed cable
lengths should be trimmed in order to bring the DDM reading to zero.
If the DDM reading is positive (150 Hz dominance) the antenna cable at the right hand side
(A4...A6) should be trimmed.
The sensitivity of DDM versus electrical phase error of 2° (5° CS) is given in the table below:
The sensitivity of DDM versus electrical phase error can be estimated using the following pro-
cedure:
1. Note the DDM value reported by the operator at the Field Test Set for the antenna pair
under test.
2. a) If the DDM value is positive (150 Hz dominance), insert a male-female (MF) N-adaptor
(-9°) in the antenna left side seen forward toward the Field test set.
b) If the DDM value is negative (90 Hz dominance), insert a male-female (MF) N-adaptor
(-9°) in the antenna right side seen forward toward the Field test set.
3. Note the new DDM value. (This value should have oposite polarity compared to the value
without the adaptor.)
4. Calculate the corresponding phase error (electrical degrees) from the formula
: DDM1 (%) measured in item 1.
: DDM3 (%) measured in item 3.
(Example values from NM3523B)
ϕ°() 9°DDM1
DDM1DDM3
+
-------------------------------------------
=

Example 1:
Item 1: A1/A12: +4.3% DDM
Item 3: A1+MF/A12: -2.0% DDM (MF in A1)
Example 2:
Item 1: A6/A7: -0.6% DDM
Item 3: A6 /A7+MF: +1.86% DDM (MF in A7)
Cable trimming length: 6.2 mm/°.
1.2.5 Phase and amplitude transfer measurement
Connect each antenna cable and monitor cable to LPDA load and source respectively. Utilise
a vector voltmeter or network analyser in a test set-up
Figure 1-2 Phase and amplitude transfer measurement set-up.
Measure relative transfer phase and amplitude for each Antenna/Monitor return cable in ref-
erence to A1/M1.
Then determine if one or more of the monitor cables must be trimmed in order to comply with
phase tolerance for the set of cables.
Tolerance: ±2°.
ϕ9°4.3⋅
4.3 2.0+
---------------------4.8°==
ϕ9°0.6⋅
0.6 1.86+
------------------------1.7°==
20dB
AB
VECTOR VOLTMETER
A(n)
M(n)
From cabinet
CSB BNC o/p
LPDA
DIR. COUPL.

Amplitude tolerance: ±1.0 dB. If the amplitude tolerance is exceeded something might be
wrong in the LPDA monitor circuit or connector/cable.
Record the final result in Ground Commissioning Record.
1.2.6 Antenna return loss
Utilise a vector voltmeter or network analyser in a test set-up
Figure 1-3. Measure return loss for each LPDA.
Measure and record in Ground Commissioning Record the return loss value for each LPDA
including antenna cable.
Tolerance: 20 dB minimum
.
Figure 1-3 Antenna return loss measurement set-up.
1.3 Course sector width adjustment
The required course sector width (CS) can be pre-adjusted by two methods:
1. DDM measurement of ADU antenna feed outputs.
2. DDM field check.
Preferably both methods should be carried out and compared.
20dB
AB
VECTOR VOLTMETER
From cabinet
CSB BNC o/
p
DIR. COUPL.
Antenna cable under test
Antenna

1.3.1 DDM check of ADU O/P (output port)
At each antenna feed output of the ADU the measured DDM is a result of the SBO/CSB ratio
according to the formula
where
CSB is a fixed value.
SBO is adjustable by the SBO attenuator in the cabinet.
γ is 0° when the 90°-stub is inserted into the SBO.
For each course sector width (CS) of the array a set of corresponding DDM values exists
unique for each antenna O/P.
For CS = 5°:
For other CS values use the formula:
Example
A3 DDM for CS = 5.4°:
PROCEDURE
Insert the 90°-stub into the SBO path.
Connect a directional coupler with 50* load to antenna O/P A3.
Connect the NM3710 (use 20 dB attenuator at NM3710 I/P) to the directional coupler's for-
ward port.
Adjust the SBO attenuator (for the Tx to air) until the DDM value equals the previously calcu-
lated value for the CS.
%DDM µA %SDM
A2 -34.8 -337 40.0
A3 -32.7 -316 40.0
DDM 2SBO⋅
CSB
-------------------COSγ=
DDMAn()
DDM 5°()
5°⋅
CS
---------------------------------
=
D
DMA332.7 5⋅–
5.4
---------------------29.5%==

Move the directional coupler to A4 and compare readings with calculated value. If measured
DDM is lower than the calculated values for A4 then increase the SBO power, or vice versa,
until a fairly good matching set of values are obtained.
Adjust the SBO attenuator for the other Tx to the same setting.
Remove the 90°-stub
1.3.2 DDM field check
Set the localizer to normal radiation. From the centreline of the opposite threshold determine
points perpendicular to the CL 105 meter to both sides of the runway. Use the NM3710 with
portable antenna and measure DDM at these points. The readings should be close to -15.5%
at the 90-side and 15.5% at the 150-side. However, some unsymmetry may be expected due
to reflections and tolerances in the antenna system.
Check the CL DDM at two or three positions in order to estimate an average value.
Expected value: 0.0%±0.2% DDM.
1.4 Monitor combining unit (MCU) adjustments
1.4.1 Course Line
Connect the Field Test Set to the CL output connector of the MCU.
Adjust the CL line stretcher to obtain 0.0% DDM.
1.4.2 Course Sector
Connect the Field Test Set to the CS output of the MCU.
Adjust the CS line stretcher to obtain a reading of 15.5% DDM.
1.5 Near field monitor adjustments
The exact position of the near field monitor antenna cannot be determined until after the flight
check is completed, due to possible mechanical re-alignment of the antenna array.
1.5.1 Mechanical alignment
Align the near field (NF) monitor antenna mechanically in the extended runway centreline
position.
1.5.2 Final electrical position adjustment
Connect the Field Test Set to the NF monitor cable. The reading should be 0.0% DDM if the
antenna is aligned correctly and no reflections appear.
Otherwise, a small mechanical re-positioning of the antenna may be necessary in order to
obtain 0.0% DDM.

1.6 DC-Loop adjustment and testing
1.6.1 DC-LOOP adjustment
The DC loop (cable fault monitor) alignment is carried out accordingly to the procedure
described in Monitor Alignment and Calibration chapter.
1.6.2 Antenna fault condition testing
For this test observe that the LLZ cabinet System Status indicates ALARM.
The transmitter must be on during this test.The monitors should be in MANUAL mode in order
to prevent transmitter from being shut off during the test.
Disconnect one antenna at a time and check that the LLZ cabinet System Status indicates
ALARM after each antenna disconnection.
Carry out this test for all antennas.

2 NM 3523B 12 Elements antenna system adjustments - LLZ (Single fre-
quency)
2.1 Mechanical alignments of antenna array
2.1.1 Right angle points with reference to runway centre line
The alignment of the antenna array perpendicular to the runway centreline should be carried
out to an accuracy of 0.02°.
This corresponds to within 5 mm accuracy at positions antenna 1 and antenna 12. A theodo-
lite should be utilised.
2.1.2 Spacing distance between LPDA’s
Check that the spacing between each LPDA is according to dimensions given in dwg.no.
8151A3.
Tolerance: ±5 mm.
2.1.3 Vertical alignment of LPDA support masts
On each rear support mast for LPDA check with waterlevel that mast is vertically aligned in
both planes.
2.1.4 Azimuth alignment of LPDA’s
Determine a fixed point as far as possible along the extended centreline not less than approx-
imately 3000 m from the antenna array.
On each LPDA utilise the top horizontal line composed of the two half sections of the radome
to point toward the fixed point.
If necessary adjust the LPDA horizontally by adjusting the mast supports on the front mast, so
that the extended radome top line ends at the fixed point.
2.2 Electrical measurements
2.2.1 CSB and SBO cables
The CSB and SBO cable between the cabinet and MCU must be of equal electrical length.
Utilise a vector voltmeter or network analyser in a test set-up as in Figure 2-1.
Measure open cable return phase for each cable.
Refer to CSB cable as zero phase and measure the return phase for the SBO cable. The
cable pair must be matched within ±3.0° return phase, equal to ±1.5° true phase

.
Figure 2-1 Cable phasing measurement set-up.
2.2.2 CSB/SBO phasing
127(
$VFHUWDLQWKDWWKH7[PRGXODWRUXVHGLVRSWLPDOO\FDOLEUDWHG
Connect the NM3710 Field Test Set to the monitor BNC test connector in the ADU. (Use
20..30 dB attenuator at the I/P of the Field Test Set.)
Adjust SBO phaser in the Cabinet (associated with Tx to air) to obtain 0.0% DDM reading.
Repeat the phasing procedure for the other transmitter.
2.2.3 Antenna cable lengths (Electrical phase equality)
Each antenna cable should be electrically checked before the end connector is terminated in
the LPDA.
Utilise a vector voltmeter or network analyser. Establish antenna cable (A1) (leftmost seen
from rear) return phase as 0° reference phase.
Measure return phase for each of the remaining antenna cables (A2...A12).
Tolerance: ±1.0° true electrical cable length.
See measurement set-up diagram 2-1.
2.2.4 Antenna pair phasing
127(
%HIRUHWKHDQWHQQDSDLUSKDVLQJSURFHGXUHLVFRPPHQFHGDVFHUWDLQWKDWWKH7[PRGXODWRUXVHGLV
RSWLPDOO\FDOLEUDWHG
Connect the antenna cables A1 and A12 to the ADU outputs labelled A1 and A12 respec-
tively.
20dB
AB
VECTOR
From cabinet
CSB BNC o/
p
CABLE UNDER TEST
OPEN END
DIR. COUPL.

Connect all other ADU outputs to dummy load. Use the NM3710 with portable test antenna.
On the the runway establish a point officially marked as the centre line for DDM measure-
ments. Ascertain that the measurement point is not affected by reflected signals upsetting the
direct received signals from the antenna pairs. This can be tested by moving the test antenna
a few meters back and fourth while observing the DDM reading. If the value is not changing
then the measurement position is OK.
Take a note of the DDM reading first from antenna pair A1/A12.
Connect pair A2/A11 to ADU outputs A2/A11 and disconnect pair A1/A12, dummyload A1/
A12 ADU.
Take a note of the DDM reading.
Carry out this procedure until all antenna pairs DDM readings have been noted.
If any antenna pair measures DDM different from zero, one of the antenna pair feed cable
lengths should be trimmed in order to bring the DDM reading to zero.
If the DDM reading is positive (150 Hz dominance) the antenna cable at the right hand side
(A7...A12) should be trimmed.
The sensitivity of DDM versus electrical phase error can be estimated using the following pro-
cedure:
1. Note the DDM value reported by the operator at the Field Test Set for the antenna pair
under test.
2. a) If the DDM value is positive (150 Hz dominance), insert a male-female (MF) N-adaptor
(-9°) in the antenna left side seen forward toward the Field test set.
b) If the DDM value is negative (90 Hz dominance), insert a male-female (MF) N-adaptor (-
9°) in the antenna right side seen forward toward the Field test set.
3. Note the new DDM value. (This value should have oposite polarity compared to the value
without the adaptor.)
4. Calculate the corresponding phase error (electrical degrees) from the formula
DDM1: DDM(%) measured in item 1.
DDM3: DDM(%) measured in item 3.
(Example values from NM3523B)
Example 1:
Item 1: A1/A12: +4.3% DDM
Item 3: A1+MF/A12: -2.0% DDM (MF in A1)
ϕ°() 9°DDM1
DDM1DDM3
+
-------------------------------------------
=

Example 2:
Item 1: A6/A7: -0.6% DDM
Item 3: A6 /A7+MF: +1.86% DDM (MF in A7)
Cable trimming length: 6.2 mm/°.
2.2.5 Phase and amplitude transfer measurement
Connect each antenna cable and monitor cable to LPDA load and source respectively. Utilise
a vector voltmeter or network analyser in a test set-up Figure 2-2
Figure 2-2 Phase and amplitude transfer measurement set-up.
Measure relative transfer phase and amplitude for each Antenna/Monitor return cable in ref-
erence to A1/M1.
Then determine if one of the monitor cables must be trimmed in order to comply with phase
tolerance for the set of cables.
Tolerance: ±2°.
Amplitude tolerance: ±1.0 dB. If the amplitude tolerance is exceeded something might be
wrong in the LPDA monitor circuit or connector/cable.
Record the final result in Ground Commissioning Record.
2.2.6 Antenna return loss
Utilise a vector voltmeter or network analyser in a test set-up Figure 2-3. Measure return loss
for each LPDA.
ϕ9°4.3⋅
4.3 2.0+
---------------------4.8°==
ϕ9°0.6⋅
0.6 1.86+
------------------------1.7°==
20dB
AB
VECTOR VOLTMETER
A(n)
M(n)
From cabinet
CSB BNC o/p
LPDA
DIR. COUPL.

Measure and record in Ground Commissioning Record the return loss value for each LPDA
including antenna cable.
Tolerance: 20 dB minimum.
Figure 2-3 Antenna return loss measurement set-up.
2.3 Course sector adjustment
The required course sector width (CS) can be pre-adjusted by two methods:
1. DDM measurement of ADU antenna feed outputs.
2. DDM field check.
Preferably both methods should be carried out and compared.
2.3.1 DDM check of ADU O/P
At each antenna feed output of the ADU the measured DDM is a result of the SBO/CSB ratio
according to the formula
where
CSB is a fixed value.
SBO is adjustable by the SBO attenuator in the cabinet.
γ is 0° when the 90°-stub is inserted into the SBO.
For each course sector width (CS) of the array a set of corresponding DDM values exists
unique for each antenna O/P.
20dB
AB
VECTOR VOLTMETER
From cabinet
CSB BNC o/
p
DIR. COUPL.
Antenna cable under test
Antenna
DMM 2SBO⋅
CSB
-------------------COSγ=

For CS = 4°:
For other CS values use the formula:
EXAMPLE
A5 DDM for CS = 5°:
PROCEDURE
Insert the 90°-stub into the SBO path.
Connect a directional coupler with 50Ω load to antenna O/P A3.
Connect the NM3710 (use 20 dB attenuator at NM3710 I/P) to the directional coupler's for-
ward port.
Adjust the SBO attenuator (for the Tx to air) until the DDM value equals the previously calcu-
lated value for the CS.
Move the directional coupler to A4, A5, A6 and compare readings with calculated values. If
measured DDM is lower than the calculated values for A4, A5, A6 then increase the SBO
power, or vice versa, until a fairly good matching set of values are obtained.
Adjust the SBO attenuator for the other Tx to the same setting.
Remove the 90°-stub.
2.3.2 DDM field check
Set the localizer to normal radiation. From the centreline of the opposite threshold determine
points perpendicular to the CL 105 meter to both sides of the runway. Use the NM3710 with
portable antenna and measure DDM at these points. The readings should be close to -15.5%
at the 90-side and 15.5% at the 150-side. However, some unsymmetry may be expected due
to reflections and tolerances in the antenna system.
Check the CL DDM at two or three positions in order to estimate an average value.
Expected value: 0.0%±0.2% DDM.
% DDM µA %SDM
A2 -34.8 -337 40.0
A3 -32.7 -316 40.0
A5 -28.1 -272 40.0
A6 -30.4 -294 40.0
DDMAn()
DDM 4°()
4°⋅
CS
---------------------------------
=
D
MA328.1 4⋅–
5
---------------------22.5%–==

2.4 Monitor combining unit (MCU) adjustments
2.4.1 Course Line
Connect the Field Test Set to the CL output connector of the MCU.
Adjust the CL line stretcher to obtain 0.0% DDM.
2.4.2 Course Sector
Connect the Field Test Set to the CS output of the MCU.
Adjust the CS line stretcher to obtain a reading of 15.5% DDM.
2.5 Near field monitor adjustments
The exact position of the near field monitor antenna cannot be determined until after the flight
check is completed, due to possible mechanical re-alignment of the antenna array.
2.5.1 Mechanical alignment
Align the near field (NF) monitor antenna mechanically in the extended runway centreline
position.
2.5.2 Final electrical position adjustment
Connect the Field Test Set to the NF monitor cable. The reading should be 0.0% DDM if the
antenna is aligned correctly and no reflections appear.
Otherwise, a small mechanical re-positioning of the antenna may be necessary in order to
obtain 0.0% DDM.
2.6 DC-Loop adjustment and testing
2.6.1 DC-LOOP adjustment
The DC loop (cable fault monitor) alignment is carried out accordingly to the procedure
described in Monitor Alignment and Calibration chapter.
2.6.2 Antenna fault condition testing
For this test observe that the LLZ cabinet System Status indicates ALARM.
The transmitter must be on during this test.
The monitors should be in MANUAL mode in order to prevent transmitter from being shut off
during the test.
Disconnect one antenna at a time and check that the LLZ cabinet System Status indicates
ALARM after each antenna disconnection.
Carry out this test for all antennas.


3 NM 3524 12 Elements antenna system adjustments - LLZ (Dual fre-
quency)
3.1 Mechanical alignment of antenna array
3.1.1 Right angle points with reference to runway centre line
The alignment of the antenna array perpendicular to the runway centreline should be carried
out to an accuracy of 0.02°.
This corresponds to within 4 mm accuracy at positions antenna 1 and antenna 12. A theodo-
lite should be utilised.
3.1.2 Spacing distance between LPDA’s
Check that the spacing between each LPDA is 2.04 m.
Tolerance: ±5 mm.
3.1.3 Vertical alignment of LPDA support masts
On each rear support mast for LPDA check with waterlevel that mast is vertically aligned in
both planes.
3.1.4 Azimuth alignment of LPDA’s
Determine a fixed point as far as possible along the extended centreline not less than approx-
imately 3000 m from the antenna array.
On each LPDA utilise the top horizontal line composed of the two half sections of the radome
to point toward the fixed point.
If necessary adjust the LPDA horizontally by adjusting the mast supports on the front mast, so
that the extended radome top line ends at the fixed point.
3.2 Electrical measurements
3.2.1 CSB and SBO cables
Course Tx cables.
The CSB and SBO cable between the cabinet and MCU must be of equal electrical length.
Utilise a vector voltmeter or network analyser in a test set-up as in Figure 3-1.
Measure open cable return phase for each cable.
Refer to CSB cable as zero phase and measure the return phase for the SBO cable. The
cable pair must be matched within ±3.0° return phase, equal to ±1.5° true phase.
Clearance Tx cables.
Repeat the procedure 3.2.1 for CLR Tx CSB and SBO cables

.
Figure 3-1 Cable phasing measurement set-up.
3.2.2 CSB/SBO phasing
127(
6ZLWFKRIIWKHFOHDUDQFHWUDQVPLWWHU
$VFHUWDLQWKDWWKH7[PRGXODWRUXVHGLVRSWLPDOO\FDOLEUDWHG
Connect the NM3710 Field Test Set to the monitor BNC test connector in the ADU. (Use
20..30 dB attenuator at the I/P of the Field Test Set.)
Adjust Course SBO phaser in the Cabinet (associated with Tx to air) to obtain 0.0% DDM
reading.
Repeat the phasing procedure for the other transmitter.
Switch off the course transmitter.
With the clearance transmitter on repeat the phasing procedure now adjusting the clearance
SBO phaser associated with Tx to air.
3.2.3 Antenna cable lengths (Electrical phase equality)
Each antenna cable should be electrically checked before the end connector is terminated in
the LPDA.
Utilise a vector voltmeter or network analyser. Establish antenna cable (A1) (leftmost seen
from rear) return phase as 0° reference phase.
Measure return phase for each of the remaining antenna cables (A2...A12).
Tolerance: ±1.0° true electrical cable length.
See measurement set-up diagram Figure 3-1.
20dB
AB
VECTOR
From cabinet
CSB BNC o/
p
CABLE UNDER TEST
OPEN END
DIR. COUPL.

3.2.4 Antenna pair phasing
127(
%HIRUHWKHDQWHQQDSDLUSKDVLQJSURFHGXUHLVFRPPHQFHGDVFHUWDLQWKDWWKH7;PRGXODWRUXVHGLV
RSWLPDOO\FDOLEUDWHG
6ZLWFKRIIWKHFOHDUDQFHWUDQVPLWWHU
Connect the antenna cables A1 and A12 to the ADU outputs labelled A1 and A12 respec-
tively.
Connect all other ADU outputs to dummy load. Use the NM3710 with portable test antenna.
On the the runway establish a point officially marked as the centre line for DDM measure-
ments. Ascertain that the measurement point is not affected by reflected signals upsetting the
direct received signals from the antenna pairs. This can be tested by moving the test antenna
a few meters back and fourth while observing the DDM reading. If the value is not changing
then the measurement position is OK.
Take a note of the DDM reading first from antenna pair A1/A12.
Connect pair A2/A11 to ADU outputs A2/A11 and disconnect pair A1/A12, dummyload A1/
A12 ADU.
Take a note of the DDM reading.
Carry out this procedure until all antenna pairs DDM readings have been noted.
If any antenna pair measures DDM different from zero, one of the antenna pair feed cable
lengths should be trimmed in order to bring the DDM reading to zero.
If the DDM reading is positive (150 Hz dominance) the antenna cable at the right hand side
(A7...A12) should be trimmed.
The sensitivity of DDM versus electrical phase error of 2° (4° CS) is given in the table below:
Cable trimming length: 6.2 mm/°.
The sensitivity of DDM versus electrical phase error can be estimated using the following pro-
cedure:
Note the DDM value reported by the operator at the Field Test Set for the antenna pair under
test.
a) If the DDM value is positive (150 Hz dominance), insert a male-female (MF) N-adaptor (-
9°) in the antenna left side seen forward toward the Field test set.
b) If the DDM value is negative (90 Hz dominance), insert a male-female (MF) N-adaptor (-9°)
in the antenna right side seen forward toward the Field test set.
Note the new DDM value. (This value should have oposite polarity compared to the value
without the adaptor.)

Calculate the corresponding phase error (electrical degrees) from the formula
: DDM (%) measured in item 1.
: DDM (%) measured in item 3.
(Example values from NM3523B)
Example 1:
Item 1: A1/A12: +4.3% DDM
Item 3: A1+MF/A12: -2.0% DDM (MF in A1)
Example 2:
Item 1: A6/A7: -0.6% DDM
Item 3: A6 /A7+MF: +1.86% DDM (MF in A7)
3.2.5 Phase and amplitude transfer measurement
Connect each antenna cable and monitor cable to LPDA load and source respectively. Utilise
a vector voltmeter or network analyser in a test set-up Figure 3-2.
Figure 3-2 Phase and amplitude transfer measurement set-up.
Measure relative transfer phase and amplitude for each Antenna/Monitor return cable in ref-
erence to A1/M1.
ϕ°() 9°DDM1
DDM1DDM3
+
-------------------------------------------
=
ϕ9°4.3⋅
4.3 2.0+
---------------------4.8°==
ϕ9°0.6⋅
0.6 1.86+
------------------------1.7°==
20dB
AB
VECTOR VOLTMETER
A
(
n
)
M
(
n
)
From cabinet
CSB BNC o/
p
Ant.
DIR. COUPL.

Then determine if one of the monitor cables must be trimmed in order to comply with phase
tolerance for the set of cables.
Tolerance: ±2°.
Amplitude tolerance: ±1.0 dB. If the amplitude tolerance is exceeded something might be
wrong in the LPDA monitor circuit or connector/cable.
Record the final result in Ground Commissioning Record.
3.2.6 Antenna return loss
Utilise a vector voltmeter or network analyser in a test set-up
Figure 3-3. Measure return loss for each LPDA.
Measure and record in Ground Commissioning Record the return loss value for each LPDA
including antenna cable.
Tolerance: 20 dB minimum
.
Figure 3-3 Antenna return loss measurement set-up.
3.3 Course sector width adjustment
The required course sector width (CS) can be pre-adjusted by two methods:
1. DDM measurement of ADU antenna feed outputs.
2. DDM field check.
Preferably both methods should be carried out and compared.
20dB
AB
VECTOR VOLTMETER
From cabinet
CSB BNC o/
p
DIR. COUPL.
Antenna cable under test
Antenna

3.3.1 DDM check of ADU O/P
At each antenna feed output of the ADU the measured DDM is a result of the SBO/CSB ratio
according to the formula
where
CSB is a fixed value.
SBO is adjustable by the SBO attenuator in the cabinet.
γ is 0° when the 90°-stub is inserted into the SBO.
For each course sector width (CS) of the array a set of corresponding DDM values exists
unique for each antenna O/P.
For CS = 4°:
For other CS values use the formula:
Example
A3 DDM for CS = 5°:
PROCEDURE
Turn off the clearance transmitter. Insert the 90°-stub into the course SBO path.
Connect a directional coupler with 50Ω load to antenna O/P A3.
Connect the NM3710 (use 20 dB attenuator at NM3710 I/P) to the directional coupler's for-
ward port.
Adjust the SBO attenuator (for the Tx to air) until the DDM value equals the previously calcu-
lated value for the CS.
Move the directional coupler to A4, A5 and compare readings with calculated values. If mea-
sured DDM is lower than the calculated values for A4, A5 then increase the SBO power, or
vice versa, until a fairly good matching set of values are obtained.
% DDM µA %SDM
A3 -40.0 -387 53.8
A4 -38.3 -371 40.0
A5 -22.9 -222 40.0
DDMAn()
DDM 4°()
4°⋅
CS
---------------------------------
=
D
DMA353.8 4⋅–
5
---------------------43.0%==

Adjust the SBO attenuator for the other Tx to the same setting.
Remove the 90°-stub.
3.3.2 Clearance SBO power
Switch off the course transmitter.
Insert the 90°-stub in the CLR SBO path. Connect the Field Test Set to the BNC test connec-
tor (antenna 7 sample) in the ADU. (Use 20...30 dB attenuator at the Field Test Set I/P).
Switch on the clearance transmitter. Adjust the CLR SBO attenuator in the cabinet (associ-
ated with Tx to air) until a reading of 36% DDM is obtained.
Carry out the same procedure for the other transmitter.
3.3.3 DDM field check
Set the localizer to normal radiation (clearance transmitter on). From the centreline of the
opposite threshold determine points perpendicular to the CL 105 meter to both sides of the
runway. Use the NM3710 with portable antenna and measure DDM at these points. The read-
ings should be close to -15.5% at the 90-side and 15.5% at the 150-side. However, some
unsymmetry may be expected due to reflections and tolerances in the antenna system.
Check the CL DDM at two or three positions in order to estimate an average value. Expected
value: 0.0%±0.2% DDM.
3.4 Monitor combining unit (MCU) adjustments
3.4.1 Course Line
Connect the Field Test Set to the CL output connector of the MCU.
Adjust the CL line stretcher to obtain 0.0% DDM.
3.4.2 Course Sector
Connect the Field Test Set to the CS output of the MCU.
Adjust the CS line stretcher to obtain a reading of 15.5% DDM.
3.4.3 Clearance
Connect the Field Test Set to the CLR output connector of the MCU. Adjust the CLR line
stretcher to obtain a reading of 27% DDM.
3.5 Near field monitor adjustments
The exact position of the near field monitor antenna cannot be determined until after the flight
check is completed, due to possible mechanical re-alignment of the antenna array.

3.5.1 Mechanical alignment
Align the near field (NF) monitor antenna mechanically in the extended runway centreline
position.
3.5.2 Final electrical position adjustment
Connect the Field Test Set to the NF monitor cable. The reading should be 0.0% DDM if the
antenna is aligned correctly and no reflections appear.
Otherwise, a small mechanical re-positioning of the antenna may be necessary in order to
obtain 0.0% DDM.
3.6 DC-Loop adjustment and testing
3.6.1 DC-LOOP adjustment
The DC loop (cable fault monitor) alignment is carried out accordingly to the procedure
described in Monitor Alignment and Calibration chapter.
3.6.2 Antenna fault condition testing
For this test observe that the LLZ cabinet System Status indicates ALARM.
The transmitter must be on during this test.
The monitors should be in MANUAL mode in order to prevent transmitter from being shut off
during the test.
Disconnect one antenna at a time and check that the LLZ cabinet System Status indicates
ALARM after each antenna disconnection.
Carry out this test for all antennas.

4 NM 3525 24 Elements antenna system adjustments - LLZ
4.1 Mechanical alignments of antenna array
4.1.1 Right angle points with reference to runway centre line
The alignment of the antenna array perpendicular to the runway centreline should be carried
out to an accuracy of 0.01°.
This corresponds to within 5 mm accuracy at positions antenna 1 and antenna 24. A theodo-
lite should be utilised.
4.1.2 Spacing distance between LPDA’s
Check that the spacing between each LPDA is 2.04 m.
Tolerance: ±5 mm.
4.1.3 Vertical alignment of LPDA support masts
On each rear support mast for LPDA check with waterlevel that mast is vertically aligned in
both planes.
4.1.4 Azimuth alignment of LPDA’s
Determine a fixed point as far as possible along the extended centreline not less than approx-
imately 3000 m from the antenna array.
On each LPDA utilise the top horizontal line composed of the two half sections of the radome
to point toward the fixed point.
If necessary adjust the LPDA horizontally by adjusting the mast supports on the front mast, so
that the extended radome top line ends at the fixed point.
4.2 Electrical measurements
4.2.1 CSB and SBO cables
Course Tx cables.
The CSB and SBO cable between the cabinet and MCU must be of equal electrical length.
Utilise a vector voltmeter or network analyser in a test set-up as in Figure 4-1.
Measure open cable return phase for each cable.
Refer to CSB cable as zero phase and measure the return phase for the SBO cable. The
cable pair must be matched within ±3.0° return phase, equal to ±1.5° true phase.
Clearance Tx cables.
Repeat the procedure 1.2.1 for CLR Tx CSB and SBO cables

.
Figure 4-1 Cable phasing measurement set-up.
4.2.2 CSB/SBO phasing
127(
6ZLWFKRIIWKHFOHDUDQFHWUDQVPLWWHU
$VFHUWDLQWKDWWKH7[PRGXODWRUXVHGLVRSWLPDOO\FDOLEUDWHG
Connect the NM3710 Field Test Set to the monitor BNC test connector in the ADU. (Use
20..30 dB attenuator at the I/P of the Field Test Set.)
Adjust SBO phaser in the Cabinet (associated with Tx to air) to obtain 0.0% DDM reading.
Repeat the phasing procedure for the other transmitter.
Switch off the course transmitter.
With the clearance transmitter on repeat the phasing procedure now adjusting the clearance
SBO phaser associated with Tx to air.
4.2.3 Antenna cable lengths (Electrical phase equality)
Each antenna cable should be electrically checked before the end connector is terminated in
the LPDA.
Utilise a vector voltmeter or network analyser. Establish antenna cable (A1) (leftmost seen
from rear) return phase as 0° reference phase.
Measure return phase for each of the remaining antenna cables (A2...A24).
Tolerance: ±1.0° true electrical cable length.
See measurement set-up diagram Figure 4-1
20dB
AB
VECTOR VOLTMETER
From cabinet
CSB BNC o/
p
CABLE UNDER TEST
OPEN END
DIR. COUPL.

4.2.4 Antenna pair phasing
127(
%HIRUHWKHDQWHQQDSDLUSKDVLQJSURFHGXUHLVFRPPHQFHGDVFHUWDLQWKDWWKH7[PRGXODWRUXVHGLV
RSWLPDOO\FDOLEUDWHG
6ZLWFKRIIWKHFOHDUDQFHWUDQVPLWWHU
Connect the antenna cables A1 and A24 to the ADU outputs labelled A1 and A24 respec-
tively.
Connect all other ADU outputs to dummy load. Use the NM3710 with portable test antenna.
On the the runway establish a point officially marked as the centre line for DDM measure-
ments. Ascertain that the measurement point is not affected by reflected signals upsetting the
direct received signals from the antenna pairs. This can be tested by moving the test antenna
a few meters back and fourth while observing the DDM reading. If the value is not changing
then the measurement position is OK.
Take a note of the DDM reading first from antenna pair A1/A24.
Connect pair A2/A23 to ADU outputs A2/A23 and disconnect pair A1/A24, dummyload A1/
A24 ADU.
Take a note of the DDM reading.
Carry out this procedure until all antenna pairs DDM readings have been noted.
If any antenna pair measures DDM different from zero, one of the antenna pair feed cable
lengths should be trimmed in order to bring the DDM reading to zero.
If the DDM reading is positive (150 Hz dominance) the antenna cable at the right hand side
(A13...A24) should be trimmed.
The sensitivity of DDM versus electrical phase error of 6° (4° CS) is given in the table below:

Cable trimming length: 6.2 mm/°.
4.2.5 Phase and amplitude transfer measurement
Connect each antenna cable and monitor cable to LPDA load and source respectively. Utilise
a vector voltmeter or network analyser in a test set-up Figure 4-2
.
Figure 4-2 Phase and amplitude transfer measurement set-up.
Measure relative transfer phase and amplitude for each Antenna/Monitor return cable in ref-
erence to A1/M1.
Pair µA DDM
(6°) % DDM
(6°)
A1/A24 20.1 2.08
A2/A23 18.5 1.91
A3/A22 16.8 1.74
A4/A21 14.9 1.54
A5/A20 13.2 1.36
A6/A19 11.4 1.18
A7/A18 9.7 1.00
A8/A17 7.9 0.82
A9/A16 6.2 0.64
A10/A15 4.4 0.45
A11/A14 2.6 0.27
A12/A13 0.9 0.09
20dB
AB
VECTOR VOLTMETER
A(n)
M(n)
From cabinet
CSB BNC o/p
LPDA
DIR. COUPL.

Then determine if one of the monitor cables must be trimmed in order to comply with phase
tolerance for the set of cables.
Tolerance: ±2°.
Amplitude tolerance: ±1.0 dB. If the amplitude tolerance is exceeded something might be
wrong in the LPDA monitor circuit or connector/cable.
Record the final result in Ground Commissioning Record.
4.2.6 Antenna return loss
Utilise a vector voltmeter or network analyser in a test set-up Figure 4.3. Measure return loss
for each LPDA.
Measure and record in Ground Commissioning Record the return loss value for each LPDA
including antenna cable.
Tolerance: 20 dB minimum
.
Figure 4-3 Antenna return loss measurement set-up.
4.3 Course sector width adjustments
The required course sector width (CS) can be pre-adjusted by two methods:
1. DDM measurement of ADU antenna feed outputs.
2. DDM field check.
Preferably both methods should be carried out and compared.
4.3.1 DDM check of ADU O/P
At each antenna feed output of the ADU the measured DDM is a result of the SBO/CSB ratio
according to the formula
20dB
AB
VECTOR VOLTMETER
From cabinet
CSB BNC o/
p
DIR. COUPL.
Antenna cable under test
Antenna

where
CSB is a fixed value.
SBO is adjustable by the SBO attenuator in the cabinet.
γ is 0° when the 90°-stub is inserted into the SBO.
For each course sector width (CS) of the array a set of corresponding DDM values exists
unique for each antenna O/P.
For CS = 4°:
For other CS values use the formula:
Example
A3 DDM for CS = 3.5°:
PROCEDURE
Turn off the clearance transmitter. Insert the 90°-stub into the course SBO path.
Connect a directional coupler with 50Ω load to antenna O/P A3.
Connect the NM3710 (use 20 dB attenuator at NM3710 I/P) to the directional coupler's for-
ward port.
Adjust the SBO attenuator (for the Tx to air) until the DDM value equals the previously calcu-
lated value for the CS.
Move the directional coupler to A4, A5 and compare readings with calculated values. If mea-
sured DDM is lower than the calculated values for A4, A5 then increase the SBO power, or
vice versa, until a fairly good matching set of values are obtained.
Adjust the SBO attenuator for the other Tx to the same setting.
Remove the 90°-stub.
A3 -33.0% DDM
A4 -29.3% DDM
A5 -26.0% DDM
DDM 2SBO⋅
CSB
-------------------COSγ=
DDMAn()
DDM 4°()
4°⋅
CS
---------------------------------
=
DDMA333.0 4⋅–
3.5
---------------------37%–==

4.3.2 Clearance SBO power
Switch off the course transmitter.
Insert the 90°-stub in the CLR SBO path. Connect the Field Test Set to the BNC test connec-
tor TEST 1 (antenna 13 sample) in the ADU. (Use 20...30 dB attenuator at the Field Test Set
I/P).
Switch on the clearance transmitter. Adjust the CLR SBO attenuator in the cabinet (associ-
ated with Tx to air) until a reading of 36% DDM is obtained.
Carry out the same procedure for the other transmitter.
4.3.3 DDM field check
Set the localizer to normal radiation (clearance transmitter on). From the centreline of the
opposite threshold determine points perpendicular to the CL 105 meter to both sides of the
runway. Use the NM3710 with portable antenna and measure DDM at these points. The read-
ings should be close to -15.5% at the 90-side and 15.5% at the 150-side. However, some
unsymmetry may be expected due to reflections and tolerances in the antenna system.
Check the CL DDM at two or three positions in order to estimate an average value.
Expected value: 0.0% ±0.2% DDM.
4.4 Monitor combining unit (MCU) adjustments
4.4.1 Course Line
Connect the Field Test Set to the CL output connector of the MCU.
Adjust the CL line stretcher to obtain 0.0% DDM.
4.4.2 Course Sector
Connect the Field Test Set to the CS output of the MCU.
Adjust the CS line stretcher to obtain a reading of 15.5% DDM.
4.4.3 Clearance
Connect the Field Test Set to the CLR output connector of the MCU. Adjust the CLR line
stretcher to obtain a reading of 27% DDM.
4.5 Near field monitor adjustments
The exact position of the near field monitor antenna cannot be determined until after the flight
check is completed, due to possible mechanical re-alignment of the antenna array.
4.5.1 Mechanical alignment
Align the near field (NF) monitor antenna mechanically in the extended runway centreline
position.

4.5.2 Final electrical position adjustment
Connect the Field Test Set to the NF monitor cable. The reading should be 0.0% DDM if the
antenna is aligned correctly and no reflections appear.
Otherwise, a small mechanical re-positioning of the antenna may be necessary in order to
obtain 0.0% DDM.
4.6 DC-Loop adjustment and testing
4.6.1 DC-LOOP adjustment
The DC loop (cable fault monitor) alignment is carried out accordingly to the procedure
described in Monitor Alignment and Calibration chapter.
4.6.2 Antenna fault condition testing
For this test observe that the LLZ cabinet System Status indicates ALARM.
The transmitter must be on during this test.
The monitors should be in MANUAL mode in order to prevent transmitter from being shut off
during the test.
Disconnect one antenna at a time and check that the LLZ cabinet System Status indicates
ALARM after each antenna disconnection.
Carry out this test for all antennas.

5 NM 3526 16 Elements antenna system adjustments - LLZ
5.1 Mechanical alignments of antenna array
5.1.1 Right angle points with reference to runway centre line
The alignment of the antenna array perpendicular to the runway centreline should be carried
out to an accuracy of 0.01°.
This corresponds to within 4 mm accuracy at positions antenna 1 and antenna 16. A theodo-
lite should be utilised.
5.1.2 Spacing distance between LPDA’s
Check that the spacing between each LPDA is according to dimensions given in dwg.no.
16362A3.
Tolerance: ±5 mm.
5.1.3 Vertical alignment of LPDA support masts
On each rear support mast for LPDA check with waterlevel that mast is vertically aligned in
both planes.
5.1.4 Azimuth alignment of LPDA’s
Determine a fixed point as far as possible along the extended centreline not less than approx-
imately 3000 m from the antenna array.
On each LPDA utilise the top horizontal line composed of the two half sections of the radome
to point toward the fixed point.
If necessary adjust the LPDA horizontally by adjusting the mast supports on the front mast, so
that the extended radome top line ends at the fixed point.
5.2 Electrical measurements
5.2.1 CSB and SBO cables
Course Tx cables.
The CSB and SBO cable between the cabinet and MCU must be of equal electrical length.
Utilise a vector voltmeter or network analyser in a test set-up as in Figure 5-1.
Measure open cable return phase for each cable.
Refer to CSB cable as zero phase and measure the return phase for the SBO cable. The
cable pair must be matched within ±3.0° return phase, equal to ±1.5° true phase.
Clearance Tx cables.
Repeat the procedure 1.2.1 for CLR Tx CSB and SBO cables

.
Figure 5-1 Cable phasing measurement set-up.
5.2.2 CSB/SBO phasing
127(
6ZLWFKRIIWKHFOHDUDQFHWUDQVPLWWHU
$VFHUWDLQWKDWWKH7[PRGXODWRUXVHGLVRSWLPDOO\FDOLEUDWHG
Connect the NM3710 Field Test Set to the monitor BNC test connector in the ADU. (Use
20..30 dB attenuator at the I/P of the Field Test Set.)
Adjust SBO phaser in the Cabinet (associated with Tx to air) to obtain 0.0% DDM reading.
Repeat the phasing procedure for the other transmitter.
Switch off the course transmitter.
With the clearance transmitter on repeat the phasing procedure now adjusting the clearance
SBO phaser associated with Tx to air.
5.2.3 Antenna cable lengths (Electrical phase equality)
Each antenna cable should be electrically checked before the end connector is terminated in
the LPDA.
Utilise a vector voltmeter or network analyser. Establish antenna cable (A1) (leftmost seen
from rear) return phase as 0° reference phase.
Measure return phase for each of the remaining antenna cables (A2...A16).
Tolerance: ±1.0° true electrical cable length.
See measurement set-up diagram Figure 5-1
20dB
AB
VECTOR
From cabinet
CSB BNC o/
p
CABLE UNDER TEST
OPEN END
DIR. COUPL.

5.2.4 Antenna pair phasing
127(
%HIRUHWKHDQWHQQDSDLUSKDVLQJSURFHGXUHLVFRPPHQFHGDVFHUWDLQWKDWWKH7[PRGXODWRUXVHGLV
RSWLPDOO\FDOLEUDWHG
6ZLWFKRIIWKHFOHDUDQFHWUDQVPLWWHU
Connect the antenna cables A1 and A16 to the ADU outputs labelled A1 and A16 respec-
tively.
Connect all other ADU outputs to dummy load. Use the NM3710 with portable test antenna.
On the the runway establish a point officially marked as the centre line for DDM measure-
ments. Ascertain that the measurement point is not affected by reflected signals upsetting the
direct received signals from the antenna pairs. This can be tested by moving the test antenna
a few meters back and fourth while observing the DDM reading. If the value is not changing
then the measurement position is OK.
Take a note of the DDM reading first from antenna pair A1/A16.
Connect pair A2/A15 to ADU outputs A2/A15 and disconnect pair A1/A16, dummyload A1/
A16 ADU.
Take a note of the DDM reading.
Carry out this procedure until all antenna pairs DDM readings have been noted.
If any antenna pair measures DDM different from zero, one of the antenna pair feed cable
lengths should be trimmed in order to bring the DDM reading to zero.
If the DDM reading is positive (150 Hz dominance) the antenna cable at the right hand side
(A8...A16) should be trimmed.
The sensitivity of DDM versus electrical phase error of 2° (4° CS) is given in the table below:
Pair DDM µADDM %
A1/A16 12.6 1.30
A2/A15 7.5 0.78
A3/A14 5.7 0.59
A4/A13 4.2 0.43
A5/A12 2.8 0.29
A6/A11 2.0 0.21
A7/A10 1.1 0.11
A8/A9 0.4 0.04

The sensitivity of DDM versus electrical phase error can be estimated using the following pro-
cedure:
1. Note the DDM value reported by the operator at the Field Test Set for the antenna pair
under test.
2. a) If the DDM value is positive (150 Hz dominance), insert a male-female (MF) N-adaptor
(-9°) in the antenna left side seen forward toward the Field test set.
b) If the DDM value is negative (90 Hz dominance), insert a male-female (MF) N-adaptor
(-9°) in the antenna right side seen forward toward the Field test set.
3. Note the new DDM value. (This value should have oposite polarity compared to the value
without the adaptor.)
4. Calculate the corresponding phase error (electrical degrees) from the formula
DDM1 : DDM (%) measured in item 1.
DDM3 : DDM (%) measured in item 3.
(Example values from NM3523B)
Example 1:
Item 1: A1/A12: +4.3% DDM
Item 3: A1+MF/A12: -2.0% DDM (MF in A1)
Example 2:
Item 1: A6/A7: -0.6% DDM
Item 3: A6 /A7+MF: +1.86% DDM (MF in A7)
Cable trimming length: 6.2 mm/°.
5.2.5 Phase and amplitude transfer measurement
Connect each antenna cable and monitor cable to LPDA load and source respectively. Utilise
a vector voltmeter or network analyser in a test set-up Figure 5-2
ϕ°() 9°DDM1
DDM1DDM3
+
-------------------------------------------
=
ϕ9°4.3⋅
4.3 2.0+
---------------------4.8°==
ϕ9°0.6⋅
0.6 1.86+
------------------------1.7°==

.
Figure 5-2 Phase and amplitude transfer measurement set-up.
Measure relative transfer phase and amplitude for each Antenna/Monitor return cable in ref-
erence to A1/M1.
Then determine if one of the monitor cables must be trimmed in order to comply with phase
tolerance for the set of cables.
Tolerance: ±2°.
Amplitude tolerance: ±1.0 dB. If the amplitude tolerance is exceeded something might be
wrong in the LPDA monitor circuit or connector/cable.
Record the final result in Ground Commissioning Record.
5.2.6 Antenna return loss
Utilise a vector voltmeter or network analyser in a test set-up Figure 5-3. Measure return loss
for each LPDA.
Measure and record in Ground Commissioning Record the return loss value for each LPDA
including antenna cable.
Tolerance: 20 dB minimum
.
Figure 5-3 Antenna return loss measurement set-up.
20dB
AB
VECTOR VOLTMETER
A
(
n
)
M
(
n
)
From cabinet
CSB BNC o/
p
Ant.
DIR. COUPL.
20dB
AB
VECTOR VOLTMETER
From cabinet
CSB BNC o/
p
DIR. COUPL.
Antenna cable under test
Antenna

5.3 Course sector width adjustment
The required course sector width (CS) can be pre-adjusted by two methods:
1. DDM measurement of ADU antenna feed outputs.
2. DDM field check.
Preferably both methods should be carried out and compared.
5.3.1 DDM check of ADU O/P
At each antenna feed output of the ADU the measured DDM is a result of the SBO/CSB ratio
according to the formula
where
CSB is a fixed value.
SBO is adjustable by the SBO attenuator in the cabinet.
γ is 0° when the 90°-stub is inserted into the SBO and clearance transmitter is switched off.
For each course sector width (CS) of the array a set of corresponding DDM values exists
unique for each antenna O/P.
For CS = 4°:
For other CS values use the formula:
Example
A3 DDM for CS = 3.5°:
PROCEDURE
Turn off the clearance transmitter. Insert the 90°-stub into the course SBO path.
Connect a directional coupler with 50Ω load to antenna O/P A3.
% DDM µA% SDM
A3 -33.7 -326 40.0
A4 -24.9 -241 40.0
A5 -17.9 -173 40.0
DDM 2SBO⋅
CSB
-------------------COSγ=
DDMAn()
DDM 4°()
4°⋅
CS
---------------------------------
=
D
MA3() 33.7 4⋅–
3.5
---------------------38.5%==

Connect the NM3710 (use 20 dB attenuator at NM3710 I/P) to the directional coupler’s for-
ward port.
Adjust the SBO attenuator (for the Tx to air) until the DDM value equals the previously calcu-
lated value for the CS.
Move the directional coupler to A4, A5 and compare readings with calculated values. If mea-
sured DDM is lower than the calculated values for A4, A5 then increase the SBO power, or
vice versa, until a fairly good matching set of values are obtained.
Adjust the SBO attenuator for the other Tx to the same setting.
Remove the 90°-stub.
5.3.2 Clearance SBO power
Switch off the course transmitter.
Insert the 90°-stub in the CLR SBO path. Connect the Field Test Set to the BNC test connec-
tor (antenna 4 sample) in the ADU. (Use 20...30 dB attenuator at the Field Test Set I/P).
Switch on the clearance transmitter. Adjust the CLR SBO attenuator in the cabinet (associ-
ated with Tx to air) until a reading of 43.6% SDM is obtained.
Carry out the same procedure for the other transmitter.
5.3.3 DDM field check
Set the localizer to normal radiation (clearance transmitter on). From the centreline of the
opposite threshold determine points perpendicular to the CL 105 meter to both sides of the
runway. Use the NM3710 with portable antenna and measure DDM at these points. The read-
ings should be close to -15.5% at the 90-side and 15.5% at the 150-side. However, some
unsymmetry may be expected due to reflections and tolerances in the antenna system.
Check the CL DDM at two or three positions in order to estimate an average value.
Expected value: 0.0%±0.2% DDM.
5.4 Monitor combining unit (MCU) adjustments
5.4.1 Course Line
Connect the Field Test Set to the CL output connector of the MCU.
Adjust the CL line stretcher to obtain 0.0% DDM.
5.4.2 Course Sector
Connect the Field Test Set to the CS output of the MCU.
Adjust the CS line stretcher to obtain a reading of 15.5% DDM.

5.4.3 Clearance
Connect the Field Test Set to the CLR output connector of the MCU and use the acual DDM
as standard signal to the monitors.
5.5 Near field monitor adjustments
The exact position of the near field monitor antenna cannot be determined until after the flight
check is completed, due to possible mechanical re-alignment of the antenna array.
5.5.1 Mechanical alignment
Align the near field (NF) monitor antenna mechanically in the extended runway centreline
position.
5.5.2 Final electrical position adjustment
Connect the Field Test Set to the NF monitor cable. The reading should be 0.0% DDM if the
antenna is aligned correctly and no reflections appear.
Otherwise, a small mechanical re-positioning of the antenna may be necessary in order to
obtain 0.0% DDM.
5.6 DC-Loop adjustment and testing
5.6.1 DC-LOOP adjustment
The DC loop (cable fault monitor) alignment is carried out accordingly to the procedure
described in Monitor Alignment and Calibration chapter.
5.6.2 Antenna fault condition testing
For this test observe that the LLZ cabinet System Status indicates ALARM.
The transmitter must be on during this test.
The monitors should be in MANUAL mode in order to prevent transmitter from being shut off
during the test.
Disconnect one antenna at a time and check that the LLZ cabinet System Status indicates
ALARM after each antenna disconnection.
Carry out this test for all antennas.

6 NM 3543 Null reference antenna system adjustments - Glide path
6.1 Mechanical alignment of mast and antennas
6.1.1 Preparation of mechanical- and electrical data
A ground level plot made with theodolite should be available. From this plot Forward slope
(FSL) and Sideway slope (SSL) can be calculated. FSL is defined negative for falling forward
slope seen from the GP mast. SSL is defined positive for rising side slope seen from the GP
mast toward the runway.
In order to calculate the data needed to position the GP mast, the antenna elements and near
field antenna, the following parameters must be known:
• Forward slope (FSL)
• Sideway slope (SSL)
• Sideway distance from runway centreline to GP mast
• Operating glide path angle
• GP rf channel frequency
The mechanical data outputs are:
• Antenna forward shift, same as FSL
• Antenna elements heights
• Antenna elements offsets
• Near field monitor antenna distance and height
• Threshold data
6.1.2 Forward shift (FWD)
The antennas should be vertically offset to compensate for forward slope (FSL). See Section
1, Chapter 3.6.3.
6.1.3 Antenna heights
Antenna heights shall be referenced to the intercept point of the terrain slope and the GP
mast. In addition rf wave penetration a few centimetres into the soil (reflection plane) shall be
included to equal the specified antenna heights. See Section 1, Chapter 3.6.3.
6.1.4 Antenna offsets.
The antenna offsets derived from (51.0) shall be accurately adjusted such that the upper ele-
ment is closer to the runway than the lower element. See Section 1, Chapter 3.6.3.
6.2 Electrical measurements
6.2.1 Antenna cable lengths (Electrical phase equality)
Each antenna cable must be electrically measured before the end connector is terminated in
the Antenna.
Utilise a vector voltmeter or network analyser. Establish the lower antenna cable (A1) return
phase as 0° reference phase.

Measure return phase for the upper antenna cable (A2). Then take into account the phase
centres of the Antenna given in the factory data sheet. Determine if one of the cables should
be trimmed in order to comply with phase equality tolerance for the set of antennas.
Tolerance: ±1.0° true electrical cable length including Antenna phase centre deviation. (if
available)
See measurement set-up diagram Figure 6-1
Figure 6-1 Cable phasing measurement set-up.
6.2.2 Monitor return cable length
Measure return phase as described in (52.0) for both monitor cables. Check that initial values
are within ±1.5° true phase (±3.0° return phase).
6.2.3 Phase and amplitude transfer measurement
Connect each antenna cable and monitor cable to Antenna load and source respectively. Uti-
lise a vector voltmeter or network analyser in a test set-up
Figure 6-2 Phase and amplitude transfer measurement set-up.
20dB
AB
VECTOR
From cabinet
CSB BNC o/
p
CABLE UNDER TEST
OPEN END
DIR. COUPL.
20dB
AB
VECTOR VOLTMETER
A
(
n
)
M
(
n
)
From cabinet
CSB BNC o/
p
Ant.
DIR. COUPL.

Measure and record phase/amplitude for upper antenna transfer signals. Then determine if
one of the monitor cables must be trimmed in order to comply with phase tolerance for the set
of cables.
Tolerance: ±1°.
Amplitude tolerance: ±1.0 dB. If the amplitude tolerance is exceeded something might be
wrong in the Antenna monitor circuit or connector/cable.
Record final result in Ground Commissioning Records.
6.2.4 Antenna return loss
Utilise a vector voltmeter or network analyser in a test set-up
Figure 6-3. Measure return loss for each Antenna.
Measure and record in Ground Commissioning Record the return loss value for each Antenna
including antenna cable.
Tolerance: 20 dB minimum
.
Figure 6-3 Antenna return loss measurement set-up.
6.3 CSB/SBO Phasing and sector width adjustment
See Figure 6-4
6.3.1 CSB/SBO phasing
A 180° hybrid can be utilised to adjust (preset) the phase between CSB and SBO.
Connect the O/P CSB cable from the Cabinet to port 1. Connect the O/P SBO cable from the
Cabinet to port 3.
Insert the 90°-stub into the SBO path.
20dB
AB
VECTOR VOLTMETER
From cabinet
CSB BNC o/p
DIR. COUPL.
Antenna cable under test
Antenna

The hybrid port 4 is terminated in 50Ω, min. 5 watts dummy load. Port 2 is connected to a
directional coupler which is terminated in 50Ω, min. 5 watts dummy load. The directional cou-
pler forward port is connected to NM3710 Field Test Set. Use 20 dB attenuator at the BNC I/P
of NM3710.
The NM3710 DDM should be 0.0%. If necessary adjust the SBO phaser of associated trans-
mitter in the Cabinet to 0.0% DDM. Carry out the same procedure for the other transmitter.
6.3.2 Sector Width adjustment
Figure 6-4 test set-up is used. Remove the 90°-stub.
The NM3710 DDM should be 23.4%. If necessary adjust the SBO attenuator of associated
transmitter in the Cabinet to obtain 23.4% DDM. Carry out the same procedure for the other
transmitter.
127(
7RFRPSHQVDWHIRUDVORSLQJWHUUDLQLQIURQWRIWKH*3WKH''0DFFRUGLQJO\VKRXOGEH
where
θ0 is the glide path angle
FSL is forward slope, negative sign for falling terrain referred from the GP
.
Figure 6-4 Measurement set-up for CSB/SBO phasing and Sector Width adjustment.
DDM 11.7 θ0FSL–()
θ0
--------------------------------------
=
1
2
3
4
0°
0°0°
180°
180° HYBRID
50Ω 50Ω
CSB
SBO 20dB NM3710
FIELD TEST SET

6.4 Monitoring combining unit (MCU) adjustments
6.4.1 Procedure
Insert the 90°/stub in the SBO output of the NM3531 Cabinet.
Connect the Field Test Set to the CL output of the MCU. Check that the reading is 0% ±0.5%
DDM.
Remove the 90°-stub from the SBO path.
Connect the Field Test Set to the DS output of the MCU. Adjust the MCU attenuator at A2 to
obtain 17.5% DDM.
6.5 Location of near field antenna position
According to site data (slope, etc.,) the theoretical position of the NF antenna should be calcu-
lated.
6.5.1 Near Field Monitor Position Search
Install the NF antenna at the position according to calculations (distance and height). Adjust
the height to obtain 0 DDM reading on the Field Test Set connected to the NF monitor cable.
(Ladder and personnel must be vacated from the NF area.)


7 NM 3544 Sideband reference antenna system adjustment - Glide path
7.1 Mechanical alignment of mast and antennas
7.1.1 Preparation of mechanical- and electrical data
A ground level plot made with theodolite should be available. From this plot Forward slope
(FSL) and Sideway slope (SSL) can be calculated. FSL is defined negative for falling forward
slope seen from the GP mast. SSL is defined positive for rising side slope seen from the GP
mast toward the runway.
In order to calculate the data needed to position the GP mast, the antenna elements and near
field antenna, the following parameters must be known:
• Forward slope (FSL)
• Sideway slope (SSL)
• Sideway distance from runway centreline to GP mast
• Operating glide path angle
• GP rf channel frequency
The mechanical data outputs are:
• Mast tilt, same as FSL
• Antenna elements heights
• Antenna elements offsets
• Near field monitor antenna distance and height
• Threshold data
7.1.2 Forward shift (FWD)
The antennas should be vertically offset to compensate for forward slope (FSL). See Section
1, Chapter 3.6.3.
7.1.3 Antenna heights
Antenna heights shall be referenced to the intercept point of the terrain slope and the GP
mast. In addition rf wave penetration a few centimetres into the soil (reflection plane) shall be
included to equal the specified antenna heights. See Section 1, Chapter 3.6.3.
7.1.4 Antenna offsets
The antenna offsets derived from (61.0) shall be accurately adjusted such that the Upper ele-
ment is closer to the runway than the lower element. See Section 1, Chapter 3.6.3.
7.2 Initial electrical measurements
7.2.1 Antenna cable lengths (Electrical phase equality)
Each antenna cable must be electrically measured before the end connector is terminated in
the Antenna.
Utilise a vector voltmeter or network analyser. Establish the lower antenna cable (A1) return
phase as 0° reference phase.

Measure return phase for the upper antenna cable (A2). Then take into account the phase
centres of the Antenna given in the factory data sheet. Determine if one of the cables should
be trimmed in order to comply with phase equality tolerance for the set of antennas.
Tolerance: ±1.0° true electrical cable length including Antenna phase centre deviation. (if
available)
See measurement set-up diagram Figure 7-1 below
:
Figure 7-1 Cable phasing measurement set-up.
7.2.2 Monitor return cable length
Measure return phase as described in (62.0) for both monitor cables. Check that initial values
are within ±1.5° true phase (±3.0° return phase).
7.2.3 Phase and amplitude transfer measurement
Connect each antenna cable and monitor cable to Antenna load and source respectively. Uti-
lise a vector voltmeter or network analyser in a test set-up Figure 7-2, and measure relative
transfer phase and amplitude for the upper antenna cable (A2) in reference to the lower
antenna (A1).
Figure 7-2 Phase and amplitude transfer measurement set-up.
20dB
AB
VECTOR
From cabinet
CSB BNC o/
p
CABLE UNDER TEST
OPEN END
DIR. COUPL.
20dB
AB
VECTOR VOLTMETER
A
(
n
)
M
(
n
)
From cabinet
CSB BNC o/
p
Ant.
DIR. COUPL.

Measure and record phase/amplitude for upper antenna transfer signals. Then determine if
one of the monitor cables must be trimmed in order to comply with phase tolerance for the set
of cables.
Tolerance: ±1°.
Amplitude tolerance: ±1.0 dB. If the amplitude tolerance is exceeded something might be
wrong in the Antenna monitor circuit or connector/cable.
Record final result in Ground Commissioning Record.
7.2.4 Antenna return loss
Utilise a vector voltmeter or network analyser in a test set-up Figure 7-3. Measure return loss
for each Antenna.
Measure and record in Ground Commissioning Record the return loss value for each Antenna
including antenna cable.
Tolerance: 20 dB minimum
.
Figure 7-3 Antenna return loss measurement set-up.
7.3 CSB/SBO Phasing
7.3.1 CSB and SBO cables
The CSB and SBO cable between NM3531 cabinet and MCU must be of equal electrical
length. Utilise a vector voltmeter or network analyser in a test set-up as in Figure 7-1.
Measure open cable return phase for each cable.
Refer to CSB cable as zero phase and measure the return phase for the SBO cable. The
cable pair must be matched within ±3.0° return phase, equal to ±1.5° true phase.
20dB
AB
VECTOR VOLTMETER
From cabinet
CSB BNC o/
p
DIR. COUPL.
Antenna cable under test
Antenna

7.3.2 CSB/SBO phasing
Insert the 90°-stub in the SBO cable path to the ADU. Connect the NM3710 Field Test Set to
the monitor return cable (M1) from the lower antenna.
Adjust SBO phaser in the Cabinet (associated with Tx to air) to obtain 0 DDM reading.
Repeat the phasing procedure for the second transmitter.
Remove the 90°-stub from the SBO path.
7.4 Sector width adjustment
7.4.1 SBO power adjustment
Connect the Field Test Set to the monitor return cable (M1) from the lower antenna.
Adjust the SBO step attenuator in the cabinet (associated with Tx to air) to obtain the pre-
scribed DDM value.
For a perfect flat terrain the DDM in A1 (M1) should be -11.7%.
127(
7RFRPSHQVDWHIRUDVORSLQJWHUUDLQLQIURQWRIWKH*3WKH''0DFFRUGLQJO\VKRXOGEH
where θ is the glide path angle
FSL is forward slope, negative for falling terrain referred from the GP.
Repeat the SBO attenuator adjustment for the second transmitter.
7.5 Monitor combining unit (MCU) adjustments
7.5.1 Procedure for horizontal terrain (FSL = 0°)
Connect the Field Test Set to the CL output of the MCU. Adjust the MCU phaser at A1 (lower
antenna) to read 0% DDM.
Remove the 90°-stub from the SBO path. Adjust the MCU attenuator at A1 to read 0% DDM at
the CL output.
Connect the Field Test Set to the DS output of the MCU. Read the DDM value. This should be
8.75% DDM unless a SBO power compensation for sloping foreground and K3, K4 cable
length compensation has been taken into account (See 1.5.2).
7.5.2 Procedure for sloping terrain (1° > FSL > -1°)
If the terrain in front of the GP is not horizontal, cable lengths K3 and K4 should be changed in
accordance with the table below:
DDM 11.7 θ0FSL–()–
θ0
-----------------------------------------
=

FSL (+) : Upsloping terrain.
(-) mm means shorter cable.
After cable length modification carry out procedure 1.5.1. Note that DS DDM after adjustment
should correspond to the value given in the table above (column 4). However, the final DS
DDM value depends on the SBO power setting of the Tx SBO attenuator.
7.6 Location of near field antenna position
According to site data (slope, etc.,) the theoretical position of the NF antenna should be calcu-
lated.
Install the NF antenna at the position according to calculations (distance and height). Adjust
the height to obtain 0% DDM reading on the Field Test Set connected to the NF monitor
cable. (Ladder and personnel must be vacated from the NF area.)
FSL (°) K3 (mm) K4 (mm) DS DDM (%)
1.0 -27 -18 10.3
0.9 -23 -15 10.1
0.8 -19 -13 9.9
0.7 -16 -11 9.7
0.6 -13 -9 9.5
0.5 -11 -7 9.4
0.4-8-59.3
0.3-6-49.2
0.2-4-39.0
0.1-2-28.9
0.0 0 0 8.75
-0.1 2 1 8.6
-0.2 3 2 8.5
-0.3 5 3 8.4
-0.4 6 4 8.3
-0.5 8 5 8.2
-0.6 9 6 8.1
-0.7 10 7 8.0
-0.8 11 7 7.9
-0.9 12 8 7.8
-1.0 13 9 7.8

Theoretically, DDM should be close to -0.9% DDM (90) as a minimum value due to path loss
differences between antennas seen from the NF antenna.
7.6.1 Near Field Monitor Position Search
A de-phasing test procedure of upper antenna (A2) can be carried out in order to search for
the optimum monitor position.
An "elbow" type N-adapter (-21°) is inserted in the lower antenna feed (A1). This is equivalent
to advance (+) phase of the upper antenna.
Retard (-) phase is introduced by inserting the "elbow" adapter in A2 only.
The DDM readings and correlation of the monitor antenna signal to the CL integral from MCU
(far field) should theoretically be:
127(
7KHYDOXHVDWWKH1)SRVLWLRQDUHQRUPDOLVHGLH''0ZLWKQR$GHSKDVLQJ
In order to look for the optimal distance between the GP mast and the NF antenna carry out
the following test:
Measure DDM at positions +1 m and -1 m of original position. Then compare the results with
the theoretical values for these offsets from the nominal 180° position, as denoted below:
127(
:KHQPRYLQJWKH1)DQWHQQDSRVLWLRQEDFNZDUGDQGIRUZDUGWDNHLQWRDFFRXQWWKHRIIVHW''0
IRUQRGHSKDVLQJLHQRUPDOLVHWKHYDOXHVEHIRUHFRPSDULQJWRWKHRUHWLFDOYDOXHV
Based on the comparing results then determine the best correlated position for the NF monitor
antenna.
Dephasing Near Field (NF) Far field (CL)
21° retard -13µA/-1.5% DDM -11µA/-1.3% DDM
21° advance -11µA/-1.3% DDM -13µA/-1.5% DDM
Dephasing NF 1 m forward NF 1 m backward
21° retard -19µA/-2.2% DDM -9µA/-1.1% DDM
21° advance -7µA/-0.8% DDM -16µA/-1.9% DDM

7.7 Antenna distribution unit (ADU) phase and amplitude check
7KLVFKHFNLVRSWLRQDO
7.7.1 Preparation
Utilise a vector voltmeter in a test set-up Figure 7-4
.
Figure 7-4 Test set-up for ADU Phase and Amplitude check.
Connect CSB and SBO outputs from Cabinet to dummy loads. Terminate the disconnected
cables from ADU to dummy loads.
Switch off the modulation to the transmitter used for the test.
Insert a 20 dB attenuator at the input port of the directional coupler.
Connect a test cable from the Cabinet’s CSB BNC connector to the 20 dB attenuator.
Connect the vector voltmeter A-probe to the directional coupler’s forward O/P.
7.7.2 Procedure
1. Connect the cable TEST SIG (throughput from the directional coupler) to the ADU SBO I/P.
Connect the B-probe to L O/P. Note the B-probe RF level (dB). (0.1 dB resolution)
Move the B-probe to U O/P. If necessary adjust phaser PH1 (AMPLITUDE ADJ) to obtain
0.0 dB difference referenced to L O/P.
127(
,I3+KDVEHHQDGMXVWHGUHFKHFNWKHUHIHUHQFHOHYHOIURP/23DQGPHDVXUHDJDLQWKH823
OHYHO5HSHDWXQWLOG%GLIIHUHQFHLVDFKLHYHG
2. Connect the cable TEST SIG to the SBO input. Connect the B-probe to L O/P. Adjust the
20dB
AB
VECTOR VOLTMETER
From cabinet
CSB BNC o/p
50Ω
ADU
SBO
CSB
U
L
DIR. COUPL.

vector voltmeter to 0° reference phase.
Move the B-probe to U O/P. If necessary adjust SBO U/L phaser (PH2) to obtain 180°
reading at the U O/P.
127(
,I3+KDVEHHQDGMXVWHGUHFKHFNWKHUHIHUHQFHSKDVHIURP/23DQGPHDVXUHDJDLQWKH8SKDVH
5HSHDWXQWLOSKDVHGLIIHUHQFHLVDFKLHYHG
End of check.

8 NM 3545 M-Array antenna system adjustments - Glide path
8.1 Mechanical alignment of mast and antennas
8.1.1 Preparation of mechanical- and electrical data
A ground level plot made with theodolite should be available. From this plot Forward slope
(FSL) and Sideway slope (SSL) can be calculated. FSL is defined negative for falling forward
slope seen from the GP mast. SSL is defined positive for rising side slope seen from the GP
mast toward the runway.
In order to calculate the data needed to position the GP mast, the antenna elements and near
field antenna, the following parameters must be known:
• Forward slope (FSL)
• Sideway slope (SSL)
• Sideway distance from runway centreline to GP mast
• Operating glide path angle
• GP rf channel frequency
The mechanical data outputs are:
• Mast tilt, same as FSL
• Antenna elements heights
• Antenna elements offsets
• Near field monitor antenna distance and height
• Threshold data
8.1.2 Forward shift (FWD)
The antennas should be vertically offset to compensate for forward slope (FSL). See Section
1, Chapter 3.6.3.
8.1.3 Antenna heights
Antenna heights shall be referenced to the intercept point of the terrain slope and the GP
mast. In addition rf wave penetration a few centimetres into the soil (reflection plane) shall be
included to equal the specified antenna heights. See Section 1, Chapter 3.6.3.
8.1.4 Antenna offsets
The antenna offsets derived from (71.0) shall be accurately adjusted such that the upper ele-
ment is closer to the runway than the lower element. See Section 1, Chapter 3.6.3.
8.2 Initial electrical measurements
8.2.1 Antenna cable lengths (Electrical phase equality)
Each antenna cable must be electrically measured before the end connector is terminated in
the Antenna.
Utilise a vector voltmeter or network analyser. Establish the lower antenna cable (A1) return
phase as 0° reference phase.

Measure return phase for the middle antenna cable (A2) and upper antenna cable (A3). Then
take into account the phase centres of the Antennas given in the factory data sheet. Deter-
mine if one of the cables should be trimmed in order to comply with phase equality tolerance
for the set of antennas.
Tolerance: ±1.0° true electrical cable length including Antenna phase centre deviation. (if
available)
See measurement set-up diagram Figure 8-1 below:
Figure 8-1 Cable phasing measurement set-up.
8.2.2 Monitor return cable length
Measure return phase as described in (72.0) for all three monitor cables. Check that initial
values are within ±1.5° true phase (±3.0° return phase).
8.2.3 Phase and amplitude transfer measurement
Connect each antenna cable and monitor cable to Antenna load and source respectively. Uti-
lise a vector voltmeter or network analyser in a test set-up Figure 8-2, and measure relative
transfer phase and amplitude for the middle and upper antenna cable (A2 & A3) in reference
to the lower antenna (A1)
.
Figure 8-2 Phase and amplitude transfer measurement set-up.
20dB
AB
VECTOR
From cabinet
CSB BNC o/
p
CABLE UNDER TEST
OPEN END
DIR. COUPL.
20dB
AB
VECTOR VOLTMETER
A
(
n
)
M
(
n
)
From cabinet
CSB BNC o/
p
Ant.
DIR. COUPL.

Measure and record phase/amplitude for upper antenna transfer signals. Then determine if
one of the monitor cables must be trimmed in order to comply with phase tolerance for the set
of cables.
Tolerance: ±1°.
Amplitude tolerance: ±1.0 dB. If the amplitude tolerance is exceeded something might be
wrong in the Antenna monitor circuit or connector/cable.
Record final result in Ground Commissioning Records.
8.2.4 Antenna return loss
Utilise a vector voltmeter or network analyser in a test set-up Figure 8-3. Measure return loss
for each Antenna.
Measure and record in Ground Commissioning Record the return loss value for each Antenna
including antenna cable.
Tolerance: 20 dB minimum
.
Figure 8-3 Antenna return loss measurement set-up.
8.3 CSB/SBO Phasing
8.3.1 CSB and SBO cables
The CSB and SBO cable between NM3531 cabinet and MCU must be of equal electrical
length. Utilise a vector voltmeter or network analyser in a test set-up as in Figure 8-1.
Measure open cable return phase for each cable.
Refer to CSB cable as zero phase and measure the return phase for the SBO cable. The
cable pair must be matched within ±3.0° return phase, equal to ±1.5° true phase.
8.3.2 CSB/SBO phasing
Insert the 90°-stub in the SBO cable path to the ADU. Connect the NM3710 Field Test Set to
20dB
AB
VECTOR VOLTMETER
From cabinet
CSB BNC o/
p
DIR. COUPL.
Antenna cable under test
Antenna

the monitor return cable (M1) from the lower antenna.
Adjust SBO phaser in the Cabinet (associated with Tx to air) to obtain 0 DDM reading.
Repeat the phasing procedure for the second transmitter.
Remove the 90°-stub from the SBO path.
8.4 Sector width adjustment
8.4.1 SBO power adjustment
Connect the Field Test Set to the monitor return cable (M1) from the lower antenna.
Adjust the SBO step attenuator in the cabinet (associated with Tx to air) to obtain the pre-
scribed DDM value.
For a perfect flat terrain the DDM in A1 (M1) should be -11.7%.
NOTE. To compensate for a sloping terrain in front of the GP the DDM accordingly should be:
where θ is the glide path angle
FSL is forward slope, negative for falling terrain referred from the GP.
Repeat the SBO attenuator adjustment for the second transmitter.
8.5 Monitor combining unit (MCU) MOA 338D adjustments
Monitor Combining Unit MOA338D is equipped with plug-in attenuators dependent upon for-
ward slope, according to the following table (AT6 is common for all FSL):
Make sure that correct attenuators are installed for the actual site.
FSL
rel.to θ0
Equiv.FSL
in degrees for
θ0= 3°
AT3
Type AT4
Type AT5
Type AT7
Type
-0.2θ0 ± 0.05θ0-0.6° ± 0.15°AT1305B AT1305G AT1305
MAT1305S
-0.1θ0 ± 0.05θ0-0.3° ± 0.15°AT1305C AT1305H AT1305N AT1305T
0.0θ0 ± 0.05θ0 0.0° ± 0.15°AT1305D AT1305J AT1305P AT1305U
+0.1θ0 ± 0.05θ0+0.3° ± 0.15°AT1305E AT1305K AT1305Q AT1305V
+0.2θ0 ± 0.05θ0+0.6° ± 0.15°AT1305F AT1305L AT1305B AT1305
W
DDM 11.7 θ0FSL–()–
θ0
-----------------------------------------
=

8.5.1 Adjustments procedure
The Clearance transmitter shall be switched off during steps a) through e) below.
1. Connect the Field Test Set to the CL output of the MCU. Insert the 90° stub in the SBO out-
put of the Transmitter Cabinet. In the Antenna Distribution Unit (ADU), disconnect SBO to
Lower antenna by using the SBO-L link. Terminate open ends. Adjust Upper antenna
phaser PH1 in MCU to give 0% DDM.
2. Reconnect SBO to Lower antenna. Remove the 90° stub. Adjust CL attenuator AT1 in
MCU to give 0 % DDM.
3. Connect the Field Test Set to the DS output of the MCU. Insert the 90° stub in the SBO out-
put of the Transmitter Cabinet. Adjust Middle antenna phaser PH2 in MCU to give 0%
DDM.
4. Remove the 90° stub. Adjust DS attenuator AT2 in MCU to give 8.75% DDM (75µA), 150
Hz dominance.
5. Connect the Field Test Set to the CLR output of the MCU. Adjust phaser PH3 in MCU to
maximum DDM (150 Hz dominance).
6. Turn on CLR transmitter. Check that sufficient 150Hz dominance remains.
8.6 Location of near field antenna position
According to site data (slope, etc.,) the theoretical position of the NF antenna should be calcu-
lated.
Install the NF antenna at the position according to calculations (distance and height). Adjust
the height to 0 DDM reading on the Field Test Set connected to the NF monitor cable. (Ladder
and personnel must be removed from the NF area.)
8.6.1 Near Field Monitor Position Search
A de-phasing test procedure of upper antenna (A3) can be carried out in order to search for
the optimum monitor position.
A N-type adapter (-27°) (made from a male-male and female-female adapter put together) is
inserted in the lower antenna feed (A1) and middle antenna feed (A2). This is equivalent to
advance (+) phase of the upper antenna.
Retard (-) phase is introduced by inserting the adapter in upper antenna feed A3 only.
The DDM readings and correlation of the monitor antenna signal to the CL integral from MCU
(far field) should theoretically be:
Dephasing Near Field (NF) Far field (CL)
27° retard -12µA/-1.4% DDM -11µA/-1.3% DDM
27° advance -9µA/-1.1% DDM -11µA/-1.3% DDM

127(
7KHYDOXHVDWWKH1)SRVLWLRQDUHQRUPDOLVHGLH''0ZLWKQR$GHSKDVLQJ
In order to look for the optimal distance between the GP mast and the NF antenna carry out
the following test:
Measure DDM at positions +1 m and -1 m of original position. Then compare the results with
the theoretical values for these offsets from the nominal 360° position, as denoted below:
127(
:KHQPRYLQJWKH1)DQWHQQDSRVLWLRQEDFNZDUGDQGIRUZDUGWDNHLQWRDFFRXQWWKHRIIVHW''0
IRUQRGHSKDVLQJLHQRUPDOLVHWKHYDOXHVEHIRUHFRPSDULQJWRWKHRUHWLFDOYDOXHV
Based on the comparing results then determine the best correlated position for the NF monitor
antenna.
8.7 Antenna distribution unit (ADU) DIA 346A phase and amplitude check
7KLVFKHFNLVRSWLRQDO,ILWLVFDUULHGRXWLWVKRXOGSUHIHUDEO\EHH[HFXWHGSULRUWRVWHS
8.7.1 Preparation
Use a vector voltmeter in a test set-up figure 8-4
.
Figure 8-4 Test set-up for ADU Phase and Amplitude check.
Connect CSB and SBO outputs from Cabinet to dummy loads. Terminate the disconnected
cables from ADU to dummy loads.
Dephasing NF 1 m forward NF 1 m backward
27° retard -16µA/-1.9% DDM -9µA/-1.1% DDM
27° advance -5µA/-0.6% DDM -12µA/-1.4% DDM
20dB
AB
VECTOR VOLTMETER
From cabinet
CSB BNC o/p
Dir. coupl.
50Ω
ADU
CSB
SBO
U
M
L

The clearance transmitter shall be switched off.
Switch off the modulation to the transmitter used for the test.
Insert a 20 dB attenuator at the input port of the directional coupler.
Connect a test cable from the Cabinet’s CSB BNC connector to the 20 dB attenuator.
Connect the vector voltmeter A-probe to the directional coupler’s forward output.
8.7.2 Procedure
1. Connect the cable TEST SIG (throughput from the directional coupler) to the ADU CSB
input.
Connect the B-probe to L output. Note the B-probe RF level (dB). (0.1 dB resolution)
Move the B-probe to M output. If necessary adjust phaser D1 to obtain -6.0 dB difference
referenced to L output.
127(
,I'KDVEHHQDGMXVWHGUHFKHFNWKHUHIHUHQFHOHYHOIURP/RXWSXWDQGPHDVXUHDJDLQWKH0RXWSXW
OHYHO5HSHDWXQWLOG%GLIIHUHQFHLVDFKLHYHG
2. Connect the cable TEST SIG to the SBO input. Connect the B-probe to U output. Note the
level.
Move the B-probe to the L output. If necessary adjust phaser D3 to obtain 0.0 dB difference
referenced to U output.
127(
,I'KDVEHHQDGMXVWHGUHFKHFNWKHUHIHUHQFHOHYHOIURP8RXWSXWDQGPHDVXUHDJDLQWKH/RXWSXW
OHYHO5HSHDWXQWLOG%GLIIHUHQFHLVDFKLHYHG
3. Connect the B-probe to M output. Note the level.
Move the B-probe to L output.
If necessary adjust phaser D2 to obtain -6.0 dB difference referenced to M output.
127(
,I'KDVEHHQDGMXVWHGUHFKHFNWKHUHIHUHQFHOHYHOIURP/RXWSXWDQGPHDVXUHDJDLQWKH02RXW
SXWOHYHO5HSHDWXQWLOG%GLIIHUHQFHLVDFKLHYHG
4. Connect the cable TEST SIG to the SBO input. Connect the B-probe to M output. Adjust
the vector voltmeter to 0° reference phase.
Move the TEST SIG cable to the CSB input. Check that the phase is 180° ±2°.
5. Connect the B-probe to L output. If necessary adjust LOWER ANT phaser (PH1) for 0°
phase.


9 NM 3561 Single antenna system adjustments - MKR
9.1 Mechanical alignment
9.1.1 Antenna mast
Utilise a waterlevel and align the mast vertically by adjustments of the base nuts.
9.2 Electrical measurements
9.2.1 Antenna return loss
Utilise a vector voltmeter or network analyser in a test set-up.
Measure return loss for the LPDA.
Measure the return loss value for the LPDA including antenna cable.
Tolerance: 22 dB minimum
.
Figure 9-1 Antenna return loss measurement set-up.
20dB
AB
VECTOR VOLTMETER
DIR. COUPL.
Antenna cable under test
Antenna
From Marker
Dir. coupler


10 NM 3562 Dual antenna system adjustments - MKR
10.1 Mechanical alignment
10.1.1 Antenna mast
Utilise a waterlevel and align the mast vertically by adjustments of the base nuts.
10.2 Electrical measurements
:$51,1*
,IWKHDWWHQXDWRUPRGXOHLQWKH0DUNHUXQLWLVFRQILJXUHGIRUG%WKHQWKH5)RXWSXWSRZHULVLQ
WKHUDQJHRIZDWWV7DNHFDUHRIQRWWRRYHUORDGWKHYHFWRUYROWPHWHU
Connect a directional coupler terminated in 50* 10W to the N output connector of the Marker.
Then use the forward coupled port as the signal source for the measurements.
Always use a 20 dB attenuator at the I/P of the directional coupler in Fig. 1,2 and 3.
10.2.1 Antenna cable lengths (Electrical phase equality)
Each antenna cable must be electrically measured before the end connector is terminated in
the LPDA.
Utilise a vector voltmeter or network analyser. Establish antenna cable (A1) return phase as
0° reference phase.
Measure return phase for the other antenna cable (A2). Then take into account the phase
centres of the LPDA's given in the factory data sheet.
Tolerance: ±1.5° true electrical cable length.
See measurement set-up diagram Figure 10-1 below:
Figure 10-1 Cable phasing measurement set-up.
20dB
AB
VECTOR VOLTMETER
CABLE UNDER TEST
OPEN END
DIR. COUPL.
From Marker
Dir. coupler
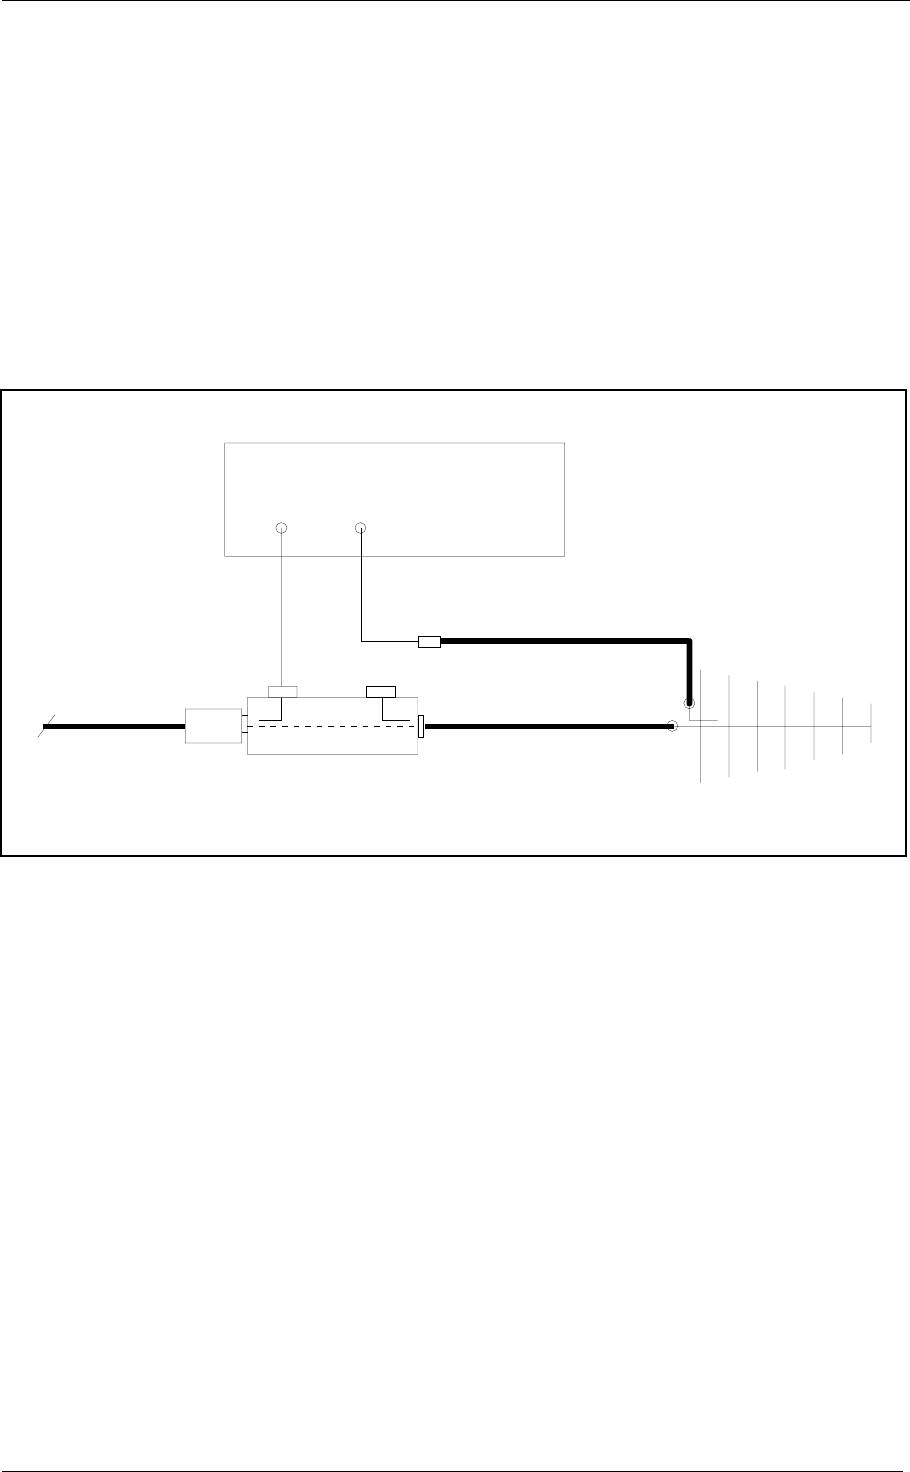
10.2.2 Monitor return cable length
Measure return phase as described in (8.2.1) for both monitor cables. Check that initial val-
ues are within ±1.5° true phase (±3.0° return phase).
10.2.3 Phase and amplitude transfer measurement
Connect each antenna cable and monitor cable to LPDA load and source respectively. Utilise
a vector voltmeter or network analyser in a test set-up
Figure 10-2, and measure relative transfer phase and amplitude for the antenna cable (A2) in
reference to antenna (A1)
.
Figure 10-2 Phase and amplitude transfer measurement set-up.
Measure and record phase/amplitude for each antenna. Then determine if one of the monitor
cables must be trimmed in order to comply with phase tolerance for the set of cables.
Tolerance: ±3°.
Amplitude tolerance: ±1.0 dB. If the amplitude tolerance is exceeded something might be
wrong in the LPDA monitor circuit or connector/cable.
20dB
AB
VECTOR VOLTMETER
A(n)
M(n)
LPDA
DIR. COUPL.
From Marker
Dir. coupler


1250$5&
1DYLD$YLDWLRQ$6
,167$//$7,21&200,66,21,1*+$1'%22.
SECTION 4
TEST AND ADJUSTEMENTS
Table of Contents
1 Tests and adjustments LLZ/GP...............................................................................3
1.1 Configuration Settings........................................................................................3
1.1.1 ILS Configuration......................................................................................... 3
1.1.2 Remote Ports Access Level Configuration .................................................. 4
1.1.3 Warning Configuration ................................................................................. 4
1.2 Transmitter Alignments and Calibration ............................................................. 4
1.2.1 RF Phase Feedback Adjustment................................................................. 5
1.2.2 RF Power..................................................................................................... 6
1.2.3 LF Phase Adjustment .................................................................................. 6
1.2.4 RF Power Balance Adjustment.................................................................... 7
1.2.5 RF Phase at Combiner I/P...........................................................................8
1.2.6 SDM Calibration...........................................................................................9
1.2.7 DDM Calibration ..........................................................................................9
1.2.8 Ident Tone Modulation Depth ......................................................................10
1.2.9 RF Frequency Adjustment...........................................................................10
1.3 Antenna System Adjustments ............................................................................10
1.4 Monitor Alignment and Calibration. ....................................................................11
1.4.1 General: ....................................................................................................... 11
1.4.2 RF Input Level Adjustment. .........................................................................11
1.4.3 AGC Time Adjustment ................................................................................. 12
1.4.4 SDM Adjustment.......................................................................................... 12
1.4.5 DDM Adjustment.......................................................................................... 12
1.5 Monitor Alarm Setting Procedure .......................................................................13
1.6 Maintenance Limit Adjustments ......................................................................... 14
1.7 Adjustment points............................................................................................... 15
2 Tests and adjustments marker beacon ..................................................................19
2.1 ........................................................................................................................... 19
2.1.1 Preparations ................................................................................................ 19
2.1.2 Configuration settings..................................................................................19
2.2 Adjustment points............................................................................................... 22
2.3 Adjustments at installation.................................................................................. 23
2.3.1 Transmitter output power adjustment .......................................................... 23
2.3.2 Monitor calibration ....................................................................................... 24
2.4 Other adjustments.............................................................................................. 24
2.4.1 Output power readout calibration.................................................................24
2.4.2 Battery protection cut-off voltage ................................................................. 25
2.4.3 Battery charger voltage................................................................................ 25


1250$5&
1DYLD$YLDWLRQ$6
,167$//$7,21&200,66,21,1*+$1'%22.
1 Tests and adjustments LLZ/GP
1.1 Configuration Settings
Follow this procedure to set the configurations in the ILS according to the desired system con-
figuration.
1.1.1 ILS Configuration
Set the correct configuration for this ILS according to this table. The Station Control strap plat-
form is located on TCA 1218.
Table 1-1 ILS configuration settings.
1 Strap IN NOT interlock
Strap OUT Interlock
2 Strap IN NOT hot standby
Strap OUT Hot standby
3 Strap IN 2 frequency ILS
Strap OUT 1 frequency ILS
4 Strap IN 1 of 2 voting
Strap OUT 2 of 2 voting (default)
5 Strap IN Lost contact with remote control will NOT turn off transmitters.
Strap OUT Lost contact with remote control will turn off transmitters. (default)
6Strap IN WRITE DISABLE switch in horizontal position generate service con-
dition. (default)
Strap OUT WRITE DISABLE switch in horizontal position does not generate ser-
vice condition.
7Strap IN Grant/deny switch on remote control must be grant position in order to
obtain access level 2 or 3 from the RMM system on the remote ports.
Strap OUT Grant/deny switch on remote control is overridden.
8Strap IN Tells the RMS that this is a GP ILS.
Strap OUT Tells the RMS that this is a LLZ ILS.
9Strap IN Spare, Not used.
Strap OUT Spare, Not used.
10 Strap IN Spare, Not used.
Strap OUT Spare, Not used.
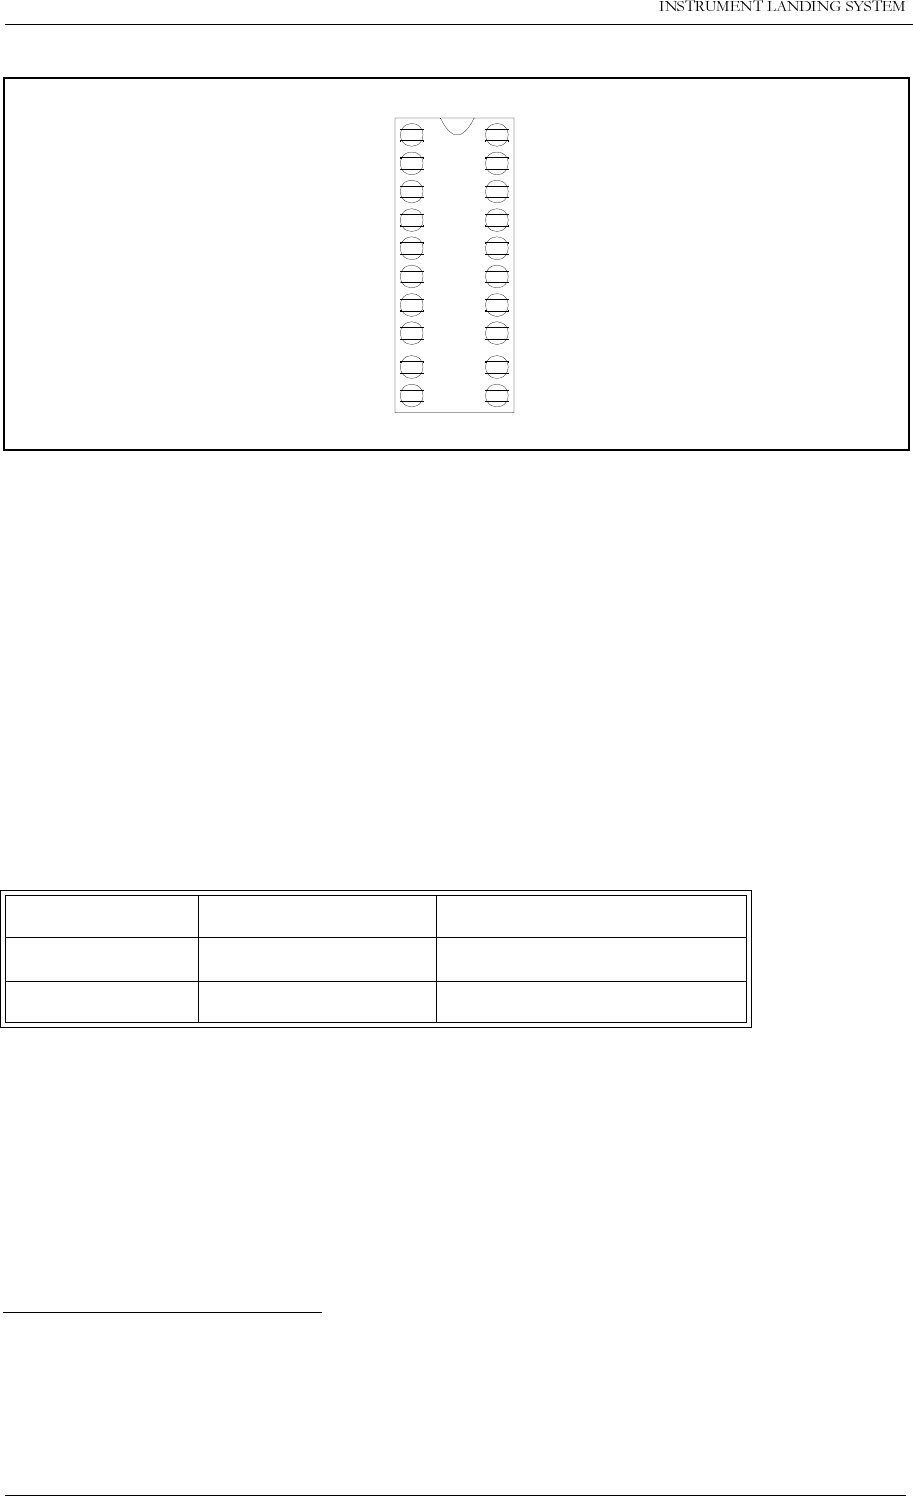
1250$5&,167$//$7,21&200,66,21,1*+$1'%22.
1DYLD$YLDWLRQ$6
Figure 1-1 Station Control strap platform.
1.1.2 Remote Ports Access Level Configuration
The allowed access levels on REMOTE ports 1 and 2 on the RMS can be configured by set-
ting jumpers on the TCA1218A.
Set jumpers in S1 - S4 to configure which access levels that are allowed on remote ports 1
and 2.
Jumper in means that access level is allowed.
Jumper out means that access level is denied.
The table below shows which jumpers are connected to different ports and access levels.
Table 1-2 Access level strap settings.
1.1.3 Warning Configuration
Use the RMM Program to configure which warnings shall cause system warning i.e. illuminate
the RC main warning lamp.
1.2 Transmitter Alignments and Calibration
TEST EQUIPMENT REQUIRED:
• Oscilloscope, general purpose
• NM 3710 Field Test Set (with 20 dB attenuator)
• BNC Test Cable
• Frequency Counter RF
PORT ACC. LEVEL 2 ACC. LEVEL 3
Remote 1 Strap S1 Strap S2
Remote 2 Strap S3 Strap S4
1
2
3
4
5
6
7
8
9
10 HBK592-1

1250$5&
1DYLD$YLDWLRQ$6
,167$//$7,21&200,66,21,1*+$1'%22.
Carry out the alignment steps in the order outlined below:
127(
,IVRPHRIWKHIXQFWLRQVSDUDPHWHUVGHSDUWFRQVLGHUDEO\IURPQRUPDOWKHQUHSHDWWKHVWHSV
LQVHTXHQFHRQFHPRUHH[FHSWVWHSV
127(
7KLVDGMXVWPHQWSURFHGXUHDVVXPHVWKDWWKH/3$VDQG*3$V5)OHYHO''0DQG6'0
SDUDPHWHUVDUHFRUUHFWO\DGMXVWHG6LWHDGMXVWPHQWVVKRXOGEHOLPLWHGWRVPDOOWRXFKXS
DGMXVWPHQWVRQ5)SKDVH5)SKDVHIHHGEDFNDQG5)SRZHUEDODQFH
1.2.1 RF Phase Feedback Adjustment
Connect the oscilloscope to the BNC test connector labelled PHASE CORR. located on the
transmitter modules.
127(
6HWWKHVFRSHVLQSXWPRGHWR'&
The waveform observed should take a continuous form without limiting segments or deep
notches or other dis-continuities.
(Each modulator developes it’s own waveform shape due to spreads in insertion phases).
The dynamic maximum point should be adjusted to approximately -4 volt.
The average operating point of the PHASE CORR. signal can be shifted by means of adjust-
ing potentiometer PH.OFFS. at the back of the LPA/GPA.
1.2.1 RF Phase Feedback Adjustment
1.2.2 RF Power
1.2.3 LF Phase Adjustment
1.2.4 RF Power Balance Adjustment
1.2.5 RF Phase at Combiner I/P
1.2.6 SDM Calibration
1.2.7 DDM Calibration
1.2.7.1 TEST DDM Setting
1.2.8 Ident Tone Modulation Depth
1.2.9 RF Frequency Adjustment

1250$5&,167$//$7,21&200,66,21,1*+$1'%22.
1DYLD$YLDWLRQ$6
1.2.2 RF Power
The CSB and corresponding SBO output power can be adjusted by means of the RMM Pro-
gram or the Local Display/Keyboard.
Normal operating power level is:
The output power can be read by means of the RMM Program or the Local Display/Keyboard.
1.2.3 LF Phase Adjustment
1.2.3A LF Phase Adjustment (One-frequency system)
Connect oscilloscope channel A to the BNC test connector labelled CSB located on LPA/
GPA Course 1 (2).
Set oscilloscope input mode to DC.
Adjust 150 Hz COU phase adj. R3 (LF1223A) observing oscillocope channel A until the
waveform equals left hand graph in Figure 1-2.
A significant indication of correct LF phase is that the pair of the intermediate peaks are equal
in amplitude.
Figure 1-3 shows the corresponding SBO waveforms for normal and 10º LF phase error
respectively.
1.2.3B LF Phase Adjustment (Two-frequency system)
Connect oscilloscope channel A to the BNC test connector labelled CSB located on LPA/
GPA Course 1 (2).
Connect oscilloscope channel B to the BNC test connector labelled CSB located on LPA/
GPA Clearance 1 (2).
Set oscilloscope input mode to DC. Select CHOP mode.
Adjust channel A and B gain so that both waveforms show the same amplitude.
By means of the RMM turn off 90 Hz modulation for Course Tx and Clearance Tx.
Adjust 150 Hz CLR phase adj. R180 to track 150 Hz Course waveform in the same phase
(waveform overlap).
LLZ Course 15 W CSB
LLZ Clearance 15 W CSB
GP Course 5 W CSB
GP Clearance 0.5 W CSB

1250$5&
1DYLD$YLDWLRQ$6
,167$//$7,21&200,66,21,1*+$1'%22.
By means of the RMM turn on 90 Hz modulation for both Course Tx and Clearance Tx.
Adjust 90 Hz COU phase adj. R1 (LF1223A) observing oscillocope channel A until the wave-
form equals left hand graph in Figure 1-2.
Adjust 90 Hz CLR phase adj. R179 (LF1223A) observing oscillocope channel B until the
waveform equals left hand graph in Figure 1-2.
A significant indication of correct LF phase is that the pair of the intermediate peaks are equal
in amplitude
.
Figure 1-2 LF phase CSB illustration.
Figure 1-3 LF phase SBO illustration.
1.2.4 RF Power Balance Adjustment
Connect the oscilloscope to the BNC test connector labelled SBO located on the transmitter
modules.
127(
6HWWKHVFRSHVLQSXWPRGHWR'&
'(02'8/$7('&6%1250$/ '(02'8/$7('&6%3+$6((5525
'(02'8/$7('6%21250$/ '(02'8/$7('6%23+$6((5525

1250$5&,167$//$7,21&200,66,21,1*+$1'%22.
1DYLD$YLDWLRQ$6
Figure 1-4 Power balance SBO illustration.
Perfect power balance between the 90 Hz modulated carrier and the 150 Hz modulated car-
rier is indicated when the two largest sets of peak waveforms fall on lines paralell to the base-
line.
A more accurate way of observing a power balance error is to double the sweep rate in non-
trigger mode such that the second 60 Hz half of the cycle is folded back on the first half and
tracks the envelope waveform. (Kissing pattern method)
RF Power Balance can be adjusted by potentiometer RF-BAL on the back of the LPA/GPA
Adjust until both halvs fall on the same envelope waveform or the two largest sets of peak
waveforms fall on lines paralell to the baseline.
1.2.5 RF Phase at Combiner I/P
Connect the oscilloscope to the BNC test connector labelled SBO located on the transmitter
modules.
127(
6HWWKHVFRSHVLQSXWPRGHWR'&
Set the oscilloscope in normal trigger mode such that the waveform below can be observed
.
Figure 1-5 RF phase SBO illustration.
'(02'8/$7('6%21250$/ '(02'8/$7('6%2'%32:(5,0%$/
$1&(+=+=
'(02'8/$7('6%21250$/ '(02'8/$7('6%25)3+$6((5525

1250$5&
1DYLD$YLDWLRQ$6
,167$//$7,21&200,66,21,1*+$1'%22.
The RF phase (90° start phase) can be adjusted by trimmer RF PHASE on the back of the
LPA/GPA.
Adjust until the minima points between the smallest peak waveform reach the baseline or a
minimum.
1.2.6 SDM Calibration
Connect the NM 3710 Field Test Set to the CSB BNC test connector in the Cabinet's Change-
over section.
(Insert a 20 dB attenuator at the input of the Field Test Set in order to avoid overloading).
SDM should be calibrated to 40.0% +/-0.1% SDM by adjusting SDM from the RMM Program
or the Local Display/Keyboard.
1.2.7 DDM Calibration
127(
&KHFNWKDWDOO7(67''0VHWWLQJVDUHLQ1250$/
Connect the NM 3710 Field Test Set to the CSB BNC test connector in the Cabinet's Change-
over section.
(Insert a 20 dB attenuator at the input of the Field Test Set in order to avoid overloading).
DDM should be calibrated to 0.0% +/-0.05% DDM by adjusting DDM from the RMM Program
or the Local Display/Keyboard.
1.2.7.1 TEST DDM Setting
TEST DDM with 90Hz or 150Hz dominance can be switched on and off from the RMM Pro-
gram or the Local Display/Keyboard. The DDM values inserted by TEST DDM are preset val-
ues which is set as described below.
a) 90 Hz dominance preset
Utilise the Field Test Set as in the previous test.
Set the TEST DDM in position 90 Hz dominance from the RMM Program or
the Local Display/Keyboard. Adjust the (90 Hz) test DDM setting until a
wanted DDM value indicating (-) sign is obtained. (Typical value: -0.8%...-
1.0% DDM).
b) 150 Hz dominance preset
Utilise the Field Test Set as in the previous test.
Set the TEST DDM in position 150 Hz dominance from the RMM Program or
the Local Display/Keyboard. Adjust the (150 Hz) test DDM setting until a
wanted DDM value indicating (+) sign is obtained. (Typical value:
0.8%...1.0% DDM).
Set the TEST DDM back to normal.

1250$5&,167$//$7,21&200,66,21,1*+$1'%22.
1DYLD$YLDWLRQ$6
1.2.8 Ident Tone Modulation Depth
Connect the Field Test Set to the CSB BNC test connector in the Cabinet’s Change-over sec-
tion.
(Insert a 20 dB attenuator at the input of the Field Test Set in order to avoid overloading).
Set the Ident Control to CONTINUOUS from the RMM Program or the Local Display/Key-
board.
On the Field Test Set, press IDENT.
1020 Hz modulation depth can be adjusted from the RMM Program or the Local Display/Key-
board.
Adjust modulation depth to 10.0% +/-0.3%.
An alternative method of checking 1020 Hz modulation depth to 10% is described below:
Connect the oscilloscope to the BNC test Connector labelled CSB.
Switch off the 90 Hz modulation and the 1020 Hz modulation.
Note the peak-to-peak deflection of the remaining 150 Hz waveform.
Then switch off the 150 Hz modulation and switch the 1020 Hz modulation to CONTINUOUS.
For mod. Depth 10%.The observed 1020 Hz peak-to-peak waveform amplitude should be
50% of the 150 Hz amplitude.
1.2.9 RF Frequency Adjustment
Fine-adjustment of the operating frequency can be carried out by adjusting C1 in the
OS1221A/B RF Oscillator module.
The top cover must be removed.
Set the OS1221A/B on an extention board.
In order to monitor the frequency, connect the Frequency Counter to the BNC test connector
labelled CSB. (Make sure the transmitter under test is routed to Antenna).
If necessary for reliable counting switch off modulation tones.
Adjust until frequency is less than 1 kHz from operating frequency. Trimmer C1 adjusts course
and clearance frequencies simultaneously.
1.3 Antenna System Adjustments
After the transmitters has been alligned correctly the antenna system must be alligned. This
includes mechanical adjustments of the Antenna System, electrical adjustments (phasing)
and adjustments of the ADU and MCU.

1250$5&
1DYLD$YLDWLRQ$6
,167$//$7,21&200,66,21,1*+$1'%22.
For details, refer to the adjustment procedure for each antenna system.
1.4 Monitor Alignment and Calibration.
TEST EQUIPMENT REQUIRED:
• Oscilloscope, general purpose
• NM 3710 Field Test Set (with 20 dB attenuator)
• BNC Test Cable
• Digital Voltmeter, 4 digits, DC
1.4.1 General:
Description is given only for the DS channels. R338++ means that the other channels has
numbers R1338, R2338 and R3338 for CL, CLR and NF channels.
Before any monitor adjustments are attempted, the following procedures shall be completed:
Transmitter calibrations
Network alignments
It is imperative for the result that the signals from the Monitor Combining Network (MCU) are
correct. Check these signals with the NM3710, Field Test Set,It will be these signals which we
use for aligning the monitors.
1.4.2 RF Input Level Adjustment.
Put the MF12xx on an extender card.
Turn on the transmitters.
Set the potmeter SR338++ in middle position. See Figure 1-6
.
Figure 1-6 Adjustment points on MF12xx.

1250$5&,167$//$7,21&200,66,21,1*+$1'%22.
1DYLD$YLDWLRQ$6
Adjust the jumper settings in P2++ and potmeters R338++ until the voltage is 240mV at
TP23++
.
Figure 1-7 Alternative jumper settings of P2++.
Turn off the equipment and remove the extender card. Set the MF12xx in its correct position.
Turn on the transmitters.
Adjust the RF level potensiometer on the front of MF12xx until the monitor gives a RF level
reading of 3.0V.
Repeat above for all monitor channels.
1.4.3 AGC Time Adjustment
Turn on the transmitters.
Make a note of the AGC voltages on TP 1,2,3 and 4 on MF12xx.
Turn off the transmitters.
Adjust the AGC TIM potmeter on the front of MF12xx until the AGC voltage (TP1,2,3 or 4) is
the same as with a nominal RF input.
Do this for all four monitor channels on all of the MF12xx modules in the system.
This ensures fast response from the monitors.
1.4.4 SDM Adjustment
Adjust the SDM potmeter on the front of MF12xx until the monitors reads 40.0/80.0%SDM +/-
0.1%SDM.
1.4.5 DDM Adjustment
Measure and note down the DDM values from the MCU and NF antenna with help of the Field
Test Set.
Set the Nominal values for each channel to the measured values with help of the RMM Pro-
gram.

1250$5&
1DYLD$YLDWLRQ$6
,167$//$7,21&200,66,21,1*+$1'%22.
1.5 Monitor Alarm Setting Procedure
Type in the wanted alarm limits from the RMM Program or the Local Display/Keyboard.
The monitors will have preset alarm limits when the ILS is delivered for factory.These alarm
limits are as listed in the table below:
Table 1-3 Localizer alarm limits
.
*) Only for single frequency ILS. For two frequency ILS the limit is +/- 1dB.
CL DS NF CLR
DDM 15uA 25uA 15uA 40uA
CAT I SDM +/- 4% --- --- +/- 4%
RF level +/- 3dB*) --- --- +/- 1dB
LLZ DDM 11uA 25uA 11uA 40uA
CAT II SDM +/- 4% --- --- +/- 4%
RF level +/- 3dB*) --- --- +/- 1dB
DDM 9uA 25uA 9uA 40uA
CAT III SDM +/- 4% --- --- +/- 4%
RF level +/- 3dB*) --- --- +/- 1dB
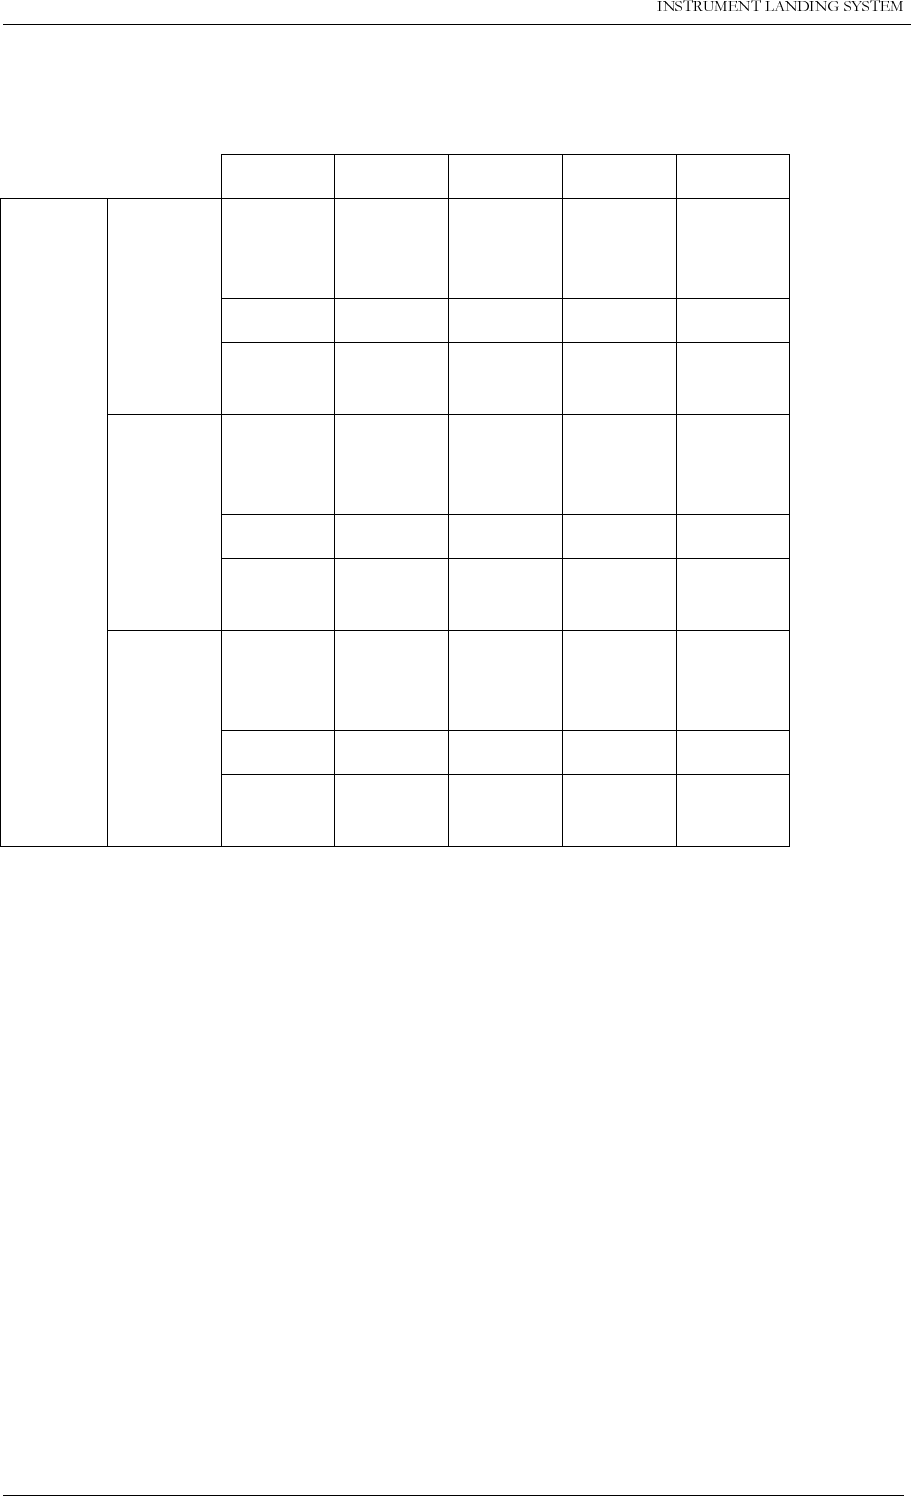
1250$5&,167$//$7,21&200,66,21,1*+$1'%22.
1DYLD$YLDWLRQ$6
Table 1-4 Glidepath alarm limits
.
*) Only for single frequency ILS. For two frequency ILS the limit is +/- 1dB.
CLR transmitter is only present in two frequency ILS.
1.6 Maintenance Limit Adjustments
Use the RMM Program to set maintenance warning limits in the system. All new systems will
have factory preset maintenance warning limits. Maintenance warning limits can not be set
from the Local Display/Keyboard.
CL DS NF CLR
DDM see
annex.
10
37uA
18.5uA 35uA 45uA
CAT I SDM +/- 5% --- --- +/- 5%
RF level +/-
3dB*) --- --- +/- 1dB
GP DDM see
annex.
10
37uA
18.5uA 35uA 45uA
CAT II SDM +/- 5% --- --- +/- 5%
RF level +/-
3dB*) --- --- +/- 1dB
DDM see
annex.
10
37uA 35uA 45uA
CAT III SDM +/- 5% --- --- +/- 5%
RF level +/-
3dB*) --- --- +/- 1dB

1250$5&
1DYLD$YLDWLRQ$6
,167$//$7,21&200,66,21,1*+$1'%22.
1.7 Adjustment points
Figure 1-8 Front side adjustment points.
11
LF 1223A
MF 1211A
ESC PREV NEXT
-+
ENTER
READ
QUICK
CLR
COAXIAL
COURSE
MAIN
POSITION
WRITE
PROTECT
WARNING
ON/
NORMAL
INTERLOCK
OVERRIDE
MAINT
STBY
OFF
REMOTE
LOCAL
AUTO
MANUAL
OVER
CHANGE
TX1
ALARM
SERVICE
PARAM
DISAGR
BATT
IDENT
TX1
TX2
TX2
STAND
BY
Mon.1 Mon.2
Mon.stby.
90Hz COU phase adj.
150Hz COU phase adj.
90Hz CLR phase adj.
150Hz CLR phase adj.
TX1 TX2
NF SDM adj.
NF AGC time constant adj.
NF RF level adj.
CL SDM adj.
CL AGC time constant adj.
CL RF level adj.
CLR SDM adj.
CLR AGC time constant adj.
CLR RF level adj.
DS SDM adj.
DS AGC time constant adj.
DS RF level adj.
Ident mod adj.
HBK698-2

1250$5&,167$//$7,21&200,66,21,1*+$1'%22.
1DYLD$YLDWLRQ$6
Figure 1-9 CI1210A Connection Interface adjustment point.
TEMP
INDOOR TEMP
OUTDOOR AC
LEVEL ANALOG
CH.1 ANALOG
CH.2 ANALOG
CH.3 DIGITAL
PORT A DIGITAL
PORT B DIGITAL
PORT C DIGITAL
PORT D
TO MB1203
RS232 RS232 RS232 REMOTE
CONTROL
DC-LOOP DC-LOOP DME
LOCAL REMOTE 2 REMOTE 1 CH.1&2 CH.3&4
CI1210A
BATTERY
WARNING
Battery protection
level adj.
HBK697-1

1250$5&
1DYLD$YLDWLRQ$6
,167$//$7,21&200,66,21,1*+$1'%22.
Figure 1-10 Power Amplifier Assembly adjustment points (rear view).
PH.OFFS.
G150Hz
RF-BAL
G90Hz
DC
OSC.
SBO
CSB
FREMDRIFT
RF.PHASE
Phase feedback offset adj.
DC offset adj.
RF balance adj.
90Hz mod. adj.
150 Hz mod. adj.
RF phase adj.
HBK696-1

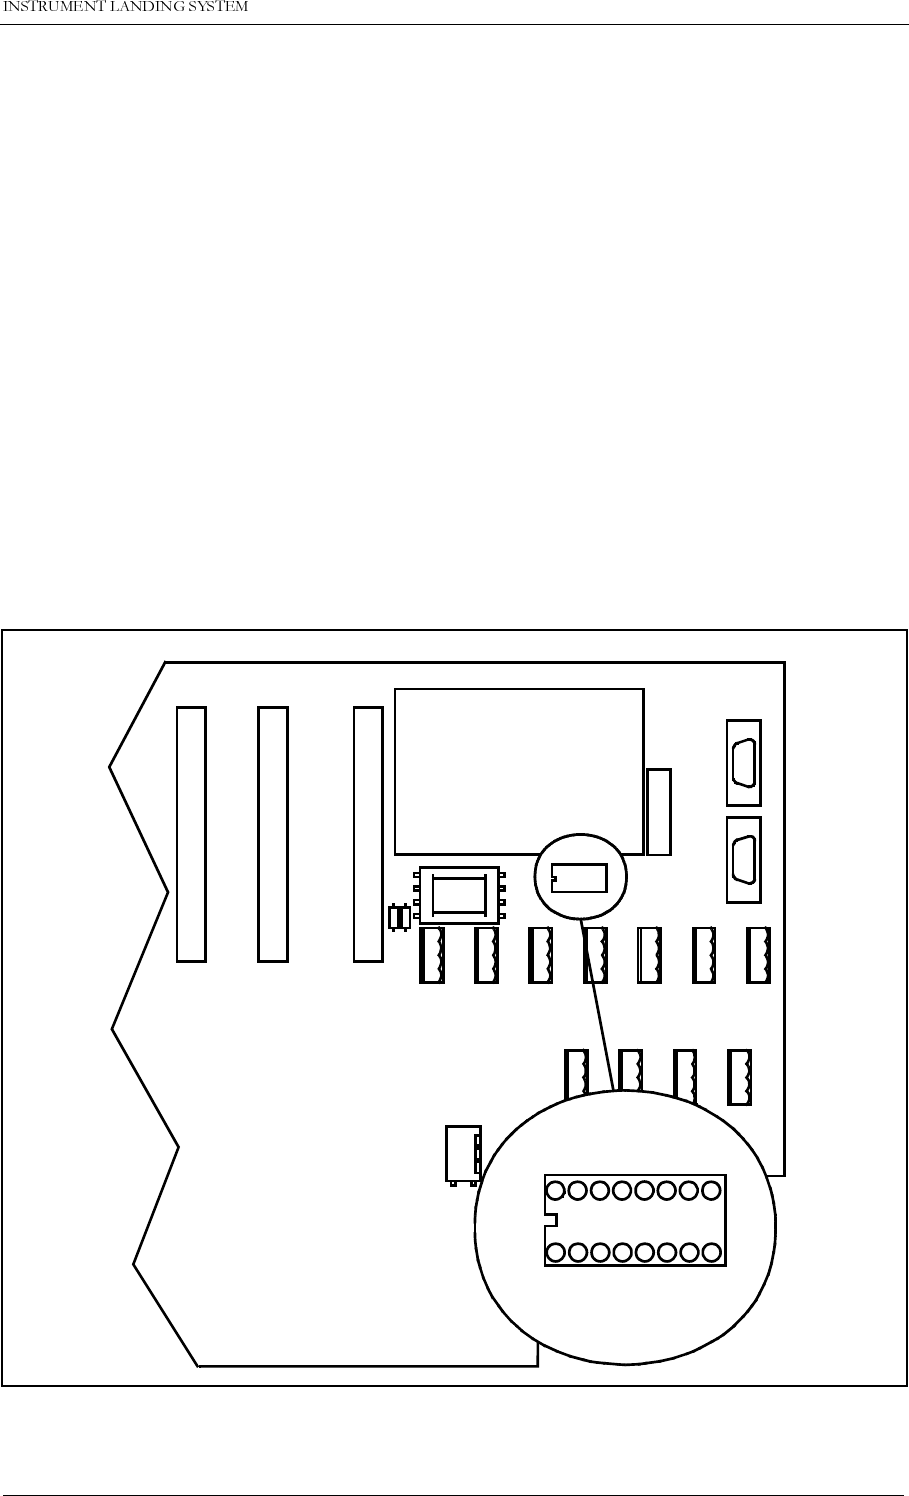
1250$5&
1DYLD$YLDWLRQ$6
,167$//$7,21&200,66,21,1*+$1'%22.
2 Tests and adjustments marker beacon
2.1
2.1.1 Preparations
Terminate the RF OUT terminal with a 50Ω load (antenna or dummy). The transmitters are fac-
tory adjusted to 2 watt output power. Let both transmitters run for ½ hour at this power to
achieve a stable working temperature before any fine tuning is carried out.
2.1.2 Configuration settings
Follow this procedure to set the configurations in the Marker Beacon according to desired sys-
tem configuration.
2.1.2.1 General Configuration
The static control strap on the Connection interface board sets hardware configuration,
remote access configuration and shutdown configuration. Figure 2-1 shows where the static
control strap is located on CI 1376
Figure 2-1 Location of Static Control Strap on CI 1376
DIG PORT A DIG PORT B DIG PORT C DIG PORT D
CI 1376
PB 1378
REMOTE
CONTROL
LINE
TEMP
OUTDOOR
TEMP
INDOOR
AC LEVEL ANA CHA1 ANA CHA2 ANA CHA3
REMOTE RMM
RS232
REMOTE CONTOL
RS232
CONFIGURATION
S1
S2
S3
S4
S5
S6
S7
S8
CONFIGURATION
S1
S2
S3
S4
S5
S6
S7
S8
HBK797/1

1250$5&,167$//$7,21&200,66,21,1*+$1'%22.
1DYLD$YLDWLRQ$6
Set the configuration for the MB according to Table 2-1
.
Table 2-1 MB Configuration settings
S1 and S3 will decide the model (NM 7050 A, B, C or D) and show up in the Link Status win-
dow in the RMM program and the Initial Window in the LCD menu. A disagreement
between the settings and the actual number of modules will cause a
Maintenance Warning
on
the Front Panel and an
Error
in the Maintenance window.
With S2 =
In
the Access Grant switch on the Remote Control will have no effect. You may still
acquire
access level 2
and
3
on the RMM remote port if the settings of S6 and S7 permits.
S4 decides wheather lost communication with the Remote Control will cause shutdown (no
TX to air) or not.
S5 instructs the transmitter control software weather a failed standby transmitter will be shut
down or continue to transmit.
S6 and S7 decides the highest access level permitted on the RMM remote port. All access
levels are available on the RMM local port regardless of S6 and S7.
2.1.2.2 Setting inner, outer or middle marker
To configure the beacon for outer, middle or inner marker set the straps (S1-S4) on the trans-
mitter board(s) according to Table 2-2.
Strap no State Function
S1 Strap IN 2 power supplies
(NM 7050 B/D)
Strap OUT 1 power supply
(NM 7050 A/C)
S2 Strap IN Access Grant disabled
Strap OUT Access Grant enabled
S3 Strap IN 2 monitor units
(NM 7050 C/D)
Strap OUT 1 monitor unit
(NM 7050 A/B)
S4 Strap IN Lost contact with remote control will NOT cause shutdown
Strap OUT Lost contact with remote control will cause shutdown
S5 Strap IN Standby transmitter failure will NOTcause shutdown
Strap OUT Standby transmitter failure will cause shutdown
S6 Strap IN Access level 2 on RMM remote port enabled
Strap OUT Access level 2 on RMM remote port disabled
S7 Strap IN Access level 3 on RMM remote port enabled
Strap OUT Access level 3 on RMM remote port disabled
S8 Should always be left open.

1250$5&
1DYLD$YLDWLRQ$6
,167$//$7,21&200,66,21,1*+$1'%22.
Table 2-2 Marker function configuration
Figure 2-2 shows where the straps are located on the transmitter board(s)
.
Figure 2-2 Location of Marker Beacon type straps on transmitter board
Strap Function when strap is in
S1 Beacon is INNER marker
S2 Beacon is MIDDLE marker
S3 Beacon is OUTER marker
S4 Beacon is FAN marker
S1
S2
S3
S4
TX 1373
HBK798/1

1250$5&,167$//$7,21&200,66,21,1*+$1'%22.
1DYLD$YLDWLRQ$6
2.2 Adjustment points
The adjustment points are shown in Figure 2-3 Adjustment points and explained below. The
figure shows a fully equipped system, NM 7050D, see Section 3 for configuration details:
1. Battery charging voltage (nom 27.4V@20°C)
2. Bias for power transistor (use factory settings)
3. Battery protection cut-off voltage (nom. 22V)
4. Tx Detected Rf level (nom. 2.5V@4W carrier)
5. Monitor RF level (nom. 3V@nominal output power)
6. Monitor frontend input filter centre frequency (use factory settings)
7. Real time clock fine tuning(use factory settings)
⇒The adjustment points marked
Use Factory Settings
should not be touched.
⇒The baseband level has to be adjusted at installation.
⇒The other are factory pre-set but may be adjusted.

1250$5&
1DYLD$YLDWLRQ$6
,167$//$7,21&200,66,21,1*+$1'%22.
Figure 2-3 Adjustment points
2.3 Adjustments at installation
These procedures have to be carried out at installation in order to set up your equipment right.
2.3.1 Transmitter output power adjustment
This adjustment is most easily done with the RMM PC program but the local keyboard/display
may be used.
• Make sure the output signal RF OUT is terminated with a 50Ω load (antenna or dummy
load).
• If this is an Inner Marker make sure the external attenuator (10dB) is installed, inside the
Cabinet at the Tx output.
• Start the RMM program on the PC (see chapter 10)
• Open the TX settings window, RF level for TX1 and TX2 are to be adjusted.
• Open the Maintenance window. RF level for TX1 and TX2 are to be watched.
•Set
Local
mode with the Remote/Local switch.
•Set
Manual
mode with the Auto/Manual switch.
•Set
TX1
to air with the Changeover button
•Adjust
RF level in TX settings until you read the desired output power on RF level in Main-
tenance.
A
N
T
I
S
T
A
T
Shield box
Oscillator
123
4
5
6
7
HBK864/1

1250$5&,167$//$7,21&200,66,21,1*+$1'%22.
1DYLD$YLDWLRQ$6
• Check that you read the desired modulation depth in Maintenance.
•Set
TX2
to air and repeat the two previous steps.
2.3.2 Monitor calibration
The software adjustments are most easily done with the RMM program, but may be carried
out from the front panel.
• This procedure requires that the output power is already adjusted
• Set the input attenuation straps on MO1374 according to the marker type. Start out with
22dB attenuation for outer marker, 18dB for middle marker and 12dB for inner marker.
• Watch the Monitor parameter RF level.
• Adjust the potentiometer R850 until RF level is
3V
at the nominal output power.
• (Ref. fig. 2-4)
• If this is impossible to achieve, try another strap setting and readjust R850
.
Figure 2-4 Input Signal attenuator
2.4 Other adjustments
These adjustments are normally not required, the factory settings should be sufficient.
2.4.1 Output power readout calibration
The Carrier Power parameter in the RMM Maintenance window is the internal wattmeter. It is
factory calibrated, but may be recalibrated by following this procedure. The software adjust-
ments are most easily done with the RMM program, but may be carried out from the front
panel.
• Connect a reference wattmeter to the output signal RF OUT.
• Set TX1 to air.
• Watch the maintenance parameter Carrier Power
• Adjust the TX settings parameter RF level until the watt meter shows
2W
• Check that the Maintenance parameter Carrier Power on TX1 is accurate to within 5%.
0dB
6dB
12dB
16dB
MO 1374
18dB
22dB
R850
28dB
34dB
HBK799/1

1250$5&
1DYLD$YLDWLRQ$6
,167$//$7,21&200,66,21,1*+$1'%22.
• If not, adjust the Carrier Power potentiometer on TX1 until the parameter shows 2.00W
• Repeat for 1W and 0.5W
• Repeat for TX2.
2.4.2 Battery protection cut-off voltage
The purpose of this circuit is to avoid deep discharge and thereby reduced life time of the
backup battery. For normal lead acid accumulators 22V (1.83V/cell) is a reasonable cut-off
voltage.
• Turn
Off
the Mains switch
• Connect a DC supply, preadjusted to the desired cut-off (reference) voltage and deacti-
vated, to the external charger input on CI 1376. This is called the reference supply.
• Connect a multimeter in DC volt position to the battery input.
• Turn the reference supply On.
• If you measure 0V on the battery adjust the potentiometer on PB1378 until the relay tog-
gles and you measure the reference voltage.
• If you measure the reference voltage, adjust the potentiometer until the relay disconnects
and you measure 0V.
2.4.3 Battery charger voltage
The cells of a lead acid battery has an optimal voltage when they are fully charged. This volt-
age is greatly dependent on the temperature. The battery life time will decrease if this rule is
not followed. To meet the demand, the internal battery charger(s) in NM 7050, the PS 1375,
has a temperature compensated charging voltage.
Due to current limiting in PS 1375, a discharged battery will firstly be charged with a constant
current, ≈2A with one PS1375 and ≈6A with two PS1375. When the battery draws less than
the current limit, the battery will be charged with a constant voltage (UBATT). The factory set-
ting for the internal battery charger is:
UBATT20=27.6V@20°C with
This is the normal final voltage for lead acid accumulators. If your batteries require a different
final voltage, the adjustment procedure is as follows:
• Turn the Battery switch
Off
and have one TX on .
• Measure the environment temperature TENV (in °C)
• Compute the temperature deviation ∆T = TENV - 20°C
• Compute the new expected final voltage at your environment temperature as
• Adjust the potentiometer on PS1375 until you measure UBATT on the 27V test point on CI
1376.
⇒Inner Marker uses an external 10 dB attenuator, use 0.2W, 0.1W and 50mW to cali-
brate. Carrier Power is measured prior to the attenuator, but the software will automati-
cally compensate for the 10dB.
k∆UBATT
∆T
-------------------- 40 mV
°C
--------
–==
UU kTBATT BATT=+⋅20 ∆
Example:
Your battery requires a final voltage of 26V at 20°C, and you have measured an environ-
mental temperature of 25°C. You should then adjust the charger to give
UBATT = 26 + (-0.04)(25 - 20) = 25.8V


1250$5&
91DYLD$YLDWLRQ$6
,167$//$7,21&200,66,21,1*+$1'%22.
SECTION 5
GROUND COMMISIONING REFERANCE DOCUMENTS
Table of Contents
NM7000 LOCALIZER...........................................................................................2
NM7000 GLIDE PATH.........................................................................................11
NM7050 MARKER BEACON...............................................................................18

1250$5&
91DYLD$YLDWLRQ$6
,167$//$7,21&200,66,21,1*+$1'%22.
GROUND COMMISSIONING DOCUMENT
NM7000 LOCALIZER
Airport Runway
Cabinet Serial no.
Antenna system
Antenna Distribution Unit (ADU) Serial no.
Monitor Distribution Unit (MCU) Serial no.
Place: Date:
Navia Aviation representative (Sign.) Customer representative (Sign.)

1250$5&
91DYLD$YLDWLRQ$6
,167$//$7,21&200,66,21,1*+$1'%22.
GENERAL
The purpose of this document is to
• Ensure that all operating functions are working before the equipment is put into service.
• Establish useful reference data and settings for comparisons to routine maintenance data
and trouble shooting.
REQUIRED TEST EQUIPMENT
• Vector voltmeter or Network Analyser
• ILS Field Test Set NM3710 with 20 - 30 dB external input attenuator
• General purpose Oscilloscope
• Frequency Counter, 30 Hz to 350 MHz
• Digital Multimeter
• Directional Coupler, 75 - 350 MHz
DESCRIPTION OF TEST PROCEDURE
1.1 - 1.2 , 1.8 - 1.9
(COURSE AND CLEARANCE SECTIONS)
Connect NM3710 (use external 20-30 attenuator at BNC input) to COURSE RF BNC test
point and CLEARANCE RF BNC test point of Cabinet Coaxial section respectively. Use
keypad CHANGE OVER to alternate between Tx 1 and Tx 2. Read DDM and SDM.
1.3, 1.10
(COURSE AND CLEARANCE SECTIONS)
Connect the Frequency Counter (use 50Ω input port) to COURSE RF BNC test point and
CLEARANCE RF BNC test point of Cabinet Coaxial section respectively. Use keypad
CHANGE OVER to alternate between Tx 1 and Tx2.
1.4 - 1.5
Connect the Frequency Counter (use HI imp. input port) CSB BNC test point on Transmit-
ter section LPA1230. Switch off IDENT modulation.
90 Hz count: Switch off 150 Hz tone.
150 Hz count: Switch on 150 Hz tone and switch off 90 Hz tone.
1.6, 1.11
Connect the Frequency Counter (use HI imp. input port) CSB BNC test point on Transmit-
ter section LPA1230.
Switch off 90 and 150 Hz tones. Set the IDENT 1020 Hz to CONTINUOUS. Count the 1020
Hz.
1.7, 1.12
Connect NM3710 (use external 20-30 attenuator at BNC input) to COURSE RF BNC test
point and CLEARANCE RF BNC test point of COA1207A respectively. Push keypad
CHANGE OVER to activate the second transmitter. Read IDENT modulation depth.
1.13
Connect the Digital Multimeter (volts DC) to the BATTERY terminals. (Batteries shall be
fully charged). Read the voltage.

1250$5&
91DYLD$YLDWLRQ$6
,167$//$7,21&200,66,21,1*+$1'%22.
2.1 - 2.2
Connect the NM3710 to the monitor input CL cable (from MCU). Use keypad CHANGE
OVER to activate the second transmitter. Read DDM and SDM.
2.3 - 2.4
Connect the NM3710 to the monitor input DS cable (from MCU). Use keypad CHANGE
OVER to activate the second transmitter. Read DDM and SDM.
2.5 - 2.6
Connect the NM3710 to the monitor input NF cable (from NF antenna). Use keypad
CHANGE OVER to activate the second transmitter. Read DDM and SDM.
2.7 - 2.8
Connect the NM3710 to the monitor input CLR cable (from MCU). Use keypad CHANGE
OVER to activate the second transmitter. Read DDM and SDM.
3.1 - 3.3
Connect the oscilloscope to BNC test points (LPA units) at each relevant Transmitter unit
and check that normal waveforms exist.
4.1 - 4.7
Record all relevant SBO attenuator values obtained from Flight Commissioning Data.
4.8 - 4.11
Record relevant phaser settings (scale divisions). (4.9 is ADU SBO attenuator setting for
NM3522 only.)
5.1 - 5.24
Fill in phase and amplitude of signals from the receiving end of the monitor cables refer-
enced to the input phase/amplitude of the antenna cables. Normalise to A1/M1.
Fill in antenna return loss data in column
Return loss
.
6.1 - 6.9
Check that all remote control functions are OK.
7.1 - 7.6
Check that all Slave panel functions are OK.
8.1 - 8.2
Check that the 90° cable stub and 3 pcs different extension cards exist.
9.1 - 9.24
Transmitter shall be radiating. Select ILS\Measurements\Monitor II. Disconnect one
antenna at a time. Read values (Mon 1,2) for DC LOOP Ø,1,2,3, and record in table. For
each disconnected antenna check that one DC LOOP channel for Mon 1 and 2 is in Alarm.
10.1
Tx 1 operating normal. Make a Station Report to printer or file. Ref. Operator Manual para.
5.4.2.
10.2
Tx 2 operating normal. Make a Station Report to printer or file. Ref. Operator Manual para.
5.4.2.


1250$5&
91DYLD$YLDWLRQ$6
,167$//$7,21&200,66,21,1*+$1'%22.
1.0 Recordings from test connectors on the Cabinet:
COURSE TRANSMITTERS
CLEARANCE TRANSMITTERS
Recording across battery terminals of the Cabinet:
2.0 Recordings of monitor signal inputs to the Cabinet:
ITEM PARAMETER LIMITS Tx 1 Tx 2
1.1 CSB DDM -0.1...+0.1% % %
1.2 CSB SDM 39.5...40.5% % %
1.3 CARRIER FREQ. F ± 2.2 kHz MHz MHz
1.4 MOD 90Hz 89.9...90.1 Hz Hz Hz
1.5 MOD 150 Hz 149.9...150.1 Hz Hz Hz
1.6 IDENT 1020 Hz 1010...1030 Hz Hz Hz
1.7 IDENT MOD 9...11% % %
ITEM PARAMETER LIMITS Tx1 Tx2
1.8 CSB DDM -0.1...+0.1% % %
1.9 CSB SDM 39.5...40.5% % %
1.10 CARRIER FREQ. F ± 2.2 kHz MHz MHz
1.11 IDENT 1020 Hz 1010...1030 Hz Hz Hz
1.12 IDENT MOD 9...11% % %
1.13 Battery charge voltage 26.4...27.0V V
ITEM PARAMETER Tx 1 to Antenna Tx 2 to
Antenna
2.1 CL DDM % %
2.2 CL SDM % %
2.3 DS DDM % %
2.4 DS SDM % %
2.5 NF DDM % %
2.6 NF SDM % %
2.7 CLR DDM % %
2.8 CLR SDM % %
1250$5&
91DYLD$YLDWLRQ$6
,167$//$7,21&200,66,21,1*+$1'%22.
3.0 Transmitter waveforms test point checks (BNC test points):
4.0 Attenuators and Phaser settings in the Cabinet, Antenna Distribution Unit
(ADU) and Monitor combining unit (MCU). Cabinet:
ADU:
MCU:
ITEM PARAMETER COU Tx 1 COU Tx 2 CLR Tx 1 CLR Tx 2
3.1 CSB LF
3.2 SBO LF
3.3 PHASE CORR
ITEM PARAMETER Tx1 Tx2
4.1 COU SBO-attenuator Normal dB dB
4.2 COU SBO-attenuator Wide Alarm dB dB
4.3 COU SBO-attenuator Narrow Alarm dB dB
4.4 CLR SBO-attenuator Normal dB dB
4.5 CLR SBO-attenuator Wide Alarm dB dB
4.6 COU SBO-phaser div
.div
.
4.7 CLR SBO-phaser div
.div
.
ITEM PARAMETER
4.8 CL phaser div
.
4.9 SBO-attenuator (NM3522 6el antenna system only) dB
ITEM PARAMETER
4.10 CL phaser div
.
4.11 CS phaser div
.

1250$5&
91DYLD$YLDWLRQ$6
,167$//$7,21&200,66,21,1*+$1'%22.
5.0 Phase and Amplitude transfer data, Antenna Return Loss.
ITEM ANT.
No. Phase
transfer Ampli-
tude
transfer
Return
loss
5.1 1 °dBdB
5.2 2 ° dB dB
5.3 3 ° dB dB
5.4 4 ° dB dB
5.5 5 ° dB dB
5.6 6 ° dB dB
5.7 7 ° dB dB
5.8 8 ° dB dB
5.9 9 ° dB dB
5.10 10 ° dB dB
5.11 11 ° dB dB
5.12 12 ° dB dB
5.13 13 ° dB dB
5.14 14 ° dB dB
5.15 15 ° dB dB
5.16 16 ° dB dB
5.17 17 ° dB dB
5.18 18 ° dB dB
5.19 19 ° dB dB
5.20 20 ° dB dB
5.21 21 ° dB dB
5.22 22 ° dB dB
5.23 23 ° dB dB
5.24 24 ° dB dB

1250$5&
91DYLD$YLDWLRQ$6
,167$//$7,21&200,66,21,1*+$1'%22.
6.0 Remote Control functions:
7.0 Slave panel functions:
8.0 Accessories:
ITEM PARAMETER RCU CHECK
6.1 TX ON/OFF
6.2 CHANGE-OVER
6.3 ALARM SILENCE
6.4 PARAM WARNING
6.5 DISAGR WARNING
6.6 BATT WARNING
6.7 IDENT WARNING
6.8 MAINT WARNING
6.9 STBY WARNING
ITEM PARAMETER SLAVE-
CHECK
7.1 TX ON/OFF
7.3 ALARM SILENCE
7.4 ALARM
7.5 NORMAL
7.6 WARNING
ITEM DEVICE CHECK
8.1 90° cable w/frequency label
8.2 2 pcs different extension cards

1250$5&
91DYLD$YLDWLRQ$6
,167$//$7,21&200,66,21,1*+$1'%22.
9.0 DC-loop Test:
ITEM ANTENNA DLØ DL1 DL2 DL3
NO. Mon 1 Mon 2 Mon 1 Mon 2 Mon 1 Mon 2 Mon 1 Mon 2
9.1 A1
9.2 A2
9.3 A3
9.4 A4
9.5 A5
9.6 A6
9.7 A7
9.8 A8
9.9 A9
9.10 A10
9.11 A11
9.12 A12
9.13 A13
9.14 A14
9.15 A15
9.16 A16
9.17 A17
9.18 A18
9.19 A19
9.20 A20
9.21 A21
9.22 A22
9.23 A23
9.24 A24

1250$5&
91DYLD$YLDWLRQ$6
,167$//$7,21&200,66,21,1*+$1'%22.
GROUND COMMISSIONING DOCUMENT
NM7000 GLIDE PATH
Airport Runway
Cabinet Serial no.
Antenna system
Antenna Distribution Unit (ADU) Serial no.
Monitor Distribution Unit (MCU) Serial no.
Place: Date:
Navia Aviation representative (Sign.) Customer representative (Sign.)

1250$5&
91DYLD$YLDWLRQ$6
,167$//$7,21&200,66,21,1*+$1'%22.
GENERAL
The purpose of this document is to
• Ensure that all operating functions are working before the equipment is put into service.
• Establish useful reference data and settings for comparisons to routine maintenance data
and trouble shooting.
REQUIRED TEST EQUIPMENT
• Vector voltmeter or Network Analyser
• ILS Field Test Set NM3710 with 20 - 30 dB external input attenuator
• General purpose Oscilloscope
• Frequency Counter, 30 Hz to 350 MHz
• Digital Multimeter
• Directional Coupler, 75 - 350 MHz
DESCRIPTION OF TEST PROCEDURE
1.1 - 1.2 , 1.8 - 1.9
(COURSE AND CLEARANCE SECTIONS)
Connect NM3710 (use external 20-30 attenuator at BNC input) to COURSE RF BNC test
point and CLEARANCE RF BNC test point of Cabinet Coaxial section respectively. Use
keypad CHANGE OVER to alternate between Tx 1 and Tx 2. Read DDM and SDM.
1.3, 1.10
(COURSE AND CLEARANCE SECTIONS)
Connect the Frequency Counter (use 50Ω input port) to COURSE RF BNC test point and
CLEARANCE RF BNC test point of Cabinet Coaxial section respectively. Use keypad
CHANGE OVER to alternate between Tx 1 and Tx2.
1.4 - 1.5
Connect the Frequency Counter (use HI imp. input port) CSB BNC test point on Transmit-
ter section LPA1230.
90 Hz count: Switch off 150 Hz tone.
150 Hz count: Switch on 150 Hz tone and switch off 90 Hz tone.
1.6, 1.11
Not applicable
1.7, 1.12
Not applicable
1.13
Connect the Digital Multimeter (volts DC) to the BATTERY terminals. (Batteries shall be
fully charged). Read the voltage.
2.1 - 2.2
Connect the NM3710 to the monitor input CL cable (from MCU). Use keypad CHANGE
OVER to activate the second transmitter. Read DDM and SDM.

1250$5&
91DYLD$YLDWLRQ$6
,167$//$7,21&200,66,21,1*+$1'%22.
2.3 - 2.4
Connect the NM3710 to the monitor input DS cable (from MCU). Use keypad CHANGE
OVER to activate the second transmitter. Read DDM and SDM.
2.5 - 2.6
Connect the NM3710 to the monitor input NF cable (from NF antenna). Use keypad
CHANGE OVER to activate the second transmitter. Read DDM and SDM.
2.7 - 2.8
Connect the NM3710 to the monitor input CLR cable (from MCU). Use keypad CHANGE
OVER to activate the second transmitter. Read DDM and SDM.
3.1 - 3.3
Connect the oscilloscope to BNC test points (LPA units) at each relevant Transmitter unit
and check that normal waveforms exist.
4.1 - 4.7
Record all relevant SBO attenuator values obtained from Flight Commissioning Data.
4.8 - 4.11
Record relevant phaser settings (scale divisions).
4.12- 4.13
Record GP and SW attenuator settings.
4.14- 4.16
Record PH1, PH2, PH3 phaser settings.
5.1 - 5.24
Fill in phase and amplitude of signals from the receiving end of the monitor cables refer-
enced to the input phase/amplitude of the antenna cables. Normalise to A1/M1.
Fill in antenna return loss data in column
Return loss
.
6.1 - 6.9
Check that all remote control functions are OK.
7.1 - 7.6
Check that all Slave panel functions are OK.
8.1 - 8.2
Check that the 90° cable stub and 3 pcs different extension cards exist.
9.1Tx 1 operating normal. Make a Station Report to printer or file. Ref. Operator Manual para.
5.4.2.
9.2Tx 2 operating normal. Make a Station Report to printer or file. Ref. Operator Manual para.
5.4.2.
10.0
Make a file copy to diskette of the NM70xx ILS Configuration file.

1250$5&
91DYLD$YLDWLRQ$6
,167$//$7,21&200,66,21,1*+$1'%22.
1.0 Recordings from test connectors on the Cabinet:
COURSE TRANSMITTERS
CLEARANCE TRANSMITTERS
Recording across battery terminals of the Cabinet:
2.0 Recordings of monitor signal inputs to the Cabinet:
ITEM PARAMETER LIMITS Tx 1 Tx 2
1.1 CSB DDM -0.2...+0.2% % %
1.2 CSB SDM 79.0...81.0% % %
1.3 CARRIER FREQ. F ± 5.0 kHz MHz MHz
1.4 MOD 90Hz 89.9...90.1 Hz Hz Hz
1.5 MOD 150 Hz 149.9...150.1 Hz Hz Hz
1.6 Not applicable
1.7 Not applicable
ITEM PARAMETER LIMITS Tx1 Tx2
1.8 CSB DDM 39.8...40.2% % %
1.9 CSB SDM 79.0...81.0% % %
1.10 CARRIER FREQ. F ± 5.0 kHz MHz MHz
1.11 Not applicable
1.12 Not applicable
1.13 Battery charge voltage 26.4...27.0V V
ITEM PARAMETER Tx 1 to Antenna Tx 2 to
Antenna
2.1 CL DDM % %
2.2 CL SDM % %
2.3 DS DDM % %
2.4 DS SDM % %
2.5 NF DDM % %
2.6 NF SDM % %
2.7 CLR DDM % %
2.8 CLR SDM % %
1250$5&
91DYLD$YLDWLRQ$6
,167$//$7,21&200,66,21,1*+$1'%22.
3.0 Transmitter waveforms test point checks (BNC test points):
4.0 Attenuators and Phaser settings in the Cabinet, Antenna Distribution Unit
(ADU) and Monitor combining unit (MCU).Cabinet:
ADU NM3545 Antenna system:
ITE
MPARAMETER COU Tx 1 COU Tx 2 CLR Tx 1 CLR Tx 2
3.1 CSB LF
3.2 SBO LF
3.3 PHASE CORR
ITE
MPARAMETER Tx1 Tx2
4.1 COU SBO-attenuator Normal dB dB
4.2 COU SBO-attenuator Wide Alarm dB dB
4.3 COU SBO-attenuator Narrow Alarm dB dB
4.4 Not applicable dB dB
4.5 Not applicable dB dB
4.6 Not applicable div
.div
.
4.7 Not applicable div
.div
.
ITE
MPARAMETER div
.
4.8 CSB Power Divider D1 div
.
4.9 SBO Power Divider D2 div
.
4.10 SBO Power Divider D3 div
.
4.11 Upper Antenna Phaser PH3 div
.
4.12 SBO Upper/Lower Antenna Phaser PH2 div
.
4.11 Lower Antenna Phaser PH1 div
.

1250$5&
91DYLD$YLDWLRQ$6
,167$//$7,21&200,66,21,1*+$1'%22.
MCU NM3545 Antenna system:
5.0 Phase and Amplitude transfer data, Antenna Return Loss.
6.0 Remote Control functions:
ITE
MPARAMETER
4.12 GP Attenuator dB
4.13 SW Attenuator dB
4.14 Upper Antenna Phaser PH1 div
.
4.15 Middle Antenna Phaser PH2 div
.
4.16 Course Cancellation Phaser PH3 div
.
ITE
MANT. No. Phase
transfer Ampli-
tude
transfer
Return
loss
5.1 1 (Lower) °d
BdB
5.2 2 (Middle) ° d
BdB
5.3 3 (Upper) ° d
BdB
ITE
MPARAMETER RCU CHECK
6.1 TX ON/OFF
6.2 CHANGE-OVER
6.3 ALARM SILENCE
6.4 PARAM WARNING
6.5 DISAGR WARNING
6.6 BATT WARNING
6.7 IDENT WARNING
6.8 MAINT WARNING
6.9 STBY WARNING


1250$5&
91DYLD$YLDWLRQ$6
,167$//$7,21&200,66,21,1*+$1'%22.
GENERAL
The purpose of this document is to
• Ensure that all operating functions are working before the equipment is put into service.
• Establish useful reference data and settings for comparisons to routine maintenance data
and trouble shooting.
REQUIRED TEST EQUIPMENT
• Vector voltmeter or Network Analyser
• General purpose Oscilloscope
• Frequency Counter, 30 Hz to 350 MHz
• Digital Multimeter
• Directional Coupler, 75 - 350 MHz
DESCRIPTION OF TEST PROCEDURE
1.1Insert a 30 dB directional coupler in the antenna cable at the output connector. Turn OFF
the modulation and connect a frequency counter to the detector output. Record the RF fre-
quency. Switch to Tx 2 and repeat the procedure.
1.2Set modulation to ‘keyed’. With Tx 1 switched on and the oscilloscope connected to the
detector output, observe the keying code. Switch to Tx 2 and repeat the procedure.
1.3With Tx 1 switched on, connect a frequency counter to TP 704 on TX1373A. Set Tx 1 mod-
ulation to ‘CONTINUOUS MODULATION’ and read Tx 1 modulation frequency. Change to
transmitter 2 and set Tx 2 modulation to ‘CONTINUOUS MODULATION’. Record Tx 2
modulation frequency.
1.4Set Tx 1 in normal operation, read the Modulation Depth value from Monitor 1 and 2.
Change over to Tx 2 and repeat the procedure.
1.5With Tx 1 in normal operation, read RF Power from the Maintenance Monitor. Change over
to Tx 2 and repeat the reading.
2.1Insert a 3 dB attenuator to the output. Set the transmitter to keyed operation with the output
power 3 dB below normal level. Adjust the RF ALARM LOWER LIMIT until the alarm lamp
is lit. Remove the 3 dB attenuator. The alarm lamp shall extinguish.
2.2Set the transmitter to keyed operation. Set Tx in test mode and reduce modulation depth
until the alarm lamp is lit.
2.3With Tx 1 in normal keyed operation, set modulation to ‘CONTINUOUS MODULATION’
and observe that the alarm lamp is lit.

1250$5&
91DYLD$YLDWLRQ$6
,167$//$7,21&200,66,21,1*+$1'%22.
3.1Connect a Directional Coupler, terminated to dummy load to the output. Turn off modula-
tion and use the RF signal from the test output on the directional coupler for this measure-
ment. Save Reference on the Vector Voltmeter, connect the Vector Voltmeter to the
Antenna cable and measure the Return Loss.
4.1-4.10
Check that all remote control functions are OK.
5.1- 5.7
Check that all remote control functions are OK.
6.1Check that 2 pcs different extension cards exist.

1250$5&
91DYLD$YLDWLRQ$6
,167$//$7,21&200,66,21,1*+$1'%22.
1.0 Recordings from external test instruments and Front Panel:
2.0 Recordings of monitor signal inputs to the Cabinet
3.0 Antenna Return Loss:
4.0 Remote Control functions:
ITEM PARAMETER LIMITS Tx 1 Tx 2
1.1 Carrier frequency 75 MHz ±
2.25 kHz
MHz
MHz
1.2 Keying code
1.3 Modulation tone fre-
quency f ± 2.5%±4%
Hz
Hz
1.4 Modulation depth
(Reading from Moni-
tor 1 & 2)
95% % %
1.5 RF Power to antenna W W
ITEM PARAMETER LIMITS SETTING
2.1 Power alarm -3 dB W
2.2 Modulation depth alarm Minimum 50% %
2.3 Keying failure alarm
ITEM ANTENNA NO. RETURN
LOSS
3.1 1 dB
3.2 2 dB
ITEM PARAMETER RCU CHECK
4.1 TX ON/OFF
4.2 CHANGE-OVER
4.3 ALARM SILENCE
4.4 PARAM WARNING
4.5 DISAGR WARNING
4.6 BATT WARNING
4.7 IDENT WARNING
4.8 MAINT WARNING
4.9 STBY WARNING
4.10 INTERLOCK SWITCH


1250$5&
1DYLD$YLDWLRQ$6
,167$//$7,21&200,66,21,1*+$1'%22.
SECTION 6
APPENDIX
Table of contents
Diagram 1 Relative SBO vs CS Width, NM3522..........................................2
Diagram 2 Relative SBO vs CS Width, NM3523B. ......................................3
Diagram 3 Relative SBO vs CS Width, NM3524..........................................4
Diagram 4 Relative SBO vs CS Width, NM3525..........................................5
Diagram 5 Relative SBO vs CS Width, GP antenna systems......................6
Diagram 6 GP angle vs relative antenna height, NM3545. ..........................7
Diagram 7 GP angle vs relative antenna height, NM3544. ..........................8
Diagram 8 GP angle vs relative antenna height, NM3543. ..........................9
SPINNER cable connector installation instructions

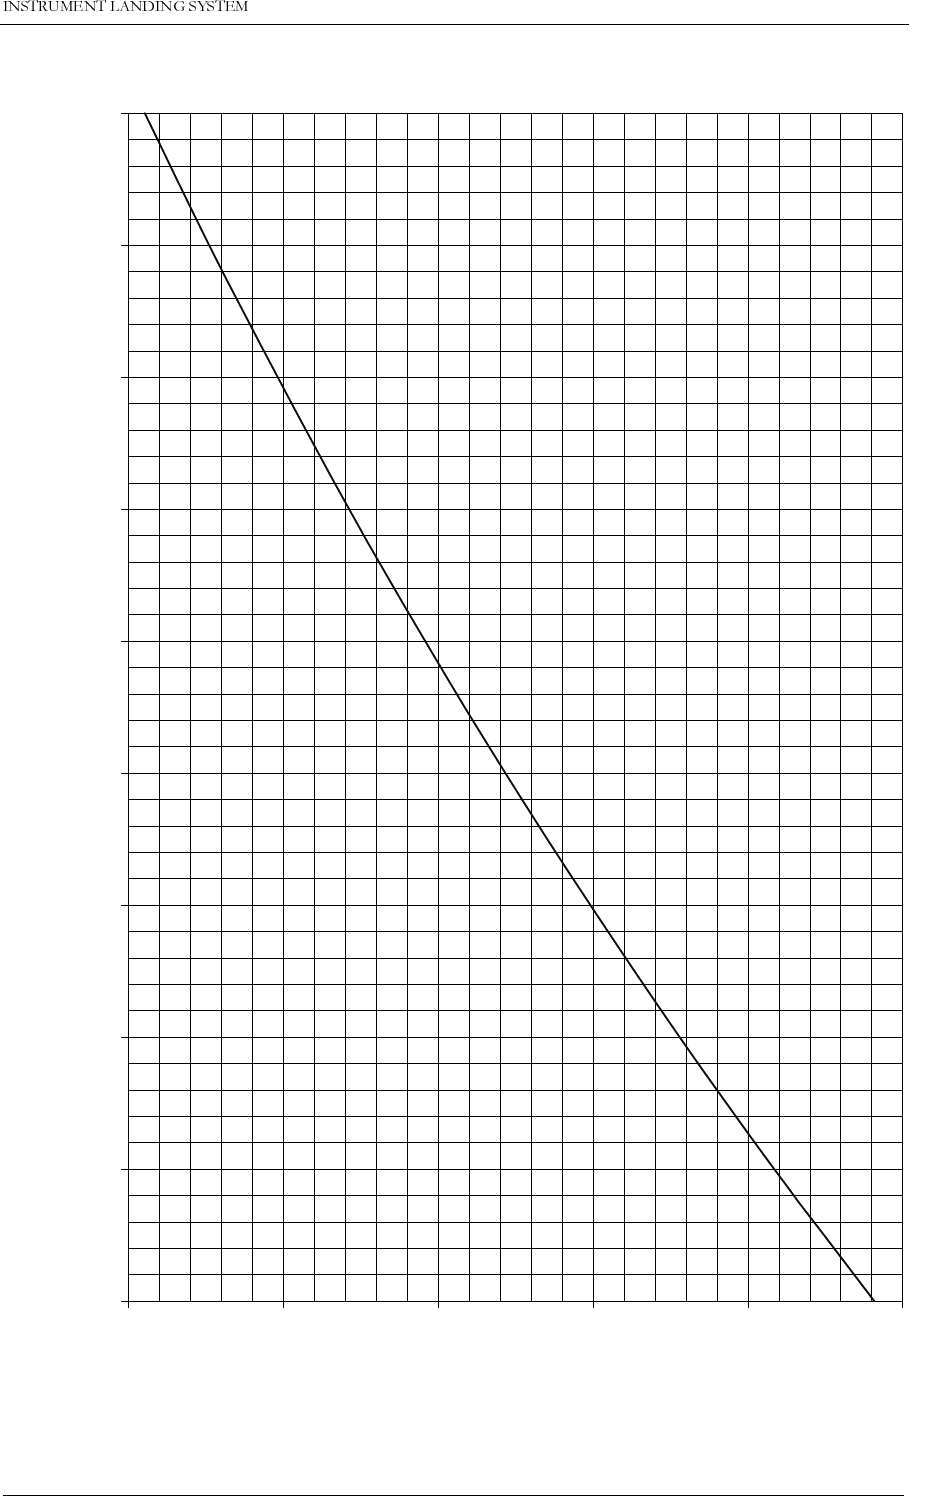


1250$5&
1DYLD$YLDWLRQ$6
,167$//$7,21&200,66,21,1*+$1'%22.
Diagram 6 GP angle vs relative antenna height, NM3545.
2,8
2,85
2,9
2,95
3
3,05
3,1
3,15
3,2
3,25
-30 -20 -10 0 10 20 30
Lower antenna relative height (cm)
Glide Path Angle (°)
Middle antenna: (cm) x 2
Upper antenna: (cm) x 3
GP angle
(°) Upper ant.
(cm) Lower ant.
(cm)
3,2 -0,33 -4 +5 0,20 -3 -3
3,1 -0,35 +3 0,21 -2
3,0 -0,38 0 0 0,23 0 0
2,9 -0,40 -2 0,24 +1
2,8 -0,43 6 -5 0,26 3 +3
Relative Sideway Offset vs GP Angle

1250$5&
1DYLD$YLDWLRQ$6
,167$//$7,21&200,66,21,1*+$1'%22.
Diagram 7 GP angle vs relative antenna height, NM3544.
2,8
2,85
2,9
2,95
3
3,05
3,1
3,15
3,2
3,25
-15 -10 -5 0 5 10 15
Lower antenna relative height (cm)
Glide Path Angle (°)
Upper antenna: (cm) x 3
GP angle
(°) Lower ant.
(cm)
3,2 0,20 -3
3,1 0,21 -1
3,0 0,23 0 0
2,9 0,24 +1
2,8 0,26 +3
Relative Sideways Offset vs GP Angle

1250$5&
1DYLD$YLDWLRQ$6
,167$//$7,21&200,66,21,1*+$1'%22.
Diagram 8 GP angle vs relative antenna height, NM3543.
2,8
2,85
2,9
2,95
3
3,05
3,1
3,15
3,2
3,25
-20 -15 -10 -5 0 5 10 15 20
Lower antenna relative height (cm)
Glide Path Angle (°)
Upper antenna: (cm) x 2
GP angle
(°) Lower ant.
(cm)
3,2 0,13 -2
3,1 0,14 -1
3,0 0,15 0 0
2,9 0,16 +1
2,8 0,17 +2
Relative Sideways Offset vs GP Angle