Mojo Networks SS300ATC60 SpectraGuard Access Point / Sensor User Manual 3
AirTight Networks, Inc. SpectraGuard Access Point / Sensor Users Manual 3
Contents
- 1. Users Manual
- 2. Users Manual-1
- 3. Users Manual-2
- 4. Users Manual-3
- 5. Users Manual-4
- 6. Users Manual-5
- 7. Users Manual-6
- 8. (SS-300AT-C-60) UserMan-Part1_2013.12.11 revised
- 9. (SS-300AT-C-60) UserMan-Part2
- 10. (SS-300AT-C-60) UserMan-Part3
- 11. (SS-300AT-C-60) UserMan-Part4
- 12. (SS-300AT-C-60) UserMan-Part5
- 13. (SS-300AT-C-60) UserMan-Part6
Users Manual-3
Locations Tab
SpectraGuard® Enterprise User Guide
121
Placing Locations on a Location Folder with an Attached Image
The system enables you to place locations on a location folder that has an attached image. This helps you identify the
physical position of each of the locations. The locations placed on the attached image are indicated by colored circles.
A green circle indicates that the location is Secure, while a red circle indicates that the location is Vulnerable.
Use the following steps to place locations on the attached image and view their details:
1. In the Location tree, select a location folder.
2. Under Available Locations, drag and drop the required locations on the attached image.
3. To view details about the location hold the mouse cursor over the colored circle.
4. To go to a particular location placed on the image, do one of the following:
Click the colored circle representing the location.
Point to the colored circle representing the location, then right-click and select Jump to this
location.
Note: You can traverse to a particular location node by following step 4 until you reach the destination location node.
Placing Locations on a Location Folder with an Attached Image and Viewing Details
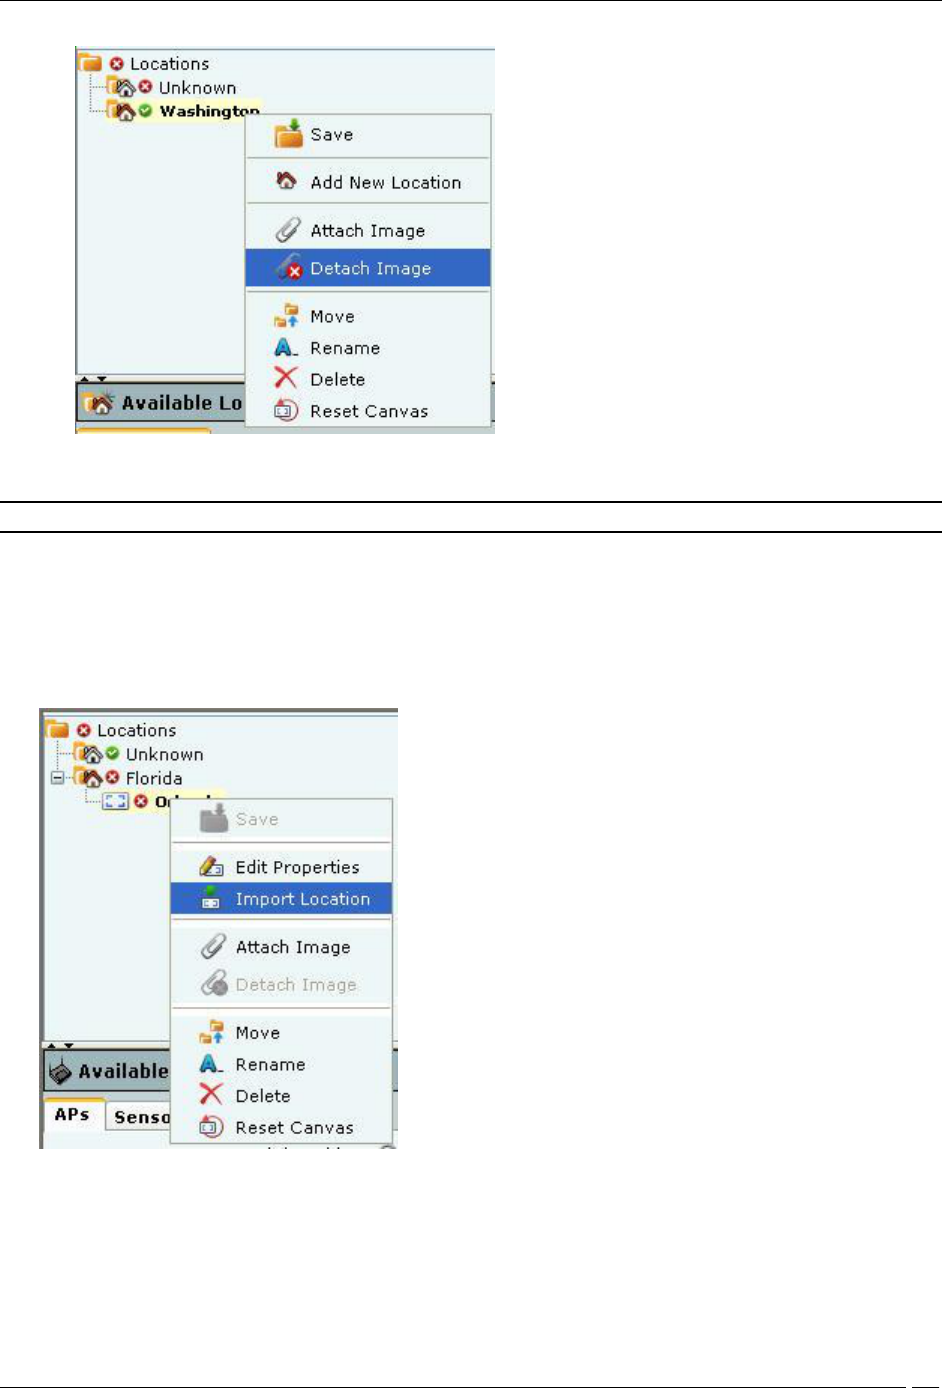
Detaching an Image
Use the following steps to detach an image:
1. In the Location tree, select the location from which you wish to detach an image.
2. Do one of the following:
Right-click and from the resulting context-sensitive menu, select Detach Image.
Click the Detach Image from floor icon in the right corner.
Locations Tab
SpectraGuard® Enterprise User Guide
122
Detaching an Image from a Location
3. Click Yes in the Confirm dialog to remove the selected image.
Note: On detaching an image, all the placed locations go back to the Available Locations list.
Importing a Planner file into a Location Node
The system enables you to specify a layout for each location node using a blank canvas, a layout image, or a .SPM file
exported from Planner. Use the following steps to import a Planner file:
1. In the Location tree, select the location node into which you wish to import the .SPM file and then right-
click.
2. From the resulting context-sensitive menu, select Import Location.
Importing a Location
3. In the Select SpectraGuard Planner (.spm) File dialog, browse to the appropriate Planner
exported .SPM file and then click Open.
Creating your Layout
This section shows you how to place devices on your floor map, view details of the layout, reset your canvas, and
edit floor properties.
Locations Tab
SpectraGuard® Enterprise User Guide
123
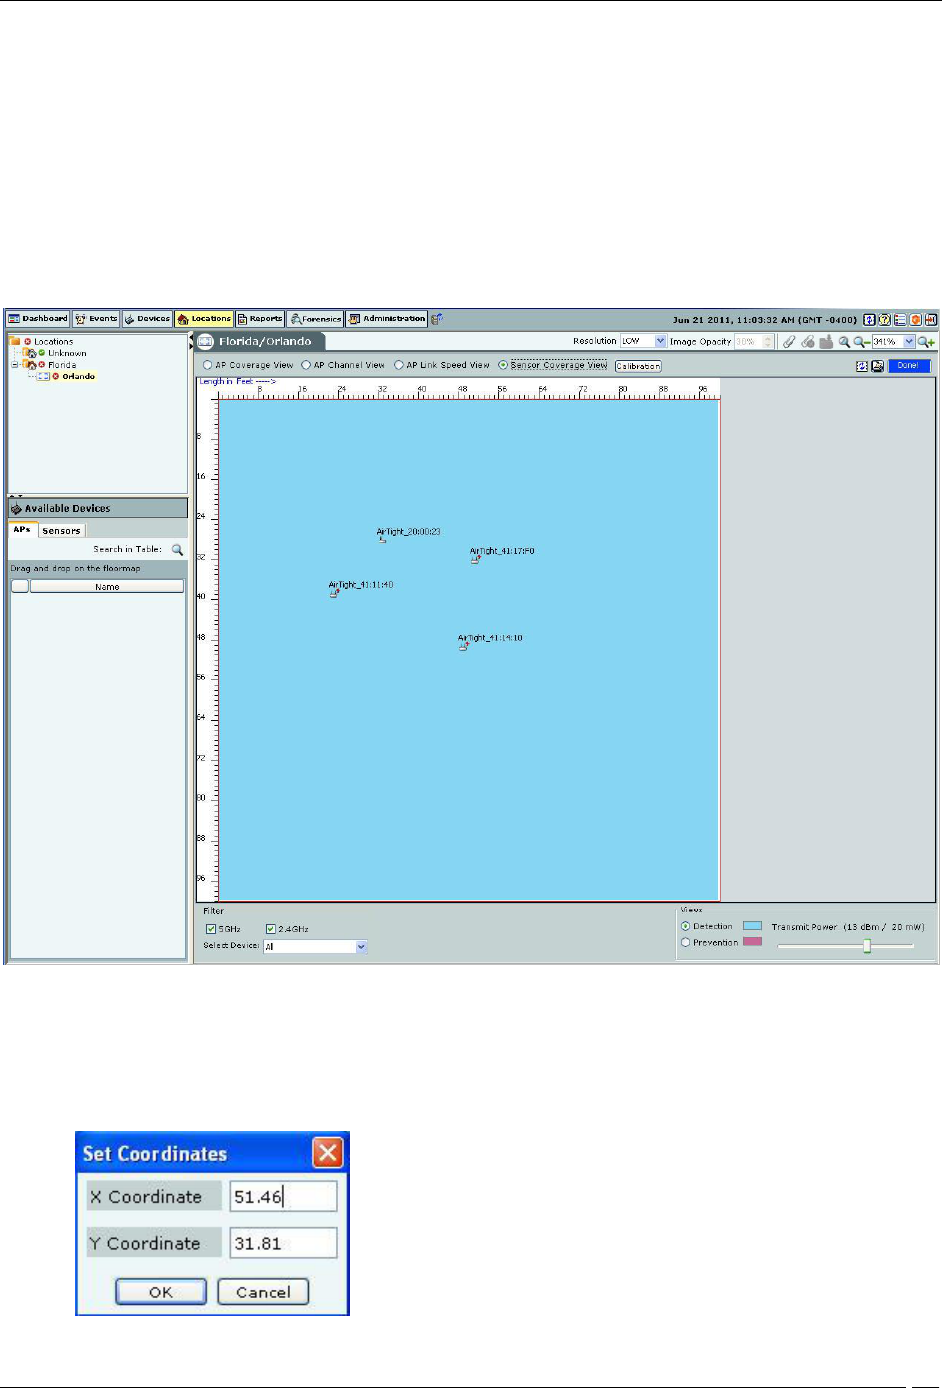
Placing APs and Sensors on the Floor map and Viewing Details
The system enables you to place APs and Sensors on the floor map to view live RF coverage maps for a location node
and perform on-floor location tracking of visible 802.11 devices. Use the following steps to place APs and Sensors on
the floor map and view their details:
1. In the Location tree, select a location node.
2. Under Available Devices, select either the APs or the Sensors tab, then drag and drop the APs or
Sensors on your floor map. As soon as you drag and drop the APs or Sensors on your floor map, the RF
views of the APs or Sensors are displayed.
3. To view details about the AP or Sensor hold the mouse cursor over the appropriate device.
4. Double-clicking the AP or Sensor displays the AP or Sensor Details screen in the Devices tab.
Placing APs and Sensors on the Floor map and Viewing Details
5. Right-click the AP or Sensor the following menu items appear.
Delete: Deletes the device
Set Coordinates: Select Set Coordinates to move the device to the specified coordinates. Enter the X
and Y Coordinate in the Set Coordinates dialog.
Set Coordinates
Locations Tab
SpectraGuard® Enterprise User Guide
124
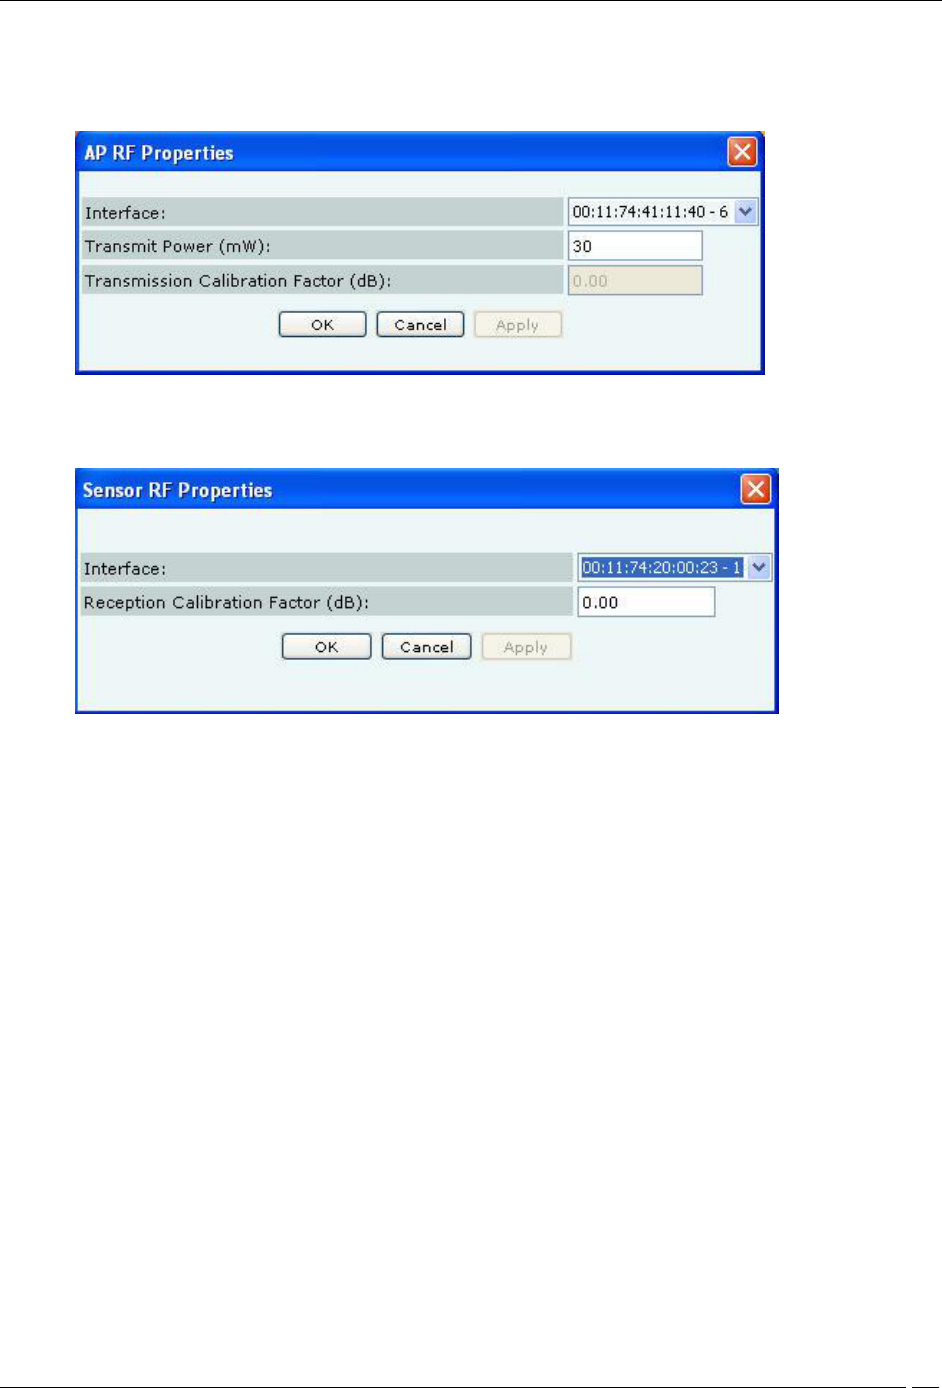
Change RF Property: Select RF Property to change the RF properties of the device. In AP RF
Properties dialog, select the Interface name from the Interface drop-down list. Enter Transmit
Power (mW) and Transmission Calibration Factor (dB). Click Apply and then OK.
AP RF Properties dialog
In the Sensor RF Properties dialog select the Interface name from the Interface drop-down list. Enter
Reception Calibration Factor (dB). Click Apply and then OK.
Sensor RF Properties dialog
Setting Coordinates and Deleting Devices from a Floor map
The system enables you to set the coordinates of APs and Sensors placed on the floor map for precise positioning.
You can delete APs and Sensors from your floor map so that the deleted devices can be placed again on the floor map.
Such devices become available under Available Devices. Use the following steps to set the coordinates of a device or
delete a device.
1. Right-click an AP/Sensor placed on the floor map. Do one of the following from the resulting menu:
Select Set Coordinates to open a dialog where you can specify the X and Y coordinates of the
selected device. To set the coordinates, click OK.
Select Delete to remove the AP/Sensor from the floor map.
Resetting your Canvas
The system enables you to reset a canvas to revert to a blank canvas. This option removes all folders and location
information from a location folder. It removes all device and location information, including the background image
and/or any imported Planner file from a location node. All placed devices go back to the Available Devices list. The
system retains the original size and the location name in the sub-list of locations.
Use the following steps to reset a canvas:
1. In the Location tree, select the location at which you wish to reset the canvas and then right-click.
2. From the resulting context-sensitive menu, select Reset Canvas.
3. Click Yes on the Confirm dialog to reset the canvas.
Editing Floor Properties
The system enables you to edit the properties of an existing floor map to change its name and dimensions. Use the
following steps to edit the floor properties:
1. In the Location tree, select the location node whose properties you wish to edit and then right-click.
Locations Tab
SpectraGuard® Enterprise User Guide
125
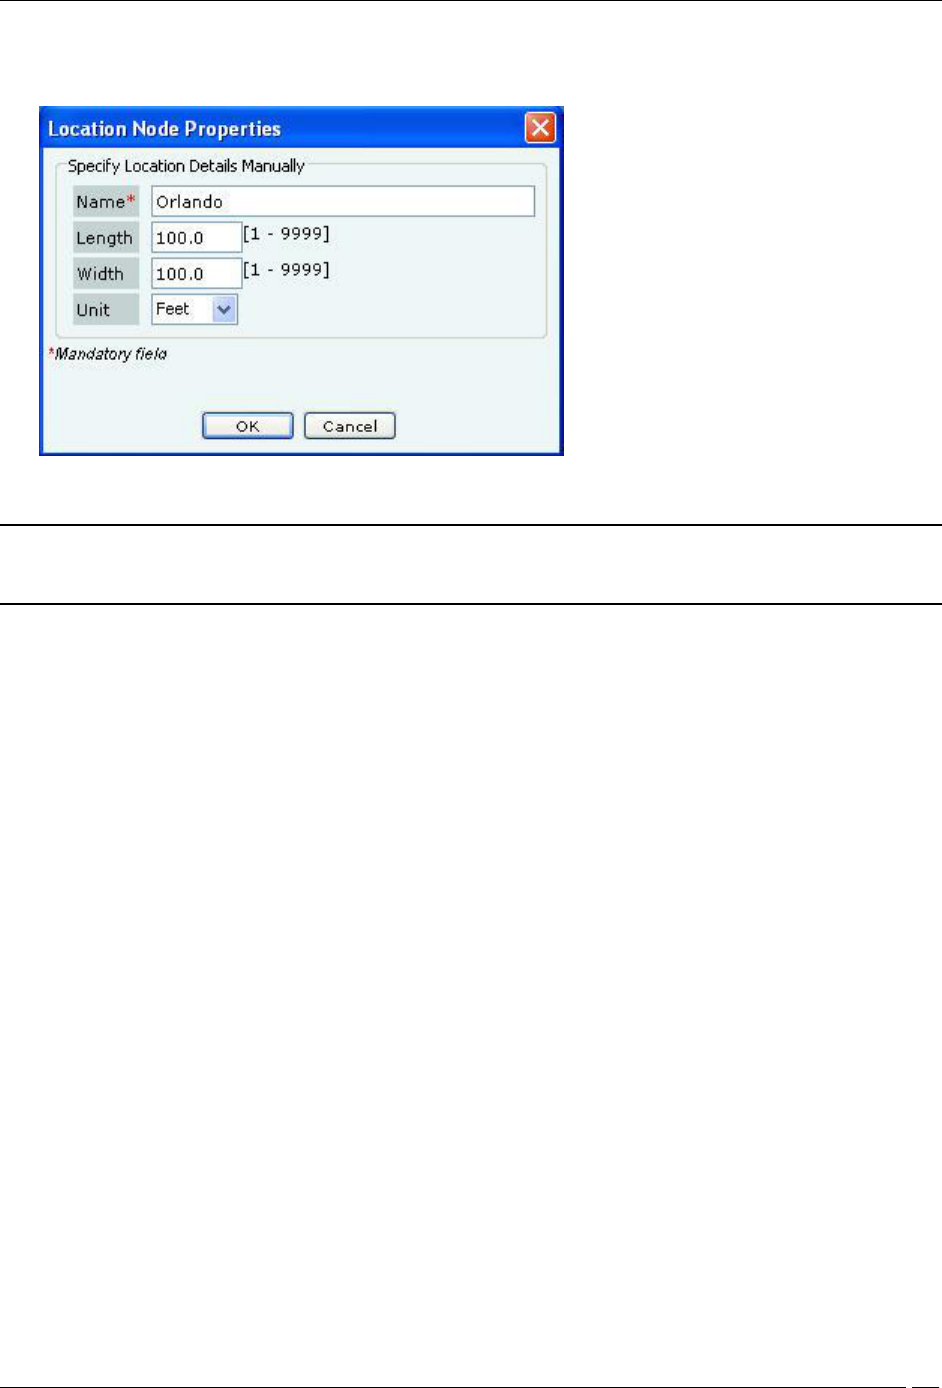
2. From the resulting context-sensitive menu, select Edit Properties.
3. On the Location Node Properties dialog, edit the required properties.
Editing the Properties of a Location Node
4. To change the properties, click Save.
Note: If you resize a location node to a smaller dimension, the objects placed on the floor map are drawn beyond the floor
boundaries. The system removes all the devices that fall outside the resized area. The system scales the attached image according
to the new size. The size of the objects placed on the floor map however, remains unaltered.
Tagging Locations
The System enables you to tag different locations on the floor map. You can add notes to a floor map. Similarly, you
can edit notes, delete notes, hide notes that are displayed on the floor map, and show hidden notes on the floor map.
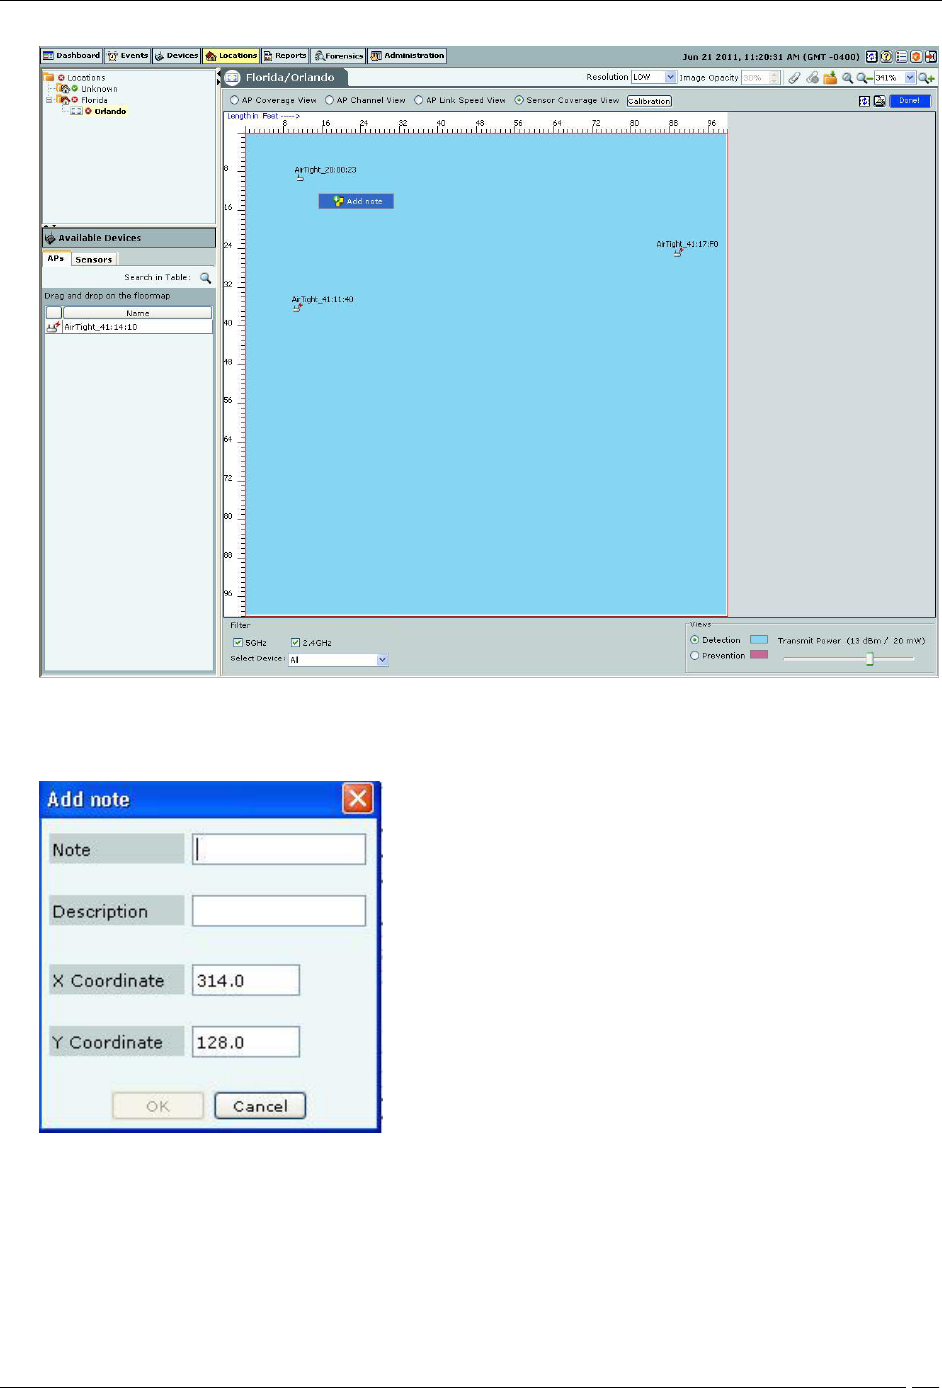
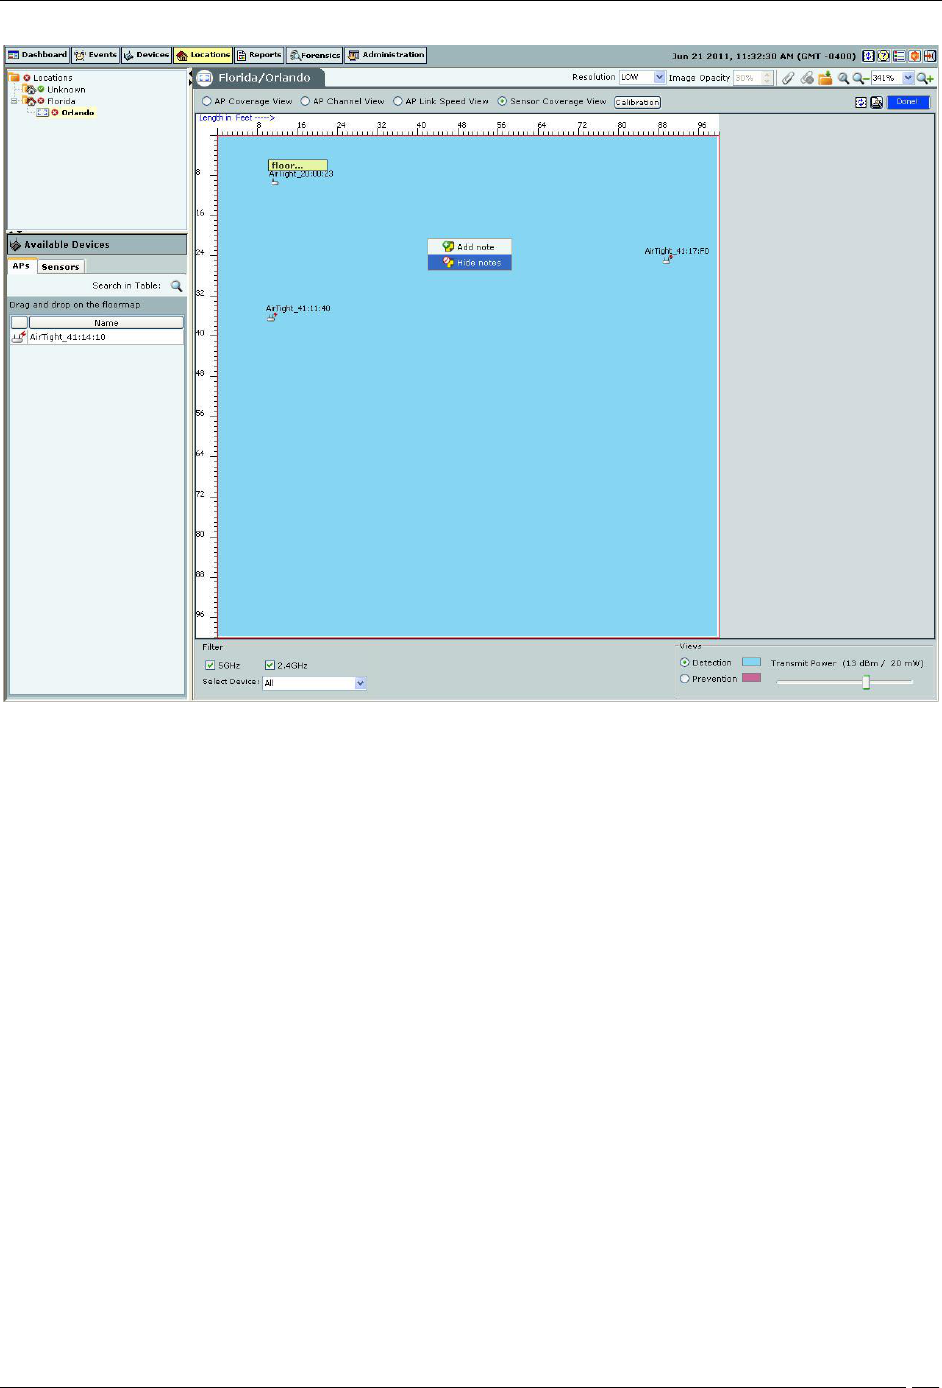
Adding Location Notes to a Floor Map
Do the following steps to tag an element or location on the floor map.
1. Right click the element or location on the floor map to be tagged.
2. The Add Notes menu is displayed. The following figure shows the Add Notes menu.
Locations Tab
SpectraGuard® Enterprise User Guide
126
Adding Notes to Floor Map Elements
3. Select Add Notes.
4. The Add note dialog is displayed. Following figure shows the Add Note dialog.
Add Notes dialog
5. Add the note and its description. The X Coordinate and Y Coordinate are sensed by the System
and populated in the Add note dialog.
6. To save the note, click OK. Click Cancel to cancel the operation.
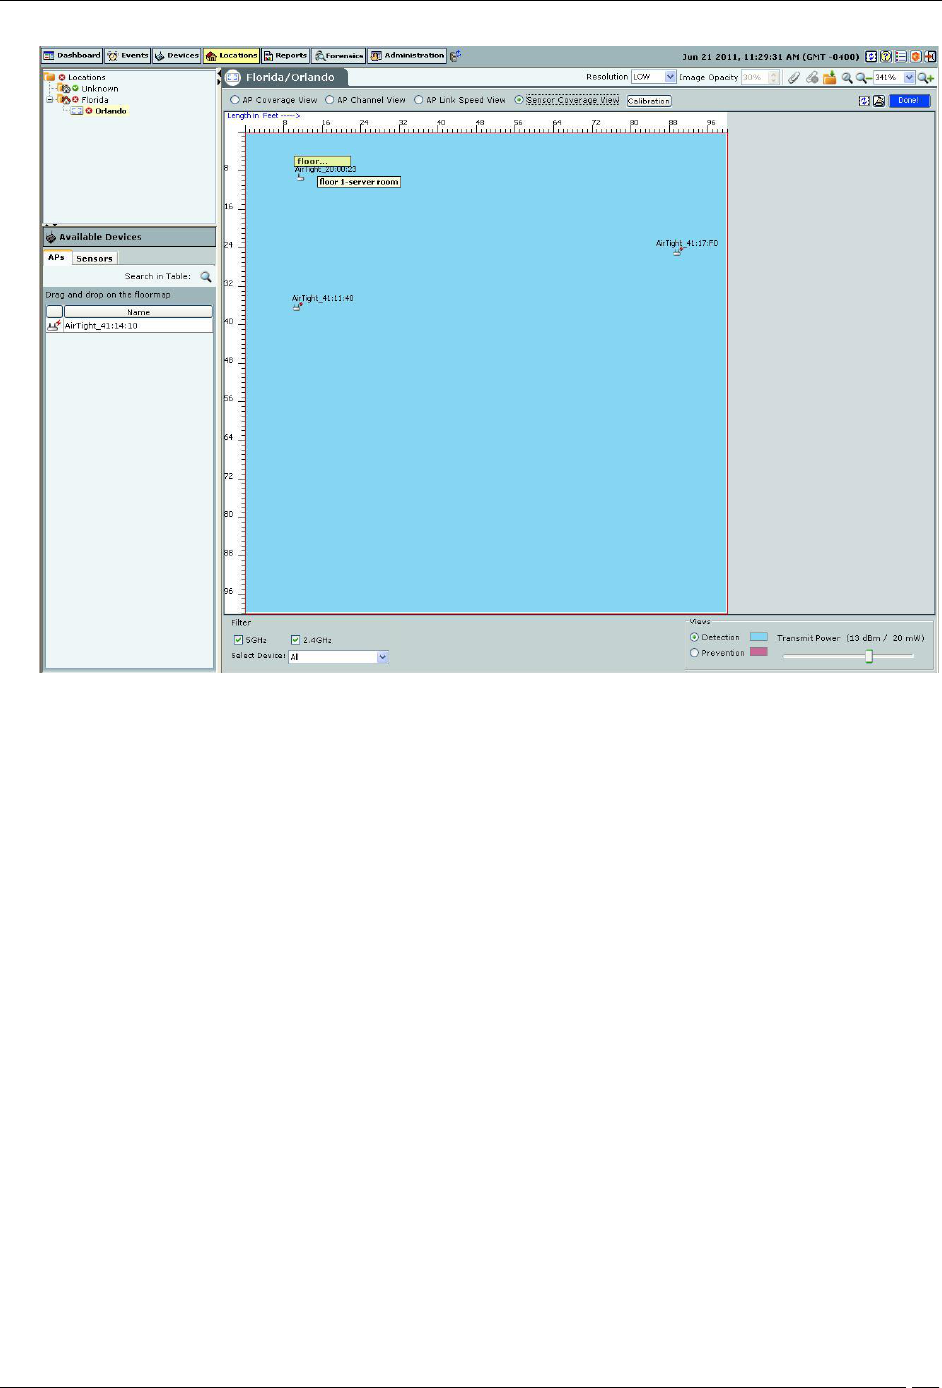
7. On saving the note, note is added to the floor map element. The following figure displays a floor
map with notes.
Locations Tab
SpectraGuard® Enterprise User Guide
127
Floor Map with a Location Note
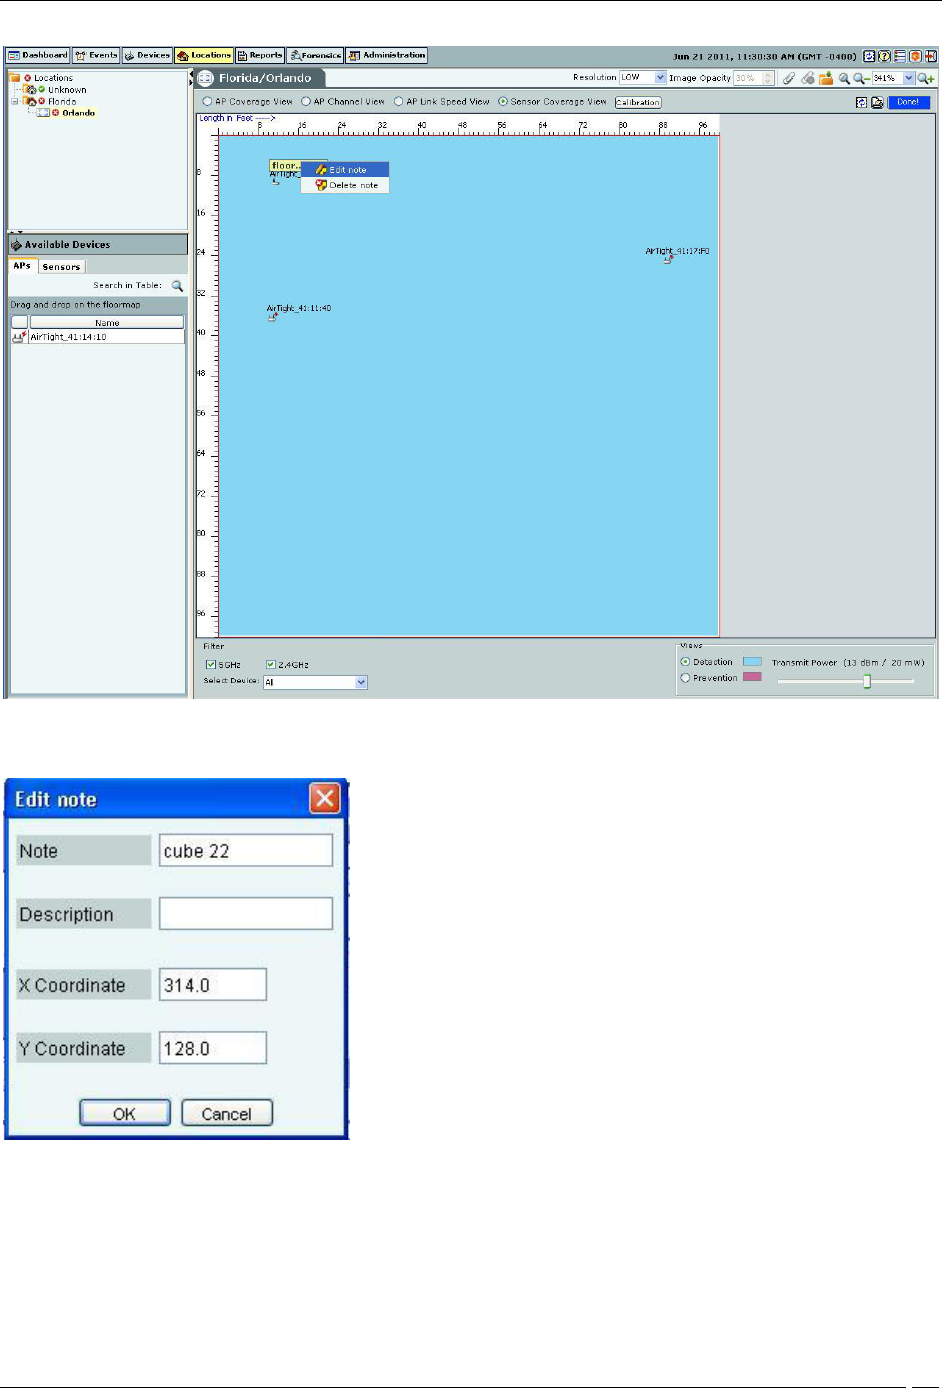
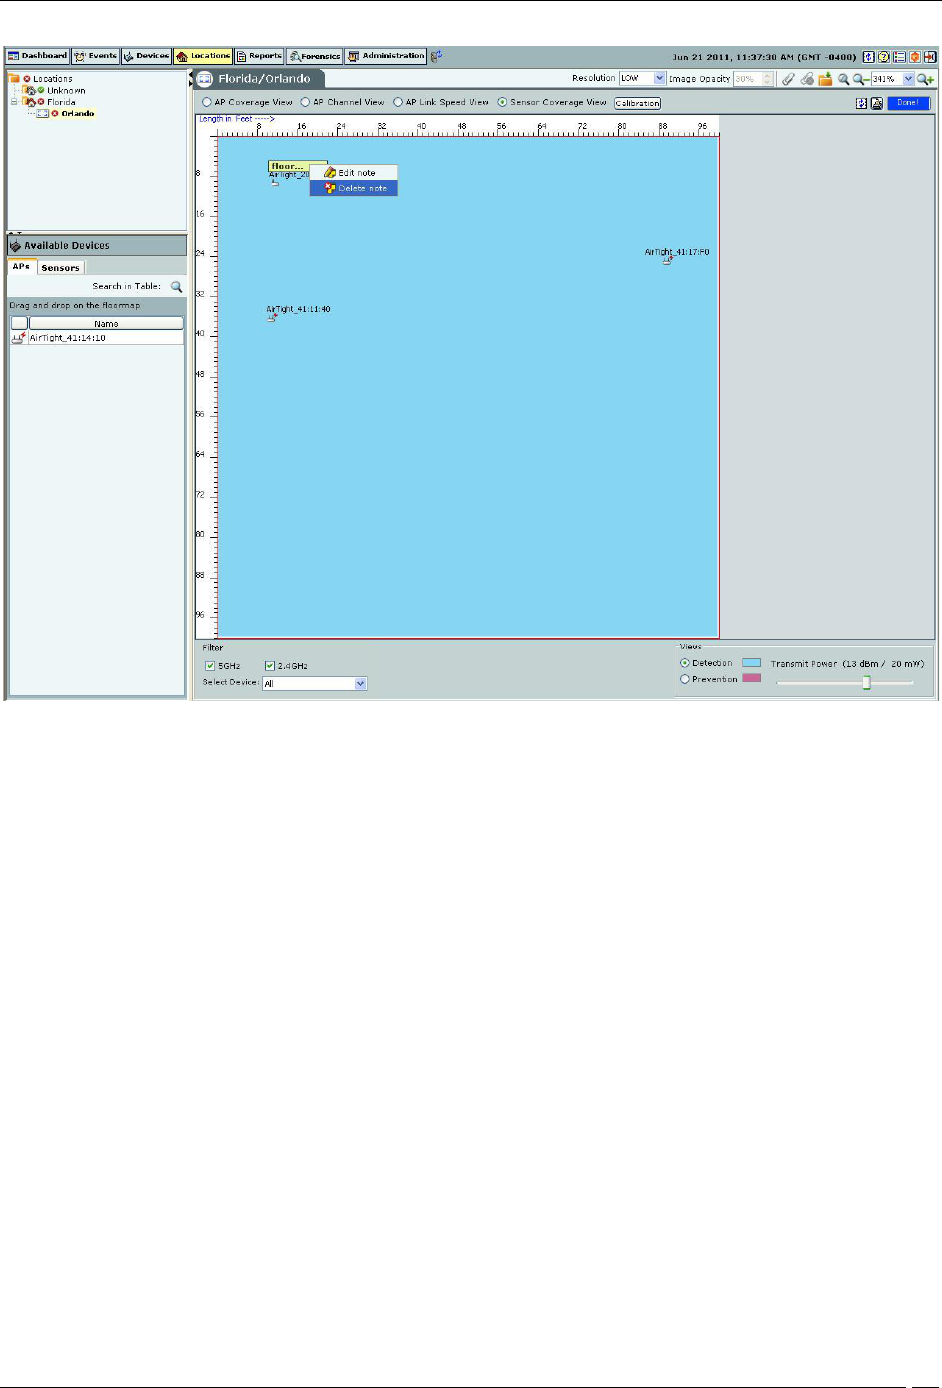
Editing Location Notes on a Floor Map
You can edit existing location notes at any given point. To do this, right click the note to be edited. Select the Edit
note option to edit the location notes. Following figure displays the Edit Note option.
Locations Tab
SpectraGuard® Enterprise User Guide
128
Editing Location Tags
On Selecting Edit Note option, Edit Note dialog appears.
Following figure displays the Edit Note dialog.
Edit Note dialog
You can edit all fields in the dialog.
Hiding Location Notes shown on a Floor Map
You can hide location notes that are visible on a floor map. To do this, right click anywhere on the floor map. Select
the Hide notes option to hide all the Location notes. Following figure displays the Hide notes option.
Locations Tab
SpectraGuard® Enterprise User Guide
129
Hiding Location Notes visible on Floor Map
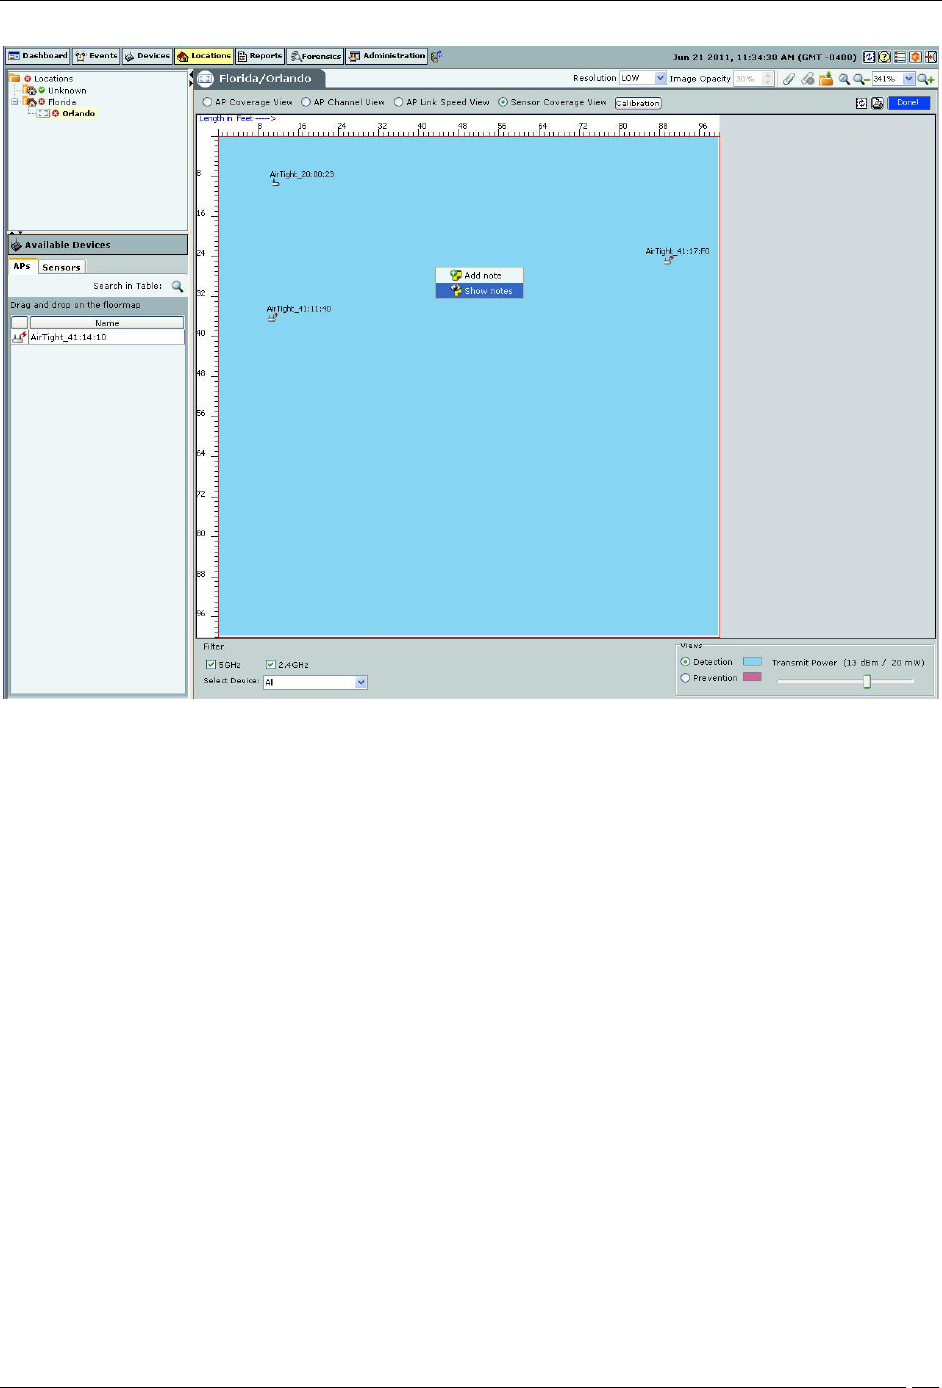
Displaying Hidden Location notes shown on a Floor Map
You can display hidden location notes on a floor map. To do this, right click anywhere on the floor map. Select the
Show notes option to show all the Location notes. Following figure displays the Show notes option.
Locations Tab
SpectraGuard® Enterprise User Guide
130
Show notes on Floor Map
Click Show Notes button to display all the notes defined for the floor map.
Deleting Location Notes from Floor Map
You can delete Location notes that are visible on a floor map. To do this, right click the note/location tag to be
deleted. Select the Delete note option to delete the location note. Following figure displays the Delete note option.
Locations Tab
SpectraGuard® Enterprise User Guide
131
Deleting Note from Floor Map
The note is deleted from the floor map.
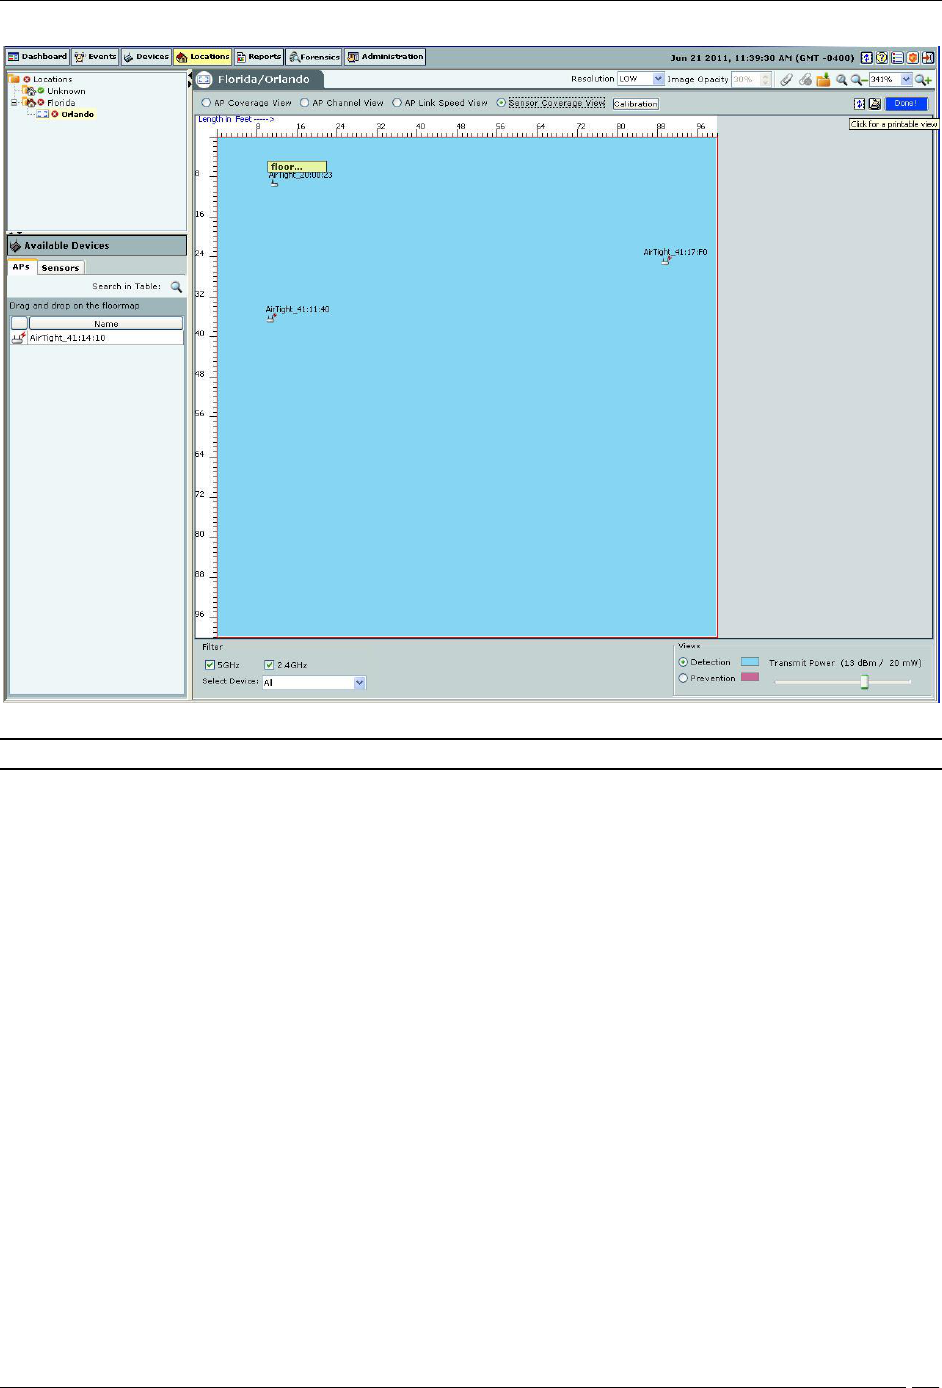
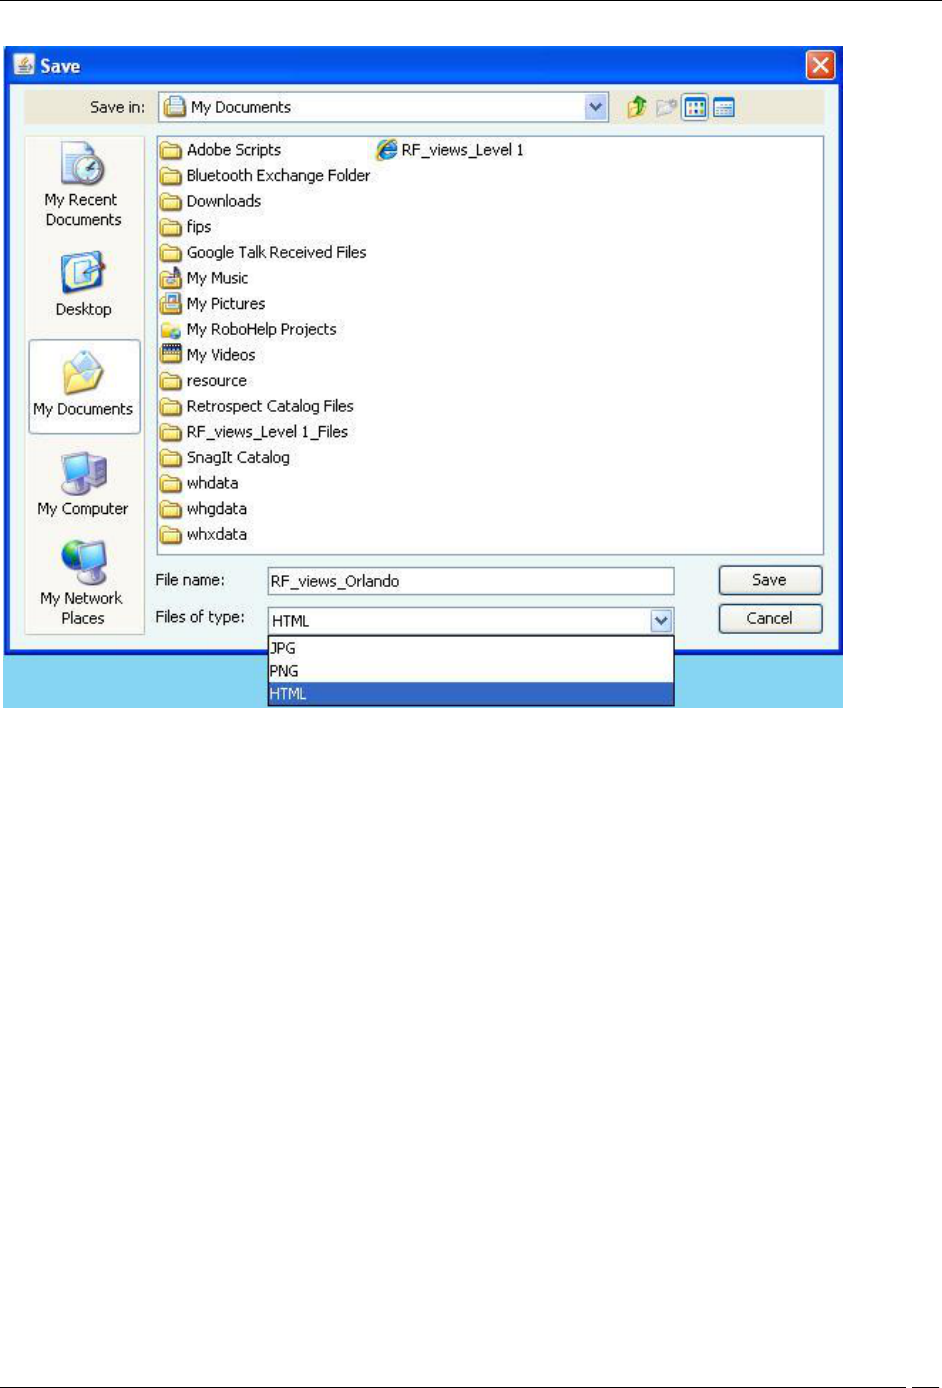
Printable View
The RF views for the floormap can be saved as printable view in jpg, png, and HTML formats.
Locations Tab
SpectraGuard® Enterprise User Guide
132
Locations Tab – Printable View Icon
Note: The Printable View icon is available on the Location nodes and not in the Location folders.
Click the Printable View icon and save the printable view as jpg, png, or HTML as shown in the figure.
Locations Tab
SpectraGuard® Enterprise User Guide
133
Saving the Printable view of the RF views
Viewing RF Coverage Maps
To view a live RF coverage map for a location node, Authorized APs and Sensors must be placed on the floor map.
Use the following steps to view live RF coverage maps:
1. Place devices on the floor map using the steps given in the Placing APs and Sensors on the Floor map
and Viewing Details section.
2. Select one of the following views.
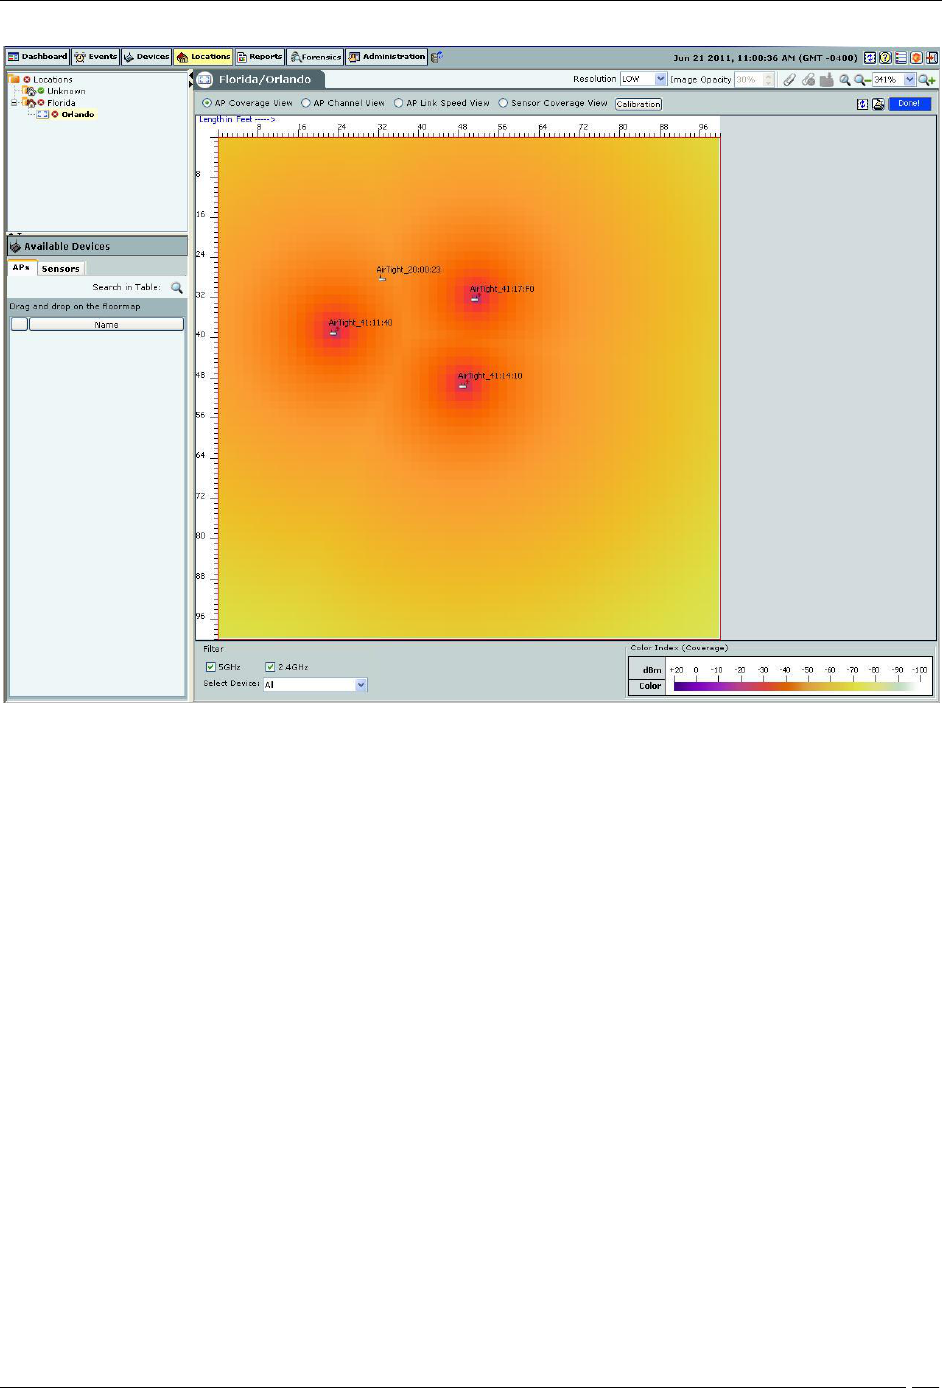
AP Coverage View
The AP Coverage View enables you to view an 802.11 RF coverage map based on the dBm at each point on the layout.
This information is useful to find out available signal strength at each point. The color-coding scheme used enhances
the readability of the map.
Locations Tab
SpectraGuard® Enterprise User Guide
134
AP Coverage View
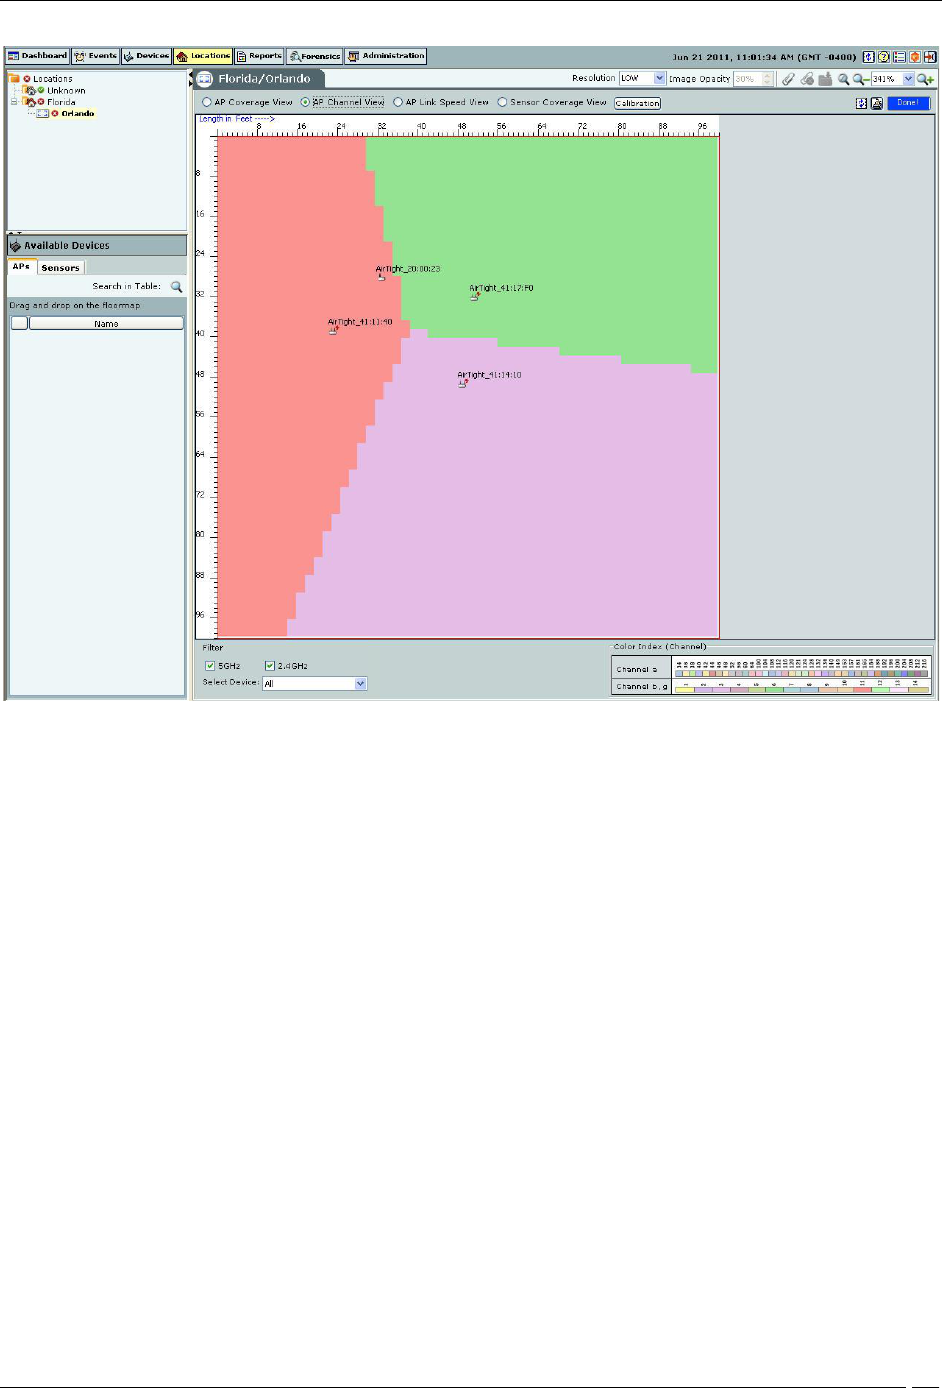
AP Channel View
The AP Channel View enables you to view all the 802.11 channels available for connection at each point on the floor.
It helps in preventing potential channel interference scenarios.
Locations Tab
SpectraGuard® Enterprise User Guide
135
AP Channel View
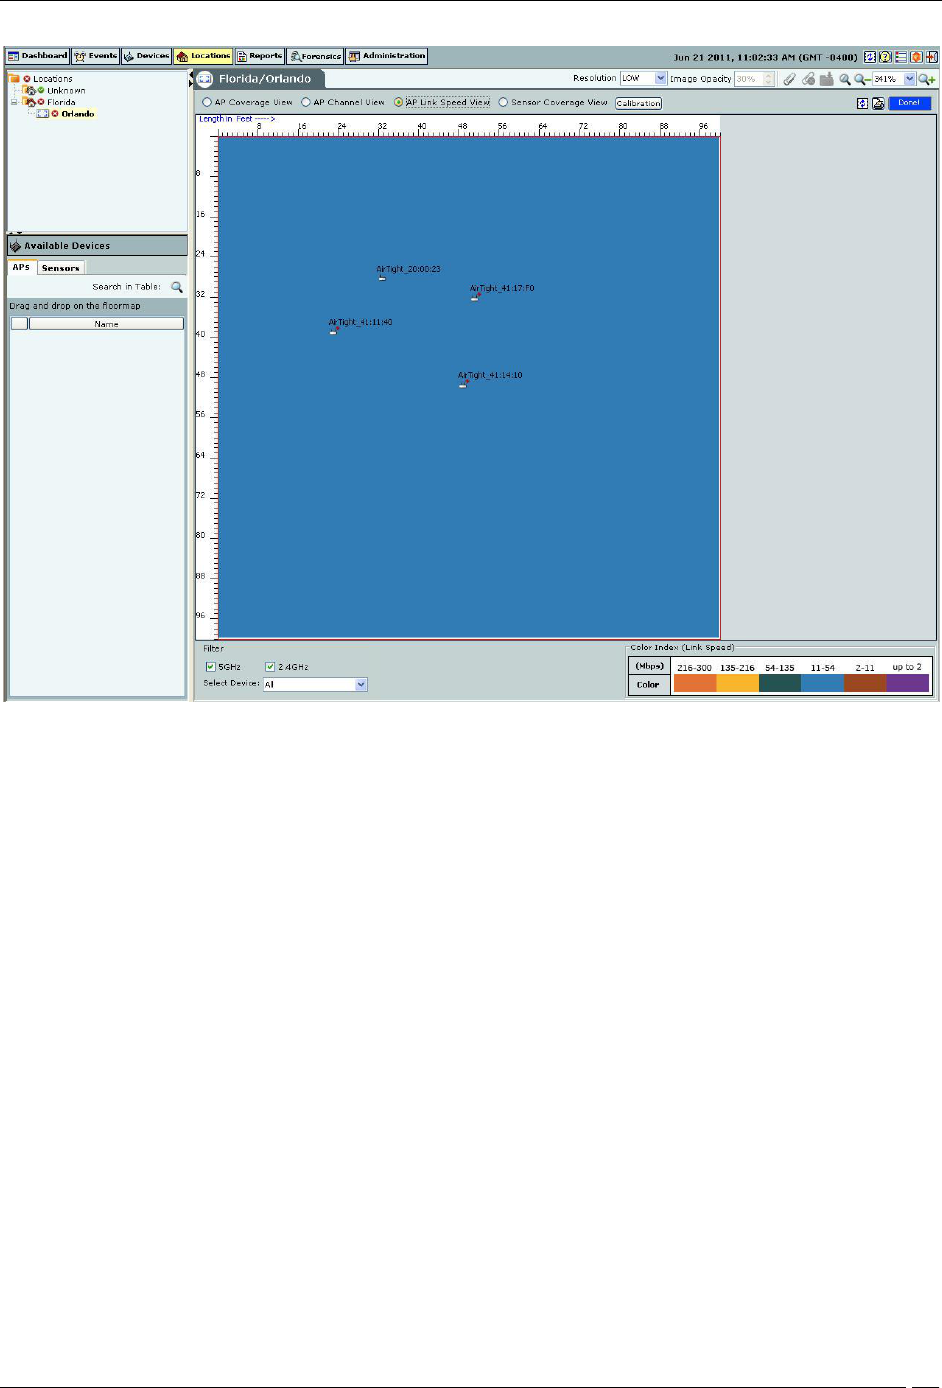
AP Link Speed View
The AP Link Speed View enables you to view the maximum downlink rate with which a Client at a particular point
can connect to an AP on the floor.
Locations Tab
SpectraGuard® Enterprise User Guide
136
AP Link Speed View
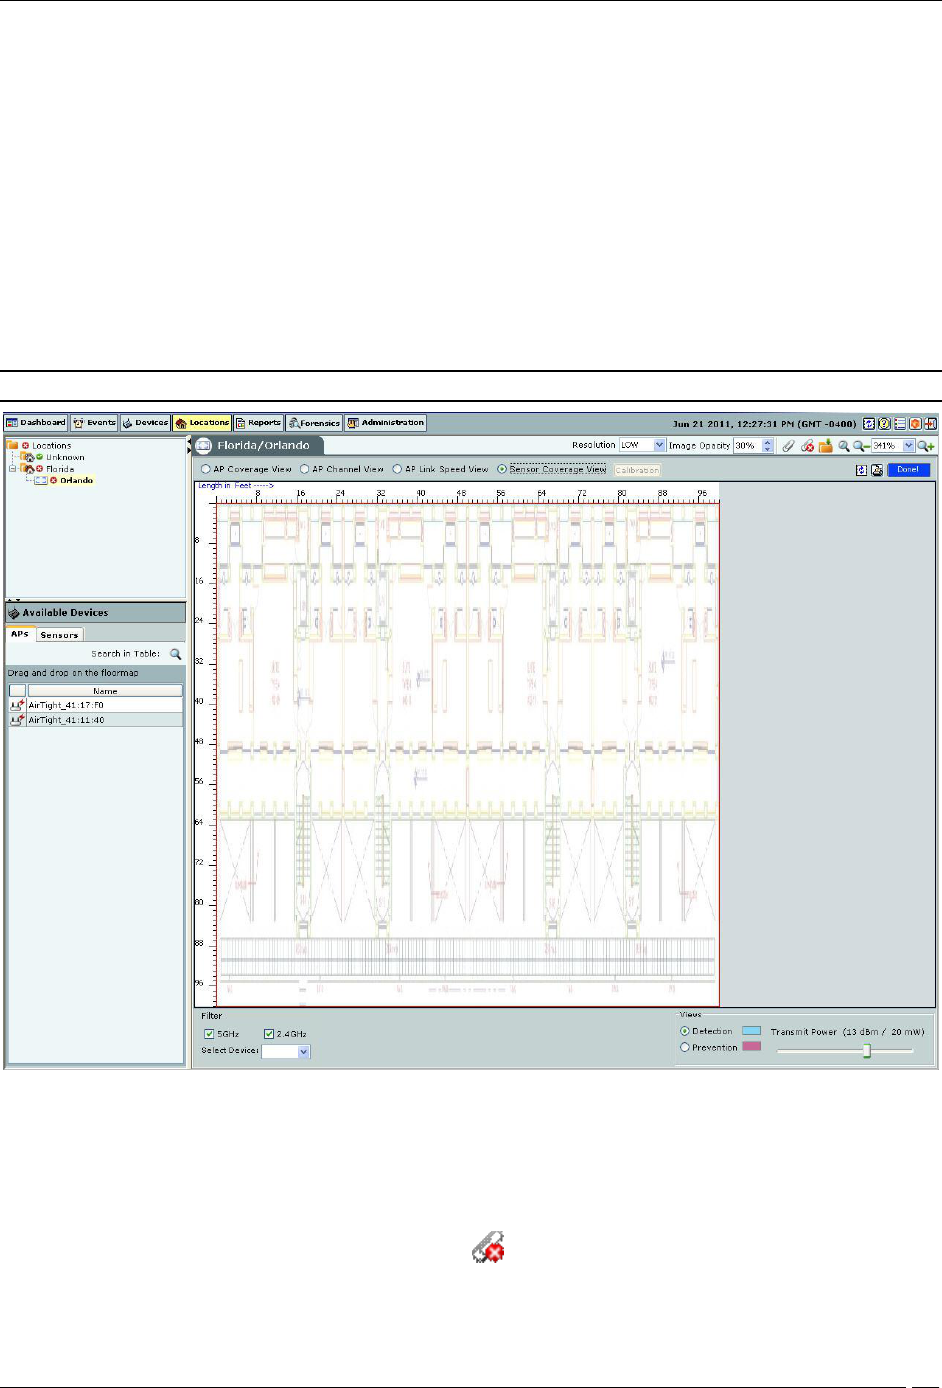
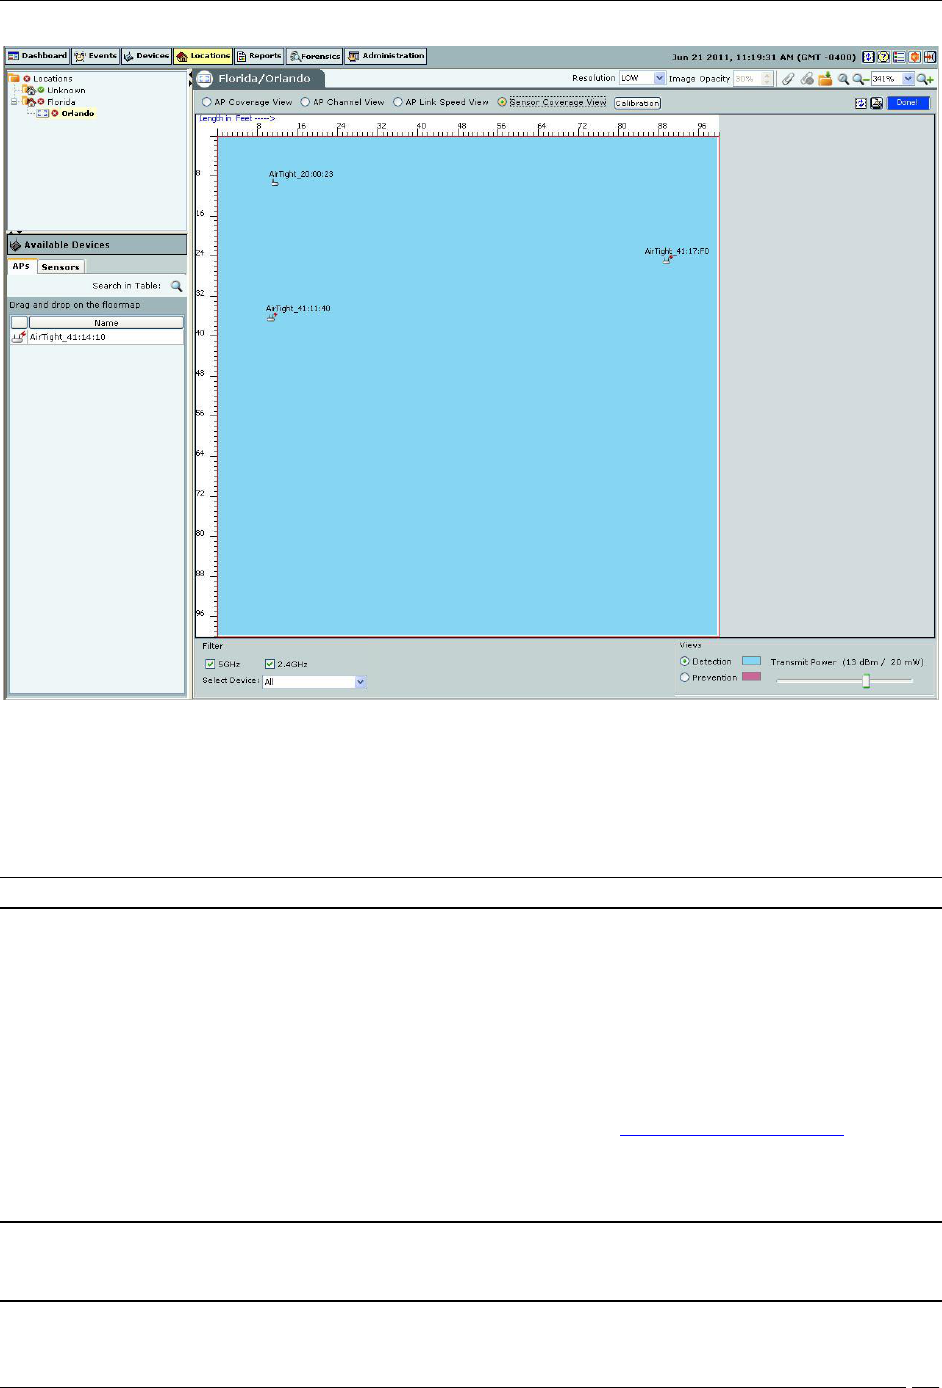
Sensor Coverage View
The Sensor Coverage View enables you to view the detection and prevention zones of visibility for selected Sensors.
Locations Tab
SpectraGuard® Enterprise User Guide
137
Sensor Coverage View
Detection Range is the area over which Sensors can reliably detect wireless activity of devices operating at a power
level greater than the value set in the Transmit Power slider. The Intrusion Detection Display Threshold
determines the threshold for this range.
Prevention Range is the area over which Sensors can prevent unauthorized wireless activity. The Intrusion
Prevention Display Threshold determines the threshold for this range.
Note: Prevention Range view is not visible if WIDS license is applied.
Both detection and prevention ranges are affected by various parameters under AdministrationGlobalLocation
SettingsRF Propagation. The reliability of the prevention also depends on the Intrusion Prevention Level chosen
under AdministrationLocalOperating PoliciesIntrusion Prevention Intrusion Prevention Level.
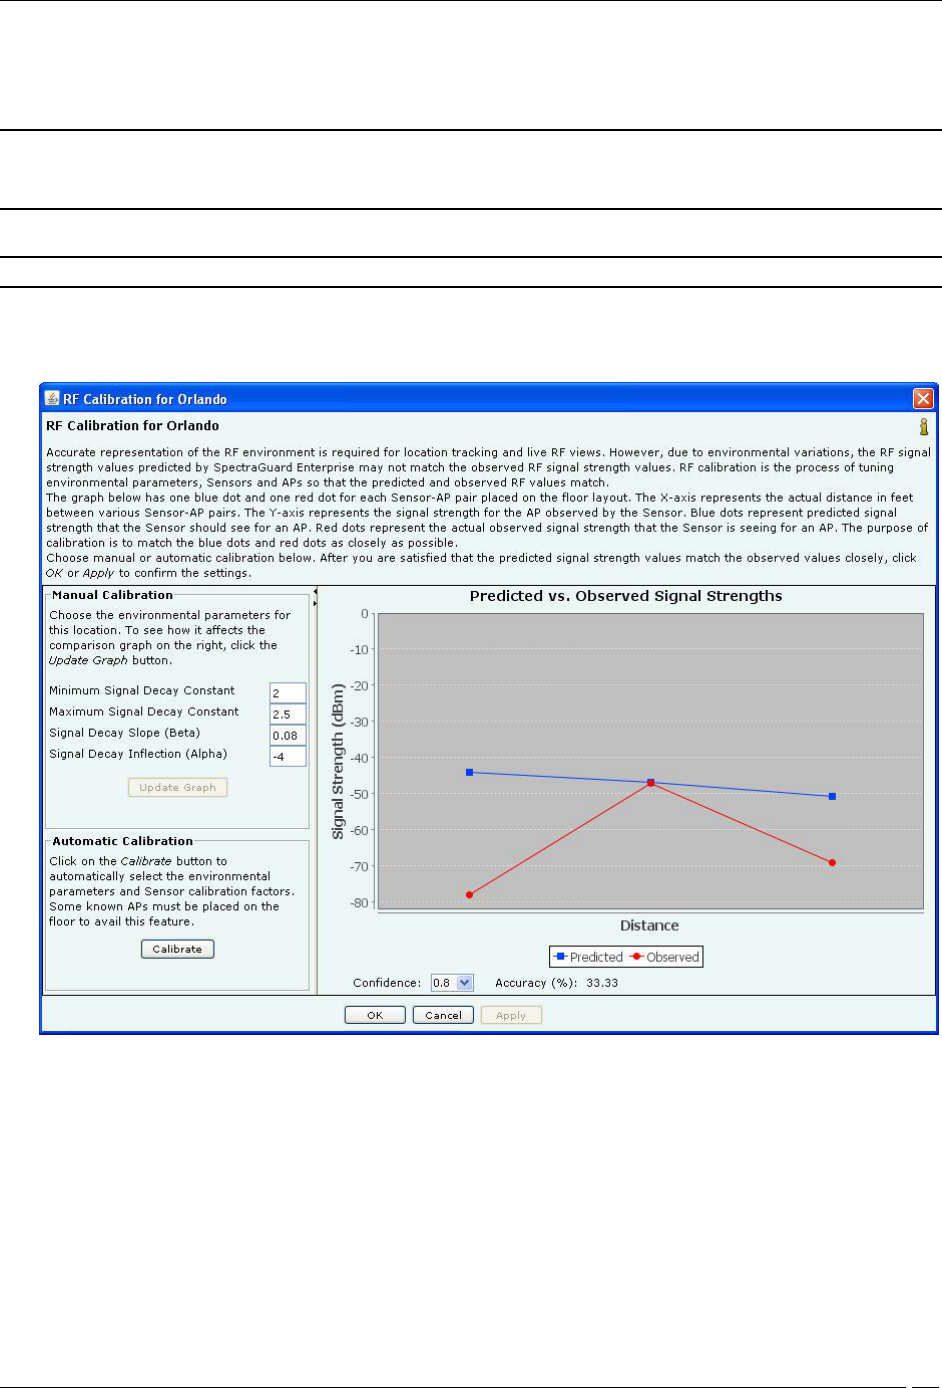
Calibrating RF Views
Calibration helps in tuning RF parameters used by the system to compare the AP and Sensor predictions to actual
observations. The system has a robust calibration technique that also allows manual intervention in case of
discrepancy. Use the following steps to calibrate RF views:
1. Generate the RF Coverage map using the steps explained in the Viewing RF Coverage Maps section and
then clicking Calibration.
2. To improve predictions, fine-tune the Min. Signal Decay Constant and the Max. Signal Decay
Constant.
Note: Min. Signal Decay Constant specifies the amount of signal loss that is acceptable for regions close to the transmitter
(Sensor). Max. Signal Decay Constant specifies the amount of signal loss that is acceptable for regions away from the
transmitter. Signal loss is directly proportional to the signal decay constants.
Locations Tab
SpectraGuard® Enterprise User Guide
138
3. Change the values of the Signal Decay Slope (Beta) and the Signal Decay Inflection (Alpha). The
system uses these parameters when computing the RF and defines the region around the transmitter
that is unobstructed.
Note: When you change the Min. Signal Decay Constant, Max. Signal Decay Constant, Signal Decay Slope (Beta), and
Signal Decay Inflection (Alpha) the RF view and location tracking for unobstructed regions is affected. In the obstructed
regions, only Location Tracking is affected, RF view is not affected.
4. Click Update Graph to view your selection against the predicted values.
Important: The Predicted value curve should overlap the Observed value curve as much as possible.
5. Click Calibrate to complete calibration if you have adjusted the parameters manually such that the two
curves are parallel (but not coinciding).
6. Click Apply to commit your changes.
RF Calibration Dialog
Reports Tab
SpectraGuard® Enterprise User Guide
139
Reports Tab
Reports: Panel for Generating Reports
The Reports screen enables you to generate predefined and customized reports. The system uses a query-based
mechanism to generate various reports. The system provides predefined compliance reports: Health Insurance
Portability and Accountability Act (HIPAA), Sarbanes-Oxley (SOX), Gramm-Leach-Bliley (GLBA), Payment Card
Industry (PCI) Standard, and so on. Additionally, information about devices and events is also available in the form
of ready made reports.
Reports Screen
You can open the Reports screen by selecting the Reports tab on the navigation bar.
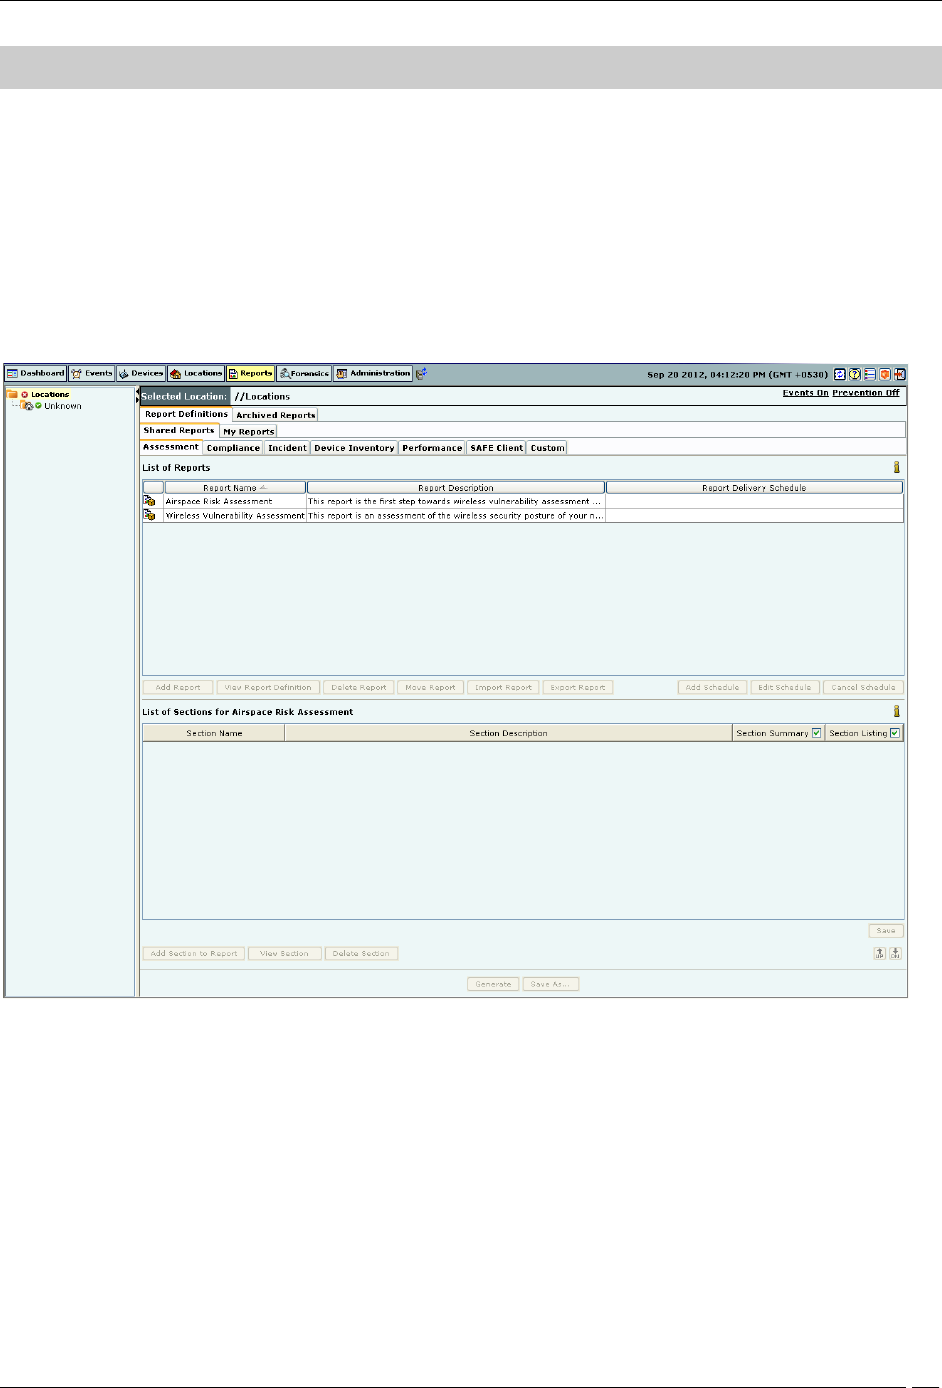
Report Definitions Screen: Shared Reports Tab
The Reports screen includes two panes.
On the left, the Location tree.
On the right, the report panel.
Location Tree
The Location tree shows the complete list of locations created for your WLAN in the system. You can select locations
for which you need to generate the report.
Report Panel
On the top of the Reports screen, Selected Location gives the path of the selected location.
The Reports screen includes two tabs:
1. Report Definitions: This tab consists of two sub-tabs:
Reports Tab
SpectraGuard® Enterprise User Guide
140
Shared Reports: Contains reports that all the users can view and schedule. These include
Assessment Reports, Compliance Reports, Incident Reports, Device Inventory Reports,
Performance Reports, SAFE Client Reports, and Custom Reports.
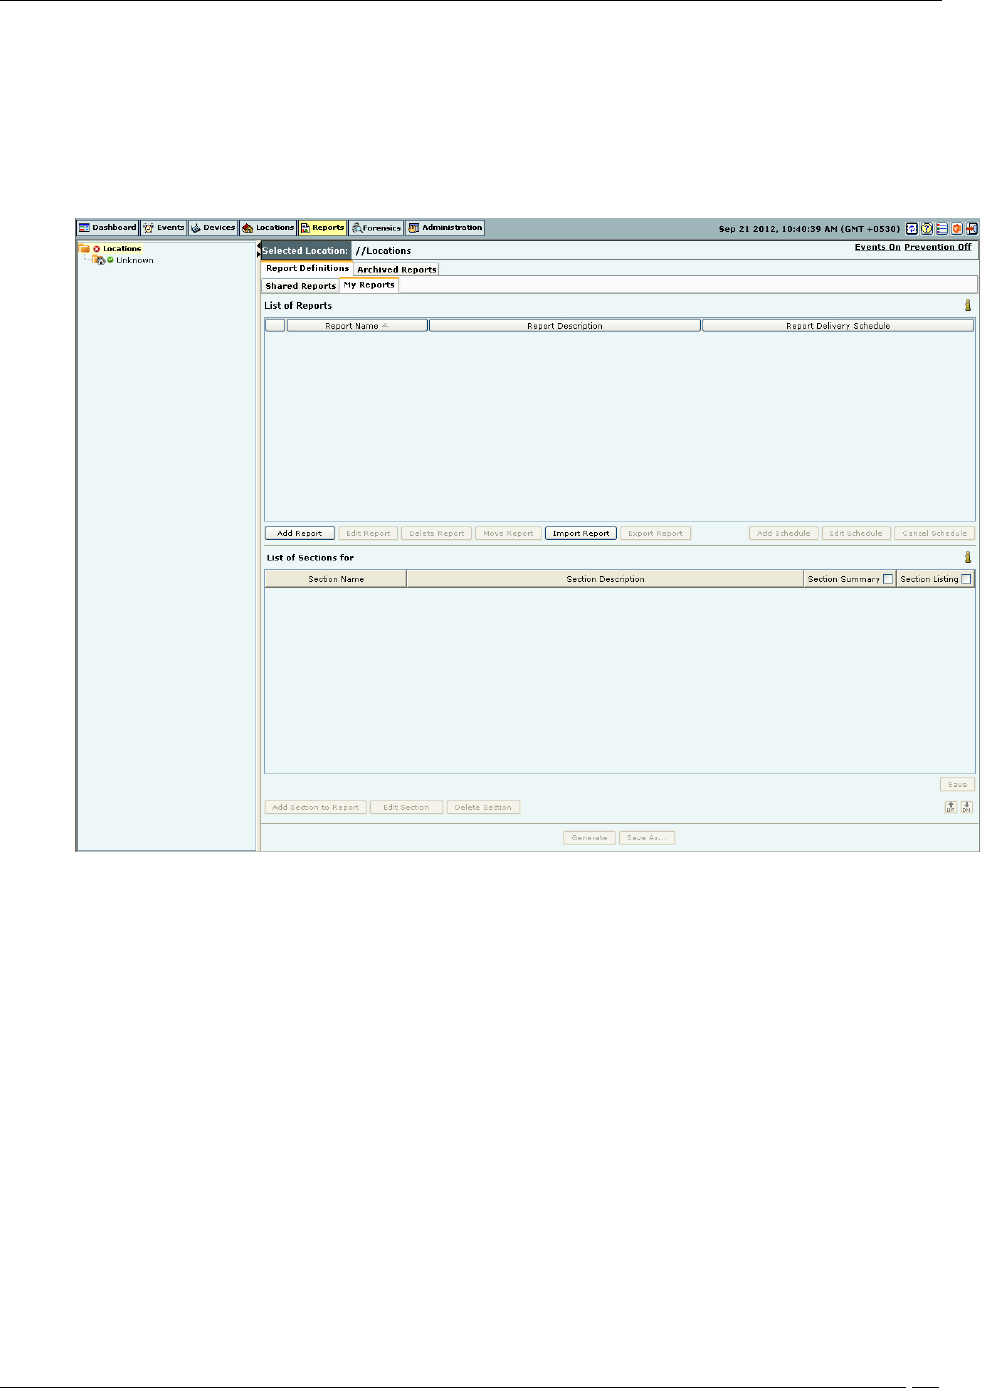
My Reports: Contains reports available only to those users who have generated them. These are
custom reports. You can import a custom report by clicking Import Report.You can import a report
created in SpectraGuard Enterprise. You can export a report by clicking Export Report. The
Import Report and Export Report buttons are enabled only for My Reports.
Report Definitions Screen: My Reports Tab
2. Archived Reports: This tab allows you to view saved or archived reports generated on the server. These
reports are useful for trend analysis. An archived report is visible to a user if the user generated the report.
A superuser can see all archived reports.
On the two tabs – Shared Reports and My Reports are two tables described in the following sections.
List of Reports
The List of Reports table displays reports available for all the locations. This table consists of the following columns:
Report Name: Displays the name of each report
Report Description: Displays a brief description of each report
Report Delivery Schedule: Displays the delivery schedule of each report for the selected location. The
schedule is only visible to the user who created it.
In the List of Reports table, you can perform the following operations under Shared Reports–Custom Reports tab or
My Reports:
Add, edit, delete, and move a report to a different tab
Add, edit, and cancel a report schedule
Under Shared Reports – Assessment Reports, Compliance Reports, Incident Reports, Device Inventory Reports,
Performance Reports, and SAFE Client Reports tabs, you can only view a report and add a report delivery schedule.
Reports Tab
SpectraGuard® Enterprise User Guide
141
List of Sections
The List of Sections table displays sections created for a selected report. This table consists of the following columns:
Section Name: Displays the name of the section contained in the selected report
Section Description: Displays a brief description of each section
Note: Throughout the user interface, events can have one of the three states (Live, Instantaneous, or Expired); however, while
defining Reports Instantaneous and Live events are grouped into a single status (Past).
Depending on whether or not you want Section Summary, Section Listing for a particular section to appear in the
report, you can select or deselect the check box under Section Summary, Section Listing for that section. To have
Section Summary for all the sections in the report, select the check box next to Section Summary. To have Section
Listing for all sections in the report, select the check box next to Section Listing. Click the Save button to save these
settings. The setting is saved for the individual user, for the report. In this way, every user can have different settings
for each report based on individual requirement.
By default, Section Summary and Section Listing for all sections are selected.
This feature is available for Shared Reports and My Reports.
In the List of Sections table, you can perform the following operations under Shared Reports–Custom Reports tab or
My Reports:
Add, edit, and delete a section of a report
Organize the sections in the report using and
Generate a report, save a report with the same, or different name
Under Shared Reports – Assessment Reports, Compliance Reports, Incident Reports, Device Inventory Reports,
Performance Reports, and SAFE Client Reports tabs, you can only view a section of a report, generate a report, and
save a report with a different name. The saved report is available under Shared Reports – Custom Reports tab.
On the Archived Reports tab, the following information is available:
Reports Tab
SpectraGuard® Enterprise User Guide
142
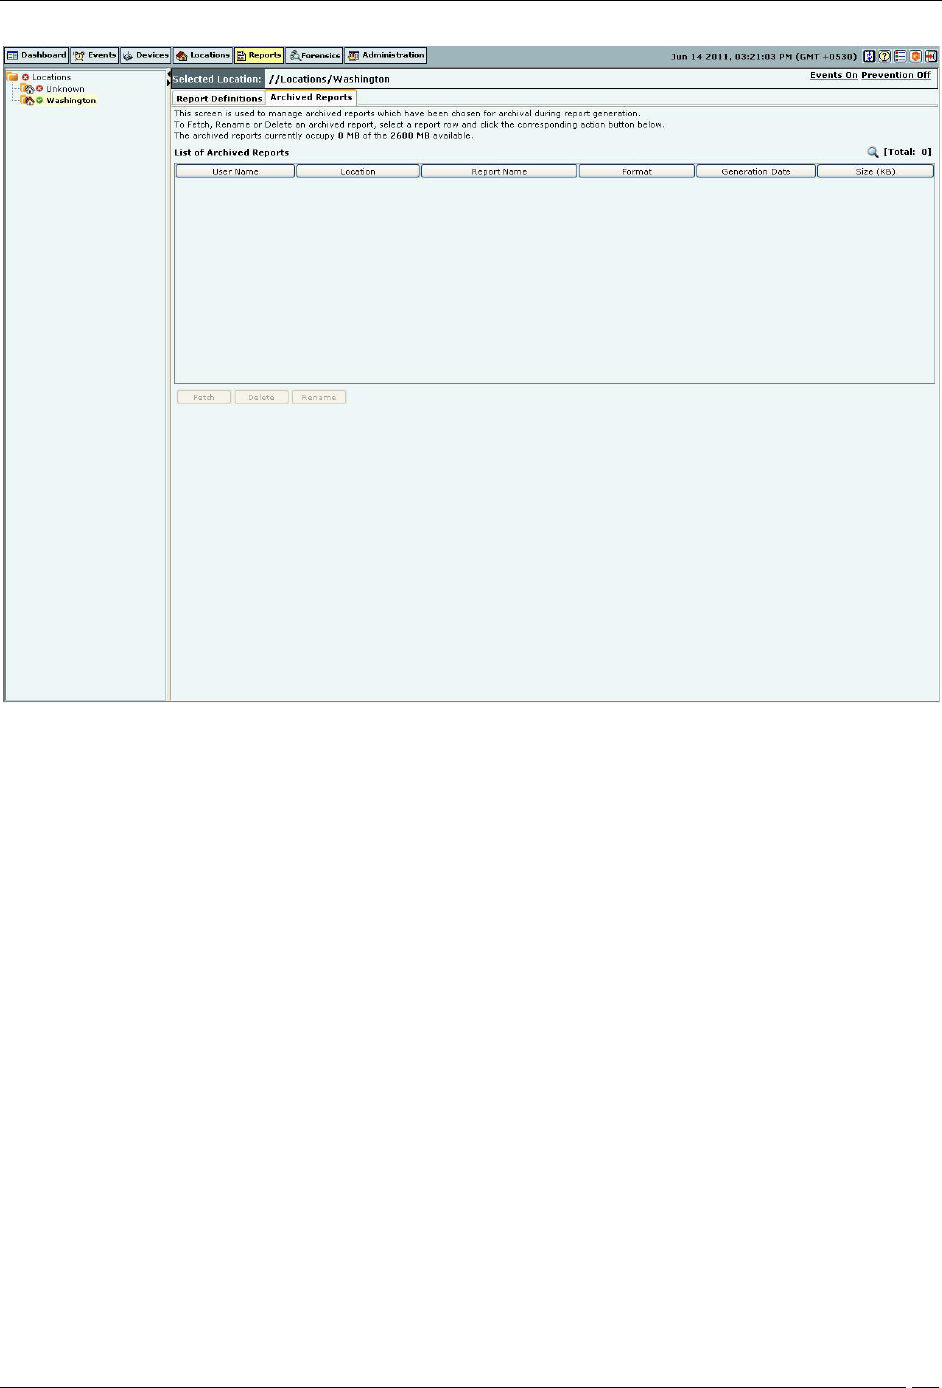
Archived Reports Tab
User Name: Displays the name of the user who generated the report.
Location: Displays the name of the location at which the report is generated. If the Location tree is updated
after a report is generated, this field is not updated.
Report Name: Displays the name of the report that appears at the time of report generation. Updating the
report name does not update the name here.
Format: Specifies the format of the report; that is HTML, XML, or PDF.
Generation Date: Indicates the time of report generation.
Size (KB): Displays the report size. This parameter is useful when deleting reports.
Managing Reports
This section shows how to add a report, edit a report, delete, and move a report. You can perform these operations
either under the My Reports tab or the Shared Reports–Custom Reports tab.
Adding a Report
The system enables you to define customized reports so that you can view precise details that you require. Use the
following steps to add a report:
1. Select the tab My Reports.
Reports Tab
SpectraGuard® Enterprise User Guide
143
2. Under List of Reports, click Add Report.
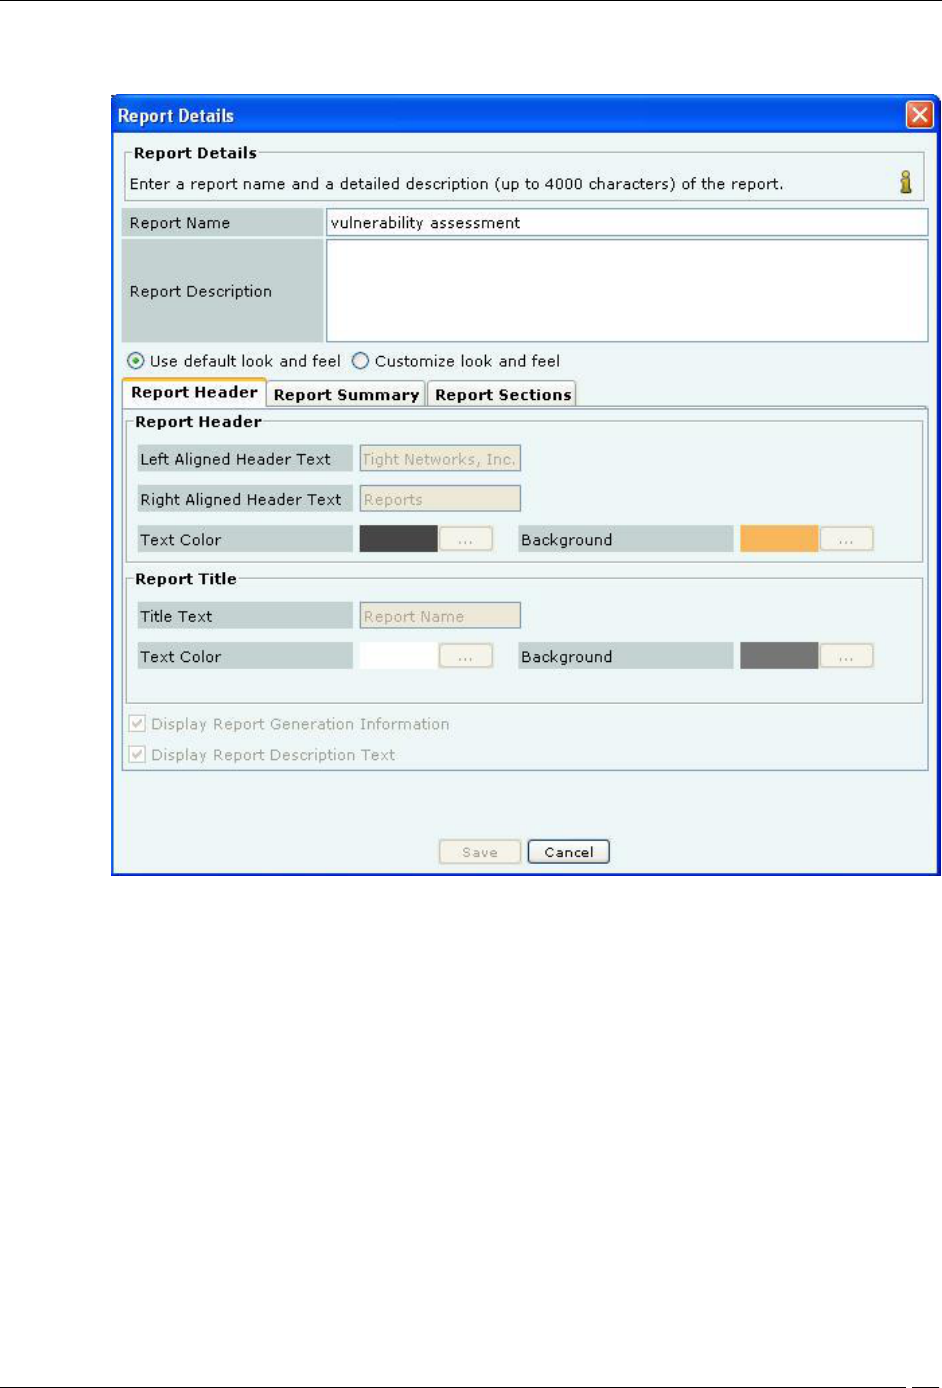
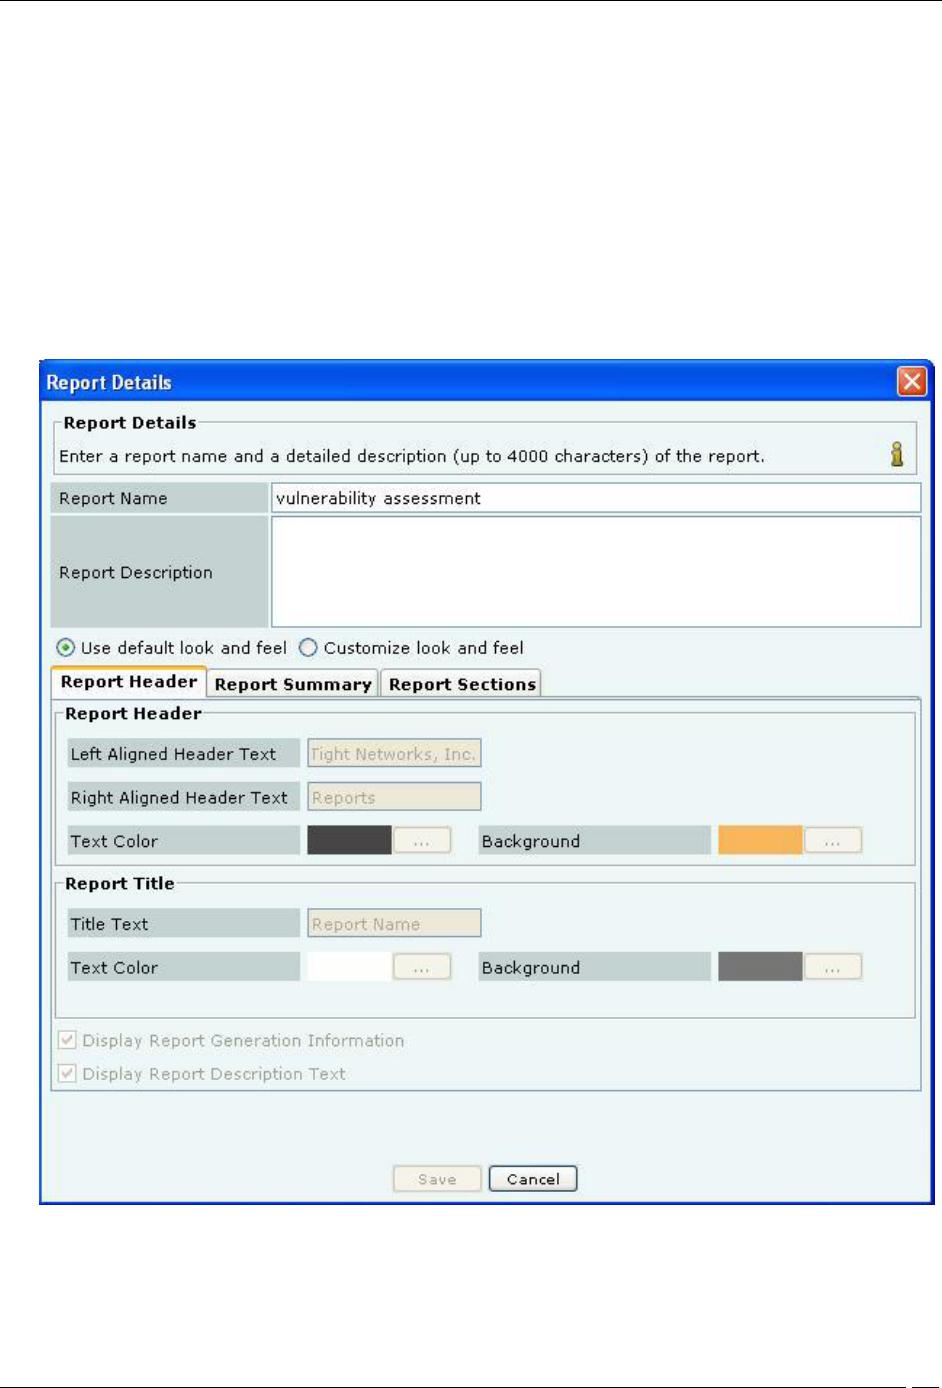
Report Details Screen showing Report Header Tab
3. On the Report Details dialog, under Report Name, enter a unique, user-friendly name for the
report.
4. Under Report Description, enter brief note to help identify the report.
5. Click Use default look and feel, to retain the default text, title, and colors for the reports.
6. Alternatively, click Customize look and feel, to customize the appearance of the report.
7. Select the Report Header tab.
8. Under Report Header, specify the following parameters to be customized in the generated report:
Left Aligned Header Text: Specify the text that should appear in the header on the left side.
Right Aligned Header Text: Specify the text that should appear in the header on the right side.
Click Pick… and select the Text Color and Background colors for the Report Header.
9. Under Report Title, specify the following parameters to be customized in the generated report:
Title Text: Specify a title that appears below the header on the left side. The Report Description
follows this title.
Click Pick… and select the Text Color and Background colors for the Report Title.
Select the checkbox, Display Report Generation Information to view the following information
below the Report Title
Duration for which the report is generated
Reports Tab
SpectraGuard® Enterprise User Guide
144
Location for which the report is generated
User who generated the report
Date and time when the report is generated
Select the checkbox, Display Report Description Text to view a detailed description of the report.
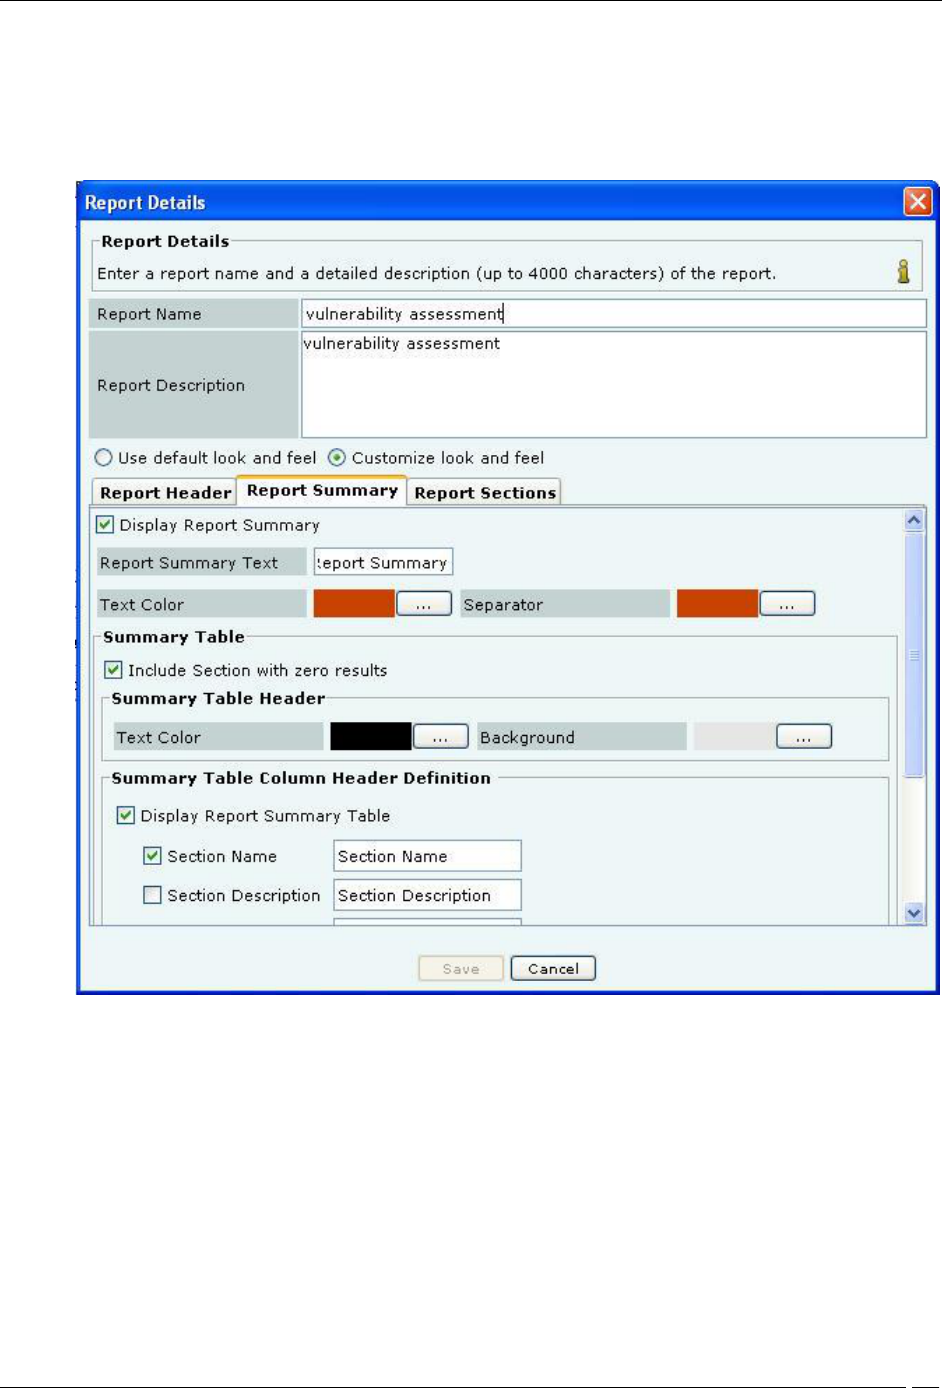
10. Select the Report Summary tab.
Report Details Screen showing Report Summary Tab
Clear the checkbox, Display Report Summary if you do not wish to view the Report Summary in a
tabular form.
Alternatively, select the checkbox, Display Report Summary to customize parameters in the
Report Summary table in the generated report.
Specify the Report Summary Text that should appear as the Report Summary table
heading.
Click Pick… and select the Text Color and Separator colors for the Report Summary table
heading.
Under Summary Table, select the checkbox, Include Section with zero results to view sections in
which the result count is zero.
Under Summary Table Header, click Pick…, select the Text Color, and Background colors for the
Report Summary table row header.
Reports Tab
SpectraGuard® Enterprise User Guide
145
Under Summary Table Column Header Definition, select the checkbox, Display Report
Summary Table to customize the following column names in the Report Summary table in the
generated report.
Section Name
Section Description
Query Type
Result Count
Jump to
Under Summary Charts, select an option button to view the charts in the desired format.
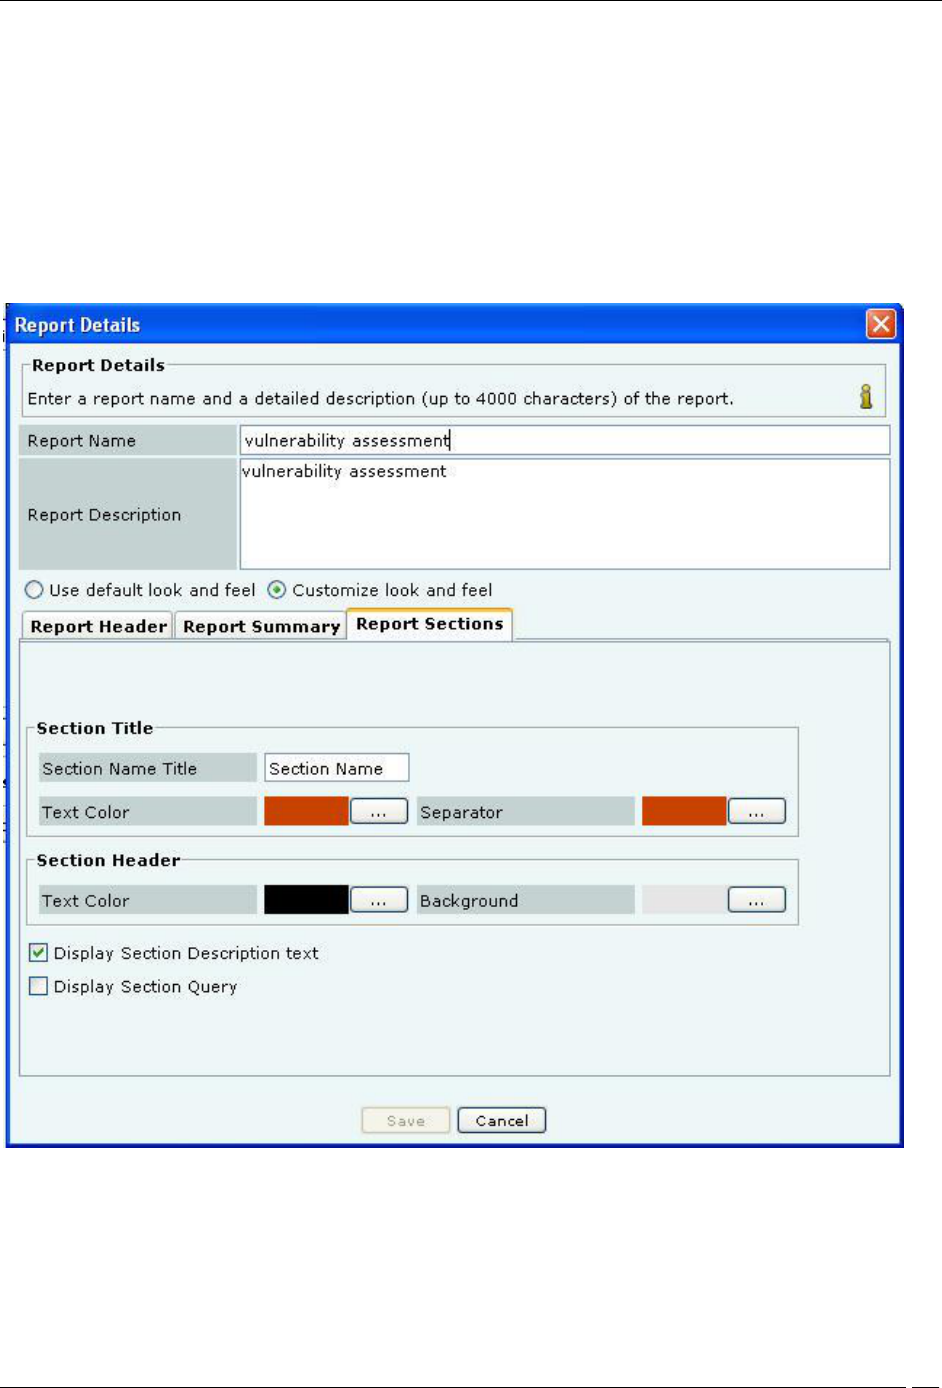
11. Select the Report Sections tab.
Report Details Screen showing Report Sections Tab
Under Section Title, specify the following parameters to be customized in the generated report:
Section Name Title: Specify the text that should appear as a common heading for all the Section Names.
Click Pick… and select the Text Color and Separator colors for the Section Name Title.
Under Section Header, specify the following parameters to be customized in the generated report:
Click Pick…, select the Text Color, and Background colors for the table row headers in the Section
Summary and Section Results sections.
Reports Tab
SpectraGuard® Enterprise User Guide
146
Select Display Section Description text to view a brief description for each section of the report.
Select Display Section Query to view all the constraints specified in the database query for that section.
11. To add the report to the List of Reports, click Save. The new report appears under the List of Reports
table.
Editing a Report
The system enables you to edit user-defined reports. You cannot edit pre-defined reports. AirTight recommends that
you do not edit a shared report scheduled by multiple users for delivery. Instead, save the report under a different
name and then modify that report. Use the following steps to edit a selected report:
1. From the List of Reports table select the report that you want to edit.
2. Click Edit Report.
3. On the Report Details dialog, change the Report Name, Report Description, default look and feel,
or customize the look and feel.
Editing a Report
4. To save the changes, click Save.
Deleting a Report

Reports Tab
SpectraGuard® Enterprise User Guide
147
The system enables you to delete a user-defined report. You cannot delete pre-defined reports or a shared report
scheduled by other users. Use the following steps to delete a report:
1. From the List of Reports table, select the report that you want to delete.
2. Click Delete Report.
3. Click Yes on the Confirm dialog to delete the report.
Moving a Report
The system enables you to move a report from Shared Reports–Custom Reports to My Reports and vice versa. Use
the following steps to move a report:
1. From the List of Reports table, select the report that you want to move.
2. Click Move Report.
3. Click Yes on the Confirm dialog to move the report.
You cannot move:
A report from Shared Reports–Custom Reports to My Reports if more than one user share or schedule it
for delivery at that location.
A report from My Reports to Shared Reports–Custom Reports if a user schedules it for delivery at that
location.
Reports provided under Shared Reports – Assessment Reports, Compliance Reports, Incident Reports,
Device Inventory Reports, Performance Reports, and SAFE Client Reports to My Reports
Working with Sections of a Report
This section shows you how to add a section to a report, edit a section of a report, and delete a section of a report.
Adding a Section to a Report
A report consists of one or more sections. Each section is a query to the database. The system then searches its
database for those records that satisfy the conditions that you impose. You cannot however add sections to
predefined reports. Use the following steps to add a section to a report:
1. From the List of Reports table, select the report to which you need to add a section.
2. Click Add Section to Report.
Reports Tab
SpectraGuard® Enterprise User Guide
148
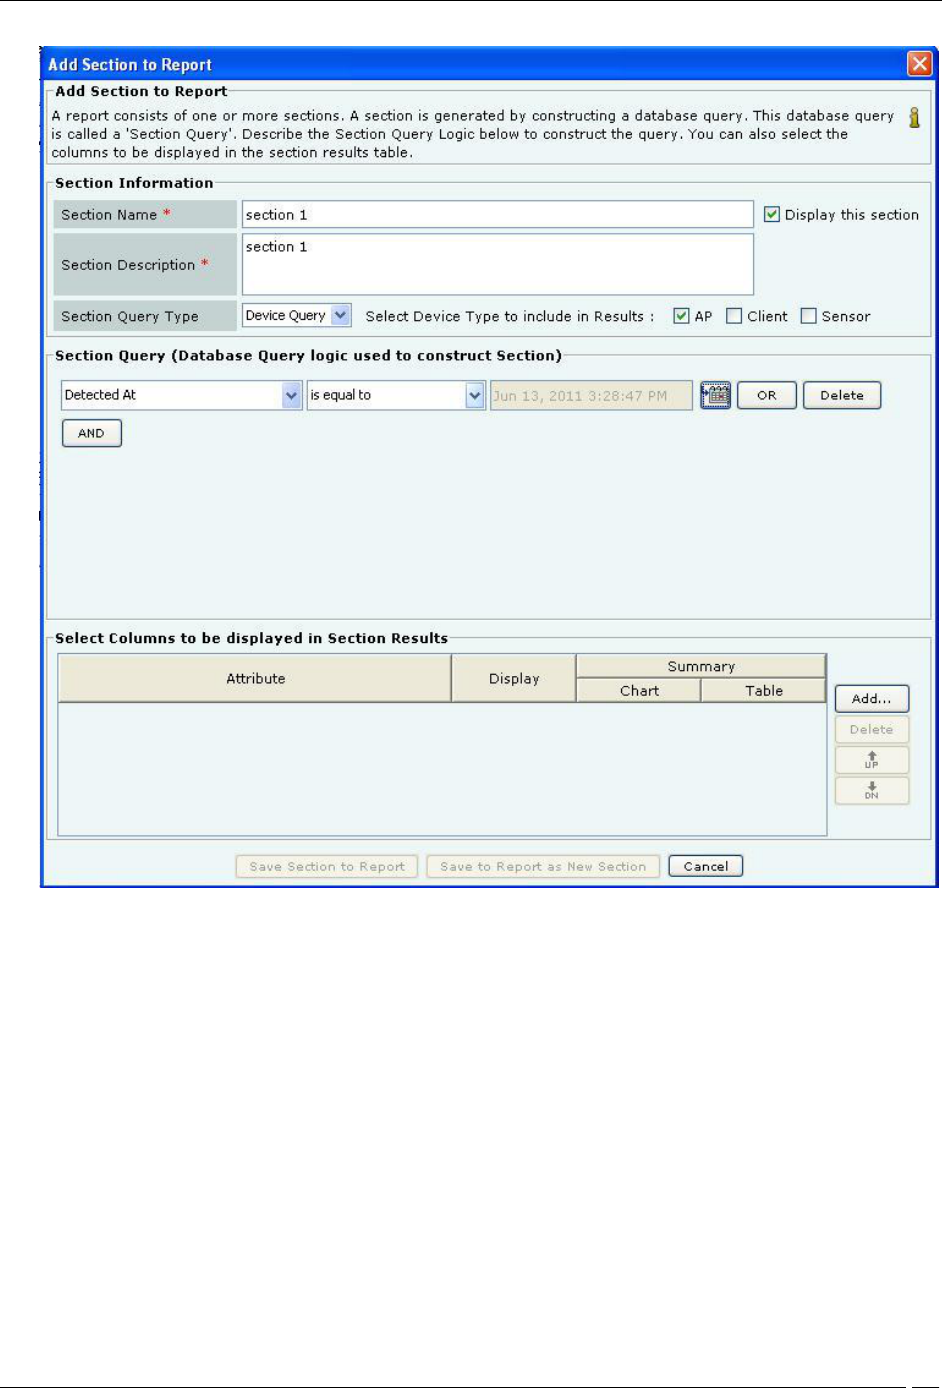
Adding a Section to a Report
3. On the Add Section to Report dialog, enter a Section Name and a Section Description for the newly
added section.
4. Select the checkbox Display this section to view this section in the generated report.
5. Under Section Query Type, select Device, Event, or SAFE as the query type.
6. Select any combination of the AP, Client, and Sensor checkboxes to include these device types in the
results. These checkboxes are not available for a SAFE query.
7. Describe the Section Query construction logic by selecting the following:
A column from Select Column
A condition from Select Condition
An object for the query, which you can select or enter
8. Optionally, select one or more Boolean connectors (OR or AND) to join two or more queries. Click
Delete to delete a query.
9. Under Select Columns to be displayed in Section Results, do the following:
Click Add to view a list of attributes and select an attribute.
Select the checkbox Display to view the selected attribute in the generated report.
Under Summary, you can choose to do the following:
Select the type of chart from the drop-down list to view a graph for the selected attribute.
Reports Tab
SpectraGuard® Enterprise User Guide
149
Select the checkbox Table to view a tabulated count for the selected attribute.
Note: Pie charts are not visible in an HTML report. You can view pie charts only in a PDF report.
Select an attribute and click <Delete> to delete that attribute.
Select an attribute and click <Up> or <Down> to organize the attributes that appear as columns in
the Section Results table of the generated report.
10. To save the section to an existing report, click <Save Section to Report>. To save the section with a new
name, click <Save to Report as New Section>.
Note: When the Section Query Type is Event Query, and you select Event from the Select Column list to construct the
section query, a list of predefined events appears in the Select Value list. This list also includes deprecated events. A deprecated
event has the strike-through style applied to the event name. For example: AP MAC Spoofing
Editing a Section of a Report
The system enables you to edit a report’s section information, query, or attributes to display in the generated report.
AirTight recommends that you do not edit a shared report scheduled by multiple users for delivery.
Use the following steps to edit a section of a report:
1. From the List of Sections table, select the section that you want to edit.
2. Click Edit Section.
3. On the Edit Section in Report dialog, make changes to the required field(s).
4. To save the changes in an existing section, click Save Section to Report. To save the edited section
with a new name, click Save to Report as New Section.
Deleting a Section of a Report
The system enables you to delete a section from a report if you no longer need the query defined in that section.
Note: Be careful when deleting a section of a report. The system cancels any existing delivery schedules for the selected report in
the selected location. Further, if you delete the last section of a report, scheduling and report generation functions are disabled.
Use the following steps to delete a section from a report:
1. From the List of Sections table, select the section that you want to delete.
2. Click Delete Section.
3. Click OK on the Confirm dialog to delete the section.
Scheduling a Report
The system enables you to schedule email delivery of a report. You can select one time delivery or recurring delivery.
Important: Scheduled reports are emailed at incorrect times if incorrect time zone settings are configured in the Server
Initialization and Configuration Wizard from the Server Config shell so choose the time zone carefully.
Setting a Report Schedule
Use the following steps to schedule email delivery of a report:
1. From the List of Reports table, select the report that you want to schedule.
2. Click Add Schedule. The Generation and Delivery Options for Selected Location dialog appears.
Reports Tab
SpectraGuard® Enterprise User Guide
150
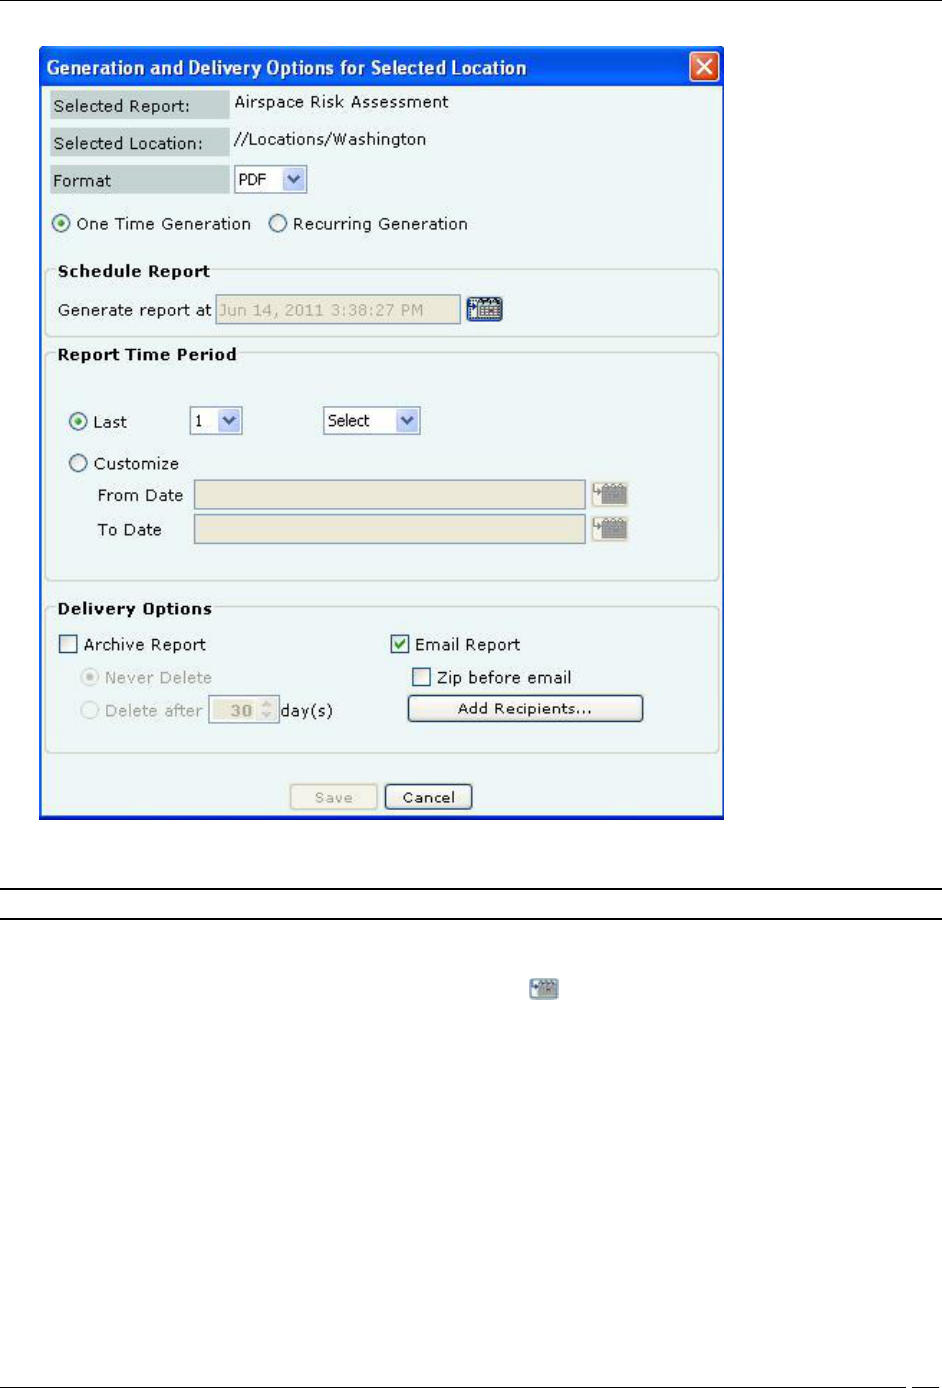
Scheduling a Report for One Time Generation
3. From the Format drop-down list, select the output type for the report, that is, HTML, XML, or PDF.
Note: The system does not support PDF report generation on older versions of IE (versions lower than 7.0).
4. Select either One Time Generation or Recurring Generation.
To schedule a report for One Time Generation, perform the following:
Under Schedule Report, click the calendar icon to specify the date and the time on which to
generate the report.
Under Report Time Period, customize the duration for which the report should be generated by
doing either of the following:
Select Last and then the number of hours, days, or months before the report delivery time.
Select Customize and then the exact date and time in From Date and To Date fields.
Reports Tab
SpectraGuard® Enterprise User Guide
151
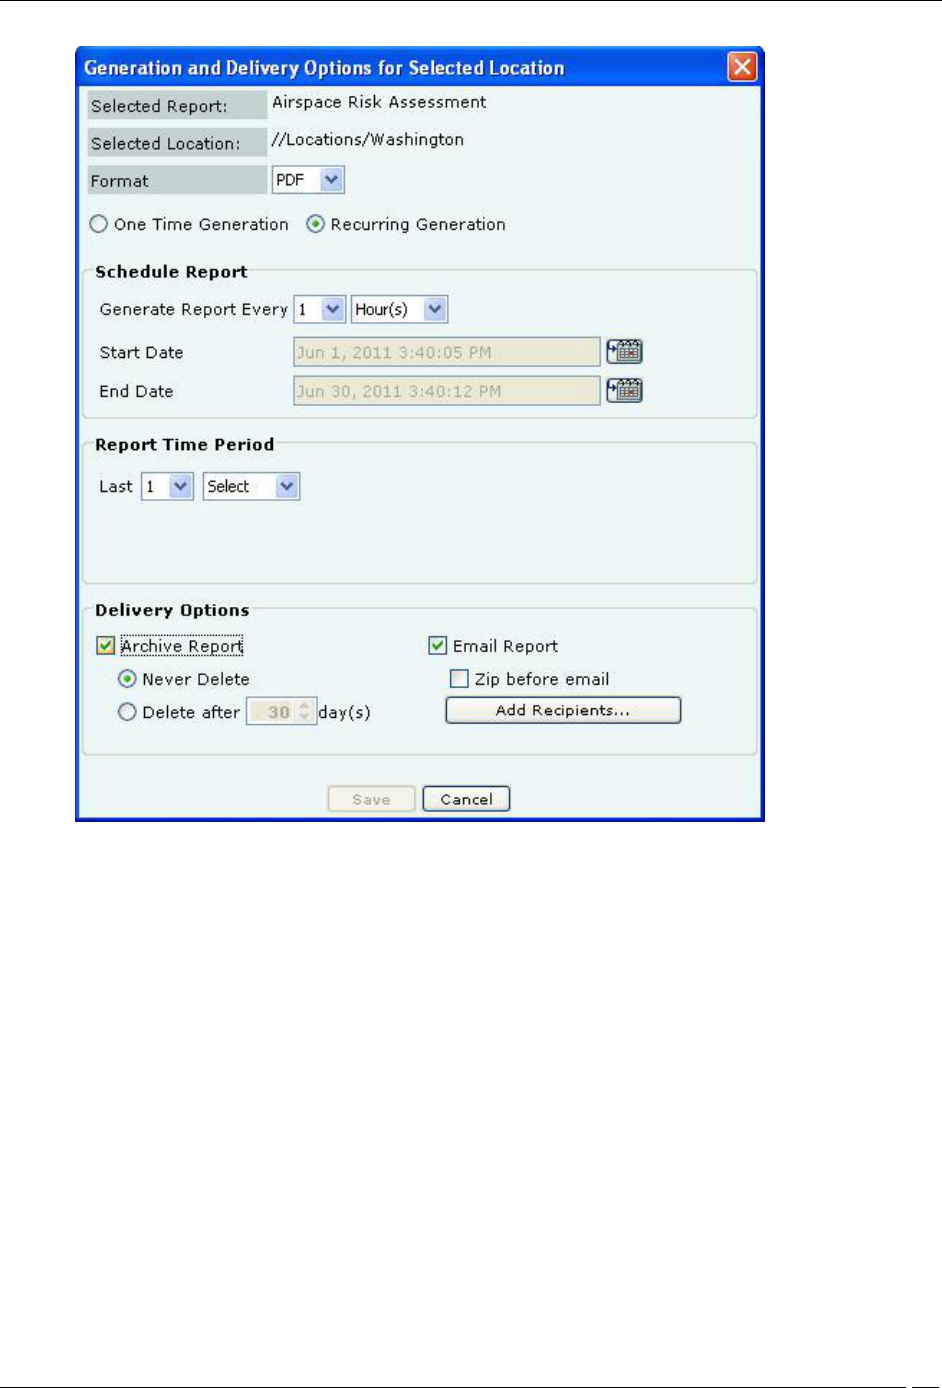
Scheduling a Report for Recurring Generation
To schedule a report for Recurring Generation, perform the following:
Under Schedule Report, from the Generate Report Every drop-down list select the number of
hours, days, or months over which to deliver the report.
Click the calendar icon next to Start Date to select the start date and time for the report.
Click the calendar icon next to End Date to select the end date and time for the report. The End
Date must be greater than the Start Date. The system automatically selects the End Date and Time
from the Start Date.
Under Report Time Period, customize the duration for which the report should be generated by
selecting Last and then the number of hours, days, or months before the report delivery time.
5. Under Delivery Options, perform the following:
Select Archive Report and then choose the following:
Never Delete to retain the report forever.
Delete after ‘n’ days to delete the report after the specified number of days
Select Email Report to email a copy of the report to the selected user(s).
Select Zip before email to compress the report before emailing it.
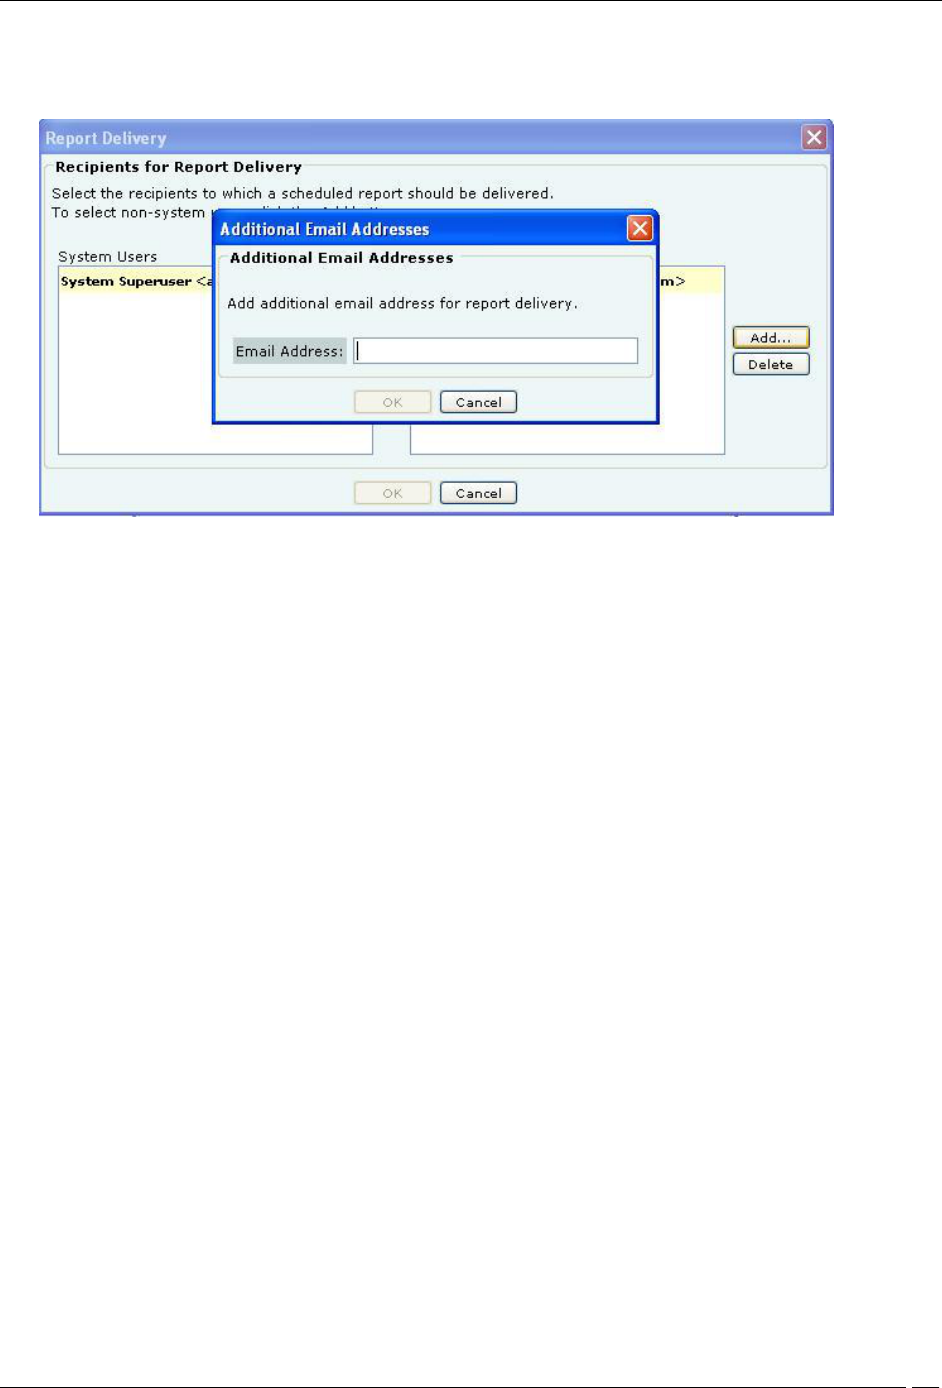
6. Click Add Recipients to open Report Delivery dialog. Here, you can do the following:
Select one or more email addresses under System Users and then click to move the
chosen email address(s) to Recipients. The system delivers scheduled reports to the users under
Recipients.
Reports Tab
SpectraGuard® Enterprise User Guide
152
Click Add to open Additional Email Addresses dialog where you can specify a custom
email address for a non-system user who will receive a scheduled report. In this dialog, you can
add multiple email addresses one at a time.
Specifying Additional Email Addresses for Report Delivery
7. Click OK to close the Additional Email Addresses dialog.
8. Click OK to close the Report Delivery dialog.
9. To schedule the report, click Save.
Editing a Report Schedule
The system enables you to edit a report schedule in response to your requirements. Use the following steps to edit a
report schedule:
1. From the List of Reports table, select the report whose schedule you want to edit.
2. Click Edit Schedule.
3. On the Generation and Delivery Options for Selected Location dialog, make the necessary changes
using the steps given in the Setting a Report Schedule section.
4. To save the changes, click Save.
Canceling a Report Schedule
The system enables you to cancel a report schedule based on your requirements. Use the following steps to cancel a
schedule:
1. From the List of Reports table, select the report whose schedule you want to cancel.
2. Click Cancel Schedule.
3. Click Yes on the Confirm dialog to cancel the schedule.
Generating a Report Instantly
The system enables you to generate a report instantly to display detailed information about your WLAN for a
selected period. Use the following steps to generate a report:
1. From the List of Reports table, select a report that has at least one section.
2. Click Generate.
Reports Tab
SpectraGuard® Enterprise User Guide
153
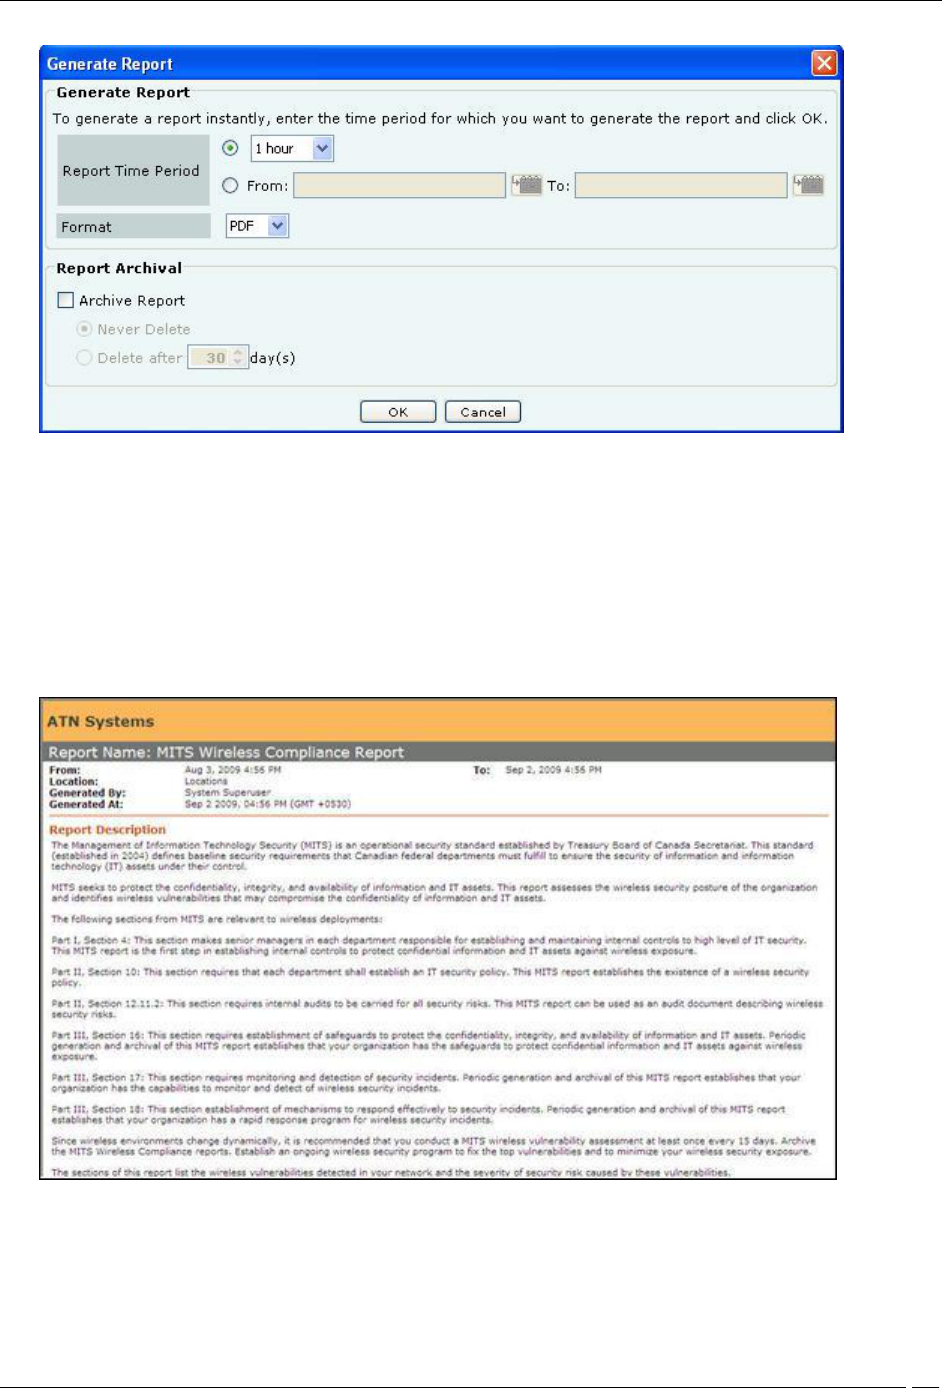
Generating a Report
3. On the Generate Report dialog, select the Report Time Period by doing one of the following:
Select the number of days or hours from the drop-down list over which to collect data. Use the calendar
icons to the right of the From and To fields to select the start time and end time for which to collect the data.
4. Select the Format in which to generate the report, that is, HTML, XML, or PDF.
5. Under Report Archival, select Archive Report and then select one of the following:
Never Delete to retain the archived report in the database forever.
Delete after ‘n’ days to delete the archived report after the selected number of days
6. Click OK to generate the report.
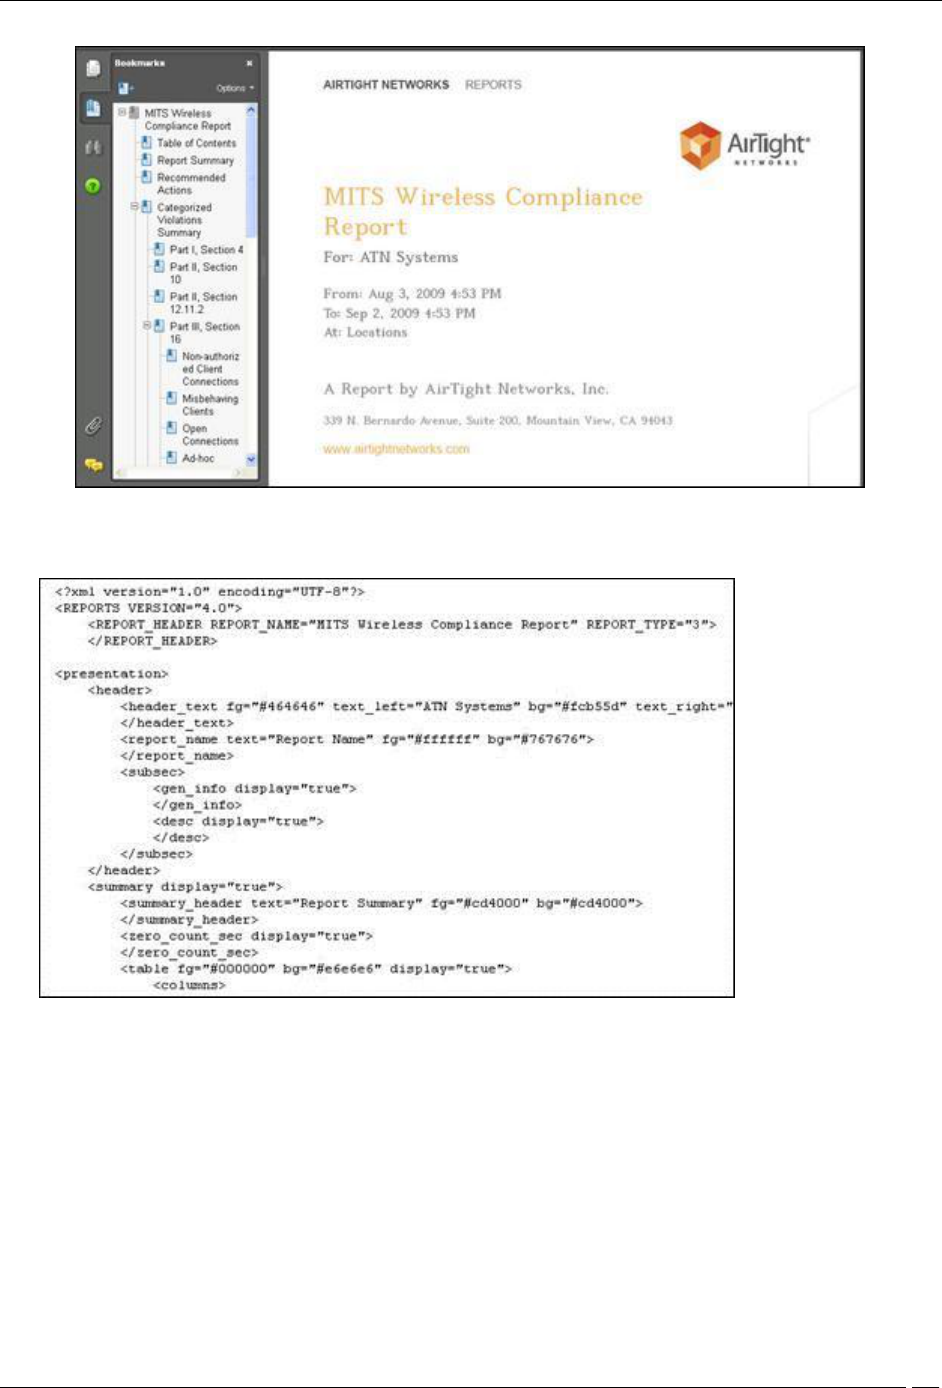
7. An HTML or PDF report opens in another browser window.
Report in HTML Format
Reports Tab
SpectraGuard® Enterprise User Guide
154
Report in PDF Format
8. Alternatively, to save a report in XML format, in the Save dialog, specify the path where you want to
save the report.
Report in XML Format
Sample Report Generation
The example given in this section walks you through the process of creating a new report and shows you how to add
a new section consisting of several database queries to the report.
Following are the steps involved in generating a report:
Creating a report
Adding a section
Specifying a section query
Selecting columns
Saving the section
Generating the report
These steps are illustrated with an example of a report that lists of all the Rogue APs in the WLAN that:
Operate only on the 802.11 b protocol.
Reports Tab
SpectraGuard® Enterprise User Guide
155
Use either Channel 6 or Channel 11 for wireless communication
Creating a Report
1. Select the tab My Reports.
2. Add a new report to the List of Reports table by clicking Add Report.
3. On the Report Details dialog, enter a Report Name for the new report (for example, Rogue AP
Associations), a Report Description to identify the report, and optionally customize the look and feel of
the report.
4. Click Save. The new report appears under the List of Report table.
Adding a Section
1. Select the newly added report.
2. Click Add Section to Report.
3. On the Add Section to Report dialog, enter a Section Name and a brief Section Description.
4. Select the checkbox Display this section to view this new section in the generated report.
Specifying a Section Query
1. Under Section Query Type, select Device Query.
2. Under Select Device Type to include in Results, select the AP checkbox. By default, the system selects
this checkbox.
3. Under Section Query, from left to right, select the following:
Violates Security Policy? is equal to Yes; the Boolean connector AND joins the first query
to the second
Active Status is equal to Inactive; the Boolean connector AND joins the second query to
the third
Channel is equal to 6; the Boolean connector OR joins the third query to the fourth
Channel is equal to 11
Note: The following steps explain a suggested method of implementing this query. You can implement the same query by
changing the order of the queries.
4. Under Select Columns to be displayed in Section Results, do the following
Click Add to view a list of attributes.
Select the following attributes one at a time and click OK.
MAC Address
SSID
Network Status
Protocol
Channel
Device Folder
Ensure that you select the following under Select Columns to be displayed in Section Results.
Attribute
Display
Summary
Chart
Table
MAC Address
Selected
-
-
SSID
Selected
Pie
Selected
Network Status
Selected
Bar
Selected
Protocol
Selected
Pie
Selected
Channel
Selected
Bar
Selected
Device Folder
Selected
Bar
Selected
Saving the Section
To save this section to the report (Rogue AP Associations), click Save Section to Report. The new section appears
under the List of Sections table.
Generating the Report
1. Select the newly created report (Rogue AP Associations).
Reports Tab
SpectraGuard® Enterprise User Guide
156
2. Click Generate. The Generate Report dialog appears.
3. Under Report Time Period, select 7 days.
4. Under Format, select PDF.
5. Under Report Archival, select Archive Report and then select Delete after 360 days to retain the
archived report for 360 days.
6. Click OK. The PDF report opens in a different browser window.
Report in PDF format for ‘Rogue AP Associations’
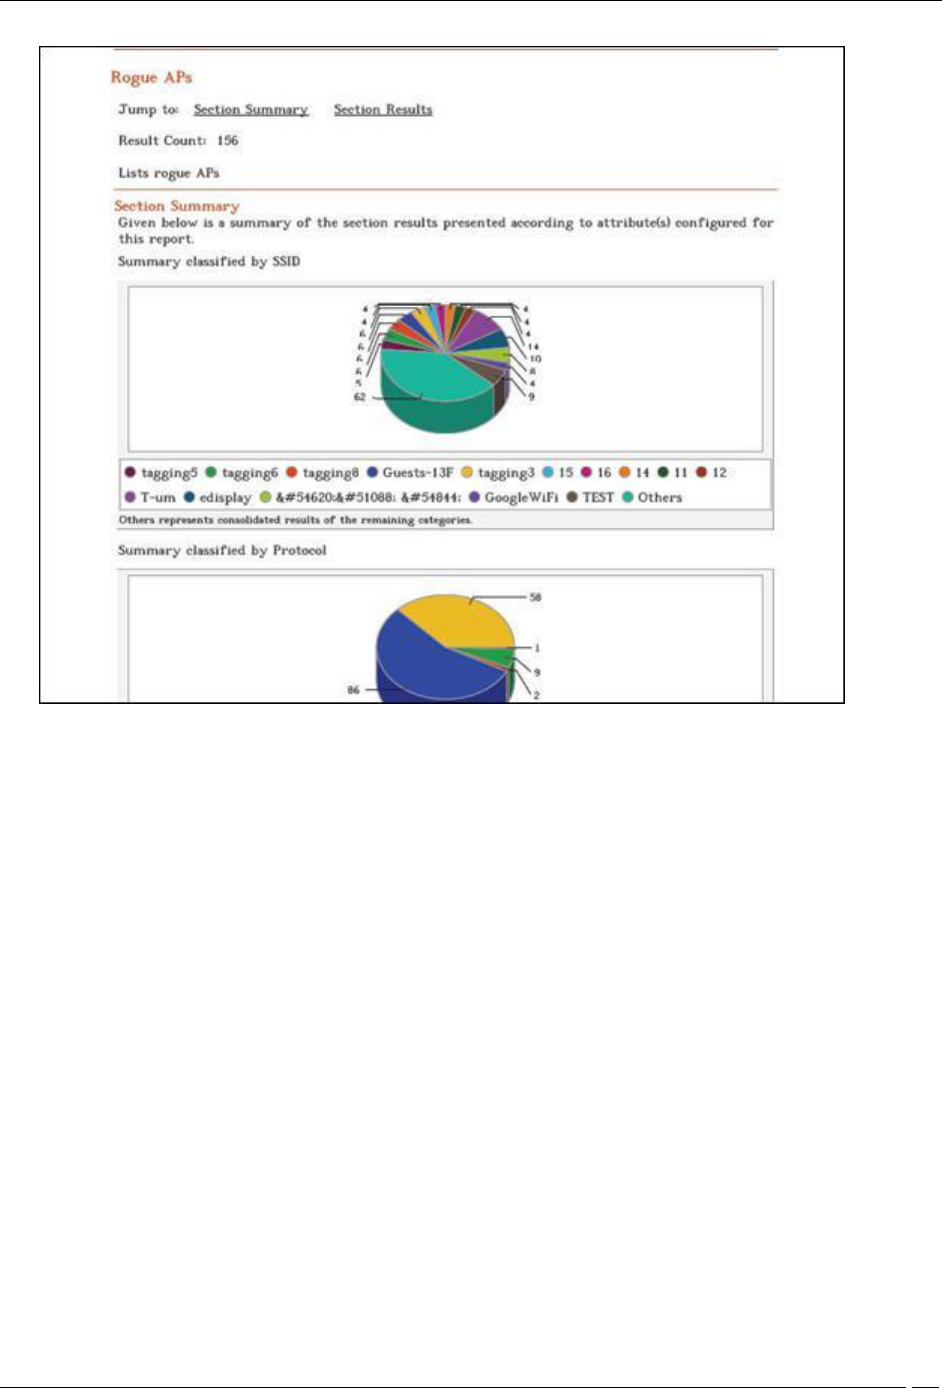
7. To view the Section Summary and Section Results of a section, click the corresponding link(s) in the
Jump to column in the Report Summary table.
Reports Tab
SpectraGuard® Enterprise User Guide
157
Report for ‘Rogue AP Associations’ showing Section Summary
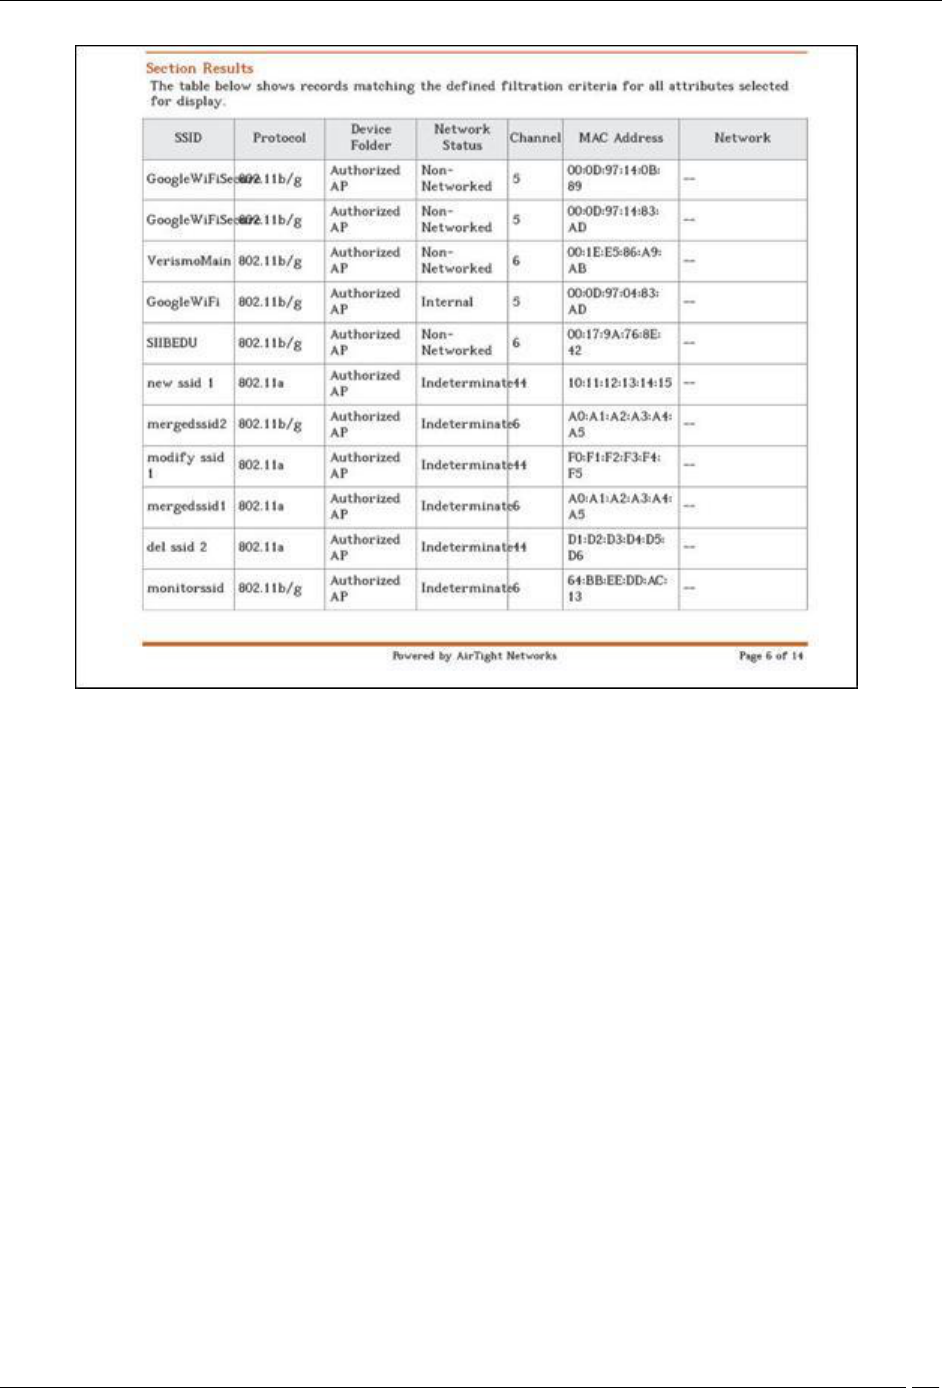
Reports Tab
SpectraGuard® Enterprise User Guide
158
Report for ‘Rogue AP Associations’ showing Section Results
Forensics Tab
SpectraGuard® Enterprise User Guide
159
Forensics Tab
Forensics: Panel for Threat Forensics
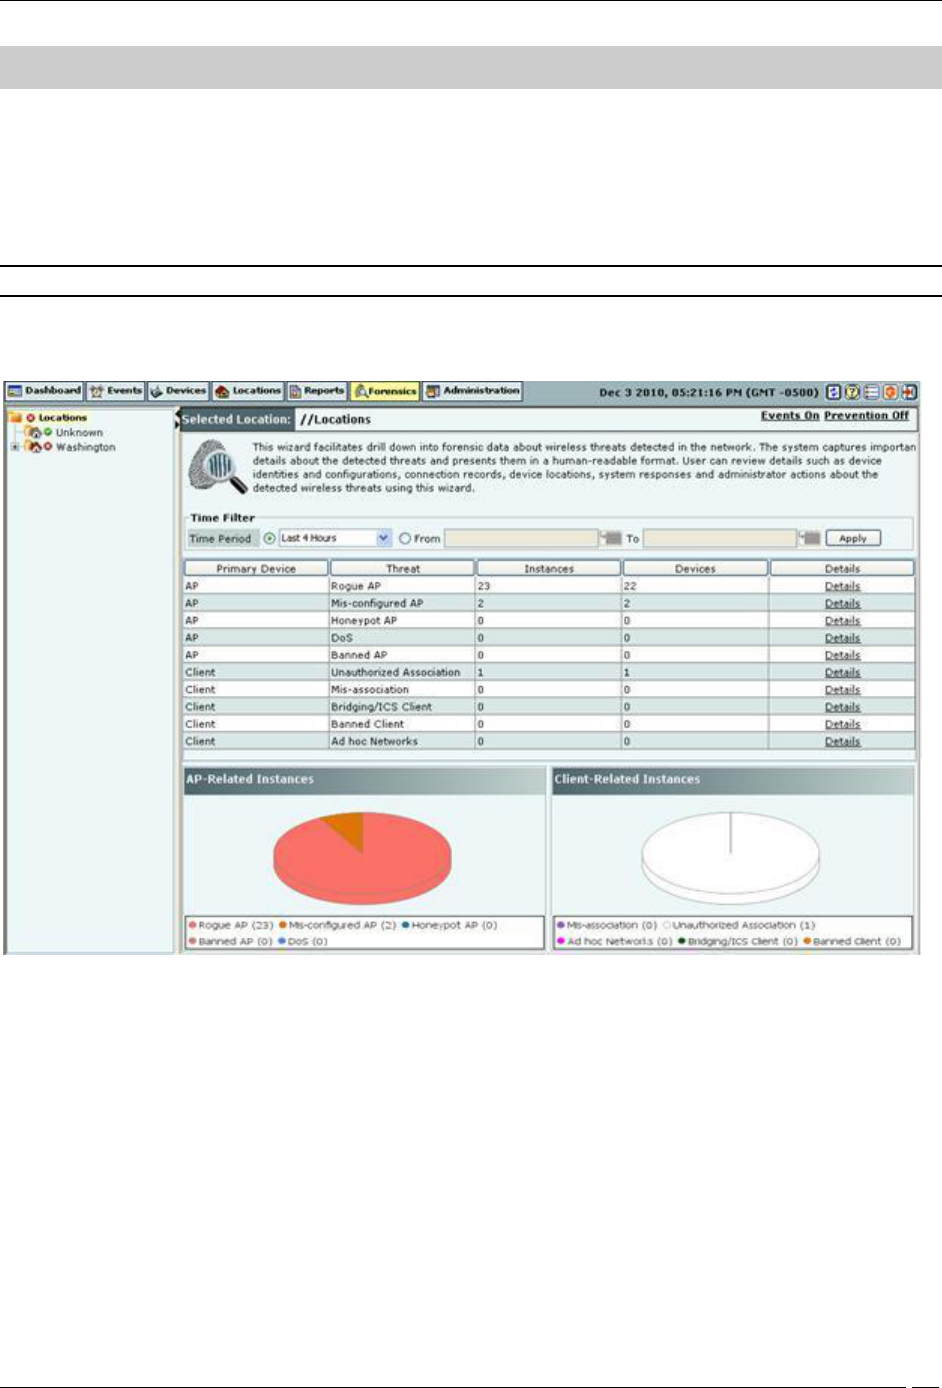
The Forensics screen enables you to drill down into forensic data about wireless threats detected in the network. The
system captures important details about the detected threats and presents them in a human-readable format. You can
review details such as device identities and configurations, connection records, device locations, system responses,
and administrator actions about the detected wireless threats using this tab.
Note: The Forensics Tab is not visible if WIDS license is applied.
Forensics Screen
You can open the Forensics screen by selecting the Forensics tab on the navigation bar.
Forensics Screen
The Forensics screen includes two panes.
On the left, the Location tree.
On the right, the Forensics tab: Time Filter, Threats List, and Pie Charts showing the AP and Client-Related Instances
in graphical form.
Forensics: Location Tree
The Location tree shows the complete list of locations created for your WLAN in the system. To view a list of wireless
threats, select a location in the Location tree, and a list of threats appears for the selected location and its child
locations.
Forensics: Time Filter, Threat List, and Pie charts
This pane shows:
Path of the selected location.
List of threats that have occurred at that location
Graphical representation of AP and Client threats as pie chart

Forensics Tab
SpectraGuard® Enterprise User Guide
160
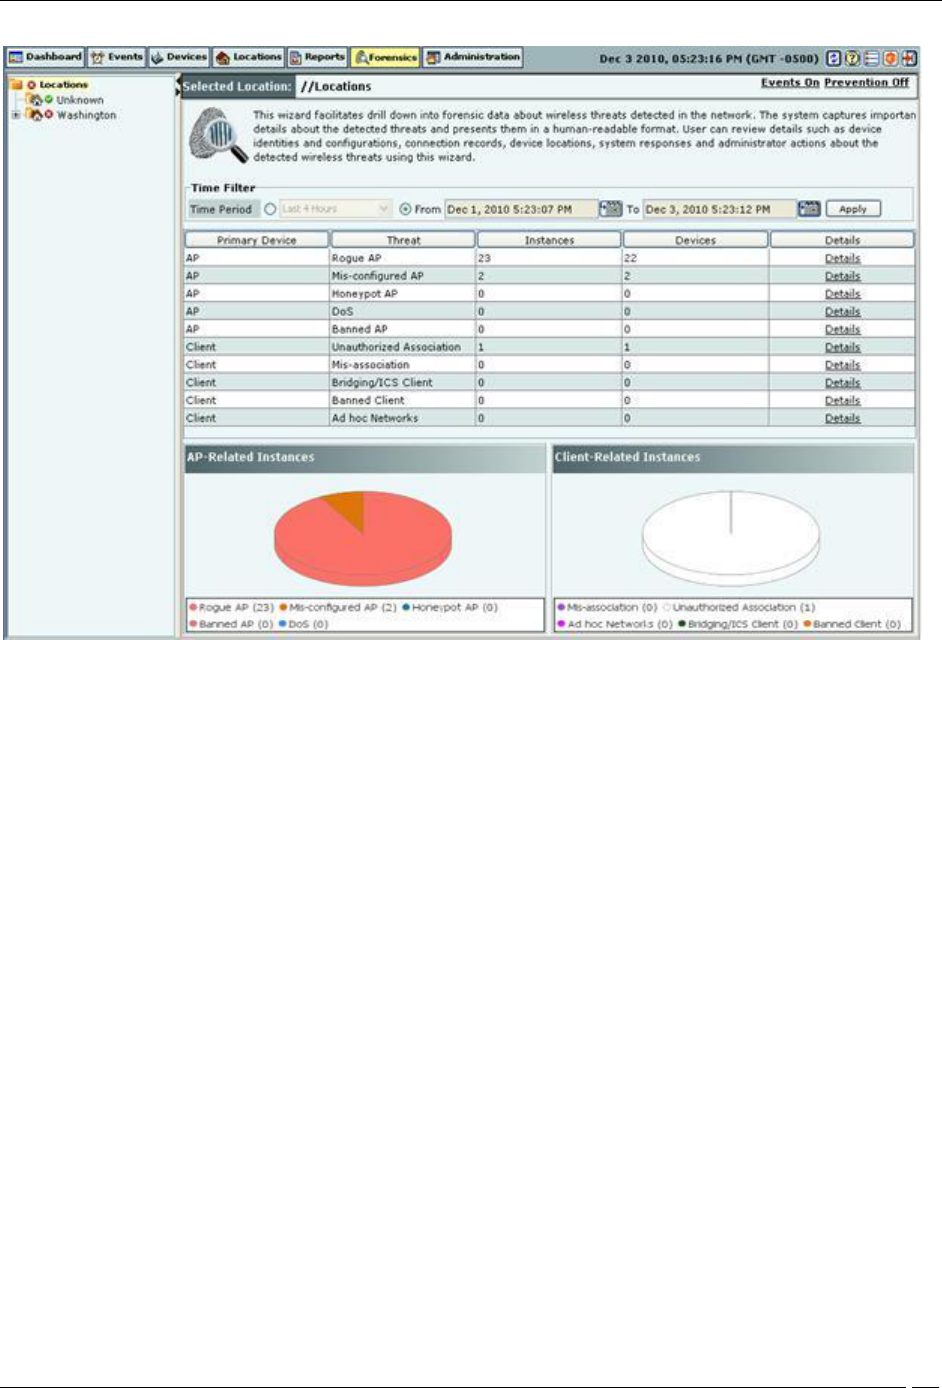
You can view the threats based on the Time Filter, do one of the following:
Select Time Period and select Last 4 Hours, Last 12 Hours, Last 24 Hours, or Last 48 Hours from the drop-
down list.
Select From click the icon to specify a start date and time. Under To, click the icon to specify an end
date and time and then click Apply.
Threat list is organized such that it is easy to determine whether it is AP based threat or Client based threat, based on
the primary device involved in the threat.
AP Based Threats: These are threats wherein the main participating/effected device is an AP. AP based
threats are sub-categorized as follows:
Rogue AP
Mis-configured AP
Honeypot AP
Banned AP
DoS
Client Based: These are threats wherein main participating/effected device is a Client. Client based threats
are sub-categorized as follows:
Unauthorized Association
Mis-association
Bridging Client
Banned Client
Ad hoc Networks
You can also view the summary information about threats in the form of pie charts under the AP related instances
and Client related instances.
Viewing Threats List
Forensics analysis of threats involve systematic drill down into the threat details. Viewing the threat list is the first of
those actions. Use the following steps to view threat list:
1. In the Location tree, select a location.
2. In the right pane, the threat list displays. The threat list has the following columns:
Forensics Tab
SpectraGuard® Enterprise User Guide
161
Threats List
Primary Device: Specifies the category of the threat (AP or Client) based on the primary device
involved/effected by the threat.
Threat: Specifies the actual name of the threat type (such as Rogue AP, Honeypot AP, Ad hoc Networks ,
and so on).
Instances: Specifies the number of threats of the respective type in the given time frame.
Devices: Specifies the number of unique Primary Devices which were involved in this threat type.
Details: When you click Details, the Forensics Details dialog opens. This helps you drill down into the
details of that threat type.
Forensics Tab
SpectraGuard® Enterprise User Guide
162
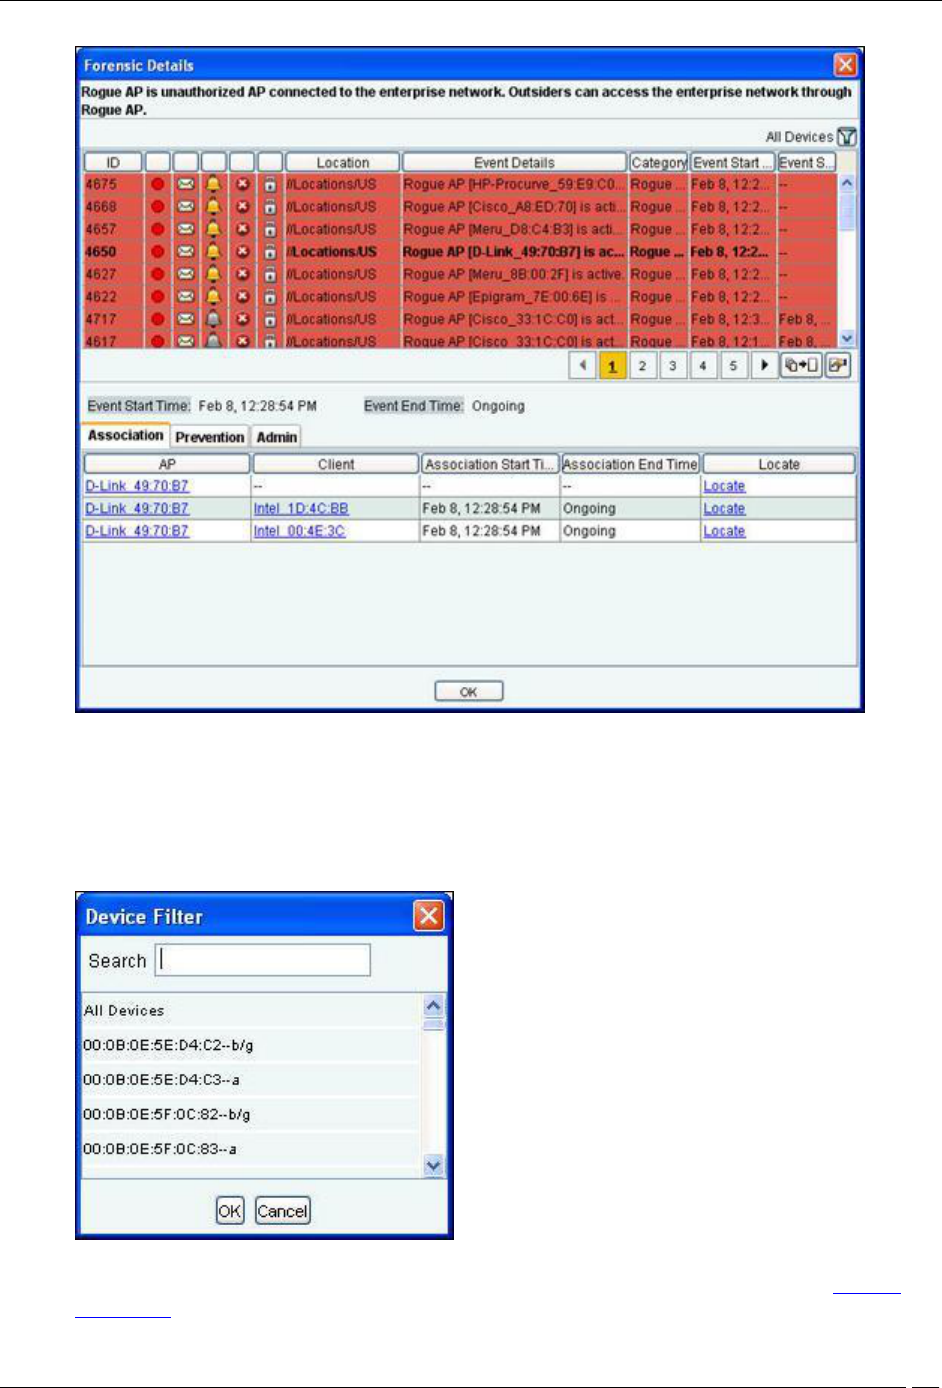
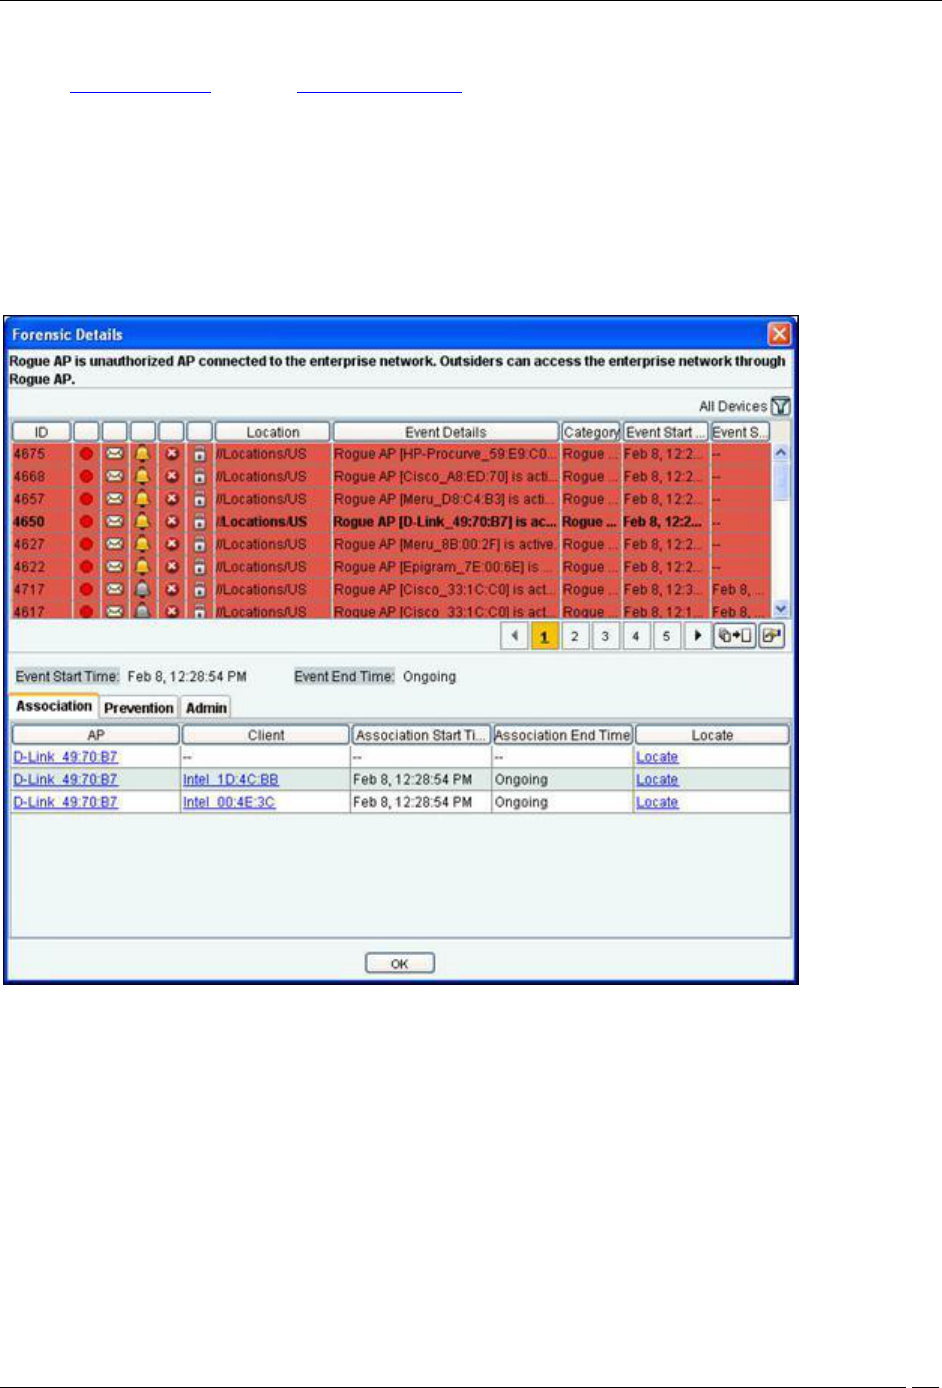
Forensics Details Dialog
The various fields and buttons in the Forensics Details dialog are:
Short Description: Provides a brief description of the selected AP/Client threat. This is presented as bold
text at the top of the dialog.
All Devices Filter: Displays unique list of all the Primary Devices which where involved in the threat in the
time frame selected in the Time Filter in the Threats List screen. Click the All Devices Filter icon, the
Device Filter dialog opens. Select the appropriate Device/All Devices in the Search. Click <OK>.
Device Filter dialog
Event Details: Specifies the event details. Right click option of Events is also available. Refer to Viewing
Events Lists section in the Events tab for details.Event Start Time: Displays the event start time.
Forensics Tab
SpectraGuard® Enterprise User Guide
163
Event End Time: Displays the event end time. If the event is live, the Event End Time is Ongoing.
Refer to AP Based Threats section or Client Based Threats section for more details about Association, Prevention,
and Admin tabs depending on the threat type.
AP Based Threats
The AP Based Threats Details dialog gives information about the AP based threat, which helps you determine the
actions taken after the threat was detected.
To open the AP Based Threat Details dialog, select an AP Threat row on the Forensics screen, and click Details. The
AP Based Threat Details dialog has the following tabs namely: Association, Prevention, and Admin. By default, the
Association tab appears.
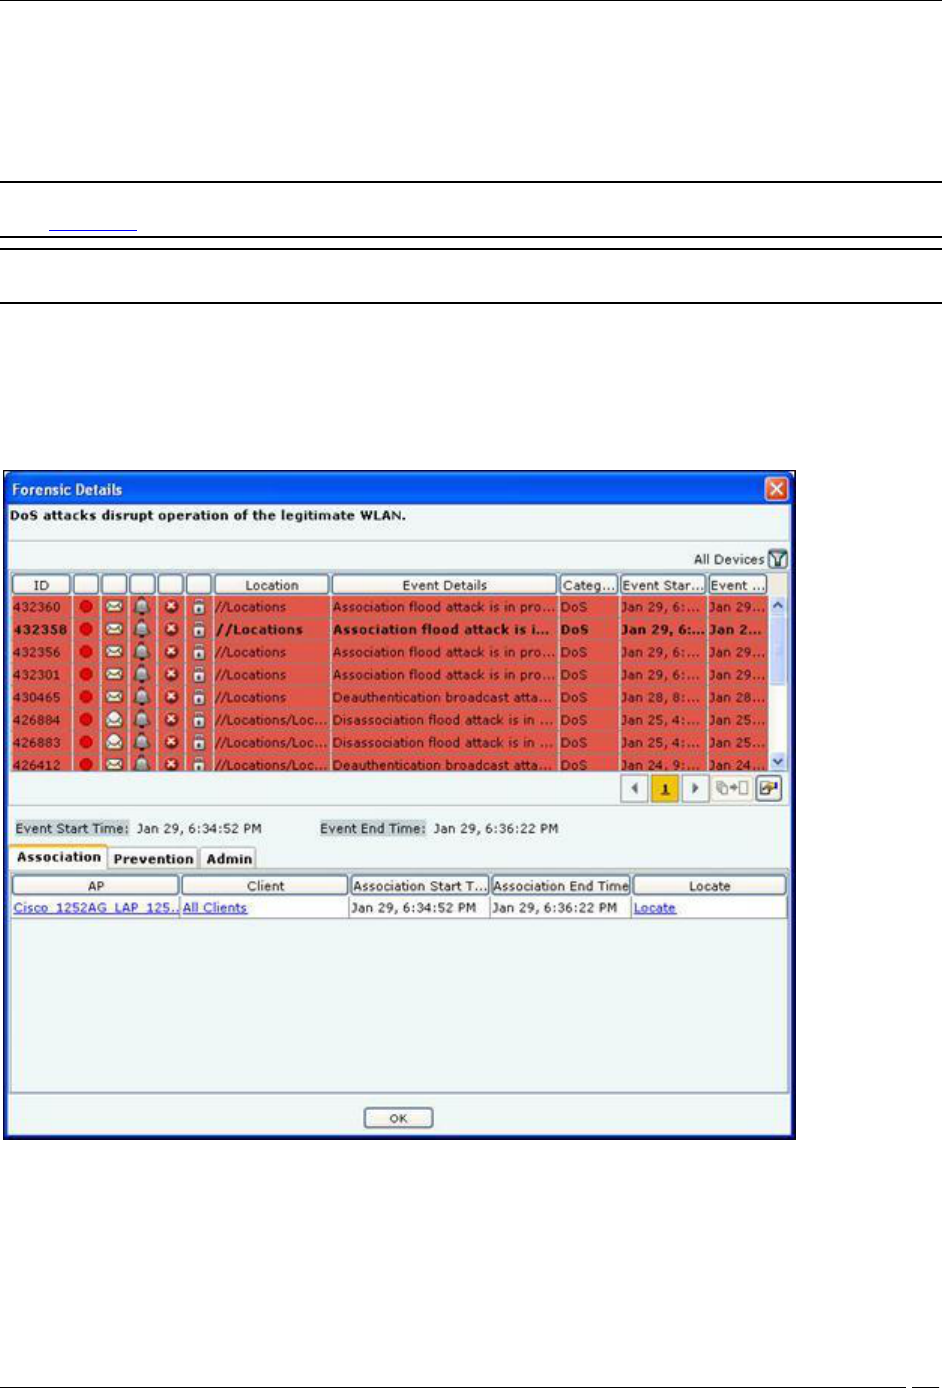
AP Based Threat Details dialog
AP Based Threat – Association Tab
Association Tab shows the number of connection attempts that where made to the AP selected for the duration of
the selected Event. The fields in Association Tab are as follows:
AP: In case of AP based threats, AP is the Primary Device. Click AP, the AP Details dialog opens.
Client: Client is the device, which is associated to the Primary Device. Click Client, the Client Details
dialog opens.
Association Start Time: Specifies the start time when the Primary Device associates with the device.
Association End Time: Specifies the end time when the Primary Device ends association with the device.
Locate: Click Locate, the Location dialog opens. Select the AP/Client participating in the event from Locate
Device drop down list. Select Start Time of Association and End Time of Association from At drop down
list. Click Locate the location of the selected device at the selected time is displayed in the Thermometer
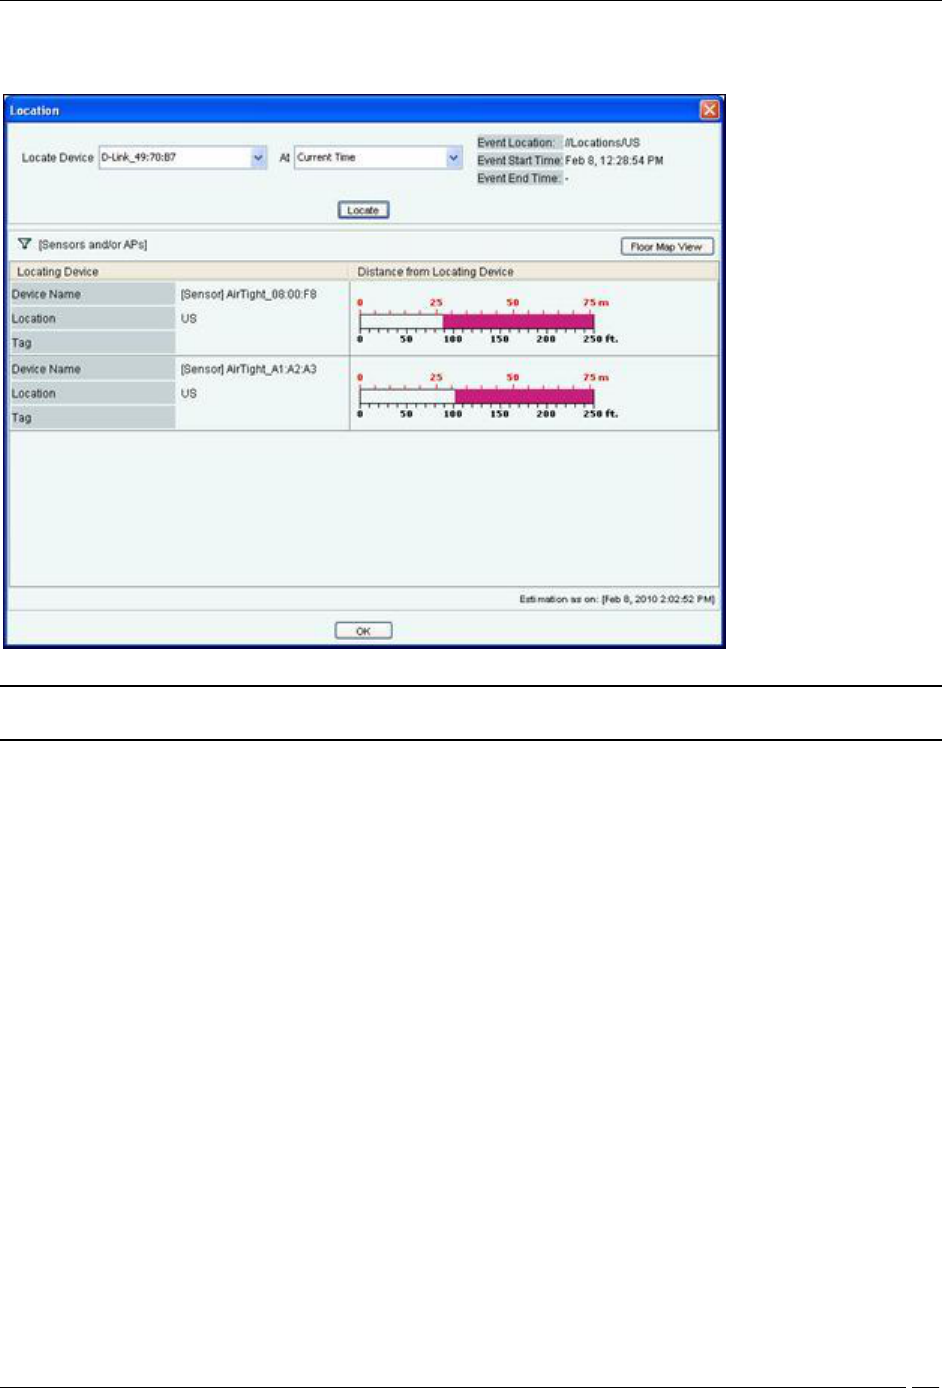
Forensics Tab
SpectraGuard® Enterprise User Guide
164
View. Click Floor Map View to view the location of the selected device at the selected time in the Floor Map
View.
Location dialog
Note: The first row in the AP based threat displays the Event Time, while rest of the rows displays the Start/End Time of
Association. This is valid for all AP based threats, except DoS.
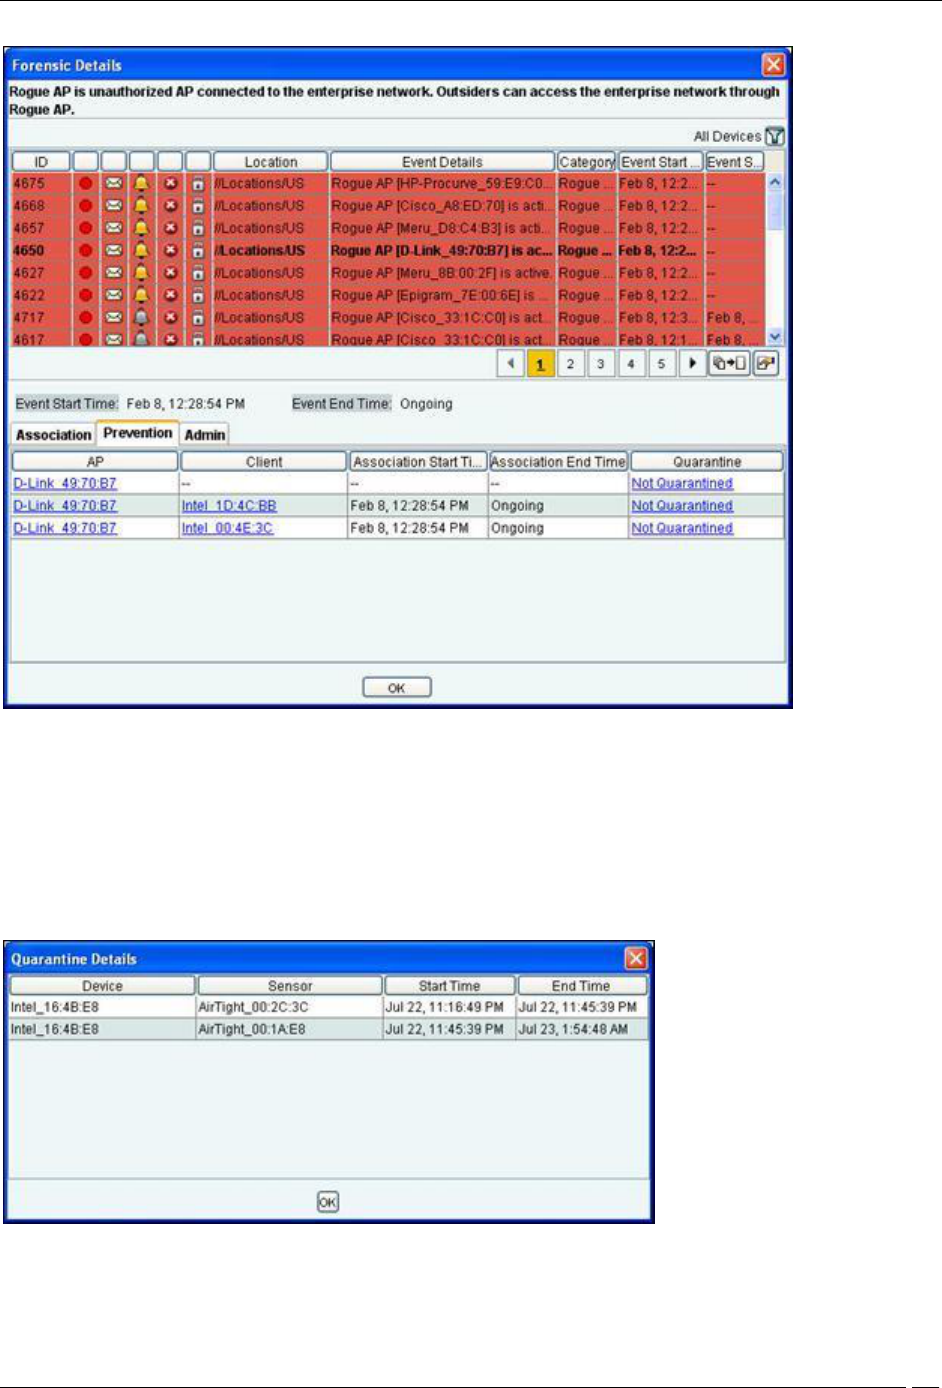
AP Based Threat – Prevention Tab
Prevention Tab shows the details of the Quarantine status of the association in the Association tab.
Forensics Tab
SpectraGuard® Enterprise User Guide
165
AP Based Threat Details – Prevention Tab
The fields in Prevention Tab are as follows:
AP
Client
Association Start Time
Association End Time
Quarantine: Specifies the action taken on both the devices in the association. Even one of device is
quarantined, the association is Quarantined, otherwise it is Not Quarantined. Click Quarantined, the
Quarantine Details dialog opens.
Quarantine Details dialog
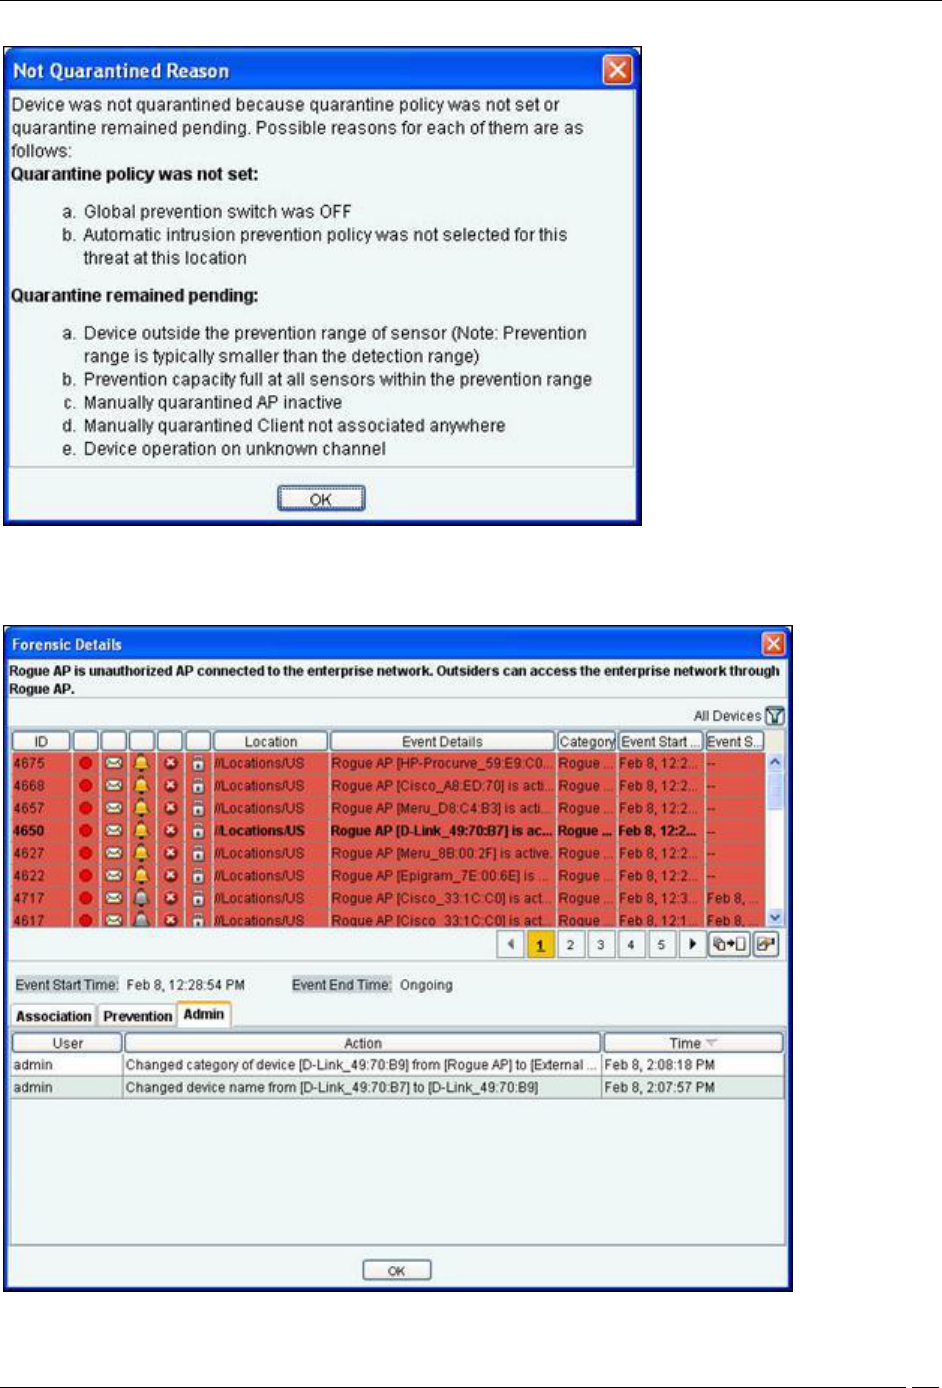
Click Not Quarantined, the Not Quarantined Reason dialog opens.
Forensics Tab
SpectraGuard® Enterprise User Guide
166
Not Quarantined Reason
AP Based Threat – Admin Tab
Admin Tab shows all the administrator actions taken on the AP between the Event Start Time and Event End Time.
AP Based Threat Details – Admin Tab
Forensics Tab
SpectraGuard® Enterprise User Guide
167
The fields in Admin Tab are as follows:
User: Specifies the name of the user who took action on the threat.
Action: Specifies the action taken by the user for the AP based threat such as AP added to quarantine, AP
name changed
Time: Specifies the time when the user action was taken
Note: All the above tabs Association, Prevention, and Admin shows the information based on the Device and Event selected
in the Threats List dialog.
Note: AP Based Threat – Rogue AP, Mis-configured AP, and Honeypot AP have the same fields for the tabs Association,
Prevention, and Admin. However AP Based Threat – DoS has some different fields as discussed in the section below.
AP Based Threat – DoS
DoS is classified into two categories:
Unicast: In Unicast only one Client connected to the AP is effected in the DoS attack
Broadcast: In Broadcast all the Clients connected to the AP are effected in the DoS attack
To open the AP – DoS Threat Details dialog, select the AP – DoS threat row on the Forensics screen, and click
Details. The AP – DoS Threat Details dialog opens.
AP – DoS Threat Details dialog
AP DoS Threat – Association tab
The fields in Association Tab are as follows:
AP
Client: Incase of Unicast, a single Client name appears, click the Client name, the Client Details screen
opens. Incase of Broadcast, All Clients is displayed in the Client name.
Forensics Tab
SpectraGuard® Enterprise User Guide
168
Association Start Time
Association End Time
Locate Click Locate, the Location dialog opens. In case of Unicast, select the AP/Client/DoS Attacker
participating in the event from Locate Device drop down list. Incase of Broadcast, select the AP/DoS
Attacker participating in the event from Locate Device drop down list. Select Start Time of Association and
End Time of Association from At drop down list. Click Locate the location of the selected device at the
selected time is displayed.
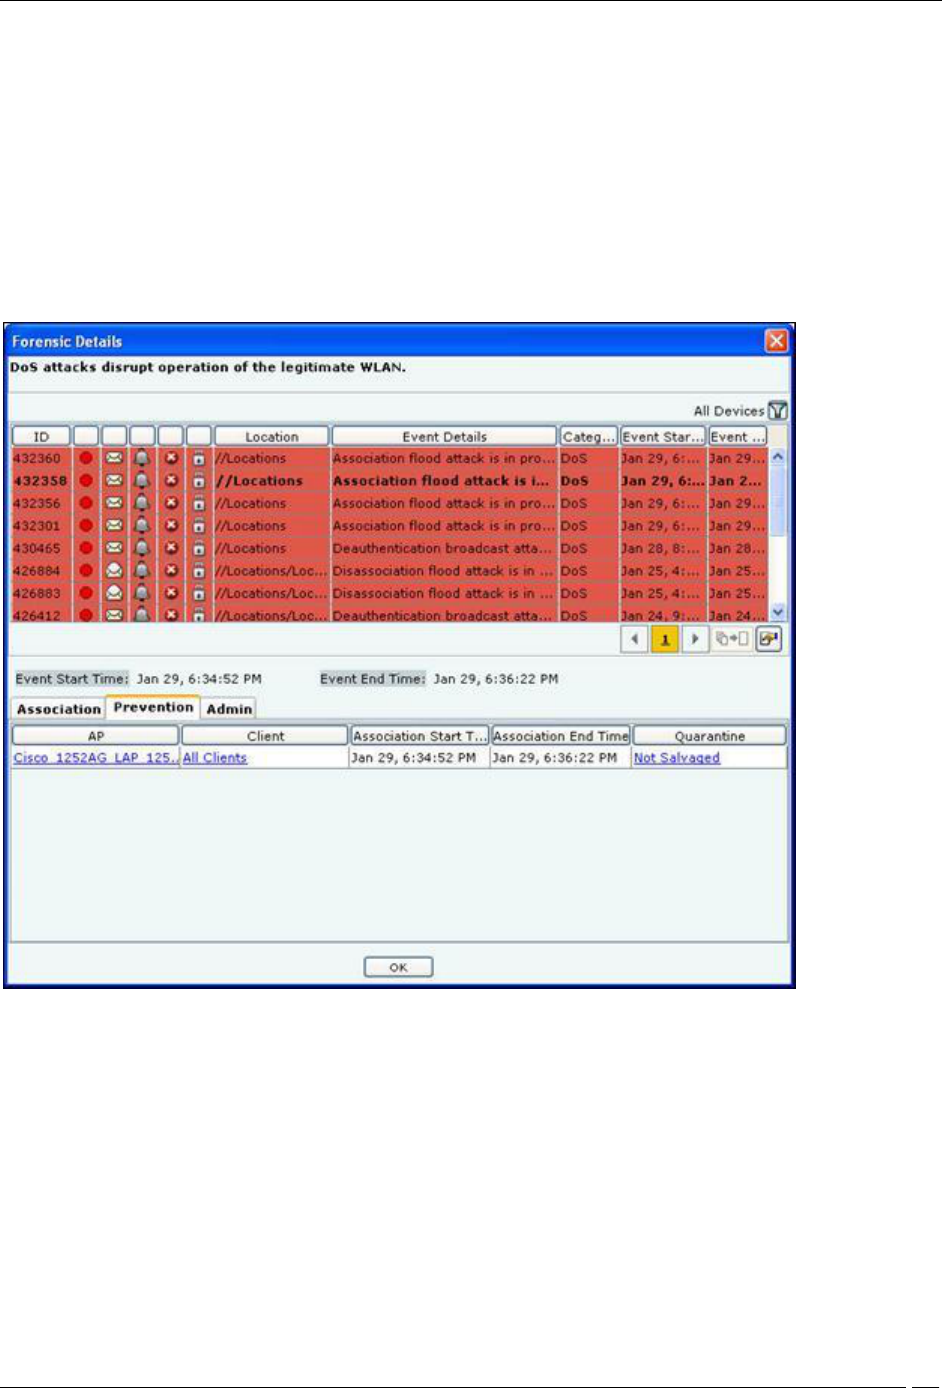
AP DoS Threat – Prevention tab
Click on Prevention Tab in the AP – DoS Threat Details dialog.
AP – DoS Threat Details – Prevention tab
The fields in Prevention tab are as follows:
AP
Client: Incase of Unicast, a single Client name appears, click the Client name, the Client Details screen
opens. Incase of Broadcast, All Clients is displayed in the Client name.
Association Start Time
Association End Time
Quarantine: Specifies the action taken during the association, whether the device was Salvaged/Not
Salvaged. Salvage unblocks the effected communication of the Authorized AP. Click Salvaged, the
Quarantine Details dialog opens. Click Not Salvaged, the Not Quarantined Reason dialog opens
AP DoS Threat – Admin Tab
Click on Admin Tab in the AP – DoS Threat Details dialog.
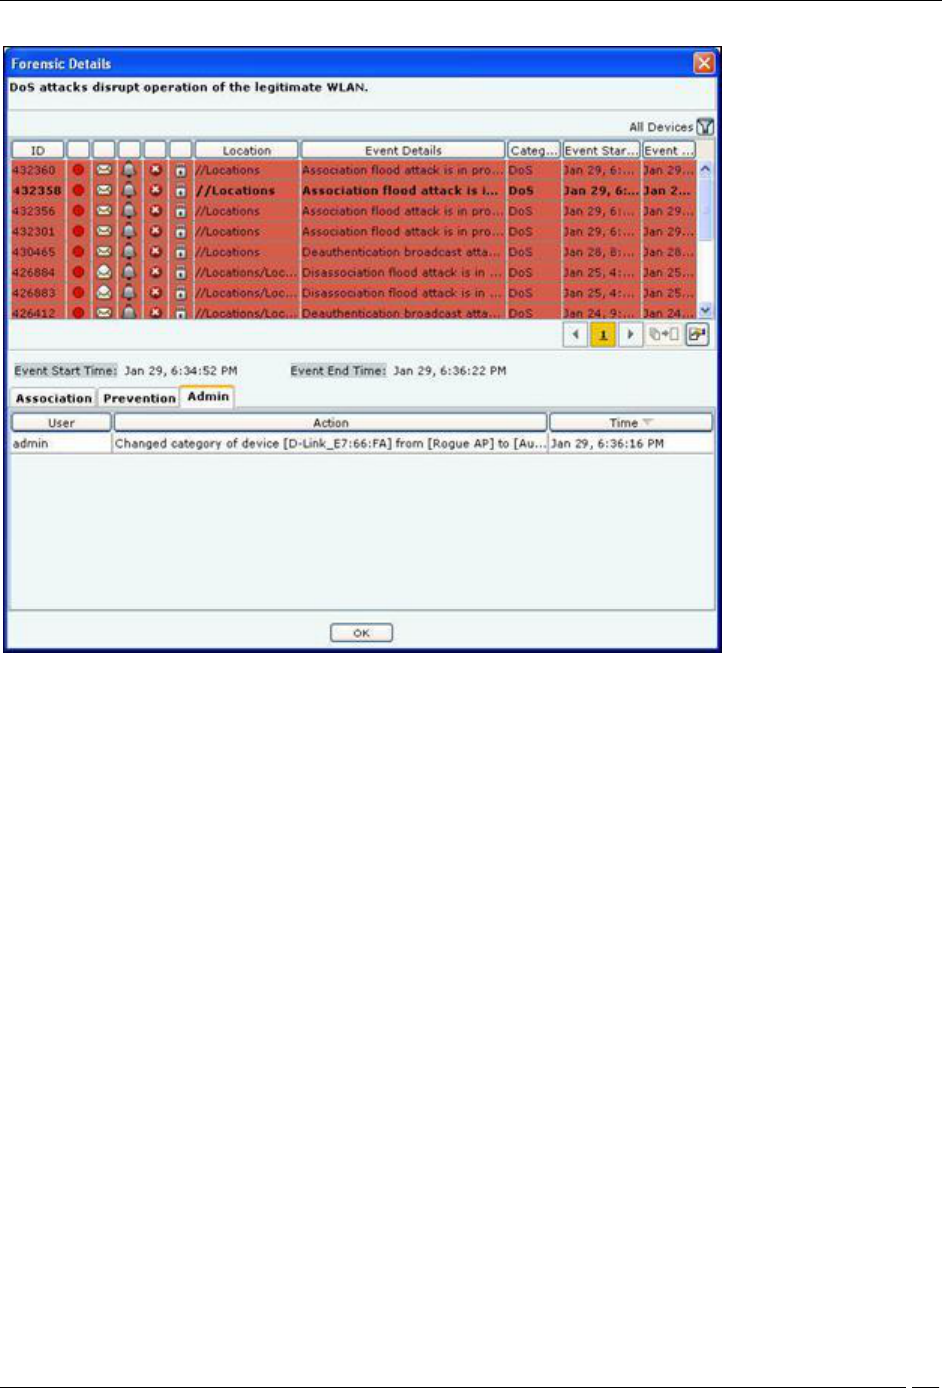
Forensics Tab
SpectraGuard® Enterprise User Guide
169
AP – DoS Threat Details – Admin tab
The fields in Admin tab are as follows:
User
Action
Time
Client Based Threats
The Client Based Threats Details dialog gives information about the Client based threat, which helps you determine
the actions taken after the threat was detected.
To open the Client Based Threat Details dialog, select a Client Threat row on the Forensics scree,n and click Details.
The Client Based Threat Details dialog has the following tabs namely: Association, Prevention, and Admin. By
default, the Association tab appears.
Forensics Tab
SpectraGuard® Enterprise User Guide
170
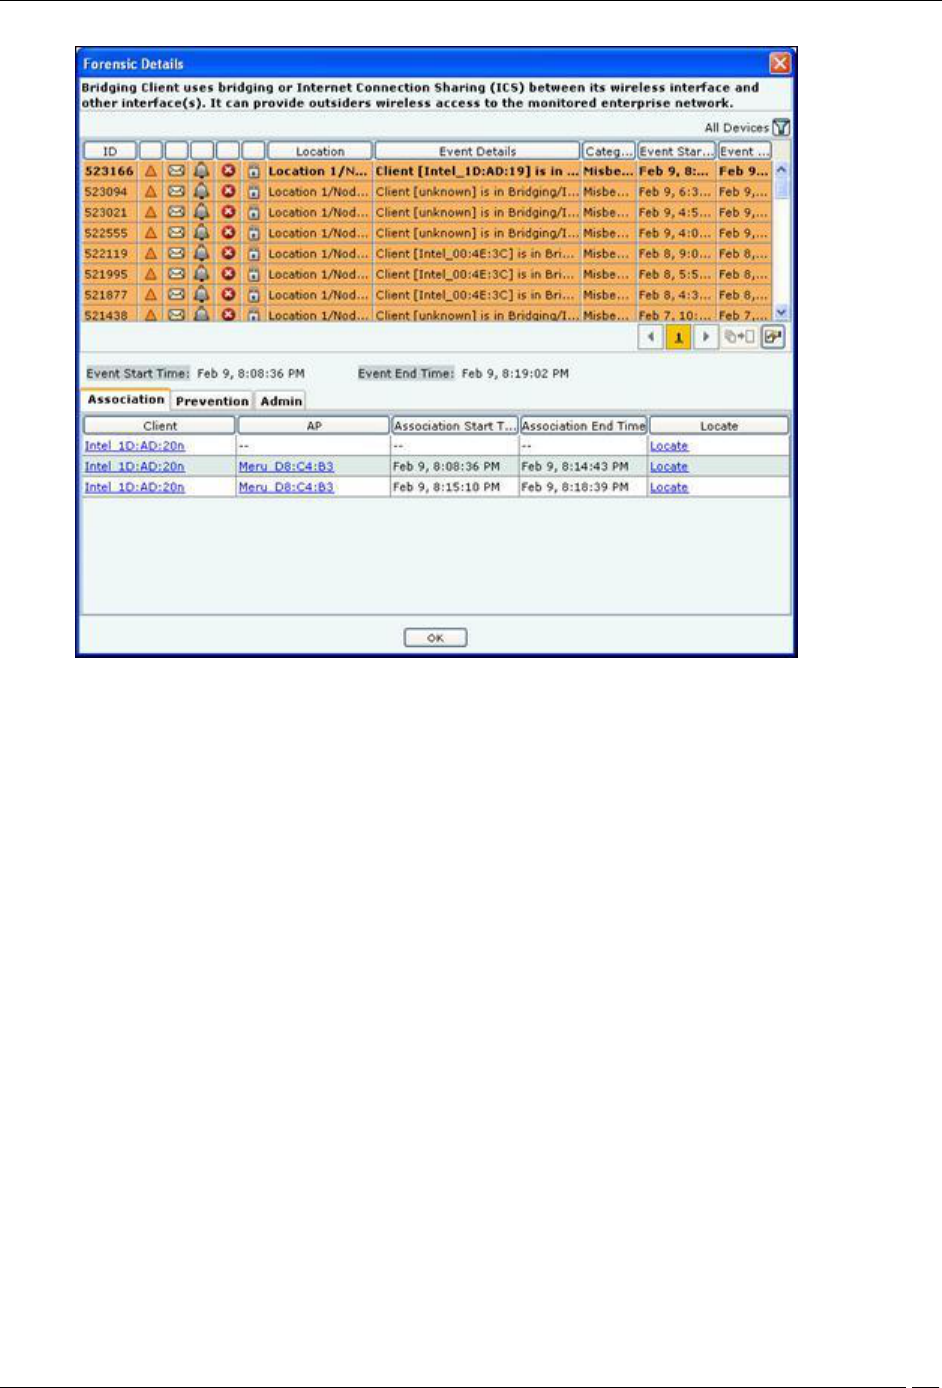
Client Based Threat Details dialog
Client Based Threat – Association Tab
Association Tab shows the number of connection attempts that where made to the Client selected for the duration of
the selected Event. The fields in Association Tab are as follows:
Client: In case of Client based threats, Client is the Primary Device. Click Client, the Client Details dialog
opens.
AP: AP is the device which is associated to the Primary Device. Click AP, the AP Details dialog opens.
Association Start Time: Specifies the start time when the Client associates with the AP.
Association End Time: Specifies the end time when the Client ends association with the AP.
Locate: Click Locate, the Location dialog opens. Select the AP/Client participating in the event from Locate
Device drop down list. Select Start Time of Association and End Time of Association from At drop down
list. Click Locate the location of the selected device at the selected time is displayed in the Thermometer
View. Click Floor Map View to view the location of the selected device at the selected time in the Floor Map
View.