B7210 Report(FCC Part 15B)
2016-04-12
: Pdf B7210 Report(Fcc Part 15B) B7210_Report(FCC_Part_15B) CertsReports 551069 ProductFiles
Open the PDF directly: View PDF ![]() .
.
Page Count: 25
Report No.:T111221S01-D
Page 1 / 25
This report shall not be reproduced except in full, without the written approval of Compliance Certification Services.
FCC 47 CFR PART 15 SUBPART B AND ANSI C63.4:2003
IC ICES-003 Issue 4
TEST REPORT
For
IP Cam
Model : B7210
Trade Name : ZAVIO
Issued for
ZAVIO Inc.
2F, No.13, R&D Rd.II, Science Based Industrial Park,
Hsinchu, Taiwan
Issued by
Compliance Certification Services Inc.
Hsinchu Lab.
NO. 989-1 Wen Shan Rd., Shang Shan Village,
Qionglin Shiang Hsinchu County 30741, Taiwan, R.O.C
TEL: +886-3-5921698
FAX: +886-3-5921108
http://www.ccsrf.com
E-Mail : service@ccsrf.com
Issued Date: January 03, 2012
Note: This report shall not be reproduced except in full, without the written approval of Compliance Certification
Services Inc. This document may be altered or revised by Compliance Certification Services Inc. personnel only,
and shall be noted in the revision section of the document. The client should not use it to claim product
endorsement by TAF or any government agencies. The test results of this report relate only to the tested sample
identified in this report.
Report No.:T111221S01-D
Page 2 / 25
This report shall not be reproduced except in full, without the written approval of Compliance Certification Services.
Revision History
Rev. Issue Date Revisions Effect Page Revised By
00 01/03/2012 Initial Issue All Page 25 Cindy Pon
Report No.:T111221S01-D
Page 3 / 25
This report shall not be reproduced except in full, without the written approval of Compliance Certification Services.
TABLE OF CONTENTS
TITLE PAGE NO.
1. TEST REPORT CERTIFICATION................................................................................4
2. EUT DESCRIPTION .....................................................................................................5
3. DESCRIPTION OF TEST MODES ...............................................................................5
4. TEST METHODOLOGY ...............................................................................................6
5. FACILITIES AND ACCREDITATION...........................................................................6
5.1 FACILITIES ............................................................................................................6
5.2 ACCREDITATIONS................................................................................................6
5.3 MEASUREMENT UNCERTAINTY.........................................................................7
6. SETUP OF EQUIPMENT UNDER TEST......................................................................8
7. EMISSION TEST..........................................................................................................9
7.1 RADIATED EMISSION...........................................................................................9-16
7.2 CONDUCTED EMISSION......................................................................................17-20
APPENDIX SETUP PHOTOS ..........................................................................................21-25
Report No.:T111221S01-D
Page 4 / 25
This report shall not be reproduced except in full, without the written approval of Compliance Certification Services.
1. TEST REPORT CERTIFICATION
Applicant : ZAVIO Inc.
Address : 2F, No.13, R&D Rd.II, Science Based Industrial Park,
Hsinchu, Taiwan
Equipment Under Test: IP Cam
Model : B7210
Trade Name : ZAVIO
Tested Date : December 21, 2011 ~ January 02, 2012
APPLICABLE STANDARD
Standard Item Test Result
Radiated Emission PASS
FCC Part 15 Subpart B, CLASS A
AND
ANSI C63.4:2003
IC ICES-003 Issue 4 Conducted Emission PASS
WE HEREBY CERTIFY THAT: The above equipment has been tested by Compliance
Certification Services Inc., and found compliance with the requirements set forth in the
technical standards mentioned above. The results of testing in this report apply only to the
product/system, which was tested. Other similar equipment will not necessarily produce the
same results due to production tolerance and measurement uncertainties.
Approved by: Reviewed by:
Sb. Lu Gundam Lin
Sr. Engineer Sr. Engineer
Report No.:T111221S01-D
Page 5 / 25
This report shall not be reproduced except in full, without the written approval of Compliance Certification Services.
2. EUT DESCRIPTION
Product Name IP Cam
Model Number B7210
Identify Number T111221S01
Received Date December 21, 2011
Power Rating 12Vdc
Test Voltage 120Vac, 60Hz
DC Power Cable Type Non-shielded cable, 1.5m (Non-detachable)
I/O Port Power Port × 1, Video Out Port × 1, RJ-45 Port × 1, Micro SD
Port × 1, DI/DO Port × 2
Power Adapter :
No. Manufacturer Model No. Power Input Power Output
1 DVE DSA-20CA-12
120150 100-240Vac, 50/60Hz,
0.8A 12Vdc, 1.5A
Remark : For more details, please refer to the User’s manual of the EUT.
3. DESCRIPTION OF TEST MODES
1. The following test modes were scanned during the preliminary test:
No. Pre-Test Mode
1 Normal Operating / Power Adapter
2 Normal Operating / PoE Mode
2. After the preliminary scan, the following test mode was found to produce the highest
emission level.
Final Test Mode
Normal Operating / Power Adapter
Radiated Emission Normal Operating / PoE Mode
Emission
Conducted Emission Normal Operating / Power Adapter
Remark : Then, the above highest emission mode of the configuration of the EUT and cable was
chosen for all final test items.
Report No.:T111221S01-D
Page 6 / 25
This report shall not be reproduced except in full, without the written approval of Compliance Certification Services.
4. TEST METHODOLOGY
The tests documented in this report were performed in accordance with ANSI C63.4:2003
and FCC CFR 47 Part 15 Subpart B, IC ICES-003 Issue 4.
5. FACILITIES AND ACCREDITATION
5.1 FACILITIES
All measurement facilities used to collect the measurement data are located at
NO. 989-1 Wen Shan Rd., Shang Shan Village,
Qionglin Shiang Hsinchu County 30741, Taiwan, R.O.C
The sites are constructed in conformance with the requirements of ANSI C63.4:2003 and
CISPR 22. All receiving equipment conforms to CISPR 16-1-1, CISPR 16-1-2, CISPR
16-1-3, CISPR 16-1-4, CISPR 16-1-5.
5.2 ACCREDITATIONS
Our laboratories are accredited and approved by the following approval agencies
according to ISO/IEC 17025.
Taiwan TAF
The measuring facility of laboratories has been authorized or registered by the following
approval agencies.
Canada INDUSTRY CANADA
Japan VCCI
Taiwan BSMI
USA FCC MRA
Copies of granted accreditation certificates are available for downloading from our web
site, http:///www.ccsrf.com
Report No.:T111221S01-D
Page 7 / 25
This report shall not be reproduced except in full, without the written approval of Compliance Certification Services.
5.3 MEASUREMENT UNCERTAINTY
The following table is for the measurement uncertainty, which is calculated as per the
document CISPR 16-4-2.
PARAMETER UNCERTAINTY
Open Area Test Site (OATS No.3) /
Radiated Emission, 30 to 1000 MHz +/- 3.7199
Semi Anechoic Chamber (966 Chamber_B) /
Radiated Emission, 30 to 1000 MHz +/- 3.5189
Semi Anechoic Chamber (966 Chamber_B) /
Radiated Emission, 1 to 18GHz +/- 2.5164
Semi Anechoic Chamber (966 Chamber_B) /
Radiated Emission, 18 to 26 GHz +/- 2.4967
Semi Anechoic Chamber (966 Chamber_B) /
Radiated Emission, 26 to 40 GHz +/- 2.7655
Conducted Emission (Mains Terminals),
9kHz to 30MHz +/- 1.5923
This uncertainty represents an expanded uncertainty expressed at approximately the
95% confidence level using a coverage factor of k=2.
Consistent with industry standard (e.g. CISPR 22: 2006, clause 11, Measurement
Uncertainty) determining compliance with the limits shall be base on the results of the
compliance measurement. Consequently the measure emissions being less than the
maximum allowed emission result in this be a compliant test or passing test.
The acceptable measurement uncertainty value without requiring revision of the
compliance statement is base on conducted and radiated emissions being less than
UCISPR which is 3.6dB and 5.2dB respectively. CCS values (called ULab in CISPR 16-4-2)
is less than UCISPR as shown in the table above. Therefore, MU need not be considered
for compliance.
Report No.:T111221S01-D
Page 8 / 25
This report shall not be reproduced except in full, without the written approval of Compliance Certification Services.
6. SETUP OF EQUIPMENT UNDER TEST
SUPPORT EQUIPMENT
No. Product Manufacturer Model No. Serial No. FCC ID
1 Notebook PC HP ProBook 4421s CNF03242PM -----
2 LCD Monitor DELL 2407WFPb
CN-0FC255-46633-
6CP-06JS -----
3 LCD Monitor ViewSonic VS10563-1M PQ3053205218 DoC
4 8-poer fast
Ethernet PoE
Switch Air Live POE-FSH804 POEF80411700328 -----
5 Micro SD Card SanDisk 2GB ----- -----
No. Signal Cable Description
1 Non-shielded RJ45 cable, 10m × 1
2 Non-shielded Video cable, 3m × 1
SETUP DIAGRAM FOR TESTS
EUT & peripherals setup diagram is shown in appendix setup photos.
EUT OPERATING CONDITION
All the equipment/cables were placed in the worst-case configuration to maximize the
emission during the test. Grounding was established in accordance with the manufacturer’s
requirements and conditions for the intended use.
Normal Operating
Power Adapter:
1. Setup whole system for test as shown on diagram
2. Notebook PC ping 192.168.1.149 to EUT
3. Video output to LCD MONITOR.
4. All of the functions are under run.
5. Start test.
PoE Mode:
1. Remove AC power adapter from EUT.
2. RJ-45 cable linking to PoE ethernet switch.
3. Notebook PC ping 192.168.1.149 to EUT with PoE ethernet switch.
4. Video output to LCD monitor.
5. All of the functions are under run.
6. Start test.
Report No.:T111221S01-D
Page 9 / 25
This report shall not be reproduced except in full, without the written approval of Compliance Certification Services.
7. EMISSION TEST
7.1 RADIATED EMISSION
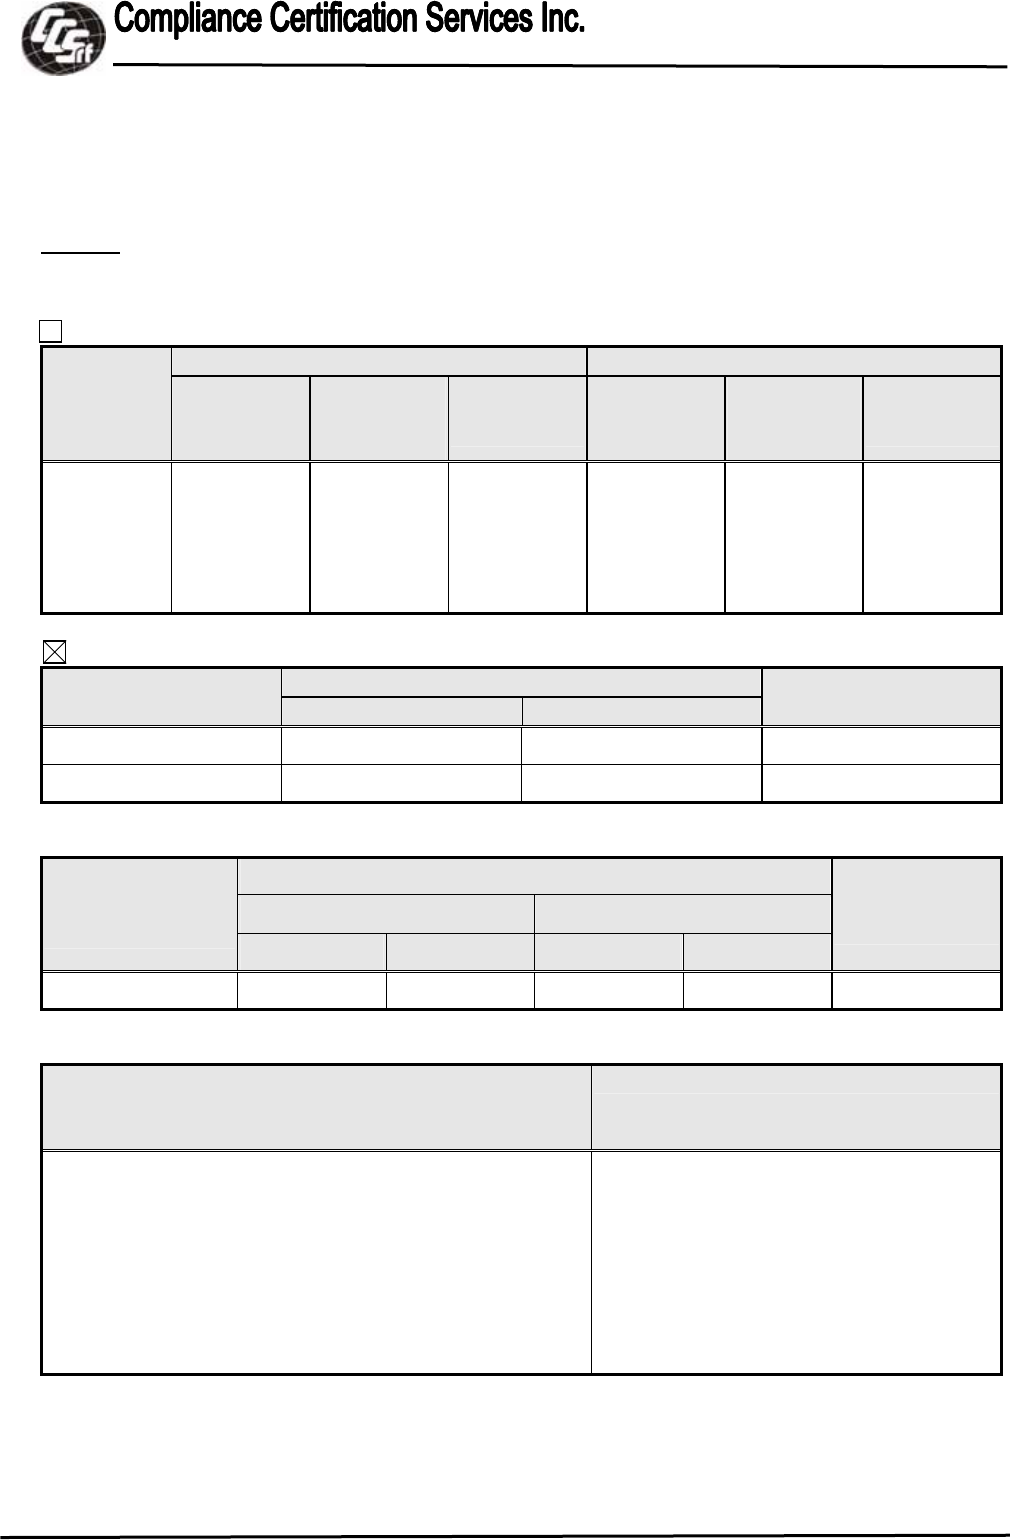
LIMITS
(1) For Frequency Below 1GHz
47 CFR Part 15 Subpart B Section 15.109 (a) (b)
Class A Class B
Frequency
(MHz) Field
Strength
(µV/m)
Field
Strength
(dBµV/m)
Distance
(meters)
Field
Strength
(µV/m)
Field
Strength
(dBµV/m)
Distance
(meters)
30 - 88 90 39.1 10 100 40.0 3
88 - 216 150 43.5 10 150 43.5 3
216 - 960 210 46.4 10 200 46.0 3
Above 960 300 49.5 10 500 54.0 3
CISPR 22 (According to 47 CFR Part 15 Subpart B Section 15.109 (g))
Field Strengths (dBµV/m)
Frequency
(MHz) Class A Class B Distance
(meters)
30 - 230 40 30 10
230 - 1000 47 37 10
(2) For Frequency Above 1GHz (According to 47 CFR Part 15 Subpart B Section 15.109)
Field Strength (dBµV/m)
Class A Class B
Frequency
(GHz) Peak Average Peak Average
Distance
(meters)
Above 1GHz 80 60 74 54 3
(3) Frequency Range of Radiated Measurement (For unintentional radiators)
Highest frequency generated or Upper
frequency of measurement used in the device
or on which the device operates or tunes (MHz) Range (MHz)
Below 1.705 30
1.705 – 108 1000
108 – 500 2000
500 – 1000 5000
Above 1000 5th harmonic of the highest frequency
or 40GHz, whichever is lower
Report No.:T111221S01-D
Page 10 / 25
This report shall not be reproduced except in full, without the written approval of Compliance Certification Services.
TEST EQUIPMENT
Radiated Emission below 1GHz / OATS3
Name of Equipment Manufacturer Model Serial Number Calibration
Due
Bi-log Antenna SCHAFFER CBL6112B 2696 10/03/2012
EMI Test Receiver ROHDE & SCHWARZ ESCI 101131 01/13/2012
Remark: Each piece of equipment is scheduled for calibration once a year.
Radiated Emission above 1GHz / 966Chamber_B
Name of Equipment Manufacture Model Serial Number Calibration
Due
Spectrum Analyzer Agilent E4446A MY43360132 06/19/2012
EMI Receiver ROHDE & SCHWARZ ESCS 30 826547/004 10/27/2012
Broadband Hybrid
Bi-Log Antenna Sunol Sciences JB1 A100209-4 10/05/2012
Double-Ridged
Waveguide Horn ETS-LINDGREN 3117 00078733 12/06/2012
Pre-Amplifier Agilent 8447D
2944A10052 07/19/2012
Pre-Amplifier Agilent 8449B 3008A01916 09/18/2012
Notch Filters Band
Reject Micro-Tronics BRM05702-01 026 N.C.R
Remark: 1. Each piece of equipment is scheduled for calibration once a year.
2. N.C.R = No Calibration Request.
Report No.:T111221S01-D
Page 11 / 25
This report shall not be reproduced except in full, without the written approval of Compliance Certification Services.
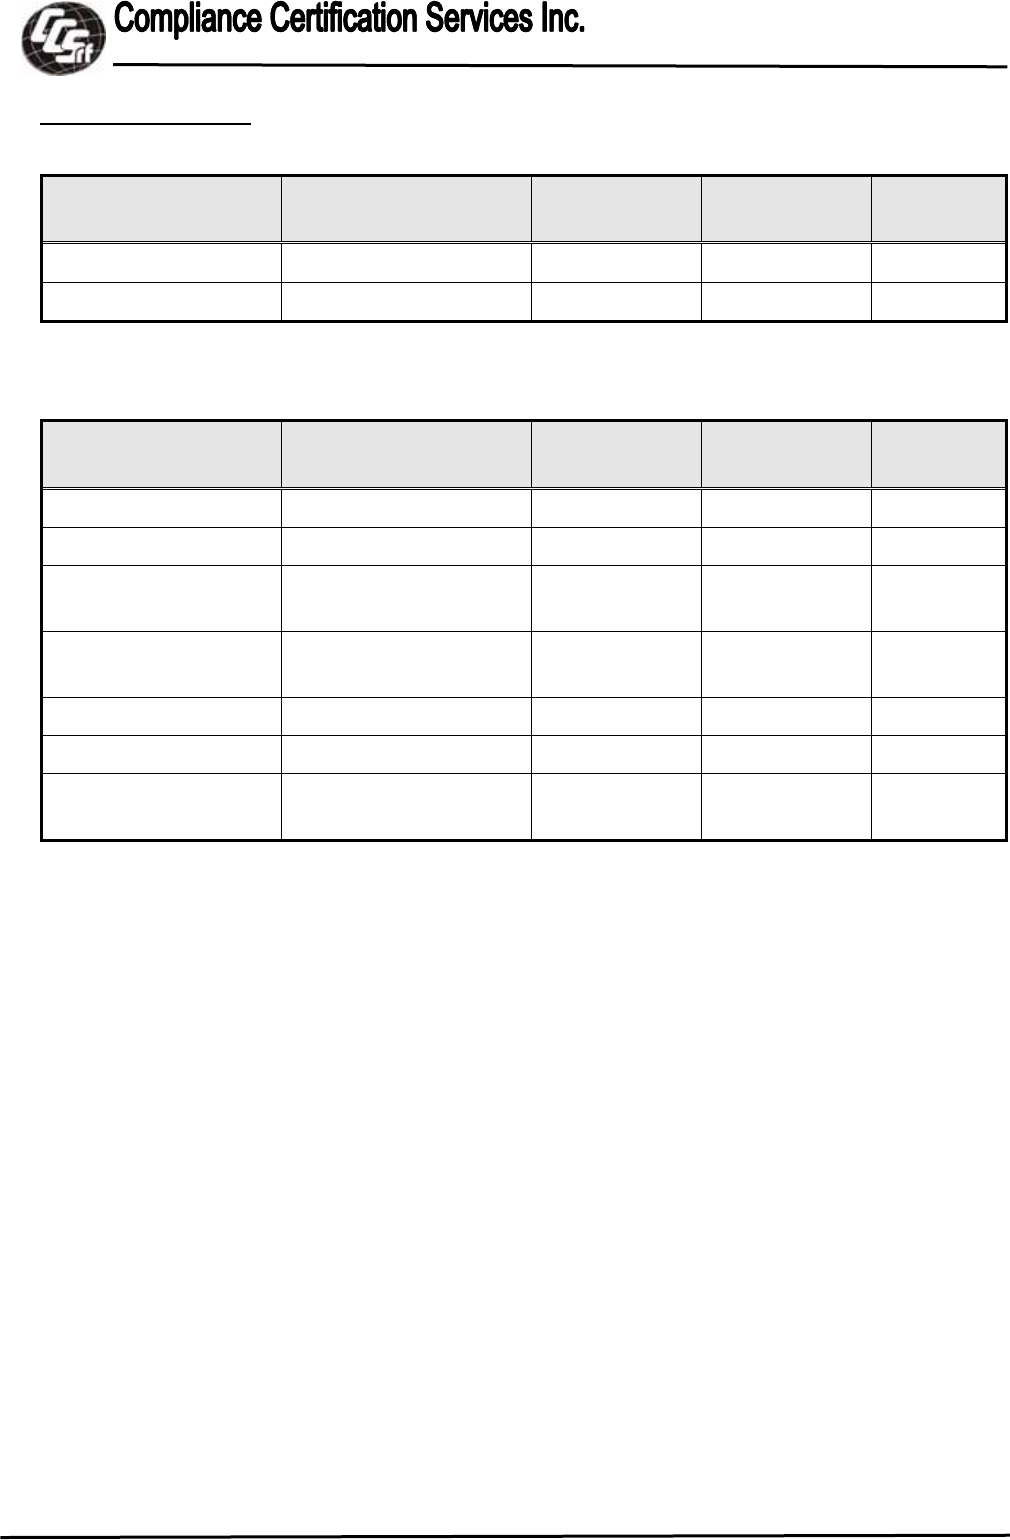
TEST SETUP
The diagram below shows the test setup that is utilized to make the measurements for
emission from below 1GHz.
EMI Test
Receiver
10m
1~4m
1m
Turntable
EUT
0.8m
Antenna
Tower
Reference ground plane
Bi-log
Antenna
Coaxial Cable
The diagram below shows the test setup that is utilized to make the measurements for
emission above 1GHz.
Spectrum
Analyzer
Horn
Antenna
3m
1~4m
1m
Turntable
EUT
0.8m
Antenna
Tower
Pre-amp
Reference ground plane
Coaxial Cable

Report No.:T111221S01-D
Page 12 / 25
This report shall not be reproduced except in full, without the written approval of Compliance Certification Services.
TEST PROCEDURE
The basic test procedure was in accordance with ANSI C63.4:2003.
The devices under test were placed on a rotatable table top 0.8 meter above ground. The
table was rotated 360 degrees to determine the position of the highest radiation. EUT is
set 3 or 10m meters from the interference receiving antenna which is mounted on the top
of a variable height mast. The antenna height is varied between one meter and four
meters above ground to find the maximum value of the field strength both horizontal
polarization and vertical polarization of the antenna are set to make the measurement.
Note:
1. The bandwidth setting on the E.M.I. meter (EMI TEST RECEIVER) is 120 KHz. The levels are
Quasi-Peak value readings. The frequency spectrum from 30MHz to 1000MHz was
investigated.
2. The resolution bandwidth and video bandwidth of test receiver/spectrum analyzer is 1 MHz for
Peak detection and frequency above 1GHz.
3. The resolution bandwidth of test receiver/spectrum analyzer is 1 MHz and the video bandwidth
is 10 Hz for Average detection (AV) at frequency above 1GHz.
Report No.:T111221S01-D
Page 13 / 25
This report shall not be reproduced except in full, without the written approval of Compliance Certification Services.
TEST RESULTS
Below 1 GHz
Product Name IP Cam Test By Tom Deng
Test Model B7210 Test Date 2011/12/27
Test Mode Normal Operating /
Power Adapter Temp. & Humidity 17°C, 65%
OATS3 at 10Meter / Horizontal
Frequency
(MHz)
Antenna
Factor
(dB/m)
Cable
Loss
(dB)
Meter
Reading
(dBµV)
Limits
(dBµV/m)
Emission
Level
(dBµV/m)
Margin
Limit
(dB)
Azimuth
(°) Height
(cm) Remark
125.11 11.82 2.08 2.95 40.00 16.85 -23.15 130 400 QP
160.03 9.94 2.50 5.12 40.00 17.56 -22.44 146 150 QP
250.65 12.77 3.45 1.41 47.00 17.63 -29.37 139 150 QP
335.48 14.09 4.11 6.14 47.00 24.34 -22.66 290 250 QP
398.26 15.64 4.68 11.78 47.00 32.10 -14.90 223 200 QP
975.36 21.41 9.20 1.32 47.00 31.93 -15.07 84 200 QP
OATS3 at 10Meter / Vertical
Frequency
(MHz)
Antenna
Factor
(dB/m)
Cable
Loss
(dB)
Meter
Reading
(dBµV)
Limits
(dBµV/m)
Emission
Level
(dBµV/m)
Margin
Limit
(dB)
Azimuth
(°) Height
(cm) Remark
32.81 15.85 0.96 10.16 40.00 26.97 -13.03 30 100 QP
125.11 11.82 2.08 8.90 40.00 22.80 -17.20 360 100 QP
160.03 9.94 2.50 12.59 40.00 25.03 -14.97 188 100 QP
398.26 15.64 4.68 12.43 47.00 32.75 -14.25 107 100 QP
875.56 20.19 8.60 2.25 47.00 31.04 -15.96 34 200 QP
975.36 21.41 9.20 1.71 47.00 32.32 -14.68 67 150 QP
Remark:
1. Quasi-peak test would be performed if the peak result were greater than the quasi-peak limit.
2. Data of measurement within this frequency range shown " --- " in the table above means the reading of
emissions are attenuated more than 20dB below the permissible limits or the field strength is too small
to be measured.
3. Emission Level (dBµV/m) = Antenna Factor (dB/m) + Cable Loss (dB) + Meter Reading (dBµV)
4. Margin (dB) = Emission Level (dBuV/m) - Quasi-peak limit (dBuV/m)
Report No.:T111221S01-D
Page 14 / 25
This report shall not be reproduced except in full, without the written approval of Compliance Certification Services.
Product Name IP Cam Test By Tom Deng
Test Model B7210 Test Date 2011/12/27
Test Mode Normal Operating /
PoE Mode Temp. & Humidity 17°C, 65%
OATS3 at 10Meter / Horizontal
Frequency
(MHz)
Antenna
Factor
(dB/m)
Cable
Loss
(dB)
Meter
Reading
(dBµV)
Limits
(dBµV/m)
Emission
Level
(dBµV/m)
Margin
Limit
(dB)
Azimuth
(°) Height
(cm) Remark
75.31 6.93 1.51 7.40 40.00 15.83 -24.17 130 300 QP
125.11 11.82 2.08 8.56 40.00 22.46 -17.54 146 100 QP
151.49 10.69 2.41 15.38 40.00 28.49 -11.51 139 150 QP
398.26 15.64 4.68 19.56 47.00 39.88 -7.12 290 200 QP
485.30 17.28 5.48 2.21 47.00 24.97 -22.03 223 100 QP
534.03 18.24 5.94 1.18 47.00 25.36 -21.64 84 200 QP
OATS3 at 10Meter / Vertical
Frequency
(MHz)
Antenna
Factor
(dB/m)
Cable
Loss
(dB)
Meter
Reading
(dBµV)
Limits
(dBµV/m)
Emission
Level
(dBµV/m)
Margin
Limit
(dB)
Azimuth
(°) Height
(cm) Remark
39.25 14.48 1.09 13.68 40.00 29.24 -10.76 236 100 QP
75.19 6.92 1.50 26.85 40.00 35.27 -4.73 160 100 QP
125.11 11.82 2.08 18.70 40.00 32.60 -7.40 32 100 QP
150.81 10.75 2.41 20.63 40.00 33.79 -6.21 68 100 QP
398.26 15.64 4.68 18.44 47.00 38.76 -8.24 65 150 QP
521.28 17.96 5.81 3.38 47.00 27.15 -19.85 73 150 QP
Remark:
1. Quasi-peak test would be performed if the peak result were greater than the quasi-peak limit.
2. Data of measurement within this frequency range shown " --- " in the table above means the reading of
emissions are attenuated more than 20dB below the permissible limits or the field strength is too small
to be measured.
3. Emission Level (dBµV/m) = Antenna Factor (dB/m) + Cable Loss (dB) + Meter Reading (dBµV)
4. Margin (dB) = Emission Level (dBuV/m) - Quasi-peak limit (dBuV/m)
Report No.:T111221S01-D
Page 15 / 25
This report shall not be reproduced except in full, without the written approval of Compliance Certification Services.
Above 1 GHz
Product Name IP Cam Test By Tom Deng
Test Model B7210 Test Date 2011/12/26
Test Mode Normal Operating /
Power Adapter Temp. & Humidity 17°C, 61%
966 Chamber_B at 3Meter / Horizontal
Frequency
(MHz)
Reading-
PK
(dBuV)
Reading-
AV
(dBuV)
Correction
Factor
(dB/m)
Result-PK
(dBuV/m)
Result-AV
(dBuV/m)
Limit-PK
(dBuV/m)
Limit-AV
(dBuV/m)
Margin
(dB)
Azimuth
(°)
Height
(cm) Remark
1070.00 49.45 --- -3.65 45.79 --- 80.00 60.00 -14.21 139.80 100.00 Peak
1175.00 48.20 --- -3.32 44.89 --- 80.00 60.00 -15.11 25.00 100.00 Peak
1600.00 45.09 --- -1.37 43.72 --- 80.00 60.00 -16.28 11.20 200.00 Peak
2645.00 43.27 --- 4.31 47.58 --- 80.00 60.00 -12.42 342.00 200.00 Peak
4205.00 40.94 --- 7.69 48.63 --- 80.00 60.00 -11.37 153.60 200.00 Peak
4835.00 40.95 --- 9.51 50.46 --- 80.00 60.00 -9.54 342.00 100.00 Peak
966 Chamber_B at 3Meter / Vertical
Frequency
(MHz)
Reading-
PK
(dBuV)
Reading-
AV
(dBuV)
Correction
Factor
(dB/m)
Result-PK
(dBuV/m)
Result-AV
(dBuV/m)
Limit-PK
(dBuV/m)
Limit-AV
(dBuV/m)
Margin
(dB)
Azimuth
(°)
Height
(cm) Remark
1050.00 49.88 --- -3.72 46.16 --- 80.00 60.00 -13.84 222.40 100.00 Peak
1175.00 48.07 --- -3.32 44.75 --- 80.00 60.00 -15.25 206.30 100.00 Peak
1600.00 45.01 --- -1.37 43.64 --- 80.00 60.00 -16.36 315.90 100.00 Peak
2760.00 42.78 --- 4.67 47.45 --- 80.00 60.00 -12.55 263.80 200.00 Peak
3075.00 42.65 --- 5.49 48.14 --- 80.00 60.00 -11.86 206.10 200.00 Peak
5855.00 39.30 --- 11.50 50.80 --- 80.00 60.00 -9.20 263.10 100.00 Peak
Remark:
1. Average test would be performed if the peak result were greater than the average limit.
2. Data of measurement within this frequency range shown “ --- ” in the table above means the reading of emissions
are attenuated more than 20dB below the permissible limits or the field strength is too small to be measured.
3. Measurements above show only up to 6 maximum emissions noted, or would be lesser, with “ N/A ” remark, if no
specific emissions from the EUT are recorded (ie: margin>20dB from the applicable limit) and considered that's
already beyond the background noise floor.
4. Result = Reading + Correction Factor
Margin = Result – Limit
Remark Peak = Result(PK) – Limit(AV)
Remark AVG = Result(AV) – Limit(AV)
Report No.:T111221S01-D
Page 16 / 25
This report shall not be reproduced except in full, without the written approval of Compliance Certification Services.
Product Name IP Cam Test By Tom Deng
Test Model B7210 Test Date 2011/12/26
Test Mode Normal Operating /
PoE Mode Temp. & Humidity 17°C, 61%
966 Chamber_B at 3Meter / Horizontal
Frequency
(MHz)
Reading-
PK
(dBuV)
Reading-
AV
(dBuV)
Correction
Factor
(dB/m)
Result-PK
(dBuV/m)
Result-AV
(dBuV/m)
Limit-PK
(dBuV/m)
Limit-AV
(dBuV/m)
Margin
(dB)
Azimuth
(°)
Height
(cm) Remark
1060.00 49.30 --- -3.69 45.61 --- 80.00 60.00 -14.39 146.60 200.00 Peak
1175.00 46.56 --- -3.32 43.24 --- 80.00 60.00 -16.76 263.80 100.00 Peak
1875.00 44.32 --- 1.10 45.41 --- 80.00 60.00 -14.59 351.30 100.00 Peak
2240.00 43.62 --- 3.01 46.63 --- 80.00 60.00 -13.37 91.60 100.00 Peak
2970.00 42.47 --- 5.32 47.79 --- 80.00 60.00 -12.21 54.80 200.00 Peak
4130.00 41.54 --- 7.44 48.98 --- 80.00 60.00 -11.02 224.90 100.00 Peak
5960.00 40.41 --- 11.73 52.14 --- 80.00 60.00 -7.86 31.80 200.00 Peak
966 Chamber_B at 3Meter / Vertical
Frequency
(MHz)
Reading-
PK
(dBuV)
Reading-
AV
(dBuV)
Correction
Factor
(dB/m)
Result-PK
(dBuV/m)
Result-AV
(dBuV/m)
Limit-PK
(dBuV/m)
Limit-AV
(dBuV/m)
Margin
(dB)
Azimuth
(°)
Height
(cm) Remark
1060.00 52.18 --- -3.69 48.49 --- 80.00 60.00 -11.51 149.10 200.00 Peak
1175.00 46.93 --- -3.32 43.61 --- 80.00 60.00 -16.39 128.40 100.00 Peak
1600.00 45.82 --- -1.37 44.45 --- 80.00 60.00 -15.55 18.20 100.00 Peak
2145.00 43.51 --- 2.70 46.21 --- 80.00 60.00 -13.79 247.70 200.00 Peak
3130.00 42.60 --- 5.55 48.16 --- 80.00 60.00 -11.84 1.30 200.00 Peak
5550.00 40.30 --- 10.86 51.15 --- 80.00 60.00 -8.85 229.40 100.00 Peak
Remark:
1. Average test would be performed if the peak result were greater than the average limit.
2. Data of measurement within this frequency range shown “ --- ” in the table above means the reading of emissions
are attenuated more than 20dB below the permissible limits or the field strength is too small to be measured.
3. Measurements above show only up to 6 maximum emissions noted, or would be lesser, with “ N/A ” remark, if no
specific emissions from the EUT are recorded (ie: margin>20dB from the applicable limit) and considered that's
already beyond the background noise floor.
4. Result = Reading + Correction Factor
Margin = Result – Limit
Remark Peak = Result(PK) – Limit(AV)
Remark AVG = Result(AV) – Limit(AV)
Report No.:T111221S01-D
Page 17 / 25
This report shall not be reproduced except in full, without the written approval of Compliance Certification Services.
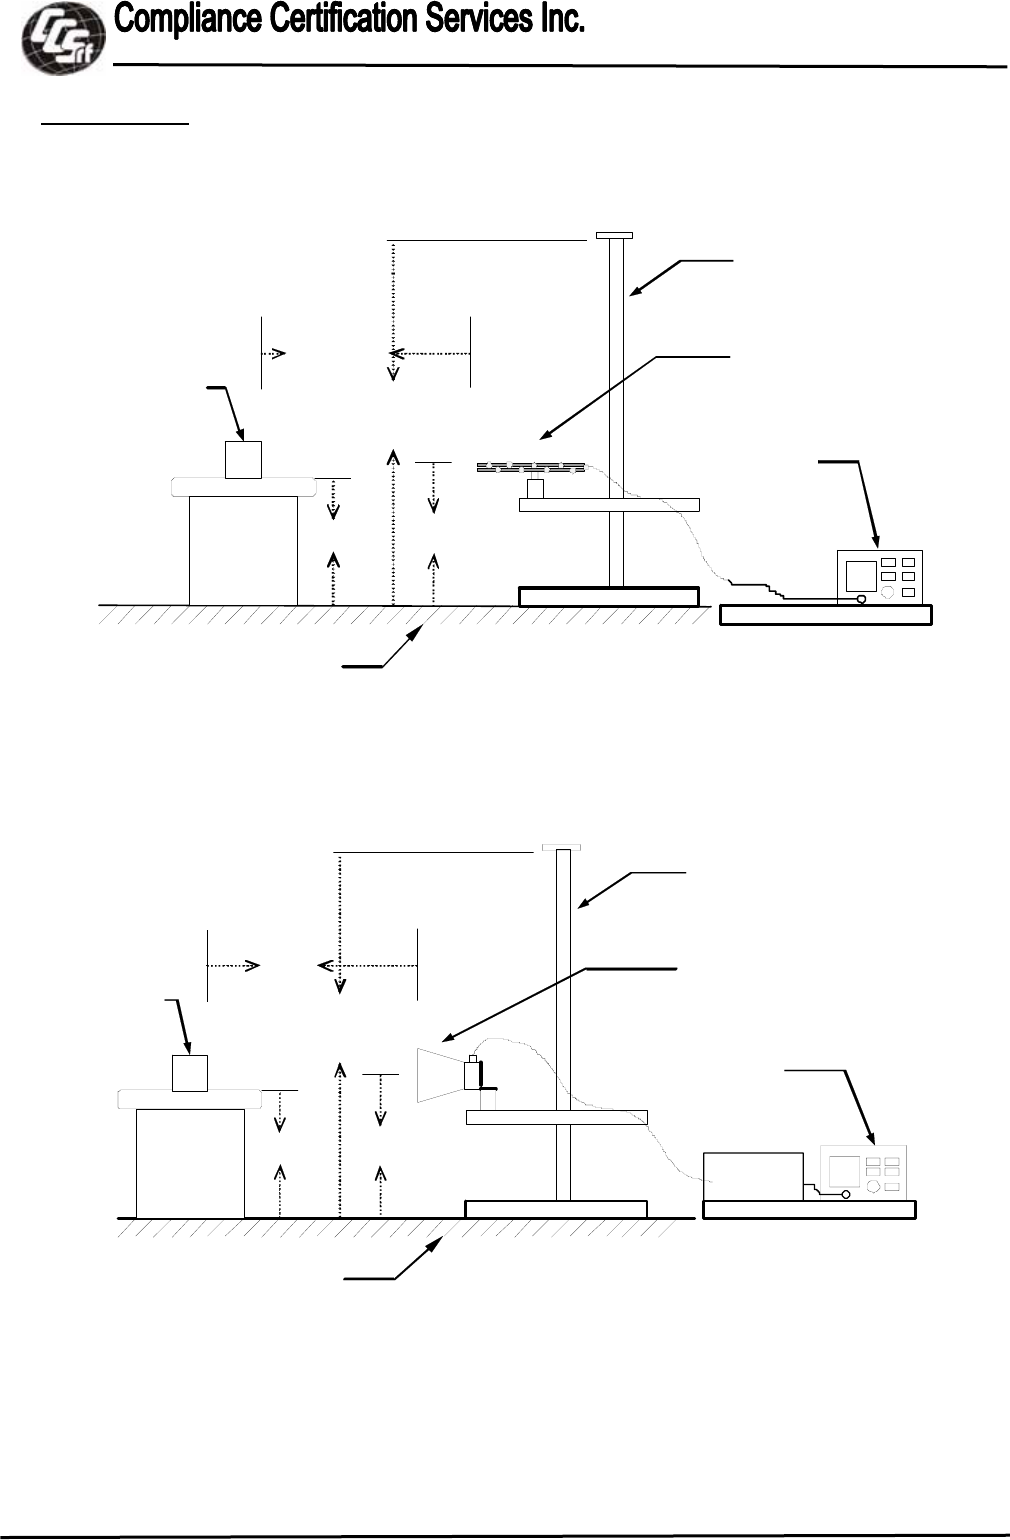
7.2 CONDUCTED EMISSION
LIMITS
Voltage Limits (dBµV)
Class A Class B
Frequency Range
(MHz) Quasi-peak Average Quasi-peak Average
0.15 - 0.50 79 66 66 - 56* 56 - 46*
0.50 - 5.00 73 60 56 46
5.00 - 30.0 73 60 60 50
Remark: (1) The limit decreases linearly with logarithm of the frequency in the range 0.15 MHz to
0.50 MHz.
(2) The lower limit shall apply at the transition frequency.
(3) * Decreasing linearly with the logarithm of the frequency.
TEST EQUIPMENT
Name of Equipment Manufacturer Model Serial Number Calibration
Due
L.I.S.N SCHWARZBECK
NSLK 8127 8127-465 08/09/2012
L.I.S.N SCHWARZBECK
NSLK 8127 8127-473 03/14/2012
EMI Receiver ROHDE & SCHWARZ ESCS 30 835418/008 10/20/2012
Pulse Limiter ROHDE & SCHWARZ ESH3-Z2 100117 09/14/2012
Remark: Each piece of equipment is scheduled for calibration once a year.
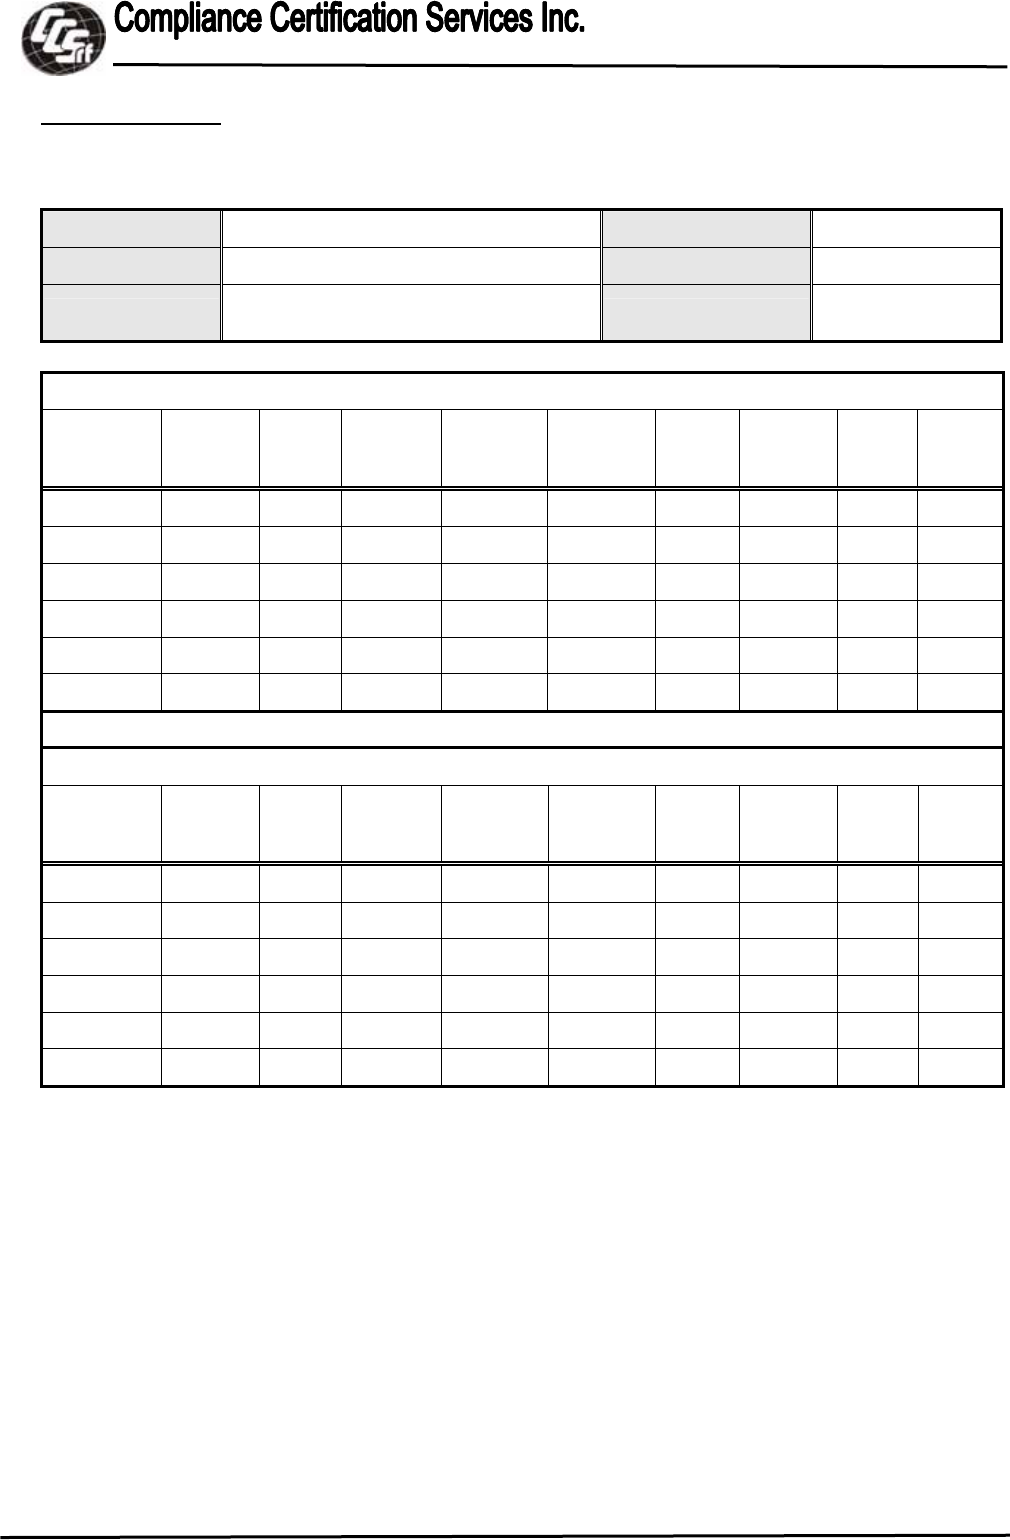
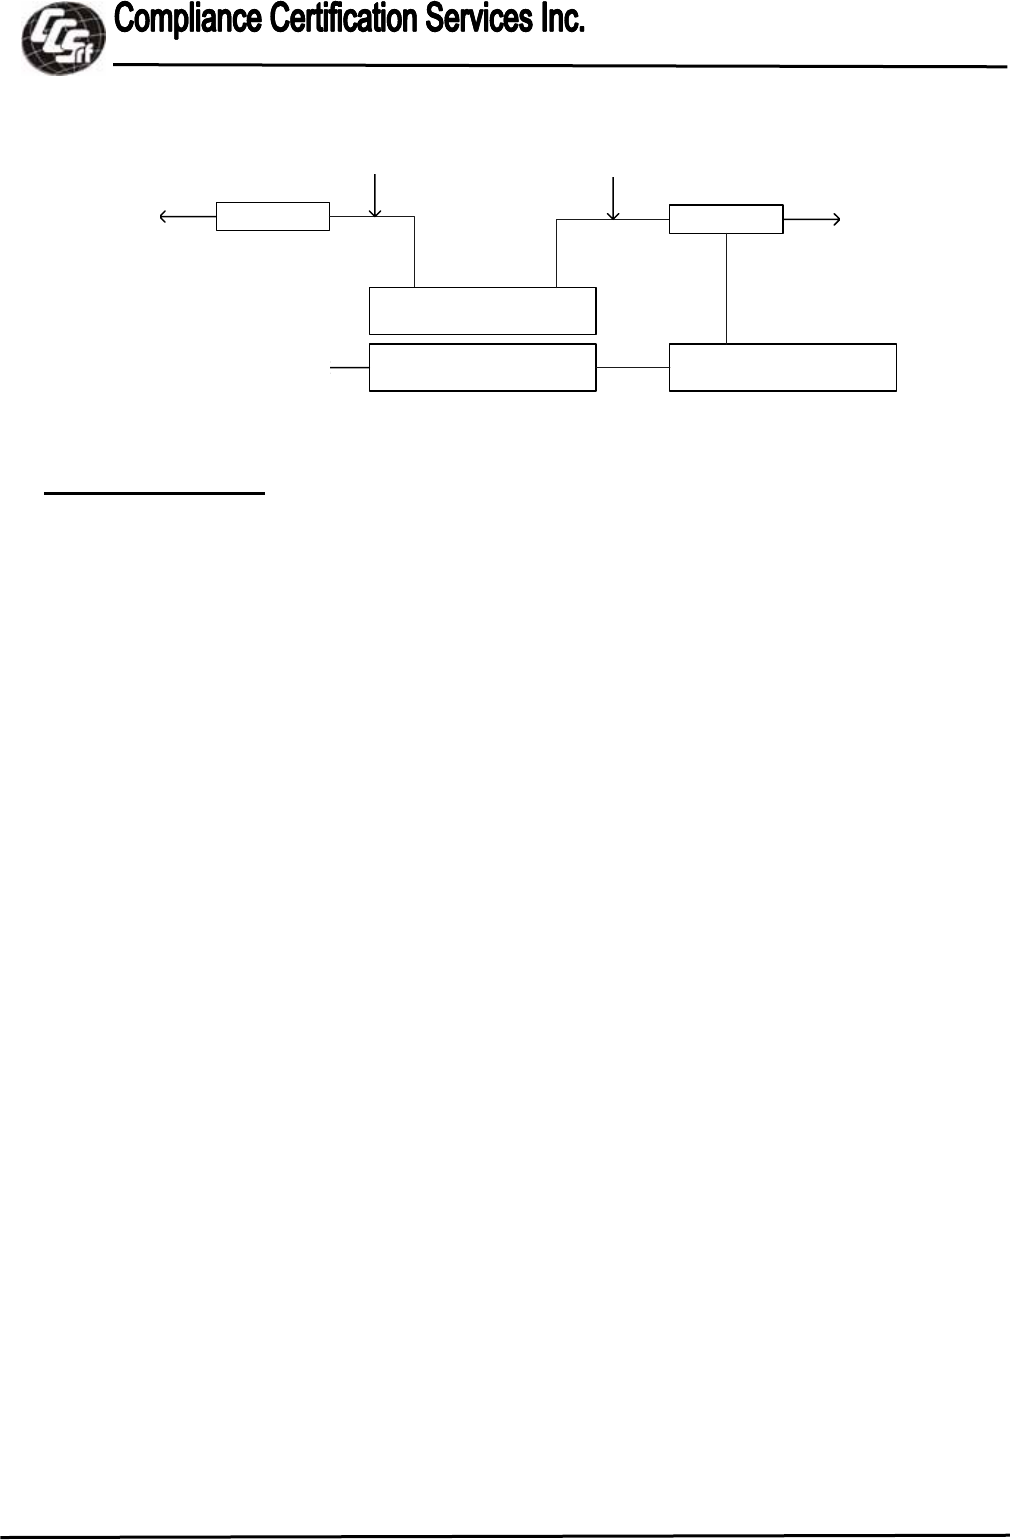
TEST SETUP
Report No.:T111221S01-D
Page 18 / 25
This report shall not be reproduced except in full, without the written approval of Compliance Certification Services.
L.I.S.N.
120VAC
/ 60Hz
EUT & Peripherals
Powerline of
Peripherals
L.I.S.N.
Powerline of
EUT
120VAC
/ 60Hz
EMI Test ReceiverIsolate Transformer
120VAC
/ 60Hz
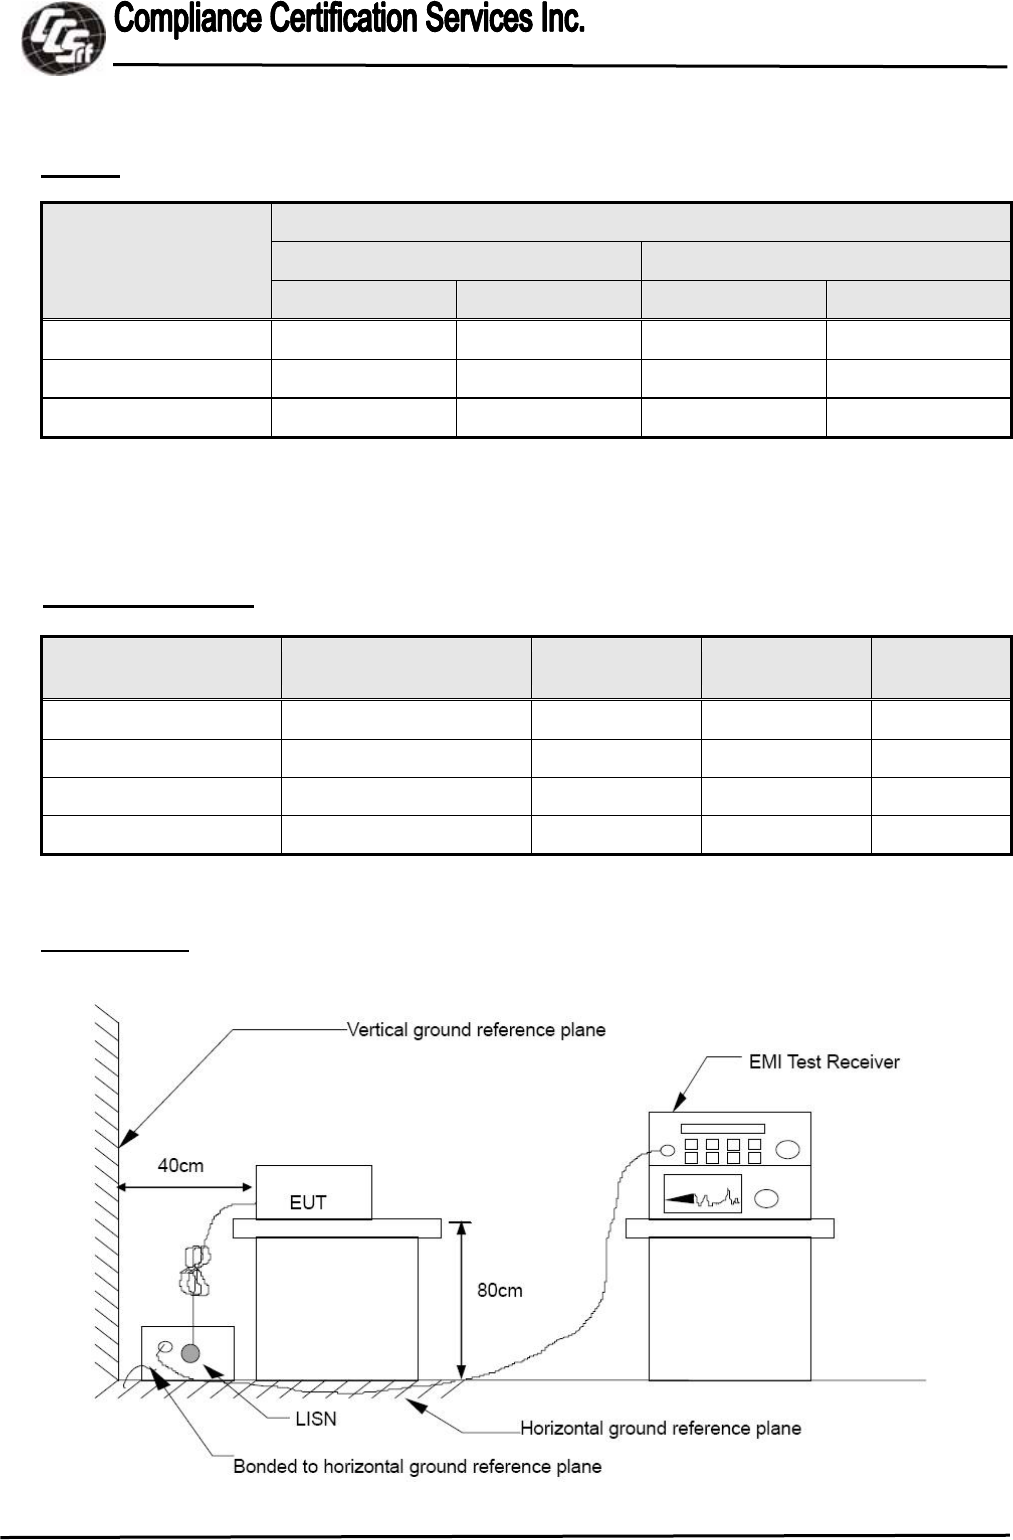
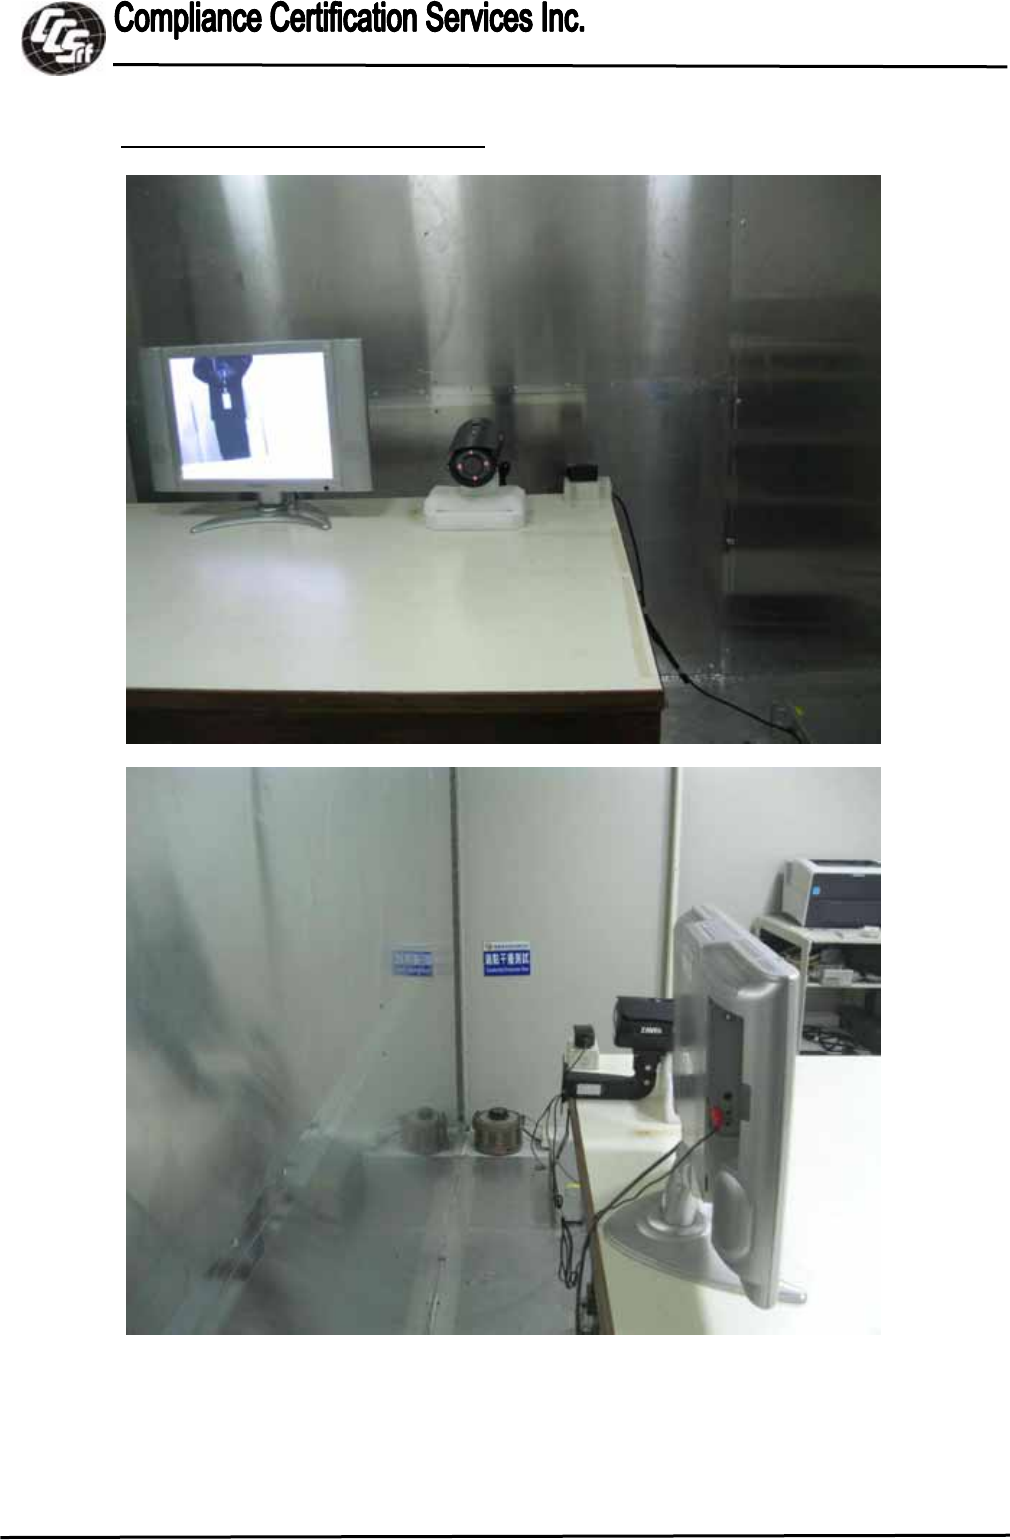
TEST PROCEDURE
The basic test procedure was in accordance with ANSI C63.4:2003.
The test procedure is performed in a 4m × 3m × 2.4m (L×W×H) shielded room.
The EUT along with its peripherals were placed on a 1.0m (W) × 1.5m (L) and 0.8m in
height wooden table and the EUT was adjusted to maintain a 0.4 meter space from a
vertical reference plane.
The EUT was connected to power mains through a line impedance stabilization network
(LISN) which provides 50 ohm coupling impedance for measuring instrument and the
chassis ground was bounded to the horizontal ground plane of shielded room. All
peripherals were connected to the second LISN and the chassis ground also bounded to
the horizontal ground plane of shielded room.
The EUT was located so that the distance between the boundary of the EUT and the
closest surface of the LISN is 0.8 m. Where a mains flexible cord was provided by the
manufacturer shall be 1 m long, or if in excess of 1 m, the excess cable was folded back
and forth as far as possible so as to form a bundle not exceeding 0.4 m in length.
Report No.:T111221S01-D
Page 19 / 25
This report shall not be reproduced except in full, without the written approval of Compliance Certification Services.
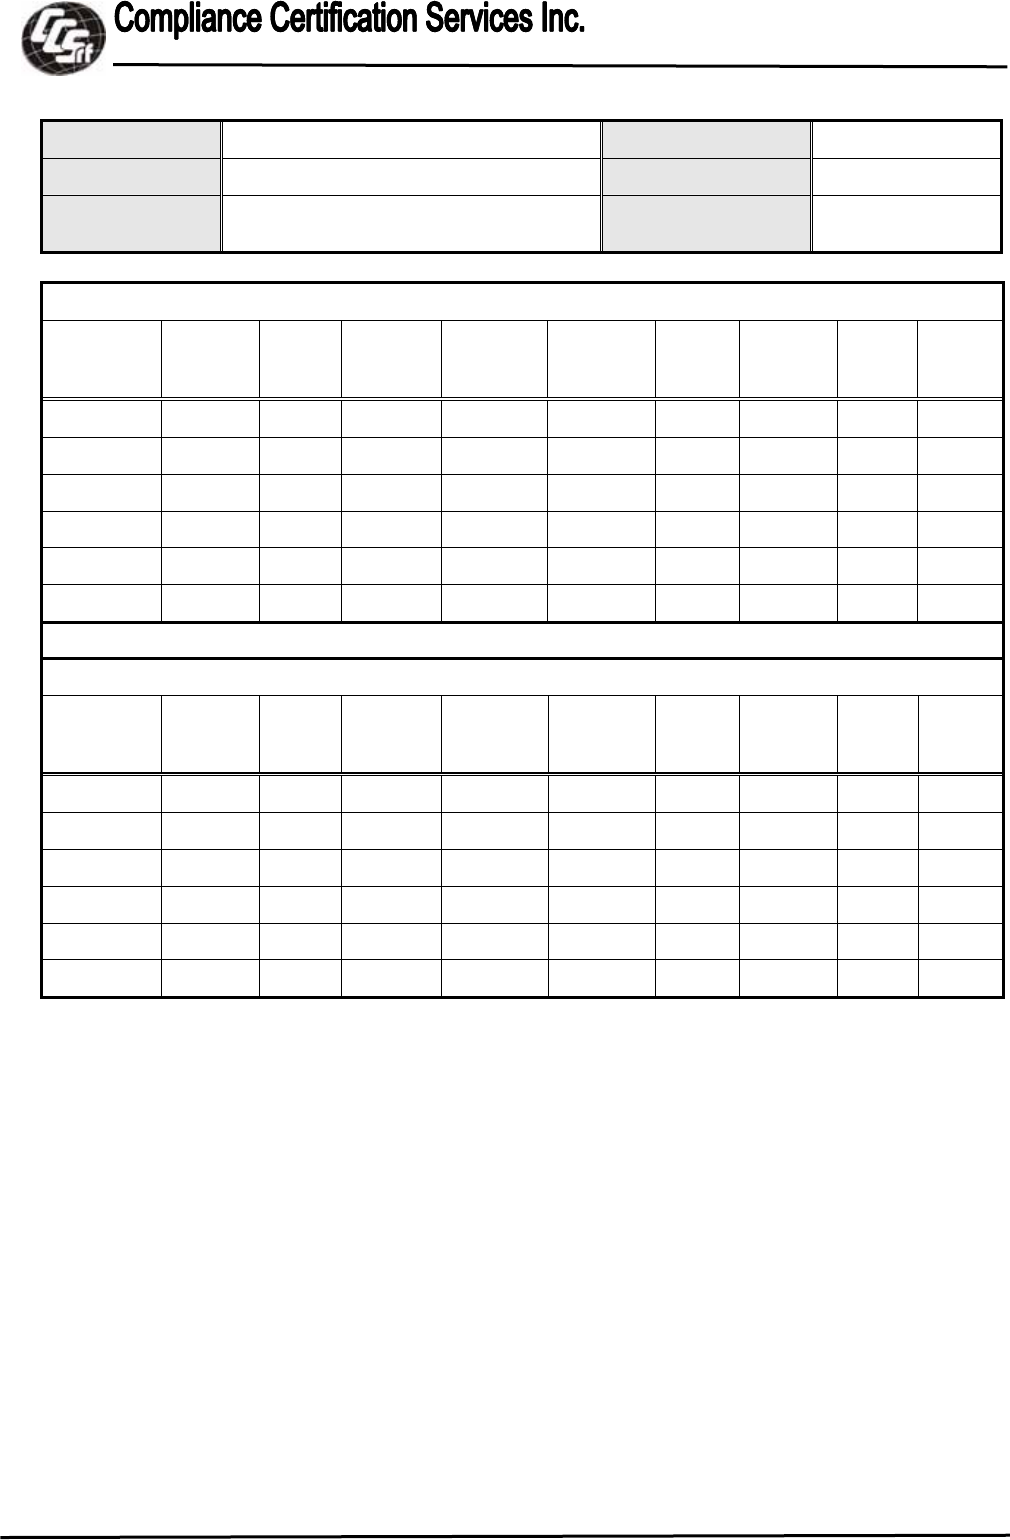
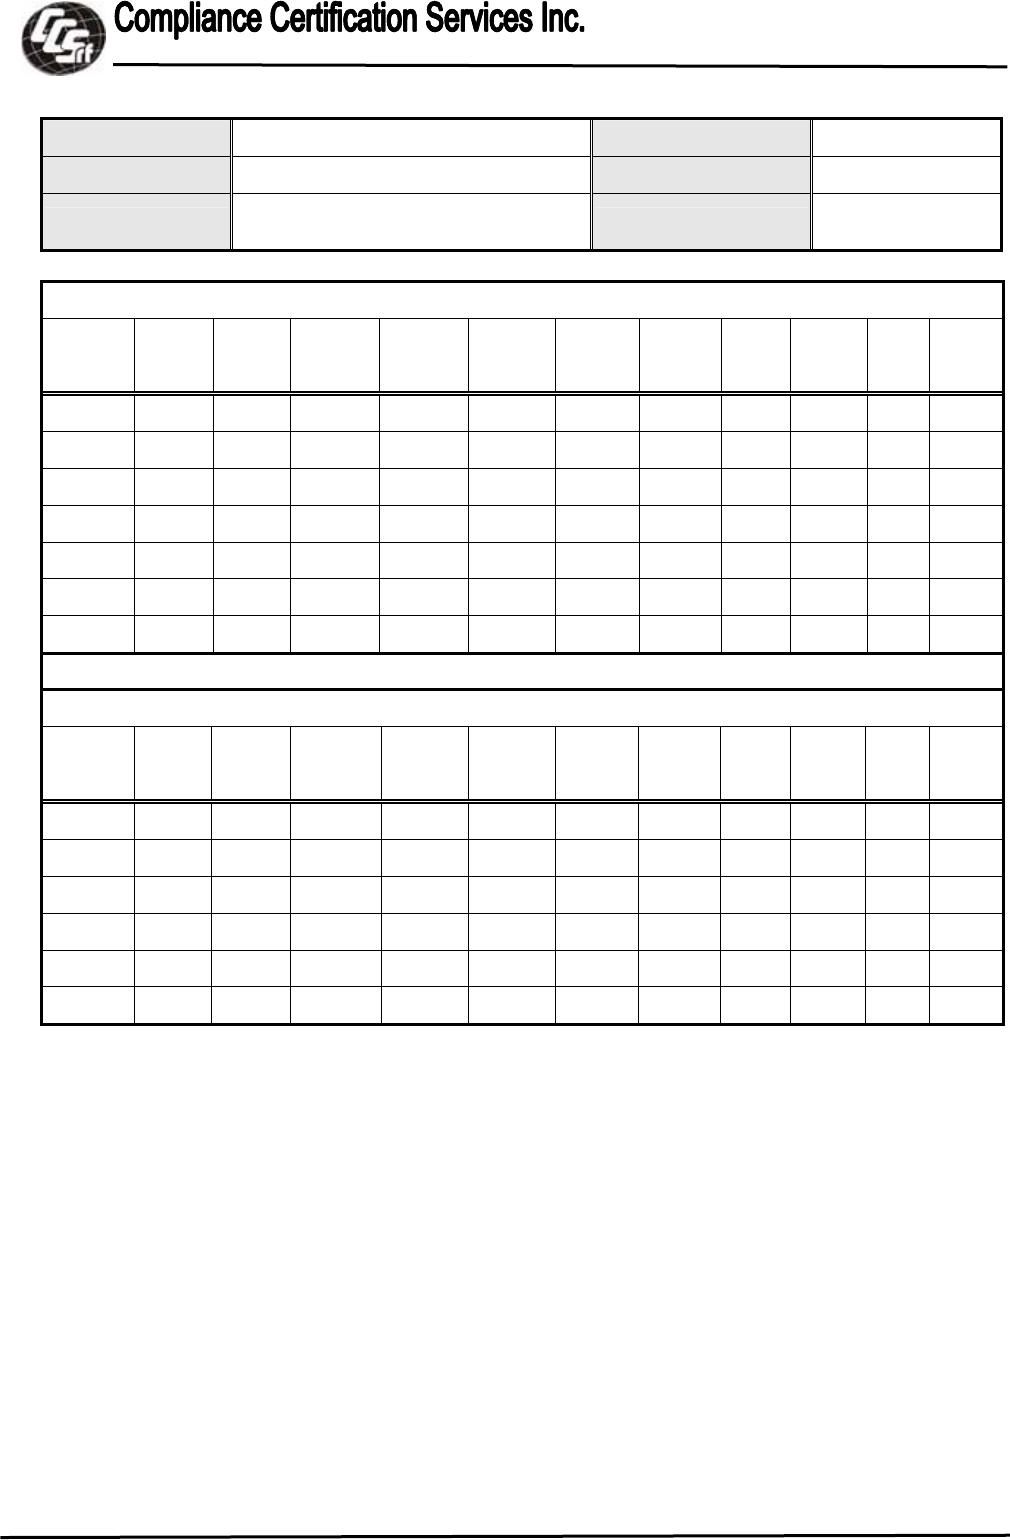
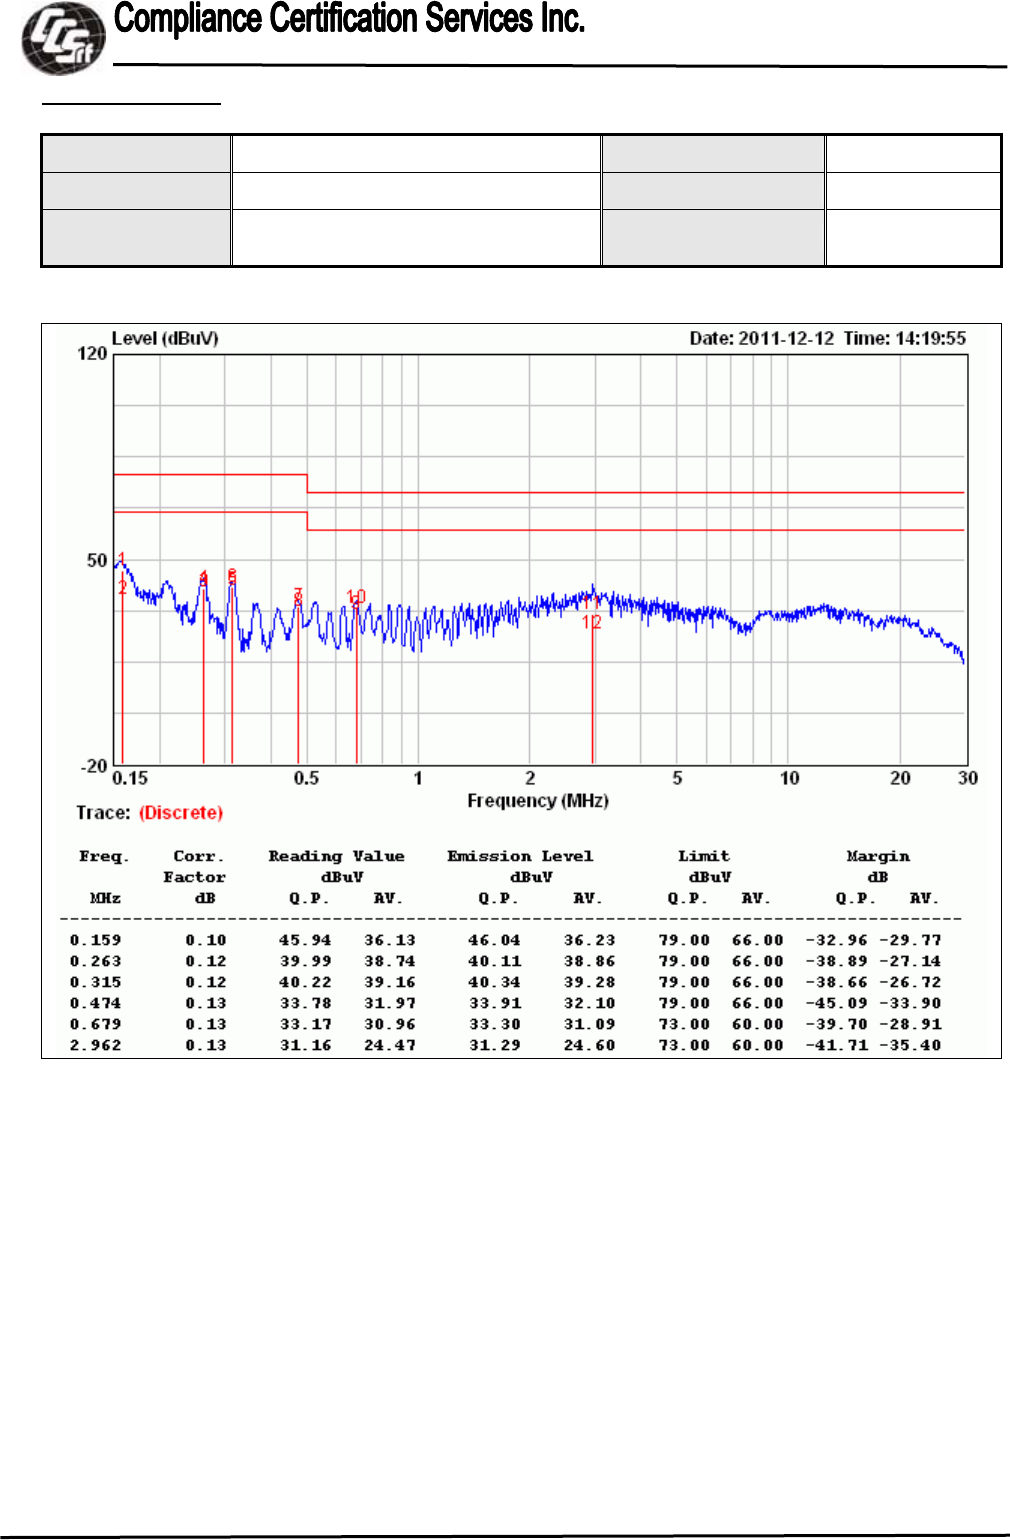
TEST RESULTS
Product Name IP Cam Test By Tom Deng
Test Model B7210 Test Date 2011/12/12
Test Mode Normal Operating /
Power Adapter Temp. & Humidity 24°C, 65%
LINE
Remark:
1. Correction Factor = Insertion loss + Cable loss
2. Emission level = Reading Value + Correction factor
3. Margin value = Emission level – Limit value
Report No.:T111221S01-D
Page 20 / 25
This report shall not be reproduced except in full, without the written approval of Compliance Certification Services.
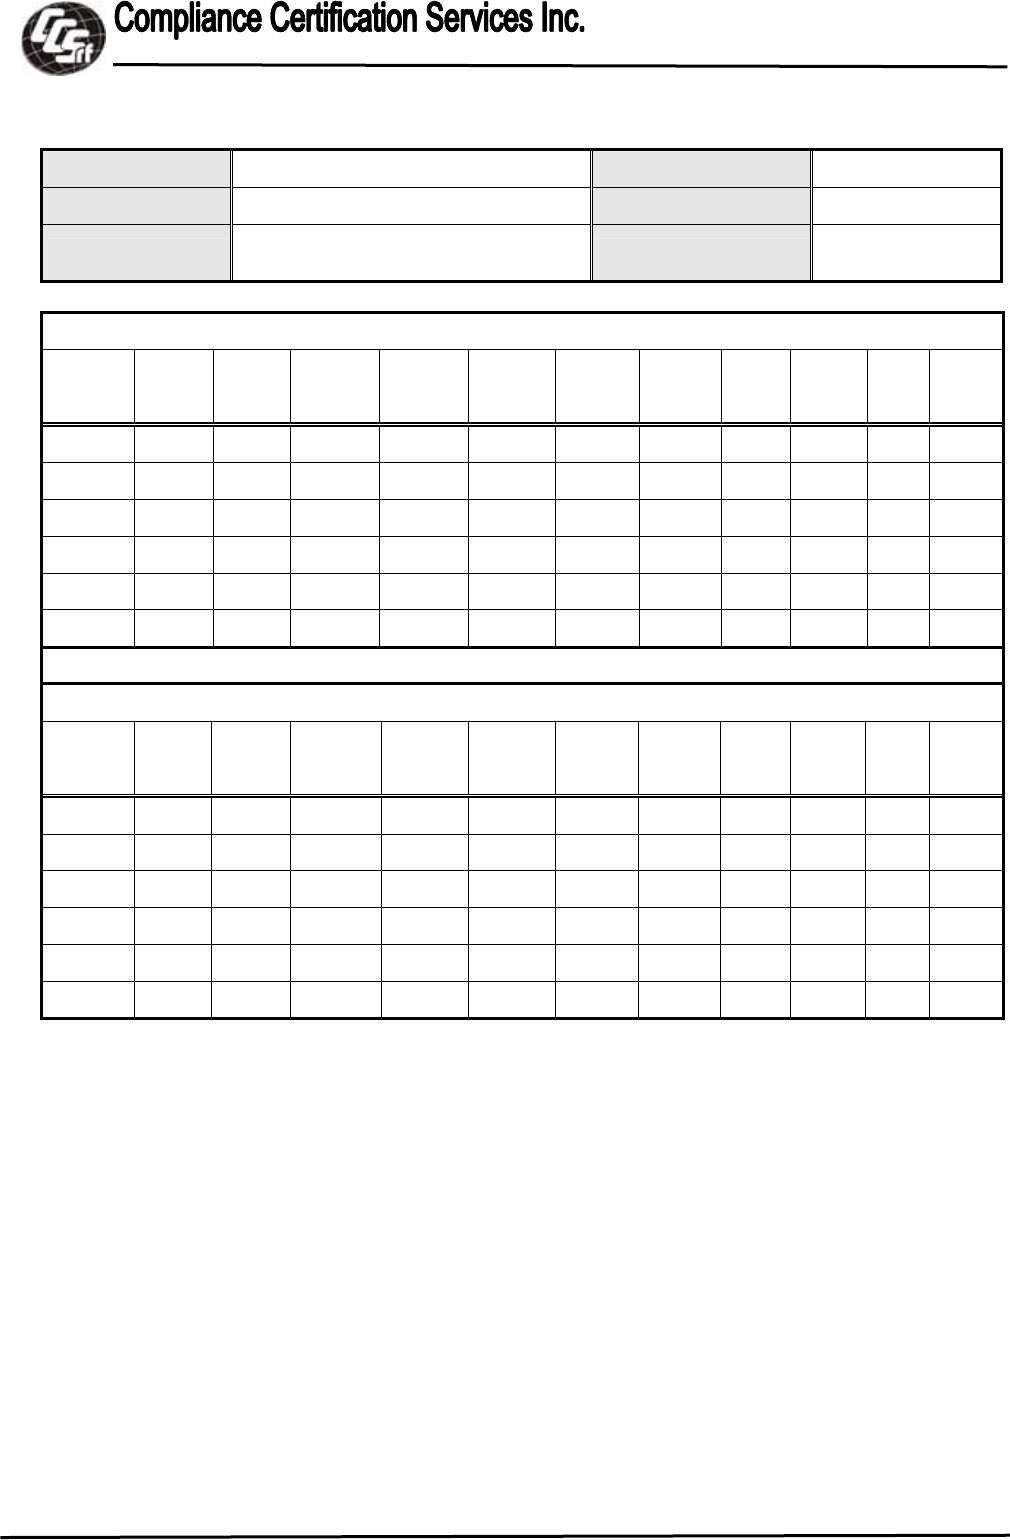
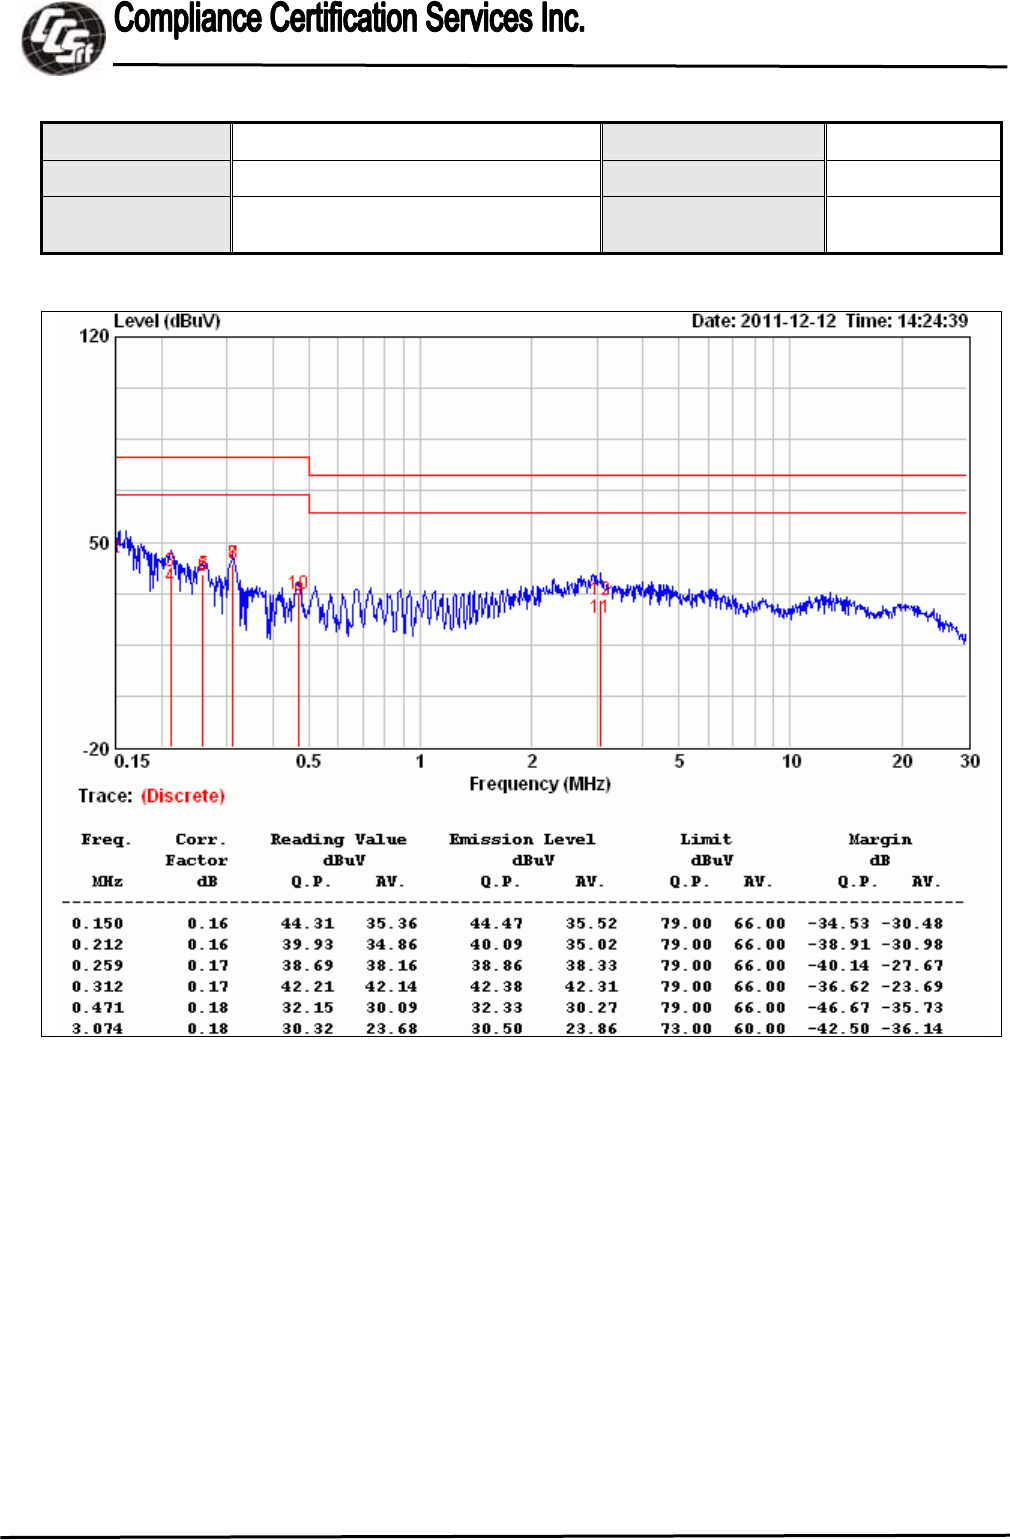
Product Name IP Cam Test By Tom Deng
Test Model B7210 Test Date 2011/12/12
Test Mode Normal Operating /
Power Adapter Temp. & Humidity 24°C, 65%
NEUTRAL
Remark:
1. Correction Factor = Insertion loss + Cable loss
2. Emission level = Reading Value + Correction factor
3. Margin value = Emission level – Limit value
Report No.:T111221S01-D
Page 21 / 25
This report shall not be reproduced except in full, without the written approval of Compliance Certification Services.
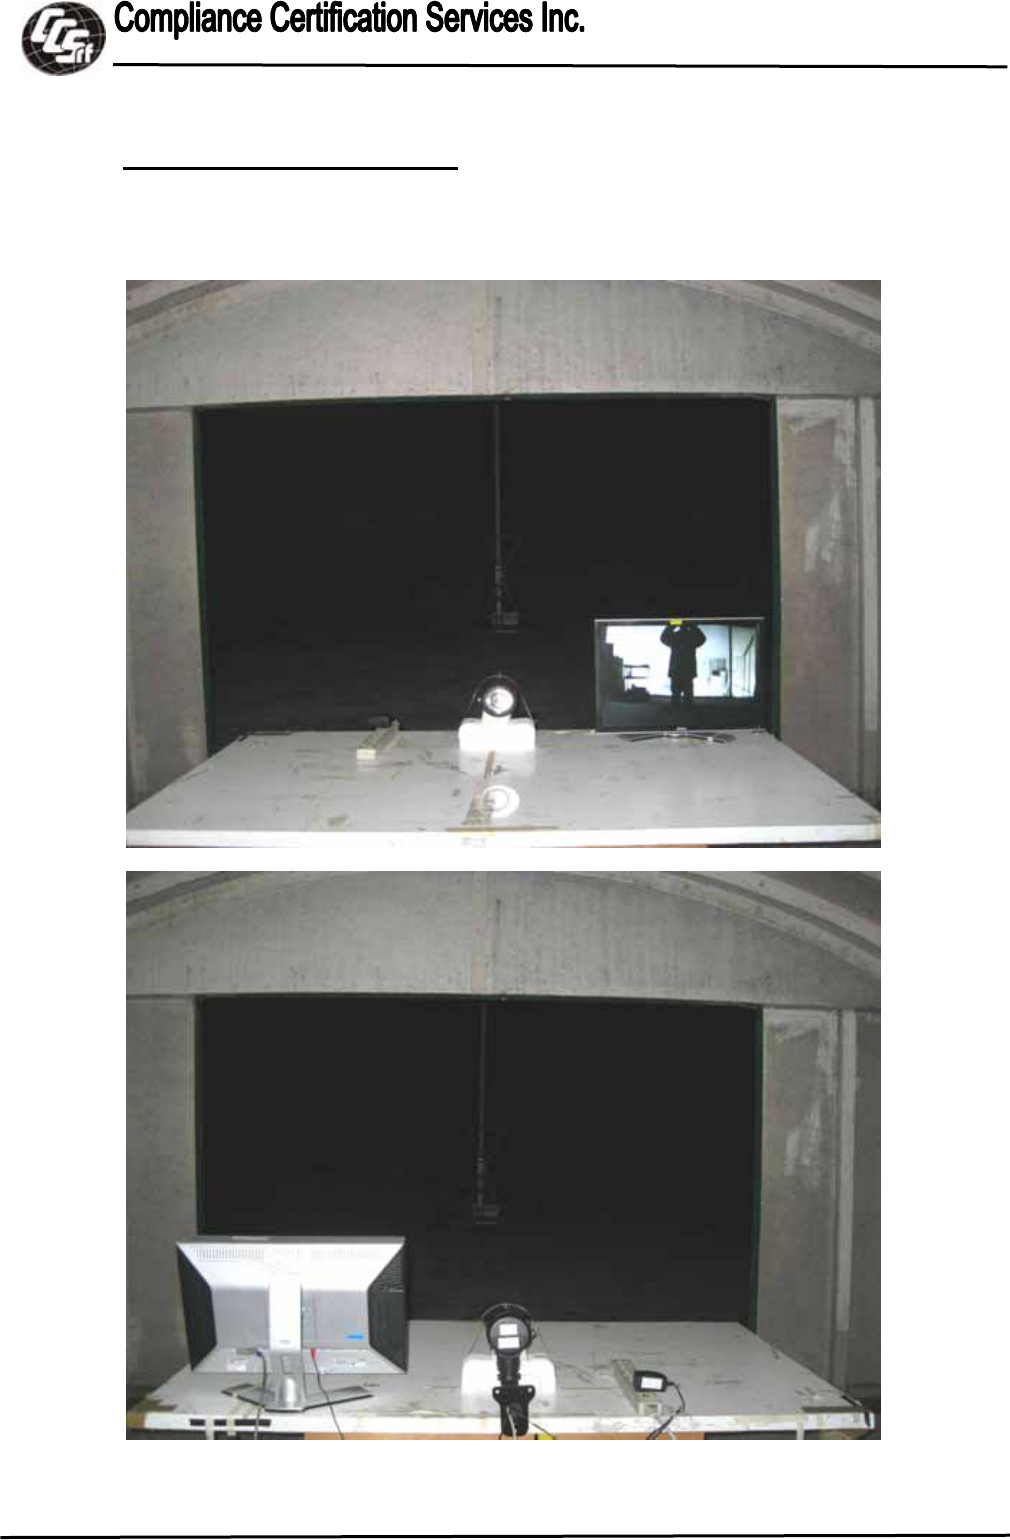
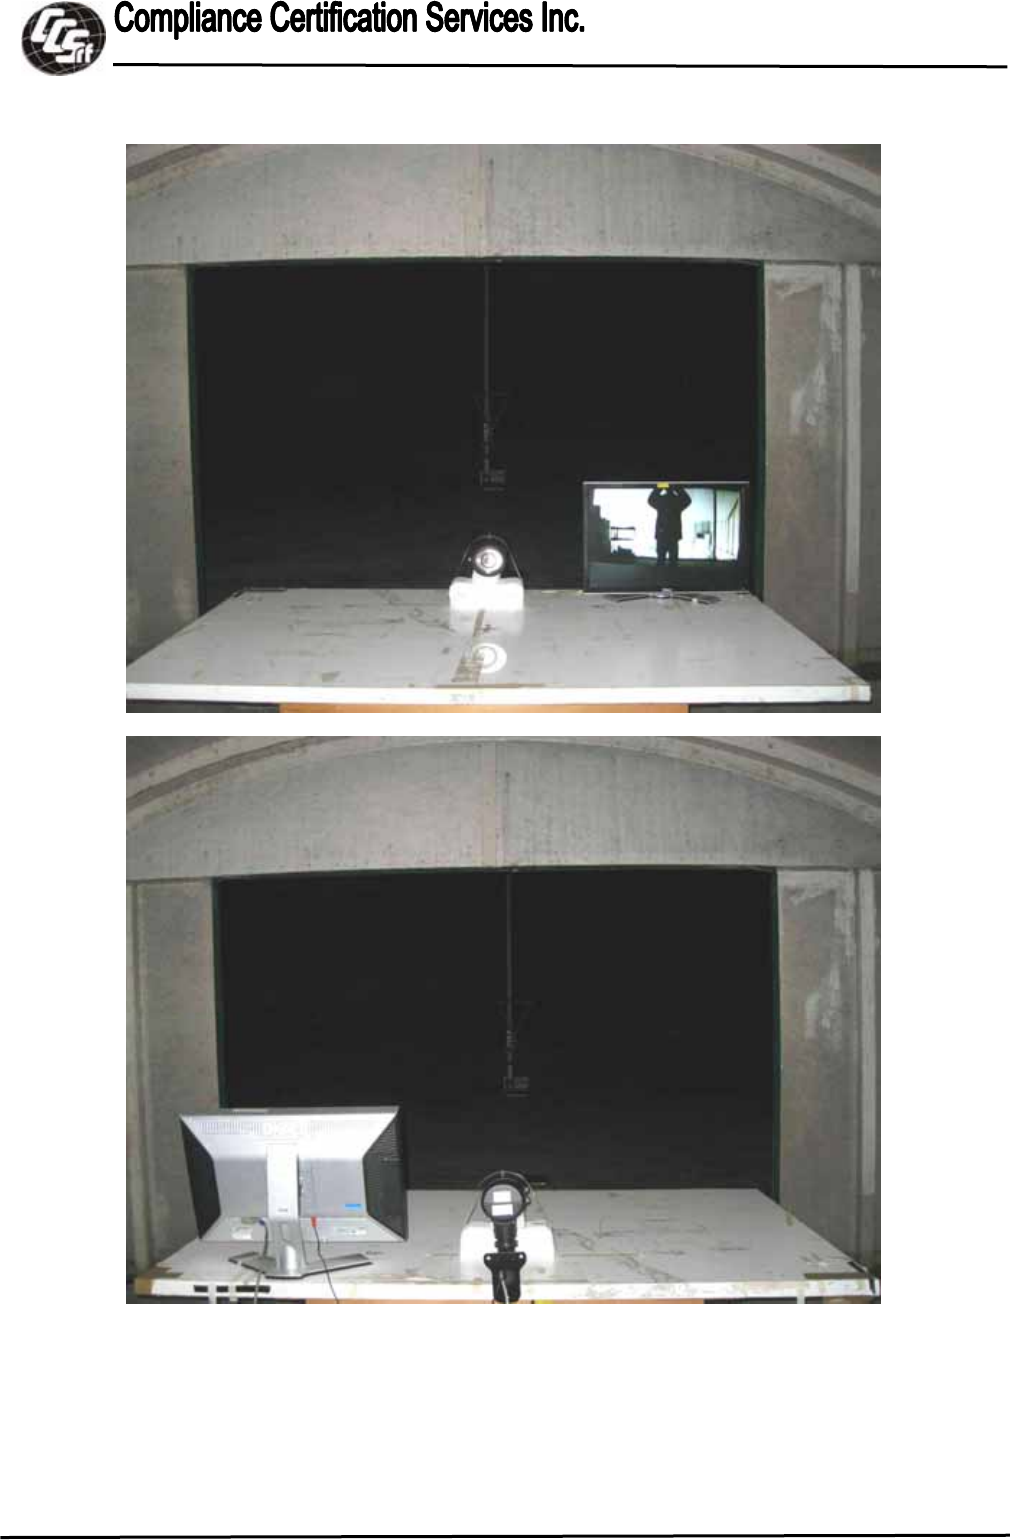
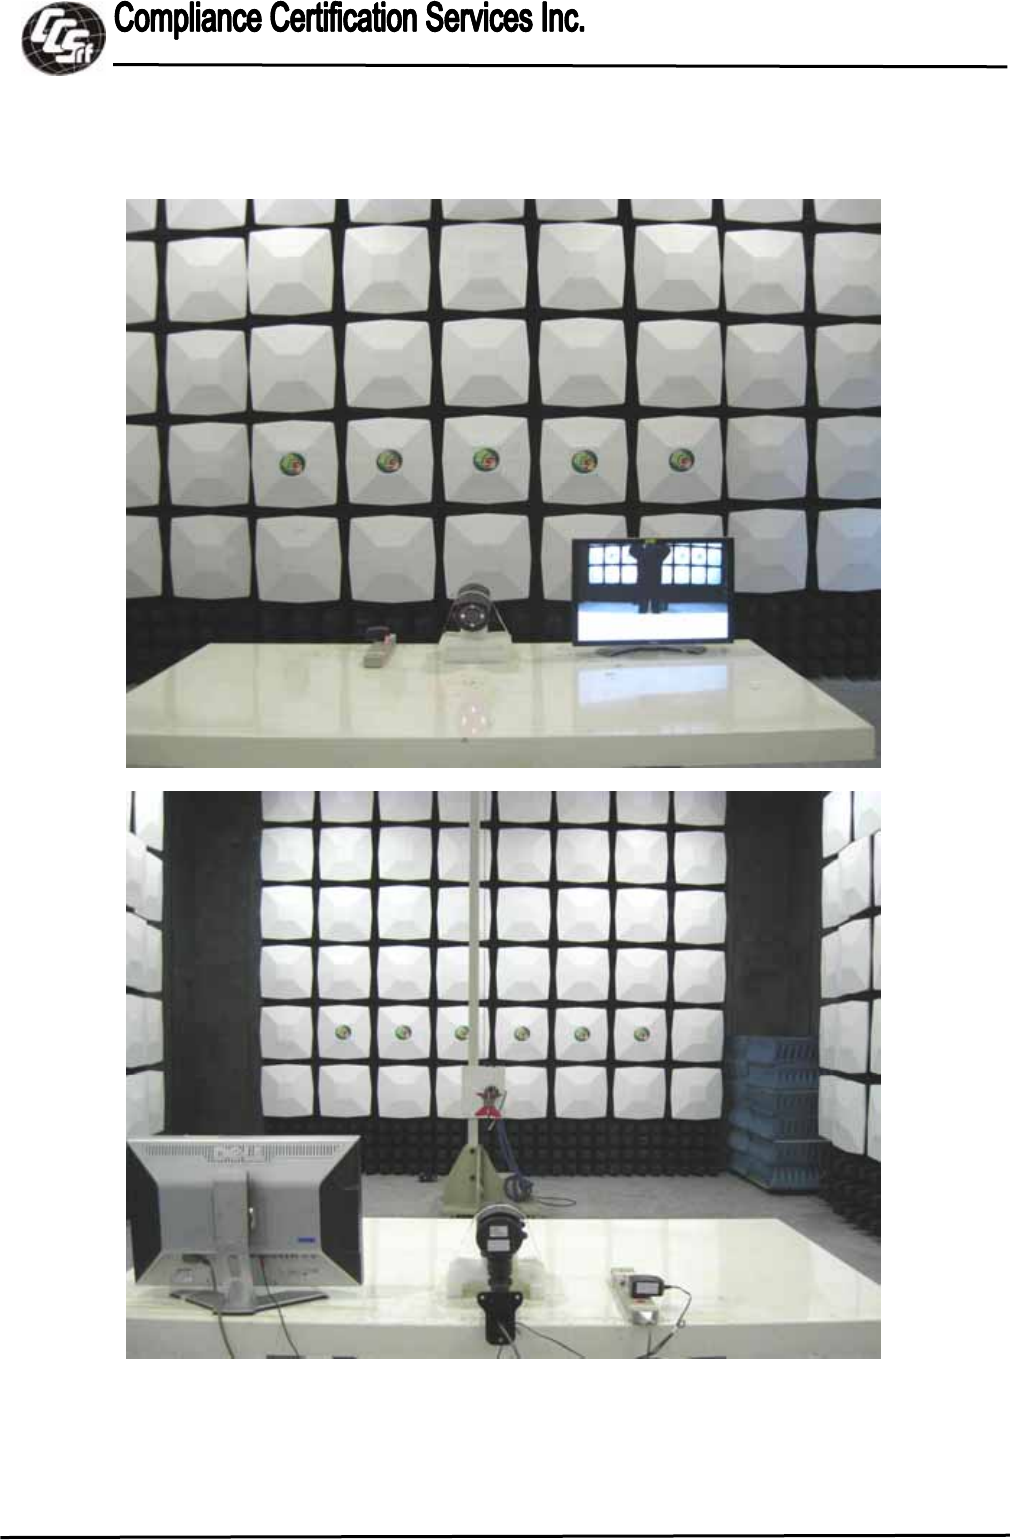
APPENDIX SETUP PHOTOS
RADIATED EMISSION SETUP
Below 1 GHz
Power Adapter
Report No.:T111221S01-D
Page 22 / 25
This report shall not be reproduced except in full, without the written approval of Compliance Certification Services.
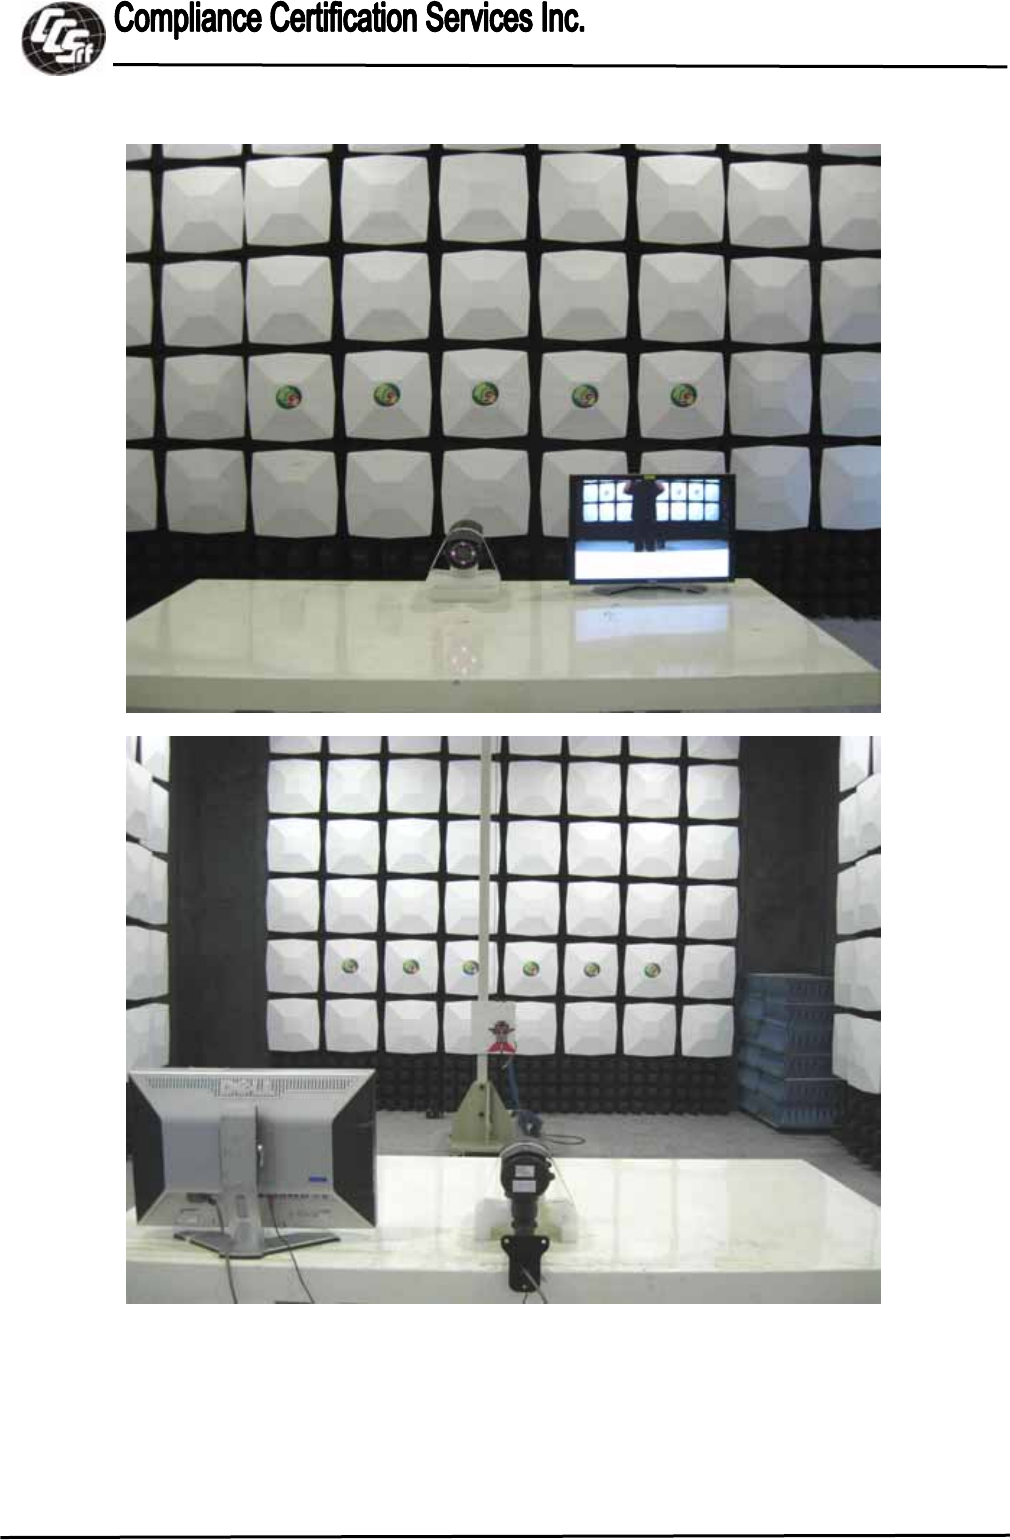
PoE Mode
Report No.:T111221S01-D
Page 23 / 25
This report shall not be reproduced except in full, without the written approval of Compliance Certification Services.
Above 1 GHz
Power Adapter
Report No.:T111221S01-D
Page 24 / 25
This report shall not be reproduced except in full, without the written approval of Compliance Certification Services.
PoE Mode
Report No.:T111221S01-D
Page 25 / 25
This report shall not be reproduced except in full, without the written approval of Compliance Certification Services.
CONDUCTED EMISSION SETUP
