D Geo Pipeline Verification Report DGeo
User Manual: Pdf DGeoPipeline-Verification-Report
Open the PDF directly: View PDF ![]() .
.
Page Count: 144 [warning: Documents this large are best viewed by clicking the View PDF Link!]
- Introduction
- 1 Group 1: Benchmarks from literature (exact solution)
- 2 Group 2: Benchmarks from literature (approximate solution)
- 3 Group 3: Benchmarks from spreadsheets
- 3.1 HDD with 2D geometry – Steel pipe in two compressible undrained layers
- 3.2 HDD with 2D geometry – Vertical bearing capacity in homogeneous compressible undrained layer with = 0
- 3.3 HDD with 2D geometry – Polyethylene (PE 80) pipe in two compressible undrained layers
- 3.4 HDD with 2D geometry – Steel pipe in two incompressible drained layers
- 3.5 HDD with 2D geometry – Steel pipe in a sequence of a compressible undrained layer and a compressible drained layer
- 3.6 HDD with 2D geometry – Steel pipe in a sequence of an incompressible undrained layer and an incompressible drained layer
- 3.7 HDD with 3D geometry – Steel pipe in 4 layers – Compressible border above drainage border
- 3.8 Special strength analysis
- 3.9 HDD with 3D geometry – Bundled pipeline (3 steel pipes and 2 PE pipes)
- 3.10 HDD with 3D geometry – Bundled pipeline (2 PE pipes)
- 3.11 HDD with 3D geometry – Bundled pipeline (3 steel pipes)
- 3.12 Micro tunneling with 3D geometry – Steel pipe
- 3.13 Micro tunneling with 3D geometry – Synthetic pipe
- 3.14 Micro tunneling with 3D geometry – Concrete pipe
- 3.15 Trenching (3 sections) – 3D geometry in four layers – Compressible border above drainage border
- 3.16 Trenching (3 sections) – 3D geometry in four layers – Drainage border above compressible border
- 3.17 Bundled pipeline with Special Stress Analysis
- 3.18 HDD with 3D geometry – Pipeline configuration not ending at surface and with an angle between radii
- 3.19 HDD with 2D geometry – Stress Analysis per Vertical – Steel pipe
- 3.20 HDD with 3D geometry – Stress Analysis per Vertical – PE pipe
- 3.21 HDD – Determination of the minimum allowable radius
- 3.22 HDD – PE pipe not filled with water on rollers
- 3.23 HDD – PE pipe always filled (100%) – Implosion
- 3.24 HDD with 2D geometry – Effect of traffic loads
- 3.25 HDD with safety factors from the European Standard CEN – Steel pipe
- 3.26 HDD with safety factors from the European Standard CEN – PE pipe
- 4 Group 4: Benchmarks generated by D-Geo Pipeline
- 5 Group 5: Benchmarks compared with other programs
- Bibliography

Verification Report
D-Geo PiPeline
Design of pipeline installation
D-GEO PIPELINE
Design of pipeline installation
Verification Report
Version: 15.1
Revision: 00
13 April 2015
D-GEO PIPELINE
, Verification Report
Published and printed by:
Deltares
Boussinesqweg 1
2629 HV Delft
P.O. 177
2600 MH Delft
The Netherlands
telephone: +31 88 335 82 73
fax: +31 88 335 85 82
e-mail: info@deltares.nl
www: http://www.deltares.nl
For sales contact:
telephone: +31 88 335 81 88
fax: +31 88 335 81 11
e-mail: sales@deltaressystems.nl
www: http://www.deltaressystems.nl
For support contact:
telephone: +31 88 335 81 00
fax: +31 88 335 81 11
e-mail: support@deltaressystems.nl
www: http://www.deltaressystems.nl
Copyright © 2015 Deltares
All rights reserved. No part of this document may be reproduced in any form by print, photo
print, photo copy, microfilm or any other means, without written permission from the publisher:
Deltares.

Contents
Contents
Introduction 1
1 Group 1: Benchmarks from literature (exact solution) 3
1.1 Soil type and displacement at maximal friction (Micro-tunneling and Trenching) 3
1.1.1 Description .............................. 3
1.1.2 Benchmark results .......................... 4
1.1.3 D-GEO PIPELINE results . . . . . . . . . . . . . . . . . . . . . . . 5
2 Group 2: Benchmarks from literature (approximate solution) 9
3 Group 3: Benchmarks from spreadsheets 11
3.1 HDD with 2D geometry – Steel pipe in two compressible undrained layers . . . 11
3.1.1 Description .............................. 11
3.1.2 Analytical results ........................... 12
3.1.3 D-GEO PIPELINE results . . . . . . . . . . . . . . . . . . . . . . . 17
3.2 HDD with 2D geometry – Vertical bearing capacity in homogeneous compress-
ible undrained layer with ϕ= 0 . . . . . . . . . . . . . . . . . . . . . . . . 21
3.2.1 Description .............................. 22
3.2.2 Analytical results ........................... 22
3.2.3 D-GEO PIPELINE results . . . . . . . . . . . . . . . . . . . . . . . 22
3.3 HDD with 2D geometry – Polyethylene (PE 80) pipe in two compressible undrained
layers ..................................... 22
3.3.1 Description .............................. 23
3.3.2 Analytical results ........................... 23
3.3.3 D-GEO PIPELINE results . . . . . . . . . . . . . . . . . . . . . . . 24
3.4 HDD with 2D geometry – Steel pipe in two incompressible drained layers . . . 26
3.4.1 Description .............................. 26
3.4.2 Analytical results ........................... 27
3.4.3 D-GEO PIPELINE results . . . . . . . . . . . . . . . . . . . . . . . 28
3.5 HDD with 2D geometry – Steel pipe in a sequence of a compressible undrained
layer and a compressible drained layer . . . . . . . . . . . . . . . . . . . . 29
3.5.1 Description .............................. 29
3.5.2 Analytical results ........................... 29
3.5.3 D-GEO PIPELINE results . . . . . . . . . . . . . . . . . . . . . . . 30
3.6 HDD with 2D geometry – Steel pipe in a sequence of an incompressible
undrained layer and an incompressible drained layer . . . . . . . . . . . . . 30
3.6.1 Description .............................. 30
3.6.2 Analytical results ........................... 31
3.6.3 D-GEO PIPELINE results . . . . . . . . . . . . . . . . . . . . . . . 31
3.7 HDD with 3D geometry – Steel pipe in 4 layers – Compressible border above
drainage border ................................ 31
3.7.1 Description .............................. 31
3.7.2 Analytical results ........................... 33
3.7.3 D-GEO PIPELINE results . . . . . . . . . . . . . . . . . . . . . . . 36
3.8 Special strength analysis ........................... 37
3.8.1 Description .............................. 37
3.8.2 Analytical results ........................... 38
3.8.3 D-GEO PIPELINE results . . . . . . . . . . . . . . . . . . . . . . . 38
3.9 HDD with 3D geometry – Bundled pipeline (3 steel pipes and 2 PE pipes) . . . 40
3.9.1 Description .............................. 41
3.9.2 Analytical results ........................... 41
3.9.3 D-GEO PIPELINE results . . . . . . . . . . . . . . . . . . . . . . . 45
3.10 HDD with 3D geometry – Bundled pipeline (2 PE pipes) . . . . . . . . . . . . 53
Deltares iii

D-GEO PIPELINE
, Verification Report
3.10.1 Description .............................. 54
3.10.2 Analytical results ........................... 54
3.10.3 D-GEO PIPELINE results . . . . . . . . . . . . . . . . . . . . . . . 56
3.11 HDD with 3D geometry – Bundled pipeline (3 steel pipes) . . . . . . . . . . . 56
3.11.1 Description .............................. 56
3.11.2 Analytical results ........................... 56
3.11.3 D-GEO PIPELINE results . . . . . . . . . . . . . . . . . . . . . . . 58
3.12 Micro tunneling with 3D geometry – Steel pipe . . . . . . . . . . . . . . . . 59
3.12.1 Description .............................. 59
3.12.2 Analytical results ........................... 59
3.12.3 D-GEO PIPELINE results . . . . . . . . . . . . . . . . . . . . . . . 60
3.13 Micro tunneling with 3D geometry – Synthetic pipe . . . . . . . . . . . . . . 64
3.13.1 Description .............................. 64
3.13.2 Analytical results ........................... 64
3.13.3 D-GEO PIPELINE results . . . . . . . . . . . . . . . . . . . . . . . 64
3.14 Micro tunneling with 3D geometry – Concrete pipe . . . . . . . . . . . . . . 65
3.14.1 Description .............................. 65
3.14.2 Analytical results ........................... 65
3.14.3 D-GEO PIPELINE results . . . . . . . . . . . . . . . . . . . . . . . 65
3.15 Trenching (3 sections) – 3D geometry in four layers – Compressible border
above drainage border . . . . . . . . . . . . . . . . . . . . . . . . . . . . 68
3.15.1 Description .............................. 68
3.15.2 Analytical results ........................... 69
3.15.3 D-GEO PIPELINE results . . . . . . . . . . . . . . . . . . . . . . . 70
3.16 Trenching (3 sections) – 3D geometry in four layers – Drainage border above
compressible border ............................. 74
3.16.1 Description .............................. 74
3.16.2 Analytical results ........................... 75
3.16.3 D-GEO PIPELINE results . . . . . . . . . . . . . . . . . . . . . . . 75
3.17 Bundled pipeline with Special Stress Analysis . . . . . . . . . . . . . . . . . 75
3.17.1 Description .............................. 76
3.17.2 Analytical results ........................... 76
3.17.3 D-GEO PIPELINE results . . . . . . . . . . . . . . . . . . . . . . . 78
3.18 HDD with 3D geometry – Pipeline configuration not ending at surface and with
an angle between radii . . . . . . . . . . . . . . . . . . . . . . . . . . . . 79
3.18.1 Description .............................. 79
3.18.2 Analytical results ........................... 79
3.18.3 D-GEO PIPELINE results . . . . . . . . . . . . . . . . . . . . . . . 81
3.19 HDD with 2D geometry – Stress Analysis per Vertical – Steel pipe . . . . . . 82
3.19.1 Description .............................. 82
3.19.2 Analytical results ........................... 82
3.19.3 D-GEO PIPELINE results . . . . . . . . . . . . . . . . . . . . . . . 83
3.20 HDD with 3D geometry – Stress Analysis per Vertical – PE pipe . . . . . . . . 88
3.20.1 Description .............................. 88
3.20.2 Analytical results ........................... 88
3.20.3 D-GEO PIPELINE results . . . . . . . . . . . . . . . . . . . . . . . 89
3.21 HDD – Determination of the minimum allowable radius . . . . . . . . . . . . 94
3.21.1 Description .............................. 94
3.21.2 Analytical results ........................... 97
3.21.3 D-GEO PIPELINE results . . . . . . . . . . . . . . . . . . . . . . . 99
3.22 HDD – PE pipe not filled with water on rollers . . . . . . . . . . . . . . . . . 101
3.22.1 Description ..............................101
3.22.2 Analytical results . . . . . . . . . . . . . . . . . . . . . . . . . . . 101
3.22.3 D-GEO PIPELINE results . . . . . . . . . . . . . . . . . . . . . . . 102
iv Deltares

Contents
3.23 HDD – PE pipe always filled (100%) – Implosion . . . . . . . . . . . . . . . 102
3.23.1 Description ..............................102
3.23.2 Analytical results . . . . . . . . . . . . . . . . . . . . . . . . . . . 103
3.23.3 D-GEO PIPELINE results . . . . . . . . . . . . . . . . . . . . . . . 103
3.24 HDD with 2D geometry – Effect of traffic loads . . . . . . . . . . . . . . . . 104
3.24.1 Description ..............................104
3.24.2 Analytical results . . . . . . . . . . . . . . . . . . . . . . . . . . . 104
3.24.3 D-GEO PIPELINE results . . . . . . . . . . . . . . . . . . . . . . . 107
3.25 HDD with safety factors from the European Standard CEN – Steel pipe . . . . 109
3.25.1 Description ..............................109
3.25.2 Analytical results . . . . . . . . . . . . . . . . . . . . . . . . . . . 110
3.25.3 D-GEO PIPELINE results . . . . . . . . . . . . . . . . . . . . . . . 111
3.26 HDD with safety factors from the European Standard CEN – PE pipe . . . . . 113
3.26.1 Description ..............................113
3.26.2 Analytical results . . . . . . . . . . . . . . . . . . . . . . . . . . . 113
3.26.3 D-GEO PIPELINE results . . . . . . . . . . . . . . . . . . . . . . . 115
4 Group 4: Benchmarks generated by D-GEO PIPELINE 117
4.1 HDD with 3D geometry – Check of the pulling direction . . . . . . . . . . . . 117
4.1.1 Description ..............................117
4.1.2 D-GEO PIPELINE results . . . . . . . . . . . . . . . . . . . . . . . 117
5 Group 5: Benchmarks compared with other programs 119
5.1 Settlements according to Koppejan model . . . . . . . . . . . . . . . . . . . 119
5.1.1 Description ..............................119
5.1.2 D-SETTLEMENT results . . . . . . . . . . . . . . . . . . . . . . . . 119
5.1.3 D-GEO PIPELINE results . . . . . . . . . . . . . . . . . . . . . . . 120
5.2 Settlements according to Isotache model . . . . . . . . . . . . . . . . . . . 120
5.2.1 Description ..............................120
5.2.2 D-SETTLEMENT results . . . . . . . . . . . . . . . . . . . . . . . . 120
5.2.3 D-GEO PIPELINE results . . . . . . . . . . . . . . . . . . . . . . . 121
Bibliography 123
Deltares v

D-GEO PIPELINE
, Verification Report
vi Deltares

List of Figures
List of Figures
1.1 Geometry of benchmark 1-1a (Construction in Trench) . . . . . . . . . . . . 4
3.1 2D Geometry of benchmark 3-1 (steel pipeline in two compressible undrained
layers) .................................... 12
3.2 Locations of the characteristic points T1 to T6 . . . . . . . . . . . . . . . . . 14
3.3 3D view of the pipeline configuration (benchmark 3-7) . . . . . . . . . . . . . 33
3.4 Lateral view of the 3 trench sections (benchmark 3-15) . . . . . . . . . . . . 69
3.5 Locations of the characteristic points T1 to T6 for case A (positive angle be-
tween radii) .................................. 80
3.6 Locations of the characteristic points T1 to T6 for case B (negative angle be-
tween radii) .................................. 81
3.7 Locations of the characteristic points (T1 to T6) and the 3 verticals . . . . . . 82
3.8 Geometry of benchmark 3-21a . . . . . . . . . . . . . . . . . . . . . . . . 95
3.9 Geometry of benchmark 3-21b . . . . . . . . . . . . . . . . . . . . . . . . 97
3.10 Warning message displayed for benchmark 3-21a . . . . . . . . . . . . . . . 99
3.11 Warning message displayed for benchmark 3-21b . . . . . . . . . . . . . . . 100
3.12 Geometry of benchmark 3-12 with 2 traffic loads . . . . . . . . . . . . . . . 104
3.13 Traffic load as a function of the depth, for different pipe diameters, according
to NEN 3650-1 ................................105
5.1 Geometry of benchmark 5-1 . . . . . . . . . . . . . . . . . . . . . . . . . 119
Deltares vii

D-GEO PIPELINE
, Verification Report
viii Deltares

List of Tables
List of Tables
1.1 Material properties of the different layers (benchmark 1-1) . . . . . . . . . . . 3
1.2 Displacement at maximal friction and classification of the soil type . . . . . . 4
1.3 Results of benchmark 1-1a, Global soil type for Construction in Trench . . . . 5
1.4 Results of benchmark 1-1a, Maximal displacement for Construction in Trench . 6
1.5 Results of benchmark 1-1b, Global soil type for Micro Tunneling . . . . . . . . 7
1.6 Results of benchmark 1-1b, Maximal displacement for Micro Tunneling . . . . 8
3.1 Soil material properties (bm3-1) . . . . . . . . . . . . . . . . . . . . . . . . 11
3.2 Pipe material data (bm3-1) . . . . . . . . . . . . . . . . . . . . . . . . . . 12
3.3 Analytical results for the calculation of dp/dz for the three stages . . . . . . . 13
3.4 Analytical results for the calculation of the maximum drilling fluid pressures . . 13
3.6 Results of benchmark 3-01, Pulling forces in the pipeline . . . . . . . . . . . 15
3.7 Set for calculation of the maximum stresses for load combination 1A . . . . . 15
3.8 Set for calculation of the maximum stresses for load combination 1B . . . . . 16
3.9 Set for calculation of the maximum stresses for load combination 3 . . . . . . 16
3.10 Set for calculation of the maximum stresses for load combination 4 . . . . . . 16
3.11 Results of benchmark 3-01, Maximum allowable drilling fluid pressure (plastic
zone related to deformation bore hole) . . . . . . . . . . . . . . . . . . . . 17
3.12 Results of benchmark 3-01, Maximum allowable drilling fluid pressure (plastic
zone related to soil cover) ........................... 17
3.13 Results of benchmark 3-01, Minimum required drilling fluid pressure (from left
to right) .................................... 17
3.14 Results of benchmark 3-01, Minimum required drilling fluid pressure (from right
to left) ..................................... 18
3.15 Results of benchmark 3-01, Equilibrium between drilling fluid pressure and
pore pressure ................................. 18
3.16 Results of benchmark 3-01, Vertical soil stresses . . . . . . . . . . . . . . . 18
3.17 Results of benchmark 3-01, Neutral horizontal soil stress and bearing capacities 19
3.18 Results of benchmark 3-01, Vertical and horizontal moduli of subgrade reaction 19
3.19 Results of benchmark 3-01, Maximal axial friction and displacements . . . . . 19
3.20 Results of benchmark 3-01, Buoyancy control . . . . . . . . . . . . . . . . . 19
3.21 Results of benchmark 3-01, Pulling forces in the pipeline . . . . . . . . . . . 20
3.22 Results of benchmark 3-01, Strength calculation for Combination 1A . . . . . 20
3.23 Results of benchmark 3-01, Strength calculation for Combination 1B . . . . . 20
3.24 Results of benchmark 3-01, Strength calculation for Combination 2 . . . . . . 20
3.25 Results of benchmark 3-01, Strength calculation for Combination 3 . . . . . . 20
3.26 Results of benchmark 3-01, Strength calculation for Combination 4 . . . . . . 21
3.27 Results of benchmark 3-01, Maximum allowable stresses . . . . . . . . . . . 21
3.28 Results of benchmark 3-01, Deflection of the pipeline . . . . . . . . . . . . . 21
3.29 Results of benchmark 3-01, Implosion . . . . . . . . . . . . . . . . . . . . 21
3.30 Analytical results for the calculation of the vertical bearing capacity . . . . . . 22
3.31 Results of benchmark 3-02, Ultimate vertical bearing capacity . . . . . . . . . 22
3.32 Pipe material data (benchmark 3-3) . . . . . . . . . . . . . . . . . . . . . . 23
3.34 Analytical results for the calculation of the five components of the pulling force
for the six characteristic points . . . . . . . . . . . . . . . . . . . . . . . . 24
3.35 Results of benchmark 3-03, Buoyancy control . . . . . . . . . . . . . . . . . 24
3.36 Results of benchmark 3-03, Pulling forces in the pipeline . . . . . . . . . . . 25
3.37 Results of benchmark 3-03, Strength calculation for Combination 1A . . . . . 25
3.38 Results of benchmark 3-03, Strength calculation for Combination 1B . . . . . 25
3.39 Results of benchmark 3-03, Strength calculation for Combination 2 . . . . . . 25
3.40 Results of benchmark 3-03, Strength calculation for Combination 3 . . . . . . 25
3.41 Results of benchmark 3-03, Strength calculation for Combination 4 . . . . . . 26
Deltares ix

D-GEO PIPELINE
, Verification Report
3.42 Results of benchmark 3-03, Maximum allowable stresses . . . . . . . . . . . 26
3.43 Results of benchmark 3-03, Deflection of the pipeline . . . . . . . . . . . . . 26
3.44 Results of benchmark 3-03, Implosion . . . . . . . . . . . . . . . . . . . . 26
3.45 Analytical results – General data’s . . . . . . . . . . . . . . . . . . . . . . 27
3.46 Analytical results for the calculation of the neutral reduced vertical stress . . . 27
3.47 Analytical results for the calculation of the maximum drilling fluid pressures . . 28
3.48 Results of benchmark 3-04, Vertical soil stresses . . . . . . . . . . . . . . . 28
3.49 Results of benchmark 3-04, Maximum allowable drilling fluid pressure (plastic
zone related to deformation bore hole) . . . . . . . . . . . . . . . . . . . . 28
3.50 Results of benchmark 3-04, Maximum allowable drilling fluid pressure (plastic
zone related to soil cover) ........................... 29
3.51 Analytical results for the calculation of the maximum drilling fluid pressures . . 29
3.52 Results of benchmark 3-05, Maximum allowable drilling fluid pressure (plastic
zone related to deformation bore hole) . . . . . . . . . . . . . . . . . . . . 30
3.53 Results of benchmark 3-05, Maximum allowable drilling fluid pressure (plastic
zone related to soil cover) ........................... 30
3.54 Results of benchmark 3-06, Vertical soil stresses . . . . . . . . . . . . . . . 31
3.55 Soil material properties (benchmark 3-07) . . . . . . . . . . . . . . . . . . . 32
3.56 Pipe material data (benchmark 3-07) . . . . . . . . . . . . . . . . . . . . . 32
3.57 Position of the characteristic points (benchmark 3-07a) . . . . . . . . . . . . 33
3.59 Analytical results for the calculation of the five components of the pulling force
for the 10 characteristic points for case a . . . . . . . . . . . . . . . . . . . 35
3.60 Analytical results for the calculation of the five components of the pulling force
for the 10 characteristic points for case b . . . . . . . . . . . . . . . . . . . 35
3.61 Results of benchmark 3-07a, Vertical soil stresses . . . . . . . . . . . . . . 36
3.62 Results of benchmark 3-07a, Neutral horizontal soil stress and bearing capac-
ities ...................................... 36
3.63 Results of benchmark 3-07a, Vertical and horizontal moduli of subgrade reaction 36
3.64 Results of benchmark 3-07a, Maximal axial friction and displacements . . . . 37
3.65 Results of benchmark 3-07a, Pulling forces in the pipeline . . . . . . . . . . . 37
3.66 Results of benchmark 3-07b, Pulling forces in the pipeline . . . . . . . . . . . 37
3.67 Analytical results for the calculation of the five components of the pulling force
for the 10 characteristic points (bm3-08) . . . . . . . . . . . . . . . . . . . 38
3.68 Results of benchmark 3-08, Buoyancy Control . . . . . . . . . . . . . . . . 38
3.69 Results of benchmark 3-08, Pulling forces in the pipeline . . . . . . . . . . . 38
3.70 Results of benchmark 3-08, Strength calculation for Combination 1A . . . . . 39
3.71 Results of benchmark 3-08, Strength calculation for Combination 1B . . . . . 39
3.72 Results of benchmark 3-08, Strength calculation for Combination 2 . . . . . . 39
3.73 Results of benchmark 3-08, Strength calculation for Combination 3 . . . . . . 39
3.74 Results of benchmark 3-08, Strength calculation for Combination 4 . . . . . . 40
3.75 Results of benchmark 3-08, Maximum allowable stresses . . . . . . . . . . . 40
3.76 Results of benchmark 3-08, Deflection of the pipeline . . . . . . . . . . . . . 40
3.77 Results of benchmark 3-08, Implosion . . . . . . . . . . . . . . . . . . . . 40
3.78 Pipe material data (benchmark 3-09) . . . . . . . . . . . . . . . . . . . . . 41
3.79 Analytical results for the calculation of the five components of the pulling force
for the 10 characteristic points (bm3-09) . . . . . . . . . . . . . . . . . . . 42
3.80 Analytical results for the calculation of the five components of the pulling force
for the 10 characteristic points (bm3-09) . . . . . . . . . . . . . . . . . . . 43
3.81 Analytical results for the calculation of the five components of the pulling force
for the 10 characteristic points (bm3-09) . . . . . . . . . . . . . . . . . . . 43
3.82 Analytical results for the calculation of the five components of the pulling force
for the 10 characteristic points (bm3-09) . . . . . . . . . . . . . . . . . . . 43
3.83 Analytical results for the calculation of the five components of the pulling force
for the 10 characteristic points (bm3-09) . . . . . . . . . . . . . . . . . . . 44
x Deltares

List of Tables
3.84 Analytical results for the calculation of the five components of the pulling force
for the 10 characteristic points (bm3-09) . . . . . . . . . . . . . . . . . . . 44
3.85 Maximal pulling forces without partial factors (bm3-09) . . . . . . . . . . . . 44
3.86 Results of benchmark 3-09, Buoyancy control . . . . . . . . . . . . . . . . . 45
3.87 Results of benchmark 3-09, Pulling forces in the pipeline . . . . . . . . . . . 45
3.88 Results of benchmark 3-09 for pipe nr. 1, Strength calculation for Combination
1A ...................................... 45
3.89 Results of benchmark 3-09 for pipe nr. 1, Strength calculation for Combination
1B ...................................... 45
3.90 Results of benchmark 3-09 for pipe nr. 1, Strength calculation for Combination 2 46
3.91 Results of benchmark 3-09 for pipe nr. 1, Strength calculation for Combination 3 46
3.92 Results of benchmark 3-09 for pipe nr. 1, Strength calculation for Combination 4 46
3.93 Results of benchmark 3-09 for pipe nr. 1, Maximum allowable stresses . . . . 46
3.94 Results of benchmark 3-09 for pipe nr. 1, Deflection of the pipeline . . . . . . 46
3.95 Results of benchmark 3-09 for pipe nr. 1, Implosion . . . . . . . . . . . . . . 47
3.96 Results of benchmark 3-09 for pipe nr. 2, Strength calculation for Combination
1A ...................................... 47
3.97 Results of benchmark 3-09 for pipe nr. 2, Strength calculation for Combination
1B ...................................... 47
3.98 Results of benchmark 3-09 for pipe nr. 2, Strength calculation for Combination 2 47
3.99 Results of benchmark 3-09 for pipe nr. 2, Strength calculation for Combination 3 47
3.100 Results of benchmark 3-09 for pipe nr. 2, Strength calculation for Combination 4 48
3.101 Results of benchmark 3-09 for pipe nr. 2, Maximum allowable stresses . . . . 48
3.102 Results of benchmark 3-09 for pipe nr. 2, Deflection of the pipeline . . . . . . 48
3.103 Results of benchmark 3-09 for pipe nr. 2, Implosion . . . . . . . . . . . . . . 48
3.104 Results of benchmark 3-09 for pipe nr. 3, Strength calculation for Combination
1A ...................................... 48
3.105 Results of benchmark 3-09 for pipe nr. 3, Strength calculation for Combination
1B ...................................... 49
3.106 Results of benchmark 3-09 for pipe nr. 3, Strength calculation for Combination 2 49
3.107 Results of benchmark 3-09 for pipe nr. 3, Strength calculation for Combination 3 49
3.108 Results of benchmark 3-09 for pipe nr. 3, Strength calculation for Combination 4 49
3.109 Results of benchmark 3-09 for pipe nr. 3, Maximum allowable stresses . . . . 50
3.110 Results of benchmark 3-09 for pipe nr. 3, Deflection of the pipeline . . . . . . 50
3.111 Results of benchmark 3-09 for pipe nr. 3, Implosion . . . . . . . . . . . . . . 50
3.112 Results of benchmark 3-09 for pipe nr. 4, Strength calculation for Combination
1A ...................................... 50
3.113 Results of benchmark 3-09 for pipe nr. 4, Strength calculation for Combination
1B ...................................... 50
3.114 Results of benchmark 3-09 for pipe nr. 4, Strength calculation for Combination 2 51
3.115 Results of benchmark 3-09 for pipe nr. 4, Strength calculation for Combination 3 51
3.116 Results of benchmark 3-09 for pipe nr. 4, Strength calculation for Combination 4 51
3.117 Results of benchmark 3-09 for pipe nr. 4, Maximum allowable stresses . . . . 51
3.118 Results of benchmark 3-09 for pipe nr. 4, Deflection of the pipeline . . . . . . 51
3.119 Results of benchmark 3-09 for pipe nr. 4, Implosion . . . . . . . . . . . . . . 52
3.120 Results of benchmark 3-09 for pipe nr. 5, Strength calculation for Combination
1A ...................................... 52
3.121 Results of benchmark 3-09 for pipe nr. 5, Strength calculation for Combination
1B ...................................... 52
3.122 Results of benchmark 3-09 for pipe nr. 5, Strength calculation for Combination 2 52
3.123 Results of benchmark 3-09 for pipe nr. 5, Strength calculation for Combination 3 52
3.124 Results of benchmark 3-09 for pipe nr. 5, Strength calculation for Combination 4 53
3.125 Results of benchmark 3-09 for pipe nr. 5, Maximum allowable stresses . . . . 53
3.126 Results of benchmark 3-09 for pipe nr. 5, Deflection of the pipeline . . . . . . 53
Deltares xi

D-GEO PIPELINE
, Verification Report
3.127 Results of benchmark 3-09 for pipe nr. 5, Implosion . . . . . . . . . . . . . . 53
3.128 Pipe material data (benchmark 3-10) . . . . . . . . . . . . . . . . . . . . . 54
3.129 Analytical results for the calculation of the five components of the pulling force
for the 10 characteristic points (bm3-10) for the equivalent pipe . . . . . . . . 55
3.130 Analytical results for the calculation of the five components of the pulling force
for the 10 characteristic points (bm3-10) for pipe nr. 1 . . . . . . . . . . . . . 55
3.131 Analytical results for the calculation of the five components of the pulling force
for the 10 characteristic points (bm3-10) for pipe nr. 2 . . . . . . . . . . . . . 55
3.132 Results of benchmark 3-10, Buoyancy control . . . . . . . . . . . . . . . . . 56
3.133 Results of benchmark 3-10, Pulling forces in the pipeline . . . . . . . . . . . 56
3.134 Pipe material data (benchmark 3-11) . . . . . . . . . . . . . . . . . . . . . 56
3.135 Analytical results for the calculation of the five components of the pulling force
for the 10 characteristic points (bm3-11) for the equivalent pipe . . . . . . . . 57
3.136 Analytical results for the calculation of the five components of the pulling force
for the 10 characteristic points (bm3-11) for pipe nr. 1 . . . . . . . . . . . . . 57
3.137 Analytical results for the calculation of the five components of the pulling force
for the 10 characteristic points (bm3-11) for pipe nr. 2 . . . . . . . . . . . . . 58
3.138 Analytical results for the calculation of the five components of the pulling force
for the 10 characteristic points (bm3-11) for pipe nr. 3 . . . . . . . . . . . . . 58
3.139 Results of benchmark 3-11, Buoyancy control . . . . . . . . . . . . . . . . . 58
3.140 Results of benchmark 3-11, Pulling forces in the pipeline . . . . . . . . . . . 59
3.141 Analytical results for the calculation of the face support pressures . . . . . . . 60
3.142 Analytical results for the calculation of the uplift safety factor . . . . . . . . . 60
3.143 Results of benchmark 3-12a, Vertical soil stresses . . . . . . . . . . . . . . 60
3.144 Results of benchmark 3-12a, Neutral horizontal soil stress and bearing capac-
ities ...................................... 61
3.145 Results of benchmark 3-12a, Vertical and horizontal moduli of subgrade reaction 61
3.146 Results of benchmark 3-12a, Maximal axial friction and displacements . . . . 61
3.147 Results of benchmark 3-12a, Face support pressures . . . . . . . . . . . . 62
3.148 Results of benchmark 3-12a, Thrust forces . . . . . . . . . . . . . . . . . . 62
3.149 Results of benchmark 3-12b, Thrust forces . . . . . . . . . . . . . . . . . . 62
3.150 Results of benchmark 3-12a, Uplift safety factor . . . . . . . . . . . . . . . . 63
3.151 Results of benchmark 3-12a, Trough . . . . . . . . . . . . . . . . . . . . . 63
3.152 Results of benchmark 3-12a, Subsidence at different horizontal distances of Z
axis (from 0 to 0.7W) ............................. 63
3.153 Results of benchmark 3-12a, Subsidence at different horizontal distances of Z
axis (from 1W to 2.5W) . . . . . . . . . . . . . . . . . . . . . . . . . . . . 64
3.154 Results of benchmark 3-13, Vertical and horizontal moduli of subgrade reaction 64
3.155 Results of benchmark 3-14, Vertical soil stresses . . . . . . . . . . . . . . . 65
3.156 Results of benchmark 3-14, Neutral horizontal soil stress and bearing capacities 65
3.157 Results of benchmark 3-14, Vertical and horizontal moduli of subgrade reaction 66
3.158 Results of benchmark 3-14, Maximal axial friction and displacements . . . . . 66
3.159 Results of benchmark 3-14, Face support pressures . . . . . . . . . . . . . 66
3.160 Results of benchmark 3-14, Thrust forces . . . . . . . . . . . . . . . . . . . 67
3.161 Results of benchmark 3-14, Uplift safety factor . . . . . . . . . . . . . . . . 67
3.162 Results of benchmark 3-14, Trough . . . . . . . . . . . . . . . . . . . . . . 67
3.163 Results of benchmark 3-14, Subsidence at different horizontal distances of Z
axe (from 0 to 0.7W) ............................. 68
3.164 Results of benchmark 3-14, Subsidence at different horizontal distances of Z
axe (from 1W to 2.5W) . . . . . . . . . . . . . . . . . . . . . . . . . . . . 68
3.165 Configuration of the 3 trench sections (benchmark 3-15a) . . . . . . . . . . . 69
3.166 Analytical results for the calculation of the uplift safety factor . . . . . . . . . 70
3.167 Analytical results for the hydraulic heave check . . . . . . . . . . . . . . . . 70
3.168 Results of benchmark 3-15a, Vertical and horizontal soil stresses . . . . . . . 70
xii Deltares

List of Tables
3.169 Results of benchmark 3-15a, Initial vertical stress qkfor sand poorly compacted 71
3.170 Results of benchmark 3-15b, Initial vertical stress qkfor stiff clay poorly com-
pacted .................................... 71
3.171 Results of benchmark 3-15c, Initial vertical stress qkfor soft soil poorly com-
pacted .................................... 71
3.172 Results of benchmark 3-15d, Initial vertical stress qkfor sand well compacted . 72
3.173 Results of benchmark 3-15e, Initial vertical stress qkfor stiff clay well compacted 72
3.174 Results of benchmark 3-15f, Initial vertical stress qkfor soft soil well compacted 72
3.175 Results of benchmark 3-15a, Horizontal modulus of subgrade reaction and
bearing capacities .............................. 73
3.176 Results of benchmark 3-15a, Vertical moduli of subgrade reaction upward . . 73
3.177 Results of benchmark 3-15a, Vertical moduli of subgrade reaction downward . 73
3.178 Results of benchmark 3-15a, Maximal axial friction and displacements . . . . 74
3.179 Results of benchmark 3-15a, Uplift check . . . . . . . . . . . . . . . . . . . 74
3.180 Results of benchmark 3-15a, Hydraulic heave check . . . . . . . . . . . . . 74
3.181 Analytical results for the hydraulic heave check . . . . . . . . . . . . . . . . 75
3.182 Results of benchmark 3-16, Hydraulic heave check . . . . . . . . . . . . . . 75
3.183 Analytical results for the calculation of the five components of the pulling force
for the 10 characteristic points (bm3-17) for the equivalent pipe . . . . . . . . 76
3.184 Analytical results for the calculation of the five components of the pulling force
for the 10 characteristic points (bm3-17) for pipe nr. 1 . . . . . . . . . . . . . 77
3.185 Analytical results for the calculation of the five components of the pulling force
for the 10 characteristic points (bm3-17) for pipe nr. 2 . . . . . . . . . . . . . 77
3.186 Analytical results for the calculation of the five components of the pulling force
for the 10 characteristic points (bm3-17) for pipe nr. 3 . . . . . . . . . . . . . 77
3.187 Analytical results for the calculation of the five components of the pulling force
for the 10 characteristic points (bm3-17) for pipe nr. 4 . . . . . . . . . . . . . 78
3.188 Analytical results for the calculation of the five components of the pulling force
for the 10 characteristic points (bm3-17) for pipe nr. 5 . . . . . . . . . . . . . 78
3.189 Results of benchmark 3-17, Buoyancy Control . . . . . . . . . . . . . . . . 78
3.190 Results of benchmark 3-17, Pulling forces in the pipeline . . . . . . . . . . . 79
3.191 Position of the 6 characteristic points (bm3-18a) for case a (positive angle
between radii) ................................. 80
3.192 Position of the 6 characteristic points (bm3-18b) for case b . . . . . . . . . . 80
3.193 Results of benchmark 3-18a, Pulling forces in the pipeline . . . . . . . . . . . 81
3.194 Results of benchmark 3-18b, Pulling forces in the pipeline . . . . . . . . . . . 81
3.195 Results of benchmark 3-19, Buoyancy Control . . . . . . . . . . . . . . . . 83
3.196 Results of benchmark 3-19, Pulling forces in the pipeline . . . . . . . . . . . 83
3.197 Results of benchmark 3-19 for vertical nr. 1, Strength calculation for Combi-
nation 1A ................................... 83
3.198 Results of benchmark 3-19 for vertical nr. 1, Strength calculation for Combi-
nation 1B ................................... 83
3.199 Results of benchmark 3-19 for vertical nr. 1, Strength calculation for Combi-
nation 2 .................................... 84
3.200 Results of benchmark 3-19 for vertical nr. 1, Strength calculation for Combi-
nation 3 .................................... 84
3.201 Results of benchmark 3-19 for vertical nr. 1, Strength calculation for Combi-
nation 4 .................................... 84
3.202 Results of benchmark 3-19 for vertical nr. 1, Maximum allowable stresses . . . 84
3.203 Results of benchmark 3-19 for vertical nr. 1, Deflection of the pipeline . . . . . 84
3.204 Results of benchmark 3-19 for vertical nr. 1, Implosion . . . . . . . . . . . . 85
3.205 Results of benchmark 3-19 for vertical nr. 2, Strength calculation for Combi-
nation 1A ................................... 85
Deltares xiii

D-GEO PIPELINE
, Verification Report
3.206 Results of benchmark 3-19 for vertical nr. 2, Strength calculation for Combi-
nation 1B ................................... 85
3.207 Results of benchmark 3-19 for vertical nr. 2, Strength calculation for Combi-
nation 2 .................................... 85
3.208 Results of benchmark 3-19 for vertical nr. 2, Strength calculation for Combi-
nation 3 .................................... 85
3.209 Results of benchmark 3-19 for vertical nr. 2, Strength calculation for Combi-
nation 4 .................................... 86
3.210 Results of benchmark 3-19 for vertical nr. 2, Maximum allowable stresses . . . 86
3.211 Results of benchmark 3-19 for vertical nr. 2, Deflection of the pipeline . . . . . 86
3.212 Results of benchmark 3-19 for vertical nr. 2, Implosion . . . . . . . . . . . . 86
3.213 Results of benchmark 3-19 for vertical nr. 3, Strength calculation for Combi-
nation 1A ................................... 86
3.214 Results of benchmark 3-19 for vertical nr. 3, Strength calculation for Combi-
nation 1B ................................... 87
3.215 Results of benchmark 3-19 for vertical nr. 3, Strength calculation for Combi-
nation 2 .................................... 87
3.216 Results of benchmark 3-19 for vertical nr. 3, Strength calculation for Combi-
nation 3 .................................... 87
3.217 Results of benchmark 3-19 for vertical nr. 3, Strength calculation for Combi-
nation 4 .................................... 87
3.218 Results of benchmark 3-19 for vertical nr. 3, Maximum allowable stresses . . . 88
3.219 Results of benchmark 3-19 for vertical nr. 3, Deflection of the pipeline . . . . . 88
3.220 Results of benchmark 3-19 for vertical nr. 3, Implosion . . . . . . . . . . . . 88
3.221 Results of benchmark 3-20, Buoyancy Control . . . . . . . . . . . . . . . . 89
3.222 Results of benchmark 3-20, Pulling forces in the pipeline . . . . . . . . . . . 89
3.223 Results of benchmark 3-20 for vertical nr. 1, Strength calculation for Combi-
nation 1A ................................... 89
3.224 Results of benchmark 3-20 for vertical nr. 1, Strength calculation for Combi-
nation 1B ................................... 89
3.225 Results of benchmark 3-20 for vertical nr. 1, Strength calculation for Combi-
nation 2 .................................... 90
3.226 Results of benchmark 3-20 for vertical nr. 1, Strength calculation for Combi-
nation 3 .................................... 90
3.227 Results of benchmark 3-20 for vertical nr. 1, Strength calculation for Combi-
nation 4 .................................... 90
3.228 Results of benchmark 3-20 for vertical nr. 1, Maximum allowable stresses . . . 90
3.229 Results of benchmark 3-20 for vertical nr. 1, Deflection of the pipeline . . . . . 90
3.230 Results of benchmark 3-20 for vertical nr. 1, Implosion . . . . . . . . . . . . 91
3.231 Results of benchmark 3-20 for vertical nr. 2, Strength calculation for Combi-
nation 1A ................................... 91
3.232 Results of benchmark 3-20 for vertical nr. 2, Strength calculation for Combi-
nation 1B ................................... 91
3.233 Results of benchmark 3-20 for vertical nr. 2, Strength calculation for Combi-
nation 2 .................................... 91
3.234 Results of benchmark 3-20 for vertical nr. 2, Strength calculation for Combi-
nation 3 .................................... 91
3.235 Results of benchmark 3-20 for vertical nr. 2, Strength calculation for Combi-
nation 4 .................................... 92
3.236 Results of benchmark 3-20 for vertical nr. 2, Maximum allowable stresses . . . 92
3.237 Results of benchmark 3-20 for vertical nr. 2, Deflection of the pipeline . . . . . 92
3.238 Results of benchmark 3-20 for vertical nr. 2, Implosion . . . . . . . . . . . . 92
3.239 Results of benchmark 3-20 for vertical nr. 3, Strength calculation for Combi-
nation 1A ................................... 92
xiv Deltares

List of Tables
3.240 Results of benchmark 3-20 for vertical nr. 3, Strength calculation for Combi-
nation 1B ................................... 93
3.241 Results of benchmark 3-20 for vertical nr. 3, Strength calculation for Combi-
nation 2 .................................... 93
3.242 Results of benchmark 3-20 for vertical nr. 3, Strength calculation for Combi-
nation 3 .................................... 93
3.243 Results of benchmark 3-20 for vertical nr. 3, Strength calculation for Combi-
nation 4 .................................... 93
3.244 Results of benchmark 3-20 for vertical nr. 3, Maximum allowable stresses . . . 94
3.245 Results of benchmark 3-20 for vertical nr. 3, Deflection of the pipeline . . . . . 94
3.246 Results of benchmark 3-20 for vertical nr. 3, Implosion . . . . . . . . . . . . 94
3.247 Properties of the different layers in benchmark 21a . . . . . . . . . . . . . . 96
3.248 Values of constant C (according to table E.1 of NEN 3650-1 (NEN, 2012a)) . . 97
3.249 Soil type as a function of the cohesion and the friction angle . . . . . . . . . 98
3.250 Bending factor (acc. to table 6 of NEN 3650-3) . . . . . . . . . . . . . . . . 98
3.251 Results of benchmark 3-21a, Allowable minimum radius for steel pipes . . . . 100
3.252 Results of benchmark 3-21b, Allowable minimum radius for PE pipes . . . . . 101
3.253 Analytical results for the calculation of the five components of the pulling force
for the six characteristic points . . . . . . . . . . . . . . . . . . . . . . . . 102
3.254 Results of benchmark 3-22, Pulling forces in the pipeline . . . . . . . . . . . 102
3.255 Analytical results for the calculation of the five components of the pulling force
for the six characteristic points . . . . . . . . . . . . . . . . . . . . . . . . 103
3.256 Results of benchmark 3-23, Buoyancy Control . . . . . . . . . . . . . . . . 103
3.257 Results of benchmark 3-23, Pulling forces in the pipeline . . . . . . . . . . . 103
3.258 Results of benchmark 3-23, Implosion . . . . . . . . . . . . . . . . . . . . 104
3.259 Analytical results for the calculation of the traffic load . . . . . . . . . . . . . 106
3.261 Results of benchmark 3-24, Buoyancy control . . . . . . . . . . . . . . . . . 107
3.262 Results of benchmark 3-24, Pulling forces in the pipeline . . . . . . . . . . . 107
3.263 Results of benchmark 3-24, Strength calculation for Combination 1A . . . . . 108
3.264 Results of benchmark 3-24, Strength calculation for Combination 1B . . . . . 108
3.265 Results of benchmark 3-24, Strength calculation for Combination 2 . . . . . . 108
3.266 Results of benchmark 3-24, Strength calculation for Combination 3 . . . . . . 108
3.267 Results of benchmark 3-24, Strength calculation for Combination 4 . . . . . . 109
3.268 Results of benchmark 3-24, Maximum allowable stresses . . . . . . . . . . . 109
3.269 Results of benchmark 3-24, Deflection of the pipeline . . . . . . . . . . . . . 109
3.270 Results of benchmark 3-24, Implosion . . . . . . . . . . . . . . . . . . . . 109
3.272 Results of benchmark 3-25, Buoyancy Control . . . . . . . . . . . . . . . . 111
3.273 Results of benchmark 3-25, Pulling forces in the pipeline . . . . . . . . . . . 111
3.274 Results of benchmark 3-25, Strength calculation for Combination 1A . . . . . 111
3.275 Results of benchmark 3-25, Strength calculation for Combination 1B . . . . . 112
3.276 Results of benchmark 3-25, Strength calculation for Combination 2 . . . . . . 112
3.277 Results of benchmark 3-25, Strength calculation for Combination 3 . . . . . . 112
3.278 Results of benchmark 3-25, Strength calculation for Combination 4 . . . . . . 112
3.279 Results of benchmark 3-25, Maximum allowable stresses . . . . . . . . . . . 113
3.280 Results of benchmark 3-25, Deflection of the pipeline . . . . . . . . . . . . . 113
3.281 Results of benchmark 3-25, Implosion . . . . . . . . . . . . . . . . . . . . 113
3.283 Results of benchmark 3-26, Buoyancy control . . . . . . . . . . . . . . . . . 115
3.284 Results of benchmark 3-26, Pulling forces in the pipeline . . . . . . . . . . . 115
3.285 Results of benchmark 3-26, Strength calculation for Combination 1A . . . . . 115
3.286 Results of benchmark 3-26, Strength calculation for Combination 1B . . . . . 115
3.287 Results of benchmark 3-26, Strength calculation for Combination 2 . . . . . . 115
3.288 Results of benchmark 3-26, Strength calculation for Combination 3 . . . . . . 116
3.289 Results of benchmark 3-26, Strength calculation for Combination 4 . . . . . . 116
3.290 Results of benchmark 3-26, Maximum allowable stresses . . . . . . . . . . . 116
Deltares xv

D-GEO PIPELINE
, Verification Report
3.291 Results of benchmark 3-26, Deflection of the pipeline . . . . . . . . . . . . . 116
3.292 Results of benchmark 3-26, Implosion . . . . . . . . . . . . . . . . . . . . 116
4.1 Results of benchmark 4-01, Pulling forces in the pipeline . . . . . . . . . . . 117
5.1 Koppejan’s parameters (benchmark 5-1) . . . . . . . . . . . . . . . . . . . 119
5.2 Results of benchmark 5-01, Settlements according to Koppejan . . . . . . . . 120
5.3 Isotache’s parameters (bm5-02) . . . . . . . . . . . . . . . . . . . . . . . . 120
5.4 Results of benchmark 5-02a, Settlements according to Isotache with OCR
consolidation . . . . . . . . . . . . . . . . . . . . . . . . . . . . . . . . . 121
5.5 Results of benchmark 5-02b, Settlements according to Isotache with POP con-
solidation . . . . . . . . . . . . . . . . . . . . . . . . . . . . . . . . . . . 121
xvi Deltares

Introduction
Deltares Systems commitment to quality control and quality assurance has leaded them to
develop a formal and extensive procedure to verify the correct working of all of their geotech-
nical engineering tools. An extensive range of benchmark checks have been developed to
check the correct functioning of each tool. During product development these checks are run
on a regular basis to verify the improved product. These benchmark checks are provided
in the following sections, to allow the user to overview the checking procedure and verify for
themselves the correct functioning of
D-GEO PIPELINE
.
The benchmarks are subdivided into five separate groups as described below.
Group 1 [chapter 1] – Benchmarks from literature (exact solution)
Simple benchmarks for which an exact analytical result is available from literature.
Group 2 [chapter 2] – Benchmarks from literature (approximate solution)
More complex benchmarks described in literature for which an approximate solution is
known.
Group 3 [chapter 3] – Benchmarks from spread sheets
Benchmarks which test program features specific to MSheet.
Group 4 [chapter 4] – Benchmarks generated by
D-GEO PIPELINE
Benchmarks for which the reference results are generated using
D-GEO PIPELINE
.
Group 5 [chapter 5] – Benchmarks compared with other programs
Benchmarks for which the results of
D-GEO PIPELINE
are compared with the results of other
programs.
The number of benchmarks in group 1 may grow in the future. The benchmarks in this chapter
are well documented in literature. There are no exact solutions available for these problems,
however in the literature estimated results are available. When verifying the program, the
results should be close to the results found in the literature.
The number of benchmarks in group 2 will grow as new versions of the program are released.
These benchmarks are designed so that (new) features specific to the program can be ver-
ified. The benchmarks are kept as simple as possible so that only one specific feature is
verified from one benchmark to the next.
As much as software developers would wish they could, it is impossible to prove the correct-
ness of any non-trivial program. Re-calculating all the benchmarks in this report, and making
sure the results are as they should be, proves to some degree that the program works as it
should. Nevertheless, there will always be combinations of input values that will cause the
program to crash or to produce wrong results. Hopefully by using the verification procedure
the number of ways this can occur will be limited.
The benchmarks are all described in sufficient detail for reproduction to be possible at any
time. The results are presented in text format with each benchmark description. The results
in graphic format are available in the appendix, together with a copy of a part of the output file.
This information is enough to be able to make the calculation. For each benchmark at least
one picture is presented which shows the relevant results.
The different benchmarks from literature with an exact solution (group 1) are described in the
following paragraphs.
Deltares 1 of 126

D-GEO PIPELINE
, Verification Report
2 of 126 Deltares
1 Group 1: Benchmarks from literature (exact solution)
1.1 Soil type and displacement at maximal friction (Micro-tunneling and Trenching)
1.1.1 Description
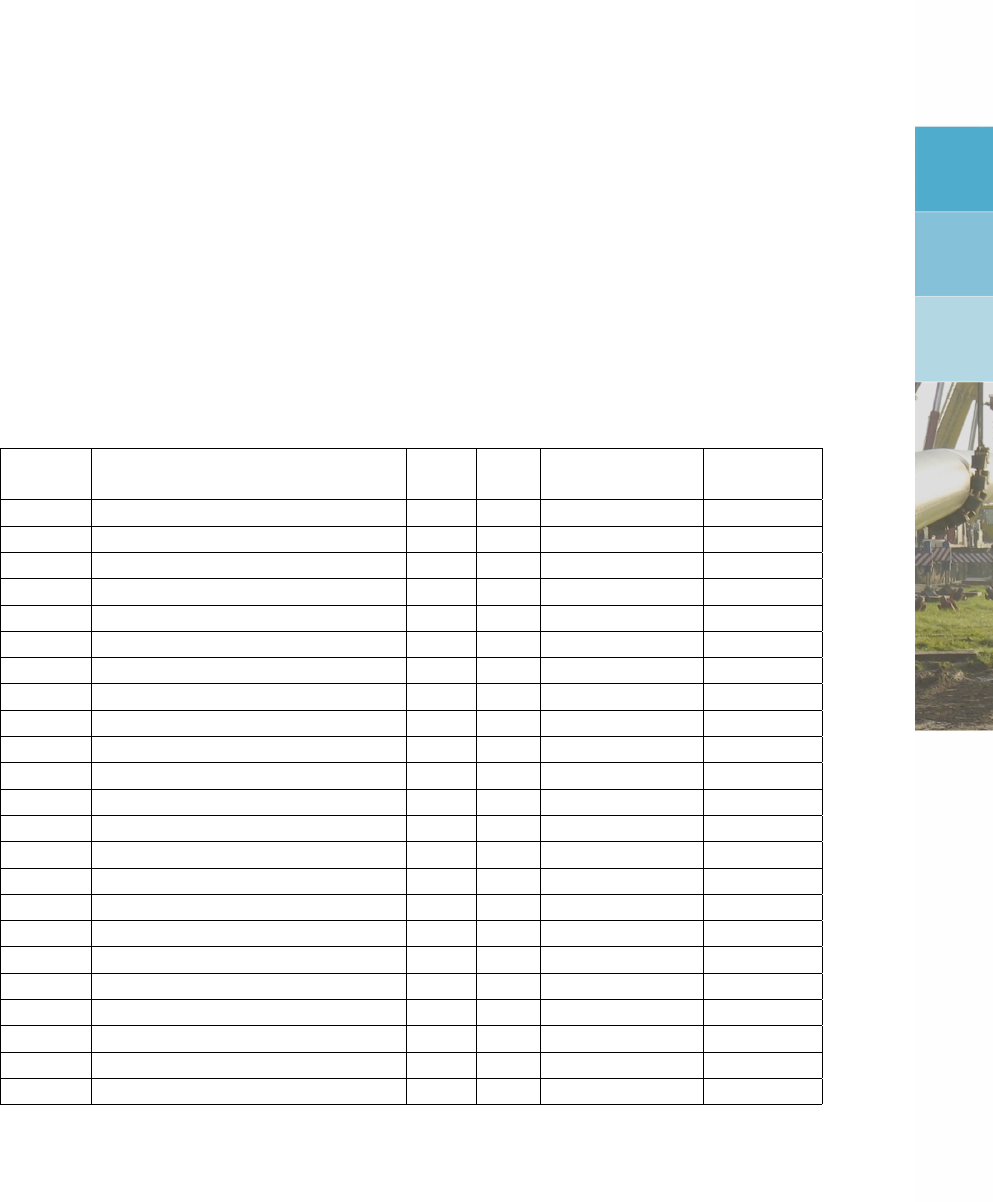
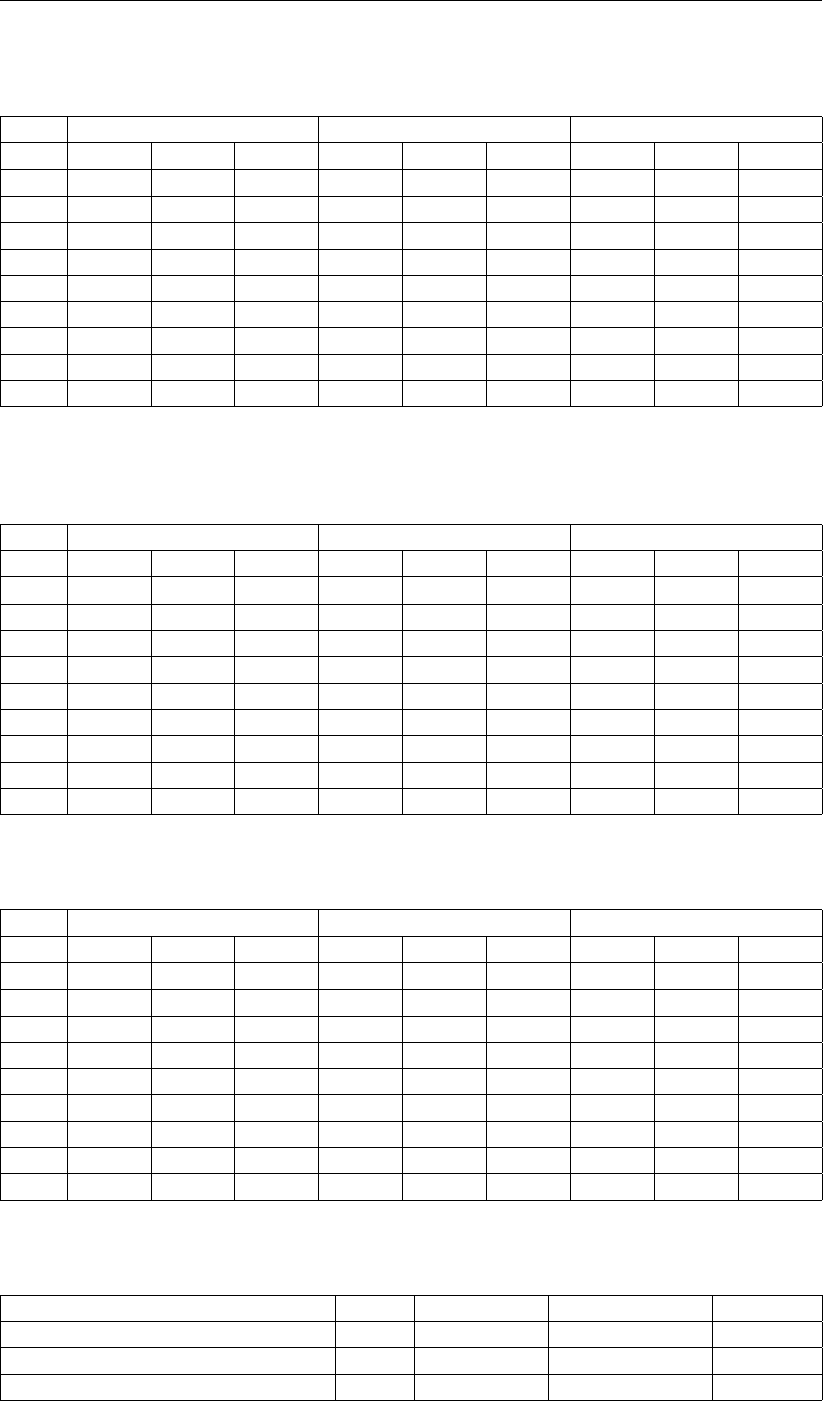
This benchmark checks the classification of the soil type and the displacement at maximal
friction associated to each soil type. Many combinations of parameters cand ϕare simulated
as shown in Table 1.1.
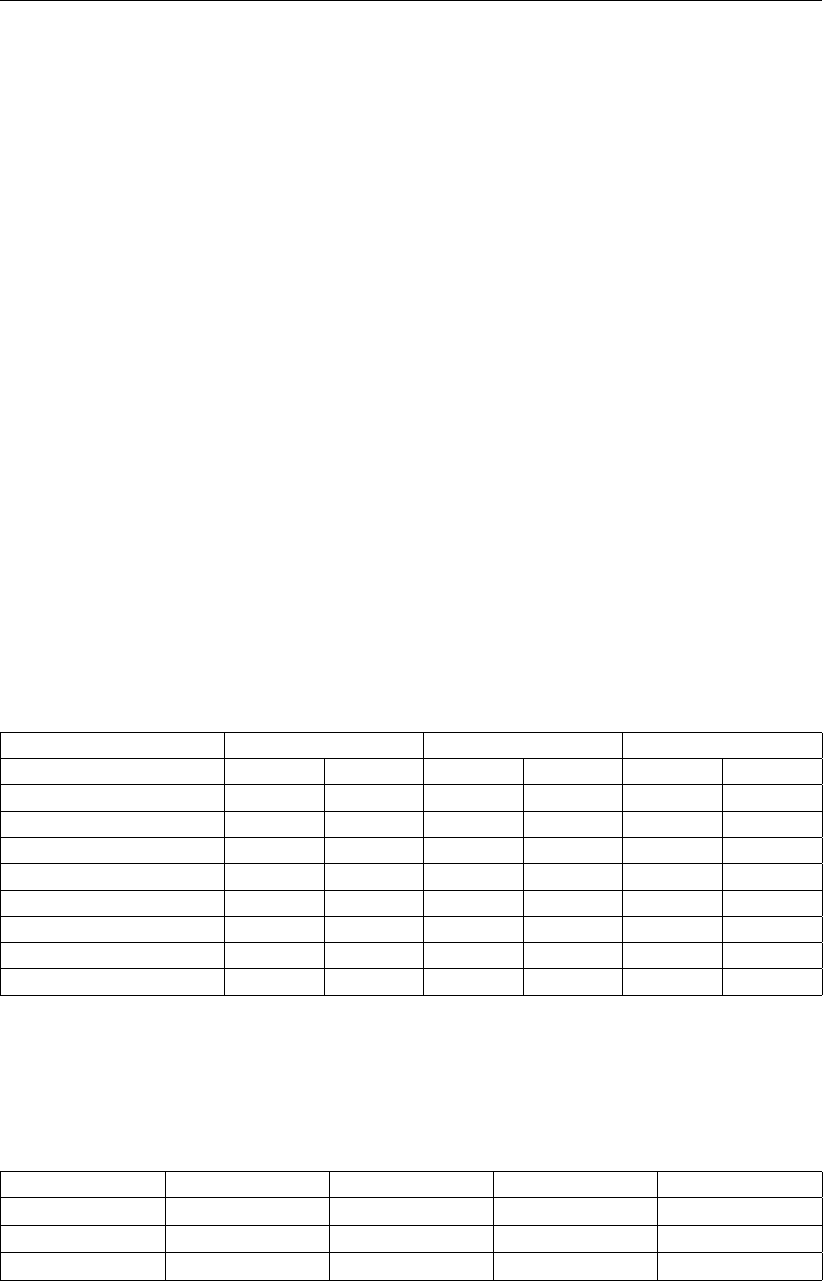
Table 1.1: Material properties of the different layers (benchmark 1-1)
Vertical Material description c ϕ Friction displac. Global soil
nr. [kPa] [◦] [mm] type
1 Dense sand 1 0.2 32.6 2 Sand
2 Dense sand 2 0.5 40 2 Sand
3 Stiff clay 1 3 35 3 Clay
4 Medium dense sand 1 0.3 30.1 4 Sand
5 Medium dense sand 2 0.5 32 4 Sand
6 Stiff clay 2 1 32.5 3 Clay
7 Loose sand 1 0.1 25.1 7 Sand
8 Loose sand 2 1 26 7 Sand
9 Stiff sandy clay 1 5 27 5 Clay
10 Stiff sandy clay 2 10 29 3 Clay
11 Stiff clay 3 35 30 3 Clay
12 Clayey sand 1 4 22.6 7 Sand
13 Clayey sand 2 5 23 7 Sand
14 Stiff sandy clay 3 12 25 3 Clay
15 Medium stiff clay 1 6 20.1 5 Clay
16 Medium stiff clay 2 10 21 5 Clay
17 Stiff clay 4 15 22.5 4 Clay
18 Soft clay 1 4.9 17.1 8 Clay
19 Soft clay 2 5 18 8 Clay
20 Medium stiff clay 3 5.3 19 5 Clay
21 Stiff clay 5 10 20 5 Clay
22 Organic clay 15 17 10 Peat
23 Peat 30 14 13 Peat
Deltares 3 of 126
D-GEO PIPELINE
, Verification Report
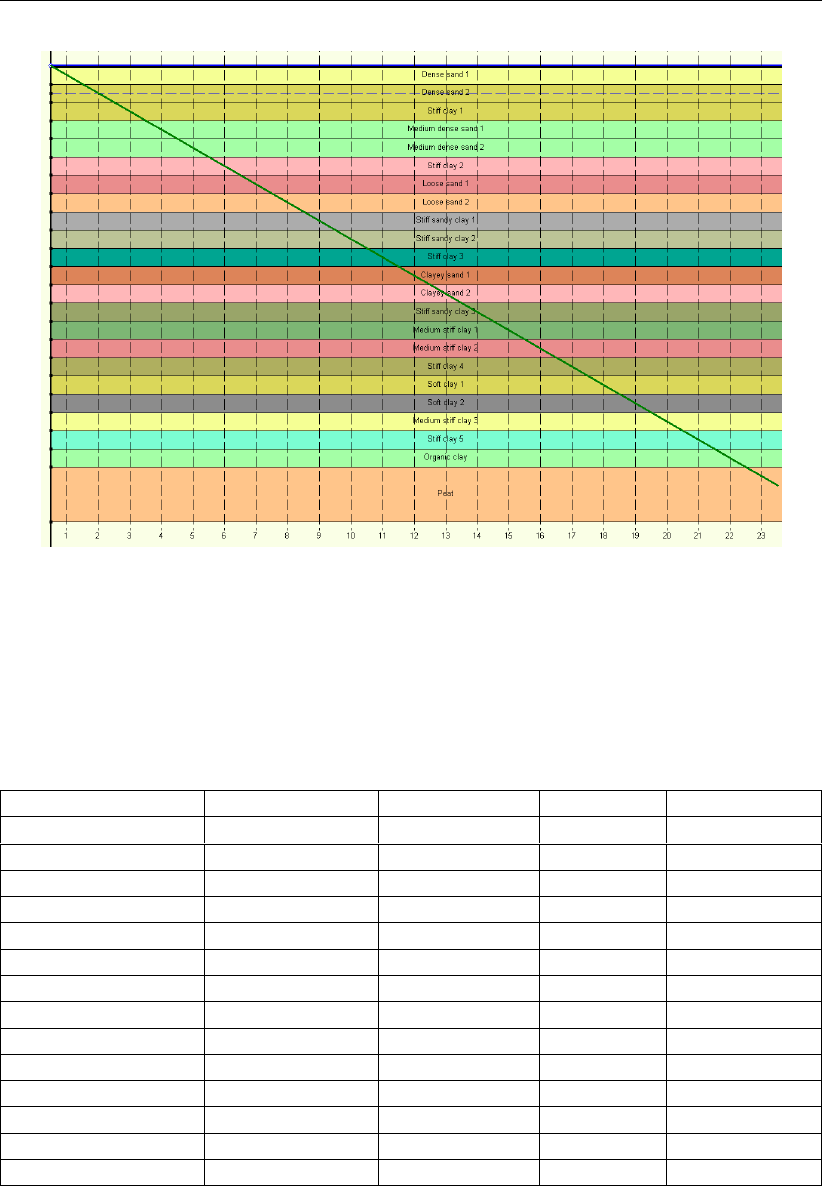
Figure 1.1: Geometry of benchmark 1-1a (Construction in Trench)
1.1.2 Benchmark results
The displacement necessary to develop the maximal axial friction along the pipeline and the
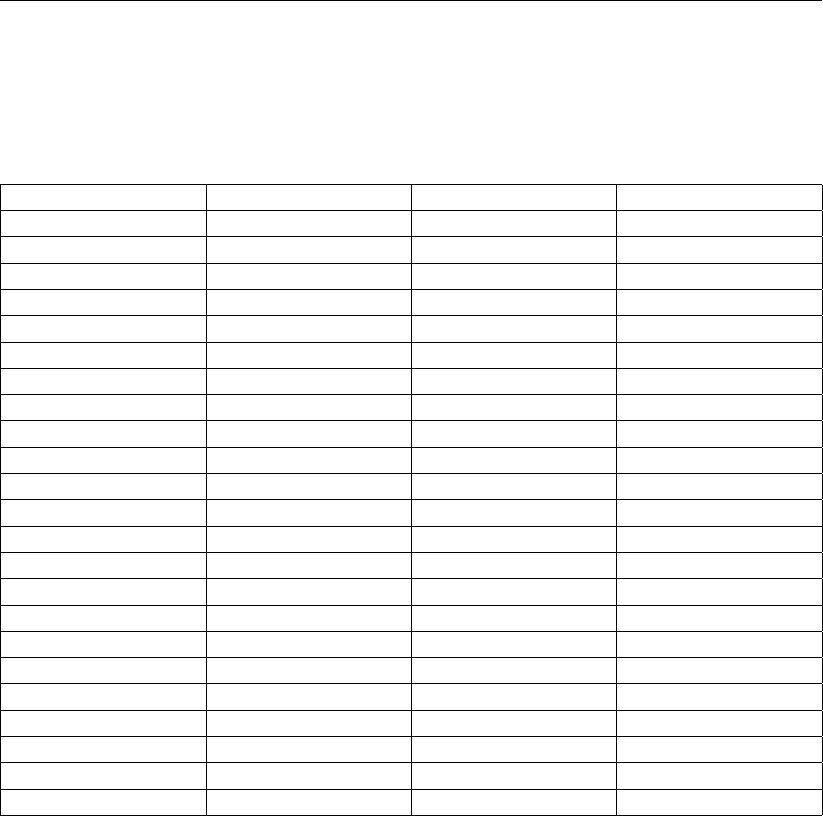
classification of global soil types are determined using Table 1.2.
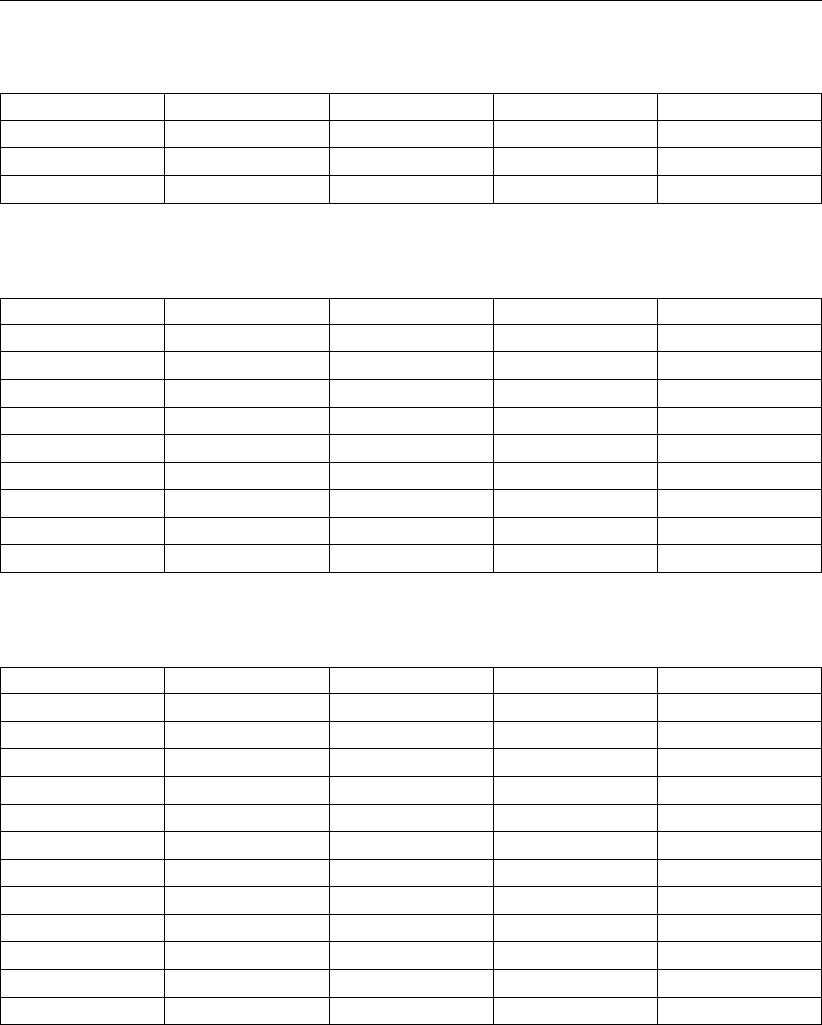
Table 1.2: Displacement at maximal friction and classification of the soil type
Soil type Global soil type ϕcDisplacement
[◦] [kN/m2] [mm]
Dense sand Sand ϕ > 32.5 c≤0.5 1-3
Medium dense sand Sand 30 < ϕ ≤32.5 c≤0.5 3-5
Medium dense sand Sand ϕ > 30 c > 0.5 3-5
Loose sand Sand 25 < ϕ ≤30 c≤1 5-8
Stiff sandy clay Clay 25 < ϕ ≤30 c > 1 4-6
Stiff sandy clay Clay 22.5 < ϕ 25 c > 5 2-4
Clayey sand Sand 22.5 < ϕ ≤25 c≤5 5-8
Stiff clay Clay 20 < ϕ ≤22.5 c > 10 2-4
Medium stiff clay Clay 20 < ϕ ≤22.5 c≤10 4-6
Stiff clay Clay 17 < ϕ ≤20 c > 10 2-4
Medium stiff clay Clay 17 < ϕ ≤20 5 < c ≤10 4-6
Soft clay Clay 17 < ϕ ≤20 c≤5 6-10
Peat / organic clay Peat ϕ≤17 10-15
The Construction in trench model (bm1-1a) and the Micro-tunneling model (bm1-1b) are
checked. Benchmark results are presented in both tables below.
4 of 126 Deltares
Group 1: Benchmarks from literature (exact solution)
1.1.3 D-GEO PIPELINE results
D-GEO PIPELINE
results can be found in the Report.
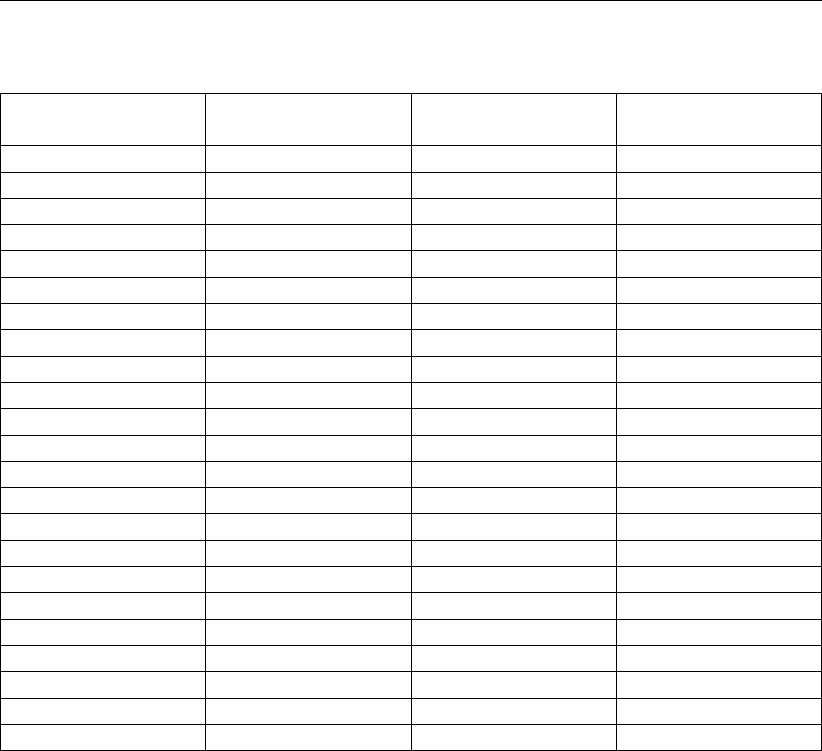
Table 1.3: Results of benchmark 1-1a, Global soil type for Construction in Trench
Vertical nr. Benchmark
D-GEO PIPELINE
Result
1 Sand Sand OK
2 Sand Sand OK
3 Clay Clay OK
4 Sand Sand OK
5 Sand Sand OK
6 Clay Clay OK
7 Sand Sand OK
8 Sand Sand OK
9 Clay Clay OK
10 Clay Clay OK
11 Clay Clay OK
12 Sand Sand OK
13 Sand Sand OK
14 Clay Clay OK
15 Clay Clay OK
16 Clay Clay OK
17 Clay Clay OK
18 Clay Clay OK
19 Clay Clay OK
20 Clay Clay OK
21 Clay Clay OK
22 Peat Peat OK
23 Peat Peat OK
Deltares 5 of 126
D-GEO PIPELINE
, Verification Report
Table 1.4: Results of benchmark 1-1a, Maximal displacement for Construction in Trench
Vertical Benchmark
D-GEO PIPELINE
Rel. error
nr. [mm] [mm] [%]
1 2 2 0.00
2 2 2 0.00
3 3 3 0.00
4 4 4 0.00
5 4 4 0.00
6 3 3 0.00
7 7 7 0.00
8 7 7 0.00
9 5 5 0.00
10 3 3 0.00
11 3 3 0.00
12 7 7 0.00
13 7 7 0.00
14 3 3 0.00
15 5 5 0.00
16 5 5 0.00
17 4 4 0.00
18 8 8 0.00
19 8 8 0.00
20 5 5 0.00
21 5 5 0.00
22 10 10 0.00
23 13 13 0.00
6 of 126 Deltares
Group 1: Benchmarks from literature (exact solution)
Table 1.5: Results of benchmark 1-1b, Global soil type for Micro Tunneling
Vertical nr. Benchmark
D-GEO PIPELINE
Error
1 Sand Sand OK
2 Sand Sand OK
3 Clay Clay OK
4 Sand Sand OK
5 Sand Sand OK
6 Clay Clay OK
7 Sand Sand OK
8 Sand Sand OK
9 Clay Clay OK
10 Clay Clay OK
11 Clay Clay OK
12 Sand Sand OK
13 Sand Sand OK
14 Clay Clay OK
15 Clay Clay OK
16 Clay Clay OK
17 Clay Clay OK
18 Clay Clay OK
19 Clay Clay OK
20 Clay Clay OK
21 Clay Clay OK
22 Peat Peat OK
23 Peat Peat OK
Deltares 7 of 126

D-GEO PIPELINE
, Verification Report
Table 1.6: Results of benchmark 1-1b, Maximal displacement for Micro Tunneling
Vertical Benchmark
D-GEO PIPELINE
Rel. error
nr. [mm] [mm] [%]
1 2 2 0.00
2 2 2 0.00
3 3 3 0.00
4 4 4 0.00
5 4 4 0.00
6 3 3 0.00
7 7 7 0.00
8 7 7 0.00
9 5 5 0.00
10 3 3 0.00
11 3 3 0.00
12 7 7 0.00
13 7 7 0.00
14 3 3 0.00
15 5 5 0.00
16 5 5 0.00
17 4 4 0.00
18 8 8 0.00
19 8 8 0.00
20 5 5 0.00
21 5 5 0.00
22 10 10 0.00
23 13 13 0.00
Use
D-GEO PIPELINE
input files bm1-1a.dri and bm1-1b.dri to run this benchmark.
8 of 126 Deltares

2 Group 2: Benchmarks from literature (approximate solution)
The different benchmarks from literature for which an approximate solution is known are de-
scribed in this chapter. Currently, no benchmarks are available.
Deltares 9 of 126

D-GEO PIPELINE
, Verification Report
10 of 126 Deltares

3 Group 3: Benchmarks from spreadsheets
The benchmarks in this chapter (group 3) check if the output of
D-GEO PIPELINE
is according
to the formula’s given in the User Manual of
D-GEO PIPELINE
[Deltares] using spreadsheets.
Those formula’s are based on the Dutch standards NEN 3650-1, NEN 3650-2, NEN 3650-3
and NEN 3651 (NEN,2012a,b,c,d).
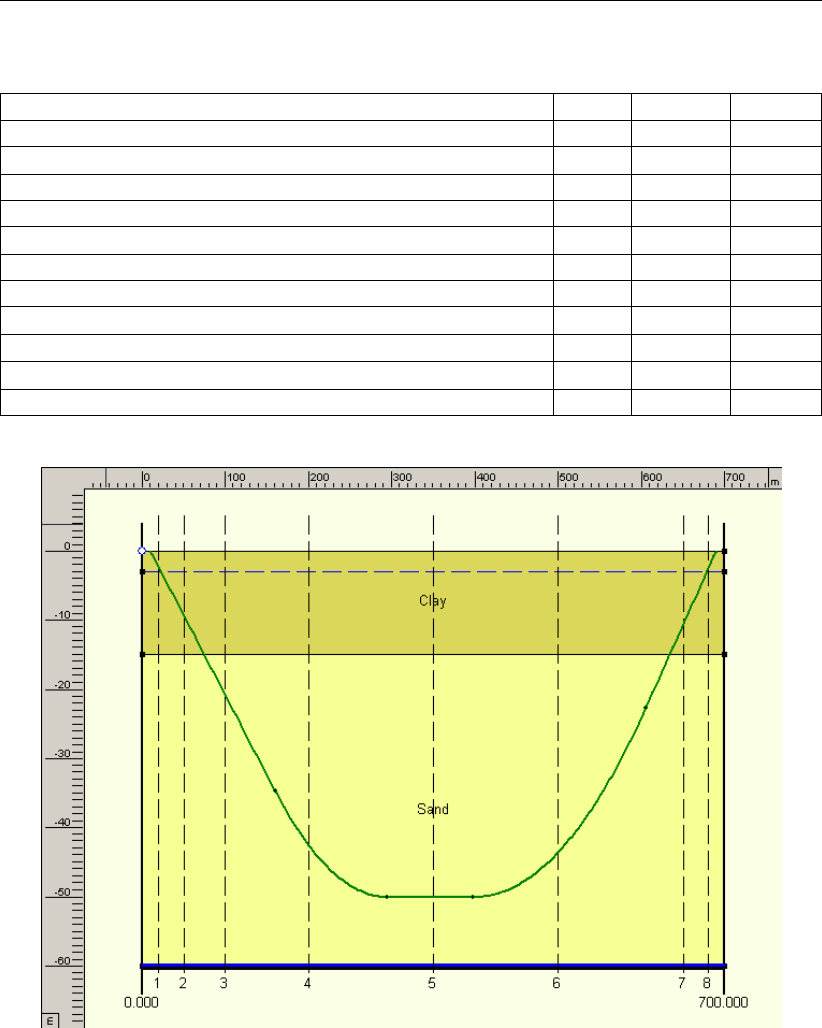
3.1 HDD with 2D geometry – Steel pipe in two compressible undrained layers
3.1.1 Description
The pipe is constructed in two compressible undrained layers (clay and sand) with the charac-
teristics given in Table 3.1. The boundaries between compressible/incompressible layers and
drained/undrained layers are situated at the bottom of the sand layer. The ground level is at
depth Z= 0 m and the phreatic line is at depth Z= -3 m. The steel pipe properties are given
in Table 3.2. Calculations are performed for 8 verticals with Lcoordinates of 20, 50, 100, 200,
350, 500, 650 and 680 m.
The configuration of the pipeline is given by:
Xleft 10 m X-coordinate of the left entry point
Xright 690 m X-coordinate of the right exit point
ϕleft 13 deg Left angle of the pipe
ϕright 15 deg Right angle of the pipe
Zlowest -50 m Lowest level of the pipe
Rleft 600 m Bending radius of the pipe at the left side
Rright 800 m Bending radius of the pipe at the right side
Rrol 1000 m Bending radius in pipe string (on rollers)
Table 3.1: Soil material properties (bm3-1)
Sand Clay
Bottom depth of the layer Zlowest [m] -60 -15
Unit weight above phreatic level γunsat [kN/m3] 18 14
Unit weight below phreatic level γsat [kN/m3] 20 16
Cohesion c[kN/m2] 0.2 5
Friction angle ϕ[deg] 30 22.5
Undrained cohesion at the top cu;top [kN/m2] 0.2 25
Undrained cohesion at the bottom cu;bot [kN/m2] 0.5 30
Young modulus at the top Etop [kN/m2] 20000 1500
Young modulus at the top Ebot [kN/m2] 25000 2000
Poisson ratio ν[-] 0.45 0.4
Deltares 11 of 126
D-GEO PIPELINE
, Verification Report
Table 3.2: Pipe material data (bm3-1)
Material Steel
Negative wall thickness tolerance δt [%] 15
Yield strength Reb [N/mm2] 235
Partial material factor γm[-] 1.1
Partial material factor for test pressure γm;test [-] 1
Young’s modulus Eb[N/mm2] 205800
Outer diameter D0[m] 0.8
Nominal wall thickness dn[mm] 19
Unit weight γb[kN/m3] 78.5
Design pressure pd[kN/m2] 600
Test pressure pt[kN/m2] 834
Temperature variation ∆t[◦] 10
Figure 3.1: 2D Geometry of benchmark 3-1 (steel pipeline in two compressible undrained
layers)
3.1.2 Analytical results
Analytical results are worked out in an Excel spreadsheet.
Soil mechanical data
The soil mechanical data’s are determined using the formulas given in chapter Calculation of
soil mechanical data in the Background section of the User Manual of
D-GEO PIPELINE
. The
maximal axial friction between the pipe and the drilling fluid is constant along the pipeline and
equal to f2= 50 N/m2. The displacement necessary to develop the maximal axial friction
along the pipeline is estimated between 6 and 9 mm (= 7.5 mm).
12 of 126 Deltares
Group 3: Benchmarks from spreadsheets
Minimum drilling fluid pressures
For the minimum drilling fluid pressures, calculations are performed during the three stages
of the drilling process using the formulas given in paragraph “Minimum required drilling fluid
pressure” in the Background section of the User Manual of
D-GEO PIPELINE
[Deltares]. The
minimum required pressure dp/dz is the optimal value for which the calculated flow rate Qis
equal to the requested flow rate Qreq (necessary to initiate flow of drilling fluid). Calculations
are performed in an Excel spreadsheet using the solver option and lead to the values of dp/dz
given in Table 3.3.
Table 3.3: Analytical results for the calculation of dp/dz for the three stages
Pilot Pre-ream Pull back
Pipe diameter [m] 0.114 0.5 0.8
Hole radius [m] 0.1 0.3 0.45
Circulation loss factor floss [-] 0.3 0.2 0.2
Annular back flow rate Qann [m3/s] 0.0025 0.0067 0.0033
Request back flow rate Qreq [m3/s] 0.00175 0.00536 0.00264
Minimum required pressure dp/dz [kN/m3] 0.63631 0.56048 0.56018
Maximum drilling fluid pressures
For the maximum drilling fluid pressures in undrained conditions, calculations are performed
using the formulas given in paragraph Maximum required drilling fluid pressure in the Back-
ground section of the User Manual of
D-GEO PIPELINE
. Analytical results are given in the table
below.
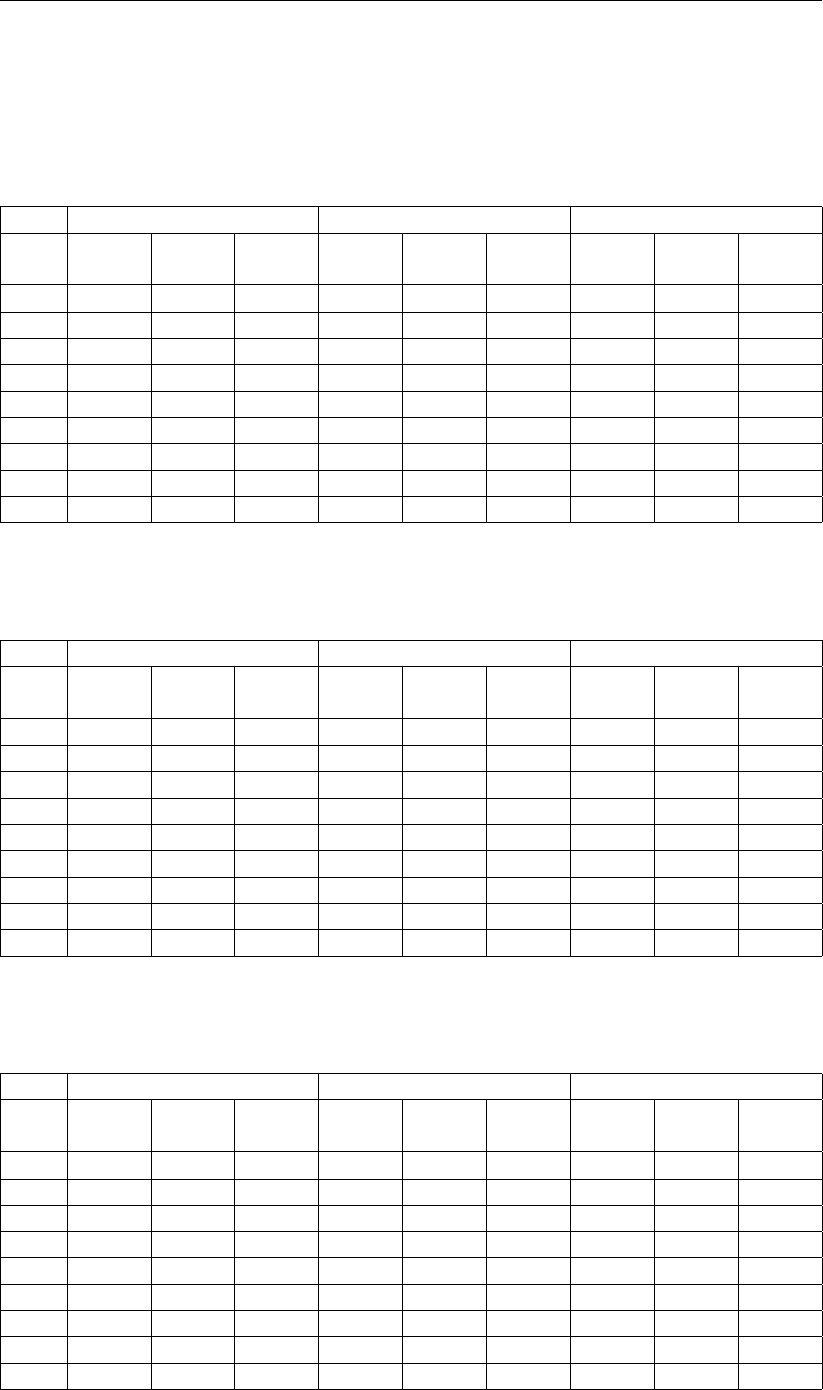
Table 3.4: Analytical results for the calculation of the maximum drilling fluid pressures
Vert. u 0.9 plimit ppilot ppreream pback ppilot ppreream pback
plastic zone related to : deformation bore hole soil cover
[-] [kN/m2] [kN/m2] [kN/m2] [kN/m2] [kN/m2] [kN/m2] [kN/m2] [kN/m2]
1 0 88.6 95.29 80.21 69.47 95.29 80.21 69.47
2 62.35 122.71 136.09 134.22 131.85 136.09 134.22 131.85
3 177.78 107.92 119.49 117.92 117.01 119.49 117.92 117.01
4 394.42 222.39 246.97 246.52 246.25 246.97 246.52 246.25
5 470 264.87 294.21 293.81 293.56 294.21 293.81 293.56
6 404.81 228.21 253.45 253 252.74 253.45 253 252.74
7 77.18 129.29 143.47 142.02 140.14 143.47 142.02 140.14
8 0 91.95 99.75 87.08 77.24 99.75 87.08 77.24
Strength calculation
For the buoyancy control, the pulling forces in the pipeline and the strength calculation, cal-
culations are performed using the formulas given in chapter “Strength pipeline calculation” in
the Background section of the User Manual of
D-GEO PIPELINE
.
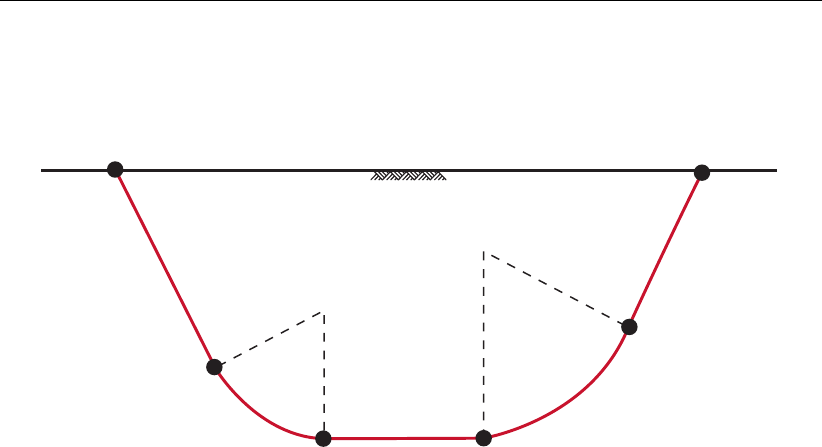
The length of the pipe in the borehole at the characteristic points (Figure 3-2) is:
LA=0 m
LB=LA+|Zlowest +Rleft ×(1 −cos ϕleft)|/sin ϕleft =153.909 m
LC=LB+ϕleft ×Rleft =290.045 m
Ld=LC+Xright − |Zlowest +Rright (1 −cos ϕright)|/tan ϕright −Rright ×sin ϕright
−Xleft − |Zlowest +Rleft ×(1 −cos ϕleft)|/tan ϕleft −Rleft ×sin ϕleft =393.185 m
LE=Ld+ϕright ×Rright =602.625 m
Deltares 13 of 126
D-GEO PIPELINE
, Verification Report
LF=LE+|Zlowest +Rright ×(1 −cos ϕright)|/sin ϕright =690.488 m
entry point exit point
ground level
T1
T2
T5
T6
T3 T4
Figure 3.2: Locations of the characteristic points T1 to T6
Hereafter are some intermediate results used for the pulling force and the strength calcula-
tions:
Factor of friction pipe-roller f10.1 [-]
Friction pipe-mud f20.00005 [N/mm2]
Factor of friction pipe-soil f30.2 [-]
Load factor - Design pressure fpd 1.25 [-]
Load factor - Design pressure (combination) fpd;comb 1.15 [-]
Load factor - Test pressure fpt 1.1 [-]
Load factor - Installation finstall 1.1 [-]
Load factor - Soil load Qn fQn1 1.5 [-]
Load factor - Temperature ftemp 1.1 [-]
Contingency factor - E-modulus fE1.25 [-]
Contingency factor - Pulling force fpull 1.4 [-]
Contingency factor - Modulus of subgrade reaction fkv 1.6 [-]
Contingency factor - Soil load Qn fQn2 1.1 [-]
Contingency factor - Bending moment fM1.27 [-]
Contingency factor - Bending radius fR1.1 [-]
Contingency factor - Pressure borehole fpress;bore 1.1 [-]
Effective weight of pipe geff 1.414 [N/mm]
Weight of pipeline (incl. filling) gfill 0.456 [N/mm]
Uplift force gupw 5.529 [N/mm]
Moment coefficient indirect bottom kb’ 0.083 [-]
Moment coefficient indirect top kt’ 0.061 [-]
Moment coefficient direct bottom kb0.138 [-]
Moment coefficient direct top kt0.131 [-]
Direct deflection factor ky0.089 [-]
Indirect deflection factor ky’ 0.048 [-]
Part of pipe filled with water during pull back Pwater 10 [%]
Cross sections of the pipe A39769.979 [mm2]
Atrek 46618.093 [mm2]
14 of 126 Deltares
Group 3: Benchmarks from spreadsheets
Ainw 456036.731 [mm2]
Minimal wall thickness dn;min 16.15 [mm]
Outer radius of the pipeline re400 [mm]
Inner radius of the pipeline ri381 [mm]
Average radius of the pipeline rg390.5 [mm]
Moment of inertia of the pipe Ib3556505999 [mm4]
Moment of inertia of the wall Iw571.583 [mm3]
Pipe resisting moment Wb8891265 [mm4m]
Wall resisting moment Ww60.167 [mm3m]
Unit weight of drilling fluid γdrill fluid 11 [kN/m3]
Maximum modulus of subgrade reaction kv;max 30945.502 [kN/m3]
Maximum neutral vertical soil load qv;n;r;max 184.15 [kN/m2]
Maximum corrected reduced soil load qn303.847 [kN/m2]
Maximum neutral horizontal soil load qh;n;r 136.488 [kN/m2]
Soil reaction - Left curve qr;left 49.727 [kN/m2]
Soil reaction - Right curve qr;right 37.295 [kN/m2]
Soil reaction - Left curve (long term) qr;left n.a. [kN/m2]
Soil reaction - Right curve (long term) qr;right n.a. [kN/m2]
Characteristic stiffness pipeline-soil λ0.0003032 [mm-1]
Characteristic stiffness pipeline-soil (long term) λlong n.a. [mm-1]
The total pulling force is the contribution of five components. Results are given in Table 3-5.
Table 3.6: Results of benchmark 3-01, Pulling forces in the pipeline
Benchmark
D-GEO PIPELINE
Relative error
Charac. points Length Force Length Force Length Force
[m] [kN] [m] [kN] [%] [%]
T1 0 284 0 284 0.00 0.00
T2 154 284 154 284 0.00 0.00
T3 290 468 290 468 0.00 0.00
T4 393 468 393 468 0.00 0.00
T5 603 622 603 622 0.00 0.00
T6 690 622 690 622 0.00 0.00
Max. rep. pulling force - 5187 - 5187 - 0.00
The maximum combined stress at the top or the bottom, and inside or outside the pipe is
calculated in the tables below and used for checking the calculated stresses.
Table 3.7: Set for calculation of the maximum stresses for load combination 1A
Top outside Top inside Bottom inside Bottom outside
σx[N/mm2] 115.5 115.5 137.51 137.51
σy[N/mm2]0000
σV[N/mm2] 115.5 115.5 137.51 137.51
Deltares 15 of 126
D-GEO PIPELINE
, Verification Report
Table 3.8: Set for calculation of the maximum stresses for load combination 1B
Top outside Top inside Bottom inside Bottom outside
σx[N/mm2] 186.75 186.75 234.92 234.92
σy[N/mm2] -15.81 15.81 21.51 -21.51
σV[N/mm2] 195.14 179.37 224.94 246.38
Table 3.9: Set for calculation of the maximum stresses for load combination 3
Top outside Top inside Bottom inside Bottom outside
σx;2 [N/mm2] 0 0 0 0
σy;2 [N/mm2] -207.43 207.43 218.51 -218.51
σV;2 [N/mm2] 207.43 207.43 218.51 218.51
σx;3 [N/mm2] -210.84 -210.84 210.84 210.84
σy;3 [N/mm2] 0 0 0 0
σV;3 [N/mm2] 210.84 210.84 210.84 210.84
σx;4 [N/mm2] -210.84 -210.84 210.84 210.84
σy;4 [N/mm2] -223.23 223.23 240.02 -240.02
σV;4 [N/mm2] 217.3 375.97 226.84 390.72
Table 3.10: Set for calculation of the maximum stresses for load combination 4
Top outside Top inside Bottom inside Bottom outside
σx;1 [N/mm2] 8.37 8.37 8.37 8.37
σy;1 [N/mm2] 16.74 16.74 16.74 16.74
σV;1 [N/mm2] 14.5 14.5 14.5 14.5
σx;2 [N/mm2] 8.37 8.37 8.37 8.37
σy;2 [N/mm2] -179.93 213.42 223.93 -190.44
σV;2 [N/mm2] 184.26 209.36 219.86 194.76
σx;3 [N/mm2] -202.46 -202.46 219.21 219.21
σy;3 [N/mm2] 16.74 16.74 16.74 16.74
σV;3 [N/mm2] 211.33 211.33 211.33 211.33
σx;4 [N/mm2] -202.46 -202.46 219.21 219.21
σy;4 [N/mm2] -195.29 228.78 244.82 -211.33
σV;4 [N/mm2] 198.97 373.7 233.07 372.88
16 of 126 Deltares
Group 3: Benchmarks from spreadsheets
3.1.3 D-GEO PIPELINE results
D-GEO PIPELINE
results presented in the tables below can be found in the Report.
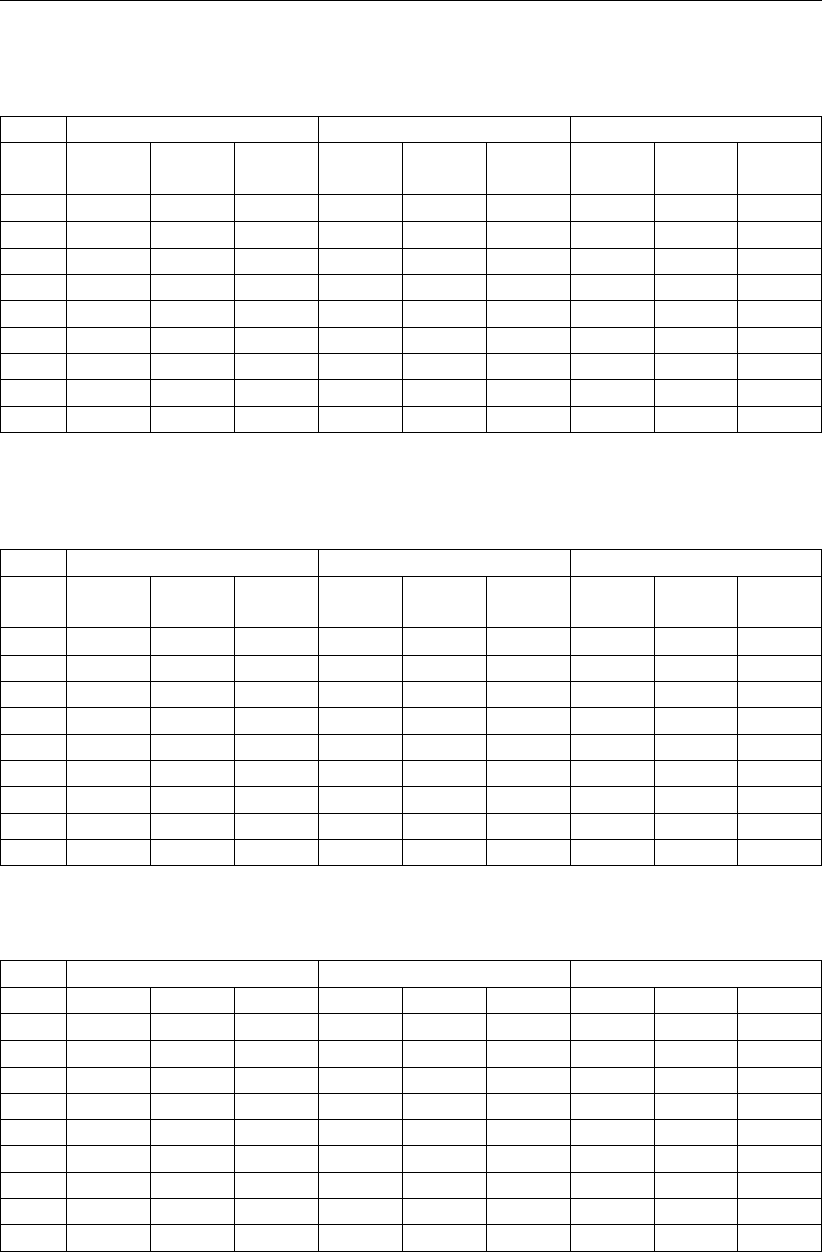
Table 3.11: Results of benchmark 3-01, Maximum allowable drilling fluid pressure (plastic
zone related to deformation bore hole)
Benchmark
D-GEO PIPELINE
Relative error
Vert. Pilot Pre-
ream
Pull
back
Pilot Pre-
ream
Pull
back
Pilot Pre-
ream
Pull
back
[-] [kN/m2] [kN/m2] [kN/m2] [kN/m2] [kN/m2] [kN/m2] [%] [%] [%]
1 89 80 69 89 80 69 0.00 0.00 0.00
2 185 185 185 185 185 185 0.00 0.00 0.00
3 286 286 286 286 286 286 0.00 0.00 0.00
4 617 617 617 617 617 617 0.00 0.00 0.00
5 735 735 735 735 735 735 0.00 0.00 0.00
6 633 633 633 634 634 634 0.16 0.16 0.16
7 206 206 206 206 206 206 0.00 0.00 0.00
8 92 87 77 92 87 77 0.00 0.00 0.00
Table 3.12: Results of benchmark 3-01, Maximum allowable drilling fluid pressure (plastic
zone related to soil cover)
Benchmark
D-GEO PIPELINE
Relative error
Vert. Pilot Pre-
ream
Pull
back
Pilot Pre-
ream
Pull
back
Pilot Pre-
ream
Pull
back
[-] [kN/m2] [kN/m2] [kN/m2] [kN/m2] [kN/m2] [kN/m2] [%] [%] [%]
1 89 80 69 89 80 69 0.00 0.00 0.00
2 185 185 185 185 185 185 0.00 0.00 0.00
3 286 286 286 286 286 286 0.00 0.00 0.00
4 617 617 617 617 617 617 0.00 0.00 0.00
5 735 735 735 735 735 735 0.00 0.00 0.00
6 633 633 633 634 634 634 0.16 0.16 0.16
7 206 206 206 206 206 206 0.00 0.00 0.00
8 92 87 77 92 87 77 0.00 0.00 0.00
Table 3.13: Results of benchmark 3-01, Minimum required drilling fluid pressure (from left
to right)
Benchmark
D-GEO PIPELINE
Relative error
Vert. Pilot Pre-
ream
Pull
back
Pilot Pre-
ream
Pull
back
Pilot Pre-
ream
Pull
back
[-] [kN/m2] [kN/m2] [kN/m2] [kN/m2] [kN/m2] [kN/m2] [%] [%] [%]
1 32 31 31 32 31 31 0.00 0.00 0.00
2 128 125 125 129 125 125 0.78 0.00 0.00
3 287 280 280 290 281 281 1.03 0.36 0.36
4 591 576 576 597 578 577 1.01 0.35 0.17
5 770 743 743 780 747 745 1.28 0.54 0.27
6 794 602 588 808 608 590 1.73 0.99 0.34
7 531 144 141 551 145 142 3.63 0.69 0.7
8 462 36 35 483 36 35 4.35 0.00 0.00
Deltares 17 of 126
D-GEO PIPELINE
, Verification Report
Table 3.14: Results of benchmark 3-01, Minimum required drilling fluid pressure (from
right to left)
Benchmark
D-GEO PIPELINE
Relative error
Vert. Pilot Pre-
ream
Pull
back
Pilot Pre-
ream
Pull
back
Pilot Pre-
ream
Pull
back
[-] [kN/m2] [kN/m2] [kN/m2] [kN/m2] [kN/m2] [kN/m2] [%] [%] [%]
1 458 32 31 479 32 31 4.38 0.00 0.00
2 515 128 125 534 129 125 3.56 0.78 0.00
3 609 287 280 627 290 281 2.87 1.03 0.36
4 782 591 576 797 597 578 1.88 1.01 0.35
5 770 744 743 780 747 745 1.28 0.4 0.27
6 602 588 588 608 590 589 0.99 0.34 0.17
7 144 141 141 145 142 141 0.69 0.7 0.00
8 36 35 35 36 35 35 0.00 0.00 0.00
Table 3.15: Results of benchmark 3-01, Equilibrium between drilling fluid pressure and
pore pressure
Benchmark
D-GEO PIPELINE
Relative error
Vert. Drilling
fluid
Water Safety Drilling
fluid
Water Safety Drilling
fluid
Water Safety
[-] [kN/m2] [kN/m2] [-] [kN/m2] [kN/m2] [-] [%] [%] [%]
1 25.4 0 - 25.4 0 0.00 0.00
2 101.58 62.35 1.63 101.58 62.35 1.63 0.00 0.00 0.00
3 228.56 177.78 1.29 228.56 177.78 1.29 0.00 0.00 0.00
4 466.86 394.42 1.18 466.86 394.42 1.18 0.00 0.00 0.00
5 550 470 1.17 550 470 1.17 0.00 0.00 0.00
6 478.29 404.81 1.18 478.29 404.81 1.18 0.00 0.00 0.00
7 117.9 77.18 1.53 117.9 77.18 1.53 0.00 0.00 0.00
8 29.47 0 - 29.47 0 0.00 0.00
Table 3.16: Results of benchmark 3-01, Vertical soil stresses
Benchmark
D-GEO PIPELINE
Relative error
Vert. qv;p qv;n qv;r;n qv;p qv;n qv;r;n qv;p qv;n qv;r;n
[-] [kN/m2] [kN/m2] [kN/m2] [kN/m2] [kN/m2] [kN/m2] [%] [%] [%]
1 47 28 28 47 28 28 0.00 0.00 0.00
2 234 77 62 234 77 62 0.00 0.00 0.00
3 916 169 114 916 169 114 0.00 0.00 0.00
4 1656 385 178 1656 385 178 0.00 0.00 0.00
5 1887 461 184 1887 461 184 0.00 0.00 0.00
6 1688 396 179 1688 396 179 0.00 0.00 0.00
7 253 86 68 253 86 68 0.00 0.00 0.00
8 60 33 33 60 33 33 0.00 0.00 0.00
18 of 126 Deltares
Group 3: Benchmarks from spreadsheets
Table 3.17: Results of benchmark 3-01, Neutral horizontal soil stress and bearing capac-
ities
Benchmark
D-GEO PIPELINE
Relative error
Vert. ph;n Pv;e Ph;e ph;n Pv;e Ph;e ph;n Pv;e Ph;e
[-] [kN/m2] [kN/m2] [kN/m2] [kN/m2] [kN/m2] [kN/m2] [%] [%] [%]
1 21 508 105 21 508 105 0.00 0.00 0.00
2 46 1090 234 46 1090 234 0.00 0.00 0.00
3 84 4612 916 84 4612 916 0.00 0.00 0.00
4 132 10388 1656 132 10388 1656 0.00 0.00 0.00
5 136 12404 1887 136 12404 1887 0.00 0.00 0.00
6 133 10665 1688 133 10665 1688 0.00 0.00 0.00
7 50 1199 253 50 1199 253 0.00 0.00 0.00
8 24 568 121 24 568 122 0.00 0.00 0.82
Table 3.18: Results of benchmark 3-01, Vertical and horizontal moduli of subgrade reac-
tion
Benchmark
D-GEO PIPELINE
Relative error
Vert. kv;top kv;bot khkv;top kv;bot khkv;top kv;bot kh
[-] [kN/m3] [kN/m3] [kN/m3] [kN/m3] [kN/m3] [kN/m3] [%] [%] [%]
1 797 865 606 797 865 606 0.00 0.00 0.00
2 904 992 695 904 992 695 0.00 0.00 0.00
3 12768 13121 9185 12768 13121 9185 0.00 0.00 0.00
4 14365 14720 10304 14365 14720 10304 0.00 0.00 0.00
5 14924 15280 10696 14924 15280 10696 0.00 0.00 0.00
6 14441 14797 10358 14441 14797 10358 0.00 0.00 0.00
7 931 1317 922 931 1317 922 0.00 0.00 0.00
8 800 872 611 800 872 611 0.00 0.00 0.00
Table 3.19: Results of benchmark 3-01, Maximal axial friction and displacements
Benchmark
D-GEO PIPELINE
Relative error
Vert. tmax dv dmax tmax dv dmax tmax dv dmax
[-] [kN/m2] [mm] [mm] [kN/m2] [mm] [mm] [%] [%] [%]
1 0.05 5 8 0.05 5 8 0.00 0.00 0.00
2 0.05 10 8 0.05 10 8 0.00 0.00 0.00
3 0.05 20 8 0.05 20 8 0.00 0.00 0.00
4 0.05 40 8 0.05 40 8 0.00 0.00 0.00
5 0.05 80 8 0.05 80 8 0.00 0.00 0.00
6 0.05 60 8 0.05 60 8 0.00 0.00 0.00
7 0.05 50 8 0.05 50 8 0.00 0.00 0.00
8 0.05 35 8 0.05 35 8 0.00 0.00 0.00
Table 3.20: Results of benchmark 3-01, Buoyancy control
Result Unit Benchmark
D-GEO PIPELINE
Error [%]
Uplift forces [kg/m] 553 553 0.00
Weight of pipeline (incl. filling) [kg/m] 412 412 0.00
Effective weight of pipe [kg/m] 141 141 0.00
Deltares 19 of 126

D-GEO PIPELINE
, Verification Report
Table 3.21: Results of benchmark 3-01, Pulling forces in the pipeline
Benchmark
D-GEO PIPELINE
Relative error
Charac. points Length Force Length Force Length Force
[m] [kN] [m] [kN] [%] [%]
T1 0 284 0 284 0.00 0.00
T2 154 284 154 284 0.00 0.00
T3 290 468 290 468 0.00 0.00
T4 393 468 393 468 0.00 0.00
T5 603 622 603 622 0.00 0.00
T6 690 622 690 622 0.00 0.00
Max. rep. pulling force - 5187 - 5187 - 0.00
Table 3.22: Results of benchmark 3-01, Strength calculation for Combination 1A
Result Unit Benchmark
D-GEO PIPELINE
Rel. error [%]
σb[N/mm2] 127 127 0.00
σt[N/mm2] 11 11 0.00
σa;max [N/mm2] 138 138 0.00
σV;max [N/mm2] 138 138 0.00
Table 3.23: Results of benchmark 3-01, Strength calculation for Combination 1B
Result Unit Benchmark
D-GEO PIPELINE
Rel. error [%]
σb[N/mm2] 211 211 0.00
σt[N/mm2] 24 24 0.00
σa;max [N/mm2] 235 235 0.00
λ[mm-1] 0.000303 0.000303 0.00
qr[N/mm2] 0.04973 0.04973 0.00
σqr [N/mm2] 22 22 0.00
σt;max [N/mm2] 22 22 0.00
σV;max [N/mm2] 246 246 0.00
Table 3.24: Results of benchmark 3-01, Strength calculation for Combination 2
Result Unit Benchmark
D-GEO PIPELINE
Rel. error [%]
σpy [N/mm2] 18 18 0.00
σpx [N/mm2] 9 9 0.00
σptest [N/mm2] 22 22 0.00
σpm [N/mm2] 16 16 0.00
Table 3.25: Results of benchmark 3-01, Strength calculation for Combination 3
Result Unit Benchmark
D-GEO PIPELINE
Rel. error [%]
σb[N/mm2] 211 211 0.00
σa;max [N/mm2] 211 211 0.00
σqr [N/mm2] 22 22 0.00
σqr [N/mm2] 219 219 0.00
σt;max [N/mm2] 240 240 0.00
σV;max [N/mm2] 391 391 0.00
20 of 126 Deltares
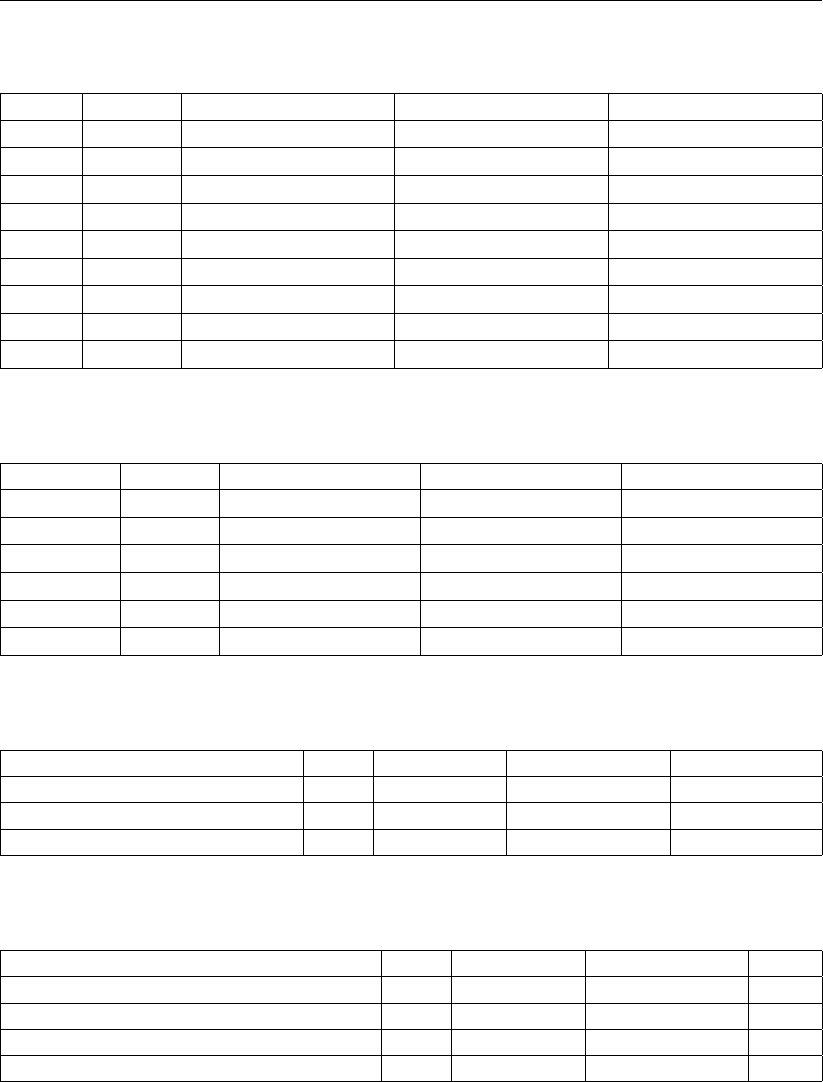
Group 3: Benchmarks from spreadsheets
Table 3.26: Results of benchmark 3-01, Strength calculation for Combination 4
Result Unit Benchmark
D-GEO PIPELINE
Rel. error [%]
σb[N/mm2] 211 211 0.00
σpy [N/mm2] 17 17 0.00
σpx [N/mm2] 8 8 0.00
σptest [N/mm2] 22 22 0.00
σptemp [N/mm2] 26 26 0.00
σa;max [N/mm2] 219 219 0.00
σqr [N/mm2] 22 22 0.00
σqr [N/mm2] 219 219 0.00
σV;max [N/mm2] 374 374 0.00
Table 3.27: Results of benchmark 3-01, Maximum allowable stresses
Result Unit Benchmark
D-GEO PIPELINE
Rel. error [%]
σptest [N/mm2] 235 235 0.00
σpy [N/mm2] 213.64 213.64 0.00
σpm [N/mm2] 235 235 0.00
σV;max [N/mm2] 363.18 363.18 0.00
σa/t (short) [N/mm2] n.a. n.a.
σa/t (long) [N/mm2] n.a. n.a.
Table 3.28: Results of benchmark 3-01, Deflection of the pipeline
Result Unit Benchmark
D-GEO PIPELINE
Rel. error [%]
Calculated [mm] 6.7 6.7 0.00
Max. allowable [mm] 136 136 0.00
Max. allow. (piggability) [mm] 64 64 0.00
Table 3.29: Results of benchmark 3-01, Implosion
Result Unit Benchmark
D-GEO PIPELINE
Error
Max. allow. external pressure (short) [kPa] n.a. n.a.
Max. allow. external pressure (long) [kPa] n.a. n.a.
Int. pressure due to 100% filling (short) [kPa] n.a. n.a.
Int. pressure due to 100% filling (long) [kPa] n.a. n.a.
Use
D-GEO PIPELINE
input file bm3-1.dri to run this benchmark.
3.2 HDD with 2D geometry – Vertical bearing capacity in homogeneous compressible
undrained layer with ϕ= 0
Deltares 21 of 126
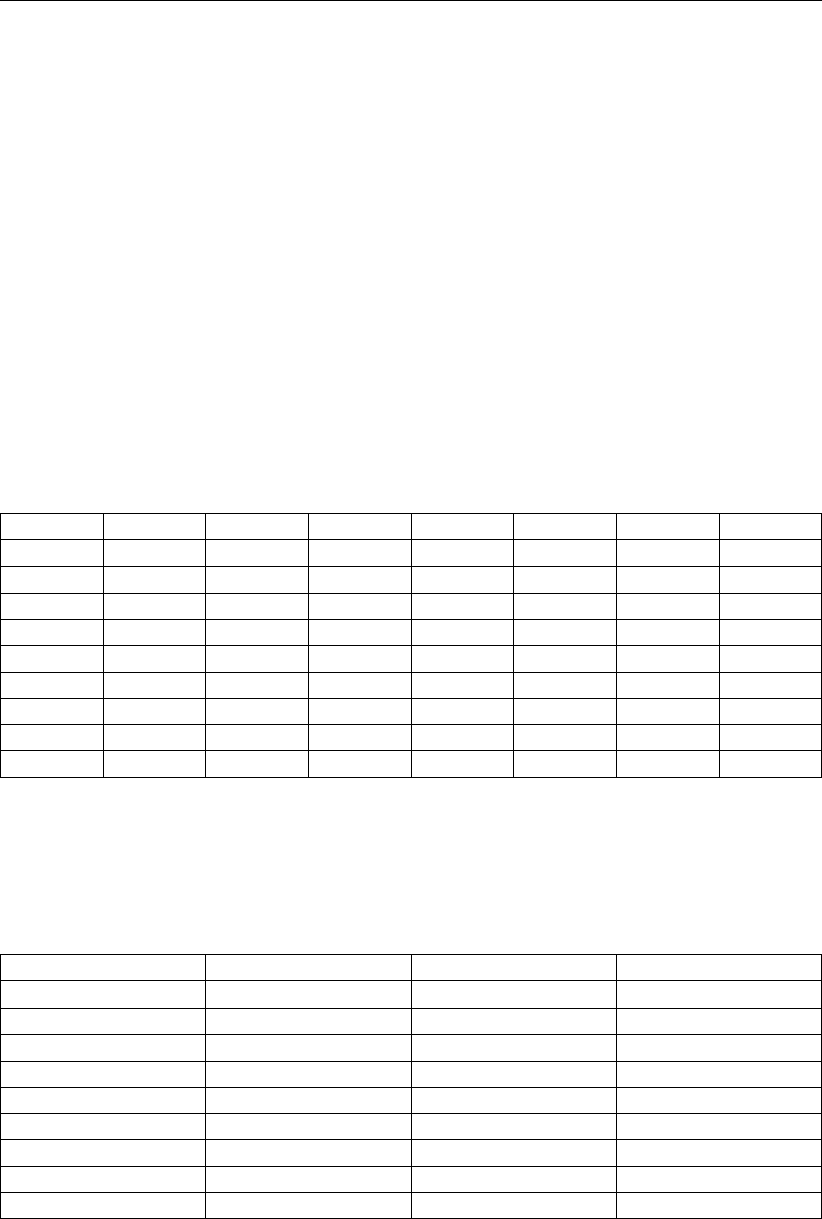
D-GEO PIPELINE
, Verification Report
3.2.1 Description
The same configuration as benchmark 3-1 (section 3.1) is used, except that both layers have
the same properties:
Unit weight above phreatic level [kN/m3]γunsat 14
Unit weight below phreatic level [kN/m3]γsat 16
Cohesion [kN/m2]c5
Friction angle [◦]ϕ0
3.2.2 Analytical results
Analytical results for the ultimate vertical bearing capacity Pv;e with ϕ= 0 are worked out in an
Excel spreadsheet using the formula given in paragraph ”Ultimate vertical bearing capacity” in
the Background section of the User Manual of
D-GEO PIPELINE
. Intermediate results are given
in the tables below.
Table 3.30: Analytical results for the calculation of the vertical bearing capacity
Vert. L Z σV’hhdCsCPv;e
[-] [m] [m] [kN/m2] [m] [-] [-] [kN/m2]
1 20 -2.309 32.322 2.309 0.513 0.02 68.156
2 50 -9.235 79.408 9.235 0.595 0.02 114.885
3 100 -20.778 148.669 20.778 0.613 0.02 181.123
4 200 -42.442 278.651 42.442 0.621 0.02 304.792
5 350 -50 324 50 0.622 0.02 347.901
6 500 -43.481 284.883 43.481 0.621 0.02 310.717
7 650 -10.718 88.308 10.718 0.6 0.02 123.447
8 680 -2.679 37.513 2.679 0.527 0.02 73.41
3.2.3 D-GEO PIPELINE results
D-GEO PIPELINE
results can be found in the Report.
Table 3.31: Results of benchmark 3-02, Ultimate vertical bearing capacity
Vert. nr. Benchmark
D-GEO PIPELINE
Relative error
[-] [kN/m2] [kN/m2] [kN/m2]
1 68.16 68.16 0.00
2 114.88 114.88 0.00
3 181.12 181.12 0.00
4 304.79 304.79 0.00
5 347.9 347.9 0.00
6 310.72 310.72 0.00
7 123.45 123.45 0.00
8 73.41 73.41 0.00
Use
D-GEO PIPELINE
input file bm3-2.dri to run this benchmark.
3.3 HDD with 2D geometry – Polyethylene (PE 80) pipe in two compressible undrained
layers
22 of 126 Deltares
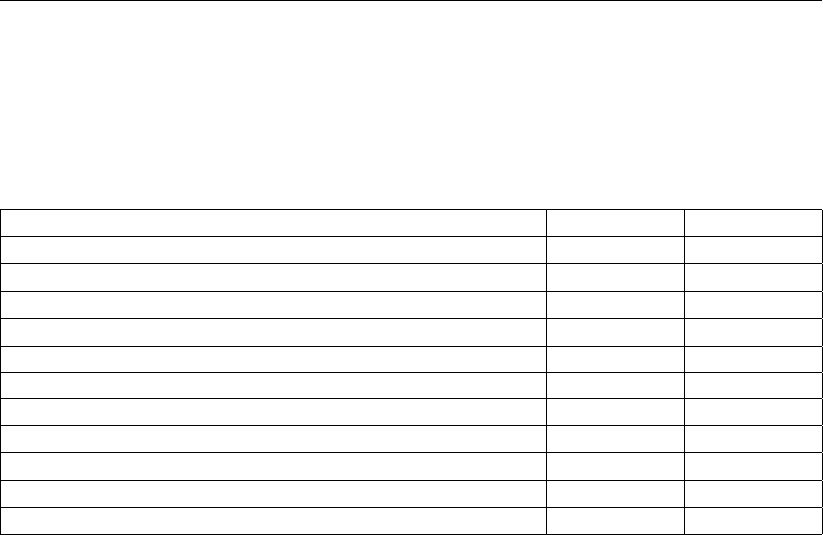
Group 3: Benchmarks from spreadsheets
3.3.1 Description
The same data used for benchmark 3-1 (section 3.1) is used except that polyethylene is used
as pipe material instead of steel as shown in Table 3.32.
Table 3.32: Pipe material data (benchmark 3-3)
Material Polyethylene PE 80
Young’s modulus (long term) Epipe;long 200 N/mm2
Young’s modulus (short term) Epipe;short 1000 N/mm2
Allowable strength (long term) Re;long 6.3 N/mm2
Allowable strength (short term) Re;short 8 N/mm2
Tensile factor α0.65
Outer diameter D00.8 m
Nominal wall thickness dn47.4 mm
Unit weight γb9.54 kN/m3
Design pressure pd600 kN/m2
Test pressure pt834 kN/m2
Temperature variation ∆t10◦
3.3.2 Analytical results
Analytical results are worked out in an Excel spreadsheet.
Strength calculation
For the buoyancy control, the pulling forces in the pipeline and the strength calculation, cal-
culations are performed using the formulas given in chapter “Strength pipeline calculation” in
the Background section of the User Manual of
D-GEO PIPELINE
. Intermediate results are given
below.
Factor of friction pipe-roller f10.1 [-]
Friction pipe-mud f20.00005 [N/mm2]
Factor of friction pipe-soil f30.2 [-]
Load factor - Design pressure fpd n.a. [-]
Load factor - Design pressure (combination) fpd;comb n.a. [-]
Load factor - Test pressure fpt n.a. [-]
Load factor - Installation finstall n.a. [-]
Load factor - Soil load Qn fQn1 n.a. [-]
Load factor - Temperature ftemp n.a. [-]
Contingency factor - E-modulus fE1.25 [-]
Contingency factor - Pulling force fpull 1.4 [-]
Contingency factor - Modulus of subgrade reaction fkv 1.6 [-]
Contingency factor - Soil load Qn fQn2 1.1 [-]
Contingency factor - Bending moment fM1.4 [-]
Contingency factor - Bending radius fRn.a. [-]
Contingency factor - Pressure borehole fpress;bore 1.1 [-]
Effective weight of pipe geff 4.069 [N/mm]
Weight of pipeline (incl. filling) gfill 0.391 [N/mm]
Uplift force gupw 5.529 [N/mm]
Moment coefficient indirect bottom kb’ 0.083 [-]
Moment coefficient indirect top kt’ 0.061 [-]
Moment coefficient direct bottom kb0.138 [-]
Moment coefficient direct top kt0.131 [-]
Deltares 23 of 126
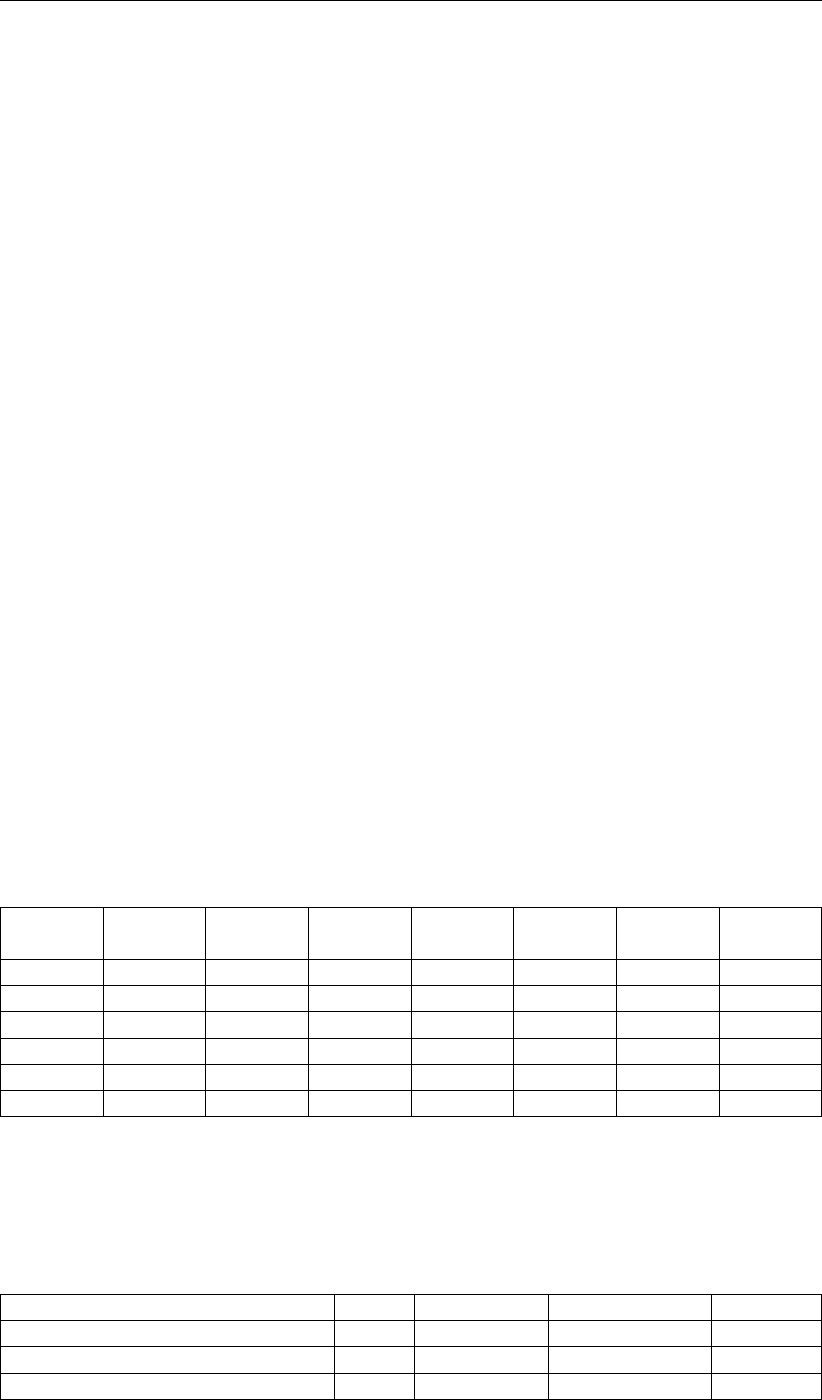
D-GEO PIPELINE
, Verification Report
Direct deflection factor ky0.089 [-]
Indirect deflection factor ky’ 0.048 [-]
Part of pipe filled with water during pull back Pwater 10 [%]
Cross sections of the pipe A112070.789 [mm2]
Atrek 112070.789 [mm2]
Ainw 390584.036 [mm2]
Minimal wall thickness dn;min 47.4 [mm]
Outer radius of the pipeline re400 [mm]
Inner radius of the pipeline ri352.6 [mm]
Average radius of the pipeline rg376.3 [mm]
Moment of inertia of the pipe Ib7966181061 [mm4]
Moment of inertia of the wall Iw8874.702 [mm3]
Pipe resisting moment Wb19915453 [mm4m]
Wall resisting moment Ww374.46 [mm3m]
Unit weight of drilling fluid γdrill fluid 11 [kN/m3]
Maximum modulus of subgrade reaction kv;max 51037.814 [kN/m3]
Maximum neutral vertical soil load qv;n;r;max 184.15 [kN/m2]
Maximum corrected reduced soil load qn202.565 [kN/m2]
Maximum neutral horizontal soil load qh;n;r 136.488 [kN/m2]
Soil reaction - Left curve qr;left 6.057 [kN/m2]
Soil reaction - Right curve qr;right 4.543 [kN/m2]
Soil reaction - Left curve (long term) qr;left 2.709 [kN/m2]
Soil reaction - Right curve (long term) qr;right 2.031 [kN/m2]
Characteristic stiffness pipeline-soil λ0.0010639 [mm-1]
Characteristic stiffness pipeline-soil (long term) λlong 0.001591 [mm-1]
The total pulling force is the contribution of five components. Results are given in the table
below.
Table 3.34: Analytical results for the calculation of the five components of the pulling force
for the six characteristic points
Charac. Length T1T2T3a T3b T3c Total
point [m] [kN] [kN] [kN] [kN] [kN] [kN]
1 0 100.79 0 0 0 0 100.79
2 153.91 78.33 144.61 0 0 0 222.93
3 290.04 58.45 0 127.91 5.72 15.25 351.94
4 393.19 43.4 45.17 0 0 0 433.79
5 602.62 12.83 0 196.78 4.29 31.55 635.84
6 690.49 0 82.55 0 0 0 705.56
3.3.3 D-GEO PIPELINE results
D-GEO PIPELINE
results presented in the tables below can be found in the Report.
Table 3.35: Results of benchmark 3-03, Buoyancy control
Result Unit Benchmark
D-GEO PIPELINE
Error [%]
Uplift forces [kg/m] 553 553 0.00
Weight of pipeline (incl. filling) [kg/m] 146 146 0.00
Effective weight of pipe [kg/m] 407 407 0.00
24 of 126 Deltares

Group 3: Benchmarks from spreadsheets
Table 3.36: Results of benchmark 3-03, Pulling forces in the pipeline
Benchmark
D-GEO PIPELINE
Relative error
Charac. points Length Force Length Force Length Force
[m] [kN] [m] [kN] [%] [%]
T1 0 100.79 0 100.79 0.00 0.00
T2 153.91 222.93 153.91 222.93 0.00 0.00
T3 290.04 351.94 290.05 351.94 0.00 0.00
T4 393.19 433.79 393.19 433.79 0.00 0.00
T5 602.62 635.84 602.63 635.84 0.00 0.00
T6 690.49 705.56 690.49 705.56 0.00 0.00
Max. rep. pulling force - 829 - 829 - 0.00
Table 3.37: Results of benchmark 3-03, Strength calculation for Combination 1A
Result Unit Benchmark
D-GEO PIPELINE
Rel. error [%]
σb[N/mm2] 0.56 0.56 0.00
σt[N/mm2] 1.26 1.26 0.00
σa;max [N/mm2] 1.62 1.62 0.00
σV;max [N/mm2] n.a. n.a.
Table 3.38: Results of benchmark 3-03, Strength calculation for Combination 1B
Result Unit Benchmark
D-GEO PIPELINE
Rel. error [%]
σb[N/mm2] 0.93 0.93 0.00
σt[N/mm2] 8.81 8.81 0.00
σa;max [N/mm2] 9.42 9.42 0.00
λ[mm-1] 0.001064 0.001064 0.00
qr[N/mm2] 0.00606 0.00606 0.00
σqr [N/mm2] 0.4 0.4 0.00
σt;max [N/mm2] 0.4 0.4 0.00
σV;max [N/mm2] n.a. n.a.
Table 3.39: Results of benchmark 3-03, Strength calculation for Combination 2
Result Unit Benchmark
D-GEO PIPELINE
Rel. error [%]
σpy [N/mm2] 4.78 4.78 0.00
σpx [N/mm2] 2.39 2.39 0.00
σptest [N/mm2] 6.65 6.65 0.00
σpm [N/mm2] 4.14 4.14 0.00
Table 3.40: Results of benchmark 3-03, Strength calculation for Combination 3
Result Unit Benchmark
D-GEO PIPELINE
Rel. error [%]
σb[N/mm2] 0.19 0.19 0.00
σa;max [N/mm2] 0.12 0.12 0.00
σqr [N/mm2] 0.18 0.18 0.00
σqr [N/mm2] 22.47 22.47 0.00
σt;max [N/mm2] 14.72 14.72 0.00
σV;max [N/mm2] n.a. n.a.
Deltares 25 of 126
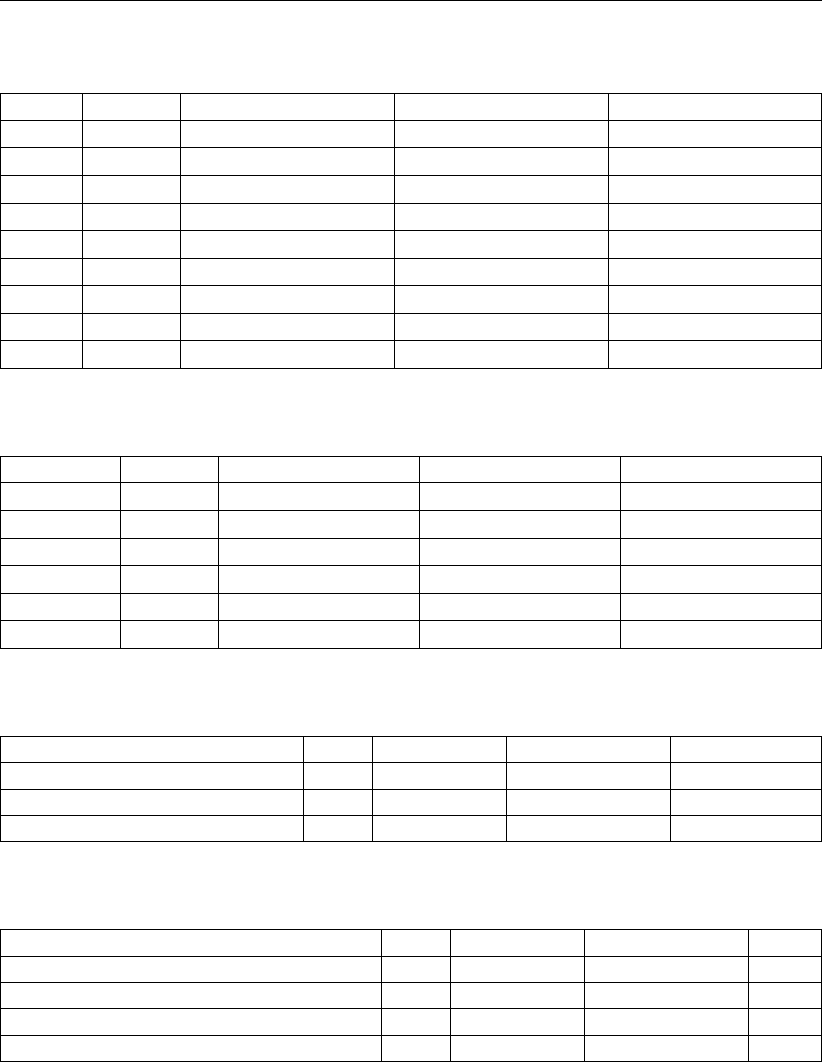
D-GEO PIPELINE
, Verification Report
Table 3.41: Results of benchmark 3-03, Strength calculation for Combination 4
Result Unit Benchmark
D-GEO PIPELINE
Rel. error [%]
σb[N/mm2] 0.19 0.19 0.00
σpy [N/mm2] 4.78 4.78 0.00
σpx [N/mm2] 2.39 2.39 0.00
σptest [N/mm2] 6.65 6.65 0.00
σptemp [N/mm2] 0.36 0.36 0.00
σa;max [N/mm2] 2.51 2.51 0.00
σqr [N/mm2] 0.18 0.18 0.00
σqr [N/mm2] 22.47 22.47 0.00
σV;max [N/mm2] n.a. n.a.
Table 3.42: Results of benchmark 3-03, Maximum allowable stresses
Result Unit Benchmark
D-GEO PIPELINE
Rel. error [%]
σptest [N/mm2] 8 8 0.00
σpy [N/mm2] 6.3 6.3 0.00
σpm [N/mm2] n.a. n.a.
σV;max [N/mm2] n.a. n.a.
σa/t (short) [N/mm2] 8 8 8
σa/t (long) [N/mm2] 6.3 6.3 6.3
Table 3.43: Results of benchmark 3-03, Deflection of the pipeline
Result Unit Benchmark
D-GEO PIPELINE
Rel. error [%]
Calculated [mm] 121.4 121.4 0.00
Max. allowable [mm] 64 64 0.00
Max. allow. (piggability) [mm] 40 40 0.00
Table 3.44: Results of benchmark 3-03, Implosion
Result Unit Benchmark
D-GEO PIPELINE
Error
Max. allow. external pressure (short) [kPa] 396.55 396.55 0.00
Max. allow. external pressure (long) [kPa] 39.66 39.66 0.00
Int. pressure due to 100% filling (short) [kPa] 0 0 0.00
Int. pressure due to 100% filling (long) [kPa] 0 0 0.00
Use
D-GEO PIPELINE
input file bm3-3.dri to run this benchmark.
3.4 HDD with 2D geometry – Steel pipe in two incompressible drained layers
3.4.1 Description
The same input values as benchmark 3-1 (section 3.1) are used, only the position of the
boundaries between compressible/incompressible layers and drained/undrained layers is dif-
ferent: the boundary coincides with the surface level.Calculations of the pulling forces and the
minimum drilling fluid pressure are independent of the soil material. Therefore, in this bench-
mark, only the calculation of the maximum drilling fluid pressure and the reduced vertical
stress are checked.
26 of 126 Deltares
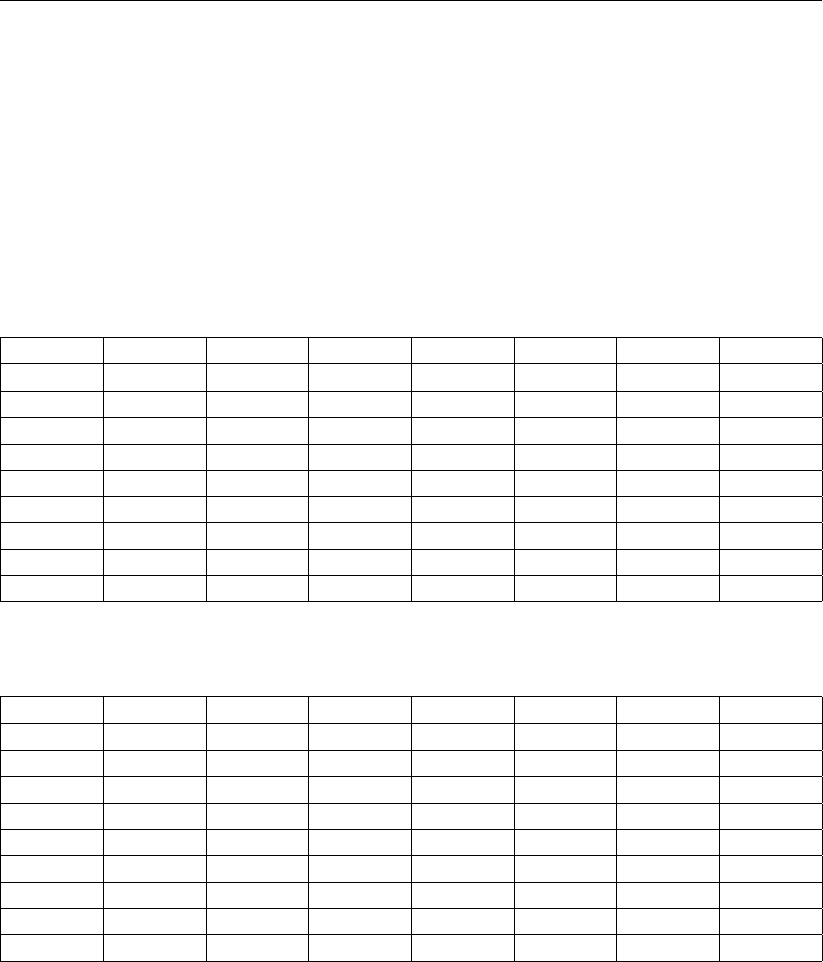
Group 3: Benchmarks from spreadsheets
3.4.2 Analytical results
Analytical results are worked out in an Excel spreadsheet.
Soil mechanical data
The soil mechanical data’s are determined using the formulas given in chapter “Calculation
of soil mechanical data” in the Background section of the User Manual of
D-GEO PIPELINE
.
Intermediate results are given in the tables below.
Table 3.45: Analytical results – General data’s
Vert. L Z hpHLhhσV’σv;H’
[-] [m] [m] [m] [m] [m] [kN/m2] [kN/m2]
1 20 -2.309 1.859 1.898 2.309 32.322 26.574
2 50 -9.235 8.785 8.824 9.235 79.408 76.945
3 100 -20.778 20.328 20.368 20.778 171.781 167.676
4 200 -42.442 41.992 42.037 42.442 388.418 384.367
5 350 -50 49.55 49.6 50 464 460
6 500 -43.481 43.031 43.077 43.481 398.806 394.773
7 650 -10.718 10.268 10.304 10.718 88.308 85.823
8 680 -2.679 2.229 2.265 2.679 37.513 31.715
Table 3.46: Analytical results for the calculation of the neutral reduced vertical stress
Vert. B1FrFr;max qnr1 qnr2 qv;n qv;r;n
[-] [m] [kN/m] [kN/m] [kN/m2] [kN/m2] [kN/m2] [kN/m2]
1 0.935 n.a. n.a. n.a. n.a. 27.808 27.808
2 0.935 n.a. n.a. n.a. n.a. 77.474 28.587
3 0.862 n.a. n.a. n.a. n.a. 168.557 26.621
4 0.862 n.a. n.a. n.a. n.a. 385.237 28.21
5 0.862 n.a. n.a. n.a. n.a. 460.858 28.448
6 0.862 n.a. n.a. n.a. n.a. 395.638 28.247
7 0.935 n.a. n.a. n.a. n.a. 86.322 28.299
8 0.935 n.a. n.a. n.a. n.a. 32.813 32.813
Maximum drilling fluid pressures
For the maximum drilling fluid pressures in drained conditions, calculations are performed
using the formulas given in paragraph “Maximum required drilling fluid pressure” in the Back-
ground section of the User Manual of
D-GEO PIPELINE
[Deltares]. Intermediate results are
given in the table below.
Deltares 27 of 126
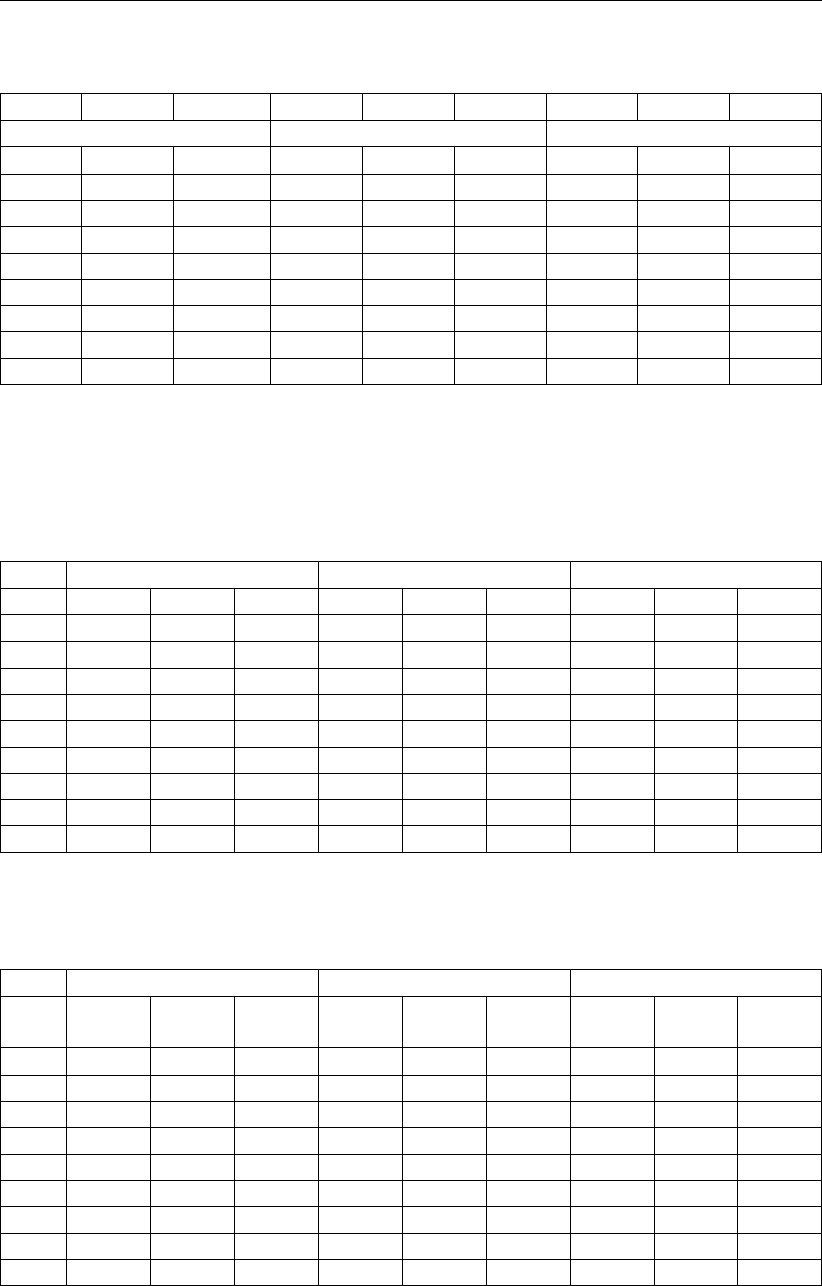
D-GEO PIPELINE
, Verification Report
Table 3.47: Analytical results for the calculation of the maximum drilling fluid pressures
Vert. u 0.9 plimit ppilot ppreream pback ppilot ppreream pback
plastic zone related to : deformation bore hole soil cover
[-] [kN/m2] [kN/m2] [kN/m2] [kN/m2] [kN/m2] [kN/m2] [kN/m2] [kN/m2]
1 0 85.33 93.1 83.32 75.01 93.1 83.32 75.01
2 62.35 111.81 124.13 123.26 122.1 124.13 123.26 122.1
3 177.78 163.77 181.95 181.77 181.53 181.95 181.77 181.53
4 394.42 285.63 317.36 317.32 317.26 317.36 317.32 317.26
5 470 328.15 364.6 364.57 364.53 364.6 364.57 364.53
6 404.81 291.48 323.86 323.82 323.76 323.86 323.82 323.76
7 77.18 116.82 129.72 129.07 128.19 129.72 129.07 128.19
8 0 88.25 96.77 88.89 81.63 96.77 88.89 81.63
3.4.3 D-GEO PIPELINE results
D-GEO PIPELINE
results can be found in the Report.
Table 3.48: Results of benchmark 3-04, Vertical soil stresses
Benchmark
D-GEO PIPELINE
Relative error
Vert. qv;pqv;nqv;r;nqv;pqv;nqv;r;nqv;pqv;nqv;r;n
[-] [kN/m2] [kN/m2] [kN/m2] [kN/m2] [kN/m2] [kN/m2] [%] [%] [%]
1 47 28 28 47 28 28 0.00 0.00 0.00
2 234 77 29 234 77 29 0.00 0.00 0.00
3 916 169 27 916 169 27 0.00 0.00 0.00
4 1656 385 28 1656 385 28 0.00 0.00 0.00
5 1887 461 28 1887 461 28 0.00 0.00 0.00
6 1688 396 28 1688 396 28 0.00 0.00 0.00
7 253 86 28 253 86 28 0.00 0.00 0.00
8 60 33 33 60 33 33 0.00 0.00 0.00
Table 3.49: Results of benchmark 3-04, Maximum allowable drilling fluid pressure (plastic
zone related to deformation bore hole)
Benchmark
D-GEO PIPELINE
Relative error
Vert. Pilot Pre-
ream
Pull
back
Pilot Pre-
ream
Pull
back
Pilot Pre-
ream
Pull
back
[-] [kN/m2] [kN/m2] [kN/m2] [kN/m2] [kN/m2] [kN/m2] [%] [%] [%]
1 48 48 48 48 48 48 0.00 0.00 0.00
2 152 152 152 152 152 152 0.00 0.00 0.00
3 503 503 503 503 503 503 0.00 0.00 0.00
4 992 992 992 992 992 992 0.00 0.00 0.00
5 1153 1153 1153 1153 1153 1153 0.00 0.00 0.00
6 1014 1014 1014 1015 1015 1015 0.1 0.1 0.1
7 175 175 175 175 175 175 0.00 0.00 0.00
8 53 53 53 53 53 53 0.00 0.00 0.00
28 of 126 Deltares
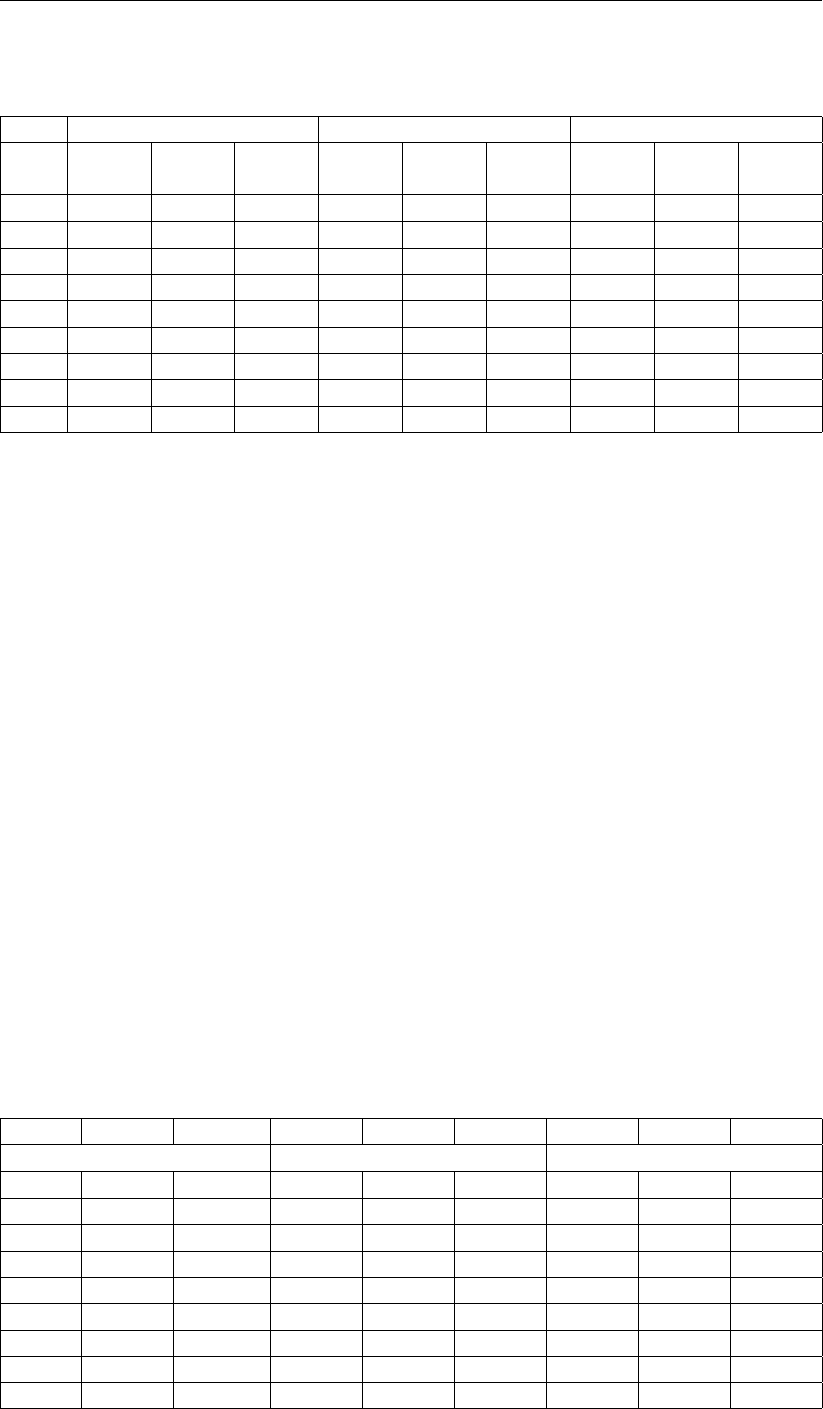
Group 3: Benchmarks from spreadsheets
Table 3.50: Results of benchmark 3-04, Maximum allowable drilling fluid pressure (plastic
zone related to soil cover)
Benchmark
D-GEO PIPELINE
Relative error
Vert. Pilot Pre-
ream
Pull
back
Pilot Pre-
ream
Pull
back
Pilot Pre-
ream
Pull
back
[-] [kN/m2] [kN/m2] [kN/m2] [kN/m2] [kN/m2] [kN/m2] [%] [%] [%]
1 88 74 62 88 74 62 0.00 0.00 0.00
2 221 221 221 221 221 221 0.00 0.00 0.00
3 800 800 800 800 800 800 0.00 0.00 0.00
4 1545 1545 1545 1545 1545 1545 0.00 0.00 0.00
5 1785 1785 1785 1785 1785 1785 0.00 0.00 0.00
6 1579 1579 1579 1579 1579 1579 0.00 0.00 0.00
7 249 249 249 249 249 249 0.00 0.00 0.00
8 96 86 74 96 86 74 0.00 0.00 0.00
Use
D-GEO PIPELINE
input file bm3-4.dri to run this benchmark.
3.5 HDD with 2D geometry – Steel pipe in a sequence of a compressible undrained layer
and a compressible drained layer
3.5.1 Description
The same input data’s as benchmark 3-1 (section 3.1) are used, except that the position of the
boundary between undrained/drained layers is different: the boundary coincides with the top
of the sand layer. Changing the position of the boundary between undrained/drained layers
will only effect the maximum drilling fluid pressures calculation.
3.5.2 Analytical results
Analytical results are worked out in an Excel spreadsheet.
Maximum drilling fluid pressures
For the maximum drilling fluid pressures in drained conditions, calculations are performed
using the formulas given in paragraph “Maximum required drilling fluid pressure” in the Back-
ground section of the User Manual of
D-GEO PIPELINE
[Deltares]. Intermediate results are
given in the table below.
Table 3.51: Analytical results for the calculation of the maximum drilling fluid pressures
Vert. u 0.9 plimit ppilot ppreream pback ppilot ppreream pback
plastic zone related to : deformation bore hole soil cover
[-] [kN/m2] [kN/m2] [kN/m2] [kN/m2] [kN/m2] [kN/m2] [kN/m2] [kN/m2]
1 0 88.6 95.29 80.21 69.47 95.29 80.21 69.47
2 62.35 122.71 136.09 134.22 131.85 136.09 134.22 131.85
3 177.78 180.76 200.46 197.59 194.1 200.46 197.59 194.1
4 394.42 302.62 336.23 336.09 335.9 336.23 336.09 335.9
5 470 345.13 383.47 383.39 383.27 383.47 383.39 383.27
6 404.81 308.46 342.72 342.59 342.41 342.72 342.59 342.41
7 77.18 129.29 143.47 142.02 140.14 143.47 142.02 140.14
8 0 91.95 99.75 87.08 77.24 99.75 87.08 77.24
Deltares 29 of 126
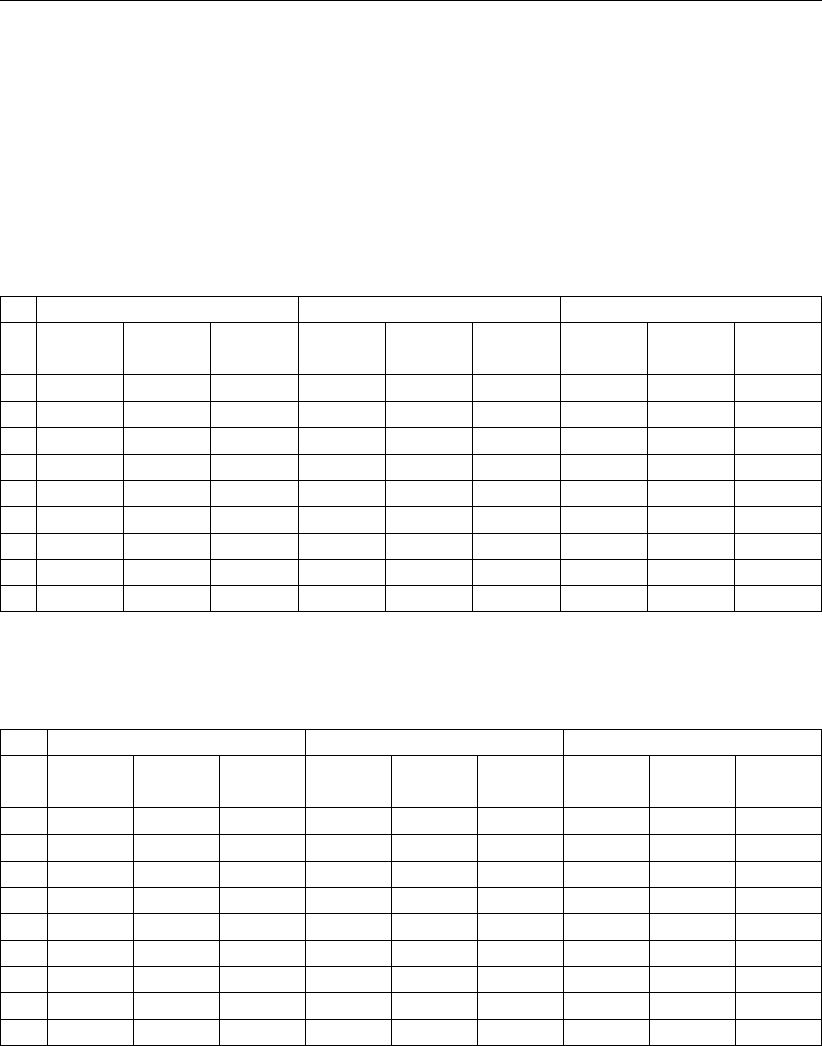
D-GEO PIPELINE
, Verification Report
The intermediate analytical results for the calculation of the maximum drilling fluid pressures
in drained conditions are the same as benchmark 3-4 (see section 3.4.2).
3.5.3 D-GEO PIPELINE results
D-GEO PIPELINE
results can be found in the Report.
Table 3.52: Results of benchmark 3-05, Maximum allowable drilling fluid pressure (plastic
zone related to deformation bore hole)
Benchmark
D-GEO PIPELINE
Relative error
Pilot Pre-
ream
Pull
back
Pilot Pre-
ream
Pull
back
Pilot Pre-
ream
Pull
back
[kN/m2] [kN/m2] [kN/m2] [kN/m2] [kN/m2] [kN/m2] [%] [%] [%]
1 89 80 69 89 80 69 0.00 0.00 0.00
2 185 185 185 185 185 185 0.00 0.00 0.00
3 503 503 503 502 502 502 0.2 0.2 0.2
4 992 992 992 992 992 992 0.00 0.00 0.00
5 1153 1153 1153 1153 1153 1153 0.00 0.00 0.00
6 1014 1014 1014 1014 1014 1014 0.00 0.00 0.00
7 206 206 206 206 206 206 0.00 0.00 0.00
8 92 87 77 92 87 77 0.00 0.00 0.00
Table 3.53: Results of benchmark 3-05, Maximum allowable drilling fluid pressure (plastic
zone related to soil cover)
Benchmark
D-GEO PIPELINE
Relative error
nr. Pilot Pre-
ream
Pull
back
Pilot Pre-
ream
Pull
back
Pilot Pre-
ream
Pull
back
[-] [kN/m2] [kN/m2] [kN/m2] [kN/m2] [kN/m2] [kN/m2] [%] [%] [%]
1 89 80 69 89 80 69 0.00 0.00 0.00
2 185 185 185 185 185 185 0.00 0.00 0.00
3 800 767 697 799 766 696 0.13 0.13 0.14
4 1545 1545 1545 1545 1545 1545 0.00 0.00 0.00
5 1785 1785 1785 1785 1785 1785 0.00 0.00 0.00
6 1579 1579 1579 1578 1578 1578 0.06 0.06 0.06
7 206 206 206 206 206 206 0.00 0.00 0.00
8 92 87 77 92 87 77 0.00 0.00 0.00
Use
D-GEO PIPELINE
input file bm3-5.dri to run this benchmark.
3.6 HDD with 2D geometry – Steel pipe in a sequence of an incompressible undrained
layer and an incompressible drained layer
3.6.1 Description
The same input data’s as benchmark 3-1 (section 3.1) are used, except for the position of the
boundary between undrained/drained layers which coincides with the top of the sand layer and
for the boundary between compressible/incompressible layers which coincides with the top of
the ground line. Changing the position of the boundary between undrained/drained layers
will only affect the maximum drilling fluid pressures calculation and changing the position of
the boundary between compressible/incompressible layers will only affect the neutral reduced
30 of 126 Deltares
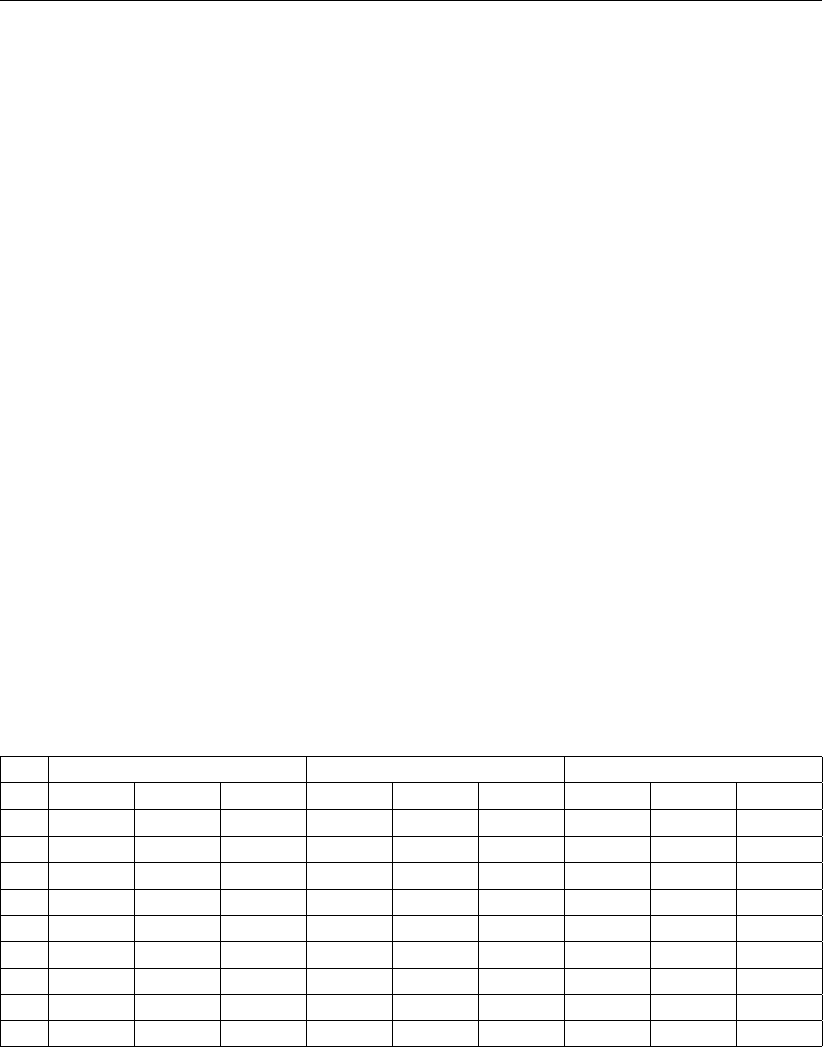
Group 3: Benchmarks from spreadsheets
vertical stress.
3.6.2 Analytical results
Analytical results are worked out in an Excel spreadsheet.
Soil mechanical data
The soil mechanical data’s are determined using the formulas given in chapter “Calculation
of soil mechanical data” in the Background section of the User Manual of
D-GEO PIPELINE
.
Intermediate results are given in the tables below. Analytical results for the neutral reduced
vertical stress are the same as benchmark 3-4 (section 3.4.2) because the position of the
boundary between compressible/incompressible layers is the same.
Maximum drilling fluid pressures
For the maximum drilling fluid pressures in drained conditions, calculations are performed
using the formulas given in paragraph “Maximum required drilling fluid pressure” in the Back-
ground section of the User Manual of
D-GEO PIPELINE
[Deltares]. Analytical results for the
maximum drilling fluid pressures are the same as benchmark 3-5 (section 3.5.2) because the
position of the boundary between undrained/drained layers is the same.
3.6.3 D-GEO PIPELINE results
D-GEO PIPELINE
results can be found in the Report.
Table 3.54: Results of benchmark 3-06, Vertical soil stresses
Benchmark
D-GEO PIPELINE
Relative error
nr. qv;pqv;nqv;r;nqv;pqv;nqv;r;nqv;pqv;nqv;r;n
[-] [kN/m2] [kN/m2] [kN/m2] [kN/m2] [kN/m2] [kN/m2] [%] [%] [%]
1 47 28 28 47 28 28 0.00 0.00 0.00
2 234 77 29 234 77 29 0.00 0.00 0.00
3 916 169 27 916 169 27 0.00 0.00 0.00
4 1656 385 28 1656 385 28 0.00 0.00 0.00
5 1887 461 28 1887 461 28 0.00 0.00 0.00
6 1688 396 28 1688 396 28 0.00 0.00 0.00
7 253 86 28 253 86 28 0.00 0.00 0.00
8 60 33 33 60 33 33 0.00 0.00 0.00
Use
D-GEO PIPELINE
input file bm3-6.dri to run this benchmark.
3.7 HDD with 3D geometry – Steel pipe in 4 layers – Compressible border above drainage
border
3.7.1 Description
The pipe is constructed in four compressible undrained layers with the characteristics given in
Table 3.57. The boundaries between compressible/uncompressible layers and drained/undrained
layers are respectively situated at the bottom of the second and third layers. The ground level
is not plane as shown in Figure 3.3 and the phreatic line is at depth Zphreatic = -5 m. The
hydraulic head at the surface level is 1 m and 10 m at the bottom (i.e. Z= -46 m). The
steel pipe properties are given in Table 3.56. Calculations are performed for 8 verticals with
Deltares 31 of 126
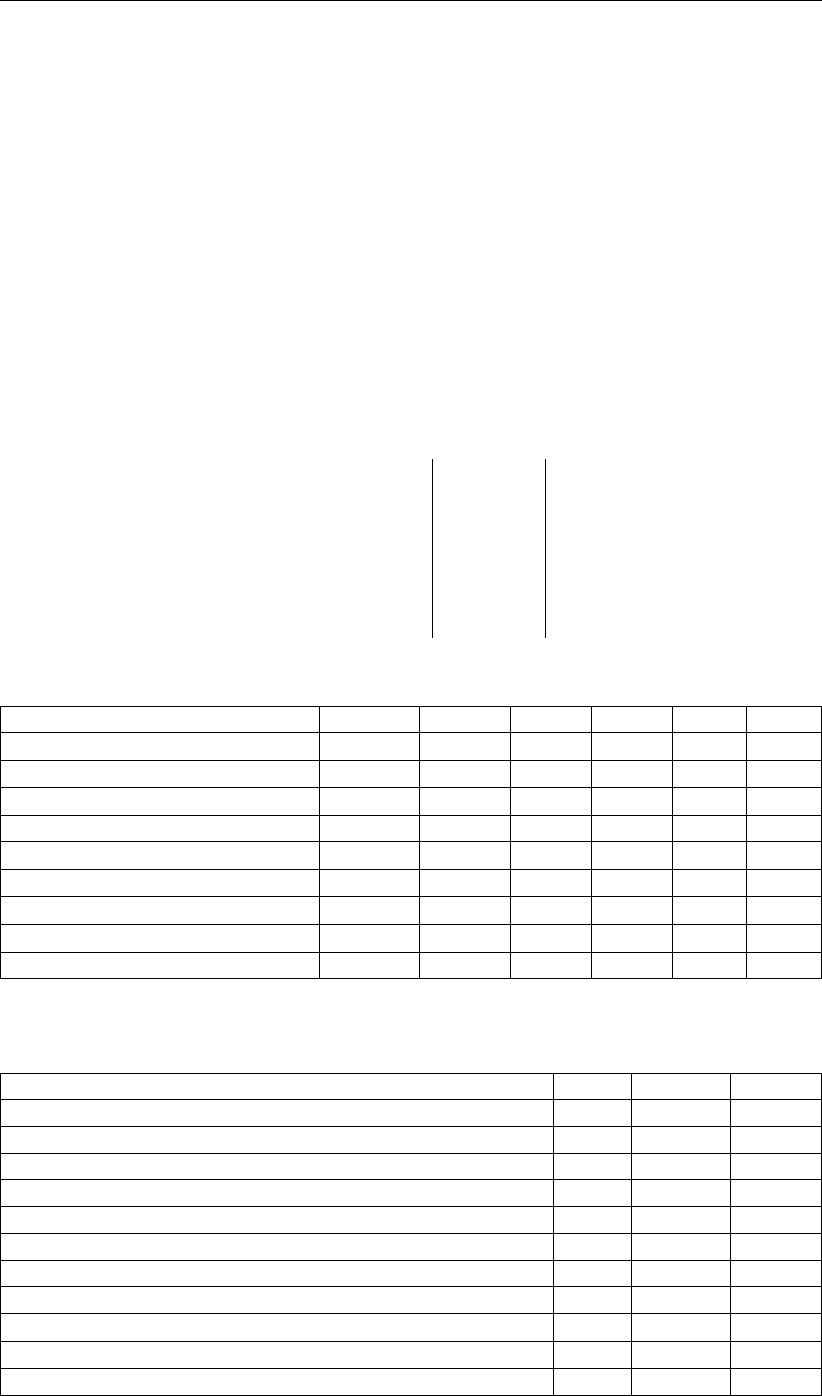
D-GEO PIPELINE
, Verification Report
L coordinates of 60, 100, 150, 170, 1000, 1650, 1775 and 1800 m. The configuration of the
pipeline is given by:
Xleft 50 m X-coordinate of the left entry point
Yleft -5 m Y-coordinate of the left entry point
Zleft -2 m Z-coordinate of the left entry point
Xright 1800 m X-coordinate of the right exit point
Yright 104.21 m Y-coordinate of the right exit point
Zright 10 m Z-coordinate of the right exit point
ϕleft 13◦Left angle of the pipe
ϕright 15◦Right angle of the pipe
Zbottom -45 m Lowest level of the pipe
Rleft 1300 m Bending radius of the pipe at the left side
Rright 1050 m Bending radius of the pipe at the right side
Rrol 800 m Bending radius in pipe string (on rollers)
with two horizontal bendings:
bending 1 bending 2
X-coordinate of the first point X1[m] 450 800
Z-coordinate of the first point Z1[m] 10 106.880
X-coordinate of the second point X2[m] 687.664 1313.615
Z-coordinate of the second point Z2[m] 61.157 171.288
Bending radius [m] 700.004 1000.008
Direction Right Left
Table 3.55: Soil material properties (benchmark 3-07)
Mat 1 Mat 2 Mat 3 Mat 4
Unit weight above phreatic level γunsat [kN/m3] 18 17 14 11
Unit weight below phreatic level γsat [kN/m3] 20 19 16 13
Cohesion c[kN/m2] 0.2 1.5 5 20
Angle of internal friction ϕ[◦] 35 30 0 15
Undrained cohesion top Cu;top [kN/m2] 1 3 30 50
Undrained cohesion bottom Cu;bottom [kN/m2] 2 5 25 40
Young modulus top Eu;top [kN/m2] 20000 30000 1500 1000
Young modulus bottom Eu;bottom [kN/m2] 25000 40000 2000 500
Poisson ratio ν[-] 0.5 0.45 0.25 0.35
Table 3.56: Pipe material data (benchmark 3-07)
Material Steel
Negative wall thickness tolerance δt [%] 25
Yield strength Re[N/mm2] 200
Partial material factor γm[-] 1.3
Partial material factor for test pressure γm;test [-] 1.15
Young’s modulus Eb[N/mm2] 180500
Outer diameter D0[m] 1.5
Nominal wall thickness dn[mm] 35
Unit weight γb[kN/m3] 65
Design pressure pd[kN/m2] 500
Test pressure pt[kN/m2] 900
Temperature variation ∆t[◦] 10
32 of 126 Deltares
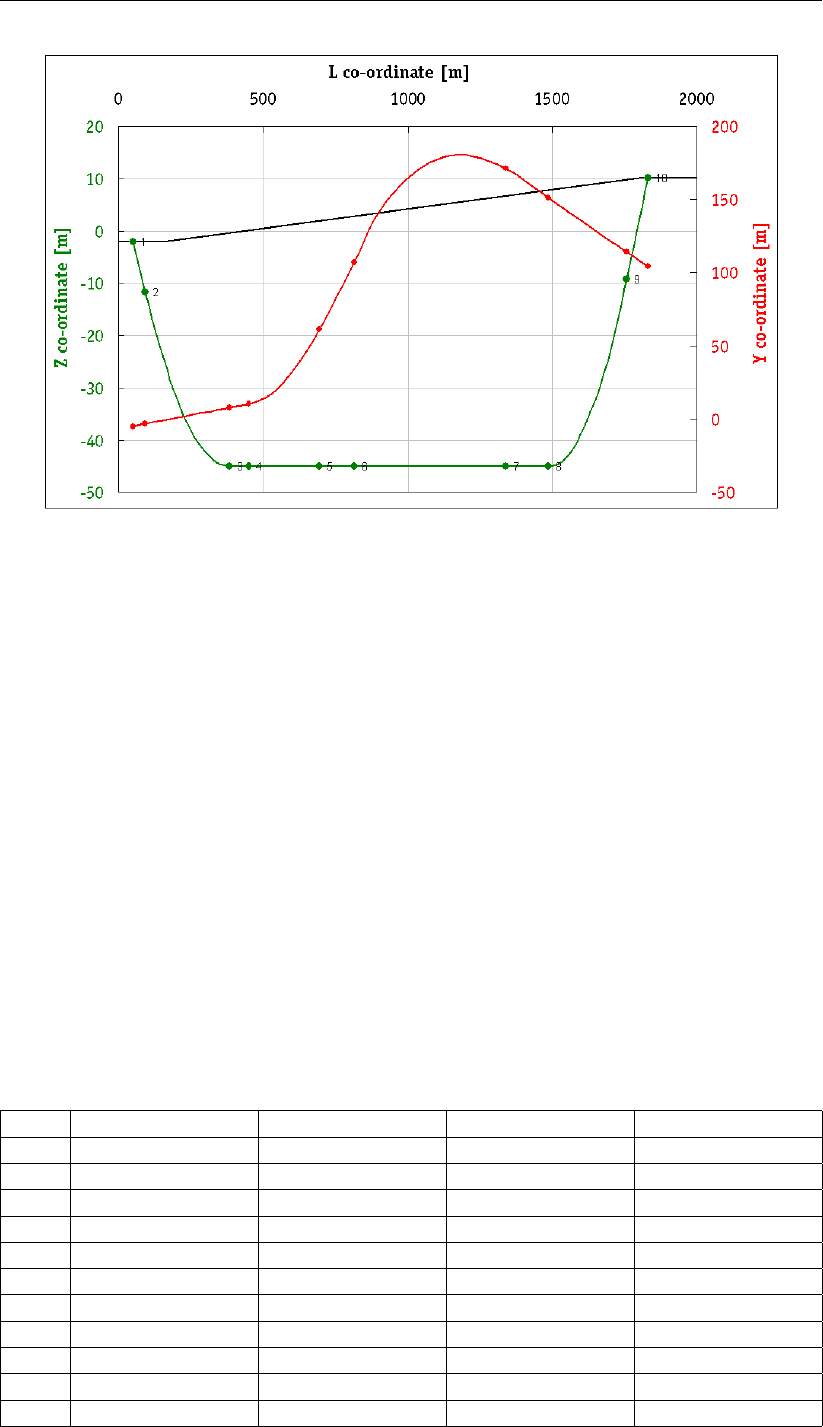
Group 3: Benchmarks from spreadsheets
Figure 3.3: 3D view of the pipeline configuration (benchmark 3-7)
3.7.2 Analytical results
Analytical results are worked out in an Excel spreadsheet.
Soil mechanical data
The soil mechanical data’s are determined using the formulas given in chapter “Calculation of
soil mechanical data” in the Background section of the User Manual of
D-GEO PIPELINE
. The
maximal axial friction between the pipe and the drilling fluid is constant along the pipeline and
equal to f2= 50 N/m2. The displacement necessary to develop the maximal axial friction
along the pipeline is estimated between 6 and 9 mm (= 7.5 mm).
Strength calculation
For the buoyancy control, the pulling forces in the pipeline and the strength calculation, cal-
culations are performed using the formulas given in chapter “Strength pipeline calculation” in
the Background section of the User Manual of
D-GEO PIPELINE
. The length of the pipe in the
borehole at the 10 characteristic points (see Figure 3.3) is:
Table 3.57: Position of the characteristic points (benchmark 3-07a)
Point L-coord. X-coord. Z-coord. Traject length
[m] [m] [m] [m]
1 50 50 -2 0
2 91.93 91.9 -11.68 43.036
3 384.37 384.13 -45 337.997
4 450.28 450 -45 403.908
5 694.63 687.66 -45 648.255
6 815.91 800 -45 769.539
7 1339.51 1313.62 -45 1293.138
8 1487 1459.72 -45 1440.628
9 1758.76 1728.93 -9.22 1715.518
10 1830.5 1800 10 1789.786
Deltares 33 of 126

D-GEO PIPELINE
, Verification Report
Hereafter are some intermediate results used for the pulling force and the strength calcula-
tions:
Factor of friction pipe-roller f10.2 [-]
Friction pipe-mud f20.00035 [N/mm2]
Factor of friction pipe-soil f30.3 [-]
Load factor - Design pressure fpd 1.1 [-]
Load factor - Design pressure (combination) fpd;comb 1.3 [-]
Load factor - Test pressure fpt 0.9 [-]
Load factor - Installation finstall 1.2 [-]
Load factor - Soil load Qn fQn1 1.3 [-]
Load factor - Temperature ftemp 1.2 [-]
Contingency factor - E-modulus fE1.4 [-]
Contingency factor - Pulling force fpull 1.1 [-]
Contingency factor - Modulus of subgrade reaction fkv 1.1 [-]
Contingency factor - Soil load Qn fQn2 1.2 [-]
Contingency factor - Bending moment fM1.15 [-]
Contingency factor - Bending radius fR1.3 [-]
Contingency factor - Pressure borehole fpress;bore 1.15 [-]
Effective weight of pipe geff 10.093 [N/mm]
Weight of pipeline (incl. filling) gfill 2.409 [N/mm]
Uplift force gupw 22.973 [N/mm]
Moment coefficient indirect bottom kb’ 0.073 [-]
Moment coefficient indirect top kt’ 0.056 [-]
Moment coefficient direct bottom kb0.139 [-]
Moment coefficient direct top kt0.139 [-]
Direct deflection factor ky0.091 [-]
Indirect deflection factor ky’ 0.043 [-]
Part of pipe filled with water during pull back Pwater 15 [%]
Cross sections of the pipe A121535.457 [mm2]
Atrek 161085.163 [mm2]
Ainw 1606060.704 [mm2]
Minimal wall thickness dn;min 26.25 [mm]
Outer radius of the pipeline re750 [mm]
Inner radius of the pipeline ri715 [mm]
Average radius of the pipeline rg732.5 [mm]
Moment of inertia of the pipe Ib43240291745 [mm4]
Moment of inertia of the wall Iw3572.917 [mm3]
Pipe resisting moment Wb57653722 [mm4m]
Wall resisting moment Ww204.167 [mm3m]
Unit weight of drilling fluid γdrill fluid 13 [kN/m3]
Maximum modulus of subgrade reaction kv;max 20467.554 [kN/m3]
Maximum neutral vertical soil load qv;n;r;max 154.787 [kN/m2]
Maximum traffic load qT;max 5 [kN/m2]
Max. red. neutral vertical soil load (incl. traffic load) qv;n;r;maxT 154.787 [kN/m2]
Max. corrected red. soil load (without traffic load) qn241.467 [kN/m2]
Max. corrected red. soil load (incl. traffic load) qnT 241.467 [kN/m2]
Maximum neutral horizontal soil load qh;n;r 101.846 [kN/m2]
Soil reaction - Left curve qr;left 52.606 [kN/m2]
Soil reaction - Right curve qr;right 65.131 [kN/m2]
Soil reaction - Left curve (long term) qr;left n.a. [kN/m2]
Soil reaction - Right curve (long term) qr;right n.a. [kN/m2]
Characteristic stiffness pipeline-soil λ0.0001771 [mm-1]
34 of 126 Deltares
Group 3: Benchmarks from spreadsheets
Characteristic stiffness pipeline-soil (long term) λlong n.a. [mm-1]
The total pulling force is the contribution of five components. Two cases are checked:
Case A (bm3-7a): pulling direction from left to right (see results in Table 3.59);
Case B (bm3-7b): pulling direction from right to left (see results in Table 3.60).
Table 3.59: Analytical results for the calculation of the five components of the pulling force
for the 10 characteristic points for case a
Charac. Length T1T2T3a T3b T3c Total
point [m] [kN] [kN] [kN] [kN] [kN] [kN]
1 0 4610.36 0 0 0 0 4610.36
2 43.04 4499.5 201.29 0 0 0 4700.79
3 338 3739.7 0 1379.62 839.93 418.44 6578.99
4 403.91 3569.92 308.29 0 0 0 6717.5
5 648.25 2940.5 0 2702.75 889.15 0 9679.98
6 769.54 2628.08 567.29 0 0 0 9934.85
7 1293.14 1279.33 0 3540.94 1797.78 0 13924.82
8 1440.63 899.4 689.86 0 0 0 14234.75
9 1715.52 191.31 0 1285.74 1039.92 823.38 16675.7
10 1789.79 0 347.38 0 0 0 16831.77
Table 3.60: Analytical results for the calculation of the five components of the pulling force
for the 10 characteristic points for case b
Charac. Length T1T2T3a T3b T3c Total
point [m] [kN] [kN] [kN] [kN] [kN] [kN]
10 0 4610.36 0 0 0 0 4610.36
9 74.27 4419.05 347.38 0 0 0 4766.42
8 349.16 3710.95 0 1285.74 1039.92 499.97 6883.96
7 496.65 3331.03 689.86 0 0 0 7193.89
6 1020.25 1982.28 0 3540.94 1372.13 0 10758.22
5 1141.53 1669.86 567.29 0 0 0 11013.08
4 1385.88 1040.44 0 2702.75 1336.7 0 14423.12
3 1451.79 870.66 308.29 0 0 0 14561.63
2 1746.75 110.86 0 1379.62 839.93 724.1 16745.49
1 1789.79 0 201.29 0 0 0 16835.92
Deltares 35 of 126
D-GEO PIPELINE
, Verification Report
3.7.3 D-GEO PIPELINE results
D-GEO PIPELINE
results presented in the tables below can be found in the Report.
Table 3.61: Results of benchmark 3-07a, Vertical soil stresses
Benchmark
D-GEO PIPELINE
Relative error
Vert. qv;p qv;n qv;r;n qv;p qv;n qv;r;n qv;p qv;n qv;r;n
[-] [kN/m2] [kN/m2] [kN/m2] [kN/m2] [kN/m2] [kN/m2] [%] [%] [%]
1 24 19 19 24 19 19 0.00 0.00 0.00
2 74 24 24 74 24 24 0.00 0.00 0.00
3 582 114 52 582 114 53 0.00 0.00 1.89
4 913 156 60 913 156 59 0.00 0.00 1.69
5 2006 442 52 2006 442 52 0.00 0.00 0.00
6 1610 346 107 1610 346 107 0.00 0.00 0.00
7 284 155 155 284 155 155 0.00 0.00 0.00
8 203 83 83 204 83 83 0.49 0.00 0.00
Table 3.62: Results of benchmark 3-07a, Neutral horizontal soil stress and bearing ca-
pacities
Benchmark
D-GEO PIPELINE
Relative error
Vert. qh;n Pv;e Ph;e qh;n Pv;e Ph;e qh;n Pv;e Ph;e
[-] [kN/m2] [kN/m2] [kN/m2] [kN/m2] [kN/m2] [kN/m2] [%] [%] [%]
1 12 442 98 12 442 99 0.00 0.00 1.01
2 16 196 115 16 196 115 0.00 0.00 0.00
3 34 3332 794 35 3332 794 2.86 0.00 0.00
4 39 4449 1020 39 4449 1020 0.00 0.00 0.00
5 34 21154 2006 34 21154 2006 0.00 0.00 0.00
6 71 16672 1610 71 16672 1610 0.00 0.00 0.00
7 102 1233 284 102 1233 284 0.00 0.00 0.00
8 55 831 211 55 831 211 0.00 0.00 0.00
Table 3.63: Results of benchmark 3-07a, Vertical and horizontal moduli of subgrade re-
action
Benchmark
D-GEO PIPELINE
Relative error
Vert. kv;top kv;bot khkv;top kv;bot khkv;top kv;bot kh
[-] [kN/m3] [kN/m3] [kN/m3] [kN/m3] [kN/m3] [kN/m3] [%] [%] [%]
1 253 190 133 253 190 133 0.00 0.00 0.00
2 188 2365 1655 188 2365 1655 0.00 0.00 0.00
3 3871 12208 8546 3871 12208 8546 0.00 0.00 0.00
4 9140 13024 9117 9140 13024 9117 0.00 0.00 0.00
5 8287 9074 6352 8287 9074 6352 0.00 0.00 0.00
6 10516 7949 5564 10516 7949 5564 0.00 0.00 0.00
7 184 309 216 184 309 216 0.00 0.00 0.00
8 233 166 116 233 166 116 0.00 0.00 0.00
36 of 126 Deltares
Group 3: Benchmarks from spreadsheets
Table 3.64: Results of benchmark 3-07a, Maximal axial friction and displacements
Benchmark
D-GEO PIPELINE
Relative error
Vert. tmax dv dmax tmax dv dmax tmax dv dmax
[-] [kN/m2] [mm] [mm] [kN/m2] [mm] [mm] [%] [%] [%]
1 0.35 5 8 0 5 8 0.00 0.00 0.00
2 0.35 10 8 0 10 8 0.00 0.00 0.00
3 0.35 20 8 0 20 8 0.00 0.00 0.00
4 0.35 40 8 0 40 8 0.00 0.00 0.00
5 0.35 80 8 0 80 8 0.00 0.00 0.00
6 0.35 60 8 0 60 8 0.00 0.00 0.00
7 0.35 50 8 0 50 8 0.00 0.00 0.00
8 0.35 35 8 0 35 8 0.00 0.00 0.00
Table 3.65: Results of benchmark 3-07a, Pulling forces in the pipeline
Benchmark
D-GEO PIPELINE
Relative error
Charac. points Length Force Length Force Length Force
[m] [kN] [m] [kN] [%] [%]
T1 0 4610 0 4610 0.00 0.00
T2 43 4701 43 4701 0.00 0.00
T3 338 6579 338 6579 0.00 0.00
T4 1441 14235 1441 14235 0.00 0.00
T5 1716 16676 1716 16676 0.00 0.00
T6 1790 16832 1790 16832 0.00 0.00
Max. rep. pulling force - 0 - 0 - 0.00
Table 3.66: Results of benchmark 3-07b, Pulling forces in the pipeline
Benchmark
D-GEO PIPELINE
Relative error
Charac. points Length Force Length Force Length Force
[m] [kN] [m] [kN] [%] [%]
T1 0 4610 0 4610 0.00 0.00
T2 74 4766 74 4766 0.00 0.00
T3 349 6884 349 6884 0.00 0.00
T4 1452 14562 1452 14562 0.00 0.00
T5 1747 16745 1747 16745 0.00 0.00
T6 1790 16836 1790 16836 0.00 0.00
Max. rep. pulling force - 0 - 0 - 0.00
Use
D-GEO PIPELINE
input files bm3-7a.dri and bm3-7b.dri to run this benchmark.
3.8 Special strength analysis
3.8.1 Description
The same input values as for benchmark 3-7a (section 3.7) are used. Calculations are per-
formed using the Special Stress Analysis calculation which means that the maximum modulus
of subgrade reaction and the maximum reduced soil load are input values instead of calcu-
lated values: kV;max = 45000 kN/m3,qn;max = 0.14 N/mm2and R= 700 m.
Deltares 37 of 126
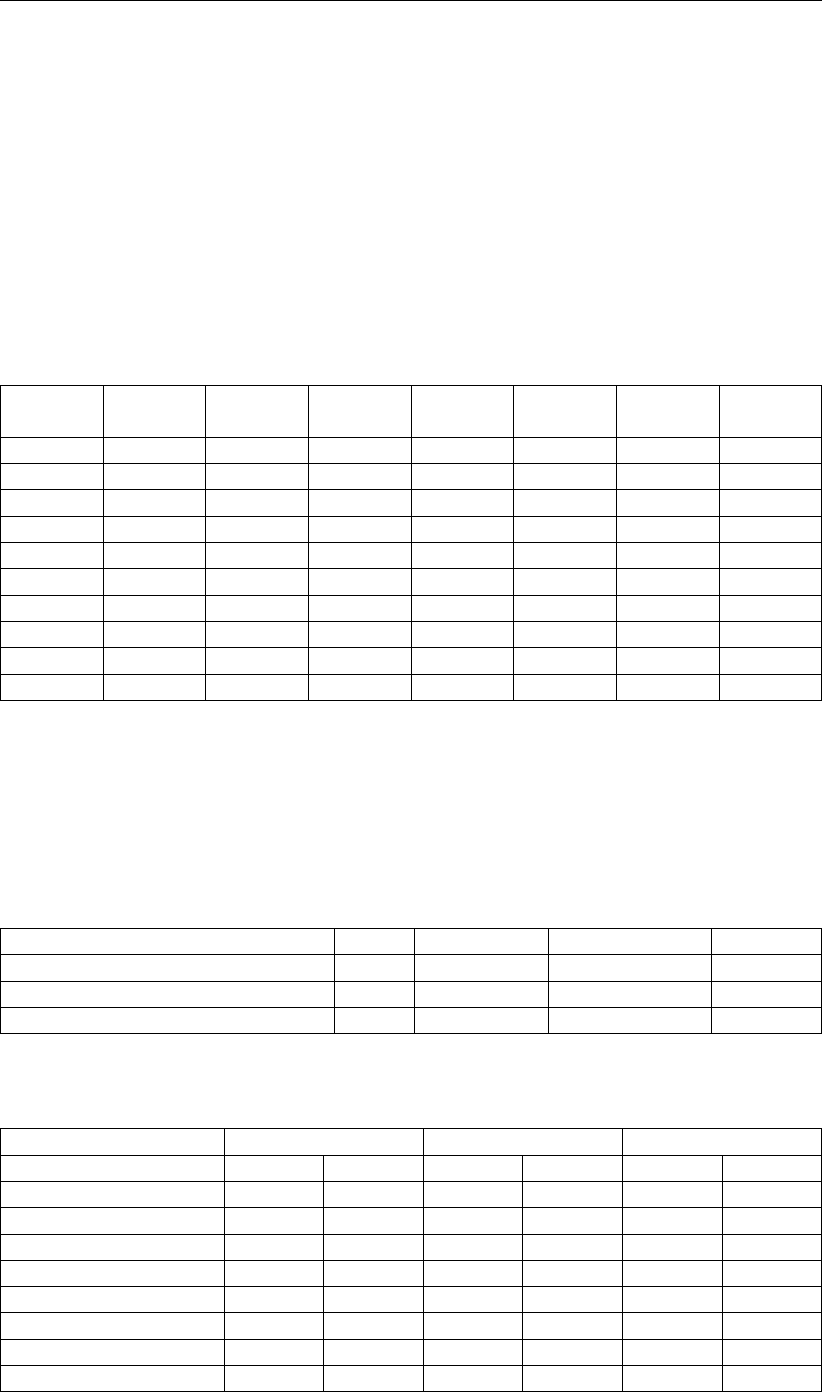
D-GEO PIPELINE
, Verification Report
3.8.2 Analytical results
Analytical results are worked out in an Excel spreadsheet.
Strength calculation
For the buoyancy control, the pulling forces in the pipeline and the strength calculation, cal-
culations are performed using the formulas given in chapter “Strength pipeline calculation” in
the Background section of the User Manual of
D-GEO PIPELINE
. The total pulling force is the
contribution of five components. Results are given in Table 3.67.
Table 3.67: Analytical results for the calculation of the five components of the pulling force
for the 10 characteristic points (bm3-08)
Charac. Length T1T2T3a T3b T3c Total
point [m] [kN] [kN] [kN] [kN] [kN] [kN]
2 43.04 4499.5 201.29 0 0 0 4700.79
3 338 3739.7 0 1379.62 1022.78 430.86 6774.25
4 403.91 3569.92 308.29 0 0 0 6912.76
5 648.25 2940.5 0 3042.32 944.88 0 10270.54
6 769.54 2628.08 567.29 0 0 0 10525.4
7 1293.14 1279.33 0 3778.64 1926.4 0 14881.69
8 1440.63 899.4 689.86 0 0 0 15191.62
9 1715.52 191.31 0 1285.74 1266.3 856.4 17891.97
10 1789.79 0 347.38 0 0 0 18048.04
0000000
3.8.3 D-GEO PIPELINE results
ASpecial Stress Analysis calculation must be performed by selecting Special Stress Analysis
for the Start menu.
D-GEO PIPELINE
results presented in the tables below can be found in the
Report.
Table 3.68: Results of benchmark 3-08, Buoyancy Control
Result Unit Benchmark
D-GEO PIPELINE
Error [%]
Uplift forces [kg/m] 2297 2297 0.00
Weight of pipeline (incl. filling) [kg/m] 1288 1288 0.00
Effective weight of pipe [kg/m] 1009 1009 0.00
Table 3.69: Results of benchmark 3-08, Pulling forces in the pipeline
Benchmark
D-GEO PIPELINE
Relative error
Charac. points Length Force Length Force Length Force
[m] [kN] [m] [kN] [%] [%]
T1 0 4610 0 4610 0.00 0.00
T2 43 4701 43 4701 0.00 0.00
T3 338 6774 338 6774 0.00 0.00
T4 1441 15192 1441 15192 0.00 0.00
T5 1716 17892 1716 17892 0.00 0.00
T6 1790 18048 1790 18048 0.00 0.00
Max. rep. pulling force - 0 - 0 - 0.00
38 of 126 Deltares
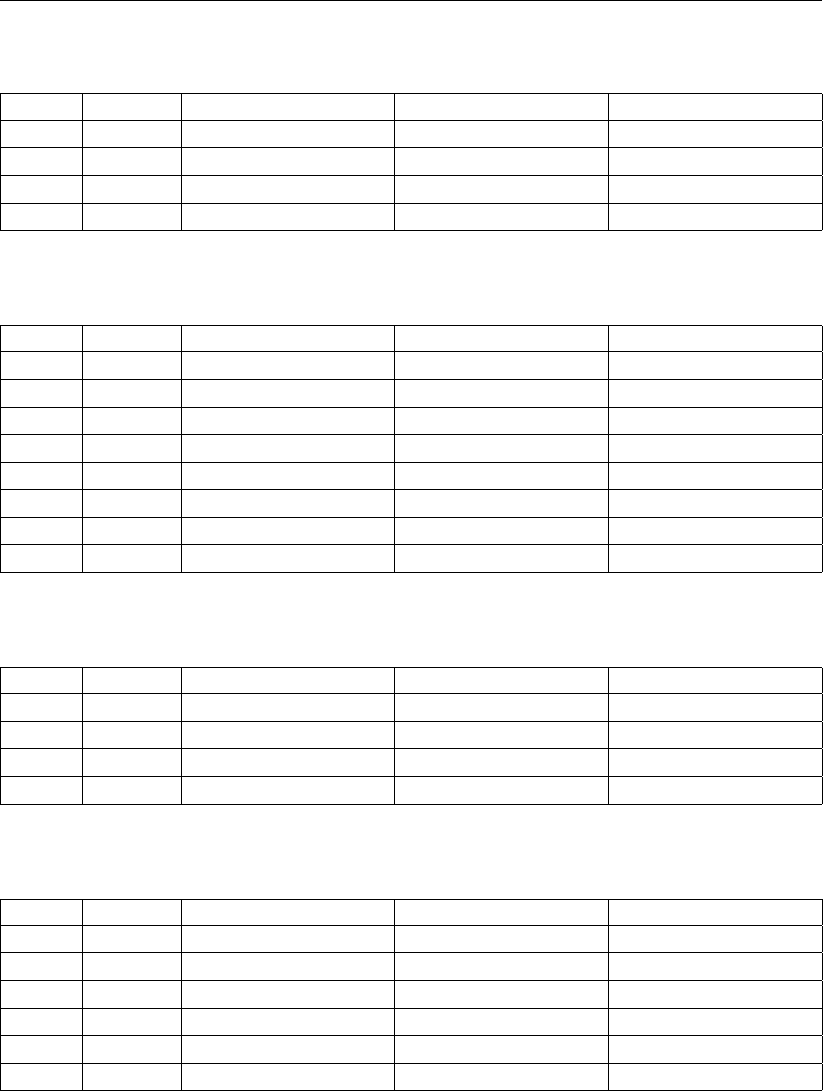
Group 3: Benchmarks from spreadsheets
Table 3.70: Results of benchmark 3-08, Strength calculation for Combination 1A
Result Unit Benchmark
D-GEO PIPELINE
Rel. error [%]
σb[N/mm2] 304 304 0.00
σt[N/mm2] 50 50 0.00
σa;max [N/mm2] 354 354 0.00
σV;max [N/mm2] 354 354 0.00
Table 3.71: Results of benchmark 3-08, Strength calculation for Combination 1B
Result Unit Benchmark
D-GEO PIPELINE
Rel. error [%]
σb[N/mm2] 347 347 0.00
σt[N/mm2] 196 196 0.00
σa;max [N/mm2] 543 543 0.00
λ[mm-1] 0.000216 0.000216 0.00
qr[N/mm2] 0.1449 0.1449 0.00
σqr [N/mm2] 57 57 0.00
σt;max [N/mm2] 57 57 0.00
σV;max [N/mm2] 574 574 0.00
Table 3.72: Results of benchmark 3-08, Strength calculation for Combination 2
Result Unit Benchmark
D-GEO PIPELINE
Rel. error [%]
σpy [N/mm2] 15 15 0.00
σpx [N/mm2] 8 8 0.00
σptest [N/mm2] 23 23 0.00
σpm [N/mm2] 13 13 0.00
Table 3.73: Results of benchmark 3-08, Strength calculation for Combination 3
Result Unit Benchmark
D-GEO PIPELINE
Rel. error [%]
σb[N/mm2] 347 347 0.00
σa;max [N/mm2] 347 347 0.00
σqr [N/mm2] 57 57 0.00
σqr [N/mm2] 164 164 0.00
σt;max [N/mm2] 222 222 0.00
σV;max [N/mm2] 496 496 0.00
Deltares 39 of 126
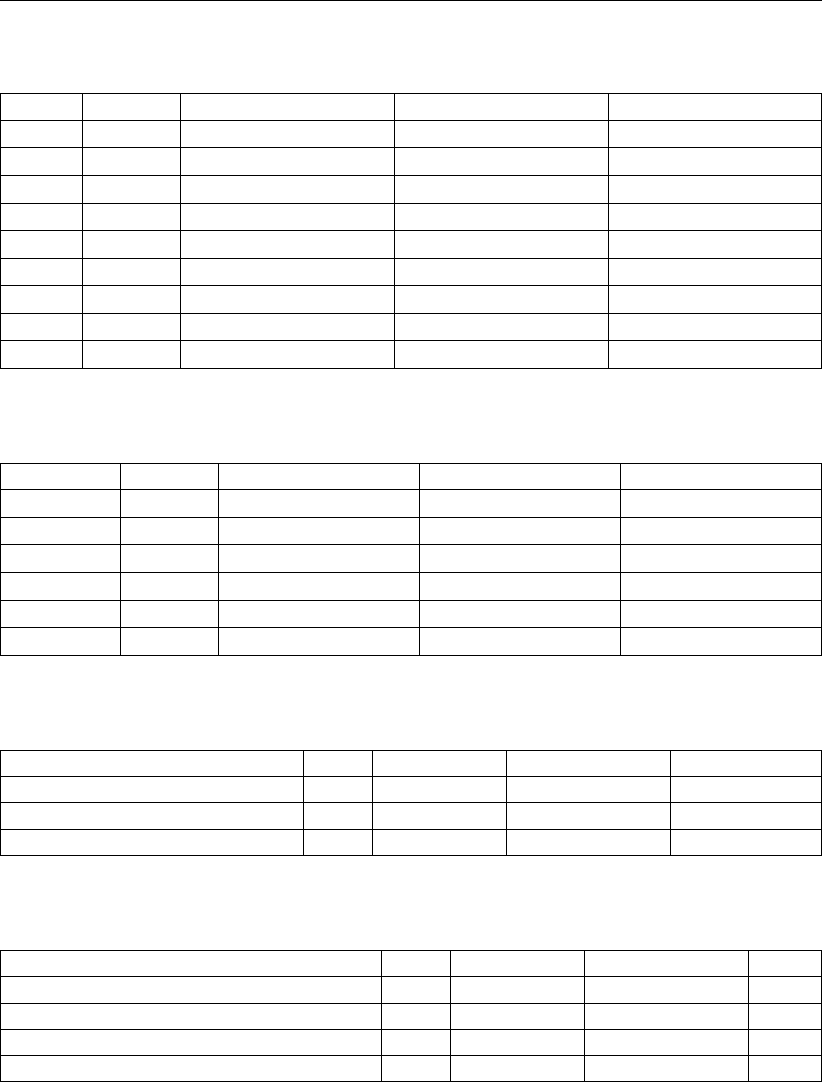
D-GEO PIPELINE
, Verification Report
Table 3.74: Results of benchmark 3-08, Strength calculation for Combination 4
Result Unit Benchmark
D-GEO PIPELINE
Rel. error [%]
σb[N/mm2] 347 347 0.00
σpy [N/mm2] 18 18 0.00
σpx [N/mm2] 9 9 0.00
σptest [N/mm2] 23 23 0.00
σptemp [N/mm2] 15 15 0.00
σa;max [N/mm2] 356 356 0.00
σqr [N/mm2] 57 57 0.00
σqr [N/mm2] 164 164 0.00
σV;max [N/mm2] 484 484 0.00
Table 3.75: Results of benchmark 3-08, Maximum allowable stresses
Result Unit Benchmark
D-GEO PIPELINE
Rel. error [%]
σptest [N/mm2] 173.91 173.91 0.00
σpy [N/mm2] 153.85 153.85 0.00
σpm [N/mm2] 169.23 169.23 0.00
σV;max [N/mm2] 261.54 261.54 0.00
σa/t (short) [N/mm2] n.a. n.a.
σa/t (long) [N/mm2] n.a. n.a.
Table 3.76: Results of benchmark 3-08, Deflection of the pipeline
Result Unit Benchmark
D-GEO PIPELINE
Rel. error [%]
Calculated [mm] 16.1 16.1 0.00
Max. allowable [mm] 255 255 0.00
Max. allow. (piggability) [mm] 120 120 0.00
Table 3.77: Results of benchmark 3-08, Implosion
Result Unit Benchmark
D-GEO PIPELINE
Error
Max. allow. external pressure (short) [kPa] n.a. n.a.
Max. allow. external pressure (long) [kPa] n.a. n.a.
Int. pressure due to 100% filling (short) [kPa] n.a. n.a.
Int. pressure due to 100% filling (long) [kPa] n.a. n.a.
Use
D-GEO PIPELINE
input file bm3-8.dri to run this benchmark.
3.9 HDD with 3D geometry – Bundled pipeline (3 steel pipes and 2 PE pipes)
40 of 126 Deltares
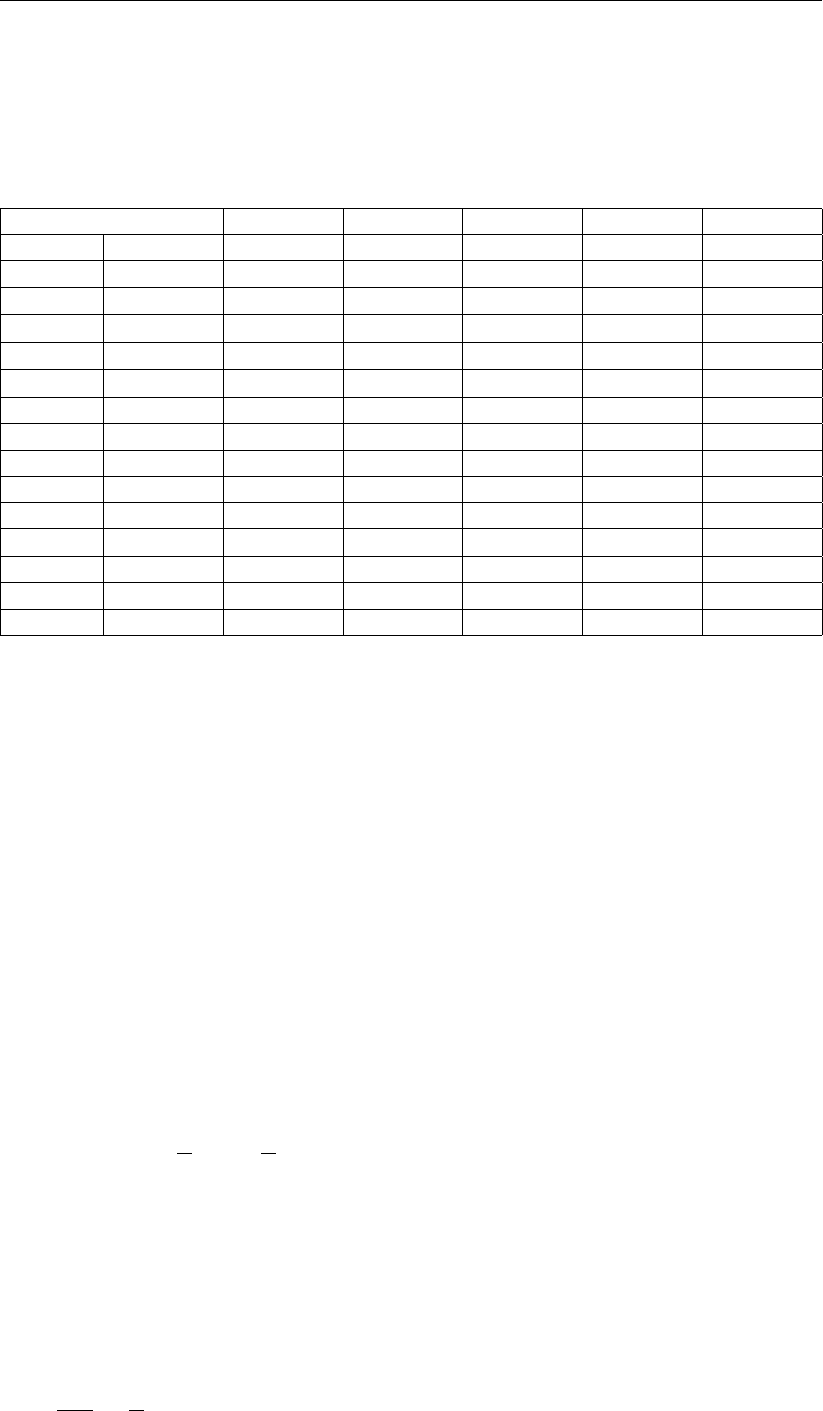
Group 3: Benchmarks from spreadsheets
3.9.1 Description
The same input as for benchmark 3-7a (section 3.7) is used except that five pipes are used
instead of one. Their characteristics are given in Table 3.78.
Table 3.78: Pipe material data (benchmark 3-09)
PE80 FE385 PE100 FE360 Steel 1
Material Synthetic Steel Synthetic Steel Steel
δt[%] 10 15 25
Eb[N/mm2] 1000 205800 1200 205800 180500
Epipe;long [N/mm2] 200 300
Reb [N/mm2] 8 385 10 360 200
Reb;long [N/mm2] 6.3 8
γm[-] 1.2 1.1 1.3
γm;test [-] 1.1 1.05 1.15
α[-] 0.65 0.5
D0[mm] 50 219.1 355 457 1000
dn[mm] 3.7 22.2 26.1 9.52 35
γb[kN/m3] 9.54 85 13 78.5 65
pd[Bar] 3 3 5 4 5
pt[Bar] 6 6 5.5 6.5 9
∆T[◦C] 5 4 6 8 10
3.9.2 Analytical results
Analytical results are worked out in an Excel spreadsheet.
Strength calculation for bundled pipelines
For the buoyancy control, the pulling forces in the pipeline and the strength calculation, cal-
culations are performed using the formulas given in chapter “Strength pipeline calculation” in
the Background section of the User Manual of
D-GEO PIPELINE
. The pulling force is calculated
for an equivalent pipeline with the parameters of the bundle:
EIeq =
n
X
i=1
EIi(3.1)
Gtot =
n
X
i=1 π
4D2
0;i −π
4(D0;i −2×dn;i)2×γi(3.2)
Deq =f×
n
X
i=1
D0;i (3.3)
Gtot
γeq
=π
4D2
eq −(Deq −2×dn;eq)2(3.4)
Deltares 41 of 126
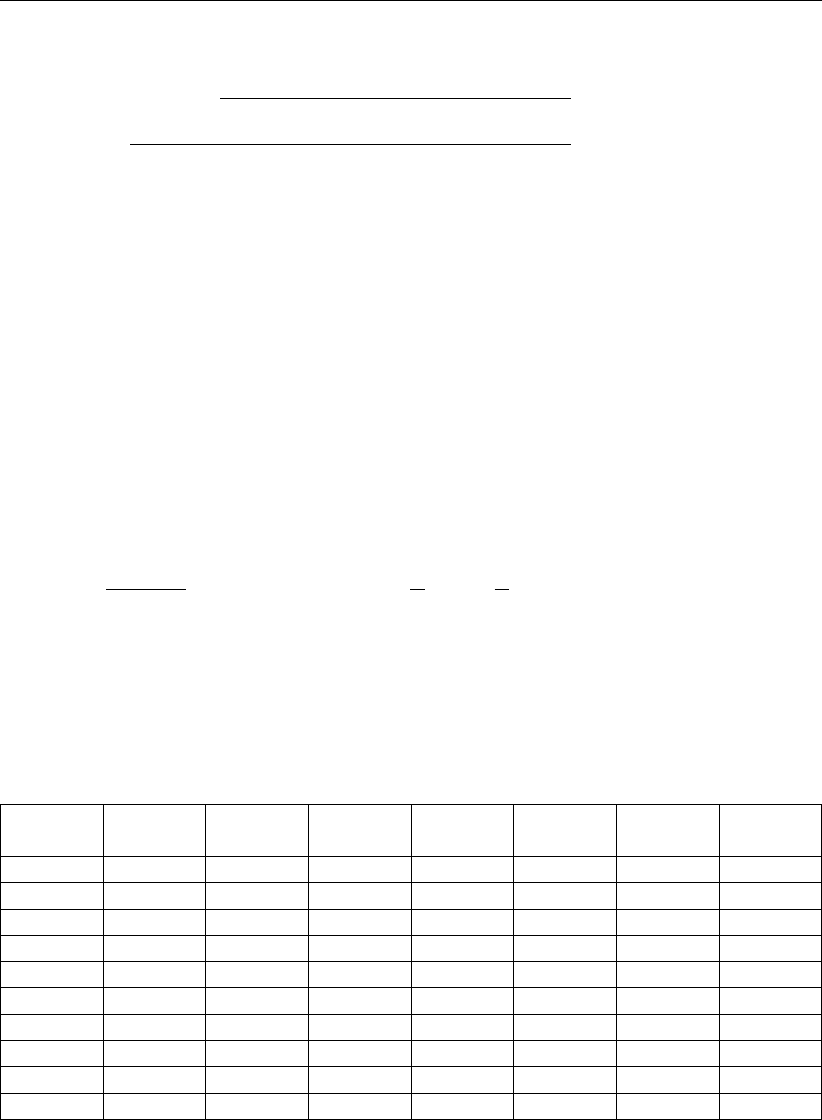
D-GEO PIPELINE
, Verification Report
dn;eq =Deq −qD2
eq −Pn
i=1 D2
0;i −(D0;i −2×dn;i)2
2(3.5)
The properties of the equivalent pipe are:
Deq [mm] 1284.11
dn;eq [mm] 41.16
γeq [kN/m3] 58.92
Ieq [m4] 0.031073
Eeq [N/mm2] 74520.87
kV;max;eq [kN/m3] 24550.63
The calculated pulling force is acting on all the pipelines in the bundle. The magnitude of the
pulling force of a single pipeline can be determined as follows:
Ti=Ai
Pn
i=1 Ai×Ttotal where Ai=π
4D2
0;i −π
4(D0;i −2×dn;i)2(3.6)
The total pulling force is the contribution of five components. Results are given in the 6 tables
below, for the equivalent pipeline and for each single pipeline.
Table 3.79: Analytical results for the calculation of the five components of the pulling force
for the 10 characteristic points (bm3-09)
Charac. Length T1T2T3a T3b T3c Total
point [m] [kN] [kN] [kN] [kN] [kN] [kN]
1 0 3887.97 0 0 0 0 3887.97
2 43.04 3794.48 103.16 0 0 0 3897.64
3 338 3153.74 0 707.01 339.9 292.32 4596.13
4 403.91 3010.56 157.99 0 0 0 4610.93
5 648.25 2479.76 0 1216.92 549.03 0 5846.09
6 769.54 2216.29 290.72 0 0 0 5873.34
7 1293.14 1078.88 0 1696.91 989.82 0 7422.66
8 1440.63 758.48 353.53 0 0 0 7455.79
9 1715.52 161.33 0 658.9 420.82 417.14 8355.52
10 1789.79 0 178.02 0 0 0 8372.2
42 of 126 Deltares

Group 3: Benchmarks from spreadsheets
Table 3.80: Analytical results for the calculation of the five components of the pulling force
for the 10 characteristic points (bm3-09)
Charac. Length T1T2T3a T3b T3c Total
point [m] [kN] [kN] [kN] [kN] [kN] [kN]
1 0 2.6 0 0 0 0 2.6
2 43.04 2.54 2.6 0 0 0 5.14
3 338 2.11 0 17.83 0 1.53 24.08
4 403.91 2.02 3.98 0 0 0 27.97
5 648.25 1.66 0 14.77 3.66 0 46.05
6 769.54 1.48 7.33 0 0 0 53.21
7 1293.14 0.72 0 31.65 10.66 0 94.76
8 1440.63 0.51 8.92 0 0 0 103.46
9 1715.52 0.11 0 16.62 0 8.25 127.93
10 1789.79 0 4.49 0 0 0 132.31
Table 3.81: Analytical results for the calculation of the five components of the pulling force
for the 10 characteristic points (bm3-09)
Charac. Length T1T2T3a T3b T3c Total
point [m] [kN] [kN] [kN] [kN] [kN] [kN]
1 0 430.7 0 0 0 0 430.7
2 43.04 420.34 19.57 0 0 0 439.92
3 338 349.36 0 134.16 7.01 34.65 544.75
4 403.91 333.5 29.98 0 0 0 558.87
5 648.25 274.7 0 124.15 62.31 0 686.52
6 769.54 245.52 55.16 0 0 0 712.5
7 1293.14 119.52 0 247.26 120.77 0 954.53
8 1440.63 84.02 67.08 0 0 0 986.12
9 1715.52 17.87 0 125.03 8.67 66.45 1120.12
10 1789.79 0 33.78 0 0 0 1136.03
Table 3.82: Analytical results for the calculation of the five components of the pulling force
for the 10 characteristic points (bm3-09)
Charac. Length T1T2T3a T3b T3c Total
point [m] [kN] [kN] [kN] [kN] [kN] [kN]
1 0 164.16 0 0 0 0 164.16
2 43.04 160.21 27.49 0 0 0 187.7
3 338 133.16 0 188.42 0.46 23.74 373.27
4 403.91 127.11 42.1 0 0 0 409.33
5 648.25 104.7 0 156.95 49.7 0 593.56
6 769.54 93.58 77.47 0 0 0 659.91
7 1293.14 45.55 0 335.07 124.81 0 1071.77
8 1440.63 32.03 94.21 0 0 0 1152.45
9 1715.52 6.81 0 175.59 0.57 88.3 1391.71
10 1789.79 0 47.44 0 0 0 1432.33
Deltares 43 of 126
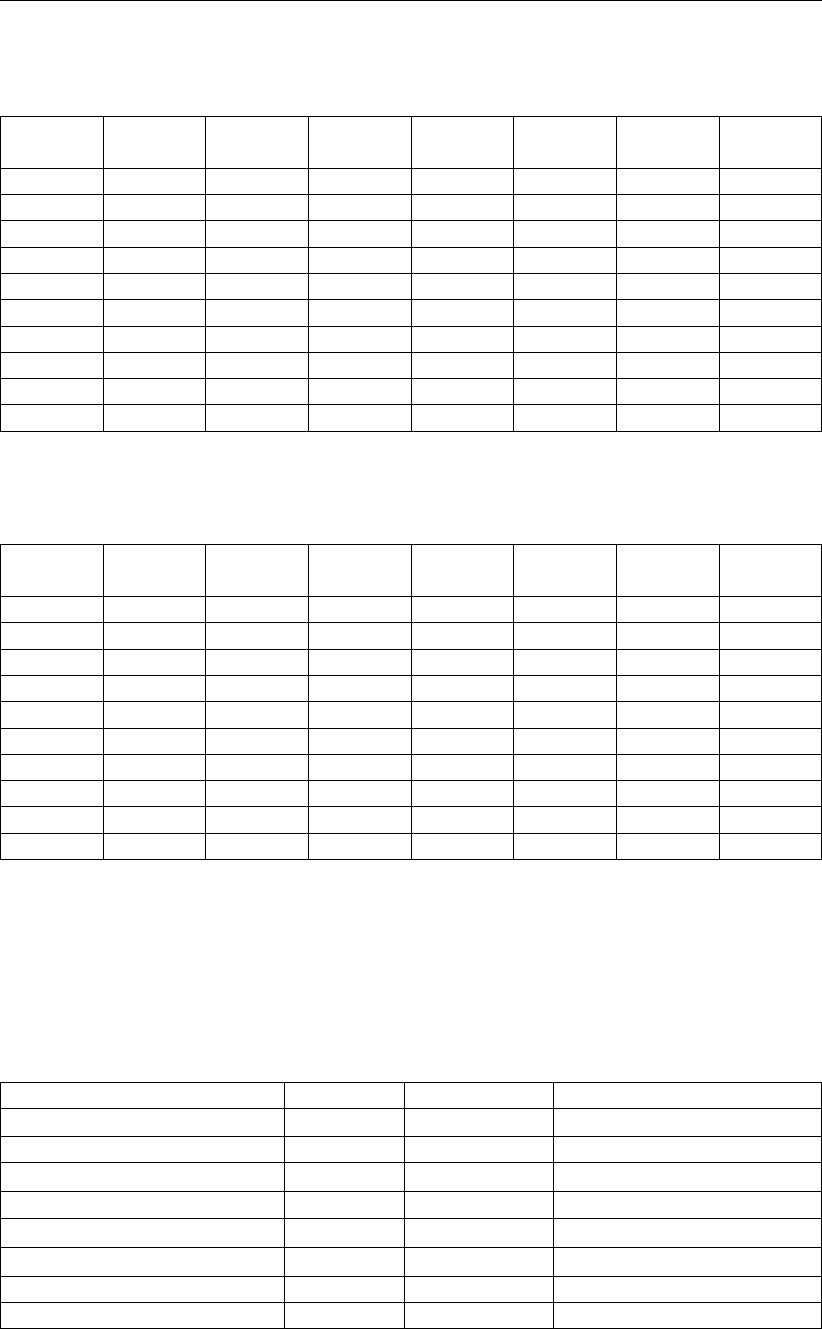
D-GEO PIPELINE
, Verification Report
Table 3.83: Analytical results for the calculation of the five components of the pulling force
for the 10 characteristic points (bm3-09)
Charac. Length T1T2T3a T3b T3c Total
point [m] [kN] [kN] [kN] [kN] [kN] [kN]
1 0 456.95 0 0 0 0 456.95
2 43.04 445.96 32.68 0 0 0 478.64
3 338 370.66 0 223.95 23.85 44.23 695.36
4 403.91 353.83 50.04 0 0 0 728.57
5 648.25 291.44 0 229.82 86.94 0 982.95
6 769.54 260.48 92.09 0 0 0 1044.07
7 1293.14 126.8 0 428.55 187.44 0 1526.37
8 1440.63 89.14 111.98 0 0 0 1600.7
9 1715.52 18.96 0 208.71 29.53 111.14 1879.89
10 1789.79 0 56.39 0 0 0 1917.32
Table 3.84: Analytical results for the calculation of the five components of the pulling force
for the 10 characteristic points (bm3-09)
Charac. Length T1T2T3a T3b T3c Total
point [m] [kN] [kN] [kN] [kN] [kN] [kN]
1 0 2833.56 0 0 0 0 2833.56
2 43.04 2765.42 76.94 0 0 0 2842.36
3 338 2298.45 0 527.34 324.47 219.2 3446.4
4 403.91 2194.1 117.84 0 0 0 3459.89
5 648.25 1807.25 0 1039.44 425.87 0 4538.35
6 769.54 1615.24 216.84 0 0 0 4563.17
7 1293.14 786.29 0 1357.92 782.44 0 5874.58
8 1440.63 552.78 263.69 0 0 0 5904.76
9 1715.52 117.58 0 491.46 401.73 323.45 6686.2
10 1789.79 0 132.78 0 0 0 6701.4
In this benchmark, the stiffness of the steel and PE materials is significantly different. There-
fore, a different approach is applied. In addition to the previous equation, the total pulling force
is divided over the stiff steel pipelines. Table 3.85 gives the maximal calculated pulling forces
for each pipeline in both cases: single and bundled calculation.
Table 3.85: Maximal pulling forces without partial factors (bm3-09)
AiTmax;i (Single) Tmax;i (Bundled steel pipes)
[mm2][kN] [kN]
PE80 538.19 132.31 132.56
FE385 13732.47 1346.74 827.111)
PE100 26968.34 1432.33 1432.33
FE360 13383.21 892.91 806.112)
Steel 1 106107.29 6369.34 6391.123)
Bundled (all) 160729.50 8024.37
Bundled (only steel) 133222.97
1)827.11 = 8024.37 ×13732.47 / 133222.97
2)806.11 = 8024.37 ×13383.21 / 133222.97
3)6391.12 = 8024.37 ×106107.29 / 133222.97
44 of 126 Deltares
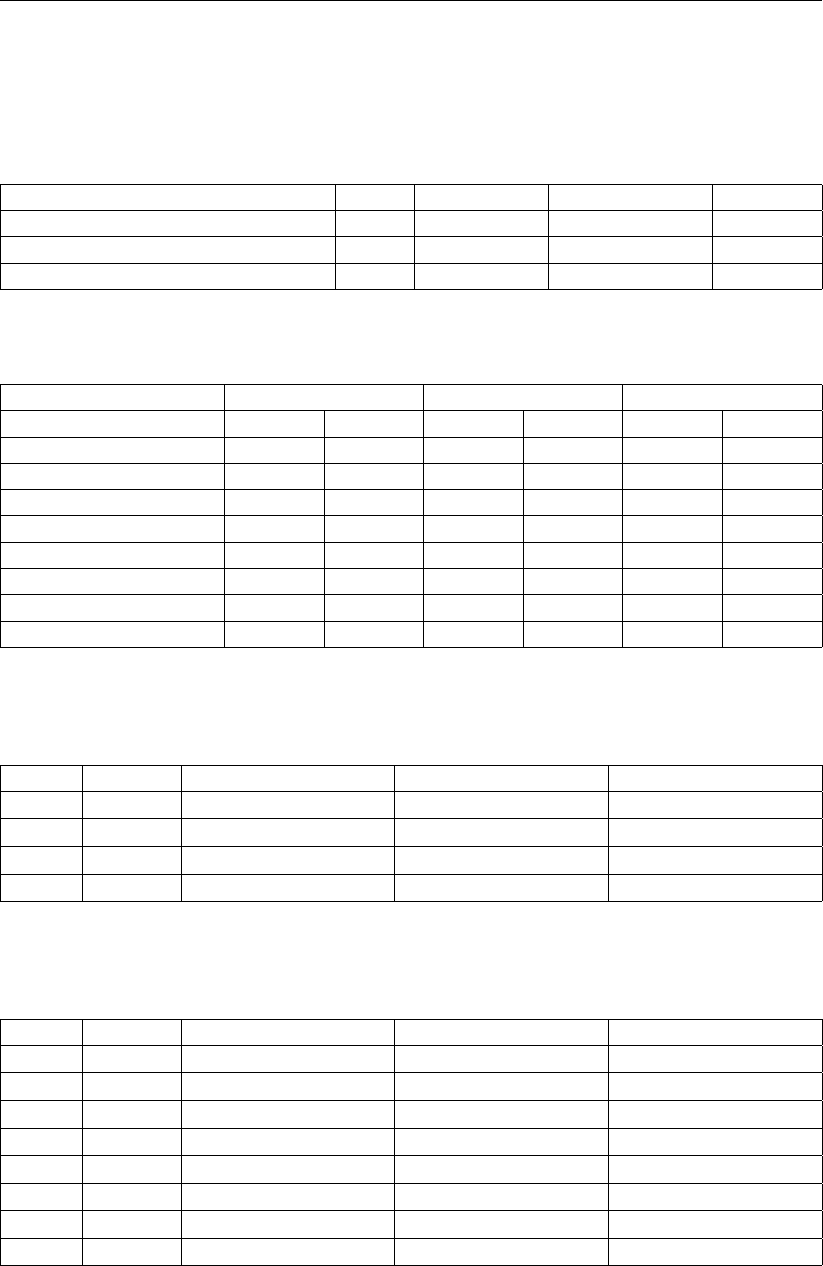
Group 3: Benchmarks from spreadsheets
3.9.3 D-GEO PIPELINE results
D-GEO PIPELINE
results presented in the tables below can be found in the Report.
Table 3.86: Results of benchmark 3-09, Buoyancy control
Result Unit Benchmark
D-GEO PIPELINE
Error [%]
Uplift forces [kg/m] 1414 1415 0.07
Weight of pipeline (incl. filling) [kg/m] 1086 1086 0.00
Effective weight of pipe [kg/m] 328 328 0.00
Table 3.87: Results of benchmark 3-09, Pulling forces in the pipeline
Benchmark
D-GEO PIPELINE
Relative error
Charac. points Length Force Length Force Length Force
[m] [kN] [m] [kN] [%] [%]
T1 0 3887.97 0 3887.97 0.00 0.00
T2 43.04 3897.64 43.04 3897.64 0.00 0.00
T3 338 4596.13 338 4596.13 0.00 0.00
T4 1440.63 7455.79 1440.63 7455.8 0.00 0.00
T5 1715.52 8355.52 1715.52 8355.52 0.00 0.00
T6 1789.79 8372.2 1789.79 8372.21 0.00 0.00
Max. rep. pulling force - 4 - 4 - 0.00
Table 3.88: Results of benchmark 3-09 for pipe nr. 1, Strength calculation for Combination
1A
Result Unit Benchmark
D-GEO PIPELINE
Rel. error [%]
σb[N/mm2] 0.04 0.04 0.00
σt[N/mm2] 5.32 5.32 0.00
σa;max [N/mm2] 5.34 5.34 0.00
σV;max [N/mm2] n.a. n.a.
Table 3.89: Results of benchmark 3-09 for pipe nr. 1, Strength calculation for Combination
1B
Result Unit Benchmark
D-GEO PIPELINE
Rel. error [%]
σb[N/mm2] 0.04 0.04 0.00
σt[N/mm2] 270.44 270.44 0.00
σa;max [N/mm2] 270.46 270.46 0.00
λ[mm-1] 0.016823 0.016823 0.00
qr[N/mm2] 0.00038 0.00038 0.00
σqr [N/mm2] 0.01 0.01 0.00
σt;max [N/mm2] 0.01 0.01 0.00
σV;max [N/mm2] n.a. n.a.
Deltares 45 of 126

D-GEO PIPELINE
, Verification Report
Table 3.90: Results of benchmark 3-09 for pipe nr. 1, Strength calculation for Combination
2
Result Unit Benchmark
D-GEO PIPELINE
Rel. error [%]
σpy [N/mm2] 1.89 1.89 0.00
σpx [N/mm2] 0.94 0.94 0.00
σptest [N/mm2] 3.78 3.78 0.00
σpm [N/mm2] 1.64 1.64 0.00
Table 3.91: Results of benchmark 3-09 for pipe nr. 1, Strength calculation for Combination
3
Result Unit Benchmark
D-GEO PIPELINE
Rel. error [%]
σb[N/mm2] 0.01 0.01 0.00
σa;max [N/mm2] 0.01 0.01 0.00
σqr [N/mm2] 0.01 0.01 0.00
σqn [N/mm2] 5.96 5.96 0.00
σt;max [N/mm2] 3.88 3.88 0.00
σV;max [N/mm2] n.a. n.a.
Table 3.92: Results of benchmark 3-09 for pipe nr. 1, Strength calculation for Combination
4
Result Unit Benchmark
D-GEO PIPELINE
Rel. error [%]
σb[N/mm2] 0.01 0.01 0.00
σpy [N/mm2] 1.89 1.89 0.00
σpx [N/mm2] 0.94 0.94 0.00
σptest [N/mm2] 3.78 3.78 0.00
σptemp [N/mm2] 0.18 0.18 0.00
σa;max [N/mm2] 0.95 0.95 0.00
σqr [N/mm2] 0.01 0.01 0.00
σqn [N/mm2] 5.96 5.96 0.00
σV;max [N/mm2] n.a. n.a.
Table 3.93: Results of benchmark 3-09 for pipe nr. 1, Maximum allowable stresses
Result Unit Benchmark
D-GEO PIPELINE
Rel. error [%]
σptest [N/mm2] 6.4 6.4 0.00
σpy [N/mm2] 5.04 5.04 0.00
σpm [N/mm2] n.a. n.a.
σV;max [N/mm2] n.a. n.a.
σa/t (short) [N/mm2] 6.4 6.4 0.00
σa/t (long) [N/mm2] 5.04 5.04 0.00
Table 3.94: Results of benchmark 3-09 for pipe nr. 1, Deflection of the pipeline
Result Unit Benchmark
D-GEO PIPELINE
Rel. error [%]
Calculated [mm] 2.4 2.4 0.00
Max. allowable [mm] 4 4 0.00
Max. allow. (piggability) [mm] 2.8 2.8 0.00
46 of 126 Deltares

Group 3: Benchmarks from spreadsheets
Table 3.95: Results of benchmark 3-09 for pipe nr. 1, Implosion
Result Unit Benchmark
D-GEO PIPELINE
Error
Max. allow. external pressure (short) [kPa] 607.55 607.55 0.00
Max. allow. external pressure (long) [kPa] 60.76 60.76 0.00
Int. pressure due to 100% filling (short) [kPa] 0 0 0.00
Int. pressure due to 100% filling (long) [kPa] 0 0 0.00
Table 3.96: Results of benchmark 3-09 for pipe nr. 2, Strength calculation for Combination
1A
Result Unit Benchmark
D-GEO PIPELINE
Rel. error [%]
σb[N/mm2] 55.83 55.83 0.00
σt[N/mm2] 42.33 42.33 0.00
σa;max [N/mm2] 98.16 98.16 0.00
σV;max [N/mm2] 98.16 98.16 0.00
Table 3.97: Results of benchmark 3-09 for pipe nr. 2, Strength calculation for Combination
1B
Result Unit Benchmark
D-GEO PIPELINE
Rel. error [%]
σb[N/mm2] 63.81 63.81 0.00
σt[N/mm2] 91.14 91.14 0.00
σa;max [N/mm2] 154.95 154.95 0.00
λ[mm-1] 0.000831 0.000831 0.00
qr[N/mm2] 0.02618 0.02618 0.00
σqr [N/mm2] 0.51 0.51 0.00
σt;max [N/mm2] 0.51 0.51 0.00
σV;max [N/mm2] 155.21 155.2 0.01
Table 3.98: Results of benchmark 3-09 for pipe nr. 2, Strength calculation for Combination
2
Result Unit Benchmark
D-GEO PIPELINE
Rel. error [%]
σpy [N/mm2] 1.66 1.66 0.00
σpx [N/mm2] 0.83 0.83 0.00
σptest [N/mm2] 2.69 2.69 0.00
σpm [N/mm2] 1.44 1.44 0.00
Table 3.99: Results of benchmark 3-09 for pipe nr. 2, Strength calculation for Combination
3
Result Unit Benchmark
D-GEO PIPELINE
Rel. error [%]
σb[N/mm2] 63.81 63.81 0.00
σa;max [N/mm2] 63.81 63.81 0.00
σqr [N/mm2] 0.51 0.51 0.00
σqn [N/mm2] 4.06 4.06 0.00
σt;max [N/mm2] 4.57 4.57 0.00
σV;max [N/mm2] 66.21 66.21 0.00
Deltares 47 of 126

D-GEO PIPELINE
, Verification Report
Table 3.100: Results of benchmark 3-09 for pipe nr. 2, Strength calculation for Combina-
tion 4
Result Unit Benchmark
D-GEO PIPELINE
Rel. error [%]
σb[N/mm2] 63.81 63.81 0.00
σpy [N/mm2] 1.96 1.96 0.00
σpx [N/mm2] 0.98 0.98 0.00
σptest [N/mm2] 2.69 2.69 0.00
σptemp [N/mm2] 11.56 11.56 0.00
σa;max [N/mm2] 64.79 64.79 0.00
σqr [N/mm2] 0.51 0.51 0.00
σqn [N/mm2] 4.06 4.06 0.00
σV;max [N/mm2] 66.27 66.27 0.00
Table 3.101: Results of benchmark 3-09 for pipe nr. 2, Maximum allowable stresses
Result Unit Benchmark
D-GEO PIPELINE
Rel. error [%]
σptest [N/mm2] 350 350 0.00
σpy [N/mm2] 320.83 320.83 0.00
σpm [N/mm2] 352.92 352.92 0.00
σV;max [N/mm2] 545.42 545.42 0.00
σa/t (short) [N/mm2] n.a. n.a.
σa/t (long) [N/mm2] n.a. n.a.
Table 3.102: Results of benchmark 3-09 for pipe nr. 2, Deflection of the pipeline
Result Unit Benchmark
D-GEO PIPELINE
Rel. error [%]
Calculated [mm] 0 0 0.00
Max. allowable [mm] 37.2 37.2 0.00
Max. allow. (piggability) [mm] 17.5 17.5 0.00
Table 3.103: Results of benchmark 3-09 for pipe nr. 2, Implosion
Result Unit Benchmark
D-GEO PIPELINE
Error
Max. allow. external pressure (short) [kPa] n.a. n.a.
Max. allow. external pressure (long) [kPa] n.a. n.a.
Int. pressure due to 100% filling (short) [kPa] n.a. n.a.
Int. pressure due to 100% filling (long) [kPa] n.a. n.a.
Table 3.104: Results of benchmark 3-09 for pipe nr. 3, Strength calculation for Combina-
tion 1A
Result Unit Benchmark
D-GEO PIPELINE
Rel. error [%]
σb[N/mm2] 0.31 0.31 0.00
σt[N/mm2] 6.7 6.7 0.00
σa;max [N/mm2] 6.85 6.85 0.00
σV;max [N/mm2] n.a. n.a.
48 of 126 Deltares

Group 3: Benchmarks from spreadsheets
Table 3.105: Results of benchmark 3-09 for pipe nr. 3, Strength calculation for Combina-
tion 1B
Result Unit Benchmark
D-GEO PIPELINE
Rel. error [%]
σb[N/mm2] 0.35 0.35 0.00
σt[N/mm2] 58.42 58.42 0.00
σa;max [N/mm2] 58.6 58.6 0.00
λ[mm-1] 0.002253 0.002253 0.00
qr[N/mm2] 0.0029 0.0029 0.00
σqr [N/mm2] 0.11 0.11 0.00
σt;max [N/mm2] 0.11 0.11 0.00
σV;max [N/mm2] n.a. n.a.
Table 3.106: Results of benchmark 3-09 for pipe nr. 3, Strength calculation for Combina-
tion 2
Result Unit Benchmark
D-GEO PIPELINE
Rel. error [%]
σpy [N/mm2] 3.17 3.17 0.00
σpx [N/mm2] 1.59 1.59 0.00
σptest [N/mm2] 3.49 3.49 0.00
σpm [N/mm2] 2.75 2.75 0.00
Table 3.107: Results of benchmark 3-09 for pipe nr. 3, Strength calculation for Combina-
tion 3
Result Unit Benchmark
D-GEO PIPELINE
Rel. error [%]
σb[N/mm2] 0.09 0.09 0.00
σa;max [N/mm2] 0.04 0.04 0.00
σqr [N/mm2] 0.05 0.05 0.00
σqn [N/mm2] 6.05 6.05 0.00
σt;max [N/mm2] 3.05 3.05 0.00
σV;max [N/mm2] n.a. n.a.
Table 3.108: Results of benchmark 3-09 for pipe nr. 3, Strength calculation for Combina-
tion 4
Result Unit Benchmark
D-GEO PIPELINE
Rel. error [%]
σb[N/mm2] 0.09 0.09 0.00
σpy [N/mm2] 3.17 3.17 0.00
σpx [N/mm2] 1.59 1.59 0.00
σptest [N/mm2] 3.49 3.49 0.00
σptemp [N/mm2] 0.32 0.32 0.00
σa;max [N/mm2] 1.63 1.63 0.00
σqr [N/mm2] 0.05 0.05 0.00
σqn [N/mm2] 6.05 6.05 0.00
σV;max [N/mm2] n.a. n.a.
Deltares 49 of 126
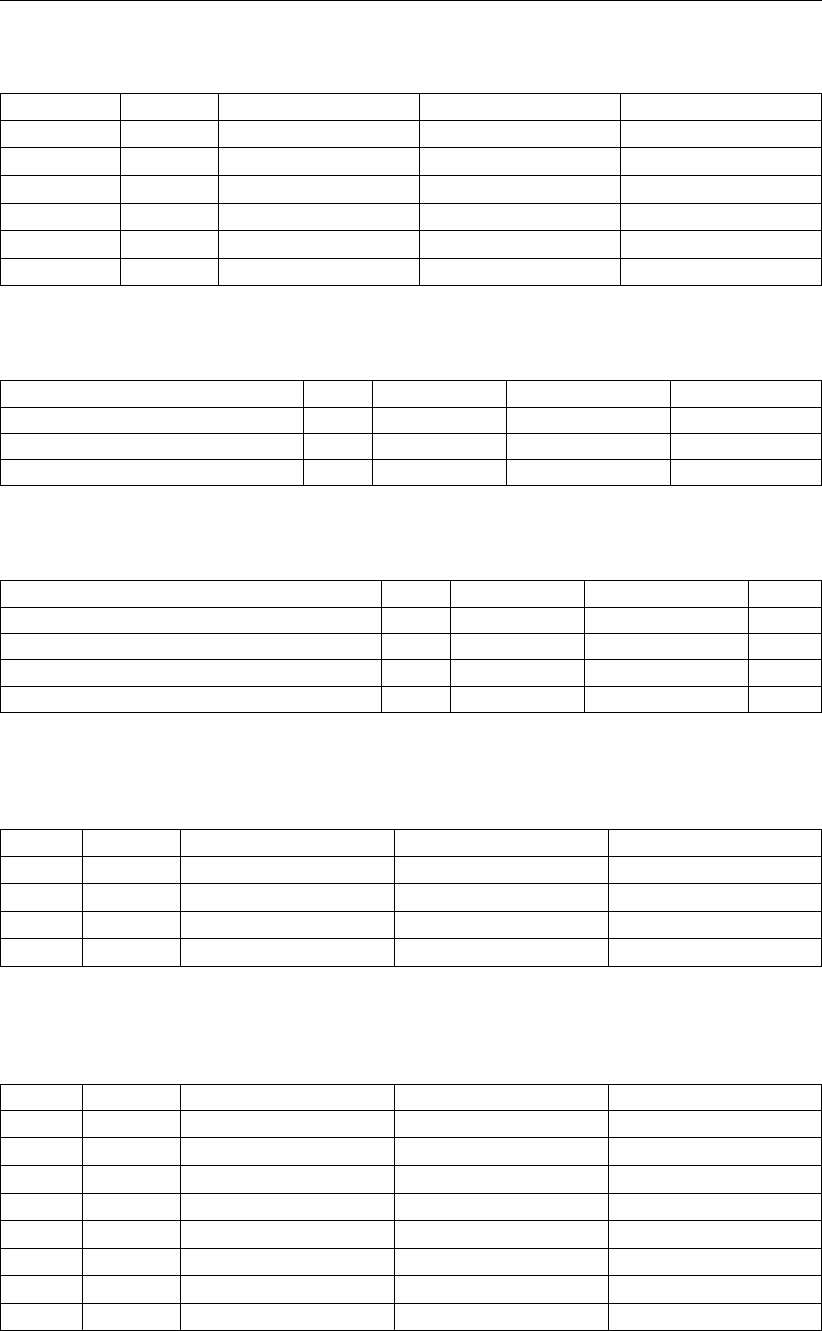
D-GEO PIPELINE
, Verification Report
Table 3.109: Results of benchmark 3-09 for pipe nr. 3, Maximum allowable stresses
Result Unit Benchmark
D-GEO PIPELINE
Rel. error [%]
σptest [N/mm2] 8 8 0.00
σpy [N/mm2] 6.4 6.4 0.00
σpm [N/mm2] n.a. n.a.
σV;max [N/mm2] n.a. n.a.
σa/t (short) [N/mm2] 8 8 0.00
σa/t (long) [N/mm2] 6.4 6.4 0.00
Table 3.110: Results of benchmark 3-09 for pipe nr. 3, Deflection of the pipeline
Result Unit Benchmark
D-GEO PIPELINE
Rel. error [%]
Calculated [mm] 11.7 11.7 0.00
Max. allowable [mm] 28.4 28.4 0.00
Max. allow. (piggability) [mm] 19.9 19.9 0.00
Table 3.111: Results of benchmark 3-09 for pipe nr. 3, Implosion
Result Unit Benchmark
D-GEO PIPELINE
Error
Max. allow. external pressure (short) [kPa] 713.89 713.89 0.00
Max. allow. external pressure (long) [kPa] 89.24 89.24 0.00
Int. pressure due to 100% filling (short) [kPa] 0 0 0.00
Int. pressure due to 100% filling (long) [kPa] 0 0 0.00
Table 3.112: Results of benchmark 3-09 for pipe nr. 4, Strength calculation for Combina-
tion 1A
Result Unit Benchmark
D-GEO PIPELINE
Rel. error [%]
σb[N/mm2] 116.46 116.46 0.00
σt[N/mm2] 45.18 45.18 0.00
σa;max [N/mm2] 161.63 161.63 0.00
σV;max [N/mm2] 161.63 161.63 0.00
Table 3.113: Results of benchmark 3-09 for pipe nr. 4, Strength calculation for Combina-
tion 1B
Result Unit Benchmark
D-GEO PIPELINE
Rel. error [%]
σb[N/mm2] 133.09 133.09 0.00
σt[N/mm2] 97.28 97.28 0.00
σa;max [N/mm2] 230.38 230.38 0.00
λ[mm-1] 0.000569 0.000569 0.00
qr[N/mm2] 0.02927 0.02927 0.00
σqr [N/mm2] 14.51 14.51 0.00
σt;max [N/mm2] 14.51 14.51 0.00
σV;max [N/mm2] 237.96 238 0.02
50 of 126 Deltares

Group 3: Benchmarks from spreadsheets
Table 3.114: Results of benchmark 3-09 for pipe nr. 4, Strength calculation for Combina-
tion 2
Result Unit Benchmark
D-GEO PIPELINE
Rel. error [%]
σpy [N/mm2] 12.2 12.2 0.00
σpx [N/mm2] 6.1 6.1 0.00
σptest [N/mm2] 16.23 16.23 0.00
σpm [N/mm2] 10.57 10.57 0.00
Table 3.115: Results of benchmark 3-09 for pipe nr. 4, Strength calculation for Combina-
tion 3
Result Unit Benchmark
D-GEO PIPELINE
Rel. error [%]
σb[N/mm2] 133.09 133.09 0.00
σa;max [N/mm2] 133.09 133.09 0.00
σqr [N/mm2] 14.51 14.51 0.00
σqn [N/mm2] 103.79 103.79 0.00
σt;max [N/mm2] 118.3 118.3 0.00
σV;max [N/mm2] 217.84 217.8 0.02
Table 3.116: Results of benchmark 3-09 for pipe nr. 4, Strength calculation for Combina-
tion 4
Result Unit Benchmark
D-GEO PIPELINE
Rel. error [%]
σb[N/mm2] 133.09 133.09 0.00
σpy [N/mm2] 14.42 14.42 0.00
σpx [N/mm2] 7.21 7.21 0.00
σptest [N/mm2] 16.23 16.23 0.00
σptemp [N/mm2] 23.12 23.12 0.00
σa;max [N/mm2] 140.31 140.31 0.00
σqr [N/mm2] 14.51 14.51 0.00
σqn [N/mm2] 103.79 103.79 0.00
σV;max [N/mm2] 216.05 216.1 0.02
Table 3.117: Results of benchmark 3-09 for pipe nr. 4, Maximum allowable stresses
Result Unit Benchmark
D-GEO PIPELINE
Rel. error [%]
σptest [N/mm2] 342.86 342.86 0.00
σpy [N/mm2] 327.27 327.27 0.00
σpm [N/mm2] 360 360 0.00
σV;max [N/mm2] 556.36 556.36 0.00
σa/t (short) [N/mm2] n.a. n.a.
σa/t (long) [N/mm2] n.a. n.a.
Table 3.118: Results of benchmark 3-09 for pipe nr. 4, Deflection of the pipeline
Result Unit Benchmark
D-GEO PIPELINE
Rel. error [%]
Calculated [mm] 2.4 2.4 0.00
Max. allowable [mm] 77.7 77.7 0.00
Max. allow. (piggability) [mm] 36.6 36.6 0.00
Deltares 51 of 126

D-GEO PIPELINE
, Verification Report
Table 3.119: Results of benchmark 3-09 for pipe nr. 4, Implosion
Result Unit Benchmark
D-GEO PIPELINE
Error
Max. allow. external pressure (short) [kPa] n.a. n.a.
Max. allow. external pressure (long) [kPa] n.a. n.a.
Int. pressure due to 100% filling (short) [kPa] n.a. n.a.
Int. pressure due to 100% filling (long) [kPa] n.a. n.a.
Table 3.120: Results of benchmark 3-09 for pipe nr. 5, Strength calculation for Combina-
tion 1A
Result Unit Benchmark
D-GEO PIPELINE
Rel. error [%]
σb[N/mm2] 223.5 223.5 0.00
σt[N/mm2] 50.9 50.9 0.00
σa;max [N/mm2] 274.41 274.41 0.00
σV;max [N/mm2] 274.41 274.41 0.00
Table 3.121: Results of benchmark 3-09 for pipe nr. 5, Strength calculation for Combina-
tion 1B
Result Unit Benchmark
D-GEO PIPELINE
Rel. error [%]
σb[N/mm2] 255.43 255.43 0.00
σt[N/mm2] 109.61 109.61 0.00
σa;max [N/mm2] 365.04 365.04 0.00
λ[mm-1] 0.000239 0.000239 0.00
qr[N/mm2] 0.07646 0.07646 0.00
σqr [N/mm2] 13.31 13.31 0.00
σt;max [N/mm2] 13.31 13.31 0.00
σV;max [N/mm2] 371.88 371.9 0.01
Table 3.122: Results of benchmark 3-09 for pipe nr. 5, Strength calculation for Combina-
tion 2
Result Unit Benchmark
D-GEO PIPELINE
Rel. error [%]
σpy [N/mm2] 10.2 10.2 0.00
σpx [N/mm2] 5.1 5.1 0.00
σptest [N/mm2] 15.02 15.02 0.00
σpm [N/mm2] 8.83 8.83 0.00
Table 3.123: Results of benchmark 3-09 for pipe nr. 5, Strength calculation for Combina-
tion 3
Result Unit Benchmark
D-GEO PIPELINE
Rel. error [%]
σb[N/mm2] 255.43 255.43 0.00
σa;max [N/mm2] 255.43 255.43 0.00
σqr [N/mm2] 13.31 13.31 0.00
σqn [N/mm2] 44.12 44.17 0.11
σt;max [N/mm2] 57.43 57.48 0.09
σV;max [N/mm2] 288.47 288.5 0.01
52 of 126 Deltares
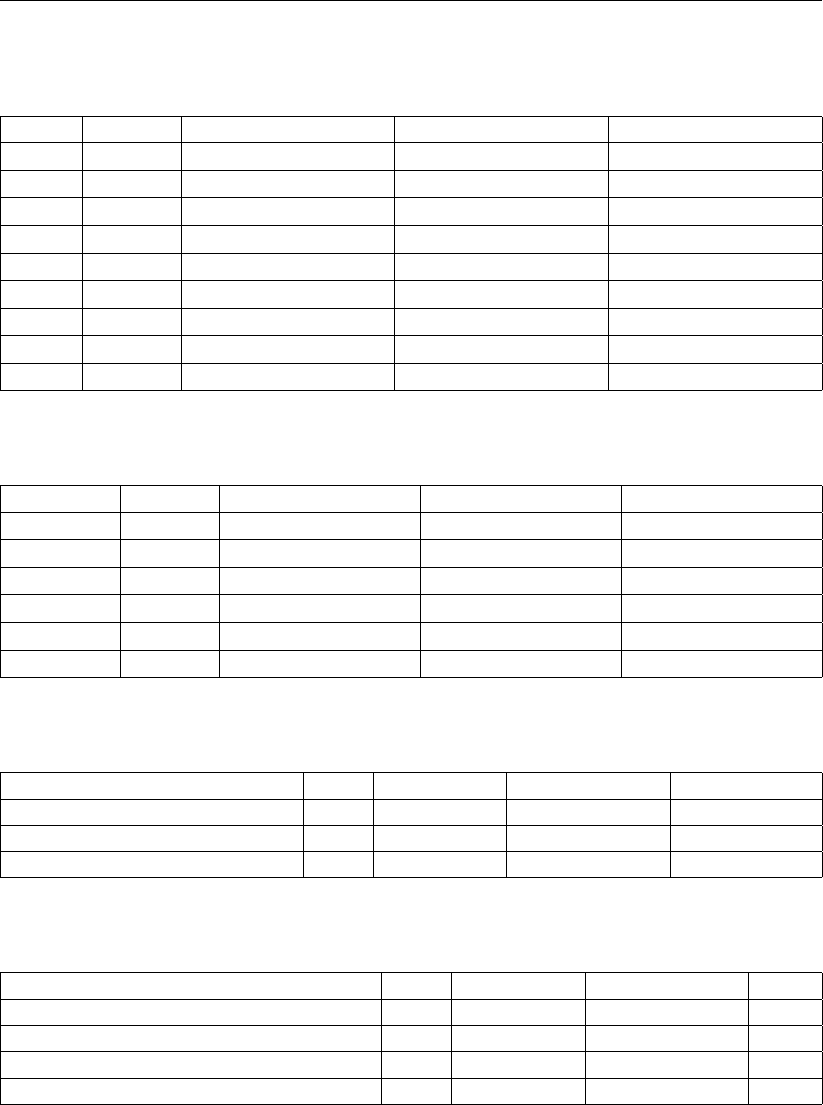
Group 3: Benchmarks from spreadsheets
Table 3.124: Results of benchmark 3-09 for pipe nr. 5, Strength calculation for Combina-
tion 4
Result Unit Benchmark
D-GEO PIPELINE
Rel. error [%]
σb[N/mm2] 255.43 255.43 0.00
σpy [N/mm2] 12.06 12.06 0.00
σpx [N/mm2] 6.03 6.03 0.00
σptest [N/mm2] 15.02 15.02 0.00
σptemp [N/mm2] 25.34 25.34 0.00
σa;max [N/mm2] 261.46 261.46 0.00
σqr [N/mm2] 13.31 13.31 0.00
σqn [N/mm2] 44.12 44.17 0.11
σV;max [N/mm2] 287.87 287.9 0.01
Table 3.125: Results of benchmark 3-09 for pipe nr. 5, Maximum allowable stresses
Result Unit Benchmark
D-GEO PIPELINE
Rel. error [%]
σptest [N/mm2] 173.91 173.91 0.00
σpy [N/mm2] 153.85 153.85 0.00
σpm [N/mm2] 169.23 169.23 0.00
σV;max [N/mm2] 261.54 261.54 0.00
σa/t (short) [N/mm2] n.a. n.a.
σa/t (long) [N/mm2] n.a. n.a.
Table 3.126: Results of benchmark 3-09 for pipe nr. 5, Deflection of the pipeline
Result Unit Benchmark
D-GEO PIPELINE
Rel. error [%]
Calculated [mm] 1.8 1.8 0.00
Max. allowable [mm] 170 170 0.00
Max. allow. (piggability) [mm] 80 80 0.00
Table 3.127: Results of benchmark 3-09 for pipe nr. 5, Implosion
Result Unit Benchmark
D-GEO PIPELINE
Error
Max. allow. external pressure (short) [kPa] n.a. n.a.
Max. allow. external pressure (long) [kPa] n.a. n.a.
Int. pressure due to 100% filling (short) [kPa] n.a. n.a.
Int. pressure due to 100% filling (long) [kPa] n.a. n.a.
Use
D-GEO PIPELINE
input file bm3-9.dri to run this benchmark.
3.10 HDD with 3D geometry – Bundled pipeline (2 PE pipes)
Deltares 53 of 126
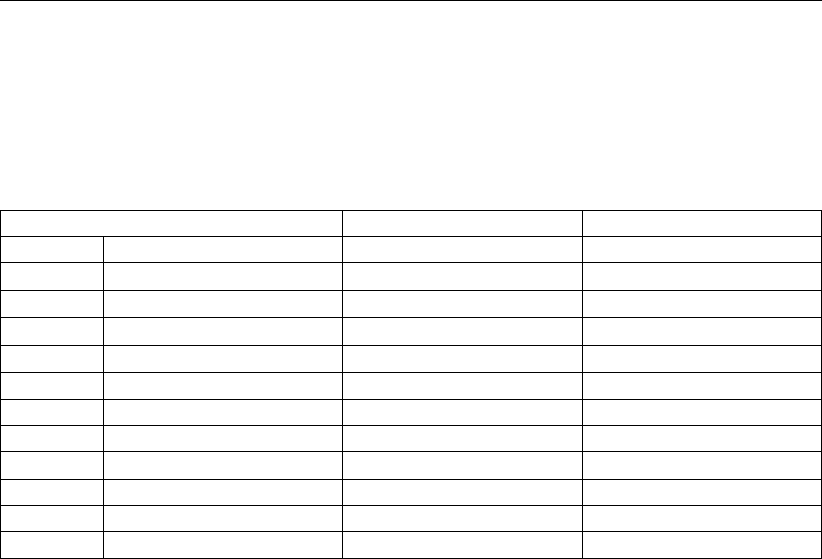
D-GEO PIPELINE
, Verification Report
3.10.1 Description
The same input as for benchmark 3-7a (section 3.7) is used except that five pipes are used
instead of one. Their characteristics are given in the table below.
Table 3.128: Pipe material data (benchmark 3-10)
PE80 PE100
Material Synthetic Synthetic
Eb[N/mm2] 1000 1200
Epipe;long [N/mm2] 200 300
Reb [N/mm2] 8 10
Reb;long [N/mm2] 6.3 8
α[-] 0.65 0.5
D0[mm] 50 355
dn[mm] 3.7 26.1
γb[kN/m3] 9.54 13
pd[Bar] 3 5
pt[Bar] 6 5.5
∆T[◦C] 5 6
3.10.2 Analytical results
Analytical results are worked out in an Excel spreadsheet.
Strength calculation for bundled pipelines
For the buoyancy control, the pulling forces in the pipeline and the strength calculation, calcu-
lations are performed using the formulas given in chapter “Strength pipeline calculation” in the
Background section of the User Manual of
D-GEO PIPELINE
. The properties of the equivalent
pipe are:
Deq [mm] 328.96
dn;eq [mm] 29.21
γeq [kN/m3] 12.93
Ieq [m4] 0.00031187
Eeq [N/mm2] 1412.43
kV;max;eq [kN/m3] 133262.93
The total pulling force is the contribution of five components. Results are given in the tables
below for the equivalent pipeline and for the 2 single pipelines.
54 of 126 Deltares

Group 3: Benchmarks from spreadsheets
Table 3.129: Analytical results for the calculation of the five components of the pulling
force for the 10 characteristic points (bm3-10) for the equivalent pipe
Charac. Length T1T2T3a T3b T3c Total
point [m] [kN] [kN] [kN] [kN] [kN] [kN]
1 0 166.76 0 0 0 0 166.76
2 43.04 162.75 26.49 0 0 0 189.25
3 338 135.27 0 181.59 0.46 23.35 367.16
4 403.91 129.13 40.58 0 0 0 401.6
5 648.25 106.36 0 151.28 48.58 0 578.69
6 769.54 95.06 74.67 0 0 0 642.06
7 1293.14 46.28 0 322.94 121.04 0 1037.25
8 1440.63 32.53 90.8 0 0 0 1114.31
9 1715.52 6.92 0 169.23 0.57 85.16 1343.66
10 1789.79 0 45.72 0 0 0 1382.46
Table 3.130: Analytical results for the calculation of the five components of the pulling
force for the 10 characteristic points (bm3-10) for pipe nr. 1
Charac. Length T1T2T3a T3b T3c Total
point [m] [kN] [kN] [kN] [kN] [kN] [kN]
1 0 2.6 0 0 0 0 2.6
2 43.04 2.54 2.6 0 0 0 5.14
3 338 2.11 0 17.83 0 1.53 24.08
4 403.91 2.02 3.98 0 0 0 27.97
5 648.25 1.66 0 14.77 3.66 0 46.05
6 769.54 1.48 7.33 0 0 0 53.21
7 1293.14 0.72 0 31.65 10.66 0 94.76
8 1440.63 0.51 8.92 0 0 0 103.46
9 1715.52 0.11 0 16.62 0 8.25 127.93
10 1789.79 0 4.49 0 0 0 132.31
Table 3.131: Analytical results for the calculation of the five components of the pulling
force for the 10 characteristic points (bm3-10) for pipe nr. 2
Charac. Length T1T2T3a T3b T3c Total
point [m] [kN] [kN] [kN] [kN] [kN] [kN]
1 0 164.16 0 0 0 0 164.16
2 43.04 160.21 27.49 0 0 0 187.7
3 338 133.16 0 188.42 0.46 23.74 373.27
4 403.91 127.11 42.1 0 0 0 409.33
5 648.25 104.7 0 156.95 49.7 0 593.56
6 769.54 93.58 77.47 0 0 0 659.91
7 1293.14 45.55 0 335.07 124.81 0 1071.77
8 1440.63 32.03 94.21 0 0 0 1152.45
9 1715.52 6.81 0 175.59 0.57 88.3 1391.71
10 1789.79 0 47.44 0 0 0 1432.33
Deltares 55 of 126
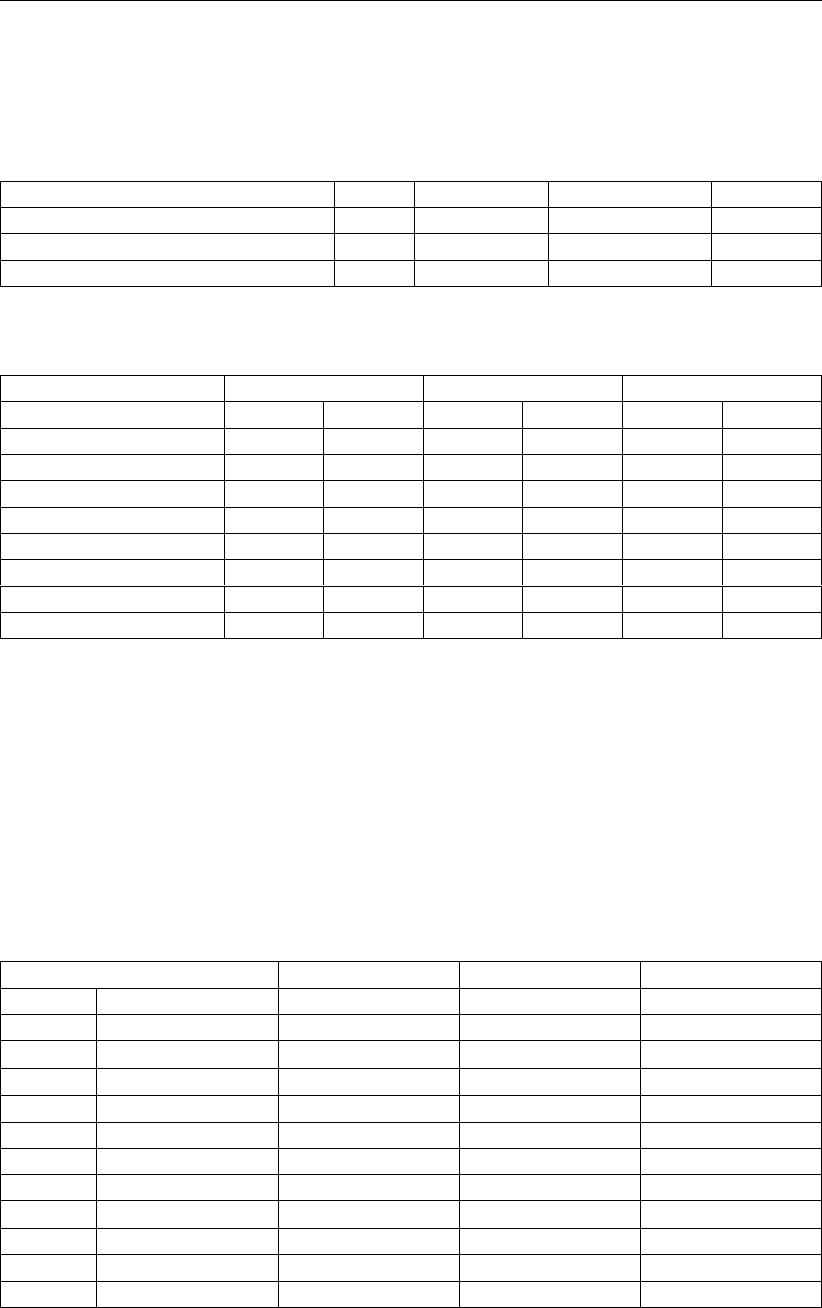
D-GEO PIPELINE
, Verification Report
3.10.3 D-GEO PIPELINE results
D-GEO PIPELINE
results presented in the tables below can be found in the Report.
Table 3.132: Results of benchmark 3-10, Buoyancy control
Result Unit Benchmark
D-GEO PIPELINE
Error [%]
Uplift forces [kg/m] 131 131 0.00
Weight of pipeline (incl. filling) [kg/m] 47 47 0.00
Effective weight of pipe [kg/m] 85 85 0.00
Table 3.133: Results of benchmark 3-10, Pulling forces in the pipeline
Benchmark
D-GEO PIPELINE
Relative error
Charac. points Length Force Length Force Length Force
[m] [kN] [m] [kN] [%] [%]
T1 0 167 0 167 0.00 0.00
T2 43 189 43 189 0.00 0.00
T3 338 367 338 367 0.00 0.00
T4 1441 1114 1441 1114 0.00 0.00
T5 1716 1344 1716 1344 0.00 0.00
T6 1790 1382 1790 1382 0.00 0.00
Max. rep. pulling force - 4 - 4 - 0.00
Use
D-GEO PIPELINE
input file bm3-10.dri to run this benchmark.
3.11 HDD with 3D geometry – Bundled pipeline (3 steel pipes)
3.11.1 Description
The same input as for benchmark 3-7a (section 3.7) is used except that five pipes are used
instead of one. Their characteristics are given in the table below.
Table 3.134: Pipe material data (benchmark 3-11)
FE385 FE360 Steel 1
Material Steel Steel Steel
δt[%] 10 15 25
Eb[N/mm2] 205800 205800 180500
Reb [N/mm2] 385 360 200
γm[-] 1.2 1.1 1.3
γm;test [-] 1.1 1.05 1.15
D0[mm] 219.1 457 1000
dn[mm] 22.2 9.52 35
γb[kN/m3] 85 78.5 65
pd[Bar] 3 4 5
pt[Bar] 6 6.5 9
∆T[◦C] 4 8 10
3.11.2 Analytical results
Analytical results are worked out in an Excel spreadsheet.
56 of 126 Deltares

Group 3: Benchmarks from spreadsheets
Strength calculation for bundled pipelines
For the buoyancy control, the pulling forces in the pipeline and the strength calculation, cal-
culations are performed using the formulas given in chapter “Strength pipeline calculation” in
the Background section of the User Manual of
D-GEO PIPELINE
[Deltares]. The properties of
the equivalent pipe are:
Deq [mm] 1205.49
dn;eq [mm] 36.27
γeq [kN/m3] 68.42
Ieq [m4] 0.0227877
Eeq [N/mm2] 101597.36
kV;max;eq [kN/m3] 25604.32
The total pulling force is the contribution of five components. Results are given in the tables
below for the equivalent pipeline and for the 3 single steel pipelines.
Table 3.135: Analytical results for the calculation of the five components of the pulling
force for the 10 characteristic points (bm3-11) for the equivalent pipe
Charac. Length T1T2T3a T3b T3c Total
point [m] [kN] [kN] [kN] [kN] [kN] [kN]
1 0 3721.21 0 0 0 0 3721.21
2 43.04 3631.73 88.51 0 0 0 3720.24
3 338 3018.47 0 606.62 338.05 275.2 4326.85
4 403.91 2881.43 135.55 0 0 0 4325.36
5 648.25 2373.4 0 1130.34 515.78 0 5463.45
6 769.54 2121.23 249.44 0 0 0 5460.71
7 1293.14 1032.6 0 1516.31 915.32 0 6803.71
8 1440.63 725.95 303.33 0 0 0 6800.39
9 1715.52 154.41 0 565.34 418.54 369.21 7581.95
10 1789.79 0 152.74 0 0 0 7580.28
Table 3.136: Analytical results for the calculation of the five components of the pulling
force for the 10 characteristic points (bm3-11) for pipe nr. 1
Charac. Length T1T2T3a T3b T3c Total
point [m] [kN] [kN] [kN] [kN] [kN] [kN]
1 0 430.7 0 0 0 0 430.7
2 43.04 420.34 19.57 0 0 0 439.92
3 338 349.36 0 134.16 7.01 34.65 544.75
4 403.91 333.5 29.98 0 0 0 558.87
5 648.25 274.7 0 124.15 62.31 0 686.52
6 769.54 245.52 55.16 0 0 0 712.5
7 1293.14 119.52 0 247.26 120.77 0 954.53
8 1440.63 84.02 67.08 0 0 0 986.12
9 1715.52 17.87 0 125.03 8.67 66.45 1120.12
10 1789.79 0 33.78 0 0 0 1136.03
Deltares 57 of 126
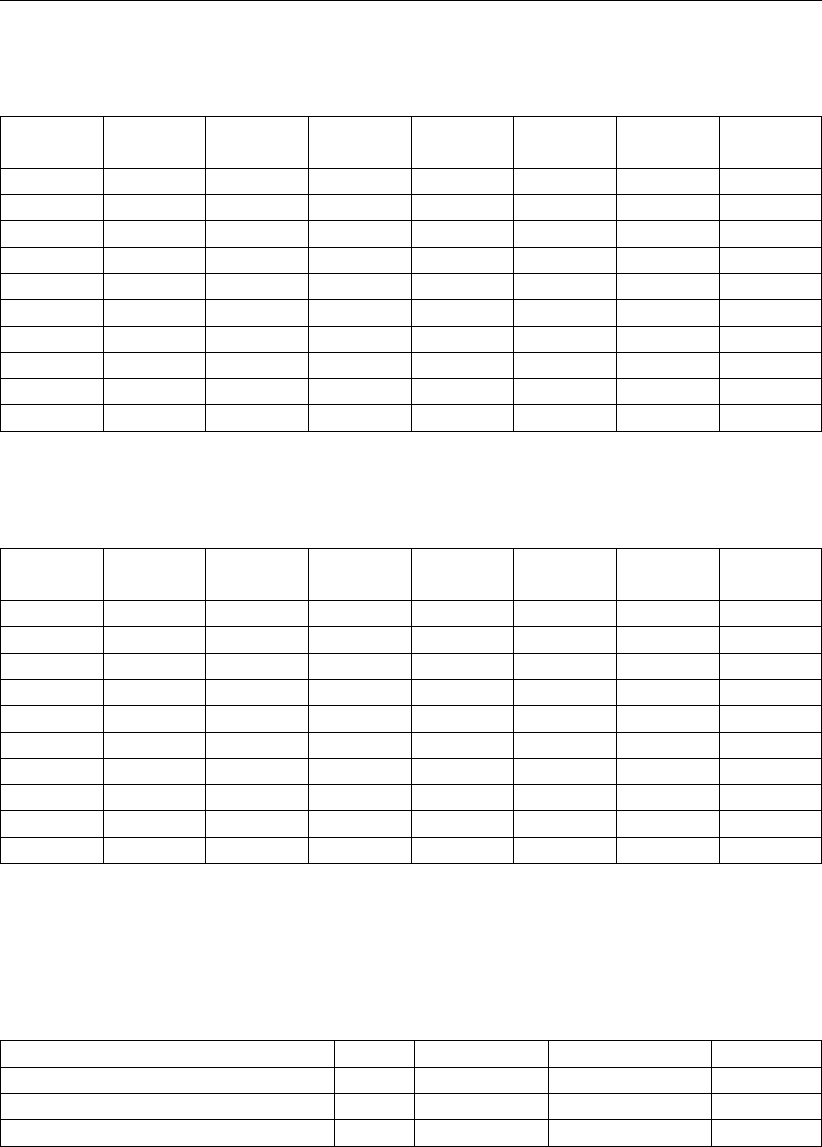
D-GEO PIPELINE
, Verification Report
Table 3.137: Analytical results for the calculation of the five components of the pulling
force for the 10 characteristic points (bm3-11) for pipe nr. 2
Charac. Length T1T2T3a T3b T3c Total
point [m] [kN] [kN] [kN] [kN] [kN] [kN]
1 0 456.95 0 0 0 0 456.95
2 43.04 445.96 32.68 0 0 0 478.64
3 338 370.66 0 223.95 23.85 44.23 695.36
4 403.91 353.83 50.04 0 0 0 728.57
5 648.25 291.44 0 229.82 86.94 0 982.95
6 769.54 260.48 92.09 0 0 0 1044.07
7 1293.14 126.8 0 428.55 187.44 0 1526.37
8 1440.63 89.14 111.98 0 0 0 1600.7
9 1715.52 18.96 0 208.71 29.53 111.14 1879.89
10 1789.79 0 56.39 0 0 0 1917.32
Table 3.138: Analytical results for the calculation of the five components of the pulling
force for the 10 characteristic points (bm3-11) for pipe nr. 3
Charac. Length T1T2T3a T3b T3c Total
point [m] [kN] [kN] [kN] [kN] [kN] [kN]
1 0 2833.56 0 0 0 0 2833.56
2 43.04 2765.42 76.94 0 0 0 2842.36
3 338 2298.45 0 527.34 324.47 219.2 3446.4
4 403.91 2194.1 117.84 0 0 0 3459.89
5 648.25 1807.25 0 1039.44 425.87 0 4538.35
6 769.54 1615.24 216.84 0 0 0 4563.17
7 1293.14 786.29 0 1357.92 782.44 0 5874.58
8 1440.63 552.78 263.69 0 0 0 5904.76
9 1715.52 117.58 0 491.46 401.73 323.45 6686.2
10 1789.79 0 132.78 0 0 0 6701.4
3.11.3 D-GEO PIPELINE results
D-GEO PIPELINE
results presented in the tables below can be found in the Report.
Table 3.139: Results of benchmark 3-11, Buoyancy control
Result Unit Benchmark
D-GEO PIPELINE
Error [%]
Uplift forces [kg/m] 1283 1283 0.00
Weight of pipeline (incl. filling) [kg/m] 1040 1040 0.00
Effective weight of pipe [kg/m] 244 244 0.00
58 of 126 Deltares
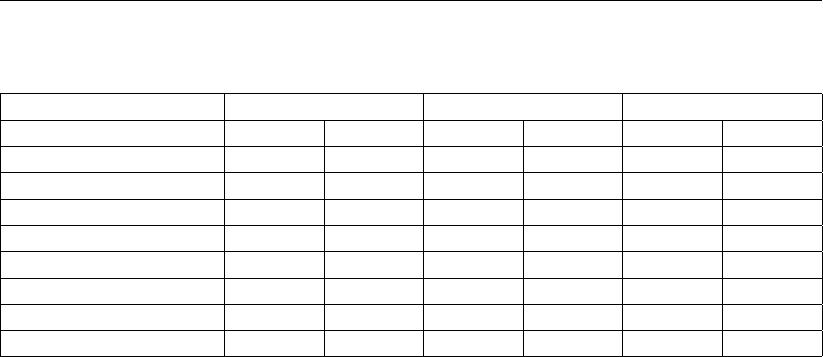
Group 3: Benchmarks from spreadsheets
Table 3.140: Results of benchmark 3-11, Pulling forces in the pipeline
Benchmark
D-GEO PIPELINE
Relative error
Charac. points Length Force Length Force Length Force
[m] [kN] [m] [kN] [%] [%]
T1 0 3721 0 3721 0.00 0.00
T2 43 3720 43 3720 0.00 0.00
T3 338 4327 338 4327 0.00 0.00
T4 1441 6800 1441 6800 0.00 0.00
T5 1716 7582 1716 7582 0.00 0.00
T6 1790 7580 1790 7580 0.00 0.00
Max. rep. pulling force - 6493 - 6493 - 0.00
Use
D-GEO PIPELINE
input file bm3-11.dri to run this benchmark.
3.12 Micro tunneling with 3D geometry – Steel pipe
3.12.1 Description
The same input data’s as for benchmark 3-7 (section 3.7) are used except that the calculation
is performed for micro tunneling instead of horizontal directional drilling. Few input values
must be added compare to HDD calculation:
Friction with injection of lubricant 7.5 [kPa]
Friction without injection of lubricant 10 [kPa]
Allowable thrust force 200 [kN]
Volume loss for surface settlement 15 [%]
Two cases are checked:
Case A (bm3-12a): thrusting direction from left to right;
Case B (bm3-12b): thrusting direction from right to left.
3.12.2 Analytical results
Analytical results are worked out in an Excel spreadsheet.
Soil mechanical data
The soil mechanical data’s are determined using the formulas given in chapter “Calculation of
soil mechanical data” in the Background section of the User Manual of
D-GEO PIPELINE
.
Deltares 59 of 126
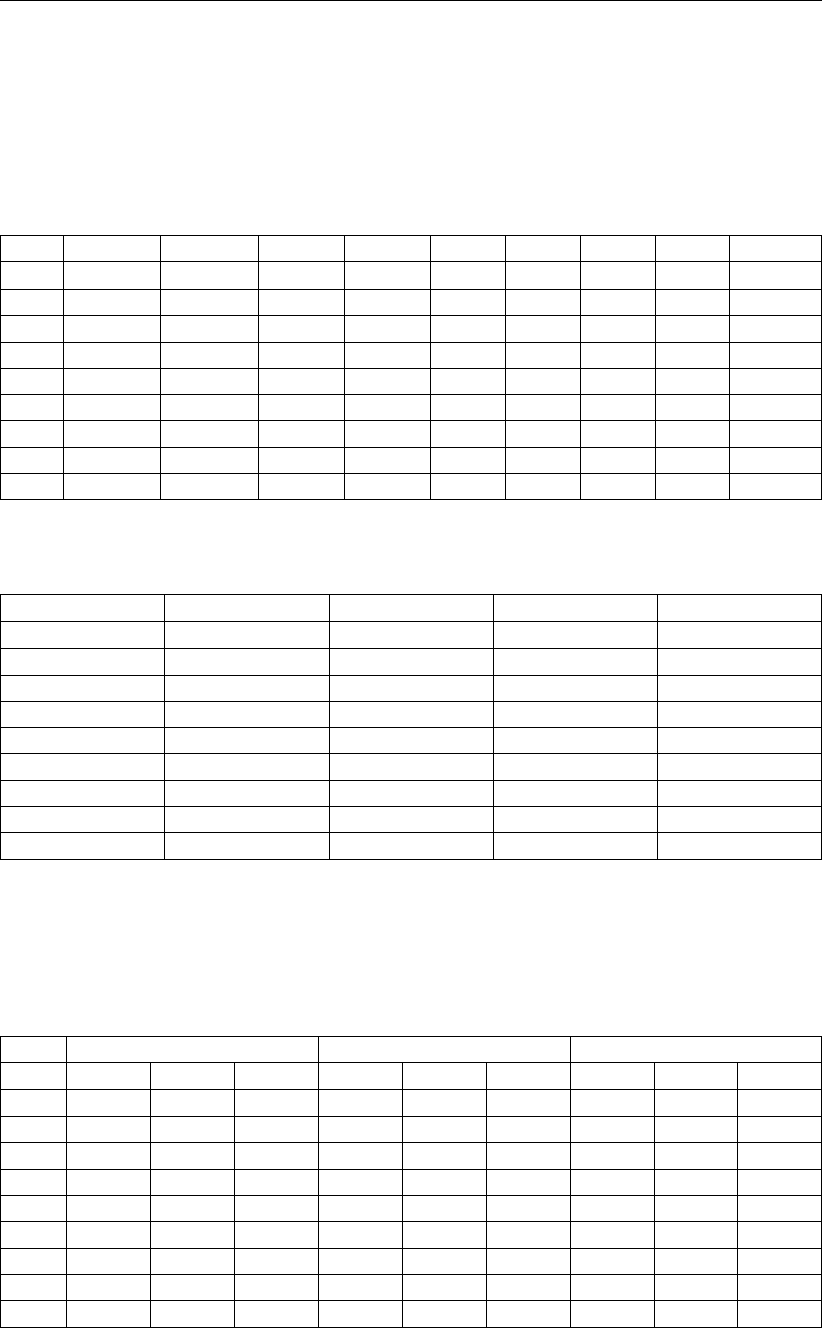
D-GEO PIPELINE
, Verification Report
Operation Parameters
The face support pressures, the thrust forces and the uplift safety factor are determined using
the formulas given in chapter “Micro Tunneling” in the Background section of the User Manual
of
D-GEO PIPELINE
. Intermediate results are given in the tables below.
Table 3.141: Analytical results for the calculation of the face support pressures
Vert. σv’u C/D β O/A α K KA3 Qs
[-] [kN/m2] [kN/m2] [-] [-] [-] [-] [-] [-] [kN/m2]
1 25.396 0 n.a. n.a. n.a. n.a. n.a. n.a. n.a.
2 27.34 116.373 n.a. n.a. n.a. n.a. n.a. n.a. n.a.
3 120.537 192.742 3.199 66.706 6.645 1.432 0.417 0.214 3.376
4 162.667 218.871 6.643 66.706 6.645 1.465 0.417 0.212 3.842
5 448.99 352.192 21.924 68.683 7.125 1.489 0.349 0.167 9.702
6 353.117 250.214 7.226 68.683 7.125 1.468 0.349 0.168 9.343
7 161.58 0 n.a. n.a. n.a. n.a. n.a. n.a. n.a.
8 89.894 0 n.a. n.a. n.a. n.a. n.a. n.a. n.a.
Table 3.142: Analytical results for the calculation of the uplift safety factor
Vert. Part dry guplift gweight fuplift
[-] [%] [kN/m2] [kN/m2] [-]
1 100 0 6.897 999
2 0 7.854 6.897 4.009
3 0 7.854 6.897 15.493
4 0 7.854 6.897 20.858
5 0 7.854 6.897 57.269
6 0 7.854 6.897 45.074
7 66.256 2.65 6.897 61.495
8 100 0 6.897 999
3.12.3 D-GEO PIPELINE results
D-GEO PIPELINE
results presented in the tables below can be found in the Report.
Table 3.143: Results of benchmark 3-12a, Vertical soil stresses
Benchmark
D-GEO PIPELINE
Relative error
Vert. qv;p qv;n qv;r;n qv;p qv;n qv;r;n qv;p qv;n qv;r;n
[-] [kN/m2] [kN/m2] [kN/m2] [kN/m2] [kN/m2] [kN/m2] [%] [%] [%]
1 32 21 21 32 21 21 0.00 0.00 0.00
2 106 25 45 106 25 45 0.00 0.00 0.00
3 830 116 79 830 116 79 0.00 0.00 0.00
4 1048 158 90 1048 158 90 0.00 0.00 0.00
5 2010 444 109 2010 444 109 0.00 0.00 0.00
6 1615 348 113 1615 348 141 0.00 0.00 19.86
7 284 157 102 284 157 102 0.00 0.00 0.00
8 213 85 85 213 85 85 0.00 0.00 0.00
60 of 126 Deltares
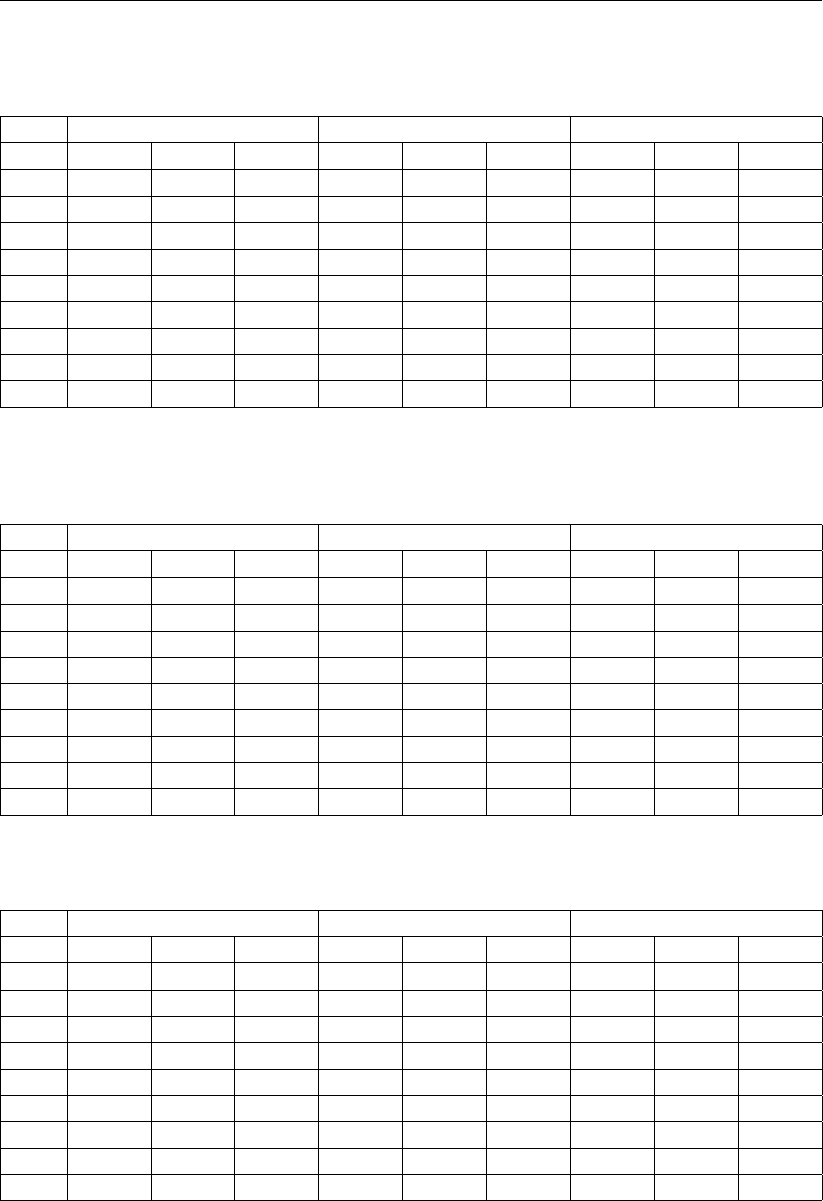
Group 3: Benchmarks from spreadsheets
Table 3.144: Results of benchmark 3-12a, Neutral horizontal soil stress and bearing ca-
pacities
Benchmark
D-GEO PIPELINE
Relative error
Vert. qh;n Pv;e Ph;e qh;n Pv;e Ph;e qh;n Pv;e Ph;e
[-] [kN/m2] [kN/m2] [kN/m2] [kN/m2] [kN/m2] [kN/m2] [%] [%] [%]
1 16 455 208 16 455 208 0.00 0.00 0.00
2 19 494 147 19 494 147 0.00 0.00 0.00
3 58 3315 1715 58 3315 1715 0.00 0.00 0.00
4 79 4434 2364 79 4435 2364 0.00 0.02 0.00
5 189 21114 12962 189 21114 12962 0.00 0.00 0.00
6 149 16630 8152 149 16630 8152 0.00 0.00 0.00
7 116 1240 702 116 1240 702 0.00 0.00 0.00
8 63 838 451 63 838 451 0.00 0.00 0.00
Table 3.145: Results of benchmark 3-12a, Vertical and horizontal moduli of subgrade re-
action
Benchmark
D-GEO PIPELINE
Relative error
Vert. kv;top kv;bot khkv;top kv;bot khkv;top kv;bot kh
[-] [kN/m3] [kN/m3] [kN/m3] [kN/m3] [kN/m3] [kN/m3] [%] [%] [%]
1 371 303 212 371 303 212 0.00 0.00 0.00
2 253 544 380 253 544 380 0.00 0.00 0.00
3 9424 17421 12195 9424 17421 12195 0.00 0.00 0.00
4 16574 18611 13028 16574 18611 13028 0.00 0.00 0.00
5 12499 13305 9313 12499 13305 9313 0.00 0.00 0.00
6 16911 11410 7987 16911 11410 7987 0.00 0.00 0.00
7 254 367 257 254 367 257 0.00 0.00 0.00
8 327 260 182 327 260 182 0.00 0.00 0.00
Table 3.146: Results of benchmark 3-12a, Maximal axial friction and displacements
Benchmark
D-GEO PIPELINE
Relative error
Vert. tmax dv dmax tmax dv dmax tmax dv dmax
[-] [kN/m2] [mm] [mm] [kN/m2] [mm] [mm] [%] [%] [%]
1 17 5 12 17 5 12 0.00 0.00 0.00
2 19 10 12 19 10 12 0.00 0.00 0.00
3 25 20 5 25 20 5 0.00 0.00 0.00
4 27 40 5 27 40 5 0.00 0.00 0.00
5 35 80 2 35 80 2 0.00 0.00 0.00
6 33 60 2 36 60 2 8.33 0.00 0.00
7 32 50 12 32 50 12 0.00 0.00 0.00
8 27 35 12 27 35 12 0.00 0.00 0.00
Deltares 61 of 126
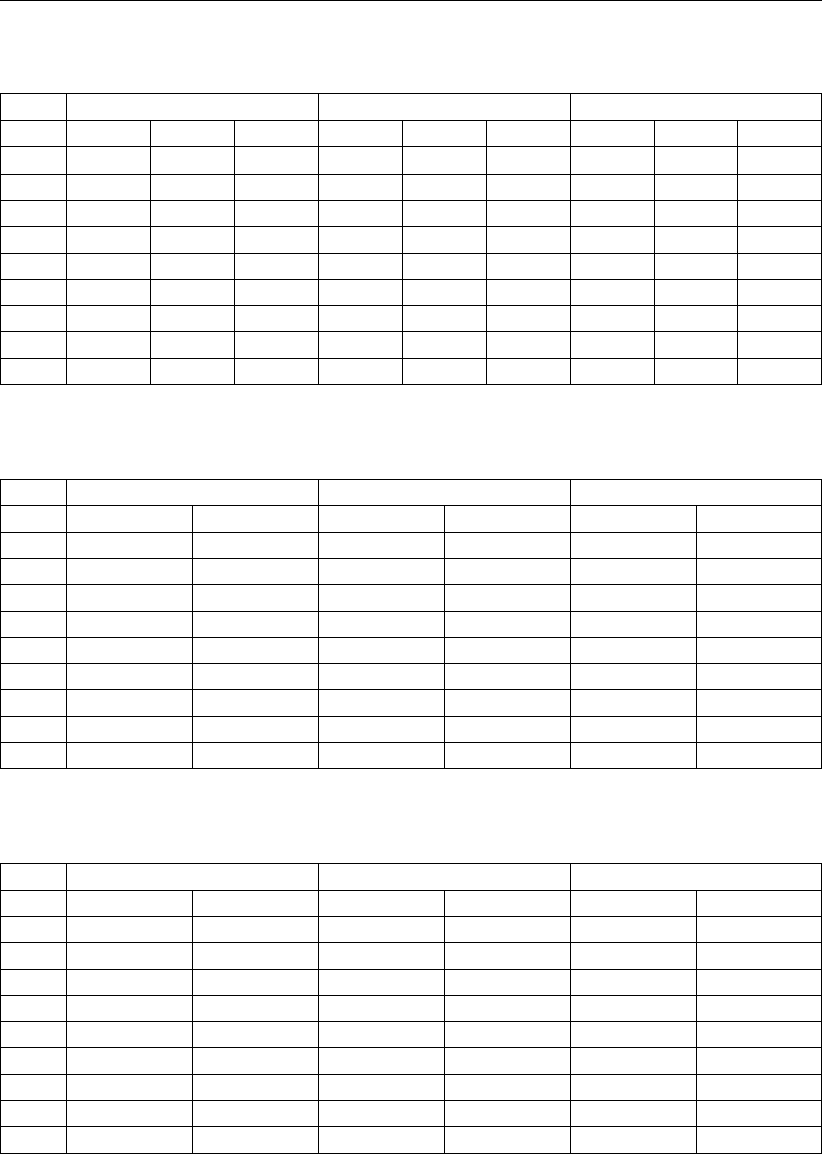
D-GEO PIPELINE
, Verification Report
Table 3.147: Results of benchmark 3-12a, Face support pressures
Benchmark
D-GEO PIPELINE
Relative error
Vert. Pmax Pmin Ptarget Pmax Pmin Ptarget Pmax Pmin Ptarget
[-] [kN/m2] [kN/m2] [kN/m2] [kN/m2] [kN/m2] [kN/m2] [%] [%] [%]
1 21 0 19 21 0 19 0.00 0.00 0.00
2 120 128 137 120 128 137 0.00 0.00 0.00
3 261 248 253 261 248 253 0.00 0.00 0.00
4 318 242 300 318 242 300 0.00 0.00 0.00
5 668 390 544 668 389 544 0.00 0.26 0.00
6 503 277 401 503 276 401 0.00 0.36 0.00
7 135 0 120 135 0 120 0.00 0.00 0.00
8 75 0 67 75 0 67 0.00 0.00 0.00
Table 3.148: Results of benchmark 3-12a, Thrust forces
Benchmark
D-GEO PIPELINE
Relative error
Vert. Flubricated Fnormal Flubricated Fnormal Flubricated Fnormal
[-] [kN] [kN] [kN] [kN] [%] [%]
1 337 498 337 498 0.00 0.00
2 1719 2525 1719 2525 0.00 0.00
3 3414 5021 3414 5021 0.00 0.00
4 4089 6015 4089 6015 0.00 0.00
5 30386 45366 30386 45366 0.00 0.00
6 50715 75915 50715 75915 0.00 0.00
7 54517 81728 54517 81728 0.00 0.00
8 55288 82906 55288 82906 0.00 0.00
Table 3.149: Results of benchmark 3-12b, Thrust forces
Benchmark
D-GEO PIPELINE
Relative error
Vert. Flubricated Fnormal Flubricated Fnormal Flubricated Fnormal
[-] [kN] [kN] [kN] [kN] [%] [%]
1 55920 83873 55920 83873 0.00 0.00
2 54723 82031 54723 82031 0.00 0.00
3 53211 79718 53211 79718 0.00 0.00
4 52611 78798 52611 78798 0.00 0.00
5 26696 39830 26696 39830 0.00 0.00
6 6142 9056 6142 9056 0.00 0.00
7 1899 2802 1899 2802 0.00 0.00
8 1044 1540 1044 1540 0.00 0.00
62 of 126 Deltares
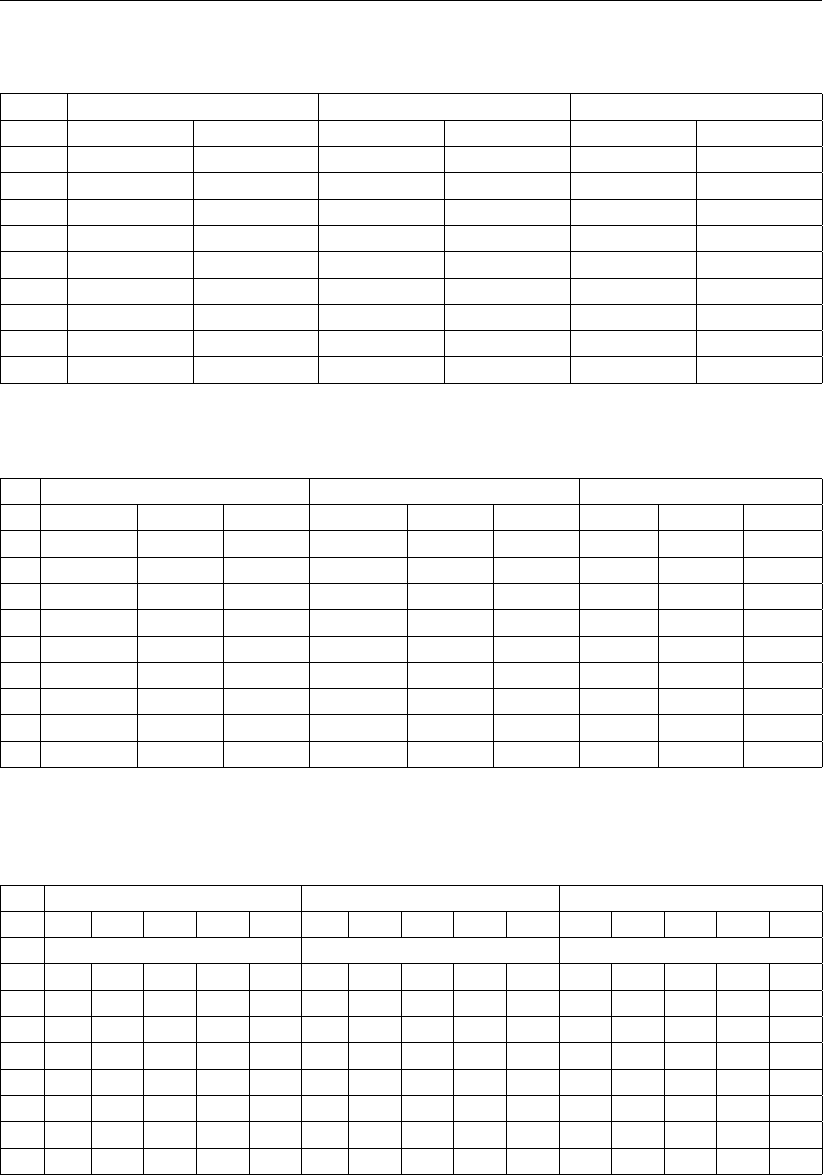
Group 3: Benchmarks from spreadsheets
Table 3.150: Results of benchmark 3-12a, Uplift safety factor
Benchmark
D-GEO PIPELINE
Relative error
Vert. Calculated Required Calculated Required Calculated Required
[-] [-] [-] [-] [-] [%] [%]
1 n.a. 1.15 999 1.15 0.00
2 4.01 1.15 4 1.15 0.25 0.00
3 15.49 1.15 15.48 1.15 0.06 0.00
4 20.86 1.15 20.85 1.15 0.05 0.00
5 57.27 1.15 57.27 1.15 0.00 0.00
6 45.07 1.15 45.07 1.15 0.00 0.00
7 61.49 1.15 57.7 1.15 6.57 0.00
8 n.a. 1.15 999 1.15 0.00
Table 3.151: Results of benchmark 3-12a, Trough
Benchmark
D-GEO PIPELINE
Relative error
ftrough Trough Depth ftrough Trough Depth ftrough Trough Depth
[-] [-] [m] [-] [-] [m] [%] [%] [%]
v1 0.02156 2.093 2.309 0.02156 2.093 2.309 0.00 0.00 0.00
v2 0.00746 6.052 11.516 0.00746 6.052 11.516 0.00 0.00 0.00
v3 0.00433 10.431 21.699 0.00433 10.431 21.699 0.00 0.00 0.00
v4 0.00376 12 25.349 0.00376 12 25.349 0.00 0.00 0.00
v5 0.00235 19.235 49.182 0.00235 19.235 49.182 0.00 0.00 0.00
v6 0.0026 17.349 41.18 0.0026 17.349 41.18 0.00 0.00 0.00
v7 0.00608 7.416 14.689 0.00608 7.416 14.689 0.00 0.00 0.00
v8 0.00978 4.614 8.172 0.00978 4.614 8.172 0.00 0.00 0.00
Table 3.152: Results of benchmark 3-12a, Subsidence at different horizontal distances of
Z axis (from 0 to 0.7W)
Benchmark [mm]
D-GEO PIPELINE
[mm] Relative error [%]
0 0.1 0.2 0.4 0.7 0 0.1 0.2 0.4 0.7 0 0.1 0.2 0.4 0.7
×W×W×W
v1 22 21 21 20 16 22 21 21 20 16 0.0 0.0 0.0 0.0 0.0
v2 7 7 7 6 3 7 7 7 6 3 0.0 0.0 0.0 0.0 0.0
v3 4 4 4 3 1 4 4 4 3 1 0.0 0.0 0.0 0.0 0.0
v4 4 4 3 3 1 4 4 3 3 1 0.0 0.0 0.0 0.0 0.0
v5 2 2 2 1 0 2 2 2 1 0 0.0 0.0 0.0 0.0 0.0
v6 3 3 2 2 1 3 3 2 2 1 0.0 0.0 0.0 0.0 0.0
v7 6 6 6 4 2 6 6 6 4 2 0.0 0.0 0.0 0.0 0.0
v8 10 10 9 8 5 10 10 9 8 5 0.0 0.0 0.0 0.0 0.0
Deltares 63 of 126
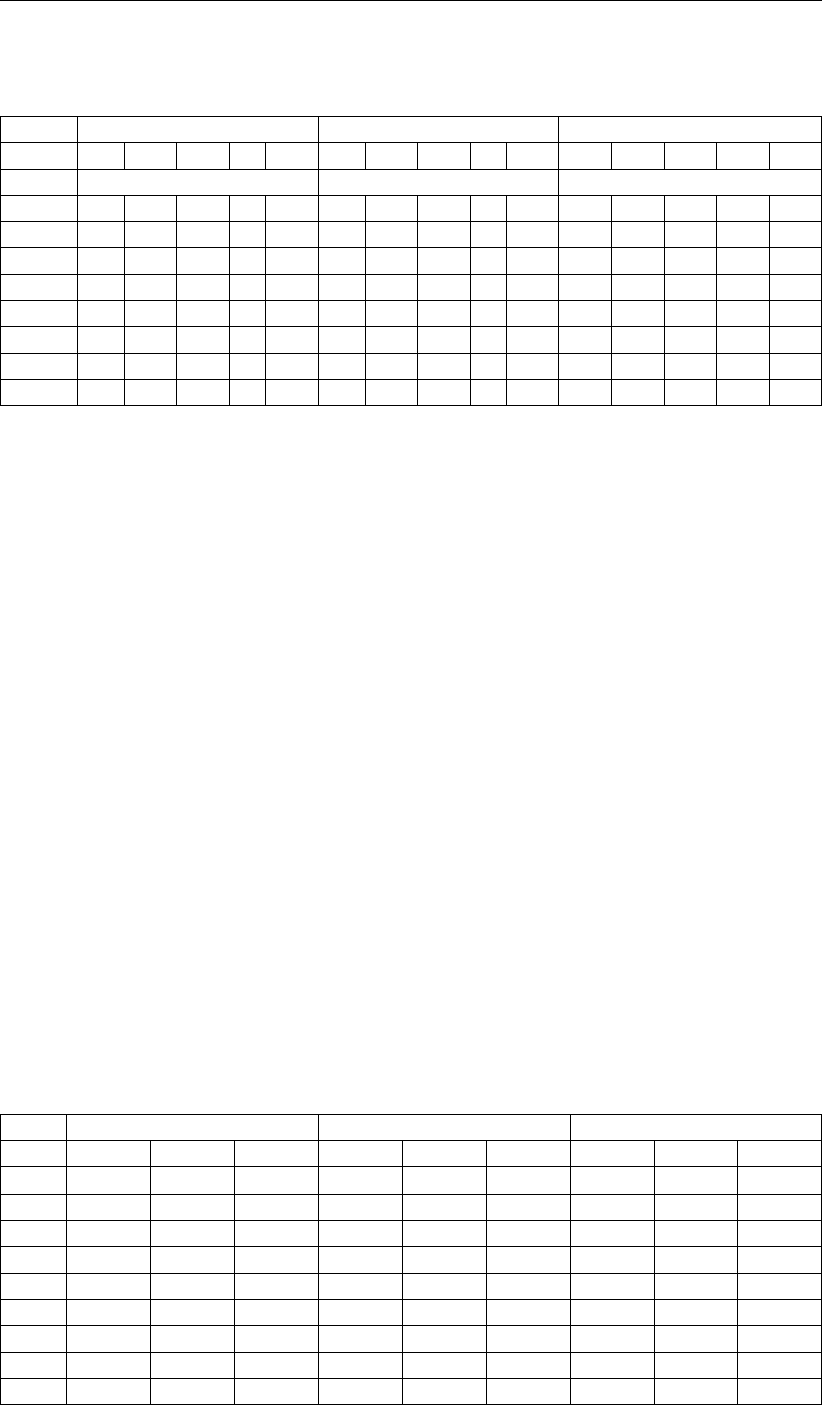
D-GEO PIPELINE
, Verification Report
Table 3.153: Results of benchmark 3-12a, Subsidence at different horizontal distances of
Z axis (from 1W to 2.5W)
Benchmark [mm]
D-GEO PIPELINE
[mm] Relative error [%]
1 1.3 1.6 2 2.5 1 1.3 1.6 2 2.5 1 1.3 1.6 2 2.5
×W×W×W
v1 12 8 5 2 0 12 8 5 2 0 0.0 0.0 0.0 0.0 0.0
v2 1 0 0 0 0 1 0 0 0 0 0.0 0.0 0.0 0.0 0.0
v3 0 0 0 0 0 0 0 0 0 0 0.0 0.0 0.0 0.0 0.0
v4 0 0 0 0 0 0 0 0 0 0 0.0 0.0 0.0 0.0 0.0
v5 0 0 0 0 0 0 0 0 0 0 0.0 0.0 0.0 0.0 0.0
v6 0 0 0 0 0 0 0 0 0 0 0.0 0.0 0.0 0.0 0.0
v7 1 0 0 0 0 1 0 0 0 0 0.0 0.0 0.0 0.0 0.0
v8 2 1 0 0 0 2 1 0 0 0 0.0 0.0 0.0 0.0 0.0
Use
D-GEO PIPELINE
input files bm3-12a.dri and bm3-12b.dri to run this benchmark.
3.13 Micro tunneling with 3D geometry – Synthetic pipe
3.13.1 Description
The same input data’s as for benchmark 3-12a (section 3.12) are used except that a synthetic
pipe (with a Young’s modulus at short term of 30000 kPa) instead of a steel pipe is used.
Results are expected to be the same as bm3-12a except for the moduli of subgrade reaction.
3.13.2 Analytical results
Analytical results are worked out in an Excel spreadsheet.
Soil mechanical data
The moduli of subgrade reaction are determined using the formulas given in chapter “Calcula-
tion of soil mechanical data” in the Background section of the User Manual of
D-GEO PIPELINE
.
3.13.3 D-GEO PIPELINE results
D-GEO PIPELINE
results presented in the table below can be found in the Report.
Table 3.154: Results of benchmark 3-13, Vertical and horizontal moduli of subgrade re-
action
Benchmark
D-GEO PIPELINE
Relative error
Vert. kv;top kv;bot khkv;top kv;bot khkv;top kv;bot kh
[-] [kN/m3] [kN/m3] [kN/m3] [kN/m3] [kN/m3] [kN/m3] [%] [%] [%]
1 405 331 232 405 331 232 0.00 0.00 0.00
2 277 594 416 277 594 416 0.00 0.00 0.00
3 10477 19458 13620 10477 19458 13620 0.00 0.00 0.00
4 18504 20827 14579 18504 20827 14579 0.00 0.00 0.00
5 13924 14829 10380 13924 14829 10380 0.00 0.00 0.00
6 18883 12703 8892 18883 12703 8892 0.00 0.00 0.00
7 278 402 281 278 402 281 0.00 0.00 0.00
8 358 285 199 358 285 199 0.00 0.00 0.00
64 of 126 Deltares
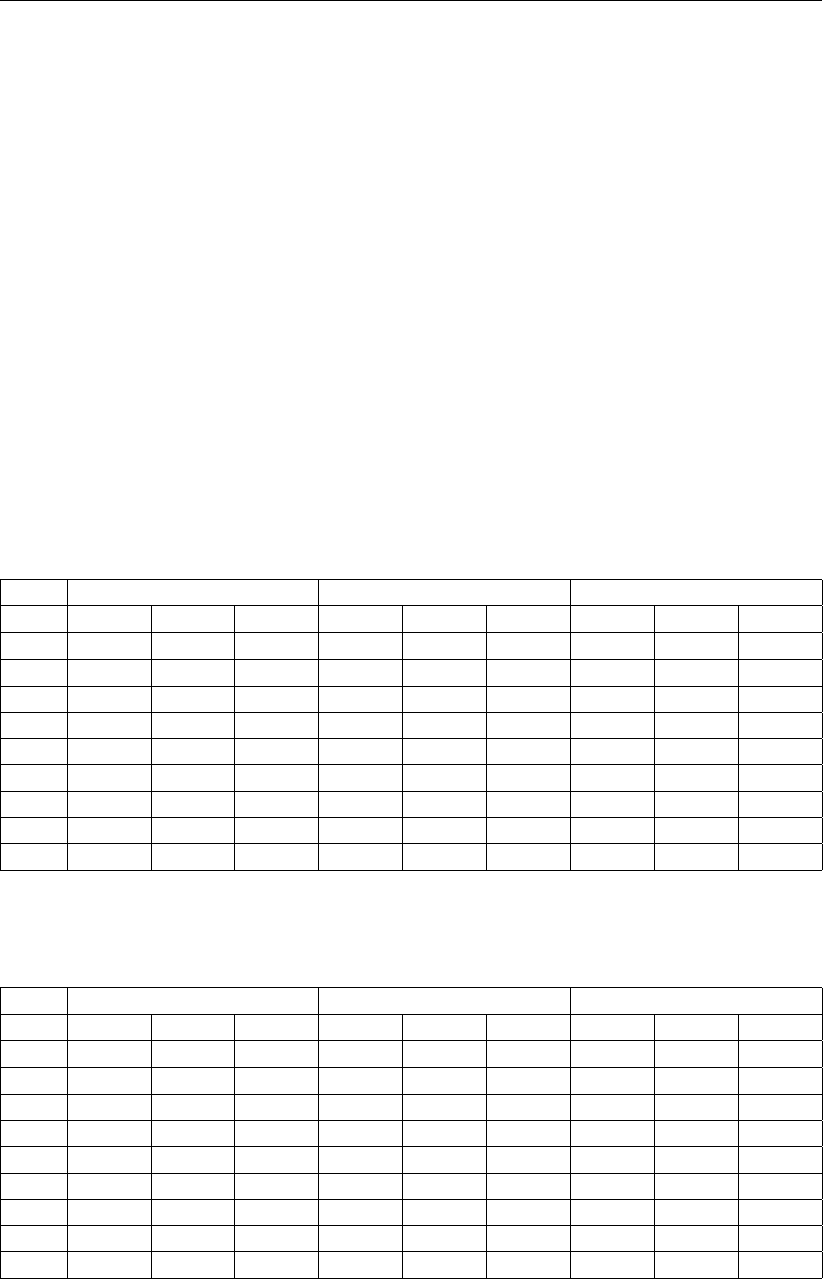
Group 3: Benchmarks from spreadsheets
Use
D-GEO PIPELINE
input file bm3-13.dri to run this benchmark.
3.14 Micro tunneling with 3D geometry – Concrete pipe
3.14.1 Description
The same input data’s as for benchmark 3-12a (section 3.12) are used except that a concrete
pipe instead of a steel pipe is used, but the properties are the same. Therefore, results are
expected to be the same as bm3-12a.
3.14.2 Analytical results
The same Excel spreadsheet as for benchmark 3-12a (section 3.12) is used.
3.14.3 D-GEO PIPELINE results
D-GEO PIPELINE
results can be found in the Report and are identical to the results of bench-
mark 3-12a (section 3.12) .
Table 3.155: Results of benchmark 3-14, Vertical soil stresses
Benchmark
D-GEO PIPELINE
Relative error
Vert. qv;p qv;n qv;r;n qv;p qv;n qv;r;n qv;p qv;n qv;r;n
[-] [kN/m2] [kN/m2] [kN/m2] [kN/m2] [kN/m2] [kN/m2] [%] [%] [%]
1 32 21 21 32 21 21 0.00 0.00 0.00
2 106 25 45 106 25 45 0.00 0.00 0.00
3 830 116 79 830 116 79 0.00 0.00 0.00
4 1048 158 90 1048 158 90 0.00 0.00 0.00
5 2010 444 109 2010 444 109 0.00 0.00 0.00
6 1615 348 113 1615 348 141 0.00 0.00 19.86
7 284 157 102 284 157 102 0.00 0.00 0.00
8 213 85 85 213 85 85 0.00 0.00 0.00
Table 3.156: Results of benchmark 3-14, Neutral horizontal soil stress and bearing ca-
pacities
Benchmark
D-GEO PIPELINE
Relative error
Vert. qh;n Pv;e Ph;e qh;n Pv;e Ph;e qh;n Pv;e Ph;e
[-] [kN/m2] [kN/m2] [kN/m2] [kN/m2] [kN/m2] [kN/m2] [%] [%] [%]
1 16 455 208 16 455 208 0.00 0.00 0.00
2 19 494 147 19 494 147 0.00 0.00 0.00
3 58 3315 1715 58 3315 1715 0.00 0.00 0.00
4 79 4434 2364 79 4435 2364 0.00 0.02 0.00
5 189 21114 12962 189 21114 12962 0.00 0.00 0.00
6 149 16630 8152 149 16630 8152 0.00 0.00 0.00
7 116 1240 702 116 1240 702 0.00 0.00 0.00
8 63 838 451 63 838 451 0.00 0.00 0.00
Deltares 65 of 126
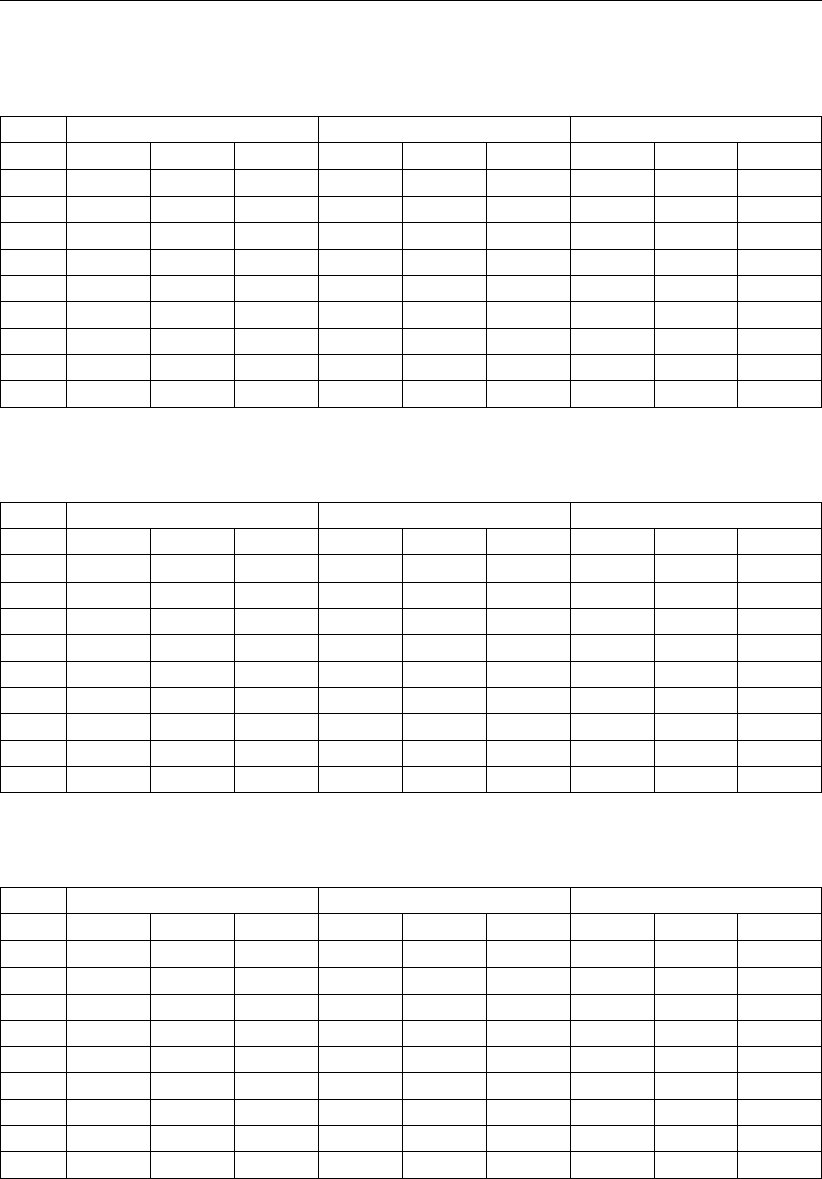
D-GEO PIPELINE
, Verification Report
Table 3.157: Results of benchmark 3-14, Vertical and horizontal moduli of subgrade re-
action
Benchmark
D-GEO PIPELINE
Relative error
Vert. kv;top kv;bot khkv;top kv;bot khkv;top kv;bot kh
[-] [kN/m3] [kN/m3] [kN/m3] [kN/m3] [kN/m3] [kN/m3] [%] [%] [%]
1 371 303 212 371 303 212 0.00 0.00 0.00
2 253 544 380 253 544 380 0.00 0.00 0.00
3 9424 17421 12195 9424 17421 12195 0.00 0.00 0.00
4 16574 18611 13028 16574 18611 13028 0.00 0.00 0.00
5 12499 13305 9313 12499 13305 9313 0.00 0.00 0.00
6 16911 11410 7987 16911 11410 7987 0.00 0.00 0.00
7 254 367 257 254 367 257 0.00 0.00 0.00
8 327 260 182 327 260 182 0.00 0.00 0.00
Table 3.158: Results of benchmark 3-14, Maximal axial friction and displacements
Benchmark
D-GEO PIPELINE
Relative error
Vert. tmax dv dmax tmax dv dmax tmax dv dmax
[-] [kN/m2] [mm] [mm] [kN/m2] [mm] [mm] [%] [%] [%]
1 16.83 5 12 17 5 12 0.00 0.00 0.00
2 18.93 10 12 19 10 12 0.00 0.00 0.00
3 24.55 20 5 25 20 5 0.00 0.00 0.00
4 26.97 40 5 27 40 5 0.00 0.00 0.00
5 35.39 80 2 35 80 2 0.00 0.00 0.00
6 33.21 60 2 36 60 2 8.33 0.00 0.00
7 32.4 50 12 32 50 12 0.00 0.00 0.00
8 26.77 35 12 27 35 12 0.00 0.00 0.00
Table 3.159: Results of benchmark 3-14, Face support pressures
Benchmark
D-GEO PIPELINE
Relative error
Vert. Pmax Pmin Ptarget Pmax Pmin Ptarget Pmax Pmin Ptarget
[-] [kN/m2] [kN/m2] [kN/m2] [kN/m2] [kN/m2] [kN/m2] [%] [%] [%]
1 21 0 19 21 0 19 0.00 0.00 0.00
2 120 128 137 120 128 137 0.00 0.00 0.00
3 261 248 253 261 248 253 0.00 0.00 0.00
4 318 242 300 318 242 300 0.00 0.00 0.00
5 668 390 544 668 389 544 0.00 0.26 0.00
6 503 277 401 503 276 401 0.00 0.36 0.00
7 135 0 120 135 0 120 0.00 0.00 0.00
8 75 0 67 75 0 67 0.00 0.00 0.00
66 of 126 Deltares
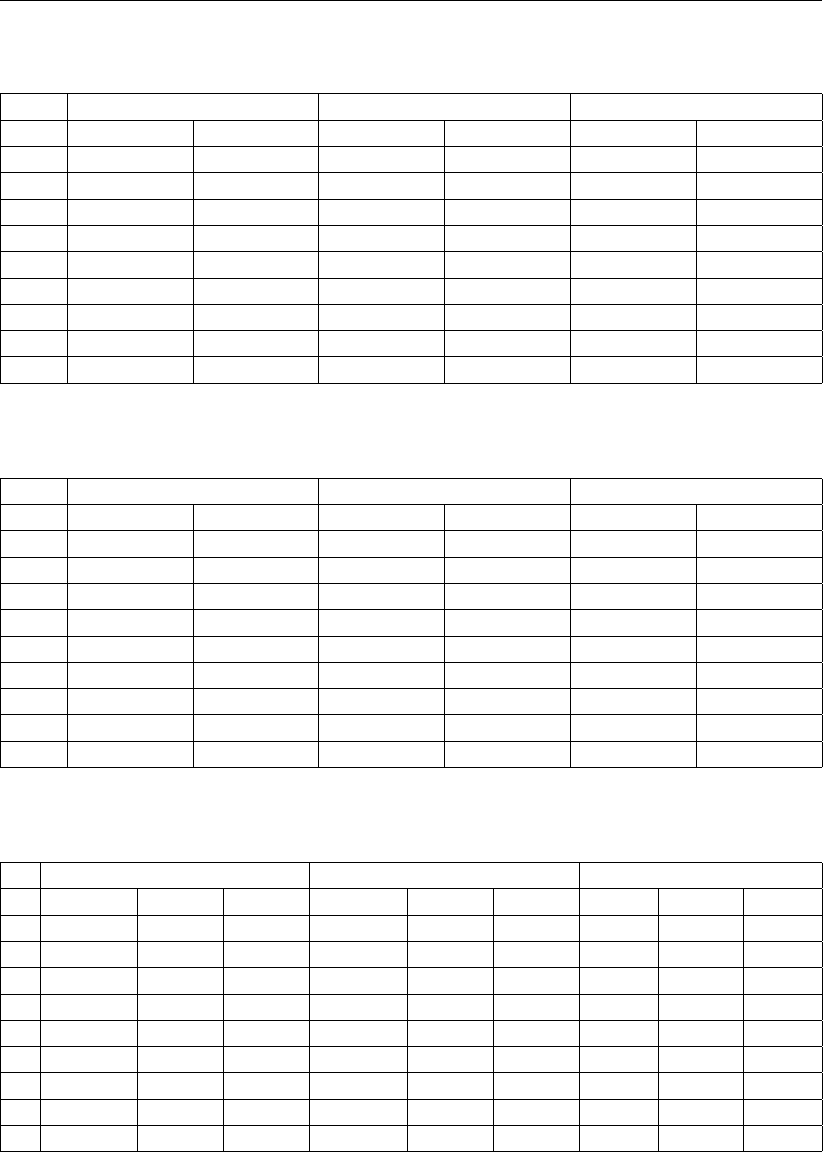
Group 3: Benchmarks from spreadsheets
Table 3.160: Results of benchmark 3-14, Thrust forces
Benchmark
D-GEO PIPELINE
Relative error
Vert. Flubricated Fnormal Flubricated Fnormal Flubricated Fnormal
[-] [kN] [kN] [kN] [kN] [%] [%]
1 337 498 337 498 0.00 0.00
2 1719 2525 1719 2525 0.00 0.00
3 3414 5021 3414 5021 0.00 0.00
4 4089 6015 4089 6015 0.00 0.00
5 30386 45366 30386 45366 0.00 0.00
6 50715 75915 50715 75915 0.00 0.00
7 54517 81728 54517 81728 0.00 0.00
8 55288 82906 55288 82906 0.00 0.00
Table 3.161: Results of benchmark 3-14, Uplift safety factor
Benchmark
D-GEO PIPELINE
Relative error
Vert. Calculated Required Calculated Required Calculated Required
[-] [-] [-] [-] [-] [%] [%]
1 999 1.15 999 1.15 0.00 0.00
2 4.01 1.15 4 1.15 0.25 0.00
3 15.49 1.15 15.48 1.15 0.06 0.00
4 20.86 1.15 20.85 1.15 0.05 0.00
5 57.27 1.15 57.27 1.15 0.00 0.00
6 45.07 1.15 45.07 1.15 0.00 0.00
7 61.49 1.15 57.7 1.15 6.57 0.00
8 999 1.15 999 1.15 0.00 0.00
Table 3.162: Results of benchmark 3-14, Trough
Benchmark
D-GEO PIPELINE
Relative error
ftrough Trough Depth ftrough Trough Depth ftrough Trough Depth
[-] [-] [m] [-] [-] [m] [%] [%] [%]
v1 0.02156 2.093 2.309 0.02156 2.093 2.309 0.00 0.00 0.00
v2 0.00746 6.052 11.516 0.00746 6.052 11.516 0.00 0.00 0.00
v3 0.00433 10.431 21.699 0.00433 10.431 21.699 0.00 0.00 0.00
v4 0.00376 12 25.349 0.00376 12 25.349 0.00 0.00 0.00
v5 0.00235 19.235 49.182 0.00235 19.235 49.182 0.00 0.00 0.00
v6 0.0026 17.349 41.18 0.0026 17.349 41.18 0.00 0.00 0.00
v7 0.00608 7.416 14.689 0.00608 7.416 14.689 0.00 0.00 0.00
v8 0.00978 4.614 8.172 0.00978 4.614 8.172 0.00 0.00 0.00
Deltares 67 of 126
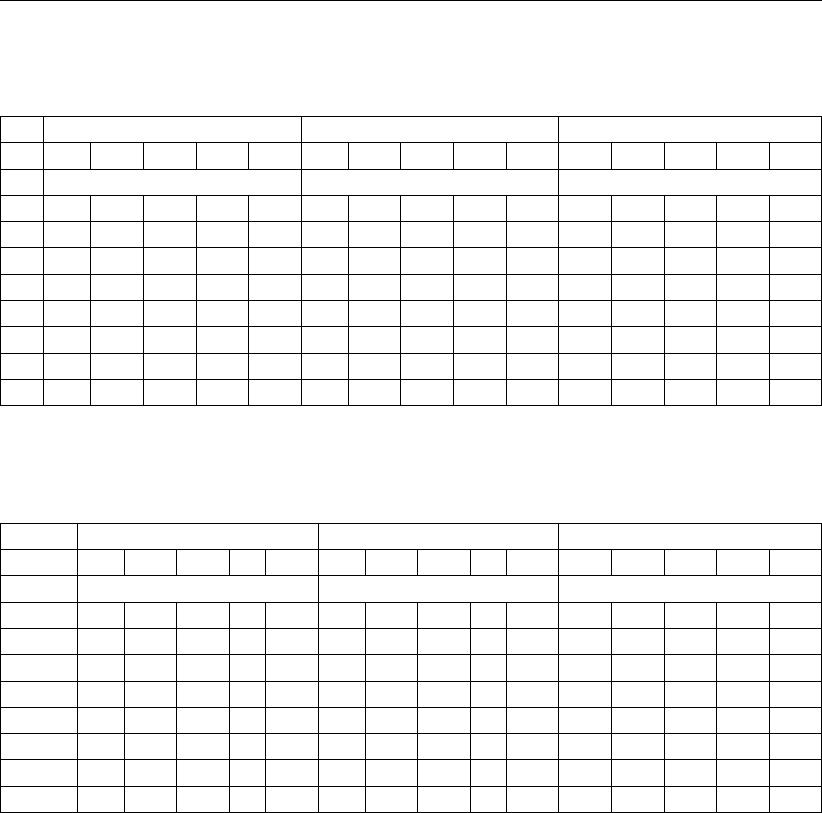
D-GEO PIPELINE
, Verification Report
Table 3.163: Results of benchmark 3-14, Subsidence at different horizontal distances of
Z axe (from 0 to 0.7W)
Benchmark [mm]
D-GEO PIPELINE
[mm] Relative error [%]
0 0.1 0.2 0.4 0.7 0 0.1 0.2 0.4 0.7 0 0.1 0.2 0.4 0.7
×W×W×W
v1 22 21 21 20 16 22 21 21 20 16 0.0 0.0 0.0 0.0 0.0
v2 7 7 7 6 3 7 7 7 6 3 0.0 0.0 0.0 0.0 0.0
v3 4 4 4 3 1 4 4 4 3 1 0.0 0.0 0.0 0.0 0.0
v4 4 4 3 3 1 4 4 3 3 1 0.0 0.0 0.0 0.0 0.0
v5 2 2 2 1 0 2 2 2 1 0 0.0 0.0 0.0 0.0 0.0
v6 3 3 2 2 1 3 3 2 2 1 0.0 0.0 0.0 0.0 0.0
v7 6 6 6 4 2 6 6 6 4 2 0.0 0.0 0.0 0.0 0.0
v8 10 10 9 8 5 10 10 9 8 5 0.0 0.0 0.0 0.0 0.0
Table 3.164: Results of benchmark 3-14, Subsidence at different horizontal distances of
Z axe (from 1W to 2.5W)
Benchmark [mm]
D-GEO PIPELINE
[mm] Relative error [%]
1 1.3 1.6 2 2.5 1 1.3 1.6 2 2.5 1 1.3 1.6 2 2.5
×W×W×W
v1 12 8 5 2 0 12 8 5 2 0 0.0 0.0 0.0 0.0 0.0
v2 1 0 0 0 0 1 0 0 0 0 0.0 0.0 0.0 0.0 0.0
v3 0 0 0 0 0 0 0 0 0 0 0.0 0.0 0.0 0.0 0.0
v4 0 0 0 0 0 0 0 0 0 0 0.0 0.0 0.0 0.0 0.0
v5 0 0 0 0 0 0 0 0 0 0 0.0 0.0 0.0 0.0 0.0
v6 0 0 0 0 0 0 0 0 0 0 0.0 0.0 0.0 0.0 0.0
v7 1 0 0 0 0 1 0 0 0 0 0.0 0.0 0.0 0.0 0.0
v8 2 1 0 0 0 2 1 0 0 0 0.0 0.0 0.0 0.0 0.0
Use
D-GEO PIPELINE
input file bm3-14.dri to run this benchmark.
3.15 Trenching (3 sections) – 3D geometry in four layers – Compressible border above
drainage border
3.15.1 Description
The same input data’s as for benchmark 1-7 (section 3.7) are used except that a construction
in trench is modeled. The trenching configuration (3 trench sections) is given in Table 3-114.
Calculations are performed for 8 verticals with Lcoordinates of 70, 150, 400, 600, 900, 1200,
1500 and 1800 m. Six cases are considered depending on the type of filling of the trench:
Case A (bm3-15a): sand poorly compacted;
Case B (bm3-15b): stiff clay poorly compacted;
Case C (bm3-15c): soft soil poorly compacted;
Case D (bm3-15d): sand well compacted;
Case E (bm3-15e): stiff clay well compacted;
Case F (bm3-15f): soft soil well compacted.
The type of filling will influence only the actual soil stress.
68 of 126 Deltares
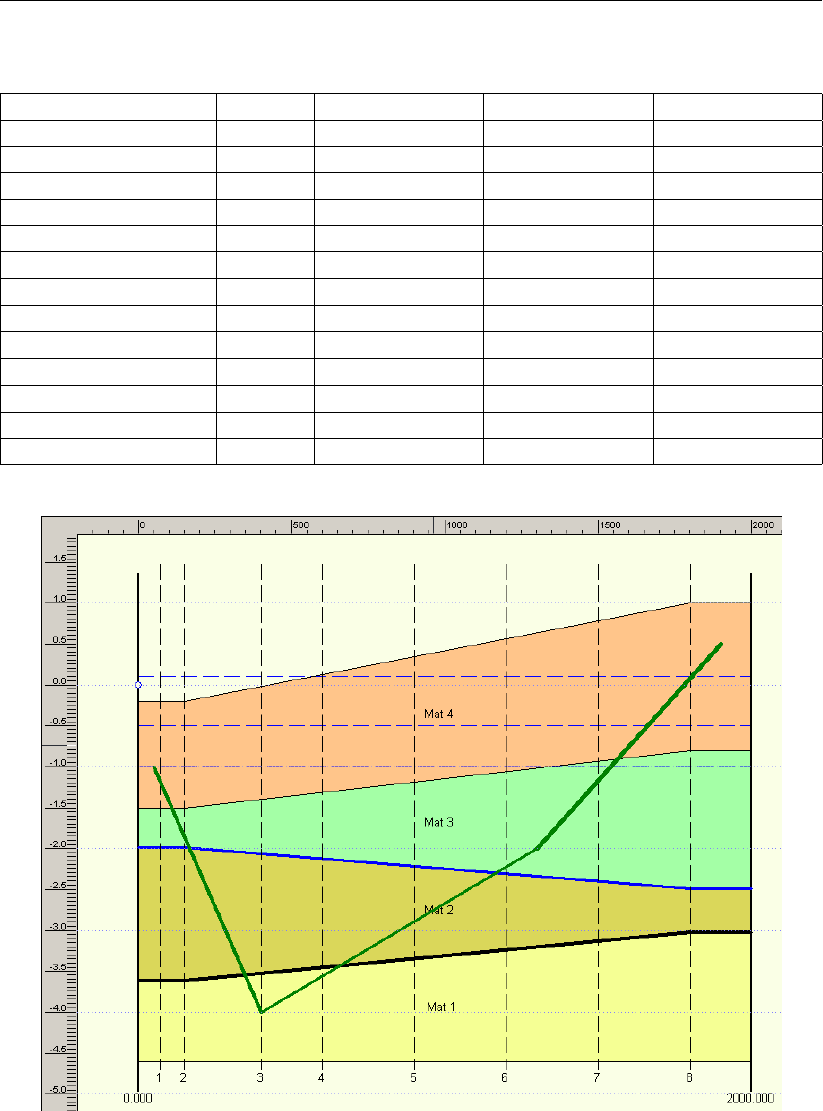
Group 3: Benchmarks from spreadsheets
Table 3.165: Configuration of the 3 trench sections (benchmark 3-15a)
Trench 1 Trench 2 Trench 3
Xbegin [m] 50 400 1300
Ybegin [m] 0 10 -6
Zbegin [m] -1 -4 -2
Xend [m] 400 1300 1900
Yend [m] 10 -6 5
Zend [m] -4 -2 0.5
Eb[N/mm2] 1500 2000 3500
D0[mm] 500 300 600
dn[mm] 35 20 50
γb[kN/m3] 78.5 90 56
Width [mm] 550 400 700
Slope of the wall [1:x] [-] 2 3 4
Offset [m] 0.1 0.2 0.3
Figure 3.4: Lateral view of the 3 trench sections (benchmark 3-15)
3.15.2 Analytical results
Analytical results are worked out in an Excel spreadsheet.
Soil mechanical data
The soil mechanical data’s are determined using the formulas given in chapter “Calculation of
soil mechanical data” in the Background section of the User Manual of
D-GEO PIPELINE
.
Deltares 69 of 126
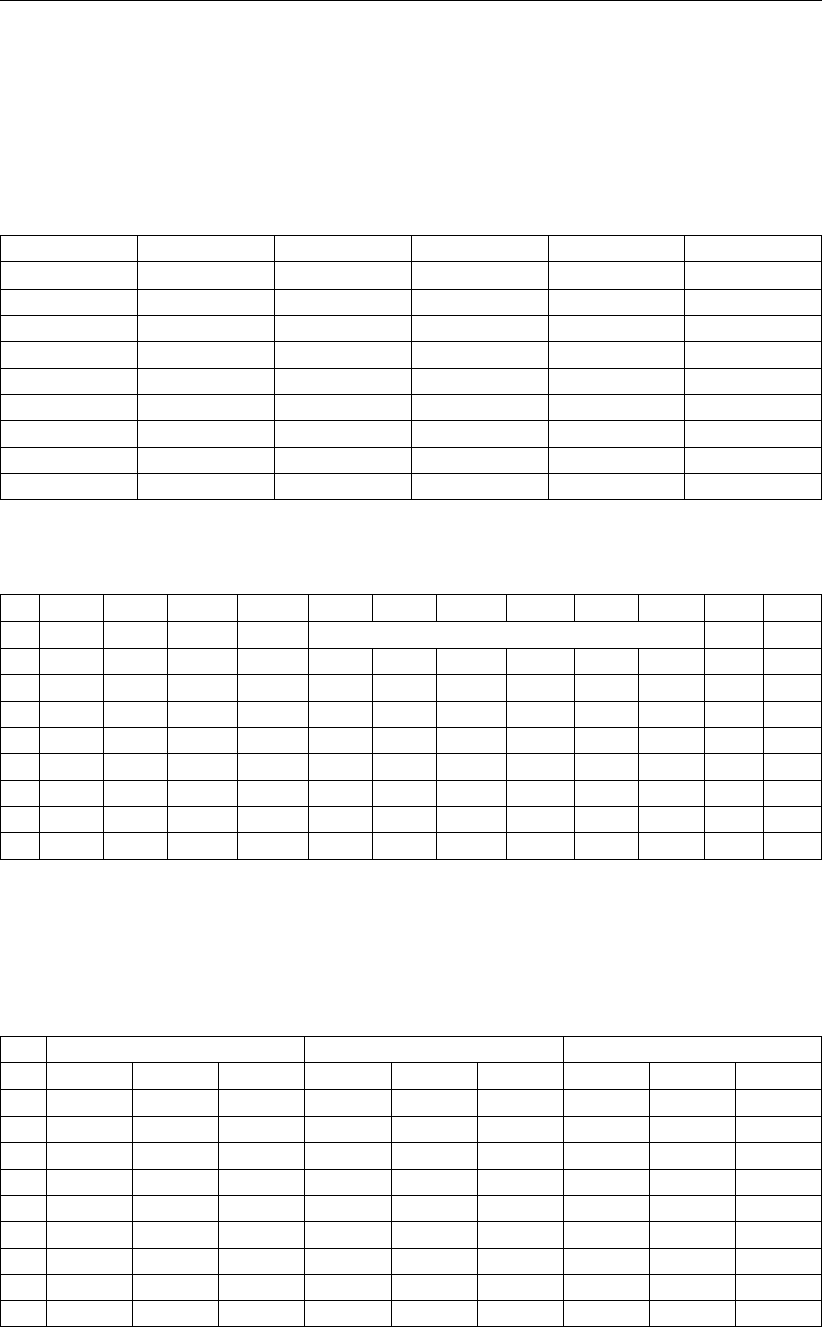
D-GEO PIPELINE
, Verification Report
Operation Parameters
The safety factors for uplift and hydraulic heave are determined using the formulas given in
chapter “Trench” in the Background section of the User Manual of
D-GEO PIPELINE
. Interme-
diate results are given in the tables below.
Table 3.166: Analytical results for the calculation of the uplift safety factor
Vert. Part dry σv;top’qpipe quplift f
[-] [%] [kN/m2] [kN/m2] [kN/m2] [-]
1 0 0.367 4.014 1.963 2.138
2 0 4.458 4.014 1.963 3.179
3 0 30.326 4.014 1.963 9.767
4 0 27.931 1.583 0.707 14.094
5 0 23.082 1.583 0.707 12.036
6 0 19.085 1.583 0.707 10.34
7 0 12.564 4.838 2.827 4.377
8 100 6.774 4.838 0 999
Table 3.167: Analytical results for the hydraulic heave check
a b d2;d fBous σvσbot Wbot Wtop Wwuopw ϕ f
[m] [m] [m] [-] [kN/m2] [m] [-]
v1 2.6 0.28 2.08 0.34 54.7 16.6 38.1 16.6 10.2 28.5 -0.8 1.9
v2 4 0.28 1.39 0.15 54.7 28.2 26.5 28.2 17.1 28.5 -0.8 1.7
v3 8.7 0.28 -0.84 -0.04 55.1 71.9 -16.8 71.9 38.5 27.7 -0.7 100
v4 12.1 0.2 -0.47 -0.01 55.4 64.7 -9.4 64.7 34.1 27.1 -0.7 100
v5 10.8 0.2 0.09 0 55.8 54.1 1.7 54.1 27.4 26.1 -0.7 1.1
v6 9.4 0.2 0.65 0.03 56.2 44 12.3 44 20.7 25.1 -0.7 1.4
v7 10.2 0.35 1.34 0.05 56.7 33.1 23.6 33.1 12.7 24.1 -0.7 1.6
v8 6.1 0.35 2.48 0.2 57.1 16.7 40.4 16.7 0.2 23.1 -0.7 1.9
3.15.3 D-GEO PIPELINE results
D-GEO PIPELINE
results presented in the tables below can be found in the Report.
Table 3.168: Results of benchmark 3-15a, Vertical and horizontal soil stresses
Benchmark
D-GEO PIPELINE
Relative error
qv;p qv;n qh;n qv;p qv;n qh;n qv;p qv;n qh;n
[kN/m2] [kN/m2] [kN/m2] [kN/m2] [kN/m2] [kN/m2] [%] [%] [%]
v1 1 1 0 1 1 0 0.00 0.00 0.00
v2 9 5 4 9 5 4 0.00 0.00 0.00
v3 99 31 13 99 31 13 0.00 0.00 0.00
v4 127 28 12 127 28 12 0.00 0.00 0.00
v5 95 23 12 95 23 12 0.00 0.00 0.00
v6 70 19 18 70 19 18 0.00 0.00 0.00
v7 23 13 13 23 13 13 0.00 0.00 0.00
v8 10 7 6 10 8 6 0.00 12.5 0.00
70 of 126 Deltares
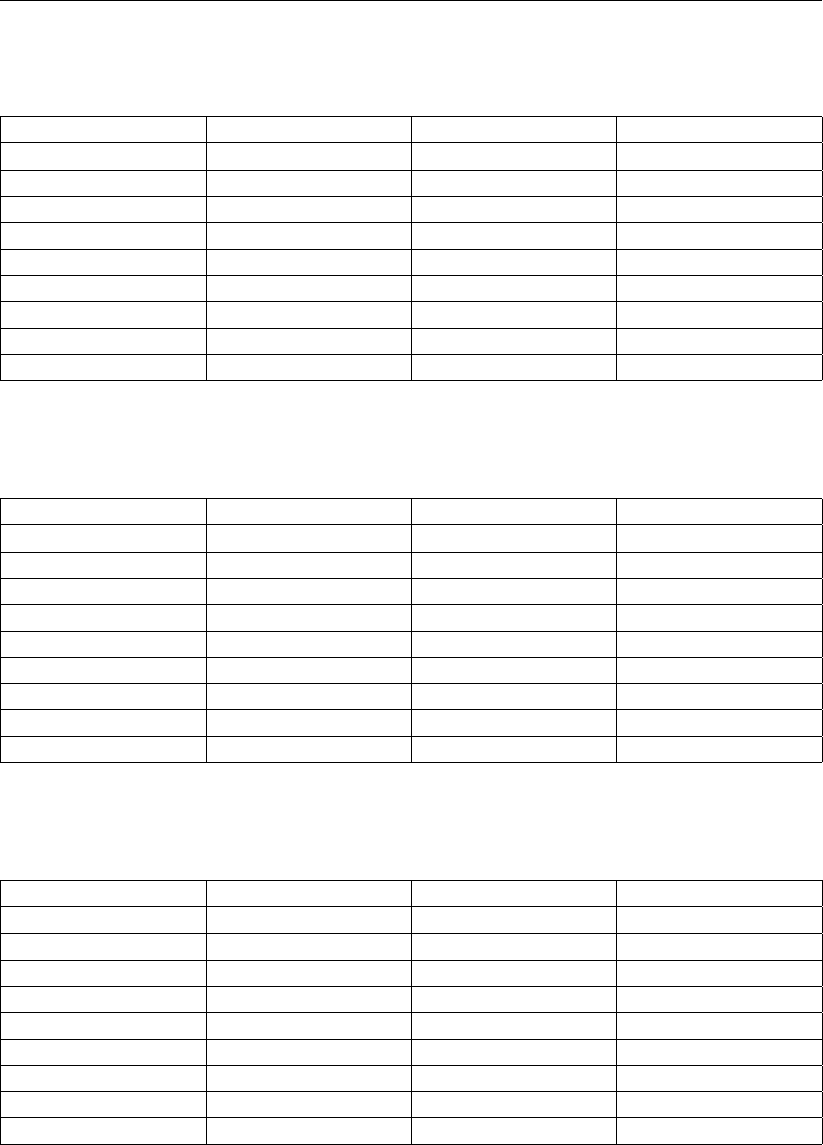
Group 3: Benchmarks from spreadsheets
Table 3.169: Results of benchmark 3-15a, Initial vertical stress qkfor sand poorly com-
pacted
Vertical nr. Benchmark
D-GEO PIPELINE
Relative error
[-] [kN/m2] [kN/m2] [%]
1 1 1 0.00
2 6 6 0.00
3 99 99 0.00
4 127 127 0.00
5 95 95 0.00
6 70 70 0.00
7 16 16 0.00
8 8 8 0.00
Table 3.170: Results of benchmark 3-15b, Initial vertical stress qkfor stiff clay poorly com-
pacted
Vertical nr. Benchmark
D-GEO PIPELINE
Relative error
[-] [kN/m2] [kN/m2] [%]
1 1 1 0.00
2 8 8 0.00
3 99 99 0.00
4 127 127 0.00
5 95 95 0.00
6 70 70 0.00
7 19 19 0.00
8 9 9 0.00
Table 3.171: Results of benchmark 3-15c, Initial vertical stress qkfor soft soil poorly com-
pacted
Vertical nr. Benchmark
D-GEO PIPELINE
Relative error
[-] [kN/m2] [kN/m2] [%]
1 1 1 0.00
2 9 9 0.00
3 99 99 0.00
4 127 127 0.00
5 95 95 0.00
6 70 70 0.00
7 21 21 0.00
8 9 9 0.00
Deltares 71 of 126
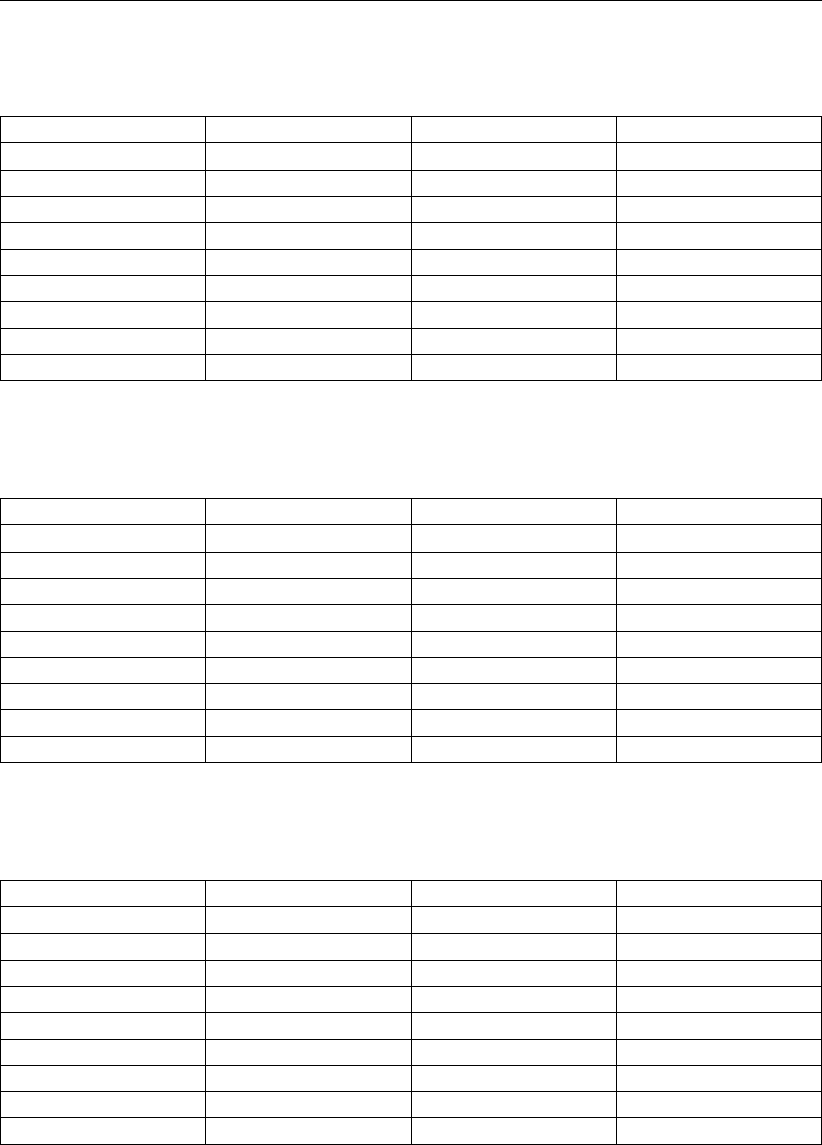
D-GEO PIPELINE
, Verification Report
Table 3.172: Results of benchmark 3-15d, Initial vertical stress qkfor sand well com-
pacted
Vertical nr. Benchmark
D-GEO PIPELINE
Relative error
[-] [kN/m2] [kN/m2] [%]
1 1 1 0.00
2 5 5 0.00
3 99 99 0.00
4 127 127 0.00
5 95 95 0.00
6 36 36 0.00
7 14 14 0.00
8 8 8 0.00
Table 3.173: Results of benchmark 3-15e, Initial vertical stress qkfor stiff clay well com-
pacted
Vertical nr. Benchmark
D-GEO PIPELINE
Relative error
[-] [kN/m2] [kN/m2] [%]
1 1 1 0.00
2 6 6 0.00
3 99 99 0.00
4 127 127 0.00
5 95 95 0.00
6 70 70 0.00
7 16 16 0.00
8 8 8 0.00
Table 3.174: Results of benchmark 3-15f, Initial vertical stress qkfor soft soil well com-
pacted
Vertical nr. Benchmark
D-GEO PIPELINE
Relative error
[-] [kN/m2] [kN/m2] [%]
1 1 1 0.00
2 7 7 0.00
3 99 99 0.00
4 127 127 0.00
5 95 95 0.00
6 70 70 0.00
7 17 17 0.00
8 8 8 0.00
72 of 126 Deltares
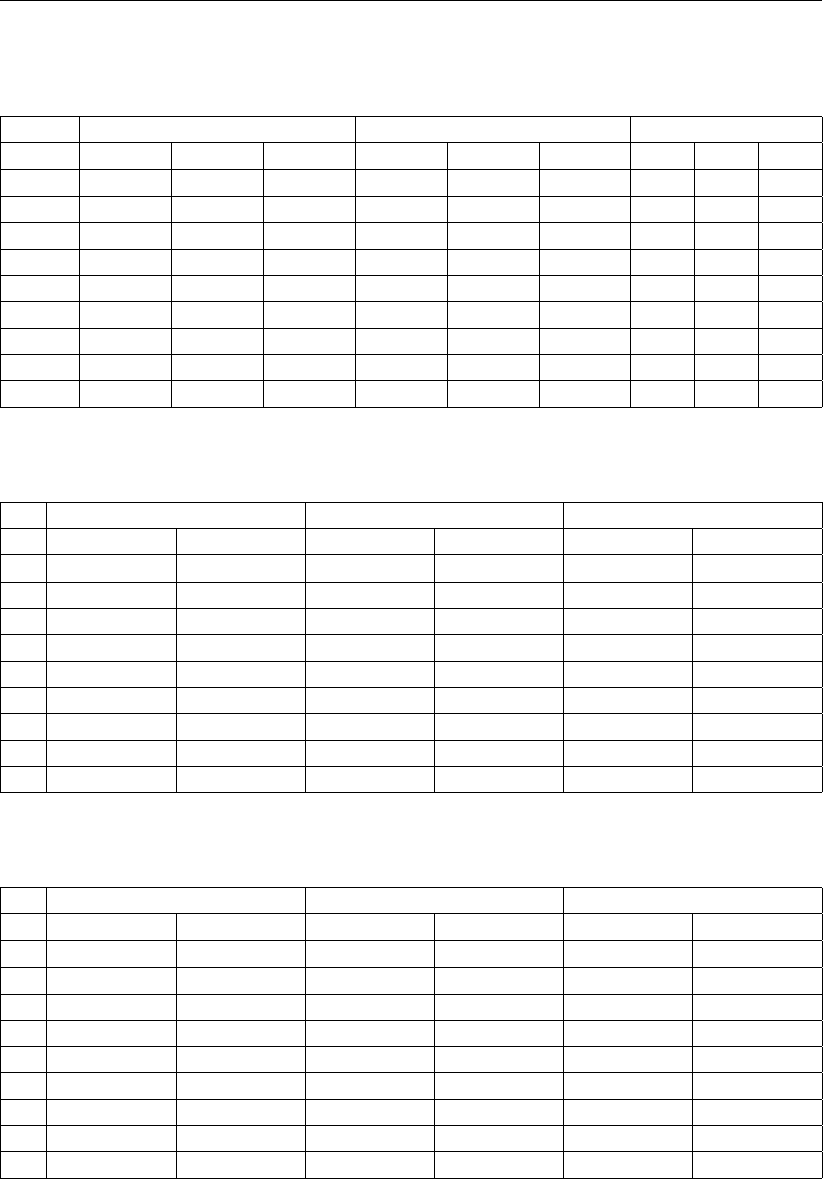
Group 3: Benchmarks from spreadsheets
Table 3.175: Results of benchmark 3-15a, Horizontal modulus of subgrade reaction and
bearing capacities
Benchmark
D-GEO PIPELINE
Relative error
khPv;e Ph;e khPv;e Ph;e khPv;e Ph;e
[kN/m3] [kN/m2] [kN/m2] [kN/m3] [kN/m2] [kN/m2] [%] [%] [%]
v1 2970 64 36 2970 64 36 0.00 0.00 0.00
v2 3699 261 59 3699 261 59 0.00 0.00 0.00
v3 15130 1622 448 15130 1622 448 0.00 0.00 0.00
v4 16398 1433 416 16407 1433 416 0.05 0.00 0.00
v5 10278 733 234 10301 733 234 0.22 0.00 0.00
v6 767 615 15 774 615 16 0.9 0.00 6.25
v7 1212 52 23 1217 52 23 0.41 0.00 0.00
v8 4105 363 53 4095 363 53 0.24 0.00 0.00
Table 3.176: Results of benchmark 3-15a, Vertical moduli of subgrade reaction upward
Benchmark
D-GEO PIPELINE
Relative error
kv;top1 kv;top2 kv;top1 kv;top2 kv;top1 kv;top2
[kN/m3] [kN/m3] [kN/m3] [kN/m3] [%] [%]
v1 1 6 1 6 0.00 0.00
v2 37 85 37 85 0.00 0.00
v3 158782 231275 158781 231274 0.00 0.00
v4 734587 945256 735567 946483 0.13 0.13
v5 129440 172065 129743 172460 0.23 0.23
v6 3080 4265 3084 4270 0.13 0.12
v7 76 170 76 170 0.00 0.00
v8 12 57 12 57 0.00 0.00
Table 3.177: Results of benchmark 3-15a, Vertical moduli of subgrade reaction downward
Benchmark
D-GEO PIPELINE
Relative error
kv;bot1 kv;bot2 kv;bot1 kv;bot2 kv;bot1 kv;bot2
[kN/m3] [kN/m3] [kN/m3] [kN/m3] [%] [%]
v1 1621 324 1621 324 0.00 0.00
v2 7876 1575 7876 1575 0.00 0.00
v3 39240 7848 39240 7848 0.00 0.00
v4 55098 11020 55116 11023 0.03 0.03
v5 31184 6237 31186 6237 0.01 0.00
v6 29860 5972 29863 5973 0.01 0.02
v7 812 162 813 163 0.12 0.61
v8 3695 591 3692 591 0.08 0.00
Deltares 73 of 126
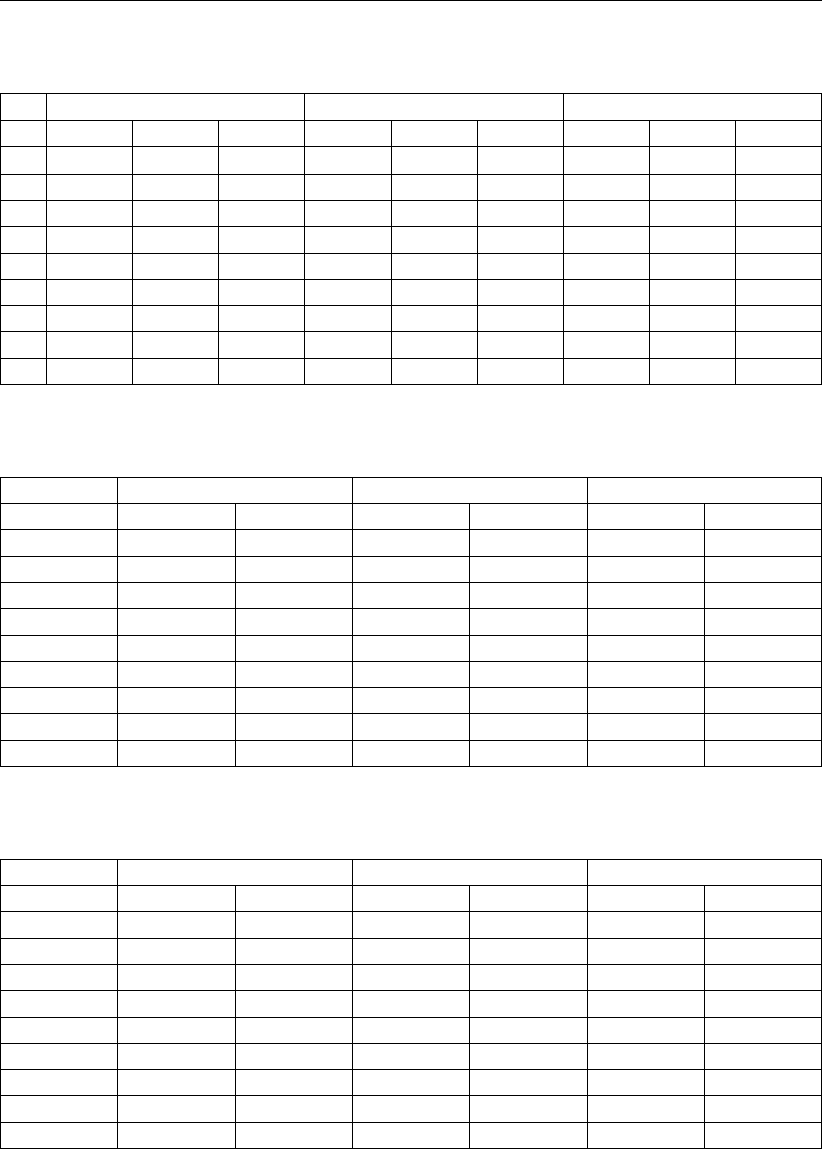
D-GEO PIPELINE
, Verification Report
Table 3.178: Results of benchmark 3-15a, Maximal axial friction and displacements
Benchmark
D-GEO PIPELINE
Relative error
tmax dv dmax tmax dv dmax tmax dv dmax
[kN/m2] [mm] [mm] [kN/m2] [mm] [mm] [%] [%] [%]
v1 19.76 5 12 24 5 12 16.67 0.00 0.00
v2 7.09 10 15 7 10 15 0.00 0.00 0.00
v3 12.59 20 2 13 20 2 0.00 0.00 0.00
v4 11.03 40 2 11 40 2 0.00 0.00 0.00
v5 9.6 80 5 10 80 5 0.00 0.00 0.00
v6 11.11 60 15 11 60 15 0.00 0.00 0.00
v7 14.05 50 15 14 50 15 0.00 0.00 0.00
v8 25.53 35 12 26 35 12 0.00 0.00 0.00
Table 3.179: Results of benchmark 3-15a, Uplift check
Benchmark
D-GEO PIPELINE
Relative error
Vertical fcalc freq fcalc freq fcalc freq
[-] [-] [-] [-] [-] [%] [%]
1 2.14 1.15 2.14 1.15 0.00 0.00
2 3.18 1.15 3.18 1.15 0.00 0.00
3 9.77 1.15 9.77 1.15 0.00 0.00
4 14.09 1.15 14.1 1.15 0.07 0.00
5 12.04 1.15 12.04 1.15 0.00 0.00
6 10.34 1.15 10.34 1.15 0.00 0.00
7 4.38 1.15 4.38 1.15 0.00 0.00
8 999 1.15 999 1.15 0.00 0.00
Table 3.180: Results of benchmark 3-15a, Hydraulic heave check
Benchmark
D-GEO PIPELINE
Relative error
Vertical fcalc freq fcalc freq fcalc freq
[-] [-] [-] [-] [-] [%] [%]
1 1.89 1.2 1.89 1.2 0.00 0.00
2 1.68 1.2 1.68 1.2 0.00 0.00
3 100 1.2 100 1.2 0.00 0.00
4 100 1.2 100 1.2 0.00 0.00
5 1.11 1.2 1.11 1.2 0.00 0.00
6 1.36 1.2 1.36 1.2 0.00 0.00
7 1.58 1.2 1.58 1.2 0.00 0.00
8 1.89 1.2 1.89 1.2 0.00 0.00
Use
D-GEO PIPELINE
input files bm3-15a.dri until bm3-15f to run this benchmark.
3.16 Trenching (3 sections) – 3D geometry in four layers – Drainage border above
compressible border
3.16.1 Description
The same input values as benchmark 3-15 (section 3.15) are used, only the positions of the
boundaries between compressible/incompressible layers and drained/undrained layers have
74 of 126 Deltares
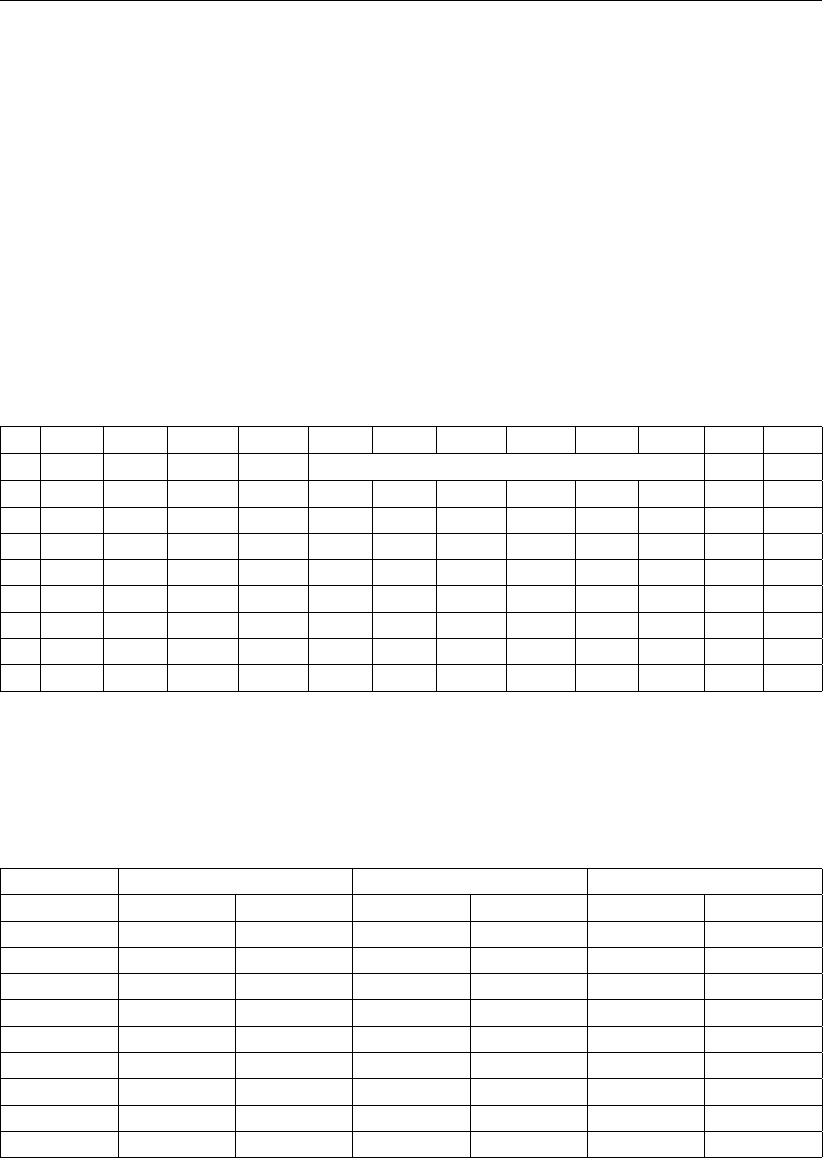
Group 3: Benchmarks from spreadsheets
been turned around. This modification will only have an influence on the hydraulic heave
check.
3.16.2 Analytical results
Analytical results are worked out in an Excel spreadsheet.
Operation Parameters
The safety factors for hydraulic heave are determined using the formulas given in chapter
“Trench” in the Background section of the User Manual of
D-GEO PIPELINE
. Intermediate re-
sults are given in the table below.
Table 3.181: Analytical results for the hydraulic heave check
a b d2;d fBous σvσbot Wbot Wtop Wwuopw ϕ f
[m] [m] [m] [-] [kN/m2] [m] [-]
v1 2.6 0.28 0.48 0.04 24.3 16.6 7.7 16.6 10.2 16.5 -0.4 1.1
v2 4 0.28 -0.21 0 24.3 28.2 -3.9 28.2 17.1 16.5 -0.4 100
v3 8.7 0.28 -2.27 -0.13 27.8 71.9 -44 71.9 38.5 16.8 -0.4 100
v4 12.1 0.2 -1.77 -0.08 30.7 64.7 -34.1 64.7 34.1 17.1 -0.4 100
v5 10.8 0.2 -1.01 -0.04 34.9 54.1 -19.2 54.1 27.4 17.6 -0.5 100
v6 9.4 0.2 -0.25 0 39.1 44 -4.8 44 20.7 18 -0.5 100
v7 10.2 0.35 0.64 0.02 43.4 33.1 10.3 33.1 12.7 18.6 -0.6 1.3
v8 6.1 0.35 1.98 0.15 47.6 16.7 30.9 16.7 0.2 19.1 -0.6 1.8
3.16.3 D-GEO PIPELINE results
D-GEO PIPELINE
results presented in the tables below can be found in the Report.
Table 3.182: Results of benchmark 3-16, Hydraulic heave check
Benchmark
D-GEO PIPELINE
Relative error
Vertical fcalc freq fcalc freq fcalc freq
[-] [-] [-] [-] [-] [%] [%]
1 1.13 1.2 1.13 1.2 0.00 0.00
2 100 1.2 100 1.2 0.00 0.00
3 100 1.2 100 1.2 0.00 0.00
4 100 1.2 100 1.2 0.00 0.00
5 100 1.2 100 1.2 0.00 0.00
6 100 1.2 100 1.2 0.00 0.00
7 1.27 1.2 1.26 1.2 0.79 0.00
8 1.76 1.2 1.75 1.2 0.57 0.00
Use
D-GEO PIPELINE
input file bm3-16.dri to run this benchmark.
3.17 Bundled pipeline with Special Stress Analysis
Deltares 75 of 126
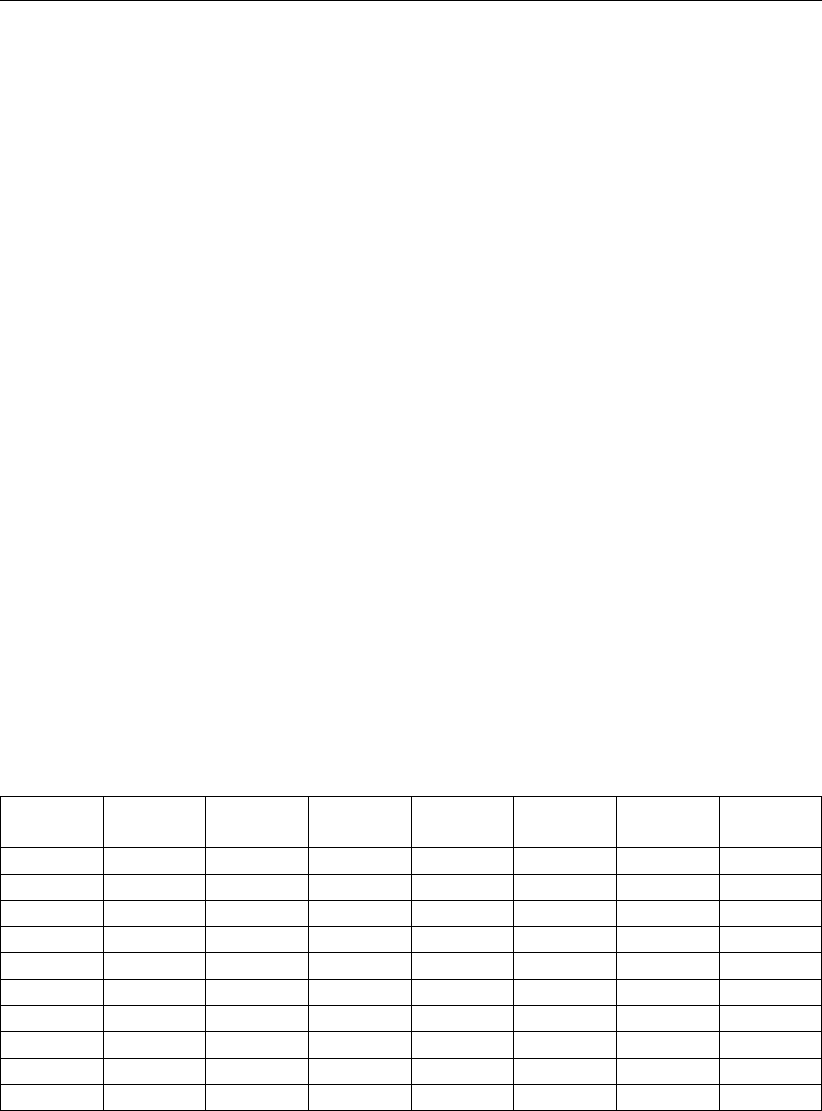
D-GEO PIPELINE
, Verification Report
3.17.1 Description
The same input data’s as for benchmark 3-9 (section 3.9) are used except that calculations
are performed using the Special Stress Analysis calculation which means that the maximum
modulus of subgrade reaction and the maximum reduced soil load are input values instead of
calculated values: kV;max = 45000 kN/m3,qn;max = 0.14 N/mm2and R= 700 m.
3.17.2 Analytical results
Analytical results are worked out in an Excel spreadsheet.
Strength calculation for bundled pipelines
For the buoyancy control, the pulling forces in the pipeline and the strength calculation, calcu-
lations are performed using the formulas given in chapter “Strength pipeline calculation” in the
Background section of the User Manual of
D-GEO PIPELINE
. The properties of the equivalent
pipe are:
D0;eq [mm] 1284.11
dn;eq [mm] 41.16
γeq [kN/m3] 58.92
Ieq [m4] 0.031073
Eeq [N/mm2] 74520.87
kV;max;eq [kN/m3] 45000
The total pulling force is the contribution of five components. Results are given in the tables
below for the equivalent pipeline and for each single pipelines.
Table 3.183: Analytical results for the calculation of the five components of the pulling
force for the 10 characteristic points (bm3-17) for the equivalent pipe
Charac. Length T1T2T3a T3b T3c Total
point [m] [kN] [kN] [kN] [kN] [kN] [kN]
1 0 3887.97 0 0 0 0 3887.97
2 43.04 3794.48 103.16 0 0 0 3897.64
3 338 3153.74 0 707.01 395.49 296.1 4655.49
4 403.91 3010.56 157.99 0 0 0 4670.3
5 648.25 2479.76 0 1320.17 565.97 0 6025.65
6 769.54 2216.29 290.72 0 0 0 6052.89
7 1293.14 1078.88 0 1769.18 1028.93 0 7713.58
8 1440.63 758.48 353.53 0 0 0 7746.72
9 1715.52 161.33 0 658.9 489.65 427.18 8725.31
10 1789.79 0 178.02 0 0 0 8742
76 of 126 Deltares

Group 3: Benchmarks from spreadsheets
Table 3.184: Analytical results for the calculation of the five components of the pulling
force for the 10 characteristic points (bm3-17) for pipe nr. 1
Charac. Length T1T2T3a T3b T3c Total
point [m] [kN] [kN] [kN] [kN] [kN] [kN]
1 0 2.6 0 0 0 0 2.6
2 43.04 2.54 2.6 0 0 0 5.14
3 338 2.11 0 17.83 0 1.53 24.08
4 403.91 2.02 3.98 0 0 0 27.97
5 648.25 1.66 0 14.77 3.66 0 46.05
6 769.54 1.48 7.33 0 0 0 53.2
7 1293.14 0.72 0 31.65 10.66 0 94.76
8 1440.63 0.51 8.92 0 0 0 103.46
9 1715.52 0.11 0 16.62 0 8.25 127.93
10 1789.79 0 4.49 0 0 0 132.31
Table 3.185: Analytical results for the calculation of the five components of the pulling
force for the 10 characteristic points (bm3-17) for pipe nr. 2
Charac. Length T1T2T3a T3b T3c Total
point [m] [kN] [kN] [kN] [kN] [kN] [kN]
1 0 430.7 0 0 0 0 430.7
2 43.04 420.34 19.57 0 0 0 439.92
3 338 349.36 0 134.16 5.47 34.54 543.11
4 403.91 333.5 29.98 0 0 0 557.23
5 648.25 274.7 0 121.3 61.84 0 681.57
6 769.54 245.52 55.16 0 0 0 707.55
7 1293.14 119.52 0 245.27 119.69 0 946.51
8 1440.63 84.02 67.08 0 0 0 978.1
9 1715.52 17.87 0 125.03 6.78 66.17 1109.92
10 1789.79 0 33.78 0 0 0 1125.83
Table 3.186: Analytical results for the calculation of the five components of the pulling
force for the 10 characteristic points (bm3-17) for pipe nr. 3
Charac. Length T1T2T3a T3b T3c Total
point [m] [kN] [kN] [kN] [kN] [kN] [kN]
1 0 164.16 0 0 0 0 164.16
2 43.04 160.21 27.49 0 0 0 187.7
3 338 133.16 0 188.42 0.36 23.73 373.16
4 403.91 127.11 42.1 0 0 0 409.21
5 648.25 104.7 0 156.75 49.67 0 593.22
6 769.54 93.58 77.47 0 0 0 659.57
7 1293.14 45.55 0 334.93 124.74 0 1071.21
8 1440.63 32.03 94.21 0 0 0 1151.9
9 1715.52 6.81 0 175.59 0.44 88.28 1391
10 1789.79 0 47.44 0 0 0 1431.63
Deltares 77 of 126

D-GEO PIPELINE
, Verification Report
Table 3.187: Analytical results for the calculation of the five components of the pulling
force for the 10 characteristic points (bm3-17) for pipe nr. 4
Charac. Length T1T2T3a T3b T3c Total
point [m] [kN] [kN] [kN] [kN] [kN] [kN]
1 0 456.95 0 0 0 0 456.95
2 43.04 445.96 32.68 0 0 0 478.64
3 338 370.66 0 223.95 21.9 44.09 693.27
4 403.91 353.83 50.04 0 0 0 726.49
5 648.25 291.44 0 226.19 86.34 0 976.64
6 769.54 260.48 92.09 0 0 0 1037.76
7 1293.14 126.8 0 426.01 186.06 0 1516.16
8 1440.63 89.14 111.98 0 0 0 1590.48
9 1715.52 18.96 0 208.71 27.12 110.78 1866.91
10 1789.79 0 56.39 0 0 0 1904.33
Table 3.188: Analytical results for the calculation of the five components of the pulling
force for the 10 characteristic points (bm3-17) for pipe nr. 5
Charac. Length T1T2T3a T3b T3c Total
point [m] [kN] [kN] [kN] [kN] [kN] [kN]
1 0 2833.56 0 0 0 0 2833.56
2 43.04 2765.42 76.94 0 0 0 2842.36
3 338 2298.45 0 527.34 361.45 221.71 3485.89
4 403.91 2194.1 117.84 0 0 0 3499.38
5 648.25 1807.25 0 1108.12 437.14 0 4657.8
6 769.54 1615.24 216.84 0 0 0 4682.62
7 1293.14 786.29 0 1405.99 808.45 0 6068.11
8 1440.63 552.78 263.69 0 0 0 6098.3
9 1715.52 117.58 0 491.46 447.51 330.13 6932.19
10 1789.79 0 132.78 0 0 0 6947.39
3.17.3 D-GEO PIPELINE results
ASpecial Stress Analysis calculation must be performed by selecting Special Stress Analysis
for the Start menu.
D-GEO PIPELINE
results can be found in the Report.
Table 3.189: Results of benchmark 3-17, Buoyancy Control
Result Unit Benchmark
D-GEO PIPELINE
Error [%]
Uplift forces [kg/m] 1414 1415 0.07
Weight of pipeline (incl. filling) [kg/m] 1086 1086 0.00
Effective weight of pipe [kg/m] 328 328 0.00
78 of 126 Deltares

Group 3: Benchmarks from spreadsheets
Table 3.190: Results of benchmark 3-17, Pulling forces in the pipeline
Benchmark
D-GEO PIPELINE
Relative error
Charac. points Length Force Length Force Length Force
[m] [kN] [m] [kN] [%] [%]
T1 0 3887.97 0 3887.97 0.00 0.00
T2 43.04 3897.64 43.04 3897.64 0.00 0.00
T3 338 4655.49 338 4655.49 0.00 0.00
T4 1440.63 7746.72 1440.63 7746.72 0.00 0.00
T5 1715.52 8725.31 1715.52 8725.31 0.00 0.00
T6 1789.79 8742 1789.79 8742 0.00 0.00
Max. rep. pulling force - 4 - 4 - 0.00
Use
D-GEO PIPELINE
input file bm3-17.dri to run this benchmark.
3.18 HDD with 3D geometry – Pipeline configuration not ending at surface and with an
angle between radii
3.18.1 Description
The same input values as benchmark 3-1 (section 3.1) are used, only the pipeline configu-
ration is slightly different: the configuration is not ending at surface but 5 meters below the
surface and an angle between the radii is present. Two cases are checked:
Case A (bm3-18a): the angle between the radii is positive;
Case B (bm3-18b): the angle between the radii is negative.
The configuration of the pipeline is given by:
Xleft 10 m X-coordinate of the left entry point
Yleft 10 m Y-coordinate of the left entry point
Zleft 0 m Z-coordinate of the left entry point
Xright 690 m X-coordinate of the right exit point
Yright -30 m Y-coordinate of the right exit point
Zright -5 m Z-coordinate of the right exit point
ϕleft 13◦Left angle of the pipe
ϕright 15◦Right angle of the pipe
Zbottom -50 m Lowest level of the pipe
α±2◦Angle of pipe between radii
Rleft 600 m Bending radius of the pipe at the left side
Rright 800 m Bending radius of the pipe at the right side
Rrol 1000 m Bending radius in pipe string (on rollers)
3.18.2 Analytical results
Analytical results are worked out in an Excel spreadsheet.
Strength calculation
For the buoyancy control, the pulling forces in the pipeline and the strength calculation, cal-
culations are performed using the formulas given in chapter “Strength pipeline calculation” in
the Background section of the User Manual of
D-GEO PIPELINE
. The position of the six charac-
teristic points of the pipeline configuration is represented in Figure 3.5 and Figure 3.6. Their
coordinates are given in the tables below.
Deltares 79 of 126
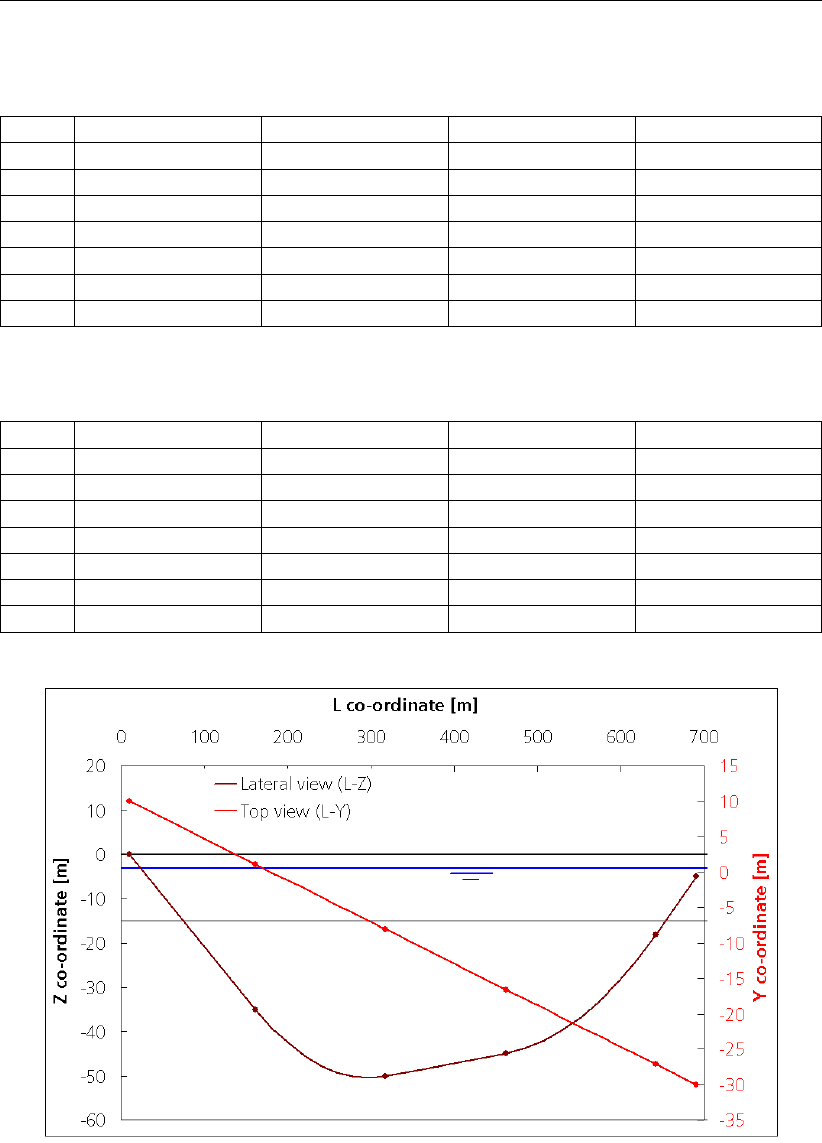
D-GEO PIPELINE
, Verification Report
Table 3.191: Position of the 6 characteristic points (bm3-18a) for case a (positive angle
between radii)
Point L-coord. X-coord. Z-coord. Traject length
[m] [m] [m] [m]
1 10 10 0 0
2 161.55 161.29 -34.99 155.534
3 317.46 316.93 -50 312.614
4 350.59 350 -48.84 345.764
5 441.52 440.78 -45.67 436.752
6 620.66 619.6 -18.9 618.266
Table 3.192: Position of the 6 characteristic points (bm3-18b) for case b
Point L-coord. X-coord. Z-coord. Traject length
[m] [m] [m] [m]
1 10 10 0 0
2 144.81 144.57 -31.12 138.353
3 258.84 258.41 -46.14 253.545
4 350.59 350 -49.34 345.35
5 369.51 368.89 -50 364.287
6 604.49 603.46 -23.23 601.652
Figure 3.5: Locations of the characteristic points T1 to T6 for case A (positive angle be-
tween radii)
80 of 126 Deltares
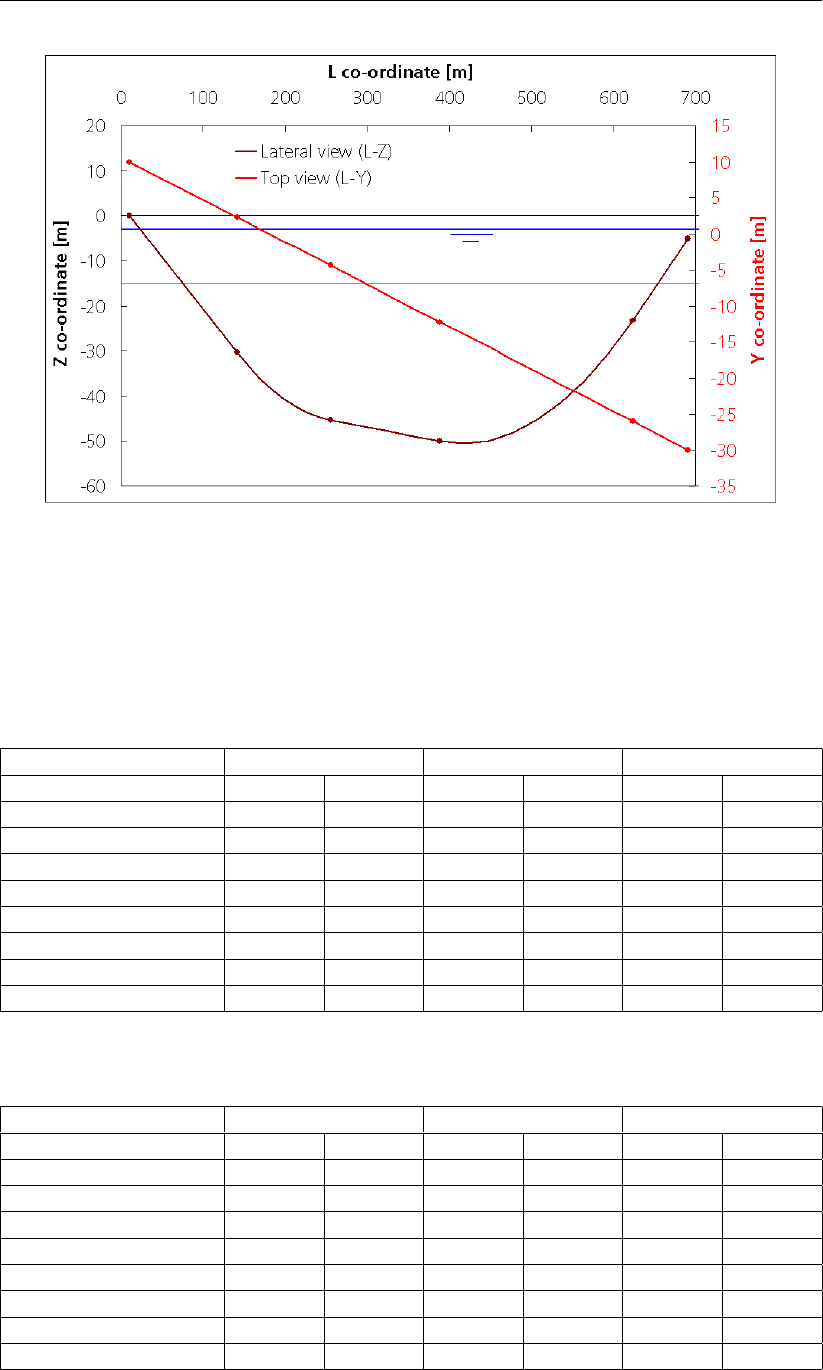
Group 3: Benchmarks from spreadsheets
Figure 3.6: Locations of the characteristic points T1 to T6 for case B (negative angle
between radii)
3.18.3 D-GEO PIPELINE results
D-GEO PIPELINE
results presented in the tables below can be found in the Dumpfile.
Table 3.193: Results of benchmark 3-18a, Pulling forces in the pipeline
Benchmark
D-GEO PIPELINE
Relative error
Charac. points Length Force Length Force Length Force
[m] [kN] [m] [kN] [%] [%]
T1 0 284.5 0 284.5 0.00 0.00
T2 155.53 284.01 155.53 284.01 0.00 0.00
T3 312.61 471.53 312.61 471.53 0.00 0.00
T4 436.75 471.14 436.75 471.14 0.00 0.00
T5 618.27 620.94 618.27 620.94 0.00 0.00
T6 691.27 620.71 691.27 620.71 0.00 0.00
Max. rep. pulling force - 5188 - 5188 - 0.00
Table 3.194: Results of benchmark 3-18b, Pulling forces in the pipeline
Benchmark
D-GEO PIPELINE
Relative error
Charac. points Length Force Length Force Length Force
[m] [kN] [m] [kN] [%] [%]
T1 0 284.55 0 284.55 0.00 0.00
T2 138.35 284.11 138.35 284.11 0.00 0.00
T3 253.54 465.66 253.55 465.66 0.00 0.00
T4 364.29 465.31 364.29 465.31 0.00 0.00
T5 601.65 622.87 601.65 622.87 0.00 0.00
T6 691.4 622.58 691.4 622.59 0.00 0.00
Max. rep. pulling force - 5187 - 5187 - 0.00
Deltares 81 of 126
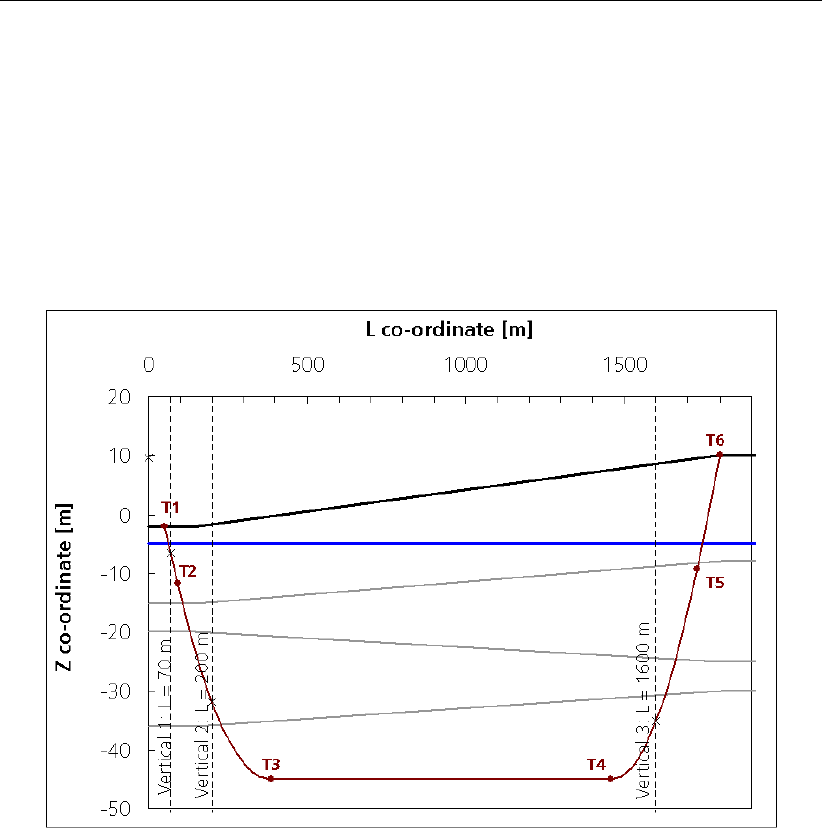
D-GEO PIPELINE
, Verification Report
Use
D-GEO PIPELINE
input files bm3-18a.dri and bm3-18b.dri to run this benchmark.
3.19 HDD with 2D geometry – Stress Analysis per Vertical – Steel pipe
3.19.1 Description
The same sub-soil as benchmark 3-7 (section 3.7) is used, with a simple pipeline configura-
tion as shown in Figure 3-7. A stress analysis per vertical is performed using 3 verticals at
L= 70 m, L= 200 m and L= 1600 m.
Figure 3.7: Locations of the characteristic points (T1 to T6) and the 3 verticals
3.19.2 Analytical results
Analytical results are worked out in an Excel spreadsheet.
Soil mechanical data
The soil mechanical data’s are determined using the formulas given in chapter “Calculation of
soil mechanical data” in the Background section of the User Manual of
D-GEO PIPELINE
.
Strength calculation
For the buoyancy control, the pulling forces in the pipeline and the strength calculation, cal-
culations are performed using the formulas given in chapter “Strength pipeline calculation” in
the Background section of the User Manual of
D-GEO PIPELINE
. For the radius, the following
values are used for each vertical:
Vertical 1, situated in the first (left) descending straight part: R= 100 000 000 m;
Vertical 2, situated in the left curved part: R= 1300 m;
Vertical 3, situated in the right curved part: R= 1050 m.
82 of 126 Deltares

Group 3: Benchmarks from spreadsheets
3.19.3 D-GEO PIPELINE results
D-GEO PIPELINE
results presented in the tables below can be found in the Report.
Table 3.195: Results of benchmark 3-19, Buoyancy Control
Result Unit Benchmark
D-GEO PIPELINE
Error [%]
Uplift forces [kg/m] 2297 2297 0.00
Weight of pipeline (incl. filling) [kg/m] 1288 1288 0.00
Effective weight of pipe [kg/m] 1009 1009 0.00
Table 3.196: Results of benchmark 3-19, Pulling forces in the pipeline
Benchmark
D-GEO PIPELINE
Relative error
Charac. points Length Force Length Force Length Force
[m] [kN] [m] [kN] [%] [%]
T1 0 4532 0 4532 0.00 0.00
T2 43 4622 43 4622 0.00 0.00
T3 338 6477 338 6477 0.00 0.00
T4 1410 8730 1410 8730 0.00 0.00
T5 1685 11136 1685 11136 0.00 0.00
T6 1759 11292 1759 11292 0.00 0.00
Max. rep. pulling force - 36460 - 36460 - 0.00
Table 3.197: Results of benchmark 3-19 for vertical nr. 1, Strength calculation for Combi-
nation 1A
Result Unit Benchmark
D-GEO PIPELINE
Rel. error [%]
σb[N/mm2] 304 304 0.00
σt[N/mm2] 49 49 0.00
σa;max [N/mm2] 353 353 0.00
σV;max [N/mm2] 353 353 0.00
Table 3.198: Results of benchmark 3-19 for vertical nr. 1, Strength calculation for Combi-
nation 1B
Result Unit Benchmark
D-GEO PIPELINE
Rel. error [%]
σb[N/mm2] 0 0 0.00
σt[N/mm2] 123 123 0.00
σa;max [N/mm2] 123 123 0.00
λ[mm-1] 0.000065 0.000065 0.00
qr[N/mm2] 0 0 0.00
σqr [N/mm2] 0 0 0.00
σt;max [N/mm2] 0 0 0.00
σV;max [N/mm2] 123 123 0.00
Deltares 83 of 126

D-GEO PIPELINE
, Verification Report
Table 3.199: Results of benchmark 3-19 for vertical nr. 1, Strength calculation for Combi-
nation 2
Result Unit Benchmark
D-GEO PIPELINE
Rel. error [%]
σpy [N/mm2] 15 15 0.00
σpx [N/mm2] 8 8 0.00
σptest [N/mm2] 23 23 0.00
σpm [N/mm2] 13 13 0.00
Table 3.200: Results of benchmark 3-19 for vertical nr. 1, Strength calculation for Combi-
nation 3
Result Unit Benchmark
D-GEO PIPELINE
Rel. error [%]
σb[N/mm2] 0 0 0.00
σa;max [N/mm2] 0 0 0.00
σqr [N/mm2] 0 0 0.00
σqn [N/mm2] 0 0 0.00
σt;max [N/mm2] 0 0 0.00
σV;max [N/mm2] 0 0 0.00
Table 3.201: Results of benchmark 3-19 for vertical nr. 1, Strength calculation for Combi-
nation 4
Result Unit Benchmark
D-GEO PIPELINE
Rel. error [%]
σb[N/mm2] 0 0 0.00
σpy [N/mm2] 18 18 0.00
σpx [N/mm2] 9 9 0.00
σptest [N/mm2] 23 23 0.00
σptemp [N/mm2] 25 25 0.00
σa;max [N/mm2] 9 9 0.00
σqr [N/mm2] 0 0 0.00
σqn [N/mm2] 0 0 0.00
σV;max [N/mm2] 16 16 0.00
Table 3.202: Results of benchmark 3-19 for vertical nr. 1, Maximum allowable stresses
Result Unit Benchmark
D-GEO PIPELINE
Rel. error [%]
σptest [N/mm2] 173.91 173.91 0.00
σpy [N/mm2] 153.85 153.85 0.00
σpm [N/mm2] 169.23 169.23 0.00
σV;max [N/mm2] 261.54 261.54 0.00
σa/t (short) [N/mm2] n.a. n.a.
σa/t (long) [N/mm2] n.a. n.a.
Table 3.203: Results of benchmark 3-19 for vertical nr. 1, Deflection of the pipeline
Result Unit Benchmark
D-GEO PIPELINE
Rel. error [%]
Calculated [mm] 0 0 0.00
Max. allowable [mm] 255 255 0.00
Max. allow. (piggability) [mm] 120 120 0.00
84 of 126 Deltares

Group 3: Benchmarks from spreadsheets
Table 3.204: Results of benchmark 3-19 for vertical nr. 1, Implosion
Result Unit Benchmark
D-GEO PIPELINE
Error
Max. allow. external pressure (short) [kPa] n.a. n.a.
Max. allow. external pressure (long) [kPa] n.a. n.a.
Int. pressure due to 100% filling (short) [kPa] n.a. n.a.
Int. pressure due to 100% filling (long) [kPa] n.a. n.a.
Table 3.205: Results of benchmark 3-19 for vertical nr. 2, Strength calculation for Combi-
nation 1A
Result Unit Benchmark
D-GEO PIPELINE
Rel. error [%]
σb[N/mm2] 304 304 0.00
σt[N/mm2] 49 49 0.00
σa;max [N/mm2] 353 353 0.00
σV;max [N/mm2] 353 353 0.00
Table 3.206: Results of benchmark 3-19 for vertical nr. 2, Strength calculation for Combi-
nation 1B
Result Unit Benchmark
D-GEO PIPELINE
Rel. error [%]
σb[N/mm2] 187 187 0.00
σt[N/mm2] 123 123 0.00
σa;max [N/mm2] 309 309 0.00
λ[mm-1] 0.000174 0.000174 0.00
qr[N/mm2] 0.05052 0.05052 0.00
σqr [N/mm2] 20 20 0.00
σt;max [N/mm2] 20 20 0.00
σV;max [N/mm2] 320 320 0.00
Table 3.207: Results of benchmark 3-19 for vertical nr. 2, Strength calculation for Combi-
nation 2
Result Unit Benchmark
D-GEO PIPELINE
Rel. error [%]
σpy [N/mm2] 15 15 0.00
σpx [N/mm2] 8 8 0.00
σptest [N/mm2] 23 23 0.00
σpm [N/mm2] 13 13 0.00
Table 3.208: Results of benchmark 3-19 for vertical nr. 2, Strength calculation for Combi-
nation 3
Result Unit Benchmark
D-GEO PIPELINE
Rel. error [%]
σb[N/mm2] 187 187 0.00
σa;max [N/mm2] 187 187 0.00
σqr [N/mm2] 20 20 0.00
σqn [N/mm2] 65 65 0.00
σt;max [N/mm2] 85 85 0.00
σV;max [N/mm2] 241 241 0.00
Deltares 85 of 126
D-GEO PIPELINE
, Verification Report
Table 3.209: Results of benchmark 3-19 for vertical nr. 2, Strength calculation for Combi-
nation 4
Result Unit Benchmark
D-GEO PIPELINE
Rel. error [%]
σb[N/mm2] 187 187 0.00
σpy [N/mm2] 18 18 0.00
σpx [N/mm2] 9 9 0.00
σptest [N/mm2] 23 23 0.00
σptemp [N/mm2] 25 25 0.00
σa;max [N/mm2] 196 196 0.00
σqr [N/mm2] 20 20 0.00
σqn [N/mm2] 65 65 0.00
σV;max [N/mm2] 239 239 0.00
Table 3.210: Results of benchmark 3-19 for vertical nr. 2, Maximum allowable stresses
Result Unit Benchmark
D-GEO PIPELINE
Rel. error [%]
σptest [N/mm2] 173.91 173.91 0.00
σpy [N/mm2] 153.85 153.85 0.00
σpm [N/mm2] 169.23 169.23 0.00
σV;max [N/mm2] 261.54 261.54 0.00
σa/t (short) [N/mm2] n.a. n.a.
σa/t (long) [N/mm2] n.a. n.a.
Table 3.211: Results of benchmark 3-19 for vertical nr. 2, Deflection of the pipeline
Result Unit Benchmark
D-GEO PIPELINE
Rel. error [%]
Calculated [mm] 6.1 6.1 0.00
Max. allowable [mm] 255 255 0.00
Max. allow. (piggability) [mm] 120 120 0.00
Table 3.212: Results of benchmark 3-19 for vertical nr. 2, Implosion
Result Unit Benchmark
D-GEO PIPELINE
Error
Max. allow. external pressure (short) [kPa] n.a. n.a.
Max. allow. external pressure (long) [kPa] n.a. n.a.
Int. pressure due to 100% filling (short) [kPa] n.a. n.a.
Int. pressure due to 100% filling (long) [kPa] n.a. n.a.
Table 3.213: Results of benchmark 3-19 for vertical nr. 3, Strength calculation for Combi-
nation 1A
Result Unit Benchmark
D-GEO PIPELINE
Rel. error [%]
σb[N/mm2] 304 304 0.00
σt[N/mm2] 49 49 0.00
σa;max [N/mm2] 353 353 0.00
σV;max [N/mm2] 353 353 0.00
86 of 126 Deltares

Group 3: Benchmarks from spreadsheets
Table 3.214: Results of benchmark 3-19 for vertical nr. 3, Strength calculation for Combi-
nation 1B
Result Unit Benchmark
D-GEO PIPELINE
Rel. error [%]
σb[N/mm2] 231 231 0.00
σt[N/mm2] 123 123 0.00
σa;max [N/mm2] 354 354 0.00
λ[mm-1] 0.000167 0.000167 0.00
qr[N/mm2] 0.0578 0.0578 0.00
σqr [N/mm2] 23 23 0.00
σt;max [N/mm2] 23 23 0.00
σV;max [N/mm2] 366 366 0.00
Table 3.215: Results of benchmark 3-19 for vertical nr. 3, Strength calculation for Combi-
nation 2
Result Unit Benchmark
D-GEO PIPELINE
Rel. error [%]
σpy [N/mm2] 15 15 0.00
σpx [N/mm2] 8 8 0.00
σptest [N/mm2] 23 23 0.00
σpm [N/mm2] 13 13 0.00
Table 3.216: Results of benchmark 3-19 for vertical nr. 3, Strength calculation for Combi-
nation 3
Result Unit Benchmark
D-GEO PIPELINE
Rel. error [%]
σb[N/mm2] 231 231 0.00
σa;max [N/mm2] 231 231 0.00
σqr [N/mm2] 23 23 0.00
σqn [N/mm2] 95 95 0.00
σt;max [N/mm2] 117 117 0.00
σV;max [N/mm2] 307 307 0.00
Table 3.217: Results of benchmark 3-19 for vertical nr. 3, Strength calculation for Combi-
nation 4
Result Unit Benchmark
D-GEO PIPELINE
Rel. error [%]
σb[N/mm2] 231 231 0.00
σpy [N/mm2] 18 18 0.00
σpx [N/mm2] 9 9 0.00
σptest [N/mm2] 23 23 0.00
σptemp [N/mm2] 25 25 0.00
σa;max [N/mm2] 240 240 0.00
σqr [N/mm2] 23 23 0.00
σqn [N/mm2] 95 95 0.00
σV;max [N/mm2] 304 304 0.00
Deltares 87 of 126
D-GEO PIPELINE
, Verification Report
Table 3.218: Results of benchmark 3-19 for vertical nr. 3, Maximum allowable stresses
Result Unit Benchmark
D-GEO PIPELINE
Rel. error [%]
σptest [N/mm2] 173.91 173.91 0.00
σpy [N/mm2] 153.85 153.85 0.00
σpm [N/mm2] 169.23 169.23 0.00
σV;max [N/mm2] 261.54 261.54 0.00
σa/t (short) [N/mm2] n.a. n.a.
σa/t (long) [N/mm2] n.a. n.a.
Table 3.219: Results of benchmark 3-19 for vertical nr. 3, Deflection of the pipeline
Result Unit Benchmark
D-GEO PIPELINE
Rel. error [%]
Calculated [mm] 8.2 8.2 0.00
Max. allowable [mm] 255 255 0.00
Max. allow. (piggability) [mm] 120 120 0.00
Table 3.220: Results of benchmark 3-19 for vertical nr. 3, Implosion
Result Unit Benchmark
D-GEO PIPELINE
Error
Max. allow. external pressure (short) [kPa] n.a. n.a.
Max. allow. external pressure (long) [kPa] n.a. n.a.
Int. pressure due to 100% filling (short) [kPa] n.a. n.a.
Int. pressure due to 100% filling (long) [kPa] n.a. n.a.
Use
D-GEO PIPELINE
input file bm3-19.dri to run this benchmark.
3.20 HDD with 3D geometry – Stress Analysis per Vertical – PE pipe
3.20.1 Description
The same input as for benchmark 3-10 (section 3.10) is used except that a stress analysis per
vertical instead of a standard analysis is performed using 3 verticals at L= 60 m, L= 170 m
and L= 1000 m and only one synthetic pipe (PE 80) is used.
3.20.2 Analytical results
Analytical results are worked out in an Excel spreadsheet.
Strength calculation for bundled pipelines
For the buoyancy control, the pulling forces in the pipeline and the strength calculation, cal-
culations are performed using the formulas given in chapter “Strength pipeline calculation” in
the Background section of the User Manual of
D-GEO PIPELINE
. For the radius, the following
values are used for each vertical:
Vertical 1, situated in the first (left) descending straight part: R= 100 000 000 m;
Vertical 2, situated in the left curved part: R= 1300 m;
Vertical 3, situated in the second bending: R= 1000.008 m.
88 of 126 Deltares

Group 3: Benchmarks from spreadsheets
3.20.3 D-GEO PIPELINE results
D-GEO PIPELINE
results presented in the tables below can be found in the Report.
Table 3.221: Results of benchmark 3-20, Buoyancy Control
Result Unit Benchmark
D-GEO PIPELINE
Error [%]
Uplift forces [kg/m] 653 654 0.15
Weight of pipeline (incl. filling) [kg/m] 166 166 0.00
Effective weight of pipe [kg/m] 488 488 0.00
Table 3.222: Results of benchmark 3-20, Pulling forces in the pipeline
Benchmark
D-GEO PIPELINE
Relative error
Charac. points Length Force Length Force Length Force
[m] [kN] [m] [kN] [%] [%]
T1 0 582 0 582 0.00 0.00
T2 43 669 43 669 0.00 0.00
T3 338 1353 338 1353 0.00 0.00
T4 1410 3510 1410 3510 0.00 0.00
T5 1685 4387 1685 4387 0.00 0.00
T6 1759 4537 1759 4537 0.00 0.00
Max. rep. pulling force - 897 - 897 - 0.00
Table 3.223: Results of benchmark 3-20 for vertical nr. 1, Strength calculation for Combi-
nation 1A
Result Unit Benchmark
D-GEO PIPELINE
Rel. error [%]
σb[N/mm2] 1 1 0.00
σt[N/mm2] 6 6 0.00
σa;max [N/mm2] 6 6 0.00
σV;max [N/mm2] n.a. n.a.
Table 3.224: Results of benchmark 3-20 for vertical nr. 1, Strength calculation for Combi-
nation 1B
Result Unit Benchmark
D-GEO PIPELINE
Rel. error [%]
σb[N/mm2] 0 0 0.00
σt[N/mm2] 45 45 0.00
σa;max [N/mm2] 45 45 0.00
λ[mm-1] 0.000398 0.000398 0.00
qr[N/mm2] 0 0 0.00
σqr [N/mm2] 0 0 0.00
σt;max [N/mm2] 0 0 0.00
σV;max [N/mm2] n.a. n.a.
Deltares 89 of 126

D-GEO PIPELINE
, Verification Report
Table 3.225: Results of benchmark 3-20 for vertical nr. 1, Strength calculation for Combi-
nation 2
Result Unit Benchmark
D-GEO PIPELINE
Rel. error [%]
σpy [N/mm2] 5 5 0.00
σpx [N/mm2] 2 2 0.00
σptest [N/mm2] 7 7 0.00
σpm [N/mm2] 4 4 0.00
Table 3.226: Results of benchmark 3-20 for vertical nr. 1, Strength calculation for Combi-
nation 3
Result Unit Benchmark
D-GEO PIPELINE
Rel. error [%]
σb[N/mm2] 0 0 0.00
σa;max [N/mm2] 0 0 0.00
σqr [N/mm2] 0 0 0.00
σqn [N/mm2] 0 0 0.00
σt;max [N/mm2] 0 0 0.00
σV;max [N/mm2] n.a. n.a.
Table 3.227: Results of benchmark 3-20 for vertical nr. 1, Strength calculation for Combi-
nation 4
Result Unit Benchmark
D-GEO PIPELINE
Rel. error [%]
σb[N/mm2] 0 0 0.00
σpy [N/mm2] 5 5 0.00
σpx [N/mm2] 2 2 0.00
σptest [N/mm2] 7 7 0.00
σptemp [N/mm2] 0 0 0.00
σa;max [N/mm2] 2 2 0.00
σqr [N/mm2] 0 0 0.00
σqn [N/mm2] 0 0 0.00
σV;max [N/mm2] n.a. n.a.
Table 3.228: Results of benchmark 3-20 for vertical nr. 1, Maximum allowable stresses
Result Unit Benchmark
D-GEO PIPELINE
Rel. error [%]
σptest [N/mm2] 6.4 6.4 0.00
σpy [N/mm2] 5.04 5.04 0.00
σpm [N/mm2] n.a. n.a.
σV;max [N/mm2] n.a. n.a.
σa/t (short) [N/mm2] 6.4 6.4 0.00
σa/t (long) [N/mm2] 5.04 5.04 0.00
Table 3.229: Results of benchmark 3-20 for vertical nr. 1, Deflection of the pipeline
Result Unit Benchmark
D-GEO PIPELINE
Rel. error [%]
Calculated [mm] 0 0 0.00
Max. allowable [mm] 64 64 0.00
Max. allow. (piggability) [mm] 44.8 44.8 0.00
90 of 126 Deltares

Group 3: Benchmarks from spreadsheets
Table 3.230: Results of benchmark 3-20 for vertical nr. 1, Implosion
Result Unit Benchmark
D-GEO PIPELINE
Error
Max. allow. external pressure (short) [kPa] 297 297 0.00
Max. allow. external pressure (long) [kPa] 30 30 0.00
Int. pressure due to 100% filling (short) [kPa] 0 0 0.00
Int. pressure due to 100% filling (long) [kPa] 0 0 0.00
Table 3.231: Results of benchmark 3-20 for vertical nr. 2, Strength calculation for Combi-
nation 1A
Result Unit Benchmark
D-GEO PIPELINE
Rel. error [%]
σb[N/mm2] 1 1 0.00
σt[N/mm2] 6 6 0.00
σa;max [N/mm2] 6 6 0.00
σV;max [N/mm2] n.a. n.a.
Table 3.232: Results of benchmark 3-20 for vertical nr. 2, Strength calculation for Combi-
nation 1B
Result Unit Benchmark
D-GEO PIPELINE
Rel. error [%]
σb[N/mm2] 0 0 0.00
σt[N/mm2] 45 45 0.00
σa;max [N/mm2] 45 45 0.00
λ[mm-1] 0.001125 0.001125 0.00
qr[N/mm2] 0.00313 0.00313 0.00
σqr [N/mm2] 0 0 0.00
σt;max [N/mm2] 0 0 0.00
σV;max [N/mm2] n.a. n.a.
Table 3.233: Results of benchmark 3-20 for vertical nr. 2, Strength calculation for Combi-
nation 2
Result Unit Benchmark
D-GEO PIPELINE
Rel. error [%]
σpy [N/mm2] 5 5 0.00
σpx [N/mm2] 2 2 0.00
σptest [N/mm2] 7 7 0.00
σpm [N/mm2] 4 4 0.00
Table 3.234: Results of benchmark 3-20 for vertical nr. 2, Strength calculation for Combi-
nation 3
Result Unit Benchmark
D-GEO PIPELINE
Rel. error [%]
σb[N/mm2] 0 0 0.00
σa;max [N/mm2] 0 0 0.00
σqr [N/mm2] 0 0 0.00
σqn [N/mm2] 4 4 0.00
σt;max [N/mm2] 3 3 0.00
σV;max [N/mm2] n.a. n.a.
Deltares 91 of 126
D-GEO PIPELINE
, Verification Report
Table 3.235: Results of benchmark 3-20 for vertical nr. 2, Strength calculation for Combi-
nation 4
Result Unit Benchmark
D-GEO PIPELINE
Rel. error [%]
σb[N/mm2] 0 0 0.00
σpy [N/mm2] 5 5 0.00
σpx [N/mm2] 2 2 0.00
σptest [N/mm2] 7 7 0.00
σptemp [N/mm2] 0 0 0.00
σa;max [N/mm2] 2 2 0.00
σqr [N/mm2] 0 0 0.00
σqn [N/mm2] 4 4 0.00
σV;max [N/mm2] n.a. n.a.
Table 3.236: Results of benchmark 3-20 for vertical nr. 2, Maximum allowable stresses
Result Unit Benchmark
D-GEO PIPELINE
Rel. error [%]
σptest [N/mm2] 6.4 6.4 0.00
σpy [N/mm2] 5.04 5.04 0.00
σpm [N/mm2] n.a. n.a.
σV;max [N/mm2] n.a. n.a.
σa/t (short) [N/mm2] 6.4 6.4 0.00
σa/t (long) [N/mm2] 5.04 5.04 0.00
Table 3.237: Results of benchmark 3-20 for vertical nr. 2, Deflection of the pipeline
Result Unit Benchmark
D-GEO PIPELINE
Rel. error [%]
Calculated [mm] 32.6 33 1.22699386503067
Max. allowable [mm] 64 64 0.00
Max. allow. (piggability) [mm] 44.8 44.8 0.00
Table 3.238: Results of benchmark 3-20 for vertical nr. 2, Implosion
Result Unit Benchmark
D-GEO PIPELINE
Error
Max. allow. external pressure (short) [kPa] 297 297 0.00
Max. allow. external pressure (long) [kPa] 30 30 0.00
Int. pressure due to 100% filling (short) [kPa] 0 0 0.00
Int. pressure due to 100% filling (long) [kPa] 0 0 0.00
Table 3.239: Results of benchmark 3-20 for vertical nr. 3, Strength calculation for Combi-
nation 1A
Result Unit Benchmark
D-GEO PIPELINE
Rel. error [%]
σb[N/mm2] 1 1 0.00
σt[N/mm2] 6 6 0.00
σa;max [N/mm2] 6 6 0.00
σV;max [N/mm2] n.a. n.a.
92 of 126 Deltares

Group 3: Benchmarks from spreadsheets
Table 3.240: Results of benchmark 3-20 for vertical nr. 3, Strength calculation for Combi-
nation 1B
Result Unit Benchmark
D-GEO PIPELINE
Rel. error [%]
σb[N/mm2] 1 1 0.00
σt[N/mm2] 45 45 0.00
σa;max [N/mm2] 45 45 0.00
λ[mm-1] 0.000994 0.000994 0.00
qr[N/mm2] 0.00302 0.00302 0.00
σqr [N/mm2] 0 0 0.00
σt;max [N/mm2] 0 0 0.00
σV;max [N/mm2] n.a. n.a.
Table 3.241: Results of benchmark 3-20 for vertical nr. 3, Strength calculation for Combi-
nation 2
Result Unit Benchmark
D-GEO PIPELINE
Rel. error [%]
σpy [N/mm2] 5 5 0.00
σpx [N/mm2] 2 2 0.00
σptest [N/mm2] 7 7 0.00
σpm [N/mm2] 4 4 0.00
Table 3.242: Results of benchmark 3-20 for vertical nr. 3, Strength calculation for Combi-
nation 3
Result Unit Benchmark
D-GEO PIPELINE
Rel. error [%]
σb[N/mm2] 0 0 0.00
σa;max [N/mm2] 0 0 0.00
σqr [N/mm2] 0 0 0.00
σqn [N/mm2] 4 4 0.00
σt;max [N/mm2] 3 3 0.00
σV;max [N/mm2] n.a. n.a.
Table 3.243: Results of benchmark 3-20 for vertical nr. 3, Strength calculation for Combi-
nation 4
Result Unit Benchmark
D-GEO PIPELINE
Rel. error [%]
σb[N/mm2] 0 0 0.00
σpy [N/mm2] 5 5 0.00
σpx [N/mm2] 2 2 0.00
σptest [N/mm2] 7 7 0.00
σptemp [N/mm2] 0 0 0.00
σa;max [N/mm2] 2 2 0.00
σqr [N/mm2] 0 0 0.00
σqn [N/mm2] 4 4 0.00
σV;max [N/mm2] n.a. n.a.
Deltares 93 of 126
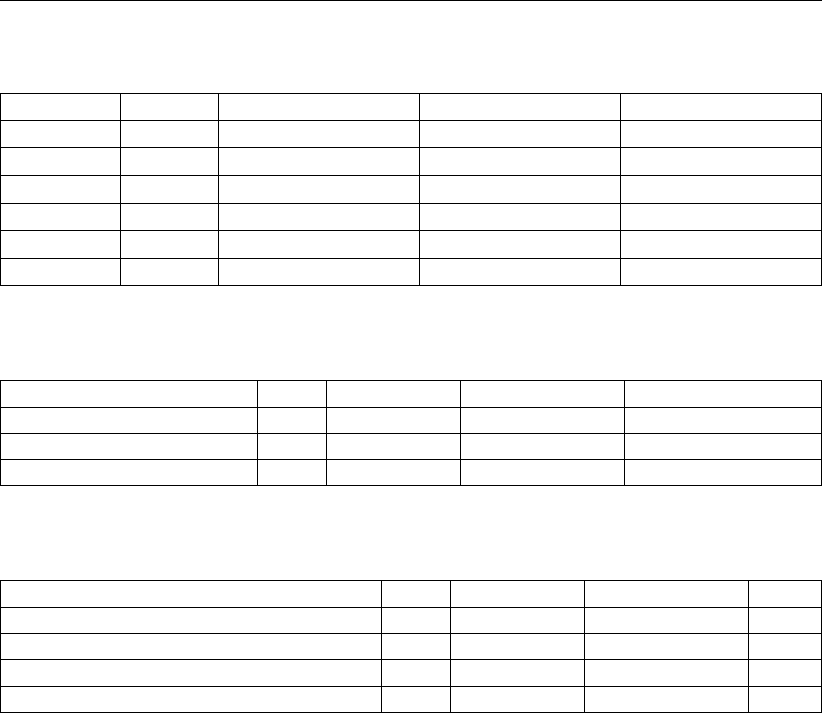
D-GEO PIPELINE
, Verification Report
Table 3.244: Results of benchmark 3-20 for vertical nr. 3, Maximum allowable stresses
Result Unit Benchmark
D-GEO PIPELINE
Rel. error [%]
σptest [N/mm2] 6.4 6.4 0.00
σpy [N/mm2] 5.04 5.04 0.00
σpm [N/mm2] n.a. n.a.
σV;max [N/mm2] n.a. n.a.
σa/t (short) [N/mm2] 6.4 6.4 0.00
σa/t (long) [N/mm2] 5.04 5.04 0.00
Table 3.245: Results of benchmark 3-20 for vertical nr. 3, Deflection of the pipeline
Result Unit Benchmark
D-GEO PIPELINE
Rel. error [%]
Calculated [mm] 36.6 37 1.09289617486339
Max. allowable [mm] 64 64 0.00
Max. allow. (piggability) [mm] 44.8 44.8 0.00
Table 3.246: Results of benchmark 3-20 for vertical nr. 3, Implosion
Result Unit Benchmark
D-GEO PIPELINE
Error
Max. allow. external pressure (short) [kPa] 297 297 0.00
Max. allow. external pressure (long) [kPa] 30 30 0.00
Int. pressure due to 100% filling (short) [kPa] 0 0 0.00
Int. pressure due to 100% filling (long) [kPa] 0 0 0.00
Use
D-GEO PIPELINE
input file bm3-20.dri to run this benchmark.
3.21 HDD – Determination of the minimum allowable radius
3.21.1 Description
This benchmark checks the determination of the minimum allowable radius in two cases:
Case A (bm3-21a): 4 different steel pipes with a diameter of 399, 400, 401 and 2000 mm
are tested;
Case B (bm3-21b): 20 different PE pipes with a diameter of 63, 100, 160, 180, 200, 225,
250, 290, 315, 335, 355, 380, 400, 500, 630, 680, 710, 760, 800 and 1000 mm are tested.
94 of 126 Deltares
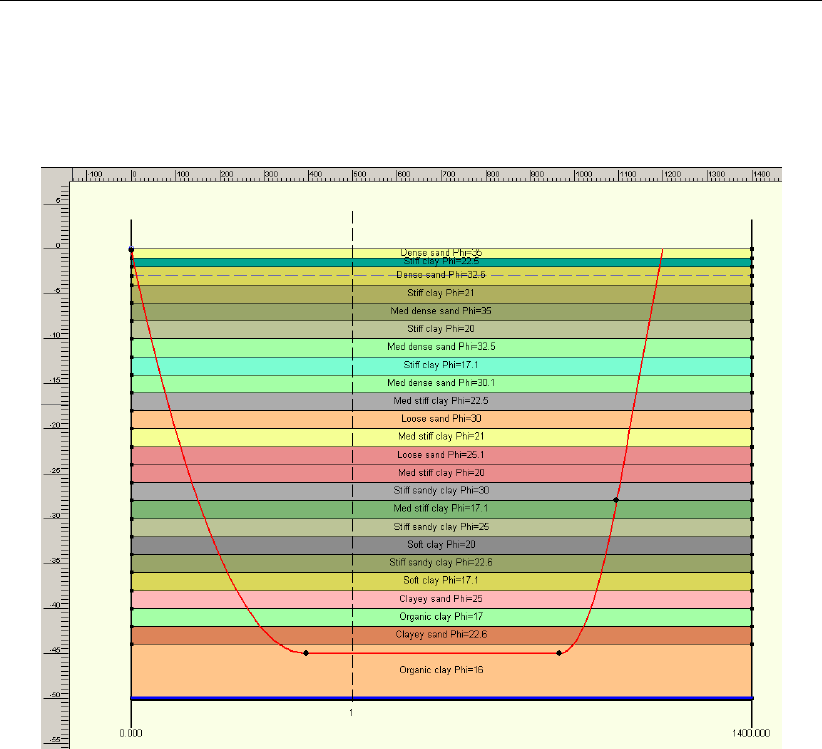
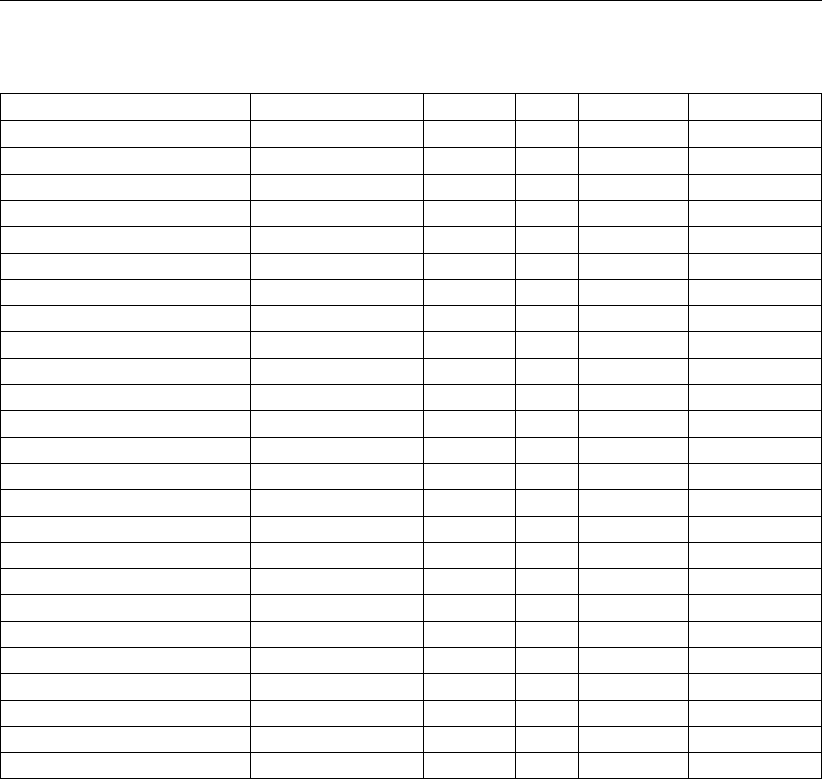
D-GEO PIPELINE
, Verification Report
Table 3.247: Properties of the different layers in benchmark 21a
Name Soil type cϕTop level Constant C
[kN/m2] [◦] [m] [-]
Dense sand Phi 35 Dense sand 1 35 0 9400
Stiff clay Phi 22.5 Stiff clay 15 22.5 -1 10500
Dense sand Phi 32.6 Dense sand 0.5 32.6 -2 9400
Stiff clay Phi 21 Stiff clay 10.1 21 -4 10500
Med dense sand Phi 35 Med dense sand 0.6 35 -6 9400
Stiff clay Phi 20 Stiff clay 15 20 -8 10500
Med dense sand Phi 32.5 Med dense sand 2 32.5 -10 9400
Stiff clay Phi 17.1 Stiff clay 10.1 17.1 -12 10500
Med dense sand Phi 30.1 Med dense sand 0.6 30.1 -14 9400
Med stiff clay Phi 22.5 Med stiff clay 10 22.5 -16 11500
Loose sand Phi 30 Loose sand 1 30 -18 10500
Med stiff clay Phi 21 Med stiff clay 7 21 -20 11500
Loose sand Phi 25.1 Loose sand 0.1 25.1 -22 10500
Med stiff clay Phi 20 Med stiff clay 10 20 -24 11500
Stiff sandy clay Phi 30 Stiff sandy clay 1.1 30 -26 10500
Med stiff clay Phi 17.1 Med stiff clay 5.1 17.1 -28 11500
Stiff sandy clay Phi 25 Stiff sandy clay 5.1 25 -30 10500
Soft clay Phi 20 Soft clay 5 20 -32 12500
Stiff sandy clay Phi 22.6 Stiff sandy clay 12 22.6 -34 10500
Soft clay Phi 17.1 Soft clay 3 17.1 -36 12500
Clayey sand Phi 25 Clayey sand 5 25 -38 10500
Organic clay Phi 17 Organic clay 15 17 -40 12500
Clayey sand Phi 22.6 Clayey sand 4 22.6 -42 10500
Organic clay Phi 16 Organic clay 30 16 -44 12500
Case B
In case B, four bending radius are present as shown in Figure 3.9.
96 of 126 Deltares
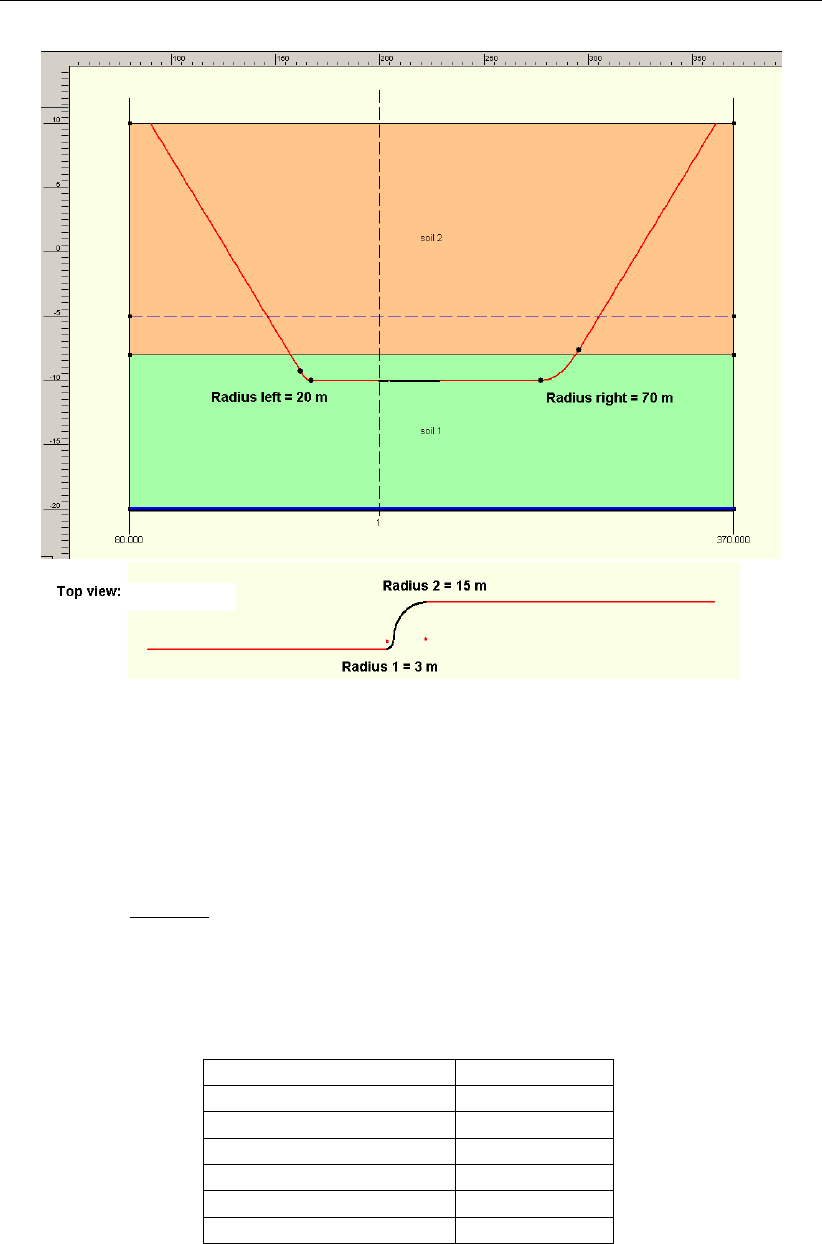
Group 3: Benchmarks from spreadsheets
Figure 3.9: Geometry of benchmark 3-21b
3.21.2 Analytical results
Case A: Allowable curve radius for steel pipes
The minimum allowable radius for steel pipes is:
R≥1000 ×D0for small pipe diameter (D0≤0.4 m)
R≥C×√D0×dnfor large pipe diameter (D0>0.4 m)
where Cis a constant (without dimension) depending on the soil type as shown in Table 3.248.
Table 3.248: Values of constant C (according to table E.1 of NEN 3650-1 (NEN,2012a))
Soil type Constant C[-]
Dense packed sand 8500
Moderate packed sand 9400
Loose packed sand 10200
Stiff clay 10500
Medium stiff clay 11500
Soft clay and peat 12500
In
D-GEO PIPELINE
, the soil type is a function of the cohesion and the friction angle of the soil,
as shown in Table 3.249.
Deltares 97 of 126
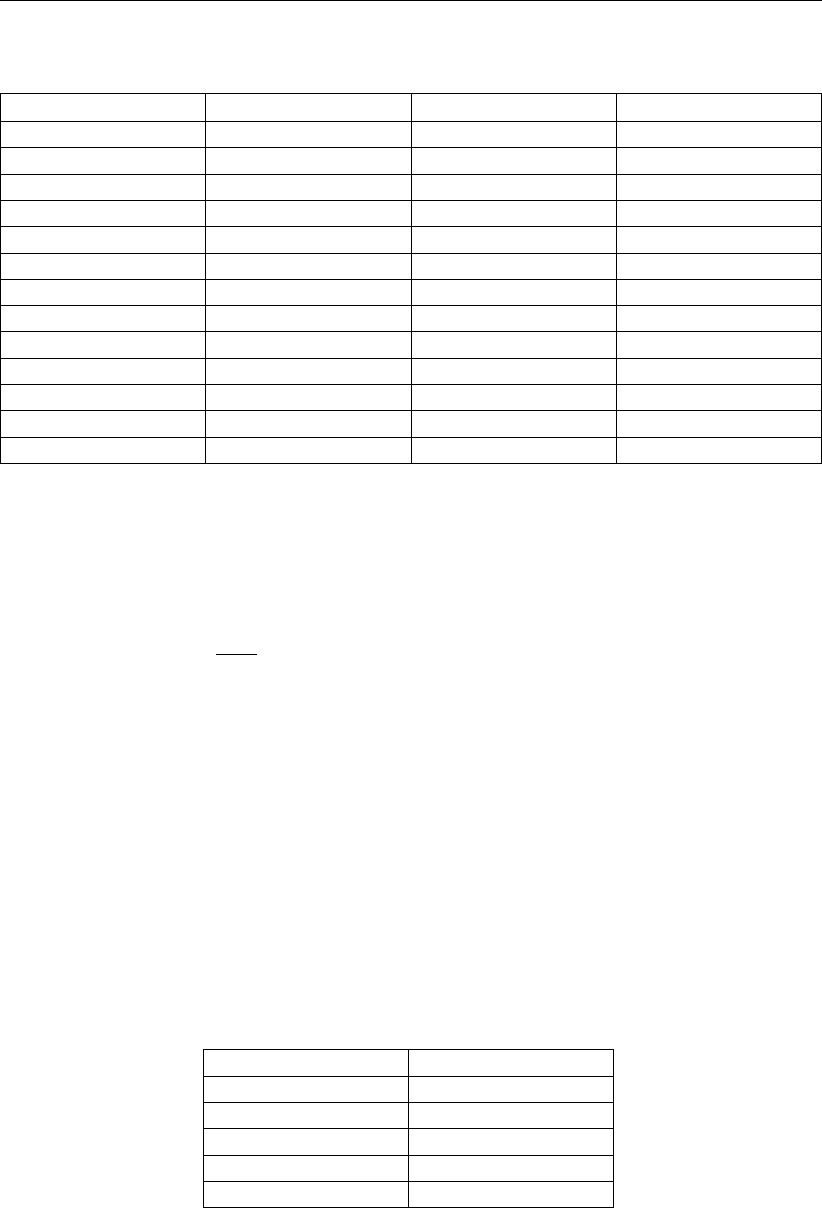
D-GEO PIPELINE
, Verification Report
Table 3.249: Soil type as a function of the cohesion and the friction angle
Soil type ϕ[◦]c[kN/m2]Constant C[-]
Dense sand ϕ > 32.5 c≤0.5 8500
Medium dense sand ϕ > 32.5 c > 0.5 9400
Medium dense sand 30 < ϕ ≤32.5 9400
Loose sand 25 < ϕ ≤30 c≤1 10200
Stiff sandy clay 25 < ϕ ≤30 c > 1 10500
Stiff sandy clay 22.5 < ϕ ≤25 c > 5 10200
Clayey sand 22.5 < ϕ ≤25 c≤5 10500
Stiff clay 20 < ϕ ≤22.5 c > 10 10500
Medium stiff clay 20 < ϕ ≤22.5 c≤10 11500
Stiff clay 17 < ϕ ≤20 c > 10 10500
Medium stiff clay 17 < ϕ ≤20 5 < c ≤10 11500
Soft clay 17 < ϕ ≤20 c≤5 12500
Peat /organic clay ϕ≤17 12500
In the case of a layered sub-soil, the highest C-value of a layer with a significant thickness is
normative. In the case of a sub-soil with an alternation of layers with relative small thicknesses,
a weighted interpolation can be performed to determine the C-value:
Cd=
n
X
i=1 Ci×di
dtotal where dtotal =
n
X
i=1
di(3.7)
in which:
nTotal number of layers in the curve [-]
CiC-value of layer i [-]
diThickness of layer i [m]
dtotal Total thickness of all layers in the curve [m]
Case B: Allowable curve radius for polyethylene pipes
According to article 8.6.4 of NEN 3650-3 (NEN,2012c), the minimal curve-radius for PE pipes
is equal to the bending factor as given in Table 3.250 times the diameter.
Table 3.250: Bending factor (acc. to table 6 of NEN 3650-3)
Diameter in mm Bending factor
63 →160 50
200 →250 75
315 →355 100
400 →630 100
710 →800 125
98 of 126 Deltares
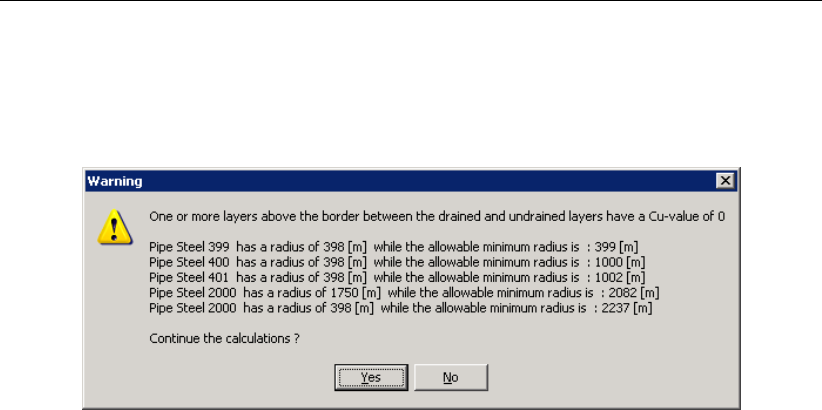
Group 3: Benchmarks from spreadsheets
3.21.3 D-GEO PIPELINE results
The check for the minimum curve radius is performed in
D-GEO PIPELINE
by means of warning
messages appearing when starting a calculation, as shown in Figure 3.10 and Figure 3.11.
Figure 3.10: Warning message displayed for benchmark 3-21a
Deltares 99 of 126
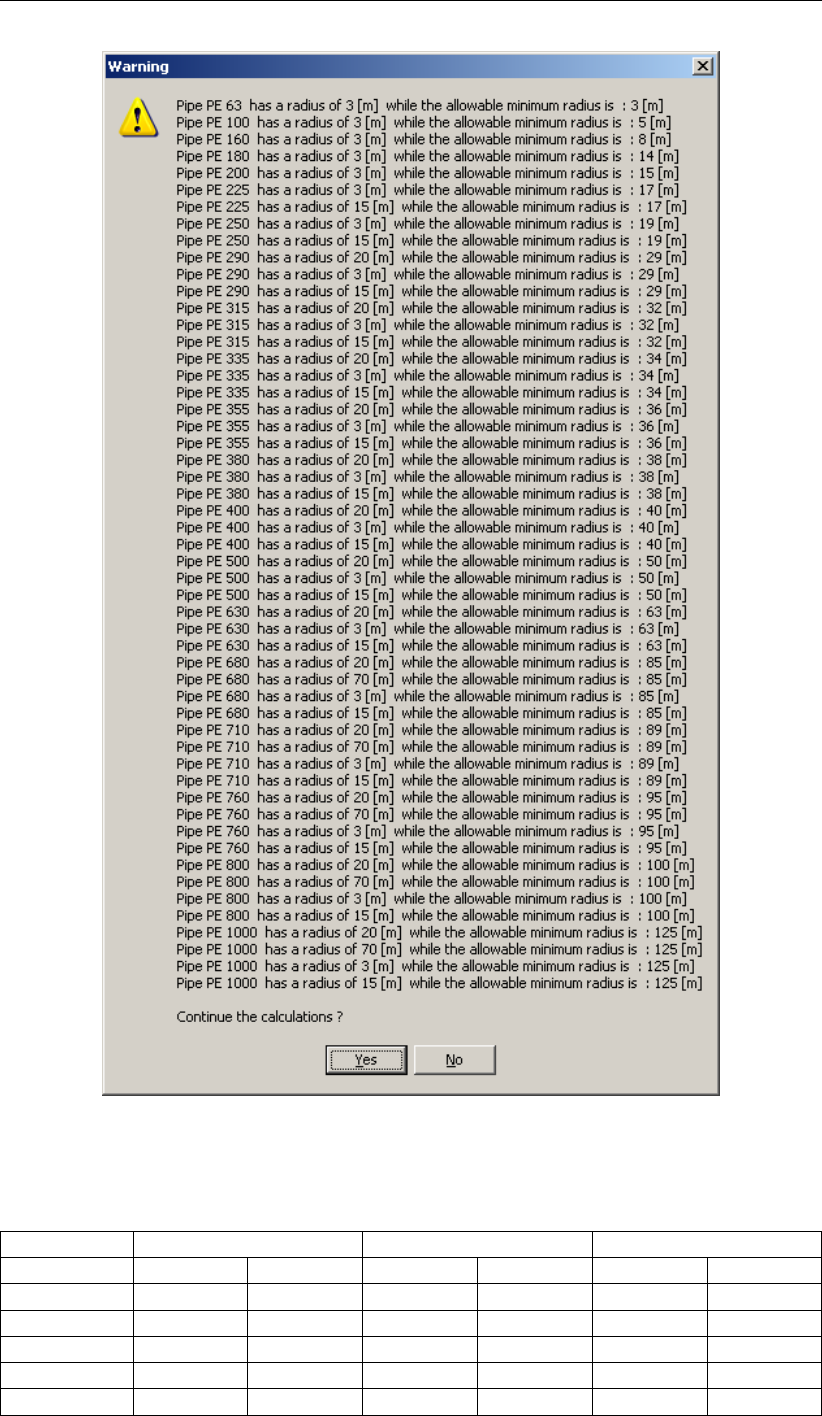
D-GEO PIPELINE
, Verification Report
Figure 3.11: Warning message displayed for benchmark 3-21b
Table 3.251: Results of benchmark 3-21a, Allowable minimum radius for steel pipes
Pipe Benchmark
D-GEO PIPELINE
Error [%]
R [m] →1750 398 1750 398 1750 398
[m] [m] [m] [m] [%] [%]
399 mm 399 399 399 0
400 mm 1631 2195 1000 119.5
401 mm 1633 2197 1002 119.26
2000 mm 3647 4907 2082 2237 75.17 119.36
100 of 126 Deltares
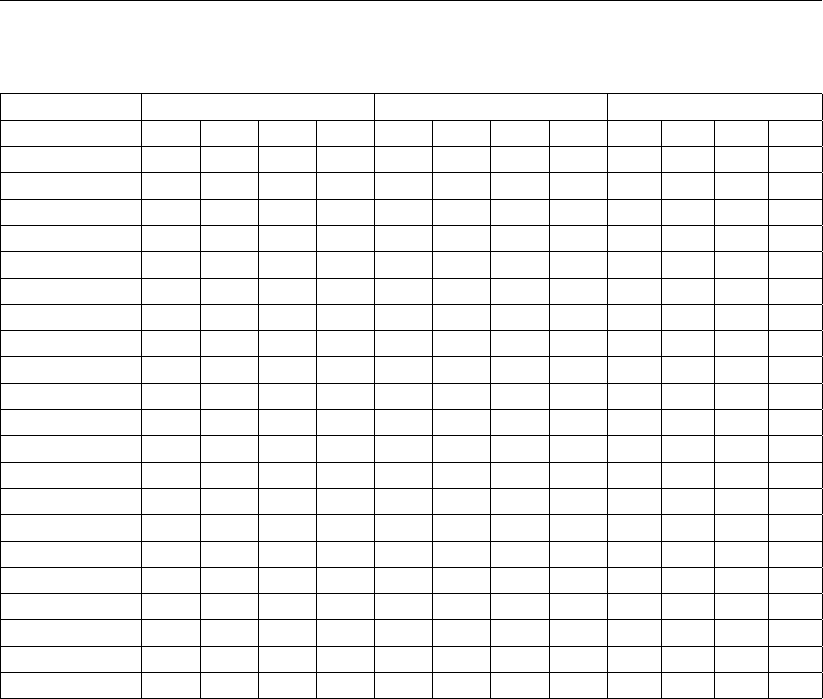
Group 3: Benchmarks from spreadsheets
Table 3.252: Results of benchmark 3-21b, Allowable minimum radius for PE pipes
Benchmark
D-GEO PIPELINE
Error [%]
R [m] →3 15 20 70 3 15 20 70 3 15 20 70
[m] [m] [m] [m] [m] [m] [m] [m] [%] [%] [%] [%]
63 mm 3 3 0
100 mm 5 5 0
160 mm 8 8 0
180 mm 14 14 0
200 mm 15 15 15 15 0 0
225 mm 17 17 17 17 0 0
250 mm 19 19 19 19 0 0
290 mm 29 29 29 29 29 29 0 0 0
315 mm 32 32 32 32 32 32 0 0 0
335 mm 34 34 34 34 34 34 0 0 0
355 mm 36 36 36 36 36 36 0 0 0
380 mm 38 38 38 38 38 38 0 0 0
400 mm 40 40 40 40 40 40 0 0 0
500 mm 50 50 50 50 50 50 0 0 0
630 mm 63 63 63 63 63 63 0 0 0
680 mm 85 85 85 85 85 85 85 85 0 0 0 0
710 mm 89 89 89 89 89 89 89 89 0 0 0 0
760 mm 95 95 95 95 95 95 95 95 0 0 0 0
800 mm 100 100 100 100 100 100 100 100 0 0 0 0
1000 mm 125 125 125 125 125 125 125 125 0 0 0 0
Use
D-GEO PIPELINE
input files bm3-21a.dri and bm3-21b.dri to run this benchmark.
3.22 HDD – PE pipe not filled with water on rollers
3.22.1 Description
This benchmark checks the effect of not-filling the pipe on rollers with water. The same input
data’s as for benchmark 3-3 (section 3.3) are used except that the option Pipe filled with water
on rollers is unchecked. This should have an influence on the calculation of T1, the pulling
force due to friction of the pipeline on the roller-lane.
3.22.2 Analytical results
The pulling force due to friction of the pipeline on the roller-lane is:
T1=f1×Lrol ×g(3.8)
where g=gpipe = 1.069 N/mm is the weight of the pipe on roller, without water filling, whereas
for benchmark 3-3 (pipe filled with water on rollers) this weight is equal to:
g=gpipe +gfill =1.069 + 0.391= 1.460 N/mm.
Analytical results are worked out in an Excel spreadsheet. Results are given in the table
below.
Deltares 101 of 126
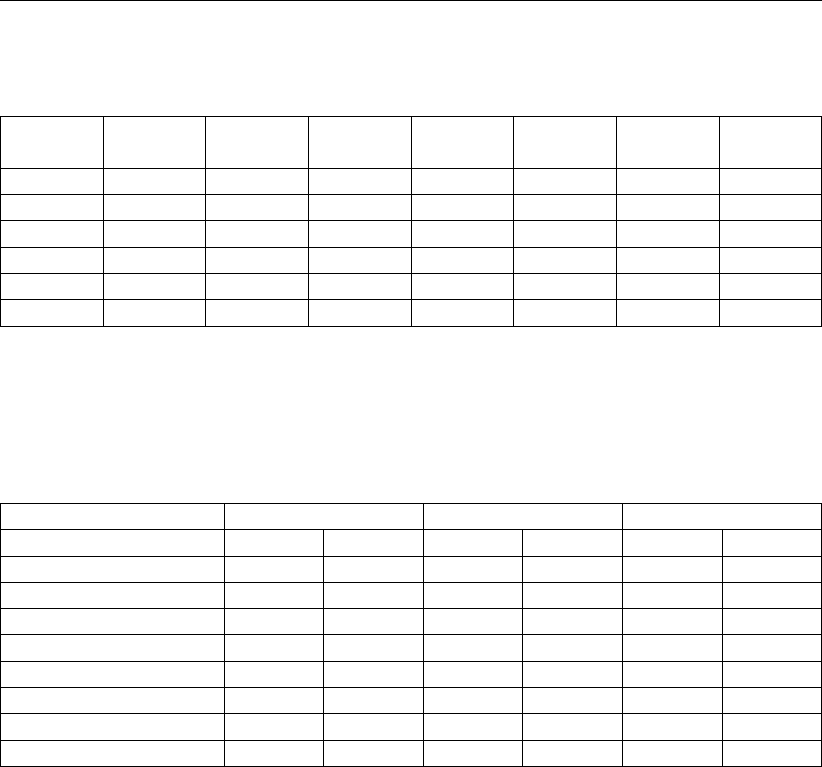
D-GEO PIPELINE
, Verification Report
Table 3.253: Analytical results for the calculation of the five components of the pulling
force for the six characteristic points
Charac. Length T1T2T3a T3b T3c Total
point [m] [kN] [kN] [kN] [kN] [kN] [kN]
1 0 73.82 0 0 0 0 73.82
2 153.91 57.37 144.61 0 0 0 201.97
3 290.04 42.81 0 127.91 5.72 14.54 335.59
4 393.19 31.79 45.17 0 0 0 421.47
5 602.62 9.39 0 196.78 4.29 31.33 631.48
6 690.49 0 82.55 0 0 0 704.64
3.22.3 D-GEO PIPELINE results
D-GEO PIPELINE
results can be found in the Report.
Table 3.254: Results of benchmark 3-22, Pulling forces in the pipeline
Benchmark
D-GEO PIPELINE
Relative error
Charac. points Length Force Length Force Length Force
[m] [kN] [m] [kN] [%] [%]
T1 0 73.82 0 73.82 0.00 0.00
T2 153.91 201.97 153.91 201.98 0.00 0.00
T3 290.04 335.59 290.05 335.59 0.00 0.00
T4 393.19 421.47 393.19 421.47 0.00 0.00
T5 602.62 631.48 602.63 631.48 0.00 0.00
T6 690.49 704.64 690.49 704.64 0.00 0.00
Max. rep. pulling force - 829 - 829 - 0.00
Use
D-GEO PIPELINE
input file bm3-22.dri to run this benchmark.
3.23 HDD – PE pipe always filled (100%) – Implosion
3.23.1 Description
This benchmark checks the effect of completely filling the pipe with fluid during pull back. The
same input data’s as for benchmark 3-3 (section 3.3) are used except that the part of the pipe
filled with fluid during pull back is 100% instead of 10%. This should have an influence on the
calculation of the effective weight of the pipe (and the the pulling forces) and on the internal
pressure during implosion check.
102 of 126 Deltares
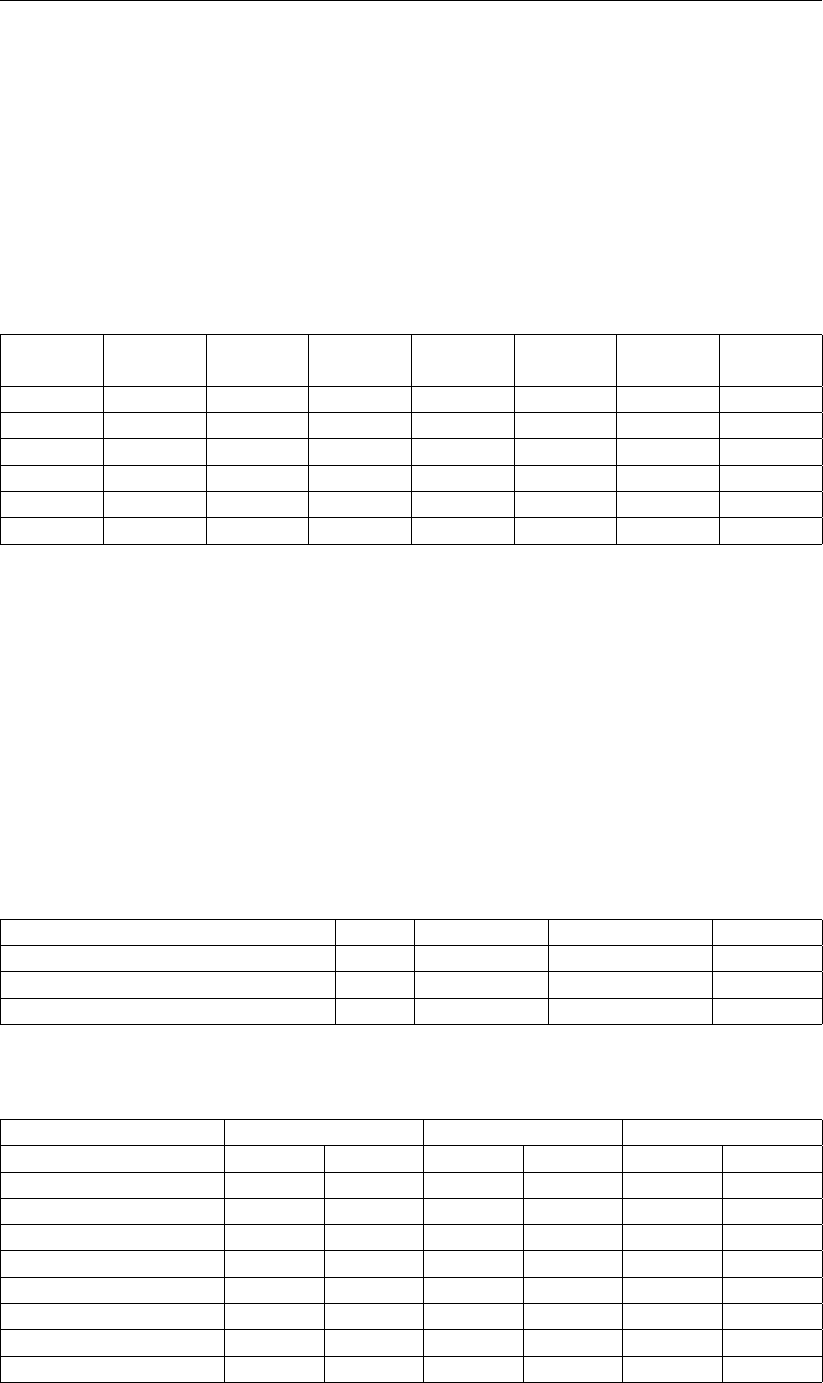
Group 3: Benchmarks from spreadsheets
3.23.2 Analytical results
The weight of the filling with fluid is equal to:
gfill = 100% ×γw×Ainw = 3.906 N/mm
whereas for benchmark 3-3 (pipe filled with 10% fluid) this weight is equal to:
gfill = 0.3906 N/mm.
This will therefore have an infuence on the pulling forces. Analytical results are worked out in
an Excel spreadsheet. Results are given in Table 3.255.
Table 3.255: Analytical results for the calculation of the five components of the pulling
force for the six characteristic points
Charac. Length T1T2T3a T3b T3c Total
point [m] [kN] [kN] [kN] [kN] [kN] [kN]
1 0 343.52 0 0 0 0 343.52
2 153.91 266.95 36.4 0 0 0 303.35
3 290.04 199.22 0 32.2 5.72 12.39 285.93
4 393.19 147.91 11.37 0 0 0 259.01
5 602.62 43.71 0 49.53 4.29 10.89 219.53
6 690.49 0 20.78 0 0 0 196.6
During implosion check, the internal pressure due to complete filling is not nil but equal to:
Pfilling =γfluid ×[min (Zleft;Zright)−Zbottom](3.9)
This leads to: Pfilling = 12 ×(0+50)= 600 kN/m2.
3.23.3 D-GEO PIPELINE results
D-GEO PIPELINE
results can be found in the Report.
Table 3.256: Results of benchmark 3-23, Buoyancy Control
Result Unit Benchmark
D-GEO PIPELINE
Error [%]
Uplift forces [kg/m] 553 553 0.00
Weight of pipeline (incl. filling) [kg/m] 497 498 0.20
Effective weight of pipe [kg/m] 55 55 0.00
Table 3.257: Results of benchmark 3-23, Pulling forces in the pipeline
Benchmark
D-GEO PIPELINE
Relative error
Charac. points Length Force Length Force Length Force
[m] [kN] [m] [kN] [%] [%]
T1 0 343.52 0 343.52 0.00 0.00
T2 153.91 303.35 153.91 303.35 0.00 0.00
T3 290.04 285.93 290.05 285.93 0.00 0.00
T4 393.19 259.01 393.19 259.01 0.00 0.00
T5 602.62 219.53 602.63 219.53 0.00 0.00
T6 690.49 196.6 690.49 196.6 0.00 0.00
Max. rep. pulling force - 829 - 829 - 0.00
Deltares 103 of 126
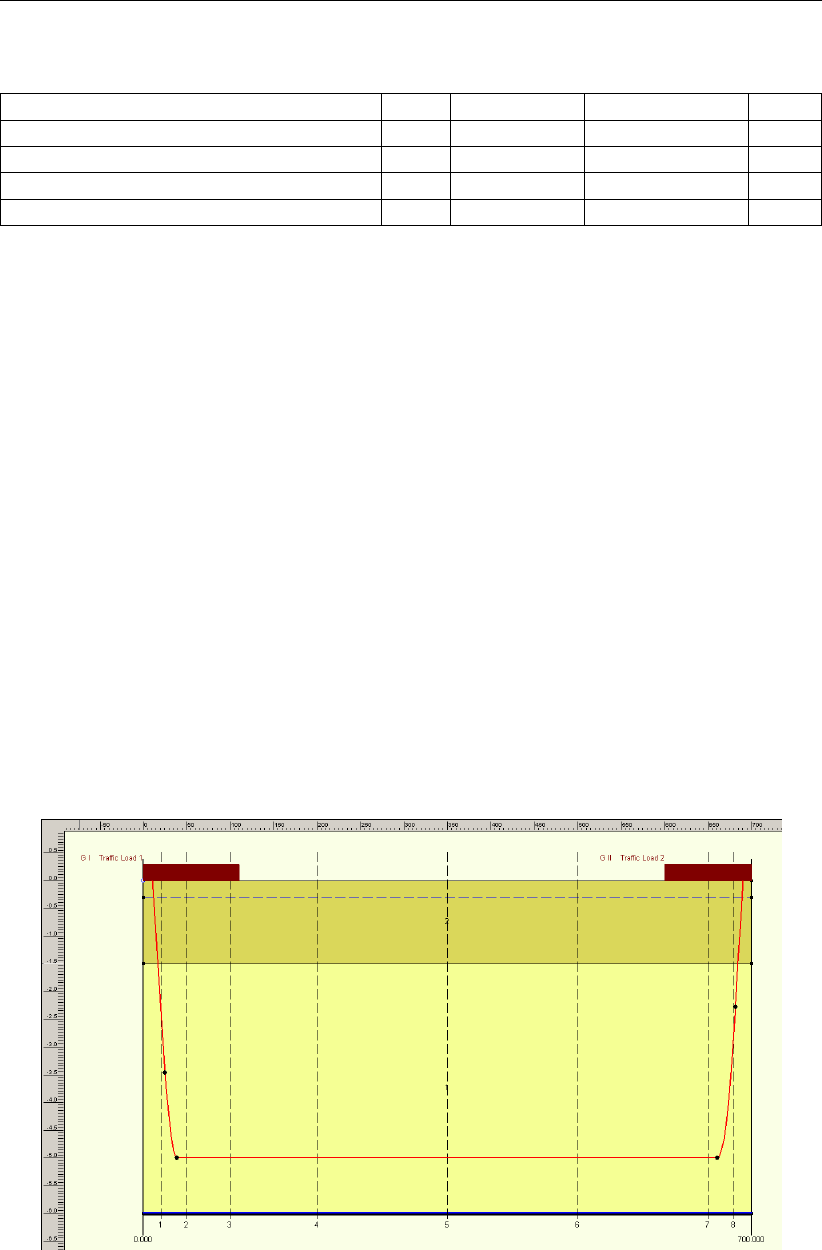
D-GEO PIPELINE
, Verification Report
Table 3.258: Results of benchmark 3-23, Implosion
Result Unit Benchmark
D-GEO PIPELINE
Error
Max. allow. external pressure (short) [kPa] 396.55 396.55 0.00
Max. allow. external pressure (long) [kPa] 39.66 39.66 0.00
Int. pressure due to 100% filling (short) [kPa] 600 600 0.00
Int. pressure due to 100% filling (long) [kPa] 600 600 0.00
Use
D-GEO PIPELINE
input file bm3-23.dri to run this benchmark.
3.24 HDD with 2D geometry – Effect of traffic loads
3.24.1 Description
This benchmark checks the effect of two traffic loads on the stress analysis. The same input
data’s as for benchmark 3-1 (section 3.1) are used except that the Z co-ordinates of the top
of the layers and the pipe configuration are divided by 10 in order to optimize the effect of the
traffic load. The new geometry is given in Figure 3.12. The traffic loads have the following
properties:
Traffic Load 1:
X co-ordinate at start 0 m
X co-ordinate at end 110 m
Load type Graph I
Traffic Load 2:
X co-ordinate at start 600 m
X co-ordinate at end 700 m
Load type Graph II
Figure 3.12: Geometry of benchmark 3-12 with 2 traffic loads
3.24.2 Analytical results
According to article C.5.1 from NEN 3650-1 (NEN,2012a), the traffic load qvis given by
Figure 3.13, for both types of load and for four diameters: 200, 600, 1000 and 1600 mm.
104 of 126 Deltares
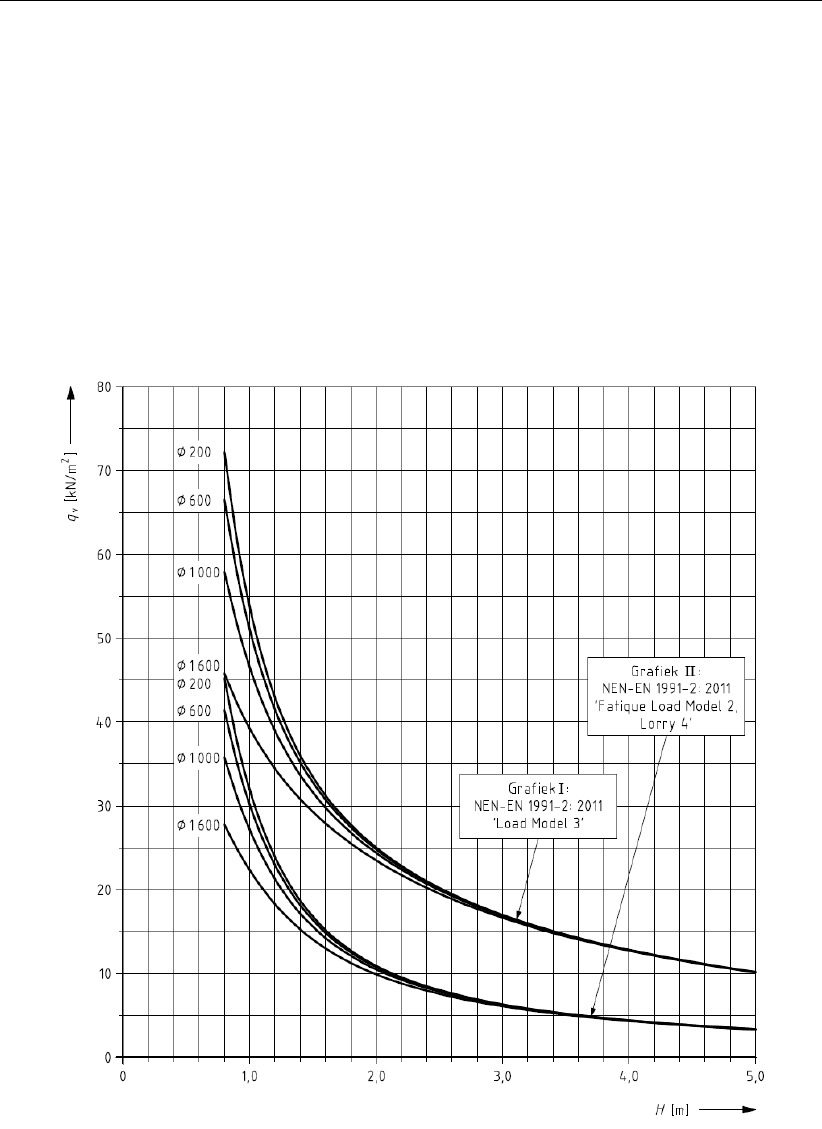
Group 3: Benchmarks from spreadsheets
Intermediary diameters are lineary interpolated.
D-GEO PIPELINE
uses the following formulas
to convert this figure into numbers:
For Graph I, 200 mm: qv= 53.988 ×Z−1.058
For Graph I, 600 mm: qv= 51.403 ×Z−1.016
For Graph I, 1000 mm: qv= 46.522 ×Z−0.94
For Graph I, 1600 mm: qv= 39.448 ×Z−0.804
For Graph II, 200 mm: qv= 31.716 ×Z−1.457
For Graph II, 600 mm: qv= 29.501 ×Z−1.4
For Graph II, 1000 mm: qv= 26.776 ×Z−1.324
For Graph II, 1600 mm: qv= 21.963 ×Z−1.172
Figure 3.13: Traffic load as a function of the depth, for different pipe diameters, according
to NEN 3650-1
In this benchmark, the pipe diameter is 800 mm, a linear interpolation between curves
600 mm and 1000 mm is performed and leads to the results given in Table 3.259.
Deltares 105 of 126

D-GEO PIPELINE
, Verification Report
Table 3.259: Analytical results for the calculation of the traffic load
Traffic Load 1 Traffic Load 2
Vert. Z qv;600 qv;1000 qv;800 qv;600 qv;1000 qv;800
[-] [m] [kN/m2] [kN/m2] [kN/m2] [kN/m2] [kN/m2] [kN/m2]
1 -1.986 34.556 32.949 33.752 n.a. n.a. n.a.
2 -4.686 14.448 14.705 14.576 n.a. n.a. n.a.
3 -4.686 14.448 14.705 14.576 n.a. n.a. n.a.
4 -4.686 n.a. n.a. n.a. n.a. n.a. n.a.
5 -4.686 n.a. n.a. n.a. n.a. n.a. n.a.
6 -4.686 n.a. n.a. n.a. n.a. n.a. n.a.
7 -4.686 n.a. n.a. n.a. 4.582 4.677 4.63
8 -2.34 n.a. n.a. n.a. 12.113 11.728 11.92
Hereafter are some intermediate results used for the pulling force and the strength calcula-
tions:
Factor of friction pipe-roller f10.1 [-]
Friction pipe-mud f20.00005 [N/mm2]
Factor of friction pipe-soil f30.2 [-]
Load factor - Design pressure fpd 1.25 [-]
Load factor - Design pressure (combination) fpd;comb 1.15 [-]
Load factor - Test pressure fpt 1.1 [-]
Load factor - Installation finstall 1.1 [-]
Load factor - Soil load Qn fQn1 1.5 [-]
Load factor - Temperature ftemp 1.1 [-]
Contingency factor - E-modulus fE1.25 [-]
Contingency factor - Pulling force fpull 1.4 [-]
Contingency factor - Modulus of subgrade reaction fkv 1.6 [-]
Contingency factor - Soil load Qn fQn2 1.1 [-]
Contingency factor - Bending moment fM1.27 [-]
Contingency factor - Bending radius fR1.1 [-]
Contingency factor - Pressure borehole fpress;bore 1.1 [-]
Factor of importance S1 [-]
Allowable deflection of pipe (Steel) 17 [%]
Piggability (Steel) 8 [%]
Allowable deflection of pipe (PE) n.a. [%]
Piggability (PE) n.a. [%]
Unit weight water γw10 [N/mm3]
Safety factor cover (Drained layer) 0.67 [-]
Safety factor cover (Undrained layer) 0.5 [-]
Traffic load factor fqv 1.35 [-]
Effective weight of pipe geff 1.414 [N/mm]
Weight of pipeline (incl. filling) gfill 0.456 [N/mm]
Uplift force gupw 5.529 [N/mm]
Moment coefficient indirect bottom kb’ 0.083 [-]
Moment coefficient indirect top kt’ 0.061 [-]
Moment coefficient direct bottom kb0.138 [-]
Moment coefficient direct top kt0.131 [-]
Direct deflection factor ky0.089 [-]
Indirect deflection factor ky’ 0.048 [-]
Part of pipe filled with water during pull back Pwater 10 [%]
Cross sections of the pipe A39769.979 [mm2]
106 of 126 Deltares

Group 3: Benchmarks from spreadsheets
Atrek 46618.093 [mm2]
Ainw 456036.731 [mm2]
Minimal wall thickness dn;min 16.15 [mm]
Outer radius of the pipeline re400 [mm]
Inner radius of the pipeline ri381 [mm]
Average radius of the pipeline rg390.5 [mm]
Moment of inertia of the pipe Ib3556505999 [mm4]
Moment of inertia of the wall Iw571.583 [mm3]
Pipe resisting moment Wb8891265 [mm4m]
Wall resisting moment Ww60.167 [mm3m]
Unit weight of drilling fluid γdrill fluid 11 [kN/m3]
Maximum modulus of subgrade reaction kv;max 31637.947 [kN/m3]
Maximum neutral vertical soil load qv;n;r;max 57.835 [kN/m2]
Maximum traffic load qT;max 33.752 [kN/m2]
Max. red. neutral vertical soil load (incl. traffic load) qv;n;r;maxT 43.258 [kN/m2]
Max. corrected red. soil load (without traffic load) qn71.376 [kN/m2]
Max. corrected red. soil load (incl. traffic load) qnT 95.427 [kN/m2]
Maximum neutral horizontal soil load qh;n;r 42.866 [kN/m2]
Soil reaction - Left curve qr;left 502.806 [kN/m2]
Soil reaction - Right curve qr;right 377.104 [kN/m2]
Soil reaction - Left curve (long term) qr;left n.a. [kN/m2]
Soil reaction - Right curve (long term) qr;right n.a. [kN/m2]
Characteristic stiffness pipeline-soil λ0.0003049 [mm-1]
Characteristic stiffness pipeline-soil (long term) λlong n.a. [mm-1]
3.24.3 D-GEO PIPELINE results
D-GEO PIPELINE
results can be found in the Report.
Table 3.261: Results of benchmark 3-24, Buoyancy control
Result Unit Benchmark
D-GEO PIPELINE
Error [%]
Uplift forces [kg/m] 553 553 0.00
Weight of pipeline (incl. filling) [kg/m] 412 412 0.00
Effective weight of pipe [kg/m] 141 141 0.00
Table 3.262: Results of benchmark 3-24, Pulling forces in the pipeline
Benchmark
D-GEO PIPELINE
Relative error
Charac. points Length Force Length Force Length Force
[m] [kN] [m] [kN] [%] [%]
T1 0 280 0 280 0.00 0.00
T2 15 280 15 280 0.00 0.00
T3 29 2026 29 2026 0.00 0.00
T4 651 2024 651 2024 0.00 0.00
T5 672 3437 672 3437 0.00 0.00
T6 681 3437 681 3437 0.00 0.00
Max. rep. pulling force - 0 - 0 - 0.00
Deltares 107 of 126
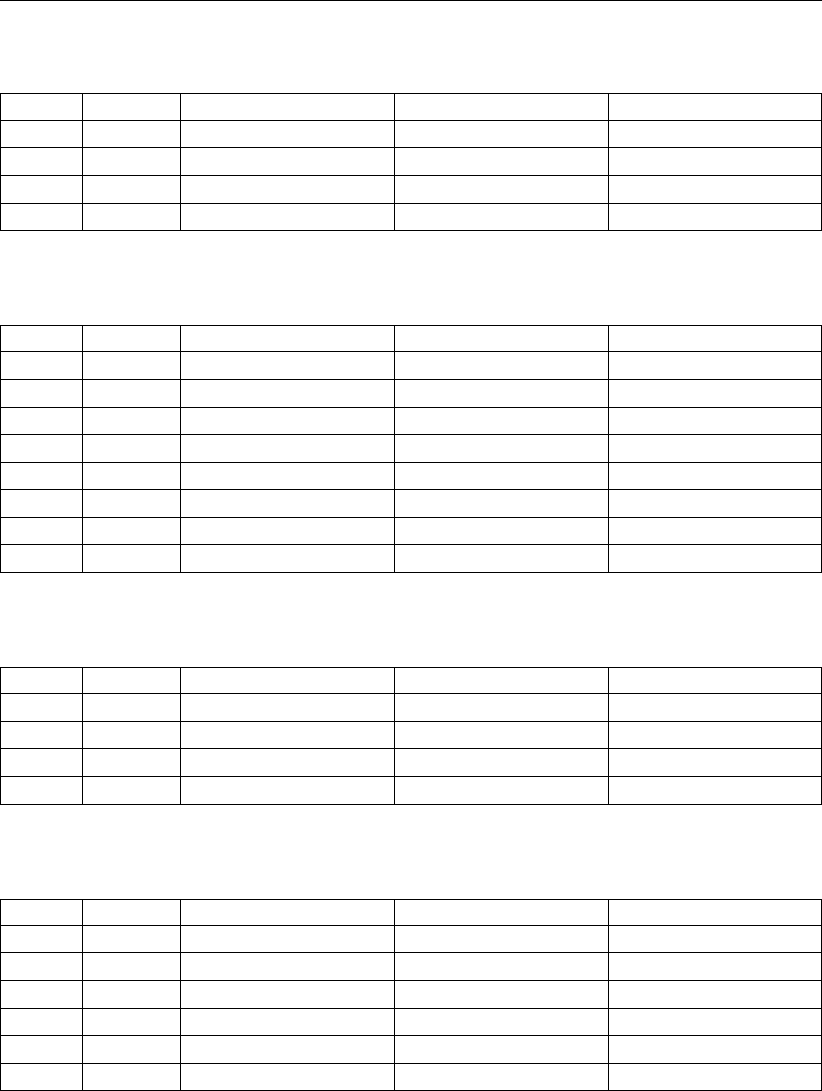
D-GEO PIPELINE
, Verification Report
Table 3.263: Results of benchmark 3-24, Strength calculation for Combination 1A
Result Unit Benchmark
D-GEO PIPELINE
Rel. error [%]
σb[N/mm2] 1265 1265 0.00
σt[N/mm2] 11 11 0.00
σa;max [N/mm2] 1276 1276 0.00
σV;max [N/mm2] 1276 1276 0.00
Table 3.264: Results of benchmark 3-24, Strength calculation for Combination 1B
Result Unit Benchmark
D-GEO PIPELINE
Rel. error [%]
σb[N/mm2] 2108 2108 0.00
σt[N/mm2] 133 133 0.00
σa;max [N/mm2] 2241 2241 0.00
λ[mm-1] 0.000305 0.000305 0.00
qr[N/mm2] 0.5028 0.5028 0.00
σqr [N/mm2] 217 217 0.00
σt;max [N/mm2] 217 217 0.00
σV;max [N/mm2] 2358 2358 0.00
Table 3.265: Results of benchmark 3-24, Strength calculation for Combination 2
Result Unit Benchmark
D-GEO PIPELINE
Rel. error [%]
σpy [N/mm2] 18 18 0.00
σpx [N/mm2] 9 9 0.00
σptest [N/mm2] 22 22 0.00
σpm [N/mm2] 16 16 0.00
Table 3.266: Results of benchmark 3-24, Strength calculation for Combination 3
Result Unit Benchmark
D-GEO PIPELINE
Rel. error [%]
σb[N/mm2] 2108 2108 0.00
σa;max [N/mm2] 2108 2108 0.00
σqr [N/mm2] 217 217 0.00
σqn [N/mm2] 69 69 0.00
σt;max [N/mm2] 286 286 0.00
σV;max [N/mm2] 2265 2265 0.00
108 of 126 Deltares

Group 3: Benchmarks from spreadsheets
Table 3.267: Results of benchmark 3-24, Strength calculation for Combination 4
Result Unit Benchmark
D-GEO PIPELINE
Rel. error [%]
σb[N/mm2] 2108 2108 0.00
σpy [N/mm2] 17 17 0.00
σpx [N/mm2] 8 8 0.00
σptest [N/mm2] 22 22 0.00
σptemp [N/mm2] 26 26 0.00
σa;max [N/mm2] 2117 2117 0.00
σqr [N/mm2] 217 217 0.00
σqn [N/mm2] 69 69 0.00
σV;max [N/mm2] 2258 2258 0.00
Table 3.268: Results of benchmark 3-24, Maximum allowable stresses
Result Unit Benchmark
D-GEO PIPELINE
Rel. error [%]
σptest [N/mm2] 235 235 0.00
σpy [N/mm2] 213.64 213.64 0.00
σpm [N/mm2] 235 235 0.00
σV;max [N/mm2] 363.18 363.18 0.00
σa/t (short) [N/mm2] n.a. n.a.
σa/t (long) [N/mm2] n.a. n.a.
Table 3.269: Results of benchmark 3-24, Deflection of the pipeline
Result Unit Benchmark
D-GEO PIPELINE
Rel. error [%]
Calculated [mm] 12.1 12.1 0.00
Max. allowable [mm] 136 136 0.00
Max. allow. (piggability) [mm] 64 64 0.00
Table 3.270: Results of benchmark 3-24, Implosion
Result Unit Benchmark
D-GEO PIPELINE
Error
Max. allow. external pressure (short) [kPa] n.a. n.a.
Max. allow. external pressure (long) [kPa] n.a. n.a.
Int. pressure due to 100% filling (short) [kPa] n.a. n.a.
Int. pressure due to 100% filling (long) [kPa] n.a. n.a.
Use
D-GEO PIPELINE
input file bm3-24.dri to run this benchmark.
3.25 HDD with safety factors from the European Standard CEN – Steel pipe
3.25.1 Description
This benchmark checks the use of the safety factors from the European Standard CEN in
combination with a steel pipe. The same input data’s as for benchmark 3-7a (section 3.7) are
used except that the safety factors are different: when selecting the European Standard CEN,
no factor is apllied on the loads. The choice of a different standard will have effects only on
the strength calculation.
Deltares 109 of 126

D-GEO PIPELINE
, Verification Report
3.25.2 Analytical results
Hereafter are some intermediate results used for the pulling force and the strength calcula-
tions:
Factor of friction pipe-roller f10.2 [-]
Friction pipe-mud f20.00035 [N/mm2]
Factor of friction pipe-soil f30.3 [-]
Load factor - Design pressure fpd n.a [-]
Load factor - Design pressure (combination) fpd;comb n.a [-]
Load factor - Test pressure fpt n.a [-]
Load factor - Installation finstall n.a [-]
Load factor - Soil load Qn fQn1 n.a [-]
Load factor - Temperature ftemp n.a [-]
Contingency factor - E-modulus fE1.4 [-]
Contingency factor - Pulling force fpull 1.1 [-]
Contingency factor - Modulus of subgrade reaction fkv 1.1 [-]
Contingency factor - Soil load Qn fQn2 1.2 [-]
Contingency factor - Bending moment fMn.a [-]
Contingency factor - Bending radius fR1.3 [-]
Contingency factor - Pressure borehole fpress;bore 1.15 [-]
Factor of importance S1 [-]
Allowable deflection of pipe (Steel) 17 [%]
Piggability (Steel) 8 [%]
Allowable deflection of pipe (PE) n.a. [%]
Piggability (PE) n.a. [%]
Unit weight water γw10 [N/mm3]
Safety factor cover (Drained layer) 0.67 [-]
Safety factor cover (Undrained layer) 0.5 [-]
Traffic load factor fqv 1.35 [-]
Effective weight of pipe geff 10.093 [N/mm]
Weight of pipeline (incl. filling) gfill 2.409 [N/mm]
Uplift force gupw 22.973 [N/mm]
Moment coefficient indirect bottom kb’ 0.073 [-]
Moment coefficient indirect top kt’ 0.056 [-]
Moment coefficient direct bottom kb0.139 [-]
Moment coefficient direct top kt0.139 [-]
Direct deflection factor ky0.091 [-]
Indirect deflection factor ky’ 0.043 [-]
Part of pipe filled with water during pull back Pwater 15 [%]
Cross sections of the pipe A121535.457 [mm2]
Atrek 161085.163 [mm2]
Ainw 1606060.704 [mm2]
Minimal wall thickness dn;min 26.25 [mm]
Outer radius of the pipeline re750 [mm]
Inner radius of the pipeline ri715 [mm]
Average radius of the pipeline rg732.5 [mm]
Moment of inertia of the pipe Ib43240291745 [mm4]
Moment of inertia of the wall Iw3572.917 [mm3]
Pipe resisting moment Wb57653722 [mm4m]
Wall resisting moment Ww204.167 [mm3m]
Unit weight of drilling fluid γdrill fluid 13 [kN/m3]
Maximum modulus of subgrade reaction kv;max 20467.554 [kN/m3]
Maximum neutral vertical soil load qv;n;r;max 154.787 [kN/m2]
110 of 126 Deltares
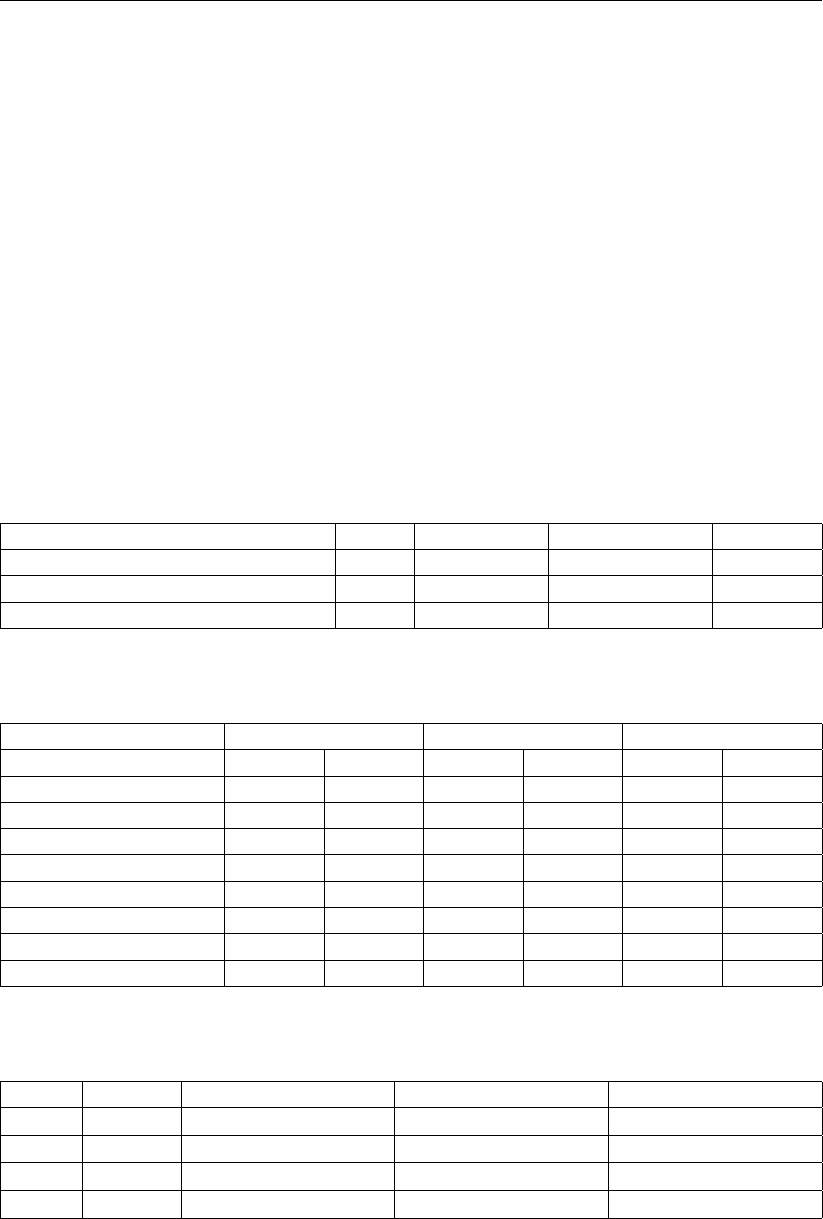
Group 3: Benchmarks from spreadsheets
Maximum traffic load qT;max 0 [kN/m2]
Max. red. neutral vertical soil load (incl. traffic load) qv;n;r;maxT 154.787 [kN/m2]
Max. corrected red. soil load (without traffic load) qn185.744 [kN/m2]
Max. corrected red. soil load (incl. traffic load) qnT 185.744 [kN/m2]
Maximum neutral horizontal soil load qh;n;r 101.846 [kN/m2]
Soil reaction - Left curve qr;left 52.606 [kN/m2]
Soil reaction - Right curve qr;right 65.131 [kN/m2]
Soil reaction - Left curve (long term) qr;left n.a. [kN/m2]
Soil reaction - Right curve (long term) qr;right n.a. [kN/m2]
Characteristic stiffness pipeline-soil λ0.0001771 [mm-1]
Characteristic stiffness pipeline-soil (long term) λlong n.a. [mm-1]
3.25.3 D-GEO PIPELINE results
D-GEO PIPELINE
results can be found in the Report.
Table 3.272: Results of benchmark 3-25, Buoyancy Control
Result Unit Benchmark
D-GEO PIPELINE
Error [%]
Uplift forces [kg/m] 2297 2297 0.00
Weight of pipeline (incl. filling) [kg/m] 1288 1288 0.00
Effective weight of pipe [kg/m] 1009 1009 0.00
Table 3.273: Results of benchmark 3-25, Pulling forces in the pipeline
Benchmark
D-GEO PIPELINE
Relative error
Charac. points Length Force Length Force Length Force
[m] [kN] [m] [kN] [%] [%]
T1 0 4610 0 4610 0.00 0.00
T2 43 4701 43 4701 0.00 0.00
T3 338 6579 338 6579 0.00 0.00
T4 1441 14235 1441 14235 0.00 0.00
T5 1716 16676 1716 16676 0.00 0.00
T6 1790 16832 1790 16832 0.00 0.00
Max. rep. pulling force - 3332 - 3332 - 0.00
Table 3.274: Results of benchmark 3-25, Strength calculation for Combination 1A
Result Unit Benchmark
D-GEO PIPELINE
Rel. error [%]
σb[N/mm2] 220 220 0.00
σt[N/mm2] 42 42 0.00
σa;max [N/mm2] 262 262 0.00
σV;max [N/mm2] 262 262 0.00
Deltares 111 of 126

D-GEO PIPELINE
, Verification Report
Table 3.275: Results of benchmark 3-25, Strength calculation for Combination 1B
Result Unit Benchmark
D-GEO PIPELINE
Rel. error [%]
σb[N/mm2] 251 251 0.00
σt[N/mm2] 152 152 0.00
σa;max [N/mm2] 404 404 0.00
λ[mm-1] 0.000177 0.000177 0.00
qr[N/mm2] 0.0977 0.0977 0.00
σqr [N/mm2] 39 39 0.00
σt;max [N/mm2] 39 39 0.00
σV;max [N/mm2] 424 424 0.00
Table 3.276: Results of benchmark 3-25, Strength calculation for Combination 2
Result Unit Benchmark
D-GEO PIPELINE
Rel. error [%]
σpy [N/mm2] 14 14 0.00
σpx [N/mm2] 7 7 0.00
σptest [N/mm2] 25 25 0.00
σpm [N/mm2] 12 12 0.00
Table 3.277: Results of benchmark 3-25, Strength calculation for Combination 3
Result Unit Benchmark
D-GEO PIPELINE
Rel. error [%]
σb[N/mm2] 251 251 0.00
σa;max [N/mm2] 251 251 0.00
σqr [N/mm2] 39 39 0.00
σqn [N/mm2] 140 140 0.00
σt;max [N/mm2] 178 178 0.00
σV;max [N/mm2] 374 374 0.00
Table 3.278: Results of benchmark 3-25, Strength calculation for Combination 4
Result Unit Benchmark
D-GEO PIPELINE
Rel. error [%]
σb[N/mm2] 251 251 0.00
σpy [N/mm2] 14 14 0.00
σpx [N/mm2] 7 7 0.00
σptest [N/mm2] 25 25 0.00
σptemp [N/mm2] 13 13 0.00
σa;max [N/mm2] 258 258 0.00
σqr [N/mm2] 39 39 0.00
σqn [N/mm2] 140 140 0.00
σV;max [N/mm2] 365 365 0.00
112 of 126 Deltares
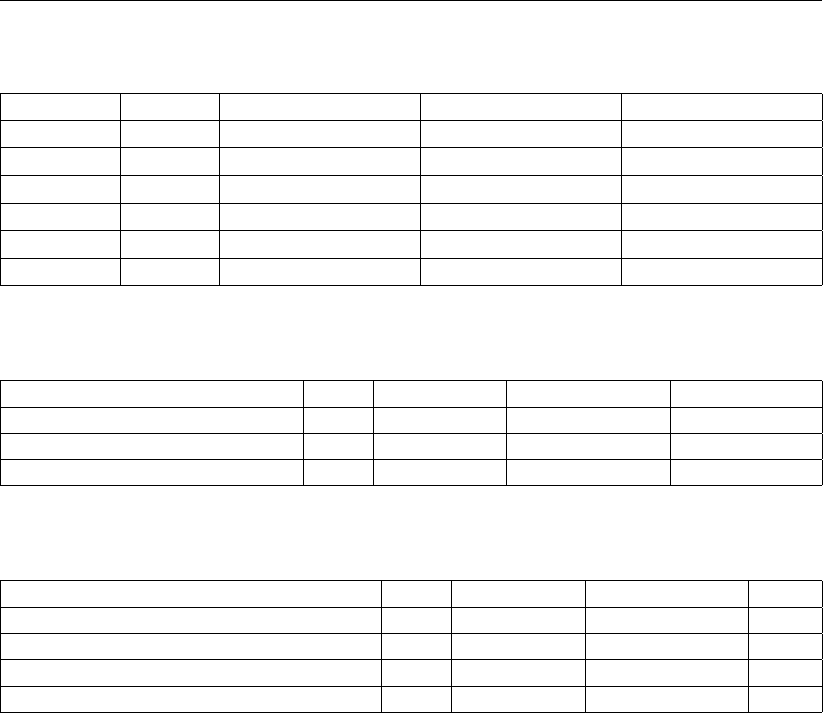
Group 3: Benchmarks from spreadsheets
Table 3.279: Results of benchmark 3-25, Maximum allowable stresses
Result Unit Benchmark
D-GEO PIPELINE
Rel. error [%]
σptest [N/mm2] 173.91 173.91 0.00
σpy [N/mm2] 153.85 153.85 0.00
σpm [N/mm2] 169.23 169.23 0.00
σV;max [N/mm2] 278 278 0.00
σa/t (short) [N/mm2] n.a. n.a.
σa/t (long) [N/mm2] n.a. n.a.
Table 3.280: Results of benchmark 3-25, Deflection of the pipeline
Result Unit Benchmark
D-GEO PIPELINE
Rel. error [%]
Calculated [mm] 10.5 10.5 0.00
Max. allowable [mm] 255 255 0.00
Max. allow. (piggability) [mm] 120 120 0.00
Table 3.281: Results of benchmark 3-25, Implosion
Result Unit Benchmark
D-GEO PIPELINE
Error
Max. allow. external pressure (short) [kPa] n.a. n.a.
Max. allow. external pressure (long) [kPa] n.a. n.a.
Int. pressure due to 100% filling (short) [kPa] n.a. n.a.
Int. pressure due to 100% filling (long) [kPa] n.a. n.a.
Use
D-GEO PIPELINE
input file bm3-25.dri to run this benchmark.
3.26 HDD with safety factors from the European Standard CEN – PE pipe
3.26.1 Description
This benchmark checks the use of the safety factors from the European Standard CEN in
combination with a PE pipe. The same input data’s as for benchmark 3-24 (section 3.24) are
used except that a PE pipe is used instead of a steel pipe.
3.26.2 Analytical results
Hereafter are some intermediate results used for the pulling force and the strength calcula-
tions:
Factor of friction pipe-roller f10.2 [-]
Friction pipe-mud f20.00035 [N/mm2]
Factor of friction pipe-soil f30.3 [-]
Load factor - Design pressure fpd n.a [-]
Load factor - Design pressure (combination) fpd;comb n.a [-]
Load factor - Test pressure fpt n.a [-]
Load factor - Installation finstall n.a [-]
Load factor - Soil load Qn fQn1 n.a [-]
Load factor - Temperature ftemp n.a [-]
Contingency factor - E-modulus fE1.4 [-]
Contingency factor - Pulling force fpull 1.1 [-]
Deltares 113 of 126

D-GEO PIPELINE
, Verification Report
Contingency factor - Modulus of subgrade reaction fkv 1.1 [-]
Contingency factor - Soil load Qn fQn2 1.2 [-]
Contingency factor - Bending moment fMn.a [-]
Contingency factor - Bending radius fRn.a. [-]
Contingency factor - Pressure borehole fpress;bore 1.15 [-]
Factor of importance S1 [-]
Allowable deflection of pipe (Steel) n.a. [%]
Piggability (Steel) n.a. [%]
Allowable deflection of pipe (PE) 8 [%]
Piggability (PE) 5 [%]
Unit weight water γw10 [N/mm3]
Safety factor cover (Drained layer) 0.67 [-]
Safety factor cover (Undrained layer) 0.5 [-]
Traffic load factor fqv 1.35 [-]
Effective weight of pipe geff 4.874 [N/mm]
Weight of pipeline (incl. filling) gfill 0.585 [N/mm]
Uplift force gupw 6.535 [N/mm]
Moment coefficient indirect bottom kb’ 0.073 [-]
Moment coefficient indirect top kt’ 0.056 [-]
Moment coefficient direct bottom kb0.139 [-]
Moment coefficient direct top kt0.139 [-]
Direct deflection factor ky0.091 [-]
Indirect deflection factor ky’ 0.043 [-]
Part of pipe filled with water during pull back Pwater 15 [%]
Cross sections of the pipe A112735.141 [mm2]
Atrek 112735.141 [mm2]
Ainw 389919.683 [mm2]
Minimal wall thickness dn;min 47.7 [mm]
Outer radius of the pipeline re400 [mm]
Inner radius of the pipeline ri352.3 [mm]
Average radius of the pipeline rg376.15 [mm]
Moment of inertia of the pipe Ib8007444342 [mm4]
Moment of inertia of the wall Iw9044.278 [mm3]
Pipe resisting moment Wb20018611 [mm4m]
Wall resisting moment Ww379.215 [mm3m]
Unit weight of drilling fluid γdrill fluid 13 [kN/m3]
Maximum modulus of subgrade reaction kv;max 61938.505 [kN/m3]
Maximum neutral vertical soil load qv;n;r;max 76.383 [kN/m2]
Maximum traffic load qT;max 0 [kN/m2]
Max. red. neutral vertical soil load (incl. traffic load) qv;n;r;maxT 76.383 [kN/m2]
Max. corrected red. soil load (without traffic load) qn91.659 [kN/m2]
Max. corrected red. soil load (incl. traffic load) qnT 91.659 [kN/m2]
Maximum neutral horizontal soil load qh;n;r 50.258 [kN/m2]
Soil reaction - Left curve qr;left 3.087 [kN/m2]
Soil reaction - Right curve qr;right 3.823 [kN/m2]
Soil reaction - Left curve (long term) qr;left 1.381 [kN/m2]
Soil reaction - Right curve (long term) qr;right 1.71 [kN/m2]
Characteristic stiffness pipeline-soil λ0.0011153 [mm-1]
Characteristic stiffness pipeline-soil (long term) λlong 0.0016677 [mm-1]
114 of 126 Deltares
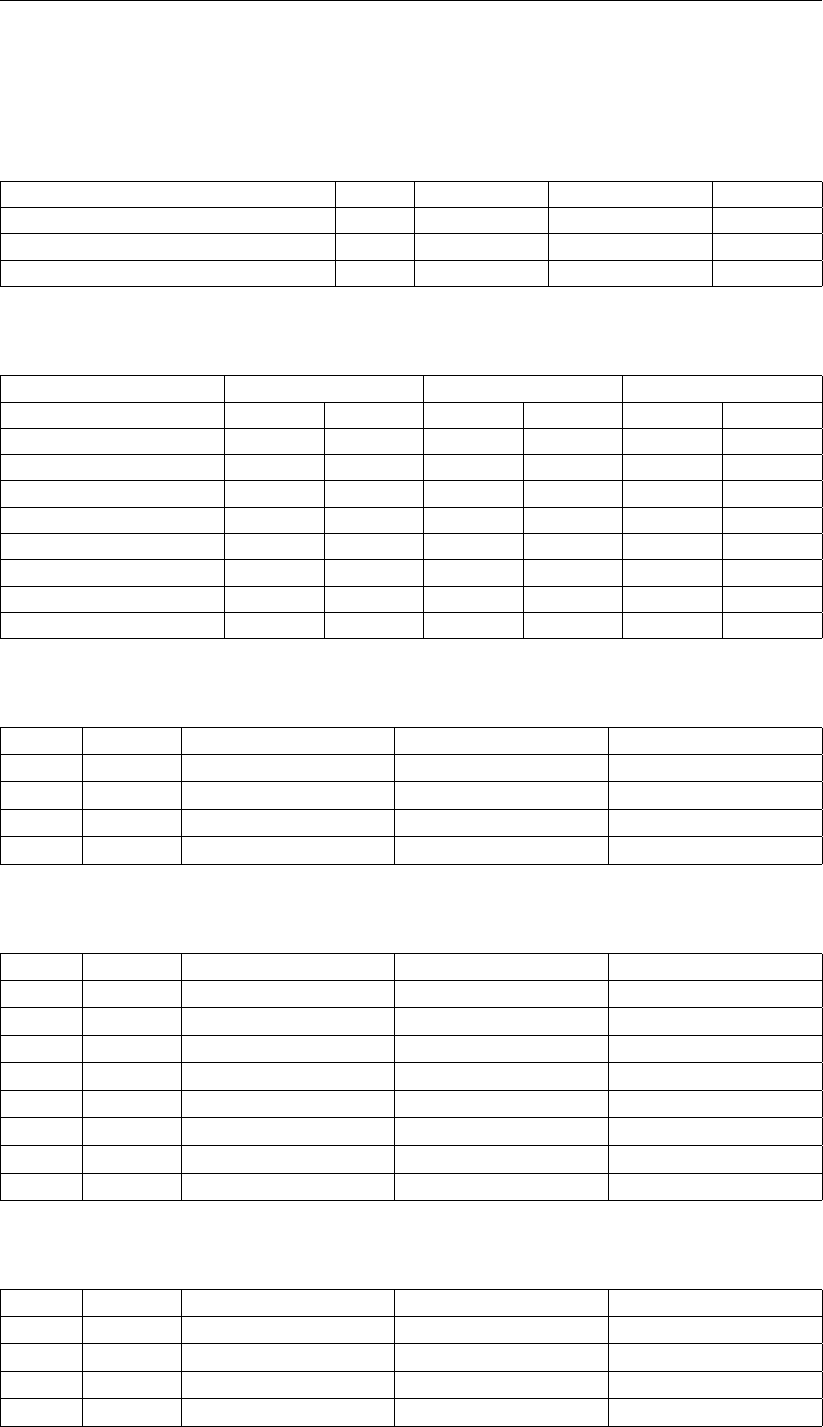
Group 3: Benchmarks from spreadsheets
3.26.3 D-GEO PIPELINE results
D-GEO PIPELINE
results can be found in the Report.
Table 3.283: Results of benchmark 3-26, Buoyancy control
Result Unit Benchmark
D-GEO PIPELINE
Error [%]
Uplift forces [kg/m] 653 654 0.15
Weight of pipeline (incl. filling) [kg/m] 166 166 0.00
Effective weight of pipe [kg/m] 487 488 0.21
Table 3.284: Results of benchmark 3-26, Pulling forces in the pipeline
Benchmark
D-GEO PIPELINE
Relative error
Charac. points Length Force Length Force Length Force
[m] [kN] [m] [kN] [%] [%]
T1 0 594.34 0 594.34 0.00 0.00
T2 43.04 680.84 43.04 680.84 0.00 0.00
T3 338 1364.62 338 1364.62 0.00 0.00
T4 1440.63 4234.93 1440.63 4234.93 0.00 0.00
T5 1715.52 5116.67 1715.52 5116.67 0.00 0.00
T6 1789.79 5265.94 1789.79 5265.94 0.00 0.00
Max. rep. pulling force - 860 - 860 - 0.00
Table 3.285: Results of benchmark 3-26, Strength calculation for Combination 1A
Result Unit Benchmark
D-GEO PIPELINE
Rel. error [%]
σb[N/mm2] 0.5 0.5 0.00
σt[N/mm2] 5.8 5.8 0.00
σa;max [N/mm2] 6.12 6.12 0.00
σV;max [N/mm2] n.a. n.a.
Table 3.286: Results of benchmark 3-26, Strength calculation for Combination 1B
Result Unit Benchmark
D-GEO PIPELINE
Rel. error [%]
σb[N/mm2] 0.57 0.57 0.00
σt[N/mm2] 51.38 51.38 0.00
σa;max [N/mm2] 51.75 51.75 0.00
λ[mm-1] 0.001115 0.001115 0.00
qr[N/mm2] 0.00573 0.00573 0.00
σqr [N/mm2] 0.33 0.33 0.00
σt;max [N/mm2] 0.33 0.33 0.00
σV;max [N/mm2] n.a. n.a.
Table 3.287: Results of benchmark 3-26, Strength calculation for Combination 2
Result Unit Benchmark
D-GEO PIPELINE
Rel. error [%]
σpy [N/mm2] 4.75 4.75 0.00
σpx [N/mm2] 2.38 2.38 0.00
σptest [N/mm2] 6.6 6.6 0.00
σpm [N/mm2] 4.11 4.11 0.00
Deltares 115 of 126

D-GEO PIPELINE
, Verification Report
Table 3.288: Results of benchmark 3-26, Strength calculation for Combination 3
Result Unit Benchmark
D-GEO PIPELINE
Rel. error [%]
σb[N/mm2] 0.11 0.11 0.00
σa;max [N/mm2] 0.07 0.07 0.00
σqr [N/mm2] 0.15 0.15 0.00
σqn [N/mm2] 10.11 10.26 1.48
σt;max [N/mm2] 6.67 6.76 1.35
σV;max [N/mm2] n.a. n.a.
Table 3.289: Results of benchmark 3-26, Strength calculation for Combination 4
Result Unit Benchmark
D-GEO PIPELINE
Rel. error [%]
σb[N/mm2] 0.11 0.11 0.00
σpy [N/mm2] 4.75 4.75 0.00
σpx [N/mm2] 2.38 2.38 0.00
σptest [N/mm2] 6.6 6.6 0.00
σptemp [N/mm2] 0.36 0.36 0.00
σa;max [N/mm2] 2.45 2.45 0.00
σqr [N/mm2] 0.15 0.15 0.00
σqn [N/mm2] 10.11 10.26 1.48
σV;max [N/mm2] n.a. n.a.
Table 3.290: Results of benchmark 3-26, Maximum allowable stresses
Result Unit Benchmark
D-GEO PIPELINE
Rel. error [%]
σptest [N/mm2] 6.4 6.4 0.00
σpy [N/mm2] 5.04 5.04 0.00
σpm [N/mm2] n.a. n.a.
σV;max [N/mm2] n.a. n.a.
σa/t (short) [N/mm2] 6.4 6.4 0.00
σa/t (long) [N/mm2] 5.04 5.04 0.00
Table 3.291: Results of benchmark 3-26, Deflection of the pipeline
Result Unit Benchmark
D-GEO PIPELINE
Rel. error [%]
Calculated [mm] 85.4 86.6 1.41
Max. allowable [mm] 64 64 0.00
Max. allow. (piggability) [mm] 44.8 44.8 0.00
Table 3.292: Results of benchmark 3-26, Implosion
Result Unit Benchmark
D-GEO PIPELINE
Error
Max. allow. external pressure (short) [kPa] 303.46 303.46 0.00
Max. allow. external pressure (long) [kPa] 30.35 30.35 0.00
Int. pressure due to 100% filling (short) [kPa] 0 0 0.00
Int. pressure due to 100% filling (long) [kPa] 0 0 0.00
Use
D-GEO PIPELINE
input file bm3-26.dri to run this benchmark.
116 of 126 Deltares
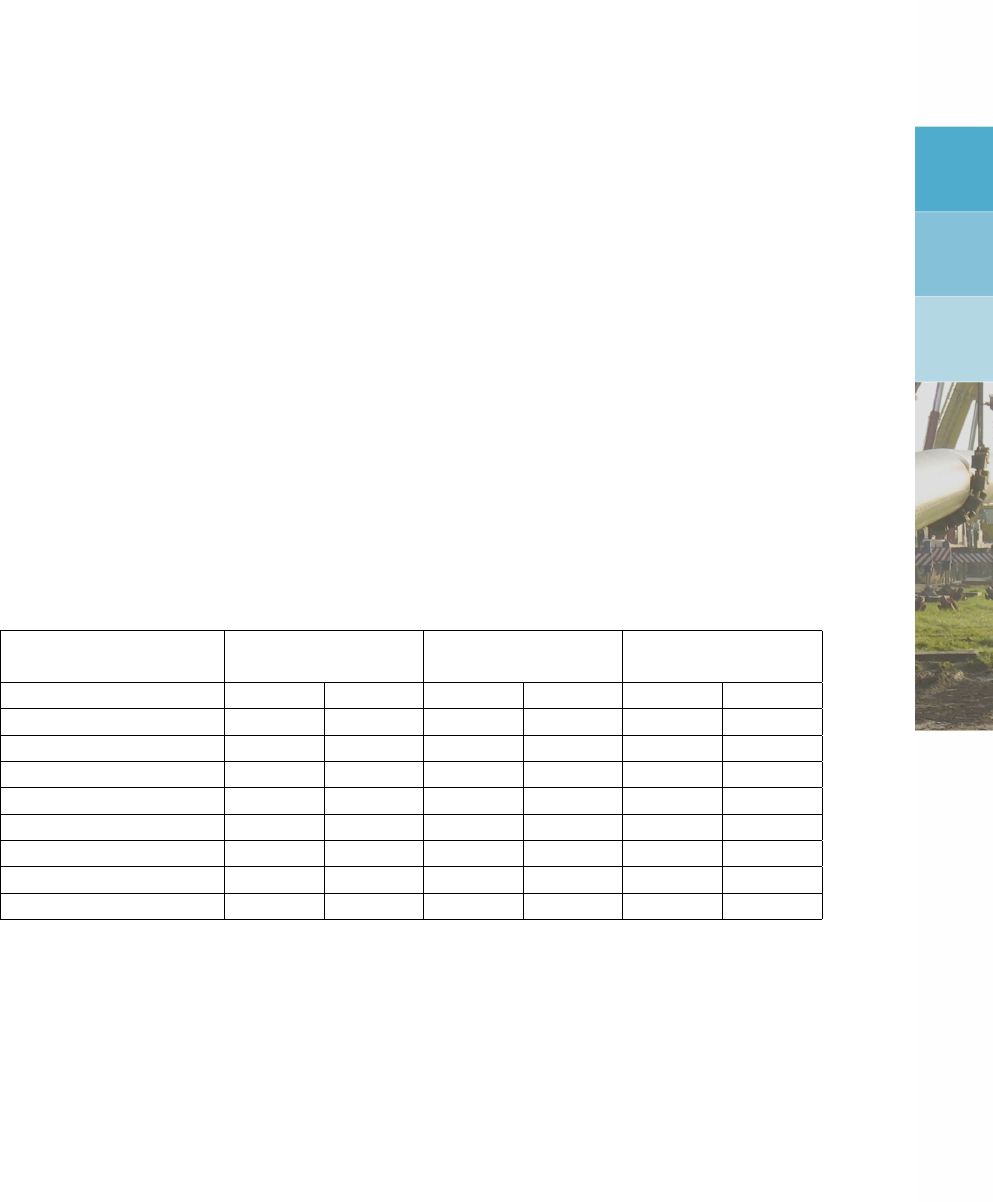
4 Group 4: Benchmarks generated by D-GEO PIPELINE
This chapter contains benchmarks for which the reference results are generated using
D-GEO PIPELINE
.
4.1 HDD with 3D geometry – Check of the pulling direction
4.1.1 Description
This benchmark checks the pulling direction. The same input data’s as for benchmark 3-7b
(section 3.7) are used except that the geometry is inversed (mirror symmetry) and the pulling
direction is from left to right instead of right to left. Results for the pulling forces are therefore
expected to be the same.
4.1.2 D-GEO PIPELINE results
Both files give identical results.
Table 4.1: Results of benchmark 4-01, Pulling forces in the pipeline
D-GEO PIPELINE D-GEO PIPELINE
Relative
(bm3-7b) (bm4-1) error
Charac. points Length Force Length Force Length Force
[m] [kN] [m] [kN] [%] [%]
T1 0 4610 0 4610 0.00 0.00
T2 74 4766 74 4766 0.00 0.00
T3 349 6884 349 6884 0.00 0.00
T4 1452 14562 1452 14562 0.00 0.00
T5 1747 16745 1747 16745 0.00 0.00
T6 1790 16836 1790 16836 0.00 0.00
Max. rep. pulling force 20468 20467 - 0.00
Use
D-GEO PIPELINE
input file bm4-1.dri to run this benchmark.
Deltares 117 of 126

D-GEO PIPELINE
, Verification Report
118 of 126 Deltares
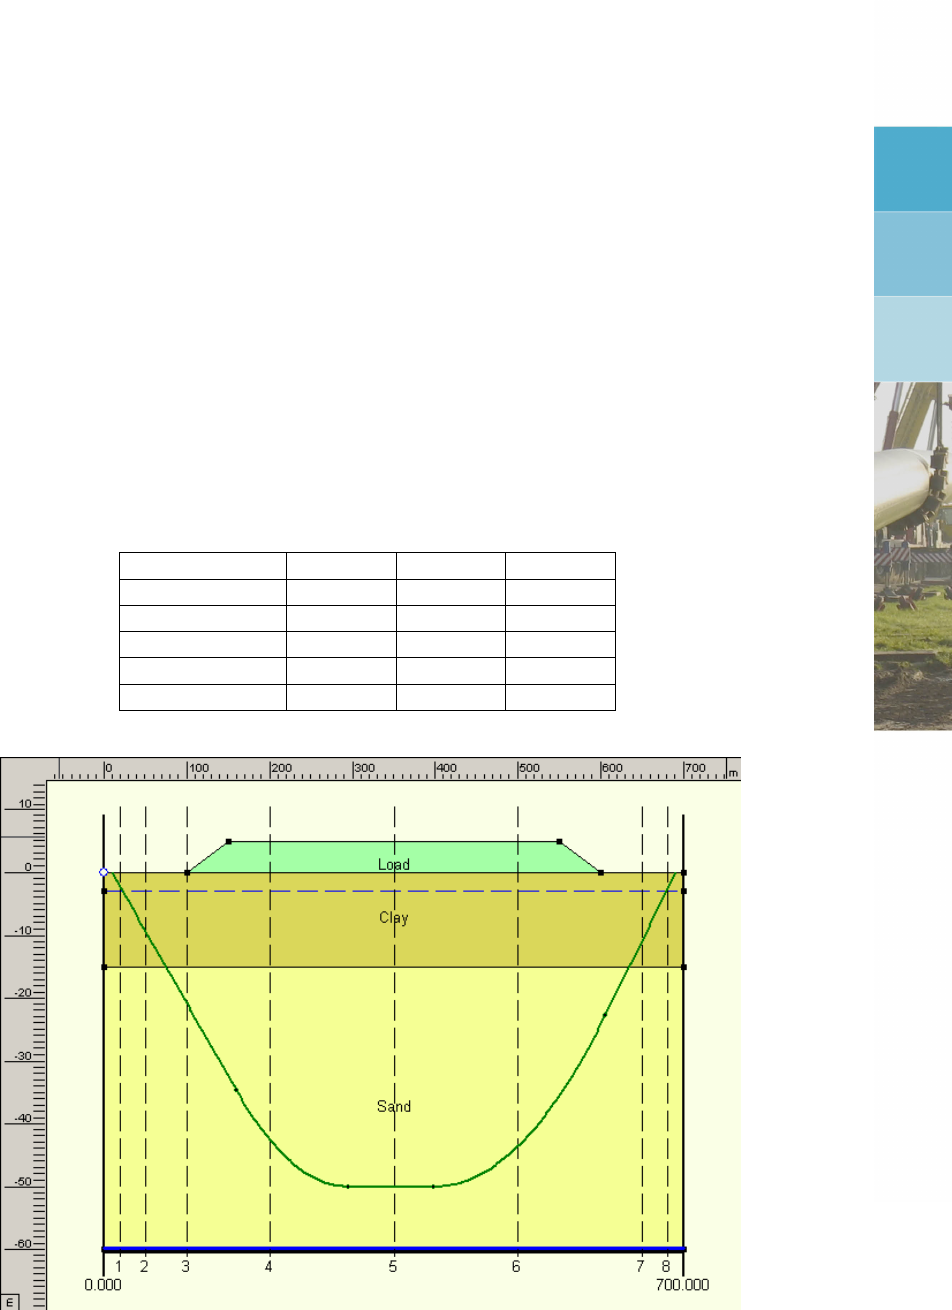
5 Group 5: Benchmarks compared with other programs
These benchmarks are intended to verify specific features of
D-GEO PIPELINE
comparing
D-GEO PIPELINE
results with those from an other program.
5.1 Settlements according to Koppejan model
5.1.1 Description
The same input data’s as benchmark 1-1 (section 3.1) are used, except that a trapezoidal load
(γunsat = 17 kN/m3and γsat = 20 kN/m3) is added at the top of the Clay layer as shown in Fig-
ure 5.1. A settlement calculation is performed using the Koppejan model with the parameters
given in Table 5.1.
Table 5.1: Koppejan’s parameters (benchmark 5-1)
Parameter Unit Sand Clay
OCR [-] 1.3 1.1
Cp[-] 200 1.1
Cp’ [-] 100 10
Cs[-] 500 200
Cs’ [-] 150 80
Figure 5.1: Geometry of benchmark 5-1
5.1.2 D-SETTLEMENT results
Benchmark results for the settlements calculation are calculated using the D-SETTLEMENT
program (formally known as MSettle). Calculations are performed for 8 verticals and the
results for each vertical are worked out in an Excel spreadsheet. A linear interpolation is used
to get the settlement at the desired depth. Results are given in Table 5.2.
Deltares 119 of 126
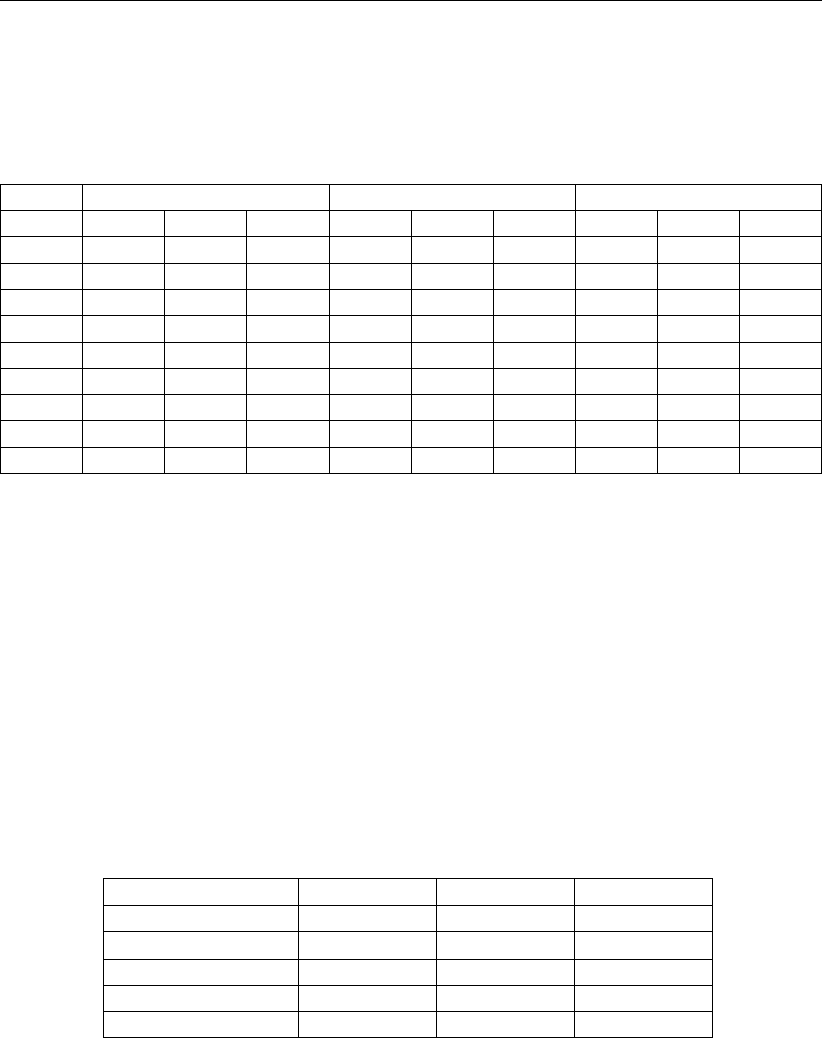
D-GEO PIPELINE
, Verification Report
5.1.3 D-GEO PIPELINE results
D-GEO PIPELINE
results can be found in the Report.
Table 5.2: Results of benchmark 5-01, Settlements according to Koppejan
Vert. Benchmark
D-GEO PIPELINE
Relative error
nr. Settl. Add. dv Settl. Add. dv Settl. Add. dv
[-] [mm] [mm] [mm] [mm] [mm] [mm] [%] [%] [%]
1 1 5 6 1 5 6 0.00 0.00 0.00
2 2 10 12 2 10 12 0.00 0.00 0.00
3 21 20 41 21 20 41 0.00 0.00 0.00
4 35 50 85 35 50 85 0.00 0.00 0.00
5 18 50 68 18 50 68 0.00 0.00 0.00
6 32 20 52 32 20 52 0.00 0.00 0.00
7 2 10 12 2 10 12 0.00 0.00 0.00
8 1 5 6 1 5 6 0.00 0.00 0.00
Use
D-GEO PIPELINE
input file bm5-1.dri to run this benchmark.
5.2 Settlements according to Isotache model
5.2.1 Description
The same input data’s as benchmark 1-1 (section 3.1) are used, except that a trapezoidal load
(γunsat = 17 kN/m3and γsat = 20 kN/m3) is added at the top of the Clay layer (see section 5.1).
A settlement calculation is performed using the Isotache model with the parameters given in
Table 5.3. Benchmark 5-2a uses an OCR parameter whereas benchmark 5-2b uses a P OP
parameter for the modelisation of the preconsolidation process.
Table 5.3: Isotache’s parameters (bm5-02)
Parameter Unit Sand Clay
OCR (bm5-2a) [-] 1.3 1.1
P OP (bm5-2b) [kN/m2] 15 20
a[-] 0.005 0.001
b[-] 0.05 0.01
c[-] 0.005 0.001
5.2.2 D-SETTLEMENT results
Benchmark results for the settlements calculation are calculated using the D-SETTLEMENT
program (formally known as MSettle). Calculations are performed for 8 verticals and the
results for each vertical are worked out in an Excel spreadsheet. A linear interpolation is used
to get the settlement at the desired Z depth. Results are given in Table 5.4 and Table 5.5.
120 of 126 Deltares
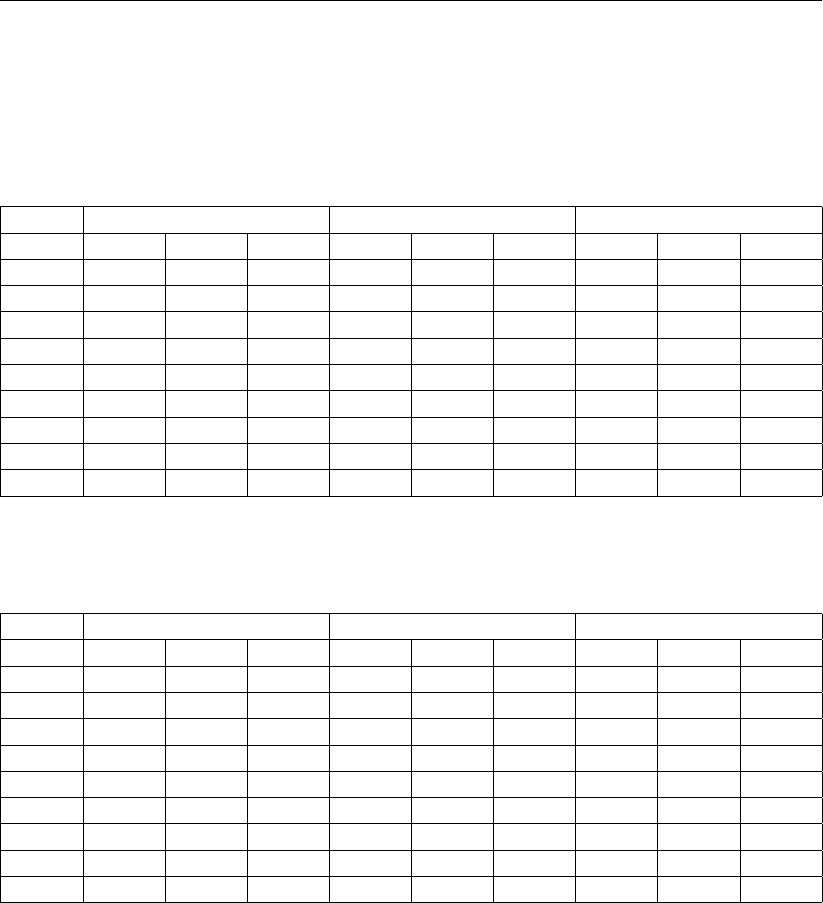
Group 5: Benchmarks compared with other programs
5.2.3 D-GEO PIPELINE results
D-GEO PIPELINE
results can be found in the Report.
Table 5.4: Results of benchmark 5-02a, Settlements according to Isotache with OCR con-
solidation
Vert. Benchmark
D-GEO PIPELINE
Relative error
nr. Settl. Add. dv Settl. Add. dv Settl. Add. dv
[-] [mm] [mm] [mm] [mm] [mm] [mm] [%] [%] [%]
1 1524 5 1529 1524 5 1529 0.00 0.00 0.00
2 1483 10 1493 1483 10 1493 0.00 0.00 0.00
3 1339 20 1359 1339 20 1359 0.00 0.00 0.00
4 702 50 752 702 50 752 0.00 0.00 0.00
5 397 50 447 397 50 447 0.00 0.00 0.00
6 659 20 679 659 20 679 0.00 0.00 0.00
7 1473 10 1483 1473 10 1483 0.00 0.00 0.00
8 1522 5 1527 1522 5 1527 0.00 0.00 0.00
Table 5.5: Results of benchmark 5-02b, Settlements according to Isotache with POP con-
solidation
Vert. Benchmark
D-GEO PIPELINE
Relative error
nr. Settl. Add. dv Settl. Add. dv Settl. Add. dv
[-] [mm] [mm] [mm] [mm] [mm] [mm] [%] [%] [%]
1 1891 5 1896 1891 5 1896 0.00 0.00 0.00
2 1867 10 1877 1867 10 1877 0.00 0.00 0.00
3 1695 20 1715 1695 20 1715 0.00 0.00 0.00
4 872 50 922 872 50 922 0.00 0.00 0.00
5 495 50 545 495 50 545 0.00 0.00 0.00
6 820 20 840 820 20 840 0.00 0.00 0.00
7 1859 10 1869 1859 10 1869 0.00 0.00 0.00
8 1890 5 1895 1890 5 1895 0.00 0.00 0.00
Use
D-GEO PIPELINE
input files bm5-2a.dri and bm5-2b.dri to run this benchmark.
Deltares 121 of 126

D-GEO PIPELINE
, Verification Report
122 of 126 Deltares

Bibliography
Deltares. D-Geo Pipeline User Manual. Deltares.
NEN, 2012a. NEN 3650-1:2012. Eisen voor buisleidingsystemen - Deel 1: Algemene eisen
(Requirements for pipeline systems - Part 1: General requirements), in Dutch.
NEN, 2012b. NEN 3650-2:2012. Eisen voor buisleidingsystemen - Deel 2: Aanvullende eisen
voor leidingen van staal (Requirements for pipeline systems - Part 2: Additional specifica-
tions for steel pipelines), in Dutch.
NEN, 2012c. NEN 3650-3:2012. Eisen voor buisleidingsystemen - Deel 3: Aanvullende eisen
voor leidingen van kunststof (Requirements for pipeline systems - Part 3: Additional speci-
fications for plastic pipelines), in Dutch.
NEN, 2012d. NEN 3651:2012. Aanvullende eisen voor buisleidingen in of nabij belangri-
jke waterstaatswerken (Additional requirements for pipelines in or nearby important public
works), in Dutch.
Deltares 123 of 126

D-GEO PIPELINE
, Verification Report
124 of 126 Deltares

PO Box 177
2600 MH Del
Rotterdamseweg 185
2629 HD Del
The Netherlands
+31 (0)88 335 81 88
sales@deltaressystems.nl
www.deltaressystems.nl
