HP LoadRunner User Guide Load Runner V12.50
User Manual: Pdf
Open the PDF directly: View PDF ![]() .
.
Page Count: 1774 [warning: Documents this large are best viewed by clicking the View PDF Link!]
- LoadRunner
- Welcome to the LoadRunner User Guide
- VuGen
- Introducing VuGen
- Vusers
- Keyboard Shortcuts
- User Interface
- VuGen Workspace
- Restoring the layout defaults
- How to Modify the VuGen Layout
- Solution Explorer Pane
- Step Navigator Pane
- Editor Pane
- Steps Toolbox Pane
- Bookmarks Pane
- Snapshot Pane
- Thumbnail Explorer
- Errors Pane
- Tasks Pane
- Task Editor
- Output Pane
- Breakpoints Pane
- Call Stack Pane
- Watch Pane
- Runtime Data Pane
- .NET Recording Filter Pane
- Options Dialog Box
- General Options
- Editor Options
- Scripting Options
- Search and Replace Dialog Boxes
- Business Process Report Dialog Box
- Replay Summary Pane
- VuGen Workflow
- Creating or Opening Vuser Scripts
- Creating Vuser Scripts - Overview
- How to Create and Open Vuser Scripts
- How to Compare Scripts Side by Side
- Working with Application Lifecycle Management
- Managing Scripts Using ALM - Overview
- How to Connect to ALM
- ALM Version Control - Overview
- How to Work with Scripts in ALM Projects
- How to Work with Version Controlled Scripts in ALM Projects
- How to Save VuGen Vuser Scripts to ALM Projects
- How to Compare Previous Versions of a Script
- HP ALM Connection Dialog Box [VuGen]
- Multiple Protocol Scripts
- Script Directory Files
- Create a New Script Dialog Box
- How to Work with .zip Files
- How to Create and Open Vuser Script Templates
- Vuser Script Templates
- Recording
- Recording - Overview
- How to Record a Vuser Script
- How to Create a Business Process Report
- Recording Options
- Citrix > Configuration Recording Options
- Citrix > Code Generation Recording Options
- Citrix > Login Recording Options
- Citrix > Recorder - Recording Options
- COM/DCOM > Filter Recording Options
- COM/DCOM > Options Recording Options
- Correlations > Configuration Recording Options
- Correlations > Rules Recording Options
- Database > Database Recording Options
- Database > Advanced Recording Options Dialog Box
- Data Format Extension > Chain Configuration Recording Options
- Data Format Extension > Code Generation Recording Options
- Flex > RTMP Recording Options
- Flex > Configuration Recording Options
- Flex > Externalizable Objects Recording Options
- General > Code Generation Recording Options
- General > Protocol Recording Options
- General > Recording - Recording Options
- General > Script Recording Options
- GUI Properties > Web Event Configuration Recording Options
- GUI Properties > Advanced Recording Options
- HTTP Properties > Advanced Recording Options
- Java > VM Recording Options
- Java > Classpath Recording Options
- Microsoft .NET > Recording - Recording Options
- Microsoft .NET > Shared DLLs Recording Options
- Network > Mapping and Filtering Recording Options
- RDP > Code Generation > Advanced Recording Options
- RDP > Code Generation > Agent Recording Options
- RDP > Code Generation > Basic Recording Options
- RDP > Client Startup Recording Options
- Recording Properties > Corba Options Recording Options
- Recording Properties > Correlation Options - Recording Options
- Recording Properties > Log Options Recording Options
- Recording Properties > Recorder Options - Recording Options
- Recording Properties > Serialization Options - Recording Options
- RTE > Configuration Recording Options
- RTE > RTE Recording Options
- SAPGUI > Auto Logon Recording Options
- SAPGUI > Code Generation Recording Options
- SAPGUI > General Recording Options
- Silverlight > Services Recording Options
- Traffic Analysis > Traffic Filters Recording Options
- WinSock Recording Options
- Recording Options - Miscellaneous Topics
- Protocol Compatibility Table
- Port Mapping and Traffic Filtering Overview
- Port Mapping Auto Detection
- EUC-Encoding (Japanese Windows only)
- Script Generation Preference Overview
- Script Language Options
- Recording Levels - Overview
- Serialization Overview
- Tips for Working with Event Listening and Recording
- Example of Click & Script Out of Context Recording
- Providing Authentication Information
- Recording via a Proxy - Overview
- How to Record a Script via a Proxy
- How to Import Actions to a Script
- How to Regenerate a Vuser Script
- Start Recording Dialog Box
- Floating Recording Toolbar
- Files Generated During Recording
- Troubleshooting and Limitations for Recording
- Correlating
- Correlation Overview
- Correlations in LoadRunner
- Correlation Tab [Design Studio] Overview
- Determining Which Values to Correlate
- Modifying Saved Parameters
- Correlation vs. Parameterization
- Wdiff Correlation Utility
- Correlating Java Scripts
- How to Correlate Scripts Using Design Studio
- How To Manually Correlate Scripts
- How to Correlate Scripts From a Snapshot
- How to Correlate Scripts - Winsock (Snapshot Pane)
- How to Correlate Scripts - Winsock (Manually)
- How to Correlate Scripts - Web (Manually)
- How to Correlate Scripts - Siebel
- How to Correlate Scripts - Oracle NCA
- How to Correlate Scripts - Microsoft .NET
- How to Correlate Scripts - Java Scripts - Serialization
- How to Correlate Scripts - Java
- How to Correlate Scripts - Flex (XPath Correlation)
- How to Correlate Scripts - COM
- How to Search for Values that Need Correlation
- How to Modify Correlation Definitions
- How to Exclude Content Based on Content-Type
- How to Exclude Strings or Content Types from the Correlation Scan
- Correlation Functions - Database Vuser Scripts
- Correlation Functions - Java Vuser Scripts
- Correlation Functions - C Vuser Scripts
- Design Studio [Correlation Tab] Dialog Box
- Replaying
- Runtime Setting Value Validation
- Debugging
- Enhancing
- Parameters
- Parameterizing Overview
- Parameter Types
- How to Create a Parameter
- Slideshow - How to Create a Parameter
- How to Work with Existing Parameters
- Data Assignment Methods for File/Table/XML Parameters
- XML Parameters
- How to Create an XML Parameter from a Web Service Call
- How to Create XML Parameters - Standard Method
- How to Define XML Value Sets
- How to Set an Assignment Method
- How to Modify XML Parameter Properties
- How to Set AUT Environment Parameters
- How to Import Parameter Data from a Database
- Select or Create Parameter Dialog Box
- Parameter Properties Dialog Box
- Parameter Simulation Dialog Box
- Parameter List Dialog Box
- Database Query Wizard
- Create Parameter Dialog Box
- Parameter Original Value Dialog Box
- Parameter Delimiters Configuration Dialog Box
- Troubleshooting and Limitations for Parameterization
- Asynchronous Communication
- Synchronous and Asynchronous Concepts
- Types of Asynchronous Communication
- VuGen Support for Asynchronous Communication
- How to Create an Asynchronous Vuser Script
- Asynchronous Communication API
- How Asynchronous Functions Differ from Synchronous Functions
- How VuGen Modifies a Vuser Script for Asynchronous Communication
- Defining the Start of an Asynchronous Conversation
- Defining the End of an Asynchronous Conversation
- Using Asynchronous Request Thresholds
- Fine-Tuning the End of an Asynchronous Conversation
- Correlating Asynchronous Vuser Scripts
- Implementing Callbacks
- Modifying Callbacks
- Parsing URLs
- Async Rules Overview
- Adding Async Rules
- Async Tab [Design Studio]
- Asynchronous Options Dialog Box
- Asynchronous Example - Poll
- Asynchronous Example - Push
- Asynchronous Example - Long-Poll
- Viewing Replay Results
- Viewing Replay Results Overview
- Customizing the Test Results Display
- Connecting to Application Lifecycle Management from the Test Results Window
- How to Send Custom Information to the Report
- How to Configure the Appearance of the Test Results Window
- How to Open the Test Results of a Specific Run
- How to Find Steps in the Test Results
- Test Results Window
- Filters Dialog Box
- Print Dialog Box
- Print Preview Dialog Box
- Export to HTML File Dialog Box
- Creating or Opening Vuser Scripts
- Protocols
- Vuser Protocols
- IPv6 Support
- Protocol Support for Async, IPv6, and 64-bit Recording
- Protocol Advisor Overview
- Ajax - Click & Script Protocol
- Citrix Protocol
- Click & Script Protocols
- COM/DCOM Protocol
- Database Protocols
- Flex (RTMP/AMF) Protocol
- Java Record Replay Protocol
- Java Record Replay Protocol Overview
- Java Record Replay Protocol Recording Tips
- Working with CORBA
- Working with RMI
- Working with Jacada
- How to Manually Insert Java Methods
- How to Manually Configure Script Generation Settings
- Compiling and Running a Script as Part of a Package
- Java Icon Reference List
- Java Custom Filters Overview
- Troubleshooting and Limitations - Java Record Replay and Java Vuser
- Java Vuser Protocol
- Manually Programming Java Scripts - Overview
- Java Protocol Programming Tips
- Running Java Vuser Scripts
- Opening Java Vuser Scripts in Eclipse
- Compiling and Running a Script as Part of a Package
- How to Manually Create a Java Script
- How to Enhance a Java Script
- Troubleshooting and Limitations - Java Record Replay and Java Vuser
- Java over HTTP Protocol
- LDAP Protocol
- Mailing Service Protocols
- Message Protocols
- Mobile Protocols
- How to Select a Script Type for Mobile Applications
- Speed Simulation for Mobile Vuser Scripts
- Mobile Application - HTTP/HTML
- Recording Methods
- Recording Traffic into a Capture (Sniffer) File
- Analyzing Traffic
- Recording with Emulation
- How to Create a Script by Analyzing Traffic (Mobile Applications)
- How to Record and Analyze Traffic (for Mobile Applications)
- Recording Wizard
- Recording Method Screen
- Analyze Traffic Screen
- Configure and Record Screen
- Record Emulator Screen
- Proxy Recording Screen
- TruClient - Mobile Web Protocol
- SMP (SAP Mobile Platform) Protocol
- .NET Protocol
- .NET Protocol Overview
- Viewing Data Sets and Grids
- Recording WCF Duplex Communication
- Asynchronous Calls
- Recording Dual HTTP Bindings
- Connection Pooling
- Debugging .NET Vuser Scripts
- .NET Filters Overview
- .NET Filters - Advanced
- Guidelines for Setting .NET Filters
- How to Configure Application Security and Permissions
- Troubleshooting and Limitations - .NET
- Oracle NCA Protocol
- RDP Protocol
- RDP Protocol - Overview
- RDP Recording Tips
- Working with Clipboard Data (RDP Protocol)
- RDP Snapshots - Overview
- Image Synchronization Overview (RDP)
- Image Synchronization Tips (RDP Protocol)
- Image Synchronization - Shifted Coordinates (RDP Protocol)
- Setting Security Levels in RDP Vuser Scripts
- RDP Agent (for Microsoft Terminal Server) Overview
- How to Install / Uninstall the RDP Agent
- How to Add Image Synchronization Points to a Script
- Failed Image Synchronization Dialog Box (RDP Protocol)
- Troubleshooting and Limitations for RDP
- RTE Protocol
- RTE Protocol Overview
- Working with Ericom Terminal Emulation
- Typing Input into a Terminal Emulator
- Generating Unique Device Names
- Setting the Field Demarcation Characters
- Reading Text from the Terminal Screen
- RTE Synchronization Overview
- Synchronizing Block-Mode (IBM) Terminals
- Synchronizing Character-Mode (VT) Terminals
- How to Map Terminal Keys to PC Keyboard Keys
- How to Record RTE Vuser Scripts
- How to Implement Continue on Error
- Troubleshooting and Limitations - RTE
- SAP Protocols
- Selecting a SAP Protocol Type
- SAP GUI Protocol
- SAP Web Protocol
- SAP (Click & Script) Protocol
- Replaying SAP GUI Optional Windows
- How to Configure the SAP Environment
- How to Record SAP GUI Scripts
- How to Replay SAP GUI Scripts
- How to Run SAP GUI Scripts in a Scenario
- How to Enhance SAP GUI Scripts
- Additional SAP Resources
- Troubleshooting and Limitations for SAP
- Siebel Web Protocol
- Silverlight Protocol
- TruClient Protocol
- Introduction to TruClient
- TruClient Standalone
- Fundamentals
- Develop TruClient Scripts
- Program TruClient Scripts
- TruClient API Reference
- Utilities
- Web - HTTP/HTML Protocol
- Web - HTTP/HTML Protocol - Overview
- Generating Vuser Scripts in JavaScript
- Using the VuGen JavaScript Engine
- JavaScript Engine: XMLHTTPRequest Example
- How to Convert a Web - HTTP/HTML Vuser Script into a Java Vuser Script
- How to Create a Script for a REST API
- How to Record the SPDY Protocol
- How to Record Applications Using Smooth Streaming
- Convert a TruClient Script to a Web HTTP/HTML Script
- Troubleshooting and Limitations - Web - HTTP/HTML Protocol
- Web Protocols (Generic)
- Web Protocols - Overview
- Web Vuser Technology
- Web Vuser Types
- Text and Image Verification (Web Vuser Scripts) - Overview
- Web Snapshots - Overview
- Browser Emulation - Overview
- How to Perform Load Testing with nCipher HSM
- Working with Cache Data
- Data Format Extensions (DFEs) - Overview
- How to Implement Data Format Extension (DFE) Support
- How to Define a Chain of DFEs
- How to Enable DFE Support
- How to Configure DFE Support
- How to Apply DFE Chains to Sections of the HTTP Message
- How DFEs Modify a Vuser Script
- Data Format Extension List
- Applying DFEs to a String
- Google Web Toolkit - Data Format Extension (GWT-DFE) - Overview
- Troubleshooting - Data Format Extension (DFE)
- Web Services
- Web Services - Adding Script Content
- Web Service Testing Overview
- Adding Web Service Script Content - Overview
- Script Integration
- Web Service Call Attachments
- Special Argument Types
- Server Traffic Scripts Overview
- Filtering Traffic
- Data on Secure Servers
- How to Add Content
- How to Assign Values to XML Elements
- How to Generate a Test Automatically
- How to Create a Script by Analyzing Traffic (Web Services)
- Specify Services Screen
- Specify Application to Record Dialog Box
- Import SOAP Dialog Box
- New Web Service Call Dialog Box
- Add Input Attachment Dialog Box
- Add Array Elements Dialog Box
- Process Base64 Data - Simple Data Dialog Box
- Process Base64 Data - Complex Data Dialog Box
- Specify Services Screen
- Specify Traffic Information Screen
- SSL Configuration Dialog Box
- Web Services - Preparing Scripts for Replay
- Preparing for Replay Overview
- Testing Web Service Transport Layers Overview
- JMS Transport Overview
- Asynchronous Messages Overview
- Customizing Overview
- User Handler Examples
- How to Prepare Scripts for Replay
- How to Send Messages over JMS
- How to Send Messages over HTTP/S
- How to Define a Testing Method
- How to Add a Database Connection
- How to Create a User Handler
- How to Customize Configuration Files
- Web Services Snapshots - Overview
- Database Connection Dialog Box
- Connection String Generator Dialog Box
- Web Services - Managing Services
- Web Services - Security
- Setting Security Overview
- Security Scenarios Overview
- WCF Scenario Settings
- Preparing Security Scenarios for Running
- How to Add Security to a Web Service Script
- How to Customize the Security
- How to Add SAML Security
- How to Create and Manage Security Scenarios
- How to Parameterize Security Elements
- Set Security Properties Dialog Box
- Security Scenario Editor Dialog Box
- Advanced Settings Dialog Box
- Select Certificate Dialog Box
- Web Services Security Examples
- Troubleshooting and Limitations for Web Services
- Web Services - Adding Script Content
- Windows Sockets Protocol
- Advanced Topics
- Additional Components
- Troubleshooting and Limitations for VuGen
- Controller
- Introducing Controller
- Designing Load Test Scenarios
- Planning Load Test Scenarios
- Designing Scenarios
- Manual Scenarios
- Goals Types for Goal-Oriented Scenarios
- Noise Generators
- How to Design a Goal-Oriented Scenario
- How to Design a Manual Scenario
- How to Change the Scenario Mode (Manual Scenario)
- How to View/Modify Scripts in the Scenario
- Relative Paths for Scripts
- Vuser Statuses
- Add Group Dialog Box
- Add Script Dialog Box
- Add Vusers Dialog Box
- Design Tab
- Edit Scenario Goal Dialog Box
- Group Information Dialog Box
- Multiple Runtime Settings Mode Dialog Box
- New Scenario Dialog Box
- Scenario Goal Pane
- Scenario Groups/Scripts Pane - Manual Scenarios
- Scenario Scripts Pane - Goal-Oriented Scenarios
- Scenario Start Time Dialog Box
- Script Information Dialog Box
- Vuser Information Dialog Box
- Vusers Dialog Box
- Load Generators
- Load Generators - Overview
- Adding a Cloud-Based Load Generator - Overview
- How to Add a Load Generator to a Scenario
- How to Provision Load Generators in the Cloud
- Managing Cloud Accounts - Overview
- How to Manage Cloud Accounts
- Manage Cloud Accounts Dialog Box
- How to Modify Load Generator Settings
- Load Balancing
- Setting up a Load Generator Environment
- How to Connect/Disconnect a Load Generator
- How to Connect to a Linux Load Generator Without Using RSH
- Linux Environment Variables
- Add New Load Generator/Load Generator Information Dialog Box
- Create Cloud Load Generator Dialog Box
- Use Cloud Load Generator Dialog Box
- Load Generator Configuration > Connection Log Tab
- Load Generator Configuration > Runtime File Storage Tab
- Load Generator Configuration > Runtime Quota Tab
- Load Generator Configuration > Connection Tab
- Load Generator Configuration > Status Tab
- Load Generator Configuration > Terminal Services Tab
- Load Generator Configuration > Linux Environment Tab
- Load Generator Configuration > Vuser Limits Tab
- Load Generator Configuration > Vuser Status Tab
- Load Generator Configuration > Network Virtualization Tab
- Load Generators Dialog Box
- Network Profile Manager Dialog Box
- LoadRunner Agent Runtime Settings Dialog Box
- SSL Utility
- How to Create Certificates for Azure Cloud
- Troubleshooting and Limitations - Load Generators
- Scheduling Manual Scenarios
- Scheduling Manual Scenarios Overview
- Scheduling by Scenario or Group
- Schedule Run Modes
- How to Define a Schedule for the Scenario - Workflow
- How to Add Actions to the Scenario Schedule
- How to Edit Schedule Actions
- Schedule Actions
- Add Action Dialog Box
- Edit Action Dialog Box
- Scenario Schedule Pane
- Schedule Definition Area
- Interactive Schedule Graph
- Actions Grid
- Service Level Agreements
- Service Level Agreements Overview
- Tracking Period
- How to Define Service Level Agreements
- How to Define Service Level Agreements - Use-Case Scenario
- Advanced Options Dialog Box
- Goal Details Dialog Box
- Service Level Agreement Pane
- Service Level Agreement Wizard
- Select a Measurement Page
- Select Transactions Page
- Set Load Criteria Page
- Set Percentile Threshold Values Page
- Set Threshold Values Page (Goal Per Time Interval)
- Set Threshold Values Page (Goal Per Whole Run)
- Multiple IP Addresses
- Configuring Terminal Services Settings
- Running Load Test Scenarios
- Online Monitor Graphs
- Configuring Scenario Options
- Configuring Scenario Options Overview
- Expert Mode
- Runtime File Storage Locations
- Path Translation
- How to Configure Scenario Options
- Path Translation Table
- Options Dialog Box
- Options > Debug Information Tab
- Options > Execution Tab
- Options > General Tab
- Options > Monitors Tab
- Options > Output Tab
- Options > Path Translation Tab
- Options > Runtime File Storage Tab
- Options > Runtime Settings Tab
- Options > Timeout Tab
- Before Running Your Scenario
- Running Scenarios
- Running Scenarios Overview
- How to Run a Scenario
- Initialize, Run, or Stop Vuser Groups - Use-Case Scenario
- Control Vusers During a Scenario Run - Use-Case Scenario
- Run/Stop Individual Vusers, or Add New Vusers - Use-Case Scenario
- Initialize/Run Additional Vusers or Stop Running Vusers - Use-Case Scenario
- Execution Notes Dialog Box
- Output Window
- Filtered Tab
- Summary Tab
- Run Tab
- Run/Stop Vusers Dialog Box
- Scenario Groups Pane
- Scenario Status Pane
- Transactions Dialog Box
- Vuser Script Log
- Rendezvous Points
- Running the Controller from the Command Line
- After the Scenario Run
- Using Unified Functional Testing Tests in LoadRunner
- Managing Scenarios Using Application Lifecycle Management
- Continuous Integration with Jenkins
- Working with Firewalls in LoadRunner
- How to Set Up Your LoadRunner System Over Firewalls
- Using Digital Certificates with Firewalls
- How To Configure Client-Server Authentication
- Network and Security Manager - Command Line Tool
- Monitoring Load Test Scenarios
- How to Set Up a Monitoring Environment
- Monitor Types
- Add Machine Dialog Box
- <Monitor Type> Monitor Configuration Dialog Box
- <monitor name> Dialog Box
- Runtime and Transaction Monitoring
- Web Resource Monitors
- System Resource Monitoring
- Network Delay Monitoring
- Network Monitoring Overview
- How to Set Up the Network Monitoring Environment
- How to Configure the Linux Source Machine for Network Monitoring
- Adding Destination Machines for Network Delay Monitoring Dialog Box
- Network Delay Time Dialog Box
- Network Delay Time Graph
- Network Monitor Settings for Defined Path Dialog Box
- Troubleshooting and Limitations - Network Delay Monitor
- Web Server Resource Monitoring
- Web Application Server Monitoring
- TruClient - Native Mobile Monitors
- Database Server Resource Monitoring
- HP Network Virtualization Monitoring
- SiteScope Server Monitoring
- Flex Monitoring
- Streaming Media Monitoring
- ERP/CRM Server Resource Monitoring
- Application Deployment Solution Monitoring
- Middleware Performance Monitoring
- Infrastructure Resources Monitoring
- Network Virtualization Integration
- Service Virtualization Integration
- Working with Diagnostics
- How to Install the LoadRunner J2EE/.NET Diagnostics Add-in
- How to Configure a LoadRunner Scenario to use J2EE/.NET Diagnostics
- How to View J2EE/.NET Diagnostics Data in LoadRunner During a Scenario Run
- How to View Offline J2EE/.NET Diagnostics Results
- HP Diagnostics for J2EE/.NET Setup Dialog Box
- Diagnostics Distribution Dialog Box
- J2EE/.NET Configuration Dialog Box
- Troubleshooting and Limitations for Firewalls
- Troubleshooting and Limitations for Controller
- Analysis
- Introducing Analysis
- Workflow
- Analysis Basics
- Session Explorer Window
- Analysis Window Layouts
- Printing Graphs or Reports
- Configuring Analysis
- Summary Data Versus Complete Data
- Importing Data Directly from the Analysis Machine
- How to Configure Settings for Analyzing Load Test Results
- General Tab (Options Dialog Box)
- Result Collection Tab (Options Dialog Box)
- Data Aggregation Configuration Dialog Box (Result Collection Tab)
- Database Tab (Options Dialog Box)
- Advanced Options Dialog Box (Database Tab)
- Web Page Diagnostics Tab (Options Dialog Box)
- Session Information Dialog Box (Options Dialog Box)
- Viewing Load Test Scenario Information
- Defining Service Level Agreements
- Service Level Agreements Overview
- Tracking Period
- How to Define Service Level Agreements
- How to Define Service Level Agreements - Use-Case Scenario
- Service Level Agreement Pane
- Advanced Options Dialog Box (Service Level Agreement Pane)
- Goal Details Dialog Box (Service Level Agreement Pane)
- Service Level Agreement Wizard
- Working with Application Lifecycle Management
- Setup
- Configuring Graph Display
- How to Customize the Analysis Display
- Display Options Dialog Box
- Editing Main Chart Dialog Box (Display Options Dialog Box)
- Chart Tab (Editing MainChart Dialog Box)
- Series Tab (Editing MainChart Dialog Box)
- Legend Window
- Measurement Description Dialog Box
- Measurement Options Dialog Box
- Legend Columns Options Dialog Box
- Apply/Edit Template Dialog Box
- Color Palettes
- Color Palette Dialog Box
- Working with Analysis Graph Data
- Filtering and Sorting Graph Data
- Cross Result and Merged Graphs
- Configuring Graph Display
- Analysis Graphs
- Open a New Graph Dialog Box
- Vuser Graphs
- Error Graphs
- Transaction Graphs
- Average Transaction Response Time Graph
- Total Transactions per Second Graph
- Transaction Breakdown Tree
- Transactions per Second Graph
- Transaction Performance Summary Graph
- Transaction Response Time (Distribution) Graph
- Transaction Response Time (Percentile) Graph
- Transaction Response Time (Under Load) Graph
- Transaction Response Time by Location Graph
- Transaction Summary Graph
- Web Resources Graphs
- Web Page Diagnostics Graphs
- Web Page Diagnostics Tree View Overview
- Web Page Diagnostics Graphs Overview
- How to View the Breakdown of a Transaction
- Web Page Diagnostics Content Icons
- Web Page Diagnostics Graph
- Page Component Breakdown Graph
- Page Component Breakdown (Over Time) Graph
- Page Download Time Breakdown Graph
- Page Download Time Breakdown (Over Time) Graph
- Page Download Time Breakdown Graph Breakdown Options
- Time to First Buffer Breakdown Graph
- Time to First Buffer Breakdown (Over Time) Graph
- Client Side Breakdown (Over Time) Graph
- Client Side Java Script Breakdown (Over Time) Graph
- Downloaded Component Size Graph
- User-Defined Data Point Graphs
- System Resource Graphs
- Network Virtualization Graphs
- Network Monitor Graphs
- Web Server Resource Graphs
- Web Application Server Resource Graphs
- Database Server Resource Graphs
- Streaming Media Graphs
- J2EE & .NET Diagnostics Graphs
- J2EE & .NET Diagnostics Graphs Overview
- How to Enable Diagnostics for J2EE & .NET
- Viewing J2EE to SAP R3 Remote Calls
- J2EE & .NET Diagnostics Data
- Example Transaction Breakdown
- Using the J2EE & .NET Breakdown Options
- Viewing Chain of Calls and Call Stack Statistics
- Understanding the Chain of Calls Window
- Graph Filter Properties
- J2EE/.NET - Average Method Response Time in Transactions Graph
- J2EE/.NET - Average Number of Exceptions in Transactions Graph
- J2EE/.NET - Average Number of Exceptions on Server Graph
- J2EE/.NET - Average Number of Timeouts in Transactions Graph
- J2EE/.NET - Average Number of Timeouts on Server Graph
- J2EE/.NET - Average Server Method Response Time Graph
- J2EE/.NET - Method Calls per Second in Transactions Graph
- J2EE/.NET - Probes Metrics Graph
- J2EE/.NET - Server Methods Calls per Second Graph
- J2EE/.NET - Server Requests per Second Graph
- J2EE/.NET - Server Request Response Time Graph
- J2EE/.NET - Server Request Time Spent in Element Graph
- J2EE/.NET - Transactions per Second Graph
- J2EE/.NET - Transaction Response Time Server Side Graph
- J2EE/.NET - Transaction Time Spent in Element Graph
- Application Component Graphs
- COM+ Average Response Time Graph
- COM+ Breakdown Graph
- COM+ Call Count Distribution Graph
- COM+ Call Count Graph
- COM+ Call Count Per Second Graph
- COM+ Total Operation Time Distribution Graph
- COM+ Total Operation Time Graph
- Microsoft COM+ Graph
- .NET Average Response Time Graph
- .NET Breakdown Graph
- .NET Call Count Distribution Graph
- .NET Call Count Graph
- .NET Call Count per Second Graph
- .NET Resources Graph
- .NET Total Operation Time Distribution Graph
- .NET Total Operation Time Graph
- Application Deployment Solutions Graphs
- Middleware Performance Graphs
- Infrastructure Resources Graphs
- HP Service Virtualization Graphs
- Flex Graphs
- WebSocket Statistics Graphs
- Diagnostics Graphs
- Siebel Diagnostics Graphs
- Siebel Diagnostics Graphs Overview
- Call Stack Statistics Window
- Chain of Calls Window
- Siebel Area Average Response Time Graph
- Siebel Area Call Count Graph
- Siebel Area Total Response Time Graph
- Siebel Breakdown Levels
- Siebel Diagnostics Graphs Summary Report
- Siebel Request Average Response Time Graph
- Siebel Transaction Average Response Time Graph
- Siebel DB Diagnostics Graphs
- Siebel DB Diagnostics Graphs Overview
- How to Synchronize Siebel Clock Settings
- Measurement Description Dialog Box
- Siebel Database Breakdown Levels
- Siebel Database Diagnostics Options Dialog Box
- Siebel DB Side Transactions Graph
- Siebel DB Side Transactions by SQL Stage Graph
- Siebel SQL Average Execution Time Graph
- Oracle - Web Diagnostics Graphs
- SAP Diagnostics Graphs
- SAP Diagnostics Graphs Overview
- How to Configure SAP Alerts
- SAP Diagnostics - Guided Flow Tab
- SAP Diagnostics Application Flow
- Dialog Steps per Second Graph
- OS Monitor Graph
- SAP Alerts Configuration Dialog box
- SAP Alerts Window
- SAP Application Processing Time Breakdown Graph
- SAP Primary Graphs
- SAP Average Dialog Step Response Time Breakdown Graph
- SAP Average Transaction Response Time Graph
- SAP Breakdown Task Pane
- SAP Server Time Breakdown (Dialog Steps) Graphs
- SAP Server Time Breakdown Graph
- SAP Database Time Breakdown Graph
- SAP Diagnostics Summary Report
- SAP Interface Time Breakdown Graph
- SAP System Time Breakdown Graph
- SAP Secondary Graphs
- Work Processes Graph
- Siebel Diagnostics Graphs
- TruClient - Native Mobile Graphs
- Analysis Reports
- Importing Data
- Troubleshooting and Limitations for Analysis
- Additional Components
- Function Reference

LoadRunner
Software Version: 12.50
User Guide
Document Release Date: August 2015
Software Release Date: August 2015
User Guide
LoadRunner
HP LoadRunner (12.50) Page 2
Legal Notices
Warranty
The only warranties for HP products and services are set forth in the express warranty statements accompanying such
products and services. Nothing herein should be construed as constituting an additional warranty. HP shall not be liable
for technical or editorial errors or omissions contained herein.
The information contained herein is subject to change without notice.
Restricted Rights Legend
Confidential computer software. Valid license from HP required for possession, use or copying. Consistent with FAR
12.211 and 12.212, Commercial Computer Software, Computer Software Documentation, and Technical Data for
Commercial Items are licensed to the U.S. Government under vendor's standard commercial license.
Copyright Notice
© Copyright 1993-2015 Hewlett-Packard Development Company, L.P.
Trademark Notices
Adobe® is a trademark of Adobe Systems Incorporated.
Microsoft® and Windows® are U.S. registered trademarks of Microsoft Corporation.
Oracle and Java are registered trademarks of Oracle and/or its affiliates.
UNIX® is a registered trademark of The Open Group.
Support
Visit the HP Software Support Online web site at: https://softwaresupport.hp.com
This web site provides contact information and details about the products, services, and support that HP Software
offers.
HP Software online support provides customer self-solve capabilities. It provides a fast and efficient way to access
interactive technical support tools needed to manage your business. As a valued support customer, you can benefit by
using the support web site to:
lSearch for knowledge documents of interest
lSubmit and track support cases and enhancement requests
lDownload software patches
lManage support contracts
lLook up HP support contacts
lReview information about available services
lEnter into discussions with other software customers
lResearch and register for software training
Most of the support areas require that you register as an HP Passport user and sign in. Many also require a support
contract. To register for an HP Passport ID, go to: https://softwaresupport.hp.com and click Register.
To find more information about access levels, go to: https://softwaresupport.hp.com/web/softwaresupport/access-
levels.
User Guide
HP LoadRunner (12.50) Page 3
HP Software Solutions &Integrations and Best Practices
Visit HP Software Solutions Now at https://h20230.www2.hp.com/sc/solutions/index.jsp to explore how the products
in the HP Software catalog work together, exchange information, and solve business needs.
Visit the Cross Portfolio Best Practices Library at https://hpln.hp.com/group/best-practices-hpsw to access a wide
variety of best practice documents and materials.
User Guide
HP LoadRunner (12.50) Page 4

Contents
LoadRunner 1
Welcome to the LoadRunner User Guide 42
What's New in LoadRunner 12.50 42
Highlights 42
VuGen 48
Introducing VuGen 48
Vusers 49
Vuser Types 50
Keyboard Shortcuts 51
User Interface 54
VuGen Workspace 54
Restoring the layout defaults 58
How to Modify the VuGen Layout 58
Solution Explorer Pane 60
Step Navigator Pane 67
Editor Pane 69
Supported Programming Languages 70
Code Completion and Tooltips 70
Code-Coloring 71
Script Folding 72
Community Search 72
Steps Toolbox Pane 74
Bookmarks Pane 76
Snapshot Pane 77
Thumbnail Explorer 85
Errors Pane 87
Tasks Pane 88
Task Editor 89
Output Pane 90
Breakpoints Pane 92
Call Stack Pane 94
Watch Pane 95
Runtime Data Pane 96
.NET Recording Filter Pane 97
Create a New Filter Dialog Box [.NET Protocol] 100
User Guide
HP LoadRunner (12.50) Page 5

Add Reference Dialog Box [.NET Protocol] 101
Options Dialog Box 101
General Options 102
Editor Options 105
Scripting Options 111
Search and Replace Dialog Boxes 118
Business Process Report Dialog Box 120
Replay Summary Pane 123
VuGen Workflow 127
Creating or Opening Vuser Scripts 127
Creating Vuser Scripts - Overview 127
How to Create and Open Vuser Scripts 128
How to Compare Scripts Side by Side 129
Working with Application Lifecycle Management 129
Managing Scripts Using ALM - Overview 129
How to Connect to ALM 129
ALM Version Control - Overview 130
How to Work with Scripts in ALM Projects 130
How to Work with Version Controlled Scripts in ALM Projects 131
How to Save VuGen Vuser Scripts to ALM Projects 132
How to Compare Previous Versions of a Script 133
HP ALM Connection Dialog Box [VuGen] 133
Multiple Protocol Scripts 135
Script Directory Files 136
Create a New Script Dialog Box 136
How to Work with .zip Files 138
How to Create and Open Vuser Script Templates 139
Vuser Script Templates 140
Recording 140
Recording - Overview 140
Vuser Script Sections 141
How to Record a Vuser Script 144
How to Create a Business Process Report 145
Recording Options 146
Citrix > Configuration Recording Options 146
Citrix > Code Generation Recording Options 147
Citrix > Login Recording Options 147
ICA File Structure 149
Citrix > Recorder - Recording Options 150
COM/DCOM > Filter Recording Options 151
COM/DCOM > Options Recording Options 152
Correlations > ConfigurationRecording Options 153
User Guide
HP LoadRunner (12.50) Page 6

Correlations > Rules Recording Options 155
Advanced Correlation Properties Dialog Box 158
Token Substitution Testpad Dialog Box 159
Database > Database Recording Options 159
Database > Advanced Recording Options Dialog Box 160
Data Format Extension > Chain Configuration Recording Options 161
Add Prefix/Postfix to Chain Dialog Box 162
Add Data Format Extension 163
Data Format Extension > Code Generation Recording Options 165
Flex > RTMP Recording Options 166
Flex > Configuration Recording Options 167
Flex > Externalizable Objects Recording Options 167
General > Code Generation Recording Options 168
General > Protocol Recording Options 169
General > Recording - Recording Options 169
Advanced URL Dialog Box 170
Advanced HTML Dialog Box 171
General > Script Recording Options 172
GUI Properties > Web Event Configuration Recording Options 175
Custom Web Event Recording Configuration Dialog Box 175
GUI Properties > Advanced Recording Options 177
HTTP Properties > Advanced Recording Options 178
Headers Dialog Box 181
Content Type Filters Dialog Box 182
Non-Resources Dialog Box 182
Java > VM Recording Options 183
Java > Classpath Recording Options 184
Microsoft .NET > Recording - Recording Options 184
Remote Objects Property 186
Microsoft .NET > Shared DLLs Recording Options 187
Network > Mapping and Filtering Recording Options 188
Server Entry - Port Mapping Dialog Box 189
Advanced Port Mapping Settings Dialog Box 191
Server Entry - Traffic Filtering Dialog Box 191
RDP > Code Generation > Advanced Recording Options 192
RDP > Code Generation > Agent Recording Options 193
RDP > Code Generation > Basic Recording Options 194
RDP > Client Startup Recording Options 195
Recording Properties > Corba Options Recording Options 196
Recording Properties > Correlation Options - Recording Options 196
Recording Properties > Log Options Recording Options 197
Recording Properties > Recorder Options - Recording Options 198
User Guide
HP LoadRunner (12.50) Page 7

Recording Properties > Serialization Options - Recording Options 199
RTE > Configuration Recording Options 200
RTE > RTE Recording Options 201
SAPGUI > Auto Logon Recording Options 202
SAPGUI > Code Generation Recording Options 202
SAPGUI > General Recording Options 203
Silverlight > Services Recording Options 203
Add / Edit Services Dialog Box 204
Connection Settings Dialog Box 204
Protocol and Security Scenario Data Dialog Box 205
Traffic Analysis > Traffic Filters Recording Options 206
WinSock Recording Options 207
Recording Options - Miscellaneous Topics 208
Protocol Compatibility Table 208
Port Mapping and Traffic Filtering Overview 212
Port Mapping Auto Detection 213
EUC-Encoding (Japanese Windows only) 214
Script Generation Preference Overview 214
Script Language Options 215
Recording Levels - Overview 215
Serialization Overview 217
Tips for Working with Event Listening and Recording 217
Example of Click & Script Out of Context Recording 217
Providing Authentication Information 218
Recording via a Proxy - Overview 220
How to Record a Script via a Proxy 221
How to Import Actions to a Script 225
How to Regenerate a Vuser Script 225
Start Recording Dialog Box 226
Floating Recording Toolbar 229
Files Generated During Recording 231
Troubleshooting and Limitations for Recording 232
Correlating 235
Correlation Overview 235
Correlations in LoadRunner 235
Correlation Tab [Design Studio] Overview 236
Determining Which Values to Correlate 238
Modifying Saved Parameters 238
Correlation vs. Parameterization 239
Wdiff Correlation Utility 239
Correlating Java Scripts 239
How to Correlate Scripts Using Design Studio 241
User Guide
HP LoadRunner (12.50) Page 8

How To Manually Correlate Scripts 243
How to Correlate Scripts From a Snapshot 243
How to Correlate Scripts - Winsock (Snapshot Pane) 244
How to Correlate Scripts - Winsock (Manually) 245
How to Correlate Scripts - Web (Manually) 246
How to Correlate Scripts - Siebel 248
How to Correlate Scripts - Oracle NCA 252
How to Correlate Scripts - Microsoft .NET 254
How to Correlate Scripts - Java Scripts - Serialization 256
How to Correlate Scripts - Java 259
How to Correlate Scripts - Flex (XPath Correlation) 261
How to Correlate Scripts - COM 262
How to Search for Values that Need Correlation 262
How to Modify Correlation Definitions 263
How to Exclude Content Based on Content-Type 267
How to Exclude Strings or Content Types from the Correlation Scan 268
Correlation Functions - Database Vuser Scripts 269
Correlation Functions - Java Vuser Scripts 269
Correlation Functions - C Vuser Scripts 270
Design Studio [Correlation Tab] Dialog Box 271
Replaying 274
Replay Overview 274
How to Replay a Vuser Script 275
How to Work with Snapshots 276
Snapshots that Have an XML View 278
How to Add a Text Check From the XML View in the Snapshot Pane 279
Running a Vuser as a Process or Thread 280
Runtime Settings 280
Runtime Settings Overview 280
Runtime Setting Value Validation 281
Runtime Settings Views 282
Runtime Settings View Descriptions 283
Preferences View - Internet Protocol 288
Importing and Exporting Runtime Settings 299
Bookmarks Overview 299
How to Run a Vuser Script from a Command Prompt 300
How to Use Bookmarks 301
Files Generated During Replay 301
Network Virtualization (NV) Analytics Report 303
Opening the NV Analytics Report 303
NV Analyatics Report Overview 304
Summaries 304
User Guide
HP LoadRunner (12.50) Page 9

Metrics 306
Endpoint Latencies 306
HTTP Analysis 307
HTTP Metrics 308
Highlighting Resources 308
HTTP Optimization 309
HTTP Resources 310
Debugging 311
Debugging Overview 311
Error Handling 313
Additional Debugging Information 314
Working with Breakpoints 315
Breakpoints Pane 316
Watching Expressions and Variables 317
Debugging Web Vuser Scripts 318
How to Debug Scripts with Breakpoints 319
Enhancing 320
Enhancing a Script for Load Testing Overview 320
Transaction Overview 322
How to Insert Transactions 323
How to Display Transactions 324
Cross-Vuser Transaction Overview 325
How to Create a Cross-Vuser Transaction 326
Rendezvous Points 327
Adding VuGen Functions Overview 327
General Vuser Functions 329
Protocol-Specific Vuser Functions 329
Encrypting and Encoding Overview 330
Password Encoding 330
Encrypting Text 331
How to Encrypt/Decrypt Text 331
How to Encode a Password 331
Password Encoder Dialog Box 332
Database Integration Overview 332
Connecting to a Database 333
Using Data Retrieved from SQL Queries 333
Validating Database Values 335
Checking Returned Values Through a Database 337
Performing Actions on Datasets 338
How to Create a Controller Scenario from VuGen 338
How to Insert Steps into a Script 339
Create Controller Scenario Dialog Box 340
User Guide
HP LoadRunner (12.50) Page 10

Parameters 341
Parameterizing Overview 341
Parameter Types 343
How to Create a Parameter 345
Slideshow - How to Create a Parameter 346
How to Work with Existing Parameters 346
Data Assignment Methods for File/Table/XML Parameters 347
Data Assignment and Update Methods for File/Table/ XML Parameters 348
Vuser Behavior in the LoadRunner Controller 349
XML Parameters 350
How to Create an XML Parameter from a Web Service Call 350
How to Create XML Parameters - Standard Method 351
How to Define XML Value Sets 352
How to Set an Assignment Method 355
How to Modify XML Parameter Properties 356
How to Set AUT Environment Parameters 356
How to Import Parameter Data from a Database 357
Select or Create Parameter Dialog Box 357
Parameter Properties Dialog Box 358
Parameter Simulation Dialog Box 368
Parameter List Dialog Box 372
Database Query Wizard 372
Create Parameter Dialog Box 373
Parameter Original Value Dialog Box 374
Parameter Delimiters Configuration Dialog Box 374
Troubleshooting and Limitations for Parameterization 375
Asynchronous Communication 376
Synchronous and Asynchronous Concepts 376
Types of Asynchronous Communication 377
VuGen Support for Asynchronous Communication 380
How to Create an Asynchronous Vuser Script 382
Asynchronous Communication API 384
How Asynchronous Functions Differ from Synchronous Functions 385
How VuGen Modifies a Vuser Script for Asynchronous Communication 385
Defining the Start of an Asynchronous Conversation 388
Defining the End of an Asynchronous Conversation 390
Using Asynchronous Request Thresholds 392
Fine-Tuning the End of an Asynchronous Conversation 392
Correlating Asynchronous Vuser Scripts 393
Implementing Callbacks 393
Modifying Callbacks 397
Parsing URLs 401
User Guide
HP LoadRunner (12.50) Page 11

Async Rules Overview 404
Adding Async Rules 405
Async Tab [Design Studio] 407
Asynchronous Options Dialog Box 409
Asynchronous Example - Poll 410
Asynchronous Example - Push 412
Asynchronous Example - Long-Poll 414
Viewing Replay Results 416
Viewing Replay Results Overview 417
Customizing the Test Results Display 417
Connecting to Application Lifecycle Management from the Test Results Window 418
How to Send Custom Information to the Report 418
How to Configure the Appearance of the Test Results Window 418
How to Open the Test Results of a Specific Run 418
How to Find Steps in the Test Results 419
Test Results Window 419
Filters Dialog Box 421
Print Dialog Box 422
Print Preview Dialog Box 423
Export to HTML File Dialog Box 424
Protocols 426
Vuser Protocols 426
IPv6 Support 430
IPv6 Deployment 430
Protocols Supported 431
Protocol Support Limitations 431
Protocol Support for Async, IPv6, and 64-bit Recording 431
Protocol Advisor Overview 433
How to use the Protocol Advisor 433
Protocol Advisor Dialog Box 435
Protocol Advisor - Troubleshooting and Limitations 436
Ajax - Click & Script Protocol 437
Ajax (Click & Script) Protocol Overview 437
Ajax (Click & Script) Supported Frameworks 437
Ajax (Click & Script) Example Script 438
Ajax (Click & Script) Recording Tips 439
Ajax (Click & Script) - Replay Tips 440
Ajax (Click & Script) Miscellaneous Tips 441
Click & Script Troubleshooting and Limitations 442
Citrix Protocol 446
Citrix Protocol - Overview 446
How to Set Up Your Citrix Environment 447
User Guide
HP LoadRunner (12.50) Page 12

Agent for Citrix Presentation Server - Overview 449
Citrix Recording Tips 452
Citrix Synchronization 455
Citrix - Automatic Synchronization 455
Citrix - Manual Synchronization 456
Citrix - Additional Ways to Synchronize Your Script 457
Failed Bitmap Synchronization Dialog Box 458
Citrix Replaying Tips 459
Citrix Debugging Tips 461
Citrix - Troubleshooting and Limitations 463
Click & Script Protocols 466
Click & Script Protocols - Overview 466
Click & Script Recording Tips 468
Click & Script - Replay Tips 469
Click & Script Miscellaneous Tips 471
Click & Script Enhancements 471
Click & Script API Notes 474
Ordinals 475
Empty Strings 475
Click & Script Troubleshooting and Limitations 476
COM/DCOM Protocol 479
COM/DCOM Protocol Overview 479
COM/DCOM Technology Overview 480
COM/DCOM Vuser Script Structure 481
COM Sample Vuser Scripts 482
Selecting COM Objects to Record 486
Database Protocols 487
Database Protocols Overview 488
VuGen Database Recording Technology 488
Database Grids 489
Handling Database Errors 490
Debugging Database Applications 491
Database Protocols - Troubleshooting and Limitations 492
Flex (RTMP/AMF) Protocol 501
Flex Overview 501
Recording Flex Scripts 503
AMF 503
RTMP Functions 505
RTMP Tunneled Functions 505
RTMP/RTMPT Streaming 506
RTMP Tunneled 513
How to Record a Flex Script 514
User Guide
HP LoadRunner (12.50) Page 13

Setting the Flex Recording Mode 515
Example 516
Code Generation in the Flex Protocol 517
Externalizable Objects in Flex Scripts 517
Flex Correlations 520
Flex Snapshots 520
How to Serialize Flex Scripts 521
How to Query an XML Tree 522
Troubleshooting and Limitations for Flex 524
GraniteDS (Data Services) 525
Java Record Replay Protocol 525
Java Record Replay Protocol Overview 525
Supported Java Communication Protocols 526
Java Record Replay Protocol Recording Tips 526
Tips for Recording a Java Record Replay Vuser Script 526
Working with CORBA 527
CORBA Application Vendor Classes 527
Editing a CORBA Vuser Script 527
Working with RMI 529
Working with Jacada 529
Recording a Jacada Vuser 529
Editing a Jacada Vuser Script 530
How to Manually Insert Java Methods 531
To Insert Java Functions: 531
How to Manually Configure Script Generation Settings 532
Compiling and Running a Script as Part of a Package 534
Java Icon Reference List 534
Java Custom Filters Overview 535
Java Custom Filters - Determining which Elements to Include 536
How to Create a Custom Java Filter 537
Define a Custom Hook File 537
Hook File Structure 538
Troubleshooting and Limitations - Java Record Replay and Java Vuser 541
Java Vuser Protocol 541
Manually Programming Java Scripts - Overview 541
Java Protocol Programming Tips 542
Running Java Vuser Scripts 543
Opening Java Vuser Scripts in Eclipse 544
Compiling and Running a Script as Part of a Package 545
How to Manually Create a Java Script 545
How to Enhance a Java Script 548
Troubleshooting and Limitations - Java Record Replay and Java Vuser 552
User Guide
HP LoadRunner (12.50) Page 14

Java over HTTP Protocol 552
Java over HTTP Protocol Overview 552
Viewing Responses and Requests in XML Format 552
How to Record with Java over HTTP 553
How to Debug Java over HTTP scripts 554
How to Insert Parameters into Java over HTTP Scripts 555
Troubleshooting and Limitations for Java over HTTP 555
LDAP Protocol 556
LDAP Protocol Overview 556
LDAP Protocol Example Script 557
Defining Distinguished Name Entries 558
LDAP Connection Options 559
Troubleshooting and Limitations - LDAP 560
Mailing Service Protocols 560
Mailing Service Protocols Overview 560
IMAP Protocol Overview 561
MAPI Protocol Overview 561
POP3 Protocol Overview 562
SMTP Protocol Overview 563
Message Protocols 563
MMS (Multimedia Messaging Service) Protocol Overview 563
How to Run an MMS Scenario in the Controller 564
Mobile Protocols 564
How to Select a Script Type for Mobile Applications 564
TruClient - Mobile Web Protocol 565
TruClient - Native Mobile Protocol 565
SMP (SAP Mobile Platform) Protocol 566
Mobile Application - HTTP/HTMLProtocol 566
Speed Simulation for Mobile Vuser Scripts 567
Mobile Application - HTTP/HTML 568
Recording Methods 568
Recording Traffic into a Capture (Sniffer) File 569
Record Traffic with VuGen's Mobile Sniffer Agent 570
Analyzing Traffic 572
Recording with Emulation 573
How to Create a Script by Analyzing Traffic (Mobile Applications) 578
How to Record and Analyze Traffic (for Mobile Applications) 579
Recording Wizard 580
Recording Method Screen 581
Analyze Traffic Screen 582
Configure and Record Screen 583
Record Emulator Screen 584
User Guide
HP LoadRunner (12.50) Page 15

Proxy Recording Screen 585
TruClient - Mobile Web Protocol 586
TruClient - Mobile Web Protocol Overview 586
How to Record a Script with TruClient - Mobile Web 586
How to Add, Remove, and Import Mobile Device Settings for TruClient - Mobile Web 587
Mobile Device Dialog Box 587
SMP (SAP Mobile Platform) Protocol 588
.NET Protocol 589
.NET Protocol Overview 589
Considerations for Working with the .NET Protocol 589
Viewing Data Sets and Grids 590
Recording WCF Duplex Communication 591
Replacement of the Callback in the Script 593
Asynchronous Calls 595
Recording Dual HTTP Bindings 595
Connection Pooling 596
Debugging .NET Vuser Scripts 597
.NET Filters Overview 598
.NET Filters - Advanced 599
Guidelines for Setting .NET Filters 600
How to Configure Application Security and Permissions 603
Troubleshooting and Limitations - .NET 604
Replay Limitations 604
Recording Limitations 604
Oracle NCA Protocol 605
Oracle NCA Protocol Overview 605
Oracle NCA Protocol Example Scripts 606
Oracle NCA Record and Replay Tips 607
Pragma Mode 608
How to Enable the Recording of Objects by Name 609
How to Launch Oracle Applications via the Personal Home Page 611
Oracle - Troubleshooting and Limitations 612
RDP Protocol 614
RDP Protocol - Overview 614
RDP Recording Tips 614
Working with Clipboard Data (RDP Protocol) 617
Correlating Clipboard Parameters 618
RDP Snapshots - Overview 618
Image Synchronization Overview (RDP) 619
Image Synchronization Tips (RDP Protocol) 620
Image Synchronization - Shifted Coordinates (RDP Protocol) 621
Setting Security Levels in RDP Vuser Scripts 621
User Guide
HP LoadRunner (12.50) Page 16

RDP Agent (for Microsoft Terminal Server) Overview 624
How to Install / Uninstall the RDP Agent 626
How to Add Image Synchronization Points to a Script 627
Failed Image Synchronization Dialog Box (RDP Protocol) 627
Troubleshooting and Limitations for RDP 629
RTE Protocol 630
RTE Protocol Overview 630
Working with Ericom Terminal Emulation 631
SSL and SSH Support for Ericom 631
Typing Input into a Terminal Emulator 632
Setting the Timeout Value for TE_type 633
Allowing a Vuser to Type Ahead 633
Generating Unique Device Names 634
Setting the Field Demarcation Characters 635
Reading Text from the Terminal Screen 636
RTE Synchronization Overview 637
Synchronizing Block-Mode (IBM) Terminals 638
Synchronizing Character-Mode (VT) Terminals 640
How to Map Terminal Keys to PC Keyboard Keys 643
How to Record RTE Vuser Scripts 644
How to Implement Continue on Error 646
Troubleshooting and Limitations - RTE 646
IP Spoofing 646
Disconnection Failures 647
SAP Protocols 647
Selecting a SAP Protocol Type 647
SAP GUI Protocol 647
SAP Web Protocol 650
SAP (Click & Script) Protocol 651
Replaying SAP GUI Optional Windows 652
How to Configure the SAP Environment 653
How to Record SAP GUI Scripts 658
How to Replay SAP GUI Scripts 660
How to Run SAP GUI Scripts in a Scenario 660
How to Enhance SAP GUI Scripts 661
Additional SAP Resources 665
Troubleshooting and Limitations for SAP 665
Siebel Web Protocol 667
Siebel Web Protocol Overview 668
Siebel Web Recording Options and Runtime Settings 668
How to Record Transaction Breakdown Information 668
Siebel Web - Troubleshooting and Limitations 669
User Guide
HP LoadRunner (12.50) Page 17

Silverlight Protocol 671
Silverlight Protocol - Overview 671
How to Import WSDL Files 672
Silverlight - Troubleshooting and Limitations 672
TruClient Protocol 673
Introduction to TruClient 674
TruClient end-to-end workflow 674
The TruClient User Interface 675
TruClient Standalone 675
TruClient Standalone System Requirements 676
Installing the TruClient Standalone 676
Differences between TruClient installations 676
Fundamentals 677
TruClientStep Structure 679
TruClient step structure 680
Understanding step events 684
TruClient Sidebar 686
TruClient Home tab 687
TruClient Edit tab 691
Window tab 693
Run Logic tab 694
Actions tab 697
Function Libraries tab 701
TruClient Toolbox 702
Browsers in TruClient 705
Private browsing 706
TruClient Browser for IE 706
Supported browsers in TruClient 707
Develop TruClient Scripts 713
Record a TruClient script 714
Record a script 715
Implement run logic 718
Replay a TruClient Script 725
How to Synchronize TruClient Scripts Steps 725
Debug TruClient Scripts 727
TruClient Snapshots 731
Resolve Object Identification Issues 736
Descriptors 745
Enhance a TruClient Script 753
Enhance a script with Toolbox functions 753
Insert transactions into a TruClient script 754
TruClient functions and function libraries 757
User Guide
HP LoadRunner (12.50) Page 18

TruClient Event Handlers 760
TruClient General Settings 765
Troubleshooting and Limitations (General) 766
Program TruClient Scripts 770
Program in TruClient 771
Working With JavaScript in TruClient Scripts 772
Learn more about JavaScript 773
How to Insert and Modify Loops 774
How to Use VTS in TruClient 775
How to Insert Custom JavaScript and C Code into TruClient Scripts 778
Examples 778
Capture a value to a string 778
Iterate over links in a web page 783
Work with dynamic tables 787
Create a dynamic transaction name 792
Create a global variable 794
TruClient API Reference 795
TruClient Functions 796
TruClient VTS Functions 801
TruClient Step Arguments 825
TruClient Properties 828
Utilities 829
Convert a TruClient Script to a Web HTTP/HTML Script 829
Manually convert TruClient .xpi scripts 829
Troubleshooting load issues 830
Web - HTTP/HTML Protocol 834
Web - HTTP/HTML Protocol - Overview 834
Generating Vuser Scripts in JavaScript 837
Recording your Vuser Script in JavaScript 837
Auto-completion 838
To activate auto-completion on an external js file: 838
Regenerating your Vuser Script 838
Debugging your JavaScript Vuser script 838
The JavaScript Function Library 839
Using the VuGen JavaScript Engine 839
JavaScript Engine: XMLHTTPRequest Example 844
How to Convert a Web - HTTP/HTML Vuser Script into a Java Vuser Script 845
How to Create a Script for a REST API 846
Examples 847
How to Record the SPDY Protocol 847
How to Record Applications Using Smooth Streaming 848
Convert a TruClient Script to a Web HTTP/HTML Script 849
User Guide
HP LoadRunner (12.50) Page 19

Troubleshooting and Limitations - Web - HTTP/HTML Protocol 850
Web Protocols (Generic) 851
Web Protocols - Overview 851
Web Vuser Technology 851
Web Vuser Types 852
Text and Image Verification (Web Vuser Scripts) - Overview 853
Understanding Web Text Check Functions 854
How to Add Text Checks and Image Checks (Web Vuser Protocols) 855
Web Snapshots - Overview 856
Browser Emulation - Overview 857
How to Perform Load Testing with nCipher HSM 860
Working with Cache Data 861
How to Insert Caching Functions 863
Data Format Extensions (DFEs) - Overview 863
How to Implement Data Format Extension (DFE) Support 867
How to Define a Chain of DFEs 867
How to Enable DFE Support 868
How to Configure DFE Support 869
How to Apply DFE Chains to Sections of the HTTP Message 870
How DFEs Modify a Vuser Script 871
Data Format Extension List 872
Applying DFEs to a String 873
Google Web Toolkit - Data Format Extension (GWT-DFE) - Overview 874
Implementing GWT-DFE Support 877
Troubleshooting - Data Format Extension (DFE) 879
Web Services 880
Web Services - Adding Script Content 880
Web Service Testing Overview 880
Adding Web Service Script Content - Overview 880
Script Integration 882
Web Service Call Attachments 882
Special Argument Types 883
Server Traffic Scripts Overview 885
Filtering Traffic 887
Data on Secure Servers 888
How to Add Content 888
How to Assign Values to XML Elements 890
How to Generate a Test Automatically 890
How to Create a Script by Analyzing Traffic (Web Services) 891
Specify Services Screen 892
Specify Application to Record Dialog Box 892
Import SOAP Dialog Box 893
User Guide
HP LoadRunner (12.50) Page 20

New Web Service Call Dialog Box 894
Add Input Attachment Dialog Box 902
Add Array Elements Dialog Box 902
Process Base64 Data - Simple Data Dialog Box 903
Process Base64 Data - Complex Data Dialog Box 904
Aspects List 905
Specify Services Screen 906
Specify Traffic Information Screen 906
SSL Configuration Dialog Box 907
Web Services - Preparing Scripts for Replay 908
Preparing for Replay Overview 908
Testing Web Service Transport Layers Overview 908
Sending Messages over HTTP/HTTPS 908
JMS Transport Overview 909
JMS Script Functions 909
JMS Message Structure 910
Asynchronous Messages Overview 911
Sending Asynchronous Calls with HTTP/HTTPS 911
WS-Addressing 911
Customizing Overview 913
User Handlers 913
Custom Configuration Files 915
User Handler Examples 915
How to Prepare Scripts for Replay 918
How to Send Messages over JMS 919
How to Send Messages over HTTP/S 920
How to Define a Testing Method 921
How to Add a Database Connection 923
How to Create a User Handler 923
How to Customize Configuration Files 926
Web Services Snapshots - Overview 927
Database Connection Dialog Box 929
Connection String Generator Dialog Box 929
Web Services - Managing Services 930
Managing Services Overview 930
Importing Services 933
Comparison Reports 933
Web Reference Analyzer 934
How to Add and Manage Services 934
How to Analyze WSDL Dependencies 936
Manage Services Dialog Box 936
Connection Settings Dialog Box 939
User Guide
HP LoadRunner (12.50) Page 21

Import Service Dialog Box 940
Search for Service in UDDI Dialog Box 940
XML/WSDL Comparison Dialog Box 941
WSDL Reference Analyzer Dialog Box 942
Web Services - Security 942
Setting Security Overview 942
Security Tokens and Encryption 943
SAML Security Options 945
Security Scenarios Overview 946
Choosing a Security Model 947
Private, Imported, and Shared Scenarios 947
Scenario Categories 948
WCF Scenario Settings 950
The WsHttpBinding Scenario 950
The Federation Scenario 951
The Custom Binding Scenarios 952
WCF Extensibility 953
Preparing Security Scenarios for Running 955
Parameterizing Security Elements 955
Protecting Custom Headers 955
Emulating Users with Iterations 956
How to Add Security to a Web Service Script 956
How to Customize the Security 957
How to Add SAML Security 960
How to Create and Manage Security Scenarios 961
How to Parameterize Security Elements 963
Set Security Properties Dialog Box 963
Security Scenario Editor Dialog Box 967
Advanced Settings Dialog Box 968
Select Certificate Dialog Box 972
Web Services Security Examples 973
Troubleshooting and Limitations for Web Services 975
Windows Sockets Protocol 976
Recording Windows Sockets - Overview 977
Translation Tables 977
Windows Sockets Data 977
Windows Sockets Snapshots - Overview 978
Data Navigation Tools 981
Buffer Data Editing 981
How to Record a Windows Sockets Script 982
How to View and Modify Windows Sockets Buffers 983
Data Buffers 986
User Guide
HP LoadRunner (12.50) Page 22

Go To Offset Dialog Box 987
Advanced Topics 989
How to Create a PCAP File 989
Manually Programming a Script using the VuGen Editor 991
Manually Programming Scripts - Overview 991
Programming Vuser Actions 991
How to Create a Template 992
How to Configure Runtime Settings Manually 993
How to Define Transaction and Insert Rendezvous Points Manually 996
C Vuser Scripts 996
Java Vusers 997
.NET Vusers 998
Troubleshooting and Limitations - Programming 999
Creating Scripts in External IDEs 1001
Creating Vuser Scripts or LoadRunner Tests in Visual Studio or Eclipse 1001
How to Create a Vuser Script in Visual Studio 1002
How to Create a Vuser Script in Eclipse 1003
How to Develop a Unit Test Using Visual Studio (NUnit test) 1004
How to Develop a Unit Test Using Eclipse (JUnit or Selenium test) 1004
Using DLLs and Customizing VuGen 1005
Calling Functions from External DLLs 1005
How to Load a DLL Locally 1006
How to Load a DLL Globally 1007
Recording OLE Servers 1007
Using CmdLine 1008
CmdLine Environment Variables 1009
VuGen File and Library Locations 1009
Storing Runtime Settings in External Files 1010
Command Line Parameters 1010
Creating and Running Scripts in Linux 1011
Creating and Running Scripts in Linux - Overview 1011
How to Compile Scripts Manually on Linux 1011
How to Run a Vuser Script from a Linux Command Line 1012
Programming with the XML API 1014
Programming with the XML API Overview 1014
Using XML Functions 1014
Specifying XML Function Parameters 1016
XML Attributes 1018
Structuring XML Scripts 1018
Enhancing a Recorded Session with XML 1019
How to Use Result Parameters 1022
Non-English Language Support 1024
User Guide
HP LoadRunner (12.50) Page 23

Non-English Language Support Overview 1024
Page Request Header Language 1025
How to Convert Encoding Format of a String 1025
How to Convert Encoding Format of Parameter Files 1026
How to Record Web Pages with Foreign Languages 1027
Troubleshooting and Limitations for Non-English Languages 1028
HP Live Network (HPLN) Integration 1031
How to Download Content from HP Live Network (HPLN) to LoadRunner 1032
How to Upload Content from LoadRunner to HP Live Network (HPLN) 1034
HP Live Network Connection Dialog Box 1036
Download from HP Live Network Dialog Box 1038
Additional Components 1040
Standalone Applications 1044
Protocol SDK 1045
Installing the Virtual Table Server (VTS) 1046
Installing the Microsoft Terminal Server Agent 1047
Troubleshooting and Limitations for Additional Components 1047
Troubleshooting and Limitations for VuGen 1048
Controller 1049
Introducing Controller 1049
Scripts and Test Types 1049
Controller Workflow 1051
Controller Technology 1051
Controller Window 1052
HP LoadRunner Agents 1054
Load Testing Overview 1055
The HP LoadRunner Solution 1056
HP LoadRunner Terminology 1056
The HP LoadRunner Testing Process 1057
License Utility 1058
LoadRunner License Utility 1058
LoadRunner License Utility - New License 1061
How to Install a New License 1064
Additional Information About LoadRunner Licenses 1064
Designing Load Test Scenarios 1065
Planning Load Test Scenarios 1066
Load Test Planning Overview 1066
Load Testing Objectives 1066
How to Plan a Load Test 1069
How to Analyze the Application 1069
User Guide
HP LoadRunner (12.50) Page 24

How to Define the Load Test Objectives 1072
How to Plan the LoadRunner Implementation 1073
Designing Scenarios 1076
Manual Scenarios 1076
Changing Scenario Modes 1076
Goals Types for Goal-Oriented Scenarios 1077
Noise Generators 1079
How to Design a Goal-Oriented Scenario 1079
How to Design a Manual Scenario 1081
How to Change the Scenario Mode (Manual Scenario) 1083
How to View/Modify Scripts in the Scenario 1083
Relative Paths for Scripts 1085
Vuser Statuses 1086
Add Group Dialog Box 1087
Add Script Dialog Box 1088
Add Vusers Dialog Box 1089
Design Tab 1090
Edit Scenario Goal Dialog Box 1093
Group Information Dialog Box 1095
Multiple Runtime Settings Mode Dialog Box 1096
New Scenario Dialog Box 1097
Scenario Goal Pane 1099
Scenario Groups/Scripts Pane - Manual Scenarios 1100
Scenario Scripts Pane - Goal-Oriented Scenarios 1103
Scenario Start Time Dialog Box 1105
Script Information Dialog Box 1106
Vuser Information Dialog Box 1107
Vusers Dialog Box 1109
Load Generators 1110
Load Generators - Overview 1110
Adding a Cloud-Based Load Generator - Overview 1112
How to Add a Load Generator to a Scenario 1113
How to Provision Load Generators in the Cloud 1115
Managing Cloud Accounts - Overview 1119
How to Manage Cloud Accounts 1122
Manage Cloud Accounts Dialog Box 1123
How to Modify Load Generator Settings 1124
Load Balancing 1125
Setting up a Load Generator Environment 1125
How to Connect/Disconnect a Load Generator 1126
How to Connect to a Linux Load Generator Without Using RSH 1126
To stop the agent daemon: 1126
User Guide
HP LoadRunner (12.50) Page 25

Linux Environment Variables 1127
Add New Load Generator/Load Generator Information Dialog Box 1127
Create Cloud Load Generator Dialog Box 1129
Use Cloud Load Generator Dialog Box 1135
Load Generator Configuration > Connection Log Tab 1136
Load Generator Configuration > Runtime File Storage Tab 1136
Load Generator Configuration > Runtime Quota Tab 1137
Load Generator Configuration > Connection Tab 1138
Load Generator Configuration > Status Tab 1139
Load Generator Configuration > Terminal Services Tab 1139
Load Generator Configuration > Linux Environment Tab 1141
Load Generator Configuration > Vuser Limits Tab 1142
Load Generator Configuration > Vuser Status Tab 1143
Load Generator Configuration > Network Virtualization Tab 1144
Load Generators Dialog Box 1144
Network Profile Manager Dialog Box 1147
LoadRunner Agent Runtime Settings Dialog Box 1149
SSL Utility 1149
How to Create Certificates for Azure Cloud 1151
Troubleshooting and Limitations - Load Generators 1152
Scheduling Manual Scenarios 1153
Scheduling Manual Scenarios Overview 1153
Scheduling by Scenario or Group 1153
Schedule Run Modes 1154
How to Define a Schedule for the Scenario - Workflow 1155
How to Add Actions to the Scenario Schedule 1158
How to Edit Schedule Actions 1160
Schedule Actions 1162
Add Action Dialog Box 1164
Edit Action Dialog Box 1165
Scenario Schedule Pane 1166
Schedule Definition Area 1167
Interactive Schedule Graph 1168
Actions Grid 1172
Service Level Agreements 1174
Service Level Agreements Overview 1174
Tracking Period 1175
How to Define Service Level Agreements 1175
How to Define Service Level Agreements - Use-Case Scenario 1176
Advanced Options Dialog Box 1179
Goal Details Dialog Box 1179
Service Level Agreement Pane 1180
User Guide
HP LoadRunner (12.50) Page 26

Service Level Agreement Wizard 1180
Select a Measurement Page 1181
Select Transactions Page 1182
Set Load Criteria Page 1183
Set Percentile Threshold Values Page 1184
Set Threshold Values Page (Goal Per Time Interval) 1185
Set Threshold Values Page (Goal Per Whole Run) 1186
Multiple IP Addresses 1186
Multiple IP Addresses Overview 1186
How to Add IP Addresses to a Load Generator 1187
IP Wizard 1188
Configuring Terminal Services Settings 1190
Terminal Services Overview 1190
About Terminal Services 1190
How to Use the Terminal Services Manager 1191
How to Configure Terminal Sessions Over a Firewall 1192
Running Load Test Scenarios 1192
Online Monitor Graphs 1193
Online Monitor Graphs Overview 1193
About Online Monitor Graphs 1193
Viewing Monitor Data Offline 1193
How to Display Online Monitor Graphs 1194
How to Customize Online Graph and Measurement Settings 1195
How to Manage Online Graphs 1197
Graph Configuration Dialog Box 1198
Measurement Configuration Dialog Box 1199
Open a New Graph Dialog Box 1201
Overlay Graphs Dialog Box 1202
Available Graphs Tree 1202
Configuring Scenario Options 1206
Configuring Scenario Options Overview 1206
Expert Mode 1206
Runtime File Storage Locations 1207
Path Translation 1207
How to Configure Scenario Options 1208
Path Translation Table 1210
Options Dialog Box 1211
Options > Debug Information Tab 1212
Options > Execution Tab 1213
Options > General Tab 1214
Options > Monitors Tab 1215
Options > Output Tab 1217
User Guide
HP LoadRunner (12.50) Page 27

Options > Path Translation Tab 1217
Options > Runtime File Storage Tab 1218
Options > Runtime Settings Tab 1219
Options > Timeout Tab 1220
Before Running Your Scenario 1221
How to Prepare a Scenario to Run 1221
Set Results Directory Dialog Box 1225
Summary Information Dialog Box 1226
Running Scenarios 1226
Running Scenarios Overview 1227
Before run 1227
Start of run 1227
During run 1227
End of run 1227
How to Run a Scenario 1228
Initialize, Run, or Stop Vuser Groups - Use-Case Scenario 1230
Control Vusers During a Scenario Run - Use-Case Scenario 1231
Run/Stop Individual Vusers, or Add New Vusers - Use-Case Scenario 1232
Initialize/Run Additional Vusers or Stop Running Vusers - Use-Case Scenario 1236
Execution Notes Dialog Box 1242
Output Window 1242
Filtered Tab 1243
Summary Tab 1244
Run Tab 1246
Run/Stop Vusers Dialog Box 1247
Scenario Groups Pane 1250
Scenario Status Pane 1251
Transactions Dialog Box 1252
Vuser Script Log 1252
Rendezvous Points 1254
Rendezvous Points Overview 1254
How to Set Up a Rendezvous in a Scenario 1254
Rendezvous Information Dialog Box 1255
Running the Controller from the Command Line 1257
Controller Command Line Arguments Overview 1257
How to Invoke the Controller from the Command Line 1257
Tips for Using Command Line Arguments 1258
Application Lifecycle Management Arguments 1258
Runtime Arguments 1259
After the Scenario Run 1259
Post Scenario Run Procedures - Overview 1260
Collating Run Data 1260
User Guide
HP LoadRunner (12.50) Page 28

How to Collate Scenario Run Results 1260
Results Folder File Structure 1261
Collate Results Dialog Box 1263
Using Unified Functional Testing Tests in LoadRunner 1264
Using QuickTest or Unified Functional Testing Tests in LoadRunner - Overview 1264
About GUI Vuser Scripts 1264
Understanding GUI Vuser Technology 1265
Guidelines for Using QuickTest or Unified Functional Testing Tests in LoadRunner 1266
How to Add a QuickTest or Unified Functional Testing Test to a Load Test Scenario 1267
Managing Scenarios Using Application Lifecycle Management 1268
Managing Scenarios Using Application Lifecycle Management - Overview 1268
How to Work with Scenarios in ALM Projects 1268
How to Connect to ALM 1269
How to Save Scenarios to ALM Projects 1269
How to Add Vuser Scripts from an Application Lifecycle Management Project 1270
HP ALM Connection Dialog Box [Controller] 1270
Continuous Integration with Jenkins 1272
Working with Firewalls in LoadRunner 1272
How to Set Up Your LoadRunner System Over Firewalls 1273
How to Set Up an Over-Firewall Deployment 1274
How to Configure the LoadRunner Agent 1277
How to Create and Verify the Connection Between Controller and Agent Machines 1279
How to Set Firewall Monitoring Preferences 1279
MI Listener Configuration Dialog Box 1280
Monitor Configuration Dialog Box 1281
Agent Configuration Dialog Box 1283
Agent Configuration Settings Dialog Box 1285
Using Digital Certificates with Firewalls 1286
Client-Server Authentication Configurations 1287
How To Configure Client-Server Authentication 1289
How to Create a Certificate Authority (CA) 1290
How to Create an SSL Digital Certificate 1291
Authentication Settings Dialog Box 1292
Network and Security Manager - Command Line Tool 1293
Common Examples 1298
Set the agent proxy and port, and the MI Listener over a firewall 1299
Read parameters from a file 1299
Remote updates 1299
Remote updates - multiple 1299
Remote updates - multiple from file 1299
Restarting the agent 1300
Monitoring Load Test Scenarios 1300
User Guide
HP LoadRunner (12.50) Page 29

How to Set Up a Monitoring Environment 1301
Monitor Types 1302
Add Machine Dialog Box 1304
<Monitor Type> Monitor Configuration Dialog Box 1305
<monitor name> Dialog Box 1306
Runtime and Transaction Monitoring 1307
Runtime Graphs Overview 1307
Transaction Monitor Graphs Overview 1309
Web Resource Monitors 1309
Web Resource Monitoring Overview 1309
WebSocket Statistics Monitor 1313
HTTP Status Codes 1314
System Resource Monitoring 1315
System Resource Monitors Overview 1315
Windows Resource Monitoring 1315
UNIX Resource Monitoring 1316
SNMP Resource Monitoring 1316
How to Set up the UNIX Monitoring Environment 1316
UNIX Resources Performance Counters 1318
Add Windows Resources Measurements Dialog Box 1319
Network Delay Monitoring 1319
Network Monitoring Overview 1320
How to Set Up the Network Monitoring Environment 1320
How to Configure the Linux Source Machine for Network Monitoring 1322
Adding Destination Machines for Network Delay Monitoring Dialog Box 1323
Network Delay Time Dialog Box 1324
Network Delay Time Graph 1325
Network Monitor Settings for Defined Path Dialog Box 1325
Troubleshooting and Limitations - Network Delay Monitor 1326
Web Server Resource Monitoring 1327
Web Server Resource Monitoring Overview 1328
How to change the Apache default server properties 1328
HTTP Status Codes 1328
Microsoft IIS Performance Counters 1329
Apache Performance Counters 1330
Web Application Server Monitoring 1330
Web Application Server Resource Monitoring Overview 1331
MS Active Server Pages Performance Counters 1331
Microsoft Active Server Pages Dialog Box 1332
TruClient - Native Mobile Monitors 1332
CPU Utilization Percentage Graph 1332
Total Free Memory In Device Monitor 1333
User Guide
HP LoadRunner (12.50) Page 30

Total Memory Consumed by Application Monitor 1333
Database Server Resource Monitoring 1333
Database Resource Monitoring Overview 1333
How to Set Up the Oracle Monitoring Environment 1334
Oracle Performance Counters 1335
SQL Server Performance Counters 1337
HP Network Virtualization Monitoring 1338
Average Latency Monitor 1338
Packet Loss Monitor 1339
Average Throughput Monitor 1341
Average Bandwidth Utilization Monitor 1343
Total Throughput Monitor 1344
SiteScope Server Monitoring 1345
SiteScope Resource Monitoring 1346
How to Set up the SiteScope Integration 1346
Flex Monitoring 1347
Streaming Media Monitoring 1347
Streaming Media Monitoring Overview 1347
RealPlayer Client Performance Counters 1348
Media Player Client Performance Counters 1349
ERP/CRM Server Resource Monitoring 1350
ERP/CRM Server Resource Monitoring Overview 1350
Siebel Server Manager Performance Counters 1350
Siebel Server Manager Configuration Dialog Box 1351
Troubleshooting and Limitations - Siebel Server Manager Monitor 1352
Application Deployment Solution Monitoring 1352
Application Deployment Solution Monitoring Overview 1353
How to Set up the Citrix Monitoring Environment 1353
Citrix Server Performance Counters 1354
Citrix Monitor Dialog Box 1358
Middleware Performance Monitoring 1359
Middleware Performance Monitoring Overview 1359
How to Set Up the IBM WebSphere MQ Monitor 1359
IBM WebSphere MQ Performance Counters 1361
IBM WebSphere MQ Queue Attributes 1363
MQ Monitor Add Measurements Dialog Box 1363
Infrastructure Resources Monitoring 1365
Infrastructure Resources Monitoring Overview 1365
Network Client Performance Counters 1365
Network Virtualization Integration 1366
Network Virtualization Locations 1367
Excluding Machines from Network Virtualization 1367
User Guide
HP LoadRunner (12.50) Page 31

How to Run a Scenario with Network Virtualization 1368
Configure the network virtualization settings per location 1369
Virtual Locations Settings Dialog Box 1371
Per Group vs Per Load Generator 1373
Troubleshooting and Limitations for Network Virtualization 1373
Service Virtualization Integration 1374
How to Use Service Virtualization when Designing Scenarios 1376
HP Service Virtualization Setup Dialog Box 1378
HP Service Virtualization Runtime Dialog Box 1380
Service Virtualization Monitors 1381
Working with Diagnostics 1383
How to Install the LoadRunner J2EE/.NET Diagnostics Add-in 1385
How to Configure a LoadRunner Scenario to use J2EE/.NET Diagnostics 1385
How to View J2EE/.NET Diagnostics Data in LoadRunner During a Scenario Run 1386
How to View Offline J2EE/.NET Diagnostics Results 1387
HP Diagnostics for J2EE/.NET Setup Dialog Box 1387
Diagnostics Distribution Dialog Box 1388
J2EE/.NET Configuration Dialog Box 1390
Troubleshooting and Limitations for Firewalls 1391
Troubleshooting and Limitations for Controller 1394
Linux Machine Issues 1394
Shellshock Vulnerability 1395
Analysis 1397
Introducing Analysis 1397
Results Overview 1397
Analysis Toolbars 1398
Analysis API 1400
Workflow 1400
Analysis Basics 1401
Session Explorer Window 1402
Analysis Window Layouts 1403
Printing Graphs or Reports 1404
Configuring Analysis 1405
Summary Data Versus Complete Data 1405
Importing Data Directly from the Analysis Machine 1405
How to Configure Settings for Analyzing Load Test Results 1407
General Tab (Options Dialog Box) 1407
Result Collection Tab (Options Dialog Box) 1410
Data Aggregation Configuration Dialog Box (Result Collection Tab) 1413
Database Tab (Options Dialog Box) 1414
User Guide
HP LoadRunner (12.50) Page 32

Advanced Options Dialog Box (Database Tab) 1418
Web Page Diagnostics Tab (Options Dialog Box) 1419
Session Information Dialog Box (Options Dialog Box) 1420
Viewing Load Test Scenario Information 1422
Viewing Load Test Scenario Information 1422
How to Configure Controller Output Messages Settings 1423
Controller Output Messages Window 1424
Summary Tab 1424
Filtered Tab 1426
Scenario Runtime Settings Dialog Box 1428
Defining Service Level Agreements 1428
Service Level Agreements Overview 1428
Tracking Period 1429
How to Define Service Level Agreements 1429
How to Define Service Level Agreements - Use-Case Scenario 1431
Service Level Agreement Pane 1433
Advanced Options Dialog Box (Service Level Agreement Pane) 1434
Goal Details Dialog Box (Service Level Agreement Pane) 1435
Service Level Agreement Wizard 1435
Select a Measurement Page 1436
Select Transactions Page 1437
Set Load Criteria Page 1437
Set Percentile Threshold Values Page 1439
Set Threshold Values Page (Goal Per Time Interval) 1439
Set Threshold Values Page (Goal Per Whole Run) 1440
Working with Application Lifecycle Management 1441
Managing Results Using ALM - Overview 1441
How to Connect to ALM from Analysis 1441
How to Work with Results in ALM - Without Performance Center 1442
How to Work with Results in ALM - With Performance Center 1443
How to Upload a Report to ALM 1445
HP ALM Connection Dialog Box 1446
Upload Report to Test Lab Dialog Box 1448
Setup 1449
Configuring Graph Display 1449
How to Customize the Analysis Display 1449
Display Options Dialog Box 1450
Editing Main Chart Dialog Box (Display Options Dialog Box) 1452
Chart Tab (Editing MainChart Dialog Box) 1453
Series Tab (Editing MainChart Dialog Box) 1454
Legend Window 1455
Measurement Description Dialog Box 1458
User Guide
HP LoadRunner (12.50) Page 33

Measurement Options Dialog Box 1459
Legend Columns Options Dialog Box 1460
Apply/Edit Template Dialog Box 1461
Color Palettes 1463
Color Palette Dialog Box 1463
Working with Analysis Graph Data 1466
Determining a Point's Coordinates 1466
Drilling Down in a Graph 1467
Changing the Granularity of the Data 1468
Viewing Measurement Trends 1469
Auto Correlating Measurements 1470
Viewing Raw Data 1471
How to Manage Graph Data 1471
Drill Down Options Dialog Box 1473
Auto Correlate Dialog Box 1474
Graph/Raw Data View Table 1477
Graph Properties Pane 1478
Filtering and Sorting Graph Data 1480
Filtering Graph Data Overview 1480
Sorting Graph Data Overview 1480
Filter Conditions 1481
Custom Filter Dialog Box 1490
Filter Dialog Boxes 1491
Filter Builder Dialog Box 1493
Hierarchical Path Dialog Box 1494
Scenario Elapsed Time Dialog Box 1494
Set Dimension Information Dialog Box 1495
Vuser ID Dialog Box 1496
Cross Result and Merged Graphs 1497
Cross Result and Merged Graphs Overview 1497
Cross Result Graphs Overview 1497
Merging Types Overview 1498
How to Generate Cross Results Graphs 1500
How to Generate Merged Graphs 1501
Merge Graphs Dialog Box 1501
Analysis Graphs 1502
Open a New Graph Dialog Box 1502
Vuser Graphs 1504
Rendezvous Graph (Vuser Graphs) 1504
Running Vusers Graph 1505
Vuser Summary Graph 1506
Error Graphs 1507
User Guide
HP LoadRunner (12.50) Page 34

Errors per Second (by Description) Graph 1507
Errors per Second Graph 1508
Error Statistics (by Description) Graph 1509
Error Statistics Graph 1510
Total Errors per Second Graph 1511
Transaction Graphs 1512
Average Transaction Response Time Graph 1512
Total Transactions per Second Graph 1514
Transaction Breakdown Tree 1515
Transactions per Second Graph 1516
Transaction Performance Summary Graph 1517
Transaction Response Time (Distribution) Graph 1518
Transaction Response Time (Percentile) Graph 1518
Transaction Response Time (Under Load) Graph 1520
Transaction Response Time by Location Graph 1520
Transaction Summary Graph 1521
Web Resources Graphs 1522
Web Resources Graphs Overview 1522
Hits per Second Graph 1523
Throughput Graph 1524
HTTP Status Code Summary Graph 1525
HTTP Status Codes 1525
HTTP Responses per Second Graph 1527
Pages Downloaded per Second Graph 1528
Retries per Second Graph 1530
Retries Summary Graph 1531
Connections Graph 1531
Connections per Second Graph 1532
SSLs per Second Graph 1533
Web Page Diagnostics Graphs 1534
Web Page Diagnostics Tree View Overview 1534
Web Page Diagnostics Graphs Overview 1535
How to View the Breakdown of a Transaction 1536
Web Page Diagnostics Content Icons 1537
Web Page Diagnostics Graph 1538
Page Component Breakdown Graph 1540
Page Component Breakdown (Over Time) Graph 1541
Page Download Time Breakdown Graph 1542
Page Download Time Breakdown (Over Time) Graph 1544
Page Download Time Breakdown Graph Breakdown Options 1546
Time to First Buffer Breakdown Graph 1547
Time to First Buffer Breakdown (Over Time) Graph 1549
User Guide
HP LoadRunner (12.50) Page 35

Client Side Breakdown (Over Time) Graph 1551
Client Side Java Script Breakdown (Over Time) Graph 1552
Downloaded Component Size Graph 1553
User-Defined Data Point Graphs 1554
User-Defined Data Point Graphs Overview 1555
Data Points (Average) Graph 1555
Data Points (Sum) Graph 1556
System Resource Graphs 1557
Server Resources Performance Counters 1557
Linux Resources Default Measurements 1558
Windows Resources Default Measurements 1559
Server Resources Graph 1561
Host Resources Graph 1561
SNMP Resources Graph 1562
Linux Resources Graph 1563
Windows Resources Graph 1564
Network Virtualization Graphs 1565
Packet Loss Graph 1565
Average Latency Graph 1568
Average Bandwidth Utilization Graph 1569
Average Throughput Graph 1571
Total Throughput Graph 1572
Network Monitor Graphs 1573
Network Monitor Graphs Overview 1574
Network Delay Time Graph 1574
Network Segment Delay Graph 1575
Network Sub-Path Time Graph 1576
Web Server Resource Graphs 1577
Web Server Resource Graphs Overview 1577
Apache Server Measurements 1577
IIS Server Measurements 1578
Apache Server Graph 1578
Microsoft Information Internet Server (IIS) Graph 1579
Web Application Server Resource Graphs 1580
Web Application Server Resource Graphs Overview 1580
Web Application Server Resource Graphs Measurements 1581
Microsoft Active Server Pages (ASP) Graph 1589
Oracle9iAS HTTP Server Graph 1589
WebLogic (SNMP) Graph 1590
WebSphere Application Server Graph 1590
Database Server Resource Graphs 1590
DB2 Database Manager Counters 1591
User Guide
HP LoadRunner (12.50) Page 36

DB2 Database Counters 1592
DB2 Application Counters 1598
Oracle Server Monitoring Measurements 1602
SQL Server Default Counters 1604
Sybase Server Monitoring Measurements 1605
DB2 Graph 1608
Oracle Graph 1609
SQL Server Graph 1610
Sybase Graph 1611
Streaming Media Graphs 1611
Streaming Media Graphs Overview 1611
Media Player Client Monitoring Measurements 1612
RealPlayer Client Monitoring Measurements 1613
RealPlayer Server Monitoring Measurements 1614
Windows Media Server Default Measurements 1615
Media Player Client Graph 1616
Real Client Graph 1616
Real Server Graph 1617
Windows Media Server Graph 1618
J2EE & .NET Diagnostics Graphs 1618
J2EE & .NET Diagnostics Graphs Overview 1619
How to Enable Diagnostics for J2EE & .NET 1619
Viewing J2EE to SAP R3 Remote Calls 1619
J2EE & .NET Diagnostics Data 1621
Example Transaction Breakdown 1621
Using the J2EE & .NET Breakdown Options 1626
Viewing Chain of Calls and Call Stack Statistics 1628
The Chain of Calls Windows 1629
Understanding the Chain of Calls Window 1630
Graph Filter Properties 1632
J2EE/.NET - Average Method Response Time in Transactions Graph 1633
J2EE/.NET - Average Number of Exceptions in Transactions Graph 1633
J2EE/.NET - Average Number of Exceptions on Server Graph 1634
J2EE/.NET - Average Number of Timeouts in Transactions Graph 1635
J2EE/.NET - Average Number of Timeouts on Server Graph 1636
J2EE/.NET - Average Server Method Response Time Graph 1637
J2EE/.NET - Method Calls per Second in Transactions Graph 1637
J2EE/.NET - Probes Metrics Graph 1638
J2EE/.NET - Server Methods Calls per Second Graph 1640
J2EE/.NET - Server Requests per Second Graph 1641
J2EE/.NET - Server Request Response Time Graph 1642
J2EE/.NET - Server Request Time Spent in Element Graph 1642
User Guide
HP LoadRunner (12.50) Page 37

J2EE/.NET - Transactions per Second Graph 1644
J2EE/.NET - Transaction Response Time Server Side Graph 1645
J2EE/.NET - Transaction Time Spent in Element Graph 1646
Application Component Graphs 1647
COM+ Average Response Time Graph 1648
COM+ Breakdown Graph 1649
COM+ Call Count Distribution Graph 1651
COM+ Call Count Graph 1652
COM+ Call Count Per Second Graph 1653
COM+ Total Operation Time Distribution Graph 1654
COM+ Total Operation Time Graph 1655
Microsoft COM+ Graph 1656
.NET Average Response Time Graph 1659
.NET Breakdown Graph 1660
.NET Call Count Distribution Graph 1661
.NET Call Count Graph 1662
.NET Call Count per Second Graph 1663
.NET Resources Graph 1664
.NET Total Operation Time Distribution Graph 1668
.NET Total Operation Time Graph 1668
Application Deployment Solutions Graphs 1669
Citrix Measurements 1670
Citrix Server Graph 1674
Middleware Performance Graphs 1675
IBM WebSphere MQ Counters 1675
Tuxedo Resources Graph Measurements 1677
IBM WebSphere MQ Graph 1679
Tuxedo Resources Graph 1680
Infrastructure Resources Graphs 1681
Network Client Measurements 1681
Network Client Graph 1682
HP Service Virtualization Graphs 1682
Service Virtualization Graphs Overview 1683
HP Service Virtualization Operations Graph 1683
HP Service Virtualization Services Graph 1684
Flex Graphs 1684
Flex RTMP Throughput Graph 1685
Flex RTMP Other Statistics Graph 1685
Flex RTMP Connections Graph 1686
TruClient CPU Utilization Percentage Graph 1687
Flex Average Buffering Time Graph 1688
WebSocket Statistics Graphs 1689
User Guide
HP LoadRunner (12.50) Page 38

Diagnostics Graphs 1689
Siebel Diagnostics Graphs 1690
Siebel Diagnostics Graphs Overview 1690
Call Stack Statistics Window 1691
Chain of Calls Window 1692
Siebel Area Average Response Time Graph 1694
Siebel Area Call Count Graph 1695
Siebel Area Total Response Time Graph 1696
Siebel Breakdown Levels 1697
Siebel Diagnostics Graphs Summary Report 1700
Siebel Request Average Response Time Graph 1701
Siebel Transaction Average Response Time Graph 1702
Siebel DB Diagnostics Graphs 1703
Siebel DB Diagnostics Graphs Overview 1703
How to Synchronize Siebel Clock Settings 1704
Measurement Description Dialog Box 1705
Siebel Database Breakdown Levels 1706
Siebel Database Diagnostics Options Dialog Box 1708
Siebel DB Side Transactions Graph 1710
Siebel DB Side Transactions by SQL Stage Graph 1710
Siebel SQL Average Execution Time Graph 1711
Oracle - Web Diagnostics Graphs 1711
Oracle - Web Diagnostics Graphs Overview 1711
Measurement Description Dialog Box 1712
Oracle Breakdown Levels 1713
Oracle - WebDB Side Transactions Graph 1716
Oracle - WebDB Side Transactions by SQL Stage Graph 1716
Oracle - Web SQL Average Execution Time Graph 1717
SAP Diagnostics Graphs 1717
SAP Diagnostics Graphs Overview 1717
How to Configure SAP Alerts 1717
SAP Diagnostics - Guided Flow Tab 1718
SAP Diagnostics Application Flow 1720
Dialog Steps per Second Graph 1721
OS Monitor Graph 1721
SAP Alerts Configuration Dialog box 1722
SAP Alerts Window 1723
SAP Application Processing Time Breakdown Graph 1724
SAP Primary Graphs 1724
SAP Average Dialog Step Response Time Breakdown Graph 1724
SAP Average Transaction Response Time Graph 1725
SAP Breakdown Task Pane 1726
User Guide
HP LoadRunner (12.50) Page 39

SAP Server Time Breakdown (Dialog Steps) Graphs 1728
SAP Server Time Breakdown Graph 1729
SAP Database Time Breakdown Graph 1730
SAP Diagnostics Summary Report 1730
SAP Interface Time Breakdown Graph 1732
SAP System Time Breakdown Graph 1732
SAP Secondary Graphs 1733
Work Processes Graph 1733
TruClient - Native Mobile Graphs 1734
TruClient CPU Utilization Percentage Graph 1734
TruClient Free Memory In Device Graph 1735
TruClient Memory Consumed by Application Graph 1735
Analysis Reports 1736
Understanding Analysis Reports 1736
Analysis Reports Overview 1736
Analyze Transaction Settings Dialog Box 1737
Analyze Transactions Dialog Box 1738
New Report Dialog Box 1740
Analysis Report Templates 1742
Report Templates Overview 1742
Report Templates Dialog Box 1742
Report Templates - General Tab 1744
Report Templates - Format Tab 1745
Report Templates - Content Tab 1747
Analysis Report Types 1749
Summary Report Overview 1749
Summary Report 1749
HTML Reports 1753
SLA Reports 1754
Transaction Analysis Report 1755
Importing Data 1756
Import Data Tool Overview 1756
How to Use the Import Data Tool 1757
How to Define Custom File Formats 1758
Supported File Types 1758
Advanced Settings Dialog Box (Import Data Dialog Box) 1760
Define External Format Dialog Box 1761
Import Data Dialog Box 1763
Troubleshooting and Limitations for Analysis 1764
General 1765
Graphs 1766
ALM Integration 1766
User Guide
HP LoadRunner (12.50) Page 40
Welcome to the LoadRunner User Guide
Welcome to LoadRunner, the HP solution for application performance testing. LoadRunner stresses
your entire application to isolate and identify potential client, network, and server bottlenecks.
LoadRunner includes:
lVuGen. HP's tool for creating Vuser scripts. You use VuGen to develop a Vuser script by recording a
user performing typical business processes. The scripts let you emulate real-life situations.
lController. Allows you to easily and effectively control all the Vusers from a single point of control
and monitor the scenario performance during test execution.
lAnalysis. You use Analysis after running a load test scenario in the HP LoadRunner Controller or HP
Performance Center. The Analysis graphs help you determine system performance and provide
information about transactions and Vusers. You can compare multiple graphs by combining results
from several load test scenarios or merging several graphs into one.
You can access various additional documentation for LoadRunner from Start > All Programs > HP
Software > HP LoadRunner > Documentation. In icon-based such as Windows 8, search for the User
Guide.
What's New in LoadRunner 12.50
Highlights
lJavaScript as a new scripting language for the Web - HTTP/HTML protocol, empowering scripting
capabilities.
lImprovements in LoadRunner integration with HP Network Virtualization:
lNetwork Virtualization Analytics report provides advanced network performance breakdown,
including optimization suggestions.
lNetwork Virtualization emulation provides support for additional protocols.
lTruClient record and replay is now supported in Chromium, enabling cross-browser capabilities such
as the ability to record in one browser and replay in another.
lLoadRunner Help Center is accessible both locally and online. To access the online help, click
http://lrhelp.saas.hp.com/en/12.50/help/.
For details about these highlights, see the sections below and their associated links.
New supported technologies and platforms
lGoogle Compute Engine available as a cloud provider in the Controller.
User Guide
Welcome to the LoadRunner User Guide
HP LoadRunner (12.50) Page 42
lSupport of GWT DFEon Linux.
lSupport for the latest versions of Internet Explorer, Google Chrome, and Firefox browsers.
lSupport for latest versions of Eclipse and Selenium.
lUpdated Linux load generator matrix with extended support for 64-bit systems. For details, see the
section Supported Linux distributions in the Readme file.
Improved HP Network Virtualization integration
lSimplified process for creating a test with "Network Virtualization Integration" on page1366:
lPredefined virtual locations.
lSimpler access to the Network Virtualization settings from the LoadRunner user interface.
lAbility to define virtual locations for all protocols. For details, see the Product Availability Matrix.
lNew Analysis graph comparing transaction response times by location.
lUnified licensing management (LoadRunner and Network Virtualization).
lThe default installation of LoadRunner includes a Network Virtualization Community license with two
free Vusers capable of running in virtual locations.
HP NV Analytics
lEnhanced replay summary in VuGen, with Network Virtualization statistics for Web-based and
TruClient - Web protocols.
lA fully functional version of NV Analytics with a 30-day license.
lNetwork Virtualization Analytics Standalone and Predictor integrations, providing feedback that
enables you to improve your Web application performance. Analytics Standalone and Predictor are
separate installations, available in the DVD/Additional Components/HP NV folder.
For details, see "Network Virtualization (NV) Analytics Report" on page303.
Protocol enhancements
lWeb - HTTP/HTML:
lAbility to create script code in JavaScript as an alternative to C. For details, see "General > Script
Recording Options" on page172.
lUsability enhancements in GWT DFE mechanism.
lAbility to generate WebSocket code directly from pcap files. For details, see "Analyzing Traffic" on
page572.
lAbility to create Vuser Script from HTTP Archive (HAR) files. For details, see "Analyzing Traffic" on
page572.
lSupport for 64-bit recording in Google Chrome.
lAbility to set default SSL level in Runtime settings. For details, see " Preferences View - Internet
Protocol" on page288.
User Guide
Welcome to the LoadRunner User Guide
HP LoadRunner (12.50) Page 43
lInitial Authentication for NTLM and Kerberos authentications. For details, see web_set_sockets_
option in the LoadRunner Function Reference.
lCorrelation settings enhancements, with improvements to the TestPad dialog box and ability to
exclude content types through the user interface. For details, see "Correlations >
ConfigurationRecording Options" on page153.
lAutomatic password hiding within script code. For details, see "HTTP Properties > Advanced
Recording Options" on page178.
lRecording alerts, issuing warnings to indicate that SSL is not being recorded.
lTruClient:
lNew protocol, TruClient - Web, allows cross-record and replay between Internet Explorer, Firefox,
and Chromium browsers. A script recorded with one browser, can be replayed in another browser.
For details, see "Record a TruClient script" on page714.
oAbility to convert TruClient - Firefox or TruClient - IE scripts to TruClient - Web.
oNew toolbox step, If Browser, allows you to add browser-specific steps.
lA global watch panel allows you to view variable values using breakpoints. For details, see "Replay
a TruClient Script" on page725.
lSupport for download filters in TruClient - Web scripts. For details, see the hints in the Network >
Download Filters view of the Runtime settings (F4).
l"TruClient Event Handlers" on page760 support for the following dialog boxes: alert, confirm,
prompt, and authentication.
lAbility to mark Generic Browser steps as optional. For details, see "Enhance a script with Toolbox
functions" on page753.
lImproved reporting, by designating the time spent on object identification for optional steps that
were not replayed, as wasted time. For details, see "Resolve Object Identification Issues" on
page736.
lEnhancements to the user interface:
oAbility to group multiple steps into an action.
oAbility to rename a function library.
oAbility to close dialog boxes using the Esc key.
oAbility to open context sensitive help using the F1 key from all dialog boxes.
oAbility to apply a dark theme to the TruClient sidebar.
lA TruClient standalone setup file allows you to install TruClient independent of VuGen. Access the
setup file in the Standalone Applications folder under the installation media's root folder.
lCitrix:
lSupport for XenApp with App-V.
lAbility to override recorded synchronization area by specifying exact values for top-left point,
width, and height of the synchronization area in the "Snapshot Pane" on page77.
User Guide
Welcome to the LoadRunner User Guide
HP LoadRunner (12.50) Page 44
lAbility to synchronize when launching the Citrix agent. For details, see ctrx_wait_for_event in the
LoadRunner Function Reference.
lImproved "Citrix Recording Tips" on page452with additional tips and guidelines.
l.NET:
lSupport for Async and Await modifiers for "Asynchronous Calls" on page595.
lThe filter manager is now a dockable pane, accessible from the View menu. For details, see ".NET
Recording Filter Pane" on page97.
lYou can manage a method's inclusion or exclusion from the VuGen editor's context menu. For
details, see "Guidelines for Setting .NET Filters" on page600.
lWeb Services: Ability to create Vuser script from Fiddler .saz files. For details, see "How to Create a
Script by Analyzing Traffic (Web Services)" on page891.
lFlex:
lSupport for RTMP over SSL (RTMPS).. For details, see "RTMP/RTMPT Streaming" on page506.
lAbility to insert a text check from the "Floating Recording Toolbar" on page229
lRDP: Session management improvements, with ability to resume unclosed sessions and terminate
sessions at the end of a replay. For details, see the field descriptions in the RDP > Advanced view in
the Runtime settings.
lPOP3, SMTP, IMAP: When recording a login step in which an IP address was specified, the script saves
the IP address instead of the host name. For details, see "Mailing Service Protocols Overview" on
page560.
lRTE: New explicit disconnect API command. For details, see the TE_disconnect in the LoadRunner
Function Reference.
lSAP - Web, Siebel - Web: Support for remote and local proxy recording. For details, see "Recording
via a Proxy - Overview" on page220.
lJava over HTTP: Support for DFE extensions (with the exception of GWT).
lWindows Sockets: Support for SSL. For details, see lrs_start_ssl in the LoadRunner Function
Reference.
VuGen replay summary improvements
lImproved replay statistics details and ability to view results for script actions.
lExport replay statistics to PDF.
lLink to Network Virtualization Analytics reports for Web-based and TruClient protocols.
For details, see "Replay Summary Pane" on page123.
VuGen general usability improvements
lJavaScript language support for Web - HTTP/HTML protocol. For details, see "General > Script
Recording Options" on page172.
User Guide
Welcome to the LoadRunner User Guide
HP LoadRunner (12.50) Page 45
lProxy recording enhancements: Support of traffic filtering, client-side certificates, and error
detection. For details, see "Recording via a Proxy - Overview" on page220.
lAbility to enable/disable Async rules when recording a script. For details, see "Asynchronous Options
Dialog Box" on page409.
lCorrelation support for JSON content type (Windows platform only). For details, see web_reg_save_
param_json in the LoadRunner Function Reference.
lAbility to edit and save all file types in VuGen code "Editor Pane" on page69.
lEnhanced keyboard support for the Runtime Settings views. For details, see "Runtime Settings
Overview" on page280.
Analysis improvements
lSupport for HTML reports in Google Chrome and Firefox browsers. For details, see "HTML Reports" on
page1753.
lNew "TruClient - Native Mobile Graphs" on page1734 graphs were added showing CPU, memory, and
free memory on device.
lPerformance and Graphs UI improvements.
lNew "Transaction Response Time by Location Graph" on page1520.
Security enhancements
lUpdated to OpenSSL version 1.0.2d incorporating all of the latest security fixes.
lFIPS Windows compatibility.
Load generator improvements
lDocker installation for Linux load generators. For details, see the LoadRunner Installation Guide.
Increased documentation accessibility
lLoadRunner Help Center is available on the Web. You can switch between the online and local Help
Centers using the button at the top right of the Help Center page.
Integrations with latest HP product versions
lHP Mobile Center:
lTruClient - Native Mobile protocol integration with version 1.50 of HP Mobile Center. For details
see the Mobile Center Help.
lNew "TruClient - Native Mobile Monitors" on page1332 and "TruClient - Native Mobile Graphs" on
page1734 showing CPU, memory, and free memory on mobile device.
lHP Service Virtualization:
User Guide
Welcome to the LoadRunner User Guide
HP LoadRunner (12.50) Page 46
lIntegration with HP Service Virtualization 3.70.
lAuto deploy functionality allowing services to be deployed automatically when test run begins. For
details, see "How to Use Service Virtualization when Designing Scenarios" on page1376.
lImproved "HP Service Virtualization Setup Dialog Box" on page1378 for configuring services
before the test run.
lImproved "HP Service Virtualization Runtime Dialog Box" on page1380 allowing interaction with
services during runtime.
lJenkins plugin: HP Application and Automation Tools integration with Jenkins version 1.602.
lIntegration with recent versions of the following HP products:
lHP Diagnostics
lHP SiteScope
lHP Unified Functional Testing (UFT)
lHP Application Lifecycle Management (ALM)
lHPPerformance Center
lHPBusiness Process Monitor (BPM)
For more details about the supported integrations for LoadRunner, see the HP Software Integrations
Support Matrices.
For details about the supported versions, see the Product Availability Matrix.
User Guide
Welcome to the LoadRunner User Guide
HP LoadRunner (12.50) Page 47
VuGen
HP Virtual User Generator (VuGen) is a component of LoadRunner, enabling you to record and develop
scripts for load testing.
To learn more about VuGen, see "Introducing VuGen" below.
Introducing VuGen
Welcome to LoadRunner's Virtual User Generator, VuGen, HP's tool for creating Vuser scripts.
When testing or monitoring an environment, you need to emulate the true behavior of users on your
system. HP testing tools emulate an environment in which users concurrently work on, or access your
system. To perform this emulation, the human is replaced with a virtual user, or a Vuser. The actions
that a Vuser performs are typically recorded in a Vuser script. The primary tool for creating Vuser scripts
is HP's Virtual User Generator, also known as VuGen.
You use VuGen to develop a Vuser script by recording a user performing typical business processes. The
Vuser scripts let you emulate real-life situations.
This following sections describe how to create scripts through recording or manual development, and
the various protocols supported by VuGen.
You use the scripts created with VuGen in conjunction with other products, as follows:
lHP LoadRunner, a tool for performance testing, stresses your entire application to isolate and
identify potential client, network, and server bottlenecks.
lHP StormRunner Load is a cloud-based load testing solution that allows Agile development teams to
create effective tests.
lHP Performance Center implements the capabilities of LoadRunner on an enterprise level.
lHP Business Service Management (BSM) helps you optimize the management and availability of
business applications and systems in production. VuGen is used in conjunction with the following BSM
components:
lBusiness Process Monitor (BPM) software is a synthetic monitoring solution that simulates
business transactions—whether or not real users are active. You use VuGen to create scripts for
BPM, in order to reuse assets in testing and production environments.
lReal User Monitoring (RUM) software monitors application performance and availability on
business critical application services, for all users. You use VuGen to capture and replay user
sessions, and to create test scripts that reflect real user behavior.
lPerformance Testing as a Service (PTaaS) enables you to run and analyze performance tests on
your web applications using resources in the cloud. You can use VuGen to record HTTP/HTML scripts
that are uploaded to the PTaaS script cloud repository.
lHP AppPulse enables you to monitor applications across traditional, mobile, virtualized, and cloud
User Guide
VuGen
HP LoadRunner (12.50) Page 48

environments. You can use VuGen to record scripts for AppPulse, across a range of protocols. The
scripts are imported into AppPulse and used for availability and performance monitoring, by
automatically reproducing the activity of the user.
Vusers
Vuser Technology
You use VuGen to develop a Vuser script by recording a user performing typical business processes on a
client application. VuGen records the actions that you perform during the recording session, recording
only the activity between the client and the server.
During recording, VuGen monitors the client and traces all the requests sent to and received from the
server.
After the recording, VuGen generates various functions that define the actions performed during the
recording session. VuGen inserts these functions into the VuGen editor to create a basic Vuser script.
Instead of having to manually program the application's API function calls to the server, VuGen
automatically generates functions that model and emulate real world situations.
VuGen not only records Vuser scripts, but also replays them. Replaying scripts from VuGen is useful for
debugging. It enables you to determine how a Vuser script will run when it is executed as part of a larger
test.
During playback, Vuser scripts communicate directly with the server by executing calls to the server API
functions. When a Vuser communicates directly with a server, system resources are not required for the
client interface. This lets you run a large number of Vusers simultaneously on a single workstation, and
enables you to use only a few testing machines to emulate large server loads.
User Guide
VuGen
HP LoadRunner (12.50) Page 49
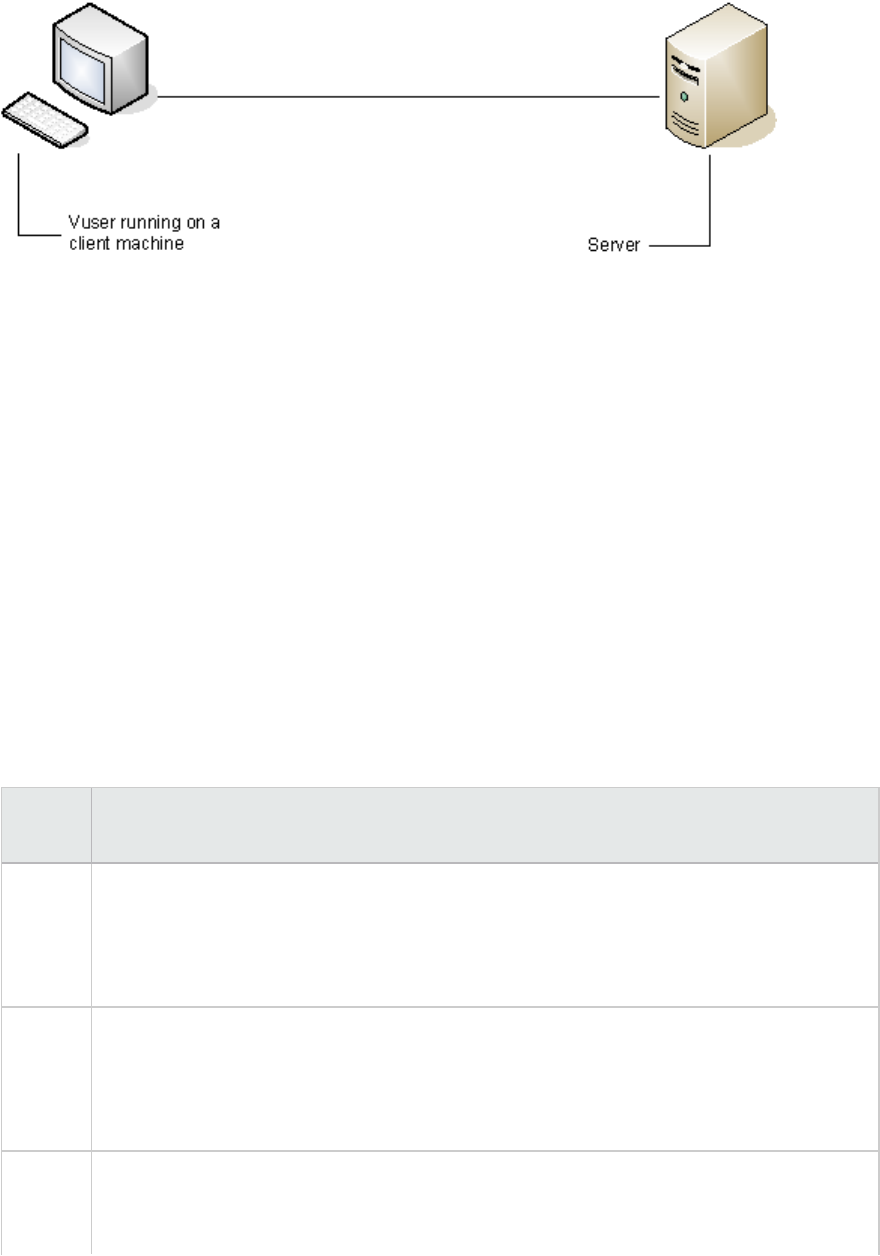
In addition, since Vuser scripts do not rely on client software, you can use Vusers to check server
performance even before the user interface of the client software has been fully developed.
To effectively use the Vuser scripts, you add them to a scenario using the LoadRunner Controller. While
running the Vusers, you gather information about the system's response. Afterwards, you can view this
information with the Analysis tool. For example, you can observe how a server behaved when one
hundred Vusers simultaneously withdrew cash from a bank's ATM. For details, see "Introducing
Controller" on page1049.
VuGen records Vuser scripts on Windows platforms only. However, a recorded Vuser script can be run on
both Windows and Linux platforms.
You can also program Vuser scripts in your native programming application such as MS Visual Studio. To
access the LoadRunner API, install the appropriate IDE add-in provided on the LoadRunner DVD.
Vuser Types
LoadRunner supports several Vuser types:
Vuser
Type
Description
Protocol
Based
Vusers
LoadRunner supports various types of Vusers using the most common protocols. Each type
is designed to handle different aspects of today's system architectures. You can create a
Vuser script using a single protocol or multiple ones.
For a complete list of the available Vuser protocols, see "Vuser Protocols" on page426.
Unit
Test
Based
Vusers
LoadRunner supports unit tests in the form of .dll or .jar/.class files, created in Microsoft
Visual Studio or Eclipse.
To create these tests, install the appropriate IDE for Developer add-in, available in the
Additional Components folder of the LoadRunner DVD.
GUI
Vusers
LoadRunner can integrate functional testing scripts in the form of GUI tests into a load
testing scenario. You create GUI tests using HP Functional Testing software - QuickTest or
Unified Functional Testing.
User Guide
VuGen
HP LoadRunner (12.50) Page 50

You can only run a single GUI Vuser on a Windows-based load generator. Use Citrix to run
multiple GUI Vusers. For additional information on Windows-based GUI Vusers, see "Using
Unified Functional Testing Tests in LoadRunner" on page1264.
Keyboard Shortcuts
The following tables list the keyboard shortcuts available for the VuGen menus:
File Menu
New > Script and Solution Ctrl+N
Open > Script/Solution Ctrl+O
Add > New Script Ctrl+Shift+A
Add > Existing Script Alt+Shift+A
Close > Document Ctrl+F4
Close > Solution Ctrl+Shift+F4
Save Script Ctrl+S
Save All Scripts Ctrl+Shift+S
Reload File Ctrl+Shift+U
Print Ctrl+P
Exit Alt+F4
Edit Menu
Undo Ctrl+Z
Redo Ctrl+Y
Cut Ctrl+X
Copy Ctrl+C
Paste Ctrl+V
Delete Del
User Guide
VuGen
HP LoadRunner (12.50) Page 51

Select All Ctrl+A
Format > Surround with Ctrl+J
Format > Increase Indent Tab
Format > Decrease Indent Shift+Tab
Folding > Toggle fold Ctrl+Shift+M
Folding > Toggle all folds Ctrl+Shift+L
Folding > Show definitions only Ctrl+Shift+P
Show Function Syntax Ctrl+Shift+Space
Complete Word Ctrl+Space
View Menu
Solution Explorer Ctrl+Alt+L
Search Results Ctrl+Alt+R
Bookmarks Ctrl+Alt+K
Steps Toolbox Ctrl+Alt+B
Snapshot Ctrl+Alt+P
Steps Navigator Ctrl+Alt+S
Thumbnail Explorer Ctrl+Alt+T
Properties Ctrl+Alt+F4
Output Ctrl+Alt+O
Full Screen Alt+Shift+Return
Search Menu
Quick Find Ctrl+F
Find Next F3
Find Next Selected Ctrl+F3
Find in Files Ctrl+Shift+F
User Guide
VuGen
HP LoadRunner (12.50) Page 52

Quick Replace Ctrl+H
Incremental Search Ctrl+E
Reverse Incremental Search Ctrl+Shift+E
Bookmarks > Toggle Bookmark Ctrl+F2
Bookmarks > Prev Bookmark Shift+F2
Bookmarks > Next Bookmark F2
Go To Ctrl+G
Design Menu
Action > Delete Action Delete
Action > Rename Action F2
Insert in Script > New Step Alt+Insert
Insert in Script > Start Transaction Ctrl+T
Insert in Script > End Transaction Ctrl+Shift+T
Insert in Script > Comment Ctrl+Alt+C
Parameters > Parameters List Ctrl+L
Parameters > Create New Parameter Ctrl+K
Parameters > Configure Parameter Delimiters Ctrl+B
Design Studio Ctrl+U
Record Menu
Record Ctrl+R
Regenerate Script Ctrl+Shift+R
Recording Options Ctrl+F7
Replay Menu
Run F5
Stop Ctrl+F5
User Guide
VuGen
HP LoadRunner (12.50) Page 53

Compile Shift+F5
Toggle Breakpoint F9
Continue Debugging F5
Run Step by Step F10
Runtime Settings F4
ALM
ALM Connection Ctrl+Q
Windows Menu
Next Window Ctrl+Tab
Prev Window Ctrl+Shift+Tab
User Interface
The VuGen user editor and panes are the environment you will be working in while you record, replay,
and debug a Vuser script.
VuGen Workspace
The VuGen workspace enables you to record, edit and debug your Vuser script. The VuGen workspace is
divided up as follows:
User Guide
VuGen
HP LoadRunner (12.50) Page 54
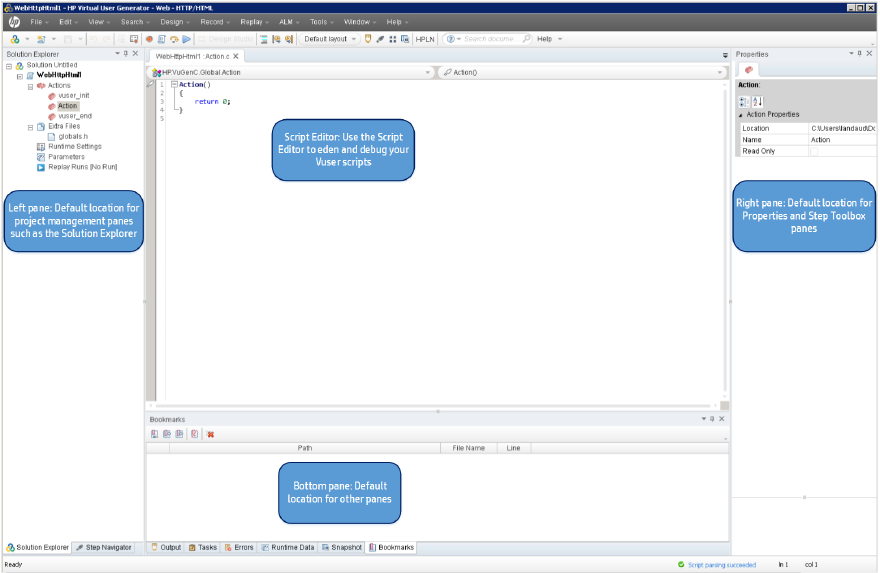
Script Editor
VuGen's Editor enables you to edit recorded scripts and other supplementary files such as header files.
You can open multiple files simultaneously, navigating tab by tab. The editor also supports multiple
programming languages, code coloring, code folding (enables you to selectively hide and display
sections of your code), code completion and tooltips for C scripts. For details see "Editor Pane" on
page69.
Project Management Panes
The project management panes include the Solution Explorer, the Step Navigator and the Outline pane.
By default they all appear on the left side of the workspace. The Solution Explorer enables you to easily
organize and navigate through script entities, enhancing the recording, replay and debug process. You
can create a solution containing multiple scripts of different protocols related to a full-cycle business
process. Each script entity includes extra files (such as header files), runtime settings, parameters, and
replay runs. For details see "Solution Explorer Pane" on page60.
The Step Navigator enables you to navigate to a selected step in your script. If your script contains
many steps, you can use the search box to search for matching text in the different parts of the steps.
For details see "Step Navigator Pane" on page67
Window Panes
VuGen has a number of window panes which by default are displayed at the bottom of the workspace.
Each window pane deals with one specific aspect of working with the script. For example, the Errors
User Guide
VuGen
HP LoadRunner (12.50) Page 55

pane displays all errors in the script.
The following table describes each pane and provides a short use case scenario.
Pane Used For: For Details:
Bookmarks Specifying a location in a script so that you can easily find it later on
for editing.
See
"Bookmarks
Pane" on
page76
Errors Displaying script errors, warnings and messages generated from
script replay.
Creating custom filters for error messages.
See "Errors
Pane" on
page87
Snapshot Displays server and client data associated with a specific step in a
script. The format of the data is dependent on the protocol used for
creating the script.
See "Snapshot
Pane" on
page77
Data Grid Simplifying views of all recordsets associated with the script. Valid
for specific protocols such as MSSQL. Contains either sent or
received data.
Parameterizing and manipulating data displayed in the data grid.
Tasks Adding, editing or searching for tasks related to a script or solution. See "Tasks
Pane" on
page88
Thumbnail Following the business process that the script has recorded. See
"Thumbnail
Explorer" on
page85
Output Event log from different operations in VuGen such as code
generation, replay, and recording.
See "Output
Pane" on
page90
Breakpoints Managing breakpoints in Vuser scripts to help debug the scripts. See
"Breakpoints
Pane" on
page92
Watch Monitoring variables and expressions while a script runs, and is in the
Paused state.
See "Watch
Pane" on
page95.
Call Stack Viewing information about the methods and functions that are See "Call Stack
User Guide
VuGen
HP LoadRunner (12.50) Page 56
Pane Used For: For Details:
currently on the call stack of your script, or the context in which the
run session was paused.
Pane" on
page94
Properties Pane and Steps Toolbox
The Properties pane and Steps Toolbox are displayed on the right side of the workspace.
The Properties pane displays the selected object's properties, such as the object's location. Each object
has its own specific properties list. You can sort the property list according to category or by
alphabetical order.
The Steps Toolbox displays a list of APIfunctions which you can drag and drop into your script. The API
functions are divided into categories. For details on each API function refer to the HPLoadrunner API
Reference Guide. For more details on the Steps Toolbox see "Steps Toolbox Pane" on page74.
Standard Layouts
VuGen has many different window panes which you may want to display or hide based on what you are
currently doing. You can also move the panes around the workspace, in order to customize the
workspace layout. VuGen comes with a set of standard layouts:
lDefault
lDebug
lPlain
lRecord
lReplay
lSnapshot
Each layout is designed to enhance a specific phase of the Vuser script development process. For
example, the Replay layout includes the panes that are most useful when you run a Vuser script: Errors,
Call Stack,Watch,Breakpoints,Output, and Runtime Data.
VuGen automatically uses specific layouts during specific phases of the script development process. For
example, the Record layout is used while you record a script, and the Replay layout is used when you
replay a script.
The VuGen toolbar displays the layout that is currently used: . To change the
layout, click the Layout drop-down and select the required layout from the list of layouts, as shown
below.
User Guide
VuGen
HP LoadRunner (12.50) Page 57
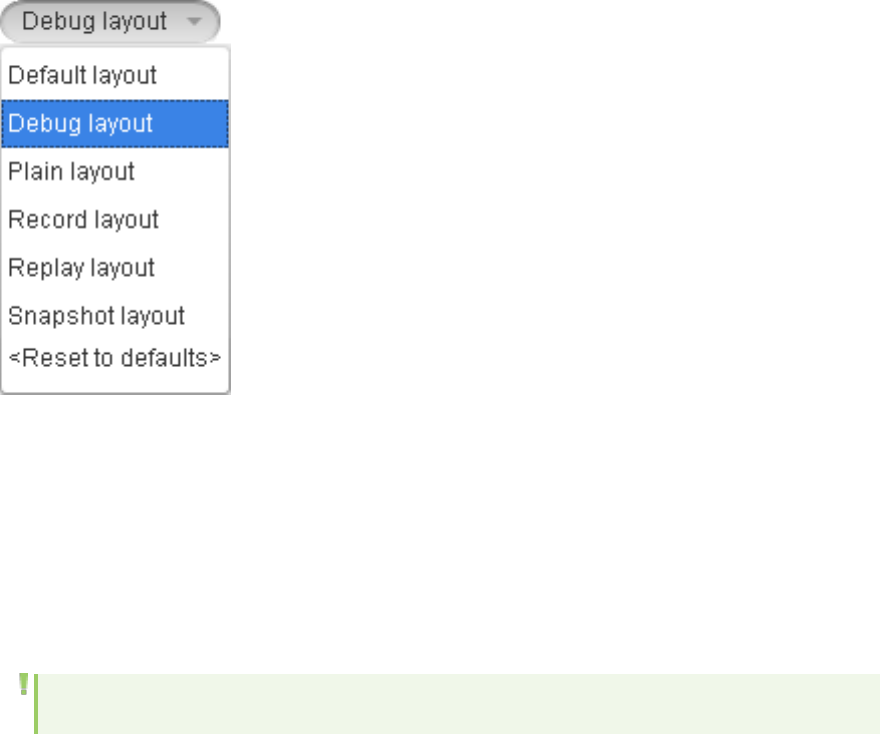
For details on how to customize VuGen layouts, see "How to Modify the VuGen Layout" below.
Customizing your Workspace
You cannot add or delete a standard layout. However, you can modify most of VuGen's standard layouts
to meet your specific requirements. When you modify a layout, you can add, move and resize zones,
select which panes to include in each zone, and specify which of these panes is displayed by default. For
task related details, see "How to Modify the VuGen Layout" below. After you modify a standard layout,
VuGen maintains that layout until you change the layout again or reset the default layouts.
Note: VuGen does not save any changes that you make to the Plain layout.
Restoring the layout defaults
On the VuGen toolbar, click the Layout drop-down, and select Reset to Defaults. VuGen resets all
standard layouts to their default settings.
How to Modify the VuGen Layout
The VuGen window is composed of a number of zones. Each zone can contain a variety of panes, such as
the Errors pane and the Snapshot pane. When more than one pane is included in a zone, the panes
appear as tabs within the zone. This section describes how to customize and modify the zones and
panes that appear in the VuGen window.
Moving a pane to a new zone
You can move any VuGen pane to a new zone. The new zone can be either a portion of an existing zone,
User Guide
VuGen
HP LoadRunner (12.50) Page 58
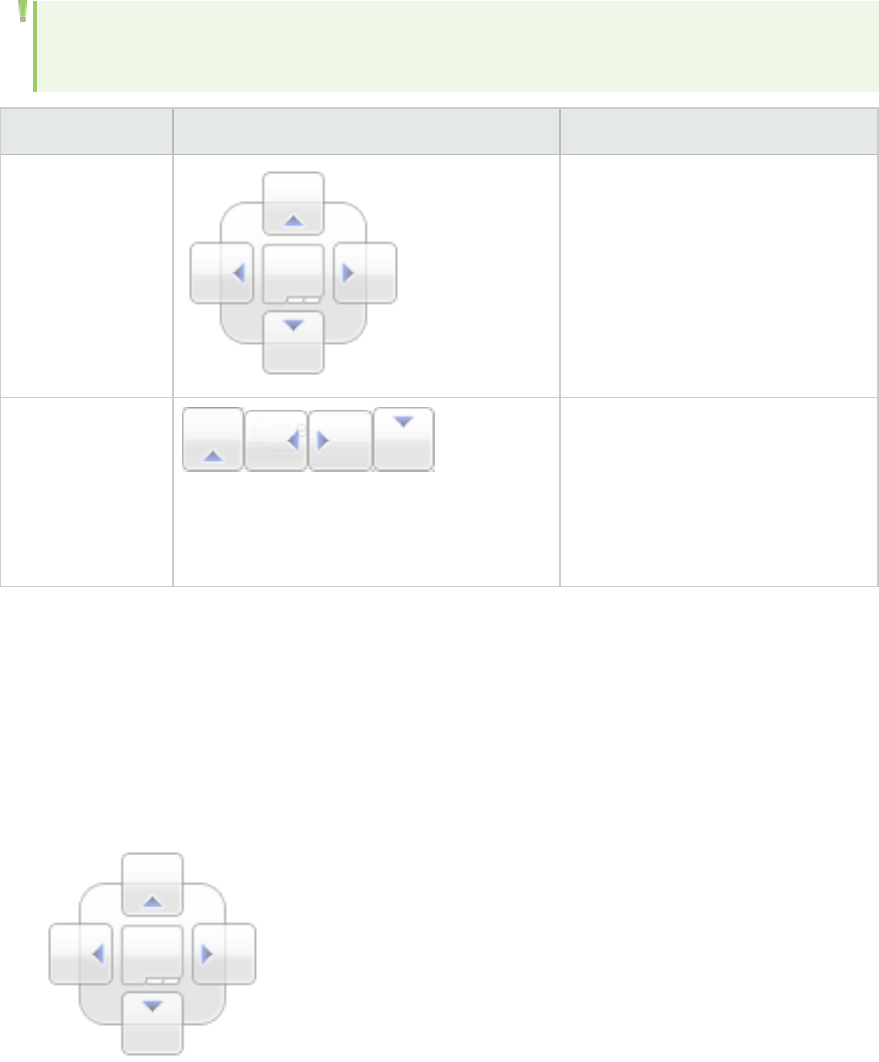
or it can occupy the entire left, right, top, or bottom of the VuGen window.
In the VuGen window, drag the title bar or tab of the pane that you want to move. (If the required pane
is not displayed in the VuGen window, you can select it from the View menu.) As you drag the pane over
the zones in the VuGen window, a complex marker is displayed in the center of the active zone and a
simple marker appears on each edge of the VuGen window.
Note: If you drag the title bar of a zone that contains multiple tabbed panes, then all the panes
in the zone are moved to the new zone.
Marker Type Marker Description
Complex marker
- Current zone
Positions the selected pane in a
new zone. The new zone is created
in the top, bottom, left, or right of
the active zone, according to the
arrow marker selected when you
release the mouse button.
Simple marker -
VuGen window
Positions the selected pane in a
new zone. The new zone is created
in the top, bottom, left, or right of
the VuGen window, according to
the arrow marker selected when
you release the mouse button.
Moving a pane to an existing zone
You can move any VuGen pane from one zone to another. When more than one pane is included in a
zone, the panes appear as tabs within the zone.
1. In the VuGen window, drag the title bar or tab of the pane you want to move. (If the required pane
is not displayed in the VuGen window, you can select it from the View menu). As you drag the pane
over the zones in the VuGen window, a complex marker is displayed in the center of the active
zone.
User Guide
VuGen
HP LoadRunner (12.50) Page 59

2. Locate the cursor over the center button of the complex marker. When you release the mouse
button, the selected pane is added as a tabbed pane to the selected zone.
3. Repeat this procedure for each pane you want to move.
Note: If you drag the title bar of a zone that contains multiple tabbed panes, then all the panes
in the zone are moved to the selected zone.
Floating and docking panes
Docked panes are fixed in a set position within the VuGen window. For example, when you move a pane
to a position indicated by a marker, the pane is docked in that position.
Floating panes are displayed on top of all other windows. Floating panes can be dragged to any position
on your screen, even outside the VuGen window. Floating panes have their own title bars.
lTo float a pane, right-click the title bar, and click Float. The pane opens on top of all the other
windows and panes, with its own title bar.
lTo dock a pane, double-click the title bar, or right-click the title bar and select Dock as tabbed
document. The pane returns to its previous position in the VuGen window.
Solution Explorer Pane
The Solution Explorer enables you to manage your Vuser scripts. A solution contains Vuser scripts. Vuser
scripts consist of script files, extra files (such as header files), runtime settings, parameters and replay
runs. A solution can contain multiple scripts of different protocols.
The image below shows a Solution Explorer with two scripts.
User Guide
VuGen
HP LoadRunner (12.50) Page 60
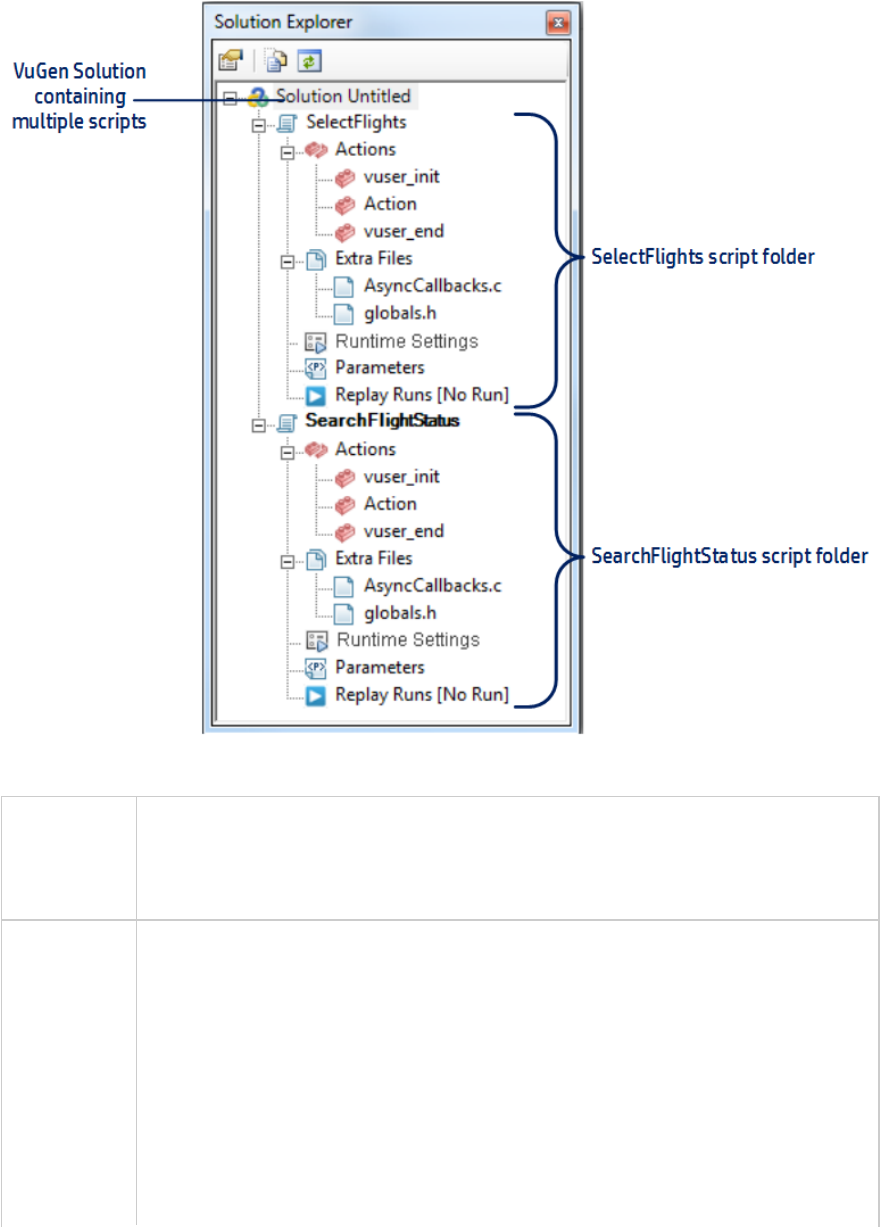
To access Do one of the following:
lView > Solution Explorer
lPress Ctrl + Alt + L
Important
information
lSolution Explorer is automatically displayed as part of the default layout.
lYou can move this pane to different areas of the Main User Interface. For details,
see "How to Modify the VuGen Layout" on page58.
lOther main interface panes such as Output, Error and Snapshot synchronize their
displays based on your location in the Solution Explorer.
lYou can double-click an asset to activate it in the editor area or right-click to
examine quick operations available for that asset.
lYou can bundle scripts in a solution. For example you can bundle scripts related to
one business process.
User Guide
VuGen
HP LoadRunner (12.50) Page 61
Note: The solution explorer can not be imported into any of the existing
management tools such as ALM or Controller.
See also l"User Interface" on page54
l"How to Import Actions to a Script" on page225
Understanding the Solution Explorer
Entity Used for Comments
Solution Container
for all
script
objects.
Give your solutions meaningful names, such as the name of the business
process. The default solution name is "Untitled"
Scripts Creating,
editing and
debugging
scripts.
Click once on a script, or one of its assets, to change the focus to that
script. VuGen applies any actions, such as clicking replay, to the script in
focus.
When any part of a script is selected, the menu options, toolbar and
window panes display functionality relevant to the script's protocol. For
example, if the script in focus is recorded in Web HTTP/HTML , the
Recording Options button is displayed on the toolbar. However, if the
script in focus is recorded in TruClient, the Develop Script button is
displayed on the toolbar.
Double-click the script's action to open it in the editor.
You can drag and drop scripts (<scriptName>.usr) from the file
directory to the Solution Explorer.
Extra Files Storing
extra files
that are
used by the
script.
The data contained in extra files can include:
lCommon utility functions used by the script (for example, code)
lDefinition of constants and variables used by the script (for example,
code)
lSpecial assets used during script execution (such as .jpeg files)
lData files manipulated by script code during script execution
lAdditional files to be parsed. For details, see "How to Create and Open
Vuser Scripts" on page128.
The following are examples of valid file types that can be added
as extra files:
User Guide
VuGen
HP LoadRunner (12.50) Page 62
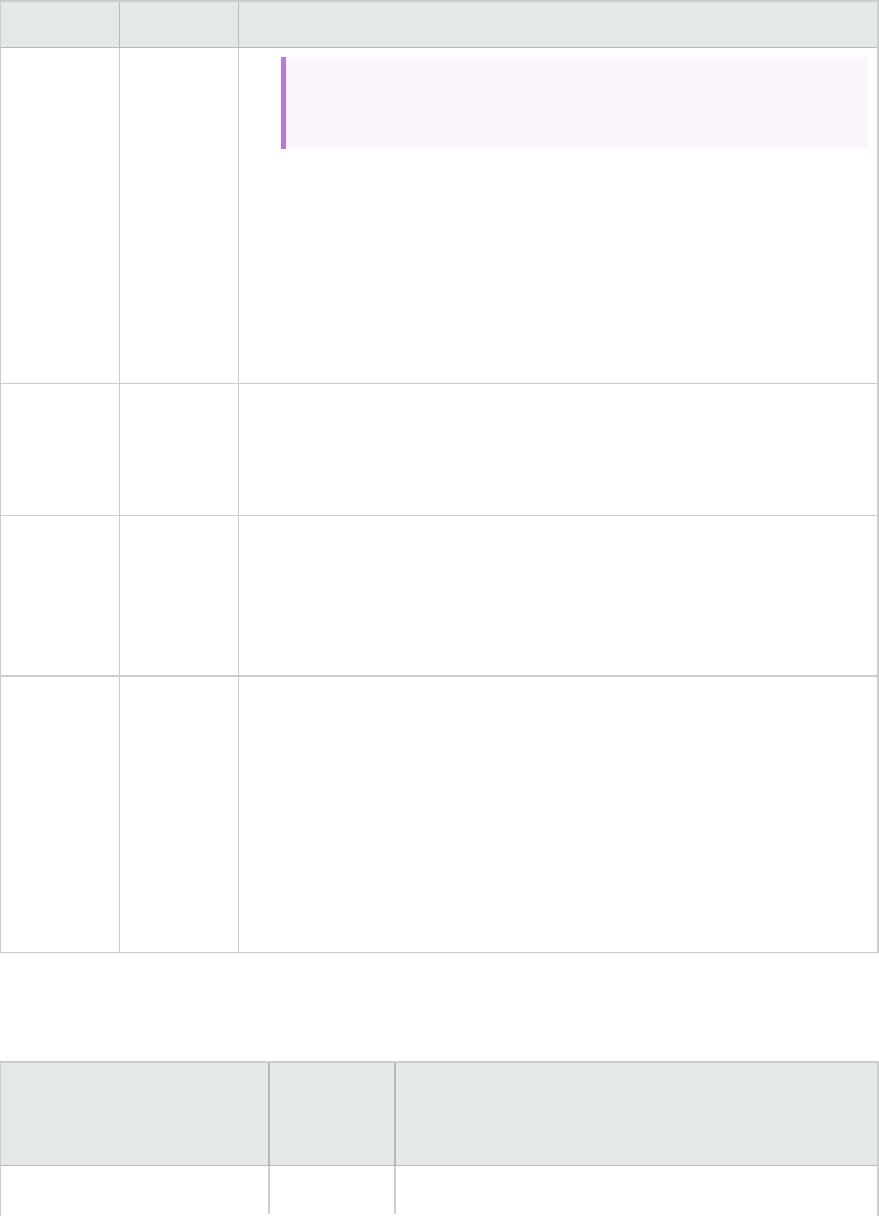
Entity Used for Comments
.ws,.h,.c.,dat,.ini,.vbs,.java,.js,.txt,.tux,.rec,.msc,.vdf,.xml,.xsl,.dtd,.h
tml,.htm
You can drag and drop header files (<headerFileName.h>from your file
directory. When you include files in the Extra Files node, these files are
automatically included in a LoadRunner scenario.
You can edit extra files in the editor if the file type is included in Tools >
Options > Scripting Tab > Script Management. Double click the extra file
to open it in the Editor. For details on how to modify the list, see
"Scripting Options" on page111.
Runtime
Settings
Defining
the way a
Vuser
script runs.
You can access runtime settings for a specific script from the Runtime
Settings node in the Solution Explorer > <Script> > Runtime Settings.
For details, see "Runtime Settings Overview" on page280.
Parameter
s
Creating
and
managing
parameter
s
You can access parameters for a specific script from the Parameters
node in the Solution Explorer > <Script> > Parameters. For details, see
"Parameterizing Overview" on page341.
Replay
Runs
Enables
you to
access the
Replay
Summary
Reports for
each
iteration in
the replay
Solution Explorer Structure and Context Menu Options:
The following table lists the context menu options when working in the Solution Explorer.
UI Element and Description Context
Menu
Options
Description
<Solution> Add New Create a new script to add to the solution. For details,
User Guide
VuGen
HP LoadRunner (12.50) Page 63


UI Element and Description Context
Menu
Options
Description
<Script>
Container for script assets
including scripts actions,
extra files, runtime settings
and parameters.
Save Script Select to save script.
Save Script
As...
Save script with new name or to a new location, such
as ALM.
Export to
Template...
Save scripts as templates. For details, see "How to
Create and Open Vuser Script Templates" on page139.
Remove
Script
Delete a script from the solution or select check box to
delete from file directory.
Select file
to compare
Compare one file to another. This option selects the
highlighted asset as the primary file.
Compare to
<filename>
Compares the selected file and the primary file.
Compare to
external
file...
Compare a file to a file outside of the solution. This
option sets the highlighted file as the primary file and
opens Windows Explorer to enable you to select the
secondary file.
Select
Folder to
Compare
Compare one folder to another. The highlighted folder
is the primary folder.
Compare to
External
Folder...
Compares between the selected folder and the
primary folder.
Open Script
Folder
While you record, VuGen creates a series of
configuration, data, and source code files. These files
contain Vuser runtime and setup information. VuGen
saves these files together with the script.
You can open the folder on the local disk where the
script is saved. For scripts that are saved on a
different storage location (such as ALM), this option
opens the temporary folder on the local disk.
<Actions>
Container for individual
actions including the default
Create New
Action
Add a new script action block to your script.
User Guide
VuGen
HP LoadRunner (12.50) Page 65

UI Element and Description Context
Menu
Options
Description
actions:
lvuser_init
laction
lvuser_end
Import
Action
Import an action from an existing script.
Extra Files
Container for extra files
associated with your script.
You can access these extra
files directly from VuGen.
Create New
File
Create a new file, and add the new file to the Extra
Files node of your script.
Add Files to
Script
Add files to the Extra Files node of your script. The files
that you add must already exist.
Add Files
Downloaded
from HPLN
Add files to the Extra Files node of your script. The files
that you add must have been previously downloaded
from HPLN.
Add Files
from
Folders and
Sub-folders
Add the contents of folders and sub-folders to the
Extra Files node of your script.
RuntimeSettings
Opens the runtime settings
dialog box.
For details, see "Runtime Settings Overview" on
page280.
Parameters
Enables you to create, edit,
and list parameters
associated with your script.
Parameters
list
Opens the Parameter List dialog box. For details, see
"Parameters" on page341.
Create new
parameter
Opens the Select or Create Parameter dialog box.
Edit
parameter
Opens the Parameter Properties dialog box.
Configure
parameter
delimiter
Opens the Parameter Delimiters Configuration dialog
box.
Replay Runs
Enables you to display the
Replay Summary report.
Open
Replay
Summary
Opens the Replay Summary in the Editor for selected
iteration.
User Guide
VuGen
HP LoadRunner (12.50) Page 66
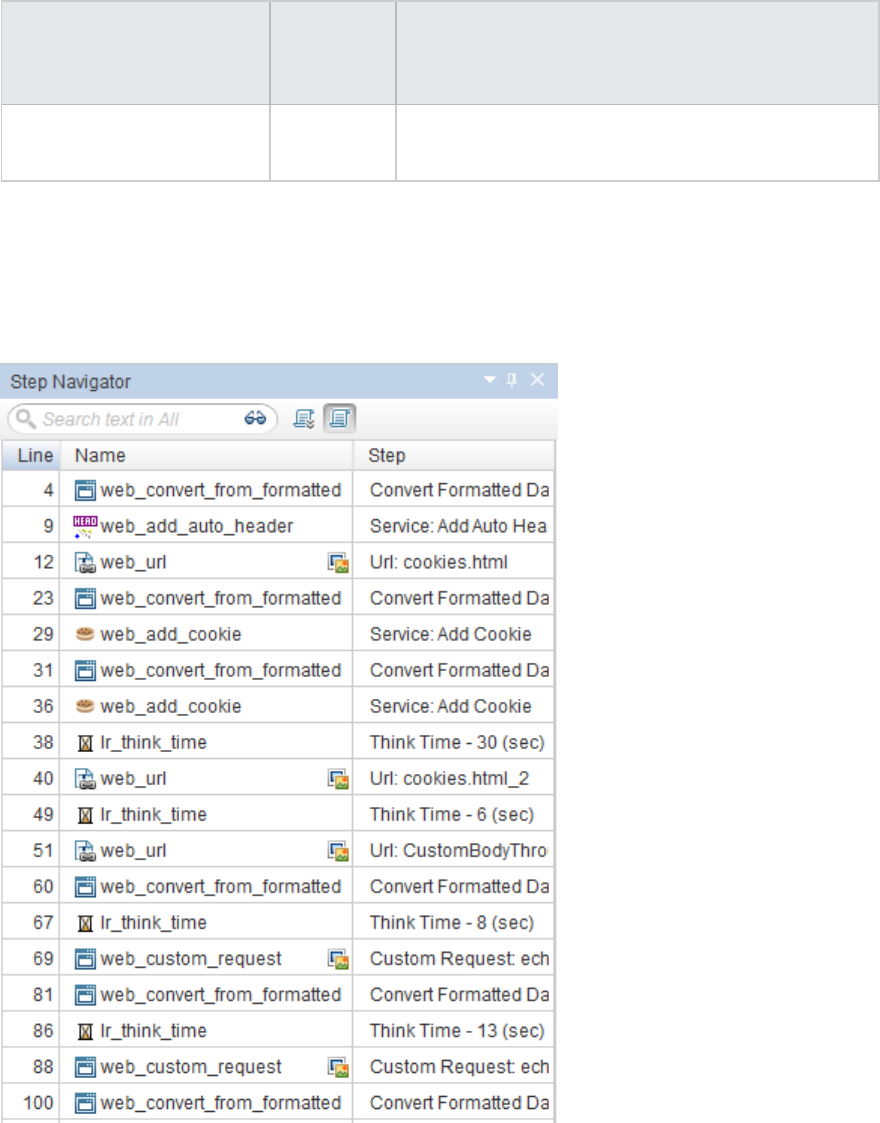
UI Element and Description Context
Menu
Options
Description
Open Test
Results
Opens the Test Results in the Editor for selected
iteration.
Step Navigator Pane
The Step Navigator is a table view of the LoadRunner API function calls in the script. In addition, the Step
Navigator pane enables you to navigate to a selected step in your script.
If your script contains many steps, you can use the search box to search for matching text in the
different parts of the steps.
User Guide
VuGen
HP LoadRunner (12.50) Page 67
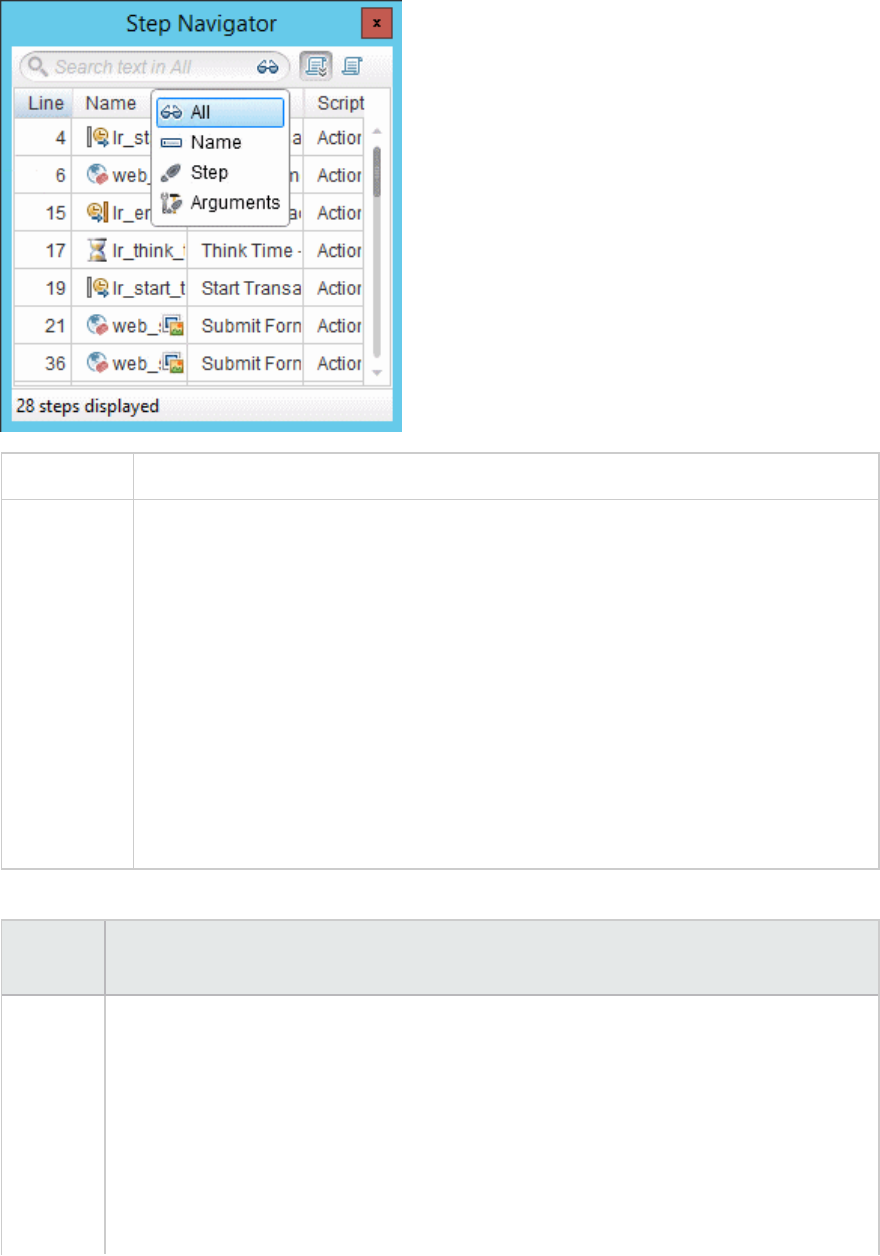
To access View > Steps
Important
information
lYou can search within an action or script but not across multiple scripts in a
solution.
lYou can move this pane to different areas of the Main User Interface. For details,
see "How to Modify the VuGen Layout" on page58.
lYou can view the script in either action or script scope.
lEvery step that has a snapshot is marked with an icon. When hovering over a step
that has an associated thumbnail it is presented as a tooltip.
lDouble clicking a step, takes you to the corresponding location in the script and
synchronizes all other panes.
lStep Navigation is synchronized based on the validity of the script. You can check
the status of the pane during script editing.
User interface elements are described below:
UI
Element
Description
Search
box
You can search different parts of the steps for matching text. The following parts of the
steps can be searched:
lAll. (Default) All parts of the step (name, step, arguments).
lName. The name of the step.
lStep. The description of the step (for example, web_url, web_custom_request)
lArguments. The arguments for the step.
Enter the text you want to search for in your steps, in the search edit box and select the
User Guide
VuGen
HP LoadRunner (12.50) Page 68
part of the steps you want to search. The Steps pane displays only those steps that
match your search criteria.
Line The number of the step in the script.
Name A step name.
Step The step type.
/File parser indicator. A green symbol indicates that parsing succeeded and a red symbol
indicates that parsing failed.
Action The action into which the step was created.
# steps
displayed
Displays the total number of steps in the script or in the action.
Editor Pane
The Editor enables you to edit scripts and other related script files. In addition, you can open a browser
session to search sites, such as the LoadRunner Forum.
To access The editor is opened when VuGen is loaded.
Important lThe editor is automatically displayed as part of the default layout.
User Guide
VuGen
HP LoadRunner (12.50) Page 69

information lPress Ctrl +Tab to display a list of tabs and panes. Highlight and click to switch
tabs in the editor.
lPress Ctrl + G or select Search > Go to... to go to a specific line in the script.
lOther interface panes such as Output, Error, and Snapshot views, synchronize
their displays based on your location in the editor.
lDouble-click an asset in the Solution Explorer to open it in the editor.
lYou can drag any type of file into the editor and modify it. To save your changes,
select File > Save File As.
lScript modifications are displayed as highlighted text in the editor. The following
are examples:
lScript has been modified but not saved.
lScript has been modified and saved.
lBreakpoint has been inserted.
See Also l"Editor Options" on page105
Editing your code
Supported Programming Languages
Recorded scripts are generated in C, which has full language and parsing support in VuGen. You can
enhance your Vuser scripts by adding standard ANSI C functions. ANSI C functions allow you to add
comments, control flow statements, conditional statements to your Vuser scripts. You can add standard
ANSI C functions to any type of Vuser script. For details, see "C Vuser Scripts" on page996.
In addition, the VuGen editor enables you to write manual scripts with the following programing
languages:
lJava: For details, see "Java Vusers" on page997.
lC#: For details, see ".NET Vusers" on page998.
lVB.NET: For details, see "How to Create a Vuser Script in Visual Studio" on page1002.
Code Completion and Tooltips
Code completion enables you to quickly and accurately write code by providing a list of code items from
which you can select options. Press CTRL + SPACE to activate statement completion when your cursor is in
the editor. Tooltips appear when you hover over a code element with your mouse.
The following table describes available code completion items, scope, identifying icon, and tooltip
context:
User Guide
VuGen
HP LoadRunner (12.50) Page 70
Code
Completion
Item
Scope Icon The Tooltip Displays
ANSI C
Keywords
and Types
All possible standard C
keywords.
Function type, name, and parameters
LR API
Functions
All steps in the script. LR API Step
LR API
Constants
Used to delimit groups of
parameters in steps. For
example, ENDITEM
LR API Constant
User
Functions
All the functions that you have
defined in action files.
• Function type, name and parameters.
• When Using Functions (Method Insight)
The required arguments, highlighting each
argument as you define it moving to the next
argument when you enter the delimiter.
Variables Local variables – visible only in
the function where they have
been defined.
Global variables – defined
outside of any function body.
Available everywhere in the
script.
Type and name.
Parameters Available only in the function
body where they have been
defined.
• Parameter type and name
• When Using parameters (Method Insight)
The required arguments, highlighting each
argument as you define it moving to the next
argument when you enter the delimiter.
By default, VuGen uses code completion globally. To disable code completion, select Tools > Options>
Editor Tab > Code Completion. Clear the Enable code completion features check box.
Code-Coloring
To facilitate script writing and debugging, code item types are colored by an identifying background and
foreground. The colored text enables you to easily read scripts and scan for syntax errors.
The following table provides examples of code item types and their assigned colors.
User Guide
VuGen
HP LoadRunner (12.50) Page 71

Code Type Color Example
Comments /* comment */ // comment
Keywords if (a) { } else { }
Method Parameter Name foo( "parameter=value" )
LoadRunner API web_url
Method Call foo( )
String char * text = "Hello, World!"
In addition, you can customize code item types to suit your needs by selecting Tools > Options > Editor
Tab > Code Color.
Script Folding
Script folding enables you to selectively hide and display sections of a script, making it easier to manage
large scripts by viewing only those sections that you are currently editing. For details, see "Editor
Options" on page105.
Community Search
You can perform Web searches from the VuGen toolbar, which opens a browser tab in the editor. The
default Web site is the LoadRunner Forum which enables you to search topics, post questions, or blog
about your expertise. You can add additional search sites by selecting Tools > Options > General >
Community. For details on adding additional sites, see "General Options" on page102.
User interface elements
The following table describes the editor user interface and the right-click (context) menu options
(unlabeled elements are shown in angle brackets).
UI Element Description
<Gutter> The editor gutter enables you to add toggle functionality including:
lBreakpoints
For details, see "Working with Breakpoints" on page315 or "Breakpoints Pane"
on page92.
lBookmarks
For details, see "How to Use Bookmarks" on page301.
User Guide
VuGen
HP LoadRunner (12.50) Page 72
UI Element Description
Class/Function
Browser
When enabled, you can navigate quickly to a specific class or function in your script
by selecting it from the drop-down list in the browser.
Line numbers Display of line numbers in the script.
Context Menu
Comment or
Uncomment
Enables you to comment or uncomment highlighted script lines.
Surround with
Transaction
Inserts an lr_start_transaction function immediately above the highlighted
script and a lr_end_transaction function immediately below the highlighted
script.
Decode with
DFE
Applies to Web - HTTP/HTML including Web - HTTP/HTML steps in Flex Vuser scripts,
and Silverlight Vuser Scripts. For details see, "Data Format Extensions (DFEs) -
Overview" on page863.
Show
Snapshot
Show the snapshot associated with the highlighted script step.
Show
Arguments
When the cursor is placed on a function, the Step Properties dialog box appears with
the details of the function's arguments.
Correlate
Selection
Opens Design Studio and scans for dynamic values to be correlated in the selected
script section.
Go to Step in
Replay Log
Navigates to the location in the Output pane that correlates to the function in the
editor.
Insert Inserts a New Step into your script.
Inserts a Start Transaction step into your script.
For details, see "Transaction Overview" on page322.
Inserts an End Transaction step into your script.
For details, see "Transaction Overview" on page322.
Inserts a Rendezvous point step into your script.
For details, see "Rendezvous Points" on page327.
Comment Inserts comments into your script.
User Guide
VuGen
HP LoadRunner (12.50) Page 73
UI Element Description
Log
Message
Inserts a
into
your script.
Toggle
Breakpoints
Adds or removes a breakpoint.
Search
Community
Opens the default Community Search browser.
Steps Toolbox Pane
This pane enables you to drag and drop API functions into your script.
User Guide
VuGen
HP LoadRunner (12.50) Page 74
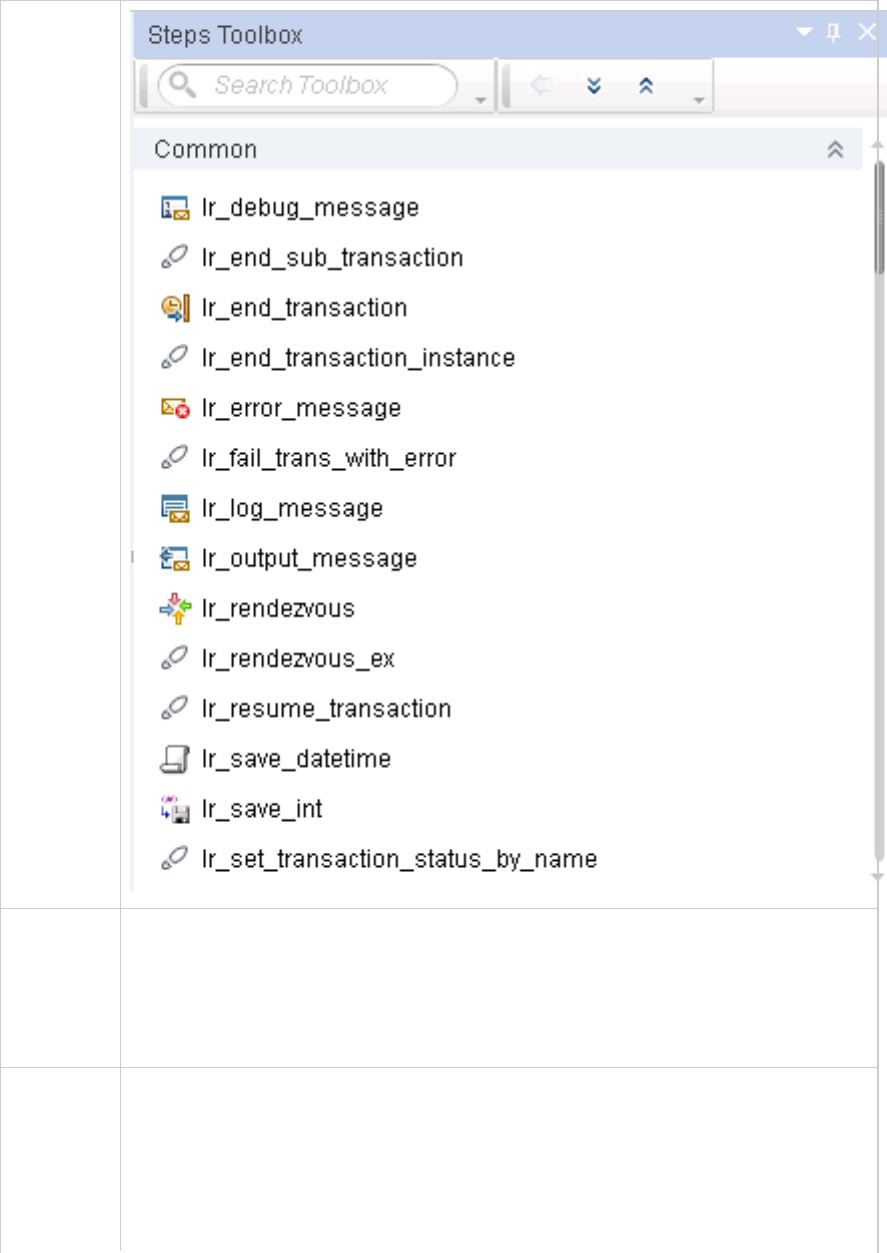
UI example
To access Use one of the following:
lDesign > Insert in Script > New Step
lClick within a script and select Insert > New Step from the right-click menu
lPress Ctrl+Alt+B
Important
informatio
n
lA step's associated parameter dialog box opens when you add the step to the script.
lYou can drag and drop steps into your script.
lYou cannot drag and drop a step into a step from the Steps Toolbox but you can
manually add a step parameter within a step.
lIf you insert a step into the incorrect location in your script, the script may fail.
User Guide
VuGen
HP LoadRunner (12.50) Page 75
Relevant
tasks
"How to Insert Steps into a Script" on page339.
User interface elements are described below (unlabeled elements are shown in angle brackets):
UI Element Description
<Function List> Displays a list of available functions divided into the following categories:
lCommon
lWeb checks
lServices
lXML
lWeb JS
lAsync
Search. Enables you to perform an incremental search in the function list by
entering text. For example, if you type "web" into the search box, the function
list will display only those function that include the letters "web".
Add. Add the highlighted step to the current location in your script.
Expand/Collapse. Expand or collapse the step categories.
Bookmarks Pane
The Bookmarks pane displays a list of the bookmarks in your Vuser script. You can navigate between
the bookmarks to help analyze and debug your code.
To access View > Bookmarks
Important
information
lAll bookmarks added to a Vuser script are maintained after you close and reopen
the Bookmarks pane.
lYou can move this pane to different areas of the Main User Interface. For details,
see "How to Modify the VuGen Layout" on page58.
Relevant
tasks
"How to Use Bookmarks" on page301
See also "User Interface" on page54
User interface elements are described below (unlabeled elements are shown in angle brackets):
User Guide
VuGen
HP LoadRunner (12.50) Page 76
UI Element Description
<Bookmarks
list>
Displays a list of all bookmarks that are defined in the Vuser script. You can double-
click any bookmark line to navigate directly to the relevant line in the Vuser script.
Toggles the status of the selected bookmark.
Navigates to previous bookmark in the pane.
Navigates to next bookmark in the pane.
Deletes the selected bookmark.
Deletes all bookmarks.
Snapshot Pane
Snapshots contain the data generated by the traffic between the client and the server and are
captured when a script is recorded and when the script is replayed.
Snapshots are displayed in various formats and provide different functionality depending on the Vuser
protocol.
Note: The Snapshot pane is not available for all Vuser protocols - only specific Vuser protocols
give you access to the Snapshot pane.
To access
Select View > Snapshot, or click the Show Snapshot Pane button on the VuGen
toolbar.
Important
information
lA snapshot displays all data associated with a specific step in a script.
lSnapshots enable you to search for correlations, compare record versus replay
snapshots and search for the specific values using the standard search operation.
lPress Ctrl+F to search for text within a snapshot view. (Search is not supported for
the JSON view.)
lThe appearance and functionality of the Snapshot pane varies depending on the
protocol of the current Vuser script. In addition to the standard controls, the
Snapshot pane may display controls that are specific to the current Vuser protocol.
lThe new Web snapshot model is backward compatible with previous versions of
User Guide
VuGen
HP LoadRunner (12.50) Page 77
LoadRunner. However some snapshot data may be missing. If this occurs,
regenerate the script.
lWhen using Windows 2008 R2 and opening a snapshot from the step navigator in
SAP GUI and Web protocols, the snapshots might not open automatically.
Workaround: Internet Explorer Enhanced Security Configuration must be disabled to
view help content. It is enabled by default. (Control Panel > Administrative tools >
Server manager > Configure IE ESC).
lYou can move this pane to different areas of the Main User Interface. For details,
see "How to Modify the VuGen Layout" on page58.
See also "How to Work with Snapshots" on page276
Standard Snapshot pane controls
The Snapshot pane displays the following standard controls:
UI Element Description
Shows a single snapshot in the Snapshot pane.
Splits the Snapshot pane to show two snapshots.
Displays two snapshots in the Snapshot pane - one to the side of the other.
Displays two snapshots in the Snapshot pane - one above the other.
Shows the record snapshot in the Snapshot pane.
Shows the replay snapshot in the Snapshot pane.
Select the iteration number of the replay snapshot to display.
Synchronizes the display of the two snapshots if the Snapshot pane is split.
Note: Snapshot synchronization is available for only specific Vuser
protocols, and for only specific views within the protocols.
Compares the two snapshots that are currently displayed in the Snapshot
pane. To enable the Compare functionality, you must first split the Snapshot
pane to show two snapshots. By default, VuGen uses the WDiff utility to
User Guide
VuGen
HP LoadRunner (12.50) Page 78
compare snapshots. You can specify an alternative comparison tool as
described in "Scripting Options" on page111.
Note: The snapshot comparison functionality is available for only the
Web HTTP/HTML and Web Services protocols.
Snapshot pane controls for Citrix, RDP, and SAP protocols
User interface elements are described below:
UI Element Description
Image Displays a graphical representation of the snapshot. You can synchronize the display
of two snapshots in the Snapshot pane. Snapshots display faster when the Image view
is used than when the Full view is used.
Full Displays a graphical representation of the snapshot. You cannot synchronize the
display of two snapshots in the Snapshot pane. Snapshots display slower when the Full
view is used than when the Image view is used.
Context Menu
Copy Image
to the
Clipboard
Copies the image to the clipboard.
Insert
Mouse Click
Inserts a mouse click function, for example, ctrx_mouse_click, at the point of the
cursor in the script.
Insert
Mouse
Double Click
Inserts a double mouse click function, for example, ctrx_mouse_double_click, at the
point of the cursor in the script.
Insert Sync
onBitmap
Inserts a sync on image function, for example, ctrx_sync_on_bitmap, at the point of
the cursor in the script. Select the bitmap area with the cursor to get the bitmap
values (x,y coordinates, width, height) for the function.
Insert Sync
on Bitmap
(by
coordinates)
Inserts a sync on image function with synchronization area coordinates as function
parameters, for example, ctrx_sync_on_bitmap. The parameters are entered in a
dialog box displayed after selecting this option. The function is inserted at the point of
the cursor in the script.
Insert Get
Bitmap
Value
Inserts a get bitmap value function, for example, ctrx_get_bitmap_value, at the point
of the cursor in the script. This function retrieves the hashed string value of a bitmap
for use in custom synchronization functions. Select the bitmap area with the cursor to
User Guide
VuGen
HP LoadRunner (12.50) Page 79
get the bitmap values (x,y coordinates, width, height) for the function.
Insert Get
Text
Inserts a get text function, for example, ctrx_get_text function, at the point of the
cursor in the script. Select the text area with the cursor to get the values (x,y
coordinates, width, height) for the function.
Note: This menu item only appears when the Vuser script is recorded on a
Citrix server, with the LoadRunner Citrix agent installed on it.
Insert Sync
on Text
Inserts a sync on text function, for example, ctrx_sync_on_text_ex function, at the
point of the cursor in the script. Select the text area with the cursor to get the values
(x,y coordinates, width, height) for the function. This function waits until the specified
text is displayed (agent installations only).
Note: This menu item only appears when the Vuser script is recorded on a
Citrix server, with the LoadRunner Citrix agent installed on it.
Insert Obj
Get Info
Inserts an object get info function, for example, ctrx_get_obj_info, at the point of the
cursor in the script. This function retrieves the current state of the requested object
property.
Note: This menu item only appears when the Vuser script is recorded on a
Citrix server, with the LoadRunner Citrix agent installed on it.
Insert Sync
on Obj Info
Inserts a sync on obj info function, for example, ctrx_sync_on_obj_info, at the point of
the cursor in the script. This function causes VuGen to wait for a certain state before
continuing.
Note: This menu item only appears when the Vuser script is recorded on a
Citrix server, with the LoadRunner Citrix agent installed on it.
Snapshot pane controls for Windows Sockets protocol
The snapshot for Windows Sockets protocol are displayed as textual and hexadecimal representations
of data buffers sent and received.
User interface elements are described below:
UI Element Description
User Guide
VuGen
HP LoadRunner (12.50) Page 80
Hex Displays the buffer data in hexadecimal.
Text Displays the buffer data as text.
Go To Opens the Go To Offset dialog box that enables you
to navigate within the data buffer.
Context Menu
Create Correlation (Select the text for
correlation, from the Response Body tab)
Opens the Correlation dialog box. For details see
"Correlating" on page235.
Snapshot pane controls for Web - HTTP/HTML protocol
The snapshot for Web - HTTP/HTML protocol are displayed as textual and hexadecimal representations
of the request and response.
User interface elements are described below. These are available for both the Recording and Replay
snapshots.
UI Element Description
Displays step data in HTTP format. This enables you to view in-depth information
about the step, including request data, response data, cookies, and headers. For
more information, see "Web Snapshots - Overview" on page856.
Displays step data in HTML format.
(Http Data view only) Displays the HTTP flow data in a tree structure.
The data is separated into separate tabs: Raw Data,Request Body,Response
Body,Headers,Cookies, and Query String.
For some of the above tabs, you can display the data in text, hexadecimal, or json
views, using the buttons on the right: Text View,Hex View, and JSON View.
Note: Depending on your application, some tabs may not have any data.
(Http Data view only) Displays the HTTP flow data in a list format.
Iteration The iteration number to display in the pane (only for Replay snapshots)
Context Menu
Create
Correlation
Opens the Correlation dialog box. For details see "Correlating" on page235.
User Guide
VuGen
HP LoadRunner (12.50) Page 81
Note: This option is available in the Response view only. This option is
available for attribute and value nodes only.
Create
Correlation
Rule
Opens the Add asRule dialog box. For details see "How to Correlate Scripts Using
Design Studio" on page241
Note: This option is available in the Response view only. This option is
available for attribute and value nodes only.
Create
Parameter
Opens the CreateParameter dialog box. For details see "How to Create a
Parameter" on page345
Note: This option is available in the Response view only. This option is
available for attribute and value nodes only.
Search
Community
Opens the LoadRunner Support Forum.
Add Text Check
Step
Opens the Find Text dialog box. For details see "How to Add a Text Check From the
XML View in the Snapshot Pane" on page279
Note: This option is available in the Response view only. This option is
available for attribute and value nodes only.
Snapshot pane controls for protocols with an XML request/response (such as Web
Services)
The snapshots for XML protocols are displayed as XML and textual and hexadecimal representation of
the request and response bodies.
User interface elements are described below:
UI Element Description
Displays an XML view of the server response.
Displays an XML view of the request.
Opens the XPath search dialog box, allowing you to search the XML code using a
standard XPath expression.
User Guide
VuGen
HP LoadRunner (12.50) Page 82
Context Menu
Copy Selection Copies the text that is selected in the text view to the clipboard
Search
Community
Performs a community search using the text that is selected in the text view as the
search string. For details about performing a community search, see "Editor Pane"
on page69.
Copy XPath In the tree view, copies the XPath of the selected node to the clipboard. In the text
view, copies the XPath of the XML element in which the cursor is located to the
clipboard.
Copy full value In the tree view, copies the full XML code of the selected node to the clipboard. In
the text view, copies the full XML code of the XML element in which the cursor is
located.
Node
Properties
Opens the XML Node Properties dialog box.
Insert XML
Check
Opens the Insert XML Check dialog box that enables you to insert an XML Find step
into the Vuser script.
Note: This option is available in the Response view only.
This option is available for attribute and value nodes only.
Save value in
parameter
Opens the Save Value as Parameter dialog box that enables you to save the
selected value to a simple parameter.
Note: This option is available in the Response view only.
This option is available for attribute and value nodes only.
Save XML in
parameter
Opens the Save Value as Parameter dialog box that enables you to save the
selected value to an XML parameter.
This option is available in the Response view only.
Create
Correlation
Opens the Correlation tab in the Design Studio. The text selected in the Snapshot
pane appears as a manual correlation entry in the Design Studio. For details, see
"How To Manually Correlate Scripts" on page243.
Note: This option is available in the Response view only.
This option is available for attribute and value nodes in the tree view, and
when text is selected in the text view.
User Guide
VuGen
HP LoadRunner (12.50) Page 83
Create
Correlation
Rule
Opens the Add as Rule dialog box that enables you to add the selected text as part
of a correlation rule. For details, see "Correlation Tab [Design Studio] Overview" on
page236.
Note: This option is available in the Response view only.
This option is available for attribute and value nodes in the tree view, and
when text is selected in the text view.
Copy XML
Snapshot pane controls for Database Protocols
User interface elements are described below:
UI Element Description
Shows the record snapshot in the Snapshot pane.
Displays data in a data grid.
Context Menu
Create Correlation Opens the Correlation dialog box. For details see "Correlating" on page235.
Note: This option is available in the Response view only. This option is
available for attribute and value nodes only.
Save Grid to File Saves the grid's contents to a CSV file.
Copying images to the clipboard
You can copy an image-based snapshot to the clipboard. This enables you to import the image into a
graphics application, where you can analyze and modify the graphic.
For details on how to copy a snapshot to the clipboard, see "How to Work with Snapshots" on page276.
Note: The "copy snapshot to the clipboard" functionality is available for only RDP, Citrix, and SAP
GUI protocols.
Copying snapshot text to the clipboard
You can copy text from a snapshot to the clipboard. You can then paste the text from the clipboard into
User Guide
VuGen
HP LoadRunner (12.50) Page 84

another application.
For details on how to copy snapshot text to the clipboard, see "How to Work with Snapshots" on
page276.
Note: The "copy snapshot text to the clipboard" functionality is available for only Ajax - Click &
Script and SAP - Click & Script protocols.
Customized Snapshot pane functionality
In addition to the basic Snapshot pane functionality, the Snapshot panes for some Vuser protocols
include customized functionality. For example, the Snapshot pane for RDP Vuser scripts lets you display
snapshots in either Full or Image modes; the Snapshot pane for Winsock Vuser scripts lets you display
snapshots in either Text or Hex modes. The controls for the customized functionality can be found in
the Snapshot pane toolbars.
Activating the Snapshot on error functionality
In addition to showing record and replay snapshots, the Snapshot pane can display snapshots of errors
that occurred during the replay of a script. The "snapshot on error" functionality is available for only
specific Vuser protocols.
You can generate and display snapshots of errors only if the "snapshot on error" functionality is
activated.
To activate the snapshot-on-error functionality:
1. Click Replay > Runtime Settings. The runtime settings dialog box opens.
2. Under General, click Miscellaneous.
3. Under Error Handling, select the Generate snapshot on error check box.
Thumbnail Explorer
This pane enables you to flip through thumbnail images of your business process, enhancing your ability
to navigate to specific locations in the Editor based on a visual representation of a step. Conversely, you
can scroll through the Editor and see the visual context of your script in the Thumbnail Explorer.
To access Use one of the following:
lView >Thumbnail Explorer
lClick the button on the VuGen toolbar.
Important
information
lYou can move this pane to different areas of the Main User Interface. For details,
see "How to Modify the VuGen Layout" on page58.
lYou can configure the Thumbnail Explorer in Options > Scripting Options. For
User Guide
VuGen
HP LoadRunner (12.50) Page 85
details, see "Scripting Options" on page111.
lThumbnails are created in the same order as the actions in the Solution Explorer
and not controlled by the settings in runtime settings > General > Run Logic.
lEnabling automatic creation of thumbnails in Options > Scripting > Thumbnails
enables VuGen to create thumbnails during the application's idle time.
lIf the Windows Aero theme is enabled, thumbnails capture more realistic images of
the application.
Relevant
tasks
"How to Modify the VuGen Layout" on page58
User interface elements are described below (unlabeled elements are shown in angle brackets):
UI Element Description
Moves the cursor to the step in the Editor associated with the highlighted
thumbnail in the Thumbnail Explorer.
Enables a full screen view of the thumbnail.
Synchronizes the scrolling in the Editor with the associated thumbnail in the
Thumbnail Explorer and step in the Step Navigator.
Filters out minor thumbnails that are not directly related to the recorded
business process.
Refreshes the generated thumbnails.
Scroll a page left in the Thumbnail Explorer.
Move to the previous thumbnail in the Thumbnail Explorer.
Move to the next thumbnail in the Thumbnail Explorer.
Scroll a page right in the Thumbnail Explorer.
User Guide
VuGen
HP LoadRunner (12.50) Page 86
Errors Pane
The Errors pane lists the replay and syntax errors found in your script, and enables you to locate each
error so that you can resolve it.
To access View > Errors
Important information lAfter every test process, such as code generation and replay,
you can check the error pane for the error log.
lThe error log includes errors, warnings and messages.
lCommunity search is available with context menu on
highlighted error.
lDouble-click message to jump to the location in the script.
lYou can move this pane to different areas of the main user
interface. For details, see "How to Modify the VuGen Layout"
on page58.
lWhen you open an existing script, the items displayed in the
Error Pane are from the latest replay or compilation.
See also l"User Interface" on page54
l"Debugging" on page311
User interface elements are described below (unlabeled elements are shown in angle brackets):
UI Element Description
<Define Available Categories>
dropdown
Filters the error list by the source of the error.
Shows or hides syntax errors.
Shows or hides warnings detected during the run.
Shows or hides informational messages detected during the run.
! <Exclamation Point> Task type:
lError
lWarning
lInformational message
User Guide
VuGen
HP LoadRunner (12.50) Page 87
Line The line containing the error.
Description Description of the error, warning or message and advice on how
to fix the problem. For example, a syntax error is displayed if you
opened a conditional block with an If statement but did not close
it with an End If statement, the description is Expected
Expression.
Note: If the description does not fit within the
Description column, a tooltip displays the full description
when you hover the cursor over the column. In certain
cases, VuGen is unable to identify the exact error and
displays a number of possible error conditions, for
example: Expected 'End Sub', or 'End Function', or 'End
Property'. Check the statement at the specified line to
clarify which error is relevant in your case.
File The name of the file that contains the problematic statement.
Path The full path of the file that generated the error.
Test The name of the script in which the error was detected.
Tasks Pane
This pane enables you to add, edit and track tasks associated with an individual script or the overall
goals of the project. Tasks are divided between user defined tasks and tasks that are inserted into the
Vuser script as action items using keywords such as ToDo, Undone and FixMe.
User defined tasks are displayed when you select the User Tasks option in the Task pane. Action items
are displayed when you select the Comments option in the Task pane.
To access View > Tasks
See also "User Interface" on page54
User interface elements are described below (unlabeled elements are shown in angle brackets):
UI
Element
Description
Comments
view
Comment tasks are added directly into your script using the comment syntax of your
scripting language and include a keyword such as TODO or FIXME. For example, in C a
comment script would look like this:
User Guide
VuGen
HP LoadRunner (12.50) Page 88
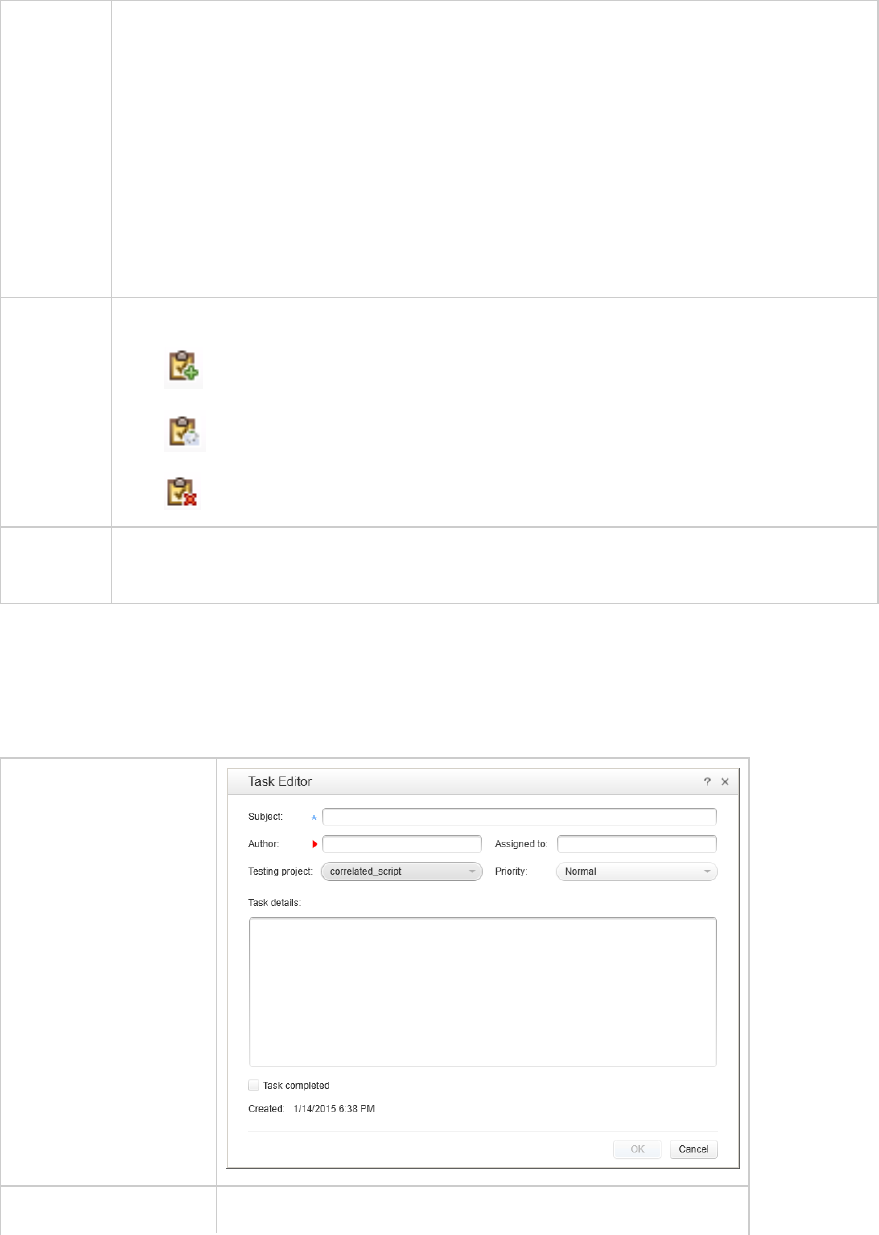
//TODO Add Parameter
The Task Pane displays the following information about each task:
l!: Task Type
lLine: What line the task is located. Double-clicking the task jumps to that location in
the script.
lDescription: The Keyword and the task contents.
lFile: Action
lPath: File location of the action.
User
Tasks
view
You can add, edit, delete user tasks:
Click to add a task with the "Task Editor" below.
Click to edit a task with the "Task Editor" below.
Click to delete a task.
<Task
Filter>
You can filter tasks associated with a particular script or see all the tasks associated
with the solution.
, continued
Task Editor
This dialog box enables you to add or edit user tasks.
UI example
To access View > Tasks > User Tasks tab
User Guide
VuGen
HP LoadRunner (12.50) Page 89
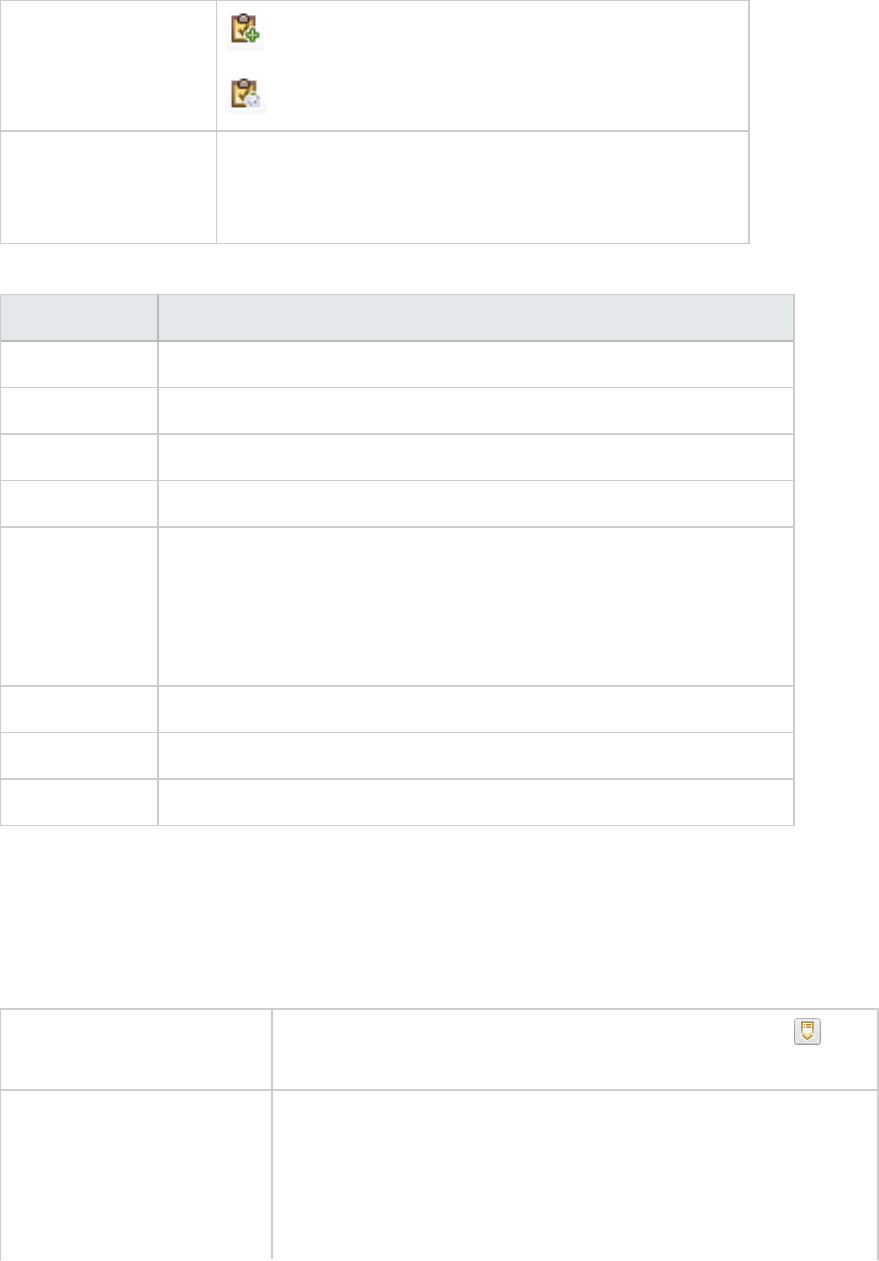
Adds a new task
Opens the highlighted task for editing
Important information lA blue asterisk indicates a required field.
lYou can copy and duplicate tasks using the right-click
menu.
User interface elements are described below:
UI Element Description
Subject *Brief description of task. Required field.
Author *User who initiates the task
Assigned to User who is assigned to complete the task
Testing Project Script associated with the task.
Priority You can assign a priority to the task:
lHigh
lNormal
lLow
Task details A textual description of the task
Task completed A check box indicating that you have completed the task
Created A non-editable field that displays the date and time the task was created
Output Pane
The Output pane displays messages that were generated during the recording, compilation, and replay
of your script.
To access Select View > Output, or click the Show Output Pane button on
the VuGen toolbar.
Important information lYou can move this pane to different areas of the Main User
Interface. For details, see "How to Modify the VuGen Layout" on
page58.
lWhen you open an existing script, the items displayed in the
Output Pane are from the latest replay or compilation.
User Guide
VuGen
HP LoadRunner (12.50) Page 90
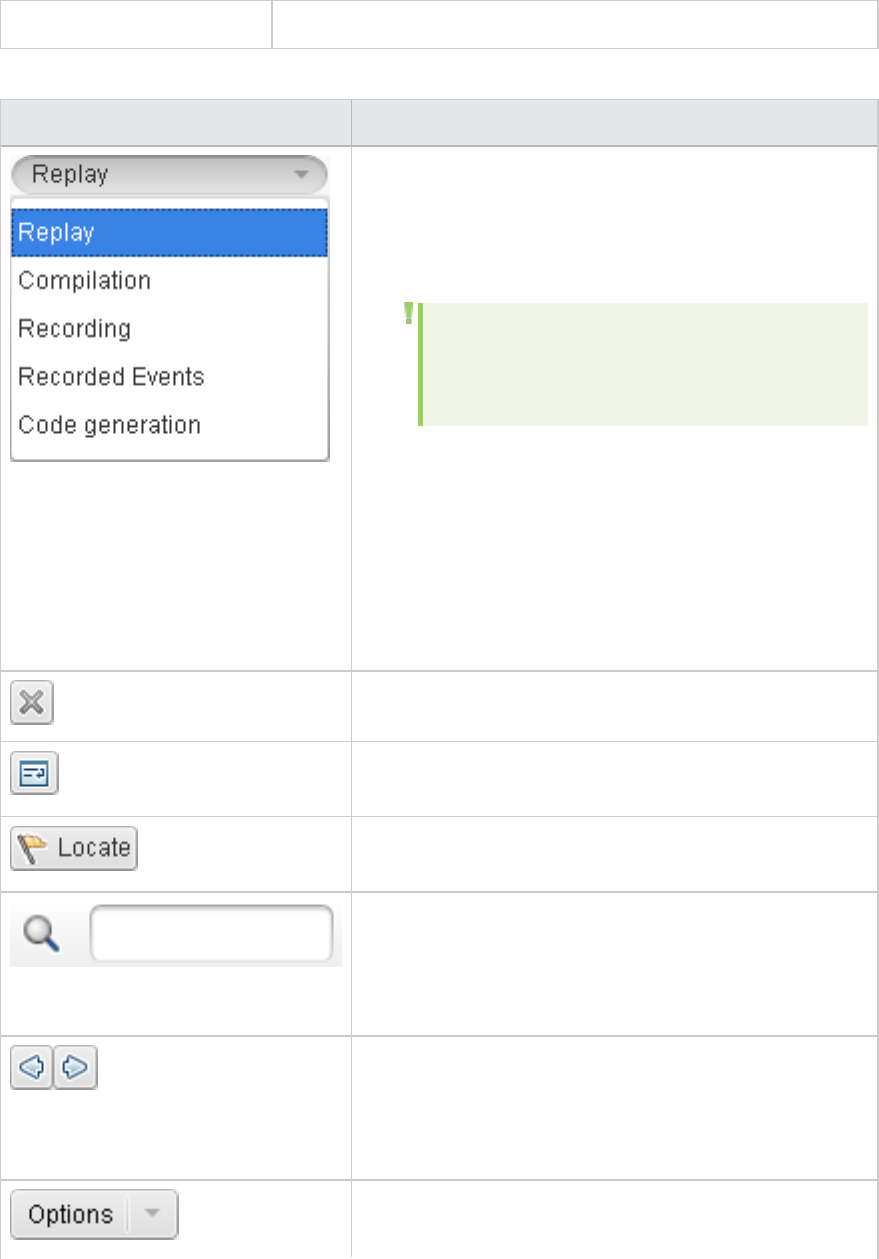
See also "User Interface" on page54
User interface elements are described below:
UI Element Description
The type of output to display. The following types are
available:
lReplay. Displays the messages generated by the script
replay.
Note: If you double-click an entry in the Replay
log, VuGen moves the cursor to the
corresponding line in the Editor.
lCompilation. Displays the compilation messages.
lCode Generation. Displays the code generated during
the recording.
lRecording. Displays the messages generated during the
recording.
lRecorded Events. Displays events that occurred during
recording.
Clears all of the messages from the message list.
Toggle Line Wrap. When selected, wraps the text of each
message onto the next line - as required.
Jumps to the location in the source document relevant to
the selected output message.
<Find box>. The text string that you want to find. You can
refine your search by selecting one of the Options
described below.
Press ENTER to begin the search.
Find Previous / Find Next. Highlights the next or previous
string that matches the text you entered in the Find box.
These buttons are available only after you enter text in the
Find box.
Enables you to refine your search with the following
options:
User Guide
VuGen
HP LoadRunner (12.50) Page 91
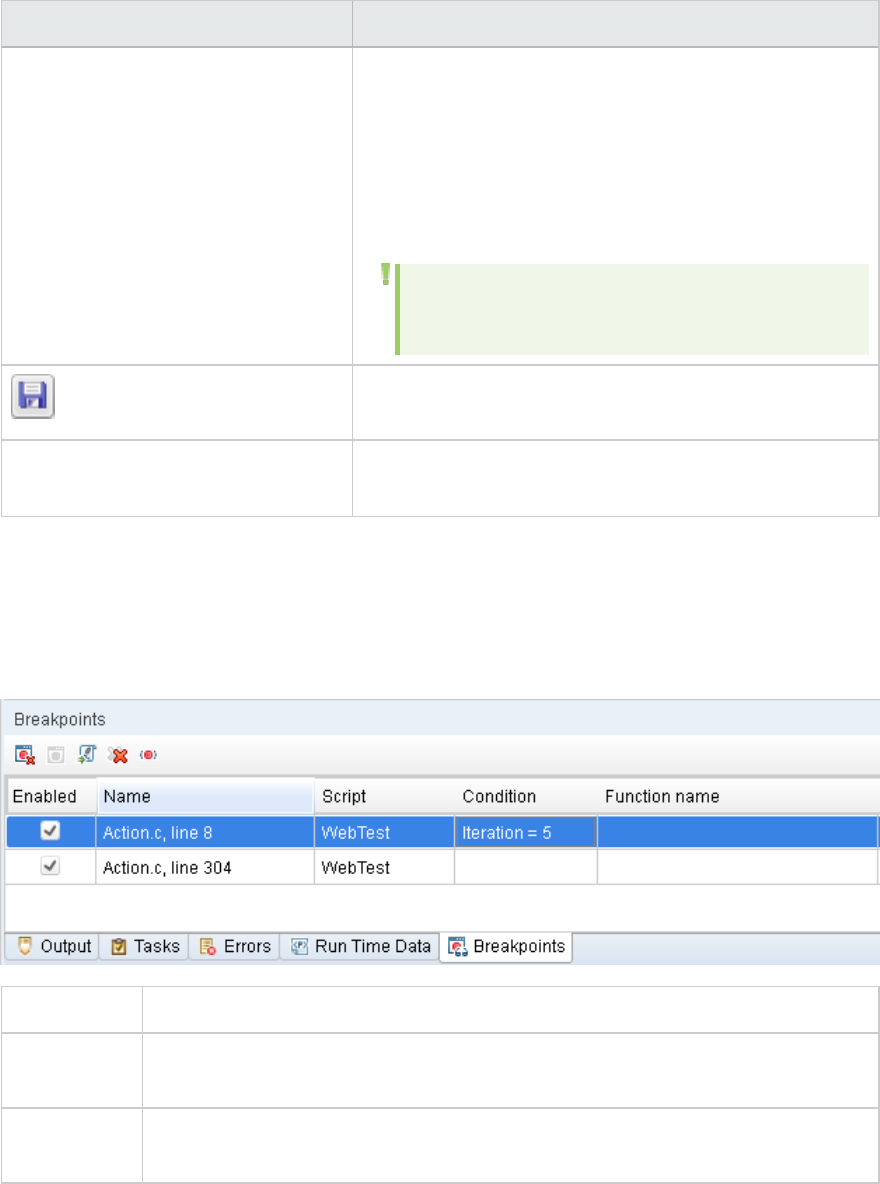
UI Element Description
lMatch Case. Distinguishes between upper-case and
lower-case characters in the search.
lMatch Whole Word. Searches for occurrences that are
only whole words and not part of longer words.
lUse Regular Expression. Treats the specified text string
as a regular expression.
Note: Extended regular expressions and multi-line
searches are not supported.
Opens the Save As dialog box, enabling you to save the
contents of the message list as a text file.
View Summary
[Available in the Replay log only]
Opens the Replay Summary tab. For details, see "Replay
Summary Pane" on page123.
Breakpoints Pane
The Breakpoints pane enables you to set and manage breakpoints to help analyze the effects of the
script on your application at pre-determined points during script execution.
To access View > Debug > Breakpoints
Important
information
You can move this pane to different areas of the Main User Interface. For details,
see "How to Modify the VuGen Layout" on page58.
Relevant
tasks
"How to Debug Scripts with Breakpoints" on page319
User Guide
VuGen
HP LoadRunner (12.50) Page 92
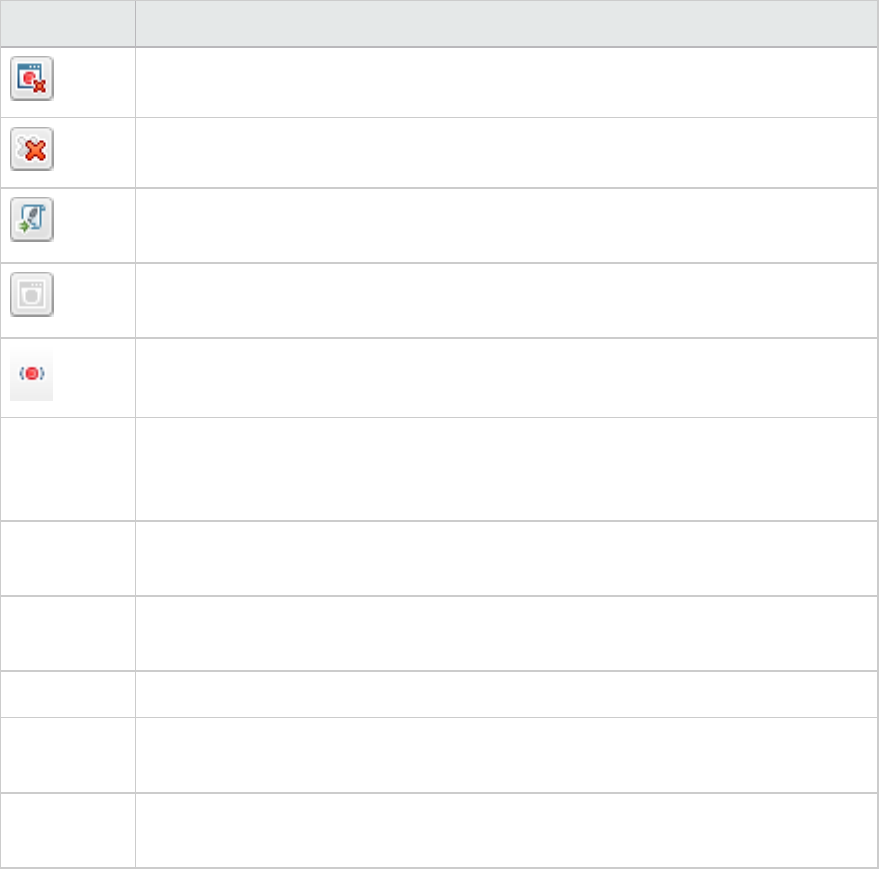
Breakpoints Pane
User interface elements are described below (unlabeled elements are shown in angle brackets):
UI Element Description
Removes the selected breakpoint.
Removes all breakpoints.
Locates the cursor in the Vuser script at the line that contains the selected
breakpoint.
Disables the selected breakpoint if it is enabled, and enables the selected breakpoint
if it is disabled.
Allows you to enter conditions for the selected breakpoint. See "Breakpoint Condition
Dialog Box" below for more details.
<Breakpoints
Grid>
A list of the breakpoints and their locations in the script. To enable a breakpoint,
select the Enable check box next to that breakpoint. To disable a breakpoint, clear
the Enable check box.
Enabled A check box that specifies whether the breakpoint is enabled or disabled, and enables
you to enable or disable the adjacent breakpoint.
Name The name of the file that contains the breakpoint, and the line number within the file
that contains the breakpoint.
Script The name of the Vuser script that contains the breakpoint.
Condition The condition that applies to this breakpoint. If there is no condition, the replay will
always stop at the breakpoint.
Function
Name
The name of the function within the Vuser script that contains the breakpoint.
Breakpoint Condition Dialog Box
The Breakpoint Condition dialog box enables you to condition breakpoints by the iteration number, the
value of one or more parameters, or a combination of both parameter values and iteration number.
User Guide
VuGen
HP LoadRunner (12.50) Page 93
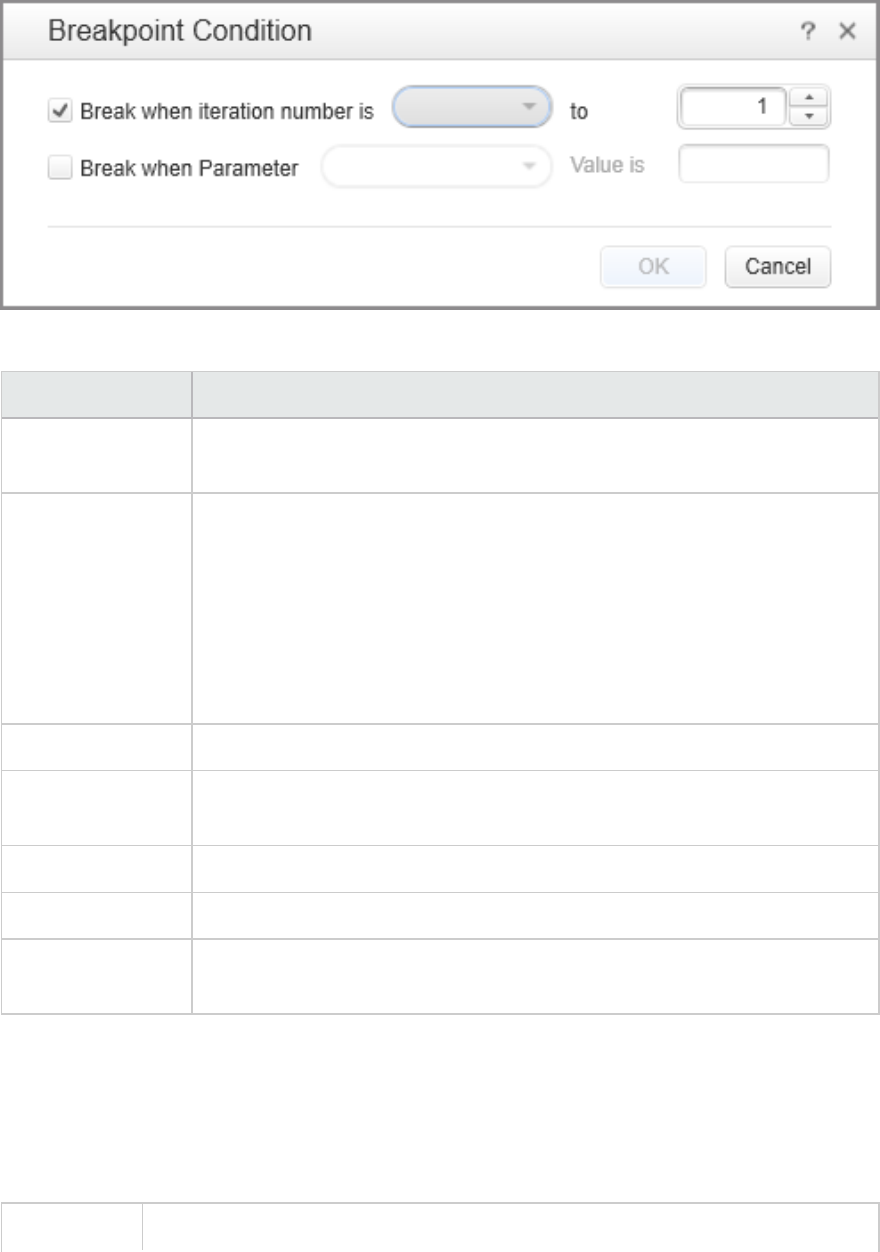
User interface elements are described below (unlabeled elements are shown in angle brackets):
UI Element Description
Break when
iteration number is
A check box that enables you to specify a breakpoint dependant on the
iteration number.
<Operand> Choose one of the following operands:
l= (equal)
l<= (less than or equal to)
l=> (equal to or greater than)
l< (less than)
l> (greater than)
to Enter an iteration number.
Break when
Parameter
A check box that enables you to specify a breakpoint dependant on the value
of a parameter.
<Parameter Name> Choose a parameter from the drop-down list
Value is Enter the parameter value for which you want a breakpoint.
OK Apply the conditions to the selected breakpoint. All future replays will only stop
at this breakpoint if these conditions are met.
Call Stack Pane
This debug pane enables you to view information about the functions that are currently on the call
stack of your script.
To access View > Debug > Call Stack
User Guide
VuGen
HP LoadRunner (12.50) Page 94
Important
information
lThis pane is relevant only when a run session is paused.
lYou can double-click any element in the Call Stack pane to navigate to the
beginning of the relevant function/action.
lThis pane is read-only.
lYou can move this pane to different areas of the Main User Interface. For details,
see "How to Modify the VuGen Layout" on page58.
See also l"User Interface" on page54
l"Debugging" on page311
, continued
User interface elements are described below:
UI Element Description
Function name The name of the function currently called.
File name The name of the file containing the called function.
Line # The line number on which the function definition begins.
Watch Pane
The Watch pane enables you to monitor variables while a script runs.
To access View > Debug > Watch
Important
information
lThis pane is relevant only when a run session is paused.
lYou can move this pane to different areas of the Main User Interface. For details,
see "How to Modify the VuGen Layout" on page58.
User interface elements are described below:
UI
Element
Description
Enables you to add a variable to the watch list.
Enables you to edit the selected variable in the watch list.
Deletes the selected variable from the watch list.
User Guide
VuGen
HP LoadRunner (12.50) Page 95
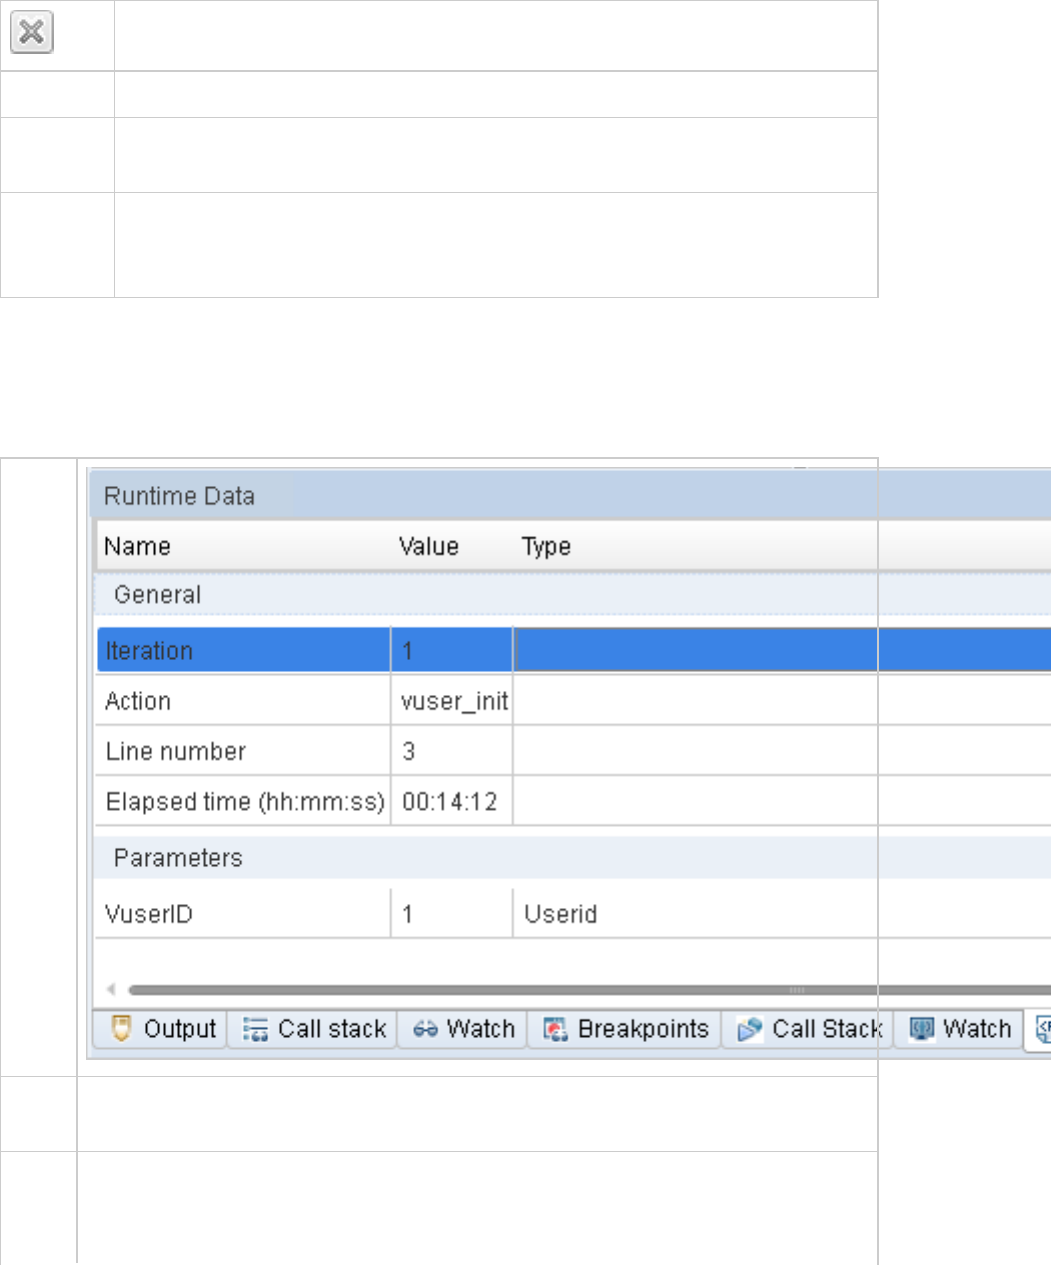
Deletes all the variables from the watch list.
Expression The variable whose value you want to watch.
Value The current value of the variable. The evaluated value is displayed only when a run
session is paused.
Type
name
The type of the variable's value after it is evaluated (for example, Integer or Char). If an
variable cannot be evaluated in the current context, the type displayed is Incorrect
expression.
Runtime Data Pane
The Runtime Data pane displays information about the current script execution.
UI
Exam
ple
To
access
View > Debug > Runtime Data
Impor
tant
infor
lThe Runtime Data pane is accessible during script replay only.
lYou can move this pane to different areas of the Main User Interface. For details, see
"How to Modify the VuGen Layout" on page58.
User Guide
VuGen
HP LoadRunner (12.50) Page 96
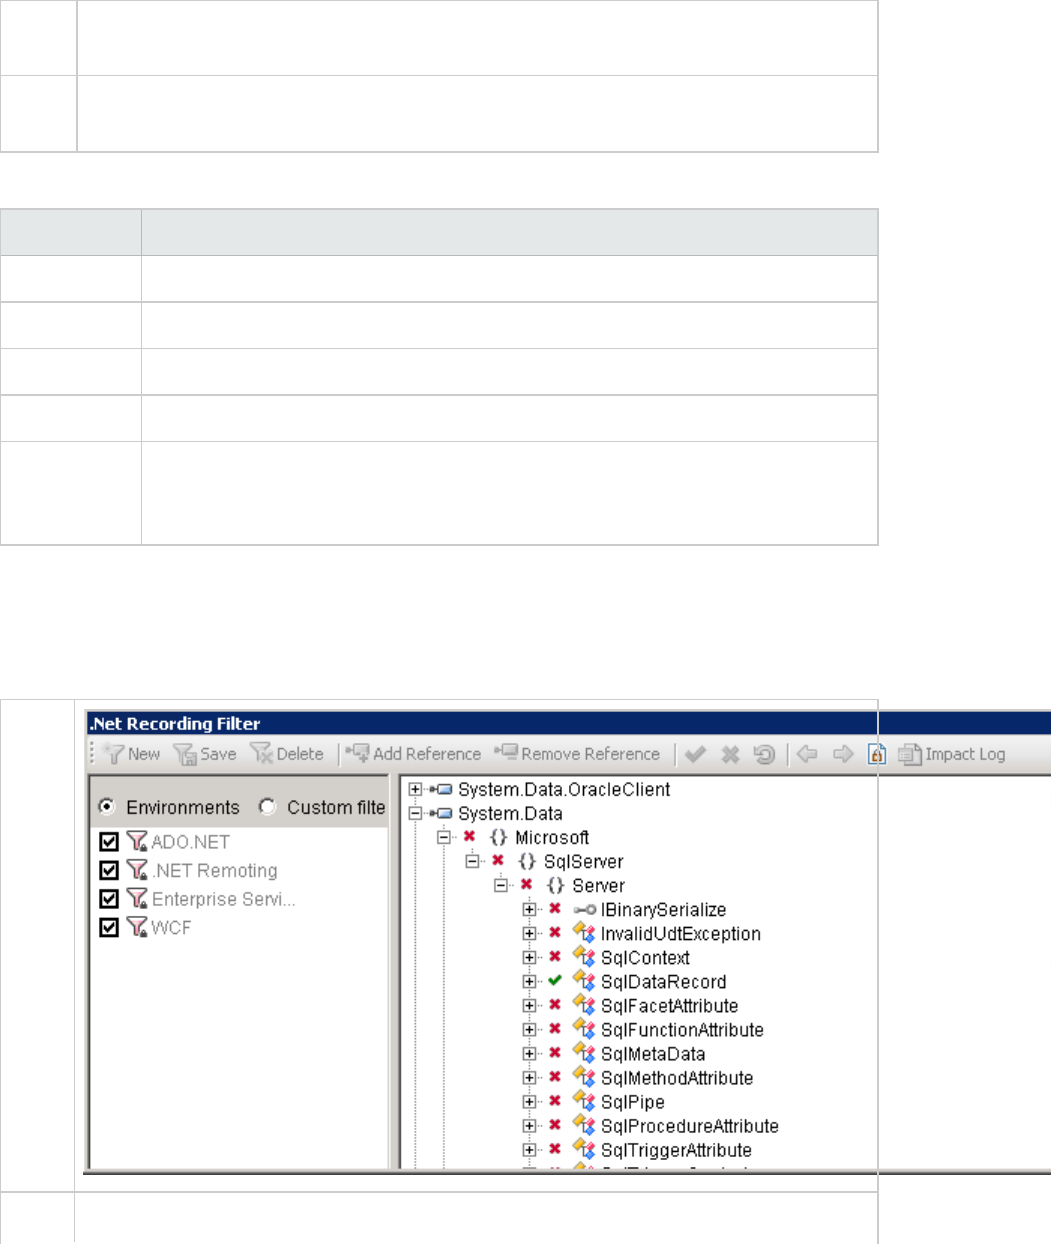
matio
n
See
also
"How to Replay a Vuser Script" on page275
, continued
User interface elements are described below (unlabeled elements are shown in angle brackets):
UI Element Description
Iteration Displays the current iteration number.
Action Displays the Action name of the currently replayed step.
Line Number Displays the line number of the currently replayed step.
Elapsed time Displays the time that has elapsed since the start of the replay.
<Parameters> Displays all parameters defined, together with the script and their substitution
values based on the selected update method (sequential, unique, etc.). VuGen shows
this information even if the parameter is not used in the script.
.NET Recording Filter Pane
This pane enables you to manage .NET filters.
UI
Exam
ple
To View > .Net Recording Filter
User Guide
VuGen
HP LoadRunner (12.50) Page 97

acces
s
See
also
l".NET Filters Overview" on page598
l".NET Filters - Advanced" on page599
l"Guidelines for Setting .NET Filters" on page600
User interface elements are described below (unlabeled elements are shown in angle brackets):
UI Element Description
<Filter List> Alist of the recording filters.
lEnvironments. Built-in system filters for .NET Remoting, ADO.NET, Enterprise
Services, and WCF (Windows Communication Foundation).
lCustom filters. Filters that you created manually for this script. TO create a
custom filter, click New.
<Filter Tree> The Filter tree uses symbols to illustrate the elements and their status. For details
about each of the icons, see the table below.
lElement icons represent the type of element—assembly, namespace, class,
method, structure, property, events, or interfaces.
lA check mark or X adjacent to the element icon, indicates whether or not the
element is included or excluded.
lA bold element indicates that it was explicitly included or excluded. This may be a
result of being manually included or excluded by the user or by a pre-defined rule
in the environment filter. If you reset a bold node, it returns to its original, non-
bold state.
New Opens the Create a New Filter dialog box, in which you create an empty filter or a new
filter based on an existing one. For more information, see "Create a New Filter Dialog
Box [.NET Protocol]" on page100.
Save Saves the changes you made to filter.
Delete Deletes the selected custom filter. The filter pane prompts you for a confirmation.
Add
Reference
Opens the Add Reference dialog box with a list of .NET Framework components or
assemblies in the Public Assemblies folder. For more information, see "Add
Reference Dialog Box [.NET Protocol]" on page101.
Remove
Reference
Removes the assembly that is selected in the Filter pane and disables all of the rules
associated with it. All disabled rules are enabled after adding the reference to this
assembly once again. The Filter mechanism prompts you for a confirmation.
Include. Includes the selected element. If you manually include a parent node, the
filter mechanism includes the child elements below it, provided that no other rule
User Guide
VuGen
HP LoadRunner (12.50) Page 98
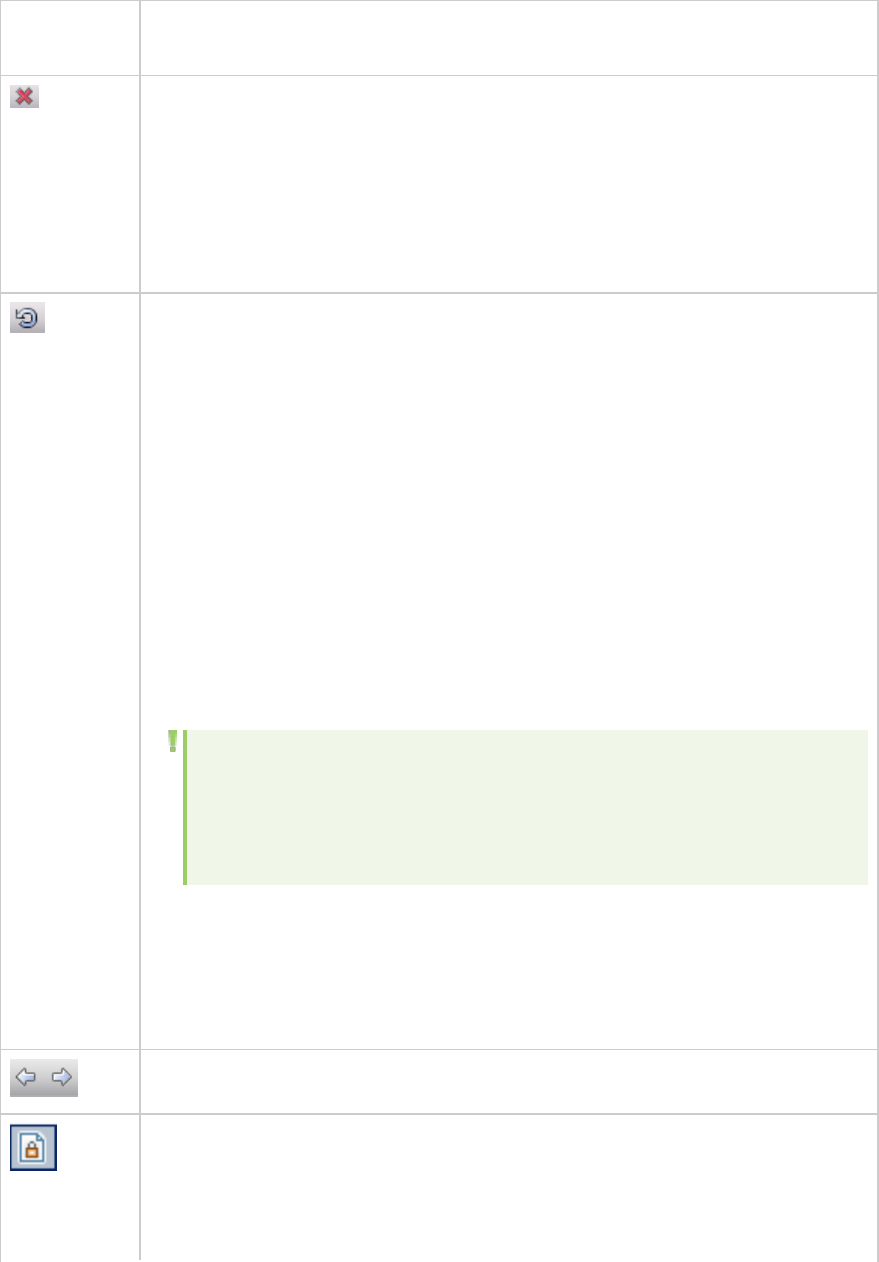
exists. For example, if you include a class, it will include all its methods unless you
specifically excluded a method.
Exclude. Excludes the selected element. The child elements are also excluded unless
they were included by another rule. By default, when you exclude a class, the filter
mechanism applies the Exclude attribute to the class, but it allows the recording
engine to record activity within the methods of the excluded class. When you exclude
amethod, however, the filter mechanism applies Totally Exclude, preventing the
recording engine from recording any activity within the methods of the excluded
class. Advanced users can modify these setting in the filter file.
Reset. Removes the manual inclusion or exclusion rule. In this case, the element may
be impacted by other parent elements.
The inclusion and exclusion rules have the following properties:
lThe rules are hierarchical—if you add an include or exclude rule to a class, then
the derived classes will follow the same rule unless otherwise specified.
lA rule on a class only affects its public methods, derived classes, and inner
classes.
lA rule on a namespace affects all the classes and their public methods.
lNote that adding or removing assemblies does not necessarily affect the classes
that they contain—you can remove an assembly, yet its methods may be
recorded due to the hierarchical nature of the filter.
lAs part of the filter design, several methods, such as .cctor() and Dispose(bool),
do not follow the standard hierarchical rules.
Note: The resetting of a parent node does not override a manual inclusion or
exclusion applied to a child node. For example, if you manually exclude a
method, and then reset its class, which by default included all sub-nodes,
your method will remain excluded.
Properties and events are view-only and cannot be included or excluded through the
.NET Recording Filter pane. In addition, several system related elements are
protected and may not be altered.
For tips about including and excluding elements in the filter, see "Guidelines for
Setting .NET Filters" on page600.
Navigate. Navigates to the previous or next tree node visited by the user.
Show non-public items. By default, the filter tree shows only public classes and class
members. By clicking this button, you instruct the tree view to display non-public
items.
If you include a class which contains non-public items, they will not be added to the
User Guide
VuGen
HP LoadRunner (12.50) Page 99
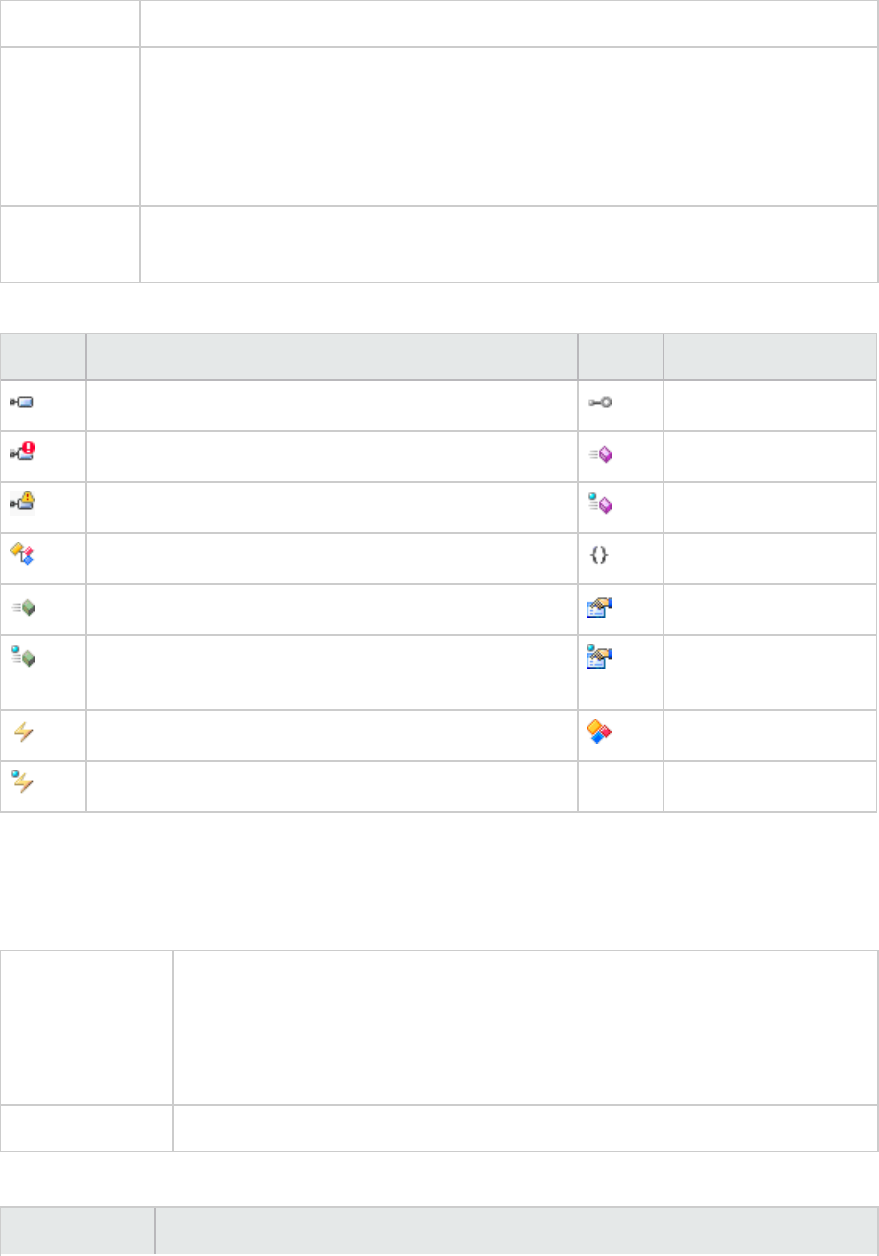
filter automatically. You must explicitly include each non-public item to the filter.
Impact Log Opens the Impact Log, which indicates what your last changes were and how they
affected your filter. The user actions are listed in descending order, with the latest
changes at the top.
For each element, the log indicates how each manual inclusion or exclusion were
affected. It also provides a link to the affected element in the filter pane hierarchy.
View Impact
Log
Opens the Impact log for the selected filter. The Impact log shows which nodes in the
tree were affected by recent actions.
The following table shows the filter tree icons that represent the various elements:
Icon Description Icon Description
assembly interface
assembly that couldn't be loaded method
assembly that was partially loaded static method
class namespace
constructor property
static constructor static
property
event structure
static event
Create a New Filter Dialog Box [.NET Protocol]
This dialog box enables you to create a new filter for .NET Vuser scripts.
To access Perform the following:
1. Select View > .Net Recording Filter.
2. Select the Custom filter option in the left pane.
3. Click New.
See also ".NET Recording Filter Pane" on page97
User interface elements are described below:
UI Element Description
User Guide
VuGen
HP LoadRunner (12.50) Page 100

Start with an
empty filter
Create a new filter that is not based on a pre-existing filter.
Based on an
environment
filter
Create a new filter based on an environment filter. Use the check boxes next to the
environment filters to indicate which environment filters to base the filter on.
Based on a
custom filter
Create a new filter based on a custom filter. Use the drop-down menu to select the
custom filter.
Add Reference Dialog Box [.NET Protocol]
This dialog box enables you to add references to .NET filters.
To access Perform the following:
1. Select View > .Net Recording Filter.
2. Select the Custom filters option in the left pane.
3. Select a filter element.
4. Click Add Reference.
See also ".NET Recording Filter Pane" on page97
User interface elements are described below (unlabeled elements are shown in angle brackets):
UI Element Description
<Component
List>
A list of .NET Framework components or assemblies in the Public Assemblies folder.
lTo add one of the listed items, select it and click Select. You can select multiple
components using ctrl-click. The bottom pane shows the selected references.
lTo add an assembly that is not in the list, click Browse and locate the reference on
your file system or network.
<Selected
Component
List>
The list of selected components. The Type column indicates .NET for a component
from the Public Assemblies folder and File for a component that was added by
selecting Browse.
lTo clear an item from the list, select it in the bottom pane and click Remove.
Options Dialog Box
The Options dialog box is comprised of VuGen application settings. The settings are common to all
protocols available in VuGen.
Specific details of each of the settings are described in the topic of the relevant category topic.
User Guide
VuGen
HP LoadRunner (12.50) Page 101

The Options dialog box is divided into three tabs, General,Editor and Scripting.
General Options
This pane enables you to configure general user interface options.
Task List
To access VuGen > Tools > Options > General > Task List
User interface elements are described below:
UI
Element
Description
Comment
Tags
This pane enables you to add, delete or modify tags names that you can use to label
comment tasks in your scripts.
Tags. List of available tags.
Name. Displays the name of the highlighted tags in the token list. This area enables you
to modify, add or delete the current tag.
Add. Enables you to add a tag to the token list.
Edit. Enables you to modify the name of tag from the token list.
Delete. Enables you to delete a tag from the token list.
Scripts and Solutions
To access VuGen > Tools > Options > General > Scripts and Solutions
User interface elements are described below:
UI Element Description
Settings Default project location
Enables you to specify a path to your saved projects. Default location =
C:\Users\<username>\Documents\SharpDevelop Projects
Load previous solution on startup
Enables you to automatically load the previous solution.
By default this option is enabled.
User Guide
VuGen
HP LoadRunner (12.50) Page 102
Start Page
Settings
Display Start Page on startup
By default this option is enabled.
Close Start Page after script loads
By default this option is enabled.
ALM
To access VuGen > Tools > Options > General > ALM
User interface elements are described below:
UI Element Description
Connect to
ALM in CAC
mode
Connects to HP Application Lifecycle Management using CAC (Common Access
Card).This enables you to log in without providing a username and password.
Message Dialogs
Using these checkboxes, you indicate which messages should be issued as popups and which should be
hidden.
To access VuGen > Tools > Options > General > Message Dialogs
User interface elements are described below:
UI Element Description
Proxy Recording
Tips Message
This tip instructs you how to proceed when recording an application that runs on
another machine or device.
Web - HTTP/HTML
Protocol
JavaScript
Message
This message appears when you create a Web - HTTP/HTML script, informing you
that you can create your Vuser script in JavaScript.
Closing VuGen
and Browser
Message
This question appears when you close a TruClient script that is being edited in
Interactive mode, warning you that the TruClient browser will be closed.
Community
Search Privacy
Warning
This warning message appears when you select the Search Community
command from the context menu. It notifies you that the selected script text will
be automatically passed into the search engine.
Paste runtime This warning appears when you paste runtime settings from the clipboard. It
User Guide
VuGen
HP LoadRunner (12.50) Page 103
settings Warning notifies you that the operation cannot to be undone.
Action Reordered
Warning
This notification informs you that rearranging actions within the solution tree
will not affect the run logic.
Start Recording
with IPv6
Warning
This warning notifies you that you cannot record an application with IPv6 with
the current protocol.
Discard
Correlation
Warning
The Design Studio issues this message when you discard a correlation. It also
explains how to restore it.
Mobile Settings
Changed Warning
VuGen issues this message in TruClient Mobile protocol when you try to change
the runtime settings. This warning informs you that you must re-run the script in
order to apply the new runtime settings.
Community
To access VuGen > Tools > Options > General > Community
See also For details, see Community Search in the "Editor Pane" on page69.
User interface elements are described below:
UI Element Description
Community Search Sites
Adds a new search site to the list of Community search sites.
lName: Enables you to specify a name of the search site that is displayed on the
VuGen toolbar.
lURL: Enables you to specify the URL of the search site.
Example URLs
http://www.bing.com/search?q=%QUERY%
http://www.google.com/search?q=%QUERY%
http://www.google.de/search?q=%QUERY% (localized google site, e.g. de
for Germany)
User Guide
VuGen
HP LoadRunner (12.50) Page 104
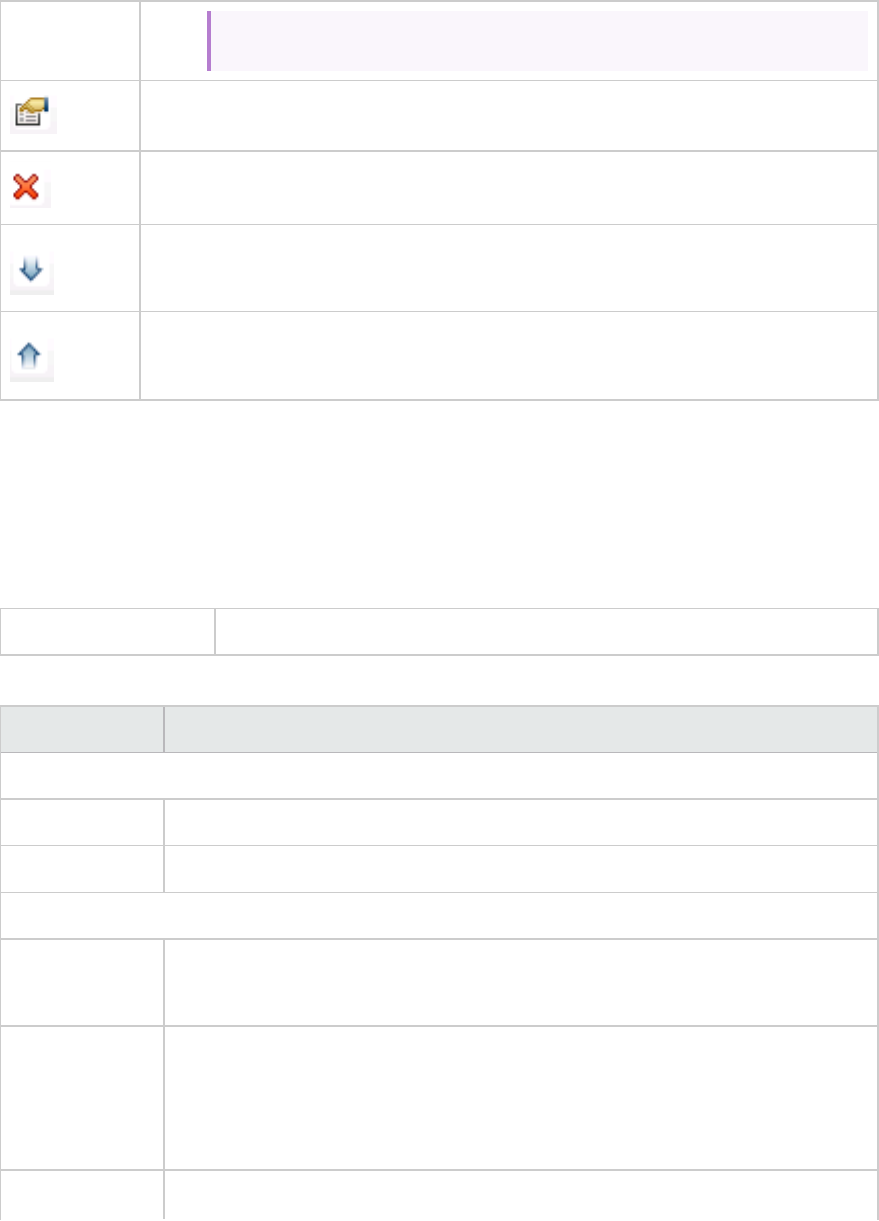
http://en.wikipedia.org/wiki/%QUERY%
Enables you to edit the properties of the custom search site.
Deletes the search site from the list of available sites.
Moves the search site lower down on the list of available sites.
Moves the search site higher up on the list of available sites.
Editor Options
This pane enables you to configure the text editor options.
General
To access Tools > Options > Editor > General
User interface elements are described below:
UI Element Description
Font
Text Font Enables you to select the font.
Size Enables you to select the font size.
General Options
Word wrap Automatically wraps text to the next line.
By default this option is disabled.
Show
Class/Function
Browser
Show or hide the Class/Function Browser. When enabled, you can navigate quickly
to a specific class or function in your script by selecting it from the drop-down list
in the browser.
By default this option is enabled.
Show line Enable line numbering of script in the Editor.
User Guide
VuGen
HP LoadRunner (12.50) Page 105
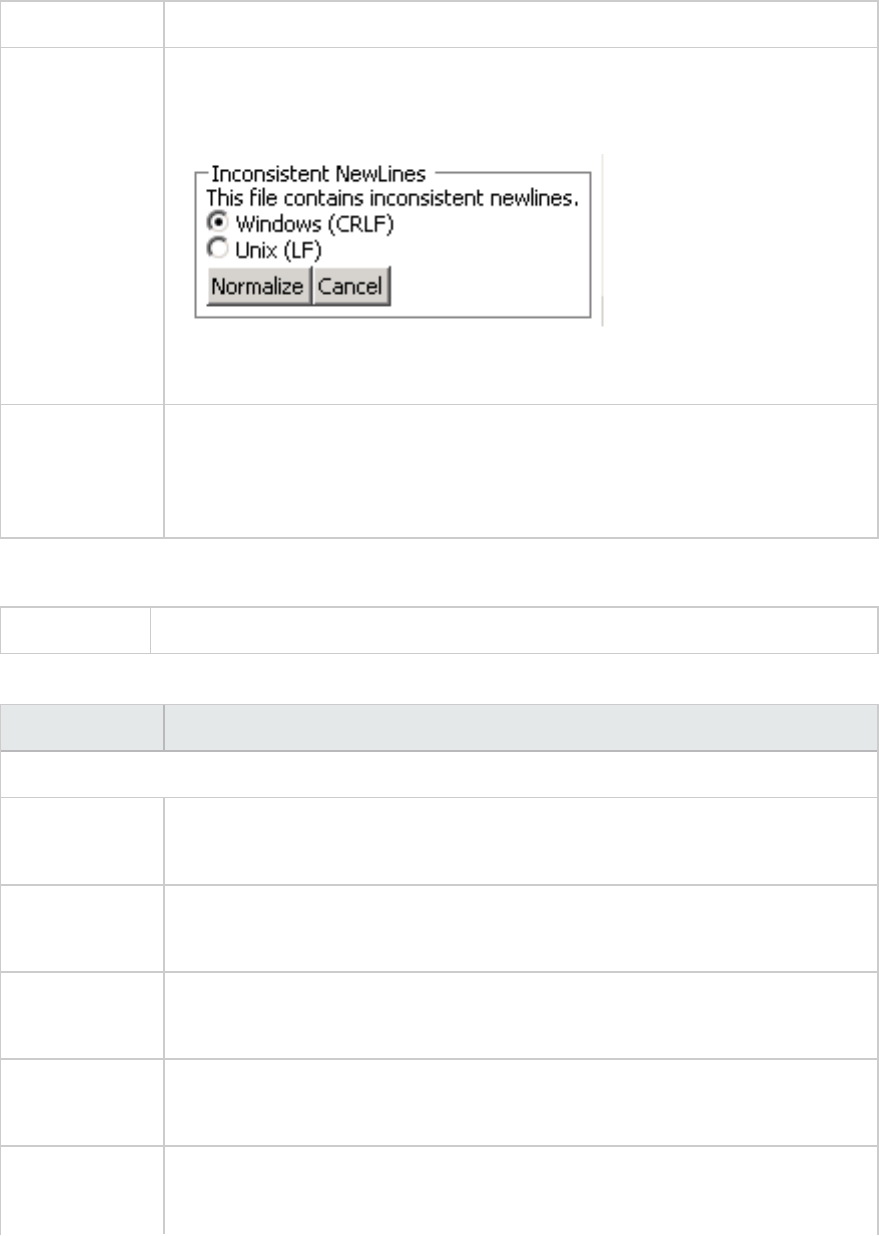
numbers By default this option is enabled.
Check for line
ending
inconsistencies
Enable the editor to check for end of line inconsistencies in your script. If enabled,
a utility appears in the script editor that enables you to normalize line endings
based either on a Windows standard (CRLF) or a Linux standard (LF).
This option is enabled by default.
Enable working
URL hypertext
links in the
Editor
Enable URLs in scripts to function as hypertext links. Disabling this option may
increase performance.
By default this option is enabled.
Markers and Rulers
To access VuGen > Tools > Options > Editor > Markers and Rulers
User interface elements are described below:
UI Element Description
Markers and Rulers
Show spaces Enable markers that indicate where tabs exists.
By default this option is disabled.
Show tabs Enable markers that indicate where line ends.
By default this option is disabled.
Show end-of-
line makers
Enable markers that indicate where line ends.
By default this option is disabled.
Underline errors Enable underlining of errors.
By default this option is enabled.
Highlight
matching
Enable highlighting of matching brackets.
By default this option is enabled.
User Guide
VuGen
HP LoadRunner (12.50) Page 106
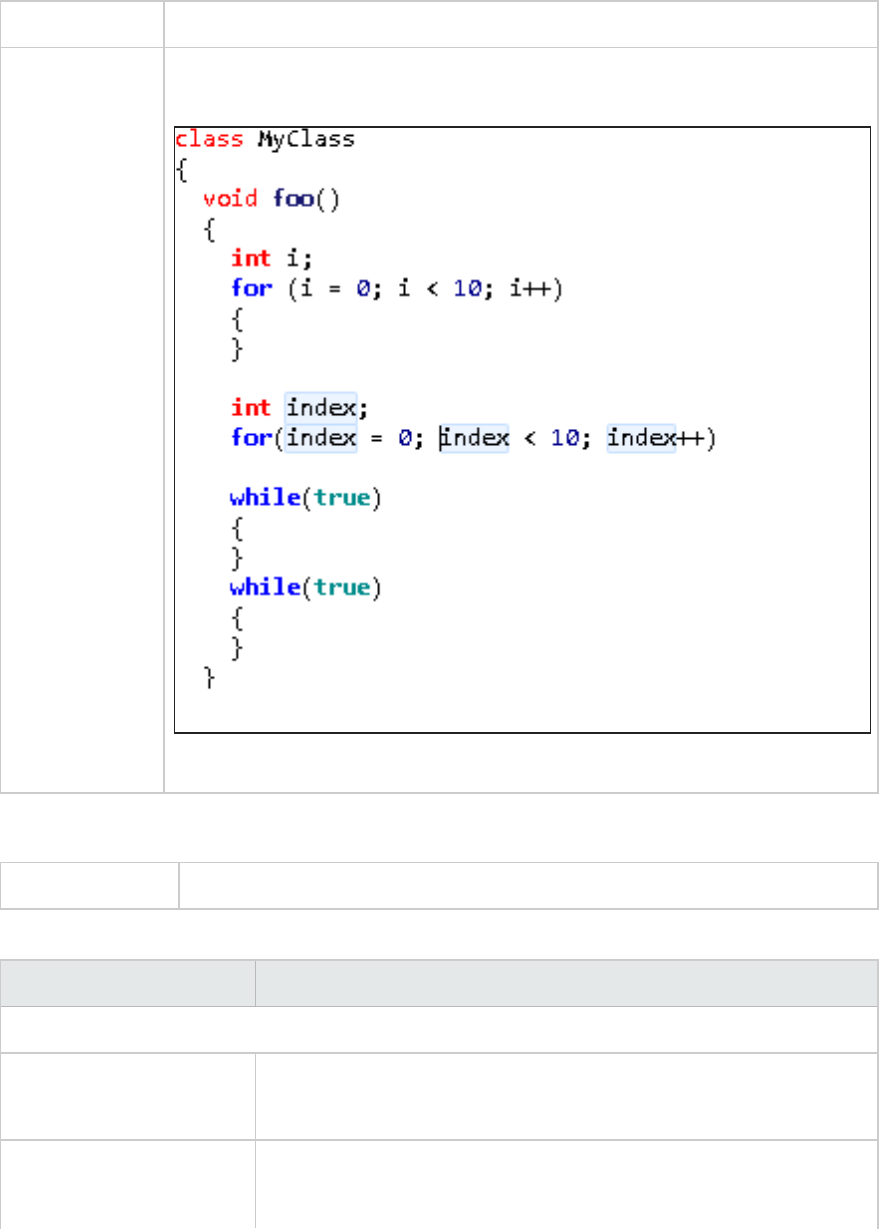
brackets
Highlight
symbols
When this option is enabled, you can select a non-keyword in your script and the
Editor will highlight all other occurrences in your script.
By default this option is enabled.
Behavior
To access VuGen > Tools > Options > Editor > Behavior
User interface elements are described below:
UI Element Description
Tabs
Indentation Enables you to set the spacing for tab indentation.
Default indentation is four spaces.
Convert tabs to spaces Converts tabs to spaces.
By default this option is disabled.
User Guide
VuGen
HP LoadRunner (12.50) Page 107

Use smart indentation Automatically applies the indentation format from the previous line.
By default this option is enabled.
Behavior
Enable zoom with mouse
wheel
Enables you to use the mouse wheel to zoom.
By default this option is enabled.
Cut or Copy entire line
when nothing is selected
Allows you to cut or copy an entire line without highlighting it in the
editor, as long as the cursor is within that line.
By default this option is enabled.
Enable Ctrl + Click for "Go
to Definition"
Enables the Ctrl + Click shortcut for "Go To Definition". This lets you
move the cursor to the definition of a function you highlighted in the
editor.
By default this option is enabled.
Recording and Code Generation
Use Compact mode for
JavaScript scripts
wherever possible
When using JavaScript as the coding language, use Compact mode. This
mode reduces the number of lines in the script by selectively removing
line breaks.
Code Color
To access VuGen > Tools > Options > Editor > Highlighting
Important information Highlighting options enable you to customize the color of script elements.
User interface elements are described below:
UI Element Description
<Language
Selection>
Drop-down list of script languages for which you can customize appearance
including:
lC#
lHTML
lVuGen C
lXML
<Element
Selection>
List of code elements whose appearance you can customize.
User Guide
VuGen
HP LoadRunner (12.50) Page 108
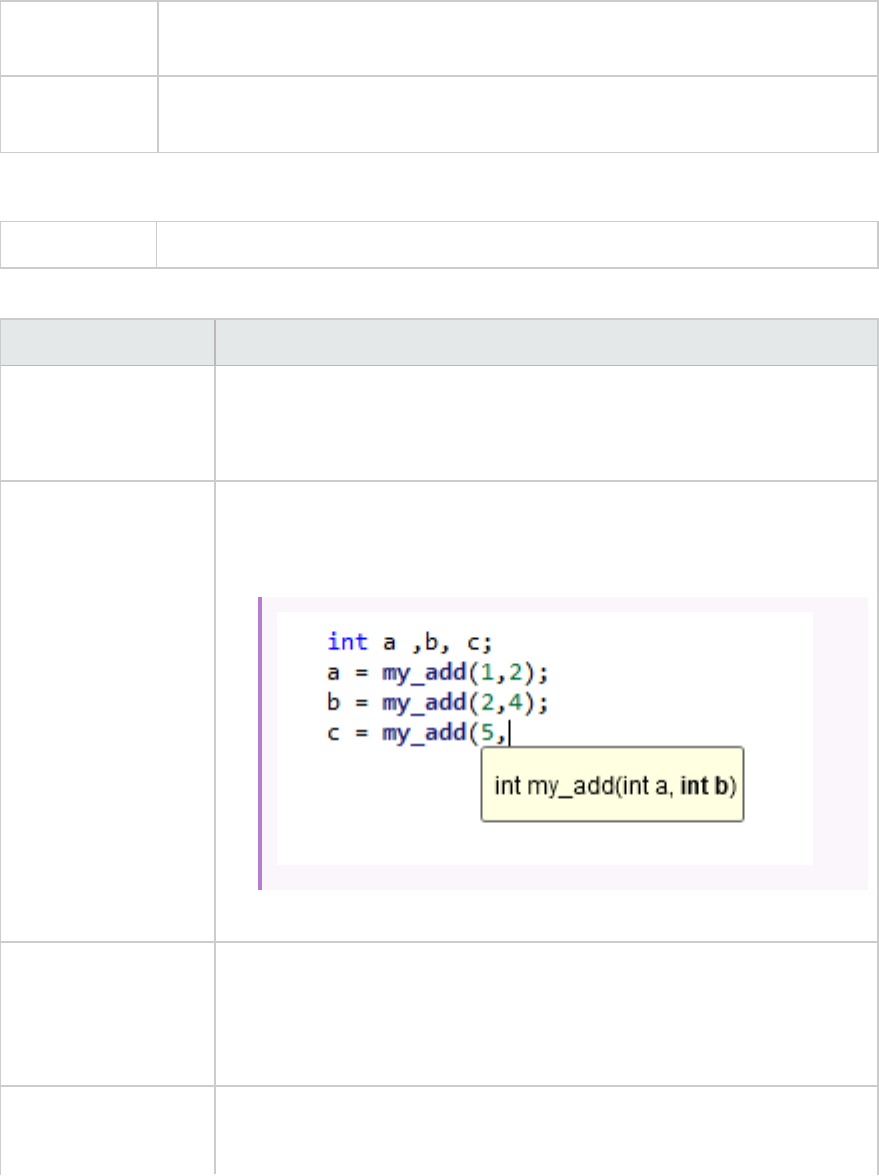
Foreground
color
Enables you to select a color from the pallet. The select color is applied to the
foreground of the code element.
Background
color
Enables you to select a color from the pallet. The select color is applied to
background of the code element.
Code Completion
To access VuGen > Tools > Options > Editor > Code Completion
User interface elements are described below:
UI Element Description
Enable code
completion features
Code completion features are enabled. For details on code completion, see
"Editor Pane" on page69.
By default this option is enabled.
Enable syntax tooltip Enables tooltips that display function arguments. Each argument is
highlighted as you are defining it, moving to the subsequent argument when
the delimiter is entered.
By default this option is enabled.
Show tooltips when
mouse pointer stops
over an identifier
When this option is enabled, a description of the code elements is displayed
when the mouse hovers over the identifier. This option is disabled when
Show tooltips in debug mode only is enabled.
By default this option is enabled.
Show tooltips in
debug mode only
Tooltips are displayed in debug mode only.
By default this option is disabled.
User Guide
VuGen
HP LoadRunner (12.50) Page 109
Include in the code completion list
ANSI C keywords Enables you to include ANSI C keywords in code completion list.
By default this option is enabled.
LoadRunner API Steps Enables you to include LoadRunner API Steps in the code completion list.
By default this option is enabled.
LoadRunner API
Constants
Enables you to include LoadRunner API Constants in the code completion
list.
By default this option is disabled.
User-defined
functions
Enables you to include user-defined functions in the code completion list.
By default this option is enabled.
Function parameters,
local and global
variables
Enables you to include function parameters, local, and global variables in
the code completion list.
By default this option is enabled.
Folding
To access VuGen > Tools > Options > Editor> Folding
User interface elements are described below:
UI Element Description
Enable folding features This option enables expanding and collapsing of script sections.
By default this option is enabled.
Enable steps folding This option enables expanding and collapsing of script steps.
By default this option is disabled.
When step length is more than [ ]
characters
Enables you define the number of characters in a step before
implementing folding.
By default this option is disabled.
When step consists of more than
[ ] lines
Enables you to define the number of lines to a step before
implementing folding.
By default this option is disabled.
User Guide
VuGen
HP LoadRunner (12.50) Page 110
Scripting Options
This pane enables you to configure options related to recording, replaying and debugging scripts.
Recording UI
To access Tools > Options > Scripting > Recording UI
User interface elements are described below:
UI Element Description
Enable Recording
Floating Toolbar
transparency mode
Display a transparent floating recording toolbar. When you click or hover
on the toolbar it becomes opaque.
By default this option is disabled.
Enable 'Cancel
Recording' button
Enable the Cancel Recording button on the floating recording toolbar.
Note: When the Cancel Recording button is enabled, there may be
a delay when you start recording into an existing script. This delay
occurs while VuGen makes a copy of the existing script.
By default, this option is enabled.
Open Start Recording
Dialog Box after new
script is created
Automatically open the Start Recording Dialog Box after a new script is
created.
By default this option is disabled.
Automatically close
transactions
Enable this function if you want VuGen to insert an end transaction step for
open transactions before recording a subsequent action.
By default this option is disabled.
Replay
To access VuGen > Tools > Options > Scripting > Replay
User interface elements are described below:
UI
Element
Description
Layout Do not switch the layout during Replay. By default, when you replay a script, VuGen
User Guide
VuGen
HP LoadRunner (12.50) Page 111
automatically switches the UI layout to the Debug layout. This option enables you to
maintain your selected layout during replay.
By default this option is disabled.
Animated
Run
Animated Run
Runs the script in animated mode, highlighting the line in the script that is currently
running. In non-animated mode, VuGen runs the script, but does not indicate the line
being executed.
By default this option is enabled.
Animated Run Delay
You can set a delay of the highlighting in the animated run, allowing you to better view
the effects of each step. You set the delay in milliseconds.
The default delay is 1.
Animate Functions in the Action section only
Animates the content of the Action sections only, not the init or end sections.
By default this option is enabled.
Results Enables result of replay summary to be saved to a named folder after
each script run
When this option is enabled the dialog box prompts you to name a results file before
running a script in VuGen. When not enabled, VuGen automatically names the directory
'result1'. Subsequent script runs will automatically overwrite previous results files unless
you specify a different name.
Note: Results are stored in a subdirectory of the script.
By default this option is disabled.
Generate report during script execution
By default this option is disabled.
During
Replay
lShow runtime view during replay
Enables the runtime viewer
lAuto Arrange Window
Select this option to arrange the two viewers side by side. This option is disabled by
default.
User Guide
VuGen
HP LoadRunner (12.50) Page 112
lCollect replay statistics
Select this option to enable the collection of replay-time statistics. The data collected
is displayed in the Replay Summary report. This option is enabled by default. For
details, see "Replay Summary Pane" on page123.
lDisplay Network Virtualization (NV) Analytics report
Select this option to enable the NV Analytics report. You open the NV Analytics
Integration report from the Replay Summary page. This option is enabled by default
when NV Analytics Integration is installed on the VuGen machine. For a detailed
description of the report, see "Network Virtualization (NV) Analytics Report" on
page303,
Note: This option is only available for users who have installed NV Analytics
Integration on the VuGen machine. The NV Analytics report includes various
reports which pinpoint factors that negatively impact an application's
performance across a network. Certain sections of the report are only
available for licensed users.
After
replay
After replay show
Instructs VuGen how to proceed after the replay:
lScript. Show script in the Editor.
lReplay summary. Go directly to the Replay Summary window in the Editor. (Default)
Script Management
To access VuGen > Tools > Options > Scripting > Script Management
User interface elements are described below:
UI Element Description
List of file types, by extension, that can
be edited in the Editor
Enables you to modify the list of valid file extensions
that can be edited in the Editor.
Comparison
To access VuGen > Tools > Options > Scripting > Comparison
User interface elements are described below:
UI
Element
Description
User Guide
VuGen
HP LoadRunner (12.50) Page 113
Path to
comparing
tool
You can select a comparison tool to be used when comparing two scripts. VuGen is
installed with a default comparison tool (Wdiff).
Click the browse button to locate a third-party comparison tool that is installed on your
local machine.
Command
line
arguments
This option contains the mandatory default arguments %1 and %2 for the two files you
want to compare, which should not be modified. You can add additional arguments, as
needed, for your comparison tool.
Step Navigator
To access VuGen > Tools > Options > Scripting > Step Navigator
User interface elements are described below:
UI Element Description
Enable Editor
highlighting
This option enables you to highlight filtered steps in your script.
Background color Enables you to select a background color to apply to the filtered steps in
your script.
Border color Enables you to select a border color to apply to the filtered steps in your
script.
Thumbnails
To access VuGen > Tools > Options > Scripting > Thumbnails
User interface elements are described below:
UI Element Description
Enable Thumbnail
Explorer
Enables slide view of generated thumbnails in the Thumbnail Explorer.
Double clicking a thumbnail sets the cursor at the associated step in the
script.
Highlight the
thumbnail associated
with a step
Sync the display of the Thumbnail Explorer while scrolling through steps in
the Editor.
Show important
thumbnails by default
VuGen displays thumbnails directly related to the business process and
filters out less important thumbnails by default.
Enable Automatic Enables the automatic creation of thumbnails during the application's idle
User Guide
VuGen
HP LoadRunner (12.50) Page 114
Creation time.
Cache thumbnails to
script folder
Optimize VuGen's performance by saving rendered thumbnails to a cache
file. Thumbnails are loaded from the cache file after the initial generation.
Output Pane
To access VuGen > Tools > Options > Scripting > Output
User interface elements are described below:
UI Element Description
Format Word wrap
Enables word wrapping in the Output pane.
Font Text Font
Enables you to select a font.
Size
Enables you to select a font size.
Java
To access VuGen > Tools > Options > Scripting > Java
User interface elements are described below:
UI Element Description
Eclipse IDE Location Browse
Enables you to set the location of the Eclipse program, eclipse.exe.
Citrix
To access VuGen > Tools > Options > Scripting > Citrix
User interface elements are described below:
UI Element Description
Show client
during replay
Shows the Citrix client during script replay.
Show Bitmap Issues a popup message when inserting a Get Text or Sync Bitmap function
User Guide
VuGen
HP LoadRunner (12.50) Page 115
Selection popup before selecting a bitmap or text in the snapshot.
Correlation
To access VuGen > Tools > Options > Scripting > Correlation
User interface elements are described below:
UI Element Description
Enable correlation
from replay
snapshots
Enables the Create Correlation context menu item in the Replay snapshot's
Response Body pane.
This option instructs VuGen to format the data so that it will be open for
correlations. When disabled, VuGen only generates raw data which cannot be
altered.
Snapshots
To access VuGen > Tools > Options > Scripting > Snapshots
User interface elements are described below:
UI Element Description
Enable snapshot
viewing
Enables the viewing of snapshots when you click on a step in the editor or step
navigator.This option allows you to improve VuGen's performance when working
with very large scripts.
Enable enhanced
XML view
Enables the following XML viewer visual features:
lXML tree
lcoloring
Clear this option to reduce the amount of memory consumed by the XML view.
Enable snapshot
caching
Allows snapshots to be cached.
Clear this option where you are working with large snapshots and are running
out of memory.
Do not load text
snapshots larger
than
Text-based snapshots are not loaded if they are larger than the specified size.
Do not load
binary snapshots
larger than
Binary [hexadecimal] based snapshots are not loaded if they are larger than the
specified size.
User Guide
VuGen
HP LoadRunner (12.50) Page 116
Do not load XML
snapshots larger
than
XML-based snapshots are not loaded if they are larger than the specified size.
Do not highlight
XML snapshots
larger than
XML-based snapshots are not highlighted if they are larger than the specified
size.
Parameters
To access VuGen > Tools > Options > Scripting > Parameters
User interface elements are described below:
UI Element Description
Left parameter
delimiter
Enables you to specify a left parameter delimiter.
The following characters are valid: !, #, $, %, &, (, ), [, ], {, }, |, ~, `, <, >, ?
Note: If you change the left parameter delimiter, the specified delimiter
will be applied to new Vuser scripts only, not to existing scripts.
Right
parameter
delimiter
Enables you to specify a right parameter delimiter.
The following characters are valid: !, #, $, %, &, (, ), [, ], {, }, |, ~, `, <, >, ?
Note: If you change the right parameter delimiter, the specified delimiter
will be applied to new Vuser scripts only, not to existing scripts.
Parameter
background
color
Enables you to specify the background color for parameters in a Vuser script.
Parameter
border color
Enables you to specify the border color for parameters in a Vuser script.
Restore
Delimiter
Defaults
Resets both the left and right parameter delimiters to their default values.
Parser
To access VuGen > Tools > Options > Scripting > Parser
User Guide
VuGen
HP LoadRunner (12.50) Page 117
User interface elements are described below:
UI Element Description
Enable C
Language
Parser
Disabling the C language parser may improve application performance when you are
working with very large scripts. However, the following features will be disabled:
lEditing step arguments in the Editor
lStatement completion
lSnapshots
lTasks
lThumbnails
lAdditional step-related functionality
This option is enabled by default.
Search and Replace Dialog Boxes
These dialog boxes enable you to find and replace text strings in Vuser scripts and solutions.
Search Dialog Box
To access lSearch > Quick Find
lSearch > Find in Files
Important
information
VuGen’s find mechanism does not perform a cyclic search and will stop when it
reaches the end of the last file in the specified scope.
Tip: To perform another search, click Find Next at the end of the search.
User interface elements are described below (unlabeled elements are shown in angle brackets). Some
of the UI elements in the table below only appear in the Quick Find dialog box, while others only appear
in the Find in Files dialog box:
UI Element Description
<Search-
type drop-
down>
Enables you to specify the type of search to perform: Quick Find or Find in Files.
Note: The Search dialog box user interface changes depending on the
selection.
Find text Specify the text to search for.
User Guide
VuGen
HP LoadRunner (12.50) Page 118
Shows the Regular Expression Builder. The Regular Expression Builder enables you to
build a regular expression in the Find text box.
Regular
Expression
Select Regular Expression to indicate that the Find text string is a regular expression.
Scope Specify the files in which to search.
Match case Distinguishes between uppercase and lowercase characters during the search.
Match
whole word
Searches for occurrences that are whole words, and not part of a larger word.
Search up Performs the searches upwards.
Include in
search
Enables you to select which entities are included in the search.
Directory Specify the folder that contains the files that will be searched during a "Find in Files"
search.
Options Enables you to specify options when performing a "Find in Files" search.
Find Next Finds the next occurrence of the text or regular expression in the Find text box.
Find All Finds all occurrences of the text or regular expression that appears in the Find text
box. The results appear in the Search Results pane. In the Search Results pane, you
can:
lRight-click an entry and select Locate to show the corresponding text in the Vuser
script or wherever it is located.
lRight-click an entry and select Copy to copy the selected search result to the
clipboard.
lRight-click and select Copy All to copy all the search results to the clipboard.
Replace Dialog Box
To access Search > Quick Replace
User interface elements are described below:
UI Element Description
Find text Specify the text to search for.
Shows the Regular Expression Builder. The Regular Expression Builder enables you to
build a regular expression in the Find text box.
User Guide
VuGen
HP LoadRunner (12.50) Page 119

Regular
Expression
Select Regular Expression to indicate that the Find text string is a regular expression.
Replace
with
Specify the text that will replace the Find text.
Scope Specify the files in which to search.
Options Enables you to specify options when performing the search.
Match case Distinguishes between uppercase and lowercase characters during the search.
Match
whole word
Searches for occurrences that are whole words, and not part of a larger word.
Search up Performs the searches upwards.
Find Next Finds the next occurrence of the text or regular expression in the Find text box.
Replace Replaces the selected text with the text in the Replace with box.
Replace All Replaces all found occurrences of the text or regular expression in the Find text box
with the text in the Replace with box.
Business Process Report Dialog Box
This dialog box enables you to create a business process report.
User Guide
VuGen
HP LoadRunner (12.50) Page 120
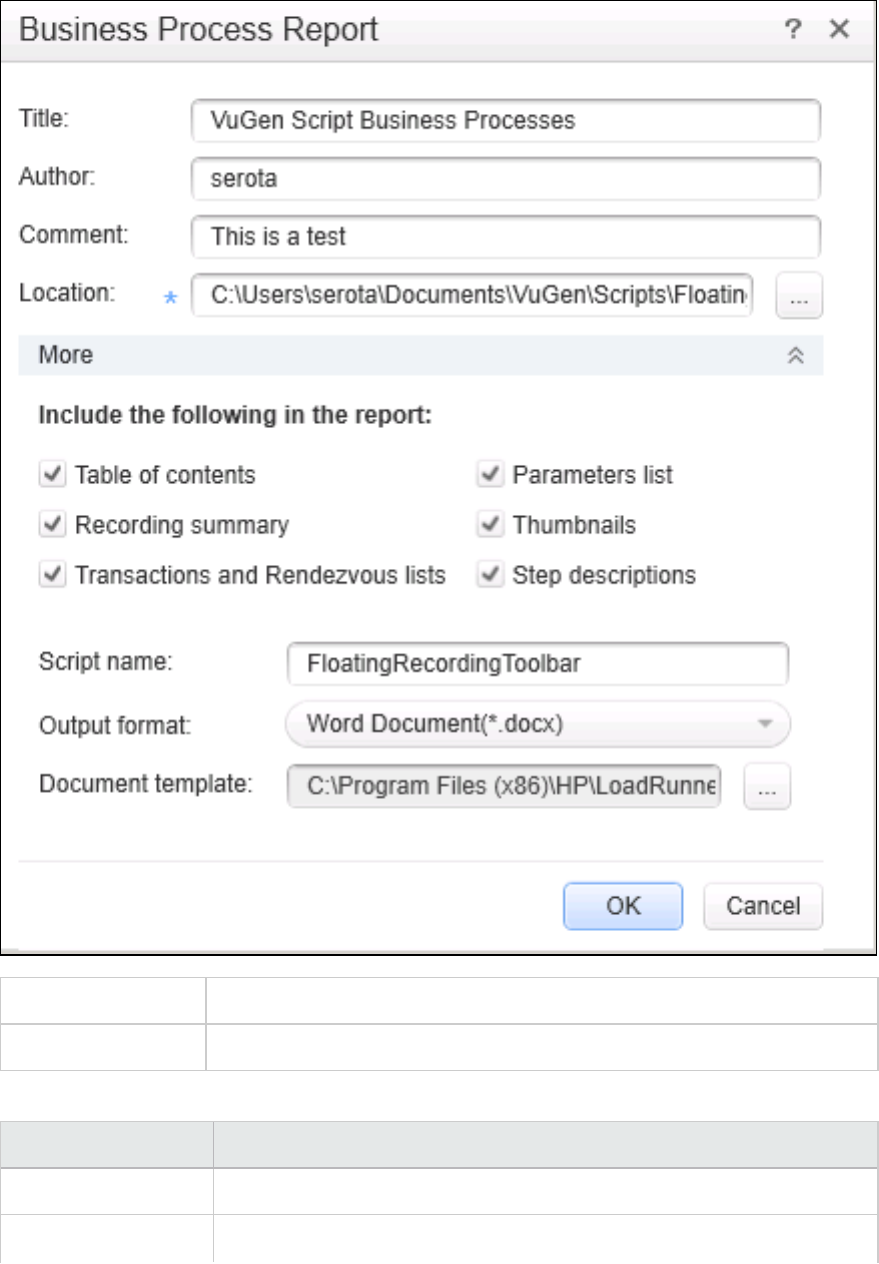

UI Element Description
Comment Any additional comments you want to appear in the report.
Location The path where you want the report to be saved.
Default value: script folder.
Expands the Business Process Report dialog box to display more options.
Table of contents A table of contents generates for your report. If you disable an option, it will
not appear in the table of contents.
Default value: enabled.
Recording summary A summary of the recording session as it appears when you click the
Recording Summary link in the Tasks list.
Default value: enabled.
Transactions and
Rendezvous lists
A list of all of the transactions and rendezvous points that were defined in
the script.
Default value: enabled.
Parameters list A list of all the parameters that were defined in the script. This list
corresponds to the parameters listed in the Parameter List dialog box
Design > Parameter List.
Default value: enabled.
Thumbnails An actual snapshot of the recorded step, adjacent to the step name and
description.
Default value: enabled.
Step descriptions A short description of each step.
Default value: enabled.
Script name The .usr file name of the script.
Output format Creates the report in the selected format. The following formats are
available:
lMicrosoft Word
lAdobe PDF
lHTML
User Guide
VuGen
HP LoadRunner (12.50) Page 122
UI Element Description
Document template The path and file name of the template to use for the report. The default
template is stored in the LoadRunner's dat folder.
To change the report template, click the browse button and specify new
template with a .docx extension. If you want to create a new template, we
recommend that you use an existing template as a basis for the new one.
This will make sure that the required bookmarks and styles are maintained
within the new template.
Replay Summary Pane
This pane provides summarized replay results and links to script replay details.
To access Use one of the following:
lSolution Explorer > Right click Replay Runs > Select Open Replay Summary
lSelect View Summary link on the Output Pane
Important
information
To enable transaction breakdown data, select Options > Scripting > Replay >
Collect replay statistics
Note: Enabling the Collect replay statistics option will affect replay
performance.
See Also l"Output Pane" on page90
l"How to Replay a Vuser Script" on page275
UI Element
(unlabeled elements
are shown in angle
brackets)
Description
Results Dashboard Displays basic script information including:
lScript name
lReplay Status: Displays a replay status of the script as either Script
Passed or Script Failed.
lElapsed time: Total time passed duration script replay.
lStarted at: Starting time of the script replay.
lEnded at: Ending time of the script replay.
User Guide
VuGen
HP LoadRunner (12.50) Page 123
UI Element
(unlabeled elements
are shown in angle
brackets)
Description
lThink time: Total duration of Think time1passed during script replay.
lWasted time: Total duration of Wasted time2passed during script replay.
lExport to PDF: Saves the current replay summary to a PDFfile.
lOpen Network Virtualization Analytics Report: Opens the NV Analytics
Report. For details, see "Network Virtualization (NV) Analytics Report" on
page303.
<Script Performance> A list of the script's actions and transactions with basic information. Click on
an action or transaction to show or hide its details below the table (only
available if you enable the collection of replay statistics).
lName. The name of the action or transaction.
lDuration: When the scope is a single iteration, the time displayed is the
duration of the transaction. When the scope is an average, the time
displayed is the average duration of all iterations.
lDuration Trend: A Sparkline representation of values over all iterations
(for multiple iterations only).
lStatus: The number of iterations with a status of Passed/Total iterations.
Connection statistics
Details
A collection of statistics per action or transaction, as per the selected scope
(the script average, a specific action, or a specific iteration).
Note: These statistics are only available for Web - HTTP/HTML
protocol scripts.
lCount: The number (or average number for multiple iterations) of
connections to the server per domain.
lHit Count: The number (or average number for multiple iterations) of
files requested from the server.
lHit Count %: The amount of each hits per item (or average for multiple
iterations) as a percentage of the total hits to all items. Expand the node
to view all of the items.
1Span of time inserted into a script to simulate a user's pausing before moving on to the next step in a
business process.
2Time spent on activities whose purpose is to support test analysis, but would never be performed by a
browser user.
User Guide
VuGen
HP LoadRunner (12.50) Page 124
UI Element
(unlabeled elements
are shown in angle
brackets)
Description
lHit Count % Trend: A Sparkline representation of the hit count values
over all iterations.
lSize: The size (or average size for multiple iterations) of the data
returned from the server per domain.
lSize %: The percentage (or average percentage for multiple iterations)
of data size returned from the server per domain, of the total returned
data.
lSize % Trend: A Sparkline representation of values over all iterations.
Responses per
content-type
Details
Content-type statistics per transaction or action for the current scope (the
script average, a specific action, or a specific iteration).
Note: These statistics are only available for Web HTTP/HTML
protocol scripts.
lResponses per content-type: A list of the content type returned from the
server, for example, an image, a JavaScript, a CSS (expand to view list).
lCount: The number (or average number for multiple iterations) of
connections per content type.
lCount %: The percentage (or average percentage for multiple iterations)
of connections to the server content type from the total number of
connections.
lCount % Trend: A Sparkline representation of the count values over all
iterations.
lSize: The size (or average size for multiple iterations) of the data
returned from the server per content type.
lSize %: The percentage (or average percentage for multiple iterations)
of data returned from the server for each content type from the total
returned data.
lSize % Trend: A Sparkline representation of values of the data size per
content type over all iterations.
Responses per HTTP
status
Details
HTTP Status statistics per action or transaction for the current scope (the
script average, a specific action, or a specific iteration).
User Guide
VuGen
HP LoadRunner (12.50) Page 125
UI Element
(unlabeled elements
are shown in angle
brackets)
Description
Note: These statistics are only available for Web - HTTP/HTML
protocol scripts.
lResponses per HTTP Status: List of the HTTP status codes returned .
lCount: The number (or average number for multiple iterations) of
connections per HTTP status code.
lCount %: The percentage (or average percentage for multiple iterations)
of connections per HTTP status code from the whole action or
transaction.
lSize % Trend: A Sparkline representation of values over all iterations.
Replay Statistics
Summary
A list of script statistics and their values after replay, per scope (the script
average, a specific action, or a specific iteration).
More information is
available in:
lTest Results
For details, see "Test Results Window" on page419.
lReplay Log
<Modify Runtime
Settings>
Enables you to access Runtime Settings for your active script.
<Modify Content
Check Rules>
VuGen's ContentCheck mechanism enables you to detect all types of errors
sent by the web server.
For details, see Internet Protocol > ContentCheck view in the runtime
settings.
User Guide
VuGen
HP LoadRunner (12.50) Page 126
VuGen Workflow
The VuGen Workflow section provides you with an understanding or the steps you need to follow in
order to create an effective load testing script.
Creating or Opening Vuser Scripts
This section describes how to create new Vuser scripts, and open existing ones.
What do you want to do?
lLearn more about creating scripts
lCreate a new script
lOpen a script from ALM
lCreate a multiple protocol script
lSave my script to an archive file
Creating Vuser Scripts - Overview
Creating a Vuser script includes the steps shown below. This topic provides and overview of the first
step, creating a Vuser script.
The first step in developing a Vuser script is to create a blank script. For details on how to create a blank
Vuser script, see "How to Create and Open Vuser Scripts" on the next page. The contents and structure
of the blank Vuser script vary slightly based on the protocol of the script. Therefore, before you create a
blank Vuser script, you must know the protocol to use for the script. You can use the Protocol Advisor to
help you to select a protocol. The Protocol Advisor scans your application for elements of different
protocols and displays a list of the protocols that it detects. For details, see "Protocol Advisor Dialog
Box" on page435. After you create a blank Vuser script, you are ready to perform the next step in the
script creation workflow - recording user actions into the script. For details, see "Recording" on
page140.
When you create a Vuser script, VuGen creates a series of configuration files, data files, and source
code files that comprise the Vuser script. These files contain Vuser runtime and setup information. For
details on the files that comprise a Vuser script, see "Script Directory Files" on page136.
VuGen enables you to:
lCreate or open a script from a template. For task details, see "How to Create and Open Vuser Script
Templates" on page139.
lOpen or work with a .zip script. You can unzip or work with a script in .zip format. For task details, see
"How to Work with .zip Files" on page138.
User Guide
VuGen
HP LoadRunner (12.50) Page 127

lOpen a script stored in Application Lifecycle Management. For more information, see "Working with
Application Lifecycle Management" on the next page.
lUse HP Application Lifecycle Management (ALM) to store and retrieve Vuser scripts, scenarios, and
analysis results. You can store scripts in an ALM project and organize the scripts into unique groups.
For more information, see "Managing Scripts Using ALM - Overview" on the next page.
How to Create and Open Vuser Scripts
This task describes various ways to create a new Vuser script or to open an existing Vuser script.
Create a new Vuser script
1. Open VuGen and select File > New Script and Solution.
2. In the Create a New Script dialog box, select Single Protocol or Multiple Protocols from the
Category list.
3. Select a protocol from the Protocols list.
4. In the Script Name box, enter a name for the script.
Note: Do not name scripts init,run or end, since these names are used internally by VuGen.
5. Click Create to create the Vuser script.
For user interface details, see "Create a New Script Dialog Box" on page136.
After you create a new Vuser script, you can record user activity into the script. For details, see "How to
Record a Vuser Script" on page144.
Create or open a script from a template
For task details, see "How to Create and Open Vuser Script Templates" on page139.
Open an existing script
To open an existing script that is saved on your local machine or on a network drive, select File > Open
> Script/Solution.
Open or work with a .zip script
You can unzip or work with a script in .zip format. For task details, see "How to Work with .zip Files" on
page138.
Open a script stored in Application Lifecycle Management
You can store scripts on HP ALM and modify them in VuGen. For more information, see "Working with
Application Lifecycle Management" on the next page.
User Guide
VuGen
HP LoadRunner (12.50) Page 128

How to Compare Scripts Side by Side
Vuser scripts can be compared and displayed side by side using the comparison tool.
To compare Vuser scripts:
1. Right click on the primary script in Solution Explorer and select Set as first comparing object.
2. Right click on the secondary script in the Solution Explorer and select Compare which will run the
compare functionality.
or
3. Right click and select Compare with external object.
You can compare an asset to a file outside of the solution. This option sets the highlighted asset as
the primary asset and opens Windows Explorer to enable you to select the secondary asset.
Note: You can change the comparison tool from Options > Scripting> Comparison. For
more information, see "Scripting Options" on page111.
Working with Application Lifecycle Management
The Working with Application Lifecycle Management section describes who to manage your Vuser
scripts by integrating with Application Life Cycle Management.
Managing Scripts Using ALM - Overview
VuGen works together with HP Application Lifecycle Management (ALM). ALM provides efficient
functionality for storing and retrieving Vuser scripts, scenarios, and analysis results. You can store
scripts in an ALM project and organize the scripts into unique groups.
In order for VuGen to access an ALM project, you must connect VuGen to the Web server on which the
ALM project is located. You can connect to either a local or remote Web server.
For more information on working with ALM, see the HP Application Lifecycle Management User Guide.
How to Connect to ALM
To store and retrieve scripts from ALM, you need to connect to an ALM project. You can connect or
disconnect from an ALM project at any time during the testing process.
You can connect to one version of HP ALM from VuGen and a different version from your browser. For
more information, see the Important Information section in "HP ALM Connection Dialog Box [VuGen]" on
page133.
User Guide
VuGen
HP LoadRunner (12.50) Page 129

Connect to a project in ALM
1. Determine the type of authentication required for the ALM server: User name/password or CAC
(Common Access Card). For CAC mode, enable CAC authentication in VuGen's General options. For
details, see "General Options" on page102.
2. Select ALM >ALM Connection. The HP ALM Connection dialog box opens.
3. In the Step 1: Connect to server section, enter a user name and password (not relevant for CAC
authentication) and click Connect. VuGen connects to the ALM server.
To disconnect from ALM, click Disconnect.
4. In the Step 2: Login to project section,enter the domain and project details, and then click Login.
VuGen logs in to the specified project.
To log out of the project, click Logout.
5. Click Close to close the HPALM Connection dialog box.
Note: If you authenticated through CAC mode and disconnected from the ALM server, you need
to restart VuGen before reconnecting in CAC mode.
ALM Version Control - Overview
VuGen supports version control features in Vuser scripts saved in ALM projects that use version control.
The version control features change the process of opening and saving a script. Scripts with version
control are either in a state of checked-in or checked-out. When you are working with a script in a
checked-out state, any changes you make will not be saved on the ALM server until you check in the
script. If you save the script from within VuGen, a temporary file is saved on your machine that protects
your changes in case your computer crashes.
If you are working with a script in a checked-in state, the script is read-only and you cannot make any
changes until you check out the script.
If a particular script is being saved to ALM for the first time, and the project uses version control, the
script automatically starts in a checked-out state.
How to Work with Scripts in ALM Projects
The following steps describe the workflow of how to work with Vuser scripts that are saved in an ALM
project.
Note: To work with scripts in ALM projects with version control, see "How to Work with Version
Controlled Scripts in ALM Projects" on the next page.
User Guide
VuGen
HP LoadRunner (12.50) Page 130

1. Connect to ALM
Open a connection to the ALM server and project that contains the script. For task details, see
"How to Connect to ALM" on page129.
2. Open the script
Select File > Open > Script/Solution. In the Open VuGen Script or Solution dialog box, select the
script to open and then click Open.
3. Save the script
Select File > Save Script. If the script is in a project that uses version control and is not checked
out, the script is saved as a temporary file on your local machine.
How to Work with Version Controlled Scripts in ALM Projects
The following steps describe the workflow of how to work with scripts saved in ALM projects that use
version control.
Note: This procedure is relevant only for scripts in ALM projects that support version control and
have the Performance Center addition installed. If these two conditions are not met, see "How
to Work with Scripts in ALM Projects" on the previous page.
1. Connect to ALM
Open a connection to the ALM server and project that contains the script. For task details, see
"How to Connect to ALM" on page129.
2. Open the script
Select File > Open > Script/Solution. In the Open VuGen Script or Solution dialog box, select the
script to open and then click Open.
3. Check in/out the script
If the ALM project has version control, each script is always defined as being either checked-in or
checked-out. For more details, see "ALM Version Control - Overview" on the previous page. To
check in and check out scripts, select ALM > Check In/Check Out.
Note: If the ALM project has version control, the file is locked when it is checked out.
If the ALM project is not version controlled, the file is not locked when checked out of the
project.
User Guide
VuGen
HP LoadRunner (12.50) Page 131
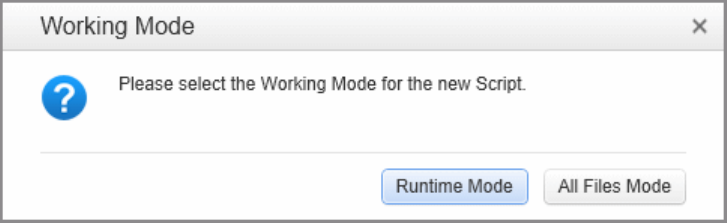
4. Cancel a check out (optional)
If you checked out a script and do not want to save the changes, you can return the status of the
script to checked-in without saving by selecting ALM > Undo Check Out.
5. Save the script
Select File > Save Script. If the script is in a project that uses version control and is not checked
out, the script is saved as a temporary file on your local machine.
How to Save VuGen Vuser Scripts to ALM Projects
The following steps describe how to save a Vuser script to an ALM project.
1. Open or create the Vuser script
Create or open the desired script in VuGen.
2. Connect to ALM
Open a connection to the ALM server and project in which you want to store the script. For task
details, see "How to Connect to ALM" on page129.
3. Save the script to ALM
a. Select File > Save Script as. The Save Script As dialog box opens.
b. Click ALM Test Plan, and then specify the name and location for the script.
c. Click Save. After a short time, the Working Mode dialog box opens.
d. Select one of the following options:
Runtime Mode. Copies only the files needed to replay the script. This option does not copy
recording snapshot files and other unnecessary files. This results in a shorter transfer time.
All Files Mode. Copies all of the files associated with this script. This results in a longer
transfer time.
User Guide
VuGen
HP LoadRunner (12.50) Page 132
How to Compare Previous Versions of a Script
If your Vuser script is saved in an ALM project that uses version control, you can compare previous
versions of the script. The following steps describe how to do this.
1. Connect to ALM
Open a connection to the ALM server and project that contains the script that you want to view or
modify. For task details, see "How to Connect to ALM" on page129.
2. Open the script
Select File > Open > Script/Solution. In the Open VuGen Script or Solution dialog box, select the
script to open and then click Open.
3. Compare previous versions of the script
a. Select ALM > Version History. The Version History dialog box opens.
b. Select two previous versions of the script and then click Compare Versions. WDiff opens and
displays the two versions of the script.
HP ALM Connection Dialog Box [VuGen]
This dialog box enables you to connect to an HPALM project from within VuGen.
User Guide
VuGen
HP LoadRunner (12.50) Page 133
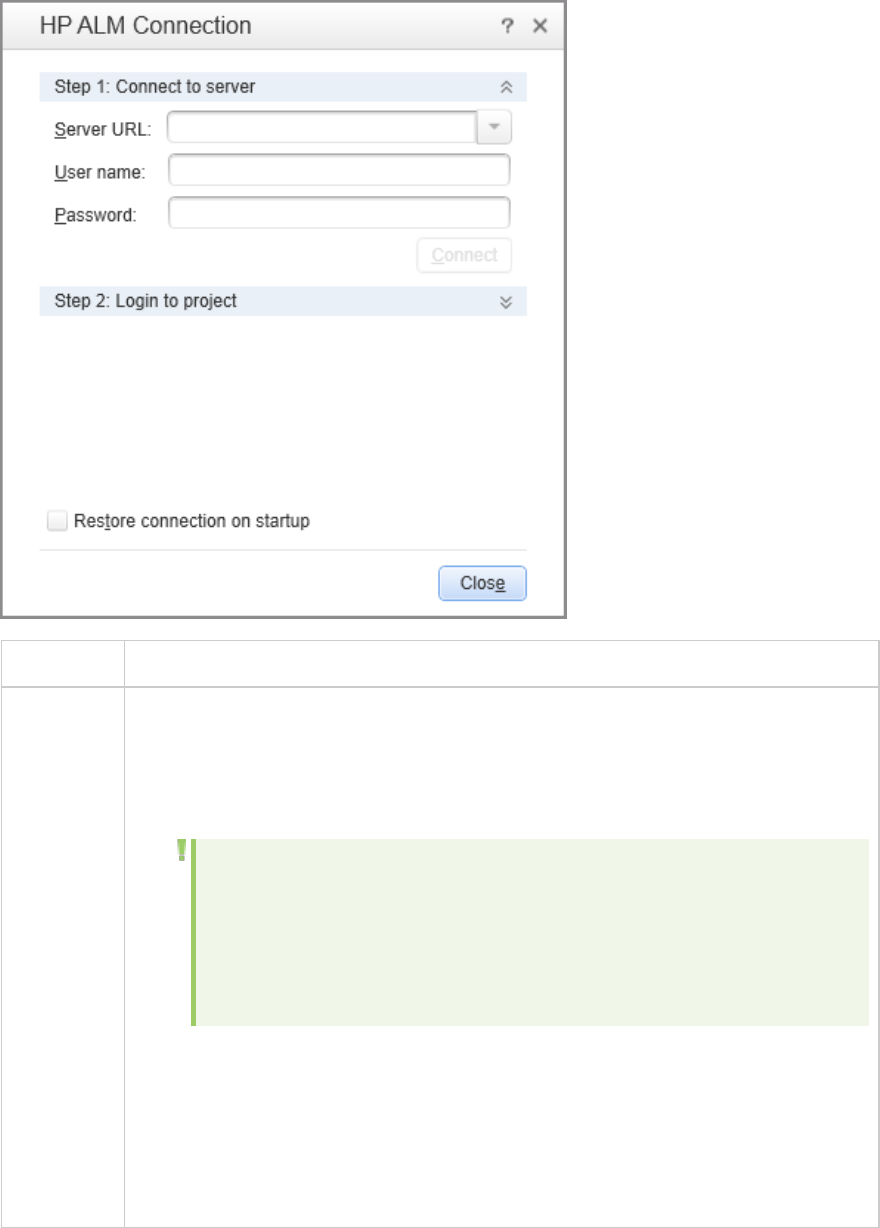
To access ALM > ALM Connection
Important
information
lYou can connect to one version of HP ALM from VuGen and a different version of HP
ALM from your browser.
lYou can connect to different versions of HP ALM only if one of the versions is HP ALM
11.00 or higher.
Note: Before you connect to results stored on ALM through the this dialog
box, it is recommended that you first connect to the HPALMserver through
your browser.This automatically downloads the ALMclient files to your
computer.
lYou can configure more advanced settings, such as a proxy setting, by using the
Webgate Customization tool (webgatecustomization.exe) and then sign into ALM
using the HP ALM Connection Dialog Box. The Webgate Customization tool can be
found on your ALM server at the following address: http://<ALM
Server>/qcbin/Apps/.
User interface elements are described below:
User Guide
VuGen
HP LoadRunner (12.50) Page 134
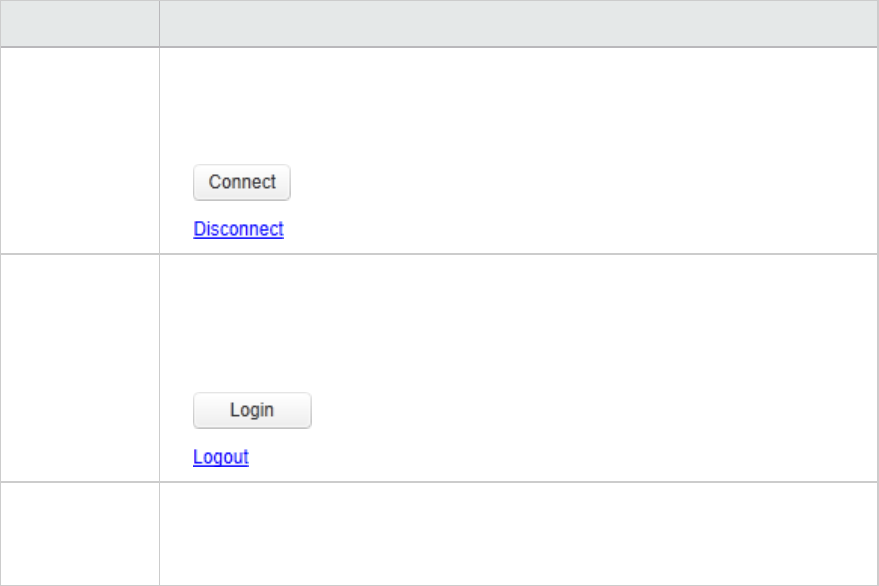
UI Element Description
Step 1: Connect
to Server
lServer URL. The URL of the server on which ALM is installed.
lUser name. Your ALM project user name (not relevant for CAC authentication).
lPassword. Your ALM project password (not relevant for CAC authentication).
l.Connects to the server specified in the Server URL box.
l.Disconnects from the current ALM server.
Step 2: Login to
Project
lDomain. The domain that contains the ALM project. Only those domains
containing projects to which you have permission to connect to are displayed.
lProject. Enter the ALM project name or select a project from the list. The list
includes only those projects to which you have permission to connect.
l.Logs into the ALM project.
l.Logs out of the current ALM project.
Restore
connection on
startup
Automatically reconnect to the ALM server the next time you start VuGen, using
the same credentials.
Multiple Protocol Scripts
When you record a single protocol, VuGen records only the specified protocol. When you record in multi-
protocol mode, VuGen records the actions in several protocols. To see which Vuser types are supported
for multi-protocol recording, click the Multiple Protocols node in the Create a New Script dialog box. For
details, see "Create a New Script Dialog Box" on the next page.
Another variation between Vuser types is multiple-action support. Most protocols support more than
one action section. Currently, the following protocols support multi-actions: Oracle NCA, Web -
HTTP/HTML, RTE, and C Vusers.
For most Vuser types, you create a new Vuser script each time you record—you cannot record into an
existing script. However, when recording a Java, Web - HTTP/HTML, Oracle NCA, or RTE Vuser script, you
can also record within an existing script.
Since VuGen supports a large variety of protocols, some of the recording steps that follow apply only to
specific protocols.
For all Java language Vusers see "Java Record Replay Protocol" on page525.
In SOA (Service Oriented Architecture) systems, it is essential that you test the stability of your
applications and services before deployment. VuGen allows you to create basic Web Service scripts.
Unified Functional Testing (UFT), HP's functional testing tool, contains additional features that help
you create a comprehensive testing solution for your SOA environment. For more information, contact
an HP representative.
User Guide
VuGen
HP LoadRunner (12.50) Page 135
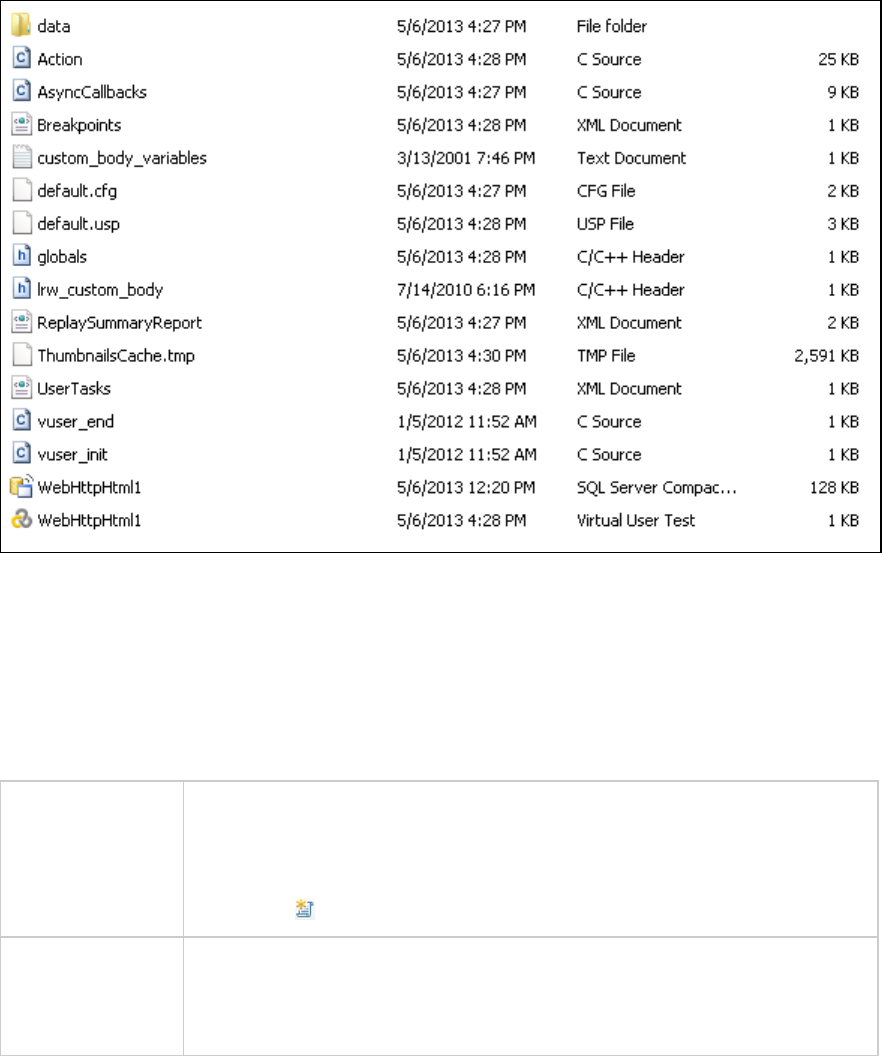
Script Directory Files
While you create a Vuser script, VuGen creates a series of configuration files, data files, and source
code files that comprise the Vuser script. These files contain Vuser runtime and setup information.
VuGen saves these files together with the script, in the script folder. To access the files in the script
folder, right click on the script name in the Solution Explorer and select Open Script Folder.
For details on the files that are included in the script folder, see "Files Generated During Recording" on
page231.
Create a New Script Dialog Box
This dialog box enables you to create a new Vuser script.
To access Do one of the following:
lFile > New Script and Solution
lFile > Add > New Script
lClick the button in VuGen.
Relevant tasks l"Creating or Opening Vuser Scripts" on page127
l"How to Record a Vuser Script" on page144
l"How to Record a Script with TruClient - Mobile Web" on page586
User Guide
VuGen
HP LoadRunner (12.50) Page 136
User interface elements are described below:
UI
Element
Description
Category The protocols to display in the Protocol pane and the type of script to create (for Single
and Multiple Protocols):
lSingle Protocol. Shows all of the protocols. When you click OK, it creates a single
protocol script using the selected protocol.
lMultiple Protocols. Shows all of the protocols that can be included in a multi-protocol
script. Select the check boxes adjacent to the protocols that you want to include.
lMobile. Create a script for a mobile application, using one of the mobile protocols:
Mobile Application - HTTP/HTML,SMP,TruClient - Mobile Web, or TruClient - Native
Mobile. For details, see " How to Select a Script Type for Mobile Applications" on
page564.
lPopular. Shows a list of the most commonly used protocols.
lRecent. Shows a list of the most recently used protocols.
Protocol The protocols included in the selected category.
Category Protocol List displays...
Single Protocol A list of protocols.
You select one protocol.
Multiple
Protocols
A list of protocols with a check box to the left of each protocol.
Select a check box to include the protocol in the Vuser script.
Mobile Protocols that record mobile applications.
Popular The most popular protocols in use in the LoadRunner user
community.
Recent The protocols you have most recently used.
Filter Enables you to filter the protocol list by entering text. For example, if you type "Java" into
the Filter box, the Protocol list will display only those protocols that include the word
Java.
Script
Name
Enables you to specify the name of your script.
If you create a single protocol script,the default name is <protocol name>xwhere x
represents the numerical sequence of the script created. For example, the name of the
third script created for the Web- HTTP/HTML protocol would be WebHttpHtml3.
If you create a multi-protocol script, the default name is <protocol name_multi>x
User Guide
VuGen
HP LoadRunner (12.50) Page 137
where protocol name is the first protocol you selected from the list and x represents the
numerical sequence of the script created.
Location Enables you specify the file location of your script. You can use the browse button to
navigate to a location on your file system.
Tools > General > Projects and Solutions enables you to specify a default location.
Solution
Name
This option is displayed only when a solution is not open in the Solution Explorer. You can
specify a name for the solution. If you leave it blank, the default name is 'Untitled'.
Create a
folder for
this
solution
Enables you to create a folder for your solution.
Solution
Target
Displays the file path of the solution.
Protocol
Advisor
Enables you to access the Protocol Advisor dialog box. For details, see "Protocol Advisor
Dialog Box" on page435
Displays the protocols in list view.
Displays the protocols in icon view.
How to Work with .zip Files
VuGen allows you to work with .zip file in several ways. The advantages of working with .zip files is that
you conserve disk space, and it allows your scripts to be portable. Instead of copying many files from
machine to machine, you need to copy only one .zip file.
Import from a Zip File
To open a script stored in a .zip file, select File > Manage Zip Files > Import from Zip File. After you
select a .zip file, VuGen prompts you for a location in which to store the unzipped files.
Note: If you import a script from an archive file, if it was archived with runtime files only, you will
not be able to regenerate the script to its original recorded state. For details, see "How to
Regenerate a Vuser Script" on page225.
Export to a Zip File
To save the entire script folder as a .zip file, select File > Manage Zip Files > Export to Zip File.
User Guide
VuGen
HP LoadRunner (12.50) Page 138

You can indicate whether to save all the files or only the runtime files.
Note: If you export the script with the runtime files only, the user of the imported script will not
be able to regenerate the script to its original recorded state.
Zip and Email
To create a .zip file and send it as an email attachment, select File > Manage Zip Files > Zip and Email.
When you click OK in the Zip and Email dialog box, VuGen compresses the file according to your settings
and opens an email compose form with the .zip file as an attachment.
Edit Script in Zip File
To work from a .zip file, while not expanding or saving the script files, select File > Manage Zip Files >
Edit Script in Zip File. When you modify the script and save it, the changes are stored directly in the
.zip file.
How to Create and Open Vuser Script Templates
This task describes how to create, create from, and rename Vuser script templates.
Create a Vuser Script Template
1. Open a script in VuGen.
2. Select File > User-Defined Templates > Export to Template.
3. Enter a name and location for the template.
4. Click OK to create the template.
Create a Vuser Script From a Template
Select File > New Script and Solution > VuGen > User Templates and select the template file (only
available after your create at least one template).
Rename a Vuser Script Template
1. Select File > User-Defined Templates > Manage from Explorer
2. In the Explorer dialog box:
a. Rename the content file (.zip)
b. Rename the description file (.xpt)
3. Using a text editor, modify the following tags in the .xpt file:
a. Name tag:<Name>NewName </Name>
b. File tag src property: <File name="template_temp.zip" src="NewName.zip"
binary="True" />
Notes and Limitations
User Guide
VuGen
HP LoadRunner (12.50) Page 139
lOnce you have configured a script for a specific protocol and then saved the script as a template,
further scripts based on that template will only work with that same protocol.
lOnce you have created your template, you cannot edit it directly in VuGen. To make any changes, you
open the template and save it again with another name or overwrite the existing template.
Vuser Script Templates
The User-Defined Template enables you to save a script with a specific configuration as a template. You
can then use this template as a basis for creating future scripts.
The template supports the following files and data:
lRuntime settings
lParameters
lExtra files
lActions
lSnapshots
Recording options and General options are not supported as they are generic settings and are not
relevant to a specific script.
Notes and Limitations
lOnce you have configured a script for a specific protocol and then save the script as a template,
further scripts based on that template will only work with that same protocol.
lOnce you have created your template, you cannot edit it directly in VuGen. To make any changes, you
open the template and save it again with another name or overwrite the existing template.
lIf you regenerate an original script from a template, you will lose all of your manual changes.
Recording
The Recording section describes script sections, script recording, working with templates, and other
recording tools.
Recording - Overview
Creating a Vuser script includes the steps shown below. This topic provides and overview of the second
step, recording a Vuser script.
After you create an empty Vuser script, you are ready to use VuGen to record typical user-actions into
the script. While you record the script, VuGen's floating Recording toolbar gives you access to the main
recording functionality, such as pausing and stopping the recording, and inserting transactions and
rendezvous points. For details on how to record a Vuser script, see "How to Record a Vuser Script" on
page144.
User Guide
VuGen
HP LoadRunner (12.50) Page 140
Each Vuser script contains at least three sections: vuser_init, one or more action sections, and vuser_
end. When you run multiple iterations of a Vuser script, only the Actions sections of the script are
repeated—the vuser_init and vuser_end sections are not repeated. Before you record, and during
recording, you can select the section of the script into which VuGen will insert the recorded functions.
For details on the script sections, see "Vuser Script Sections" below.
Before you start recording, make sure that the recording options are set correctly for the script. For
more information about the recording options, see "Recording Options" on page146.
When you have finished recording the user actions, VuGen generates the Vuser script and performs
various other post-recording operations. You can replay the script to make sure that it functions
correctly. For details, see "Replaying" on page274.
To resolve situations where you cannot install VuGen on the client machine, VuGen allows you to record
scripts using a LoadRunner proxy. Proxy recording may be required with certain Linux machines, Mac OS
machines, and mobile devices. For details, see "Recording via a Proxy - Overview" on page220
After you have successfully recorded a Vuser script, you can replay the script. For details, see "Replay
Overview" on page274.
Vuser Script Sections
Each Vuser script contains at least three sections: vuser_init, one or more Actions, and vuser_end.
Before and during recording, you can select the section of the script into which VuGen will insert the
recorded functions. The following table shows what to record into each section, and when each section
is executed:
Script Section Used when recording... Is executed when...
vuser_init a login to a server the Vuser is initialized (loaded)
Actions client activity the Vuser is in Running status
vuser_end a logoff procedure the Vuser finishes or is stopped
When you run multiple iterations of a Vuser script, only the Actions sections of the script are repeated—
the vuser_init and vuser_end sections are not repeated. For more information on the iteration settings,
see the General > Run Logic view in the Runtime settings.
You use the VuGen script editor to display and edit the contents of each of the script sections. You can
display the contents of only a single section at a time. To display a section in the script editor, double-
click the name of the section in the Solution Explorer.
When working with Vuser scripts that use Java classes, you place all your code in the Actions class. The
Actions class contains three methods: init, action, and end. These methods correspond to the sections
of scripts developed using other protocols—you insert initialization routines into the init method, client
actions into the action method, and log off procedures in the end method.
For more information, see "Java Vuser Protocol" on page541.
User Guide
VuGen
HP LoadRunner (12.50) Page 141
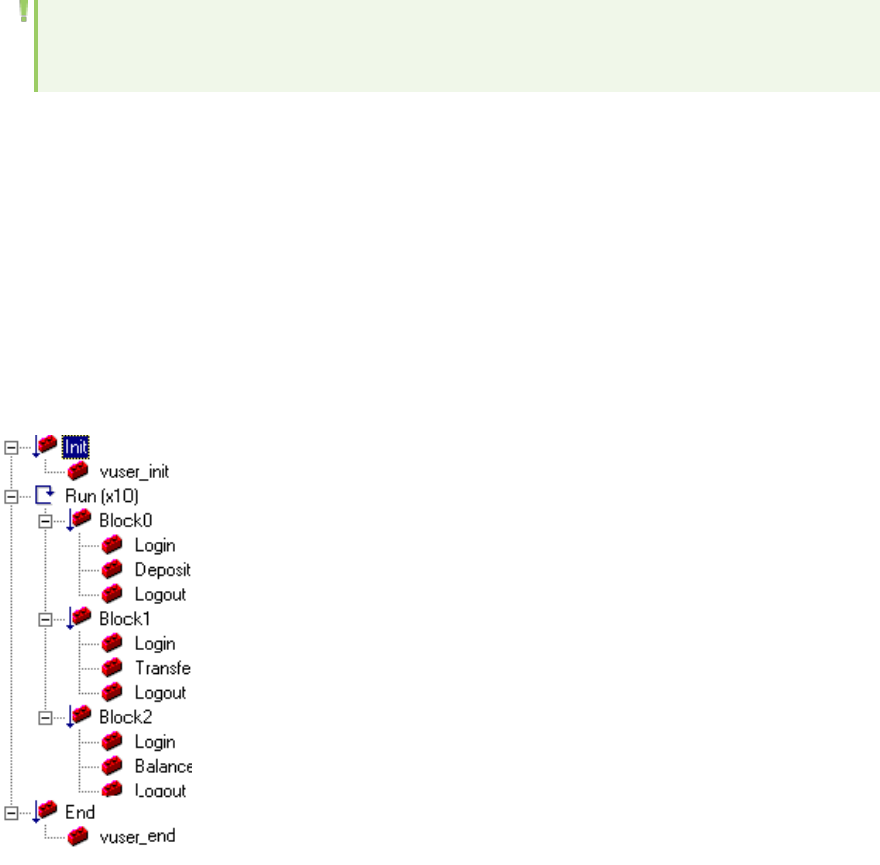
public class Actions{
public int init() {
return 0;}
public int action() {
return 0;}
public int end() {
return 0;}
}
Note: Transaction Breakdown for Oracle DB is not available for actions recorded in the vuser_
init section.
Script Section Structure Example
Every Vuser script contains three sections: vuser_init,Run (Actions), and vuser_end. You can instruct a
Vuser to repeat the Run section when you run the script. Each repetition is known as an iteration.
The vuser_init and vuser_end sections of a Vuser script are not repeated when you run multiple
iterations.
When you run scripts with multiple actions, you can indicate how to execute the actions, and how the
Vuser executes them:
In the following example, Block0 performs a deposit, Block1 performs a transfer, and Block2 submits a
balance request. The Login and Logout actions are common to the three blocks.
Sequence. You can set the order of actions within your script. You can also indicate whether to perform
actions sequentially or randomly.
Iterations. In addition to setting the number of iterations for the entire Run section, you can set
iterations for individual actions or action blocks. This is useful, for example, in emulating a commercial
User Guide
VuGen
HP LoadRunner (12.50) Page 142

site where you perform many queries to locate a product, but only one purchase.
Weighting. For action blocks running their actions randomly, you can set the weight or percentage of
each action within a block.
In most cases, the name of the header file corresponds to the prefix of the protocol. For example,
Database functions that begin with an lrd prefix, are listed in the lrd.h file.
Header Files
Header files commonly contain forward declarations of classes, subroutines, variables, and other
identifiers. In most cases, the name of the header file corresponds to the prefix of the protocol. For
example, Database functions that begin with an lrd prefix, are listed in the lrd.h file.
The following table lists the header files associated with the most commonly used protocols:
Protocol File
Ajax (Click & Script) web_ajax.h
Citrix ctrxfuncs.h
COM/DCOM lrc.h
Database lrd.h
FTP mic_ftp.h
General C function lrun.h
IMAP mic_imap.h
LDAP mic_mldap.h
MAPI mic_mapi.h
Oracle NCA orafuncs.h
POP3 mic_pop3.h
RDP lrrdp.h
SAP GUI as_sapgui.h
SAP (Click & Script) sap_api.h
Siebel lrdsiebel.h
SMTP mic_smtp.h
Terminal Emulator lrrte.h
User Guide
VuGen
HP LoadRunner (12.50) Page 143

Protocol File
WAP as_wap.h
Web (HTML\HTTP) as_web.h
Web (Click & Script) web_api.h
Web Services wssoap.h
Windows Sockets lrs.h
How to Record a Vuser Script
This task describes how to record a Vuser script.
1. Create a new script or open an existing script
For details, see "Creating or Opening Vuser Scripts" on page127.
2. Modify the Windows DEP settings - recommended
a. Open Start > Control Panel > System.
b. In the Advanced tab, click Performance settings.
c. In the Performance Options Data Execution Prevention tab, select the first option, DEP for
essential services only.
If you cannot change this option, click Add. Browse to the client program, for example
IEXPLORE.EXE.
d. If neither of these options are possible, try to disable DEP completely.
i. Open a command prompt.
ii. Run the following command: bcdedit.exe /set {current} nx AlwaysOff
iii. Reboot the machine
iv. Verify that the settings took effect by running the following at the command line:
BCDEdit /enum
v. Verify that the last line shows nx AlwaysOff.
3. Configure the recording options - optional
The recording options affect the way a Vuser script is recorded and how it is generated after the
recording. For concept and user interface details, see "Recording Options" on page146.
Tip: If the business process you want to record contains asynchronous push
communication, select Recording Options > HTTP > Advanced Node and check the Use
User Guide
VuGen
HP LoadRunner (12.50) Page 144
streaming mode when recording with the LoadRunner Proxy option.
If you are not able to successfully record a script with VuGen, select Recording Options >
HTTP > Advanced Node and check the Use LR Proxy to record a local application option.
Then rerecord your business process.
4. Start the recording session
To start recording, click the Record button on the VuGen toolbar, make the relevant selections in
the Start Recording dialog box, and click Start Recording. VuGen's floating toolbar appears, VuGen
opens your application and begins recording your actions.
- For user interface details, see "Start Recording Dialog Box" on page226.
- For details on the script sections into which you can record, see "Vuser Script Sections" on
page141.
5. Perform a business processes on your application
Perform the desired business processes that you wish to record. The floating toolbar allows you to
insert transactions, rendezvous points, and comments. You can also use the floating toolbar to
specify into which section of the script to record. For user interface details, see "Floating Recording
Toolbar" on page229.
Click the Stop button on the floating toolbar when you are finished recording.
Note: If you want to cancel the recording session, click the Cancel Recording button
on the floating toolbar. When you cancel a recording, VuGen removes all the code that was
added to the script during the current recording session, thereby restoring the script to its
status before the current recording session. For details on how to enable or disable the
Cancel Recording button, see "Scripting Options" on page111.
How to Create a Business Process Report
At the final stage of script creation, you can create a report that describes your business process.
VuGen exports the script information to one of the following formats:
lMicrosoft Word
lAcrobat PDF
lHTML
You can use a pre-designed template or one provided with VuGen, to create reports with summary
information about your test run. The VuGen template is available in Microsoft Word 2007 (docx) format.
You can edit or update the template according to your requirements.
User Guide
VuGen
HP LoadRunner (12.50) Page 145
VuGen lets you customize the contents of the report by indicating what type of information you want to
include.
Note: Business Process Reports are available for the following protocols: Ajax (Click & Script),
TruClient, Citrix, Oracle NCA, Oracle - Web, RDP, SAP (Click & Script), SAP GUI, SAP - Web, Web -
HTTP/HTML, and Web Services.
1. Create a business process report
Select Tools > Create Business Process Report and complete the dialog box. For user interface
details, see "Business Process Report Dialog Box" on page120.
2. Configure additional options
To modify additional report options such as the table of contents, snapshots, and the document
template, click the More button. For user interface details, see "Business Process Report Dialog
Box" on page120.
Recording Options
The Recording Options sections describes the many different options that affect your Vuser script
during the recording and generation stages of creating a script.
Citrix > Configuration Recording Options
Enables you to set the window properties and encryption settings for the Citrix client during the
recording session.
To access Record > Recording Options > Citrix > Configuration
Important information This node is available only for specific protocols. For a complete list of
protocols and their associated nodes, see "Protocol Compatibility Table" on
page208.
User interface elements are described below:
UI
Element
Description
Encryption
Level
The level of encryption for the ICA connection: Basic,128 bit for login only,40 bit,56
bit,128 bit, or Use Server Default to use the machine's default.
Window
Size
The size of the client window.
Default value: 800 x 600.
User Guide
VuGen
HP LoadRunner (12.50) Page 146

Citrix > Code Generation Recording Options
Enables you to configure the way VuGen captures information during recording.
To access Record > Recording Options > Citrix > Code Generation
Important
information
lThis node is available only for specific protocols. For a complete list of protocols and
their associated nodes, see "Protocol Compatibility Table" on page208.
lText synchronization steps that you add manually during the recording are not
affected by the above settings—they appear in the script even if you disable the
above options.
lThe synchronization options also work for regenerating a script. For example, if you
originally recorded a script with Add text synchronization calls disabled, you can
regenerate after recording to include text synchronization.
User interface elements are described below:
UI Element Description
Use Citrix Agent input
in Code Generation
Use the Citrix Agent input to generate a more descriptive script with
additional synchronization functions.
Default value: enabled.
lAutomatically generate text synchronization calls. Adds text
synchronization Sync on Text steps before each mouse click.
Default value: disabled.
Citrix > Login Recording Options
Enables you to you set the connection and login information for the recording session.
To access Record > Recording Options > Citrix > Login
Important
information
lThe Login node is available only when creating a single protocol Citrix script.
When creating a multi-protocol Citrix+Web script, the login information is
retrieved from the Web interface.
For a complete list of protocols and their associated nodes, see "Protocol
Compatibility Table" on page208.
lIf you do not provide login information, you are prompted for the information
when the client locates the specified server.
User interface elements are described below:
UI Element Description
User Guide
VuGen
HP LoadRunner (12.50) Page 147

Connection lNetwork Protocol. The preferred protocols are TCP/IP and TCP/IP+HTTP. Most Citrix
Servers support TCP/IP, however some Citrix clients do not. Certain servers are
configured by the administrators to allow only TCP/IP with specific HTTP headers. If
you encounter a communication problem, select the TCP/IP+HTTP option.
lServer. The Citrix server name. To add a new server to the list, click Add, and enter
the server name (and its port for TCP/IP + HTTP).
Note: Multiple servers apply only when you specify a Published Application. If
you are connecting to the desktop without a specific application, then list
only one server.
lPublished Application. The name of the Published Application as it is recognized
on Citrix server. The drop-down menu contains a list of the available applications. If
you do not specify a published application, VuGen uses the server's desktop. If you
added or renamed a published application, close the Recording options and reopen
them to view the new list. Additionally, you can also enter the name of a published
application manually if you know it exists (useful in cases where the drop-down list
is inaccurate).
To change the name of the published application on the Citrix client, you must make
the change on the Citrix Server machine. Select Manage Console > Application and
create a new application or rename an existing one.
Note: If you do not specify a published application, Citrix load balancing will
not work. To use load balancing when accessing the server's desktop,
register the desktop as a published application on the server machine, and
select this name from the Published Application drop-down list.
Define
connection
parameters
Allows you to manually define the logon and connection details.
Logon
Information
Specify the User Name,Password, and Domain of the Citrix user. Optionally, you can
also specify the Client Name by which the Citrix server identifies the client.
Use ICA file
for
connection
parameters
Specify an ICA file with the connection configuration information for the application.
For details, see "ICA File Structure" on the next page.
User Guide
VuGen
HP LoadRunner (12.50) Page 148

ICA File Structure
Citrix ICA client files are text files that contain configuration information for the applications accessed
through the Citrix client.
Tip: When you load an ICA file using the Recording Options, VuGen saves the file together with
your script, eliminating the need to copy the ICA file to each load generator machine.
ICAFiles must have an .ica extension and must conform to the following format:
[WFClient]
Version=
TcpBrowserAddress=
[ApplicationServers]
AppName1=
[AppName1]
Address=
InitialProgram=#
ClientAudio=
AudioBandwidthLimit=
Compress=
DesiredHRES=
DesiredVRES=
DesiredColor=
TransportDriver=
WinStationDriver=
Username=
Domain=
ClearPassword=
The following example shows a sample ICA file for using Microsoft Word on a remote machine through
the Citrix client:
[WFClient]
Version=2
TcpBrowserAddress=235.119.93.56
[ApplicationServers]
Word=
[Word]
Address=Word
InitialProgram=#Word
ClientAudio=On
AudioBandwidthLimit=2
Compress=On
User Guide
VuGen
HP LoadRunner (12.50) Page 149
DesiredHRES=800
DesiredVRES=600
DesiredColor=2
TransportDriver=TCP/IP
WinStationDriver=ICA 3.0
Username=test
Domain=user_lab
ClearPassword=test
For more information, see the Citrix website www.citrix.com.
Citrix > Recorder - Recording Options
Enables you to specify how to generate window names where the window titles change during
recording. You can also specify whether to save snapshots of the screens together with the script files
and whether to generate text synchronization functions.
To access Record > Recording Options > Citrix > Recorder
Important
information
This node is available only for specific protocols. For a complete list of protocols and
their associated nodes, see "Protocol Compatibility Table" on page208.
User interface elements are described below:
UI
Element
Description
Save
snapshots
Saves a snapshot of the Citrix client window for each script step, when relevant. We
recommend that you enable this option to provide you with a better understanding of
the recorded actions. Saving snapshots, however, uses more disk space and slows down
the recording session.
Window
name
In some applications, the active window name changes while you are recording. If you try
to replay the script as is, the Vuser uses the original window name and the replay may
fail. You can specify a naming convention for the windows in which VuGen uses a
common prefix or common suffix to identify the windows as follows:
lUse new window name as is. Set the window name as it appears in the window title.
(default)
lUse common prefix for new window names. Use the common string from the
beginning of the window titles as a window name.
lUse common suffix for new window names. Use the common string from the end of
the window titles as a name.
Alternatively, you can modify the window names in the actual script after recording. In
User Guide
VuGen
HP LoadRunner (12.50) Page 150

the Script view, locate the window name, and replace the beginning or end of the window
name with the "*" wildcard notation.
ctrx_sync_on_window ("My Application*", ACTIVATE, ...CTRX_LAST);
COM/DCOM > Filter Recording Options
Enables you to define which COM/DCOM objects to record.
To access Use one of the following:
lRecord > Recording Options > COM/DCOM > Filter
lReplay > Recording Options > COM/DCOM > Filter
User interface elements are described below:
UI Element Description
DCOM
Profile
Specify one of the following filter types:
lDefault Filter. The filter to be used as the default when recording a COM Vuser
script.
lNew Filter. A clean filter based on the default environment settings. Note that you
must specify a name for this filter before you can record with its settings.
You can also save the current settings and delete a filter using the Save As and
Delete buttons.
DCOM
Listener
Settings List
Displays a tree hierarchy of type libraries. You can expand the tree to show all of the
available classes in the type library. You can expand the class tree to show all of the
interfaces supported by that class.
To exclude a type library, clear the check box next to the library name. This excludes
all of its classes in that type library. By expanding the tree, you can exclude individual
classes or interfaces by clearing the check box next to the item.
An interface can be implemented differently by various classes. When you exclude an
interface that is implemented by other classes that have not been excluded, a dialog
box opens asking you if you also want to exclude the interface in all classes that
implement it this interface.
Note that when you clear the check box adjacent to an interface, it is equivalent to
selecting it in the Excluded Interfaces dialog box.
lEnvironment. The environments to record: ADO objects, RDS Objects, and Remote
Objects. Clear the objects you do not want to record.
lType Libraries. A type library .tlb or .dll file, that represents the COM object to
record. All COM objects have a type library that represents them. You can select a
type library from the Registry, Microsoft Transaction Server, or file system.
User Guide
VuGen
HP LoadRunner (12.50) Page 151

Type Libraries. In the lower section of the dialog box, VuGen displays the following
information for each type library.
lTypLib. The name of the type library (tlb file).
lPath. The path of the type library.
lGuid. The Global Unique Identifier of the type library.
Adds another COM type library.
lBrowse Registry. Displays a list of type libraries found in the registry of the local
computer. Select the check box next to the desired library or libraries and click OK.
lBrowse file system. Allows you to select type libraries from your local file system.
lBrowse MTS. add a component from a Microsoft Transaction Server. The MTS
Components dialog box prompts you to enter the name of the MTS server.
Type the name of the MTS server and click Connect. Remember that to record MTS
components you need an MTS client installed on your machine.
Select one or more packages of MTS components from the list of available
packages and click Add. Once the package appears in the list of Type Libraries, you
can select specific components from the package.
Removes a COM type library.
Excludes interfaces in the filter through the Excluded Interfaces dialog box.
In this dialog box, the checked interface listings are the ones that are excluded. You
can also add interfaces that are not listed. Click Add Interface... in the Excluded
Interfaces dialog box and enter the GUID number (interface ID) and name of the
interface. You can copy the GUID from the interfaces.h file created by VuGen and
listed in the selection tree in the left-hand column of the VuGen screen. Use the Add
Interface... feature to exclude interfaces that are called needlessly by the script, but
are not listed anywhere in the filter.
An interface can be implemented differently by various classes. When you exclude an
interface that is implemented by other classes that have not been excluded, VuGen
displays the a warning. If you check Don't ask me again and close the dialog box, then
the status of all instances of the interface in all other classes will be changed
automatically for this filter, whenever you change the status of the interface in one
object. Click Yes to all to change the status of all instances of this interface for all
other classes, click No to all to leave the status of all other instances unchanged.
Click Next Instance to view the next class that uses this interface.
COM/DCOM > Options Recording Options
Enables you to set additional options for your COM recording session, relating to the handling of objects,
generation of logs, and VARIANT definitions.
User Guide
VuGen
HP LoadRunner (12.50) Page 152

The DCOM scripting options apply to all programming languages. These settings let you configure the
scripting options for DCOM methods and interface handling.
To access Record > Recording Options > COM/DCOM > Options
User interface elements are described below:
UI Element Description
ADO Recordset filtering Condense multiple recordset operations into a single-line fetch
statement (enabled by default).
Declare Temporary
VARIANTs as Globals
Define temporary VARIANT types as Globals, not as local variables
(enabled by default).
Fill array in separate
scopes
Fill in each array in a separate scope (enabled by default).
Fill structure in separate
scopes
Fill in each structure in a separate scope (enabled by default).
Generate COM exceptions Generate COM functions and methods that raised exceptions during
recording (disabled by default).
Generate COM statistics Generate recording time performance statistics and summary
information (disabled by default).
Limit size of SafeArray log Limit the number of elements printed in the safearray log per COM
call, to 16 (enabled by default).
Release COM Objects Record the releasing of COM objects when they are no longer in use
(enabled by default).
Save Recordset content Stores Recordset content as grids, to allow viewing of recordset in
VuGen (enabled by default).
Trap binded moniker
objects
Trap all of the bound moniker objects (disabled by default).
Correlations > ConfigurationRecording Options
This recording option pane enables you to configure settings for the Correlation tab.
To access VuGen > Recording Options > Correlations > Configuration
Important
information
l"Correlation Tab [Design Studio] Overview" on page236
l"Correlations > Rules Recording Options" on page155
lThis recording option is only available for specific protocols. For a complete list of
User Guide
VuGen
HP LoadRunner (12.50) Page 153
protocols and their associated nodes, see "Protocol Compatibility Table" on
page208.
Relevant
tasks
"How to Correlate Scripts Using Design Studio" on page241
User interface elements are described below:
UI Element Description
Scan for correlations applying:
Rules Scan Apply correlation rules when performing correlation scan.
For details, see "Correlations > Rules Recording Options" on the next page.
Automatically
correlate values found
Design Studio will automatically correlate dynamic values found using the
rules scan.
Record Scan Scan for correlations with the record based engine.
Replay Scan Scan for correlations with the replay based engine.
Record and Replay scan configuration
API used for
correlations
Select the API function to be used for correlation:
Boundary based: web_reg_save_param_ex
Regular Expression: web_reg_save_param_regexp
Note: If you change the API function, the changes will only take
effect after a new scan.
Excluded strings Enables you to enter strings that should be ignored by the record and
replay scan.
For details, see "How to Exclude Strings or Content Types from the
Correlation Scan" on page268.
Excluded content
types
Enables you to enter content types that should be ignored by the record
and replay scan. For details, see "How to Exclude Strings or Content Types
from the Correlation Scan" on page268.
Ignore values shorter
than [ ]
Enables you to define how short a dynamic value can be before it is ignored
by the record or replay scan.
Default length is 4 characters.
Ignore values longer Enables you to define how long a dynamic value can be before it is ignored
User Guide
VuGen
HP LoadRunner (12.50) Page 154

UI Element Description
than [ ] by the record or replay scan.
Default length is 400 characters.
Warm me if the
dynamic string size is
greater than 10 KB
Issues a warning if you try to correlate a string whose size is 10 KB or larger.
Ignore case when
searching for
correlation values
Disable case sensitivity during correlation scan.
Record scan configuration
Heuristic level Enables you to set the filter level that controls the amount of correlation
results that are returned. The higher the filter level, the shorter the scan
will take to run.
High. Design Studio performs a detailed scan returning a highly refined
result set.
Medium. Design Studio performs a less detailed scan returning more
results. This is the default setting.
Low. Design Studio performs a more detailed scan returning the most
results. This setting may produce many unwanted results.
Replay scan configuration
Scan for differences
between snapshots
using
Select a comparison method:
lHTML Comparison. Display the differences in HTML code only.
lText Comparison. Display all text, HTML, and binary differences.
Correlations > Rules Recording Options
This dialog box enables you to manage correlation rules that automatically correlate dynamic values
during code generation. You can:
lAdd a new application
lAdd a new rule
lDelete a rule
lExport rules
lImport rules
lTest a rule
User Guide
VuGen
HP LoadRunner (12.50) Page 155
To access Do one of the following:
lRecord > Recording Options > Correlations > Rules
lDesign Studio > Options > Correlations tab > Rules
Important information l"Correlation Overview" on page235
l"Correlation Tab [Design Studio] Overview" on page236
Relevant tasks "How to Correlate Scripts Using Design Studio" on page241
User interface elements are described below (unlabeled elements are shown in angle brackets):
UI Element Description
<Application
List >
A list of applications and their rules.
lSelect the check box adjacent to the application to activate it during recording.
lExpand the application tree to select the check box adjacent to the rules to
activate them during recording.
Add a new application to <Application List>.
Enter a new rule for the selected application in Correlation Rules.
For details, see "New Rule Pane" below.
Delete the selected application or rule from the list.
Import a file containing correlation rule definitions.
Export a file containing a correlation rule definition.
Test a correlation rule.
For details, see " Token Substitution Testpad Dialog Box" on page159.
New Rule Pane
Enables you to define a new custom rule.
To access Record > Recording Options > Correlation > Rules > New Rule
Important
information
This pane is available only for specific protocols. For a complete list of protocols and
their associated nodes, see the "Protocol Compatibility Table" on page208.
User interface elements are described below:
User Guide
VuGen
HP LoadRunner (12.50) Page 156

UI Element Description
Opens the "Advanced Correlation Properties Dialog Box" on the next page.
Action Specify the type of action for the rule from the following options:
lSearch for Parameters in all of the Body Text. Searches the entire body—not
just links, form actions or cookies. It searches the text for a match using the
borders that you specify.
lSearch for parameters inlinks and form actions. Searches within links and
forms' actions for the text to parameterize. This method is for application servers
where you know the context rules. You define a left boundary, a right boundary,
an alternate right boundary, and an instance of the left boundary within the
current link.
lSearch for Parameters from cookie headers. Similar to the previous rule, except
that the value is extracted from cookie text (exactly as it appears in the recording
log) instead of from a link or form action.
lParameterize form field value. Saves the named form field value to a
parameter. It creates a parameter and places it in the script before the form's
action step. For this option, you need to specify the field name.
lText to enter a web_reg_add_cookie function by method inserts a web_reg_
add_cookie function if it detects a certain string in the buffer. It only adds the
function for those cookies with the specified prefix. For this option, you need to
specify the search text and the cookie prefix.
Scan Type The scan type: Regular Expression, Boundary Based, XPath query, or JSON query.
RegExp
String
A regular expression to which this rule will apply. This element only applies to a
Regular Expression scan type.
Left
boundary
The left-most boundary where the rule will apply. This element only applies to
Boundary Based scan type.
Right
boundary
The right-most boundary where the rule will apply. Use the drop-down menu to
define this boundary as either the end of a string, a newline character, or a user-
defined text. The element only applies to Boundary Based scan type.
XPath query An XPath expression to which this rule will apply. This element only applies to a XPath
query scan type. When VuGen detects a value that matches this expression, it
creates a web_reg_save_param_xpath function.
JSON query A JSON query expression to which this rule will apply. This element only applies to a
JSON query scan type. When VuGen detects a value that matches this expression, it
creates a web_reg_save_param_json function. For details about creating a JSON
query, see Internet resources on JSONPath expressions.
User Guide
VuGen
HP LoadRunner (12.50) Page 157
Parameter
prefix
Uses a prefix in all automatically generated parameters based on this rule. Prefixes
prevent you from overwriting existing user parameters. In addition, prefixes allow
you to recognize the parameter in your script. For example, in Siebel Web, one of the
built-in rules searches for the Siebel_row_id prefix.
Match Case Matches the case when looking for boundaries.
Use '#' for
any digit
Replaces all digits with a hash sign. The hash signs serve as wildcard, allowing you to
find text strings with any digit.
Example: If you enable this option and specify HP### as the left boundary,
HP193 and HP284 will be valid matches.
This element only applies to boundary based scan type.
Advanced Correlation Properties Dialog Box
Enables you to set the advanced options for correlation rules.
To access Record > Recording Options > Correlation > Rules > New Rule > Advanced
Important
information
This node is available only for specific protocols. For a complete list of protocols and
their associated nodes, see the "Protocol Compatibility Table" on page208.
User interface elements are described below:
UI Element Description
Always create new
parameter
Creates a new parameter for this rule even if the value replaced by the
parameter has not changed from the previous instance.
Replace with
parameter only for
exact matches
Replaces a value with a parameter only when the text exactly matches the
found value.
Reverse search Performs a backwards search.
Left boundary
instance
The number of occurrences of the left boundary in order for it to be
considered a match.
Offset The offset of the string within the found value.
Length The length of the string, starting with the offset, to save to the parameter. If
this is not specified, the parameter continues until the end of the found value.
User Guide
VuGen
HP LoadRunner (12.50) Page 158
Alternate right
boundary
Alternative criteria for the right boundary, if the previously specified boundary
is not found. Select one of the following options: User-defined Text, Newline
Character, End Of Page.
, continued
Token Substitution Testpad Dialog Box
Enables you to test correlation rules before applying them.
To access Record > Recording Options > Correlations > Rules > Test
User interface elements are described below:
UI Element Description
Runs the test.
Applied rules A list of the rules and their values that were applied during the test.
Source string for substitution Enter the source string for substitution.
Substitution Result The results of the test.
Database > Database Recording Options
Enables you to set the recording options for database protocols.
To access Record > Recording Options > Database > Database
Important
information
This node is available only for specific protocols. For a complete list of protocols and
their associated nodes, see "Protocol Compatibility Table" on page208.
User interface elements are described below:
UI Element Description
Opens the "Database > Advanced Recording Options Dialog Box" on the next page.
Automatic
transactions
Marks every lrd_exec and lrd_fetch function as a transaction. When these options
are enabled, VuGen inserts lr_start_transaction and lr_end_transaction functions
around every lrd_exec or lrd_fetch function. Default value: Disabled.
Script
options
Generates comments into recorded scripts, describing the lrd_stmt option values. In
addition, you can specify the maximum length of a line in the script.
Default value: 80 characters.
Think time VuGen automatically records the operator's think time. You can set a threshold level,
User Guide
VuGen
HP LoadRunner (12.50) Page 159
below which the recorded think time will be ignored. If the recorded think time
exceeds the threshold level, VuGen places an lr_think_time statement before LRD
functions. If the recorded think time is below the threshold level, an lr_think_time
statement is not generated.
Default value: five seconds.
Database > Advanced Recording Options Dialog Box
Enables you set the advanced recording options for database protocols.
To access Record > Recording Options > Database > Database > Advanced
Important
information
This node is available only for specific protocols. For a complete list of protocols and
their associated nodes, see "Protocol Compatibility Table" on page208.
User interface elements are described below:
UI
Element
Description
Code
generation
buffer size
Specify in kilobytes the maximum size of the code generation buffer.
Default value: 128 kilobytes.
CtLib
Function
You can instruct VuGen to generate a send data time stamp or an extended result set
statement.
lGenerate send data time stamp. Generates lrd_send_data statements with the
TotalLen and Log keywords for the mpszReqSpec parameter. The Advanced
Recording Options dialog box lets you instruct VuGen to also generate the
TimeStamp keyword. If you change this setting on an existing script, you must
regenerate the Vuser script by choosing Record > Regenerate Script. It is not
recommended to generate the Timestamp keyword by default. The timestamp
generated during recording is different than that generated during replay and script
execution will fail. You should use this option only after a failed attempt in running a
script, where an lrd_result_set following an lrd_send_data fails. The generated
timestamp can be correlated with a timestamp generated by an earlier lrd_send_
data.
lGenerate extended result set statement. Generates an lrd_result_set function
when preparing the result set. This setting instructs VuGen to generate the extended
form of the lrd_result_set function, lrd_result_set_ext. In addition to preparing a
result set, this function also issues a return code and type from ct_results.
Recording
engine
You can instruct VuGen to record scripts with the older LRD recording engine for
compatibility with previous versions of VuGen.
User Guide
VuGen
HP LoadRunner (12.50) Page 160
Note: This option is available only for single-protocol scripts.
Recording
log
options
You can set the detail level for the trace and ASCII log files. The available levels for the
trace file are Off,Error Trace,Brief Trace, or Full Trace. The error trace only logs error
messages. The Brief Trace logs errors and lists the functions generated during
recording. The Full Trace logs all messages, notifications, and warnings.
You can also instruct VuGen to generate ASCII type logs of the recording session. The
available levels are Off,Brief detail, and Full detail. The Brief detail logs all of the
functions, and the Full detail logs all of the generated functions and messages in ASCII
code.
Data Format Extension > Chain Configuration Recording Options
Enables you to add, delete, and modify chains, and to manage the DFEs that are included in the chains.
To access Record > Recording Options > Data Format Extension > Chain Configuration
Important
information
This node is available only for specific protocols. For a complete list of protocols and
their associated nodes, see "Protocol Compatibility Table" on page208.
See also l"Data Format Extensions (DFEs) - Overview" on page863
l"Data Format Extension List" on page872
l"Implementing GWT-DFE Support" on page877
l" Add Prefix/Postfix to Chain Dialog Box" on the next page
User interface elements are described below:
UI
Element
Description
Chains
pane
Displays a list of the DFE chains that are defined for the script.
Add Chain. Enables you to add a new chain.
Edit Chain Name. Enables you to modify the name of the selected chain.
Delete Chain. Deletes the selected chain.
Chain: <chain name> pane
Add DFE. Enables you to add a DFE to the selected chain in the Chains pane. For more
information on Data Format Extensions, see "Data Format Extension List" on page872.
User Guide
VuGen
HP LoadRunner (12.50) Page 161
Edit DFE.For a Prefix Postfix Extension, edit the prefix and postfix to cut. For a GWT
Extension, specify the classpath.
Add Custom Path. Lets you add a custom classpath for GWT. You can use this to specify
Linux paths. For example, /tmp/stockwatcher.war.
Delete DFE. Deletes the selected DFE from the chain.
Move Up/Down. Moves the selected Data Format Extension up or down in the chain.
Extensions are run in the order in which they appear in the extensions list.
Name The display name of the Data Format Extension.
Tag The unique ID of the extension.
Provider The creator of the Data Format Extension.
Continue
Processing
Determines how the chain behaves after the DFE is applied:
lTrue:
The data is passed on to the next DFE in the chain, whether or not the data was
converted.
lFalse:
If the DFE converted the data that it received, the chain is terminated - no further
DFEs are applied to the data.
If the DFE did not convert the data that it received, the data is passed on to the next
DFE in the chain.
Note: If the chain contains only a single DFE, the Continue Processing setting is
not significant.
Add Prefix/Postfix to Chain Dialog Box
This dialog enables you to add or edit a prefix/postfix extension to the selected chain.
User Guide
VuGen
HP LoadRunner (12.50) Page 162
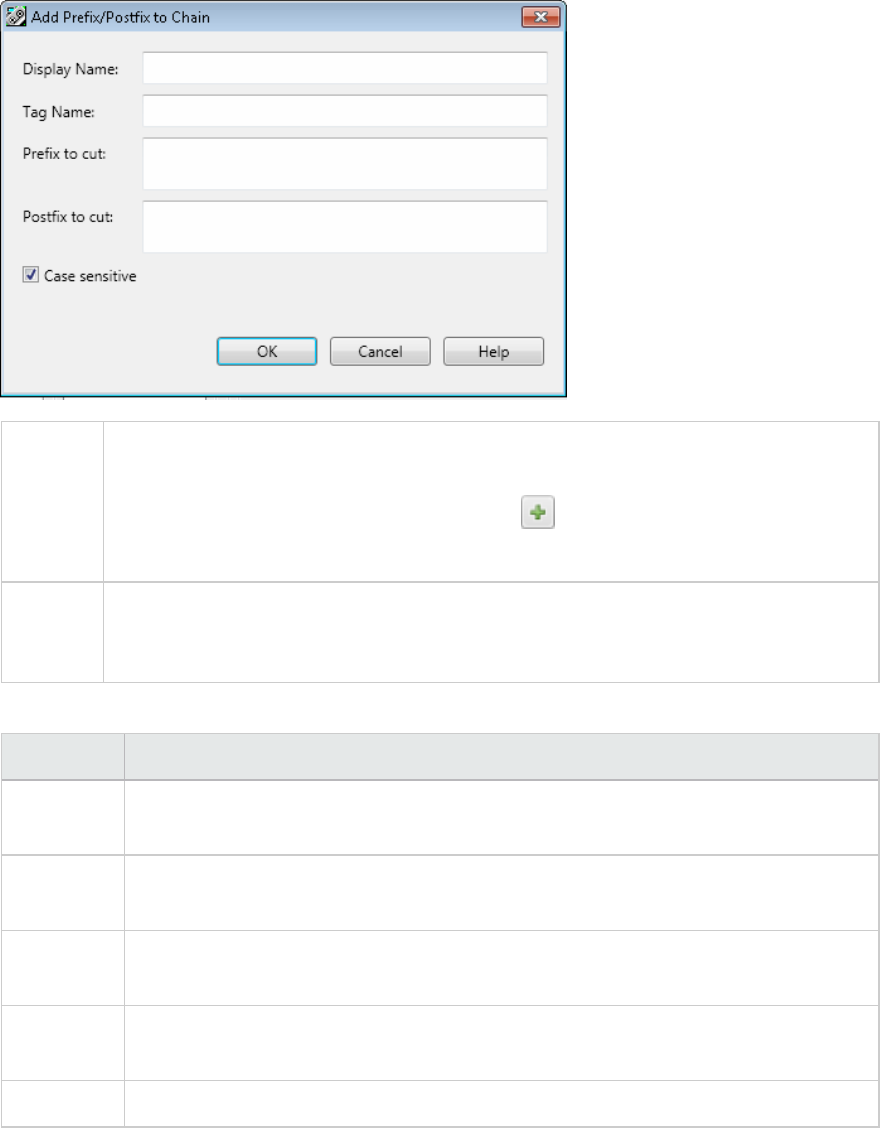
To
access
1. Go to Record > Recording Options > Data Format Extension > Chain Configuration
node.
2. In the Chain: <Chain name> area, click the button.
3. Select Prefix Postfix Extensionand click OK.
See also "Data Format Extension > Chain Configuration Recording Options" on page161
"Data Format Extensions (DFEs) - Overview" on page863
"Data Format Extension List" on page872
User interface elements are described below:
UI Element Description
Case
sensitive
Sets the extension to cut from the defined prefix and postfix of the string only if the
letter cases match.
Display
name
The name of Prefix/Postfix Extension.
Postfix to
cut
The section you want to cut, from the end of the string.
Prefix to
cut
The section you want to cut, from the beginning of the string.
Tag name The unique ID of the Prefix/Postfix Extension.
Add Data Format Extension
This dialog box enables you to select the data format extension type.
User Guide
VuGen
HP LoadRunner (12.50) Page 163
UI example
To access VuGen > Recording Options > Data Format Extension > Chain Configuration >
Important
information
l"Data Format Extension > Chain Configuration Recording Options" on page161
l" Add Prefix/Postfix to Chain Dialog Box" on page162
Relevant
tasks
"How to Apply DFE Chains to Sections of the HTTP Message" on page870
Data
Format
Extension
Description
Base64
Extension
Decodes strings that are encoded with a Base64 encoder.
GWT
Extension
Transforms GWT data to XML format.
URL
Encoding
Extension
Decodes strings that are encoded with URL encoding format.
JSON to XML
Extension
Transforms JSON data to XML format.
XML
Extension
Receives data and checks to see if it conforms with XML syntax. This check allows
VuGen to perform correlations based on XPath and to display snapshot data in an XML
viewer.
Prefix
Postfix
Extension
Enables you to cut data from the beginning and/or end of a string which you do not
want decoded. You can add and customize as many prefix/postfix extensions as
required. Each postfix/prefix extension created should have a unique display name and
tag name.
Binary to
XML
Extension
Transforms Microsoft WCF binary XML into XML format.
Remedy to
XML
Extension
Transforms Remedy request data into XML format.
Note that this extension does not transform Remedy response data - which is
JavaScript code.
XSS
Extension
Enables you to test sites that use Cross Site Scripting (XSS) defense code.
User Guide
VuGen
HP LoadRunner (12.50) Page 164
Data Format Extension > Code Generation Recording Options
Enables Data Format Extensions during code generation, and enables you to define chains for each
section of the HTTP message.
To access Record > Recording Options > Data Format Extension > Code Generation
Important
information
This node is available for specific protocols only. For a complete list of protocols and
their associated nodes, see "Protocol Compatibility Table" on page208.
See also l"Data Format Extensions (DFEs) - Overview" on page863
l"Data Format Extension List" on page872
User interface elements are described below (unlabeled elements are shown in angle brackets):
UI Element Description
Enable data
format
extension
Enables you to select chains for each message section of the HTTP message.
By default, this option is not selected.
Configuration
Format lCode and snapshots. (default) Enables Data Format Extensions on the code and
snapshot data.
lSnapshots. Enables Data Format Extensions on snapshot data, but does not
format the data in the script itself.
Verify
formatted
data
Checks the results of the formatted data by converting it back to the original state
and verifying that it matches the original data.
Note: Available for Base64 extension only.
Chain Assignment
Imports the Data Format Extensions from a file.
Exports the Data Format Extensions to a file.
<Message
sections list>
Displays a list of the following sections of the HTTP message included in the script:
lBody
lHeaders
lCookies
lQuery String
User Guide
VuGen
HP LoadRunner (12.50) Page 165
When you select a message section from the list, the title of the section chains pane
(described below) reflects your selection and the pane displays the list of chains for
that section.
<Section Chains>
Add Chain. Adds chain to selected message section.
Note:
lEnabled for Headers and Cookies sections only. Enables you to add
additional chains to the selected message section.
lFor VuGen to correctly match the chain to the Headers or Cookies section,
the name in the Name column must match the name of the Headers or
Cookies section.
Delete Chain. Removes chain from corresponding message section.
Note: You cannot delete the default options from any of the message
sections.
Reset. Clears the selected chain in the Chain column.
Flex > RTMP Recording Options
This node enables you to include the flex_rtmp_recive_stream step in Flex RTMP scripts.
To access Record > Recording Options > Flex > RTMP
Important
Information
This node is available only for specific protocols. For a complete list of protocols and
their associated nodes, see "Protocol Compatibility Table" on page208.
User interface elements are described below:
UI Element Description
Generate
single step
for RTMP/T
stream
handling
Generates a single step, flex_rtmp_receive_stream, when recording a stream. This
step does not replay certain actions, such as pause and seek. If your script requires
these actions, clear the check box to record all receive and send steps. However, in this
case, you must manually modify your script as described in the Readme.
User Guide
VuGen
HP LoadRunner (12.50) Page 166

Flex > Configuration Recording Options
Enables you to set an external JVM (Java Virtual Machine) path.
To access Record > Recording Options> Flex > Configuration
Important
information
This node is available only for specific protocols. For a complete list of protocols and
their associated nodes, see "Protocol Compatibility Table" on page208.
User interface elements are described below:
UI Element Description
Use External JVM Enables you to use an external JVM. If you choose this option, you must
specify the path:
External JVM Path The full path of the external JVM.
VuGen must be restarted for the changes to be applied.
UseGraniteDS
configuration
Defines the server side Data Service configuration.
If you select this option, do not select Use Flex LCDS/BlazeDS jars to
serialize the messages. Ensure that the granit-config.xml file matches the
one deployed on the server.
Maximum Formatted
Request/Response
size to print
Enables you to specify the maximum character length of a request or
response body to be captured in the log files. The option only affects the
flex_amf_call and flex_remoting_call steps.
For example, if you specify a value of 1048576 characters (1MB), only
responses or requests with a length less than a megabyte will be printed on
the Code Generation or Replay log.
Flex > Externalizable Objects Recording Options
This dialog box enables you to configure how LoadRunner handles externalizable objects in Flex scripts.
To access Record > Recording Options > Flex > Externalizable Objects
Important
information
This node is available only for specific protocols. For a complete list of protocols and
their associated nodes, see "Protocol Compatibility Table" on page208.
Relevant
tasks
lHow to Serialize Using External Java Serializer
l"How to Serialize Flex Scripts " on page521
See also l"Flex Overview" on page501
User Guide
VuGen
HP LoadRunner (12.50) Page 167
l"Externalizable Objects in Flex Scripts" on page517
User interface elements are described below:
UI Element Description
Do not
serialize
externalizable
objects
Generate script using default settings.
Serialize
objects using
Select the appropriate option:
lSelect LoadRunner AMF serializer if you are not using the Adobe LiveCycle Data
Services or Adobe BlazeDS server.
lSelect Custom Java classes and select one or both of the available options:
lSelect Use Flex LCDS/BlazeDS jars if you are using Flex LCDS or BlazeDS jars
to serialize the messages. If you selected UseGraniteDS configuration in the
Configuration node, do not select Use Flex LCDS/BlazeDS jars.
lSelect Use additional jars to add additional jars to serialize the messages.
You must copy the jar files from the server and specify their location in the
Classpath Entries list described below. Copy only those jars that contain the
class that is externalizable. Ensure that the files exist in the same location on
all load generator computers. If you add jars with the same names as the Flex
LCDS or Blaze DS jars chosen by selecting the first check box, these files will
be overwritten.
Classpath Entries List
Down Arrow. Moves a classpath entry down the list.
Up Arrow. Moves a classpath entry up the list.
Add Classpath. Adds a new line to the classpath list.
Add Classpath Folder. Adds all files from the folder to the classpath list.
Delete. Permanently removes a classpath.
General > Code Generation Recording Options
This pane of the Recording Options dialog box enables you to define what tasks VuGen performs
automatically after generating a Vuser script.
User Guide
VuGen
HP LoadRunner (12.50) Page 168
To access Record > Recording Options > General > Code Generation
Relevant tasks "How to Create an Asynchronous Vuser Script" on page382
"How to Correlate Scripts Using Design Studio" on page241
User interface elements are described below:
UI Element Description
Correlations
Scan
Instructs VuGen to analyze the Vuser script to locate dynamic values that may need to
be correlated. This scan is performed after a new script is recorded and after an
existing script is regenerated.
Async Scan Instructs VuGen to analyze the Vuser script to locate asynchronous communication.
This scan is performed after a new script is generated and after an existing script is
regenerated.
Async
Options...
Opens the "Asynchronous Options Dialog Box" on page409.
Tip: It is recommended that you use a 100% display size and not a larger one.
General > Protocol Recording Options
Enables you to set the script generation preferences by setting the scripting language and options.
To access Record > Recording Options > General > Protocols
Important
information
This node is available only for specific protocols. For a complete list of protocols and
their associated nodes, see "Protocol Compatibility Table" on page208.
User interface elements are described below:
UI
Element
Description
Active
Protocols
List
A list of the protocols which comprise your multiple protocol script. VuGen lets you modify
the protocol list for which to generate code during the recording session. Select the
check boxes adjacent to the protocols you want to record in the next recording session.
Clear the check boxes adjacent to the protocols you do not want to record in the next
recording session.
General > Recording - Recording Options
Enables you to specify what information to record and which functions to use when generating a Vuser
script, by selecting a recording level.
User Guide
VuGen
HP LoadRunner (12.50) Page 169
To access Record > Recording Options > General > Recording
Important
information
This node is available only for specific protocols. For a complete list of protocols and
their associated nodes, see "Protocol Compatibility Table" on page208.
User interface elements are described below:
UI Element Description
Opens the "Advanced HTML Dialog Box" on the next page.
Opens the "Advanced URL Dialog Box" below.
HTML-based script This is the default recording level for Web - HTTP/HTML Vusers. It instructs
VuGen to record HTML actions in the context of the current Web page. It does
not record all resources during the recording session, but downloads them
during replay. This options is recommended for browser applications with
applets and VB script.
URL-based script Record all requests and resources from the server. It automatically records
every HTTP resource as URL steps (web_url statements), or in the case of
forms, as web_submit_data. It does not generate the web_link,web_image,
and web_submit_form functions, nor does it record frames. This options is
recommended For non-browser applications.
Advanced URL Dialog Box
Enables you to set the advanced options for scripts using the URL recording mode.
To access Record > Recording Options > General > Recording > URL Advanced
Important
information
This dialog box is available only for specific protocols. For a complete list of protocols
and their associated nodes, see "Protocol Compatibility Table" on page208.
User interface elements are described below:
UI Element Description
Restores the default settings of this dialog box.
Create
concurrent
groups for
resources after
their source
HTML page
Records the resources in a concurrent group (enclosed by web_concurrent_start
and web_concurrent_end statements) after the URL. Resources include files
such as images and js files. If you disable this option, the resources are listed as
separate web_url steps, but not marked as a concurrent group.
User Guide
VuGen
HP LoadRunner (12.50) Page 170
Enable EUC-
Encoded Web
Pages
(For Japanese windows only) Instructs VuGen to use EUC encoding. For more
information, see "EUC-Encoding (Japanese Windows only)" on page214.
Use web_
custom_request
only
Records all HTTP requests as custom requests. VuGen generates a web_custom_
request function for all requests, regardless of their content. Recommended for
non-browser applications.
Advanced HTML Dialog Box
Enables you to set the advanced options for HTTP-based scripts.
To access Record > Recording Options > General > Recording > HTML Advanced
Important
information
This dialog box is available only for specific protocols. For a complete list of protocols
and their associated nodes, see "Protocol Compatibility Table" on page208.
User interface elements are described below:
UI Element Description
Restores the default settings of this dialog box.
Non-HTML
generated
elements
Many Web pages contain non-HTML elements, such as applets, XML, ActiveX elements,
or JavaScript. These non-HTML elements usually contain or retrieve their own
resources. Using the following options, you can control how VuGen records non HTML-
generated elements.
lRecord within the current script step. Does not generate a new function for each
of the non HTML-generated resources. It lists all resources as arguments of the
relevant functions, such as web_url,web_link, and web_submit_data. The
resources, arguments of the Web functions, are indicated by the EXTRARES flag.
lRecord in separate steps and use concurrent groups. Creates a new function for
each one of the non HTML-generated resources and does not include them as
items in the page's functions (such as web_url and web_link). All of the web_url
functions generated for a resource are placed in a concurrent group (surrounded
by web_concurrent_start and web_concurrent_end).
lDo not record. Does not record any non-HTML generated resources.
Script type lA script describing user actions. Generates functions that correspond directly to
the action taken. It creates URL (web_url), link (web_link), image (web_image),
and form submission (web_submit_form) functions. The resulting script is very
intuitive and resembles a context sensitive recording.
lA script containing explicit URL's only. Records all links, images and URLs as
web_url statements, or in the case of forms, as web_submit_data. It does not
User Guide
VuGen
HP LoadRunner (12.50) Page 171
generate the web_link,web_image, and web_submit_form functions. The
resulting script is less intuitive. This mode is useful for instances where many links
within your site have the same link text. If you record the site using the first option,
it records an ordinal (instance) for the link, but if you record using the second
option, each link is listed by its URL. This facilitates parameterization and
correlation for that step.
General > Script Recording Options
Enables you to set the script generation preferences by setting the scripting language and options.
To access Record > Recording Options > General > Script
Important
information
This node is only available for specific protocols. In addition, the list of options
differs between protocols.
For a complete list of protocols and their associated nodes, see the "Protocol
Compatibility Table" on page208.
User interface elements are described below:
UI Element Description
Scripting
Language
Select the language to generate the Vuser script in, C or JavaScript. The default is C.
Note: This option is available for Web - HTTP/HTML Vuser scripts only.
Add a
comment for
each action
Insert informative logging messages before each message invocation (non-C only).
Default value: enabled.
Close all AUT
processes
when
recording
stops
Automatically closes all of the AUT's (Application Under Test) processes when VuGen
stops recording.
Default value: disabled.
Correlate
arrays
Tracks and correlates arrays of all data types, such as string, structures, numbers,
and so on.
Default value: enabled.
Correlate
large
numbers
Correlates long data types such as integers, long integers, 64-bit characters, float,
and double.
Default value: disabled.
Correlate Correlates simple, non-array strings and phrases.
User Guide
VuGen
HP LoadRunner (12.50) Page 172

UI Element Description
simple
strings
Default value: disabled.
Correlate
small
numbers
Correlates short data types such as bytes, characters, and short integers.
Default value: disabled.
Correlate
structures
Tracks and correlates complex structures.
Default value: enabled.
Declare
primitives as
locals
Declares primitive value variables as local variables rather than class variables (C, C#,
and .NET only).
Default value: enabled.
Explicit
variant
declaration
Declares variant types explicitly in order to handle ByRef variants (Visual Basic for
Applications only).
Default value: enabled.
Generate
fixed think
time after
end
transaction
Adds a fixed think time, in seconds, after the end of each transaction. When you
enable this option, you can specify a value for the think time.
Default value: disabled, 3 seconds when enabled.
Generate
recorded
events log
Generates a log of all events that took place during recording.
Default value: disabled.
Generate
think time
greater than
threshold
Uses a threshold value for think time. If the recorded think time is less than the
threshold, VuGen does not generate a think time statement. You also specify the
threshold value. The default values is 3—if the think time is less than 3 seconds,
VuGen does not generate think time statements. If you disable this option, VuGen will
not generate any think times.
Default value: enabled, 3 seconds.
Insert output
parameters
values
Inserts output parameter values after each call (C, C#, and .NET only).
Default value: disabled.
Insert post-
invocation
info
Insert informative logging messages after each message invocation (non-C only).
Default value: enabled.
Maximum
number of
lines in
Create a new file if the number of lines in the action exceeds the specified threshold.
The default threshold is 60000 lines (C, C#, and .NET only).
Default value: disabled.
User Guide
VuGen
HP LoadRunner (12.50) Page 173

UI Element Description
action file
Replace long
strings with
parameter
Save strings exceeding the maximum length to a parameter. This option has an initial
maximum length of 100 characters. The parameters and the complete strings are
stored in the lr_strings.h file in the script's folder in the following format:
const char <paramName_uniqueID> ="string".
This option allows you to have a more readable script. It does not effect the
performance of the script.
Default value: enabled.
Reuse
variables for
primitive
return values
Reuse the same variables for primitives received from method calls. This overrides
the Declare primitives as locals setting.
Default value: enabled.
Track
processes
created as
COM local
servers
Track the activity of the recorded application if one of its sub-processes was created
as a COM local server (C and COM only).
Default value: enabled.
Use full type
names
Use the full type name when declaring a new variable (C# and .NET only).
Default value: disabled.
Use helpers
for arrays
Use helper functions to extract components in variant arrays (Java and VB Scripting
only).
Default value: disabled.
Use helpers
for objects
Use helper functions to extract object references from variants when passed as
function arguments (Java and VB Scripting only).
Default value: disabled.
Use
protected
application
recording
Use this option if VuGen is unable to record your application. Your application may
block access to VuGen, and recording with this option selected may enable access.
Default value: disabled.
Warn me if
the
application
being
recorded
encounters
an error
Selecting this option enables VuGen to prompt you to cancel the recording if the
recorded application crashes or if no events are recorded for 3 minutes. If you
choose to cancel the recording, no script is generated. In proxy mode, if the recorded
application crashes, there is no error message. Instead, a no-events error is
displayed after 3 minutes.
Default value: enabled.
User Guide
VuGen
HP LoadRunner (12.50) Page 174
UI Element Description
Note: This option is available for Web - HTTP/HTML Vuser scripts only.
GUI Properties > Web Event Configuration Recording Options
Enables you to set the level of detail recorded in a script (web event recording).
To access Record > Recording Options > GUI Properties > Web Event Configuration
Important
information
This node is available only for specific protocols. For a complete list of protocols and
their associated nodes, see "Protocol Compatibility Table" on page208.
User interface elements are described below:
UI Element Description
Basic Event
Configuration
Level
lAlways records click events on standard Web objects such as images, buttons,
and radio buttons.
lAlways records the submit event within forms.
lRecords click events on other objects with a handler or behavior connected.
lRecords the mouseover event on images and image maps only if the event
following the mouseover is performed on the same object.
Custom Settings Opens the "Custom Web Event Recording Configuration Dialog Box" below, where
you can customize the event recording configuration.
High Event
Configuration
Level
In addition to the objects recorded in the Medium level, it records mouseover,
mousedown, and double-click events on objects with handlers or behaviors
attached.
Medium Event
Configuration
Level
In addition to the objects recorded in the Basic level, it records click events on the
<DIV>, <SPAN>, and <TD> HTML tag objects.
Custom Web Event Recording Configuration Dialog Box
Enables you to customize the level of web event recording.
To access Record > Recording Options > GUI Properties > Web Event Configuration > Custom
Settings
Important
information
This dialog box is available only for specific protocols. For a complete list of protocols
and their associated nodes, see "Protocol Compatibility Table" on page208.
User interface elements are described below (unlabeled elements are shown in angle brackets):
User Guide
VuGen
HP LoadRunner (12.50) Page 175

UI
Element
Description
<Object
List>
A list of the web objects. Each web object can be customized according to the other
settings in this dialog box.
<Object
Menu>
lAdd. Adds a new HTML tag object to the object list. Type in the name of the tag.
lDelete. Deletes an object from the object list.
Event
Menu
lAdd. Adds an event to the Event Name column of this object.
lDelete. Deletes an event from the Event Name column of this object.
Event
Name
A list of events associated with the object.
File
Menu
lLoad Configuration. Loads a previously created custom configuration.
lSave Configuration As. Saves the current configuration.
Listen The criteria which determines when VuGen listens for an event.
lAlways. Always listen to the event.
lIf Handler. Listens to the event if a handler is attached to it. A handler is code in a Web
page, typically a function or routine written in a scripting language, that receives
control when the corresponding event occurs.
lIf Behavior. Listens to the event if a DHTML behavior is attached to it. A DHTML
behavior encapsulates specific functionality or behavior on a page. When applied to a
standard HTML element on a page, a behavior enhances that element's default
behavior.
lIf Handler or Behavior. Listens to the event if either a handler or a behavior is attached
to it.
lNever. Never listens to the event.
For more information, see "Tips for Working with Event Listening and Recording" on
page217.
Record The criteria which determines when VuGen records an event.
lEnabled. Records the event each time it occurs on the object as long as VuGen listens
to the event on the selected object, or on another object to which the event bubbles.
Bubbling is the process whereby, when an event occurs on a child object, the event can
travel up the chain of hierarchy within the HTML code until it encounters an event
handler to process the event.
lDisabled. Does not record the specified event and ignores event bubbling where
applicable.
lEnabled on next event. Same as Enabled, except that it records the event only if the
subsequent event occurs on the same object. For example, suppose a mouseover
User Guide
VuGen
HP LoadRunner (12.50) Page 176

UI
Element
Description
behavior modifies an image link. You may not want to record the mouseover event each
time you happen to move the mouse over this image. Because only the image that is
displayed after the mouseover event enables the link event, however, it is essential
that the mouseover event is recorded before a click event on the same object.
For more information, see "Tips for Working with Event Listening and Recording" on
page217.
Reset
Settings
Resets the custom settings to the settings of your choice: basic,medium, or high.
GUI Properties > Advanced Recording Options
Enables you to set advanced recording options for Click & Script Vusers.
To access Record > Recording Options > GUI Properties > Advanced
Important
information
This node is available only for specific protocols. For a complete list of protocols and
their associated nodes, see "Protocol Compatibility Table" on page208.
User interface elements are described below:
Recording Settings Properties
UI Element Description
Record
rendering-
related
property
values
Records the values of the rendering-related properties of DOM objects (for example,
offsetTop), so that they can be used during replay. Note that this may significantly
decrease the replay speed.
Default value: disabled.
Record 'click'
by mouse
events
Records mouse clicks by capturing mouse events instead of capturing the click()
method. Enable when the recorded application uses the DOM click() method, to
prevent the generation of multiple functions for the same user action.
Default value: enabled.
Record socket
level data
Enables the recording of socket level data. If you disable this option you will need to
manually add the starting URL before recording. In addition, you will be unable to
regenerate the script on an HTML level.
Default value: enabled.
Generate Enables generation of snapshots for Ajax steps. Enabling this option can result in
User Guide
VuGen
HP LoadRunner (12.50) Page 177
snapshots for
Ajax steps
errors during recording.
Default value: disabled.
Code Generation Settings Properties
UI Element Description
Enable
generation of
out-of-context
steps
Creates a URL-based script for ActiveX controls and Java applets, so that they will
be replayed. Since these functions are not part of the native recording, they are
referred to as out-of-context recording.
Default value: disabled.
Enable
automatic
browser title
verification
Enables automatic browser title verification.
Default value: disabled.
Perform a title
verification
for
leach navigation. Performs a title verification only after a navigation. When a
user performs several operations on the same page, such as filling out a multi-
field form, the title remains the same and verification is not required.
leach step. Performs a title verification for each step to make sure that no step
modified the browser title. A modified browser title may cause the script to fail.
lPerform a title verification using the URL if the title is missing. For browser
windows without a title, perform a title verification for each step using its URL.
HTTP Properties > Advanced Recording Options
Enables you to customize the code generation settings in the area of think time, resetting contexts,
saving snapshots, the generation of web_reg_find functions, and the encryption of passwords.
To access Record > Recording Options > HTTP Properties > Advanced
Important
information
lThis node is available only for specific protocols. For a complete list of protocols and
their associated nodes, see "Protocol Compatibility Table" on page208.
lSome options within this node are not available in when using a multi-protocol
script.
User interface elements are described below:
UI Element Description
Opens the "Headers Dialog Box" on page181.
Opens the "Content Type Filters Dialog Box" on page182.
User Guide
VuGen
HP LoadRunner (12.50) Page 178
Opens the "Non-Resources Dialog Box" on page182.
Reset context for
each action
Resets all HTTP contexts between actions. Resetting contexts allows the
Vuser to more accurately emulate a new user beginning a browsing session.
This option resets the HTML context, so that a context-less function is always
recorded in the beginning of the action. It also clears the cache and resets the
user names and passwords.
Note: This option is available only for Web and Oracle NCA protocols
Save snapshot
resources locally
Saves a local copy of the snapshot resources during record and replay,
thereby creating snapshots more accurately and displaying them quicker.
Generate web_reg_
find functions for
page titles
Generates web_reg_find functions for all HTML page titles. VuGen adds the
string from the page's title tag and uses it as an argument for web_reg_find.
lGenerate web_reg_find functions for sub-frames. Generates web_reg_
find functions for page titles in all sub-frames of the recorded page.
Note: This option is available only for Web and Oracle NCA protocols
Add comment to
script for HTTP
errors while
recording
Adds a comment to the script for each HTTP request error. An error request is
defined as one that generated a server response value of 400 or greater
during recording.
Support charset lUTF-8. Enables support for UTF-8 encoding. This instructs VuGen to
convert non-ASCII UTF-8 characters to the encoding of your locale's
machine in order to display them properly in VuGen. You should enable this
option only on non-English UTF-8 encoded pages. The recorded site's
language must match the operating system language. You cannot record
non-English Web pages with different encodings (for example, UTF-8
together with ISO-8859-1 or shift_jis) within the same script.
lEUC-JP. If you are using Japanese Windows, select this option to enable
support for Web sites that use EUC-JP character encoding. This instructs
VuGen to convert EUC-JP strings to the encoding of your locale's machine
in order to display them properly in VuGen. VuGen converts all EUC-JP
(Japanese UNIX) strings to the SJIS (Japanese Windows) encoding of your
locale's machine, and adds a web_sjis_to_euc_param function to the
script. (Kanji only)
Parameterize server
names
(Web - HTTP/HTML only) VuGen identifies server names and IP addresses
when you regenerate a Vuser script. These server names and IP addresses
are contained in specific arguments associated with specific functions in the
User Guide
VuGen
HP LoadRunner (12.50) Page 179

Vuser script. [See the table below for details.] When this option is enabled,
VuGen replaces the identified server names and IP addresses with
parameters. Parameterizing server names and IP addresses enables you to
run the Vuser script in different environments by simply changing the server
and IP address values in the parameter file. For an introduction to
parameters, see "Parameterizing Overview" on page341.
Note: To identify data for parameterization, VuGen searches the
arguments that are listed for the following functions:
API Function Arguments
web_url lURL
lReferrer
web_custom_request lURL
lReferrer
web_image lURL
lReferrer
web_submit_data lAction
lURL
lReferrer
web_submit_form lAction
lURL
lReferrer
By default, this option is not selected.
Generate steps with
missing responses
(Mobile Applications - HTTP/HTML only) Generate steps for HTTP requests
that are missing server responses.
Generate web_add_
cookie functions
Detect the time when a cookie is created, and generate web_add_cookie or
web_add_cookie_ex functions. If you clear this option, the above functions
will not appear in the script.
Generate steps for
WebSocket traffic
Generate code and correlate WebSocket functions. If you clear this option,
WebSocket functions will not appear in the script.
Replace passwords
with encrypted
parameters
When generating a script, replace actual passwords with an encrypted string.
User Guide
VuGen
HP LoadRunner (12.50) Page 180
Use the LoadRunner
Proxy to record a
local application
Provides an alternative way to record if the standard VuGen recording
mechanism is not compatible with your application. This applies when you
have selected to record a Web browser or Windows application. For details,
see "How to Record a Script via a Proxy" on page221.
Note: After recording, clear this option to restore the default mode.
Use streaming mode
when recording with
the LoadRunner
Proxy
Streaming mode enables HTTP data portions received from the server to be
forwarded to the application with buffering. This allows you to record
asynchronous push communication.
Note: If this option is enabled, the remote recording toolbar is
disabled.
Headers Dialog Box
Enables you to automatically send additional HTTP headers with every HTTP request submitted to the
server.
To access Record > Recording Options > HTTP > Advanced > Headers
Important
information
lThis dialog box is available only for specific protocols. For a complete list of
protocols and their associated nodes, see "Protocol Compatibility Table" on
page208.
lThe following standard headers are considered risky: Authorization, Connection,
Content-Length, Cookie, Host, If-Modified-Since, Proxy-Authenticate, Proxy-
Authorization, Proxy-Connection, Referer, and WWW-Authenticate. They are not
recorded unless selected in the Header list.
User interface elements are described below (unlabeled elements are shown in angle brackets):
UI Element Description
Plus. Adds a new entry.
Minus. Deletes an entry.
Restores the current list to the default values and entries.
Restores all lists to the default values and entries.
<Drop-down
menu>
Controls the options for this dialog box:
lDo not record headers
User Guide
VuGen
HP LoadRunner (12.50) Page 181
lRecord headers in list
lRecord headers not in list
<Header
list>
List of headers which may or may not be recorded. The lists vary depending on which
drop-down item is selected. Each item can be selected or deselected using its
individual check box.
, continued
Content Type Filters Dialog Box
Enables you to filter content types for your recorded script. You can specify the type of the content you
want to record or exclude from your script.
To access Record > Recording Options > HTTP > Advanced > Content Types
Important
information
This node is available only for specific protocols. For a complete list of protocols and
their associated nodes, see "Protocol Compatibility Table" on page208.
User interface elements are described below (unlabeled elements are shown in angle brackets):
UI Element Description
Plus. Adds a new entry.
Minus. Deletes an entry.
Restores the current list to the default values and entries.
Restores all lists to the default values and entries.
<Drop-down
menu>
Controls the options for this dialog box:
lDo not filter content types.
lFilter content types in list.
lFilter content types not in list.
<Header
list>
List of content types which may or may not be filtered. The lists vary depending on
which drop-down item is selected. Each item can be selected or deselected using its
individual check box.
Non-Resources Dialog Box
When you record a script, VuGen indicates whether or not it will retrieve the resource during replay
using the Resource attribute in the web_url function. If the Resource attribute is set to 0, the resource
is retrieved during script execution. If the Resource attribute is set to 1, the Vuser skips the resource
type.
User Guide
VuGen
HP LoadRunner (12.50) Page 182
You can exclude specific content types from being handled as resources. For example, you can indicate
to VuGen that gif type resources should not be handled as a resource and therefore be downloaded
unconditionally.
To access Record > Recording Options > HTTP > Advanced > Non-Resources
Important
information
This dialog box is available only for specific protocols. For a complete list of protocols
and their associated nodes, see "Protocol Compatibility Table" on page208.
User interface elements are described below (unlabeled elements are shown in angle brackets):
UI Element Description
Add. Adds a new entry to the list.
Remove. Deletes an entry from the list.
Restores the default list.
<Non-Resource
Content Type list>
List of items which should not be recorded as resources. Each item can be
selected or deselected using its individual check box.
Java > VM Recording Options
Enables you to indicate additional parameters to use when recording Java applications.
To access Record > Recording Options > Java Environment Settings > Java VM
Important
information
This node is available only for specific protocols. For a complete list of protocols and
their associated nodes, see "Protocol Compatibility Table" on page208.
User interface elements are described below:
UI Element Description
Additional VM
Parameters
List the Java command line parameters here. These parameters may be any Java
VM argument. The common arguments are the debug flag (-verbose) or memory
settings (-ms,-mx). In additional, you may also pass properties to Java applications
in the form of a -D flag. For more information about the Java VM flags, see the JVM
documentation.
Prepend
CLASSPATH to
-
Xbootclasspath
parameter
Instructs VuGen to add the Classpath before the Xbootclasspath (prepend the
string).
Use classic Instructs VuGen to use the classic version of VM (for example, not Sun's Java
User Guide
VuGen
HP LoadRunner (12.50) Page 183
Java VM HotSpot).
Use the
specified
Additional VM
Parameters
during replay
Instructs VuGen to use the same Additional VM parameters in replay.
Java > Classpath Recording Options
Enables you to specify the location of additional classes that were not included in the system's
classpath environment variable. You may need these classes to run Java applications and insure proper
recording.
To access Record > Recording Options > Java Environment Settings > Classpath
Important
information
This node is available only for specific protocols. For a complete list of protocols and
their associated nodes, see "Protocol Compatibility Table" on page208.
User interface elements are described below:
UI Element Description
Down Arrow. Moves a classpath entry down the list.
Up Arrow. Moves a classpath entry up the list.
Add Classpath. Adds a new line to the classpath list.
Delete. Permanently removes a classpath.
Classpath Entries List A list of classpath entries.
Microsoft .NET > Recording - Recording Options
This screen enables you to set the recording options for .NET Vuser scripts.
To access Record > Recording Options > Microsoft .NET > Recording
Important
information
This node is available only for specific protocols. For a complete list of protocols and
their associated nodes, see "Protocol Compatibility Table" on page208.
User interface elements are described below:
UI Element Description
User Guide
VuGen
HP LoadRunner (12.50) Page 184

Code
Generation
Allow you to indicate whether to show warnings, a stack trace, or all event
subscriptions during code generation.
lShow Warnings. Shows warning messages that are issued during the code
generation process.
lShow Stack Trace. Shows the recorded stack trace if it is available.
lShow All Event Subscriptions. Generates code for all event subscriptions that
were recorded. If this option is disabled, VuGen will only generate code for events in
which both the publisher (the object which invokes the event) and the subscriber
(the object informed of the event) are included in the filter.
Default value: disabled.
Debug
Options
Enables you to trace the stack and specify its size.
lStack Trace. Traces the contents of the stack for each invocation within the script.
It allows you to determine which classes and methods were used by your
application. This can be useful in determining which references, namespaces,
classes, or methods to include in your filter. Enabling the trace may affect your
application's performance during recording.
Default value: disabled
lStack Trace Limit. The maximum number of calls to be stored in the stack. If the
number of calls exceeds the limit, VuGen truncates it.
Default value: 20 calls.
Filters lIgnore all assemblies by default. Ignores all assemblies that are not explicitly
included by the selected filter. If you disable this option, VuGen looks for a
matching filter rule for all assemblies loaded during the recording.
Logging The Logging options let you set the level of detail that is recorded in the recording log
file.
lLog severity. Sets the level of logging to Errors Only (default), or Debug. The
severity setting applies for all the logs that you enable below. You should always
use the Errors Only log unless specifically instructed to do otherwise by HP
support, since detailed logging may significantly increase the recording time.
lInstrumentation Log. Logs messages related to the instrumentation process.
Default value: enabled.
lRecording Log. Logs messages issued during recording.
Default value: enabled.
lCode Generation Log. Logs messages issued during the code generation stage.
Default value: enabled.
Remote
Objects
For information about this property, see "Remote Objects Property" on the next page.
User Guide
VuGen
HP LoadRunner (12.50) Page 185
Serialization lSerialization format. The format of the serialization file that VuGen creates while
recording a class that supports serialization: Binary,XML, or Both. The advantage
of the binary format is that since it is more compressed, it is quicker. The
disadvantage of the binary format is that you do not have the ability to manipulate
the data as you do with XML.
lSerialize long arrays. For long arrays containing serializable objects (for example,
an array of primitives), use VuGen's serialization mechanism. Enabling this option
generates LrReplayUtils.GetSerializedObject calls if the array size is equal to or
larger than the threshold value.
lThreshold value for long array size. The threshold size for an array to be
considered a long array.If the array size is equal to or larger than this size, VuGen
serializes it when detecting serializable objects.
Tip: For XML serialization, you can view the content of the XML file. To view
the file, select View XML from the right-click menu.
Remote Objects Property
User interface elements are described below:
UI Element Description
Record in-
process
objects
Records activity between the client and server when the server is hosted in the same
process as the client. Since the actions are not true client/server traffic, it is usually
not of interest. When in-process methods are relevant, for example, in certain
Enterprise Service applications, you can enable this option to capture them.
Default value: disabled.
Asynchronous
calls
Specifies how VuGen should handle asynchronous calls on remote objects and their
callback methods
lCall original callbacks by default. Uses the recorded application's original
callback when generating and replaying the script. If the callback method is
explicitly excluded by a filter, the callback will be excluded even if you enable this
option.
lGenerate asynchronous callbacks. This option defines how VuGen will handle
callbacks when the original callbacks are not recorded.
For more information, see "Asynchronous Calls" on page595.
WCF duplex
binding
lGenerate dummy callback handler. Replaces the original callback in duplex
communication with a dummy callback, performing the following actions:
lStore arguments. When the server calls the handler during replay, it saves the
method arguments to a key-value in memory map.
User Guide
VuGen
HP LoadRunner (12.50) Page 186
lSynchronize replay. It stops the script execution until the next response
arrives. VuGen places the synchronization at the point that the callback
occurred during recording. This is represented in the script by a warning:
lGenerate unique client base address. If your application employs dual HTTP
Binding, since HTTP is inherently not a duplex protocol, the framework uses a
standard port to receive response data being passed to the callback. When you
attempt to run multiple instances of your application, you may be unable to do so
using the same port number. This option replaces the original client base
address's port number with a unique port.
For background information about WCF duplex binding, see "Recording WCF Duplex
Communication" on page591.
Microsoft .NET > Shared DLLs Recording Options
This dialog box enables you to specify the list of shared DLLs before you record a Vuser script. If a DLLis
included in the list of shared DLLs, when the Vuser script is run and requires a particular DLL, the Vuser
will access the DLL in its shared location – the DLL will not be copied to the load generator. Adding a DLL
to the list of shared DLLs therefore saves hard-drive space on the load generator when a Vuser is run.
Note: The location that you specify for a shared DLL must be accessible to all load generators
on which the Vuser will run.
After you record a Vuser script, the list of shared DLLs is copied from the Recording Options to the
Runtime Settings. For details on how to view and modify the runtime settings, see the Replay >
Runtime Settings > .NET> Shared DLLsview.
To access Record > Recording Options > Microsoft .NET > Shared DLLs
User interface elements are described below:
UI
Element
Description
DLL
Entries
The list of shared DLLs that VuGen will access while the Vuser script is being recorded.
The order in which the DLLs appear in the list is significant. When a specific DLL is
required, VuGen will access the first instance of that DLL in the list.
If a specific DLL is not currently available, clear the check box to the left of the DLL entry.
The DLL will remain in the list of shared DLLs. To enable the DLL, select the check box to
the left of the DLL entry.
Down Arrow. Moves the selected DLL entry down the list.
Up Arrow. Moves the selected DLL entry up the list.
User Guide
VuGen
HP LoadRunner (12.50) Page 187
Add DLL. Enables you to add a DLL to the list of shared DLLs.
Add DLL Folder. This option is always disabled.
Delete. Removes the selected DLL from the list of shared DLLs.
Network > Mapping and Filtering Recording Options
Enables you to set the port mapping and traffic filtering for the recording or code generation. This
option lets you include or exclude specific IPs or ports for your Vusers.
To access Record > Recording Options > Network > Mapping and Filtering
Important
information
This node is available only for specific protocols. For a complete list of protocols and
their associated nodes, see "Protocol Compatibility Table" on page208.
See also l"Port Mapping and Traffic Filtering Overview" on page212
lA relevant blog post that discusses the benefits of port mapping.
User interface elements are described below (unlabeled elements are shown in angle brackets):
UI Element Description
Capture level For port mapping only: The level of data to capture (relevant only for HTTP
based protocols):
lSocket level data. Capture data using trapping on the socket level only. Port
mappings apply in this case (default).
lWinINet level data. Capture data using hooks on the WinINet.dll API used by
certain HTTP applications. The most common application that uses these
hooks is Internet Explorer. Port mappings are not relevant for this level.
lSocket level and WinINet level data. Captures data using both mechanisms.
WinINet level sends information for applications that use WinINet.dll. Socket
level sends data only if it determines that it did not originate from
WinINet.dll. Port mapping applies to data that did not originate from
WinINet.dll.
Network-level
server address
mappings for
For port mapping only: Specifies the mappings per protocol. For example, to
show only the FTP mappings, select FTP.
<Port mapping
list>
A list of the port mappings.
You can temporarily disable the settings for an entry by clearing the check box
adjacent to it. When the check box is cleared, VuGen ignores the custom
User Guide
VuGen
HP LoadRunner (12.50) Page 188

settings for the entry and uses the default settings—it does not cause the
host:port to be ignored. To filter a host and port, use Traffic Filtering.
<Traffic filtering
list>
A list of the traffic filters, indicating the server name, port and filtering level.
lClick New Entry or Edit Entry to set these values.
lClear the check box adjacent to an entry to disable it temporarily.
lWhen you launch VuGen, all unchecked port mapping entries are converted
into traffic filter entities.
In the Port mapping section: Opens the Server Entry dialog box, allowing you to
add a new mapping. For user interface details, see "Server Entry - Port Mapping
Dialog Box" below.
In the Traffic filtering section: Opens the New Entry dialog box, allowing you to
add a new traffic filter. For user interface details, see "Server Entry - Traffic
Filtering Dialog Box" on page191.
Opens the Server Entry or New Entry dialog box, allowing you to edit the
selected entry.
For port mapping, this button opens the Advanced Settings dialog box to enable
auto-detection of the communication protocol and SSL level. For details, see
"Advanced Port Mapping Settings Dialog Box" on page191.
Note:
lIn LoadRunner versions prior to 12.02, only port mapping was available, but not traffic
filtering. For details, see "Port Mapping and Traffic Filtering Overview" on page212.
lIf you upgrade from a version of LoadRunner prior to 12.02, the first time you open VuGen, it
will automatically convert all of the unchecked port mapping entries into traffic filters.
Server Entry - Port Mapping Dialog Box
Enables you to define a server from the server list in the network port mapping node.
To access Record > Recording Options > Network > Port Mapping > New Entry / Edit Entry
Important
information
This dialog box is available only for specific protocols. For a complete list of protocols
and their associated nodes, see "Protocol Compatibility Table" on page208.
User interface elements are described below:
Section UI Element Description
Socket Service Target The IP address or host name of the target server for which this
User Guide
VuGen
HP LoadRunner (12.50) Page 189

Server entry applies.
Default value: Any Server.
Port The port of the target server for which this entry applies.
Entering 0specifies all ports.
If you do not specify all of the port and server names, VuGen uses
the following priorities in assigning data to a service:
lPriority 1: port and server specified
lPriority 2: port not specified, server specified
lPriority 3: port specified, server not specified
lPriority 4: port and server not specified
A map entry with a high priority does not get overridden by an
entry with a lower priority. For example, if you specify that traffic
on server twilight using port 25 be handled as SMTP and then you
specify that all servers on port 25 be handled as HTTP, the data
will be treated as SMTP.
lForced mapping. If you specify a mapping for a port number,
server name, or combination server:port, VuGen forces the
network traffic to use that service. For example, if you were to
specify <Any> server on port 80 to use FTP, VuGen uses the FTP
protocol to record that communication, even though the
actual communication may be HTTP. In this instance, the Vuser
script might be empty.
Service ID A protocol or service name used by the recorder to identify the
type of connection (i.e. HTTP, FTP, and so on). You can also specify
a new name. The name may not exceed 8 characters.
Service
Type
The type of service, currently set to TCP.
Record Type The type of recording—directly or through a proxy server.
Connection
Type
The security level of the connection: Plain (non-secure), SSL, or
Auto. If you select Auto, the recorder checks the first 4 bytes for
an SSL signature. If it detects the SSL signature, it assumes that
SSL is being used.
SSL
Configuration
SSL Version The preferred SSL version to use when communicating with the
client application and the server.
Default value: SSL 2/3. However some services require SSL 3.0
only or SSL 2.0 only. Some new wireless applications require a the
Transport Layer Security algorithm, TLS 1.x.
SSL Cipher The preferred SSL cipher to use when connecting with a remote
User Guide
VuGen
HP LoadRunner (12.50) Page 190

secure server.
Use
specified
client-side
certificate
The default client-side certificate to use when connecting to a
remote server. Specify or browse for a certificate file in txt,crt,
or pem format, and supply a password.
Use
specified
proxy-
server
certificate
The default server certificate to present to client applications
that request a server certificate. Specify or browse for a
certificate file in txt,crt, or pem format, and supply a password.
Click Test SSL to check the authentication information against
the server.
Advanced Port Mapping Settings Dialog Box
Enables you to set the advanced port mapping settings. For more information, see "Port Mapping Auto
Detection" on page213.
To access Record > Recording Options > Network > Mapping and Filtering. Click Options in the
Port Mapping section.
Important
information
This dialog box is available only for specific protocols. For a complete list of protocols
and their associated nodes, see "Protocol Compatibility Table" on page208.
User interface elements are described below:
UI Element Description
Enable auto
SSL detection
Automatically detects SSL communication. Specify the version and default cipher
that you want to detect. Note that this only applies to port mappings that were
defined as auto in the Connection type box, or not defined at all. If a server, port,
or server:port combination was defined as either Plain or SSL, then auto SSL
detection does not apply.
Enable auto
detection of
SOCKET based
communication
Automatically detects the type of communication. If required, raise the maximum
number of transitions, one at a time until VuGen succeeds in detecting the
protocol. You can also gradually increase the maximum buffer size by 1024 bytes (1
KB) at a time until VuGen succeeds in detecting the protocol. This allows VuGen to
review a larger amount of data in order to find a signature.
Log Level Sets the logging level for the automatic socket detection.
Server Entry - Traffic Filtering Dialog Box
Enables you to define a new entry for traffic filtering.
To Record > Recording Options > Network > Mapping and Filtering > New Entry / Edit Entry
User Guide
VuGen
HP LoadRunner (12.50) Page 191
access in the Traffic filtering section.
User interface elements are described below:
UI
Element
Description
Target
server
The IP address or host name of the target server for which this entry applies. You can
use an asterisk (*) as a wildcard to include, for example, multiple servers in a single
domain.
Default value: All Servers.
Regular
Expression
Indicates that the Target server string is a regular expression. You can use a regular
expression to define an "all but one" filter. For example, you can filter out all servers
that do not contain "acme.com" with the following expression: ^(?!,*\.acme\.com).
Port The ports to which the filtering should be applied:
All ports,Specific port, or Port range.
Filtering
level
Where to apply the filtering:
lRecording. Filter the selected entries when during recording.
lCode generation. Filter the selected entries during code generation only. If you
enable this option, you will be able to retrieve excluded traffic at a later stage, by
modifying the traffic filters before regenerating a script. For details, select Record >
Regenerate Script and click Options.
RDP > Code Generation > Advanced Recording Options
Enables you to control the way VuGen creates an RDP script. Only advanced users are advised to modify
these settings.
To access Record > Recording Options > RDP > Code Generation - Adv
Important
information
This node is available only for specific protocols. For a complete list of protocols and
their associated nodes, see "Protocol Compatibility Table" on page208.
User interface elements are described below:
UI Element Description
Correlate
clipboard
parameters
Replaces the recorded clipboard text sent by the user with the correlated
parameter containing the same text as received from the server.
Double-click
timeout (msec)
The maximum time (in milliseconds) between two consecutive mouse button clicks
to be considered a double-click.
User Guide
VuGen
HP LoadRunner (12.50) Page 192
Default value: 500 milliseconds.
Prefix for
clipboard
parameters
The prefix for clipboard parameters generated in the current script. This is useful
when merging scripts, allowing you to specify a different prefix for each script.
Default value:ClipboardDataParam_.
Prefix for
snapshot
names
The prefix for snapshot file names generated in the current script. This is useful
when merging scripts—you can specify a different prefix for each script.
Default value: snapshot_.
RDP > Code Generation > Agent Recording Options
Enables you to control the way the agent for Microsoft Agent for Terminal Server functions with VuGen
during recording.
To access Record > Recording Options > RDP > Code Generation - Agent
Important
information
This node is available only for specific protocols. For a complete list of protocols and
their associated nodes, see "Protocol Compatibility Table" on page208.
User interface elements are described below:
UI
Element
Description
Use RDP
agent
Generates script using extended information gathered by the RDP agent. The LoadRunner
RDP agent must be installed on the server. For details, see "How to Install / Uninstall the
RDP Agent" on page626.
Note: To utilize this feature, you must enable the Replay with RDP agent runtime
settings. For details, see RDP > RDP Agent view in the runtime settings.
Enable
RDP
agent
log
Enables the RDP agent log.
lRDP agent log detail level. Configures the level of detail generated in the RDP agent
log with Standard being the lowest level of detail and Extended Debug being the
highest level of detail.
lRDP agent log destination. Configures the destination of the RDP agent log data. File
saves the log messages only on the remote server side. Stream sends the log messages
to the VuGen machine. FileAndStream sends the log messages to both destinations.
lRDP agent log folder. The folder path on the remote server that the RDP agent log file
will be generated in.
User Guide
VuGen
HP LoadRunner (12.50) Page 193

RDP > Code Generation > Basic Recording Options
Enables you to control the way VuGen creates a script—the level of detail, triggers, and timeouts.
To access Record > Recording Options > RDP > Code Generation - Basic
Important
information
This node is available only for specific protocols. For a complete list of protocols and
their associated nodes, see "Protocol Compatibility Table" on page208.
User interface elements are described below:
UI Element Description
Always
generate
connection
name
If selected, function call will contain the ConnectionName parameter. If not
selected, the functions will only contain this parameter if more than a single rdp_
connect_server appears in the script.
Default value: disabled.
Automatic
generation of
synchronization
points
Synchronization points allow the script to pause in the replay while waiting for a
window or dialog to pop-up, or some other control to fulfil a certain condition. This
option automatically generates sync_on_image functions before mouse clicks and
drags (enabled by default). The Sync radius is the distance from the mouse
operation to the sides of the rectangle which defines the synchronization area.
The default is 20 pixels. Select one of the following options:
lNone. No synchronization points are automatically added.
lRectangular. Creates synchronization points as rectangular boxes centered
around the click or drag location.
lEnhanced. Creates synchronization points designed to select only the desired
location (e.g. a button) and to react to changes in the UI (e.g. the button moves).
If a synchronization region is not recognized, the rectangular synchronization
settings are used.
Generate
mouse
movement
calls
Generates rdp_mouse_move calls in the script. When enabled, this option
significantly increases the script size.
Default value: disabled.
Generate raw
keyboard calls
Generates rdp_raw_key_up/down calls as if the script level was set to Raw.
Mouse calls will still be generated according to the script level. If disabled, VuGen
generates Keyboard calls according to the script level. If the script level is set to
Raw, this option is ignored.
Default value: disabled.
Generate raw Generates rdp_mouse_button_up/down calls as if the script level was set to Raw.
User Guide
VuGen
HP LoadRunner (12.50) Page 194

UI Element Description
mouse calls Keyboard calls will still be generated according to the script level. If disabled,
VuGen generates Mouse calls according to the script level. If the script level is set
to Raw, this option is ignored.
Default value: disabled.
Script
generation
level
The level of the script and the type of API functions to use when generating the
script.
lHigh. Generate high level scripts. Keyboard events are translated to rdp_type
calls. Two consecutive mouse clicks with the same coordinates are translated
as a double-click.
lLow. Generate low level scripts. Key up/down events are translated into rdp_
key events. Modifier keys (Alt, Ctrl, Shift) are used as a KeyModifier parameter
for other functions. Mouse up/down/ move events are translated to mouse
click/drag events.
lRaw. Generates a script on a raw level, by extracting input events from network
buffers and generating calls in their simplest form: key up/down, mouse
up/down/move. The KeyModifier parameter is not used.
RDP > Client Startup Recording Options
Enables you to set the RDP client startup recording options.
To access Record > Recording Options > RDP > Client Startup
Important
information
This node is available only for specific protocols. For a complete list of protocols and
their associated nodes, see "Protocol Compatibility Table" on page208.
User interface elements are described below:
UI Element Description
Run RDP
client
application
Connects to the terminal server by running the Terminal Services client.
Use custom
connection
file
Connects to the terminal server by using an existing connection file. The file should
have an *.rdp extension. You can browse for the file on your file system or network.
Use default
connection
file
Connects to the terminal server by using the Default.rdp file in your document's
folder.
User Guide
VuGen
HP LoadRunner (12.50) Page 195

Recording Properties > Corba Options Recording Options
Enables you to set the CORBA specific recording properties and several callback options.
To access Record > Recording Options > Recording Properties > Corba Options
Important
information
This node is available only for specific protocols. For a complete list of protocols and
their associated nodes, see "Protocol Compatibility Table" on page208.
User interface elements are described below:
UI Element Description
Record
CallBack
Connection
Instructs VuGen to generate a connect statement for the connection to the ORB, for
each callback object.
Default value: disabled.
Record DLL
only
Instructs VuGen to record only on a DLL level.
Default value: disabled.
Record
Properties
Instructs VuGen to record system and custom properties related to the protocol.
Default value: enabled.
Resolve
CORBA
Objects
When correlation fails to resolve a CORBA object, recreate it using its binary data.
Default value: disabled.
Show IDL
Constructs
Displays the IDL construct that is used when passed as a parameter to a CORBA
invocation.
Default value: enabled.
Use local
vendor
classes
Use local vendor classes and add the srv folder to the BOOT classpath. If you disable
this option, VuGen uses network classes and adds the script's classes to the
classpath.
Default value: enabled.
Vendor The CORBA vendors: Inprise Visibroker,Iona OrbixWeb, or Bea Weblogic.
Recording Properties > Correlation Options - Recording Options
Allows you to enable automatic correlation, and control its depth.
To access Record > Recording Options > Recording Properties > Correlation Options
Important
information
This node is available only for specific protocols. For a complete list of protocols and
their associated nodes, see "Protocol Compatibility Table" on page208.
User interface elements are described below:
User Guide
VuGen
HP LoadRunner (12.50) Page 196
UI Element Description
Advanced
Correlation
Enables correlation on complex objects such as arrays and CORBA container constructs
and arrays. This type of correlation is also known as deep correlation.
Default value: enabled.
Correlate
Collection
Type
Correlates objects from the Collection class for JDK 1.2 and higher.
Default value: disabled.
Correlate
String
Arrays
Correlate strings within string arrays during recording. If disabled, strings within arrays
are not correlated and the actual values are placed in the script.
Default value: enabled.
Correlate
Strings
Correlate strings in script during recording. If disabled, the actual recorded values are
included in the script between quotation marks and all other correlation options are
ignored
Default value: disabled.
Correlation
Level
Indicates the level of deep correlation, the number of inner containers to be scanned.
Default value: 15.
Recording Properties > Log Options Recording Options
Enables you to determine the level of debug information generated during recording.
To access Record > Recording Options > Recording Properties > Log Options
Important
information
This node is available only for specific protocols. For a complete list of protocols and
their associated nodes, see "Protocol Compatibility Table" on page208.
User interface elements are described below:
UI Element Description
Class
Dumping
Dumps all of the loaded classes to the script folder. Default value: disabled.
Tip: Under the script's data folder, VuGen creates a subfolder named dump.
This folder will contain a copy of each class file that was loaded. You can use
these class files to determine the signatures when defining custom hooks.
Digest
Calculation
Generate a digest of all recorded objects.
Default value: disabled.
lExclude from Digest. A list of objects not to be included in the digest calculation.
User Guide
VuGen
HP LoadRunner (12.50) Page 197
Syntax: java.lang.Object class format, delimiter = ","
Log Level The level of recording log to generate:
lNone. No log file is created
lBrief. Generates a standard recording log and output redirection
lDetailed. Generates a detailed log for methods, arguments, and return values.
lDebug. Records hooking and recording debug information, along with all of the
above.
Note: The log files will be stored in the script folder's data directory.
Synchronize
Threads
For multi-threaded applications, instructs VuGen to synchronize between the different
threads.
Default value: disabled.
Recording Properties > Recorder Options - Recording Options
Enables you to set the Java protocol to record as well as other protocol specific recording options.
To access Record > Recording Options > Recording Properties > Recorder Options
Important
information
This node is available only for specific protocols. For a complete list of protocols and
their associated nodes, see "Protocol Compatibility Table" on page208.
User interface elements are described below:
UI Element Description
Byte Array
Format
The format of byte arrays in a script: Regular, Unfolded Serialized Objects, or
Folded Serialized Objects. Use one of the serialized object options when recording
very long byte arrays.
Default value: Regular.
Bytes as
Characters
Displays readable characters as characters with the necessary casting—not in
byte or hexadecimal form.
Default value: enabled.
Comment Lines
Containing
Comment out all lines in the script containing one of the specified strings. To
specify multiple strings, separate the entries with commas.
Default value: Any line with a string containing <undefined> will be commented
out.
Extensions List A comma separated list of all supported extensions. Each extension has its own
hooks file.
User Guide
VuGen
HP LoadRunner (12.50) Page 198

UI Element Description
Default value: JNDI.
Insert Functional
Check
Inserts verification code that compares the return value received during replay,
to the expected return value generated during recording. This option only applies
to primitive return values.
Default value: disabled.
Load Parent
Class Before
Class
Change the loading order so that parent classed are loaded before child classes.
This helps identify hooking for trees with deep inheritance.
Default value: enabled.
Record
LoadRunner
Callback
Records the LoadRunner stub object as a callback. If disabled, VuGen records the
original class as the callback.
Default value: enabled.
Recorded
Protocol
Specifies which protocol to record: RMI, CORBA, JMS, or Jacada.
Default value: RMI.
Remove Lines
Containing
Remove all lines containing one of the specified strings from the script. To
specify multiple strings, separate the entries with commas. This feature is useful
for customizing the script for a specific testing goal.
Unreadable
Strings as Bytes
Represents strings containing unreadable characters as byte arrays. This option
applies to strings that are passed as parameters to invocations.
Default value: enabled.
Use _JAVA_
OPTIONS flag
Forces JVM versions 1.2 and higher to use the _JAVA_OPTION environment
variable which contains the desired JVM parameters.
Default value: disabled.
Use DLL hooking
to attach
LoadRunner
support
Use DLL hooking to automatically attach LoadRunner support to any JVM.
Recording Properties > Serialization Options - Recording Options
Enables you to control how objects are serialized. Serialization is often relevant to displaying objects in
an ASCII representation in order to parameterize their values.
To access Record > Recording Options > Recording Properties > Serialization Options
Important
information
This node is available only for specific protocols. For a complete list of protocols and
their associated nodes, "Protocol Compatibility Table" on page208.
See also "How to Correlate Scripts - Java Scripts - Serialization" on page256
User Guide
VuGen
HP LoadRunner (12.50) Page 199

User interface elements are described below:
UI
Element
Description
Unfold
Serialized
Objects
Expands serialized objects in ASCII representation and allows you to view the ASCII values
of the objects in order to perform parameterization.
lLimit Object Size (bytes). Limits serializable objects to the specified value. Objects
whose size exceeds this value, will not be given ASCII representation in the script.
Default value: 3072 bytes.
lIgnore Serialized Objects. Lists the serialized objects not to be unfolded when
encountered in the recorded script. Separate objects with commas.
Syntax: java.lang.Object class format, delimiter = ","
lSerialization Delimiter. Indicates the delimiter separating the elements in the ASCII
representation of objects. VuGen will only parameterize strings contained within
these delimiters. The default delimiter is `#'.
lUnfold Arrays. Expands array elements of serialized objects in ASCII representation. If
you disable this option and an object contains an array, the object will not be
expanded.
Default value: enabled—all deserialized objects are totally unfolded.
lLimit Array Entries. Instructs the recorder not to open arrays with more than the
specified number of elements.
Default value: 200.
RTE > Configuration Recording Options
Enables you to set the recording options to match the character set used during terminal emulation.
To access Record > Recording Options > RTE > Configuration
Important
information
This node is available only for specific protocols. For a complete list of protocols and
their associated nodes, see "Protocol Compatibility Table" on page208.
User interface elements are described below:
UI
Element
Description
Character
Set
Match the character set used during terminal emulation. The default character set is
ANSI. For Kanji and other multi-byte platforms, you can specify DBCS (Double-byte
Character Set).
User Guide
VuGen
HP LoadRunner (12.50) Page 200
RTE > RTE Recording Options
Enables you to set the general RTE recording options.
To access Record > Recording Options > RTE > RTE
Important
information
This node is available only for specific protocols. For a complete list of protocols and
their associated nodes, see "Protocol Compatibility Table" on page208.
User interface elements are described below:
UI Element Description
Generate
automatic
synchronization
commands
Automatically generates a number of TE-synchronization functions, and insert
them into the script while you record.
lCursor. Generate a TE_wait_cursor function before each TE_type function.
lPrompt. Generate a TE_wait_text function before each TE_type function
(where appropriate).
lX-System. Generate a TE_wait_sync function each time a new screen is
displayed while recording.
Note: VuGen generates meaningful TE_wait_text functions when
recording VT type terminals only. Do not use automatic TE_wait_text
function generation when recording block-mode (IBM) terminals.
Generate
automatic X-
System
transaction
Records the time that the system was in the XSYSTEM mode during a scenario
run. This is accomplished by inserting a TE_wait_sync_transaction function after
each TE_wait_sync function. Each TE_wait_sync_transaction function creates a
transaction with the name default. Each TE_wait_sync_transaction function
records the time that the system spent in the previous X SYSTEM state.
Generate
screen header
comments
Generates screen header comments while recording a Vuser script, and inserts the
comments into the script. A generated comment contains the text that appears on
the first line of the terminal emulator window.
Note: You can generate comments automatically only when using block-
mode terminal emulators such as the IBM 5250.
Keyboard
record timeout
When you type text into a terminal emulator while recording, VuGen monitors the
text input. After each keystroke, VuGen waits up to a specified amount of time for
the next key stroke. If there is no subsequent keystroke within the specified time,
VuGen assumes that the command is complete.
User Guide
VuGen
HP LoadRunner (12.50) Page 201

SAPGUI > Auto Logon Recording Options
Enables you to log on automatically when you begin recording. The logon functions are placed in the
vuser_init section of the script.
To access Record > Recording Options > SAPGUI > Auto Logon
Important
information
This node is available only for specific protocols. For a complete list of protocols and
their associated nodes, see "Protocol Compatibility Table" on page208.
User interface elements are described below:
UI
Element
Description
Enable
Auto
logon
Enables you to log on automatically when you begin recording. Enter the Server name,
User,Password,Client name, and interface Languages for the SAP server.
SAPGUI > Code Generation Recording Options
Enables you to set the code generation settings for the SAPGUI protocol.
To access Record > Recording Options > SAPGUI > Code Generation
Important
information
This node is available only for specific protocols. For a complete list of protocols and
their associated nodes, see "Protocol Compatibility Table" on page208.
User interface elements are described below:
UI Element Description
Always
generate
Object ID in
header file
Places the Object IDs in a separate header file instead of in the script. When you
disable this option, VuGen generates the IDs according to the specified string length
in the general script setting. This results in a more compact and cleaner script.
Generate Fill
Data steps
Generates Fill Data steps for table and grid controls—instead of separate steps for
each cell.
Generate
logon
operation as
a single step
Generates a single sapgui_logon method for all of the logon operations. This helps
simplify the code. If you encounter login problems, disable this option.
User Guide
VuGen
HP LoadRunner (12.50) Page 202
SAPGUI > General Recording Options
Enables you to set the general recording options for the SAPGUI protocol.
To access Record > Recording Options > SAPGUI > General
Important
information
This node is available only for specific protocols. For a complete list of protocols and
their associated nodes, see "Protocol Compatibility Table" on page208.
User interface elements are described below:
UI
Element
Description
Capture
screen
snapshots
Indicates how to save the snapshots of the SAPGUI screens as they appear during
recording: ActiveScreensnapshots,Regular snapshots, or None. ActiveScreen snapshots
provide more interactivity and screen information after recording, but they require more
resources.
Changing
events
during
recording
Process Context menus by text. Processes context menus by their text, generating
sapgui_toolbar_select_context_menu_item_by_text functions. When disabled, VuGen
processes context menus by their IDs, and generates a sapgui_toolbar_select_context_
menu_item for context menus. This is an advantage when working with Japanese
characters.
Silverlight > Services Recording Options
Enables you to manage WSDL files in Silverlight Protocol scripts.
To access Record > Recording Options > Silverlight > Services
Important
information
This node is available only for specific protocols. For a complete list of protocols and
their associated nodes, see "Protocol Compatibility Table" on page208.
Relevant
tasks
"How to Import WSDL Files" on page672
User interface elements are described below (unlabeled elements are shown in angle brackets):
UI Element Description
<Service list> The list of imported WSDL files and their locations. The toolbar allows
you to add, delete and edit WSDL files. Additionally, select the Protocol
and Security Data button to edit Protocol and Security Data.
Automatically detect Automatically attempts to locate and import WSDL files used in your
script.
User Guide
VuGen
HP LoadRunner (12.50) Page 203
WSDL files and import
services during code
generation
Do not use WSDL files Disables WSDL files in your script, generating SOAP requests instead.
This results in a lower level script, however it generally increases the
script performance.
Service Endpoint The location of the endpoint at which a given WSDL is available.
Use WSDL files included in
the script
Enables WSDL files imported automatically or manually.
WSDL Location The location of the selected WSDL file.
Add / Edit Services Dialog Box
Enables you to locate and import WSDLs to a Silverlight Protocol script.
To access Record > Recording Options > Silverlight > Services > Add
Important
information
This node is available only for specific protocols. For a complete list of protocols and
their associated nodes, see "Protocol Compatibility Table" on page208.
Relevant
tasks
"How to Import WSDL Files" on page672
User interface elements are described below:
UI Element Description
Opens the Connection Settings dialog box, enabling you to configure the
proxy and authentication information for the specified WSDL file. For user
interface information, see "Connection Settings Dialog Box" below.
Select WSDL from lURL. Select the WSDL by specifying the URL.
lFile. Select the WSDL by specifying the local path.
lPreviously Imported. Select the WSDL from the WSDL History (list of
previously imported WSDL files).
Service Endpoint The location of the endpoint at which a given WSDL is available.
WSDL Location The URL or local path to the WSDL.
Connection Settings Dialog Box
Configures the proxy and authentication information for WSDL files in Silverlight Protocol scripts.
User Guide
VuGen
HP LoadRunner (12.50) Page 204
To access Record > Recording Options > Silverlight > Services > Add > Connection Settings
Important
information
lThis node is available only for specific protocols. For a complete list of protocols and
their associated nodes, see "Protocol Compatibility Table" on page208.
lThese settings are only relevant for importing WSDL files. To configure
authentication and proxy information for WSDL files to be used during replay, add a
web_set_user_step function with the desired values.
Relevant
tasks
"How to Import WSDL Files" on page672
User interface elements are described below:
UI Element Description
Authentication Enable the authentication settings by selecting Use Authentication Settings and
entering your user name and password.
Proxy Enable the proxy settings by selecting Use Proxy Settings and entering your user
name, password, server, and port number.
Protocol and Security Scenario Data Dialog Box
Enables you to configure the protocol and security scenario data settings.
To access Record > Recording Options > Silverlight > Services > Protocol and Security Data
Button
Important
information
lThis node is available only for specific protocols. For a complete list of protocols and
their associated nodes, see "Protocol Compatibility Table" on page208.
lThese settings are only relevant for importing WSDL files. To configure
authentication and proxy information for WSDL files to be used during replay, add a
web_set_user_step function with the desired values.
lThe settings in this dialog box are reset during code generation.
Relevant
tasks
"How to Import WSDL Files" on page672
User interface elements are described below:
UI Element Description
Port An individual endpoint for a WSDL binding.
Note: Selecting a different port resets the values in this dialog box to the
last saved values. Any changes made that have not yet been saved will be
User Guide
VuGen
HP LoadRunner (12.50) Page 205
reset.
Transport The transport layer protocol used by VuGen to send service requests to the server.
You can select HTTP, HTTPS, or LrHTTP.
Note: HTTP is not compatible with UserNameOverTransport security and
HTTPS requires that you select UserNameOverTransport security.
Encoding The encoding method to be used for service requests sent to the server.
WS Addressing
version
The WS-Addressing version for the selected WSDL file.
Security
Authentication
mode
Enable authentication by selecting UserNameOverTransport mode.
Default mode: None.
Username When authentication is enabled, a valid username is required.
Password When authentication is enabled, a valid password is required.
Traffic Analysis > Traffic Filters Recording Options
This dialog box enables you to filter either incoming or outgoing traffic.
To access Record > Recording Options > Traffic Analysis > Traffic Filters
Important
information
lFor details, see "Analyzing Traffic" on page572.
lThis node is available only for specific protocols. For a complete list of protocols and
their associated nodes, see the "Protocol Compatibility Table" on page208.
Relevant
tasks
"How to Create a Script by Analyzing Traffic (Mobile Applications)" on page578
User interface elements are described below (unlabeled elements are shown in angle brackets):
UI Element Description
When generating the
script
Include all IP addressing the list. Includes traffic from specified IP
address.
Exclude all IP address in the list. Excludes traffic from specified IP
addresses.
<Incoming Traffic Tab>
User Guide
VuGen
HP LoadRunner (12.50) Page 206
UI Element Description
Enables you to identify IP addresses for incoming traffic
Adds an IP address.
Source IP The IP address of the server.
Deletes an IP address.
<Outgoing Traffic Tab>
Enables you to identify IP addresses for outgoing traffic
Adds an IP address.
Destination IP The IP address of the server.
Destination Port The destination port of the server.
Deletes an IP address.
WinSock Recording Options
Enables you to set the WinSock recording options.
To access Record > Recording Options > WinSock
Important
information
When using translation tables on Solaris machines, you must set the following
environment variables on all machines running scripts:
setenv LRSDRV_SERVER_FORMAT 0025
setenv LRSDRV_CLIENT_FORMAT 04e4
Relevant
tasks
"How to Record a Windows Sockets Script" on page982
User interface elements are described below:
UI Element Description
Adds a new entry to the list of excluded sockets.
Removes the selected entry from the list of excluded sockets.
Do not
include
excluded
socket in
Excludes the sockets on the list from the log. Clearing this option enables logging for
the excluded sockets. Their actions are preceded by "Exclude" in the log file.
User Guide
VuGen
HP LoadRunner (12.50) Page 207
log
Exclude
Settings/
Socket List
The host and port of the sockets to exclude from the recording or regeneration of the
script. Use the following syntax:
lhost:port format excludes a specific port.
lhost format excludes all ports for the specified host.
l:port format excludes a specific port on the local host.
l*:port format excludes a specific port on all hosts.
Encoding
Method
Use OEM encoding. Enable data encoding that supports non-English characters.
Use ASCII encoding. Enable data encoding that is limited to English characters. Use this
option to replicate the LR 9.5x data encoding method.
Think Time
Threshold
During recording, VuGen automatically inserts the think time steps when you pause
between actions. You can set a threshold level, below which the recorded think time will
be ignored.
Default value: five seconds.
Translation
tables
The Translation Table lets you specify the format for recording sessions when using the
WinSock single protocol, and for code generation when using a WinSock multi protocol.
This applies to users running on mainframe machines or AS/400 servers. Both the
server and client machines determine the format of the data from translation tables
installed on your system. Select a translation option from the list box.
The first four digits of the listbox item represent the server format. The last four digits
represent the client format.
The translation tables are located in the ebcdic folder under the VuGen's installation
folder. If your system uses different translation tables, copy them to the ebcdic folder.
Note: If your data is in ASCII format, it does not require translation. Select the
None option, the default value.
Recording Options - Miscellaneous Topics
This section contains a variety of topics relating to recording options.
Protocol Compatibility Table
The following table lists the Vuser protocols and which recording option nodes are available for each
protocol.
Protocol Recording Options Nodes
.NET lGeneral - Script
User Guide
VuGen
HP LoadRunner (12.50) Page 208

Protocol Recording Options Nodes
lMicrosoft .NET - Recording, Shared DLLs
Ajax - Click and
Script
lGeneral - Recording, Script
lGUI Properties - Advanced, Web Event Configuration
lHTTP Properties - Advanced
lNetwork - Mapping and Filtering
lCorrelations - Rules
TruClient lNone
C Vuser lNone
Citrix ICA lGeneral - Script
lCitrix - Configuration, Recorder, Code Generation, Login
Note:TheCitrix Login node is available only when creating a single
protocol Citrix script. It is not available when creating a multi-protocol
Citrix+Web script.
COM/DCOM lGeneral - Script
lCOM/DCOM - Filter, Options
DNS lNone
FTP lGeneral - Script
lNetwork - Mapping and Filtering
Flex lGeneral - Recording, Script, Protocols, Code Generation
lFlex - RTMP, Configuration, Externalizable Objects
lCorrelations - Configuration, Rules
lHTTP Properties - Advanced
lNetwork - Mapping and Filtering
lData Format Extension - Chain Configuration, Code Generation
IMAP lGeneral - Script
lNetwork - Mapping and Filtering
Java over HTTP lGeneral - Recording
lCorrelations - Configuration, Rules
lHTTP Properties - Advanced
lNetwork - Mapping and Filtering
lJava Environment Settings - Java VM, Classpath
User Guide
VuGen
HP LoadRunner (12.50) Page 209

Protocol Recording Options Nodes
lData Format Extension - Chain Configuration, Code Generation
Java Record Replay lJava Environment Settings - Java VM, Classpath
lRecording Properties - Recorder Options, Serialization Options,
Correlation Options, Log Options, Corba Options
Java Vuser lNone
LDAP lGeneral - Script
MMS (Media Player) lNone
MAPI (Microsoft
Exchange)
lNone
MMS (Multimedia
Messaging Service)
lGeneral - Script
ODBC lGeneral - Script
lDatabase - Database
Oracle - 2-Tier lGeneral - Script
lDatabase - Database
Oracle NCA lGeneral - Script, Protocols, Recording
lHTTP Properties - Advanced
lCorrelations - Configuration, Rules
lNetwork - Mapping and Filtering
Oracle - Web lGeneral - Script, Recording
lCorrelations - Configurations, Rules
lHTTP Properties - Advanced
lNetwork - Mapping and Filtering
lData Format Extension - Chain Configuration, Code Generation
POP3 lGeneral - Script
lNetwork - Port Mapping
RDP (Remote
Desktop Protocol)
lGeneral - Script
lRDP - Client Startup, Code Generation (Basic, Advanced, and Agent)
lNetwork - Mapping and Filtering
SAP Click & Script lGeneral - Recording, Script
User Guide
VuGen
HP LoadRunner (12.50) Page 210

Protocol Recording Options Nodes
lGUI Properties - Advanced, Web Event Configuration
lNetwork - Mapping and Filtering
lHTTP Properties - Advanced
lCorrelations - Rules
SAP - Web lGeneral - Recording, Script, Protocols, Code Generation
lCorrelations - Configuration, Rules
lHTTP Properties - Advanced
lNetwork - Mapping and Filtering
SAP GUI lGeneral - Script
lSAP GUI - General, Code Generation, Auto Logon
Siebel - Web lGeneral - Recording, Script, Protocols
lHTTP Properties - Advanced
lNetwork - Mapping and Filtering
lCorrelations - Rules
Silverlight lGeneral - Recording, Script, Protocols, Code Generation
lSilverlight - Services
lHTTP Properties - Advanced
lNetwork - Mapping and Filtering
lData Format Extensions - Chain Configuration, Code Generation
lCorrelations - Rules
SMTP lGeneral - Script
lNetwork - Mapping and Filtering
Web - HTTP/HTML lGeneral - Recording, Script, Protocols, Code Generation
lCorrelations - Configuration, Rules
lHTTP Properties - Advanced
lNetwork - Mapping and Filtering
lData Format Extension - Chain Configuration, Code Generation
Web Services lGeneral - Recording, Script, Protocols, Code Generation
lCorrelation - Configuration, Rules
lHTTP Properties - Advanced
lTraffic Analysis - Traffic Filters
User Guide
VuGen
HP LoadRunner (12.50) Page 211
Protocol Recording Options Nodes
lNetwork - Mapping and Filtering
Windows Sockets lSockets - Winsock
Port Mapping and Traffic Filtering Overview
When you record a business process, a portion of the generated traffic is not related to the actual
business process. For example, the Chrome browser accesses many external servers. This overhead
may not be meaningful for the load test.
In addition, as a tester, you may not be interested in some of the generated traffic, even if you
generate it during a recording session.
Another issue is a non-Internet business process. If you do not have Internet access, VuGen can
successfully record the business process, but it will fail if you use a browser that constantly attempts to
access the Internet.
The Port Mapping and TrafficFiltering features allow you to specify the behavior of specific traffic or
exclude certain server:port combinations from your Vuser script.
Port Mapping
When recording Vuser scripts that record network traffic on a socket level (HTTP, SMTP, POP3, FTP,
IMAP, Oracle NCA and WinSock), you can set the Port Mapping options. Using these options, you can map
the traffic from a specific server:port combination to the desired communication protocol.
The available communication protocols to which you can map are FTP, HTTP, IMAP, NCA, POP3, SMTP, and
SOCKET. You create a mapping by specifying a server name, port number, or a complete server:port
combination. For example, you can indicate that all traffic from the server twilight on port 25, should be
handled as SMTP. You can also specify that all traffic from the server called viper, should be mapped to
the FTP protocol, regardless of the port. Additionally, you can map all traffic on port 23 to SMTP,
regardless of the server name.
When recording in multi-protocol mode, If at least one of the protocols records on a socket level, the
Mapping and Filtering node will be available. Wildcards in the server name are not supported for port
mapping.
For details on adding new port mappings, see "Server Entry - Port Mapping Dialog Box" on page189.
Traffic Filtering
Traffic filtering extends the capabilities of port mapping by letting you list URLs and ports to exclude. In
port mapping, you cannot use wildcards.
Using traffic filtering, you add an entry for each server that you want to exclude. You can use wildcards
to exclude all traffic associated with a specific domain.
You may also specify a port or a range of ports. For example, you can filter out only SSL traffic coming
through port 443. Once you define an entry, you can clear its check box to temporarily disable it.
You can select a filtering level:
User Guide
VuGen
HP LoadRunner (12.50) Page 212
lRecording
lCode generation
The advantage of excluding undesired traffic from the recording session, is that your script will be
lighter, increasing its performance.
The benefit of only excluding traffic from the code generation, is that traffic will be recorded and will be
accessible to you if you need it at a later point. You can then reapply a different filter without having to
rerecord the business process.
For details on adding new traffic filters, see the "Server Entry - Traffic Filtering Dialog Box" on page191.
Port Mapping Auto Detection
VuGen's advanced Port mapping options let you configure the auto-detection options. VuGen's auto-
detection analyzes the data that is sent to the server. It checks the data for a signature, a pattern in
the data's content, that identifies the protocol. For the purpose of detecting a signature, all of the send
buffers until the first receive buffer, are combined. All send buffers that were sent until a receive buffer
is returned, are considered a single data transition. By default, no mappings are defined and VuGen
employs auto-detection. In some protocols, VuGen determines the type in a single transition, (such as
HTTP). Other network protocols require several transitions before determining the type. For this
purpose, VuGen creates a temporary buffer for each server-port combination. If VuGen cannot
determine the protocol type by reading the first transition buffers, it stores the data in a temporary
buffer. It continues to read the incoming buffers until it detects a signature of a specific protocol.
By default, VuGen allows 4 transitions and uses a temporary buffer of 2048 bytes in order to detect a
protocol signature. If VuGen has not yet determined the type after reaching the maximum number of
transitions, or after reaching the maximum buffer size, it assigns the data to the WinSock protocol. If
you did not instruct VuGen to record the WinSock protocol (in the multi-protocol selection), VuGen
discards the data.
You can change the maximum number of buffers you want VuGen to read in order to detect the
protocol type. You can also specify the size of the temporary buffer. In instances where the amount of
data in the first send buffers, is greater than the size of the temporary buffer, VuGen cannot auto-
detect the protocol type. In this case, you should increase the size of the temporary buffer.
When working with the above network level protocols, we recommend that you allow VuGen to use
auto-detection to determine the protocol type. In most cases, VuGen's recorder is able to recognize the
signatures of these protocols. It then automatically processes them according to the protocol
specifications. In certain instances, however, VuGen may be unable to recognize the protocol. For
example:
lThe protocol signature closely resembles an existing protocol, resulting in erroneous processing.
lThere is no unique signature for the protocol.
lThe protocol uses SSL encryption, and therefore cannot be recognized on a WinSock level.
In all of the above cases, you can supply information to uniquely identify the server and port hosting the
protocol.
User Guide
VuGen
HP LoadRunner (12.50) Page 213

EUC-Encoding (Japanese Windows only)
When working with non-Windows standard character sets, you may need to perform a code conversion.
A character set is a mapping from a set of characters to a set of integers. This mapping forms a unique
character-integer combination for a given alphabet. Extended UNIX Code (EUC) and Shift Japan Industry
Standard (SJIS) are non-Windows standard character sets used to display Japanese characters on Web
sites.
Windows uses SJIS encoding, while UNIX uses EUC encoding. When a Web server is running UNIX and the
client is running Windows, the characters in a Web site are not displayed on the client machine properly
due to the difference in the encoding methods. This affects the display of EUC-encoded Japanese
characters in a Vuser script.
During recording, VuGen detects the encoding of a Web page through its HTTP header. If the
information on the character set is not present in the HTTP header, it checks the HTML meta tag.
If you know in advance that a Web page is encoded in EUC, you can instruct VuGen to use the correct
encoding by using the recording options. To record a page in EUC-encoding, enable the EUC option in the
Recording Options Recording node (only visible for Japanese Windows).
Enabling the EUC option forces VuGen to record a Web page in EUC encoding, even when it is not EUC-
encoded. Therefore, you should only enable this option when VuGen cannot detect the encoding from
the HTTP header or the HTML meta tag or when you know in advance that the page is EUC-encoded.
During recording, VuGen receives an EUC-encoded string from the Web server and converts it to SJIS.
The SJIS string is saved in the script's Action function. However, for replay to succeed, the string has to
be converted back to EUC before being sent back to the Web server. Therefore, VuGen adds a web_
sjis_to_euc_param function before the Action function, which converts the SJIS string back to EUC.
In the following example, the user navigates to an EUC-encoded Web page and clicks a link. VuGen
records the Action function and adds the web_sjis_to_euc_param function to the script before the
Action function.
web_sjis_to_euc_param("param_link","Search");
web_link("LinkStep","Text={param_link}");
For more information, see "Advanced URL Dialog Box" on page170.
Script Generation Preference Overview
Before you record a session, VuGen allows you to specify a language for script generation. The available
languages for script generation vary per protocol. The most common available languages are C and
Java. By default, VuGen generates a script in the most common language for that protocol, but you can
change this through the Script recording options node.
For user interface details, see "General > Script Recording Options" on page172.
Tip: If you record a script in one language, you can regenerate it in another language after the
User Guide
VuGen
HP LoadRunner (12.50) Page 214

recording. For task details, see "How to Regenerate a Vuser Script" on page225.
After you select a generation language, you can enable language-specific recording options which
instruct the recorder what to include in the script and how to generate it.
If at least one of the protocols you are recording has multi-protocol capabilities, the Script node will be
available except when you record HTTP or WinSock as a single protocol script.
Script Language Options
When you record a session, VuGen creates a script that emulates your actions. The default script
generation language is C. The following list specifies which protocols are appropriate for each language:
lC. For recording applications that use complex COM constructs and C++ objects.
lC #. For recording applications that use complex applications and environments (MS .NET protocol
only).
lVisual Basic .NET. For VB .NET applications using the full capabilities of VB.
lJavaScript. For Web-based applications , especially those using dynamic HTML applications.
After the recording session, you can modify the script with regular C, C#, .NET, or JavaScript code and
control flow statements.
Recording Levels - Overview
VuGen lets you specify what information to record and which functions to use when generating a Vuser
script by selecting a recording level in the General > Recording node of the Recording Options dialog
box. The recording level you select depends on your needs and environment. The available levels are
HTML-based script and URL-based script. For user interface information, see "General > Recording -
Recording Options" on page169.
The following examples show scripts using the three recording levels:
HTML-based script
Generates a separate step for each HTML user action. The steps are intuitive, but they do not reflect
true emulation of the JavaScript code.
/* HTML-based mode - a script describing user actions*/
...
web_url("WebTours",
"URL=http://localhost/WebTours/",
"Resource=0",
"RecContentType=text/html",
"Referer=",
"Snapshot=t1.inf",
"Mode=HTML",
LAST);
User Guide
VuGen
HP LoadRunner (12.50) Page 215
web_link("Click Here For Additional Restrictions",
"Text=Click Here For Additional Restrictions",
"Snapshot=t4.inf",
LAST);
web_image("buttonhelp.gif",
"Src=/images/buttonhelp.gif",
"Snapshot=t5.inf",
LAST);
...
URL-based script
Records all browser requests and resources from the server that were sent due to the user's actions.
Automatically records all HTTP resources as URL steps (web_url statements). For normal browser
recordings, it is not recommended to use the URL-based mode since is more prone to correlation
related issues. However, if you are recording pages such as applets and non-browser applications, this
mode is ideal.
URL-based scripts are not as intuitive as the HTML-based scripts since all actions are recorded as web_
url steps instead of web_link,web_image, and so on.
/* URL-based mode - only web_url functions */
...
web_url("spacer.gif",
"URL=http://graphics.hplab.com/images/spacer.gif",
"Resource=1",
"RecContentType=image/gif",
"Referer=",
"Mode=HTTP",
LAST);
web_url("calendar_functions.js",
"URL=http://www.im.hplab.com/travelp/calendar_functions.js",
"Resource=1",
"RecContentType=application/x-javascript",
"Referer=",
"Mode=HTTP",
LAST);
...
You can switch recording levels and advanced recording options while recording, provided that you are
not recording a multi-protocol script. The option of combining recording levels is available to advanced
users for performance testing.
You can also regenerate a script after recording, using a different method than the original recording.
For example, if your record a script on an HTML-based level, you can regenerate it on a URL-based level.
To regenerate a script, select Record > Regenerate Script and click Options to set the recording
options for the regeneration.
User Guide
VuGen
HP LoadRunner (12.50) Page 216
Serialization Overview
VuGen uses serialization when it encounters an unknown object during the recording, provided that the
object supports serialization. An unknown object can be an input argument which was not included by
the filter and therefore its construction was not recorded. Serialization helps prevent compilation
errors caused by the passing of an unknown argument to a method. If an object is serialized, it is often
advisable to set a custom filter to record this object. For details, see "How to Serialize Flex Scripts " on
page521.
Tips for Working with Event Listening and Recording
It can sometimes be difficult to find the ideal listen and recording settings. When defining these
settings, keep in mind the following guidelines:
lTo record an event on an object, you must instruct VuGen to listen for the event, and to record the
event when it occurs. You can listen for an event on a child object, even if a parent object contains
the handler or behavior, or you can listen for an event on a parent object, even if the child object
contains the handler or behavior.
However, you must enable recording for the event on the source object (the one on which the event
actually occurs, regardless of which parent object contains the handler or behavior).
For example, suppose a table cell with an onmouse over event handler contains two images. When a
user touches either of the images with the mouse pointer, the event bubbles up to the cell and
includes information on which image was actually touched. You can record this mouse over event by:
lSetting Listen on the WebTable mouse over event to If Handler (so that VuGen "hears" the event
when it occurs), while disabling recording on it, and then setting Listen on the Image mouse over
event to Never, while setting its recording status to Enable (to record the mouse over event on the
image after it is listened to at the WebTable level).
lSetting Listen on the Image mouse over event to Always (to listen for the mouse over event even
though the image tag does not contain a behavior or handler), and setting the recording status on
the Image object to Enabled (to record the mouse over event on the image).
lInstructing VuGen to listen for many events on many objects may lower performance, so try to limit
listening settings to the required objects.
lIn rare situations, listening to the object on which the event occurs (the source object) may interfere
with the event.
Example of Click & Script Out of Context Recording
In the following example, a script was regenerated with the out-of-context recording option enabled.
web_image_link("Search Flights Button",
"Snapshot=t5.inf",
DESCRIPTION,
"Alt=Search Flights Button",
"FrameName=navbar",
User Guide
VuGen
HP LoadRunner (12.50) Page 217
ACTION,
"ClickCoordinates=58,9",
LAST);
web_add_cookie("MSO=SID=;1141052844; DOMAIN=localhost");
web_add_cookie("MTUserInfo=hash=;47=;firstName=;Joseph=;expDate=;
%0A=;creditCard=;=;address1=;234%20Willow%20Drive=;
lastName=;Marshall%0A=;address2=;San%20Jose%2FCA%2F94085=;
username=;jojo; DOMAIN=localhost");
web_url("FormDateUpdate.class",
"URL=http://localhost:1080/WebTours/FormDateUpdate.class",
"Resource=0",
"RecContentType=text/html",
"Referer=",
"UserAgent=Mozilla/4.0 (Windows 2000 5.0) Java/1.4.2_08",
"Mode=HTTP",
LAST);
...
If you disable this option, VuGen does not generate code for the ActiveX controls and Java applets. In the
following example, VuGen only generated the web_image_link function—not the web_url functions
containing the class files.
web_image_link("Search Flights Button",
"Snapshot=t5.inf",
DESCRIPTION,
"Alt=Search Flights Button",
"FrameName=navbar",
ACTION,
"ClickCoordinates=58,9",
LAST);
For more information, see "GUI Properties > Advanced Recording Options" on page177.
Providing Authentication Information
The following section applies only to multi-protocol scripts.
When recording a Web session that uses NTLM authentication, your server may require you to enter
details such as a user name and password.
Initially, IE (Internet Explorer) tries to use the NT authentication information of the current user:
lIf IE succeeds in logging in using this information and you record a script —then, at the end of the
recording VuGen prompts you to enter a password. VuGen retrieves the user name and domain
information automatically. If necessary, you can also edit the user name in the Web Recorder NTLM
authentication dialog box.
User Guide
VuGen
HP LoadRunner (12.50) Page 218
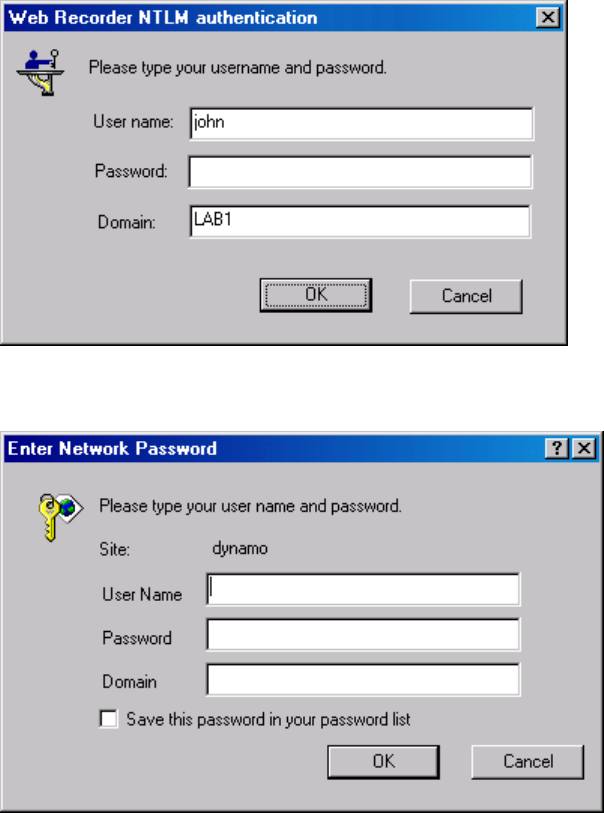
lIf IE is unable to log in with the current user's information, it prompts you to enter a user name and
password using the standard browser authentication dialog box.
Generating a web_set_user function
When performing NTLM authentication, VuGen adds a web_set_user function to the script.
lIf the authentication succeeds, VuGen generates a web_set_user function with your user name,
encrypted password, and host.
web_set_user("domain1\\dashwood",
lr_decrypt("4042e3e7c8bbbcfde0f737f91f"),
"sussex:8080");
lIf you cancel the Web Recorder NTLM Authentication dialog box without entering information, VuGen
generates a web_set_user function for you to edit manually.
web_set_user("domain1\\dashwood,
"Enter NTLM Password Here",
"sussex:8080");
User Guide
VuGen
HP LoadRunner (12.50) Page 219
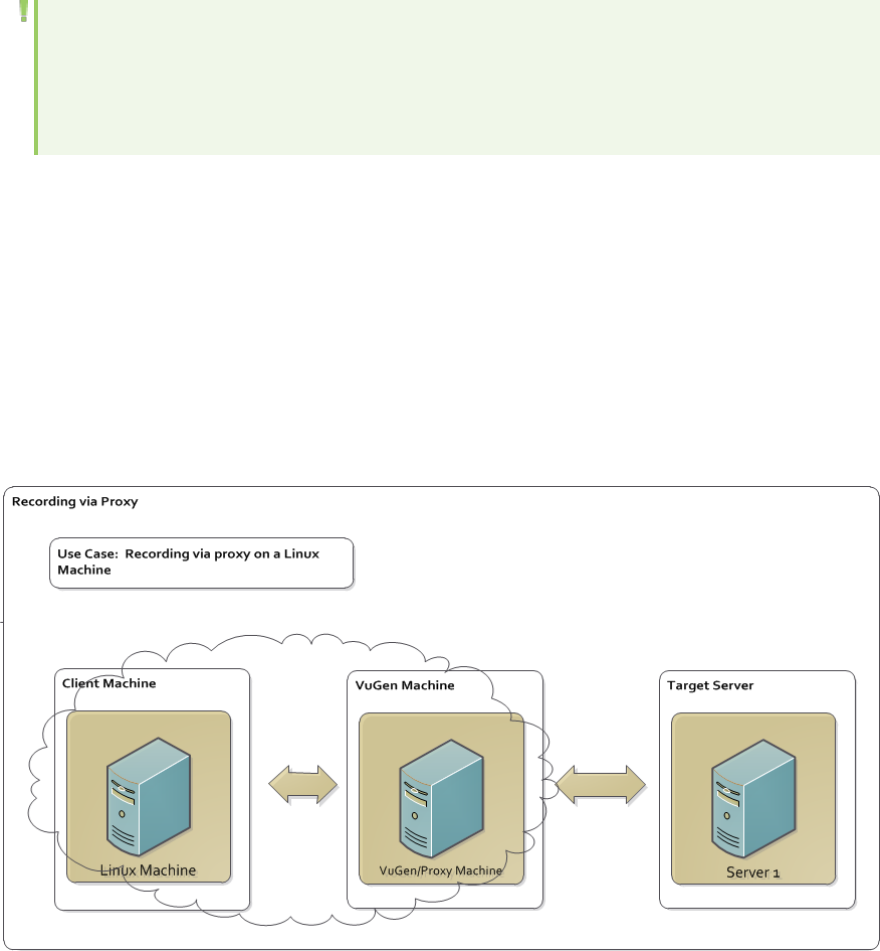
Note: If you enter a password manually, it will appear in the script as-is, presenting a security
issue. To encrypt the password, right-click the password and select Encrypt string. VuGen
encrypts the string and generates an lr_decrypt function, used to decode the password during
replay. For more information about encrypting strings, see "Encrypting Text" on page331.
Recording via a Proxy - Overview
VuGen allows you to record scripts using a LoadRunner proxy to resolve situations where you cannot
install VuGen on the client machine. This may be the case with certain Linux machines, Mac OS
machines, and mobile devices.
When using this option, the VuGen machine acts as a proxy server capturing all the traffic from the
client machine to the target server. After the business process has been recorded VuGen creates a
script.
The following diagram illustrates the basic workflow:
Considerations for Recording via a Proxy:
lRecording via a proxy is not available for all protocols. A partial list of the supported protocols is: Web
- HTTP/HTML, Flex, Java over HTTP, Oracle NCA, and Oracle - Web.
lThe client must allow proxy configurations, meaning, you must be able to specify the port and the
address of the VuGen machine on the client device or machine.
lThe client device or machine and the VuGen machine must be in the same network.
User Guide
VuGen
HP LoadRunner (12.50) Page 220

lBecause VuGen is unable to bypass the browser's cache and history settings on the client machine,
the client machine's browsing history must be deleted prior to recording the business process. This
enables VuGen to accurately record your business process via a proxy.
HTTP forwarding to multiple targets
If multiple target machines are present, the VuGen proxy can correctly forward data to the right target
server according to the Host HTTP header.
Forwarding to target server via Internet proxy server
You can configure the VuGen machine to establish a connection with your organization's internet proxy
by selecting the Remote Application via LoadRunner proxy mode in the Start Recording dialog box.
For details, see "Start Recording Dialog Box" on page226.
How to Record a Script via a Proxy
This topic describes various methods for recording a script using a proxy server.
Note: In all use cases, the client machine and VuGen machine are in the same network.
Use Case 1: You want to record a business process but you cannot install VuGen on
the client machine or device.
1. Create a script
Create a new Web - HTTP/HTML script.
2. Start Recording
a. From the Start Recording dialog box, select Recording Mode > Record > Remote Application
via LoadRunner Proxy. For details, see "Start Recording Dialog Box" on page226.
b. Specify the port on which the LoadRunner proxy will listen, by default, port 8888.
c. Check the Display recording toolbar on client machine. This allows you to see and interact
with the recording toolbar on the client machine.
d. Click Start Recording.
3. Delete the cache
On the client machine, delete browser cache data which includes Temporary Internet Files and
Cookies.
4. Configure proxy settings on client machine
Configure the proxy settings to specify the VuGen machine as the proxy server. To do this, specify
User Guide
VuGen
HP LoadRunner (12.50) Page 221
the machine address and port on which the LoadRunner proxy will listen.
Below are some sample configurations:
Browser/OS Path Configuration
Internet
Explorer
lInternet Options > Connections > LAN
Settings > Proxy server
or
lControl Panel and IE Tools > Options menu
a. Select Use a proxy server
for your LAN
b. Specify Port
c. Specify Address
FireFox Tools > Options > Network > Advanced >
Connection > Settings...
a. Select Manual proxy
configuration
b. Specify HTTP Proxy
c. Specify Port
d. Check Use this proxy
server for all protocols
5. Record the business process
a. Navigate to your application.
b. Perform the steps of your business process you want to record.
6. Generate the script
a. Select Stop Recording from either the Recording Toolbar on the client machine or the
Floating Recording Toolbar on the VuGen machine.
b. VuGen generates the script.
Note: It is common for business processes to use SSL communication even when not
explicitly displaying a URL with https. In this case, a certificate may be required. Refer to
Use Case 3 for more information on obtaining the certificate.
Use Case 2: You want to record a business process but you cannot install VuGen on
the machine (or device) running the application. The client machine requires a
proxy to access the Internet.
1. Create a script
Create a new Web - HTTP/HTML script.
2. Start recording
a. From the Start Recording dialog box, select Recording Mode > Record > Remote application
User Guide
VuGen
HP LoadRunner (12.50) Page 222
via LoadRunner Proxy.
b. If necessary, change the port the LoadRunner proxy listens on. The default is port 8888.
c. Check Display recording toolbar on client machine. This allows you to see and interact with
the recording toolbar on the client machine.
d. A browser session is not launched on the local machine during a proxy recording. Set the VuGen
Internet Explorer proxy details as follows:
In Internet Explorer, select Tools > Internet Options > Connections. Click LAN settings and
enter the port and address of the client machine's Internet proxy.
Note: The Use automatic configuration script option is not supported.
e. Select Start Recording.
3. Delete the cache
On the client machine, delete browser cache data which includes Temporary Internet Files and
Cookies.
4. Configure proxy settings on the client machine
On your client machine, configure the browser settings to use the VuGen's machine IP and port. The
following table explains how to set the proxy settings.
Browser/OS Path Configuration
Internet
Explorer
lInternet Options > Connections > LAN
Settings > Proxy server
lControl Panel and IE Tools > Options menu
a. Select Use a proxy server
for your LAN
b. Specify Port
c. Specify the VuGen IP in
Address
FireFox Tools > Options > Network > Advanced >
Connection > Settings...
a. Select Manual proxy
configuration
b. Specify HTTP Proxy
c. Specify Port
d. Check Use this proxy
server for all protocols
5. Record the business process
a. Navigate to your application.
b. Perform the steps of your business process you want to record.
6. Generate the script
User Guide
VuGen
HP LoadRunner (12.50) Page 223
a. Select Stop Recording from the either the Recording Toolbar on the client machine or the
Floating Recording Toolbar on the VuGen machine.
b. VuGen generates the script.
Note: It is common for business processes to use SSL communication even when not
explicitly displaying a URL with https. In this case, a certificate may be required. Refer to
Use Case 3 for more information on obtaining the certificate.
Use Case 3: Your application communicates using SSL.
1. Prepare to import the LoadRunner SSL certificate to the client machine.
Note: As an application developer, you can set certain policies on the server certificate
when using SSL. However, only if the LoadRunner certificate conforms to the policy, can the
client trust the server and the SSL connection be set.
2. Download the certificate, by navigating to http://<computer name of VuGen
machine>:port/proxyroot.cer or http://<ip address of VuGen
machine>:port/proxyroot.cer.
Note: If you experience security restrictions, navigate to http://<computer name VuGen
machine>:port/proxyroot.dat or http://<ip address of VuGen
machine>:port/proxyroot.dat. After downloading the certificate, change the .dat
extension back to .cer to import the certificate.
3. Import the SSL certificate. The following table provides examples of the path for various browsers.
lFor Internet Explorer, select Internet Options > Content > Trusted Root Certificate Authorities
> Import.
lFor Firefox, select Tools > Options > Advanced > Certificates tab > View Certificates >
Authorities > Import.
Use Case 4: You want to do a proxy recording of a local application that uses the
system proxy, where VuGen and the client application are on the same machine.
1. Create a script
Create a new Web - HTTP/HTML script.
2. Set the recording option
Open the recording options (Recording > Recording Options) and select the HTTP Properties
>Advanced node. Enable the Use the LoadRunner Proxy to record a local application.
User Guide
VuGen
HP LoadRunner (12.50) Page 224

3. Start recording
a. Open the Start Recording dialog box (Ctrl +R).
b. In the Recording mode section, select Record: Web Browser.
4. Perform the business process
Perform typical actions within your recording session. When you are finished, stop the recording
and save the script.
VuGen automatically resets the proxy back to its original setting after the recording. If the recording did
not end in the normal way, for example, if your application crashed during recording, you may need to
manually set the proxy back to its original value. To do so, go to Internet Options > Connections > LAN
Settings > Proxy server.
If you are recording a Java application or a browser other than Internet Explorer, if the application is not
using the system proxy settings, you will need to manually set the proxy of the application.
How to Import Actions to a Script
For Vuser types that support multiple actions, you can import actions into your script from another
Vuser script. You can import actions from Vusers of the same type only. Note that any parameters
associated with the imported action will be merged with the script. The following steps describe how to
import actions into the current script.
1. Select Design > Action > Import Action, or right-click the Solution Explorer and select Import
Action from the right-click menu. The Import Action into VuGen Script dialog box opens.
2. Click Browse to select a Vuser script. A list of the script's actions appears in the Actions to Import
section.
3. Select the actions you want to include and click Import. The imported action(s) are displayed in the
Solution Explorer.
How to Regenerate a Vuser Script
If you need to revert back to the script as it was when you your originally recorded it, you can
regenerate the script. This feature is ideal for debugging, or fixing a corrupted script.
When you regenerate a script, VuGen removes all of the manually added enhancements to the recorded
actions in the script. If you added parameters to your script, VuGen restores the original values. The
parameter list, however, is not deleted; you can reinsert parameters that you created earlier. Note that
regeneration only cleans up the recorded actions, but not those that were manually added.
Note: If your script was imported from a zip archive file, make sure that it was archived with all
files. If it was only saved with the runtime files, you will not be able to regenerate the script to
User Guide
VuGen
HP LoadRunner (12.50) Page 225
its original recorded state. For details, see "How to Work with .zip Files" on page138.
This task describes how to regenerate a Vuser script.
1. Initialize the regeneration
Select Record > Regenerate Script. VuGen issues a warning indicating that all manual changes will
be overwritten.
2. Modify regenerate options - optional
Click Options to open the Regenerate Options dialog box.
In a multiple protocol script, you can use the General > Protocols node to modify which protocols
you want to record when the script is regenerated. For user interface details, see "General >
Protocol Recording Options" on page169.
To change the Script options, select the General > Script node and select or clear the appropriate
check box. For user interface details, see "General > Script Recording Options" on page172.
Click OK to close the Regenerate Options dialog box.
3. Indicate whether to include imported actions
If your script contains actions that you imported from another script, the dialog box will contain an
option to delete imported actions during the regeneration.
If you chose to regenerate the script in a different language, (using the General > Script options in
the previous step), then non-recorded actions will automatically be deleted. Non-recorded actions
include imported, renamed, or manually added actions.
Note: If a Flex, Silverlight, or Java over HTTP Vuser script encounters errors during the code
generation phase, VuGen shows the errors in the Error pane. This Error pane displays details
about each error, as well as recommended actions. Follow the recommended actions and
regenerate the script.
Start Recording Dialog Box
This dialog box enables you to record your business process.
To access lRecord > Record
l[VuGen] Start Recording button
Important
information
This dialog box is dynamic and changes according to the options you select and
the protocol you are using.
Relevant tasks l"How to Record a Vuser Script" on page144
User Guide
VuGen
HP LoadRunner (12.50) Page 226
l"Scripting Options" on page111
l"How to Record a Script via a Proxy" on page221
User interface elements are described below:
All Protocols (except Java)
UI Element Description
Record into
action
The section into which you want to record.
You can add your own action. Type the action name in the Record into action field
and click Add. The new action is added to the script.
Recording mode The mode used to record your business process.
You can record:
lWeb Browser. For example Web and Oracle NCA record Web applications.
lWindows Application.. For example, Windows Socket Vusers record a Windows
application.
lRemote Application via LoadRunner Proxy. (For Internet protocols only) To
record traffic when VuGen cannot run on the client machine. For example,
Linux machines, Mac OS machines, and mobile devices. If you choose this mode,
you can specify the following options:
a. LoadRunner proxy listens on port: The port on which the LoadRunner
proxy will listen.
b. Display recording toolbar on client machine. This allows you to interact
with the recording toolbar on the client machine.
Application lFor Web Browser recording: The desired browser.
lFor Windows Application recording: The path of an executable file.
Note: To run a batch (files with a .bat extension), specify cmd.exe with
its path as the Application, and the batch file as its Program
arguments.
URL address The starting URL address. This option is displayed for Internet applications only.
Program
arguments
(Windows applications only) The command line arguments for the executable
specified in Recorded application. For example, if you specify plus32.exe
(recorded application) with the command line options peter@neptune, it
connects the user Peter to the server Neptune when starting plus32.exe.
Start Recording
(For Internet
You can record your business process either:
User Guide
VuGen
HP LoadRunner (12.50) Page 227

UI Element Description
protocols only) lImmediately - Recording starts as soon as you click the Start Recording
button.
lIn delayed mode - In the following instances, it may not be advisable to record
immediately:
lIf you are recording multiple actions, in which case you only need to perform
the startup in one action.
lIn cases where you want to navigate to a specific point in the application
before starting to record.
lIf you are recording into an existing script.
Working
directory
For applications that require you to specify a working directory.
Recording
Options
Opens the Recording Options dialog box. For user interface details,see "Recording
Options" on page146.
Start Recording
button
Begins to record your business process based on the option selected above:
Immediate or In delayed mode.
Java Protocols
UI Element Description
Record into
action
The section into which you want to record.
Record: lJava applet to record a Java applet through Sun's applet viewer.
lJava application to record a Java application.
lInternet Explorer to record an applet within a browser.
lExecutable/Batch to record an applet or application that is launched from
within a batch file or the name of an executable file.
lListener to instruct VuGen to wait for the batch file that initializes the
configuration and runs an application before recording. This mode requires
you to define the system variable _JAVA_OPTIONS as --Xrunjdkhook using
jdk1.2.x and higher. (For JDK 1..x, define the environment variable _classload_
hook=JDKhook. For JDK 1.6 set _JAVA_OPTIONS as -agentlib:jdhook.)
URL address The URL to start recording (for Internet Explorer recordings)
Parameters Any additional parameters that your application requires.
User Guide
VuGen
HP LoadRunner (12.50) Page 228
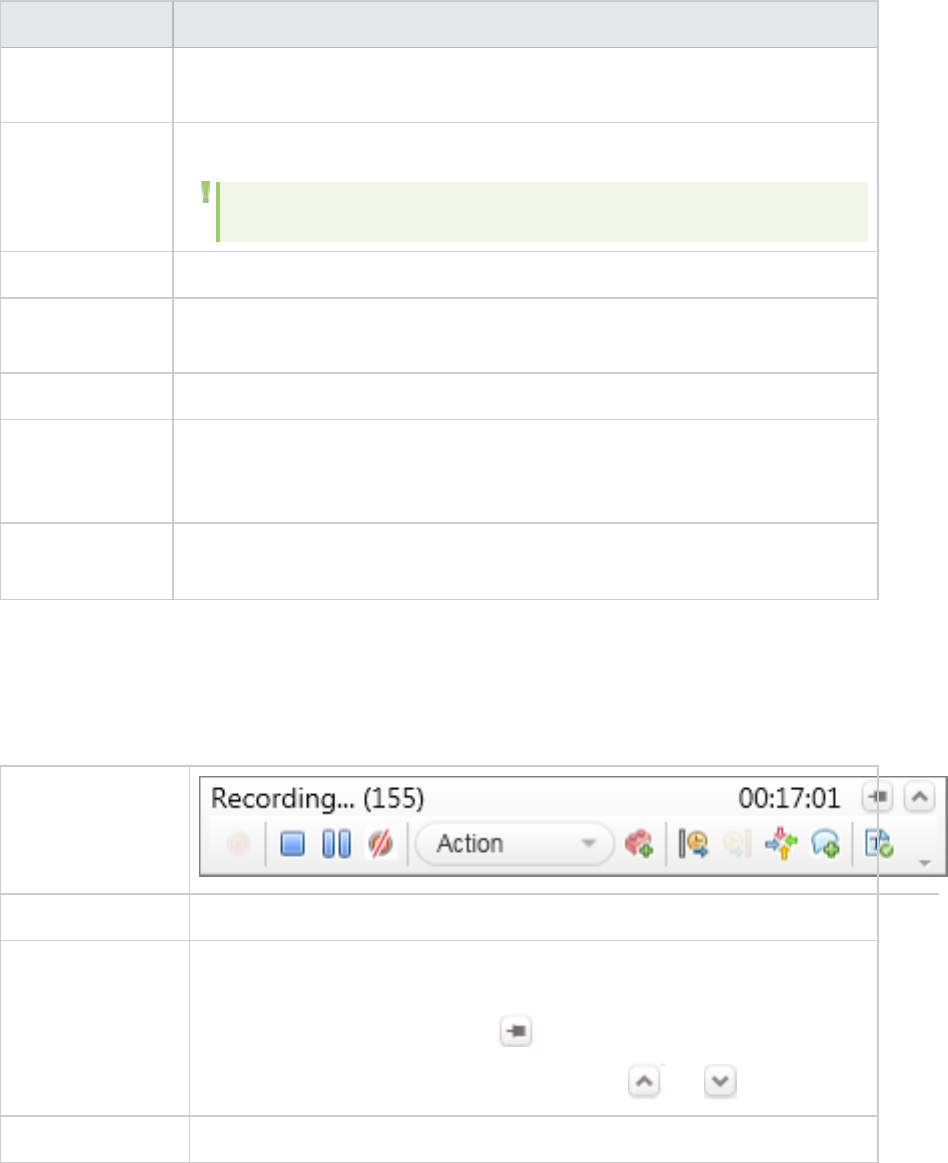
UI Element Description
Record into
action
The section into which you want to record.
Main Class The complete path of the Java class with the main method.
Note: This option is only present for Java Application type applications.
Applet path This option is only present for Java applets.
Internet Explorer
path
This option is only present for Internet Explorer type applications.
Executable\Batch This option is only present for Executable\Batch type applications.
Working
directory
A working directory is necessary only if your application must know the location
of the working directory (for example, reading property files or writing log files).
The default is the local LoadRunner/VuGen bin directory.
Recording
Options
Opens the Recording Options dialog box. For user interface details, see
"Recording Options" on page146.
Floating Recording Toolbar
The floating recording toolbar enables you to control the recording of Vuser scripts, and provides easy
access to common script commands.
UI example
To access The floating recording toolbar appears when script recording begins.
Important
information
lThe floating recording toolbar is dockable. For details, see How to Modify
the VuGen Layout.
lYou can pin the toolbar with the button.
lYou can expand or collapse the toolbar with the and buttons.
Relevant tasks "Creating or Opening Vuser Scripts" on page127
User interface elements are described below:
User Guide
VuGen
HP LoadRunner (12.50) Page 229
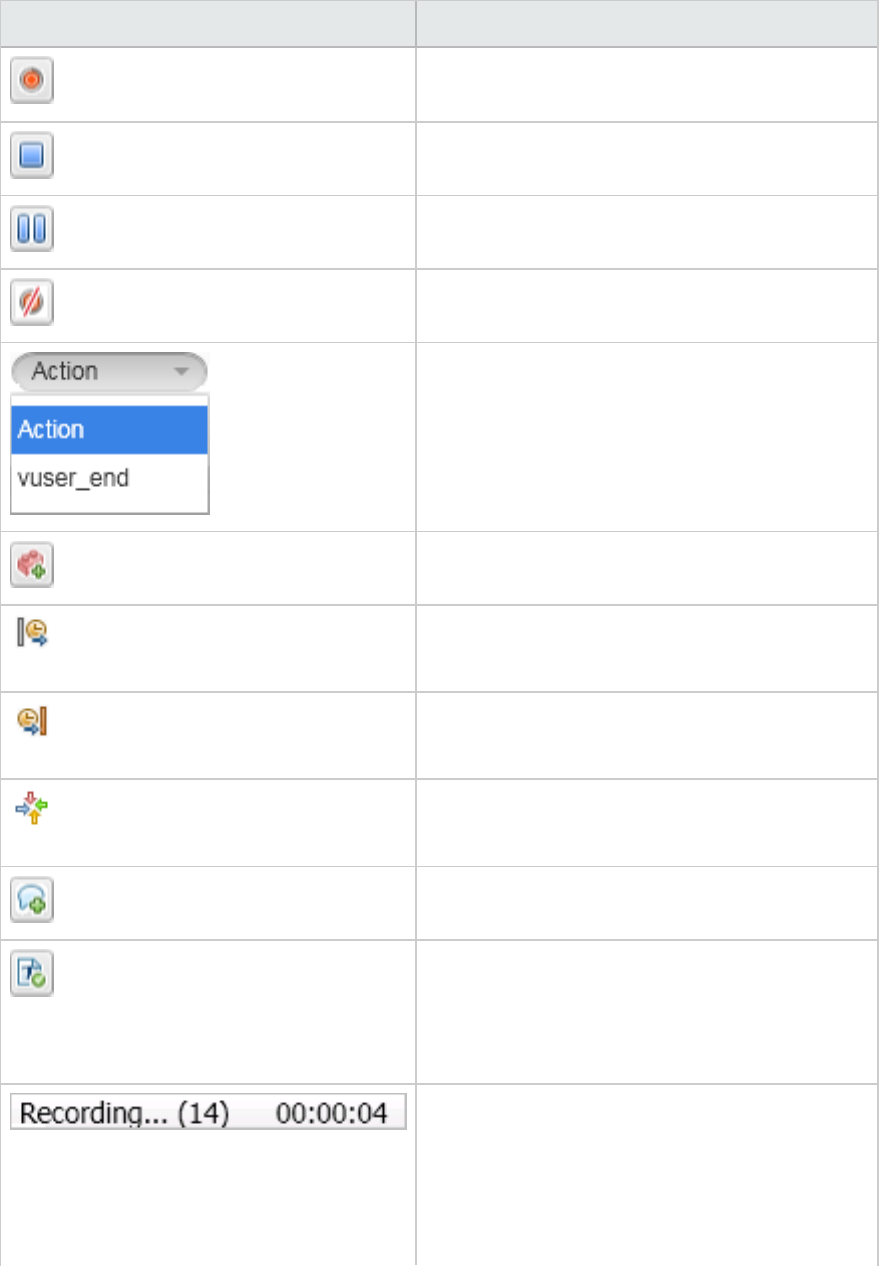
UI Element Description
Continue recording the script after recording has
been paused.
Stop recording the script.
Pause recording.
Cancel the recording.
Select an action to record into.
Create a new action to record into.
Insert a Start Transaction step into your script.
For details, see "Transaction Overview" on page322.
Insert an End Transaction step into your script.
For details, see "Transaction Overview" on page322.
Insert a Rendezvous point step into your script.
For details, see "Rendezvous Points" on page327.
Insert a comment into your script.
Insert a Text Check step into your script (not
available for all protocols).
For details, see "Text and Image Verification (Web
Vuser Scripts) - Overview" on page853.
Displays:
lHow many events have been recorded into your
script.
lThe time elapsed since recording began,
excluding time the script was paused.
User Guide
VuGen
HP LoadRunner (12.50) Page 230
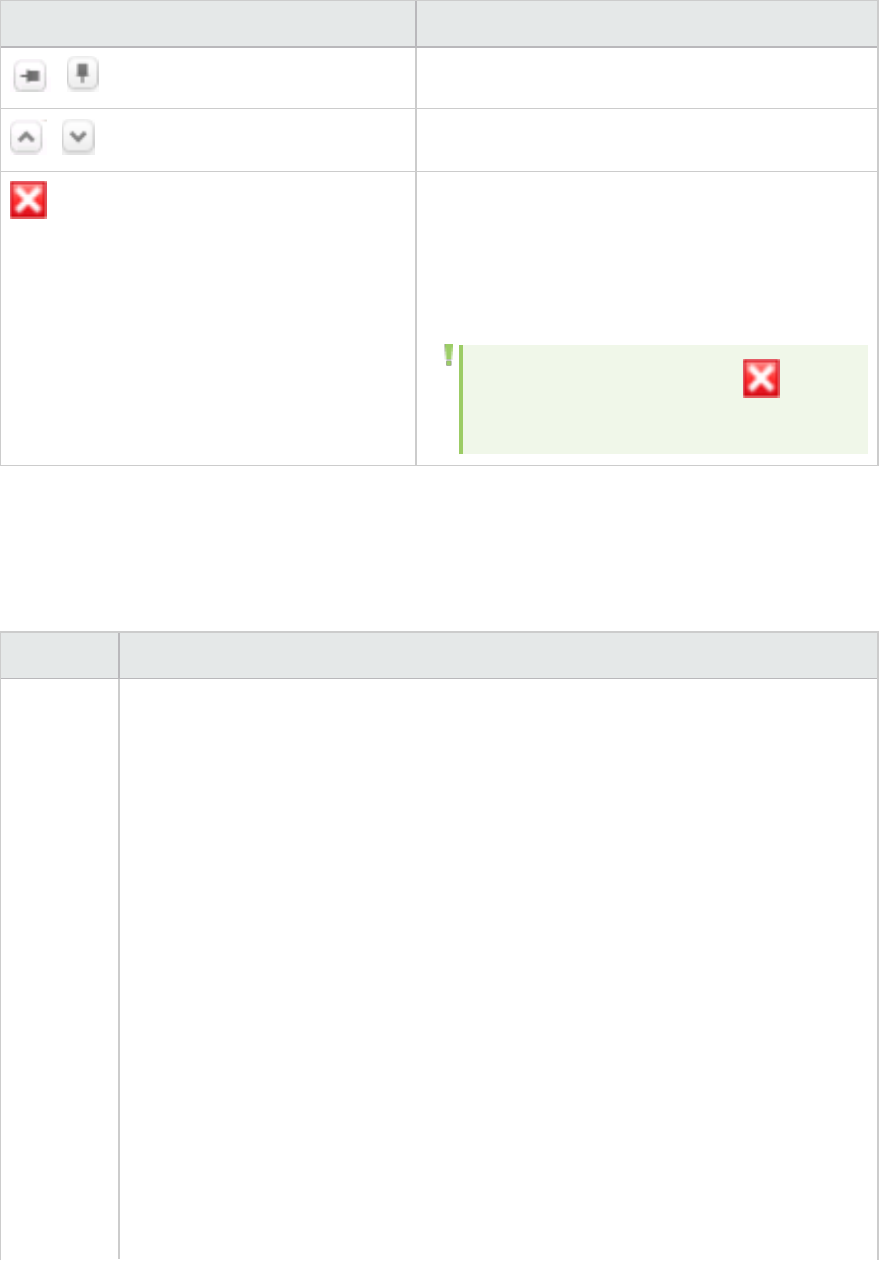
UI Element Description
/ Pin or unpin the recording toolbar.
/ Display or hide the toolbar buttons.
Hide the recording toolbar. The toolbar reappears
when you refresh or navigate to the next page.
Hiding the toolbar may be useful if the toolbar
covers controls in the application being operated,
thereby preventing access to the controls.
Note: The Hide Toolbar button appears
for proxy recording only.
Files Generated During Recording
Assuming that the recorded script has been given the name vuser and is stored under c:\tmp, the
following is a list of the more important files that are generated after recording:
File Name Details
vuser.usr Contains information about the Vuser type, AUT, action files, and so forth.
Example of vuser.usr file
[General]
Type=Oracle_NCA
DefaultCfg=default.cfg
BuildTarget=
ParamRightBrace=>
ParamLeftBrace=<
NewFunctionHeader=0
MajorVersion=5
MinorVersion=0
ParameterFile=nca_test3.prm
GlobalParameterFile=
[Transactions]
Connect=
[Actions]
vuser_init=init.c
Actions=run.c
vuser_end=end.c
User Guide
VuGen
HP LoadRunner (12.50) Page 231

vuser.bak A copy of Vuser.usr before the last save operation.
default.cfg Contains a listing of all runtime settings as defined in the VuGen application (think time,
iterations, log, web).
Example of default.cfg file
[General]
XlBridgeTimeout=120
[ThinkTime]
Options=NOTHINK
Factor=1
LimitFlag=0
Limit=1
[Iterations]
NumOfIterations=1
IterationPace=IterationASAP
StartEvery=60
RandomMin=60
RandomMax=90
[Log]
LogOptions=LogBrief
MsgClassData=0
MsgClassParameters=0
MsgClassFull=0
vuser.asc The original recorded API calls.
vuser.grd Contains the column headers for grids in database scripts.
default.usp Contains the script's run logic, including how the actions sections run.
init.c Exact copy of the Vuser_init function as seen in the VuGen main window.
run.c Exact copy of the Action function as seen in the VuGen main window.
end.c Exact copy of the Vuser_end function as seen in the VuGen main window.
vdf.h A header file of C variable definitions used in the script.
\Data The Data folder stores all of the recorded data used primarily as a backup. Once the
data is in this folder, it is not touched or used. For example, Vuser.c is a copy of run.c.
Troubleshooting and Limitations for Recording
This section describes troubleshooting and limitations for recording scripts with VuGen.
User Guide
VuGen
HP LoadRunner (12.50) Page 232
Proxy recording
lIf a client-side certificate is required during remote proxy recording, the dialog box requesting the
certificate, opens on the VuGen machine, and not on the client machine.
lNTLM authentication is not supported for proxy recording.
lIssue: When recording a session in Chrome, the browser may appear to hang as it continually
searches for external links.
Workaround: Manually set the environment's proxy settings in Chrome—do not enable
Automatically detect settings.
Security Levels
Issue: "Trusted sites" appears in every recorded snapshot.
Solution: Open Internet Explorer at least once before recording a script in VuGen.
Common Web recording issues
Issue: The most common problems seen in Web recording.
The following blog post lists five tips to solve the most common Web recording issues:
http://h30499.www3.hp.com/t5/HP-LoadRunner-and-Performance/5-tips-to-solve-the-most-common-
problems-seen-in-Web-recording/ba-p/6357387.
Troubleshooting missing steps
Issue: Your script is missing steps you recorded.
You encounter the following warning in the Output Pane > Code generation tab:
Warning: One or more responses are missing or have missing packets. Therefore, a
step may appear to be missing in the script.
This issue can be caused if the recording was stopped before all the responses were
received.
If the script is generated from a .pcap file, check if the file has missing
packets.
This can be caused when you click Stop Recording before all the traffic has been received.
Steps to Resolve: Record the script again. Make sure all pages and resources have been downloaded
before clicking the Stop Record button.
Recording on Internet Explorer 10
Issue: When recording on Internet Explorer (IE) 10, the browser uses cached pages, and may not record
all of the steps.
Steps to Resolve: Each time you begin recording, configure IE 10 to always refresh Web pages from the
server. After you begin a recording session, in IE, click F12 to open the Developer Tools pane. In this
User Guide
VuGen
HP LoadRunner (12.50) Page 233
pane, usually located at the bottom of the browser window, select Cache > Always refresh from
server.
Certificate warning message
When you open VuGen as a non-administrator user, during the recording process you may see a
certificate pop-up warning message. The message is automatically closed and does not affect the
recording.
Multi-Protocol recording
If you record a script in the Init section and then re-record in the Actions sections, compilation may fail.
This happens because VuGen creates new header files with each code generation, removing the old
ones.
Workaround: Re-record the new session in the same section as the first recording.
Overwriting of data
When recording a Web HTTP/HTML script using WebSockets, if you stop the recording and then resume
the recording session, the new data overwrites the original data in the buffer. This is true even if you
perform the second recording into a new action.
Firefox as default browser
If Firefox is set as the default browser, the Obtain the proxy settings from the default browser option
(Runtime Settings > Internet Protocol > Proxy) does not work, and a direct connection is used.
FTP and Active SSL
FTP Active SSL mode is not supported for record or replay.
FTP Recording
An FTP recording may generate an empty script.
Workarounds: Perform one of the following:
lConfigure the FTP server to include the string "FTP" in the welcome message.
lOpen the Network > Mapping and Filtering recording option node. In the Port mapping area (upper
section), click New Entry. In the Server Entry - Port Mapping dialog box, set the Service ID to FTP and
specify the FTP server's port number.
64-bit Recording
In general, 64-bit applications ported from a 32-bit client version should work identically to the 32-bit
client. There is a small risk that new clients will use the power of native 64-bit applications. For example,
when using 64-bit long types for Identifiers in DB tables, the identifier value will be cut and the query will
fail.
The following guidelines apply:
User Guide
VuGen
HP LoadRunner (12.50) Page 234

lThe environment for 64-bit recording must be a Windows 7 x64 or Windows 8 x64 (Windows 8 x64
added in Service Pack 11.52), and a 64-bit Application Under Test (AUT).
lRecording on 64-bit operating system for 32 and 64-bit applications (running as a 64-bit application)
is supported.
lYou cannot record a page requiring a client certificate with 64-bit version of Internet Explorer.
lReplay is only supported for 32-bit.
lFor the Java Over HTTP protocol: JVM 32-bit is required for replay.
lOracle 2-Tier: Both 32-bit and 64-bit clients need to be installed (the 32-bit client is required for
replay).
lFor the .NET protocol: There are two available 64-bit types for .NET applications (AnyCPU and pure 64-
bit). LoadRunner only supports AnyCPU. There is currently no solution for pure 64-bit applications.
For replay, LoadRunner uses the same AnyCPU dlls that were used for Recording.
Note: With LoadRunner 11.50 and higher, .NET Framework 4 should be installed. This package
carries both versions of the libraries for 32 and 64-bit systems.
Correlating
Correlation Overview
Creating a Vuser script includes the steps shown below. This topic provides and overview of the third
step, correlating a Vuser script.
Correlation is used when a recorded script includes a dynamic value (such as a session ID) and therefore
cannot be successfully replayed. To resolve this, you convert the dynamic value into a variable—thereby
enabling your script to replay successfully.
For example, many applications and Web sites use the current date and time to identify a session. If you
try to replay a script that was recorded on such a site, the script may fail because the current time is
different from the recorded time. Correlating the data enables you to save the dynamic data and use it
throughout the scenario run.
When a correlation is created, VuGen adds a function that extracts the dynamic value to a parameter.
Appropriate occurrences of the original value are replaced with a parameter.
For details, see "Correlation Tab [Design Studio] Overview" on the next page.
Correlations in LoadRunner
A slideshow describing how to correlate values in LoadRunner, is available in the online help provided
with LoadRunner.
User Guide
VuGen
HP LoadRunner (12.50) Page 235
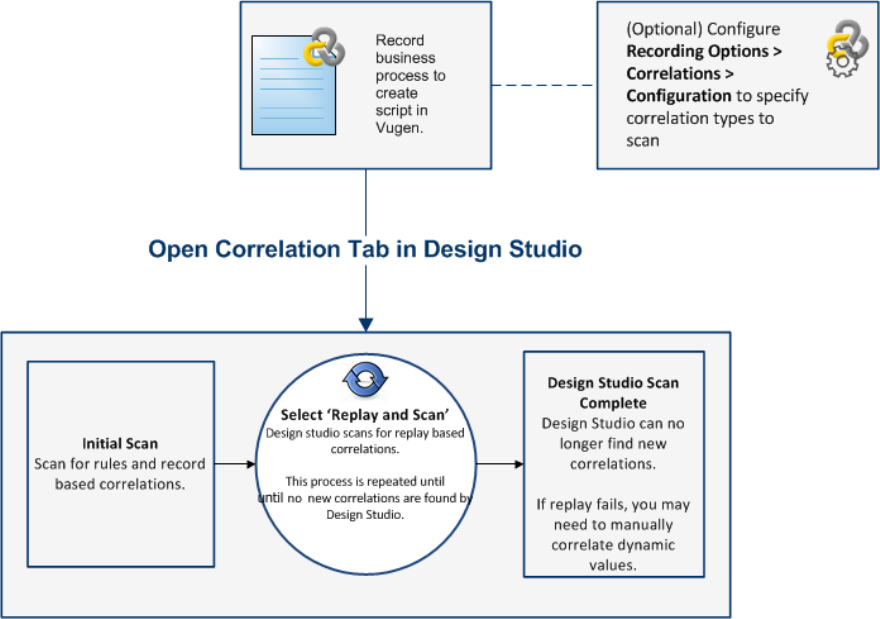
Correlation Tab [Design Studio] Overview
The Correlation tab enables you to correlate and manage dynamic values in your web-based Vuser
scripts. To learn more about correlation concepts, see "Correlation Overview" on the previous page.
With the Correlation tab you can:
lScan for correlations using rules, record based, and replay based engines
lCorrelate both raw and formatted data
lAdd and edit rules
lUndo correlations
lReview details pertaining to a specific dynamic value in a snapshot
When you record a script using a web-based protocol, many of the values change dynamically each time
a request is sent to the server. An example of a dynamic value is a sessionID which may include a date
and time stamp of when the web session was opened. To learn more, see "How to Correlate Scripts
Using Design Studio" on page241.
The following flow chart illustrates the process for correlating values in your script using the Correlation
tab:
User Guide
VuGen
HP LoadRunner (12.50) Page 236

As you can see from the flow chart, the Correlation tab scans for dynamic values using different
processes.
Correlation Types
Design Studio uses three processes to automatically find dynamic values that may need to be
correlated.
lRules
Design Studio first scans for dynamic values that are defined by rules, if the rules scan has been
enabled. To learn more, see "Correlation Rules" below.
lRecord
Design Studio scans for dynamic values after code generation. This method can find a significant
percentage of dynamic values in your script.
lReplay
Design Studio scans for dynamic values after replay. This method may need to be repeated several
times.
You can select which scan types the Correlation tab should use by configuring Recording Options >
Correlations > Configuration. In general, it is recommended to enable all scan types.
The following table explains the expected behavior at various script states:
Script State when
opening the
Correlation tab
Behavior in the Correlation tab
(All scan types enabled)
Script contains
recorded data.
When Design Studio is opened, it will scan for rule and record based
correlations.
You can then replay and scan for replay based correlations. Repeat this
process until the Design Studio no longer finds new correlations.
Script contains
recorded data and has
been replayed.
When the Correlation tab is opened, it will scan for all correlation types.
You can then replay and scan for additional replay based correlations.
Repeat this process until Design Studio no longer finds new correlations.
Correlation Rules
If you know the dynamic values that need to be correlated before recording, you can create correlation
rules that will automatically identify those values while you record. If "Automatically apply correlation
rules" is selected in the Recording Options > Correlations > Configuration node, values found based on
rules will automatically be correlated. Additionally, there are some correlation rules that come pre-
defined in VuGen for supported application servers. You can enable or disable rules in "Correlations >
Rules Recording Options" on page155.
User Guide
VuGen
HP LoadRunner (12.50) Page 237
Snapshot Details and Occurrences
Design Studio provides details on each snapshot step that contains dynamic values. These details can
help you determine which values to correlate in your script. In addition to the snapshot details, the
Correlation tab, displays all occurrences of the dynamic value in your script. You can select specific
occurrences to correlate or correlate all. For details, see "Design Studio [Correlation Tab] Dialog Box" on
page271.
Determining Which Values to Correlate
Once you generate a list of differences, you need to determine which ones to correlate. If you
mistakenly correlate a difference that did not require correlation, your replay may be adversely
affected.
The following strings most probably require correlation:
lLogin string. A login string with dynamic data such as a session ID or a timestamp.
lDate/Time Stamp. Any string using a date or time stamp, or other user credentials.
lCommon Prefix. A common prefix, such as SessionID or CustomerID, followed by a string of
characters.
If you are in doubt whether a difference should be correlated, correlate only that difference and then
run your script. Check the Replay log to see if the issue was resolved.
You should also correlate differences in which some of the recorded and replayed strings are identical,
but others differ. For example, SessionID strings with identical prefixes and suffixes, but different
characters in between, should be correlated.
Modifying Saved Parameters
After you save a value to a parameter, you may need to modify it before using it in your script. If you
need to perform arithmetical operations on a parameter, you must change it from a string to an integer
using the atoi or atol C functions. After you modify the value as an integer, you must convert it back to
a string to use the new variable in your script.
In the following WinSock example, the data at offset 67 was saved to the parameter, param1. Using
atol, VuGen converted the string to a long integer. After increasing the value of param1 by one, VuGen
converted it back to a string using sprintf and saved it as a new string, new_param1. The value of the
parameter is displayed using lr_output_message. This new value may be used at a later point in the
script.
lrs_receive("socket2", "buf47", LrsLastArg);lrs_save_param("socket2",
NULL, "param1", 67, 5);
lr_output_message ("param1: %s", lr_eval_string("<param1>"));
sprintf(new_param1, "value=%ld", atol(lr_eval_string("<param1>")) + 1);
lr_output_message("ID Number:"%s" lr_eval_string("new_param1"));
User Guide
VuGen
HP LoadRunner (12.50) Page 238
Correlation vs. Parameterization
Parameterization is used when you want to take a value and turn it into a variable in order to make your
script more realistic. For example, if you are filling out a form on a website, you may want to vary the
value entered for a particular field.
Correlation is used when a recorded script includes a dynamic value (such as a session ID) and cannot
replay. To resolve this, you make the dynamic value into a variable thereby enabling your script to replay
successfully.
Wdiff Correlation Utility
The Wdiff Utility lets you compare recorded Vuser scripts and replay results to determine which values
need to be correlated.
To use WDiff effectively, you record the identical operation twice, and compare the scripts (or data files
for WinSock). WDiff displays differences in yellow. Note that not all differences indicate a value to
correlate. For example, certain receive buffers that indicate the time of execution do not require
correlation.
For task details, see "How to Search for Values that Need Correlation" on page262.
Correlating Java Scripts
VuGen's Java recorder attempts to automatically correlate statements in the generated script. It only
performs correlation on Java objects. When it encounters a Java primitive (byte, character, boolean,
integer, float, double, short, and long) during recording, the argument values appear in the script
without association to variables. VuGen automatically correlates all objects, arrays of objects, and
arrays of primitives. Note that Java arrays and strings are also considered objects.
VuGen employs several levels of correlation: Standard, Enhanced, and Strings. You enable or disable
correlations from the Recording options. An additional method of Serialization can be used to handle
scripts where none of the former methods can be applied.
Standard Correlation
Standard correlation refers to the automatic correlation performed during recording for simple objects,
excluding object arrays, vectors, and container constructs.
When the recorded application invokes a method that returns an object, VuGen's correlation
mechanism records these objects. When you run the script, VuGen compares the generated objects to
the recorded objects. If the objects match, the same object is used. The following example shows two
CORBA objects my_bank and my_account. The first object, my_bank, is invoked; the second object, my_
account, is correlated and passed as a parameter in final line of the segment:
User Guide
VuGen
HP LoadRunner (12.50) Page 239
public class Actions {
// Public function: init
public int init() throws Throwable {
Bank my_bank = bankHelper.bind("bank", "pumpkin");
Account my_account = accountHelper.bind("account","pumpkin");
my_bank.remove_account(my_account);
}
}
Advanced Correlation
Advanced or deep correlation refers to the automatic correlation performed during recording for
complex objects, such as object arrays and CORBA container constructs.
The deep correlation mechanism handles CORBA constructs (structures, unions, sequences, arrays,
holders, `any's) as containers. This allows it to reference inner members of containers, additional
objects, or different containers. Whenever an object is invoked or passed as a parameter, it is also
compared against the inner members of the containers.
In the following example, VuGen performs deep correlation by referencing an element of an array. The
remove_account object receives an account object as a parameter. During recording, the correlation
mechanism searches the returned array my_accounts and determines that its sixth element should be
passed as a parameter.
public class Actions {
// Public function: init
public int init() throws Throwable {
my_banks[] = bankHelper.bind("banks", "pumpkin");
my_accounts[] = accountHelper.bind("accounts","pumpkin");
my_banks[2].remove_account(my_accounts[6]);
}
}
The following segment further illustrates enhanced correlation. The script invokes the send_letter
object that received an address type argument. The correlation mechanism retrieves the inner
member, address, in the sixth element of the my_accounts array.
public class Actions {
// Public function: init
public int init() throws Throwable {
my_banks = bankHelper.bind("bank", "pumpkin");
my_accounts = accountHelper.bind("account", "pumpkin");
my_banks[2].send_letter(my_accounts[6].address);
}
}
String Correlation
String correlation refers to the representation of a recorded value as an actual string or a variable.
User Guide
VuGen
HP LoadRunner (12.50) Page 240

When you disable string correlation (the default setting), the actual recorded value of the string is
indicated explicitly within the script. When you enable string correlation, it creates a variable for each
string, allowing you to use it at a later point in the script.
In the following segment, string correlation is enabled—you store the value returned from the get_id
method in a string type variable for use later on in the script.
public class Actions {
// Public function: init
public int init() throws Throwable {
my_bank = bankHelper.bind("bank", "pumpkin");
my_account1 = accountHelper.bind("account1", "pumpkin");
my_account2 = accountHelper.bind("account2", "pumpkin");
string = my_account1.get_id();
string2 = my_account2.get_id();
my_bank.transfer_money(string, string2);
}
}
How to Correlate Scripts Using Design Studio
This topic describes how to use the Correlation tab to correlate Vuser scripts.
Prerequisites
1. Record a script using one of the following protocols:
lWeb HTTP/HTML
lFlex
lRTMP/RTMPT
lCitrix
lSAP - Web
lOracle NCA
Note: You can only correlate the Web HTTP/HTML steps within your Oracle NCA script
and the Web HTTP/HTML protocol must be active. To activate, select Recording
Options > Protocol > Active Protocols > Web HTTP/HTML.
For additional information on manual correlation, see "How to Correlate Scripts - Oracle
NCA" on page252
2. Verify that Record > Recording Options > Correlations > Configuration has all scan types
enabled.
User Guide
VuGen
HP LoadRunner (12.50) Page 241
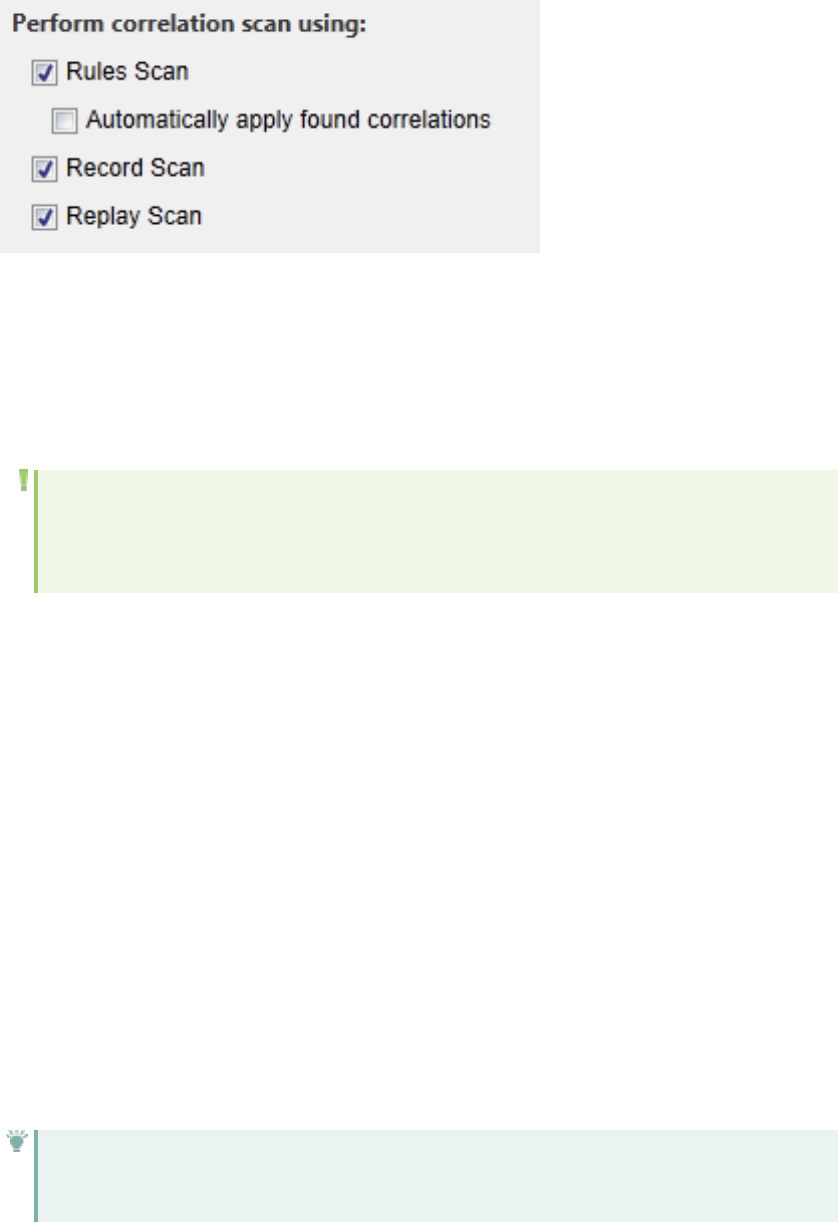
Using the Correlation tab
1. Click the Design Studio button to perform an initial scan. This will open the Design Studio dialog
box which will scan for response (or record based) correlations and apply correlation rules. The
progress bar in the dialog box indicates if the initial scan was successful.
For details on the Correlation tab, see "Correlation Tab [Design Studio] Overview" on page236.
Note: If no dynamic values for correlation are found, a warning is displayed, advising you to
check your recording options. Verify that Record > Recording Options > Correlations >
Configuration has all scan types enabled.
2. Select which values to correlate by highlighting the value in the grid and clicking the Correlate
button.
When a value is correlated, VuGen adds a web_reg_save_param_* function, and saves the original
value in a comment in the script.
You can examine the details of the correlation by expanding the Details Chevron in the dialog box.
For details, see "Design Studio [Correlation Tab] Dialog Box" on page271.
For details on the Correlation tab, see "Correlation Tab [Design Studio] Overview" on page236.
3. Click the Add as Rule button to add a rule type . In addition, you can click the Edit rule button to
view and edit the corresponding rule if the dynamic value was correlated by a rule. For details, see
"Correlations > Rules Recording Options" on page155.
4. Click the Replay and Scan button. The Correlation tab progress bar indicates if additional
correlations have been found. Again, you can select which values you would like to correlate by
highlighting the value in the grid and clicking the Correlate button. You may need to repeat this
step several times.
5. When Design Studio no longer finds new correlations, the progress bar will display Design Studio
Scan Complete.
Tip: If Design Studio does not resolve all correlation-based errors, try to resolve them
using manual correlation. For details, see "How To Manually Correlate Scripts" on the next
User Guide
VuGen
HP LoadRunner (12.50) Page 242
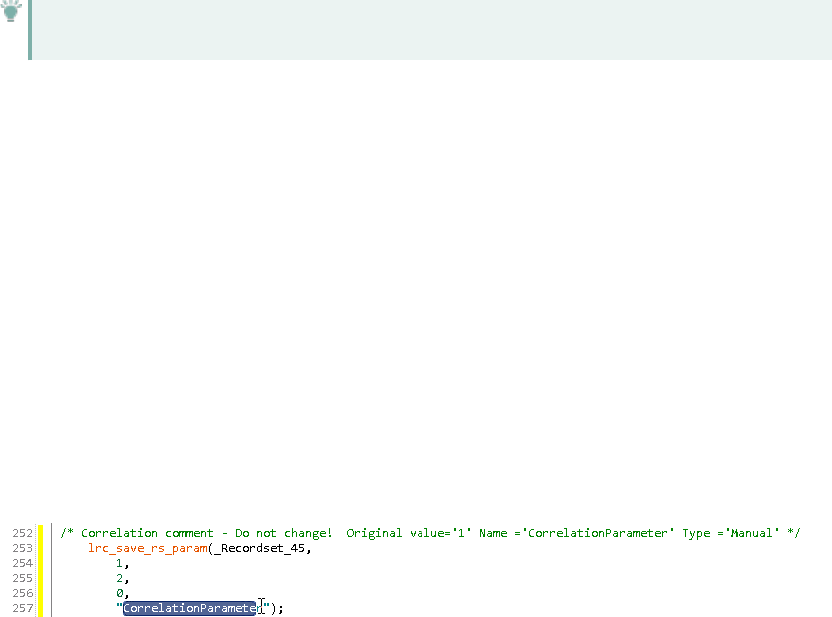
page.
How To Manually Correlate Scripts
If the scan for correlation did not resolve all correlation-based errors in your script, you can attempt to
manually correlate your script as follows:
1. Search for values that need correlation manually. There are a number of ways to manually
search for values that need correlation. For details, see "How to Search for Values that Need
Correlation" on page262.
2. Correlate the value.
Select one of the following methods:
lCorrelate from snapshots. Highlight the value to correlate, right-click, and select Create
Correlation.
When a value is correlated, VuGen adds the correlation parameter and saves the original value in
a comment in the script.
lManually add correlation functions. Manually insert the relevant correlation functions into your
script. For details, see "How to Correlate Scripts - Web (Manually)" on page246.
How to Correlate Scripts From a Snapshot
The following steps describe how to correlate scripts from a snapshot.
In order to correlate values from a snapshot, you must first select the Enable correlation from
snapshots option in the Scripting > Correlation section of the "Options Dialog Box" on page101.
This task applies to the following protocols:
lDatabase Protocols
lRTMP
lCOM Protocols
1. Open the Output Pane
Select View >Output to display the output tabs at the bottom of the window. Check for errors in the
Replay tab. Often, these errors can be corrected by correlation.
2. Select the relevant step in the Step Navigator, and view the step in the Snaphot pane. Right click
User Guide
VuGen
HP LoadRunner (12.50) Page 243
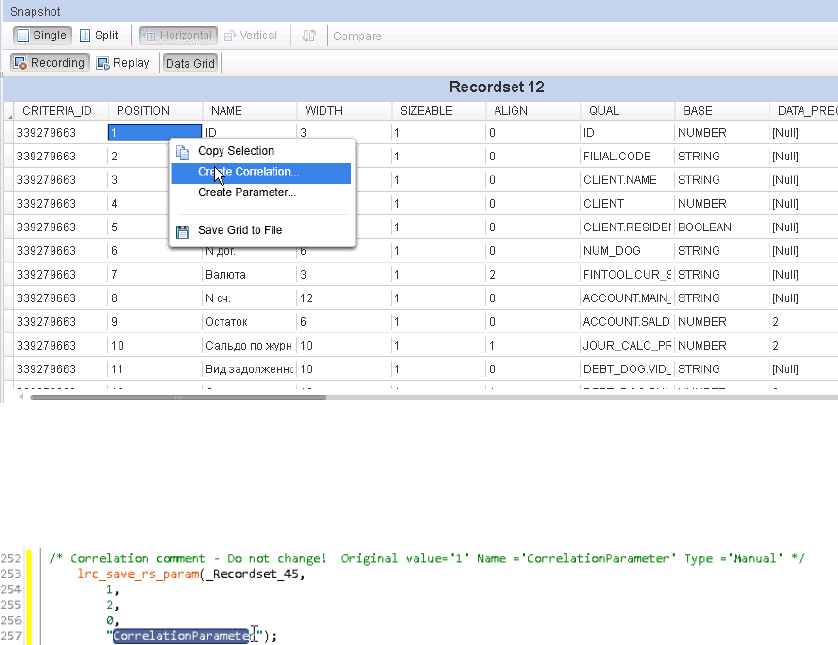
the value in the snapshot and select Create correlation. This will open the Design Studio window.
3. You can select the value you would like to correlate by highlighting it in the grid and clicking the
Correlate button.
4. When a value is correlated, VuGen adds the correlation parameter, and saves the original value in a
comment in the script.
How to Correlate Scripts - Winsock (Snapshot Pane)
VuGen's Design Studio provides a user interface for correlating Vuser scripts. Correlation is required
when working with dynamic data. A common issue with Winsock Vuser scripts is dynamic ports—ports
whose numbers are assigned dynamically. While certain applications always use the same port, others
use the next available port. If you try to replay a script and the recorded port is no longer available, your
script will fail to replay. To overcome this issue, you must perform correlation—save the actual runtime
values and use them within the script.
VuGen uses lrs_save_param and lrs_save_searched_string functions correlate Winsock scripts. This
means that it stores the data that is received for use in a later point within the script. Since correlation
stores the received data, it applies only to Receive buffers and not to Send buffers. The recommended
procedure is to select a string of dynamic data within the Receive buffer that you want to correlate. Use
that same parameter in a subsequent Send buffer.
Correlating a Winsock script
You use the Snapshot pane to begin correlating Winsock Vuser scripts. Both the Text and the Hex tabs in
the Snapshot pane have the correlating functionality.
User Guide
VuGen
HP LoadRunner (12.50) Page 244
1. In the Snapshot pane, select the data that you want to correlate.
2. Right-click in the selection, and select Create Correlation or Create Boundary Correlation. The
Design Studio opens and displays the Correlation tab.
Note that you can click the number of occurrences in the Replace/Found column to enable you to
choose the exact occurrences that you want to correlate.
3. Click the Details bar to display details about the correlation.
4. Make sure that the Original Snapshot Step tab is visible. Notice that the type is either Data Range
or Boundary Based.
5. Click Correlate to perform the correlation of the Vuser script.
6. Click Close to close the Design Studio. Notice that VuGen has inserted the appropriate correlation
functions and comments into the script.
For further details on how to use the Design Studio, see "Correlation Tab [Design Studio] Overview" on
page236.
Parameterization vs Correlation
This type of correlation should not be confused with simple parameterization. Simple parameterization
(Design > Parameters > Create New Parameter) applies only to data within Send buffers. You set up a
parameter and assign it several values. VuGen uses the different values in each of the script runs or
iterations. For further details, see "Correlation vs. Parameterization" on page239.
For details on how to manually correlate a Winsock Vuser script, see "How to Correlate Scripts - Winsock
(Manually)" below.
How to Correlate Scripts - Winsock (Manually)
This topic describes how to use the Editor to manually correlate values in a Winsock Vuser script. It is
recommended that you first try to correlate values through the Design Studio. For details, see "How to
Correlate Scripts - Winsock (Snapshot Pane)" on the previous page.
In the following example, a user performed a telnet session. The user used a ps command to determine
the process ID (PID), and killed an application based on that PID.
frodo:/u/user1>ps
PID TTY TIME CMD
14602 pts/18 0:00 clock
14569 pts/18 0:03 tcsh
frodo:/u/user1>kill 14602
[3] Exit 1 clock
frodo:/u/user1>
During execution, the PID of the procedure is different, so killing the recorded PID will be ineffective. To
overcome this problem, use lrs_save_param_ex to save the current PID to a parameter. Replace the
constant PID value with the parameter.
To manually correlate the value:
User Guide
VuGen
HP LoadRunner (12.50) Page 245

1. View the buffer contents by selecting data.ws in the Extra File node of the script. Locate the data
that you want to replace with the contents of the saved buffer. Use the right-click menu item
Replace with Parameter, to replace all instances of the value with the parameter.
2. In the data.ws file, note the buffer in which the data was received, for example buf47.
recv buf47 98
"\r"
"\x00"
"\r\n"
" PID TTY TIME CMD\r\n"
" 14602 pts/18 0:00 clock\r\n"
" 14569 pts/18 0:02 tcsh\r\n"
"frodo:/u/lab>"
.
.
.
send buf58
"kill 14602"
3. Determine the offset (starting point) and length of the data string to save. In the above example,
the offset of the PID is 11 and its length is 5 bytes. For additional information about displaying the
data, see "Data Buffers" on page986.
4. In the recorded section, determine the socket used by buf47. In this example, buf47 used socket1.
lrs_receive("socket1", "buf47", LrsLastArg);
5. Using the Steps Toolbox, insert an lrs_save_param_ex function in the recorded section, after the
lrs_receive for the relevant buffer. In our example, the buffer is buf47. Use the parameter name
that you used in Step 1.
lrs_save_param_ex("socket1", "user", buf47, 11, 5, ascii, param1);
6. Print the parameter to the output using lr_output_message.
lr_output_message ("param1: %s", lr_eval_string("<param1>"));
How to Correlate Scripts - Web (Manually)
This task describes how to correlate web scripts manually by modifying the code.
1. Locate the string and its details
Identify the statement that contains dynamic data and the patterns that characterize the
locations of the data. These patterns may be boundaries or xpaths.
a. Identify Patterns using Boundaries
Use these guidelines to determine and set the boundaries of the dynamic data:
User Guide
VuGen
HP LoadRunner (12.50) Page 246
oAnalyze the location of the dynamic data within the HTTP response.
oIdentify the string that is immediately to the left of the dynamic data. This string defines
the left boundary of the dynamic data.
oIdentify the string that is immediately to the right of the dynamic data. This string defines
the right boundary of the dynamic data.
oThe right and left boundaries should be as unique as possible to better locate the strings.
oweb_reg_save_param_ex looks for the characters between (but not including) the
specified boundaries and saves the information beginning one byte after the left boundary
and ending one byte before the right boundary. web_reg_save_param_ex does not
support embedded boundary characters.
For example, if the input buffer is {a{b{c} and "{" is specified as a left boundary, and "}" as
a right boundary, the first instance is c and there are no further instances—it found the
right and left boundaries but it does not allow embedded boundaries, so "c" is the only valid
match.
By default, the maximum length of any boundary string is 256 characters. Include a web_set_
max_html_param_len function in your script to increase the maximum permitted length. For
example, the following function increases the maximum length to 1024 characters:
These length restrictions do not apply where either the left or right boundaries are blank.
b. Identify Patterns using XPath or JSONPath expressions
Use the snapshot pane to manually search for the XPath of the desired string.
By default, the maximum length of any boundary string is 256 characters Include a web_set_
max_html_param_len function in your script to increase the maximum permitted length. For
example, the following function increases the maximum length to 1024 characters:
These length restrictions do not apply where either the left or right boundaries are blank.
2. Add web_reg_save_param_* function
Add a web_reg_save_param_ex or web_reg_save_param_xpath function into the script before
the statement that contains the dynamic data.
a. web_reg_save_param_ex
This function searches server responses in web steps for the left boundary following by the
string and the right boundary and saves the string to a parameter named in the function's
argument. After finding the specified number of occurrences, web_reg_save_param_ex does
not search any more responses. For more information, see the Function Reference (Help >
Function Reference).
b. web_reg_save_param_xpath
This function searches server responses in web steps for a specified XPath. The string located
in specified XPath is saved to a parameter named in the function's argument. For more
information, see the Function Reference (Help > Function Reference).
c. web_reg_save_param_json
User Guide
VuGen
HP LoadRunner (12.50) Page 247
This function searches server responses in Web steps for a specified JSONPath. The located
string is saved to a parameter named in the function's argument. For more information, see
the Function Reference and Internet resources for JSONPath, XPath for JSON.
3. Replace data with parameter
Select Edit >Replace from the VuGen main window to display the Search and Replace dialog box.
Search the entire script for the dynamic data and replace it with a parameter. Give the parameter
any name and enclose it with braces: {param_name}. You can include a maximum of 64
parameters per script.
How to Correlate Scripts - Siebel
The following steps describe how to correlate Siebel Web Vuser scripts.
Correlation Library
To assist you with correlation, Siebel has released a correlation library file as part of the Siebel
Application Server version 7.7. This library is available only through Siebel. The library file, ssdtcorr.dll, is
located under the siebsrvr\bin folder for Windows and under siebsrvr/lib for Linux installations.
The library file, ssdtcorr.dll, must be available to all machines where a Load Generator or Controller
reside. Support for this library requires VuGen 8.0 and higher. The following steps describe how to
enable correlation with this library.
1. Copy the DLL file into the bin folder of the product installation.
2. Open a multi-protocol script using the Siebel-Web Vuser type.
3. Enable UTF-8 support in the Recording Options > HTTP Properties > Advanced node.
4. Open the recording option's Correlation node and click Import. Import the rules file,
WebSiebel77Correlation.cor, from the \dat\webrulesdefaultsetting folder. If you are prompted
with warnings, click Override.
To revert to the default correlation, delete all of the Siebel rules and click Use Defaults.
When using the Siebel correlation library, verify that the SWE count rules (where the left boundary
contains the SWEC string) are not disabled.
Correlation Rules
VuGen's native built-in rules for the Siebel server detect the Siebel server variables and strings,
automatically saving them for use at a later point within the script. The rules list the boundary criteria
that are unique for Siebel server strings.
When VuGen detects a match using the boundary criteria, it saves the value between the boundaries to
a parameter. The value can be a simple variable or a public function.
User Guide
VuGen
HP LoadRunner (12.50) Page 248
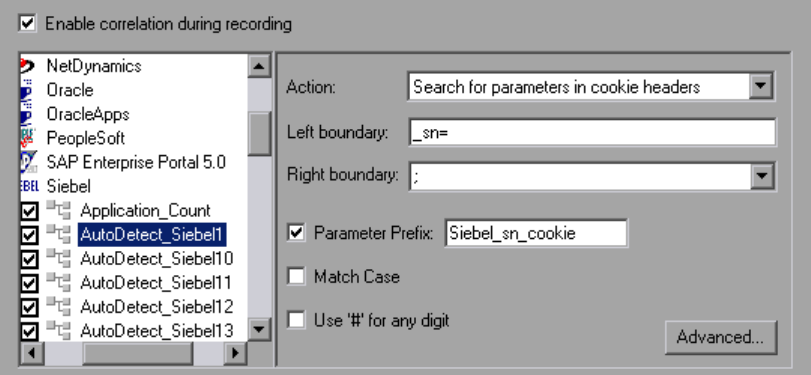
In normal situations, you do not need to disable any rules. In some cases, however, you may want to
disable rules that do not apply. For example, disable Japanese content check rules when testing English-
only applications.
Another reason to disable a rule is if the Controller explicitly requires an error condition to be
generated. View the rule properties in the recording options and determine the conditions necessary for
your application.
Simple Variable Correlation
In the following example, the left boundary criteria is _sn=. For every instance of _sn= in the left
boundary and ;in the right, VuGen creates a parameter with the Siebel_sn_cookie prefix.
In the following example, VuGen detected the _sn boundary. It saved the parameter to Siebel_sn_
cookie6 and used it in the web_url function.
/* Registering parameter(s) from source
web_reg_save_param("Siebel_sn_cookie6",
"LB/IC=_sn=",
"RB/IC=;",
"Ord=1",
"Search=headers",
"RelFrameId=1",
LAST);
...
web_url("start.swe_3",
"URL=http://cannon.hplab.com/callcenter_
enu/start.swe?SWECmd=GotoPostedAction=;SWEDIC=true=;_sn={Siebel_sn_cookie6}=;SWEC=
{Siebel_SWECount}=;SWEFrame=top._sweclient=;SWECS=true",
"TargetFrame=",
"Resource=0",
"RecContentType=text/html",
"Referer=http://cannon.hplab.com/callcenter_enu/start.swe?SWECmd=GetCachedFrame=;_
sn={Siebel_sn_cookie6}=;SWEC={Siebel_SWECount}=;SWEFrame=top._swe",
"Snapshot=t4.inf",
User Guide
VuGen
HP LoadRunner (12.50) Page 249
"Mode=HTML",
LAST);
Function Correlation
In certain instances, the boundary match is a function. Functions generally use an array to store the
runtime values. In order to correlate these values, VuGen parses the array and saves each argument to
a separate parameter using the following format:
<parameter_name> = <recorded_value> (display_name)
The display name is the text that appears next to the value, in the Siebel Application.
VuGen inserts a comment block with all of the parameter definitions.
/* Registering parameter(s) from source task id 159
// {Siebel_Star_Array_Op33_7} = ""
// {Siebel_Star_Array_Op33_6} = "1-231"
// {Siebel_Star_Array_Op33_2} = ""
// {Siebel_Star_Array_Op33_8} = "Opportunity"
// {Siebel_Star_Array_Op33_5} = "06/26/2003 19:55:23"
// {Siebel_Star_Array_Op33_4} = "06/26/2003 19:55:23"
// {Siebel_Star_Array_Op33_3} = ""
// {Siebel_Star_Array_Op33_1} = "test camp"
// {Siebel_Star_Array_Op33_9} = ""
// {Siebel_Star_Array_Op33_rowid} = "1-6F"
// */
In addition, when encountering a function, VuGen generates a new parameter for web_reg_save_
param,AutoCorrelationFunction. VuGen also determines the prefix of the parameters and uses it as
the parameter name. In the following example, the prefix is Siebel_Star_Array_Op33.
web_reg_save_param("Siebel_Star_Array_Op33",
"LB/IC=`v`",
"RB/IC=`",
"Ord=1",
"Search=Body",
"RelFrameId=1",
"AutoCorrelationFunction=flCorrelationCallbackParseStarArray",
LAST);
VuGen uses the parameters at a later point within the script. In the following example, the parameter is
called in web_submit_data.
web_submit_data("start.swe_14", "Action=http://cannon.hplab.com/callcenter_enu/start.swe",
"Method=POST", "RecContentType=text/html", "Referer=", "Snapshot=t15.inf", "Mode=HTML",
ITEMDATA, "Name=SWECLK", "Value=1", ENDITEM, "Name=SWEField", "Value=s_2_1_13_0", ENDITEM,
"Name=SWER", "Value=0", ENDITEM, "Name=SWESP", "Value=false", ENDITEM, "Name=s_2_2_29_0",
"Value={Siebel_Star_Array_Op33_1}", ENDITEM, "Name=s_2_2_30_0", "Value={Siebel_Star_Array_
Op33_2}", ENDITEM, "Name=s_2_2_36_0", "Value={Siebel_Star_Array_Op33_3}", ENDITEM, ...
User Guide
VuGen
HP LoadRunner (12.50) Page 250

During replay, Vusers do a callback to the public function, using the array elements that were saved as
parameters.
Note: Correlation for the SWEC parameter is not done through the correlation rules. VuGen
handles it automatically with a built-in detection mechanism. For more information, see below.
SWEC Correlation
SWEC is a parameter used by Siebel servers representing the number of user clicks. The SWEC
parameter usually appears as an argument of a URL or a POST statement. For example:
GET /callcenter_enu/start.swe?SWECmd=GetCachedFrame=;_sn=2-
mOTFXHWBAAGb5Xzv9Ls2Z45QvxGQnOnPVtX6vnfUU_=;SWEC=1=;SWEFrame=top._swe._sweapp
HTTP/1.1
or
POST /callcenter_enu/start.swe HTTP/1.1
...
\r\n\r\n
SWERPC=1=;SWEC=0=;_sn=2-mOTFXHWBAAGb5Xzv9Ls2Z45QvxGQnOnPVtX6vnfUU_
=;SWECmd=InvokeMethod...
VuGen handles the changes of the SWEC by incrementing a counter before each relevant step. VuGen
stores the current value of the SWEC in a separate variable (Siebel_SWECount_var). Before each step,
VuGen saves the counter's value to a VuGen parameter (Siebel_SWECount).
In the following example, web_submit_data uses the dynamic value of the SWEC parameter, Siebel_
SWECount.
Siebel_SWECount_var += 1;
lr_save_int(Siebel_SWECount_var, "Siebel_SWECount");
web_submit_data("start.swe_8",
"Action=http://cannon.hplab.com/callcenter_enu/start.swe",
"Method=POST",
"TargetFrame=",
"RecContentType=text/html",
"Referer=",
"Snapshot=t9.inf",
"Mode=HTML",
"EncodeAtSign=YES",
ITEMDATA,
"Name=SWERPC", "Value=1", ENDITEM,
"Name=SWEC", "Value={Siebel_SWECount}", ENDITEM,
"Name=SWECmd", "Value=InvokeMethod", ENDITEM,
"Name=SWEService", "Value=SWE Command Manager", ENDITEM,
"Name=SWEMethod", "Value=BatchCanInvoke", ENDITEM,
"Name=SWEIPS",...
LAST);
User Guide
VuGen
HP LoadRunner (12.50) Page 251
Note that the SWEC parameter may also appear in the referrer URL. However, its value in the referrer
URL usually differs from its value in the requested URL. VuGen handles this automatically.
Correlate SWECount Parameters
The SWECount parameter value is usually a small number consisting of one or two digits. It is often
difficult to determine where to replace the recorded value with a parameter.
In the web_submit_data function, VuGen only replaces it in the SWEC field.
In URLs, VuGen only replaces the value when it appears after the strings "SWEC=" or "SWEC`".
The parameter name for all the SWECount correlations is the same.
Correlate ROWID Parameters
In certain cases, the rowid is preceded by its length, encoded in hexadecimal format. Since this length
can change, this value must be correlated.
For example, the following string is comprised of a length value and RowID, xxx6_1-4ABCyyy, where 6 is
the length, and 1-4ABC is the RowID.
If you define parameters to correlate the string as
xxx{rowid_Length}_{rowid}yyy
then using this enhanced correlation, VuGen generates the following function before the string:
web_save_param_length("rowid", LAST);
This function gets the value of rowid, and saves its length into the parameter rowid_length in
hexadecimal format.
Correlate SWET (timestamp) Parameters
The SWETS value in the script, is the number of milliseconds since midnight January 1st, 1970.
VuGen replaces all non-empty timestamps in the script, with the parameter {SiebelTimeStamp}. Before
saving a value to this parameter, VuGen generates the following function:
web_save_timestamp_param("SiebelTimeStamp", LAST);
This function saves the current timestamp to the SiebelTimeStamp parameter.
How to Correlate Scripts - Oracle NCA
The following steps describe different items in Oracle NCA scripts that may need correlation.
Correlate Statements for Load Balancing
VuGen supports load balancing for multiple application servers. You correlate the HTTP return values
with the nca_connect_server parameters. The Vuser then connects to the relevant server during test
User Guide
VuGen
HP LoadRunner (12.50) Page 252
execution, applying load balancing. The following steps describe how to correlate statements for load
balancing.
1. Record a multi-protocol script.
Record a multi-protocol script for Oracle NCA and Web Protocols. Perform the desired actions and
save the script.
2. Define parameters for host and host arguments.
Define two variables, serverHost and serverArgs, for parameterization:
web_set_max_html_param_len("512");
web_reg_save_param("serverHost", "NOTFOUND=ERROR",
"LB=<PARAM name=\"serverHost\" value=\"","RB=\">", LAST);
web_reg_save_param("serverArgs", "NOTFOUND=ERROR",
"LB=<PARAM name=\"serverArgs\" value=\"","RB=\">", LAST);
3. Assign values to serverHost and serverArgs:
web_url("step_name", "URL=http://server1.acme.com/test.htm", LAST);
4. Modify the nca_connect_server statement from:
nca_connect_server("199.203.78.170", 9000"/*version=107*/,
"module=e:\\appsnca...fndnam=apps ");
to:
nca_connect_server("{serverHost }", "9000"/*version=107*/, "{serverArgs}");
The script should now look like this:
web_set_max_html_param_len("512");
web_reg_save_param("serverHost", "NOTFOUND=ERROR",
"LB=<PARAM name=\"serverHost\" value=\"","RB=\">", LAST);
web_reg_save_param("serverArgs", "NOTFOUND=ERROR",
"LB=<PARAM name=\"serverArgs\" value=\"","RB=\">", LAST);
web_url("step_name", "URL=http://server1.acme/test.htm", LAST);
nca_connect_server("{serverHost}","9000"/*version=107*/,"{serverArgs}");
Correlate the icx_ticket Variable
The icx_ticket variable, is part of the information sent in the web_url and nca_connect_server
functions:
web_url("fnd_icx_launch.runforms",
"URL=http://ABC-123:8002/pls/VIS/fnd_icx_launch.runforms\?ICX_
TICKET=5843A55058947ED3=;RESP_APP=AR=;RESP_KEY=RECEIVABLES_MANAGER=;SECGRP_
KEY=STANDARD", LAST);
This icx_ticket value is different for each recording. It contains cookie information sent by the client. To
correlate your recording, add web_reg_save_param before the first occurrence of the recorded icx_
ticket value:
User Guide
VuGen
HP LoadRunner (12.50) Page 253

web_reg_save_param("icx_ticket", "LB=TICKET=", "RB==;RES", LAST);
...
web_url("fnd_icx_launch.runforms",
"URL=http://ABC-123:8002/pls/VIS/fnd_icx_launch.runforms\?ICX_TICKET={icx_ticket}
=;RESP_APP=AR=;RESP_KEY=RECEIVABLES_MANAGER=;SECGRP_KEY=STANDARD", LAST);
Note: The left and right boundaries of web_reg_save_param may differ depending on your
application setup.
Correlate the JServSessionldroot Values
The JServSessionIdroot value is a cookie that the application sets to store the session ID. In most cases,
VuGen automatically correlates this value and inserts a web_reg_save_param function. If VuGen did not
add this function automatically, you add it manually, replacing all of its occurrences with the parameter
name.
To identify the value that you need to correlate, open the Execution log (View > Output Window) and
locate the response body.
vuser_init.c(8): Set-Cookie: JServSessionIdroot=my1sanw2n1.JS4; path=/\r\n
vuser_init.c(8): Content-Length: 79\r\n
vuser_init.c(8): Content-Type: text/plain\r\n
vuser_init.c(8): \r\n
vuser_init.c(8): 81-byte response body for "http://ABC-
123/servlet/oracle.forms.servlet.ListenerServlet?ifcmd=getinfo=;
ifhost=mercury=;ifip=123.45.789.12" (RelFrameId=1)
vuser_init.c(8):
/servlet/oracle.forms.servlet.ListenerServlet?JServSessionIdroot=my1sanw2n1.JS4\r\n
To correlate this dynamic value, insert a web_reg_save_param function before the first occurrence and
then replace the variable value with the parameter name throughout the script. In this example, the
right and left boundaries are \r and \n, but you should check your specific environment to determine the
exact boundaries in your environment.
web_reg_save_param("NCAJServSessionId","LB=\r\n\r\n","RB=\r","ORD=1",LAST);
web_url("f60servlet",
"URL= http://ABC-
"123/servlet/oracle.forms.servlet.ListenerServlet?ifcmd=getinfo=;"
"ifhost=mercury=;ifip=123.45.789.12", LAST);
web_url("oracle.forms.servlet.ListenerSer",
"URL=http://ABC-123{NCAJServSessionId}?ifcmd=getinfo=;"
"ifhost=mercury=;ifip=123.45.789.12", LAST);
How to Correlate Scripts - Microsoft .NET
This task describes how to correlate Microsoft .NET Vuser scripts.
User Guide
VuGen
HP LoadRunner (12.50) Page 254
Correlate scripts using ADO.net environments
1. Locate the dataset in your script.
Display the Vuser script in the Editor and expand the applicable DATASET_XML statement. Click
View > Snapshot.
2. Locate the value.
Locate the value you want to correlate. To search for a value in a data grid, display the data grid in
the Snapshot pane, and click Search > Quick Find to open the Search dialog box.
In the Search dialog box, click Include in Search, and then select the Snapshots check box.
3. Create a correlation.
Right-click on the value in the grid that you want to correlate and select Create Correlation. The
Create a correlation dialog box opens.
4. Specify a parameter name.
Specify a parameter name, identical to the variable you defined earlier. Click OK. VuGen prompts
you if you want to search for all occurrences. Click OK.
VuGen adds an lr.save_string function before each dataset. For example:
lr.save_string("MyCustomerID", CustomerAndOrdersDataSet_3.Tables
["Customers"].Rows[0]["CompanyName"].ToString());
5. Reference the parameter at a later point in the script.
Select the value you want to replace with a parameter and select Replace with a parameter from
the right-click menu. Insert the saved variable name in the Parameter name box. Click OK. VuGen
prompts you to replace all of the values with a parameter, using the lr.eval_string function to
evaluate the string's value.
lr.message("The customer ID is""+ lr.eval_string("{MyCustomerID}") + ");
Unlike other protocols, the script includes direct calls to the application or framework method.
Therefore, you cannot replace the string value with the {paramName}—instead you must use
lr.eval_string to evaluate the parameter's value.
Correlate with output parameters
For primitive values, you should generate the script with output parameter values and examine the
output parameters for correlations.
1. Select Recording > Recording Options, and select the General > Script node.
User Guide
VuGen
HP LoadRunner (12.50) Page 255
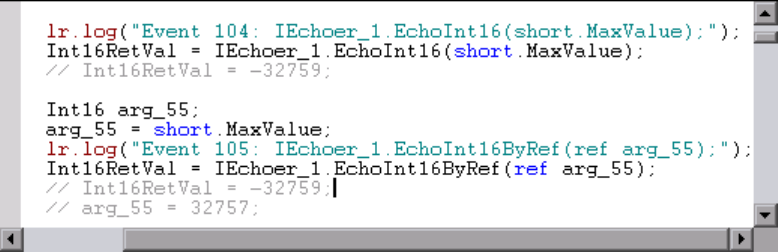
2. Select the Insert output parameter values check box. Click OK to close the Recording Options
dialog box.
3. Select Record > Regenerate Script to regenerate the script.
4. Search the commented output primitive values for correlations.
For more information about using correlation functions, see the Function Reference (Help > Function
Reference).
How to Correlate Scripts - Java Scripts - Serialization
In RMI and some cases of CORBA, the client AUT creates a new instance of a Java object using the
java.io.serializable interface. It passes this instance as a parameter for a server invocation. In the
following segment, the instance pis created and passed as a parameter.
// AUT code:
java.awt.Point p = new java.awt.Point(3,7);
map.set_point(p);
The automatic correlation mechanism is ineffective here, since the object did not return from any
previous call. In this case, VuGen activates the serialization mechanism and stores the object being
passed as a parameter. It saves the information to a binary data file under the user folder. Additional
parameters are saved as new binary data files, numbered sequentially. VuGen generates the following
code:
public class Actions {
// Public function: init
public int init() throws Throwable {
java.awt.Point p = (java.awt.Point)lr.deserialize(0, false);
map.set_point(p);
}
}
The integer passed to lr.deserialize represents the number of binary data files in the Vuser folder.
To parameterize the recorded value, use the public setLocation method (for information, see the JDK
function reference). The following example uses the setLocation method to set the value of the object,
p.
User Guide
VuGen
HP LoadRunner (12.50) Page 256

public class Actions {
// Public function: init
public int init() throws Throwable {
java.awt.Point p = (java.awt.Point)lr.deserialize(0, false);
p.setLocation(2,9);
map.set_point(p);
}
}
In certain instances the public method of setLocation is not applicable. As an alternative, you can use
the API of your class that incorporate get or set accessor methods. If you are working with AUT classes
that do not have get/set methods or use private methods, or if you are unfamiliar with the classes' API,
you can use VuGen's built-in serialization mechanism. This mechanism allows you to expand objects in
their ASCII representation and manually parameterize the script. You enable this mechanism in the
Recording Options dialog box. For details, see "Recording Properties > Serialization Options - Recording
Options" on page199.
VuGen generates an lr.deserialize method that deserializes the data or displays complex data
structures as serial strings. Once the structure is broken down to its components, it is easier to
parameterize. The lr.deserialize method receives two arguments, a string and an integer. The string is
the parameter's value that is to be substituted during replay. The integer is the index number of binary
file to load.
If you choose not to expand objects in your script by clearing the Unfold Serialized Objects check box,
you can control the serialization mechanism by passing arguments to the lr.deserialize method. The
first argument is an integer indicating the number of binary files to load. The second integer is a
boolean value:
true Use VuGen's serialization mechanism.
false Use the standard Java serialization mechanism.
The following segment shows a generated script in which the serialization mechanism was enabled.
public class Actions {
// Public function: init
public int init() throws Throwable {
_string = "java.awt.Point __CURRENT_OBJECT = {" +
"int x = "#5#" +
"int y = "#8#" +
"}";
java.awt.Point p = (java.awt.Point)lr.deserialize(_string,0);
map.set_point(p);
}
}
The string values are placed between delimiters. The default delimiter is "#". You can change the
delimiter in the Serialization tab of the recording options. Delimiters are used to speed up the parsing
of the string during replay.
User Guide
VuGen
HP LoadRunner (12.50) Page 257
When modifying the string, you must maintain the following rules:
lOrder of lines may not be changed. The parser reads the values one-by-one—not the member
names.
lOnly values between two delimiters may be modified.
lObject references may not be modified. Object references are indicated only to maintain internal
consistency.
l"_NULL_" can appear as a value, representing the Java null constant. You can replace it with string
type values only.
lObjects may be deserialized anywhere in the script. For example, you can deserialize all objects in the
init method and use the values in the action method.
lMaintain internal consistency for the objects. For example, if a member of a vector is element count
and you add an element, you must modify the element count.
In the following segment, a vector contains two elements:
public class Actions {
// Public function: init
public int init() throws Throwable {
_string = "java.util.Vector CURRENTOBJECT = {" +
"int capacityIncrement = "#0#" +
"int elementCount = #2#" +
"java/lang/Object elementData[] = {" +
"elementData[0] = #First Element#" +
"elementData[1] = #Second Element#" +
"elementData[2] = _NULL_" +
....
"elementData[9] = _NULL_" +
"}" +
"}";
_vector = (java.util.Vector)lr.deserialize(_string,0);
map.set_vector(_vector);
}
}
In the following example, one of the vector's elements was changed—a "_NULL_" value was changed to
"Third element". In coordination with the addition of the new element, the elementCount member was
modified to 3.
public class Actions {
// Public function: init
public int init() throws Throwable {
_string = "java.util.Vector CURRENTOBJECT = {" +
"int capacityIncrement = "#0#" +
"int elementCount = #3# " +
"java/lang/Object elementData[] = {" +
"elementData[0] = #First Element#" +
"elementData[1] = #Second Element#" +
"elementData[2] = #Third Element#" +
User Guide
VuGen
HP LoadRunner (12.50) Page 258
....
"elementData[9] = _NULL_" +
"}" +
"}";
_vector = (java.util.Vector)lr.deserialize(_string,0);
map.set_vector(_vector);
}
}
Due to the complexity of the serialization mechanism, which opens up the objects to ASCII
representation, opening large objects while recording may increase the time required for script
generation. To decrease this time, you can specify flags which will improve the performance of the
serialization mechanism.
When adding lr.deserialize to your script, we recommend that you add it to the init method—not the
action method. This will improve performance since VuGen will only deserialize the strings once. If it
appears in the action method, VuGen will deserialize strings for every iteration.
How to Correlate Scripts - Java
VuGen's Java recorder attempts to automatically correlate statements in the generated script. It
performs correlation on Java objects only. When it encounters a Java primitive (byte, character,
boolean, integer, float, double, short, and long) during recording, the argument values appear in the
script without association to variables. VuGen automatically correlates all objects, arrays of objects, and
arrays of primitives. Note that Java arrays and strings are also considered objects.
VuGen employs several levels of correlation: Standard, Enhanced, Strings. You enable or disable
correlation from the Recording options. An additional method of Serialization can be used to handle
scripts where none of the former methods can be applied.
Standard Correlation
Standard correlation refers to the automatic correlation performed during recording for simple objects,
excluding object arrays, vectors, and container constructs.
When the recorded application invokes a method that returns an object, VuGen's correlation
mechanism records these objects. When you run the script, VuGen compares the generated objects to
the recorded objects. If the objects match, the same object is used. The following example shows two
CORBA objects my_bank and my_account. The first object, my_bank, is invoked; the second object, my_
account, is correlated and passed as a parameter in final line of the segment:
public class Actions {
// Public function: init
public int init() throws Throwable {
Bank my_bank = bankHelper.bind("bank", "pumpkin");
Account my_account = accountHelper.bind("account","pumpkin");
my_bank.remove_account(my_account);
User Guide
VuGen
HP LoadRunner (12.50) Page 259
}
}
Advanced Correlation
Advanced or deep correlation refers to the automatic correlation performed during recording for
complex objects, such as object arrays and CORBA container constructs.
The deep correlation mechanism handles CORBA constructs (structures, unions, sequences, arrays,
holders, `any's) as containers. This allows it to reference inner members of containers, additional
objects, or different containers. Whenever an object is invoked or passed as a parameter, it is also
compared against the inner members of the containers.
In the following example, VuGen performs deep correlation by referencing an element of an array. The
remove_account object receives an account object as a parameter. During recording, the correlation
mechanism searches the returned array my_accounts and determines that its sixth element should be
passed as a parameter.
public class Actions {
// Public function: init
public int init() throws Throwable {
my_banks[] = bankHelper.bind("banks", "pumpkin");
my_accounts[] = accountHelper.bind("accounts","pumpkin");
my_banks[2].remove_account(my_accounts[6]);
}
}
The following segment further illustrates enhanced correlation. The script invokes the send_letter
object that received an address type argument. The correlation mechanism retrieves the inner
member, address, in the sixth element of the my_accounts array.
public class Actions {
// Public function: init
public int init() throws Throwable {
my_banks = bankHelper.bind("bank", "pumpkin");
my_accounts = accountHelper.bind("account", "pumpkin");
my_banks[2].send_letter(my_accounts[6].address);
}
}
String Correlation
String correlation refers to the representation of a recorded value as an actual string or a variable.
When you disable string correlation (the default setting), the actual recorded value of the string is
indicated explicitly within the script. When you enable string correlation, it creates a variable for each
string, allowing you to use it at a later point in the script.
In the following segment, string correlation is enabled—you store the value returned from the get_id
method in a string type variable for use later on in the script.
User Guide
VuGen
HP LoadRunner (12.50) Page 260

public class Actions {
// Public function: init
public int init() throws Throwable {
my_bank = bankHelper.bind("bank", "pumpkin");
my_account1 = accountHelper.bind("account1", "pumpkin");
my_account2 = accountHelper.bind("account2", "pumpkin");
string = my_account1.get_id();
string2 = my_account2.get_id();
my_bank.transfer_money(string, string2);
}
}
How to Correlate Scripts - Flex (XPath Correlation)
This topic describes how to use XPath correlation in Flex Vuser scripts. You use the XML View inside the
Snapshot pane to perform the correlation. Before you can successfully implement XPath correlation,
you must first configure the recording options.
For details on how to use regular correlation in Flex Vuser scripts, see "How to Correlate Scripts Using
Design Studio" on page241.
1. Configure the recording options
a. Select Record > Recording Options.
b. Under Flex, click Externalizable Objects.
c. Click Serialize objects using, and select Custom Java Classes.
d. Click the Add jar or zip file button .
e. On the LiveCycle installation discs, locate the following three files, and add them to the
Classpath Entries list:
i. flex.jar
ii. flex-messaging-common.jar
iii. flex-messaging-core.jar
Ensure that the added files exist in the same location on all load generator machines.
2. Record the Vuser script.
3. In the Editor, click inside the flex_amf_call step that contains the data you want to correlate, or in
the Step Navigator, double-click the flex_amf_call step that contains the data you want to
correlate.
4. Click View > Snapshot or click the Snapshot button on the VuGen toolbar.
5. In the Snapshot pane, click the Response Body tab.
6. On the right-side of the Snapshot pane, click the XML View tab.
7. In the XML View, locate and select the entire string that contains the dynamic data that requires
User Guide
VuGen
HP LoadRunner (12.50) Page 261
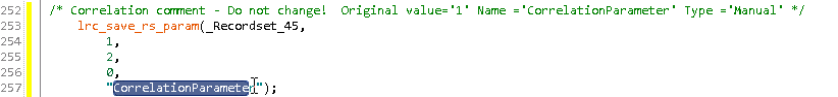
correlation.
8. Right-click inside the selection, and select Create Correlation. The Design Studio opens. For details
on how to use Design Studio, see "Correlation Tab [Design Studio] Overview" on page236.
When the correlation is complete, VuGen adds a web_reg_save_parm_xpath step to the Vuser script.
How to Correlate Scripts - COM
The following steps describe how to correlate COM Vuser scripts.
1. Select View >Output to display the output tabs at the bottom of the window. Check for errors in
the Replay tab. Often, these errors can be corrected by correlation.
2. Select the relevant step in the Step Navigator, and view the step in the Snaphot pane.
3. Right click the value in the snapshot and select Create correlation. This will open the Design
Studio window.
4. Select the value you would like to correlate by highlighting it in the grid and clicking the Correlate
button.
When a value is correlated, VuGen adds the correlation parameter and saves the original value in a
comment in the script.
How to Search for Values that Need Correlation
The following steps describe different ways to search for values that need correlation.
Search by Comparing Scripts
1. Record a script and save it.
2. Create a new script and record the identical operations. Save the script.
3. Select Tools >Compare with Vuser to compare the scripts. For more details, see "How to Compare
Scripts Side by Side" on page129.
4. Differences in the script are highlighted. Review the differences to determine which ones may
require correlation.
User Guide
VuGen
HP LoadRunner (12.50) Page 262
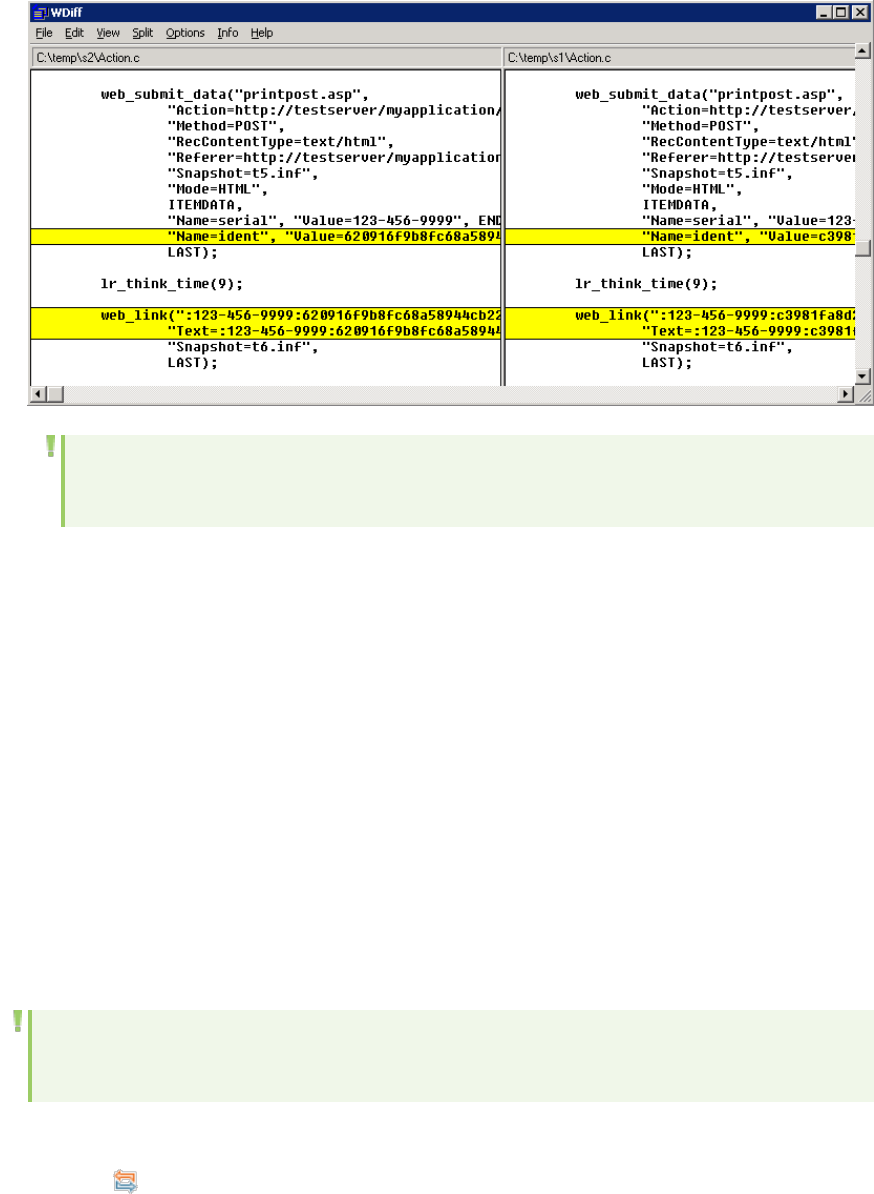
Note: WDiff is the default utility, but you can specify a custom comparison tool. For more
information, see "How to Compare Scripts Side by Side" on page129.
Replay Log Search
1. Scan the script in script view for strings that may need correlation such as hash strings, random
strings, session ID's, and so on.
2. Search the generation log for the first time that the string appears (this is the response from the
server).
3. Search the extended replay log for the same response. Check to see if this response contains a
different string within the same boundaries as the original suspected string. If yes, this string
requires correlation.
How to Modify Correlation Definitions
You can modify correlation definitions to help eliminate dynamic values that do not require correlation.
These tasks describe how to modify boundary based, regular expression, and XPath query correlation
definitions for record or response correlation.
Note: These methods only apply to modifying correlations within your script. They do not affect
the correlation rules.
Modifying Boundary Based Correlation Definitions
1. Click the Design Studio button on the VuGen toolbar.
2. Select a dynamic value from the correlation grid and expand Details.
User Guide
VuGen
HP LoadRunner (12.50) Page 263
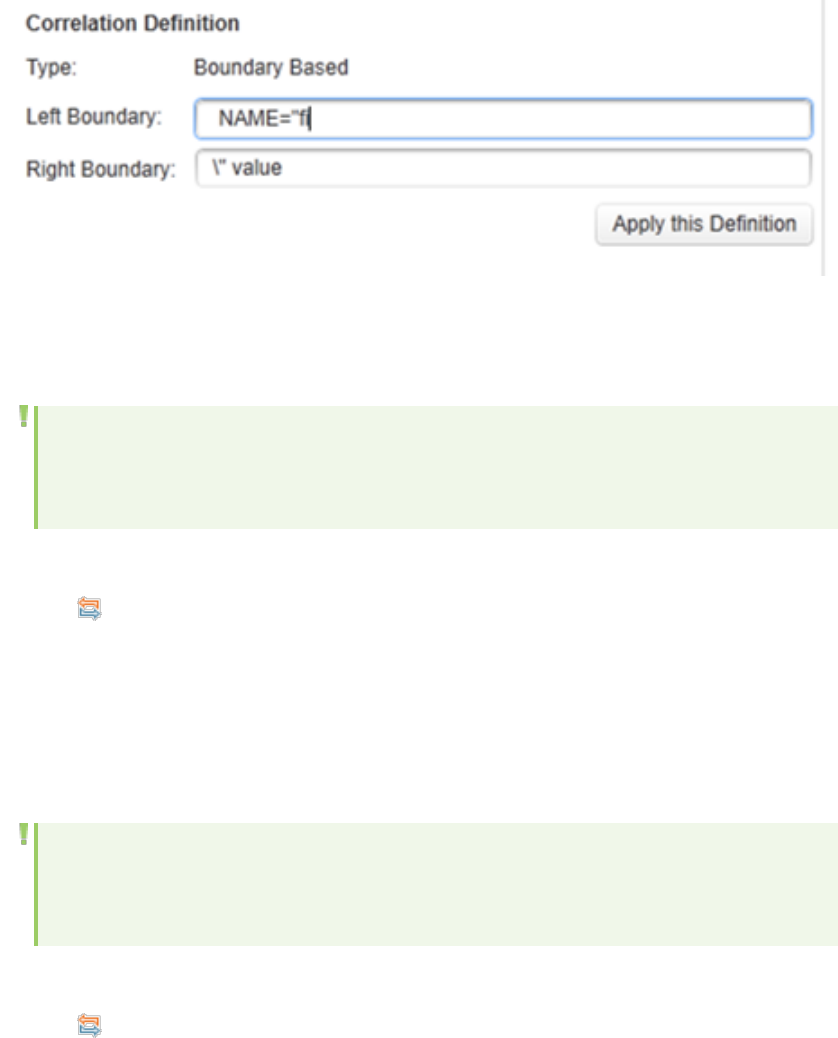
3. Edit the Left Boundary or Right Boundary under the Correlation Definition section. You can
modify the definition by adding or deleting text.
4. Click Apply this Definition.
The Apply this Definition button will not be enabled unless the modified boundary definition
occurs in the snapshot and the script.
Note: If you do not apply the definition before selecting another dynamic value in the grid,
your changes will be lost. If you select Replay & Scan before correlating your value with
the modified definition, your changes will be lost.
Modifying Regular Expression Correlation Definitions
1. Click the Design Studio button on the VuGen toolbar.
2. Select a dynamic value from the correlation grid and expand Details.
3. Edit the Regular Expression under the Correlation Definition section.
4. Click Apply this Definition.
The Apply this Definition button will not be enabled unless the modified boundary definition
occurs in the snapshot and the script.
Note: If you do not apply the definition before selecting another dynamic value in the grid,
your changes will be lost. If you select Replay & Scan before correlating your value with
the modified definition, your changes will be lost.
Modifying XPath Correlation Definitions
1. Click the Design Studio button on the VuGen toolbar.
2. Select a dynamic value from the correlation grid and expand Details.
3. Edit the XPath definition under the Correlation Definition section.
4. Click Apply this Definition.
User Guide
VuGen
HP LoadRunner (12.50) Page 264
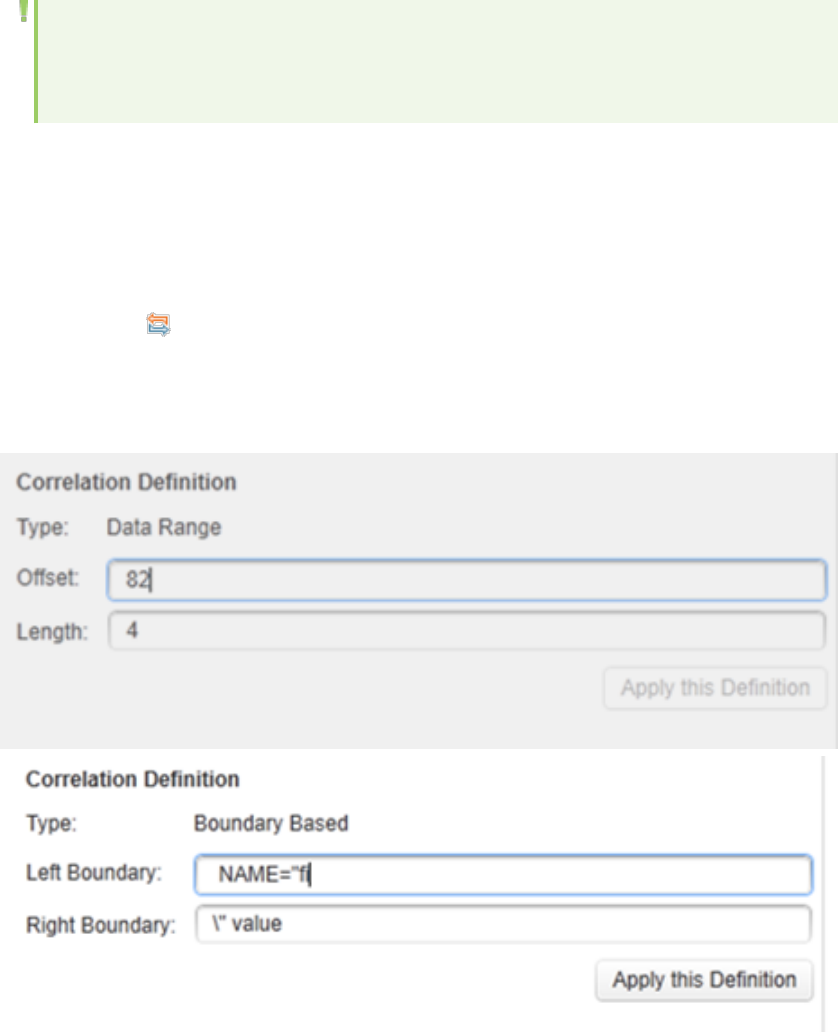
The Apply this Definition button will not be enabled unless the modified boundary definition
occurs in the snapshot and the script.
Note: If you do not apply the definition before selecting another dynamic value in the grid,
your changes will be lost. If you select Replay & Scan before correlating your value with
the modified definition, your changes will be lost.
Modifying Winsocket Correlation Definitions
1. Winsocket dynamic values are correlated from the snapshot. To access, select the relevant step in
the Step Navigator, and view the step in the Snaphot pane. The Winsocket protocol has both a hex
and text snapshot.
Right click the value in the snapshot and select Create correlation or Create boundary correlation.
This will open the Design Studiowindow.
2. Select a dynamic value from the correlation grid and expand Details.
3. If you selected Create correlation, edit the Data Range in the Correlation Definition section. If you
selected Create boundary correlation, edit the left of right boundary.
4. Click Apply this Definition.
The Apply this Definition button will not be enabled unless the modified boundary definition
occurs in the snapshot.
User Guide
VuGen
HP LoadRunner (12.50) Page 265
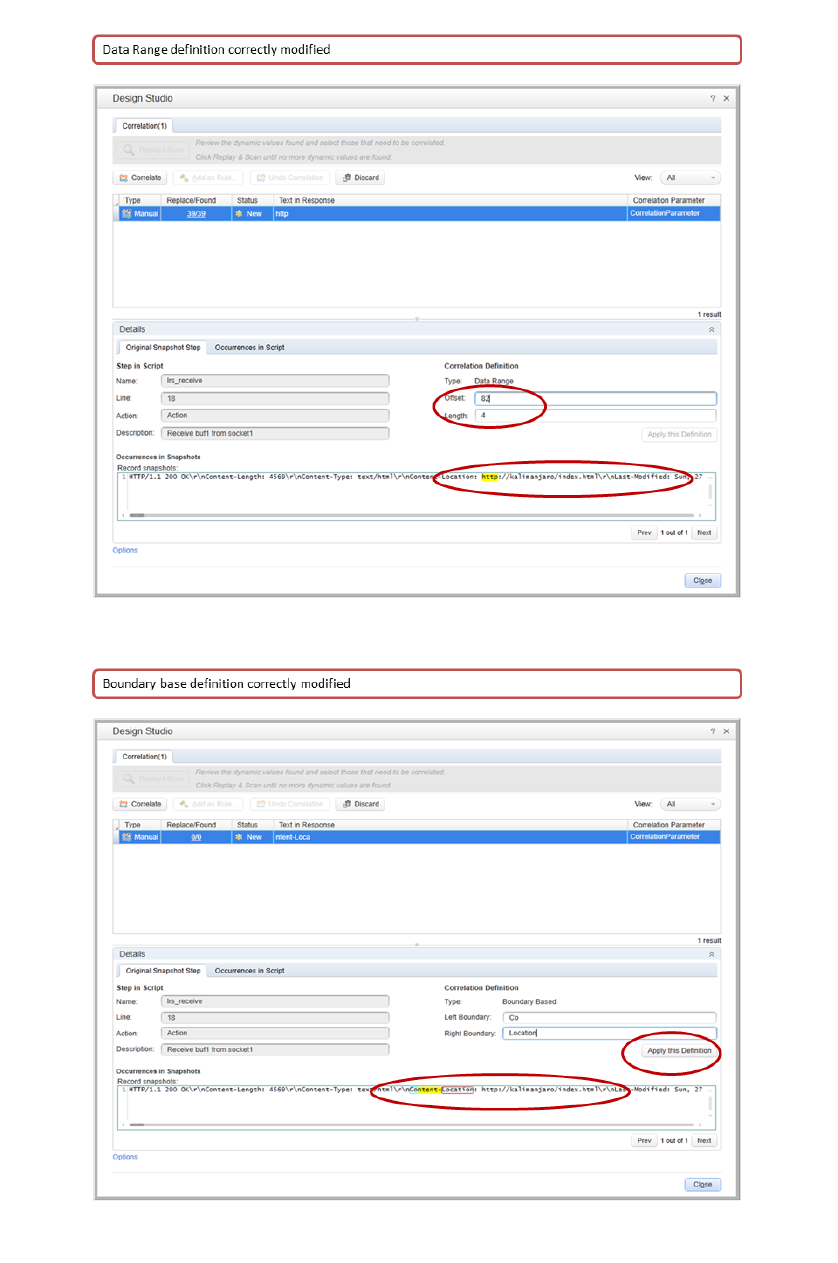
View the following images that display both a Data Range definition and a Boundary definition.
User Guide
VuGen
HP LoadRunner (12.50) Page 266
Note: If you do not apply the definition before selecting another dynamic value in the grid,
your changes will be lost. If you select Replay & Scan before correlating your value with
the modified definition, your changes will be lost.
How to Exclude Content Based on Content-Type
The HTTP header "content-type:" defines the type of HTTP response(content). This topic describes how
to exclude content by content-type from the correlation scan by modifying the IgnoredContent.xml file.
1. Open the <LoadRunner Installation folder>\config\IgnoredContent.xml in a text editor.
IgnoredContent.xml
<?xml version="1.0" encoding="utf-8" ?>
<IgnoredHttpContentTypes xmlns:xsi="http://www.w3.org/2001/XMLSchema-instance"
xmlns:xsd="http://www.w3.org/2001/XMLSchema">
<CONTENT_TYPES>
<string>application/(?!(x-amf|json))</string>
<string>audio/</string>
<string>image/</string>
<string>model/</string>
<string>video/</string>
</CONTENT_TYPES>
</IgnoredHttpContentTypes>
2. Modify the IgnoredContent.xml to exclude content-type by inserting a string or regular expression.
If you enter: Design Studio will:
image/ Ignore any content type beginning with image/ such as image/gif,
image/jpeg, image/png
application/(!?
(json|x-amf))
Ignore content type that begins with application/ except for content
type application/json or application/x-amf.
Example of content added to the IgnoredContent.xml
In our example, the correlation engine will ignore application content except for x-amf , json, or
javascript application content.
<?xml version="1.0" encoding="utf-8" ?>
<IgnoredHttpContentTypes xmlns:xsi="http://www.w3.org/2001/XMLSchema-instance"
xmlns:xsd="http://www.w3.org/2001/XMLSchema">
<CONTENT_TYPES>
<string>application/(?!(x-amf|json|javascript))</string>
<string>audio/</string>
<string>image/</string>
User Guide
VuGen
HP LoadRunner (12.50) Page 267
<string>model/</string>
<string>video/</string>
</CONTENT_TYPES>
</IgnoredHttpContentTypes>
How to Exclude Strings or Content Types from the Correlation
Scan
This topic describes how to exclude strings from the correlation scan.
By default, the correlation engine will scan all plain and html text searching for correlations. Some of
the candidates found may not be real correlations. To enhance correlation accuracy, you can configure
VuGen to ignore certain items, either text strings, regular expressions, or content types.
1. To exclude a specific text string
a. Select Record > Recording Options > Correlations > Configuration.
b. Click the button adjacent to Excluded strings.
c. Click the button to open the Add string to exclude dialog box.
d. Enter the string and click OK.
2. To exclude matches of a regular expression
a. Select Record > Recording Options > Correlations > Configuration.
Click the button adjacent to Excluded strings.
b. Click the button to open the Add string to exclude dialog box.
c. Enter a regular expression and check the Regular Expression box or select the button to
view and select from a list box of regular expression character classes and complete the
regular expression.
For example:
If you enter: Design Studio will:
getCachedId
Exclude getCachedID as a correlation candidate.
^navurl:.* Exclude strings such as navurl:\\any_char, navurl:1234 as correlation
candidates.
d. Click OK.
User Guide
VuGen
HP LoadRunner (12.50) Page 268
3. To exclude content types
a. Select Record > Recording Options > Correlations > Configuration.
Click the button adjacent to Excluded content types to open the
Excluded Content Type List dialog box. The list shows the content types that are
automatically excluded.
b. Click the button to add a new entry.
c. Click OK.
4. Delete an excluded item
a. Highlight an item in the Excluded String List or Excluded Content Type List dialog boxes.
b. Click the button.
Correlation Functions - Database Vuser Scripts
When working with Database Vuser scripts, (such as ODBC, Oracle 2-Tier) you can use VuGen's
automated correlation feature to insert the appropriate functions into your script. The correlating
functions are:
llrd_save_col saves a query result appearing in a grid, to a parameter. This function is placed before
fetching the data. It assigns the value retrieved by the subsequent lrd_fetch to the specified
parameter.
(lrd_ora8_save_col for Oracle 8 and higher)
llrd_save_value saves the current value of a placeholder descriptor to a parameter. It is used with
database functions that set output placeholders (such as certain stored procedures under Oracle).
llrd_save_ret_param saves a stored procedure's return value to a parameter. It is used primarily with
database procedures stored in DbLib that generate return values.
Note: VuGen does not apply correlation if the saved value is invalid or NULL (no rows returned).
For more information about these functions and their arguments, see the Function Reference (Help >
Function Reference).
Correlation Functions - Java Vuser Scripts
To correlate statements for Java Vusers, you can use the Java Vuser correlation functions. These
functions may be used for all Java type Vusers, to save a string to a parameter and retrieve it when
required.
User Guide
VuGen
HP LoadRunner (12.50) Page 269

lr.eval_string Replaces a parameter with its current value.
lr.eval_data Replaces a parameter with a byte value.
lr.eval_int Replaces a parameter with an integer value.
lr.eval_string Replaces a parameter with a string.
lr.save_data Saves a byte as a parameter.
lr.save_int Saves an integer as a parameter.
lr.save_string Saves a null-terminated string to a parameter.
When recording a CORBA or RMI session, VuGen performs correlation internally. For more information,
see "How to Correlate Scripts - Java" on page259.
Using the Java String Functions
When programming Java Vuser scripts, you can use the Java Vuser string functions to correlate your
scripts. In the following example, lr.eval_int substitutes the variable ID_num with its value, defined at
an earlier point in the script.
lr.message(" Track Stock: " + lr.eval_int(ID_num));
In the following example, lr.save_string assigns John Doe to the parameter Student. This parameter is
then used in an output message.
lr.save_string("John Doe", "Student");
// ...
lr.message("Get report card for " + lr.eval_string("<Student>"));
classroom.getReportCard
Correlation Functions - C Vuser Scripts
To correlate statements for protocols that do not have specific functions, you can use the C Vuser
correlation functions. These functions can be used for all C-type Vusers, to save a string to a parameter
and retrieve it when required.
lr_eval_string Replaces all occurrences of a parameter with its current value.
lr_save_string Saves a null-terminated string to a parameter.
lr_save_var Saves a variable length string to a parameter.
User Guide
VuGen
HP LoadRunner (12.50) Page 270
For additional information about the syntax of these functions, see the Function Reference (Help >
Function Reference).
Using lr_eval_string
In the following example, lr_eval_string replaces the parameter row_cnt with its current value. This
value is sent to the Output window using lr_output_message.
lrd_stmt(Csr1, "select count(*) from employee", -1, 1 /*Deferred*/, ...);
lrd_bind_col(Csr1, 1, =;COUNT_D1, 0, 0);
lrd_exec(Csr1, 0, 0, 0, 0, 0);
lrd_save_col(Csr1, 1, 1, 0, "row_cnt");
lrd_fetch(Csr1, 1, 1, 0, PrintRow2, 0);
lr_output_message("value: %s" , lr_eval_string("The row count is: <row_cnt>"));
Using lr_save_string
To save a NULL terminated string to a parameter, use lr_save_string. To save a variable length string,
use lr_save_var and specify the length of the string to save.
In the following example, lr_save_string assigns 777 to a parameter emp_id. This parameter is then
used in another query or for further processing.
lrd_stmt(Csr1, "select id from employees where name='John'",...);
lrd_bind_col(Csr1,1,=;ID_D1,...);
lrd_exec(Csr1, ...);
lrd_fetch(Csr1, 1, ...);
/* GRID showing returned value "777" */
lr_save_string("777", "emp_id");
Design Studio [Correlation Tab] Dialog Box
This dialog box enables you to scan for, correlate, and view information about dynamic values in your
script.
To access Click the Design Studio button on the VuGen toolbar.
The button is enabled only when you have a recorded script in the Solution
Explorer.
Important
information
"Correlation Tab [Design Studio] Overview" on page236
Relevant tasks "How to Correlate Scripts Using Design Studio" on page241
User interface elements are described below (unlabeled elements are shown in angle brackets):
UI Element Description
Correlation Tab
User Guide
VuGen
HP LoadRunner (12.50) Page 271

UI Element Description
Replay and
Scan
Design studio scans for dynamic values using all enabled types: rule, record, and
replay.
Correlate Replace a dynamic value in the script with a correlation parameter.
Add as Rule Add dynamic value definition as a rule.
Rule name. Enables you to specify a rule name.
Application Name. Enables you to associate the rule to a specific application.
For details, see "Correlations > Rules Recording Options" on page155.
Undo
Correlation
Replace the correlation parameter with the original dynamic value.
Discard Delete the selected dynamic values from the correlation grid. You can only use the
discard action when the dynamic value has a status of New.
In addition, this action adds the text to the list of excluded strings. You can edit the
list in Recording Options > Correlation > Configuration > Excluded string list.
View Enables you to filter values found for correlation by the following types:
lAll
lNew
lCorrelated
Correlation Grid
Displays details about each dynamic value in the script
Type Displays which engine found the dynamic value for correlations:
lRecord
lRules
lReplay
lManual
Found/Replace Displays information about the number of dynamic values found with the same
definitions. Since you can perform partial correlation, meaning you can replace
specific occurrences, the information displayed depends on if you have correlated
the value or not.
lBefore you correlate
Number of values that can be replaced/ Number of values found
lAfter you correlate
Number of values that have been replaced/Number of values found.
User Guide
VuGen
HP LoadRunner (12.50) Page 272

UI Element Description
Status Displays correlation status of the dynamic value from the script:
lNew
lCorrelated
Text in
Response
Displays the string of the dynamic value from the script.
Correlation
Parameter
Displays the correlation parameter name of the dynamic value.
Correlation Details Chevron
Displays details about the dynamic value in the snapshot/script
Original Snapshot Step Tab
Step in Script Details
Name Displays the step name in the script where the dynamic value was found.
Line Displays the line of the script where the dynamic value was found.
Action Name Displays the name of action from the script where the dynamic value was found.
Description Displays a description of the step.
Correlation Definition Details
Type Display API function that will be used to correlate the value.
Regular expression: web_reg_save_param_regexp
Boundary based: web_reg_save_param_ex
Definition Displays the definition of the dynamic value.
lRegular Expression. Dynamic value correlation is defined by a regular
expression. A regular expression is a special text string for describing a search
pattern.
lBoundary based. Dynamic value correlation is defined by left and right boundary
text strings.
Apply
Definition
Enables you to select which definition to apply to the dynamic value. You can scroll
through the definition of the dynamic value in Occurrences in Snapshot by clicking
Prev or Next buttons.
Occurrences in
Snapshot
Record snapshot. Displays all the occurrences of the dynamic value in the record
snapshot once the script as been replayed. You can scroll to view each occurrence in
the snapshot.
User Guide
VuGen
HP LoadRunner (12.50) Page 273
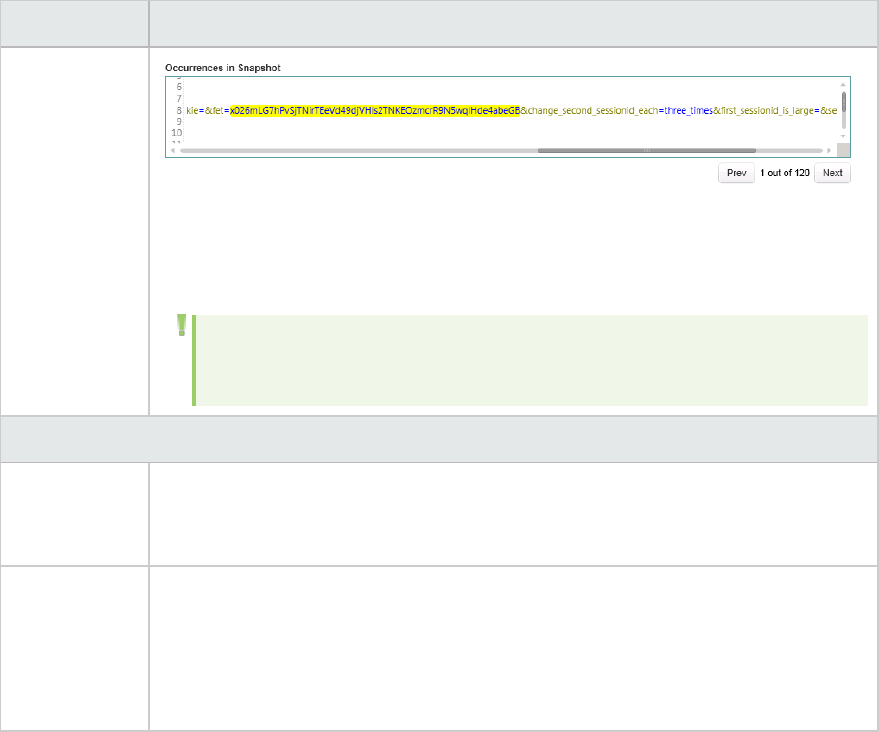
UI Element Description
Replay snapshot.If the scan type of Replay has been selected, Design Studio
displays all the occurrences of the dynamic value in the replay snapshot once the
script as been replayed. You can scroll to view each occurrence in the snapshot.
Note: Once the value has been correlated, the replay snapshot will be blank.
If you modify the Correlation Definition, the replay snapshot will be blank.
Correlation Occurrences Tab
Occurrences in
Script
Displays the occurrences of the dynamic value in your script. You can correlate all
the values or select individual values to correlate by selecting the check box
adjacent to the occurrence.
Options Opens the Recording Options dialog box.
For details, see:
l"Correlations > ConfigurationRecording Options" on page153
l"Correlations > Rules Recording Options" on page155
Replaying
The Replaying section describes the various methods that are available to replay Vuser scripts.
Replay Overview
Developing a Vuser script includes the steps shown below. This topic provides an overview of the fourth
step, replaying a Vuser script.
After recording a Vuser script, you use VuGen to replay the script. This helps to test the basic
functionality of the Vuser script, as well as helps you to uncover errors and issues that need to be
addressed. The need for correlation is a typical issue that is revealed when you first replay a script. For
details on correlation, see "Correlation Overview" on page235. When the replay is successful, you are
ready to enhance the script by adding load-testing functionality to the script. Such functionality could
include parameterization, transactions, and rendezvous points.
User Guide
VuGen
HP LoadRunner (12.50) Page 274
lFor details on how to replay a Vuser script, see "How to Replay a Vuser Script" below.
lIf you encounter problems when you replay the script, you can use VuGen's debugging functionality to
help resolved the issues. For details, see "Debugging Overview" on page311.
lFor details on the files that VuGen creates during a script replay, see "Files Generated During Replay"
on page301.
lYou can use bookmarks to navigate between sections of the script. For details, see "Bookmarks
Overview" on page299.
lYou can run a Vuser script from a Windows command prompt. For details, see "How to Run a Vuser
Script from a Command Prompt" on page300.
lYou can run a Vuser script from a Linux command line. For details, see "How to Run a Vuser Script
from a Linux Command Line" on page1012.
How to Replay a Vuser Script
This task describes how to replay a Vuser script.
1. Configure the runtime settings and replay options
a. Runtime settings control how your Vuser script is replayed. Access the desired runtime
settings by double-clicking the Runtime Settings node in the Solution Explorer.
For an overview of runtime settings, see "Runtime Settings Overview" on page280.
b. Specify replay options by selecting Tools > Options. For details on options, see "Options Dialog
Box" on page101.
2. Replay the script
To run a Vuser script until the end of the script or until the next breakpoint, perform one of the
following:
lSelect Replay > Run.
lClick the Run button on the Vuser toolbar.
lPress F5.
Note: The status of the Vuser script execution appears in the lower left corner of VuGen.
The script execution status may be Ready,Running, or Paused.
lTo stop a script that is running, click the Stop Replay button on the VuGen toolbar.
lTo pause a script that is running, click the Pause button on the VuGen toolbar.
User Guide
VuGen
HP LoadRunner (12.50) Page 275

lTo continue running a script that is paused, click the Continue button on the VuGen
toolbar.
3. View the logs for detailed information
You can view detailed information about how your script behaved during the replay. This
information appears in the Output window. For details, see "Output Pane" on page90.
To learn more about replaying a Vuser script, see "Replay Overview" on page274.
How to Work with Snapshots
This topic describes how to use the basic Snapshot pane functionality. For an overview of the snapshot
functionality, see "Snapshot Pane" on page77.
How to show the Snapshot pane
To show the Snapshot pane, do one of the following options:
lSelect View > Snapshot.
lClick the Snapshot button on the VuGen toolbar.
lIn the Editor, click inside a step that contains a reference to a snapshot.
lIn the Step Navigator, double-click a step that contains a reference to a snapshot. Note that in the
Step Navigator, each step that contains a snapshot displays a Snapshot icon . You can place your
mouse cursor over the snapshot icon to see a thumbnail view of the snapshot.
User Guide
VuGen
HP LoadRunner (12.50) Page 276
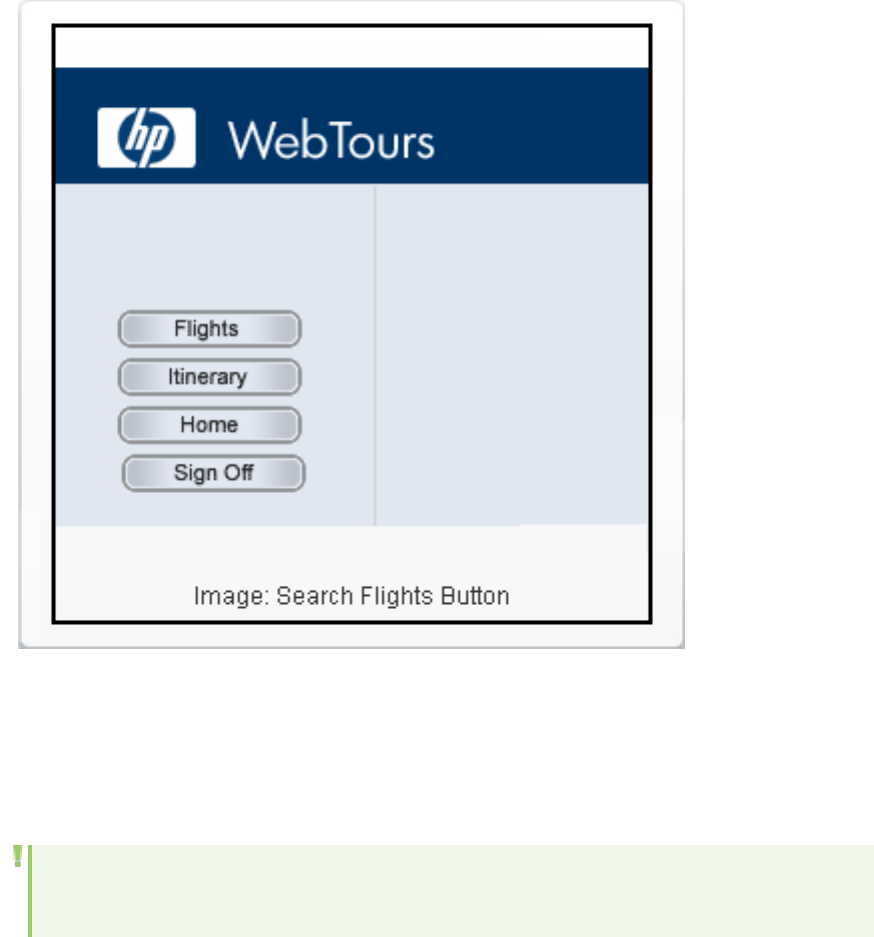
For more details on the Snapshot pane, see "Snapshot Pane" on page77
How to copy a snapshot to the clipboard
1. Display the snapshot in the Snapshot pane.
2. Right-click on the snapshot, and then select Copy Image to the Clipboard.
Note: The "copy snapshot to the clipboard" functionality is available for only RDP, Citrix, and SAP
Vuser scripts.
How to copy snapshot text to the clipboard
1. Display the snapshot in the Snapshot pane.
2. Select the text that you want to copy.
3. Right-click in the selected text, and select Copy Selection.
How to activate the snapshot-on-error functionality
1. Click Replay > Runtime Settings. The runtime settings dialog box opens.
2. Under General, click Miscellaneous.
User Guide
VuGen
HP LoadRunner (12.50) Page 277
3. Under Error Handling, select the Generate snapshot on error check box.
How to set the snapshot options
1. Click Tools > Options. The Options dialog box opens.
2. Click Scripting, and then click Snapshot. The snapshot options appear on the right of the dialog
box.
Troubleshooting Snapshots
If you encounter a step without a snapshot, follow these guidelines to determine why it is not available.
Note that not all steps are associated with snapshots—only steps with screen operations or for Web,
showing browser window content, have snapshots.
Several protocols allow you to disable the capturing of snapshots during recording using the Recording
options.
If there is no Record snapshot displayed for the selected step, it may be due to one of the following
reasons:
lThe script was recorded with a VuGen version 6.02 or earlier.
lSnapshots are not generated for certain types of steps.
lThe imported actions do not contain snapshots.
If there is no Replay snapshot displayed for the selected step, it may be due to one of the following
reasons:
lThe script was recorded with VuGen version 6.02 or earlier.
lThe imported actions do not contain snapshots.
lThe Vuser files are stored in a read-only folder, and VuGen could not save the replay snapshots.
lThe step represents navigation to a resource.
Snapshots that Have an XML View
VuGen's Snapshot pane shows various snapshots that were recorded while a Vuser script was recorded
or replayed. For specific Vuser protocols only, the Snapshot pane can show XML views of the snapshot.
The XML or JSON data is displayed in the XML View tab.
The XML View tab only appears within the Response and Request Body tabs. The XML view includes its
own set of controls and functionality.
The XML view is divided into two areas. On the left is the tree view of the snapshot data, and on the right
is the text view.
User Guide
VuGen
HP LoadRunner (12.50) Page 278
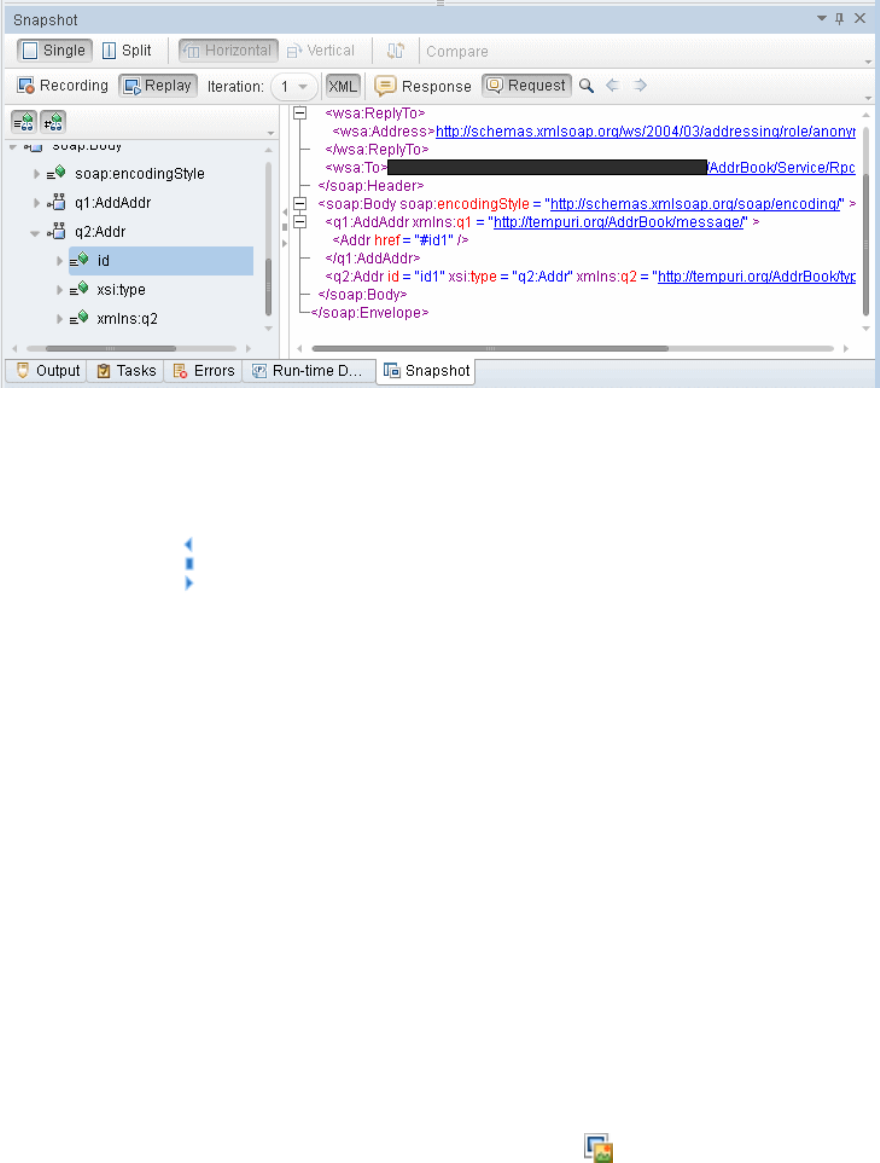
The two XML views are synchronized. If you select an entry in the tree view, VuGen highlights the
corresponding element, attribute, or value in the text view. Alternatively, if you double-click an element,
attribute, or value in the text view, VuGen opens the tree view as required, and highlights the
corresponding entry.
The splitter controls ( ) between the tree view and text view enable you to set the proportion of the
available space that is occupied by each of the views.
Controls to the left of the text view enable you to expand and collapse elements within the text view.
Click the right-facing arrow to expand an element in the view, and click the down-facing arrow to
collapse an element in the view. Note that you can place the mouse cursor inside an element in the text
view and then press the <+> key to expand the element or the <-> key to collapse the element, as
appropriate.
After recording a Vuser script, you can use the XML View in the Snapshot pane to add a text check to the
script. For details, see "How to Add a Text Check From the XML View in the Snapshot Pane" below.
How to Add a Text Check From the XML View in the Snapshot
Pane
After recording a Vuser script, you can add a text check from the XML view in the Snapshot pane. For
details on the XML view in the Snapshot pane, see "Snapshots that Have an XML View" on the previous
page.
To add a text check from the XML view in the Snapshot pane:
1. Click View > Snapshot, or click the Show Snapshot Pane button on the VuGen toolbar.
2. In the Snapshot pane, display a snapshot that contains the text that you want to verify.
3. On the right-side of the Snapshot pane, click the XML View tab.
User Guide
VuGen
HP LoadRunner (12.50) Page 279

4. In the Snapshot pane, click the Response Body tab.
5. In either the Tree view or the Grid view, locate and select the text string that you want to verify.
6. Right-click inside the selection, and select Add Text Check Step. The Find Text dialog box opens.
7. Modify the options in the Find Text dialog box. For details on the dialog box options, press F1 when
in the dialog box to open the Function Reference.
8. Click OK to insert a web_reg_find step into the Vuser script.
Running a Vuser as a Process or Thread
The Controller uses a driver program (such as mdrv.exe or r3vuser.exe) to run your Vusers.
If you run each Vuser as a process, then the same driver program is launched (and loaded) into the
memory again and again for every instance of the Vuser. Loading the same driver program into memory
uses up large amounts of RAM (random access memory) and other system resources. This limits the
numbers of Vusers that can be run on any load generator.
Alternatively, if you run each Vuser as a thread, the Controller launches only one instance of the driver
program (such as mdrv.exe), for every 50 Vusers (by default). This driver process/program launches
several Vusers, each Vuser running as a thread. These threaded Vusers share segments of the memory
of the parent driver process. This eliminates the need for multiple re-loading of the driver
program/process saves much memory space, thereby enabling more Vusers to be run on a single load
generator.
To configure these options, open the runtime settings (F4) and select the General > Miscellaneous
node.
Note: For MMS (Multimedia Messaging Service) protocol, it is recommended that you run Vusers
as a process.
Runtime Settings
This section contains a variety of topics relating to runtime settings (Replay > Runtime Settings).
Runtime Settings Overview
Runtime settings define the way a Vuser script runs and can be configured before or after you record a
script. These settings are stored in files located in the Vuser script folder. Runtime settings are applied
to Vusers when you run a script using VuGen, the Controller, Performance Center, or Business Process
Monitor.
Configuring runtime settings allows you to emulate different kinds of user activity. For example, you can
emulate a user who responds immediately to output from the server, or a user who stops and thinks
User Guide
VuGen
HP LoadRunner (12.50) Page 280
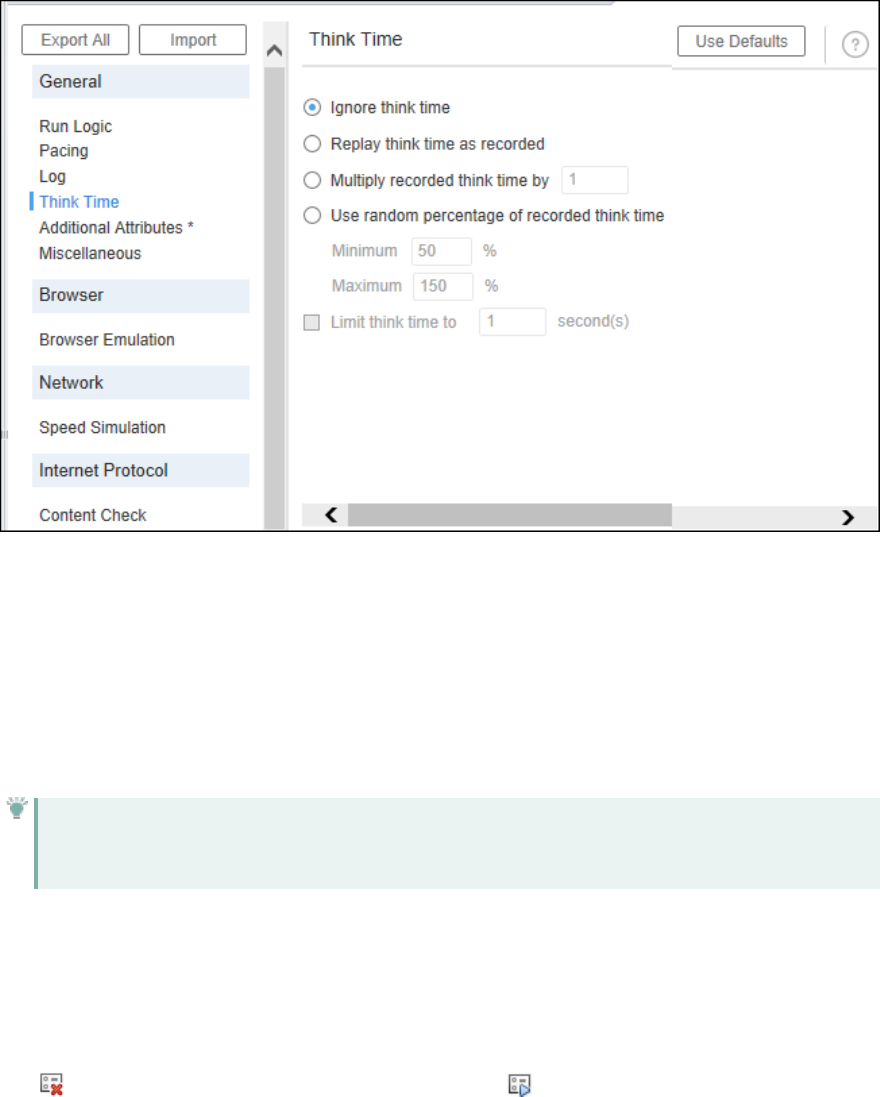
before each response. You can also configure the runtime settings to specify how many times the Vuser
should repeat its set of actions.
A blue line adjacent to the runtime setting, indicates the current view. The following example indicates
that the Think Time runtime setting is active.
You can export runtime settings to a JSON file and import them into another script, instead of having to
set them repeatedly for each script. You can also revert the runtime settings back to the default values.
For more information, see "Importing and Exporting Runtime Settings" on page299.
Different combinations of runtime settings are available for each protocol. When you open the runtime
settings, the relevant runtime setting views for that protocol are listed.
Runtime settings are now a script entity. This allows you to copy or export them for use with other
scripts using the shortcut menu.
Tip: Descriptions of the individual runtime settings are available within the runtime settings
views, by hovering the mouse over a runtime setting field name.
For more information on the Runtime settings views, see "Runtime Settings Views" on the next page.
Runtime Setting Value Validation
The Solution Explorer indicates that one or more runtime settings have illegal values, with a warning
icon in place of the standard Runtime Setting node icon, .
User Guide
VuGen
HP LoadRunner (12.50) Page 281
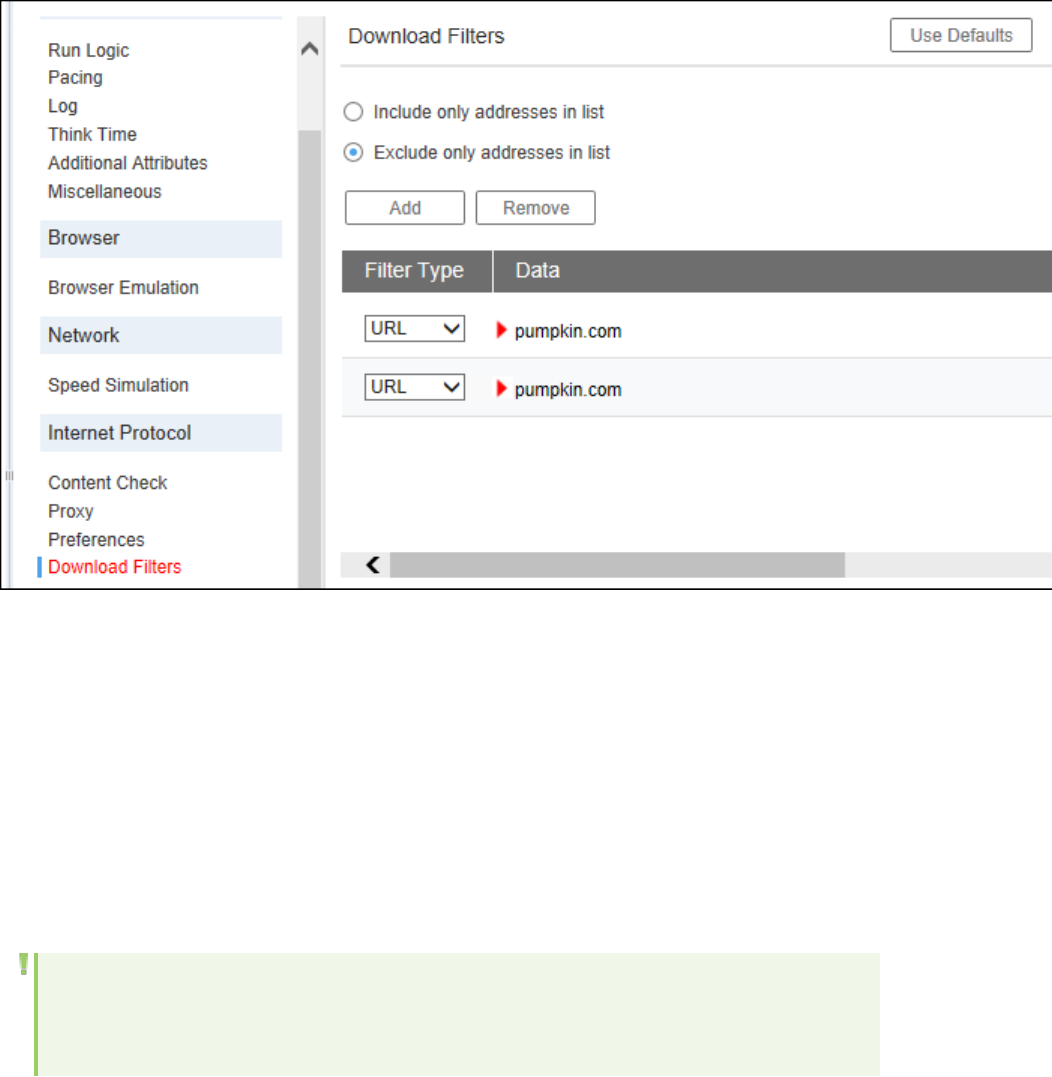
If you enter a value above the maximum allowed value, VuGen automatically substitutes it with the
maximum allowed value. If you enter a value below the minimal allowed value, VuGen automatically
substitutes it with the minimum allowed value.
A red highlighted value, indicates that one of the values in the view is invalid. The following example
shows duplicate filter names in the Download Filters view.
Runtime Settings Views
This page describes the runtime settings views.
To open the runtime settings, do one of the following:
lIn the Solution Explorer, double-click on the name of a Runtime Settings view.
lSelect the menu item Replay > Runtime Settings.
lPress the shortcut key, F4.
For an overview of the runtime settings, see "Runtime Settings Overview" on page280.
Note: Descriptions of the individual runtime settings are available within the runtime settings
views, by hovering the mouse over a runtime setting field name.
For some runtime settings, there is additional information on the settings included in " Runtime
User Guide
VuGen
HP LoadRunner (12.50) Page 282
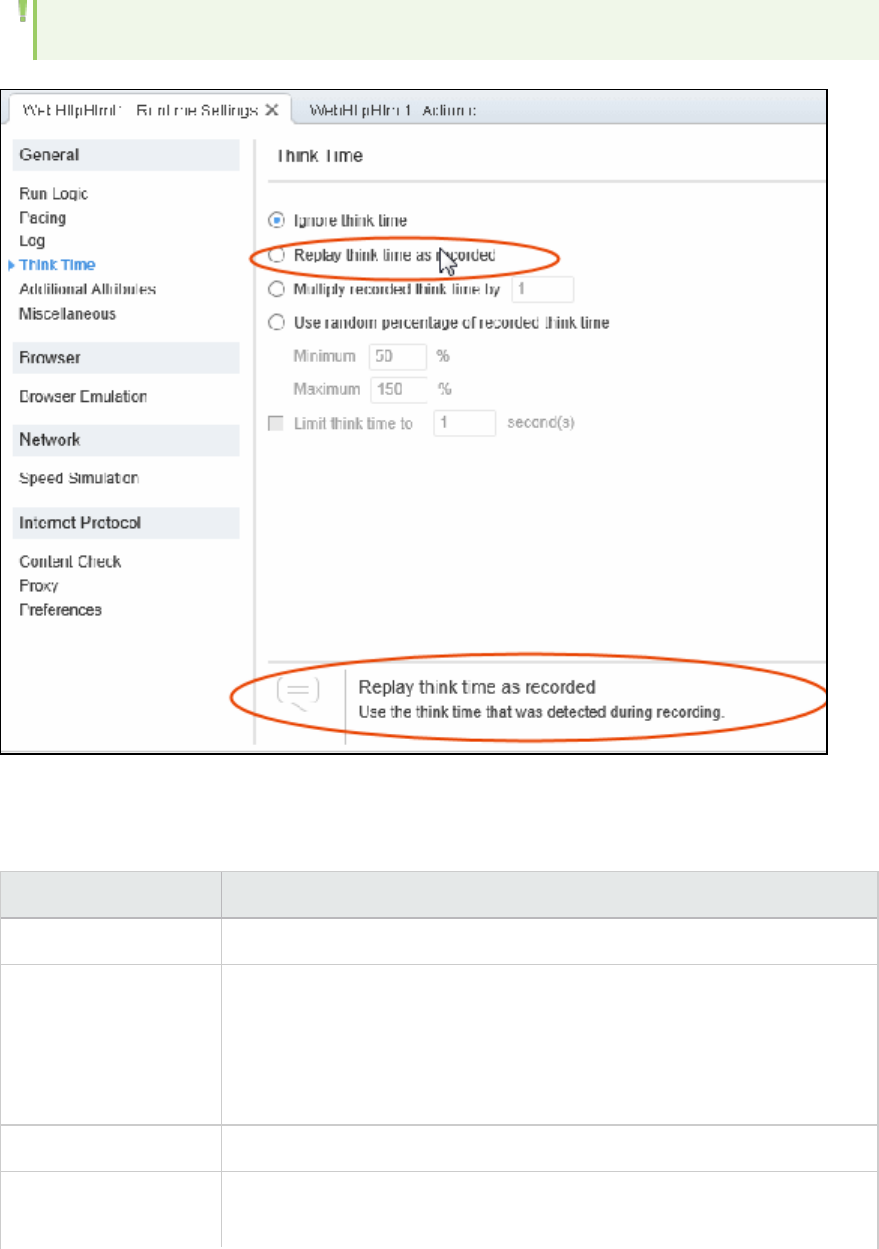
Settings View Descriptions" on the next page.
Runtime Settings View Descriptions
View Description
.NET Environment View Enables you to set the runtime settings for .NET Vuser scripts.
Additional Attributes
View
Enables you to provide additional arguments for a Vuser script. The
Additional Attributes settings apply to all Vuser script types. You specify
command line arguments that you can retrieve at a later point during the
test run, using Command Line Parsing functions. Using this view, you can
pass external parameters to prepared scripts.
Browser Emulation View Enables you to configure the browser related runtime settings.
Browser View (TruClient
FireFox/IE)
Enables you to configure settings for the TruClient FireFox or IE browser,
for scripts that you run in load mode.
User Guide
VuGen
HP LoadRunner (12.50) Page 283

View Description
Additional information:
lSettings that you modify in this view only affect TruClient Vusers in load
mode.
lThese settings correspond to those in the Browser Settings tab in the
"TruClient General Settings " on page765. However, the settings that
you modify in the TruClient General Settings Dialog Box only affect
interactive mode.
lWhen you save your script in interactive mode, the settings that you
modified in the Browser Settings tab are applied to these Load Runtime
settings.
For details, see "TruClient Home tab" on page687.
Citrix Configuration
View
Enables you to set the Citrix configuration runtime settings.
Citrix Synchronization
View
Enables you to set the Citrix synchronization runtime settings.
Client Emulation View Enables you to set the Oracle NCA runtime settings.
Content Check View Enables you to check websites for content during runtime. You can set
Content Check runtime settings for Web - HTTP/HTML and other Internet
protocols.
Additional information:
You use the Content Check settings to check the contents of a page for a
specific string. This is useful for detecting non-standard errors. In normal
operations, when your application server fails, the browser displays a
generic HTTP error page indicating the nature of the error. The standard
error pages are recognized by VuGen and treated as errors, causing the
script to fail. Some application servers, however, issue their own error
pages that are not detected by VuGen as error pages. The page is sent by
the server and it contains a formatted text string, stating that an error
occurred.
For example, suppose that your application issues a custom page when an
error occurs, containing the text ASP Error. You instruct VuGen to look for
this text on all returned pages. When VuGen detects this string, it fails the
replay.
Note: VuGen searches the body of the pages—not the headers.
User Guide
VuGen
HP LoadRunner (12.50) Page 284
View Description
DFE Chain Configuration
View
Enables Data Format Extensions during replay.
Download Filters View Enables you to set the download filters for a script.
Flex Configuration View Enables you to set an external JVM (Java Virtual Machine) path and other
runtime settings.
Flex Externalizable View Enables you to configure runtime setting for externalizable objects in Flex
scripts.
Flex RTMP View Enables you to set the Flex RTMP runtime settings.
Java Classpath View Enables you to specify the location of additional classes that were not
included in the system's classpath environment variable. You may need
these classes to run Java applications and ensure proper replay.
Java VM View Enables you to set the Java VM runtime settings.
JMS Advanced View Enables you to set the JMS advanced runtime settings.
Log View Enables you to configure the amount and types of information that are
recorded in the log.
Log View (TruClient) Enables you to configure the amount and types of information that are
reported to a log for TruClient scripts.
Miscellaneous View Enables you to set miscellaneous runtime settings.
Tip:
lIt is not recommended to enable both the Continue on Error
and Generate Snapshot on Error options in a load test
environment. This configuration may adversely affect the
Vusers' performance.
lIf you require the Vusers to generate breakdown data for
diagnostics (J2EE) during the test run, do not use automatic
transactions. Instead, manually define the beginning and end
of each transaction.
lFor considerations on whether to run a Vuser as a process or
thread, see "Running a Vuser as a Process or Thread" on
page280.
User Guide
VuGen
HP LoadRunner (12.50) Page 285
View Description
Note: Automatic transactions are not relevant for HP Business
Service Management.
Mobile Device View Enables you to select mobile device properties when recording a TruClient -
Mobile Web script.
Other Settings View
(TruClient)
Enables you to configure snapshot generation and action on error for
TruClient.
Pacing View Enables you to control the time between iterations. The pace tells the
Vuser how long to wait between iterations of your actions.
Preferences View Enables you to set various Internet-related runtime settings.
For information about the Internet Preferences runtime settings, see "
Preferences View - Internet Protocol" on page288.
Proxy View Enables you to set the proxy server connection settings.
RDP Advanced View Enables you to set the RDP advanced runtime settings.
Tip: Disable the options that are not essential for your test, in
order to conserve system resources on the remote desktop server.
RDP Agent View Enables you to set the RDP Agent runtime settings.
Tip: For the RDP agent log folder option—if no folder is specified
and the agent log destination was set to File, the log is saved in
the temp folder of the user on the server.
RDP Configuration View Enables you to set the RDP configuration runtime settings.
RDP Synchronization
View
Enables you to set the RDP synchronization runtime settings.
Replay View (TruClient) Enables you to set the runtime settings for replay of TruClient scripts.
RTE View Enables you to set the RTE runtime settings.
Tip: In the Delay before typing option, the delay settings
determine how Vusers execute TE_type functions.
User Guide
VuGen
HP LoadRunner (12.50) Page 286
View Description
lFirst key. Specifies the time in milliseconds, that a Vuser waits
before entering the first character of a string.
lSubsequent keys. Specifies the time in milliseconds, that a
Vuser waits between submitting successive characters.
Note: You can use the TE_typing_style function to override the
Delay settings for a portion of a Vuser script.
Run Logic View Enables you to set the run logic runtime settings.
SAP GUI General View Enables you to set the SAP GUI runtime settings.
Additional information:
lShow SAP Client during replay. This option shows an animation of the
actions in the SAP client during replay. The benefit of this, is that you
can closely follow the actions of the Vuser and see how the forms are
filled out. This option, however, requires additional resources and may
affect the performance of your load test.
lTake ActiveScreen snapshots during replay. This feature captures
replay snapshots with Control ID information for all active objects.
ActiveScreen snapshots differ from regular ones, in that they allow you
to see which objects were recognized by VuGen in the SAP GUI client. As
you move your mouse across the snapshot, VuGen highlights the
detected objects. You can then add new steps to the script directly from
within the snapshot. It also allows you to add steps interactively from
within the snapshot for a specific object. For more information, see
"How to Enhance SAP GUI Scripts" on page661.
Server and Protocol
View
Enables you to set the MMS (Multimedia Messaging Service) runtime
settings.
Tip: For the MMS protocol, it is recommended that you run Vusers
as a process. To configure this option, open the runtime settings
(F4) and select the General > Miscellaneous view.
Server (TruClient Native
Mobile)
Enables you to specify the server from which you want to collect data and
the credentials.
Shared DLLs View Enables you to modify the list of shared DLLs after you record a Vuser
script. If a DLL is included in the list of shared DLLs, when the Vuser script is
User Guide
VuGen
HP LoadRunner (12.50) Page 287
View Description
run and requires a particular DLL, the Vuser will access the DLL in its shared
location – the DLL will not be copied to the load generator. Adding a DLL to
the list of shared DLLs therefore saves hard-drive space on the load
generator when a Vuser is run.
Silverlight Services View Enables you to view the WSDL files associated with your script and modify
their settings for the replay phase.
Speed Simulation View Enables you to configure bandwidth runtime settings.
Speed Simulation View
(TruClient)
Enables you to configure bandwidth for the mobile protocol.
Think Time View Enables you to configure the think time settings, controlling the time that
a VuGen waits between actions. These settings are designed to help you
emulate a real user.
WAP Bearers View Enables you to set the WAP Bearers runtime settings.
Note: These runtime settings are only relevant for legacy scripts
using the WAP protocol.
WAP Gateway View Enables you to set the WAP Gateway runtime settings.
Note: These runtime settings are only relevant for legacy scripts
using the WAP protocol.
WAP Radius View Enables you to set the WAP Radius runtime settings.
Note: These runtime settings are only relevant for legacy scripts
using the WAP protocol.
Preferences View - Internet Protocol
The Preferences view runtime settings (Replay > Runtime Settings > Internet Protocol > Preferences)
enable you to set various Internet-related options.
This view is available only for specific protocols. When you open the runtime settings, only the relevant
views are displayed.
For general information about runtime settings, see "Runtime Settings Overview" on page280.
The user interface elements are described below:
User Guide
VuGen
HP LoadRunner (12.50) Page 288
UI Element Description
Checks Enable image and text checks. Allows the Vuser to perform verification checks
during replay by executing the verification functions web_find or web_image_check.
This option only applies to statements recorded in HTML-based mode. Vusers running
with verification checks use more memory than Vusers who do not perform checks.
Default value: Disabled
Web
Performance
Graph
Generation
Instructs a Vuser to collect data for Web Performance graphs. You view the Hits per
Second,Pages per Second, and Response Bytes per Second (Throughput) graphs
during test execution using the online monitors and after test execution using the
Analysis. You view the Component Breakdown graph after test execution using the
Analysis. Select the types of graph data for the Vuser to collect.
Note: If you do not use the Web performance graphs, disable these options to
conserve memory.
Advanced lUse WinInet replay instead of Sockets (Windows only). Instructs VuGen to use
the WinInet replay engine instead of the standard Sockets replay. VuGen has two
HTTP replay engines: Sockets-based (default) or WinInet based. The WinInet is the
engine used by Internet Explorer and it supports all of the features incorporated
into the IE browser. The limitations of the WinInet replay engine are that it is not
scalable and does not support Linux. In addition, when working with threads, the
WinInet engine does not accurately emulate the modem speed and number of
connections. VuGen's proprietary sockets-based replay is a lighter engine that is
scalable for load testing. It is also accurate when working with threads. The
limitation of the sockets-based engine is that it does not support SOCKS proxy. If
you are recording in that type of environment, use the WinInet replay engine.
Default value: disabled (socket-based replay engine).
lInclude File name and line in automatic transaction names. Creates unique
transaction names for automatic transactions by adding file name and line number
to the transaction name.
lList non-critical resource errors as warnings. Returns a warning status for a
function which failed on an item that is not critical for load testing, such as an
image or Java applet that failed to download. This option is enabled by default. If
you want a certain warning to be considered an error and fail your test, you can
disable this option. You can set a content-type to be critical by adding it to the list
of Non-Resources. For more information, see "Non-Resources Dialog Box" on
page182.
lSave snapshot resources locally. Saves the snapshot resources to files on the
local machine.
User Guide
VuGen
HP LoadRunner (12.50) Page 289

HTTP
UI Element Description
HTTP version Specifies which version HTTP to use: version 1.0 or 1.1. This information is included in
the HTTP request header whenever a Vuser sends a request to a Web server.
HTTP 1.1 supports the following features:
lPersistent Connections—see "Keep-Alive HTTP connections" below.
lHTML compression—see Accept Server-Side Compression below.
lVirtual Hosting—multiple domain names sharing the same IP address.
Keep-Alive
HTTP
connections
Keep-alive is a term used for an HTTP extension that allows persistent or continuous
connections. These long-lived HTTP sessions allow multiple requests to be sent over
the same TCP connection. This improves the performance of the Web server and
clients.
The keep-alive option works only with Web servers that support keep-alive
connections. This setting specifies that all Vusers that run the Vuser script have
keep-alive HTTP connections enabled.
Default value: Enabled
Include
Accept-
Language
request
header
Provides a comma-separated list of accepted languages. For example, en-us,fr, and
so forth. For more details, see "Page Request Header Language" on page1025.
Mark HTTP
errors as
warnings
Issues a warning instead of an error upon failing to download resources due to an
HTTP error.
HTTP-
request
connect
timeout (sec)
The time, in seconds, that a Vuser will wait for the connection of a specific HTTP
request within a step before aborting. Timeouts provide an opportunity for the server
to stabilize and respond to the user.
Maximum value: 32000 seconds
HTTP-
request
receive
timeout (sec)
The time, in seconds, that a Vuser will wait to receive the response of a specific HTTP
request within a step before aborting. Timeouts provide an opportunity for the server
to stabilize and respond to the user.
Maximum value: 32000 seconds
HTTP Keep-
Alive
timeout (sec)
A time limit within which some activity must be performed on an HTTP connection. If
this timeout is reached, the connections is closed during replay.
User Guide
VuGen
HP LoadRunner (12.50) Page 290
UI Element Description
Request zlib
headers
Sends request data to the server with the zlib compression library headers. By
default, requests sent to the server include the zlib headers. This option lets you
emulate non-browser applications that do not include zlib headers in their requests.
Default value: Enabled
Accept
server-side
compression
Indicate to the server that the replay can accept compressed data. The available
options are: None (no compression), gzip (accept gzip compression), gzip, deflate
(accept gzip or deflate compression), and deflate (accept deflate compression). Note
that by accepting compressed data, you may significantly increase the CPU
consumption.
Default value: Accept gzip and deflate compression.
To manually add compression, enter the following function at the beginning of the
script:
web_add_auto_header("Accept-Encoding", "gzip");
To verify that the server sent compressed data, search for the string Content -
Encoding: gzip in the section of the server's responses of the replay log. The log also
shows the data size before and after decompression.
Delete
unreferenced
cache
entries
Delete cache entries that have not been referenced within the specified number of
iterations. Set to zero (0) to never delete cache entries.
General
UI Element Description
Enable
snapshots
during replay
Create snapshots during replay.
Note: Disabling replay snapshots will improve the replay speed. However,
snapshot-dependent features such as DFE and correlations, will not be able
to use data captured during the replay. This may cause unstable behavior.
DNS caching Instructs the Vuser to save a host's IP addresses to a cache after resolving its value
from the Domain Name Server. This saves time in subsequent calls to the same
server. In situations where the IP address changes, as with certain load balancing
techniques, be sure to disable this option to prevent Vuser from using the value in
the cache.
Default value: Enabled
User Guide
VuGen
HP LoadRunner (12.50) Page 291

UI Element Description
Convert
to/from UTF-
8
Converts received HTML pages and submitted data from and to UTF-8. You enable
UTF-8 support in the recording options. For more information, see "Recording
Options" on page146.
Default value: No
Charset to
use for
converting
HTML
The character set to use to convert received HTMLs and submitted data from/to the
set charset. This option is ignored if you enabled the previous option, \'Convert
to/from UTF-8\'.
Mark step
timeouts
caused by
resources as
a warning
Issues a warning instead of an error when a timeout occurs due to a resource that
did not load within the timeout interval. For non-resources, VuGen issues an error.
Default value: Disabled
Parse HTML
content-type
When expecting HTML, parse the response only when it is the specified content-type:
HTML,text\html,TEXT any text, or ANY, any content-type. Note that text/xml is not
parsed as HTML.
Default value: TEXT
Step
download
timeout (sec)
The time that the Vuser will wait before aborting a step in the script. This option can
be used to emulate a user behavior of not waiting for more than x seconds for a
page.
Maximum value: 32000 seconds
The timeout settings are primarily for advanced users who have determined that
acceptable timeout values should be different for their environment. The default
settings should be sufficient in most cases. If the server does not respond in a
reasonable amount of time, check for other connection-related issues, rather than
setting a very long timeout which could cause the scripts to wait unnecessarily.
Network
buffer size
Sets the maximum size of the buffer used to receive the HTTP response. If the size
of the data is larger than the specified size, the server will send the data in chunks,
increasing the overhead of the system. When running multiple Vusers from the
Controller, every Vuser uses its own network buffer. This setting is primarily for
advanced users who have determined that the network buffer size may affect their
script's performance. The default is 12K bytes. The maximum size is 0x7FFF FFFF.
Print NTLM
information
Print information about the NTLM handshake to the standard log.
Print SSL Print information about the SSL handshake to the standard log.
User Guide
VuGen
HP LoadRunner (12.50) Page 292

UI Element Description
information
SSL version The version of SSLused by your application.
Maximum
number of
failure-
matches to
list as errors
Limit the number of content-check failures that are issued as errors, where a failure
is indicated by the appearance of a string (Fail=Found). This applies to match criteria
using a left and right boundary. All subsequent matches are listed as informational
messages.
Default value: 10 matches
Maximum
redirection
depth
The maximum number of allowed redirections.
Default value: 10
Maximum
number of
'META
Refresh' on a
single page
The maximum number of times that a META refresh can be performed per page.
Default value: 2
Convert
ContentCheck
values to
UTF-8
Store the values in the ContentCheck XML file in UTF-8.
Default value: Disabled
Limit the
Tree view
request body
to
Limit the number of request body bytes displayed in Tree-View. Set to zero (0) for no
limit.
Limit the
stored
snapshot to
Limit the size of each snapshot file to a specific number of kilobytes. Enter 0 to
indicate no limit.
IP version The IP version to be used: IPv4, IPv6 or automatic selection. The default value is IPv4.
web_sync
retry interval
The time to wait (in milliseconds) between testing the condition that yields false and
the next retry.
Default value: 1000
web_sync
retry timeout
The maximum time (in milliseconds) during which retries are allowed. If the
computed timeout exceeds the step timeout (as determined by the 'Step download
timeout' setting), the latter is used.
User Guide
VuGen
HP LoadRunner (12.50) Page 293

UI Element Description
WebSocket
callback
interval
The time interval in milliseconds, before repeating a call to a WebSocket callback
handler. This must be a non-zero value.
Prefetch and
prerender
callback
timer
interval
The time interval in milliseconds, before repeating a call to Prefetch and Prerender
callback handlers. This must be a non-zero value.
Authentication
UI Element Description
Add a fixed
delay upon
authentication
Automatically adds think time to the Vuser script for emulating a user entering
authentication information (username and password). This think time will be
included in the transaction time.
Default value: 0
Disable NTLM2
session
security
Use full NTLM 2 handshake security instead of the more basic NTLM 2 session
security response.
Default value: No
Use the native
Windows NTLM
implementation
Use the Microsoft Security API for NTLM authentication instead of the indigenous
one.
Default value: No
Override
credentials in a
Windows native
NTML
implementation
Use the credentials provided by the user at logon.
Enable
integrated
authentication
Enable Kerberos-based authentication. When the server proposes authentication
schemes, use Negotiate in preference to other schemes.
Default value: No
Induce heavy
KDC load
Do not reuse credentials obtained in previous iterations. Enabling this setting will
increase the load on the KDC (Key Distribution Server). To lower the load on the
server, set this option to Yes in order to reuse the credentials obtained in previous
iterations. This option is only relevant when Kerberos authentication is used.
User Guide
VuGen
HP LoadRunner (12.50) Page 294

UI Element Description
Default value: No
Use canonical
name in SPN
Use the canonical name instead of the original hostname retrieved from the URL,
to generate SPN (Service Principal Name).
Default value: Yes
Append non-
default port to
SPN
Append the port number to the SPN, if the specified port is a non-standard one
(neither 80 nor 443).
Default value: No
Enable
retrieving keys
from nCipher
HSM
Enables LoadRunner to retrieve private keys from the nCipher HSM (Hardware
Security Module). This option loads and initializes the CHIL engine necessary to
retrieve these keys.
Default value: Yes
Logging
UI Element Description
Print buffer line length Line length for printing request/response header/body and/or
JavaScript source, disabling wrapping.
Print buffer escape for binary
zeros only
lYes. Escape only binary zeros when printing request/response
headers/body and/or JavaScript source.
lNo. Escape any unprintable/control characters.
Limit the maximum response
size written to the log
Limits the size of the log containing the response data.
JavaScript
UI Element Description
Enable
JavaScript
debugging
mode
Only visible for Web-based Vuser Scripts generated in the JavaScript language.
Enables debugging for the replay of Vuser scripts. This only applies to the replay in
VuGen—not the Controller. Enabling this option may impact replay performance.
Enable
running
JavaScript
code
Only visible for Vuser Scripts generated in the C language. Enables the replay of
Web JavaScript steps, such as web_js_run() and web_js_reset(). This option creates a
JavaScript runtime engine even in the there are no JavaScript steps in the script.
User Guide
VuGen
HP LoadRunner (12.50) Page 295

UI Element Description
JavaScript
Engine
runtime
size
Only visible for Vuser Scripts generated in the C language.The memory size in
kilobytes, to allocate for the JavaScript engine runtime. One runtime engine will be
created for all Vusers in a process.
Default: 51200 KB
JavaScript
Engine
stack size
per thread
Only visible for Vuser Scripts generated in the C language.The memory size in
kilobytes, to allocate for each Vuser thread in the JavaScript engine.
Default: 32 KB
Click & Script Preferences
UI Element Description
General lHome Page URL. The URL of the home page that opens with your browser (default
is about:blank).
lDOM-based snapshots. Instructs VuGen to generate snapshots from the DOM
instead of from the server responses.
Default value: Yes
lCharset conversions by HTTP. Perform charset conversions by the `Content-
Type:....; charset=...' HTTP response header. Overrides `Convert from /to UTF-8.'
lReparse when META changes charset. Reparse HTML when a META tag changes
the charset. Effective only when Charset conversions by HTTP is enabled. Auto
means reparsing is enabled only if it used in the first iteration.
lFail on JavaScript error. Fails the Vuser when a JavaScript evaluation error occurs.
Default value: No (issue a warning message only after a JavaScript error, but
continue to run the script).
lInitialize standard classes for each new window project. When enabled, the
script—the src compiled script, will not be cached.
lIgnore acted on element being disabled. Ignore the element acted on by a Vuser
script function being disabled.
Timers lOptimize timers at end of step. When possible, executes a
setTimeout/setInterval/<META refresh> that expires at the end of the step before
the expiration time.
Default value: Yes
lSingle setTimeout/setInterval threshold (seconds). Specifies an upper timeout
for the window.setTimeout and window.setInterval methods. If the delay exceeds
this timeout, these methods will not invoke the functions that are passed to them.
User Guide
VuGen
HP LoadRunner (12.50) Page 296

UI Element Description
This emulates a user waiting a specified time before clicking on the next element.
Default value: 5 seconds
lAccumulative setTimeout/setInterval threshold (seconds). Specifies a timeout
for the window.setTimeout and window.setInterval methods. If the delay exceeds
this timeout, additional calls to window.setTimeout and window.setInterval will be
ignored. The timeout is accumulative per step.
Default value: 30 seconds
lReestablish setInterval at end of step.0 = No; 1= Once; 2= Yes.
lLimit no-network timers at end of step: Limit the number of
setTimeout/setInterval specified script evaluations at the end of a step when no
network requests are issued. Set to zero (0) for no limit. The default value is 100.
This limit is only used when 'Optimize timers at end of step' is enabled.
History lHistory support. Enables support for the window.history object for the test run.
The options are Enabled,Disabled, and Auto. The Auto option instructs Vusers to
support the window.history object only if it was used in the first iteration. Note that
by disabling this option, you improve performance.
Default value: Auto
lMaximum history size. The maximum number of steps to keep in the history list.
Default value: 100 steps
Navigator
Properties
lnavigator.browserLanguage. The browser language set in the navigator DOM
object's browserLanguage property.
Default value: The recorded value. Scripts created with older recording engines
use en-us by default.
lnavigator.systemLanguage. The system language set in the navigator DOM
object's systemLanguage property.
Default value: The recorded value. Scripts created with older recording engines
use en-us by default.
lnavigator.userLanguage. The user language set in the navigator DOM object's
userLanguage property.
Default value: The recorded value. Scripts created with older recording engines
use en-us by default.
Screen
Properties
lscreen.width Sets the width property of the screen DOM object in pixels.
Default value: 1024 pixels
lscreen.height Sets the height property of the screen DOM object in pixels.
Default value: 768 pixels
User Guide
VuGen
HP LoadRunner (12.50) Page 297

UI Element Description
lscreen.availWidth Sets the availWidth property of the screen DOM object in pixels.
Default value: 1024 pixels
lscreen.availHeight. Sets the availHeight property of the screen DOM object in
pixels.
Default value: 768 pixels
Memory
Management
lDefault block size for DOM memory allocations. Sets the default block size for
DOM memory allocations. If the value is too small, it may result in extra calls to
malloc, slowing the execution times. Too large a block size, may result in an
unnecessarily big footprint.
Default value: 16384 bytes
lMemory Manager for dynamically-created DOM objects.Yes—Use the Memory
Manager for dynamically-created DOM objects. No—Do not use the Memory
Manager, for example when multiple DOM objects are dynamically created in the
same document as under SAP. Auto—Use the protocol recommended (default Yes
for all protocols except for SAP).
lJavaScript Runtime memory size (KB). Specifies the size of the JavaScript
runtime memory in kilobytes.
Default value: 256 KB
lJavaScript Stack memory size (KB). Specifies the size of the JavaScript stack
memory in kilobytes.
Default value: 32 KB
Web
Javascript
lEnable running Javascript code.Yes—Enables running web Javascript steps, such
as web_js_run() and web_js_reset().No—Web Javascript steps can
not be run. Note that enabling this option causes the creation of a Javascript
Engine Runtime, even if there are no Javascript steps in the script.
Default value: No
lJavascript Engine runtime size (KB). Specifies the size of the Javascript Engine
Runtime memory in kilobytes. One Runtime will be created for all Vusers in a
process.
Default value: 10240 KB
lJavascript Engine stack size per-thread (KB). Specifies the size of each Vuser
thread in the Javascript Engine memory, in kilobytes.
Default value: 32 KB
User Guide
VuGen
HP LoadRunner (12.50) Page 298
Importing and Exporting Runtime Settings
This topic describes how to import and export runtime settings. This functionality is available for all
Vuser protocols. For an overview of the runtime settings functionality, see "Runtime Settings Overview"
on page280.
How to export runtime settings
1. Open a script and double-click Runtime Settings in the Solution Explorer.
2. In the Runtime Settings view, click Export All.
3. In the Save As dialog box, choose a location for the JSON file that will store the runtime settings
and click Save.
How to import runtime settings
1. Open a script and double-click Runtime Settings in the Solution Explorer.
2. In the Runtime Settings view, click Import.
3. In the Open dialog box, select a JSON file containing the runtime settings that you exported earlier
and click Open.
4. Save the script.
How to revert runtime settings to the default settings
1. In the Solution Explorer pane, select the runtime settings node of the script to be changed and
navigate to the required setting.
2. Click the Use Defaults button.
3. Save the script. Only the defaults for the displayed node are changed. If you want to revert to the
default settings for all the runtime settings, you must repeat the above steps for each runtime
setting node.
Bookmarks Overview
When you edit a Vuser script, you can use bookmarks to navigate between sections of the script. When
you add a bookmark, a bookmark icon is added to the left of the selected line in your script.
The Bookmarks pane displays a list of all bookmarks that exist in the Vuser script. Using the Bookmarks
pane, you can:
lNavigate to the location of the bookmark in your script.
lNavigate between consecutive bookmarks in the pane.
lDelete an individual bookmark.
lClear all bookmarks.
For task details, see "How to Use Bookmarks" on page301.
User Guide
VuGen
HP LoadRunner (12.50) Page 299

How to Run a Vuser Script from a Command Prompt
This task describes how to run a Vuser script from a command prompt or from the Windows Run dialog
box—without the VuGen user interface.
To send command line parameters to a Vuser from within VuGen, add the attributes and their values in
the Runtime Settings dialog box. For details, see the General > Additional Attributes view.
To run a script from a command line or the Run dialog box:
1. Open a Command Prompt window, or select Start >Run to open the Run dialog box.
2. Type mdrv followed by the script name, using the following syntax:
<installation_dir>/bin/mdrv.exe -usr <script_name>
where script_name is the full path to the .usr script file, for example, c:\temp\mytest\mytest.usr.
3. Add other command line options and arguments.
4. Click Enter. The mdrv program runs a single instance of the script without the user interface. The
output files provide the runtime information.
For a complete list of the command line options, type mdrv at a command prompt from the LoadRunner
bin folder, without any arguments. The following examples provide common usages of a command line
expression:
lYou can specify the load generator, as well as indicate the number of times to run the script as
indicated by the following example:
script1 -host pc4 -loop 5
lSpecify a location for the output files. For example:
-out c:\tmp\vuser
lSpecify arguments to pass to your script by using the following format:
script_name -arg_name arg_value -arg_name arg_value
You can retrieve the command line values by parsing the command line during replay, using the parsing
functions, such as lr_get_attrib_double. For details, see the Function Reference (Help > Function
Reference).
Note: The Linux command line utility, run_db_vuser, does not yet support many of the standard
Windows command line options. For details, see "How to Run a Vuser Script from a Linux
Command Line" on page1012.
User Guide
VuGen
HP LoadRunner (12.50) Page 300

How to Use Bookmarks
When working in the Editor, VuGen lets you place bookmarks at various locations within your script. You
can navigate between the bookmarks to analyze and debug your code. The following steps describe how
to work with bookmarks. Most of the bookmark functionality is available from VuGen's Bookmarks
pane. To access the Bookmarks pane, click View > Bookmarks.
Create a Bookmark
In the Editor, place the cursor at the desired location and press Ctrl + F2. VuGen places a bookmark icon
in the left margin of the script.
Remove a Bookmark
To remove a bookmark, perform one of the following:
lIn the Editor, click in the line that contains the bookmark and press Ctrl + F2.
lIn the Bookmark pane, select the bookmark that you want to delete and click the Delete Bookmark
button .
VuGen removes the bookmark icon from the left margin.
Navigate between Bookmarks
Click View > Bookmarks to display the Bookmarks pane.
lTo move to the next bookmark, click the Next Bookmark button or press F2.
lTo return to the previous bookmark, click the Previous Bookmark button or press Shift + F2.
You can navigate between bookmarks in the current action only. To navigate to a bookmark in another
action, select that action in the left pane and then press F2.
Navigate to a Specific Bookmark in a Vuser Script
In the Bookmarks pane, double-click the specific bookmark to which you want to navigate. The cursor
flashes in the Editor at the start of the line containing the bookmark.
Files Generated During Replay
This section describes what occurs when a Vuser script is replayed, and describes the files that are
created.
1. The options.txt file is created. This file includes command line parameters to the preprocessor.
User Guide
VuGen
HP LoadRunner (12.50) Page 301

Example of options.txt file
-DCCI
-D_IDA_XL
-DWINNT
-Ic:\tmp\Vuser (name and location of Vuser include
files)
-IE:\LRUN45B2\include (name and location of include files)
-ec:\tmp\Vuser\logfile.log (name and location of output logfile)
c:\tmp\Vuser\VUSER.c (name and location of file to be
processed)
2. The file Vuser.c is created. This file contains 'includes' to all the relevant .c and .h files.
Example of Vuser.c file
#include "E:\LRUN45B2\include\lrun.h"
#include "c:\tmp\web\init.c"
#include "c:\tmp\web\run.c"
#include "c:\tmp\web\end.c"
3. The c preprocessor cpp.exe is invoked in order to 'fill in' any macro definitions, precompiler
directives, and so on, from the development files.
The following command line is used:
cpp -foptions.txt
4. The file pre_cci.c is created which is also a C file (pre_cci.c is defined in the options.txt file). The
file logfile.log (also defined in options.txt) is created containing any output of this process. This
file should be empty if there are no problems with the preprocessing stage. If the file is not empty
then it is almost certain that the next stage of compilation will fail due to a fatal error.
5. The cci.exe C compiler is now invoked to create a platform-dependent pseudo-binary file (.ci) to be
used by the Vuser driver program that will interpret it at runtime. The cci takes the pre_cci.c file as
input.
6. The file pre_cci.ci is created as follows:
cci -errout c:\tmp\Vuser\logfile.log -c pre_cci.
7. The file logfile.log is the log file containing output of the compilation.
8. The file pre_cci.ci is now renamed to Vuser.ci.
Since the compilation can contain both warnings and errors, and since the driver does not know the
results of this process, the driver first checks if there are entries in the logfile.log file. If there are,
User Guide
VuGen
HP LoadRunner (12.50) Page 302

it then checks if the file Vuser.ci has been built. If the file size is not zero, it means that the cci has
succeeded to compile - if not, then the compilation has failed and an error message will be given.
9. The relevant driver is now run, taking both the .usr file and the Vuser.ci file as input. For example:
mdrv.exe -usr c:\tmp\Vuser\.usr -out c:\tmp\Vuser -file c:\tmp\Vuser\Vuser.ci
The .usr file is needed since it tells the driver program which database is being used. This
determines which libraries need to be loaded for the run.
10. If there is an existing replay log file, output.txt, (see the following entry), the log file is copied to
output.bak.
11. The output.txt file is created (in the path defined by the 'out' variable). This file contains the
output messages that were generated during the script replay. These are the same messages that
appear in the Replay view of VuGen's Output pane.
Network Virtualization (NV) Analytics Report
Note:
lThis report is only available for Web HTTP/HTML, TruClient Web, Flex, Mobile HTTP, SAP Web
and Siebel Web protocols and where the NV Analytics report has been installed on the VuGen
machine. The report is not supported when replaying in TruClient Chromium, but is available
forTruClient Firefox and TruClient Internet Explorer.
lThe report cannot be created if several instances of VuGen are running at the same time.
lThe Network Virtualization report only supports IPv4 network traffic-not IPv6.
This section describes how to view and analyze the results generated by the NV Analytics report.
NV Analytics assists in pinpointing factors that negatively impact an application's performance across a
network. NV Analytics performs its analysis based on packet list data, then displays the resulting data in
informative reports that provide insight into an application's operation. The NV Analytics report consists
of several subreports, each displaying different aspects of network data captured during the replay of a
Vuser script.
The report includes performance optimization recommendations as well as HTTP analysis and resources
breakdown, as well as load times, component download analysis, response time breakdown, and details
of errors received.
Opening the NV Analytics Report
1. Make sure the NVAnalytics component is properly installed in order to generate the NV Analytics
report. See the LoadRunner Installation Guide for details of how to install NV Analytics on the
VuGen machine. Once NVAnalytics is installed the report is automatically generated. To disable
User Guide
VuGen
HP LoadRunner (12.50) Page 303
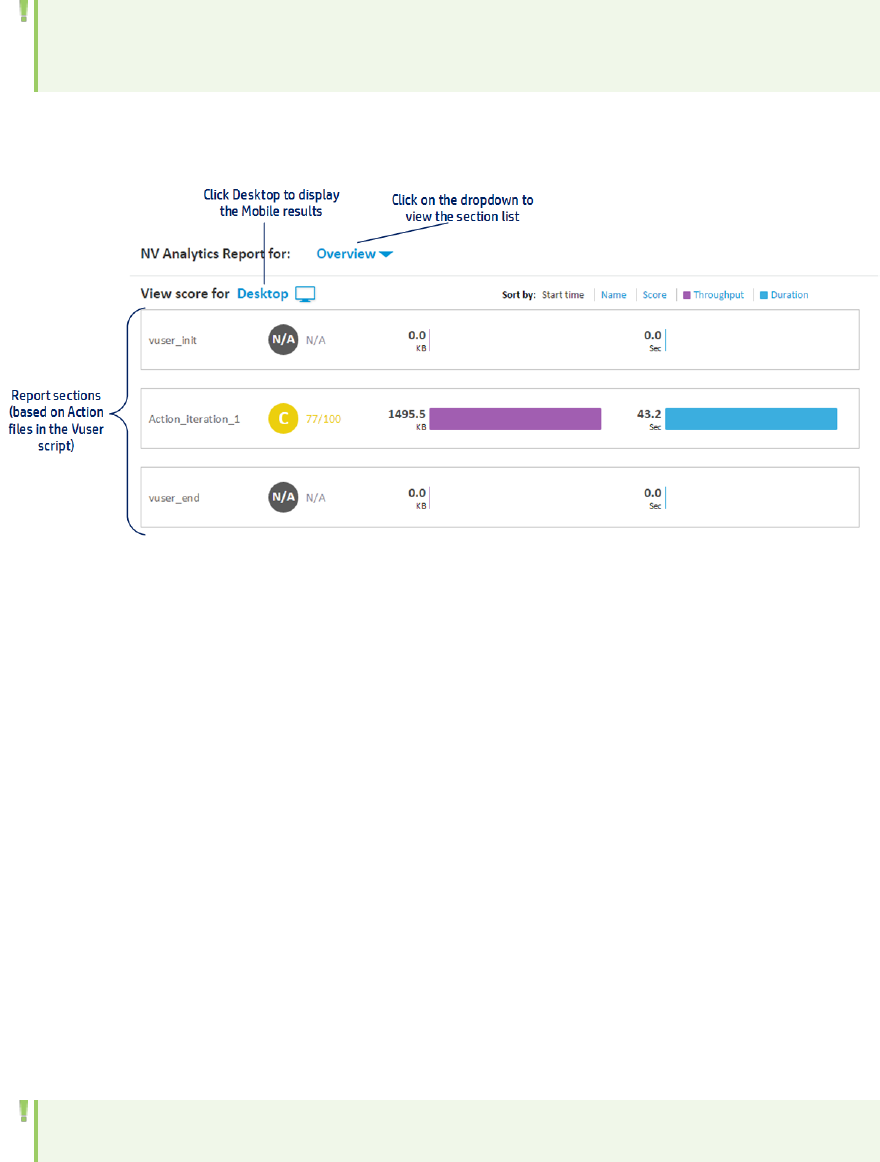
report generation see, "Display Network Virtualization (NV) Analytics report" on page113.
2. Open the report by clicking the link in the Replay Summary page (displayed after script replay).
Note: For long scripts, generating the report may take time. Click Cancel to discard report
generation.
NV Analyatics Report Overview
The report opens in the Overview page. The Overview page displays all actions contained in your script.
Each action is assigned a performance score with a letter (from A to F) and a percentage, as well as
details of the throughput and time taken to complete the action. Action scores and the performance
optimization recommendations can be different for Mobile and Desktop clients. By default, the
Overview page opens with details for desktop performance. Click Desktop to see the results for mobile.
Click any action to view the detailed report for that action or click the dropdown at the top to see the
list of actions.
The NV for Analytics report consists of the following sections:
l"Summaries" below
l"Endpoint Latencies" on page306
l"HTTP Analysis" on page307
l"HTTP Optimization" on page309
l"HTTP Resources" on page310
Summaries
Note: This report is available for 30 days after installation. After 30 days, you need an NV
User Guide
VuGen
HP LoadRunner (12.50) Page 304
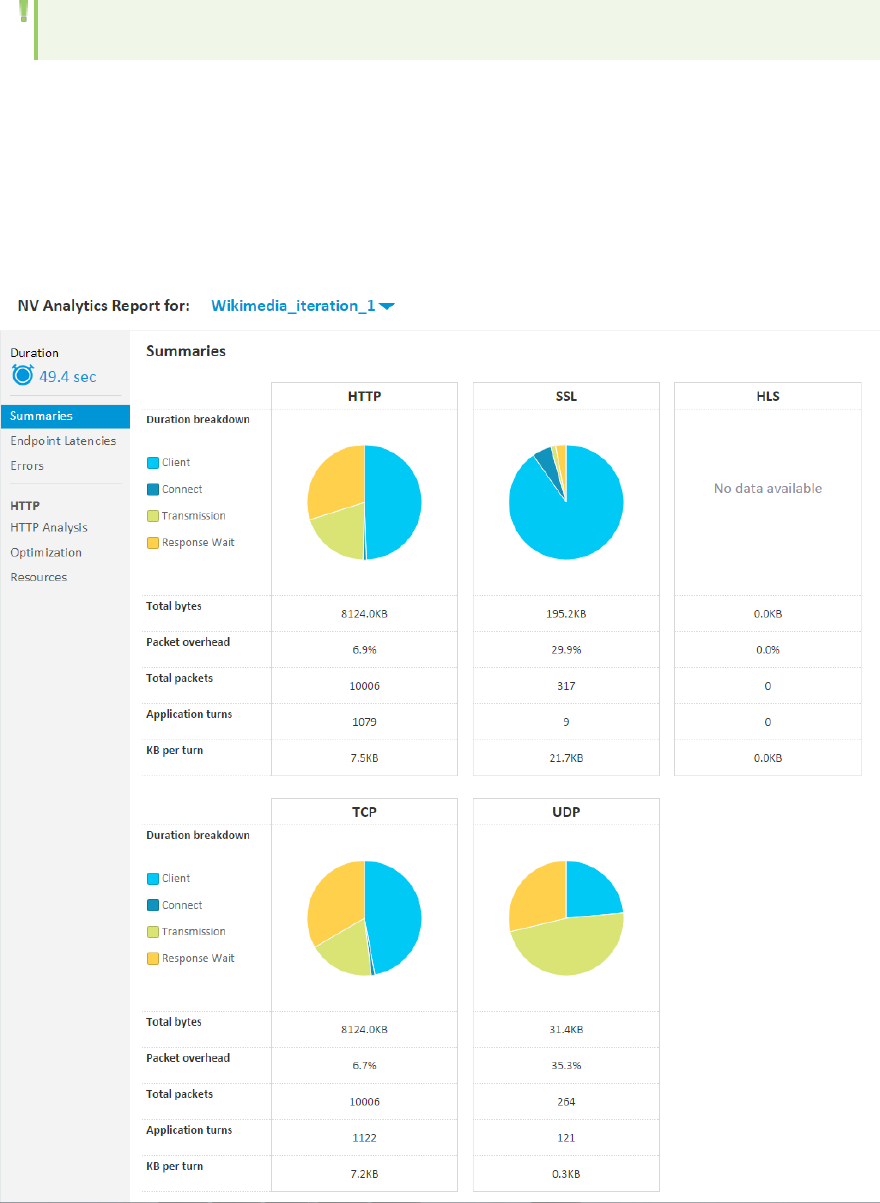
Analytics report license to view the report.
Displays the Client Network Server Breakdown of the action and different metrics for the following
protocols:
lHTTP
lSSL (secure communication)
lTCP
lUDP
User Guide
VuGen
HP LoadRunner (12.50) Page 305
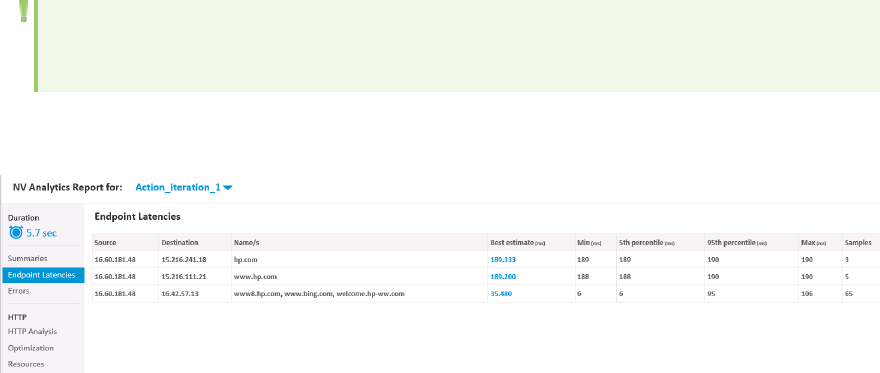
Duration Breakdown
The values for the fields shown in each pie are:
lClient: Portion of time that the client process ran (does not include time waiting for a server
response)
lConnect: Portion of time in which the client connects to the server, such as the request in TCP or SSL
handshake (the establishment of a secure channel)
lTransmission: Portion of time data was downloaded or uploaded
lResponse wait: Portion of time spent waiting for the server’s response
Metrics
lTotal bytes: The total amount of transmitted data (KB)
lPacket overhead:The percentage of the total bytes per protocol used by non-data elements
lTotal packets: Total number of packets associated with the protocol
lApplication turns:The number of times a communication flow change occurs from the request to
the response, per protocol
lKB per turn:The average of the throughput per application turn, per protocol
See also:
l"Network Virtualization (NV) Analytics Report" on page303
l"Endpoint Latencies" below
l"Network Virtualization Integration" on page1366
Endpoint Latencies
Note: This report is available for 30 days after installation. After 30 days, you need an NV
Analytics report license to view the report.
The Endpoint Latencies report displays details of the latency observed at the client and server
endpoints.
User Guide
VuGen
HP LoadRunner (12.50) Page 306
lSource: The source IP address
lDestination: The destination IPaddress
lName/s: The name/s of the server
lBest estimate (ms): Best estimate of the latency between the client and server, as deduced from
the TCP connections between them. This estimate accounts for additional latencies found in the
packet capture due to bandwidth constraints. As a result, this value may be less than the minimum
value.
lMin (ms): The minimum value observed in the packet capture
l5th percentile (ms): The minimum value observed in the packet capture, not including outermost
conditions
l95th percentile (ms): The maximum value observed in the packet capture, not including outermost
conditions
lMax (ms): The maximum value observed in the packet capture
lSamples: The number of packets used in the calculation of the latency
See also:
l"Network Virtualization (NV) Analytics Report" on page303
l"HTTP Analysis" below
l"Network Virtualization Integration" on page1366
HTTP Analysis
The HTTP Analysis report is displayed both as a table and a graph displaying throughput values. The
report displays the list of requests/resources sent over the network. You can locate bottlenecks in your
application and correct them accordingly. Click a resource to see more details. Click any of the table
headers to sort the table according to the column. You can highlight a section of the throughput graph
(displayed below) to view that section's details only in the table.
User Guide
VuGen
HP LoadRunner (12.50) Page 307
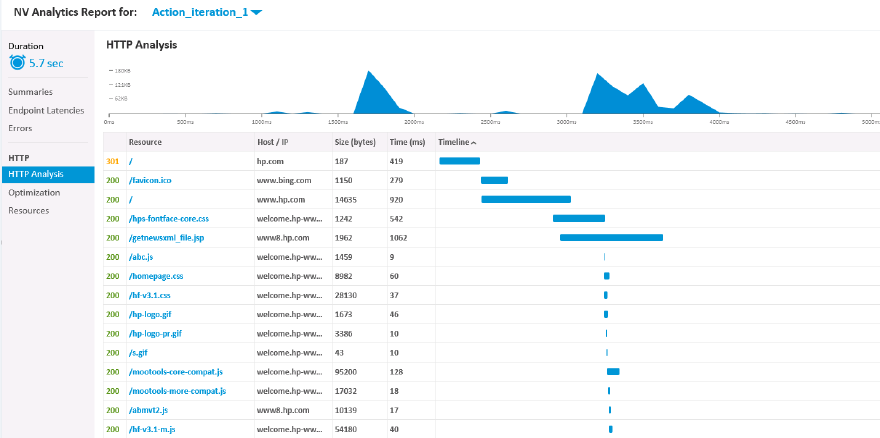
The following columns are displayed in the report:
lStatus: The HTTP status-code, such as 404 (page not found) or 200 (OK)
lResource: Displays the URL
lHost / IP: The host server name
lSize(bytes): The response body size
lTime(ms): Response time in milliseconds
lTimeline: The position of the resource in the timeline
HTTP Metrics
To display the details of a Request/Response:
1. Click the resource to view the following information:
lRequest Headers: Displays the request header details
lResponse Headers: Displays the response header details
lTimeline Breakdown: Breakdown of the time taken for the resource to be processed.
lResource: The resource's full URL
Highlighting Resources
You can highlight resources in the Analysis table according to hosts and sessions. This enables you to
see which resources were downloaded together either from the same host, or in the same session.
To highlight resources:
User Guide
VuGen
HP LoadRunner (12.50) Page 308
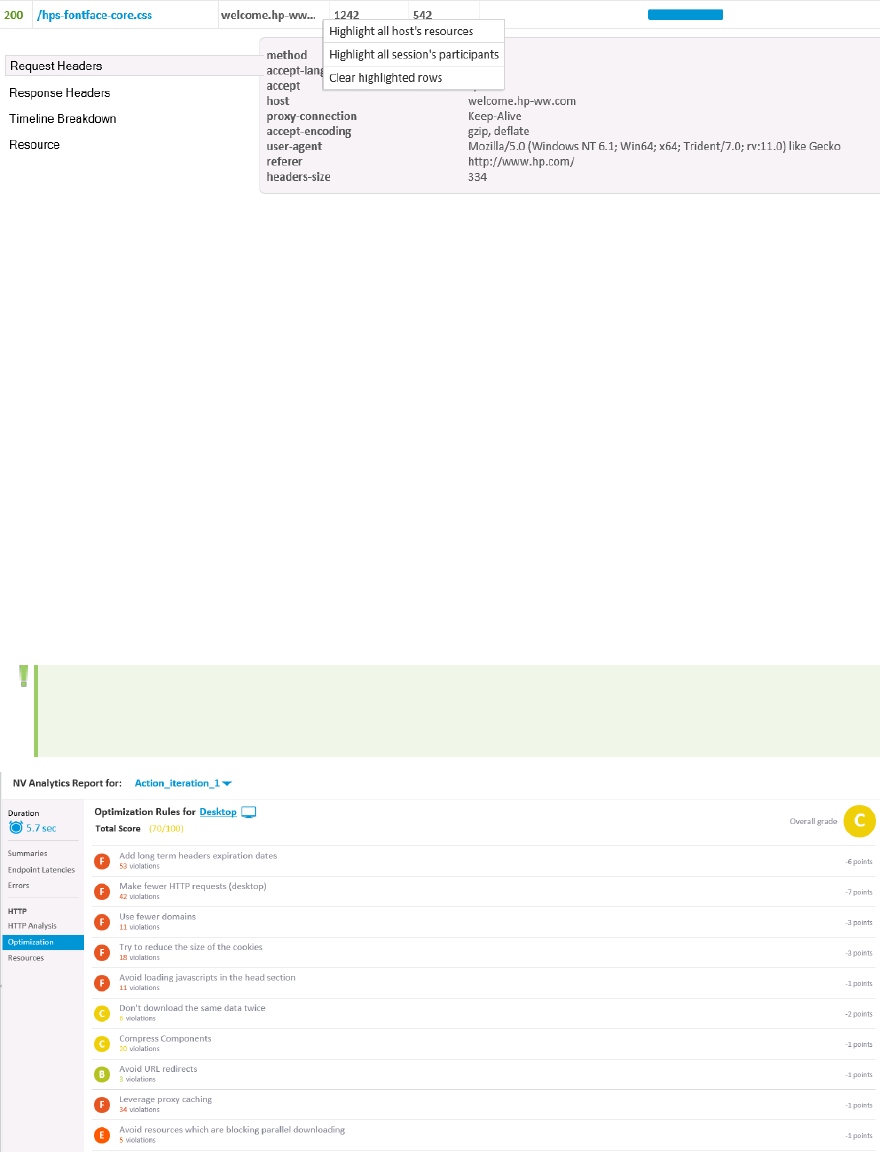
lPlace the cursor on the Host/IP column of the resource you want to group for the highlight menu to
appear.
lSelect Highlight all host's resources to highlight all the resources downloaded from that host.
lSelect Highlight all session's participants to highlight all resources downloaded from the same
session.
lSelect Clear highlighted rows to remove any highlights.
See also:
l"Network Virtualization (NV) Analytics Report" on page303
l"HTTP Optimization" below
l"Network Virtualization Integration" on page1366
HTTP Optimization
Note: This report is available for 30 days after installation. After 30 days, you need an NV
Analytics report license to view the report.
There are many factors beyond bandwidth and latency that affect the speed at which network requests
are fulfilled. For example, two web pages that look exactly the same can load at very different speeds if
one of the pages is optimized and the other isn't. As part of the analysis process, NVprovides
User Guide
VuGen
HP LoadRunner (12.50) Page 309

recommendations for optimizing network traffic in your script so that it is as efficient as possible. Each
action is measured against accepted industry standards as well as HP's enhanced best practices in
order to detect performance problems. The Optimization report shows:
lA specific category for each best-practice
lIndividual best-practice violations in each category
lOptimization recommendations for each category
Additionally, the Optimization Report gives you a grade for each category, and then gives you a total
optimization grade for the entire transaction. The higher your grade, the better your transaction is
optimized.
Click the optimization rule to see which resource is not compliant with the rule. Click a resource to open
the resource in the HTTP Analysis.
The optimization rules differ slightly between desktop and mobile clients. Click Desktop or Mobile to
switch between the clients.
Note: Not every recommendation will be suitable to your environment. The recommendations in
the report are not a replacement for a full investigation of each case.
See also:
l"Network Virtualization (NV) Analytics Report" on page303
l"HTTP Resources" below
l"Network Virtualization Integration" on page1366
HTTP Resources
The Resources Breakdown sub-report displays the Instances and size for each type of resource that is
present in the action.
Place your mouse over each section of the pie chart to see the resource it represents.
User Guide
VuGen
HP LoadRunner (12.50) Page 310
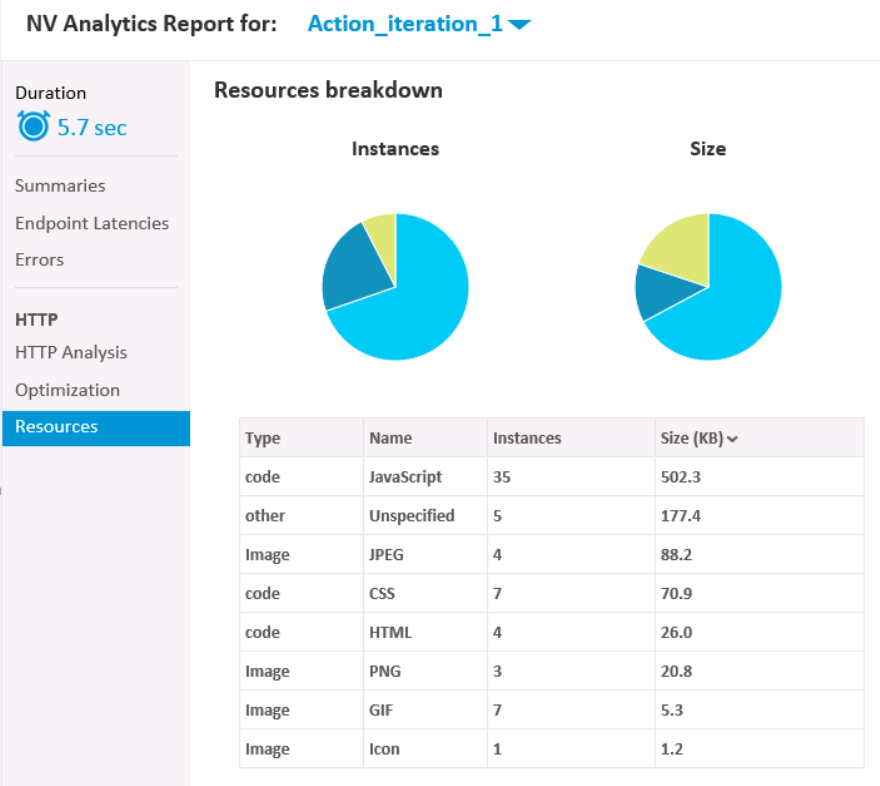
See also:
l"Network Virtualization (NV) Analytics Report" on page303
l"Summaries" on page304
l"Network Virtualization Integration" on page1366
Debugging
The Debugging section describes the various methods that are available to debug Vuser scripts.
Debugging Overview
Developing a Vuser script includes the steps shown below. This topic provides an overview of the fifth
step, debugging a Vuser script.
User Guide
VuGen
HP LoadRunner (12.50) Page 311
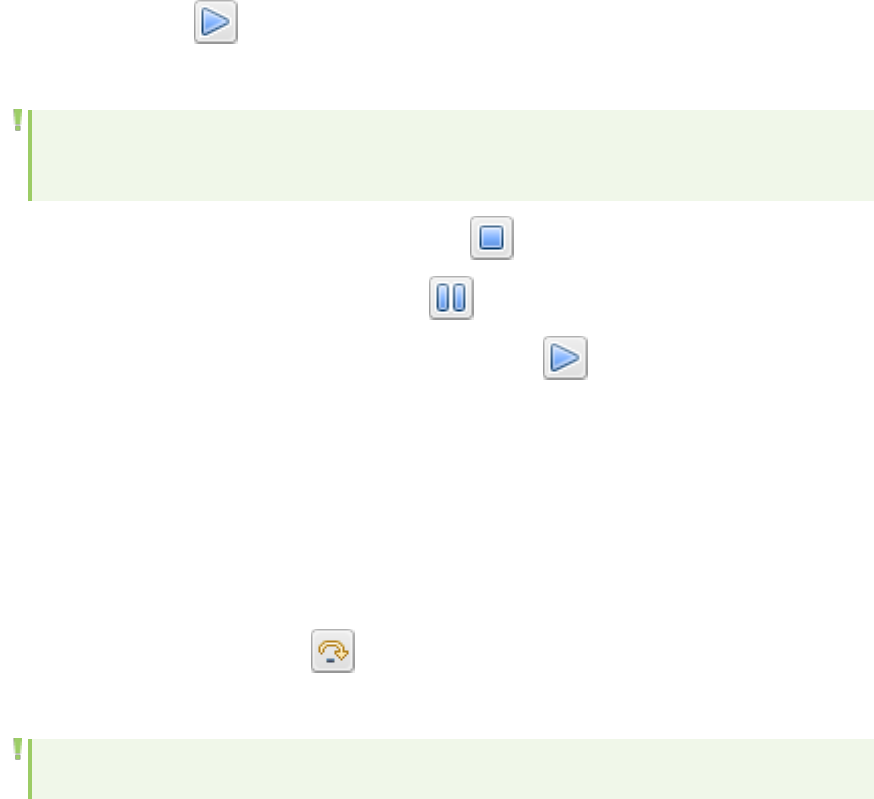
After creating a Vuser script, replay the script to verify that the script runs without errors. Using
VuGen's debug features, you can identify and resolve errors in your scripts. You can access most of
these script debugging features from the VuGen toolbar.
Running a Vuser script
To run a Vuser script until the end of the script or until the next breakpoint, perform one of the
following:
lSelect Replay > Run.
lClick the Run button on the Vuser toolbar.
lPress F5.
Note: The status of the Vuser script execution appears in the lower left corner of VuGen. The
script execution status may be Ready,Running, or Paused.
lTo stop a script that is running, click the Stop Replay button on the VuGen toolbar.
lTo pause a script that is running, click the Pause button on the VuGen toolbar.
lTo continue running a script that is paused, click the Continue button on the VuGen toolbar.
The Run Step by Step Command
The Run Step by Step command runs the script one line at a time. This enables you to follow the script
execution. The Run Step by Step command starts the script replay, and then and pauses it on the first
line of the script, usually in the vuser_init() action.
To run the script step by step, perform one of the following:
lSelect Replay > Run Step by Step.
lClick the Run Step by Step button on the VuGen toolbar.
lPress F10.
Note: The Run Step by Step button is available only while a script is being replayed.
Breakpoints
Breakpoints pause script execution at specified points in the script. This enables you to examine the
effects of the script on your application at pre-determined points during script execution.
lFor concept details on breakpoints, see "Working with Breakpoints" on page315.
lFor task details, see "How to Debug Scripts with Breakpoints" on page319.
User Guide
VuGen
HP LoadRunner (12.50) Page 312
Bookmarks
When working in Script view, VuGen lets you place bookmarks at various locations within your script. You
can navigate between the bookmarks to help analyze and debug your code.
lFor task details, see "How to Use Bookmarks" on page301.
Watching Variables
The Watch pane enables you to monitor variables and expressions while a script runs. You can monitor
variables and expressions only when execution of a Vuser script is in the Paused state. To display the
Watch pane, click View > Debug > Watch. For details on using the Watch pane, see "Watching
Expressions and Variables" on page317.
Go To Commands
lTo navigate around a script using breakpoints, you can use the Go To Source command. For details,
see "How to Debug Scripts with Breakpoints" on page319.
lTo navigate around a script using bookmarks, you can use the Next Bookmark and Previous
Bookmark commands. For details, see "How to Use Bookmarks" on page301.
If you want to examine the Replay log messages for a specific step or function, right-click the step in
the Editor and select Go To Step in Replay Log. VuGen places the cursor at the start of the
corresponding step in the Output pane's Replay log.
Output Pane
The Output pane displays messages that were generated during the replay of your script. For details,
see "Output Pane" on page90.
To enable some recorded Vuser scripts to replay correctly, it may be necessary to implement
correlation. Correlation is used when a recorded script includes a dynamic value (such as a session ID)
and therefore cannot be successfully replayed. To resolve this, you convert the dynamic value into a
variable—thereby enabling your script to replay successfully. For details, see "Correlation Overview" on
page235.
Error Handling
You can specify how a Vuser handles errors during script execution. By default, when a Vuser detects an
error, the Vuser stops executing the script. You can instruct a Vuser to continue with the next iteration
when an error occurs using one of the following methods:
lUsing runtime settings. You can specify the Continue on Error runtime setting. The Continue on
Error runtime setting applies to the entire Vuser script. You can use the lr_continue_on_error
function to override the Continue on Error runtime setting for a portion of a script.
lUsing the lr_continue_on_error function. The lr_continue_on_error function enables you to control
error handling for a specific segment of a Vuser script. To mark the segment, enclose it with lr_
User Guide
VuGen
HP LoadRunner (12.50) Page 313
continue_on_error(1);and lr_continue_on_error(0); statements. The new error settings
apply to the enclosed Vuser script segment. See the paragraphs below for details.
For example, if you enable the Continue on Error runtime setting and a Vuser encounters an error during
replay of the following script segment, the Vuser continues executing the script:
web_link("EBOOKS",
"Text=EBOOKS",
"Snapshot=t2.inf",
LAST);
web_link("Find Rocket eBooks",
"Text=Find Rocket eBooks",
"Snapshot=t3.inf",
LAST);
To instruct the Vuser to continue on error for a specific segment of the script, enclose the segment with
the appropriate lr_continue_on_error statements:
lr_continue_on_error(1);
web_link("EBOOKS",
"Text=EBOOKS",
"Snapshot=t2.inf",
LAST);
web_link("Find Rocket eBooks",
"Text=Find Rocket eBooks",
"Snapshot=t3.inf",
LAST);
lr_continue_on_error(0);
Additional Debugging Information
General Debugging Tip
VuGen can be used as a regular text editor. You can open any text file in it and edit it. When an error
message is displayed during replay in the output window below, you can double click on it and VuGen
jumps the cursor to the line of the test that caused the problem. You can also place the cursor on the
error code and press F1 to view the online help explanation for the error code.
Using C Functions for Tracing
You can use the C interpreter trace option (in version 230 or higher) to debug your Vuser scripts. The
ci_set_debug statement allows trace and debug to be turned on and off at specific points in the script.
ci_set_debug(ci_this_context, int debug, int trace);
For example, you could add the following statements to your script:
ci_set_debug(ci_this_context, 1, 1) /* turn ON trace =; debug */
ci_set_debug(ci_this_context, 0, 0) /* turn OFF trace =; debug */
User Guide
VuGen
HP LoadRunner (12.50) Page 314

Additional C Language Keywords
When you run a C script in VuGen, its parser uses the built-in C interpreter to parse the functions in the
script. You can add keywords that are not part of the standard parser's library. By default, several
common C++ keywords are added during installation, such as size_t and DWORD. You can edit the list
and add additional keywords for your environment.
Add Additional Keywords
1. Open the vugen_extra_keywords.ini file, located in your machine's <Windows> or
<Windows>/System directory.
2. In the EXTRA_KEYWORDS_C section, add the desired keywords for the C interpreter.
The file has the following format:
[EXTRA_KEYWORDS_C]
FILE=
size_t=
WORD=
DWORD=
LPCSTR=
Examining Replay Output
Look at the replay output (either from within VuGen, or the file output.txt representing the output of
the VuGen driver). You may also change the runtime settings options in VuGen to select more extensive
logging in order to obtain a more detailed log output of the replayed test.
Working with Breakpoints
VuGen lets you include breakpoints in you Vuser scripts to help you to debug the scripts. Breakpoints
pause script execution at specified points in the script. This enables you to analyze the effects of the
script on your application at pre-determined points during script execution. For task details, see "How to
Debug Scripts with Breakpoints" on page319. A breakpoint symbol ( ) in the left margin of the script
indicates the presence of a breakpoint. In addition, VuGen highlights the line in the script.
You can disable a breakpoint if the breakpoint is temporarily not required. A white dot inside the
Breakpoint symbol indicates a disabled breakpoint ( ). When a breakpoint is disabled, script execution
continues at the disabled breakpoint and is paused at the following enabled breakpoint. You use the
Breakpoints pane to enable and disable breakpoints. In addition, the breakpoints pane enables you to
delete an existing breakpoint or delete all existing breakpoints. To display the Breakpoints pane, click
View > Debug > Breakpoints.
To run a script with breakpoints, begin running the script as usual. VuGen pauses script execution when
it reaches a breakpoint. You can examine the effects of the script run up to the breakpoint, make any
necessary changes, and then restart the script from the breakpoint.
User Guide
VuGen
HP LoadRunner (12.50) Page 315
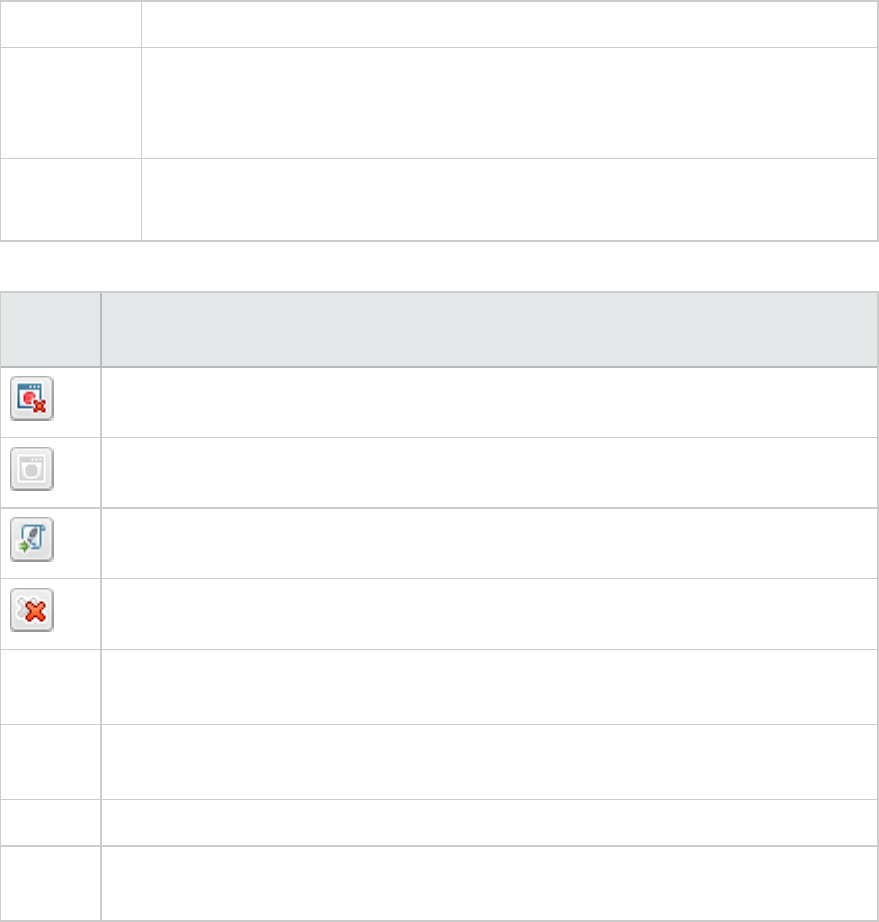
To resume execution, select Replay > Run. Once restarted, the script continues until it encounters
another breakpoint or the end of the script.
Breakpoints Pane
This VuGen pane enables you to set and manage breakpoints to help analyze the effects of the script on
your application at pre-determined points during script execution.
To access View > Debug > Breakpoints
Important
information
lThis pane is relevant only when a run session is paused.
lYou can move this pane to different areas of the Main User Interface. For details,
see "How to Modify the VuGen Layout" on page58.
See also l"User Interface" on page54
l"Debugging" on page311
User interface elements are described below (unlabeled elements are shown in angle brackets):
UI
Element
Description
Enables you to delete the selected breakpoint.
Enables you to enable or disable the selected breakpoint.
Enables you to navigate to a specific breakpoint in a Vuser script.
Deletes all breakpoints in the Vuser script.
Enabled A check box that specifies whether the breakpoint is enabled or disabled, and enables you
to enable or disable the adjacent breakpoint.
Name The name of the file that contains the breakpoint, and the line number within the file that
contains the breakpoint.
Script The name of the Vuser script that contains the breakpoint.
Function
Name
The name of the function within the Vuser script that contains the breakpoint.
User Guide
VuGen
HP LoadRunner (12.50) Page 316
Watching Expressions and Variables
VuGen's Watch pane enables you to monitor variables while a script runs. The list of variables that you
want to watch is known as the watch list, and is displayed in the watch pane. To display the Watch pane,
click View > Debug > Watch. You can add only variables to the watch list - you cannot add expressions
to the watch list. You can add, edit, or remove variables within the watch list by using the Watch pane's
toolbar buttons. You can sort the columns in the watch pane by expression, value, or type name by
clicking the column headers. For details on other debugging features in VuGen, see "Debugging
Overview" on page311.
Note: You can monitor variables only when execution of a Vuser script is in the Paused state.
Adding a New Watch to the Watch List
You can add a new watch expression only when execution of a Vuser script is in the Paused state.
To add a new watch:
1. Click View > Debug > Watch to open the Watch pane.
2. Click the Add Watch button . The Add New Watch dialog box opens.
3. In the Expression field, enter the variable that you want to watch, and then click OK. VuGen adds
the variable to the list of expressions in the watch list.
Note: You can add only variables to the watch list - you cannot add expressions to the watch list.
Editing a Watch Expression
Note: You can edit a watch expression only when execution of a Vuser script is in the Paused state.
To edit a watch expression:
1. Click View > Debug > Watch to open the Watch pane.
2. In the watch list, select the expression that you want to edit, and then click the Edit Watch
Expression button . The Edit Watch dialog box opens.
3. In the Expression field, modify the existing variable as required, and then click OK. VuGen displays
the modified variable in the list of variables in the watch list.
Deleting a Watch Expression
Note: You can delete a watch expression only when execution of a Vuser script is in the Paused state.
To delete a watch expression:
User Guide
VuGen
HP LoadRunner (12.50) Page 317
1. Click View > Debug > Watch to open the Watch pane.
2. In the Watch pane, select the expression that you want to delete, and then click the Delete Watch
button . VuGen deletes the selected expression from the list of expressions in the watch list.
Deleting All Watch Expressions From the Watch List
Note: You can delete watch expressions only when execution of a Vuser script is in the Paused state.
To delete all watch expressions from the watch list:
1. Click View > Debug > Watch to open the Watch pane.
2. Click the Delete All Watches button . VuGen deletes all the expressions from the watch list.
Debugging Web Vuser Scripts
VuGen provides an additional tool to help you debug Web Vuser scripts—the Results Summary report.
You can specify whether or not a Web Vuser generates a Results Summary report during script
execution. The Results Summary report summarizes the success or failure of each step in the Web
Vuser scripts and allows you to view the Web page returned by each step. For additional details on
working with the Results Summary report, select Replay > Test Results and click F1 to open the online
help.
You can instruct VuGen to display a runtime viewer when you run a Web Vuser script. The runtime viewer
was developed specifically for use with VuGen—it is unrelated to the browser that you use to record
your Vuser scripts.
The runtime viewer shows each Web page as it is accessed by the Vuser. This is useful when you debug
Web Vuser scripts because it allows you to check that the Vuser accesses the correct Web pages. For
information on how to enable the view, see "Scripting Options" on page111.
Note: The runtime viewer, in order to conserve resources, may display part of the page's HTML
as text.
You can specify whether or not a Web Vuser generates a Results Summary report during script
execution. This report summarizes the success or failure of each step in Web Vuser scripts and allows
you to view the Web page returned by each step. For details, select Replay > Test Results and click F1
to open the online help.
Note: Transaction times may be increased when a Vuser generates a Results Summary report.
Vusers can generate Results Summary reports only when run from VuGen. When you run a
script from the Controller or Business Process Monitor, Vusers do not generate reports.
User Guide
VuGen
HP LoadRunner (12.50) Page 318

How to Debug Scripts with Breakpoints
The following steps describe how to work with breakpoints. For concept details, see "Working with
Breakpoints" on page315.
Add a Breakpoint
To add a breakpoint:
Locate the cursor in the script where you want to insert the breakpoint and then do one of the
following:
1. Select Replay > Toggle Breakpoint.
2. Press F9.
3. Click in the left margin if the script, adjacent to where you want to insert the breakpoint.
The Breakpoint symbol ( ) appears in the left margin of the script, and VuGen highlights the line in the
script.
Delete a Breakpoint
To delete a breakpoint:
Locate the cursor in the script where you want to delete the breakpoint and then do one of the
following:
1. Select Replay > Toggle Breakpoint.
2. Press F9.
3. Click the breakpoint symbol left margin if the script.
The Breakpoint symbol ( ) is removed from the left margin of the script.
Enable/Disable a Breakpoint
To disable a breakpoint:
1. Click View > Debug > Breakpoints to display the Breakpoints pane.
2. Select the appropriate Enable check box to enable a breakpoint. The Breakpoint symbol ( )
appears in the left margin of the script.
3. Clear the appropriate Enable check box to disable a breakpoint. The Disabled Breakpoint symbol (
) appears in the left margin of the script.
When a breakpoint is disabled, script execution continues at the disabled breakpoint and is paused at
the following enabled breakpoint.
Manage Breakpoints
The Breakpoints pane allows you to remove, enable, and disable breakpoints in a Vuser script. For user
User Guide
VuGen
HP LoadRunner (12.50) Page 319

interface details, see "Breakpoints Pane" on page92.
Navigate to a specific breakpoint in a Vuser script
To navigate to a specific breakpoint in a Vuser script, perform one of the following:
lIn the Breakpoints pane, select the specific breakpoint to which you want to navigate, and then click
the Go to source button .
lIn the Breakpoints pane, double-click the breakpoint to which you want to navigate.
The cursor flashes in the Editor at the start of the line containing the breakpoint.
Run a Script With Breakpoints
Begin running the script as usual. VuGen pauses script execution when it reaches a breakpoint. You can
examine the effects of the script run up to the breakpoint, make any necessary changes, and then
restart the script from the breakpoint.
To resume execution, select Replay > Run. Once restarted, the script continues until it encounters
another breakpoint or the end of the script.
Enhancing
The Enhancing section explains the features that VuGen provides to enable you to enhance Vuser
scripts that will be able to accurately generate load. This includes features such as transactions and
rendezvous points.
Enhancing a Script for Load Testing Overview
Developing a Vuser script includes the steps shown below. This topic provides an overview of the sixth
step, viewing the results of the replay of a Vuser script.
This task describes the additional things you can do to a Vuser script to prepare the script for load
testing. All of the items in this task are optional.
Add Parameterization
When you record a business process, VuGen generates a script that contains the actual values used
during recording. Suppose you want to perform the script's actions (query, submit, and so forth) using
different values from those recorded. To do this, you replace the recorded values with parameters. This
is known as parameterizing the script. For more information, see "Parameterizing Overview" on
page341.
Insert Transactions
You can insert transactions into your Vuser script either while recording the script or after recording the
User Guide
VuGen
HP LoadRunner (12.50) Page 320

script.
For inserting transactions during recording, use the buttons on the floating toolbar, or click Ctrl +T. For
inserting transactions into your script after recording, use the Design > Insert in Script menu items.
For task details, see "How to Insert Transactions" on page323.
Insert Rendezvous Points
You can instruct multiple Vusers to perform a task at exactly the same moment using a rendezvous
point. When a Vuser arrives at the rendezvous point, it waits until all Vusers participating in the
rendezvous arrive. When the designated number of Vusers arrive, the Vusers are released.
You can insert rendezvous points in one of the following ways:
lTo insert a rendezvous point while recording, click the Rendezvous button on the Recording
toolbar and enter a name in the dialog box (not case sensitive).
lTo insert a rendezvous point after recording, select Design > Insert in Script >Rendezvous and
enter a name for the rendezvous point (not case sensitive).
When a rendezvous point is inserted, VuGen inserts a lr_rendezvous function into the Vuser script. For
example, the following function defines a rendezvous point named rendezvous1:
lr_rendezvous("rendezvous1");
For concept details, see "Rendezvous Points" on page327.
Insert VuGen Functions
You can insert VuGen functions at this point. For a list of some useful functions see "Adding VuGen
Functions Overview" on page327.
Insert Steps
You can insert a variety of steps into your script such as think time steps, debug messages, and output
messages. For task details, see "How to Insert Steps into a Script" on page339.
Insert Comments
VuGen allows you to insert comments between Vuser activities. You can insert a comment to describe
an activity or to provide information about a specific operation. For example, if you are recording
database actions, you could insert a comment to mark the first query, such as "This is the first query."
You can insert a comment in one of the following ways:
lTo insert a comment while recording, click the Insert Comment button on the Recording toolbar
and enter the desired comment in the Insert Comment dialog box.
lTo insert a comment after recording, select Design > Insert in Script > Comment and enter the
comment.
User Guide
VuGen
HP LoadRunner (12.50) Page 321
The following script segment shows how a comment appears in a Vuser script:
/* <comments> */
Insert Log Messages
You can use VuGen to generate and insert lr_log_message functions into a Vuser script. For example, if
you are recording database actions, you could insert a message to indicate the first query, "This is the
first query."
To insert a log message, select Design > Insert in Script > Log Message and enter the message.
Insert Synchronization Points (RTE Vusers only)
You can add synchronization functions to synchronize the execution of the Vuser script with the output
from your application. Synchronization applies to RTE Vuser scripts only.
The following is a list of the available synchronization functions:
Function Description
TE_wait_cursor Waits for the cursor to appear at a specified location in the terminal
window.
TE_wait_silent Waits for the client application to be silent for a specified number of
seconds.
TE_wait_sync Waits for the system to return from X-SYSTEM or Input Inhibited mode.
TE_wait_text Waits for a string to appear in a designated location.
TE_wait_sync_
transaction
Records the time that the system remained in the most recent X-SYSTEM
mode.
For details about synchronization in RTE Vuser scripts, see "RTE Synchronization Overview" on page637.
Transaction Overview
You define transactions to measure the performance of the server. Each transaction measures the
time it takes for the server to respond to specified Vuser requests. These requests can be simple tasks
such as waiting for a response for a single query, or complex tasks, such as submitting several queries
and generating a report.
To measure a transaction, you insert Vuser functions to mark the beginning and the end of a task.
Within a script, you can mark an unlimited number of transactions, each transaction with a different
name.
For LoadRunner, the Controller measures the time that it takes to perform each transaction. After the
test run, you analyze the server's performance per transaction using the Analysis' graphs and reports.
User Guide
VuGen
HP LoadRunner (12.50) Page 322
Before creating a script, you should determine which business processes you want to measure. You then
mark each business process or sub-process as a transaction.
Avoid using a "," or "@" symbol in a transaction name. These characters may cause errors to occur when
attempting to open the Analysis Cross Results graphs.
You can create transactions either during or after recording. For task details, see "How to Insert
Transactions" below.
How to Insert Transactions
You can insert a transaction into a Vuser script either while recording the script or after recording the
script. The following steps describe different methods to insert transactions. For background
information, see "Transaction Overview" on the previous page.
Insert a transaction after recording
You use VuGen's Editor to insert a transaction after recording a Vuser script.
1. To mark the start of a transaction, locate the cursor in the script where you want to start the
transaction, and then perform one of the following:
lSelect Design > Insert in Script > Start Transaction.
lPress Ctrl+T.
lRight-click in the script where you want to start the transaction and select Insert > Start
Transaction.
VuGen inserts an lr_start_transaction statement into the Vuser script. Enter a transaction name
into the new step.
2. To mark the end of a transaction, locate the cursor in the script where you want to end the
transaction, and then perform one of the following:
lSelect Design > Insert in Script > End Transaction.
lPress Ctrl+Shift+T.
lRight-click in the script where you want to end the transaction and select Insert > End
Transaction.
VuGen inserts an lr_end_transaction statement into the Vuser script. Enter a transaction name
into the new step.
3. To simultaneously mark the start and end of a transaction:
a. Select the steps that you want to include in the transaction.
b. Select Design > Insert in Script > Surround with Transaction, or right-click inside the
selection and select Surround with Transaction, or press Shift+Ctrl+I.
The Surround with Transaction dialog box opens.
c. Enter a name for the transaction, and then click OK.
User Guide
VuGen
HP LoadRunner (12.50) Page 323

VuGen inserts an lr_start_transaction statement before the first selected step, and an lr_end_
transaction statement after the last selected step.
Insert a transaction while recording
lTo mark the start of a transaction, click the Start Transaction button on the Recording toolbar,
enter a transaction name, and click OK. When the script is generated, VuGen inserts an lr_start_
transaction statement into the Vuser script.
lTo mark the end of a transaction, click the End Transaction button on the Recording toolbar
and select the transaction to close. When the script is generated, VuGen inserts an lr_end_
transaction statement into the Vuser script.
Note:
lYou can create nested transactions—transactions within transactions. If you nest
transactions, close the inner transactions before closing the outer ones—otherwise the
transactions won't be analyzed properly. However, transactions must be contained within a
single action section.
lTransaction names must be unique and may contain letters or numbers. Do not use the
following characters: . , : # / \ " <.
lA failed transaction does not automatically set the script's Replay status to Failed.
How to Display Transactions
The following steps describe how to display different types of transactions when viewing them in the
task pane. For background information, see "Transaction Overview" on page322.
Display Hidden Transactions
To display the hidden transactions—the non-primary and client side transactions—click the button
adjacent to Show hidden transactions at the bottom of the transaction list. VuGen lists the hidden
transactions in gray. To hide them, click the button again.
Display Transactions With Errors
Transactions with errors are those that do not measure any server steps, or those with illegal names.
To show the transactions with errors, click the Show transactions with errors button. VuGen lists the
transactions with errors in red. To hide them, click the button again.
Display Transactions for Non-primary Steps
To show the transactions for non-primary steps, you need to display all of the thumbnails. Select View >
Show All Thumbnails.
User Guide
VuGen
HP LoadRunner (12.50) Page 324
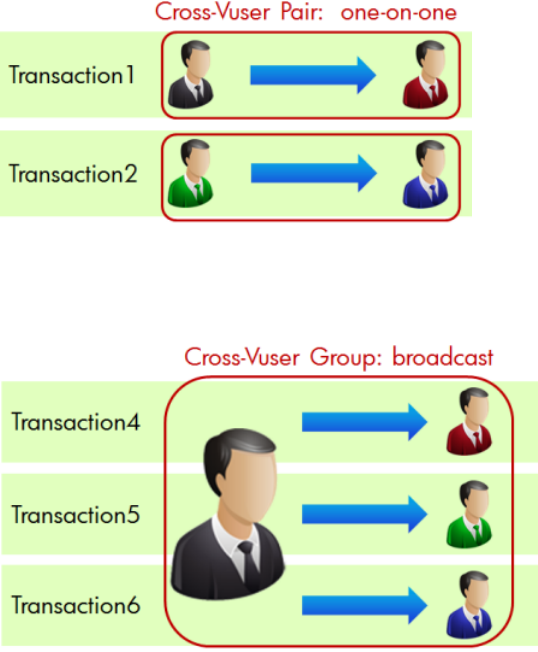
Cross-Vuser Transaction Overview
Cross-Vuser transactions are transactions that allow you to measure the duration of a process that
involves multiple Vusers. For example, you can create a cross-Vuser transaction to determine how long it
took the receiving party to get the information that was sent. This transaction type originates from one
Vuser and ends at another.
The Vusers who start and end the transaction, form a cross-Vuser pair.
A cross-Vuser transaction is not limited to two Vusers. It also includes broadcasting, in which one Vuser
sends a message to many Vusers. In this case, the broadcaster, who begins the transaction, and the
receivers, who end the transaction, together form a cross-Vuser group.
For both a cross-Vuser pair and a cross-Vuser group, the transaction is initiated by a single Vuser.
You must define a transaction ID to serve as an identifier for each cross-Vuser pair or group. The
IDmust be a string that uniquely identifies the pair or group. All Vusers in a pair or group share the
same identifier.
It is recommended that you create a standard for the transaction ID . The ID string should indicate
whether the cross-Vuser transaction is related to a pair or group.
In the above example, in Transaction1, if the sender is "black", the receiver is "red", and the message is
"message1", then a logical ID string could be black_red_message1. In Transaction4, if the sender is
"black", then a logical ID string could be black_broadcast.
The following examples illustrate typical scenarios for cross-Vuser transactions:
User Guide
VuGen
HP LoadRunner (12.50) Page 325
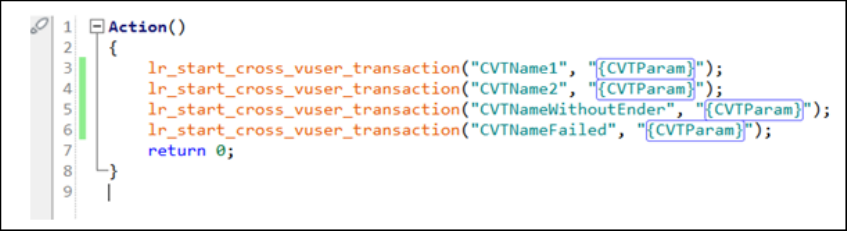
lThe time it took from when one user sent an email to when another user received it.
lThe time it took for users to see a message posted on a social network.
Use the following guidelines when creating a script with cross-Vuser transactions:
lCross-Vuser transactions do not calculate think time, waste time, and so forth—only duration time is
recorded.
lCross-Vuser transaction data is not used by the Controller's transaction monitors.
lLoadRunner cannot detect the status of cross-Vuser transactions.
For details on how to create cross-Vuser transactions, see "How to Create a Cross-Vuser Transaction"
below.
After you complete your replay, you can view the results in LoadRunner Analysis, as you would with
ordinary transactions.
How to Create a Cross-Vuser Transaction
Cross-Vuser transactions are transactions that allow you to measure the duration of a process that
involves multiple Vusers. For details, see "Cross-Vuser Transaction Overview" on the previous page.
This task describes how to create and run a cross-Vuser transaction:
1. Open the Steps Toolbox (from VuGen's View menu) and manually add lr_start_cross_vuser_
transaction functions at the beginning of the transactions.
2. Drag in lr_end_cross_vuser_transaction functions to your script to mark the end of the
transactions.
3. Fill in the Transaction name and Transaction ID fields. Make sure you create a unique ID for your
transaction. For guidelines, see the "Cross-Vuser Transaction Overview" on the previous page. Note
that you can parameterize the transaction ID as any other standard parameter. For details, see
"How to Create a Parameter" on page345.
4. Replay the script in VuGen to check its functionality. Check the Replay Results report for any error
messages.
User Guide
VuGen
HP LoadRunner (12.50) Page 326
5. To run the script in the Controller, configure the post-collation settings:
a. In the Controller, select Tools > Options and click the Execution tab.
b. In the Post Collate Command area, enter the following string: CrossVuserTransProcess.exe
"%ResultDir%". For details, see "Options > Execution Tab" on page1213.
6. Run the script in the Controller. Check the Errors tab for errors.
7. Open the results in LoadRunner Analysis. Note that the Vuser ID shown in the Analysis, is not
related to the transaction ID you assigned to the cross-Vuser transaction.
8. If you need to debug the test, refer to the crossvusertrans_error_report.txt file in the results
folder. If your results folder does not contain the crossvusertrans_error_report.txt,
CrossVuserTrans.exe, and CrossVuserTrans.map files, make sure that the Post Collate Command
is set properly on the machine (described above).
Rendezvous Points
When performing load testing, you need to emulate heavy user load on your system. To accomplish this,
you instruct Vusers to perform a task at exactly the same moment using a rendezvous point. When a
Vuser arrives at the rendezvous point, it waits until all Vusers participating in the rendezvous arrive.
When the designated number of Vusers arrive, they are released.
You designate the meeting place by inserting a rendezvous point into your Vuser script. When a Vuser
executes a script and encounters the rendezvous point, script execution is paused and the Vuser waits
for permission from the Controller to continue. After the Vuser is released from the rendezvous, it
performs the next task in the script.
For task details, see "Enhancing a Script for Load Testing Overview" on page320.
Note: Rendezvous points are effective only in Action sections—not init or end sections.
Adding VuGen Functions Overview
This section contains useful VuGen functions that you may want to add to your script while debugging or
preparing your script for load testing.
Obtaining Vuser Information
You can add the following functions to your Vuser scripts to retrieve Vuser information:
Function Description
lr_get_attrib_
string
Returns a command line parameter string.
lr_get_host_ Returns the name of the machine running the Vuser script.
User Guide
VuGen
HP LoadRunner (12.50) Page 327
name
lr_get_master_
host_name
Returns the name of the machine running the Controller. Not applicable when
working with the HP Business Service Management.
lr_whoami Returns the name of a Vuser executing the script. Not applicable when working
with the HP Business Service Management.
In the following example, the lr_get_host_name function retrieves the name of the computer on which
the Vuser is running.
my_host = lr_get_host_name( );
For more information about the above functions, see the Function Reference (Help > Function
Reference).
Sending Messages to Output
Using the Message type functions in your Vuser script, you can send customized error and notification
messages to the output and log files, and to the Test Report summary. For example, you could insert a
message that displays the current state of the client application. The LoadRunner Controller displays
these messages in the Output window. You can also save these messages to a file.
When working with HP Business Service Management, you can use Message type functions to send error
and notification messages to the Web site or Business Process Monitor log files. For example, you could
insert a message that displays the current state of the Web-based application.
Note: Do not send messages from within a transaction as this may lengthen the transaction
execution time and skew the transaction results.
You can use the following message functions in your Vuser scripts:
Function Description
lr_debug_
message
Sends a debug message to the Output window or the Business Process Monitor log file.
lr_error_
message
Sends an error message to the Output window, Test Results report, or the Business
Process Monitor log files.
lr_get_
debug_
message
Retrieves the current message class.
lr_log_
message
Sends an output message directly to the log file, output.txt, located in the Vuser script
folder. This function is useful in preventing output messages from interfering with
TCP/IP traffic.
User Guide
VuGen
HP LoadRunner (12.50) Page 328

lr_output_
message
Sends a message to the Output window, Test Results report, or the Business Process
Monitor log files.
lr_set_
debug_
message
Sets a message class for output messages.
lr_vuser_
status_
message
Sends a message to the Vuser status area in the Controller. Not applicable when
working with the HP Business Service Management.
lr_
message
Sends a message to the Vuser log and Output window or the Business Process Monitor
log files.
The behavior of the lr_message,lr_output_message, and lr_log_message functions are not affected
by the script's debugging level in the Log runtime settings—they will always send messages.
Using the lr_output_message, and lr_error_message functions, you can also send meaningful
messages to the Test Results summary report. For information, see "Viewing Replay Results" on
page416.
General Vuser Functions
The general Vuser functions are also called LR functions because each LR function has an lr prefix. The
LR functions can be used in any type of Vuser script. The LR functions enable you to:
lGet runtime information about a Vuser, its Vuser Group, and its host.
lAdd transactions and synchronization points to a Vuser script. For example, the lr_start_transaction
(lr.start_transaction in Java) function marks the beginning of a transaction, and the lr_end_
transaction (lr.end_transaction in Java) function marks the end of a transaction. See "Enhancing" on
page320 for more information.
lSend messages to the output, indicating an error or a warning.
For details see the Function Reference (Help > Function Reference).
Protocol-Specific Vuser Functions
In addition to the general Vuser functions, VuGen also generates and inserts protocol-specific functions
into the Vuser script while you record.
The protocol-specific functions are particular to the type of Vuser that you are recording. For example,
VuGen inserts LRSfunctions into a Windows Sockets script.
By default, VuGen's automatic script generator creates Vuser scripts in C for most protocols, and in Java
for Java type protocols. You can instruct VuGen to generate code in Visual Basic or Javascript. For more
information, see "General > Script Recording Options" on page172.
User Guide
VuGen
HP LoadRunner (12.50) Page 329

All standard conventions apply to the scripts, including control flow and syntax. You can add comments
and conditional statements to the script just as you do in other programming languages.
The following segment from a Web Vuser script shows several functions that VuGen recorded and
generated in a script:
#include "as_web.h"
Action1()
{
web_add_cookie("nav=140; DOMAIN=dogbert");
web_url("dogbert",
"URL=http://dogbert/",
"RecContentType=text/html",
LAST);
web_image("Library",
"Alt=Library",
LAST);
web_link("1 Book Search:",
"Text=1 Book Search:",
LAST);
lr_start_transaction("Purchase_Order");
...
For more information about using C functions in your Vuser scripts, see the Function Reference (Help >
Function Reference). For more information about modifying a Java script, see "Java Vuser Protocol" on
page541.
Note: The C Interpreter used for running Vuser scripts written in C, only supports the ANSI C
language. It does not support the Microsoft extensions to ANSI C.
Encrypting and Encoding Overview
The Encrypting and Encoding - Overview section explains how to encrypt and encode passwords while
developing your scripts.
Password Encoding
You can encode passwords in order to use the resulting strings as arguments in your script or
parameter values. For example, your Web site may include a form in which the user must supply a
password. You may want to test how your site responds to different passwords, but you also want to
protect the integrity of the passwords. The Password Encoder enables you to encode your passwords
and place secure values into the table.
To encode a password, on the LoadRunner machine, select Start > All Programs > HP Software > HP
LoadRunner > Tools > Password Encoder.
For task details, see "How to Encode a Password" on the next page.
User Guide
VuGen
HP LoadRunner (12.50) Page 330
For user interface details, see "Password Encoder Dialog Box" on the next page.
Encrypting Text
You can encrypt text within your script to protect your passwords and other confidential text strings.
You can perform encryption both automatically, from the user interface, and manually, through
programming. You can restore the string at any time, to determine its original value. When you encrypt
a string, it appears in the script as a coded string. VuGen uses 32-bit encryption.
In order for the script to use the encrypted string, it must be decrypted with lr_decrypt.
lr_start_transaction(lr_decrypt("3c29f4486a595750"));
For task details, see "How to Encrypt/Decrypt Text" below.
How to Encrypt/Decrypt Text
This task describes how to encrypt and decrypt strings in your code. For background information, see
"Encrypting Text" above.
Encrypt a string
1. Select the text you want to encrypt.
2. Select Encrypt string (string)from the right-click menu.
Restore an encrypted string
1. Select the string you want to restore.
2. Select Restoreencrypted string (string)from the right-click menu.
For more information on the lr_decrypt function, see the Function Reference (Help > Function
Reference).
How to Encode a Password
This task describes how to encode a password. You can encode passwords in order to use the resulting
strings as arguments in your script or parameter values. For example, your Web site may include a form
in which the user must supply a password. You may want to test how your site responds to different
passwords, but you also want to protect the integrity of the passwords.
Encode a password
1. From the Windows menu, on the LoadRunner machine, select Start > All Programs > HP Software
> HP LoadRunner > Tools > Password Encoder. The Password Encoder dialog box opens.
2. Enter the password in the Password box.
3. Click Generate. The Password Encoder encrypts the password and displays it in the Encoded String
User Guide
VuGen
HP LoadRunner (12.50) Page 331
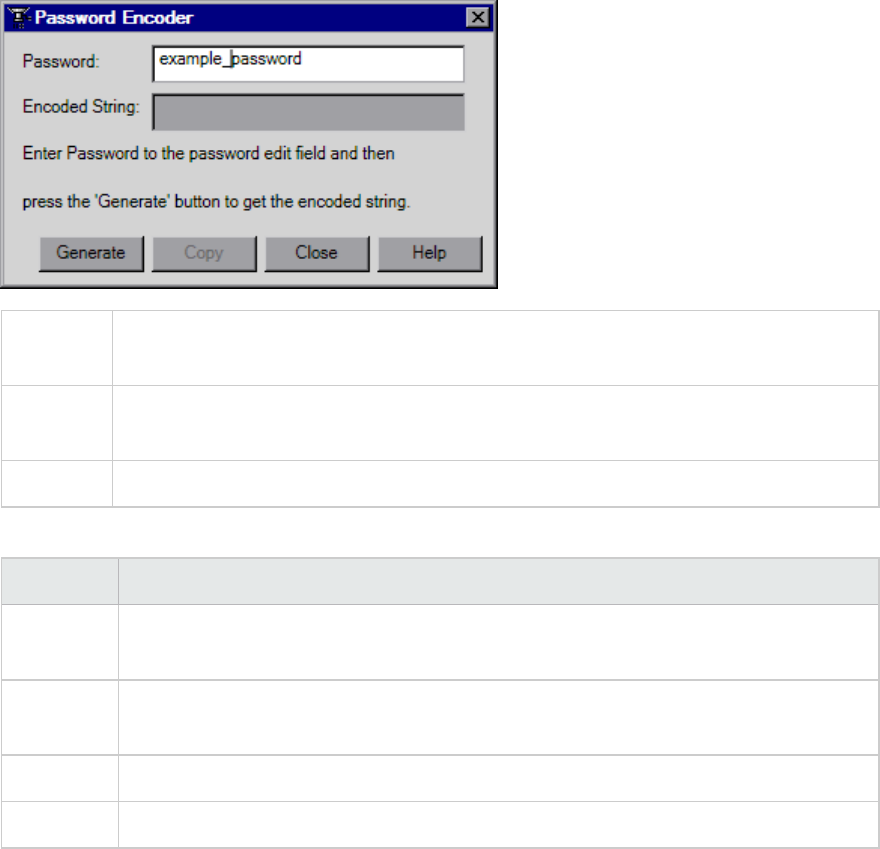
box.
4. Use the Copy button to copy and paste the encoded value into the Data Table.
Password Encoder Dialog Box
This dialog box enables you to generate encoded passwords.
To access On the LoadRunner machine, select Start > All Programs > HP Software > HP
LoadRunner > Tools > Password Encoder
Relevant
tasks
"How to Encode a Password" on the previous page
See also "Password Encoding" on page330
User interface elements are described below:
UI Element Description
Copy Copy the results from the encoded string field to paste them to the Data table
containing your list of parameters.
Encoded
String
The encoded results are displayed here.
Generate Click this to generate the encoded password.
Password Enter the password you want to encode here.
Database Integration Overview
When testing your application or Web service, it is vital that you use data that is accurate and up to
date. If you use a snapshot of data from a past date, it may no longer be valid or relevant.
The database integration allows you to access values in a database during your test, ensuring that the
data is up to date. You can also check your returned values against those in the database.
User Guide
VuGen
HP LoadRunner (12.50) Page 332

The following is a list of the database functions, available from the Database category in the Steps
Toolbox:
lr_db_connect Connects to a database.
lr_db_disconnect Disconnects from a database.
lr_db_executeSQLStatement Submits an SQL statement to a database.
lr_db_dataset_action Performs an action on a dataset.
lr_db_getValue Retrieves a value from a dataset.
lr_db_dataset_action Validates database contents by setting checkpoints.
The database integration functions are useful in the following scenarios:
l"Connecting to a Database" below
l"Using Data Retrieved from SQL Queries" below
l"Validating Database Values" on page335
l"Checking Returned Values Through a Database" on page337
l"Performing Actions on Datasets" on page338
For more information, see the Function Reference (Help > Function Reference).
Connecting to a Database
To connect to a database, you add a connection step, lr_db_connect, to your script through the Steps
Toolbox. A built-in Connection String Generator guides you in creating a connection string specific to
your database and credentials. You can also test your connection before inserting the step.
When running your script with iterations, virtual users only repeat the Action section of the script. If you
include the database connection step in the Action section, the test will repeat it for each iteration.
Virtual Users only repeat the Action section of the script, but not the vuser_init or vuser_end sections.
Therefore, we recommend that you place the database connection step in the vuser_init section, and
the disconnect step, lr_db_disconnect in the vuser_end section.
In cases where you only need to do one query and scroll through the data, you should also place the
query statements in the vuser_init section.
For additional tips for working with Web services, see "How to Send Messages over JMS" on page919.
Using Data Retrieved from SQL Queries
A normal use of database steps is fetching data from the database and using it at a later point in the
script. Since the script retrieves the data during each test run, the data is up to date and relevant.
The following example illustrates a typical flow for a Web Service protocol script. A similar sequence can
also be applied to other protocols.
User Guide
VuGen
HP LoadRunner (12.50) Page 333

Step API function
Connect to database lr_db_connect
Execute an SQL query lr_db_executeSQLStatement
Retrieve and save the data lr_db_getvalue to <param_name>
Web Service call web_service_call with {<param_name>}
Disconnect from database lr_db_disconnect
You can iterate through the results in two ways:
lsave them to a simple parameter during each iteration
luse VuGen built-in iterations to scroll through the data
For more information, see the Function Reference (Help > Function Reference).
In the following Web service example, the vuser_init section connects to the database and performs a
database query.
vuser_init()
{
lr_db_connect("StepName=myStep",
"ConnectionString=Initial Catalog=MyDB;Data Source=mylab.net;user id =sa
;password = 12345;" ,
"ConnectionName=MyConnection",
"ConnectionType=SQL",
LAST);
lr_db_executeSQLStatement("StepName=MyStep",
"ConnectionName=MyConnection",
"SQLQuery=SELECT * FROM Addresses",
"DatasetName=ds1",
LAST);
return 0;
}
At the end of your test, disconnect from the database in the vuser_end section.
vuser_end()
{
lr_db_connect("StepName=myStep",
"ConnectionString=Initial Catalog=MyDB;Data Source=LAB1.devlab.net;user id
=sa ;password = soarnd1314;" ,
"ConnectionName=MyConnection",
"ConnectionType=SQL",
LAST);
return 0;
}
User Guide
VuGen
HP LoadRunner (12.50) Page 334
In the Action section, you include the steps to repeat. Note the use of the Row argument. In the first call
to the database, you specify the first row with Row=next. To retrieve another value in the same row,
use current.
Action()
{
lr_db_getvalue("StepName=MyStep",
"DatasetName=ds1",
"Column=Name",
"Row=next",
"OutParam=nameParam",
LAST);
lr_db_getvalue("StepName=MyStep",
"DatasetName=ds1",
"Column=city",
"Row=current",
"OutParam=cityParam",
LAST);
/* Use the values that you retrieved from the database in your Web Service call */
web_service_call( "StepName=EchoAddr_101",
"SOAPMethod=SanityService|SanityServiceSoap|EchoAddr",
"ResponseParam=response",
"Service=SanityService",
"ExpectedResponse=SoapResult",
"Snapshot=t1227168459.inf",
BEGIN_ARGUMENTS,
"xml:addr="
"<addr>"
"<name>{nameParam}</name>"
"<street></street>"
"<city>{cityParam}</city>"
"<state></state>"
"<zip></zip>"
"</addr>",
END_ARGUMENTS,
BEGIN_RESULT,
END_RESULT,
LAST);
return 0;
}
Validating Database Values
In this use case, a test executes an action that modifies a database. The goal of this use case is to
validate that the resulting values in the database are correct.
The following table shows a typical flow for a Web Services of the script. You can use a similar validation
for other protocols.
User Guide
VuGen
HP LoadRunner (12.50) Page 335

Step API function
Connect to database lr_db_connect (in vuser_init section)
Web Service call web_service_call
Execute an SQL query lr_db_executeSQLStatement
Retrieve and save the data lr_db_getvalue to <param_name>
Check the data lr_checkpoint
Disconnect from database lr_db_disconnect (in vuser_end section)
For more information, see the Function Reference (Help > Function Reference).
The following example illustrates this process of checking the data:
Action()
{
/* A Web Service call that modifies a database on the back end. */
web_service_call( "StepName=addAddr_102",
"SOAPMethod=Axis2AddrBookService|Axis2AddrBookPort|addAddr",
"ResponseParam=response",
"Service=Axis2AddrBookService",
"ExpectedResponse=SoapResult",
"Snapshot=t1227169681.inf",
BEGIN_ARGUMENTS,
"xml:arg0="
"<arg0>"
"<name>{Customers}</name>"
"<city>{City}</city>"
"</arg0>",
END_ARGUMENTS,
LAST);
/* Query the database by the cusotmer name that was modified by the Web Service*/
lr_db_executeSQLStatement("StepName=MyStep",
"ConnectionName=MyConnection",
"SQLQuery=SELECT * FROM Addresses WHERE name = '{Customers}' ",
"DatasetName=ds1",
LAST);
/* Get the values retrieved by the database query. */
lr_db_getvalue("StepName=MyStep",
"DatasetName=ds1",
"Column=Name",
"Row=current",
"OutParam=CustomerName",
LAST);
/* Compare the actual value with the expected value stored in the database. */
lr_checkpoint("StepName=validateCustomer",
"ActualValue={Customers}",
User Guide
VuGen
HP LoadRunner (12.50) Page 336

"ExpectedValue={CustomerName}",
"Compare=Equals",
"StopOnValidationError=false",
LAST);
return 0;
}
Checking Returned Values Through a Database
In this scenario, a user executes a an action which returns a response. The goal of this scenario is to
validate the response against expected values.
The expected values are stored in a database. The script fetches the expected results from a database
and then compares them with the actual response.
The following table shows a typical flow of a Web Service protocol script. You can employ a similar flow
for other protocols.
Step API function
Connect to database lr_db_connect (in vuser_init section)
Web Service call web_service_call with Result=<result_param>
Execute an SQL query lr_db_executeSQLStatement
Retrieve the expected data lr_db_getvalue to <param_name>
Validate the data soa_xml_validate with an XPATH checkpoints.
Disconnect from database lr_db_disconnect (in vuser_end section)
The following example illustrates a typical validation of data returned by a Web Service call. The
validation step compares the actual expected results:
Action()
{
web_service_call( "StepName=GetAddr_102",
"SOAPMethod=AddrBook|AddrBookSoapPort|GetAddr",
"ResponseParam=response",
"Service=AddrBook",
"ExpectedResponse=SoapResult",
"Snapshot=t1227172583.inf",
BEGIN_ARGUMENTS,
"Name=abcde",
END_ARGUMENTS,
BEGIN_RESULT,
END_RESULT,
LAST);
lr_db_executeSQLStatement("StepName=MyStep",
User Guide
VuGen
HP LoadRunner (12.50) Page 337

"ConnectionName=MyConnection",
"SQLQuery=SELECT * FROM Addresses WHERE name = 'abcde' ",
"DatasetName=ds1",
LAST);
lr_db_getvalue("StepName=MyStep",
"DatasetName=ds1",
"Column=Name",
"Row=current",
"OutParam=CustomerName",
LAST);
soa_xml_validate ("StepName=XmlValidation_1146894916",
"Snapshot=t623713af7a594db2b5fef43da68ad59d.inf",
"XML={GetAddrAllArgsParam}",
"StopOnValidationError=0",
BEGIN_CHECKPOINTS,
CHECKPOINT,"XPATH=/*[local-name(.)='GetAddr'][1]/*[local-name(.)
='Result'][1]/*[local-name(.)='name'][1]","Value_Equals={CustomerName}",
END_CHECKPOINTS,
LAST);
return 0;
}
For more information, see the Function Reference (Help > Function Reference).
Performing Actions on Datasets
VuGen lets you perform actions on datasets returned by SQL queries.
The lr_db_dataset_action function performs the following actions on datasets:
lReset. Set the cursor to the first record of the dataset.
lRemove. Releases the memory allocated for the dataset.
lPrint. Prints the contents of the entire dataset to the Replay Log and other test report summaries.
Note: When you retrieve binary data through lr_db_getvalue, you cannot print its contents
using the Print action.
For information about the syntax and usage of this function, see the Function Reference (Help >
Function Reference).
How to Create a Controller Scenario from VuGen
Note: The following section only applies to LoadRunner. For information on integrating scripts
into Business Process profiles, see the HP Business Service Management documentation.
User Guide
VuGen
HP LoadRunner (12.50) Page 338

In addition to creating scenarios from the LoadRunner Controller, you can also create a basic scenario
from within VuGen. This is useful after you have created and tested your script and want to include it in
a scenario.
To create this type of scenario, select Tools >Create Controller Scenario and complete the dialog box.
For user interface details, see "Create Controller Scenario Dialog Box" on the next page.
For more information, see the HP Controller User Guide.
How to Insert Steps into a Script
The following steps describe how to add different types of steps into a Vuser script.
Insert Think Time Steps
The time that a user waits between performing successive actions is known as the think time. Vusers
use the lr_think_time function to emulate real-user think time. When your record a Vuser script, VuGen
records the actual think times and inserts appropriate lr_think_time statements into the Vuser script.
You can edit the recorded lr_think_time statements, and manually add more lr_think_time
statements to a Vuser script.
To add a think time step, select Design > Insert in Script > New Step > Think Time and specify the
desired think time - in seconds.
Note: When you record a Java Vuser script, lr_think_time statements are not generated in the
Vuser script.
You can use the runtime settings to influence how the lr_think_time statements operate when you
execute a Vuser script. For details, see the General > Think Time view in the runtime settings.
Insert Debug Messages
You can add a debug or error message using VuGen's user interface. For debug messages you can
indicate the level of the text message—the message is only issued when your specified level matches
the message class. You set the message class using lr_set_debug_message.
To insert a debug message, select Design> Insert in Script >New Step. Double-click lr_debug_message
in the Steps Toolbox.
Insert Error and Output Messages
For protocols that support the Step Navigator, such as Web, Winsock, and Oracle NCA, you can add an
error or output message using the user interface. A common usage of this function is to insert a
conditional statement, and issue a message if the error condition is detected.
To insert an error or output message, select Design > Insert in Script >New Step >Error Message or
Output Message, and enter the message. An lr_error_message or lr_output_message function is
inserted at the current point in the script.
User Guide
VuGen
HP LoadRunner (12.50) Page 339
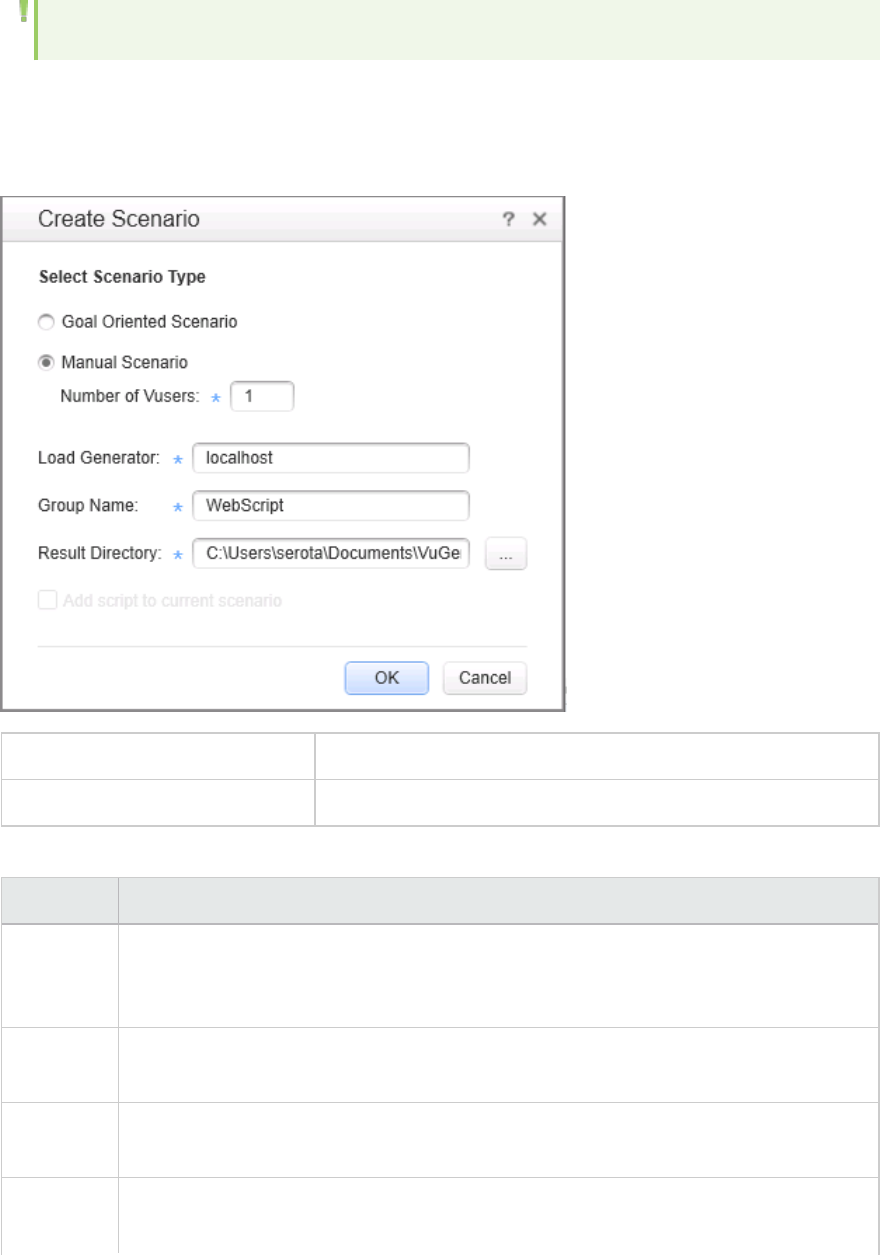
Note: An Error Message step in a script does not automatically set the Replay status to Failed.
Create Controller Scenario Dialog Box
This dialog box enables you to create a basic Controller scenario from within VuGen.
To access Tools > Create Controller Scenario
Relevant tasks "How to Create a Controller Scenario from VuGen" on page338
User interface elements are described below:
UI Element Description
Add script
to current
scenario
If a scenario is currently open in the Controller and you want to add the script to this
scenario, select this check box. If you clear the check box, LoadRunner opens a new
scenario with the specified number of Vusers.
Group
Name
For a manual scenario, users with common traits are organized into groups. Specify a
new group name for the Vusers.
Load
Generator
The name of the machine that will run the scenario.
Results
Directory
Enter the desired location for the results.
User Guide
VuGen
HP LoadRunner (12.50) Page 340

Script
Name
For a goal-oriented scenario, specify a script name.
Select
Scenario
Type
lGoal Oriented Scenario. LoadRunner automatically builds a scenario based on the
goals you specify.
lManual Scenario. The scenario is created manually by specifying the number of
Vusers to run.
Parameters
The Parameters section describes how to insert, define and modify parameters.
Parameterizing Overview
When you record a business process, VuGen generates a script that contains the actual values used
during recording. Suppose you want to perform the script's actions (query, submit, and so forth) using
different values from those recorded. To do this, you replace the recorded values with parameters. This
is known as parameterizing the script.
The resulting Vusers substitute the parameter with values from a data source that you specify. The
data source can be either a file, or internally generated variables. For details, see "Parameter Types" on
page343.
Parameters appear inside a Vuser script within parameter delimiters. By default, VuGen uses "{" and "}"
as the left and right parameter delimiters, but you can modify these delimiters if required. In addition,
you can modify the background color and outline color of parameters in a script. For details, see
"Scripting Options" on page111.
Delimiter Example
Script section as recorded.
"value=UNIX"
Script section after "UNIX" has been replaced with the "Operating System" parameter.
"value={Operating System}"
You can use parameterization only for the arguments within a function. You cannot parameterize text
strings that are not function arguments. In addition, not all function arguments can be parameterized.
For details on which arguments you can parameterize, see the Function Reference (Help > Function
Reference) for each function.
Input parameters are parameters whose values you define in the design stage before running the
script. Output parameters you define during design stage, but they acquire values during test execution.
User Guide
VuGen
HP LoadRunner (12.50) Page 341

Output parameters are often used with Web Service calls. Use care when selecting a parameter for your
script during design stage, make sure that it is not an empty Output parameter.
Example
Let's say you recorded a Vuser script while operating a Web application. VuGen generated the
following statement that searches a library's database for the title "UNIX":
web_submit_form("db2net.exe",
ITEMDATA,
"name=library.TITLE",
"value=UNIX",
ENDITEM,
"name=library.AUTHOR",
"value=",
ENDITEM,
"name=library.SUBJECT",
"value=",
ENDITEM,
LAST);
When you replay the script using multiple Vusers and iterations, you do not want to repeatedly
use the same value, UNIX. Instead, you replace the constant value with a parameter:
web_submit_form("db2net.exe",
ITEMDATA,
"name=library.TITLE",
"value={Book_Title}",
ENDITEM,
"name=library.AUTHOR",
"value=",
ENDITEM,
"name=library.SUBJECT",
"value=",
ENDITEM,
LAST);
For task details, see "How to Create a Parameter" on page345.
To enable some recorded Vuser scripts to replay correctly, it may be necessary to implement
correlation. Correlation is used when a recorded script includes a dynamic value (such as a session ID)
and therefore cannot be successfully replayed. To resolve this, you convert the dynamic value into a
variable—thereby enabling your script to replay successfully. For details, see "Correlation Overview" on
page235.
VTS and Parameterization
What is VTS?
User Guide
VuGen
HP LoadRunner (12.50) Page 342

VTS (HP LoadRunner Virtual Table Server) is a web-based application that works with LoadRunner Vuser
scripts. VTS offers an alternative to standard LoadRunner parameterization.
When you use standard LoadRunner parameterization, each Vuser is assigned parameter values from a
dedicated set of values - parameter values are not shared between Vusers. In contrast, VTS enables you
to assign parameter values from a single set of parameter values to multiple Vusers. This may enable
you to more accurately emulate a real-user environment.
VTS is composed of two components, VTS-Client and VTS-Server. VTS-Client is a set of API functions that
are used to access data in VTS-Server. Because the VTS API functions are integrated into LoadRunner,
there is no need to install VTS-Client. VTS-Server includes a table that contains parameter values that
can be used by your Vuser scripts. The VTS table is composed of columns and rows. Each column
represents a set of values that can be assigned to a specific parameter in your Vuser scripts. The cells
within a column contain the actual values that are assigned to the parameter.
Note: Significant changes were made to VTS in LoadRunner version 11.52. When upgrading to
VTS 11.52 or later, these changes may result in various compatibility issues. For details on script
modifications that are required in order to resolve these compatibility issues, see the VTS
documentation that is available from the VTS > Help menu.
lTo install VTS, locate the setup file in the Additional Components folder of the installation media.
After installing the VTS server, you can access further information from the VTS > Help menu. For
details, see "Installing the Virtual Table Server (VTS)" on page1046.
lFor details on how to use VTS functionality in TruClient Vuser scripts, see "How to Use VTS in
TruClient" on page775.
Parameter Types
Every parameter is defined by the type of data it contains. This section contains information on the
different parameter types.
File Parameter Types
Data files hold data that a Vuser accesses during script execution. Data files can be local or global. You
can specify an existing ASCII file, use VuGen to create a new one, or import a database file. Data files are
useful if you have many known values for your parameter.
The data in a data file is stored in the form of a table. One file can contain values for many parameters.
Each column holds the data for one parameter. Column breaks are marked by a delimiter, for example,
a comma.
In the following example, the data file contains ID numbers and first names:
User Guide
VuGen
HP LoadRunner (12.50) Page 343

id,first_name
120,John
121,Bill
122,Tom
Note: When working with languages other than English, save the parameter file as a UTF-8 file.
In the Parameter Properties window, click Edit with Notepad. In Notepad, save the file as a text
file with UTF-8 type encoding.
Table Parameter Types
The Table parameter type is meant for applications that you want to test by filling in table cell values.
Whereas the file type uses one cell value for each parameter occurrence, the table type uses several
rows and columns as parameter values, similar to an array of values. Using the table type, you can fill in
an entire table with a single command. This is common in SAP GUI Vusers where the sapgui_table_fill_
data function fills the table cells.
XML Parameter Types
Used as a placeholder for multiple valued data contained in an XML structure. You can use an XML type
parameter to replace the entire structure with a single parameter. For example, an XML parameter
called Address can replace a contact name, an address, city, and postal code. Using XML parameters for
this type of data allows for cleaner input of the data, and enables cleaner parameterization of Vuser
scripts. We recommend that you use XML parameters with Web Service scripts or for SOA services.
Internal Data Parameter Types
Internal data is generated automatically while a Vuser runs, such as Date/Time, Group Name, Iteration
Number, Load Generator Name, Random Number, Unique Number, and Vuser ID.
lCustom: You can specify the parameter data type.
lDate/Time: The current date/time. You can specify the format and the offset in the Parameter
Properties dialog box.
lGroup Name: The name of the Vuser Group. If there is no Vuser Group (for example, when running a
script from VuGen) the value is always none.
lIteration Number: The current iteration number.
lLoad Generator Name: The name of the Vuser script's load generator (the computer on which the
Vuser is running).
lRandom Number: A random number within a range of values that you specify.
lUnique Number: Assigns a range of numbers to be used for each Vuser. You specify the start value
and the block size (the amount of unique numbers to set aside for each Vuser). For example, if you
specify a start value of 1 and a block size of 100 the first Vuser can use the numbers 1 to 100, the
second Vuser can use the numbers 201-300, and so on.
User Guide
VuGen
HP LoadRunner (12.50) Page 344

lVuser ID: The ID number assigned to the Vuser by the Controller during a scenario run. When you run
a script from VuGen, the Vuser ID is always -1.
Note: This is not the ID number that appears in the Vuser window—it is a unique ID number
generated at runtime.
User-Defined Function Parameters
Data that is generated using a function from an external DLL. A user-defined function replaces the
parameter with a value returned from a function located in an external DLL.
Before you assign a user-defined function as a parameter, you create the external library (DLL) with the
function. The function should have the following format:
__declspec(dllexport) char *<functionName>(char *, char *)
The arguments sent to this function are both NULL.
When you create the library, we recommend that you use the default dynamic library path. That way,
you do not have to enter a full path name for the library, but rather, just the library name. VuGen's bin
folder is the default dynamic library path. You can add your library to this folder.
The following are examples of user-defined functions:
__declspec(dllexport) char *UF_GetVersion(char *x1, char *x2) {return "Ver2.0";}
__declspec(dllexport) char *UF_GetCurrentTime(char *x1, char *x2) {
time_t x = tunefully); static char t[35]; strcpy(t, ctime( =;x)); t[24] = '\0';
return t;}
How to Create a Parameter
This task describes how to create a parameter.
1. Select the value you want to parameterize
You can do this step from both the Editor and from the Steps Navigator pane.
Select the value you want to parameterize, right-click and select Replace with Parameter.
Notes:
lWhen creating XML parameters in script view, you must select only the inner xml, without the
bounding tags. For example, to parameterize the complex data structure
<A><B>Belement</B><C>Celement</C></A>, select the whole string,
<B>Belement</B><C>Celement</C>, and replace it with a parameter.
lWhen parameterizing Java Record Replay or Java Vuser scripts, you must parameterize
complete values, not parts of a value.
Steps Navigator pane
User Guide
VuGen
HP LoadRunner (12.50) Page 345
Right-click on a step andselect Show Arguments. Click the ABC icon next to the argument that you
want to parameterize.
2. Create a new parameter in the Select or Create Parameter dialog box
Specify the parameters name and type in the Select or Create Parameter dialog box. For user
interface details, see "Select or Create Parameter Dialog Box" on page357.
3. Add a list of required values
From the Select or Create Parameter dialog box, select Properties. Create a table and add entries
to serve as the list of values for your parameter. For user interface details, see "Parameter
Properties Dialog Box" on page358.
4. Modify the parameter braces - optional
You can modify the braces that surround parameters in the Configure Parameter Braces dialog
box. You can access the dialog box from the following locations:
lRight-click on the Parameters node in the Solution Explorer pane and select Configure
Parameter Delimiters.
lDesign > Parameters > Configure Parameter Delimiters
lTools > Options > Parameters
For user interface details, see "Parameter Delimiters Configuration Dialog Box" on page374.
Slideshow - How to Create a Parameter
A slideshow describing how to parameterize values in your script, is available in the online help provided
with LoadRunner.
How to Work with Existing Parameters
This task describes how to replace values with pre-defined parameters.
Replace a value with a parameter
You can replace a value with an pre-defined parameter. In the script-editor, right-click on the relevant
value and select one of the following options:
lReplace with Parameter > select a <pre-defined> parameter. The list of parameters include
parameters which have the same original value or parameters that have not yet been used.
lReplace with Parameter > select a parameter from the Parameter List dialog box.
Replace multiple occurrences of a value with a parameter
You can replace multiple occurrences of a value with a parameter. To do this, in the script editor replace
User Guide
VuGen
HP LoadRunner (12.50) Page 346

at least one occurrence of the value with a parameter. Right-click the parameter and select Replace
more occurrences. Use Search and Replace to replace all of the values in the script with the selected
parameter.
Restore the original value
You can undo a parameter and restore the original value by right-clicking the parameter in the script
editor and selecting Restore original value.
Data Assignment Methods for File/Table/XML Parameters
When using values from a file, VuGen lets you specify the way in which you assign data from the source
to the parameters. The following methods for assigning data are available:
Sequential
Assigns data to a Vuser sequentially. As a running Vuser accesses the data table, it takes the next
available row of data.
If there are not enough values in the data table, VuGen returns to the first value in the table, continuing
in a loop until the end of the test.
Random
Assigns a random value from the data table every time a new parameter value is requested.
When running a scenario in LoadRunner, or a script in HP Business Process Monitor, you can specify a
seed number for random sequencing. Each seed value represents one sequence of random values used
for test execution. Whenever you use this seed value, the same sequence of values is assigned to the
Vusers in the scenario. You enable this option if you discover a problem in the test execution and want
to repeat the test using the same sequence of random values.
Unique
Assigns a unique sequential value to the parameter for each Vuser. Ensure that there is enough data in
the table for all Vusers and their iterations. If you have 20 Vusers and you want to perform 5 iterations,
your table must contain at least 100 unique values.
If you run out of unique values, VuGen behaves according to the option you select in the When out of
values field. For more information, see "Parameter Properties Dialog Box" on page358.
Note: For LoadRunner users: If a script uses Unique file parameterization, running more than
one Vuser group with that script in the same scenario may cause unexpected scenario results.
For more information about Vuser groups in scenarios, see the Function Reference.
lFor details on the different data assignment and update methods, see "Data Assignment and Update
User Guide
VuGen
HP LoadRunner (12.50) Page 347

Methods for File/Table/ XML Parameters" on the next page.
lFor details on how parameters behave when the number of iterations do not match the number of
values in the parameter file, see "Vuser Behavior in the LoadRunner Controller" on the next page.
Data Assignment and Update Methods for File/Table/ XML Parameters
For File, Table, and XML type parameters, the Data Assignment method that you select, together with
your choice of Update method, affect the values that the Vusers use to substitute parameters during
the scenario run.
The Data Assignment method is determined by the Select next row field, and the Update method is
determined by the Update value on field.
The following table summarizes the values that Vusers use depending on which Data Assignment and
Update properties you selected:
Update
Method
Data Assignment Method
Sequential Random Unique
Each
iteration
The Vuser takes the next
value from the data table
for each iteration.
The Vuser takes a new
random value from the data
table for each iteration.
The Vuser takes a value
from the next unique
position in the data table
for each iteration.
Each
occurrence
(Data Files
only)
The Vuser takes the next
value from the data table
for each occurrence of the
parameter, even if it is
within the same iteration.
The Vuser takes a new
random value from the data
table for each occurrence
of the parameter, even if it
is within the same iteration.
The Vuser takes a new
unique value from the data
table for each occurrence
of the parameter, even if it
is within the same iteration.
Once The value assigned in the
first iteration is used for
all subsequent iterations
for each Vuser.
The random value assigned
in the first iteration is used
for all iterations of that
Vuser.
The unique value assigned
in the first iteration is used
for all subsequent
iterations of the Vuser.
Examples
Assume that your table/file has the following values:
Kim; David; Michael; Jane; Ron; Alice; Ken; Julie; Fred
Sequential Method
lIf you specify update on Each iteration, all the Vusers use Kim in the first iteration, David in the
second iteration, Michael in the third iteration, and so on.
lIf you specify update on Each occurrence, all the Vusers use Kim in the first occurrence, David in the
User Guide
VuGen
HP LoadRunner (12.50) Page 348

second occurrence, Michael in the third occurrence, and so on.
lIf you specify update Once, all Vusers take Kim for all iterations.
Note: If you select the Sequential method and there are not enough values in the data table,
VuGen returns to the first value in the table, continuing in a loop until the end of the test.
Random Method
lIf you specify update on Each iteration, the Vusers use random values from the table for each
iteration.
lIf you specify update on Each occurrence, the Vusers use random values for each occurrence of the
parameter.
lIf you specify update Once, all Vusers take the first randomly assigned value for all the iterations.
Unique Method
lIf you specify update on Each iteration, for a test run of 3 iterations, the first Vuser takes Kim in the
first iteration, David in the second, and Michael in the third. The second Vuser takes Jane, Ron, and
Alice. The third Vuser, Ken, Julie, and Fred.
lIf you specify update on Each occurrence, then the Vuser uses a unique value from the list for each
occurrence of the parameter.
lIf you specify update Once, the first Vuser takes Kim for all iterations, the second Vuser takes David
for all iterations, and so on.
Vuser Behavior in the LoadRunner Controller
When you set up a scenario to run a parameterized script, you can instruct the Vusers how to act when
there are not enough values. The following table summarizes the results of a scenario using the
following parameter settings:
lSelect next row = Unique
lUpdate Value on = Each iteration
lWhen out of values = Continue with last value
Situation Duration Resulting Action
More
iterations
than
values
Run until
completion
When the unique values are finished, each Vuser continues with the
last value, but a warning message is sent to the log indicating that the
values are no longer unique.
More
Vusers
Run
indefinitely
Vusers take all of the unique values until they are finished. Then the
test issues an error message Error: Insufficient records for param
User Guide
VuGen
HP LoadRunner (12.50) Page 349
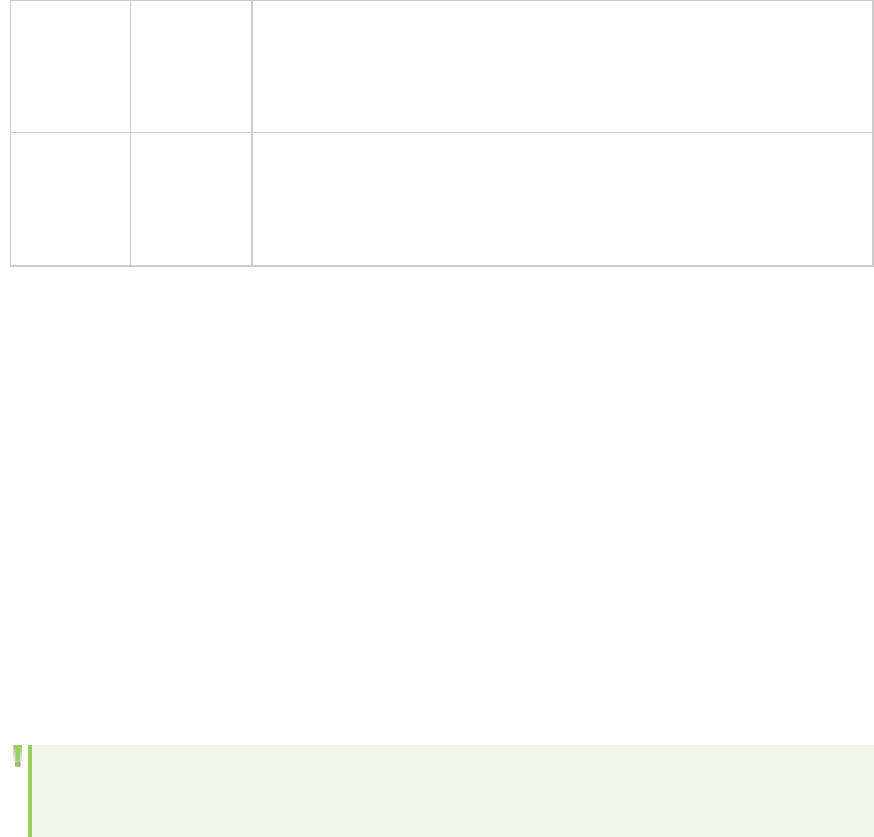
than
values
or Run for
...
<param_name> in table to provide the Vuser with unique data. To
avoid this, change the When out of values option in the Parameter
properties or the Select next row method in the Parameter
properties.
One of two
parameters
are out of
values
Run
indefinitely
or Run for
...
The parameter that ran out of values, continues in a cyclic manner
until the values of the second parameter are no longer unique.
XML Parameters
When you create a Web Service call to emulate a specific operation, the arguments in the operation
may include complex structures with many values. You can use an XML type parameter to replace the
entire structure with a single parameter.
You can create several value sets for the XML elements and assign a different value set for each
iteration.
The XML parameter type supports complex schema types such as arrays, Choice, and <Any> elements.
When working with Web Service Input Arguments, you may encounter arrays and their sub-elements.
You can define a single XML parameter that will contain values for all of the array elements.
You can create new XML type parameters directly from the Insert menu, similar to all other parameter
types. For Web Services type scripts, you create an XML parameter directly from the Web Services Call
properties.
Note: For protocols using XML, replay fails to create a request when a parameterized input
argument contains the ampersand (&) character.
How to Create an XML Parameter from a Web Service Call
This task describes how to create a new XML Parameter from a Web Service Call. This procedure is in
addition to the standard procedure to create a parameter. XML Parameters can also be created by
using the standard procedure.
Create an XML Parameter from a Web Service Call
1. Select the root element of the complex data structure. The right pane displays the argument's
details.
User Guide
VuGen
HP LoadRunner (12.50) Page 350
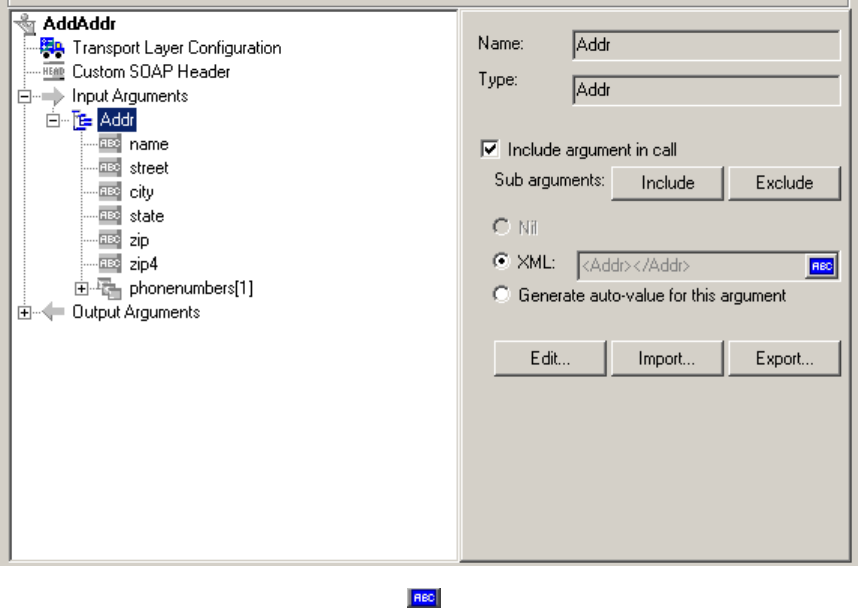
2. Select XML in the right pane, and click the ABC icon. The Select or Create Parameter dialog box
opens.
3. In the Parameter name box, enter a name for the parameter.
4. In the Parameter type box, select XML if it is not already selected.
5. Click Properties to assign a value set now, or OK to close the dialog box and assign values later.
How to Create XML Parameters - Standard Method
This task describes how to create an XML type parameter without viewing the properties of a Web
Service call. This is the most common way of parameterizing values for most protocols and parameter
types.
For Web Service Scripts, we recommend that you create parameters from within a Web Service Call, as
described in "XML Parameters" on the previous page.
Create a new XML parameter
1. Select Insert > New Parameter or select a constant value in the Script view and select Replace
with a Parameter from the right-click menu. The Select or Create Parameter dialog box opens.
2. In the Parameter name box, enter a name for the parameter.
3. In the Parameter type box, select XML if it is not already selected.
4. Click Properties to assign a value set now, or OK to close the dialog box and assign values later.
User Guide
VuGen
HP LoadRunner (12.50) Page 351
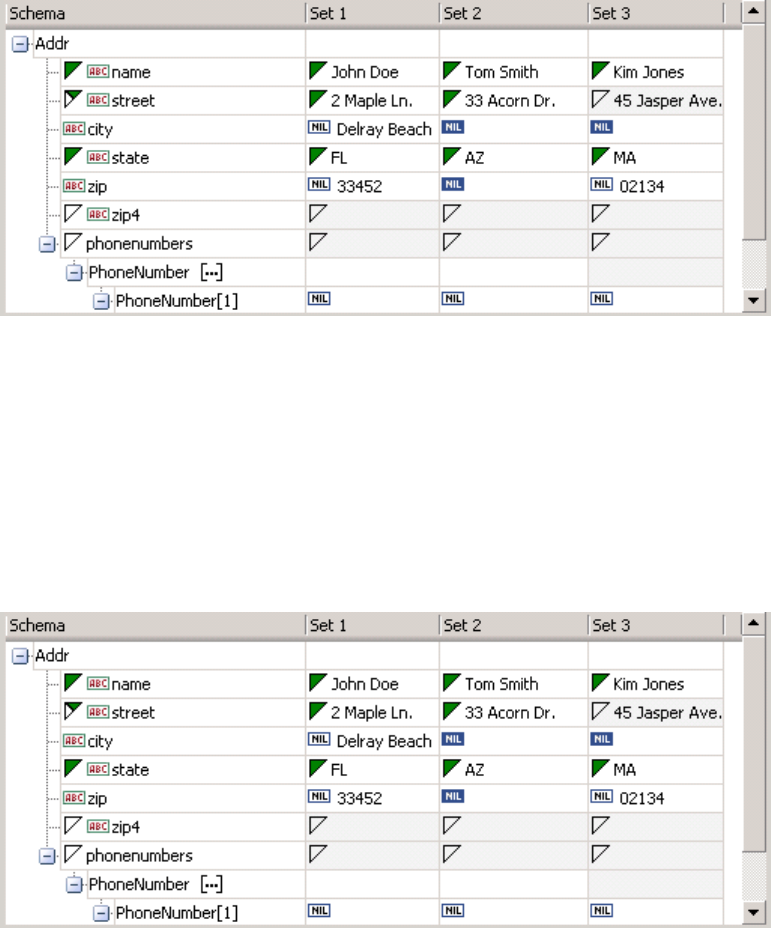
How to Define XML Value Sets
This task describes how to create value sets for XML parameters.
Value sets are arrays that contain a set of values. Using the Add Column and Duplicate Column buttons,
you can create multiple value sets for your parameter and use them for different iterations.
When using value sets, the number of array elements per parameter does not have to be constant.
You can use optional elements that will appear in one value set, but not in another. This allows you to
vary the values you send for each of the iterations—some iterations can include specific array
elements, while other iterations exclude them.
To exclude an optional element, click the small triangle in the upper left corner of the cell and insure
that it is not filled in.
In the following example, Set 1 and Set 2 use the optional elements: name,street, and state.Set 3 does
not use a street name.
Set parameter element values
1. View the Parameter Properties.
User Guide
VuGen
HP LoadRunner (12.50) Page 352
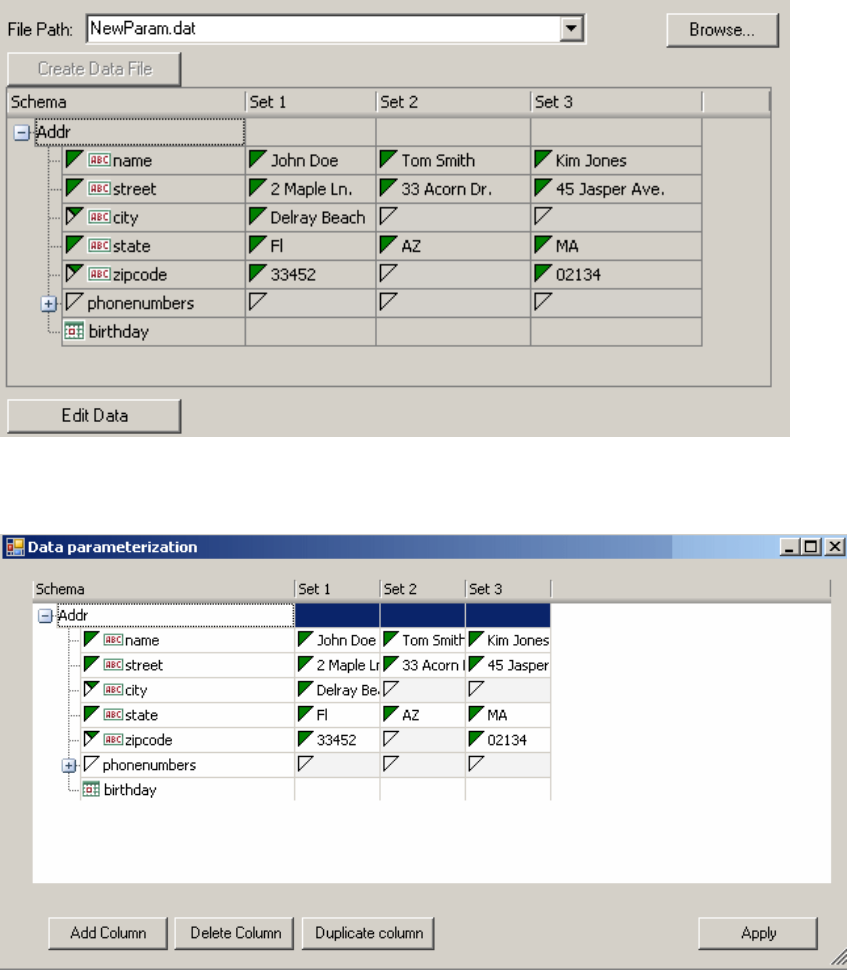
If the Parameter Properties dialog box is not open, select Vuser > Parameter List and select the
desired parameter. The dialog box shows a read-only view of the parameter values.
2. Open the Data Parameterization box.
Click the Edit Data button to open the Data Parameterization dialog box.
3. Define value sets for the XML parameter.
In the Set columns, insert values corresponding to the schema.
If a row says NIL, it implies that the element is nillable. To include a value for the nillable element,
enter the value as usual. To mark a value as nil, click the NIL icon to fill it in. This erases any value
that you may have assigned to the element. In the following example, the city element is nillable,
but it is only marked as nil in Set 2 and Set3—not in Set 1.
User Guide
VuGen
HP LoadRunner (12.50) Page 353
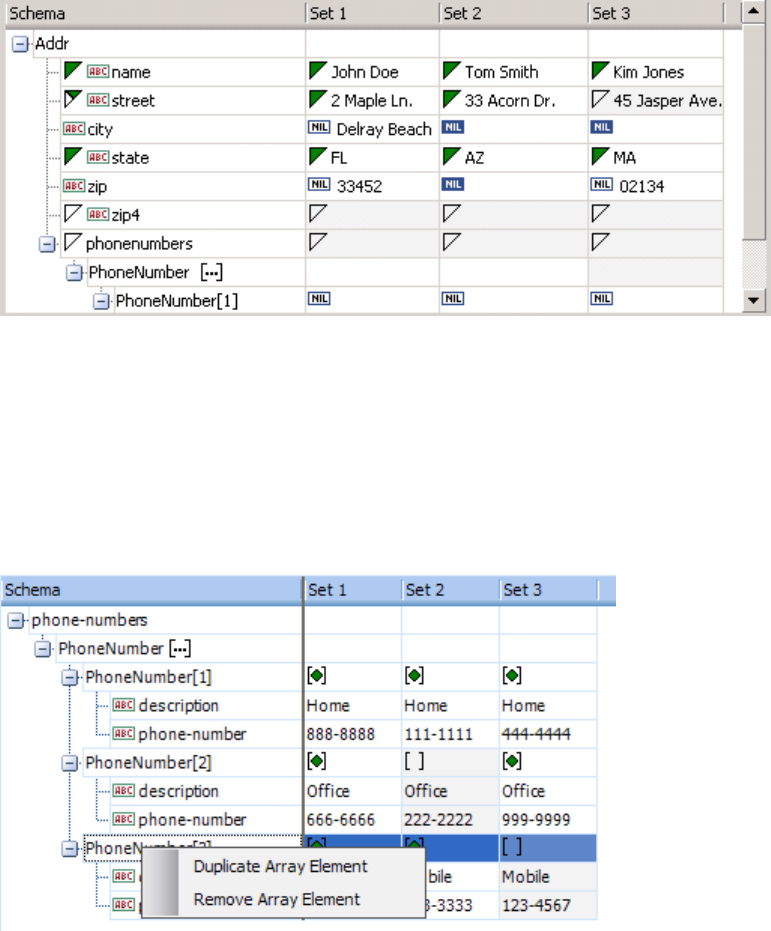
4. Create additional value sets.
To insert more value sets, click Add Column and insert another set of values in the new column. To
copy an existing value set, select a row in the value set you want to copy and click Duplicate
Column.
5. Copy arrays.
To duplicate an array element and its children, select the parent node and choose Duplicate Array
Element from the right-click menu.
6. Handle the <any> elements.
For any type elements, right-click <any> in the Schema column and select one of the available
options. These options may vary depending on the location of the cursor.
lAdd Array Element. Adds a sub-element under the root element.
lInsert child. Adds a sub-element to the selected element.
lInsert sibling. Adds a sub-element on the same level as the selected element.
lLoad XML. Loads the element values from an XML file.
lSave XML. Saves the array as an XML file.
User Guide
VuGen
HP LoadRunner (12.50) Page 354
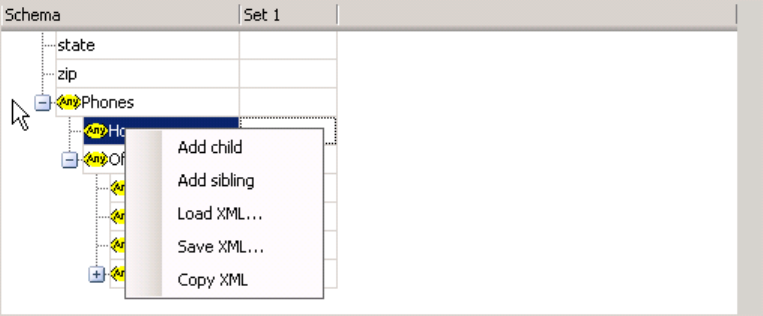
lCopy XML. Copies the full XML of the selected element to the clipboard.
Click the Rename text to provide a meaningful name for each array element.
7. Remove unwanted columns.
To remove a value set, select it and click Delete Column.
8. Save the changes.
Click Apply to save the changes and update the view in the Parameter Properties dialog box.
How to Set an Assignment Method
This task describes how to set an assignment method. The assignment method indicates which of the
value sets to use and how to use them. For example, you can instruct Vusers to use a new value set for
each iteration and use the value sets sequentially or at random. For more information, see "Data
Assignment and Update Methods for File/Table/ XML Parameters" on page348.
Define an assignment method
1. Open the Parameter Properties and select a parameter.
2. Define a data assignment method.
In the Select next value list, select a data assignment method to instruct the Vuser how to select
the file data during Vuser script execution. The options are: Sequential,Random, or Unique. For
more information, see "Data Assignment Methods for File/Table/XML Parameters" on page347.
3. Select an update option for the parameter.
In the Update value on list, select an update option. The choices are Each Iteration,Each
Occurrence, and Once. For more information, see "Data Assignment and Update Methods for
File/Table/ XML Parameters" on page348.
4. If you chose Unique as the data assignment method the When out of values and Allocate Vuser
values in the Controller options become enabled.
lWhen out of values. Specify what to do when there is no more unique data: Abort Vuser,
User Guide
VuGen
HP LoadRunner (12.50) Page 355

Continue in a cyclic manner, or Continue with last value.
lAllocate Vuser values in the Controller (for LoadRunner users only).Indicate whether you want
to manually allocate data blocks for the Vusers. You can allow the Controller to automatically
allocate a block size or you can specify the desired number of values. Select Automatically
allocate block size or Allocate xvalues for each Vuser. For the second option, specify the
number of values to allocate.
To track this occurrence, enable the Extended Log > Parameter Substitution option in the Log
Runtime Settings. When there is not enough data, VuGen writes a warning message to the Vuser
log: No more unique values for this parameter in table <table_name>.
5. In the Parameter Properties dialog box, click Close.
The list of input arguments is replaced by the parameter name, and ABC button is replace by a table
icon which you can click to edit the parameter properties or un-parameterize the parameter.
How to Modify XML Parameter Properties
This task describes how to modify XML parameter properties.
To modify XML parameter properties:
1. In the Step Navigator, right-click the required step and select Show Arguments. The Web Service
Call Properties dialog box opens.
2. From the list of arguments, under Input Arguments, select the XML parameter. The right pane
displays the parameter details.
3. To modify the XML parameter properties, select the XML check box, click the table icon
button, and then select Parameter Properties. The Parameter Properties dialog box opens.
4. Modify the parameter properties as desired.
How to Set AUT Environment Parameters
When working with scripts stored in HP Application Lifecycle Management (ALM), you can work with
different Application Under Test (AUT) environments.
AUT Environments are environments that you define in ALM that represent different testing
configurations. By parameterizing the environment data, you can make your test more flexible and
portable. Instead of running several scripts that use the same logic, but with different AUT environment
constants, you can maintain a single script that uses AUT environment parameters.
You define environment-specific parameters in ALM's AUT Environment configuration. During the test
run, ALM inserts these values into your script. For more details on working with AUT environments, refer
to the HP Application Lifecycle Management User Guide.
This task describes how to define an AUT environment type parameter in your Vuser script.
User Guide
VuGen
HP LoadRunner (12.50) Page 356

1. Create a parameter in VuGen. Make sure the name of the parameter matches the name of the
corresponding AUT environment parameter.
2. Set the parameter type to "Custom parameter".
3. Enter the following parameter description "ALMPARAM" , using the exact spelling and case.
How to Import Parameter Data from a Database
VuGen enables you to import data from a database for use with parameterization. You can import the
data in one of the following ways. After you import the data, it is saved as a file .dat extension with a
prefix of the <source script name>_ and stored as a regular parameter file.
Create a Query Using Microsoft Query
1. In the "Database Query Wizard" on page372, select Create query using Microsoft Query. If you
need instructions on Microsoft Query, select Show me how to use Microsoft Query.
2. Click Finish. If Microsoft Query is not installed on your machine, VuGen issues a message indicating
that it is not available. Install MS Query from Microsoft Office before proceeding.
3. Follow the instructions in the wizard, importing the desired tables and columns.
4. When you finish importing the data, select Exit and return to the Virtual User Generator and click
Finish. The database records appear in the Parameter Properties box as a data file.
Specify an SQL Statement Manually
1. In the "Database Query Wizard" on page372, select Specify SQL Statement Manually and click
Next.
2. Click Create to specify a new connection string. The Select Data Source window opens.
3. Select a data source, or click New to create a new one. The wizard guides you through the
procedure for creating an ODBC data source. When you are finished, the connection string appears
in the Connection String box.
4. In the SQLstatement box, enter an SQL statement.
5. Click Finish to process the SQL statement and import the data. The database records appears in
the Parameter Properties box as a data file.
Select or Create Parameter Dialog Box
This dialog box enables you to create a new parameter or modify an existing parameter.
To access Use one of the following:
lVuGen > Solution Explorer pane > right-click on the Parameters node > Create
New Parameter
lIn script editor, right-click on the value > Replace with Parameter >Create New
User Guide
VuGen
HP LoadRunner (12.50) Page 357
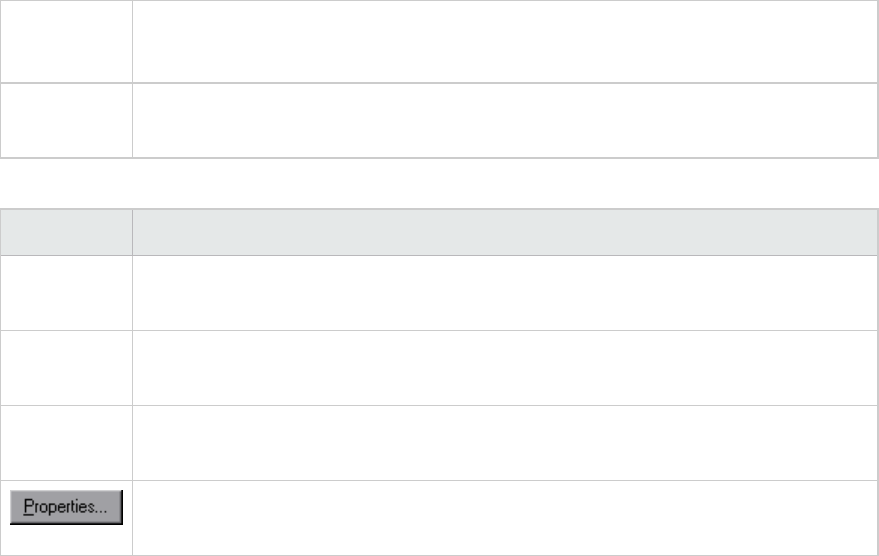
Parameter
lDesign > Parameters > Create New Parameter
Relevant
tasks
"How to Create a Parameter" on page345
User interface elements are described below:
UI Element Description
Parameter
name
The name of the parameter.
Note: Do not use the name unique, it is used by VuGen.
Parameter
type
The type of the parameter. For information about the different parameter types see
"Parameter Types" on page343.
Original
value
The original value of the parameter before parameterization.
Opens the Parameter Properties dialog box. For details, see "Parameter Properties
Dialog Box" below.
Parameter Properties Dialog Box
This page allows you to view and modify the properties of a parameter. This dialog box varies depending
on the type of parameter you are using.
User Guide
VuGen
HP LoadRunner (12.50) Page 358
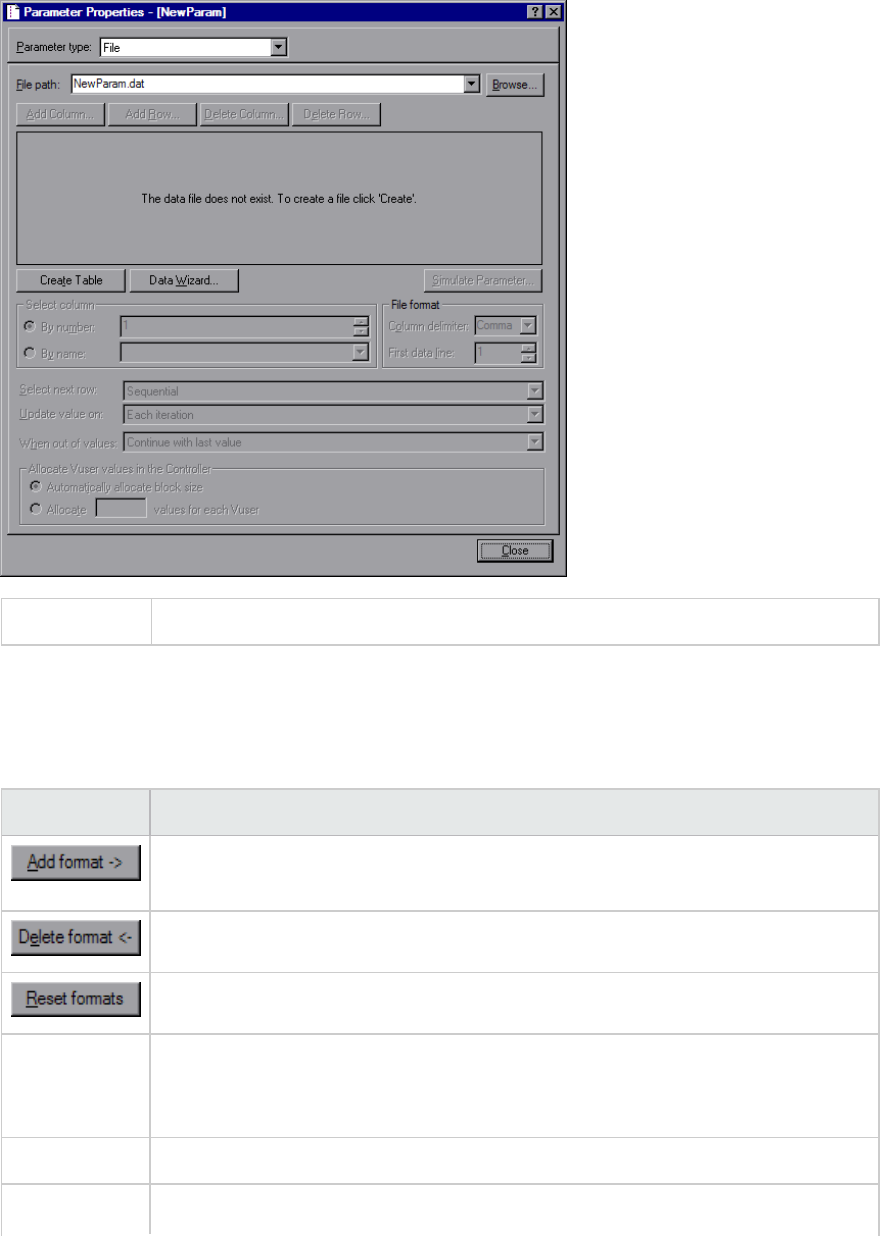
To access VuGen > Right-click parameter > Parameter properties
Date/Time, Group Name, Iteration Number, Load Generation Name, and Vuser ID
Parameters
User interface elements are described below:
UI Element Description
Adds the custom format specified in the Date/time format or Text format field to
the format list.
Deletes the selected format from the format list.
Restores the format list to it's default state.
Date/time
format / Text
format
You can specify a custom format here. See the chart below for a list of Date/time
symbols.
Format list The list of formats. See the chart below for a list of Date/time symbols.
Offset Allows you to set an offset for the date/time parameter. For example, if you want to
User Guide
VuGen
HP LoadRunner (12.50) Page 359
UI Element Description
(Date/time to
type only)
test a date next month, you set the date offset to 30 days.
lWorking days only. Use values for work days only (excludes Saturdays and
Sundays).
Note: To change the non-working days, configure the NonWorkingDays
parameter under the Misc section in the vugen.ini file:
[Misc]
NonWorkingDays="5,6"
Days are represented by integers as follows:
Mon = 1, Tue = 2, Wed = 3 ,Thur = 4, Fri = 5, Sat = 6, Sun = 7
lPrior to current date. Sets the offset for a date or time that has already passed
(negative offset).
Parameter
type
The parameter type. For more information see "Parameter Types" on page343.
Sample
(current time)
Displays an example parameter value based on the selected format.
Update values
on
lEach occurrence. Use a new value for each occurrence of the parameter in your
script. This is useful when the statements using a parameter are unrelated. For
example, for random data, it may be useful to use a new value for each
occurrence of the parameter.
lEach iteration. Updates the parameter one time per iteration. If a parameter
appears in a script several times, the Vuser uses the same value for all
occurrences of the parameter, for the entire iteration. This is useful when the
statements using a parameter are related.
Note: If you create an action block with parameters using its own
iteration count—if you instruct VuGen to update their values each
iteration, it refers to the global iteration and not the block iteration.
lOnce. Updates the parameter value only once during the scenario run. The Vuser
uses the same parameter value for all occurrences and all iterations of the
parameter. This type may be useful when working with dates and times.
The following table describes the date/time symbols:
User Guide
VuGen
HP LoadRunner (12.50) Page 360
Symbol Description
c complete date and time in digits
#c complete date as a string and time
H hours (24 hour clock)
I hours (12 hour clock)
M minutes
S seconds
p AM or PM
d day
m month in digits (01-12)
b month as a string - short format (e.g. Dec)
B month as a string - long format (e.g. December)
y year in short format (e.g. 03)
Y year in long format (e.g. 2013)
File Parameters
User interface elements are described below:
UI Element Description
Adds a column to the data set.
Adds a row to the data set.
Creates a new data table.
Opens the Database Query Wizard, enabling you to import data from an
existing database. For more information, see
Deletes a column from the data set.
Deletes a row from the data set.
User Guide
VuGen
HP LoadRunner (12.50) Page 361
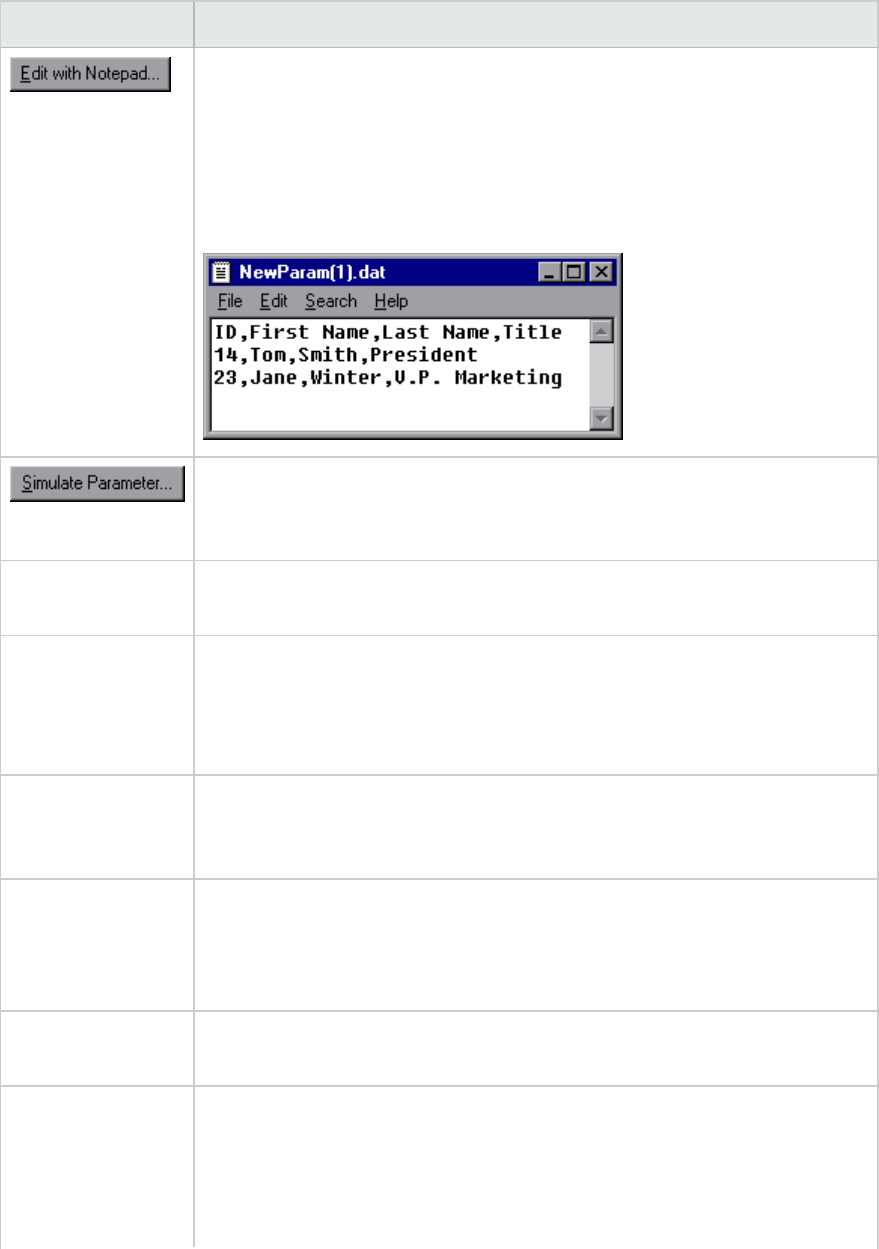
UI Element Description
Enables you to view and edit parameter values in Notepad. This is important
when working with large data sets because VuGen only displays up to 100 rows
in the UI.
Notepad opens with the parameter's name in the first row and its original
value in the second row. Enter additional column names and values into the
file using a delimiter such as a comma or a tab to indicate a column break.
Begin a new line for each table row (for each new row of data).
Opens the Parameter Simulation dialog box. This allows you to simulate the
parameter behavior with your data set. For more information, see "Parameter
Simulation Dialog Box" on page368.
Select Column Enables you to select the column to use as the data source either by the
column number or name.
File Format lColumn delimiter. The character used to separate values in the data file.
lFirst data line. The first line of data to be used during Vuser script
execution. The header is line 0. To begin with the first line after the header,
specify 1. If there is no header, specify 0.
Select next row The method of selecting the file data during Vuser script execution. The
options are: Sequential,Random, or Unique. For more information see "Data
Assignment Methods for File/Table/XML Parameters" on page347.
Update value on The method that determines when the parameter will switch to the next value.
The choices are Each Iteration,Each Occurrence, and Once. For more
information see "Data Assignment Methods for File/Table/XML Parameters"
on page347.
When out of values Specify what to do when there is no more unique data: Abort the Vuser,
Continue in a cyclic manner, or Continue with last value.
Allocate Vuser
values in the
Controller
(LoadRunner only).Indicate whether you want to manually allocate data blocks
for the Vusers. You can allow the Controller to automatically allocate a block
size or you can specify the desired number of values. Select Automatically
allocate block size or Allocate xvalues for each Vuser. For the second
option, specify the number of values to allocate.
User Guide
VuGen
HP LoadRunner (12.50) Page 362
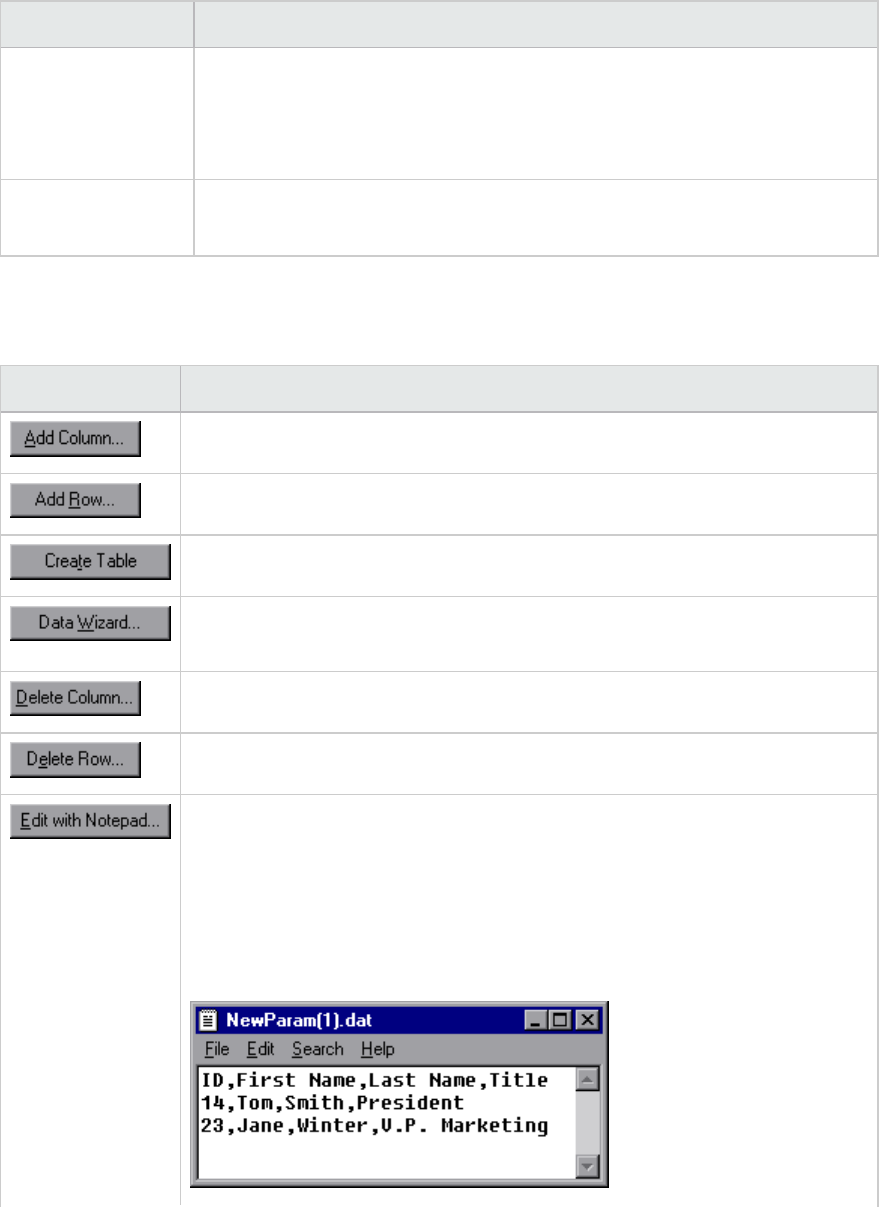
UI Element Description
To track this occurrence, enable the Extended Log > Parameter Substitution
option in the Log Runtime Settings. When there is not enough data, VuGen
writes a warning message to the Vuser log "No more unique values for this
parameter in table <table_name>".
File path Select the .dat file with the data for your parameter. Alternatively, you can
create a new data set using the Create Table button.
Table Parameters
User interface elements are described below:
UI Element (A-Z) Description
Adds a column to the data set.
Adds a row to the data set.
Creates a new data table.
Opens the Database Query Wizard, enabling you to import data from an existing
database. For more information, see
Deletes a column from the data set.
Deletes a row from the data set.
Enables you to view and edit parameter values in Notepad. This is important
when working with large data sets because VuGen only displays up to 100 rows
in the UI.
Notepad opens with the parameter's name in the first row and its original value
in the second row. Enter additional column names and values into the file using
a delimiter such as a comma or a tab to indicate a column break. Begin a new
line for each table row (for each new row of data).
User Guide
VuGen
HP LoadRunner (12.50) Page 363

UI Element (A-Z) Description
Allocate Vuser
values in the
Controller
(LoadRunner only).Indicate whether you want to manually allocate data blocks
for the Vusers. You can allow the Controller to automatically allocate a block
size or you can specify the desired number of values. Select Automatically
allocate block size or Allocate xvalues for each Vuser. For the second option,
specify the number of values to allocate.
To track this occurrence, enable the Extended Log > Parameter Substitution
option in the Log Runtime Settings. When there is not enough data, VuGen
writes a warning message to the Vuser log "No more unique values for this
parameter in table <table_name>".
Column The columns to use. Alternatively, you can select Select all columns.
To specify one or more columns by their number, select Columns by number
and enter the column numbers separated by a comma or a dash. The column
number is the index of the column containing your data. For example, if the data
for the parameter is in the table's first column, select 1.
In the Column delimiter box, select a column delimiter—the character used to
separate the columns in the table. The available delimiters are: comma, tab,
space.
File path Select the .dat file with the data for your parameter. Alternatively, you can
create a new data set using the Create Table button.
Row delimiter for
log display
This delimiter is used to differentiate between rows in the output logs. If you
enable parameter substitution logging, VuGen sends the substituted values to
the Replay log. The row delimiter character in the Replay log indicates a new
row.
Rows lRows per iteration. How many rows to use per iteration. This only relevant
when the Update value on field is set to Each iteration. If Update value on is
set to Once, then the same rows will be used for all iterations.
lFirst line of data. The first line of data to be used during script execution. To
begin with the first line after the header, enter 1.
l. Displays information about the table, including how many
rows of data are available.
Select next row The method of selecting the file data during Vuser script execution. The options
are: Sequential,Random, or Unique. For more information see "Data
Assignment Methods for File/Table/XML Parameters" on page347.
Update value on The method that determines when the parameter will switch to the next value.
The choices are Each Iteration,Each Occurrence, and Once. For more
information see "Data Assignment Methods for File/Table/XML Parameters" on
User Guide
VuGen
HP LoadRunner (12.50) Page 364
UI Element (A-Z) Description
page347.
When not enough
rows
Specifies what VuGen does when there are not enough rows in the table for the
iteration.
Example: The table you want to fill has 3 rows, but your data only has two rows.
Select Parameter will get less rows than required to fill in only two rows.
Select Use behavior of "Select Next Row" to loop around and get the next row
according the method specified in the Select Next Row box.
When out of
values
Specify what to do when there is no more unique data: Abort the Vuser,
Continue in a cyclic manner, or Continue with last value.
Random Number Parameters
User interface elements are described below:
UI
Element
Description
Number
format
Specifies the minimum number of digits your parameter will have. Where %01d represents
one digit, %02d represents two digits, and so on.
Random
range
The minimum and maximum range for the random values.
Sample
value
Displays sample minimum and maximum values based on the selected Number format.
Update
value
on
lEach occurrence. Use a new value for each occurrence of the parameter in your script.
This is useful when the statements using a parameter are unrelated. For example, for
random data, it may be useful to use a new value for each occurrence of the
parameter.
lEach iteration. Updates the parameter one time per iteration. If a parameter appears
in a script several times, the Vuser uses the same value for all occurrences of the
parameter, for the entire iteration. This is useful when the statements using a
parameter are related.
Note: If you create an action block with parameters using its own iteration
count—if you instruct VuGen to update their values each iteration, it refers to
the global iteration and not the block iteration.
lOnce. Updates the parameter value only once during the scenario run. The Vuser uses
User Guide
VuGen
HP LoadRunner (12.50) Page 365
UI
Element
Description
the same parameter value for all occurrences and all iterations of the parameter. This
type may be useful when working with dates and times.
Unique Number Parameters
Note: When scheduling a scenario in the Controller, the When out of values option only applies
to the Run for HH:MM:SS option in the Schedule Builder's Duration tab. It is ignored for the Run
until completion option.
User interface elements are described below:
UI
Element
Description
Number
format
Specifies the minimum number of digits your parameter will have. Where %01d represents
one digit, %02d represents two digits, and so on.
Number
range
lStart. The starting value.
lBlock size per Vuser. The amount of unique numbers assigned to each Vuser. For
example, if you specify a starting value of 1 and a block size of 100, the values be 1-100
can be used by the first Vuser, the values 101-200 can be used by the second Vuser, and
so on.
Sample
value
Displays an example parameter value based on the selected format.
Update
value
on
lEach occurrence. Use a new value for each occurrence of the parameter in your script.
This is useful when the statements using a parameter are unrelated. For example, for
random data, it may be useful to use a new value for each occurrence of the
parameter.
lEach iteration. Updates the parameter one time per iteration. If a parameter appears
in a script several times, the Vuser uses the same value for all occurrences of the
parameter, for the entire iteration. This is useful when the statements using a
parameter are related.
Note: If you create an action block with parameters using its own iteration
count—if you instruct VuGen to update their values each iteration, it refers to
the global iteration and not the block iteration.
User Guide
VuGen
HP LoadRunner (12.50) Page 366
UI
Element
Description
lOnce. Updates the parameter value only once during the scenario run. The Vuser uses
the same parameter value for all occurrences and all iterations of the parameter. This
type may be useful when working with dates and times.
When
out of
values
Determines what to do when the range of values is reached for a Vuser. The range of
values is determined by the start value and the block size.
Abort Vuser. Terminates the Vuser script.
Continue in a cyclical manner. Restart the unique numbers for this Vuser from the
beginning of its assigned range. For example, if a Vuser had the range of 1-100 and it
reached 100, it would start again at 1.
Continue with last value. Use the last assigned value for this parameter for all
subsequent occurrences of this parameter. For example, if a Vuser had the range of 1-100
and it reached 100, it would continue with the value of 100 until the end of the script.
User Defined Function Parameters
User interface elements are described below:
UI
Element
Description
Function
Name
The name of the function. Use the name of the function as it appears in the DLL file.
Library
Names
The location of the relevant library files.
Update
value on
lEach occurrence. Use a new value for each occurrence of the parameter in your script.
This is useful when the statements using a parameter are unrelated. For example, for
random data, it may be useful to use a new value for each occurrence of the
parameter.
lEach iteration. Updates the parameter one time per iteration. If a parameter appears
in a script several times, the Vuser uses the same value for all occurrences of the
parameter, for the entire iteration. This is useful when the statements using a
parameter are related.
Note: If you create an action block with parameters using its own iteration
count—if you instruct VuGen to update their values each iteration, it refers to
the global iteration and not the block iteration.
lOnce. Updates the parameter value only once during the scenario run. The Vuser uses
User Guide
VuGen
HP LoadRunner (12.50) Page 367
UI
Element
Description
the same parameter value for all occurrences and all iterations of the parameter. This
type may be useful when working with dates and times.
XML Parameters
For information about Web Services XML parameters, see "XML Parameters" on page350.
Parameter Simulation Dialog Box
This dialog box allows you to view a simulation of the behavior of a file parameter.
To access VuGen > Parameter List > Select Parameter > Simulate Parameter
Important
information
lThis feature is only relevant for file type parameters.
lNot all types of Parameter Substitution can be simulated. If you select Select next
row: Same line as... or Update value on: Each occurrence, then the Parameter
Simulation dialog box will not open.
lVuGen can simulate up to 256 iterations and 256 Vusers.
lRun Indefinitely is compliant with the Real-life schedule in the Scheduler of the
Controller.
lIf you select Select next row: Unique in the Parameter List dialog, then each Vuser
is assigned a unique range of rows from which the Simulator will substitute values
(for that Vuser).
Note: If you have more than one unique parameter, you need to verify that
each parameter has defined values for all Vusers.
With this setting, the default selection in the Allocate Vuser values in the Controller
section is Automatically allocate block size. In this case, when you run the
simulation, the range allocation takes place in accordance with your Scenario run
mode selection.
If you change the default selection to Allocate x values for each Vuser, then the
Vusers will be allocated the amount of values you specify, ignoring of your Scenario
run mode selection.
User interface elements are described below:
UI Element Description
Vusers The number of Vusers to run in the simulation.
User Guide
VuGen
HP LoadRunner (12.50) Page 368
Scenario
Run Mode
lRun until completion. Enter the number of iteration to run or select Take number
of iteration from Runtime Settings.
lRun indefinitely. Simulates the run indefinitely option in the controller. VuGen only
actually simulates the number of iterations you specify.
Runs the parameter simulation. The values of each parameter substitution are
displayed.
Example:
In the following examples, the settings in the Parameter List dialog box are:
lValues for the new parameter. Value1 to Value7
lSelect next row. Unique
lWhen out of rows. Continue with last value
lAllocate Vuser values in the Controller. Automatically allocate block size
Scenario run mode: Run until completion
In the following example, the user has selected three Vusers, set the Scenario run mode to Run until
completion, and selected three iterations.
User Guide
VuGen
HP LoadRunner (12.50) Page 369
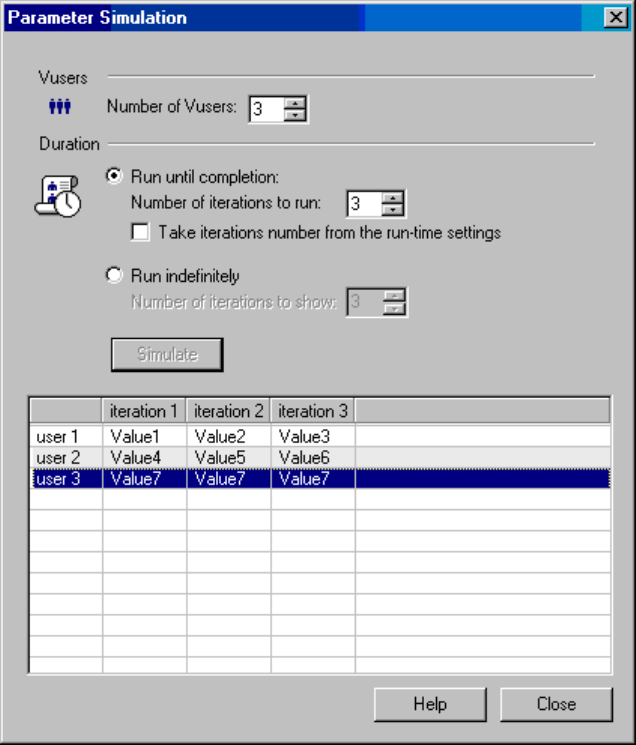
When the scenario run mode is set to Run until completion, the number of rows that each Vuser
receives is the same as the number of iterations. The range allocation stops when there are no longer
enough rows in the table.
As the simulation is run, the first Vuser takes the first three values (because this was the number of
iterations). The second Vuser takes the next three values. The third Vuser takes the remaining value in
the first iteration. For the remaining iterations, since the When out of values option in the Parameter
List dialog box was set to Continue with last value, the third Vuser continues with the same value.
A fourth Vuser would have failed.
Scenario run mode: Run indefinitely
In the following example, the user has selected 3 Vusers and set the Scenario run mode to Run
indefinitely and selected to show 3 iterations.
User Guide
VuGen
HP LoadRunner (12.50) Page 370
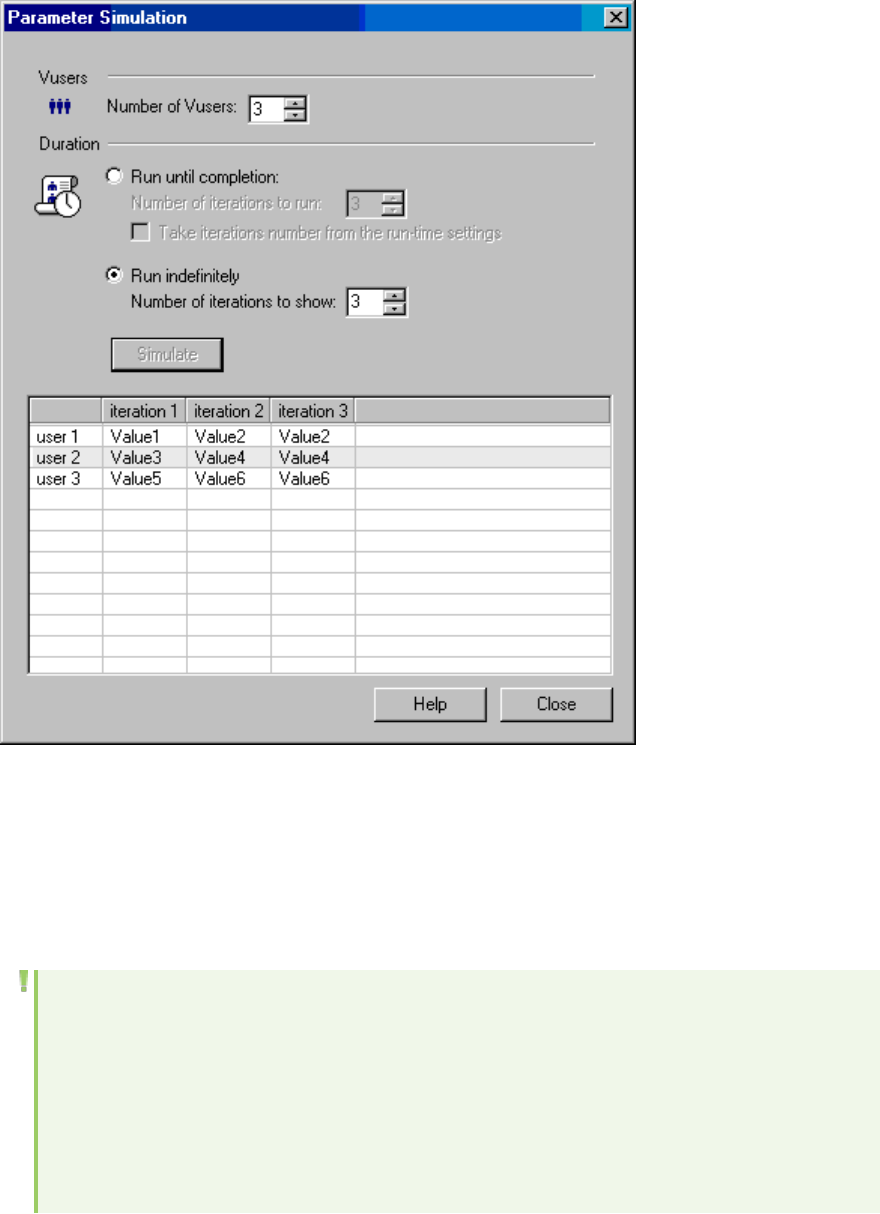
When the Scenario run mode is set to Run indefinitely, the allocated range for each Vuser is calculated
by dividing the number of cells in the .dat file by the number of Vusers. In this scenario, that is 7/3 = 2
(The simulator takes the closest smaller integer.).
As the simulation is run, the first Vuser takes Value1 and Value2. The second Vuser takes Value3 and
Value4 and the third Vuser takes Value5 and Value6. Since there are were only 3 Vusers, Value7 was not
distributed.
Note: If you hold the mouse over the cells in the first column of the table, a tool tip appears with
information about which values were assigned to that Vuser.
If you hold the mouse over cells which were not assigned values, a tool tip appears with the
reason no values were assigned.
A tool tip does not appear if a proper value was assigned.
User Guide
VuGen
HP LoadRunner (12.50) Page 371
Parameter List Dialog Box
This dialog box enables you to view, create, delete, select, and modify parameters. The Parameter list
shows all of the parameters that you created, including both input and output parameters.
To access Use one of the following:
lVuGen > Solution Explorer pane >>Parameters node > Parameter List
lIn the script editor, right-click on a value > Replace with Parameter>
Parameter List
lDesign > Parameters > Parameter List
Important
information
Do not name a parameter unique, since this name is used by VuGen.
See also "Parameter Properties Dialog Box" on page358
User interface elements are described below (unlabeled elements are shown in angle brackets):
UI Element Description
Creates a new parameter. This does not replace any highlighted text with the
parameter. Do not name a parameter unique, since this name is used by VuGen.
Deletes the selected parameter.
Note: If the parameter replaced a previous value, the original value is
restored.
<Parameter
Properties
Pane>
This pane appears different depending on the type of parameter you are using. For
information about this pane, see the relevant section in the "Parameter Properties
Dialog Box" on page358.
Parameter
type
This drop-down list lets you select the parameter type. For information about the
different parameter types, see "Parameter Types" on page343.
Database Query Wizard
This wizard enables you to select data for a parameter from a database.
To access For an existing parameter:
VuGen editor > Right-click parameter > Parameter properties > Data Wizard (only
available for File / Table type parameters)
User Guide
VuGen
HP LoadRunner (12.50) Page 372

For a new parameter:
Design > Parameters > Create new parameter > Properties > Data Wizard
Relevant
tasks
"How to Import Parameter Data from a Database" on page357
User interface elements are described below:
UI Element Description
Query Definition Select from one of the following options:
lCreate query using Microsoft Query
lSpecify SQL statement manually
Show me how to use
Microsoft Query
Displays instructions for using Microsoft Query when after you click
next.
Maximum number of rows The maximum number of rows to be created in the .dat file based on
the specified query.
Create Parameter Dialog Box
This dialog box enables you to create parameters directly from the Snapshot view.
To access In VuGen:
1. After recording a script, show the Snapshot pane: View > Snapshot.
2. Click the Recording button to show the Recording snapshot.
3. Select the string you want to parameterize.
4. Select Create Parameter from the right-click menu.
Important
Information
This dialog box is only available for protocols with snapshots, such as Web
HTTP/HTML.
User interface elements are described below:
UI Element Description
Parameter Name The name of the parameter.
Selected Value The string that will be substituted by a parameter.
Left Boundary The left boundary of the string to define as a parameter.
Right Boundary The right boundary of the string to define as a parameter.
User Guide
VuGen
HP LoadRunner (12.50) Page 373
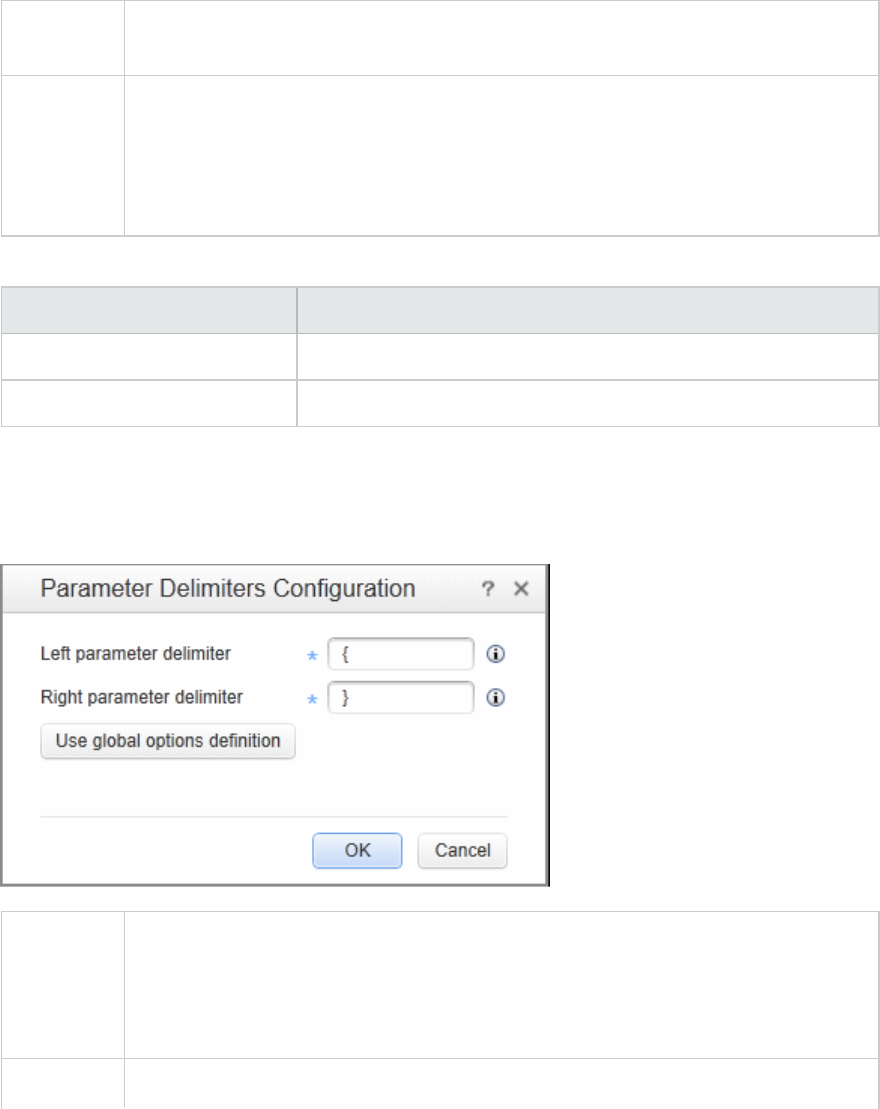
Parameter Original Value Dialog Box
This dialog box appears when you are parameterizing a Vuser script, and lets you specify the
parameter's original value.
To access In VuGen, select a text string in the Editor. Right-click and then select Replace with
Parameter > Parameter List. Select an existing parameter and click Close.
Important
information
Each parameter has an original value. You can replace any parameter in a Vuser script
with the parameter's original value. When you parameterize a selected text string and
the selected text string is not the same as the selected parameter's original value, you
can select to either keep the parameter's existing original value, or replace the
parameter's original value with the selected text string.
User interface elements are described below:
UI Element Description
Use old original value <text> Keeps the parameter's existing original value.
Use new original value <text> Assigns the selected text as the parameter's new original value.
Parameter Delimiters Configuration Dialog Box
This dialog box enables you to define the delimiter type used to enclose the selected parameter.
To access Use one of the following:
lVuGen > Solution Explorer pane > right-click on the Parameters node > Configure
Parameter Braces
lDesign > Parameters >Configure Parameter Braces
Important You can enter any character to be used as the left and right delimiters. The characters
User Guide
VuGen
HP LoadRunner (12.50) Page 374
information do not have to be identical. After you have defined the characters, subsequent scripts
use the characters defined for right and left delimiter.
User interface elements are described below:
UI Element Description
Left parameter brace The delimiter used at the left of the parameter.
Note: The left parameter brace does not have to be the same as
the right parameter brace.
Right parameter brace The delimiter used at the right of the parameter.
Note: The left parameter brace does not have to be the same as
the right parameter brace
Use global options
definition
This option reverts the selected delimiter to {.
Troubleshooting and Limitations for Parameterization
This section describes troubleshooting and limitations for parameters.
Function Argument Limitations
You can use parameterization only for the arguments within a function. You cannot parameterize text
strings that are not function arguments. In addition, not all function arguments can be parameterized.
For details on which arguments you can parameterize, see the Function Reference (Help > Function
Reference) for each function.
For example, consider the lrd_stmt function. The function has the following syntax:
lrd_stmt (LRD_CURSOR FAR *mptCursor, char FAR *mpcText, long mliTextLen, LRDOS_INT4
mjOpt1, LRDOS_INT4 mjOpt2, int miDBErrorSeverity);
The indicates that you can parameterize only the mpcText argument.
A recorded lrd_stmt function could look like this:
lrd_stmt(Csr4, "select name from sysobjects where name =\"Kim\" ", -1, 148, -99999,
0);
You could parameterize the recorded function to look like this:
User Guide
VuGen
HP LoadRunner (12.50) Page 375

lrd_stmt(Csr4, "select name from sysobjects where name =\"<name>\" ", -1, 148, -
99999, 0);
Note: You can use the lr_eval_string function to "parameterize" a function argument that you
cannot parameterize by using standard parameterization. In addition, you can use the lr_eval_
string function to "parameterize" any string in a Vuser script.
For VB, COM, and Microsoft .NET protocols, you must use the lr.eval string function to define a
parameter. For example,
lr.eval_string("{Custom_param}").
For more information on the lr_eval_string function, see the Function Reference.
Data Table File Size Limitations
If .dat file's size is over 100MB, a message is displayed that the file is too big and will not be displayed.
If you need to load a file over 100MB, you can change "MaxParametersDisplaySize" parameter in
vugen.ini:
[ParamTable]
MaxParametersDisplaySize=100000000
Asynchronous Communication
Synchronous and Asynchronous Concepts
Note: This topic applies to Web (HTTP/HTML), Mobile Application - HTTP/HTML, Flex, and Web
Services Vuser scripts.
Original web applications communicated using conversations that had a synchronous nature. A typical
synchronous conversation includes the following steps:
1. The user interacts with an application that is presented in a web browser.
2. Based on the user input, the browser submits a request to the web server.
3. The server sends a response to the request, and the application in the browser is updated.
Synchronous applications have a number of limitations. One limitation involves the updating of the data
that is displayed in the application inside the browser. For example, consider an application that displays
stock prices of a number of shares. Ideally, the application should be able to update the display of the
stock prices as soon as the prices are updated on the web-server. A synchronous application would be
able to update the prices on a fixed time interval. For example, every 10 seconds, the browser could
User Guide
VuGen
HP LoadRunner (12.50) Page 376

sent a request to the server for the most up-to-date stock prices. One limitation of this solution is that
the displayed stock prices may be out-of-date for a period of time before the refresh interval is
reached. Although this may not be critical in our share portfolio scenario, the scenario illustrates the
limitation of a synchronous application to timeously update information.
Where necessary, synchronous applications are being replaced with what are known as asynchronous
applications. Asynchronous applications enable a client to be notified whenever an event occurs on the
server side. Asynchronous applications are therefore better able to update information as required.
In order to enable asynchronous behavior, asynchronous communication occurs in parallel
(simultaneously) with the main, synchronous flow of the business processes. This behavior makes
asynchronous applications harder to accurately emulate using traditional synchronous Vuser scripts.
Although there are numerous types of asynchronous applications, there are three primary types: push,
poll, and long-poll. For details, see "Types of Asynchronous Communication" below.
For an introduction to using asynchronous communication in Vuser scripts, see "VuGen Support for
Asynchronous Communication" on page380.
Types of Asynchronous Communication
Note: This topic applies to Web (HTTP/HTML), Mobile Application - HTTP/HTML, Flex, and Web
Services Vuser scripts.
Asynchronous request and response sequences
Asynchronous communication is comprised of various request and response sequences. Such request
and response sequences can be classified as one of three types of asynchronous communication: poll,
push, and long-poll. When you develop a Vuser script, it is often useful to know the types of
asynchronous communication that are implemented when the required business processes are
performed.
Polling Asynchronous Communication
The browser sends HTTP requests to the server at regular intervals, for example, every 5 seconds. The
server responds with updates. This enables the system to intermittently update the application
interface inside the browser. If the server has no update, it informs the application that there is no
update, based on the application protocol.
User Guide
VuGen
HP LoadRunner (12.50) Page 377
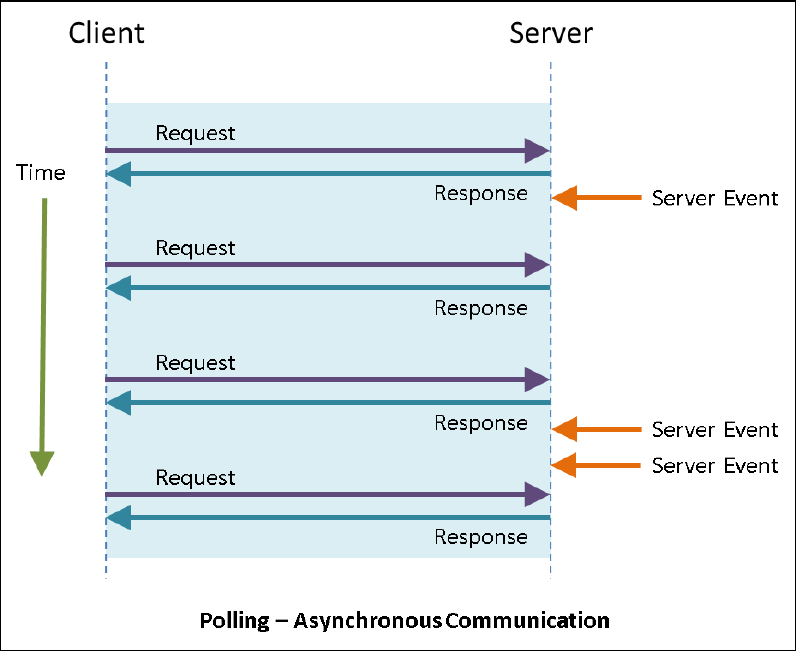
Long-Polling Asynchronous Communication
The client generates an HTTP request to a known address on the server. Whenever the server has an
update, it responds with an HTTP response. Immediately after receiving the server response, the client
issues another request.
User Guide
VuGen
HP LoadRunner (12.50) Page 378
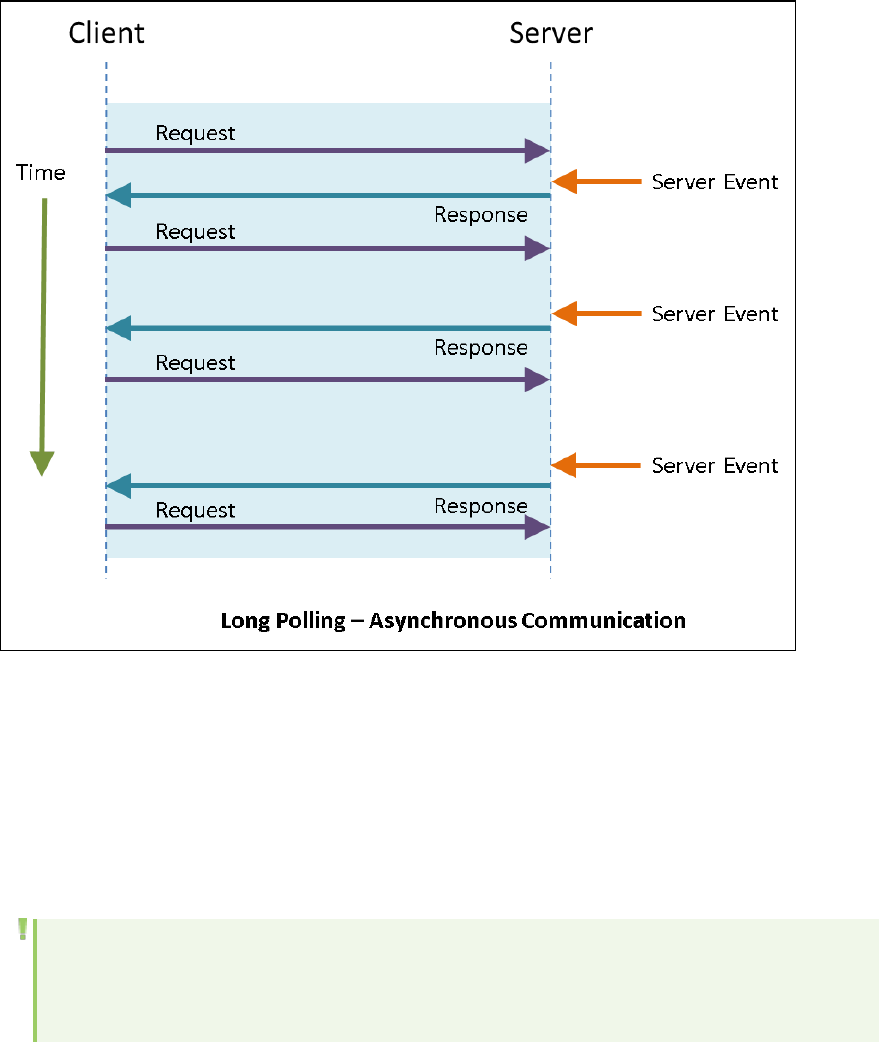
Push Asynchronous Communication
The client opens a connection with the server by sending a single HTTP request to a known address on
the server. The server then sends a response that appears to never end, so that the client never closes
the connection. Whenever necessary, the server sends a “sub message” update to the client over the
open connection. The server may or may not terminate this connection. During the time the connection
is open, if the server has no real update to send, it sends "ping" messages to the client to prevent the
client from closing the connection for timeout reasons.
Note: Push-type conversations are supported for Web - HTTP/HTML protocol actions inside Web
- HTTP/HTML, Flex, Silverlight, and Web Services Vuser scripts, NOT for Flex_amf_call steps in
Flex Vuser scripts.
User Guide
VuGen
HP LoadRunner (12.50) Page 379
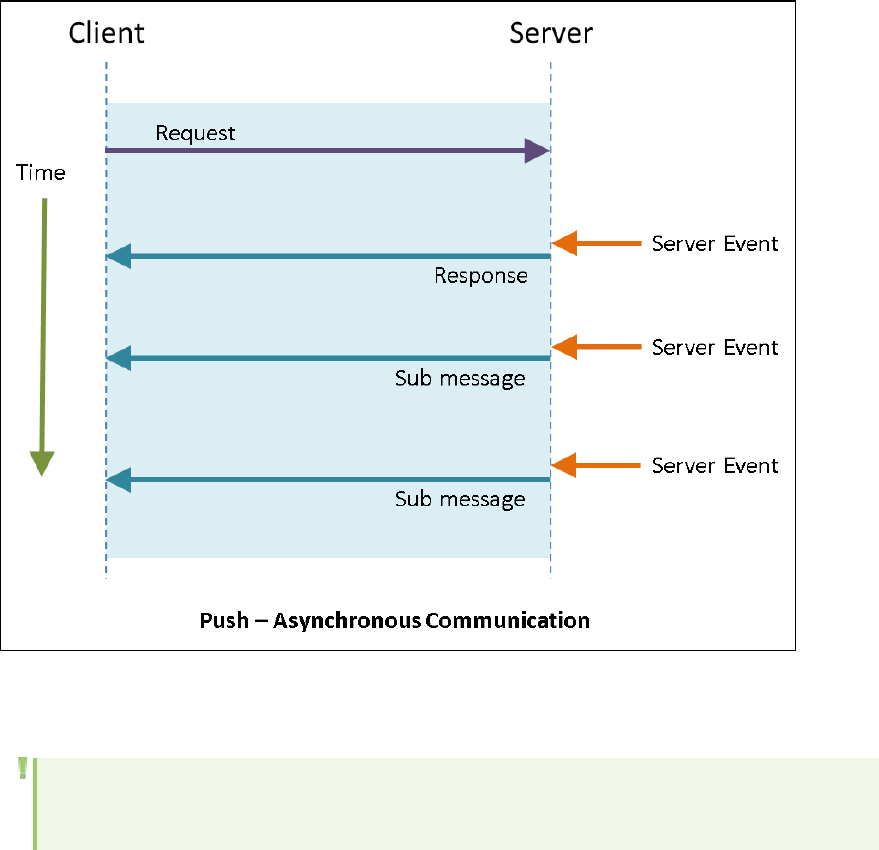
VuGen Support for Asynchronous Communication
Note: This topic applies to Web (HTTP/HTML), Mobile Application - HTTP/HTML, Flex, and Web
Services Vuser scripts.
Web-based applications can exhibit synchronous behavior, asynchronous behavior, or a combination of
both. For an introduction to these behavior types, see "Synchronous and Asynchronous Concepts" on
page376. LoadRunner enables you to build and run Vuser scripts that emulate user activity for both
synchronous and asynchronous applications. To build a Vuser script for a synchronous application, follow
the typical LoadRunner Vuser script building process. However, to build a script for an asynchronous
application, you must perform some additional tasks - beyond the typical Vuser script building process.
If you record and generate a script for an application that performs asynchronous behavior - without
performing the additional asynchronous-related tasks, the script may not run successfully.
Building a Vuser script for an asynchronous application begins with recording the business processes
that produce the asynchronous communication. After the business processes are recorded and the
Vuser script is generated, VuGen scans the generated Vuser script and attempts to locate the
asynchronous communication. If asynchronous communication is detected, VuGen modifies the script -
inserting the appropriate asynchronous API functions.
User Guide
VuGen
HP LoadRunner (12.50) Page 380
Identifying Asynchronous Conversations
In order for VuGen to be able to successfully identify the asynchronous behavior in a Vuser script, the
asynchronous communication must contain at least the required minimum number of request and
response sequences.
lIdentifying a poll-type conversation
To enable VuGen to successfully identify a poll conversation, the recorded Vuser script must contain
at least 3 sequences with matching URLs and similar polling intervals.
lIdentifying a long-poll type conversation
To enable VuGen to successfully identify a long-poll conversation, the recorded Vuser script must
contain at least 3 sequences with matching URLs.
Note: VuGen will scan a script for asynchronous communication only if the Async Scan recording
option is selected. For details, see "How to Create an Asynchronous Vuser Script" on the next
page.
In some scenarios, the modifications that VuGen makes to the Vuser script are sufficient to enable the
script to run and emulate the required asynchronous behavior. In other scenarios, additional "manual"
modifications are required. For details, see "How VuGen Modifies a Vuser Script for Asynchronous
Communication" on page385.
Note: the modifications that must be made to a generated Vuser script to enable the script to
emulate asynchronous behavior are dependent on the type of the asynchronous behavior: push,
polling, or long-polling. For details, see "Types of Asynchronous Communication" on page377.
Asynchronous communication in a Vuser script is divided into one or more conversations. The individual
asynchronous conversations that VuGen detects in a Vuser script are listed in the Async tab of the
Design Studio. Use this list of asynchronous conversations to systematically analyze the modifications
that VuGen made to the Vuser script to make sure that VuGen has correctly identified the asynchronous
behavior, and correctly modified the Vuser script to emulate the required asynchronous behavior. For
details on the Async tab of the Design Studio, see "Async Tab [Design Studio]" on page407.
After modifying a Vuser script to enable it to emulate asynchronous communication, it may be
necessary to perform correlation activities on the modified script. For details about correlation, see
"Correlating Asynchronous Vuser Scripts" on page393.
Note: Async functionality is not supported when you replay a Vuser script in WinINet mode.
For details on how to build a Vuser script for an application that utilizes asynchronous communication,
see "How to Create an Asynchronous Vuser Script" on the next page.
User Guide
VuGen
HP LoadRunner (12.50) Page 381

How to Create an Asynchronous Vuser Script
Note: This topic applies to Web (HTTP/HTML), Mobile Application - HTTP/HTML, Flex, and Web
Services Vuser scripts.
To build a Vuser script for an asynchronous application, perform the following:
Create a new Vuser script
1. Click the New Script button on the VuGen toolbar.
2. Select Web - HTTP/HTML, or one of the other Vuser protocols that support asynchronous
communication.
3. Click Create. VuGen creates a basic Vuser script.
Enable Async Scan
1. Select Record > Recording Options.
2. Under General, select Code Generation.
3. Make sure that the Async Scan check box is selected. This instructs VuGen to scan the Vuser script
after recording, locate asynchronous communication, and insert the appropriate asynchronous
functionality.
Record the business processes using the typical VuGen recording process
1. Click Record on the VuGen toolbar.
2. Enter the required information in the Start Recording dialog box, and then click Start Recording.
3. Perform the business processes that the Vuser will emulate, and then click Stop Recording on the
floating toolbar.
Note: In order for VuGen to be able to successfully identify the asynchronous behavior in a
Vuser script, the asynchronous communication must contain at least the required
minimum number of client requests and server responses. For details, see "Types of
Asynchronous Communication" on page377.
Generate, scan, and modify the Vuser script
1. After you click Stop Recording, VuGen generates the Vuser script.
2. After generating the script, VuGen scans the generated script to locate instances of asynchronous
communication.
User Guide
VuGen
HP LoadRunner (12.50) Page 382

3. If VuGen locates any instances of asynchronous communication, VuGen will modify the script to
enable the script to run and emulate the asynchronous behavior. For details, see "How VuGen
Modifies a Vuser Script for Asynchronous Communication" on page385.
4. The Design Studio opens. Click the Async tab. The Async tab displays a list of all instances of
asynchronous communication that VuGen located in the Vuser script.
Review the modifications that VuGen made to the script
For each asynchronous conversation that appears in the Async tab of the Design Studio, perform the
following tasks:
1. Open the Vuser script in the Editor.
2. Locate the web_reg_async_attributes step that starts the asynchronous conversation. Ensure
that the web_reg_async_attributes step is located at the start of the asynchronous conversation.
3. Make sure that the URL parameter in the web_reg_async_attributes step is the same as one of
the URLs that are specified in the action step that follows the web_reg_async_attributes step.
For details on the web_reg_async_attributes step, see "Defining the Start of an Asynchronous
Conversation" on page388.
4. Notice that the step comment before the web_reg_async_attributes step contains a TODO token.
The TODO token indicates that you should check the relevant callback implementations in the
AsyncCallbacks.c extra file.
5. Locate the web_stop_async step that ends the asynchronous conversation. Ensure that the web_
stop_async step is located at the end of the asynchronous conversation.
6. Make sure that the web_stop_async step runs as required. For details, see "Fine-Tuning the End of
an Asynchronous Conversation" on page392.
For details on the web_stop_async step, see "Defining the End of an Asynchronous Conversation"
on page390.
7. Review the callback implementation and make modifications to the script as required. For details,
see "Implementing Callbacks" on page393.
8. Make sure that all counter and complex string parameters are set correctly. Notice that for each
such parameter, a TODO comment exists and has a matching task in the Tasks pane. For details,
see "Parsing URLs" on page401.
9. Check the Tasks pane for specific actions that are required in order to complete the script
development process. Such actions may include verifying callback implementations, or verifying
the implementation of specific parameters.
10. Once all parameters are initialized correctly, run the script to make sure that the asynchronous
conversation runs as expected.
Note: Async functionality is not supported when you replay a Vuser script in WinINet mode.
Once you have reviewed the modified script and made sure that the asynchronous communication has
been implemented correctly, run the script. For details, see Enabling Asynchronous Scripts to Run.
User Guide
VuGen
HP LoadRunner (12.50) Page 383

Asynchronous Communication API
Note: This topic applies to Web (HTTP/HTML), Mobile Application - HTTP/HTML, Flex, and Web
Services Vuser scripts.
The LoadRunner API includes several functions that enable Vuser scripts to emulate asynchronous
communication. These asynchronous communication functions are:
web_reg_async_attributes
This function registers the next action function as the beginning of an asynchronous conversation, and
defines the behavior of the asynchronous communication.
web_stop_async
This function cancels the specified asynchronous conversation, including all its active and future tasks.
web_sync
This function suspends the Vuser script execution until the specified parameter is defined.
web_util_set_request_url
This function sets the specified string to be the request URL for the next request sent in the
conversation. This is applicable only when called from a callback.
web_util_set_request_body
This function sets the specified string to be the request body for the next request sent in the
conversation. This is applicable only when called from a callback.
web_util_set_formatted_request_body
This function is similar to the web_util_set_request_body function. However, this function is included
as part of a Flex protocol asynchronous conversation instead of a Web(HTTP/HTML) protocol
asynchronous conversation. This function expects an XML formatted request body, which will be
converted before the request is sent.
For details on the asynchronous API functions, see the Function Reference (Help > Function Reference).
The web_reg_async_attributes function should be called before the step that starts the asynchronous
conversation. The web_reg_async_attributes function receives a number of arguments that define the
asynchronous conversation. One of these arguments is the URL of the asynchronous conversation. As
soon as the replay engine downloads this URL in the step that follows the web_reg_async_attributes
function, the asynchronous conversation begins. The callbacks that are registered in the web_reg_
async_attributes function enable the script developer to control some of the characteristics of the
asynchronous conversation (for example, to change the URL). The asynchronous conversation continues
User Guide
VuGen
HP LoadRunner (12.50) Page 384
until the web_stop_async step, or until the end of the iteration. In a push-type conversation, the server
may close the connection and thereby end the conversation.
Note: Async functionality is not supported when you replay a Vuser script in WinINet mode.
For details on how the asynchronous functions differ from synchronous functions, see "How
Asynchronous Functions Differ from Synchronous Functions" below.
How Asynchronous Functions Differ from Synchronous
Functions
Note: This topic applies to Web (HTTP/HTML), Mobile Application - HTTP/HTML, Flex, and Web
Services Vuser scripts.
The LoadRunner API includes several functions that enable Vuser scripts to emulate asynchronous
communication. These asynchronous functions differ from the other API functions in the following ways:
lThe network traffic that the asynchronous functions generate runs in parallel – simultaneously –
with the main flow in the Vuser script. This means that the asynchronous communication can
continue even when the synchronous steps end.
lThe asynchronous communication continues even during execution of non-web functions (e.g. lr_
think_time).
lSome of the asynchronous communication API functions use callback functions. The user needs to
specify callbacks that are scheduled by the replay engine when a predefined event occurs. For details
on using callbacks with asynchronous functions, see "Implementing Callbacks" on page393.
How VuGen Modifies a Vuser Script for Asynchronous
Communication
Note: This topic applies to Web (HTTP/HTML), Mobile Application - HTTP/HTML, Flex, and Web
Services Vuser scripts.
After you create a Vuser script and record the required business processes, VuGen generates the Vuser
script. VuGen then scans the generated script to locate instances of asynchronous communication. This
process is called an Async scan. If VuGen locates any instances of asynchronous communication in the
Vuser script, VuGen modifies the script to enable the script to run and emulate the required
asynchronous behavior.
Note: VuGen will scan a script for asynchronous communication only if the Async Scan recording
User Guide
VuGen
HP LoadRunner (12.50) Page 385

option is selected. For details, see "How to Create an Asynchronous Vuser Script" on page382.
Asynchronous communication in a Vuser script is divided into one or more conversations. The individual
asynchronous conversations that VuGen detects in a Vuser script are listed in the Async tab of the
Design Studio. Use this list of asynchronous conversations to systematically analyze the modifications
that VuGen made to the Vuser script during the Async scan. Make sure that VuGen has correctly
identified the asynchronous behavior in the Vuser script, and correctly modified the Vuser script to
emulate the required asynchronous behavior. For details on the Async tab of the Design Studio, see
"Async Tab [Design Studio]" on page407.
Note: After modifying a Vuser script to enable it to emulate asynchronous communication, it
may be necessary to perform correlation activities on the modified script. For details about
correlation, see "Correlating Asynchronous Vuser Scripts" on page393.
How does VuGen modify a Vuser script?
Asynchronous behavior in a Vuser script is divided into one or more asynchronous conversations. For
each asynchronous conversation, VuGen performs the following tasks:
1. VuGen inserts a web_reg_async_attributes step before the start of the asynchronous
conversation. The web_reg_async_attributes step includes an ID for the asynchronous
conversation. This ID is used by a subsequent web_stop_async step to indicate the end of the
asynchronous conversation. The Pattern argument indicates the type of the asynchronous
behavior: push,poll, or long-poll.
web_reg_async_attributes("ID=Push_0",
"Pattern=Push",
"URL=http://push.example.com/example",
"RequestCB=Push_0_RequestCB",
"ResponseHeadersCB=Push_0_ResponseHeadersCB",
"ResponseBodyBufferCB=Push_0_ResponseBodyBufferCB",
"ResponseCB=Push_0_ResponseCB",
LAST);
User Guide
VuGen
HP LoadRunner (12.50) Page 386

For details on how a web_reg_async_attributes step is used at the start of an asynchronous
conversation, see "Defining the Start of an Asynchronous Conversation" on the next page.
For details on the web_reg_async_attributes function, see the Function Reference (Help >
Function Reference).
For details on the types of asynchronous behavior that are supported by LoadRunner, see "Types
of Asynchronous Communication" on page377.
2. VuGen adds a comment before the inserted web_reg_async_attributes step. The comment
includes details about the asynchronous conversation, including:
a. The ID of the asynchronous conversation.
b. The URLs that are included in the conversation.
c. Suggested implementations for the callback functions that are declared in the web_reg_
async_attributes step. These implementations are added in AsyncCallbacks.c, one of the
script’s extra files.
/* Added by Async CodeGen.
ID=Push_0
ScanType = Recording
The following URLs are considered part of this conversation:
http://push.example.com/example
TODO - The following callbacks have been added to AsyncCallbacks.c.
Add your code to the callback implementations as necessary.
Push_0_RequestCB
Push_0_ResponseHeadersCB
Push_0_ResponseBodyBufferCB
Push_0_ResponseCB
*/
3. For push conversations, VuGen inserts asynchronous API functions into the Vuser script, but does
not remove any of the recorded code from the Vuser script. For polling and long-polling
conversations, VuGen may remove steps or step parameters from the generated Vuser script.
User Guide
VuGen
HP LoadRunner (12.50) Page 387

VuGen removes steps or step parameters in cases where the relevant URLs will be requested by
running the inserted asynchronous functions - and not by running the original steps that have been
removed.
Note: Removed steps are not deleted – they are commented out. You can "uncomment"
these steps if required.
4. When relevant, VuGen adds a web_stop_async step at the end of the asynchronous conversation.
The web_stop_async step marks the end of the asynchronous conversation. For details on the
web_stop_async step, see the Function Reference (Help > Function Reference).
5. The recording snapshots are updated by grouping the tasks in the asynchronous conversation
under the step that started the conversation.
How VuGen modifies flex_amf_call steps
VuGen supports asynchronous polling and long-polling behavior in flex_amf_call steps. Flex scripts that
contain polling or long-polling in flex_amf_call steps are handled by VuGen just like Web(HTTP/HTML)
scripts, except for the following:
lThe RequestCB will contain a commented call to web_util_set_formatted_request_body, which can
be used to pass an XML formatted request body, which will be encoded and sent with the request.
lThe aResponseBodyStr and aResponseBodyLen parameters of the ResponseCB give user access to
the XML representation of the response body.
Defining the Start of an Asynchronous Conversation
Note: This topic applies to Web (HTTP/HTML), Mobile Application - HTTP/HTML, Flex, and Web
Services Vuser scripts.
After VuGen scans a Vuser script for asynchronous communication, the Async tab of the Design Studio
lists the asynchronous conversations that VuGen found in the script. VuGen inserts a web_reg_async_
attributes into the Vuser script at the start of each asynchronous conversation that was detected. Use
VuGen's Step Navigator to find the associated web_reg_async_attributes steps in the Vuser script. The
web_reg_async_attributes steps should be located where the asynchronous conversations start when
the script runs.
Aweb_reg_async_attributes step that is added to a Vuser script includes the following parameters:
lID
lURL
lPattern
lPollIntervalMS (for poll-type conversations only)
lRequestCB
User Guide
VuGen
HP LoadRunner (12.50) Page 388
lResponseBodyBufferCB (for push-type conversations only)
lResponseHeadersCB (for push-type conversations only)
lResponseCB
The URL parameter in the web_reg_async_attributes step should be the same as one of the URLs that
are specified in the step that follows the web_reg_async_attributes step. For details on the web_reg_
async_attributes step, see the Function Reference (Help > Function Reference).
Inserting a Comment
When VuGen inserts a web_reg_async_attributes step into a script, VuGen inserts an associated
comment before the web_reg_async_attributes step. The inserted comment contains information
about the associated asynchronous conversation, such as the conversation ID, the communication
pattern (push,poll, or long-poll), a list of URLs that are part of the asynchronous communication, and
list of callbacks implemented in the AsyncCallbacks.c extra file.
Notice that the step comment contains a TODO token. The TODO token indicates that you should check
the relevant callback implementations in the AsyncCallbacks.c extra file.
For details on how an asynchronous conversation is terminated, see "Defining the End of an
Asynchronous Conversation" on the next page.
Example - web_reg_async_attributes
The sample code below shows a web_reg_async_attributes step that was added by VuGen. Notice that
the web_reg_async_attributes step was added before a web_url step, and that the URL parameter in
the web_reg_async_attributes step is the same as the URL parameter in the web_url step.
User Guide
VuGen
HP LoadRunner (12.50) Page 389
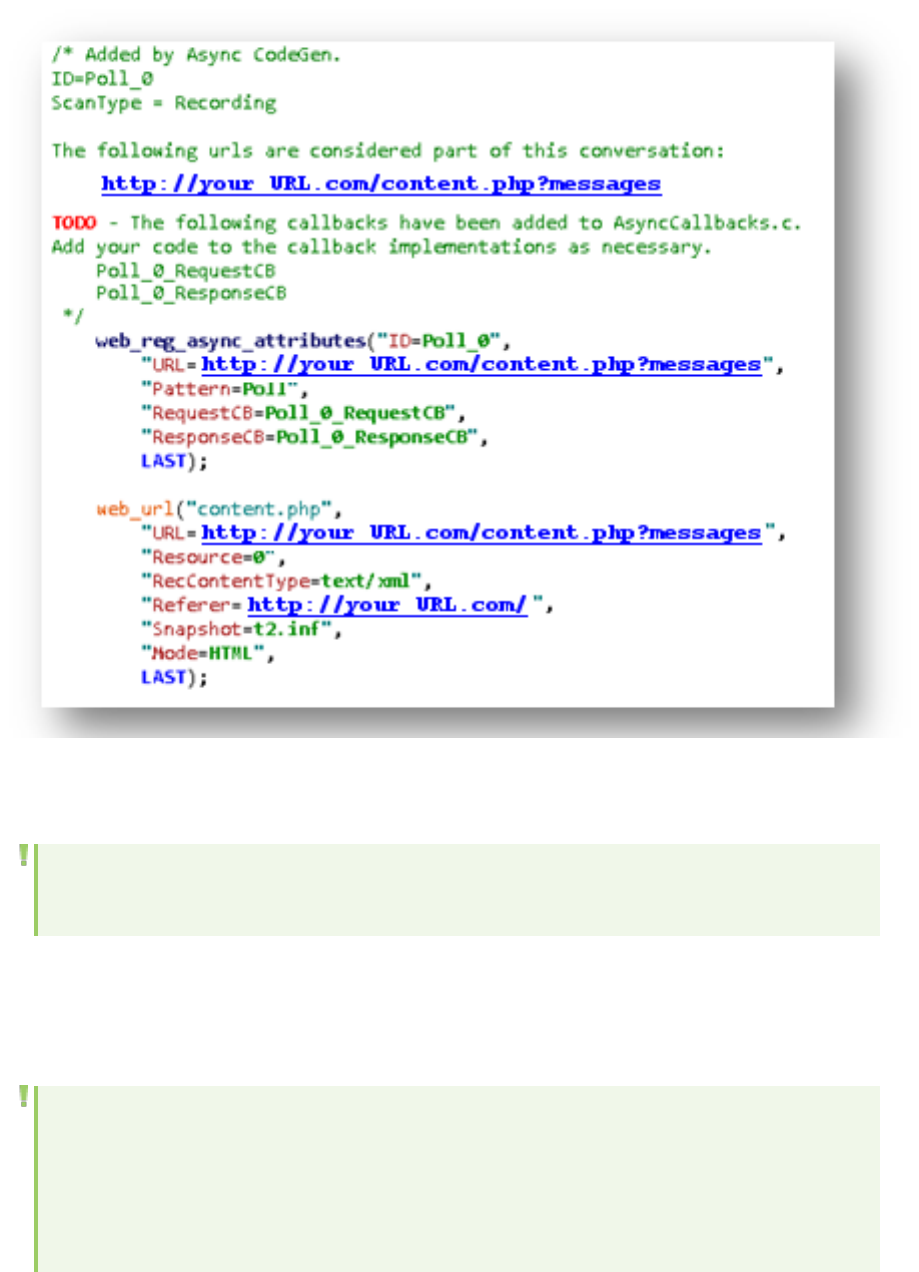
Defining the End of an Asynchronous Conversation
Note: This topic applies to Web (HTTP/HTML), Mobile Application - HTTP/HTML, Flex, and Web
Services Vuser scripts.
After VuGen scans a Vuser script for asynchronous communication, the Async tab of the Design Studio
lists the asynchronous conversations that VuGen found in the script. A web_stop_async step is inserted
into the Vuser script at the end of each asynchronous conversation that was detected. Use VuGen's
Step Navigator to find the associated web_stop_async steps in the Vuser script.
Note: In some cases VuGen will not add a web_stop_async step at the end of an asynchronous
conversation. This may occur when VuGen is not able to determine where the asynchronous
conversation ends. This can occur when the asynchronous conversation was added due to a
specific Async rule or when the asynchronous conversation was not ended during the recording.
For details on Async rules, see "Async Rules Overview" on page404.
User Guide
VuGen
HP LoadRunner (12.50) Page 390
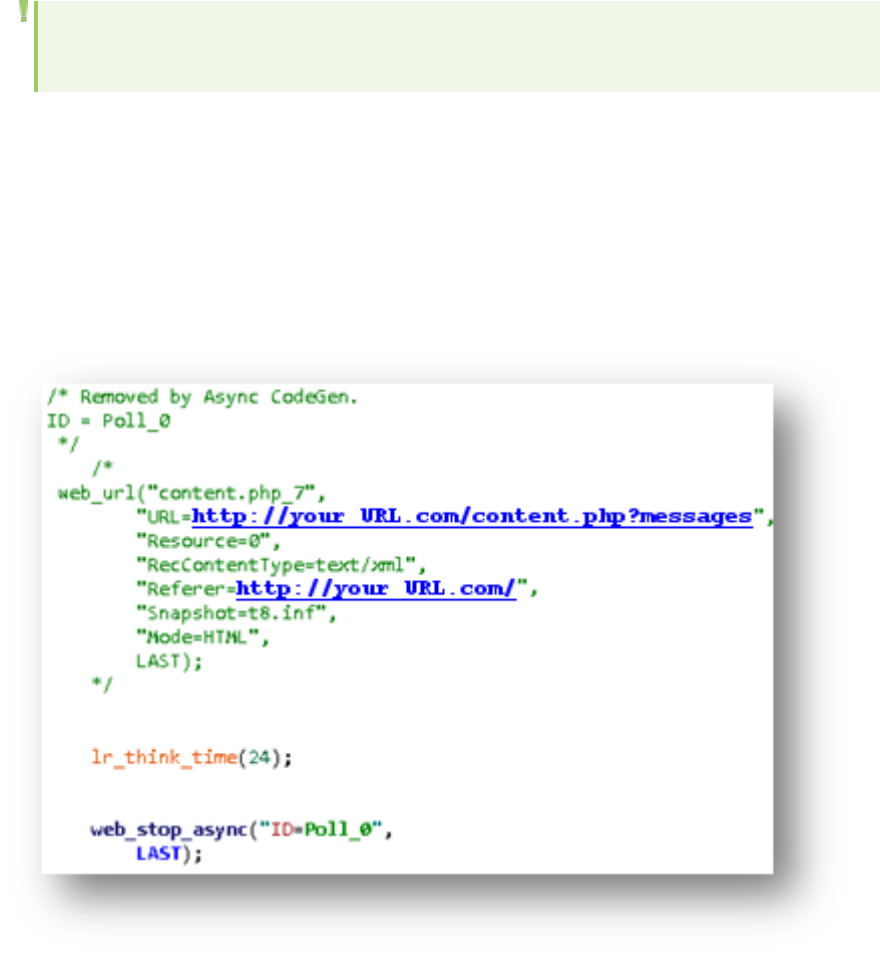
After VuGen has inserted a web_stop_async step into a Vuser script, make sure the web_stop_async
step was added in the correct location in the script, that is – where the asynchronous conversation
should end when the Vuser script runs.
In order to make sure the asynchronous conversation ends correctly when the script runs, it may be
necessary to modify the details of the web_stop_async step in the Vuser script. For details, see "Fine-
Tuning the End of an Asynchronous Conversation" on the next page.
Note: All Async conversations are automatically terminated at the end of each iteration even if
the Simulate a new user each iteration runtime option is disabled.
For details on how an asynchronous conversation is started, see "Defining the Start of an Asynchronous
Conversation" on page388.
Example - web_stop_async:
In the code sample below, VuGen added a web_stop_async step at the end of a poll conversation. In this
example, the original polling steps are commented out, and the lr_think_time steps that separated
them have been merged into one lr_think_time step in order to emulate the duration of the entire poll
conversation.
User Guide
VuGen
HP LoadRunner (12.50) Page 391

Using Asynchronous Request Thresholds
Note: This topic applies to Web (HTTP/HTML), Mobile Application - HTTP/HTML, Flex, and Web
Services Vuser scripts.
You can fine-tune some of VuGen's behavior when VuGen scans a Vuser script to locate asynchronous
communication. You use VuGen's asynchronous request thresholds to fine-tune VuGen's behavior. Each
of the thresholds is associated with only one of the types of asynchronous conversations: push,poll, or
long-poll.
lAsynchronous request thresholds for push conversations
Minimum Response Size. Specify the minimum response content length (in bytes) for defining push
asynchronous conversations. If the server sent less than the specified value, VuGen will not classify
the conversation as a push-type asynchronous conversation.
Maximum Sub Message Size. Specify the maximum sub message size (in bytes) sent by the server
for defining push asynchronous conversations. If the server sent a sub message of size greater than
the specified value, VuGen will not classify the conversation as a push-type asynchronous
conversation.
Minimum Number of Sub Messages. Specify the minimum number of sub messages for defining
push asynchronous conversations. A push conversation in which less than the specified number of
sub messages was sent by the server will not be classified by VuGen as a push-type asynchronous
conversation.
lAsynchronous request thresholds for poll conversations
Interval Tolerance. Specify the interval tolerance (in milliseconds) for classifying poll asynchronous
conversations. A conversation in which intervals differ from each other by more than the specified
value will not be classified by VuGen as a poll-type asynchronous conversation.
lAsynchronous request thresholds for long-poll conversations
Maximum Interval. Specify the maximum interval (in milliseconds) between the end of one response
and the start of a new request for classifying long-poll asynchronous conversations. A conversation
in which a request starts more than the specified value after the end of the previous response will
not be classified by VuGen as a long-poll type asynchronous conversation.
For details on the available asynchronous request thresholds, see "Asynchronous Options Dialog Box" on
page409.
Fine-Tuning the End of an Asynchronous Conversation
Note: This topic applies to Web (HTTP/HTML), Mobile Application - HTTP/HTML, Flex, and Web
Services Vuser scripts.
User Guide
VuGen
HP LoadRunner (12.50) Page 392

After VuGen scans a Vuser script for asynchronous communication, the Async tab of the Design Studio
lists the asynchronous conversations that were found in the script. A web_stop_async step is inserted
into the Vuser script at the end of each asynchronous conversation that was detected. In order to make
sure that each asynchronous conversation ends correctly when the script runs, it may be necessary to
perform one or more of the following tasks:
lRemove the web_stop_async step so that the asynchronous conversation will be terminated at the
end of the iteration.
lMove the web_stop_async step to a location that is after an existing action step or an existing lr_
think_time step, so the asynchronous conversation will end after that step is performed.
lAdd an lr_think_time step before the web_stop_async step, or change the time parameter in an
existing lr_think_time step. Make sure that think-time is enabled in the runtime settings. For
details, see the General > Think Time view.
lAdd a web_sync step to stop the asynchronous conversation after a specified parameter receives a
value. Use the asynchronous conversation callbacks to make sure the parameter receives a value
only when you want to end the conversation.
Correlating Asynchronous Vuser Scripts
Note: This topic applies to Web (HTTP/HTML), Mobile Application - HTTP/HTML, Flex, and Web
Services Vuser scripts.
After modifying a Vuser script to enable it to emulate asynchronous communication, it may be
necessary to perform correlation activities on the modified script. Due to asynchronous nature, dynamic
values from asynchronous communication cannot be handled by Design Studio, and must be correlated
manually.
You can search for dynamic values inside Response callbacks functions using the lr_save_param_
regexp function. This function can be called from a callback to extract the necessary value from server
response (ResponseCB) or response buffer (ResponseBodyBufferCB), and assign this value to a
parameter. This parameter can then be used for correlations.
For details about the lr_save_param_regexp function, see the Function Reference (Help > Function
Reference).
Implementing Callbacks
Note: This topic applies to Web (HTTP/HTML), Mobile Application - HTTP/HTML, Flex, and Web
Services Vuser scripts.
After VuGen scans a Vuser script for asynchronous communication, the Async tab of the Design Studio
lists the asynchronous conversations that were found in the script. For each asynchronous conversation
User Guide
VuGen
HP LoadRunner (12.50) Page 393
found during the scan, VuGen adds the callback function signatures matching those declared in the
web_reg_async_attributes step. The signatures are added to the AsyncCallbacks.c extra file.
The names of the callback functions start with the conversation ID of the asynchronous conversation.
For example, the RequestCB callback for an asynchronous conversation with ID “LongPoll_0” will be
LongPoll_0_RequestCB.
The names of the callback functions are declared in the web_reg_async_attributes step in the script.
The available callbacks are:
lRequestCB
This callback is called before a request is sent.
lResponseBodyBufferCB
This callback is called when there is content in the response body buffer and at the end of the
response body. This callback is generated by VuGen automatically for push-type conversations, but is
available for poll and long-poll conversations as well.
lResponseCB
This callback is called after every response is received in the conversation.
Example 1:
In the following sample code, the three callback functions are declared in the web_reg_async_
attributes step.
User Guide
VuGen
HP LoadRunner (12.50) Page 394
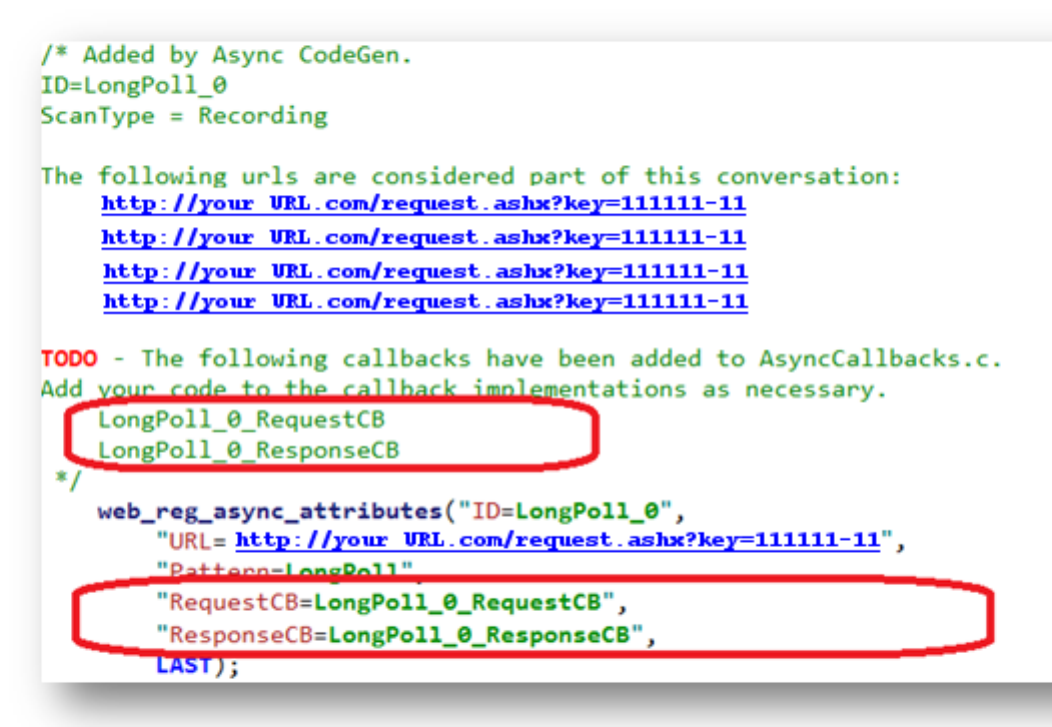
Example 2:
In the following sample code, the two callbacks are implemented in the AsyncCallbacks.c extra file.
User Guide
VuGen
HP LoadRunner (12.50) Page 395
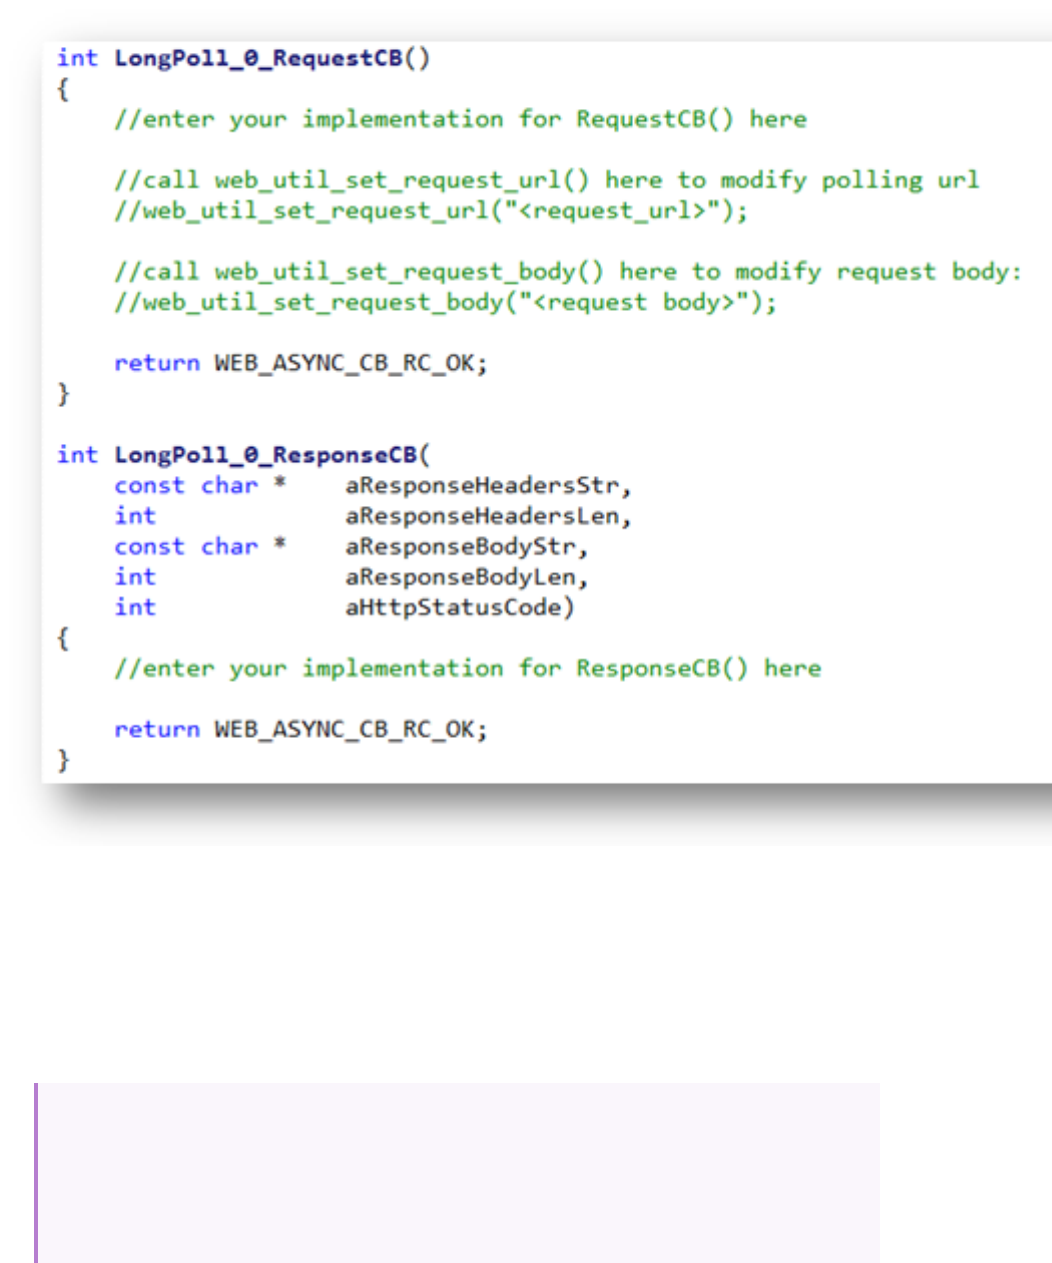
You can modify the callbacks to implement the required behavior. For details, see "Modifying Callbacks"
on the next page.
Example 3:
The following sample code shows an implementation of the ResponseHeader callback function,
including the three arguments: HTTP Status code, Accumulated headers string and Accumulated
headers string length.
int Push_0_ResponseHeadersCB(
int aHttpStatusCode,
const char * aAccumulatedHeadersStr,
User Guide
VuGen
HP LoadRunner (12.50) Page 396

int aAccumulatedHeadersLen)
{
//Enter your implementation for ResponseHeadersCB() here.
lr_output_message("Response status code is :[%d]", aHttpStatusCode);
lr_output_message("Response headers are :/n[%s]", aAccumulatedHeadersStr);
return WEB_ASYNC_CB_RC_OK;
}
A sample of the output from the above callback function is shown below:
Response status code is :[200]
Response headers are :
[HTTP/1.1 200 OK
Connection: close
Date: Tue, 25 Jun 2013 09:03:33 GMT
Server: Microsoft-IIS/6.0
Content-Type: text/html
Cache-control: private]
Modifying Callbacks
Note: This topic applies to Web (HTTP/HTML), Mobile Application - HTTP/HTML, Flex, and Web
Services Vuser scripts.
After VuGen scans a Vuser script for asynchronous communication, the Async tab of the Design Studio
lists the asynchronous conversations that were found in the script. For each asynchronous conversation
User Guide
VuGen
HP LoadRunner (12.50) Page 397
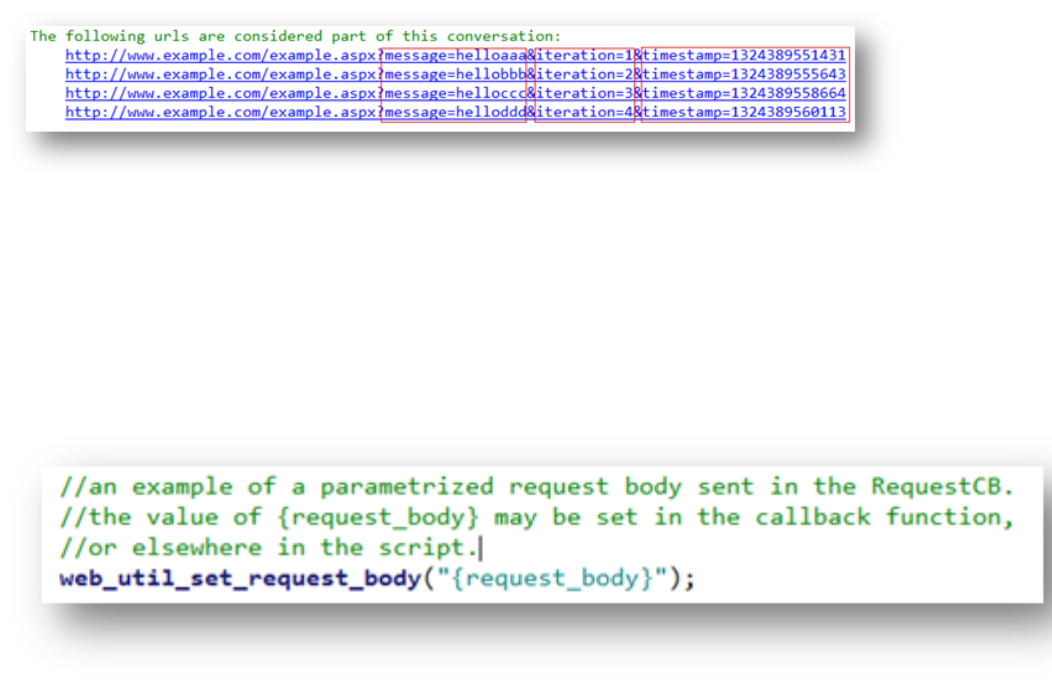
found during the scan, VuGen adds the required callback function declarations in the AsyncCallbacks.c
file. To implement the required behavior, you can modify the callbacks that were added by VuGen.
Modifying a callback includes:
Modifying the request URL in the RequestCB callback
In poll and long-poll conversations, requested URLs often change in each polling iteration. The change
is usually determined by client-side logic, usually implemented by JavaScript that is executed by the
browser. Parts of the URL may be determined by correlation of a known parameter, such as a session
ID. For details, see "Parsing URLs" on page401.
Request URLs in an asynchronous conversation will be modified before the request is sent by using the
RequestCB and the web_util_set_request_url function.
Modifying the request body in the RequestCB callback
The request body in requests that are part of an asynchronous conversation may need to be modified
before the request is sent. You use the RequestCB and the web_util_set_request_body util function to
modify the request body.
Modifying the request body is useful in poll and long-poll conversations in which each new request
requires a different request body.
Each RequestCB that is generated by VuGen contains a commented snippet. You can "uncomment" the
snippet in order to use the web_util_set_request_body util function.
If VuGen finds that different requests have different body values in the recorded conversation, the
generated RequestCB will contain a comment that prompts you to check the recording in order to
implement the request body sent in each request when the script runs.
User Guide
VuGen
HP LoadRunner (12.50) Page 398
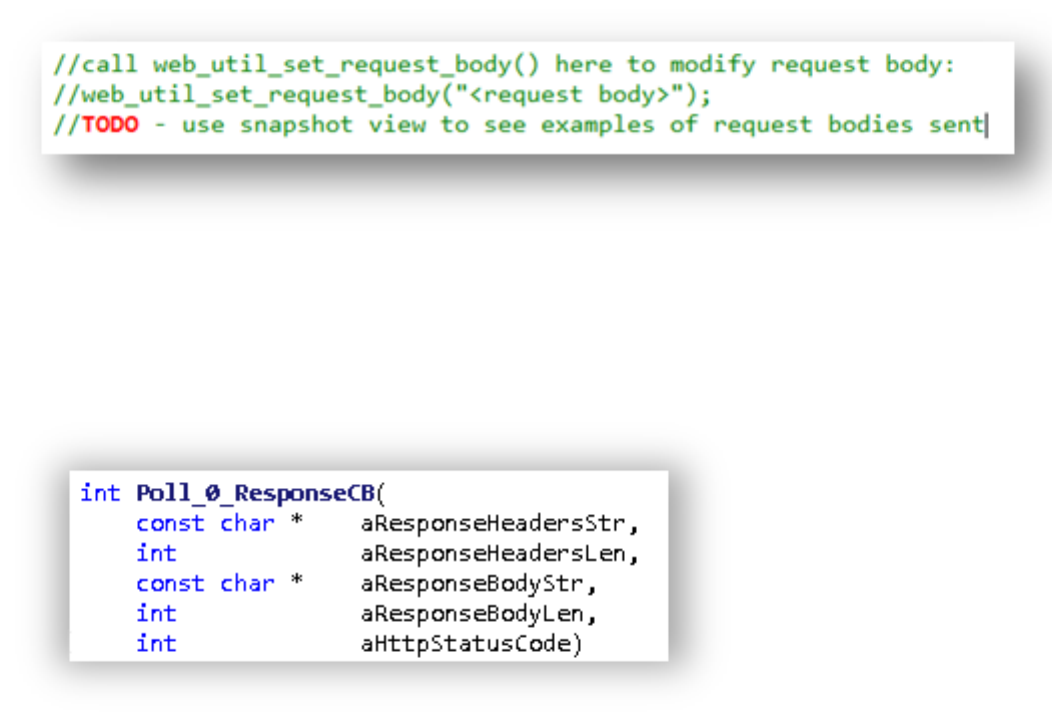
Modifying the response in the ResponseCB callback
You can modify the response callback in an asynchronous conversation to verify validity of the
responses, or to wait for a specific event. For example, you could check the response headers for each
response to determine if a specific value was received.
When the expected value has been received, you can use a web_stop_async step in the Action file to
end the asynchronous conversation.
The following code sample provides an example for ending a synchronized conversation. In this example,
in the AsyncCallback.c file, the scripts counts 10 iterations of the polling conversation, after which it
creates a new parameter, stopAsync.
int Poll_0_ResponseCB(
...{
//increment iteration counter for every response received.
static int iter = 0;
iter++;
//Once the desired number of responses has been reached,
//create and save the parameter.
if (iter > 10) {
lr_save_int(iter, "stopAsync");
}
return WEB_ASYNC_CB_RC_OK;
}
User Guide
VuGen
HP LoadRunner (12.50) Page 399
In the Action file, the web_sync step uses the generated parameter, stopAsync, to end the
conversation:
web_reg_async_attributes("ID=Poll_0","Pattern=Poll",
"URL=http://pumpkin:2080/nioamfpoll;AMFSessionId=6F8D6108-E309-38B2-3D65-
963B431D0A38",
"PollIntervalMs=3000",
"RequestCB=Poll_0_RequestCB",
"ResponseCB=Poll_0_ResponseCB",
LAST);
web_custom_request("nioamfpoll;AMFSessionId=6F8D6108-E309-38B2-3D65-963B431D0A38_
2",
"URL=http://pumpkin:2080/nioamfpoll;AMFSessionId=6F8D6108-E309-38B2-3D65-
963B431D0A38",
"Method=POST",
"Resource=0",
"RecContentType=application/x-amf",
"Referer=http://pumpkin:8081/lcds-samples/traderdesktop/traderdesktop.swf/
[[DYNAMIC]]/3",
"Snapshot=t11.inf",
"Mode=HTML",
"EncType=application/x-amf",
"BodyBinary=\\x00\\x03\\x00\\x00\\x00\\x01\\x00\\x04null\\x00\\x02/6\\x00\\x00\\x00
Z\n\\x00\\x00\\x00\\x01\\x11\n\\x07\\x07DSC\\x8D\\x02\n\\x0B\\x01\\x01\\x06\\x01\n\
\x05\tDSId\\x06I6F8D611E-DC1C-9D0C-2BBA-
36CC2AB8633B\\x01\\x0C!\\xC0\\xBE\\xA6Z74\\xBE\\xC3\\xCF\\xC7\\xFA\\xE6\\xC3\t\\xE2
\\x92\\x01\\x06\\x01\\x01\\x04\\x02",
LAST);
lr_think_time(30);
//suspend the script until the desired number
//of iterations have been performed.
web_sync("ParamCreated=stopAsync", "RetryIntervalMs=1000", "RetryTimeoutMs=300000",
LAST);
web_stop_async("ID=Poll_0",LAST);
For more details about ending an asynchronous conversation, see "Defining the End of an Asynchronous
Conversation" on page390.
Modifying callbacks in Flex Vuser scripts
For Flex asynchronous polling and long-polling conversations, the generated RequestCB in the
AsyncCallback.c file contains a call to web_util_set_formatted_request_body, which sets an XML
formatted request body for each request.
User Guide
VuGen
HP LoadRunner (12.50) Page 400

web_util_set_formatted_request_body("<AMFPacket AMF_version=\"3\">"
"<AMFHeaders />"
"<Messages>"
"<Message method=\"null\" target=\"/{Target_Poll_0}\">"
…
"</Message>"
"</Messages>"
"</AMFPacket>");
After uncommenting the commented code in the TODO section, and adding your callback code, open the
Script Design Studio to scan for correlations.
Note that code generation automatically parameterizes the Target parameter in the request body. It
also generates code for automatically incrementing this parameter before each polling iteration.
The generated RequestCB also contains a reminder to ensure that the counter initialization parameter
for Target_Poll_0 in the Action file matches the target attribute in the first Message element in the first
polling request.
lr_param_increment("Target_Poll_0", "{Target_Poll_0}");
web_util_set_formatted_request_body("<AMFPacket AMF_version=\"3\">"
"<AMFHeaders />"
"<Messages>"
"<Message method=\"null\" target=\"/{Target_Poll_0}\">"
…
In the Action file, make sure that you initialize the same polling parameter used in AsyncCallbacks.c. In
the following segment from the Action file, the polling parameter, Target_Poll_0, matches the one used
in AsyncCallbacks.c.
/* Initialize target parameter before sending first request. */
/* Notice that parameter will be incremented once before first request. */
lr_save_int(5, "Target_Poll_0");
For more details on using callback functions, see "Implementing Callbacks" on page393.
Parsing URLs
Note: This topic applies to Web (HTTP/HTML), Mobile Application - HTTP/HTML, Flex, and Web
Services Vuser scripts.
URLs that are included in asynchronous conversations often include query strings that are derived in a
variety of ways. These strings may include:
User Guide
VuGen
HP LoadRunner (12.50) Page 401
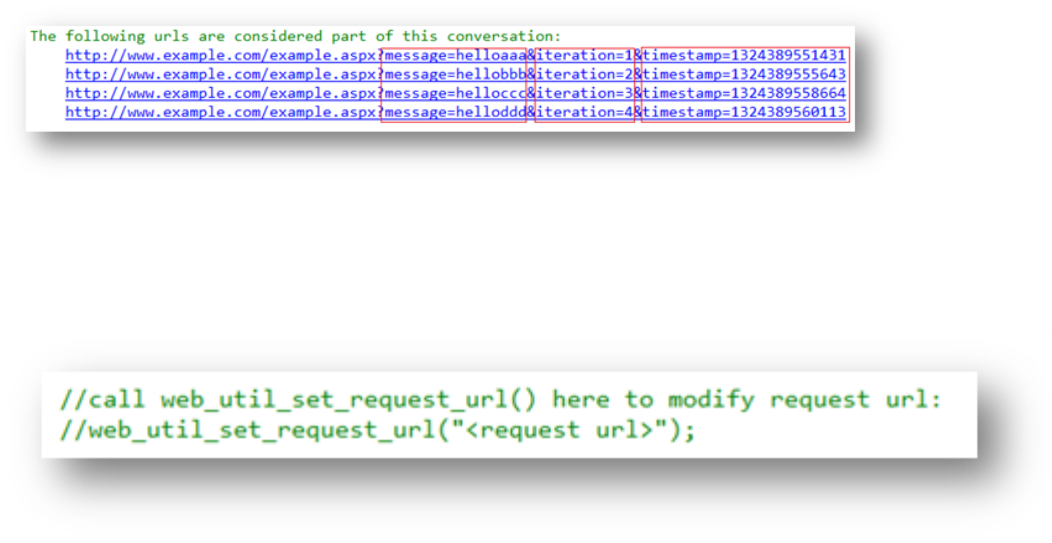
lTime-stamps
lCounters
lComplex strings
To enable a Vuser script to successfully perform asynchronous communication, VuGen must be able to
recreate the required URLs.
lWhen the URL includes a time-stamp, VuGen is usually able to successfully create the required URL.
lWhen the URL includes a counter, VuGen is usually able to recreate the counter, but it may be
necessary to manually initialize the counter in the script.
lWhen the URL includes more complex strings, the algorithms for generating the URLs must be
manually added to the code in the Vuser script.
Example:
The sample code below shows a set of URLs that are part of a long-poll conversation. The URLs are
included in the comment generated for a web_reg_async_attributes step:
If none of the parameters shown in the code sample above was found in VuGen's scan of the recorded
Vuser script, the RequestCB implementation will contain a snippet that may be uncommented in order
to set the URL for each response according to user defined code. For details, see "Modifying Callbacks"
on page397.
If any or all of the parameters shown in the sample code above are found during VuGen's scan of the
recorded Vuser script, the RequestCB implementation will contain the following:
lA comment prompting the user to call web_util_set_request_url. The comment will contain a
parameterized version of the URL.
lFor each time-stamp parameter found in the URL, a snippet for saving the time-stamp to a
parameter.
User Guide
VuGen
HP LoadRunner (12.50) Page 402
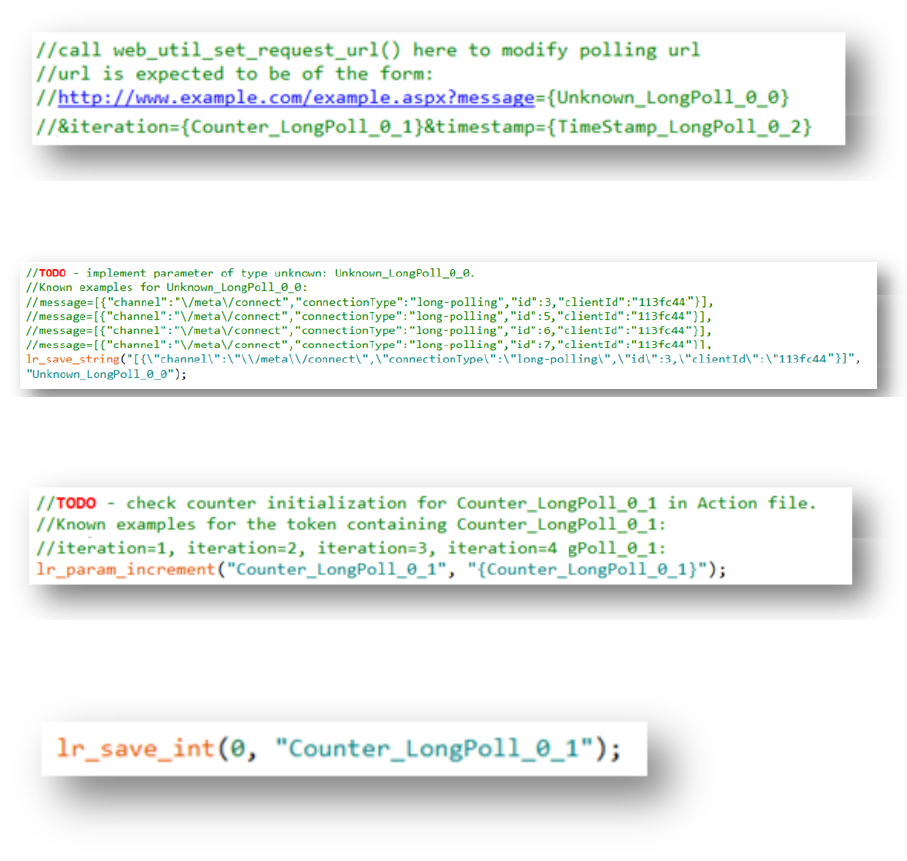
lFor each counter parameter found in the URL, a snippet for incrementing a counter parameter. A
matching step for initializing the counter parameter will also be added to the Action file. The snippet
will also contain examples of the URL token containing the counter parameter, as seen during the
recording.
lFor each complex string parameter found in the URL, a snippet for saving the string to a parameter.
It is up to the user to generate the correct string to be saved to the parameter to be used in the URL.
The snippet will also contain examples of the URL token that is considered an unknown parameter,
as seen during the recording.
lA snippet for passing the parameterized version of the URL to the web_util_set_request_url
function.
Example: A snippet containing the parameterized version of a URL.
Example: A snippet prompting the user to set the value of an unknown parameter.
Example: A snippet for incrementing a counter parameter.
Example: A snippet for initializing a counter parameter.
Example: A snippet for saving a timestamp parameter.
User Guide
VuGen
HP LoadRunner (12.50) Page 403
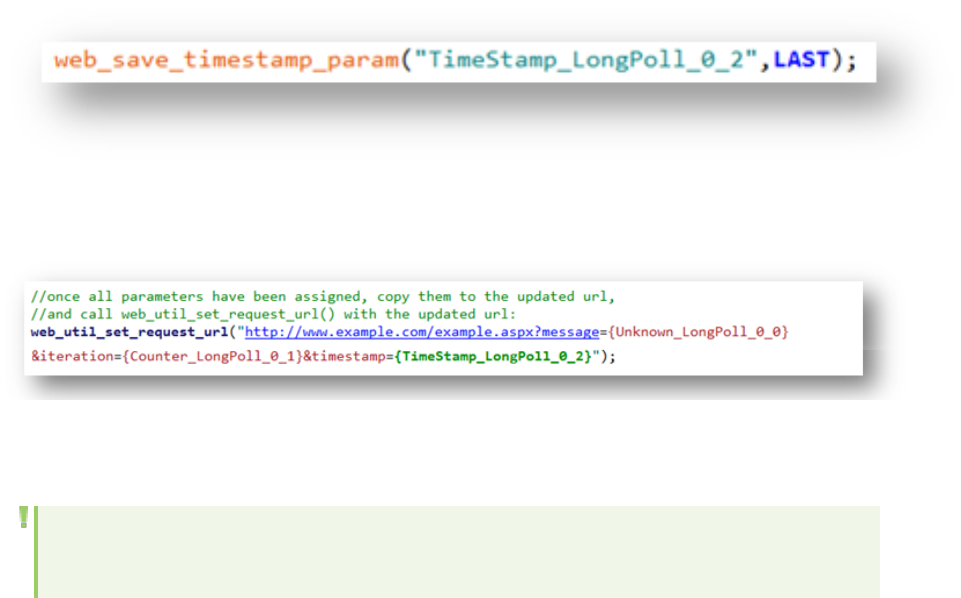
Example: A snippet for passing the parameterized version of a URL to the web_util_set_request_url
function.
Async Rules Overview
Note: This topic applies to Web (HTTP/HTML), Mobile Application - HTTP/HTML, Flex, and Web
Services Vuser scripts.
In some cases, when VuGen performs an Async scan, VuGen may fail to correctly identify some of the
asynchronous conversations that are included in the Vuser script. In other cases, VuGen may
erroneously classify regular synchronous steps as part of asynchronous conversations. To help rectify
both of these scenarios, you can define Async rules to determine how requests to specified URLs are
classified during an Async scan.
Async rules can be positive or negative.
lPositive: When VuGen fails to identify asynchronous conversations that are included in a Vuser
script, implement a positive Async rule to enable VuGen to identify the asynchronous behavior.
Scenario: VuGen does not identify URLs under http://www.true-async.com/push_example.aspx as
push asynchronous conversations, and you know that they are part of push asynchronous
conversations. Add a positive rule to enable VuGen to correctly identify the push asynchronous
conversations. When you regenerate the script, the Async scan will apply the added rule, and all URLs
that start with http://www.true-async.com/push_example.aspx will be included as part of push
asynchronous conversations.
lNegative: When VuGen erroneously classifies regular synchronous steps as part of an asynchronous
conversation, implement a negative Async rule to prevent VuGen from erroneously identifying
asynchronous behavior.
Scenario: VuGen identifies all URLs under http://www.not-async.com/ as asynchronous poll
conversations. You know that these are not asynchronous conversations. Implement a negative
Async rule to prevent VuGen from erroneously identifying asynchronous behavior. When you
User Guide
VuGen
HP LoadRunner (12.50) Page 404
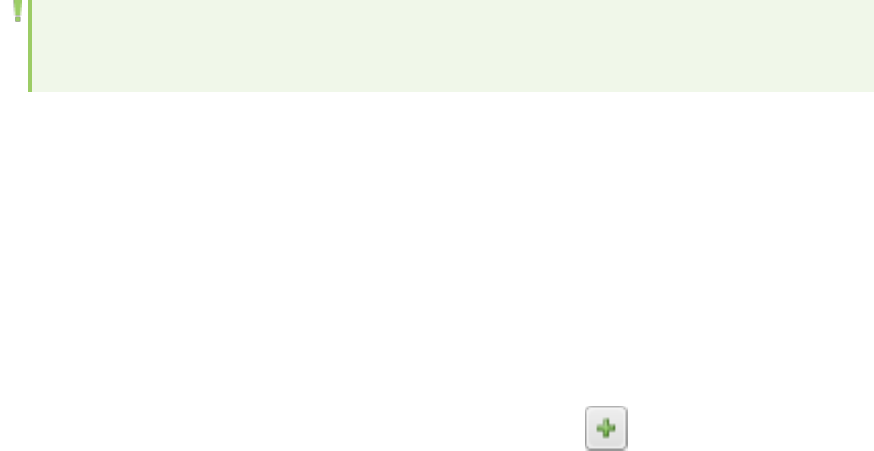
regenerate the script, the Async scan will apply the added rule so that all URLs that start with
http://www.not-async.com/ will not be classified as part of asynchronous conversations.
For details on how to implement Async rules, see "Adding Async Rules" below.
Adding Async Rules
Note: This topic applies to Web (HTTP/HTML), Mobile Application - HTTP/HTML, Flex, and Web
Services Vuser scripts.
When VuGen scans a Vuser script after recording or regenerating the script, VuGen may fail to identify
asynchronous conversations that are included in the Vuser script. In other cases, VuGen may
erroneously classify a regular synchronous step as part of an asynchronous conversation.
You can define Async rules that determine how requests to specified URLs will be classified during an
Async scan. Async rules may be positive or negative. This topic describes how to implement Async rules.
For an introduction to Async rules, see "Async Rules Overview" on the previous page.
Adding a positive Async rule
1. Select Record > Recording Options > General > Code Generation and then click Async Options.
The Asynchronous Options dialog box opens.
2. Under Asynchronous Regular Expressions, click Add Async Rule . The Add Rule dialog box
opens.
3. From the Type list, select Push,Poll, or Long Poll, as required.
4. In URL Regular Expression, enter a regular expression for URLs that should be considered part of
asynchronous conversations.
User Guide
VuGen
HP LoadRunner (12.50) Page 405
Special characters that you can include in a regular expression:
Note: To include characters such as “?” and “+” in the regular expression, insert a
backslash “\” before the required character.
5. Click OK. The new rule appears in the list of Async rules for the Vuser script.
Note: When you regenerate the script:
lFor each push conversation that includes a URL that matches the regular expression, VuGen
inserts asynchronous API functions into the Vuser script, but does not remove any of the
recorded code from the Vuser script.
lFor each polling or long-polling conversation that includes a URL that matches the regular
expression, VuGen inserts asynchronous API functions into the Vuser script, and may remove
User Guide
VuGen
HP LoadRunner (12.50) Page 406
steps or step parameters from the generated Vuser script. VuGen removes steps or step
parameters in cases where the relevant URLs will be requested by running the inserted
asynchronous functions - and not by running the original steps that have been removed.
For further details, see "How VuGen Modifies a Vuser Script for Asynchronous Communication"
on page385.
Adding a negative Async rule
1. Select Record > Recording Options > General > Code Generation and then click Async Options.
The Asynchronous Options dialog box opens.
2. Under Synchronous Regular Expressions, click Add Async Rule . The Add Asynchronous Rule
dialog box opens.
3. From the Rule Type list, select Not Async.
4. In URL Regular Expression, enter a regular expression for URLs that should not be considered part
of asynchronous conversations.
5. Click OK. The new rule appears in the list of Async rules for the Vuser script.
When you regenerate the script, steps that contain URLs that match the regular expression will not
be included in asynchronous conversations.
Async Tab [Design Studio]
The Async tab of the Design Studio lists all the occurrences of asynchronous communication that VuGen
detected in the Vuser script.
To access lSelect Design > Design Studio, and then click the Async tab.
lClick the Design Studio button on the VuGen toolbar, and then click the Async
tab.
Important
information
lThe Design Studio button is enabled only when you display a recorded Vuser script
in the Solution Explorer.
lThe Async tab enables you to only view the asynchronous communication that is
included in the Vuser script - you cannot edit any of the asynchronous details from
the Async tab. Changes to the asynchronous details must be made in the Vuser
script.
Relevant
tasks
"How to Create an Asynchronous Vuser Script" on page382
User interface elements are described below:
User Guide
VuGen
HP LoadRunner (12.50) Page 407

UI Element Description
Type Indicates the origin of the asynchronous code in the Vuser script:
Record. The asynchronous code was added by VuGen during an Async scan that was
performed after recording or regenerating the Vuser script.
Rule. The asynchronous code was added by VuGen due to a specific rule in the Async
rules file.
Manual. The asynchronous code was manually added by a user.
Action The section of the Vuser script in which the asynchronous behavior is located.
Occurrences lFor push-type conversations, Occurrences is always 1.
lFor poll and long-poll conversations, Occurrences indicates the number of steps or
extra resource attributes that were removed [commented-out] by VuGen during the
Async scan of the Vuser script.
Status Always has the value Applied.
Async Type The type of the asynchronous behavior that was detected: Push,Poll, or Long-Poll.
URL The URL in the web_reg_async_attributes step that starts the asynchronous
conversation.
Filter Select which asynchronous conversations to display in the conversation list.
Details Expands the dialog box to show details about the selected asynchronous conversation.
Name Always has the value web_reg_async_attributes.
Line The line in the Vuser script that contains the web_reg_async_attributes step.
Action
Name
The section of the Vuser script in which the asynchronous behavior is located.
Description The comment in the Vuser script that precedes the web_reg_async_attributes step.
Occurrences
in Snapshot
lFor push-type conversations, displays the response body.
lFor poll and long-poll conversations, displays HTTP attributes associated with the
asynchronous conversation.
Options Opens the Asynchronous Request Thresholds dialog box.
User Guide
VuGen
HP LoadRunner (12.50) Page 408

Asynchronous Options Dialog Box
This dialog box enables you to fine-tune some of VuGen's behavior when VuGen scans a Vuser script to
locate asynchronous communication.
To access Record > Recording Options > General > Code Generation and then click Async Options.
User interface elements are described below:
UI
Element
Description
Minimum
Response
Size
Specify the minimum size (in bytes) of a server response for defining push
asynchronous conversations. If the server sent less than the specified value, VuGen will
not classify the conversation as a push-type asynchronous conversation.
Maximum
Sub
Message
Size
Specify the maximum sub message size (in bytes) sent by the server for defining push
asynchronous conversations. If the server sent a sub message of size greater than the
specified value, VuGen will not classify the conversation as a push-type asynchronous
conversation.
Minimum
Number of
Sub
Messages
Specify the minimum number of valid sub messages for defining push asynchronous
conversations. A push conversation in which less than the specified number of valid sub
messages was sent by the server will not be classified by VuGen as a push-type
asynchronous conversation.
Interval
Tolerance
Specify the interval tolerance (in milliseconds) for classifying poll asynchronous
conversations. A conversation in which intervals differ from each other by more than
the specified value will not be classified by VuGen as a poll-type asynchronous
conversation.
Maximum
Interval
Specify the maximum interval (in milliseconds) between the end of one response and
the start of a new request for classifying long poll asynchronous conversations. A
conversation in which a request starts more than the specified value after the end of
the previous response will not be classified by VuGen as a long-poll type asynchronous
conversation.
Asynchronous Regular Expressions Table
<Activate
Rule>
A check box indicating whether or not the rule is activated. To select all rules, select the
check box in the toolbar.
Rule Type Push,Poll, and Long Poll are positive asynchronous rules. Not Async is a negative rule.
For details on the asynchronous rule types, see "Async Rules Overview" on page404.
Regular
Expression
A regular expression for URLs that should be considered part of asynchronous
conversations. For a list of the special characters that you can include in a regular
User Guide
VuGen
HP LoadRunner (12.50) Page 409
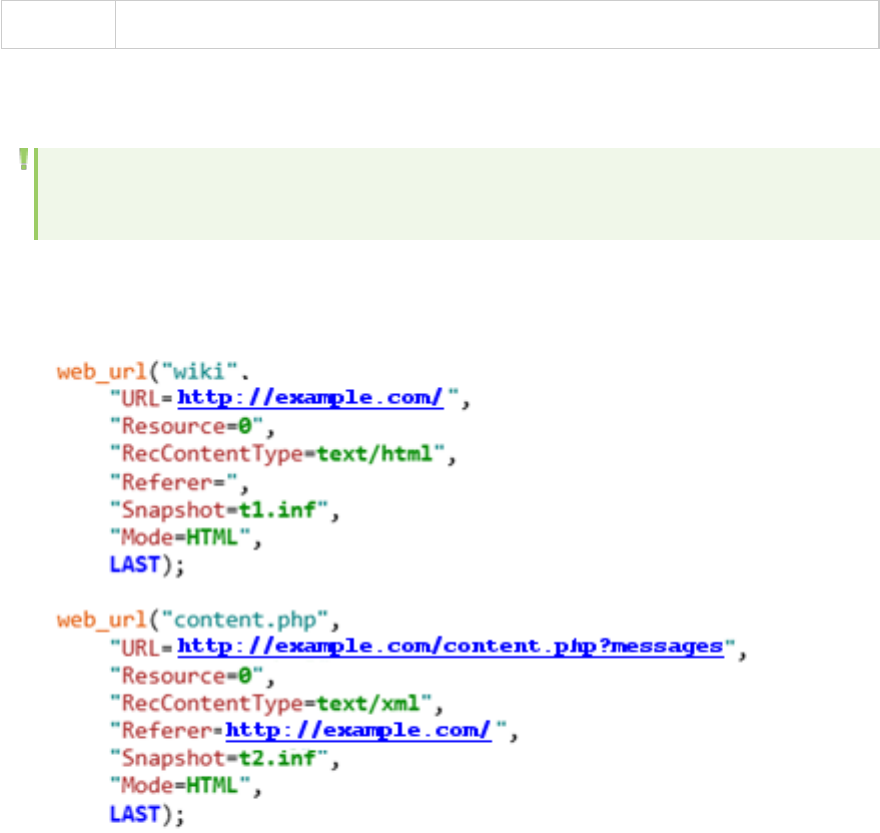
expression, see "Adding Async Rules" on page405.
Asynchronous Example - Poll
Note: This topic applies to Web (HTTP/HTML), Mobile Application - HTTP/HTML, Flex, and Web
Services Vuser scripts.
The following example describes a Vuser script that includes a poll asynchronous conversation. The
application that is emulated by the Vuser is a demo of a “wiki” page. The browser displays the wiki page,
and sends requests to refresh the page at intervals of 5 seconds.
User Guide
VuGen
HP LoadRunner (12.50) Page 410
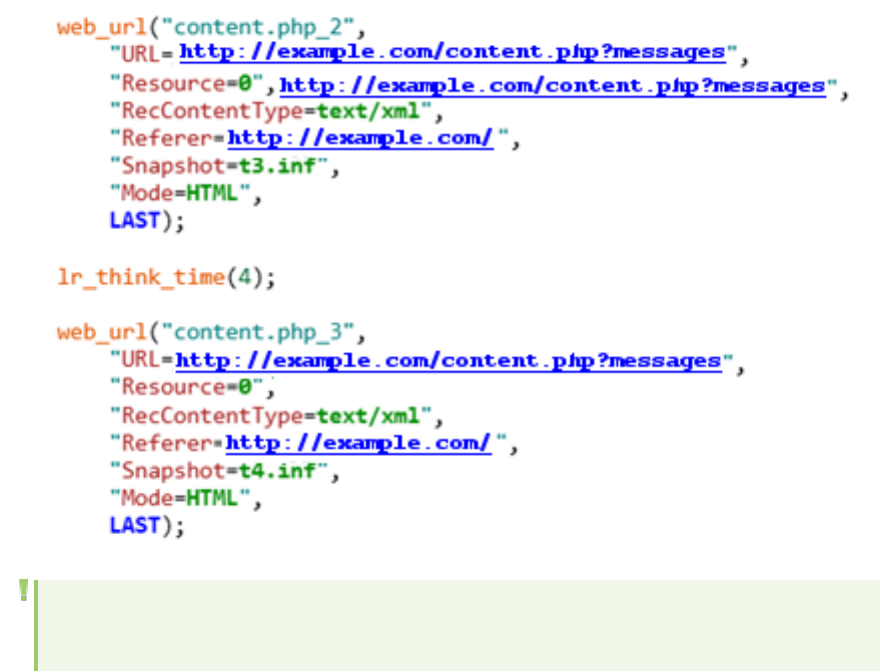
Note: You can modify VuGen's asynchronous request thresholds to assist VuGen in finding poll-
type conversations. For details, see "Using Asynchronous Request Thresholds" on page392.
The above script was generated by VuGen after the required business processes were recorded. An
asynchronous scan was not performed on the script after the script was generated. Notice that the
script contains a series of web_url functions with a repeating URL, namely:
http://example.com/content.php?messages. These web_url functions are separated by lr_think_time
functions, indicating that the web_url functions repeat at intervals of 4 seconds.
When the Vuser script runs, requests for http://example.com/content.php?messages should be sent
repeatedly until the script is finished. Additionally, these requests should be sent in parallel
(simultaneously) with other actions performed in the Vuser script.
After VuGen performed an asynchronous scan on the script, the script looks as follows:
User Guide
VuGen
HP LoadRunner (12.50) Page 411
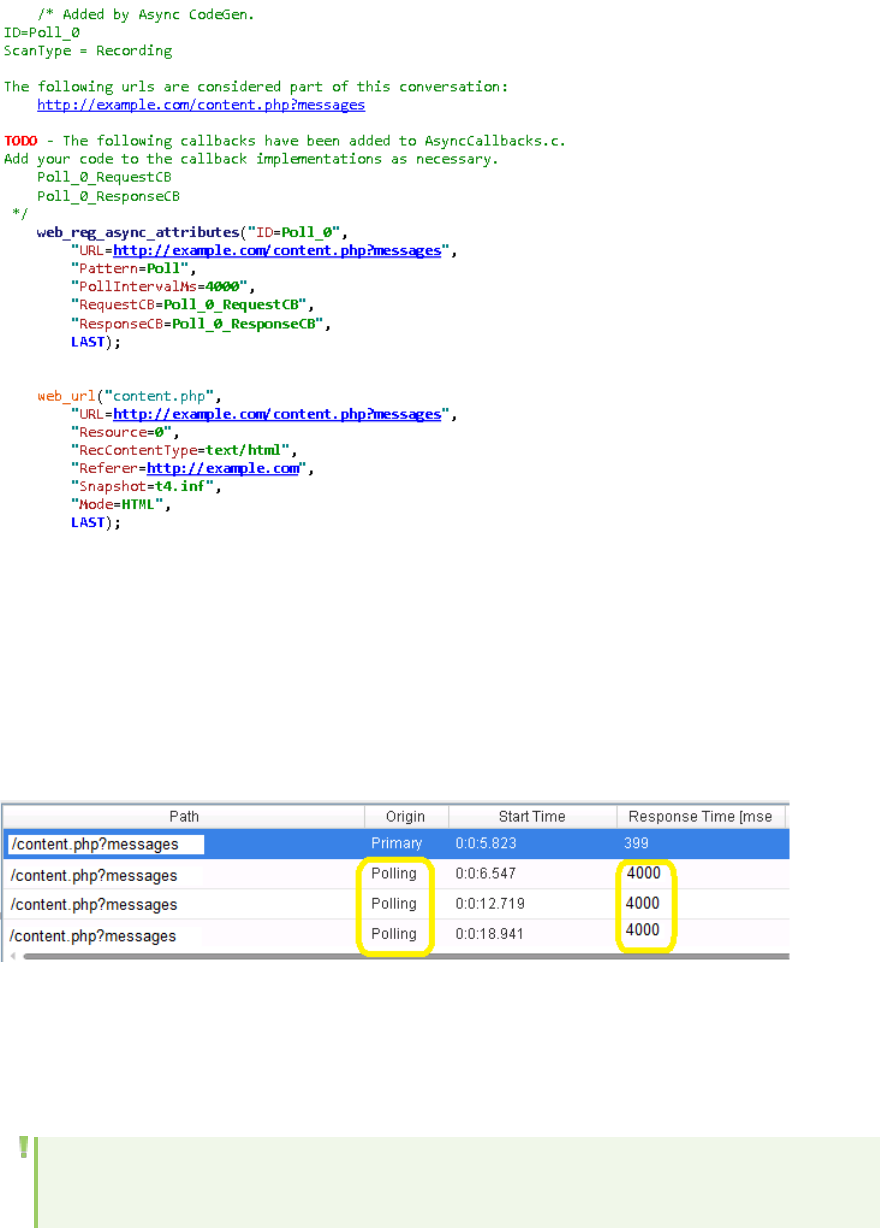
Notice that a web_reg_async_attributes function has been added to the script before the first web_url
function that calls http://example.com/content.php?messages.
Except for the first call to http://example.com/content.php?messages, all other web_url functions that
call the same URL have been commented-out by VuGen.
Notice that the lr_think_time functions have been merged into one lr_think_time function.
The Snapshot pane for the remaining web_url function shows that the snapshots for the removed
web_url functions now have Origin = Polling, and that they start at intervals of 5 seconds.
Since the requests also have a response time, the think time in lr_think_time functions between the
polling steps in the original script has been rounded down to 4 seconds.
Asynchronous Example - Push
Note: This topic applies to Web (HTTP/HTML), Mobile Application - HTTP/HTML, Flex, and Web
Services Vuser scripts.
User Guide
VuGen
HP LoadRunner (12.50) Page 412
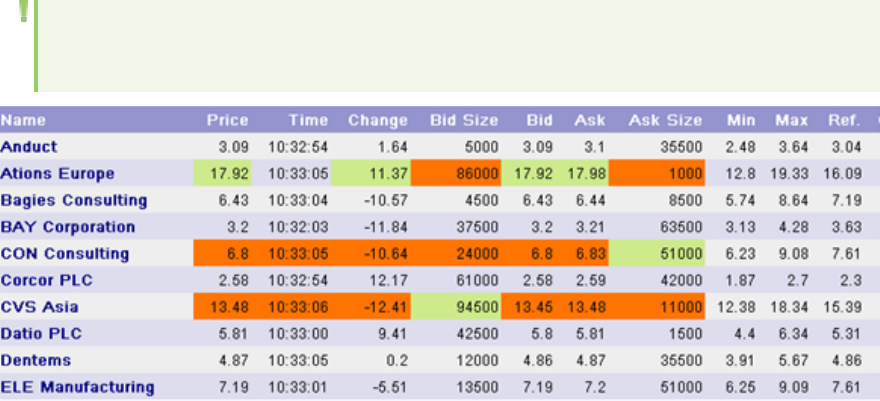
The following example describes a Vuser script that is developed to emulate a browser displaying an
application that utilizes push-type asynchronous conversations. The application is a demo of a “stock
quote” page. The browser shows the page with the stock values, and then sends a request and receives
a response with updated stock values. The request remains open until it is closed by the user. For as
long as the page is displayed, the server will continue to send sub-messages as part of the response -
whenever the server has an update for the displayed stocks. Whenever such a sub-message is received
by the client, the client displays the updated stock values.
Note: You can modify VuGen's asynchronous request thresholds to assist VuGen in finding push-
type conversations. For details, see "Using Asynchronous Request Thresholds" on page392.
If you attempt to run a script that calls a push url - without first performing an asynchronous scan - the
replay will halt while waiting for the response to the highlighted request. After two minutes, VuGen will
display an error similar to the following, in the Replay log:
Action.c(140): Error -27782: Timeout (120 seconds) exceeded while waiting to
receive data for URL "http://push.example.com" [MsgId: MERR-27782]
The error indicates that the response never finished.
Regenerating the script with Async Scan enabled will create a script similar to the following:
User Guide
VuGen
HP LoadRunner (12.50) Page 413
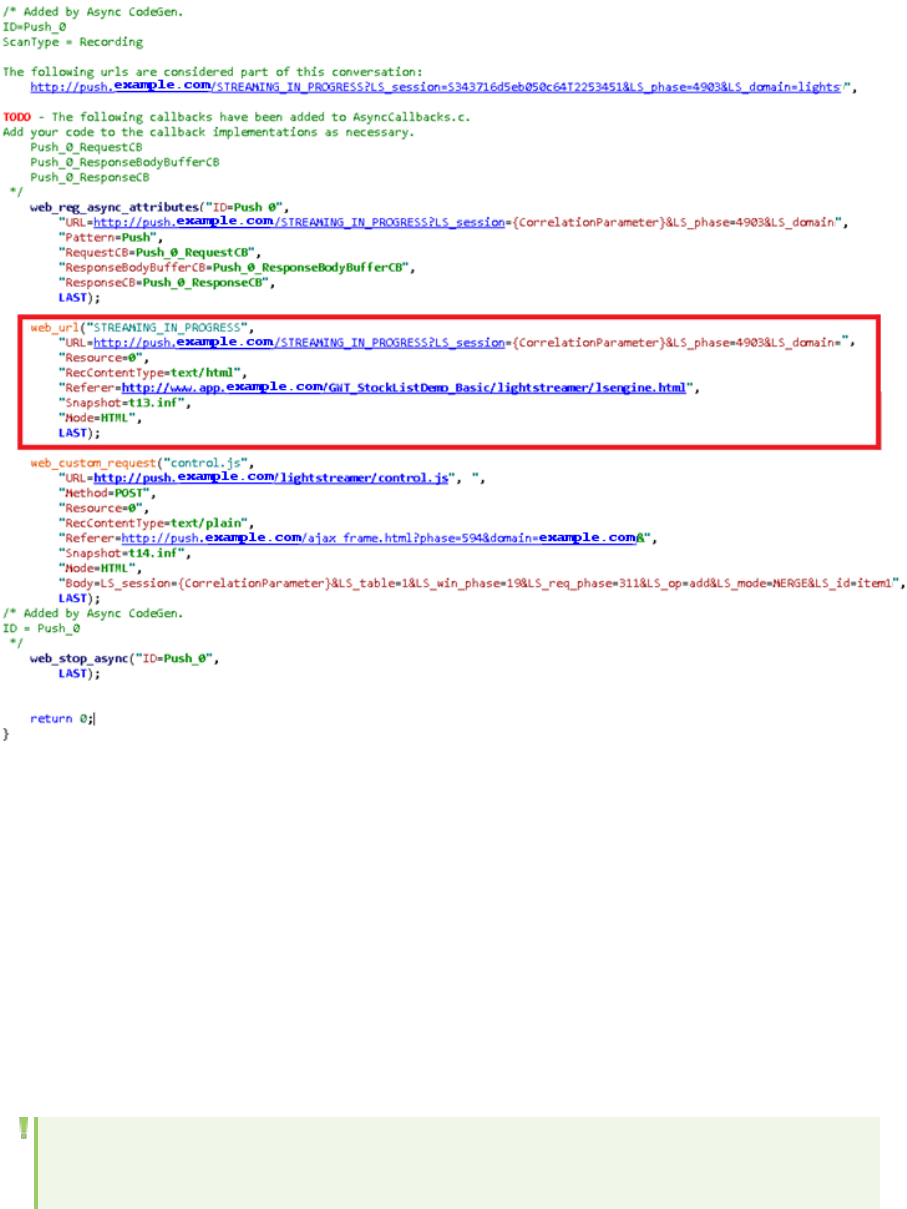
Notice that a web_reg_async_attributes function has been added before the web_url function that
starts the push conversation, and that a web_stop_async function has been added after the last action
step in the script. The script will now run successfully. The push conversation will remain active –
running in parallel with the other script functions – until the web_stop_async function, or until the end
of the script is reached.
Note that during the Async scan, VuGen did not remove (comment-out) any of the generated code in the
Vuser script.
Asynchronous Example - Long-Poll
Note: This topic applies to Web (HTTP/HTML), Mobile Application - HTTP/HTML, Flex, and Web
Services Vuser scripts.
User Guide
VuGen
HP LoadRunner (12.50) Page 414
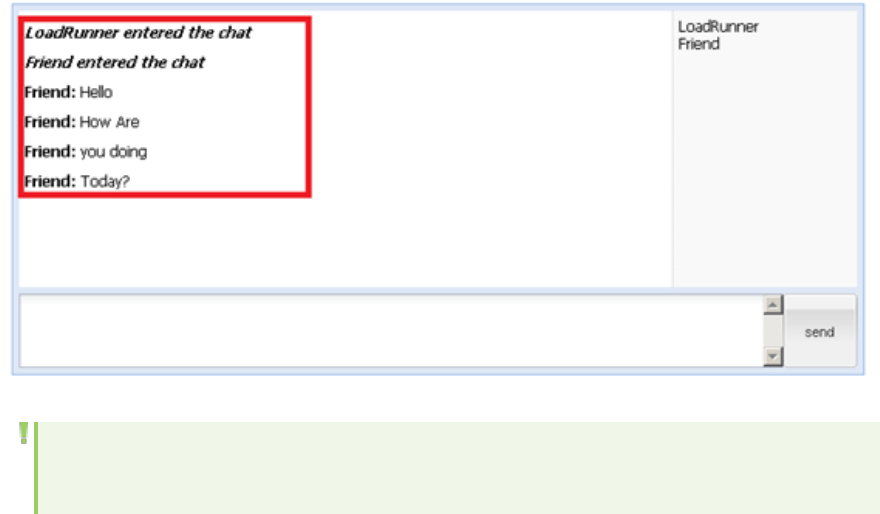
The following example describes a Vuser script that emulates an application that implements a long-
poll asynchronous conversation. The application is a demo of a “chat” page. A browser shows the chat
page, and sends a request that remains open until a new message is sent to the chat by another user.
After such a message is sent:
lThe response is finished.
lThe new message is shown in the browser.
lThe browser sends another request in order to listen for the next message sent to the chat.
Note: You can modify VuGen's asynchronous request thresholds to assist VuGen in finding long-
poll type conversations. For details, see "Using Asynchronous Request Thresholds" on page392.
The following is the Vuser script that VuGen generated after recording the application - before an
asynchronous scan was performed. The script contains a series of web_url functions with similar URLs.
Since new requests are sent as soon as the previous response is finished, no lr_think_time functions
are added between the web_url functions. This help to indicate that this is a long-poll conversation and
not a poll conversation.
When the Vuser script runs, requests to the chat application should be sent repeatedly every time a
response from the chat application is finished. In addition, requests should be sent in parallel
(simultaneously) with other actions performed in the script.
After VuGen performs an asynchronous scan on the script, the modified script looks as follows:
User Guide
VuGen
HP LoadRunner (12.50) Page 415
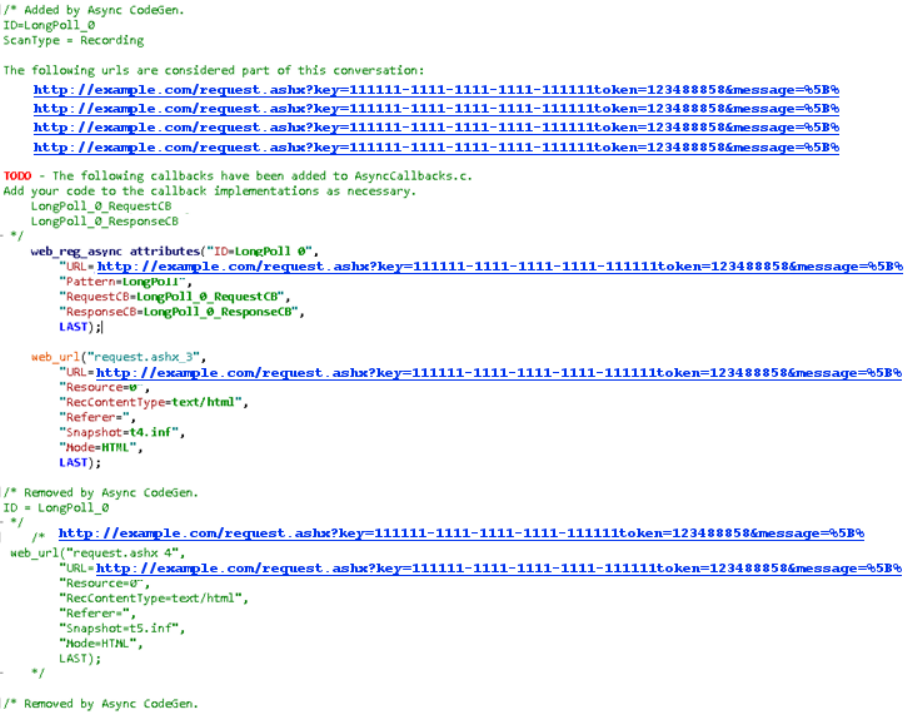
Notice that a web_reg_async_attributes function has been added before the first web_url function
that calls the chat application.
Except for the first call the chat application, all other web_url functions that call similar URLs have been
commented out.
A close look at the Snapshot pane for the remaining web_url function shows that the snapshots for the
removed steps now have origin = Polling. Notice that the response times vary greatly as the responses
arrive only when another user has sent a chat message. This helps to indicate that this is a long-poll
conversation, and not a poll conversation.
Viewing Replay Results
The Viewing Replay Results section explains how to view and customize the results of a Vuser script
replay.
User Guide
VuGen
HP LoadRunner (12.50) Page 416
Viewing Replay Results Overview
Developing a Vuser script includes the steps shown below. This topic provides an overview of the
seventh step, viewing the results of the replay of a Vuser script.
To assist with debugging a Vuser script, you can view a report that summarizes the results of your script
run. VuGen generates the report during the Vuser script execution and you view the report when script
execution is complete.
The Test Results window displays all aspects of the test run and can include:
lA high-level results overview report (pass/fail status)
lThe data used in all runs
lAn expandable tree of the steps, specifying exactly where application failures occurred
lThe exact locations in the script where failures occurred
lA still image of the state of your application at a particular step
lA movie clip of the state of your application at a particular step or of the entire test
lDetailed explanations of each step and checkpoint pass or failure, at each stage of the test
Customizing the Test Results Display
Each result set is saved in a single .xml file (called results.xml). This .xml file stores information on
each of the test result nodes in the display. The information in these nodes is used to dynamically
create .htm files that are shown in the top-right pane of the Test Results window.
Each node in the run results tree is an element in the results.xml file. In addition, there are different
elements that represent different types of information displayed in the test results. You can take test
result information from the .xml file and use XSL to display the information you require in a customized
format (either when printing from within the Test Results window, when displaying test results in your
own customized results viewer, or when exporting the test results to an HTML file).
XSL provides you with the tools to describe exactly which test result information to display and exactly
where and how to display, print or export it. Using a XSL editor, you can modify the .css and .xsl files in
the results folder, to change the appearance of the report (fonts, colors, and so forth).
For example, in the results.xml file, one element tag contains the name of an action, and another
element tag contains information on the time at which the run was performed. Using XSL, you could tell
your customized editor that the action name should be displayed in a specific place on the page and in a
bold green font, and that the time information should not be displayed at all.
User Guide
VuGen
HP LoadRunner (12.50) Page 417

Connecting to Application Lifecycle Management from the
Test Results Window
To manually submit defects to Application Lifecycle Management from the Test Results window, you
must be connected to Application Lifecycle Management.
The connection process has two stages.
lFirst, you connect to a local or remote Application Lifecycle Management server. This server handles
the connections between the Test Results and the Application Lifecycle Management project.
lNext, you log in and choose the project you want to access. The project stores tests and run session
information for the application you are testing.
Note: Application Lifecycle Management projects are password protected, so you must provide
a user name and a password.
For more information on connecting to an ALM project, see "How to Work with Scripts in ALM Projects"
on page130.
How to Send Custom Information to the Report
In addition to the information sent automatically to the report, for Web Service Vusers, you can send
information to the report using the message functions lr_output_message or lr_error_message.
For task details, see "How to Insert Steps into a Script" on page339.
How to Configure the Appearance of the Test Results Window
By default, the Test Results window has the same look and feel as the window, using the Microsoft
Office 2003 theme. You can change the look and feel of the Test Results window, as required.
To change these settings, select View > Window Theme and select the desired theme.
Note: You can apply the Microsoft Windows XP theme to the Tests Results window only if your
computer is set to use a Windows XP theme.
How to Open the Test Results of a Specific Run
This task describes how to open the test results window for a specific run.
1. Select File > Open from within the Test Results window.
2. Select a script file to display the test results for that file and select the desired test result file. By
User Guide
VuGen
HP LoadRunner (12.50) Page 418

default, result files for tests are stored in <Script>\<ResultName>.xml. If your script is stored in
Application Lifecycle Management, see below.
3. Select a results set and click Open.
Note: Results files for earlier versions were saved with a .qtp file extension. In the Select
Results File dialog box, only results files with an .xml extension are shown by default. To view
results files with a .qtp extension in the Select Results File dialog box, select Test Results
(*.qtp) in the Files of type box.
Select a Script Stored in Application Lifecycle Management
1. Click the Application Lifecycle Management Connection button and connect to your
Application Lifecycle Management project.
2. In the Open Test Results dialog box, enter the path of the folder that contains the results file for
your test, or click the browse button to open the Open Test from ALM Project dialog box.
3. Select DB Vuser in the Test Type list.
4. Select the script whose test results you want to view, and click OK.
5. In the Open Test Results dialog box, highlight the test result set you want to view, and click Open.
The Test Results window displays the selected test results.
How to Find Steps in the Test Results
This task describes how to search the test results for steps of a particular type.
1. Select Tools > Find from within the Test Results window.
2. Select the type of step you wish to find. You can select multiple options.
3. Select Up or Down to indicate the direction of the search.
4. Select Find Next to find the next occurrence of the type of step you selected.
Test Results Window
This window displays a report that summarizes the results of your script run.
User Guide
VuGen
HP LoadRunner (12.50) Page 419
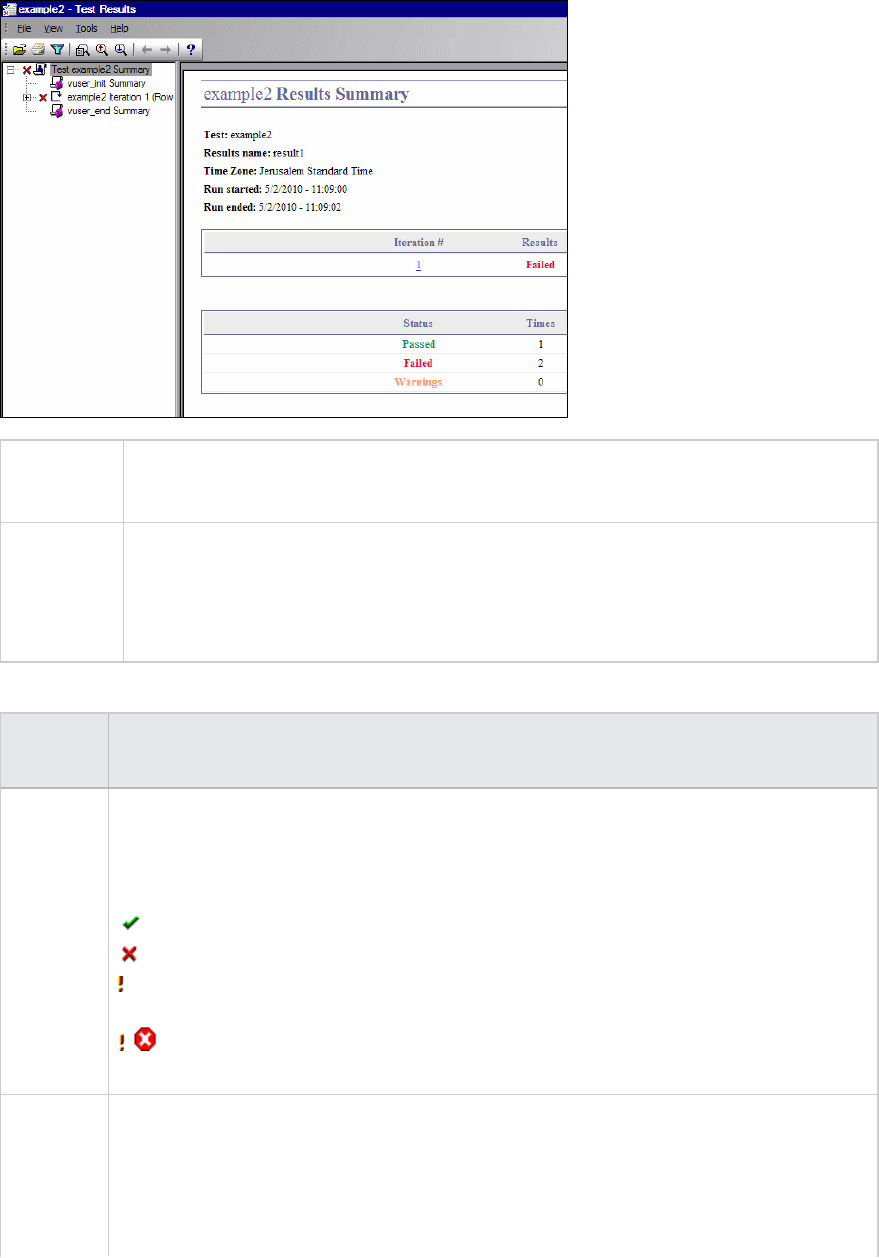
To access lOpens automatically after running a script.
lReplay > Test Results...
Important
information
lYou can configure the result settings from Tools > Options > Scripting > Replay .
lThe Test Results window can show results with up to 300 levels in the tree
hierarchy. If you have results with more than 300 nested levels, you can view the
entire report by manually opening the results.xml file.
User interface elements are described below:
UI
Element
Description
Report
Tree
A graphical representation of the test results located in a pane on the left of the
window. You can collapse or expand a branch in the run results tree to change the level
of detail that the tree displays.
The icons next to the steps indicate the following information:
Indicates a step that succeeded.
Indicates a step that failed.
Indicates a warning, meaning that the step did not succeed, but it did not cause the
test to fail.
Indicates a step that failed unexpectedly.
You can expand and collapse all of the nodes from the View menu, or by clicking *.
Results
Details
Pane
(Results
Summary)
Contains details of the test run which change depending on which part of the report tree
you select. When you select the top node of the tree, the Result Details tab shows a
summary of the results for your test. When you select a branch or step in the tree, the
Result Details tab contains the details for that step. The Result Details tab may also
include a still image of your application for the highlighted step.
User Guide
VuGen
HP LoadRunner (12.50) Page 420
lIterations, actions, and steps that contain checkpoints are marked Passed or Failed
in the right part of the Test Results window and are identified by icons in the tree
pane.
lIterations, actions, and steps that ran successfully, but do not contain checkpoints,
are marked Done in the right part of the Test Results window.
Screen
Recorder
Tab
Contains the movie associated with your test results. If there is no movie associated with
your test results, the Screen Recorder tab contains the message: No movie is
associated with the results.
Opens the test results of a specific run. For more details, see "How to Open the Test
Results of a Specific Run" on page418.
Opens the Print dialog box, enabling you to print the test results. For more information,
see "Print Dialog Box" on the next page.
Opens the Filters dialog box, enabling you to filter the test results. For more information,
see "Filters Dialog Box" below.
Opens the Find dialog box, enabling you to search the test results for steps of a
particular type. For more information, see "How to Find Steps in the Test Results" on
page419.
Searches the test results for the previous step matching the criteria in the Find dialog
box.
Searches the test results for the next step matching the criteria specified in the Find
dialog box.
Selects the previous node.
Selects the next node.
Opens the product documentation.
Filters Dialog Box
This dialog box enables you to filter the test results in the test results window.
User Guide
VuGen
HP LoadRunner (12.50) Page 421
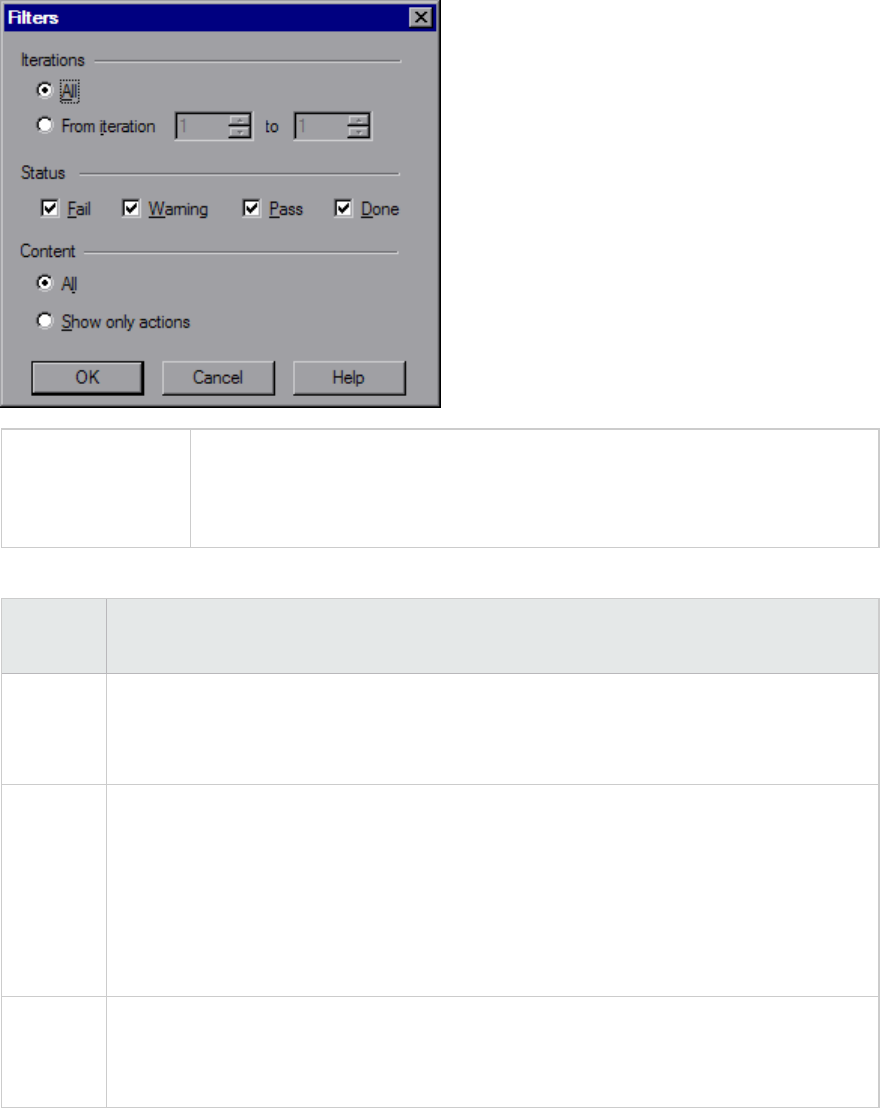
To access Do the following:
1. In VuGen: Replay > Test Results >
2. In the Test Results window: View > Filters
User interface elements are described below:
UI
Element
Description
Iterations lAll. Displays test results from all iterations.
lFromiteration X to Y. Displays the test results from a specified range of test
iterations.
Status lFail. Displays the results for the steps that failed.
lWarning. Displays the results for the steps with the status Warning (steps that did
not pass, but did not cause the script to fail).
lPass. Displays the results for the steps that passed.
lDone. Displays the results for the steps with the status Done (steps that were
performed successfully but did not receive a pass, fail, or warning status).
Content lAll. Displays all steps from all nodes in the test.
lShow only actions. Displays the action nodes in the test (not the specific steps in the
action nodes).
Print Dialog Box
This dialog box enables you to print the test results.
User Guide
VuGen
HP LoadRunner (12.50) Page 422
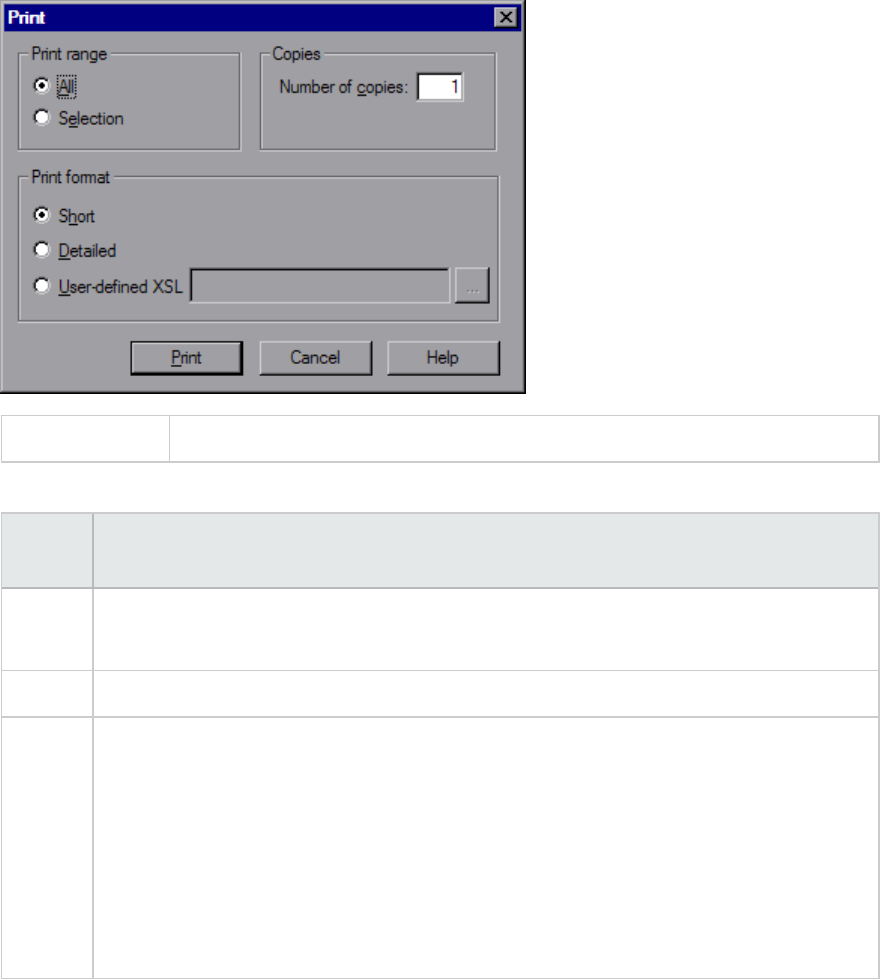
To access "Test Results Window" on page419 > File > Print
User interface elements are described below:
UI
Element
Description
Print
range
lAll. Prints the results for the entire script.
lSelection. Prints the results for the selected branch in the run results tree.
Copies The number of copies to print.
Print
format
lShort. Prints a summary line (when available) for each item in the run results tree. This
option is available only if you the print range is set to All.
lDetailed. Prints all available information for each item in the run results tree, or for the
selected branch.
lUser-defined XSL. Enables you to browse to and select a customized .xsl file. You can
create a customized .xsl file that specifies the information to be included in the printed
report, and the way it should appear. For more information, see "Customizing the Test
Results Display" on page417.
Print Preview Dialog Box
This dialog box enables you to view a print preview of the test results.
User Guide
VuGen
HP LoadRunner (12.50) Page 423
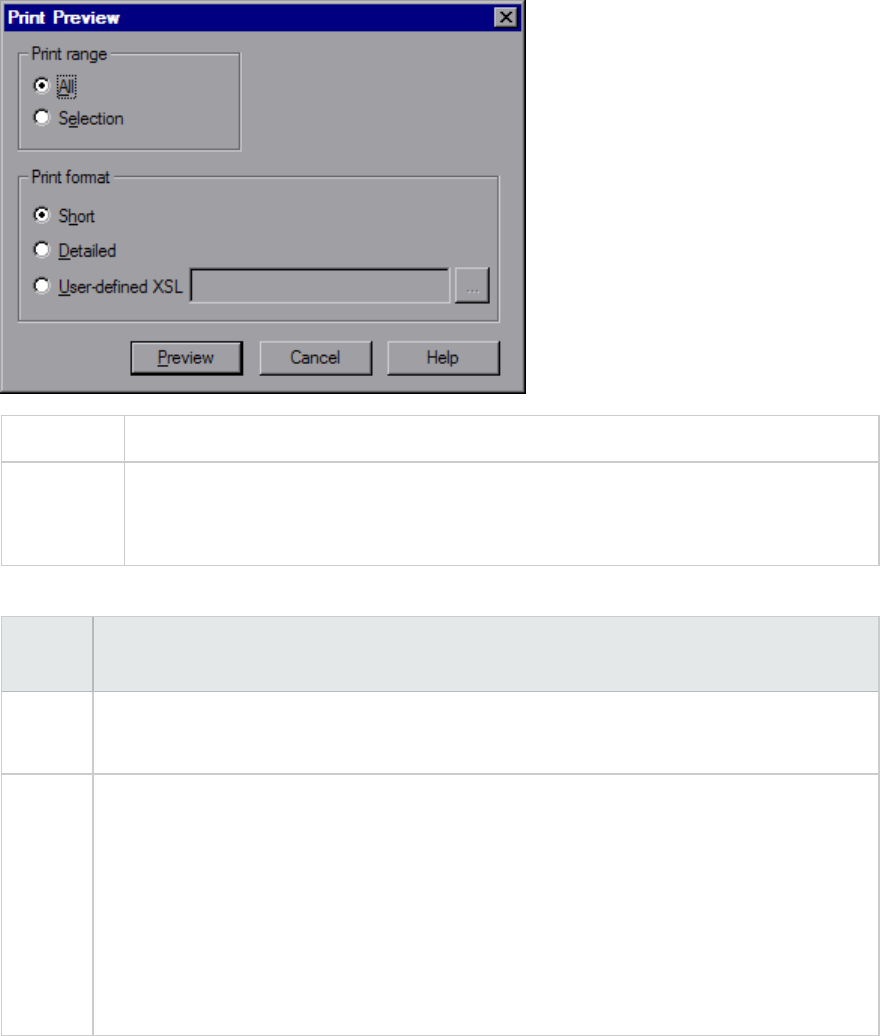
To access "Test Results Window" on page419 > File > Print Preview
Important
information
If some of the information is cut off in the preview, for example, if checkpoint names
are too long to fit in the display, click the Page Setup button in the Print Preview
window and change the page orientation from Portrait to Landscape.
User interface elements are described below:
UI
Element
Description
Print
range
lAll. Prints the results for the entire script.
lSelection. Prints the results for the selected branch in the run results tree.
Print
format
lShort. Prints a summary line (when available) for each item in the run results tree. This
option is available only if you the print range is set to All.
lDetailed. Prints all available information for each item in the run results tree, or for the
selected branch.
lUser-defined XSL. Enables you to browse to and select a customized .xsl file. You can
create a customized .xsl file that specifies the information to be included in the printed
report, and the way it should appear. For more information, see "Customizing the Test
Results Display" on page417.
Export to HTML File Dialog Box
This dialog box enables you to export the test results to an HTML file. This enables you to view the
results even if the Test Results Viewer environment is unavailable. For example, you can send the file
containing the results in an e-mail to a third-party. You can select the type of report you want to export,
and you can also create and export a customized report.
User Guide
VuGen
HP LoadRunner (12.50) Page 424
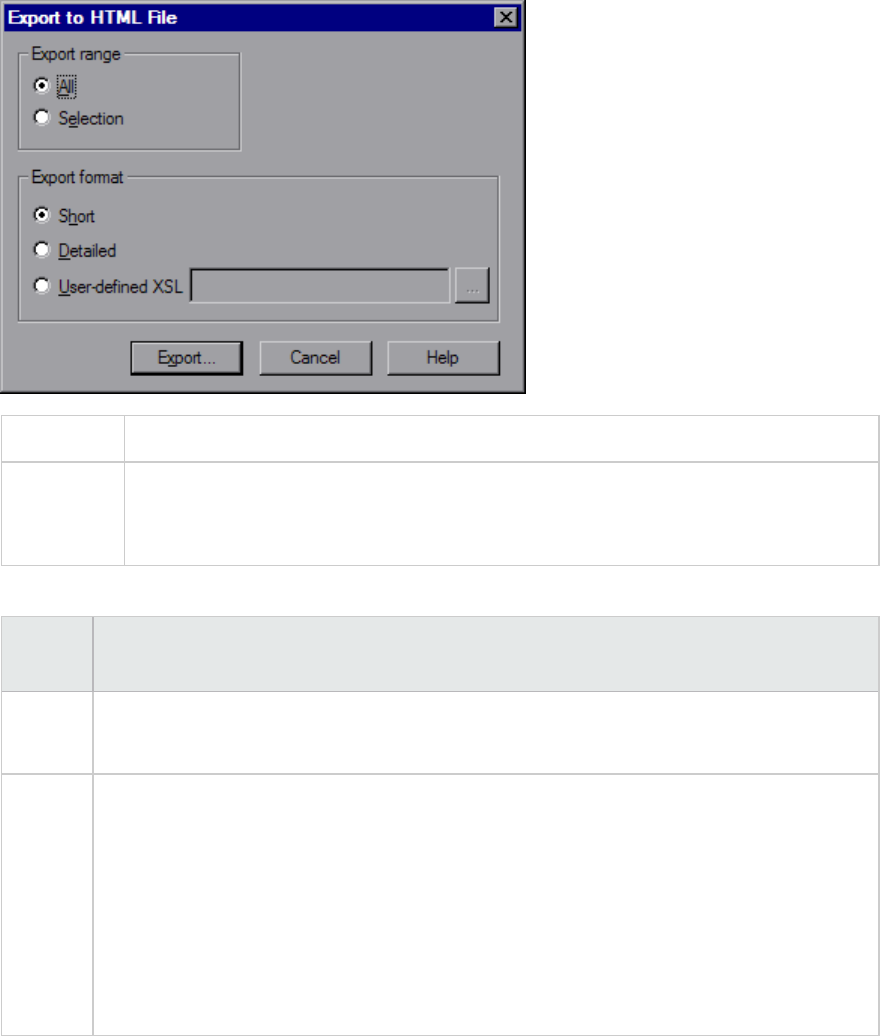
To access "Test Results Window" on page419 > File > Export to HTML File
Important
Information
In Test Result reports, you can only use the Export to HTML file utility for scripts
replayed in version 9.50 and later. To generate an HTML report for scripts created with
earlier versions, run the script again in the 9.50 version (or later) of the product.
User interface elements are described below:
UI
Element
Description
Export
Range
lAll. Exports the results for the entire script.
lSelection. Exports result information for the selected branch in the results tree.
Export
Format
lShort. Prints a summary line (when available) for each item in the run results tree. This
option is available only if you the print range is set to All.
lDetailed. Prints all available information for each item in the run results tree, or for the
selected branch.
lUser-defined XSL. Enables you to browse to and select a customized .xsl file. You can
create a customized .xsl file that specifies the information to be included in the printed
report, and the way it should appear. For more information, see "Customizing the Test
Results Display" on page417.
User Guide
VuGen
HP LoadRunner (12.50) Page 425
Protocols
In the Create a New Script dialog box, you select the script type that matches your application's
protocol.
Popular Protocols
lCitrix ICA
lFlex
lJava Record Replay
lMobile Application - HTTP/HTML
lOracle NCA
lTruClient
lWeb - HTTP/HTML
lWeb Services
Vuser Protocols
VuGen enables you to record a variety of protocols, each suited to a particular load testing environment
or topology and results in a specific type of Vuser script. For example, you can use a Web - HTTP/HTML
Vuser Script to emulate users operating Web browsers. You can use FTP Vusers to emulate an FTP
session. The various Vuser technologies can be used alone or together, to create effective load tests.
The following table lists the available Vuser protocols, and a brief description of each protocol.
Note: Protocols with links have expanded information.
Protocol Description
.NET Supports the recording of Microsoft .NET client-server technologies.
Ajax (Click
& Script)
An acronym for Asynchronous JavaScript and XML. Ajax (Click & Script) uses
asynchronous HTTP requests, allowing Web pages to request small bits of information
instead of whole pages.
C Vuser A generic virtual user which uses the standard C library.
Citrix ICA A remote access tool, allowing users to run specific applications on external machines.
COM/DCOM Component Object Model (COM) - a technology for developing reusable software
components.
User Guide
VuGen
HP LoadRunner (12.50) Page 426

Protocol Description
(DNS)
Domain
Name
Resolution
The DNS protocol is a low-level protocol that allows you to emulate the actions of a
user working against a DNS server.
The DNS protocol emulates a user accessing a Domain Name Server to resolve a host
name with its IP address. Only replay is supported for this protocol—you need to
manually add the functions to your script.
Flex Flex is an application development solution for creating Rich Internet Applications
(RIAs) within the enterprise and across the Web. Action Message Format (AMF), is a
Macromedia proprietary protocol that allows Flash Remoting binary data to be
exchanged between a Flash application and an application server over HTTP.
FTP
(File
Transfer
Protocol )
File Transfer Protocol - a system which transfers files from one location to another
over a network.
The FTP protocol is a low-level protocol that allows you to emulate the actions of a user
working against an FTP server.
IMAP
(Internet
Messaging)
Internet Message Application - a protocol which enables clients to read email from a
mail server.
Java over
HTTP
Designed to record java-based applications and applets. It produces a Java language
script using web functions. This protocol is distinguished from other Java protocols in
that it can record and replay Java remote calls over HTTP.
Java
Record
Replay
Common Java recorder.
Java Vuser Java programming language with protocol level support.
LDAP
(Listing
Directory
Service)
An Internet protocol designed to allow email applications to look up contact
information from a server.
MAPI
(Microsoft
Exchange)
Messaging Application Programming Interface designed to allow applications to send
and receive email messages.
MMS
(Media
Player)
Streaming data from a media server using Microsoft's MMS protocol.
Important:
lIn order to replay Media Player functions, you must place a file called wmload.asf on
the Windows Media server machine. The VuGen machine must be able to access it
using mms://<servername>/wmload.asf. This file can be any media file renamed to
wmload.asf.
User Guide
VuGen
HP LoadRunner (12.50) Page 427

Protocol Description
lMake sure that Media Player is installed on VuGen and the load generator machines.
MMS
(Multimedia
Messaging
Service)
A messaging service used for sending MMS messages between mobile devices.
Mobile
Application
-
HTTP/HTML
Enables the recording of mobile native applications.
ODBC Open Database Connectivity - a protocol providing a common interface for accessing
databases.
Oracle - 2
Tier
Oracle database using a standard 2-tier client/server architecture.
Oracle -
Web
The Oracle Applications interface that performs actions over the Web. This Vuser type
detects actions on both the LoadRunner API and Javascript levels.
Oracle NCA Oracle 3-tier architecture database consisting of Java client, Web server and database.
POP3
(Post Office
Protocol)
A protocol designed to allow single computers to retrieve email from a mail server.
RDP
(Remote
Desktop
Protocol)
A remote access tool using the Microsoft Remote Desktop Connection to run
applications on an external machine.
RTE
(Remote
Terminal
Emulator)
Emulation of users who submit input to, and receive output from, character-based
applications.
SAP (Click &
Script)
Emulation of communication between a browser and SAP server on a GUI or user-action
level.
SAP GUI An Enterprise Resource Planning system to integrate key business and management
processes using the SAP GUI client for Windows.
SAP - Web An Enterprise Resource Planning system to integrate key business and management
processes using the SAP Portal or Workplace clients.
Siebel - A Customer Relationship Management Application.
User Guide
VuGen
HP LoadRunner (12.50) Page 428
Protocol Description
Web
Silverlight A protocol for Silverlight based applications emulating user activity at the transport
level. Allows generating high level scripts by automatically importing and configuring
WSDL files used by the application.
SMP (SAP
Mobile
Platform)
A protocol for recording actions on a mobile SAP application.
SMTP
(Simple
Mail
Protocol)
Simple Mail Transfer Protocol - a system for distributing mail to a particular machine.
TruClient -
Mobile Web
Enables the recording of mobile browser based applications using the TruClient
technology.
TruClient -
Native
Mobile
Records native mobile applications using the TruClient technology.
TruClient -
Web
An advanced protocol for modern JavaScript-based applications emulating user activity
within a Web browser. Scripts are developed interactively from within a Web browser.
Web -
HTTP/HTML
Emulation of communication between a browser and Web server on an HTTP or HTML
level.
Web
Services
Web Services are a programmatic interface for applications to communicate with one
another over the World Wide Web.
Windows
Sockets
The standard network programming interface for the Windows platform.
Note: In order to use the Controller to run Vusers of the various protocols, you must have either
a global license or licenses for the desired protocols. The Community Bundle Includes 50 Vusers
for all protocols, except GUI (UFT), COM/DCOM and protocols in the template bundle, such as C
Vuser. To check your Vuser licensing details, open the LoadRunner License Utility by selecting
Start > All Programs > HP Software > HP LoadRunner > License > LoadRunner License Utility
on the LoadRunner machine. In icon-based desktops such as Windows 8, search for the
LoadRunner License Utility.
User Guide
VuGen
HP LoadRunner (12.50) Page 429
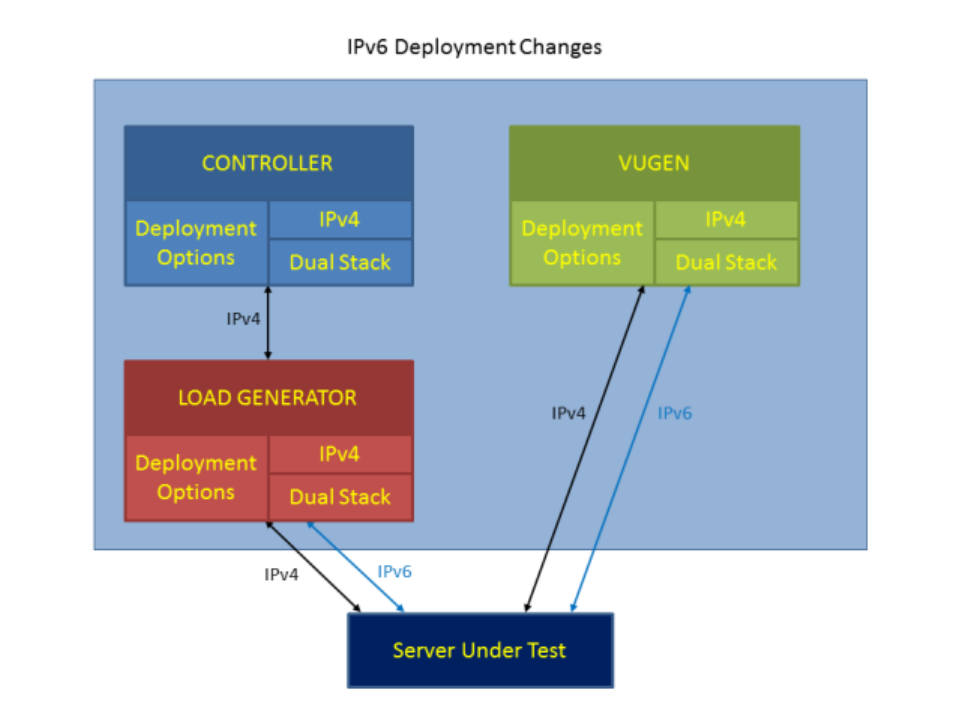
IPv6 Support
LoadRunner enables you to test IPv6 based applications in addition to IPv4 based ones. Script recording
supports recording for both IPv4 and IPv6 simultaneously. The code that is generated is non-IP specific.
Except for Web HTTP based protocols, users are unaware of which IP version is being used when
replaying the script in a load test. Web HTTP protocols have a Runtime setting that allows you to choose
between IPv4 and IPv6 for the replay.
IPv6 Deployment
The internal LoadRunner communication between the Controller and Load Generators uses IPv4
communication. To record and replay in both IPv4 and IPv6, install both VuGen and Load Generator on
IPv6-enabled computers, as shown in the diagram below.
For more details about IPv6 related changes, see the Preferences View - Internet Protocol.
User Guide
VuGen
HP LoadRunner (12.50) Page 430

Protocols Supported
For a list of the supported protocols, see the support matrix for this version of LoadRunner.
Protocol Support Limitations
Support for IPv6 is available with the following limitations:
lWeb HTTP protocol
lFTP from Web is not supported
lWeb Breakdown is not supported
lKerberos is not supported
lSpoofing from Web is not supported
lPAC file is not supported
lWebtrace
lIPv6 Webtrace is not supported on 6to4 outgoing network interfaces.
lIPv6 webtrace does not support RawSocket mode
lGeneral limitations
lReplay failures may occur because of a IPv4/IPv6 switch between recording and replaying.
Protocol Support for Async, IPv6, and 64-bit Recording
The following table shows the protocol support for Async, IPv6, and 64-bit recording:
Protocol Async IPv6 64-bit recording
DNS No Yes No
Flex AMF Yes Yes No
Flex RMTP No No No
FTP No Yes No
IMAP No Yes No
Java Over HTTP No Yes Yes
User Guide
VuGen
HP LoadRunner (12.50) Page 431
Protocol Async IPv6 64-bit recording
LDAP No No Yes
Microsoft .NET No No Yes
Mobile Applications HTTP/HTML No Yes No
Windows Sockets (multi-protocol) No Yes Yes
Oracle 2-Tier No No Yes
Oracle NCA No Yes Yes
POP3 No Yes No
RDP No Yes Yes
SAP – Web No No Yes
Siebel - Web No No Yes
Silverlight No Yes No
SMTP No Yes No
TruClient - Firefox No Yes No
TruClient - IE No Yes No
TruClient - Mobile Web No Yes No
Click & Script family (Ajax, SAP) No Yes No
Web - HTTP/HTML Yes Yes Yes
Web Services Yes Yes Yes
Note: In all the protocols that support asynchronous sessions, recording will only be applied to
web_* steps.
User Guide
VuGen
HP LoadRunner (12.50) Page 432
Protocol Advisor Overview
You use the Protocol Advisor to help you determine an appropriate protocol for recording a Vuser script.
The Protocol Advisor scans your application for elements of different protocols and displays a list of the
detected protocols. These protocols should be used as guidelines and as a starting point for finding the
optimal protocol for your application.
In most cases, the Protocol Advisor suggests more than one protocol, along with combinations of
protocols.
How to use the Protocol Advisor
This task describes a typical workflow for finding the optimal protocol to record your application using
the Protocol Advisor.
1. Start the Protocol Advisor
In VuGen, select Record > Protocol Advisor > Analyze Application.
If you are analyzing a web application, you will need to specify:
lProgram to analyze
lURL Address
lWorking Directory
If you are analyzing a Windows application, you will need to specify:
lProgram to analyze
lProgram arguments, if any
lWorking Directory
For details, see "Protocol Advisor Dialog Box" on page435.
2. Perform typical business processes
Perform typical business processes in your application. Try to walk through a variety of business
processes to make sure that your results are comprehensive. Click Stop Analyzing to end the
analysis and display the results.
3. Save the results
Select Record > Protocol Advisor > Save Results or click Save Results from the toolbar at the top
of the report. Enter a name and select the folder.
To display a previous report, select Record > Protocol Advisor > Recent reports. VuGen will
maintain a history of the last sixteen Protocol Advisor reports generated. To clear the history,
select Record > Protocol Advisor > Clear Recent Reports.
User Guide
VuGen
HP LoadRunner (12.50) Page 433
4. Select a protocol and create a new Vuser script
Select one of the protocols using the following order of priority and create a Vuser script using that
protocol:
lMulti/Combination protocol
lThe highest level application protocol
lThe first protocol on the list
5. Enhance, debug, and verify replay
Enhance and debug your script until you can replay it successfully. If, after enhancing and
debugging the Vuser script, you cannot replay it successfully, proceed to the next step.
6. If the replay is unsuccessful, select a different protocol and repeat
lFor all non Web-based protocols: Return to the Protocol Advisor Results page and select the
next protocol on the list and repeat previous steps. If there are no more protocols listed,
contact HP Customer Support.
lFor Web-based protocols: The following diagram illustrates several Web-based protocols
arranged according to their application level. The arrows indicate the order in which you should
attempt a new protocol. For example, if the first protocol you used was Oracle - Web and it
failed to successfully replay, you would then try the Oracle NCA protocol.
User Guide
VuGen
HP LoadRunner (12.50) Page 434
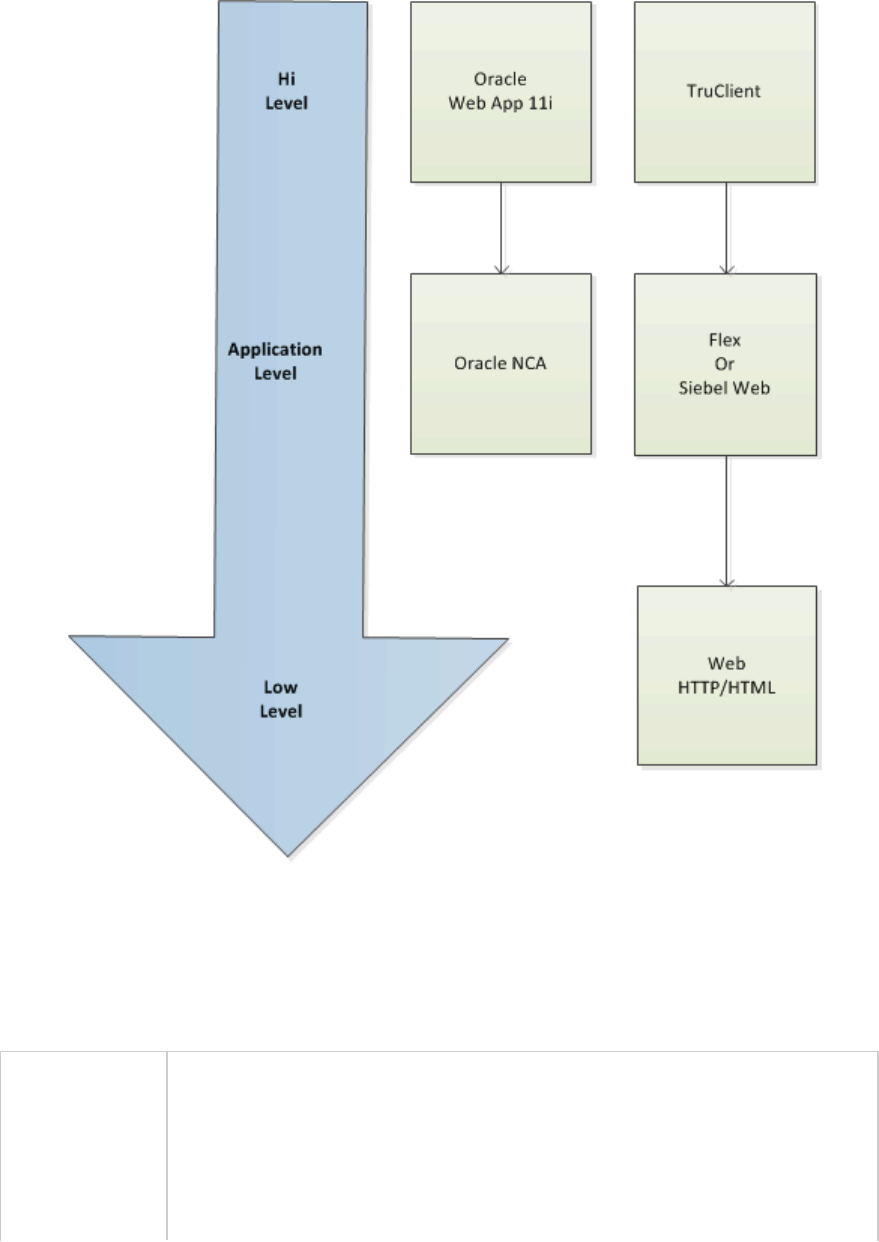
Protocol Advisor Dialog Box
This dialog box enables you to analyze your application to determine the appropriate VuGen protocols to
use for recording.
To access Do one of the following:
lRecord > Protocol Advisor > Analyze Application
lSelect File > New Script and Solution. In the Create a New Script dialgo box,
click the Protocol Advisor link.
lFrom the Start menu, HP LoadRunner > Tools > Protocol Advisor.
User Guide
VuGen
HP LoadRunner (12.50) Page 435
Important
information
lThe options in this dialog box change according to the selection you make for
Application type.
Relevant tasks "How to use the Protocol Advisor" on page433
User interface elements are described below:
UI Element Description
Application
type
Windows or Web application.
Program
arguments
(Win32
Applications
only)
Specify command line arguments for the executable specified above. For example, if
you specify plus32.exe with the command line options peter@neptune, it connects the
user Peter to the server Neptune when starting plus32.exe. This option is displayed
only for Windows applications.
Program to
analyze
Select the browser, Web application, or Windows application to analyze.
URL Address
(Internet
Applications
only)
The starting URL address. This option is displayed only for Web applications.
Working
directory
The working directory for your application, if needed.
Protocol Advisor - Troubleshooting and Limitations
This section describes troubleshooting and limitations for the Protocol Advisor.
lThis feature will only detect protocols supported by LoadRunner.
lSome Web protocols are detected based on the URL. For example, the URL may contain keywords
such as SAP. Therefore, if you use a different URL or a different application with the same URL, the
results may differ.
lThe following protocols are frequently detected but are not always appropriate for use. You should
only use them if there are no other detected protocols.
lCOM/DCOM
lJava
l.NET
lWinSock
lLDAP
User Guide
VuGen
HP LoadRunner (12.50) Page 436
lIf you terminated the Protocol Advisor immediately after the detection process started, the Protocol
Advisor may leave a hanging process of the detected application, causing all recordings and
detection sessions that follow to fail.
Workaround: Manually terminate the hanging process.
Ajax - Click & Script Protocol
Ajax (Asynchronous JavaScript and XML) represents a group of technologies for creating interactive Web
applications. With Ajax, web pages exchange small packets of data with the server, instead of reloading
an entire page. This reduces the amount of time that a user needs to wait when requesting data. It also
increases the interactive capabilities and enhances the usability.
Using Ajax, developers can create fast Web pages using Javascript and asynchronous server requests.
The requests can originate from user actions, timer events, or other predefined triggers.
Ajax components, also known as Ajax controls, are GUI based controls that use the Ajax technique—they
send a request to the server when a trigger occurs.
For example, a popular Ajax control is a Reorder List control that lets you drag components to a desired
position in a list. VuGen's support for Ajax implementation is based on Microsoft's ASP.NET Ajax Control
Toolkit formerly known as Atlas.
Ajax (Click & Script) Protocol Overview
Ajax (Asynchronous JavaScript and XML) represents a group of technologies for creating interactive Web
applications. With Ajax, web pages exchange small packets of data with the server, instead of reloading
an entire page. This reduces the amount of time that a user needs to wait when requesting data. It also
increases the interactive capabilities and enhances the usability.
Using Ajax, developers can create fast Web pages using Javascript and asynchronous server requests.
The requests can originate from user actions, timer events, or other predefined triggers.
Ajax components, also known as Ajax controls, are GUI based controls that use the Ajax technique—they
send a request to the server when a trigger occurs.
For example, a popular Ajax control is a Reorder List control that lets you drag components to a desired
position in a list. VuGen's support for Ajax implementation is based on Microsoft's ASP.NET Ajax Control
Toolkit formerly known as Atlas.
For an overview on the Click and Script protocols, see "Click & Script Protocols - Overview" on page466.
Ajax (Click & Script) Supported Frameworks
The supported frameworks for Ajax Click & Script functions are:
lAtlas 1.0.10920.0/ASP.NET Ajax—All controls
User Guide
VuGen
HP LoadRunner (12.50) Page 437

lScriptaculous 1.8—Autocomplete, Reorder List, and Slider
VuGen supports the following frameworks at the engine level. This implies that VuGen will create
standard Click & Script steps, but not Ajax specific functions:
lPrototype 1.6
lGoogle Web Toolkit (GWT) 1.4
Ajax (Click & Script) Example Script
VuGen uses the control handler layer to create the effect of an operation on a GUI control. During
recording, when encountering one of the supported Ajax controls, VuGen generates a function with an
ajax_xxx prefix.
In the following example, a user selected item number 1 (index=1) in an Accordion control. VuGen
generated an ajax_accordion function.
web_browser("Accordion.aspx",
DESCRIPTION,
ACTION,
"Navigate=http://labm1app08/AJAX/Accordion/.aspx",
LAST);
lr_think_time(5);
ajax_accordion("Accordion",
DESCRIPTION,
"Framework=atlas",
"ID=ctl00_SampleContent_MyAccordion",
ACTION,
"UserAction=SelectIndex",
"Index=1",
LAST);
web_edit_field("free_text_2",
"Snapshot=t18.inf",
DESCRIPTION,
"Type=text",
"Name=free_text",
ACTION,
"SetValue=FILE_PATH",
LAST);
Note: When you record an Ajax session, VuGen generates standard Click & Script functions for
objects that are not one of the supported Ajax controls. In the example above, the word FILE_
PATH was typed into an edit box.
User Guide
VuGen
HP LoadRunner (12.50) Page 438

Ajax (Click & Script) Recording Tips
This section lists tips for recording click-and-script Vuser scripts.
Note: Some of the items below apply to specific click-and-script protocols only.
Use the Mouse and not the Keyboard
It is preferable to click on an object with the mouse rather than using the keyboard. During recording,
use only GUI objects that are within the browser's pane. Do not use any browser icons, controls, the Stop
button, or menu items, such as View > Refresh. You may, however, use the Refresh, Home, Back and
Forward buttons and the address bar.
Do not Record Over an Existing Script
It is best to record into a newly created script—not an existing one.
Avoid Context Menus
Avoid using context menus during recording. Context menus are right-click menus which pop up when
clicking certain objects in a graphical user interface.
Avoid Working in Another Browser While Recording
While recording, do not work in any browser window other than the browser windows opened by VuGen.
Wait for Downloads
Wait for all downloads to complete before doing any action, such as clicking on a button or filling in a
text field.
Wait for Pages to Load
During recording, it is best to wait for the page to load completely before doing the next step. If you did
not wait for all of the pages to load, record the script again.
Navigate to the Start Page
If the last page in an action does not contain the links and buttons that were available at the start of
the iteration, then the next iteration will fail. For example, if the first page has a text link Book A Flight,
make sure to navigate to the appropriate page at the end of your recording, so that the same link will
be visible at the end of the business process.
Use a Higher Event Configuration Level
Record the business process again using the High event configuration level. For more information on
changing the event configuration level, see "Click & Script Troubleshooting and Limitations" on
User Guide
VuGen
HP LoadRunner (12.50) Page 439

page476.
Disable Socket Level Recording
In certain cases, the capturing of the socket level messages disrupts the application. For most
recordings, socket level data is not required. To prevent the recording of socket level data, disable the
option in the recording options. For more information, see "GUI Properties > Advanced Recording
Options" on page177.
Enable the "Record rendering-related property values" Option
If the client-side scripts of the application use a lot of styling activities, enable the Record rendering-
related property values option before recording the script. For example, enable this option to record
additional DOM properties such as offsetTop. Note that enabling this option may decrease the recording
speed. You can enable the option by selecting Recording Options > GUI Properties > Advanced. For
more information, see "GUI Properties > Advanced Recording Options" on page177.
Ajax (Click & Script) - Replay Tips
This section lists tips for replaying click-and-script Vuser scripts.
Note: Some of the items below apply to specific click-and-script protocols only.
Do not Reorder Statements in a Recorded Script
Do not change the order of the statements within a recorded script. Also, copying segments of code
from one Action to another is not recommended.
Convert non-ASCII Characters
If your links contain non-ASCII characters, you should instruct VuGen to convert the data to or from the
UTF-8 format.
Enable UTF-8 Conversion
1. Select Replay > Runtime Settings and select the Internet Protocol > Preferences node.
2. Click Options to open the Advanced Options dialog box.
3. Locate the Convert from/to UTF-8 option and set it to Yes.
Alternatively, view the list of options that is displayed when a link is not found. Enter the displayed text
as-is, such as the hex escape sequences \xA0 or any other non-standard format.
Run the Same Sequence of Actions Twice
In some cases, you can perform a certain process only once—such as deleting a user from the
User Guide
VuGen
HP LoadRunner (12.50) Page 440

database. Replay will fail after the first iteration because the action is no longer valid. Verify that your
business process can be repeated more than once with the same data.
Set Unique Image Properties
In the Step Navigator, double click on the previous image step to open its properties. If the Id,Name,
and Alt properties are empty, provide further identification of the image, such as its file name in the Src
property.
Alternatively, you can add an Ordinal argument to specify the occurrence number of the image on that
page. The Ordinal argument uniquely identifies each image on the page where all other identification
arguments are not unique. For more information, see the Function Reference (Help> Function
Reference).
Check the Step's Description
If you receive a GUI Object is not found error, check the Output pane for a list of the objects in the
problematic step. In some cases, the object description changes slightly from run to run.
There are several solutions:
lIf the new value is stable, open the script in the Editor and manually modify the value of the step's
DESCRIPTION argument.
lIf the description changes from run to run, you can use a regular expression in the DESCRIPTION
argument. For more information, see the Function Reference (Help>Function Reference).
lAlternatively, replace the problematic object description property, such as Name, with the Ordinal
property. For more information, see the Function Reference (Help>Function Reference).
ThreadingModel
Replay of COM script in VuGen fails when the dll registration is missing the ThreadingModel string under
the InprocServer32 folder of the GUID.
Ajax (Click & Script) Miscellaneous Tips
The following additional tips may help you in troubleshooting problems that you experience with click-
and-script Vuser scripts.
Note: Some of the items below apply to specific click-and-script protocols only.
Search for Warnings
Search for warnings or alerts in the Output pane.
Verify the Response
Verify the response of the previous step is correct using web_reg_find. For more information, see the
User Guide
VuGen
HP LoadRunner (12.50) Page 441

Function Reference (Help > Function Reference).
Use Alternate Navigation
For problematic steps or those using Java applets, use Alternative Navigation to replace the Web step
with an HTTP level step. Note that the HTTP level steps may require manual correlations. To perform
Alternative Navigation, select a step in the Step Navigator, or the text in Script View, and select Replace
with alternative navigation from the right-click menu.
Working with the Kerberos Protocol
If you are using the Kerberos Protocol for authentication, you must customize VuGen to properly
convene authorization sessions. Advanced users can attempt to perform this customization
themselves.
In order for the Kerberos Protocol to work properly, create a krb5.ini file and put it in an available folder.
Save the full path name of krb5.ini into the KRB5_CONFIG environment variable.
The krb5.ini file should contain detailed information about each domain (KDS and AS addresses) and
trust chains.
For more information, contact HP software support.
Click & Script Troubleshooting and Limitations
This section describes troubleshooting and limitations for click-and-script protocols.
Note: Some of the items below apply to specific click-and-script protocols only.
Recording Issues and Limitations
Browser support
lOnly Internet Explorer is supported for Click & Script. To record browser activity on Firefox, use the
Web - HTTP/HTML protocol.
lNot supported for Internet Explorer 10.
lFor Click & Script protocols, VuGen may take an excessive amount of time to open the Recording
Options dialog box.
Language Support
lRecording an application in a specific language (e.g., French, Japanese) must be performed on a
machine whose default locale (in Settings > Control Panel > Regional Options) is the same language
lSupport of right-to-left languages is limited (e.g., bi-directional or reversed text may not be
processed as expected). This is defined by the default operating system translation table.
lThe locale of the load-generator machine, must be configured to be the same as that of the
recording machine. It cannot be assumed that the Linux default character set is the same as in
User Guide
VuGen
HP LoadRunner (12.50) Page 442
Windows, even for US-English machines, and this has to be explicitly verified. For example, the
default character set on Linux, is UTF-8.
Application behaves differently while being recorded
If your application behaves differently during recording, than it does without recording, you should
determine if the recording problem is unique to Web. The effect may be that a Web page will not load,
part of the content may be missing, a popup window will not open, and so forth.
Workaround: Create a new Web - HTTP/HTML script and repeat the recording.
In the event that the recording fails in Web - HTTP/HTML, we recommend that you disable socket level
recording (see "Click & Script Recording Tips" on page468).
The problem may be the result of an event listener. Use trial and error to disable event listeners in the
Web Event Configuration Recording Options, and then re-record your session as a Web - HTTP/HTML
user.
Certain Click & Script steps do not generate properly
After recording a script, if not all steps are correctly generated, the problem may be due to the
Windows Component > Internet Explorer Enhanced Security Configuration.
Remove Internet Explorer Enhanced Security Configuration by selecting Control Panel > Add or
Remove Programs > Add or Remove Windows Components and re-record your script.
Disable an Event Listener
1. Click Record > Recording Options to open the Recording Options dialog box.
2. Select the GUI Properties > Web Event Configuration node.
3. Click Custom Settings and expand the Web Objects node. Select an object.
4. Select Disabled from the list in the Record column for the relevant Web object. If the recording still
does not work, enable the listener you previously disabled, and try disabling another one. Repeat
these steps until your recording succeeds.
Dynamic menu navigation was not recorded
A dynamic menu is a menu that dynamically changes depending on where you select it. If the dynamic
menu navigation was not recorded, record again using "high" event configuration mode. These settings
can be found in the Recording Options > GUI Properties > Web Event Configuration node.
Certain user actions were not recorded
Check if there is a Java applet running inside the browser. If not, record the script with the Web -
HTTP/HTML protocol.
Replay Issues
GUI object not found
Does the error occur at the beginning of the second iteration?
User Guide
VuGen
HP LoadRunner (12.50) Page 443
If the error occurs at the beginning of the second iteration's Action section, it is probably the result of a
starting page that was present for the first iteration, but missing for the second one. If the last page in
an action does not contain the links and buttons that were available at the start of the iteration, then
the next iteration will fail. For example, if the first page has a text link Book A Flight, make sure to
navigate to the appropriate page, so that the same link will be visible at the end of the business
process.
Is it a text link containing non-ASCII characters?
If the problem occurs with non-ASCII characters, you should instruct VuGen to covert the data to a
suitable character set.
Enable Data Conversion on Windows Machines
1. Select Replay > Runtime Settings and select the Internet Protocol > Preferences node.
2. Click Options to open the Advanced Options dialog box.
3. Locate Charset Conversions by HTTP in the Web (Click & Script) > General options, and set it to
Yes.
Enable UTF-8 conversion for Linux Machines
1. Select Replay > Runtime Settings and select the Internet Protocol > Preferences node.
2. Click Options to open the Advanced Options dialog box.
3. Locate Convert from/to UTF-8 in the General options and set it to Yes
Alternatively, view the list of alternatives that are displayed when a link is not found. Enter the displayed
text as-is, such as hex escape sequences \xA0 or any other non-standard format.
Can you run the same sequence of actions twice in the application?
In some cases, you can only perform a certain process once, such as deleting a user from the database.
Replay will fail after the first iteration, because the action is no longer valid. Verify that your business
process can be repeated in the application more than once with the same data, without recording again.
Were the image properties 'Id', 'Name' and 'Alt' empty?
In the Step Navigator, double click on the previous image step to open its properties. If the Id,Name,
and Alt properties are empty, provide further identification of the image, such as its file name in the Src
property.
Alternatively, you add an Ordinal argument to specify the occurrence number of the image on that
page. The Ordinal argument uniquely identifies each image on the page where all other identification
arguments are not unique. For more information, see the Function Reference (Help > Function
Reference).
Did the step's description change?
Check the Output pane for a list of the objects in the problematic step. In some cases, the object
description changes slightly from run to run.
There are several solutions:
User Guide
VuGen
HP LoadRunner (12.50) Page 444
lIf the new value is stable, open the Script View and manually modify the value of the step's
DESCRIPTION argument(s).
lIf the description changes from run to run, you can use a regular expression in the DESCRIPTION
argument(s). For more information, see the Function Reference (Help > Function Reference).
lAlternatively, replace the problematic object description property, such as Name, with the Ordinal
property For more information, see the Function Reference (Help > Function Reference).
Did the page load completely during recording?
During recording, it is best to wait for the page to load completely before doing the next step. If you did
not wait for all of the pages to load, record the script again.
Replay failure
If the replay fails at a particular step, check the step description. VuGen may have interpreted a single
space as a double space. Make sure that there are no incorrect double spaces in the string.
Replay snapshots
Replay snapshots may differ from the actual Web page.
Memory Issues
Out of memory error in JavaScript
Increase the JavaScript memory in the runtime settings.
Increase the JavaScript Memory Size
1. Select Replay > Runtime Settings and select the Internet Protocol > Preferences node.
2. Click Options to open the Advanced Options dialog box.
3. Locate the Memory Management JavaScript Runtime Memory Size (Kb) and Memory
Management JavaScript Stack Memory Size (Kb) options.
4. Increase the memory sizes to 512Kb or higher.
VuGen displays JavaScript errors
If VuGen displays JavaScript errors in the Output pane, enable IE (Internet Explorer) script errors in
order to verify that the Javascript itself does not contain errors.
Show Script Errors
1. Open Internet Explorer.
2. Select Tools > Internet Options and click the Advanced tab.
3. Under Browsing, select the Display a notification about every script error check box.
4. Rerun the application in IE. If IE displays script errors, then there is a problem with the JavaScript
application. If it is not possible to fix the application, you can safely ignore the corresponding replay
errors.
User Guide
VuGen
HP LoadRunner (12.50) Page 445
Problems following parameterization
If you encounter problems only after you have parameterized values, verify that the values are valid
for your application. Perform business process with the value of the parameter and verify that the
application accepts it.
Problems with applications that utilize styling actions
If the client-side scripts of the application use a lot of styling activities, you should record the script
again after enabling the Record rendering-related property values option. This enables the
recording of additional DOM objects.
Enable the "Record rendering-related property values" Option
1. Select Recording > Recording Options and select the GUI Properties > Advanced node.
2. Select the Record rendering-related property values check box.
3. Re-record the Vuser script.
Supported Environments
lActiveX objects and Java applets are only supported on Windows platforms.
lNot supported for Macromedia Flash or VB Script.
lClick & Script protocols do not support pop-up windows.
Citrix Protocol
Citrix Protocol - Overview
Citrix Vuser scripts emulate Citrix ICA protocol communication between a Citrix client and server. VuGen
records all activity during the communication and creates a Vuser script.
Before you can create scripts for the Citrix protocol, you must set up and configure your Citrix
environment to work with LoadRunner.
After the system is properly configured, VuGen generates Citrix functions when you perform actions on
the remote server. Each function begins with a ctrx prefix. These functions emulate the analog
movements of the mouse and keyboard. For example:
ctrx_mouse_click(44, 318, LEFT_BUTTON, 0, CTRX_LAST);
In addition, you can use other ctrx functions to synchronize the replay of the actions, by waiting for
specific windows to open.
VuGen also allows you to record a Citrix Web interface session. In this case, the Citrix client is installed,
but your interface is a browser instead of a client interface. To record Citrix Web interface sessions, you
must perform a multi-protocol recording for Citrix and Web Vusers. In multi-protocol mode, VuGen
generates functions from both Citrix and Web protocols during recording.
User Guide
VuGen
HP LoadRunner (12.50) Page 446
For more information about the syntax and parameters, see the Function Reference (Help > Function
Reference).
How to Set Up Your Citrix Environment
Before creating a Citrix script, you need to properly configure your Citrix client and server.
1. Prerequisite
Ensure that you are working with supported versions of your Citrix client and server as listed in the
latest LoadRunner Support Matrix, available from the Software Support site.
2. Setup your Citrix ICAclients
a. Install the client on the VuGen and Load Generator machines. To run your script, you must
install a Citrix client on the VuGen machine each Load Generator machine. If you do not have a
client installed, you can download one from the Citrix website www.citrix.com under the
Downloads section.
b. Verify the required VuGen Citrix settings. For some Citrix versions, the TCP/IP Citrix
connection option does not work. In that case, use the TCP/IP+HTTP Citrix connection option:
In the VuGen Recording Options dialog box, select Citrix >Login. In the Connection area, select
TCP/IP+HTTP as the Network Protocol. For more details, see "Citrix > Login Recording Options"
on page147.
3. Set up your Citrix Web Interface clients (Only when connecting to Citrix server
via Web Interface)
a. DEP. Before recording, Turn off Microsoft DEPon the VuGen machine. This is done in different
ways on different operating systems.
One way to do this on Vista, Windows 7, and Windows 2008 is as follows:
i. From the cmd shell, run bcdedit.exe/set nx AlwaysOff.
ii. Restart the computer.
b. Security Software. If possible, disable anti-malware and other security or antivirus software.
Alternatively, add an exception to ignore vugen.exe,runcitrixclient.exe (a LoadRunner
process)and wfica32.exe (the Citrix client process). Otherwise, your security software may
suspect LoadRunner's Web recording engine and prevent LoadRunner from launching your
application.
c. Disable the desktoptoolbar. The Citrix administrator should disable the desktop toolbar.
There are several ways to do this. Add ConnectionBar=0 to the default.ica file, or follow the
method described in: http://support.citrix.com/article/CTX122544.
(Relevant only for published desktops, not published applications.)
d. Internet Explorer Settings.
User Guide
VuGen
HP LoadRunner (12.50) Page 447
i. When working with Internet Explorer 8 or later, ensure that the Enable SmartScreen
Filter option (Internet Options >Advanced) is not selected.
ii. When recording on the Citrix Web Interface from a Windows server operating system,
Internet Explorer Enhanced Security (IEESC) must be disabled. This option is set in
different locations in different operating systems.
For example, in Windows 2008 server, you set this option from the Server Manager, using
the Configure IEESC option.
e. VuGen Settings.
i. Make sure that VuGen is set to create scripts containing only explicit URLs.
In the VuGen Recording Options dialog box, select General > Recording and click the
HTMLAdvanced button. In the Script type area, select:A script containing explicit URLs
only.
ii. Enable the Citrix server SessionToken correlation rules:
In the VuGen Recording Options dialog box, select Correlations > Rules, expand the
Citrix_XenApp node and select the relevant token option for the Citrix version you are
using. (If you are not sure which option to select, you can select all of them.)
4. Set Your Citrix client to work in non-seamless mode
LoadRunner can create Citrix scripts only in non-seamless mode (client opens within a Citrix
ICAwindow and not as a local application).
In the Citrix client, select Preferences > Session Settings andset Window size to No preference.
This setting is saved across Citrix settings for the same user. Alternatively , add TWIMode=Off in
the default.ica file on the server.
5. Configure the Citrix Server
a. Session Disconnect. By default, when a client times out or disconnects from the Citrix server,
the session remains open for a defined time period. However, beginning a run in a Citrix
session that has an unpredictable state can cause your test to fail.
Therefore, the Citrix server administrator should configure the Citrix server to end (reset)the
client session when a client disconnects for any reason.
b. Multi-Session Support. If you are going to run more than one Citrix Vuser on a load generator,
ensure that the Citrix server is configured to enable multiple sessions per user/client.
6. Install the LoadRunner Citrix Agent on the Citrix Server (Optional)
The LoadRunner Citrix Agent provides an additional level of object-oriented information about the
Citrix published application or desktop that enables you to improve the functionality and
robustness of your Citrix script. It also provides some extra enhancements over the normal Citrix
functionality. For details, see "Agent for Citrix Presentation Server - Overview" on the next page.
a. If you are upgrading the agent, make sure to uninstall the previous version before installing
the next one.
User Guide
VuGen
HP LoadRunner (12.50) Page 448

b. If your Citrix server requires administrator permissions to install software, log in as an
administrator to the server.
c. Ensure that Microsoft DEPis fully disabled. (DEPmust be disabled when using the agent.)
d. Locate the installation file, SetupCitrixAgent.exe, on the HPproduct installation disk in the
Additional Components\Agent for Citrix Server folder.
e. Follow the installation wizard to completion.
f. To enable logging for the agent, set DebugEnabled=1 in the [General] section of
CtrxAgent.ini file. The log file will be created in either the Agent’s bin\ folder or in session’s
%TEMP% folder, depending on user permissions.
Note:
oAfter installation, the agent will be active only for LoadRunner invoked Citrix
sessions—it will not be active Citrix sessions started without LoadRunner.
oTo uninstall, select HP Software Agent for Citrix Presentation Server in the
Add/Remove Programs window on the server machine.
oThe Citrix agent was designed to be cross-compatible, allowing you to use a one
version of LoadRunner and yet another version of the agent. It is recommended
that you use the most recent version of the agent.
Agent for Citrix Presentation Server - Overview
The Agent for Citrix Presentation Server, or Citrix Agent, is an optional utility that you can install on the
Citrix server. It provides enhancements to the normal Citrix functionality. The following sections
describe these enhancements.
It is provided in the product's installation disk and you can install it on any supported Citrix server. For
more information, see "Install the LoadRunner Citrix Agent on the Citrix Server (Optional)" on the
previous page For details on supported Citrix server versions, see the latest LoadRunner Support Matrix,
available from the Software Support site.
Object Detail Recording
If the Citrix Agent is installed on the Citrix server, then when you record a Citrix script, VuGen records
specific information about the active object instead of general information about the action. For
example, VuGen generates Obj Mouse Click and Obj Mouse Double Click steps instead of the Mouse
Click and Mouse Double Click that it generates without the agent.
The following example shows the same mouse-click action recorded with and without the agent
installation. Note that with an agent, VuGen generates ctrx_obj_xxx functions for all of the mouse
actions, such as click, double-click, and release.
/* Without Agent Installation */
ctrx_mouse_click(573, 61, LEFT_BUTTON, 0, test3.txt - Notepad);
User Guide
VuGen
HP LoadRunner (12.50) Page 449
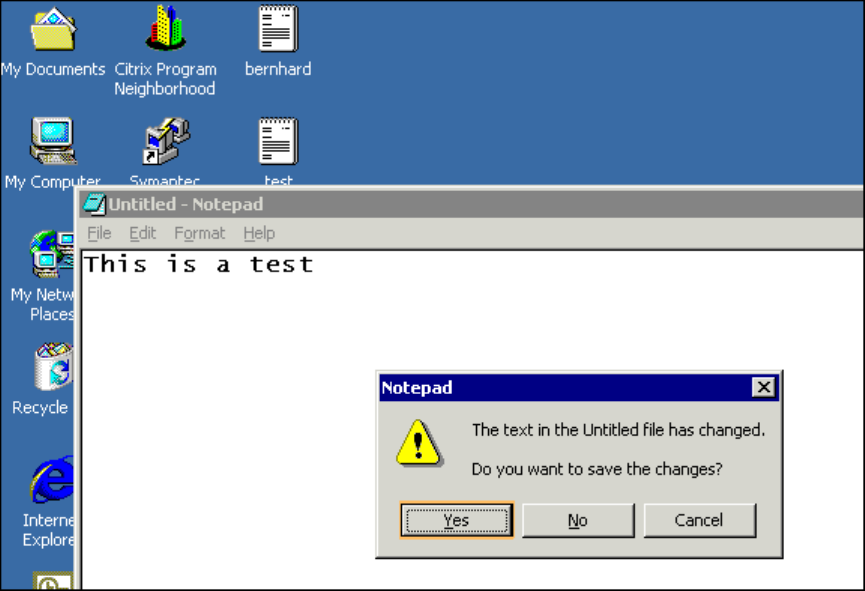
/* WIth Agent Installation */
ctrx_obj_mouse_click("<text=test3.txt - Notepad class=Notepad>" 573,
61, LEFT_BUTTON, 0, test3.txt - Notepad=snapshot21, CTRX_LAST);
In the example above, the first argument of the ctrx_obj_mouse_click function contains the text of the
window's title and the class, Notepad. Note that although the agent provides additional information
about each object, Vusers only access objects by their window name and the object coordinates.
Active Object Recognition
The Citrix Agent lets you see which objects VuGen detects in the client window . This includes all
Windows Basic Objects such as edit boxes, buttons, and item lists in the current window.
To see the detected objects, you move your mouse through the snapshot. VuGen highlights the borders
of the detected objects as the mouse passes over them.
In the following example, the Yes button is one of the detected objects.
Expanded Right-Click Menu
When you click within a snapshot, you can insert several functions into the script using the right-click
menu. When no agent is installed, you are limited to the Insert Mouse Click,Insert Mouse Double Click,
Insert Sync on Bitmap , and Insert Get Bitmap Value. If you are using a 256-color set, the Insert Sync
on Bitmap and Get Bitmap Value steps are not available from the right-click menu.
User Guide
VuGen
HP LoadRunner (12.50) Page 450
If the Citrix Agent is installed on the Citrix server, the following additional options are available from the
right-click menu of the Citrix window in focus:
lObj Get Info and Sync on Obj Info. Provide information about the state of the object: ENABLED,
FOCUSED, VISIBLE, TEXT, CHECKED, and LINES.
lInsert Sync on Obj Info. Instructs VuGen to wait for a certain state before continuing. This is
generated as a ctrx_sync_on_obj_info function.
lInsert Obj Get Info. Retrieves the current state of any object property. This is generated as a ctrx_
get_obj_info function.
lInsert Sync on Text and Get Text.
For more information on the above-mentioned synchronization steps, see "Citrix - Automatic
Synchronization" on page455 and "Citrix - Manual Synchronization" on page456.
These commands are interactive—when you insert them into the script, you are prompted to mark the
object or text area in the snapshot.
In the following example, the ctrx_sync_on_obj_info function provides synchronization by waiting for
the Font dialog box to come into focus.
ctrx_sync_on_obj_info("Font", 31, 59, FOCUSED, "TRUE", CTRX_LAST);
Utilizing VuGen's ability to detect objects, you can perform actions on specific objects interactively, from
within the snapshot.
Insert a Function Interactively Using the Agent Capabilities
1. Click at a point within the Step Navigator to insert the new step. Make sure that a snapshot is
visible.
2. Click within the snapshot.
3. To mark a bitmap:
a. Select it and choose Insert Sync on Bitmap from the right-click menu.
b. Mark the required area.
c. Click OK in the Sync on Bitmap dialog box. VuGen inserts the step into the script after the
currently selected step.
4. For all other steps, move your mouse over snapshot objects to determine which items are active—
VuGen highlights the borders of active objects as the mouse passes over them.
When the object is highlighted, right-click and select one of the Insert commands. A dialog box
opens with the step's properties.
User Guide
VuGen
HP LoadRunner (12.50) Page 451
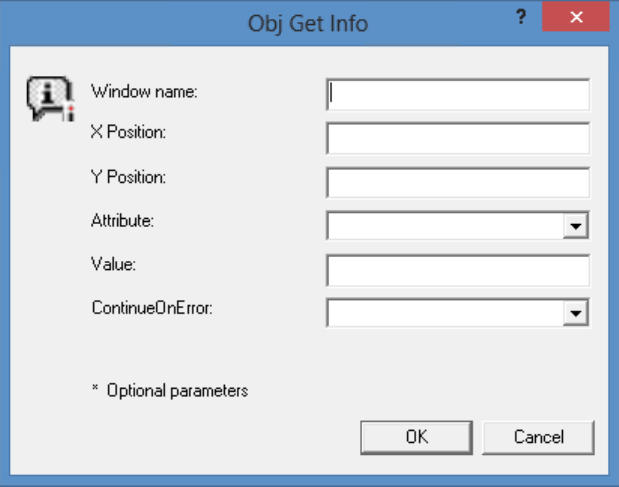
Set the desired properties and click OK. VuGen inserts the step into your script.
Text Retrieval
With the agent installed, VuGen lets you save standard text to a buffer. Note that VuGen can only save
true text—not a graphical representation of text in the form of an image.
You save the text using the Get Text step either during or after recording.
For additional details, see "Citrix - Manual Synchronization" on page456.
Citrix Recording Tips
Before recording a Citrix Vuser script, make sure your environment is set up as described in "How to Set
Up Your Citrix Environment" on page447, and then consider these guidelines:
Plan before recording
Make sure you have a well-defined business process planned, and run through it before recording it in
VuGen.
Avoid production environments if possible
Try to load test Citrix applications which are restricted (contained) to a few Citrix servers in a Citrix
development/test “farm” rather than to load test in a live Citrix production environment.
User Guide
VuGen
HP LoadRunner (12.50) Page 452
Consider creating your first test using single-protocol script before testing the Web
interface
Consider using a single-protocol Citrix ICAscript to load test the ICA elements of your application before
expanding the test to address the Web interface. Once you have stabilized the ICAsteps of your script, it
may be easier to troubleshoot any problems that arise in your multi-protocol script.
Record into appropriate sections
Record the connection process into the vuser_init section, and the closing process into the vuser_end
section. This will prevent you from performing iterations on the connecting and disconnecting. For more
information about recording into sections, see "Vuser Script Sections" on page141.
Ensure a clean session
When recording a session, make sure to perform the complete business process, starting with the
connection and ending with the cleanup. End your session at a point from where you could start the
entire process from the beginning. Do not leave any client or application windows open.
Use explicit clicks
When opening expanded menu options, click explicitly on each option—do not depend on the expanding
menu. For example, when choosing Start > All Programs > Microsoft Word, be sure to click on the line
All Programs.
Do not resize windows
To ensure exact reproduction of recorded actions, avoid moving or resizing windows while recording. If it
is absolutely necessary to change the size or position of a window, double-click on the relevant Sync on
Window step in the Step Navigator and modify the window's coordinates. This will often, but not always
give the desired replay results.
Make sure resolution settings are consistent
To ensure successful bitmap synchronization, make sure that the resolution settings match. On the
recording machine, check the settings of the Citrix client, the Recording Options, and the runtime
settings. On the load generators, check the settings of the Citrix client, and make sure that they are
consistent between all load generators and recording machines. If there is an inconsistency between
the resolutions, the server traffic increases in order to make the necessary adjustments.
Add Manual Synchronization Points
If it is necessary to wait for an event during recording, such as the opening of an application, add
manual synchronization points, such as Sync on Text (if using the Citrix agent)or Sync on Bitmap. For
details, see "Citrix - Manual Synchronization" on page456.
User Guide
VuGen
HP LoadRunner (12.50) Page 453
Use Classic Windows Style
For Sync on Bitmap steps, record windows in the "classic" windows style—not the XP style. To do this:
1. Click in the desktop area.
2. Select Properties from the right-click menu.
3. Click the Theme tab.
4. From the Theme list, select Windows Classic.
5. Click OK.
Modify or disable DEP
DEP (Data Execution Prevention) is a security feature included in Windows. It can interfere with some of
the Citrix Agent's functionality during record and replay, and may cause Internet Explorer to hang on the
VuGen machine. If you experience unusual behavior during recording, modify the DEP settings.
1. Open Start > Control Panel > System and Security > System > Advanced system settings. The
System Properties dialog box opens.
2. Select the Advanced tab, click the Settings button in the Performance section.
3. In the Performance Options dialog box, click the Data Execution Prevention tab. Select the first
option, Turn on DEP for essential Windows programs and services only.
If you cannot change this option, click Add. Browse to the client program, for example
IEXPLORE.EXE and click Open to add the application to the exception list.
4. If neither of the above options are possible, try to disable DEP completely.
a. Open a command prompt.
b. Run the following command: bcdedit.exe /set {current} nx AlwaysOff
c. Reboot the machine.
d. Verify that the settings took effect by running the following at the command line: BCDEdit
/enum
e. Verify that the last line shows nx AlwaysOff.
Disable Active X
If the application containing the Citrix session is a native Citrix binary file, disable AcitveX controls in
order to prevent execution of the Citrix Online plugin. To disable ActiveX, in Internet Explorer go to Tools
> Internet Options >Security tab. Click Custom level and under Run ActiveX controls and plug-ins
select Disable. Make sure that ActiveX is disabled for the Internet Zone to which the Citrix WebInterface
site belongs.
If you cannot change above settings, try to suppress the loading of the Citrix ActiveX object into the
browser's process by setting the SuppressCitrixOcxEnabledto flag to true in LR\config\bbhook.ini.
User Guide
VuGen
HP LoadRunner (12.50) Page 454
Disable Client Updates
Disable client updates when prompted by the Citrix client. This will prevent forward compatibility issues
between VuGen and newer Citrix clients that are not currently supported. (For details on supported
versions, see the latest LoadRunner Support Matrix, available from the Software Support site.)
For more help, see "Citrix - Troubleshooting and Limitations" on page463.
Citrix Synchronization
Synchronization refers to waiting for windows and objects to become available before executing an
action. This is necessary when recording Citrix scripts because, for example, if a step in a script opens a
window, and the next step performs an action in that window, the second step cannot be implemented
until the window opens. In order to ensure that VuGen does not replay the script incorrectly, it
automatically generates functions that synchronize the script by waiting for windows or objects to
become available. In addition, you can add synchronization functions manually.
For information about automatic synchronization, see "Citrix - Automatic Synchronization" below.
For information about manually adding synchronization points, see "Citrix - Manual Synchronization" on
the next page.
Citrix - Automatic Synchronization
During recording, VuGen automatically generates steps that help synchronize the Vuser's replay of the
script:
Sync on Window
The Sync on Window step instructs the Vuser to wait for a specific event before resuming replay. The
available events are Create and Active. The Create event waits until the window is created. The Active
event waits until the window is created and then activated (in focus). Usually VuGen generates a
function with a Create event. If, however, the next instruction is a keyboard event, VuGen generates a
function with an Active event.
In the Editor, the corresponding function call to the Sync on Window step is ctrx_sync_on_window.
Sync on Obj Info
The Sync on Obj Info step instructs the Vuser to wait for a specific object property before resuming
replay. The available attributes are Enabled,Visible,Focused,Text,Checked,Lines, or Item. The
Enabled, Visible, Focused, and Checked attributes are boolean values that can receive the values true or
false. The other attributes require a textual or numerical object value.
A primary objective of this step is to wait for an object to be in focus before performing an action upon
it.
User Guide
VuGen
HP LoadRunner (12.50) Page 455

VuGen automatically generates sync_on_obj_info steps when the Citrix agent is installed and the Use
Citrix Agent Input in Code Generation option is enabled in the Recording Options. By default, this
Recording option is enabled. For more information, see "Citrix > Code Generation Recording Options" on
page147.
ctrx_sync_on_obj_info("Run=snapshot9", 120, 144, TEXT, "OK",
CTRX_LAST);
Sync on Text
A text synchronization step, Sync on Text, instructs the Vuser to wait for a text string to appear at the
specified position before continuing. When replaying Sync on Text, the Vuser searches for the text in
the rectangle whose modifiable coordinates are specified in the step's properties.
Note: The maximum allowable length of a text string is 255 characters.
By default, automatic text synchronization is disabled. However, with the LoadRunner Citrix Agent
installed (see "Agent for Citrix Presentation Server - Overview" on page449), you can instruct VuGen to
automatically generate a text synchronization step before each mouse click or double-click. After this
option is enabled, it applies both to newly recorded scripts and also to existing scripts if you choose the
Record > Regenerate Script option. For more information, see "Citrix > Code Generation Recording
Options" on page147.
In the Editor, the corresponding function call to the Sync on Text step is ctrx_sync_on_text_ex.
The following segment shows a ctrx_sync_on_text_ex function that was recorded during a Citrix
recording with the Citrix Agent installed and text synchronization enabled.
ctrx_sync_on_window ("ICA Seamless Host Agent", ACTIVATE, 0, 0,391,224,
"snapshot1", CTRX_LAST);
ctrx_sync_on_text_ex (196, 198, 44, 14, "OK", "ICA Seamless Host Agent=snapshot2",
CTRX_LAST);
ctrx_obj_mouse_click ("<class=Button text=OK>", 196, 198, LEFT_BUTTON, 0, "ICA
Seamless Host Agent=snapshot2", CTRX_LAST);
For more information on this function, see the Function Reference (Help > Function Reference).
See "Citrix - Additional Ways to Synchronize Your Script" on the next page for additional information.
Citrix - Manual Synchronization
You can manually add synchronization steps both during and after recording. A common use of this
capability is where the actual window did not change, but an object within the window changed. Since
the window did not change, VuGen did not detect or record a Sync on Window.
For example, if you want the replay to wait for a specific graphic image in a browser window, you insert
manual synchronization. Or, if you are recording a large window with several tabs, you can insert a
synchronization step to wait for the new tab's content to open.
User Guide
VuGen
HP LoadRunner (12.50) Page 456
Note: You can also instruct LoadRunner to insert automatic synchronization steps during your
recording session. For details, see "Citrix - Automatic Synchronization" on page455.
Synchronize manually during recording
To add synchronization during recording, you use the floating toolbar. The Sync on Bitmap and Sync on
Text functions enable you to mark an area or text that needs to be visible within the client window
before resuming replay.
lTo insert a Sync on Bitmap step, click the Insert Sync on Bitmap button on the toolbar and mark
a rectangle around the desired area.
lTo insert a Sync on Text step (Citrix Agent required), click the Insert Sync on Text button on the
toolbar and mark a rectangle around the desired text.
Synchronize manually after recording
You can also add synchronization after the recording session. To add a synchronization step, right-click
in the Snapshot pane, and select a synchronization option:
lInsert Sync on Bitmap. Replay waits until the marked bitmap appears. You mark a rectangle around
the desired area.
lInsert Sync on Bitmap (by coordinates).This option is identical to the one above, except that it
allows you to manually enter coordinates for the synchronization area.
lInsert Sync on Obj Info. Waits until an object's attributes have the specified values (agent
installations only).
lSync on Text. Waits until the specified text is displayed (agent installations only).
Citrix - Additional Ways to Synchronize Your Script
In addition to automatic and manual synchronization in Citric Vuser scripts, you can add certain other
steps that affect the synchronization indirectly:
Setting a Delay
The ctrx_set_waiting_time step sets a waiting time for the other Citrix synchronization functions. This
setting applies to all functions that follow it within the script. For example, if your ctrx_sync_on_
window steps are timing out, you can increase the default timeout from 60 seconds to 180 seconds.
To insert this step, insert a ctrx_set_waiting_time step from the Steps toolbox.
Checking if a Window Exists or Closed
The ctrx_win_exist step checks if a window is visible in the Citrix client. By adding control flow
statements, you can use this function to check for a window that does not always open, such as a
warning dialog box. In the following example, ctrx_win_exist checks whether a browser was launched.
User Guide
VuGen
HP LoadRunner (12.50) Page 457

The second argument indicates how long to wait for the browser window to open. If the window did not
open in the specified time, it double-clicks the application's icon to open it.
if (!ctrx_win_exist("Welcome",6, CTRX_LAST))
ctrx_mouse_double_click(34, 325, LEFT_BUTTON, 0, CTRX_LAST)
To insert this step, insert a ctrx_win_exist step from the Steps toolbox.
Another useful application for this step is to check if a window has been closed. If you need to wait for a
window to close, you should use a synchronization step such as ctrx_unset_window.
For detailed information about these functions, see the Function Reference (Help > Function
Reference).
Waiting for a Bitmap Change
In certain cases, you do not know what data or image will be displayed in an area, but you do expect it to
change. To emulate this, you can use the ctrx_sync_on_bitmap_change function. Right-click in the
snapshot, and select Insert Sync on Bitmap from the right-click menu. VuGen inserts the step or
function at the location of the cursor.
The syntax of the functions is as follows:
ctrx_sync_on_bitmap (x_start, y_start, width, height, hash, CTRX_LAST);
ctrx_sync_on_bitmap_change (x_start, y_start, width, height, [initial_wait_time,]
[timeout,] [initial_bitmap_value,] CTRX_LAST);
The following optional arguments are available for ctrx_sync_on_bitmap_change:
linitial_wait_time. When to begin checking for a change.
ltimeout. The amount of time in seconds to wait for a change to occur before failing.
linitial_bitmap_value. The initial hash value of the bitmap. Vusers wait until the hash value is
different from the specified initial bitmap value.
In the following example, the recorded function was modified and assigned an initial waiting time of 300
seconds and a timeout of 400 seconds.
ctrx_sync_on_bitmap_change(93, 227, 78, 52,
300,400, "66de3122a58baade89e63698d1c0d5dfa",CTRX_LAST);
Note: If you are using ctrx_sync_on_bitmap, make sure that the screen settings in the
Controller, Load Generator machine, and VuGen are the same. Otherwise, VuGen may be unable
to find the correct bitmaps during replay. For information on how to configure the client
settings, see "Recording Options" on page146.
Failed Bitmap Synchronization Dialog Box
This dialog box enables you to decide what to do when a bitmap synchronization fails.
User Guide
VuGen
HP LoadRunner (12.50) Page 458
To
access
This dialog box opens automatically during replay when there is a mismatch between the
record snapshot and the replay snapshot in a bitmap synchronization step.
User interface elements are described below:
UI
Element
Description
Continue Accept the mismatch and use both the original and new snapshots as a basis for
comparison between screens during future replays. If replay returns either one of the
bitmaps, the Vuser will not fail.
Recording
Snapshot
A view of the recording snapshot.
Replay
Snapshot
A view of the replay snapshot.
Stop Consider the mismatch between the snapshots to be an error. This error will be handled
like all other errors and halt the execution by default. Alternatively, you can specify
Continue on Error for a specific function as described in "Citrix - Troubleshooting and
Limitations" on page463.
Citrix Replaying Tips
Before replaying a Citrix Vuser script, consider these guidelines:
Wildcards
You can use wildcards (*) in defining window names. This is especially useful where the window name
may change during replay, by its suffix or prefix.
In the following example, the title of the Microsoft Internet Explorer window was modified with a
wildcard.
ctrx_mouse_click(573, 61, LEFT_BUTTON, 0,
"Welcome to MSN.com - Microsoft Internet Explorer");ctrx_mouse_click(573, 61, LEFT_
BUTTON, 0,
"*- Microsoft Internet Explorer");
For more information, see the Function Reference (Help > Function Reference).
Run as a Process—not a Service
Since the Citrix protocol is GUI-based, it relies on several settings which are imperative for enabling
interactivity. The VuGen script was recorded in an interactive session configured with specific screen
settings, ClearType options, keyboard layouts, and so forth. If you run the test as a service, which by
default, uses the SYSTEM account, the settings will most likely be different. Any mismatch in the above
User Guide
VuGen
HP LoadRunner (12.50) Page 459
settings may result in a failed replay. Therefore, you should run the test as a process.
Enable Think Time
For best results, ensure that think time is enabled in the runtime settings. Think time is especially
relevant before the ctrx_sync_on_window and ctrx_sync_on_bitmap functions, which require time to
stabilize.
Set Initialization Quota
To prevent overloading by multiple Vusers while connecting, set an initialization quota of 4 to 10 Vusers
(depending on the capacity of the server) or apply ramp-up initialization using the Scheduler.
Set a Bitmap Polling Delay
To prevent a false failure in bitmap synchronization, set the Bitmap polling delay in the runtime
settings Citrix > Synchronization view, to a non-zero value. A recommended value is 1000 msecs.
Use Exact Tolerance
It is recommended to always use Exact tolerance for synchronization. Set the Default Image Sync
Tolerance in the runtime settings Citrix > Synchronization view, to Exact. Setting this option to Non-
exact is not effective for slight changes, such as a difference in the ClearType settings.
Set Consistency Between Machines
If you intend to replay the script on another machine, make sure that the following items are consistent
between the record and replay machines: Window Size (resolution), Window Colors, System Font,
ClearType, and the other Default Options settings for the Citrix client. These settings affect the hash
value of bitmaps, and inconsistencies may cause replay to fail. To view the Citrix client settings, right-
click an item from the Citrix program group and select Application Set Settings or Custom Connection
Settings. (Note that the remote session on the Citrix server inherits the ClearType settings of the local
machine.)
Increasing the Number of Vusers per Load Generator Machine
Load Generator machines running Citrix Vusers may be limited in the number of Vusers that can run,
due to the graphic resources available to that machine, also known as the GDI. To increase the number
of Vusers per machine, you can open a terminal server session on the machine to act as an additional
load generator.
The GDI count is operating system-dependent. The actual GDI (Graphics Device Interface) count for a
heavily loaded machine using LoadRunner is approximately 7,500. The maximum available GDI on most
Windows operating systems is 16,384.
For more information on creating a terminal server session, see "Terminal Services Overview" on
page1190.
User Guide
VuGen
HP LoadRunner (12.50) Page 460

Note: By default, sessions on a terminal server use a 256-color set. If you intend to use a
terminal session for load testing, make sure to record on machines with a 256-color set.
Citrix Debugging Tips
When your test does not run as expected, try these debugging tips:
Single Client Installation
If you are unsuccessful in recording any Citrix actions, verify that you have only one Citrix client installed
on your machine. To verify that only one client is installed, open the Add/Remove Programs dialog box
from the Control Panel and make sure that there is only one entry for a Citrix client.
Add Breakpoints
Add breakpoints to your script in VuGen to help you determine the problematic lines of code.
Synchronize Your Script
If replay fails, you may need to insert synchronization functions into your script to allow more time for
the desired windows to come into focus. Although you can manually add a delay using lr_think_time, we
recommend that you use one of the synchronization functions discussed in "Citrix - Automatic
Synchronization" on page455.
Regenerate Your Script
During recording, VuGen saves all of the agent information together with the script. By default, it also
includes this information in the script, except for the ctrx_sync_on_text steps. If you encounter text
synchronization issues, regenerate the script to include the text synchronization steps.
In addition, if you disabled the generation of agent information in the recording options, you can
regenerate the script to include them.
To regenerate a script, select Record > Regenerate Script and select the desired options. For more
information about regenerating scripts, see "How to Regenerate a Vuser Script" on page225.
Continue on Error
You can instruct Vusers to continue running even after encountering an error, such as not locating a
matching window. You specify Continue on Error for individual steps.
This is especially useful where you know that one of two windows may open, but you are unsure of
which. Both windows are legal, but only one will open.
To indicate Continue on Error:
1. In the Step Navigator, right-click on the step and select Show Arguments. In the Continue on Error
box, select the CONTINUE_ON_ERROR option.
User Guide
VuGen
HP LoadRunner (12.50) Page 461
2. In Script view, locate the function and add CONTINUE_ON_ERROR as a final argument, before
CTRX_LAST.
This option is not available for the following functions:
lctrx_key
lctrx_key_down
lctrx_key_up
lctrx_type
lctrx_set_waiting_time
lctrx_save_bitmap
lctrx_execute_on_window
lctrx_set_exception
View the Extended Log
You can view additional replay information such as:
lthe total amount of GDI handles being used
la list of the running Citrix processes (concentr.exe, receiver.exe, wfica32.exe, wfcrun32.exe) with
their PIDs and user names (if the process is not running under the LoadRunner user)
lthe Citrix client name
lincompatibility warnings
To view these details, enable Extended logging in the runtime settings ( F4 Shortcut key) Log tab. You
can view this information in the Output pane or in the output.txt file in the script's folder.
Save a Snapshot Bitmap
During recording, the bitmaps generated for the ctrx_sync_on_bitmap function are saved under the
script's data folder. The bitmap name has the format of hash_value.bmp. If synchronization fails during
replay, the generated bitmap is written to the script's output folder, or if you are running it in a
scenario, to wherever the output files are written. You can examine the new bitmap to determine why
synchronization failed.
Show Vusers
To show Vusers during a scenario, enter the following in the Vuser command line box: -lr_citrix_vuser_
view. In the Controller, open the Vuser Details dialog box and click More to expand the dialog box. Note
that this will affect the scalability of the test, so this should only be done to examine a problematic
Vuser's behavior.
To reduce the effect on the script's scalability, you can show the details for an individual Vuser by
adding the Vuser's ID at the end of the command line: -lr_citrix_vuser_view <VuserID>.
User Guide
VuGen
HP LoadRunner (12.50) Page 462
To open multiple Vusers, place a comma-separated list of IDs after the command line. Do not use
spaces, but you may use commas or dashes. For example, 1,3-5,7 would show Vusers 1,3,4,5, and 7, but
would not show Vuser 2, 6, or any Vuser with an ID higher than 7.
When recording with XenApp using a Citrix and Web multi-protocol script, manual modifications may be
required to ensure proper recording.
Citrix - Troubleshooting and Limitations
This section describes troubleshooting and limitations for Citrix Vusers.
General Limitations
lThe Citrix registry patch is installed when you record or replay a Citrix Vuser script for the first time.
In rare situations, the error log will indicate that it could not be installed. In this case, try to install the
registry patch manually. The patch can be found at: <LoadRunner installation>\dat\Enable_Citrix_
API.reg. To install the registry patch, double-click Enable_Citrix_API.reg on the relevant machine.
Note: The Citrix client is 32-bit software. Therefore, on a 64-bit OS, install this registry patch
under HKLM\SOFTWARE\Wow6432Node\ , and not under HKLM\SOFTWARE\ . To do this,
launch Enable_Citrix_API.reg from the 32-bit file manager or modify it before launching it
from Windows Explorer."
lRunning Citrix Vusers on virtual machines may adversely affect performance due to the sharing of
physical resources.
lText recognition may not work correctly for overlapped windows on Windows 2012 servers.
lOn Windows 8.1, in replay, the Start menu may not appear after clicking on the Start button.
Workaround: Add another ctrx_mouse_click function into the script below the recorded ctrx_
mouse_click or ctrx_obj_mouse_click functions.
lThe Citrix agent does not provide support for Java applications on x86 operating systems.
lIf an ICAscript succeeds in VuGen, but fails when running on a Load Generator, check the display on
the LoadGenerator machine. If it displays a Citrix dialog box titled, ICAClient File Security, then in the
Access section of the dialog box, select Full Accessand then select Never ask me again for any
application and click OKto apply your changes.
Note: You can also set these options in WebICA.ini. For details, see
http://support.citrix.com/article/CTX568194
lThe Citrix agent cannot capture text from Java-based applications or from Internet Explorer version
9 and later.
lThe Citrix agent cannot capture text from certain Java controls with overlapping text boxes, such as
User Guide
VuGen
HP LoadRunner (12.50) Page 463
drop down and combo boxes.
lThe recording window size option does not work properly with the Plugin for Hosted Applications 11.
The size of the client window is captured, but the server screen resolution is not. This is a Citrix Client
limitation and may be fixed in future Citrix Client versions.
Workaround: When recording, set the window size equal to the local screen resolution. When
replaying/load testing, set the VuGen or Load Generator screen resolution to equal the resolution
used when the script was recorded. To verify the recorded resolution, view the Window property in
the <Script Folder>\default.cfg file.
lThe Citrix Connection Center may prevent record and replay of Citrix ICA scripts, if it is running in a
different user session on the same machine.
Workaround: Close all instances of the concenter.exe process for all users. To prevent the Citrix
Connection Center from starting automatically, set the ConnectionCenter registry key to an empty
value. This key can be found at:
For 32-bit systems: HKEY_LOCAL_MACHINE\SOFTWARE\Microsoft\Windows\CurrentVersion\Run
For 64-bit systems: HKEY_LOCAL_MACHINE\SOFTWARE\Wow6432Node\Microsoft\Windows\Curr
lRecording a Citrix Web Interface script on Internet Explorer 9 is supported only from Citrix client
version 12.1.0.44 or later.
Effects and Memory Requirements of Citrix Agent
When you run Citrix Vusers with the agent installed, each Vuser runs its own process of ctrxagent.exe.
This results in a slight reduction in the number of Vusers that can run on the server machine (about 7%).
When the agent is installed, the memory requirements per Citrix Vuser is approximately 4.35 MB. To run
25 Vusers, you would need 110 MBs of memory.
Random Failures of Functions Accessing Citrix Agent
Communication between Citrix Server and Citrix client-side software is directed via Citrix ICA Virtual
Channels. This is a bi-directional connection for the exchange of packet data.
Each Vuser opens its own instance of HP Citrix Agent on the server side, and, respectively, its own virtual
channel. Citrix Virtual Channels may become unreliable under high load. As a consequence, functions
that rely on Citrix Agent API (ctrx_get_text(), ctrx_sync_on_obj_info() etc.) may fail randomly.
Workaround: Use a TCP channel for communication with the Citrix Agent. Set the following flags:
TCPChannel=1 in the [CITIRX] section of the script’s default.cfg configuration file,
TcpChannelEnabled=1 in the [ChannelConfig] section of the CtrxAgent.ini file.
Note that for MinPortValue and NumPorts flags in CtrxAgent.ini, the agent tries to find a free port and
enumerates NumPorts ports starting from MinPortValue. If you have firewall software on the Citrix
server or load generator, make sure to configure it to allow connections on these ports.
User Guide
VuGen
HP LoadRunner (12.50) Page 464
Citrix Agent will not start
If the Citrix Agent does not start, check that corresponding keys are present in the registry.
In order to be launched during session initialization, Citrix Agent’s installer writes it to registry. For
servers, it adds it under HKLM\SOFTWARE\Microsoft\Windows NT\CurrentVersion\Winlogon, and for
client machines under HKLM\SOFTWARE\Microsoft\Windows\CurrentVersion\Run.
Also, make sure the Citrix agent's installation folder, usually C:\Program Files (x86)\HP\Agent for Citrix
Server, is set to "Read and Execute" and not only “Read”.
Unexpected Disconnection
If you experience an unexpected disconnection, it may be a result of connecting to a session that
already exists on the server. When a Vuser enters an existing session, it cannot receive Windows events
from a Citrix ICA object. This is a limitation of the Citrix software.
Workaround: To prevent this, ask the Citrix administrator to configure sessions on the Citrix server to
be terminated immediately after disconnect or log off. In the VuGen script side, make sure to add a
ctrx_logoff() function at the end of the script (in the vuser_end section).
Citrix Receiver -Security Warning
The Citrix client may prompt you with a warning "An online application is attempting to access files in
your computer". This dialog box blocks the replay because it requires user intervention.
Workaround: To prevent this, configure the registry on the Citrix client machine to allow it to silently
access local drives, as described in http://support.citrix.com/article/CTX124921.
Failed to get session from client
This error occurs when the Citrix registry patch (LR\dat\Enable_Citrix_API.reg) is not installed
Workaround:Make sure the AllowSimulationAPI key is present in the above registry and not set to 0, as
it enables Citrix ICO functionality. Note that in 64-bit operating systems, these keys should reside under
the HKLM\Software\Wow6432Node, node, since the Citrix client is a 32-bit application.
Citrix Error 13 "Unsupported Function"
The Citrix Error 13 is a general error code that usually refers to an error for which Citrix do not provide a
specific code. This error is most common in Performance Center and BPM environments where Citrix
processes (wfica32.exe, wfcrun32.exe, concentr.exe, receiver.exe…) are running in sessions other than
that of the mdrv process.
Workaround: Use TaskManager or ProcessExplorer to find and kill all of these processes.
Citrix Error 70, Client Error 1030 "Protocol driver error"
This error may occur for several reasons: network issues, proxy configuration, and so forth. Often, it
occurs when you are running a Citrix+Web multi-protocol script recorded against a secured (https) Web
User Guide
VuGen
HP LoadRunner (12.50) Page 465

Interface site, and the certificate required by this site is missing on the Load Generator machine.
Workaround: Try to open the published application from the Web Interface on the problematic machine.
Look at the log file %APPDATA%\ICAClient\wfcwin32.log and search for “SSL Error 61”. If you find this
text, it is clearly a certificate issue. For example,
09-18-2014 10:28:55:380 Calculator MUCFARMEXT01: SSL Error 61: You have not chosen
to trust "AddTrust External CA Root", the issuer of the server's security
certificate.
Compare certificates on the Load Generator and VuGen machines and install the missing one. Make
sure that the attributes match—do not rely on a matching certificate name only. You must also check
also other attributes such as “Expiration date”.
Capturing Empty Text
In certain Windows 7 installations, VuGen is unable to capture the actual text during recording. Instead it
captures empty text.
Workaround:
1. Open Start > Control Panel > System and Security > System > Advanced system settings. The
System Properties dialog box opens.
2. Select the Advanced tab and click the Settings button in the Performance section.
3. In the Performance Options dialog box, click the Visual Effects tab.
4. Clear the check box adjacent to the last option, Use visual styles on windows and buttons.
Click & Script Protocols
Note: From LoadRunner 12.00 and later, Web (Click & Script) is only supported for replay—not
recording.
Click & Script Protocols - Overview
The Click & Script protocols—Ajax (Click &Script) and SAP (Click & Script)—record Web sessions on a
user-action GUI level. VuGen creates a GUI-level script that intuitively represents actions in the Web
interface. For example, VuGen generates a web_button function when you click a button to submit
information, and VuGen generates a web_edit_field function when you enter text into an edit box.
Click & Script Vusers support non-HTML code such as Javascript on the client side. VuGen creates an
intuitive script that emulates your actions on the web page, and executes the necessary Javascript
code.
Click & Script Vusers handle most correlations automatically, reducing the time required to create the
script. In most cases, you do not need to define rules for correlations or perform manual correlations
after the recording.
User Guide
VuGen
HP LoadRunner (12.50) Page 466
Click & Script Vusers allow you to generate detailed Business Process Reports which summarize the
script. For example, when you click a button to submit data, VuGen generates a web_button function. If
the button is an image, VuGen generates a web_image_submit function. In the following example, a
Vuser clicks the Login button.
web_image_submit("Login",
"Snapshot=t4.inf",
DESCRIPTION,
"Alt=Login",
"Name=login",
"FrameName=navbar",
ACTION,
"ClickCoordinates=31,6",
LAST);}
The next section illustrates a user navigating to the Asset ExpressAdd process under the Manage Assets
branch. The user navigates by clicking the text links of the desired branches, generating web_text_link
functions.
web_text_link("Manage Assets_2",
DESCRIPTION,
"Text=Manage Assets",
"Ordinal=2",
"FrameName=main",
ACTION,
"UserAction=Click",
LAST);
web_text_link("Use",
DESCRIPTION,
"Text=Use",
"FrameName=main",
ACTION,
"UserAction=Click",
LAST);
web_text_link("Asset ExpressAdd",
DESCRIPTION,
"Text=Asset ExpressAdd",
"FrameName=main",
ACTION,
"UserAction=Click",
LAST);
In the following example, the web_list function emulates the selection of a list item.
web_list("Year",
DESCRIPTION,
"Name=Year",
"FrameName=CalFrame",
ACTION,
"Select=2000",
LAST);
User Guide
VuGen
HP LoadRunner (12.50) Page 467

When you click on an image that is associated with an image map, VuGen generates a web_map_area
function.
web_map_area("map2_2",
DESCRIPTION,
"MapName=map2",
"Ordinal=20",
"FrameName=CalFrame",
ACTION,
"UserAction=Click",
LAST);
Note: Click & Script Vusers do not support applets or VB script. If the Web site that is accessed
by the Vusers contains these items, use the Web - HTTP/HTML protocol.
Click & Script Recording Tips
This section lists tips for recording click-and-script Vuser scripts.
Note: Some of the items below apply to specific click-and-script protocols only.
Use the Mouse and not the Keyboard
It is preferable to click on an object with the mouse rather than using the keyboard. During recording,
use only GUI objects that are within the browser's pane. Do not use any browser icons, controls, the Stop
button, or menu items, such as View > Refresh. You may, however, use the Refresh, Home, Back and
Forward buttons and the address bar.
Do not Record Over an Existing Script
It is best to record into a newly created script—not an existing one.
Avoid Context Menus
Avoid using context menus during recording. Context menus are right-click menus which pop up when
clicking certain objects in a graphical user interface.
Avoid Working in Another Browser While Recording
While recording, do not work in any browser window other than the browser windows opened by VuGen.
Wait for Downloads
Wait for all downloads to complete before doing any action, such as clicking on a button or filling in a
User Guide
VuGen
HP LoadRunner (12.50) Page 468

text field.
Wait for Pages to Load
During recording, it is best to wait for the page to load completely before doing the next step. If you did
not wait for all of the pages to load, record the script again.
Navigate to the Start Page
If the last page in an action does not contain the links and buttons that were available at the start of
the iteration, then the next iteration will fail. For example, if the first page has a text link Book A Flight,
make sure to navigate to the appropriate page at the end of your recording, so that the same link will
be visible at the end of the business process.
Use a Higher Event Configuration Level
Record the business process again using the High event configuration level. For more information on
changing the event configuration level, see "Click & Script Troubleshooting and Limitations" on
page476.
Disable Socket Level Recording
In certain cases, the capturing of the socket level messages disrupts the application. For most
recordings, socket level data is not required. To prevent the recording of socket level data, disable the
option in the recording options. For more information, see "GUI Properties > Advanced Recording
Options" on page177.
Enable the "Record rendering-related property values" Option
If the client-side scripts of the application use a lot of styling activities, enable the Record rendering-
related property values option before recording the script. For example, enable this option to record
additional DOM properties such as offsetTop. Note that enabling this option may decrease the recording
speed. You can enable the option by selecting Recording Options > GUI Properties > Advanced. For
more information, see "GUI Properties > Advanced Recording Options" on page177.
Click & Script - Replay Tips
This section lists tips for replaying click-and-script Vuser scripts.
Note: Some of the items below apply to specific click-and-script protocols only.
Do not Reorder Statements in a Recorded Script
Do not change the order of the statements within a recorded script. Also, copying segments of code
from one Action to another is not recommended.
User Guide
VuGen
HP LoadRunner (12.50) Page 469
Convert non-ASCII Characters
If your links contain non-ASCII characters, you should instruct VuGen to convert the data to or from the
UTF-8 format.
Enable UTF-8 Conversion
1. Select Replay > Runtime Settings and select the Internet Protocol > Preferences node.
2. Click Options to open the Advanced Options dialog box.
3. Locate the Convert from/to UTF-8 option and set it to Yes.
Alternatively, view the list of options that is displayed when a link is not found. Enter the displayed text
as-is, such as the hex escape sequences \xA0 or any other non-standard format.
Run the Same Sequence of Actions Twice
In some cases, you can perform a certain process only once—such as deleting a user from the
database. Replay will fail after the first iteration because the action is no longer valid. Verify that your
business process can be repeated more than once with the same data.
Set Unique Image Properties
In the Step Navigator, double click on the previous image step to open its properties. If the Id,Name,
and Alt properties are empty, provide further identification of the image, such as its file name in the Src
property.
Alternatively, you can add an Ordinal argument to specify the occurrence number of the image on that
page. The Ordinal argument uniquely identifies each image on the page where all other identification
arguments are not unique. For more information, see the Function Reference (Help> Function
Reference).
Check the Step's Description
If you receive a GUI Object is not found error, check the Output pane for a list of the objects in the
problematic step. In some cases, the object description changes slightly from run to run.
There are several solutions:
lIf the new value is stable, open the script in the Editor and manually modify the value of the step's
DESCRIPTION argument.
lIf the description changes from run to run, you can use a regular expression in the DESCRIPTION
argument. For more information, see the Function Reference (Help>Function Reference).
lAlternatively, replace the problematic object description property, such as Name, with the Ordinal
property. For more information, see the Function Reference (Help>Function Reference).
ThreadingModel
Replay of COM script in VuGen fails when the dll registration is missing the ThreadingModel string under
User Guide
VuGen
HP LoadRunner (12.50) Page 470

the InprocServer32 folder of the GUID.
Click & Script Miscellaneous Tips
The following additional tips may help you in troubleshooting problems that you experience with click-
and-script Vuser scripts.
Note: Some of the items below apply to specific click-and-script protocols only.
Search for Warnings
Search for warnings or alerts in the Output pane.
Verify the Response
Verify the response of the previous step is correct using web_reg_find. For more information, see the
Function Reference (Help > Function Reference).
Use Alternate Navigation
For problematic steps or those using Java applets, use Alternative Navigation to replace the Web step
with an HTTP level step. Note that the HTTP level steps may require manual correlations. To perform
Alternative Navigation, select a step in the Step Navigator, or the text in Script View, and select Replace
with alternative navigation from the right-click menu.
Working with the Kerberos Protocol
If you are using the Kerberos Protocol for authentication, you must customize VuGen to properly
convene authorization sessions. Advanced users can attempt to perform this customization
themselves.
In order for the Kerberos Protocol to work properly, create a krb5.ini file and put it in an available folder.
Save the full path name of krb5.ini into the KRB5_CONFIG environment variable.
The krb5.ini file should contain detailed information about each domain (KDS and AS addresses) and
trust chains.
For more information, contact HP software support.
Click & Script Enhancements
The following section describes several enhancements that can assist you in creating your script.
Most of the features described below are enhancements to the API functions. For detailed information
about the functions and their arguments, see the Function Reference (Help>Function Reference) or
click F1 on any function.
User Guide
VuGen
HP LoadRunner (12.50) Page 471
Adding conditional steps
The Web (Click & Script) functions, web_xxxx, allow you to specify conditional actions during replay.
Conditions are useful, for example, if you need to check for an element and perform an action only if
the element is found.
For example, suppose you perform an Internet search and you want to navigate to all of the result
pages by clicking Next. Since you do not know how many result pages there will be, you need to check if
there is a Next button, indicating another page, without failing the step. The following code adds a
verification step with a notification—if it finds the Next button, it clicks on it.
While (web_text_link("Next",
DESCRIPTION,
"Text=Next",
VERIFICATION,
"NotFound=Notify",
ACTION, "UserAction=Click",
LAST) == LR_PASS);
For details about the syntax and use of the VERIFICATION section, see the Function Reference
(Help>Function Reference).
Checking a page title
In web_browser steps, you can use the title verification recording option to make sure that the correct
page is downloaded. You can instruct the Vuser to perform this check automatically for every step or
every navigation to a new top level window.
In addition, you can manually add title verifications to your script at the desired locations, using both
exact and regular expression matches.
web_browser("test_step",
DESCRIPTION,
...
VERIFICATION,
"BrowserTitle=Title",
ACTION,]
,
LAST);
For more information, see theFunction Reference (Help>Function Reference).
You can set title verification options directly from within the Recording options. For more information,
see the section about recording with Click & Script.
Text check verification
Using text checkpoints, you can verify that a text string is displayed in the appropriate place on a Web
page or application and then perform an action based on the findings. You can check that a text string
exists (ContainsText),or that it does not exist (DoesNotContainText),using exact or regular expression
User Guide
VuGen
HP LoadRunner (12.50) Page 472

matching.
For example, suppose a Web page displays the sentence "Flight departing from New York to San
Francisco". You can create a text checkpoint that checks that the words "New York" are displayed
between "Flight departing from" and "to San Francisco". (In this example, you would need to use regular
expression criteria.)
To implement these checkpoints, you add the Text Check related arguments to the VERIFICATION
section of the step. During replay, Vusers search the innerText of the browser's HTML document and
any child frames. The NotFound argument specifies the action to take if verification fails, either
because the object was not found or because the text verification failed: Error, Warning, or Notify.
You can manually add text verifications to your script for existing steps. Place the text verification after
the step that generated the element.
The text validation arguments are valid for the following Action functions: web_browser,web_element,
web_list,web_text_link,web_table, and web_text_area.
Note: You can only use the same type of text verification once per step (for example,
ContainsText twice). If you want to check for multiple texts, separate them into several steps.
You can, however, use different verifications in the same step (for example, ContainsText =;
DoesNotContainText). In this case, all conditions have to be met in order for the step to pass.
In the following example, the verification arguments check that we were not directed from
www.acme.com to the French version of the website, acme.com/fr.
web_browser("www.acme.com",
ACTION,
"Navigate=http://www.acme.com/",
LAST);
web_browser("Verify",
VERIFICATION,
"ContainsText=Go to Acme France",
"DoesNotContainText=acme.com in English",
LAST);
Saving a Java script value to a parameter
The EvalJavaScript argument lets you evaluate Java Script on the Web page.
Suppose you want to click on a link which has the same name as the page title. The following example
evaluates the document title and uses it in the next web_text_link function.
web_browser("GetTitle",
ACTION,
"EvalJavaScript=document.title;",
"EvalJavaScriptResultParam=title",
LAST);
web_text_link("Link",
User Guide
VuGen
HP LoadRunner (12.50) Page 473
DESCRIPTION,
"Text={title}",
LAST);
Working with custom descriptions
Suppose you want to randomly click a link that belongs to some group. For example, on hp.com you
want to randomly select a country. Regular description matching will not allow this type of operation.
However, using a custom description argument, you can identify the group with an attribute that is
common to all the links in the group.
Using the custom description argument, you specify any attribute of the element, even those that are
not predefined for that element. During replay, the Vuser searches for those attributes specified in the
DESCRIPTION section. Replay will not fail on any unknown argument in the DESCRIPTION section.
For example, to find the following hyperlink:
<a href="yahoo.com" my_attribute="bar">Yahoo</a>, use:
web_text_link("yahoo",
DESCRIPTION,
"Text=yahoo",
"my_attribute=bar",
LAST);
In the following example, since all the relevant links have the same class name, newmerc-left-ct, you
can perform a random click using the following code:
web_text_link("Click",
DESCRIPTION,
"Class=newmerc-left-ct",
"Ordinal=random",
LAST);
The following functions do not support the custom description arguments: web_browser,web_map_
area,web_radio_group, and web_reg_dialog.
Copying text to the clipboard
VuGen lets you copy text from a browser to the clipboard. This functionality is available in both the Page
view and Page Source view. For details on how to copy the text to the clipboard, see "How to Work with
Snapshots" on page276.
Click & Script API Notes
This section lists general notes about the Web functions. Note that you can specify a regular expression
for most object descriptions, by preceding the text with "/RE" before the equals sign. See the Function
Reference (Help > Function Reference) for more details. For example:
User Guide
VuGen
HP LoadRunner (12.50) Page 474
web_text_link("Manage Assets",
DESCRIPTION,
"Text/RE=(Manage Assets)|(Configure Assets)",
ACTION,
"UserAction=Click",
LAST);
Ordinals
The Ordinal attribute is a one-based index to distinguish between multiple occurrences of objects with
identical descriptions. In the following example, the two recorded web_text_link functions have
identical arguments, except for the ordinal. The ordinal value of 2, indicates the second occurrence.
web_text_link("Manage Assets",
DESCRIPTION,
"Text=Manage Assets",
"FrameName=main",
ACTION,
"UserAction=Click",
LAST);
web_text_link("Manage Assets_2",
DESCRIPTION,
"Text=Manage Assets",
"Ordinal=2",
"FrameName=main",
ACTION,
"UserAction=Click",
LAST);
Empty Strings
There is a difference between not specifying an argument and specifying it as an empty string. When
you do not specify an argument, VuGen uses the default value or ignores it. When you list an argument,
but assign it an empty string as a value, VuGen attempts to find a match with an empty string or no
string at all. For example, omitting the id argument instructs VuGen to ignore the id property of the
HTML element. Specifying "ID=" searches for HTML elements with no id property or with an empty ID.
web_text_link("Manage Assets_2",
DESCRIPTION,
"Text=Manage Assets",
"Id=",
"FrameName=main",
ACTION,
"UserAction=Click",
LAST);
User Guide
VuGen
HP LoadRunner (12.50) Page 475

Click & Script Troubleshooting and Limitations
This section describes troubleshooting and limitations for click-and-script protocols.
Note: Some of the items below apply to specific click-and-script protocols only.
Recording Issues and Limitations
Browser support
lOnly Internet Explorer is supported for Click & Script protocols. To record browser activity on Firefox,
use the Web (HTTP/HTML) protocol.
Language Support
lRecording an application in a specific language (e.g., French, Japanese) must be performed on a
machine whose default locale (in Settings > Control Panel > Regional Options) is the same language
lSupport of right-to-left languages is limited (e.g., bi-directional or reversed text may not be
processed as expected). This is defined by the default operating system translation table.
lThe locale of the load-generator machine, must be configured to be the same as that of the
recording machine. It cannot be assumed that the Linux default character set is the same as in
Windows, even for US-English machines, and this has to be explicitly verified. For example, the
default character set on Linux, is UTF-8.
Application behaves differently while being recorded
If your application behaves differently during recording, than it does without recording, you should
determine if the recording problem is unique to Web. The effect may be that a Web page will not load,
part of the content is missing, a popup window does not open, and so forth.
Create a new Web (HTTP/HTML) script and repeat the recording.
In the event that the recording fails in Web (HTTP/HTML), we recommend that you disable socket level
recording (see "Click & Script Recording Tips" on page468).
The problem may be the result of an event listener. Use trial and error to disable event listeners in the
Web Event Configuration Recording Options, and then re-record your session as a Web user.
Certain Click & Script steps do not generate properly
After recording a script, if not all steps are correctly generated, the problem may be due to the
Windows Component > Internet Explorer Enhanced Security Configuration.
Remove Internet Explorer Enhanced Security Configuration by selecting Control Panel > Add or
Remove Programs > Add or Remove Windows Components and re-record your script.
Disable an Event Listener
1. Click Record > Recording Options to open the Recording Options dialog box.
User Guide
VuGen
HP LoadRunner (12.50) Page 476
2. Select the GUI Properties > Web Event Configuration node.
3. Click Custom Settings and expand the Web Objects node. Select an object.
4. Select Disabled from the list in the Record column for the relevant Web object. If the recording still
does not work, enable the listener you previously disabled, and try disabling another one. Repeat
these steps until your recording succeeds.
Dynamic menu navigation was not recorded
A dynamic menu is a menu that dynamically changes depending on where you select it. If the dynamic
menu navigation was not recorded, record again using "high" event configuration mode. These settings
can be found in the Recording Options > GUI Properties > Web Event Configuration node.
Certain user actions were not recorded
Check if there is a Java applet running inside the browser. If not, record the script with the Web
(HTTP/HTML) protocol.
Replay Issues
GUI object not found
Does the error occur at the beginning of the second iteration?
If the error occurs at the beginning of the second iteration's Action section, it is probably the result of a
starting page that was present for the first iteration, but missing for the second one. If the last page in
an action does not contain the links and buttons that were available at the start of the iteration, then
the next iteration will fail. For example, if the first page has a text link Book A Flight, make sure to
navigate to the appropriate page, so that the same link will be visible at the end of the business
process.
Is it a text link containing non-ASCII characters?
If the problem occurs with non-ASCII characters, you should instruct VuGen to covert the data to a
suitable character set.
Enable Data Conversion on Windows Machines
1. Select Replay > Runtime Settings and select the Internet Protocol > Preferences node.
2. Click Options to open the Advanced Options dialog box.
3. Locate Charset Conversions by HTTP in the Web (Click & Script) > General options, and set it to
Yes.
Enable UTF-8 conversion for Linux Machines
1. Select Replay > Runtime Settings and select the Internet Protocol > Preferences node.
2. Click Options to open the Advanced Options dialog box.
3. Locate Convert from/to UTF-8 in the General options and set it to Yes
Alternatively, view the list of alternatives that are displayed when a link is not found. Enter the displayed
text as-is, such as hex escape sequences \xA0 or any other non-standard format.
User Guide
VuGen
HP LoadRunner (12.50) Page 477
Can you run the same sequence of actions twice in the application?
In some cases, you can only perform a certain process once, such as deleting a user from the database.
Replay will fail after the first iteration, because the action is no longer valid. Verify that your business
process can be repeated in the application more than once with the same data, without recording again.
Were the image properties 'Id', 'Name' and 'Alt' empty?
In the Step Navigator, double click on the previous image step to open its properties. If the Id,Name,
and Alt properties are empty, provide further identification of the image, such as its file name in the Src
property.
Alternatively, you add an Ordinal argument to specify the occurrence number of the image on that
page. The Ordinal argument uniquely identifies each image on the page where all other identification
arguments are not unique. For more information, see the Function Reference (Help > Function
Reference).
Did the step's description change?
Check the Output pane for a list of the objects in the problematic step. In some cases, the object
description changes slightly from run to run.
There are several solutions:
lIf the new value is stable, open the Script View and manually modify the value of the step's
DESCRIPTION argument(s).
lIf the description changes from run to run, you can use a regular expression in the DESCRIPTION
argument(s). For more information, see the Function Reference (Help > Function Reference).
lAlternatively, replace the problematic object description property, such as Name, with the Ordinal
property For more information, see the Function Reference (Help > Function Reference).
Did the page load completely during recording?
During recording, it is best to wait for the page to load completely before doing the next step. If you did
not wait for all of the pages to load, record the script again.
Replay failure
If the replay is failing at a particular step, check the step description. VuGen sometimes reads a single
space as a double space. Make sure that there are no incorrect double spaces in the string.
Miscellaneous Issues
Out of memory error in JavaScript
Increase the JavaScript memory in the Runtime settings.
Increase the JavaScript Memory Size
1. Select Replay > Runtime Settings and select the Internet Protocol > Preferences node.
2. Click Options to open the Advanced Options dialog box.
User Guide
VuGen
HP LoadRunner (12.50) Page 478
3. Locate the Memory Management JavaScript Runtime Memory Size (Kb) and Memory
Management JavaScript Stack Memory Size (Kb) options.
4. Increase the memory sizes to 512Kb or higher.
VuGen displays JavaScript errors
If VuGen displays JavaScript errors in the Output pane, enable IE (Internet Explorer) script errors in
order to verify that the Javascript itself does not contain errors.
Show Script Errors
1. Open Internet Explorer.
2. Select Tools > Internet Options and click the Advanced tab.
3. Under Browsing, select the Display a notification about every script error check box.
4. Rerun the application in IE. If IE displays script errors, then there is a problem with the JavaScript
application. If it is not possible to fix the application, you can safely ignore the corresponding replay
errors.
Problems following parameterization
If you encounter problems only after you have parameterized values, verify that the values are valid
for your application. Perform business process with the value of the parameter and verify that the
application accepts it.
Problems with applications that utilize styling actions
If the client-side scripts of the application use a lot of styling activities, you should record the script
again after enabling the Record rendering-related property values option. This enables the
recording of additional DOM objects.
Enable the "Record rendering-related property values" Option
1. Select Recording > Recording Options and select the GUI Properties > Advanced node.
2. Select the Record rendering-related property values check box.
Re-record the Vuser script.
COM/DCOM Protocol
COM/DCOM Protocol Overview
When you record COM client applications, VuGen generates functions that describe COM client-server
activity. The recorded script contains interface declarations, API calls and instance calls to methods.
Each COM function begins with an lrc prefix. You can configure the programming language in which to
create a Vuser script as either C or Visual Basic.
For each COM/DCOM Vuser script, VuGen creates the following:
User Guide
VuGen
HP LoadRunner (12.50) Page 479
lInterface pointer and other variable declarations in the interfaces.h file.
lFunction calls that you can record in the vuser_init, actions or vuser_end sections of the Vuser file.
lA user.h file containing the translation of the Vuser script into low level calls.
COM/DCOM Technology Overview
This section provides an outline of COM technology. This should be enough to get you started with COM
Vuser scripts. See Microsoft Developer's Network (MSDN) and other documentation for further details.
COM (Component Object Model) is a technology for developing reusable software components ("plug-
ins"). DCOM (Distributed COM) allows use of COM components on remote computers. Microsoft
transaction servers (MTS), Visual Basic and Explorer all use COM/DCOM technology. Thus, the application
you are testing may use COM technology indirectly, even though you don't know it. You will probably
have to include some, but certainly not all, of the COM calls made by your application in the Vuser script.
Objects, Interfaces and Type Libraries
COM objects are binary code modules. Each COM object implements one or more interfaces that allow
client programs to communicate with it. You need to know about these interfaces in order to follow the
COM calls in the Vuser scripts. Type libraries, used as a reference for accessing COM interface methods
and parameters, contain descriptions of COM objects and interfaces. Each COM class, interface, and
type library is identified by a Global Unique Identifier (GUID).
COM Interfaces
A COM interface provides a grouped collection of related methods. For example, a Clock object may
have Clock,Alarm and Timer interfaces. Each interface has one or more methods. For example the
Alarm interface may have AlarmOn and AlarmOff methods.
An interface may also have one or more properties. Sometimes, the same function may be performed
by calling a method or by setting or getting the value of a property. For example, you can set the Alarm
Status property to On or call the AlarmOn method.
A COM object may support many interfaces. The IUnknown interface is implemented by all components
and is used to find out about other interfaces. Many components also implement the IDispatch
interface, which exposes all other interfaces and methods of the object, allowing implementation of
COM automation in scripting languages.
COM Class Context and Location Transparency
COM objects can run on the same machine as the client application, or on a remote server. COM objects
that an application creates may be in a local library, a local process or a remote machine ("Remote
Object Proxy"). The location of the COM object, known as the "Context," can be transparent to the
application. Most users apply the Vusers to check the load on remote servers. Therefore, objects
accessed by Remote Object Proxy are usually the most relevant for these tests.
User Guide
VuGen
HP LoadRunner (12.50) Page 480
COM Data Types
COM also provides several special data types, including safe arrays, BSTR strings and variants. You may
need to use these data types for debugging, parameterization and similar tasks.
COM/DCOM Vuser Script Structure
VuGen COM Vuser scripts are structured in a special way to meet the needs of COM interfaces.
Interface Methods
Calls to interface methods have the following names and syntax conventions:
lrc_<interface name>_<method name>(instance,...);
Note that the instance is always the first parameter passed.
The vendors of the respective COM components usually supply documentation for the interface
functions.
Interface Pointers
The interface header file defines the interface pointers, as well as other variables, that can be used in
the script. Each interface has an Interface ID (IID) which uniquely identifies the interface.
The format of the interface definition is:
<interface type>*<interface name> = 0; //"{<IID of the interface type>}"
In the following example, the interface type is IDispatch, the name of the interface instance is
IDispatch_0, and the IID of IDispatch type is the long number string:
IDispatch* IDispatch_0= 0;//"{00020400-0000--C000-000000000046}"
Vuser Script Statements
The COM Vuser script consist of code that creates object instances, retrieves interface pointers and
calls the interface methods. Each user action may generate one or more COM calls. Each COM call is
coded by VuGen as a group of statements. Each such group is contained in a separate scope enclosed in
braces. Several different statements prepare for the main call by assigning values and performing type
conversions. For example, the group of calls needed to create an object may look like this:
{
GUID pClsid = lrc_GUID("student..1");
IUnknown * pUnkOuter = (IUnknown*)NULL;
unsigned long dwClsContext = lrc_ulong("7");
GUID riid = IID_IUnknown;
lrc_CoCreateInstance(=;pClsid, pUnkOuter, dwClsContext, =;riid, (void**)=;IUnknown_
0, CHECK_HRES);
}
User Guide
VuGen
HP LoadRunner (12.50) Page 481

Error Checking
Each COM method or API call returns an error value. VuGen will set a flag to check or not to check errors
during replay, depending upon whether the call succeeded during the original recording. The flag
appears as the last argument of the function call and has these values:
CHECK_HRES This value is inserted if the function passed during recording and errors should be
checked during replay.
DONT_CHECK_
HRES
This value is inserted if the function failed during recording and errors should not be
checked during replay.
COM Sample Vuser Scripts
This section shows examples of how VuGen emulates a COM client application. It is divided up into the
basic COM script operations. Each type of operation is done within a separate scope.
Instantiation of the Object
To use a COM object, the application must first instantiate it and get a pointer to an interface of that
object.
VuGen does the following to instantiate an object
1. VuGen calls lrc_GUID to get a unique ProgID for the object, to be stored in pClsid:
GUID pClsid = lrc_GUID("student..1");
pClsid is the unique global CLSID of the object, which was converted from the student.student.1
ProgID.
2. If the unknown interface pointer is a pointer to an aggregated object, VuGen retrieves the pointer
to that object, or else it sets it to NULL:
IUnknown * pUnkOuter = (IUnknown*)NULL;
3. VuGen sets the contexts of the object to be created:
unsigned long dwClsContext = lrc_ulong("7");
dwClsContext contains the context of the object (in process, local, remote or combinations of
these.)
4. VuGen sets a variable to hold the requested interface ID, which is IUnknown in this case:
GUID riid = IID_IUnknown;
riid contains the interface ID of the IUnknown interface.
5. After the input parameters are prepared, a call to lrc_CoCreateInstance creates an object using
User Guide
VuGen
HP LoadRunner (12.50) Page 482
the parameters defined in the preceding statements. A pointer to the IUnknown interface is
assigned to output parameter IUnknown_0. This pointer is needed for subsequent calls:
lrc_CoCreateInstance(=;pClsid, pUnkOuter, dwClsContext, =;riid, (void**)
=;IUnknown_0, CHECK_HRES);
The input parameters were prepared and explained above. Since the call succeeded, VuGen sets
error checking on during the user simulation by inserting the CHECK_HRES value. The call returns a
pointer to the IUnknown interface in IUnknown_0, that can be used in subsequent calls.
Retrieving an Interface
After creating an object, VuGen has access only to the IUnknown interface . VuGen will use the
IUnknown interface for communicating with the object. This is done using the QueryInterface method
of the IUnknown standard interface. The first parameter in a VuGen method call is the interface
instance. In this case it is the IUnknown_0 pointer set previously by CoCreateInstance. The
QueryInterface call requires as input the ID of the interface to be retrieved, and returns a pointer to the
interface designated by that ID.
Get the Interface
1. First, VuGen sets a parameter, riid, equal to the ID of the Istudent interface:
GUID riid = IID_Istudent;
2. A call to QueryInterface assigns a pointer to the Istudent interface to output parameter Istudent_0
if the Istudent object has such an interface:
lrc_IUnknown_QueryInterface(IUnknown_0, =;riid, (void**)=;Istudent_0, CHECK_
HRES);
Using an Interface to Set Data
Here is an example of using the methods of the interface to set data. Suppose that in the application,
the user is supposed to input a name. This activates a method for setting the name. VuGen records this
in two statements. One statement is used for setting up the name string and the second one sets the
name property.
Set up the Entire Function Call
1. First, VuGen sets a variable (Prop Value) equal to the string. The parameter is of type BSTR, a string
type used in COM files:
BSTR PropValue = lrc_BSTR("John Smith");
In subsequent stages, you will probably parameterize this call, replacing "John Smith" with a
parameter, so that different names are used each time the Vuser script is run.
2. Next, VuGen calls the Put_Name method of the Istudent interface to enter the name:
User Guide
VuGen
HP LoadRunner (12.50) Page 483
lrc_Istudent_put_name(Istudent_0, PropValue, CHECK_HRES);
Using an Interface to Return Data
Returning data from an application is different than entering the data, because you might want to store
these values and use them as inputs in subsequent calls for parameterization.
The following is an example of what VuGen may do when the application retrieves
data
1. Create a variable of the appropriate type (in this case a BSTR) that will contain the value of the
property.
BSTR pVal;
2. Get the value of the property, in this case a name, into the pVal variable created above, using the
get_name method of the Istudent interface in this example.
lrc_Istudent_get_name(Istudent_0, =;pVal, CHECK_HRES);
3. VuGen then generates a statement for saving the values.
//lrc_save_BSTR("param-name",pVal);
The statement is commented out. You can remove the comments and change <param-name> to a
variable with a meaningful name to be used for storing this value. VuGen will use the variable to
save the value of pVal returned by the previous call. You can then use the variable as a
parameterized input in subsequent calls to other methods.
The IDispatch Interface
Most COM objects have specific interfaces. Many of them also implement a general-purpose interface
called IDispatch, which VuGen translates in a special way. IDispatch is a "superinterface" that exposes
all of the other interfaces and methods of a COM object. Calls to the IDispatch:Invoke method from
VuGen scripts are implemented using lrc_Disp functions. These calls are constructed somewhat
differently from calls to other interfaces.
The IDispatch interface Invoke method can execute a method, it can get a property value, or it can set
a value or reference value for a property. In the standard IDispatch:Invoke method these different uses
are signaled in a wflags parameter. In the VuGen implementation they are implemented in different
procedure calls that invoke a method or put or get a property.
For example, a call to IDispatch to activate the GetAgentsArray method may look like this:
retValue = lrc_DispMethod1((IDispatch*)IDispatch_0, "GetAgentsArray",
/*locale*/1033, LAST_ARG, CHECK_HRES);
The parameters in the above call are:
User Guide
VuGen
HP LoadRunner (12.50) Page 484

IDispatch_0 This is the pointer to the IDispatch interface returned by a previous call to the
IUnknown:Queryinterface method.
GetAgentsArray This is the name of the method to invoke. Behind the scenes, VuGen will get the ID
of the method from the name.
1033 This is the language locale.
LAST_ARG This is a flag to tell the IDispatch interface that there are no more arguments.
CHECK_HRES This flag turns on checking of HRES, since the call succeeded when it was recorded.
In addition, there might be another parameter, OPTIONAL_ARGS. This signals that in addition to any
standard parameters, VuGen is sending some optional arguments. Each optional argument consists of a
pair giving the ID or name of the argument and its value. For example, the following call to lrc_
DispMethod passes optional arguments "#3" and "var3":
{
GUID riid = IID_IDispatch;
lrc_IOptional_QueryInterface(IOptional_0, =;riid, (void**)=;IOptional_0,
CHECK_HRES);
}
{
VARIANT P1 = lrc_variant_short("47");
VARIANT P2 = lrc_variant_short("37");
VARIANT P3 = lrc_variant_date("3/19/1901");
VARIANT var3 = lrc_variant_scode("4");
lrc_DispMethod((IDispatch*)IOptional_0, "in_out_optional_args",
/*locale*/1024, =;P1, =;P2, OPTIONAL_ARGS, "#3", =;P3, "var3", =;var3, LAST_ARG,
CHECK_HRES);
}
The different lrc_Disp methods that use the IDispatch interface are detailed in the Function Reference
(Help > Function Reference).
Type Conversions and Data Extraction
As shown in the above example, many COM parameters are defined as variants. To extract these values,
VuGen uses a number of conversion functions, derived from the equivalent COM functions. The full list is
given in the Function Reference (Help > Function Reference). Previously, we showed how the lrc_
DispMethod1 call was used to retrieve an array of name strings:
VARIANT retValue = lrc_variant_empty();
retValue = lrc_DispMethod1((IDispatch*)IDispatch_0, "GetAgentsArray",
/*locale*/1033, LAST_ARG, CHECK_HRES);
The following example now shows how VuGen gets the strings out of retValue, which is a variant that
will be read as an array of strings.
First, VuGen extracts the BSTR array from the variant:
User Guide
VuGen
HP LoadRunner (12.50) Page 485
BstrArray array0 = 0;
array0 = lrc_GetBstrArrayFromVariant(=;retValue);
With all the values in array0, VuGen provides you with code that you can use to extract the elements
from the array for later use in parameterization, as in the example below:
//GetElementFrom1DBstrArray(array0, 0); // value: Alex
//GetElementFrom1DBstrArray(array0, 1); // value: Amanda
....
VuGen has numerous type conversion functions and functions for extracting conventional types from
variants. These are detailed in the Function Reference (Help > Function Reference).
Selecting COM Objects to Record
The application you are testing may use a great many COM objects. Only a few may actually create load
and may be important for the load test. Thus, before you record a COM application, you should select
the objects you want to record for the load test. VuGen allows you to browse for objects from type
libraries that it can read on the local machine and on other computers in the network.
Deciding Which Objects to Use
There are several ways to decide which COM objects should be included in the test. Try to determine
which remote objects are used by the software. If you are unsure which objects to use, try using the
default filter. The Environments branch of the filter includes calls to three sets of objects (ADO, RDS and
Remote) that are likely to generate load on remote servers.
You can also check the actual calls to refine the filter. After you have recorded the test, you can save
the file and look in the data folder that VuGen creates for a file named lrc_debug_list_<nnn>.log",
where nnn is the process number. This log file contains a listing of each COM object that was called by
the recorded application, regardless of whether or not the recording filter included that object. Only
calls that generate load on the server should be included for recording.
For example, the following is a local COM of the Visual Basic library:
Class JetES {039EA4C0-E696-11D0-878A-00A0C91EC756}
was loaded from type library "JET Expression Service Type Library"
({2358C810-62BA-11D1-B3DB-00600832C573} ver 4.0)
It should not be added since it does not generate load on the server.
Likewise, since the OLE DB and Microsoft Windows Common Controls are local objects, the following are
examples of classes and libraries that are not going to place any load on the server and should not be
recorded:
Class DataLinks {2206CDB2-19C1-11D1-89E0-00C04FD7A829}
was loaded from type library "Microsoft OLE DB Service Component 1.0 Type Library"
({2206CEB0-19C1-11D1-89E0-00C04FD7A829} ver 1.0)
Class DataObject {2334D2B2-713E-11CF-8AE5-00AA00C00905}
User Guide
VuGen
HP LoadRunner (12.50) Page 486
was loaded from type library "Microsoft Windows Common Controls 6.0 (SP3)"
({831FDD16-0C5C-11D2-A9FC-0000F8754DA1} ver 2.0)
However, for example, a listing such as the following indicates a class that should be recorded since it
does generate load on the server:
Class Order {B4CC7A90-1067-11D4-9939-00105ACECF9A}
was loaded from type library "FRS"
({B4CC7A8C-1067-11D4-9939-00105ACECF9A} ver 1.0)
Calls to classes of the FRS library, used for instance in the flight_sample that is installed with VuGen,
use server capacity and should be recorded.
If a COM object itself calls other COM objects, all the calls will be listed in the type information log file.
For example, every time the application calls an FRS class function, the FRS library calls the ActiveX
Data Object (ADO) library. If several functions in such a chain are listed in a filter, VuGen records only
the first call that initiates the chain. If you selected both FRS and ADO calls, only the FRS calls will be
recorded.
On the other hand, if you select only the ADO library in the filter, then calls to the ADO library will be
recorded. It is often easier to record the call to the first remote object in the chain. In some cases,
however, an application may use methods from several different COM objects. If all of them use a single
object that puts a load on the server, you could only record the final common object.
Which Objects Can be Selected
VuGen can only record objects if it can read their type libraries. If the type libraries were not installed in
the system or VuGen cannot find them, the COM objects will not be listed in the Recording Options dialog
box. If they are used by your application, VuGen will not be able to identify these objects and will identify
them as INoTypeInfo in the files.
Which Interfaces Can be Excluded
For each object, the Recording Options dialog box will show you all interfaces that are listed in the Type
Library, and allow you to specify inclusion or exclusion of each one. However, ADO,RDS and Remote
Objects can be included in the filter as a group. The filter will not show the individual objects of those
environments or their interfaces. Objects that you included from type libraries may also have interfaces
that are not listed in the type library and therefore not shown in the Recording Options dialog. After
generating a VuGen script, you can identify these interfaces in the script and get their GUID numbers
from the interfaces.h file that VuGen generates. Using this information, you can exclude the interfaces
as explained in "COM/DCOM > Filter Recording Options" on page151.
Database Protocols
User Guide
VuGen
HP LoadRunner (12.50) Page 487
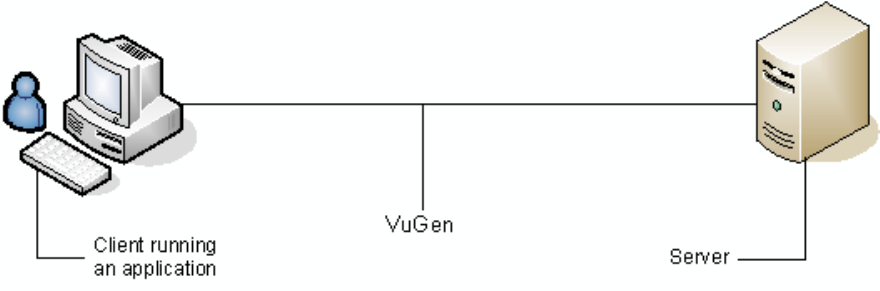
Database Protocols Overview
Suppose that you have a database of customer information that is accessed by customer service
personnel located throughout the country. You use Database Vusers to emulate the situation in which
the database server services many requests for information. A Database Vuser could:
lConnect to the server
lSubmit an SQL query
lRetrieve and process the information
lDisconnect from the server
VuGen supports the following database types: CtLib, DbLib, Oracle, ODBC, and DB2-CLI. The resulting
script contains LRD functions that describe the database activity.
VuGen Database Recording Technology
VuGen creates Database Vuser scripts by recording all the activity between a database client and a
server. VuGen monitors the client end of the database and traces all the requests sent to and received
from the database server.
Like all other Vusers created using VuGen, Database Vusers communicate with the server without
relying on client software. Instead, each Database Vuser executes a script that executes calls directly to
server API functions.
User Guide
VuGen
HP LoadRunner (12.50) Page 488
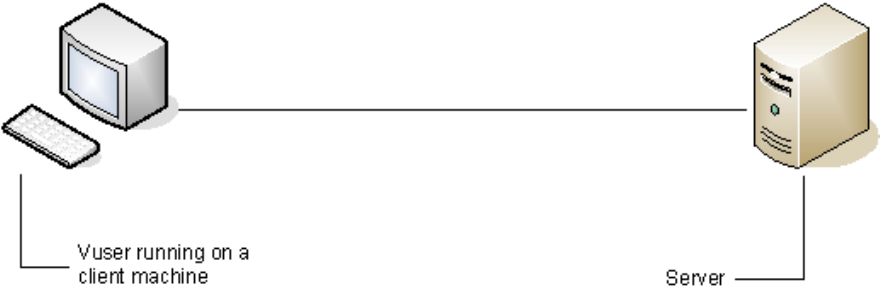
You create Database Vuser scripts in a Windows environment using VuGen. Once you create a script, you
can assign it to Vusers in both Windows and Linux environments.
Users working in a Linux only environment can create Database Vuser scripts through programming
using VuGen templates as the basis for a script. For information about programming Database Vuser
scripts on Linux, see "Creating and Running Scripts in Linux" on page1011.
Database Grids
When you record or replay a Vuser script, the data that is returned by each query is displayed in a data
grid. In a Vuser script, the existence of a data grid is indicated by a GRID statement. VuGen displays data
grids in either the Data Grids pane or the Snapshot pane.
lFor details on how to work with the Snapshot pane, see "How to Work with Snapshots" on page276.
lFor details on the Snapshot pane UI, see "Snapshot Pane" on page77.
To correlate a value in a data grid:
Display the data grid in the Snapshot pane, right-click in a cell inside the data grid, and select Create
Correlation.
To save the data in a data grid to a file:
Display the data grid in the Snapshot pane or the Data Grids pane, right-click in any cell in the data grid,
and select Save Grid To File.
To copy the text from a cell in a data grid to the clipboard:
Display the data grid in the Snapshot pane or in the Data Grids pane, right-click in the cell in the data
grid, and select Copy Selection.
To search for data inside a data grid:
1. Display the data grid in the Snapshot pane, and click Search > Quick Find to open the Search dialog
box.
User Guide
VuGen
HP LoadRunner (12.50) Page 489
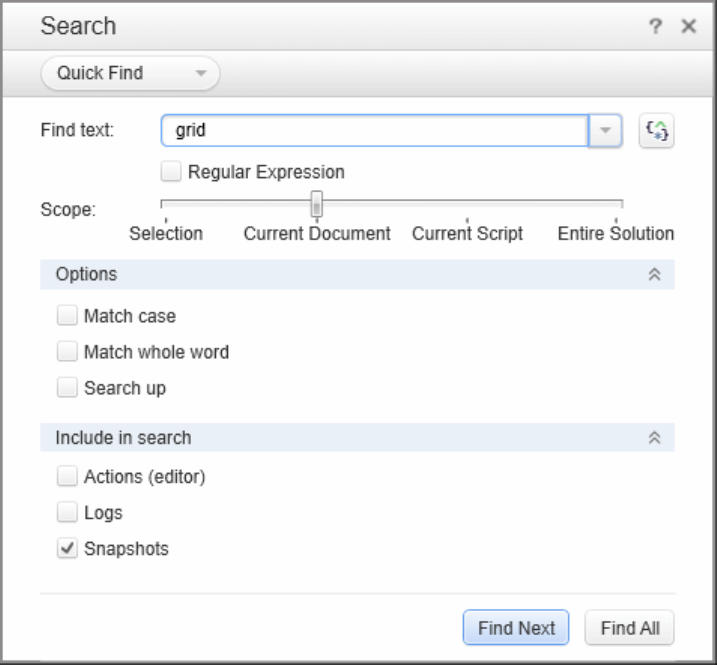
2. Click Include in Search, and then select the Snapshots check box.
Handling Database Errors
You can control how database Vusers handle errors when you run a database Vuser script. By default, if
an error occurs during script execution, the script execution is terminated. To change the default
behavior, you can instruct the Vuser to continue when an error occurs. You can apply this behavior in
different ways as described below.
Globally Modifying Error Handling
You can change the way that Vusers handle errors by issuing an LRD_ON_ERROR_CONTINUE or LRD_ON_
ERROR_EXIT statement. By default, a Vuser aborts the script execution when it encounters any type of
error—database, parameter related, and so on. To change the default behavior, insert the following line
into your script:
LRD_ON_ERROR_CONTINUE;
From this point on, the Vuser continues script execution, even when an error occurs.
User Guide
VuGen
HP LoadRunner (12.50) Page 490

You can also specify that the Vuser continue script execution when an error occurs only within a
segment of the script. For example, the following code tells the Vuser to continue script execution even
if an error occurs in the lrd_stmt or lrd_exec functions:
LRD_ON_ERROR_CONTINUE;
lrd_stmt(Csr1, "select..."...);
lrd_exec(...);
LRD_ON_ERROR_EXIT;
Use the LRD_ON_ERROR_CONTINUE statement with caution, as significant and severe errors may be
missed.
Locally Modifying Error Handling
You can set error handling for a specific function by modifying the severity level. Functions such as lrd_
stmt and lrd_exec, which perform database operations, use severity levels. The severity level is
indicated by the function's final parameter, miDBErrorSeverity. This parameter tells the Vuser whether
or not to continue script execution when a database error occurs (error code 2009). The default, 0,
indicates that the Vuser should abort the script when an error occurs.
For example, if you reference a table that does not exist, the following database statement fails and
the script execution terminates.
lrd_stmt(Csr1, "insert into EMP values ('Smith',301)\n", -1, 1 /*Deferred*/,
1 /*Dflt Ora Ver*/, 0);
To tell a Vuser to continue script execution, even when a database operation error occurs for that
function, change the statement's severity parameter from 0 to 1.
lrd_stmt(Csr1, "insert into EMP values ('Smith',301)\n", -1, 1 /*Deferred*/,
1 /*Dflt Ora Ver*/, 1);
When the severity is set to 1 and a database error occurs, a warning is issued. Note that the severity
level set for a particular function applies only to that function.
Debugging Database Applications
The following tips apply to database applications only (such as ODBC):
Generating Debugging Information
Note: You can now set options to view most of the information described in this section using
VuGen's user interface.
VuGen contains an inspector "engine." You can force VuGen recorder to create "inspector" output by
editing <install_dir>\config\vugen.ini as follows:
User Guide
VuGen
HP LoadRunner (12.50) Page 491
[LogMode]
EnableAscii=ASCII_LOG_ON
When this option is enabled, VuGen creates a file, vuser.asc in the Data folder at the end of the
recording. Note that this option should be used for debugging purposes only. This output file can
become very large (several MB) and have serious effects on machine performance and disk space.
For cases like ODBC-based applications, it is possible to configure the ODBC Administrator (located in the
Windows Control Panel) to provide a similar trace output. Open the ODBC options, and select `Trace
ODBC calls' to ON. Similarly the ODBC Developer Kit provides a Spy utility for call tracing.
To enable further debug information, add the following section to the <install_dir>\config\vugen.ini:
[INSPECTOR]
TRACE_LEVEL=3
TRACE_FILENAME=c:\tmp\sqltrace.txt
The file (sqltrace.txt) will include useful internal information regarding the hooking calls made during
recording. The trace_level is between 1 and 3, with 3 representing the most detailed debug level. Note
that in VuGen versions 5.02 and higher, you can set the trace level from the user interface.
Examining Compiler Information
You can view information about each stage of code generation, preprocessing and compilation to
determine the source of any errors.
Code Generation Information
Look at the vuser.log file under the Data folder. This file, which contains a log of the code generation
phase, is automatically created at the end of every lrd recording (i.e. all database protocols).
The following is an example of a log file:
lrd_init: OK
lrd_option: OK
lrd_option: OK
lrd_option: OK
Code generation successful
lrd_option: OK
lrd_end: OK
If any of the messages are not OK or successful, then a problem occurred during the code generation.
Preprocessing and Compilation Information
During runtime, VuGen displays information about both the preprocessing and compilation processes.
Database Protocols - Troubleshooting and Limitations
This section describes troubleshooting and limitations for database protocols.
User Guide
VuGen
HP LoadRunner (12.50) Page 492

Troubleshooting all database protocols
IE crashes when recording Oracle NCA or Oracle - Web scripts
This can occur due to an incompatible dll file.
Replace the incompatible dll
1. Open the C:\program files\oracle\JInitiator_1.3.1.18\bin\hotspot folder.
2. Back up the jvm.dll file.
3. Delete the jvm.dll file and replace it with a different version of the file.
Evaluating Error Codes
When a Vuser executes an LRD function, the function generates a return code. A return code of 0
indicates that the function succeeded. For example, a return code of 0 indicates that another row is
available from the result set. If an error occurs, the return code indicates the type of error. For
example, a return code of 2014 indicates that an error occurred in the initialization.
There are four types of return codes, each represented by a numerical range:
Type of Return Code Range
Informational 0 to 999
Warning 1000 to 1999
Error 2000 to 2999
Internal Error 5000 to 5999
For more detailed information on the return codes, see the Function Reference (Help > Function
Reference).
You can evaluate the return code of an LRD function to determine if the function succeeded. The
following script segment evaluates the return code of an lrd_fetch function:
static int rc;
rc=lrd_fetch(Csr15, -13, 0, 0, PrintRow4, 0);
if (rc==0)
lr_output_message("The function succeeded");
else
lr_output_message("The function returned an error code:%d",rc);
Two-tier Database Scripting Tips
The following section offers solutions for two-tier database scripts.
Question 1: Why does the script fail when it is data driven, while the same values work with the
application itself?
User Guide
VuGen
HP LoadRunner (12.50) Page 493
Answer: The failure may be a result of trailing spaces in your data values. Even though the data values
that you type directly into the GUI are probably truncated, you should manually eliminate them from
your data file. Tab-delimited files can hide trailing spaces and therefore obscure problems. In general,
comma-delimited files are recommended. You can view the files in Excel to see if things are correct.
Question 2: Why does an SQL error of an invalid cursor state occur on the second iteration?
Answer: The lrd_close_cursor function may not have been generated or it may be in the end section
instead of the action section. You will need to add a cursor close function or move it from the end
section to make the script iterate successfully.
Opening a new cursor may be costly in terms of resources. Therefore, we recommend that you only
open a cursor once in the actions section during the first iteration. You can then add a new parameter
that contains the iteration number as a string by using the Iteration Number type. Call this parameter
IterationNum. Then, inside the actions section replace a call to open a new cursor, for example,
lrd_open_cursor(=;Csr1, Con1, 0);
with
if (!strcmp(lr_eval_string("<IterationNum>"), "1"))
lrd_open_cursor(=;Csr1, Con1, 0);
Question 3: How can I fix code produced by VuGen that will not compile because of data declarations in
the vdf.h file?
Answer: The problem, most likely, is an SQL data type that is not supported by VuGen. For Microsoft SQL,
you can often work around this issue by replacing the undefined error message in vdf.h with "DT_SZ"
(null terminated string). Although this is not the actual datatype, VuGen can compile the script correctly.
Please report the problem and send the original script to customer support.
Question 4: What is the meaning of LRD Error 2048?
Answer: VuGen is failing because it is trying to bind a variable with a longer length than what was
allocated during recording. You can correct this by enlarging the variable definition in vdf.h to receive a
longer string back from the database. Search this file for the unique numeric identifier. You will see its
definition and length. The length is the third element in the structure. Increase this length as required
and the script will replay successfully.
For example, in the following script, we have:
lrd_assign(=;_2_D354, "<ROW_ID>", 0, 0, 0);
In vdf.h, we search for _2_D354 and find
static LRD_VAR_DESC _2_D354 = {
LRD_VAR_DESC_EYECAT, 1, 10, LRD_BYTYPE_ODBC,
{0 ,0, 0}, DT_SZ, 0, 0, 15, 12};
We change it to:
static LRD_VAR_DESC _2_D354 = {
User Guide
VuGen
HP LoadRunner (12.50) Page 494
LRD_VAR_DESC_EYECAT, 1, 12, LRD_BYTYPE_ODBC,
{0,, 0}, DT_SZ, 0, 0, 15, 12};
The complete definition of LRD_VAR_DESC appears in lrd.h. You can find it by searching for typedef
struct LRD_VAR_DESC.
Question 5: How can I obtain the number of rows affected by an UPDATE,INSERT or DELETE when using
ODBC and Oracle?
Answer: You can use lrd functions to obtain this information. For ODBC, use lrd_row_count. The syntax
is:
int rowcount;
.
.
.
lrd_row_count(Csr33, =;rowcount, 0);
Note that lrd_row_count must immediately follow the pertinent statement execution.
For Oracle you can use the fourth argument of lrd_exec.
lrd_exec(Csr19, 1, 0, =;rowcount, 0, 0);
If you are using Oracle's OCI 8, you can use the fifth argument of lrd_ora8_exec.
lrd_ora8_exec(OraSvc1, OraStm3, 1, 0, =;uliRowsProcessed, 0, 0, 0, 0, 0);
Question 6: How can I avoid duplicate key violations?
Answer: Occasionally, you will see a duplicate key violation when performing an Insert. You should be
able to find the primary key by comparing two recordings to determine the problem. Check whether this
or earlier UPDATE or INSERT statement should use correlated queries. You can use the data dictionary in
order to find the columns that are used in the violated unique constraint.
In Oracle you will see the following message when a unique constraint is violated:
ORA-00001: unique constraint (SCOTT.PK_EMP) violated
In this example SCOTT is the owner of the related unique index, and PK_EMP is the name of this index.
Use SQL*Plus to query the data dictionary to find the columns. The pattern for this query is:
select column_name from all_ind_columns where index_name = '<IndexName> and index_
owner = '<IndexOwner>';
select column_name from all_ind_columns where index_name = 'PK_EMP' and index_owner
= 'SCOTT';
Since the values inserted into the database are new, they might not appear in earlier queries, but they
could be related to the results of earlier queries, such as one more than the value returned in an earlier
query.
User Guide
VuGen
HP LoadRunner (12.50) Page 495
For Microsoft SQL Server you will see one of these messages:
Cannot insert duplicate key row in object 'newtab' with unique index 'IX_newtab'.
Violation of UNIQUE KEY constraint 'IX_Mark_Table'. Cannot insert duplicate key in
object 'Mark_Table'.
Violation of PRIMARY KEY constraint 'PK_NewTab'. Cannot insert duplicate key in
object 'NewTab'.
You can use the Query Analyzer to find out which columns used by the key or index. The pattern for this
query is:
select C.name
from sysindexes A, sysindexkeys B, syscolumns C
where C.colid = B.colid and C.id = B.id and
A.id = B.id and A.indid = B.indid
and A.name = '<IndexName>' and A.id = object_id('<TableName>')
select C.name
from sysindexes A, sysindexkeys B, syscolumns C
where C.colid = B.colid and C.id = B.id and
A.id = B.id and A.indid = B.indid
and A.name = 'IX_newtab' and A.id = object_id('newtab')
For DB2 you might see the following message:
SQL0803N One or more values in the INSERT statement, UPDATE statement, or foreign
key update caused by a DELETE statement are not valid because they would produce
duplicate rows for a table with a primary key, unique constraint, or unique index.
SQLSTATE=23505
If you still encounter problems, be sure to check the number of rows changed for Updates and Inserts
for both recording and replay. Very often, an UPDATE fails to change any rows during replay, because the
WHERE clause was not satisfied. This does not directly result in an error, but it causes a table not to be
properly updated, and can cause a later SELECT to select the wrong value when correlating the query.
Also verify that there are no problems during multi-user replay. In certain instances, only one user will
successfully perform an UPDATE. This occurs with Siebel, where it is necessary to manually write a loop
to overcome the problem.
Question 7: The database does not appear to be modified after replaying a script which should have
modified the database.
Answer: Through the user application's UI, check if the updated values appear when trying to see the
current data accessible to the application. If the values have not been updated, you need to determine
they were not changed. Possibly, an UPDATE statement changed one or more rows when the application
was recorded, and did not change any during replay.
Check these items:
lVerify statement. If there is a WHERE clause in the UPDATE statement, verify that it is correct.
lCheck for correlations. Record the application twice and compare the UPDATE statements from
each of the recordings to make sure that the necessary correlations were performed.
User Guide
VuGen
HP LoadRunner (12.50) Page 496
lCheck the total number of rows. Check the number of rows that were changed after the UPDATE.
For Oracle, this information is stored in the fourth parameter of lrd_exec. For ODBC, use lrd_row_
count to determine the number of rows updated. You can also add code to your script that prints the
number of rows that were updated. If this value is 0, the UPDATE failed to modify the database.
lCheck the SET clause. Check the SET clause of the UPDATE statement. Make sure that you
correlated any necessary values here instead of hard-coding them. You can see this by comparing
two recordings of the UPDATE.
It certain cases, the UPDATE works when replaying one Vuser, but not for multiple Vusers. The UPDATE of
one Vuser might interfere with that of another. Parameterize each Vuser so that each one uses
different values during the UPDATE, unless you want each Vuser to update with the same values. In this
case try adding retry logic to perform the UPDATE a second time.
Question 8:How do I avoid the unique column name error when replaying a statement recorded with an
Oracle Application. For example:
lrd_stmt(Csr9, "SELECT UOM_CODE, UOM_CODE, DESCRIPTION FROM "
"MTL_UNITS_OF_MEASURE "
"WHERE NVL(DISABLE_DATE, SYSDATE + 1) > "
"SYSDATE ORDER BY UOM_CODE", -1, 1, 1, 0);
The following error message was issued:
"lrdo.c/fjParse: "oparse" ERROR return-code=960, oerhms=ORA-00960: ambiguous column naming in
select list".
Answer: Change the statement by adding an alias to at least one of the non-unique columns, thereby
mapping it to a new unique name. For example:
lrd_stmt(Csr9,"SELECT UOM_CODE,UOM_CODE second, DESCRIPTION FROM"
"MTL_UNITS_OF_MEASURE "
"WHERE NVL(DISABLE_DATE, SYSDATE + 1) > "
"SYSDATE ORDER BY UOM_CODE", -1, 1, 1, 0);
Troubleshooting Oracle 2-Tier Vusers
This section contains a list of common problems that you may encounter while working with Oracle
Vusers, and suggested solutions.
ORA-20001 and ORA-06512
Errors ORA-20001 and ORA-06512 appear during replay when the lrd_stmt contains the pl/sql block:
fnd_signon.audit_responsibility(...)
This statement fails during replay because the sign-on number is unique for each new connection.
Solution
User Guide
VuGen
HP LoadRunner (12.50) Page 497

In order to solve this problem you need to use the new correlation tool for the sign-on number. This is
second assigned value in the statement.
After you scan for possible values to correlate, highlight the value of the second lrd_assign_bind() for
the failed statement. Note that the values in the "correlated query" window may not appear in the same
order as the actual recorded statements.
The grid containing the substitution value should appear after the lrd_stmt which contains the pl/sql
block: fnd_signon.audit_user(...).
Note: Since the sign-on number is unique for every connection, you need to use correlation for
each new connection that you record.
Example of Solution
The following statement failed in replay because the second value, "1498224" is the unique sign-on
number for every new connection.
lrd_stmt(Csr6, "begin fnd_signon.audit_responsibility(:s,:l,:f,:a,:r,:t,:p)"
"; end;", -1, 1, 1, 0);
lrd_assign_bind(Csr6, "s", "D", =;s_D216, 0, 0, 0);
lrd_assign_bind(Csr6, "l", "1498224", =;l_D217, 0, 0, 0);
lrd_assign_bind(Csr6, "f", "1", =;f_D218, 0, 0, 0);
lrd_assign_bind(Csr6, "a", "810", =;a_D219, 0, 0, 0);
lrd_assign_bind(Csr6, "r", "20675", =;r_D220, 0, 0, 0);
lrd_assign_bind(Csr6, "t", "Windows PC", =;t_D221, 0, 0, 0);
lrd_assign_bind(Csr6, "p", "", =;p_D222, 0, 0, 0);
lrd_exec(Csr6, 1, 0, 0, 0, 0);
The sign-on number can be found in the lrd_stmt with "fnd_signon.audit_user". The value of the first
placeholder "a" should be saved. The input of "a" is always "0" but the output is the requested value.
Modified code:
lrd_stmt(Csr4, "begin fnd_signon.audit_user(:a,:l,:u,:t,:n,:p,:s); end;", -1, 1, 1, 0);
lrd_assign_bind(Csr4, "a", "0", =;a_D46, 0, 0, 0);
lrd_assign_bind(Csr4, "l", "D", =;l_D47, 0, 0, 0);
lrd_assign_bind(Csr4, "u", "1001", =;u_D48, 0, 0, 0);
lrd_assign_bind(Csr4, "t", "Windows PC", =;t_D49, 0, 0, 0);
lrd_assign_bind(Csr4, "n", "OraUser", =;n_D50, 0, 0, 0);
lrd_assign_bind(Csr4, "p", "", =;p_D51, 0, 0, 0);
User Guide
VuGen
HP LoadRunner (12.50) Page 498
lrd_assign_bind(Csr4, "s", "14157", =;s_D52, 0, 0, 0);
lrd_exec(Csr4, 1, 0, 0, 0, 0);
lrd_save_value(=;a_D46, 0, 0, " saved_a_D46");
Grid0(17);
lrd_stmt(Csr6, "begin fnd_signon.audit_responsibility(:s,:l,:f,:a,:r,:t,:p)"
"; end;", -1, 1, 1, 0);
lrd_assign_bind(Csr6, "s", "D", =;s_D216, 0, 0, 0);
lrd_assign_bind(Csr6, "l", " <saved_a_D46>", =;l_D217, 0, 0, 0);
lrd_assign_bind(Csr6, "f", "1", =;f_D218, 0, 0, 0);
lrd_assign_bind(Csr6, "a", "810", =;a_D219, 0, 0, 0);
lrd_assign_bind(Csr6, "r", "20675", =;r_D220, 0, 0, 0);
lrd_assign_bind(Csr6, "t", "Windows PC", =;t_D221, 0, 0, 0);
lrd_assign_bind(Csr6, "p", "", =;p_D222, 0, 0, 0);
lrd_exec(Csr6, 1, 0, 0, 0, 0);
Working with large numbers
Large numbers (NUMBER data type) sometimes appear in different format in the GRID and in the ASCII
file. This difference makes it more difficult to identify numbers while searching for values to save for
correlation.
For example, you could have a value appear as 1000003 in the grid, but as 1e+0006 in the Recording Log
(ASCII file).
Workaround
If you have an error during replay and the correlation tool cannot locate the value in previous results,
look for this value in the other format in grid.
ORA-00960
This error may occur with non-unique column names. For example:
lrd_stmt(Csr9, "SELECT UOM_CODE, UOM_CODE, DESCRIPTION FROM "
"MTL_UNITS_OF_MEASURE "
"WHERE NVL(DISABLE_DATE, SYSDATE + 1) > "
"SYSDATE ORDER BY UOM_CODE", -1, 1, 1, 0);
In this case you receive the following error:
"lrdo.c/fjParse: "oparse" ERROR return-code=960, oerhms=ORA-00960: ambiguous column naming in
select list".
User Guide
VuGen
HP LoadRunner (12.50) Page 499
Workaround
Change the statement by adding an alias to at least one of the non-unique columns, thus mapping it to
a new unique name. For example:
lrd_stmt(Csr9,"SELECT UOM_CODE,UOM_CODE second, DESCRIPTION FROM"
"MTL_UNITS_OF_MEASURE "
"WHERE NVL(DISABLE_DATE, SYSDATE + 1) > "
"SYSDATE ORDER BY UOM_CODE", -1, 1, 1, 0);
Alternate Workaround: remove ORDER BY from the lrd statement.
ORA-2002
Error 2002 appears when you try to use an unopened cursor. It occurs when you replay a user more than
one iteration and you recorded into more than one section of the script.
Specifically, if a cursor is opened in the vuser_init section and closed in the Actions section, then you will
encounter this error on the second iteration if you try to use the cursor. This is because it was closed
but not re-opened.
For example: You have lrd_open_cursor in the vuser_init section and lrd_close_cursor in the Actions
section. If you replay this user more than one iteration, you are going to get an error in the second
iteration because you try using an unopened cursor (it was closed in first iteration, but not re-opened in
the second).
Workaround
The easiest way to solve this is to move the lrd_close_cursor or/and lrd_close_connection of the
problem cursor to the vuser_end section.
Database Protocols (lrd)
Replay of recorded asynchronous operations is not supported.
Wrong Client Version
You may receive an error message when running the wrong Oracle client version:
"Error: lrdo_open_connection: "olog" LDA/CDA return-code_019: unable to allocate memory in the user
side"
Workaround
You need to modify the library information in the lrd.ini file, located in the product's bin folder. This file
contains the settings that indicate which version of database support is loaded during recording or
replay. The file contains a section for each type of host.
For example, the following section of the lrd.ini file is for Oracle on Windows NT:
[ORACLE_WINNT]
805=lrdo32.dll+ora805.dll
816=lrdo32.dll+oci.dll
User Guide
VuGen
HP LoadRunner (12.50) Page 500

815=lrdo32.dll+oraclient8.dll
804=lrdo32.dll+ora804.dll
803=lrdo32.dll+ora803.dll
73=lrdo32.dll+ora73.dll
72=lrdo32.dll+ora72.dll
71=lrdo32.dll+orant71.dll
These settings indicate that Vusers should use the LoadRunner library ora805.dll if the client uses
Oracle 8.0.5, oci.dll for Oracle 8.1.6, and so on.
Flex (RTMP/AMF) Protocol
Flex Overview
Note: This topic applies to Flex Vuser scripts only.
The Flex Vuser protocol emulates communication between a client server application that uses the Flex
collection of technologies.
This topic provides an overview of various topics relating to Flex Vuser scripts.
What is Flex
Flex is a collection of technologies that provides developers with a framework for building RIAs (Rich
Internet Applications) based on the Flash Player.
RIAs are lightweight online programs that provide users with more dynamic control than with a standard
Web page. Like Web applications built with Ajax, Flex applications are generally more responsive,
because the application does not need to load a new Web page every time the user performs an action.
However, unlike working with Ajax, Flex is independent of browser implementations such as JavaScript
or CSS. The framework runs on Adobe's cross-platform Flash Player.
Flex applications consist of many MXML and ActionScript files. They are compiled into a single SWF
movie file which can be played by the Flash player installed on the client's browser.
Note: For Flex applications working with SOAP data, use the Web Services Vuser protocol.
Flex Technologies
The following tables describe the specific technologies that are supported by the VuGen recording
engine.
User Guide
VuGen
HP LoadRunner (12.50) Page 501
Technology Description
AMF0 Action Message Format
AMF3 Action Message Format - Compressed format
RTMP Real Time Message Protocol: Messaging and streaming over TCP
RTMPS Real Time Message Protocol: Messaging and streaming over TCP/SSL
RTMPT Real Time Message Protocol Tunneled: Messaging and streaming over HTTP
VuGen supports the following development solutions:
Development
Platforms
Description
BlazeDS Open Source Remoting and Messaging solution
GraniteDS Open source development and integration solution for building Flex
applications.
LiveCycle Adobe development and integration solution for building Flex applications.
The table below displays a list of the LoadRunner documentation that relates to the process of
developing a Flex Vuser script.
Topic Description
Creating a Flex
Vuser script
See VuGen's generic documentation about creating Vuser scripts ["Creating
Vuser Scripts - Overview" on page127].
Recording In addition to the generic documentation about recording Vuser scripts
["Recording - Overview" on page140], see:
l"How to Record a Flex Script" on page514
l"Setting the Flex Recording Mode" on page515
l"RTMP/RTMPT Streaming" on page506
l"RTMP Tunneled" on page513
You may need to configure recording options for your Flex script:
l" Flex > RTMP Recording Options" on page166
l"Flex > Externalizable Objects Recording Options" on page167
Correlating In addition to the generic VuGen documentation on correlating Vuser scripts
["Correlation Overview" on page235], see:
"Flex Correlations" on page520
User Guide
VuGen
HP LoadRunner (12.50) Page 502

Topic Description
Replaying In addition to the generic VuGen documentation about replaying Vuser scripts
["Replay Overview" on page274], see:
l"How to Query an XML Tree" on page522
You may need to configure runtime settings for your Flex script:
lFlex > RTMP view
lFlex > Externalizable view
lFlex > Configuration view
Debugging See the generic documentation about debugging Vuser scripts ["Debugging
Overview" on page311].
l"Externalizable Objects in Flex Scripts" on page517
l"How to Serialize Flex Scripts " on page521
Viewing Test
Results
See the generic documentation about viewing test results ["Viewing Replay
Results Overview" on page417].
Recording Flex Scripts
When you record a Flex application, VuGen generates Flex Vuser script functions that emulate the
application. The following tables describe the functions that are supported by the Flex protocol.
AMF
VuGen's Flex protocol lets you create scripts that emulate Flex applications working with AMF0 and
AMF3.
Function Name Description
flex_amf_call Sends an AMF request.
flex_amf_define_envelope_
header_set
Defines a set of envelope headers.
flex_amf_define_header_set Defines a set of AMF headers.
flex_login Logs on to a password-protected Flex application.
flex_logout Logs off of a password-protected Flex application.
flex_ping Checks if a Flex application is available.
flex_remoting_call Invokes one or more methods of a server-side Remote object
(RPC).
User Guide
VuGen
HP LoadRunner (12.50) Page 503

AMF Example 1:
In the following example, flex_ping checks for the availability of a service. The flex_remoting_call
function invokes the service remotely.
flex_ping("1",
"URL=http://<HOST>/weborb.aspx",
"Snapshot=t6.inf",
LAST);
flex_remoting_call("getProductEdition::GenericDestination",
"URL=http://testlab1/weborb30/console/weborb.aspx",
"Snapshot=t1.inf",
INVOCATION,
"Target=/2",
"Operation=getProductEdition",
"Destination=GenericDestination",
"DSEndpoint=my-amf",
"Source=Weborb.Management.LicenseService",
"Argument=<arguments/>",
LAST);
AMF Example 2:
In the following AMF0 example, the flex_amf_call function accesses a gateway and sends message to
the server.
flex_amf_call("EchoAny",
"Gateway=http://<host>/gateway.aspx",
"Snapshot=t1.inf",
"IsParseResponse=No",
MESSAGE,
"Method=EchoAMF.EchoAMF.EchoAny",
"TargetObjectId=/1",
BEGIN_ARGUMENTS,
"<boolean>true</boolean>",
END_ARGUMENTS,
LAST);
AMF Example 3:
In the following AMF3 example, the flex_remoting_call function sends the server an AMF call that can
be serialized.
flex_remoting_call(
"product::getProductsByName",
URL=http://<HOST>:<PORT>/amf;jsessionid={CorrelationParameter}",
"Snapshot=t1.inf",
User Guide
VuGen
HP LoadRunner (12.50) Page 504
"IsParseResponse=No",
INVOCATION,
"Target=/2",
"Operation=getProductsByName",
"Destination=product",
"DSEndpoint=my-amf",
"DSId=8E3759E5-E51A-3906-0EAB-6119CD1E26BF",
"Argument="
"<arguments>"
"<string>A</string>"
"</arguments>",
LAST);
RTMP Functions
Function Name Description
flex_rtmp_connect Connects a client to an RTMP server and sets connection options.
flex_rtmp_disconnect Disconnects a client from an RTMP server.
flex_rtmp_receive_stream Receives streaming data from an RTMP server.
flex_rtmp_receive Receives responses from an RTMP server.
flex_rtmp_send Sends a request to an RTMP server.
RTMP Example
In the following example, flex_rtmp_receive receives data.
flex_rtmp_receive("recv_step0",
"ConnectionID=19",
"Snapshot=tRTMP44.inf",
CHANNEL,
"ChunkStreamID=2",
CHANNEL,
"ChunkStreamID=2",
LAST);
RTMP Tunneled Functions
Function Name Description
flex_rtmp_tunneled_connect Connects a client to an RTMP server over HTTP.
flex_rtmp_tunneled_disconnect Disconnects a client from session over HTTP with an RTMP server.
User Guide
VuGen
HP LoadRunner (12.50) Page 505

Function Name Description
flex_rtmp_tunneled_send Sends a request to an RTMPserver over HTTP.
RTMP Tunneled Example
In the following example, flex_rtmp_tunneled_send sends an RTMP tunneled request.
flex_rtmp_tunneled_send(
"send_step0",
"SessionID=0",
"Snapshot=t30.inf",
MESSAGE,
"DataType=command message amf3",
"ChunkStreamID=3",
"MessageStreamID=0",
"Argument="
"<arguments>"
...
"</arguments>",
LAST);
For detailed syntax information about all of the Flex functions, see the Function Reference (Help >
Function Reference).
RTMP/RTMPT Streaming
VuGen's Flex protocol supports record and replay of streaming data for both the RTMP and RTMPT
protocols. You can record using either the regular recording mode or the simplified recording mode. The
simplified mode enables VuGen to generate a single function in place of the multiple functions that are
generated when the regular recording mode is used.
VuGen also supports RTMPS and RTMPTS in which the streaming data is sent over SSL.
When you use the simplified mode to record, the following occurs:
lFor an RTMP-based stream: VuGen generates a single flex_rtmp_receive_stream step in place of
many flex_rtmp_receive and flex_rtmp_send steps.
lFor an RTMPT-based stream: VuGen generates a single modified flex_rtmp_tunneled_send step in
place of many flex_rtmp_tunneled_send steps.
The single generated flex_rtmp_receive_stream or flex_rtmp_tunneled_send step makes the Vuser
script more readable (by eliminating multiple lines of code), and makes the script replay more reliable. It
is recommended that you use the simplified mode for recording your Vuser scripts, unless the Vuser
activity includes asynchronous behavior, as described below.
User Guide
VuGen
HP LoadRunner (12.50) Page 506
The simplified recording mode is the default recording mode for streaming. To activate the simplified
mode, open the Recording Options dialog box, click Flex > RTMP, and select the Generate single step
for RTMP/T stream handling check box.
The differences between the simplified and regular recording modes are listed below:
Simplified mode Regular mode
(Recording option) Generate single step
for RTMP/T stream handling check box
Selected Not selected
Functions generated RTMP: Generates flex_
rtmp_receive_stream
functions.
RTMPT: Generates flex_
rtmp_tunneled_send
functions.
Generates flex_rtmp_
receive and flex_rtmp_send
steps.
Number of functions generated per
stream
One Multiple
Supports asynchronous behavior No Yes
Default Mode Yes No
Note: The simplified recording mode is supported for Flash Media Server versions 3.5 and 4.
Synchronous Vuser behavior
The flex_rtmp_receive_stream and flex_rtmp_tunneled_send functions that are generated when the
simplified recording mode is selected are synchronous functions. This means that no other Vuser
functions can be executed while either of these functions is executing. For example, consider a Vuser
script that includes a flex_rtmp_receive_stream function that streams a video for 5 minutes. During
the 5 minute period during which the video is streaming, the Vuser will not be able to perform any other
actions, such as clicking the Pause button or skipping to a different location in the video. Clicking a
button while a video is streaming is an example of asynchronous behavior.
Although a single generated step makes script replay more reliable, it is not able to replay
asynchronous actions (such as pause and seek) that you may have performed while recording the script.
The single generated step also does not replay the automatic requests that the client performs when
Dynamic Stream is in use. If it is important to replay these asynchronous actions, you must record the
Vuser script using the regular recording mode - not the simplified recording mode - and then manually
modify the generated script as described below.
User Guide
VuGen
HP LoadRunner (12.50) Page 507
Modifying scripts to replay asynchronous user actions
If your Vuser script must be able to replay asynchronous actions that are performed while a streaming
action is executed, you must record the Vuser script using the regular recording mode - not the
simplified recording mode - and then manually modify the generated script. The modified script will
include a combination of single streaming steps and the more verbose steps that are generated with
regular recording.
Note: In this section, we will use the term required user actions to refer to the actions that must
be performed while a video is streamed.
To create a script that can replay asynchronous behavior, first you record the script using the regular
recording mode - not the simplified recording mode. Thereafter, identify the flex_rtmp_send steps that
represent required user actions. Then replace the steps between the required user actions with single
streaming functions. See the sections below for details.
Note: The modification procedure differs slightly between RTMP and RTMPT steps.
Modifying recorded Flex RTMP steps
When you use the regular recording mode, VuGen generates flex_rtmp_receive and flex_rtmp_send
steps for all communication with the server. This ensures that user actions such as pause and seek, as
well as automatic requests that the client performs when Dynamic Stream is in use, are included in the
script. However, this method also captures less-necessary lines of code that are difficult to read and
may not be reliable during replay of streaming actions.
Note: To activate the regular recording mode, clear the Generate single step for RTMP/T
stream handling check box in the Flex > RTMP pane of the Recording Options dialog box.
Follow the instructions below to remove the unnecessary flex_rtmp_receive and flex_rtmp_send steps
from your script.
1. Search for the flex_rtmp_send step that contains the initial play argument. For example:
flex_rtmp_send("send_step2",
"ConnectionID=10",
"Snapshot=tRTMP6.inf",
MESSAGE,
...
...
MESSAGE,
User Guide
VuGen
HP LoadRunner (12.50) Page 508
...
...
"Argument=<arguments><string>play</string><number>0</number><null/>"
...
LAST);
2. Delete or comment out the flex_rtmp_receive steps that occur during streaming. For example:
//this is the start of the stream:
flex_rtmp_receive("recv_step2",
"ConnectionID=10",
"Snapshot=tRTMP7.inf",
CHANNEL,
"ChunkStreamID=2",
CHANNEL,
"ChunkStreamID=2",
CHANNEL,
"ChunkStreamID=4",
CHANNEL,
"ChunkStreamID=2",
LAST);
flex_rtmp_receive("recv_step3",
"ConnectionID=10",
"Snapshot=tRTMP8.inf",
CHANNEL,
"ChunkStreamID=5",
CHANNEL,
...
...
3. Remove the flex_rtmp_send steps that are not related to the required user actions, such as "user
control message" types. For example:
flex_rtmp_send("send_step3",
"ConnectionID=10",
"Snapshot=tRTMP9.inf",
MESSAGE,
User Guide
VuGen
HP LoadRunner (12.50) Page 509
"DataType=user control message",
"EventType=set buffer length",
"MessageStreamID=1",
"BufferLength=100",
LAST);
4. When you find a flex_rtmp_send step that represents a required user action, do the following:
a. Manually add a flex_rtmp_receive_stream step before the send step.
- Make sure that the ConnectionID argument has the same value as the steps you removed
above it.
- The Snapshot argument is not relevant for the manually added step.
- You can use the ContinueToNexStepAfter = <msec> argument to control the minimum play
duration of the stream to download before continuing to the next step.
b. Determine the flex_rtmp_send steps that represent the required user actions. These will
likely include arguments such as pauseRaw,pause,seek and play2 (for Dynamic Stream). For
example:
flex_rtmp_send("send_step5",
"ConnectionID=10",
"Snapshot=tRTMP62.inf",
MESSAGE,
"DataType=command message amf3",
"ChunkStreamID=8",
"MessageStreamID=1",
"Argument=<arguments><string>pauseRaw</string><number>0</number><null/>"
"<boolean>true</boolean><number>12000</number></arguments>",
LAST);
c. Determine whether there are some extra flex_rtmp_send steps that you can remove. For
example, if you dragged a button to seek in the stream, subtle jerks in the motion may be
recorded as separate pause and seek actions. In these cases, may not need all of them. Keep
only those that describe the desired operations.
d. Identify the flex_rtmp_receive step that indicates that the server has received the end of the
user action. For example:
//this is the confirmation from the server on the "seek" command.
flex_rtmp_receive("recv_step55",
"ConnectionID=10",
"Snapshot=tRTMP68.inf",
User Guide
VuGen
HP LoadRunner (12.50) Page 510

CHANNEL,
"ChunkStreamID=2",
CHANNEL,
"ChunkStreamID=2",
LAST);
5. Repeat steps 2 - 4 for each set of unnecessary receive data and required user actions in your
script.
For additional details on flex_rtmp_receive_stream including a complete example, see the Function
Reference (Help > Function Reference).
Modifying recorded Flex RTMPT steps
When you use the regular recording mode, VuGen generates a flex_rtmp_tunneled_send step for all
communication with the server. This ensures that user actions such as pause and seek, as well as
automatic requests that the client performs when Dynamic Stream is in use, are included in the script.
However, this method also captures less-necessary lines of code that are difficult to read and may not
be reliable during replay of streaming actions.
Note: To activate the regular recording mode, clear the Generate single step for RTMP/T
stream handling check box in the Flex > RTMP pane of the Recording Options dialog box.
Follow the instructions below to remove the unnecessary steps from your script.
1. Search for the flex_rtmp_tunneled_send step that contains the initial play argument. For
example:
flex_rtmp_tunneled_send("send_step2",
"SessionID=1",
"Snapshot=t36.inf",
MESSAGE,
...
...
MESSAGE,
...
...
"Argument=<arguments><string>play</string><number>0</number><null/>"
...
LAST);
2. Remove flex_rtmp_tunneled_send steps that are not related to required user actions, such as
"user control message" types. For example:
flex_rtmp_tunneled_send("send_step3",
"SessionID=10",
User Guide
VuGen
HP LoadRunner (12.50) Page 511
"Snapshot=t15.inf",
MESSAGE,
"DataType=user control message",
"EventType=set buffer length",
"MessageStreamID=1",
"BufferLength=100",
LAST);
3. When you find a flex_rtmp_tunneled_send step that represents a required user action, do the
following:
a. Add a ContinueToNexStepAfter = <msec> argument to the previous step. The
ContinueToNexStepAfter = <msec> argument controls the minimum play duration of the
stream to download before continuing to the next step. For example:
flex_rtmp_tunneled_send("send_step2",
"SessionID=1",
"Snapshot=t36.inf",
//Read the stream until at least 15 seconds of media have been downloaded
"ContinueToNexStepAfter = 15000",
MESSAGE,
...
...
MESSAGE,
...
...
"Argument=<arguments><string>play</string><number>0</number><null/>"
...
LAST);
b. Determine the flex_rtmp_tunneled_send steps that represent the required user actions.
These will typically include arguments such as pauseRaw,pause,seek and play2 (for Dynamic
Stream). For example:
flex_rtmp_tunneled_send("send_step5",
"SessionID=10",
"Snapshot=t16.inf",
User Guide
VuGen
HP LoadRunner (12.50) Page 512

MESSAGE,
"DataType=command message amf3",
"ChunkStreamID=8",
"MessageStreamID=1",
"Argument=<arguments><string>pauseRaw</string><number>0</number><null/>"
"<boolean>true</boolean><number>12000</number></arguments>",
LAST);
c. Determine whether there are extra flex_rtmp_tunneled_send steps that you can remove. For
example, if you dragged a button to seek in the stream, subtle jerks in the motion may be
recorded as separate pause and seek actions. In these cases, you may not need all of them.
Keep only those that describe the desired operations.
4. Repeat steps 2 - 3 for each set of unnecessary send data and required user actions in your script.
For additional details on the flex_rtmp_tunneled_send function, including a complete example, see the
Function Reference (Help > Function Reference).
Live Streaming
VuGen's Flex protocol supports Adobe’s Live Streaming. If VuGen detects a live stream while you record
a Vuser script, VuGen adds ‘ContinueToNextStepAfter’ and ‘ContinueMode’ arguments to the generated
flex_rtmp_receive_stream or flex_rtmp_tunneled_send function. These additional arguments enable
the live stream to be accurately replayed. For details on these arguments, see the Function Reference
(Help > Function Reference).
Note: The default value of the generated ContinueToNextStepAfter argument is the length of
time (in milliseconds) for which the video was streamed while the Vuser script was recorded.
RTMP Tunneled
VuGen supports the recording of RTMP Tunneled steps in Flex application which are split into the
following step types:
lMessaging support. The Flex protocol supports enhanced record and replay of messaging and has
been verified for Adobe LiveCycle Data Services ES2 Version 3.1.
lStreaming support. The Flex protocol supports enhanced record and replay of streaming. For details,
see "RTMP/RTMPT Streaming" on page506.
When you record a Flex stream, by default, LoadRunner generates a single flex_rtmp_tunneled_
send step in place of many flex_rtmp_tunneled_send steps. The flex_rtmp_tunneled_send step
makes your script more readable (eliminating tens or hundreds of lines) and makes the replay more
reliable.
User Guide
VuGen
HP LoadRunner (12.50) Page 513

Note: The new flex_rtmp_tunneled_send step is generated when the Generate single
RTMP/T step option is selected in the Flex:RTMP pane of the Recording Options dialog box.
Although this step makes the script more reliable, it does not replay certain actions you may
perform while recording your script, such as pause and seek. It also does not replay the
automatic requests that the client performs when Dynamic Stream is in use.
If it is important to replay these actions, you can clear the Generate single RTMP/T step option in
the Flex> RTMP pane of the Recording Options dialog box, which causes LoadRunner to generate the
steps for all of the raw streaming data.
However, to ensure proper replay, you must manually modify the generated script as described in
"RTMP/RTMPT Streaming" on page506.
The above functionality has been verified for Flash Media Server versions 3.5 and 4.
lExternalizable objects. LoadRunner supports externalizable objects over RTMP Tunneled. For details,
see "Externalizable Objects in Flex Scripts" on page517.
lUser Data Points. LoadRunner generates a number of new data points that provide more useful
information for analysis.
lThe Flex RTMP-Tunneled protocol supports manual correlation using web_reg_save_param_xpath
API.
For additional details on flex_rtmp_tunneled_send including a complete example, see the Function
Reference (Help > Function Reference).
How to Record a Flex Script
This task describes how to record a script using the Flex Vuser protocol.
Create a new script or open an existing script
Select New Script and Solution > Flex protocol
For details, see "Creating or Opening Vuser Scripts" on page127.
Configure the recording options
The recording options contain options that affect the way that a Vuser script is generated after
recording or regenerating the script.
In a Flex script, you will need to configure the following recording options:
lRecording options > Flex > RTMP > Generate single step for RTMPT/Streaming
This option, selected by default, enables VuGen to create a single step while recording a stream.
However, when you create a single step, certain actions are not replayed, such as pause and seek. If
you want to be able to replay these actions, disable the option.
lRecording Options > Flex > Configuration > Use External JVM
User Guide
VuGen
HP LoadRunner (12.50) Page 514

If you are using an external Java Virtual Machine select this option and configure the path of the JVM
in the value field.
lRecording Options > Flex > Configuration > Use GraniteDS
Check this option if you are using GraniteDS as a sever side Data Service configuration.
lRecording Options > Flex > Externalizable Objects
This option enables you to specify additional .jars that are required to record your script.
For details, see "Externalizable Objects in Flex Scripts" on page517.
lRecording Options > HTTP Properties > Advanced
Make sure that the Save snapshot resources locally option is enabled, as local snapshots are
required for data loading.
For details, see "HTTP Properties > Advanced Recording Options" on page178.
For concept and user interface details, see "Recording Options" on page146.
Initialize the recording session
When creating a new script, this occurs automatically. To manually start recording, click the Start
Record button on the VuGen toolbar, complete the Start Recording dialog box, and then click Start
Recording. VuGen's floating toolbar appears, VuGen opens your application and begins recording your
actions.
lFor user interface details, see "Start Recording Dialog Box" on page226.
lFor details on the script sections into which you can record, see "Vuser Script Sections" on page141.
Perform business processes on your application
Perform the desired business processes that you wish to record. The floating toolbar allows you to
insert transactions, rendezvous points, and comments. You can also use the floating toolbar to specify
into which section of the script to record. For user interface details, see "Floating Recording Toolbar" on
page229.
Click the Stop button on the floating toolbar when you are finished recording.
Regenerate the code
After recording, regenerate the script to determine if all the steps have been correctly parsed.
For details, see "Code Generation in the Flex Protocol" on page517.
Setting the Flex Recording Mode
You can instruct VuGen how to generate a script from a Flash Remoting session using the Flex and Web
Protocols.
User Guide
VuGen
HP LoadRunner (12.50) Page 515
Example
Use Web HTTP technology to generate web_custom_request functions with the Flash Remoting
information.
web_url("flash",
"URL=http://<HOST>:<PORT>/flash/",
"Resource=0",
"RecContentType=text/html",
"Referer=",
"Snapshot=t1.inf",
"Mode=HTML",
EXTRARES,
"Url=movies/XMLExample.swf", "Referer=", ENDITEM,
"Url=movies/JavaBeanExample.swf", "Referer=", ENDITEM,
LAST);
web_link("Sample JavaBean Movie Source",
"Text=Sample JavaBean Movie Source",
"Snapshot=t2.inf",
EXTRARES,
"Url=XMLExample.swf", "Referer=", ENDITEM,
"Url=JavaBeanExample.swf", "Referer=", ENDITEM,
LAST);
web_custom_request("gateway",
"URL=http://<HOST>:<PORT>/flashservices/gateway",
"Method=POST",
"Resource=0",
"RecContentType=application/x-amf",
"Referer=",
"Snapshot=t3.inf",
"Mode=HTML",
"EncType=application/x-amf",
"BodyBinary=\\x00\\x00\\x00\\x01\\x00\\x10amf_server_debug\\x01
\\x00\\x00\\x00`\\x03\\x00\ncoldfusion\\x01\\x01\\x00
\namfheaders\\x01\\x00\\x00\\x03amf\\x01\\x00\\x00
\\x0Bhttpheaders\\x01\\x00\\x00\trecordset\\x01\\x01
\\x00\\x05error\\x01\\x01\\x00\\x05trace\\x01\\x01
\\x00\\x07m_debug\\x01\\x01\\x00\\x00\t\\x00\\x01
\\x00/flashgateway.samples.FlashJavaBean.testDocument
\\x00\\x02/1\\x00\\x00\\x004\n\\x00\\x00\\x00\\x01
\\x0F\\x00\\x00\\x00*<TEST message=\"test\"><INSIDETEST /></TEST>",
LAST);
User Guide
VuGen
HP LoadRunner (12.50) Page 516
Code Generation in the Flex Protocol
Code Generation Notification
If a Flex, Silverlight, or Java over HTTP script encounters an error during the code generation phase,
VuGen issues a warning. This warning appears in the Errors pane, when the Warnings button is selected,
and the Define Available Categories filter is set to All or Code Generation Notification.The list of
warnings displays details about each error, as well as recommended actions for resolving the problem.
Follow the recommended actions and regenerate the script.
If the error is related to externalizable objects in a Flex script, see "Externalizable Objects in Flex
Scripts" below.
To manually open the Errors pane at any time, select View > Errors.
Parsing Responses in Flex Scripts
When generating a Flex script, LoadRunner attempts to parse responses for any of the following steps:
• flex_amf_call
• flex_remoting_call
• flex_login
• flex_logout
• flex_ping
If the parsing fails, the following attribute is dynamically added to the step:
IsParseResponse = No
This instructs LoadRunner not to parse the responses for that step during script replay. Every time you
regenerate the script, LoadRunner will attempt to parse again, and will set this parameter to false if it
fails. If needed, you can delete this line, or set the value to = 'Yes' to force LoadRunner to parse
responses for that step during replay.
Additionally, you can manually add the attribute and set the value to 'No' in a generated script, even if
the parse is successful, as it may enhance replay performance.
Externalizable Objects in Flex Scripts
When recording a Flex application, information is usually passed between the client and server using
known serialization methods (AMF). If this is the case, VuGen creates a flex_amf_call and both the
request and response are parsed.
However, when a given AMF object uses a custom serialization method (externalizable), VuGen
automatically issues a warning. This warning displays details about the exception, as well as
recommended actions for resolving it.
User Guide
VuGen
HP LoadRunner (12.50) Page 517
The following are some examples of the exceptions that the generated script may include when an AMF
object uses a custom serialization method:
lRequest and response not parsed. This exception is automatically displayed in the Errors pane when
the Warnings button is selected, and the Define Available Categories filter is set to All or Code
Generation Notification. Details about the exception are listed, as well as recommended actions. For
details, see "Errors Pane" on page87.
lRequest parsed but response is not parsed. VuGen generates a IsParseResponse=No statement.
Additionally, VuGen issues a warning that is automatically displayed in the Errors pane when the
Warnings button is selected, and the Define Available Categories filter is set to All or Code
Generation Notification. The list of warnings displays details about the exception, as well as
recommended actions. For details, see "Errors Pane" on page87.
For details on configuring the Recording Options > Flex > Externalizable Objects Node, see "Flex >
Externalizable Objects Recording Options" on page167.
The following flowchart illustrates the steps to resolve externalizable objects in Flex scripts:
User Guide
VuGen
HP LoadRunner (12.50) Page 518
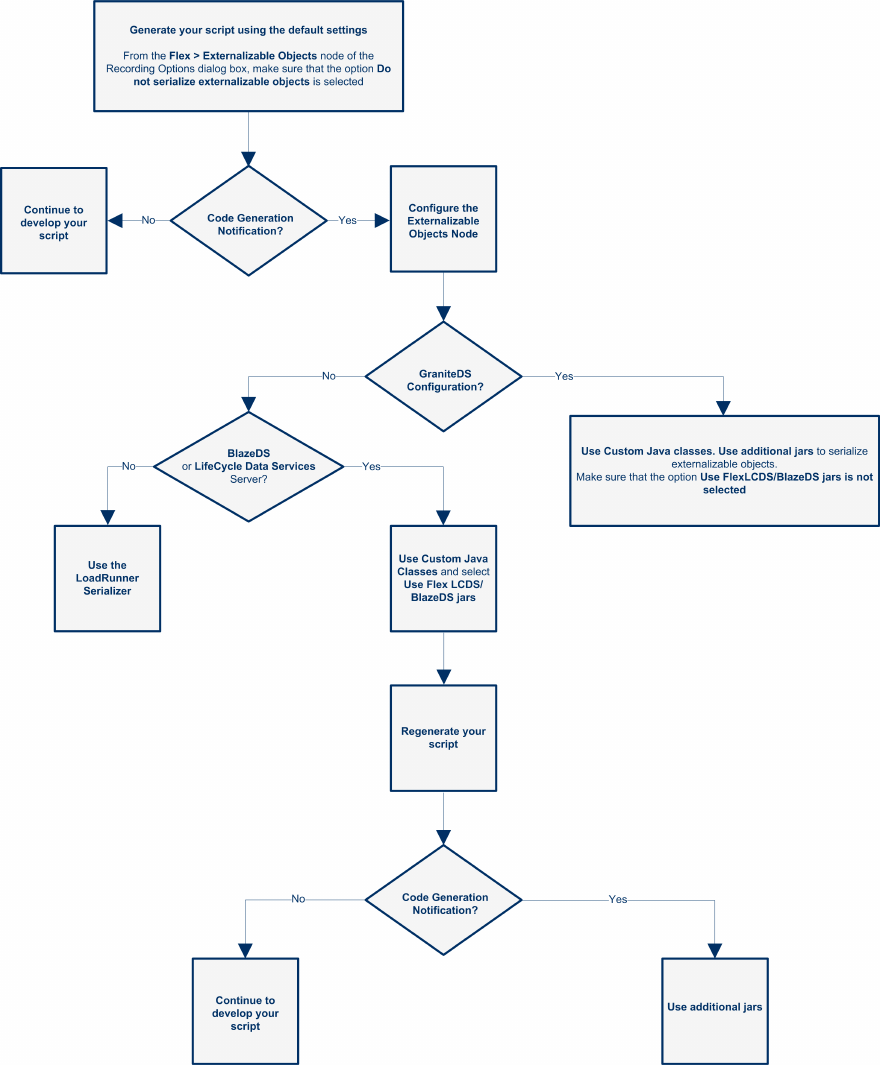
Flex Correlations
VuGen supports correlation in Flex scripts.
Support for correlations applies to the following Flex steps:
lflex_login
lflex_logout
lflex_ping
lflex_amf_call
lflex_remoting_call
lflex_rtmp_tunnelled_connect
lflex_rtmp_tunnelled_send
Flex correlation includes integration with the following features:
lCorrelations rules
DSid,jsessionid, and RTMPTID
lDesign Studio
lManual correlation using the API web_reg_save_param_xpath.
For general information, see "Correlation Tab [Design Studio] Overview" on page236.
For task details, see "How to Correlate Scripts Using Design Studio" on page241.
Flex Snapshots
Vuser scripts based on the Flex protocol utilize VuGen's Snapshot pane.
lFor details on how to work with the Snapshot pane, see "How to Work with Snapshots" on page276.
lFor details on the Snapshot pane UI, see "Snapshot Pane" on page77.
In addition, a new snapshot has been designed to show Flex data in several views:
lRaw Data
The data received from the server that has not been formatted or parsed in any way.
lResponse Body
Data entity received from the server
lRequest Body
Data entity sent to the server
lHeaders
If the Response Body and the Request Body are in XML format, the data can be displayed as:
User Guide
VuGen
HP LoadRunner (12.50) Page 520
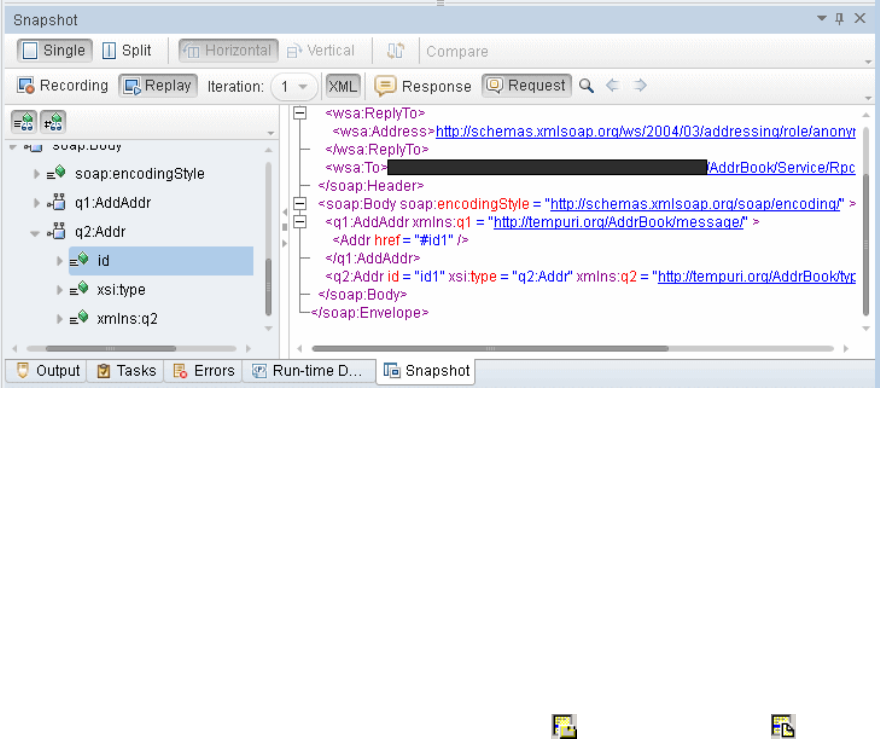
lText
lHex
lXML
How to Serialize Flex Scripts
Serialize Using External Java Serializer
You can use the Java classes from the Flex server to serialize AMF messages in your script. This process
has been simplified so that you need to include the application JAR files only if the AMF objects
implement an externalizable interface.
1. In the Recording Options > Flex > Externalizable Objects node, select Serialize objects using
and select Custom Java Classes from the drop-down menu.
2. Add the relevant files by using the Add all classes in folder or Add JAR or Zip file buttons.
Add the following files:
a. For Adobe BlazeDS or Adobe LCDS, add the following JAR files:
oflex-messaging-common.jar
oflex-messaging-core.jar
b. Regenerate the script and note any errors. Open the recording options dialog box using the
Generation Options button and add the necessary application JAR files.
3. Ensure that the added files exist in the same location both on the VuGen machine and on all load
generators.
For details, see "Externalizable Objects in Flex Scripts" on page517.
User Guide
VuGen
HP LoadRunner (12.50) Page 521
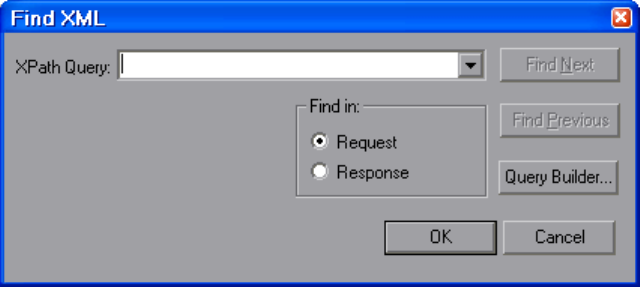
Notes and Limitations for the Java Serializer
lSupported JDK versions: 1.6 and earlier.
lSupported servers: Adobe BlazeDS and Adobe Livecycle DS.
lMicrosoft .NET classes are not supported.
lDuring code generation VuGen performs a validity test of the request buffers by verifying that
the buffer can be read and written using the provided jars. Failure in this validity test indicates
that the classes are incompatible with LoadRunner.
Use the LoadRunner Serializer
You can attempt to serialize externalizable objects using the LoadRunner serializer. Ensure that you
have saved all open scripts because this option may result in unexpected errors or invalid steps.
1. Save all open scripts in VuGen.
2. In the Recording Options > Flex > Externalizable Objects node, select Serialize objects using
and select LoadRunner AMF serializer.
How to Query an XML Tree
VuGen provides a Query Builder that lets you create and execute queries on the XML.
VuGen displays the XML code in an expandable tree. You can perform a query on your XML document,
and search for a specific Namespace URI, value, or attribute. Note that all queries are case-sensitive.
Perform a query
1. In the Snapshot pane, select the node that you want to search. Click the Find XML button. The Find
XML dialog button opens.
2. Select Request or Response. Enter an XPath query and click OK. To formulate a query, click Query
Builder button. The XML Node Query dialog box opens.
3. Enable one or more items for searching.
User Guide
VuGen
HP LoadRunner (12.50) Page 522
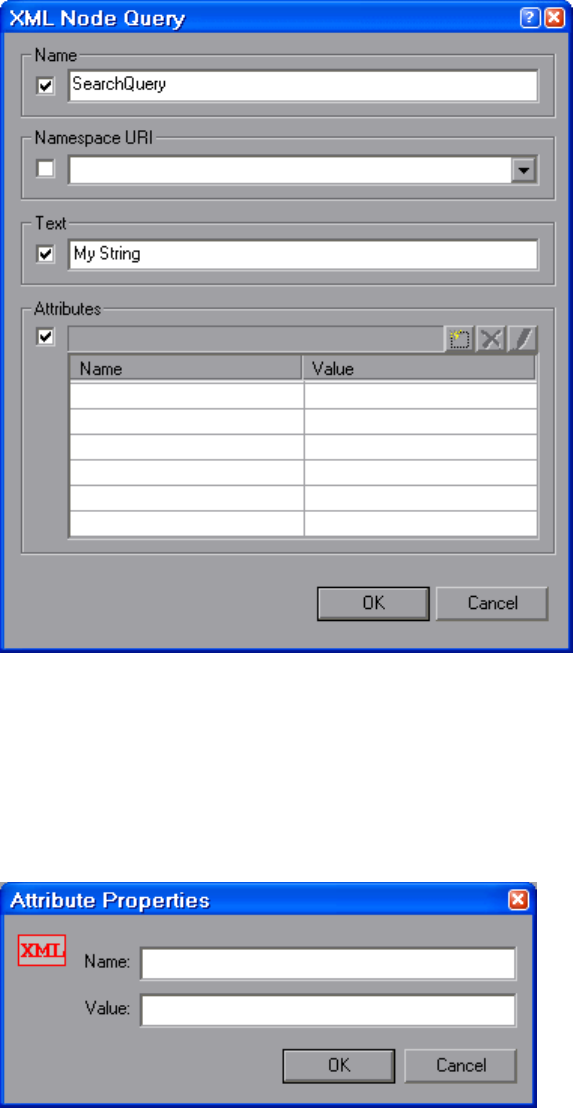
4. Enable the Name section to search for the name of a node or element.
5. Enable the Namespace URI section to search for a namespace.
6. Enable the Text section to search for the value of the element indicated in the Name box.
7. Enable the Attributes section to search for an attribute.
8. Enter the search text in the appropriate boxes. To add an attribute, click the Add button. The
Attribute Properties box opens. Enter an attribute name and value. Click OK.
9. Click OK in the XML Node Query dialog box. VuGen places the text of the query in the Find XML box.
User Guide
VuGen
HP LoadRunner (12.50) Page 523
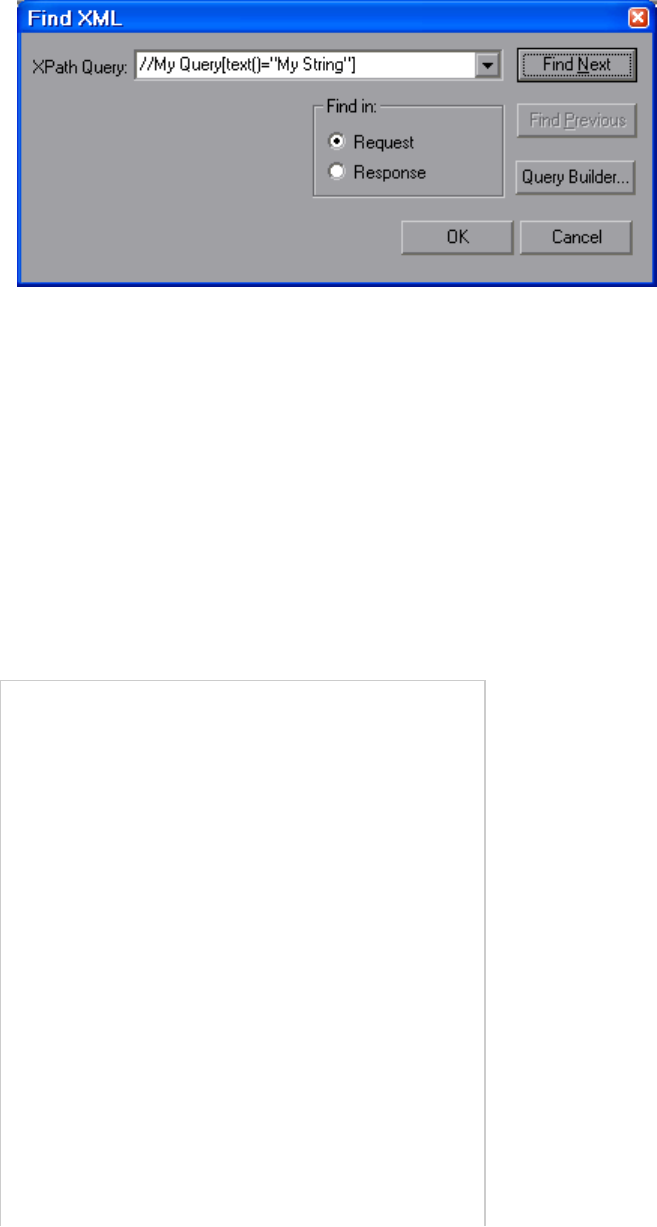
10. Click Find Next to begin the search.
Troubleshooting and Limitations for Flex
This section describes troubleshooting and limitations for the Flex Protocol.
lA Flex script cannot be generated using an external Java Virtual Machine (JVM) version 1.4 or lower.
lProxy recording is not supported for the Flex protocol.
lIf your script contains more than one flex_RTMP_tunneled_connect step, with the same gateway
parameter, you must insert a disconnect step for the previous flex_RTMP_tunneled_connect step
before you connect again. For example:
Flex_rtmp_tunneled_connect("connect_step0",
"SessionId=0",
"Gateway=http://123.123.123.123:1935",
.
LAST);
.
Flex_rtmp_tunneled_disconnect("disconnect_step0",
"SessionId=0")
flex_rtmp_tunneled_connect("connect_step1",
"SessionId=1",
"Gateway=http://123.123.123.123:1935",
.
LAST);
User Guide
VuGen
HP LoadRunner (12.50) Page 524

.
Flex_rtmp_tunneled_disconnect("disconnect_step0",
"SessionId=1")
, continued
lIf a subsequent flex_rtmp_tunneled_connect command has the same gateway parameter as the
previous flex_trtmp_tunneled_connect step and the flex_rtmp_tunneled_disconnect step is
omitted, the script will pause indefinitely.
GraniteDS (Data Services)
lIf you have modified the granite-config.xml, copy it to the <LoadRunnerInstallation>\dat directory.
lWhen switching between BlazeDS and GraniteDS parsing (Recording Options > Flex >
Configuration), VuGen must be restarted.
lLoadRunner cannot serialize both GraniteDS and BlazeDS/LCDS messages in the same script.
lFlex RTMP messaging support. All limitations that apply to AMF3 parsing apply to externalizable
objects over RTMP.
lflex_rtmp_receive_stream step. If the Generate flex_rtmp_receive_stream step option is enabled,
all transactions, comments, and rendezvous points that you add from the Recording toolbar are
added to the script after the flex_rtmp_receive_stream step in your script.
lWeb diagnostics does not work for RTMP and RTMPT steps (even when the breakdown is enabled).
lYou cannot replay two RTMPT steps at once.
Java Record Replay Protocol
Java Record Replay Protocol Overview
The Java Record Replay protocol enables full VuGen functionality when recording a script on a Java
application or applet. VuGen creates a script in pure Java and enhances it with HP LoadRunner API Java-
specific functions.
In order to successfully record a script, you must install JDK on the VuGen machine before recording a
script. JRE alone is insufficient. Ensure that the classpath and path environment variables are set
according to the JDK installation instructions.
After recording, you can enhance or modify the script with standard Java code using JDK libraries or
custom classes. VuGen utilizes the standard Java compiler, javac.exe, to compile the script. Once the
User Guide
VuGen
HP LoadRunner (12.50) Page 525

script is successfully compiled you can incorporate it into a LoadRunner scenario or Business Process
Monitor configuration.
Supported Java Communication Protocols
VuGen supports a variety of different communication protocols for Java applications:
lRMI: For information on the RMIprotocol, see "Working with RMI" on page529.
lCORBA: For information on the CORBA protocol, see "Working with CORBA" on the next page.
lJACADA: For information on the Jacada protocols, see "Working with Jacada" on page529.
lJMS
VuGen's built-in support for the Java protocols utilizes hook files to define how different classes
communicate with each other. For information on the hook file structure, see "Hook File Structure" on
page538.
By default, VuGen only records client side activity in a script, which then emulates the load on the server.
You must edit the hook file to change the actions recorded by VuGen. To manually edit the hook file, see
"Java Custom Filters Overview" on page535.
Note: If you are recording a script that does not use one of the supported protocols (RMI,
CORBA, JMS, Jacada), you must define your own hook file otherwise your Vuser script will be
empty.
VuGen provides a tool that enables you to convert a script created for Web, into Java. For more
information, see "How to Convert a Web - HTTP/HTML Vuser Script into a Java Vuser Script" on page845.
Note: By default, Java 7 enables the Java Split Verifier. This prevents Java recording in
LoadRunner. LoadRunner uses the -XX:-UseSplitVerifier key while initializing the JVM during
recording, to disable the verifier. This adaptation does not require any user intervention.
Java Record Replay Protocol Recording Tips
This section gives tips and important information to consider when recording a Java Record Replay
Vuser Script.
For a general overview of how to work with scripts, see "VuGen Workflow" on page127
For a detailed description of how to record a script, see "Recording - Overview" on page140.
Tips for Recording a Java Record Replay Vuser Script
lThe Java Record Replay protocol can only record 32-bit applications. When you specify an application,
make sure to specify the 32-bit version.
User Guide
VuGen
HP LoadRunner (12.50) Page 526
lYou can also specify a batch (.bat) file as the application to record.
lWhen you load an applet or application from VuGen during recording, it may take several seconds
longer than if you were to load it independent of VuGen.
lMake sure that you have properly installed a JDK version on the machine running the Vusers—JRE
alone is insufficient.
lVerify that the classpath and path environment variables are set according to the JDK installation
instructions. Before you replay a Vuser script, verify that your environment is configured properly for
the JDK and relevant Java classes. For details on how to set the Java Environment settings, see "Java
> VM Recording Options" on page183 and "Java > Classpath Recording Options" on page184.
lEnsure your code is thread-safe if you intend to run the Java Vuser script as a thread.
Working with CORBA
CORBA Application Vendor Classes
Running CORBA applications with JDK1.2 or later, might load the JDK internal CORBA classes instead of
the specific vendor CORBA classes. To force the virtual machine to use the vendor classes, specify the
following java.exe command-line parameters:
Visigenic 3.4
-Dorg.omg.CORBA.ORBClass=com.visigenic.vbroker.orb.ORB
-Dorg.omg.CORBA.ORBSingletonClass=com.visigenic.vbroker.orb.
ORBSingleton
Visigenic 4.0
-Dorg.omg.CORBA.ORBClass=com.inprise.vbroker.orb.ORB
-Dorg.omg.CORBA.ORBSingletonClass=com.inprise.vbroker.orb.ORBSingleton
OrbixWeb 3.x
-Dorg.omg.CORBA.ORBClass=IE.Iona.OrbixWeb.CORBA.ORB
-Dorg.omg.CORBA.ORBSingletonClass=IE.Iona.OrbixWeb.CORBA.
singletonORB
OrbixWeb 2000
-Dorg.omg.CORBA.ORBClass=com.iona.corba.art.artimpl.ORBImpl
-Dorg.omg.CORBA.ORBSingletonClass=com.iona.corba.art.artimpl.
ORBSingleton
Editing a CORBA Vuser Script
CORBA-specific scripts usually have a well-defined pattern. The first section contains the ORB
initialization and configuration. The next section indicates the location of the CORBA objects. The
following section consists of the server invocations on the CORBA objects. The final section includes a
shutdown procedure which closes the ORB. Note that pattern is not mandatory and that each one of
these sections may appear multiple times within a script.
User Guide
VuGen
HP LoadRunner (12.50) Page 527

In the following segment, the script initializes an ORB instance and performs a bind operation to obtain
a CORBA object. VuGen imports all the necessary classes.
import org.omg.CORBA.*;
import org.omg.CORBA.ORB.*;
import lrapi.lr;
public class Actions {
public int init() throws Throwable {
// Initialize Orb instance...
MApplet mapplet = new MApplet("http://chaos/classes/", null);
orb = org.omg.CORBA.ORB.init(mapplet, null);
// Bind to server...
grid = grid_dsi.gridHelper.bind("gridDSI", "chaos");
return lr.PASS;
}
The org.omg.CORBA.ORB function makes the connection to ORB. Therefore, it should only be called
once. When running multiple iterations, place this function in the init section.
In the following section, VuGen recorded the actions performed on a grid CORBA object.
public int action() throws Throwable {
grid.width();
grid.height();
grid.set(2, 4, 10);
grid.get(2, 4);
return lr.PASS;
}
At the end of the session, VuGen recorded the shutdown of the ORB. The variables used throughout the
entire recorded code appear after the end method and before the Actions class closing curly bracket.
public int end() throws Throwable {
if (lr.get_vuser_id() == -1)
orb.shutdown();
return lr.PASS;
}
// Variable section
org.omg.CORBA.ORB orb;
grid_dsi.grid ;
}
Note: The ORB shutdown statement was customized for this product. This customization
prevents a single Vuser's shutdown from shutting down all other Vusers.
User Guide
VuGen
HP LoadRunner (12.50) Page 528
Working with RMI
This section describes the elements of the Java Vuser script that are specific to RMI. VuGen provides full
support for the RMI over IIOP protocol. Depending on what you are recording, you can utilize VuGen's RMI
recorder to create a script that will optimally emulate a real user for:
lPure RMI client: Recording a client that uses native JRMP protocol for remote invocations
lRMI over IIOP client: Recording a client application that was compiled using the IIOP protocol instead
of JRMP (for compatibility with CORBA servers).
RMI does not have constructs (as in CORBA)—instead it uses Serializable Java objects. In RMI there is no
specific shutdown section (unlike CORBA).
The following code example locates a naming registry and utilizes a lookup operation to obtain a
specific Java object. You can then perform functions such as set_sum,increment, and get_sum on the
object. You must import the RMI classes to access the RMI functions.
Import java.rmi.*;
Import java.rmi.registry.*;
public int action() throws Throwable {
_registry = LocateRegistry.getRegistry("localhost",1099);
counter = (Counter)_registry.lookup("Counter1");
counter.set_sum(0);
counter.increment();
counter.increment();
counter.get_sum();
return lr.PASS;
}
When recording RMI Java, your script may contain several calls to lr.deserialize, which deserializes all of
the relevant objects. The lr.deserialize calls are generated because the object passed to the next
invocation could not be correlated to a return value from any of the previous calls. VuGen therefore
records its state and calls the lr.deserialize function to represent these values during replay. The
deserialization is done before VuGen passes the objects as parameters to invocations. For more
information, see "How to Correlate Scripts - Java Scripts - Serialization" on page256.
Working with Jacada
Recording a Jacada Vuser
The Jacada Interface Server provides an interface layer for mainframe applications. This layer
separates the user interface from the application logic in order to insulate the organization from
changes in standards and technologies.
User Guide
VuGen
HP LoadRunner (12.50) Page 529
VuGen records Jacada's Java thin-client. To record communication with the Jacada server through the
HTML thin-client, use the Web HTTP/HTML type Vuser. For more information, see "Web Protocols
(Generic)" on page851.
Before replay, you must also download the clbase.jar file from the Jacada server. All classes used by the
Java Vuser must be in the classpath—either set in the machine's classpath environment variable or in
the Classpath Entries list in the Classpath node of the runtime settings.
During replay, the Jacada server may return screens from the legacy system, in a different order than
they appear in the recorded script. This may cause an exception in the replay. For information on how to
handle these exceptions, contact HP support.
Editing a Jacada Vuser Script
The Actions method of a Java Vuser script using Jacada, has two main parts: properties and body. Use
the properties section to retrieve and set the server properties. Once your have the server properties
you can connect to the Jacada server.
// Set system properties...
_properties = new Properties(System.getProperties());
_properties.put("com.ms.applet.enable.logging", "true");
System.setProperties(_properties);
_jacadavirtualuser = new cst.client.manager.JacadaVirtualUser();
lr.think_time(4);
_jacadavirtualuser.connectUsingPorts("localhost", 1100, "LOADTEST", "", "",
"");
The body of the script contains the user actions along with the exception handling blocks for the
checkFieldValue and checkTableCell methods.
try {
_jacadavirtualuser.checkFieldValue(23, "S44452BA");
} catch(java.lang.Exception e) {
lr.log_message(e.getMessage());
}
try {
_jacadavirtualuser.checkTableCell(41, 0, 0, "");
} catch(java.lang.Exception e) {
lr.log_message(e.getMessage());
}
The checkField method has two arguments: field ID number and expected value. The checkTableCell
method has four arguments: table ID, row, column, and expected value. If there is a mismatch between
the expected value and the received value, an exception is generated.
User Guide
VuGen
HP LoadRunner (12.50) Page 530
By default, the try-catch wrapper blocks are commented out. To use them in your script, remove the
comment markers.
In addition to the recorded script, you can add any of the Java Vuser API functions. For a list of these
functions and information on how to add them to your script, see "Java Vuser Protocol" on page541.
How to Manually Insert Java Methods
You can use pre-defined Java packages within the VuGen script. The packages are added to a zip file or
saved in a designated folder. You can use the Java Function navigator to view and add the functions to
your script. Packages, classes, methods and other objects are represented in the Java Function
navigator by different icons. For a list of icons, see"Java Icon Reference List" on page534.
You can customize the function generation settings by modifying the configuration file. For more
information, see "General > Script Recording Options" on page172.
To Insert Java Functions:
1. Click within your script at the desired point of insertion.
2. Click Java Function in the toolbar to insert a Java function into the script. The Insert Java Function
dialog box opens. The Packages listbox displays the list of packages added to the project. The
Description text box displays a description of the selected Java object.
3. To add a package to the list of packages, click Locations. The Locations dialog box opens. By
default, VuGen lists the paths defined in the CLASSPATH environment variable.
4. To add a path, select ... > Folder. To add an archive (jar or zip), select ... > File. When you select a
folder or a file, VuGen inserts it in the Location Name box.
5. Click Add to add the item to the list.
6. Repeat steps 4 and 5 for each path or archive you want to add.
7. Select or clear the check boxes to the left of each item in the list. If an item is checked, its
members will be listed in the Java Class navigator.
8. Click OK to close the Locations dialog box and view the available packages.
9. Click the arrow to the left of each item in the navigator, to expand or collapse the trees.
10. Select an object and click Paste. VuGen places the object at the location of the cursor in the script.
To paste all the methods of a class into your script, select the class and click Paste.
11. Repeat the previous step for all of the desired methods or classes.
12. Modify the method parameter. If the script generation setting DefaultValues is set to true, you
can use the default values inserted by VuGen. If DefaultValues is set to false, you must add
parameters for all methods you insert into the script.
In addition, modify any return values. For example, if your script generated the following statement
"(String)=LavaVersion.getVersionId();", replace (String) with a string type variable.
13. Add any necessary statements to your script such as imports or HP LoadRunner Function
User Guide
VuGen
HP LoadRunner (12.50) Page 531
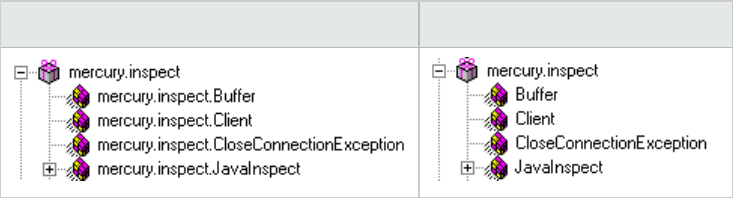
Reference API Java functions (described in "Java Vuser Protocol" on page541).
14. Save the script and run it from VuGen.
How to Manually Configure Script Generation Settings
You can customize the way the navigator adds methods to your script.
To view the configuration setting, open the jquery.ini file in VuGen's dat folder.
[Display]
FullClassName=False
[Insert]
AutoTransaction=False
DefaultValues=True
CleanClassPaste=False
Class Name Path
The FullClassName option displays the complete package and class name in the Java Function
navigator. This option does not affect the way the functions are added into the script—it only affects
the way the classes are displayed in the navigator. By default, this option is set to false. If your
packages have many classes and you are unable to view the package and class names at the same
time, you should enable this option.
FullClassName enabled FullClassName disabled
Automatic Transactions
The AutoTransaction setting creates a Vuser transaction for all methods. When you enable this option,
VuGen automatically encloses all Java methods with lr.start_transaction and lr.end_transaction
functions. This allows you to individually track the performance of each method. This option is disabled
by default.
User Guide
VuGen
HP LoadRunner (12.50) Page 532
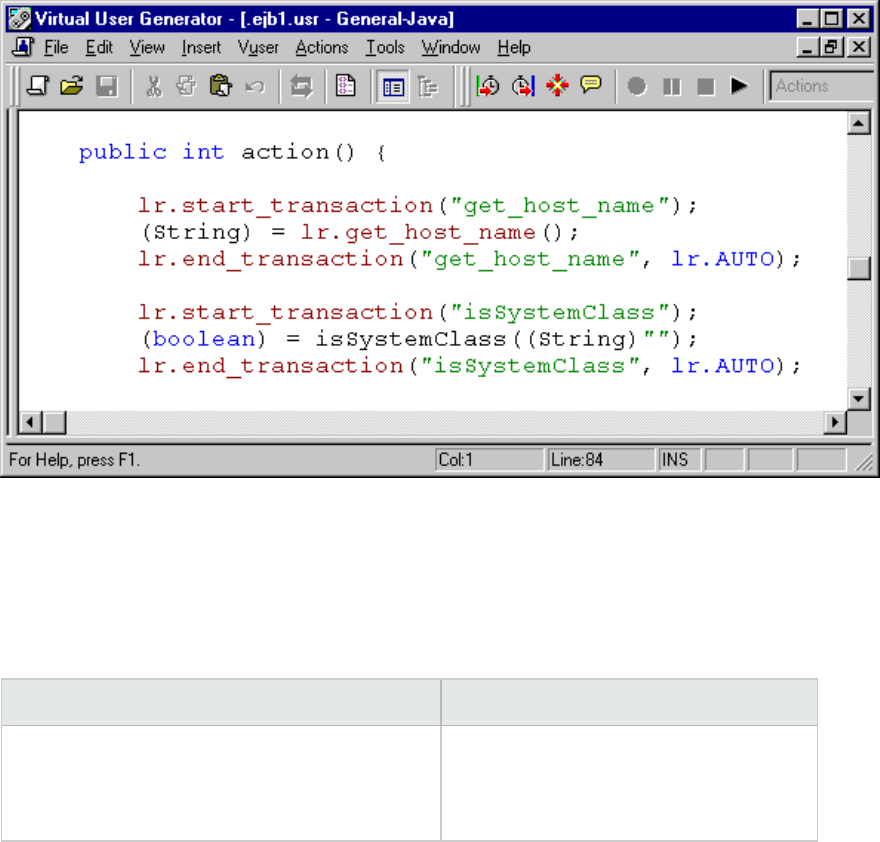
Default Parameter Values
The DefaultValues setting includes default values for all methods you paste into your script. This option
is enabled by default and inserts a null for all objects. If you disable this option, you must manually
insert parameter values for all functions in the script. The following table illustrates the DefaultValues
flag enabled and disabled.
DefaultValues enabled DefaultValues disabled
lr.message((String)"");
lr.think_time((int)0);
lr.enable_redirection((boolean)false);
lr.save_data((byte[])null, (String)"");
lr.message((String));
lr.think_time((int));
lr.enable_redirection((boolean));
lr.save_data((byte[]), (String));
Class Pasting
The CleanClassPaste setting pastes a class so that it will compile cleanly: with an instance returning
from the constructor, with default values as parameters, and without a need for import statements.
Using this option, you will most likely be able to run your script without any further modifications. If you
disable this option (default), you may need to manually define parameters and include import
statements. Note that this setting is only effective when you paste an entire class into your script—not
when you paste a single method.
The following segment shows the toString method pasted into the script with the CleanClassPaste
option enabled.
_class.toString();
// Returns: java.lang.String
User Guide
VuGen
HP LoadRunner (12.50) Page 533
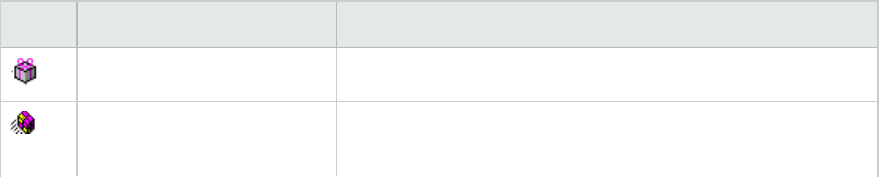
The same method with the CleanClassPaste option disabled is pasted as follows:
(String) = toString();
The next segment shows the NumInserter Constructor method pasted into the script with the
CleanClassPaste option enabled.
utils.NumInserter _numinserter = new utils.NumInserter
((java.lang.String)"", (java.lang.String)"", (java.lang.String)
""...);
// Returns: void
The same method with the CleanClassPaste option disabled is pasted as:
new utils.NumInserter((String)"", (String)"", (String)"",...);
Compiling and Running a Script as Part of a Package
When creating a Java Record Replay or a Java Vuser script, you may need to use methods in other
classes in which the class or method is protected. If you try to compile this type of script, you will receive
errors in the compilation stage indicating that the methods are inaccessible. To make sure that your
script can access these methods, insert the package name containing these methods at the top of the
script, just as you would do in a standard Java program— <package_name>. In the following example,
the script defines the my.test package which consists of a path:
package my.test;
import lrapi.*;
public class Actions
{
}
In the above example, VuGen automatically creates the my/test folder hierarchy under the Vuser folder,
and copies the Actions.java file to my/test/Actions.java, allowing it to compile with the relevant
package. Note that the package statement must be the first line in the script, similar to Java (excluding
comments).
Java Icon Reference List
The following table describes the icons that represent the various Java objects:
Icon Item Example
Package java.util
Class public class Hashtable extends java.util.Dictionary
implements java.lang.Cloneable, java.io.Serializable
User Guide
VuGen
HP LoadRunner (12.50) Page 534
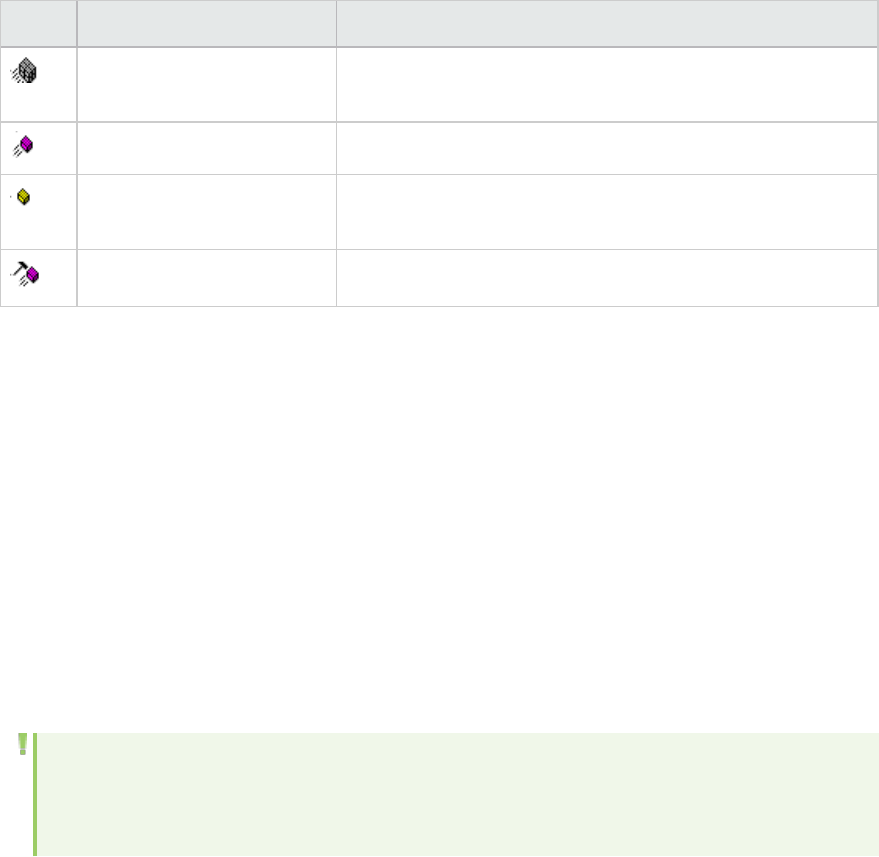
Icon Item Example
Interface Class
(gray icon)
public interface Enumeration
Method public synchronized java.util.Enumeration keys ()
Static Method
(yellow icon)
public static synchronized java.util.TimeZone getTimeZone
Constructor Method public void Hashtable ()
Java Custom Filters Overview
This section describes the background information necessary to create custom Java filters. For task
details, see "How to Create a Custom Java Filter" on page537.
When recording a Java Record Replay script, the recorder selects which methods are recorded in the
Vuser script and which are left out. VuGen uses hooking to filter the methods to include in the script.
VuGen comes with built-in support for the RMI, CORBA, JMSand Jacada protocols. The built-in filters for
RMI, CORBA, JMS, and JACADA protocols are designed to record only the server related traffic relevant to
your testing goals. If your protocol is not supported, you can define your own custom hook file. Custom
Java protocols, proprietary enhancements and extensions to the default protocols, and data
abstraction all require a custom filter definition.
Note: If you are recording a script that does not use one of the supported protocols (RMI,
CORBA, JMS, Jacada), you must define your own hook file. Otherwise, your Vuser script will be
empty.
Creating a custom hook file demands planning and a good understanding of the protocols your
application uses. When hooking is implemented correctly, the Vuser script should be well correlated and
ready for compilation. For more details on how to select which methods and classes to hook, see "Java
Custom Filters - Determining which Elements to Include" on the next page.
When you record a method, the methods which are called from the recorded method either directly or
indirectly, are not recorded.
In order to record a method, VuGen must recognize the object upon which the method is invoked, along
with the method's arguments. VuGen recognizes an object if it is returned by another recorded method
provided that:
lThe construction method of that object is hooked.
lIt is a primitive or a built-in object.
lIt supports a serializable interface.
User Guide
VuGen
HP LoadRunner (12.50) Page 535
You can create a custom filter to exclude unwanted methods. When recording a Java application, your
script may include calls to methods that do not affect the server, such as calls to a local utility or the
GUI interface. These calls are usually not relevant to your testing goals, and it would be correct to filter
them out.
Before creating a test, we recommend that you become familiar with your application and determine its
primary classes and methods, so that you will know which ones to include in your recording.
If you are not familiar with your application's classes, VuGen allows you to record with a stack trace that
logs all of the methods that were called by your application. In order to record with stack trace set the
log level to Detailed.
Java Custom Filters - Determining which Elements to Include
When designing a custom filter, we recommend that you start by choosing the appropriate built-in filter
as a base filter. You can then customize the filter using one of the following approaches:
lTop Down Approach. An approach in which you include the relevant package and exclude specific
classes that are not part of the client-server activity. This is recommended if you are familiar with
your application and you can identify a well-defined layer which implements all client-server activity
without involving any GUI elements.
lBottom up Approach. An approach in which you use the default filter and refine it by adding
individual methods or classes. Use this approach if you cannot identify a well-defined layer or if you
are not familiar with your application. Do not add all AUT packages and then try to remove extra
component one by one.
The following section provides guidelines on when to include or exclude elements.
lIf, as a result of your including a class, your script has many unrelated method calls, try modifying the
filter to exclude the irrelevant methods.
lIf you identify a non-client/server call in your script, exclude its method in the filter.
lDuring recording, VuGen may detect an unknown input argument, for example, an argument whose
construction it had never encountered before. If this argument supports serialization, VuGen
serializes it by saving it to a file in a special format. During replay, VuGen reconstructs the argument
by deserializing it.
lVuGen serializes objects passed as arguments that were not included by the filter. We recommend
that you include this object in the filter in order to track its construction and activity instead of using
it in its serialized form. You can identify serialized objects in the script by searching for calls to the
lr.deserialize() method in your script. For more information see "How to Correlate Scripts - Java
Scripts - Serialization" on page256.
lExclude all activity which involves GUI elements.
lAdd classes for utilities that may be required for the script to be compiled.
User Guide
VuGen
HP LoadRunner (12.50) Page 536
How to Create a Custom Java Filter
This task describes how to create a custom Java filter. For background information, see "Java Custom
Filters Overview" on page535.
For details of the hook file structure, see "Hook File Structure" on the next page.
When preparing a script, you may need to customize the filter several times in order to achieve the
optimal filter. An optimal filter records the relevant methods without introducing a large number of
irrelevant calls to the script.
Note: If you plan to add manual code to your script such as control flow or message statements,
make sure to do so after you have a functional script that runs inside VuGen. The reason for
this, is that if you re-record a script after modifying the filters, it will overwrite all manual
changes.
Define a Custom Hook File
1. Create a user.hooks file in the VuGen installation classes folder, typically C:\Program Files (x86)
\HP\Virtual User Generator\classes. VuGen automatically searches for this file when recording.
For structural details about the user.hook file, see "Hook File Structure" on the next page.
2. Open the Recording Options dialog box (Ctrl+F7) and select the Log Options node. Select the Log
Level to Detailed.
3. Record your application. Click Start Record (Ctrl + R) to begin and Stop (Ctrl + F5) to end.
4. View the script's steps. If you can determine the business logic from the steps and apply
correlation, you may not need to create custom filters. If, however, the script is very long or hard to
maintain and correlate, you should customize the script's filter.
5. Try to identify the high-level method in the call that captures or wraps one or more client server
calls. You can do this by opening the AUT source files (if they are available) or by viewing a Stack
Trace of the script.
6. Set the filter to include the relevant methods. For more information, see "Java Custom Filters -
Determining which Elements to Include" on the previous page.
7. Record the application again. You should always rerecord the application after modifying the filter.
8. Repeat steps 4 through 7 until you get a simple script which can be maintained and correlated.
9. Correlate the script. In order for your test to run properly, you may need to insert a correlation to
capture a value and use it at a later point in the script. For more information about the built-in
correlation mechanism, see "How to Correlate Scripts - Java Scripts - Serialization" on page256.
Note: Do not modify any of the other .hooks file as it might damage the VuGen recorder.
User Guide
VuGen
HP LoadRunner (12.50) Page 537
Adding custom hooks to the default recorder is a complicated task and should be considered
thoroughly as it has both functional and performance consequences.
Caution: Incorrect hooking definitions can lead to incorrect scripts, slow recording, and
application freeze-up.
Hook File Structure
The following section describes the structure of a typical .hooks file:
[hook-Name]
class = MyPackage.MyClass
method = MyMethod
signature = ()V
ignore_cl =
ignore_mtd =
ignore_tree =
cb_class = mercury.ProtocolSupport
cb_mtd =
general_cb = true
deep_mode = soft | hard
make_methods_public = true | false
lock = true | false
The hook files are structured as .ini files where each section represents a hook definition. Regular
expressions are supported in some of the entries. Any entry that uses regular expression must start
with a '!'.
Note: When you use a filter such as !.* then the ! indicates the beginning of a RegExp—not a
Regexp negation.
hook-Name
Specifies the name of this section in the hooks file. Hook-Name must be unique across all hooks files. A
good practice is to give the fully qualified class name and method. For example:
[javax.jms.Queue.getQueueName]
class
A fully qualified class name. Regular expression can be used to include several classes from the same
User Guide
VuGen
HP LoadRunner (12.50) Page 538

package, a whole package, several packages, or any class that matches a name. The following example
filters for any class that starts with javax.jms and is followed by at least one character.
class = !javax\.jms\.*
method
The simple name of the method to include. Regular expressions can be used to include more than one
method from the class. For example:
method = getQueueName
signature
The standard Java internal type signature of the method. To determine the signature of a method, run
the command javap -s class-name where class name is the fully qualified name of the class.
Regular expressions can be used to include several methods with the same name, but with different
arguments. For example:
For example:
signature = !.* will match any possible signature, thus causing any method in this class to be
recorded into the script regardless of signature.
signature = !\(Lorg/omg/CORBA/ORB;\).* will match any signature starting with
(Lorg/omg/CORBA/ORB;).
ignore_cl (optional)
A specific class to ignore from the classes that match this hook. This can be a list of comma separated
class names. Each item in the list can contain a regular expression. If an item in the list contains a
regular expression, prepend a '!' to the class name. For example:
Ignore_cl = !com.hp.jms.Queue,!com\.hp\..*
ignore_mtd (optional)
A specific method to ignore. When the loaded class method matches this hook definition, this method
will not be hooked. The method name must be the simple method name followed by the signature (as
explained above). To ignore multiple methods, list them in a comma separated list. To use a regular
expression, prepend a '!' to the method name. For example:
ignore_cl = open, close
User Guide
VuGen
HP LoadRunner (12.50) Page 539

ignore_tree (optional)
A specific tree to ignore. When the name of the class matches the ignore tree expression, any class that
inherits from it will not be hooked, if it matches this hooks definition. To ignore multiple trees, list them
in a comma separated list. To use a regular expression, prepend a '!' to the class name. This option is
relevant only for hooks that are defined as deep.
cb_class
The callback class that gets the call from the hooked method. It should always be set to
mercury.ProtocolSupport.
cb_mtd (optional)
A method in the callback class that gets the call from the hooked method. If omitted, it uses the
default, general_rec_func. For cases where you just need to lock the subtree of calls, use general_func
instead.
general_cb
The general callback method. This value should always be set to true.
deep_mode
Deep mode refers to classes and interfaces that inherit or implement the class or interface that the
hook is listed for. The inherited classes will be hooked according to the type of hook: Hard,Soft, or Off.
lHard. Hooks the current class and any class that inherits from it. If regular expressions exist, they
are matched against every class that inherits from the class in the hook definition. Interface
inheritance is treated the same as class inheritance.
lSoft. Hooks the current class and any class that inherits from it, only if the methods are overridden
in the inheriting class. If the hook lists an interface, then if a class implements this interface those
methods will be hooked. If they exist in classes that directly inherit from that class they will also be
hooked. However, if the hook lists an interface and a class implements a second interface that
inherits from this interface, the class will not be hooked.
Note: Regular expressions are not inherited but converted to actual methods.
lOff. Only the class listed in the hook definition and the direct inheriting class will be hooked. If the
hook lists an interface, only classes that directly implement it will be hooked.
make_methods_public (optional)
Any method that matches the hook definition will be converted to public. This is useful for custom hooks
or for locking a sub tree of calls from a non-public method.
User Guide
VuGen
HP LoadRunner (12.50) Page 540
Note that this applies only during record. During replay, the method will use the original access flags. In
the case of non-public methods, it will throw java.lang.VerifyError.
lock (optional)
When set to true (default), it locks the sub tree and prevents the calling of any method originating from
the original method.
When set to false, it will unlock the sub tree, record any method originating from the current method (if
it is hooked), and invoke the callback.
Troubleshooting and Limitations - Java Record Replay and Java
Vuser
This section describes troubleshooting and limitations for the Java protocol.
lWhen recording on Internet Explorer 8 using the Java protocol, you must first close all instances of
Internet Explorer before LoadRunner opens an Explorer instance for the record session.
lJava Record Replay Protocol: Recording of JMS applications requires JDK version 1.7 or 1.6u32 and
lower.
lDue to a restriction in JVM architecture, a method cannot exceed 64 KB.
Java Vuser Protocol
Manually Programming Java Scripts - Overview
To prepare Vuser scripts using Java code, use the Java type Vusers. This Vuser type supports Java on a
protocol level. The Vuser script is compiled by a Java compiler and supports all of the standard Java
conventions. For example, you can insert a comment by preceding the text with two forward slashes
"//".
The first step in creating a Java compatible Vuser script, is to create a new Vuser script template of the
type Java Vuser. Then, you program or paste the desired Java code into the script template. You can
add Java Vuser functions to enhance the script and parameterize the arguments to use different values
during iterations.
The Java Vuser script runs as a scalable multi-threaded application. If you include a custom class in your
script, make sure that the code is thread-safe. Code that is not thread-safe may cause inaccurate
results. For code that is not thread-safe, run the Java Vusers as processes. This creates a separate Java
Virtual Machine for each process, resulting in a script that is less scalable.
After you prepare a script, run it as a standalone test from VuGen. A Java compiler (javac), checks it for
errors and compiles the script.
User Guide
VuGen
HP LoadRunner (12.50) Page 541
After you create a script, you integrate it into your environment: a LoadRunner scenario, Performance
Center load test, or Business Process Monitor configuration.
Java Protocol Programming Tips
When programming a Java Vuser script, you can paste ready-made code segments into scripts or
import ready-made classes in order to invoke their methods. If Vusers need to run as threads under the
Controller (for scalability reasons), you need to make sure that all of the imported code is thread-safe.
Thread-safety is often difficult to detect. A Java Vuser may run flawlessly under VuGen and under the
Controller with a limited number of Vusers. However, problems may then occur with a large number of
Vusers. Code that is not thread-safe is usually the result of static class member usage as shown in the
following example:
import lrapi.*;
public class Actions
{
private static int iteration_counter = 0;
public int init() {
return 0;
}
public int action() {
iteration_counter++;
return 0;
}
public int end() {
lr.message("Number of Vuser iterations: "+iteration_counter);
return 0;
}
}
When you run one Vuser, the iteration_counter member determines the number of iterations that were
executed. When multiple Vusers run together as threads on a single virtual machine, the static class
member iteration_counter is shared by all threads, resulting in an incorrect counting. The total number
of all Vusers iterations is counted.
If code is known to be non thread-safe and you still want to import it into your script, you can run the
Vusers as processes. For more information on running Vusers as threads or processes, see "Runtime
Settings Overview" on page280.
When you run a basic Java Vuser script, it usually consists of a single thread—the main thread. Only the
main thread can access the Java Vuser API. If a Java Vuser spawns secondary worker threads, using the
Java API may cause unpredictable results. Therefore, we recommend that you use the Java Vuser API
only in the main thread. Note that this limitation also affects the lr.enable_redirection function.
The following example illustrates where the LR API may and may not be used. The first log message in
the execution log indicates that the value of flag is false. The virtual machine then spawns a new thread
set_thread. This thread runs and sets flag to true, but will not issue a message to the log, even though
User Guide
VuGen
HP LoadRunner (12.50) Page 542

the call to lr.message exists. The final log message indicates that the code inside the thread was
executed and that flag was set to true.
boolean flag = false;
public int action() {
lr.message("Flag value: "+flag);
Thread set_thread = new Thread(new Runnable();{
public void run() {
lr.message("LR-API NOT working!");
try {Thread.sleep(1000);} catch(Exception e) {}
flag = true;
}
});
set_thread.start();
try {Thread.sleep(3000);} catch(Exception e) {}
lr.message("Flag value: "+flag);
return 0;
}
Running Java Vuser Scripts
Java Vuser scripts differ from C Vuser scripts in that they are first compiled and then executed; C Vuser
scripts are interpreted. VuGen locates the javac compiler from within the JDK installation and compiles
the Java code inside the script. This stage is indicated by the Compiling... status message in the bottom
of the VuGen window. If errors occur during compilation, they are listed in the execution log. To go to the
code in your script that caused the error, double-click on the error message containing the line number
of the error. Fix the error and run the script again.
If the compilation succeeds, the status message Compiling... changes to Running... and VuGen begins
to execute the script. When you run the script again, VuGen runs the script without recompiling it,
provided that no changes were made to the script. To debug your script further, you can use
breakpoints and animated run type execution using the step option.
Note: If you are making calls to JNDI extensions within your script, you may encounter problems
trying to run your Vusers as threads. This happens because JNDI requires each thread to have
its own context class loader. In order to run as threads, instruct each Vuser to run with its own
context class loader, by adding the following line to the beginning of the init section:
DummyClassLoader.setContextClassLoader();
Editing and Running Scripts in Eclipse
Eclipse provides you with additional tools to view, edit, and debug your Java Vuser (Java Record Replay,
and Java over HTTP) scripts. You can add breakpoints, view variable values, add references, and edit the
script using IntelliSense. You can also run the script in a step-by-step mode for debugging.
User Guide
VuGen
HP LoadRunner (12.50) Page 543
When you save your script, VuGen creates java source files in your script's folder. You can open the
solution file in Eclipse and view all of its components in the Projects Explorer.
To open the Vuser script in Eclipse, click the Open Script in Eclipse button on the VuGen toolbar. If
this is your first time using Eclipse from within VuGen, it will automatically install the Eclipse plugin.
Note: Before opening a script in Eclipse, you need to set the location of the Eclipse IDE in the
Java node of the VuGen's Scripting options. If you do not set this value, VuGen prompts you to
select its location. For details, see "Scripting Options" on page111.
An additional LoadRunner toolbar menu provides access to common VuGen commands, such as Runtime
Settings, Parameter List, Run, Stop, and Create a Scenario.
LoadRunner also provides an add-in for Eclipse developers that allows you to create JUnit tests that can
be called directly from the Controller, without having to open them in VuGen. The add-ins are located in
the DVD/Additional Components folder. For details, see "Additional Components" on page1769.
For more information, see "Creating Vuser Scripts or LoadRunner Tests in Visual Studio or Eclipse" on
page1001
Opening Java Vuser Scripts in Eclipse
Eclipse provides you with additional tools to view, edit, and debug your Java Vuser (such as Java Record
Replay and Java over HTTP) scripts. You can add breakpoints, view variable values, add references, and
edit the script in the Eclipse editor using IntelliSense.
The VuGen and Eclipse integration allows you to configure the script as you would in VuGen, from the
Eclipse IDE. AVuser menu added to the Eclipse IDE, provides access to the Parameter List, runtime
settings, run/stop control, and scenario creation.
To open the Vuser script in Eclipse:
1. Make sure you have Eclipse 4.2 or higher on your machine, running with JDK 1.7.
2. Set the location of the Eclipse IDE in the Scripting >Java node in VuGen's Options dialog box. For
details, see "Scripting Options" on page111.
3. Create a Java script (Java Vuser, Java Record Replay, Java over HTTP, and so forth).
4. Click the Open Script in Eclipse button on the VuGen toolbar. If this is your first time using
Eclipse from within VuGen, it will automatically install the VuGen Eclipse plugin.
5. Double-click the appropriate section, such as Actions.java, to edit the code.
6. Use the Vuser menu to define parameters, configure runtime settings, and run the script directly
from the Eclipse IDE.
User Guide
VuGen
HP LoadRunner (12.50) Page 544
Compiling and Running a Script as Part of a Package
When creating a Java Record Replay or a Java Vuser script, you may need to use methods in other
classes in which the class or method is protected. If you try to compile this type of script, you will receive
errors in the compilation stage indicating that the methods are inaccessible. To make sure that your
script can access these methods, insert the package name containing these methods at the top of the
script, just as you would do in a standard Java program— <package_name>. In the following example,
the script defines the my.test package which consists of a path:
package my.test;
import lrapi.*;
public class Actions
{
}
In the above example, VuGen automatically creates the my/test folder hierarchy under the Vuser folder,
and copies the Actions.java file to my/test/Actions.java, allowing it to compile with the relevant
package. Note that the package statement must be the first line in the script, similar to Java (excluding
comments).
How to Manually Create a Java Script
This task describes how to manually create and edit a custom Java script.
1. Create a new script
a. Open VuGen.
b. Select File > New or click the New button. The New Virtual User dialog box opens.
c. Select Custom > Java Vuser from the Select Vuser type list, and click OK. VuGen displays a
blank Java Vuser script.
d. Click the Actions section in the left frame to display the Actions class.
2. Insert your code into the script
After generating an empty template, you can insert the desired Java code. When working with this
type of Vuser script, you place all your code in the Actions class. To view the Actions class, click
Actions in the left pane. VuGen displays its contents in the right pane.
import lrapi.*;
public class Actions
{
public int init() {
return 0;
}
public int action() {
User Guide
VuGen
HP LoadRunner (12.50) Page 545
return 0;
}
public int end() {
return 0;
}
}
The Actions class contains three methods: init, action, and end. The following table shows what to
include in each method and when each method is executed.
Script method Used to emulate... Is executed when...
init a login to a server the Vuser is initialized (loaded)
action client activity the Vuser is in "Running" status
end a log off procedure the Vuser finishes or is stopped
Init Method
Place all the login procedures and one-time configuration settings in the init method. The init
method is only executed once—when the Vuser begins running the script. The following sample init
method initializes an applet. Make sure to import the org.omg.CORBA.ORB function into this
section, so that it will not be repeated for each iteration.
import org.omg.CORBA.*;
import org.omg.CORBA.ORB.*;
import lrapi.lr;
// Public function: init
public int init() throws Throwable {
// Initialize Orb instance...
MApplet mapplet = new MApplet("http://chaos/classes/", null);
orb = org.omg.CORBA.ORB.init(mapplet, null);
...
Action Method
Place all Vuser actions in the action method. The action method is executed according to the
number of iterations you set in the runtime settings. For more information on the iteration
settings, see "Runtime Settings Overview" on page280. The following sample action method
retrieves and prints the Vuser ID.
public int action() {
lr.message("vuser: " + lr.get_vuser_id() + " xxx");
return 0;
}
End Method
In the end method, place the code you want the Vuser to execute at the end of the script, such as
logging off from a server, cleaning up the environment, and so forth.
User Guide
VuGen
HP LoadRunner (12.50) Page 546
The end method is only executed once—when the Vuser finishes running the script. In the following
example, the end method closes and prints the end message to the execution log.
public int end() {
lr.message("End");
return 0;
}
3. Insert additional LoadRunner API functions
VuGen provides a specific Java API for Java Vuser scripts. These functions are all static methods of
the lrapi.lr class.
The Java API functions are classified into several categories: Transaction, Command Line Parsing,
Informational, String, Message, and Runtimefunctions.
For further information about each of these functions, see the Function Reference (Help >
Function Reference). Note that when you create a new Java Vuser script, the import lrapi.* is
already inserted into the script.
4. Insert additional Java functions
To use additional Java classes, import them at the beginning of the script as shown below.
Remember to add the classes folder or relevant jar file to the classpath. Make sure that the
additional classes are thread-safe and scalable.
import java.io.*;
import lrapi.*;
public class Actions
{
...
}
5. Add script enhancements
You add script enhancements such as rendezvous points, transactions, and output messages. For
more information, see "How to Enhance a Java Script" on the next page.
6. Set the Java environment
Before running your Java Vuser script, make sure that the environment variables, path and
classpath, are properly set on all machines running Vusers:
lTo compile and replay the scripts, you must have a complete JDK installation. The installation of
the JRE alone is not sufficient. It is preferable not to have more than one JDK or JRE installation
on a machine. If possible, uninstall all unnecessary versions. For information about supported
versions, see the LoadRunner Installation Guide.
lThe PATH environment variable must contain an entry for JDK/bin.
lFor JDK 1.1.x, the CLASSPATH environment variable must include the classes.zip path, (JDK/lib
subfolder) and all of the VuGen classes (classes subfolder).
User Guide
VuGen
HP LoadRunner (12.50) Page 547
lAll classes used by the Java Vuser must be in the classpath—either set in the machine's
CLASSPATH environment variable or in the Classpath Entries list in the Classpath node of the
Runtime settings.
How to Enhance a Java Script
This task describes how to enhance custom Java scripts.
Inserting Transactions
You define transactions to measure the performance of the server. Each transaction measures the
time it takes for the server to respond to specified requests. These requests can be short or complex
tasks. When working with LoadRunner, you can analyze the performance per transaction during and
after the scenario run, using online monitor and graphs.
You can also specify a transaction status: lr.PASS or lr.FAIL. You can let the Vuser automatically
determine if the transaction was successful, or you can incorporate it into a conditional loop. For
example, in your code you can check for a specific return code. If the code is correct, you issue a lr.PASS
status. If the code is wrong, you issue an lr.FAIL status.
Mark a transaction
1. Insert lr.start_transaction into the script, at the point where you want to begin measuring the
timing of a task.
2. Insert lr.end_transaction into the script, at the point where you want to stop measuring the task.
Use the transaction name as it appears in the lr.start_transaction function.
3. Specify the desired status for the transaction: lr.PASS or lr.FAIL.
public int action() {
for(int i=0;i<10;i++)
{
lr.message("action()"+i);
lr.start_transaction("trans1");
lr.think_time(2);
lr.end_transaction("trans1",lr.PASS);
}
return 0;
}
Inserting Rendezvous Points
To emulate heavy user load on your client/server system, you synchronize Vusers to perform a task at
exactly the same moment by creating a rendezvous point. When a Vuser arrives at the rendezvous
point, it is held by the Controller until all Vusers participating in the rendezvous arrive.
You designate the meeting place by inserting a rendezvous function into your Vuser script.
User Guide
VuGen
HP LoadRunner (12.50) Page 548

Insert a Rendezvous Point
lInsert an lr.rendezvous function into the script, at the point where you want the Vusers to perform a
rendezvous.
public int action() {
for(int i=0;i<10;i++)
{
lr.rendezvous("rendz1");
lr.message("action()"+i);
lr.think_time(2);
}
return 0;
}
Obtaining Vuser Information
You can add the following functions to your Vuser scripts to retrieve Vuser information:
lr.get_attrib_
string
Returns a string containing command line argument values or runtime information
such as the Vuser ID or the load generator name.
lr.get_group_
name
Returns the name of the Vuser's group.
lr.get_host_
name
Returns the name of the load generator executing the Vuser script.
lr.get_master_
host_name
Returns the name of the machine running the LoadRunner Controller or Business
Process Monitor.
lr.get_
scenario_id
Returns the ID of the current scenario. (LoadRunner only)
lr.get_vuser_id Returns the ID of the current Vuser. (LoadRunner only)
In the following example, the lr.get_host_name function retrieves the name of the computer on which
the Vuser is running.
String my_host = lr.get_host_name();
For more information about the above functions, see the Function Reference (Help > Function
Reference).
Issuing Output Messages
When you run a scenario, the Controller Output window displays information about script execution. You
can include statements in a Vuser script to send error and notification messages to the Controller. The
Controller displays these messages in the Output window. For example, you could insert a message that
User Guide
VuGen
HP LoadRunner (12.50) Page 549
displays the current state of the client application. You can also save these messages to a file.
Note: Do not send messages from within a transaction. Doing so lengthens the transaction
execution time and may skew the actual transaction results.
You can use the following message functions in your Vuser script:
lr.debug_message Sends a debug message to the Output window.
lr.log_message Sends a message to the Vuser log file.
lr.message Sends a message to a the Output window.
lr.output_message Sends a message to the log file and Output window with location information.
In the following example, lr.message sends a message to the output indicating the loop number:
for(int i=0;i<10;i++)
{
lr.message("action()"+i);
lr.think_time(2);
}
For more information about the message functions, see the Function Reference (Help > Function
Reference).
You can instruct the Vusers to redirect the Java standard output and standard error streams to VuGen's
Execution log. This is especially helpful when you need to paste existing Java code or use ready-made
classes containing System.out and System.err calls in your Vuser scripts. In the execution log, standard
output messages are colored blue, while standard errors are shown in red.
The following example shows how to redirect specific messages to the standard output and standard
error using lr.enable_redirection:
lr.enable_redirection(true);
System.out.println("This is an informatory message..."); // Redirected
System.err.println("This is an error message..."); // Redirected
lr.enable_redirection(false);
System.out.println("This is an informatory message..."); // Not redirected
System.err.println("This is an error message..."); // Not redirected
Note: When you set lr.enable_redirection to true, it overrides all previous redirections. To
restore the former redirections, set this function to false.
For additional information about this function, see the Function Reference (Help > Function Reference).
User Guide
VuGen
HP LoadRunner (12.50) Page 550

Emulating User Think Time
The time that a user waits between performing successive actions is known as the think time. Vusers
use the lr.think_time function to emulate user think time. In the following example, the Vuser waits two
seconds between loops:
for(int i=0;i<10;i++)
{
lr.message("action()"+i);
lr.think_time(2);
}
You can use the think time settings as they appear in the script, or a factor of these values. To
configure how Vusers handle think time functions, open the runtime settings dialog box. For more
information, see "Runtime Settings Overview" on page280.
For more information about the lr.think_time function, see the Function Reference (Help > Function
Reference).
Handling Command Line Arguments
You can pass values to a Vuser script at runtime by specifying command line arguments when you run
the script. You insert command line options after the script path and filename in the Controller or
Business Process Monitor. There are three functions that allow you to read the command line
arguments, and then to pass the values to a Vuser script:
lr.get_attrib_double Retrieves double precision floating point type arguments
lr.get_attrib_long Retrieves long integer type arguments
lr.get_attrib_string Retrieves character strings
Your command line should have the following format, where the arguments and their values are listed
in pairs after the script name:
script_name - argument argument_value -argument argument_value
The following example shows the command line string used to repeat script1 five times on the machine
pc4:
script1 -host pc4 -loop 5
For more information on the command line parsing functions, see the Function Reference (Help >
Function Reference). For more information on how to insert the command line options, see the
LoadRunner Controller,Performance Center, or HP Business Service Management documentation.
User Guide
VuGen
HP LoadRunner (12.50) Page 551

Troubleshooting and Limitations - Java Record Replay and Java
Vuser
This section describes troubleshooting and limitations for the Java protocol.
lWhen recording on Internet Explorer 8 using the Java protocol, you must first close all instances of
Internet Explorer before LoadRunner opens an Explorer instance for the record session.
lJava Record Replay Protocol: Recording of JMS applications requires JDK version 1.7 or 1.6u32 and
lower.
lDue to a restriction in JVM architecture, a method cannot exceed 64 KB.
Java over HTTP Protocol
Java over HTTP Protocol Overview
The Java over HTTP protocol is designed to record java-based applications and applets. It produces a
Java language script using web functions. This protocol is distinguished from other Java protocols in
that it can record and replay Java remote calls over HTTP.
Note: Java over HTTP supports asymmetric Java object traffic. This means that object
serialization traffic is recognized even when it is on only one side of the communication. This
occurs when the request is serialization and the response is plain HTTP, or vice versa.
Viewing Responses and Requests in XML Format
Note: This topic applies to the Java over HTTP protocol only.
For each request and response, you can view the corresponding XML that represents the binary java
object during the recording phase.
View XML data
1. Locate the target request or response section in the code. Right-click the commented
RequestBodyX.xml or ResponseBodyX.xml.
2. Select View XML. The XML is displayed in a separate window.
User Guide
VuGen
HP LoadRunner (12.50) Page 552
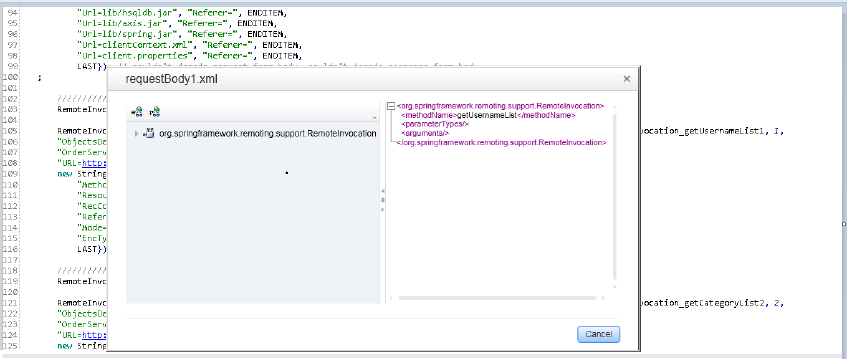
How to Record with Java over HTTP
To record with Java over HTTP, you must specify which .jar files to use in order to deserialize the
recorded data.
This topic describes how to locate the relevant .jar files and add them to the classpath.
Recording Java Applets
If your application uses Java Applets, you need to find the relevant .jar files and enable them in the
classpath.
1. Clear the JAR cache by selecting Control Panel > Java > General Tab > Temporary Internet Files
> Settings > Delete Files.
2. Open your application and perform a few business processes to repopulate the JAR cache with .jar
files from your application. When you are finished, close your application.
3. Select Control Panel > Java > General Tab > Temporary Internet Files > View. This lists the JAR
cache and should contain only the .jar files used by your application.
4. Download the files. Try the options below in the order in which they appear. When you succeed,
proceed to the next step to add the .jar files to the classpath.
a. Option 1: For each .jar file, go to the listed URL and download the file. If you cannot download
one or more of the .jar files, continue with the next option.
b. Option 2: Clear the cache again by selecting Control Panel > Java > General Tab > Temporary
Internet Files > Settings > Delete Files. Open your application again and perform a few
business processes. Do not close your application. Open the Java Console. There should be a
message for each .jar file telling you the location it is stored in a temporary file on your
computer. The files are usually hashed and don't have .jar extensions. Change the name
(including changing each extension to .jar) and copy the file to a known location.
c. Option 3: If the files don't show up in the Java console, locate the temporary folder as listed in
User Guide
VuGen
HP LoadRunner (12.50) Page 553
Control Panel > Java > General Tab > Temporary Internet Files > Settings > Location. Open
the specified location and rename all the files in the sub-folders to .jar. Do not rename all the
files in the main folder.
5. Add the .jar files to the classpath in the Recording Options > Java Environment Settings >
Classpath node. For more information, see "Java > Classpath Recording Options" on page184.
Recording Local Java Applications
If you are recording a local Java application (not an applet), all of the .jar files already exist on your
computer.
1. Look in the batch file that launched the application. All of the .jar files that are referenced should
be added to the classpath.
2. If you cannot locate or understand the batch file, add all of the .jar files from the application folder
and sub-folders to the classpath.
3. Add the .jar files to the classpath in the Recording Options > Java Environment Settings >
Classpath node. For more information, see "Java > Classpath Recording Options" on page184.
How to Debug Java over HTTP scripts
This task describes how to debug Java over HTTP Vuser scripts by comparing the request and response
data from the record and replay stages.
1. Add arguments to the VM Param Node
Select Replay > Runtime Settings > Java VM node. In the Additional VM Parameters field, enter
the following string:
-DdumpServerRequests=true -DdumpServerResponses=true
2. Compare record and replay data
In the Solution Explorer, right-click the script name and select Open Script Folder. The data from
the recording phase is in the main folder. The data from the replay phase is in the replay folder.
The files that follow the format RequestBodyX contain the request data. The files that follow the
format ResponseBodyX contain the response data.
To compare the record and replay data for the purposes of debugging, compare the files with
identical names from the recording and replay phases. For example, compare the RequestBody1
file from the main folder (recording phase) to the RequestBody1 file from the replay folder.
Normally, the files should be identical. Cases where the files are not identical may indicate
problems in the script.
3. Remove arguments before load testing
Return to the Java VM node and the items you added to the Additional VM Parameters field.
User Guide
VuGen
HP LoadRunner (12.50) Page 554
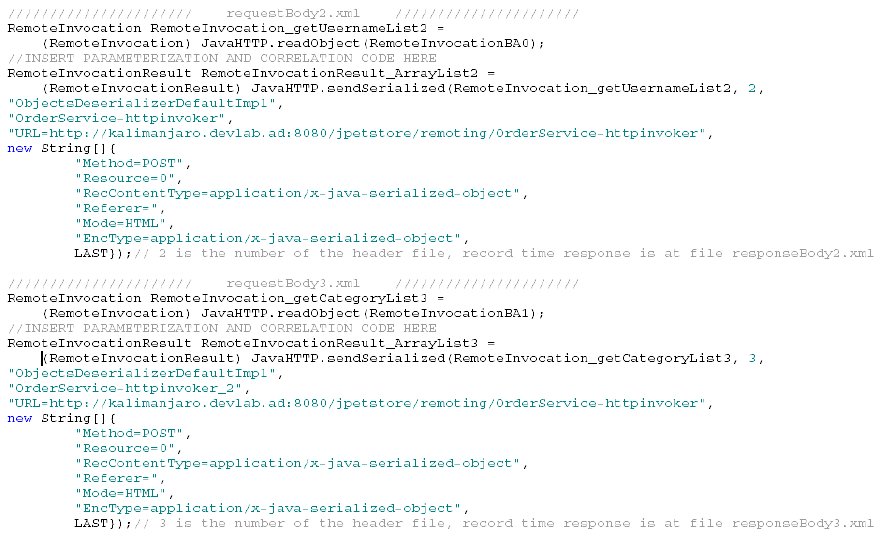
How to Insert Parameters into Java over HTTP Scripts
Parameter functions can be added for each response or request body text in a specific location. This
location is indicated by a blank line, usually one to two lines below the start of the response or request
body. In the example below, parameter functions can be added to the blank lines in each requestBody
section.
Troubleshooting and Limitations for Java over HTTP
This section describes troubleshooting and limitations for the Java over HTTP protocol.
Limitations
lJDK 1.5 or higher is required.
lYou cannot use the GWT DFE extension or other Java-compatible DFE extensions. This is a result of a
limitation of VuGen’s mdrv process, which only allows you to instantiate a single JVM.
lLazy evaluating objects are not supported, for example hibernate in lazy mode.
lIf there are stateful serialization mechanisms on the application server, this can interfere with
LoadRunner deserialization and result in unserialized data and unexpected errors.
lThe Remote Application via LoadRunner Proxy > Display recording toolbar on client machine
option, is not supported for the Java over HTTP protocol. For details, see "Start Recording Dialog Box"
on page226.
User Guide
VuGen
HP LoadRunner (12.50) Page 555
Disable Exception Error Checking
If you are receiving exception errors and you are sure that the error is irrelevant, VuGen allows you to
disable all such error messages. To do this, select Replay > Runtime Settings > Java VM node. In the
Additional VM Parameters field, and append the following string to the end of the current entry:
-DvalidateServerResponse=false
Additionally, you can change the error checking behavior of a specific step by adding a closing argument
to the sendSerialized function in script view. For more information, see the Function Reference.
Cannot Correlate Private Object Members
When you need to correlate or parameterize data that is a private member of an object, you can use
the lrapi.lr2.fieldSetter and lrapi.lr2.fieldGetter functions.
RemoteInvocation RemoteInvocation2 = (RemoteInvocation) JavaHTTP.readObject
(RemoteInvocationBA0);
RemoteInvocation.methodName="applyToSchool";
Student student=RemoteInvocation.arguments[0];
Map grades=lr2.fieldGetter(student,"grades");//grades is a private
member of Student
grades.put("Math","95");
lr2.fieldSetter(student,"super.name","Tom");
//Student class inherits the name field from Person. name field is a
string
lr2.fieldSetter(student,"super.ID","98764321");
//Student class inherits the ID field from Person. ID field is an int
RemoteInvocationResult RemoteInvocationResult_ArrayList2 =
(RemoteInvocationResult) JavaHTTP.sendSerialized(RemoteInvocation2, 2,
"ObjectsDeserializerDefaultImpl",....
LDAP Protocol
LDAP Protocol Overview
LDAP, the Lightweight Directory Access Protocol, is a protocol used to access a folder listing. The LDAP
folder is composed of many LDAP entries. Each LDAP entry is a collection of attributes with a name,
called a distinguished name (DN). For more information about DN, see "Defining Distinguished Name
Entries" on page558.
LDAP folder entries are arranged in a hierarchical structure that reflects political, geographic, and/or
organizational boundaries. Entries representing countries appear at the top of the tree. Below them are
entries representing states or national organizations. Below them might be entries representing
people, organizational units, printers, documents, or just about anything else.
User Guide
VuGen
HP LoadRunner (12.50) Page 556
VuGen records communication over LDAP servers. It creates a Vuser script, with functions that emulate
your actions. This includes logging in and out of the server, adding and deleting entries, and querying an
entry.
LDAP Protocol Example Script
All LDAP functions come in pairs—one for global sessions and one where you can indicate a specific
session. To apply the action to all sessions, use the version without the ex suffix. To apply the action to
a specific session, use the version with the session identifier with the ex suffix. For example, mldap_
logon logs on to the LDAP server globally, while mldap_logon_ex logs on to the LDAP server for a
specific session.
In the following example, the user logs on to an LDAP server, ldap1. It adds an entry and then renames
the OU attribute from Sales to Marketing.
Action()
{
// Logon to the LDAP server
mldap_logon("Login",
"URL=ldap://johnsmith:tiger@ldap1:80",
LAST);
// Add an entry for Sally R. Jones
mldap_add("LDAP Add",
"DN=cn=Sally R. Jones,OU=Sales, DC=com",
"Name=givenName", "Value=Sally", ENDITEM,
"Name=initials", "Value=R", ENDITEM,
"Name=sn", "Value=Jones", ENDITEM,
"Name=objectClass", "Value=contact", ENDITEM,
LAST);
// Rename Sally's OU to Marketing
mldap_rename("LDAP Rename",
"DN=CN=Sally R. Jones,OU=Sales,DC=com",
"NewDN=OU=Marketing",
LAST);
// Logout from the LDAP server
mldap_logoff();
return 0;
}
User Guide
VuGen
HP LoadRunner (12.50) Page 557

Defining Distinguished Name Entries
The LDAP API references objects by its distinguished name (DN). A DN is a sequence of relative
distinguished names (RDN) separated by commas.
An RDN is an attribute with an associated value in the form attribute=value. The attribute names are
not case-sensitive. The following table lists the most common RDN attribute types.
String Attribute Type
DC domainComponent
CN commonName
OU organizationalUnitName
OorganizationName
STREET streetAddress
LlocalityName
ST stateOrProvinceName
CcountryName
UID userid
The following are examples of distinguished names:
DN=CN=John Smith,OU=Accounting,DC=Fabrikam,DC=COM
DN=CN=Tracy White,CN=admin,DC=corp,DC=Fabrikam,DC=COM
The following table lists reserved characters that cannot be used in an attribute value.
Character Description
space or # character at the beginning of a string
space character at the end of a string
, comma
+ plus sign
" double quote
\ backslash
< left angle bracket
User Guide
VuGen
HP LoadRunner (12.50) Page 558
> right angle bracket
; semicolon
To use a reserved character as part of an attribute value, you must precede it with an escape character,
a backslash (\). If an attribute value contains other reserved characters, such as the equal sign (=) or
non-UTF-8 characters, you must encode it in hexadecimal format—a backslash followed by two hex
digits.
The following are examples of DNs that include escaped characters. The first example is an
organizational unit name with an embedded comma; the second example is a value containing a
carriage return.
DN=CN=Bitwise,OU=Docs\, Support,DC=Fabrikam,DC=COM
DN=CN=Before\0DAfter,OU=Test,DC=North America,DC=Fabrikam,DC=COM
LDAP Connection Options
Using the mldap_logon[_ex] function, you control the way you login to the LDAP server.
When specifying the URL of the LDAP server, you specify how to connect and with what credentials.
When specifying the server's URL, use the following format:
ldap[s][username:[password]@][server[:port]]
The following table shows several examples of connections to LDAP servers.
Syntax Description
ldap://a:b@server.com:389 Connects to the server (to 389 port) and then binds with username "a" ,
password "b"
ldap://:@server.com Connects to server (to default unsecured port 389) then binds
anonymously with a NULL username and password
ldaps://a:@server.com Connects to server (to default secured port 636) and then binds with
username "a", password ""
ldap://@server.com,
ldap://server.com
Connects to server without binding
ldap://a:b@ Binds with username "a", password "b, executing a bind on the existing
session without reconnecting
ldap://:@ Binds anonymously with a NULL username and password (executes bind
on existing session without reconnecting)
You can also specify LDAP modes or SSL certificates using the following optional arguments:
lMode. The LDAP call mode: Sync or Async
User Guide
VuGen
HP LoadRunner (12.50) Page 559
lTimeout. The maximum time in seconds to search for the LDAP server
lVersion. The version of the LDAP protocol version 1,2, or 3
lSSLCertDir. The path to the SSL certificates database file (cert8.db)
lSSLKeysDir. The path to the SSL keys database file (key3.db)
lSSLKeyNickname. The SSL key nickname in the keys database file
lSSLKeyCertNickname. The SSL key's certificate nickname in the certificates database file
lSSLSecModule. The path to the SSL security module file (secmod.db)
lStartTLS. Requires that the StartTLS extension's specific command must be issued in order to switch
the connection to TLS (SSL) mode
For detailed information about these arguments, see the Function Reference (Help > Function
Reference).
Troubleshooting and Limitations - LDAP
This section describes troubleshooting and limitations for the LDAP protocol.
lIf an LDAP version 3 script fails during replay, modify the mldpa_logon_ex statement to specify the
version number by adding "Version=3" after "URL=.."
lAddress lists are only partially supported—the script only uses the first address in the list.
lWhen recording LDAP scripts, the binary parameter values for certain LDAP functions (such as
mldap_add or mldap_modify) are not recorded. Recording of binary parameters is part of the
protocol's extended functionality and is not supported by VuGen.
lLDAP Protocol can be recorded in parallel with the Windows Socket protocol in multi-protocol
recording mode. This allows you to record additional network activity generated by the LDAP
application. The multi-protocol recording may result in duplicate calls to the LDAP application.
Workaround: Edit the script and manually remove the duplicate calls. Leave the the Windows Socket
calls that emulate the additional networking I/O.
Mailing Service Protocols
Mailing Service Protocols Overview
The Mailing Service protocols emulate users working with email clients, viewing and sending emails. The
following mailing services are supported:
lInternet Messaging (IMAP). For details, see "IMAP Protocol Overview" on the next page.
lMS Exchange (MAPI). For details, see "MAPI Protocol Overview" on the next page.
lPost Office Protocol (POP3). For details, see "POP3 Protocol Overview" on page562.
lSimple Mail Transfer Protocol (SMTP). For details, see "SMTP Protocol Overview" on page563.
The mail protocols support both record and replay, with the exception of MAPI that supports only replay.
User Guide
VuGen
HP LoadRunner (12.50) Page 560
IMAP Protocol Overview
IMAP Vuser script functions record the Internet Mail Application Protocol.
Each IMAP function begins with an imap prefix. For detailed syntax information on these functions, see
the Function Reference (Help > Function Reference).
In the following example, the imap_create function creates several new mailboxes: Products, Solutions,
and FAQs.
Actions()
{
imap_logon("ImapLogon",
"URL=imap://johnd:letmein@exchange.mycompany.com",
LAST);
imap_create("CreateMailboxes",
"Mailbox=Products",
"Mailbox=Solutions",
"Mailbox=FAQs",
LAST);
imap_logout();
return 1;
}
When recording a login step in which an IP address was specified, the script saves the IP address instead
of the host name.
Note: VuGen currently only supports the IMAP LOGIN authentication method, but not the
AUTHENTICATE method.
MAPI Protocol Overview
MAPI Vuser script functions generate activity to and from an MS Exchange server. Each MAPI function
begins with a mapi prefix. For detailed syntax information on these functions, see the Function
Reference (Help > Function Reference). Note that recording of Vuser scripts is not supported for the
MAPI protocol.
Note: To run MAPI scripts, you must define a mail profile on the machine running the script. For
example, install Outlook Express, set it as the default mail client, and create a mail account.
Alternatively, install Microsoft Outlook, set it as the default mail client, create a mail account
and create a mail profile. To create a mail profile in Microsoft Outlook, select Settings > Control
Panel > Mail >Show Profiles and add a mail profile.
User Guide
VuGen
HP LoadRunner (12.50) Page 561

In the following example, the mapi_send_mail function sends a sticky note through an MS Exchange
server.
Actions()
{
mapi_logon("Logon",
"ProfileName=John Smith",
"ProfilePass=Tiger",
LAST);
//Send a Sticky Note message
mapi_send_mail("SendMail",
"To=user1@techno.merc-int.com",
"Cc=user0002t@techno.merc-int.com",
"Subject=<GROUP>:<VUID> @ <DATE>",
"Type=Ipm.StickyNote",
"Body=Please update your profile today.",
LAST);
mapi_logout();
return 1;
}
POP3 Protocol Overview
POP3 Vuser script functions emulate actions using the Post Office Protocol, POP3. Each function begins
with a pop3 prefix. For detailed syntax information on these functions, see the Function Reference (Help
> Function Reference).
In the following example, the pop3_retrieve function retrieves five messages from the POP3 server.
Actions()
{
pop3_logon("Login", "
URL=pop3://user0004t:my_pwd@techno.merc-int.com",
LAST);
// List all messages on the server and receive that value
totalMessages = pop3_list("POP3", LAST);
// Display the received value (It is also displayed by the pop3_list function)
lr_log_message("There are %d messages.\r\n\r\n", totalMessages);
// Retrieve 5 messages on the server without deleting them
pop3_retrieve("POP3", "RetrieveList=1:5", "DeleteMail=false", LAST);
pop3_logoff();
return 1;
}
Note: When recording a login step in which an IP address was specified, the script saves the IP
address instead of the host name.
User Guide
VuGen
HP LoadRunner (12.50) Page 562

SMTP Protocol Overview
SMTP Vuser script functions emulate the Single Mail Transfer Protocol traffic. Each SMTP function
begins with an smtp prefix. For detailed syntax information on these functions, see the Function
Reference (Help > Function Reference).
In the following example, the smtp_send_mail function sends a mail message, through the SMTP mail
server, techno.
Actions()
{
smtp_logon("Logon",
"URL=smtp://user0001t@techno.merc-int.com",
"CommonName=Smtp Test User 0001",
NULL);
smtp_send_mail( "SendMail",
"To=user0002t@merc-int.com",
"Subject=MIC Smtp: Sample Test",
"MAILOPTIONS",
"X-Priority: 3",
"X-MSMail-Priority: Medium",
"X-Mailer: Microsoft Outlook Express 5.50.400\r\n",
"X-MimeOLE: By Microsoft MimeOLE V5.50.00\r\n",
"MAILDATA",
"MessageText="
"Content-Type: text/plain;\r\n"
"\tcharset=\"iso-8859-1\"\r\n"
"Test,\r\n"
"MessageBlob=16384",
NULL);
smtp_logout();
return 1;
}
Note: When recording a login step in which an IP address was specified, the script saves the IP
address instead of the host name.
Message Protocols
MMS (Multimedia Messaging Service) Protocol Overview
The MMS protocol is useful for sending MMS messages between mobile devices.
User Guide
VuGen
HP LoadRunner (12.50) Page 563
MMS (Multimedia Messaging Service) is an extension of the SMS protocol. Whereas SMS messages can
contain only text, MMS allows you to send and receive messages with a wide range of content to MMS
capable handsets. This content can be in the form of text, sound, email messages, images, video clips,
and even streaming data. It is also possible to send multimedia messages from a mobile phone to an
email address.
An MMS message typically includes a collection of attachments. While SMS messages are limited to 160
bytes, an MMS message could be several MBs in size. MMS usually requires a third generation (3G)
network to enable such large messages to be delivered.
To receive an MMS message, a mobile phone receives an MMS notification over SMS. The SMS message
can be received over various SMS protocols such as SMPP, UCP, and CIMD2. The SMS message contains a
unique path to the MMS message stored in the MMSC server's database and the mobile phone uses this
path to download the message from the SMSC. The current version of VuGen supports the receiving of
MMS notifications over the SMPP interface.
Multimedia Messaging Service Vuser scripts support the 1.0 and 1.1 versions of the MMS protocol, as
defined by OMA (Open Mobile Alliance organization). Using MMS Vusers, you can send MMS messages to
the MMSC server directly over the HTTP protocol, or over the WAP protocol through a WAP gateway.
Multimedia Messaging Service functions emulate the sending and receiving of MMS messages. Each
function begins with an mm prefix. For detailed syntax information for these functions, see the Function
Reference (Help > Function Reference).
How to Run an MMS Scenario in the Controller
An MMS (Multimedia Messaging Service) scenario requires a command line setting.
To set the MMS command line setting:
1. From the Scenario Schedule screen, click Details. The Group Information dialog is displayed.
2. If the Command line box is not visible, click the More button.
3. Add the following to the end of the Command line text: -usingwininet yes
4. Click OK to accept the Command line switch.
Mobile Protocols
How to Select a Script Type for Mobile Applications
The VuGen Mobile protocols expand LoadRunner's capability of recording user activity from mobile
applications, both native1and browser-based2. With this solution you can:
1A mobile application, such as a new service, where the application resides on the device, but
communicates with the server at various intervals.
2A browser-based application that has been configured for the display of the mobile device.
User Guide
VuGen
HP LoadRunner (12.50) Page 564
lSimulate users working on mobile devices
lCreate scripts based on the recording of mobile devices or emulators
You can record user activity on a mobile device and generate scripts in VuGen using one of the following
protocols:
lTruClient - Mobile Web: A protocol enabling you to record user activity in browser-based mobile
applications using TruClient technology. The TruClient browser is modified to emulate the display of
your mobile browser. For details about recording, see "How to Record a Script with TruClient - Mobile
Web" on page586.
lTruClient - Native Mobile: A protocol enabling you to record user activity in native, browser-
based, or hybrid mobile applications using TruClient technology. The replay is performed on real
devices, allowing you to obtain client-side measurements and test end-to-end performance. This
method requires the installation of HP Mobile Center.
lSMP (SAP Mobile Platform): A protocol enabling you to create .NET based scripts using files
generated by SMP. For details, see "SMP (SAP Mobile Platform) Protocol" on page588.
lMobile Application - HTTP/HTML: A protocol enabling you to develop scripts using mobile
devices or device emulators communicating with servers over HTTP. You can record network traffic
into a capture file (PCAP file) and create a VuGen script. Additionally, you can use a mobile emulator
on your VuGen machine to develop your scripts.
The following tables summarize the requirements for the various options for recording mobile
applications.
To learn more about a specific recording method, click on the link.
TruClient - Mobile Web Protocol
If your client application.... you can use ...
lIs a browser-based mobile version of a Web site
lSupports Firefox TruClient - Mobile Web
TruClient - Native Mobile Protocol
If your client application.... you can use ...
lIs a native, browser-based, or hybrid mobile
application HP Mobile Center
User Guide
VuGen
HP LoadRunner (12.50) Page 565
SMP (SAP Mobile Platform) Protocol
If your client application.... you can use ...
lIs built on SMP (SAP Mobile Platform)
SMP (SAP Mobile Platform)
Mobile Application - HTTP/HTMLProtocol
If your client
application...
and... To learn how see ...
lCommunicates with
the HTML/HTTP
protocol
lIs either a browser-
based or native
application
lYour device is in the same network as the
VuGen machine
lYour device allows proxy configuration
LoadRunner Proxy
lCommunicates with
the HTML/HTTP
protocol
lIs either a browser-
based or native
application
lYou do not want (or cannot) record from
the actual device.
lThe device, the server application and the
VuGen machine are all in the same
network
lYou can install the Mobile Sniffer Agent on
the server machine
Mobile HTTP/ HTML >
Record & Analyze Traffic
lCommunicates with
the HTML/HTTP
protocol
lIs either a browser-
based or native
application
lYou have an existing capture file
Mobile HTTP/HTML >
Analyze Traffic
lCommunicates with
the HTML/HTTP
protocol
lIs either a browser-
based or native
application
lYou do not want (or cannot) record from
the actual device
lYour mobile OS is Android
lYou have a device emulator
Mobile HTTP/HTML >
Record Emulator
User Guide
VuGen
HP LoadRunner (12.50) Page 566
Speed Simulation for Mobile Vuser Scripts
Speed Simulation models the behavior of a mobile network. This enables you to test applications, while
taking into consideration end-to-end response time from device to server.
Three configuration options are available, allowing you to maximize the accuracy of your simulation:
lMaximum Bandwidth
lStandard Bandwidth
lCustom Bandwidth
You set the bandwidth using the Speed Simulation Runtime settings as described below.
To access VuGen > Runtime settings > Network > Speed Simulation
User interface elements are described below:
UI
Element
Description
Use
maximum
bandwidth
Vusers run at the maximum bandwidth that is available over the network. This option is
provided in cases where you do not wish to emulate a specific network. This is the
default setting.
Use
standard
bandwidth
lGeneral Packet Radio Service (GPRS)
lEnhanced Data rates for GSM Evolution (EDGE)
lUniversal Mobile Telecommunications System (UMTS)
lHigh-Speed Downlink Packet Access (HSDPA)
lHigh-Speed Downlink Packet Access Phase 2 (HSDPA phase 2)
lHigh-Speed Uplink Packet Access (HSUPA)
Each network type has both a maximum and expected rate. The maximum rate
represents the technology's best case performance rate while the expected rate more
accurately reflects real time performance.
Use
custom
bandwidth
Sets a custom download and upload speed, defined in bits. You can set a single value or
range for either the upload or download speed. A case where this option would be
useful, is when you know the expected network speed from your cellular provider for a
specific area.
Download speed:The download speed in bits, defined as a range or single value.
Upload speed:The upload speed in bits, defined as a range or single value.
User Guide
VuGen
HP LoadRunner (12.50) Page 567
UI
Element
Description
Note:
lIf you select this option and either the upload speed or download speed fields
are left blank, the empty value is automatically set to the value of the non-
empty field.
lIf you select this option and leave the upload speed and download speed
fields blank, the default setting of maximum bandwidth will be used.
Mobile Application - HTTP/HTML
Recording Methods
The Mobile Application - HTTP/HTML protocol provides the following methods for script generation:
Create a Script With a Capture File
You can analyze a capture file that was created with either an external capture file utility, such as
Wireshark, or VuGen's Mobile Sniffer Agent. The Recording Wizard >Analyze Traffic option enables you
to point to the capture file, specify the source or destination IP address to include, and generate the
script.
For details see:
l"Recording Traffic into a Capture (Sniffer) File" on the next page
l"How to Create a Script by Analyzing Traffic (Web Services)" on page891
l"Recording Wizard" on page580
Record and Analyze Traffic
This method is used to create and analyze a capture file either on a remote server or a on your local
host computer. After the connection is configured using the Recording Wizard, you can record business
transactions from your mobile device to a capture file. Subsequently, you can analyze the traffic of the
capture file and generate a script.
For details see:
l"Recording Traffic into a Capture (Sniffer) File" on the next page
l"Recording Wizard" on page580
User Guide
VuGen
HP LoadRunner (12.50) Page 568

Create a Script Using an Emulator
For many mobile devices, there are third party emulators that you can install on your computer. Once
installed, you can use the Emulate Record method to record and generate a script.
For details see:
l"Recording with Emulation" on page573
l"Recording Wizard" on page580
Create a script using the LoadRunner Proxy
The VuGen machine acts as a proxy server capturing all the traffic from the mobile device to the target
server. After the business process has been recorded VuGen creates a script.
For details, see
l"Recording via a Proxy - Overview" on page220
l"How to Record a Script via a Proxy" on page221
Recording Traffic into a Capture (Sniffer) File
Recording application traffic to a capture file is effective when you are unable to record an application
using VuGen as is the case with mobile applications. A capture file is a trace file containing a log of all
TCP traffic over the network. Using a sniffer application, you obtain a dump of all of the network traffic.
The sniffer captures all of the events on the network and saves them to a capture file. To generate a
smaller, more manageable script, try to capture the network traffic only for the time that you perform
actions in your application.
Depending on your OS and device, you have many options on where and how to record a capture file. The
table below lists the some of the locations and their related advantages and disadvantages:
Capture File
Source
Supported by Mobile
Sniffer Agent
Advantages Disadvantages
VuGen with
configured hot
spot1
lEasy and intuitive
lAdministrator
permission not an issue
lNot all devices support
“ad hoc”
lCaptures WiFi only (Not
capturing cellular
network traffic)
Server Record real traffic (both
WiFi and cellular network
traffic)
lRequires administrator
permissions
lRequires installation of
1A WiFi connection
User Guide
VuGen
HP LoadRunner (12.50) Page 569
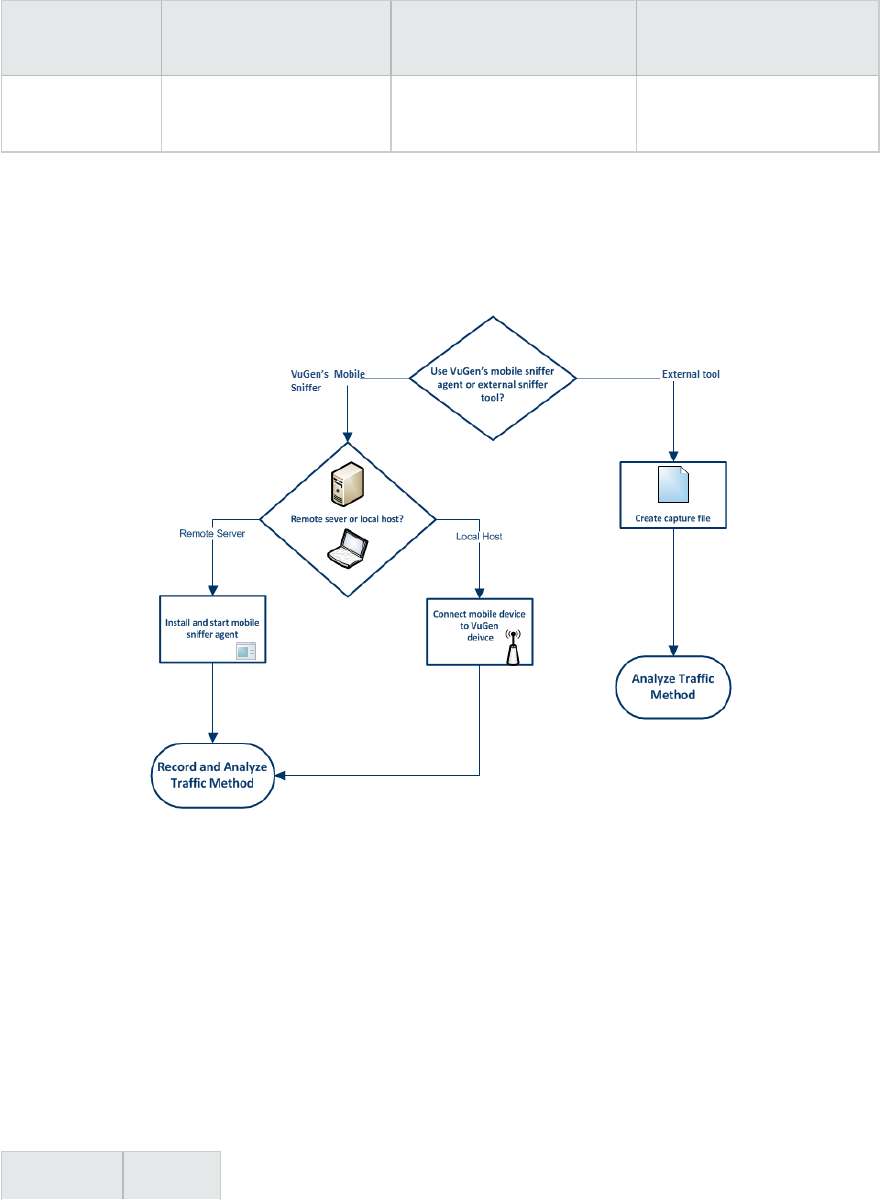
Capture File
Source
Supported by Mobile
Sniffer Agent
Advantages Disadvantages
a software on the
server
You have the flexibility to record traffic with LoadRunner's mobile sniffer agent or record traffic with an
external sniffer agent. The following flow chart illustrates the workflow for both methods:
Record Traffic with VuGen's Mobile Sniffer Agent
Recording traffic on remote servers
To record traffic on a remote server you first must manually install the mobile sniffer agent on your
server by copying the relevant folder from <LR installation directory>\mobileRemoteAgent\ to a
location of your choice on your server. The following table lists the supported operating systems and
their corresponding file directories:
OS Folder
User Guide
VuGen
HP LoadRunner (12.50) Page 570
Windows OS Win32
Linux LinuxRH3
Mac Mac
Once you have copied the folder, you initiate the process by typing a command line argument. For
example, if you are recording in a Windows environment the command line string may look something
like this:
mongoose-2.11.exe -e errorLog.txt -r "C:\Program
Files\HP\LoadRunner\mobileRemoteAgent\win32" -C ".cgi" -p 80
Common command arguments and their descriptions:
-c Identify the remote sniffer agent extensions. Always "cgi".
-p Identify the port and optionally the ip address that you want the mobile sniffer agent to
listen on.
-r Location of the mobile sniffer agent. Path must be absolute or the process will fail.
-l Restricts access to the mobile sniffer agent to a specific client identified by the client's IP.
-e Name of the error log.
Note: Do not use –g option. (“digest user/password” ) There is a defect with this option.
Once a sniffer agent is installed, you manually start the agent and continue the Record and Analyze
method from the Recording Wizard.
For details, see "Recording Wizard" on page580
CGI Configuration File Options
The CGI configuration file is located in <LR installation
directory>\mobileRemoteAgent\<win32/Mac/LinuxRH3>/cgi-bin/mobileCGI.conf
You can configure the following options:
ltimeout-seconds
Default =1800
The timeout session check stops when the process is sleeping due to traffic inactivity; the timeout
session resumes as soon as the adapter is recording events.
lmax-pcap-file-size-kb
Default = 102400
Maximum file size check stops when the process is sleeping due to traffic inactivity; the timeout
session resumes as soon as the adapter is recording events.
User Guide
VuGen
HP LoadRunner (12.50) Page 571

Since traffic is first written to a buffer file and flashed to the hard drive, the maximum size may be
exceeded.
llog-file-enable
Default = 0
Example of CGI configuration file
timeout-seconds 1800
max-pcap-file-size-kb 102400
log-file-enable 0
Recording traffic on local hosts
In order to record using a local host, you must first configure your machine as a hotspot. There are two
ways to accomplish this, either by ad hoc or SoftAp.
Information about ad hoc and SoftAP is available from many publicly available web sites.
Note:
lNot all the devices support adhoc. For example, some versions of Andoid do not support it.
lSince our agent is using libpcap ( the same package used by Wireshark) not all network
configurations will be supported by the mobile sniffer agent.
lIn order for a hotspot to work, you first need to configure your firewall to support it.
lThe hotspot may be implemented with NAT thus the address of the mobile will be identical to
the hotspot machine.
Once hotspot as been configured on your local host, you continue to Record and Analyze method using
the "Recording Wizard" on page580.
For additional information about creating capture files, see "How to Create a PCAP File" on page989.
Analyzing Traffic
When using the Analyzing Traffic method, you need to specify a capture file containing client/server
traffic. VuGen supports capture files with the following extensions: .cap, .pcap, .lrcap, .saz, and .har.
When creating a script through traffic analysis, you will need to specify the IP to analyze. The Recording
Wizard provides two methods to specify which IP address's traffic to include in the script. Traffic is
User Guide
VuGen
HP LoadRunner (12.50) Page 572
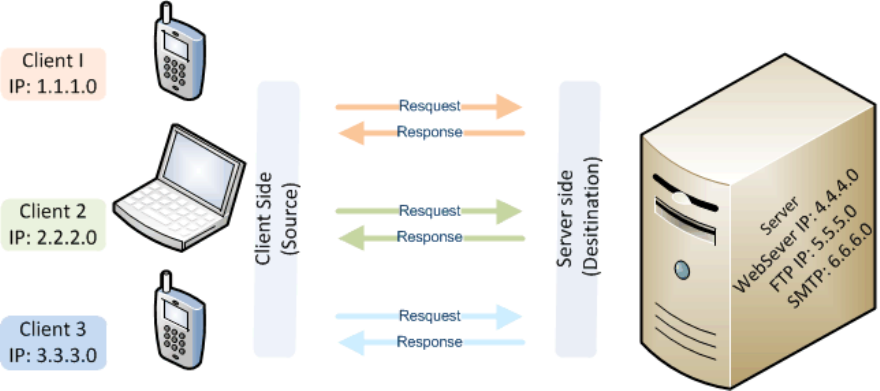
identified either from the server side or from the client side. You will need to specify which IP address's
traffic, and either the client or server side, to include in the script.
Server Side (Destination)
You can configure multiple IP addresses on one server. For example you may be running SMTP , FTP and
a web server all on the same computer with unique IP addresses. When the sniffer agent creates the
capture file it will include all events to all the services on the server. However, by configuring server side
traffic, you can specify the IP address and port where your application under test resides. This method
is useful when you are certain that only one client is communicating with the server.
Client Side (Source)
You can identify the client that has been communicating with the server as the IP address to analyze.
This way, only the events from the client's IP address will be included in the script VuGen will generate.
Filter Options
You can specify additional IP addresses to either include or exclude during code generation Recording
Options > Traffic Analysis > Traffic Filters. For details, see "Traffic Analysis > Traffic Filters Recording
Options" on page206.
Recording with Emulation
Testing mobile applications with an emulator is a solid solution for many mobile devices. You can install
a third party emulation application on your local computer and record events with the Record Emulator
method from the Recording Wizard. The Record Emulator method requires three settings in order to
start the emulator:
lEmulator to record
lCommand line
lWorking directory
For details, see " Record Emulator Screen" on page584.
User Guide
VuGen
HP LoadRunner (12.50) Page 573

Below is a table including emulator download site and Record Emulator settings for Web OS:
Mobile
OS
Link to
Downloa
d SDK
Emulator to record
(example)
Command line (example) Working directory
(example)
Android Android
Emulator
Downloa
d
C:\Program
Files\Android\android-
sdk-windows\tools
\emulator.exe
@Android_v2.2 C:\Program
Files\Android\andro
id-sdk-
windows\tools
Blackber
ry
Blackber
ry
Emulator
Downloa
d
C:\Program
Files\Research In
Motion\BlackBerry
Smartphone Simulators
6.0.0\6.0.0.337 (9800)
\fledge.exe
/app=Jvm.dll /handheld=9800
/session=9800 /app-
param=DisableRegistration
/app-
param=JvmAlxConfigFile:9800
.xml /data-port=0x4d44
/data-port=0x4d4e
/pin=0x2100000A
C:\Program
Files\Research In
Motion\BlackBerry
Smartphone
Simulators
6.0.0\60.0.337
(9800)
Windows
8
Windows
Mobile
Emulator
Downloa
d
C:\Program
Files\Microsoft
SDKs\Windows
Phone\v7.0\Tools\XDE
Launcher\XdeLauncher.
exe
"Windows Phone 7" "Windows
Phone 7 Emulator"
C:\Program
Files\Microsoft
SDKs\Windows
Phone\v7.0\Tools\X
DE Launcher
Recording with a Mac iPhone Emulator
Using the Record and Analyze method from the Recording Wizard, you can record an iPhone script using
an emulator.
lDownload the iPhone emulator and install your Mac. iPhone Emulator Download.
lUse the Record and Analyze method from the Recording Wizard to create capture file.
Recording with a Google Android Emulator
lIf you are recording with Google Android Emulator Version 2.0 and above, apply the following
workaround if you are experiencing problems recording:
1. Enter a new Port Mapping by selecting Recording Options > Network > Mapping and Filtering and
select New Entry in the Port Mapping section.
2. Specify a Target server and port.
User Guide
VuGen
HP LoadRunner (12.50) Page 574
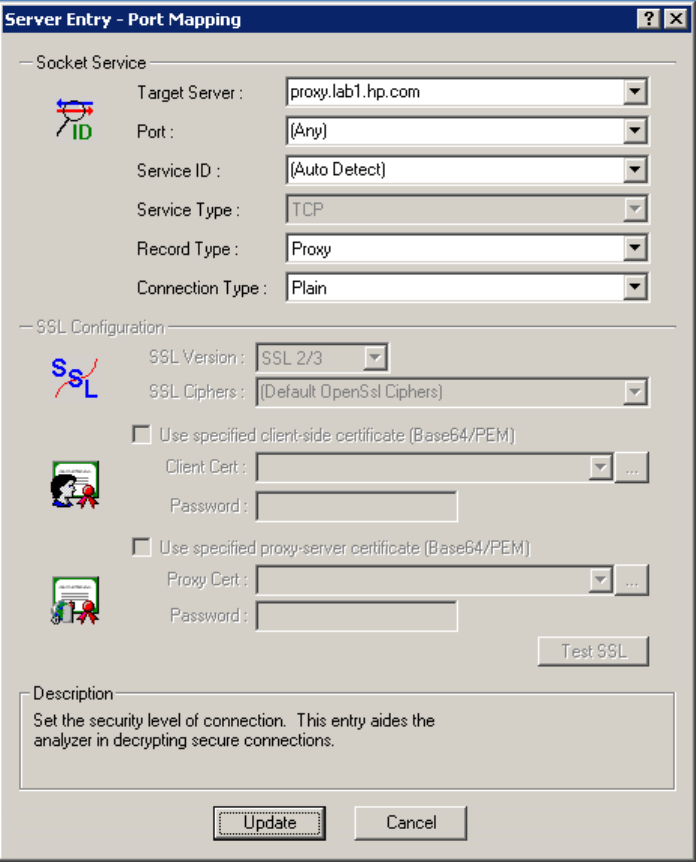
3. Enter a second Port Mapping entry without changing any details.
User Guide
VuGen
HP LoadRunner (12.50) Page 575
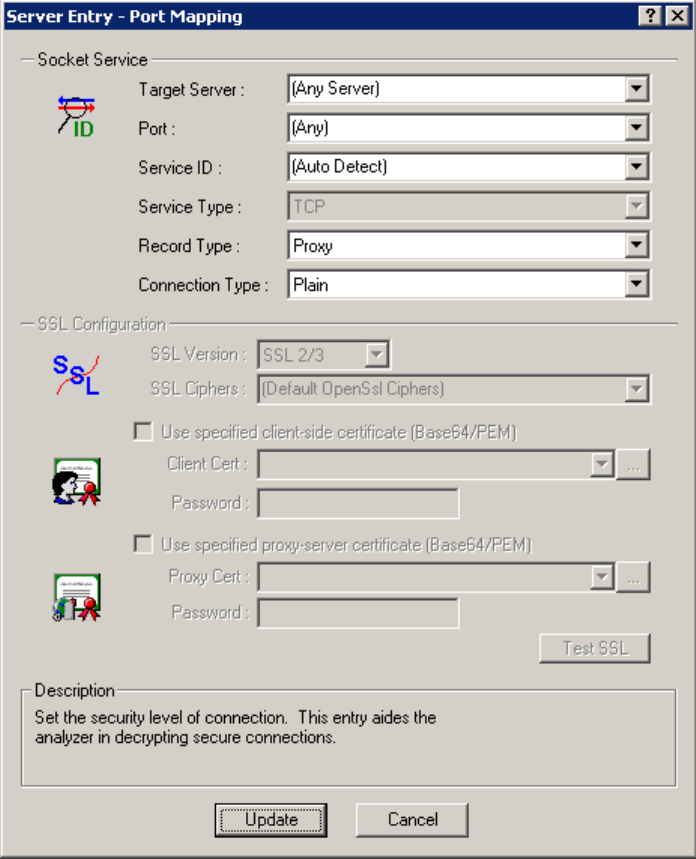
4. Disable the second entry so all traffic is handled by the first entry in the Port Mapping.
User Guide
VuGen
HP LoadRunner (12.50) Page 576
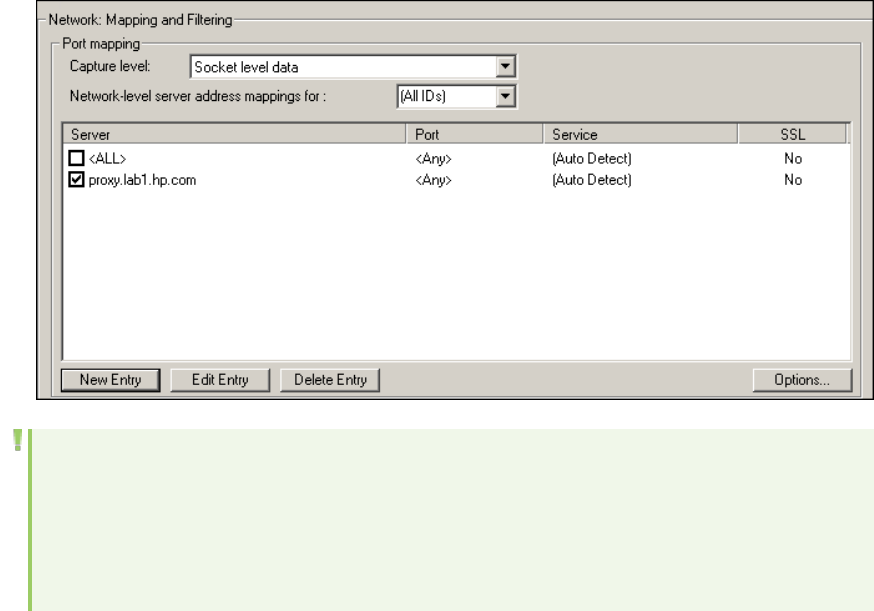
Note:
lThis limitation was fixed in Google Android Emulator Version 4.03
lWhile recording a SSL site, you may encounter a warning message stating that there are
User Guide
VuGen
HP LoadRunner (12.50) Page 577
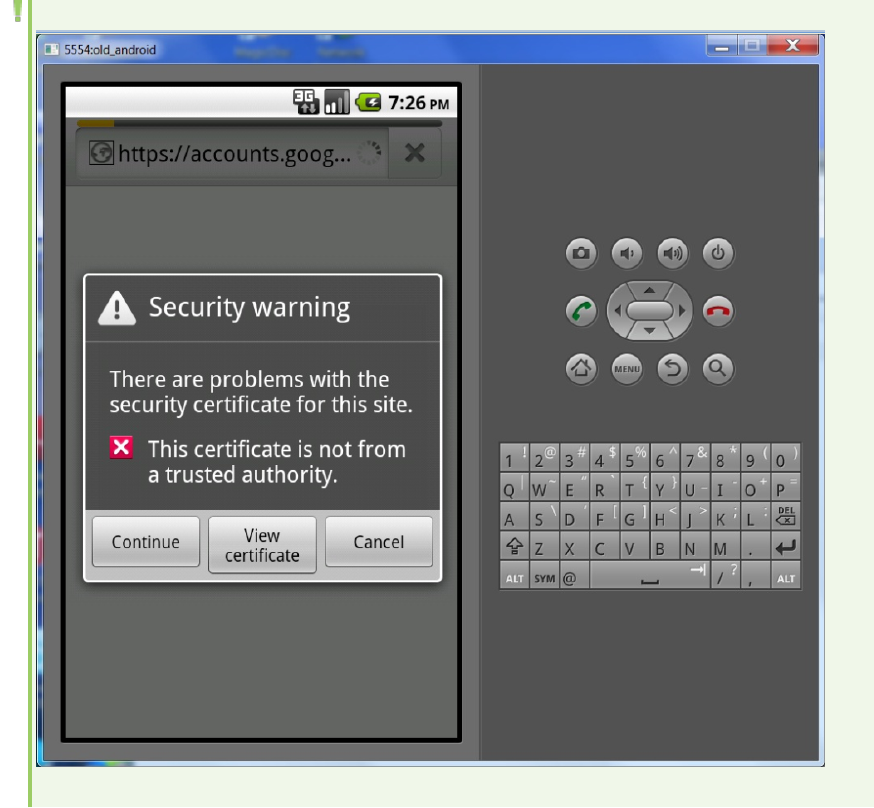
problems with the certificate for the site. Click continue to proceed with the recording.
How to Create a Script by Analyzing Traffic (Mobile Applications)
This task describes how to create a Mobile Application - HTTP/HTML Vuser script using a network traffic
file (capture file).
1. Obtain a capture file
Locate your pcap,saz (Fiddler), or harcapture file, or create a new one using an external tool, such
as Wireshark. For details about creating a capture file in a Windows, Linux, or mobile environment,
see "How to Create a PCAP File" on page989.
2. Option 1 - Create a script in Windows Explorer from an existing Fiddler or
packet capture file
You can create a Vuser script directly from a pcap,saz (Fiddler), or har file. Open Windows Explorer
User Guide
VuGen
HP LoadRunner (12.50) Page 578
on the machine upon which VuGen is installed. Select a pcap,saz (Fiddler), or har file and choose
Create VuGen script from the Windows Explorer's right-click menu. VuGen opens a new instance
with the capture file converted to a Mobile Application - HTTP/HTML script.
Note: The wizard engine does not support .saz files with password protection.
3. Option 2 - Create a script from using VuGen's Recording Wizard
a. Create a new Mobile Application - HTTP/HTML script in VuGen.
b. Click the Start Record button to start the recording wizard. Select the Analyze Traffic
method.
c. Browse to the capture file with a .pcap,.lrcap,.saz, or .har extension. Specify the section of
the script into which you want to load the traffic: vuser_init,Action, or vuser_end.
d. Indicate whether you want to analyze server or client side traffic. For details, see "Analyzing
Traffic" on page572.
e. To analyze traffic from a secure server, click the SSL Configuration button to add its
certificates (not available for *.har files; configure the SSL through Fiddler). For details, see
"SSL Configuration Dialog Box" on page907.
For details, see the "Recording Wizard" on the next page.
Note: If you have load on the server that prevents getting responses on time, you can create a
script based on requests only, by editing the registry.
Start regedit and add a DWORD key to the below location:
Location:
Software\\Mercury Interactive\\LoadRunner\\Protocols\\HTTP\\Analyzer\
Key:
AllowAutomaticOutApiEvents = 1
How to Record and Analyze Traffic (for Mobile Applications)
This task describes how to record and analyze traffic in order to create a new Mobile Application -
HTTP/HTML script with the Recording Wizard.
1. Prerequisites
lIf you are recording the capture file on a remote server, you must manually start the mobile
sniffer agent.
lIf you are recording the capture file on the local host, you must connect your mobile device to
the local host.
User Guide
VuGen
HP LoadRunner (12.50) Page 579

For details, see "Recording Traffic into a Capture (Sniffer) File" on page569.
2. Create new Mobile Application - HTTP/HTML script
a. Select File > New Script and Solution > Mobile Application - HTTP/HTML script.
b. Click the Start Record button.
c. In the Recording Wizard, select the Record and Analyze Traffic method.
For details, see "Recording Wizard" below.
3. Specify mobile sniffer agent location
Enter the URL where the mobile sniffer agent resides. For example, if the mobile sniffer agent is on
the local machine enter http:\\localhost. Click Connect.
4. Configure mobile sniffer agent
a. Specify the Record network interface. This is the network adapter to which you want the
mobile sniffer agent to listen.
b. Specify which section of the script into which you want to load the traffic: vuser_init, Action, or
vuser_end.
5. Click Start Recording
Record the desired business process.
6. Click Stop Recording
VuGen will generate a capture file.
Save the capture file on the local machine when you are prompted.
7. Analyze Traffic
For details, see "How to Create a Script by Analyzing Traffic (Mobile Applications)" on page578
starting with Step 4.
Recording Wizard
This wizard enables you to configure record and analyze setting for the Mobile Application - HTTP/HTML
protocol.
To access Click the Record button
Wizard map: Record
and Analyze Traffic
The following is the wizard map if you select Record and Analyze as the
recording method:
"Recording Method Screen" on the next page >"Configure and Record
Screen" on page583 >"Analyze Traffic Screen" on page582
User Guide
VuGen
HP LoadRunner (12.50) Page 580

Wizard map: Analyze
Traffic
The following is the wizard map if you select Analyze Traffic as the
recording method:
"Recording Method Screen" below >"Analyze Traffic Screen" on the next
page
Wizard map: Record
Emulator
The following is the wizard map if you select Record Emulator as the
recording method:
"Recording Method Screen" below >" Record Emulator Screen" on
page584
Wizard map: Proxy
Recording
The following is the wizard map if you select Proxy Recording as the
recording Method:
"Recording Method Screen" below >"Proxy Recording Screen" on page585
Relevant tasks l"How to Create a Script by Analyzing Traffic (Mobile Applications)" on
page578
l"How to Record and Analyze Traffic (for Mobile Applications)" on
page579
See also "Recording Traffic into a Capture (Sniffer) File" on page569
"Analyzing Traffic" on page572
Recording Method Screen
This dialog box enables you to select a recording method.
To access VuGen > Start Record button
Relevant tasks l"How to Create a Script by Analyzing Traffic (Mobile Applications)" on page578
l"How to Record and Analyze Traffic (for Mobile Applications)" on page579
User interface elements are described below:
UI Element Description
Analyze
Traffic
Create a script by converting an existing capture file to a Vuser script. For details,
see "Recording Traffic into a Capture (Sniffer) File" on page569
Record and
Analyze
Traffic
Create a Vuser script by recording events with a device emulator installed on the
VuGen machine.
Record Create a Vuser script by recording events with a device emulator installed on the
User Guide
VuGen
HP LoadRunner (12.50) Page 581
UI Element Description
Emulator VuGen machine.
Proxy
Recording
Create a Vuser script by recording a client application via the LoadRunner proxy.
Analyze Traffic Screen
This screen enables you to configure settings for script generation from an existing capture file.
To access 1. Create a MobileApplication - HTTP/HTML Vuser script.
2. Click the Record button.
3. In the wizard, select Analyze Traffic.
4. Click Next. Fill in the details.
5. Click Next.
Wizard map "Recording Method Screen" on the previous page >"Configure and Record Screen"
on the next page >Analyze Traffic Screen
Important
information
If you select both server and client filtering, the wizard will only process traffic that
matches both fitlers.
User interface elements are described below:
UI Element Description
Capture file The name of a capture file containing the client/server traffic.
VuGen supports capture files with the following extensions: .cap, .pcap, .lrcap, .saz,
and .har.
In addition, only files where the link-layer header type is either LINKTYPE_ETHERNET
or LINKTYPE_LINUX_SLL are supported by VuGen. If your link-layer header is not
one of the above, your file may not be parsed correctly.
The link-layer header type can be determined by opening the capture file within
WireShark and selecting Statistics > Summary > Encapsulation from the main
menu.
Browse. Allows you to select a capture file to import.
Server side
filter
The IP address and port of the server whose traffic you want to examine. You can
specify multiple servers.
Client side
filter
The IP address of the client whose traffic you want to examine.
User Guide
VuGen
HP LoadRunner (12.50) Page 582
UI Element Description
Record into
action
The section into which you want to record: vuser_init, Action, or vuser_end. For
actions you want to repeat, use the Action section. For initialization steps, use vuser_
init. Click New to define a new repeatable action.
Use the new
parsing
engine
Instructs VuGen to use the new parsing engine that supports TLS 1.1 and 1.2, when
generating the script. This feature is a technical preview.
Note: To use the new engine, WireShark version 1.12.0 or higher must be
installed.
Options Opens the Recording Options dialog box to the most recently accessed node. For
details, see "Recording Options" on page146.
SSL
configuration
Opens the SSL Configuration Dialog Box which allows you to add SSL certificates to
analyze traffic from a secure server (Disabled for *.har files—instead, configure the
SSL through Fiddler).
Configure and Record Screen
This dialog box enables you to configure settings to record traffic to a pcap file.
To access 1. Create a Mobile Application - HTTP/HTML Vuser script.
2. Click the Record button.
3. In the wizard, select Record and Analyze Traffic.
4. Click Next.
Wizard map "How to Record and Analyze Traffic (for Mobile Applications)" on page579
Relevant tasks l"How to Record and Analyze Traffic (for Mobile Applications)" on page579
l"How to Record and Analyze Traffic (for Mobile Applications)" on page579
User interface elements are described below:
UI Element Description
Mobile sniffer
agent
location
Host URL. URL where the mobile sniffer agent resides.
Port. Specify the port for the mobile sniffer agent to listen.
Mobile sniffer
configuration:
Record network interface. Servers and computers can have multiple network
adapters. The setting enables you to select the network adapter you want the
User Guide
VuGen
HP LoadRunner (12.50) Page 583
UI Element Description
mobile agent to listen on.
Record into action. The section into which you want to record: vuser_init,Action, or
vuser_end. For actions that you want to repeat, use the Action section. For
initialization steps, use vuser_init.
Recording Start Recording. Begin recording traffic.
Stop Recording: Stop recording traffic.
Record Emulator Screen
This wizard screen enables you to configure the settings to use a mobile emulator to record a script.
To access 1. Create a Mobile Application - HTTP/HTML Vuser script.
2. Click the Record button.
3. In the wizard, select Record Emulator.
4. Click Next.
Wizard map "Recording Method Screen" on page581 >Record Emulator Screen
User interface elements are described below:
UI Element Description
Emulator to
record
The location of the emulator application executable file.
Command line The arguments that the emulator application requires to run the emulator.
Working
directory
The location in which the emulator application should store files.
Record into
action
The section into which you want to record: vuser_init,Action, or vuser_end.
For actions you want to repeat, use the Action section. For initialization steps, use
vuser_init.
To create a new repeatable action section, click New.
Options button Opens the Recording Options dialog box. For details, see "Recording Options" on
page146.
User Guide
VuGen
HP LoadRunner (12.50) Page 584
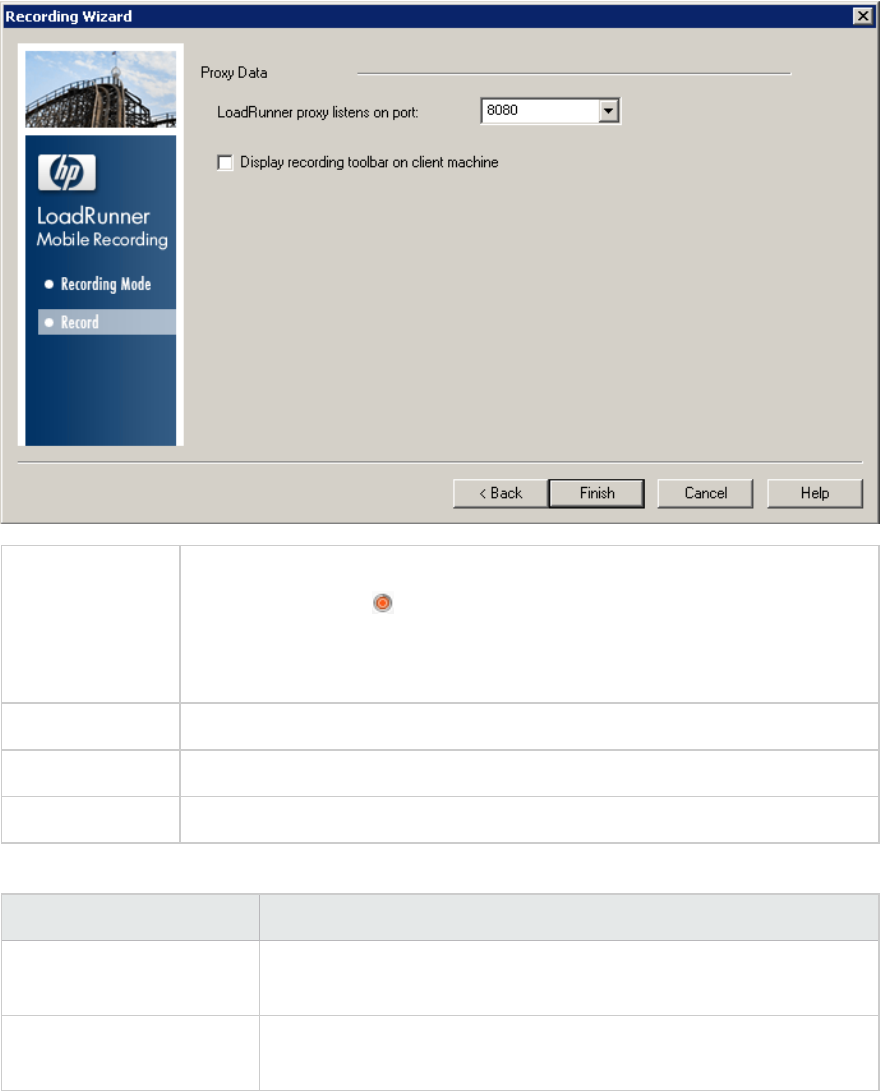
Proxy Recording Screen
This dialog box enables you to configure proxy settings.
To access 1. Create a Mobile Application - HTTP/HTML Vuser script.
2. Click the Record button.
3. In the wizard, select Proxy Recording.
4. Click Next.
Wizard map "Recording Method Screen" on page581 >Proxy Recording Screen
Relevant tasks "How to Record a Script via a Proxy" on page221
See also "Recording via a Proxy - Overview" on page220
User interface elements are described below:
UI Element Description
LoadRunner proxy listens
on port:
The port on which the LoadRunner proxy will listen, for example, Port
8080.
Display recording toolbar
on client machine
Shows the recording toolbar on the client machine, providing you with
better control when recording your script.
User Guide
VuGen
HP LoadRunner (12.50) Page 585
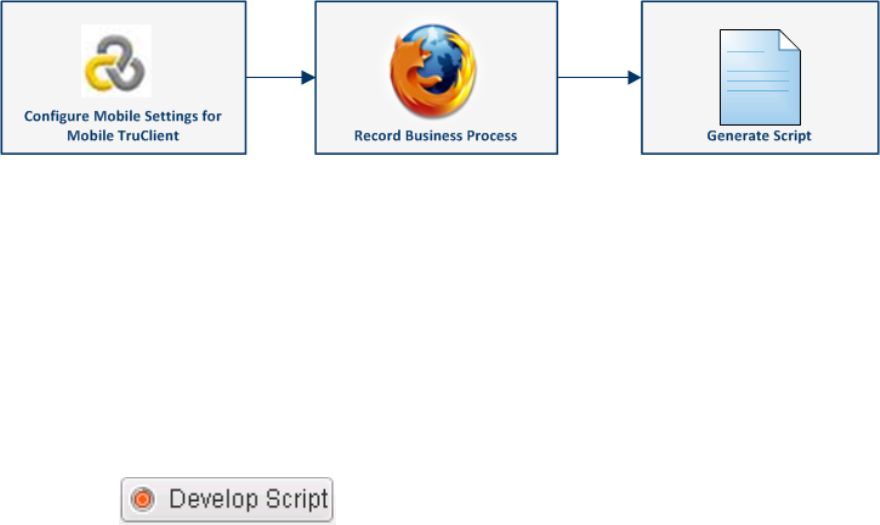
TruClient - Mobile Web Protocol
TruClient - Mobile Web Protocol Overview
Based on LoadRunner's innovative TruClient technology, TruClient - Mobile Web enables you to test web
applications designed for mobile devices.
With this protocol you can:
lSimulate various mobile browsers.
lDevelop scripts that are recorded on the user level making them clear and easily maintained.
The following illustrates the workflow for using the TruClient - Mobile Web protocol:
How to Record a Script with TruClient - Mobile Web
1. Create a new script, of the type TruClient -Mobile Web.
2. Add or import a mobile device
Select Tools > Mobile TruClient Device Manager > Add Mobile Device or Import Mobile Device.
For details, see "Mobile Device Dialog Box" on the next page.
3. Start developing the script
Click the button. In the Mobile Settings dialog box, select a device. If you
need to modify a setting for this recording, do so now.
For details, see "Mobile Device Dialog Box" on the next page.
4. Record a business process
For details on using TruClient's functionality, see "TruClient Protocol" on page673.
User Guide
VuGen
HP LoadRunner (12.50) Page 586

How to Add, Remove, and Import Mobile Device Settings for TruClient -
Mobile Web
How to Create a Custom Device Using the Mobile Device Manager
The TruClient - Mobile Web device manager is delivered with the settings for many popular mobile
devices, however, you can easily add a custom device.
1. Select Tools > Mobile TruClient Device Manger > Add Mobile Device. This opens the Add Mobile
Device dialog box.
2. Enter the name of the device you would like to add or select an existing device from the drop-down
list to customize.
3. Specify the User Agent.
4. Specify the Display. For details, see "Mobile Device Dialog Box" below.
5. Click Add.
How to Remove a Mobile Device
1. Select Tools > Mobile TruClient Device Manger > Remove Mobile Device. This opens the Remove
Mobile Device dialog box.
2. Select the device from the Mobile Device dropdown and click Remove.
How to Import a Mobile Device Settings to Your Script
The import feature can be used to import mobile devices created in other users' scripts.
1. Open a script that contains custom device settings.
2. Select Tools > Mobile TruClient Device Manger > Import Mobile Device. This opens the Import
Mobile Device dialog box.
3. Select the Import Device Settings. This opens the Import Device Settings dialog box.
4. Highlight the custom device and click Import.
Mobile Device Dialog Box
The Mobile Device dialog boxes (Mobile Settings, Add, Remove, and Import) enable you to select, add,
remove, and import mobile devices for use with the TruClient - Mobile Web Protocol.
To access Use one of the following:
lDevelop Script button (opens the Mobile Settings dialog box)
lTools > Mobile TruClient Device Manager > ...
lAdd Mobile Device
User Guide
VuGen
HP LoadRunner (12.50) Page 587
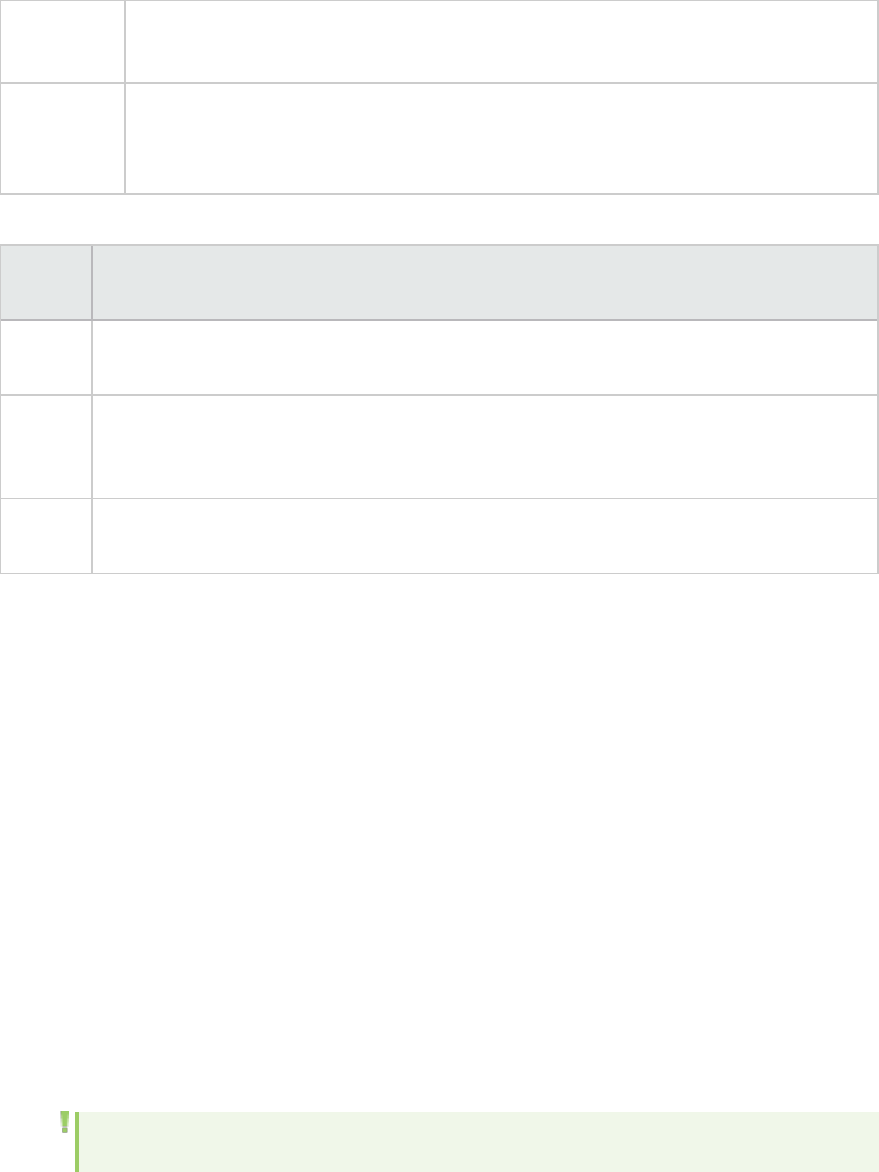
lRemove Mobile Device
lImport Mobile Device
Relevant
tasks
l"How to Add, Remove, and Import Mobile Device Settings for TruClient - Mobile Web"
on the previous page
l"How to Record a Script with TruClient - Mobile Web" on page586
UI
Element
Description
Mobile
Device
The mobile device under test.
If you added a new device, it will appear at the end of the drop down list.
User
Agent
The header string that is sent to server to identify your mobile device. Once you have a
selected a device, the default header value will appear. However, this header string can be
modified.
Display Specify the width and height of your mobile device screen. TruClient - Mobile Web will open
a browser window according to the display settings.
SMP (SAP Mobile Platform) Protocol
The SMP (SAP Mobile Platform) protocol enables you to create and replay .NET based scripts using files
that have been generated by SMP, formerly known as SUP. This task describes the steps to create an
SMP script.
Prerequisites
To create an SMP script you will need to record a business process with SMP, a platform that is provided
by Sybase, an SAP company. The recording generates the following files:
lAction.cs
lVuser_init.cs
lVuser_end.cs
Create an SMP (SAP mobile Platform) script
1. Select New Script and Solution > SMP (SAP Mobile Platform).
2. Copy the generated .cs files into the script folder.
Note: The recording mechanism for SMP scripts is disabled.
3. Save,close and reopen the script.
4. Add the location of the SAP.Mobile.LoadRunner.dll through the Replay > Runtime Settings > .NET>
User Guide
VuGen
HP LoadRunner (12.50) Page 588

Shared DLLs view.
Note: The SAP.Mobile.LoadRunner.dll has been developed and is maintained by Sybase, an
SAP company.
5. Generated .cs files can include objects from external .dlls. To successfully replay the script, include
a reference to these .dlls in Runtime Settings > .NET > Shared DLLs.
6. Replay the script. For details, see "Debugging .NET Vuser Scripts" on page597.
.NET Protocol
.NET Protocol Overview
Microsoft .NET Framework provides a foundation for developers to build various types of applications
such as ASP.NET, Windows Forms, Web Services, distributed applications, and applications that combine
several of these models.
VuGen supports .NET as an application level protocol. VuGen allows you to create Vuser scripts that
emulate users of Microsoft .NET client applications created in its .NET Framework. VuGen records all of
the client actions through methods and classes, and creates Vuser scripts in C Sharp or VB .NET.
By default, the VuGen environment is configured for .NET Remoting, ADO.NET, Enterprise Services, and
WCF (Windows Communication Foundation) applications. Contact Customer Support for information on
how to configure VuGen to record applications created with other client-server activity.
Considerations for Working with the .NET Protocol
The .NET protocol enables you to load test by replaying the application’s method calls.
You can write a load test script manually, or you can generate a load test script by recording a business
process.
Unlike other LoadRunner transport based protocols, the .NET protocol records the application method
calls that are specified in the filter. Method calls that are not defined in the filter are not included in the
generated script during the recording of the application.
Typically, a user is able to generate a script that can be used for load test using the default
environment filter. However, for certain complex applications it may be difficult to generate a working
script because the wrong method has been specified in the filter. The most difficult task of creating a
load test script with the .NET protocol is resolving recording or code generation errors.
The following requirements will facilitate your ability to define the correct filter for the recording
process and generate a working load test script:
User Guide
VuGen
HP LoadRunner (12.50) Page 589
lYou should be familiar with .NET framework.
lYou should be able to code using C# or VB.NET.
lYou should be familiar with XML.
lYou should have Visual Studio 2010 installed.
lYou should have an understanding of the architecture and communication techniques of the
application so as to determine what functions or classes are relevant for the load test script.
The following can streamline the process of creating the correct filter:
You should have access to the application code or have some .NET reflector tools to enable you to view
the decompiled code.
You should have access to the developers of the application who can help you identify the methods that
are required for the load test.
For more information about .NET and the above environments, see the MSDN Web site.
Viewing Data Sets and Grids
When you record a method returning a dataset, data table, or data reader action, VuGen generates a
grid for displaying the data.
When working with a data reader, VuGen collects the data retrieved from each Read operation and
converts it to the replay helper function, DoDataRead.
For example, after recording the following application code,
SqlDataReader reader = command.ExecuteReader();
while( reader.Read() )
{
// read the values, e.g., get the string located in column 1
string str = reader.GetString(1)
}
VuGen generates the following lines in the script:
SqlDataReader_1 = SqlCommand_1.ExecuteReader();
LrReplayUtils.DoDataRead(SqlDataReader_1, out valueTable_1, true, 27);
where the two parameters indicate that during recording, the Application read all 27 available records.
Therefore, during replay the script will read all available records.
In addition, VuGen generates a data grid containing all the information retrieved by the Read
operations.
During replay you can use the output data table, containing the actual retrieved values, for correlation
and verification. For more information regarding the DoDataRead function, see the Function Reference
(Help > Function Reference).
When applicable, VuGen displays grid steps in the Step Navigator, and displays the associated grids in
the Snapshot pane.
User Guide
VuGen
HP LoadRunner (12.50) Page 590
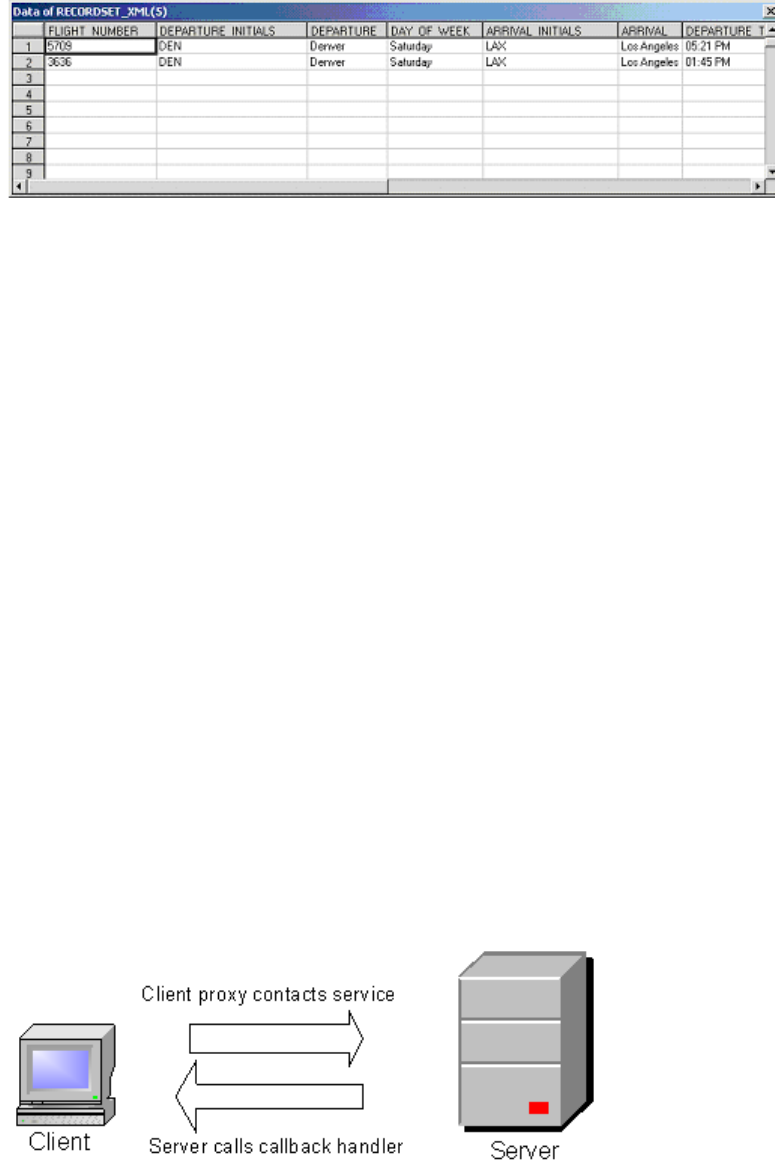
The dataset is stored in an XML file. You can view this XML file in the script's data/datasets folder. The
data files are represented by an <index_name>.xml file, such as 20.xml. Since one file may contain
several data tables, see the file datasets.grd, which maps the script index to the file index to determine
which XML contains the data.
Recording WCF Duplex Communication
WCF (Windows Communication Foundation) is a programming model that unifies Web Services, .NET
Remoting, Distributed Transactions, and Message Queues into a single Service-oriented programming
model for distributed computing.
WCF creates a proxy object to provide data for the service. It also marshals the data returned by the
service into the form expected by the caller.
In addition to general support for the WCF environment, VuGen provides specialized support for
applications that use WCF's duplex communication. In duplex communication, the client proxy contacts
the service, and the service invokes the callback handler on the client machine. The callback handler
implements a callback interface defined by the server. The server does not have to respond in a
synchronous manner—it independently determines when to respond and invoke the callback handler.
Communication Between Client and Server
The communication between the client and server is as follows:
lThe server defines the service contract and an interface for the callback.
lThe client implements the callback interface defined by the server.
lThe server calls the callback handler in the client whenever needed.
When trying to record and replay duplex communication, you may encounter problems when the script
calls the original callback methods. By default, the callback handlers are not included in the filter. You
User Guide
VuGen
HP LoadRunner (12.50) Page 591
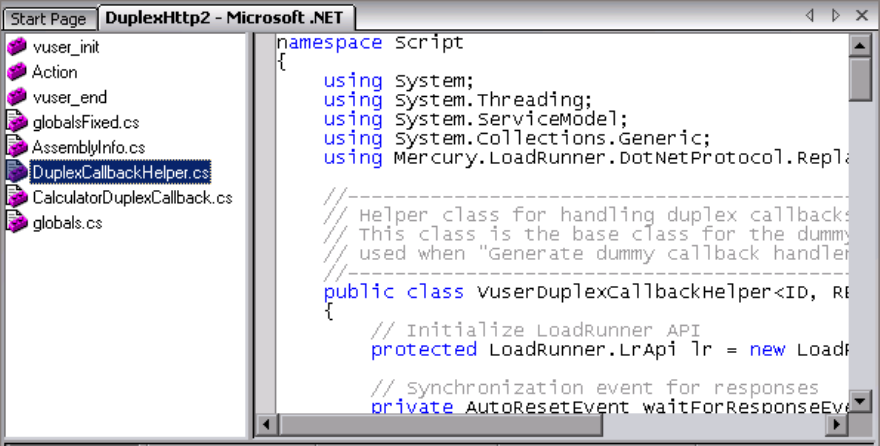
could customize the filter to include those callback handlers. However, the standard playback would be
ineffective for a load test, since many of the callbacks are local operations such as GUI updates. For an
effective load test you cannot replay the original callback method invoked by the server.
VuGen's solution is based on replacing the original callback handler with a dummy implementation. This
implementation performs a typical set of actions that you can customize further for your application.
You instruct VuGen to replace the original callbacks by activating the Generate Dummy Callback
Handler recording option. For more information, see "Microsoft .NET > Recording - Recording Options"
on page184.
VuGen Implementation of a Duplex Callback
As part of the duplex communication solution, VuGen generates two support files:
lDuplexCallbackHelper.<language>
lCallback_Name.<language>
The following example shows the generated files for a Calculator application using duplex
communication:
The Helper file serves as a general template for working with duplex callback handlers. It serves as a
base class for the implementation of the callback.
The second file, Callback_Name, contains the implementation of the callback. The name of the callback
implementation class is Vuser<xxxx> where xxxx is the name of the callback interface and it inherits
from the VuserDuplexCallbackHelper class defined in the Helper file. VuGen creates separate
implementation files for each interface.
This file performs two primary tasks:
Set Response. It stores the data that came from the server in a map. It stores them with sequential IDs
User Guide
VuGen
HP LoadRunner (12.50) Page 592
facilitating their retrieval. This method is called from the implementation of the callback interface. The
following sample code demonstrates the dummy implementation of a callback method named Result.
The method's arguments are stored in the map as an object array.
public virtual void Result(string operation, double result) {
// Add here your own callback implementation and set the response data
SetResponse(responseIndex++, new object[] {
operation,
result});
}
lGet Response. Waits for the next response to arrive. The implementation of GetNextResponse
retrieves the next response stored in the map using a sequential indexer, or waits until the next
response arrives.
The script calls GetNextResponse at the point that the original callback handler was called during
recording. At that point, the script prints a warning to wait for here for the next response, and indicating
the original callback.
Replacement of the Callback in the Script
When you enable the Dummy Callback option (enabled by default), VuGen replaces the original duplex
callback handlers with dummy implementations. The dummy implementation is called Vuser <Callback
Name>. At the point of the original callback handler, the script prints a warning indicating that it was
replaced.
Customizing the Dummy Implementation
You can modify the implementation file to reflect your environment. This section contains several
suggested customizations.
Timeouts
The default timeout for which the callback waits for the next response is 60000 msec, or one minute. To
use a specific timeout, replace the call to GetNextResponse with the overloading method which gets the
timeout as an argument as shown below. This method is implemented in the callback implementation
file <Callback_Name> listed in the left pane after the DuplexCallbackHelper file.
// Get the next response.
// This method waits until receiving the response from the server
// or when the specified timeout is exceeded.
public virtual object GetNextResponse(int millisecondsTimeout) {
return base.GetResponse(requestIndex++, millisecondsTimeout);
}
To change the default threshold for all callbacks, modify the DuplexCallbackHelper file.
// Default timeout threshold while waiting for response
protected int millisecondsTimeoutThreshold = 60000;
User Guide
VuGen
HP LoadRunner (12.50) Page 593
Key Identifier
Many applications assign key identifiers to the data, which connects the request and response to one
another. This allows you to retrieve the data from the map using its ID instead of the built-in
incremental index. To use a key identifier instead of the index, modify the file <Callback_Name>
replacing the first base template parameter, named ID, with the type of your key identifier. For
example, if your key identifier is a string you may change the first template argument from int to
string:
public class VuserXXX : VuserDuplexCallbackHelper<string, object>
In addition, you may remove the implementation of GetNextResponse() and replace it with calls to
GetResponse(ID) defined in the base class.
Return Values
By default, since VuGen supports OneWay communication, the implementation callback does not return
any value or update an output parameter when it is invoked.
public virtual void Result(string operation, double result) {
// Add your own callback implementation and set the response data
If your application requires that the callback return a value, insert your implementation at that point.
Get Response Order
In VuGen's implementation, a blocking method waits for each response. This reflects the order of
events as they occurred during recording—the server responded with data. You can modify this
behavior to execute without waiting for a response or to implement the blocking only after the
completion of the business process.
Find Port
The FindPort method in the Helper file is a useful utility that can be used in a variety of
implementations. The Helper class uses this method to find unique ports for running multiple instances
of the script. You can utilize this utility method for other custom implementations.
Recording Server Hosted By Client Applications
If the communication in your system is a server hosted by a client, VuGen's default solution for duplex
communication will not be effective. In server hosted by client environments, it is not true duplex
communication since the client opens the service and does not communicate through the Framework.
For example, in queuing, the client sends a message to the service and opens a response queue to
gather the responses.
To emulate a server hosted by a client, use the pattern depicted in the above solution—replace the
original response queues with dummy callbacks and perform synchronization as required. For more
information, contact HP support.
User Guide
VuGen
HP LoadRunner (12.50) Page 594

Asynchronous Calls
When VuGen records asynchronous calls on remote objects, you can specify how the calls are handled in
the "Microsoft .NET > Recording - Recording Options" on page184. These options are particularly
relevant for .NET Remoting and WCF environments.
You can configure VuGen to one of the following options:
lCall original callbacks by default. Uses the recorded application's original callback when generating
and replaying the script. If the callback method is explicitly excluded by a filter, the callback will be
excluded even if you enable this option. If your callbacks perform actions that are not directly related
to the business process, such as updating the GUI, then make sure to disable this option.
lGenerate asynchronous callbacks. This option defines how VuGen will handle callbacks when the
original callbacks are not recorded. This is relevant when the above option, Call original callbacks is
disabled or when the callbacks are explicitly excluded.
When you enable this option, it creates a dummy method which will be called during replay instead of
the original callback. This dummy callback will be generated in the callbacks.cs section of the script.
When you disable this option, VuGen inserts a NULL value for the callback and records the events as
they occur.
Note: VuGen supports the Async and Await modifiers, so if your AUT (application under test)
uses these modifiers, they will be included in your script.
The following segment shows script generation for a Calculator client, when Generate asynchronous
callbacks is enabled.
To display the callback method, OnComplete1, you click on the callback.cs file in the left pane.
The following segment shows script generation when the option is disabled. VuGen generates a NULL in
place of the callback and records the events of the callback as they occur.
Note: If you recorded a script with specific recording options, and you want to modify them, you
do not need to re-record the script. Instead, use the Record > Regenerate Script option to
recreate the script with the new settings.
Recording Dual HTTP Bindings
If your application employs dual HTTP Binding, since HTTP is inherently not a duplex protocol, the
framework uses a standard port to receive response data being passed to the callback. When you
attempt to run multiple instances of your application, you may be unable to do so using the same port
User Guide
VuGen
HP LoadRunner (12.50) Page 595

number. VuGen provides you with an option of replacing the original client base address's port number
with a unique port.
When you enable the Generate Unique Client Base Address recording option, VuGen checks the type of
communication used by the application. If it detects dual HTTP communication, WSDualHttpBinding, it
runs the FindPort utility (provided in LrReplayUtils) in the Helper file and finds unique ports for each
instance of the callback.
This option is enabled by default. It is only relevant when you enable the above option, Generate dummy
callback handler.
When you enable this option, VuGen generates the following code in the script:
#warning: Code Generation Warning
// Override the original client base address with a unique port number
DualProxyHelper.SetUniqueClientBaseAddress<XXXX>(YYYYY);
For more information, see "Microsoft .NET > Recording - Recording Options" on page184.
Connection Pooling
ADO.NET providers deploy a feature called connection pooling which can significantly influence load test
accuracy. Whenever only one app domain is used for all Vusers, connection pooling is turned on—.NET
Framework keeps the database connections open and tries to reuse them when a new connection is
requested. Since many Vusers are executed in the context of a single application domain, they may
interfere with one another. Their behavior will not be linear and that may decrease their accuracy.
In the .NET runtime settings, the AppDomain Per Vuser property enables execution of each Vuser in a
separate app domain (true by default). This means that there is connection pooling in the scope of each
Vuser, but the Vusers will not interfere with one another. This setting provides more accuracy, but lower
scalability.
If you disable this option, you need to manually disable connection pooling for the database.
The following table describes how to manually disable connection pooling:
Provider Option
.NET
Framework
Data
Provider for
SQL Server
"Pooling=false" or "Pooling=no"
.NET
Framework
Data
Provider for
Oracle
"Pooling=false" or "Pooling=no"
User Guide
VuGen
HP LoadRunner (12.50) Page 596

.NET
Framework
Data
Provider for
ODBC
Connection pooling is managed by an ODBC Driver Manager. To enable or disable
connection pooling, use the ODBC Data Source Administrator (found in Control Panel or
the Administrative Tools folder). The Connection Pooling tab allows you to specify
connection pooling parameters for each of the installed ODBC drivers.
.NET
Framework
Data
Provider for
OLE DB
"OLE DB Services=-2"
Oracle Data
Provider for
.NET
"Pooling=false"
Adaptive
Server
Enterprise
ADO.NET
Data
Provider
"Pooling=False"
Debugging .NET Vuser Scripts
You can compile a .NET Vuser script to check its syntax, without running the script. To compile the script
directly from VuGen, press Shift+F5 or select Vuser > Compile. If VuGen detects a compilation error, it
displays the error in the Output window. Double-click on the error to go to the problematic line in the
script.
To run the script directly from VuGen, press F5 or select Replay > Run. Breakpoints and step-by-step
replay are not supported in VuGen's editor window for .NET Vusers. To debug a script and run it with
breakpoints or step-by-step, run it from within Visual Studio .NET as described below.
Viewing Scripts in Visual Studio
Visual Studio provides you with additional tools to view, edit, and debug your Vuser scripts. You can add
breakpoints, view variable values, add assembly references, and edit the script using Visual Studio's
IntelliSense. You can also run the script in a step-by-step mode for debugging.
When you save your script, VuGen creates a Visual Studio 2010 solution file, Script.sln, in your script's
folder. You can open the solution file in Visual Studio .NET and view all of its components in the Solution
Explorer.
To open the Vuser script in Visual Studio 2010, select Design > Open Script in Visual Studio or click the
Visual Studio button on the VuGen toolbar.
User Guide
VuGen
HP LoadRunner (12.50) Page 597

Note:
lIf the Vuser script was created with an earlier version of LoadRunner (11 or earlier),
LoadRunner will open the script in Visual Studio 2008.
lIf Visual Studio 2010 is also installed, the script will be converted to a Visual Studio 2010
solution.
lIf the script was created with LoadRunner 11.50 or later, it requires Visual Studio 2010.
Double-click the appropriate section in the Solution Explorer, such as vuser_init.cs, to view the contents
of the script.
Note: VuGen automatically loads all of the necessary references that were required during
recording. You can add additional references for use during compilation and replay through the
Solution Explorer. Select the Reference node and select Add Reference from the right-click
menu.
Click on globals.cs or globals.vb in the Solution Explorer to view a list of the variables defined and used
by your script.
.NET Filters Overview
Recording filters indicate which assemblies, interfaces, namespaces, classes, or methods to include or
exclude during the recording and script generation.
By default, VuGen provides built-in system filters for .NET Remoting, ADO.NET, Enterprise Services, and
WCF (Windows Communication Foundation). These filters were designed to include the relevant
interfaces for standard ADO.NET, Remoting, Enterprise Services, and WCF. VuGen also allows you to
design custom filters.
Custom filters provide several benefits:
lRemoting. When working with .NET Remoting, it is important to include certain classes that allow you
to record the arguments passed to the remote method.
lMissing Objects. If your recorded script did not record a specific object within your application, you
can use a filter to include the missing interface, class or method.
lDebugging. If you receive an error, but you are unsure of it's origin, you can use filters to exclude
methods, classes, or interfaces in order to pin-point the problematic operation.
lMaintainability. You can record script in higher level, make script more easy to maintain and to
correlate.
The .Net Recording Filter pane lets you manipulate existing custom filters. It displays the assemblies,
namespaces, classes, methods, and properties in a color-coded tree hierarchy.
User Guide
VuGen
HP LoadRunner (12.50) Page 598
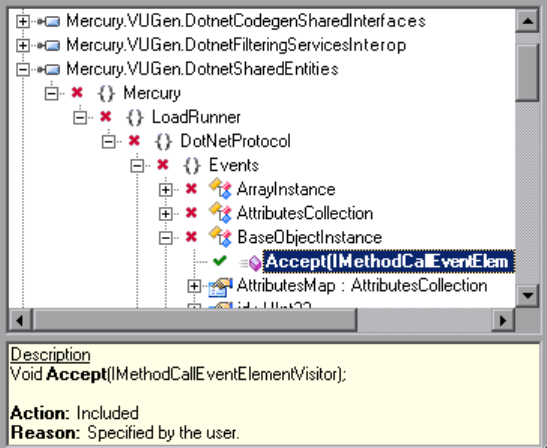
The bottom pane provides a description of the assembly, namespace, class, method, property, or event.
It also indicates whether or not it is included or excluded and a reason for the inclusion or exclusion.
For details about managing your filters, see ".NET Recording Filter Pane" on page97.
.NET Filters - Advanced
The filter tree hierarchy only displays public classes and methods. It does not show non-public classes or
delegates.
You can add classes or methods that are not public by manually entering them in the filter's definition
file.
The filter definition files, <filter_name>.xml reside in the dat\DotnetFilters folder of your installation.
The available Action properties for each element are: Include,Exclude, or Totally Exclude. For more
information, see ".NET Recording Filter Pane" on page97.
By default, when you exclude a class, the filter mechanism applies Exclude, excluding the class, but
including activity generated by the excluded class. When you exclude a method, however, it applies
Totally Exclude, excluding all referenced methods.
User Guide
VuGen
HP LoadRunner (12.50) Page 599
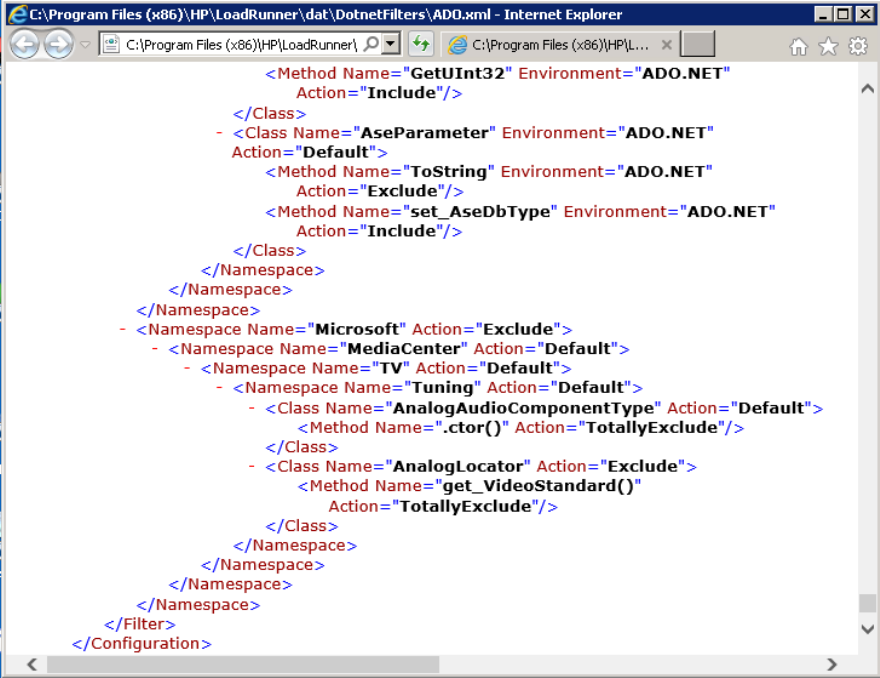
For example, suppose Function A calls function B. If Function A is Excluded, then when the service calls
Function A, the script will include a call to Function B. However, if function A is Totally Excluded, the
script will not include a call to Function B. Function B would only be recorded if called directly—not
through Function A.
VuGen saves a backup copy of the filter as it was configured during the recording,
RecordingFilterFile.xml, in the script's data folder. This is useful if you made changes to the filter since
your last recording and you need to reconstruct the environment.
Guidelines for Setting .NET Filters
When testing your .NET application, your goal is to determine how the server reacts to requests from
the client. When load testing, you want to see how the server responds to a load of multiple users.
When recording a .NET application, your script may include calls to methods that do not affect the
server, such as calls to a local utility or the GUI interface. These calls are usually not relevant to your
testing goals, and it would be correct to filter them out.
The built-in filters, .NET Remoting, ADO.NET, Enterprise Services, and WCF, were designed to record only
the server related traffic relevant to your testing goals. In some instances, however, you may need to
customize filters to capture your .NET application's calls or exclude unnecessary calls. Using the ".NET
User Guide
VuGen
HP LoadRunner (12.50) Page 600

Recording Filter Pane" on page97, you can design custom filters to exclude the irrelevant calls and
capture the server related calls.
Before creating a test, we recommend that you become familiar with your application and determine its
primary classes and methods, so that you will know which ones to include in your recording.
If you are not familiar with your application's classes, you can use Visual Studio or a Stack Trace to help
you determine which methods are being called by your application in order to include them in the filter.
VuGen allows you to record with a stack trace that logs all of the methods that were called by your
application.
Once you determine the required methods and classes, you include them using the .NET Recording Filter
pane. When preparing a script, you may need to customize the filter several times in order to achieve
the optimal filter. An optimal filter records the relevant methods without introducing a large number of
irrelevant calls to the script.
Tip: Strive to modify the filter so that your script will compile (Shift+F5) inside VuGen. Then
customize the filter further to create a functional script that runs inside VuGen.
Note that if you plan to add manual code to your script such as control flow or message statements,
make sure to do so after you have a functional script that runs inside VuGen. The reason for this is that
if you re-record a script or regenerate the script, you will lose all of the manual changes.
Determining which Elements to Include or Exclude
When designing a custom filter, we recommend that you start by choosing the appropriate built-in filter
as a base filter. You can then customize the filter using one of the following approaches:
lTop Down Approach. An approach in which you include the relevant namespace and exclude specific
classes that are not part of the client-server activity. This is recommended if you are familiar with
your application and you can identify a well-defined assembly which implements all client-server
activity without involving any GUI elements, such as MyDataAccessLayer.dll.
lBottom up Approach. An approach in which you use the default filter and refine it by adding
individual methods or classes. Use this approach if you cannot identify a well-defined layer or if you
are not familiar with your application. Do not add all AUT assemblies and then try to remove extra
component one by one.
The following guidelines indicate when to include or exclude elements:
lIf, as a result of your including a class, your script has many unrelated method calls, try modifying the
filter to exclude the irrelevant methods.
lIf you identify a non-client/server call in your script, exclude its method in the filter.
lDuring recording, VuGen may detect an unknown input argument, for example, an argument whose
construction it had never encountered before. If this argument supports serialization, VuGen
serializes it by saving it to a file in a special format. During replay, VuGen reconstructs the argument
by deserializing it.
User Guide
VuGen
HP LoadRunner (12.50) Page 601

lVuGen serializes objects passed as arguments that were not included by the filter. We recommend
that you include this object in the filter in order to track its construction and activity instead of using
it in its serialized form. You can identify serialized objects in the script by searching for calls to the
LrReplayUtils.GetSerializedObject method or, in WCF environments,
LrReplayUtils.GetSerializedDataContract. VuGen stores serialized objects in the script's
\data\SerializedObjects folder as XML files with indexes: Serialization_1.xml,Serialization_2.xml
and so forth.
lWhen no rules are specified for a method, it is excluded by default. However, when the remoting
environment is enabled, all remote calls are included by default, even if they are not explicitly
included. To change the default behavior, you can add a custom rule to exclude specific calls which
are targeted to the remote server.
lArguments passed in remoting calls whose types are not included by the filter, are handled by the
serialization mechanism. To prevent the arguments from being serialized, you can explicitly include
such types in order to record the construction and the activity of the arguments.
lExclude all activity which involves GUI elements.
lAdd assemblies for utilities that may be required for the script to be compiled.
For information on how to include and exclude elements, see ".NET Recording Filter Pane" on page97.
Tip: You can include or exclude a method directly from the VuGen editor. Select it and choose
Open current method in Filter Pad from the right-click menu. Once the method is selected in
the filter tree, choose Include or Exclude from the right-click menu.
Defining an Effective Filter
When preparing a script, you may need to customize the filter several times in order to achieve the
optimal filter. An optimal filter records the relevant methods without introducing a large number of
irrelevant calls to the script.
Define an Effective Filter
1. Create a new filter based on one of the built-in filters. If you know that the AUT (Application Under
Test) does not use ADO.NET, Remoting, WCF, or Enterprise Services, clear that option since
unnecessary filters may slow down the recording.
2. Set the Stack Trace option to true for both recording and code generation. Open the Recording
Options ( ctrl+f7) and select the Recording node. Enable Debug Options: Stack Trace and Code
Generation: Show Stack Trace.
3. Record your application. Click Start Record ( ctrl + r) to begin and Stop ( ctrl + f5) to end.
4. View the script's steps. If you can determine the business logic from the steps and apply
correlation, you may not need to create custom filters. If, however, the script is very long or hard to
maintain or correlate, you should customize the script's filter.
5. Try to identify the high-level method in the call that captures or wraps one or more client server
User Guide
VuGen
HP LoadRunner (12.50) Page 602
calls. You can do this by opening the AUT source files (if they are available) in Visual Studio or by
viewing a Stack Trace of the script.
6. Set the filter to include the relevant methods—you may need to add their assembly beforehand.
For tips about including and excluding elements in the filter, see ".NET Filters Overview" on
page598.
7. Record the application again. You should always re-record the application after modifying the
filter.
8. Repeat steps 4 through 7 until you get a simple script which can be maintained and correlated.
9. After creating an optimal script, turn off the Stack Trace options and regenerate the script. Open
the Recording Options ( ctrl+f7) and select the Recording node. Disable Debug Options: Stack
Trace and Code Generation: Show Stack Trace. This will improve the performance of subsequent
recordings.
10. Correlate the script. In order for your test to run properly, you may need to insert a correlation to
capture a value and use it at a later point in the script. For more information, see "How to Correlate
Scripts - Microsoft .NET" on page254.
How to Configure Application Security and Permissions
A Security Exception that occurs while recording an application is usually due to a lack of permissions—
the recording machine does not have sufficient permissions to record the application. This is common
where your application is not local, but on the Intranet or network.
To solve this problem, you need to allow the recording machine to access the application and the script
with Full Trust.
One solution is to copy the application and save your script locally, since by default, users have Full Trust
permissions to all local applications and folders.
An additional solution is to create new code groups that gives Full Trust to each application folder, and
the script folder.
Grant Full Trust permissions to a Specific Folder (Visual Studio NOT installed)
1. From the command prompt, run the caspol.exe application.
2. Set the desired permission.
Grant Full Trust Permissions to a Specific Folder (Visual Studio installed)
1. Open the .NET Configuration settings. Select Start > All Programs > Administrative Tools >
Microsoft .NET Framework 2.0 Configuration. The .NET Configuration window opens.
2. Expand the Runtime Security Policy node to show the Code Groups of the machine.
3. Select the All_Code node.
4. Select Action > New. The Create New Code Group dialog box opens.
User Guide
VuGen
HP LoadRunner (12.50) Page 603

5. Enter a name for a new Code Group for your application or script. Click Next.
6. Select the URL condition type. In the URL box, specify the full path of the application or script in the
format file://... and click Next.
7. Select the FullTrust permission set. Click Next.
8. Click Finish in the Completing the Wizard dialog box. The configuration tool adds your Code Group
to the list of existing groups.
9. Repeat the above procedure for all .NET applications that you plan to record.
10. Repeat the above procedure for the Vuser script folder.
Note: Make sure that the script folder has FullTrust permissions on all Load Generator
machines that are participating in the test (LoadRunner only).
Troubleshooting and Limitations - .NET
This section describes troubleshooting and limitations for .NET Vuser scripts.
Replay Limitations
lExceptions in .NET scripts generated by vts functions, may cause the replay to abort, even when the
Continue on error Runtime setting is enabled.
Workaround: Use try and catch statements for error handling of the vts functions.
l.NET Scripts which contain UI objects can behave unexpectedly during replay in VuGen, the Controller,
or on a load generator machine.
Recording Limitations
The following limitations apply to the VuGen recording of a Microsoft .NET application:
l.NET Vuser scripts support only single-protocol recording in VuGen.
lDirect access to public fields is not supported—the AUT must access fields through methods or
properties.
lVuGen does not record static fields in the applications—it only records methods within classes.
lMulti-threaded support is dependent on the client application. If the recorded application supports
multi-threading, then the Vuser script will also support multi-threading.
lIn certain cases, you may be unable to run multiple iterations without modifying the script. Objects
that are already initialized from a previous iteration, cannot be reinitialized. Therefore, to run
multiple iterations, make sure to close all of the open connections or remoting channels at the end
of each iteration.
lRecording is not supported for Enterprise Services communication based on MSMQ and Enterprise
Services hosted in IIS.
User Guide
VuGen
HP LoadRunner (12.50) Page 604
lThe .NET version should be the same on the record and replay machines.
lVuGen partially supports the recording of WCF services hosted by the client application.
lRecording is not supported for Remoting calls using a custom proxy.
lRecording is not supported for ExtendedProperties property of ADO.NET objects, when using the
default ADO.NET filter.
lApplications created with .NET Framework 1.1 which are not compatible with Framework 2.0, cannot
be recorded. To check if your Framework 1.1 application is compatible, add the following XML tags to
your application's .config file:
<configuration>
<startup>
<supportedRuntime version="v2.0.50727"/>
</startup>
</configuration>
Invoke the application (without VuGen) and test its functionality. If the application works properly,
VuGen can record it. Remove the above tags before recording the AUT with VuGen. For more
information regarding this solution, see the MSDN Knowledge Base.
lApplications that use the .NET Remoting Framework and are executed in CLR 2 (.NET frameworks
2/3/3.5), might crash during recording. During a crash you will receive a message containing the
strings Version=4.x.x.x, and "is not registered for activation".
Potential Workaround: In the Microsoft .NET: Recording user interface under Support for
previous.NET version, select Emulate previous .NET versions in transport level, and then record
again.
lWhen the application under test retrieves a server-activated object by calling new RemoteObject(),
VuGen generates a RemotingServices.Connect function.
lApplications using multiple processes or multiple application domains are only partially supported.
lShared DLLs must be specified in the Recording Options only. Changes made in the runtime settings
to the list of shared DLLs have no effect.
lWhen McAfee antivirus is active, it may issue the following message when recording a .NET script:
"The solution has been changed externally".
Workaround: Add the VuGen.exe process to the Low-Risk processes in the McAfee antivirus On-
Access Scan Properties.
Oracle NCA Protocol
Oracle NCA Protocol Overview
Oracle NCA is a protocol that handles communication with the Oracle Forms server. Using your browser,
you launch the database client, an applet viewer. You perform actions on the NCA database through its
User Guide
VuGen
HP LoadRunner (12.50) Page 605
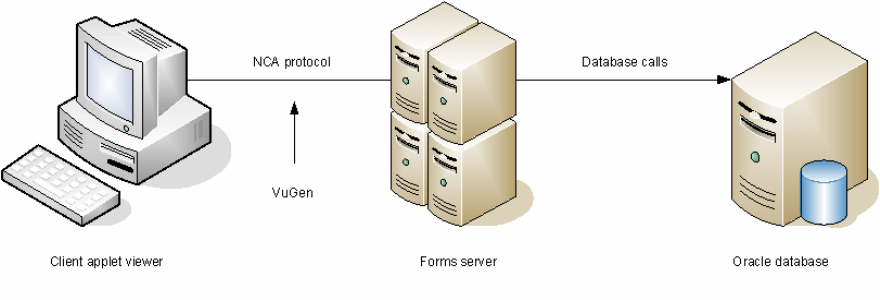
applet viewer. This eliminates the need for client software and allows you to perform database actions
from all platforms that support the applet viewer.
The NCA environment is a three-tier environment. The user first sends an http call from his browser to a
Web server. This call accesses the startup HTML page which invokes the Oracle Applications applet. The
client (applet viewer) communicates through the proprietary NCA protocol with the application server
(Oracle Forms server) which then submits information to the database server.
VuGen records and replays the NCA communication between the client and the Forms server
(application server).
The Oracle NCA protocol is commonly used as a multi-protocol in combination with Web - HTTP/HTML.
This is the recommended way to record with Oracle NCA. If you are using Oracle NCA as a single protocol,
web events are recorded but steps are not generated (or replayed) by default.
If you initially created a single protocol script for Oracle NCA, and at a later stage you require the Web
functions for testing, you can regenerate your script in VuGen to add the Web functions, without having
to re-record the session. You indicate this from the Protocols node in the Recording Options.
Oracle NCA Protocol Example Scripts
In the following example, the user selected an item from a list (nca_list_activate_item), pressed a
button (nca_button_press), retrieved a list value (nca_lov_retrieve_items), and performed a click in an
edit field (nca_edit_click). The logical names of the objects are the parameters of these functions.
nca_lov_select_item("Responsibilities","General Ledger, Vision Operations");
nca_list_activate_item("FNDSCSGN.NAVIGATOR.LIST.0","+ Journals");
nca_list_activate_item("FNDSCSGN.NAVIGATOR.LIST.0"," Enter");
nca_button_press("GLXJEENT.TOOLBAR.LIST.0");
nca_lov_find_value("Batches","");
nca_lov_retrieve_items("Batches",1,9);
nca_lov_select_item("Batches","AR 1020 Receivables 2537: A 1020");
nca_edit_click("GLXJEENT.FOLDER_QF.BATCH_NAME.0");
In certain tests, such as those performed on Oracle Configurator applications, information returned by
one function is required throughout the session. VuGen automatically saves the dynamic information to
User Guide
VuGen
HP LoadRunner (12.50) Page 606

a parameter, by inserting a web_reg_save_param function into the script. In the following example, the
connection information is saved to a parameter called NCAJServSessionID.
web_reg_save_param ("NCAJServSessionId", "LB=\r\n\r\n", "RB=\r",
LAST);
web_url("f60servlet",
"URL=http://usscifforms05.sfb.na/servlet/f60servlet\?config
=mult", LAST);
In the above example, the right boundary is \r. The actual right boundary may differ between systems.
Note: We recommend that the user not modify the web_reg_save_param parameters if they
were generated automatically. Alternatively, you can manually add a new web_reg_save_param
function or add a new correlation rule.
Oracle NCA Record and Replay Tips
When recording an Oracle NCA Vuser script, follow these guidelines:
lWe recommend installing Jinitiator before recording a script.
lClose all browsers before you begin recording.
lRecord the login procedure in the vuser_init section. Record a typical business process in the Actions
section. When you run the script, you can then specify multiple iterations for a specific business
process. For more information, see "Solution Explorer Pane" on page60.
lVuGen supports the recording of Oracle Forms applications using the Forms Listener Servlet in multi-
protocol mode. The application server uses the Forms Listener Servlet to create a runtime process
for each client. The runtime process, Forms Server Runtime, maintains a persistent connection with
the client and sends information to and from the server.
To support Forms 4.5 in replay, modify the mdrv_oracle_nca.dat file in the dat > mdrv folder to
match the following example:
[Oracle_NCA]
ExtPriorityType=protocol
WINNT_EXT_LIBS=ncarp110.dll
WIN95_EXT_LIBS=ncarp110.dll
LINUX_EXT_LIBS=liboranca.so
SOLARIS_EXT_LIBS=liboranca.so
HPUX_EXT_LIBS=liboranca.sl
AIX_EXT_LIBS=liboranca.so
LibCfgFunc=oracle_gui_configure
UtilityExt=lrun_api
To restore Forms support for versions later than 4.5, restore the original values.
User Guide
VuGen
HP LoadRunner (12.50) Page 607
Pragma Mode
The client side of the Oracle NCA Vuser can be configured to send an additional header to the server
named Pragma. The header is a counter that behaves in the following way: the initial message of the
NCA handshake has a value of 1.
The messages that follow the handshake are counted, beginning with 3. The counter is incremented by
1 for each message sent by the client.
If the message received from the server is the type plain\text and the body of the message begins
with ifError:#/#00, the client sends a 0 byte message to the server and the Pragma value changes its
sign to a minus. This sign changes back after the client succeeds in receiving the information from the
server.
Recording of the Pragma header is only supported in the multi-protocol mode (Oracle NCA and Web).
You can identify the Pragma mode within the script's default.cfg file. When operating in Pragma mode,
the UseServletMode is set to 2.
[HttpConnectMode]
UseHttpConnectMode=1
RelativeURL=<NCAJServSessionId>
UseServletMode=2
For information on the Pragma related settings, see the Oracle NCA > Client Emulation view in the
runtime settings.
To identify the Pragma mode, you can perform a WinSock level recording and check the buffer
contents. In the first example, the buffer contains the Pragma values as a counter:
send buf108
"POST /ss2servlet/oracle.forms.servlet.ListenerServlet?JServSessionIdss2ser"
"vlet=gk5q79uqy1 HTTP/1.1\r\n"
"Pragma: 1\r\n"
...
send buf110
"POST /ss2servlet/oracle.forms.servlet.ListenerServlet?JServSessionIdss2ser"
"vlet=gk5q79uqy1 HTTP/1.1\r\n"
"Pragma: 3\r\n"
...
In the following example, the buffer contains the Pragma values as an error indicator:
recv buf129 281
"HTTP/1.1 200 OK\r\n"
"Date: Tue, 21 May 2002 00:03:48 GMT\r\n"
"Server: Oracle HTTP Server Powered by Apache/1.3.19 (Unix) mod_fastcgi/2.2"
".10 mod_perl/1.25 mod_oprocmgr/1.0\r\n"
"Content-Length: 13\r\n"
"Content-Type: text/plain\r\n"
"\r\n"
"ifError:8/100"
User Guide
VuGen
HP LoadRunner (12.50) Page 608
send buf130
"POST /ss2servlet/oracle.forms.servlet.ListenerServlet?JServSessionIdss2ser"
"vlet=gk5q79uqy1 HTTP/1.1\r\n"
"Pragma: -12\r\n"
...
How to Enable the Recording of Objects by Name
When recording an Oracle NCA script, you must record the session using object names instead of the
standard object ID. If the script is recorded using the object ID, replay may fail because the ID is
generated dynamically by the server and may differ between iterations. You can verify that your script
is being recorded with object names by examining the nca_connect_server function.
nca_connect_server("199.35.107.119","9002"/*version=11i*/,"module=/d1/oracle
/visappl/fnd/11.5.0/forms/US/FNDSCSGN userid=APPLSYSPUB/PUB@VIS
fndnam=apps record=names ");
If the record=names argument does not appear in the nca_connect_server function, you may be
recording object IDs. You can instruct VuGen to record object names by modifying one of the following:
Startup HTML File
If you have access to the startup HTML file, you instruct VuGen to record object names instead of its
object ID by setting the record=names flag in the startup file, the file that is loaded when you start the
Oracle NCA application. The following steps describe how to enable the recording of object names using
the startup HTML file.
1. Edit the startup file that is called when the applet viewer begins by modifying the line shown below.
<PARAM name="serverArgs ... fndnam=APPS">
2. Add the Oracle key record=names as shown below.
<PARAM name="serverArgs ... fndnam=APPS record=names">
Forms Configuration File
If the application has a startup HTML file that references a Forms Web CGI configuration file
formsweb.cfg (a common reference), you may encounter problems if you add record=names to the
Startup file. In this situation, you should modify the configuration file. The following steps describe how
to enable the recording of object names using the configuration file.
1. Go to the Forms Web CGI configuration file.
2. Define a new parameter in this file (see sample Web CGI configuration file below for this change).
serverApp=forecast
serverPort=9001
serverHost=easgdev1.dats.ml.com
connectMode=socket
User Guide
VuGen
HP LoadRunner (12.50) Page 609
archive=f60web.jar
archive_ie=f60all.cab
xrecord=names
3. Open the startup HTML file and locate PARAM NAME="serverArgs".
4. Add the variable name as an argument to the ServerArgs parameter, for example,
record=%xrecord% as shown below.
<PARAM NAME="serverArgs" VALUE="module=%form% userid=%userid% %otherParams%
record=%xrecord%">
5. Alternatively, you can edit the basejini.htm file in the Oracle Forms installation folder. This file is
the default HTML file for running a form on the web using JInitiator-style tags to include the Forms
applet. In the basejinin.htm file add the following line to the parameter definitions:
<PARAM NAME="recordFileName" VALUE="%recordFileName%">
In the <EMBED> tag, add the following line:
serverApp="%serverApp%"
logo="%logo%"
imageBase="%imageBase%"
formsMessageListener="%formsMessageListener%"
recordFileName="%recordFileName%"
The drawback in editing this file instead of the servlet configuration file formsweb.cfg, is that this
file is replaced when you reinstall Oracle Forms. To avoid this, you can create a copy of the
basejini.htm file and store it at another location. In the servlet configuration file, edit the
baseHTMLJinitiator parameter to point to the new file.
URL to Record
If you do not have access to the startup HTML file, you can still have Oracle NCA record object names
instead of its object ID by modifying the URL to record. The following solution only works if the startup
HTML file does not reference another file while loading.
For this solution, you add "?record=names" after the URL in the Start Recording dialog box, after the
URL name to record.
User Guide
VuGen
HP LoadRunner (12.50) Page 610
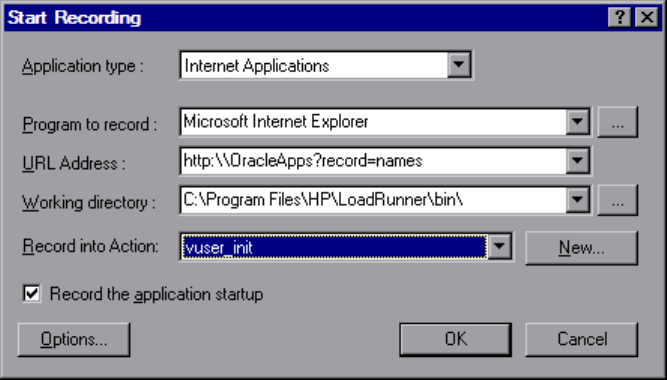
How to Launch Oracle Applications via the Personal Home Page
When launching Oracle Forms applications (versions 6i and higher) by logging in through the Personal
Home Page, you must set several system profile options at the user level. It is desirable to pass such
variables at the user level, and not at the site level, where it will affect all users. The following steps
describe how to configure the "ICX: Forms Launcher" profile.
1. Sign on to the application and select the "System Administrator" responsibility.
2. Select Profile/System from the Navigator menu.
3. Within the Find System Profile Values form:
a. Select the Display > Site option
b. Users = <your user logon> for example, operations, mfg, and so on)
c. Enter Profile =%ICX%Launch%
d. Click Find.
4. Update the User value to the ICX:Forms Launcher profile:
lIf no parameter has been passed to the URL, append the following string to the end of the URL of
the user value: ?play==;record=names
lIf a parameter has been passed to the URL, append the following string to the end of the URL of
the user value: =;play==;record=names
5. Save the transaction.
6. Log out of the Oracle Forms session.
7. Log out of the Personal Home Page session.
8. Sign on again via the Personal Home Page using your username.
If you were unable to update the ICX: Forms Launcher profile option at the user level, open the
Application Developer responsibility and select the Updatable option for the ICX_FORMS_LAUNCHER
profile.
User Guide
VuGen
HP LoadRunner (12.50) Page 611
The first parameter passed to the URL must begin with a question mark (?). You pass all subsequent
parameters with an ampersand (=;). In most cases, the URL already contains parameters, which you can
identify by searching for a question mark.
Oracle - Troubleshooting and Limitations
This section describes troubleshooting and limitations for Oracle NCA and Oracle-Web protocol scripts.
General Limitations
lThe Remote Application via LoadRunner Proxy > Display recording toolbar on client machine
option, is not supported for the Oracle NCA or Oracle-Web protocols. For details, see "Start Recording
Dialog Box" on page226.
Testing Secure Oracle NCA Applications
lIn the Mapping and Filtering node of the Recording Options dialog box, delete any existing Port
mapping entries for port 443 and create a new Port mapping entry for the Oracle server name:
Service ID: HTTP
Target Server: Oracle Forms Server IP address or long host name
Target Port: 443
Connection Type: SSL
SSL Version: Active SSL version. If in doubt, select SSL 2/3.
Note that the Service ID is HTTP and not NCA.
For more information, see "Network > Mapping and Filtering Recording Options" on page188.
lIf you encounter problems when replaying an NCA HTTPS script during the nca_connect_server
command, insert the following function at the beginning of the script.
web_set_sockets_option("SSL_VERSION","3");
Testing Servlets and other Oracle NCA Applications
Certain NCA sessions use servlets:
lthe Forms Listener servlet
lapplications or modules that use both NCA and HTTP communications, such as the Oracle
Configurator
lthe initializing of the NCA application (downloading the applet, jar, and gif files)
When recording servlets, you must record both Oracle NCA and Web functions. You can do this by using
the Oracle Apps IIi protocol or creating an Oracle NCA multi-protocol script. Alternatively, if you created a
single protocol script for Oracle NCA, open the General > Protocols node in the Recording Options, and
enable the Web protocol. Then you can begin recording.
User Guide
VuGen
HP LoadRunner (12.50) Page 612
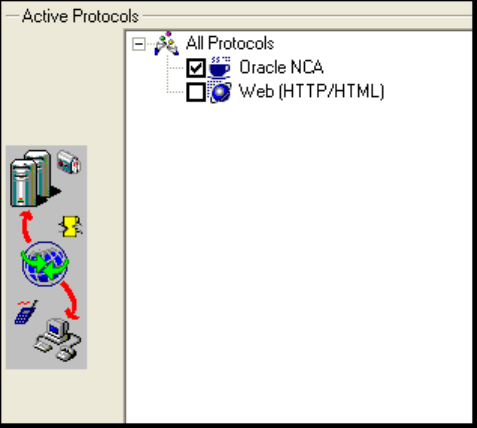
If you are unsure whether your application uses servlets, you can check the default.cfg file in the script
folder after recording a script. Locate the entry "UseServletMode="
If the value is 1 or 2, then servlets are being used and you must enable HTTP recording in addition to
Oracle NCA.
If you already recorded a script, you can regenerate the code automatically to include the Web
functions without having to re-record. Select Record > Regenerate Script, and select the Web protocol
in the Protocols section.
Determining the Recording Mode
When recording Oracle NCA scripts: VuGen automatically determines the correct connection mode: HTTP
or Socket mode. Generally, you are not required to modify any of the recording settings as VuGen auto-
detects the system configuration (unless you are working with Forms Server 4.5). In systems where the
standard port mapping are reserved by other applications, you may need to modify the Port Mapping
settings, depending on the recording mode.
You can determine the recording mode in one of the following ways:
lWhen using the NCA application, open the Java Console.
proxyHost=null
proxyPort=0
connectMode=HTTP
Forms Applet version is: 60812
The connectMode entry indicates HTTP,HTTPS, or socket.
lAfter recording an NCA session, open the default.cfg file in the Vuser folder and check the value of
the UseHttpConnectMode entry.
User Guide
VuGen
HP LoadRunner (12.50) Page 613

[HttpConnectMode]
UseHttpConnectMode= 2
// 0 = socket 1 = http 2 = https
When defining a new port mapping in the Server Entry dialog box, use a Service ID of HTTP for HTTP or
HTTPS modes. For Socket mode, use a Service ID of NCA.
For more information about Port Mapping settings, see "Network > Mapping and Filtering Recording
Options" on page188.
Recording Trace Information for Oracle DB
To debug your script, you can use the Oracle DB breakdown graphs. To gather data for this graph, you
turn on the trace mechanism before running the script.
To manually turn on the tracing mechanism, use the nca_set_custom_dbtrace function. For more
information, see the Function Reference (Help > Function Reference).
RDP Protocol
RDP Protocol - Overview
The Microsoft RDP (Remote Desktop Protocol) enables one computer [the client] to connect to another
computer [the server] over a network connection. For example, you can use RDP to connect to a central,
powerful server for working on specific business applications or graphic terminals. This provides you
with the same look and feel as if you are working on a standalone PC. The client computer employs RDP
client software for this purpose, while the other computer must run RDP server software. The client
software is referred to as Remote Desktop Connection. The server software is referred to as Remote
Desktop Services.
For details on the versions of RDP that are supported by VuGen, see the LoadRunner Product Availability
Matrix (PAM).
Note: RDP versions 5.1 and later have an Experience tab that allows you to set various options.
This tab is not supported by VuGen recording. All options are set to the ON position.
RDP Recording Tips
Note: This topic applies to RDP Vuser scripts only.
When recording an RDP Vuser script, follow these guidelines in order to create an effective script.
User Guide
VuGen
HP LoadRunner (12.50) Page 614

Single vs. Multi-Protocol Scripts
When creating a new script, you may create a single protocol or multi-protocol script. For example, to
record both RDP traffic and Web responses, create a multi-protocol script for RDP and Web to enable
the recording of both protocols.
Record into Appropriate Sections
Record the connection process into the vuser_init section, and the closing process into the vuser_end
section. This will prevent you from performing iterations on the connecting and disconnecting
processes. For more information about recording into sections, see "Vuser Script Sections" on page141.
FIPS
Beginning with LoadRunner version 12.50, recording is supported for RDP scripts when FIPS
enforcement is enabled on the machine.
Run a Clean Session
When recording a session, make sure to perform the complete business process, starting with the
connection and ending with the cleanup. End your session at a point from where you could start the
entire process from the beginning. Do not leave any client or application windows open.
You should also configure your terminal server to end disconnected sessions. Select Administrative
Tools > Terminal Services Configuration > Connection Properties > Sessions > Override User
Settings and set the server to end disconnected sessions.
Explicit Mouse Clicks
When opening expanded menu options, click explicitly on each option—do not depend on the expanding
menu. For example, when choosing Start > All Programs > Microsoft Word, be sure to click on the word
Programs.
Using Windows Logo key combinations
Note: This tip applies only to Windows 8 installations on remote computers.
Because support for mouse movement in RDP Vusers can cause performance issues, by default, mouse
movement support is disabled. Therefore, when you record an RDP Vuser script, it is recommended that
you use the Windows Logo key combinations to display the Start screen [Windows Logo key], to show
the Desktop [Windows logo key + D], and to open the charms bar [Windows Logo key + C].
When you run an RDP Vuser script, Windows key combinations can be applied on either the host
computer or on the remote computer. To ensure that Windows key combinations are applied on the
remote computer, when you record the connection to the remote computer, you must specify that
Windows key combinations are applied on the remote computer.
User Guide
VuGen
HP LoadRunner (12.50) Page 615
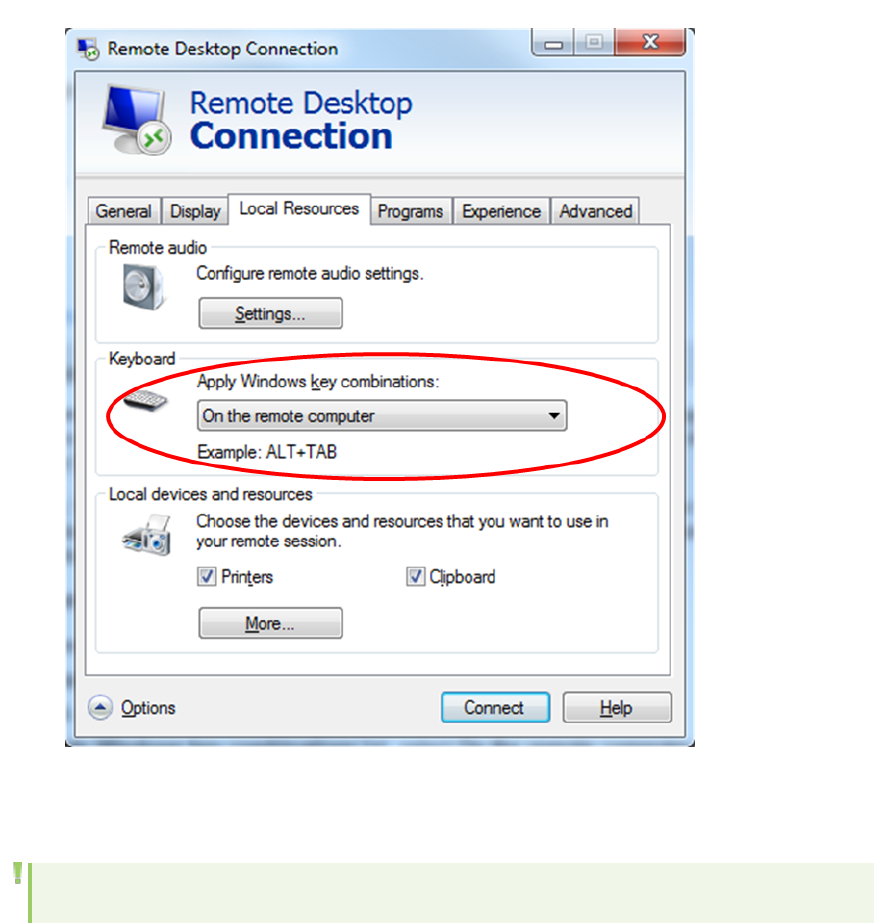
How to apply Windows key combinations on the remote computer:
1. Open the Remote Desktop Connection dialog box.
2. Click Options to expand the dialog box.
3. Click the Local Resources tab.
4. Under Keyboard, from the Apply Windows key combinations list, select On the remote computer.
Synchronizing using Windows 8 apps
Note: This tip applies only to Windows 8 installations on remote computers.
Because many Windows 8 apps have dynamic user interfaces, avoid using these apps for image-based
synchronization.
User Guide
VuGen
HP LoadRunner (12.50) Page 616

Working with Clipboard Data (RDP Protocol)
Note: This topic applies to RDP Vuser scripts only.
VuGen allows you to copy and paste the text of a clipboard during an RDP session. You can copy the
contents locally and paste them remotely, or vice versa—copy the contents from the remote machine
and paste them locally. The copying of text is supported in TEXT, LOCALE, and UNICODE formats.
VuGen generates separate functions when copying or saving the clipboard data.
Code sample #1
The following example illustrates a copy operation on a local machine and a paste operation on a
remote machine:
//Notifies the Remote Desktop that new data is available in the Local machine's
//clipboard.The data can be provided in three formats: TEXT, UNICODE and LOCALE
rdp_notify_new_clipboard_data(
"StepDescription=Send local clipboard formats 1",
"Snapshot=snapshot1.inf",
"FormatsList=RDP_CF_TEXT|RDP_CF_UNICODE|RDP_CF_LOCALE",
RDP_LAST );
rdp_key(
"StepDescription=Key Press 2",
"Snapshot=snapshot_9.inf",
"KeyValue=V",
"KeyModifier=CONTROL_KEY",
RDP_LAST );
//Provides clipboard data to the Remote Desktop when it requests the data.
rdp_send_clipboard_data(
"StepDescription=Set Remote Desktop clipboard 1",
"Snapshot=snapshot1.inf",
"Timeout=20",
REQUEST_RESPONSE, "Format=RDP_CF_UNICODE", "Text=text for clipboard",
RDP_LAST);
Code sample #2
This example illustrates a copy operation on a remote machine and a paste operation on a local
machine:
rdp_key(
"StepDescription=Key Press 2",
"Snapshot=snapshot_9.inf",
"KeyValue=C",
"KeyModifier=CONTROL_KEY",
RDP_LAST);
User Guide
VuGen
HP LoadRunner (12.50) Page 617

// The function requests the Remote Desktop UNICODE text and saves it to a
//parameter
rdp_receive_clipboard_data(
"StepDescription=Get Remote Desktop clipboard 1",
"Snapshot=snapshot1.inf",
"ClipboardDataFormat=RDP_CF_UNICODE",
"ParamToSaveData=MyParam",
RDP_LAST);
Normally, the Remote Desktop clipboard data is saved in UNICODE format. If the Remote Desktop
requests data in the TEXT or LOCALE formats, the rdp_send_clipboard_data function automatically
converts the content of MyParam from UNICODE into the requested format and sends it to the Remote
Desktop. The Replay log indicates this conversion with an informational message. If the conversion is
not possible, the step fails.
For more information about the rdp functions, see the Function Reference (Help > Function Reference).
Correlating Clipboard Parameters
During a recording session, if the client sends the server the same data that it received, VuGen replaces
the sent data with a parameter during code generation. VuGen performs this correlation only when the
received and sent data formats are the same.
Code sample #3
The following example shows how the same parameter, MyParam, is used for both receiving and
sending the data.
// Receive the data from the server
rdp_receive_clipboard_data("StepDescription=Get Remote Desktop clipboard 1",
"Snapshot=snapshot_9.inf",
"Timeout=0",
"ClipboardDataFormat=RDP_CF_UNICODETEXT",
"ParamToSaveData=MyParam",
RDP_LAST);
...
// Send the data to the server
rdp_send_clipboard_data("StepDescription=Get Remote Desktop clipboard 1",
"Snapshot=snapshot_9.inf",
"Timeout=10",
REQUEST_RESPONSE, "Format=RDP_CF_UNICODETEXT", "Text={MyParam}",
RDP_LAST);
RDP Snapshots - Overview
Note: This topic applies to RDP Vuser scripts only.
Vuser scripts based on the RDP protocol utilize VuGen's Snapshot pane.
User Guide
VuGen
HP LoadRunner (12.50) Page 618
lFor details on how to work with the Snapshot pane, see "How to Work with Snapshots" on page276.
lFor details on the Snapshot pane UI, see "Snapshot Pane" on page77.
When you open an RDP Vuser script, VuGen's standard Snapshot pane functionality is available. The
Snapshot pane displays snapshots of the remote display, saved during recording and playback of the
Vuser script. Typically, these snapshots are used to synchronize playback of the Vuser script.
In addition to the basic Snapshot pane functionality, the Snapshot pane for RDP Vuser scripts lets you
display snapshots in one of the following views:
lImage. Displays only the image of the snapshot and is ideal for visually comparing two images. This
view displays the snapshot faster and requires less memory than the Full view. You can synchronize
two snapshots in the Snapshot pane if both snapshots are displayed in the Image view. The Image
view does not automatically scroll to show the area of a snapshot that is used for synchronization.
lFull. Scrolls to display the area that is used for synchronization. This view displays the snapshot
slower and requires more memory than the Image view. You cannot synchronize two snapshots
displayed in the Snapshot pane if either of the snapshots is displayed in the Full view. By default,
snapshots are displayed in the Full view.
To display a specific synchronization snapshot in the Snapshot pane, do one of the following:
lIn the Editor, select the step that contains a reference to the snapshot.
lIn the Step Navigator, double-click the step that contains a reference to the snapshot.
When working with RDP Vuser scripts, the Snapshot pane lets you copy a snapshot to the clipboard, and
display a snapshot of the most recent replay error. For more information on how to use the Snapshot
pane, see "How to Work with Snapshots" on page276.
Image Synchronization Overview (RDP)
An RDP session executes remotely on a computer that is referred to as the server. All keyboard and
mouse operations are done on the server, and it is the server that reacts to input from the keyboard
and mouse. For example, when you double-click an application icon on the desktop, it is the server that
realizes that a double-click took place, and that the application must be loaded.
When an RDP client connects to a server, the client does two things:
lIt sends the server coordinates of actions. For example, 'clicked the left mouse button at coordinates
(100, 100) on the screen'.
lIt receives images from the server showing the current status of the screen after the action took
place.
The RDP client (and therefore, the Vuser) does not know that the remote screen contains windows,
buttons, icons, and other objects. It knows only that the screen contains an image and at what
coordinates the user performed an action. To allow the server to correctly interpret an action, you set a
synchronization point within the script. When you replay the script, the synchronization point instructs
the Vuser to wait until the image on the server screen matches the corresponding image stored as part
User Guide
VuGen
HP LoadRunner (12.50) Page 619
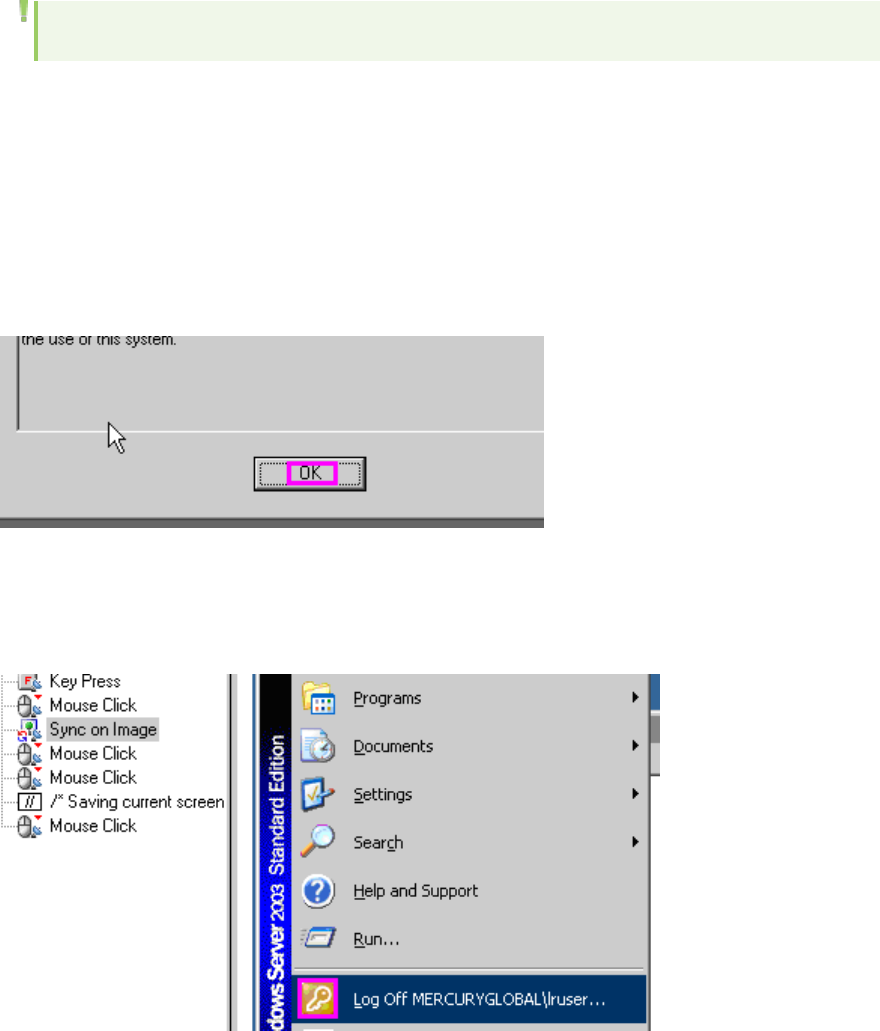
of the synchronization point. For details on how to add an image synchronization point, see "Image
Synchronization Tips (RDP Protocol)" below.
Image Synchronization Tips (RDP Protocol)
Note: This topic applies to RDP Vuser scripts only.
Use the following guidelines for effective image synchronization:
Synchronize on the Smallest Significant Area
When synchronizing on an image, try to synchronize only the part of the image that is necessary.
Additional details within the image may not be reproduced during replay and could result in a
synchronization failure.
For example, when synchronizing on an image of a button, select only the text itself and not the dotted
lines around the text as they may not appear during replay.
When synchronizing a highlighted area, try to capture only the part of the image that is not effected by
the highlighting. In the following example, perform a synchronization on the Log Off icon, but not the
entire button, since the highlighting may not appear during replay, and the color could vary with
different color schemes.
User Guide
VuGen
HP LoadRunner (12.50) Page 620

Synchronize Before Every User Action
It is recommended that you synchronize before every mouse operation. You should also synchronize
before the first rdp_key or rdp_type operation that follows a mouse operation.
Image Synchronization - Shifted Coordinates (RDP Protocol)
Note: This topic applies to RDP Vuser scripts only.
When replaying a script, a recorded object may appear at different coordinates on the screen. The
object is the same, but its placement has been shifted. For example, during recording a window opened
at coordinates (100, 100), but during replay at (200, 250).
In this case, the synchronization point will automatically find the new coordinates without any
intervention on your part. It will automatically note the difference of 100 pixels in the horizontal axis
and 150 pixels in the vertical axis.
All subsequent mouse operations that are coordinate dependent will use the modified coordinates, so
that a mouse click recorded at (130, 130) will be replayed to (230, 280) = (130 + 100, 130 + 150).
You control the shifting of the coordinates through the AddOffsetToInput parameter in the rdp_sync_
on_image step. You can override this parameter to either add or not add the differences in location
during replay to the recorded coordinates for any further operations. If you do not override this
parameter, VuGen takes its value from the default setting in the runtime settings.
The corresponding parameter in the operations (for example rdp_mouse_click or rdp_mouse_drag) is
Origin. This parameter decides whether the operation should take its coordinates only from the 'clean'
values that were recorded, or whether it should take into account the differences that were added by
the last synchronization point. If not explicitly specified, VuGen takes the value for this parameter from
the runtime settings.
Setting Security Levels in RDP Vuser Scripts
Note: This topic applies to RDP Vuser scripts only.
Remote Desktop Protocol (RDP) enables a client computer to connect to a server. Various security
options are available for the connection, depending on the particular Windows operating systems that
are installed on the client and server computers. The security options define security-related issues,
such as the authentication and encryption, that are used for the connection.
The list of security options that are available for a Vuser script is different when you record a Vuser
script and when you replay the script.
Security levels when recording an RDP Vuser Script
User Guide
VuGen
HP LoadRunner (12.50) Page 621
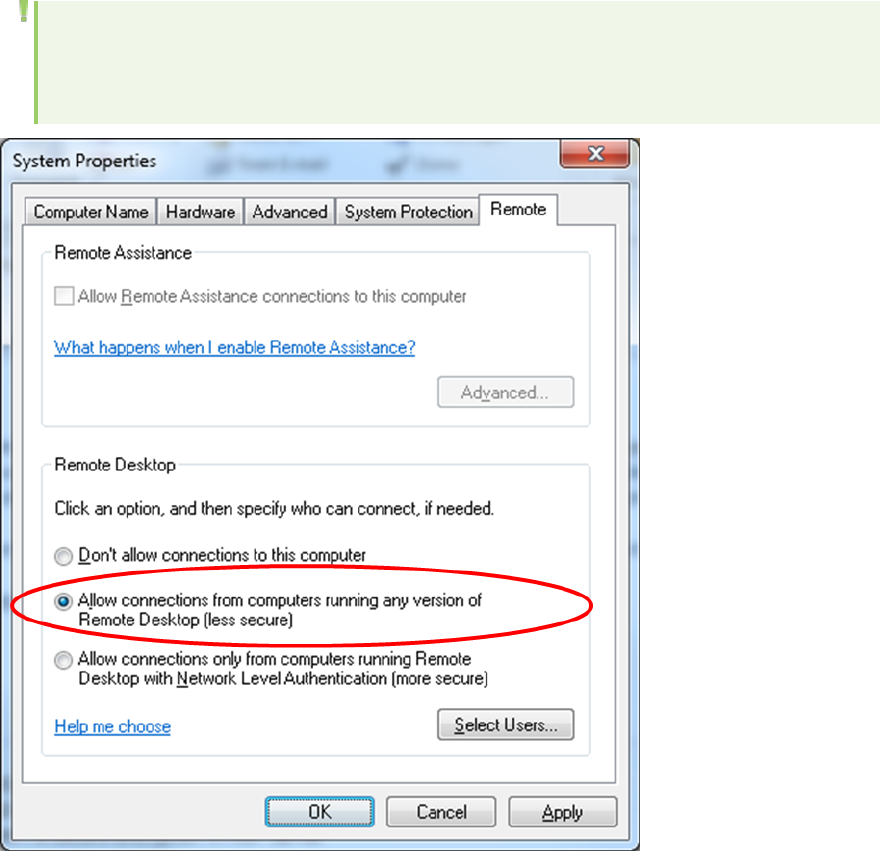
Standard RDP security is the only form of security that you can use when you record an RDP Vuser
script. Before you record an RDP Vuser script, make sure that the server is configured to allow
connections from computers that are running any version of Remote Desktop, and not only from
computers that are running Remote Desktop with Network Level Authentication. You use the Remote
tab in the System Properties dialog box on the server to set the security level that is required to
establish the connection.
Note: If your RDP session is launched through an RDP configuration file, you must disable
credssp authentication in the configuration file, using the following string:
enablecredsspsupport:i:0
Security levels when replaying an RDP Vuser Script
You can use the Vuser script's runtime settings to specify the security that is used for the connection
when the Vuser runs. The available security levels are:
lRDP: Connects using standard RDP security. RDP provides the least secure connection.
lSSL: Connects using SSL as an external security protocol to enhance the standard RDP security. SSL
provides a moderate level of security.
User Guide
VuGen
HP LoadRunner (12.50) Page 622
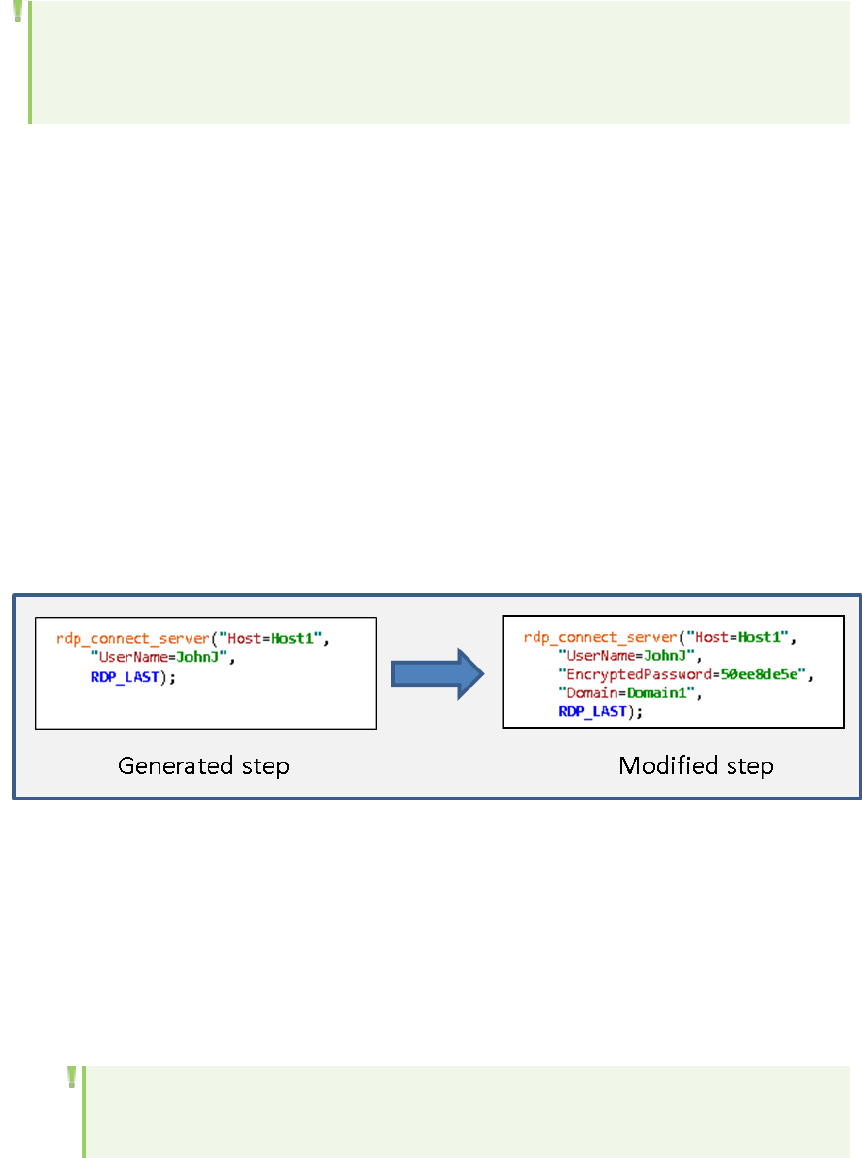
lCredSSP: Connects using the Credential Security Support Provider (CredSSP) protocol. CredSSP
provides the most secure connection.
Note: If you specify CredSSP authentication, you must make certain changes to the Vuser
script each time the script is regenerated. For details, see Modifying a script to support
CredSSP authentication below.
The security level that you specify in the runtime settings is an indication to the server of the maximum
level of security that is supported by the client. However, the security that is actually used for the
connection is defined by the server settings. For example, if you specify CredSSP as the encryption level
in the runtime settings, when you run the Vuser, the Vuser will inform the server that the Vuser
supports CredSSP, SSL, and RDP security. If the server supports only RDP security (for example,its
operating system is Windows 2003), then the connection will be made using RDP.
To set the RDP security level for the Vuser script, click Replay > Runtime Settings > RDP >
Configuration and then select the required level from the Supported Encryption Level list.
Modifying a script to support CredSSP authentication
If you specify CredSSP authentication in the Vuser script's runtime settings, you must perform the
following tasks each time the script is regenerated:
1. In the rdp_connect_server step in the script, modify the step to provide the user name, password,
and domain that are required to access the server. For details on the rdp_connect_server step,
see the Function Reference (Help > Function Reference).
2. Remove the block of code that contains the login-related mouse, keyboard, and image
synchronization steps from the generated script, as described below.
a. Locate the rdp_connect_server step in the Vuser script.
The step after the rdp_connect_server step is the first step in the block of code to delete.
b. Locate the rdp mouse_click step or the rdp_key step that submits the password to the
server.
This is the last step in the block of code to delete.
Note: If an rdp_set_lock step exists immediately after the rdp_connect_server step,
do not delete the rdp_set_lock step.
User Guide
VuGen
HP LoadRunner (12.50) Page 623
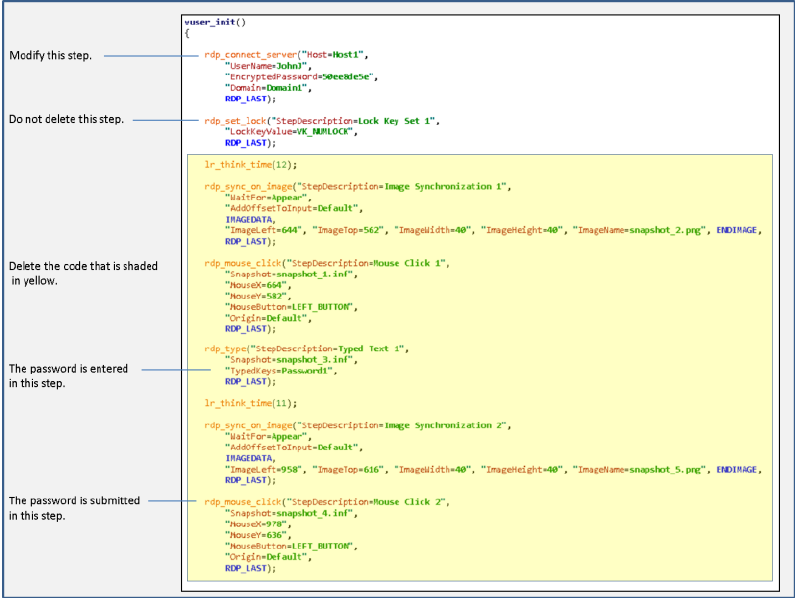
c. Delete all the steps in the block of code that is defined above.
RDP Agent (for Microsoft Terminal Server) Overview
The Agent for Microsoft Terminal Server is an optional utility that you can install on the RDP server. It
provides enhancements to the normal RDP functionality. It is provided in the LoadRunner installation
DVD and you can install it on any RDP server. The agent provides you with more intuitive and readable
scripts, built-in synchronization, and detailed information about relevant objects. Note that when you
run RDP Vusers with the agent installed, each Vuser runs its own process of lrrdpagent.exe. This results
in a slight reduction in the number of Vusers that can run on the server machine.
Tips for Using the Agent for Microsoft Terminal Server
lWhen opening application menus (e.g. File, Edit...) with the mouse, sync steps will sometimes fail. To
avoid this issue, use the keyboard to select menu items when recording.
lWhen you add a sync_on_object_mouse_click step manually, the coordinates given are absolute
coordinates (relating to the entire screen). To create the synchronization point, you need to calculate
the offset in the window (relative coordinates) of the desired click location and modify the absolute
coordinates accordingly for the synchronization to successfully replay.
lIf a synchronization object exists at the correct location and time during replay, but is covered by
another window (such as a pop-up), then the synchronization step will pass and a click will be
User Guide
VuGen
HP LoadRunner (12.50) Page 624
executed on the window which is covering the synchronization point and therefore harm the script
flow.
lDuring recording, if you want to return the application window to the foreground, either click on the
title bar, or use the keyboard (ALT+TAB). Note that if you click inside the application window to return
it to the foreground, the RDP session may terminate unexpectedly.
The Agent for Microsoft Terminal Server provides the following enhancements to the normal RDP
functionality:
Resumed Sessions
Beginning with LoadRunner version 12.50, the RDP Agent process is always active on the server
machine. This allows you to record a resumed RDP session on a machine with the RDPagent—you do
not need to start a new one.
Object Detail Recording
When the Agent for Microsoft Terminal Server is installed, VuGen can record specific information about
the object that is being used instead of general information about the action. For example, VuGen
generates sync_object mouse_click and sync_object_mouse_double_click steps instead of mouse_
click and mouse_double_click that it generates without the agent.
The following example shows a double-mouse-click action recorded with and without the agent
installation. Note that with the agent, VuGen generates sync_object functions for all of the mouse
actions.
rdp_sync_object_mouse_double_click("StepDescription=Mouse Double Click on
Synchronized Object 1",
"Snapshot=snapshot_12.inf",
"WindowTitle=RDP2",
"Attribute=TEXT",
"Value=button1",
"MouseX=100",
"MouseY=71",
"MouseButton=LEFT_BUTTON",
RDP_LAST);
rdp_mouse_double_click("StepDescription=Mouse Double Click 1",
"Snapshot=snapshot_2.inf",
"MouseX=268",
"MouseY=592",
"MouseButton=LEFT_BUTTON",
"Origin=Default",
RDP_LAST);
Expanded Right-Click Menu
When you click within a snapshot, you can insert several functions into the script using the right-click
menu. When the agent is not active, you are limited to inserting only mouse_click,mouse_double_click,
User Guide
VuGen
HP LoadRunner (12.50) Page 625

and sync_on_Image steps. When the agent is installed, you are able to insert all possible steps that
involve the RDP agent:
lget_object_info and Sync_on_object_iInfo. Provides information about the state of the object, and
synchronize on a specific object property such as: ENABLED, FOCUSED, CONTROL_ID, ITEM_TEXT, TEXT,
CHECKED, and LINES.
linsert_sync_on_text and get_text. For details, see the Function Reference (Help > Function
Reference).
Code sample
In the following example, the rdp_sync_on_object_info function provides synchronization by waiting for
the Internet Options dialog box to come into focus.
rdp_sync_on_object_info("StepDescription=Sync on Object Info 0",
"Snapshot=snapshot_30.inf",
"WindowTitle=Internet Options",
"ObjectX=172",
"ObjectY=155",
"Attribute=FOCUSED",
"Value={valueParam}",
"Timeout=10",
"FailStepIfNotFound=No",
RDP_LAST);
How to Install / Uninstall the RDP Agent
Note: This topic applies to RDP Vuser scripts only.
The installation file for the Agent for Microsoft Terminal Server is located on the LoadRunner
installation disk, under the Additional Components\ Agent for Microsoft Terminal Server folder.
Note: The agent should be installed on your RDP server machine only, not on Load Generator
machines.
If you are upgrading the agent, make sure to uninstall the previous version before installing the new
one (see uninstallation instructions below).
Install the RDP Agent
1. If your server requires administrator permissions to install software, log in as an administrator to
the server.
2. Locate the installation file, Setup.exe, on the LoadRunner DVD in the Additional Components\
Agent for Microsoft Terminal Server folder.
User Guide
VuGen
HP LoadRunner (12.50) Page 626

3. Follow the installation wizard to completion.
To use the agent, you must set the recording options before recording a Vuser script. In the Start
Recording dialog box, click Options. In the Advanced Code Generation node, select the Use RDP Agent
check box.
Uninstall the RDP Agent
1. If your server requires administrator privileges to remove software, log in to the server as an
administrator.
2. Select Control Panel > Add/Remove Programs > HP Software Agent for Microsoft Terminal
Server and click Change/Remove.
How to Add Image Synchronization Points to a Script
Note: This topic applies to RDP Vuser scripts only.
1. Select an operation to which you would like to add a synchronization point in your script.
2. Right-click on the image snapshot and select Insert Synch On Image from the menu. The cursor will
change to a cross-hair.
3. Mark the area on the screen that you would like to synchronize upon by clicking on the left button
and dragging the box to enclose the area. When you release the mouse button, the Sync on Image
dialog box opens.
4. Click OK. VuGen adds a new Sync on Image step before the selected step. When you select this
step, VuGen displays a snapshot that contains a pink box around the area you selected for
synchronization.
The next time you replay the script, it will wait until the image returned by the server matches the
image you selected.
Failed Image Synchronization Dialog Box (RDP Protocol)
This dialog box opens when an image synchronization fails during the replay of a script. You can stop the
script or continue the replay despite the error.
The content of this dialog box varies depending on the reason for the failed synchronization:
lAppend Snapshot. The Failed Image Synchronization - Append Snapshot dialog box opens when the
replay image is so different from the record image that changing the tolerance level will not help.
lRaise Tolerance. The Failed Image Synchronization - Raise Tolerance dialog box opens when the
script replay failed to find the exact image requested, but if the tolerance level for performing
synchronization on images was relaxed, then it would have succeeded in finding the image.
User Guide
VuGen
HP LoadRunner (12.50) Page 627
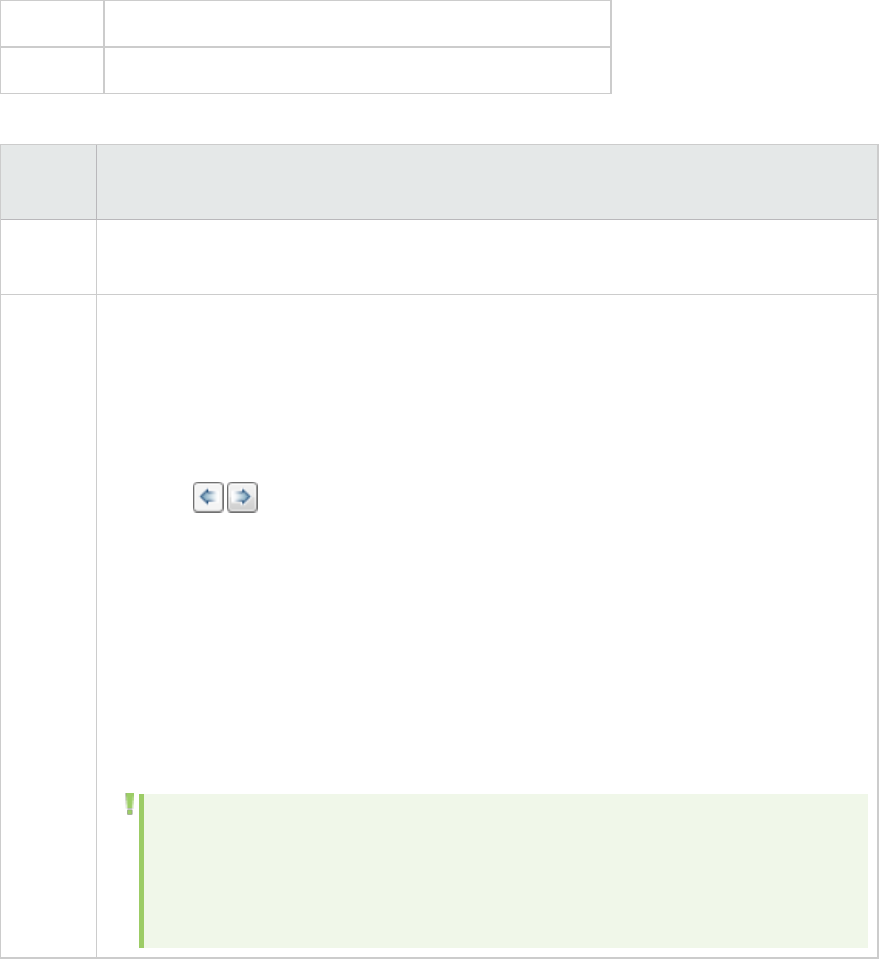
lLower Tolerance. The Failed Image Synchronization - Lower Tolerance dialog box opens when the
script replay fails to meet the NotAppear or Change conditions. VuGen detected an image match
where you expected it not to detect one. If the tolerance level was reduced, the recorded and replay
images would not match, and the NotAppear or Change conditions would be met resulting in a
successful replay.
lNon Specified. The Failed Image Synchronization dialog box opens when the script replay fails to
meet any of the synchronization conditions such as NotAppear or Change. VuGen did not find another
image at the original coordinates that could be appended to the script.
To access Opens automatically when an image synchronization fails.
See also "Image Synchronization Overview (RDP)" on page619
User interface elements are described below:
UI
Element
Description
Stop Consider the mismatch between the snapshots to be an error. This error will be handled
like all other errors and halt the execution of the script.
Continue This button performs different actions depending on the type of dialog box:
lAppend Snapshot. Accept the mismatch. VuGen appends the replay snapshot as a
"record" snapshot for the step. In future replays of the step, VuGen uses all existing
record snapshots and the appended snapshot as the basis for comparison between
screens. If the replay returns any of the record snapshots, the Vuser will not fail. You
can view the original and appended snapshots for a step by clicking the navigation
arrows in the Snapshot pane toolbar.
lLower Tolerance. Accept the mismatch and lower the tolerance level so that VuGen
permits a smaller mismatch between the record images and those displayed during
replay.
lRaise Tolerance. Accept the mismatch and raise the tolerance level so that VuGen
permits a greater mismatch between the record images and those displayed during
replay.
lNon-specified. Accept the mismatch, and do not make any changes in the script.
Continue script execution despite the mismatch.
Note: Raising or lowering the tolerance level from the dialog box changes the
level for the current step only. To change the tolerance level for the whole script,
change the Default tolerance for image synchronization setting in the Runtime
Settings > RDP > Synchronization view.
User Guide
VuGen
HP LoadRunner (12.50) Page 628

Troubleshooting and Limitations for RDP
This section describes troubleshooting information for RDP scripts using the Agent for Microsoft
Terminal Server.
lClipboard sharing supports only short simple textual content.
lWhen recording with RDP Agent, applications which were developed using CBuilder may not record
properly.
lRDP does not support 32-bit color depth. If recording uses this color depth, VuGen automatically
switches to a lower color depth and a "[RDP Analyzer Warning (790: 418)] 32-bit color depth is not
supported, switch to lower one". warning log item appears in the Recording Window.
lFor Windows 8, we recommend using the Windows key to switch between the Desktop and Startup
screen. This reduces the number of generated mouse calls and simplifies debugging.
lWhen working on a 64-bit Windows 8.1 machine, you must manually install VcDist_x32 for Visual
Studio 2012 before installing the RDP agent.
lReplay fails on rdp_sync_object_mouse_click/double_click steps.
Workaround 1: Modify RDPAgentCodeGen.cfg file
The RDPAgentCodeGen.cfg file can configure VuGen to automatically create an rdp_sync_on_image
and rdp_mouse_click step the next time the script is generated for each rdp_sync_object_mouse_
click/double_click steps which occur within a given window. To do this, you specify the name of the
window, update a variable which counts the total number of windows for which this process occurs, and
regenerate the script.
Modify the RDPAgentCodeGen.cfg file
1. Open the RDPAgentCodeGen.cfg file in the Script Directory > data folder.
2. Open the Step Navigator and double-click the step that failed.
3. Copy the name of the window
4. In the RDPAgentCodeGen.cfg file, increase the value of NumberOfTitles by 1.
5. Add a line as follows:
WindowTitleX=<name of window>
where Xis the new value of NumberOfTitles.
6. Regenerate the script.
Note: The RDPAgentCodeGen.cfg file can be used to automatically produce rdp_sync_on_
image and rdp_mouse_click steps in a similar way for rdp_sync_object_mouse_
click/double_click steps which are specified in different ways as well. Steps can be
targeted based on the class attribute of the control. For more information, contact HP
User Guide
VuGen
HP LoadRunner (12.50) Page 629

software support.
Workaround 2: Manually Insert a New Step
Manually insert an rdp_sync_on_image and rdp_mouse_click step for each step that fails. This method
is less desirable, since steps added in this way will be lost if the script is regenerated.
RTE Protocol
RTE Protocol Overview
An RTE Vuser types character input into a terminal emulator, submits the data to a server, and then
waits for the server to respond. For instance, suppose that you have a server that maintains customer
information for a maintenance company. Each time a field service representative makes a repair, he
accesses the server database by modem using a terminal emulator. The service representative
accesses information about the customer and then records the details of the repair that he performs.
You could use RTE Vusers to emulate this case. An RTE Vuser would:
1. Type 60 at the command line to open an application program.
2. Type F296, the field service representative's number.
3. Type NY270, the customer number.
4. Wait for the word "Details" to appear on the screen. The appearance of "Details" indicates that all
the customer details are displayed on the screen.
5. Type Changed gasket P249, and performed Major Service the details of the current repair.
6. Type Qto close the application program.
You use VuGen to create RTE Vuser scripts. The script generator records the actions of a human user on
a terminal emulator. The script generator records the keyboard input from the terminal window,
generates the appropriate statements, and inserts them into the Vuser script. While you record, the
script generator automatically inserts synchronization functions into the script. For details, see "RTE
Synchronization Overview" on page637.
The functions developed to emulate a terminal communicating with a server are called TE Vuser
functions. Each TE Vuser function has a TE prefix. VuGen automatically records most of the TE functions
listed in this section during an RTE recording session. You can also manually program any of the
functions into your script.
For syntax and examples of the TE functions, see the Function Reference (Help > Function Reference).
An RTE Vuser emulates the actions of a real user. Human users use terminals or terminal emulators to
operate application programs.
User Guide
VuGen
HP LoadRunner (12.50) Page 630
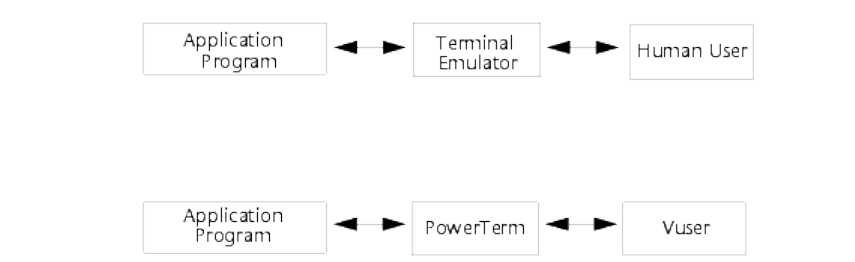
In the RTE Vuser environment, a Vuser replaces the human. The Vuser operates PowerTerm, a terminal
emulator.
PowerTerm works like a standard terminal emulator, supporting common protocols such as IBM 3270 =;
5250, VT100, VT220, and VT420-7.
Working with Ericom Terminal Emulation
VuGen supports record and replay with Ericom Terminal Emulators.
The Ericom support handles escape sequences during record and replay. Ericom's PowerTerm lets you
map PC keys to custom escape sequences. For information about mapping, see the PowerTerm help.
When a user presses mapped keys while recording an Ericom VT session, VuGen generates TE_send_
text functions instead of the standard TE_type. This allows the script to handle custom escape
sequences in a single step. For more information, see the Function Reference (Help > Function
Reference) for the TE_send_text function.
SSL and SSH Support for Ericom
VuGen also supports SSL/SSH record and replay for the RTE Ericom library. To work with SSL or SSH, you
select the type in the Security section of the Connect dialog box.
When working with SSH Security, by default VuGen opens a popup dialog box prompting you for more
information. We recommend that you disable the Show options to prevent the pop-ups from being
issued. If you enable these pop-ups, it may affect the replay. You can access the advanced security
options by clicking the Details button.
User Guide
VuGen
HP LoadRunner (12.50) Page 631
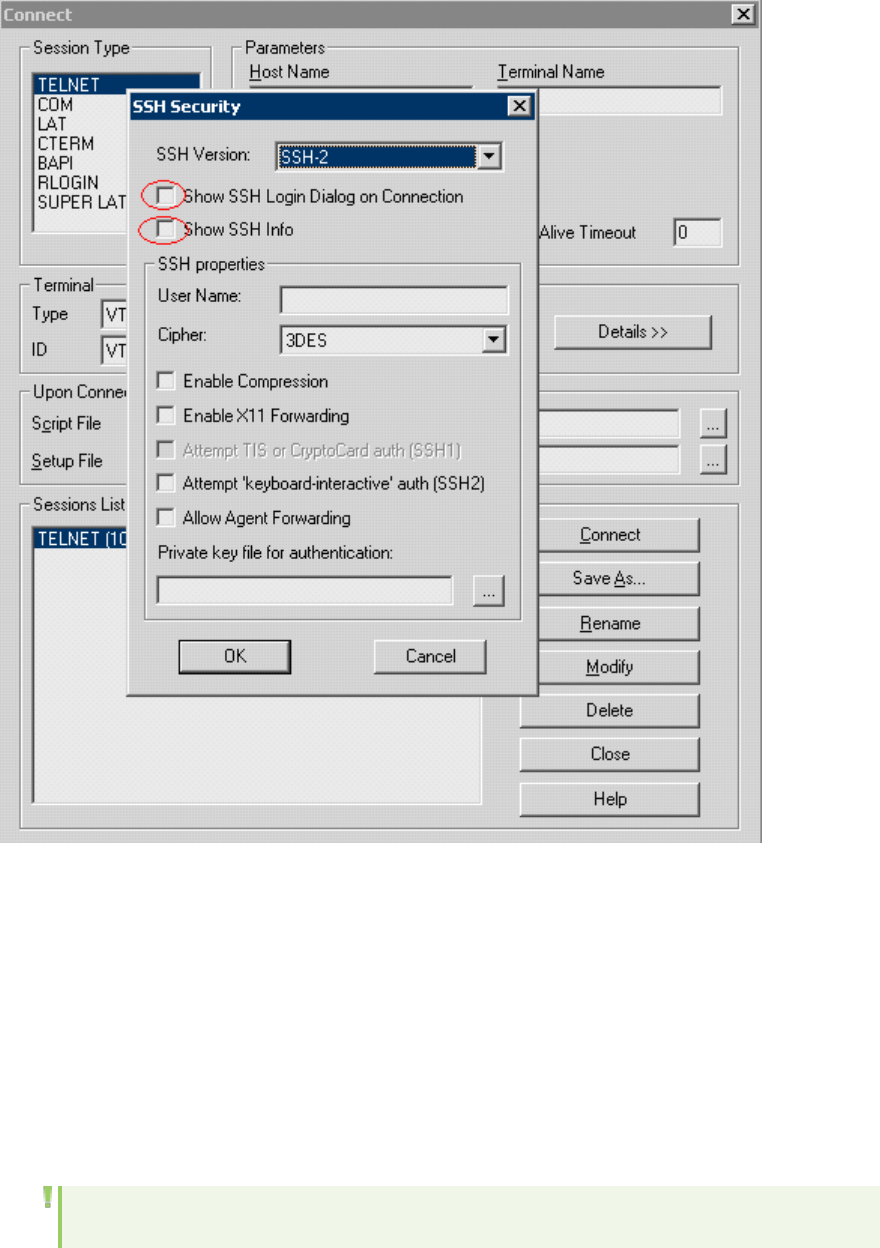
Typing Input into a Terminal Emulator
Two TE Vuser functions enable Vusers to "type" character input into the PowerTerm terminal emulator:
lTE_type sends characters to the terminal emulator. When recording, the VuGen automatically
generates TE_type functions for keyboard input to the terminal window. For details, see below.
lTE_typing_style determines the speed at which the Vuser types. You can manually define the typing
style by inserting a TE_typing_style function into the Vuser script. Alternatively, you can set the
typing style by using the runtime settings. For more information, see "Runtime Settings Overview" on
page280.
Note: While recording an RTE Vuser script, do not use the mouse to relocate the cursor
User Guide
VuGen
HP LoadRunner (12.50) Page 632

within the terminal emulator window. VuGen does not record these cursor movements.
Using the TE_type Function
When you record a script, the VuGen records all keyboard input and generates appropriate TE_type
functions. During execution, TE_type functions send formatted strings to the terminal emulator.
Keyboard input is defined as a regular text string (including blank spaces). For example:
TE_type ("hello, world");
Input key names longer than one character are represented by identifiers beginning with the letter k,
and are bracketed within greater-than/less-than signs(< >).
For example, the following function depicts the input of the Return key followed by the Control and y
keys:
TE_type("<kReturn><kControl-y>");
Some other examples include: <kF1>, <kUp>, <kF10>, <kHelp>, <kTab>.
To determine a key name, record an operation on the key, and then check the recorded statement for
its name.
Note: When you program a TE_type statement (rather than recording it), use the key
definitions provided in the Function Reference (Help > Function Reference).
Setting the Timeout Value for TE_type
If a Vuser attempts to submit a TE_type statement while the system is in XSYSTEM (or input inhibited)
mode, the Vuser will wait until the XSYSTEM mode ends before typing. If the system stays in XSYSTEM
mode for more than TE_XSYSTEM_TIMEOUT milliseconds, then the TE_type function returns a TE_
TIMEOUT error.
You can set the value of TE_XSYSTEM_TIMEOUT by using TE_setvar. The default value for TE_XSYSTEM_
TIMEOUT is 30seconds.
Allowing a Vuser to Type Ahead
Under certain circumstances you may want a Vuser to submit a keystroke even though the system is in
XSYSTEM (or input inhibited) mode. For example, you may want the Vuser to press the Break key. You
use the TE_ALLOW_TYPEAHEAD variable to enable the Vuser to submit a keystroke even though the
system is in XSYSTEM mode.
User Guide
VuGen
HP LoadRunner (12.50) Page 633
Set TE_ALLOW_TYPEAHEAD to zero to disable typing ahead, and to any non-zero number to permit
typing ahead. You use TE_setvar to set the value of TE_ALLOW_TYPEAHEAD. By default, TE_ALLOW_
TYPEAHEAD is set to zero, preventing keystrokes from being sent during XSYSTEM mode.
For more information about the TE_type function and its conventions, see the Function Reference (Help
> Function Reference).
Setting the Typing Style
You can set two typing styles for RTE Vuser: FAST and HUMAN. In the FAST style, the Vuser types input
into the terminal emulator as quickly as possible. In the HUMAN style, the Vuser pauses after typing
each character. In this way, the Vuser more closely emulates a human user typing at the keyboard.
You set the typing style using the TE_typing_style function. The syntax of the TE_typing_style function
is:
int TE_typing_style (char * style );
where style can be FAST or HUMAN. The default typing style is HUMAN. If you select the HUMAN typing
style, the format is:
HUMAN, delay [, first_delay]
The delay indicates the interval (in milliseconds) between keystrokes. The optional parameter first_
delay indicates the wait (in milliseconds) before typing the first character in the string. For example,
TE_typing_style ("HUMAN, 100, 500");
TE_type ("ABC");
means that the Vuser will wait 0.5 seconds before typing the letter A; it will then wait 0.1 seconds before
typing "B" and then a further 0.1 seconds before typing "C".
For more information about the TE_typing_style function and its conventions, see the Function
Reference (Help > Function Reference).
In addition to setting the typing style by using the TE_typing_style function, you can also use the
runtime settings. For details, see "Runtime Settings Overview" on page280.
Generating Unique Device Names
Some protocols, such as APPC, require a unique device name for each terminal that logs on to the
system. Using the runtime settings, you can specify that the TE_connect function generate a unique 8-
character device name for each Vuser, and connect using this name. Although this solves the
requirement for uniqueness, some systems have an additional requirement: The device names must
conform to a specific format. See "Runtime Settings Overview" on page280 for more information.
To define the format of the device names that the TE_connect function uses to connect a Vuser to the
system, add an RteGenerateDeviceName function to the Vuser script. The function has the following
prototype:
void RteGenerateDeviceName(char buf[32])
User Guide
VuGen
HP LoadRunner (12.50) Page 634
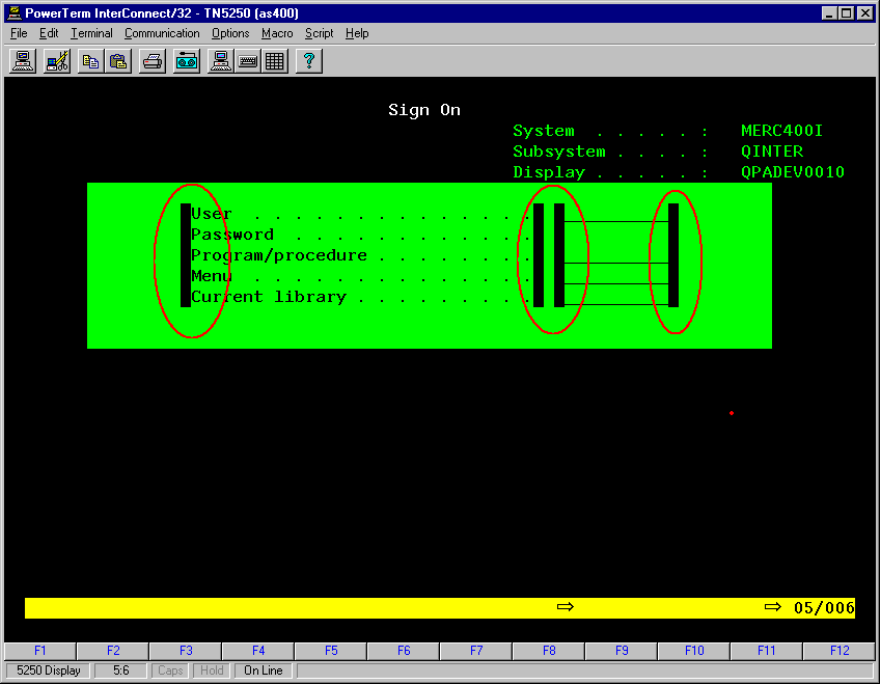
The device name should be written into buf.
If an RteGenerateDeviceName function exists in a Vuser script, the Vuser calls the function each time a
new device name is needed. If no RteGenerateDeviceName function is defined in the script—and unique
device names are required—the TE_connect function generates the required names.
In the following example, the RteGenerateDeviceName function generates unique device names with
the format "TERMx". The first name is TERM0, followed by TERM1, TERM2, and so forth.
RteGenerateDeviceName(char buf[32])
{
static int n=0;
sprintf(buf, "TERM%d", n);
n=n+1;
}
Setting the Field Demarcation Characters
Some terminal emulators use demarcation characters to mark the beginning and the end of each field.
These demarcation characters are not visible—appearing on the screen as spaces. In the terminal
emulator shown below, the colors in the middle section of the screen have been inverted to display the
field demarcation characters. These characters are surrounded by ellipses.
User Guide
VuGen
HP LoadRunner (12.50) Page 635
The TE_wait_text,TE_get_text, and TE_find_text functions operate by identifying the characters in a
specified portion of the screen. If a field demarcation character is located within the specified section,
you can identify the character as a space or an ASCII character. You use the TE_FIELD_CHARS system
variable to specify the method of identification. You can set TE_FIELD_CHARS to 0 or 1:
l0 specifies that the character in the position of the field demarcation characters is returned as a
space.
l1 specifies that the character in the position of the field demarcation characters is returned as an
ascii code (ascii 0 or ascii 1).
By default, TE_FIELD_CHARS is set to 0.
You retrieve and set the value of TE_FIELD_CHARS by using the TE_getvar and TE_setvar functions.
Reading Text from the Terminal Screen
There are several Vuser functions that RTE Vusers can use to read text from the terminal screen. You
can use these functions, TE_find_text and TE_get_text_line, to check that the terminal emulator is
responding correctly, or to enhance the logic in your scripts.
After recording, you can manually insert TE_find_text and TE_get_text_line statements directly into
your RTE Vuser scripts.
Searching for Text on the Screen
The TE_find_text function searches for a line of text on the screen. The syntax of the function is:
int TE_find_text (char *pattern, int col1, int row1, int col2, int row2,
int *retcol, int *retrow, char *match );
This function searches for text matching pattern within the rectangle defined by col1, row1, col2, row2.
Text matching the pattern is returned to match, and the actual row and column position is returned to
retcol and retrow. The search begins in the top-left corner. If more than one string matches pattern,
the one closest to the top-left corner is returned.
The pattern can include a regular expression. See the Function Reference (Help > Function Reference)
for details on using regular expressions.
You must manually type TE_find_text statements into your Vuser scripts. For details on the syntax of
the TE_find_text function, see the Function Reference (Help > Function Reference).
Reading Text from the Screen
The TE_get_text_line function reads a line of text from the area of the screen that you designate. The
syntax of the function is:
char *TE_get_text_line (int col, int row, int width, char * text );
This function copies a line of text from the terminal screen to a buffer text. The first character in the
line is defined by col, row. The column coordinate of the last character in the line is indicated by width.
User Guide
VuGen
HP LoadRunner (12.50) Page 636

The text from the screen is returned to the buffer text. If the line contains tabs or spaces, the
equivalent number of spaces is returned.
In addition, the TE_get_cursor_position function can be used to retrieve the current position of the
cursor on the terminal screen. The TE_get_line_attribute function returns the character formatting
(for instance, bold or underline) of a line of text.
You must manually type TE_get_text_line statements into your Vuser scripts. For details on the syntax
of the TE_get_text_line function, see the Function Reference (Help > Function Reference).
RTE Synchronization Overview
Depending on the system you are testing, you may need to synchronize the input that a Vuser sends to
a terminal emulator with the subsequent responses from the server. When you synchronize input, you
instruct the Vuser to suspend script execution and wait for a cue from the system, before the Vuser
performs its next action. For instance, suppose that a human user wants to submit the following
sequence of key strokes to a bank application:
1. Type 1 to select "Financial Information" from the menu of a bank application.
2. When the message "What information do you require?" appears, type 3 to select "Dow Jones
Industrial Average" from the menu.
3. When the full report has been written to the screen, type 5 to exit the bank application.
In this example, the input to the bank application is synchronized because at each step, the human user
waits for a visual cue before typing.
This cue can be either the appearance of a particular message on the screen, or stability of all the
information on the screen.
You can synchronize the input of a Vuser in the same way by using the TE-synchronization functions,
TE_wait_sync,TE_wait_text,TE_wait_silent, and TE_wait_cursor. These functions effectively emulate
a human user who types into a terminal window and then waits for the server to respond, before typing
in the next command.
The TE_wait_sync function is used to synchronize block-mode (IBM) terminals only. The other TE-
synchronization functions are used to synchronize character-mode (VT) terminals.
When you record an RTE Vuser script, VuGen can automatically generate and insert TE_wait_sync,TE_
wait_text, and TE_wait_cursor statements into the script. You use VuGen's recording options to
specify which synchronization functions VuGen should insert.
Note: Do not include any synchronization statements in the Vuser_end section of a Vuser script.
Since a Vuser can be aborted at any time, you cannot predict when the Vuser_end section will be
executed.
User Guide
VuGen
HP LoadRunner (12.50) Page 637

Synchronizing Block-Mode (IBM) Terminals
The TE_wait_sync function is used for synchronization RTE Vusers operating block-mode (IBM)
terminals. Block-mode terminals display the "XSYSTEM" message to indicate that the system is in Input
Inhibited mode. When a system is in the Input Inhibited mode no typing can take place because the
terminal emulator is waiting for a transfer of data from the server.
When you record a script on a block-mode terminal, by default, VuGen generates and inserts a TE_
wait_sync function into the script each time the "X SYSTEM" message appears. You use VuGen's
recording options to specify whether or not VuGen should automatically insert TE_wait_sync functions.
When you run a Vuser script, the TE_wait_sync function checks if the system is in the X SYSTEM mode.
If the system is in the X SYSTEM mode, the TE_wait_sync function suspends script execution. When the
"X SYSTEM" message is removed from the screen, script execution continues.
Note: You can use the TE_wait_sync function only with IBM block-mode terminals emulators
(5250 and 3270).
In general, the TE_wait_sync function provides adequate synchronization for all block-mode terminal
emulators. However, if the TE_wait_sync function is ineffective in a particular situation, you can
enhance the synchronization by including a TE_wait_text function. For more information on the TE_
wait_text function, see "Synchronizing Character-Mode (VT) Terminals" on page640, and the Function
Reference (Help > Function Reference).
In the following script segment, the Vuser logs on with the user name "QUSER" and the password
"HPLAB". The Vuser then presses Enter to submit the login details to the server. The terminal emulator
displays the XSYSTEM message while the system waits for the server to respond.
The TE_wait_sync statement causes the Vuser to wait until the server has responded to the login
request, that is, for the XSYSTEM message to be removed—before executing the next line of the script.
TE_type("QUSER");
lr_think_time(2);
TE_type("<kTab>HPLAB");
lr_think_time(3);
TE_type("<kEnter>");
TE_wait_sync();
....
When a TE_wait_sync function suspends the execution of a script while an XSYSTEM message is
displayed, the Vuser continues to monitor the system—waiting for the XSYSTEM message to disappear.
If the XSYSTEM message does not disappear before the synchronization timeout expires, the TE_wait_
sync function returns an error code. The default timeout is 60 seconds.
User Guide
VuGen
HP LoadRunner (12.50) Page 638
Set the TE_wait_sync synchronization timeout
1. Select Vuser >Runtime Settings. The runtime settings dialog box appears.
2. Select the RTE:RTE node in the Runtimesetting tree.
3. Under X SYSTEM Synchronization, enter a value (in seconds) in the Timeout box.
4. Click OK to close the runtime settings dialog box.
After a Vuser executes a TE_wait_sync function, the Vuser waits until the terminal is no longer in
the X S YSTEM mode . When the terminal returns from the X S YSTEM mode, the Vuser continues to
monitor the system for a short period to verify that the terminal is fully stable, that is, that the
system does not return to the X S YSTEM mode. Only then does the TE_wait_sync function
terminate and allow the Vuser to continue executing its script. The period that the Vuser continues
to monitor the system, after the system has returned from the X SYSTEM mode, is known as the
stable time. The default stable time is 1000 milliseconds.
You may need to increase the stable time if your system exhibits the following behavior:
When a system returns from the X SYSTEM mode, some systems "flickers" to and from the X
SYSTEM for a short period of time until the system stabilizes. If the system remains out of the X
SYSTEM mode for more than one second, and then returns to the X SYSTEM mode, the TE_wait_
sync function will assume that the system is stable. If a Vuser then tries to type information to the
system, the system will shift into keyboard-locked mode.
Alternatively, if your system never flickers when it returns from the XSYSTEM mode, you can reduce
the stable time to less than the default value of one second.
Change the stable time for TE_wait_sync functions
1. Select Vuser >Runtime Settings. The runtime settings dialog box appears.
2. Select the RTE:RTE node.
3. Under X SYSTEM Synchronization, enter a value (in milliseconds) in the Stable time box.
4. Click OK to close the runtime settings dialog box.
For more information on the TE_wait_sync function, see the Function Reference (Help > Function
Reference).
You can instruct VuGen to record the time that the system remains in the XSYSTEM mode each
time that the X SYSTEM mode is entered. To do so, VuGen inserts a TE_wait_sync_transaction
function after each TE_wait_sync function, as shown in the following script segment:
TE_wait_sync();
TE_wait_sync_transaction("syncTrans1");
Each TE_wait_sync_transaction function creates a transaction with the name "default." This allows
you to analyze how long the terminal emulator waits for responses from the server during a
scenario run. You use the recording options to specify whether VuGen should generate and insert
TE_wait_sync_transaction statements.
User Guide
VuGen
HP LoadRunner (12.50) Page 639
Instruct VuGen to insert TE_wait_sync_transaction statements
1. Select Vuser >Recording Options. The Recording Settings dialog box appears.
2. Select the Generate Automatic X SYSTEM transactions option, and then click OK.
Synchronizing Character-Mode (VT) Terminals
There are three types of synchronization that you can use for character-mode (VT) terminals. The type
of synchronization that you select depends on:
lthe design of the application that is running in the terminal emulator
lthe specific action to be synchronized
Waiting for the Cursor to Appear at a Specific Location
The preferred method of synchronization for VT type terminals is cursor synchronization. Cursor
synchronization is particularly useful with full-screen or form-type applications, as opposed to scrolling
or TTY-type applications.
Cursor synchronization uses the TE_wait_cursor function. When you run an RTE Vuser script, the TE_
wait_cursor function instructs a Vuser to suspend script execution until the cursor appears at a
specified location on the screen. The appearance of the cursor at the specified location means that the
application is ready to accept the next input from the terminal emulator.
The syntax of the TE_wait_cursor function is:
int TE_wait_cursor (int col, int row, int stable, int timeout );
During script execution, the TE_wait_cursor function waits for the cursor to reach the location
specified by col , row.
The stable parameter specifies the time (in milliseconds) that the cursor must remain at the specified
location. If you record a script using VuGen, stable is set to 100 milliseconds by default. If the client
application does not become stable in the time specified by the timeout parameter, the function
returns TIMEOUT. If you record a script using VuGen, timeout is set by default to the value of TIMEOUT,
which is 90 seconds. You can change the value of both the stable and timeout parameters by directly
editing the recorded script.
The following statement waits for the cursor to remain stable for three seconds. If the cursor doesn't
stabilize within 10 seconds, the function returns TIMEOUT.
TE_wait_cursor (10, 24, 3000, 10);
For more information on the TE_wait_cursor function, see the Function Reference (Help > Function
Reference).
You can instruct VuGen to automatically generate TE_wait_cursor statements, and insert them into a
script, while you record the script. The following is an example of a TE_wait_cursor statement that was
automatically generated by VuGen:
User Guide
VuGen
HP LoadRunner (12.50) Page 640

TE_wait_cursor(7, 20, 100, 90);
Instruct VuGen to automatically generate TE_wait_cursor statements, and insert
them into a script while recording
1. Select Vuser >Recording Options. The Recording Settings dialog box appears.
2. Under Generate Automatic Synchronization Commands select the Cursor check box, and then
click OK.
Waiting for Text to Appear on the Screen
You can use text synchronization to synchronize an RTE Vuser running on a VT terminal emulator. Text
synchronization uses the TE_wait_text function. During script execution, the TE_wait_text function
suspends script execution and waits for a specific string to appear in the terminal window before
continuing with script execution. Text synchronization is useful with those applications in which the
cursor does not consistently appear in a predefined area on the screen.
Note: Although text synchronization is designed to be used with character mode (VT) terminals,
it can also be used with IBM block-mode terminals. Do not use automatic text synchronization
with block-mode terminals.
The syntax of the TE_wait_text function is:
int TE_wait_text (char * pattern, int timeout, int col1, int row1, int col2, int row2,
int * retcol, int * retrow, char * match );
This function waits for text matching pattern to appear within the rectangle defined by col1, row1, col2,
row2. Text matching the pattern is returned to match, and the actual row and column position is
returned to retcol and retrow. If the pattern does not appear before the timeout expires, the function
returns an error code. The pattern can include a regular expression. See the Function Reference for
details on using regular expressions. Besides the pattern and timeout parameters, all the other
parameters are optional.
If pattern is passed as an empty string, the function will wait for timeout if it finds any text at all within
the rectangle. If there is no text, it returns immediately.
If the pattern does appear, then the function waits for the emulator to be stable (finish redrawing, and
not display any new characters) for the interval defined by the TE_SILENT_SEC and TE_SILENT_MILLI
system variables. This, in effect, allows the terminal to become stable and emulates a human user.
If the terminal does not become stable within the interval defined by TE_SILENT_TIMEOUT, script
execution continues. The function returns 0 for success, but sets the TE_errno variable to indicate that
the terminal was not silent after the text appeared.
To modify or retrieve the value of any of the TE_SILENT system variables, use the TE_getvar and TE_
setvar functions. For more information, see the Function Reference (Help > Function Reference).
User Guide
VuGen
HP LoadRunner (12.50) Page 641

In the following example, the Vuser types in its name, and then waits for the application to respond.
/* Declare variables for TE_wait_text */
int ret_row;
int ret_col;
char ret_text [80];
/* Type in user name. */
TE_type ("John");
/* Wait for teller to respond. */
TE_wait_text ("Enter secret code:", 30, 29, 13, 1, 13, =;ret_col, =;ret_row,
ret_text);
You can instruct VuGen to automatically generate TE_wait_text statements, and insert them into a
script, while you record the script.
Instruct VuGen to automatically generate TE_wait_text statements, and insert them
into a script while recording
1. Select Vuser >Recording Options. The Recording Settings dialog box appears.
2. Under Generate Automatic Synchronization Commands, select the Prompt check box, and then
click OK.
The following is an example of a TE_wait_text statement that was automatically generated by
VuGen. The function waits up to 20 seconds for the string "keys" to appear anywhere on the screen.
Note that VuGen omits all the optional parameters when it generates a TE_wait_text function.
TE_wait_text("keys", 20);
Waiting for the Terminal to be Silent
In instances when neither cursor synchronization nor text synchronization are effective, you can use
"silent synchronization" to synchronize the script. With "silent synchronization," the Vuser waits for the
terminal emulator to be silent for a specified period of time. The emulator is considered to be silent
when it does not receive any input from the server for a specified period of time.
Note: Use silent synchronization only when neither cursor synchronization nor text
synchronization are effective.
You use the TE_wait_silent function to instruct a script to wait for the terminal to be silent. You specify
the period for which the terminal must be silent. If the terminal is silent for the specified period, then
the TE_wait_silent function assumes that the application has stopped printing text to the terminal
screen, and that the screen has stabilized.
The syntax of the function is:
int TE_wait_silent (int sec, int milli, int timeout );
User Guide
VuGen
HP LoadRunner (12.50) Page 642

The TE_wait_silent function waits for the terminal emulator to be silent for the time specified by sec
(seconds) and milli (milliseconds). The emulator is considered silent when it does not receive any input
from the server. If the emulator does not become silent (i.e. stop receiving characters) during the time
specified by the time timeout variable, then the function returns an error.
For example, the following statement waits for the screen to be stable for three seconds. If after ten
seconds, the screen has not become stable, the function returns an error.
TE_wait_silent (3, 0, 10);
For more information, see the Function Reference (Help > Function Reference).
How to Map Terminal Keys to PC Keyboard Keys
Because you are using a terminal emulator, you will be using a PC keyboard in place of a terminal
keyboard. Many keys that are found on the terminal keyboard are not available on a PC keyboard.
Examples of such keys are HELP, AUTHOR, and PUSH, which are found on the IBM 5250 keyboard. To
successfully operate the terminal emulator and any associated application programs, you may have to
map certain terminal keys to keys on the PC keyboard.
Map a Terminal Key to a Key on the PC Keyboard
1. In the terminal emulator, select Options>Keyboard Map, or click the Keyboard Mapping button
. The Keyboard Mapping dialog box opens.
User Guide
VuGen
HP LoadRunner (12.50) Page 643
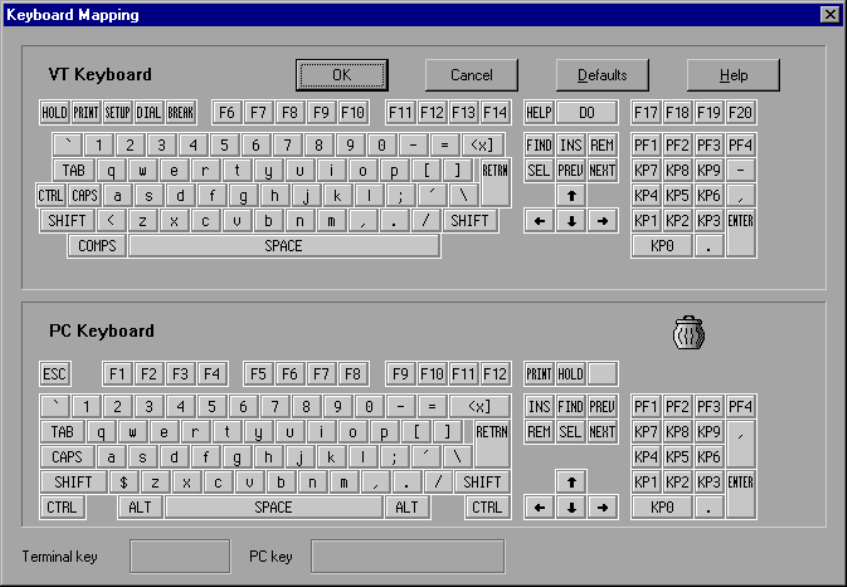
2. Click the Keyboard Mapping button on the toolbar. To map a terminal key to a PC key, drag a key
from the upper terminal keyboard to a PC key on the lower keyboard.
You can click the Shift and/or Control keys on the upper keyboard to display additional key functions
that can be viewed only by first selecting either of these keys. You can then drag the required key
from the upper terminal keyboard to a key on the lower PC keyboard.
To cancel a definition, drag the PC key definition to the wastebasket. This restores the default
function of the PC key.
To restore the default mappings, click Defaults.
How to Record RTE Vuser Scripts
You use VuGen to record RTE Vuser scripts. VuGen uses the PowerTerm terminal emulator to emulate a
wide variety of terminal types.
This task describes how to record RTE Vuser scripts. This procedure differs from the general recording
procedure in "Recording" on page140.
1. Record the terminal setup and connection
a. Open an existing RTE Vuser script, or create a new one.
b. In the Sections box, select the vuser_init section to insert the recorded statements.
c. In the Vuser script, place the cursor at the location where you want to begin recording.
User Guide
VuGen
HP LoadRunner (12.50) Page 644
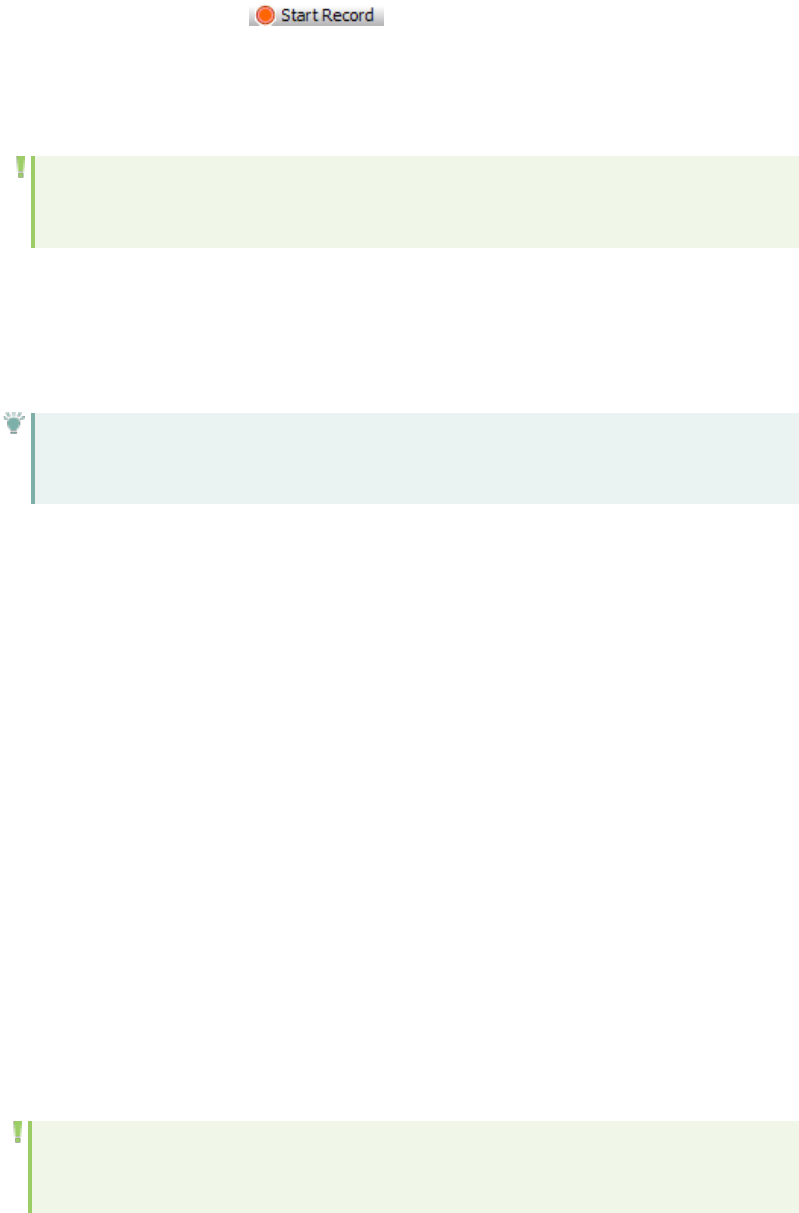
d. Click the Start Record button . The PowerTerm main window opens.
e. From the PowerTerm menu bar, select Terminal>Setup to display the Terminal Setup dialog
box.
f. Select the type of emulation from the VT Terminal and IBM Terminal types, and then click OK.
Note: Select an IBM terminal type to connect to an AS/400 machine or an IBM
mainframe; select a VT terminal type to connect to a Linux workstation.
g. Select Communication>Connect to display the Connect dialog box.
h. Under Session Type, select the type of communication to use.
i. Under Parameters, specify the required options. The available parameters vary depending on
the type of session that you select. For details on the parameters, click Help.
Tip: Click Save As to save the parameter-sets for re-use in the future. The
parameter-sets that you save are displayed in the Sessions List box.
j. Click Connect. PowerTerm connects to the specified system, and VuGen inserts a TE_connect
function into the script, at the insertion point. The TE_connect statement has the following
form:
/* *** The terminal type is VT 100. */
TE_connect(
"comm-type = telnet;"
"host-name = alfa;"
"telnet-port = 992;"
"terminal-id = ;"
"set-window-size = true;"
"security-type = ssl;"
"ssl-type = tls1;"
"terminal-type = vt100;"
"terminal-model = vt100;"
"login-command-file = ;"
"terminal-setup-file = ;"
, 60000);
if (TE_errno != TE_SUCCESS)
return -1;
The inserted TE_connect statement is followed by an if statement that checks whether or not
the TE_connect function succeeds during replay.
Note: Do not record more than one connection to a server (TE_connect) in a Vuser
script.
User Guide
VuGen
HP LoadRunner (12.50) Page 645

2. Record typical user actions
After recording the setup procedure, you perform typical user actions or business processes. You
record these processes into the Actions section of the Vuser script. Only the Actions section of a
Vuser script is repeated when you run multiple iterations of the script.
When recording a session, VuGen records the text strokes and not the text. Therefore, it is not
recommended that you copy and paste commands into the PowerTerm window—instead, type
them in directly.
a. Select the Actions section in the Section box.
b. Proceed to perform typical user actions in the terminal emulator. VuGen generates the
appropriate statements, and inserts them into the Vuser script while you type. If necessary,
you can edit the recorded statements while you record the script.
3. Record the log-off procedure
a. Make sure that you have performed and recorded the typical user actions as described in the
previous section.
b. In the VuGen main window, click vuser_end in the Section box.
c. Perform the log off procedure. VuGen records the procedure into the vuser_end section of the
script.
d. Click Stop Recording on the Recording toolbar. The main VuGen window displays all the
recorded statements.
e. Click Save to save the recorded session. After recording a script, you can manually edit it in
VuGen's main window.
How to Implement Continue on Error
To configure the Continue on Error functionality in RTE Scripts:
lTo continue running the script on error, insert the following function:
TE_setvar(TE_IGNORE_ERRORS, 1)
lTo restore the default behavior of failing the script on error, insert the following function:
TE_setvar(TE_IGNORE_ERRORS, 0)
Troubleshooting and Limitations - RTE
This section describes troubleshooting and limitations for RTE Vusers.
IP Spoofing
IP spoofing is not supported for RTE Vusers.
User Guide
VuGen
HP LoadRunner (12.50) Page 646

Disconnection Failures
When running an RTE script from the Controller, it may hang in the Gradual Exiting stage. A possible
reason may be that the terminal session tried to disconnect but did not finish disconnecting before a
new connect command arrived. As a result, the scenario cannot exit properly.
Possible workaround: In scripts created with versions of LoadRunner prior to 12.50, TE_disconnect was
not automatically recorded. Manually add TE_disconnect functions to older RTE scripts.
SAP Protocols
Selecting a SAP Protocol Type
lTo test the SAP GUI user operating only on the client, use the SAP GUI Vuser type.
lTo test a SAP GUI user that also uses a Web browser, use the SAP (Click & Script) or SAP-Web
protocol.
To record a SAP GUI session that uses browser controls, create a multi-protocol Vuser script with the
SAP GUI and SAP-Web protocols. This allows VuGen to record Web-specific functions when encountering
the browser controls. This will not work if you attempt to combine SAP GUI and Web protocols.
Before recording a session, verify that your modules and client interfaces are supported by VuGen. The
following table describes the SAP client modules for SAP Business applications and the relevant tools:
SAP module VuGen support
SAP Web Client or
mySAP.com
Use the SAP-Web protocol.
SAP GUI for Windows Use the SAP GUI protocol. This also supports APO module recording
(requires patch level 24 for APO 3.0 for SAP 6.20).
SAP GUI for Windows
and a web browser
Use the SAP (Click & Script) protocol.
SAP GUI for Java This client is not supported.
SAP GUI Protocol
The SAP GUI Vuser script typically contains several SAP transactions which make up a business process.
A business process consists of functions that emulate user actions. Open the Step Navigator to see
each user action as a Vuser script step.
The following example shows a typical recording of a SAP GUI client. The first section, vuser_init,
contains the opening of a connection and a logon.
User Guide
VuGen
HP LoadRunner (12.50) Page 647
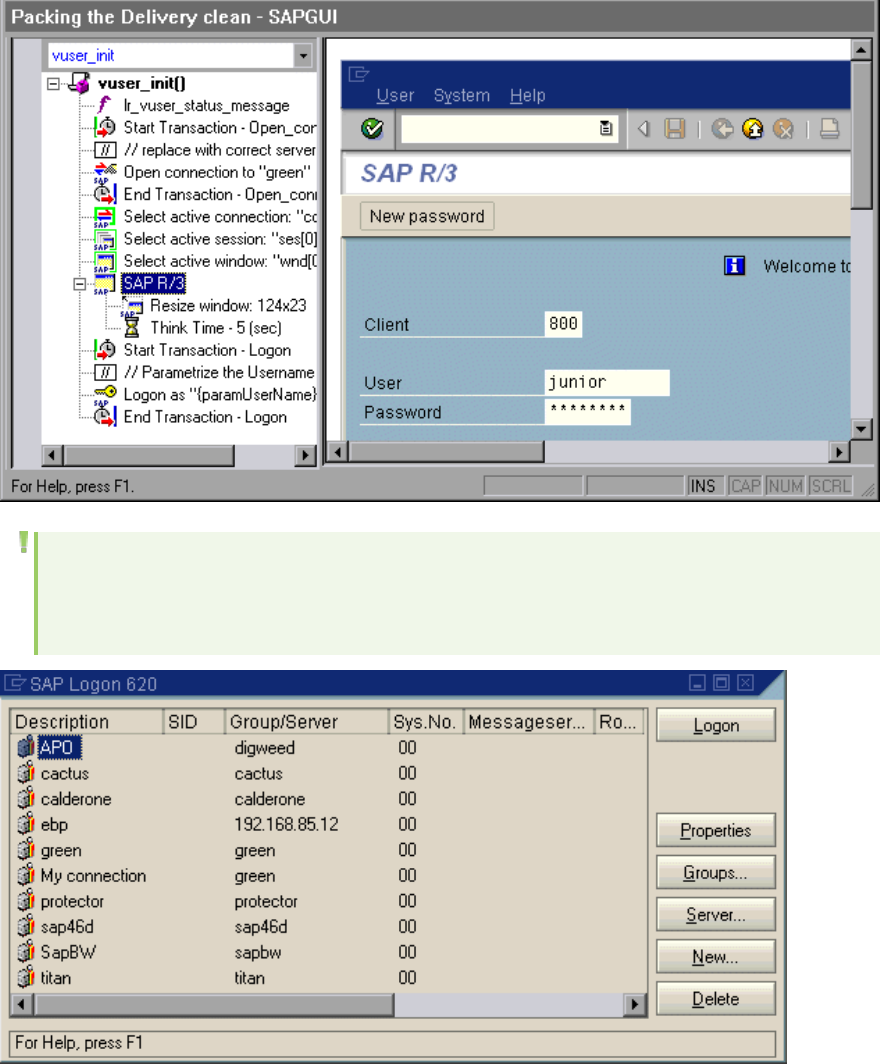
Note: The Open Connection step uses one of the connection names in the SAP Logon
Descriptions list. If the specified connection name is not in the list, the Vuser looks for a server
with that name.
In the following section, the functions emulate typical user operations such as menu selection and the
setting of a check box.
User Guide
VuGen
HP LoadRunner (12.50) Page 648
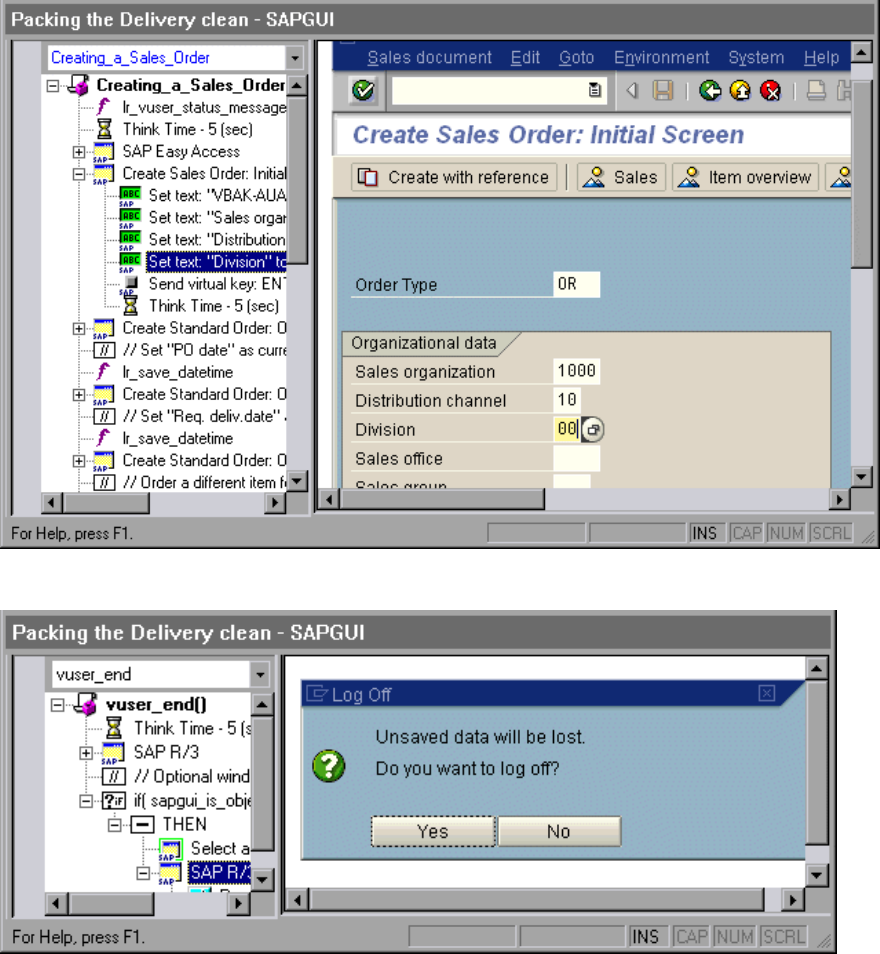
The final section, vuser_end, illustrates the logoff procedure.
When recording a multi- protocol script for both SAP GUI and Web, VuGen generates steps for both
protocols. In the Script view, you can view both sapgui and web functions.
The following example illustrates a multi-protocol recording in which the SAP GUI client opens a Web
control. Note the switch from sapgui to web functions.
sapgui_tree_double_click_item("Use as general WWW browser, REPTITLE",
"shellcont/shell",
"000732",
"REPTITLE",
BEGIN_OPTIONAL,
"AdditionalInfo=sapgui1020",
User Guide
VuGen
HP LoadRunner (12.50) Page 649
END_OPTIONAL);
...
sapgui_set_text("",
"http:\\\\yahoo.com",
"usr/txtEDURL",
BEGIN_OPTIONAL,
"AdditionalInfo=sapgui1021",
END_OPTIONAL);
...
web_add_cookie("B=7pt5cisv1p3m2=;b=2; DOMAIN=www.yahoo.com");
web_url("yahoo.com",
"URL=http://yahoo.com/",
"Resource=0",
"RecContentType=text/html",
"Referer=",
"Snapshot=t1.inf",
"Mode=HTML",
EXTRARES,
"URL=http://srd.yahoo.com/hpt1/ni=17/ct=lan/sss=1043752588/t1=1043752575385/d1=1251
/d2=1312/d3=1642/d4=4757/0.4097009487287739/*1",
"Referer=http://www.yahoo.com/", ENDITEM,
LAST);
SAP Web Protocol
The SAP-Web Vuser script typically contains several SAP transactions which make up a business process.
The business process consists of functions that emulate user actions. For information about these
functions, see the Web functions in the Function Reference (Help > Function Reference).
Example:
The following example shows a typical recording for an SAP Portal client:
vuser_init()
{
web_reg_find("Text=SAP Portals Enterprise Portal 5.0",
LAST);
web_set_user("junior{UserNumber}",
lr_decrypt("3ed4cfe457afe04e"),
"sonata.hplab.com:80");
web_url("sapportal",
"URL=http://sonata.hplab.com/sapportal",
"Resource=0",
"RecContentType=text/html",
"Snapshot=t1.inf",
"Mode=HTML",
EXTRARES,
"Url=/SAPPortal/IE/Media/sap_mango_polarwind/images/header/branding_
image.jpg",
User Guide
VuGen
HP LoadRunner (12.50) Page 650
"Referer=http://sonata.hplab.com/hrnp$30001/sonata.hplab.coml:80/Action/26011
[header]"
, ENDITEM,
"Url=/SAPPortal/IE/Media/sap_mango_polarwind/images/header/logo.gif",
"Referer=http://sonata.hplab.com/hrnp$30001/sonata.hplab.com:80/Action/26011
[header]",
ENDITEM,
...
LAST);
The following section illustrates an SAP Web and SAP GUI multi-protocol recording in which the Portal
client opens an SAP control. Note the switch from web_xxx to sapgui_xxx functions.
web_url("dummy",
"URL=http://sonata.hplab.com:1000/hrnp$30000/sonata.hplab.com:
1000/Action/dummy?PASS_PARAMS=YES=;dummyComp=dummy=;
Tcode=VA01=;draggable=0=;CompFName=VA01=;Style=sap_mango_polarwind",
"Resource=0",
"RecContentType=text/html",
"Referer=http://sonata.hplab.com/sapportal",
"Snapshot=t9.inf",
"Mode=HTML",
LAST);
sapgui_open_connection_ex(" /H/Protector/S/3200 /WP",
"",
"con[0]");
sapgui_select_active_connection("con[0]");
sapgui_select_active_session("ses[0]");
/*Before running script, enter password in place of asterisks in logon
function*/
sapgui_logon("JUNIOR{UserNumber}",
"ides",
"800",
"EN",
BEGIN_OPTIONAL,
"AdditionalInfo=sapgui102",
END_OPTIONAL);
SAP (Click & Script) Protocol
VuGen can create Vuser scripts for SAP Enterprise portal7 and SAP ITS 6.20/6.40 environments using
specialized test objects and methods that have been customized for SAP. The objects are APIs based on
HP QuickTest or Unified Functional Testing support for SAP.
As you record a test or component on your SAP application, VuGen records the operations you perform.
VuGen recognizes special SAPWindows objects such as frames, table controls, iViews, and portals.
For an overview on the Click and Script protocols, see "Click & Script Protocols - Overview" on page466.
User Guide
VuGen
HP LoadRunner (12.50) Page 651

VuGen supports recording for the following SAP controls: button, check box, drop-down menu, edit field,
iview, list, menu, navigation bar, OK code, portal, radio group, status bar, tab strip, table, and tree view.
VuGen uses the control handler layer to create the effect of an operation on a GUI control. During
recording, when encountering one of the supported SAP objects, VuGen generates a function with an
sap_xxx prefix.
Example:
In the following example, a user selected the User Profile tab. VuGen generated a sap_portal function.
web_browser("Close_2",
"Snapshot=t7.inf",
DESCRIPTION,
"Ordinal=2",
ACTION,
"UserAction=Close",
LAST);
lr_think_time(7);
web_text_link("Personalize",
"Snapshot=t8.inf",
DESCRIPTION,
"Text=Personalize",
ACTION,
"UserAction=Click",
LAST);
lr_think_time(6);
sap_portal("Sap Portal_2",
"Snapshot=t9.inf",
DESCRIPTION,
"BrowserOrdinal=2",
ACTION,
"DetailedNavigation=User Profile",
LAST);
Note: When you record an SAP (Click & Script) session, VuGen generates standard Click & Script
functions for objects that are not SAP-specific. You do not need to explicitly specify the Web
protocol. In the example above, VuGen generated a web_text_link function when the user
clicked the Personalize button.
Replaying SAP GUI Optional Windows
When working with SAP GUI Vuser Scripts, you may encounter optional windows in the SAP GUI client—
windows that were present during recording, but do not exist during replay. If you try to replay your
recorded script as is, it will fail when it attempts to find the missing windows.
VuGen's optional window mechanism performs the actions on a window only after verifying that it
exists. The Vuser checks if the window indicated in the Select active window step exists. If the window
User Guide
VuGen
HP LoadRunner (12.50) Page 652

is found during replay, it performs the actions as they were recorded in the script. If it does not exist,
the Vuser ignores all window actions until the next Select active window step. Note that only SAP GUI
steps (beginning with a sapgui prefix) are ignored.
To use this feature, in Tree view select the appropriate Select Active Window step and select Run steps
for window only if it exists from the right-click menu.
To disable this feature and attempt to run these steps at all times, regardless of whether the Vuser
finds the window or not, select Always run steps for this window from the right-click menu.
How to Configure the SAP Environment
This task describes configure and verify the SAP environment for use with VuGen.
VuGen support for the SAP GUI for Windows client, is based on SAP's Scripting API. This API allows Vusers
to interact with the SAP GUI client, receive notifications, and perform operations.
The Scripting API is available only in recent versions of the SAP Kernel. In kernel versions that support
scripting, the option is disabled by default. In order to use VuGen, first make sure that the SAP servers
support the Scripting API, and enable the API on both the server and clients. For more information and to
download patches, see the SAP OSS note #480149.
Checking the SAPGUI Scripting API is enabled.
Run the VerifyScripting.exe file from the Additional Components\SAP_Tools\VerifySAPGUI folder. For
details, see "Additional Components" on page1769. For more information, see the file
VerifyScripting.htm provided with this utility.
Checking the SAP GUI for Windows Client Patch Level
You can check the patch level of your SAP GUI for Windows client from the About box. The lowest patch
level supported is version 6.20 patch 32.
Check the Patch Level
1. Open the SAP GUI logon window. Click the top left corner of the SAP Logon dialog box and select
About SAP Logon from the menu.
2. The SAP version information dialog box opens. Verify that the Patch Level entry is 32 or higher.
Check the Kernel Patch Level
1. Log in to the SAP system
2. Select System > Status
3. Click the Other kernel information button.
4. In the Kernel Information section, check the value of the Sup. Pkg. lvl.
User Guide
VuGen
HP LoadRunner (12.50) Page 653

The level must be greater than the level listed in the following chart depending on the SAP version
you are using.
Software Component SAP Release Kernel Patch Level
SAP_APPL 31I Kernel 3.1I level 650
SAP_APPL 40B Kernel 4.0B level 903
SAP_APPL 45B Kernel 4.5B level 753
SAP_BASIS 46B Kernel 4.6D level 948
SAP_BASIS 46C Kernel 4.6D level 948
SAP_BASIS 46D Kernel 4.6D level 948
SAP_BASIS 610 Kernel 6.10 level 360
Check the R/3 Support Packages
1. Log on to the SAP system and run the SPAM transaction.
2. In the Directory section, select All Support Packages, and click the Display button.
3. Verify that the correct package is installed for your version of SAP according to the table below.
Software Component Release Package Name
SAP_APPL 31I SAPKH31I96
SAP_APPL 40B SAPKH40B71
SAP_APPL 45B SAPKH45B49
SAP_BASIS 46B SAPKB46B37
SAP_BASIS 46C SAPKB46C29
SAP_BASIS 46D SAPKB46D17
SAP_BASIS 610 SAPKB61012
If the correct version is installed, a green circle appears in the Status column.
User Guide
VuGen
HP LoadRunner (12.50) Page 654
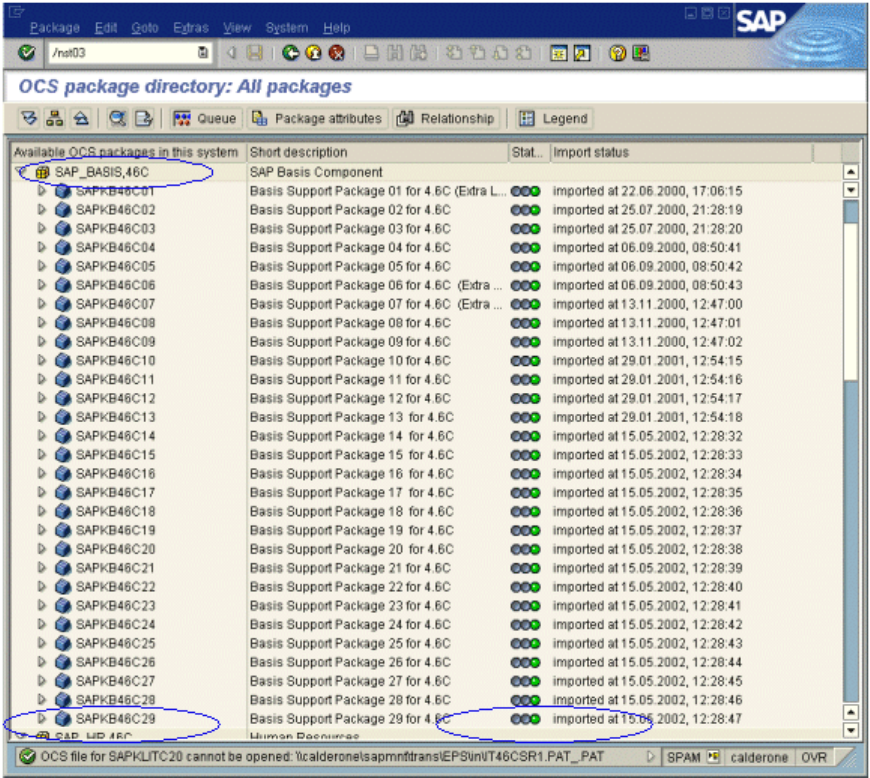
If you do not have the OCS package installed, download it the from the www.sap.com Web site and
install it. For more information, see the SAP OSS note #480149.
Enable scripting on the SAP Application Server
A user with administrative permissions enables scripting by setting the sapgui/user_scripting profile
parameter to TRUE on the application server. To enable scripting for all users, set this parameter on all
application servers. To enable scripting for a specific group of users, only set the parameter on
application servers with the desired access restrictions. The following steps describe how to change the
profile parameter.
1. Open transaction rz11. Specify the parameter name sapgui/user_scripting and click Display. The
Display Profile Parameter Attributes window opens.
User Guide
VuGen
HP LoadRunner (12.50) Page 655
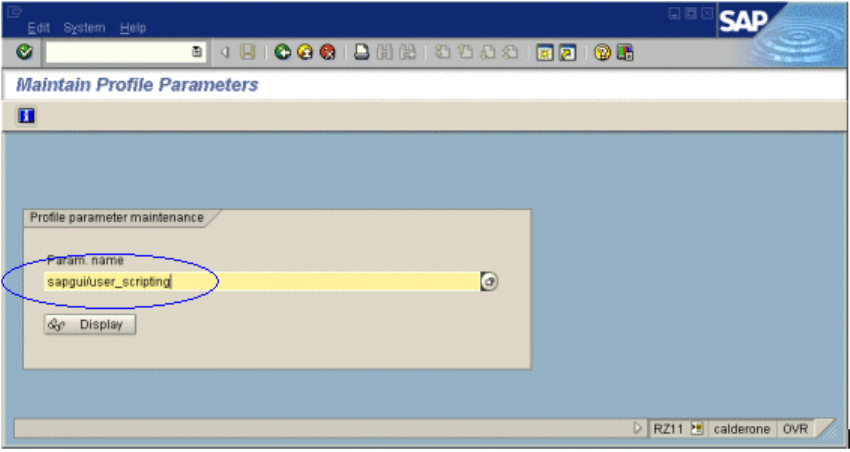
If Parameter name is unknown appears in the status bar, this indicates that you are missing the
current Support Package. Import the Support Package that corresponds to the SAP BASIS and kernel
versions of the application server, as described in the steps above.
2. If Profile Val is FALSE, you need to modify its value. Click the Change value button in the toolbar.
The Change Parameter Value window opens. Enter TRUE in the ProfileVal box and click the Save
button.
User Guide
VuGen
HP LoadRunner (12.50) Page 656
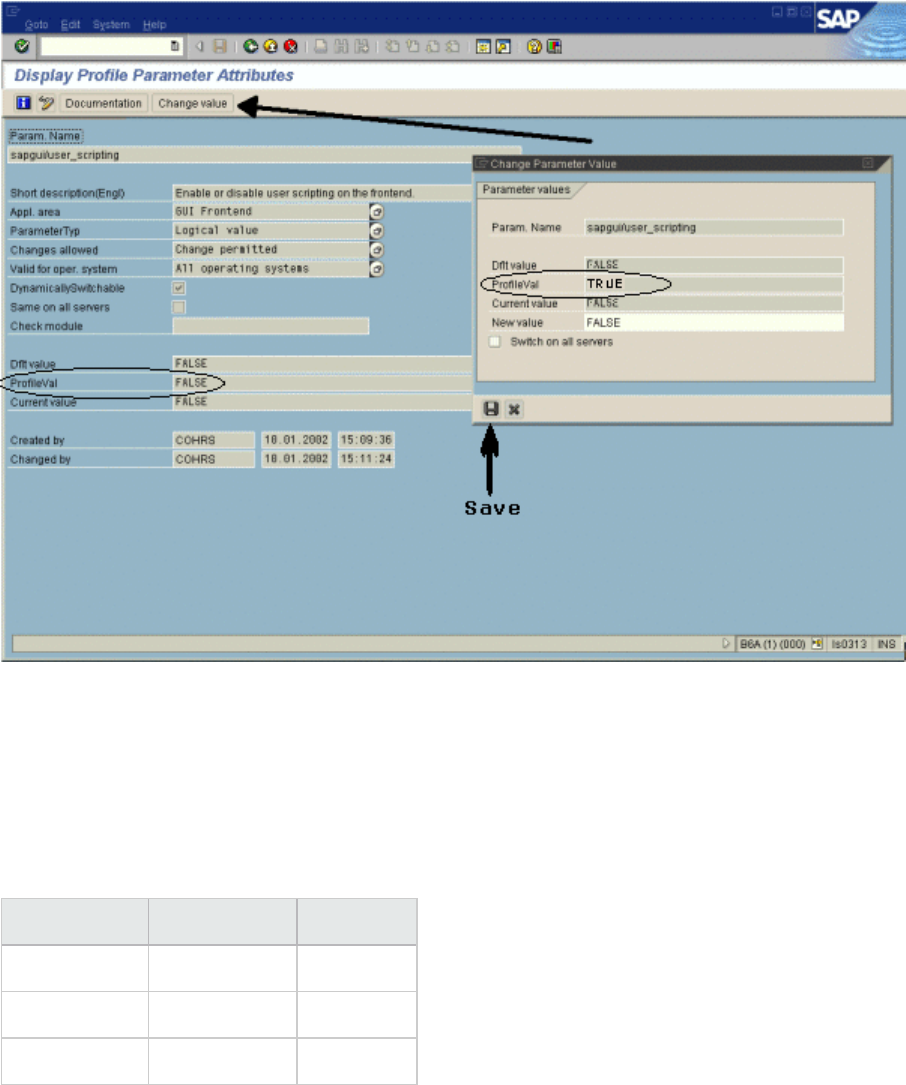
When you save the change, the window closes and ProfileVal is set to TRUE.
3. Restart the application server, since this change only takes effect when you log onto the system.
If the updated ProfileVal did not change, even after restarting the server, then the kernel of the
application server is outdated. Import the required kernel patch, as specified in the steps above.
Note that the Profile Value may be dynamically activated in the following kernel versions, using
transaction rz11, without having to restart the application server.
Release Kernel Version Patch Level
4.6B, 4.6C, 4.6D 4.6D 972
6.10 6.10 391
6.20 all versions all levels
Enable scripting on SAP GUI 6.20 client
To allow VuGen to run scripts, you must also enable scripting on the SAP GUI client. You should also
configure the client not to display certain messages, such as when a connection is established, or when
a script is attached to the GUI process. The following steps describe how to configure the SAP GUI client
User Guide
VuGen
HP LoadRunner (12.50) Page 657
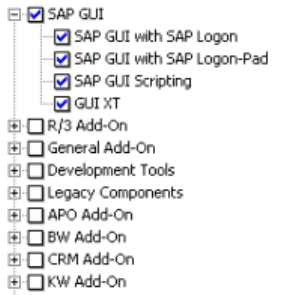
to work with .
1. During installation. While installing the SAP GUI client, enable the SAP GUI Scripting option.
2. After installation. Suppress warning messages. Open the Options dialog box in the SAP GUI client.
Select the Scripting tab and clear the following options:
lNotify when a script attaches to a running GUI
lNotify when a script opens a connection
You can also prevent these messages from popping up by setting the values WarnOnAttach and
WarnOnConnection in the following registry key to 0:
HKCU\SOFTWARE\SAP\SAPGUI Front\SAP Frontend Server\Security.
How to Record SAP GUI Scripts
The following steps describe some prerequisites to recording a SAP GUI script.
Configure the application server for scripting
As a security precaution, scripting is disabled by default. In order to record, you need to enable scripting
on the application server. From the RZ11 transaction, set the following profile parameters as follows:
lsapgui/user_scripting TRUE
lsapgui/user_scripting_force_notification FALSE
lsapgui/user_scripting_set_readonly FALSE
lsapgui/user_scripting_disable_recording FALSE
Close SAPLogon application when recording with Multi
When recording a multi-protocol script in which the SAP GUI client contains Web controls, close the
SAPLogon application before recording.
Use Modal dialog boxes for F1 Help
Instruct the SAP GUI client to open the F1 help in a modal dialog box as follows:
User Guide
VuGen
HP LoadRunner (12.50) Page 658
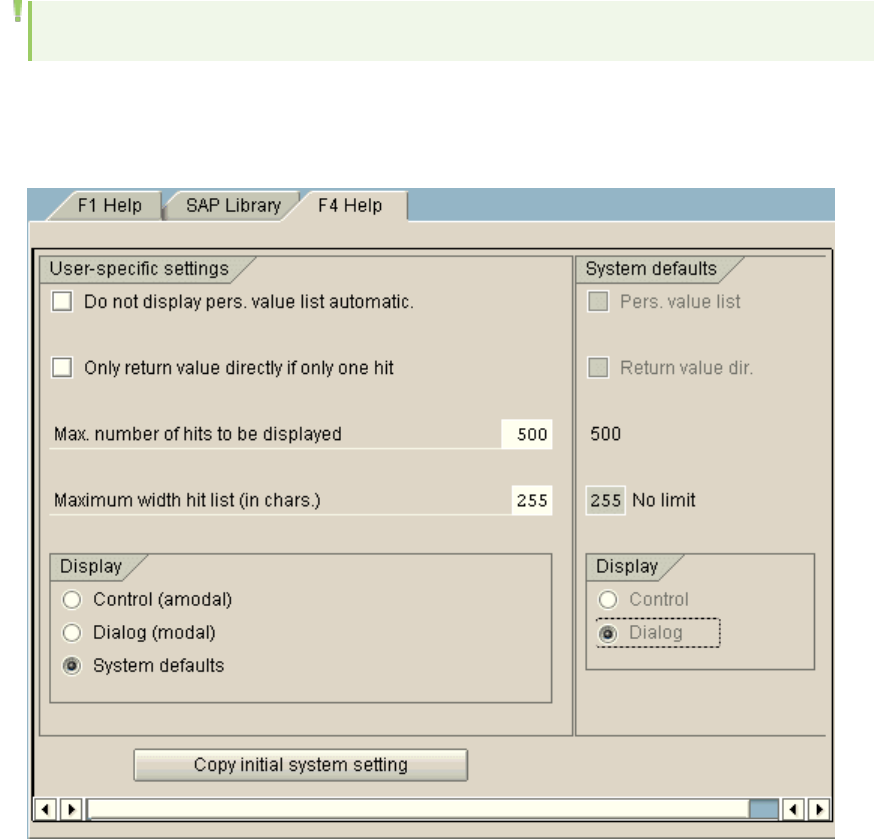
1. Select Help > Settings.
2. Click the F1 Help tab.
3. Select in modal dialog box in the Display section.
Use Modal dialog boxes for F4 Help
Note: This procedure can only be performed by the administrator.
Instruct the SAP GUI client to open the F4 help in a modal dialog box:
1. Make sure that all users have logged off from the server.
2. Select Help > Settings. Click the F4 Help tab.
3. In the Display section, select System defaults.
4. In the Display portion of the System defaults section, select Dialog.
5. Save the changes by clicking Copy initial system setting.
6. Verify that the status bar displays the message Data was saved.
7. Close the session and restart the service through the SAP Management Console.
User Guide
VuGen
HP LoadRunner (12.50) Page 659
How to Replay SAP GUI Scripts
The following steps describe prerequisites to replaying SAPGUI scripts.
Replace Encrypted Password
Replace the encrypted password in the sapgui_logon function generated during recording, with the real
password. It is the second argument of the function, after the following user name
sapgui_logon("user", "pswd", "800", "EN");
For additional security, you can encrypt the password within the code. Select the password text (the
actual text, not *****) and select Encrypt string from the right-click menu. VuGen inserts an lr_decrypt
function at the location of the password as follows:
sapgui_logon("user", lr_decrypt("3ea037b758"), "800", "EN");
Display SAP GUI During Replay (optional)
When running a script for the first time, configure VuGen to show the SAP GUI user interface during
replay, in order to see the operations being performed through the UI. Select Replay > Runtime
Settings > SAPGUI > General node and select Show SAP Client During Replay. During a load scenario,
disable this option, since it uses a large amount of system resources in displaying the UI for multiple
Vusers.
How to Run SAP GUI Scripts in a Scenario
The following steps describe tips for running SAP GUI scripts in a scenario.
LoadRunner Controller Settings
When working with a LoadRunner scenario, set the following values when running your script in a load
test configuration:
lRamp-up. One by one (to insure proper logon) in the Scheduler.
lThink time. Random think time in the runtime settings.
lUsers per load generator. 50 Vusers for machine with 512 MB of memory in the Load Generators
dialog box.
Make Sure the Agent is Running in Process Mode
Make sure that the LoadRunner (or Performance Center) Remote Agent is running in Process mode.
Service mode is not supported.
To check this, move your mouse over the agent's icon in the Windows task bar area, and read the
description. If the description reads HP Load Testing Agent Service, it is running as a service.
User Guide
VuGen
HP LoadRunner (12.50) Page 660
The following steps describe how to restart the agent as a process.
1. Stop the agent. Right-click the LoadRunner Agent icon and select Close.
2. Run magentproc.exe, located in the launch_service\bin folder, under the LoadRunner installation.
3. To make sure that the correct Agent is launched the next time you start your machine, change the
Start type of the Agent Service from Automatic to Manual. Then add a shortcut to magentproc.exe
to the Windows Startup folder.
lTerminal Sessions. Machines running SAP GUI Vusers may be limited in the number of Vusers
that can run, due to the graphic resources available to that machine. To increase the number of
Vusers per machine, open additional terminal server sessions on the Load Generator machines.
Select Agent Configuration from Start > All Programs > <product_name> > Advanced Settings,
and select the Enable Terminal Service option. You specify the number of terminal sessions in
the Load generator machine properties. For more information, see "Configuring Terminal
Services Settings" on page1190.
Note: When the LoadRunner Agent is running in a terminal session, and the terminal
session's window is minimized, no snapshots will be captured on errors.
How to Enhance SAP GUI Scripts
The following steps describe how to enhance SAP GUI protocol scripts.
Insert Steps Interactively into a SAP GUI Script
After recording, you can manually add steps to the script in either the Editor or Step Navigator. In
addition to manually adding new functions, you can add new steps interactively for SAP GUI Vusers,
directly from the snapshot. Using the right-click menu, you can add object-related steps.
When adding a step from within a snapshot, VuGen uses the Active Screen capability and determines
the ID of each object in the SAP GUI client window (unless you disabled Active Screen snapshots in the
"SAPGUI > General Recording Options" on page203). The following steps describe how to insert a step
interactively for a specific object.
1. Verify that you recorded the script when Active Screen snapshots were selected in the SAPGUI
General node of the Recording Options (enabled by default).
User Guide
VuGen
HP LoadRunner (12.50) Page 661
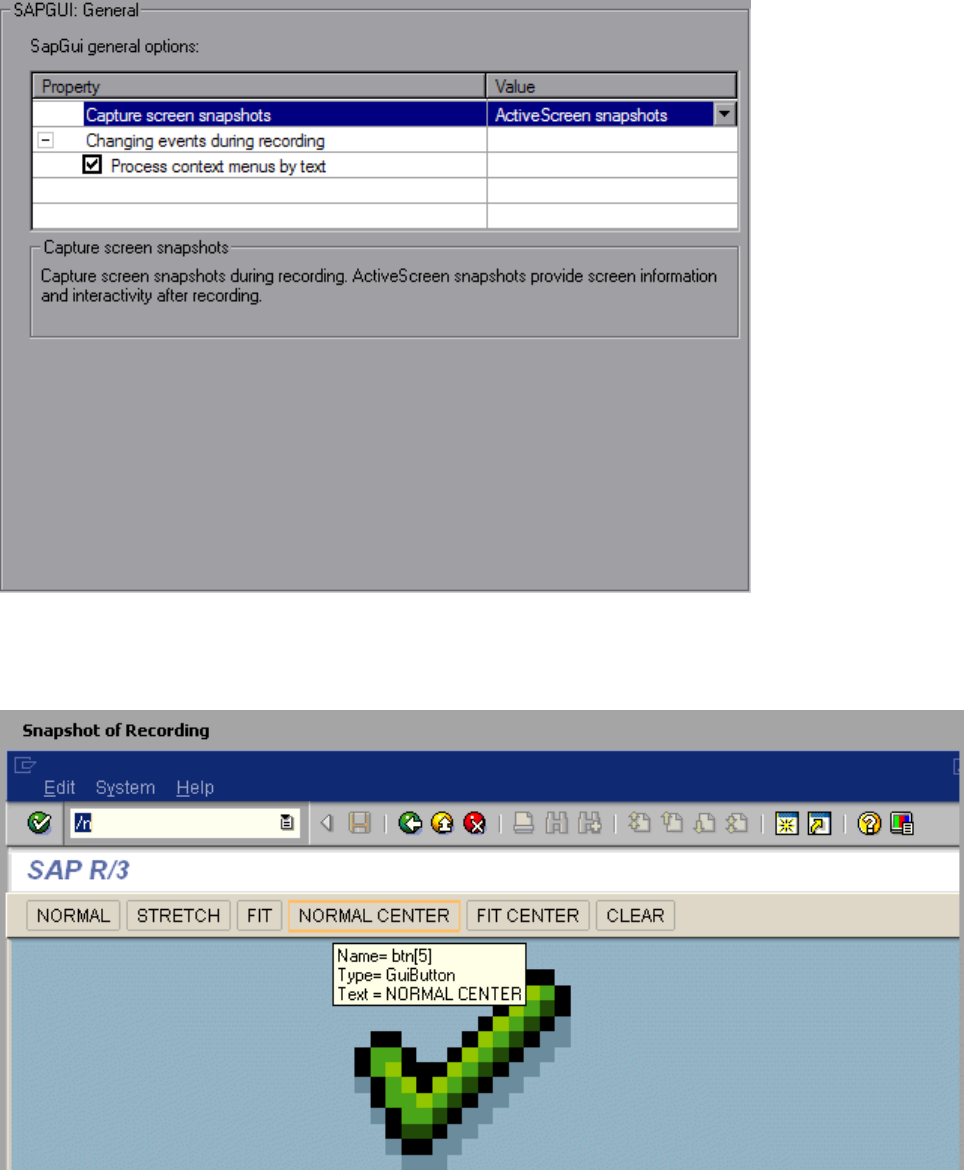
2. Click within the Snapshot pane.
3. Move the mouse over the object for which you want to add a function. Make sure that VuGen
recognizes the object and encloses it with a box.
4. Right-click the object, click Insert New Step, and then select a step from the list of steps that are
available for the object.
User Guide
VuGen
HP LoadRunner (12.50) Page 662
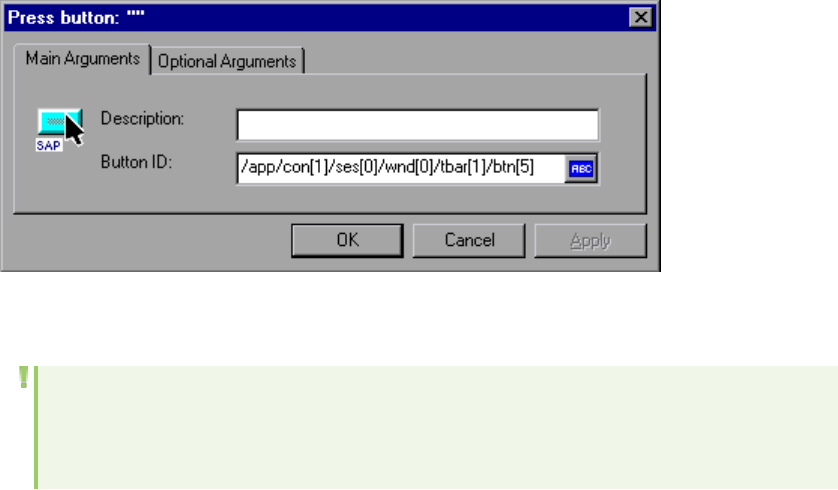
The step's Properties dialog box opens, with the Control ID of the object when relevant. For
example, if you add a Press Button step, for the normal center button as shown above, the
Properties box displays the following ID:
5. Enter a name for the object in the Description box. Click OK. VuGen inserts the new step after the
selected step.
Note: You can get the Control ID of the object for the purpose of pasting it into a specific
location. To do this, select Copy Control ID from the right-click menu. You can past it into a
Properties box or directly into the code from the Script view.
Add Verification Functions
When working with optional or dynamic windows or frames, you can use verification functions to
determine if the window or object is available. An optional window is a window that does not consistently
open during the SAP session. This function allow the Vuser script to continue running even if an optional
window opens or an exception occurs.
The first example checks if a window is available. If the window is available, the Vuser closes it before
continuing.
if (!sapgui_is_object_available("wnd[1]"))
sapgui_call_method("{ButtonID}",
"press",
LAST,
AdditionalInfo=info1011");
sapgui_press_button(.....)
The next example illustrates a dynamic object in the ME51N transaction. The Document overview frame
is optional, and can be opened/closed by the Document overview on/off button.
The code checks the text on the Document overview button. If the text on the button shows Document
overview on, we click the button to close the Document overview frame.
if(sapgui_is_object_available("tbar[1]/btn[9]"))
{
sapgui_get_text("Document overview on/off button",
User Guide
VuGen
HP LoadRunner (12.50) Page 663
"tbar[1]/btn[9]",
"paramButtonText",
LAST);
if(0 == strcmp("Document overview off", lr_eval_string("{paramButtonText}
")))
sapgui_press_button("Document overview off",
"tbar[1]/btn[9]",
BEGIN_OPTIONAL,
"AdditionalInfo=sapgui1013",
END_OPTIONAL);
}
Retrieve Information
When working with SAGUI Vusers, you can retrieve the current value of a SAP GUI object using the
sapgui_get_<xxx> functions. You can use this value as input for another business process, or display it
in the output log.
The following example illustrates how to save part of a status bar message in order to retrieve the
order number.
1. Navigate to the point where you want to check the status bar text, and select Insert New Step.
Select the sapgui_status_bar_get_type function. This verifies that the Vuser can successfully
retrieve text from the status bar.
2. Insert an if statement that checks if the previous statement succeeded. If so, save the value of the
argument using sapgui_status_bar_get_param.
This sapgui_status_bar_get_param function saves the order number into a user-defined
parameter. In this case, the order number is the second index of the status bar string.
sapgui_press_button("Save (Ctrl+S)",
"tbar[0]/btn[11]",
BEGIN_OPTIONAL,
"AdditionalInfo=sapgui1038",
END_OPTIONAL);
sapgui_status_bar_get_type("Status");
if(0==strcmp(lr_eval_string("{Status}"),"Success"))
sapgui_status_bar_get_param("2", " Order_Number ");
During test execution, the Execution log indicates the value and parameter name:
Action.c(240): Pressed button " Save (Ctrl+S)"
Action.c(248): The type of the status bar is "Success"
Action.c(251): The value of parameter 2 in the status bar is "33232"
Save Date Information
When creating scripts that use dates, your script may not run properly. For example, if you record the
script on June 2, and replay it on June 3, the date fields will be incorrect. Therefore, you need to save the
date to a parameter during text execution, and use the stored value as input for other date fields. To
User Guide
VuGen
HP LoadRunner (12.50) Page 664
save the current date or time during script execution, use the lr_save_datetime function. Insert this
function before the function requiring the date information. Note that the format of the date is specific
to your locale. Use the relevant format within the lr_save_datetime function. For example, for
month.day.year, specify "%m.%d.%Y".
In the following example, lr_save_datetime saves the current date. The sapgui_set_text function uses
this value to set the delivery date for two days later.
lr_save_datetime("%d.%m.%Y", DATE_NOW + (2 * ONE_DAY),
"paramDateTodayPlus2");
sapgui_set_text("Req. deliv.date",
"{paramDateTodayPlus2}",
"usr/ctxtRV45A-KETDAT",
BEGIN_OPTIONAL,
"AdditionalInfo=sapgui1025",
END_OPTIONAL);
Additional SAP Resources
For more information, see the SAP website at www.sap.com or one of the following locations:
lSAP Notes-https://websmp103.sap-ag.de/notes
Note #480149: New profile parameter for user scripting on the front end
Note #587202: Drag =; Drop is a known limitation of the SAP GUI interface
lSAP Patches -https://websmp104.sap-ag.de/patches
SAP GUI for Windows - SAP GUI 6.20 Patch (the lowest allowed level is 32)
Troubleshooting and Limitations for SAP
This section describes troubleshooting and limitations for SAP GUI, SAP-Web, and SAP (Click & Script)
protocols.
General SAP (Click & Script) limitations
lYou cannot define transactions to measure time of a subset of steps performed in a modal dialog.
lDuring recording, if you double-click on a tree-view tree cell outside of its text, VuGen records
"Select" instead of "Activate." This results in a missing POST in replay.
lIf the list of retrieved values contains a scroll bar, you cannot select an item that requires scrolling in
order to retrieve from the server.
lScalability is lower than the SAP Web protocol, depending on the size and functionality of the
business process.
lDoes not support the Replace with Alternate Navigation runtime setting.
User Guide
VuGen
HP LoadRunner (12.50) Page 665
lIn certain SAP environments (such as 6.20 and 6.40), the replay fails for tests that call the web_
element function and select an element whose tag name is "TD".
lDuring recording, if you use a keyboard option instead of a UI element (for example, pressing Enter
instead of clicking the log on button), the step may not be recorded. In general, when recording your
script, it is recommended to use UI elements rather than keyboard options.
General SAPGUI limitations
lIf a business process in SAP GUI 7.30 includes selecting an item from a Combo-list, the business
process may not be correctly replayed in LoadRunner versions 9.52 and higher.
Workaround: Add the path of the SAP GUI installation folder to the Windows PATH environment
variable.
lRecording is not supported for the SAP GUI Security dialog box.
lRecording is not supported for standard Windows dialog boxes (for example Save or Open) which are
opened from the SAP GUI client.
lIf you encounter a warning during SAP GUI recording: "Sizing conflicts exist on the screen…" it may
affect replay. "Headers Dialog Box" on page181
Workaround: Disable the warning in the SAP GUI application:
a. Click the right-most button on the SAP GUI toolbar (or click Alt+F2) to open the Customize Local
Layout screen.
b. Select the SAP Internal sub-menu.
c. Clear the Enable dialog box for screen size check box.
Question 1: I was able to record a script, but why does replay fail?
Answer: In LoadRunner, make sure that the LoadRunner Remote Agent is running in Process mode.
Service mode is not supported. For more information, see "How to Replay SAP GUI Scripts" on page660.
Question 2: Why were certain SAP GUI controls not recorded?
Answer: Some SAP GUI controls are only supported in their menu or toolbar contexts. Try performing the
problematic task using a different means—through a menu option, context menu, toolbar, and so on.
Question 3: Why can't I record or replay any scripts in VuGen?
Answer:
1. Verify that you have the latest patch of SAP GUI 6.20 installed. The lowest allowed patch level is
patch 32.
2. Make sure that scripting is enabled. See the "How to Configure the SAP Environment" on page653.
3. Verify that notifications are disabled in the SAP GUI for Windows client. Click the Customizing of
Local Layout button or press ALT+F12. Click Options and select the Scripting tab. Clear both Notify
options.
User Guide
VuGen
HP LoadRunner (12.50) Page 666
Question 4: What is the meaning of the error popup messages that are issued when
I try to run the script?
Answer: Certain SAP applications store the last layout for each user (such as which frames are visible or
hidden). If the stored layout was changed since the script was recorded, this may cause replay
problems. For Example, in the ME52N transaction, the Document overview Off/On button will change
the number of visible frames.
If this occurs:
1. Navigate the transaction to the same point as it was during recording, before starting replay. You
can use the Snapshot viewer to see the layout in which it was recorded.
2. Add statements to the script that bring the transaction to the desired layout during replay. For
example, if an optional frame interferes with your replay, insert a verification function that checks
if the frame is open. If it is open, click a button to close it. For verification examples, see "How to
Enhance SAP GUI Scripts" on page661.
Question 5: Can I use the single sign-on mechanism when running a script on a
remote machine?
Answer: No, VuGen does not support the single sign-on connection mechanism. In your SAP GUI client,
open the Advanced Options and clear the Enable Secure Network Communication feature. Note that
you must re-record the script after you modify the Connection preferences.
Question 6: Can VuGen record all SAP objects?
Answer: Recording is not available for objects not supported by SAP GUI Scripting. See your recording log
for information about those objects.
Question 7: Are all business processes supported?
Answer: VuGen does not support business processes that invoke Microsoft Office module controls, nor
those that require the use of GuiXT. You can disable GuiXT from the SAP GUI for Windows client Options
menu.
Question 8: When I go to the Auto Logon node of the Recording Options, why is the
list of server names empty?
Answer: This sometimes occurs when using SAP GUI Client 7.20. To resolve this issue, copy the
saplogon.ini file from %APPDATA%\SAP\Common where %APPDATA% stands for the environment
variable specifying the Application Data folder located directly below the user profile folder. Paste the
file to the %WINDIR% folder (C:\Windows).
Siebel Web Protocol
User Guide
VuGen
HP LoadRunner (12.50) Page 667
Siebel Web Protocol Overview
The Siebel-Web protocol is similar to the standard Web Vuser protocol, with several changes in the
default settings to allow it to work with the Siebel Customer Relationship Management (CRM)
application.
You record typical activities in your Siebel session. VuGen records the actions and generates functions
with a web_ prefix, that emulate your actions.
Siebel Web Recording Options and Runtime Settings
Before recording a Siebel Web Vuser script, set the following recording options:
lRecording node: HTML-based script
HTML Advanced - Script type: A script containing explicit URLs only
HTML Advanced - Non HTML-generated elements: Do not record
lAdvanced node: Clear the Reset context for each action check box.
Before running a Siebel Web Vuser script, set the following runtime setting:
In the Runtime Settings, clear the Simulate a new user on each iteration check box in the Browser
Emulation node.
How to Record Transaction Breakdown Information
VuGen provides a diagnostic tool for understanding the transaction components in your test—
transaction breakdown. Using transaction breakdown, you can determine where the bottlenecks are
and the issues that need to be resolved.
When preparing your script for transaction breakdown, we recommend that you add think time steps at
the end of each transaction using the ratio of one second per hour of testing. For more information
about adding think time steps, see "How to Insert Steps into a Script" on page339.
In order to record the transaction breakdown information, you need to modify your the
parameterization functions in your script.
Prepare Your Script for Transaction Breakdown
1. Identify the script parameterization replacement of the Session ID.
/* Registering parameter(s) from source task id 15
// {Siebel_sn_body4} = "28eMu9uzkn.YGFFevN1FdrCfCCOc8c_"
// */
web_reg_save_param("Siebel_sn_body4",
"LB/IC=_sn=",
"RB/IC==;",
User Guide
VuGen
HP LoadRunner (12.50) Page 668

"Ord=1",
"Search=Body",
"RelFrameId=1",
LAST);
2. Mark the next web_submit_data function as a transaction by enclosing it with lr_start_
transaction and lr_end_transaction functions.
3. Before the end of the transactions, add a call to lr_transaction_instance_add_info, where the first
parameter, 0 is mandatory and the session ID has a SSQLBD prefix.
lr_start_transaction("LoginSQLSync");
web_submit_data("start.swe_2",
"Action=http://design/callcenter_enu/start.swe",
"Method=POST",
"RecContentType=text/html",
"Referer=http://design/callcenter_enu/start.swe",
"Snapshot=t2.inf",
"Mode=HTML",
ITEMDATA,
"Name=SWEUserName", "Value=wrun", ENDITEM,
"Name=SWEPassword", "Value=wrun", ENDITEM,
"Name=SWERememberUser", "Value=Yes", ENDITEM,
"Name=SWENeedContext", "Value=false", ENDITEM,
"Name=SWEFo", "Value=SWEEntryForm", ENDITEM,
"Name=SWETS", "Value={SiebelTimeStamp}", ENDITEM,
"Name=SWECmd", "Value=ExecuteLogin", ENDITEM,
"Name=SWEBID", "Value=-1", ENDITEM,
"Name=SWEC", "Value=0", ENDITEM,
LAST);
lr_transaction_instance_add_info(0,lr_eval_string("SSQLBD:{Siebel_sn_body4}"));
lr_end_transaction("LoginSQLSync", LR_AUTO);
Note: To avoid session ID conflicts, make sure that the Vusers log off from the database at
the end of each session.
Siebel Web - Troubleshooting and Limitations
This section describes troubleshooting and limitations for Siebel Web Vuser scripts.
Recording High Interactivity Client
The Siebel High Interactivity client is only supported with a 32-bit Internet Explorer, version 9 and
earlier. To record this type of session, check your browser version and downgrade if necessary.
Alternatively, you can use proxy recording. For details, see "Recording via a Proxy - Overview" on
page220.
User Guide
VuGen
HP LoadRunner (12.50) Page 669
Back or Refresh Error
An error message relating to Back or Refresh typically has the following text:
We are unable to process your request. This is most likely because you used the browser back or
refresh button to get to this point.
Cause: The possible causes of this problem may be:
lThe SWEC was not correlated correctly for the current request.
lThe SWETS was not correlated correctly for the current request.
lThe request was submitted twice to the Siebel server without the SWEC being updated.
lA previous request should have opened a frame for the browser to download. This frame was not
created on the server probably because the SWEMethod has changed since the recording.
Same Values
A typical Web page response to the Same Values error is:
@0`0`3`3``0`UC`1`Status`Error`SWEC`10`0`1`Errors`0`2`0`Level0`0`ErrMsg`The same values for
'Name' already exist. If you would like to enter a new record, please make sure that the field values are
unique.`ErrCode`28591`
Cause: The possible cause of this problem may be that one of the values in the request (in the above
example, the value of the Name field) duplicates a value in another row of the database table. This
value needs to be replaced with a unique value to be used for each iteration per user. The
recommended solution is to replace the row ID with its parameter instead insuring that it will be unique.
No Content HTTP Response
A typical HTTP response for a No Content HTTP Response type error is:
HTTP/1.1 204 No Content
Server: Microsoft-IIS/5.0
Date: Fri, 31 Jan 2003 21:52:30 GMT
Content-Language: en
Cache-Control: no-cache
Cause: The possible causes of this problem may be that the row ID is not correlated at all or that it is
correlated incorrectly.
Restoring the Context
The typical Web page response to the Restoring the Context type error is:
@0`0`3`3``0`UC`1`Status`Error`SWEC`9`0`1`Errors`0`2`0`Level0`0`ErrMsg`An error happened
during restoring the context for requested location`ErrCode`27631`
User Guide
VuGen
HP LoadRunner (12.50) Page 670
Cause: The possible causes of this problem may be that the rowid is not correlated or that it is
correlated incorrectly.
Cannot Locate Record
The typical Web page response to the Cannot locate record type error is:
@0`0`3`3``0`UC`1`Status`Error`SWEC`23`0`2`Errors`0`2`0`Level0`0`ErrMsg`Cannot locate record
within view: Contact Detail - Opportunities View applet: Opportunity List Applet.`ErrCode`27573`
Cause: The possible causes of this problem may be that the input name SWERowId does not contain a
row ID for a record on the Web page. This input name should have been parameterized. The
parameter's source value may have changed its location.
End of File
The typical Web page response to the End of File type error is:
@0`0`3`3``0`UC`1`Status`Error`SWEC`28`0`1`Errors`0`2`0`Level0`0`ErrMsg`An end of file error
has occurred. Please continue or ask your systems administrator to check your application
configuration if the problem persists.`ErrCode`28601`
Cause: The possible causes of this problem may be that the input name SWERowId does not contain a
row ID for a record on the Web page. This input name should have been parameterized. The
parameter's source value may have changed its location.
Unable to Retrieve Search Categories
The typical Web page response to the Unable to Retrieve Search Categories type error is:
Cause: A possible cause of this problem may be that the search frame was not downloaded from the
server. This occurs when the previous request did not ask the server to create the search frame
correctly.
Silverlight Protocol
Silverlight Protocol - Overview
Microsoft Silverlight is a web application framework that supports graphics, animations, and
interactivity. The Silverlight protocol enables you to record applications built with Microsoft Silverlight.
The Silverlight protocol includes the Web - HTTP/HTML protocol as a subset, as well as a number of
additional functions, recording options, and runtime settings.
In order to record high level Vuser scripts, you can import WSDL files used by your application in the
recording options.
User Guide
VuGen
HP LoadRunner (12.50) Page 671
How to Import WSDL Files
The following steps describe how to import WSDL files into a Silverlight Vuser script, manually or
automatically. Alternatively, you can disable WSDL files and generate soap requests. All of these options
are performed in the Silverlight > Services node of the Recording Options Dialog Box. For user
interface details, see "Silverlight > Services Recording Options" on page203.
Automatically Locate WSDL Files
To configure VuGen to automatically detect the WSDL files used by your script and attempt to locate
them, select Use WSDL files included in the script and Automatically detect WSDL files and import
services during code generation. If a WSDL is detected that cannot be imported, you will be notified in
the Code Generation Notifications box.
Manually Locate WSDL Files
You can manually locate WSDL files in a number of ways from the Add Service Dialog Box. To locate a
WSDL file whose URL is known, use the URL option. If the WSDL file is on your local machine, you the File
option. To search for the WSDL in the WSDL History (a list of previously imported WSDLs), select
Previously Imported and click ... to open the list.
For user interface details, see "Add / Edit Services Dialog Box" on page204.
Disable WSDL Files
You can disable WSDL files and generate SOAP requests instead. This results in a lower level script,
however it does increase the performance of your script. To disable WSDL files, select Do not use WSDL
files.
Advanced Security Settings
You can modify security and password settings in the Protocol and Security Scenario Data dialog box.
For details, see "Protocol and Security Scenario Data Dialog Box" on page205.
Silverlight - Troubleshooting and Limitations
This section describes troubleshooting and limitations for the Silverlight protocol.
lWhile recording a site developed in Silverlight, the Install Silverlight step is recorded even though
recording process did not include installing the Silverlight plug-in.
Workaround
Configure the runtime settings to exclude the following address:
http://go.microsoft.com/fwlink/?LinkId=108181
a. Select the runtime settings > Internet Protocol > Download Filters Node.
b. Select the Exclude addresses in list radio button.
User Guide
VuGen
HP LoadRunner (12.50) Page 672
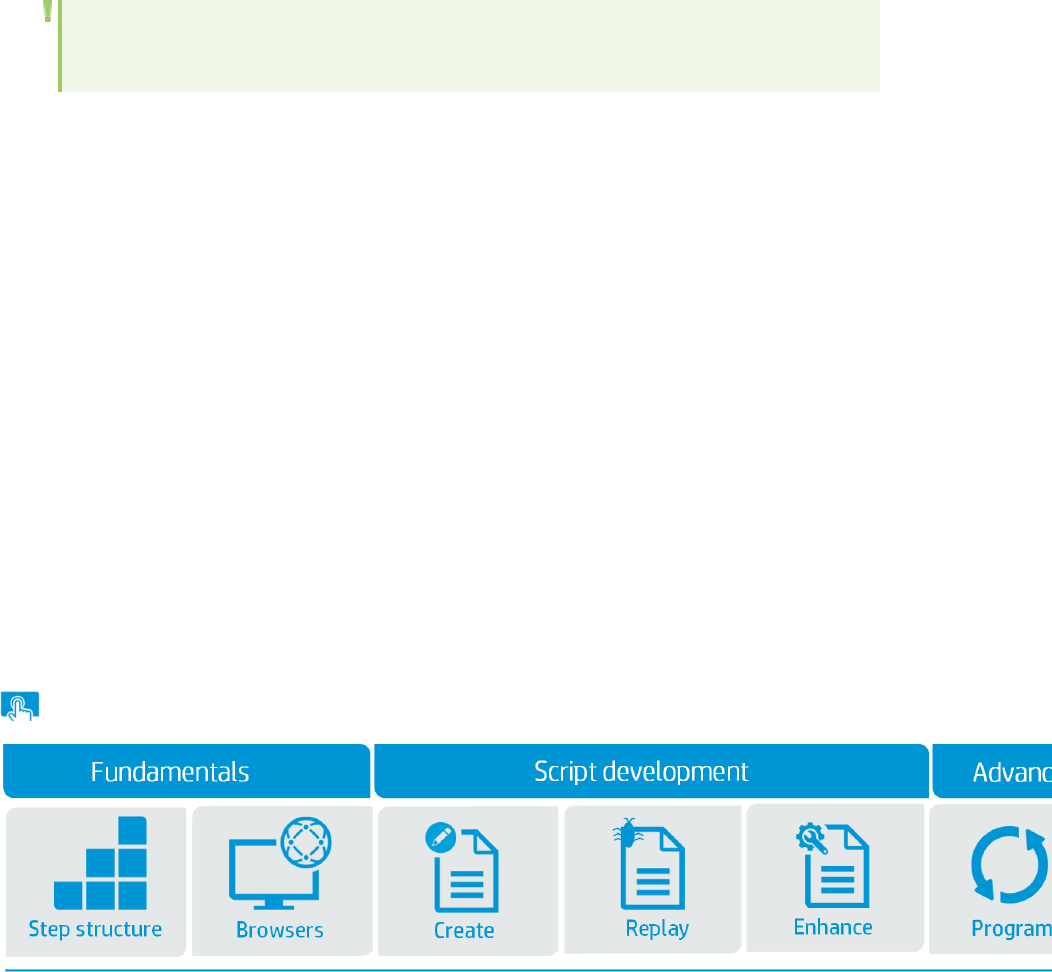
c. Click Add and add http://go.microsoft.com/fwlink/?LinkId=108181 to the list.
Note: The ?LinkId=108181 portion of the URL address may not be static over time and may
need to be updated.
lREST services do not generate Silverlight service calls. However they can be recorded and replayed.
lYou cannot edit the WSDL location in the Protocol and Security Scenario dialog box.
lThe Update button in the Silverlight Service node of the Recording Options dialog box updates the
service if the WSDL location has not changed.
lIf the WSDL location has changed, the service is re-imported (delete service and import service).
lDuplex (Polling) Binding for WCF Web Services is not supported.
lSilverlight 4 and 5 clients are supported, however applications developed using the new
communication features such as net.tcp binding are not supported.
lThe VuGen snapshot viewer does not support Silverlight controls.
lThe Silverlight Protocol does not support applications which use Japanese, Korean, Simplified
Chinese, and Traditional Chinese.
TruClient Protocol
TruClient is a tool for recording Web-based applications. The TruClient engine records your actions as
you navigate through your business process. It creates a script in real-time, allowing you to see the
steps as they are performed in a sidebar.
Select an image to learn more.
What do you want to do?
lLearn about TruClient "Fundamentals" on page677
l"Develop TruClient Scripts" on page713
l"Program TruClient Scripts" on page770
lView the "TruClient API Reference" on page795
User Guide
VuGen
HP LoadRunner (12.50) Page 673

Introduction to TruClient
TruClient is a tool for recording Web-based applications. The TruClient engine records your actions as
you navigate through your business process. It creates a script in real-time, allowing you to see the
steps as they are performed in a sidebar.
TruClient provides you with the tools to record Web-based applications.
TruClient end-to-end workflow
The following tasks describes the end-to end work flow to develop a robust TruClient script that can
replay iteratively with no errors.
Record a business process interactively in the browser.
The TruClient engine records your actions as you navigate through your business process. It creates a
script in real-time, containing a series of steps that are displayed as they are performed in the sidebar.
See "Record a script" on page715 or "Implement run logic " on page718to understand recording and
run logic basics.
Note: Alternatively, you can create a scripts by manually adding steps from the toolbox. For
details, see the "TruClient Toolbox" on page702.
"Capture a value to a string" on page778 demonstrates how to manually add steps to a script.
Replay the script to automatically assign end event.
Steps in TruClient scripts are asynchronous, meaning, one step does not necessarily need to end before
the next step can begin. The end event of each step determines when the subsequent step will start.
After you record a script, you will need to replay it, possibly multiple times, until each step is assigned
the correct end event.
During first replay, TruClient will automatically assign an end event. For details, see "Understanding step
events" on page684 or "How to Synchronize TruClient Scripts Steps" on page725.
Debug the script
After the initial replay, the script may still contain replay errors related to object identification. Object
identification, TruClient's ability to identify an object, such as a button or image, often causes issues
during replay. TruClient provides several tools to resolve object identification such as alternate steps
and modifying an object's identification method specifically using descriptors.
For general debugging tips, see "Debug TruClient Scripts" on page727.
User Guide
VuGen
HP LoadRunner (12.50) Page 674
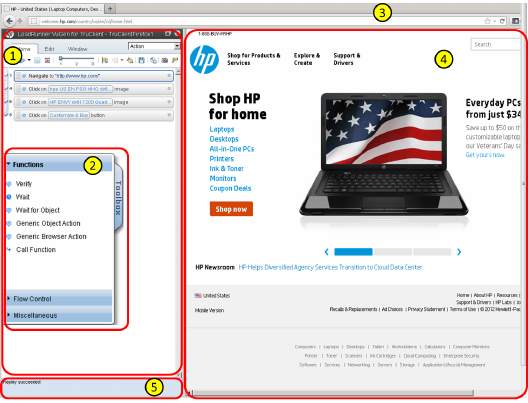
Enhance the script
Enhance your script by inserting transactions or parameters. You can further optimize scripts with
functions and function libraries and event handlers.
The TruClient User Interface
The TruClient user interface is made up of the following sections:
1. TruClient Sidebar. The heart of the interface, the sidebar contains all the tools you need to
develop your TruClient scripts.
2. TruClient Toolbox. The toolbox contains all of the steps that you can add to a TruClient script. The
toolbox opens and closes by clicking on the tab, and moves by dragging it up or down.
3. Browser Navigation Bar. Enter the URL of the application for which you are developing a script.
4. Application Browser Window.The window containing the browser where you develop and replay
your script interactively.
5. TruClient Sidebar Status Pane. A pane that displays status details about the active action in the
TruClient Sidebar.
TruClient Standalone
The TruClient Standalone enables you to create scripts independent of a VuGen installation.
The scripts are compatible with the following products:
lAppPulse
lBusiness Service Management
lLoadRunner
User Guide
VuGen
HP LoadRunner (12.50) Page 675
lPerformance Center
lStormRunner
TruClient Standalone System Requirements
The following table describes the system requirements for installing the TruClient standalone.
Note: Windows 8.1 and Windows 2012 R2 can only be used in conjunction with Internet Explorer 11;
earlier versions cannot be installed.
Requirement Value
Processor speed Dual-Core 2.2 GHZ or faster
Operating system lWindows Server 2008 R2 SP1 64-bit
lWindows Server 2012 R2 64-bit (recommended)
lWindows 7 SP1 32-bit or 64-bit
lWindows 8.1 64-bit (recommended)
Memory (RAM) Recommended: 8 GB
Screen resolution Minimum: 1366x768
Browser Microsoft IE (Internet Explorer) 9, 10, or 11
(It is recommended to keep the default IE settings)
Available hard disk space Minimum: 50 GB
Installing the TruClient Standalone
Product Location of the TruClient Standalone installer
LoadRunner DVD/Standalone Applications
AppPulse SSO site
Business Management Services SSO site
Performance Center DVD/Standalone Applications
StormRunner Download from the product
Differences between TruClient installations
The following table highlights the differences between TruClient in VuGen and the TruClient Standalone:
User Guide
VuGen
HP LoadRunner (12.50) Page 676

Feature TruClient in VuGen TruClient Standalone
Visibility of extra files
in the script
lfunction.js
lglobals.h
lJS-functions.js
Visible in Solution Explorer. Located in the <path>/scripts
folder.
Use a text editor to edit these files.
Log viewer VuGen > Output Pane Not available
Open Parameters
Dialog Box
You can access parameters from
the Toolbar in Vugen
You can access parameters from
the TruClient sidebar
Runtime settings You can access Runtime settings
from the Toolbar in VuGen.
You can access Runtime settings
from the TruClient Sidebar.
Network Virtualization
Analytics
Available Not available
Network Section
lSpeed Simulation
lDownload filters
VuGen > Runtime settings Not available
Ability to add custom
extra files
Available Not available
Convert the script to
Web (HTTP/HTML)
Available Not available
Connection to HPLN. Available Not available
Fundamentals
TruClient provides you with a sidebar that allows you to see the steps as they are performed.
Select an image to learn more.
User Guide
VuGen
HP LoadRunner (12.50) Page 677
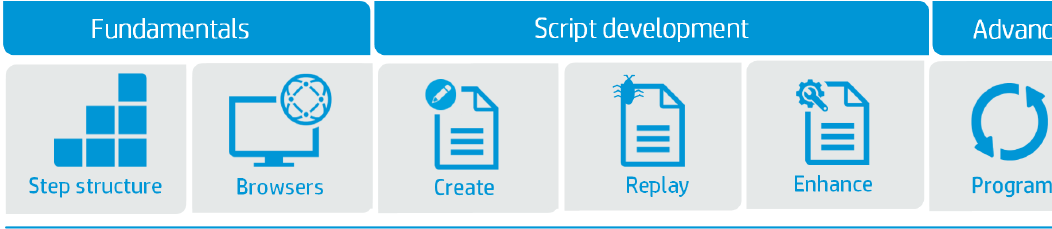
TruClientStep Structure
TruClient steps are comprised of a number of sections and elements. Explore the following topics to
learn more.
What do you want to do?
lRead about TruClient step structure
lRead about step events
lLearn how to synchronize TruClient scripts steps
Next steps
"Record a TruClient script" on page714
"Replay a TruClient Script" on page725
"Enhance a TruClient Script" on page753
HP LoadRunner (12.50) Page 679
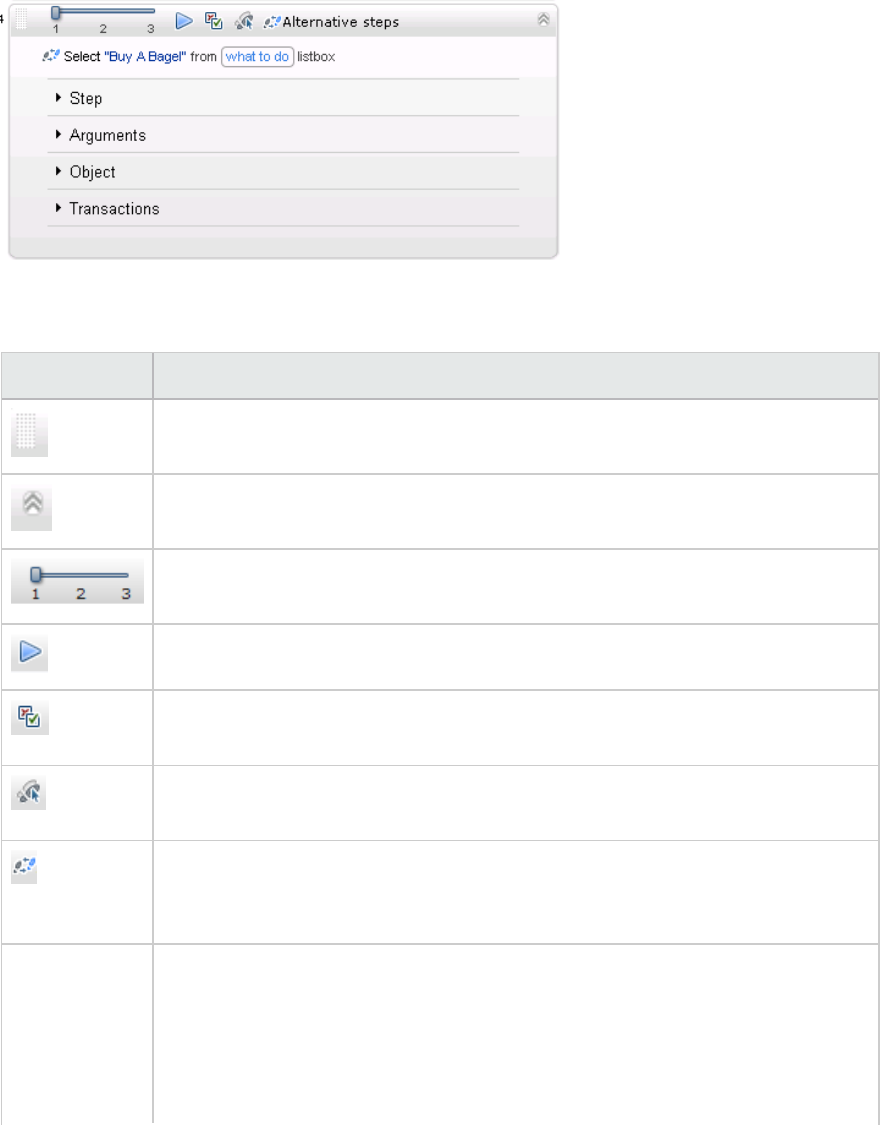
TruClient step structure
TruClient steps are comprised of a number of sections. The sections and elements within each section
vary depending on the type of step.
User interface elements are described below:
UI Element Description
Drag Step. Arrange the order of your script by dragging the step to a different
location.
Expand Step. Displays the individual components of a step which includes step,
argument and object.
Script levels selector. View and modify the script level of a step. For more
information, see "Modify and view script levels" on page729.
Replay. Replay this step only.
Disable/Enable Step. Temporarily remove steps from the script without deleting
them. Steps that are disabled are not replayed.
Optional Step.In the event that the step can not find its object, the script continues
without returning an error.
Alternative Steps. This icon indicates a step which can be redefined in alternative
ways. To redefine the step, click the icon, select the desired step definition, and
click Back. For more information, see "Use Alternative Steps" on page737.
Step lAction. The action that defines the step. The list of relevant actions is
determined by the object roles.
lObject Timeout. If the object does not appear before this time in seconds, the
step returns an error.
lStep Timeout. If the End Event is not reached by this time in seconds, the step
Step Structure
HP LoadRunner (12.50) Page 680

returns an error. The way the script behaves when such an error occurs can be
configured in the dialog box.
lMinimum Time.The least time, in seconds, that the execution of the step will
take. The value of this field can be either 0, “as recorded” or another manually
set number.
The step execution will end immediately after the step’s end event if minimum
time is = 0.
A minimum time value greater than 0 forces TruClient to wait the additional time
(if not elapsed already) from the step's end event before moving on to the next
step.
TruClient records and stores the time that elapsed between recorded actions
and allows you to set the minimum time to “as recorded”.
The runtime settings determine the step's effective minimum time value unless
the step's minimum time value has a non-default setting.
lEnd Event. TruClient defines when the End Event occurs during tge furst script
replay.
An End Event can be one of the following:
lAutomatic: Not Set Yet. The automatic end event has not yet been
determined.
lAutomatic: Timers Ended. The automatic end event whenever TruClient
identifies either the setTimeout() or the setInterval() function running
as part of the document load in the JavaScript code.
lAction Completed. Step ends when its action is completed. An example of an
action is a button click.
lDOM content loaded. Step ends when the page's Document Object Model
(DOM) is ready. This means that the API for interacting with the content, style
and structure of a page is ready to receive requests from your application
client side code.
lStep synchronous network completed. Step ends when all HTTP requests
have been completed excluding requests that are associated with open
connections that are not relevant to the step. Usually, these requests are
triggered by using XMLHttpRequest.
lDocument load. Step ends when the process of loading a document is
completed. This means that all scripts and stylesheets have finished loading
and have been executed, and all images have been downloaded and
displayed.
lStep network completed. Step ends when all HTTP requests have completed
including requests initiated by XMLHttpRequest.
lDialog opened. Step ends when a dialog box is opened.
Step Structure, continued
User Guide
HP LoadRunner (12.50) Page 681

For details, see "How to Synchronize TruClient Scripts Steps" on page725
Arguments Contains step arguments. These arguments differ for different step actions and
roles.
By default, arguments are assumed to be plain text. However, you can specify an
argument to be evaluated as JavaScript in the argument drop-down.
For a list of the step arguments, see "TruClient Step Arguments" on page825.
Object lRoles. The functions that TruClient understands about an object. This
information is read-only and is updated dynamically depending on how the
object is used during recording. The list of available step actions is defined by
these roles.
lName. A logical name for the object. This does not affect replay and can be
modified to enhance readability.
lID Method. The method of identifying the object.
lAutomatic. TruClient's default object identification method. If this method
does not successfully find the object during replay, click the Improve Object
Identification button, reselect the correct object from the application, and
replay the script again.
lXPath. Identifies the object based on its XPath expression that defines the
object in the DOM tree. When you select this option, the next edit box in the
display is labeled XPath and enables you to select an XPath to define the
object. See "XPath" below for details.
lJavaScript. JavaScript code that returns an object. When you select this
option, the next edit box in the display is labeled JavaScript and enables you
to write JavaScript to define the object. For details, see "JavaScript" on the
next page or Working With JavaScript In TruClient Scripts.
lDescriptors. Enables you to identify an object by it's properties in an editor.
For details, see Descriptors.
lRelated Objects. Tool to enable TruClient to identify a target object in relation
to an anchor object. For details, see "Resolve Object Identification Issues" on
page736.
Transactions Allows you to create, modify, and view transactions. For more information, see
"Enhance a script with Toolbox functions" on page753.
XPath/JavaScript
XPath TruClient generates two possible XPaths, one based upon the object's property and
the other based upon the object's DOM structure. Click the drop-down arrow next
Step Structure, continued
User Guide
HP LoadRunner (12.50) Page 682
to the XPath edit box to select a suggested XPath for the object. You can manually
modify the suggested XPath. To revert to one of the original expressions generated
by TruClient, select one of the options from the drop-down again.
You can also click the Regenerate expression button and select an object. TruClient
generates a new set of suggestions based on the selected object.
JavaScript If TruClient can generate a suggested XPath for the object, that XPath is entered as
the argument in an evalXPath function in the JavaScipt field. The evalXPath
function returns an array of the objects defined by the XPath in the argument.
You can modify the suggested XPath in the argument to return a different list of
objects, or you can enter a different JavaScript.For example:
document.getElementById("SearchButton") returns an element that has a DOM ID
attribute of "SearchButton".
TruClient also includes a random function that returns a random item from the
array that is provided as its argument. For example:random
(document.getElementsByTagName("a"))
Note: The evalXPath and random functions are available as object
identification methods only. They are not recognized in an Evaluate
JavaScript code step.
Step Structure, continued
User Guide
HP LoadRunner (12.50) Page 683
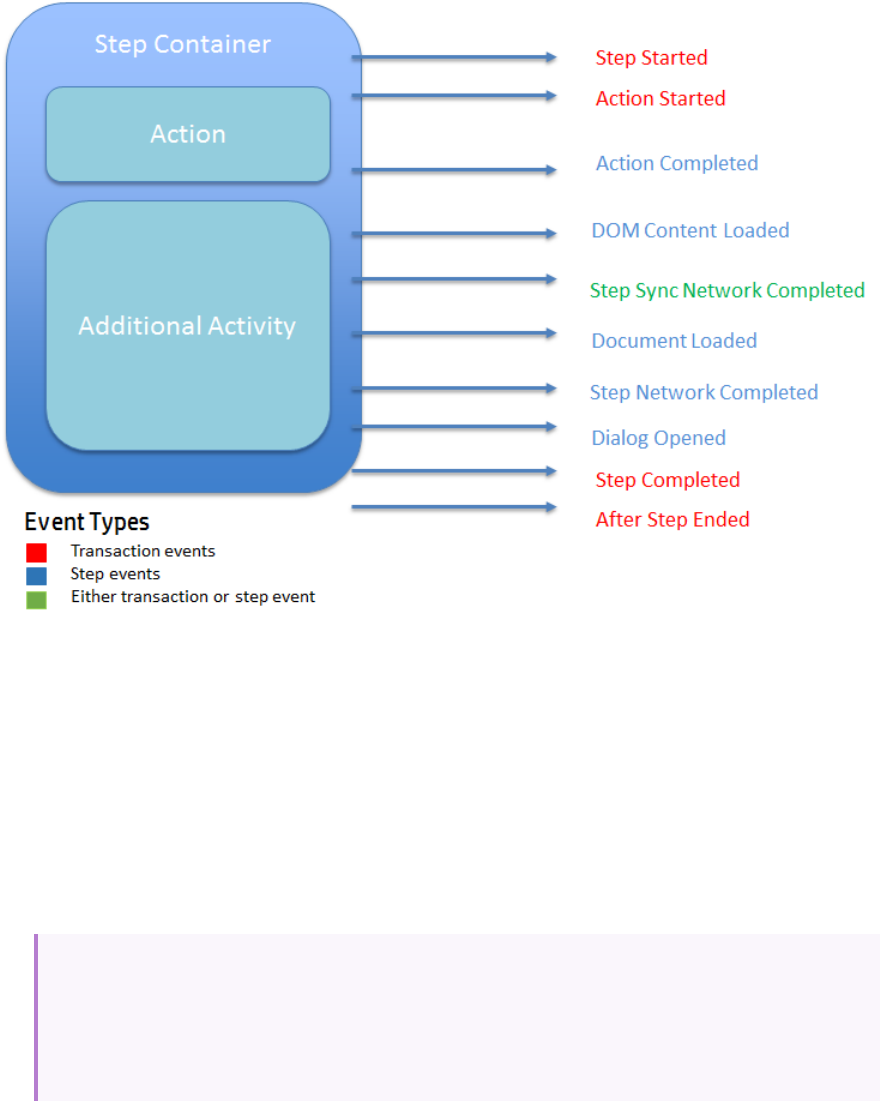
Understanding step events
A TruClient step contains an action, and for application related steps, additional activity. The following
diagram illustrates the sequence of events triggered as a result of step execution.
What is an End Event?
TruClient scripts are asynchronous which means steps do not have to wait for previous steps to
complete before they start. Each step has an event flow and the End Event defines the point at which
subsequent steps are allowed to start. During script replay, TruClient will determine each step's end
event. For details see, "How to Synchronize TruClient Scripts Steps".
A step can be thought of as a container including an action and additional application activity. Each step
execution differs and may go through a different event flow. The following examples illustrate how step
execution can differ:
Example 1: Getting parameters using EvaluateJS step
The step includes an Evaluate JS step with TC.getParam("Name"); code. In this step there is no
application related activity. Therefore, the end event is automatically set to Action completed.
The remaining events in the chain are not relevant.
HP LoadRunner (12.50) Page 684

Example 2: Click on a simple search box (no auto-suggest)
This step interacts with the application but it does not trigger any network or DOM activity.
Therefore, the end event is automatically set to Action completed. The remaining events in the
chain are not relevant.
Example 3: Click on a search button
This step interacts with the application and triggers both network and DOM activity. Therefore,
the end event is automatically set to one of the events that follows Action completed. The
event selected depends upon the specific application behavior.
When to manually change step end events
lThe next step is not ready to be executed because the preceding end event is incorrect. For details,
see "How to Synchronize TruClient Scripts Steps".
lYou have created a transaction that surrounds several steps. You are interested in measuring a
certain aspect of the transaction more accurately. For details, see "Insert transactions into a
TruClient script" on page754.
User Guide
HP LoadRunner (12.50) Page 685
TruClient Sidebar
The sidebar contains all the tools you need to develop your TruClient scripts.
What do you want to do?
Read more about:
"TruClient Home tab" on page687
" TruClient Edit tab" on page691
"Run Logic tab" on page694
"Actions tab" on page697
"Function Libraries tab" on page701
"TruClient Toolbox" on page702
Keyboard shortcuts
See also
"The TruClient User Interface" on page675
HP LoadRunner (12.50) Page 686
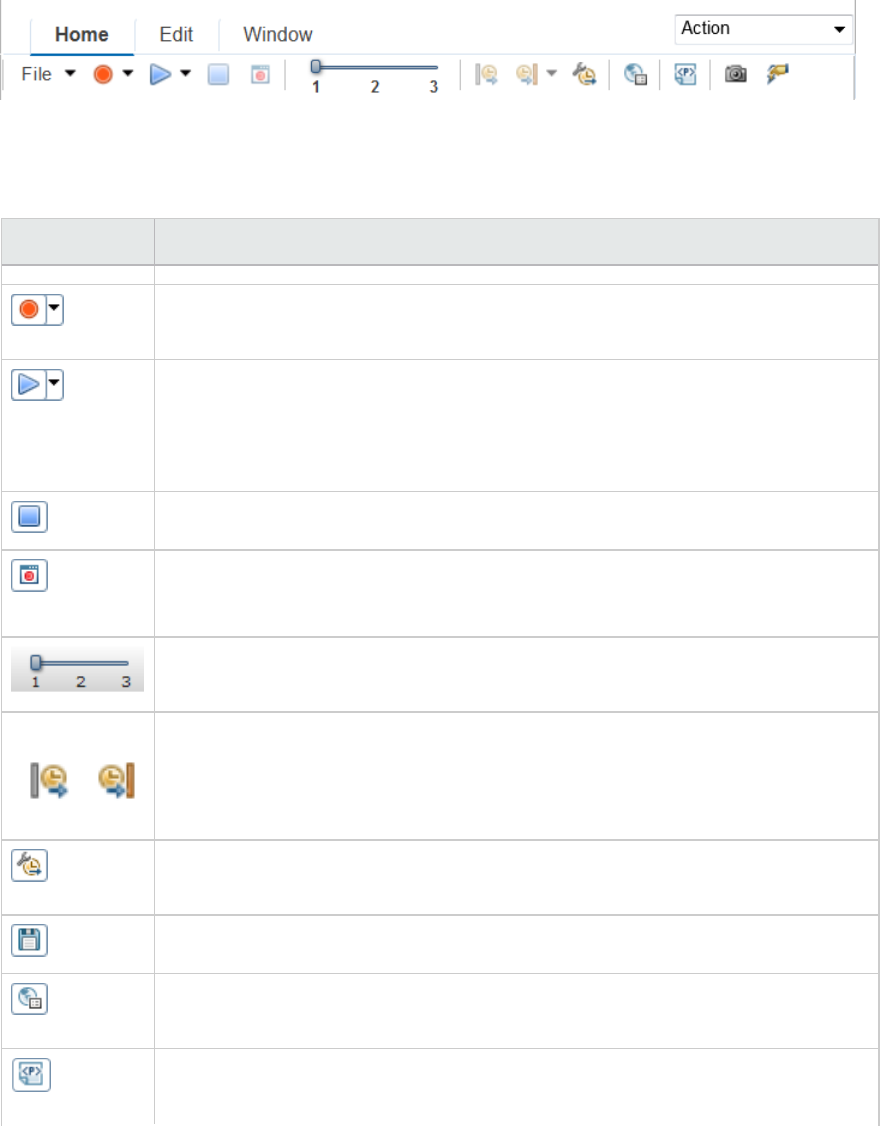
TruClient Home tab
This tab enables you to control the basic flow of the recording process for TruClient scripts.
Where do I find it?
Select Action from the drop-down list on the TruClient sidebar.
UI Elements Description
Record. Starts recording the script. Additionally, you can use the arrow to specify
whether to record before or after the selected step.
Play. Replays the script. Additionally, you can use the arrow to specify whether to
play the selected step only, or to run the script step by step. Running the script
step by step pauses the replay after each step. For more information, see "Debug
TruClient Scripts" on page727.
Stop. Stops recording or replaying the script.
Toggle Breakpoint. Toggles breakpoints on the selected step.
For details, see "Insert Toggle Breakpoints" on page727.
Script Level. Modifies the script levels that are visible and replayed in the script.
For more information, see "Modify and view script levels" on page729.
Start/End Transaction. Inserts a starting or ending point for a transaction.
Transaction Editor. Opens the Transaction Editor, enabling you to define new
transactions and modify existing ones.
Save. Saves the script.
General Settings. Opens the General Settings dialog box. For details, see "TruClient
General Settings " on page765.
Parameters. Set parameter values. For details, see "Enhance a script with Toolbox
functions" on page753
HP LoadRunner (12.50) Page 687
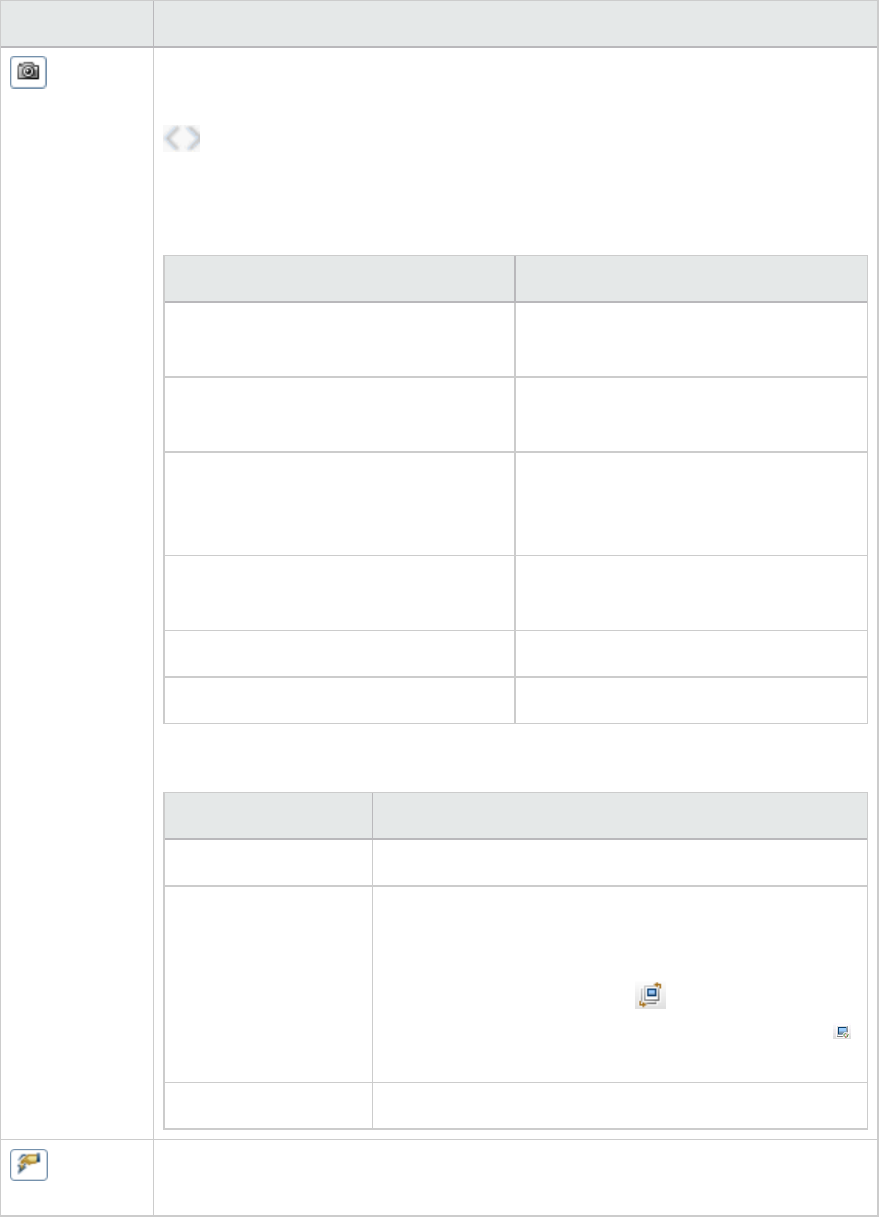
UI Elements Description
The snapshot viewer displays the snapshot in the right pane and adds the following
elements :
Previous/Next. Navigates to the screenshot for the previous or next step. The
corresponding step is highlighted in the script.
Snapshot type
UI Element Description
Recording. Displays snapshots that were taken for
a specific step during recording.
Interactive Replay. Display snapshots that were taken for
a specific step during interactive replay
Iteration. Display snapshots for a specific
iteration during interactive replay
mode.
Load Mode Replay. Display snapshots that were taken for
a specific step during load mode replay
Play Slide Show. Display snapshots as a slide show.
Stop Slide Show.
View
UI Element Description
Single. Displays the snapshot for a single step.
Compare. Splits the screen so you can compare snapshots from
different modes. Use the Snapshot View buttons in each
pane to select which snapshots to view. Click the
Synchronize Scrolling button to synchronize
scrolling between the panes. The snapshot error icon
indicates that the snapshot is not current for the step.
Thumbnail. Displays the snapshots in thumbnails view.
Opens the Event Handler Editor box. For details, see "TruClient Event Handlers" on
page760.
User Guide
HP LoadRunner (12.50) Page 688

Context Menu
To access Select a step and right click to display the context menu.
Relevant tasks "TruClient step structure" on page680
UI Element Description
<Replay
Actions>
Play This Step. Replay the selected step only.
Play From This Step. Replay the script from the selected step.
<Record> lBefore step. Insert the next set of recorded steps before the selected step.
lInto Step. Insert the next set of recorded steps into the selected step.
lAfter Step. Insert the next set of recorded steps after the selected step.
Toggle
Breakpoint
Insert/Remove a breakpoint.
<Transaction
Steps>
lStart Transaction. Insert a Start Transaction step into the script.
lSurround With Transaction. Insert a Start Transaction and End Transaction
steps around a single or multiple steps into the scripts.
lEnd Transaction. Insert an End Transaction step into the script.
<Group
Actions>
Group Steps Multiple steps are grouped together as a single step.
Group Into Multiple steps are group into:
lAction. A group of steps that you define as a new or existing action.
lIf Clause. A logical structure that controls the flow of your script.
lFor Loop Clause . A logical structure that repeats the steps contained in the loop
a specified number of times.
lNew Function. A group of steps, such as a login, that you define as a function.
<Edit Actions> lCut. Cut select step from the script.
lCopy. Copy selected step in the script.
lPaste. Paste selected step into the script.
Export/Import
Steps
You can copy and paste steps from one script into a new or existing script using the
Export/Import function.
The following limitations apply:
lYou can copy and paste steps between scripts that are developed using the
same browser. For example, if you copy steps from a Firefox script, you can only
paste them into another script developed in Firefox.
User Guide
HP LoadRunner (12.50) Page 689

lYou can copy and paste steps to and from the Actions or Function Libraries tabs
of a script.
Export. Copy selected steps in a TruClient script to paste into another script.
Import. Paste selected steps, that have been exported, into a second script.
Delete Delete a step from the script.
Disable/Enable Toggle between disabling or enabling a step during replay.
Edit Step Expand the step to display step, argument and transaction properties.
Show Step Numbers. Display step numbers.
Animations. Enable/Disable step animation in the TruClient sidebar.
Unfold all Minimize all steps and groups.
Fold all Display all steps in groups.
User Guide
HP LoadRunner (12.50) Page 690
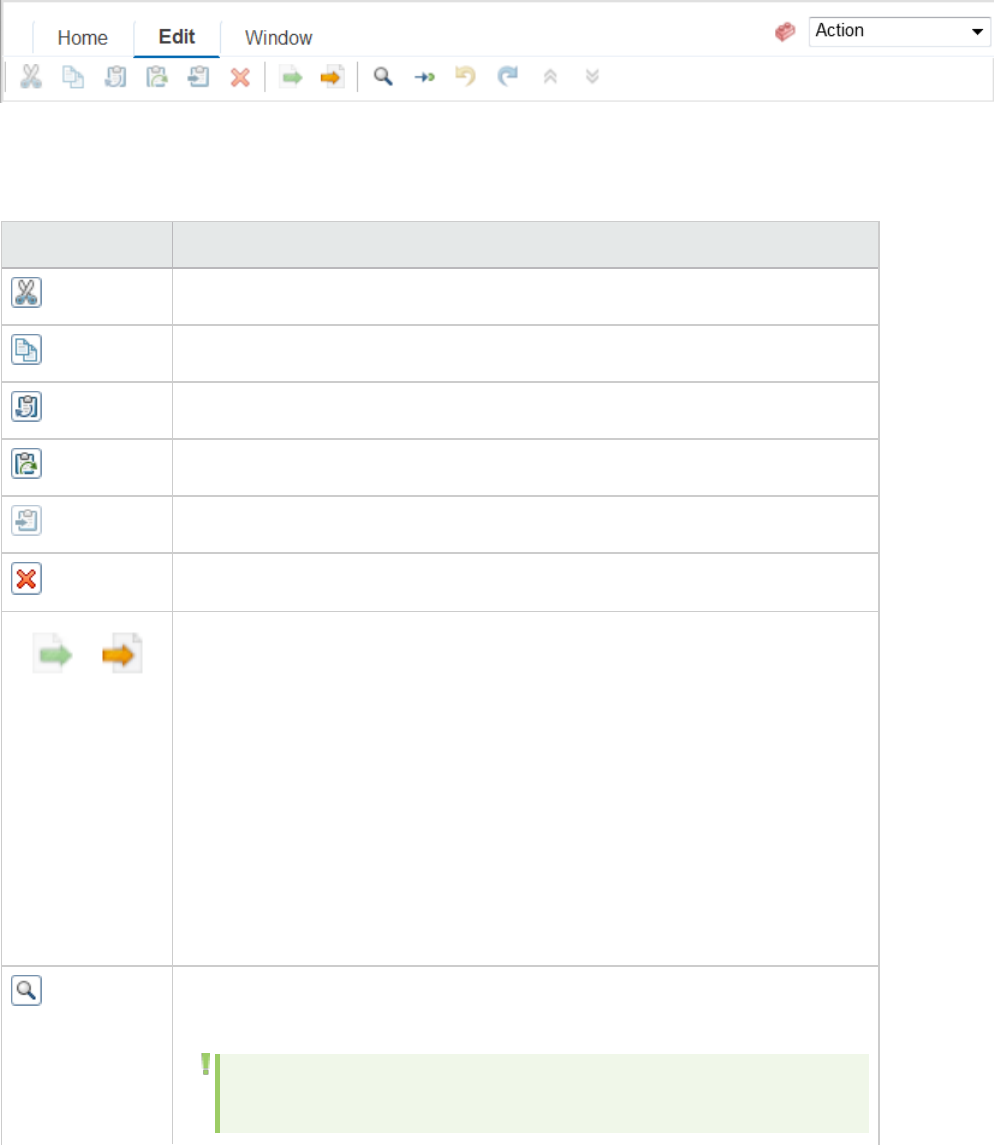
TruClient Edit tab
This tab enables you to cut, copy, and paste steps and data in TruClient scripts.
Where do I find it?
Select the Edit tab from the TruClient sidebar.
UI Element Description
Cut the selected data or step.
Copy the selected data or step.
Pastes before the selected step.
Pastes after the selected step.
Pastes into the selected step.
Deletes the selected step.
You can copy and paste steps from one script into a new or existing script using
the Export/Import function.
The following limitations apply:
lYou can copy and paste steps between scripts that are developed using the
same browser. For example, if you copy steps from a Firefox script, you can
only paste them into another script developed in Firefox.
lYou can copy and paste steps to and from the Actions or Function Libraries
tabs of a script.
Export. Copy selected steps in a TruClient script to paste into another script.
Import. Paste selected steps, that have been exported, into a second script.
Opens the Find dialog box, allowing you to search the script for steps by step
name or number.
Note: You can create a step that is a group of sub-steps. If you are
searching for step that is a sub-step, you need to specify both the step
HP LoadRunner (12.50) Page 691
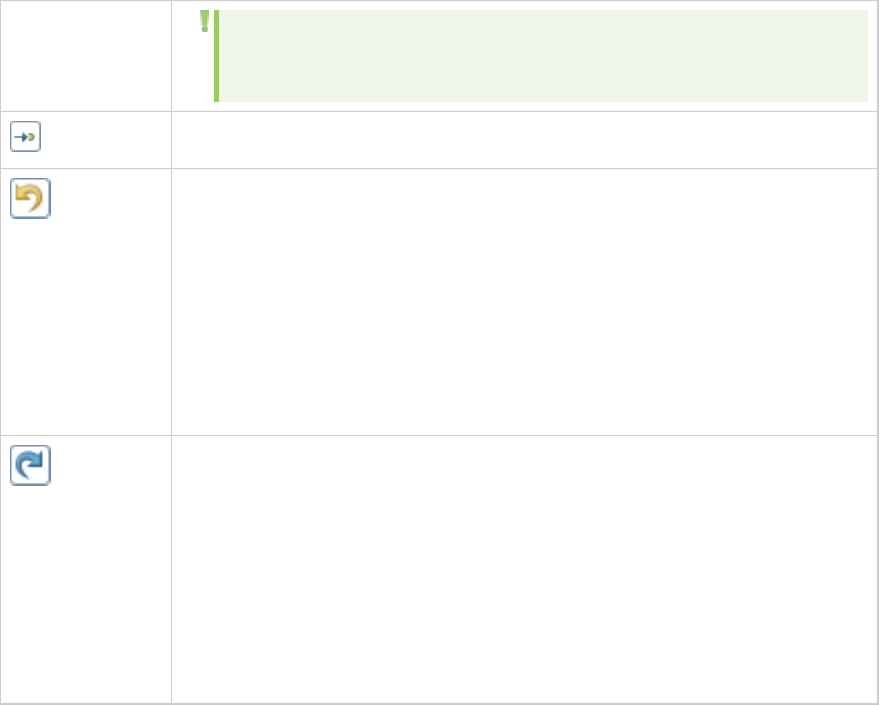
group number and sub-step number. For example, enter 4.1 to search for
the first sub-step in the fourth (group) step .
Go to the specified step.
The following actions can be undone:
lCut
lCopy
lPaste
lDelete
lGroup • Drag & drop (step)
lAdd step from the toolbox
The following actions can be redone:
lCut
lCopy
lPaste
lDelete
lGroup • Drag & drop (step)
lAdd step from the toolbox
User Guide
HP LoadRunner (12.50) Page 692
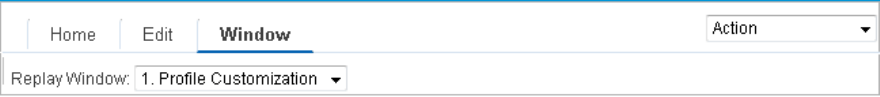
Window tab
This tab enables you to control multiple browser windows for the same script. Select the window that
contains the application that you want to bring to focus. This is needed for the debugging phase of
script development, for example, when attempting to highlight a step object.
HP LoadRunner (12.50) Page 693

Run Logic tab
This tab enables you to develop the flow of your scripts with run logic.
Where do I find it?
Select the Run Logic tab from the TruClient Sidebar.
What is run logic?
Run logic is the ability to control the flow of how your script is run. Using run logic you can create scripts
that reflect users interacting with your application.
See Run Logic samples
Run Logic Structure
The following table describes each section of the run logic structure. application.
Note: You cannot delete any block from the run logic structure
UI
Elements
Description
Init
block
The init block, run once, is the opening sequence of steps to a business process. For
example, a login to a web site.
You can add additional Block steps and Run action steps to build the run logic of your
script. For details, see "Implement run logic in a script" on page720.
By default, the Init Block calls the Init action.
In VuGen, this action is called vuser_init
Run
block
The Run Block controls the flow of the business process you are recording.
You can add additional Block steps and Run action steps to build the run logic of your
script. For details, see "Implement run logic in a script" on page720.
By default, the Block calls the Action action.
End
Block
The end block, run once, is the closing sequence of steps of a business process. For
example a logout from a web site.
You can add additional Block steps and Run action steps to build the run logic of your
script. For details, see "Implement run logic in a script" on page720.
By default, the End Block calls the End action.
In VuGen, this action is called vuser_end
HP LoadRunner (12.50) Page 694
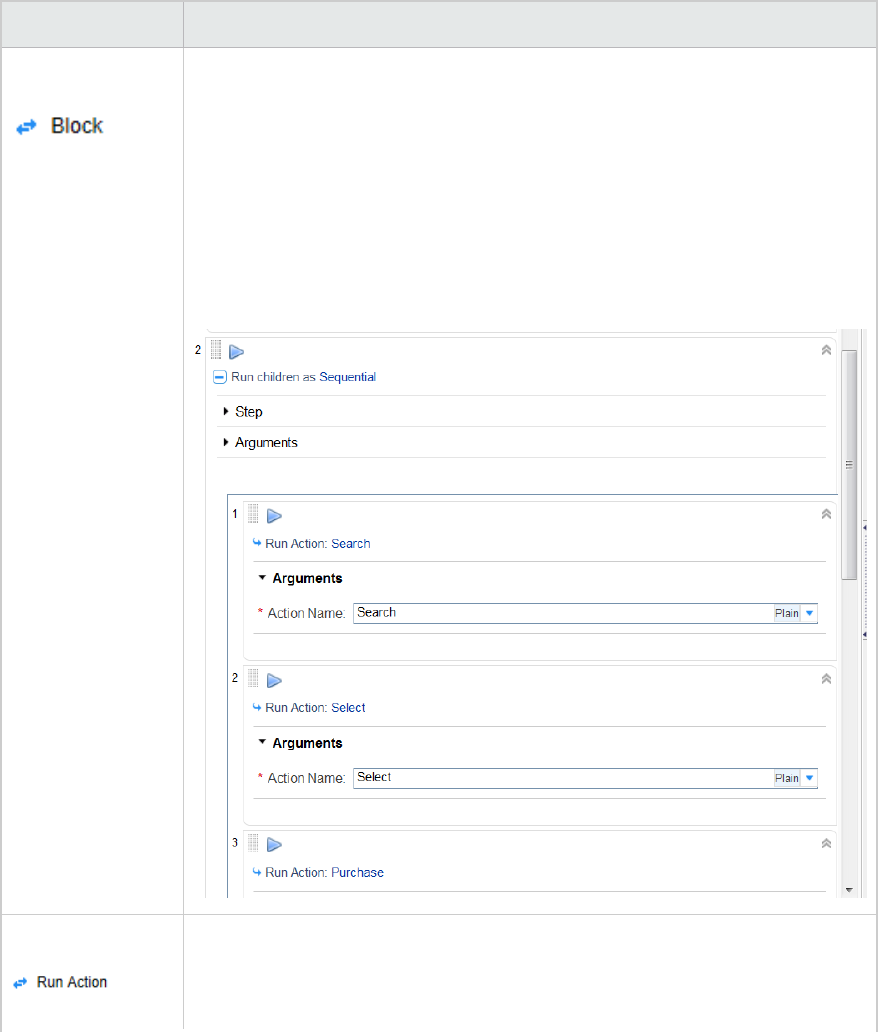
Run Logic steps
You can add run logic steps from the toolbar to build your script flow.
UI Elements Description
Block This function adds aBlock step to your script enabling you to control the flow of
your script.
Arguments.Define the iteration and the mode.
lIteration.Set the number times to run the block.
lMode. Run the actions in the block, referred to as children, either
sequentially or randomly.
Run actions. Drag and drop Run Action steps into the Block.
Run Action This functions adds a Run Action step to the script.
In the Arguments section of the step, you specify the Action name you want to
call. For details on adding actions, see the Actions tab.
User Guide
HP LoadRunner (12.50) Page 695
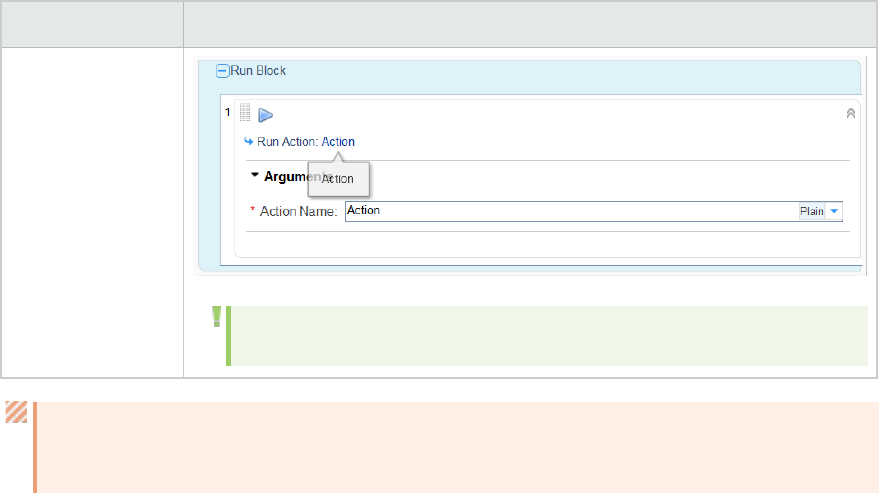
UI Elements Description
Note: Each block contains a default Run Action step.
Caution: Play from this step will not work for a step that is located in an action which is not
part of the run logic.
User Guide
HP LoadRunner (12.50) Page 696
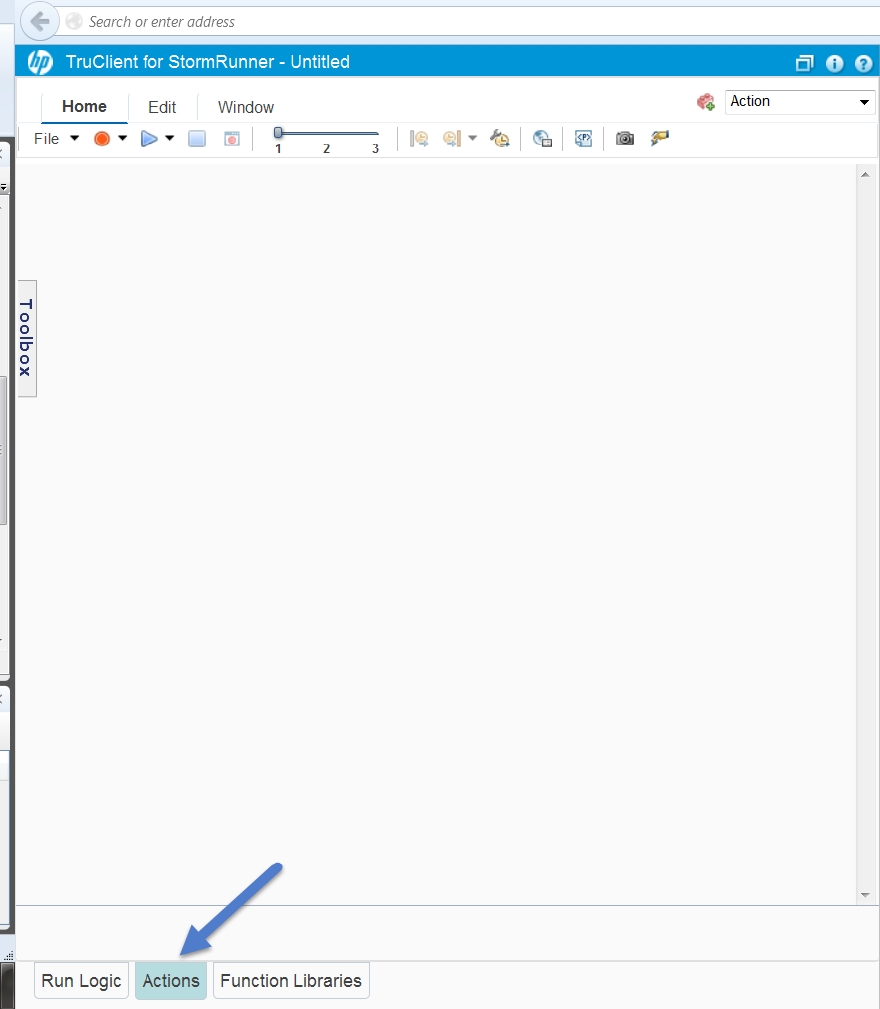
Actions tab
The Action tab enables you to create actions into which you record your business process and run your
script.
Where do I find it?
Select the Actions tab from the TruClient Sidebar.
HP LoadRunner (12.50) Page 697
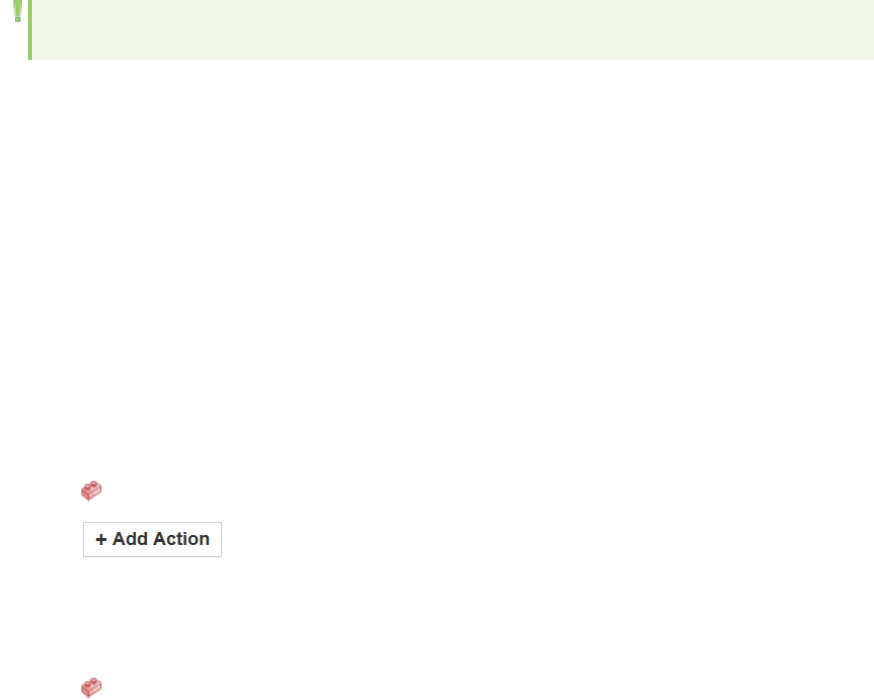
Note: It is from this tab that you record and replay your script.
What is an action?
An action is a set of steps that are represent a business process.
There are three default actions, Init,Action and End. These default sections cannot be deleted. For
details, see "Run Logic tab" on page694.
You can record your entire script into the default Action or you can create new actions that represent a
section of your business process.
See Run Logic examples
What do you want to do?
Add an action to your script
1. Click at the upper right hand corner of the TruClient sidebar to open the Actions dialog box.
2. Click .
Give the Action a meaningful name.
Rearrange the order of Actions
1. Click at the upper right hand corner of the TruClient sidebar to open the Actions dialog box.
2. Select an Action
User Guide
HP LoadRunner (12.50) Page 698
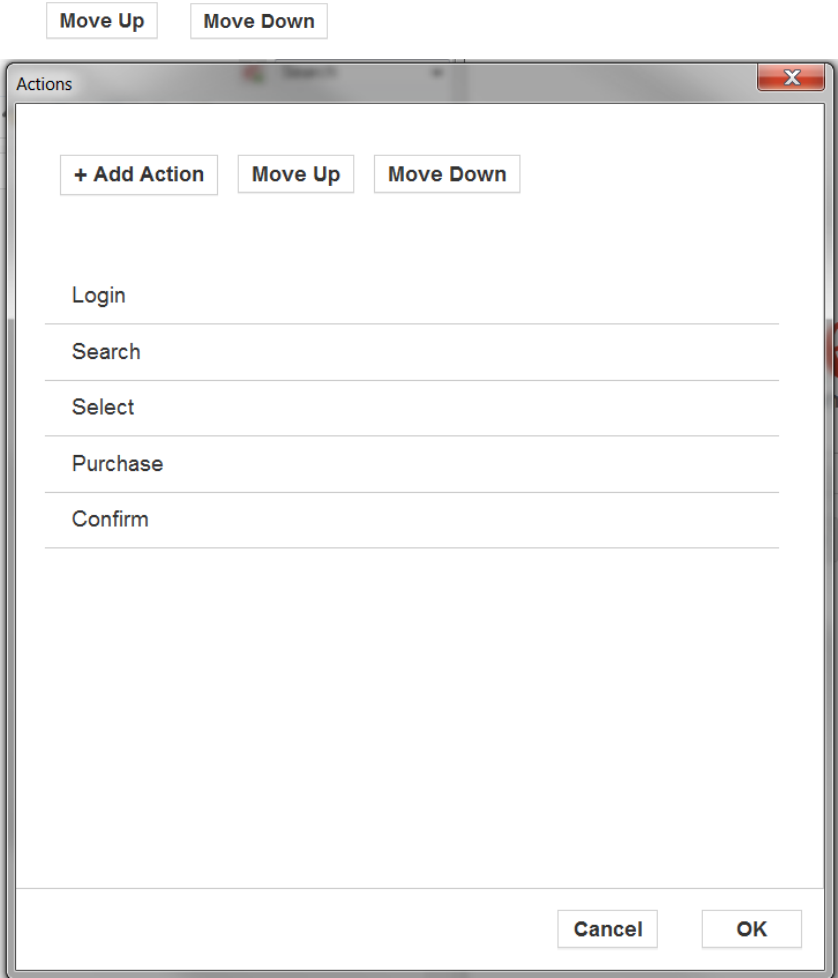
3. Click or to reorder the action.
User Guide
HP LoadRunner (12.50) Page 699
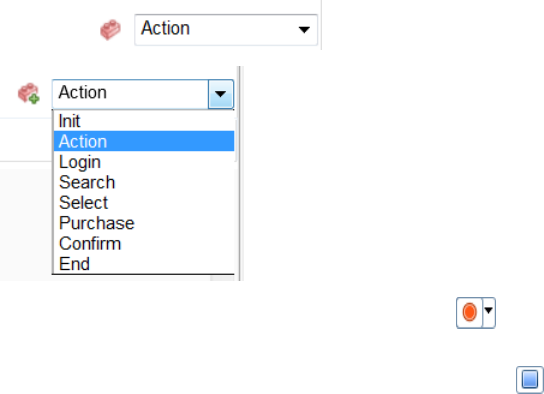
Record into an action
1. From the drop-down box, select an action.
2. Navigate to the desired starting website and click the Record button . All of your actions will
be recorded and displayed in the TruClient Sidebar on the left as you perform your business
process. You can stop recording by selecting the Stop button . You can continue recording from
any point in the script.
To record into a different section of the script, right-click a step and select Record > Record after
or Record > Record before to record new steps into that location of the script. If you are recording
into a group step, select Record > Record into. For more information on group steps, see"TruClient
Home tab" on page687.
User Guide
HP LoadRunner (12.50) Page 700
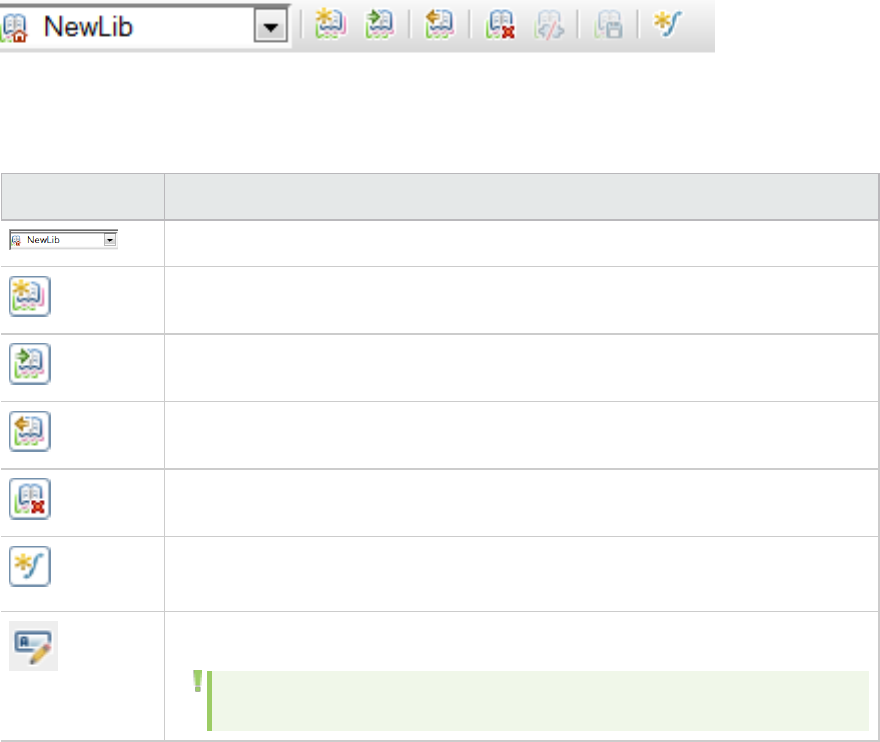
Function Libraries tab
This tab enables you to create and manage functions in libraries.
Where do I find it?
Select Functions from the drop-down list on the TruClient Sidebar.
UI Element Description
Enables you to select the active library.
New Library. Enables you to create a new library.
Import Library. Import a function library from an xml file.
Export Library. Export a function library to an xml file.
Delete Library. Delete a function library.
New Function. Enables you to create a new function. For details, see "TruClient
functions and function libraries" on page757
Rename Library. Rename an existing library.
Note: If you rename a library, modify all references to it.
HP LoadRunner (12.50) Page 701
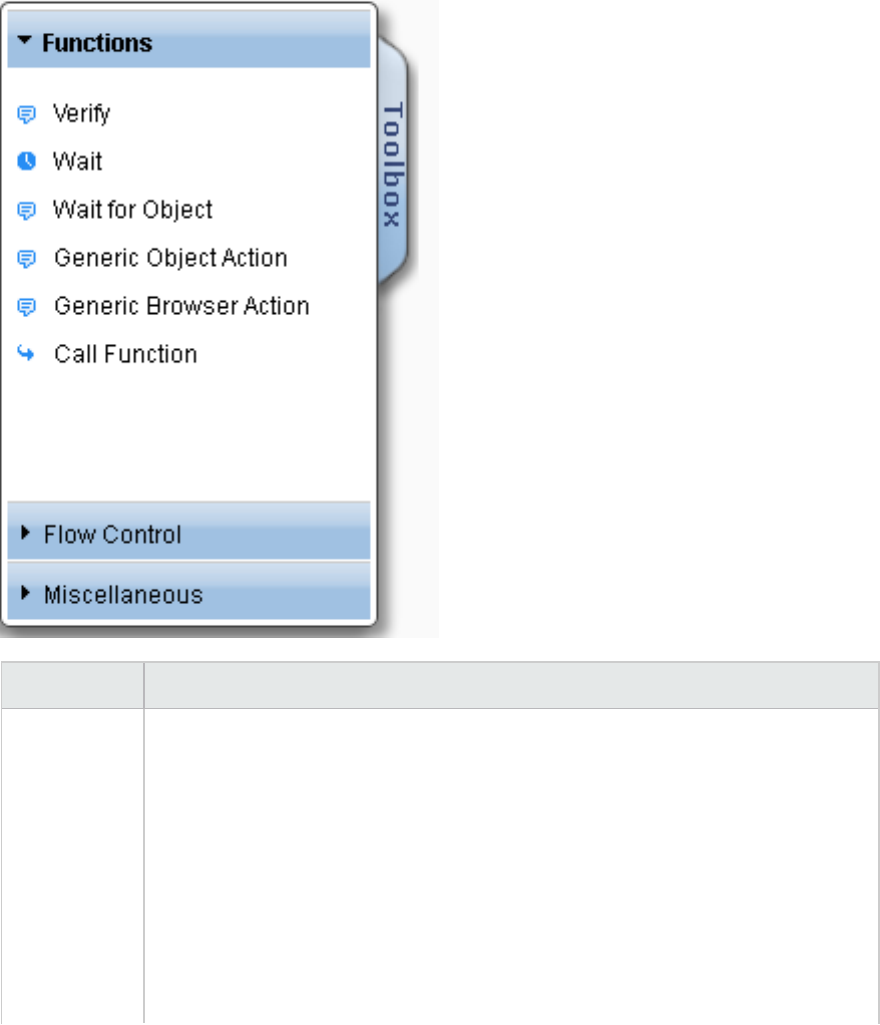
TruClient Toolbox
The toolbox contains all of the steps that you can add to a TruClient script. The toolbox opens and closes
by clicking on the tab, and moves by dragging it up or down.
Where do I find it?
In the TruClient sidebar, click the Toolbox tab
UI Element Description
Functions lVerify. Verify that an object exists in the application.
lVerify PDF Content. Verify the content of a PDF document during script
execution. For details, see "Verify PDF Content " on page826
lWait. Wait for a specified number of seconds before continuing with the next
step.
lWait for Object. Wait for an object to load before continuing with the next step.
lGeneric Object/Browser Action. Blank steps that can be inserted and manually
configured.
lCall Function. Insert a custom function in the script. For details, see "TruClient
HP LoadRunner (12.50) Page 702
functions and function libraries" on page757.
Flow Control lFor Loop. A logical structure that repeats the steps contained in the loop a
specified number of times.
lIf Block. A logical structure that runs the steps contained in the block if the
condition is met.
lAdd else. Click the Add else link to add an else section to your If block. If the
condition is not met, the steps included in the else section run.
lRemove else. Removes the else section from the If block.
Note: If the else section contains steps and you click Remove else, the
steps are deleted. Copy and paste them into the main body of your script to
save them.
lIf exists. A combination of “If Block” and “Verify”, a logical structure that runs the
steps contained in the block if the condition on a property of the selected object
is met.
lIf verify. A logical structure that runs the steps contained in the block if the
selected object exists in the application.
lIf Browser. A logical structure that enables you to branch your script to run
specified steps in a specific browser. If Browser example.
lBreak. Causes the loop to end immediately without completing the current or
remaining iterations.
lContinue.. Causes the current loop iteration to end immediately. The script
continues with the next iteration.
lCatch Error. Catches an error in the step immediately preceding and runs the
contents of the catch error step. For more information, see "Enhance a script
with Toolbox functions" on page753.
lExit. Exits the iteration or the entire script depending on the specified setting.
Miscellaneous lEvaluate JavaScript. Runs the JavaScript code contained in the step.
lEvaluate JS on Object. Runs the JavaScript code contained in the step after the
specified object is loaded in the application.
lEvaluate C. Runs the C code contained in the step.
lComment. A blank step which allows you to write comments in your script.
lRendezvous. Synchronize all Vusers in a Controller scenario to run a specified
step at the same time. For example, you may want to test the impact of several
users logging into your application at the same time.
User Guide
HP LoadRunner (12.50) Page 703

Note: To insert a rendezvous step, drag it from the toolbox and place it
above the step you want to synchronize.
User Guide
HP LoadRunner (12.50) Page 704
Browsers in TruClient
What do you want to do?
lRead about Private Browsing
lRead about the "TruClient Browser for IE" on page706
lRead about supported browsers in TruClient
Next steps
l"Record a TruClient script" on page714
l"Replay a TruClient Script" on page725
l"Enhance a TruClient Script" on page753
HP LoadRunner (12.50) Page 705

Private browsing
General
Private Browsing is a browser mode which allows you to browse without saving information about your
session. Some examples of items which are not saved are passwords, cookies, and history.
To more accurately emulate multiple real users running on the same load generator, TruClient replays
scripts in private browsing mode. This ensures that the browser does not use saved session information
and users do not share cache and cookies related data which might affect the reliability of the run.
See also
"Supported browsers in TruClient" on the next page
Browser limitations
TruClient Browser for IE
The TruClient Browser for IE simulates the functionality of an IE browser. This enables you to record and
replay scripts as if you were working in an IE environment.
Note: The TruClient for IE protocol is designed to work with applications running in standard
mode only.
The TruClient engine depends on specific browser features, available in IE 9 or higher versions,
that are not supported by Internet Explorer prior to version 9 and are also not supported in IE9
if backward compatibility mechanisms are in use.
For details on document and browser modes, see Browser modes.
Note: The TruClient browser for IE also requires read access to the following registry key: HKEY_
LOCAL_MACHINE\SOFTWARE\Microsoft\Internet Explorer
The TruClient browser for IE also requires write access to the following registry key: HKEY_
CURRENT_USER\SOFTWARE\Hewlett-Packard\TruClient
Firebug Lite
Firebug Lite is a third-party utility that provides many valuable development tools. You can edit, debug,
and monitor CSS, HTML, and JavaScript live in any web page. You can access this utility by selecting
Advanced > FireBug Lite or by pressing F12 while in TruClient's IE browser.
For details on FireBug Lite's features, see What is Firebug?
Enforce Standard Mode
HP LoadRunner (12.50) Page 706
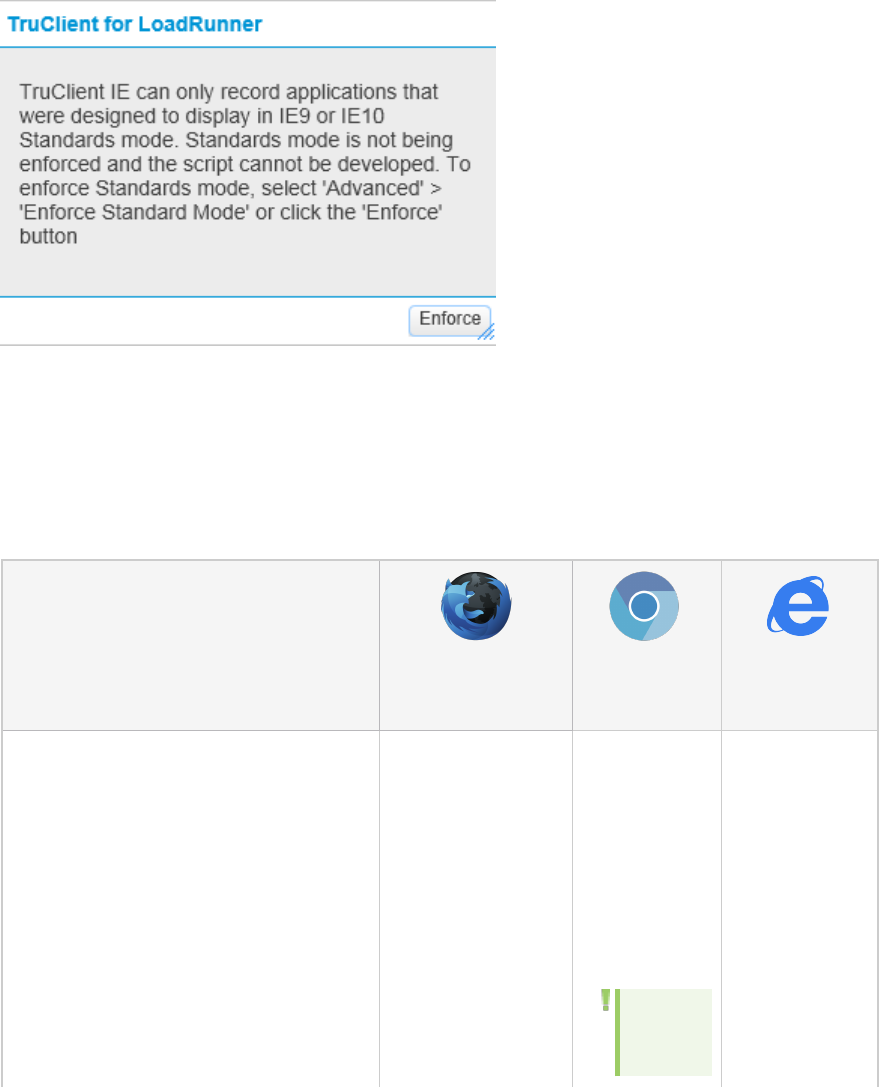
TruClient for IE can only record and replay application in standard mode. TruClient enforces this mode
on all pages that you navigate to while you are recording and replaying.
If you wish to explore how pages are rendered in a non-standard IE mode, you can temporarily
deactivate enforcement by deselecting Advanced > Enforce Standard Mode. When deselected the
following message appears in the Sidebar:
While in the mode you will not be able to develop or edit scripts in the TruClient IE browser. Click the
Enforce button in the message box or select Advanced > Enforce Standard Mode, to continue recording
and replaying in the TruClient for IE browser.
Supported browsers in TruClient
Item/Feature
Firefox Chromium Internet
Explorer
Browser description
Description of each browser type.
Open-source web
browser developed
for Windows, OS X,
and Linux.
Chromium is
an open-
source web
browser
project from
which Google
Chrome draws
it source code.
Note:
Chromi
Browser
developed for
Microsoft
Windows.
The following table describes features that have limitations in one or more of the browsers.
User Guide
HP LoadRunner (12.50) Page 707
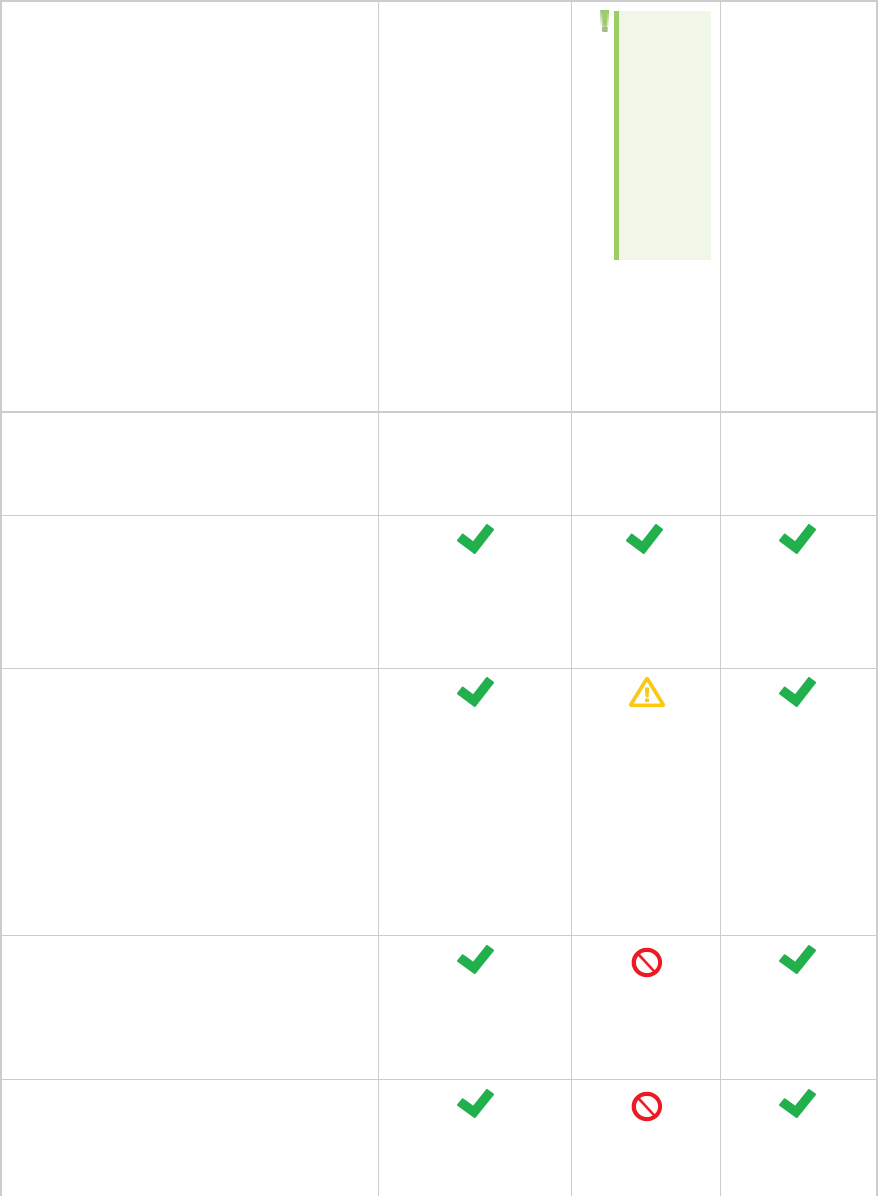
um is
not
suppor
ted on
Windo
ws 32
bit OS
Chromium source
code on Github
Request Chromium
source from the
TruClient team
Browser version Firefox 37.0.2 Chromium 39 Internet
Explorer 9,10,
11
Client certificates
Manually attach
client certificates
Manually
attach client
certificates
HP Network Virtualization reports
integration
If you have Network Virtualization
installed and you replay a script in VuGen
load mode, a HAR file is created in the
script folder.
The HTTP Archive
report can be
viewed in Network
Virtualization.
To view the
HAR file results
you will need
to manually
view it with a
third party
tool.
The HTTP
Archive report
can be viewed in
Network
Virtualization.
HP Network Virtualization emulation
integration
Configure a WAN profile on the group in
the Controller.
HP Diagnostics integration
Enables server side diagnostics for J2EE
and .Net applications.
The following table describes features that have limitations in one or more of the browsers. , continued
User Guide
HP LoadRunner (12.50) Page 708
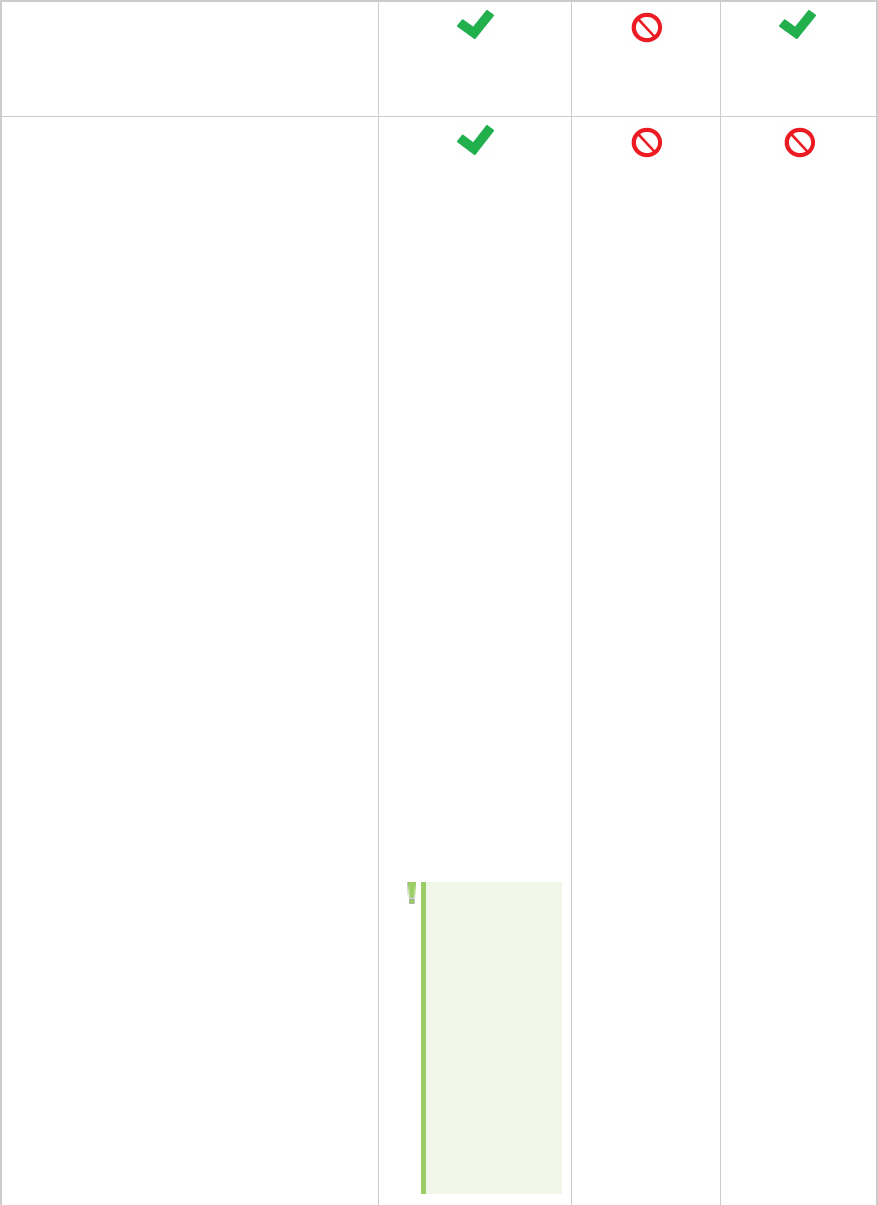
IP spoofing
Enables to mimic multiple IP addresses
from the same load generator.
Modify preferences
Edit applications settings (preferences)
that are read from the profile files,
prefs.js and user.js, and from application
defaults
1. Open a Firefox
script in
Develop Script
mode
2. Enter
about:config
in the browser
address bar.
3. Acknowledge
the warning.
4. Search for the
preference
name you want
to edit and
modify the
value.
5. Save the script
and verify that
the user_
modified_
perfs.json was
created or
modified.
Note: Do
not modify
TC* or
TruClient
related
settings as
these
changes are
ignored.
The following table describes features that have limitations in one or more of the browsers. , continued
User Guide
HP LoadRunner (12.50) Page 709
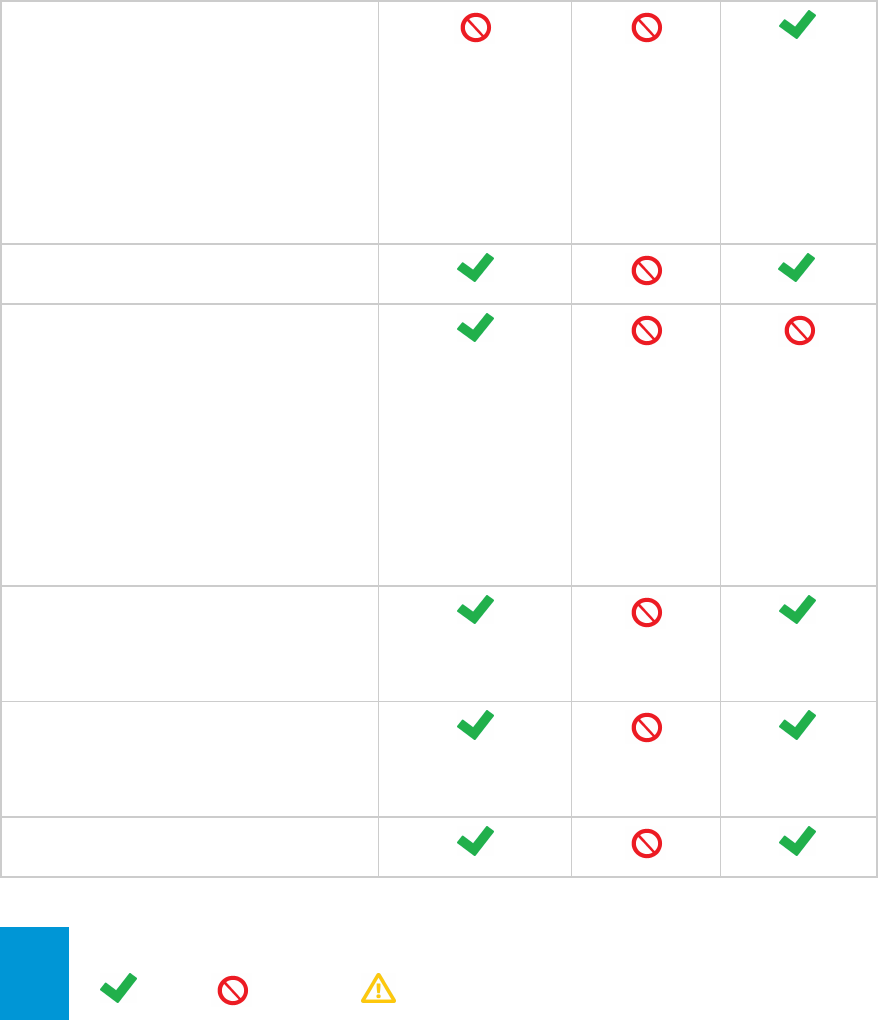
SSl Connections
Report the number of open SSL
connections. Firefox version 33
and above no longer
reports SSL
connection count as
a data point.
Chromium
does not
expose the
number of
open SSL
connections.
Record Flash objects
Responsive design based application
Applications render differently based on
screen resolution settings.
This behavior is particularly observed
when running the application under a
service account (session 0) which has a
dedicated desktop with a smaller screen
resolution.
Enable Runtime
settings > Load
settings > Other >
Browser specific
settings > Firefox
settings > Run AUT
using recorded
window size
Verify PDF Step
Verify the content of a PDF document
during script execution.
Record snapshots
Snapshots generated during the recording
of a script.
Modem speed emulation
The following table describes features that have limitations in one or more of the browsers. , continued
Legend Supported Not supported Partially supported
Troubleshooting issues replaying a script across browsers
You may encounter issues replaying a script recorded in another browser.
The following table lists some possible workarounds:
User Guide
HP LoadRunner (12.50) Page 710
The script
fails to
replay
because of
...
Workaround
End events 1. Add an If Browser step from the toolbar.
2. In the If Browser step, create a branch for each browser where the end event is
different.
The If Browser step automatically creates a Default branch.
3. Copy the failing step into each of the If Browser branches. Update the end event
for each browser branch.
4. Replay the step in the relevant browsers.
Example:
User Guide
HP LoadRunner (12.50) Page 711
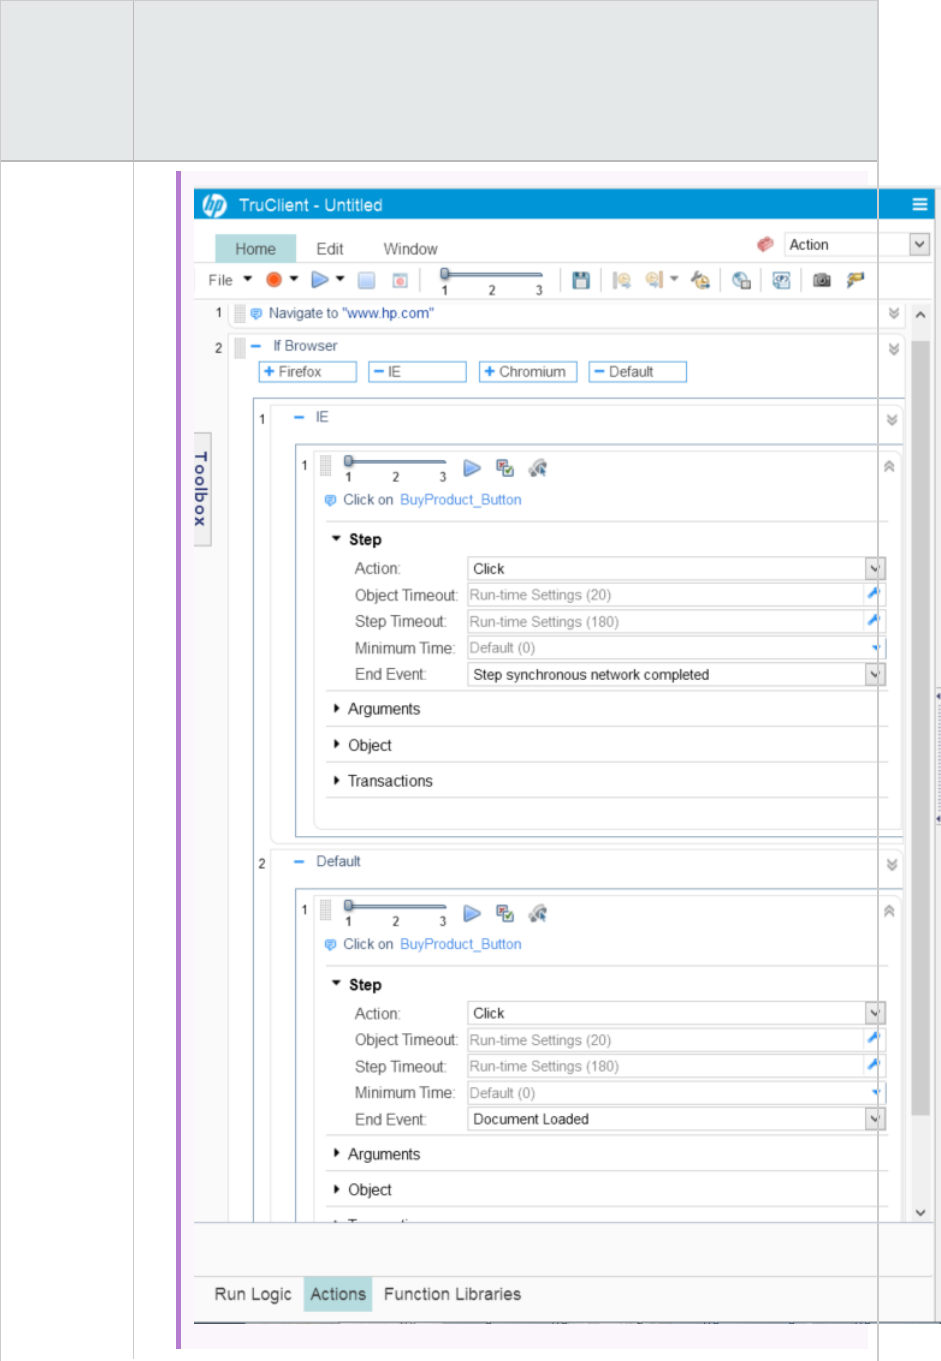
The script
fails to
replay
because of
...
Workaround
User Guide
HP LoadRunner (12.50) Page 712
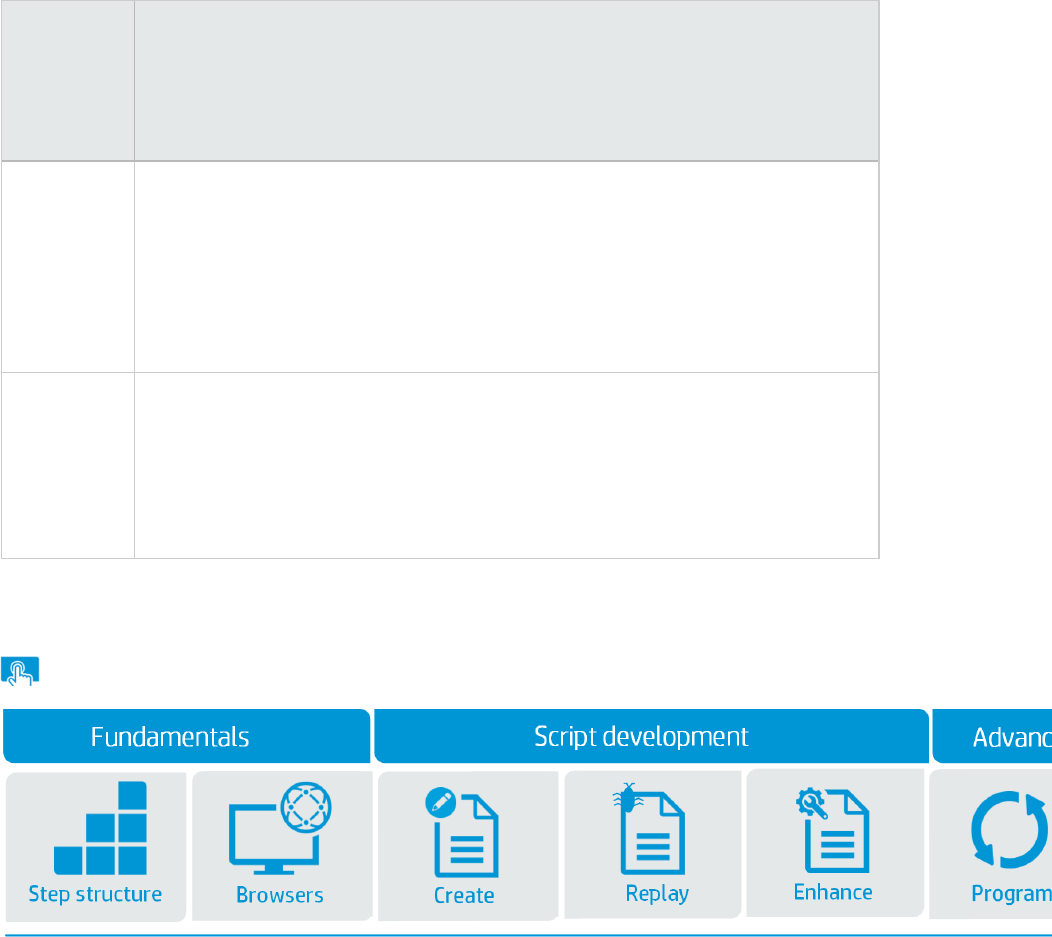
The script
fails to
replay
because of
...
Workaround
Object
identificatio
n
1. Add an If Browser step from the toolbar.
2. In the If Browser step, create a branch for each browser where the object
identification is different.
The If Browser step automatically creates a Default branch.
3. Drag a Generic Object Action step into each branch and select the correct
object to be identified.
Security Browsers may behave differently during authentication and requiring client
certificates.
If authentication is required in only one of the browsers, add an Authentication step
to the script and either set it as an optional step or embed it in an If Browser step.
For managing client certificate, see Client Certificates.
Develop TruClient Scripts
Select an image to learn more.
What do you want to do?
lRecord a TruClient Script
l"Implement run logic " on page718
Next steps
l"Replay a TruClient Script" on page725
l"Enhance a TruClient Script" on page753
User Guide
HP LoadRunner (12.50) Page 713
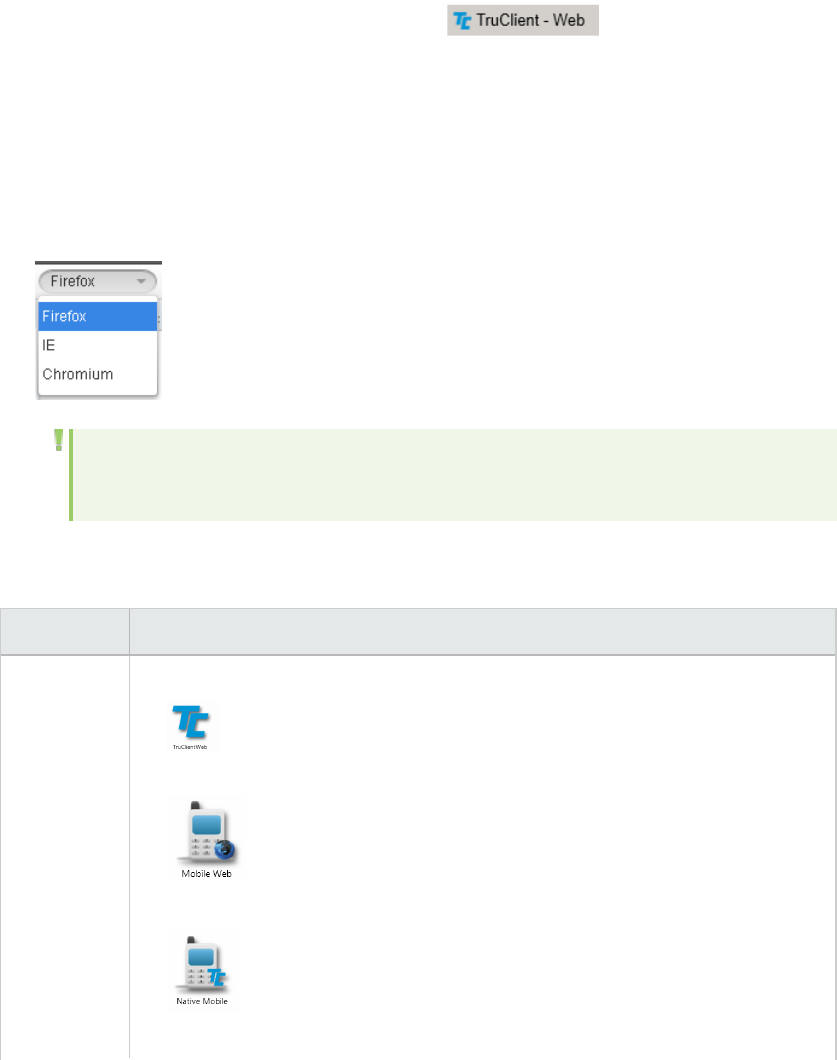
Record a script
This tasks describes how to record a TruClient script.
1. Create a TruClient script
a. From the Create a New Script dialog box, select
For information about creating a VuGen script, see "Creating or Opening Vuser Scripts" on
page127.
b. From the toolbar, select a browser type:
oFirefox
oIE
oChromium*
Note: *Chromium is an open-source web browser project from which Google Chrome
draws it source code.
From the TruClient sidebar, select File > New.
From the TruClient Launcher do the following:
Action How to
Select a
script type
From the TruClient Launcher select a script type:
lTruClient Web.Use TruClient to record a business process in a browser
(Firefox, Chromium or IE).
lMobile Web. Use TruClient to record a business process in a mobile
browser such as Safari.
lNative Mobile. Use TruClient to record a native application using a
mobile device located in the HP Mobile Center.
HP LoadRunner (12.50) Page 715
Action How to
Select a
browser
From the TruClient launcher, select a browser type to record your script. You can
select from one of the following:
lFirefox. Open-source web browser developed for Windows, OS X, and
Linux.
lChromium. Open-source web browser project from which Google
Chrome draws it source code.
lInternet Explorer. Browser developed for Microsoft Windows.
2. Configure the General Browser Settings
The Browser Configuration settings allow you to configure settings that apply to all TruClient
scripts. The settings are imported to new scripts as they are created.
To edit these settings, click the "TruClient General Settings " on page765 button.
3. Record interactively
Navigate to the desired starting website and click the Record button . All of your actions will
be recorded and displayed in the TruClient Sidebar on the left as you perform your business
process. You can stop recording by selecting the Stop button . You can continue recording from
any point in the script.
To record into a different section of the script, right-click a step and select Record > Record after
or Record > Record before to record new steps into that location of the script. If you are recording
into a group step, select Record > Record into. For more information on group steps, see"TruClient
Home tab" on page687.
4. Replay the script
It is recommended that you replay the script at least twice, correcting any errors that occur during
the process. After two successful consecutive replays, you can move on to the next step. If you
continue to experience errors, see "Debug TruClient Scripts" on page727.
Script action details can be seen in the TruClient Sidebar Status Pane.
5. Save the script
Select File > Save or File > Save as to save the script.
User Guide
HP LoadRunner (12.50) Page 716

Tip: General Tips Regarding Successful Interactive Replay
lDo not switch between applications during interactive replay. Keep the browser in focus.
This is especially important when the Related Objects feature is used, as resizing may change
the relative position of the objects.
lDo not re-size the browser between record and replay and during replay. This can cause
objects to move and interfere with TruClient's ability to locate them.
lAny customizations (such as bookmarks) that you make within this instance of broswer will
not be saved globally. This is because TruClient opens each script in a unique browser profile.
If you want to use the browser for any use other than creating this script (e.g. browsing the
Internet), we recommend that you open an additional browser window.
User Guide
HP LoadRunner (12.50) Page 717
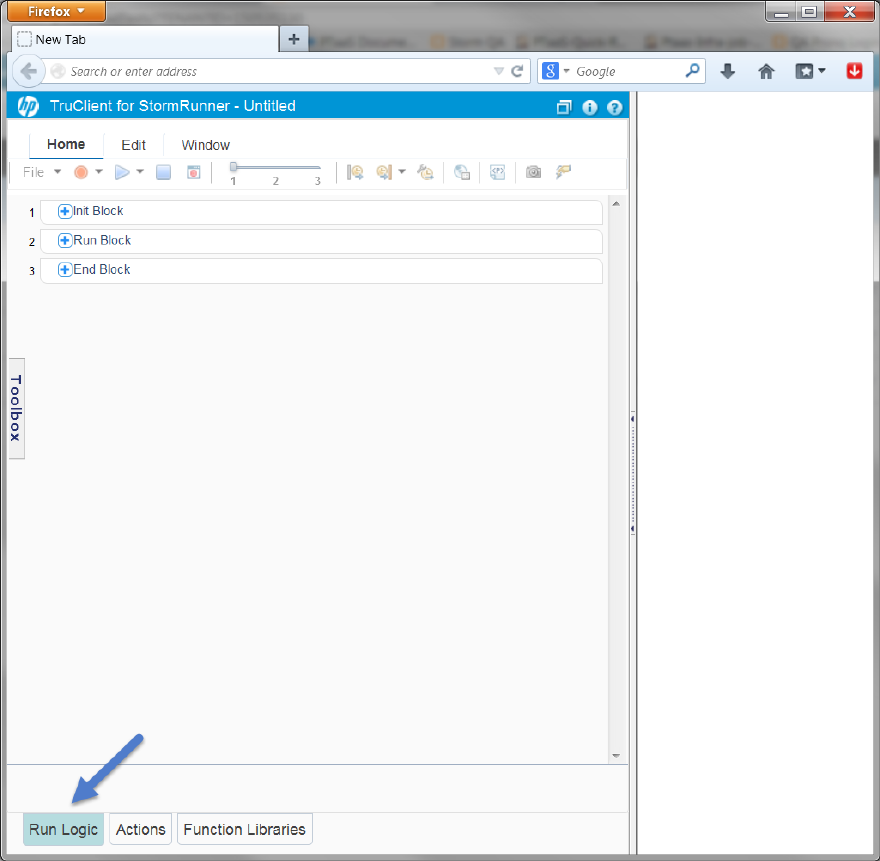
Implement run logic
This topic describes how to implement run logic during the development of your TruClient scripts.
Where do Ifind it?
Select the Run Logic tab from the TruClient Sidebar.
What is run logic?
Run logic is the ability to control the flow of how your script is run. Using run logic you can create scripts
that reflect users interacting with your application.
HP LoadRunner (12.50) Page 718
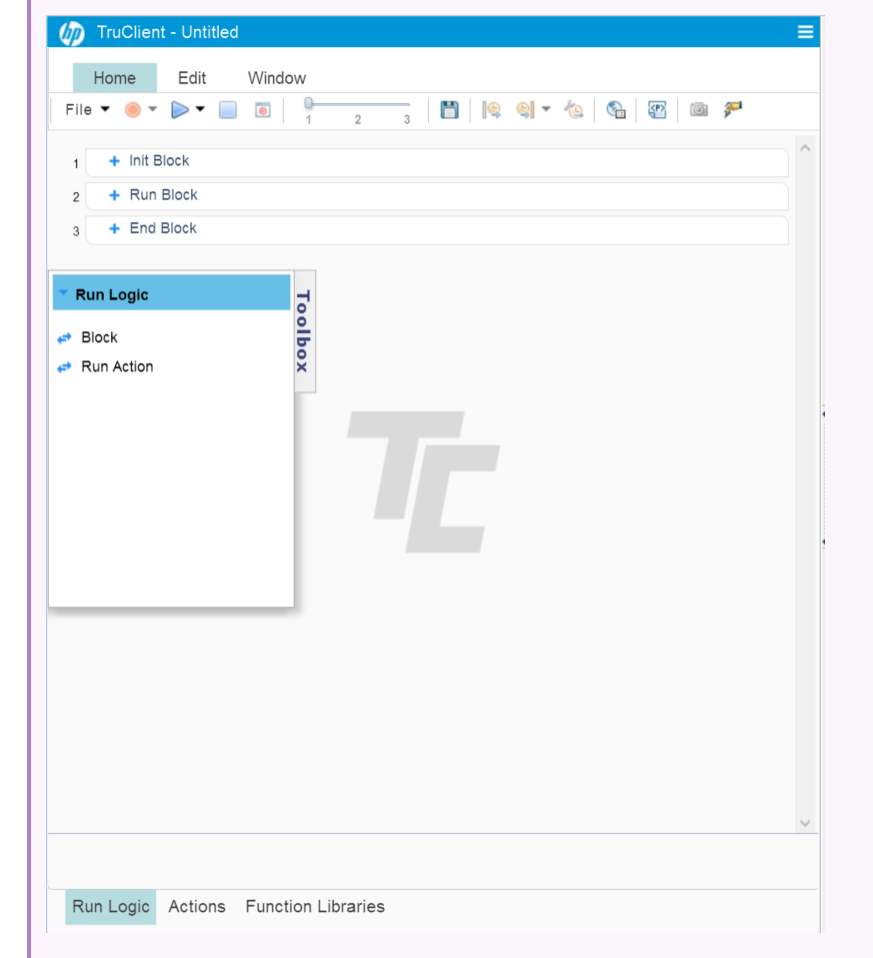
What do you want to do?
Learn about the Run logic functions
On the Run Logic tab, the Toolbox contains the steps you can add to your script to define its run logic.
lBlock. This step enables you to call a set of actions, referred to as children, either sequentially or
randomly.
For details, see Run Logic Block step.
User Guide
HP LoadRunner (12.50) Page 719
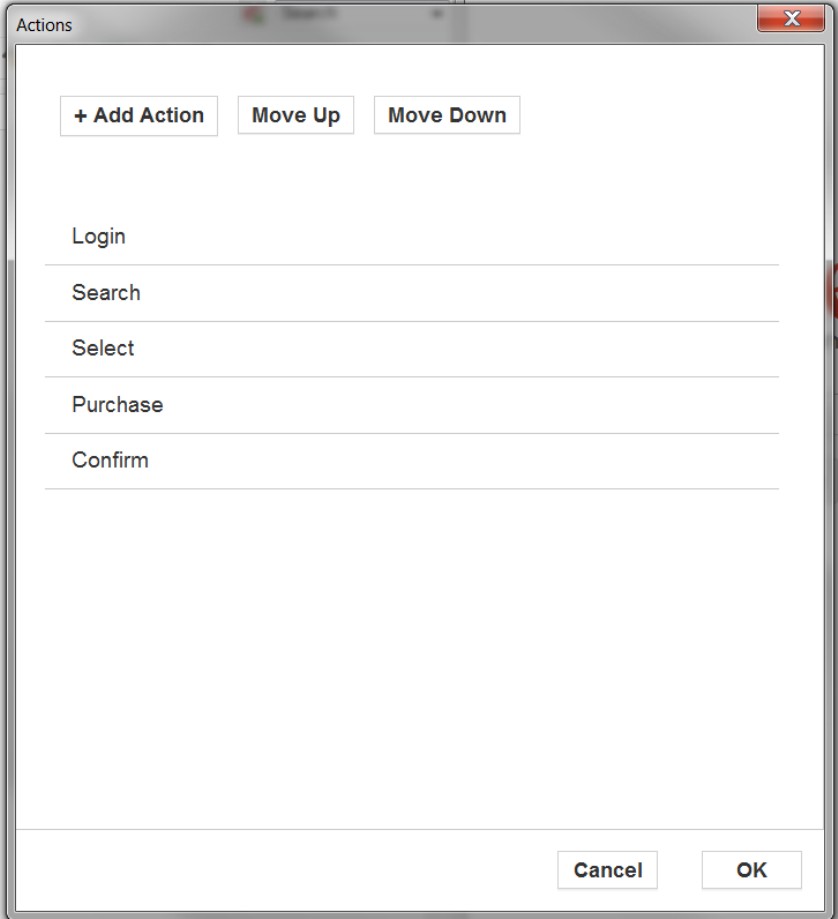
lRun Action. This enables you to insert an action into the logic block. Specify the action in Arguments
> Action Name.
For details, see Call Action step.
Implement run logic in a script
1. Create a TruClient script
2. Create actions
From the Actions tab, create actions for each segment of your business process.
3. Record the business process into the corresponding actions.
User Guide
HP LoadRunner (12.50) Page 720
a. Select an action from the drop down list.
b. Navigate to the desired starting website and click the button . All of your actions will be
recorded and displayed in the TruClient Sidebar on the left as you perform your business
process. You can stop recording by selecting the Stop button . You can continue recording
from any point in the script.
To record into a different section of the script, right-click a step and select Record > Record
after or Record > Record before to record new steps into that location of the script. If you are
recording into a group step, select Record > Record into. For more information on group
steps, see "TruClient Home tab" on page687.
Complete steps a. and b. for each Action in your business process.
4. Implement Run Logic in a specific block
a. Click the Run Logic tab
b. Select one of the three blocks to implement logic: Init, Action, End. For details, see "Run Logic
tab" on page694.
c. If you want to run a group actions as a set, either randomly or sequentially, add a Run Logic
Block step from theToolbar to the logic block. For details on implementing this step, see "
Block" on page695
Caution: If you modify Run Logic in VuGen Runtime Settings, close your
LoadRunnerscript without saving it and reopen it to view changes.
Caution: LoadRunner does not support setting run properties on the master run block
such as iteration and run logic.
Note: Play from selected step will not work for a step that is located in an action
which is not part of the run logic.
d. To add a single action to logic block, add a Call Action step from the Toolbar. For details on
implementing this step, see Call Action step.
Explore run logic samples
Scenario
Let's suppose that your website is a travel site enabling customers to search and book flights.
To test the performance of your travel site, record a user performing the following actions:
User Guide
HP LoadRunner (12.50) Page 721
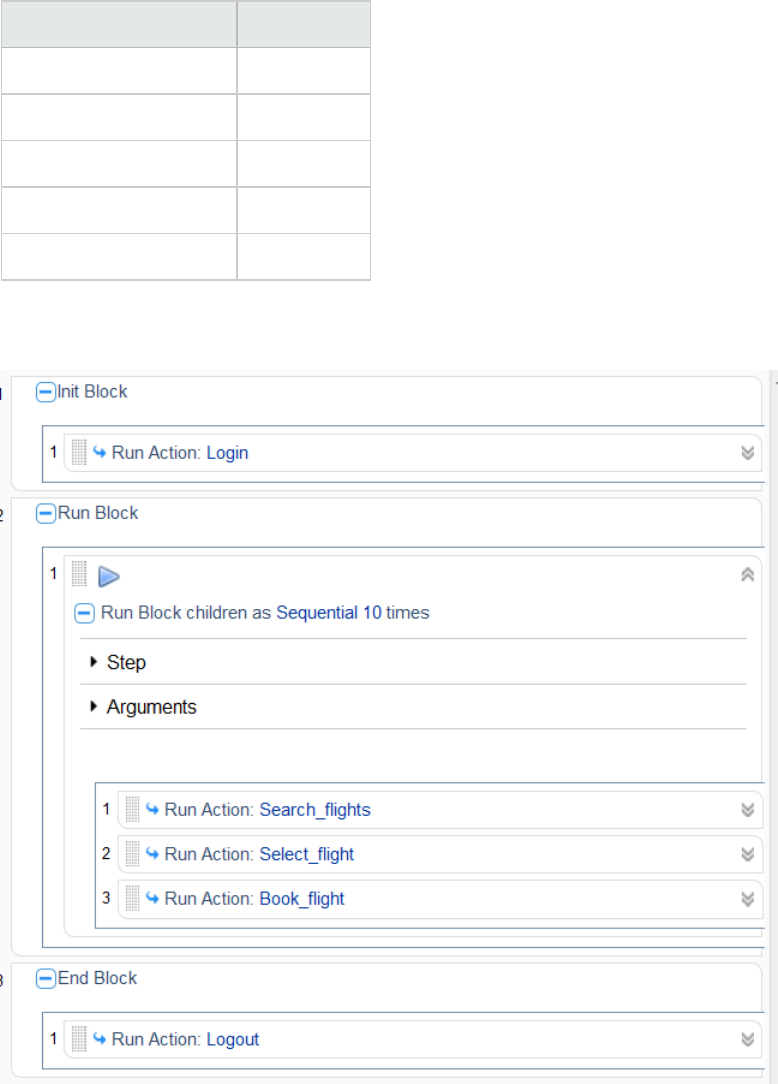
Action Action Name
Log into the application Login
Search for a flight Search_flight
Select a flight Select_flight
Book a flight Book_flight
Log out of the application Logout
Sequential run logic
The following example shows how to structure the script to run all of the actions sequentially.
lThe Init Block' section's run action has been set to call the Login action. This block will run once.
lARun Block step has been inserted into the main Run Block section.
lIn the Argument section of the Run Blockstep, three Call Action steps have been inserted, one for
each action: Search_flight,Select_flight and Book_flight.
User Guide
HP LoadRunner (12.50) Page 722
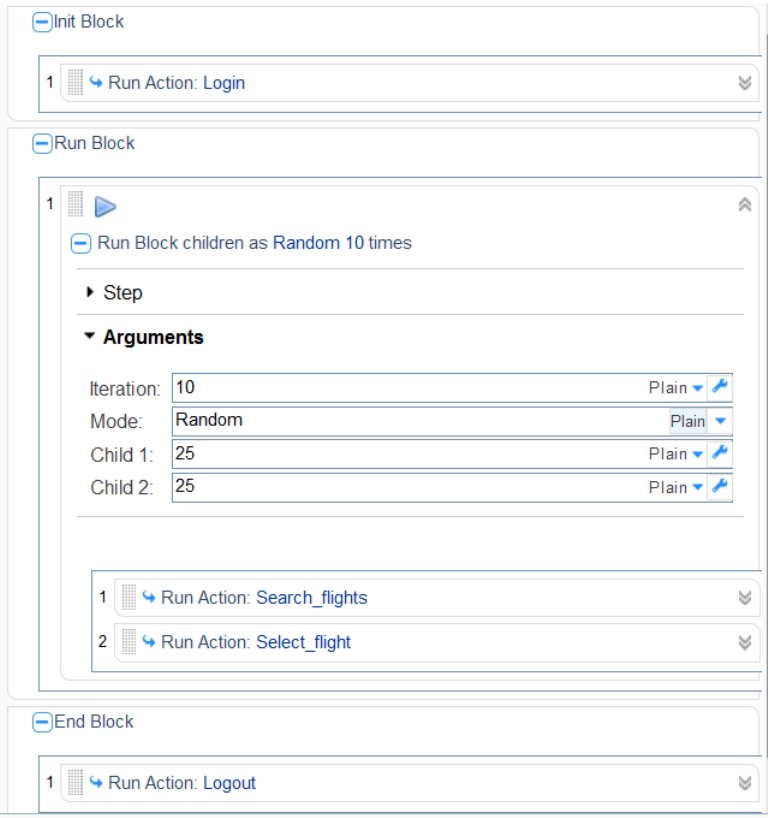
lArgument > Iteration has been set to 10.
lArgument> Mode has been set to Sequential.
lThe End Block section's Run Action has been set to call the Logout action. This block will run once.
Random run logic
You may want to run actions randomly. This example shows how to structure your run logic to run your
actions randomly. You can assign a weight to each action to determine how likely it will be run.
lThe Init Block' section's run action has been set to call the Login action. This block will run once.
lARun Block step has been inserted into the main Run Block section.
lIn the Argument section of the Run Block step, two Call Action steps have been inserted, Search_
flight and Select_flight.
lArgument > Iteration has been set to 10.
lArgument > Mode has been set to Random.
User Guide
HP LoadRunner (12.50) Page 723
lArgument > Child 1 has been set to 75 and Argument > Child 2 has been set to 25. Children refer to
the actions that have been inserted into the Run Block. In this scenario, a 75 percent chance has
been assigned to Child 1(Search_flight) to run and 25 percent chance that Child 2(Select_flight)
will run.
lThe End Block section's Run Action has been set to call the Logout action. This block will run once.
Run logic limitations
1. TruClient predefined actions “Init” and "End” are presented in VuGen as “vuser_init” and “vuser_
end”
2. You cannot create actions with the names “vuser_init”, “vuser_end” or “Scrip-View”.
3. If you update settings in VuGen >Runtime Settings > Run Logic it will not be displayed in the
TruClient browser until you close and reopen TruClient.
It is recommended to change the run logic using the run logic tab if the TruClient browser is open
and use the Runtime Settings > Run Logic if the TruClient browser is not open.
4. “Script-View” is not a valid action. It is not added in TruClient browser if it has been added to the
run logic using VuGen> Runtime Settings >Run Logic.
5. The “Run” section cannot be set to random mode in the TruClient browser. Setting it to random in
VuGen> Runtime Settings >Run Logic will be ignored by TruClient browser.
Related topics
Run logic tab
Actions tab
User Guide
HP LoadRunner (12.50) Page 724
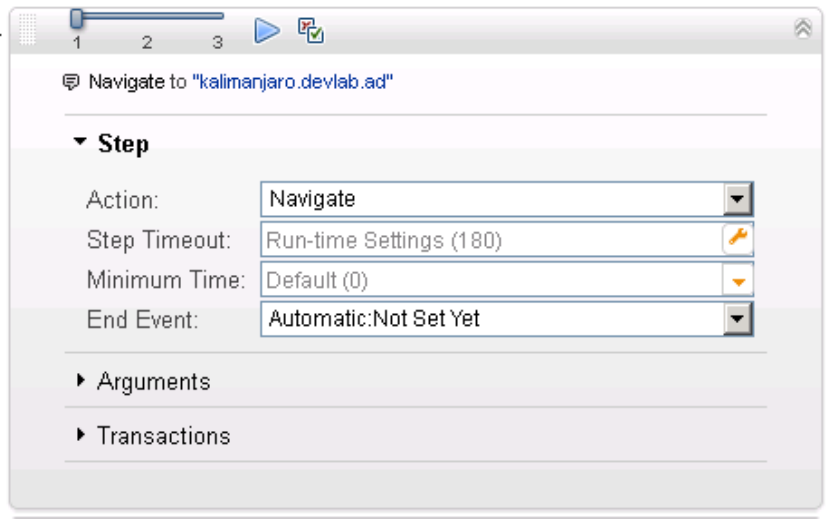
Replay a TruClient Script
What do you want to do?
lSynchronize script steps
lDebug TruClient Scripts
lDebug scripts with TruClient Snapshots
lResolve Object Identification Issues in TruClient
lUse Descriptors to identify an object
Next steps
Enhance a script
How to Synchronize TruClient Scripts Steps
This task describes the process of synchronizing steps in TruClient Scripts.
1. Interactively record the business process
TruClient scripts are asynchronous which means steps do not have to wait for previous steps to
complete. Each step has an End Event which defines the point at which subsequent steps are
allowed to start running. After the interactive recording, each End Event is set to Automatic: Not
Set Yet.
HP LoadRunner (12.50) Page 725
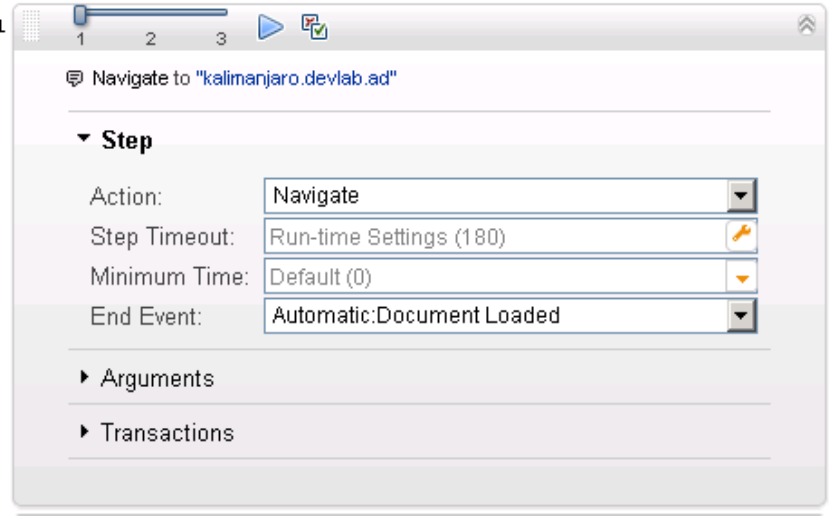
2. Identifying the End Event
Before enhancing a TruClient script, replay the script to synchronize the steps. During the first
script replay, TruClient will try to automatically identify the End Event for each step.
An End Event can be one of the following:
lAutomatic: Not Set Yet. The automatic end event has not yet been determined.
lAutomatic: Timers Ended. The automatic end event whenever TruClient identifies either the
setTimeout() or the setInterval() function running as part of the document load in the
JavaScript code.
lAction Completed. Step ends when its action is completed. An example of an action is a button
click.
lDOM content loaded. Step ends when the page's Document Object Model (DOM) is ready. This
means that the API for interacting with the content, style and structure of a page is ready to
receive requests from your application client side code.
lStep synchronous network completed. Step ends when all HTTP requests have been completed
excluding requests that are associated with open connections that are not relevant to the step.
Usually, these requests are triggered by using XMLHttpRequest.
lDocument load. Step ends when the process of loading a document is completed. This means
that all scripts and stylesheets have finished loading and have been executed, and all images
have been downloaded and displayed.
lStep network completed. Step ends when all HTTP requests have completed including requests
initiated by XMLHttpRequest.
lDialog opened. Step ends when a dialog box is opened.
User Guide
HP LoadRunner (12.50) Page 726
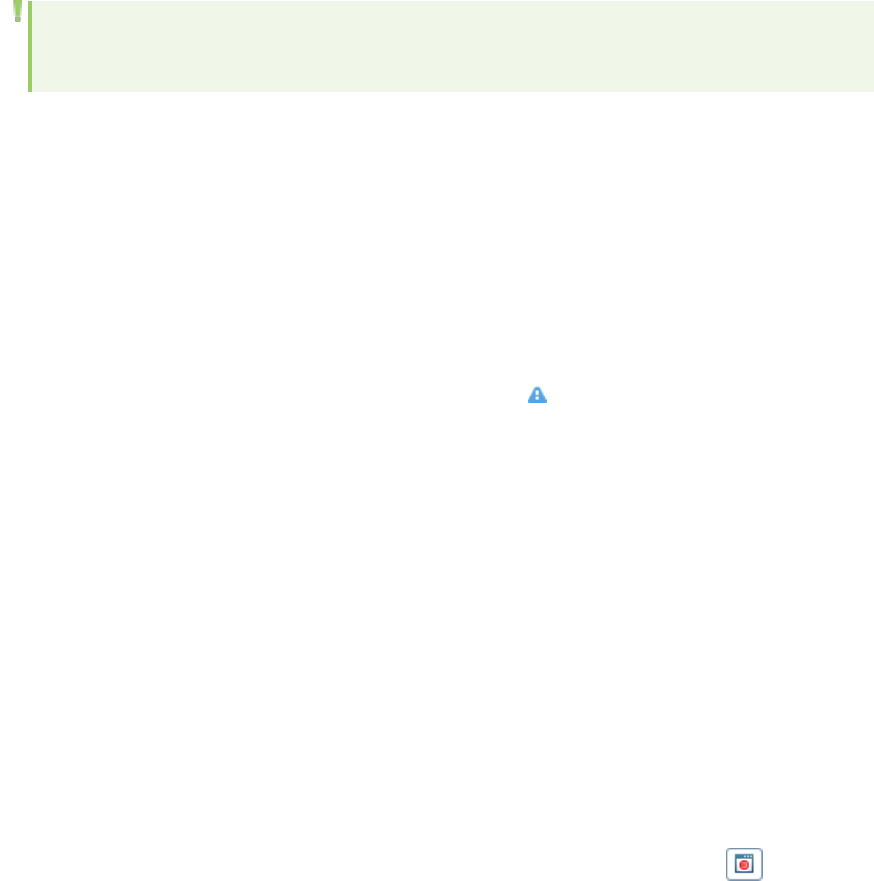
If during the first replay, a step initiates the Object Identification Assistant to resolve object
identification, the previous step's End Event will most likely be misidentified and TruClient will
automatically reset it to Automatic:Not Set Yet.
3. Confirming the End Event
During the second script replay, TruClient confirm the Automatic End Event and will assigned any
step's End Event that had been reset to Automatic:Not Set Yet.
If TruClient is unable to assign an automatic End Event during replay, usually due to a network
timeout, a warning message will inform you that the End Event has been reset to Automatic:Not
Set Yet. Replay the script to automatically assign the End Event or assign the End Event manually.
Note: You may need to replay the script several times until all steps have been accurately
synchronized.
Related topics
Understanding Step Events
Debug TruClient Scripts
This task describes different options to debug a TruClient script.
View Replay Errors in the TruClient sidebar
If any steps failed during replay, they are marked with an error icon. Hover the mouse over these
icons to view descriptions of the errors.
Run The Script Step by Step
You can run your script step by step to view the replay more slowly and in a controlled manner. To run
the script step by step, select the down arrow from the replay button in the browser and select Replay
step by step. Repeat this procedure after each step to continue the step by step replay.
View the Replay Logs
In the VuGen Output Pane, you can view details of your script's replay. Select Output Pane > <Browser
name> - Interactive Replay. For details, see the "Output Pane" on page90.
Insert Toggle Breakpoints
Breakpoints instruct the script to stop running during a replay when in interactive mode. They can be
used to help debug your script.
To insert a toggle breakpoint, select the desired step and click the Breakpoints button .
User Guide
HP LoadRunner (12.50) Page 727
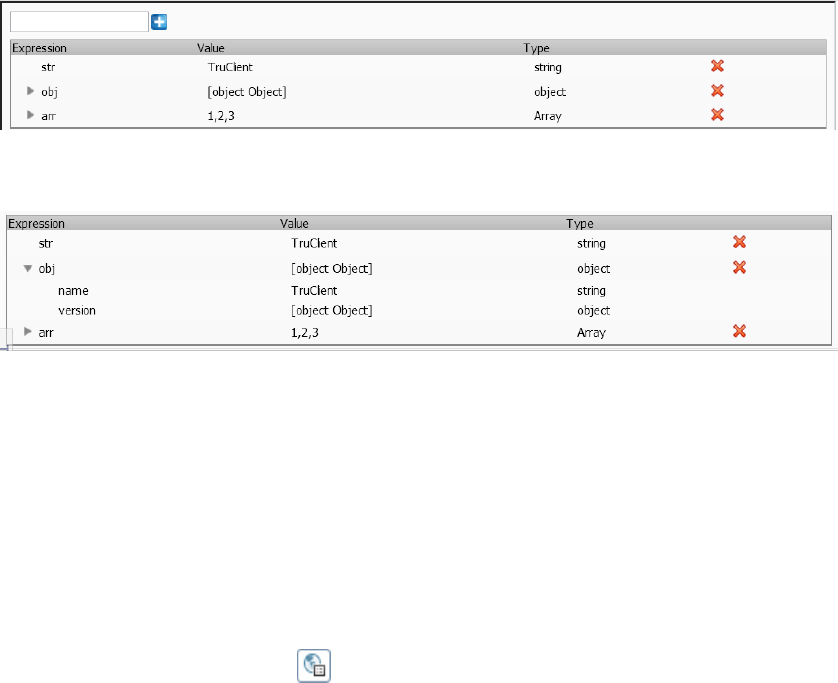
Global Watch Panel
During replay, use breakpoints to inspect the values of variables in the Global Watch panel.
1. Define variables in a Evaluate JS step.
For example:
var str = 'TruClient';
var obj={name:'TruClient',
version:{
major:12,
minor:50
}
}
var arr= [1, 2, 3]
2. Enter a breakpoint in your script.
3. When you replay the script, the Global Watch panel appears.
4. To display the value of a variable at the breakpoint, enter the name of the variable and click the +
to add it to the Global Watch panel.
Debug Scripts Using Snapshots
TruClient generates snapshots during recording according to the snapshot generation settings. These
snapshots can be viewed by hovering the mouse over each step's icon. The snapshots are taken before
the step's action is implemented and they are saved as .png files. Click each snapshot to display it in a
new browser tab. Make sure that the correct tab is active before replay. Record snapshots are stored in
the snapshot folder.
You can use the snapshots generated during replay to debug scripts by viewing the snapshots of the
failed step(s).
1. Select the General Settings button on the TruClient Sidebar and select the Interactive
User Guide
HP LoadRunner (12.50) Page 728

Options tab. Set the Replay Snapshots Generation to On Error.
2. Replay the script from the TruClient Sidebar.
3. Look in the Output Pane > Replay or the Output Pane > Browser Replay logs for errors. Note the
step numbers of the steps that had errors.
4. To view the snapshots from the TruClient Sidebar, select a step with an error, and select the
button.
or
To view the snapshots from VuGen, select View > Snapshot Pane.
You now have a group of snapshots that displays the errors that occurred during replay.
For UI details, see Snapshots.
Modify and view script levels
As part of the process of recording a business process, some steps that are performed by the user
while recording are not required during replay. TruClient removes steps it deems to be unnecessary and
places them in higher script levels. For example, a click step that occurs in an area of the application
that has no effect is placed in level 2. TruClient assumes that this step is not significant and will not help
the user to emulate a business process on the application. The default view displays level 1 steps only.
In certain cases, you may want to override TruClient's assessment and manually change the level of a
step. For example, a mouseover is usually deemed an unnecessary step and is placed at level 3. Howeer,
it can happen that mouseover steps are needed during replay.
You can manually modify higher level steps to level 1. To move a step to a different level, open the step
and click on the step section. Move the slider to the desired level. If the step is part of a group step,
both the group step and the individual step must be modified.
Alternatively, you can modify the script's replay level. Drag the slider in the toolbar to the desired level.
Dragging the slider to level 3 displays and replays the steps on levels 1, 2, and 3.
Note: Automatic leveling during replay
The level of a step is normally set during recording according to the importance of the events in
the business process. It can happen that an important step will look unimportant and will be
placed in a lower script level. This may cause the replay to fail, generating an “object not found”
error. During replay,TruClient will check if there are steps in a lower level that can affect the
outcome of the current step. If found, the meaningful step will be moved to higher script level.
For a video demonstration of the script levels, click TruClient Script Levels Demonstration Video.
The following screen shot displays a small script. Note that the step numbers skip from 1 to 3. Step 2 is
hidden in a different level.
User Guide
HP LoadRunner (12.50) Page 729
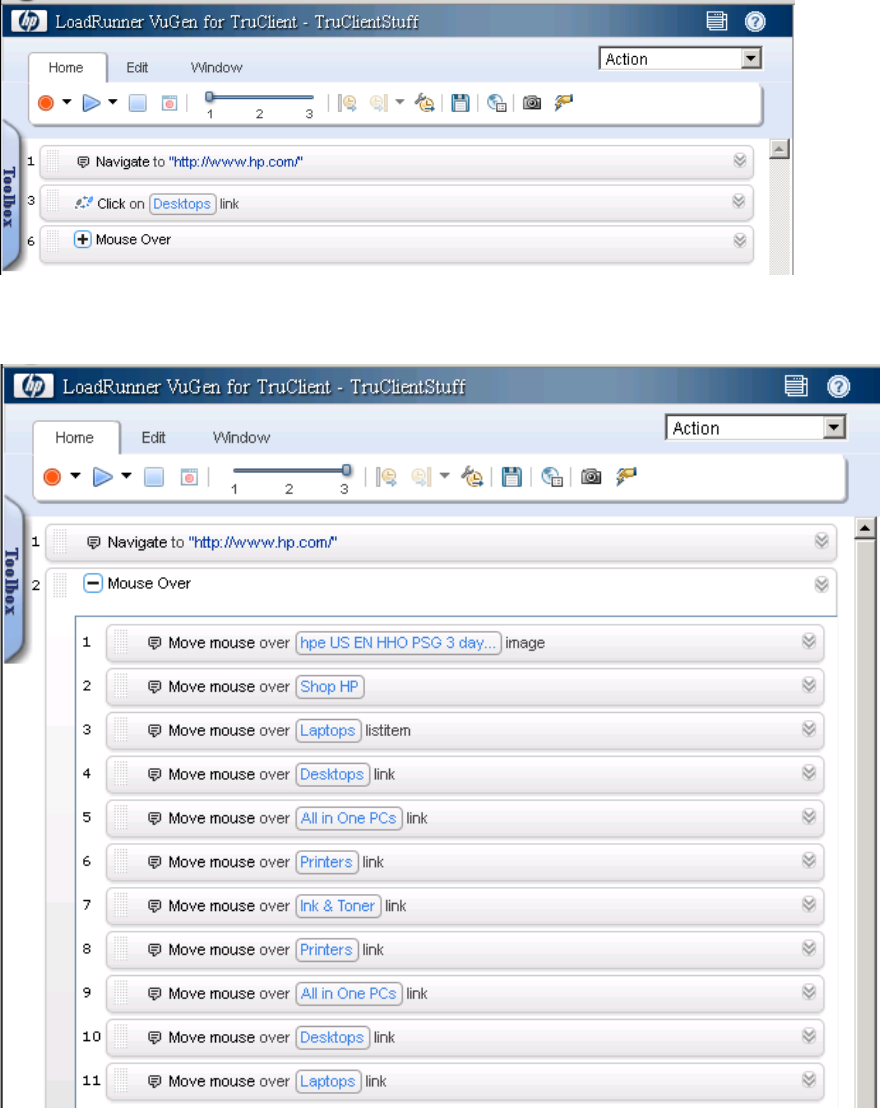
After changing the display settings by using the slide bar, all steps are now displayed and will run if
replayed in interactive mode.
Insert Wait steps
Sometimes a script will fail to replay because an object in a step is not available when the previous step
has finished. You can resolve this by inserting Wait Steps into your script which pause the script replay
User Guide
HP LoadRunner (12.50) Page 730

before continuing to the next step. There are two different types of Wait Steps:
lThe Wait step pauses the script for a specified amount of time before continuing to the next step.
lThe Wait for Object step pauses the script until a specified object is loaded before continuing to the
next step.
Wait Steps begin after the End Event of the previous step. This means that the previous step may
continue to run after the Wait Step has been reached.
To insert a Wait Step, select Toolbox > Functions and drag the Wait or Wait for Object icon to the
desired location in your script. If you add a Wait step, configure the interval in the argument section of
the step. If you add a Wait for Object step, select the Click to choose an object button to select the
target object in the application.
Note: Wait Steps differ from Think Time steps in other protocols. Think time controls the time
that a VuGen waits between actions. Wait Steps pause a script replay until either a specified
time elapses or an specified object is loaded.
Additional Script Debugging Tips
Alert Function
Since all the TruClient arguments support JavaScript, you can use the Alert function to display
information during script development. You can also reference any DOM element using regular
functions, such as location.
Firebug for IE or Dom Inspector for FF
To further improve debugging capabilities, you can install plug-ins such as DOM Inspector and Firebug
that can provide additional information on the application object properties.
For more information on Firebug Lite, see "TruClient Browser for IE" on page706.
Resolving Step Timeouts
Steps may timeout due to several reasons:
lThe application is responding slowly, possibly under load. This is actually an important test result and
identifies a performance issue.
lStep Timeout is incorrect and should be modified via the Step section of the step properties.
lThe end event of the step is incorrect and the step is waiting for an event that does not occur. The
end event should be changed via the Step section of the step properties.
TruClient Snapshots
TruClient generates snapshots of interactive steps during recording and replay of a script. This topic
describes how to work with snapshots.
User Guide
HP LoadRunner (12.50) Page 731
What do you want to do?
Learn about TruClient snapshots
TruClient generates snapshots during recording and replay according to the snapshot generation
settings.
You can configure snapshot generation during recording and replay by clicking the General Settings
button and selecting the Interactive Options tab. For details, see "TruClient General Settings " on
page765.
TruClient can also generate snapshots during load mode according to your specifications in the runtime
settings.
Replay snapshots are stored in the results folder and are organized according to the type of replay
(interactive or load), the script section, and the iteration.
The following table summarizes snapshot behaviors:
Mode Snapshot
generation
Snapshot location Snapshots
folder
structure
During
Record
Snapshots are
created in memory
Stop
Record
l(IE) Snapshots are dumped to the snapshots
folder.
l(FF) Nothing is saved.
Save script
in
Interactive
Mode
lSnapshots are saved under snapshots folder.
lThe data folder holds INF files of Record for the
VuGen snapshot viewer:
a. When replay starts, TruClient deletes data
folder.
b. The data folder is recreated if there is at
least one step with a snapshot file.
c. The inf file is created for every snapshot. The
naming format is as follows: [Action]_
[StepNum].inf or [LibName]_
[FuncNum].[StepNum].inf
For example Init_1.inf,Action_3.inf or
MyLib_1.1.inf
lThe ResultSnap folder holds inf files for
Record
folder
User Guide
HP LoadRunner (12.50) Page 732

Mode Snapshot
generation
Snapshot location Snapshots
folder
structure
Interactive Replay for the VuGen snapshot
viewer:
a. When replay starts, ResultSnap folder is
deleted.
b. ResultSnap folder is recreated only if full
Interactive Replay is performed.
c. For every iteration a folder named
“IterationX” will be created.
d. In the “IterationX” folder the inf files of Init
and End are duplicated even if it was replayed
once.
This is because the Vugen viewer has no
Action selection, only an iteration selection.
e. inf files are created for every snapshot in the
form of [Action]_[StepNum].inf.
For example: Init_1.inf,Action_3.inf
f. inf files are created for every snapshot in the
form of[LibName]_[FuncNum].
[StepNum].inf.
For example: MyLib_1.1.inf
During
Interactive
Replay
Snapshots are
generated after:
lFull replay
lEither Always or
Snapshot On
Error is selected.
Snapshots are not
generated when
using:
lPlay this Step
lPlay From This
Step
1. When starting replay, TruClient deletes the
Result\Interactive folder.
2. The Result\Interactive folder is created only if
there is at least one snapshot to create (for any
action or Library). Snapshot will be created in
one of the following folders according to the
location of the step:
lResult\Interactive\Init – for steps located
in the Init action.
lResult\Interactive\Action\IterationX - for
steps located in the Action action.
lResult\Interactive\End – for steps located
in the End action
lResultModInteractive\<LibName> - for
steps located in the library
Replay
folder
User Guide
HP LoadRunner (12.50) Page 733

Mode Snapshot
generation
Snapshot location Snapshots
folder
structure
3. When Always generate snapshot is selected in
settings, all snapshots are saved.
4. When Snapshot on Error is selected in settings,
only the snapshot of the step with error is
generated. It is generated with the suffix -
error.png. In addition, the following actions
are performed:
a. TruClient duplicates the PNG file created by
default and places it in one of the following
folders naming it t[X].png:
oResult\Interactive\IterationInit – for
steps located in the Init action.
oResult\Interactive\IterationX - for
steps located in the Action action.
oResult\Interactive\IterationEnd – for
steps located in the End action.
b. TruClient also creates a t[X].inf file pointing
it to the t[X].png file.
Load Mode
run from
VuGen
Snapshots are
generated only
when the setting is
either Always or
Snapshot On Error
Same behavior as in interactive only that the
snapshot directory is Result\Load.
Load Mode
run from
Controller
Snapshots are
generated only
when the setting is:
lController >Load
Mode
lAlways or
Snapshot On
Error
Same behavior as in interactive only that the
snapshot directory is
<ResultDir>\log\<ScriptName>_<VuserNumber>.
Configure snapshot generation
User Guide
HP LoadRunner (12.50) Page 734
View a snapshot
lDouble click a snapshot in the sidebar to display it in a new browser tab.
lSnapshots can be viewed in the snapshot viewer in VuGen. For details, see "How to Work with
Snapshots" on page276. You can also view snapshots in the TruClient snapshot viewer.
The following table summarizes when the snapshot viewer will show snapshots:
Mode Type
Interactive lRecord
lInteractive replay
lLoad (VuGen Replay)
VuGen lRecord
lInteractive replay
Controller Steps with an error
Click the button in the sidebar. The snapshot viewer displays the snapshot in the right pane and
adds the following elements:
Previous/Next. Navigates to the snapshot for the previous or next step. The corresponding step
is highlighted in the script.
Snapshot type
UI Element Description
Recording Displays snapshots that were taken for a specific step during
recording.
Interactive Replay Display snapshots that were taken for a specific step during
interactive replay.
Iteration Display snapshots for a specific iteration during interactive replay
mode.
Load Mode Replay. Display snapshots that were taken for a specific step during load
mode replay.
Play Slide Show Display snapshots as a slide show.
Stop Slide Show
User Guide
HP LoadRunner (12.50) Page 735
View
UI Element Description
Single Displays the snapshot for a single step.
Compare Splits the screen so you can compare snapshots from different modes.
Use the Snapshot View buttons in each pane to select which snapshots to
view. Click the Synchronize Scrolling button to synchronize scrolling
between the panes. The snapshot error icon indicates that the
snapshot is not current for the step.
Thumbnail Displays the snapshots in thumbnails view.
Resolve Object Identification Issues
Object identification presents one of the biggest challenges with recording and replaying Web 2.0
applications because objects which have been recorded can move or change content. When recorded
objects change dynamically during replay, TruClient can lose the ability to automatically locate the
object.
TruClient includes sophisticated mechanisms to overcome this challenge including the Highlight,
Improve Object Identification, Replace Object and Related Object, and Object Identification Assistant
options.
Note: When identifying objects for applications that have been recorded in multiple windows,
make sure that the correct window is selected in the TruClient Sidebar > Window Tab > Replay
Window.
What do you want to do?
Suspend object selection mode (CTRL + ALT+ F4)
Highlight, Improve Identification, Replace, and Related Objects all require you to select an object in the
application. There are cases in which various actions are required in the application to make the object
visible such as mouse over and mouse click. In these cases use the CTRL+ALT+F4 to suspend the TruClient
object selection mode until you've brought the object into view and press CTRL+ALT+F4 again to select the
object.
Highlighting an object
Regardless of which method of object identification is used, you can use the highlight button, located
in the Object section of the step, to check if an object is visible in the application at any time. If the
User Guide
HP LoadRunner (12.50) Page 736
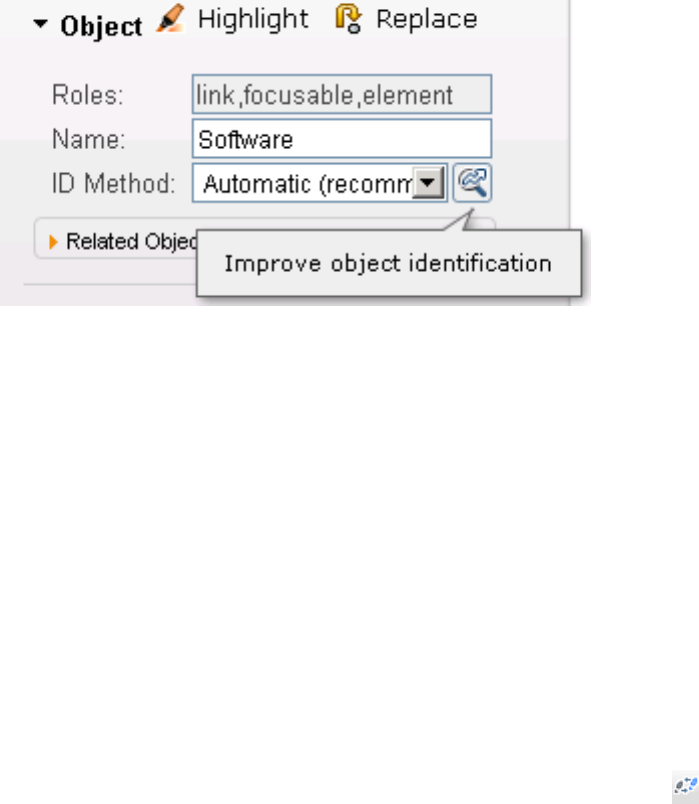
object is not found this may be an issue of pacing and timing. If the object cannot be found, an error
message is displayed.
Improve Object Identification
If the Highlight option fails, use the Improve Object Identification.
This option is located in the Object section of the step, next to the ID Method drop-down. This will let
TruClient relearn the properties of the object and compare them to the properties learned during
recording. Based on the differences, the necessary adjustments can be made. Depending on how
dynamic the application is, you may need to use the Improve Object Identification function more than
once.
Once you have done this, try replaying the step again to verify that the problem has been solved.
Use Alternative Steps
Alternative steps allow you to view instances in which there are multiple ways to perform the same
action in a step. If Improve Object Identification fails, try using one of the alternative steps.
For example, you may be clicking on an option in a drop-down list in which the text changes based on
some value. If you try to click based on the text, the step may fail. If you use an alternative step that
selects the item in the list based on the ordinal value of the option within the list, the click will succeed
regardless of the text.
Steps that have alternative options are labeled with an alternative step symbol . Click it to view the
alternative options for that step. Click the desired alternative and select Back.
Below is a snapshot of a step in which the second item in a listbox named "Desktop" was selected. The
alternative steps feature gives you the option of defining the step based on clicking the link "Desktop",
selecting the object "Desktop" from the listbox, or selecting the second item in the listbox.
User Guide
HP LoadRunner (12.50) Page 737
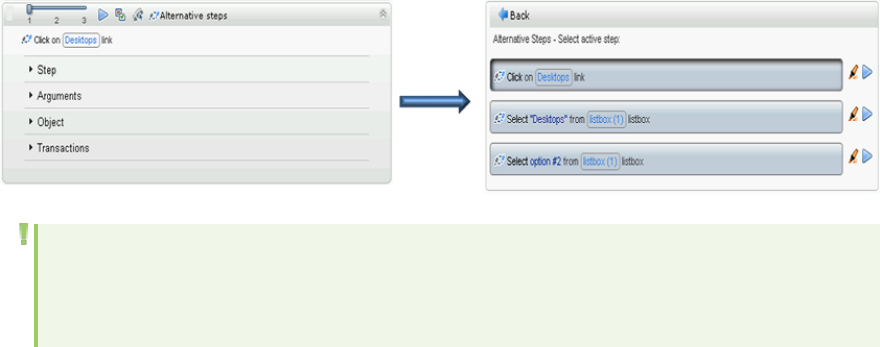
Note: Before selecting one of the alternatives, try highlighting the object used by the
alternative step and replaying it. This way you can make sure the alternative step is replaying
the necessary action.
Modify the Object Identification Method
You can modify the way TruClient identifies the object by modifying the object identification method in
the Object section of the step properties. The following options are available:
lAutomatic. TruClient's default object identification method. The Automatic method allows TruClient
to use its internal advanced algorithms to locate the object. If this method does not successfully find
the object during replay, click the Improve Object Identification button and replay the script again.
lXPath. If Automatic identification fails, even after using Improve Identification or Related Objects
(described below), try using the XPath identification method. This method identifies the object based
on an XPath expression that defines the object in the DOM tree. Click the drop-down arrow next to
the XPath edit box to select a suggested XPath for the object. You can manually modify the
suggested path. To revert to one of the original expressions generated by TruClient, select one of the
options from the drop-down again.
For example, if you need to select the first search result, regardless of the term being searched for,
using XPath identification may help.
lJavaScript. JavaScript code that returns an object. For example: document.getElementById
("SearchButton") returns an element that has a DOM ID attribute of "SearchButton".
Using the JavaScript identification method you can write JavaScript code that references the returned
document and can use CSS selectors and other standard functions.
For example, the page returned by the server contains multiple links with the same "title" attribute
(search results) and we want the script to randomly click on one of the available links.
Object identification for this case, using the JavaScript identification method, may look something like
this:
var my_results = document.querySelectorAll('a[title="SearchResult"]');
random(my_results);
lDescriptors. Enables you to identify an object by it's properties in an editor. For details, see
Descriptors.
User Guide
HP LoadRunner (12.50) Page 738

Modify the script timing
Sometimes objects may not be found because of timing and synchronization issues. For example, the
script may be looking for an object that was in the application, but the script replayed too quickly and
already progressed to another page. If you suspect that the object is not being found because of a
timing or synchronization issue, you can insert Wait steps. For more information, see "Debug TruClient
Scripts" on page727.
Relating objects to other objects
If the Improve Object Identification function does not solve the issue and neither do any of the
alternative steps, try using the Related Objects option.
If an object becomes difficult to identify on its own, you can label the object based on a different, more
stable object. Relations are defined visually, relating objects according to their distance in pixels from
other objects. Relations are defined per ID method, per object. If more than one relation is defined for
an ID method of a given object, both relations must locate the same object for the step to pass.
TruClient then uses this object to help locate the target object. To use this function, expand the step,
select Object > Related Objects, and click the add button . Follow the directions to create a relation.
Verify that it has worked by highlighting both the object and its related object.
Tips:
lUse this feature only if other identification methods have failed as it may be more resource
intensive.
lUse the minimum search area to improve performance.
lRelated Objects are sensitive to window sizing. Resizing may alter object positions and
relationships. This should be taken into account.
lEach identification method (Automatic, XPath, and JavaScript) has its own set of related
objects. These related objects are not shared between identification methods.
lIf several relations exist they all need to be found in order for the identification to succeed.
Replacing an object
If you selected the wrong object during recording, or an object has permanently changed, you can
replace it with a different object without replacing the step. This effectively resets the step, deleting
changes made to the original step such as relations. Expand the step, select Object, and click the
Replace button . Select the new object and replay the script.
Replace Object will tell TruClient that the object currently referenced in the step is incorrect. TruClient
will remove any current knowledge of the object and learn the object you select.
User Guide
HP LoadRunner (12.50) Page 739
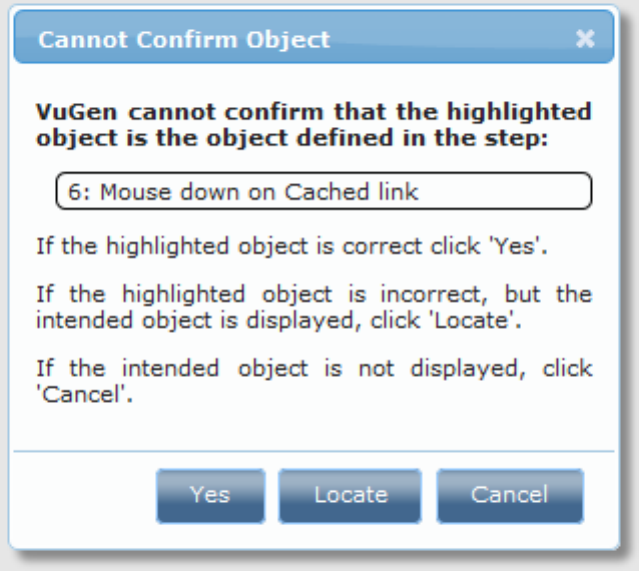
Therefore, you should only use the Replace Object option if the object you used during recording was
the wrong one.
Learn about the Object Identification Assistant
Object identification can fail during replay for several reasons. For each reason, TruClient will launch the
object identification assistant to try to resolve failed identification.
Cannot confirm object
TruClient suspects a specific object to be the desired object but it cannot be positively identified. The
suspected object is highlighted on the screen, and the following assistant dialog box appears:
Options:
lYes. The suspected (and highlighted) object is the correct object.
lLocate. The suspected object is not the right object. You will need to identify the correct object in the
application.
lCancel. Stop the replay.
Multiple objects found
TruClient found several objects that match the identification of the desired object. All suspected objects
will be highlighted on the screen, and the following assistant dialog box will appear:
User Guide
HP LoadRunner (12.50) Page 740
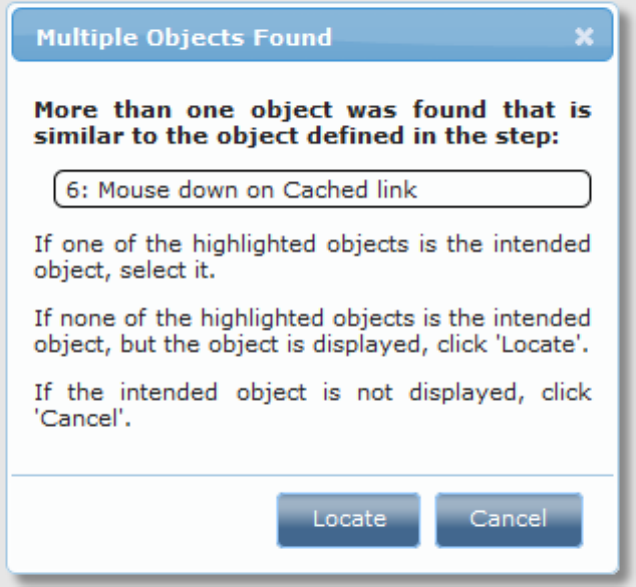
Options:
lThe correct object is one of the marked objects. Click the object in the application to specify the
correct one.
lLocate. The suspected object is not one of the highlighted objects.You will then need to highlight the
correct object in the application.
lCancel. Stop the replay.
Object not found
TruClient could not find the desired object. The following assistant dialog box will appear:
User Guide
HP LoadRunner (12.50) Page 741
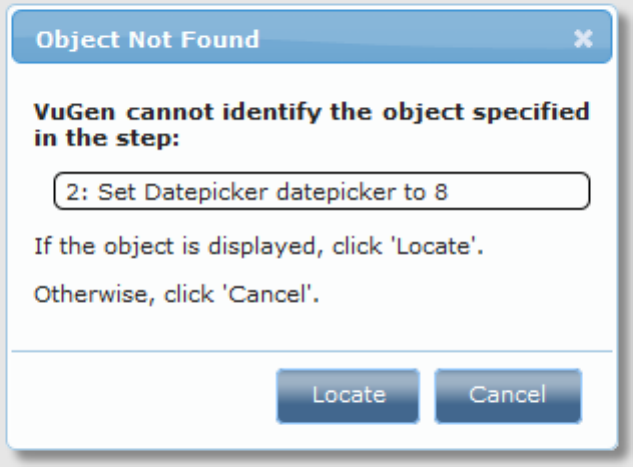
Options:
lLocate. Locate the object. You will need to highlight the correct object in the application.
lCancel. Stop the replay.
Wrong level on step
TruClient found that a step in a higher level is needed for the identification of the object of current step.
This is common for mouse over steps that are usually recorded in level 3 but might be needed for click
steps that are recorded in level 1.
When TruClient recognizes this dependency during recording, the mouse over will move automatically to
level 1.
When TruClient recognizes this dependency during replay, the following assistant will appear:
User Guide
HP LoadRunner (12.50) Page 742
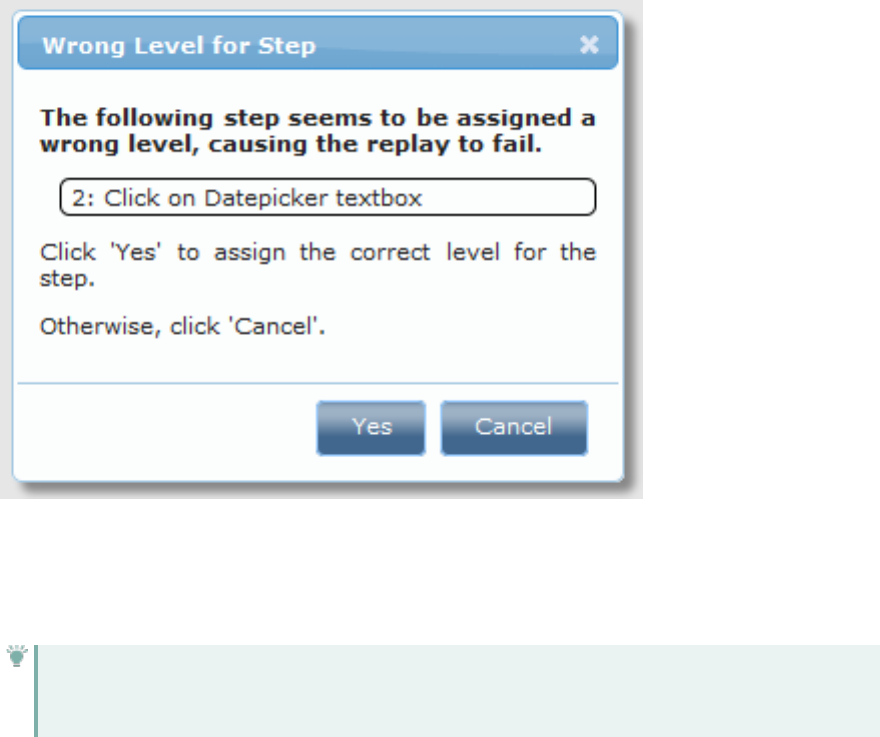
Options:
lYes. Move the needed step to level 1.
lCancel. Stop the replay.
Tip: After you perform any of the changes, replay the single failed step. Then replay the whole
script again. This will help verify whether the change has solved the issue you encountered.
Troubleshooting Object Identification Issues
How Related Objects Can Help the XPath and JavaScript Identification Methods
The XPath and JavaScript identification methods may return multiple elements depending on the
expression used.
For example, if the XPath value is //button, and the web page in question includes multiple button
elements, multiple objects will be returned.
To return a single object you can add a Related Object that will narrow down the identification.
Interactive Replay Fails with Object Not Found Error
If replay stops with an error that says the object was not found try the following:
lSelect the failed step and press Highlight. If the correct object is not highlight use Improve
Identification to improve object identification.
lIf the object is highlighted it may be that step was reached before the object appeared. Add a Wait or
User Guide
HP LoadRunner (12.50) Page 743
Wait for Object step before the problematic step.
Sometimes you may need to choose an Alternative Step that is provided in order to solve the issue. For
example, you may be clicking on an option in a drop-down list in which the text changes based on some
value. If you try to click based on the text, the step may fail.If you use an alternative step that selects
the item in the list based on the ordinal value of this option within the list, the click will succeed
regardless of the text.
Interactive Replay Fails Due to Object Not Found Although Highlight Locates the
Object
If the replay fails even though the Highlight option finds the correct object, this may be a case of pacing.
The object takes a little longer to load and the step is executed faster. Therefore, during execution the
step cannot locate the object although, during debugging, the Highlight option on the failed step finds
the object.
In this case it is recommended to "slow down" the script so there is enough time for the object to load.
Use one of the following options to do this:
lChange the Object Timeout of the failing step. This is available via the Step section on the step's
properties.
lAdd a Wait or Wait for Object step before the failed step.
Replay Fails to Select an Item from a List
One of the common reasons for this is that the names of the items in the list are dynamic.
For example, the list may include a list of cities based on the text entered so far (auto-complete).
Based on the text types the list constantly changes.
There are two ways to solve this issue:
lUse an alternative step that selects an item from the list using the ordinal identifier instead of the
text of the actual item.
lIf the text is only partially dynamic you can use a regular expression to locate the required item
based on partial text matching.
Enable the Object Identification Debug log
Enable the Object Identification Debug log to understand why TruClient was not able to identify an
object using Automatic or Descriptors ID methods.
1. In the script folder, create a .json file and name it additionalSettings.json. For example:
C:\Users\<UserName>\Documents\VuGen\Scripts\<ScriptName>
2. Add the following configuration to the file:
{
"TruClient": {
User Guide
HP LoadRunner (12.50) Page 744

"EnableIdentDescriptorsDebug": true,
"EnableIdentDebug": true
}
}
3. If TruClient is unable to identify an object, the log contains the following information:
t=00006967ms: Error -205177: ** 3.1: Click on שופיח combobox ** failed -
target object was not found. Snapshot Info [MSH 1 0] [MsgId:
MERR-205177] *Comment* The object not found
t=00006970ms: Error -205177: Step ID: step:{b80a25a2-ec24-4186-8d1a-
d72e6f525461}
*Comment* Internal
step information
Test Object: testObj:{246c634d-e8bb-4c1e-9a33-899bff8c9a1b}
Elected object: <input class="b_searchbox" id="sb_form_q" name="q"
title="Enter your search term" value="" maxlength="1000"
autocapitalize="off" autocorrect="off" autocomplete="off"
spellcheck="false" type="search"> *Comment* Candidate object to elect
Total votes received: -1 *Comment* Votes outcome
Electors voted: *Comment* Electors vote.
0. Elector: leaf, Value: true, Recorded Score: 0.01, Replay Voted
Score: 0.01
1. Elector: position, Value: {"pos":"absolute"}, Recorded Score: 0.1,
Replay Voted Score: -0.2
2. Elector: role, Value: "combobox", Recorded Score: 0.05, Replay Voted
Score: -1
*Comments added to describe log sections.
Descriptors
This topic describes how to use the TruClient descriptor editor to identify objects in your TruClient
scripts.
Where do Ifind it?
<Step> Object > ID Method > Descriptors
What are descriptors?
Descriptors allow you to perform Object Identification by explicitly specifying the object’s HTML and CSS
properties (such as ID, Class, Position and more). These properties are defined by creating Conditions in
the TruClient Descriptor Editor.
lDescriptor identification is automatically created during recording or when manually selecting or
replacing an object.
User Guide
HP LoadRunner (12.50) Page 745

lEach condition contains a property, an operator, and a value and when applicable, optional
arguments .
lEvery object requires a tagName property.
What do you want to do?
Configure descriptors manually
1. Add a Generic Object Action step or expand an existing step to your script. Expand the Object
section, select Descriptors from the ID Method drop down box.
2. From the Descriptors, select Click here to edit to open the Descriptors Editor.
3. Set the value for the tagName condition.
4. Add additional conditions
a. Select an object property.
List of properties
Property
Category
Property Value type Description
Role role String Standard role DOM attribute.
ID id String Standard id DOM attribute .
Name name String Standard name DOM attribute.
Class class White space
separated string
Standard class DOM attribute.
Text text String Inner text.
Label text String Element label.
ARIA label labeledby White space
separated string
Element ids used as labels for the
object.
Title title White space
separated string
Standard title DOM attribute
Input type input/type String Type attribute of an input
element.
Input text input/text/value String Text value of a text box.
Button
value
input/button/value String Caption of a button.
User Guide
HP LoadRunner (12.50) Page 746

Property
Category
Property Value type Description
Alternative
text
alt String Alternative text for an element
when the text property is not
available.
Image
source
img/sc String Standard src attribute of an image
element.
Hyperlink ourl
oprotocol
opathname
osearch
String Standard hyperlink properties.
Form
action
form/action String Standard form action.
Form
method
form/method String Standard form method DOM
attribute.
Table
columns
tr/cols Number Number of columns for table row
elements.
Number isNumber Boolean Determine if the textual content of
the element is a number.
Currency isCurrency Boolean Determine if the textual content of
the element is a currency value.
Date isDate Boolean Determine if the textual content of
the element is a date value.
Time is Time Boolean Determine if the textual content of
the element is a time value.
DOM leaf isLeaf Boolean Determine if the element is a tree
leaf.
Flash
wrapper
wrapId If the object is a Flash Player, the id
of the parent element.
Border otop
oright
obottom
Number Border widths in pixels.
User Guide
HP LoadRunner (12.50) Page 747

Property
Category
Property Value type Description
oleft
Dimension owidth
oheight
Number Standard computed width and
height in pixels.
Headline text String Content of the h1/h2/…/h6
element found among the
element's ancestors.
List
headline
list/headline String Content of the first h1/h2/…/h6
element among the preceding
siblings of the current elements
(for lists (ui/ol) only).
HTML
Editor
isHtmlEdit Boolean Determine if the current element
is an HTML editor.
Custom
Attribute
attributeA
attributeB
...
attributeZ
String Custom DOM attribute with an
arbitrary name.
Custom
Property
propertyA
propertyB
...
propertyZ
Expected value is a
string while the
actual value can be
any JS type.
Custom JS property with an
arbitrary name.
b. Select an operator
List of Operators
Operator Description
equalsIgnoreChars Compares the object property to the value
specified in the descriptor editor ignoring any
characters specified in the Arguments section.
endsWith The object property ends with the value
specified in the descriptor editor.
equals Compares the object property to the value
User Guide
HP LoadRunner (12.50) Page 748
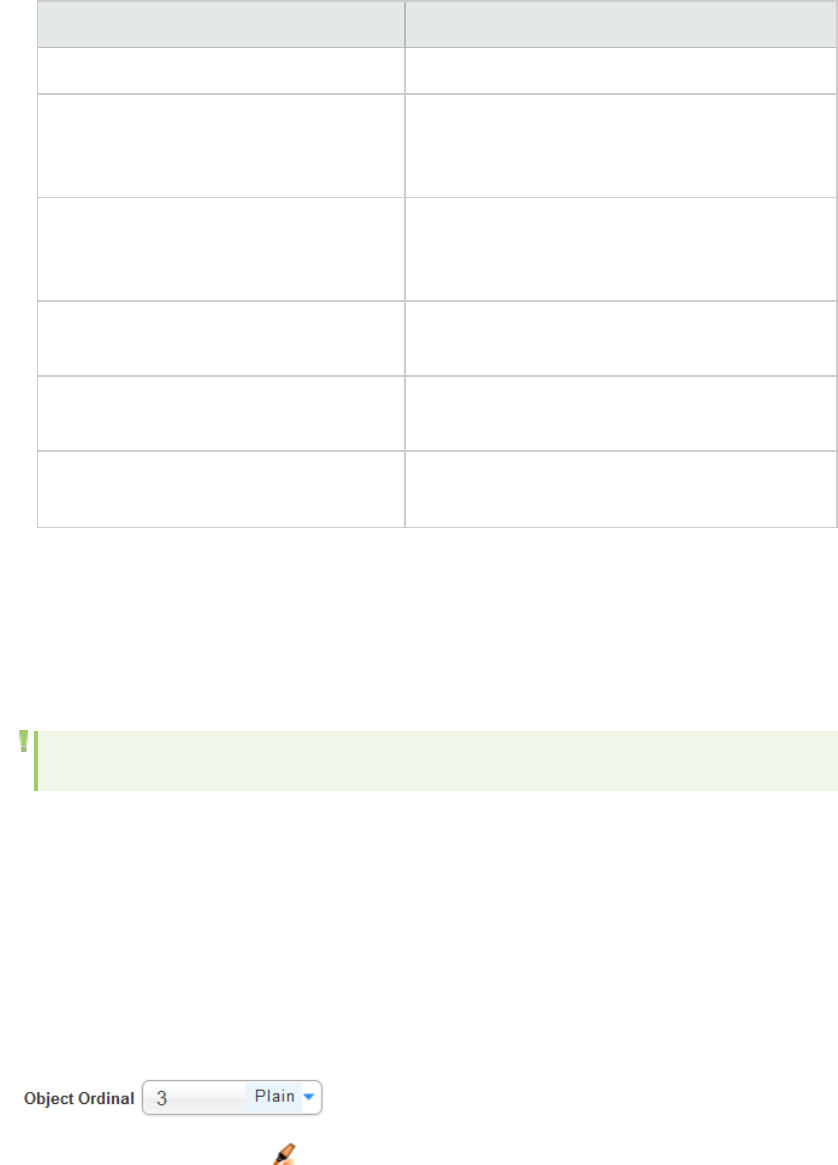
Operator Description
specified in the descriptor editor.
equalsIgnoreDigits Compares the object property to the value
specified in the descriptor editor ignoring any
numeric characters.
equalsIgnoreCase Compares the object property to the value
specified in the descriptor editor ignoring case
considerations.
startsWith The object property begins with the value
specified in the descriptor editor.
isRegExpMatch The object property matches the regular
expression specified in the descriptor editor.
isSubstring The object property contains the value specified
in the descriptor editor.
c. Set the property value.
5. Repeat step 5 until you have defined all the properties of your object.
6. If relevant, specify the Object Ordinal.
When an element cannot be identified uniquely, you can use the Object Ordinal to specify which
occurrence to pick.
Note: The Object Ordinal is 1-based and not 0-based.
For example, let's assume that you would like to identify the third row of the column in the table
below. You cannot do it without specifying the Object Ordinal = 3 since all the columns look the
same.
<table>
<tr><td class”emptyrow”></td></tr>
<tr><td class”emptyrow”></td></tr>
<tr><td class”emptyrow”></td></tr>
<tr><td class”emptyrow”></td></tr>
</table>
7. Click the highlight object button to verify that the object can be identified.
User Guide
HP LoadRunner (12.50) Page 749

Use a custom property or attribute
You can use DOM attributes or JavaScript properties to identify an object. JavaScript properties are
attached to the DOM object by JavaScript or by the browser code during initialization. Both attributes
and properties can be changed.
Differences between custom properties and custom attributes
lThe APIs to manipulate properties contains the dot operator versus the attribute APIs which use
“getAttribute”, “setAttribute” methods.
lJavaScript properties cannot be set by the HTML markup.
lJavaScript properties cannot be seen in the outerHTML/innerHTML strings of an element while
attributes can be seen.
lThe JSON.stringify function will serialize a subset of JavaScript properties but not DOM
attributes.
See a list of object properties
Property
Category
Property Value type Description
Role role String Standard role DOM attribute.
ID id String Standard id DOM attribute .
Name name String Standard name DOM attribute.
Class class White space
separated string
Standard class DOM attribute.
Text text String Inner text.
Label text String Element label.
ARIA label labeledby White space
separated string
Element ids used as labels for the object.
Title title White space
separated string
Standard title DOM attribute
Input type input/type String Type attribute of an input element.
Input text input/text/value String Text value of a text box.
Button
value
input/button/value String Caption of a button.
User Guide
HP LoadRunner (12.50) Page 750

Property
Category
Property Value type Description
Alternative
text
alt String Alternative text for an element when the
text property is not available.
Image
source
img/sc String Standard src attribute of an image
element.
Hyperlink lurl
lprotocol
lpathname
lsearch
String Standard hyperlink properties.
Form
action
form/action String Standard form action.
Form
method
form/method String Standard form method DOM attribute.
Table
columns
tr/cols Number Number of columns for table row
elements.
Number isNumber Boolean Determine if the textual content of the
element is a number.
Currency isCurrency Boolean Determine if the textual content of the
element is a currency value.
Date isDate Boolean Determine if the textual content of the
element is a date value.
Time is Time Boolean Determine if the textual content of the
element is a time value.
DOM leaf isLeaf Boolean Determine if the element is a tree leaf.
Flash
wrapper
wrapId If the object is a Flash Player, the id of
the parent element.
Border ltop
lright
lbottom
lleft
Number Border widths in pixels.
Dimension lwidth Number Standard computed width and height in
User Guide
HP LoadRunner (12.50) Page 751

Property
Category
Property Value type Description
lheight pixels.
Headline text String Content of the h1/h2/…/h6 element
found among the element's ancestors.
List
headline
list/headline String Content of the first h1/h2/…/h6 element
among the preceding siblings of the
current elements (for lists (ui/ol) only).
HTML
Editor
isHtmlEdit Boolean Determine if the current element is an
HTML editor.
Custom
Attribute
attributeA
attributeB
...
attributeZ
String Custom DOM attribute with an arbitrary
name.
Custom
Property
propertyA
propertyB
...
propertyZ
Expected value is a
string while the actual
value can be any JS
type.
Custom JS property with an arbitrary
name.
See a list of operators
Operator Description
equalsIgnoreChars Compares the object property to the value specified in
the descriptor editor ignoring any characters specified in
the Arguments section.
endsWith The object property ends with the value specified in the
descriptor editor.
equals Compares the object property to the value specified in
the descriptor editor.
equalsIgnoreDigits Compares the object property to the value specified in
the descriptor editor ignoring any numeric characters.
equalsIgnoreCase Compares the object property to the value specified in
User Guide
HP LoadRunner (12.50) Page 752

Operator Description
the descriptor editor ignoring case considerations.
startsWith The object property begins with the value specified in the
descriptor editor.
isRegExpMatch The object property matches the regular expression
specified in the descriptor editor.
isSubstring The object property contains the value specified in the
descriptor editor.
Enhance a TruClient Script
What do you want to do?
lEnhance a TruClient script with Toolbox functions
lUse parameters in TruClient scripts
l"Insert transactions into a TruClient script" on the next page
lUse "TruClient functions and function libraries" on page757
lUse an Event Handler
Related topics
Function Reference
Enhance a script with Toolbox functions
There are a number of optional enhancements that can be added to scripts beyond the basic workflow.
This task describes the enhancements and how to use them. For step details, see Toolbox.
Modify Steps
Modify step arguments and objects by selecting the desired step and expanding the options. This
expands the step and allows you to modify the objects and properties. For a detailed list of the step
structure, see "TruClient Toolbox" on page702.
lInsert Flow Control Steps
Loops repeat selected portions of the script until certain criteria is met or for a specified number of
times. To insert a loop, select Toolbox > Flow Control > For loop. For details, see " How to Insert and
Modify Loops" on page774.
User Guide
HP LoadRunner (12.50) Page 753
lInsert If blocks or If-else blocks and exit steps
To conditionalize a portion of the script, you can insert If or If-else blocks. To insert an If block, select
Toolbox > Flow Control > If block. To add an else condition, click the Add else link next to the If step
title. For more details, see "TruClient Step Arguments" on page825.
Exit steps cause a script to exit the iteration or the entire script. These can be used with If
statements to exit a script or iteration when a specified condition occurs. To insert an exit step,
select Toolbox > Flow Control > Exit.
Insert comments
You can insert comments into your script by selecting Toolbox > Misc and dragging the Comment icon
to the desired location.
Insert Catch Error Steps
Catch error steps are group steps that run their contents if the previous step contains an error.
Additionally, the error is "caught" and is not returned. You can define catch error steps to catch any
error, or a specific type of error. If there are two catch error steps in a row, they both apply to the same
step. To insert a catch error step, select Toolbox > Flow Control > Catch Error.
Verify that an object exists
To verify that a string or object exists in the application, you can insert a verify step:
1. Select Toolbox > Functions and drag the Verify icon to the desired location.
2. Click the object in the verify step.
3. Select the object you want to verify.
Insert Generic Steps
You can insert a generic or blank step and manually configure it. To insert a generic step do the
following:
1. Select Toolbox > Functions > Generic Object/Browser Action.
2. Drag and drop the step to the desired location.
3. Expand the step, and enter the desired step properties.
Generic Object Actions perform an unspecified action on an object. Generic Browser Actions
perform an unspecified action on the browser such as back, reload and switch tabs.
Download filters
You can add URLs to Runtime Settings >Download Filters to either include or exclude specific URLs
while replaying your script.
Insert transactions into a TruClient script
You can add transactions by using the Transaction Editor.
User Guide
HP LoadRunner (12.50) Page 754
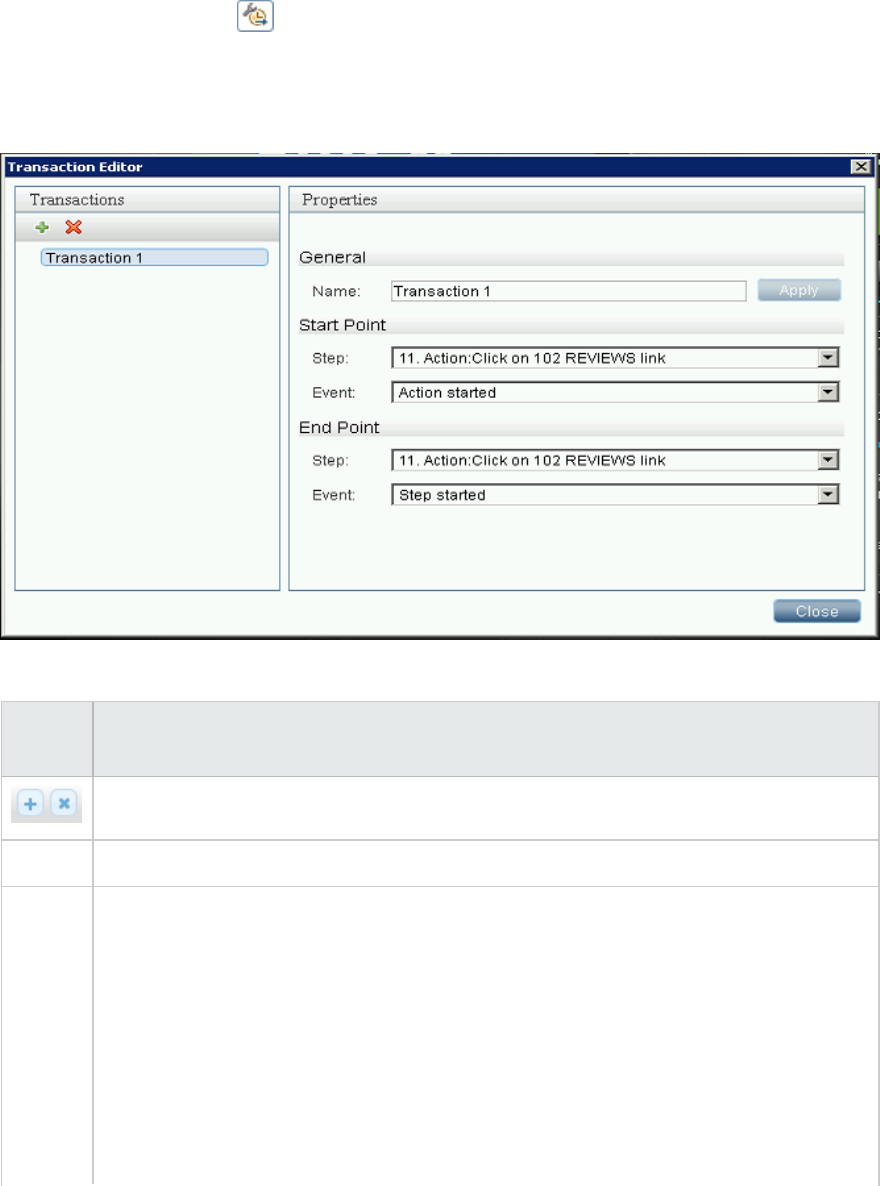
Where do I find it?
Click the Transaction Editor button from the Home Tab or click Ctrl + Alt + F7.
TruClient transactions function differently from other protocols because of the asynchronous nature of
TruClient steps. Transactions are defined based on start and end steps and step events. Due to this
definition, a transaction's end can be triggered before the true end of a step.
User interface elements are described below:
UI
Element
Description
Adds a new transaction or deletes the selected transaction.
General Enables you to edit the name of the transaction.
Start
Point
The step and the event which marks the start of the transaction.
An event can be one of the following:
lStep started. The first event triggered when a step starts running. The event triggered
before the step action has started running and before any other activity takes place.
lAction started. This event occurs immediately after the Step started event and
signifies that the action to be performed has started. For example, the action might be
navigation to a URL or a button click.
lAction completed. This event is triggered when the action to be performed has
completed. However, the step may not have ended yet. For example, for steps related
User Guide
HP LoadRunner (12.50) Page 755

to the application, there might be additional network or DOM activity.
lStep synchronous network completed. Step ends when all HTTP requests have been
completed excluding requests that are associated with open connections that are not
relevant to the step. Usually, these requests are triggered by using XMLHttpRequest.
lDOM content loaded. Step ends when the page's Document Object Model (DOM) is
ready. This means that the API for interacting with the content, style and structure of a
page is ready to receive requests from your application client side code.
lDocument load. Step ends when the process of loading a document is completed. This
means that all scripts and stylesheets have finished loading and have been executed,
and all images have been downloaded and displayed.
lDialog opened. Step ends when a dialog box is opened.
lStep completed.This event is triggered as soon as the work inside the step container
has completed. It is triggered only if the step completed successfully.
lAfter step ended. The last event in the events chain, it occurs after Step completed,
but unlike Step completed it will be triggered regardless if the step was completed
successfully or not.
End
Point
The step and the event which marks the end of the transaction.
An event can be one of the following:
lStep started. The first event triggered when a step starts running. The event triggered
before the step action has started running and before any other activity takes place.
lAction started. This event occurs immediately after the Step started event and
signifies that the action to be performed has started. For example, the action might be
navigation to a URL or a button click.
lAction completed. This event is triggered when the action to be performed has
completed. However, the step may not have ended yet. For example, for steps related
to the application, there might be additional network or DOM activity.
lStep synchronous network completed. Step ends when all HTTP requests have been
completed excluding requests that are associated with open connections that are not
relevant to the step. Usually, these requests are triggered by using XMLHttpRequest.
lDOM content loaded. Step ends when the page's Document Object Model (DOM) is
ready. This means that the API for interacting with the content, style and structure of a
page is ready to receive requests from your application client side code.
lDocument load. Step ends when the process of loading a document is completed. This
means that all scripts and stylesheets have finished loading and have been executed,
and all images have been downloaded and displayed.
lDialog opened. Step ends when a dialog box is opened.
lStep completed.This event is triggered as soon as the work inside the step container
has completed. It is triggered only if the step completed successfully.
lAfter step ended. The last event in the events chain, it occurs after Step completed,
User Guide
HP LoadRunner (12.50) Page 756
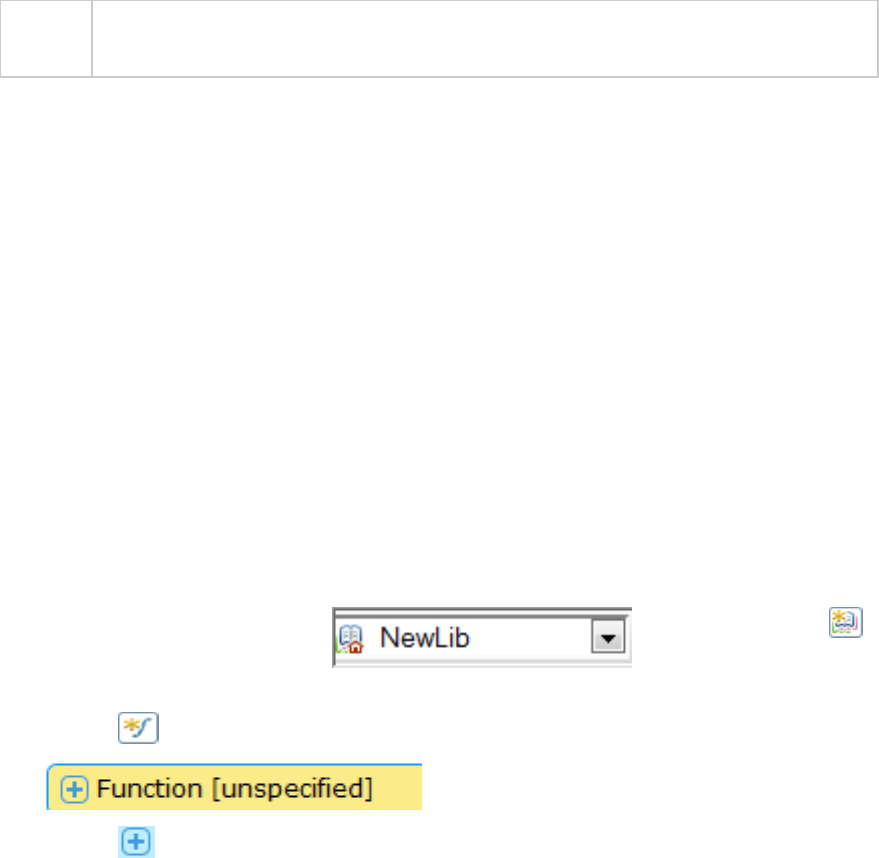
but unlike Step completed it will be triggered regardless if the step was completed
successfully or not.
TruClient functions and function libraries
A TruClient function is a group of steps, such as a login, that you define as a function. Functions are
stored in libraries that can be reused multiple times in a script. Each library can contain multiple
functions.
Each library can be either local or global. A local library can be accessed by the script that created it. A
global library can be accessed by all TruClient scripts. Additionally, a global library can be saved on the
network and shared between many users.
Where do I find it?
Right click on a highlighted step in the script, and then select Group Into > New Function.
What do you want to do?
Create a function library and function from the TruClient sidebar
1. Select the Functions Libraries tab at the bottom of the TruClient sidebar.
2. Select an existing library from the drop-down or click the
button from the Function toolbar to create a new library.
3. Click the button to create a new function. This will insert a new unspecified function.
4. Click the button to expand the function.
5. Define the step including function name and end event.
6. Define the function arguments using the Argument Editor. Argument names should be meaningful
so that when you are using the function it is clear what value you need to specify.
7. Define the transaction using the Transaction Editor. For details, see "Insert transactions into a
TruClient script" on page754.
Create a function within a script
1. Highlight the steps in the script to include in the function. To select multiple steps, press CTRL.
2. Right-click on a highlighted step and select Group Into > Function which opens the Create a New
Function dialog box.
3. To assign steps that contain arguments, expand the argument section, and insert the function
User Guide
HP LoadRunner (12.50) Page 757
FuncArgs.<argument name>.
Tip: To insert javascript as the argument value, click the button to access the
Javascript editor.
Create a global library
1. Select Function Libraries from the drop-down from the TruClient Sidebar.
2. Select an existing library from the drop-down in the TruClient
Sidebar.
3. Click the button to export the library to a location on your file directory as an xml file.
Using the copy paste operation in global libraries
Pasting steps that contain test objects from a local script or a local library to a global library creates
separate test object that refer to the same UI element. If you change or update one of the test objects
in the global library or in the script, you will need to manually update the other test object that refers to
the same UI element.
See examples
1. Global library “GlobLib” contains step A with a test object “Foo” that relates to the
application.
Script also contains step B with a test object “Foo” that relates to the application.
If you copy step B and paste it to “GlobLib there are two different test objects in “GlobLib”
that related to “Foo”. Therefore, if you change or update one of them you should consider
changing the other one manually.
2. Global library “GlobLib” contains Step A with a test object “Foo” that relates to the
application.
Script has steps B and C with a test objects "Foo" that relates to the application. If you copy
steps B and C to “GlobLib” there are two different test objects in “GlobLib” that relate to
“Foo”.
User Guide
HP LoadRunner (12.50) Page 758
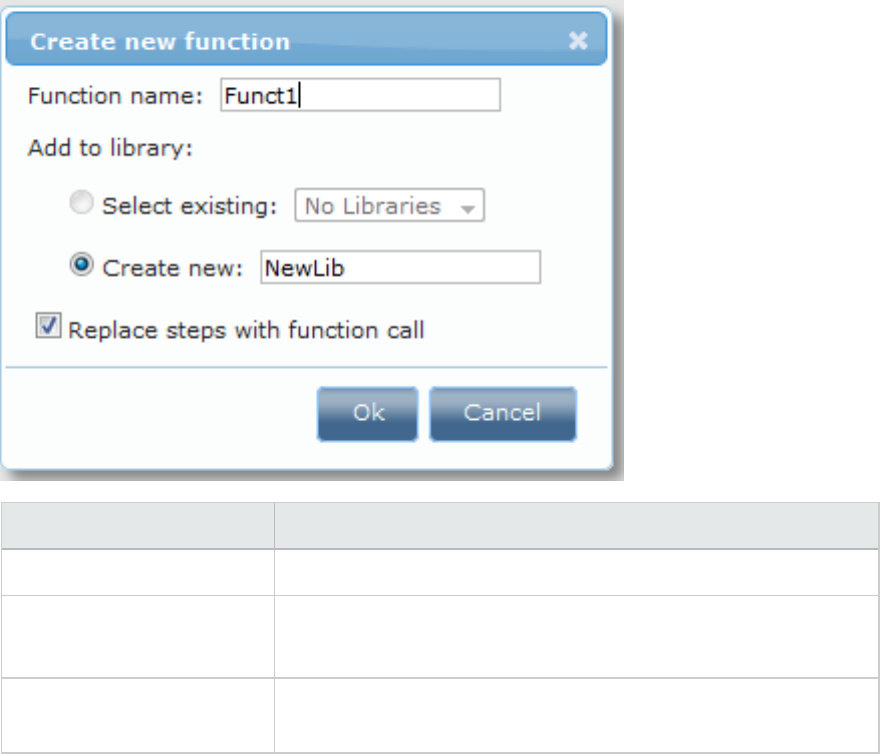
Use a function in the script
1. Click the TruClient Toolbox tab.
2. Select the Functions tab.
3. Drag and drop Call Function to the correct location in your script.
4. Click the Call Function link to expand the function.
5. Specify the library and the function in the step section.
6. Specify the arguments' values in the augments section. For details, see "Create a function within a
script " on page757. (Optional)
7. Specify transactions in the transaction section. (Optional) For details, see "Insert transactions into
a TruClient script" on page754.
Learn about the Create New Function Dialog Box
This dialog box enables you create a new function and assign the function to a library.
UI Element Description
Function Name Enables you to specify a function name.
Add to library lSelect Existing. Save new function to an existing library.
lCreate New. Save new function to a new library.
Replace steps with function
call
If selected, TruClient will automatically insert a call function in place
of steps.
User Guide
HP LoadRunner (12.50) Page 759
Note:
lWhen working with a global library, you can save changes to the library by clicking the
button.
lIf you save the library to a network location, other users can click the button to import
the library.
lClick the button to disconnect the library from global mode. Any changes that you make in
local mode are saved within the script.
TruClient Event Handlers
Event handlers manage events that can occur at any time during the run of the script. The event trigger
is set to an object or dialog appearing in the application with or without an additional specified property.
The handler (action) of the event is a function selected from the script’s function libraries.
During the replay of the script, when moving from one step to the next, TruClient checks to see if a
defined event occurs and if it does, it runs the function associated with the event.
The flowchart below illustrates the Event Handler workflow using the business process example of
buying and selling of stocks.
User Guide
HP LoadRunner (12.50) Page 760
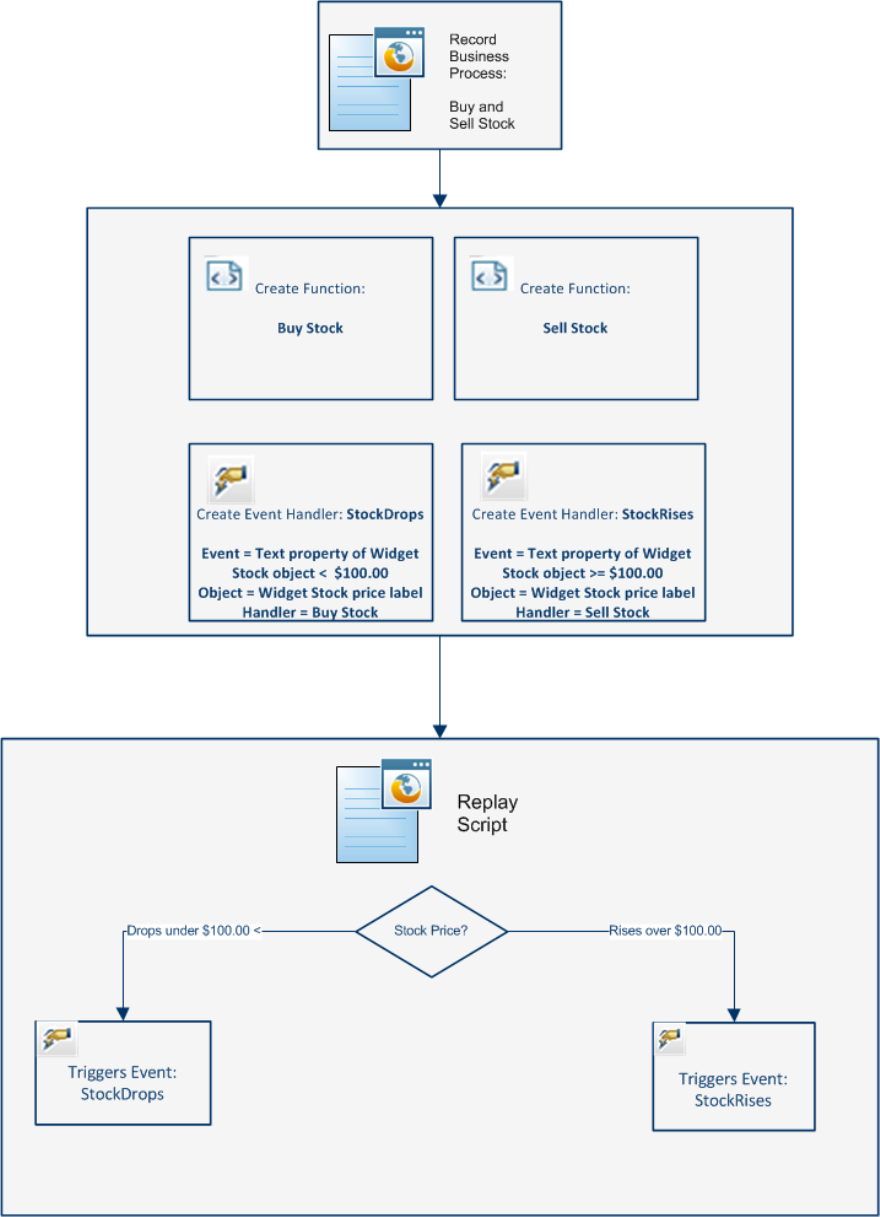
User Guide
HP LoadRunner (12.50) Page 761
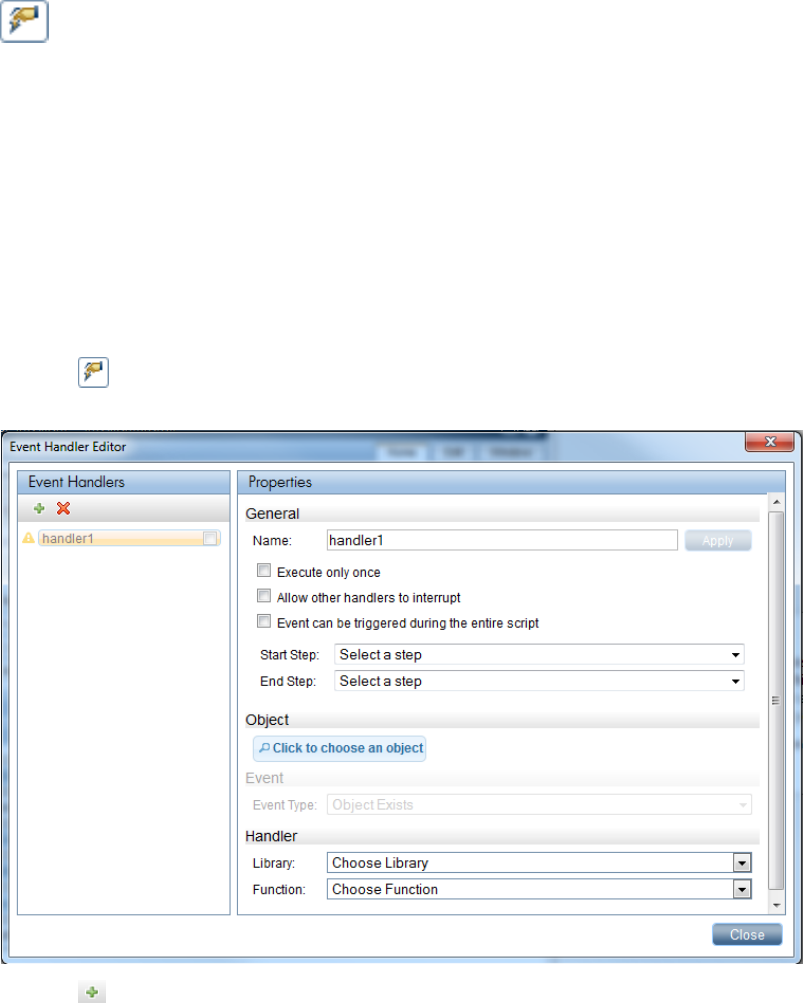
Where do I find it?
Click the button from the TruClient sidebar.
What do you want to do?
Use the events handler
This task describes how to create and use events with the Global Events Handler.
Prerequisites
The Global Events Handler runs functions if a certain event occurs during the replay of the script. Before
you create handlers, you must create the associated functions. For details, see .
1. Create an Event Handler
a. Click the button from the TruClient Toolbar. This will open the Event Handler Editor
.
b. Click the button from the Event Handler pane.
c. Define the properties of the handler.
You can specify if you want the handler to run at any time during the script or only between
certain steps. For details on this and other properties, see .
User Guide
HP LoadRunner (12.50) Page 762
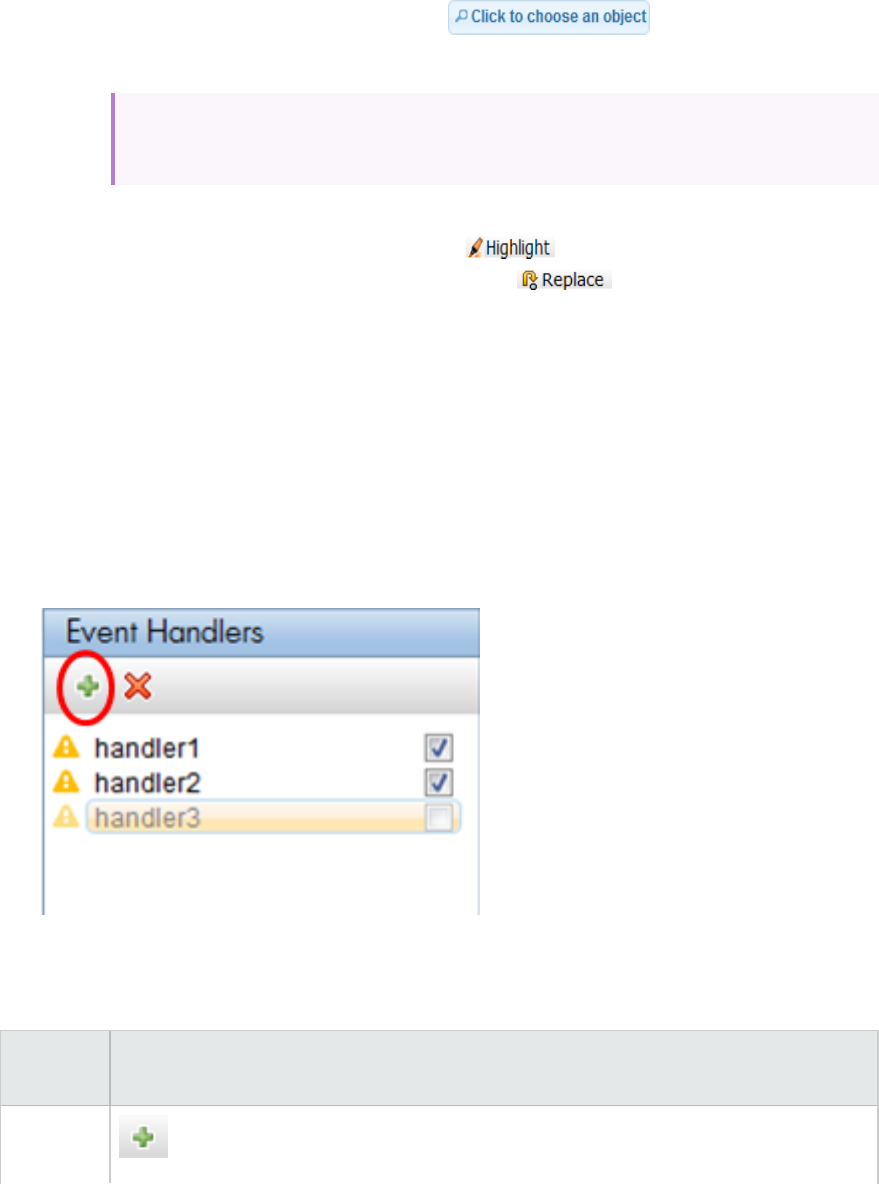
2. Define object associated with event
a. Select the object in the application with the button on which the event
will occur.
For example, select the text box for the widget StockPrice if you wish to trigger the
function SellStock, if the stock prices rises over $99.99.
b. Once the object is selected you can select the button to verify that the correct
object was selected. Additionally, you can select the button to replace the selected
object with another one. For details, see "Resolve Object Identification Issues" on page736.
3. Define the event
You can select to run the handler if the object exists or if, object's properties meet specific
conditions. For details, see .
4. Assign handler to the event
Select the function library, the function and specify argument values. For details, see .
5. Enable the handler
To enable the handler during script replay, select the check box next to the handler in the Event
Handler Pane.
Learn about the TruClient Events Handler Editor Dialog Box
This dialog box enables you to define events handlers and their properties.
UI
Element
Description
Event
Handler Add Event Handler. Add an event to the event handler.
User Guide
HP LoadRunner (12.50) Page 763
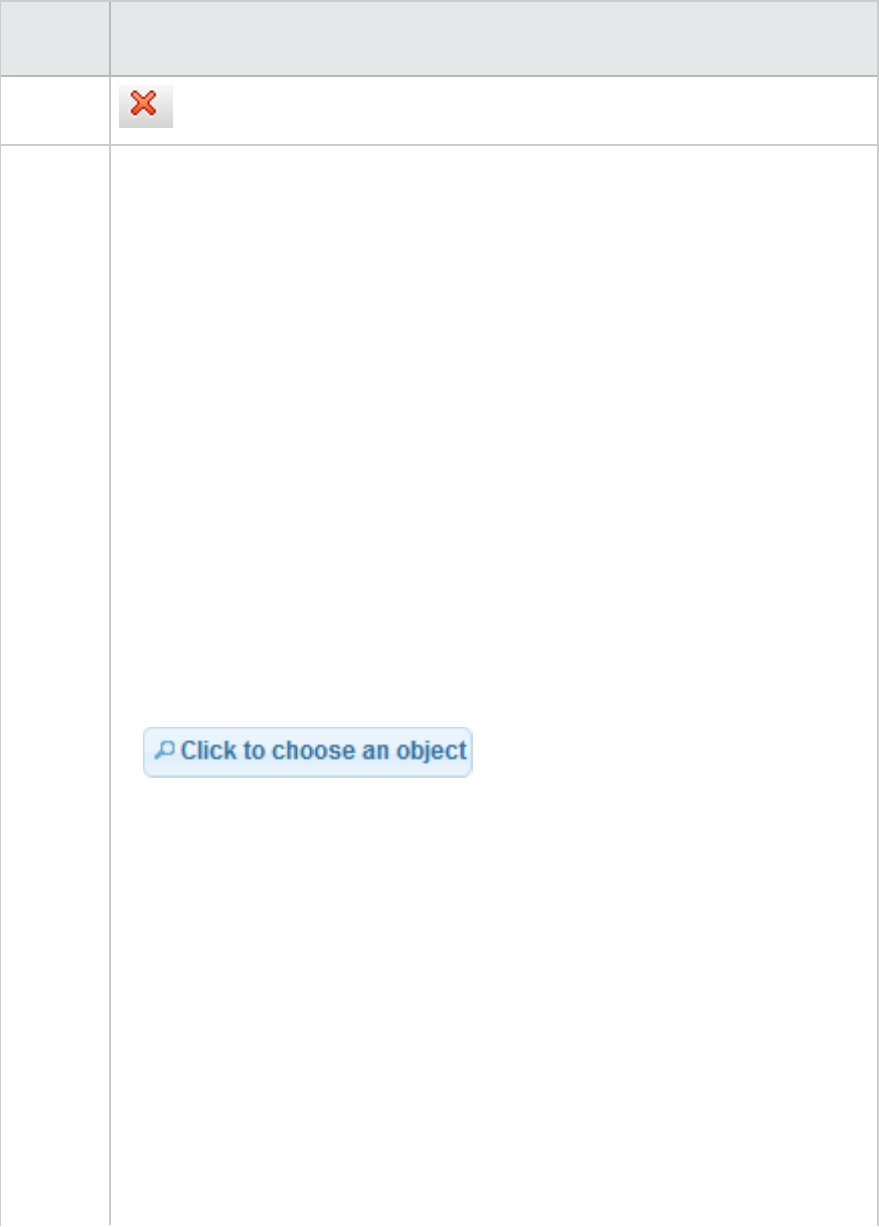
UI
Element
Description
Pane
Delete Event Handler. Delete an event from the event handler.
Properties General
lName. Enables you to name the event.
lExecute only once. Execute the event once.
lAllow other handlers to interrupt. Select check box to enable other events to run
during the run of this event.
You can select either:
lEvent can be triggered during the entire script. Enable event to be triggered during
entire script.
or
lStart Step. Enables you to select a start step from which point the event handler can
be triggered.
lEnd Step. Enables you to select a end step after which the event handler cannot be
triggered.
Type. You can select either object or dialog.
Object
If you select object, you need to specify the following:
lEnables you to select an object from your
application that will trigger the event handler.
lRoles. Displays the roles that determine which operations can be done on the object.
For example, an “element” role has operations like “click” and “mouse over". The
“textbox” role will also have a “type” operation.
Other roles: element, foucasable, textbox, check box, filebox, radiogroup, listbox,
multi_listbox, slider, datepicker, video, audio, browser.
lName. Enables you to specify the name of the object.
lID Method
Automatic (Recommended). Enable TruClient to resolve object identification.
XPath.Enables you to insert an xpath query to identify the object
JavaScript.Enables you to insert JavaScript code to identify the object.
lRelated objects. Enables you to associate your object with another object in your
application that facilitates object identification during replay.
User Guide
HP LoadRunner (12.50) Page 764

UI
Element
Description
Event
lEvent type
You can select between the following event types:
Object Exists. If object exists during replay, the event handler is triggered.
Property exists on Object. If the property of an object meets the defined criteria, the
event handler is triggered.
Dialog opened. If the specified dialog box is opened, the event handler is triggered.
Handler
lLibrary. Enables you to select the library containing the function.
lFunction. Enables you to select the function.
lArguments.Enables you to specify the argument values.
TruClient General Settings
This dialog box enables you to set many options that affect the browser as you develop your scripts in
interactive mode.
Tab Description
Browser
setting
This tab enables you to configure settings for the TruClient browser for scripts that you
run in interactive mode.
Settings that you modify in the Browsing Settings tab affect interactive mode only and
apply to all TruClient scripts. When you save your script in interactive mode, any
settings that you modified in the Browsing Settings tab are applied to the Load Mode
Browser settings.
Interactive
Options
Replay and debug settings for interactive mode.
Client
certificates
Manually attach client certificate.
Server
exceptions
For scripts recorded in Firefox, you can add a server exception to prevent the Security
Exception dialog pop-up.
User Guide
HP LoadRunner (12.50) Page 765
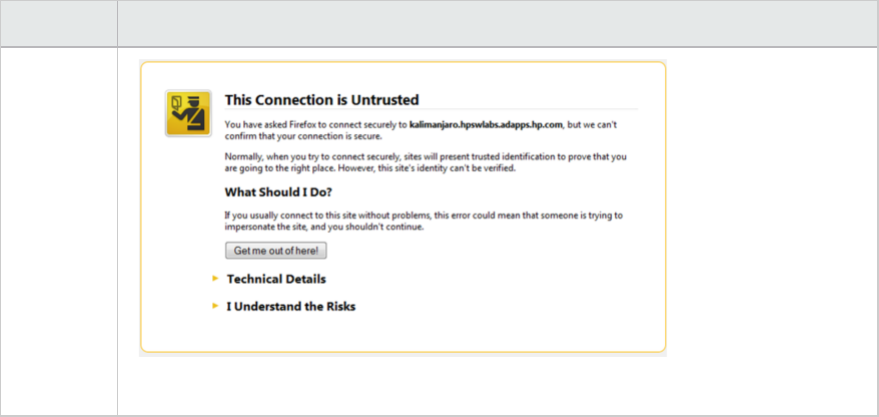
Tab Description
Location. Specify the server URL with the https:// prefix.
, continued
05
Troubleshooting and Limitations (General)
This section describes troubleshooting and limitations for TruClient scripts.
General Troubleshooting
Word Verification Function in the Business Process
Many web sites use special Word Verification fields that display some text that the user must enter in
order to validate that an actual user is filling out the form.
This is designed to block crawlers, spiders and so on from using the site and taking up valuable system
resources.
These fields are especially designed to block automatic tools such as LoadRunner.
In order to complete your business process automatically you must cancel this function on the web site
against which you are running the load.
Problems with TruClient dialog boxes
TruClient dialog boxes, such the Transaction Editor or Event Handler do not work as expected. This is a
known issue caused by Microsoft update KB3008923.
Solution: Uninstall the update or install KB 3025390.
Problems with uploading files
If your script contains steps to upload files using a Windows Explorer dialog box replay may fail.
User Guide
HP LoadRunner (12.50) Page 766
In most cases, it is possible to work around this issue by using custom JavaScript code. Contact HP
Support for a solution.
Problems with an event handler
If Simulate New User is enabled in the runtime settings, an event handler is not triggered if the event
happens in the last step of the Init section.
Workaround: Add another step after the last step in the Init section such as a Wait step.
Dragging of a slider or a map does not replay correctly
If drag does not work, for example, set an option of slider or drag of map, and the result does not bring
the control to the appropriate place, try one of the following:
lUse one of the Alternative Steps.
lSet the values manually until they meet your needs (e.g. the precise number of pixels you would like
to drag in each of the relevant directions).
lTry using the "Drag to" capability (by changing the Action of the Drag step in the Step section of the
step properties). This way you can drag your object to a relative position from another object.
Troubleshooting Communication between VuGen and TruClient
Error message: VuGen cannot open the TruClient browser because the port range is
busy or invalid.
Recommendation: In order to open a server, a free port is needed. The server is open on the
http://127.0.0.1:<free_port>/ url.
The free port can be configured in the following xml files :
%APPDATA%\Hewlett-Packard\LoadRunner\Data\Settings\VuGenProperties.xml
<VuGenProperties>
<BrowserCommunicationServerEndPort value="8090" />
<BrowserCommunicationServerStartPort value="8080" />
The default port range is between 8080 through 8090. If there is a problem with the ports (all ports are
busy or the start port is bigger than the end port) you can change the range in the configuration file.
If you are unable to resolve this issue contact HP software support.
Error Message: VuGen cannot open the TruClient browser.
This error has occurred because you do not have the proper permissions to establish communication
between VuGen and the TruClient browser.
Recommendation: Ask your administrator or a power user to run this command:
User Guide
HP LoadRunner (12.50) Page 767
netsh http add urlacl url=http://127.0.0.1:<port_given_in_the_error_message>/
user=<DOMAIN>\<USER_NAME>
Example: netsh http add urlacl url=http://127.0.0.1:8080/ user=DOMAIN\john
Protocol Limitations
TruClient - IE Protocol
lIf you are running TruClient on a Windows Server machine, you must turn off IE Enhanced Security by
selecting Server Manager > Configure IE ESC to record and replay scripts on your machine.
lThe TruClient - IE protocol does not support Diagnostics for J2EE/.NET.
lIf all steps are not correctly generated after recording a script, the problem may be due to the
Windows Component > Internet Explorer Enhanced Security Configuration.
Remove Internet Explorer Enhanced Security Configuration by selecting Control Panel > Add or
Remove Programs > Add or Remove Windows Components and re-record your script.
lIf Nvidia shim drivers are installed, TruClient IE might behave unexpectedly.
oEnusre that Nvd3d9wrap.dll is not loaded with TruClient IE using third-party tools such as
process explorer by SysInternalsl Nvd3d9wrap.dll
If Nvd3d9wrap.dll is installed, either uninstall the driver or rename the file and restart
TruClient IE.
lLocal Storage, an HTML5 feature, that enables web applications to locally store data within the user's
browser. Microsoft IE does not support local storage when the browser runs in service mode. If
TruClient is also running in service mode this feature is not supported.
lNetwork Virtualization is not supported with TruClient IE in IE 11.
lWhen recording a script in TruClient -IE protocol, a keyboard event together with the Ctrl key is not
supported and therefore not recorded.
lWhen using a script recorded with TruClient IE and replaying it on IE 11, the number of connections
measurement will not be available in Controller and Analysis.
lTruClient - IE protocol requires Internet Explorer 9 or 10 to be installed on the load generator.
lDue to Internet Explorer 9 behavior, when using TruClient - IE protocol with Internet Explorer 9, and
you have a JRE plug-in that is older than version 7, the browser may crash when you visit web pages
that are rendered and contain applets that need to instantiate the plug-in.
Workaround: Install the JRE 7 plug-in or a later version.
lTruClient supports only IE9 or IE10 Standard modes.
lWhile the script is running and the application calls cross domain data sources, it may cause the
script to hang due to security pop-up launched by browser.
User Guide
HP LoadRunner (12.50) Page 768

TruClient - Firefox Protocol
lSecurity warning dialog boxes are not displayed in TruClient during script development.
lIf you encounter problems when running TruClient - Firefox Vusers in load mode, modify the Pacing
settings (Replay > Runtime Settings > General > Pacing) as follows: Select either After the
previous iteration ends, or At <fixed/random> intervals.
lThe TruClient - Firefox protocol can only be used with applications that support the Mozilla Firefox
browser.
lTruClient - Firefox does not support Kerberos authentication. If the server also supports NTLM,
TruClient will automatically move the authentication to NTLM and continue working.
lIf you select Runtime Settings > General > Log > Extended log and check Log HTTP request
headers and Log HTTP response headers part of the request headers will be missing from the replay
log.
McAfee Anti-virus causes Vusers to stop running in Load Mode
Issue: Newer versions of McAfee Anti-virus may cause network hook collision with the TruClient for IE
protocol. You may experience unexpected behavior during load. For example, some of your Vusers may
stop running. As a result, an error message will appear in the Controller > Scenario Status > Errors
pane and the Vuser status displays as Failed.
Steps to resolve: Disable McAfee.
Flash, Silverlight, ActiveX limitation for TruClient IE
User actions on UI elements that are based on Flash, Silverlight, ActiveX in general and Java applets
technologies are currently not recorded and replayed.
Java applets and Silverlight limitation for TruClient FF
User actions on UI elements that are based on Java applets and Silverlight technologies are currently
not supported for record and replay.
Other Protocol Limitations
lWhen you view Web page component breakdown graphs for TruClient Vusers, TruClient
measurements might not be available or might be less accurate than those of other protocols. For
example the Time to First Buffer Breakdown graph, and measurements such as SSL Handshake, and
Client/Error Time might not be available.
User Guide
HP LoadRunner (12.50) Page 769
lTruClient is a UI based protocol therefore while running a TruClient script in Controller you might
encounter an exception: "Failed to Initialize. Reason TimeOut". It is recommend to increase
the Init time out. (Controller > Tools > Options)to provide the Vusers with additional time to finalize
the initialization stage.
lTruClient does not support closing dialogs opened by user code written in Evaluate JavaScript step
(e.g. window.alert(“my alert”);)
lAfter opening TruClient by clicking Develop Script, and subsequently closing it, VuGen may still display
the yellow banner of Develop mode. Workarounds: If working with a proxy, you must specify "bypass
local connections". If working with a PAC file, the PAC must specify a direct connection for 127.0.0.1
lIf you edit a TruClient script using a later version of LoadRunner than the one on which you recorded
the script, it may fail to replay in some cases.
Before modifying the script, save a backup copy of the script. Workaround: If the replay fails, re-
record the script using the latest version of the TruClient protocol.
lTruClient for will not record "mouse overs" when the element has a CSS rule of "Mouse Hover".
Workaround: Instead of mouse hovering, click the elements to open the drop down (the clicks are
recorded).
lTruClient protocol step types and arguments are not localized.
lTruClient General Strings are not localized in the Japanese version.
lIn the default Run Block, you cannot set the mode to Random as you can in VuGen UI.
Program TruClient Scripts
Select an image to learn more.
You can code TruClient scripts to add custom capabilities.
What do you want to do?
l"Program in TruClient" on page771
lSee examples
User Guide
HP LoadRunner (12.50) Page 770
Program in TruClient
Enhance your TruClient script by adding custom JavaScript code.
What do you want to do?
lWork with JavaScript in TruClient Scripts
lLearn More about JavaScript
lInsert and Modify Loops in TruClient
lUse VTS in TruClient Scripts
lInsert Custom JavaScript and C Code into TruClient Scripts
lRead the Function Reference
HP LoadRunner (12.50) Page 771
Working With JavaScript in TruClient Scripts
The following section contains tips for recording TruClient scripts. To learn more about JavaScript, see
How Can I Learn More about JavaScript.
JavaScript Support
The arguments listed in the Arguments section of each step are all JavaScript based and can accept
JavaScript expressions which are evaluated during script replay.
Strings are expressed between quotes. For example, City will be interpreted as a variable whereas
"City" or 'City' will be evaluated as a string.
All other sections such as Step, Object, Transactions, are not JavaScript based, are not evaluated as
JavaScript, and do not support JavaScript expressions. The only exception is object identification using
JavaScript.
Working with the ArgsContext object
Object identification variables and step variables do not share the same context. This means that
variables that are defined in one context are not recognized in the other. To use a variable in object
identification that is defined in a step, add the prefix ArgsContext before the variable name.
For example, if the variable firstname is defined as a value for an argument of a step, use the
firstname variable in object identification, refer to the variable as ArgsContext.firstname.
For an example of using AgrsContext in a for loop, see How to Insert and Modify Loops in TruClient.
Using Regular Expressions
To use regular expressions, there are two options:
lUse the '/' notation: Replace the quotation marks of a string with a slash.
For example:
/LoadRunner/ is a regular expression that will match any string that contains the word "LoadRunner"
in it.
lIf you need to dynamically create a regular expression (e.g. using a parameter), you can use the
regular expression constructor and specify the string. For example, the equivalent of the above
example is RegExp("LoadRunner").
The full list of supported regular expressions can be found here:
https://developer.mozilla.org/en/JavaScript/Reference/Global_Objects/RegExp
HP LoadRunner (12.50) Page 772
Learn more about JavaScript
JavaScript is the scripting language of the Web. JavaScript is used in millions of Web pages to add
functionality, validate forms, detect browsers, and much more. The Internet is full of resources for
learning JavaScript and can be located using search engines.
An example of some tutorials and references:
http://www.javascriptkit.com/jsref/
http://www.w3schools.com
http://www.learn-javascript-tutorial.com/
HP LoadRunner (12.50) Page 773
How to Insert and Modify Loops
Loops repeat selected portions of the script until certain criteria is met or for a specified number of
iterations. You can insert loops and loop modifiers from the Flow control section of the Toolbox.
For Loops
For loops perform the steps surrounded by the loop until the end condition is met or the code reaches a
break statement. Loops arguments use JavaScript syntax. To insert a for loop, select Toolbox > Flow
Control >Functions > For Loop.
Break statements
Break statements indicate that the current loop should end immediately. For example, if a break
statement is encountered in the second of five iteration in a for loop, the loop will end immediately
without completing the remaining iterations. To insert a break statement, select Toolbox > Functions >
Flow Control > Break.
Continue statements
Continue statements indicate that the current loop iteration should end immediately. The loop
condition is then checked to see if the entire loop should end as well. For example, if a continue
statement is encountered in the second of five iterations in a for loop, the second iteration will end
immediately and the third iteration will begin. To insert a continue statement, select Toolbox >
Functions > Flow Control > Continue.
HP LoadRunner (12.50) Page 774
How to Use VTS in TruClient
This task describes an example of how to use VTS in a TruClient script.
What is VTS?
lHP LoadRunner Virtual Table Server - or VTS for short - is a web-based application that is
built to work with LoadRunner Vuser scripts. VTS offers an alternative to standard
LoadRunner parameterization.
lWhen you use standard LoadRunner parameterization, each Vuser is assigned parameter
values from a dedicated set of values - parameter values are not shared between Vusers. In
contrast, VTS enables you to assign parameter values from a single set of parameter values
to multiple Vusers. This may enable you to more accurately emulate a real-user environment.
lVTS includes a table that contains parameter values that can be used by your Vuser scripts.
The VTS table is composed of columns and rows. Each column represents a set of values that
can be used by a specific parameter in your Vuser scripts. The cells within a column contain
the actual values of the parameter.
How to connect/disconnect to a VTS server
1. Select Toolbox > Miscellaneous and add a step to your script.
2. To connect to a VTS, enter TC.vtcConnect(“server”,port,"alias") in the Arguments > Code
section of the step.
You can identify the server either by name or by ip address.
Example: TC.vtcConnect("myServer",8888,"myVTS");
3. To disconnect from a VTS, enter TC.vtcDisonnect("alias") in the Arguments > Code section of the
step.
Tips:
lBefore you replay the script, play the TC.vtcConnect step (from within the step) to verify
the connection to the VTS server.
lOnce you have established a connection to the VTS server, you can play other VTS API steps,
modify them and replay again.
lReplaying the entire script will automatically disconnect the VTS even if there is no
disconnect step in your script.
Examples of connecting and disconnecting to a server:
HP LoadRunner (12.50) Page 775

lUsing a server name and alias
TC.vtcConnect(“MyServer”,8888,”UsersTableVts”);
TC.vtcDiscconect(“UsersTableVts”);
For details on the use of aliases, see "How to Use VTS in TruClient" on the previous page
lUsing the server ip address and alias
TC.vtcConnect(“192.168.1.133”,8888,”WorkersTableVts”);
TC.vtcDiscconect(“WorkersTableVts”);
lUsing the server name without an alias
TC.vtcConnect(“MyServer”,8888);
TC.vtcDiscconect();
lUsing the server ip address without an alias
TC.vtcConnect(“192.168.1.133”,8888);
TC.vtcDiscconect();
Why do you need an alias for your VTS server?
If you are using more than one server, creating an alias for each server will simplify identifying which
VTS your are referencing in your code.
Examples:
In the connect statement below, "UserTableVts" is an alias for "MyServer".
TC.vtcConnect(“MyServer”,8888,”UsersTableVts”);
In the example below, we are connecting to two VTS servers and disconnecting, by alias, to the
first one:
TC. vtcConnect("MyServer", 8888, "UsersTableVts");
TC.vtcConnect("MyServer1",8888, "ScriptDataVts");
TC.vtcDisconnect("UsersTableVts");
User Guide
HP LoadRunner (12.50) Page 776
How to use Eval JavaScript code step to pass VTS parameters to another step.
You can use the Eval JavaScript code step to pass VTS parameters to another step in your script. The
example below shows you how to parametrize a URL.
1. Connect to a VTS server
a. Select Toolbox > Miscellaneous and add an step to your script.
b. To connect to a VTS, enter TC.vtcConnect(“server”,port,"alias") in the Arguments >
Code section of the step.
2. Create a step that contains a variable.
a. Select Toolbox > Miscellaneous and add an step to your script.
b. In Argument > Code section enter define your variable.
For example, to get data from the server enter var ws = TC.vtcGetCell("Web
Sites",1,"alias");
3. Select Toolbox > Functions and add a Generic Browser Action to your script.
4. Enter the variable you defined in Step 2 in Argument > Location .
How to use a VTSAPI function directly in a step.
You can use the Eval JavaScript code step implement a VTS API in your script. The example below shows
you how to parametrize a URL.
1. Connect to a VTS server
a. Select Toolbox > Miscellaneous and add an step to your script.
b. To connect to a VTS, enter TC.vtcConnect(“server”,port,"alias") in the Arguments >
Code section of the step.
2. Select Toolbox > Functions and add a Generic Browser Action to your script.
3. Enter TC.vtcGetCell("Web Sites",1,"alias");in the Argument > Location section of the
script..
User Guide
HP LoadRunner (12.50) Page 777

How to Insert Custom JavaScript and C Code into TruClient Scripts
This task describes how to insert code into an TruClient script. You can insert code into a pre-existing
step as part of a step argument or insert steps that are completely comprised of external code (C or
JavaScript).
1. Insert code into a pre-existing step
You can insert JavaScript code into pre-existing steps in the arguments fields of most steps. This
allows you to perform multiple customizations.
2. Insert steps composed entirely of code
You can insert steps comprised entirely of code into your script. To do so, select Toolbox >
Miscellaneous and drag the Eval Javascript,Eval C, or Eval JS on Object icon to the desired
location. The Eval JS on Object step runs the JavaScript code after the specified Object has loaded.
We recommend avoiding Eval C and using JavaScript instead wherever possible. You can refer to
this object as the variable "object" in the JavaScript code within the step.
Example:
The following code creates a variable called amount that generates a random number between 1
and 5. You can then use this variable in the argument fields of other steps.
var amount=Math.floor(Math.random()*5)+1;
Examples
Variables and transactions Using Object Identification to enhance scripts
This section provides examples on how to
enhance TruClient scripts with variables
and transactions.
lCreate and use a global variable
lCreate a dynamic transaction name
This section provides examples for using the non-
automatic object identification methods to enhance
and generalize your scripts.
lCapture a value to a string
lIterate over links in a web page
lWork with dynamic tables
Capture a value to a string
You can capture a string that is embedded in the HTML by using object identification. For example,
sending an input value back to the server or writing it as a user defined data point.
Try it out!
The following table summarizes the pages and scripts used in the example:
HP LoadRunner (12.50) Page 778
Example description HTML
pages
Page
Description
Example scripts
Extract a number from html and report
it to the Vuser log as a user defined
data point.
dynamic_
value.html
Generates a
random
number
CaptureSTringDescriptors.zip
CaptureStringJS.zip
The following example demonstrates how to capture the string and to write it to the log file and to a
data point using either the Descriptors or the JavaScript ID method.
1. Record the following steps:
a. Navigate to the dynamic_value.html page.
b. Click the button.
c. Stop recording.
2. From the Toolbox add an Evaluate on JS Object step and select the No. <Value> step as the
object.
3. In the Object section, change the ID method of the No.<Value> step.
Use JavaScript ID Method
a. Select JavaScript from the ID method drop-down.
b. In the JavaScript editor enter the following code:
document.getElementById("generated_data");
User Guide
HP LoadRunner (12.50) Page 779
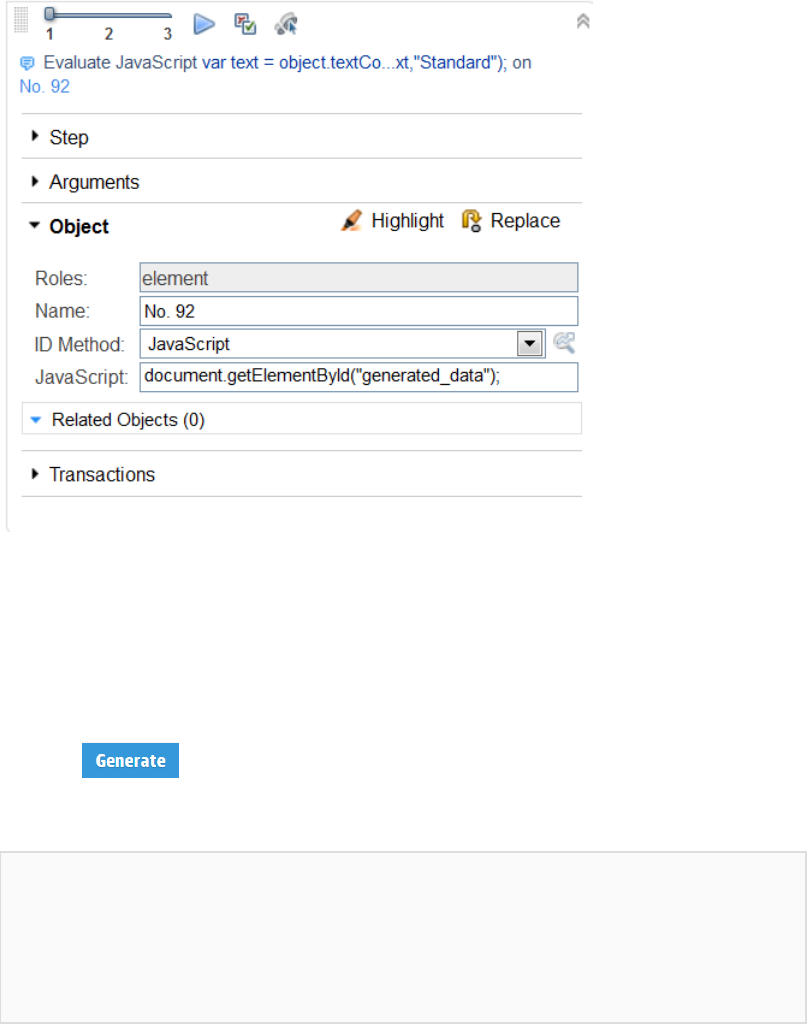
Use Descriptors ID Method
a. Select Descriptors from the ID Method drop-down.
b. Click Click here to edit to open the Descriptors editor.
c. Change the text operator from equals to equalsIgnoreDigits
This method searches for No.<Value> and ignores the number that is generated every time
you click
4. Edit the Arguments section by adding the following code:
var text = object.textContent; //object holds the DOM object that we
previously found
var index = text.indexOf(". "); //The indexOf() method returns the
position of the first occurrence of a specified value in a string.
var randomText = text.substr(index+2);
TC.log("Captured String: " + randomText,"Standard");
User Guide
HP LoadRunner (12.50) Page 780
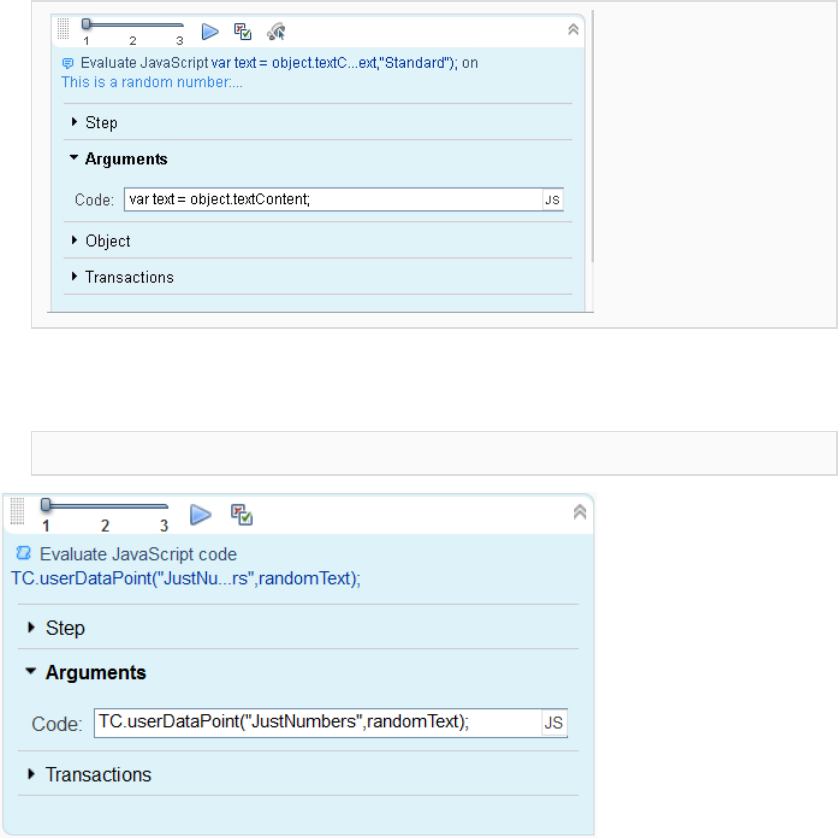
5. From the Toolbox, drag and drop an Evaluate JavaScript step into the script.
6. In the Arguments section add the following code:
TC.userDataPoint("JustNumbers",randomText);
7. Check the logs to verify that the string was captured.
User Guide
HP LoadRunner (12.50) Page 781
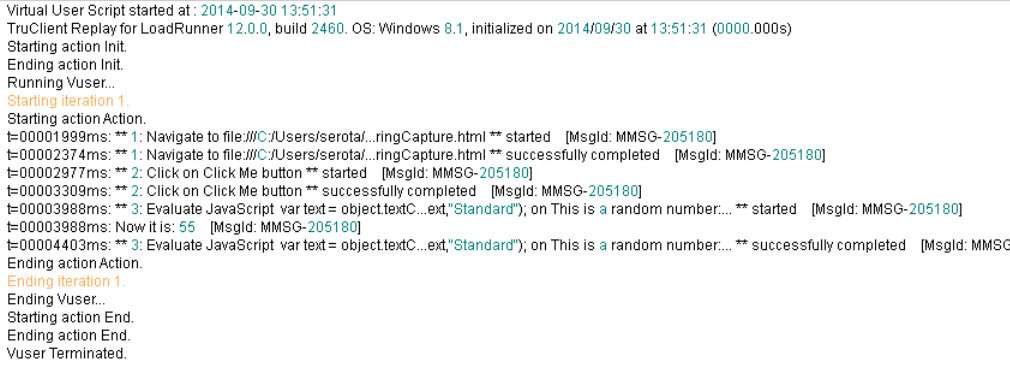
User Guide
HP LoadRunner (12.50) Page 782
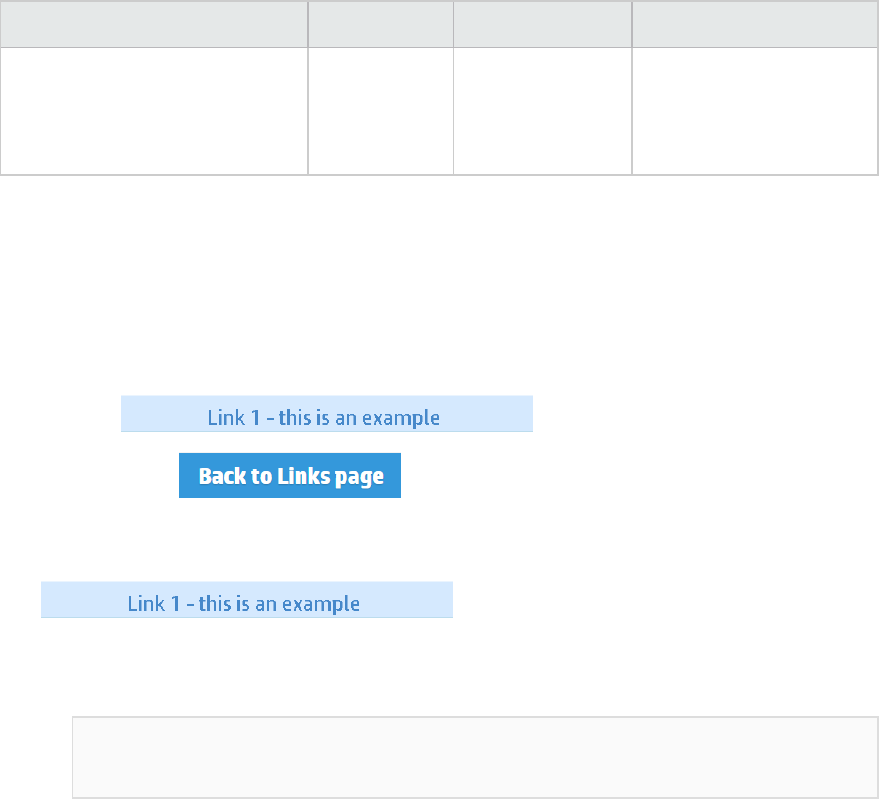
Iterate over links in a web page
Let's suppose you have a web page that contains a series of links. You would like to create a script that
sequentially clicks each link.
You can record a script by manually clicking each link.
Alternatively, you can accomplish this task dynamically using one the following methods:
Use a parameter and a For Loop statement
You can use a parameter and a For Loop step to automatically iterate over links in your TruClient script.
Try it out!
The following table summarizes the pages and scripts used in the example:
Example description HTML pages Page Description Example scripts
Iterate over links in a web page links.html
empty.html
List of links
Landing page
Links1.zip
1. Add a parameter to your script ("LinkText") and create entries for each link name. For details on
creating parameters, see "Enhance a script with Toolbox functions" on page753
2. Record navigation to links.html.
3. Add a For Loop step to your script and set the i variable to the number of links on your page. In this
example, i is set to 8.
4. Record the following steps into the For Loop:
a. Click .
b. Click on the button.
c. Stop recording.
5. In the Object section, change the ID method on the
from Automatic (recommended) to
JavaScript.
6. Add the following code to the JavaScript text under the Object section:
evalXPath("//li[text()=\"" + ArgsContext.TC.getParam("LinkText") + "\"]
");
HP LoadRunner (12.50) Page 783
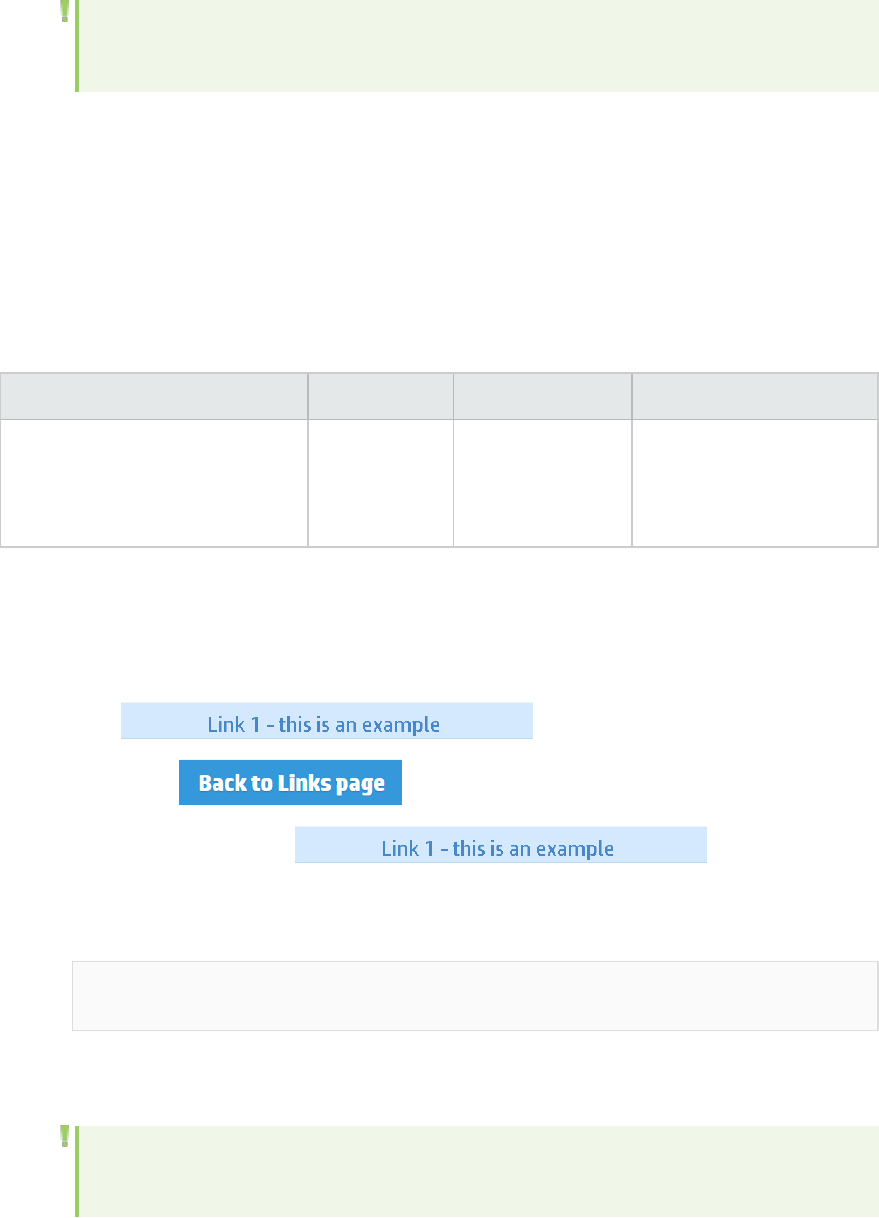
Note: ArgsContext enables you to refer to arguments defined outside the argument
section. For details, see "Working with the ArgsContext object" on page772.
7. Replay the script.
Use the XPath property, JavaScript and a For Loop
You can also use the For Loop step, the XPath property, and JavaScript to develop a script section that
dynamically clicks links in a script.
Try it out
The following table summarizes the pages and scripts used in the example:
Example description HTML pages Page Description Example scripts
Iterate over links in a web page links.html
empty.html
List of links
Landing page
Links2.zip
1. Record navigation to links.html.
2. Add a For Loop step to your script and set the i variable to the number of links on your page. In this
example, i is set to 0. Init value is set to 1.
3. Record the following steps into the For Loop:
a. Click .
b. Click on the button.
4. Change the ID method on the from Automatic
(recommended) to JavaScript.
5. Add the following code to the JavaScript text under the Object section:
evalXPath("//li[text()=\"Link " + ArgsContext.i + " - this is an
example\"]");
TruClient evaluates the statements and then runs an XPath query on the DOM to find any list item
with text equals to the value fetched from parameter “LinkText”
Note: ArgsContext enables you to refer to arguments defined outside the argument
User Guide
HP LoadRunner (12.50) Page 784
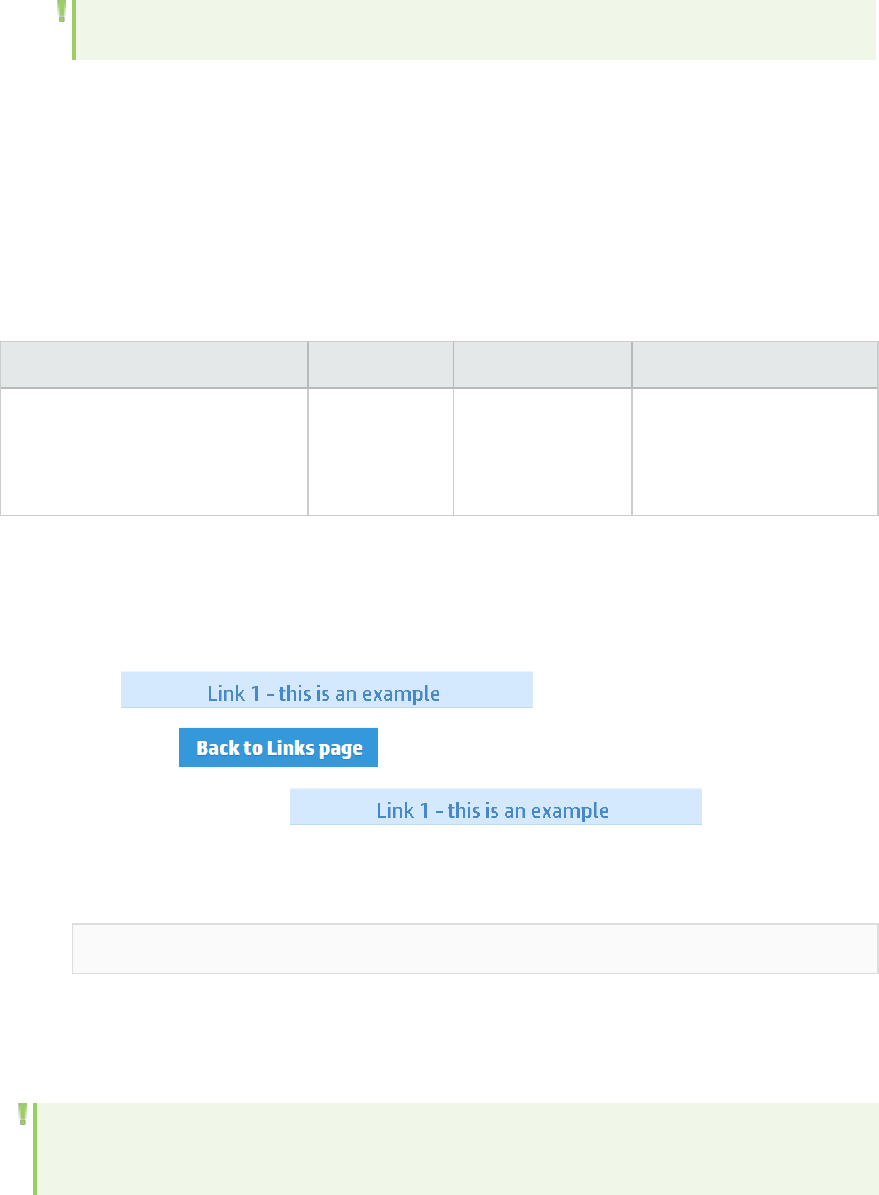
section. For details, see "Working with the ArgsContext object" on page772.
6. Replay the script.
Use the XPath DOM Structure, JavaScript and a For Loop
You can also use the For Loop step, the XPath DOM structure, and JavaScript to develop a script section
that dynamically clicks links in a script.
Try it out!
The following table summarizes the pages and scripts used in the example:
Example description HTML pages Page Description Example scripts
Iterate over links in a web page links.html
empty.html
List of links
Landing page
Links3.zip
1. Record navigation to links.html.
2. Add a For Loop step to your script and set the i variable to the number of links on your page. In this
example, i is set to 0. Init value is set to 1.
3. Record the following steps into the For Loop:
a. Click .
b. Click on the button.
4. Change the ID method on the from Automatic
(recommended) to JavaScript.
5. Add the following code to the JavaScript text under the Object section:
evalXPath("/html/body/ul/li[" + ArgsContext.i + "]/a");
TruClient evaluates the statements and then run XPath query on the DOM to find any list item with
text equals to the value fetched from parameter “LinkText”
6. Replay the script.
Note: ArgsContext enables you to refer to arguments defined outside the argument section.
For details, see "Working with the ArgsContext object" on page772.
User Guide
HP LoadRunner (12.50) Page 785
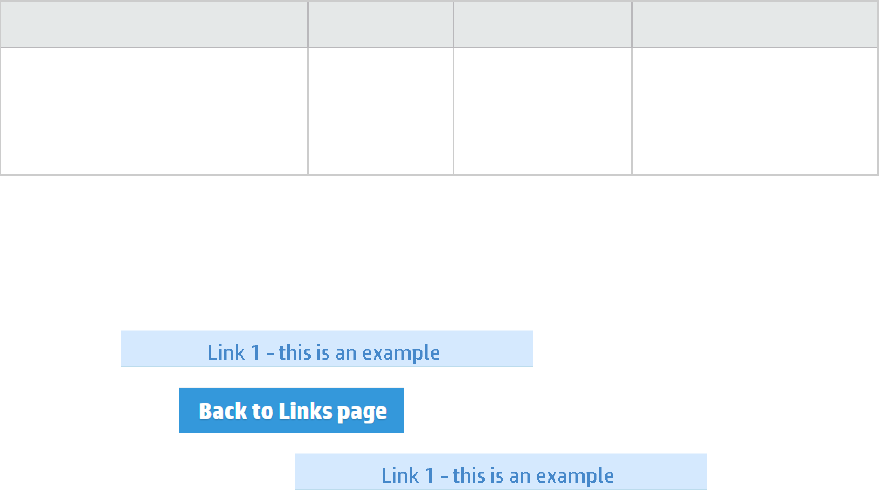
Use Descriptors
You can use descriptors and the object ordinal feature to automatically iterate of links in a web page in
your TruClient script.
Try it out!
The following table summarizes the pages and scripts used in the example:
Example description HTML pages Page Description Example scripts
Iterate over links in a web page links.html
empty.html
List of links
Landing page
Links4.zip
1. Record navigation to links.html.
2. Add a For Loop step to your script and set the i variable to the number of links on your page. In this
example, i is set to 0. Init value is set to 1.
3. Record the following steps into the For Loop:
a. Click .
b. Click on the button.
4. Change the ID method on the from Automatic
(recommended) to Descriptors.
5. Click "Click here to edit" to open the Descriptors Editor.
6. Change the operator of the text property from "equals" to "equalsIgnoreDigits". This forces
TruClient to ignore the digits while searching for the DOM object.
7. From the Descriptors editor, select the object ordinal JS instead of plain text. Enter the following
code:
ArgsContext.i
User Guide
HP LoadRunner (12.50) Page 786
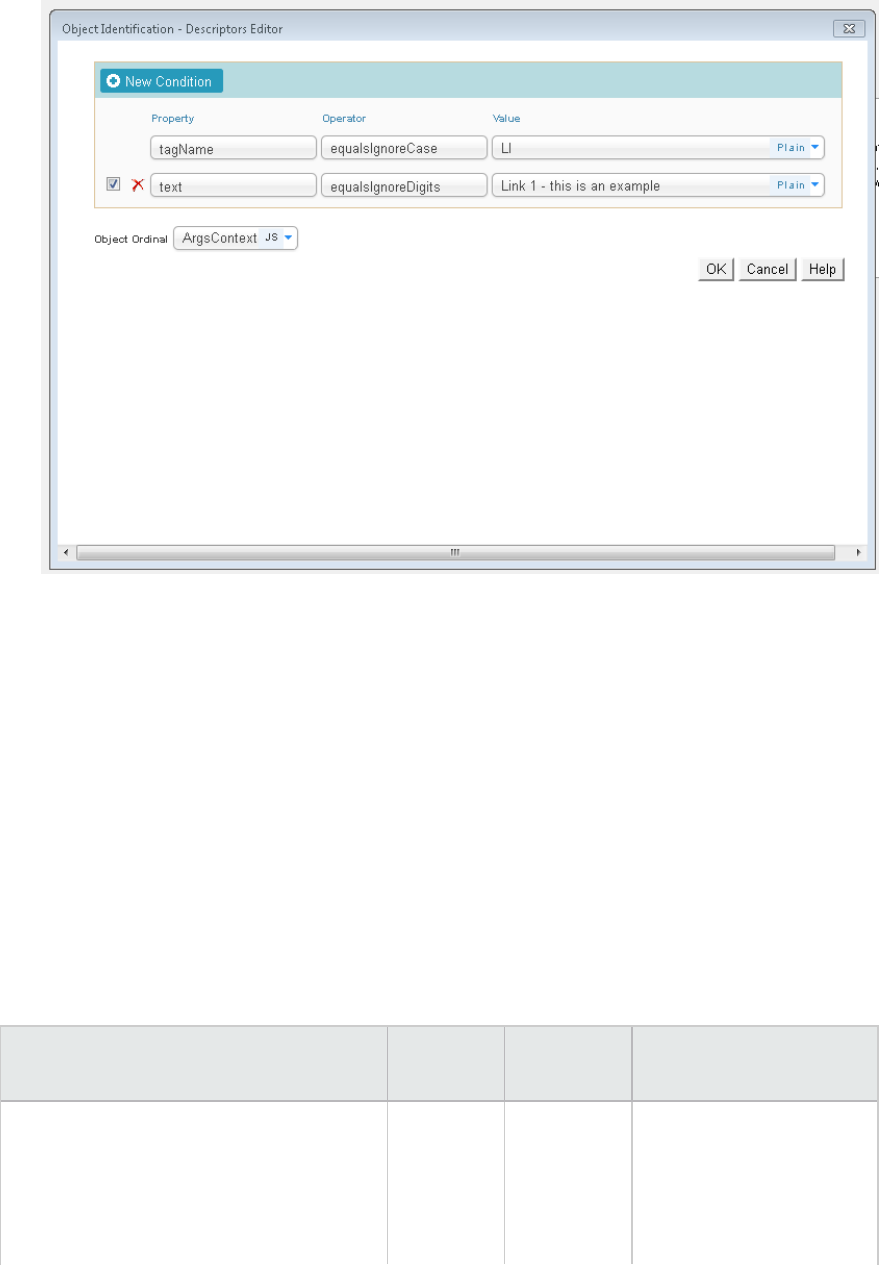
8. Replay the script.
Work with dynamic tables
Web content from a server or database is often displayed in HTML tables. Each time the page refreshes,
the content of the table can change. You may want to create a script that automatically manipulates
dynamic data.
Find an object in the DOM and perform an action
The following example demonstrates how you can use object identification to find an object in the DOM
and perform an action using object identification methods.
Try it out!
The following table summarizes the pages and scripts used in the example:
Example description HTML
pages
Page
Description
Example scripts
The HTML page generates a table with a
random number of rows. The first column
of each row contains a check box which is
randomly checked. One of the cells has a
gray background. The script automatically
table1.html Generates a
table with a
random
number of
table1.zip
User Guide
HP LoadRunner (12.50) Page 787
Example description HTML
pages
Page
Description
Example scripts
toggles the state of the check box in the
grayed cell.
rows every
time you
click the
Refresh
button.
1. Record navigation to table1.html.
2. From the Toolbox add a Miscellaneous > Evaluate JS on Object step.
3. Click in the step and highlight the grayed cell in the table.
4. Change the ID Method
Use JavaScript ID method
In the Object section, set the Id method to JavaScript. In the JavaScript text box, add the following
code:
function findCheckBox(){
var checkboxes = evalXPath("(//input[@type=\"checkbox\"])"); //get
all checkbox elements using xpath
for (var i=0; i<checkboxes.length; i++){ //
iterate over the checkboxes collection to find that reside in a table
cell (TD) colored in gray
if (checkboxes[i].parentNode.tagName == 'TD')
if (checkboxes[i].parentNode.style.getPropertyValue("background-
color") === "rgb(170, 170, 170)"){
return checkboxes[i];
//return checkbox with gray background
}
}
}
findCheckBox(); //execute
findCheckBox()
This code creates a function and a function call. The function determines which of the cells in the
table is gray, which is the consistent characteristic in the table, and returns the checkbox DOM
object.
User Guide
HP LoadRunner (12.50) Page 788
Use Descriptors ID method
In the Object section, set the Id method to Descriptors. You can view the object properties by
clicking "Click here to edit".
5. In the Arguments section of the step add the following code:
"object.checked = !object.checked;" //for JS
"object.firstChild.checked = !object.firstChild.checked;" // for Descriptors
The 'object' refers to the DOM object that was found in Step 4.
This code switches the status of the check box.
6. Replay the script.
Find an object and perform an action if a condition exists
The following example shows you how you can use object identification to find an object and perform an
action if a condition exists using object identification methods.
Try it out!
The following table summarizes the pages and scripts used in the example:
Example description HTML
pages
Page
Description
Example scripts
The HTML generates a table with a random
number of rows. The first column contains a
“Submit Data” button. The second column
displays a status, as a string, either “Open”
or “Close”. If the status is open, clicking
“Submit Data” button updates the status to
“Close". If the status is closed, clicking
“Submit Data” button updates the status to
“Error”.
In the example you see how to create a
script that automatically updates the rows
with a status of "Open" to "Close".
table2.html Generates
a table with
a random
number of
rows every
time you
click the
refresh
button.
Table2Descriptors.zip
Table2XPath.zip
Use Descriptors
1. Record navigation to table2.html.
User Guide
HP LoadRunner (12.50) Page 789

2. To determine the number of rows that have been generated, add an Evaluate JS on Object step.
a. Select the table as the object.
b. To store the number of rows of the table in the 'rows', add the following code in the argument
section.
var rows = object.rows.length;
3. Change the Method IDto descriptors or XPath on the Evaluate JS on Object
If you change the method Id to descriptors, select "Click here to edit" button and remove the text
property.
4. From Toolbar > Flow Control add a For Loop step.
a. Change the arguments of the init section of the for loop to:Init:
var i = 1 , Condition: i <= rows
5. From the Toolbar > Flow Control add an IfExists step inside the For Loop step.
a. Select a cell where the status is set to "Open".
b. Change the ID Method to Descriptors and verify that the Object Ordinal is set to 1.
6. From the Toolbar > Miscellaneous, add an Evaluate JS on Object step inside the If Exists step.
a. Select a cell where the status is set to "Open"
b. Add the following code to the Arguments section:
var theOpenText = object;
7. From the Toolbar > Miscellaneous, add an Evaluate JavaScript step inside the If Exists step.
Add the following code to the Arguments section:
var clickOn = theOpenText.previousSibling.firstChild; //From the ‘Open’
text node extract the corresponding Submit Data button relying on the
DOM structure. After we get the Submit Data button Dom object, click on
it.
clickOn.click();
8. From the Toolbar > Flow Control, add a Break step in the Else section of the If Exists step.
On the last iteration, TruClient will search for a cell with a status of "Open". Since it will not find one
it will break form the loop. The search ends when the object times out.
User Guide
HP LoadRunner (12.50) Page 790
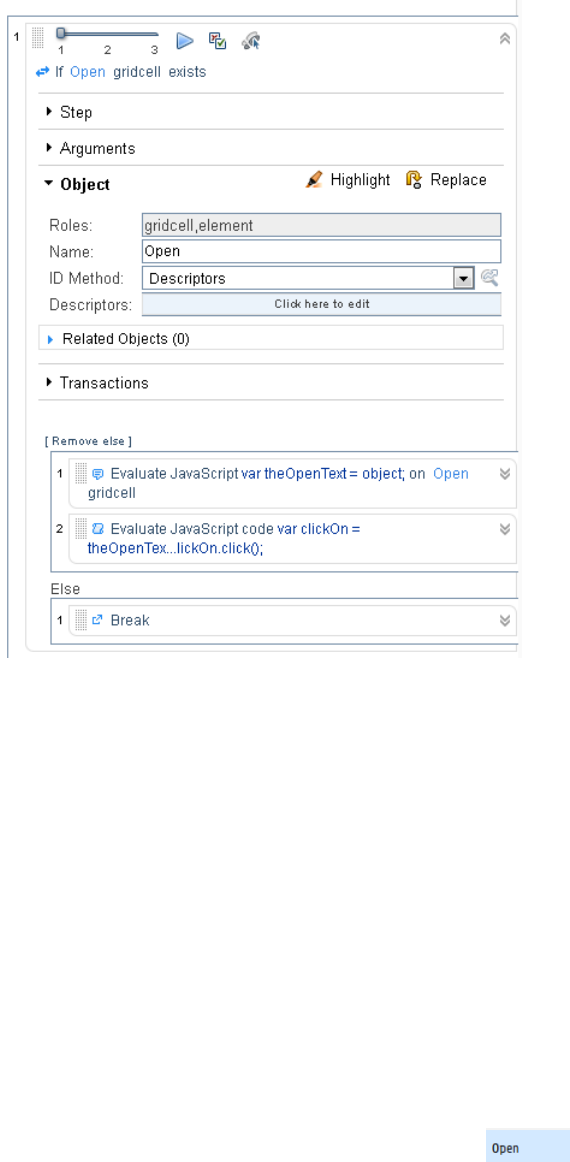
Use XPath
1. Record the following script:
a. Navigation to table2.html
b. Click on the a Submit button in a row that has a status of "Open".
c. Click Stop Recording
2. To determine the number of rows that have been generated, add an Evaluate JS on Object step.
a. Select the table as the object.
b.
To store the number of rows of the table in the 'rows', add the following code in the argument
section.
var rows = object.rows.length;
3. Change the Method IDto descriptors or XPath on the Evaluate JS on Object
If you change the method Id to descriptors, select "Click here to edit" button and remove the text
property.
4. From the Toolbox, add a If Verify step and select an text as the object.
5. Cut the "Click on Submit' button and paste into the IfVerify step.
User Guide
HP LoadRunner (12.50) Page 791
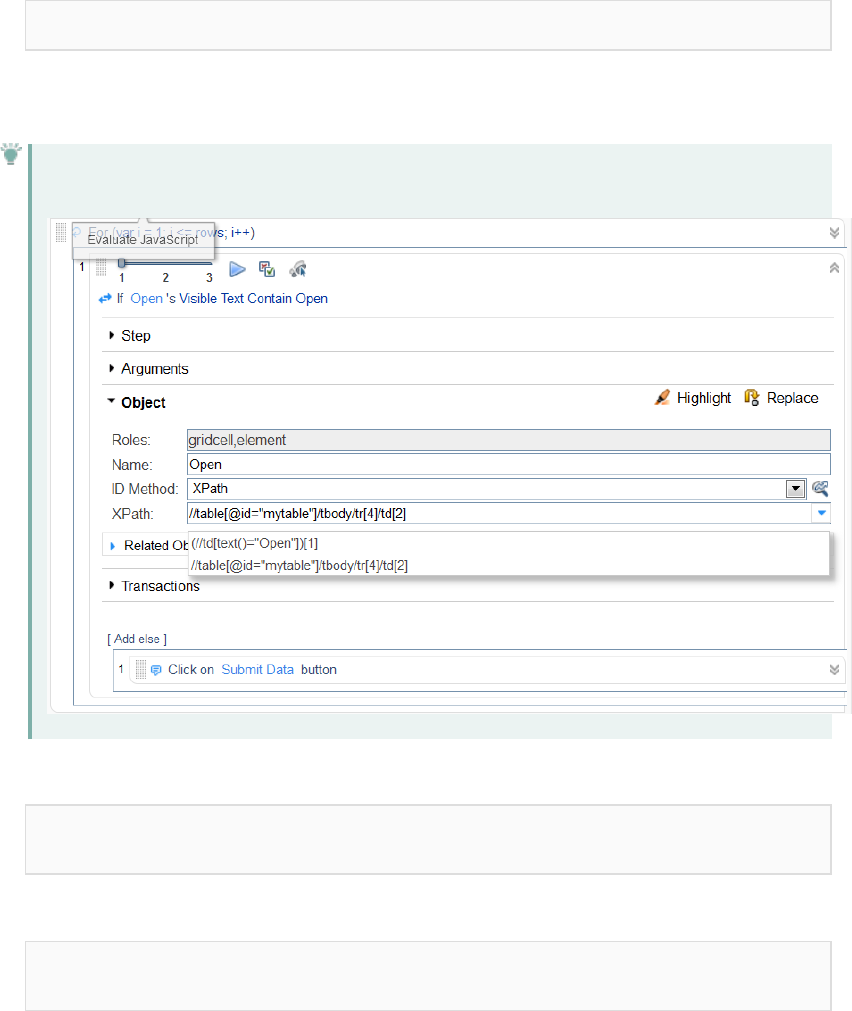
6. Select Group Into > ForLoop Clause to surround the IfVerify step with a ForLoop step.
7. Change the arguments of the ForLoop to
var i = 1 , Condition: i <= rows
8. In each iteration, we are using the xpath of the object to find the next "Open" text to update to
"Close". We use the 'i' identifier to get the current row of the table.
Tip: You can select XPath as the ID Method and copy the DOM structure syntax to an editor.
Change the ID method of the IfVerify to JavaScript and add the following code:
evalXPath("//table[@id='mytable']/tbody/tr[" + ArgsContext.i + "]/td[2]
");
9. Change the ID method of the Submit data to JavaScript and add the following code:
evalXPath("//table[@id='mytable']/tbody/tr[" + ArgsContext.i + "]/td[1]
/input");
Create a dynamic transaction name
Create a dynamic transaction name in a TruClient script.
User Guide
HP LoadRunner (12.50) Page 792
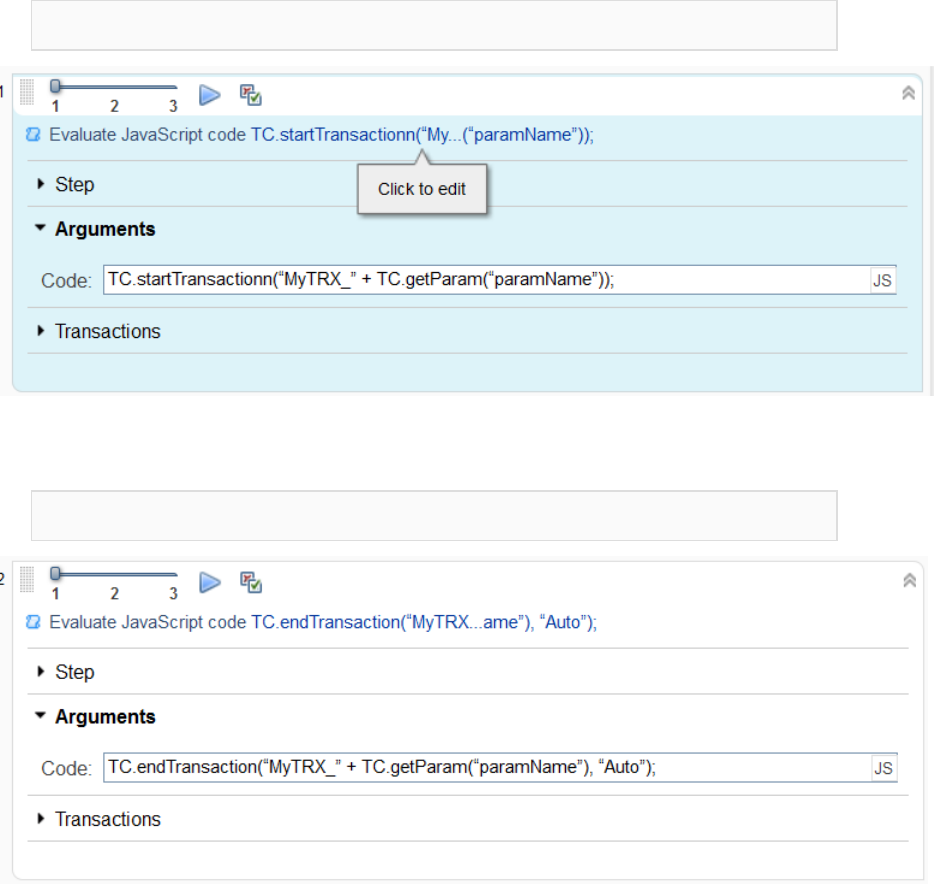
1. Add an Evaluate JavaScript step. In the Arguments section enter the following cod to create a
start start transaction"
TC.startTransaction(“MyTRX_” + TC.getParam(“paramName”));
2. Add another Evaluate JavaScript step . In the Arguments section enter following code to end the
transaction:
TC.endTransaction(“MyTRX_” + TC.getParam(“paramName”), “Auto”);
3. Add steps you would like to measure between the start and end transaction steps. In this example,
we navigate to HP.com
User Guide
HP LoadRunner (12.50) Page 793
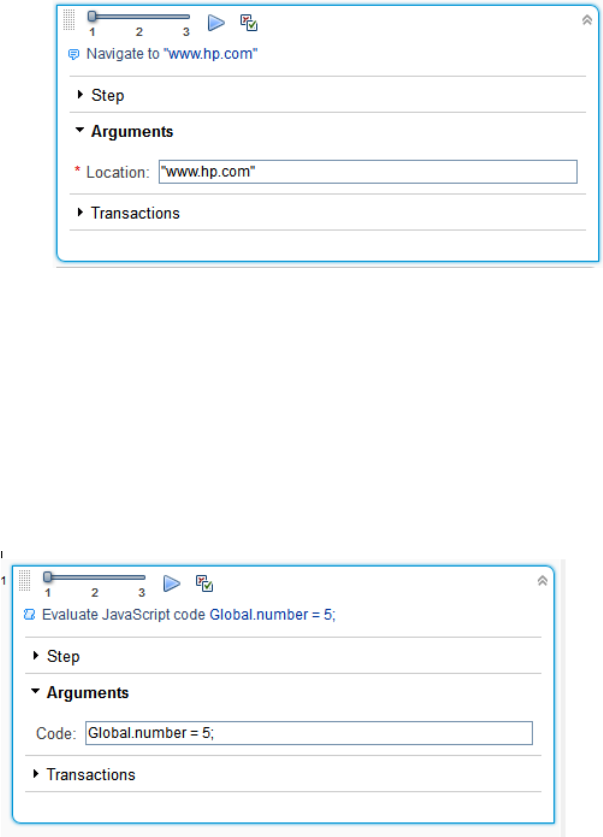
Create a global variable
When the TruClient General Settings > Local > Simulate a new user on each iteration is selected,
variables are cleared between iterations. You can create a global variable whose scope exists between
iterations.
1. Add an Evaluate JavaScript step. In the Arguments sections add code to define the variable in the
Init Block:
For example, Global.Number=5:. The global prefix defines a global variable named number.
2. After defining the variable, use it in the Run Block. For example, use the variable to control script
flow:
User Guide
HP LoadRunner (12.50) Page 794
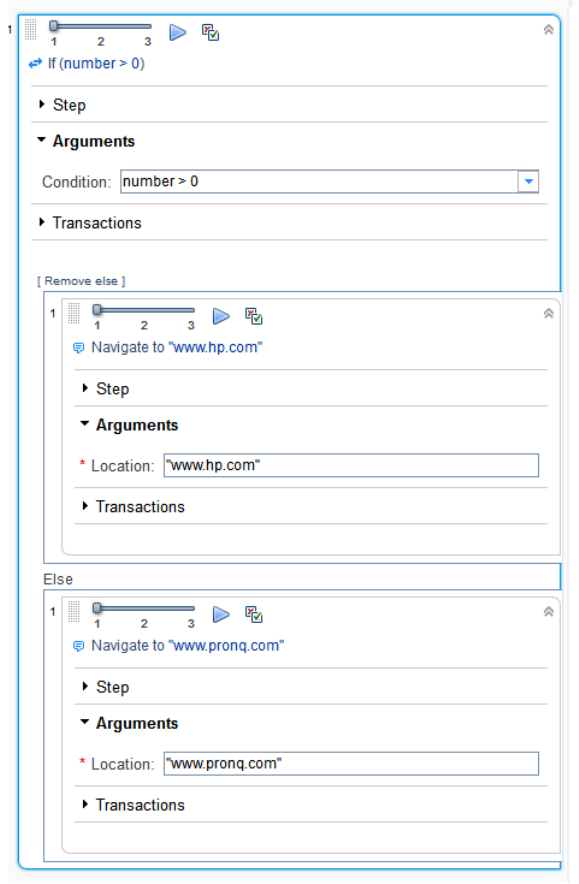

TruClient Functions
The following functions can be inserted as values in TruClient step elements.
Note: In LoadRunner TruClient scripts, the TC prefix can be replaced with LR.
Method Description Arguments
The arguments in this
row can be used in all
methods
lobject. The step's object as
defined in the application.
lwindow. Points to the global
window object of the application.
ldocument. The global document
object of the application.
IO.createDir(path) Creates the specified folder. If needed, creates
all the folders necessary to complete the path.
path. The absolute path of the
folder.
IO.delete(path) Deletes the specified folder or file. If a folder is
specified, deletes all the files in the folder,
including sub-directories.
path. The absolute path of the folder
or file.
IO.isExist(path) Returns True if the specified folder or file exists
and False if it does not. Returns False for a
disconnected or unauthenticated mapped drive.
path. The absolute path of the folder
or file.
IO.read(path, charset) Returns all the data from the specified file.
Converts the data from the specified charset to
unicode.
path. The absolute path to the file.
charset. The charset of the file, if it
is not UTF 8.
IO.write(path, string,
append, charset)
Writes the string to the specified file. If the file
does not exist it is created.
absolute path. The absolute path to
the file.
string. The string to write to the file.
append. Boolean.
True. (default) Append the string to
the end of the file.
False. Overwrite the file with the
string.
charset. The charset of the file, if it
is not UTF 8.
TC.advanceParam
(parameter)
Advances the specified parameter to the next
value in the file.
parameter. The name of the
parameter to advance. Must be a
parameter of type file or unique
number.
TC.getUserIP Returns the IP address when IP spoofing is
enabled and the script is running in load mode in
HP LoadRunner (12.50) Page 796
Method Description Arguments
Controller.
TC.setParam(name,
value)
Saves a string to a parameter, creating the
parameter if it does not exist.
name. The name of the parameter in
which to save the value.
value. The value.
TC.crossTransactionStart
(name,value)
Begins a transaction in a Vuser script that will be
ended in another Vuser script.
name.The name of the transaction.
value.A pointer to a parameter list.
TC.outputMessage(text) Same as TC.log at the Standard log level with the
additional ability to show the message in the
Controller's Output window as a notification.
text. The message text.
TC.crossTransactionEnd
(name,value,status)
Ends a transaction in a Vuser script that has been
started in another Vuser script.
name. The name of the transaction.
value. A pointer to a parameter list.
status. One of the following:"Pass"
or "Fail".
TC.transactionDuration
(name)
Returns the duration of a specific transaction. name. The name of the transaction
TC.getParam(name) Returns the value of the specified parameter. name. The parameter name.
TC.evalC(funcname) Runs the specified function whose definition is
found in the specified file.
funcname. The function name.
Note: Use the #include
command to include the file
where the function is
defined.
TC.log(text, level) Logs a message. text. The message.
level. One of the following:
l"Error",
l"Warning",
l"Standard",
l"Extended",
l"Status". The TC.log level= Status
sends a string to the Status area
of the Controller. It also sends the
string to the Vuser log. When run
from VuGen, the message is sent
to output.txt.
example: TC.log("text", "Error");
TC.decrypt(text) Returns the text after decryption. text. The encrypted text.
TC.userDataPoint(name, Records a user-defined data point for analysis. name. The name of the data point.
User Guide
HP LoadRunner (12.50) Page 797
Method Description Arguments
value) Do not begin a data-point name with
any of these strings: HTTP, NON_
HTTP, RETRY, mic_, stream_, mms_
value. The numeric value.
evalXPath(XPath) Returns an array of the objects defined by the
XPath in the argument.
xpath. The xpath query.
TC.startTransaction
(name)
Starts a LoadRunner transaction. name. The name of the transaction
to start.
TC.endTransaction
(name, status)
Ends a LoadRunner transaction. lname. The name of the
transaction to end
lstatus. One of the following
values: “Pass”, “Fail”, “Auto”
TC.vuserStatusMessage
(string)
Indicates which Vuser is handling a specific
script.
string. Any string.
Utils.clearCookies() Removes all cookies currently stored by the
Vuser.
Caution: Not supported in the
Chromium browser
Utils.clearCache() Clears the contents of the cache simulator.
Caution: Not supported in the
Chromium browser
Utils.getEnv(name) Returns the value of the specified environment
variable. Returns an empty string if the specified
variable does not exist.
name. The name of the environment
variable.
Utils.import(path) Evaluates the specified JavaScript file in the
arguments context.
path. The absolute path to the
JavaScript file.
Utils.isEnvExists(name) Returns True if the specified environment
variable exists and False if it does not exist.
name. The name of the environment
variable.
Utils.setEnv(name,
value)
Sets the named environment variable to the
specified value. If the variable already has a
value it is overwritten.
lname. The name of the
environment variable.
lvalue. The value to set the
environment variable to.
Utils.addAutoFilter(filter,
isIncluded
Adding a filter to one of the black list or white
list lists of URLs. The URL of each HTTP request
will be checked against those lists – first the
lfilter. String representing the
URL.
lisInclude. True value indicates
User Guide
HP LoadRunner (12.50) Page 798

Method Description Arguments
black list, and if not empty, the white list. HTTP
requests that do not pass the check will be
blocked.
the white list, false otherwise.
Utils.removeAutoFilter
(filter, isIncluded
Remove a filter from one of the black list or
white list lists of URLs.
lfilter. String representing the
URL.
lisInclude. True value indicates
the white list, false otherwise.
Utils.cleanupAutoFilters
()
Remove all filters from both the black list and
white list lists of URLs.
Utils.addAutoHeader
(header, value, merge)
Adding an HTTP header to every consecutive
HTTP requests following this function call.
lheader. The name of the header
to be added.
lvalue. The value of the header to
be added.
lmerge. True value indicates
to merge the value with an
existing header by the same
name, false indicates to overwrite
it.
Utils.removeAutoHeader
(header)
Stops the adding of an HTTP header to every
consecutive HTTP request following this function
call.
header. The name of the header to
be stopped from being added.
Utils.cleanupAutoHeaders
()
Removes all HTTP headers and stops adding
HTTP headers to every consecutive HTTP request
following this function call.
TC.setProxy Enables you to set a proxy address manually in
the script.
loption. Specify the type of proxy do
you want to use.
l"PROXY_NONE". No proxy
l"PROXY_SYSTEM". Use system
proxy, settingsString will be
ignored.
l"PROXY_MANUAL" .manually set
proxy
l"PROXY_PAC". use PAC
lsettingsString. The details of the
proxy setting.
TC.setLogLevel
(logLevel,log_flags)
Enables you to change the log level during script
replay. To restore initial log level setting, use
TC.restoreLogLevel.
llogLevel.Specify the log level
lDisabled. No log file captured.
lStandard. Standard log
captured.
lExtended. Extended log file
User Guide
HP LoadRunner (12.50) Page 799

Method Description Arguments
captured.
llog_flags.
If the log level is set to extended,
you can specify which data is
captured using Boolean
(true/false) flags as properties of
json_object.
Any flag which is omitted will be
considered as “false”
llog_htttp
llog_AUT
llog_parameters
TC.restoreLogLevel() Restore log level to the initial setting.
User Guide
HP LoadRunner (12.50) Page 800

TruClient VTS Functions
The following functions can be inserted as values in TruClient step elements.
In LoadRunnerTruClient scripts, the TC prefix can be replaced with LR.
Method Descript
ion
Load
Runn
er
Meth
od
Nam
e
Argum
ents
Note
s
abou
t
func
tion
beha
vior
Example
TC.vtcAddCell(colName,
value, VtsName)
Sets the
last field
of a
column
to a
value.
lrvt
c_
sen
d_
mess
age
colNam
e.The
name
of the
colum
n.
value.
The
value
as a
string.
VtsNa
me.The
alias of
the VTS
server.
If
the
colu
mn
spec
ified
in
the
argu
men
t
does
not
exis
t,
the
colu
mn
will
be
crea
ted
and
the
cell
cont
TC.vtcAddCell
("MyColumn","myValue","MyVts")
HP LoadRunner (12.50) Page 801

Method Descript
ion
Load
Runn
er
Meth
od
Nam
e
Argum
ents
Note
s
abou
t
func
tion
beha
vior
Example
ent
is
set
to
the
argu
men
t
valu
e.
TC.vtcAddCells(colNames,
values,option, VtsName)
Sets the
data in
multiple
columns.
If option
selected
is 2,
returns
a value
of 0 if
value
inserted.
Returns
a value
of 1 if
the
value
already
exists.
vtc_
sen
d_
row1
ColNa
mes.
The
column
names
delimit
ed by a
semi-
colon.
values.
The
values
as a
string
delimit
ed by a
semi-
colon.
option.
.Define
how
the
If
the
colu
mns
spec
ified
in
the
argu
men
t do
not
exis
t,
the
colu
mns
will
be
crea
ted
and
TC.vtcAddCells("MyColumn1;
MyColumn2;MyColumn2",1,"MyValue
1;MyValue2;MyValue3",0,"MyVts")
User Guide
HP LoadRunner (12.50) Page 802

Method Descript
ion
Load
Runn
er
Meth
od
Nam
e
Argum
ents
Note
s
abou
t
func
tion
beha
vior
Example
values
are
added
0. Add
as
same
row in
all
column
s based
on the
column
with
the
highest
row
count.
The
create
d row
will be
n+1 for
all
column
s.
1. Add
as
stack -
last
row in
every
colum
n.
the
cell
cont
ents
are
set
to
the
argu
men
t
valu
es.
User Guide
HP LoadRunner (12.50) Page 803

Method Descript
ion
Load
Runn
er
Meth
od
Nam
e
Argum
ents
Note
s
abou
t
func
tion
beha
vior
Example
2. Add
as
unique
stack -
last
row in
every
column
only if
the
value is
unique
in the
colum
n.
VtsNa
me.The
alias of
the VTS
server.
TC.vtcAddUniqueCell
(colName, value, VtsName)
Sets the
last field
of a
column
to a
value if
the
value
does not
exist in
the
column.
lrvt
c_
sen
d_if_
uniq
ue
ColNam
e.The
name
of the
colum
n.
value.
The
value.
VtsNa
me.The
alias of
If
the
colu
mn
spec
ified
in
the
argu
men
t
TC.vtcAddUniqueCel
("MyColumn",1,"MyVts")
User Guide
HP LoadRunner (12.50) Page 804

Method Descript
ion
Load
Runn
er
Meth
od
Nam
e
Argum
ents
Note
s
abou
t
func
tion
beha
vior
Example
Returns
a value
of 0 if a
value is
inserted.
Returns
a value
of 1 if
the
value
already
exists.
the VTS
server.
does
not
exis
t,
the
colu
mn
will
be
crea
ted
and
the
cell
cont
ent
is
set
to
the
argu
men
t
valu
e.
TC.vtcClearColumn
(colName,VtsName)
Clears
all data
in a
column.
lrvt
c_
clea
r_
colu
mn
colNam
e.The
name
of the
colum
n.
VtsNa
If
the
colu
mn
spec
ified
TC.vtcClearColumn
("MyColumn","MyVts")
User Guide
HP LoadRunner (12.50) Page 805

Method Descript
ion
Load
Runn
er
Meth
od
Nam
e
Argum
ents
Note
s
abou
t
func
tion
beha
vior
Example
me.The
alias of
the VTS
server.
in
the
argu
men
t
does
not
exis
t,
the
step
will
run
with
out
retu
rnin
g an
erro
r
and
no
data
in
the
VTS
is
chan
ged.
TC.vtcClearCell
(colName,rowIndex,VtsNa
me)
Clears
the data
in a
field.
lrvt
c_
clea
r_
colNam
e. The
name
of the
If
the
TC.vtcClearCell
("MyColumn",1,"MyVts")
User Guide
HP LoadRunner (12.50) Page 806

Method Descript
ion
Load
Runn
er
Meth
od
Nam
e
Argum
ents
Note
s
abou
t
func
tion
beha
vior
Example
mess
age
colum
n.
rowInd
ex.The
index
numbe
r of the
field as
an
intege
r. 1 is
the
first
field in
the
colum
n.
VtsNa
me.The
alias of
the VTS
server.
colu
mn
or
the
row
inde
x
spec
ified
in
the
argu
men
t
does
not
exis
t,
the
step
will
run
with
out
retu
rnin
g an
erro
r
and
no
data
in
User Guide
HP LoadRunner (12.50) Page 807

Method Descript
ion
Load
Runn
er
Meth
od
Nam
e
Argum
ents
Note
s
abou
t
func
tion
beha
vior
Example
will
be
chan
ged.
TC.vtcColumnSize
(colName, VtsName)
Returns
the
number
of fields
that
contain
data in a
column.
lrvt
c_
colu
mn_
size
colNam
e.The
name
of the
colum
n.
VtsNa
me.The
alias of
the VTS
server.
If
the
colu
mn
spec
ified
in
the
argu
men
t
does
not
exis
t,
the
step
will
run
with
out
retu
rnin
g an
erro
r
and
the
retu
TC.vtcColumnSize
("MyColumn","MyVts")
User Guide
HP LoadRunner (12.50) Page 808

Method Descript
ion
Load
Runn
er
Meth
od
Nam
e
Argum
ents
Note
s
abou
t
func
tion
beha
vior
Example
rn
valu
e is
0.
TC.vtcConnect
(serverName, port,
VtsName)
Creates
a
connecti
on to
the
server.
vtc_
conn
ect
server
Name.
Either
the IP
or
server
name.
port.
The
port
numbe
r
VtsNa
me..
The
alias of
the VTS
server.
TC.vtcConnect("MyServer", 8888,
"MyVts")
TC.vtcDisconnect
(VtsName)
Disconn
ects
from the
server.
lrvt
c_
disco
nnec
t
VtsNa
me.The
alias of
the VTS
server.
TC.vtcDisconnect( "MyVts")
TC.vtcDropIndex
(colName,VtsName)
Deletes
the
index on
a
lrvt
c_
dro
p_
colNam
e.The
column
name.
If
the
colu
TC.vtcDropIndxe
("MyColumn","MyVts")
User Guide
HP LoadRunner (12.50) Page 809

Method Descript
ion
Load
Runn
er
Meth
od
Nam
e
Argum
ents
Note
s
abou
t
func
tion
beha
vior
Example
column. index VtsNa
me.The
alias of
the VTS
server.
mn
spec
ified
in
the
argu
men
t
does
not
exis
t,
the
step
will
run
with
out
retu
rnin
g an
erro
r.
In
addi
tion,
if
the
inde
x
has
alre
User Guide
HP LoadRunner (12.50) Page 810

Method Descript
ion
Load
Runn
er
Meth
od
Nam
e
Argum
ents
Note
s
abou
t
func
tion
beha
vior
Example
ady
been
drop
ped
on
the
colu
mn,
the
step
will
run
with
out
retu
rnin
g
and
erro
r.
TC.vtcEnsureIndex
(colName,VtsName)
Creates
an index
on a
column.
lrvc
t_
ensu
re_
index
colNam
e.The
name
of the
colum
n.
VtsNa
me.The
alias of
the VTS
server.
If
the
colu
mn
spec
ified
in
the
argu
men
t
does
TC.vtcEnsureIndex
("MyColumn","MyVts")
User Guide
HP LoadRunner (12.50) Page 811

Method Descript
ion
Load
Runn
er
Meth
od
Nam
e
Argum
ents
Note
s
abou
t
func
tion
beha
vior
Example
not
exis
t,
the
step
will
run
with
out
retu
rnin
g an
erro
r.
In
addi
tion,
if
the
inde
x
has
alre
ady
been
crea
ted
on
the
colu
mn,
the
step
User Guide
HP LoadRunner (12.50) Page 812

Method Descript
ion
Load
Runn
er
Meth
od
Nam
e
Argum
ents
Note
s
abou
t
func
tion
beha
vior
Example
will
run
with
out
retu
rnin
g
and
erro
r.
TC.vtcIncrement
(colName,rowIndex,value,V
tsName)
Increme
nts a
counter
stored in
a field.
ltvt
c_
incre
ment
colNam
e.The
name
of the
colum
n.
rowInd
ex.The
index
numbe
r of the
field as
an
intege
r. 1 is
the
first
field in
the
colum
n.
value.
If
the
colu
mn
nam
e
spec
ified
in
the
argu
men
t
does
not
exis
t,
the
colu
mn
will
be
TC.vtcIncrement
("MyColumn",1,1,"MyVTS")
User Guide
HP LoadRunner (12.50) Page 813

Method Descript
ion
Load
Runn
er
Meth
od
Nam
e
Argum
ents
Note
s
abou
t
func
tion
beha
vior
Example
The
value
as a
string.
VtsNa
me.The
alias of
the VTS
server.
crea
ted
and
the
cell
refe
renc
ed
by
the
inde
x will
be
set
to
the
argu
men
t
valu
e.
If
the
inde
x
spec
ified
in
the
argu
User Guide
HP LoadRunner (12.50) Page 814

Method Descript
ion
Load
Runn
er
Meth
od
Nam
e
Argum
ents
Note
s
abou
t
func
tion
beha
vior
Example
men
t
exce
eds
the
colu
mn
size,
the
cell
is
crea
ted
by
the
spec
ified
inde
x
and
the
cell
cont
ents
is
set
to
the
argu
men
t
valu
e.
User Guide
HP LoadRunner (12.50) Page 815

Method Descript
ion
Load
Runn
er
Meth
od
Nam
e
Argum
ents
Note
s
abou
t
func
tion
beha
vior
Example
If
the
colu
mn
refe
renc
ed
by
the
inde
x
cont
ains
a
strin
g,
the
cell
cont
ents
are
repl
aced
with
the
valu
e
argu
men
t.
TC.vtcGetCell
(colName,rowIndex,VtsNa
me)
Returns
the data
in a
lrvt
c_
quer
colNam
e.The
name
If
the
TC.vtcGetCell
("MyColumn",1,"MyVts")
User Guide
HP LoadRunner (12.50) Page 816

Method Descript
ion
Load
Runn
er
Meth
od
Nam
e
Argum
ents
Note
s
abou
t
func
tion
beha
vior
Example
field. y_
colu
mn
of the
colum
n.
rowInd
ex.The
index
numbe
r of the
field as
an
intege
r. 1 is
the
first
field in
the
colum
n.
VtsNa
me.The
alias of
the VTS
server.
colu
mn
nam
e or
inde
x
nam
e
spec
ified
in
the
argu
men
t
does
not
exis
t, a
null
valu
e will
be
retu
rne
d.
TC.vtcGetRowCells
(rowIndex,VtsName)
Returns
the data
in a row
as a
javascri
lrvt
c_
quer
y_
row
rowInd
ex.The
index
numbe
r of the
If
the
colu
mn
TC.vtcGetRowCells(1,"MyVTS")
User Guide
HP LoadRunner (12.50) Page 817

Method Descript
ion
Load
Runn
er
Meth
od
Nam
e
Argum
ents
Note
s
abou
t
func
tion
beha
vior
Example
pt
object.
The
properti
es of the
object
will be
set to
the
column
names.
field . 1
is the
first
field in
the
colum
n.
VtsNa
me..
The
alias of
the VTS
server.
spec
ified
in
the
argu
men
t
does
not
exis
t, a
null
valu
e will
be
retu
rned
for
ever
y
colu
mn.
TC.vtcPopCell
(colName,VtsName)
Pops the
first
field
from a
column.
lrvt
c_
retri
eve_
mess
age
colNam
e.The
name
of the
colum
n.
VtsNa
me.The
alias of
the VTS
server.
If
the
colu
mn
nam
e
spec
ified
in
the
TC.vtcPopCell("MyColumn","MyVts")
User Guide
HP LoadRunner (12.50) Page 818

Method Descript
ion
Load
Runn
er
Meth
od
Nam
e
Argum
ents
Note
s
abou
t
func
tion
beha
vior
Example
argu
men
t
does
not
exis
t, a
null
valu
e will
be
retu
rne
d.
TC.vtcPopMultipleCells
(colNames,VtsName)
Pops the
first
fields
from
specifie
d
columns
.Returne
d as a
javascri
pt
object.
The
properti
es of the
object
will be
set to
the
vtc_
retri
ve_
mess
ages
1
colNam
es.The
names
of the
column
s.
VtsNa
me.The
alias of
the VTS
server.
If
the
colu
mn
nam
es
spec
ified
in
the
argu
men
t
does
not
exis
t, a
null
valu
TC.vtcPopMultipleCells
("MyColumn","MyVts")
User Guide
HP LoadRunner (12.50) Page 819

Method Descript
ion
Load
Runn
er
Meth
od
Nam
e
Argum
ents
Note
s
abou
t
func
tion
beha
vior
Example
column
names.
e will
be
retu
rne
d.
TC.vtcUpdateCell
(colName,rowIndex,value,V
tsName)
Replace
s the
data in a
field.
lrvt
c_
upda
te_
mess
age
colNam
e.The
name
of the
colum
n.
rowInd
ex.The
index
numbe
r of the
field as
an
intege
r. 1 is
the
first
field in
the
colum
n.
value.
The
value
as a
string.
If
the
colu
mn
nam
e or
inde
x
does
not
exis
t,
the
colu
mn
and/
or
the
cell
refe
renc
ed
by
the
inde
x will
be
TC.vtcUpdateCell
("MyColumn",1,"MyValue","MyVTS")
User Guide
HP LoadRunner (12.50) Page 820

Method Descript
ion
Load
Runn
er
Meth
od
Nam
e
Argum
ents
Note
s
abou
t
func
tion
beha
vior
Example
VtsNa
me.The
alias of
the VTS
server.
crea
ted
and
the
cell
cont
ents
set
to
the
argu
men
t
valu
e.
TC.vtcUpdateEqualsCell
(colName,rowIndex,value,c
omparedValue,VtsName)
Replace
s the
data in a
field if
the
current
data
equals a
given
value.
Returns
a value
of 0 if
the
value is
updated.
Returns
lrvt
c_
upda
te_
mess
age_
ifequ
als
colNam
e.The
name
of the
colum
n.
rowInd
ex.The
index
numbe
r of the
field as
an
intege
r. 1 is
the
first
If
the
colu
mn
nam
e or
inde
x
does
not
exis
t,
the
colu
mn
and/
or
TC.vtcUpdateEqualsCell
("MyColumn",1,"MyValue","MyCompa
reValue",MyVTS")
User Guide
HP LoadRunner (12.50) Page 821

Method Descript
ion
Load
Runn
er
Meth
od
Nam
e
Argum
ents
Note
s
abou
t
func
tion
beha
vior
Example
a value
of 1 if
the
value
does not
match
the
compare
value.
field in
the
colum
n.
value.
The
value
as a
string.
compar
edValu
e.
VtsNa
me.The
alias of
the VTS
server.
the
cell
poin
ted
to by
the
row
inde
x will
be
crea
ted
and
the
cell
cont
ents
set
to
the
argu
men
t
valu
e.
TC.vtcUpdateRowCells
(colNames,rowIndex,value
s,VtsName)
Replace
s the
data in a
row.
lrvt
c_
upda
te_
row1
colNam
es.The
name
of the
column
s.
rowInd
If
the
colu
mn
nam
es or
TC.vtcUpdateRowCells("MyColumn1;
MyColumn2;MyColumn3",1,"MyValue
1;MyValue2;MyValue3","MyVts")
User Guide
HP LoadRunner (12.50) Page 822

Method Descript
ion
Load
Runn
er
Meth
od
Nam
e
Argum
ents
Note
s
abou
t
func
tion
beha
vior
Example
ex.The
index
numbe
r of the
field as
an
intege
r. 1 is
the
first
field in
the
colum
n.
values.
The
values
as a
string
delimit
ed by
semi-
colons.
VtsNa
me.The
alias of
the VTS
server.
inde
x
does
not
exis
t,
the
colu
mns
and/
or
the
cells
refe
renc
ed
by
the
inde
x will
be
crea
ted
and
the
cells
cont
ents
are
set
to
the
argu
User Guide
HP LoadRunner (12.50) Page 823

Method Descript
ion
Load
Runn
er
Meth
od
Nam
e
Argum
ents
Note
s
abou
t
func
tion
beha
vior
Example
User Guide
HP LoadRunner (12.50) Page 824

TruClient Step Arguments
The following table displays the step arguments categorized by role. Mandatory arguments are marked
with a red star to the left of the argument name in the user interface. All arguments can accept
JavaScript code and LoadRunner functions as values. For a list of LoadRunner functions, see "TruClient
Functions" on page796.
Role Action Arguments
element Evaluate JavaScript Code: JavaScript code
element Mouse Actions: Mouse
Down, Mouse Up, Mouse
Over, Click, Double Click
lButton. The mouse button that is clicked.
lX Coordinate. The offset location of the action relative to the upper left
corner of the object. This number must be positive. If not specified, the
default is the center of the object.
lY Coordinate. The offset location of the action relative to the upper left
corner of the object. If not specified, the default is the center of the
object.
lCtrl Key. Whether or not this key is pressed during the action.
lAlt Key. Whether or not this key is pressed during the action.
lShift Key. Whether or not this key is pressed during the action.
element Drag lButton. The mouse button that is clicked.
lX Offset. The amount of pixels to drag the object on the x axis. A
positive number indicates a drag to the right.
lY Offset. The amount of pixels to drag the object on the y axis. A
positive number indicates a drag down.
lPath. List of coordinates representing user drag path. Do not modify this
argument.
element Drag To lTarget Object. The step object is dragged to this target object.
lX Offset. The offset from the top left of the target object in the x axis.
This number must be positive.
lY Offset. The offset from the top left of the target object in the y axis.
This number must be positive.
element Get Property lProperty. The property whose value will be stored in the specified
variable. The list of properties available depends on all the roles of the
object.
The following are the default properties available for all objects:
lVisible text. The visible text of the item, corresponding to the DOM
textContent property.
lAll text. The entire text of the item, corresponding to the DOM
textContent property.
lInner HTML. The inner html markup of the object, corresponding to the
DOM innerHTML property.
HP LoadRunner (12.50) Page 825

Role Action Arguments
lVariable. The name of the variable in which to store the specified
property value.
element Verify lValue. The string or number to verify.
lProperty. The object property whose value will be verified. The list of
properties available to verify depends on all the roles of the object.
The following are the default properties available for verification on all
objects:
lVisible text. Items that are visible in the application.
lAll text. Items that are in the application but are not necessarily
visible. Items in this category are contained in DOM property
textContent.
lInner HTML. Items contained in the DOM property innerHTML.
lCondition. The relationship between the value and property
arguments.
element Verify PDF Content lPath. The file location. The location can be either a local file or a web
address.
lValue. The PDF string to verify. The value can be either plain text or
JavaScript code.
lCondition. Specify how to verify the value.
lContain. The PDF contains the specified value.
lNot Contain. The PDF does not contain the specified value.
lRegular expression. Define a regular expression to search the PDF
content.
Step Limitations
lYou cannot search for content across a page break.
lYou can cannot search for a value that contains both special, such as
Chinese or Japanese characters, and alphanumeric characters.
element Wait for Property lValue. The value of the specified property that the step will wait for,
before the step passes.
lProperty. The object property whose value the script will wait for. The
list of properties available for which to wait, depends on all the roles of
the object.
The following are the default properties available for all objects:
lVisible text. Items that are visible in the application.
lAll text. Items that are in the application but are not necessarily
visible. Items in this category are contained in DOM property
textContent.
lInner HTML. Items contained in the DOM property innerHTML.
lCondition. The relationship between the value and property
User Guide
HP LoadRunner (12.50) Page 826

Role Action Arguments
arguments.
focusable Press Key lKey name. Enter or Space.
text box Type lValue. What is typed.
lClear. Clear the text box before typing. The default is true.
lTyping Interval. The average time in milliseconds between keystrokes.
check box Set lChecked. Set the check box to either checked (T) or unchecked (F).
listbox Select lText. The selected string or a use a regular expression.
lOrdinal. The order of the selected item in the list. If the text argument is
also specified, than this argument refers to the instance of the specified
text value in the listbox. An ordinal of 0 generates a random value.
radiogroup Select lText. The selected string or a use a regular expression.
lOrdinal. The order of the selected item in the list. If the text argument is
also specified, than this argument refers to the instance of the specified
text value in the listbox. An ordinal of 0 generates a random value.
filebox Set lPath. The selected path.
slider Set lValue. The value that the slider is set to.
datepicker Set Day lDay. An integer between 1-31 representing the day of the month.
browser Activate lOrdinal. Defined as an integer. Moves the specified browser window to
the foreground.
browser Activate Tab lOrdinal. Which tab (integer) to activate.
browser Close Tab lOrdinal. Which tab (integer) to close.
browser Add Tab lLocation. The URL to navigate to in the newly opened tab.
browser Navigate lLocation. The URL to navigate to.
browser Go Back lCount. The number of pages to go back.
browser Go Forward lCount. The number of pages to go forward.
browser Resize lWidth. The new width. Leaving this blank means do not resize the width.
lHeight. The new height. Leaving this blank means do not resize the
height.
browser Scroll lX Coordinate. The new x coordinate. Leaving this blank means do not
scroll along the x axis.
lY Coordinate. The new y coordinate. Leaving this blank means do not
scroll along the y axis.
browser Dialog - Confirm lButton. Ok or Cancel.
browser Dialog Prompt lValue. The string to enter.
User Guide
HP LoadRunner (12.50) Page 827

Role Action Arguments
lButton. Ok or Cancel.
browser Dialog - Authentication lUsername. The username to enter.
lPassword. The password to enter.
lDomain. The domain to enter.
lButton. Ok or Cancel.
browser Verify lValue. The value of the property to verify.
lProperty. The property to verify. You can verify the following properties
of a browser object:
lTitle. The title of the browser window.
lLocation. The location of the browser window.
lCondition. The relationship between the value and property arguments.
TruClient Properties
These properties can be used as arguments in TruClient functions.
Property Description
LR.userId The user ID as it appears in the MDRV command line. MDRV is the main process that
runs all protocols.
LR.groupName The group name as it appears in the MDRV command line. MDRV is the main process
that runs all protocols. If the process was started by VuGen its value is 0.
LR.scenarioId The scenario ID as it appears in the MDRV command line. MDRV is the main process
that runs all protocols. The scenario ID exists only if MDRV was started by Controller,
if it was started by VuGen its value is 0.
LR.outputDir The user output folder that contains all the output for the script. For VuGen the
output folder and script folder are the same. For Controller they are different. The
returned path includes the last folder separator.
LR.scriptDir The user script folder. You can store external files in the script folder such that
when you want to include them in your script, you can append the filename of your
external file to LR.scriptDir.
User Guide
HP LoadRunner (12.50) Page 828

Utilities
What do you want to do?
lTruClient Script Converter
lTroubleshoot load issues
Convert a TruClient Script to a Web HTTP/HTML Script
Combine the advantage of fast script development and the advantage of running many Vusers by
converting a TruClient script to a Web HTTP/HTML script.
Note:
You will need to have an understanding of the Web HTTP/HTML protocol to successfully replay
the script.
During the conversion, comments and APIs are added to the Web HTTP/HTML protocol script
that document the conversion process.
1. Create a TruClient script. For details, see How to Develop TruClient Scripts
2. Save the script and close the TruClient Side Bar.
3. From VuGen toolbar, click the button to convert the script.
4. After the script is generated, review the script, keeping in mind that the Web HTTP/HTML protocol
records on the transport level. For example, you may need to address correlation or parameter
issues in your converted script. For details, see "Web - HTTP/HTML Protocol - Overview" on
page834.
When you add a converted script to a scenario, LoadRunner offers to create a new Vuser group for the
script, provided that the original TruClient script is in the specified path. Having a separate group, allows
you to view its results separately.
Watch a video
Limitations
Conversion of TruClient scripts to Web HTTP/HTML scripts does not support converting steps that call
127.0.0.1 (localhost) address.
Manually convert TruClient .xpi scripts
Convert existing scripts created with TruClient for StormRunner Firefox .xpi extension for use with
TruCLient Launcher or VuGen using the following procedure:
User Guide
HP LoadRunner (12.50) Page 829
1. Extract the script zip file, created using TC for StormRunner, to a file folder.
Note: This is your source folder.
2. Open the TruClient Launcher and create a blank script.
Note: This is your target folder.
3. Save the script you just created and close the TruClient Launcher.
4. Add the script steps to the target folder.
Copy and replace the default.xml file in the target folder with default.xml file from the source
folder.
5. Create a zip file of the target folder.
Select all the files under the script target folder and add to a zip file.
Note: The name of the zip file you create should match the name you created when you
saved the script in step 3.
6. Open the script in the TruClient Launcher.
Note: Script settings and parameters cannot be copied over and need be reconfigured in the
TruClient standalone.
7. From the toolbar, select the "TruClient General Settings " on page765 dialog box to configure
the script settings.
8. From the toolbar, click the Parameters dialog box to add parameters.
Caution: The TruClient Launcher does not support TC.getParam("name", column"). If you used
this function, you will need to redevelop your parameter structure and work with TC.getParam
("name") function.
9. Replay the script in interactive mode. See "Debug TruClient Scripts" on page727 if the script
encounters errors during replay.
Troubleshooting load issues
This topic describes how troubleshoot TruClient load issues .
User Guide
HP LoadRunner (12.50) Page 830

TruClient technology provides you with the ability to quickly and easily record complex business
processes. However, because TruClient records at the user level and requires a browser for replay, the
more complex an application's client logic is, the more CPU and memory is required to run a Vuser.
Note: The TruClient footprint can be significantly larger than the footprints of other Vuser
protocols. This larger footprint will require more CPU and memory capacity than would be
required to run a similar business process recorded in another protocol.
What do you want to do?
Calculate the number of load generators
Use the following method to determine the required number of load generators:
1. Record a script using TruClient. For details, see step 5 of "Record a script" on page715.
2. Replay a single Vuser in Controller and check the average CPU and the peak memory consumption
of the mdrv.exe process by adding a counter for % Processor Time and Private Bytes.
3. Based on your load generator hardware and the CPU and memory consumption of a single Vuser,
calculate the number of Vusers per machine.
For example:
Let us assume that each of our load generators has 8 core processors and 8GB of memory.
Let us also assume that a single Vuser consumes 80MB of peak memory and 10% CPU on
average for the specific business process.
From a CPU perspective, if we limit the CPU consumption up to 70% utilization, we can have
7 Vusers per core processor (70% /10%). If our load generator has a total of 8 cores
processors, 8 * 7 Vusers per processor equals 56 Vusers per load generator.
From a memory perspective, the load generator machine has 8GB memory of which 7GB is
available for the Vusers so approximately 87 Vusers per load generator machine (7GB /
80MB).
Therefore, to meet both the CPU and memory capacity limits, we use the lower number of
Vusers and we calculate that for this business process, we can run approximately 56
Vusers per load generator.
Configure Runtime settings to improve load
User Guide
HP LoadRunner (12.50) Page 831
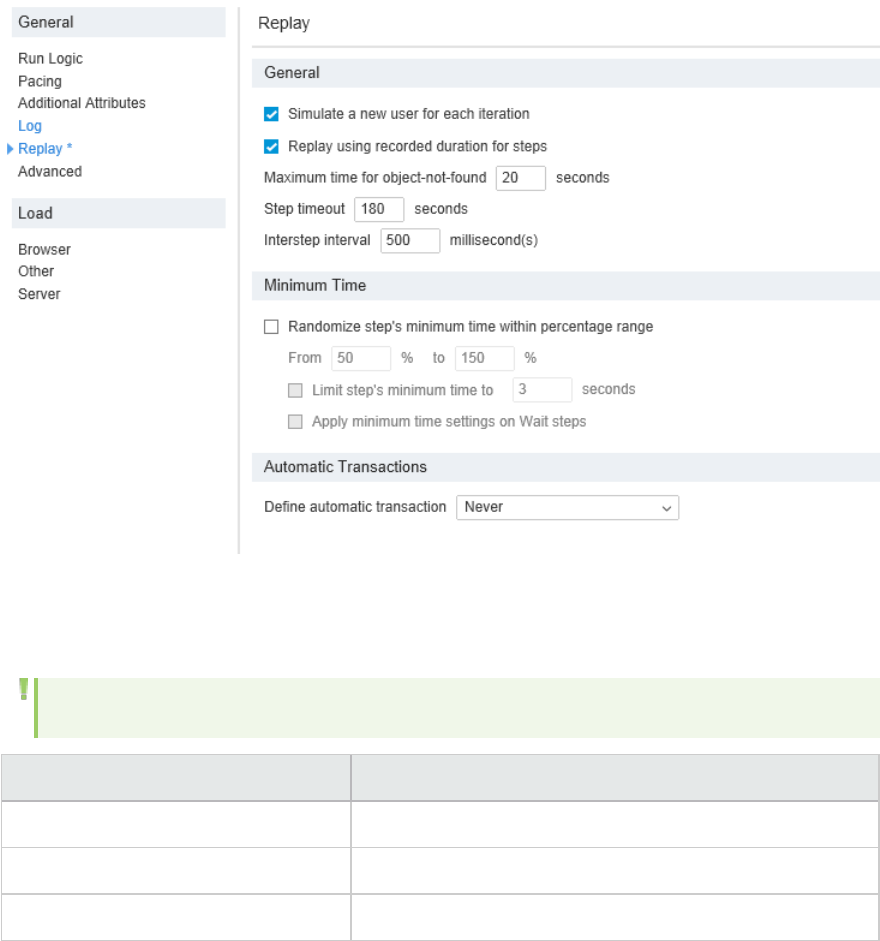
To improve the ability to run more Vusers, select Runtime Settings> General > Replay and check the
Replay using recorded duration for steps option.
Measure the load generator performance
Use the following monitors to ensure that the load generator is not being over utilized.
Note: Over utilization of the load generator can cause inaccurate transaction response time.
Monitor Threshold
Processor\% Processor Time 80%
Memory\Available Mbytes Less than 10 percent of the total physical RAM
System\Context Switches/sec Less than 8K context switches/sec per core
In the case that you do not see standard performance issues, GDI resource consumption may limit the
number of vuser you can run. As the number of vusers increases, the GDI resources needed to display
the application in a browser can reach the limit supported by the Windows Operating system per
session.
You can better utilize the load generator hardware resources by connecting to the same load generator
using different windows sessions. For more details see, LoadRunner integration with Terminal Services.
User Guide
HP LoadRunner (12.50) Page 832
Manage TruClient scalability
Use the following tips to manage TruClient scalability:
lTo support a larger number of Vusers, use high performance hardware and use more load
generators.
lIncrease the ramp up time between vusers.
For example, minimally set the ramp up to 2 vusers every 30 seconds.
lConfigure Controller to not initialize vusers before they run. This will reduce the demand on the CPU
and I/O during ramp up.
lIf CPU is a bottleneck, consider doing one of the following:
lAdd a longer pacing time between iterations.
lAdd wait steps of a second or two.
lIf memory is a bottleneck, run fewer Vusers.
lIf the bottleneck is not CPU or memory, it is most likely the GDI resources.Consider using
LoadRunner/Peformance Center integration with Terminal Services and split Vusers among
different terminal sessions.
The following table provides estimated metrics regarding the browser footprint generated replaying
an empty script. Use these values to estimate the hardware required for running a load test using
TruClient. For details, see "Calculate the number of load generators" on page831.
The metrics were compiled with the following specifications:
lHardware specifications: 2.20 GHz CPU, 16 cores, 32 logical processors and 96 GB of memory.
lThe script only contains a Wait step with a default wait time of three seconds.
lThe pacing between iterations has been set to five seconds.
Monitor Firefox 37 IE Chromium 39
Single
Vuser
(empty
script)
Memory
(private
working
set)
~75 MB 40 MB ~50 + ~35 + ~60 = ~145 MB
(sum of 3 process)
Memory
(private
bytes)
~100 MB 45 MB 75 + 55 + 70 = 200 MB
(sum of 3 process)
CPU ~2% ~2% ~1.5% + ~2% + ~4% = ~7.5%
(sum of 150 processes)
Context
switches
~700 ~1400 ~20
User Guide
HP LoadRunner (12.50) Page 833
Monitor Firefox 37 IE Chromium 39
50
Vusers
(empty
script)
Memory
(private
working
set)
~3800 MB ~2000 MB ~6700 MB
(sum of 150 processes)
Memory
(private
bytes)
~5100 MB ~2200 MB ~9200 MB
(sum of 150 processes)
CPU ~80% ~70% ~85
(sum of 150 processes)
Context
switches
~36000 ~190000 ~70000
Caution: The Chromium footprint is larger than Firefox and IE. Therefore, Vuser throughput
in Chromium is smaller compared to a Vuser running in TruClient IE or TruClient Firefox.
Web - HTTP/HTML Protocol
The Web - HTTP/HTML Vuser protocol is one of LoadRunner's Web Vuser protocols. This section includes
information that is specific to the Web - HTTP/HTML Vuser protocol. For information that is generic to
all Web Vuser protocols, see "Web Protocols (Generic)" on page851.
Web - HTTP/HTML Protocol - Overview
Note: This topic applies to Web - HTTP/HTML Vuser scripts only.
The Web - HTTP/HTML Vuser protocol emulates communication between a browser and Web server on
an HTTP or HTML level.
Note: The Web - HTTP/HTML Vuser protocol is one of LoadRunner's Web Vuser protocols. For a
full list of Web Vuser protocols, see "Web Vuser Types" on page852.
This topic provides an overview of various topics relating to Web - HTTP/HTML Vuser scripts.
User Guide
HP LoadRunner (12.50) Page 834

When should you use the Web - HTTP/HTML Vuser protocol?
You can use the Web - HTTP/HTML Vuser protocol for browser applications that include applets and VB
script, and for non-browser applications.
Use the Web - HTTP/HTML Vuser protocol when the client and the server communication is done over
http/s communication, and the complexity of the communication does not require content modification.
If content modification is required, consider using the TruClient protocol. For further information about
the TruClient protocol, see "Introduction to TruClient " on page674.
For details on how to select a Vuser protocol, see "Protocol Advisor Overview" on page433.
Web - HTTP/HTML Vuser Technology
You use VuGen to develop Web - HTTP/HTML Vuser scripts. To record a Web - HTTP/HTML Vuser script,
you navigate through a web site - performing typical user activities. VuGen records your actions and
generates a Web - HTTP/HTML Vuser script. The script contains detailed information about the recorded
traffic. When you run the script, the resulting Vuser emulates a user accessing the Internet.
For details, see "Web Vuser Technology" on page851.
The table below displays a list of the LoadRunner documentation that relates to the process of
developing a Web - HTTP/HTML Vuser script.
Topic Description
Creating a Web
(HTTP/HTML ) Vuser
script
See VuGen's generic documentation about creating Vuser scripts ["Creating
Vuser Scripts - Overview" on page127].
Recording In addition to the generic documentation about recording Vuser scripts
["Recording - Overview" on page140], see:
l"Recording Levels - Overview" on page215
Recording Options
You can configure the following recording options for your Web (HTTP/HTML )
Vuser script:
l"General > Script Recording Options" on page172
l"General > Protocol Recording Options" on page169
l"General > Recording - Recording Options" on page169
l"Network > Mapping and Filtering Recording Options" on page188
l"HTTP Properties > Advanced Recording Options" on page178
l"Correlations > Rules Recording Options" on page155
l"Correlations > ConfigurationRecording Options" on page153
User Guide
HP LoadRunner (12.50) Page 835

Topic Description
l"Data Format Extension > Chain Configuration Recording Options" on
page161
l"Data Format Extension > Code Generation Recording Options" on page165
Correlating In addition to the generic VuGen documentation on correlating Vuser scripts
["Correlation Overview" on page235], see:
l"How to Correlate Scripts - Web (Manually)" on page246
l"Data Format Extensions (DFEs) - Overview" on page863
l"Using the VuGen JavaScript Engine" on page839
Replaying In addition to the generic VuGen documentation about replaying Vuser scripts
["Replay Overview" on page274], see:
l"Browser Emulation - Overview" on page857
l"Working with Cache Data" on page861
Runtime Settings
You can configure the following runtime settings for your Web (HTTP/HTML )
Vuser script:
lGeneral - Run Logic, Pacing, Log, Think Time, Additional Attributes,
Miscellaneous
lNetwork > Speed Simulation Node
lBrowser > Browser Emulation Node
lInternet Protocol > Proxy Node
lInternet Protocol > Preferences Node
lInternet Protocol > Download Filters Node
lInternet Protocol > ContentCheck Node
Debugging See VuGen's generic documentation about debugging Vuser scripts
["Debugging Overview" on page311].
Parameterizing In addition to the generic VuGen documentation on parameterizing Vuser
scripts ["Parameterizing Overview" on page341], see:
l"Data Format Extensions (DFEs) - Overview" on page863
l"Using the VuGen JavaScript Engine" on page839
Adding Load Testing
functionality
In addition to the generic VuGen documentation on adding load testing
functionality ["Enhancing a Script for Load Testing Overview" on page320],
see:
l"Text and Image Verification (Web Vuser Scripts) - Overview" on page853
User Guide
HP LoadRunner (12.50) Page 836
Topic Description
Viewing Test Results See VuGen's generic documentation about viewing test results ["Viewing
Replay Results Overview" on page417].
Misc The following miscellaneous topics are applicable to Web - HTTP/HTML Vuser
scripts:
l"Convert a TruClient Script to a Web HTTP/HTML Script" on page849
l"Generating Vuser Scripts in JavaScript" below
l"How to Convert a Web - HTTP/HTML Vuser Script into a Java Vuser Script"
on page845
l"Web Snapshots - Overview" on page856
l"How to Record the SPDY Protocol" on page847
l"How to Record Applications Using Smooth Streaming" on page848
Generating Vuser Scripts in JavaScript
You can create Vuser scripts in JavaScript as well as C, using the Web HTTP/HTML protocol. The
JavaScript engine is Google's V8 engine and is ECMAScript 5 compatible. You can choose to generate
your code in JavaScript before you start recording, or you can regenerate existing C code into
JavaScript. The default language for a new script is C.
Note: VuGen's code regeneration overwrites all manual changes that you made to a recorded
script; it only regenerates the recorded functions.
JavaScript Vuser scripts support asynchronous behavior and functionality. For details, see "How to
Create an Asynchronous Vuser Script" on page382.
JavaScript Vuser scripts support Virtual User Tables (VTS). For more information see "Parameterizing
Overview" on page341
When you create a Web HTTP/HTML Vuser script, you are notified that you can choose to generate the
script in JavaScript. See "General Options" on page102 to disable the message.
Recording your Vuser Script in JavaScript
To record your script in JavaScript:
1. Click Record > Recording Options. Select Script in the General menu on the left.
2. Select JavaScript in the Scripting Language drop down list.
3. Click OK.
User Guide
HP LoadRunner (12.50) Page 837
Note: Once you have recorded your script the Language option in the Recording Options dialog
box is disabled and can not be changed.
Auto-completion
JavaScript scripts automatically supports auto-completion for standard Vuser script files. Auto-
completion for user-defined methods imported into the project are supported for js file extensions only.
You must activate auto-completion on external files.
To activate auto-completion on an external js file:
1. Record a Vuser script in JavaScript.
2. Add your .js file to the project.
3. Right click on the file name and select Add to Parsing List.
Note: If you regenerate your script in another language, any additional files, such as a user-
defined .js file, are removed from the parsing list.
Regenerating your Vuser Script
You must have an existing script in C to regenerate your script. You can only regenerate scripts that
were recorded. If you write your own script or edit the recorded scripts, your changes are not
regenerated.
To regenerate C scripts into JavaScript:
1. Click or Record > Regenerate Script. A warning appears that any changes to the code are
overwritten.
2. Click Options. The Regenerate Options dialog box appears.
3. In the Script section, select the target language to convert the script to.
4. Click OK in the Regenerate Options dialog box. Click OK to approve regenerating the code.
Debugging your JavaScript Vuser script
You can debug your JavaScript Vuser script as necessary. For details on how to debug a script, see
"Debugging" on page311
User Guide
HP LoadRunner (12.50) Page 838

The JavaScript Function Library
The VuGen API includes a JavaScript library consisting of a variety of functions you can use in your Vuser
script. Included in the JavaScript library are string functions, database connectivity functions and
XMLfunctions among others. In addition, the lr.require and lr.loadLibrary functions enable you to
import JavaScript files into your script. For more information, see the JavaScript Functions section of
the HP LoadRunner Function Reference.
Using the VuGen JavaScript Engine
Note: This topic applies to Web - HTTP/HTML Vuser scripts written in C only.
What is the VuGen JavaScript Engine?
Typically, Web - HTTP/HTML Vuser scripts contain C code. The LoadRunner JavaScript Engine enables you
to insert snippets of JavaScript code into the C code.
What can I do with JavaScript in a Vuser script?
You can insert JavaScript code into a Web - HTTP/HTML Vuser script to manipulate text strings that are
included in the request and response messages that are sent between the client and server.
Manipulating strings is often useful for correlation and parameterization purposes. Typical string
manipulations include converting decimal to hexadecimal, encoding and decoding Base64, URL encoding
and decoding, and accessing object values inside JSON-formatted data.
Note: It is possible to perform many of these string manipulation procedures by using
LoadRunner's built-in DFEs (Data Format Extensions). For details, see "Data Format Extensions
(DFEs) - Overview" on page863.
Inserting JavaScript code into a Vuser script may also be useful when client-side logic is implemented in
JavaScript. Inserting snippets of the original client-side JavaScript code into the Vuser script removes
the requirement of having to re-write the JavaScript logic into C code to be included in the Vuser script.
You can use JavaScript code in a Vuser script to execute an XMLHTTPRequest. This allows you to
generate and send HTTP or HTTPS requests using standard Javascript APIs. Such APIs include, for
example, sending asynchronous requests, assigning callbacks to handle responses, reading responses in
XML format. An XMLHTTPRequest used this way may replace a call to an action step such as web_url or
web_custom_request.
Why use JavaScript snippets?
Although it may be possible to achieve the required functionality by using C code alone, including
JavaScript in a Vuser script may be beneficial for the following reasons:
User Guide
HP LoadRunner (12.50) Page 839
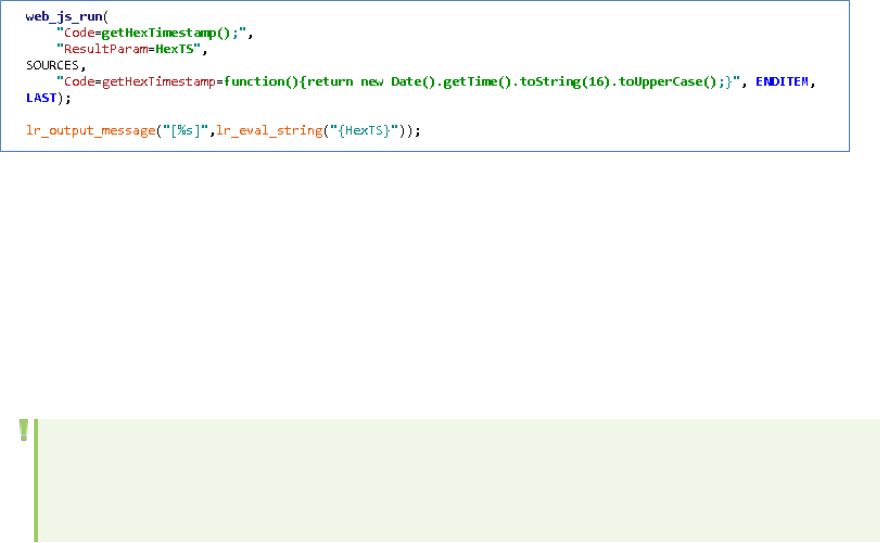
lJavaScript often offers a more intuitive, easier to implement solution than C.
lThe JavaScript regular expression library simplifies the challenge of working with regular
expressions.
lThere are numerous JavaScript libraries that assist with string manipulation.
lClient-side logic is often implemented in JavaScript. Inserting snippets of the original JavaScript code
removes the requirement of having to translate the JavaScript client logic into C code.
Can I use the JavaScript Engine in Vuser scripts of all protocols?
No, the JavaScript Engine enables you to insert JavaScript into Web - HTTP/HTML Vuser scripts only.
What are some scenarios in which the JavaScript Engine may be useful?
Including JavaScript code in a Vuser script may be useful in the following scenarios:
Scenario 1: Converting a decimal number to its hexadecimal representation
In this scenario, the response that a Vuser sends to the server must include a 13-digit timestamp in
hexadecimal format. For example, the date/time stamp "1234567891234" must be converted by the
Vuser into hex and sent as "11F71FB0922". LoadRunner does not include any standard functionality to
perform this conversion, and developing the required C code is not trivial. This problem can be resolved
by inserting the following JavaScript code into the Vuser script:
Scenario 2: Base64 encoding and decoding
The request and response messages that are sent between the client and server include data that is
encoded using a Base64 coding scheme. Because the data is encoded, it is often difficult or impossible
to parameterize or correlate the raw data. The data must be decoded before it can be parameterized
or correlated, and then re-encoded before being sent to the server. By including JavaScript snippets in a
Vuser script, you can access external JavaScript libraries that implement the required Base64 decoding
and encoding functionality.
Note: It is possible to implement Base64 decoding and encoding using LoadRunner's built-in
Base64 DFE (Data Format Extension). For details, see "Data Format Extensions (DFEs) -
Overview" on page863.
Scenario 3: URL encoding and decoding
In this scenario, the request and response messages that are sent between the client and server
include URLs that are encoded using JavaScript URL encoding. By including a JavaScript snippet in a
User Guide
HP LoadRunner (12.50) Page 840

Vuser script, you can access the JavaScript encodeURI() and decodeURI() functions that perform the
required decoding and encoding procedures.
Note: It is possible to implement URL decoding and encoding using LoadRunner's built-in URL
Encoding DFE (Data Format Extension). For details, see "Data Format Extensions (DFEs) -
Overview" on page863.
Scenario 4: Accessing objects inside JSON-formatted data
In this scenario, the request and response messages that are sent between the client and server
include data in JSONformat. To access objects inside the JSONformatted data, you can include a
JavaScript snippet inside the Vuser script to access the JavaScript eval() function.
Note: It is possible to access objects inside JSON-formatted data by using LoadRunner's built-in
JSON-To-XML DFE (Data Format Extension). For details, see "Data Format Extensions (DFEs) -
Overview" on page863.
Scenario 5: Using XMLHTTPRequest
You can use JavaScript code in a Vuser script to execute an XMLHTTPRequest to download stock quotes
from a specified site. For an example of how to execute an XMLHTTPRequest, see "JavaScript Engine:
XMLHTTPRequest Example" on page844.
Scenario 6: Pre-existing client-side JavaScript code
To access a particular web-site, the Vuser must submit a user name and an encrypted password. The
server sends a server hash to the browser to enable the browser to generate the required encrypted
password. The code to generate the hash is complicated, and exists in JavaScript. This JavaScript code
can be included in the Vuser script, removing the requirement to re-write the JavaScript logic into C
code.
What are the LoadRunner API functions that I can use in a Vuser script to execute Javascript code?
The following LoadRunner API functions are available for including JavaScript in a Vuser script:
1. web_js_run: Runs the specified JavaScript code.
2. web_js_reset: Clears the JavaScript context.
You use the web_js_run function to include JavaScript code in a Vuser script. Using the web_js_run
function, you can either insert the required JavaScipt code into the Vuser script, or you can reference a
file that contains the required JavaScript code.
Example of inserted JavaScript code
The following is an example of how to include JavaScript code directly from the Vuser script:
User Guide
HP LoadRunner (12.50) Page 841
web_js_run(
"Code=xor((LR.getParam('buffer'), 0xFFFF));",
"ResultParam=param",
LAST);
Example of a referenced file that contains JavaScript code
The following is an example of how to include JavaScript code by calling a file that contains the
JavaScript code:
web_js_run(
"File=XMLHTTPRequest_sync_sample.js;",
"ResultParam=param",
LAST);
For details on the above functions, and examples of how they can be used, see the Function Reference
(Help > Function Reference).
Can I use JavaScript to access any "internal" LoadRunner API functions?
JavaScript in a Vuser script gives you access to a number of "internal" LoadRunner API functions that
can be called directly from a web_js_run function in the JavaScript code. These functions are used
primarily for managing parameters, but also enable you to log specified messages, record data, and run
XMLHTTPRequest.
LoadRunner API functions
API Function Description Arguments
LR.advanceParam
(parameter)
Advances the specified
parameter to the next
value in the file.
parameter. The name of the parameter to advance.
Must be a parameter of type file or unique number.
LR.setParam
(name, value)
Saves a string to a
parameter, creating the
parameter if it does not
exist.
name. The name of the parameter in which to save
the value.
value. The value.
LR.freeParam
(name)
Deletes a dynamic
parameter at runtime,
freeing its buffer.
name. The parameter name.
LR.getParam
(name)
Returns the value of the
specified parameter.
name. The parameter name.
LR.log(text, level) Logs a message. text. The message.
User Guide
HP LoadRunner (12.50) Page 842
API Function Description Arguments
level. One of the following:
l"Error"
l"Warning"
l"Standard"
l"Extended"
l"Status"
example: LR.log("text", "Error");
LR.userDataPoint
(name, value)
Records a user-defined
data point for analysis.
name. The name of the data point. Do not begin a
data-point name with any of these strings: HTTP,
NON_HTTP, RETRY, mic_, stream_, mms_
value. The numeric value.
How do I enable the LoadRunner Javascript Engine?
To run JavaScript from within a Vuser script, you must enable the JavaScript engine for the Vuser script.
To enable the JavaScript engine, open the Replay > Runtime Settings > Internet Protocol >
Preferences view. Go to the JavaScript section and select the Enable running JavaScript code option.
Note: Enabling this option causes the creation of a JavaScript Runtime Engine, even if there are
no JavaScript steps in the script.
How do I configure the LoadRunner JavaScript Engine?
You use the Vuser script's runtime settings to configure the LoadRunner JavaScript Engine.
To access the JavaScript Engine (JSE) runtime settings, select Replay > Runtime Settings > Internet
Protocol > Preferences, and expand the JavaScript section.
lJavaScript Engine runtime size: Specifies the size of the allocated JavaScript Engine Runtime
memory, in kilobytes. This value may need to be increased when running a large number of Vusers.
lJavaScript Engine stack size per-thread: Specifies the size of each Vuser thread in the JavaScript
Engine memory, in kilobytes. This value may need to be increased for large objects or deep stack
calls.
For user interface details, see " Preferences View - Internet Protocol" on page288.
What is the connection between the JavaScript Engine and LoadRunner's JavaScript Protocol?
There is no connection between the LoadRunner JavaScript Engine and the LoadRunner JavaScript
Protocol.
Troubleshooting
User Guide
HP LoadRunner (12.50) Page 843
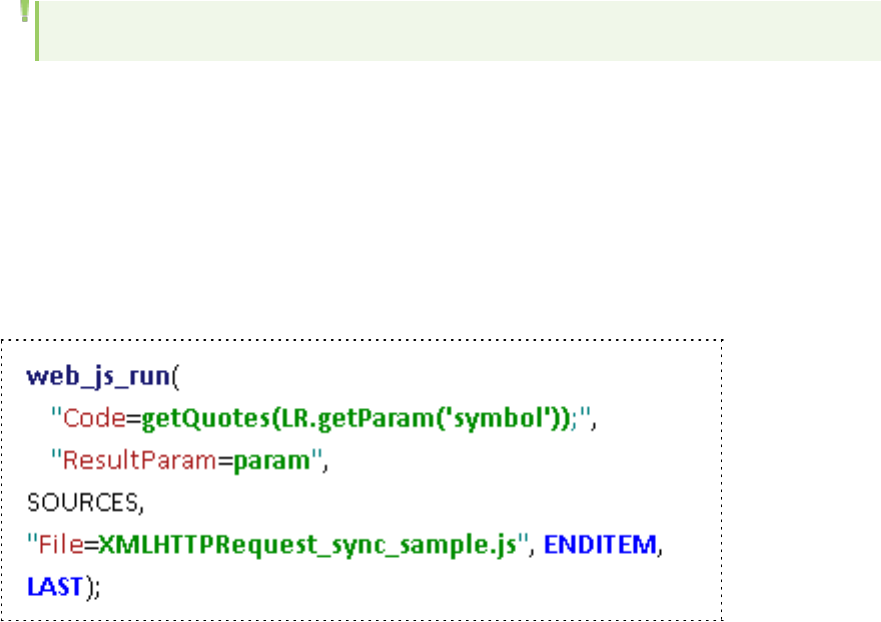
If you encounter difficulties when implementing JavaScript Engine support, review the items below for
possible solutions.
1. Make sure that the LoadRunner JavaScript Engine is enabled. For details, see How do I enable the
JavaScript Engine?
2. Javascript limits you to adding up to 9,000 operands in one function. For example, if you are
combining strings, "str1"+"str2"+"str3"+..."str9000", you can only add up to 9,000 strings.
3. Memory issues
lIf the Simulate a new user on each iteration > Clear cash on each iterationruntime setting is
selected, web_js_reset is called automatically at the start of each iteration.
lIf Simulate a new user on each iteration > Clear cash on each iteration is not set, avoid
excessive memory consumption by inserting web_js_reset calls in your Vuser script at points
where you no longer need the saved context.
For details on the web_js_reset function, see the Function Reference (Help > Function Reference).
For details on the runtime settings, see the hints below the option in the runtime settings view.
4. Performance issues
If you are experiencing performance issues, modify the JavaScript runtime settings. For details,
see " Preferences View - Internet Protocol" on page288.
JavaScript Engine: XMLHTTPRequest Example
Note: This topic applies to Web - HTTP/HTML Vuser scripts written in C only.
The LoadRunner JavaScript Engine enables you to include JavaScript code in a Vuser script. For details
on the JavaScript Engine, see "Using the VuGen JavaScript Engine" on page839.
The example below shows how you can use a JavaScript XMLHTTPRequest object in a Web(HTTP/HTML)
Vuser script. In this example, the XMLHTTPRequest object enables the Vuser to download a stock quote
from finance.example.com, and then to save the value to a parameter for future use.
The script section below shows a web_js_run function that has been inserted into a Vuser script. The
web_js_run function includes a reference to a file called XMLHTTPRequest_sync_sample.js. This file
contains the JavaScript code that executes the XMLHTTPRequest function.
User Guide
HP LoadRunner (12.50) Page 844
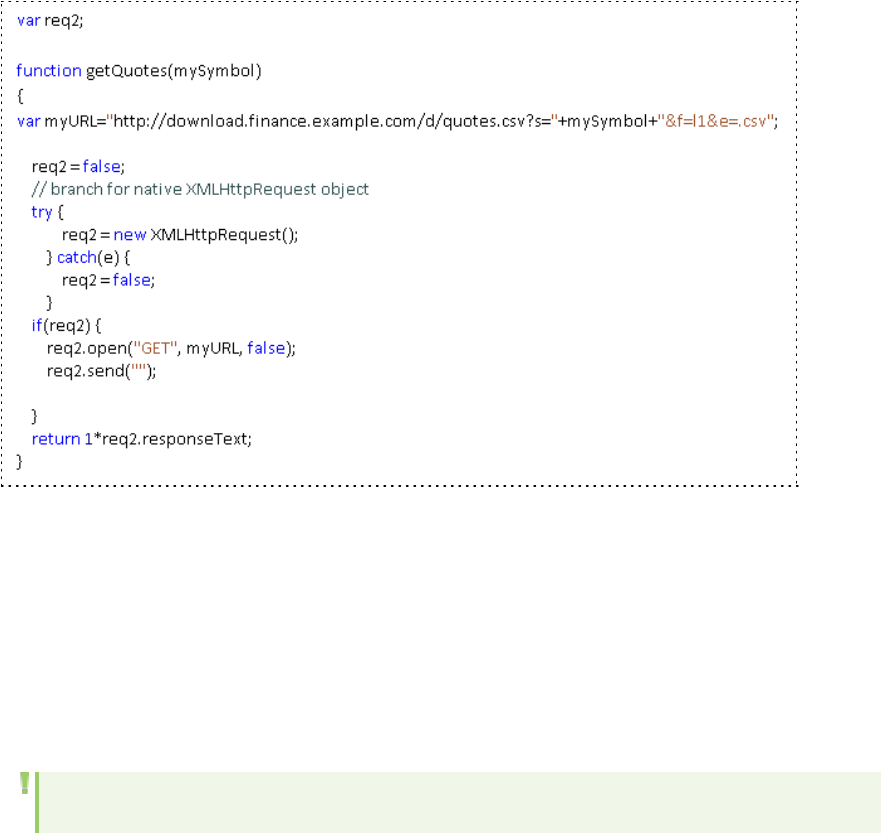
The contents of the XMLHTTPRequest_sync_sample.js file are shown below.
lFor additional examples of code used with the JavaScript Engine, see the Function Reference (Help >
Function Reference).
lFor information about the XMLHTTPRequest object, see http://www.w3schools.com/ajax/ajax_
xmlhttprequest_send.asp.
How to Convert a Web - HTTP/HTML Vuser Script into a Java
Vuser Script
Note: This topic applies to Web - HTTP/HTML and Java Vuser scripts only.
VuGen provides a utility that enables you to convert a Web - HTTP/HTML Vuser script into a Java Vuser
script. This also allows you to create a hybrid Vuser script for both Web and Java.
How to convert a Web - HTTP/HTML Vuser script into a Java Vuser script
1. Create an empty Java Vuser script and save it.
2. Create an empty Web (HTML/HTTP) Vuser script and save it.
3. Record a session into the Web (HTML/HTTP) Vuser script.
4. Replay the Web (HTML/HTTP) Vuser script. When it replays correctly, cut and paste the entire script
into a text editor and save it as a text file (.txt).
In the text file, modify any parameter braces from the Web type, "{ }" to the Java type, "< >".
5. Open a DOS command window and go to the <LoadRunner Installation> / dat folder.
6. Type the following command:
User Guide
HP LoadRunner (12.50) Page 845

<LoadRunner_Installation Folder>\bin\sed -f web_to_java.sed filename >
outputfilename
where filename is the full path and filename of the text file you saved earlier, and outputfilename
is the full path and filename of the output file.
7. Open the output file, and copy its contents into your Java Vuser script action section at the desired
location.
If you are pasting the contents into an empty custom Java template (Java Vuser type), modify the
line containing public int action() as follows:
public int action() throws Throwable
This change is done automatically for recorded Java users (RMI and CORBA).
8. Parameterize and correlate the Vuser script as you would with an ordinary Java script, and run the
script.
How to Create a Script for a REST API
In recent years, Representational State Transfer (REST) has become a popular model for software
architecture, especially for Web-based applications. Today, most large websites such as Twitter, Google,
Flickr, and so forth, use REST APIs. Using LoadRunner’s web_custom_request function, you can create a
load test script for a REST API.
A REST API call consists of the following components:
lUniform Resource Identifier (URI). A string comprised of the host, the path of the functional
component, and the Query string, with key-value pairs. For example
http://www.shopping.hp.com/en_US/home-office/-
/products/Tablets/Tablets?SearchParameter=ElitePad:
lAction. The action to perform, such a GET, POST, PUT, DELETE, and PATCH.
lData. The data to send to the server, usually in JSON format.
All of these components are included as parameters of a web_cutom_request function.
This tasks describes how to create script steps for a Web - HTTP/HTML script that calls a REST API.
1. Create a Web (HTTP/HTML ) Vuser script. For details see, "Creating Vuser Scripts - Overview" on
page127.
2. Record the REST API application. Perform typical business processes in your application.
3. After you finish recording, add new web_custom_request calls using the following format:
web_custom_request("<step_name>",
"URL=<URI of the REST API>",
"Method=<action>",
"Resource=0",
"EncType=application/json",
User Guide
HP LoadRunner (12.50) Page 846
"Mode=HTTP",
"Body=<body text in JSON format>,
LAST);
4. If you want to reference a file with the JSON data instead of entering the actual text, follow these
steps:
a. In the Solution Explorer, right-click the Extra Files node and select Add Files to Script to add
the .json data file.
b. Replace the Body argument with BodyFilePath=<file_name.json>.
c. Allow JSON files. Select Tools > Options > Scripting > Script Management and add .json to the
Allowed Extensions list.
Examples
The following example shows a REST API function that updates values using a PUT action:
web_custom_request("Update My App",
"URL=http://localhost:3000/MyRESTAPI/3",
"Method=PUT",
"Resource=0",
"EncType=application/json",
"Mode=HTTP",
"Body={\"id\":3,
\"isFinished\":false,\"MyText\":\"Updated name\"}",
LAST);
The next example shows a REST API function that updates values using a POST action, using data from a
file:
web_custom_request("Update My App",
"URL=http://localhost:3000/MyRESTAPI/3",
"Method=POST",
"Resource=0",
"EncType=application/json",
"Mode=HTTP",
"BodyFilePath=data.json",
LAST);
How to Record the SPDY Protocol
SPDY is an open networking protocol for transporting web content. The goal of SPDY is to reduce web
page load time. The transport is SSL (HTTPS). SPDY does not replace HTTP rather, it modifies the way
HTTP requests and responses are sent.
This tasks describes how to record a Web - HTTP/HTML script that uses the SPDY protocol.
User Guide
HP LoadRunner (12.50) Page 847
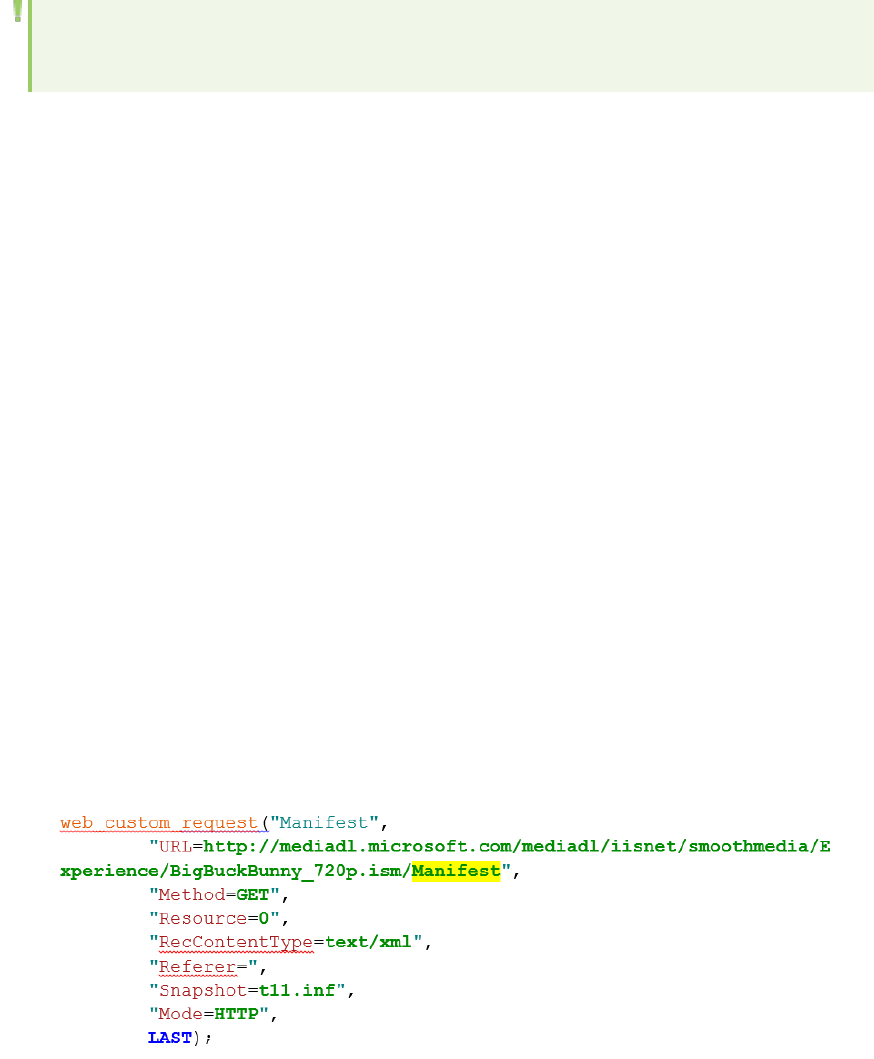
Note: SPDY scripts do not fully support HTML parsing, snapshots, the Design Studio
(correlations), or parameterization.
1. Create a Web (HTTP/HTML ) Vuser script. For details see, "Creating Vuser Scripts - Overview" on
page127.
2. Select Recording Options > Network > Port Mapping > Options > TLS NPN to enable the recording
of the SPDY protocol.
3. Click the Start Record button. In the Start Recording dialog box, select a browser. Note: If you are
recording on Chrome, make sure all other instances of Chrome are closed before you begin the
recording.
4. Start recording and perform typical business processes on your application.
How to Record Applications Using Smooth Streaming
This task explains how to record applications that use Smooth Streaming.
What is Smooth Streaming?
Smooth Streaming is an Internet Information Services (IIS) Media Services extension which provides
streaming of high-quality video to clients over HTTP. Smooth Streaming adapts the stream rate and
quality by monitoring the local bandwidth and video playback performance of the client while traditional
streaming delivers the content at a fixed rate and quality.
How to prepare a script for load testing for applications that use Smooth Streaming:
1. Create a Web (HTTP/HTML ) Vuser script. For details see, "Creating Vuser Scripts - Overview" on
page127.
2. Look for the “Manifest” request at the start of the streaming communication:
3. Following the “Manifest” request, you should find a number of streaming requests:
User Guide
HP LoadRunner (12.50) Page 848
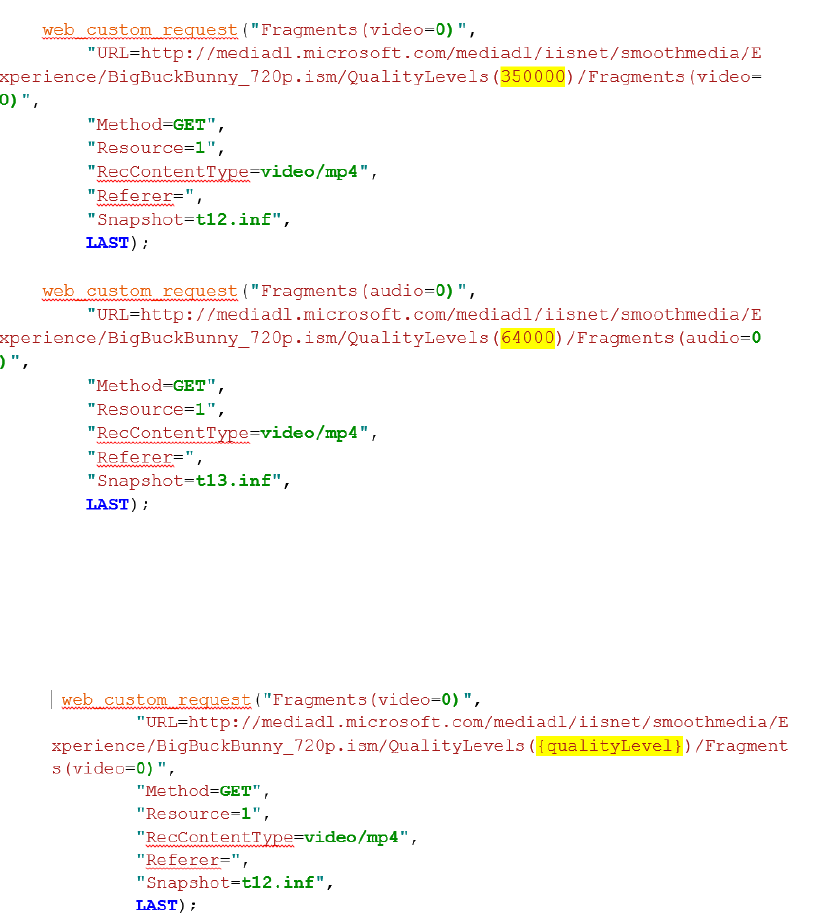
Create and configure parameters to emulate different bandwidths than the ones that were
recorded.
For example:
a. In the streaming request, replace QualityLevel with a parameter named 'qualityLevel'.
b. Configure the 'qualitylevel' values that will be used during each iteration of the load test in the
"Parameter Properties Dialog Box" on page358.
4. Replay the script and verify that the size of the response from each request corresponds to the
value of the parameter that was sent.
Convert a TruClient Script to a Web HTTP/HTML Script
Combine the advantage of fast script development and the advantage of running many Vusers by
converting a TruClient script to a Web HTTP/HTML script.
User Guide
HP LoadRunner (12.50) Page 849

Note:
You will need to have an understanding of the Web HTTP/HTML protocol to successfully replay
the script.
During the conversion, comments and APIs are added to the Web HTTP/HTML protocol script
that document the conversion process.
1. Create a TruClient script. For details, see How to Develop TruClient Scripts
2. Save the script and close the TruClient Side Bar.
3. From VuGen toolbar, click the button to convert the script.
4. After the script is generated, review the script, keeping in mind that the Web HTTP/HTML protocol
records on the transport level. For example, you may need to address correlation or parameter
issues in your converted script. For details, see "Web - HTTP/HTML Protocol - Overview" on
page834.
When you add a converted script to a scenario, LoadRunner offers to create a new Vuser group for the
script, provided that the original TruClient script is in the specified path. Having a separate group, allows
you to view its results separately.
Watch a video
Limitations
Conversion of TruClient scripts to Web HTTP/HTML scripts does not support converting steps that call
127.0.0.1 (localhost) address.
Troubleshooting and Limitations - Web - HTTP/HTML Protocol
This section describes troubleshooting and limitations for the Web - HTTP/HTML protocol.
lCertain POST requests may require HTTP headers which are not automatically generated in the
recorded script. To add headers, use the web_add_header API function. For details, see the Online
Function Reference.
lPort mapping configurations is not supported in the Proxy Recording mode.
lVuGen cannot get a client certificate from Internet Explorer 10 while recording a session.
Workaround: Provide a client certificate in the port mapping settings.
lWhen strong private key protection is set on a certificate and the WinInet mode is used during the
replay, you may be required to manually enter authentication details when replaying the script.
lIn previous versions of LoadRunner, the C type "char" was considered a "signed char". In LoadRunner
11.50 and later, it is considered as an "unsigned char". If you used "char" without specifying whether
it is signed or unsigned, and performed arithmetic operations on this variable, the results may be
different when comparing current results with those from previous versions of LoadRunner.
User Guide
HP LoadRunner (12.50) Page 850

Web Protocols (Generic)
The Web Protocols section includes information that is generic to all Web Vuser protocols. For
information that is specific to a given Web Vuser protocol, see the documentation for that specific
protocol.
Web Protocols - Overview
Note: This topic applies to Web Vuser protocols only. For a list of Web Vuser protocols, see "Web
Vuser Types" on the next page.
You use VuGen to develop Web Vuser scripts. While you navigate through a site performing typical user
activities, VuGen records your actions and generates a Vuser script. When you run the script, the
resulting Vuser emulates a user accessing the Internet.
Suppose you have a web site that displays product information for your company. The site is accessed
by customers and potential customers. You want to make sure that the response time for any customer
query is less than a specified value (for example, 20 seconds)—even when many users (for example,
200) access the site simultaneously. You use Vusers to emulate this scenario, where the web server
services simultaneous requests for information. Each Vuser could do the following:
lLoad the home page
lNavigate to the page containing the product information
lSubmit a query
lWait for a response from the server
You can distribute several hundred Vusers among the available testing machines, each Vuser accessing
the server by using its API. This enables you to measure the performance of the server under the load of
many Vusers.
For more details about Web Vuser scripts, see "Web Vuser Technology" below.
Web Vuser Technology
Note: This topic applies to Web Vuser protocols only. For a list of Web Vuser protocols, see "Web
Vuser Types" on the next page.
VuGen creates Web Vuser scripts by monitoring and recording the web traffic that flows between a web
browser and a web server while you perform typical business processes. The web traffic includes HTTP
requests sent by the browser to the server, and the HTTP responses returned by the server.
User Guide
HP LoadRunner (12.50) Page 851
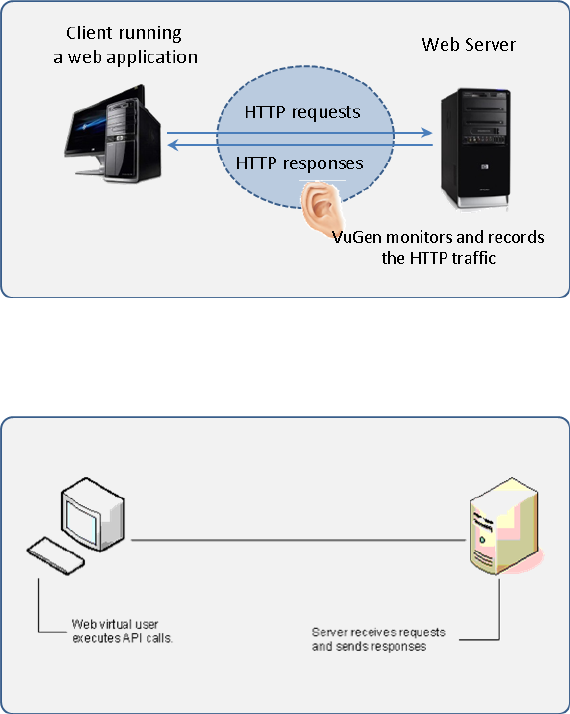
When you run a Web Vuser script, the resulting Vuser communicates directly with the web server
without relying on a browser or client software. To perform this communication, the Vuser script sends
web API functions directly to the web server.
Web Vuser Types
LoadRunner enables you to build and run web-based Vuser scripts using a variety of Web Vuser
protocols. Following is a list of LoadRunner's Web Vuser protocols:
lAjax (Click & Script)
lFlex
lJava over HTTP
lOracle - Web Applications
lSAP (Click & Script)
lSAP – Web
lSiebel – Web
lSilverlight
lTruClient - Firefox, TruClient - IE, TruClient - Mobile Web
lWeb - HTTP/HTML
User Guide
HP LoadRunner (12.50) Page 852
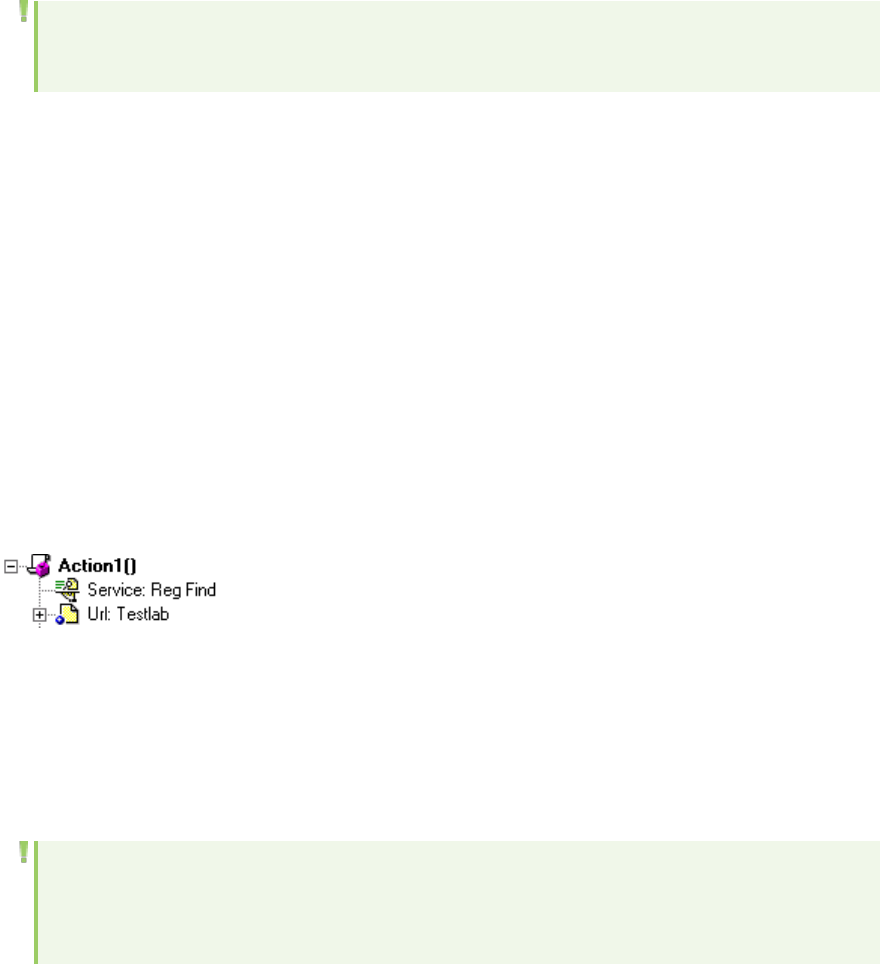
Text and Image Verification (Web Vuser Scripts) - Overview
Note: This topic applies to Web Vuser protocols only. For a list of Web Vuser protocols, see "Web
Vuser Types" on the previous page.
VuGen enables you to add checks to your Web Vuser scripts. A check verifies the presence of a specific
object in a Web page. The object can be either a text string or an image.
Checks enable you to determine whether or not your Web site is functioning correctly while it is being
accessed by many Vusers—that is, does the server return the correct Web pages? This is particularly
important while your site is under the load of many users, a period when the server is more likely to
return incorrect pages.
For example, assume that your Web site displays information on the temperatures in major cities
around the world. You use VuGen to create a Vuser script that accesses your Web site.
The Vuser accesses the site and executes a text check on this web page. For example, if the word
Temperature appears on the page, the check passes. If Temperature does not appear because, for
example, the correct page was not returned by the server, the check fails. Note that the text check step
appears before the URL step. This is because VuGen registers, or prepares in advance, the search
information relevant for the next step. When you run the Vuser script, VuGen conducts the check on the
web page that follows.
Although the server may display the correct page when you record the script and when a single Vuser
executes the script, it is possible that the correct page will not be returned when the server is under the
load of many Vusers. The server may then be overloaded and may therefore return meaningless or
incorrect HTML code. Alternatively, in some instances when a server is overloaded, the server returns a
500 Server Error page. In both of these cases, you can insert a check to determine whether or not the
correct page is returned by the server.
Note: Checks increase the work of a Vuser, and therefore you may be able to run fewer Vusers
per load generator. You should use checks only where experience has shown that the server
sometimes returns an incorrect page.
lFor more details, see "Understanding Web Text Check Functions" on the next page.
lFor details on how to add a text check or an image check, see "How to Add Text Checks and Image
Checks (Web Vuser Protocols)" on page855.
User Guide
HP LoadRunner (12.50) Page 853
Understanding Web Text Check Functions
Note: This topic applies to Web Vuser protocols only. For a list of Web Vuser protocols, see "Web
Vuser Types" on page852.
When you add a text check to a Web Vuser script, VuGen adds a web_reg_find function to the script.
This function registers a search for a text string in an HTML page. Registration means that the Vuser
does not execute the search immediately—rather the Vuser performs the check only after executing
the next Action function, such as web_url.
Note: If you are working with a concurrent functions group, the web_reg_find function is
executed only at the end of the grouping.
In the following example, the web_reg_find function searches for the text string "Welcome". If the
string is not found, the next action function fails and the script execution stops.
web_reg_find("Text=Welcome", "Fail=Found", LAST);
web_url("Step", "URL=...", LAST);
In addition to the web_reg_find function, you can use other functions to search for text within an HTML
page:
Several additional functions can be used for searching for text:
lweb_find
lweb_global_verification
The web_find function, primarily used for backward compatibility, differs from the web_reg_find
function in that web_find is limited to HTML-based scripts (see Recording Options > Recording tab). It
also has less attributes, such as instance, allowing you to determine the number of times the text
appeared. When performing a standard text search, web_reg_find is the preferred function.
The web_global_verification function allows you to search the data of an entire business process. In
contrast to web_reg_find, which only applies to the next Action function, this function applies to all
subsequent Action functions such web_url. By default, the scope of the search is NORESOURCE,
searching only the HTML body, excluding headers and resources.
The web_global_verification function is ideal for detecting application level errors that are not
included the HTTP status codes. This function is not limited to an HTML-Based script (see Recording
Options > Recording tab).
User Guide
HP LoadRunner (12.50) Page 854
How to Add Text Checks and Image Checks (Web Vuser Protocols)
Note: This topic applies to Web Vuser protocols only. For a list of Web Vuser protocols, see "Web
Vuser Types" on page852.
There are a number of different types of checks that you can add to your Web Vuser scripts. For
background information, see "Text and Image Verification (Web Vuser Scripts) - Overview" on page853.
How to Add a Text Check While Recording
1. In the web browser, select the desired text.
2. Click the Insert Text Check button on the VuGen Recording toolbar. VuGen adds a web_reg_
find function to the script.
Note: When recording a multi-protocol script, you can only insert a text check in the Web
part of the script.
How to Add a Text Check After Recording
1. In the Snapshot pane, display a snapshot that contains the text you want to verify.
2. In the Snapshot pane toolbar, click HTTP Data to display the HTTP Data view of the snapshot.
3. In the snapshot, select the text you want to verify. The text must be located in a response section
of the snapshot - not in a request section.
4. Right-click and select Add Text Check Step from the menu.
5. Modify the options in the Find Text dialog box. For details on the dialog box options, press F1 when
in the dialog box to open the Function Reference.
6. Click OK to insert the function into the Vuser script.
How to Add Other Text Checks After Recording
1. In the script editor, locate the position where you want to insert the check.
2. Select View > Toolbox to open the Toolbox.
a. To insert a web_reg_find function, in the Toolbox, under Services, select web_reg_find.
b. To insert a web_global_verification function, in the Toolbox, under Services, select the
required web_global_verification function.
3. Drag the selected function to the required location in the Editor.
4. Enter the required details in the dialog box that opens. For details on the dialog box options, press
F1 when in the dialog box to open the Function Reference.
5. Click OK to insert the function into the Vuser script.
User Guide
HP LoadRunner (12.50) Page 855

How to Add an Image Check After Recording
1. In the Editor, locate the position where you want to insert the check.
2. Select View > Toolbox to open the Toolbox.
3. In the Toolbox, under Web Checks, select web_image_check.
4. Drag the selected web_image_check function to the required location in the Editor.
5. Enter the required details in the Image Check Properties dialog box. For details on the dialog box
options, press F1 when in the dialog box to open the Function Reference.
6. Click OK to insert the function into the Vuser script.
Web Snapshots - Overview
Note: This topic applies to Web Vuser protocols only. For a list of Web Vuser protocols, see "Web
Vuser Types" on page852.
Web Vuser scripts use VuGen's Snapshot pane.
lFor details on how to work with the Snapshot pane, see "How to Work with Snapshots" on page276.
lFor details on the Snapshot pane UI, see "Snapshot Pane" on page77.
The snapshots show detailed information about some of the steps in the Vuser script. Each snapshot
can be displayed using either the Page view or the more detailed HTTP Data view.
The HTTP Data view displays each HTTP transaction in either a tree view or a grid view. The transaction
data is broken up into response data, request data, headers, cookies, and query strings.
User Guide
HP LoadRunner (12.50) Page 856
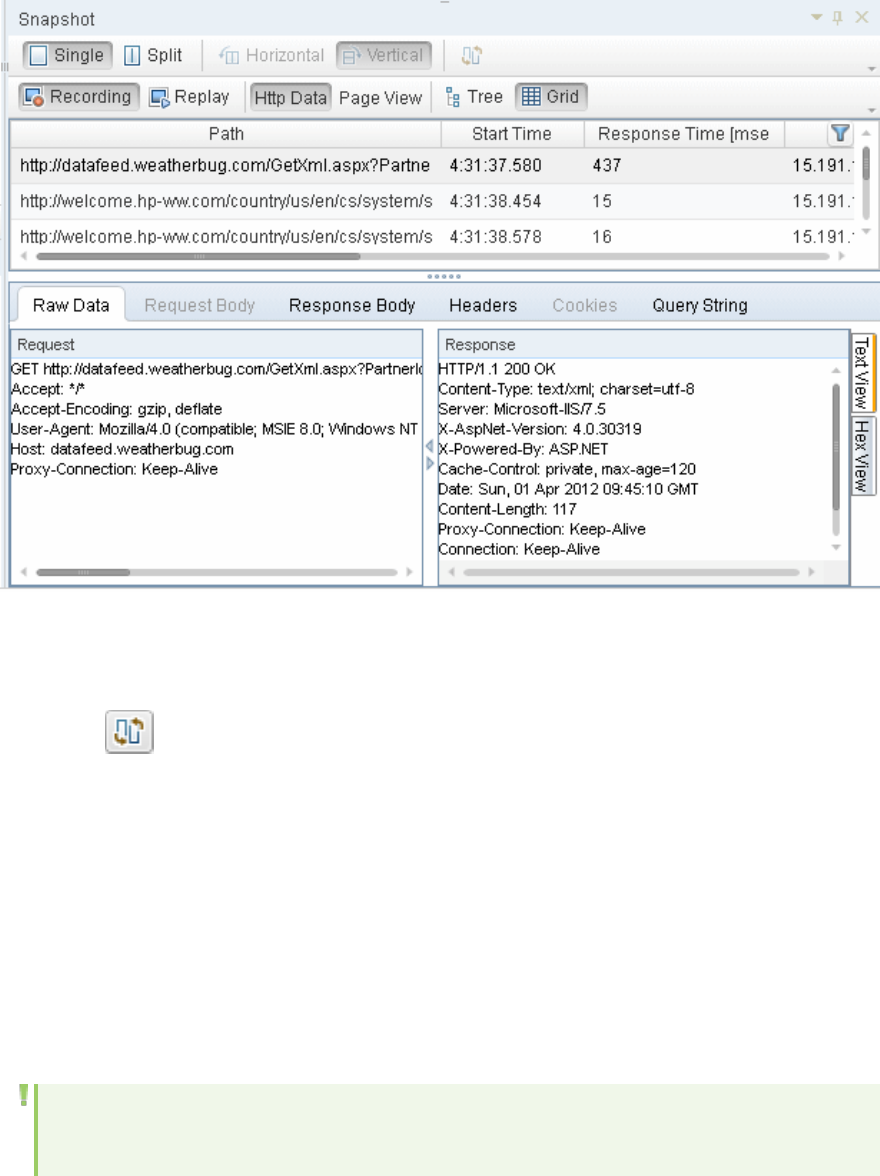
Data in the snapshots can be displayed in a number of formats: Data view, Text view, and Hex view.
You can split the Snapshot pane to display two snapshots - typically a record snapshot and the
corresponding replay snapshot. If both snapshots are displayed in the HTTP Data view, you can click the
Sync button on the Snapshot pane toolbar to synchronize the data that is displayed in the two
snapshots. For details, see "How to Work with Snapshots" on page276.
Correlations and parameters can be created on response data by selecting the desired text and right-
clicking.
For data that is difficult to work with (such as binary data), VuGen offers a variety of Data Format
Extensions that can transform certain data types into more readable formats. Data that has been
formatted by a Data Format Extension can be displayed in its original or formatted state. For more
information, see "Data Format Extensions (DFEs) - Overview" on page863.
Browser Emulation - Overview
Note: This topic applies to Web Vuser protocols only. For a list of Web Vuser protocols, see "Web
Vuser Types" on page852.
When you run a Web Vuser that accesses a web-site, the Vuser does not use an actual browser to
access the site. Instead, the Vuser emulates a browser accessing the site. To enable the emulation, the
Vuser uses a user-agent string.
User Guide
HP LoadRunner (12.50) Page 857
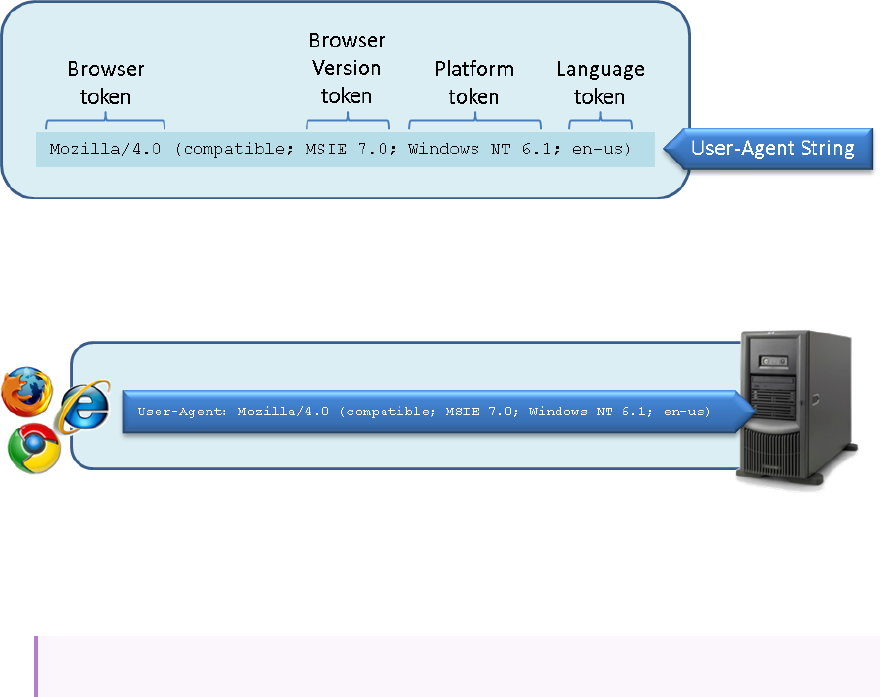
What is a User-Agent String?
When a browser sends a request to a server, the browser sends a user-agent string that identifies
itself to the server. The identifying details in the user-agent string are included in various tokens. These
tokens provide various details such as which browser is being used, the version of the browser, and the
operating system on which the browser is running.
The user-agent string is included in a User-Agent header that is part of every request that is sent by the
browser to the server. Servers can use the information that is contained in the user-agent string to
provide content that is tailored for the specific browser.
Below is an example of a User-Agent header that contains a user-agent string that is sent to a server. In
this example, the user-agent string identifies the browser as Internet Explorer 7.0, running under
Windows 7.
User-Agent: Mozilla/4.0 (compatible; MSIE 7.0; Windows NT 6.1)
Emulating a specific browser
When you run a Web Vuser that accesses a web-site, the Vuser emulates a browser accessing the site.
To enable the emulation, the Vuser creates a user-agent string that includes various tokens.
lThe Browser and Version tokens define the browser to emulate and the version of the emulated
browser.
lThe Platform token defines the operating system on which the emulated browser is running.
lThe Language token defines the language for which the emulated browser is localized.
The user-agent string is included in a User-Agent header in every request that the Vuser sends to the
server that hosts the web-site.
What information is included in Web Vuser's user-agent string?
User Guide
HP LoadRunner (12.50) Page 858

1. When a Vuser script is first created, the browser in the user-agent string is Internet Explorer 6, and
the operating system is Windows.
2. After the code in a Vuser script is generated, the browser in the user-agent string is changed to
the browser that was used when the script was recorded, and the operating system is changed to
the operating system that was used when the script was recorded.
After the code in a Vuser script is generated, you can use the Vuser script's runtime settings to specify
an emulated browser that is different from the browser that was used when the script was recorded.
There are scenarios in which this enables you to more accurately emulate the real-world situation.
When you specify the emulated browser, you can specify the browser type and version, the platform on
which the Vuser runs, and the language for which the browser is localized. VuGen creates a user-agent
string that includes the details that you specify. If required, you can edit the user-agent string to create
a customized user-agent string.
Specifying a specific browser to emulate
To specify an emulated browser that is different from the browser that was used when the script was
recorded:
1. Open the Vuser script.
2. Click Replay > Runtime Settings.
3. In the runtime settings dialog box, click Browser > Browser Emulation, and then select Use
Browser.
4. Select from the lists of available options to specify the browser to emulate.
Note: The User-Agent String that is displayed is updated after each selection that you
make.
Customizing the user-agent string
You can customize the user-agent string as follows:
1. Open the Vuser script.
2. Click Replay > Runtime Settings.
3. In the runtime settings dialog box, click Browser > Browser Emulation, and then select Use
Custom.
4. Modify the user-agent string as required.
Maximum number of concurrent connections
When a browser accesses a web-site, the browser maintains a number of concurrent connections with
the web server that hosts the web-site. Therefore, when you access a web page that contains many
different objects, such as images, Javascript files, frames, data feeds etc, the browser may try to
improve performance by downloading several of the objects simultaneously. The maximum number of
concurrent connections is dependent on the browser type, and the version of the browser. For example,
User Guide
HP LoadRunner (12.50) Page 859
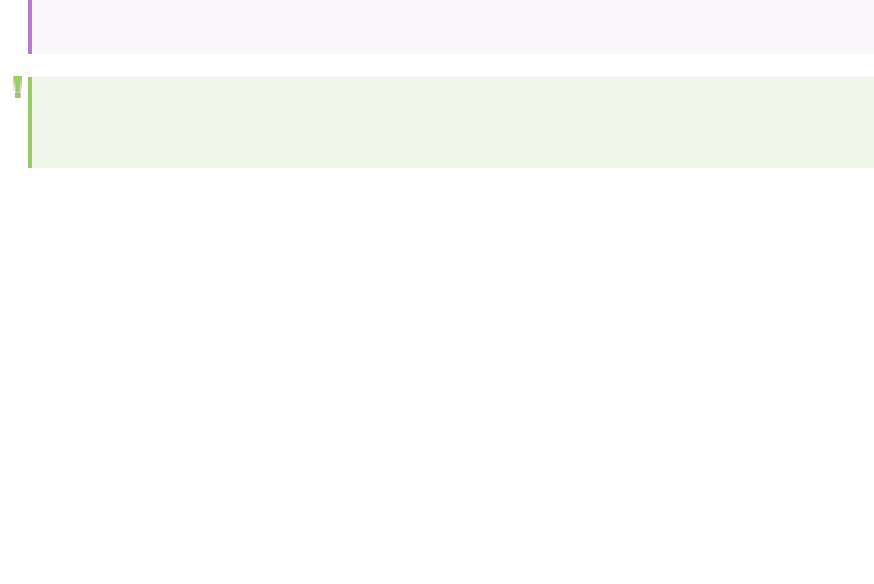
Internet Explorer 6 limits the number of concurrent connections to 2; Internet Explorer 8 and Firefox 3+
limit the number of concurrent connections to 6.
Defining the maximum number of concurrent connections for a Vuser
When you run a Web Vuser, by default, the maximum number of concurrent connections that the Vuser
can maintain with a web-server is defined by the browser that is specified in the Vuser script's user-
agent string. However, you can use the MAX_CONNECTIONS_PER_HOST option in the web_set_sockets_
option function to override the default value. For details, see the Function Reference (Help > Function
reference).
The following example sets the maximum number of concurrent connections to 10:
web_set_sockets_option("MAX_CONNECTIONS_PER_HOST", "10");
Note: When you run a Web Vuser script, the maximum number of concurrent connections that
the Vuser can maintain with the server appears in the Replay log.
How to Perform Load Testing with nCipher HSM
This task describes how to set up a a script to load test an environment with an nCipher HSM (Hardware
Security Module).
1. Prerequisite
Generate the client certificate file (client_cert.pem) with the private key (client_key.pem) pointing
to the private keys stored in the HSM. Make sure that you can connect to your Web server (A.com)
with a generated CA file (ca-certs.pem). The successful Openssl command should have the
following form:
openssl s_client –connect A.com:443 –CAfile ca-certs.pem –cert client_cert.pem –certform
PEM –key client_key.pem – keyform PEM –engine CHIL
2. Set up the PATH environment variable
Add the nfhwcrhk.dll file, usually located in c:\Program Files (x86)\nCipher\nfast\toolkits\hwcrhk,
to the PATH environment variable. Restart VuGen in order for the change to take affect.
3. Enable nCipher key retrieval
In the runtime settings, go to the Internet Protocol > Preferences view and expand the
Authentication section. Select the Enable retrieving keys from nCipher HSM option. For details,
see Preferences View - Internet Protocol.
4. Edit the Vuser script
Add the following content to the vuser_init section of your Vuser script.
User Guide
HP LoadRunner (12.50) Page 860

web_set_sockets_option(SSL_VERSION, "TLS");
web_set_sockets_option(DEFAULT_VERIFY_PATH, <full_path>\ca-certs.pem);
web_set_certificate_ex (
"CertFilePath=<full_path_to_client_cert_file>/client_cert.pem",
"CertFormat=PEM",
"KeyFilePath= <full_path_to_client_private_key_file> /client_key.pem",
"KeyFormat=PEM",
LAST);
Working with Cache Data
Note: This topic applies to Web Vuser protocols only. For a list of Web Vuser protocols, see "Web
Vuser Types" on page852.
Web browsers maintain a cache of objects that have been downloaded by the browser. When accessing
a website, if any of these objects are required, the browser may use the objects directly from the cache,
and not have to download the objects again. This enables the required pages to be loaded quicker.
When you run a Vuser script, by default, the Vuser starts with an empty cache. This implies that the
Vuser must download each object the first time that the object is required. To better emulate a real-
world situation, you can provide the Vuser with a pre-defined cache at any stage while the Vuser is
running. The Vuser can then access required objects directly from the cache, without having to
download them. To provide a Vuser with a pre-defined cache, first you create a file that contains the
cache, and then you load the cache into the Vuser. You use the web_dump_cache function to create the
cache file, and the web_load_cache function to load the cache file into the Vuser.
lFor details on the cache functions, see the Function Reference (Help > Function Reference).
lFor details on how to implement the cache functions, see "How to Insert Caching Functions" on
page863.
Creating the cache file
You use the web_dump_cache function to create a cache file. The web_dump_cache function creates a
file that contains all the objects that exist in the Vuser cache when the web_dump_cache function is
executed. Insert the web_dump_cache function into a Vuser script, typically towards the end of the
User Guide
HP LoadRunner (12.50) Page 861

Action section of the script. This will ensure that the Vuser cache contains the required objects when the
web_dump_cache function is run to create the cache file. After inserting the web_dump_cache
function, run the script to build the Vuser cache and create the cache file.
Note: You need to run the web_dump_cache function only once to generate the required cache
file. Typically, this run is not part of a scenario. After the cache file has been created, when you
run the Vuser script as part of a scenario, there is no need to execute the web_dump_cache
function. Therefore you should comment-out the web_dump_cache function in the Vuser script.
You use the FileName argument in the web_dump_cache function to specify the name and location of
the file to create. The FileName path can be either absolute (e.g. "FileName=c:\\MyDir\\User1.cache") or
relative to the current Vuser directory (e.g. "FileName=Iteration1.cache").
lAbsolute path names: Use absolute path names if you do not want the cache file to be linked to the
script. For example, if you wish to use a different cache on each host, use an absolute path.
lRelative path names: If you use a relative path name, the cache file is created inside the Vuser
directory. When you copy the Vuser script, save it to a new location, or copy it to a load generator
host, the cache file is also copied. Relative paths are independent of drive mappings and network
locations.
The file extension of the cache file is always ".cache". The ".cache" extension is added if it is not
specified in the FileName argument. For example, if you specify "FileName=Iteration2.txt", the cache
file is called "FileName=Iteration2.txt.cache".
File names in the FileName argument can be parameterized so that different Vusers or different
iterations can use different cache files. For example, "FileName=Iteration{param}.cache"
In the following example, the web_dump_cache function creates a cache file for each VuserName
parameter running the script. The cache files are located in c:\temp.
web_dump_cache("paycheckcache","FileName=c:\\temp\\{Vuser
Name}paycheck", "Replace=yes", LAST)
If you run a single Vuser user ten times, VuGen creates ten cache files in the following format, where
the "Kunnn" prefix is the VuserName value:
Ku001paycheck.cache
Ku002paycheck.cache
Ku003paycheck.cache
...
Loading the cache file into a Vuser
The web_load_cache function loads a cache file into a Vuser. The FileName argument in the web_load_
cache function specifies the name and location of the cache file to load. The specified cache file must
exist before the web_load_cache function is executed. Therefore, you can run the web_load_cache
User Guide
HP LoadRunner (12.50) Page 862
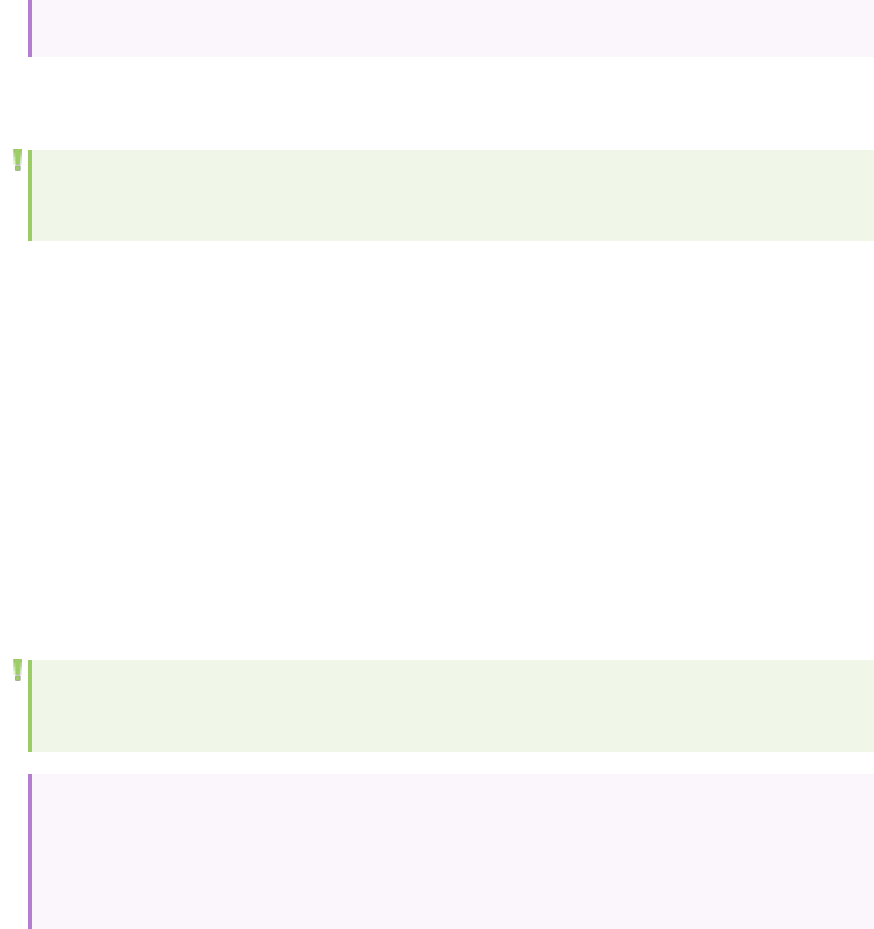
function only after running the web_dump_cache function to create the cache file.
In the following example, the web_load_cache function loads the {VuserName}paycheck cache files
from c:\temp.
web_load_cache("ActionLoad","FileName=c:\\temp\\{VuserName}paycheck",LAST)
How to Insert Caching Functions
Note: This topic applies to Web Vuser protocols only. For a list of Web Vuser protocols, see "Web
Vuser Types" on page852.
This task describes how to use caching functions. Caching functions allow you to create a cache file that
contains the Vuser cache, and then to load the cache file data into a Vuser. For more information, see
"Working with Cache Data" on page861. The following steps describe how to use the caching functions.
1. Insert the web_dump_cache function into your Vuser script.
2. Run the script to create the cache file.
3. Insert the web_load_cache function into your script - before the Vuser actions.
4. Comment-out the web_dump_cache function.
5. Run and save the script.
For details on the caching functions, see the Function Reference (Help > Function Reference).
Data Format Extensions (DFEs) - Overview
Note: This topic applies to Web - HTTP/HTML and Silverlight Vuser scripts, and to Web -
HTTP/HTML steps inside Flex Vuser scripts.
Definition: Data Format Extension support - or DFE support for short - enables easier scripting
of web applications by providing the ability to decode and encode formatted data that is
exchanged between the client and the server. This enables easier correlation and
parameterization of the generated Vuser scripts.
For details on how to implement DFEs into your Vuser scripts, see "How to Implement Data Format
Extension (DFE) Support" on page867.
In what situations are DFEs helpful?
When you record a Vuser script, VuGen records the HTTP requests and responses that are passed
between the client and the web server. The data in these HTTP requests and responses is often
User Guide
HP LoadRunner (12.50) Page 863
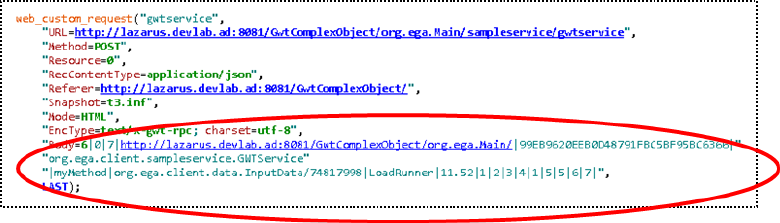
encoded. For example, some of the data may be in binary format. The encoded data may be in the HTTP
query string, headers, body, or cookies. When the encoded data is included in a Vuser script, the
resulting script will contain data that is difficult to decipher. This makes it difficult to identify text
strings that can be used for parameterization and correlation.
The script segment below shows a section of a Vuser script that was generated while recording
business processes on a GWT-based application. Notice how some sections of the script contain
encoded data and are therefore difficult to decipher.
LoadRunner uses data format extensions (DFEs) to resolve the difficulties that arise from encoded data
in Vuser scripts. DFE support allows easier creation of Vuser scripts by providing the ability to decode
the encoded data that is exchanged between the client and the server. By providing the decoded format
of the data, the information is presented in the Vuser script in a readable format that enables you to
correlate and parameterize the script as required. When the script is replayed, the DFE support re-
encodes the modified Vuser script, and enables the Vuser to send the correctly encoded request to the
server.
LoadRunner includes a number of pre-defined DFEs. Each DFE is able to decode and encode a specific
type of data. For example, the GWT DFE decodes GWT data to XML format when a script is generated,
and it encodes XML-formatted data to GWT-formatted data before the script is replayed. For a full list
of the pre-defined DFEs, see "Data Format Extension List" on page872.
When a DFE is applied to a Vuser script and the script is then regenerated, the DFE modifies the script
and replaces the encoded data with decoded data. For details on how the script is modified, see "How
DFEs Modify a Vuser Script" on page871.
When is DFE functionality applied?
You enable DFE support for each Vuser script that requires decoding of encoded data. When DFE
support is enabled, the DFE support is applied in the following circumstances:
lEach time the script is generated (after recording) or regenerated. The DFEs are applied to decode
the encoded data to produce a script that is easy to decipher.
User Guide
HP LoadRunner (12.50) Page 864
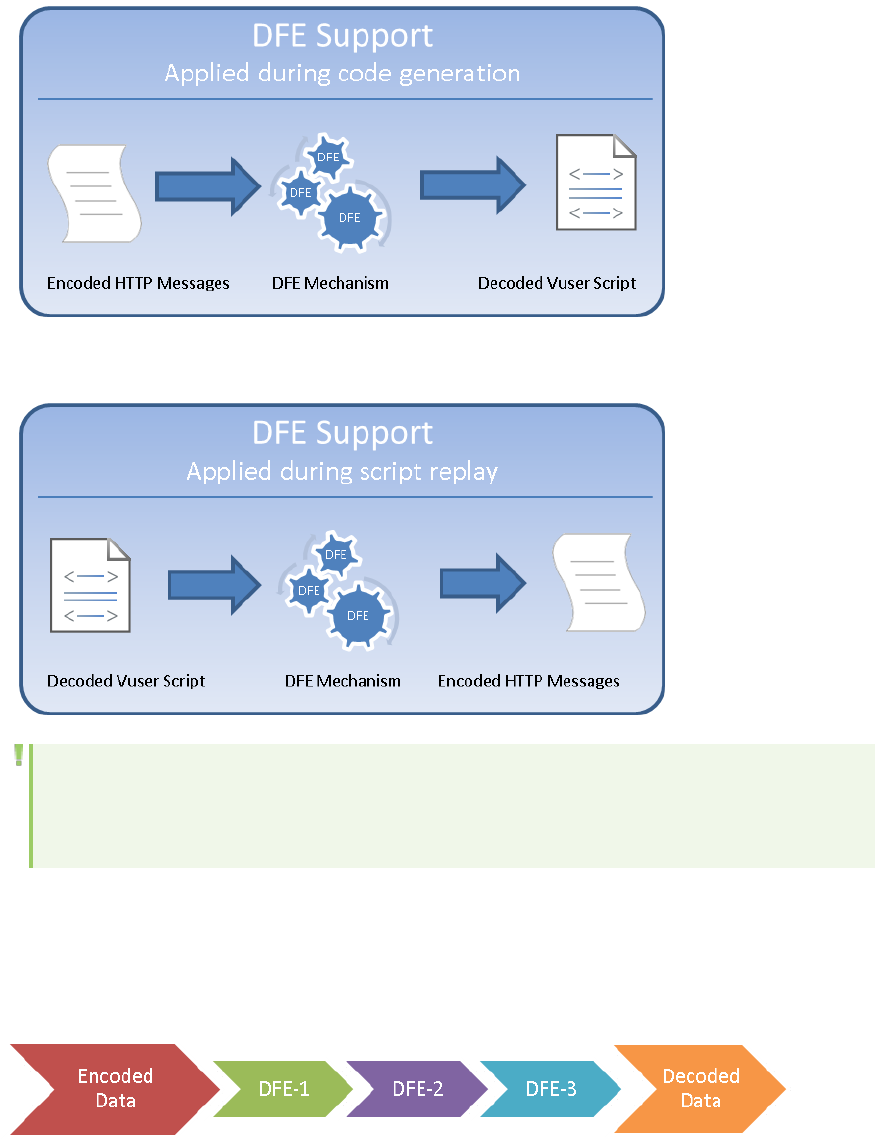
lEach time the script is run. The DFEs are applied to re-encode the decoded data to produce HTTP
messages with encoded data in a format that is expected by the server.
Note: In addition to applying DFEs when a script is generated or replayed, it is possible to apply a
DFE to a selected string in a Vuser script. For details, see "Applying DFEs to a String" on
page873.
In some scenarios, decoding of encoded data must be performed in a number of stages, until the fully
decoded data is produced. Each stage in the conversion process is performed by applying a specified
DFE. For example, encoded data from a response may be decoded by applying three DFEs - first DFE-1,
then DFE-2, and then DFE-3. In each stage, the output from one DFE is the input to the next DFE, until
the fully decoded data is produced.
DFE Chains
The series of DFEs that are required to decode encoded data is defined in a chain. For example, you
User Guide
HP LoadRunner (12.50) Page 865
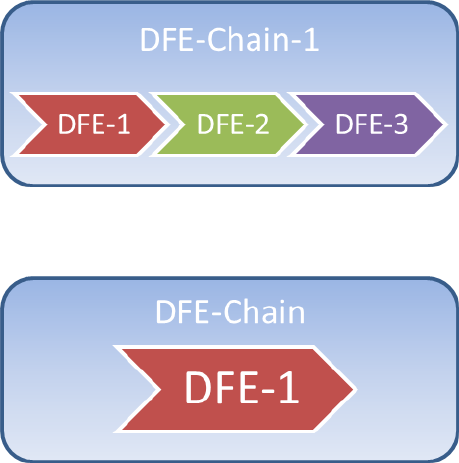
could create a chain called DFE-Chain-1 that includes three DFEs: DFE-1, DFE-2, and DFE-3. The
sequence of the DFEs inside a chain is significant - the sequence indicates the order in which the DFEs
are applied to the encoded data.
Note that if only a single DFE is required to decode encoded data, the DFE must still be included in a
chain.
Assigning DFE chains
HTTP messages can be divided into a number of sections, including a body, headers, cookies, and a
query string. After you define the DFE chains that will be applied to decode and encode a Vuser script,
you must specify to which sections of the HTTP messages the DFE chains will apply. Because each HTTP
message has only one Body section and one Query String section, you can specify only a single DFE
chain to apply to each of these sections. In contrast, each HTTP message can contain numerous headers
and cookies. Consequently, you can specify a particular DFE chain to apply to each header and cookie.
For details, see "How to Apply DFE Chains to Sections of the HTTP Message" on page870.
Replaying Vuser scripts that contain DFE functionality
When you replay a Vuser script that contains DFE functionality, various messages are added to the
Replay log in VuGen's Output pane. Make sure to check these messages to ensure that the DFE
functionality is correctly implemented. For further details, see "Troubleshooting - Data Format
Extension (DFE) " on page879.
Custom DFEs
Advanced LoadRunner users can create custom DFEs. For details, see the HP LoadRunner Data Format
Extensions Developer Guide. In addition, you can use the LoadRunner JavaScript Engine to encode and
decode data using common JavaScript libraries. For details, see "Using the VuGen JavaScript Engine" on
page839.
User Guide
HP LoadRunner (12.50) Page 866
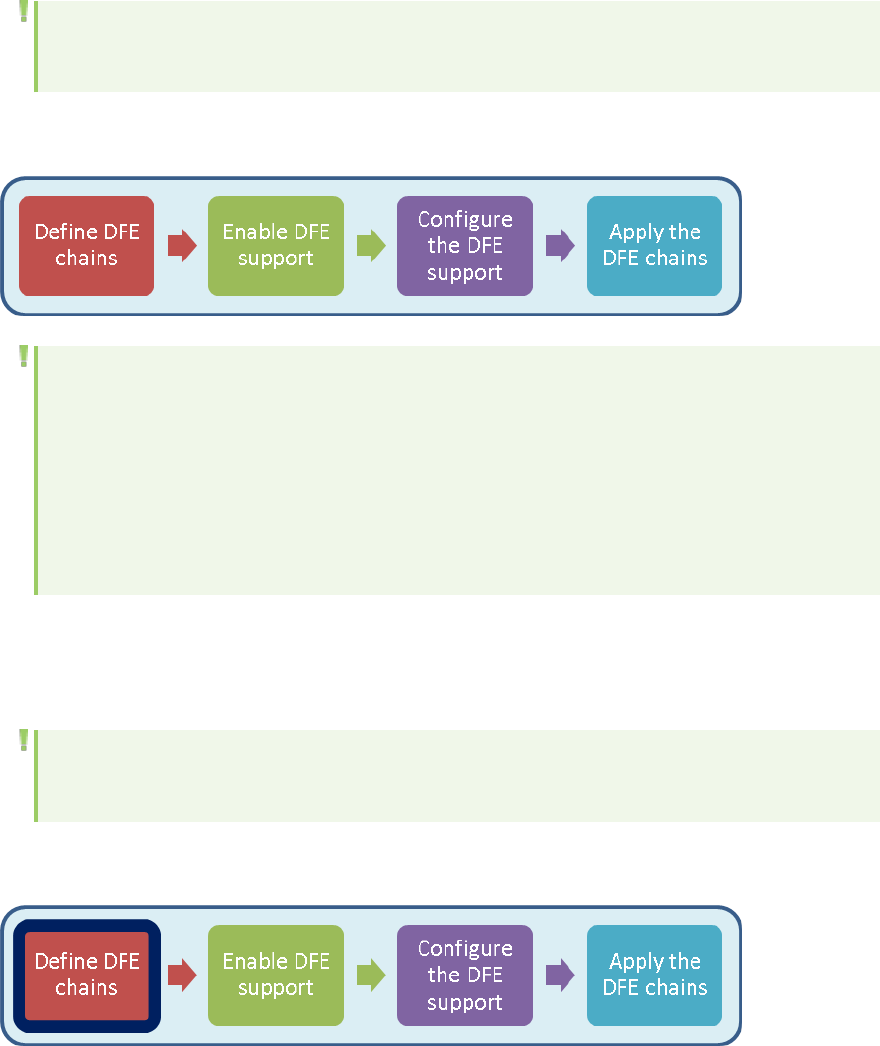
How to Implement Data Format Extension (DFE) Support
Note: This topic applies to Web - HTTP/HTML and Silverlight Vuser scripts, and to Web -
HTTP/HTML steps inside Flex Vuser scripts.
In order to implement the DFE support for a Vuser script, you must perform the steps shown in the
diagram below:
Note: You may encounter the following errors with DFE functions on 64-bit Linux environments:
Error -27040: Data Format Extension: Creating custom chain failed: Extension
"UrlEncoding" was not found.
Error -35063: The "DFEs" argument is invalid. Check that the provided
extensions have their configuration files defined.
Solution: Install the 32-bit version of keyutils-libs.so (keyutils-libs.i686) on your system, if it
does not already exist.
For additional details about DFEs, see "Data Format Extensions (DFEs) - Overview" on page863.
How to Define a Chain of DFEs
Note: This topic applies to Web - HTTP/HTML and Silverlight Vuser scripts, and to Web -
HTTP/HTML steps inside Flex Vuser scripts.
In order to implement DFE support for a Vuser script, you must first define the DFE chains that are
applied by the Vuser. Defining the DFE chains is the first step in implementing DFE support.
Defining the DFE chains includes the following tasks:
1. Adding a DFE chain
User Guide
HP LoadRunner (12.50) Page 867
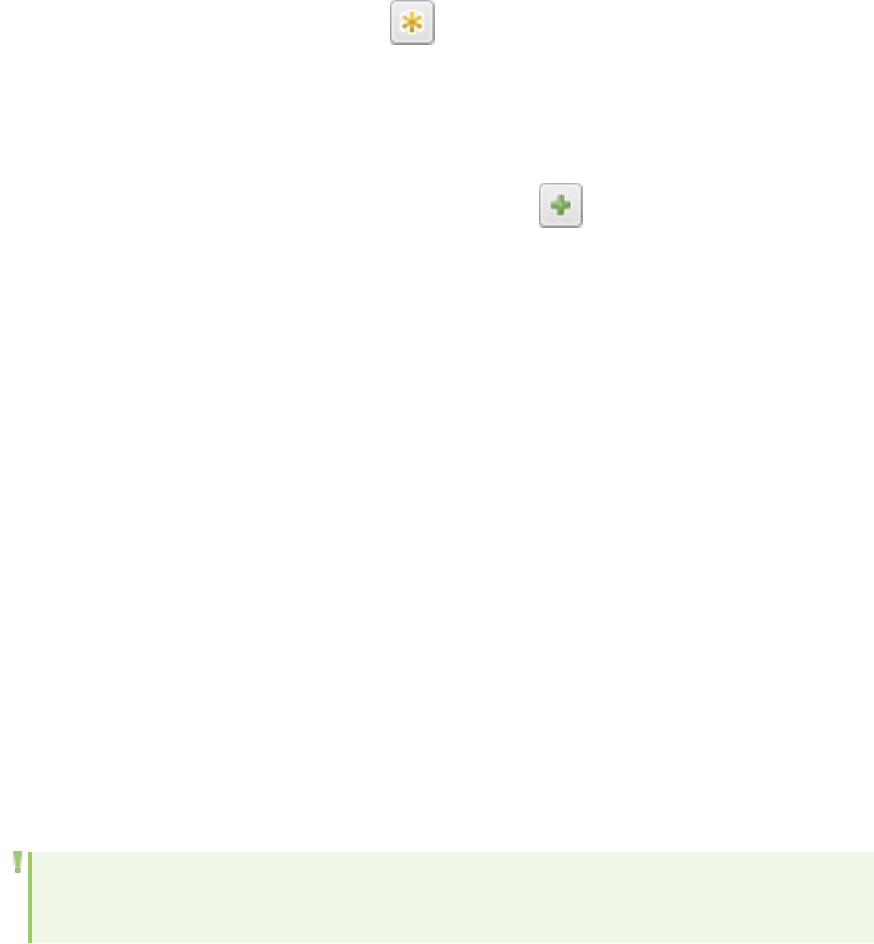
In VuGen, open the Vuser script.
Click Record >Recording Options >Data Format Extension >Chain Configuration.
For details on the dialog box options, see "Data Format Extension > Chain Configuration Recording
Options" on page161.
Under Chains, click the New Chain button and create a new chain. The new chain is listed in
the Chains pane.
2. Adding DFEs to the new DFE chain
In the Chains pane, select the chain to which you want to add DFEs.
In the Chain: <chain name> pane, click the Add DFE button .
In the Add Data Format Extension dialog box, select the DFE that you want to add to the chain, and
then click OK.
When you add the GWT DFE or the Prefix Postfix DFE to a chain, you are required to supply
additional configuration details about the DFE. For more information, see the documentation about
the specific DFE.
For details on the Chain: <chain name> pane, see "Data Format Extension > Chain Configuration
Recording Options" on page161.
After you add a DFE to the chain, select the appropriate option from the Continue Processing list.
For details on the Continue Processing option, see "Data Format Extension > Chain Configuration
Recording Options" on page161.
Add additional DFEs to the chain as required.
lAfter defining the required DFE chains, you must enable DFE support for the Vuser script, as
described in "How to Enable DFE Support" below.
lFor an overview of the process of implementing DFE support, see "How to Implement Data Format
Extension (DFE) Support" on the previous page.
lFor additional details about DFEs, see "Data Format Extensions (DFEs) - Overview" on page863.
How to Enable DFE Support
Note: This topic applies to Web - HTTP/HTML and Silverlight Vuser scripts, and to Web -
HTTP/HTML steps inside Flex Vuser scripts.
After you define the DFE chains that are available to a Vuser script, you must enable the DFE support, as
described below. Enabling DFE support is the second step in implementing DFE support.
User Guide
HP LoadRunner (12.50) Page 868
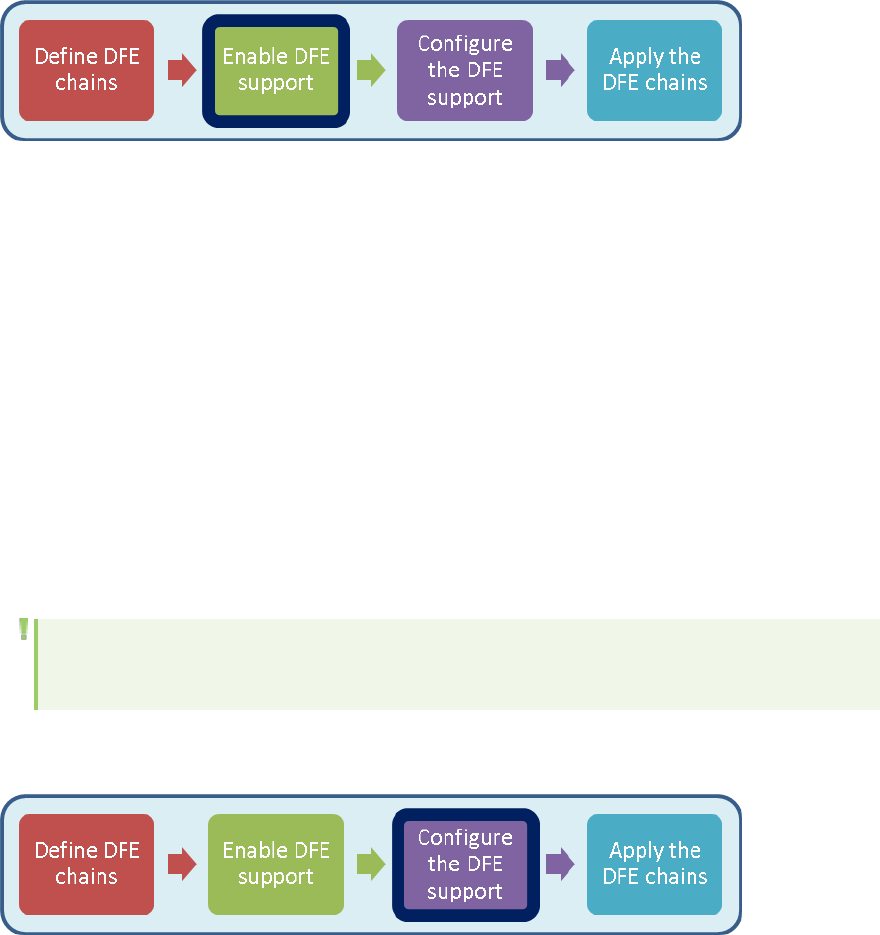
1. In VuGen, open the Vuser script.
2. Click Record >Recording Options >Data Format Extension >Code Generation.
For details on the dialog box options, see "Data Format Extension > Chain Configuration Recording
Options" on page161.
3. Select the Enable data format extension check box.
lAfter enabling the DFE support, you can configure the DFE support as described in "How to Configure
DFE Support" below.
lFor details on how to define DFE chains, see "How to Define a Chain of DFEs" on page867.
lFor an overview of the process of implementing DFE support, see "How to Implement Data Format
Extension (DFE) Support" on page867.
lFor additional details about DFEs, see "Data Format Extensions (DFEs) - Overview" on page863.
How to Configure DFE Support
Note: This topic applies to Web - HTTP/HTML and Silverlight Vuser scripts, and to Web -
HTTP/HTML steps inside Flex Vuser scripts.
After you enable DFE support for a Vuser script, you can configure the DFE support as described below.
Configuring DFE support is the third step in implementing DFE support.
1. Open the Vuser script in VuGen.
2. Click Record >Recording Options >Data Format Extension >Code Generation.
For details on the dialog box options, see "Data Format Extension > Code Generation Recording
Options" on page165.
3. Under Configuration, from the Format list, select the parts of the Vuser script to which the DFEs
will be applied.
lCode and snapshots. Applies DFEs to convert the Vuser script code and the snapshot data.
lSnapshots. Applies DFEs to convert the snapshot data only - not the Vuser script code.
User Guide
HP LoadRunner (12.50) Page 869
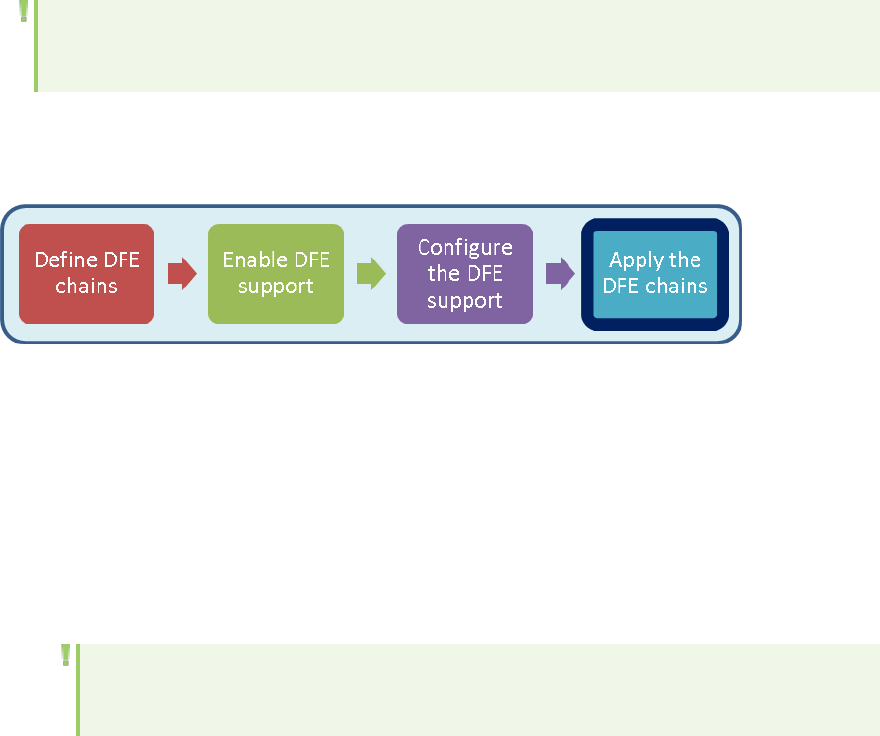
4. Select the Verify formatted data check box to check the results of the data conversion by
converting the converted data back to the original state, and then verifying that it matches the
original data.
lFor details on the dialog box options, see "Data Format Extension > Code Generation Recording
Options" on page165.
lAfter configuring the DFE support, you can assign the DFE chains to specific sections of the HTTP
messages. For details, see "How to Apply DFE Chains to Sections of the HTTP Message" below.
lFor an overview of the process of implementing DFE support, see "How to Implement Data Format
Extension (DFE) Support" on page867.
lFor additional details about DFEs, see "Data Format Extensions (DFEs) - Overview" on page863.
How to Apply DFE Chains to Sections of the HTTP Message
Note: This topic applies to Web - HTTP/HTML and Silverlight Vuser scripts, and to Web -
HTTP/HTML steps inside Flex Vuser scripts.
After you have defined the DFE chains that are available to a Vuser script, enabled and configured DFE
support, you must define to which sections of the HTTP messages to apply the DFE chains, as described
below. Applying DFE chains to message sections is the last step in implementing DFE support.
1. Open the Vuser script in VuGen.
2. Click Record >Recording Options >Data Format Extension >Code Generation.
For details on the dialog box options, see "Data Format Extension > Chain Configuration Recording
Options" on page161.
3. [Optional] In the <message section> pane, click Body add then select the chain that will be applied
to the message body.
4. [Optional] In the <message section> pane, click Headers add then select the chains that will be
applied to the message headers.
Note: For VuGen to correctly assign the chain to a specific header, the entry in the Name
column must be exactly the same as the name of the header in the message.
5. [Optional] In the <message section> pane, click Cookies add then select the chains that will be
applied to the message cookies.
User Guide
HP LoadRunner (12.50) Page 870
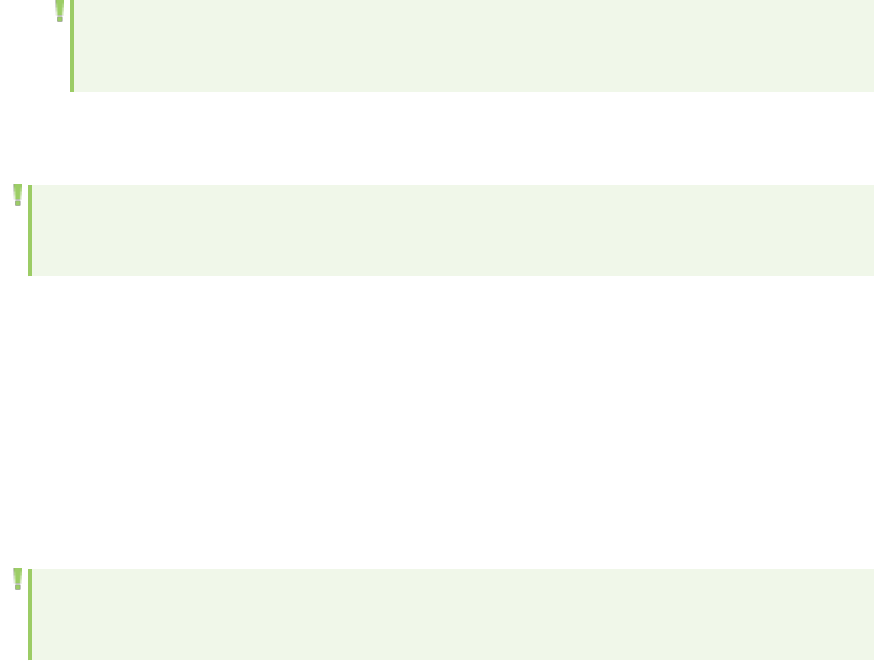
Note: For VuGen to correctly assign the chain to a specific cookie, the entry in the Name
column must be exactly the same as the name of the cookie in the message.
6. [Optional] In the <message section> pane, click Query String add then select the chain that will be
applied to the message query string.
Note: Whereas you can modify only the default chain for the Body and Query String sections,
you can add multiple chains for the Headers and Cookies sections.
lAfter configuring the DFE support, you can assign the DFE chains to specific sections of the HTTP
messages. For details, see "How to Apply DFE Chains to Sections of the HTTP Message" on the
previous page.
lFor an overview of the process of implementing DFE support, see "How to Implement Data Format
Extension (DFE) Support" on page867.
lFor additional details about DFEs, see "Data Format Extensions (DFEs) - Overview" on page863.
How DFEs Modify a Vuser Script
Note: This topic applies to Web - HTTP/HTML and Silverlight Vuser scripts, and to Web -
HTTP/HTML steps inside Flex Vuser scripts.
When a DFE is applied to a Vuser script and the script is then regenerated, the DFE causes various
modifications to be made to the script, as follows:
lVuGen replaces the original encoded text string with a parameter.
lVuGen inserts a web_convert_from_formatted function before the function that contains the new
parameter. The web_convert_from_formatted function contains the decoded value of the original
encoded text.
The script section below shows a web_custom_request function that was generated without DFE
support. The Body tag in the function includes a text string that is base64 encoded, Body=TW9uZGF5.
Because the value of the Body tag is encoded, it is difficult to change its value if required for correlation
or parameterization purposes.
User Guide
HP LoadRunner (12.50) Page 871
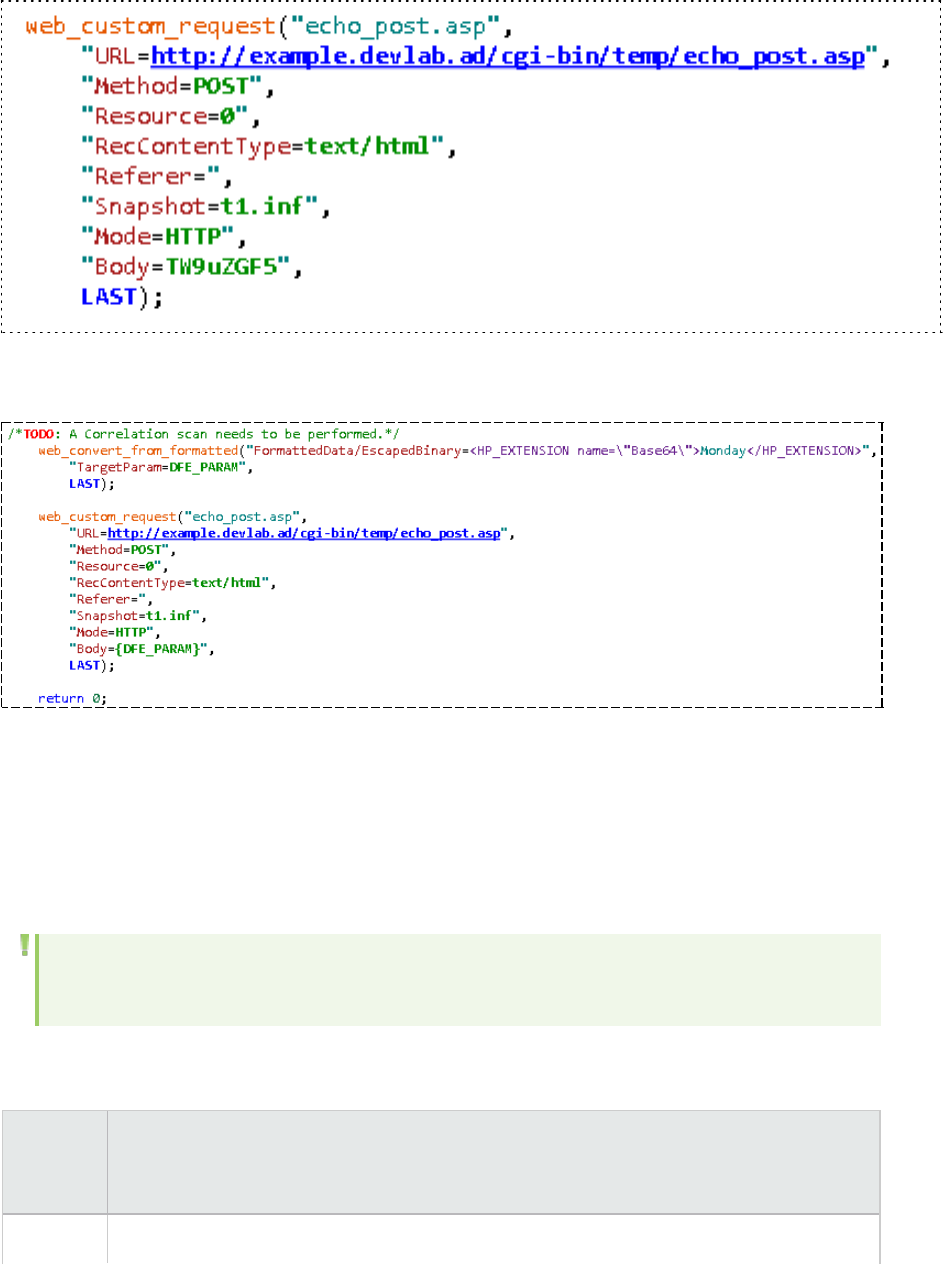
After applying Base64 DFE support, the value of the Body tag in the regenerated script is replaced with
a parameter called DFE_PARAM, "Body={DFE_PARAM}, as shown below.
In addition, the modified code also includes a web_convert_from_formatted function. The function
indicates that the decoded value of the originally encoded string is Monday. It is now simple to change
the value from Monday to any other day by simply changing the decoded value in the web_convert_
from_formatted function.
Data Format Extension List
Note: This topic applies to Web - HTTP/HTML and Silverlight Vuser scripts, and to Web -
HTTP/HTML steps inside Flex Vuser scripts.
The following table lists the pre-defined LoadRunner DFEs (Data Format Extensions). For more
information about DFEs, see "Data Format Extensions (DFEs) - Overview" on page863.
Data
Format
Extension
Description
Base64 Decodes strings that are encoded with a Base64 encoder.
User Guide
HP LoadRunner (12.50) Page 872
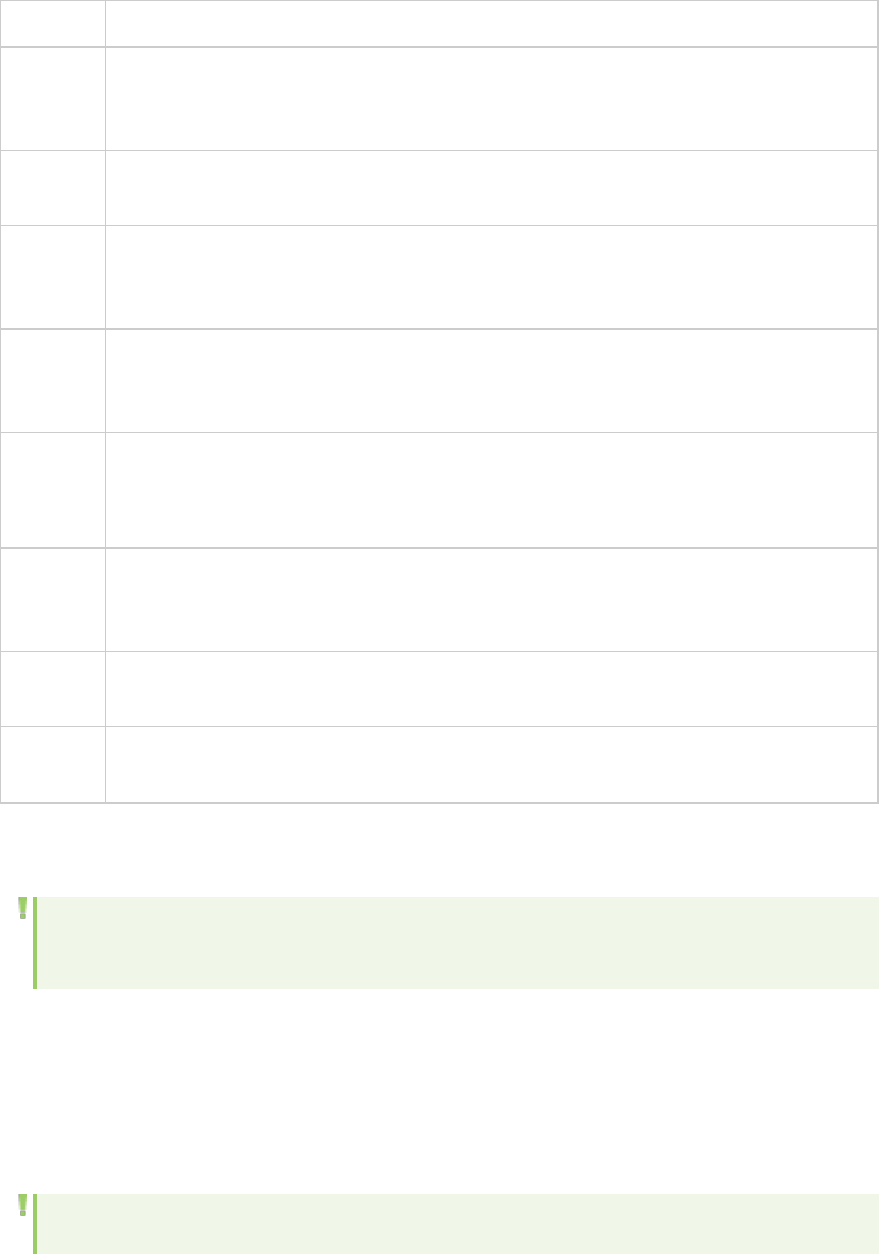
Extension
Binary to
XML
Extension
Transforms Microsoft WCF binary XML into XML format.
GWT
Extension
Transforms GWT data to XML format.
JSON to
XML
Extension
Transforms JSON data to XML format.
Prefix
Postfix
Extension
Enables you to cut data from the beginning and/or end of a string which you do not want
decoded. You can add and customize as many prefix/postfix extensions as required. Each
postfix/prefix extension created should have a unique display name and tag name.
Remedy
to XML
Extension
Transforms Remedy request data into XML format.
Note that this extension does not transform Remedy response data - which is JavaScript
code.
URL
Encoding
Extension
Decodes strings that are encoded with URL encoding format.
XML
Extension
Receives data and checks to see if it conforms with XML syntax. This check allows VuGen
to perform correlations based on XPath and to display snapshot data in an XML viewer.
XSS
Extension
Enables you to test sites that use Cross Site Scripting (XSS) defense code.
Applying DFEs to a String
Note: This topic applies to Web - HTTP/HTML and Silverlight Vuser scripts, and to Web -
HTTP/HTML steps inside Flex Vuser scripts.
You can apply DFEs to a Vuser script to decode encoded data in the script. You can apply the DFEs:
lto specified sections of the Vuser script, when the script is generated or regenerated. For details, see
"How to Implement Data Format Extension (DFE) Support" on page867.
lto a single encoded string in the Vuser script, as described in this topic.
For an overview of DFEs, see "Data Format Extensions (DFEs) - Overview" on page863.
Note: After you apply a DFE to s string in a Vuser script, VuGen adds an entry to the Tasks tab.
User Guide
HP LoadRunner (12.50) Page 873
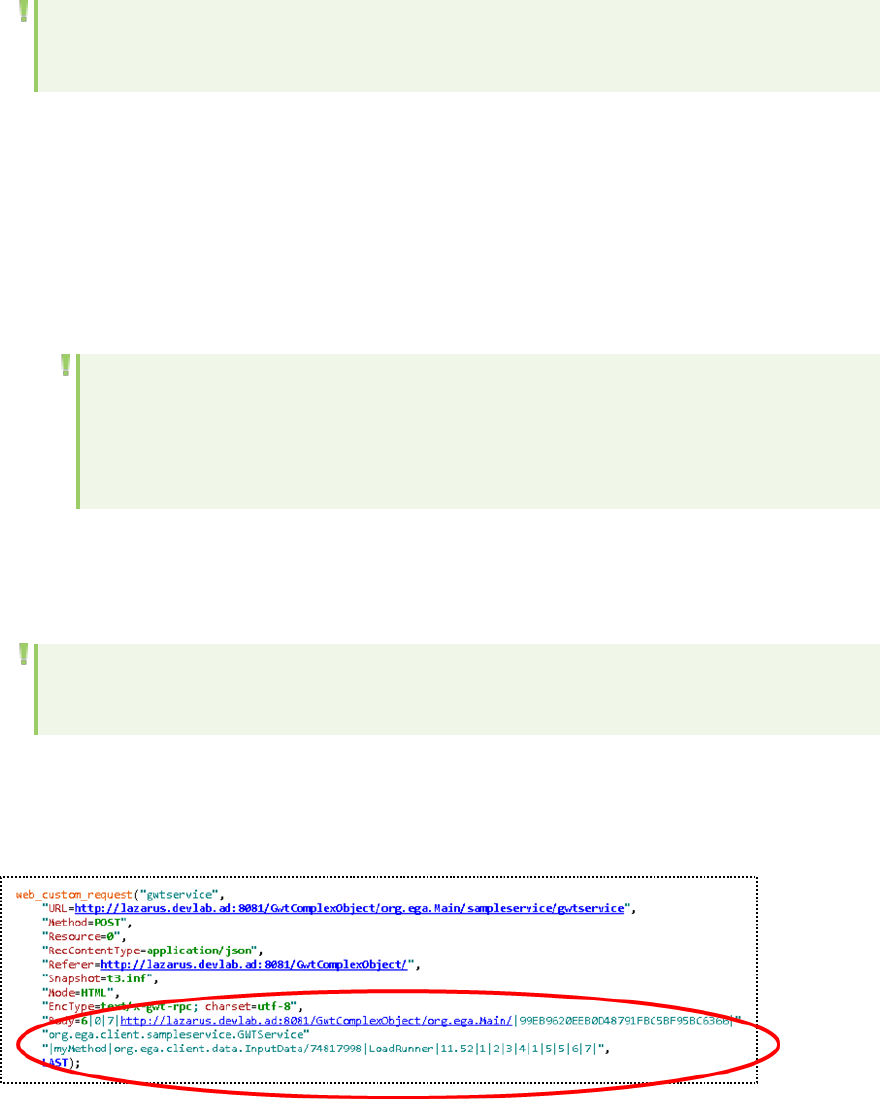
The added entry indicates that a correlation scan should be performed. For details on
performing a correlation scan, see "Correlating" on page235.
To apply a DFE to an encoded string in a Vuser script:
1. Open the script in VuGen, and select the encoded text string.
2. Right-click inside the selection, click Decode with DFE, and click the name of the chain that
contains the DFEs to decode the encoded string. For details on how to define a DFE chain, see "How
to Define a Chain of DFEs" on page867.
VuGen replaces the selected text with a parameter, and adds a web_convert_from_formatted
function that contains the decoded equivalent of the originally selected text.
Note: To change the name that VuGen assigns to new parameters, right-click some
encoded text in the Vuser script, click Decode with DFE > Advanced, and then specify the
parameter name in the Target Parameter box. VuGen will add a counter to the parameter
name, and increment the counter as required.
Google Web Toolkit - Data Format Extension (GWT-DFE) - Overview
Note: This topic applies to Web - HTTP/HTML, Silverlight, and Java over HTTP Vuser scripts. It
also applies to Web - HTTP/HTML steps inside Flex Vuser scripts.
GWT-DFE is one of the standard LoadRunner DFEs. The GWT-DFE support helps to generate Vuser
scripts for GWT-based web sites that use the GWT-RPC mechanism. When you record a GWT-RPC based
web site without enabling the GWT-DFE support, the resulting Vuser script may contain significant
amounts of data that is cryptic and therefore difficult to decipher, as shown in the code segment below:
The cryptic formatting of the data makes it difficult to identify text strings to be used for correlation,
parameterization, and verification.
User Guide
HP LoadRunner (12.50) Page 874

Note: The presence of numerous pipes in the recorded data indicates that the recorded site
may be a GWT-based web site that uses the GWT-RPC mechanism.
When you enable GWT-DFE support, VuGen is able to decode much of the complex data in the HTTP
responses and requests. This enables VuGen to generate Vuser scripts that contain data in XML format.
In addition, the original coded data contains only values, without the associated names of the data
fields. After applying GWT-DFE, the resulting XML-formatted data includes both the names and the
values of the data fields. The XML-formatted data in the scripts is therefore easier to decipher, making
the scripts easier to correlate, parameterize, and use for verification purposes. The table below shows a
sample of code that was generated before and after GWT-DFE support was enabled.
Example of code generated with and without GWT-DFE support:
Original Script - without GWT-DFE Support
6|0|11|http://localhost:8081/MyTestApp/testapp/|624C899BB846618A2E7F49092
8212946|com.test.client.GreetingService|greetServeCompAns|com.test.client.Complex
Object/198661839
|GWT User|inside
object|java.util.HashSet/1594477813|java.lang.String/2004016611|add string1|
string2|1|2|3|4|1|5|5|1001|1999|6|5|321|1234|7|0|8|0|8|2|9|10|9|11|
Script after applying GWT-DFE Support
<HP_EXTENSION name="GWT_DFE_1">
<com.hp.dfe.GWT__Request>
<moduleBaseURL>http://localhost:8081/MyTestApp/testapp/</moduleBaseURL>
<rpcRequest>
<flags>0</flags>
<method>
<class>com.test.client.GreetingService</class>
<name>greetServeCompAns</name>
<parameter-types>
<class>com.test.client.ComplexObject</class>
</parameter-types>
</method>
<parameters>
User Guide
HP LoadRunner (12.50) Page 875

Script after applying GWT-DFE Support
<com.test.client.ComplexObject>
<anIntField>1001</anIntField>
<anotherIntField>1999</anotherIntField>
<name>GWT User</name>
<objectInComposingField>
<anIntField>321</anIntField>
<anotherIntField>1234</anotherIntField>
<name>inside object</name>
<stringsSet/>
</objectInComposingField>
<stringsSet>
<string>add string2</string>
<string>add string1</string>
</stringsSet>
</com.test.client.ComplexObject>
</parameters>
<serializationPolicy
class="com.google.gwt.user.server.rpc.impl.StandardSerializationPolicy"/>
</rpcRequest>
</com.hp.dfe.GWT__Request>
</HP_EXTENSION>
To enable VuGen to decode the complex data in the HTTP communication, you must identify the .war file
that is used by the web application. The .war file contains the logic used by GWT to encode and decode
the information in the HTTP communication. VuGen needs access to the .war file so that VuGen can
perform similar encoding and decoding procedures. Typically, these .war files are located on the
application server, under the web applications folder.
Note: Make sure that the .war file that you associate with the Vuser script is the most up-to-
date .war file for your application. The .war file is changed each time changes are made to the
web application. GWT-DFE support will function correctly only if the most up-to-date .war file is
available.
User Guide
HP LoadRunner (12.50) Page 876
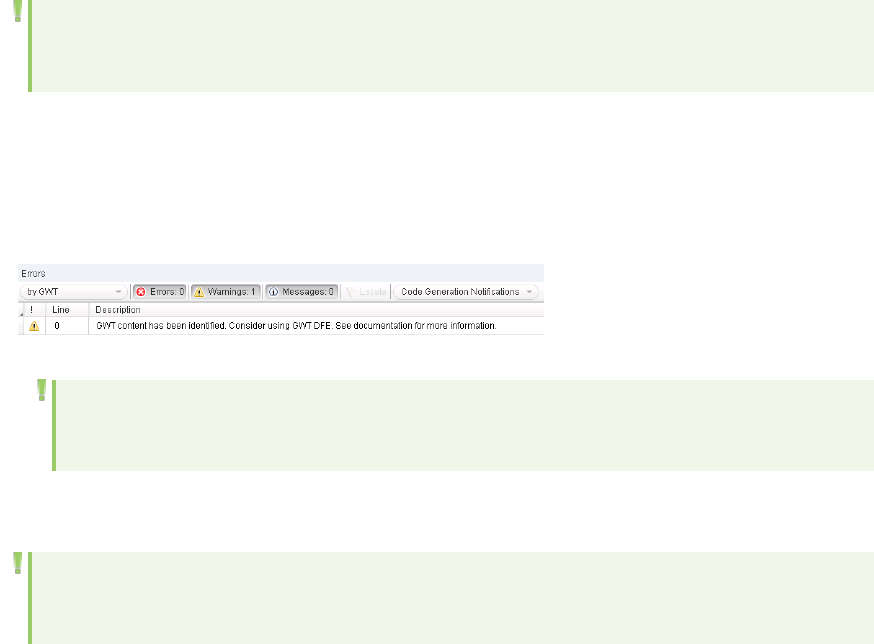
lFor an introduction to using DFEs in Vuser scripts, see "Data Format Extensions (DFEs) - Overview" on
page863.
lFor details on how to implement DFE support, see "How to Implement Data Format Extension (DFE)
Support" on page867.
lFor a full list of the standard LoadRunner DFEs, see "Data Format Extension List" on page872.
Note: GWT- DFE provides an automatic solution for GWT specific (STRONG_NAME_HEADER)
correlations.
lAuto-detection of GWT Remote Procedure Calls (RPCs):
When VuGen generates or regenerates a Vuser script, VuGen scans the HTTP headers in the requests
that are sent to the server. If VuGen detects both a x-gwt-module-base text string and a x-gwt-
permutation text string in any of these HTTP headers, VuGen displays a warning in the VuGen Error
tab. The warning recommends that the GWT DFE be enabled for the Vuser script.
Note: VuGen will continue to issue the above warning - each time the script is generated or
regenerated - until the GWT DFE is enabled.
Implementing GWT-DFE Support
Note: This topic applies to Web - HTTP/HTML and Silverlight Vuser scripts, and to Web -
HTTP/HTML steps inside Flex Vuser scripts.
This topic provides information that is specific to implementing GWT-DFE support. Use this information
in addition to the generic information about implementing DFE support, as described in "How to
Implement Data Format Extension (DFE) Support" on page867.
Prerequisites for implementing GWT-DFE support
LoadRunner includes OpenJDK 7 JRE. However, some applications may be compiled for JVM1.8 and
higher. If your application is compiled with JDK1.8 or higher, replace the
<;LoadRunner>\lib\openjdk32\jre folder with your own OpenJDK 8 or higher JRE before recording a GWT
application.
Recording GWT-DFE Headers
As part of the GWT-DFE support implementation process, it is necessary to specify that VuGen record x-
gwt-permutation headers when recording business processes. This procedure, as described below, can
User Guide
HP LoadRunner (12.50) Page 877
be performed at any stage of the GWT-DFE support implementation process.
1. Create a Web - HTTP/HTML protocol script .
2. Select Record > Recording Options > HTTP Properties > Advanced and then click Headers.
3. In the Headers dialog box, select Record headers in list.
4. From the Headers list, select the x-gwt-permutation header check box.
Applying GWT-DFE chains
When you implement any DFE support, you must apply the DFE chains to specific sections of the HTTP
communication. The basic process is described in "How to Apply DFE Chains to Sections of the HTTP
Message" on page870. This topic includes information required when assigning chains while
implementing GWT-DFE support. When you assign the chains while implementing GWT-DFE support, you
must specify the classpath entries that are associated with the application that is operated by the
Vusers. To assign the classpath entries, you must have access to the GWT WAR folder that is used by
your development team. The WAR folder includes the following file types:
l*.gwt.rpc files
l*.jar files
l*.class files
Specifying the classpath entries
1. Select Record > Recording Options > Data Format Extension > Chain Configuration.
2. Under Chains, click to create and name a new DFE chain.
3. Click .
4. In the Add Data Format Extension dialog box, select GWT Extension and click OK.
5. In the Add GWT dialog box, specify the classpath entries:
a. If the classpath entries are contained in a single .war file, click and then specify the
location of the .war file.
Note: If you have write permissions in the folder containing the .war file, it
automatically creates a new folder with the extracted contents. It adds the specific
classes/jars to VuGen in the following structure:
<ServerDir>\<applicationDir>\<MyGWTApplication>\<SomeDirContaining .gwt.rpc file>
oWEB-INF\classes
oWEB-INF\lib\gwt-servlet.jar
oWEB-INF\lib\gwt-servlet-deps.jar
User Guide
HP LoadRunner (12.50) Page 878
oWEB-INF\lib\log4j.jar
oWEB-INF\lib\<AdditionalAUTRelatedJarFile>.jar
If you do not have write access, it will just add the .war file without extracting its
contents.
b. If the classpath entries are not contained in a single .war file:
oClick to add the folder that contains .gwt.rpc files.
oClick to add the application classes folder.
oClick to add the application JAR files from the WEB-INF\lib folder.
Note: If the location of the classpath entries is not the same on the computer on which
the script was recorded and the computer on which the script will be replayed, then
you must modify the runtime settings for the script. Select Replay > Runtime
Settings > Data Format Extension > Chain Configuration and specify the location of
the classpath entries on the computer on which the script will be replayed.
6. Select Recording Options > Data Format Extension > Code Generation.
7. Select the Enable data format extension check box.
8. Under Configuration, select Code and snapshots from the Format list.
9. Under Chain Assignment, select Body and select a chain. Select Headers and choose the same
chain.
10. Click OK.
Troubleshooting - Data Format Extension (DFE)
This section describes troubleshooting tasks for Vuser scripts that contain DFE functionality.
Replay log: Warning -27040: Data Format Extension: Convert: Empty string
returned from extension {Extension name}
When you replay a Vuser script that contains DFE functionality, various messages are added to the
Replay log in VuGen's Output pane. The above message indicates that when the Vuser script was
replayed, the result of the specified web_convert_from_formatted step in the script was an empty
string. For some DFEs, returning an empty string from a web_convert_from_formatted step is the
correct behavior. However, if the Vuser script includes GWT-DFE functionality, the above message may
indicate one or both of the following:
User Guide
HP LoadRunner (12.50) Page 879
lSome of the required classpath files are not included in the runtime settings for the Vuser script.
lSome of the required classpath files do not exist in the specified location on the LoadGenerator.
For details on how to resolve these issues, see "Implementing GWT-DFE Support" on page877.
If you have implemented your own version of DFE, the definition of class HTTPEntity in DfeDefinitions.h
file has been updated in LoadRunner 11.50. No code change is required, but all DFE extensions need be
recompiled.
Web Services
Web Services - Adding Script Content
Web Service Testing Overview
SOA systems are based on Web Services, self-contained applications that can run across the Internet on
a variety of platforms. The services are built using Extensible Markup Language (XML) and Simple Object
Access Protocol (SOAP). They serve as building blocks, thereby enabling the rapid development and
deployment of new applications.
Using VuGen, you create Vuser scripts for testing your SOA environment. You can use a test generation
wizard to automatically generate scripts, or you can create the scripts manually.
Adding Web Service Script Content - Overview
Web Services scripts let you test your environment by emulating Web Service clients.
After creating an empty Web Services script, as described in "Create a New Script Dialog Box" on
page136, you add content through one of the following methods: recording, manually inserting Web
Service calls, importing SOAP, or by analyzing server traffic.
Recording a Web Services Script
By recording a Web Services session, you capture the events of a typical business process. If you have
already built a client that interacts with the Web Service, you can record all of the actions that the client
performs. The resulting script emulates the operations of your Web Service client. After recording, you
can add more Web Service calls and make other enhancements to the script.
When you record an application, you can record it with or without a Web Service WSDL file. If you include
a WSDL file, VuGen allows you to create a script by selecting the desired methods and entering values
for their arguments.VuGen creates a descriptive script that can be updated when there are changes in
the WSDL.
User Guide
HP LoadRunner (12.50) Page 880
If you record a script without previously importing a service (not recommended) VuGen creates SOAP
requests instead of Web Service call steps. SOAP request arguments are less intuitive and harder to
maintain.
For more information, see "How to Add Content" on page888.
Adding New Web Service Calls
You can create a Web Services script by manually adding Web Service calls. You design the call based on
operation, transport, arguments, and other properties.
For more information, see "How to Add Content" on page888.
Importing SOAP Requests
VuGen lets you create Web Service calls from SOAP files. If you have a SOAP request file, you can load it
directly into your script. VuGen imports the entire SOAP request (excluding the security headers) with
the argument values as they were defined in the XML elements. By importing the SOAP, you do not need
to set argument values manually as in standard Web Service calls.
For example, suppose you have a SOAP request with the following elements:
- <soap:Body soap:encodingStyle="http://schemas.xmlsoap.org/soap/encoding/">
- <q1:AddAddr xmlns:q1="http://tempuri.org/AddrBook/message/">
<Addr href="#id1" />
</q1:AddAddr>
- <q2:Addr id="id1" xsi:type="q2:Addr"
xmlns:q2="http://tempuri.org/AddrBook/type/">
<name xsi:type="xsd:string">Tom Smith</name>
<street xsi:type="xsd:string">15 Elm Street</street>
<city xsi:type="xsd:string">Pheonix</city>
<state xsi:type="xsd:string">AZ</state>
<zip-code xsi:type="xsd:string">97432</zip-code>
<phone-numbers href="#id2" />
<birthday xsi:type="xsd:date">1983-04-22</birthday>
</q2:Addr>
...
When you import the SOAP request, VuGen imports all of the values to the Web Service call. To view the
values, in the Step Navigator, right-click the step and then click Show Arguments.
To create a new Web Service call based on a SOAP request, you must first import a WSDL file. If a WSDL
is not available, or if you want to send the SOAP traffic directly, you can create a SOAP Request step. You
specify the URL of the server, the SOAP action, and the response parameter.
In the Editor, the SOAP Request step appears as a soap_request function, described in the Function
Reference (Help > Function Reference).
For more information, see "How to Add Content" on page888.
User Guide
HP LoadRunner (12.50) Page 881
Analyzing Server Traffic
The main focus when testing enterprises and complex systems, is to measure the performance from
the client end. Ordinarily, VuGen records the actions you perform in the application or browser, and
generates a script emulating the client actions and requests to the server.
In certain test environments, you may be unable to record the client application to retrieve the requests
to the server. This may be a result of the server acting as a client, or because you do not have access to
the client application. In these cases, you can create a script using VuGen's Analyze Traffic feature.
The Analyze Traffic feature examines a capture file containing the server network traffic, and creates
a script that emulates requests sent to or from the server.
For more information, see "How to Create a Script by Analyzing Traffic (Web Services)" on page891.
Script Integration
You can use the completed script to test your system in several ways:
lFunctional Testing. Run the script to see if your Web services are functional. You can also check to
see if the Web service generated the expected values. For more information, see "Web Services -
Preparing Scripts for Replay" on page908.
lLoad Testing. Integrate the script into a LoadRunner Controller scenario to test the performance of
your system under load. For more information, see the HP Controller documentation.
lProduction Testing. Check your Web service's performance over time through a Business Process
Monitor configuration. For more information, see the HP Business Process Monitor documentation.
Web Service Call Attachments
When transferring binary files such as images over SOAP, the data must be serialized into XML.
Serialization and deserialization can cause a significant amount of overhead. Therefore, it is common to
send large binary files using an attachments mechanism. This keeps the binary data intact, reducing the
parsing overhead.
Using attachments, the original data is sent outside the SOAP envelope, eliminating the need to serialize
the data into XML and making the transfer of the data more efficient.
The formats used for passing a SOAP message together with binary data are MIME (Multipurpose
Internet Mail Extensions) and the newer, more efficient DIME (Direct Internet Message Encapsulation)
specifications. VuGen supports DIME for all toolkits, but MIME only for the Axis toolkit. To use MIME
attachments for the .NET toolkit, see " User Handler Examples" on page915.
VuGen supports the sending and receiving of attachments with SOAP messages. You can send Input
(Request) or save Output (Response) attachments. For task details, see "How to Add Content" on
page888.
Output attachments are used to save the response as an attachment. You can choose one of the
following options: Save All Attachments or Save Attachment by Index.
User Guide
HP LoadRunner (12.50) Page 882
When you specify Save All Attachments, VuGen creates three parameters for each attachment based
on the parameter name that your specify: a parameter containing the attachment data, the content
type of the attachment, and a unique ID for the attachment.
For example, if you specify the name MyParam in the Content field, the parameter names for the first
attachment would be:
MyParam_1
MyParam_1_ContentType
MyParam_1_ContentID
When you specify Save Attachments by Index, you specify the index number and name of the
parameter in which to store the attachment. The parameter name that you specify for Content, is used
as a prefix for the Content type and Content ID parameters.
Special Argument Types
VuGen handles special argument types such as derived, recursive, choice, and optional elements.
Derived Types
VuGen supports WSDLs with derived types. When setting the properties for a Web Service Call, VuGen
allows you to use the base type or derived type for the argument. After you select a type, VuGen
updates the argument tree node to reflect the new type. For details, see "New Web Service Call Dialog
Box" on page894.
Abstract Types
Abstract is a declaration type declared by the programmer. When an element or type is declared to be
abstract, it cannot be used in an instance document. Instead, a member of the element's substitution
group, provided by the XML schema, must appear in the instance document. In such a case, all instances
of that element must use the xsi:type to indicate a derived type that is not abstract.
When VuGen encounters an Abstract type, it cannot create an abstract class and replay will fail. In this
case, VuGen displays a warning message beneath the Type box, instructing you to replace the Abstract
type with a derived type.
Optional Elements
In WSDL files, optional parameters are defined by one of the following attributes:
minoccurs='0'
nillable='true'
minoccurs = 0 indicates a truly optional element, that can be omitted. Nillable means that the element
can be present without its normal content, provided that the nillable attribute is set to true or 1. By
default, the minoccurs and maxoccurs attributes are set to 1.
In the following example, name is mandatory, age is optional, and phone is nillable.
User Guide
HP LoadRunner (12.50) Page 883
<s:element minOccurs="1" name="name" type="s:string" />
<s:element minOccurs="0" name="age" type="s:int" />
<s:element minOccurs="1" name="phone" nillable="true" type="s:string" />
The following table indicates the availability of the options:
Parameter type Nil radio button Include arguments in call
Mandatory disabled disabled
MinOccurs=0 disabled enabled
Nillable enabled disabled
To include a specific optional argument in the service call, click the node and select Include Argument
in Call. The nodes for all included arguments are colored in blue. Arguments that are not included are
colored in gray.
If you include an element on a parent level, it automatically includes all mandatory and nillable children
elements beneath it. If it is a child element, then it automatically includes the parent element and all
other mandatory or nillable elements on that level. If you specify Generate auto-value to a parent
element, VuGen provides values for those child elements that are included beneath the parent.
Note: VuGen interprets whether elements are mandatory or optional through the toolkit
implementation. This may not always be consistent with the element's attributes in the WSDL
file.
Choice Optional Elements
A Choice element in a WSDL defines a set of elements where only one of them appears in the SOAP
message. In some cases, one of the Choice elements is optional, while the others are not. You can select
the Choice element and still prevent its optional element from appearing in the SOAP envelope. In the
Step Navigator, select the Choice element, and clear the Include argument in call option. In Script view,
delete the line that defines the Choice argument.
Recursive Elements
Using the Properties dialog box, you can control the level of recursive elements to include in the Web
Service call.
To exclude a certain level and exclude those below, select the lowest parent node that you want to
include and select Include Argument in Call. VuGen includes the selected nodes, its mandatory children,
and all of its parent nodes.
In the following example, three levels of the Choice argument are included—the rest are not. Excluded
nodes are grayed out.
User Guide
HP LoadRunner (12.50) Page 884
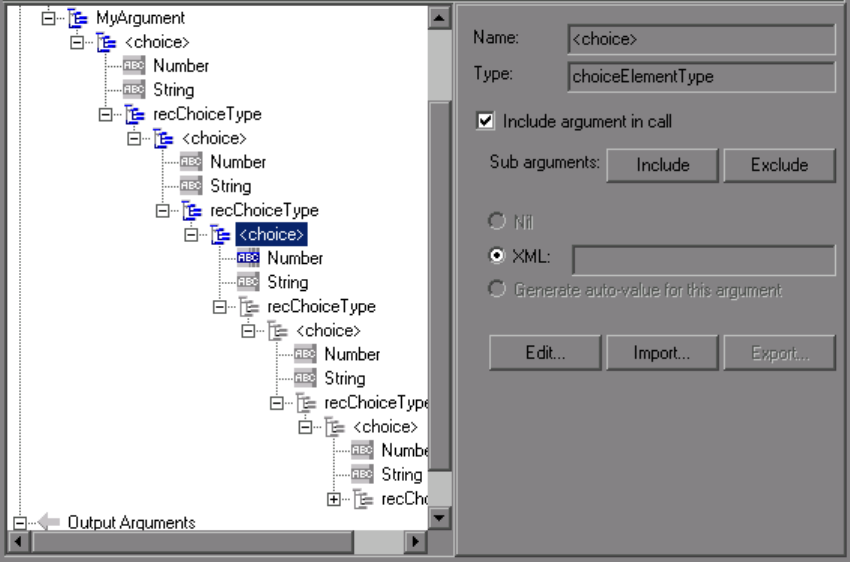
Base 64 Arguments
Base 64 encoding is an encoding method used to represent binary data as ASCII text. Since SOAP
envelopes are plain text, you can use this encoding to represent binary data as text within SOAP
envelopes.
When VuGen detects a WSDL element of base64Binary type, it lets you provide an encoded value. You
can specify a value in two ways:
lGet from file. Reference a file name.
lEmbed encoded text. Specify the text to encode.
For details, see "Process Base64 Data - Simple Data Dialog Box" on page903.
Server Traffic Scripts Overview
The main focus when testing enterprises and complex systems, is to measure the performance from
the client end. Ordinarily, VuGen records the actions you perform in the application or browser, and
generates a script emulating the client actions and requests to the server.
In certain test environments, you may be unable to record the client application to retrieve the requests
to the server. This may be a result of the server acting as a client, or because you do not have access to
the client application. In these cases, you can create a script using VuGen's Analyze Traffic feature.
User Guide
HP LoadRunner (12.50) Page 885
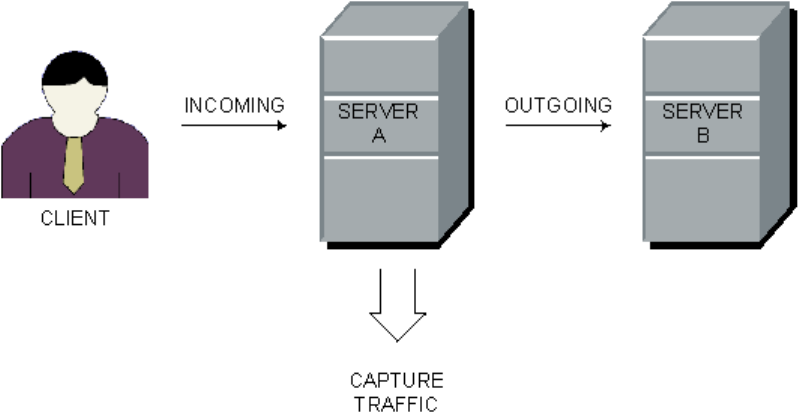
The Analyze Traffic feature examines a capture file containing the server network traffic, and creates
a script that emulates requests sent to or from the server. The steps in creating a script by analyzing
server traffic are described in "How to Create a Script by Analyzing Traffic (Web Services)" on page891.
There are two types of emulations: Incomingtraffic and Outgoing traffic.
Incoming traffic scripts emulate situations in which you want to send requests to the server, but you do
not have access to the client application, for example, due to security constraints. The most accurate
solution in this case is to generate a script from the traffic going into the server, from the side of the
client.
When you specify an Incoming server network traffic, you indicate the IP address of the server and the
port number upon which the application is running. VuGen examines all of the traffic going into the
server, extracts the relevant messages, and creates a script. In the above diagram, if the client is
unavailable, you could create an Incoming script to emulate the requests coming into Server A.
Outgoing Traffic scripts emulate the server acting as a client for another server. In an application
server that contains several internal servers, you may want to emulate communication between server
machines, for example between Server A and Server B in the above diagram. The solution in this case is
to generate a script from the traffic sent as output from a particular server.
When you create an Outgoing traffic script, you indicate the IP address of the server whose outgoing
traffic you want to emulate, and VuGen extracts the traffic going out of that server. In the above
diagram, an Outgoing script could emulate the requests that Server A submits to the Server B.
l"How to Create a PCAP File" on page989
l"Filtering Traffic" on the next page
l"Data on Secure Servers" on page888
User Guide
HP LoadRunner (12.50) Page 886
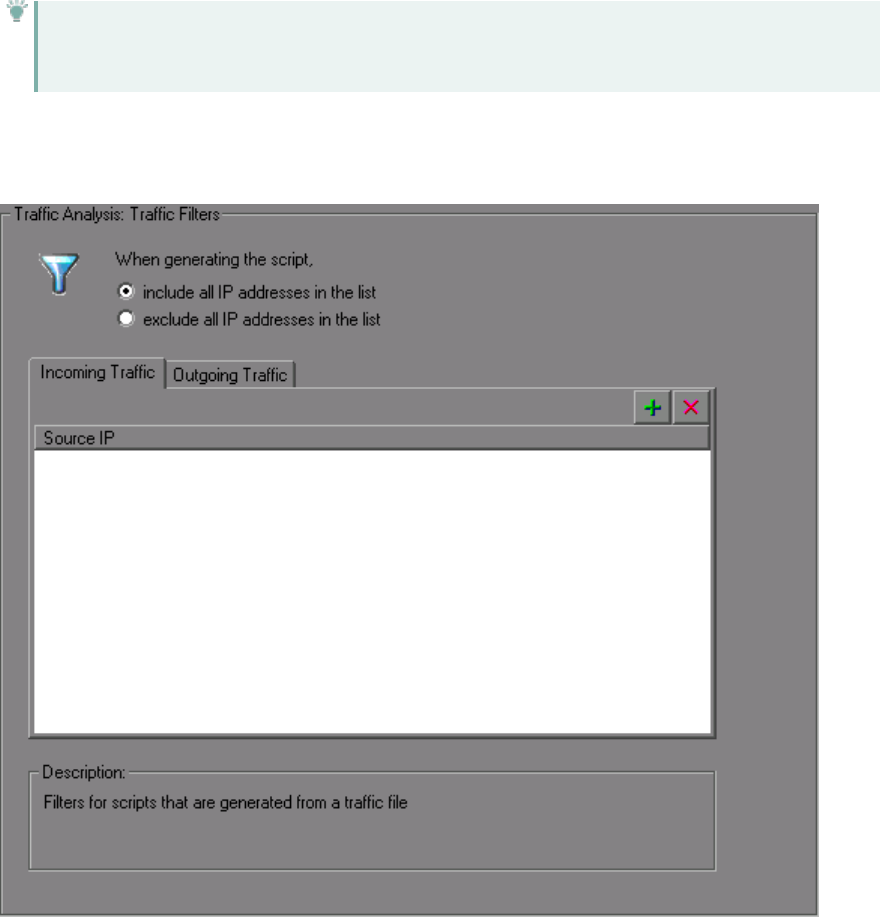
Filtering Traffic
You can provide a filter to drill down on specific requests going to or from a server, by specifying its IP
address and port.
Tip: Several external capture tools allow you to filter the IP addresses while capturing the
traffic.
You filter the requests by choosing the relevant host IP addresses. The filter can be inclusive or
exclusive—you can include only those IPs in the list, or include everything except for those IPs that
appear in the list.
For more information, see "How to Create a Script by Analyzing Traffic (Web Services)" on page891.
User Guide
HP LoadRunner (12.50) Page 887

Data on Secure Servers
To analyze traffic from a secure server, you must provide a certificate containing the private key of the
server.
If the traffic is SSL encrypted, you must supply a certificate file and password for decryption. If you want
traffic from multiple servers to be reflected in the script, you must supply a separate certificate and
password for each IP address that uses SSL.
For more information, see "How to Create a Script by Analyzing Traffic (Web Services)" on page891.
How to Add Content
This topic describes how to add content, such as Web Service calls, to a Web Services Vuser script.
Prerequisites
Create an empty Web Services Vuser script. Click File > New Script and Solution and choose the Web
Services protocol. You can create either a single-protocol or multi-protocol Vuser script.
Record a Session - Optional
1. Click the Start Recording button on the VuGen toolbar or press Ctrl+R to open the Recording
Wizard > Specify Services screen.
For user interface details, see "Specify Services Screen" on page892.
2. Add services to the list. Click Import to load a WSDL for the test. Indicate the location of the WSDL
file.
For user interface details, see "Import Service Dialog Box" on page940.
3. Click Next. Specify the location of the application and any other relevant arguments. See the
"Specify Application to Record Dialog Box" on page892.
Add a New Service Call - Optional
1. Import a service. Click Manage Services to access the Import dialog box.
For user interface details, see "Import Service Dialog Box" on page940.
2. Click the cursor at the desired location in your script (Editor) or in the test steps (Step Navigator).
3. Click the Add Service Call button. The New Web Service Call dialog box opens.
4. In the Select Web Service Call section, select a Service,Port Name, and Operation.
5. To specify an endpoint other than the default Target Address, select Override Address and insert
the new endpoint to which you want to submit the requests.
6. Expand the nodes and specify argument values. To create sample values for all Input arguments,
select the Input Arguments node and click Generate. To edit, import, or export the element's XML
User Guide
HP LoadRunner (12.50) Page 888
structure, see "How to Assign Values to XML Elements" on the next page.
7. To parameterize an input argument, click the node and select the Value option. Click the ABC icon
and proceed with parameterization. For more information, see "Parameters" on page341.
8. Select the Transport Layer Configuration node to specify advanced options, such as JMS transport
for SOAP messages (Axis toolkit only), asynchronous messaging, or WS Addressing. For more
information, see "How to Send Messages over JMS" on page919.
Add Attachments - Optional
1. To add an attachment to an input argument, choose an operation in the left pane. Select Add to
request (Input). VuGen prompts you to enter information about the attachment and adds it to the
method's tree structure. For details, see the "Add Input Attachment Dialog Box" on page902.
2. To specify an output attachment through which to store output arguments, choose an operation in
the left pane. Select Save received (Output). Select the desired option: Save All Attachments or
Save Attachment by Index based on their index number—beginning with 1. For details, see "Web
Service Call Attachments" on page882.
3. To edit the properties of either an Input or Output attachment, click the attachment in the left
pane, and enter the required information in the right pane.
Specify SOAP Headers - Optional
Select the CustomSOAP Header node in the left pane and enable the Use SOAP header option. You must
individually specify SOAP headers for each element. To compose your own, click Edit and edit the XML.
To import an XML file for the SOAP header, click Import.
Import SOAP - Optional
1. Import a service if one is available. Click Manage Services to access the Import dialog box. For
more information, see the "Import Service Dialog Box" on page940.
2. Click the Import SOAP button to open the Import SOAP dialog box.
3. Browse for the XML file that represents your SOAP request.
4. Select the type of step you would like to generate: Create Web Service Call or Create SOAP
Request. In order to create a Web Service Call, you must first import at least one WSDL that
describes the operation in the SOAP request file. To view the SOAP before loading it, click View
SOAP.
5. Click Load to import the XML element values.
For a Web Service Call, set the properties for the Service call as described in the "New Web Service
Call Dialog Box" on page894.
For a SOAP Request, provide the URL and the other relevant parameters.
6. For a Web Service Call, if there are multiple services with same operation (method) names, select
the service whose SOAP traffic you want to import.
7. Click OK to generate the new step within your script.
User Guide
HP LoadRunner (12.50) Page 889
Analyze Server Traffic - Optional
To create a script by analyzing a file containing a dump of the server traffic, click Analyze Traffic.
For details, see "Server Traffic Scripts Overview" on page885.
How to Assign Values to XML Elements
This task describes how to work with XML elements by manually editing the code, importing an external
file, and exporting the XML for later use.
1. Prerequisites
Import a service and create a new Web Service call. Alternatively, in the Step Navigator, right-click
a step and select Show Arguments.
2. Select the element
In the left pane, select a complex type or array argument. In the right pane, click XML. The XML
field shows the XML code as a single string.
3. Import a file - optional
To import a previously saved XML file, click Import and specify the file's location.
4. Edit the XML elements - optional
To edit the XML structure and element values, click Edit. The XML Editor opens. To import a
previously saved XML file, click Import File.
lTo manually edit the code, click the Text View tab.
lTo modify the XML through a graphical interface, click the Step Navigator. Use the shortcut
menu to add children and sibling elements and rename the node. Click Insert from the shortcut
menu to add a new element before or after the selected one.
5. Export a file - optional
To save your XML data to a file so it can be used for other tests, click Export and specify a location.
How to Generate a Test Automatically
This task describes how to create requirements or tests for checking your service.
1. Open the wizard
Select File > New to open the New Virtual User dialog box. Select SOA Test Generator in the left
pane and click Create.
2. Add a service
User Guide
HP LoadRunner (12.50) Page 890

Proceed to the next screen and click Add to import at least one service. If your service is not ready
yet, you can use an emulated service. For details, see "How to Add and Manage Services" on
page934. Click Next.
3. Select testing aspects
Expand the nodes and select the desired testing aspects. Click Next.
4. Specify a location
Specify a test name and a location for the test scripts: HP ALM or a local file system. If you
specified ALM, click Connect to log on to the server and Browse to locate the test node.
5. Complete the test generation
Review the summary and include or exclude any scripts from the generation. Click Generate.
6. Open the scripts
In the final screen, review the list of generated scripts and indicate which ones to open. Click
Finish.
How to Create a Script by Analyzing Traffic (Web Services)
This task describes how to create a Web Services Vuser script using a network traffic file. You can use a
capture file of the following types: our pcap,pcap,lrcap, or saz (Fiddler).
1. Create a capture file on a Windows Platform - optional
Locate your capture file, or create a new one using an external tool, such as Wireshark. For details
about creating a capture file in a Windows, Linux, or mobile environment, see "How to Create a
PCAP File" on page989.
2. Open the Analyzing Traffic wizard
Create a new Web Services Vuser script and click Analyze Traffic button .
The "Specify Services Screen" opens.
3. Import a Service - optional
Add one or more services to the list (optional). Click Import to load a WSDL file. For details, see the
"Import Service Dialog Box" on page940.
Click Next.
4. Specify traffic information
a. Browse for the capture file.
User Guide
HP LoadRunner (12.50) Page 891
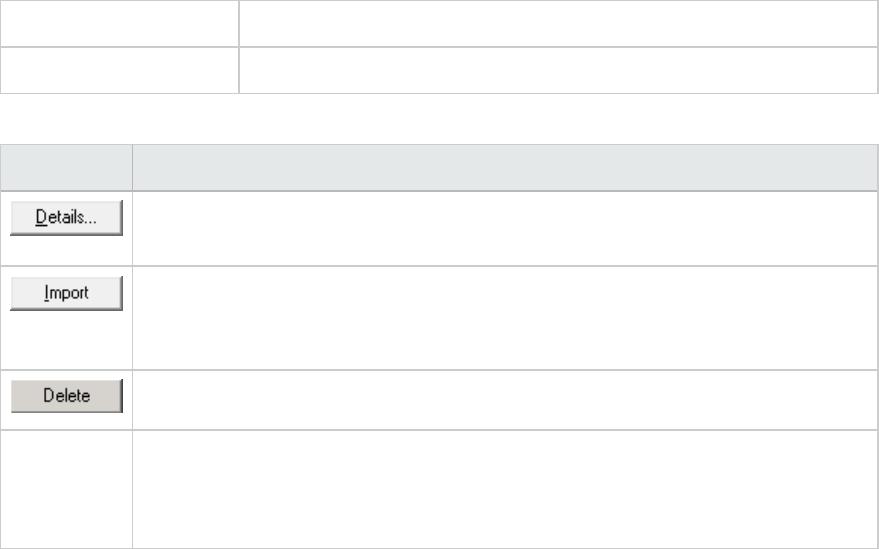
b. Indicate whether you want to analyze Incoming or Outgoing traffic and specify the server
whose traffic you want to analyze.
c. Select the section of the script into which you want to load the traffic: vuser_init,Action, or
vuser_end.
5. Filter the IP addresses - optional
Click the Filter Options button to open the Recording options and indicate which IP addresses to
ignore or include.
For details, see "Traffic Analysis > Traffic Filters Recording Options" on page206.
6. Configure the SSL - optional
Click the SSL Configuration button to add SSL certificates. This is necessary in order to analyze
traffic from a secure server.
For details, see the "SSL Configuration Dialog Box" on page907.
Specify Services Screen
This dialog box enables specify the basic details needed to begin recording a Web Services script.
To access VuGen > Start Record button
Relevant tasks "How to Add Content" on page888
User interface elements are described below (unlabeled elements are shown in angle brackets):
UI Element Description
Opens the Manage Services dialog box for providing further information about the
service. For more information, see "Manage Services Dialog Box" on page936.
Opens the Import Service dialog box. For more information, see the "Import Service
Dialog Box" on page940. For user interface details, see the "Import Service Dialog
Box" on page940.
Removes the selected service from the list.
<services
list>
A list of the available services:
lService Name. The native name of the service.
lWSDL Location. The source of the WSDL.
Specify Application to Record Dialog Box
This dialog box enables specify the basic details needed to begin recording a Web Services script.
User Guide
HP LoadRunner (12.50) Page 892
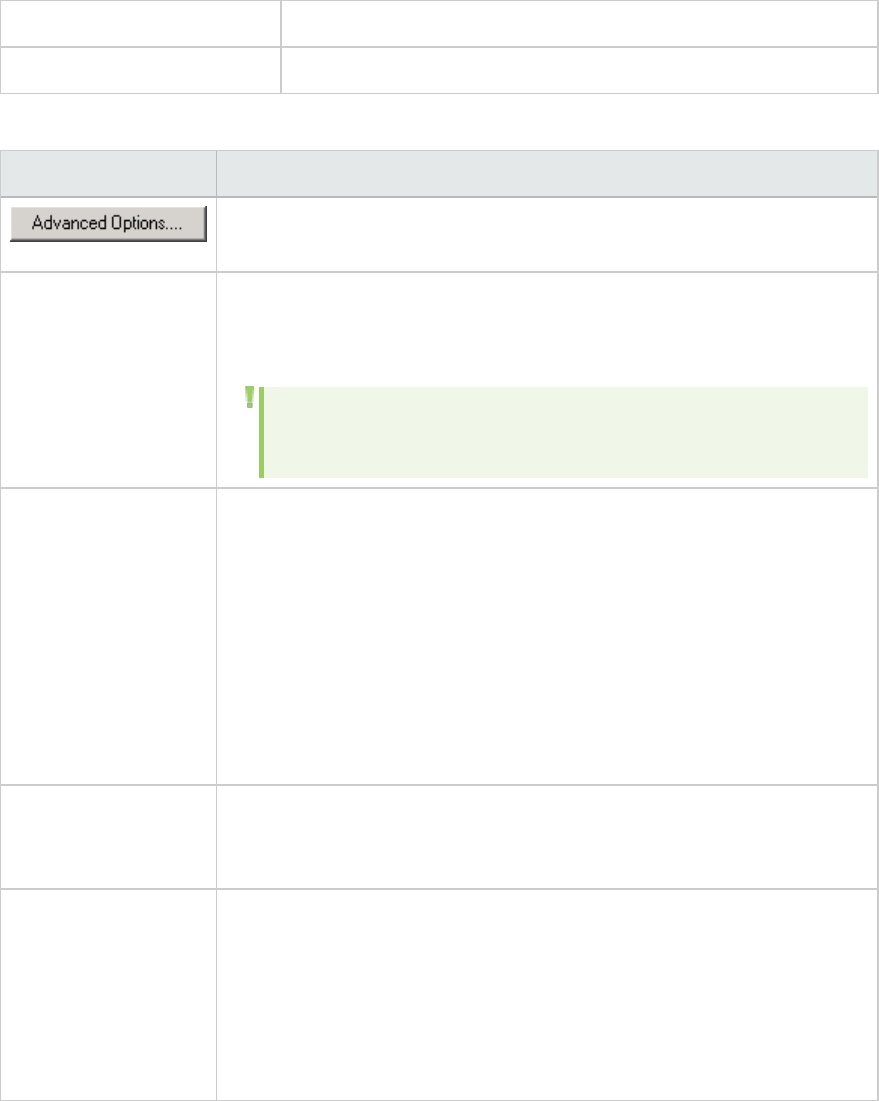
To access VuGen > Start Record button, Next
Relevant tasks "How to Add Content" on page888
User interface elements are described below:
UI Element Description
Opens the Recording Options dialog box. For user interface details, see
"Recording Options" on page146.
Record default Web
browser
Records the default browser actions. Specify the starting URL or click the
Browse button to navigate to a location.
Note: The Web Services protocol only supports IE as the default
browser.
Record any
application
Records any Win32 application. You can also specify the following:
lProgram to record. Select the browser, internet application, or Win32
application to record
lProgram arguments (Win32 Applications only). Command line arguments
for the application. For example, if you specify plus32.exe with the
command line options peter@neptune, it connects the user Peter to the
server Neptune when starting plus32.exe.
lWorking directory. A working folder for the application (only when
required by the application).
Record into action The section into which you want to record: vuser_init,Action, or vuser_end.
For actions you want to repeat, use the Action section. For initialization
steps, use vuser_init.
Record application
startup
In the following instances, it may not be advisable to record the startup:
lIf you are recording multiple actions, in which case you need to perform
the startup in only one action.
lIn cases where you want to navigate to a specific point in the application
before starting to record.
lIf you are recording into an existing script.
Import SOAP Dialog Box
This dialog box enables you to create a test step based on a SOAP file.
User Guide
HP LoadRunner (12.50) Page 893
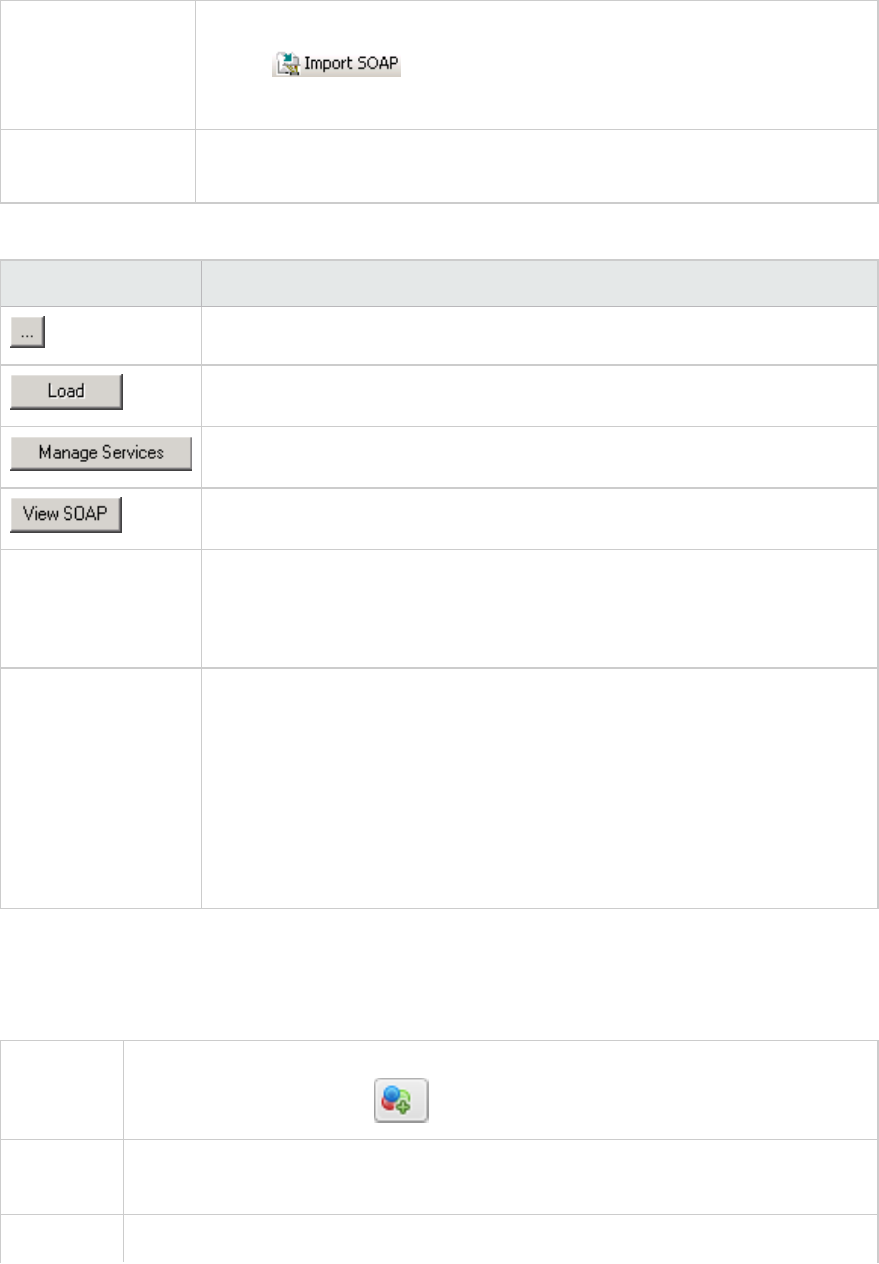
To access Use one of the following:
lClick
lSOA Tools > Import SOAP
Relevant tasks "How to Add Content" on page888
"Adding Web Service Script Content - Overview" on page880
User interface elements are described below (unlabeled elements are shown in angle brackets):
UI Element Description
Browse. Locate the XML file containing SOAP traffic.
Loads the element values from the SOAP file.
Opens the Manage Services dialog box for importing and configuring services.
Opens the SOAP file in a browser for viewing.
<Call type> The type of call to generate in the script/test:
lWeb Service Call. Requires the import of a service.
lSOAP Request. Generates a soap_request step in the script.
SOAP Request
Properties
The properties of the SOAP request (only visible for SOAP Request type calls).
Specify the following:
lURL. The URL or IP address of the server to which to submit the request.
lSOAP Action. The SOAP action to include in the request (applicable if there
are multiple actions).
lResponse Parameter. A parameter name to store the response of the
SOAP or Web Service call request.
New Web Service Call Dialog Box
This dialog box lets you create and configure a new Web Service call.
To access Open a Web Service Vuser script and then click SOA Tools > Add Service Call or click
the Add Service Call button on the VuGen toolbar.
Important
Information
To access the Web Service call properties for existing Web Service calls, select a step
in the Step Navigator and choose Properties from the shortcut menu.
Relevant "How to Add Content" on page888
User Guide
HP LoadRunner (12.50) Page 894

tasks
User interface elements are described below (unlabeled elements are shown in angle brackets):
UI Element Description
<service argument tree>
(left pane)
An expandable tree hierarchy of the Service containing the following
nodes:
l<operation name>
lTransport Layer Configuration
lCustom SOAP Header
lInput Arguments
lOutput Arguments
<parameter values> (right
pane)
Enables you to set and select values for each of the left pane's nodes.
Select Web Service Call Lets you set the following items:
lService. A drop-down list of all of the imported services, with the
name derived from the WSDL.
lPort Name. A drop-down list of available ports through which to send
the request.
lOperation. A drop-down list of the service's operations.
lTarget Address. The default endpoint of the service.
lOverride Address. Allows you to enter an alternate endpoint address
in the Target Address box.
<Operation Name> Node
Allows you to generate sample values for the operation's input arguments and add attachments.
User interface elements are described below:
UI Element Description
Method The name of the selected operation (read-only).
Description Free text area for entering a description of the service.
Attachments Handles input and output attachments:
lAdd to Request (Input). Attaches a file or parameter value to the
request.
lSave Received (Output). Saves the response to a parameter.
User Guide
HP LoadRunner (12.50) Page 895
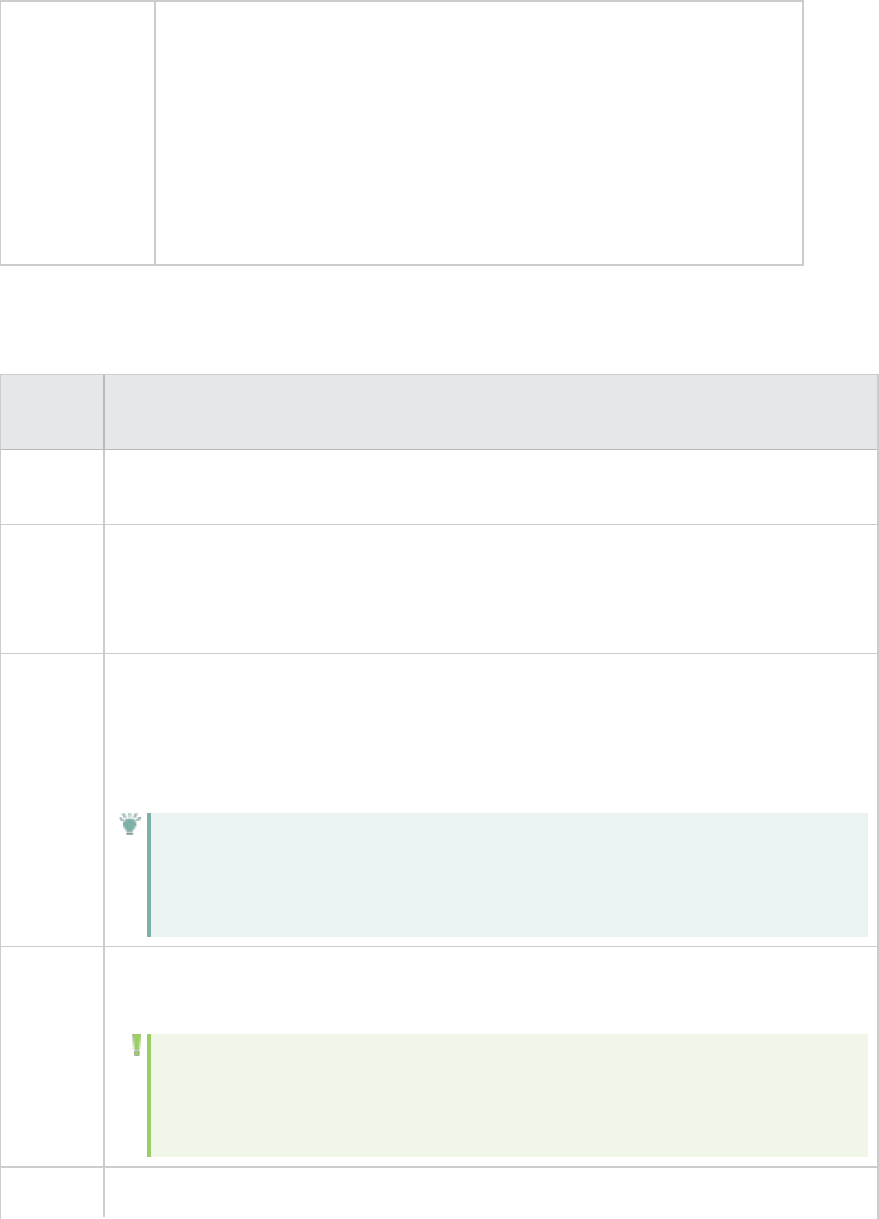
Step properties Lists the following service call properties and their values:
lWSDL file location
lService
lPort name
lTarget address
lSOAP action
lSOAP namespace
Transport Layer Configuration Node
User interface elements are described below:
UI
Element
Description
HTTP/S
Transport
Sets the transport method to HTTP or HTTPS transport.
Async
Support
Marks the Web Service call as an asynchronous message activated by an event:
Async Event. An arbitrary name for the event.
Note: Add a Web Service Wait For Event step to the script, to instruct the replay engine
to wait for the event.
WSA
Support
Enables WS-Addressing. Use one of the following options for a reply:
lWS-A Reply. An IP address of the server to reply to when the event occurs.
lAutodetect. Reply to the current host when the event occurs. This is useful when
running the same script on several machines.
Tip: To use WS-Addressing calls in synchronous mode, leave the Async Event box
empty. In Script view, remove the AsyncEvent argument. This instructs the replay
to block script execution until the complete response is received from the server.
JMS
Transport
Sets the transport method to JMS for synchronous messages. For details, see "Testing
Web Service Transport Layers Overview" on page908.
Note: For JMS asynchronous messages, manually add a JMS Send Message
Queue or JMS Receive Message Queue step to the script, to set up the message
queue information.
Override Enables you to provide the request and response queues.
User Guide
HP LoadRunner (12.50) Page 896
JMS
Queues
Request
Queue
The queue name for the request message.
Response
Queue
The queue name for the response message.
Custom SOAP Header Node
Lets you specify additional application-generated header elements to include in the SOAP envelope of
an HTTP message. For task details, see "How to Add Content" on page888.
User interface elements are described below:
UI Element Description
Opens an XML editor that lets you view and edit the SOAP header XML code.
Opens the Select XML File to Import dialog box.
Opens the Export SOAP Header into File dialog box.
Opens the Select or Create New Parameter dialog box.
Use SOAP Header Includes a SOAP header in the HTTP request.
Header The header source:
lFor an imported file: Header element as it appears in the imported file.
lFor a parameter: The parameter name (in curly brackets)
Input Arguments Node
Lets you set the properties and generate values for all input arguments.
User interface elements are described below:
UI Element Description
Includes all of the method's arguments in the Web Service call.
Resets the arguments to their original state. It removes their inclusion in the call,
and sets them to the values in the WSDL.
User Guide
HP LoadRunner (12.50) Page 897
Generates sample data for all of the input arguments.
Opens the pane for editing the selected argument's value.
Name The name of the operation (read-only)
Argument List A list of the input arguments.
lSimple parameters
lArrays (shows the top level only).
<Input Argument Name> Node
When selecting an input argument, the right pane allows you to specify argument values.
User interface elements are described below:
UI Element Description
Opens the "Add Array Elements Dialog Box" on page902 for adding a new array
element to the input argument (only visible when selecting a parent node in an input
array).
Removes the selected array element in the input argument (only visible when
selecting a parent node in an input array).
Includes the sub-arguments of the selected argument, in the Web Service call. This is
only enabled for an argument with sub-arguments with the Include argument in call
option enabled.
Excludes the sub-arguments of the parent argument, from the Web Service call.
Opens an XML editor for editing the XML code containing the argument values. The
only changes saved are the element values and the number of array elements.
Opens the Select XML File to Import dialog box,
Opens the Export argument XML into file dialog box.
Opens the Select or Create Parameter dialog box.
Name The name of the argument or array.
Include
argument in
Include the argument in the call. For arrays, click Include to add the sub arguments to
the call. To exclude all omittable arguments, click Exclude.
User Guide
HP LoadRunner (12.50) Page 898

call
Type The argument type as defined in the WSDL. When the WSDL contains derived types,
this box becomes a drop-down list. For details, see "Special Argument Types" on
page883.
Nil Sets the Nillable attribute to true.
XML (for
arrays only)
lXML. Enables the Edit,Import, and Export buttons. By editing the XML, you can
manually insert argument values. Click on the ABC icon to replace the entire XML
structure with a single XML type parameter. Note: This import operation handles
XML files that were previously exported—not standard SOAP files.
lGenerate auto-value for this argument. Inserts automatic values for all children
elements.
lAdd/Delete. Adds or removes elements from the array.
Value (for
non -array
elements)
The argument value. To parameterize this value, click the abc icon (only available for
non-arrays).
Generate
auto-value
for this
argument
Generates a sample value for the selected argument.
Input Attachments Node
Lets you add attachment to the input arguments. This is only visible if you enabled Add to request
(Input) in the operation name (top level parent) node.
User interface elements are described below:
UI Element Description
Open the Add Input Dialog box. In this dialog box, you specify the source, content-type,
and content-ID of the attachment.
Attachment
format
The format of the attachment, such as MIME,DIME, and so forth.
<Input Argument Attachment> Node
Lets you set the properties for input attachments. This is only visible if you enabled Add to request
(Input) in the operation name (top level parent) node.
User interface elements are described below:
User Guide
HP LoadRunner (12.50) Page 899
UI Element Description
Deletes the selected attachment parameter. If you have saved the attachments
by index, it only removes the selected item.
Take data from The source of the attachment—either a file, or an existing parameter.
Content-type The content type of the parameter: Detect automatically or specify a value
such as application/octet-stream.
Content-ID A unique content ID for the parameter: Generate automatically or specify a
value.
Output Arguments Node
Lets you see the properties of all output arguments.
User interface elements are described below:
UI Element Description
Opens the pane for editing the selected argument's value.
Name The name of the operation (read-only).
Argument List A list of the output arguments and the corresponding parameters storing the
values.
<Output Argument Name> Node
Lets you specify a parameter for storing the value of the output argument.
User interface elements are described below:
UI Element Description
Opens the "Add Array Elements Dialog Box" on page902 for adding a new array
element to the output argument (only visible when selecting a parent node in an
output array). For details, see the "Add Array Elements Dialog Box" on page902.
Removes the selected array element in the output argument (only visible when
selecting a parent node in the output array).
Name The name of the output argument or array.
Save
returned
value in
Saves the value of the selected argument to a parameter. To specify a custom
parameter name, modify the default Param_<arg_name> in the Parameter field.
User Guide
HP LoadRunner (12.50) Page 900
parameter
Nil Sets the value of the current argument to nil=true.
XML (for
arrays only)
XML code containing the argument values. To parameterize this value, click the abc
icon (only available for arrays).
Output Attachments Node
Lets you set the properties for output attachment parameters. This is only visible if you enabled Save
received (Output) attachments in the operation name (top level parent) node.
User interface elements are described below:
UI Element Description
Adds a new index-based output argument. This is available only when choosing Save
Attachments by Index.
Save All
Attachments
Saves all output attachments to a parameter with the following properties:
lContent. An editable name for the parameter storing the attachment
lContent-type. The type of parameter (read-only).
lContent-ID. A unique ID for the parameter (read-only).
Save
Attachments
by Index
Saves the output attachments to index-based parameters. To set the index, select
one of the parameters and modify the index number in the right pane.
<Output Argument Attachment> Node
Lets you set the properties for output attachments. This is only visible if you enabled Save received
(Output) attachments in the operation name (top level parent) node.
User interface elements are described below:
UI Element Description
Deletes the selected attachment parameter. If you have saved the attachments
by index, it only removes the selected item.
Index An index number for the parameter. This field is only enabled when you select
Save Attachments by Index in the Output Attachments node.
Content An editable name for the parameter storing the attachment
Content-type The content type of parameter (read-only).
Content-ID A unique content ID for the parameter (read-only).
User Guide
HP LoadRunner (12.50) Page 901
Add Input Attachment Dialog Box
This page enables you to add input attachments to your Web requests.
To access Click and select the top node—the Operation name. Select Add to
Request (input) in the Attachments section.
Important
information
You must import a service before adding an attachment to a service call.
For background information, see "Web Service Call Attachments" on page882.
Relevant
tasks
"How to Add Content" on page888
User interface elements are described below:
UI
Element
Description
Take
data
from
The location of the data.
lFile. The file location:
lAbsolute Path: The full path of the file. Note that this file must be accessible from all
machines running the script.
lRelative Path: (recommended) A file name. Using this method, during replay, VuGen
searches for the attachment file in the script's folder. To add it to the script's folder,
select File > Add Files to Script and specify the file name.
lParameter. The name of a parameter containing the data.
Content-
type
The content type of the file containing the data. The Detect Automatically option
instructs VuGen to automatically determine the content type. The Value box accepts
manual entries and provides a drop-down list of common content types.
Content-
id
A unique identifier for the attachment. By default, VuGen generates this automatically.
Optionally, you can specify another ID in the Value box.
Add Array Elements Dialog Box
This page enables you to add elements to an argument array with an identical structure to the existing
array. This is available for both Input and Output arguments.
For Input elements, you can base the new array's values on an existing element.
To access Click . Select an argument node that is an array.
Important You must have an array in your argument tree in order to view this dialog
User Guide
HP LoadRunner (12.50) Page 902
information box.
Relevant tasks "How to Add Content" on page888
User interface elements are described below:
UI Element Description
Name The name and index of the array's parent node.
Start Index The index from which to add new array elements.
Elements The number of identical array elements to add to your argument tree.
Copy values
from index
Creates the new array elements with the values of a specific array element (only
available for Input arguments).
Process Base64 Data - Simple Data Dialog Box
This dialog box enables you to set the encoding options for your simple base64 data.
To access For simple, non-complex Base64 values:
lSelect an input argument in the Web Service Call Properties of Base64 type.
lSelect the Value option.
lChoose Embed encoded text.
lClick the Browse button.
Important
information
For a complex array, use the "Process Base64 Data - Complex Data Dialog Box"
on the next page.
Relevant tasks "How to Add Content" on page888
User interface elements are described below:
UI Element Description
Allows you to save the decoded text to a file.
Text to encode For complex data, use the "Process Base64 Data - Complex Data Dialog Box" on
the next page.
Encoding Options A list of encoding methods.
Default: Unicode (UTF-8)
Encoded data The encoded version of the data from the Text to encode pane.
User Guide
HP LoadRunner (12.50) Page 903
Process Base64 Data - Complex Data Dialog Box
This dialog box enables you to set the encoding options for your complex base64 data.
To access For complex Base64 values:
lSelect a complex input argument in the Web Service Call Properties, of Base64
type.
lSelect the Value option click the Parameter icon.
lReplace the value with a parameter.
lRight-click the Parameter icon in the Value box and select Parameter
Properties.
lClick the Edit Data button.
lIn the desired values set column, click the B64 button.
Important
information
For simple, non-complex data, use the "Process Base64 Data - Simple Data Dialog
Box" on the previous page.
Relevant tasks "How to Add Content" on page888
User interface elements are described below:
UI Element Description
Encodes the specified file.
Enables you to save decoded data to a file. This is usually data obtained during
replay.
File Encode the file by reference or its contents.
lFile path. The file to encode.
lLink to file. References the file containing the values If cleared, it uses the
content of the specified file. It copies the content to the script folder.
Tip: For text exceeding 10KB, enable Link to file.
Text Encodes the specified text string.
lText to encode. The Base64 text to encode. As you type the text, VuGen
encodes it in the Encoded data pane.
lEncoding Options. A list of encoding methods. The default is Unicode (UTF-8).
User Guide
HP LoadRunner (12.50) Page 904

Aspects List
The following table lists the available testing aspects:
Aspect Name Description
Positive
Testing
Generates a full positive test that checks each operation of the service.
Standard
Compliance
Checks the service's compliancy with industry standards such as WS-I and SOAP.
Service
Interoperability
Tests the interoperability of the service's operations with all supported Web
Services toolkits.
Contains the following sub-aspects:
l.NET Framework. Tests that the services are fully interoperable with .NET
Framework WSE 2 Toolkit by calling all of its operations with default/expected
values.
lAxis/Java Based Web Services. Tests that the services are fully interoperable
with Axis 1.3 Web Services Framework by calling all of its operations with
default/expected values.
Security
Testing
Tests service security. Contains the following sub-aspects:
lSQL Injection Vulnerability. Checks if the service is vulnerable to SQL injections
by injecting SQL statements and errors into relevant parameters.
lCross-site Scripting (XSS). Attempts to hack the service by injecting code into a
Web site that will disrupt its functionality.
Boundary
Testing
Using the negative testing technique, creates tests to manipulate data, types,
parameters, and the actual SOAP message to test the service to its limits.
Contains the following sub-aspects:
lExtreme Values. Provides invalid data types to the services and verifies they
are not accepted.
lNull Values. Provides NULL parameters to the services to verify they are not
accepted.
Performance
Testing
Contains the following sub-aspects:
lStress Testing. Tests the maximum load that can be placed on the application.
lOverload Sustainability Testing. Tests how well the hardware allocated for the
application can support the number of anticipated users.
lVolume Testing. Tests that the system can handle a massive data entry.
lLongevity Test. Tests that the system can sustain a consistent number of
concurrent Vusers executing transactions using near-peak capacity, over a
User Guide
HP LoadRunner (12.50) Page 905
minimum 24-hour period.
lScalability Testing. Repeated stress, overload, volume, and longevity tests with
different server or network hardware configurations.
, continued
Specify Services Screen
This wizard screen enables you to select Web services to associate with your traffic-based script.
To access Analyze Traffic button
Relevant tasks "How to Add Content" on page888
User interface elements are described below (unlabeled elements are shown in angle brackets):
UI Element Description
Opens the Manage Services dialog box for providing further information about the
service. For more information, see "Manage Services Dialog Box" on page936.
Opens the Import Service dialog box. For more information, see "Import Service
Dialog Box" on page940.
Removes the selected service from the list.
<services
list>
A list of the available services:
lService Name. The native name of the service.
lWSDL Location. The source of the WSDL.
Specify Traffic Information Screen
This wizard screen enables you to specify the capture file for the incoming or outgoing traffic.
To access Analyze Traffic button, Next
Relevant tasks "How to Add Content" on page888
User interface elements are described below:
UI Element Description
Browse. Allows you to select a capture file to import.
Opens the Traffic Filters node in the Recording Options dialog box. This
allows you to specify which IP addresses to include or exclude from the
script. For details, see "Recording Options" on page146.
User Guide
HP LoadRunner (12.50) Page 906
Opens the "SSL Configuration Dialog Box" below which allows you to add SSL
certificates to analyze traffic from a secure server.
Capture file The name of a capture file containing the server traffic, usually with a cap
extension.
Incoming Traffic The IP address and port of the server whose incoming traffic you want to
examine.
Outgoing Traffic The IP address of the server whose outgoing traffic you want to examine.
Record into action The section into which you want to create the script: vuser_init,Action, or
vuser_end. For actions you want to repeat, use the Action section. For
initialization steps, use vuser_init.
SSL Configuration Dialog Box
This dialog box enables you to configure the SSL information for decrypting your traffic file.
To access Analyze Traffic button, Next,
Relevant tasks "How to Add Content" on page888
User interface elements are described below (unlabeled elements are shown in angle brackets):
UI Element Description
Add Certificate. Adds a new entry to the certificate list,
containing information about an SSL server and its private key.
Delete. Removes the selected private key.
<certificate list> The properties of the SSL entry. Specify the following:
lIP. IP address of the server being analyzed.
lPort. Port of the server being analyzed.
lFile. The path of the certificate file (with a pem extension)
containing the private key. Use the Browse button to locate
the file.
lPassword. A password for decrypting the private key.
See Certificate Utility below for details on how to convert
certificates.
Opens the Convert Certificate tab of the SSL Utility that
enables you to convert certificates from PKCS #12 and X.509
formats to PEM format.
User Guide
HP LoadRunner (12.50) Page 907

For details on how to convert the certificate to PEM format, see
the "SSL Utility" on page1149, or see Help > LoadRunner
Function Reference > Web Vuser Functions (WEB) > Web Vuser
Functions > web_set_certificate_ex.
Web Services - Preparing Scripts for Replay
Preparing for Replay Overview
After you create a script with Web Service calls, you prepare it for replay.
You can enhance it with custom error and log messages or with transactions. In addition, you can
enhance your script with JMS functions, jms_<suffix> or XML functions, lr_xml_<suffix>. For more
information, see the Function Reference (Help > Function Reference).
Runtime settings let you emulate real users more accurately, configure the runtime settings. These
settings include general settings and Web Service specific settings. For details, see "Runtime Settings
Overview" on page280.
In certain cases, you may need to use the result of one Web Service call as input for another. To do this,
you save the result to a parameter and reference it later. For more information, see "How to Prepare
Scripts for Replay" on page918.
Testing Web Service Transport Layers Overview
Web services can be sent over various transport layers. The transport layer is the protocol used to
transport messages to and from the server.
VuGen allows you to configure the transport layer for your services. It fully supports HTTP/HTTPS and
JMS (Java Message Service) transport layers.
With user handlers, you can process SOAP requests and responses and assign them a custom behavior.
For more information, see " User Handlers" on page913.
l"Sending Messages over HTTP/HTTPS" below
Sending Messages over HTTP/HTTPS
HTTP is used for sending requests from a Web client, usually a browser, to a Web server. HTTP is also
used to return the Web content from the server back to the client.
HTTPS handles secure communication between a client and server. Typically, it handles credit card
transactions and other sensitive data.
The typical request and response mechanism is synchronous. In synchronous messaging, the replay
engine blocks script execution until the server sends its response. In asynchronous mode, the replay
engine executes the script without waiting for server's response for previous messages.
User Guide
HP LoadRunner (12.50) Page 908

If you are working with HTTP or HTTPS transport, you can use asynchronous calls in conjunction with WS-
Addressing. For details, see "WS-Addressing" on page911.
JMS Transport Overview
JMS is a J2EE standard for sending messages, either text or Java objects, between Java clients.
There are two scenarios for communication:
Peer-to-Peer. Also known as Point-to-Point. JMS implements point-to-point messaging by defining a
message queue as the target for a message. Multiple senders send messages to a message queue, and
the receiver gets the message from the queue.
Publish-Subscribe. Each message is sent from one publisher to many subscribers through a designated
topic. The subscribers only receive messages sent after they have subscribed.
VuGen supports point-to-point communication by allowing you to send and receive JMS messages to
and from a queue.
Before you can send messages over JMS transport, you need to configure several items that describe
the transport:
lJNDI initial context factory. The class name of the factory class that creates an initial context which
will be used to locate the JMS resources such as JMS connection factory or JMS queue.
lJNDI provider. The URL of the service provider which will be used to locate the JMS resources such as
JMS connection factory or JMS queue.
lJMS connection factory. The JNDI name of the JMS connection factory.
In addition, you can set a timeout for received messages and the number of JMS connections per
process.
You configure these settings through the JMS runtime settings. For details, see the JMS > Advanced
view.
This section also includes:
l"JMS Script Functions" below
l"JMS Message Structure" on the next page
JMS Script Functions
VuGen uses its API functions to implement the JMS transport. Each function begins with a jms prefix:
Function Name Description
jms_publish_
message_topic
Publishes messages to a specific topic
jms_receive_
message_queue
Receives a message from a queue
User Guide
HP LoadRunner (12.50) Page 909

jms_receive_
message_topic
Receives published messages to a specific topic on a subscription.
jms_send_message_
queue
Sends a message to a queue.
jms_send_receive_
message_queue
Sends a message to a specified queue and receives a message from a
specified queue.
jms_subscribe_topic Creates a subscription for a topic.
jms_set_general_
property
Sets a general property in the user context.
jms_set_message_
property
Sets a JMS header or property for the next message to be sent, or uses a JMS
header or property to filter received messages.
The JMS steps/functions are only available when manually creating scripts—you cannot record JMS
messages sent between the client and server.
Unlike peer-to-peer communication that uses message queues, the publish-subscribe functions, jms_
publish_message_topic,jms_subscribe_topic, and jms_receive_message_topic, are not supported for
Web Service calls. To use these functions with Web Service calls, you must manually set up user
handlers to generate the JMS message payload. For more information, see "How to Create a User
Handler" on page923.
For details about the JMS functions, see the Function Reference (Help > Function Reference or click F1
on the function).
JMS Message Structure
Each JMS message is composed of:
lHeader. contains standard attributes (Correlation ID, Priority, Expiration date).
lProperties. custom attributes.
lBody. text or binary information.
JMS can be sent with several message body formats. Two common formats are TextMessage and
BytesMessage.
To override the default behavior, use a jms_set_general_property function before sending the
message. Set the JMS_MESSAGE_TYPE property to TextMessage, BytesMessage, or Default. For
Example:
jms_set_general_property("step1","JMS_MESSAGE_TYPE","BytesMessage");
For more information, see the Function Reference (Help > Function Reference).
User Guide
HP LoadRunner (12.50) Page 910
Asynchronous Messages Overview
You can use VuGen to emulate both synchronous and asynchronous messaging.
In synchronous messaging, the replay engine blocks script execution until the server sends its response.
In asynchronous mode, the replay engine executes the script without waiting for server's response for
previous messages.
This section also includes:
l"Sending Asynchronous Calls with HTTP/HTTPS" below
l"WS-Addressing" below
Sending Asynchronous Calls with HTTP/HTTPS
This following section describes how to use asynchronous calls in HTTP/HTTPS. You use a Wait for Event
step to instruct Vusers to wait for the response of previous asynchronous requests before continuing.
The listener blocks the execution of the service until the server responds.
When adding a Web Service Wait for Event step, you specify the following:
lQuantifier. The quantifier indicates whether the Vuser should wait for ALL events to receive a
response or ANY, just one of them. ANY returns the name of the first event to receive a response.
ALL returns one of the event names.
lTimeout. the timeout in milliseconds. If no events receive responses in the specified timeout, then
web_service_wait_for_event returns a NULL.
lEvents. a list all of the asynchronous events for which you want to wait.
When running a script with asynchronous messaging, the Replay log provides information about the
events and the input and output arguments.
For task details, see "How to Send Messages over HTTP/S" on page920.
When setting up an asynchronous message, you can set the location to which the service responds
when it detects an event using WS-Addressing. For more information, see "WS-Addressing" below.
WS-Addressing
WS-Addressing is a specification that allows Web Services to communicate addressing information. It
does this by identifying Web service endpoints in order to secure end-to-end endpoint identification in
messages. This allows you to transmit messages through networks that have additional processing
nodes such as endpoint managers, firewalls, and gateways. WS-Addressing supports Web Services
messages traveling over both synchronous or asynchronous transports.
The WS-Addressing specification requires a WSAReplyTo address—the location to which you want the
service to reply.
An optional WSAAction argument allows you to define a SOAP action for instances where transport
layers fails to send a message.
User Guide
HP LoadRunner (12.50) Page 911
The following example illustrates a typical SOAP message using WS-Addressing, implemented in the
background by VuGen.
<S:Envelope xmlns:S="http://www.w3.org/2003/05/soap-envelope"
xmlns:wsa="http://www.w3.org/2004/12/addressing">
<S:Header>
<wsa:MessageID>
http://example.com/SomeUniqueMessageIdString
</wsa:MessageID>
<wsa:ReplyTo>
<wsa:Address>http://myClient.example/someClientUser</wsa:Address>
</wsa:ReplyTo>
<wsa:Address>http://myserver.example/DemoErrorHandler</wsa:Address>
</wsa:FaultTo>
<wsa:To>http://myserver.example/DemoServiceURI</wsa:To>
<wsa:Action>http://myserver.example/DoAction</wsa:Action>
</S:Header>
<S:Body>
<!-- Body of SOAP request message -->
</S:Body>
</S:Envelope>
In the following example, the server responds to the interface 212.199.95.138 when it detects Event_1.
web_service_call("StepName=Add_101",
"SOAPMethod=Calc.CalcSoap.Add",
"ResponseParam=response",
"AsyncEvent=Event_1", "WSAReplyTo=212.199.95.138",
"WSDL=http://lab1/WebServices/CalcWS/Calc.asmx?wsdl",
"UseWSDLCopy=1",
"Snapshot=t1153825715.inf",
BEGIN_ARGUMENTS,
"first=1",
"second=2",
END_ARGUMENTS,
BEGIN_RESULT,
"AddResult=Param_AddResult1",
END_RESULT,
LAST);
You can issue WS-Addressing calls in both asynchronous and synchronous modes. To use WS-Addressing
in synchronous mode, leave the Async Event box empty in the Transport Layer options. In Script view,
remove the AsyncEvent argument. This instructs the replay engine to block script execution until the
complete response is received from the server.
For task details, see "How to Send Messages over HTTP/S" on page920.
User Guide
HP LoadRunner (12.50) Page 912
Customizing Overview
VuGen provides several advanced capabilities that allow you to customize the way your script behaves.
These capabilities are user handlers and configuration files.
With user handlers, you can process SOAP requests and responses and assign them a custom behavior.
For more information, see below.
Configuration files let you customize advanced settings such as security information and the WSE
configuration.
l" User Handlers" below
l" Custom Configuration Files" on page915
User Handlers
User Handlers are open APIs through which you can perform the following operations:
lGet and set the request/response SOAP envelopes
lOverride the transport layer
lGet and set the request/response content type
lGet and Set values for LoadRunner parameters
lRetrieve a configuration argument from the script
lIssue messages to the execution log
lFail an execution
You can set up a user handler directly in a script, or implement it through a DLL. You can apply the
handler locally or globally.
For task details, see "How to Create a User Handler" on page923.
For sample user handlers, see " User Handler Examples" on page915.
Handler Function Definitions
For basic implementation of a user handler, you define a user handler function within your Vuser script
with the following syntax:
int MyScriptFunction(const char* pArgs, int isRequest)
The pArgs argument contains the string that is specified in UserHandlerArgs argument of web_
service_call function.
The isRequest argument indicates whether the function is being called during processing of a Request
(1) or Response (0) SOAP envelope.
User Guide
HP LoadRunner (12.50) Page 913

The content of SOAP envelope is passed to a parameter called SoapEnvelopeParam for both requests
and responses. After the function processes the SOAP envelope, make sure to store it in the same
parameter.
To call the handler function, use the function name as a value for the UserHandlerFunction argument in
the relevant Web Service Call step. For more information, see the Function Reference (Help > Function
Reference).
Event Handler Return Codes
VuGen recognizes the following return codes for the handler function.
Return Code Description
LR_HANDLER_SUCCEEDED 0 The Handler succeeded, but the SOAP envelope did not change.
LR_HANDLER_FAILED 1 The Handler failed and further processing should be stopped.
LR_HANDLER_SUCCEEDED_
AND_MODIFIED
2 The Handler succeeded and the updated SOAP envelope is stored
in SoapEnvelopeParam.
In the following example, a script handler manipulates the outgoing envelope:
//This function processes the SOAP envelope before sending it to the server.
int MyScriptFunction(const char* pArgs, int isRequest)
{
if (isRequest == 1) {
//Get the request that is going to be sent
char* str = lr_eval_string("{SoapEnvelopeParam}");
//Manipulate the string...
//Assign the new request content
lr_save_string(str, "SoapEnvelopeParam");
return LR_HANDLER_SUCCEEDED_AND_MODIFIED;
}
return LR_HANDLER_SUCCEEDED;
}
Action()
{
//Instruct the web_service_call to use the handler
web_service_call( "StepName=EchoAddr_102",
"SOAPMethod=SpecialCases.SpecialCasesSoap.EchoAddr",
"ResponseParam=response",
"userHandlerFunction=MyScriptFunction",
"Service=SpecialCases",
"Snapshot=t1174304648.inf",
BEGIN_ARGUMENTS,
"xml:addr="
"<addr>"
"<name>abcde</name>"
User Guide
HP LoadRunner (12.50) Page 914
"<street>abcde</street>"
"<city>abcde</city>"
"<state>abcde</state>"
"<zip>abcde</zip>"
"</addr>",
END_ARGUMENTS,
BEGIN_RESULT,
END_RESULT,
LAST);
return 0;
Custom Configuration Files
Configuration files let you customize advanced settings such as security information and the WSE
configuration. These files let you control the behavior of the test during runtime.
The standard .NET configuration file, mmdrv.exe.config, is located in the VuGen installation folder.
Some applications have their own configuration file, app.config.
You can customize the test run further, by filtering out the input or output. In addition, you can
configure security information. such as token information and whether or not to allow unsigned test
certificates.
For task details, see "How to Customize Configuration Files" on page926.
User Handler Examples
This section illustrates several common uses for user handlers.
.NET Filters
You can apply a .NET filter to your messages using the user handler mechanism.
If you are familiar with Microsoft's Web Service Enhancements (WSE) 2.0, you can create a .NET filter
and register it for incoming or outgoing SOAP messages. A .NET filter is a class that is derived from
Microsoft.Web.Services2.SoapInputFilter or Microsoft.Web.Services2.SoapOutputFilter. By overriding the
ProcessMessage function of this class, you can examine and modify the envelope's body and header.
To define the filter globally for the entire script, add the following lines to the script's default.cfg file
below.
[UserHandler]
Function=LrWsSoapFilterLoader
Args=<Filters InputFilterClass="class name" InputFilterLib="lib name"
OutputFilterClass="class name" OutputFilterLib="lib name" />
Order=BeforeSecurity/AfterSecurity/AfterAttachments
The InputFilterClass parameter indicates the name of your class, and InputFilterLib indicates the name
of the assembly in which the class resides. For example:
User Guide
HP LoadRunner (12.50) Page 915
web_service_call(
...
"UserHandlerName=LrWsSoapFilterLoader",
"UserHandlerArgs=<Filters
InputFilterClass=\"MyFilterNamespace.MyFilterClassName\"
InputFilterLib=\"MyAssemblyName\" />",
BEGIN_ARGUMENTS,
...
END_ARGUMENTS,
...
);
Use SoapOutputFilter to examine an outgoing web_service_call request, and SoapInputFilter to
examine the response from the server. Use InputFilterClass and InputFilterLib if your filter is derived
from SoapInputFilter, or OutputFilterClass and OutputFilterLib if your filter is derived from
SoapOutputFilter.
To define the filter for a specific step, add the following arguments to the web_service_call function.
UserHandlerName= LrWsSoapFilterLoader
UserHandlerArgs=<Filters InputFilterClass=\"class name\" InputFilterLib=\"lib
name\" OutputFilterClass=\"class name\" OutputFilterLib=\"lib name\" />
UserHandlerOrder=BeforeSecurity/AfterSecurity/AfterAttachments
Overriding the Transport Layer
The following example shows a user handler function overriding the transport layer. VuGen does not
automatically send the SOAP request over HTTP transport—instead it follows the transport method
indicated in the custom handler.
After you receive a response, set the response envelope with the command:
lr_save_string(someResponseEnvelopeStr, "SoapEnvelopeParam");
To apply an alternate transport layer, specify ReplaceTransport as a value for the UserHandlerOrder
argument. Define the transport layer in the handler.
web_service_call(
...
"UserHandlerFunction=<Transport HandlerFunction>",
"UserHandlerArgs=<handler arguments>",
"UserHandlerOrder=ReplaceTransport"
...
LAST);
User Guide
HP LoadRunner (12.50) Page 916
Including MIME Attachments
When working with Web Service scripts based on the .NET toolkit, the infrastructure does not support
MIME attachments. Using the handlers mechanism, you can add MIME attachment functionality to .NET
scripts.
The following sections describe how to send and receive MIME attachments for the .NET toolkit. You can
receive and send a MIME attachment in the same operation.
Sending MIME Attachments
To send a MIME attachment, add the boldfaced code to the web_service_call:
web_service_call( "StepName=EchoComplex_101",
"SOAPMethod=SimpleService|SimpleServiceSoap|EchoComplex",
"ResponseParam=response",
"Service=SimpleService",
"UserHandlerName=LrWsAttachmentsHandler", "UserHandlerArgs=ATTACHMENT_ADD;
ATTACHMENTS_FORMAT_MIME; ContentType=text/plain;
FileName=C:\\temp\\results.discomap",
"ExpectedResponse=SoapResult",
"Snapshot=t1208947811.inf",
BEGIN_ARGUMENTS,
"xml:cls="
"<cls>"
"<i>123456789</i>"
"<s>abcde</s>"
"</cls>",
END_ARGUMENTS,
BEGIN_RESULT,
END_RESULT,
LAST);
Modify the FileName and ContentType parameters to indicate the actual path and content type.
Receiving MIME Attachments
To receive a MIME attachment, add the following code to the web_service_call:
"UserHandlerName=LrWsAttachmentsHandler",
"UserHandlerArgs=ATTACHMENT_SAVE_ALL;ParamNamePrefix=attach;"
Sending and Receiving MIME Attachments
To send and receive a MIME attachment in the same web_service_call, modify the Web Service call as
shown below:
"UserHandlerName=LrWsAttachmentsHandler",
"UserHandlerArgs=ATTACHMENT_SAVE_ALL;ParamNamePrefix=attach; ATTACHMENT_ADD;
User Guide
HP LoadRunner (12.50) Page 917
ATTACHMENTS_FORMAT_MIME; ContentType=text/plain;
FileName=C:\\temp\\results.discomap",
How to Prepare Scripts for Replay
This task describes how to prepare the script for replay and run it.
Assign Input Parameter Values
First save the output result to a parameter, and then reference that parameter in a later Web Service
call.
1. Save the output parameter.
a. In the Step Navigator, double-click the Web Service call whose output you want to use, to view
its properties.
b. In the left pane, select the output argument whose value you want to save to a parameter.
c. In the right pane, select Save returned value in parameter. Specify a name in the Parameter
box.
2. Use the saved parameter for input.
a. In the Step Navigator, double-click the Web Service call whose input parameters you want to
set.
b. In the left pane, select the input argument for which to use the saved parameter.
c. In the right pane, select Value, and click on the abc icon. The Select or Create Parameter box
opens.
d. Select the saved output parameter from the Parameter name list.
e. To specify an input parameter in Script view, select the value you want to replace and select
Use Existing Parameters from the shortcut menu. Select one of the available parameters.
Set the Runtime Settings - Optional
Open the runtime settings (F4) to configure JMS and VM settings. Click the JMS > Advanced node. For
details, see the JMS > Advanced view in the runtime settings.
Configure XSDs With any type Elements - Optional
For Web Services that have an XSD schema with an Any type element, <xsd:element name="<Any_
element>" type="xsd:anyType" />, check that the script conforms with the following model:
BEGIN_ARGUMENTS,
"xml:Any_element="
"<Any_element>"
"<string>the string to send</string>"
"</Any_element>",
END_ARGUMENTS,
User Guide
HP LoadRunner (12.50) Page 918
The actual SOAP may differ slightly, but as long as your script conforms to the above model, it will run
properly.
You can also send complex type elements for the <any> type. For example:
"xml:Any_element="
"<Any_element>"
"<myComplexTypeName>"
"<property1>123</property1>"
"<property2>456</property2>"
"</myComplexTypeName>"
"</Any_element>",
Run the Script
Click Replay > Run. Observe the output log for relevant messages.
Review the Test Results
The Test Results viewer opens automatically after the test run. An X indicates a failed step.
Expand the nodes to see detailed information about the SOAP response and checkpoints. For details,
see "Viewing Replay Results" on page416.
How to Send Messages over JMS
This task describes how to send messages using the JMS transport method.
1. Open the step properties
In the Step Navigator, select the step whose transport you want to set, and then select Show
Arguments from the shortcut menu.
2. Select the JMS transport method
Select the Transport Layer Configuration node and choose JMS Transport.
For UI details, see "New Web Service Call Dialog Box" on page894.
3. Set the runtime settings - optional
Configure the runtime settings as described in the JMS > Advanced view.
4. Send synchronous JMS messages - optional
Once you create a Web Service call and designate the transport method as JMS, VuGen sends the
JMS messages in a synchronous manner. If desired, specify the queue information.
5. Send asynchronous JMS messages - optional
To implement asynchronous messages over JMS, you send the request or retrieve the response
using JMS steps—not Web Service calls.
User Guide
HP LoadRunner (12.50) Page 919
a. Click within the script at the desired location. Select Insert > New Step from the right-click
menu, and locate the JMS Functions in the Steps Toolbox.
b. Select a JMS function: JMS Send Message Queue sends a message to a queue. JMS Receive
Message Queue receives a message from the queue.
c. Click OK to open the JMS function properties.
d. Specify a queue name and click OK to generate the JMS functions.
For additional information about these functions, see the Function Reference (Help > Function
Reference or click F1 on the function).
6. Send messages over JMS using SOAP messages - optional
To send messages over JMS, using the SOAP message and without a Web Service call:
a. Record SOAP messages using a standard Web protocol.
b. Click within the script at the desired location. Select Insert > New Step from the right-click
menu, and locate the JMS Functions in the Steps Toolbox.
c. Select a JMS function: Send Message Queue or JMS Receive Message Queue.
d. Click OK to open the JMS function properties.
e. Specify a queue name and click OK to generate the JMS functions.
For details, see the Function Reference (Help > Function Reference or click F1 on the
function).
How to Send Messages over HTTP/S
This task describes how to send messages using the HTTP transport method.
1. Open the step properties
In the Step Navigator, select the step whose transport you want to set, and then select Show
Arguments from the shortcut menu.
2. Select the HTTP/S transport method
Select the Transport Layer Configuration node and choose HTTP/S Transport.
3. Send a HTTP synchronous message - optional
To send messages in synchronous mode over HTTP, create a standard Web Service call, and do not
enable the Async Support option.
4. Send asynchronous HTTP messages - optional
a. Choose HTTP/S Transport and select the Async Support option.
b. Type an event name in the Async Event box.
c. Click OK to generate the Web Service call.
User Guide
HP LoadRunner (12.50) Page 920
d. Add a Wait for Event step. Select Insert > New Step from the right-click menu and choose
web_service_wait_for_event from the SOAP functions in the Steps Toolbox.
e. Specify a step name, a quantifier, and a timeout. Click Add and insert the name of the event
that you defined in the previous step.
In Script view, VuGen indicates asynchronous messaging with the added parameter,
AsyncEvent.
web_service_call("StepName=EchoString_101",
"SOAPMethod=EchoRpcEncoded.EchoSoap.EchoString",
"ResponseParam=response1",
"Service=ExtendedECHO_rpc_encoded",
"AsyncEvent=Event_1",
"Snapshot=t1157371707.inf",
BEGIN_ARGUMENTS,
"sec=7",
"strString=mytext",
END_ARGUMENTS,
BEGIN_RESULT,
"EchoStringResult=first_call",
END_RESULT,
LAST);
The AsyncEvent flag instructs the Vuser to wait for the response of previous asynchronous
service requests.
5. Send an asynchronous message using WS-Addressing - optional
a. Select the Async Support option and provide an event name in the Async Event box. This can
be an arbitrary name.
b. Select WSA Support. In the WS-A Reply to box, enter an IP address or autodetect to use the
current host. Autodetect is useful when running the same script on several different machines.
The server will reply to the specified location when the event occurs.
c. Click OK to save the settings.
d. Instruct the Vuser to wait for an event. Select Insert > New Step from the right-click menu
and choose web_service_wait_for_event from the SOAP functions in the Steps Toolbox.
e. Specify a step name, quantifier, and timeout. To add an event name, click Add. The Web
Service will wait for the specified event before responding.
f. Use the Edit,Move Up, and Move Down buttons to manipulate the events.
How to Define a Testing Method
This task describes how to select a testing method.
1. Open the step properties
User Guide
HP LoadRunner (12.50) Page 921
In the Step Navigator, right-click the step whose response you want to test, and select Show
Arguments.
2. Select an argument
Select the Output Argument node. For details, see "New Web Service Call Dialog Box" on page894.
3. Select a testing method and choose an expected response
lTo perform negative testing only, select the Negative Testing check box and choose SOAP
Fault as the Expected Response.
lTo accept any type of SOAP response, select the Negative Testing check box and choose Any
SOAP as the Expected Response.
lTo perform positive testing only, clear the Negative Testing check box.
4. Verify function in the script
In Script view, VuGen indicates the testing method with the ExpectedResponse argument. In the
following example, the script performs negative testing, indicated by the SoapFault value:
web_service_call("StepName=AddAddr_101",
"SOAPMethod=AddrBook|AddrBookSoapPort|AddAddr",
"ResponseParam=response",
"Service=AddrBook",
"ExpectedResponse=SoapFault",
"Snapshot=t1189409011.inf",
BEGIN_ARGUMENTS,
END_ARGUMENTS,
BEGIN_RESULT,
END_RESULT,
LAST);
5. Evaluate the SOAP fault value
When you replay a script that results in a SOAP fault, VuGen saves the fault to a parameter called
response. To check the returned value of the SOAP fault, evaluate the response output parameter
using lr_xml_find.
In the following example, lr_xml_find checks for a VersionMismatch SOAP fault and issues an
output message.
lr_xml_find("XML={response}",
"FastQuery=/Envelope/Body/Fault/faultString ",
"Value=VersionMismatch",
LAST);
if (soap_fault_cnt >0)
lr_output_message{"A Version Mismatch SOAP Fault occurred")
For more information about lr_xml_find, see the Function Reference (Help > Function Reference).
User Guide
HP LoadRunner (12.50) Page 922
How to Add a Database Connection
This task describes how to add a database connection step through Tree view.
1. Open Solution Explorer
Select View > Solution Explorer.
2. Select a section
Select the desired section: vuser_init or Action. To avoid repeating the connection sequence in
every iteration, place it in the vuser_init section.
3. Insert a database connection step
Select Design > Insert in Script > New Step. Choose the lr_db_connect step. The Database
Connection dialog box opens. Specify a Step Name,Connection Name, and Data Provider, OLEDB or
SQL.
4. Create a database connection string
a. Click Connection String Generator to generate a database connection string specific to your
environment.
b. Indicate the connection properties:
oServer Name
oDatabase Name
oAuthentication method: Windows Authentication or User/password.
oUsername and Password
c. Click Test Connection to verify that the information you provided is correct.
d. Select an SQL Provider, OLEDB or SQL, and click Generate.
5. Verify function in the script
Check that an lr_db_connect function was written to the script.
How to Create a User Handler
This task describes how to write a user handler for your script.
1. Prerequisite - Create a Web Service call
Import a WSDL file and create a standard Web Service Call. For details, see "Adding Web Service
Script Content - Overview" on page880.
2. Define a user handler function
User Guide
HP LoadRunner (12.50) Page 923
Define a user handler before the Web Service call:
int MyScriptFunction(const char* pArgs, int isRequest)
{
...
}
3. Call the user handler function
Call the handler function by specifying the function name as a value for the UserHandlerFunction
argument. in the Web Service Call.
web_service_call(
...
"UserHandlerFunction=MyScriptFunction",
"UserHandlerArgs=<handler arguments>",
LAST);
4. Evaluate the handler function
Evaluate the handler's return code to determine if it succeeded. Use the return codes as described
in " User Handlers" on page913.
//This function processes the SOAP envelope before sending it to the server.
int MyScriptFunction(const char* pArgs, int isRequest)
{
if (isRequest == 1) {
//Get the request that is going to be sent
char* str = lr_eval_string("{SoapEnvelopeParam}");
//Manipulate the string...
//Assign the new request content
lr_save_string(str, "SoapEnvelopeParam");
return LR_HANDLER_SUCCEEDED_AND_MODIFIED;
}
return LR_HANDLER_SUCCEEDED;
}
5. Create a DLL file - optional
To define a user handler through a DLL, locate the API header file, LrWsHandlerAPI.h in the
product's include folder.
You can use a sample Visual Studio project located in the samples/WebServices/SampleWsHandler
folder as a template for creating a handler. The sample retrieves the request and response
envelope and saves it to a parameter. To use this sample, open it in Visual Studio and modify it as
required. If you do not need to save the request/response to a parameter, you can remove that
section of the sample.
After editing the sample, save it and compile the DLL. When you compile the project, Visual Studio
places the <user_handler_name>.DLL file in the bin folder. If you compile the project from another
User Guide
HP LoadRunner (12.50) Page 924

location, or if you want to copy the DLL from one machine to another, make sure to place it in the
bin folder.
6. Configure the user handler - optional
Declare the DLL user handler globally or locally.
To apply the user handler globally to all requests in the script, add the following section to the
default.cfg file in the script's folder.
[UserHandler]
Function=<name>
Args=<arguments>
Order=<BeforeSecurity/AfterSecurity/AfterAttachments>
lName. The name of the DLL.
lArgs. A list of the configuration arguments for the handler. Use the GetArguments method to
retrieve the arguments in your handler.
lOrder. The order in which Vusers process the user handler in requests: Before Security,After
Security, or After Attachments. You can also use this argument to override the transport layer,
by entering the value Replace Transport.
Note: Setting the UserHandlerFunction property of a web_service_call function,
overrides the definitions in the .cfg file.
By default, user handlers are processed before the security. For request messages, Vusers
process the attachments handler after the security handler. For responses, Vusers process the
handlers in a reversed order. In typical cases the order does not matter, so any value is
acceptable.
To override the Transport layer, specify Order=Replace Transport and specify the new
transport handler. If you implement the transport handler as a separate DLL, the
HandleRequest function is called, while the HandleResponse function is ignored.
To use the handler locally, for a specific request, add the following arguments to the web_
service_call function:
UserHandlerName=<name1>
UserHandlerArgs=<args1>
UserHandlerOrder=<BeforeSecurity/AfterSecurity/AfterAttachments/Replace
Transport>
7. Copy the user handler to all required machines
Make sure that the user handler DLL is accessible to all Load Generator machines running scripts
that call it. You may, for example, copy it to the product's /bin folder.
If you copy the script to another machine, it retains the handler information, since it is defined in
script's folder.
User Guide
HP LoadRunner (12.50) Page 925
8. Implement the user handler - optional
To implement a user handler, you use the entry functions HandleRequest or HandleResponse. Both
functions have a single parameter, context, whose properties you can set in your handler. Use the
Get functions to retrieve properties, and Set functions to pass information from the replay
framework to the handlers or between the handlers.
lGetEnvelope. Gets the envelope content. For example, example:
const char * pEnvelope = context->GetEnvelope();
lGetEnvelopeLength. Gets the envelope length
lSetEnvelope. Sets the envelope content and length. For example:
string str("MySoapEnvelope...");
context->SetEnvelope(str.c_str(), str.length());
lSetContentType. Sets a new value for HTTP header content type
lLogMessage. Issues a message to the replay log
lGetArguments. Gets the configuration arguments defined for the current handler in order to
pass it to the DLL
lGetProperty. Gets a custom property value
lSetProperty. Sets a custom property value
For more information, see the comments in the LrWsHandlerAPI.h file located in the product's
include folder.
How to Customize Configuration Files
The following steps describe how to modify configuration files. For details, see " Custom Configuration
Files" on page915.
Locate the configuration file
Determine the location of the configuration file. The standard .NET configuration file,
mmdrv.exe.config is located in the product's bin folder. Some applications have their own file,
app.config.
Save the application's configuration file
If your application has its own app.config file:
lTo apply the configuration information globally to all scripts, save the app.config file as
mmdrv.exe.config in the bin folder, overwriting the existing file.
lTo apply the configuration information locally, specifically for this script, copy the app.config file to
the script's folder. This overrides the mmdrv.exe.config file, and remains associated with this script
even when you copy it to other machines.
User Guide
HP LoadRunner (12.50) Page 926
Set the security - optional
By default, VuGen allows unsigned certificates to facilitate testing. To disallow unsigned certificates,
modify the allowTestRoot flag in the <security> section to false.
<security>
<x509 storeLocation="currentuser" alllowTestRoot="false"
Web Services Snapshots - Overview
Vuser scripts based on the Web Services protocol utilize VuGen's Snapshot pane.
lFor details on how to work with the Snapshot pane, see "How to Work with Snapshots" on page276.
lFor details on the standard Snapshot pane UI, see "Snapshot Pane" on page77.
The Snapshot pane enables you to view snapshots of Web service calls. When you display the Snapshot
pane for a Web Services script, the left side of the Snapshot pane displays a tree view of the snapshot
data; the right side of the Snapshot pane displays a text view of the snapshot data.
The tree view on the left of the Snapshot pane is composed of a number of nodes. An icon to the left of
each node indicates the type of the node:
lElement: Indicates that the node represents an element in the XML file.
lAttribute: Indicates that the node represents an attribute in the XML file.
lValue: Indicates that the node represents a value in the XML file.
In addition to the basic Snapshot pane functionality, the Snapshot pane for Web Services scripts
includes additional functionality. The UI for this additional functionality is described below.
To access
Select View > Snapshot, or click the Show Snapshot Pane button on the VuGen
toolbar.
Relevant
tasks
"How to Prepare Scripts for Replay" on page918
User interface elements are described below (unlabeled elements are shown in angle brackets):
UI Element Description
Displays a snapshot of the SOAP response returned by the server.
Displays a snapshot of the SOAP request sent to the server by the Web Service call.
Opens the XPath Search dialog box which enables you to perform an XPath search
of the snapshot.
Displays the previous or next results of the XPath search.
User Guide
HP LoadRunner (12.50) Page 927
Displays or hides the XML attribute nodes in the tree view of the snapshot.
Displays or hides the XML value nodes in the tree view of the snapshot.
<shortcut
menu>
lCopy Selection. Copies the text that is selected in the text view to the clipboard.
lSearch Community. Performs a community search using the text that is
selected in the text view as the search string. For details about performing a
community search, see "Editor Pane" on page69.
lCopy XPath. In the tree view, copies the XPath of the selected node to the
clipboard. In the text view, copies the XPath of the XML element in which the
cursor is located to the clipboard.
lCopy full value. In the tree view, copies the full XML code of the selected node
to the clipboard. In the text view, copies the full XML code of the XML element in
which the cursor is located.
lInsert XML Check. Opens the Insert XML Check dialog box that enables you to
insert an XML Find step into the Vuser script.
Note:
lThis option is available in the Response view only.
lThis option is available for attribute and value nodes only.
lSave value in parameter. Opens the Save Value as Parameter dialog box that
enables you to save the selected value to a simple parameter.
Note:
lThis option is available in the Response view only.
lThis option is available for attribute and value nodes only.
lSave XML in parameter. Opens the Save Value as Parameter dialog box that
enables you to save the selected value to an XML parameter.
This option is available in the Response view only.
lCreate Correlation. Opens the Correlation tab in the Design Studio. The text
selected in the Snapshot pane appears as a manual correlation entry in the
Design Studio. For details, see "How To Manually Correlate Scripts" on page243.
Note:
lThis option is available in the Response view only.
lThis option is available for attribute and value nodes in the
tree view, and when text is selected in the text view.
User Guide
HP LoadRunner (12.50) Page 928
lCreate Correlation Rule. Opens the Add as Rule dialog box that enables you to
add the selected text as part of a correlation rule. For details, see "Correlation
Tab [Design Studio] Overview" on page236.
Note:
lThis option is available in the Response view only.
lThis option is available for attribute and value nodes in the
tree view, and when text is selected in the text view.
Database Connection Dialog Box
This dialog box helps you create a string to connect to your database.
To access Click Connection String Generator in the Database Connection dialog box.
Relevant tasks "How to Send Messages over JMS" on page919
See also "Connection String Generator Dialog Box" below
User interface elements are described below:
UI Element Description
Opens the Connection String Generator. For details, see "Connection
String Generator Dialog Box" below.
Step Name The name or IP address of the database server.
Connection String The string by which to connect to the database. Use the Connection
String Generator.
Data Provider The SQL provider: OLEDB or SQL.
Connection String Generator Dialog Box
This dialog box helps you create a string to connect to your database.
To access Click Connection String Generator in the Database Connection dialog box.
Relevant tasks "How to Send Messages over JMS" on page919
See also "Database Connection Dialog Box" above
User interface elements are described below:
User Guide
HP LoadRunner (12.50) Page 929
UI Element Description
Tests the connection to the database.
Generates the database connection string and writes it in the Connection
String field in the Database Connection dialog box.
Server Name The name or IP address of the database server.
DB Name The name of the database.
Authentication The authentication method for the database: Windows Authentication or
User/password.
lUser Name, Password. The credentials for the database.
SQL Provider The SQL provider: OLEDB or SQL.
Web Services - Managing Services
Managing Services Overview
The Service Management window lets you manage a list of service entries for the current script. You
can view and set the properties of each service entry.
You add service entries to the list by importing WSDL files. When you add a WSDL to the list, VuGen
creates a working copy that it saves with the script—it is not global. Therefore, for each script that you
create, you must import the desired WSDL files.
The Service Management window provides quick access buttons for importing, deleting, and comparing
services.
User Guide
HP LoadRunner (12.50) Page 930
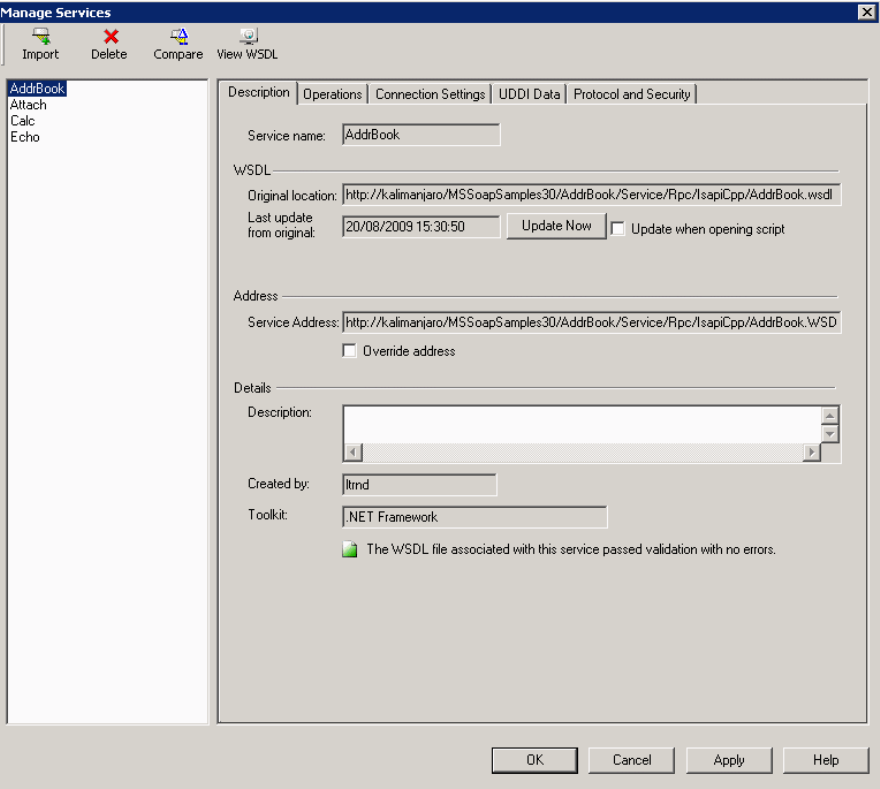
The tabs provide you with the ability to set the WSDL properties.
Description
The Description tab displays information about the service:
lOriginal location. The original source of the WSDL file (read-only).
lService name. The name of the Web Service (read-only).
lLast update from original. The last date that the local copy was updated from the original source
(read-only). You can update the version manually or retrieve it automatically each time you reopen
the test.
lService address. An endpoint address to which the request is sent. If required, you can override the
endpoint specified in the WSDL file.
lCreated by. The name of the user who originally imported the service (read-only).
lToolkit. The toolkit associated with the script. You set this before importing the first WSDL file
User Guide
HP LoadRunner (12.50) Page 931
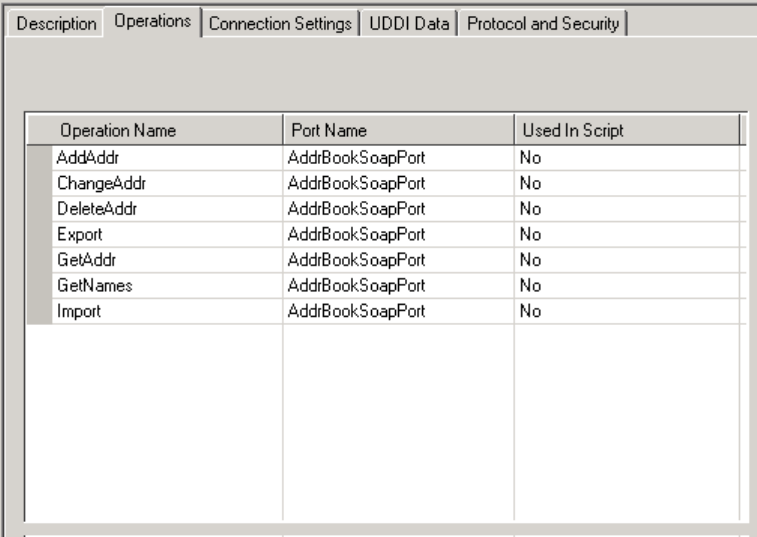
(read-only).
Operations
Each of the imported services may define multiple operations. The Operations tab indicates which
operations are being used for the service selected in the left pane.
Connection Settings
In some cases WSDLs reside on secure sites requiring authentication. In certain instances, the WSDL is
accessed through a proxy server.
VuGen supports the importing of WSDLs using security and WSDLs accessed through proxy servers. The
following security and authentication methods are supported:
lSSL
lBasic and NTLM authentication
lKerberos for the .NET toolkit
For more information about setting the connection information while importing the WSDL, see "How to
Add and Manage Services" on page934.
UDDI Data
You can view the details of the UDDI server for each service that you imported from a UDDI registry.
The read-only information indicates the URL of the UDDI server, the UDDI version, and the Service key.
User Guide
HP LoadRunner (12.50) Page 932
Protocol and Security Settings
The Protocol and Security Settings tab shows the details of the security scenario applied to the script. If
you did not choose a scenario, it uses the default <no scenario>. For more information, see "How to Add
and Manage Services" on the next page.
This section also includes:
l"Importing Services" below
l"Comparison Reports" below
Importing Services
VuGen lets you import services for the purpose of creating a high-level tests with Web Service Call
steps. Typically, you begin creating a script by importing a WSDL file.
The Import mechanism requires the following information:
lSource. The source of the WSDL: URL, File, UDDI, or Application Lifecycle Management. UDDI is a
universal repository for services (Universal Description, Discovery, and Integration). Service brokers
register and categorize published Web Services and provide search capabilities. The UDDI business
registry is an example of a service broker for WSDL-described Web Services.
lLocation. the path or URL of the WSDL, entered manually or by browsing.
lToolkit. The toolkit to permanently associate with all services in the script for all subsequent imports
and replays (only available for the first service added to the script). The toolkit setting instructs
VuGen to send real client traffic using an actual toolkit—not an emulation.
VuGen supports the .NET Framework with WSE 2 version SP3 and Axis/Java based Web Services
Framework toolkits. VuGen imports, records, and replays the script using the actual .NET or Axis
toolkit. By default, VuGen uses automatic detection to determine the most appropriate toolkit.
lConnection Settings. Authentication or proxy server information. This setting is useful for WSDLs
residing on secure servers, or WSDLs that must be accessed via a proxy server.
If VuGen detects a problem with your WSDL when attempting to do an import, it issues an alert and
prompts you to open the report. The report lists the errors and provides details about them.
For task details, see "How to Add and Manage Services" on the next page.
Comparison Reports
VuGen lists the differences between the files in a Comparison report.
You can configure the comparison settings, indicating which items to ignore during the comparison. For
more information, see the "XML/WSDL Comparison Dialog Box" on page941.
In WSDL Comparison reports, there are two columns— Working Copy and Original File. The Working
Copy is the WSDL stored with the script, while the Original File is the WSDL at its original location—a
network file path or a URL.
In XML Comparison reports, each column displays the path of an XML file.
User Guide
HP LoadRunner (12.50) Page 933
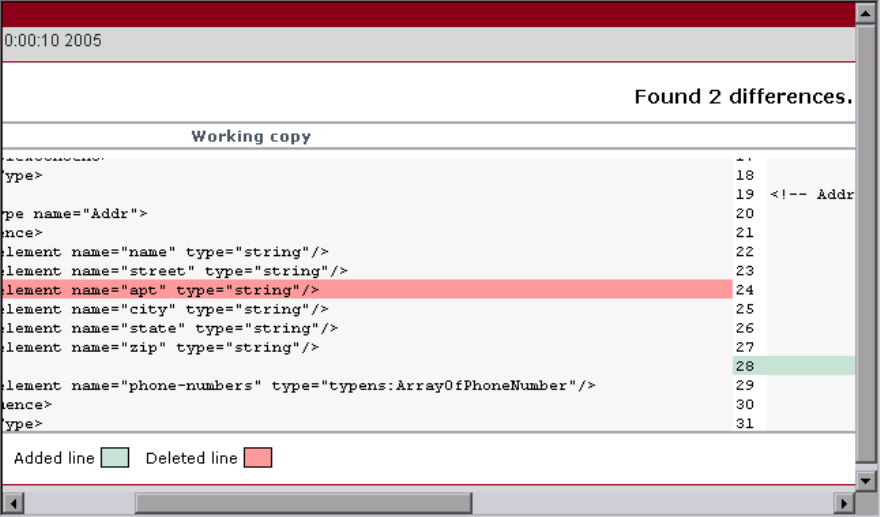
The Comparison report uses the following legend to mark the differences between the two files:
lYellow. Changes to an existing element (shown in both versions).
lGreen. A new element added (shown in the original file copy).
lPink. A deleted element (shown in the working copy).
In the following example, line 24 was deleted from the original copy and line 28 was added.
Web Reference Analyzer
Many WSDL files reference other files such as XSD and other XML files. Before running a script, you may
want to determine what these files are and if they are available.
VuGen's WSDL Reference Analyzer checks the WSDL for dependencies, and lists them in the WSDL
Reference Analyzer window and in a log file.
The Analyzer places the WSDL and its dependent files in a zip archive file. It saves the dependency
information to a log file, listing its path in the Analyzer window.
For user interface details, see "WSDL Reference Analyzer Dialog Box" on page942.
For task details, see "How to Analyze WSDL Dependencies" on page936.
How to Add and Manage Services
This task describes how to create a list of services that you can call from your test. Using the Manage
Services window, you import services and configure their settings.
User Guide
HP LoadRunner (12.50) Page 934
Open the Manage Services Dialog Box
Select SOA Tools > Manage Services or click the toolbar button to open the Manage Services dialog
box.
Import a Service
Click Import. In the Import Service dialog box, select a WSDL source and browse to the location.
For URL type imports, the Browse button opens a new browser. Navigate to the WSDL and then close the
browser. This action places the URL in the location box. For details, see the "Import Service Dialog Box"
on page940.
If your service requires authentication or uses a proxy, configure these settings before importing the
WSDL. Expand the Import Services dialog box and click Configure. For details, see the "Connection
Settings Dialog Box" on page939.
Repeat this step for all the services you want to include in your test.
Get to Know the WSDL
Familiarize yourself with the WSDL. View its details as described in the "Manage Services Dialog Box" on
the next page.
Click View WSDL to open the locally saved WSDL file in Internet Explorer and study its structure.
Check for WSDL Updates - Optional
Use the Comparison tool to check that the WSDL did not change since your last import or update.
First, set the comparison options. Click SOA Tools > SOA Settings > XML/WSDL Comparison. Specify
what differences to ignore. For details, see "XML/WSDL Comparison Dialog Box" on page941.
In the Manage Services window, click Compare to open a report comparing the working copy of the
WSDL with the one at the original location.
If you discover changes in the Comparison report, click Update Now to retrieve the latest version of the
WSDL from its source.
Override the Service Address- Optional
View the address in the Service Address box. This is the default endpoint address as retrieved from the
WSDL. If you want to override it, select Override address and type in an alternate endpoint address for
the service requests.
To return to the default address, clear the Override address option. For details, see the "Manage
Services Dialog Box" on the next page.
Set a Security Scenario - Optional
Click the Protocol and Security tab to use WS-Security or another type of a security scenario.
User Guide
HP LoadRunner (12.50) Page 935
For more information, see "Web Services - Security" on page942.
How to Analyze WSDL Dependencies
This task describes how to use the Reference Analyzer to determine WSDL dependencies. For user
interface details, see "WSDL Reference Analyzer Dialog Box" on page942.
1. Open the Reference Analyzer
Select SOA Tools > WSDL Reference Analyzer.
2. Select a source and target
In the Select WSDL file box, indicate the location of the WSDL you want to analyze.
In the Output file path box, indicate a location for the zip file.
3. Begin the analysis
Click Start Analyzing. The Analyzer lists all of the dependencies in the output window along with
their paths.
4. View the log
View the results in the log window. To clear the results and perform another analysis, click Clear
Log.
Manage Services Dialog Box
This dialog box enables you to manage your WSDLs, provide authentication information, and set a
security scenario.
To access Use one of the following:
lClick the Manage Services button on the VuGen toolbar.
lSOA Tools > Manage Services
Relevant tasks "How to Add and Manage Services" on page934
User interface elements are described below (unlabeled elements are shown in angle brackets):
UI Element Description
Opens the Import Service dialog box.
Removes the selected service from the list.
User Guide
HP LoadRunner (12.50) Page 936
Opens the WSDL Comparison Report showing the Working copy and Original copy of the
WSDL side-by-side.
To set the comparison settings, see "XML/WSDL Comparison Dialog Box" on page941.
Displays the WSDL in a browser.
<WSDL
list>
A list of the imported WSDLs.
Description
tab
Provides information about the WSDL, its endpoint address, toolkit, and update
information.
Operations
tab
Lists the operations of the service: Operation Name,PortName, and Used in Script (Yes
or No).
Click a column to sort the operations by that column's data. Click it again to reverse the
sorting order.
Connection
Settings
tab
Allows you to provide authentication settings for the machine from which you are
importing a service. For more information, see the "Manage Services Dialog Box" on the
previous page.
Note: This only applies to URL and UDDI type imports.
UDDI Data
tab
The UDDI server, UDDI version, and service key. For more information, see the "Manage
Services Dialog Box" on the previous page.
Protocol
and
Security
tab
Allows you to view and set a security scenario for your Web Service calls. For more
information, see below.
Description Tab
The following elements are displayed in the Description tab:
UI Element Description
Loads the latest version of the WSDL from its original location.
Created By The name with which you logged in. You can edit this field and specify a different
name. This is useful for sorting the services in reports (read-only).
Description An editable field into which you can type information about the service.
Last update
from original
The last date and time the WSDL was updated (read-only).
User Guide
HP LoadRunner (12.50) Page 937

Original
Location
The original location from where the WSDL was imported (read-only).
Override
address
Enables you to enter an alternate endpoint for the service in the Service Address
box.
Service
Address
The endpoint of the service to which service requests are sent, retrieved from the
WSDL file (read only). To override the default address, select Override address.
Service Name The native service name in the WSDL file that is displayed by default when
importing the service (read-only).
Toolkit The toolkit associated with the service. You set this when you import the service
(read-only).
Update when
opening script
Updates the WSDL from its source each time you open the script.
Connection Settings Tab
The following elements are included:
UI Element Description
Authentication Use Authentication Setting: Enables you to enter credentials for authentication.
lUsername, Password. The user name and password to use for retrieving the
WSDL.
Tip: For users not in the default domain, type the domain name before the user
name. For example, domain1/alex_qc.
Proxy Use Proxy Setting. Enables you to enter proxy details and credentials.
lServer. Name or IP address of proxy server.
lPort. Port through which to access the WSDL.
lUsername, Password. the user name and password to be used for
authentication. For users not in the default domain, type the domain name
before the user name. For example, domain1/alex_qc.
UDDI Data Tab
The following elements are included:
UI
Element
Description
Service A unique identifier of the service on the UDDI server, used to locate the service definition
User Guide
HP LoadRunner (12.50) Page 938

Key when updating the service.
UDDI
Server
The URL address and version of the UDDI server from which the service definition is
imported.
UDDI
Version
The version of the UDDI registry: 2 or 3.
Connection Settings Dialog Box
Enables you to provide authentication credentials and proxy server details for the machine hosting the
WSDL file.
To access lFor a new service: Select SOA Tools > Manage Services. Click the Import button. In
the Import Services dialog box, click Connection Settings.
lFor existing services: Select a service in the Mange Services dialog box, and click
the Connection Settings tab.
Important
information
Only available for services imported through a URL and UDDI.
Relevant
tasks
"How to Add and Manage Services" on page934
The following elements are included:
UI Element Description
Authentication Use Authentication Setting: Enables you to enter credentials for authentication.
lUsername, Password. the user name and password to use for retrieving the
WSDL.
Tip: For users not in the default domain, type the domain name before the user
name. For example, domain1/alex_qc.
Proxy Use Proxy Setting. Enables you to enter proxy details and credentials.
lServer. Name or IP address of proxy server.
lPort. Port through which to access the WSDL.
lUsername, Password. the user name and password to be used for
authentication. For users not in the default domain, type the domain name
before the user name. For example, domain1/alex_qc.
User Guide
HP LoadRunner (12.50) Page 939
Import Service Dialog Box
Enables you to import WSDLs from a file system, a URL, Application Lifecycle Management, a UDDI, or
Systinet.
To access Use one of the following:
lSelect Services > New > Import Services
lSelect New > Import Services from the shortcut menu
Relevant tasks "How to Add and Manage Services" on page934
The following elements are included:
UI Element Description
Browse. Enables you to locate a service on the file system, through a browser,
UDDI registry, or Application Lifecycle Management repository depending on
your Import WSDL from selection.
Opens the Connections Settings dialog box for configuring the authentication
and proxy settings of the server hosting the WSDL. For details, see "Connection
Settings Dialog Box" on the previous page.
Allows you to select a toolkit for the test. Choose Automatic,.NET, or Axis. The
Automatic setting uses an algorithm to determine the most suitable toolkit.
Begins the import process.
Select WSDL from Location of WSDL. Browse for the information or enter it manually:
lURL: Complete URL. Make sure to insert a complete URL—not a shortened
version.
lFile: Full path and file name.
lUDDI: UDDI registry ID. The Browse button opens the "Search for Service in
UDDI Dialog Box" below.
Search for Service in UDDI Dialog Box
This dialog box enables you to locate a specific service from a UDDI registry.
To access lIn the Manage Services window, click Import.
lIn the Import dialog box, select UDDI in the Select WSDL from section.
lClick .
User Guide
HP LoadRunner (12.50) Page 940
Relevant tasks "How to Add and Manage Services" on page934
User interface elements are described below (unlabeled elements are shown in angle brackets):
UI Element Description
Begins the search for a service based on the text in the All or part of the service
name box.
<service list> An alphabetical list of all the services that match the string. The grid shows the
following columns: Service Name,Service Key,Service Description,Service WSDL.
All or part of
the service
name
A string including the desired service name or part of the name. You do not need to
use wildcard expressions.
The following options narrow the search:
lExact Match. The service name must exactly match your text.
lCase Sensitive. The case of service name must match the case of the specified
text.
UDDI server
inquiry
address
The complete path for the inquiry on the UDDI server.
UDDI Version
2/3
The UDDI version of the services to display in the list.
XML/WSDL Comparison Dialog Box
This dialog box enables you to configure the settings for comparing different versions of a WSDL You
can instruct the comparison tool to ignore specific differences such as case, comments, and so forth.
To access SOA Tools > SOA Settings > XML/WSDL Comparison.
Relevant tasks "How to Add and Manage Services" on page934
User interface elements are described below:
UI Element Description
Show only differences Show only differences in the report—do not display the matching
text.
Ignore case Do not show case mismatches as differences.
Ignore comments Do not mark mismatches in the comment as differences.
Ignore processing Do not mark mismatches in the processing instructions as
User Guide
HP LoadRunner (12.50) Page 941
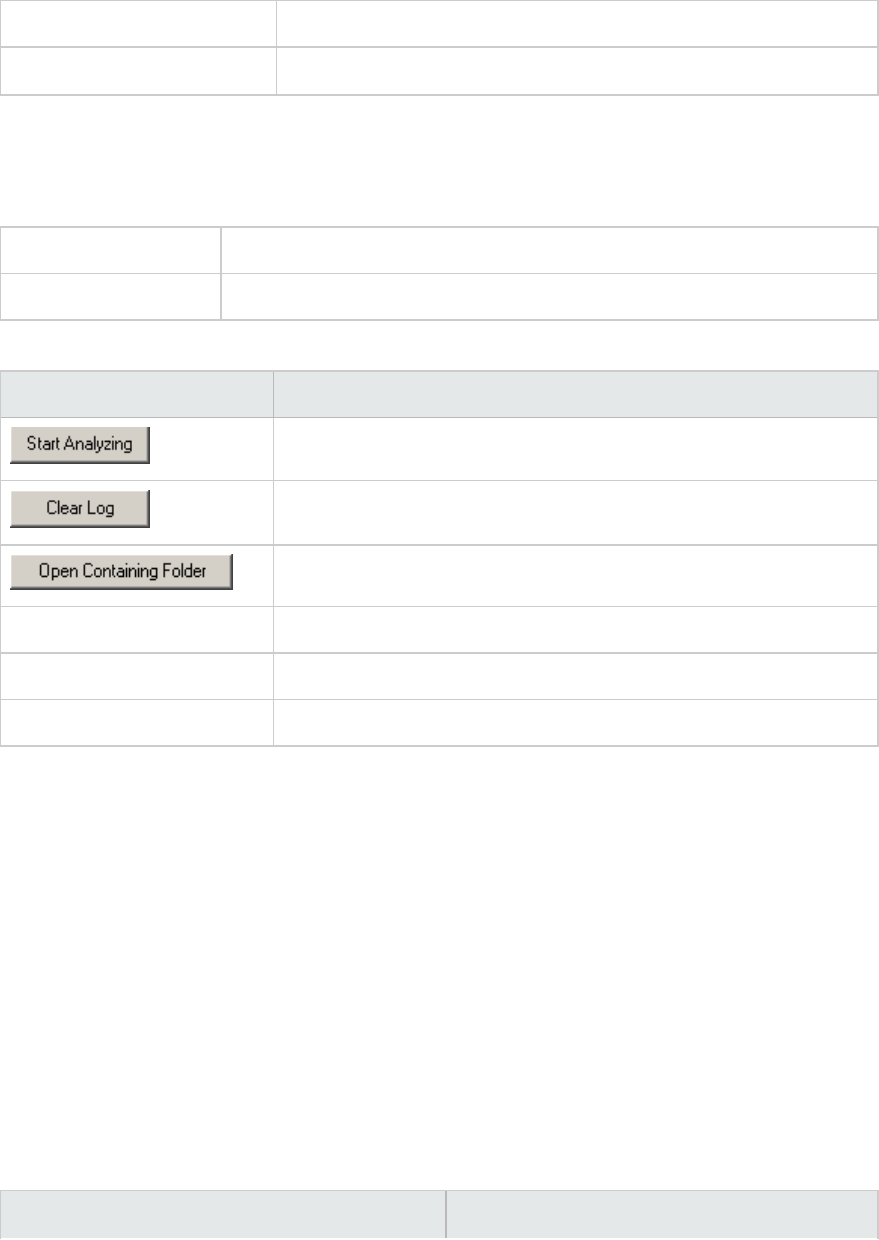
instructions differences.
Ignore namespaces Do not mark mismatches in namespaces as differences.
, continued
WSDL Reference Analyzer Dialog Box
This dialog box enables you to determine the dependencies of a WSDL file.
To access SOA Tools > WSDL Reference Analyzer
Relevant tasks "How to Analyze WSDL Dependencies" on page936
User interface elements are described below (unlabeled elements are shown in angle brackets):
UI Element Description
Begins the analysis, showing all the results in the Log window.
Clears the log window and log file.
Opens the folder containing the output file.
<log window> A running log of the reference analysis.
Select WSDL file The local path or URL of the WSDL file to analyze.
Output file path A location for the output zip file.
Web Services - Security
Setting Security Overview
When building Web Service applications, there is a challenge in building scalable applications that are
secure. You can secure Web Services by having the message sent over a secure transport, such as
Secure Sockets Layer (SSL), but this is limited to point-to-point communication.
To allow you to send your messages securely, VuGen supports several security mechanisms, Security
Tokens (WS-Security), and SAML.
For more information on tokens, see below. For more information on SAML, see "SAML Security Options"
on page945.
The following table lists the considerations for using each of the models.
Legacy Model Scenario Based Model
User Guide
HP LoadRunner (12.50) Page 942
You are working with a script that already uses
the legacy model
You are testing a WCF Service.
You are testing a service written in frameworks
such as .NET 2.0, Axis, or other older toolkits
You are testing a service written in a new
framework, such as Axis2 or Metro (WSIT).
You require a low-level control over WS-Security
tokens
Your service uses advanced specifications such
as WS-SecureConversation or WS-Trust.
You are having trouble using the new model or
find the capabilities of the legacy more adequate
for your needs
You are having trouble using the legacy model or
you find the capabilities of the new model more
adequate.
Note: If your WSDL is located in a secure location, you must provide the security information
through the Manage Services dialog box. For more information, see the "Connection Settings
Dialog Box" on page939.
Security Tokens and Encryption
The WS-Security specification lets you place security credentials in the actual SOAP message. You
accomplish this by instructing a client to obtain security credentials from a source that is trusted by
both the sender and receiver. When a SOAP message sender sends a request, those security
credentials, known as security tokens, are placed in the SOAP message. When the Web server receives
the SOAP request, it does not need to send additional requests to verify the integrity of the sender. The
server verifies that the credentials are authentic before letting the Web Service execute the
application. By not having to go back to the source of the credentials, this significantly improves the
application's scalability.
To further secure Web Services, it is common to use digital signatures or encryption for the SOAP
messages. Digitally signing a SOAP message verifies that the message has not been altered during
transmission. Encrypting a SOAP message helps secure a Web Service by making it difficult for anyone
other than the intended recipient to read the contents of the message.
The Web Services security mechanism associates security tokens with messages. This mechanism
supports several security token formats to accommodate a variety of authentication requirements. For
example, a client might need to provide a proof of identity or a security certificate.
To support WS-Security, VuGen allows you to create security tokens for your script. You can create
multiple tokens and set their properties. After creating a token, you use it to sign or encrypt a SOAP
message.
In certain instances, you do not send the token explicitly—you use the token for the purpose of
signatures or encryption, without including the actual token in the SOAP envelope header. Using the Add
option, you can indicate whether to send the actual token explicitly.
User Guide
HP LoadRunner (12.50) Page 943
The available tokens are Username and Password,X.509 Certificate,Kerberos Ticket,Kerberos2
Ticket,Security Context Token, and Derived Token. The information you need to provide differs for
each token.
lUser Name and Password. The User Name and Password token contains user identification
information for the purpose of authentication: User Name and Password.
You can also specify Password Options, indicating how to send the password to the server for
authentication: SendPlainText,SendNone, or SendHashed.
lX.509 Certificate. This security token is a token based on an X.509 certificate. To obtain a
certificate, you can either purchase it from a certificate authority, such as VeriSign, Inc. or set up
your own certificate service to issue a certificate. Most Windows servers support the public key
infrastructure (PKI) which enable you to create certificates. You can then have it signed by a
certificate authority or use an unsigned certificate.
When you add an X.509 token to the Vuser script, you specify the LogicalName,Store Name,Key
identifier type,Key identifier value, and Store Location arguments.
lKerberos Ticket/Kerberos2 Ticket. (for Windows 2003 or XP SP1 and later) The Kerberos protocol is
used to mutually authenticate users and services on an open and unsecured network. Using shared
secret keys, it encrypts and signs user credentials. A third party, known as a KDC (Kerberos Key
Distribution Center), authenticates the credentials. After authentication, the user may request a
service ticket to access one or more services on the network. The ticket includes the encrypted,
authenticated identity of the user. The tickets are obtained using the current user's credentials.
VuGen supports tokens based on both Kerberos and Kerberos2 security tokens. The primary difference
between the Kerberos and Kerberos2 tokens is that Kerberos2 uses the Security Support Provider
Interface (SSPI), so it does not require elevated privileges to impersonate the client's identity. In
addition, the Kerberos2 security token can be used to secure SOAP messages sent to a Web Service
running in a Web farm.
When you add a Kerberos token to the Vuser script, you specify a LogicalName for the token along with
the Host and Domain names of the Web Services machine.
lSecurity Context Token. These tokens are security tokens that can be used repeatedly until they
expire. SOAP message senders can use security context tokens to sign and/or encrypt a series of
SOAP messages, known as a conversation, between a SOAP message sender and the target Web
Service. The main benefits of this type of token are:
lAs long as the security context token has not expired, the SOAP message sender can use the same
security context token to sign and/or encrypt the SOAP messages sent to the target Web Service.
lSecurity context tokens are based on a symmetric key, making them more efficient at digitally
signing or encrypting a SOAP message than an asymmetric key.
lSecurity context tokens can be requested from one security token service by sending a SOAP
message to another security token service.
When you add a Security Context token to the Vuser script, you specify values for the LogicalName,
Base Token,Issuer Token,End Point URI, and Add applies to arguments.
lDerived Token. The Derived token is a token based on another existing token, excluding X.509 for
User Guide
HP LoadRunner (12.50) Page 944
which derivation is not supported. You need to specify a LogicalName and the Derived From token. If
you remove the original token, then the derived token will no longer be available. Note that you
cannot use a Derived type of token in a recursive manner.
For details about the token attribute in the script, see the Function Reference (Help > Function
Reference).
Adding the Security Policy
To add a security policy to a section of your script, you enclose the relevant steps with Web Service Set
Security and Web Service Cancel Security steps.
When you add a Web Services Set Security step to your script, VuGen adds a web_service_set_
security function that contains arguments with the tokens, message signatures, and encryption that
you defined.
web_service_set_security(
SECURITY_TOKEN, "Type=USERNAME", "TokenName=mytoekn1", "UserName=bob",
"Password=123", "PasswordOptions=SendNone", "Add=True", LAST);
Parameterization is not supported for the following arguments: Token Type, Logical Name, Base
Token, Issuer Token or Derive From arguments.
Working with Message Signatures and Encrypted Data
When you add a security token to a SOAP message, it is added to the SOAP message in the form of an
XML element in the WS-Security SOAP header.
The message, however, is exposed and therefore requires additional security. This is especially true
when the credentials, including the password, are sent in plain text as it is with role-based security.
The two methods used to secure the data are digital signatures and encryption.
lDigital Signatures. Digital Signatures are used by message recipients to verify that messages were
not altered since their signing. The digital signature is usually in the form of XML within the SOAP
message. The recipient checks the signature to make sure it is valid. Certain environments, such as
WSE, automatically verify the signature on the SOAP recipient's computer.
lEncryption. Although the XML digital signature offers a mechanism for verifying that the message
has not been altered since it was signed, it does not encrypt the SOAP message—the message is still
plain text in XML format. To secure the message in order that it should not be exposed, you encrypt
it, making it difficult for an intruder to view and obtain a user's password.
Parameterization is not supported for message signatures and encryption arguments. For details on
adding message signatures and encryption to your script, see "How to Add Security to a Web Service
Script" on page956.
SAML Security Options
VuGen supports SAML (Security Assertion Markup Language) for Web Services. SAML is an XML standard
for exchanging security-related information, called assertions, between business partners over the
User Guide
HP LoadRunner (12.50) Page 945

Internet. The assertions can include attribute statements, authentication, decision statements, and
authorization decision statements.
SAML uses brokered authentication with a security token issued by STS (Security Token Service). The
STS is trusted by the client and the Web Service to provide interoperable security tokens. SAML tokens
are important for Web Service security because they provide cross-platform interoperability and a
means of exchanging information between clients and services that do not reside within a single
security domain.
You can set the SAML settings for an entire script or part of the script. For details, see "How to Add
SAML Security" on page960.
Note: You cannot apply SAML security and the standard Web Service (a Web Service Set
Security step) security to the same step. To cancel Web Service security, insert a Web Service
Cancel Security step.
Signing SAML Assertions
VuGen provides a method for signing an unsigned SAML assertion. As input, you provide the unsigned
assertion, a certificate file, and the optional password. As output, VuGen provides the signed SAML
assertion. For task details, see "How to Add SAML Security" on page960.
Policy Files
SAML policy files follow the WSE 3.0 standard and define the attribute values for the SAML security. By
default, VuGen uses the samlPolicy.config file located in the installation's dat folder.
When entering SAML security information, you can enter it manually in the properties dialog box, or you
can refer to a policy file containing all of the security information. You can create your own policy file
based on samlPolicy.config.
You can modify the policy file to include values for the security parameters, such as username and
certificate information. When adding a SAML security step to your script, if you explicitly specify values
for the security arguments, they override the values in the policy file.
If you make changes to the default policy file, we recommend that you copy the new policy file to your
script's folder. Make sure to save custom policy files with a .config extension to insure that they remain
with the script, even when running it on other machines or calling it from the LoadRunner Controller.
To learn more about the SAML policy files, see the SAML STS example on the MSDN Web site. If you want
to emulate SAML Federation behavior, copy the samlFederationPolicy.config file from the data folder
to your script's folder, and specify it as the policy file.
Security Scenarios Overview
VuGen allows you to test Web Services that utilize advanced security and WS-Specifications. Such
services can be written in various platforms such as WCF (Windows Communication Foundation), Metro
(WSIT), and Axis2. For WCF services, VuGen also supports proprietary standards and transports.
User Guide
HP LoadRunner (12.50) Page 946

You enable this support by setting up a security scenario. Each scenario represents a typical
environment used in conjunction with Web Service calls. VuGen provides several built-in security
scenarios that are commonly used. It applies the scenario's settings individually to each service.
For the built-in scenarios, the user interface lets you provide identity information where required. You
can customize security, transport, proxy, and other advanced settings.
If you cannot find a scenario that corresponds to your environment, you can use the generic custom
scenario.
For more information, see "Security Scenario Editor Dialog Box" on page967.
Choosing a Security Model
VuGen supports two models for configuring security for your Web Service calls: Legacy (no scenario) and
Scenario. This chapter describes the Scenario security models. The Legacy model refers to the manual
addition of Web Service Set Security steps, or the web_service_set_security function.
The following table lists the considerations for using each of the models.
Legacy Model Scenario Based Model
You are working with a script that already uses
the legacy model
You are testing a WCF Service
You are testing a service written in frameworks
such as .NET 2.0, Axis, or other older toolkits
You are testing a service written in a new
framework such as Axis2 or Metro (WSIT).
You require a low-level control over WS-
Security tokens
Your service uses advanced specifications such as
WS-SecureConversation or WS-Trust
You are having trouble using the new model or
find the capabilities of the legacy functions
adequate
You are having trouble using the legacy model or
you find the capabilities of the new model more
adequate
Private, Imported, and Shared Scenarios
To assign a security scenario to a specific service, use the Manage Services window. The Protocol and
Security tab contains the interface to create and view security scenarios for individual services.
You can select a scenario in three ways:
lPrivate scenario. Create a new scenario by selecting one of the built-in ones and customizing it for
your Web Service.
lImported scenario. Use a scenario created at an earlier time. The scenario will be editable, and if
someone modifies the original scenario, it will not affect you.
lShared scenario. Load a security scenario already configured by another user from a remote
location or the file system. You cannot edit this scenario's settings from the Manage Services
window. If someone edits the scenario, it will affect your environment. You usually use this option
User Guide
HP LoadRunner (12.50) Page 947

after working with the product for some time and saving the scenario files.
Scenario Categories
The scenario describes the configuration of your Web Service. It contains information such as security,
encoding, proxy, and so forth. VuGen provides a Security Scenario editor that allows you to configure the
settings for each scenario.
To determine the scenario that best fits your service, refer to the sections below. If you are unsure
which scenario to choose, we recommend to use the Custom Binding scenario. For more information,
see " The Custom Binding Scenarios" on page952.
Use the default <no scenario> for:
lsimple Web Services where no advanced standards are required.
lscripts that use the legacy security model
lWeb Services that require a specific security setting, not available in any of the existing scenarios.
If you select a built-in scenario and experience problems in replay, it is possible that no scenario was
required and the problem is elsewhere. Reset the value to <no scenario>.
The built-in security scenarios are divided into the following categories:
Core Scenarios
The following table describes the built-in Core scenario.
Scenario Name When to use
Plain SOAP lWeb services which do not require advanced standards
lWeb services which may require you to specify the WS-Addressing
version
For this type of scenario, if your service uses WS-Addressing, specify the version.
Security Scenarios
The following table describes the built-in Security scenario.
Scenario Name When to use
Username
Authentication
lClient is authenticated with a username and password on the message
level
For this type of scenario, specify the username/password, and if your service uses WS-Addressing,
specify the version.
WCF Scenarios
The following table shows the scenarios for Web Services that utilize WCF. The WSHttpBinding-based
User Guide
HP LoadRunner (12.50) Page 948

scenarios are divided according to the way the client authenticates itself to the server. For example, if
your client presents a user name and a password to the server, choose the Username (message
protection) scenario. The user interface lets you provide the identity information in the form of a user
name or a certificate as required.
WCF Scenario Name When to use
WSHttpBinding - No Authentication lClient uses the server's X.509 certificate for
encryption
lClient is not authenticated
lCommunication may utilize advanced standards such
as secure conversation and MTOM
WSHttpBinding - Windows authentication lClient and server use Windows authentication
lSecurity is based on Kerberos or SPNEGO negotiations
lCommunication may utilize advanced standards such
as secure conversation and MTOM
wsHttpBInding - Certificate
authentication
lClient uses the server's X.509 certificate for
encryption
lClient uses its own X.509 certificate for signature
lCommunication may utilize advanced standards such
as secure conversation and MTOM
WSHttpBinding - username (message
protection) authentication
lClient uses the server's X.509 certificate for
encryption
lClient is authenticated with a username and password
lCommunication may utilize advanced standards such
as secure conversation and MTOM
WSHttpBinding - username (transport
protection) authentication
lSSL is enabled
lClient is authenticated with a username and password
lCommunication may utilize advanced standards such
as secure conversation and MTOM
WSFederationHttpBinding lClient authenticates against the STS using a
predefined scenario
lClient uses the token given from the STS to
authenticate against the server
Custom Binding lWeb Service that uses WS-* standards
lWCF services of any configuration
User Guide
HP LoadRunner (12.50) Page 949

Optimization Scenarios
The following table describes the built-in Optimization scenario.
Scenario Name When to use
MTOM lMTOM enabled Web services
lWeb Services which may require you to specify the WS-Addressing version
For MTOM type scenarios, if your service uses WS-Addressing, specify the version.
WCF Scenario Settings
This section describes the values required for the WCF security scenarios:
The WsHttpBinding Scenario
No Authentication (Anonymous)
In this scenario, the client uses the server's certificate to encrypt a message; there is no client
authentication.
You specify only one of the following settings:
lNegotiate service credentials. Negotiate the Web Service's certificate with the server.
lSpecify service certificate. Browse for a service certificate. For more information, see "Select
Certificate Dialog Box" on page972. If you select this option, the Negotiate service credentials
option is not available.
Provide the DNS information.
lExpected server DNS. The expected identity of the server in terms of its DNS. This can be localhost,
an IP address, or a server name. It can also be the common name by which the certificate was issued.
Windows Authentication
This WCF scenario uses Windows Authentication.
You declare the expected identity of the server in terms of its SPN or UPN identities. If you are testing a
WCF service that has not been customized and uses the default configuration, use this type of scenario.
Certificate Authentication
In this WCF WSHttpBinding scenario, the client uses the server's X.509 certificate to encrypt the
message and its own certificate for a signature.
Specify only one of the following settings:
lNegotiate service credentials. Negotiate the Web Service's certificate with the server.
User Guide
HP LoadRunner (12.50) Page 950
lSpecify service certificate. Browse for a service certificate. For details, see "Select Certificate
Dialog Box" on page972. If you select this option, the Negotiate service credentials option is not
available.
Provide the DNS information:
lExpected server DNS. The expected identity of the server in terms of its DNS. This can be localhost,
an IP address, or a server name. It can also be the common name by which the certificate was issued.
Username Authentication (Message Protection)
In this WCF WSHttpBinding scenario, the client uses the server's X.509 certificate to encrypt the
message, and sends a user name and password to authenticate itself.
Specify the following settings:
lUsername. Password. The client's user name and password credentials.
Specify only one of the following settings:
lNegotiate service credentials. Negotiate the Web Service's certificate with the server.
lSpecify service certificate. Browse for a service certificate. For details, see "Select Certificate
Dialog Box" on page972. If you select this option, the Negotiate service credentials option is not
available.
Provide the DNS information:
lExpected server DNS. The expected identity of the server in terms of its DNS. This can be localhost,
an IP address, or a server name. It can also be the common name by which the certificate was issued.
Username (Transport Protection) Authentication
This WCF WSHttpBinding scenario enables SSL and authenticates the client with a user name and
password on the message level.
Specify the following settings:
lUsername. Password. The client's user name and password credentials.
The Federation Scenario
In the WSFederationHttpBinding scenario, the client authenticates against the STS (Security Token
Service) to obtain a token. The client uses the token to authenticate against the application server.
Therefore, two bindings are needed, one against the STS and another against the application server.
First, use the Security Scenario editor to define an STS binding. For more information, see " How to
Create and Manage Security Scenarios" on page961. When setting the binding against the application
server, specify this file in the Referenced file box.
For the Federation scenario, specify the following server information:
lTransport. HTTP or HTTPS
User Guide
HP LoadRunner (12.50) Page 951
lEncoding. Text or MTOM
For the Federation scenario, specify the following security information:
lAuthentication mode. IssuedToken, IssuedTokenForCertificate, IssuedTokenForSslNegotiated,
IssuedTokenOverTransport, or SecureConversation
lBootstrap policy. IssuedToken, IssuedTokenForCertificate, IssuedTokenForSslNegotiated, or
IssuedTokenOverTransport
For the Federation scenario, specify the following identity information:
lServer certificate. Browse for a server certificate. For more information, see the "Select Certificate
Dialog Box" on page972.
lExpected server DNS. the expected identity of the server in terms of its DNS. This can be localhost
or an IP address or server name.
For the Federation scenario, specify the following STS (Security Token Service) information:
lIssuer address. The address of the issuer of the STS. This can be localhost, an IP address, or a server
name.
lReferenced binding. The file that references the binding that contacts the STS (Security Token
Service)
The Custom Binding Scenarios
The Custom Binding scenario enables the highest degree of customization. Since it is based upon WCF
customBinding, it allows you to test most WCF services, along with services on other platforms such as
Java that use
WS - <spec_name> specifications.
Use the Custom Binding scenario to configure a custom scenario that does not comply with any of the
predefined security scenarios.
For the Custom Binding scenario, specify the following server information:
lTransport. HTTP, HTTPS, TCP, or NamedPipe
lEncoding. Text, MTOM, or WCF Binary
Specify the following security information:
lAuthentication mode. None, AnonymousForCertificate, AnonymousForSslNegotiated,
CertificateOverTransport, Kerberos, KerberosOverTransport, MutualCertificate, MutualSslNegotiated,
SecureConversation, SspiNegotiated, UserNameForCertificate, UserNameForSslNegotiated,
UserNameOverTransport, or SspiNegotiatedOverTransport
lBootstrap policy. For SecureConversation type authentication, specify a bootstrap policy:
AnonymousForCertificate, AnonymousForSslNegotiated, CertificateOverTransport, Kerberos,
KerberosOverTransport, MutualCertificate, MutualSslNegotiated, SspiNegotiated,
UserNameForCertificate, UserNameForSslNegotiated, UserNameOverTransport, or
SspiNegotiatedOverTransport
lNet security. the network security. Select None, Windows stream security, or SSL stream security.
User Guide
HP LoadRunner (12.50) Page 952
For services with HTTP transport, leave the default value, None. To enable SSL for HTTP, choose the
HTTPS transport.
If your Web Service uses Reliable messaging, enable the option, and select Ordered or Not Ordered.
Identities
Your security settings may require you to provide identity details for either the client and server, or
both of them.
An example of identity details for the client, are user name/password or an X.509 certificate.
For identity information, provide one or more authentication details as required by the service:
Username,Password,Server certificate,Client certificate, or a custom Windows identity. For details
about choosing a certificate, see "Select Certificate Dialog Box" on page972.
Some scenarios require you to declare the expected identity of the server in terms of its DNS, SPN, or
UPN identity.
lDNS. Provide the name of a server or use localhost.
lSPN. Provide the SPN identity in the domain\machine format.
lUPN. Provide the UPN identity in the user@domain format.
After setting the basic values, you can set advanced attributes as described in "Advanced Settings
Dialog Box" on page968.
WCF Extensibility
You can implement your own binding, behavior, or channel when using customBinding by defining the
assemblyPath and typeName by modifying the configuration file <script
directory>/WSDL/@config/[your config].stss.
The assemblyPath attribute should have a value of either the full path of the dll or its relative path to
script directory.
The typeName attribute should have the full type name: ns.typeName.
Binding
Name the scenario attribute in the protocols element and provide the assemblyPath and typeName
attributes.
The class you use for binding is inherited from System.ServiceModel.Channels.Binding.
Channel
Add a new element under the customization node. You can specify any name for the element, however
the element must contain the two attributes:assemblyPath andtypeName.
The class to use for binding is inherited from System.ServiceModel.Channel.BindingElement.
User Guide
HP LoadRunner (12.50) Page 953

Note: This will work with customBinding scenarios only.
Behavior
Add a new element under the behaviors element (which is under endpointBehavior) and add the two
attributes assemblyPath and typeName.
To bind the new element, implement the System.ServiceModel.Description.IEndpointBehavior
class.
Note: If you inherit from System.ServiceModel.Description.ClientCredentials, the
client credentials from this class will be used.
Examples of Channel and Behavior
<protocols scenario="customBinding" uiType="customBinding"
xmlns="http://hp/ServiceTest/config">
<mode>Private</mode>
<customization>
<textMessageEncoding />
<preferlrhttpTransport />
<myChannel assemblyPath="CustomChannel.dll"
typeName="CustomChannel.WCFChannel" />
</customization>
<behaviors>
<endpointBehaviors>
<behavior>
<clientVia viaUri="qwqwq" />
<myBehavior assemblyPath="CustomBehavior.dll"
typeName="CustomBehavior.WCFbeahvior" />
User Guide
HP LoadRunner (12.50) Page 954

</behavior>
</endpointBehaviors>
</behaviors>
</protocols>
An example of overriding the whole binding (the configuration may contain just one line):
<protocols scenario="userBinding" assemblyPath="WCFBinding.dll" typeName="
WCFBinding.Binding"/>
Preparing Security Scenarios for Running
Parameterizing Security Elements
You can parameterize the security elements in a script independently. For example, in a username-
based security scenario, you might want each Vuser or iteration to use a different user name.
Protecting Custom Headers
When an operation uses SOAP headers, VuGen does not automatically sign or encrypt them. To
incorporate a protection scheme such as a signature or encryption, you must manually add the
following information to the scenario's configuration file (.stss) in the behavior element:
lsoapAction of the relevant operation
lThe header XML name and namespace
lThe protection level
The following example shows an outgoing message with the soapAction, http://mySoapAction. The XML
element header1 from namespace http://myServiceNamespace is encrypted and signed. The header2
element from the same namespace is only signed.
<protocols ...>
...
<behaviors>
<contractBehaviors>
<behavior>
<channelProtectionBehavior>
<protectionRequirements
action="http://mySoapAction">
<incomingEncryptionParts>
<header localName="header1"
namespace="http://myServiceNamespace" />
User Guide
HP LoadRunner (12.50) Page 955
</incomingEncryptionParts>
<incomingSignatureParts>
<header localName="header1" namespace="
http://myServiceNamespace " />
<header localName="header2" namespace="
http://myServiceNamespace " />
</incomingSignatureParts>
</protectionRequirements>
</channelProtectionBehavior>
</behavior>
</contractBehaviors>
</behaviors>
</protocols>
Emulating Users with Iterations
Many of the security scenarios establish a session with the server. For example, every scenario that
uses WS-SecureConversation establishes a server session. This session is established when the first
operation is executed and ends when the script is finished. By default, VuGen closes all sessions after
each iteration and opens them again when the next iteration begins. This implies that every iteration
simulates a new session and Vuser.
When working with multiple iterations, this may not be the desired effect—you may prefer to keep the
original session active and not open a new session for each iteration. This applies when load testing
through the LoadRunner Controller or when setting multiple iterations in the runtime settings.
You can override this behavior so that only the first iteration will establish a new session, while all
subsequent ones will continue to use the open session. This simulates a user who repeatedly performs
an action using the same session.
To determine which simulation mode to use, choose the one which is most appropriate to what you are
simulating. For example, if you are simulating a load test where most of the actions are performed
repeatedly by the same user in a single session, use the above configuration. If you are unsure, leave
the default settings.
How to Add Security to a Web Service Script
This task describes how to add set the security for your Web Service calls. For details about Web
Services security, see "Setting Security Overview" on page942.
Insert a new Web Services Security Step
1. Place the cursor at the point at which you want to add the security settings. In most cases, it is
best to place it in vuser_init so that the security scope will be applied to the whole script. To apply
User Guide
HP LoadRunner (12.50) Page 956
the security for specific calls, place it at the desired location.
2. Select Insert > New Step from the right-click menu and choose web_service_set_security from
the Web Services functions in the Steps Toolbox. The Set Security Properties box opens.
Add a token - optional
1. Click Add to add a new token. The Add Token dialog box opens.
2. Select a token type. For details, see "Security Tokens and Encryption" on page943.
In the LogicalName box, assign an arbitrary name for the token to be used by VuGen in identifying
the token.
Add any relevant information, such as User Name and Password for the User Name and Password
type token.
To send the token explicitly in the SOAP envelope header, select True. To exclude the token from the
SOAP envelope header, select False.
Add a message signature or encryption - optional
1. Click Add > Message Signature or Add > Encrypted Data.
2. Select a token to use with the message signature or encryption. Both signatures and encryptions
require you to specify a token previously defined as the signing/encrypting token.
3. Specify a target token, or leave the field blank to apply the signature or encryption to the whole
message body. For details, see "Security Tokens and Encryption" on page943.
Set a message timeout - optional
To specify a time for which the message packet is considered valid, select Time To Live and specify a
time in seconds.
Cancel the security settings - optional
To cancel the security settings at a specific point within the script, add a Web Service Cancel Security
step at the desired point.
How to Customize the Security
This task describes how to how to configure special cases common to Web Service security.
Reference a token with a SubjectKeyIdentifier - optional
By default, Service Test adds all of the defined X.509 tokens to the SOAP envelope and references them
as binary tokens. It is also possible to exclude the tokens from the message and reference them with a
SKI (Subject Key Identifier). This is common with tokens that are used for encryption.
1. Add a token as described in the "How to Add Security to a Web Service Script" on the previous page.
User Guide
HP LoadRunner (12.50) Page 957
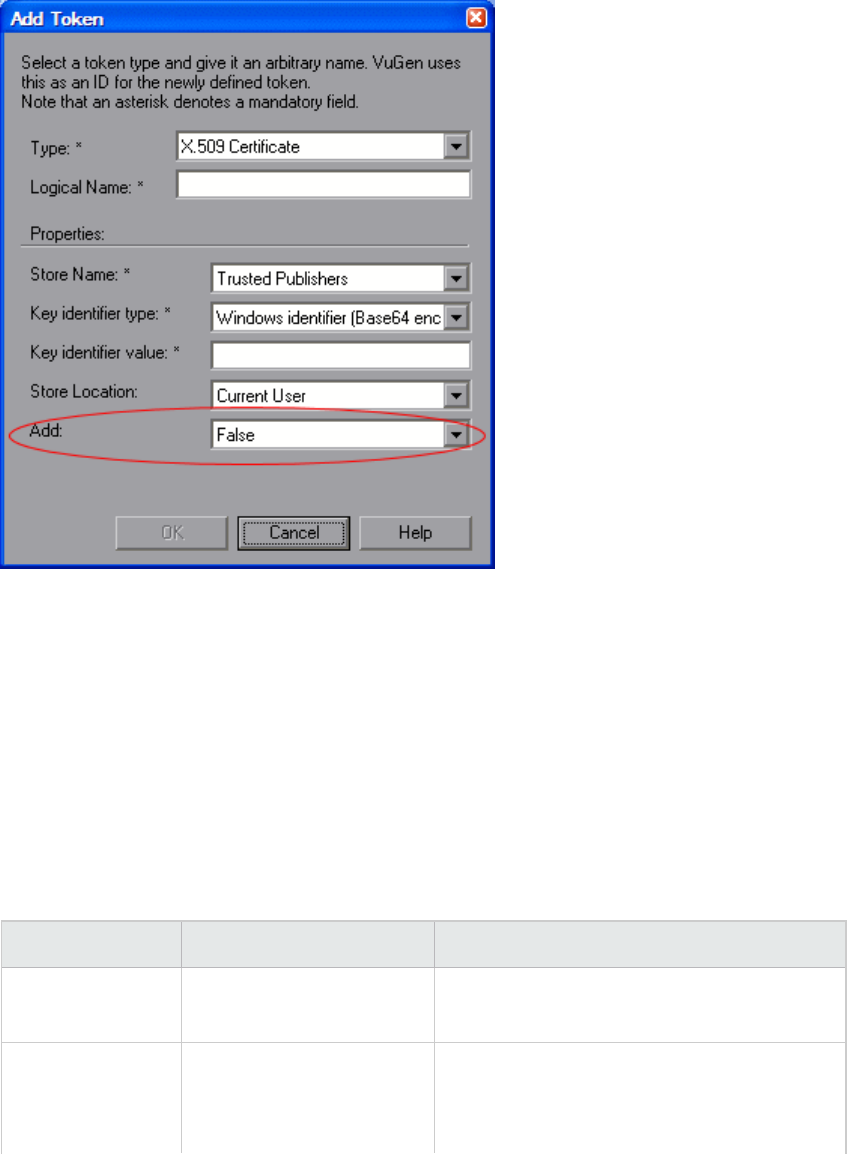
2. In the Add Token dialog box, set the Add option to False.
3. Alternatively, configure this setting in the script:
SECURITY_TOKEN, "Type=X509","LogicalName=myToken", "StoreName=My",
"IDType=SubjectName", "IDValue=CN=myCert", "StoreLocation=CurrentUser",
"Add=False",
4. If necessary, set the useRFC3280 settings as described in "How to Customize the Security" on the
previous page.
You can customize the Username token with a nonce and timestamp.
1. Locate the web_service_set_security function in the script.
2. Add the attributes and their values according to this chart:
Name Meaning Possible values
IsNonceIncluded Include a nonce with the
token.
True (default) or False
TimestampFormat The timestamp format to
use with the token.
lNone. no timestamp
lFull. a <timestamp> element with
<created> and <expired> inner elements
User Guide
HP LoadRunner (12.50) Page 958

lCreated. (default) only a <created>
element
For example:
web_service_set_security(
SECURITY_TOKEN, "Type=USERNAME","LogicalName=myToken", "UserName=John",
"Password=1234", "PasswordOptions=SendPlainText", "IsNonceIncluded=true",
"TimestampFormat=Full", "Add=True",
LAST);
Customize the encryption - optional
You customize encryption by indicating whether to encrypt the whole element or only its content. This is
common when encrypting tokens such as a user name. By default, only the content is encrypted. The
following steps describe how to encrypt the entire token.
1. Locate the web_service_set_security function in the script.
2. Add the EncryptionType attribute with the value Element.
web_service_set_security(
...
ENCRYPTED_DATA, "UseToken=myToken", "TargetToken=myOtherToken",
"EncryptionType=Element",
LAST);
3. To return to the default, remove the EncryptionType attribute or set it to Content.
Customize WS-Security - optional
To change the algorithm Service Test uses for encryption or to modify some other low-level security
details.
1. To change either of these items, open the %Service Test%/bin/mmdrv.exe.config file in a text
editor.
2. If this file does not contain the <microsoft.web.services2> element, add it as shown below.
<configuration>
...
<microsoft.web.services2>
<security>
<x509 storeLocation="CurrentUser" allowTestRoot="true" useRFC3280="true"
/>
<binarySecurityTokenManager valueType="http://docs.oasis-
open.org/wss/2004/01/oasis-200401-wss-x509-token-profile-1.0#X509v3">
<sessionKeyAlgorithm name="TripleDES" />
<keyAlgorithm name="RSA15" />
</binarySecurityTokenManager>
</security>
User Guide
HP LoadRunner (12.50) Page 959

</microsoft.web.services2>
...
<configuration>
3. Set the element values as required:
Name Meaning Possible
values
verifyTrusy Check sent/received x.509 certificate's validity. lTrue
(default)
lFalse
sessionKeyAlgorithm The algorithm the session symmetric key should use to
encrypt the message.
lAES128
lAES192
lAES256
lTripleDE
S
keyAlgorithm The algorithm to use by the public key to encrypt the
session key.
lRSA15
lRSAOAEP
useRFC3280 Generate subject key identifiers that are interoperable
and not Windows specific.
lTrue
lFalse
(default)
How to Add SAML Security
This task describes how to add SAML security for your Web Service calls. For more information about
SAML security, see "SAML Security Options" on page945.
For syntax information, see the Function Reference (Help > Function Reference).
1. Insert a new Web Services Security step
a. Place the cursor at the point at which you want to add the security settings.
b. Select Insert > New Step from the right-click menu and choose web_service_set_security_
saml from the SOAP functions in the Steps Toolbox.
2. Insert a SAML assertion
Select Insert > New Step from the right-click menu and choose ws_sign_saml_assertion from the
SOAP functions in the Steps Toolbox. Provide the unsigned assertion, a certificate file, and a
password (optional).
3. Set the security policy - optional
User Guide
HP LoadRunner (12.50) Page 960
Specify a policy file, or leave it blank to use the default. If you manually enter values, they override
any values in the policy file. You must provide an Issuer URL, also known as the STS URL.
4. Cancel the SAML settings - optional
To remove the settings at a specific point in the script, insert a web_service_cancel_security_
saml step.
How to Create and Manage Security Scenarios
The following steps describes how to create and customize a security scenario for a specific service.
1. Open the Security Scenario Data dialog box
a. Click Manage Services. In the left pane, select the service for which you want to set the
security scenario. If necessary, import a service, as described in "Import Service Dialog Box" on
page940.
b. Select the Protocol and Security tab and click the Edit Data button. The Security Scenario
Data dialog box opens.
2. Create a scenario (if you do not have existing ones)
a. Choose Private scenario and select a built-on security scenario for the current service.
b. In the Scenario type box, choose a scenario. For details, see "Choosing a Security Model" on
page947.
c. Specify the required values for your scenario. For details, see "WCF Scenario Settings" on
page950.
d. To specify a certificate (only applicable to some of the scenarios), click the Browse button
adjacent to the Client certificate or Specify service certificate box to open the Select
Certificate dialog box. For details, see the "Select Certificate Dialog Box" on page972.
oTo retrieve a certificate from a file, choose File and locate its path.
oTo retrieve a certificate from a Windows store, Choose Windows Store. Select a Store
location and name. Specify a search string—to search for all certificates, leave the Search
text box empty. To search for a specific certificate, specify a substring of the certificate
name. If required, specify a password for the private key. Click Find to generate the list of
certificates found in the store.
3. Load a security scenario (if you have existing ones)
a. To use an existing scenario with the ability to modify it, choose Private scenario. Click Import.
In the Shared Scenario dialog box, select a stored scenario. If required, modify the settings as
described in "WCF Scenario Settings" on page950.
b. To use an existing scenario without the option of changing it, choose Shared Scenario. Use the
Browse button to open the Shared Scenario dialog box and select a stored scenario.
User Guide
HP LoadRunner (12.50) Page 961

Note: If someone modifies a shared scenario file at its source, it will affect your script.
4. Configure advanced settings - optional
Click Advanced to configure the Proxy, Encoding, and other advanced setting. For most scenarios,
the default settings are ideal. For details, see "Advanced Settings Dialog Box" on page968. Click OK
to save the security scenario.
5. Modify an existing security scenario - optional
To create and modify security scenarios that will be available globally for all scripts—not just this
specific service, use the Security Scenario editor. You can also use the editor to save the scenario
so that others may load it.
a. Choose SOA Tools >Security Scenario Editor.
b. Click the Load button and browse for an existing stss scenario file.
c. Modify the scenario settings as required
d. Click Save or Save as.
6. Protect SOAP headers - optional
Manually modify the behavior element in the scenario's configuration file
a. In VuGen, open the Script view. Choose choose View > Script View.
b. Click in the script editor and select Open Script Directory from the shortcut menu.
c. Locate the security scenario's configuration file <service_name>.stss in WSDL/@config folder.
d. Modify the behavior section of the file. For details, see "Protecting Custom Headers" on
page955.
7. Set the iteration mode- optional
To configure your environment to use the same session for all iterations:
a. Open the script root folder: In Script view, click inside the script and choose Open Script
Directory from the shortcut menu.
b. Open default.cfg file in a text editor.
c. In the [WebServices] section, add in a row under the toolkit. If you are using the Axis toolkit or
if you configured other settings, the file contents may differ.
[WebServices]
Toolkit=.NET
SimulateNewUserInNewIteration=0
d. Save and close the file.
For details, see "Emulating Users with Iterations" on page956.
User Guide
HP LoadRunner (12.50) Page 962

How to Parameterize Security Elements
This task describes how to independently parameterize the security elements in a script.
1. Open the Security Scenario Editor
Select SOA Tools > Security Scenario Editor.
2. Set up a scenario for each Vuser
Set up a scenario for each Vuser as described in " How to Create and Manage Security Scenarios"
on page961. We recommend you use the names user1,user2, and so forth, and save them in a
new folder, %script root%/WSDL/referencedConfig.
3. Open the Parameter List window and create a parameter
Select Vuser > Parameters List. Create a new parameter, <ServiceName>_shared_config. Replace
the <ServiceName> with the case-sensitive name of the service you are testing. To determine the
exact name of the service, click Manage Services to see the list of services.
4. Add parameter values
In the values table, in each row add the file names of the security scenarios with their .stss
extensions. You can use a relative path, relative to the script folder. Click Add Row to add multiple
values. Close the Parameter List dialog box.
5. Call the parameter
a. Click Manage Services and select the Protocol and Security tab. Click Edit Data.
b. Select Shared Scenario. Click the Browse button and enter the parameter name,
<ServiceName>_shared_config, in the test box.
Set Security Properties Dialog Box
This dialog box enables you to set the security properties for your Web Service calls.
To access In the Steps Toolbox pane, double-click the web_service_set_security step.
Relevant
tasks
"How to Add Security to a Web Service Script" on page956
See also "How to Add SAML Security" on page960
Important
Information
If you have edited key algorithm or session algorithm values in the mmdrv.config file
for an existing script, these values are replaced with the system default values.
User Guide
HP LoadRunner (12.50) Page 963
WS -Security Tab
User interface elements are described below (unlabeled elements are shown in angle brackets):
UI Element Description
<Token Grid> Displays a unique number, type and name of all tokens that have been
added.
Add Security
Token
Enables you to select a token type:
Username and Password
UI Element Description
Token Name A meaningful name for the token.
Include nonce If selected, an arbitrary number is used once to sign
communication.
Username Specify the username.
Password Specify the password.
Password type Specify the password as one of the following:
lText
lHash
lNone
Timestamp
format
Specify the timestamp format:
lFull
lCreated
lNone
X.509 Certificate Token
UI Element Description
Token Name A meaningful name for the token.
Certificate If selected, an arbitrary number is used once to sign
communication.
Reference Specify the username.
User Guide
HP LoadRunner (12.50) Page 964
UI Element Description
Type
Kerberos Token
UI
Element
Description
Token
Name
A meaningful name for the token.
Host The host name of the server against which you want to
authenticate. In most cases, it is the host portion of the
service URL.
Domain The Windows domain of the server against which you want to
authenticate.
Kerberos2 Token
UI
Element
Description
Token
Name
Specify the name of the token.
Host The host name of the server against which you want to
authenticate. In most cases, it is the host portion of the
service URL.
Domain The Windows domain of the server against which you want to
authenticate.
Add Message
Signature
UI Element Description
Signing token The token to use for signing, usually an X.509 type.
Select from the list of all added tokens.
Canonicalization
algorithm
A URL for the algorithm to use for canonicalization. A
drop-down list provides common algorithms. If you
are unsure which value to use, keep the default.
Transform
Algorithm
A URL for the Transform algorithm to apply to the
message signature. A drop down list provides
User Guide
HP LoadRunner (12.50) Page 965
UI Element Description
common algorithms. If you are unsure which value to
use, keep the default.
Inclusive
namespace list
A list of comma-separated prefixes to be treated as
inclusive (optional).
What to sign
The SOAP elements to sign: SOAP Body, Timestamp, and WS-Addressing.
Xpath (optional) An XPath that specifies which parts in the message to
sign. If left blank, the elements selected in the
Signature options field are signed. For example, //*
[local-name(.)='Body'].
Token (optional) The target token you want to sign. Select from the
drop-down list of all added tokens. With most
services, this field should be left empty.
Add Message
Encryption
UI
Element
Description
Encrypting
Token
The token to use for encryption, usually an X.509 type. You
can select from a list of all previously created tokens.
Encrypting
Type
Indicates whether to encrypt the whole destination Element
or only its Content.
Key
algorithm
The algorithm to use for the encryption of the session key:
RSA15 or RSAOAEP.
Note: If you have edited the mmdrv.config file with
a custom key algorithm value for an existing script,
this value is replaced with the system default value
of RSA15.
Session
algorithm
The algorithm to use for the encryption of the SOAP
message. You can select from a list of common values.
Note: If you have edited the mmdrv.config file with
a custom session algorithm value for an existing
User Guide
HP LoadRunner (12.50) Page 966
UI
Element
Description
script, this value is replaced with the system default
of AES128.
What to encrypt
Xpath
(optional)
An XPath that indicates the parts of the message to
encrypt. If left blank, only the SOAP body is encrypted.
Token
(optional)
The name of the encrypted token. A drop-down box
provides a list of all added tokens. With most services, this
field should be left empty.
Delete a token definition from the grid.
Up/Down. Positioning tools that allow you to set the
priority of the security elements.
Note: Make sure the security elements are positioned in order of
their priority.
Exclude Timestamp Removes the timestamp from the SOAP header before sending the security
element to the server.
WS Addressing
The WS-Addressing tab indicates whether WS-Addressing is used by the service, and if so, its version
number. You can also specify the IP address of the server to which you want the response to be sent.
Security Scenario Editor Dialog Box
This dialog box enables you to define security scenarios for your script.
To access SOA Tools > Security Scenario Editor
Important
information
You can also define scenarios for a specific service. For details, see " How to Create
and Manage Security Scenarios" on page961.
Relevant
tasks
" How to Create and Manage Security Scenarios" on page961
User Guide
HP LoadRunner (12.50) Page 967
User interface elements are described below:
UI Element Description
New. Resets the editor for defining a new security scenario. If you made changes to
the current scenario, it prompts you to save them.
Load. Opens an existing shared scenario from a URL or file.
Save. Saves the scenario file. If you have not saved the file at least once, it prompts
you for a name.
Save as. Saves the scenario file at a new location.
Help. Opens the Online help for security scenarios.
Close. Closes the dialog box.
Opens the Advanced Setting dialog box for setting the encoding, reliable messaging,
secure session information, and proxy configuration.
For details, see "Advanced Settings Dialog Box" below.
Scenario type The security scenario type: No scenario or a sub-type of Core, Security, WCF, or
Optimization scenarios.
Advanced Settings Dialog Box
This dialog box lets you configure advanced settings for security scenario in the areas of Encoding,
Advanced Standards, Security, or HTTP and Proxy. You access these setting via the "Security Scenario
Editor Dialog Box" on the previous page.
Not all settings are relevant for all scenarios—some of them might be disabled or hidden depending on
the scenario type.
Encoding
The Encoding tab lets you indicate the type of encoding to use for the messages: Text,MTOM, or Binary.
The default is Text encoding.
For each of these encoding methods, you can choose a version of WS-Addressing:
lNone
lWSA 1.0
lWSA 04/08
Advanced Standards
This tab lets you configure advanced WS- standards, such as Reliable Messaging and the Via address
User Guide
HP LoadRunner (12.50) Page 968

option.
If your service implements the WS-ReliableMessaging specification, enable the Reliable Messaging
option and set the following options:
lReliable messaging ordered. indicates whether the reliable session should be ordered
lReliable messaging version. WSReliableMessagingFebruary2005 or WSReliableMessaging11
Via Address
In certain instances, you may need to send a message to an intermediate service that submits it to the
actual server. This may also apply when you send the message to a debugging proxy. This corresponds
to the WCF clientVia behavior.
In such cases it may be useful to separate the physical address to which the message is actually sent,
from the logical address for which the message is intended. The logical address may be the physical
address of the final server or any name. It appears in the SOAP message as follows:
<wsa:Action>http://myLogicalAddress<wsa:Action>
The logical address is retrieved from the user interface. By default, it is the address specified in the
WSDL. You can override this address from the Manage Services dialog box.
Security
The Advanced security settings correspond to the WS-Security specifications.
For security scenarios that are based upon WCF WSHttpBinding, you can indicate the following settings:
lEnable secure session. Establish a security context using the WS-SecureConversation standard.
lNegotiate service credentials. Allow WCF proprietary negotiations to negotiate the service's
security.
For WSHttpBinding, Custom Binding, or WSFederationHttpBinding WCF type scenarios, you can set the
default algorithm suite and protection level:
Attribute Meaning Possible Values
Default
Algorithm Suite
The algorithm to use for symmetric/
asymmetric encryption.
These are the values from the
SecurityAlgorithmSuite configuration in WCF:
lBasic128
lBasic128Rsa15
lBasic128Sha256
lBasic128Sha256Rsa15
lBasic192
lBasic192Rsa15
lBasic192Sha256
lBasic192Sha256Rsa15
lBasic256
User Guide
HP LoadRunner (12.50) Page 969

lBasic256Rsa15
lBasic256Sha256
lBasic256Sha256Rsa15
lTripleDes
lTripleDesRsa15
lTripleDesSha256
lTripleDesSha256Rsa15
Protection
Level
Should the SOAP Body be encrypted/signed None, Sign, and
EncryptAndSign (default)
For Custom Binding or WSFederationHttpBinding WCF type scenarios, you can customize the security
settings in greater detail. The following table describes the options and their values:
Attribute Meaning Possible Values
Message Protection
Order
The order for signing and
encrypting
lSignBeforeEncrypt
lSignBeforeEncrypt-
AndEncryptSignature
lEncryptBeforeSign
Message Security
Version
The WS-Security security version A list of the current versions
Security Header Layout The layout for the message header lStrict
lLax
lLaxTimeStampFirst
lLaxTimeStampLast
Key Entropy Mode The entropy mode for the security
key.
lClient Entropy
lSecurity Entropy
lCombined Entropy
You can enable or disable the following options:
lRequire derived keys. Indicates whether or not to require derived keys.
lRequire security context cancellation. Disabling this option implies that stateful security tokens will
be used in the WS-SecureConversation session (if enabled).
lInclude timestamp. Includes a timestamp in the header.
lAllow serialized token on reply. Enables the reply to send a serialized token.
lRequire signature confirmation. Instructs the server to send a signature confirmation in the
response.
User Guide
HP LoadRunner (12.50) Page 970

For X.509 certificates, you can specify values for the following items:
Attribute Meaning Possible Values
X509 Inclusion Mode When to include the X509 certificate lAlways to Recipient
lNever
lOnce
lAlwaysToInitiator
X509 Reference Style How to reference the certificate lInternal
lExternal
X509 require derived keys Should X509 certificates require derived
keys
lEnable - Yes
lDisable - No
X509 key identifier clause
type
The type of clause used to identify the
X509 key.
lAny
lThumbprint
lIssuerSerial
lSubjectKeyIdentifier
lRawDataKeyIdentifie
r
HTTP and Proxy
This tab lets you set the HTTP and Proxy information for your test.
HTTP(S) Transport
The following table describes the HTTP(S) Transport options:
Option Meaning Possible Values
Transfer mode The transfer method for
requests/responses
Buffered, Streamed,
StreamedRequest, StreamedResponse
Max response
size (KB)
The maximum size of the response
before being concatenated
Default 65 KB
Allow cookies Enable cookies Enabled/Disabled
Keep-Alive
Enabled
Enable keep-alive connections Enabled/Disabled
Authentication
scheme
HTTP authentication method None, Digest, Negotiate, NTLM,
IntegratedWindows
User Guide
HP LoadRunner (12.50) Page 971

Authentication, Basic, Anonymous
Realm The realm of the authentication scheme Any URL
Require client
certificate
For SSL transport, require a certificate Enabled/Disabled
Proxy Information
If the Web service's transport uses a proxy server, you can specify its details in the Security tab. The
following table describes the proxy options:
Option Meaning Possible Values
Use default web
proxy
Use machine's default proxy settings Enabled/Disabled
Bypass proxy on
local
Ignore proxy when the service is on
the local machine
Enabled/Disabled
Proxy address the proxy server Any URL
Proxy authentication
scheme
HTTP authentication method on Proxy None, Digest, Negotiate, NTLM,
IntegratedWindows
Authentication, Basic, Anonymous
Select Certificate Dialog Box
This dialog box enables you to search and locate a certificate from a file or Windows store.
To access Select a scenario that uses a certificate in one of the following ways:
lOpen the Security Scenario Editor: Choose SOA Tools > Security Scenario Editor.
lIn the Manage Services dialog box, select the Protocol and Security tab and click
the Edit Data button.
Select a WCF scenario that uses a client or service certificate, such as WsHttpBinding
or Federation. In the Certificate field, click the Browse button.
Important
information
This only applies to security scenarios that allow you to specify client, server, or
service certificates.
Relevant
tasks
l" How to Create and Manage Security Scenarios" on page961.
l" How to Create and Manage Security Scenarios" on page961.
Select Certificate from File
When you choose File, the dialog box shows the user interface elements described below:
User Guide
HP LoadRunner (12.50) Page 972
UI Element Description
Browse. Allows you to locate the certificate file with a .pem, .arm, .der, or .pfx
extension.
File The complete path of the certificate file.
Password
(optional)
The password required to access the certificate.
Select Certificate from Windows Store
When you choose Windows Store, the dialog box shows the user interface elements described below
(unlabeled elements are shown in angle brackets):
UI Element Description
Begins the search for the certificate.
Import from The location of the certificate:
lWindows store
lFile
Store location The store location, for example Current User.
Store name The store name, for example, AuthRoot.
Search text The text to match in the certificate name.
Password
(optional)
The password required to access the certificate.
<certificate
list>
A list of the certificates in the Windows store sorted by Subject, Issuer, Private,
Store Location, and Store Name.
Web Services Security Examples
This section illustrates several common security scenarios.
Authenticating with a Username Token
The following example illustrates the sending of a message level username/password token (a
username token), where the user name is John and the password is 1234.
web_service_set_security(
SECURITY_TOKEN, "Type=USERNAME","LogicalName=myToken", "UserName=John",
User Guide
HP LoadRunner (12.50) Page 973

"Password=1234", "PasswordOptions=SendPlainText", "Add=True",
LAST);
Signing a Specific Element with an X.509 Certificate
It is possible to sign only a specific element in a message. The following example signs a specific
element using an XPATH expression:
web_service_set_security(
SECURITY_TOKEN, "Type=X509","LogicalName=myCert", "StoreName=My",
"IDType=SubjectName", "IDValue=CN=myCert", "StoreLocation=CurrentUser", "Add=True",
MESSAGE_SIGNATURE, "UseToken=myCert", "TargetPath=//*[local-name(.)
='someElement' and namespace-uri(.)='http://myNamespace']",
LAST);
Signing with an X.509 Certificate
The following example shows a script using an X.509 certificate for a digital signature.
web_service_set_security(
SECURITY_TOKEN, "Type=X509","LogicalName=myCert", "StoreName=My",
"IDType=SubjectName", "IDValue=CN=myCert", "StoreLocation=CurrentUser", "Add=True",
MESSAGE_SIGNATURE, "UseToken=myCert",
LAST);
Note: The certificate needs to be installed in the Windows certificate store. In the example
above, you need to set the actual store name, store location, and subject name of your
certificate.
Encrypting with a Certificate
The following sample encrypts a message with the service's X.509 certificate.
web_service_set_security(
SECURITY_TOKEN, "Type=X509","LogicalName=serviceCert", "StoreName=My",
"IDType=SubjectName", "IDValue=CN=serviceCert", "StoreLocation=CurrentUser",
"Add=False",
ENCRYPTED_DATA, "UseToken=serviceCert",
LAST);
After you specify the details of your X.509 certificate, you can encrypt a specific XPATH in the message.
Since we want to generate a Subject Key Identifier, we set the Add value to False.
Authenticating with a Username Token and Encrypting with an X.509 Certificate
The following example sends a username token to the service and encrypts it with the server's X.509
certificate:
User Guide
HP LoadRunner (12.50) Page 974
web_service_set_security(
SECURITY_TOKEN, "Type=X509","LogicalName=serviceCert", "StoreName=My",
"IDType=SubjectName", "IDValue=CN=serviceCert", "StoreLocation=CurrentUser",
"Add=True",
SECURITY_TOKEN, "Type=USERNAME","LogicalName=myUser", "UserName=John",
"Password=1234", "PasswordOptions=SendPlainText", "Add=True",
ENCRYPTED_DATA, "UseToken=serviceCert", "TargetToken=myUser",
LAST);
The UseToken and TargetToken properties indicate which token to use and which to encrypt. Their
values reference the LogicalName property of the tokens.
Encrypting and Signing a Message
This example shows how to sign a message using a private key and then encrypt it using the service's
public key.
web_service_set_security(
SECURITY_TOKEN, "Type=X509","LogicalName=myCert", "StoreName=My",
"IDType=SubjectName", "IDValue=CN=myCert", "StoreLocation=CurrentUser", "Add=True",
SECURITY_TOKEN, "Type=X509","LogicalName=serverToken", "StoreName=My",
"IDType=SubjectName", "IDValue=CN=serverCert", "StoreLocation=CurrentUser",
"Add=False",
MESSAGE_SIGNATURE, "UseToken=myCert",
ENCRYPTED_DATA, "UseToken=serverCert",
LAST);
Referencing an X.509 Certificate Using a Hash
In certain cases, you may be unable to reference a certificate with a subject name. This example shows
how to reference the certificate using its unique hash.
web_service_set_security(
SECURITY_TOKEN, "Type=X509","LogicalName=serviceCert", "StoreName=My",
"IDType=Base64KeyID", "IDValue=pOl0+1iuotKLlO91nhjDg5reEw0=",
"StoreLocation=CurrentUser", "Add=False",
ENCRYPTED_DATA, "UseToken=serviceCert",
LAST);
Troubleshooting and Limitations for Web Services
This section describes troubleshooting and limitations for the Web Services protocol.
lIf your script contains one of the following API functions: web_service_call,web_service_set_
security, or web_service_set_security_saml, you will encounter an error if WSE 2.0 SP3 and WSE 3.0
are not installed.
Solution:
lFirst, activate .NET 3.5. For Windows 8.1/2012 R2, turn on the feature as described in the
MSDN. For Windows 7/2008 R2, download and install .NET Framework 3.5.
User Guide
HP LoadRunner (12.50) Page 975
lNext, install the WSE components from the LoadRunner DVD folders,
lrunner\Common\wse20sp3 and lrunner\Common\wse30, or download them from the
Internet.
lThe Record default web browser option in the Recording Wizard, is only supported for Internet
Explorer.
lFor large SOAP envelopes, Record and Replay snapshots are disabled.
lThe Import SOAP feature is not supported for envelopes containing a single element larger than
500KB.
lRecording requests with attachments or security is not supported.
lFor Axis toolkit, Web service calls that include both attachments and security are not supported.
lFor .NET toolkit, SOAP version 1.2 is not supported for asynchronous calls.
lYou can enter text strings up to 10 KB to encode to base 64. If your string is larger, use the Get from
file option.
lVuGen supports Web Service messages over JMS message Queue, but does not support JMS Topics.
lJMS Bindings Extensions are not supported.
lAll services in your script should have the same security scenario. This can be configured via the
Protocols and Security tab.
lAsynchronous Web Service calls and custom user handlers are not supported for WCF.
lLoadRunner cannot replay scripts containing the soa_xml_validate function.
lWhen using Update service, steps that are already in the script will not display the updated
properties (in the step argument view) until you close and reopen the application. After you reopen
the app, step arguments are updated. If the script is open when performing "update service", then on
the script view arguments, the application throws an exception.
Workaround: Close the script file while running "update service", or reopen the test after running
"update service".
lA Web Service script might not open when you import the WDSL with the Axis toolkit.Workaround:
Import the WDSL with the .NET toolkit.
If there is a problem recreating the scripts, do the following:
a. Create a new test.
b. Import the WSDL using .NET toolkit.
c. Go to the directory of the new script.
d. Copy the folder "WSDL" and paste it on the directory of the old script.
e. In the directory of the old script open the 'default.cfg' file
f. Under [WebServices] header, instead of "Toolkit=Axis" write "Toolkit=.NET"
Windows Sockets Protocol
User Guide
HP LoadRunner (12.50) Page 976
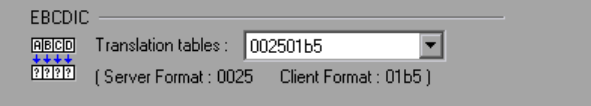
Recording Windows Sockets - Overview
The Windows Sockets protocol supports applications which communicate over the TCP/IP protocol using
a Microsoft WinSock DLL. The WinSock protocol allows you to see the actual data sent and received by
the buffers.
The WinSock protocol records functions that relate to the sockets, data buffers, and the Windows
Sockets environment. Using VuGen, you record your application's API calls to the Winsock.dll or
Wsock32.dll. For example, you could create a script by recording the actions of a telnet application.
After creating a Winsock Vuser script, you can view the recorded buffers as raw data or as a snapshot.
For details, see "Windows Sockets Data" below or "Windows Sockets Snapshots - Overview" on the next
page.
Translation Tables
You can display Windows Sockets data in EBCDIC format through a translation table.
A translation table allows you to specify the format for recording when using the WinSock single
protocol, and for code generation when using a WinSock multi protocol. This applies to users running on
mainframe machines or AS/400 servers. Both the server and client machines determine the format of
the data from translation tables installed on your system. If your data is in ASCII format, it does not
require translation.
The first four digits of the listbox item represent the server format. The last four digits represent the
client format. In the above example, the selected translation table is 002501b5. The server format is
0025 and the client format is 01b5 indicating a transfer from the server to the client. In a transmission
from the client to the server, you would select the item that reverses the formats—01b50025
indicating that the client's 01b5 format needs to be translated to the server's 0025 format.
The translation tables are located in the ebcdic folder under the VuGen's installation folder. If your
system uses different translation tables, copy them to the ebcdic folder.
For details on selecting a translation table in the recording options, see the "WinSock Recording
Options" on page207.
Windows Sockets Data
When you use VuGen to create a Windows Sockets Vuser script, your actions are recorded into the three
sections of the script: vuser_init,Action, and vuser_end. In addition to the Vuser script, VuGen also
creates data files:
User Guide
HP LoadRunner (12.50) Page 977
lsnapshotdata.ws contains the data that was transmitted or received during the recording session.
VuGen's Snapshot pane displays the contents of the data file. Do not modify the contents of the
snapshotdata.ws file.
ldata.ws contains the data that is transmitted during the replay sessions, and is expected to be
received. You can right-click any step in the Editor and then select Show Arguments to show the
buffer content that is stored in data.ws for the selected step. Using the Text View tab of the dialog
box that opens, you can edit the data that is stored for any data buffer.
Several LRS functions, such as lrs_receive and lrs_send, handle the actual data that is transferred
between servers and clients. The data that is received or transmitted is stored in data buffers, which
can be very large. In order to simplify the appearance of the Vuser script, the actual data is stored in
external files—not in the C file. When a data transfer occurs, the data is copied from the external file
into a temporary buffer.
The external file, data.ws, contains the contents of all the temporary buffers. The buffers' contents are
stored as sequential records. The records are marked by identifiers indicating whether the data was
sent or received, and the buffer descriptor. The LRS functions use the buffer descriptors to access the
data.
The descriptors have one of the following formats:
recv buf index number of bytes received
send buf index number of bytes sent
The buffer index begins with 0 (zero), and all subsequent buffers are numbered sequentially (1,2,3...)
regardless of whether they are send or receive buffers.
In the following example, an lrs_receive function was recorded during a Vuser session:
lrs_receive("socket1", "buf4", LrsLastArg)
In this example, lrs_receive handled data that was received on socket1. The data was stored in the fifth
receive record(buf4)—note that the index number is zero-based. The corresponding section of the
data.ws file shows the buffer and its contents.
recv buf4 39
"\xff\xfb\x01\xff\xfb\x03\xff\xfd\x01"
"\r\n"
"\r\n"
"SunOS UNIX (sunny)\r\n"
"\r"
"\x0"
"\r\n"
"\r"
"\x0"
For task details, see "How to View and Modify Windows Sockets Buffers" on page983.
Windows Sockets Snapshots - Overview
Vuser scripts based on the Windows Sockets Vuser protocol utilize VuGen's Snapshot pane.
User Guide
HP LoadRunner (12.50) Page 978

lFor details on how to work with the Snapshot pane, see "How to Work with Snapshots" on page276.
lFor details on the Snapshot pane UI, see "Snapshot Pane" on page77.
For Windows Sockets Vuser scripts, the Snapshot pane displays snapshots of the recorded data buffers.
The following sections describe how to view and use the data.
Displaying Buffer Data
To display a specific buffer in the Snapshot pane:
lIn the Editor, select the step that contains a reference to the required buffer.
lIn the Step Navigator, double-click the step that contains a reference to the required buffer.
Buffer Views
You can view the buffer snapshots in either Text view or Hex view.
Note: VuGen stores the snapshot data as read-only data. You cannot modify the contents of the
snapshots. However, you can modify the buffer data that is associated with any of the steps in a
Vuser script. To modify the buffer data, right-click the required step in the Editor and then
select Show Arguments. The Text View tab of the dialog box that opens lets you modify the
buffer data. For details, see "How to View and Modify Windows Sockets Buffers" on page983.
The Text view shows the buffer data as text.
The Hex view shows the buffer data in hexadecimal representation. The data is displayed in three
columns:
lThe left column shows the offset of the first character in each row.
lThe middle column shows the hexadecimal value of the data.
lThe right column shows the data in ASCII format.
User Guide
HP LoadRunner (12.50) Page 979
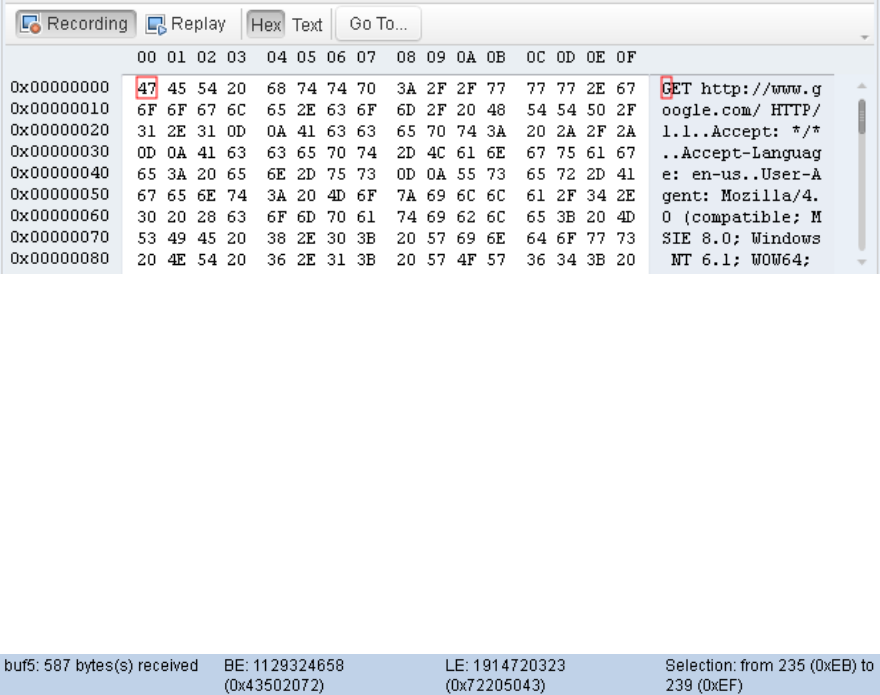
Status Bar
The status bar below the buffer snapshot displays information about the buffer and the data selected
in the buffer:
lBuffer number. The buffer number of the displayed buffer.
lBuffer size. The total number of bytes in the buffer.
lBuffer type. The type of buffer—received or sent.
lData. The value of the data that is selected in the buffer, in decimal and hexadecimal formats. Both
big endian and little endian sequences are displayed.
lOffset. The offset of the selected data from the beginning of the buffer. If you select multiple bytes,
the offset displays the range of the selection.
Navigating within the Buffer Data
lTo go to a specific offset within the buffer (absolute), click Go To. In the Go To Offset dialog box
enter an offset value, and then click Apply.
lTo jump to a location relative to the selected entry, click Go To. In the Go To Offset dialog box, click
Advance by , specify the number of bytes to advance, and then click Apply.
Creating Correlations from the Buffer Data
Using the shortcut menu, you can create correlations directly from the Recording tab in the Snapshot
pane.
lTo create a regular correlation, select the data and choose Create Correlation from the shortcut
menu. VuGen adds an lrs_save_param function to the script.
lTo create a boundary bounded correlation, select the data and choose Create Boundary Correlation
from the shortcut menu. VuGen adds an lrs_save_searched_string function to the script.
User Guide
HP LoadRunner (12.50) Page 980

Data Navigation Tools
VuGen provides you with Go To functionality to help you to navigate through the data in the Snapshot
pane. This helps you to identify and analyze a specific values in the snapshot. You can move around
within the data buffer by specifying an offset. You can indicate the absolute location of the data, or a
location relative to the current position of the cursor within the buffer. You can also select a range of
data, by specifying the starting and end offsets. For details on the dialog box options, see "Go To Offset
Dialog Box" on page987.
Buffer Data Editing
You can perform all of the standard edit operations on buffer data: copy, paste, and delete. To perform
edit operations on buffer data, right-click the required step in the Editor and select Show Arguments.
You can then perform the edit operation in the Text View tab of the dialog box that opens. You cannot
perform any edit operations in the Binary View tab.
Note: You perform edit operations on buffer data only, not on Snapshot data - which is read-
only.
User Guide
HP LoadRunner (12.50) Page 981
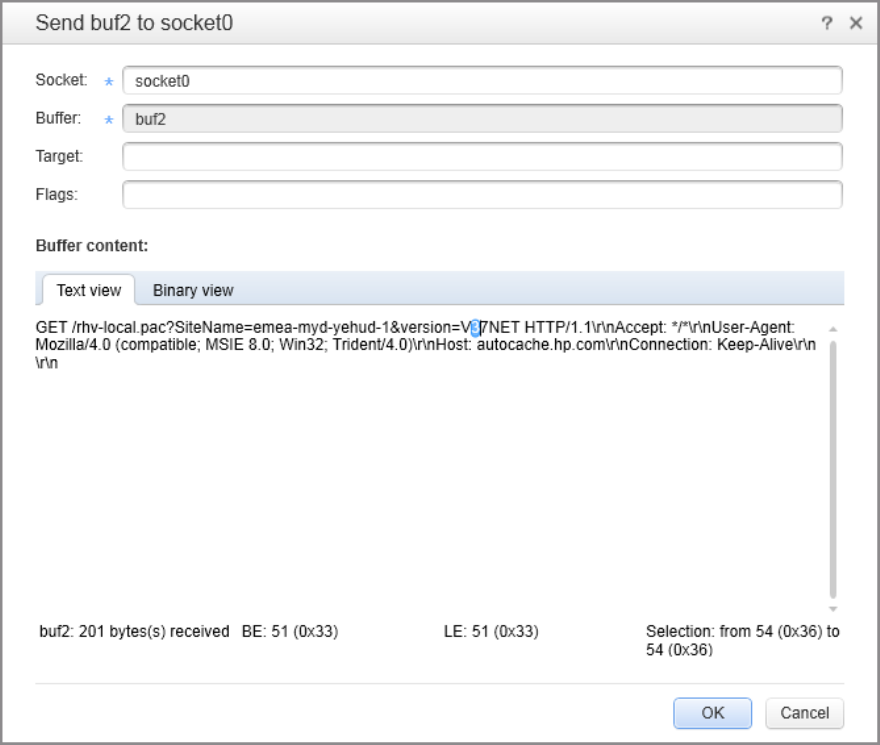
When you copy data from a buffer, VuGen allows you to copy the data either in hexadecimal format or in
decimal format. When you insert data into a buffer, VuGen allows you to specify the format of the
data—single byte, 2-byte, or 4-byte.
How to Record a Windows Sockets Script
This task describes how to set up a Windows Sockets recording and how to record the session.
1. Open the recording options - optional
After creating a WinSock script, select Record > Recording Options and click the WinSock node.
2. Select a translation table - optional
In the EBCDIC section, select a translation table. If your data is in ASCII format, select the None
option—otherwise VuGen will convert the ASCII data. For details, see "Translation Tables" on
page977.
User Guide
HP LoadRunner (12.50) Page 982

3. Exclude any non-relevant sockets - optional
In the Exclude Settings section, add any non-relevant sockets to the list. You should exclude hosts
and ports that do not influence the server load under test, similar to the local host and the DNS
port (53), which are excluded by default.
To exclude the entries from the recording, but include them in the log, clear the Do not include
excluded sockets in log option.
For user interface details, see the "WinSock Recording Options" on page207.
4. Set a think time threshold - optional
Indicate a think time threshold. If VuGen detects a pause in action less than the threshold time, it
will not generate a Think Time step/ lr_think_time function. For details, see the "WinSock
Recording Options" on page207.
5. Record the session
Record the session and save the script.
6. Parameterize the script - optional
Replace recorded values with parameters using the shortcut menu. For more information, see
"Parameters" on page341
7. Regenerate the script - optional
If you need to regenerate the script, for example if you want to include an excluded host:port, or if
the translation was not correct:
lSelect Record > Regenerate Script.
lClick the Options link.
lUnder General, select Protocols, and then under Active Protocols, ensure that the Windows
Sockets check box is selected.
lUnder Sockets, select Winsock, and then modify the settings.
Note: Options for script regeneration are available for multi-protocol scripts only.
How to View and Modify Windows Sockets Buffers
The following steps describe how to view, modify, and navigate through WinSock buffer data.
Modifying buffer data
You can modify buffer data in the Show Arguments dialog box for specific lrs steps in a Vuser script. You
can use the Show Arguments dialog box to modify buffer data for the following steps:
User Guide
HP LoadRunner (12.50) Page 983

llrs_length_receive
llrs_length_send
llrs_receive
llrs_receive_ex
llrs_send
For further details on these steps, see the Function Reference (Help > Function Reference).
To display the Show Arguments dialog box for any of the above steps, right-click a step in the Editor and
select Show Arguments. A dialog box opens and displays the buffer data in the Buffer Content section
of the dialog box.
For further details about editing buffer data in Windows Sockets steps, see "Buffer Data Editing" on
page981.
Note: You cannot modify any data in the Snapshot pane
View and modify the data in the data.ws file
In the Solution Explorer, double-click the data.ws file. The contents of the data.ws file appear in the
VuGen Editor. Modify the data directly in the Editor. For details, see "Windows Sockets Data" on
page977.
Note: Although it is possible to modify data.ws files, it is recommended that you do not modify
these files.
View the data in the Snapshot pane
1. Ensure that the Snapshot pane is displayed.
2. Open the Vuser script in the Editor and select a step, or double-click an entry in the Step Navigator.
The associated snapshot is displayed in the Snapshot pane. You cannot edit the snapshot data.
Navigate within the snapshot data
To navigate within the buffer data, display in the Snapshot pane, and then click Go to. The Go to Offset
dialog box opens.
User Guide
HP LoadRunner (12.50) Page 984
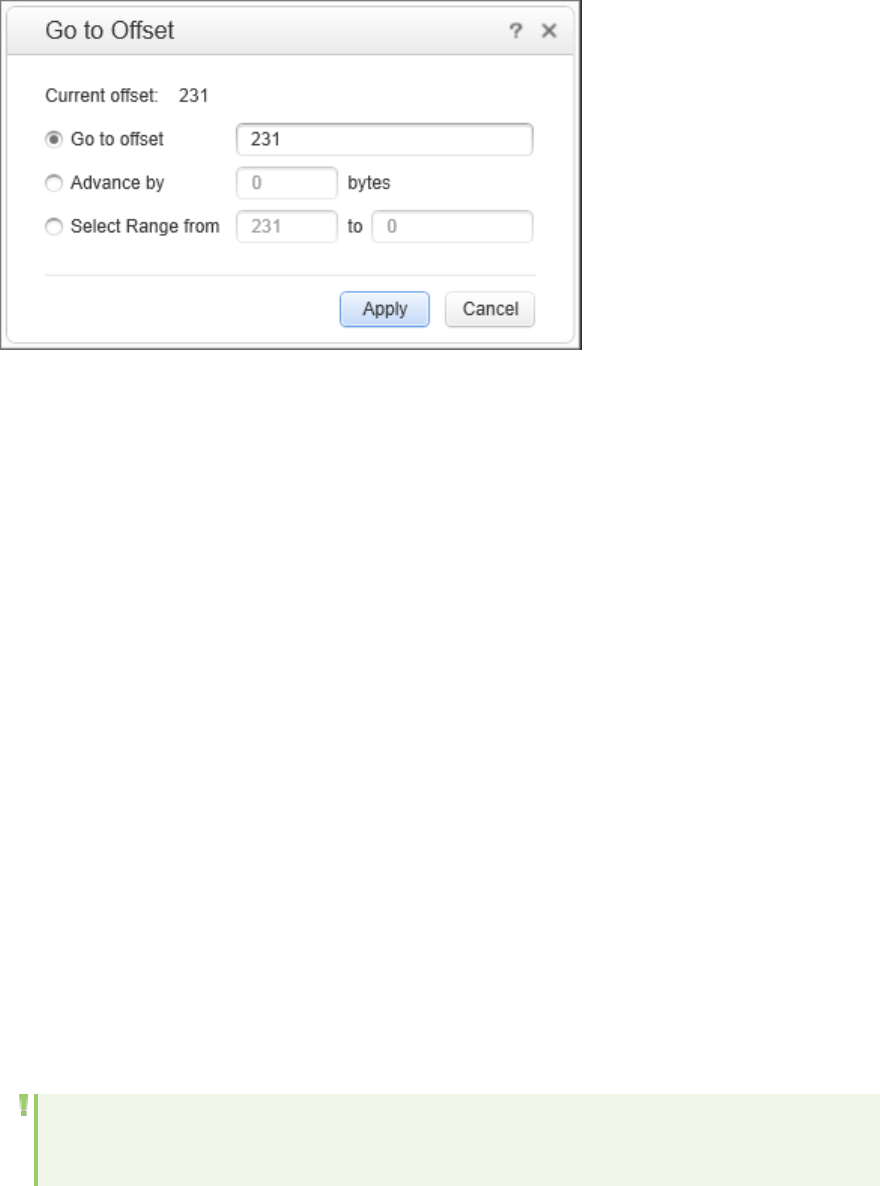
lTo go to a specific offset within the buffer (absolute), select Go to offset and specify an offset value.
Click Apply.
lTo jump to a location relative to the cursor, click Advance by and specify the number of bytes to
advance. To advance ahead, enter a positive value. To move backwards within the buffer, use a
negative value. Click Apply.
lTo select a range of data within the buffer, click Select range from and specify the beginning and
end offsets. Click Apply.
Insert data into a buffer
You can insert a numerical value into a data buffer. You can insert the data as a single, double-byte, or
4-byte value. The following steps describe how to insert a number into a data buffer.
1. Copy the numerical data to be inserted to the clipboard.
2. Right-click a step in the Editor and select Show Arguments.
3. In the dialog box that opens, ensure that the Text View tab is displayed.
4. Under Buffer Content, right-click at the location in the buffer where you want to insert the data,
and then select Advanced > Paste Byte or Advanced > Paste Short (2 bytes) or Advanced >
Paste Long (4 bytes).
5. Click OK. VuGen inserts the data into the buffer.
Copy and paste blocks of data
You can modify the buffer data as characters, decimal numbers, or hexadecimal numbers. For details,
see "Buffer Data Editing" on page981.
Note: You can only edit buffer data when you view the step arguments. You cannot edit buffer
data in the Snapshot pane.
1. Right-click a step in the Editor and select Show Arguments. A dialog box opens and displays the
User Guide
HP LoadRunner (12.50) Page 985
buffer data in the Buffer Content section of the dialog box.
2. To copy buffer data:
lAs characters, select one or more bytes and press Ctrl+c.
lAs a decimal number, select one or more bytes, right-click in the selection and select Advanced >
Copy As Decimal Number.
lAs a hexadecimal number, select one or more bytes, right-click in the selection and select
Advanced > Copy As Hexadecimal Number.
3. To paste the data:
lAs characters, press Ctrl+V.
lAs a single byte (assuming the size of the data on the clipboard is a single byte), right-click at the
desired location in the buffer and click Advanced > Paste Byte.
lIn short format (2-byte), right-click at the desired location in the buffer and click Advanced >
Paste Short (2 bytes).
lIn long format (4-byte), right-click at the desired location in the buffer and click Advanced >
Paste Long (4 bytes).
4. To delete data, select the data in the Text view, right-click inside the selection and select Delete.
Data Buffers
When you use VuGen to create a Windows Sockets Vuser script, VuGen creates the data.ws data file.
This file contains the data that is transmitted, and is expected to be received, during the replay
sessions. You can right-click any step in the Editor and then select Show Arguments to show the buffer
content that is stored in data.ws for the selected step. Using the Text View tab of the dialog box that
opens, you can edit the data that is stored for any data buffer.
The data.ws data file has the following format:
lFile header
lA list of buffers and their contents
The file header includes an internal version number of the data file format. The current version is 2. If
you try to access data from a data file with format version 1, VuGen issues an error.
;WSRData 2 1
An identifier precedes each record, indicating whether the data was received or sent, followed by the
buffer descriptor, and the number of bytes received (for lrs_receive only). The buffer descriptor
contains a number identifying the buffer.
For example,
recv buf5 25
User Guide
HP LoadRunner (12.50) Page 986
indicates that the buffer contains data that was received. The record number is 5, indicating that this
receive operation was the sixth data transfer (the index is zero based), and twenty-five bytes of data
were received.
If your data is in ASCII format, the descriptor is followed by the actual ASCII data that was transferred by
the sockets.
If your data is in EBCDIC format, it must be translated through a look-up table. For information on
setting the translation table, see the "WinSock Recording Options" on page207. The EBCDIC whose ASCII
value (after translation) is printable, is displayed as an ASCII character. If the ASCII value corresponds to
a non-printable character, then VuGen displays the original EBCDIC value.
recv buf6 39
"\xff\xfb\x01\xff\xfb\x03\xff\xfd\x01"
"\r\n"
"SunOS UNIX (sunny)\r\n"
The following segment shows the header, descriptors, and data in a typical data file:
;WSRData 2 1
send buf0 48
"\xff\xfd\x01\xff\xfd\x03\xff\xfb\x03\xff\xfb\x18"
recv buf1 15
"\xff\xfd\x18\xff\xfd\x1f\xff\xfd"
"#"
"\xff\xfd"
"'"
"\xff\xfd"
"$"
send buf2 24
"\xff\xfb\x18"
Go To Offset Dialog Box
This dialog box allows you to go to a specific location within the recorded data.
To access On the Snapshot pane toolbar, click Go to.
Relevant tasks "How to View and Modify Windows Sockets Buffers" on page983
User interface elements are described below:
UI Element Description
Current
offset
The current offset of the cursor (read only).
Go to offset Goes to a specific, absolute offset within the data.
Advance Jumps to a location relative to the cursor, by a number of bytes. Positive values
User Guide
HP LoadRunner (12.50) Page 987

by...bytes indicate a forward direction. Negative values indicate a reverse direction.
Select range
from...to...
Selects a range of data within the buffer.
Apply Moves the cursor to the specified offset.
User Guide
HP LoadRunner (12.50) Page 988

Advanced Topics
The Advanced topics section provides you with tools to customize your scripts, such as how to manually
program scripts and how to replay them on Linux machines.
What do you want to do?
lCreate a pcap file
lManually program a script from within VuGen
lCreate a script in an external IDE
lRun a script on a Linux machine
lDownload resources from HPLN
See also
lNon-English Language support
lAdditional Components in the DVD folder
How to Create a PCAP File
Pcap (Packet Capture) files consist of network packet data, created by capturing live network activity
through capture tools such as Wireshark. The file, with a .pcap extension, can be used for packet
sniffing and analyzing network activity. LoadRunner is capable of parsing .pcap files and converting
them into a Vuser script.
This task describes how to create a .pcap capture file of network or application traffic to use in the
preparation of a Vuser script. The primary uses for the .pcap file are:
lWeb Services scripts. For details, see "How to Create a Script by Analyzing Traffic (Web Services)" on
page891.
lMobile Applications scripts. For details, see "How to Create a Script by Analyzing Traffic (Mobile
Applications)" on page578.
Tip:
lTo generate a smaller, more manageable script, try to capture the network traffic only for
the time that you perform actions in your application.
lWhen using external tools, make sure that all packet data is being captured and none of it is
being truncated.
lFor command line capture utilities, make sure to provide all of the required arguments.
The following sections describe how to create a capture file on several different platforms.
User Guide
HP LoadRunner (12.50) Page 989

Create a capture file on a Windows platform
Create a capture file containing a log of all TCP traffic over the network on a Windows platform. Use a
downloadable capture tool such as Wireshark. Make sure to save the Wireshark capture file in the
tcdump format, as this is the format supported by LoadRunner.
Create a capture file on a Mobile platform
Create a capture file using tPacketCapture on Android devices, or a similar application.
Create a capture file on a Linux Redhat platform
1. Copy the LinuxRH3 folder from LoadRunner installation disk DVD\Additional
Components\mobileRemoteAgent, to the Linux machine.
2. Run the following commands in the shell to give the two files executable permissions on Linux.
a. chmod +x mongoose
b. chmod +x cgi-bin/mobileCGI.cgi
3. Perform a Change directory to the cgi-bin/ folder and run the following commands:
a. export SCRIPT_FILENAME=<Full path of mobileCGI.cgi>, where <Full path of mobileCGI.cgi> is
the path to the mobileCGI.cgi file.
b. export QUERY_STRING=STARTRECORD=0, where 0 is the 0-based sequence number of the
network interface in VuGen's Start Recording dialog box.
c. ./mobileCGI.cgi This generates a currentPCAP.pcap file which contains all traffic captured
over the specified Ethernet interface.
Note: Step c. is primarily for troubleshooting, to make sure that your Linux
environment was configured correctly. Once verified, you do not need to run this
command again in future runs.
Troubleshooting missing packets
Issue: Your script is missing steps you recorded into a capture file.
You encounter the following warning in the Output Pane> Code generation tab:
Warning: One or more responses are missing or have missing packets. Therefore, a
step may appear to be missing in the script.
This issue can be caused if the recording was stopped before all the responses were
received.
If the script is generated from a .pcap file, check if the file has missing
packets.
This error may be caused by unnecessary network activity on the recorded machine, which can cause
the capturing application to drop packets.
User Guide
HP LoadRunner (12.50) Page 990

Steps to Resolve: Ensure that the capturing machine has no unnecessary network traffic in the
background.
Note: To workaround this issue, for Mobile Applications - HTTP/HTML scripts, you can
circumvent this issue using the Recording options. Select Recording Options > HTTP Properties
>Advanced >Generate steps with missing responses to generate steps for HTTP requests that
are missing server responses.
Manually Programming a Script using the VuGen Editor
Manually Programming Scripts - Overview
VuGen allows you to program your own functions into the script, instead of recording an actual session.
You can use the Vuser API or standard programming functions. Vuser API functions allow you to gather
information about Vusers. For example, you can use Vuser functions to measure server performance,
control server load, add debugging code, or retrieve runtime information about the Vusers participating
in the test or monitoring.
This chapter describes how to program a Vuser script from within the VuGen editor, incorporating your
application's libraries or classes.
You can also develop a Vuser script through programming within the Visual C and Visual Basic
environments. In these environments, you develop your Vuser script within your development
application, while importing the Vuser API function libraries. For more information, see "Creating Scripts
in External IDEs" on page1001.
To create a customized script, you first create a skeleton script. The skeleton script contains the three
primary sections of a script: init,actions, and end. These sections are empty and you manually insert
functions into them.
You can create empty scripts for the C and Java programming languages.
Tip: Make sure to define all variables at the beginning of the action, before all other API
functions. This will prevent compilation errors.
Programming Vuser Actions
The Vuser script files, test.c, test.usr, and test.cfg, can be customized for your Vuser.
You program the actual Vuser actions into the test.c file.This file has the required structure for a
programmed Vuser script. The Vuser script contains three sections: vuser_init, Actions, and vuser_end.
User Guide
HP LoadRunner (12.50) Page 991

Note that the template defines extern C for users of C++. This definition is required for all C++ users, to
make sure that none of the exported functions are modified inadvertently.
#include "lrun.h"
#if defined(__cplusplus) || defined(cplusplus) extern "C"
{
#endif
int LR_FUNC vuser_init(LR_PARAM p)
{
lr_message("vuser_init done\n");
return 0;
}
int Actions(LR_PARAM p)
{
lr_message("Actions done\n");
return 0;
}
int vuser_end(LR_PARAM p)
{
lr_message("vuser_end done\n");
return 0;
}
#if defined(__cplusplus) || defined(cplusplus)}
#endif
You program Vuser actions directly into the empty script, before the lr_message function of each
section.
The vuser_init section is executed first, during initialization. In this section, include the connection
information and the logon procedure. The vuser_init section is only performed once each time you run
the script.
The Actions section is executed after the initialization. In this section, include the actual operations
performed by the Vuser. You can set up the Vuser to repeat the Actions section (in the test.cfg file).
The vuser_end section is executed last, after the all of the Vuser's actions. In this section, include the
clean-up and logoff procedures. The vuser_end section is only performed once each time you run the
script.
Note: LoadRunner controls Vusers by sending SIGHUP, SIGUSR1, and SIGUSR2 Linux signals. Do
not use these signals in your Vuser programs.
How to Create a Template
VuGen includes a utility that copies a template into your working folder. The utility is called mkdbtest,
and is located in $M_LROOT/bin. You run the utility by typing:
mkdbtest name
User Guide
HP LoadRunner (12.50) Page 992
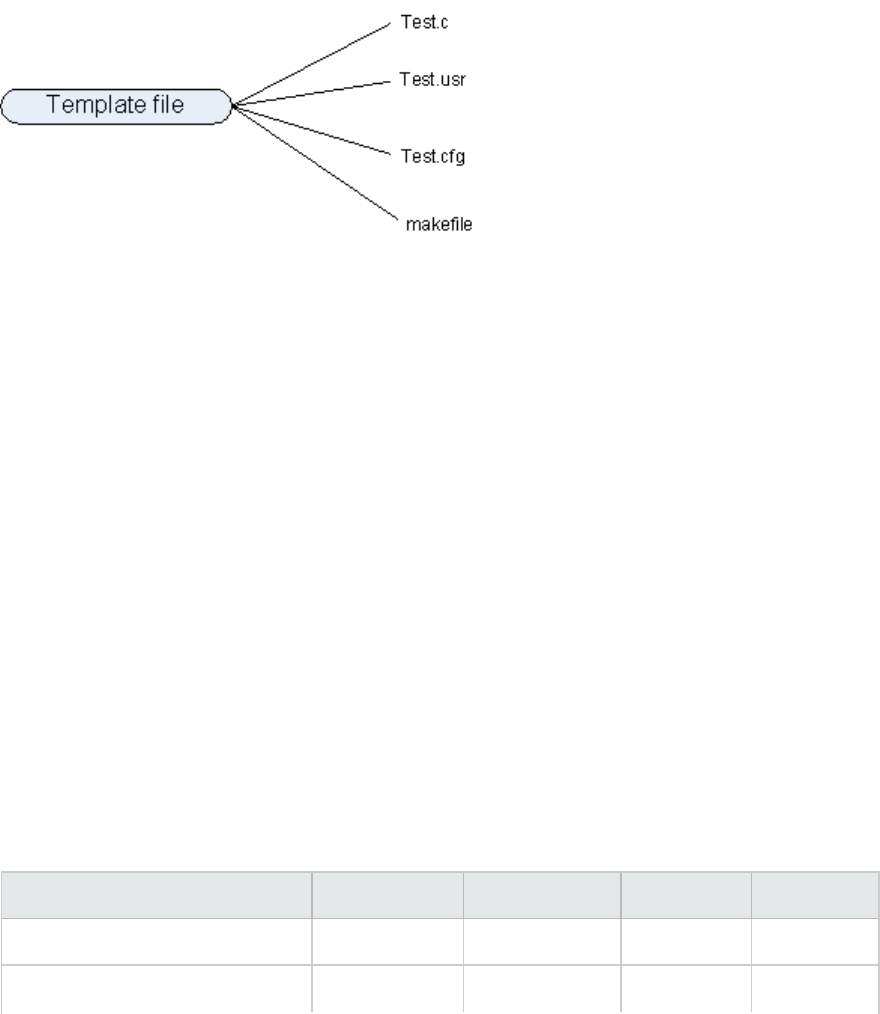
When you run mkdbtest, it creates a folder called name, which contains the template file, name.c. For
example, if you type:
mkdbtest test1
mkdbtest creates a folder called test1, which contains the template script, test1.c.
When you run the mkdbtest utility, a folder is created containing four files test.c, test.usr,test.cfg and
Makefile, where test is the test name you specified for mkdbtest.
How to Configure Runtime Settings Manually
To configure Vuser runtime settings, you modify the default.cfg and default.usp files created with the
script. These runtime settings correspond to VuGen's runtime settings. (See "Runtime Settings
Overview" on page280.) The default.cfg file contains the setting for the General, Think Time, and Log
options. The default.usp file contains the setting for the Run Logic and Pacing.
General Options
There is one General option for Linux Vuser scripts:
ContinueOnError instructs the Vuser to continue when an error occurs. To activate the option, specify 1.
To disable the option, specify 0.
In the following example, the Vuser will continue on an error.
[General]
ContinueOnError=1
Think Time Options
You can set the think time options to control how the Vuser uses think time during script execution. You
set the parameters Options, Factor, LimitFlag, and Limit parameters according to the following chart.
Option Options Factor LimitFlag Limit
Ignore think time NOTHINK N/A N/A N/A
Use recorded think time RECORDED 1.000 N/A N/A
User Guide
HP LoadRunner (12.50) Page 993

Multiply the recorded think time
by...
MULTIPLY number N/A N/A
Use random percentage of
recorded think time
RANDOM range lowest
percentage
upper
percentage
Limit the recorded think time to... RECORDED/
MULTIPLY
number (for
MULTIPLY)
1 value in
seconds
To limit the think time used during execution, set the LimitFlag variable to 1 and specify the think
time Limit, in seconds.
In the following example, the settings tell the Vuser to multiply the recorded think time by a random
percentage, ranging from 50 to 150.
[ThinkTime]
Options=RANDOM
Factor=1
LimitFlag=0
Limit=0
ThinkTimeRandomLow=50
ThinkTimeRandomHigh=150
Log Options
You can set the log options to create a brief or detailed log file for the script's execution.
[Log]
LogOptions=LogBrief
MsgClassData=0
MsgClassParameters=0
MsgClassFull=0
You set the parameters LogOptions, MsGClassData, MsgClassParameters, and MsgClassFull variables
according to the following chart:
Logging Type LogOptions MsgClassData MsgClassParameters MsgClassFull
Disable Logging LogDisabled N/A N/A N/A
Standard Log LogBrief N/A N/A N/A
Parameter Substitution
(only)
LogExtended 0 1 0
Data Returned by Server
(only)
LogExtended 1 0 0
Advanced Trace (only) LogExtended 0 0 1
User Guide
HP LoadRunner (12.50) Page 994

All LogExtended 1 1 1
In the following example, the settings tell the Vuser to log all data returned by the server and the
parameters used for substitution.
[Log]
LogOptions=LogExtended
MsgClassData=1
MsgClassParameters=1
MsgClassFull=0
Iterations and Run Logic
You can set the Iteration options to perform multiple iterations and control the pacing between the
iterations. You can also manually set the order of the actions and their weight. To modify the run logic
and iteration properties of a script, you must edit the default.usp file.
To instruct the Vuser to perform multiple iterations of the Actions section, set
RunLogicNumOfIterations to the appropriate value.
To control the pacing between the iterations, set the RunLogicPaceType variable and its related values,
according to the following chart:
Pacing RunLogicPaceType Related Variables
As soon as possible ASAP N/A
Wait between Iterations for a set
time
Const RunLogicPaceConstTime
Wait between iterations a
random time
Random RunLogicRandomPaceMin,
RunLogicRandomPaceMax
Wait after each iteration a set
time
ConstAfter RunLogicPaceConstAfterTime
Wait after each iteration a
random time
After RunLogicAfterPaceMin,
RunLogicAfterPaceMax
In the following example, the settings tell the Vuser to perform four iterations, while waiting a random
number of seconds between iterations. The range of the random number is from 60 to 90 seconds.
[RunLogicRunRoot]
MercIniTreeFather=""
MercIniTreeSectionName="RunLogicRunRoot"
RunLogicRunMode="Random"
RunLogicActionOrder="Action,Action2,Action3"
RunLogicPaceType="Random"
RunLogicRandomPaceMax="90.000"
RunLogicPaceConstTime="40.000"
User Guide
HP LoadRunner (12.50) Page 995
RunLogicObjectKind="Group"
RunLogicAfterPaceMin="50.000"
Name="Run"
RunLogicNumOfIterations="4"
RunLogicActionType="VuserRun"
RunLogicAfterPaceMax="70.000"
RunLogicRandomPaceMin="60.000"
MercIniTreeSons="Action,Action2,Action3"
RunLogicPaceConstAfterTime="30.000"
How to Define Transaction and Insert Rendezvous Points
Manually
When programming a Vuser script without VuGen, you must manually configure the Vuser file in order to
enable transactions and rendezvous. The configuration settings are listed in the test.usr file.
[General]
Type=any
DefaultCfg=Test.cfg
BinVuser=libtest.libsuffix
RunType=Binary
[Actions]
vuser_init=
Actions=
vuser_end=
[Transactions]
transaction1=
[Rendezvous]
Meeting=
Each transaction and rendezvous must be defined in the usr file. Add the transaction name to the
Transactions section (followed by an "="). Add each rendezvous name to the Rendezvous section
(followed by an "="). If the sections are not present, add them to the usr file as shown above.
C Vuser Scripts
In a C Vuser script, you can use any C code that conforms to the standard ANSI conventions. To create an
empty C Vuser script, select C Vuser in the Create a New Script dialog box. VuGen creates an empty C
Vuser script:
Action1()
{
return 0;
}
You can use C Vuser functions in all of Vuser script types that use C functions.
User Guide
HP LoadRunner (12.50) Page 996
See the Function Reference (Help > Function Reference) for a C reference that includes syntax and
examples of commonly used C functions.
Guidelines for Using C Functions
All standard ANSI-C conventions apply to C Vuser scripts, including control flow and syntax. You can add
comments and conditional statements to the script just as you do in other C programs. You declare and
define variables using ANSI C conventions.
The C interpreter that is used to run Vuser scripts accepts the standard ANSI C language. It does not
support any Microsoft extensions to ANSI C.
Before you add any C functions to a Vuser script, note the following limitations:
lA Vuser script cannot pass the address of one of its functions as a callback to a library function.
lThe stdargs,longjmp, and alloca functions are not supported in Vuser scripts.
lVuser scripts do not support structure arguments or return types. Pointers to structures are
supported.
lIn Vuser scripts, string literals are read-only. Any attempt to write to a string literal generates an
access violation.
lC Functions that do not return int, must be casted. For example,
extern char * strtok();
Calling libc Functions
In a Vuser script, you can call libc functions. However, since the interpreter that is used to run Vuser
scripts does not support any Microsoft extensions to ANSI C, you cannot use Microsoft's include files.
You can either write your own prototypes, or ask HP Customer Support to send you ANSI-compatible
include files containing prototypes for libc functions.
Linking Mode
The C interpreter that is used to run Vuser scripts uses a "lazy" linking mode in the sense that a function
need not be defined at the start of a run, as long as the function is defined before it is used. For
example:
lr_load_dll("mydll.dll");
myfun(); /* defined in mydll.dll -- can be called directly,
immediately after myfun.dll is loaded. */
Java Vusers
In Java Vuser scripts, you can place any standard Java code. To create an empty Java Vuser script, select
Java Vuser in the New Virtual User dialog box. VuGen creates an empty Java script:
import lrapi.lr;
public class Actions
{
User Guide
HP LoadRunner (12.50) Page 997
public int init() {
return 0;
}
public int action() {
return 0;
}
public int end() {
return 0;
}
}
Note: For Java type Vusers, you can only edit the Actions class. Within the Actions class, there
are three methods: init,action, and end. Place initialization code in the init method, business
processes in the action method, and cleanup code in the end method.
.NET Vusers
You can create an empty .NET Vuser script, in which to place .NETcode. This script type lets you
incorporate your existing .NET application into VuGen. To create an empty .NET Vuser script, select .NET
in the Create a New Script dialog box.
In a .NET Vuser script the default language is C#. If your script is generated from a recorded session,
VuGen enables you to change the script language from C# to VB.NET by selecting Visual Basic .NET
Language from Record > Recording Options > General > Script and regenerating the script.
Tip: You can edit the script in Visual Studio by clicking the button.
The following example shows the Action section of an empty .NET script:
namespace Script
{
public partial class VuserClass
{
public int Action()
{
// Add your code here
return 0;
}
}
}
Note: Enter the business process code in the Action method. Add initialization code to the
vuser_init method, and cleanup code to the vuser_end method.
User Guide
HP LoadRunner (12.50) Page 998
Troubleshooting and Limitations - Programming
Framework 4.5 for .NET scripts
Issue: Running a .NETscript recorded in VuGen, fails if you run it in Visual Studio—cannot find
associated DLL.
Steps to Resolve: If the script was recorded with a .NET 4.5 AUT, rebuild the script with Framework
version 4.5 in Visual Studio.
Framework 4.5 and Visual Studio 2010
Issue: Compilation fails for all C++ projects on machines with Framework 4.5.
Steps to Resolve: Install Visual Studio 2010 SP1.
Framework 3.5 for .NET scripts
Issue: .NETDLLs created in Visual Studio using Framework 3.5 may not run.
Steps to Resolve: Add the following to the <app>.config file:(if there is no such file, create one)
<configuration>
<startup>
<supportedRuntime version="v4.0" />
</startup>
</configuration>
Missing references for scripts created in Visual Studio
Issue: A compilation error occurs (such as error CS0246 or warning MSB3644) when compiling scripts
created in Visual Studio, possibly because the referenced assemblies were not added correctly to
Script.csproj.
Steps to Resolve:
If Visual Studio is installed:
1. Open the script solution file in Visual Studio.
2. In the Solution Explorer, click References and select Add Reference from the right-click menu.
3. Save the solution, close Visual Studio, and reopen the script in VuGen.
If Visual Studio is not installed:
1. Open the script.csproj file in a text editor.
2. In the ItemGroup element, add an Include statement for your reference as follows:
User Guide
HP LoadRunner (12.50) Page 999

<Reference Include="ICSharpCode.SharpZipLib">
<HintPath>C:\xxxx\ICSharpCode.SharpZipLib.dll</HintPath>
</Reference>
3. Save the file, close the editor, and reopen the script in VuGen.
Visual Studio Addin with C Vuser scripts
Issue: C# scripts in Visual Studio 2010, create .NET assemblies that need to be registered in the system
before their run. Registration of the .NET assembly requires administrative permissions.
Steps to Resolve: There are 2 ways to register .NET assembly before run test:
1. Run Visual Studio "As Administrator" and provide administrative credentials when prompted. In
Project Settings, ensure that the Register for COM interop option is set (Project > Properties >
Build > Register for COM interop). Visual Studio will automatically register the test DLL as a .NET
assembly every time it builds the project.
2. Run Visual Studio without administrative permissions, and manually register the test DLL after
build. To do so, run Windows Console with administrative permissions and run the following
command %WINDIR%\Microsoft.NET\Framework\v4.0.30319\RegAsm.exe <TargetDLLwithPath>
/codebase (ignore the warning issued when you run this command.)
For example, you might replace <TargetDLLwithPath> with "c:\users\qatest\documents\visual
studio 2010\Projects\LoadRunnerUser1\LoadRunnerUser1\LoadRunnerUser1.dll". You do not need
to register the DLL after every build. It is enough to register it once after making changes in the
COM interfaces defined in the DLL.
For both options, make sure to keep UAC enabled. Otherwise, when you run Visual Studio or the Console
"As Administrator", you will be not prompted for Administrative credentials and the applications will run
with restricted user rights.
NUnit testing with FIPS enabled
Issue: When working with the Visual Studio 2010 IDE Add-in for Developers, you may encounter one of
the following errors when trying to build an NUnit testing solution:
"Source file '<Path_to_cs>' could not be opened ('An operation is not legal in the current state.')"
"Source file '<Path_to_cs>' could not be opened ('This implementation is not part of the
Windows Platform FIPS validated cryptographic algorithms.')"
.
User Guide
HP LoadRunner (12.50) Page 1000
Steps to Resolve: Since Visual Studio 2010 is not officially FIPS compliant, you need to disable FIPS in
one of the following ways:
1. Disable FIPS for whole system.
2. Disable FIPS for a specific application. For example, you can add a <enforceFIPSPolicy
enabled="false"/> parameter to the <runtime> section of devenv.exe.config in Visual Studio's IDE
folder.
Creating Scripts in External IDEs
Creating Vuser Scripts or LoadRunner Tests in Visual Studio or
Eclipse
The following sections describe how to develop a Vuser script or LoadRunner test through programming
within the Visual Studio or Eclipse environments.
LoadRunner provides add-ins that allow you to develop scripts with Visual Studio or Eclipse.
There are two types of add-ins:
lVisual Studio/Eclipse IDE add-in
lVisual Studio/Eclipse IDE add-in for Developers
The basic IDE add-in allows you to create a Vuser script within the Visual Studio or Eclipse environment.
You program a standard Vuser script using standard LoadRunner or C# functions, within your native
environment. You can then add the script to a LoadRunner scenario.
The IDE add-in for Developers allows you to create and run a unit test directly from within Visual Studio
or Eclipse. The run mechanism is LoadRunner's mdrv process. This add-in adds a Devops menu to the
Visual Studio or Eclipse interface. You can configure runtime settings directly from your development
environment and run the test. The saved tests, NUnit (Visual Studio) or JUnit (Eclipse), can be added
directly to a LoadRunner scenario.
These add-ins are provided in the main DVD folder of the LoadRunner product, under the Additional
Components folder. Be sure to select the correct Visual Studio add-in for your version of Visual Studio.
Once you install the basic IDE add-in, you can create a new LoadRunner script within Visual Studio.
Alternatively, you can begin developing your script in VuGen. If, while developing a script in VuGen, you
realize that you need to the capabilities of your native environment, the Open in Visual Studio or Open
in Eclipse button opens the script in the respective application. This requires you to have first installed
the basic Visual Studio IDE add-in. (For Eclipse, LoadRunner internally installs the add-in the first time
you choose Open in Eclipse). For details, see Debugging .NET Vuser Scripts or Opening Java Vuser
Scripts in Eclipse.
User Guide
HP LoadRunner (12.50) Page 1001
When working in Visual Studio or Eclipse, the complete LoadRunner API is available from the Object
browser. For information about each of the LoadRunner API functions that you can use when
programming your script, see the Function Reference (Help > Function Reference).
How to Create a Vuser Script in Visual Studio
LoadRunner's basic IDE add-ins for Visual Studio let you create a Vuser script in Visual Studio in VB, C++,
or C#.
To create a Vuser script in Visual Studio:
1. Install the IDE add-in for your version of Microsoft Visual Studio from the download/DVD Additional
Components folder. For example Additional Components\IDE Add-Ins\MS Visual Studio
.NET\LRVS2010IDEAddInSetup.exe.
2. In Visual Studio, select the appropriate template from the Installed Templates LoadRunner
VB|C++|C# .NET Vuser. Visual Studio creates a new project with one class and a template for a
Vuser, and the script file, <name>.usr. The template contains three sections, Initialize,Actions,
and Terminate.
The following example shows a Visual C# template:
public int Initialize()
{
// TO DO: Add virtual user's initialization routines
return lr.PASS;
}
public int Actions()
{
// TO DO: Add virtual user's business process actions
return lr.PASS;
}
public int Terminate()
{
// TO DO: Add virtual user's termination routines
return lr.PASS;
}
3. Add code to the template, in the TODO sections.
4. Open the Object Browser (View menu). Expand the LoadRunner node (for example
Interop.LoadRunner) to see the LoadRunner elements. Add the desired elements to your script,
such as transactions, rendezvous points, and messages.
5. Expand the Toolbar menu, Vuser, and enhance your script with runtime settings and parameters.
For more information, see the runtime settings General > Run Logic or the "Parameter List Dialog
Box" on page372.
6. Use the Vuser menu to replay the script and test its functionality.
7. Select Vuser > Create Load Scenario, to create a LoadRunner scenario using this .usr file.
8. You can also build the LoadRunner project as a DLL file, which will be saved in the same folder as
User Guide
HP LoadRunner (12.50) Page 1002

the project. You can reference this DLL directly from a LoadRunner scenario.
How to Create a Vuser Script in Eclipse
LoadRunner's basic IDE add-in for Eclipse, lets you create a Java Vuser script in Eclipse. You can begin in
VuGen and then open Eclipse. Alternatively, you can work from start to finish in Eclipse.
Prerequisite
1. Make sure you have JDK 1.7 (JRE 7) on your machine. Go to java.com to check your version or
download the required version. After you install it, open Eclipse and select Window > Preferences.
Navigate to the Java > Installed JREs node. If jre7 is not in the Installed JREs list, click Add and
use the wizard to add its folder (for example c:\Program Files\Java\jre7). In the Installed JREs list,
click the check box by jre7 to instruct Eclipse to use this version. Close Eclipse.
Method 1: Create a script in VuGen, and develop it further in Eclipse
1. Open VuGen and create a new Java type script.
2. Record or add steps as you normally would.
3. Click the Open in Eclipse button on the toolbar. If this is the first time you are opening Eclipse
from VuGen, a message box prompts you to enter the Eclipse location. VuGen automatically copies
the required files in Eclipse's dropins folder. Eclipse opens with your current script in the Package
Explorer pane.
Method 2: Create the script in Eclipse
1. Manually copy the hp.lr.vugeneclipse42addin.jar file from the DVD's Additional Components\IDE
Add-Ins\EclipseAddin folder into the Eclipse dropins folder. Extract the files from the jar file.
2. Open Eclipse. Select File > New > Project and expand the LoadRunner Script node. You can create
any of the Java protocol scripts: Java Vuser, Java Record Replay, or Java over HTTP.
Tip: To verify that the add-in installed correctly, open the Eclipse Installation Details dialog
box (Help > About > Installation Details.)
Develop the script in Eclipse
1. Expand the script's node and select the default package > Action.java node. Code the script as
you normally would in the Eclipse editor, in the appropriate sections.
2. In the script's node in the Package Explorer, expand Referenced Libraries > classes >lrapi > to
access the desired LoadRunner elements, such as transactions, rendezvous points, and messages.
3. Expand the Vuser menu (this may require you to select the parent script name in the Package
Explorer) and enhance your script with runtime settings and parameters. For more information,
see the runtime setting General > Run Logic or "Parameter List Dialog Box" on page372.
User Guide
HP LoadRunner (12.50) Page 1003

4. Save and run the project. Select Vuser > Run Vuser to test the script. Then select Vuser > Create
Load Scenario to run it from the Controller. Note that you will not be able to open this script in
VuGen once you edit it in Eclipse.
How to Develop a Unit Test Using Visual Studio (NUnit test)
The LoadRunner Add-in for Developers lets you create an NUnit test in Visual Studio.
To create an NUnit test in Visual Studio:
1. Install the IDE for Dev add-in for your Microsoft Visual Studio version from the download or DVD
Additional Components\IDE Add-ins Dev folder. For example Additional Components\IDE Add-Ins
Dev\LRVS2012IDEAddInDevSetup.exe.
2. In Visual Studio, open your unit test. This test should comply with the following guidelines:
lIt is a class library
lThere is a reference to the NUnit library, nunit.framework.dll, using nunit.framework;
lAt least one of the classes in the project should be a TextFixture (using the [TextFixture]
annotation)
3. In the code, instantiate the LoadRunner API function. For example,
private LoadRunner.LrApi lr = new LoadRunner.LrApi();
4. Select DevOps Vuser > Add LoadRunner API Reference to add LoadRunner API functions to your
test. Alternatively, select Add LoadRunner API Reference from the context menu. Add LoadRunner
functionality, such as transactions, think time, messaging, and so forth.
5. Build the LoadRunner project as a DLL file, which will be saved in the same folder as the project.
6. Select DevOps Vuser > Run Vuser to run the test with the LoadRunner engine. In the Visual Studio
Output window, select Show output from: LoadRunner Information to view the runtime data.
7. (Optional) Add the DLL as a unit test to an existing or new LoadRunner scenario. For details, see
"New Scenario Dialog Box" on page1097.
How to Develop a Unit Test Using Eclipse (JUnit or Selenium test)
The LoadRunner Eclipse Add-in for Developers lets you create a JUnit test in Eclipse.
To create a unit test in Eclipse:
1. Make sure you have JDK 1.7 (JRE 7) on your machine. Go to java.com to check your version or
download the required version. After you install it, open Eclipse and select Window > Preferences.
Navigate to the Java > Installed JREs node. If jre7 is not in the Installed JREs list, click Add and
use the wizard to add its folder (for example c:\Program Files\Java\jre7). In the Installed JREs list,
click the check box by jre7 to instruct Eclipse to use this version.
2. Run the Eclipse Dev add-in, LREclipseIDEAddInDevSetup.exe, from the download/DVD folder:
User Guide
HP LoadRunner (12.50) Page 1004

Additional Components\IDE Add-Ins Dev. After installing the Eclipse add-in, rebuild the plugin
cache by running the following command line string: Eclipse.exe -clean.
3. In Eclipse, open your Selenium or JUnit test.
4. Code the test as you normally would in Eclipse.
5. Build your java classes.
6. Select Devops Vuser > Add LoadRunner API Reference to add the desired LoadRunner functions
to your script as well as transactions, rendezvous points, and messages.
7. Expand the Devops Vuser menu and enhance the test with runtime settings and parameters. For
more information, see the runtime setting General > Run Logic or the "Parameter List Dialog Box"
on page372.
8. Select Devops Vuser > Run Vuser to run the test from within Eclipse to verify its functionality.
9. Use the Devops Vuser menu to launch the LoadRunner Controller, or add the test to a Controller
scenario that is already open.
10. Add the class file at any time as a unit test, to a LoadRunner scenario. For details, see "New
Scenario Dialog Box" on page1097.
Note: If you are running multiple instances of Eclipse and you want to use add-in for each
instance, you must manually install the Eclipse Add-in for Developers for each instance.
Locate the hp.lr.continuousdelivery.eclipse42addin.jar file in the <LR_install_dir>\bin
folder, and copy it to the dropins folder for each Eclipse instance.
Using DLLs and Customizing VuGen
Calling Functions from External DLLs
You can call functions that are defined in external DLLs. By calling external functions from your script,
you can reduce the memory footprint of your script and the overall runtime.
To call the external function, you load the DLL in which the function is defined.
You can load a DLL in one of the following ways:
lLocally (for one script) by using the lr_load_dll function. For task details, see "How to Load a DLL
Locally" on the next page.
lGlobally (for all scripts) by adding statements to the vugen.dat file. For task details, see "How to Load
a DLL Globally" on page1007.
User Guide
HP LoadRunner (12.50) Page 1005

How to Load a DLL Locally
This task describes how to use the lr_load_dll function to load a DLL into your Vuser script. Once the
DLL is loaded, you can call any function defined within the DLL without having to declare it in your script.
To load a DLL locally:
1. In a C Vuser script, add an lr_load_dll function to load the DLL at the beginning of your script. Place
the statement at the beginning of the vuser_init section. lr_load_dll replaces the ci_load_dll
function.
Use the following syntax:
lr_load_dll( library_name);
Note that for Linux platforms, DLLs are known as shared libraries. The extension of the libraries is
platform dependent.
2. Call the function defined in the DLL in the appropriate place within your script.
In the following example, the insert_vals function, defined in orac1.dll, is called, after the creation
of the Test_1 table.
int LR_FUNC Actions(LR_PARAM p)
{
lr_load_dll("orac1.dll");
lrd_stmt(Csr1, "create table Test_1 (name char(15), id integer)\n", -1,
1 /*Deferred*/, 1 /*Dflt Ora Ver*/, 0);
lrd_exec(Csr1, 0, 0, 0, 0, 0);
/* Call the insert_vals function to insert values into the table. */
insert_vals();
lrd_stmt(Csr1, "select * from Test_1\n", -1, 1 /*Deferred*/, 1 /*Dflt Ora Ver*/,
0);
lrd_bind_col(Csr1, 1, =;NAME_D11, 0, 0);
lrd_bind_col(Csr1, 2, =;ID_D12, 0, 0);
lrd_exec(Csr1, 0, 0, 0, 0, 0);
lrd_fetch(Csr1, -4, 15, 0, PrintRow14, 0);
...
Note: You can specify a full path for the DLL. If you do not specify a path, lr_load_library
searches for the DLL using the standard sequence used by the C++ function, LoadLibrary on
Windows platforms. On Linux platforms you can set the LD_LIBRARY_PATH environment
variable (or the platform equivalent). The lr_load_dll function uses the same search rules
as dlopen. For more information, see the main pages for dlopen or its equivalent.
User Guide
HP LoadRunner (12.50) Page 1006
How to Load a DLL Globally
This task describes how to load a DLL globally, to make its functions available to all your Vuser scripts.
Once the DLL is loaded, you can call any function defined within the DLL, without having to declare it in
your script.
To globally load DLLs:
1. Add a list of the DLLs you want to load to the appropriate section of the mdrv.dat file, located in
your application's dat folder.
Use the following syntax:
PLATFORM_DLLS=my_dll1.dll, my_dll2.dll, ...
replacing the word PLATFORM with your specific platform. For a list of platforms, see the beginning
section of the mdrv.dat file.
For example, to load DLLs for Winsock Vusers on an NT platform, add the following statement to the
mdrv.dat file:
[WinSock]
ExtPriorityType=protocol
WINNT_EXT_LIBS=wsrun32.dll
WIN95_EXT_LIBS=wsrun32.dll
LINUX_EXT_LIBS=liblrs.so
SOLARIS_EXT_LIBS=liblrs.so
HPUX_EXT_LIBS=liblrs.sl
AIX_EXT_LIBS=liblrs.so
LibCfgFunc=winsock_exten_conf
UtilityExt=lrun_api
ExtMessageQueue=0
ExtCmdLineOverwrite=-WinInet No
ExtCmdLineConc=-UsingWinInet No
WINNT_DLLS=user_dll1 .dll, user_dll2 .dll, ...
2. Call the function defined in the DLL in the appropriate place within your script.
Recording OLE Servers
VuGen currently does not support recording for OLE applications. These are applications where the
actual process is not launched by the standard process creation routines, but by the OLE Automation
system. However, you can create a Vuser script for OLE applications based on the following guidelines.
There are two types of OLE servers: executables, and DLLs.
DLL Servers
If the server is the DLL, it will eventually be loaded into the application process space, and VuGen will
User Guide
HP LoadRunner (12.50) Page 1007
record the call to LoadLibrary. In this case, you may not even realize that it was an OLE application.
Executable Servers
If the server is the executable, you must invoke the executable in the VuGen in a special way:
lFirst, determine which process actually needs to be recorded. In most cases, the customer knows the
name of the application's executable. If the customer doesn't know the name of the application,
invoke it and determine its name from the NT Task Manager.
lAfter you identify the required process, click Start Recording in VuGen. When prompted for the
Application name, enter the OLE application followed by the flag "/Automation". Next, launch the user
process in the usual way (not via VuGen). VuGen records the running OLE server and does not invoke
another copy of it. In most cases, these steps are sufficient to enable VuGen to record the actions of
an OLE server.
lIf you still are experiencing difficulties with recording, you can use the CmdLine program to
determine the full command line of a process which is not directly launched. (The program is
available in a knowledge base article on the Customer Support Web site, http://support.hp.com)
Using CmdLine
In the following example, CmdLine.exe is used to determine the full command line for the process
MyOleSrv.exe, which is launched by some other process.
Determine its full command line
1. Rename MyOleSrv.exe to MyOleSrv.orig.exe.
2. Place CmdLine.exe in the same folder as the application, and rename it to MyOleSrv.exe.
3. Launch MyOleSrv.exe. It issues a popup with a message containing the complete command line of
the original application, (including additional information), and writes the information into
c:\temp\CmdLine.txt.
4. Restore the old names, and launch the OLE server, MyOleSrv.exe, from VuGen with the correct
command line parameters. Launch the user application in a regular way - not through VuGen. In
most cases, VuGen will record properly.
Additional Workarounds
If you still are experiencing difficulties with recording, proceed with the following steps:
1. Rename the OLE server to MyOleSrv.1.exe, and CmdLine to MyOleSrv.exe.
2. Set the environment variables "CmdStartNotepad" and "CmdNoPopup" to 1. See "Recording OLE
Servers" on the previous page for a list of the CmdLine environment variables.
3. Start the application (not from VuGen). Notepad opens with the full command line. Check the
command line arguments. Start the application several times and compare the command line
arguments. If the arguments are the same each time you invoke the application, then you can
User Guide
HP LoadRunner (12.50) Page 1008

reset the CmdStartNotepad environment variable. Otherwise, leave it set to "1".
4. In VuGen, invoke the program, MyOleSrv.1.exe with the command line parameters (use Copy/Paste
from the Notepad window).
5. Start the application (not from within VuGen).
CmdLine Environment Variables
You can control the execution of CmdLine through the following environment variables:
CmdNoPopup If set, the popup window will not appear.
CmdOutFileName If set, and non-empty, CmdLine will attempt to create this file instead of
c:\temp\CmdLine.txt.
CmdStartNotepad If set, the output file will be displayed in the notepad (Best used with
CmdNoPopup).
VuGen File and Library Locations
The VuGen .dat files contain the location information of the script's files, as well as the library files for
specific protocols.
There are two .dat files, residing in the M_LROOT\dat folder used by VuGen: mdrv.dat and vugen.dat.
mdrv.dat
The mdrv.dat file contains a separate section for each protocol defining the location of the library files
and driver executables.
For information about how to add a custom protocol, see "Protocol SDK" on page1045.
vugen.dat
The vugen.dat file contains general information about VuGen, used by VuGen and the Controller.
[Templates]
RelativeDirectory=template
The Templates section indicates where the templates are for the VuGen protocols. The default entry
indicates that they are in the relative template folder. Each protocol has a subfolder under template,
which contains the template files for that protocol.
The next section is the GlobalFiles section.
[GlobalFiles]
main.c=main.c
User Guide
HP LoadRunner (12.50) Page 1009

@@TestName@@.usr=test.usr
default.cfg=test.cfg
default.usp=test.usp
The GlobalFiles section contains a list of files that VuGen copies to the test folder whenever you create
a new test. For example, if you have a test called "user1", then VuGen will copy main.c, user1.usr and
user1.cfg to the test folder.
The ActionFiles section contains the name of the file containing the Actions to be performed by the
Vuser and upon which to perform iterations.
[ActionFiles]
@@actionFile@@=action.c
In addition to the settings shown above, vugen.dat contains settings that indicate the operating system
and other compilation related settings.
Storing Runtime Settings in External Files
Vuser behavior refers to the items that you can set in the runtime settings, such as wait times, pacing
times, looping iterations, and logging.
Since VuGen creates the Vuser script and the Vuser behavior as two independent sources, you can
configure user behavior without directly referencing the Vuser script. This feature lets you make
configuration changes to a Vuser and store several profiles for the same Vuser script.
VuGen stores the behavior settings in the default Vuser.cfg file. You can save several versions of this
file for different user behavior and then run the Vuser script referencing the relevant .cfg file.
By default, you cannot control the behavior file from VuGen. VuGen automatically uses the .cfg file with
the same name as the script.
To call a specific configuration file, run the Vuser from the command line and add the following string:
-cfg c:\tmp\<MyCustomConfigFile>.cfg
For information on command line parameters, see "Command Line Parameters" below.
Note: The Linux utility, run_db_vuser, does not support this option.
Command Line Parameters
The Vusers can accept command line parameters when invoked.
For a complete list of the command line options, type mdrv at a command prompt from the LoadRunner
bin folder, without any arguments.
To send command line parameters to a Vuser from within VuGen, add the attributes and their values in
the runtime settings. For details, see the General > Additional Attributes runtime settings view.
User Guide
HP LoadRunner (12.50) Page 1010

To control a Vuser from the Windows command line, type mdrv at a command prompt from the
LoadRunner bin folder, with the desired commands. You can also add custom user parameters, after all
the other driver parameters. For example:
mdrv.exe -usr c:\tmp\Vuser\Vuser.usr -out c:\tmp\vuser command_line_params
There are several Vuser API functions available to reference them (such as lr_get_attrib_double, and so
forth). For details, see the Online Function Reference.
Note: The Linux utility, run_db_vuser, does not support some of the standard Windows
command line options. For details, see "How to Run a Vuser Script from a Linux Command Line"
on the next page.
Creating and Running Scripts in Linux
Creating and Running Scripts in Linux - Overview
You can use VuGen on a Linux environment in the following ways:
lYou can use VuGen to create Vuser scripts that run on Linux platforms. You record your application in
a Windows environment and run it in Linux—recording is not supported on Linux.
lUsers working in Linux-only environments can program Vuser scripts. Scripts can be programmed in C
or C++ and they must be compiled into a dynamic library.
To create a script through programming, you can use a Vuser template as a basis for a larger Vuser
scripts. The template provides:
lcorrect program structure
lVuser API calls
lsource code and makefiles for creating a dynamic library
How to Compile Scripts Manually on Linux
After you modify the template, you compile it with the appropriate Makefile in the script's folder. The
compiler creates a dynamic library called libtest.so.
You can modify the Makefile and assign additional compiler flags and libraries by modifying the
appropriate sections.
If you are working with a general template, you must include your application's libraries and header
files. For example, if your application uses a library called testlib, include it in the LIBS section.
LIBS = \
-testlib \
User Guide
HP LoadRunner (12.50) Page 1011
-lLrun50 \
-lm
After you modify the Makefile, type make from the command line in the working folder to create the
dynamic library files for the Vuser script.
After you create a script, you check its functionality from the command line. Check that your script
communicates with the server and performs all the required tasks. For details, see "How to Run a Vuser
Script from a Linux Command Line" below.
How to Run a Vuser Script from a Linux Command Line
When using VuGen to develop Linux-based Vusers, you must check that the recorded script runs on the
Linux platform. This task describes how to perform this check and run a Vuser script from a Linux
command.
1. Verify that the script replays in VuGen
Replay the script in VuGen to verify that the script works in windows before attempting to run it in
Linux. This is recommended because it is easier to edit and debug the script in VuGen. For task
details, see "How to Replay a Vuser Script" on page275.
2. Copy the script files to the Linux server
Transfer the script files to the Linux server.
3. Check the Vuser setup on the Linux machine by using verify_generator.
If you intend to run all of the Vusers on one host, type:
verify_generator
The verify_generator either returns OK when the setting is correct, or Failed and a suggestion on
how to correct the setup.
For detailed information about the verify checks type:
verify_generator [-v]
The verify utility checks the local host for its communication parameters and its compatibility with
all types of Vusers. It checks the following items in the Vuser environment:
lat least 128 file descriptors
lproper .rhost permissions: -rw-r--r--
lthe host can be contacted using rsh to the host. If not, checks for the host name in .rhosts
lM_LROOT is defined
l.cshrc defines the correct M_LROOT
l.cshrc exists in the home directory
lthe current user is the owner of the .cshrc
User Guide
HP LoadRunner (12.50) Page 1012

la LoadRunner installation exists in $M_LROOT
lthe executables have executable permissions
lPATH contains $M_LROOT/bin, and /usr/bin
lthe rstatd daemon exists and is running
4. Run the script
Run the script in standalone mode from the Vuser script folder, using the run_db_vuser shell
script:
run_db_vuser.sh <commands> script_name.usr
The run_db_vuser shell script has the following command line options:
Command Description
--help Display the available options. (This option must be preceded by two dashes.)
-cpp_only Run cpp only (pre-processing) on the script.
-cci_only Run cci only (pre-compiling) on the script to create a file with a .ci extension. You
can run cci only after a successful cpp.
-driver
driver_
path
Use a specific driver program. Each database has its own driver program located in
the /bin folder. For example, the driver for CtLib located in the /bin folder, is mdrv.
This option lets you specify an external driver.
-exec_
only
Execute the Vuser .ci file. This option is available only when a valid .ci file exists.
-ci ci_
file_
name
Execute a specific .ci file.
-out
output_
path
Place the results in a specific folder.
By default, run_db_vuser.sh runs cpp,cci, and execute in verbose mode. It uses the driver in the
VuGen installation\bin folder, and saves the results to an output file in the Vuser script folder. You
must always specify a .usr file. If you are not in the script folder, specify the full path of the .usr
file.
For example, the following command line executes a Vuser script called test1, and places the
output file in a folder called results1. The results folder must be an existing folder—it will not be
created automatically:
run_db_vuser.sh-out /u/joe/results1 test1.usr
User Guide
HP LoadRunner (12.50) Page 1013
Programming with the XML API
Programming with the XML API Overview
VuGen's support for XML allows you to dynamically work with XML code and retrieve the values during
test execution. Follow these steps in creating an effective XML script:
lRecord a script in the desired protocol, usually Web, Web Services, or Wireless.
lCopy the XML structures into your script.
lAdd XML functions from the LR API in order to retrieve dynamic data and the XML element values.
The LR API uses XPath, the XML Path language to manipulate the text in an XML document.
You can instruct VuGen to display the output values of XML elements in the Execution log window using
the runtime settings. VuGen displays the line numbers, the number of matches, and the value. To allow
the displaying of values, you need to enable parameter substitution. In the runtime settings, open the
General:Log node, select Extended log, and select Parameter Substitution. For more information, see
"Runtime Settings Overview" on page280.
All Vuser API XML functions return the number of matches successfully found, or zero for failure.
Using XML Functions
This section provides examples of how to work with data in an XML tree. Certain functions allow you to
retrieve information, and others let you write information to an XML tree. The examples use the
following XML tree containing the names and extensions of several employees in the Acme organization.
<acme_org>
<accounting_dept>
<employee type='PT'>
<name>John Smith</name>
<extension>2145</extension>
</employee>
</accounting_dept>
<engineering_dept>
<employee type='PT'>
<name>Sue Jones</name>
<extension>2375</extension>
</employee>
</engineering_dept>
</acme_org>
User Guide
HP LoadRunner (12.50) Page 1014

Reading Information from an XML Tree
The functions which read information from an XML tree are:
lr_xml_extract Extracts XML string fragments from an XML string.
lr_xml_find Performs a query on an XML string.
lr_xml_get_values Retrieves values of XML elements found by a query.
To retrieve a specific value through a query, you specify the tags of the parent and child nodes in a path
format.
For example, to retrieve an employee name in the Accounting department, use the following string:
lr_xml_get_values("XML={XML_Input_Param}",
"ValueParam=OutputParam",
"Query=/acme_org/accounting_dept/employee/name",
LAST);
The Execution log window (with Extended logging enabled) shows the output of this function:
Output:
Action.c(20): "lr_xml_get_values" was successful, 1 match processed
Action.c(25): Query result = John Smith
Writing to an XML Structure
The functions which write values to an XML tree are:
lr_xml_delete Deletes fragments from an XML string.
lr_xml_insert Inserts a new XML fragment into an XML string.
lr_xml_replace Replaces fragments of an XML string.
lr_xml_set_values Sets the values of XML elements found by a query.
lr_xml_transform Applies Extensible Stylesheet Language (XSL) transformation to XML data.
The most common writing function is lr_xml_set_values which sets the values of specified elements in
an XML string. The following example uses lr_xml_set_values to change the phone extensions of two
employee elements in an XML string.
User Guide
HP LoadRunner (12.50) Page 1015
First, we save the XML string to a parameter called XML_Input_Param. We want two values to be
matched and substituted, so we prepare two new parameters, ExtensionParam_1 and ExtensionParam_
2, and set their values to two new phone extensions, 1111 and 2222.
lr_xml_set_values contains the argument "ValueName=ExtensionParam", which picks up the values of
ExtensionParam_1 and ExtensionParam_2. The current extensions of the two employees are
substituted with the values of these parameters, 1111 and 2222. The value of OutputParam is then
evaluated proving that the new phone extensions were in fact substituted.
Action() {
int i, NumOfValues;
char buf[64];
lr_save_string(xml_input, "XML_Input_Param"); // Save input as parameter
lr_save_string("1111", "ExtensionParam_1");
lr_save_string("2222", "ExtensionParam_2");
lr_xml_set_values("XML={XML_Input_Param}",
"ResultParam=NewXmlParam", "ValueParam=ExtensionParam",
"SelectAll=yes", "Query=//extension", LAST);
NumOfValues= lr_xml_get_values("XML={NewXmlParam}",
"ValueParam=OutputParam", "Query=//extension",
"SelectAll=yes", LAST);
for (i = 0; i < NumOfValues; i++) {/* Print the multiple values of MultiParam
*/
sprintf(buf, "Retrieved value %d : {OutputParam_%d}", i+1, i+1);
lr_output_message(lr_eval_string(buf));
}
return 0;
}
Output:
Action.c(40): Retrieved value 1: 1111
Action.c(40): Retrieved value 2: 2222
Specifying XML Function Parameters
Most XML API functions require that you specify the XML element and a query. You can also indicate if
you want to retrieve all results or a single one.
Defining the XML Element
For defining the XML element to query, you can specify a literal string of the XML element, or a
parameter that contains the XML. The following example shows the XML input string defined as a literal
User Guide
HP LoadRunner (12.50) Page 1016
string:
"XML=<employee>JohnSmith</employee>"
Alternatively, the XML string can be a parameter containing the XML data. For example:
"XML={EmployeeNameParam}"
Querying an XML Tree
Suppose you want to find a value within an XML tag, for example, an employee's extension. You
formulate a query for the desired value. The query indicates the location of the element and which
element you want to retrieve or set. The path that you specify limits the scope of the search to a
specific tag. You can also search for all elements of a specific type under all nodes below the root.
For a specific path, use "Query=/full_xml_path_name/element_name"
For the same element name under all nodes, use "Query=//element_name"
In the VuGen implementation of XML functions, the scope of a query is the entire XML tree. The tree
information is sent to the Vuser API functions as the value of the xml argument.
Multiple Query Matching
When you perform a query on an XML element, by default VuGen returns only the first match. To
retrieve multiple values from a query, you specify the "SelectAll=yes" attribute within your functions.
VuGen adds a suffix of _index to indicate multiple parameters. For example, if you defined a parameter
by the name EmployeeName, VuGen creates EmployeeName_1,EmployeeName_2,EmployeeName_3,
and so on.
lr_xml_set_values("XML={XML_Input_Param}",
"ResultParam=NewXmlParam", "ValueParam=ExtensionParam",
"SelectAll=yes", "Query=//extension", LAST);
With functions that write to a parameter, the values written to the parameter can then be evaluated.
For example, the following code retrieves and prints multiple matches of a query:
NumOfValues = lr_xml_get_values("Xml={XmlParam}", "Query=//name",
"SelectAll=yes", "ValueParam=EmployeeName", LAST);
For functions that read from parameters, the values of the parameters must be pre-defined. The
parameter must also use the convention ParamName_IndexNumber, for example Param_1, Param_2,
Param_3, and so on. This collection of parameters is also known as a parameter set.
In the following example, lr_xml_set_values reads values from the parameter set and then uses those
values in the XPath query. The parameter set that represents the employee extensions, is called
ExtensionParam. It has two members: ExtensionParam_1 and ExtensionParam_2. The lr_xml_set_
values function queries the XML input string and sets the value of the first match to 1111 and the
second match to 2222.
lr_save_string("1111", "ExtensionParam_1");
lr_save_string("2222", "ExtensionParam_2");
User Guide
HP LoadRunner (12.50) Page 1017
lr_xml_set_values("XML={XML_Input_Param}",
"ResultParam=NewXmlParam", "ValueParam=ExtensionParam",
"SelectAll=yes", "Query=//extension", LAST);
XML Attributes
VuGen contains support for attributes. You can use a simple expression to manipulate attributes of XML
elements and nodes, just as you can manipulate the elements themselves. You can modify the desired
attribute or only attributes with specific values.
In the following example, lr_xml_delete deletes the first cubicle element with the name attribute.
lr_xml_delete( "Xml={ParamXml}",
"Query=//cubicle/@name",
"ResultParam=Result",
LAST
);
In the next example, lr_xml_delete deletes the first cubicle element with a name attribute that is equal
to Paul.
lr_xml_delete( "Xml={ParamXml}",
"Query=//cubicle/@name="Paul",
"ResultParam=Result",
LAST
);
Structuring XML Scripts
Initially, you create a new script in your preferred protocol. You can record a session in that protocol, or
you may program the entire script without recording. Structure the Actions section of the script as
follows:
lXML input declaration
lThe Actions section
The XML input section contains the XML tree that you want to use as an input variable. You define the
XML tree as a char type variable. For example:
char *xml_input=
"<acme_org>"
"<employee>"
" <name>John Smith</name>"
"<cubicle>227</cubicle>"
"<extension>2145</extension>"
"</employee>"
"<employee>"
"<name>Sue Jones</name>"
"<cubicle>227</cubicle>"
"<extension>2375</extension>"
User Guide
HP LoadRunner (12.50) Page 1018
"</employee>"
"</acme_org>";
The Action section contains the evaluation of the variables and queries for the element values. In the
following example, the XML input string is evaluated using lr_save_string. The input variable is queried
for employee names and extensions.
Action() {
/* Save the input as a parameter.*/
lr_save_string(xml_input, "XML_Input_Param");
/* Query 1 - Retrieve an employee name from the specified element.*/
lr_xml_get_values("XML={XML_Input_Param}",
"ValueParam=OutputParam",
"Query=/acme_org/employee/name", LAST);
/* Query 2 - Retrieve an extension under any path below the root.*/
lr_xml_get_values("XML={XML_Input_Param}",
"ValueParam=OutputParam",
"Query=//extension", LAST);
return 0;
}
Enhancing a Recorded Session with XML
You can prepare an XML script by recording a session and then manually adding the relevant XML and
Vuser API functions.
The following example illustrates how a recorded session was enhanced with Vuser API functions. Note
that the only function that was recorded was web_submit_data, which appears in bold.
The first section contains the XML input declaration of the variable SOAPTemplate, for a SOAP message:
#include "as_web.h"
// SOAP message
const char* pSoapTemplate=
"<soap:Envelope xmlns:soap=\"http://schemas.xmlsoap.org/soap/envelope/\">"
"<soap:Body>"
"<SendMail xmlns=\"urn:EmailIPortTypeInft-IEmailService\"/>"
"</soap:Body>"
"</soap:Envelope>";
The following section represents the actions of the user:
Action1()
{
// get response body
web_reg_save_param("ParamXml", "LB=", "RB=", "Search=body", LAST);
// fetch weather by HTTP GET
User Guide
HP LoadRunner (12.50) Page 1019
web_submit_data("GetWeather","Action=http://glkev.net.innerhost.com/glkev_ws/
WeatherFetcher.asmx/GetWeather",
"Method=GET",
"EncType=",
"RecContentType=text/xml",
"Referer=http://glkev.net.innerhost.com/glkev_
ws/WeatherFetcher.asmx?op=GetWeather",
"Snapshot=t2.inf",
"Mode=HTTP",
ITEMDATA,
"Name=zipCode", "Value=10010", ENDITEM,
LAST);
// Get City value
lr_xml_get_values("Xml={ParamXml}",
"Query=City",
"ValueParam=ParamCity",
LAST
);
lr_output_message(lr_eval_string("***** City = {ParamCity} *****"));
//Get State value
lr_xml_get_values("Xml={ParamXml}",
"Query=State",
"ValueParam=ParamState",
LAST
);
lr_output_message(lr_eval_string("***** State ={ParamState}*****"));
// Get several values at once by using template
lr_xml_get_values_ex("Xml={ParamXml}",
"Template="
"<Weather>"
"<Time>{ParamTime}</Time>"
"<Temperature>{ParamTemp}</Temperature>"
"<Humidity>{ParamHumid}</Humidity>"
"<Conditions>{ParamCond}</Conditions>"
"</Weather>",
LAST
);
lr_output_message(lr_eval_string( "***** Time = {ParamTime},
Temperature = {ParamTemp}, "
"Humidity = {ParamHumid},
Conditions = {ParamCond} *****"));
User Guide
HP LoadRunner (12.50) Page 1020
//Generate readable forecast
lr_save_string(lr_eval_string("\r\n\r\n*** Weather Forecast for {ParamCity},
{ParamState} ***\r\n"
"\tTime: {ParamTime}\r\n"
"\tTemperature: {ParamTemp} deg. Fahrenheit\r\n"
"\tHumidity: {ParamHumid}\r\n"
"\t{ParamCond} conditions expected\r\n"
"\r\n"),
"ParamForecast"
);
// Save soap template into parameter
lr_save_string(pSoapTemplate, "ParamSoap");
// Insert request body into SOAP template
lr_xml_insert("Xml={ParamSoap}",
"ResultParam=ParamRequest",
"Query=Body/SendMail",
"position=child",
"XmlFragment="
"<FromAddress>taurus@merc-int.com</FromAddress>"
"<ToAddress>support@merc-int.com</ToAddress>"
"<ASubject>Weather Forecast</ASubject>"
"<MsgBody/>",
LAST
);
"<soap:Envelope
xmlns:soap=\"http://schemas.xmlsoap.org/soap/envelope/\">" "<soap:Body>" "<Se
ndMail xmlns=\"urn:EmailIPortTypeInft-
IEmailService\"/>" "<FromAddress>taurus@merc-int.com</FromAddress>"
"<ToAddress>support@merc-int.com</ToAddress>"
"<ASubject>Weather Forecast</ASubject>"
"<MsgBody/>"
"</SendMail>"
"</soap:Body>""</soap:Envelope>";
// Insert actual forecast text
lr_xml_set_values("Xml={ParamRequest}",
"ResultParam=ParamRequest",
"Query=Body/SendMail/MsgBody",
"ValueParam=ParamForecast",
LAST);
// Add header for SOAP
web_add_header("SOAPAction", "urn:EmailIPortTypeInft-IEmailService");
// Get response body
web_reg_save_param("ParamXml", "LB=", "RB=", "Search=body", LAST);
// Send forecast to recipient, using SOAP request
web_custom_request("web_custom_request",
"URL=http://webservices.matlus.com/scripts/emailwebservice.dll/soap
User Guide
HP LoadRunner (12.50) Page 1021
/IEmailservice",
"Method=POST",
"TargetFrame=",
"Resource=0",
"Referer=",
"Body={ParamRequest}",
LAST);
// Verify that mail was sent
lr_xml_find("Xml={ParamXml}",
"Query=Body/SendMailResponse/return",
"Value=0",
LAST
);
return 0;
}
How to Use Result Parameters
Some of the lr_xml functions return a result parameter, such as ResultParam. This parameter contains
the resulting XML data after the function is executed. The result parameters will be available from the
parameter list in the Select or Create Parameter dialog box.
For example, for lr_xml_insert, ResultParam contains the complete XML data resulting from the
insertion of the new XML fragment
You can use the result parameters as input to other XML related functions such as Web Service calls.
During replay, VuGen captures the value of the result parameter. In a later step, you can use that value
as an input argument.
The functions that support result parameters are lr_xml_insert,lr_xml_transform,lr_xml_replace,lr_
xml_delete, and lr_xml_set_values.
The following functions save values to a parameter other than the resultParam: lr_xml_get_values
saves values to ValueParam and lr_xml_extract saves values to XMLFragmentParam. These values are
also available for parameter substitution.
Use the Result Parameter as Input
1. In the Step Navigator, double-click on an XML step to view its Properties.
2. In the Result XML Parameter box, specify a name for the Result XML parameter (or ValueParam
and XMLFragmentParam).
User Guide
HP LoadRunner (12.50) Page 1022
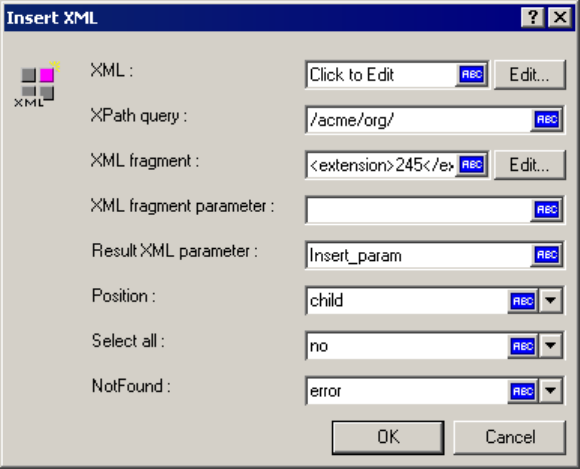
3. Reference the parameter name as in input argument.
User Guide
HP LoadRunner (12.50) Page 1023
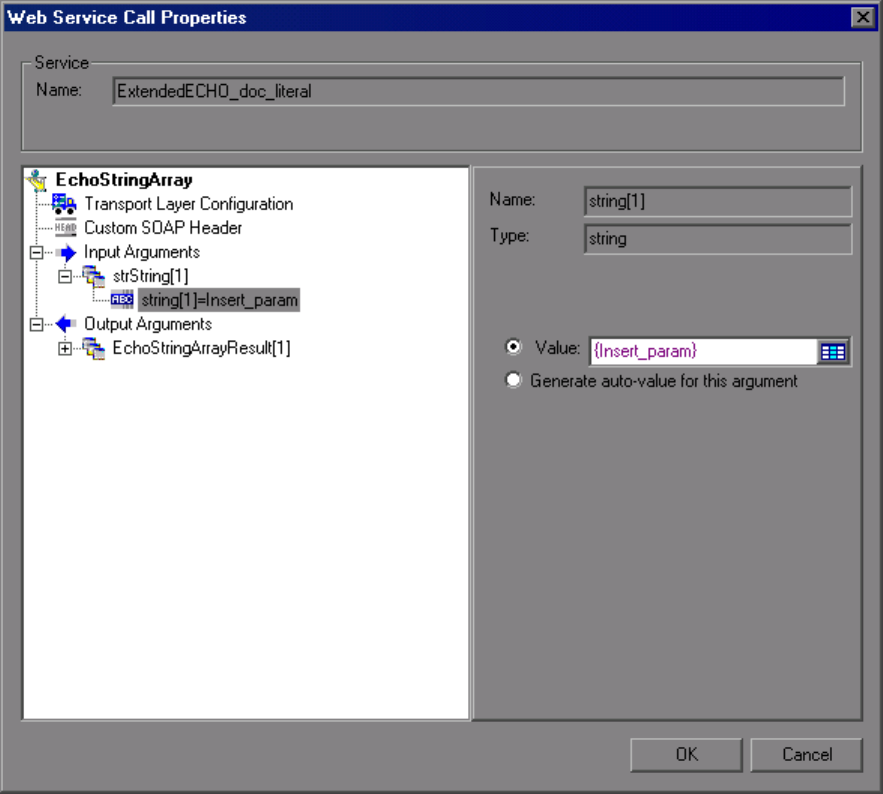
For more information, see "New Web Service Call Dialog Box" on page894.
Non-English Language Support
Non-English Language Support Overview
VuGen supports multilingual environments, allowing you to use languages other than English on native
language machines when creating and running scripts.
When working with languages other than English, the primary issue is ensuring that VuGen recognizes
the encoding of the text during record and replay. The encoding applies to all texts used by the script.
This includes texts in HTTP headers and HTML pages for Web Vusers, data in parameter files, and
others.
User Guide
HP LoadRunner (12.50) Page 1024

If you need to use non-English symbols in paths to scripts, scenarios, results, or analysis sessions, make
sure to select the appropriate locale in the your machine's Region and Language settings. Script
names, however, must be in English.
Windows 2000 and higher lets you save text files with a specific encoding directly from Notepad: ANSI,
Unicode, Unicode big endian, or UTF-8.
By default, VuGen works with the local machine encoding (ANSI). Some servers working with foreign
languages, require you to work with UTF-8 encoding. To work against this server, you must indicate in
the Advanced recording options, that your script requires UTF-8 encoding.
Page Request Header Language
Before running a Web script, you can set the page's request header to match your current language. In
the Internet Protocol runtime settings, you set the language of the Accept-Language request header.
This header provides the server with a list of all of the accepted languages.
To set this value, select Replay > Runtime Settings > Internet Protocol > Preferences > Advanced >
Options > Accept-Language request header and select the desired language.
For user interface details, see " Preferences View - Internet Protocol" on page288.
How to Convert Encoding Format of a String
You can manually convert a string from one encoding to another (UTF-8, Unicode, or locale machine
encoding) using the lr_convert_string_encoding function with the following syntax:
lr_convert_string_encoding(char * sourceString, char * fromEncoding, char *
toEncoding, char * paramName)
The function saves the result string (including its terminating NULL) in the third argument, paramName.
It returns a 0 on success and -1 on failure.
The format for the fromEncoding and toEncoding arguments are:
LR_ENC_SYSTEM_LOCALE NULL
LR_ENC_UTF8 "utf-8"
LR_ENC_UNICODE "ucs-2"
In the following example, lr_convert_string_encoding converts "Hello world" from the system locale to
Unicode.
Action()
{
int rc = 0;
User Guide
HP LoadRunner (12.50) Page 1025
unsigned long converted_buffer_size_unicode = 0;
char *converted_buffer_unicode = NULL;
rc = lr_convert_string_encoding("Hello world", NULL, LR_ENC_UNICODE,
"stringInUnicode");
if(rc < 0)
{
// error
}
return 0;
}
In the replay log, the output window shows the following information:
Output:
Starting action Action.
Action.c(7): Notify: Saving Parameter "stringInUnicode = H\x00e\x00l\x00l\x00o\x00
\x00w\x00o\x00r\x00l\x00d\x00\\x00"
Ending action Action.
The result of the conversion is saved to the paramName argument.
How to Convert Encoding Format of Parameter Files
The parameter file contains the data for parameters that were defined in the script. This file, stored in
the script's folder, has a *.dat extension. When running a script, Vusers use the data to execute actions
with varying values.
By default, VuGen saves the parameter file with your machine's encoding. When working with languages
other than English, however, in cases where the server expects to receive the string in UTF-8, you may
need to convert the parameter file to UTF-8. You can do this directly from Notepad, provided that you
are working with Windows 2000 or higher.
Apply UTF-8 Encoding to a Parameter File
1. Select Vuser > Parameter List and view the parameter properties.
2. In the right pane, locate the parameter file in the File path box.
3. With the parameter table in view, click Edit in Notepad. Notepad opens with the parameter file in
csv format.
4. In the Save as type box, select All Files.
In the Encoding box, select UTF-8 type encoding.
User Guide
HP LoadRunner (12.50) Page 1026
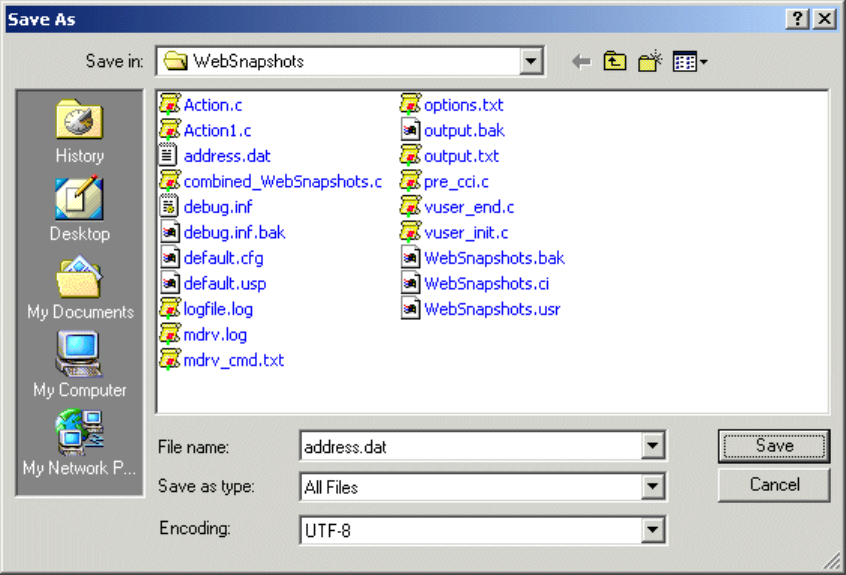
5. Click Save. Notepad asks you to confirm the overwriting of the existing parameter file. Click Yes.
VuGen now recognizes the parameter file as UTF-8 text, although it still displays it in regular
characters.
How to Record Web Pages with Foreign Languages
When working with Web or other Internet protocols, you can indicate the encoding of the Web page text
for recording. The recorded site's language must match the operating system language. You cannot mix
encodings in a single recording—for example, UTF-8 together with ISO-8859-1 or shift_jis.
This task describes how to record web pages with foreign languages using VuGen.
Automatically Record Foreign Language Web Pages.
In order to be recognized as a non-English Web page, the page must indicate the charset in the HTTP
header or in the HTML meta tag. Otherwise, VuGen will not detect the EUC-JP encoding and the Web site
will not be recorded properly. To instruct VuGen to record non-English requests as EUC-JP or UT-8,
select Record > Recording Options > HTTP Properties > Advanced > support charset and select the
appropriate option in the Recording Options dialog box, HTPP Properties: Advanced node. For user
interface details, see "HTTP Properties > Advanced Recording Options" on page178.
Note that by selecting the EUC-JP or UTF-8 option in the Recording Options, you are forcing VuGen to
record a Web page with the selected encoding, even when it uses different encoding. If, for example, a
non-EUC encoded Web page is recorded as EUC-JP, the script will not replay properly.
User Guide
HP LoadRunner (12.50) Page 1027
Manually Record Foreign Language Web Pages
You can manually add full support for recording and replaying of HTML pages encoded in EUC-JP using
the web_sjis_to_euc_param function. This also allows VuGen to display Japanese EUC-encoded
characters correctly in Vuser scripts.
When you use web_sjis_to_euc_param, VuGen shows the value of the parameter in the Execution Log
using EUC-JP encoding. For example, when you replay the web_find function, VuGen displays the
encoded values. These include string values that were converted into EUC by the web_sjis_to_euc_
param function, or parameter substitution when enabled in the RuntimeSetting > Log > Extended Log.
Troubleshooting and Limitations for Non-English Languages
This section describes troubleshooting and limitations when working with non-English languages.
Script / Scenario Names
lWhen recording COM, FTP, IMAP, SMTP, or POP3 protocols, the length of the script name is limited to
10 multi-byte characters (21 bytes).
lIf you need to use non-English symbols in paths to scripts, scenarios, results, or analysis sessions,
make sure to select the appropriate locale in the your machine's Region and Language settings.
Script names, however, must be in English.
lThe name and path of a scenario cannot contain multi-byte characters. . It is also recommended to
use English characters for argument and parameter names.
lThe GWT DFE extension does not support non-English characters in its classpath.
Browser Configuration
lIf, during recording, non-English characters in the script are displayed as escaped hexadecimal
numbers (For example, the string " =;" becomes "%DC%26"), you can correct this by configuring your
browser not to send URLs in UTF-8 encoding. In Internet Explorer, select Tools > Internet Options
and click the Advanced tab. Clear the Always Send URLs as a UTF-8 option in the Browsing section.
For more information, use the web_sjis_to_euc_param function described in the LoadRunner
Function Reference.
Protocol Limitations
SMTP: If you work with the SMTP protocol through MS Outlook or Outlook Express, the Japanese text
recorded in a Vuser script is not displayed correctly. However, the script records and replays correctly.
ContentCheck in Multilingual Environments
lThis version supports ContentCheck rules in French, German, Spanish, and Italian. The correct
language file should be installed according to the system locale.
User Guide
HP LoadRunner (12.50) Page 1028
lThe suitable language file can also be copied from the installation disk:
..\lrunner\MSI\setup\international\<lang>\dat\LrwiAedInstallation.xml to the <LoadRunner>\dat
directory.
Language Packs
lUninstalling LoadRunner: LoadRunner fails to uninstall on a Chinese operating system if the
LoadRunner installation path contains Chinese characters.
lLicense Utility warnings. A License Utility dialog box may open when installing a language pack. It
will not affect the installation. Close it, and continue installing the language pack.
lCertificate warnings. VuGen may issue warnings about certificates when recording a Web -
HTTP/HTML script on Windows 2012 R2 and Windows 8.1. This only occurs when you install VuGen on a
non-English operating system.
Workaround: Install the language pack for the language of the operating system. Do not delete the
certificate after recording.
lRecording Functions: LoadRunner cannot record a Vuser script for certain protocols if the
LoadRunner installation is on a Chinese operating system, and the installation path contains Chinese
characters.
lLoadRunner Language Pack. While installing the language pack, a warning message may be
displayed that the HP LoadRunner Launcher Process is in use.
Workaround: Click Continue to resume the installation.
lLoadRunner Language Pack. If you are working with a LoadRunner language pack, it is recommended
that you install it before running LoadRunner for the first time.
lThe language pack of .NET Framework needs to be installed to show the localized strings.
lTutorial scripts. After the language pack installation, all sessions and scripts in
\HP\LoadRunner\tutorial will remain in English.
lMenus and toolbars. If you install a LoadRunner language pack after running LoadRunner for the
first time, the menus and toolbars may not get translated.
Workaround: Close LoadRunner and delete the following folder from the registry: HKEY_
CURRENT_USER\Software\<Folder Name>, where <Folder Name> is the drive on which you
installed LoadRunner.
For example, if LoadRunner is installed on the C drive, the registry folder name would be: HKEY_
CURRENT_USER\Software\C.Restar t LoadRunner.
lReport Templates in Analysis. If you install a LoadRunner language pack after running LoadRunner
for the first time, the Report Templates in Analysis (Reports > Report Templates) may not get
translated.
Workaround: Close LoadRunner and copy the files from: <LoadRunner Language Pack CD
root>\Reporting to folder <LoadRunner installation folder>\bin\dat\Reporting. Restart LoadRunner.
Non-Localized LoadRunner on Foreign Language Operating Systems
lLanguage support. LoadRunner only supports English and the native language of the machine's
User Guide
HP LoadRunner (12.50) Page 1029
operating system. For example, if you are using Japanese Windows XP, you can work with LoadRunner
in Japanese and in English.
lInstallation path. The path in which installation files for LoadRunner are located, and the path in
which LoadRunner is installed, can contain only English characters.
lDiagnostics add-in. To use the Diagnostics add-in with Controller on a computer with a non-English
operating system the Diagnostics_9.0_8.0_LR_Addin_QCCR1I52206 hotfix should be installed. For
further assistance, contact HP customer support.
l.NET Framework 3.5 failure. Installing LoadRunner on a localized machine may result in a failure in
the .NET Framework 3.5 installation process, and you will be asked to terminate the installation. This
happens because the .NET 3.5 Framework installation attempts to download the Framework
Language Pack but fails.
Workaround: Terminate the LoadRunner installation according to the Installation wizard's
instructions and invoke the LoadRunner installation again.
lOnline Help. The search functionality may not function as expected for strings that contain
Chinese/Japanese characters (except Japanese full-width Katakana).
Workaround: Add a half-width space after each character in the search string.
lOnline Help. For optimum performance of the online Help, install the latest JRE.
lJapanese characters in Web - HTTP/HTML scripts. If you set the advanced recording option to
specify the encoding of an application, and the application uses different character encoding for
different pages, then the recording log or script may display invalid Japanese characters. This does
not cause any errors in the script replay.
lNon-breaking spaces in Web protocols for Far Eastern languages. A non-breaking space (
    `\xA0', etc.) cannot be represented in some Far Eastern locale character sets (in
which it is considered a lead byte). Instead, non-breaking spaces are converted to regular spaces (` `,
`\x20', etc.), both during script code generation and replay. This may cause replay problems, such as
mismatches in length due to eliminating multiple regular spaces.
Workaround: Remove/add space(s) from/to the script so the comparison succeeds or specify regular
expressions to avoid the issue.
lStandalone installations. The installation interface of the VuGen and Analysis standalone are in
English and not localized.
lFlex AMF call properties. Multibyte symbols in Flex AMF call properties will be corrupted in the script
text view.
lrdp_type The rdp_type function does not support native language characters for both record and
replay.
lWord Completion. Word completion does not work when Windows is configured to use the
Ctrl+Space combination. This is common when using a Chinese keyboard.
Workaround: Select Complete word from the Edit menu. Advanced users can disable Ctrl+Space for
Chinese keyboards, by setting the following registry keys:
l[HKEY_CURRENT_USER\Control Panel\Input Method\Hot Keys\00000010]
"Key Modifiers"=hex:00,c0,00,00
"Target IME"=hex:00,00,00,00
User Guide
HP LoadRunner (12.50) Page 1030

l[HKEY_CURRENT_USER\Control Panel\Input Method\Hot Keys\00000070]
"Key Modifiers"=hex:00,c0,00,00
"Target IME"=hex:00,00,00,00
"Virtual Key"=hex:ff,00,00,00
lODBC and Oracle-2 Tier protocols. When recording a script in VuGen using the ODBC or Oracle-2 Tier
protocols, if you stop the recording while the AUT is still open, VuGen may crash.
Workaround: Close LoadRunner and open the file <LoadRunner installation
folder>\dat\protocols\options\script\general.opt in a text editor.
Comment out the following line by adding a semicolon at the beginning of the line:
Option=DumpProcesses so it looks like this: ;Option=DumpProcesses
lPDF reports. In Analysis, a PDF report may be generated with unreadable characters if it contains
non-English characters.
Workaround: Before you generate the PDF file, change the font in the Report Template that you are
using.
a. Select Reports > Report Templates.
b. Select the template that you want to use.
c. In the Detailed Report section, select the Format tab.
d. For each UI element in the list, change the font to the desired font that supports the language in
which the report is written.
HP Live Network (HPLN) Integration
HP Live Network (HPLN) provides you with additional software content and information about your HP
Software products. The LoadRunner HPLN Integration feature enables you to download and upload
content that can then be shared by other LoadRunner users.
You can download and upload the following content types to and from HPLN:
lAction/Function files with .c, .java, .js, and .cs extensions.
Note: For security reasons, .js files must be zipped before uploading to HPLN, and unzipped
after downloading from HPLN.
lCorrelation files with the .cor extension
lData Format Extension (DFE) files with the .vucsx extension
lVuGen add-in files with a .zip extension
For more information on how to use HPLN, use the following table:
User Guide
HP LoadRunner (12.50) Page 1031
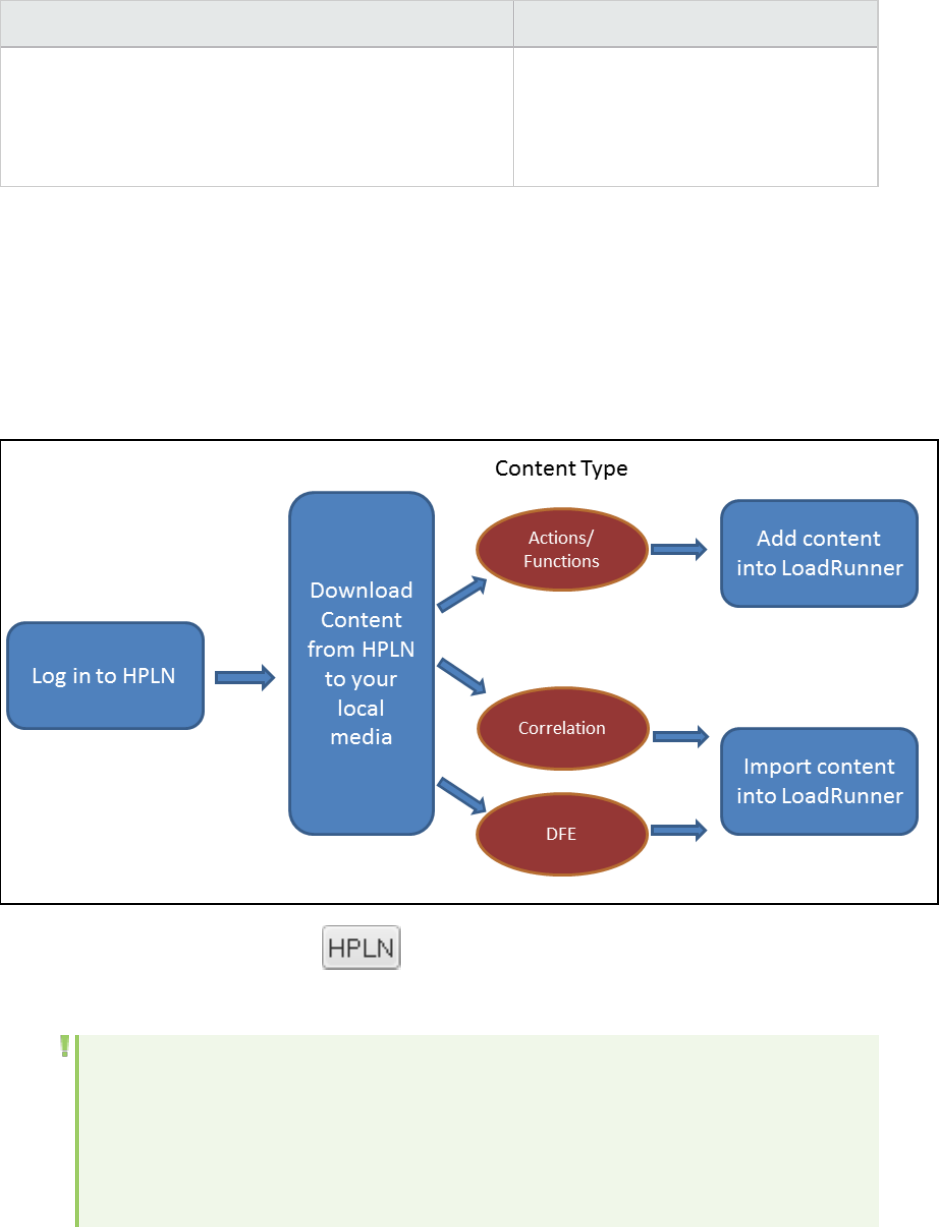
How to ... UI Descriptions
l"How to Download Content from HP Live Network
(HPLN) to LoadRunner" below
l"How to Upload Content from LoadRunner to HP Live
Network (HPLN)" on page1034
l"HP Live Network Connection Dialog
Box" on page1036
l"Download from HP Live Network
Dialog Box" on page1038
How to Download Content from HP Live Network (HPLN) to
LoadRunner
The following task describes how to download content from HPLN and import it into your LoadRunner
project.
The flow for downloading content to LoadRunner is as follows:
1. On the VuGen main Toolbar, click , and log in to HPLN.
If you are already logged on, you will be automatically directed to the HPLN download page.
Note:
lThe first time you log in to HPLN from VuGen, it may take several minutes for VuGen to
create a dynamic content page. Subsequent loadings will be quicker.
lIf you initially connect to HPLN from a machine upon which you logged on as
administrator, you cannot reconnect to HPLN, if you reconnect to the machine with a
User Guide
HP LoadRunner (12.50) Page 1032
limited account.
For more information on logging in to HPLN, see "HP Live Network Connection Dialog Box" on
page1036.
2. On the Download from HP Live Network screen, select the relevant HPLN Content type, and on the
relevant content, click Download to download the content.
When you click Download, the status Downloading appears, and when the selected file has been
downloaded the status changes to Downloaded.
Note: Downloaded content is saved in the relevant sub-folder of %programdata%\Hewlett-
Packard\LoadRunner\HPLN.
For more information on downloading content, see "Download from HP Live Network Dialog
Box" on page1038.
3. To use the content in LoadRunner, depending on the type of content you downloaded, perform the
following steps:
a. Actions/Functions content
i. If you downloaded a .zip file containing a.js file, you must unzip the .js file before you can
add the file as an extra file.
ii. In Solution Explorer, for the script you are developing, right-click Extra Files and select
Add Files Downloaded from HPLN.
iii. Then in the %programdata%\Hewlett-Packard\LoadRunner\HPLN\function folder, select
the relevant function file, and click Open.
b. Correlation content
i. On the VuGen main menu, select Record >Recording Options >Correlations - Rules, and
click Import.
ii. In the %programdata%\Hewlett-Packard\LoadRunner\HPLN\cor folder select the
correlation file, and click Open.
c. DFE content
i. On the VuGen main menu, select Record >Recording Options >Data Format Extension -
Code Generation.
ii. Select Enable data format extension and click Import.
If you are prompted with a message "This operation will overwrite the current settings",
and you wish to overwrite the current settings, click Yes.
User Guide
HP LoadRunner (12.50) Page 1033
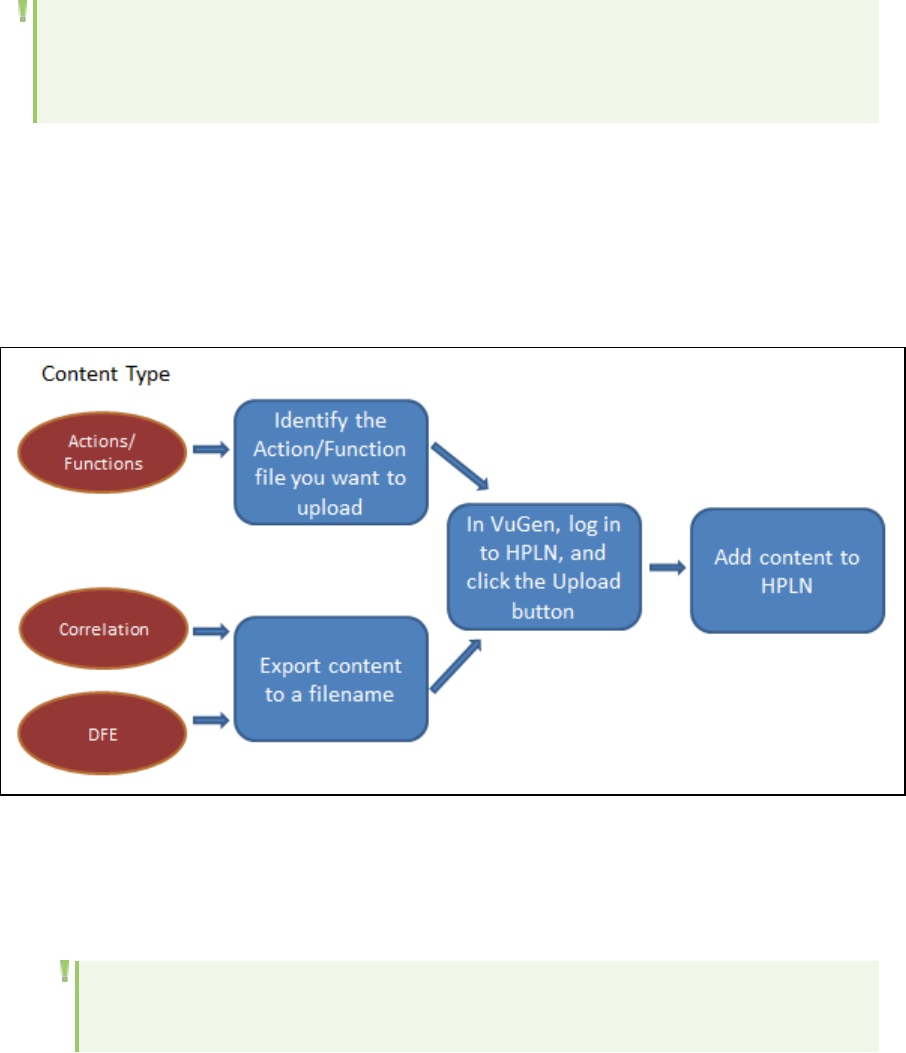
iii. In the %programdata%\Hewlett-Packard\LoadRunner\HPLN\dfe folder, select the DFE
file, and click Open.
Note: If you initially connect to HPLN from a machine from which you logged on as
administrator, you cannot reconnect to HPLN, if you reconnect to the machine with a limited
account.
How to Upload Content from LoadRunner to HP Live Network
(HPLN)
The following task describes how to upload content from LoadRunner to HPLN.
The flow for uploading content from LoadRunner to HPLN is as follows:
1. Export the content you want to upload to a file as follows:
Actions/Functions content
Locate the action or function file in preparation for uploading to HPLN.
Note: If you are uploading a .js file, for security reasons you must zip the .js file and upload
the zip file.
Correlation content
a. On the VuGen main menu, select Record >Recording Options >Correlations - Rules
User Guide
HP LoadRunner (12.50) Page 1034
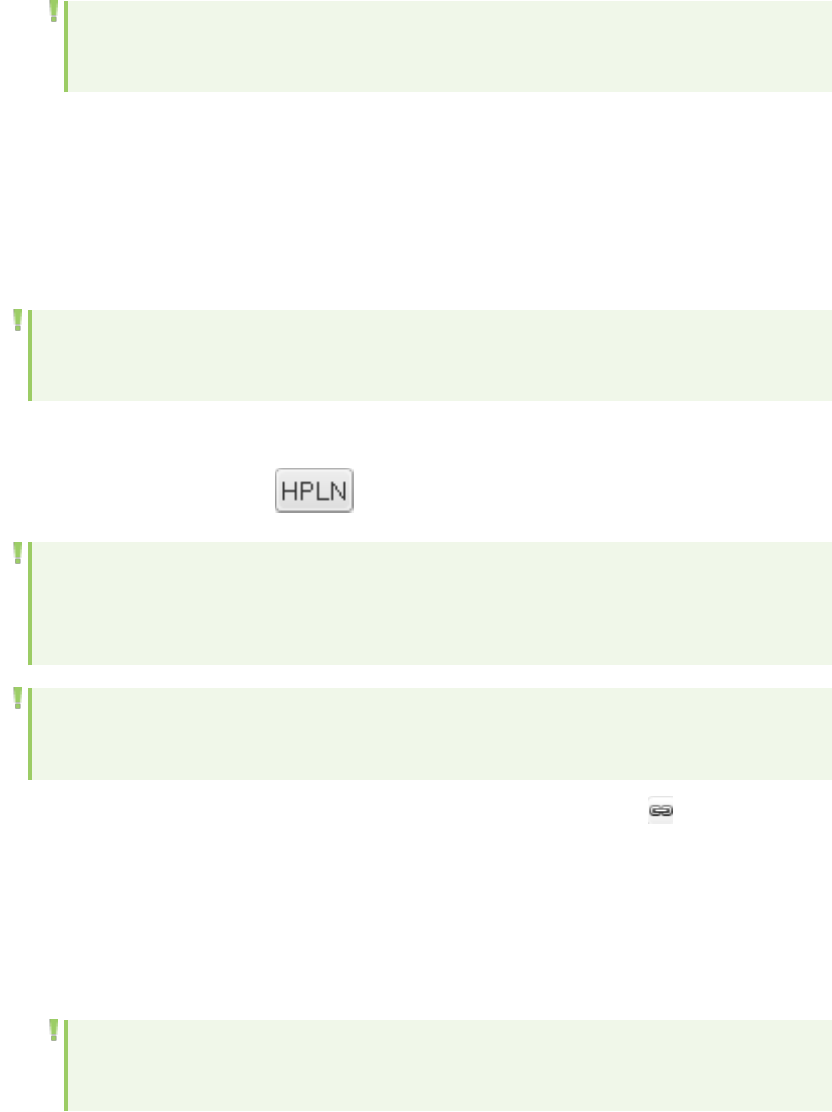
b. Click Export, select an Application to Export, and then click Export
c. Enter a filename and location, and then click Save.
Note: The file is saved by default in the %programdata%\Hewlett-
Packard\LoadRunner\HPLN\cor folder.
DFE content
a. On the VuGen main menu, select Record >Recording Options >Data Format Extension - Code
Generation
b. Select Enable data format extension, and then click Export.
c. Enter a file name and location, and then click Save.
Note: The file is saved by default in the %programdata%\Hewlett-
Packard\LoadRunner\HPLN\dfe folder.
2. Log in to HPLN
On the VuGen main Toolbar, click , and log in to HPLN.
Note: The first time you log in to HPLN in a VuGen session may take several minutes whilst
the dynamic content page is created. The subsequent loading of the content page is much
quicker.
Note: If you are already logged in, you will be automatically directed to the HPLN download
page.
3. On the Download from HP Live Network screen, click Upload Content to HPLN .
4. In the main HPLN screen, Click the Content tab, and click Add Content.
5. Start the upload procedure
Enter the following information:
a. The name and description for the content.
Note: The name and description content are used when searching the content in the
Download from HP Live Network screen.
b. The supported product versions.
User Guide
HP LoadRunner (12.50) Page 1035

Note: When the system prepares the content list for the Download from HP Live
Network screen, it displays content that is relevant to the version of VuGen you are
using.
c. The version
Enter a version number. A version number is automatically generated the first time you add
content. The version number for content is unique per update.If you in the future update the
specific content, you must enter a different version number.
d. The content type
Select the relevant content type.
Note: The content is delivered and selected according to the content type. lr_cr for
correlation content, lr_dfe for DFE content and lr_ff for Action/Function content.
6. Attach the content
Click Add Content Attachment.
On the Create Content Attachment screen:
a. Enter the name and version, and then click the File attachments tab.
b. Click Choose file, select the content file you want to upload, and then click Finish.
7. After reviewing the summary, click Publish, and on the You are about to Publish screen, click
Submit.
HP Live Network Connection Dialog Box
This dialog box enables you to log in to HP Live Network (HPLN), and gives you access to the HPLN
content files.
User Guide
HP LoadRunner (12.50) Page 1036
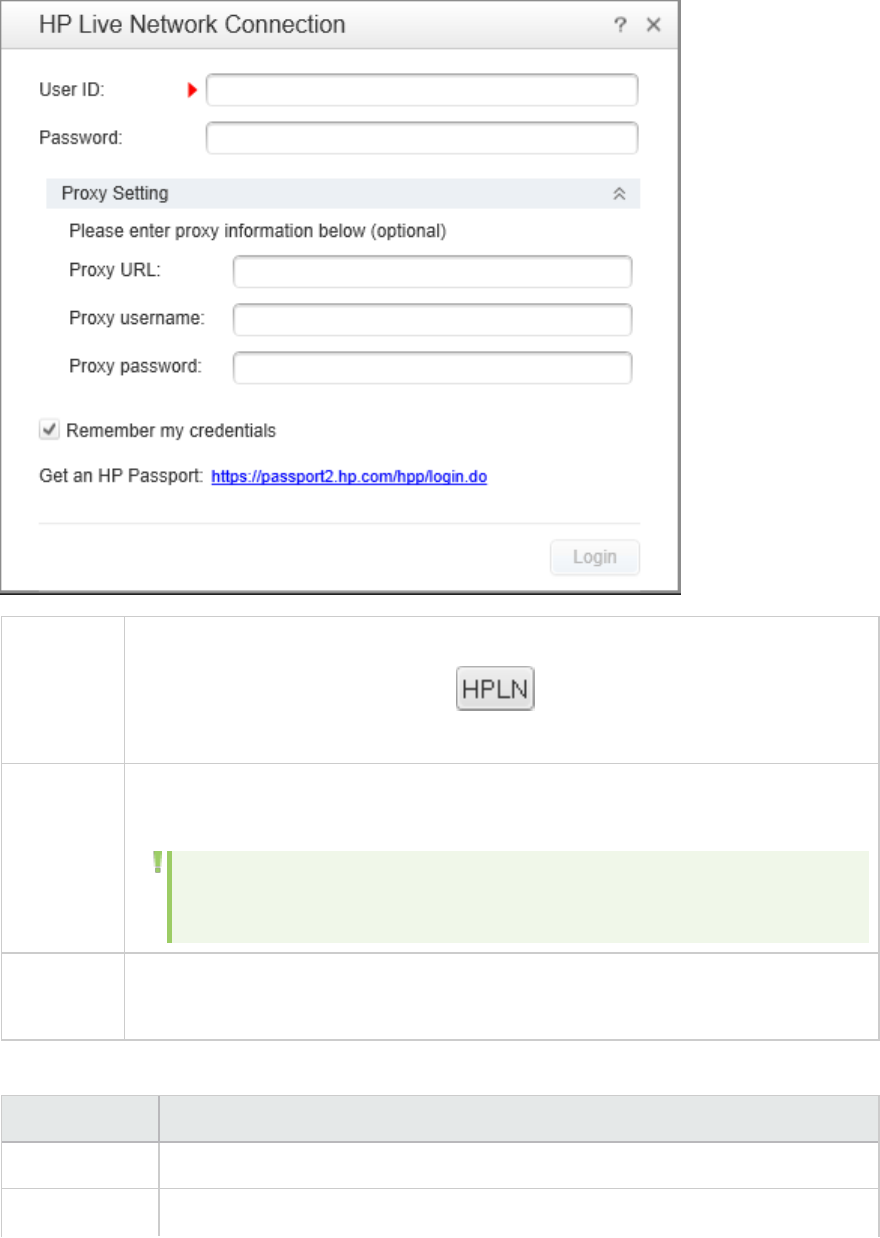
To access Use one of the following:
lFrom the main VuGen toolbar, click .
lOn the main VuGen menu, select Tools > Reset Credentials
Important
information
If you select Remember my credentials, this HP Live Network Connection dialog box
appears only when you choose to Reset Credentials.
Note: When you access HPLN for the first time in a session, the feature may
take several minutes to populate the Download from HPLN window.
Relevant
tasks
"How to Download Content from HP Live Network (HPLN) to LoadRunner" on page1032
"How to Upload Content from LoadRunner to HP Live Network (HPLN)" on page1034
User interface elements are described below (unlabeled elements are shown in angle brackets):
UI Element Description
User Id Enter your Passport ID.
Password Enter your Passport ID password.
User Guide
HP LoadRunner (12.50) Page 1037
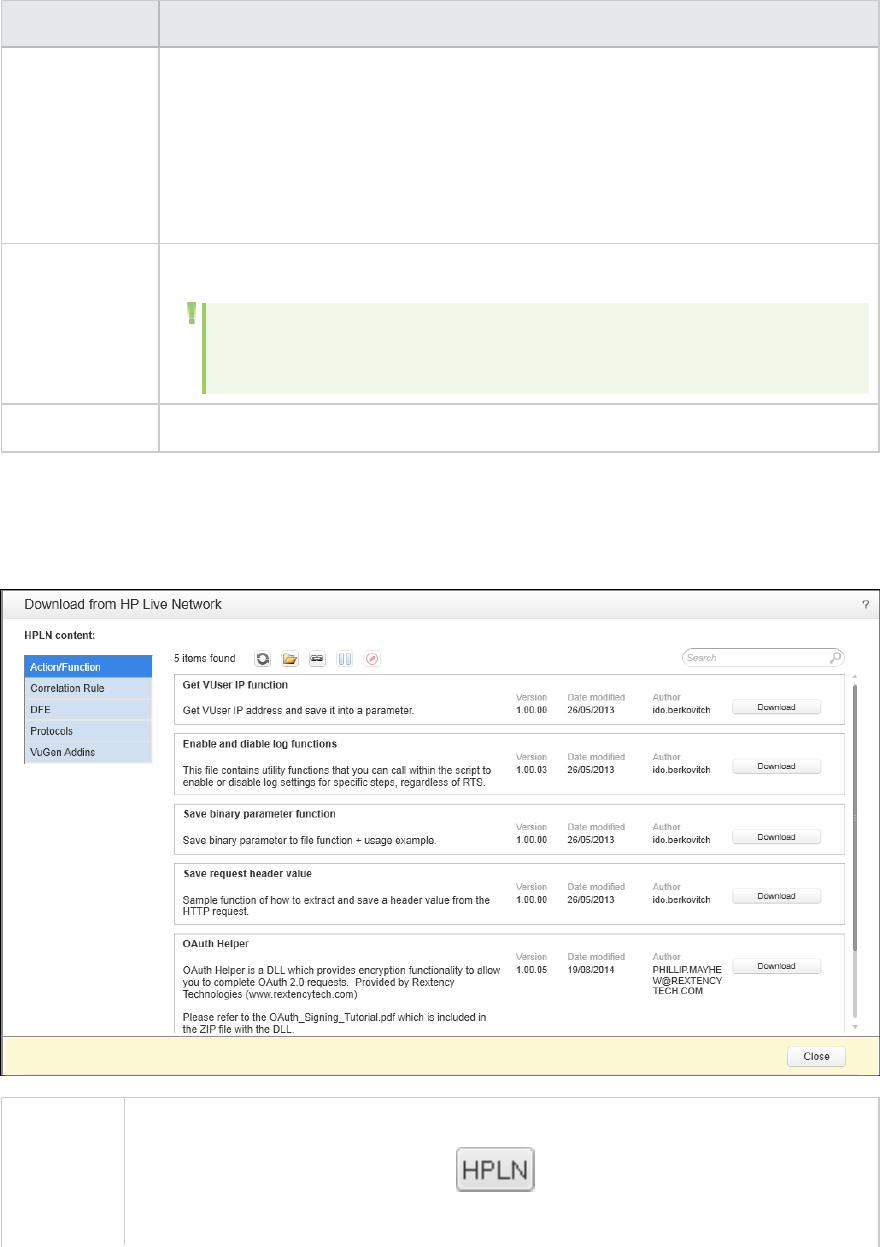
UI Element Description
Proxy Setting If you access the Internet via a proxy and your proxy settings are not automatically
configured on your machine, enter the following proxy details:
Proxy URL. The URL of your proxy server.
Proxy username. Your proxy user name.
Proxy password. Your proxy password.
<Remember my
credentials>
When selected, your previous credentials are used to log in to HPLN.
Note: To log in as a different user, on the main VuGen menu, select Tools >
Reset Credentials.
Login Click to log in to HPLN.
Download from HP Live Network Dialog Box
This dialog box enables you to download content files from HPLN.
To access Use one of the following:
lFrom the main VuGen toolbar, click .
lOn the main VuGen menu, select Tools > HPLN
User Guide
HP LoadRunner (12.50) Page 1038
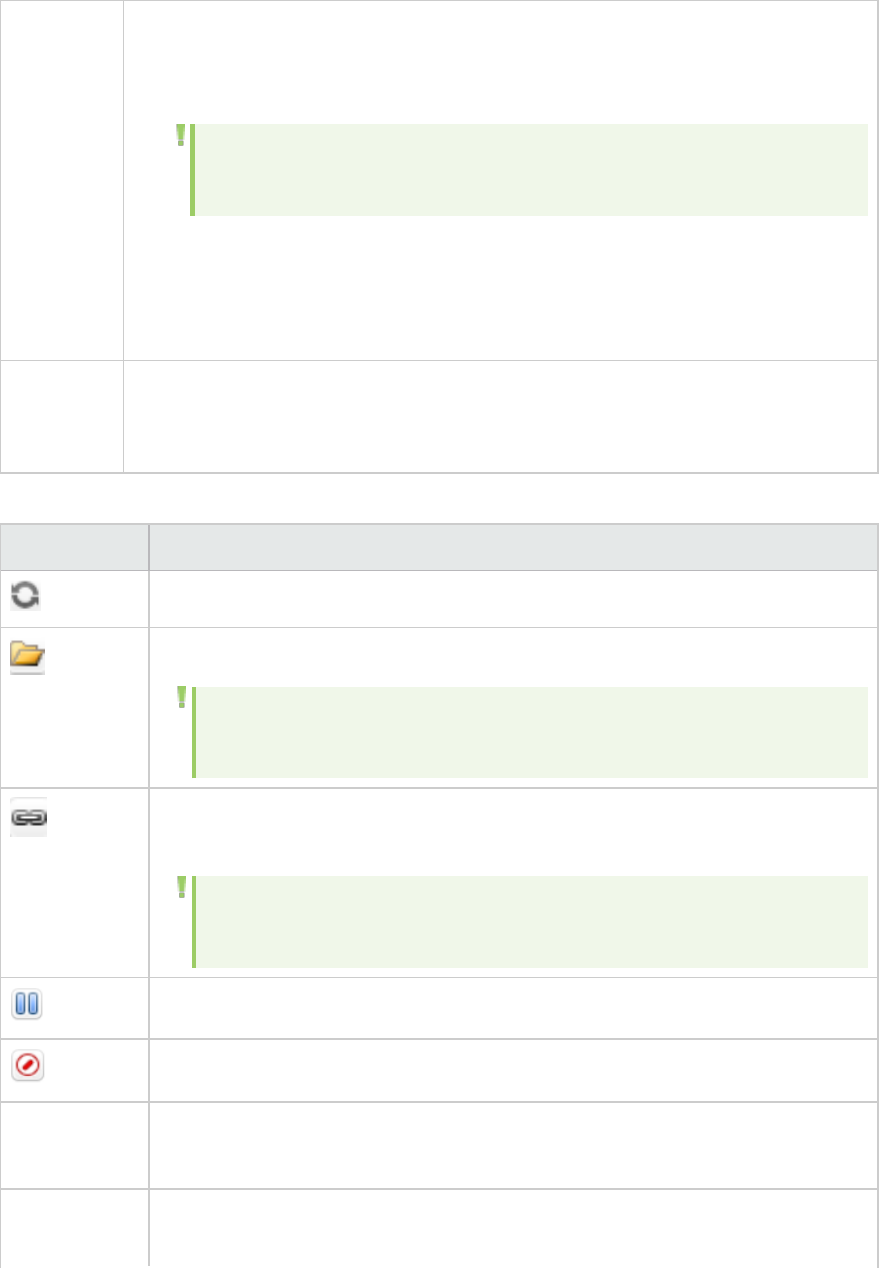
Important
information
lIf you are not logged on to HPLN, you will be directed to the HP Live Network
Connection dialog box.
lIf you are already logged on to HPLN, the Download from HPLN Dialog box appears.
Note: When you access HPLN for the first time in a session, the feature may
take several minutes to populate the Download from HPLN window.
lThe Close button, closes the dialog box, and completes the downloading of content
currently selected for download.
lYou can only use one HPLN session at any time on a server. If you have more than
one VuGen open, you cannot access HPLN from both sessions simultaneously.
Relevant
tasks
l"How to Download Content from HP Live Network (HPLN) to LoadRunner" on
page1032
l"How to Upload Content from LoadRunner to HP Live Network (HPLN)" on page1034
User interface elements are described below (unlabeled elements are shown in angle brackets):
UI Element Description
Refresh Content. Repopulates the HPLN list of content available for download.
Open Content Folder. Opens the folder where the content was downloaded to.
Note: Because the filename is not displayed on screen, you can use this
option to see the name of the downloaded content file.
Upload Content to HPLN. Directs you to the HPLN upload site. You can share
content with other LoadRunner users by uploading content to this location.
Note: You require content contributor permissions to upload content to
HPLN.These can be provided by the community owner.
Pauses all pending downloads.
Cancels all pending downloads.
<HPLN
Content>
Lists the content types that you can download.
The content types are: Actions/Functions, Correlation Rules, and DFE files.
<Search> Enter a string of text, and the displayed list of content automatically updates to
reflect the search text entered. All the text entered when the asset is created on
User Guide
HP LoadRunner (12.50) Page 1039
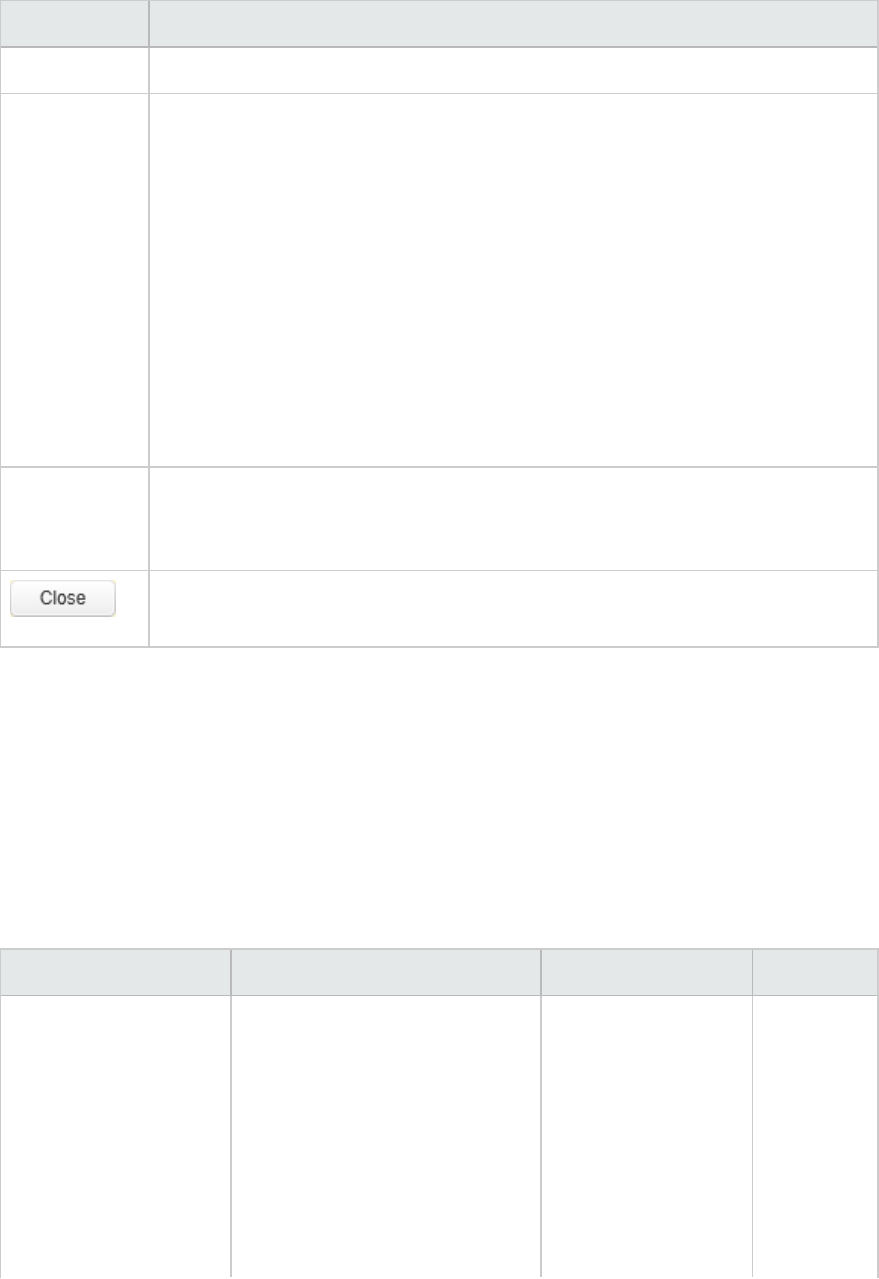
UI Element Description
HPLN is included in the text search.
<Asset
Action/Status>
The following actions/statuses can be displayed for a content item:
lDownload. Click to download a content file. Once the content has been
successfully downloaded, the Re-Download button appears.
The number of content files being downloaded is displayed on the bottom of the
Download from HP Live Network window.
If you to download several content files simultaneously, the first is downloaded
and the other content files are put in a state of Pending. When the first
download is complete, the downloading of the next content file begins.
lRe-Download. Click to re-download a content file.
lPaused. Displayed when the download of a content file is paused by clicking the
Pause button. Click Download to re-initiate the download of the content file.
<Progress
Bar>
Displays the progress of the download. If you download several content files, the
number of downloads will be displayed in the format "Downloading item x of y from
HPLN".
Closes the dialog, but completes in the background the downloading of selected
content.
Additional Components
You can install additional components that provide advanced features for working with LoadRunner.
The setup files are located in the Additional Components folder inside the root folder of the
LoadRunner installation DVD or download folder.
The table below indicates which additional components are available, and where you should install each
component:
Folder Component Description Install on...
Agent for Citrix Server SetupCitrixAgent.exe Installs the Citrix
Agent which enhances
VuGen’s capabilities in
identifying Citrix client
objects during Citrix
protocol record and
replay. For installation
instructions, see
"Install the
Citrix server
User Guide
HP LoadRunner (12.50) Page 1040

Folder Component Description Install on...
LoadRunner Citrix
Agent on the Citrix
Server (Optional)" on
page448.
The agent also
enables you to use
additional Citrix API
functions. For details,
see the LoadRunner
Function Reference.
Agent for Microsoft
Terminal Server
SetupMSTerminalAgent.exe Installs a utility that
enhances the RDP
protocol’s recording
mechanism in VuGen.
For installation
instructions, see
"Installing the
Microsoft Terminal
Server Agent" on
page1047.
RDP server
Assembly Crawler for
Analysis API
AssemblyCrawlerConsole.exe Installs a command-
line utility to build a
.NET configuration file
for a LoadRunner
Analysis API
application. For more
information, open the
Analysis API
Reference from the
Start >
Documentation menu
on the LoadRunner
machine (not available
with VuGen
Standalone).
LoadRunner
Analysis
machine
HostID Generator Host ID Generator tool,
licidgenerator.exe
Opens the Host ID
Generator utility that
displays the
computer’s Host ID.
LoadRunner
Controller
machine
User Guide
HP LoadRunner (12.50) Page 1041

Folder Component Description Install on...
This is useful when
requesting a license.
For details, see
"LoadRunner License
Utility" on page1058.
HP NV (Network
Virtualization)
NV4HPControllerSetup.exe
NV4HPLGSetup.exe
Installs HP Network
Virtualization for the
Controller or load
generator machine.
For details, see
"Network
Virtualization
Integration" on
page1366.
LoadRunner
Controller
and load
generator
machines
IDE Add-Ins hp.lr.vugeneclipse42addin.jar
LRVS2010IDEAddInSetup.exe
LRVS2012IDEAddInSetup.exe
Installs add-ins for
Visual Studio or
Eclipse enabling you to
create Vuser scripts in
your standard
development
environment using the
LoadRunner API. This
integration also allows
you to run the test
directly from Visual
Studio or Eclipse, to
test its functionality.
For details, see
"Creating Scripts in
External IDEs" on
page1001.
Visual
Studio /
Eclipse
machine
with VuGen
IDE Add-Ins Dev LREclipseIDEAddInDevSetup.exe
LRVS2010IDEAddInDevSetup.exe
LRVS2012IDEAddInDevSetup.exe
Setup files for
developer add-ins for
Visual Studio 2010/
2012 and Eclipse,
enabling you to create
NUnit or JUnit tests in
your standard
development
environment using the
Visual
Studio or
Eclipse
machine
with VuGen
User Guide
HP LoadRunner (12.50) Page 1042

Folder Component Description Install on...
LoadRunner API. For
details, see "Creating
Scripts in External
IDEs" on page1001.
LoadRunnerProtocolSDK SetupLoadRunnerProtocolSDK.exe Allows you to create
and distribute custom
LoadRunner protocols.
For details, see
"Protocol SDK" on
page1045.
Any machine
with VS
2012 and
WiX Toolset
3.8 or higher
mobile
RemoteAgent
Executable files for several
platforms
Starts the Mongoose
Web server to provide
mobile functionality.
For details, see "How
to Record and Analyze
Traffic (for Mobile
Applications)" on
page579.
Mobile AUT
backend
server
SAP Tools SapSpy.exe
VerifyScripting.exe
lSAPGUI Spy.
Examines the
hierarchy of GUI
Scripting objects,
on open windows of
SAPGUI Client for
Windows.
lSAPGUI Verify
Scripting. Verifies
that the SAPGUI
Scripting API is
enabled.
For details, see "How
to Configure the SAP
Environment" on
page653.
VuGen
machine
with SAPGUI
client
Third Parties Source files The folder contains
the source code of
some third party
N/A
User Guide
HP LoadRunner (12.50) Page 1043

Folder Component Description Install on...
software components
which are being used
in LoadRunner.
Virtual Table Server SetupVTS.exe Virtual Table Server
(VTS) offers an
alternative to
standard LoadRunner
parameterization. For
details, see
"Parameterizing
Overview" on
page341.
Any machine
Standalone Applications
The following LoadRunner standalone applications are available in the DVD/Standalone Applications
folder.
Folder Component Description Install on...
Analysis
Standalone
SetupAnalysis.exe Installs LoadRunner Analysis as a
standalone application. Install this to
open LoadRunner results and create
graphs and reports on a separate
machine. For details, see "Introducing
Analysis" on page1397.
Any machine
Load Generator SetupLoadGenerator.exe Installs the LoadRunner agent on the
machine in order to run load tests.
After you install this software, you
access this machine from the
Controller. For details, see "Load
Generators" on page1110.
Any machine
MI Listener SetupMIListener.exe Installs the HPMI Listener, which
servers as a router between the
Controller and the LoadRunner
agent. For details, see "How to Set Up
Your LoadRunner System Over
Firewalls" on page1273.
Dedicated
machine
Monitors Over SetupMoFW.exe Installs the HP Monitors Over Firewall Dedicated
User Guide
HP LoadRunner (12.50) Page 1044

Folder Component Description Install on...
Firewall component, allowing you to monitor
servers located over a firewall. For
details, see "How to Set Up Your
LoadRunner System Over Firewalls"
on page1273.
machine
TruClient
Standalone
SetupTruClient.exe Installs LoadRunner TruClient as a
standalone application. Install this to
tool to record Web applications with
TruClient technology. You save the
recordings to a script that can be
used in a LoadRunner test run. For
details, see "TruClient Protocol" on
page673.
Any machine
VuGen
Standalone
SetupVuGen.exe Installs LoadRunner Virtual User
Generator (VuGen) as a standalone
application, allowing you to create
scripts for a load test. For details,
see "Introducing VuGen" on page48.
Any machine
Protocol SDK
The HP LoadRunner Protocol SDK package allows you to create custom LoadRunner protocols from
within Visual Studio.
LoadRunner provides this package as an extension to Visual Studio 2012.
To install the LoadRunner Protocol Library package:
1. Make sure you have Visual Studio 2012 and the WiX Toolset 3.8 or higher installed on your machine.
2. Locate the installation file, SetupLoadRunnerProtocolSDK.exe, on the LoadRunner DVD in the
Additional Components\LoadRunnerProtocolSDK folder. You can install this extension on a
machine that does not have an installation of LoadRunner.
3. Follow the installation wizard to completion.
4. Create a new test using the LoadRunner Protocol SDK template. For details, see the Protocol SDK
documentation, accessible from the Start menu or from the following (default) location:
C:\Program Files (x86)\HP\LoadRunner\LoadRunner Protocol SDK\documents\webframe.html.
Note: Some of the .NET libraries defined in component feature "feature_protocol_sdk" must be
manually registered into GAC.
User Guide
HP LoadRunner (12.50) Page 1045

To uninstall the LoadRunner Protocol SDK package, do one of the following:
lIn Visual Studio, select Tools > Extensions and Updates. Click Uninstall for the LoadRunner Protocol
SDK entry.
lOpen the Control Panel to Programs > Programs and Features > Uninstall a Program, and select the
HP LoadRunner Protocol SDK entry.
Note: Some of the .NET libraries defined in component feature "feature_protocol_sdk" must be
manually unregistered out of GAC.
For more details about the HP LoadRunner SDK, see the LoadRunner knowledge base.
Installing the Virtual Table Server (VTS)
This section describes how to install VTS on your machine. For details about when to use VTS, see
"Parameterizing Overview" on page341.
To install VTS:
1. Run the setupVTS.exe file located in the Additional Components\Virtual Table Server folder in the
LoadRunner installation media. The VTS Setup Wizard opens, displaying the welcome page.
2. Follow the online instructions to complete the VTS installation.
3. During the VTS installation process, the Configure VTS administration server screen appears. This
screen lets you configure the VTS Administration server.
4. In the Admin UI server port box, keep the default value, 4000.
5. Click Next to continue with the installation. The Configure VTS screen appears.
6. Specify where to save the VTS data file.
7. Make sure that the Start Virtual Table Server Automatically check box is selected.
8. Click Next, and then follow the wizard’s instruction to complete the VTS installation procedure.
Note: At the end of the installation process, a shortcut for VTS is created and added to the Start
menu, HP Software > Tools > Virtual Table Server. This shortcut gives you access to the VTS UI
on the local machine. If you change the port that is used to access the VTS UI, you must
manually update the URL property of the shortcut. For details on how to change the VTS UI
access port, see Configuring VTS in the VTS online documentation.
If you are unable to access the VTS UI, make sure that the VTS Service service is started. To
start the VTS Service service, go to Control Panel > Systems & Security > Administration
Tools > Services. Right-click VTS Service and select Start.
User Guide
HP LoadRunner (12.50) Page 1046

If you are unable to access the VTS UI, make sure that the VTS Service service is started. To start the
VTS Service service, go to Control Panel > Systems & Security > Administration Tools > Services.
Right-click VTS Service and select Start.
Installing the Microsoft Terminal Server Agent
The installation file for the Agent for Microsoft Terminal Server is located on the product installation
disk, under the Additional Components\Agent for Microsoft Terminal Server folder.
Note: The agent should be installed on your RDP server machine—not Load Generator
machines.
If you are upgrading the agent, make sure to uninstall the previous version before installing the next
one (see uninstallation instructions below).
To install the Agent for Microsoft Terminal Server:
1. If your server requires administrator permissions to install software, log in as an administrator to
the server.
2. Locate the installation file, Setup.exe, on the LoadRunner DVD in the Additional
Components\Agent for Microsoft Terminal Server folder.
3. Follow the installation wizard to completion.
Note: To use the agent, you must set the recording options before recording a Vuser script. In
the Start Recording dialog box, click Options. In the Advanced Code Generation node, check Use
RDP Agent.
To uninstall the Agent for Microsoft Terminal Server:
1. If your server requires administrator privileges to remove software, log in as an administrator to
the server.
2. Open Add/Remove Programs in the server machine’s Control Panel. Select HP Software Agent for
Microsoft Terminal Server and click Change/Remove.
Troubleshooting and Limitations for Additional
Components
This sections contains troubleshooting and limitations for Additional Components.
Secure Channels
User Guide
HP LoadRunner (12.50) Page 1047
lYou cannot use the Host Security Manager utility to update security settings on Linux load
generators that use rsh (remote shell) to connect to the Controller.
lYou cannot use the Host Security Manager utility to change the security mode of the load generator
located over a firewall from off to on.
lWhen the load generator is located over a firewall, if the load generator and Controller have
different security modes, communication cannot be established.
lIf the Controller machine is using secure channel communication, the MI Listener should not be
installed on the same machine as the Controller.
Troubleshooting and Limitations for VuGen
This section describes general troubleshooting and limitations for the VuGen. For additional protocol-
specific limitations, see the troubleshooting sections for each of the protocols.
Internet Explorer and Windows Server Machines
When using Internet Explorer on Windows server machines, the browser’s enhanced security (ESC)
blocks certain actions. This may prevent the automatic download of files that are necessary for your
workflow.
Error Messages
For Media Player - MMSscripts, if you specify a non-default bandwidth in the runtime settings, the Vuser
may cause an error during replay.
Slow replay of JavaScript language scripts
If your JavaScript language script runs slow in VuGen, disable the debugging option: In the Internet
Protocol runtime settings, open the Preferences view and locate the JavaScript section. Clear the
Enable JavaScript debugging mode option. For details, see " Preferences View - Internet Protocol" on
page288.
Installing and Upgrading JVMs
If you install or upgrade a JVM while VuGen is open, you will need to restart VuGen before continuing to
record or develop a script.
Workaround: Add an entry "about:internet" to the Trusted Sites in Internet Explorer.
User Guide
HP LoadRunner (12.50) Page 1048
Controller
HP Controller is a component of LoadRunner, enabling you to run and monitor LoadRunner tests.
To learn more, see "Introducing Controller" below.
Introducing Controller
Welcome to the LoadRunner Controller.
The Controller is HP's tool for creating and controlling LoadRunner scenarios. A scenario defines the
events that occur during each testing session. It controls the number of users to emulate, the actions
they perform, and the machines on which they run their emulations. You use scenarios to create load
tests to check the reliability and strength of your servers. For details about load tests, see the "Load
Testing Overview" on page1055.
The following are the primary items that you define in your scenario:
lScenario type. A goal-oriented or manual scenario.
lTests. The LoadRunner scripts or unit tests to run.
lMachines. The machines upon which to run the tests.
lVusers. The number of virtual users (Vusers) to run on each machine.
lScheduling. How to load the Vusers.
lMonitors. Which measurements to monitor during the test run.
When you open the Controller for the first time, it prompts you to select a type of scenario: goal-
oriented or manual.
lGoal-oriented scenario. Define the goals you want your test to achieve and LoadRunner
automatically builds a scenario for you based on these goals. For example you can define a goal for a
specific number of Vusers to run simultaneously. Alternatively, you can define a goal to test your
server performance such as Pages per Minute, Hits per Second, or Transactions per Second. For
details, see "Goals Types for Goal-Oriented Scenarios" on page1077.
lManual scenario. Add Vusers and select scripts/unit tests manually. You then distribute them on the
available machines. For details, see "Manual Scenarios" on page1076.
Scripts and Test Types
During a scenario run, the Controller runs Vuser scripts or system/unit tests. Vuser scripts are test
scripts created with the LoadRunner Virtual User Generator.
User Guide
Controller
HP LoadRunner (12.50) Page 1049
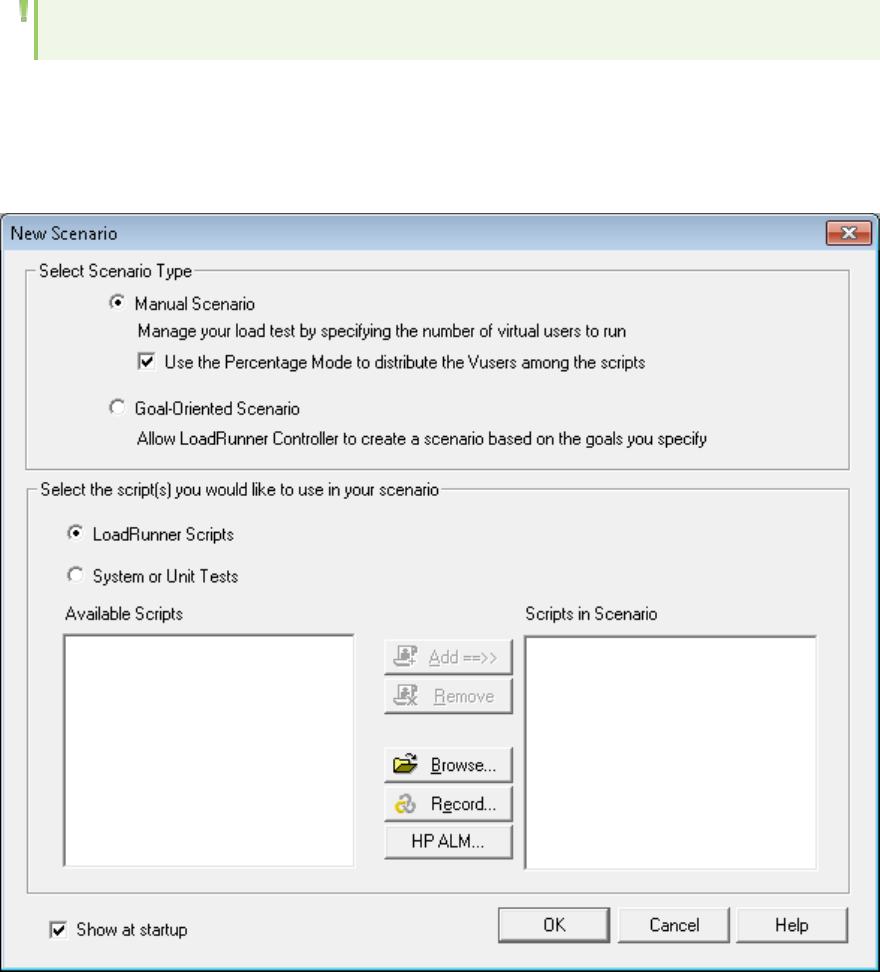
System/Unit tests refer to Selenium tests or NUnit and JUnit tests created in external development
environments, such as Microsoft Visual Studio or Eclipse. You can work in your native application and
prepare unit tests in binary form, such as .dllor .jar files, and then run them from the Controller.
Note: For more best practice information, see the HP LoadRunner Blog.
LoadRunner add-ins allow you to integrate the LoadRunner API with MS Visual Studio or Eclipse, and run
tests from your native environment. For details, see "Additional Components" on page1769.
The Controller's opening dialog box prompts you to select the scripts and/or system/unit tests to
include in the scenario. For details, see "New Scenario Dialog Box" on page1097.
All of your selections, along with the test paths, are saved in a scenario file (.lrs). You define all of the
other aspects of your scenario in the Controller's Design tab. For details, see "Design Tab" on
page1090.
User Guide
Controller
HP LoadRunner (12.50) Page 1050
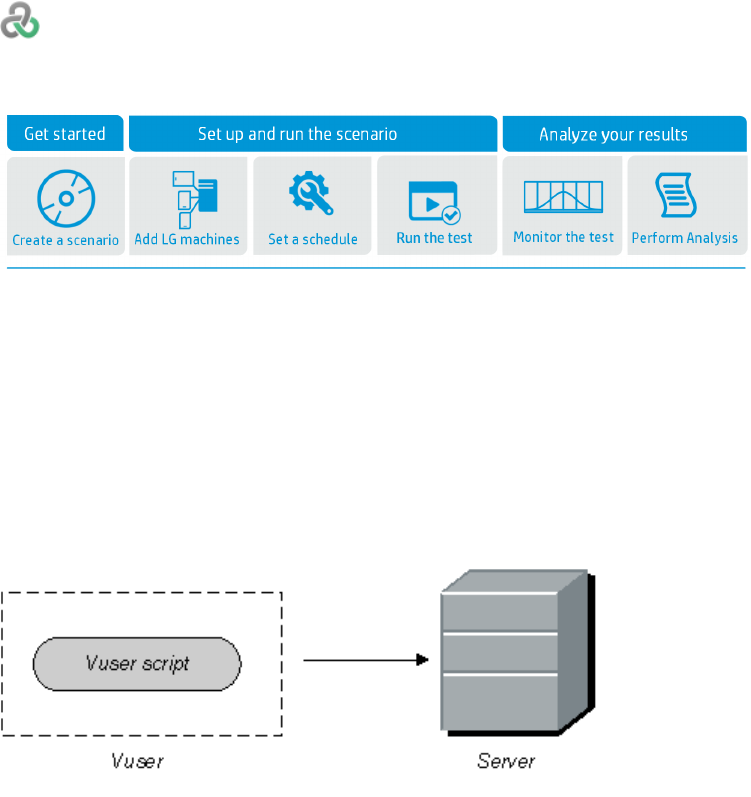
Controller Workflow
The workflow below displays the key tasks for developing and running scenarios.
Controller Technology
In the Controller, you define a number of Vusers (excluding GUI Vusers) to generate load on a server by
submitting input directly to the server. Vusers do not operate client applications—they access the
server using LoadRunner API functions. These API functions emulate the input from an actual
application.
Because Vusers are not reliant on client software, you can use Vusers to test server performance even
before the client software has been developed. Since Vusers do not have a user interface, the amount
of system resources required is minimal. This allows you to run large numbers of Vusers on a single
workstation.
The following example illustrates the use of Vusers in a scenario: Suppose that you have a Web-based
database server that maintains your customer information. The information is accessed by numerous
customer service personnel who are located throughout the country. The server receives the queries,
processes the requests, and returns responses via the Web to field personnel.
You want to test the response times of the entire system when numerous service personnel
simultaneously access the server. Using LoadRunner, you could create a scenario with several hundred
Vusers, each one accessing the server database. The Vusers enable you to emulate and measure the
performance of your database and Web servers under the load of many users.
User Guide
Controller
HP LoadRunner (12.50) Page 1051
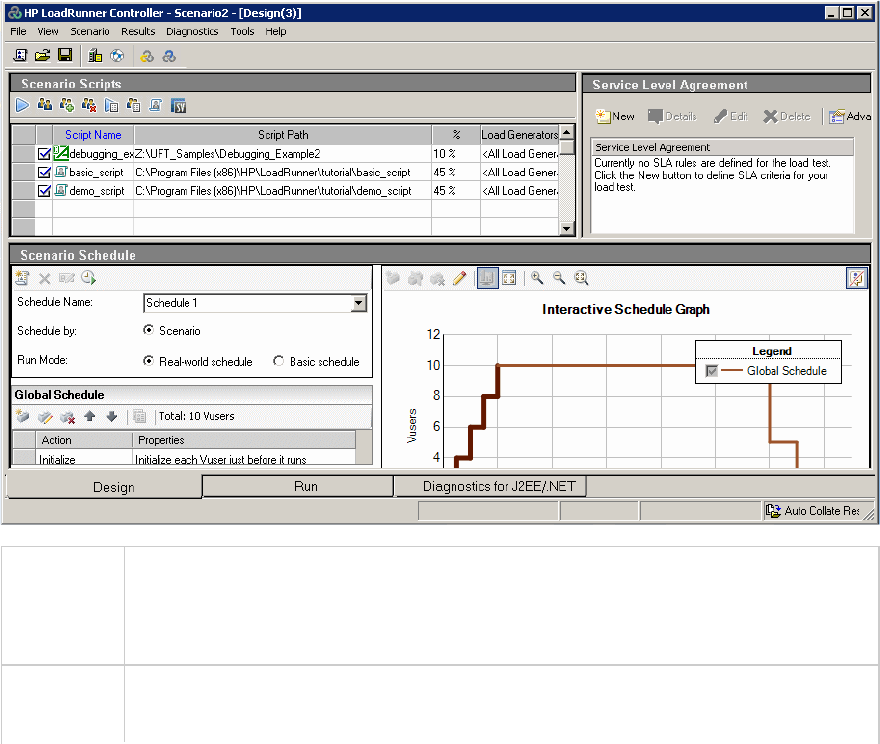
To emulate the Vusers, you create a script to define their actions. A Vuser script includes functions that
control the script execution and specify the input that the Vuser submits to the server. For more
information, see "Vusers" on page49.
For the database server example above, you could create a Vuser script that performs the following
actions:
lLogs in to the Web application
lConnects to the database server
lSubmits an SQL query
lRetrieves and processes the server response
lDisconnects from the server and the Web
Controller Window
The Controller window enables you to design and run load test scenarios, monitor their metrics, and
view Diagnostics for J2EE/.NET data.
To access Choose one of the following:
lStart>All Programs> HP Software >HP LoadRunner>Controller
lThe Controller shortcut on the desktop
Important
information
By default, upon opening the Controller, the New Scenario dialog box is displayed. To
disable this option, clear the Show at Startup option. For details, see "New Scenario
User Guide
Controller
HP LoadRunner (12.50) Page 1052
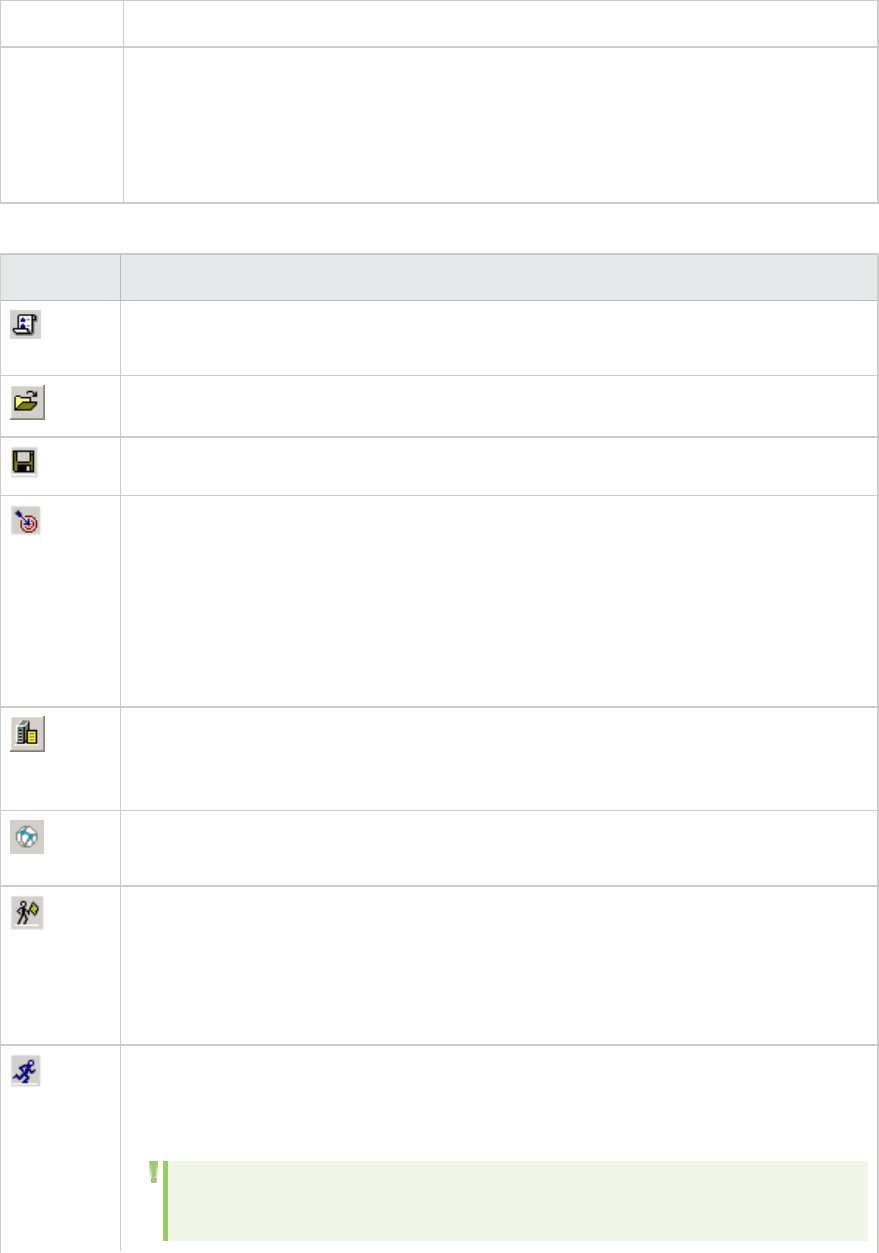
Dialog Box" on page1097.
Relevant
tasks
l"How to Design a Goal-Oriented Scenario" on page1079
l"How to Design a Manual Scenario" on page1081
l"How to Run a Scenario" on page1228
l"How to Set Up a Monitoring Environment" on page1301
User interface elements are described below:
UI Element Description
New Scenario. Opens New Scenario dialog box. For user interface details, see "New
Scenario Dialog Box" on page1097.
Open Scenario. Enables you to open an existing scenario.
Save Scenario. Enables you to save the active scenario.
(Goal-
oriented
scenario;
Run view
only)
Edit scenario goal. Opens the Edit Scenario Goal dialog box where you define goals for
a goal-oriented scenario. For user interface details, see "Edit Scenario Goal Dialog Box"
on page1093.
Load Generators. Opens the Load Generators dialog box where you can add new load
generators and view details about existing load generators. For user interface details,
see "Load Generators Dialog Box" on page1144.
Show Network Virtualization Settings. When HP Network Virtualization is installed on
the machine, opens the "Virtual Locations Settings Dialog Box" on page1371.
(Run view
only)
Initialize Vusers. Initializes all Vusers (or those that are still in the Down state) in a
selected Vuser group. The group's status changes from Down to Pending to Initializing
to Ready. If the group fails to initialize, the status changes to Error.
By initializing all of the Vusers in a group before running them, you can ensure that they
all begin executing the scenario at the same time.
(Run view
only)
Run Vusers Until Complete. Runs all Vusers in a selected Vuser group until completion.
If you run a Vuser group in the Down or Error state, LoadRunner initializes and then
runs the group.
Note: You can instruct LoadRunner to randomly run only one Vuser in a Vuser
group by right-clicking the group and selecting Run one Vuser Until Complete.
User Guide
Controller
HP LoadRunner (12.50) Page 1053
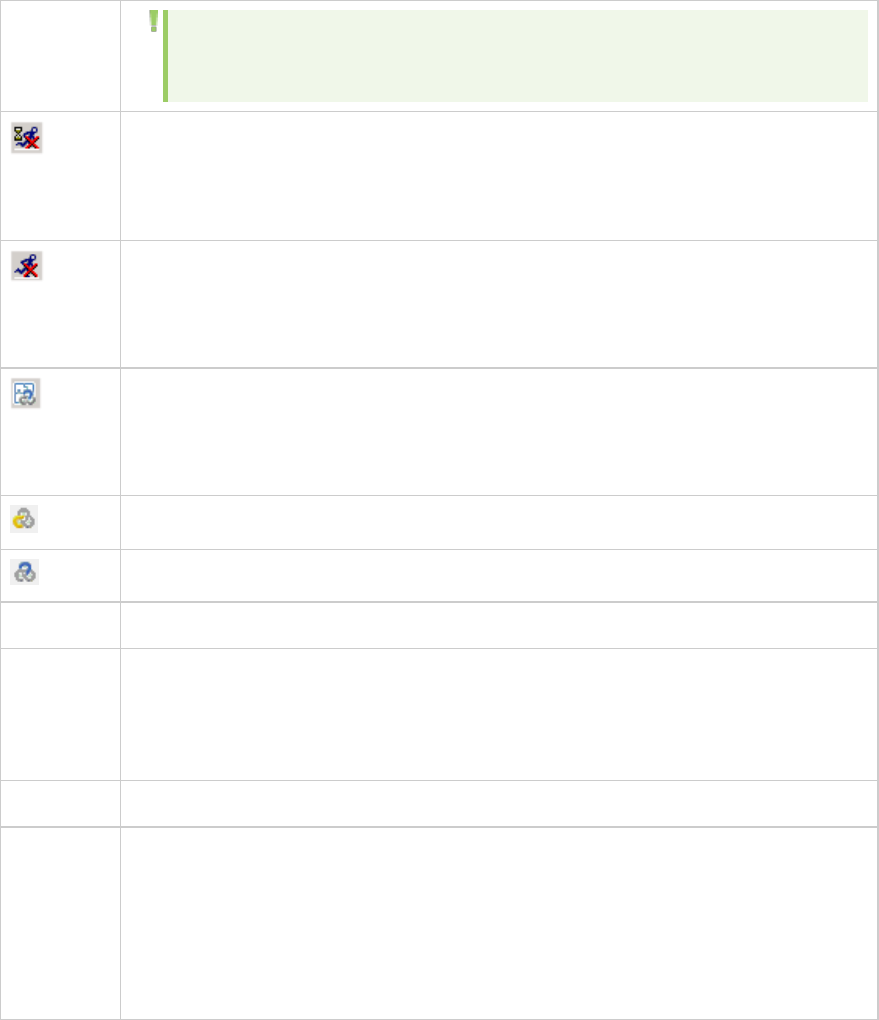
A Vuser script log opens, displaying runtime information about the Vuser. For
more information, see "Vuser Script Log" on page1252.
(Run view
only)
Gradual Stop. Gradually stops a Vuser group in the Run state if you selected the Wait
for the current iteration to end before exiting or Wait for the current action to end
before exiting options in the runtime settings tab of the Options dialog box.
(Run view
only)
Stop Vusers. Immediately stops all Vusers in selected Vuser groups from executing
their scripts.
(Run view
only)
Analyze Results. Opens diagnostics results.
Invoke VuGen. Invokes HP Virtual User Generator.
Invoke Analysis. Invokes HP LoadRunner Analysis.
Design tab Enables you to design scenarios. For details, see "Design Tab" on page1090.
Diagnostics
for
J2EE/.NET
tab
Enables you to view J2EE/.NET diagnostics data collected from a scenario run. This
requires the LoadRunner J2EE/.NET Diagnostics add-in, available on the HP Diagnostics
installation media.
For details, see "Working with Diagnostics" on page1383.
Run tab Enables you to run and monitor scenario runs. For details, see "Run Tab" on page1246.
<Status
bar>
Displays the following features of Controller (if enabled):
lApplication Lifecycle Management Connection
lIP Spoofer
lAuto Collate Results
lAuto Load Analysis
HP LoadRunner Agents
To maximize your testing coverage, you distribute Vusers over several load generator machines. Aload
generator machine is a machine upon which the Remote Agent Dispatcher (Process) and a LoadRunner
Agent are installed.
User Guide
Controller
HP LoadRunner (12.50) Page 1054
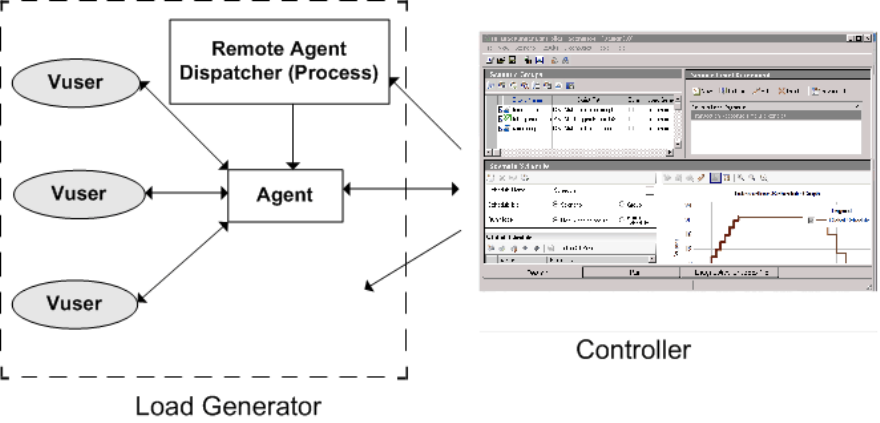
When you run the LoadRunner installation, you specify to install only these components. These
components allow the Controller to communicate with the load generator machine.
lRemote Agent Dispatcher. The Remote Agent Dispatcher (Process) enables the Controller to start
applications on the load generator.
lAgent. The LoadRunner Agent enables the Controller and the load generator to communicate with
each other. When you run a scenario, the Controller instructs the Remote Agent Dispatcher (Process)
to launch the LoadRunner agent. The agent receives instructions from the Controller to initialize, run,
pause, and stop Vusers. At the same time, the agent also relays data on the status of the Vusers
back to the Controller.
Load Testing Overview
Modern system architectures are complex. While they provide an unprecedented degree of power and
flexibility, these systems are difficult to test. Whereas single-user testing focuses primarily on
functionality and the user interface of a system component, application testing focuses on
performance and reliability of an entire system.
For example, a typical application testing scenario might depict 1000 users that log in simultaneously to
a system on Monday morning. What is the response time of the system? Does the system crash? To be
able to answer these questions and more, a complete application performance testing solution must do
the following:
lTest a system that combines a variety of software applications and hardware platforms
lDetermine the suitability of a server for any given application
lTest the server before the necessary client software has been developed
lEmulate an environment where multiple clients interact with a single server application
lTest an application under the load of tens, hundreds, or even thousands of potential users
User Guide
Controller
HP LoadRunner (12.50) Page 1055
The LoadRunner suite allows you to create load tests,which emulate the real life behavior of your
application. For details, see "The HP LoadRunner Solution" below.
The HP LoadRunner Solution
Traditional or manual testing methods offer only a partial solution to load testing. For example, you can
test an entire system manually by constructing an environment where many users work simultaneously
on the system. Each user works at a single machine and submits input to the system. However, this
manual testing method has the following drawbacks:
lIt is expensive, requiring large amounts of both personnel and machinery.
lIt is complicated, especially coordinating and synchronizing multiple testers.
lIt involves a high degree of organization, especially to record and analyze results meaningfully.
lThe repeatability of the manual tests is limited.
LoadRunner addresses the drawbacks of manual performance testing:
lLoadRunner reduces personnel requirements by replacing human users with virtual users or Vusers.
These Vusers emulate the behavior of real users operating real applications.
lBecause numerous Vusers can run on a single computer, LoadRunner reduces the amount of
hardware required for testing.
lThe HP LoadRunner Controller allows you to control all the Vusers from a single point of control.
lLoadRunner monitors the application performance online, enabling you to fine-tune your system
during test execution.
lLoadRunner automatically records the performance of the application during a test. You can choose
from a wide variety of graphs and reports to view the performance data.
lLoadRunner checks where performance delays occur: network or client delays, CPU performance, I/O
delays, database locking, or other issues at the database server. LoadRunner monitors the network
and server resources to help you improve performance.
lBecause LoadRunner tests are fully automated, you can repeat them as often as you need.
HP LoadRunner Terminology
lScenario. A scenario is a sequence of events that emulate the hypothetical actions of real users on
your application.
lVusers. In the scenario, LoadRunner replaces real users with virtual users or Vusers. While a
workstation accommodates only a single human user, many Vusers can run concurrently on a single
workstation. In fact, a scenario can contain tens, hundreds, or even thousands of Vusers.
lVuser Scripts. The actions that a Vuser performs during the scenario are described in a Vuser script.
When you run a scenario, each Vuser executes a Vuser script. The Vuser scripts include functions
that measure and record the performance of your application's components.
User Guide
Controller
HP LoadRunner (12.50) Page 1056
lTransactions. To measure the performance of the server, you define transactions. A transaction
represents an action or a set of actions that you are interested in measuring. You define
transactions within your Vuser script by enclosing the appropriate sections of the script with start
and end transaction statements. For example, you can define a transaction that measures the time
it takes for the server to process a request to view the balance of an account and for the
information to be displayed at the ATM.
lRendezvous points. You insert rendezvous points into Vuser scripts to emulate heavy user load on
the server. Rendezvous points instruct Vusers to wait during test execution for multiple Vusers to
arrive at a certain point, so that they may simultaneously perform a task. For example, to emulate
peak load on the bank server, you can insert a rendezvous point instructing 100 Vusers to deposit
cash into their accounts at the same time.
lController. You use the HP LoadRunner Controller to manage and maintain your scenarios. Using the
Controller, you control all the Vusers in a scenario from a single workstation.
lLoad Generator. When you execute a scenario, the Controller distributes each Vuser in the scenario
to a load generator. The load generator is the machine that executes the Vuser script, enabling the
Vuser to emulate the actions of a human user.
lPerformance analysis. Vuser scripts include functions that measure and record system
performance during load-testing sessions. During a scenario run, you can monitor the network and
server resources. Following a scenario run, you can view performance analysis data in reports and
graphs.
The HP LoadRunner Testing Process
The following section provides a general overview of the HP LoadRunner testing process.
1. Planning the Test
Successful load testing requires that you develop a thorough test plan. A clearly defined test plan
will ensure that the LoadRunner scenarios that you develop will accomplish your load testing
objectives. For more information, see "Planning Load Test Scenarios" on page1066.
2. Creating the Vuser Scripts
Vusers emulate human users interacting with your Web-based application. A Vuser script contains
the actions that each Vuser performs during scenario execution.
In each Vuser script, you determine the tasks that will be:
lPerformed by each Vuser
lPerformed simultaneously by multiple Vusers
lMeasured as transactions
For more information on creating Vuser scripts, see "Enhancing a Script for Load Testing Overview"
on page320.
User Guide
Controller
HP LoadRunner (12.50) Page 1057
3. Designing the Scenario
A scenario describes the events that occur during a testing session. A scenario includes a list of
machines on which Vusers run, a list of scripts that the Vusers run, and a specified number of
Vusers or Vuser groups that run during the scenario. When designing the scenario, you set the
scenario configuration and scheduling which determines how all the load generators and Vusers
behave while the scenario runs.
You design scenarios using the Controller. For information about LoadRunner scenarios, see
"Designing Scenarios" on page1076.
4. Running the Scenario
You emulate user load on the server by instructing multiple Vusers to perform tasks
simultaneously. While the scenario runs, LoadRunner measures and records the transactions that
you defined in each Vuser script. You can set the level of load by increasing and decreasing the
number of Vusers that perform tasks at the same time and you can also monitor your system's
performance online. For more information, see "Running Scenarios" on page1226.
5. Monitoring the Scenario
You configure the LoadRunner monitoring components to identify bottlenecks on the system and
determine which element is causing performance degradation, for example, file locking, resource
contention, and network overload. Use LoadRunner in conjunction with the new network and
machine monitoring tools to create load and measure performance at different points in the
system. For more information on monitoring, see Working with LoadRunner Online Monitors.
6. Analyzing Test Results
During scenario execution, LoadRunner records the performance of the application under different
loads. You use LoadRunner's graphs and reports to analyze the application's performance. For
more information about LoadRunner's reports and graphs, see "Introducing Analysis" on
page1397.
License Utility
LoadRunner License Utility
To run Vusers from the LoadRunner Controller, you need the appropriate LoadRunner licenses. These
licenses must be installed on the computer on which the LoadRunner Controller is installed. You use the
LoadRunner License Utility to manage your LoadRunner licenses.
The LoadRunner License Utility enables you to:
lView the details of licenses that are currently installed.
lInstall additional licenses.
User Guide
Controller
HP LoadRunner (12.50) Page 1058
To access On the LoadRunner machine, select Start > All Programs > HP Software > HP
LoadRunner > License > LoadRunner License Utility.
Important
information
Using the LoadRunner License Utility, you can install a new license by using either a
license file or a license key.
lLicense file. When you purchase a new license, HP may send you an email with an
attached license file. The license file contains the license keys for one or more
licenses. When you use the license file to install the new licenses, the LoadRunner
License Utility reads the license file and extracts all the license keys that are
included in the license file. You can then select which of the available licenses to
install. You may choose to use a license file to install LoadRunner licenses because
the license file enables you to install multiple licenses simultaneously.
lLicense key. Unlike a license file, a license key enables you to install just a single
license at a time. You may receive the license key directly from HP, or the license
key may be included in a license file that you receive from HP.
Relevant
tasks
"How to Install a New License" on page1064
See also l"License Utility" on the previous page
l"Additional Information About LoadRunner Licenses" on page1064
The table below describes the LoadRunner License Utility UI elements:
UI Element Description
Host ID Identifies the computer on which the Controller is installed. You may need to
provide the Host ID when purchasing new LoadRunner licenses. To obtain new
LoadRunner licenses, click the Contact HP to purchase a new license link at
the bottom of the LoadRunner License Utility.
License Summary Displays a list of the LoadRunner licenses that are installed on the Controller
computer. Click on any license in the table to display additional details about
the license. The Vuser protocols included in the selected license box displays
a list of the Vuser protocols that are included in the selected license.
Status Indicates the status of the license.
lValid . Indicates that the license in current and functional.
lInvalid . Indicates that the license is no longer valid. For one of the
following reasons:
lATime limited license expiration date has passed.
lThe remaining capacity of a VUD license is zero.
User Guide
Controller
HP LoadRunner (12.50) Page 1059
UI Element Description
Note: A license may become temporarily invalid if the License Utility
detects that the system clock has been tampered with. To restore
the affected licenses, reset the system clock to the current date
and time.
lTo be Expired . Indicates that the license will expire within 30 days.
By default, the License Summary table does not show invalid licenses. Select
the Show invalid licenses check box to show invalid licenses.
Locked Locked. Indicates that the license can be installed only on the computer on
which it is currently installed – not on any other computer.
Unlocked. Indicates that the license can be installed on any computer.
License Bundle Indicates the name of the Vuser protocol bundle to which the license applies.
The license enables the Controller to run Vusers of any protocol that is included
in the protocol bundle. To display a list of the Vuser protocols that are included
in a bundle, click the license in the License Summary table. A list of the
associated Vuser protocols is displayed at the bottom of the LoadRunner
License Utility.
Beginning with LoadRunner version 12.00, The InstantOn license was replaced
by the Community Bundle.
In addition to any other bundle you may purchase, LoadRunner is delivered with
the Community Bundle which includes:
lA permanent license with 50 Vusers.
lAccess to all the protocols with the exception of GUI (UFT) and COM/DCOM.
Note: APartner License icon that appears to the left of a license
bundle indicates that the license is for a LoadRunner partner, and not
for standard LoadRunner Vuser protocols. Partner licenses enable
third-party applications to be controller by the LoadRunner Controller.
Partner licenses operate the same as standard LoadRunner licenses.
Type Indicates the type of license:
lTime limited licenses are valid for a limited period only. Time limited
licenses are typically issued for 60 or 365 days.
lPermanent licenses do not expire - there is no time limit to the validity of
these licenses.
User Guide
Controller
HP LoadRunner (12.50) Page 1060

UI Element Description
lVUD licenses are issued with a limited capacity. The capacity is defined by
the measurement Vuser-days or VUDs. For example, the capacity of a VUD
license may be 1000 VUDs. Each day that the Controller is used to run
Vusers, the maximum number of Vusers that ran simultaneously on that day
is deducted from the remaining license capacity. If a maximum of 200
Vusers ran on day 1, then 800 VUDs will remain in the license.
Note:
lA VUD license may have an expiration date and therefore be
time-limited.
lYou cannot change the start time until the end of a VUD cycle.
For more information, see "Additional Information About LoadRunner
Licenses" on page1064.
Expiration Date Indicates the date and time when Time limited,Instant on,VUD, and
Evaluation licenses expire.
Capacity lFor Evaluation,Time Limited, and Permanent licenses, Capacity indicates
the maximum number of Vusers [of the type specified by the license bundle]
that can be run simultaneously from the LoadRunner Controller.
lFor VUD licenses, Capacity indicates the number of VUDs that remain in the
license.
Show invalid
licenses
Select this check box to show invalid licenses in the list of LoadRunner licenses
that are installed.
Vuser protocols
included in the
selected license
Displays the Vuser protocols that are included in the selected license.
Install New
Licenses
Opens the New License dialog box which enables you to install new LoadRunner
licenses. For details, see "How to Install a New License" on page1064.
LoadRunner License Utility - New License
The LoadRunner License Utility - New License dialog box enables you to install a new license by using
either a license file or a license key.
lLicense file. When you purchase a new license, HP may send you an email with an attached license
file. The license file contains the license keys for one or more licenses. When you use the license file
to install the new licenses, the LoadRunner License Utility reads the license file and extracts all the
license keys that are included in the license file. You can then select which of the available licenses to
User Guide
Controller
HP LoadRunner (12.50) Page 1061
install. You may choose to use a license file to install LoadRunner licenses because the license file
enables you to install multiple licenses simultaneously.
lLicense key. Unlike a license file, a license key enables you to install just a single license at a time.
You may receive the license key directly from HP, or the license key may be included in a license file
that you receive from HP.
To access 1. Select Start > All Programs > HP Software > HP LoadRunner > License >
LoadRunner License Utility . In icon-based operating systems, such as Windows 8,
search for License Utility and run the LoadRunner License Utility program.
2. Click Install New Licenses.
Important
information
lBefore you install a new LoadRunner license, ensure that you have a valid license file
or license key that has not expired.
lIf the computer system time is earlier than the starting time of the license, the
license will not be valid. To overcome this, generate the license with appropriate
starting time or wait until the starting time of the license.
lHost locked type licenses can only be installed on the machine for which it was
generated (with a unique HostID).
Relevant
tasks
"How to Install a New License" on page1064
See also l"License Utility" on page1058
l"Additional Information About LoadRunner Licenses" on page1064
The table below describes the LoadRunner License Utility - New License dialog box UI elements:
UI Element Description
Install licenses
using a license file
Select this option if you want to use a license file to install the new licenses.
License File Click Browse and then select the license file that was sent to you by HP.
View License File
Content
Displays the content of the license file in the table below.
Select the licenses
to install
Select the check boxes for the licenses to install.
Install Indicates the name of the Vuser protocol bundle to which the license applies.
The license enables the Controller to run Vusers of any protocol that is included
in the protocol bundle.
License Bundle Indicates the name of the Vuser protocol bundle to which the license applies.
The license enables the Controller to run Vusers of any protocol that is included
in the protocol bundle.
User Guide
Controller
HP LoadRunner (12.50) Page 1062
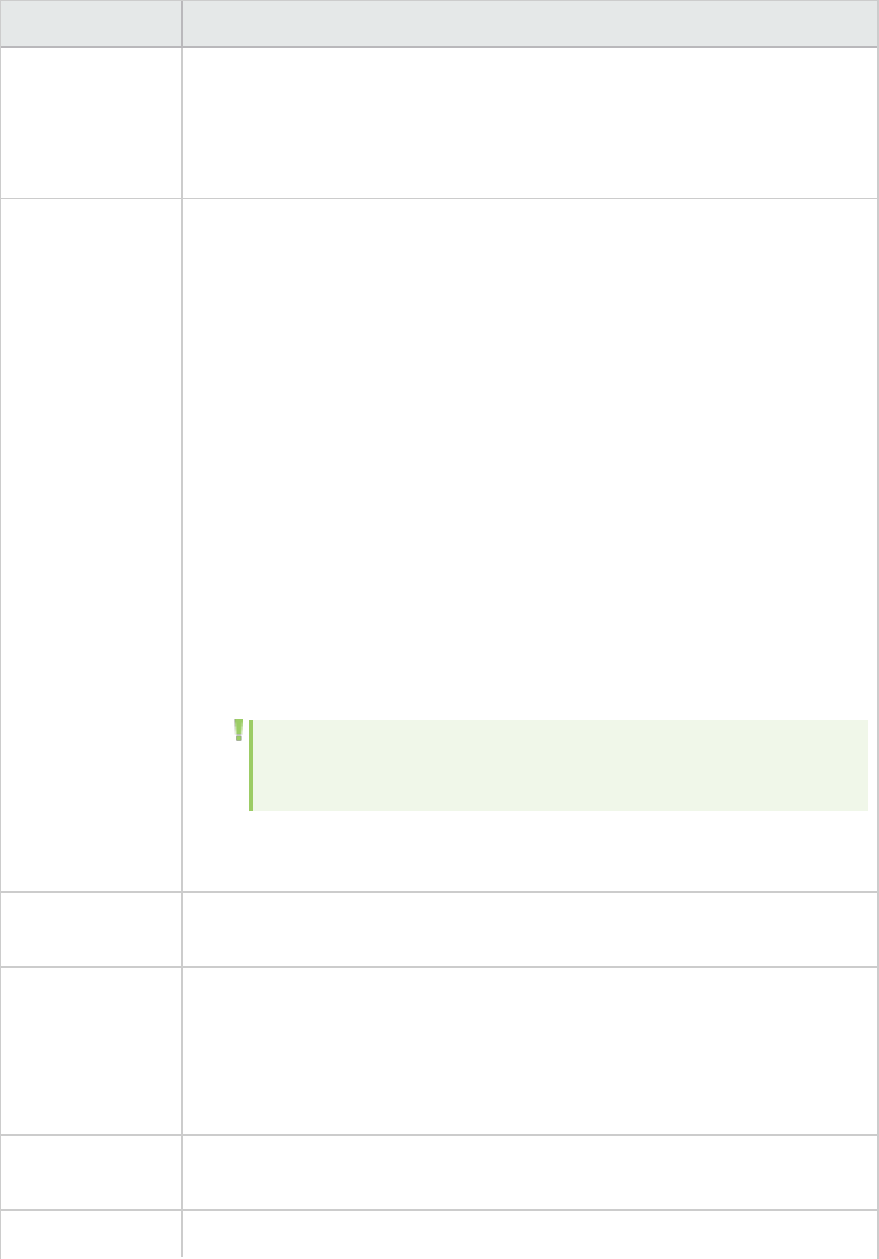
UI Element Description
In addition to any other bundle you may purchase, LoadRunner is delivered with
the Community Bundle which includes:
lA permanent license with 50 Vusers.
lAccess to all the protocols with the exception of GUI (UFT) and COM/DCOM.
Type Indicates the type of license:
lEvaluation licenses are supplied to enable potential customers to evaluate
LoadRunner functionality.
lTime limited licenses are valid for a limited period only. Time limited
licenses are typically issued for 60 or 365 days.
lPermanent licenses do not expire - there is no time limit to the validity of
these licenses.
lVUD licenses are issued with a limited capacity. The capacity is defined by the
measurement Vuser-days or VUDs. For example, the capacity of a VUD license
may be 1000 VUDs. Each day that the Controller is used to run Vusers, the
maximum number of Vusers that ran simultaneously on that day is deducted
from the remaining license capacity. For example, if a maximum of 200
Vusers ran on day 1, then 800 VUDs will remain in the license. For the
calculation of used VUDs, you can specify at what time each new day begins.
To change the time at which a new day begins, click the VUDs will begin at
link at the bottom of the LoadRunner License Utility.
Note: A VUD license may have an expiration date and therefore be
time-limited.
For more information, see "Additional Information About LoadRunner
Licenses" on the next page.
Expiration Date Indicates the date and time when Time limited,, VUD, and Evaluation licenses
expire.
Capacity lFor Evaluation,Time Limited, and Permanent licenses, Capacity indicates
the maximum number of Vusers [of the type specified by the license bundle]
that can be run simultaneously from the LoadRunner Controller.
lFor VUD licenses, Capacity indicates the number of VUDs that remain in the
license.
Install a license
using a license key
Select this option if you want to use a license key to install the new license, and
then enter the license key that was sent to you by HP.
Install Installs the licenses contained in the license file or license key.
User Guide
Controller
HP LoadRunner (12.50) Page 1063

UI Element Description
Close Closes the LoadRunner License Utility - New License dialog box.
How to Install a New License
For information about LoadRunner licenses, see "LoadRunner License Utility" on page1058.
To install a new LoadRunner license:
1. On the LoadRunner machine, select Start > All Programs > HP Software > HP LoadRunner >
License > LoadRunner License Utility.
2. In the LoadRunner License Utility, click Install New Licenses. The LoadRunner License Utility - New
License dialog box opens.
To install using a license file
a. Click the Browse button to the right of License File, and locate the license file that was sent to
you by HP.
b. Click View License File Content to display details of the licenses that are included in the
license file.
c. In the list of licenses included in the license file, select the licenses to install.
To install using a license key
a. Click Install a license using a license key.
b. Enter the license key that you received from HP.
3. Click Install. The selected licenses are installed.
4. Click Close. In the License Summary table, make sure that the new licenses appear in the list of
installed licenses.
Additional Information About LoadRunner Licenses
To run Vusers from the LoadRunner Controller, you need the appropriate LoadRunner licenses. There
are various types of LoadRunner licenses.
LoadRunner is delivered with the Community bundle replacing the Instant-on license. The Community
bundle provides 50 Vusers with the following features:
lAll protocols are included except for GUI (UFT), COM/DCOM and protocols in the template bundle. This
also includes NUnit and JUnit tests. For details about the license bundles, see
https://hpln.hp.com/node/9814/otherfiles.
lYou can use a maximum of 25 Noise Vusers with the Community bundle. For details about Noise
Vusers, see "Noise Generators" on page1079.
lYou can use a maximum of 50 Noise and Web-HTTP/HTML Vusers combined.
lYou can run two Vusers with Network Virtualization.
User Guide
Controller
HP LoadRunner (12.50) Page 1064
VUD licenses are issued with a limited capacity. The capacity is defined by the measurement Vuser-days
or VUDs. For details on how to install VUD licenses, see "LoadRunner License Utility" on page1058.
Additional information about VUD licenses:
lFor the calculation of VUDs consumed in a VUD license, you can specify at what time each new day
begins. LoadRunner determines the maximum number of Vusers that ran during the 24 hour period
after the start time. To change the time at which a new day begins, click the VUDs will start at time
link at the bottom of the LoadRunner License Utility.
lIf you have both a regular license [Instant On, Evaluation, Time limited, or Permanent] and a VUD
license for a particular Vuser protocol, LoadRunner will always use the regular license before
deducting from the VUD license. Thus, if 500 Vusers were run on a particular day, and there is a
regular license for 400 Vusers, then 100 VUDs will be deducted from the VUD license.
lA Vuser is included in the VUD count as soon as the Vuser reaches the Initialization status in a
scenario.
lConsumed VUDs are deducted from the available VUD capacity at the start of the following day.
lIf a scenario runs for more than one day, the maximum VUD usage is calculated and deducted based
on the day that the scenario run started.
lA multi-protocol Vuser will run only if licenses are available for all protocols in the Vuser script.
Therefore, if a Vuser script includes protocols from two different protocol bundles, you will need
licenses for both bundles to run the Vuser script.
lA VUD license may have an expiration date and therefore be time-limited.
Designing Load Test Scenarios
This section describes how to plan and create LoadRunner Controller scenarios.
What do you want to do?
Plan a load test scenario
Design a scenario
Set up a load generator
Provision a load generator on the cloud
Set up a network profile
Schedule a manual scenario
Prepare an SLA (Service Level Agreement)
See also
Managing Cloud accounts
SSL utility
User Guide
Controller
HP LoadRunner (12.50) Page 1065

Multiple IPAddresses
Terminal Services
Troubleshooting for Load Generators
Planning Load Test Scenarios
Load Test Planning Overview
As in any type of system testing, a well-defined test plan is the first essential step to successful testing.
Planning your load testing helps you to:
lBuild test scenarios that accurately emulate your working environment.
Load testing means testing your application under typical working conditions, and checking for
system performance, reliability, capacity, and so forth.
Before running your load test, it is important to:
lUnderstand which resources are required for testing.
Application testing requires hardware, software, and human resources. Before you begin testing, you
should know which resources are available and decide how to use them effectively.
lDefine success criteria in measurable terms.
Focused testing goals and test criteria ensure successful testing. For example, it is not enough to
define vague objectives like "Check server response time under heavy load." A more focused success
criterion would be "Check that 50 customers can check their account balance simultaneously, and
that the server response time will not exceed one minute."
Load Testing Objectives
Your test plan should be based on a clearly defined testing objective.
The following table presents common application testing objectives that LoadRunner helps you test.
Each objective is described in detail after the table.
Objective Answers the Question
Measuring end-user response
time
How long does it take to complete a business process?
Defining optimal hardware
configuration
Which hardware configuration provides the best performance?
Checking reliability How hard or long can the system work without errors or failures?
Checking hardware or software How does the upgrade affect performance or reliability?
User Guide
Controller
HP LoadRunner (12.50) Page 1066
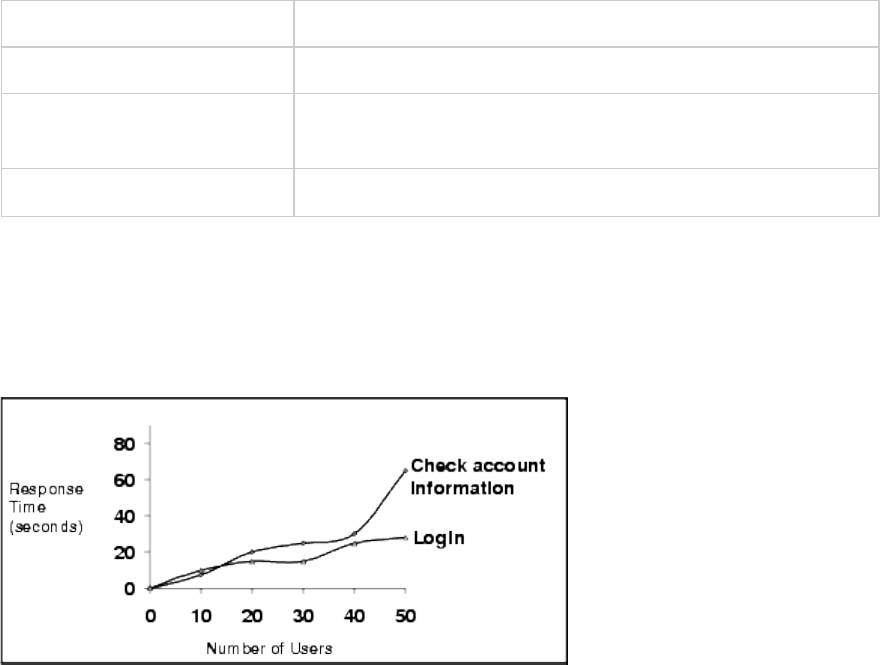
upgrades
Evaluating new products Which server hardware or software should you choose?
Measuring system capacity How much load can the system handle without significant
performance degradation?
Identifying bottlenecks Which element is slowing down response time?
Measuring End-User Response Time
Check how long it takes for the user to perform a business process and receive a response from the
server. For example, suppose that you want to verify that while your system operates under normal load
conditions, the end users receive responses to all requests within 20 seconds. The following graph
presents a sample load vs. response time measurement for a banking application:
Defining Optimal Hardware Configuration
Check how various system configurations (memory, CPU speed, cache, adaptors, modems) affect
performance. Once you understand the system architecture and have tested the application response
time, you can measure the application response for different system configurations to determine which
settings provide the desired performance levels.
For example, you could set up three different server configurations and run the same tests on each
configuration to measure performance variations.
Checking Reliability
Determine the level of system stability under heavy or continuous work loads. You can use LoadRunner
to create stress on the system: force the system to handle extended activity in a compressed time
period to simulate the kind of activity a system would normally experience over a period of weeks or
months.
Checking Hardware or Software Upgrades
Perform regression testing to compare a new release of hardware or software to an older release. You
can check how an upgrade affects response time (benchmark) and reliability. Application regression
testing does not check new features of an upgrade; rather it checks that the new release is as efficient
User Guide
Controller
HP LoadRunner (12.50) Page 1067
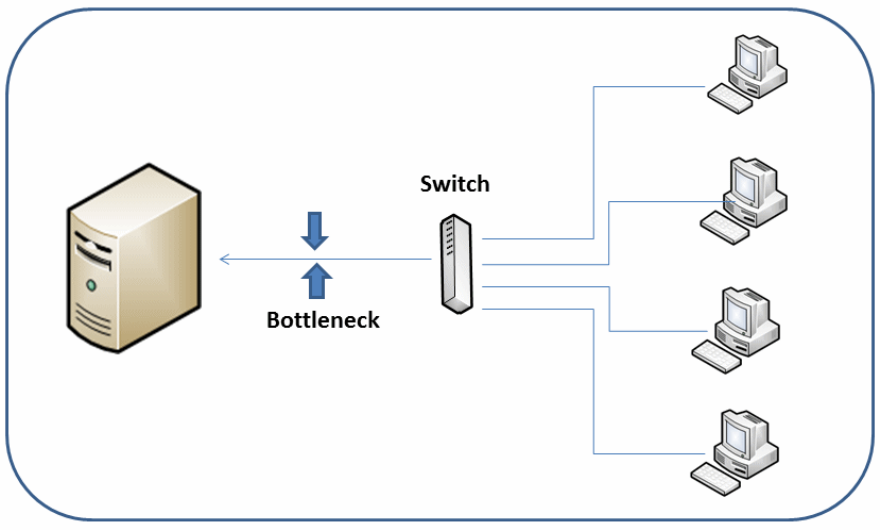
and reliable as the older release.
Evaluating New Products
You can run tests to evaluate individual products and subsystems during the planning and design stage
of a product's life cycle. For example, you can choose the hardware for the server machine or the
database package based on evaluation tests.
Identifying Bottlenecks
You configure the LoadRunner monitoring components to identify bottlenecks on the system and
determine which element is causing performance degradation, for example, file locking, resource
contention, and network overload. Use LoadRunner in conjunction with the new network and machine
monitoring tools to create load and measure performance at different points in the system. For more
information on monitoring, see Monitoring Process Overview.
Measuring System Capacity
Measure system capacity, and determine how much excess capacity the system can handle without
performance degradation. To check capacity, you can compare performance versus load on the existing
system, and determine where significant response-time degradation begins to occur. This is often
called the "knee" of the response time curve.
User Guide
Controller
HP LoadRunner (12.50) Page 1068
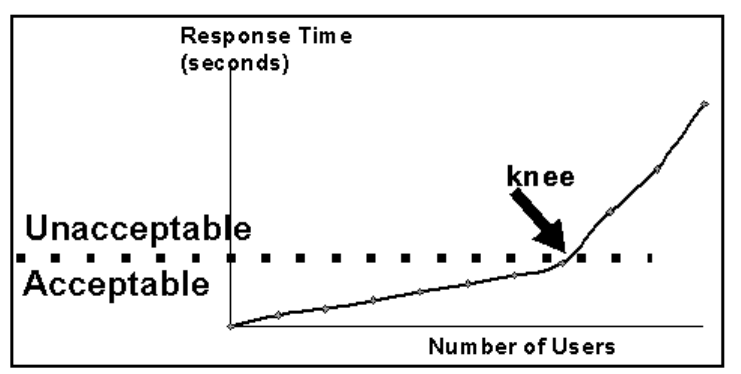
Once you determine the current capacity, you can decide if resources need to be increased to support
additional users.
How to Plan a Load Test
This task describes how to plan a load test.
1. Analyze the application
You should become thoroughly familiar with the hardware and software components, the system
configuration, and the typical usage model. This analysis ensures that the testing environment you
create using LoadRunner will reflect the environment and configuration of the application under
test. For task details, see "How to Analyze the Application" below.
2. Define the load testing objectives
Before you begin testing, you should define exactly what you want to accomplish. For task details,
see "How to Define the Load Test Objectives" on page1072.
3. Plan LoadRunner implementation
Decide how to use LoadRunner to achieve your testing goals. For task details, see "How to Plan the
LoadRunner Implementation" on page1073.
How to Analyze the Application
This task describes how to analyze the application under test as part of the load test planning process.
Each step in this task contains example information relating to an online banking system.
1. Identify system components
Draw a schematic diagram to illustrate the structure of the application. If possible, extract a
User Guide
Controller
HP LoadRunner (12.50) Page 1069
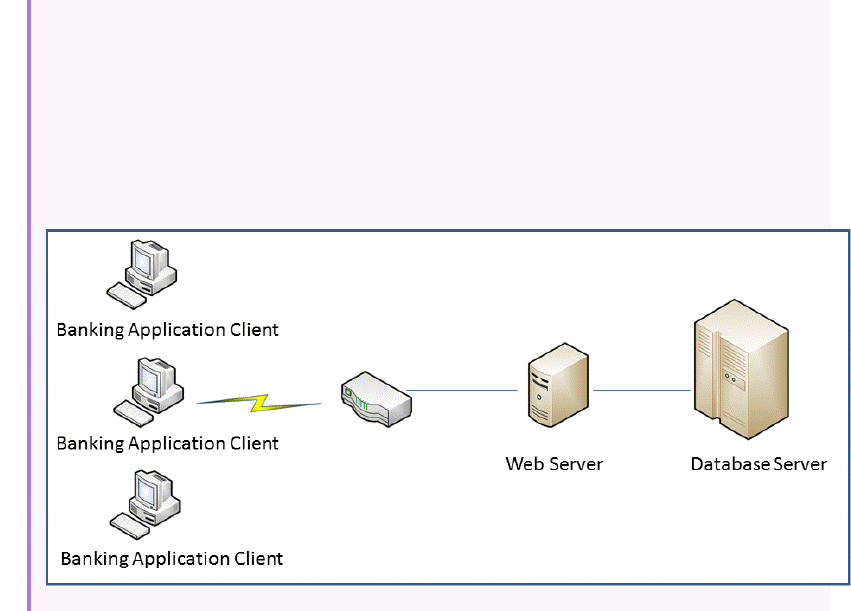
schematic diagram from existing documentation. If the application under test is part of a larger
network system, you should identify the component of the system to be tested. Make sure the
diagram includes all system components, such as client machines, network, middleware, and
servers.
Example
The following diagram illustrates an online banking system that is accessed by many Web
users. The Web users each connect to the same database to transfer funds and check
balances. The customers connect to the database server through the Web, using multiple
browsers.
2. Describe the system configuration
Enhance the schematic diagram with more details. Describe each system component's
configuration. You should be able to answer the following questions:
lHow many users are anticipated to connect to the system?
lWhat is the application client's machine configuration (hardware, memory, operating system,
software, development tool, and so forth)?
lWhat types of database and Web servers are used (hardware, database type, operating system,
file server, and so forth)?
lHow does the server communicate with the application client?
lWhat is the middleware configuration and application server between the front-end client and
back-end server?
lWhat other network components may affect response time (modems and so forth)?
lWhat is the throughput of the communications devices? How many concurrent users can each
device handle?
User Guide
Controller
HP LoadRunner (12.50) Page 1070

Example
The schematic diagram of the online banking system specified that there are multiple
application clients accessing the system.
Front-End Client Configuration
Anticipated number of application clients 50 concurrent application clients
Hardware / Memory Intel Core i7-4930K @ 3.40GHz
Operating system & version Windows Server 2012 64 bit
Client browser Internet Explorer 10
3. Analyze the usage mode
Define how the system is typically used, and decide which functions are important to test. Consider
who uses the system, the number of each type of user, and each user's common tasks. In addition,
consider any background load that might affect the system response time.
Example
Suppose 200 employees log on to the accounting system every morning, and the same
office network has a constant background load of 50 users performing various word
processing and printing tasks. You could create a LoadRunner scenario with 200 virtual
users signing in to the accounting database, and check the server response time.
To check how background load affects the response time, you could run your scenario on a
network where you also simulate the load of employees performing word processing and
printing activities.
4. Examine task distribution
In addition to defining the common user tasks, examine the distribution of these tasks.
Example
Suppose the bank uses a central database to serve clients across many states and time
zones. The 250 application clients are located in two different time zones, all connecting to
the same Web server. There are 150 in Chicago and 100 in Detroit. Each begins their
business day at 9:00 AM, but since they are in different time zones, there should never be
User Guide
Controller
HP LoadRunner (12.50) Page 1071

more than 150 users signing in at any given time. You can analyze task distribution to
determine when there is peak database activity, and which activities typically occur during
peak load time.
How to Define the Load Test Objectives
This task describes how to define the load test objectives as part of the load test planning process.
1. Decide on general objectives
For a list of suggested testing objectives, see "Load Testing Objectives" on page1066.
2. State the objectives in measurable terms
Once you decide on your general load testing objectives, you should identify more focused goals by
stating your objectives in measurable terms. To provide a baseline for evaluation, determine
exactly what constitutes acceptable and unacceptable test results.
Example
General Objective. Product Evaluation: choose hardware for the Web server.
Focused Objective. Product Evaluation: run the same group of 300 virtual users on two
different servers, HP and NEC. When all 300 users simultaneously browse the pages of your
Web application, determine which hardware gives a better response time.
3. Decide when to test
Load testing is necessary throughout the product life cycle. The following table illustrates what
types of tests are relevant for each phase of the product life cycle:
Planning
and Design
Development Deployment Production Evolution
Evaluate new
products
Measure response time Check reliability Measure
response time
Check HW or SW
upgrades
Measure
response time
Check optimal hardware
configuration
Measure
response time
Identify
bottlenecks
Measure system
capacity
Check HW or SW
upgrades
Measure
system capacity
Check reliability
User Guide
Controller
HP LoadRunner (12.50) Page 1072
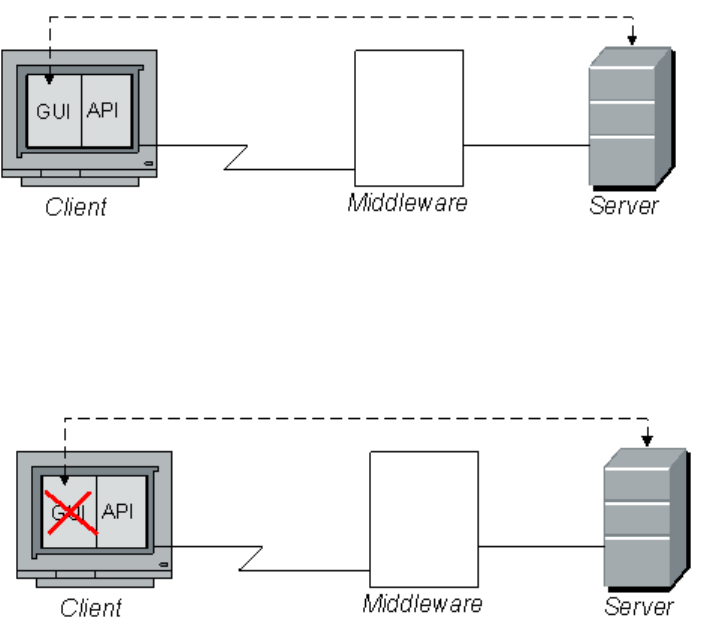
How to Plan the LoadRunner Implementation
This task describes how to plan the LoadRunner implementation as part of the load test planning
process.
1. Define the scope of performance measurements
You can use LoadRunner to measure response time at different points in the application.
Determine where to run the Vusers and which Vusers to run according to the test objectives:
lMeasuring end-to-end response time. You can measure the response time that a typical user
experiences by running a GUI Vuser at the front end. GUI Vusers emulate real users by
submitting input to and receiving output from the client application.
You can run GUI Vusers at the front end to measure the response time across the entire network,
including a terminal emulator or GUI front end, network, and server.
lMeasuring network and server response times. You can measure network and server
response time, excluding response time of the GUI front end, by running Vusers (not GUI) on the
client machine. Vusers emulate client calls to the server without the user interface. When you
run many Vusers from the client machine, you can measure how the load affects network and
server response time.
lMeasuring GUI response time. You can determine how the client application interface affects
response time by subtracting the previous two measurements:
GUI response time = end-to-end - network and server
User Guide
Controller
HP LoadRunner (12.50) Page 1073
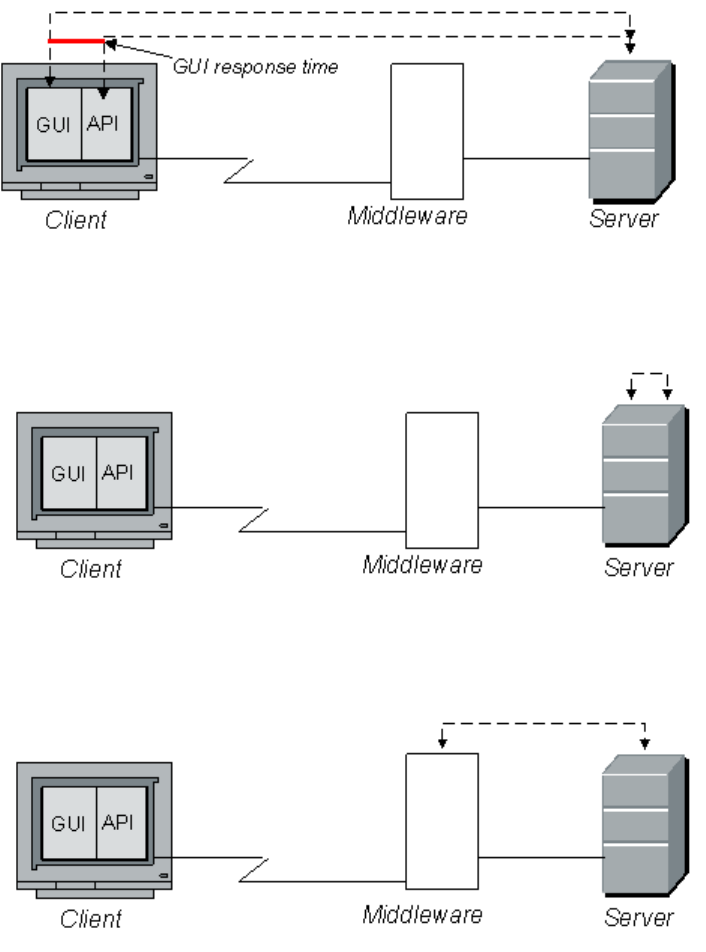
lMeasuring server response time. You can measure the time it takes for the server to respond
to a request without going across the network. When you run Vusers on a machine directly
connected to the server, you can measure server performance.
lMeasuring middleware-to-server response time. You can measure response time from the
server to middleware if you have access to the middleware and its API. You can create Vusers
with the middleware API and measure the middleware-server performance.
2. Define Vuser activities
Create Vuser scripts based on your analysis of Vuser types, their typical tasks, and your test
objectives. Since Vusers emulate the actions of a typical end-user, the Vuser scripts should include
the typical end-user tasks. For example, to emulate an online banking client, you should create a
Vuser script that performs typical banking tasks. You would browse the pages that you normally
visit to transfer funds or check balances.
You decide which tasks to measure based on your test objectives and define transactions for
these tasks. Transactions measure the time that it takes for the server to respond to tasks
User Guide
Controller
HP LoadRunner (12.50) Page 1074
submitted by Vusers (end-to-end time). For example, to check the response time of a bank Web
server supplying an account balance, define a transaction for this task in the Vuser script.
In addition, you can emulate peak activity by using rendezvous points in your script. Rendezvous
points instruct multiple Vusers to perform tasks at exactly the same time. For example, you can
define a rendezvous to emulate 70 users simultaneously updating account information.
3. Select Vusers
Before you decide on the hardware configuration to use for testing, determine the number and
type of Vusers required. To decide how many Vusers and which types to run, look at the typical
usage model, combined with the testing objectives. Some general guidelines are:
lUse one or a few GUI users to emulate each type of typical user connection.
lRun multiple Vusers to generate the rest of the load for each user type.
For example, suppose that you have five kinds of users, each performing a different business
process:
Usage Model GUI Other
100 customer service users in New York (LANconnection) 2 98
30 customers in Europe (dial-in ISDN connection) 2 28
5 background batch processes _ 5
150 customers (terminal connection) _ _
6 managers 2 4
4. Choose testing hardware/software
The hardware and software should be powerful and fast enough to emulate the required number
of virtual users. Refer to the Readme file for specific hardware requirements.
To decide on the number of machines and correct configuration, consider the following:
lIt is advisable to run HP LoadRunner Controller on a separate machine.
lEach GUI Vuser requires a separate Windows-based machine; several GUI Vusers can run on a
single Linux machine.
lConfiguration of the test machine for GUI Vusers should be as similar as possible to the actual
user's machine.
Note: The results file requires a few MB of disk space for a long scenario run with many
transactions. The load generators also require a few MB of disk space for temporary files
if there is no NFS. For more information about runtime file storage, see "Runtime File
Storage Locations" on page1207.
User Guide
Controller
HP LoadRunner (12.50) Page 1075

Designing Scenarios
Manual Scenarios
You build a manual scenario by selecting scripts to run, assigning load generators on which to run the
scripts, and distributing Vusers to run among the scripts.
You can design a manual scenario in one of the following modes:
lVuser group mode. In this mode, each script you select for the scenario is assigned to a Vuser group.
You assign a number of Vusers to each Vuser group that you create. You can instruct all Vusers in a
group to run the same script on the same load generator, or you can assign different scripts and load
generators to the various Vusers in a group.
lPercentage mode. In this mode, you define a total number of Vusers to be used in the scenario, and
assign load generators and a percentage of the total number of Vusers to each script.
After you define which Vuser groups/scripts to run in the scenario, you select or build a schedule by
which to run the scenario. For more information, see "Scheduling Manual Scenarios" on page1153.
You can also create Service Level Agreements (SLAs) which are specific goals that you define for your
load test scenario. When you run the scenario, LoadRunner gathers and stores performance-related
data. When you analyze the run, Analysis compares this data against the SLAs and determines SLA
statuses for the defined measurements. For more information, see "Service Level Agreements" on
page1174.
Changing Scenario Modes
You can convert a scenario from the Vuser group mode to the percentage mode and vice versa.
The following table describes what happens to the scenario when converting from the one mode to the
other:
Vuser
group
mode to
percentage
mode
lIf a Vuser group contains multiple scripts, in percentage mode the scripts are listed
one by one in the Scenario Scripts pane.
lIn the percentage mode, all load generators are assigned to all Vuser scripts by
default. If multiple load generators are assigned to a Vuser group, the Vusers
assigned to the scripts in the percentage mode are distributed evenly among the
load generators originally assigned to the group.
User Guide
Controller
HP LoadRunner (12.50) Page 1076
If you defined group schedules for the Vuser groups, these settings will be lost. All
profiles will contain schedule by scenario settings only. For details about scheduling
scenarios, see "Scheduling Manual Scenarios" on page1153.
Percentage
mode to
Vuser
group
mode
lEach script is converted to a Vuser group.
lIf you defined multiple load generators for a Vuser script, the Vuser group that is
created when converting the scenario will also contain multiple load generators.
lIf a schedule is defined for the scenario, all the schedule settings remain unchanged.
Note: You can convert from one scenario mode to another at any time. For details, see "How to
Change the Scenario Mode (Manual Scenario)" on page1083.
Goals Types for Goal-Oriented Scenarios
In a goal-oriented scenario, you define the goals you want your test to achieve and LoadRunner
automatically builds a scenario for you based on these goals.
You can define the following types of goals for a goal-oriented scenario:
lVirtual Users
This goal tests if your application can run a specified number of Vusers simultaneously. Running this
type of goal-oriented scenario is similar to running a manual scenario.
lPages per Minute/Hits per Second/Transactions per Second
These goals test the strength of your server. For each of these goal types, you specify a minimum-
maximum range of Vusers for the scenario to run, and in the case of the Transactions per Second goal
type, you also specify a transaction name.
Note:
lPages per Minute and Hits per Second goals are for Web Vusers only.
lHits per second relates to HTTP requests per second.
When you define one of these goal type, the Controller divides the target defined by the minimum
number of Vusers specified, and determines the target number of hits/transactions per second or
pages per minute that each Vuser should reach.
The Controller then begins loading the Vusers according to the load behavior settings you defined, as
follows:
lIf you selected to run the Vusers automatically, LoadRunner loads 50 Vusers in the first batch. If
the maximum number of Vusers defined is less than 50, LoadRunner loads all of the Vusers
simultaneously.
User Guide
Controller
HP LoadRunner (12.50) Page 1077
lIf you chose to reach your target after a certain period of the scenario elapses, LoadRunner
attempts to reach the defined target within this period of time. It determines the size of the first
batch of Vusers based on the time limit you defined and the calculated target number of hits,
transactions, or pages per Vuser.
lIf you chose to reach your target by gradation (x number of pages/hits every x amount of time),
LoadRunner calculates the target number of hits or pages per Vuser and determines the size of
the first batch of Vusers accordingly. (Not relevant for the Transactions per Second goal type).
After running each batch of Vusers, LoadRunner evaluates whether the target for the batch was
achieved. If the batch target was not reached, LoadRunner recalculates the target number of hits,
transactions, or pages per Vuser, and readjusts the number of Vusers for the next batch to be able to
achieve the defined goal. By default, a new batch of Vusers is released every two minutes.
If the goal has not been reached after the Controller has launched the maximum number of Vusers,
LoadRunner attempts to reach the defined target once more by recalculating the target number of
hits, transactions, or pages per Vuser, and running the maximum number of Vusers simultaneously.
A Pages per Minute or Hits/Transactions per Second goal-oriented scenario is assigned a Failed status
if:
lThe Controller has twice attempted to reach the goal using the maximum number of Vusers
specified, and the goal could not be reached.
lNo pages per minute or hits/transactions per second were registered after the first batch of
Vusers was run.
lThe number of pages per minute or hits/transactions per second did not increase after the
Controller ran a certain number of Vuser batches.
lAll the Vusers that ran failed.
lThere were no available load generators for the type of Vusers you attempted to run.
lTransaction Response Time
This goal tests how many Vusers can be run simultaneously without exceeding a desired transaction
response time. You specify the name of the transaction in your script that you want to test, and a
minimum-maximum range of Vusers for LoadRunner to run. The transaction response time you
specify should be a predefined threshold value.
For example, if you do not want a customer to wait more than five seconds to log in to your e-
commerce site, specify a maximum acceptable transaction response time of five seconds. Set the
minimum and maximum number of Vusers to the minimum-maximum range of customers you want to
be able to serve simultaneously.
If the scenario does not reach the maximum transaction response time that you defined, your server
is capable of responding within a reasonable period of time to the number of customers you want to
be able to serve simultaneously. If the defined response time is reached after only a portion of the
Vusers has been executed, or if you receive a message that the defined response time will be
exceeded if the Controller uses the maximum number of Vusers defined, you should consider
revamping your application and/or upgrading your server software and hardware.
User Guide
Controller
HP LoadRunner (12.50) Page 1078
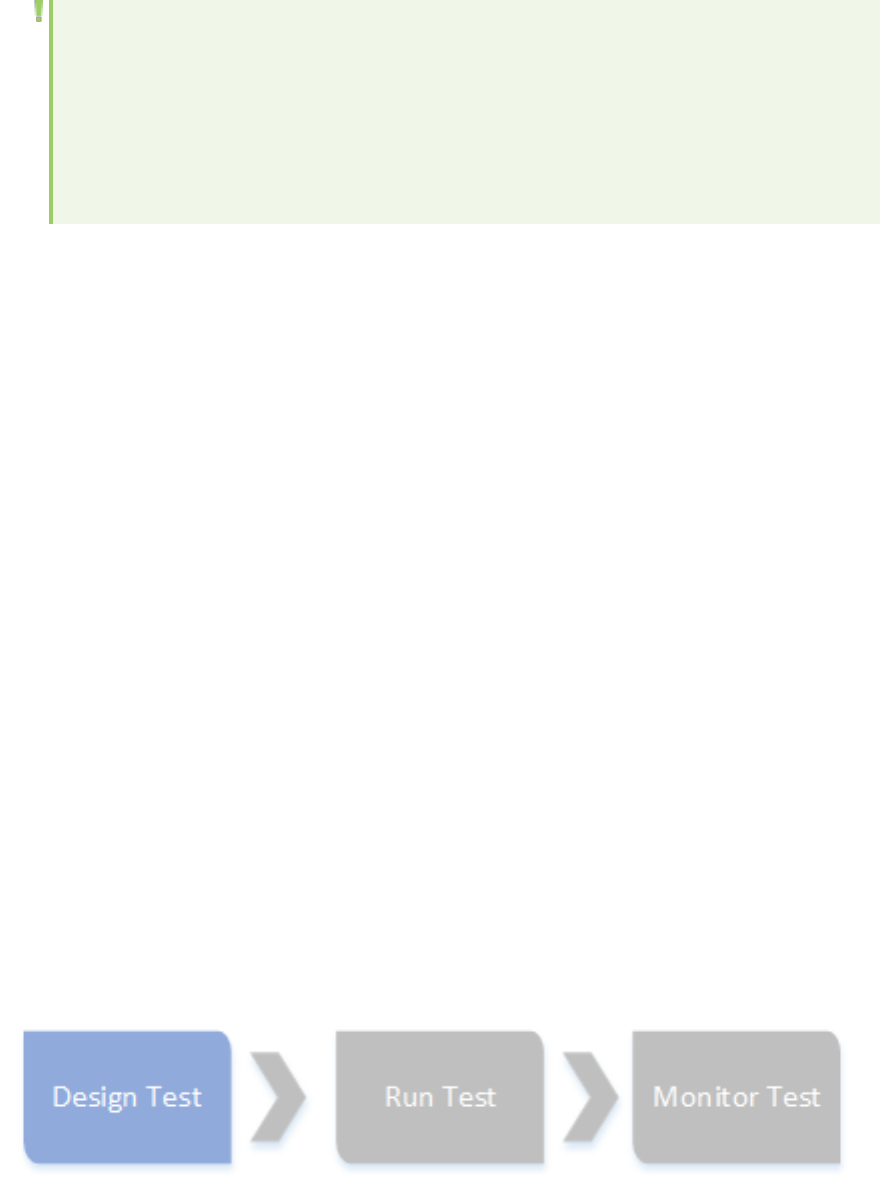
Note:
lTo achieve a Transactions per Second or Transaction Response Time goal, your script must
contain transactions. For each of these goal types, you define the transaction in the script
that you want to test.
lFor a Transaction Response Time goal-oriented scenario to be effective, you must choose
your transaction carefully, ensuring that it performs effective hits on the server.
Noise Generators
You can approach Web performance testing in the following ways:
lCreate a load test that runs complex Vuser scripts. These scripts perform a business process and
contain transactions, complex flows, checkpoints, and so forth.
lCreate a load on the server by having a large number of users (real or virtual) access the same URL
simultaneously. This is commonly known as Noise Testing.
The first approach uses a standard Vuser script generated with VuGen or through a DevOp addin. The
script performs the full business process and gathers the metrics. After the test run, you can retrieve
meaningful information from the Analysis graphs and reports.
The second approach, noise testing, only allows you to determine the response times and whether the
server can handle the load without crashing.
The LoadRunner Controller allows you to set up both types of scenarios. You can create a single
scenario that contains both standard and noise generator type Vusers.
You set up a noise generator scenario from the Add Script dialog box. You select a Noise Generator
type of script, and specify the URL of the server you want to access. During the scenario run, these
Vusers access the URL simultaneously.
You cannot edit Noise Generator scripts in VuGen.
For user interface details, see the Add Script Dialog Box or Add Group Dialog Box.
For license information, see "Additional Information About LoadRunner Licenses" on page1064.
How to Design a Goal-Oriented Scenario
User Guide
Controller
HP LoadRunner (12.50) Page 1079
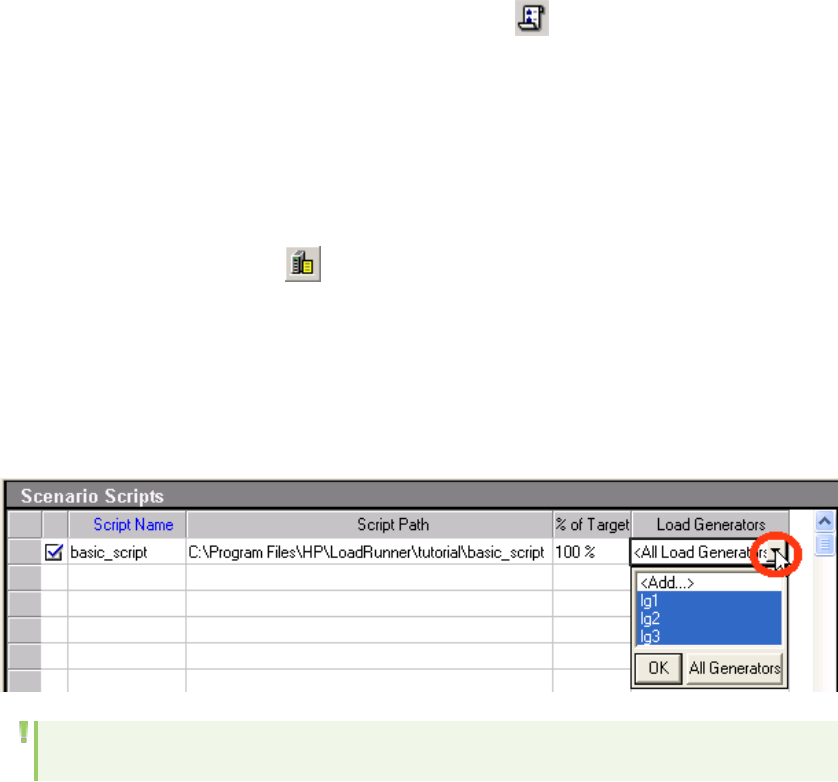
This task describes how to design a goal-oriented scenario. In this type of scenario, you define the goals
you want your test to achieve and LoadRunner automatically builds a scenario for you based on these
goals.
1. Prerequisites
lBefore setting up the scenario, decide which goal you want the scenario to reach. For details on
types of scenario goals, see "Goals Types for Goal-Oriented Scenarios" on page1077.
lBefore you start designing the scenario, record the VuGen scripts that will run in the scenario.
For details, see "How to Record a Vuser Script" on page144.
2. Open a new goal-oriented scenario
a. On the Controller toolbar, click the New Scenario button .
b. In the New Scenario dialog box that opens, select Goal-oriented Scenario.
c. Select scripts to run in the scenario. Select scripts in the Available Scripts box, and click Add
to move them to the Scripts in Scenario box.
When you click OK, the Design tab opens and displays the new scenario.
3. Add load generators to the scenario
Click the Load Generators button . In the Load Generators dialog box that opens, click Add and
enter the details of the load generator you are adding. For details about the Add Load Generator
dialog box, see "Add New Load Generator/Load Generator Information Dialog Box" on page1127.
4. Assign load generators to each script
In the Scenario Scripts pane, for each script, click the Load Generators column and select a load
generator on which to run the script.
Note: By default, the script will run on all the load generators in the scenario.
5. Define a goal for the scenario
In the Scenario Goal pane, click the Edit Scenario Goal button. In the dialog box that opens, define
the goal the scenario should reach. For details about filling in the scenario goal details, see "Edit
Scenario Goal Dialog Box" on page1093.
User Guide
Controller
HP LoadRunner (12.50) Page 1080
6. Define a virtual location for each script in the scenario - optional
In the Scenario Scripts pane's Virtual Location column, select the location for the network
virtualization. This only applies if you have HP Network Virtualization installed. For details, see
"Network Virtualization Locations" on page1367.
7. Assign each script a percentage of the total scenario target
In the Scenario Scripts pane's % of Target column, enter the percentage of the total goal you want
each script to reach during the scenario.
Note: Assign percentages to the scripts starting with the first script in the list and moving
down the list.
8. Define service level agreements for the scenario - optional
You can define service level agreements (SLAs) to measure scenario goals over time intervals, or
over a whole scenario run. When you later analyze the run using HP LoadRunner Analysis, this data
is compared against the SLAs and SLA statuses are determined for the defined measurements. To
define SLAs, see "How to Define Service Level Agreements" on page1175.
How to Design a Manual Scenario
This task describes how to design a manual scenario.
1. Prerequisites
lWhen designing a manual scenario, plan how you want to distribute the Vusers in the scenario.
For more details, see "Manual Scenarios" on page1076.
lBefore you start designing the scenario, record the VuGen scripts that will run in the scenario.
For details, see "How to Record a Vuser Script" on page144.
2. Open a scenario, or create a new one
a. On the main Controller toolbar, click the New Scenario button .
b. In the New Scenario dialog box, select Manual Scenario.
c. (Optional) To distribute the Vusers by percentage, select the Use the Percentage mode...
option.
Note: You can convert from one scenario mode to another at any time. For details,
"How to Change the Scenario Mode (Manual Scenario)" on page1083.
d. (Optional) Select scripts to participate in the scenario. If you do not select the scripts here, you
can select them later on.
User Guide
Controller
HP LoadRunner (12.50) Page 1081
When you click OK, the scenario opens in the Design tab.
3. Add load generators to the scenario
Click the Load Generators button . In the Load Generators dialog box that opens, click Add and
enter the details of the load generator you are adding. For details about adding load generators,
see "Add New Load Generator/Load Generator Information Dialog Box" on page1127.
4. Add Vuser groups/scripts to the scenario - Vuser group mode
a. In the Scenario Groups pane, click the Add Group button .
b. In the Add Group dialog box:
oGive the group a name and assign a number of Vusers to the group.
oSelect a load generator on which to run the Vusers.
oSelect a Vuser script.
5. Add Vuser groups/scripts to the scenario - Percentage mode
a. Click the Add Group button and select a Vuser script from the list. Repeat this step for all
scripts that you want to include inthe test.
b. In the Scenario Scripts pane's Load Generator column, select load generators on which to run
the scripts.
c. In the Scenario Scripts pane's % column, assign a percentage of the total number of Vusers
for each script. Assign percentages to the scripts starting with the first script in the table and
moving down the list.
6. Define a virtual location for the scenario - optional
if you have HP Network Virtualization installed, click in the Virtual Location column, and select a
location. For details, see "Network Virtualization Locations" on page1367.
7. Define a schedule for the scenario
Define a schedule by which to run the Vusers in the scenario. For details, see "How to Define a
Schedule for the Scenario - Workflow" on page1155.
8. Define service level agreements for the scenario - optional
You can define service level agreements (SLAs) to measure scenario goals over time intervals, or
over a whole scenario run. When you later analyze the run using HP LoadRunner Analysis, this data
is compared against the SLAs and SLA statuses are determined for the defined measurements. To
define SLAs, see "How to Define Service Level Agreements" on page1175.
User Guide
Controller
HP LoadRunner (12.50) Page 1082

How to Change the Scenario Mode (Manual Scenario)
This task describes how to change a manual scenario from Vuser group mode to percentage mode, and
vice versa.
For details about the scenario modes and the effects of changing from one to another, see "Manual
Scenarios" on page1076.
lTo convert the scenario from Vuser group mode to percentage mode, select Scenario > Convert
Scenario to the Percentage Mode.
lTo convert the scenario from percentage mode to Vuser group mode, select Scenario > Convert
Scenario to the Vuser Group Mode.
Note: By default, every time you convert from one mode to another, a message appears
warning you that scenario and schedule settings may change. To show/hide this warning
message, select Scenario> Show Convert Scenario Mode Warning.
How to View/Modify Scripts in the Scenario
This section describes how to view and modify scripts used in your load test scenario.
You view/modify the details of the scripts in the Group Information dialog box (see "Group Information
Dialog Box" on page1095) or in the Script Information dialog box (see "Script Information Dialog Box" on
page1106).
View script details
You can view the details of a script by right-clicking the script in the Scenario Groups/Scripts pane and
selecting Details.
In the Group/Script Information dialog box that opens, you can:
lView details about the script, including:
Note: If you do not see some of the details listed below, click More.
lScript path
lCommand line options
lRendezvous points included in the script
lVusers associated with the script
lFiles associated with the script
User Guide
Controller
HP LoadRunner (12.50) Page 1083

lOpen the script in VuGen by clicking the View Script button
lView the script's runtime settings by clicking the Runtime Settings button
Modify a script's runtime settings
lTo view or modify a script's runtime settings, in the Scenario Groups/Scripts pane right-click the
script and select Runtime Settings.
lTo view or modify runtime settings of a script associated with a particular Vuser, in the Vusers dialog
box (Scenario Groups pane > Vusers ) right-click the Vuser and select Runtime Settings.
Modifying the runtime settings for one Vuser in a group modifies the runtime settings for all the
Vusers in that group that are using the same script.
Modify multiple scripts' runtime settings
This section describes how to modify runtime settings of multiple scripts or of a Vuser group that
includes multiple scripts.
1. In the Scenario Groups/Scripts pane select multiple scripts or the Vuser group that includes
multiple scripts.
2. Right-click the selection and select Runtime Settings.
3. In the Multiple runtime settings Mode dialog box that opens:
lTo modify runtime settings for all of the scripts simultaneously, click Shared RTS.
lTo modify runtime settings per script, click Individual RTS.
For user interface details, see "Multiple Runtime Settings Mode Dialog Box" on page1096.
lFor details about specific runtime settings, see "Runtime Settings Overview" on page280.
lWhen you modify the runtime settings from the Controller, LoadRunner runs the script using the
modified settings.
View/Edit a script in VuGen
To view/edit a script included in your scenario, right-click the script and select View Script. The script
opens in VuGen. For more information on editing scripts, see the "Debugging Overview" on page311.
Specify command line options
You can specify command line options to use when running a script.
1. In the Scenario Groups/Scripts pane, right-click the script and select Details.
2. In the Group/Script Information dialog box that opens, if Command line is not displayed near the
bottom, click More.
3. Enter a command in the command line, for example: -x value -y value.
For information about passing command line argument values to a script, see "How to Enhance a
Java Script" on page548.
User Guide
Controller
HP LoadRunner (12.50) Page 1084

View rendezvous points included in the script
1. In the Scenario Groups/Scripts pane, right-click the script and select Details.
2. In the Group/Script Information dialog box, if the Rendezvous tab is not displayed near the bottom,
click More.
If there are rendezvous points included in the script, they are displayed in the Rendezvous tab. For
details about rendezvous points, see "Rendezvous Points Overview" on page1254.
View Vusers associated with the script
1. In the Scenario Groups/Scripts pane, right-click the script and select Details.
2. In the Group/Script Information dialog box, if the Vusers tab is not displayed near the bottom, click
More.
The Vusers tab displays the Vusers associated with the script.
View files associated with the script
1. In the Scenario Groups/Scripts pane, right-click the script and select Details.
2. In the Group/Script Information dialog box, if the Files tab is not displayed near the bottom, click
More.
By default, the Files tab lists all the files in the script's folder (only after your script has been added
to the script list). These files include the configuration settings file, the init, run, and end portions of
the script, the parameterization definitions file, and the .usr file. To add a file to the list, click Add.
Example
To run Visual C++ Vusers on a remote load generator, you must add the .dll of the Vuser to
the list of files.
You can delete the files that you add, but not the other files listed.
Relative Paths for Scripts
You can specify a relative location for a script in your scenario. The location can be relative to the
current scenario folder, or relative to the LoadRunner installation folder.
When you run a scenario, the script is automatically copied from this relative location to a temporary
folder on the load generator running the script. This enables the load generator to access the script
locally instead of over a network.
To specify a path relative to the current scenario director, type either of the following notations at the
start of the script path:
User Guide
Controller
HP LoadRunner (12.50) Page 1085
Notation Description
.\ Indicates that the path is relative to the location of the scenario folder
..\ Indicates that the path is relative to the location of the parent folder of the
scenario folder
For example, if the current scenario is located at F:\scenarios, to specify that the script, user1, is
located in F:\scenarios\scripts, you could type:
.\scripts\user1
To specify a path relative to the LoadRunner installation folder, type a percent sign (%) at the beginning
of the script path. For example, if the LoadRunner installation folder is located at F:\LoadRunner, to
specify that the script, user1, is located in F:\LoadRunner\scripts, you could type:
%\scripts\user1
Note: When specifying a relative path, you can include standard DOS notation (.\ and ..\) inside
the path, as shown in the following example: M:\LR\my_tests\..\..\test.usr.
Vuser Statuses
The following table describes the possible statuses of Vusers before, during, and after a scenario run.
Status Description
Down The Vuser is down.
Pending The Vuser is ready to be initialized and is waiting for an
available load generator, or is transferring files to the load generator. The Vuser will
run when the conditions set in its scheduling attributes are met.
Initializing The Vuser is being initialized on the remote machine.
Ready The Vuser already performed the init section of the script and is ready to run.
Running The Vuser is running. The Vuser script is being executed on a load generator.
Rendezvous The Vuser has arrived at the rendezvous point and is waiting to be released by
LoadRunner.
Done.Passed The Vuser has finished running. The script passed.
Done.Failed The Vuser has finished running. The script failed.
Error A problem occurred with the Vuser. Check the Status field on the Vuser dialog box or
the output window for a complete explanation of the error.
User Guide
Controller
HP LoadRunner (12.50) Page 1086
Gradual
Exiting
The Vuser is completing the iteration or action it is running (as defined in Tools >
Options > Runtime Settings) before exiting.
Exiting The Vuser has finished running or has been stopped, and is now exiting.
Stopped The Vuser stopped when the Stop command was invoked.
Add Group Dialog Box
This dialog box enables you to add Vuser groups to participate in a scenario.
To access Manual scenario > Design tab > Scenario Groups/Scripts pane > Add Group
Important
information
While a scenario is running, you can add Vuser groups to the scenario and enable them.
However, if you add a Vuser group after all the Vusers in the scenario have started
running, the new group will not run in the scenario.
Relevant
tasks
"How to Design a Manual Scenario" on page1081
See also "How to Design a Manual Scenario" on page1081
User interface elements are described below:
UI Element Description
Enables you to add Vuser scripts to the list of scripts.
Opens VuGen where you can record a Vuser script. For more information on
recording Vuser scripts, see "How to Record a Vuser Script" on page144.
Group Name The name of the Vuser group.
When you select a script the Vuser group is automatically given the same name as
the script. You can modify the group name.
Note: The name is limited to a maximum of 55 characters.
Vuser Quantity The number of Vusers to add to the group.
Load Generator
Name
The load generator assigned to the Vuser group.
To add a load generator to this list, select Add from the list. For user interface
details, see "Add New Load Generator/Load Generator Information Dialog Box" on
page1127.
Use existing Lists the available scripts that have been added to the scenario. When you select a
User Guide
Controller
HP LoadRunner (12.50) Page 1087
LoadRunner
Script
script, its name and path are displayed above the list.
To display the scripts with their full paths, right-click the list area and select Show
Paths.
Note: If a script uses Unique file parameterization, running more than one Vuser
group with that script in the same scenario may cause unexpected scenario results.
For more information about Unique file parameterization, see "Data Assignment
Methods for File/Table/XML Parameters" on page347.
Use a Noise
Generator
script with the
following URL
The URL to which you want to apply noise testing. You can provide a server name, IP
address, or a full URL. After a URLis used once, it appears in a drop down list.
LoadRunner automatically generates a script name using the following format:
Noise_<domain>_<index>, e.g. Noise_HP_1.
Note: There is no built-in validation, so you must verify that the URL you
provide is operational.
Add Script Dialog Box
This dialog box enables you to add Vuser scripts to a scenario.
To access Use one of the following:
lAll scenarios: Design tab > Right-click in Scenario Scripts pane > Add Script
lGoal-oriented scenario: Design tab > Scenario Scripts pane > Add Script
lManual scenario (percentage mode): Design tab > Add Group
Important
information
While a scenario is running, you can add scripts to the scenario and enable them.
However, if you add a script after all the Vusers in the scenario have started running,
the added script will not run in the scenario.
Relevant
tasks
l"How to Design a Manual Scenario" on page1081
l"How to Design a Goal-Oriented Scenario" on page1079
See Also lNoise Generators
User interface elements are described below:
UI Element Description
Enables you to add Vuser scripts to the list of scripts.
Opens VuGen for recording a new Vuser script. For more information, see "How
to Record a Vuser Script" on page144.
User Guide
Controller
HP LoadRunner (12.50) Page 1088
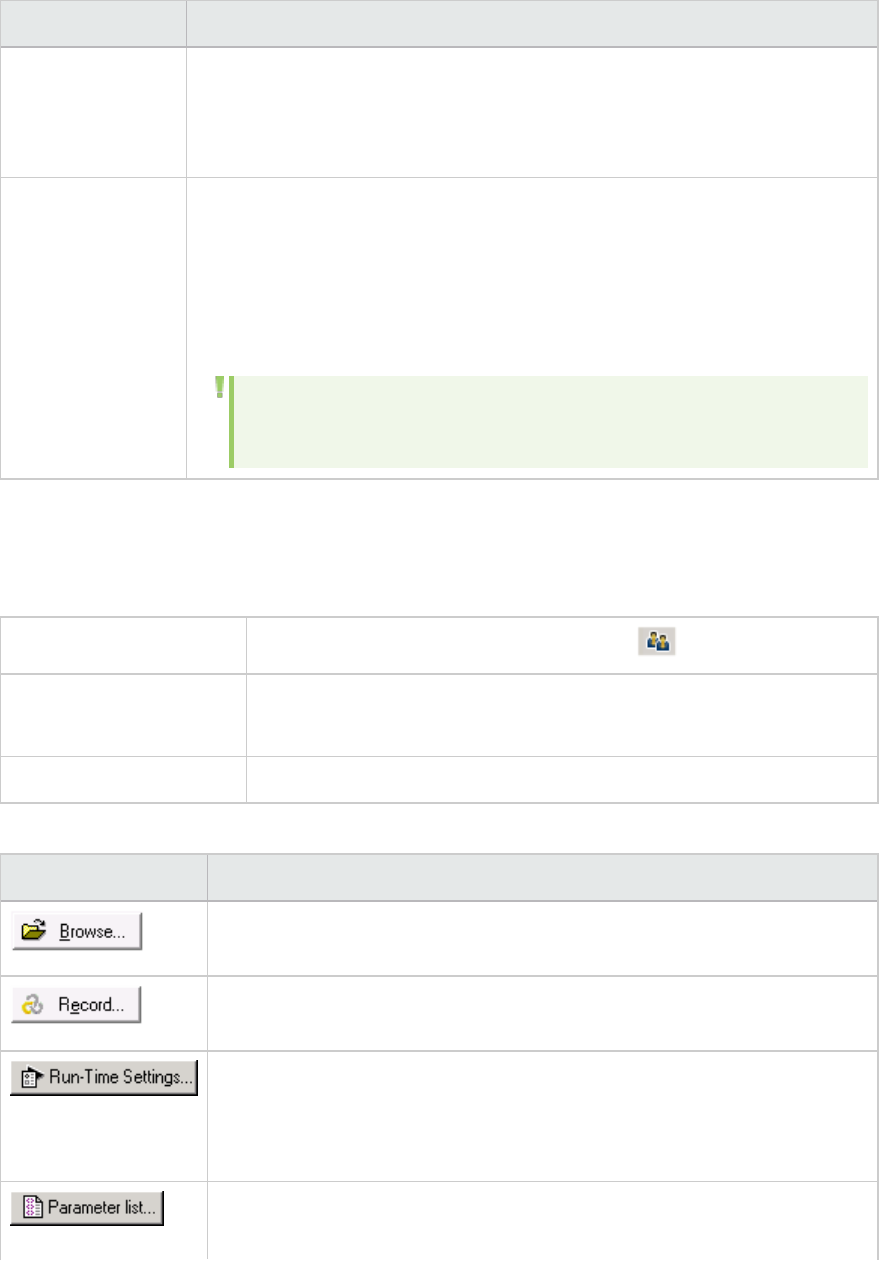
UI Element Description
Use existing
LoadRunner script
Lists the available scripts that have been added to the scenario. When you
select a script, its name and path are displayed above the list.
To display the scripts with their full paths, right-click the list area and select
Show Paths.
Use a Noise
Generator script
with the following
URL
The URL to which you want to apply noise testing. You can provide a server
name, IP address, or a full URL. After a URLis used once, it appears in a drop
down list.
LoadRunner automatically generates a script name using the following format:
Noise_<domain>_<index>, e.g. Noise_HP_1.
Note: There is no built-in validation, so you must verify that the URL
you provide is operational.
Add Vusers Dialog Box
This dialog box enables you to add Vusers to a Vuser group.
To access Design tab > Scenario Groups pane > Vusers >Add Vusers
Important information lRelevant for manual scenarios in Vuser group mode only.
lAvailable when a group is selected in the Scenario Groups pane.
See also "Run/Stop Vusers Dialog Box" on page1247
User interface elements are described below:
UI Element Description
Enables you to add Vuser scripts to the list of scripts.Note: To add a VB Vuser
script, select the .usr file.
Opens VuGen where you can record a Vuser script. For more information on
recording Vuser scripts, see "How to Record a Vuser Script" on page144.
Opens the runtime settings dialog box, where you can edit the script's
runtime settings.
When you modify the runtime settings from the Controller, LoadRunner runs
the script using the modified settings.
Opens the Parameter list in VuGen where you can create, view, modify, and
delete script parameters. For details, see "Parameterizing Overview" on
User Guide
Controller
HP LoadRunner (12.50) Page 1089

UI Element Description
page341.
Group Name The name of the group to which to add Vusers.
Load Generator
Name
The load generator assigned to the Vuser group.
To add a load generator to this list, select Add from the list. For user
interface details, see "Add New Load Generator/Load Generator Information
Dialog Box" on page1127.
Quantity to add The number of Vusers to add to the Vuser group.
Select Script Lists the scripts available for the scenario. When you select a script, its name
and path are displayed above the list.
To display the scripts with their full paths, right-click the list area and select
Show Paths.
Design Tab
The Design tab enables you to design load test scenarios.
To access Design tab
Relevant tasks l"How to Design a Manual Scenario" on page1081
l"How to Design a Goal-Oriented Scenario" on page1079
l"How to Define a Schedule for the Scenario - Workflow" on page1155
l"How to Define Service Level Agreements" on page1175
l"How to Change the Scenario Mode (Manual Scenario)" on page1083
l"How to View/Modify Scripts in the Scenario" on page1083
User interface elements are described below:
UI Element Description
Scenario Goal pane
(Goal-oriented scenario)
In goal-oriented scenarios, displays information regarding the scenario
goal.
User Guide
Controller
HP LoadRunner (12.50) Page 1090
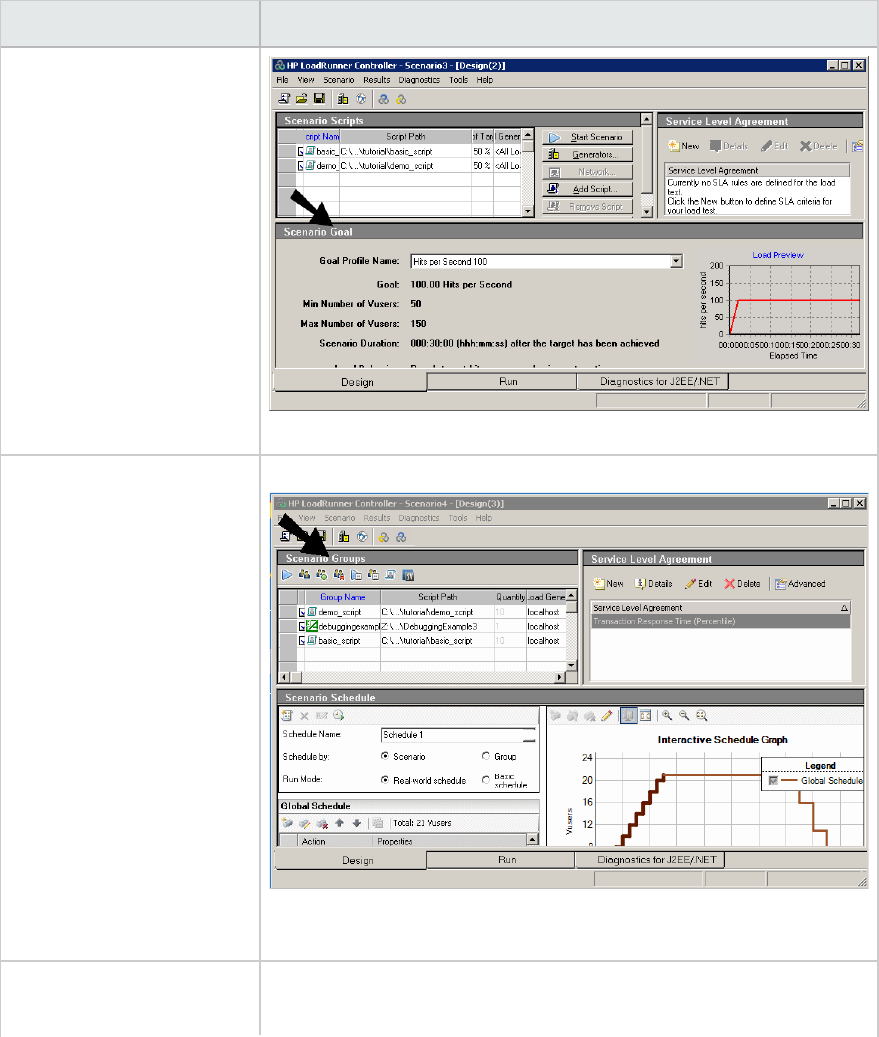
UI Element Description
For user interface details, see "Scenario Goal Pane" on page1099.
Scenario Groups pane
(Manual scenario in Vuser
Group mode)
Displays the Vuser groups created for the scenario.
For user interface details, see "Scenario Groups/Scripts Pane - Manual
Scenarios" on page1100.
Scenario Schedule pane
(Manual scenario)
Displays the scenario schedule.
User Guide
Controller
HP LoadRunner (12.50) Page 1091
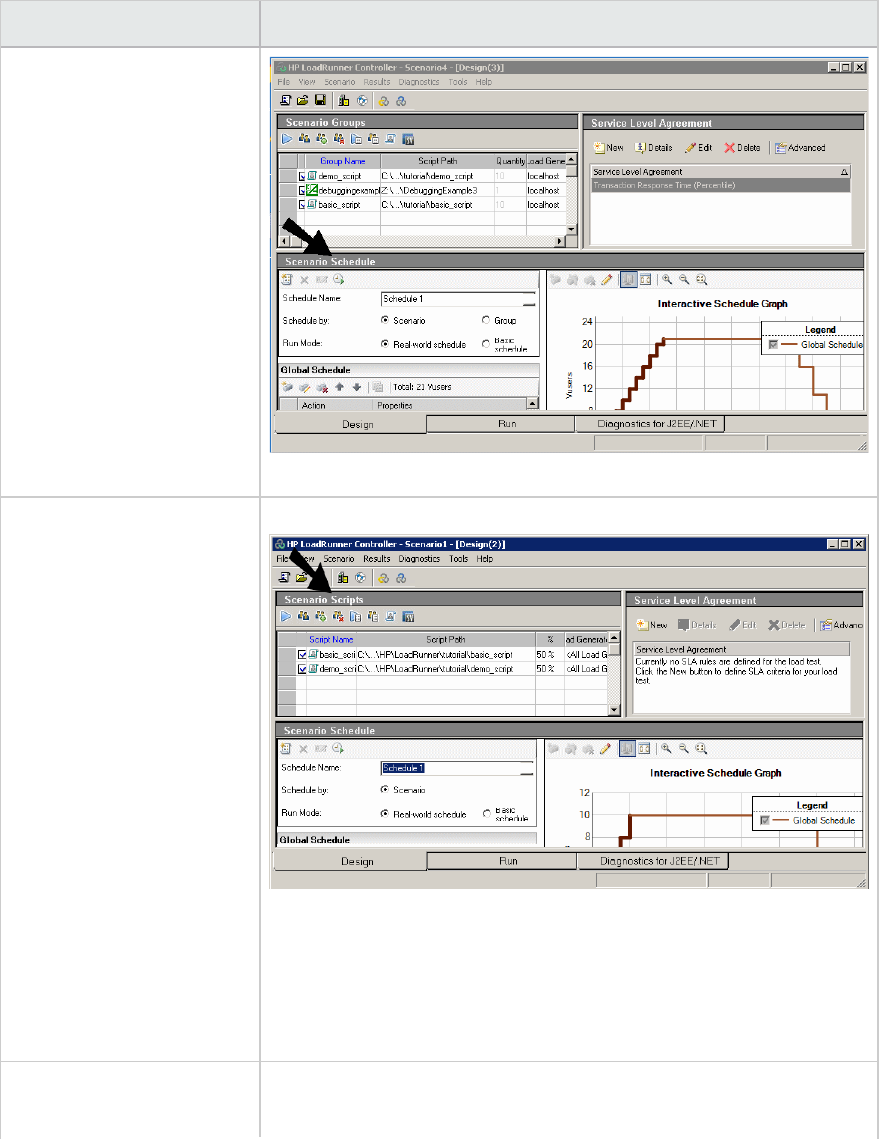
UI Element Description
For user interface details, see "Scenario Schedule Pane" on page1166.
Scenario Scripts pane Displays the Vuser scripts selected for the scenario.
For user interface details:
lSee "Scenario Groups/Scripts Pane - Manual Scenarios" on
page1100.
lSee "Scenario Scripts Pane - Goal-Oriented Scenarios" on
page1103.
Service Level Agreement
pane
Lists the service level agreements defined for the scenario.
User Guide
Controller
HP LoadRunner (12.50) Page 1092
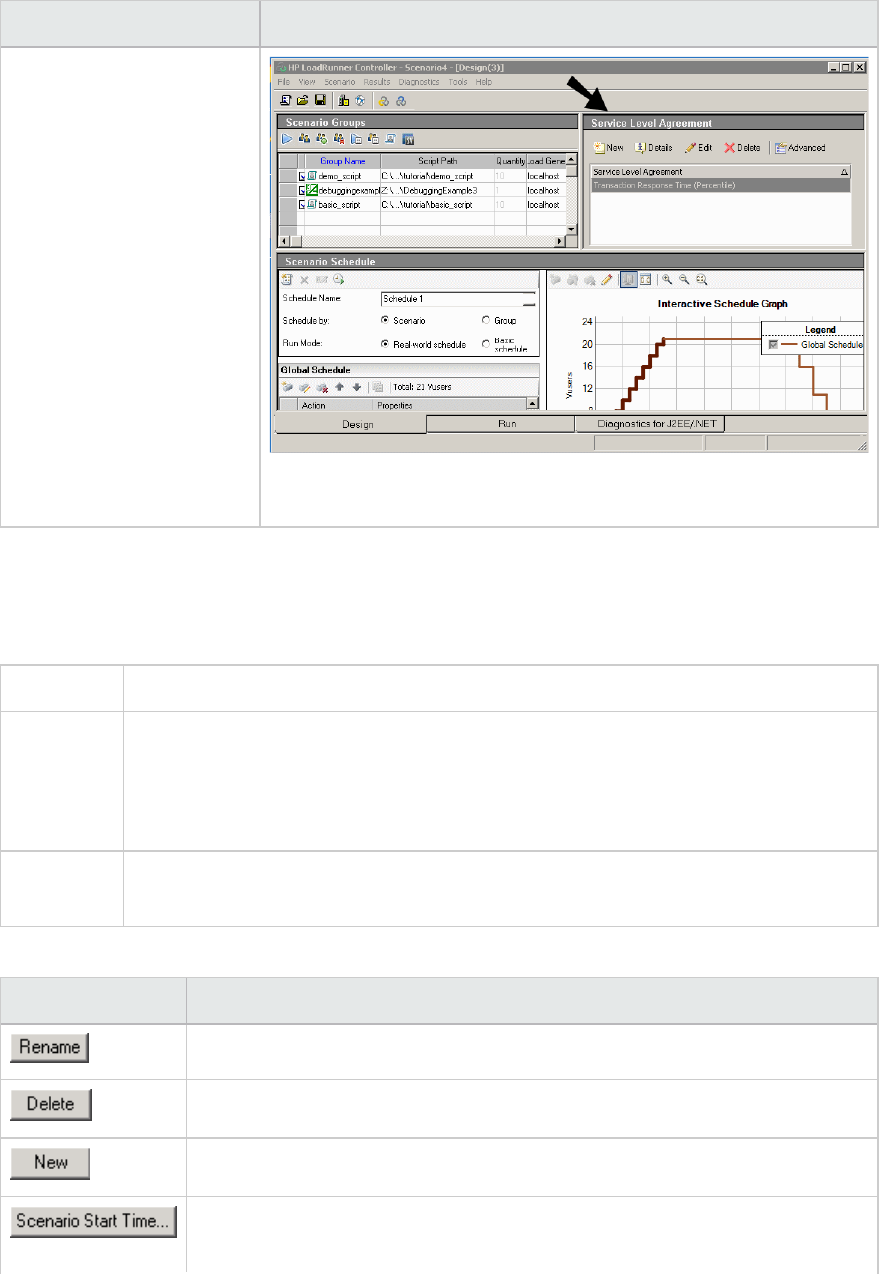
UI Element Description
For user interface details, see "Service Level Agreement Pane" on
page1180.
Edit Scenario Goal Dialog Box
This dialog box enables you to set goals for your scenario.
To access Goal-oriented scenario > Design tab > Scenario Goal pane> Edit Scenario Goal
Important
information
lAvailable for goal-oriented scenarios only.
lWhen you run a goal-oriented scenario, the goal you defined is displayed in the
appropriate graph, along with the scenario results. This enables you to compare the
results with your target goal.
Relevant
tasks
"How to Design a Goal-Oriented Scenario" on page1079
User interface elements are described below:
UI Element Description
Enables you to rename the selected goal profile.
Enables you to delete the selected goal profile.
Enables you to define a new goal profile.
Opens the Scenario Start dialog box where you can set the scenario start time
as follows:
User Guide
Controller
HP LoadRunner (12.50) Page 1093
lWithout delay. As soon as the Start Scenario command is issued.
lWith a delay of HH:MM:SS. The specified time after the Start Scenario
command is issued.
lAt HH:MM:SS on <date>. At a specified time on a specified date.
Define Scenario
Goal
The scenario goal:
lGoal Type. The type of goal. For more details, see "Goals Types for Goal-
Oriented Scenarios" on page1077.
lTransaction Name. (When goal type is Transactions per second/Transaction
Response Time) The static script transaction for your scenario to test, or
the name of an automatic/dynamic script transaction that you have
recorded.
lReach Goal of <value> <goal type>. The desired goal limits.
lUsing a minimum of <value> and a maximum of <value> Vusers. The
minimum and maximum number of Vusers to use in the scenario.
Do not change
recorded think
time
If selected, LoadRunner runs the scenario using the think time recorded in the
script.
Note: If you select this option, you may need to increase the number of
Vusers in your scenario in order to reach your target.
Goal Profile Name The goal profile name.
Load Behavior tab Enables you to specify how and when the Controller should reach the target.
Ramp Up. How the Vusers should start running.
lAutomatic. The Controller starts running the default number of Vusers in a
batch, that is, 50 Vusers every two minutes. If the maximum number of
Vusers defined is less than 50, then it runs all the Vusers.
lReach target X after. The amount of scenario time after which Controller
should reach the target.
lStep up by. How rate at which the Controller should reach the target (x
number of Vusers/hits/pages every x amount of time). (Not available for the
Transactions per Second and Transaction Response Time goal types.)
Load Preview
graph
A graphical representation of the goal and load behavior defined for the
scenario.
Scenario Settings
tab
Enables you to specify the actions to take when the target is reached, or if the
target is not reached:
lRuntime. The amount of time (in hours, minutes, and seconds) to run the
scenario after the target has been reached.
User Guide
Controller
HP LoadRunner (12.50) Page 1094
lIf target cannot be reached. The action to be taken if the target cannot be
reached.
lReceive Notification. If selected, the Controller sends an error message
indicating that the target could not be reached.
Group Information Dialog Box
This dialog box displays details about the selected Vuser group, and enables you to modify the group's
settings.
To access Manual Scenario > Design tab > Scenario Groups pane > Details
Important information lRelevant for manual scenarios in Vuser group mode only.
lAvailable when a group is selected in the Scenario Groups pane.
Relevant Tasks l"How to Design a Manual Scenario" on page1081
l"How to View/Modify Scripts in the Scenario" on page1083
User interface elements are described below:
UI Element Description
Updates script settings as follows:
lScript. If a script was modified during a scenario run, updates the script
details in the scenario.
lRuntime Settings. If you modified a script's runtime settings from the
Controller, restores the initial runtime settings.
Opens VuGen where you can view and edit the script. For more information
on editing scripts, see "Enhancing a Script for Load Testing Overview" on
page320.
Opens the runtime settings dialog box, where you can edit the Vuser script's
runtime settings.
When you modify the runtime settings from the Controller, LoadRunner runs
the script using the modified settings. To restore the initial settings
previously set using VuGen, click the Refresh button and select Runtime
Settings.
Command Line The command line options to use when running the script.
Example: -x value -y value.
For information about passing command line argument values to a script,
User Guide
Controller
HP LoadRunner (12.50) Page 1095
UI Element Description
see "How to Enhance a Java Script" on page548.
Files tab Displays all files used by the script, including the configuration settings file,
the init, run, and end portions of the script, the parameterization definitions
file, and the .usr file.
lTo exclude a file from the list, clear the check box adjacent to it.
lTo add a file or folder used by the script, click the Add button.
Note: To run Visual C++ Vusers on a remote load generator, you
must add the .dll of the Vuser to this list.
lYou can delete the files that you add, but not the other files listed.
Group Name The name of the Vuser group.
To modify, type a new name in the Group Name box. The name is limited to a
maximum of 55 characters.
Load Generator Name The load generator assigned to the Vuser group.
To add a load generator to this list, select Add from the list. For user
interface details, see "Add New Load Generator/Load Generator Information
Dialog Box" on page1127.
Rendezvous tab Displays the rendezvous points defined for the selected script.
Script The name, path, and type of the Vuser script selected for the Vuser group.
Vusers tab Displays all Vusers associated with the selected script.
Multiple Runtime Settings Mode Dialog Box
This dialog box enables you to select the mode for modifying runtime settings of multiple selected
scripts.
To access Use one of the following:
lIn the Scenario Groups/Scripts pane, right-click a multiple selection of scripts, and
select Runtime Settings
lRight-click a Vuser group that includes multiple scripts and select Runtime Settings
Important
information
lIf one of the selected scripts does not support shared runtime settings, then you
will only have the option of modifying each script's individual runtime settings
(Individual RTS).
lShared RTS mode is disabled for GUI or Astra LoadTest Vusers.
User Guide
Controller
HP LoadRunner (12.50) Page 1096
lSome runtime settings cannot be modified in Shared RTS mode. These settings will
not appear in the runtime settings window. To modify them, open the runtime
settings for each individual script.
The following nodes will not appear in Shared RTS mode:
lRun Logic node - for protocols which support the Run Logic node, the Iterations
box appears in the Pacing node
lAdditional Attributes node
lInternet Protocol:ContentCheck node
lJava Environment Settings:Classpath node
lNodes with tables in the format Property, Value for the protocols: Citrix ICA,
Oracle NCA, and WAP Forexample: Oracle NCA:Client Emulation node
Relevant
tasks
"How to View/Modify Scripts in the Scenario" on page1083
User interface elements are described below:
UI
Element
Description
Individual
RTS
Opens a separate runtime settings dialog box (one at a time) for each selected script. In
this mode, you modify each script's settings individually.
Shared
RTS
Opens the runtime settings Shared Mode dialog box containing all of the runtime
settings in blank mode. In this mode, any settings that are change are applied to all
selected scripts. All other runtime settings remain unchanged.
See Important information above.
New Scenario Dialog Box
This dialog box enables you to create a new scenario and select Vuser scripts or test modules to run in
the scenario.
To access Controller toolbar > New Scenario
Important
information
Before you create a scenario, you should have a good idea as to the type of scenario
you want to create. See "Introducing Controller" on page1049.
Relevant
tasks
l"How to Design a Manual Scenario" on page1081
l"How to Design a Goal-Oriented Scenario" on page1079
User interface elements are described below:
UI Element Description
User Guide
Controller
HP LoadRunner (12.50) Page 1097
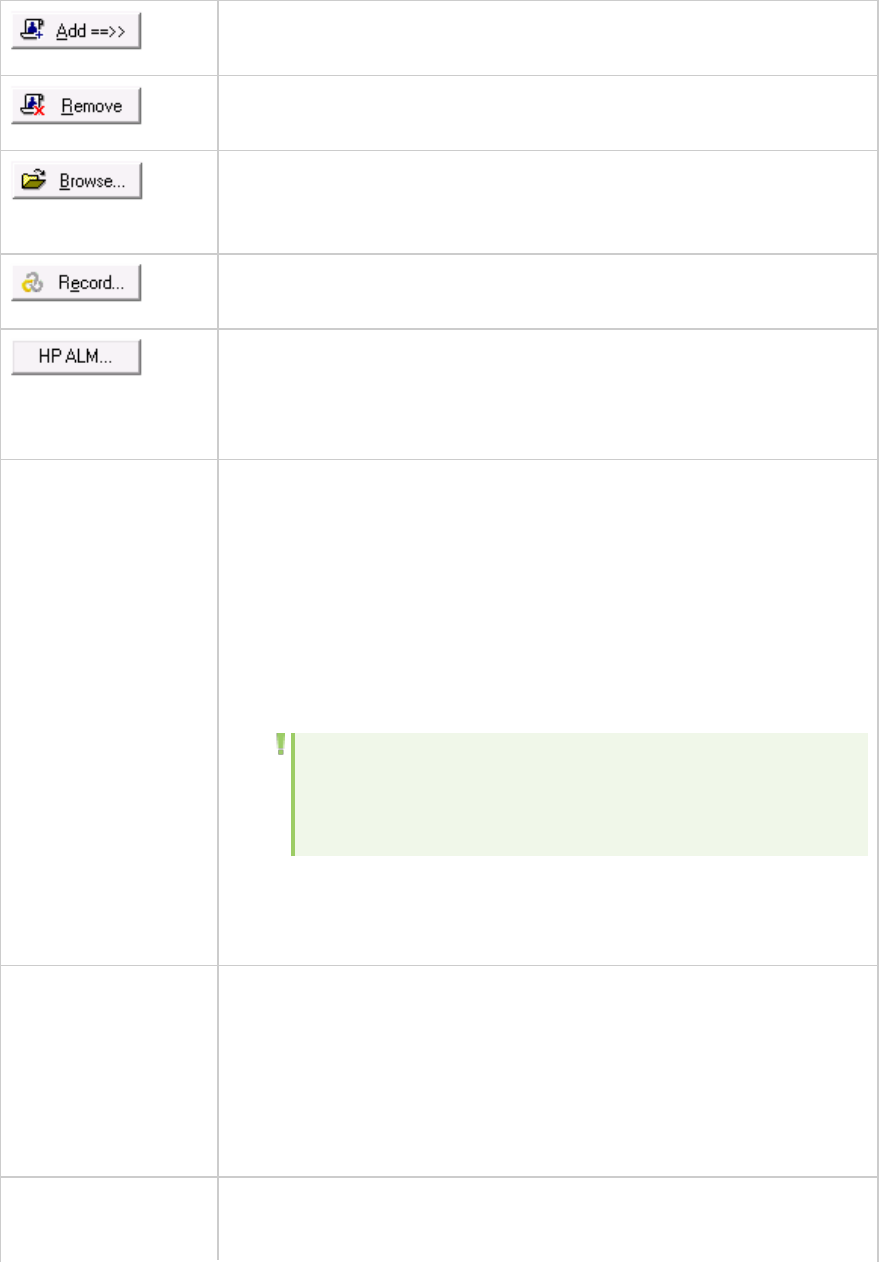
Moves the selected item in the Available Scripts/Modules box to the
Scripts/Modules in Scenario box.
Removes the selected script or module from the Scripts/Modules in
Scenario box.
Enables you to add items to the list of available scripts or unit tests. Scripts
have a .usr extension, while unit tests can have a .dll,.jar, or .class
extension.
Opens VuGen so that you can record a Vuser script. For details, see "How to
Record a Vuser Script" on page144.
Opens the Connection to HP ALM dialog box, where you can connect to
Application Lifecycle Management to download scripts.
For details, see "Managing Scenarios Using Application Lifecycle
Management - Overview" on page1268.
Select Scenario Type Select the type of scenario to create. For details, see "Introducing
Controller" on page1049.
lManual Scenario. You manually build the scenario creating Vuser groups
and specifying the script, load generators, and the number of Vusers to
include in each Vuser group.
lUse the Percentage mode... You define the total number of Vusers to
be used in the scenario and assign a percentage of the total number
of Vusers to each Vuser script.
Note: You can convert from one scenario mode to another at
any time. For details, see "How to Change the Scenario Mode
(Manual Scenario)" on page1083.
lGoal-Oriented Scenario. You define the goals you want your test to
achieve, and LoadRunner automatically builds a scenario for you, based
on these goals.
Test Scripts/
Test Modules
The type of test to use in the scenario:
lLoadRunner Scripts. LoadRunner Vuser scripts created with VuGen.
lSystem or Unit Tests. NUnit, JUnit, or Selenium test modules created
within an external application, such as Visual Studio or Eclipse. These
must be files with .dll,.jar, or .class extensions.
The Browse button allows you to locate the appropriate type of test.
Select the script(s)
you would like to use
(Optional) Select the scripts to use in the scenario.
lAvailable Scripts/Modules. Lists the fifty most recently used items.
User Guide
Controller
HP LoadRunner (12.50) Page 1098

in your scenario lScripts/Modules in Scenario. Lists the items selected for the scenario.
Click Add/Remove to move selected items between the two lists.
Note: You can change the maximum number of scripts or modules
displayed in the Available Scripts/Modules box by modifying the
following registry key:
lFor scripts: HKEY_CURRENT_USER\Software\Mercury
Interactive\RecentScripts\max_num_of_scripts
lFor system and unit tests: HKEY_CURRENT_USER\Software\Mercury
Interactive\RecentModules\max_num_of_scripts
Show at startup When selected, the New Scenario dialog box is displayed upon opening the
Controller.
Note: This option can also be enabled/disabled from the
Controller's View menu. Select View > Show New Scenario Dialog.
Scenario Goal Pane
This pane displays the goals defined for the scenario.
To access Goal-oriented scenario > Design tab
Important
information
lAvailable for goal-oriented scenarios only.
lThe goal profiles include the type of goal, the minimum and maximum number of
Vusers that should be used in the scenario, the duration of the scenario, and the
load behavior.
Relevant
tasks
"How to Design a Goal-Oriented Scenario" on page1079
User interface elements are described below:
UI Element Description
Opens the Edit Scenario Goal dialog box, where you set the goals for the
scenario. See "Edit Scenario Goal Dialog Box" on page1093.
Goal The defined goal, including the type of goal and the expected target.
Goal Profile Name The name of the goal profile.
User Guide
Controller
HP LoadRunner (12.50) Page 1099
Load Behavior How and when the Controller should reach the defined goal.
Load Preview graph A graphical representation of the goal and load behavior defined for the
scenario.
Max Number of
Vusers
The maximum number of Vuser to run in the scenario.
Min Number of
Vusers
The minimum number of Vuser to run in the scenario.
Scenario Duration The amount of time the scenario should continue running after reaching the
defined goal.
Scenario Groups/Scripts Pane - Manual Scenarios
This pane displays the Vuser groups/scripts that were added to the scenario.
To access Manual Scenario > Design tab
Important
information
The Design tab displays the Scenario Groups pane where you can define Vuser groups
to run Vuser scripts in a scenario. It lists all Vuser groups, together with the script or
module path, and the load generators. You define the number of Vusers per group in
one of two ways:
lVuser group mode. The actual number of Vusers assigned to the group. (default).
lPercentage mode: The percentage of the total number of Vusers, assigned to the
group.
Note: You can change from one scenario mode to another at any time. For
details, see "How to Change the Scenario Mode (Manual Scenario)" on
page1083.
Relevant
tasks
l"How to Design a Manual Scenario" on page1081
l"How to Change the Scenario Mode (Manual Scenario)" on page1083
See also "Introducing Controller" on page1049
User interface elements are described below (unlabeled elements are shown in angle brackets):
UI Element Description
Start Scenario. Starts running the scenario.
Virtual Users. Opens the Vusers dialog box where you can define properties for
User Guide
Controller
HP LoadRunner (12.50) Page 1100
UI Element Description
individual Vusers within a group. You can assign a different script or module, and
load generator to each Vuser.
For user interface details, see "Vusers Dialog Box" on page1109.
Add Group.
lVuser group mode: Opens the Add Group dialog box where you create Vuser
groups for the scenario. See "Add Group Dialog Box" on page1087.
lPercentage mode: Opens the Add Script dialog box where you select Vuser
scripts for the scenario. See "Add Script Dialog Box" on page1088.
Remove Group. Deletes the selected Vuser group/script.
Runtime Settings. Opens the runtime settings dialog box.
lWhen you modify the runtime settings from the Controller, LoadRunner runs
the script using the modified settings. To restore the initial settings that were
assigned in VuGen, click the Refresh button and select Runtime Settings.
lIf runtime settings were not defined in VuGen for the current script, the
Controller uses default settings for Log and Think Time. Default VuGen settings
are displayed for all other nodes.
Details. Opens the Group/Script Information dialog box where you can view and
modify the Vuser group/script's settings.
For details, see "Group Information Dialog Box" on page1095 or "Script
Information Dialog Box" on page1106.
View Script. Opens the script in VuGen where you can view and edit the Vuser
script. For more information on editing scripts, see "Enhancing a Script for Load
Testing Overview" on page320.
Service Virtualization. Opens the Service Virtualization dialog box. For more
information, see the HPService Virtualization User Guide.
<Groups/Scripts
table>
Displays the following information about the Vuser groups/scripts selected for the
scenario:
l.Indicates that the Vuser group/script is participating in the scenario.
lGroup/Script Name.The name of the Vuser group/script.
lScript Path. The path of the Vuser script. An icon adjacent to the path, indicates
whether the entry is a Vuser script , a unit test module , such as .NET or
Java, or a UFT/QTP test .
If the Vuser group includes more than one script, the scripts' names are listed.
Clicking the cell's drop-down arrow displays the scripts' full paths.
User Guide
Controller
HP LoadRunner (12.50) Page 1101
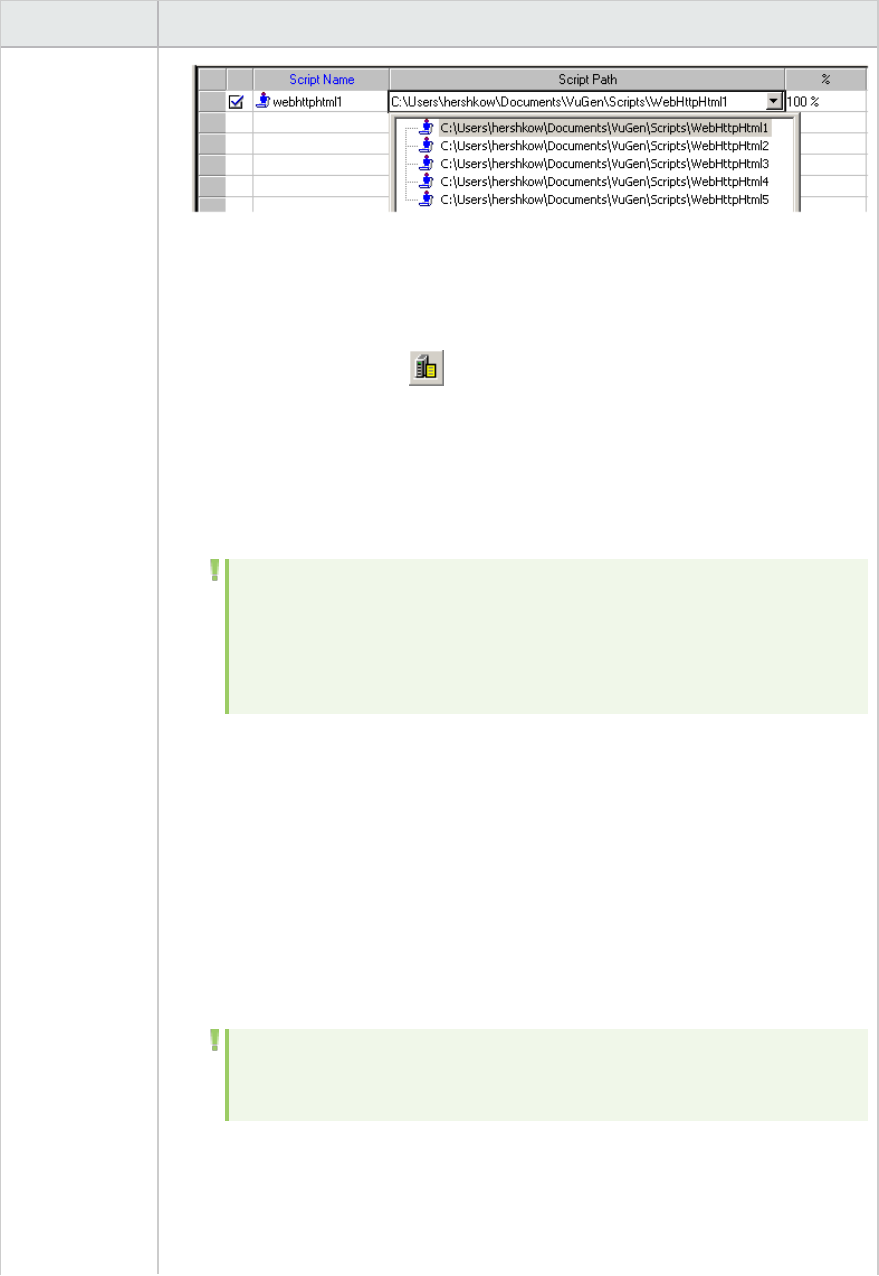
UI Element Description
If you want to access the script from a location that is relative to the current
scenario folder, you can replace the actual path with the relative path. For
details, see "Relative Paths for Scripts" on page1085.
lVirtual Location. A drop-down list of all available network virtualization
locations for the group. A icon next to the virtual location name indicates
that the script is run according to the per Load Generator mode. For more
information on the modes available for network virtualization, see "Per Group
vs Per Load Generator" on page1373. To run this group without network
virtualization, select None. Click Browse to open the Network Virtualization
Settings dialog box.
Note: This list is only available when the HP Network Virtualization
software is installed. This column does not appear if you disable
network virtualization. To enable network virtualization or edit the
locations, see "Virtual Locations Settings Dialog Box" on page1371.
lQuantity. (Vuser group mode) The number of Vusers assigned to the Vuser
group.
This column is read-only when the defining a real-world schedule (default
schedule). In this case, the quantity of Vusers is defined when designing the
scenario schedule.
l%. (Percentage mode) The percentage of Vusers assigned to run the Vuser
script.
If you modify the percentage assigned to one group, the percentages assigned
to the other scripts change to create a total of 100% for all of the Vuser scripts.
Note: Modify percentages to the scripts starting with the first script in
the list and moving down the list.
lLoad Generators. The load generators assigned to the Vuser group/script.
If you select multiple load generators for a group/script, the Vusers assigned to
the Vuser group/script are distributed evenly among the load generators.
Default value (in percentage mode): All Load Generators
User Guide
Controller
HP LoadRunner (12.50) Page 1102
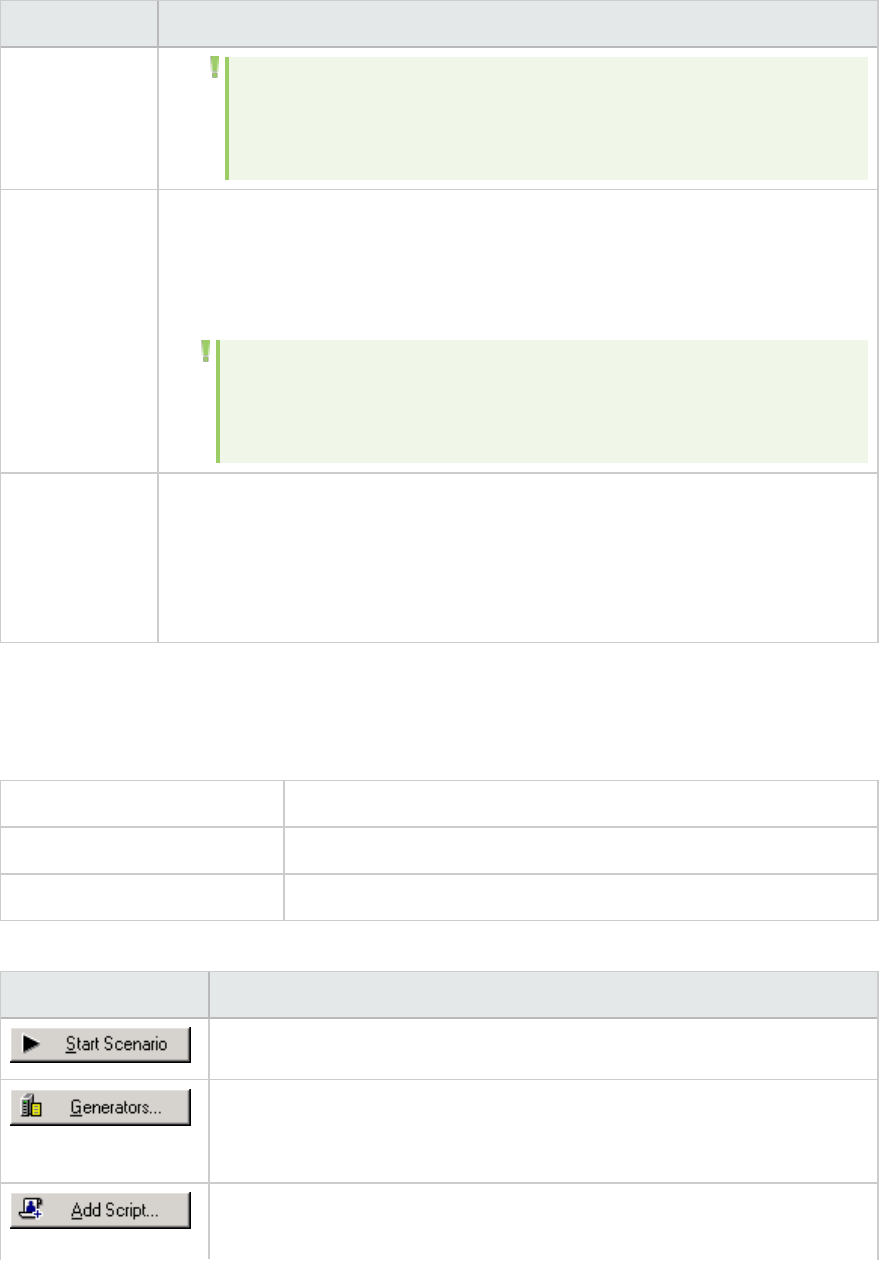
UI Element Description
Note: To add a load generator to this list, select Add from the list. For
more details, see "Add New Load Generator/Load Generator
Information Dialog Box" on page1127.
<Groups/Scripts
table>
(continued)
lLoad Generators. The load generators assigned to the Vuser group/script.
If you select multiple load generators for a group/script, the Vusers assigned to
the Vuser group/script are distributed evenly among the load generators.
Default value (in percentage mode): All Load Generators
Note: To add a load generator to this list, select Add from the list. For
more details, see "Add New Load Generator/Load Generator Information
Dialog Box" on page1127.
<Right-click
menu>
lAuto Sort. When adding a Vuser group/script, automatically sorts the table
according to the defined sort.
lSort Groups/Scripts. Enables you to sort the table by Vuser group/script name,
script path, quantity/percentage of Vusers, or load generator. To sort the table
in ascending/descending order, click the relevant table heading.
Scenario Scripts Pane - Goal-Oriented Scenarios
This pane lists the Vuser scripts selected for the goal-oriented scenario.
To access Goal-oriented scenario > Design tab
Relevant tasks "How to Design a Goal-Oriented Scenario" on page1079
See also "Introducing Controller" on page1049
User interface elements are described below (unlabeled elements are shown in angle brackets):
UI Element Description
Starts running the scenario.
Opens the Load Generators dialog box where you can add new load
generators and view details about existing load generators. See "Load
Generators Dialog Box" on page1144.
Opens the Add Script dialog box where you can select Vuser scripts to add to
the scenario. See "Add Script Dialog Box" on page1088.
User Guide
Controller
HP LoadRunner (12.50) Page 1103
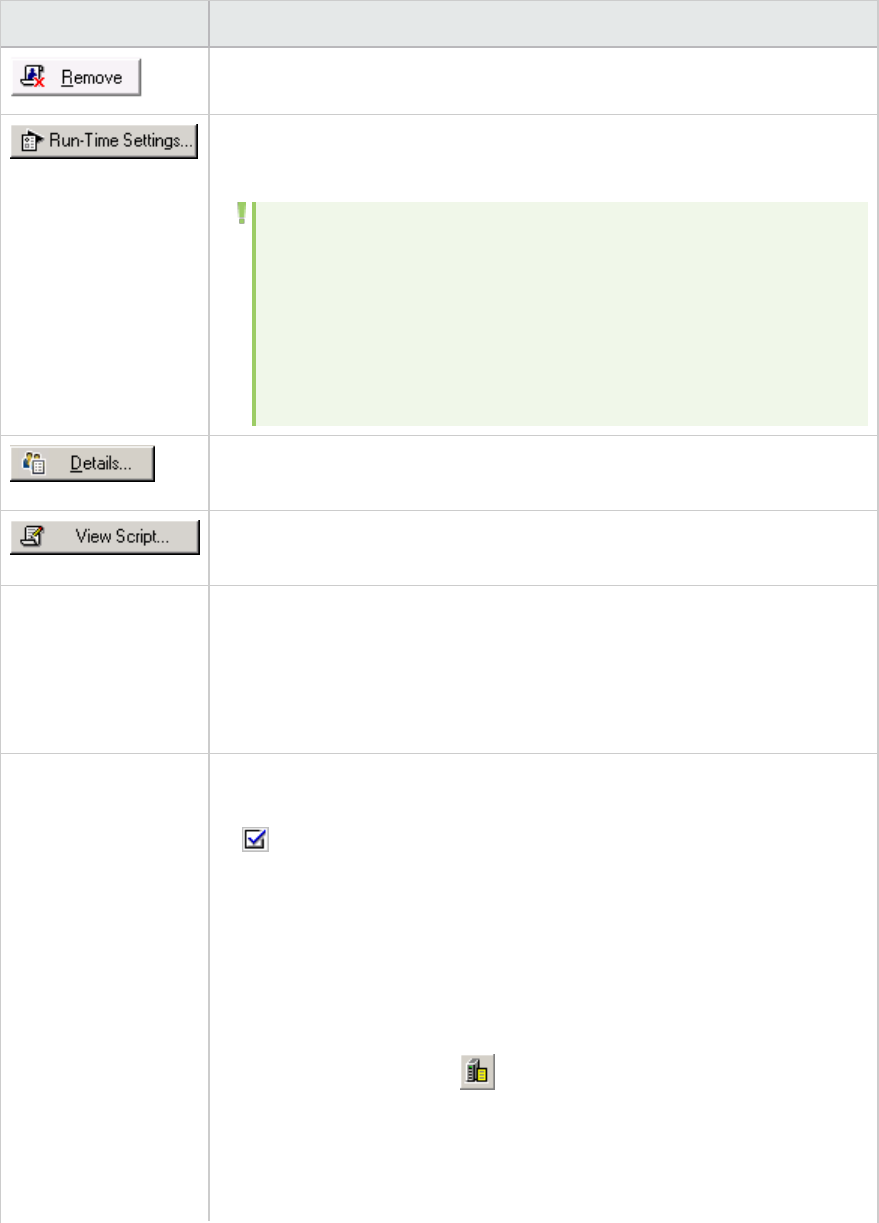
UI Element Description
Deletes the selected Vuser script.
Opens the runtime settings dialog box, where you can edit the Vuser script's
runtime settings.
Note:
lWhen you modify the runtime settings from the Controller,
LoadRunner runs the script using the modified settings.
lIf runtime settings for a script were not defined in VuGen, the
Controller displays its own default settings for Log and Think
Time. Default VuGen settings are displayed for all other nodes.
Opens the Script Information dialog box where you can view the Vuser
script's settings. See "Script Information Dialog Box" on page1106.
Opens the script in VuGen where you can view and edit the Vuser script. For
more information on editing scripts, see "Scripting Options" on page111.
<Right-click menu> lAuto Sort. When adding a script, automatically sorts the table according
to the defined sort.
lSort Scripts. Enables you to sort the table by Vuser script name, script
path, percentage of Vusers, or load generator. To sort the table in
ascending/descending order, click the relevant table heading.
<Scripts table> Displays the following information about the Vuserscripts selected for the
scenario:
l. Indicates that the script is participating in the scenario.
lScript Name. The name of the Vuser script.
lScript Path. The path of the Vuser script. If you want to access the script
from a location that is relative to the current scenario folder, you can
replace the actual path with the relative path. For details, see "Relative
Paths for Scripts" on page1085.
lVirtual Location. A drop-down list of all available network virtualization
locations for the group. A icon next to the virtual location name
indicates that the script is run according to the per Load Generator mode.
For more details, see "Per Group vs Per Load Generator" on page1373. To
run this script without network virtualization, select None. Click Browse to
open the Network Virtualization Settings dialog box.
User Guide
Controller
HP LoadRunner (12.50) Page 1104
UI Element Description
Note: This list is only available when the HP Network Virtualization
software is installed. This column does not appear if you disable
network virtualization. To enable network virtualization or edit
the locations, see "Virtual Locations Settings Dialog Box" on
page1371.
l% of Target. The percentage of the overall target number of Vusers,
pages per minute, hits per second, transactions per second, or
transaction response time that is automatically distributed to each Vuser
script.
lLoad Generators. The load generators assigned to the script. If you select
multiple load generators for a script, the Vusers assigned to the script are
distributed evenly among the load generators.
Default value: All Load Generators
Note: To add a load generator to this list, select Add from the list.
For more details, see "Add New Load Generator/Load Generator
Information Dialog Box" on page1127.
Scenario Start Time Dialog Box
This dialog box enables you to set when the scenario will start.
To
access
Goal-oriented scenario > Design tab > Scenario Schedule pane> Scenario Start Time
button.
User interface elements are described below:
UI Element Description
Without delay Starts the scenario as soon as the Start Scenario command is issued.
With a delay of
HH:MM:SS
Starts the scenario the specified time after the Start Scenario command is
issued.
At HH:MM:SS on <date> Starts the scenario at a specified time on a specified date.
User Guide
Controller
HP LoadRunner (12.50) Page 1105
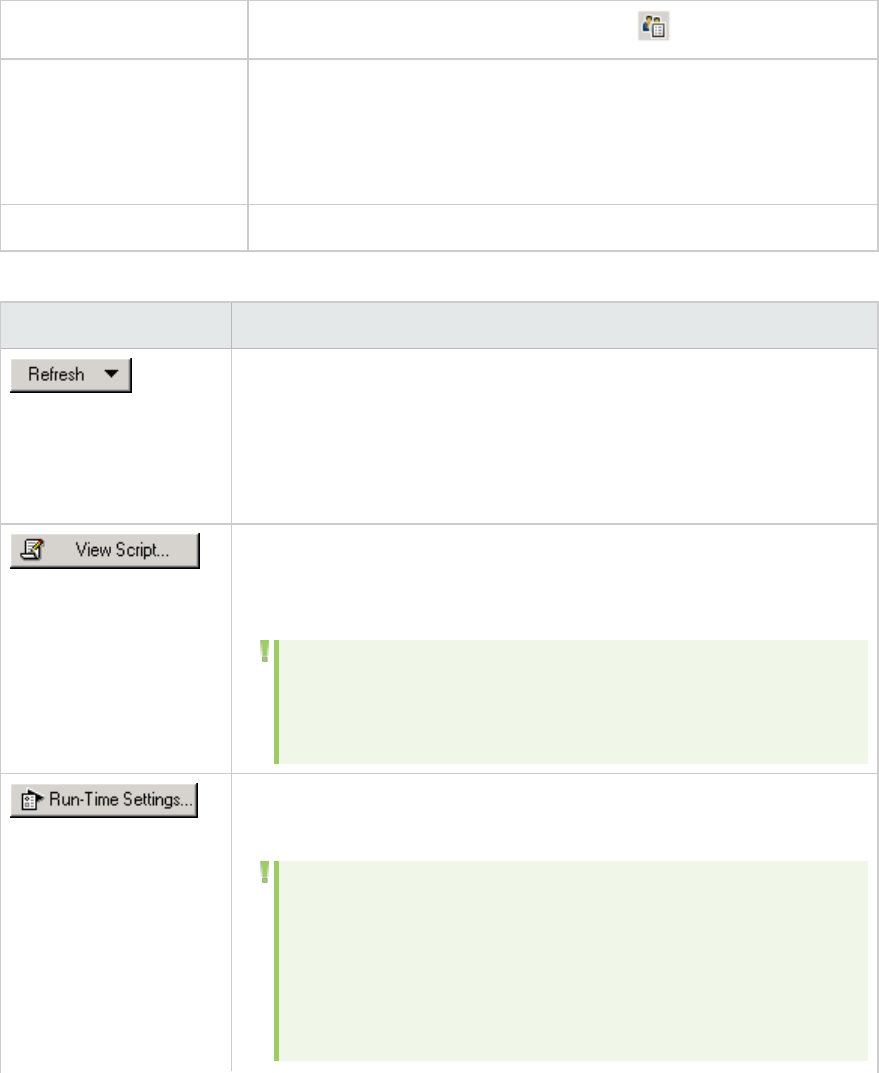
Script Information Dialog Box
This dialog box displays details about the selected Vuser group, and enables you to modify the group's
settings.
To access Design tab > Scenario Scripts pane > Details
Important information Available when a script is selected in the Scenario Scripts pane.
Relevant to:
lManual scenarios in percentage mode
lGoal-oriented scenarios
Relevant tasks l"How to View/Modify Scripts in the Scenario" on page1083
User interface elements are described below:
UI Element Description
Updates script settings as follows:
lScript. If the script was modified during a scenario run, updates the
script details in the scenario.
lRuntime Settings. If you modified the runtime settings from the
Controller, restores the initial runtime settings.
Opens VuGen where you can view and edit the script. For more
information on editing scripts, see "Enhancing a Script for Load Testing
Overview" on page320.
Note: If you use VuGen to make changes to a script while the
Controller is running, click Refresh and select Script to update the
script details in the scenario.
Opens the runtime settings dialog box, where you can edit the Vuser
script's runtime settings.
Note:
lWhen you modify the runtime settings from the Controller,
LoadRunner runs the script using the modified settings. To
restore the initial settings previously set using VuGen, click the
Refresh button and select Runtime Settings.
User Guide
Controller
HP LoadRunner (12.50) Page 1106
UI Element Description
lIf runtime settings for a script were not defined in VuGen, the
Controller displays its own default settings for Log and Think
Time. Default VuGen settings are displayed for all other nodes.
Opens the "Virtual Locations Settings Dialog Box" on page1371. This
dialog box lets you enable Network Virtualization, or change the working
mode (Per Group or Per Load Generator). It also provides a link to the
Network Virtualization software screens, allowing you to configure the
virtualization properties.
Command Line The command line options to use when running the script.
Example: -x value -y value.
For information about passing command line argument values to a script,
see "How to Enhance a Java Script" on page548.
Files tab Displays all files used by the script, including the configuration settings
file, the init, run, and end portions of the script, the parameterization
definitions file, and the .usr file.
lTo exclude a file from the list, clear the check box adjacent to it.
lTo add a file or folder used by the script, click the Add button.
Note: To run Visual C++ Vusers on a remote load generator, you
must add the .dll of the Vuser to this list.
lYou can delete the files that you add, but not the other files listed.
Rendezvous tab Displays the rendezvous points defined for the selected script.
Script The name, path, and type of the selected Vuser script.
Vusers tab Displays all Vusers associated with the selected script.
Vuser Information Dialog Box
This dialog box displays details about a specific Vuser in a group, and lets you modify the load generator
and script settings for the Vuser.
To access Use one of the following:
User Guide
Controller
HP LoadRunner (12.50) Page 1107
lManual scenario > Designtab > ScenarioGroupspane > Vusers >
lIn Vusers dialog box, double-click Vuser.
Relevant
tasks
l"How to View/Modify Scripts in the Scenario" on page1083
l"How to Run a Scenario" on page1228
User interface elements are described below:
UI Element Description
Enables you to add Vuser scripts to the list of scripts.Note: To add a VB Vuser
script, select the .usr file.
Opens VuGen where you can record a Vuser script. For more information on
recording Vuser scripts, see "How to Record a Vuser Script" on page144.
Opens the runtime settings dialog box, where you can edit the Vuser script's
runtime settings.
Note:
lModifying the runtime settings for one Vuser modifies the
runtime settings for all the Vusers in the group that are using the
same script.
lWhen you modify the runtime settings from the Controller,
LoadRunner runs the script using the modified settings.
lIf runtime settings for a script were not defined in VuGen, the
Controller displays its own default settings for Log and Think
Time. Default VuGen settings are displayed for all other nodes.
Opens the Parameter list in VuGen where you can create, view, modify, and
delete Vuser script parameters. For details, see "Parameterizing Overview"
on page341.
Group Name The name of the group to which the selected Vuser belongs.
Load Generator
Name
The load generator assigned to the Vuser's Vuser group.
To add a load generator to this list, select Add from the list. For user
interface details, see "Add New Load Generator/Load Generator Information
Dialog Box" on page1127.
Select Script Lists the available scripts that have been added to the scenario. When you
select a script, its name and path are displayed above the list.
To display the scripts with their full paths, right-click the list area and select
User Guide
Controller
HP LoadRunner (12.50) Page 1108
Show Paths.
Vuser Name The name of the selected Vuser.
Vusers Dialog Box
This dialog box displays the status of the Vusers in the selected Vuser group.
To access Manual scenario > Design tab > Scenario Groups pane > Vusers
Relevant tasks l"How to Run a Scenario" on page1228
l"Control Vusers During a Scenario Run - Use-Case Scenario" on page1231
User interface elements are described below (unlabeled elements are shown in angle brackets):
UI Element Description
Show Vuser Log. Displays a log containing runtime information about the Vuser
that is refreshed, by default, every 1000 milliseconds. For more information, see
"Vuser Script Log" on page1252.
Hide Vuser Log. Closes the Vuser log.
Starts running the selected Vuser.
Instructs the Controller to complete the current iteration or action before
stopping the Vuser.
Note: This option is only available when the Vuser is in the Run state, and
if you selected the Wait for the current iteration to end before exiting
or Wait for the current action to end before exiting option in the
runtime settings tab of the Options dialog box.
Stops running the selected Vuser immediately.
Resets the status of the Vuser to Down.
Opens the Vuser Information dialog box, where you can view details about the
selected Vuser.
Opens the Add Vusers dialog box where you can add more Vusers to the Vuser
group.
User Guide
Controller
HP LoadRunner (12.50) Page 1109
Refreshes the contents of the columns in the Vuser list. This is relevant when you
make changes outside of this window. The changes may be in the group or test
information or, when working with network virtualization, updating the virtual
location.
<Filter by
script>
Filters the Vusers table by the selected script.
<Filter by
status>
Filters the Vusers table by the selected Vuser status. For details, see "Vuser
Statuses" on page1086.
<Right-click
menu>
lFilter Vusers. Enables you to filter the Vuser list by Vuser status.
lRenumber. Renumbers the list of Vusers in sequential order, starting from 1.
lSort Vusers. Enables you to sort the table by a selected column. To sort the
table in ascending/descending order, click the relevant table heading.
<Vusers table> Displays the following information about the Vusers:
lID. The Vuser's ID number
lStatus. The Vuser's status. For details, see "Vuser Statuses" on page1086.
lScript. The script run by the Vuser.
lVirtual Location. The virtual location being emulated (read-only). This column
is only visible when Network Virtualization is enabled and set to Per Load
Generator mode. For details, see "Virtual Locations Settings Dialog Box" on
page1371.
lLoad Generator. The load generator on which the Vuser is running.
lElapsed Time. Amount of time that elapsed in the scenario since the Vuser
began running.
Load Generators
Load Generators - Overview
Load generators are the machines that run the Vuser scripts in your scenarios. Each Vuser script that
runs on a load generator results in a single Vuser. Each load generator can run multiple Vuser scripts,
thereby resulting in multiple Vusers. While these Vusers run, they create load on your system, enabling
you to analyze your system under load.
Creating a load generator
To create a load generator, you install LoadRunner's Load Generator software on a host computer. Load
generators can be either Windows-based or Linux-based. For details on how to install the appropriate
Load Generator software, see the LoadRunner Installation Guide.
User Guide
Controller
HP LoadRunner (12.50) Page 1110
Calculating the number of load generators
To estimate the number of load generators that are needed to run a Vuser script, use the Tools > Load
Generator Calculator.
Including load generators in a scenario
After you have installed the Load Generator software on a host computer to create a load generator,
you can include the new load generator in a scenario. You use the Controller to add the new load
generator to a scenario.
In order to enable a scenario to develop significant load on a system, a typical scenario may include
multiple load generators. You define and maintain the list of load generators that are available in a
scenario. When you add a load generator to the list of load generators in a scenario, you define various
attributes of the load generator, such as the platform on which the load generator runs. You can modify
some - but not all - of these attributes after the load generator is created.
Status of a load generator
The Controller's Load Generators dialog box shows the status of each load generator in a scenario. The
status of a load generator changes during a scenario run. For example, when you add a load generator
to the list of load generators in a scenario, the load generator has the status Down. The status of the
load generator changes to Ready when the load generator is connected to the Controller and is
available to run Vuser scripts, and then to Running while the load generator executes a Vuser script. For
a full list of load generator statuses, see "Load Generators Dialog Box" on page1144.
Load generator configuration
In order to create and run accurate real-life scenarios, you can configure numerous settings for each
load generator that is included in a scenario. For details on how to modify these settings, see "How to
Modify Load Generator Settings" on page1124.
Local vs. cloud-based load generators
A load generator can be located on either a local computer or in the cloud. A scenario can include both
local and cloud-based load generators. The procedure for defining and maintaining load generators is
similar for local and cloud-based load generators. For details on cloud-based load generators, see
"Adding a Cloud-Based Load Generator - Overview" on the next page.
Enabling and disabling a load generator
If a specific load generator is included in the list of load generators for a scenario, but is temporarily
unavailable for a particular scenario run, you can disable the load generator instead of removing it
permanently from the list. You can then enable the load generator if and when it becomes available.
lFor details on how to add a load generator to a scenario, see "How to Add a Load Generator to a
Scenario" on page1113.
lTo set attributes for a specific load generator, see "Add New Load Generator/Load Generator
Information Dialog Box" on page1127.
lSee "Setting up a Load Generator Environment" on page1125 for guidelines on how to set up the
environment of your load generators.
User Guide
Controller
HP LoadRunner (12.50) Page 1111
lTo set global settings that apply to all the load generators participating in the scenario, see "Options
Dialog Box" on page1211.
Note: The LoadRunner standalone Load Generator (LG SA) and standalone Monitor over Firewall
(MOFW SA) cannot be installed on the same machine. However, LG SA can be used for monitoring
purposes, the same way as the MOFW SA. Note that a single machine cannot be used
simultaneously for both running Vusers and monitoring.
Adding a Cloud-Based Load Generator - Overview
This topic discusses adding cloud-based load generators to a scenario. When you add a cloud-based
load generator to a scenario, you can add either a new load generator, or a load generator that already
exists in a cloud account.
Adding a new cloud-based load generator to a scenario
The process of creating a new load generator in a cloud account is known as provisioning the load
generator. When you provision a new load generator, the Load Generator software that is required to
create the new load generator is installed by the Controller in the cloud. To perform this installation, the
Controller uses an "image" of the required load generator. To create the new load generator, you can
use either the image that is contained in the default system configuration, or you can specify an
alternative image that is included in a custom configuration.
Note: You can choose to provision either a single load generator or to simultaneously provision
multiple load generators with the same configuration.
Adding an existing cloud-based load generator to a scenario
When you add an existing cloud-based generator to a scenario, you select the account containing
existing load generator machines.The Controller then connects to the account and lists all machines
associated with that account—not just the load generator machines. You determine which machines
are load generators by looking at their images. You then select one or more load generator machines to
include in the scenario.
Removing a load generator at the end of a scenario run
You can specify what should happen to load generators at the end of a scenario. The options are to
either leave the load generator intact, or to delete the load generator from the cloud. These options
apply whether the scenario run ended successfully or failed.
User Guide
Controller
HP LoadRunner (12.50) Page 1112
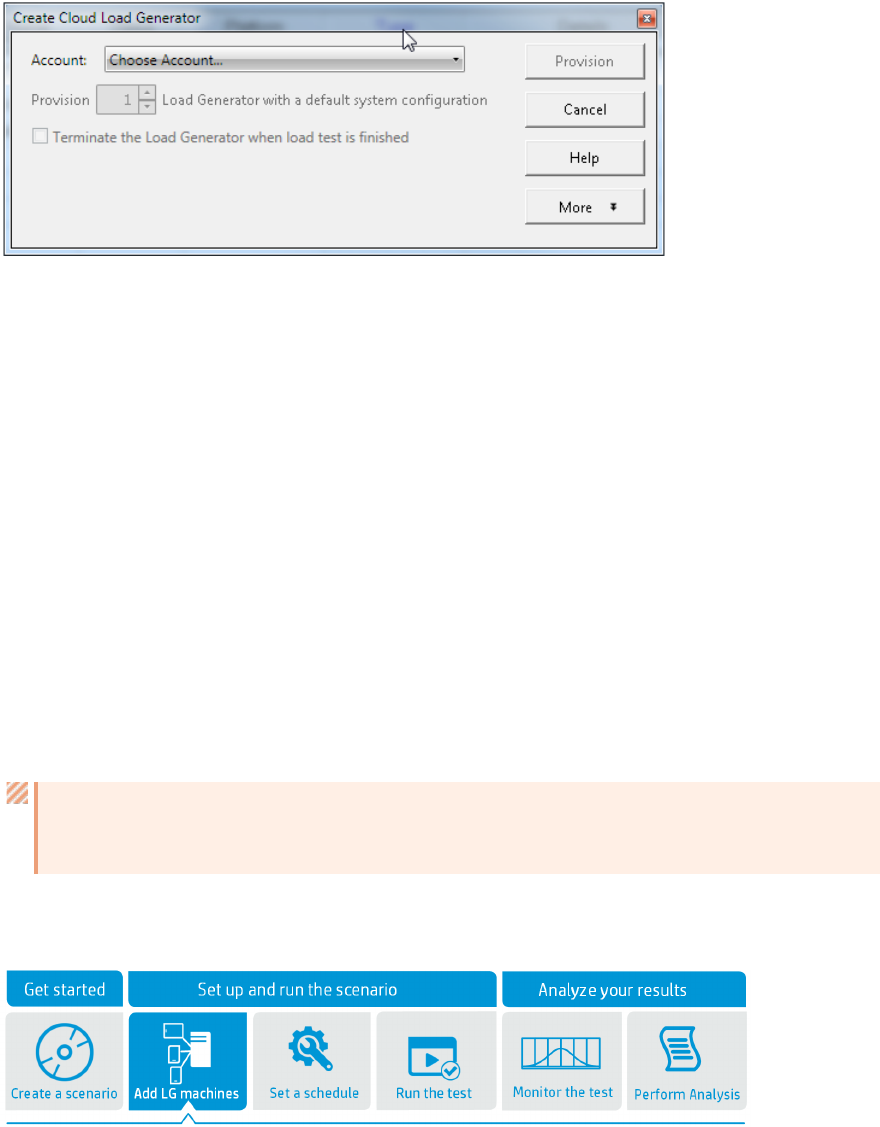
Removal of a load generator at the end of a scenario varies slightly depending on whether the scenario
run was successful or failed:
lIf the scenario was successful, the load generator is terminated as soon as the scenario ends.
lIf the scenario failed, the load generator is terminated at the time specified in the Manage Cloud
Accounts dialog box. For details on the cloud account settings, see "Managing Cloud Accounts -
Overview" on page1119.
Cloud accounts
Before you can add a cloud-based load generator to a scenario, you must have access to a cloud
account. For details on to make a cloud account available, see "How to Manage Cloud Accounts" on
page1122.
lFor details on how to add either a local load generator or a cloud-based load generator to a scenario,
see "How to Add a Load Generator to a Scenario" below.
lFor details about the Load Generator configuration tabs, see "Add New Load Generator/Load
Generator Information Dialog Box" on page1127.
Caution: If you intend to run heavy load tests on cloud-based load generators, make sure to
notify the cloud vendor before running the tests.
How to Add a Load Generator to a Scenario
The following steps describe how to add a load generator to a scenario. The procedure varies slightly
depending on whether you are adding an on-premise or cloud-based load generator.
To add load generators to your scenario:
User Guide
Controller
HP LoadRunner (12.50) Page 1113
Open the Load Generators dialog box
In the Design tab, click the Load Generators button . For details, see "Load Generators Dialog Box"
on page1144.
Add a load generator machine
Add a machine using one of the options below:
ladd an on-premise load generator
lprovision a new cloud-based load generator
ladd an existing cloud-based load generator
Add an on-premise load generator
1. Click Add, and enter the details of the load generator. For details, see "Add New Load
Generator/Load Generator Information Dialog Box" on page1127.
2. Click OK. When you add an on-premise load generator, it remains in the Down state until it is
connected.
Provision a new cloud-based load generator
Note: The process of creating a new load generator in a cloud account is known as provisioning
the load generator. You can provision either a single load generator or multiple load generators
with the same configuration. You can use either the default system configuration, or define and
apply a custom configuration.
1. Click Add From Cloud > Provision New LG. The Create Cloud Load Generator dialog box opens. For
details, see "Create Cloud Load Generator Dialog Box" on page1129.
2. From the list of available cloud accounts, select the cloud account which will host the new load
generator. For details on how to add cloud accounts, see "How to Manage Cloud Accounts" on
page1122.
3. Specify the number of load generators to provision.
4. Specify whether or not to remove the load generators at the end of the scenario.
5. The first time you provision load generators (optional for the next time you provision load
generators, since LoadRunner saves the settings) , click More to display the Cloud and Connection
tabs. In subsequent provisioning, LoadRunner uses the connection settings that you last applied to
a load generator, not necessarily a cloud-based machine.
lIn the Machine Settings section, select the relevant settings. These settings differ for each of
the supported cloud providers.The default values are the most popular and commonly used
settings.
User Guide
Controller
HP LoadRunner (12.50) Page 1114

lIn the Connections section, accept the default network profile, or select another one from the
drop-down list. Click the button to open the Network Profile Manager to create a new
profile. For details, see "Network Profile Manager Dialog Box" on page1147. All of the
connection settings will be applied to the new load generators that will be provisioned. For
example, if you specify Port 6080, the load generator will be created on port 6080 and listen on
the same port.
6. Click Provision to provision the specified load generators.
Add an existing cloud-based load generator
1. Click Add From Cloud > Use Existing LG. The Use Cloud Load Generator dialog box opens. For
details, see "Use Cloud Load Generator Dialog Box" on page1135.
2. From the list of cloud accounts, select the cloud account that hosts the desired load generator
machine. For details on how to add cloud accounts, see "How to Manage Cloud Accounts" on
page1122. A list of available load generators is displayed.
3. Select the load generators that you want to add to the scenario in the Available Machines section.
4. Select a Network Profile if you defined them beforehand. The network profile indicates the
connection information for the load generator, such as the connection mode, proxy, and ports. To
create a new network profile, close this dialog box and choose Tools > Network Profile Manager.
For details, see "Network Profile Manager Dialog Box" on page1147. If the network profile that you
chose indicates a different port for an existing load generator (cloud or on-premise), you also need
to manually set it on the load generator machine.
5. Click Add Machine.
Check your machine for Shellshock vulnerability
For Linux load generators, check your machine for the . For details, see "Troubleshooting and
Limitations for Controller" on page1394.
How to Provision Load Generators in the Cloud
This section provides step-by-step instructions on how to provision load generators in the cloud for
LoadRunner tests. Some of the instructions refer to the Amazon EC2 cloud, but you can configure the
parallel settings for HP Helion.
1. Create a cloud account
Make sure that you have a cloud account with one of the supported providers, such as Amazon EC2,
HP Helion, or Microsoft Azure. For details, see http://aws.amazon.com/ec2,
http://www.hpcloud.com, or https://azure.microsoft.com.
2. Create a security group
Asecurity group is a configuration for allowing or disallowing specific traffic to and from a
User Guide
Controller
HP LoadRunner (12.50) Page 1115
machine.
To use load generators on the cloud, you must use a security group allowing load generator
communication. Create a security group in your account management console with a custom TCP
rule that allows inbound traffic on the port used for the communication between the load
generator and the Controller. By default, LoadRunner uses port 54345. This can easily be changed
using a network profile, described below.
The source IP should be Anywhere, unless you will be using a Controller from a specific, single IP
address.
3. Create a key pair - optional
Akey pair is a security measure used for interactive logging in to cloud machines. This is not strictly
required for using load generators on the cloud, but may be useful for cases in which you need to
log into a machine manually, third-party software installation, or local log inspection.
If required, create a key pair in your account management console and save the generated .pem
file.
4. Create an access key
LoadRunner's Controller uses Access keys to communicate with the cloud provider.
For EC2, an access key is composed of an access Key ID and a secret access key. This access key is
different from your EC2 Web Console access credentials and must be created separately.Refer to
the AWS documentation for information on creating an Access Key. Save the access key ID and
secret access key.
For HP Helion, an access key set consists of an access key and secret key. For details, refer to the
HP Helion documentation.
For Microsoft Azure, you need to provide a Subscription ID and path to the relevant certificate file.
For details, refer to the Microsoft Azure documentation.
You are now finished preparing your cloud account.
5. Generate certificates
SSL encryption in used to ensure secure communication between the local LoadRunner Controller
and Load Generator on the cloud machine. You must own a CA certificate file and either a CA
private key file or an SSL certificate file.
To create new certificates, run the gen_ca_cert.exe utility . This process creates two files in the
folder from which the utility was run: the CA Certificate file, used to sign SSL certificates
(cacert.cer), and the CA Private Key, used with the CA certificate to generate an SSL certificate
(capvk.cer). For details, see "How to Create an SSL Digital Certificate" on page1291.
6. Install the certificates
a. In the Controller, select Tools > Authentication Settings.
User Guide
Controller
HP LoadRunner (12.50) Page 1116
b. In the Authentication Settings dialog box, indicate the CA and Private Key or SSL certificates
that you created earlier. For details, see "Authentication Settings Dialog Box" on page1292.
7. Configure the proxy server - optional
If you are using the LoadRunner Controller behind a proxy server (for example, an enterprise proxy
server), the proxy server must be configured to allow communication.
The following ports must be enabled in the CONNECT method:
l443 – Used for communication with Amazon AWS API.
l35357 – Used for communication with HP Helion API.
lThe port (by default 54345) used for communication between the load generator and
Controller. You can configure this with a network profile as described below.
If your environment includes an HTTP 1.0 proxy server using NTLM, make sure to enable the port
defined in the network profile for communication with the load generator machine, in order to
bypass the NTLM authentication.
8. Set the Windows Internet options - only relevant when using a proxy server
Configure the proxy locally in the Windows Internet Options:
a. Open the Windows Internet options (Tools > Internet Options)
b. In the Connection tab, click LAN Settings.
c. Specify your proxy server information.
9. Create a Controller network profile
a. In the Controller select (Tools > Network Profile Manager)
b. In the Network Profile Manager dialog box, click the Add button. Click on an empty line in the
Network Profile Name list and create a new profile. For details, see "Network Profile Manager
Dialog Box" on page1147.
c. Select Use proxy and fill the proxy server details, if required.
d. In the Connection Mode section, optionally specify a different port, to be used for the
Controller's communication with the load generators using this network profile.
10. Add a virtual account
a. In the Controller, select Tools > Manage Cloud Accounts.
b. Enter an account name and select an account provider.
c. Fill in the access credentials, such as the access and secret keys, that you created above. You
can retrieve these keys from the cloud provider's management console.
d. Optionally, specify a time delay to terminate the load generator if collation fails. For details,
see "Manage Cloud Accounts Dialog Box" on page1123.
e. Click Save. LoadRunner validates the credentials against the cloud provider.
User Guide
Controller
HP LoadRunner (12.50) Page 1117
11. Specify load generators - provision new load generators
a. In the Controller's Load Generators dialog, select Add from Cloud > Provision New LG.
b. Fill in the basic information
oSelect the account you created. Machine parameters will be retrieved from the cloud
provider.
oIncreasing the number of load generators allows you to provision more than one machine
with the same parameters.
oTo automatically terminate the machines after the scenario run and after all the data has
been collated, select Terminate the load generator when load test is finished.
c. Click More to specify provider-specific parameters and images. Initially, default parameters
are selected. These parameters are unique for each cloud provider.
oIn the Machine Settings section, select and specify values. All fields are required, except
for Additional Ports. The user name is that of the administrator account used above. You
are now creating a password for the machine to be provisioned. The password should be at
least 8 characters long and contain 3 of the lowercase/uppercase/digit/special symbols.
oIf you are behind a proxy server, or using a non-default communication port, go to the
Connections section and select the network profile created earlier to be used with the
provisioned machines.
d. Verify the provisioning parameters (amount, termination policy, and machine parameters)
before clicking the Provision button.
Once the new cloud machines are started, they will be added to the Controller's Load Generators
list. LoadRunner copies the certificates files to the load generator machine and configures the
communication port. The LoadRunner agent is also configured to check client certificate to ensure
a secure connection, since the machines are publicly available.
During provisioning, the load generator status is In Progress. This status indicates provisioning of
the test machine on the cloud and launching the OS and load generator on this machine. This
process can take a few minutes.
Once the load generator status changes to Down, it can be used for running a scenario. You can
verify its availability by clicking the Connect button.
12. Specify load generators - use existing cloud-based load generators
You can use running instances of cloud machines in your account, either provisioned through the
Controller, or manually created.
To be used as load generators, cloud machines must comply with the following: (Machines
provisioned through Controller with HP provided images, are pre-configured to comply with these
requirements.)
lLoad Generator software must be installed and the LoadRunner Agent software must be
running.
User Guide
Controller
HP LoadRunner (12.50) Page 1118

lThe certificate file on the cloud load generator must be signed by the same CA as the
certificates on the Controller.
lThe machine must locally allow the communication ports mentioned above.
To specify an existing load generator:
a. In the Controller's Load Generators dialog box, select Add from Cloud > Use Existing LG.
b. In the Use Cloud Load Generator dialog box, select your cloud account.
c. Select the machines you would like to add to the scenario.
d. If you are behind a proxy server, select the network profile created earlier to be used for the
selected machines.
e. Click Add Machine to assign the selected machine to the scenario.
13. Delete load generators
When not being used, cloud machines may still be incurring costs to your account. The Controller
allows you to terminate cloud load generators directly from the scenario.
a. In the Load Generators dialog box, select the machine you want to delete and click Delete
b. In the Delete Load Generator window, select one of the following options:
oDelete from Scenario. the machine will be removed from this Controller, but it is still up
and running.
oDelete and Terminate. the machine will be removed from this Controller and also
terminated from the cloud provider.
14. Rename load generators
You can rename load generators that you provisioned. The renaming affects the provider side too,
so that the new name will appear in the list of available machines in the "Use Cloud Load Generator
Dialog Box" on page1135.
Managing Cloud Accounts - Overview
Load generators can be hosted on either local computers or in a cloud account. This topic discusses load
generators on the cloud. To host a load generator on the cloud, you must have access to a cloud
account that will host the load generator. You use the LoadRunner Controller to maintain the list of
cloud accounts that are available to host load generators.
Note: You must already have access to a cloud account before you can use LoadRunner to use a
cloud account for hosting load generators. All costs incurred by the provisioning of cloud
machines through LoadRunner, are external to LoadRunner. They are the sole responsibility of
the user, and are subject to the cloud vendor's pricing schedule.
User Guide
Controller
HP LoadRunner (12.50) Page 1119

When you add a cloud-based load generator to a scenario, you specify which of the available accounts
will host the load generator. For details on how to add a cloud account, see "How to Manage Cloud
Accounts" on page1122. If a cloud account is no longer required by LoadRunner, you can remove the
account from the list of available cloud accounts.
Note: LoadRunner supports cloud accounts on specified cloud providers only. See the
LoadRunner Support Matrix for a list of the supported cloud providers.
Provisioning load generators
On your cloud machines, you use the Controller to create load generators for the cloud account. The
process of creating a load generator is known as provisioning. When you use the Controller to provision
a load generator, the Controller deploys an selected image upon the machine with the load generator
software. When a load generator is first provisioned, it has the status of "In Progress". When it reaches
the "Down" status. it is ready to run Vuser scripts as part of a scenario.
Terminating load generators at the end of a failed scenario run
You can configure the Controller to remove a load generator from the cloud after the scenario is
completed. Load generators are removed in order to reduce cloud usage and the associated costs. For
details on how to specify whether or not to remove load generators at the end of a scenario, see
"Adding a Cloud-Based Load Generator - Overview" on page1112.
If you specify to terminate load generators at the end of a scenario run, its termination differs slightly
depending on whether the scenario is completed successfully or fails.
lIf the scenario is completed successfully, the load generator is no longer required and is terminated
immediately .
lIf the scenario fails, then you can specify to terminate the load generator after a specified amount
of time after a scenario fails. This delay may be useful because it enables you to access information
on the load generator that may indicate why the scenario failed. After the load generator is removed,
this information is no longer available.
User Guide
Controller
HP LoadRunner (12.50) Page 1120
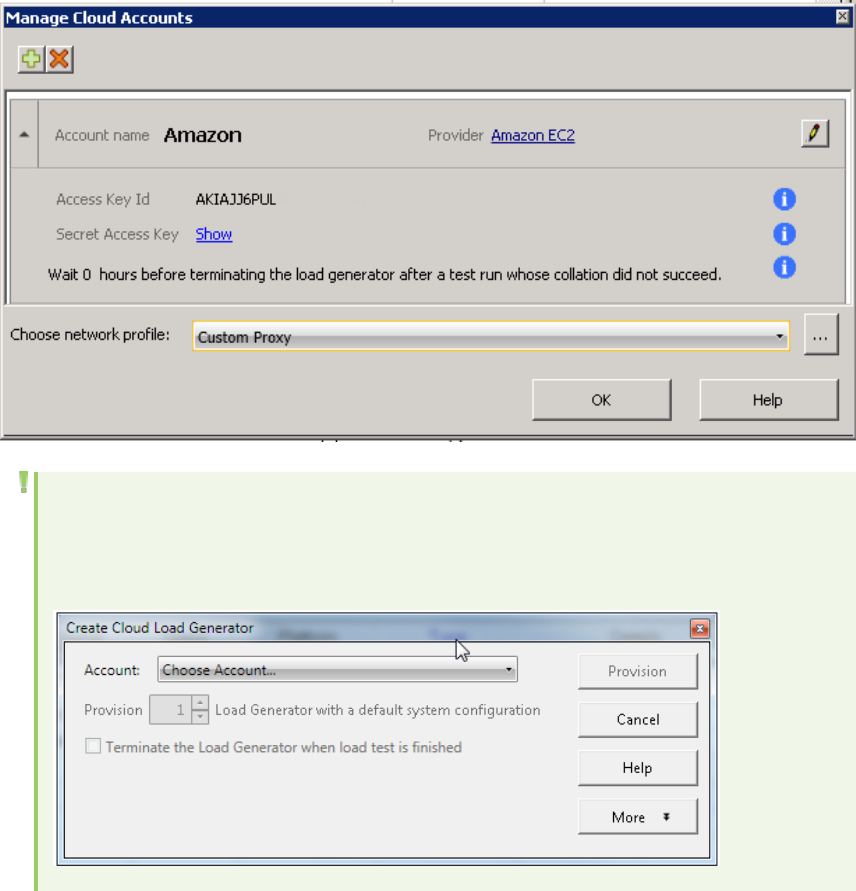
Note: The Controller will terminate a load generator only if the load generator has been
configured to be removed at the end of a scenario run. For details on this setting, see "How
to Add a Load Generator to a Scenario" on page1113.
lFor details on how to make a cloud account available to host load generators, see "How to Manage
Cloud Accounts" on the next page.
lFor details on the dialog box options, see:
l"Manage Cloud Accounts Dialog Box" on page1123
l"Create Cloud Load Generator Dialog Box" on page1129
l"Use Cloud Load Generator Dialog Box" on page1135
User Guide
Controller
HP LoadRunner (12.50) Page 1121
How to Manage Cloud Accounts
Before adding cloud accounts to LoadRunner, make sure you have a cloud account with one of the
supported providers, such as Amazon EC2, HP Helion Public Cloud, or Microsoft Azure. For details, see
http//aws.amazon.com/ec2 or http://www.hpcloud.com.
To add a cloud account to LoadRunner, and thereby make the account available to host load generators:
1. Open the Controller.
2. Click Tools > Manage Cloud Accounts. The Manage Cloud Accounts dialog box opens, and lists all
the accounts that are available to host load generators. For details, see "Manage Cloud Accounts
Dialog Box" on the next page.
3. Click the button.
4. Enter a name for the cloud account. If required, you can modify the name later.
5. Select the provider of the cloud account.
Note: LoadRunner supports cloud accounts on specified cloud providers only. See the
LoadRunner Readme file for a list of the providers.
6. Specify the provider-specific information for your account, For example, for Amazon EC2, provide
the Access Key ID and Secret Access Key that are required to access the account.
Note: You cannot create multiple accounts using the same provider and the same access
key.
7. Specify how long to wait after the end of a failed scenario before removing the load generators
from the account. This is useful if the collation did not complete successfully and you need time to
determine why it failed.
8. Select the network profile. The network profile defines the connection between the Controller and
the cloud providers. Set the connection parameters in the proxy settings section of the Network
Profile Manager dialog box. For details on how to create a network profile, see "Network Profile
Manager Dialog Box" on page1147.
9. Click Save.
Tip: To edit the details of a cloud account that appears in the list of accounts that are available
to host load generators, click the appropriate button.
For background information on adding accounts to the list of accounts that can host load generators,
see "Managing Cloud Accounts - Overview" on page1119.
User Guide
Controller
HP LoadRunner (12.50) Page 1122
Manage Cloud Accounts Dialog Box
This dialog box enables you to manage the cloud accounts that can host load generators. By default, the
dialog box displays a list of all those cloud accounts that can host load generators.
To access Controller > Tools > Manage Cloud Accounts
Important information The default proxy is used for validating the cloud account.
Relevant tasks l"How to Manage Cloud Accounts" on the previous page
See also l"Managing Cloud Accounts - Overview" on page1119
l"How to Add a Load Generator to a Scenario" on page1113
l"Use Cloud Load Generator Dialog Box" on page1135
l"How to Create Certificates for Azure Cloud" on page1151
User interface elements are described below (unlabeled elements are shown in angle brackets):
UI
Element
Description
Adds a cloud account to the list.
Removes a cloud account from the list.
Edit the details of the cloud account (visible in the expanded details of each cloud
account).
<Account
Name>
The name that you will use to identify the account in the Controller. You can modify the
name if and when required.
Username
/
Password
Placeholder identifiers before an account is selected.
Access
Key ID/
Secret
Access
Key
AWS (Amazon Web Service) identifiers that are used to manage IAM (Identity and Access
Management) in order to manage users and their security credentials across Amazon's
EC2 (Elastic Compute Cloud).
For details, see
http://docs.aws.amazon.com/AWSSecurityCredentials/1.0/AboutAWSCredentials.html#A
ccessCredentials.
Access
Key/
Identifiers that are used to manage IAM (Identity and Access Management) in order to
manage users and their security credentials across HP Helion. For details, see
User Guide
Controller
HP LoadRunner (12.50) Page 1123
Secret
Key
https://community.hpcloud.com/article/understanding-hp-cloud-authentication.
Subscripti
on ID/
Path to
certificat
e
Identifiers that are used to manage cloud subscriptions for Microsoft Azure. For details,
see https://manage.windowsazure.com.
For details, see "How to Create Certificates for Azure Cloud" on page1151.
Wait …
hours
before
terminati
ng the
load
generator
after a
test run
or
collation
that did
not
succeed
Lets you specify how long to wait after the post-run collation failed, before terminating
the cloud-based load generator. This delay gives you time to access information on the
load generator and determine why the collation failed. When a load generator is
removed from the cloud, all data saved as part of the load generator is deleted.
You can enter a value from 0 through 168, and specify two digits to the right of the
decimal point. For example, a value of 10.50 waits ten and a half hours.
Note: This setting is only visible if your cloud provider supports this feature.
Provider
Site
A direct hyperlink to the cloud provider's website.
Choose
network
profile
The network profile defines the connection between the Controller and the cloud
provider.
Note: A network profile is used to define the connection properties for the
Controller with cloud providers and the connection with Load Generators.
You can select the default connection ("LoadRunner Default), where the settings are
taken from the Internet Explorer proxy settings. Otherwise, fill in the proxy settings
section of the Network Profile Manager to define the connection with the cloud provider.
For details of how to create a network profile, see "Network Profile Manager Dialog Box"
on page1147
How to Modify Load Generator Settings
The following procedure describes how to modify the settings for a load generator.
User Guide
Controller
HP LoadRunner (12.50) Page 1124
1. Open the scenario . The scenario is displayed in the Design tab.
2. Click the Load Generators button on the Controller toolbar.
3. Select a load generator, and click Details.
4. Modify the details displayed in the configuration tabs at the bottom of the dialog box. For details,
see "Add New Load Generator/Load Generator Information Dialog Box" on page1127.
Load Balancing
Load balancing evenly distributes the load generated by Vusers among the requested load generators,
ensuring an accurate load test.
When a Windows load generator's CPU usage becomes overloaded, the Controller receives a message
and stops loading Vusers on the overloaded load generator, and automatically distributes them among
the other load generators taking part in the scenario. Only where there are no other available load
generators in the scenario does the Controller stop loading Vusers.
You can monitor the status of a machine's CPU usage using the icons in the Load Generators dialog box
(see "Load Generators Dialog Box" on page1144). When the CPU usage of a load generator becomes
problematic, the icon to the left of the load generator name contains a yellow bar. When the machine
becomes overloaded, the icon contains a red bar.
Note: Load balancing is available only in manual scenarios in the percentage mode, and in goal-
oriented scenarios.
Setting up a Load Generator Environment
Follow the guidelines below to set up the environments of your load generators.
lIn general, you should always make sure to configure the load generator machine the same as the
machine upon which you recorded or prepared the script or test.
lFor Java scripts and JUnit tests, verify that the script or test dependencies are available on the load
generator machine with the same paths defined in the classpath Runtime Settings. You can do this
by mapping network drives, manually copying files, and so forth.
lFor MMS (Media Player) scripts, make sure that Media Player is installed on the load generator
machine.
lFor NUnit tests, make sure that the NUnit framework is installed on the load generator machine in
the same path as the Controller machine.
lFor Linux machines, make sure to configure the environment variables as described in "Linux
Environment Variables" on page1127.
User Guide
Controller
HP LoadRunner (12.50) Page 1125
How to Connect/Disconnect a Load Generator
This task describes how to manually connect or disconnect a load generator.
1. On the Controller toolbar, click Load Generators .
2. Select a load generator in the list and click Connect/Disconnect.
How to Connect to a Linux Load Generator Without Using RSH
This task describes how to connect to a Linux load generator without using RSH.
1. On the Linux load generator, make sure that the agent daemon (m_agent_daemon) is running. If
not, launch it by running the following command from <load generator installation directory>/bin:
m_daemon_setup -install
If successful, you will receive the following message:
m_agent_daemon <process ID>
The agent now keeps running, even if the user is logged off. It only stops running if you run the
command explained below, or if you reboot the machine.
Note: If you look at the log file m_agent_daemon[xxx].log in the temp folder, you may see
communication errors, even if the installation succeeded. These messages appear because
the LoadRunner agent always tries to open Port #443 (because any agent can be an MI
Listener, and the MI Listener always listens to this port), and in Linux machines, this port
cannot be opened by any user except for the root user. However, this does not interfere
with using this agent for the load generator.
2. In the Controller, in the Load Generator Information dialog box > Linux Environment tab, select
the Don't use RSH option. Connect as usual. For details, see "Load Generator Configuration > Linux
Environment Tab" on page1141.
To stop the agent daemon:
Run the following command from the <LR_root>/bin folder:
m_daemon_setup -remove
This stops the m_agent_daemon. If successful, you receive the following message:
m_agent_daemon is down.
User Guide
Controller
HP LoadRunner (12.50) Page 1126
Linux Environment Variables
To work with a load generator in a Linux environment, your Linux startup configuration file needs to
include specific environment variables. To set the environment variables, users need to add the env.csh
script to their startup configuration file.
Linux Users Startup Configuration File
C shell .cshrc
Bourne and Korn shell .profile
Add the following line in the startup configuration file:
source <load generator installation directory>/env.csh
For example:
source /opt/HP/HP_LoadGenerator/env.csh
Add New Load Generator/Load Generator Information Dialog
Box
The Add New Load Generator dialog box enables you to add a new local load generator to the scenario.
The Load Generator Information dialog box enables you to view and edit information about the selected
load generator.
To access Controller toolbar >.
lAdd New Load Generator dialog box: Click Add.
lLoad Generator Information dialog box: Select a load generator and click
Details.
Important
information
After adding a load generator, it appears in the Load Generators list with a
Down status.
Relevant tasks l"How to Add a Load Generator to a Scenario" on page1113
l"How to Modify Load Generator Settings" on page1124
See also "Load Generators - Overview" on page1110
User interface elements are described below:
UI Element Description
More/Less. Shows/hides the tabs where you configure the load generator's
User Guide
Controller
HP LoadRunner (12.50) Page 1127
UI Element Description
(Add New Load
Generator dialog box
only)
details. For details, see below.
Enable load
generator to take
part in the scenario
When selected, enables the load generator to participate in the scenario.
When cleared, the load generator is disabled, and therefore does not
participate in the scenario. This is useful in the following cases:
lIf a load generator is unavailable for a particular scenario run, you can
exclude it temporarily instead of removing it entirely from the list of load
generators that are available for the scenario.
lYou can disable load generators to isolate a specific machine to test its
performance.
Name The name of the load generator.
Platform The platform on which the load generator is installed, either Windows or
Linux.
Temporary directory The location, on the load generator, where the Controller can store
temporary files.
Default: If left empty, during a scenario run LoadRunner stores the
temporary files on the load generator in a temporary folder specified by the
load generator's TEMP or TMP environment variables.
Load Generator Configuration Tabs
User interface elements are described below:
UI Element Description
Connection
Log tab
(Load
Generator
Information
dialog box
only)
Displays the standard output and standard errors generated as the Controller
connects to the selected Linux load generator. You can change the command that
the Controller sends to the remote bridge in order to connect to the load generator.
See "Load Generator Configuration > Connection Log Tab" on page1136.
Note: Available in Expert mode only.
Runtime File
Storage tab
Enables you to specify the result folder for the performance data that LoadRunner
gathers from each load generator during a scenario. See "Load Generator
Configuration > Runtime File Storage Tab" on page1136.
Runtime
Quota tab
Enables you to specify the maximum number of Vusers that the load generator can
initialize or stop simultaneously. See "Load Generator Configuration > Runtime Quota
User Guide
Controller
HP LoadRunner (12.50) Page 1128

UI Element Description
Tab" on page1137.
Connection
tab
Enables you to manage network profiles and run Vusers over a firewall. See "Load
Generator Configuration > Connection Tab" on page1138.
Status tab Displays details about the status of the load generator. See "Load Generator
Configuration > Status Tab" on page1139.
Terminal
Services tab
The Terminal Services Manager which enables you to distribute Vusers running in
your load testing scenario on terminal servers. See "Load Generator Configuration >
Terminal Services Tab" on page1139.
Linux
Environment
tab
Enables you to configure the login parameters and shell type for each Linux load
generator. See "Load Generator Configuration > Linux Environment Tab" on
page1141.
Vuser Limits
tab
(Add New
Load
Generator
dialog box
only)
Enables you to modify the maximum number of GUI, RTE, and other Vusers that the
load generator can run. See "Load Generator Configuration > Vuser Limits Tab" on
page1142.
Vuser Status
tab
(Load
Generator
Information
dialog box
only)
Displays the status of all the Vusers connected to the load generator. See "Load
Generator Configuration > Vuser Status Tab" on page1143.
Network
Virtualization
tab
Allows you to apply network virtualization to your scenario. See "Load Generator
Configuration > Network Virtualization Tab" on page1144.
Create Cloud Load Generator Dialog Box
The Create Cloud Load Generator dialog box enables you to deploy a new cloud-based load generator.
To access 1. Click on the Controller toolbar to open the Load Generator dialog box.
2. Click Add from Cloud.
3. Click Provision New LG.
User Guide
Controller
HP LoadRunner (12.50) Page 1129
Relevant tasks "How to Manage Cloud Accounts" on page1122
See also l"Managing Cloud Accounts - Overview" on page1119
l"Use Cloud Load Generator Dialog Box" on page1135
User interface elements are described below:
UI Element Description
Provision Provision the load generator(s) for the scenario according to the last
configuration used for the selected account. This button is only enabled after
you select a cloud account.
If this is the first time you are provisioning load generators, the default
configuration is used.
<number of load
generators>
The number of cloud-based load generators to provision.
Terminate the Load
Generator when load
test is finished
Terminates the current deployment when the load test is complete.
More/Less. Shows/hides the tabs where you configure the cloud load
generator parameters and the network profile to be used by the load
generator. LoadRunner saves your selections for future provisioning. For
details, see below.
Create Cloud Load Generator Sections
User interface elements are described below:
UI Element Description
Machine Settings
(Amazon EC2)
The cloud machine parameters. You can
configure the following parameters:
lRegion. The region (geographic location)
and the availability-zone (isolated location
within the region).For example us-west-1.
lAvailability Zone. The zone within the
region in which the cloud machine is
accessible.
lAMI. (Amazon Machine Image) A template
that contains a software configuration for
your server such as the operating system.
In the case of LoadRunner, the image will
User Guide
Controller
HP LoadRunner (12.50) Page 1130

UI Element Description
also contain the load generator software.
For information on creating custom cloud
images, see
https://hpln.hp.com/page/cloud-testing-
custom-images.
lSecurity Group. The security group is a
firewall-like mechanism that controls
traffic to or from its associated instances.
If you omit this property, the cloud
provider’s default security group is used.
The default security group does not allow
the Controller to connect to load
generators using its default port.
Therefore, you must create your own
security group and enable it for all of the
relevant communication ports. This
includes the LoadRunner port, default port
(54345), and any port set by the
communication channel infrastructure.
(See Network and Security Manager). In
addition, if you are going to access your
load generators manually, you need to
enable the security group for RDP access.
You can select multiple values if allowed by
the vendor.
lKey Pair. (Optional - only if you want to
connect remotely.) The key pair encrypts
and decrypts your login information.
lElastic IP. (EIP) A static IP address that lets
you mask the failure of an instance or
software by remapping the address to
another instance, if your current instance
fails. For more information, see the
Amazon documentation.
lSecurity Group. The security group is a
firewall-like mechanism that controls
traffic to or from its associated instances.
If you omit this property, the cloud
provider’s default security group is used.
User Guide
Controller
HP LoadRunner (12.50) Page 1131

UI Element Description
The default security group does not allow
the Controller to connect to load
generators using its default port.
Therefore, you must create your own
security group and enable it for all of the
relevant communication ports. This
includes the LoadRunner port, default port
(54345), and any port set by the
communication channel infrastructure.
(See Network and Security Manager). In
addition, if you are going to access your
load generators manually, you need to
enable the security group for RDP access.
You can select multiple values if allowed by
the vendor.
lInstance Type. The hardware
configuration of the host computer that
will be provisioned. This will impact
parameters such as storage and memory.
For example, m1.xlarge.
lShutdown Behavior. (For AWS cloud
service only) How to handle the cloud
machine when the scenario ends:
lTerminate. Terminate the machine
completely and remove it from the list
of load generators at the end of the
scenario run.
lStop. Place the machine in Stopped
mode and remove it from the list of
load generators at the end of the
scenario run. If you add this machine at
a later time using the "Use Cloud Load
Generator Dialog Box" on page1135, it
will be automatically started again.
Refer to the cloud provider's website for
further information about these parameters.
Machine Settings (HP
Helion)
The cloud machine parameters. You can
configure the following parameters:
lTenant. A collection of HP service
User Guide
Controller
HP LoadRunner (12.50) Page 1132

UI Element Description
subscriptions and/or resources.
lRegion. The region geographic location.
lAvailability Zone. The zone within the
region in which the cloud machine is
accessible.
lImage. A template that contains a
software configuration for your server
such as the operating system. In the case
of LoadRunner, the image will also contain
the load generator software. For
information on creating custom images,
see https://hpln.hp.com/page/cloud-
testing-custom-images.
lFlavor. A standard instance type. This will
impact parameters such as storage and
memory. For example, highmem.xlarge
indicates large memory and storage.
lSecurity Groups. The security group is a
firewall-like mechanism that controls
traffic to or from its associated instances.
If you omit this property, the cloud
provider’s default security group is used.
The default security group does not allow
the Controller to connect to load
generators using its default port.
Therefore, you must create your own
security group and enable it for all of the
relevant communication ports. This
includes the LoadRunner port, default port
(54345), and any port set by the
communication channel infrastructure.
(See Network and Security Manager). In
addition, if you are going to access your
load generators manually, you need to
enable the security group for RDP access.
lKey Pair. (Optional - only if you want to
connect remotely.) The key pair encrypts
and decrypts your login information.
Refer to the cloud provider's website for
User Guide
Controller
HP LoadRunner (12.50) Page 1133

UI Element Description
further information about these parameters.
Machine Settings
(Microsoft Azure)
The cloud machine parameters. You can
configure the following parameters:
lLocation. The geographic location.
lImage. A template that contains a
software configuration for your server
such as the operating system. In the case
of LoadRunner, the image should also
contain the load generator software. For
information on creating an image for
Azure, see
https://hpln.hp.com/page/cloud-testing-
custom-images.
lStorage Account. A specific storage area in
your account.
lSize. The hardware configuration of the
machine to be provisioned. This will impact
the storage and memory.
lUser/Password. Credentials for accessing
the machine directly, for example, through
Remote Desktop.
lAdditional Ports. (Optional) A list of ports,
separated by spaces, to be opened in the
machine. For example, to connect to the
machine using Remote Desktop, specify
port 3389.
Refer to the cloud provider's website for
further information about these parameters.
Connections tab Shows the details of the network profile
assigned to the load generator, such as the
proxy information, connection mode, and
ports.
lTo use a network profile other than the
default, select one from the drop-down
list.
lTo create a new profile, click the
User Guide
Controller
HP LoadRunner (12.50) Page 1134
UI Element Description
button to open the Network Profile
Manager. For details, see "Network Profile
Manager Dialog Box" on page1147.
Use Cloud Load Generator Dialog Box
The Use Cloud Load Generator dialog box enables you to add an existing cloud-based load generator to
your scenario.
To access 1. Click on the Controller toolbar to open the Load Generator dialog box.
2. Click Add from Cloud.
3. Click Use Existing LG.
Relevant tasks "How to Manage Cloud Accounts" on page1122
See also l"Managing Cloud Accounts - Overview" on page1119
l"Adding a Cloud-Based Load Generator - Overview" on page1112
l"Create Cloud Load Generator Dialog Box" on page1129
User interface elements are described below:
UI Element Description
Account A drop-down list of your cloud accounts.
Show Indicates which machines to display in the list below: All machines associated
with the selected account, or Only LG machine, those machines upon which a
load generator is installed.
Only include
machines using
the current SSL
certificate
Show only machines whose SSL certificate is compatible with the Controller
certificate.
Tip: The cloud machine adds the certificate's hash value to its meta data
when it is provisioned through the Controller. If you manually install the
certificate on the load generator machine, it will not be shown.
Available
Machines
A list of cloud-based machines available for the current account. The grid
contains the following columns: Name,Region/Availability Zone,Launch Time,
and Image. Click a column name to sort it by that criteria.
Network Profile A drop-down list of the network profiles that were defined for the active
User Guide
Controller
HP LoadRunner (12.50) Page 1135
scenario. This allows you to configure the network settings only once for all
machines included in the scenario. For details, see "Network Profile Manager
Dialog Box" on page1147.
Load Generator Configuration > Connection Log Tab
This tab displays the standard output and standard errors generated as the Controller connects to the
selected Linux load generator and enables you change the command that the Controller sends to the
remote bridge in order to connect to the load generator.
To access Controller toolbar >>Details
Important information This tab is displayed only when the Controller is in Expert mode.
Relevant tasks l"How to Add a Load Generator to a Scenario" on page1113
l"How to Modify Load Generator Settings" on page1124
See also l"Load Generators - Overview" on page1110
l"Expert Mode" on page1206
User interface elements are described below:
UI Element Description
Bridge cmd The command sent by the Controller to the remote bridge in order to connect the
Linux load generator.
Note: This command replaces the default bridge command sent by the
Controller.
Rsh standard
errors
Displays rsh standard errors as the Controller connects to the selected Linux load
generator.
Rsh standard
output
Displays rsh standard output as the Controller connects to the selected Linux load
generator.
Load Generator Configuration > Runtime File Storage Tab
This tab enables you to specify the results folder for the performance data that LoadRunner gathers
from this load generator during a scenario run.
To access Controller toolbar > > Add or Details
User Guide
Controller
HP LoadRunner (12.50) Page 1136
Important
information
The folder specified here stores the result files gathered on the selected load
generator. You can specify a global results folder using the Options dialog box. For
details, see "Options > Runtime File Storage Tab" on page1218.
The following guideline apply:
lIf the settings specified here differ to the global load generator settings, the
settings specified here take preference.
lIf the load generator is localhost, LoadRunner stores the scripts and results on a
shared network drive and the options on this tab are all disabled.
lIf you are monitoring over a firewall, the settings in this tab are not relevant.
Relevant
tasks
l"How to Add a Load Generator to a Scenario" on page1113
l"How to Modify Load Generator Settings" on page1124
See also l"Runtime File Storage Locations" on page1207
l"Options > Runtime File Storage Tab" on page1218
User interface elements are described below:
UI
Element
Description
Scripts
and
results
stored
Select where to store the results of the scenario run and/or Vuser scripts gathered from
the selected load generator during a scenario run:
lAs defined in Tools > Options > Runtime File Storage. Stores the results as specified
in the global settings.
lIn temporary directory on <load generator name>. Instructs the Controller to save the
runtime files on a hard drive of the load generator machine.
lOn a shared network drive. Instructs the Controller to save the scenario results and/or
the Vuser scripts on a shared network drive. A shared network drive is a drive to which
the Controller and all the load generators in the scenario have read and write
permissions.
Load Generator Configuration > Runtime Quota Tab
This tab enables you to specify a maximum number of Vuser types that the load generator should
initialize or stop simultaneously, so as to reduce load on the load generator.
To access Controller toolbar >>Add or Details
Important
Information
The settings specified here are relevant for the selected load generator.
You can set runtime quotas for all load generators in a scenario from the Tools >
Options > Runtime Settings tab. For details on setting global runtime quotas, see
User Guide
Controller
HP LoadRunner (12.50) Page 1137
"Options > Runtime Settings Tab" on page1219.
Note: If the settings specified here differ to the global load generator settings,
the settings specified here take preference for this particular load generator.
Relevant
tasks
l"How to Add a Load Generator to a Scenario" on page1113
l"How to Modify Load Generator Settings" on page1124
See also l"Options > Runtime Settings Tab" on page1219
User interface elements are described below:
UI Element Description
Resets values to their defaults.
Vuser Quota lNumber of Vusers that may be initialized at one time - <current load
generator>. The maximum number of Vusers that the current load generator can
initialize simultaneously.
Default: 50
Maximum value: 999
lLimit the number of users that may be stopped at one time to. The maximum
number of Vusers that the current load generator can stop simultaneously.
Default: 50
Load Generator Configuration > Connection Tab
This tab enables monitoring or running Vusers over a firewall. It also allows you to select a connection
profile, for customizing the ports used by the load generator and MI listener.
To access Controller toolbar >>Add or Details
Important
information
lIf the load generator is connected, you cannot change values in this tab. To
disconnect a load generator, select it in the Load Generators dialog box and click
Disconnect. The load generator status changes to Down, and you can change the
settings.
lIf the load generator is localhost, this tab is disabled.
Relevant
tasks
l"How to Add a Load Generator to a Scenario" on page1113
l"How to Modify Load Generator Settings" on page1124
See also l"Network Profile Manager Dialog Box" on page1147
User Guide
Controller
HP LoadRunner (12.50) Page 1138
User interface elements are described below:
UI
Element
Description
Choose
Network
Profile
A drop-down list of network profiles defining the connection properties of the load
generator. Each profile defines whether to connect directly or via an MI Listener. You
can also provide information to connect to the load generator via a proxy.
Browse. Opens the Network Profile Manager. For details, see "Network Profile Manager
Dialog Box" on page1147.
Enable
Monitoring
over
Firewall
Enables monitoring over firewall for this load generator.
Load Generator Configuration > Status Tab
This tab displays details about the status of the load generator.
To access Controller toolbar >>Details
Relevant tasks "How to Modify Load Generator Settings" on page1124
User interface elements are described below:
UI Element Description
Details Error and other runtime information about the selected load generator.
Load Generator Status The status of the load generator.
Load Generator Configuration > Terminal Services Tab
This tab displays the Terminal Services Manager which enables you to distribute Vusers running in your
load testing scenario on terminal servers.
To access Controller toolbar > > Add or Details
Important information This feature is not supported if the load generator is located over a firewall.
Relevant tasks l"How to Add a Load Generator to a Scenario" on page1113
l"How to Modify Load Generator Settings" on page1124
User Guide
Controller
HP LoadRunner (12.50) Page 1139
See also "Terminal Services Overview" on page1190
User interface elements are described below (unlabeled elements are shown in angle brackets):
UI Element Description
Resets values to their defaults.
<Connection
Options>
lConnect to existing Terminal Services Sessions. Enables connection to existing
(open) terminal sessions.
If you select this option, you must open a terminal client session manually for each
terminal that you want to run Vusers on during the scenario.
lCreate new Terminal Services Sessions. Enables the Controller to open and close
terminal sessions automatically. When choosing this option you also specify the
following:
lUser name,Password, and Domain. The credentials required for automatic login.
lShow Terminal Services clients on the Controller machine. Enables interaction
with new Terminal Services sessions using the RDP client.
Enable
Terminal
Services
Manager
Enables the Controller to manage load automatically using terminal sessions on the
load generator.
Note: When enabled, you can only see the load generator's name, without
adding any extra references.
If you need to use three load generator sessions, my_machine,my_machine:1, and
my_machine:2, then in the load generator list, you need only insert the load
generator, my_machine, and enable the Terminal Services Manager for three
terminals (Number of terminals = 3 -see below).
Example:
If not enabled, you need to insert each of the three terminals as separate load
generators: my_machine,my_machine:1, and my_machine:2.
Maximum
number of
Vusers per
terminal
The maximum number of Vusers that you want to run in a terminal session. This
depends on the Vuser type used in the script.
Default: 50
Example: For GUI Vusers, the maximum is one Vuser for each terminal session.
Number of
terminals
The number of terminals you want to use in your scenario. You must open a terminal
client session for each terminal on which you want to run Vusers during the scenario.
Default: 2
User Guide
Controller
HP LoadRunner (12.50) Page 1140
Load Generator Configuration > Linux Environment Tab
This tab enables you to configure the login parameters and shell type for each Linux load generator.
To access Controller toolbar > > Add or Details
Important
information
lThis tab is not available for a load generator running Vusers or monitoring
over a firewall.
lEditable only when the load generator is on a Linux platform.
Relevant tasks l"How to Add a Load Generator to a Scenario" on page1113
l"How to Modify Load Generator Settings" on page1124
l"How to Connect to a Linux Load Generator Without Using RSH" on
page1126
User interface elements are described below:
UI
Element
Description
Login as The user's credentials for logging in to the Linux environment:
lName. If the load generator is Linux-based, set the login information for the load
generator.
Default: LoadRunner uses your Windows user name for the Linux login. That is, if your
Windows login is lrunner, the Controller logs in to the load generator as lrunner. To log
in to a Linux-based load generator using a different login name, select Name and
specify the desired Linux login name.
Using this option, you can log in to the Windows Controller as bill and connect to the
Linux load generator as mike. However, you should make sure that mike allows bill to
log in using his name. This can be done by adding the line "+ bill" at the beginning of
mike's .rhosts file.
lUse lower case for login names. Instructs LoadRunner to use lower case names during
login to avoid case-sensitive issues with the Linux operation system.
lLocal User. (Expert mode only) Linux load generators that use the rsh shell to establish
a connection as the current Windows user (due to security considerations). To "mislead"
rsh and log in as a user other than the current Windows login, select Local user and
specify the desired Linux login name. Because modifying the local user name is a
security breach for rsh, this option should be used only when you encounter a problem
connecting to the remote machine.
Shell
Settings
The Linux shell settings for the remote Linux load generator.
Default: The Controller connects remotely to the Linux load generator without using rsh
User Guide
Controller
HP LoadRunner (12.50) Page 1141
UI
Element
Description
(remote shell).
lDon't use RSH. Connects to the remote load generator without using RSH. In this case,
you need to activate the agent daemon on the load generator manually.
Note: If you do want to connect using RSH, clear this check box, make sure that
RSH is enabled on the load generator, and make sure that the agent daemon is
not already running on the load generator. If the agent daemon is running, stop
it by running the following command from the <LR_root>/bin folder: m_daemon_
setup -remove
lDefault shell. The default shell on the Linux load generator: csh (C Shell—the default),
bsh (Bourne Shell), or ksh (Korn Shell).
To work with the load generator, your Linux startup configuration file needs to include
specific environment variables. For details, see "Linux Environment Variables" on
page1127.
lInitialization command. Command line options for LoadRunner to use when logging in
to a Linux system. This initialization command runs as soon as the shell opens.
Example: You could select ksh and use the following initialization command: source
.profile;
Load Generator Configuration > Vuser Limits Tab
This tab enables you to modify the maximum number of GUI, RTE, and other Vusers that the load
generator can run.
To access Controller toolbar > > Add or Details
Relevant tasks l"How to Add a Load Generator to a Scenario" on page1113
l"How to Modify Load Generator Settings" on page1124
User interface elements are described below:
UI Element Description
Resets values to their defaults.
Available
Types
The types of Vusers the load generator should run.
The types of Vusers are:
lGUI
User Guide
Controller
HP LoadRunner (12.50) Page 1142
lRTE
lOther Vusers
Maximum
Active
The maximum number of each type of Vuser that the load generator can run.
Defaults:
lGUI: 1
lRTE: 1000
lOther Vusers: 5000
Note: The maximum number of active Vusers that you specify must not
exceed the number of Vusers that you are licensed to run. To check your
Vuser licensing limitations, open the LoadRunner License Utility by selecting
on the LoadRunner machine Start > All Programs > HP Software > HP
LoadRunner > License > LoadRunner License Utility. In icon-based desktops,
such as Windows 8, search for License Utility.
Load Generator Configuration > Vuser Status Tab
This tab enables you to view the status of all the Vusers connected to the load generator.
To access Controller toolbar > > Add or Details
Important information This tab is visible only when the load generator is connected.
Relevant tasks l"How to Add a Load Generator to a Scenario" on page1113
l"How to Modify Load Generator Settings" on page1124
See also "Network Virtualization Integration" on page1366
User interface elements are described below (unlabeled elements are shown in angle brackets):
UI Element Description
<Vuser
Status>
The status of the Vusers:
lPending. Vusers are waiting to initialize.
lInitializing. Vusers are in the initialization state.
lActive. Vusers are actively running in the scenario.
GUI The number of GUI Vusers that are in the Pending,Initializing, and Active states.
Other
Vusers
The number of Vusers—other than GUI and RTE Vusers—that are in the Pending,
Initializing, and Active states.
User Guide
Controller
HP LoadRunner (12.50) Page 1143
RTE The number of RTE Vusers that are in the Pending,Initializing, and Active states.
Totals The total number of Vusers that are in the Pending,Initializing, and Active states.
Load Generator Configuration > Network Virtualization Tab
This tab shows the network virtualization location for your scenario.
To access Controller toolbar > > Add and click More or Details
Important
information
lTo enable network virtualization, see "Virtual Locations Settings Dialog Box"
on page1371.
Relevant tasks l"How to Run a Scenario with Network Virtualization" on page1368
l"How to Add a Load Generator to a Scenario" on page1113
l"How to Modify Load Generator Settings" on page1124
See also "Network Virtualization Integration" on page1366
User interface elements are described below:
UI Element Description
Network
Virtualization
Settings
button
Opens the "Virtual Locations Settings Dialog Box" on page1371. You use this dialog
box to define new Network Virtualization locations or change the working mode (Per
Group or Per Load Generator). It also provides a link to the HP Network Virtualization
screens, allowing you to configure the virtualization properties.
Default
Virtual
Location
The default virtual location for the Load Generator. (Available only when Network
Virtualization is enabled and Per Load Generator mode selected.)
For details, see "Network Virtualization Locations" on page1367.
Description The description of the virtual location as entered in the"Virtual Locations Settings
Dialog Box" on page1371.
Load Generators Dialog Box
This dialog box enables you to manage the load generators defined for the scenario.
To access
lOpen a scenario and click on the Controller toolbar
lSelect Scenario > Load Generators
Relevant tasks l"How to Add a Load Generator to a Scenario" on page1113
l"How to Modify Load Generator Settings" on page1124
User Guide
Controller
HP LoadRunner (12.50) Page 1144
See also l"Load Generators - Overview" on page1110
l"Manage Cloud Accounts Dialog Box" on page1123
User interface elements are described below (unlabeled elements are shown in angle brackets):
UI Element Description
Connect /
Disconnect
lConnect. Instructs the Controller to connect the selected load generator. When
connected, the status of the load generator changes from Down to Ready.
lDisconnect. When the load generator is connected, the button automatically
changes to Disconnect. When clicked, the status of the load generator changes
to Down.
Add Opens the Add New Load Generator dialog box where you specify and add a new
local load generator for the scenario.
See "Add New Load Generator/Load Generator Information Dialog Box" on
page1127.
Note: When you add a local load generator, the status of the load
generator is set to Down until it is connected.
Add From
Cloud
Enables you to add a cloud-based load generator to the scenario. The load
generator can be either a new load generator or a load generator that already
exists in the cloud.
Note: When you add a local load generator, the status of the load
generator is set to Down until it is connected.
Delete Removes the load generator from the list of load generators that are available to
run Vuser scripts during the scenario.
Note: If the selected load generator is cloud-based, you can select to delete
the load generator from the cloud account as well.
A load generator can be removed only when it is disconnected.
Reset Attempts to reset a failed load generator to the Down status.
Details Opens the Load Generator Information dialog box where you can view and modify
information about the selected load generator. See "Add New Load Generator/Load
Generator Information Dialog Box" on page1127.
Disable/Enable Instructs the Controller to disable or enable the selected load generator. When a
load generator is disabled, the details of the load generator are displayed in gray.
User Guide
Controller
HP LoadRunner (12.50) Page 1145
<icons> Display the status of the load generator's CPU usage:
The load generator is available to run additional Vuser scripts.
There is a problem with the CPU usage of the load generator.
The load generator is overloaded.
The status of the load generator is unknown. This applies when the specified
load generator name or IP address cannot be resolved.
Note: These icons are only displayed for Windows-based load generators.
<Load
Generator
table>
Displays the following information:
lName. The name or IPaddress of the load generator. You can rename load
generators that you already provisioned. Renaming is only supported for Amazon
AWS and HP Helion Cloud providers.
Note:
lYou can rename cloud-based load generator machines that you
already provisioned. The renaming affects the provider side too, so
that the new name will appear in the list of available machines in the
"Use Cloud Load Generator Dialog Box" on page1135.
lRenaming cloud-based load generator machines will not affect the IP
address that was provisioned for that machine. For physical load
generators, however, this name is used to establish a connection with
the machine, and should not be modified.
lStatus. The current status of the load generator
Ready The load generator is connected, and is ready to run Vuser
scripts. If the connection is secure, an icon indicates a
secure connection.
Connecting The Controller is in the process of connecting to the load
generator.
Active The load generator is running Vusers. If the connection is
secure, an icon indicates a secure connection.
Down The load generator is not connected.
Failed A connection with the load generator could not be established.
User Guide
Controller
HP LoadRunner (12.50) Page 1146
In Progress The load generator is being provisioned. This status only
applies to cloud-based load generators.
Terminating The load generator is being terminated by the provider. This
status only applies to cloud-based load generators.
lPlatform. The type of platform on which the load generator is running. The
platform indicates whether the load generator is Windows-based, Linux-based,
or cloud-based. The LoadRunner version of the load generator must match the
version of the Controller. You can determine the version of the load generator
from the Image string. To determine the version of the Controller, select Help >
About.
Note: This field may initially display Windows-based, even for machines
provisioned for Linux. The field will show Linux-based after the provider
receives confirmation of the need for a Linux machine.
lType. Indicates whether the load generator is local or cloud-based. For cloud-
based load generators, Type displays the name of the cloud provider.
lNetwork Profile. The network profile assigned to this load generator. The
network profile bundles all of the network connectivity settings, including
proxies and ports, into a single entity. For details, see "Network Profile Manager
Dialog Box" below.
lVirtual Location. The virtual location to emulate (only visible when HP Network
Virtualization is installed). Click the cell to select a location from the drop-down
list. To clear the value, select None,
lDetails. If the connection between the Controller and the load generator fails,
displays details about why the connection failed.
<Right-click
menu>
lSave List As Default. Saves the current list of load generators as the default
list.
lLoad Default List. Loads the default list of load generators.
lFilter Hosts. Enables you to filter the load generator list by status: Active ,
Ready,Down, or Failed.
lSort Hosts. Enables you to sort the Load Generator table by name, status, or
type. To sort the table in ascending/descending order, click the relevant table
heading.
Network Profile Manager Dialog Box
This dialog box enables you to set up network profiles for your load generator. For each profile, you can
allow communication over a firewall. You can also customize the ports used by the load generator and
User Guide
Controller
HP LoadRunner (12.50) Page 1147
MI listener.
To access Do one of the following:
lLoad Generator dialog box
a. Controller toolbar >Load Generators .
b. In the Load Generators dialog box, click Add or Details.
c. Select the Connections tab.
d. Click Network Profile Manager.
lTools > Network Profile Manager
Important
information
lIf the load generator is connected, you cannot change values in its profile. To
disconnect a load generator, select the load generator click Disconnect. The load
generator status changes to Down, and you can change the settings.
lNetwork Profile names may only have English characters.
Relevant
tasks
l"How to Add a Load Generator to a Scenario" on page1113
l"How to Modify Load Generator Settings" on page1124
User interface elements are described below:
UI Element Description
Profiles
Toolbar
Allows you to manage the profiles in the list.
. Add a new profile.
. Delete the selected profile.
. Clone the selected profile.
. Set the selected profile as default.
. Import a previously saved profile.
. Export the selected profile to a file for future use.
Network
Profile
Name
A list of all of the defined profiles.
Proxy
Settings >
Use proxy
Allows you to access a load generator through a proxy server.
Obtain the proxy setting from default browser. Uses your default browser proxy
definitions.
Use custom proxy server. Specifies the URL, port, and credentials for the proxy server.
Note: LoadRunner currently supports basic and NTLM proxy authentication.
User Guide
Controller
HP LoadRunner (12.50) Page 1148

Connection
Mode
Indicates how to connect to the LoadRunner agent.
Connect directly to Load Generator Agent. (default) Connects to the load generator
directly via the specified Port. The default port is 54345.
Connect via MI Listener. Connects to the load generator through the MI Listener. This
is useful when the load generator is behind a firewall. You specify the Name and Port of
the MI Listener that the load generator uses to communicate over the firewall. The
default port is 50500.
Enable SSL Enables a secure connection between the Controller and load generator. This is enabled
automatically when using a proxy.
LoadRunner Agent Runtime Settings Dialog Box
By default, you need to manually log on to a machine before it can run Vusers. This dialog box allows to
set up an automatic login so that it is not necessary to manually log on each time.
To access Do one of the following on the LoadRunner machine:
lSelect Start > All Programs> HP Software > HP LoadRunner > Tools > Agent
Runtime Settings Configuration.
lRun <LoadRunner root>\launch_service\bin\Magentconfig.exe.
Important
information
lWhen created, the HP Load Testing Agent Service starts with the LocalSystem.
lAfter configuring the automatic login, you must reboot and log on to the system
at least once after the LoadRunner installation.
See also The LoadRunner Installation Guide included on the LoadRunner installation media.
User interface elements are described below:
UI Element Description
Allow virtual users to run on
this machine without user
login
Allows an automatic login to the network from the agent machine,
so that Vusers can run without any manual intervention.
Domain. The network domain upon which the user machine resides.
User. The user name required to run the Vusers.
Password. The password for the specified user.
Manual log in to this
machine
Instructs LoadRunner to prompt you for a manual login for each
Vuser run.
SSL Utility
The SSL Utility enables you to perform common OpenSSL functions from a user interface.
User Guide
Controller
HP LoadRunner (12.50) Page 1149
Note: To open the SSL Utility, on the LoadRunner machine, selectStart > All Programs > HP
Software > HP LoadRunner > Tools > SSL Utility. In icon-based operating systems, such as
Windows 8, search for SSL Utility.
Converting Certificates
The Convert Certificate tab of the SSL Utility enables you to convert certificates from PKCS #12 and
X.509 formats to PEM format.
To convert a certificate to PEM format:
1. Open the SSL Utility, and click the Convert Certificate tab.
2. In the Source certificate file field, select the file that contains the certificate that you want to
convert. The following file types are supported:
PKCS #12 files .p12, .pxf
X.509 files .cer, .crt, .der
3. In the Import password field, enter the password for decrypting the certificate file.
4. In the PEM file field, enter the name and location of the .pem file that will be created.
5. In the PEM pass phrase field, enter a password for the new certificate. If this is not specified, the
certificate will not be password-protected.
6. From the Source format list, select the format of the original certificate that will be converted.
This is automatically determined unless a file with a non-standard extension is selected.
7. Click Convert.
Note: This tab has the same functionality as the “x509” and “pkcs12” OpenSSL commands.
Test Connection
The Test Connection tab of the SSL Utility enables you to capture the connection data from an SSL
server and save it to a file <server name>_<port number>_ConnectionData.txt in the %temp%
directory. Additionally, the file is displayed in a Notepad file when the test is completed.
To test a connection, enter the following on the Test Connection tab of the SSL Utility:
lHost/Port. Specifies the host and port to connect to. If not specified, an attempt is made to connect
to the local host on port 4433.
lClient certificate file.The certificate to use if requested by the server. By default, a certificate is not
required.
lClient key file. The private key to use. If not specified the certificate file will be used.
lPassword. The client machine's password.
User Guide
Controller
HP LoadRunner (12.50) Page 1150

Note: This tab has the same functionality as the "s_client" OpenSSL command.
Remove Certificate Encryption
This tab of the SSL Utility enables you to remove encryption from a private key certificate.
To remove certificate encryption, enter the following information:
lSource PEM. Name of the file containing an encrypted private key and password.
lTarget PEM. Name of the file that will be unencrypted.
Note: This tab has the same functionality as the "pkcs12 -export" OpenSSL command.
How to Create Certificates for Azure Cloud
This section shows how to create a self-signed certificate. To create a certificate signed by CA, refer to
the OpenSSL documentation.
Install the prerequisite software
1. Download and install Microsoft Visual C++ 2008 Redistributable Package (x86) from
http://www.microsoft.com/en-us/download/details.aspx?id=29.
2. Download and install the latest version of OpenSSL from
http://slproweb.com/products/Win32OpenSSL.html. Use all of the default settings.
Set up the OpenSSL environment
Run the following commands:
1. set OPENSSL_CONF=C:\OpenSSL-Win32\bin\openssl.cfg
2. cd C:\OpenSSL-Win32\bin
3. openssl req -newkey rsa:2048 -new -nodes -x509 -days 3650 -keyout myazurekey.pem -out
myazurekey.pem
Enter the required information. When prompted, press Enter to confirm each operation. A file titled
myazurekey.pem is created in the C:\OpenSSL-Win32\bin folder.
Create the certificate
Run the following command:
openssl x509 -inform PEM -in myazurekey.pem -outform DER -out myazurekey.cer.
The myazurekey.cer file is created in the C:\OpenSSL-Win32\bin folder.
User Guide
Controller
HP LoadRunner (12.50) Page 1151

Upload the certificate to the Azure machine
Use the Azure Console > Settings > Manage Certificates view to upload the myazurekey.cer file to Azure.
Add the certificate in the Controller
In the LoadRunner Controller, select Tools > Manage Cloud Accounts. Select Microsoft Azure as the
provider, and specify the myazurekey.pem file as the certificate. For details, see "Manage Cloud
Accounts Dialog Box" on page1123.
Troubleshooting and Limitations - Load Generators
This section describes troubleshooting and limitations for running Vusers on load generators machines.
Overloading of CPU
If you receive a warning indicating that the load generator machine has reached 80% of the CPU
resources, make sure that your load generator machine conforms to the recommended system
requirements as stated in the Readme file.
Virtual Machines
LoadRunner supports the latest versions of VMware ESX. However, running Vusers on virtual machines
may adversely affect performance due to the sharing of physical resources.
VB and C# Projects
You cannot run VB and C# projects created with the Visual Studio add-ins on load generators with
limited user permissions.
Limited Users
You cannot run LoadRunner projects created in Visual Studio (VB and C#) on remote load generators if
they were launched by a limited, non-admin user.
ODBC scripts on Linux machines
When running ODBC scripts on RHEL 6, you may encounter the following replay error:
lrdb_open_connection: "SQLConnect", return-code=-1, native-error-code=0, SQLState=01000,
SQLError=[unixODBC][Driver Manager]Can't open cursor lib 'libodbccr' : file not found"
Workaround: Create a libodbccr.so.1 soft link to libodbccr.so.2.0.0 using the following syntax:
ln -s libodbccr.so.2.0.0 libodbccr.so.1
For details, see https://bugzilla.redhat.com/show_bug.cgi?id=719595.
User Guide
Controller
HP LoadRunner (12.50) Page 1152
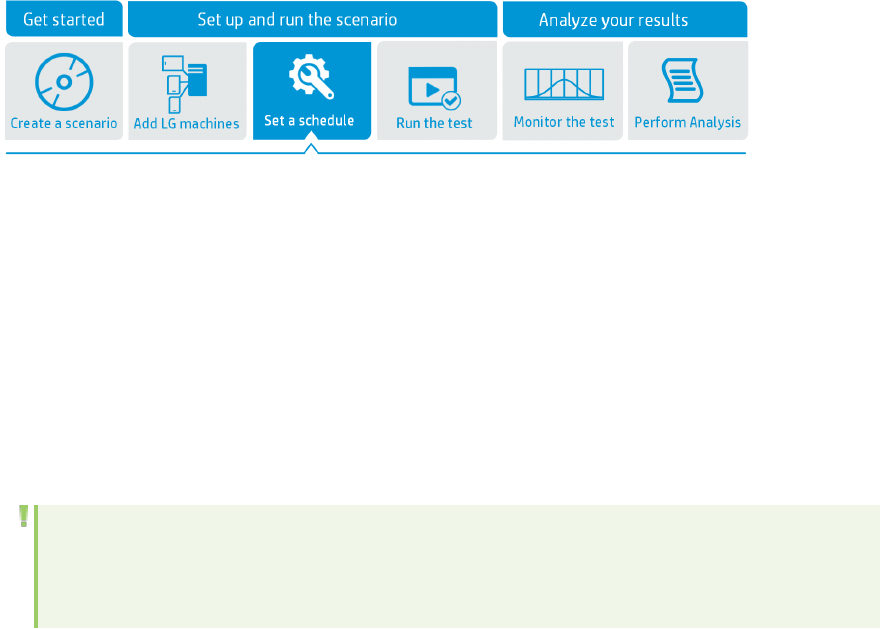
GUI Vusers
Windows Load Generator machines can only run one GUI Vuser at a time. To run multiple GUI Vusers in a
load test, you need to open a terminal server session for each GUI Vuser.
Non-English Locales
Scripts containing Japanese symbols may generate errors during replay or fail during replay, when
running on Linux load generators set to a Japanese locale.
Scheduling Manual Scenarios
Scheduling Manual Scenarios Overview
An important factor in the creation of a manual scenario is developing a test that accurately portrays
user load behavior—the type of load and the timing of the load.
After you create a scenario, you schedule the scenario to start running at a specified time. You can limit
the execution duration of the scenario or of a Vuser group within the scenario.
You can also stipulate how many Vusers to start and stop running within a certain time frame. You can
specify whether LoadRunner should start or stop running all Vusers in a scenario simultaneously, or only
a certain number of Vusers within a specified amount of time.
Note: Rendezvous points in a Vuser script interfere with a scheduled scenario run. If your script
contains rendezvous points, your scenario will not run as scheduled. For details on rendezvous
points, see "Rendezvous Points" on page1254.
Scheduling by Scenario or Group
After you have designed a manual scenario, you can schedule the participating Vuser groups/scripts to
run as part of a scenario schedule.
You can schedule all the groups/scripts to run together on one schedule, or you can define a separate
schedule for each Vuser group.
For details about manual scenario modes, see "Manual Scenarios" on page1076.
User Guide
Controller
HP LoadRunner (12.50) Page 1153
Scheduling By Scenario
When you schedule by scenario, LoadRunner runs all the Vuser groups participating in the scenario
simultaneously. That is, the schedule defined for running the scenario is applied to all the Vuser groups
concurrently, and LoadRunner applies each action proportionately to all the Vusers groups.
For example, take a scenario that includes 3 participating Vuser groups as follows:
Group Name Number of Vusers
Group1 10
Group2 20
Group3 30
Total 60
When scheduling by scenario, if the schedule instructs LoadRunner to load 30 Vusers when it starts
running, LoadRunner loads a proportional number of Vusers from each group as follows:
Group Name Number of Vusers
Group1 5
Group2 10
Group3 15
Total 30
Note: The same principle applies when viewing the scenario in percentage mode.
Scheduling By Vuser Group
Note: For scenarios in Vuser group mode only.
When you schedule by Vuser group, each Vuser group participating in the scenario runs on its own
separate schedule. That is, for each Vuser group, you can specify when to start running the Vuser group,
how many Vusers in the group to start and stop running within specified time intervals, and how long
the group should continue running.
Schedule Run Modes
You can schedule a scenario to run according to the runtime settings defined in the Vuser groups, or you
can let the groups run over and over again until the scenario schedule instructs them to stop running.
User Guide
Controller
HP LoadRunner (12.50) Page 1154
You can schedule a scenario to run in one of the following modes:
lReal-world schedule. (Default) The scenario runs according to a user-defined group of actions that
simulate a real-world schedule of events. Vuser groups run according to the iterations defined in
their runtime settings, but you can define how many Vusers to run at a time, how long Vusers should
continue to run, and how many Vusers to stop running at a time.
lBasic schedule. All enabled Vuser groups run together on one schedule, each according to its own
runtime settings. You can schedule how many Vusers to start running at a time, and how long they
should run before stopping.
Note: You can change the default run mode in the Tools > Options > Execution tab.
The following table illustrates how the given schedule types run in real-world vs basic run mode:
Schedule
by
Run Mode
Real-world Basic
Scenario All participating Vuser groups run together
on one schedule. The scenario runs
according to a user-defined group of
actions that emulate a true-to-life
schedule of events. You can schedule how
many Vusers to start running at a time,
how long to run the Vusers, and how many
Vusers to stop running at a time.
All participating Vuser groups run
together on one schedule, each according
to its own runtime settings. You can
schedule the Vusers to start and stop
running simultaneously or gradually, and
you can specify how long they should run
before stopping.
Group
(Not
applicable
when
viewing
scenario in
Percentage
mode)
Each participating Vuser group runs
according to its own defined schedule that
emulates a true-to-life schedule of events
for that Vuser group. You can schedule
when to start running the Vuser group, how
many Vusers to run at a time, how long to
run the Vusers, and how many Vusers to
stop running at a time.
Each participating Vuser group runs
according to its own schedule, each
according to its own runtime settings. For
each Vuser group, you can schedule how
many Vusers in the group to start and
stop running simultaneously or gradually,
and you can specify how long they should
run before stopping.
How to Define a Schedule for the Scenario - Workflow
This task describes how to define a schedule for a scenario.
1. Prerequisite
Make sure that a scenario is open, or create a new one, and that scripts have been selected for the
scenario.
For more details, see "How to Design a Manual Scenario" on page1081.
User Guide
Controller
HP LoadRunner (12.50) Page 1155
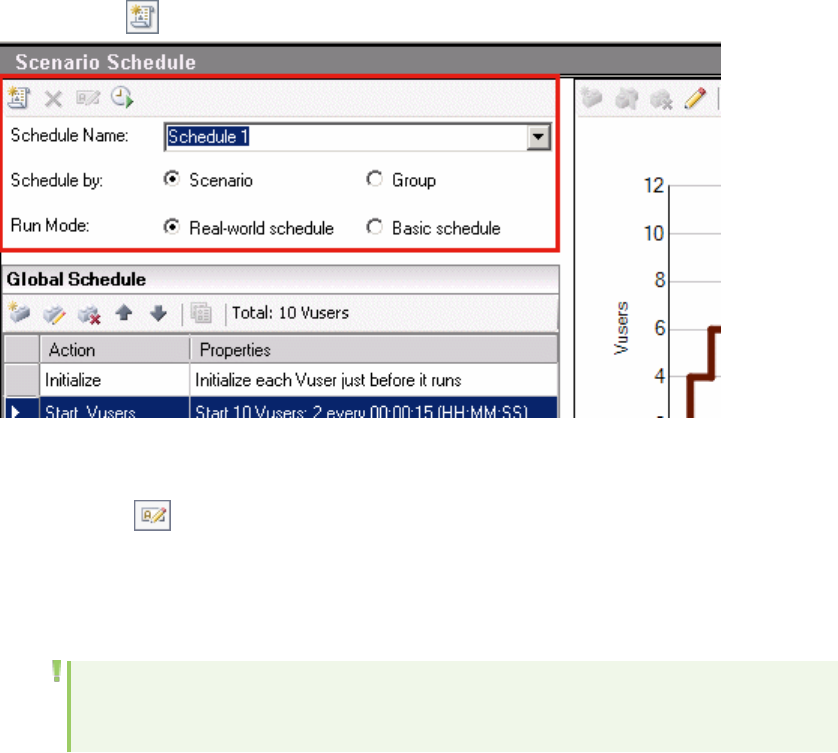
2. Define the schedule
In the Scenario Schedule pane, select a schedule from the list, or define a new schedule by clicking
New Schedule .
Define the schedule in the definition area as follows:
a. (Optional) To rename the schedule, type a new name in the Schedule Name box and click Save
New Name .
b. Select the type of schedule: Scenario or Group. For details, see "Scheduling by Scenario or
Group" on page1153.
c. Select a run mode: Real-world or Basic. For details, see "Schedule Run Modes" on page1154.
Note: The default run mode for all schedules is Real-world. You can change the default
to Basic in the Tools > Options > Execution tab.
3. Define actions for the schedule
The "Actions Grid" on page1172 displays the default actions that correspond to the type of
schedule you selected above.
User Guide
Controller
HP LoadRunner (12.50) Page 1156
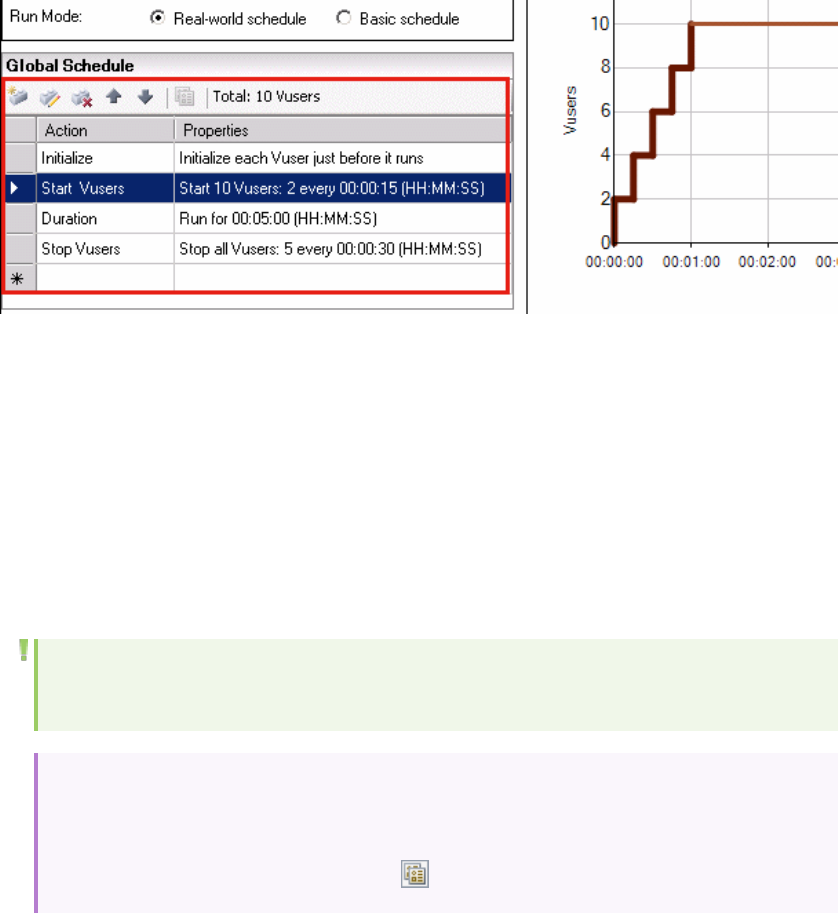
For schedule action details, see "Schedule Actions" on page1162.
lFor details about how to add actions, see "How to Add Actions to the Scenario Schedule" on the
next page.
lFor details about how to edit actions, see "How to Edit Schedule Actions" on page1160.
4. Vuser group schedules only: Copy a group's schedule settings to other groups -
optional
When scheduling by Vuser group, you can copy a Vuser group's schedule settings to other Vuser
groups.
Note: Schedule settings copied include the schedule run mode (basic or real-world) and the
set of schedule actions.
Example:
To copy group_1's schedule settings to group_2, select group_2 in the Scenario Groups
pane, click Copy Schedule Settings From , and select group_1.
User Guide
Controller
HP LoadRunner (12.50) Page 1157
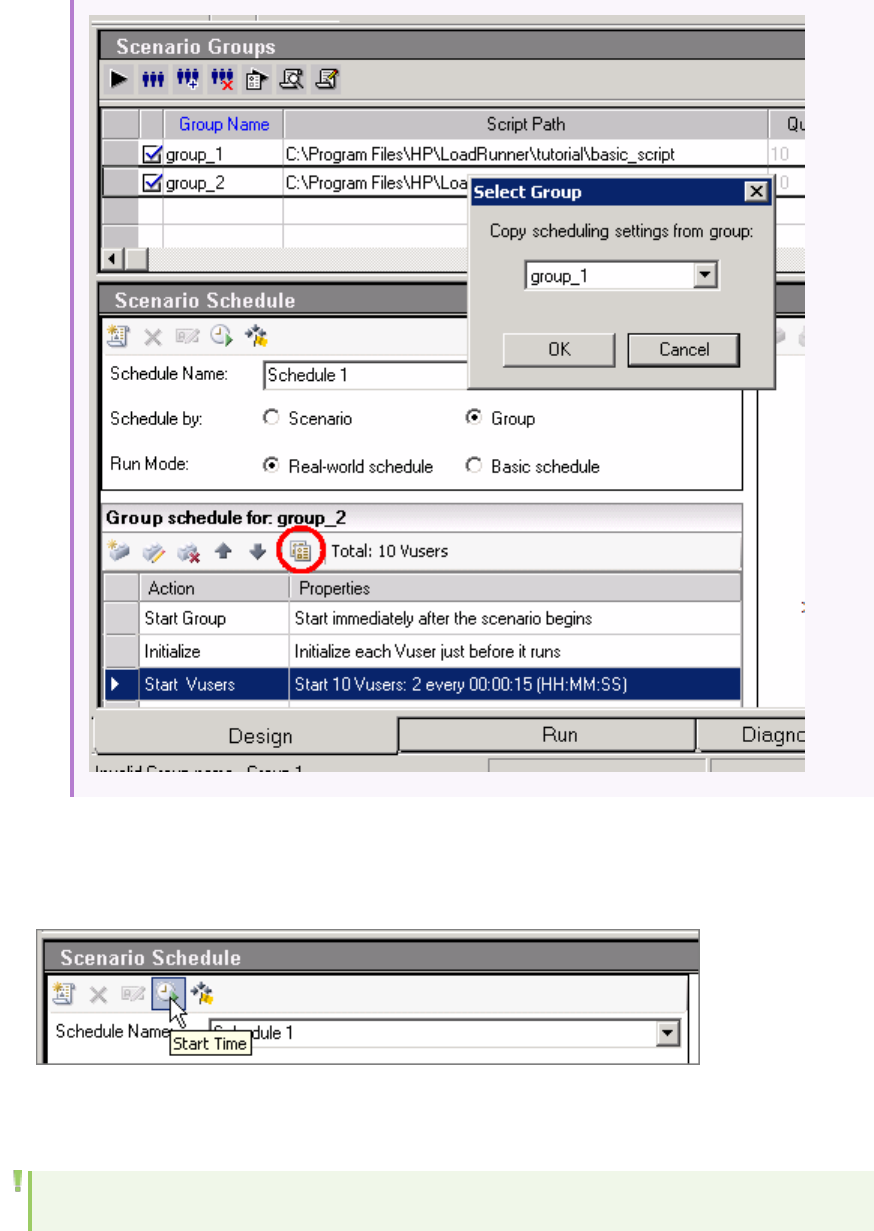
5. Schedule a start time for the scenario - optional
In the Schedule Definition area, click the Start Time button and select when to start running the
scenario.
How to Add Actions to the Scenario Schedule
Note: You can add actions to a real-world schedule only.
User Guide
Controller
HP LoadRunner (12.50) Page 1158
Add an action to the schedule from the Actions grid
1. In the Action grid do one of the following:
lTo insert an action after a specific action, select the action and click Add Action After .
lTo add an action after the last action, double-click the last row in the Actions grid—marked by
an asterisk (*).
2. In the Add Action dialog box, define the new action. For schedule action details, see "Schedule
Actions" on page1162.
3. Click Apply.
4. To add another action while in the Add Action dialog box, click Add Another Action and repeat
steps 2 through 3.
Add an action from the schedule graph
You can add Start Vusers,Duration, and Stop Vusers actions from the graph by splitting an action into
two actions, or appending a new action after the last action in the graph.
1. Make sure that the graph is in Edit mode .
2. Select the line that represents the action that you want to split.
Tip: Selecting the action in the Actions grid highlights the corresponding line in the graph.
3. Click the Split Action button . The selected line splits in two. In the Actions grid, the original
action splits into two equivalent actions, each representing half of the original action. For example:
lSplitting a Duration action of 5minutes results in two Duration actions of 2.5minutes each.
lSplitting a StartVusers action that starts 20 Vusers results in two StartVusers actions, each
starting 10 Vusers.
4. (Optional) Edit each of the actions. For details, see "How to Edit Schedule Actions" on the next page.
Append an action after the last action
1. Make sure that the graph is in Edit mode .
2. In the graph toolbar, click New Action .
3. Append new actions as follows:
lStart Vusers action. Click the graph anywhere above and to the right of the endpoint of the
last line of the graph.
User Guide
Controller
HP LoadRunner (12.50) Page 1159
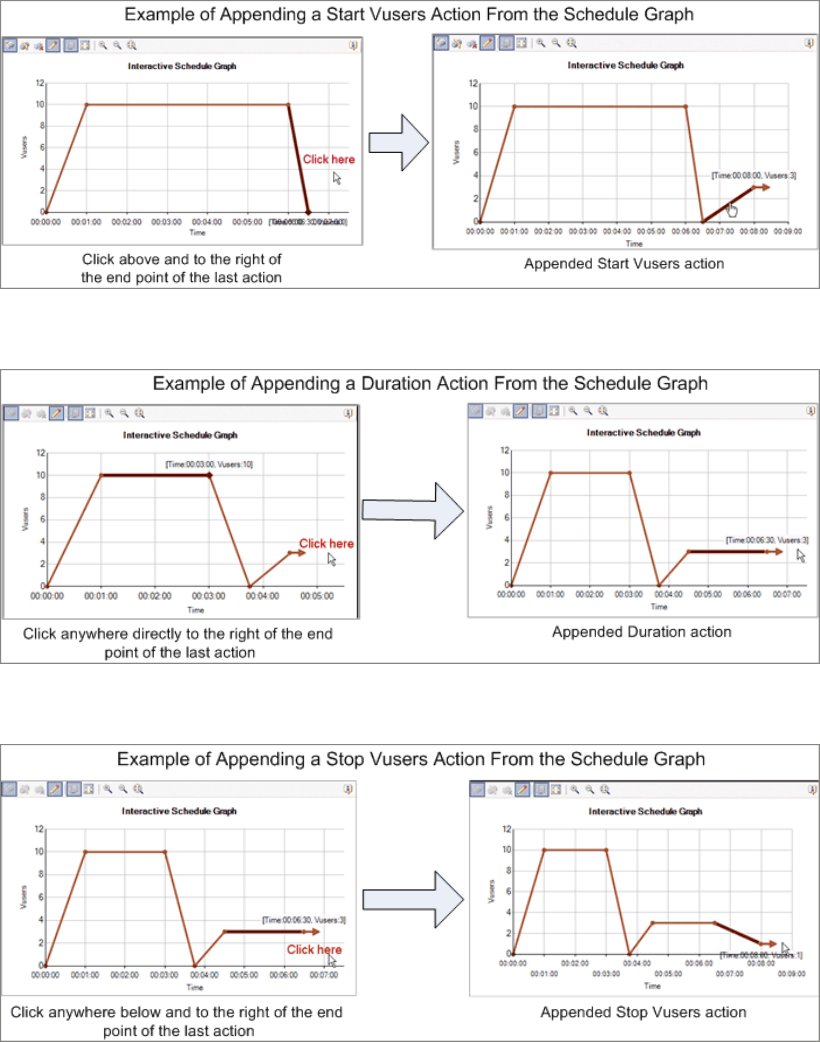
lDuration action. Click the graph anywhere directly to the right of the endpoint of the last line
of the graph.
lStop Vusers action. Click the graph anywhere below and to the right of the endpoint of the last
line of the graph.
4. Edit the actions. For details, see "How to Edit Schedule Actions" below.
How to Edit Schedule Actions
This task describes how to edit schedule actions, both in the Actions grid and from the schedule graph.
User Guide
Controller
HP LoadRunner (12.50) Page 1160
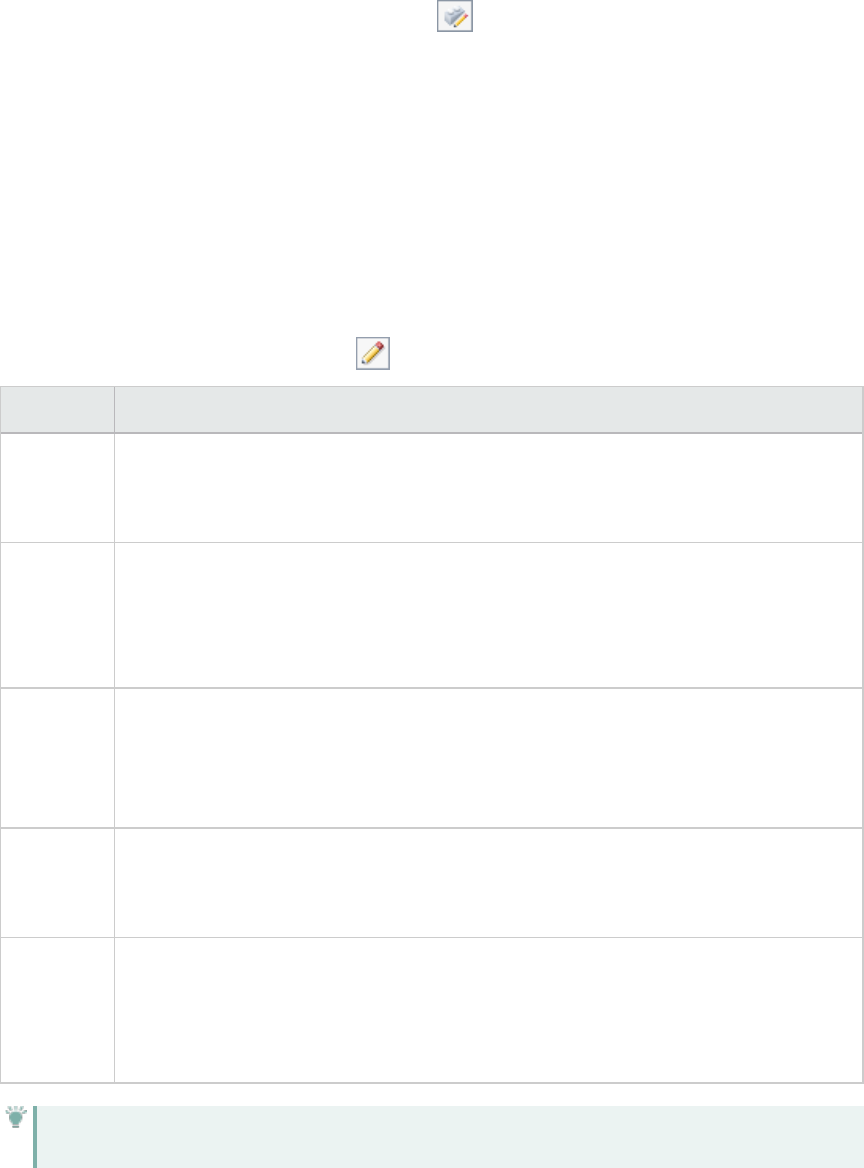
Edit an action from the Actions grid
Double-click the action (or select it), click Edit Action , and edit the action as desired.
You can also edit other actions before closing the Edit Action dialog box. Click Previous or Next to
navigate between the actions.
Edit an action from the schedule graph
You can edit real-world schedules from the graph: you can edit Start Vusers, Stop Vusers, and Duration
actions. When you edit actions from the graph, the action's details in the Actions grid are updated
accordingly.
lDouble-click the line in the graph representing the action you want to edit. Edit the action in the Edit
Action dialog box that opens. Click Previous or Next to edit other actions.
lMake sure that the graph is in Edit mode , select the line in the graph, and drag it as follows:
Action Modification
Start
Vusers
To change the number of Vusers to start running:
lTo start more Vusers, drag the diamond-shaped endpoint upwards.
lTo start fewer Vusers, drag the diamond-shaped endpoint downwards.
Start
Vusers
To change the time interval between starting Vusers:
lTo increase the time interval, drag the diamond-shaped endpoint to the right.
lTo decrease the time interval, drag the diamond-shaped endpoint to the left.
Note: A vertical line indicates that the Vusers start running simultaneously.
Duration lTo increase the duration between scheduled actions, drag the diamond-shaped
endpoint to the right.
lTo decrease the duration between scheduled actions, drag the diamond-shaped
endpoint to the left.
Stop
Vusers
To change the number of Vusers to stop running:
lTo stop fewer Vusers, drag the diamond-shaped endpoint upwards.
lTo stop more Vusers, drag the diamond-shaped endpoint downwards.
Stop
Vusers
To change the time interval between stopping Vusers:
lTo increase the time interval, drag the diamond-shaped endpoint to the right.
lTo decrease the time interval, drag the diamond-shaped endpoint to the left.
Note: A vertical line indicates that the Vusers stop running simultaneously.
Tip: To fine-tune any of the details of the selected action line, use the arrow keys on your
User Guide
Controller
HP LoadRunner (12.50) Page 1161
keyboard, or edit the action in the Actions grid.
Schedule Actions
A scenario schedule contains a series of actions that instruct the scenario when to start running a Vuser
group, how to initialize Vusers, when to start and stop running Vusers, and how long to run an action.
You set these actions from the Edit Action dialog box. For details, see "Edit Action Dialog Box" on
page1165.
The following sections describe the available schedule actions.
Start Group
The Start Group action defines when to start running a Vuser group.
Options Description
Start immediately after
the scenario begins
(Default)
LoadRunner starts running the Vuser group as soon as the scenario
starts running.
Start <00:00:00>
(HH:MM:SS) after the
scenario begins
After the scenario starts running, LoadRunner waits the specified time
(in hours, minutes, and seconds) before it starts running the Vuser
group.
Start when group <group
name> finishes
LoadRunner starts running the Vuser group immediately after the
Vuser group specified in this option has finished running.
Note:
lThe Start Group action is available for group schedules only, and always appears as each
group's first schedule action.
lThe Start Group action is always followed by the Initialize action.
lThe Start Group action cannot be deleted.
Initialize
The Initialize action instructs LoadRunner to prepare the Vusers so that they are in the Ready state and
can run.
Options Description
User Guide
Controller
HP LoadRunner (12.50) Page 1162
Initialize all Vusers
simultaneously
LoadRunner initializes all the Vusers together before running them.
Note: Selecting this option loads all of the Vuser scripts before
beginning to run them. If your scripts are very large and you expect
the loading time to be lengthy, select this option.
Initialize XX Vusers
every <00:00:00>
(HH:MM:SS)
LoadRunner initializes the specified number of Vusers gradually, according to
the specified time interval (in hours, minutes, and seconds), before running
them.
Initialize each Vuser
just before it runs
(Default)
LoadRunner initializes each Vuser just before it starts running.
Note: This option is not available for group schedules when the Wait
for all groups to initialize option is selected. For details, see "
Schedule Definition Area" on page1167.
Note:
lThe Initialize action appears in the Actions grid for all schedule types.
lThe Initialize action cannot be deleted.
Start Vusers
The Start Vusers action instructs LoadRunner to start running Vusers.
Options Description
Start XX Vusers:
Simultaneously
(Default)
LoadRunner runs the specified number of Vusers simultaneously.
Start XX Vusers: YY
Vusers every
<00:00:00>
(HH:MM:SS)
LoadRunner runs the specified number of Vusers (XX) gradually. That is,
LoadRunner runs YY Vusers, and waits the specified time (in hours, minutes,
and seconds) before running another YY Vusers.
Note:
lLoadRunner starts running Vusers only when they have reached the Ready state.
lIn a basic schedule, LoadRunner always runs all the Vusers, whether simultaneously or
gradually. In a real-world schedule, you can select how many Vusers to start running.
User Guide
Controller
HP LoadRunner (12.50) Page 1163

lWhile a scenario is running, you can add Vuser groups/scripts to participate in the scenario.
When starting the Vusers gradually, if you add a Vuser group to the scenario after all the
original Vusers have already started running, the new group starts running immediately.
Duration
The Duration action instructs LoadRunner to continue running the scenario in the current state, for the
specified amount of time.
Options Description
Run until completion The scenario runs until all the Vusers have finished running.
Note: In real-world schedules, this option is available after the first Start
Vusers action only, and if selected, causes all subsequent actions to be
deleted.
Run for XX days and
<00:00:00>
(HH:MM:SS)
The scenario runs in its current state for the specified amount of time (in
days, hours, minutes, and seconds) before continuing with the next action.
Default: 5minutes.
Note: In a real-world schedule, if you select this option, and this Duration
action is not followed by any other action, the scenario continues to run
indefinitely.
Run indefinitely
(Basic schedule only)
The scenario runs indefinitely.
Stop Vusers
The Stop Vusers action instructs LoadRunner to stop running Vusers.
Options Description
Stop XX Vusers:
Simultaneously
(Default)
LoadRunner stops running the specified number of Vusers at once.
Stop XX Vuser:
YY Vusers every
<00:00:00>
(HH:MM:SS)
LoadRunner stops running the specified number of Vusers gradually. That is,
LoadRunner stops YY Vusers, and waits the specified time (in hours, minutes, and
seconds) before stopping another YY Vusers, until all XX Vusers have stopped
running.
Add Action Dialog Box
This dialog box enables you to add actions to a real-world scenario schedule to simulate a more true-to-
life schedule by which to run your scenario.
User Guide
Controller
HP LoadRunner (12.50) Page 1164
To access In the Design tab > Scenario Schedule pane > Actions grid, do one of the
following:
lDouble-click the last row in the Actions grid—marked by an asterisk (*).
lIn the Actions grid, select the action after which you want to add a new action,
and click Add Action After .
Important
information
lAvailable for real-world schedules only.
lYou can add Start Vusers, Duration, and Stop Vusers actions only.
Relevant tasks "How to Define a Schedule for the Scenario - Workflow" on page1155
See also l"Actions Grid" on page1172
l"Schedule Actions" on page1162
User interface elements are described below (unlabeled elements are shown in angle brackets):
UI Element Description
Resets the Add Action dialog box so that you can add another action.
Available only after clicking Apply when adding an action.
Adds the defined action to the Actions grid. Leaves the Add Action dialog box
open, in edit mode, so that you can make changes to the action you added or
add another action.
<Action details
area>
The details of the new action.
For details about the schedule actions, see "Schedule Actions" on page1162.
Action type The type of action to add.
Edit Action Dialog Box
This dialog box enables you to edit schedule actions.
To access Use one of the following:
lDouble click an action in the Actions grid or in the interactive graph.
lDesign tab > Scenario Schedule pane > Actions grid/Schedule graph > Edit
Action
Important
information
lIn the Actions grid, you can edit all actions.
lIn the interactive graph, you can edit Start/Stop Vusers and Duration
actions only.
Relevant tasks l"How to Define a Schedule for the Scenario - Workflow" on page1155
User Guide
Controller
HP LoadRunner (12.50) Page 1165
l"How to Edit Schedule Actions" on page1160
See also l"Actions Grid" on page1172
l"Schedule Actions" on page1162
l"Interactive Schedule Graph" on page1168
User interface elements are described below (unlabeled elements are shown in angle brackets):
UI Element Description
Displays the details of the previous/next action in the Actions grid.
Action type Displays the type of action selected: Initialize,Start Vusers, or Duration.
<Action details
area>
Displays the current details of the selected action. For details about each action,
see Schedule Actions.
Scenario Schedule Pane
This pane enables you to define a schedule for running your scenario.
To access Manual scenario > Design tab
Relevant tasks "How to Define a Schedule for the Scenario - Workflow" on page1155
See also l"Scheduling Manual Scenarios Overview" on page1153
l"Scheduling by Scenario or Group" on page1153
l"Schedule Run Modes" on page1154
User interface elements are described below:
UI Element Description
Actions grid Displays a list of scenario's schedule actions.
See "Actions Grid" on page1172.
Interactive
schedule graph
Displays a graphical representation of the scenario schedule. The lines in the graph
correspond to the actions defined in the Actions grid.
See "Interactive Schedule Graph" on page1168.
Schedule
definition area
Displays the selected schedule's details.
See " Schedule Definition Area" on the next page.
User Guide
Controller
HP LoadRunner (12.50) Page 1166
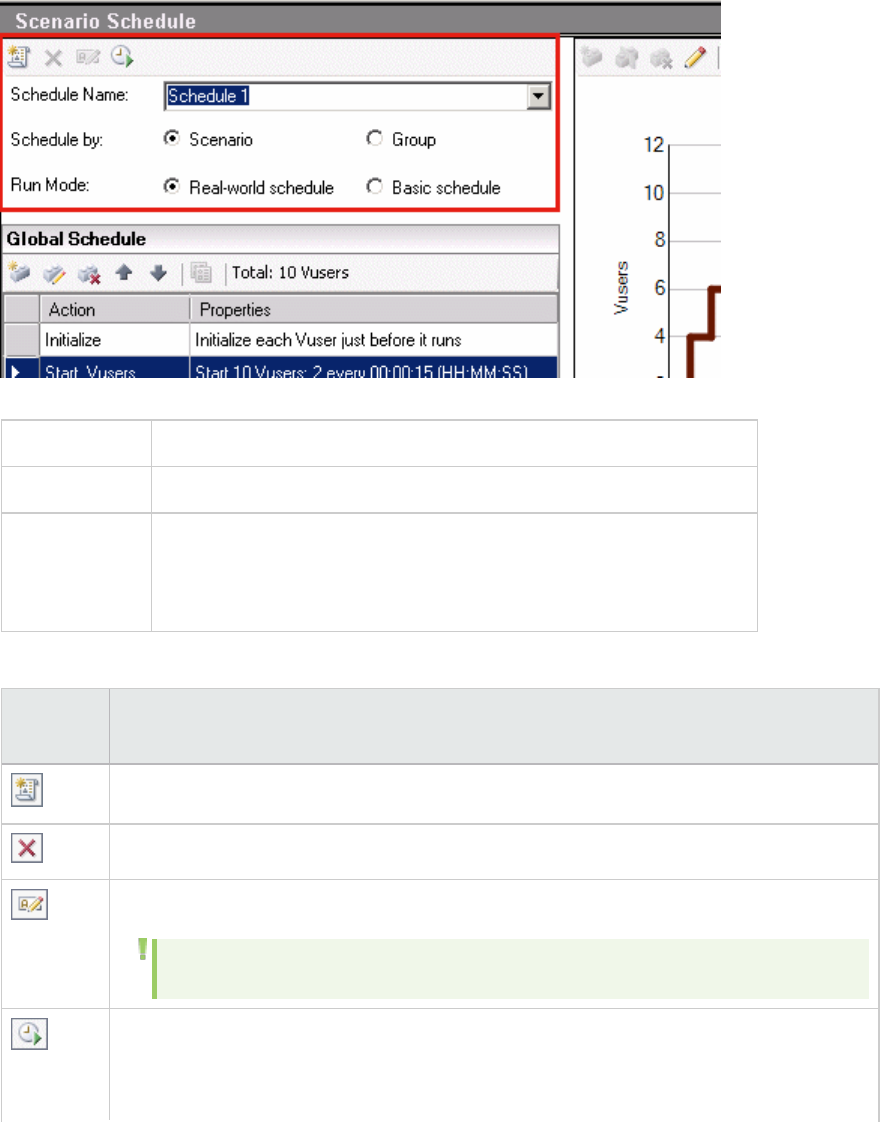
Schedule Definition Area
This area displays the selected schedule's details.
To access Manual scenario > Design tab > Scenario Schedule pane
Relevant tasks "How to Define a Schedule for the Scenario - Workflow" on page1155
See also l"Scenario Schedule Pane" on the previous page
l"Scheduling by Scenario or Group" on page1153
l"Schedule Run Modes" on page1154
User interface elements are described below:
UI
Element
Description
New Schedule. Creates a new schedule.
Delete Schedule. Deletes the selected schedule.
Save New Name. Saves a new name given to the schedule.
Note: Enabled when you start typing the new name.
Start Time. Opens the Scenario Start Time dialog box. You can schedule the scenario to
start running:
lWithout delay. As soon as the Start Scenario command is issued.
User Guide
Controller
HP LoadRunner (12.50) Page 1167
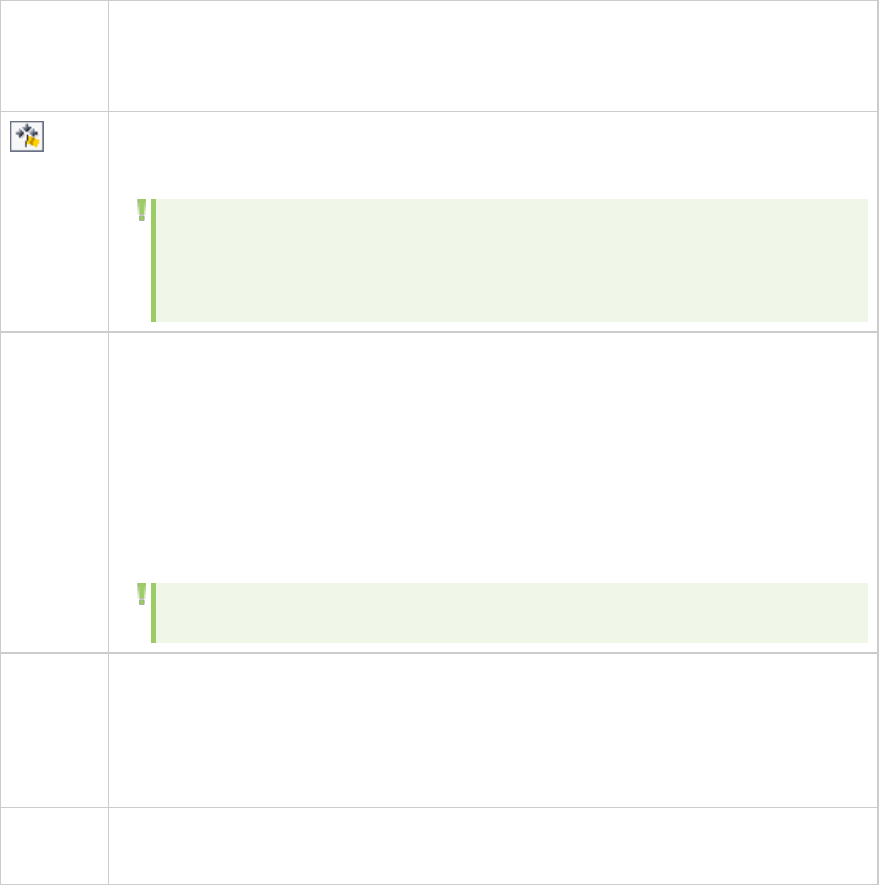
lWith a delay of HH:MM:SS. The specified time after the Start Scenario command
was issued.
lAt HH:MM:SS on <date>. At a specified time on the specified date.
(Group
schedule
only)
Wait for all groups to finish initialization. When this option is selected, all of the
Vusers in all of the Vuser groups finish initializing before any of them start running.
Note: When this option is selected, Initialize each Vuser just before it runs is
not available. For details about the Initialize action, see "Schedule Actions" on
page1162.
Run Mode The mode according to which the schedule will run:
lReal-world schedule. A schedule designed according to a true-to-life series of
events.
lBasic schedule. A schedule according to which all the Vusers start running, run for a
given duration, and then all stop running.
For details, see "Schedule Run Modes" on page1154.
Default value: Real-world.
Note: To change the default, select Tools > Options > Execution tab.
Schedule
by
The schedule type:
lScenario. Runs all participating Vuser Groups together on the same schedule.
lGroup. Each Vuser group runs on its own schedule.
For details, see "Scheduling by Scenario or Group" on page1153.
Schedule
Name
The name given to the schedule.
, continued
Interactive Schedule Graph
This graph provides a graphical representation of the scenario's schedule. From the graph, you can
watch the progress of the schedule during a scenario run.
User Guide
Controller
HP LoadRunner (12.50) Page 1168
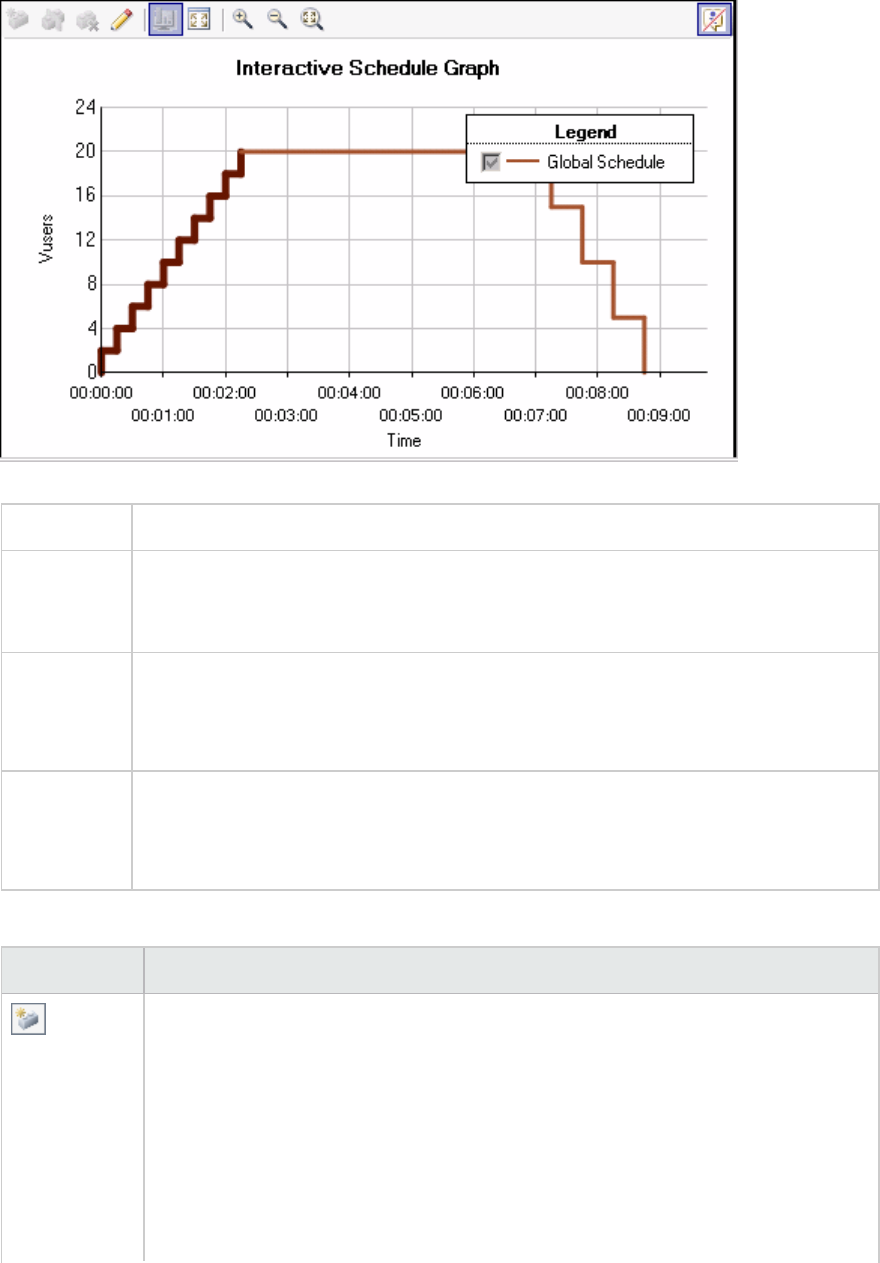
To access Manual scenario > Design tab > Scenario Schedule pane
Important
information
Only real-world schedules can be modified from the interactive schedule graph. You
can modify Start Vusers, Duration, and Stop Vusers actions.
To modify a basic schedule, you must edit the actions in the Actions grid itself.
Relevant
tasks
l"How to Define a Schedule for the Scenario - Workflow" on page1155
l"How to Add Actions to the Scenario Schedule" on page1158
l"How to Edit Schedule Actions" on page1160
See also l"Scenario Schedule Pane" on page1166
l"Schedule Actions" on page1162
l"Actions Grid" on page1172
User interface elements are described below (unlabeled elements are shown in angle brackets):
UI Element Description
(Real-world
schedule only)
New Action. Appends a new action after the last action in the graph.
Append new actions as follows:
lStart Vusers. Click the graph anywhere to the right of and above the endpoint of
the last line of the graph.
lDuration. Click the graph anywhere to the right of the endpoint of last line of the
graph.
lStop Vusers. Click the graph anywhere to the right of and below the endpoint of
the last line of the graph.
User Guide
Controller
HP LoadRunner (12.50) Page 1169
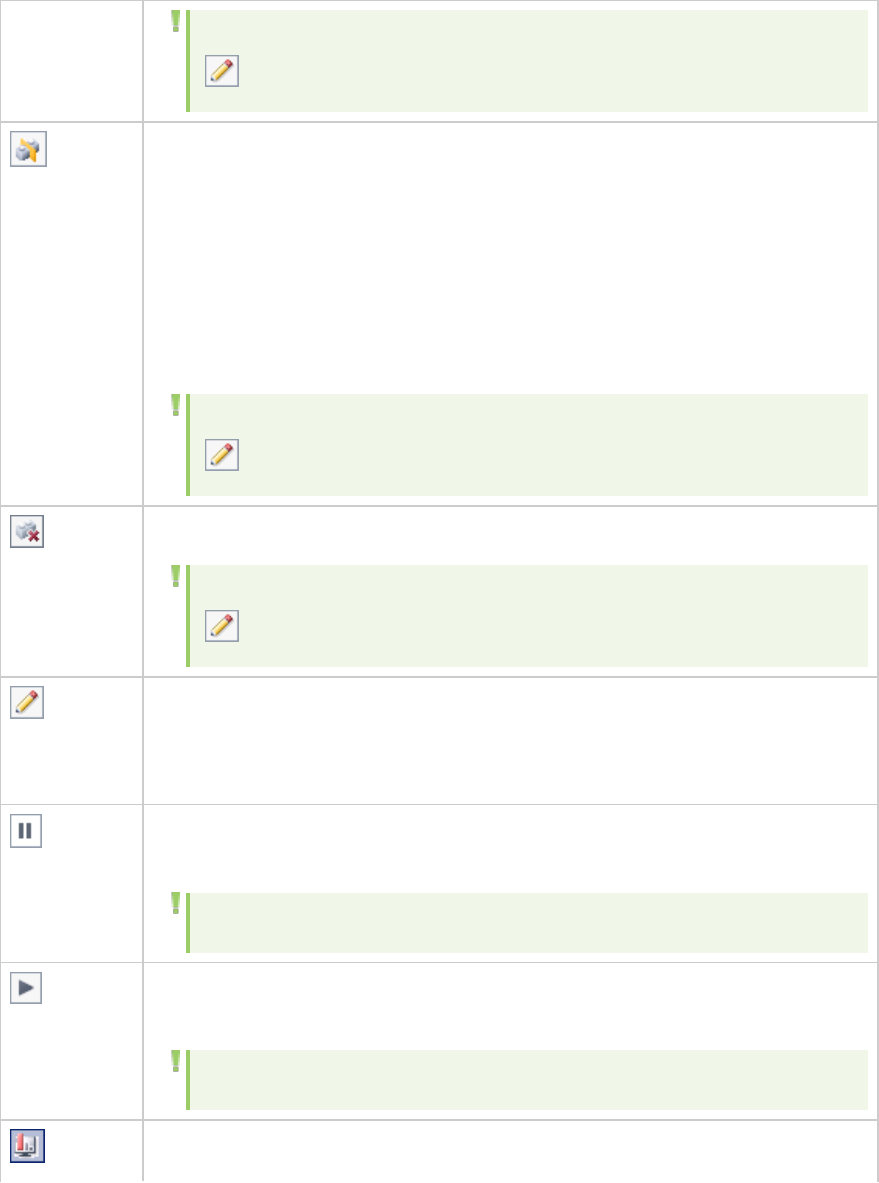
Note: Available when the graph is in Edit mode only. (See Edit/View Mode
below.)
(Real-world
schedule only)
Split Action. Splits a selected line in the graph in two. The original action in the
Actions grid is split into two equivalent actions, each representing half of the original
action.
Examples:
lSplitting a Duration action of 5minutes results in two Duration actions of
2.5minutes each.
lSplitting a StartVusers action that starts 20Vusers results in two StartVusers
actions, each starting 10Vusers.
Note: Available when the graph is in Edit mode only. (See Edit/View Mode
below.)
(Real-world
schedule only)
Delete Action. Deletes a selected action.
Note: Available when the graph is in Edit mode only. (See Edit/View Mode
below.)
(Real-world
schedule only)
Edit/View Mode. Switches the graph display between Edit mode and View mode.
Pause. Pauses the schedule during the scenario run. When the schedule is paused,
the red vertical line that indicates the schedule's progress freezes.
Note: Available only when the scenario is running.
Resume. Resumes a paused schedule. When the schedule resumes running, the red
vertical line continues moving across the graph, indicating the schedule's progress.
Note: Available only when the scenario is running.
Show Selected Group. Displays only the group selected in the Scenario Groups pane.
, continued
User Guide
Controller
HP LoadRunner (12.50) Page 1170
Note: Available for group schedules only.
Show All Groups. Displays all Vuser groups participating in the scenario.
Note: Available for group schedules only.
Open Full View. Opens the graph in its own window.
Note: All the options available in the Schedule pane's interactive graph are
also available in the full-view graph window.
Zoom In. Zooms into the x-axis of the graph— that is, spreads the graph out to view
shorter time intervals.
Zoom Out. Zoom out of the x-axis of the graph— that is, displays longer time
intervals.
Zoom Reset. Reverts to the default time intervals displayed on the x-axis.
Hide Legend. Hides the graph legend.
Show Legend. Shows the graph legend.
<End points> When an action (line) in the graph is selected, two endpoints are displayed:
lDot. Starting point of the line.
lDiamond. The endpoint of a selected line. Can be dragged to edit an action. For
details, see "How to Edit Schedule Actions" on page1160.
Note: To fine-tune any of the details of the selected action line, use the
arrow keys on your keyboard.
<Schedule
progress
indicator>
A red vertical line that slides across the schedule graph while the schedule is
running.
Note: The schedule may run a few seconds ahead of the scenario run.
<Time scroll
bar>
Appears if, when zooming into the graph, the graph spreads out wider than the
graph area.
, continued
User Guide
Controller
HP LoadRunner (12.50) Page 1171
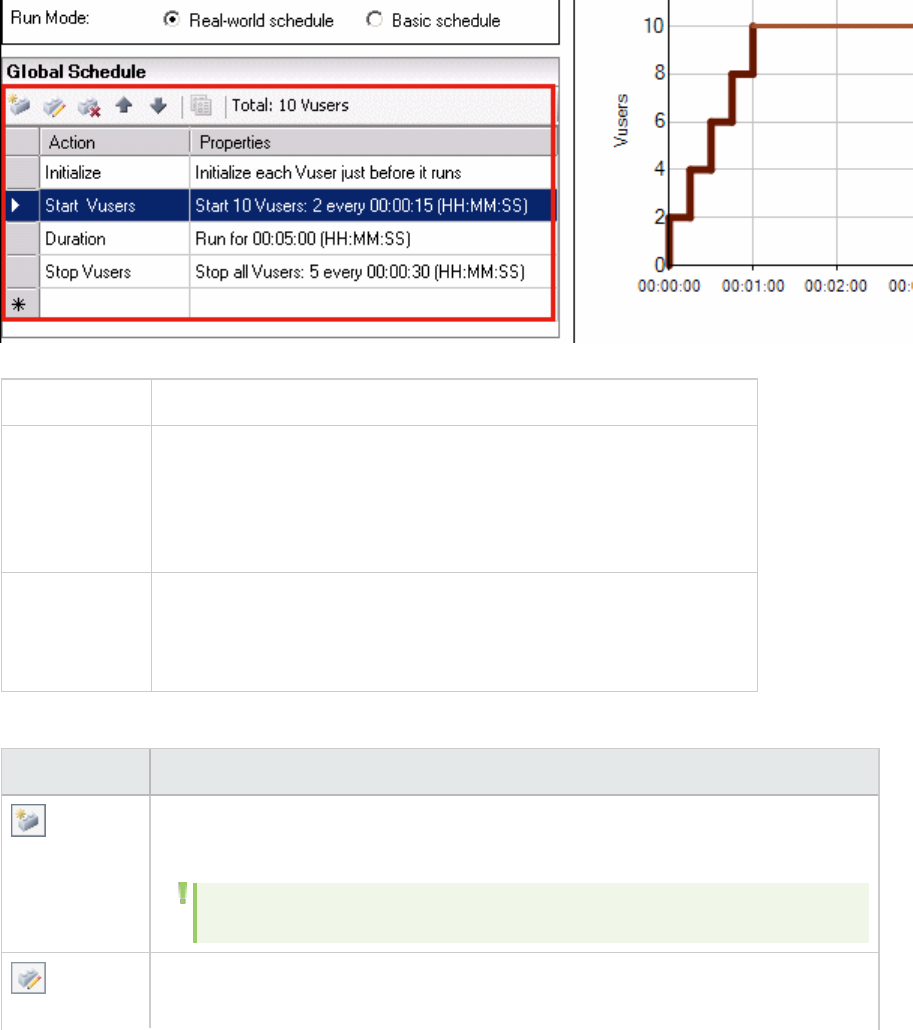
Actions Grid
You define the actions for a schedule in this area. You can add, modify, and delete actions. These
actions include starting Vuser groups (in group schedules) and initializing, starting, and stopping Vusers.
You can also define how long each action should continue.
When creating group schedules, you can copy group schedule settings from one Vuser group to another.
To access Manual scenario > Design tab > Scenario Schedule pane
Relevant tasks l"How to Define a Schedule for the Scenario - Workflow" on
page1155
l"How to Add Actions to the Scenario Schedule" on page1158
l"How to Edit Schedule Actions" on page1160
See also l"Scenario Schedule Pane" on page1166
l"Schedule Actions" on page1162
l"Interactive Schedule Graph" on page1168
User interface elements are described below:
UI Element Description
(Real-world
schedule only)
Add Action After. Opens the Add Action dialog box where you can define new
actions. For details, see "Add Action Dialog Box" on page1164.
Note: The new action is added after the action selected in the Actions grid.
Edit Action. Opens the Edit Action dialog box where you can edit the schedule
actions. For details, see "Edit Action Dialog Box" on page1165.
User Guide
Controller
HP LoadRunner (12.50) Page 1172
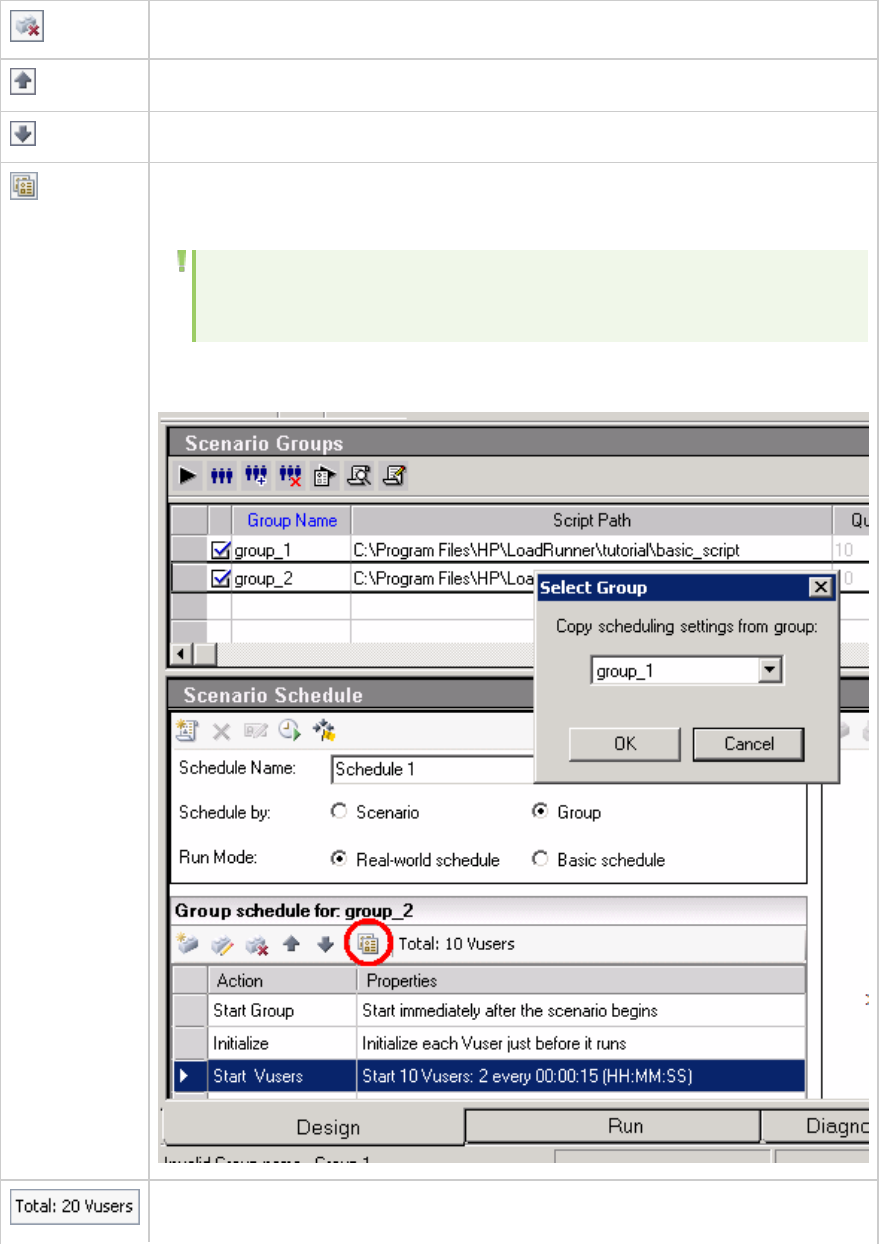
Delete Action. Deletes the selected action.
Move Action Up. Moves the selected action up the grid.
Move Action Down. Moves the selected action down the grid.
(Vuser group
schedules only)
Copy Schedule Settings From. Enables copying group schedule settings from one
Vuser group to another in the Scenario Groups pane.
Note: Schedule settings copied include the schedule runmode (basic or
real-world) and the set of schedule actions.
Example: To copy group_1's schedule settings to group_2, select group_2 in the
Scenario Groups pane. Then click this button, and select group_1.
Displays the total number of Vusers scheduled to run in the scenario.
, continued
User Guide
Controller
HP LoadRunner (12.50) Page 1173
Note:
lThis is editable in basic schedules, when the scenario is in percentage
mode only.
lWhen the scenario is in Vuser group mode and you are defining a basic
schedule, this value is updated when you modify the quantity of Vusers in
the Vuser groups.
For details, see "Add Vusers Dialog Box" on page1089.
lIn real-world schedules, the total number of Vusers is the sum of all the
Vusers defined in the Start Vusers actions.
Apply. When you modify the Total: <#> Vusers field, applies the specified total
number of Vusers proportionately to the Vuser groups. (Percentages are visible in
the %column of the Scenario Scripts pane.)
Note: Appears only when Total: <#> Vusers is modified.
, continued
Service Level Agreements
Service Level Agreements Overview
Service level agreements (SLAs) are specific goals that you define for your load test scenario. After a
scenario run, HP LoadRunner Analysis compares these goals against performance related data that was
gathered and stored during the course of the run, and determines whether the SLA passed or failed.
Depending on the measurements that you are evaluating for your goal, LoadRunner determines the SLA
status in one of the following ways:
SLA Type Description
SLA status
determined at
time intervals
over a timeline
Analysis displays SLA statuses at set time intervals over a timeline within the run.
At each time interval in the timeline—for example, every 10 seconds—Analysis
checks to see if the measurement's performance deviated from the threshold
defined in the SLA.
Measurements that can be evaluated in this way:
lAverage Transaction Response Time
lErrors per Second
SLA status
determined over
Analysis displays a single SLA status for the whole scenario run.
Measurements that can be evaluated in this way:
User Guide
Controller
HP LoadRunner (12.50) Page 1174
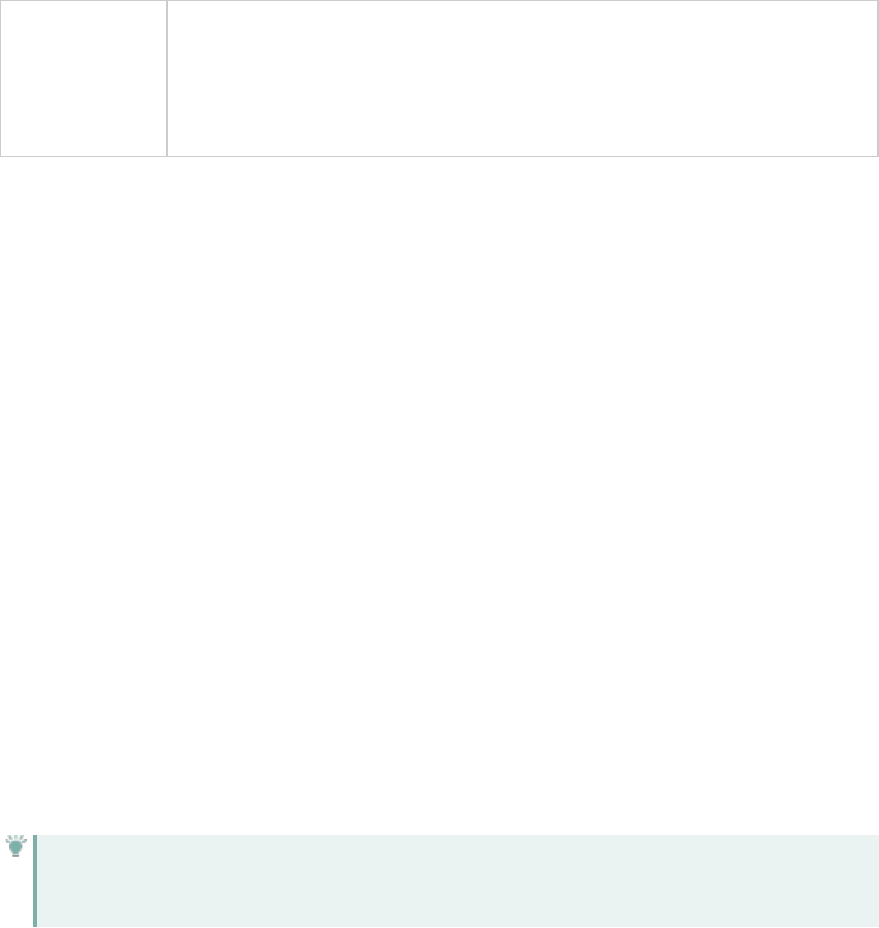
the whole run lTotal Hits per run
lAverage Hits (hits/second) per run
lTotal Throughput (bytes) per run
lAverage Throughput (bytes/second) per run
You can define and edit SLAs in the Controller or in Analysis.
To define SLAs in the Controller, see "How to Define Service Level Agreements" below.
For details about defining SLAs in Analysis and viewing SLA information in Analysis reports, see "Defining
Service Level Agreements" on page1428.
Tracking Period
When you define an SLAs for measurements that are evaluated over a timeline, Analysis determines SLA
statuses at specified time intervals within that timeline. The frequency of the time intervals is called
the tracking period.
An internally-calculated tracking period is defined by default. You can change the tracking period by
entering a value in the Advanced Options dialog box which Analysis plugs into a built-in algorithm to
calculate the tracking period. For details, see "Advanced Options Dialog Box" on page1179.
How to Define Service Level Agreements
This task describes how to define service level agreements (SLAs).
You can define service level agreements (SLAs) which measure scenario goals over time intervals, or
over a whole scenario run. For details, see "Service Level Agreements Overview" on the previous page.
See also "Workflow" on page1400.
Tip: For a use-case scenario related to this task, see "How to Define Service Level Agreements -
Use-Case Scenario" on the next page.
1. Prerequisites
If you are defining an SLA for Average Transaction Response Time, your scenario must include a
script that contains at least one transaction.
2. Run through the SLA wizard
In the Service Level Agreement pane, click New to open the Service Level Agreement wizard. For
user interface details, see "Service Level Agreement Wizard" on page1180.
a. Select a measurement for the SLA.
b. If you are defining an SLA for Average Transaction Response Time, select the transactions to
User Guide
Controller
HP LoadRunner (12.50) Page 1175
include in your goal.
c. (Optional) When evaluating SLA statuses over a timeline, select load criteria to take into
account and define appropriate load value ranges for the load criteria. For an example, see
"How to Define Service Level Agreements - Use-Case Scenario" below.
d. Set thresholds for the measurements.
oIf the Average Transaction Response Time or Errors per Second exceed the defined
thresholds, Analysis will produce a Failed SLA status.
oIf Total Hits per run,Average Hits (hits/second) per run,Total Throughput (bytes) per
run, or Average Throughput (bytes/second) per run are lower than the defined threshold,
Analysis will produce a Failed SLA status.
3. Define a tracking period - optional
For measurements whose SLA statuses are determined over time intervals, you need to define the
frequency of the time intervals, that is, the tracking period. For details, see "Tracking Period" on
the previous page.
For user interface details, see "Advanced Options Dialog Box" on page1179.
4. Results
When analyzing your scenario run, HP LoadRunner Analysis compares the data collected from the
scenario run against the SLA settings, and determines SLA statuses which are included in the
default Summary Report.
For more information, see "Workflow" on page1400.
How to Define Service Level Agreements - Use-Case Scenario
This use-case scenario describes how to define a service level agreement (SLA) for Average Transaction
Response Time.
1. Background
The administrator of HP Web Tours would like to know when the average transaction response
time for booking a flight and searching for a flight exceeds a certain value. Assume that your
scenario includes a script that includes the following transactions: book_flight and search_flight.
2. Start the SLA wizard
In the Service Level Agreement pane, click New to open the Service Level Agreement wizard.
3. Select the measurement for the SLA
On the Select a Measurement page, under SLA status determined at time intervals over a
timeline, select Average Transaction Response Time.
User Guide
Controller
HP LoadRunner (12.50) Page 1176
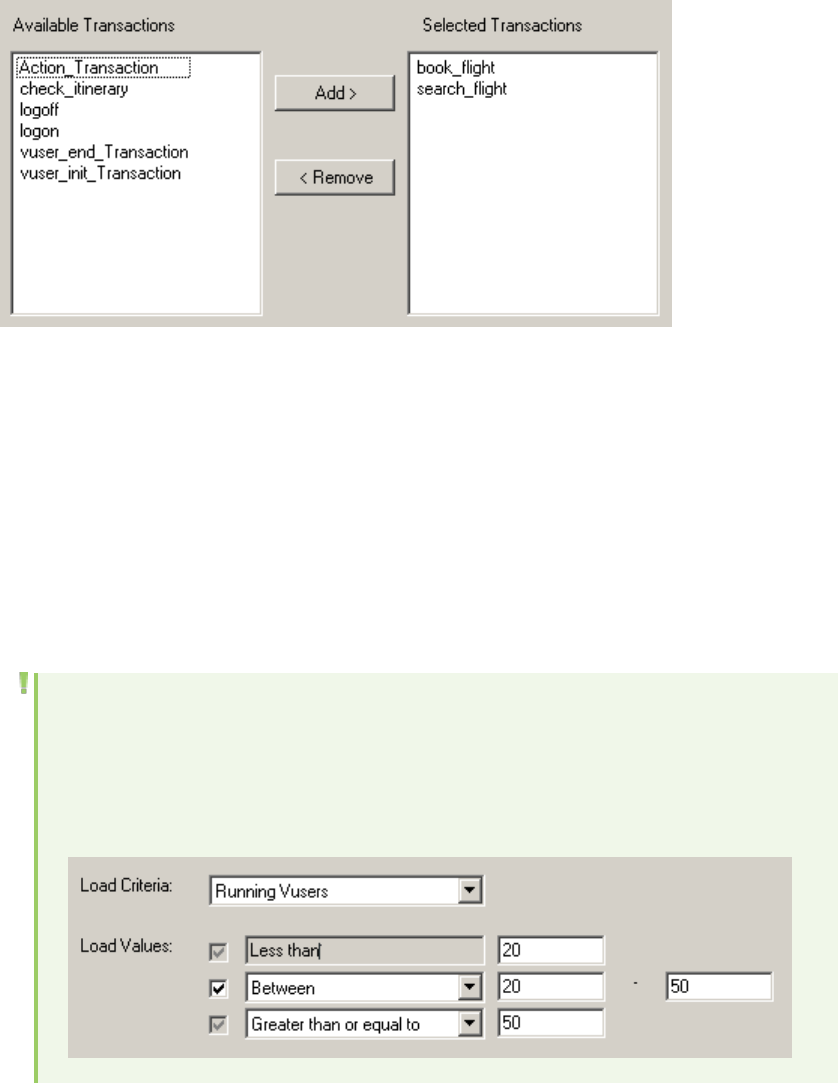
4. Select the transactions to evaluate in your goal
On the Select a Transaction page, select the transactions to be evaluated: book_flight and search_
flight.
5. Select a load criterion and define appropriate ranges of load- optional
On the Select Load Criteria page, select the load criterion to take into account when evaluating the
average transaction response time.
In this case, to see the effect that various quantities of Vusers running on the system has on the
average transaction response time of each transaction, in the Load Criteria box, select Running
Vusers.
Then set the value ranges for the running Vusers:
Consider less than 20 Vusers to be a light load, 20 – 50 Vusers an average load, and 50 Vusers or
more a heavy load. Enter these values in the Load Values boxes.
Note:
lYou can set up to three in-between ranges.
lValid load value ranges are consecutive—there are no gaps in the range—and span all
values from zero to infinity.
6. Set thresholds
User Guide
Controller
HP LoadRunner (12.50) Page 1177
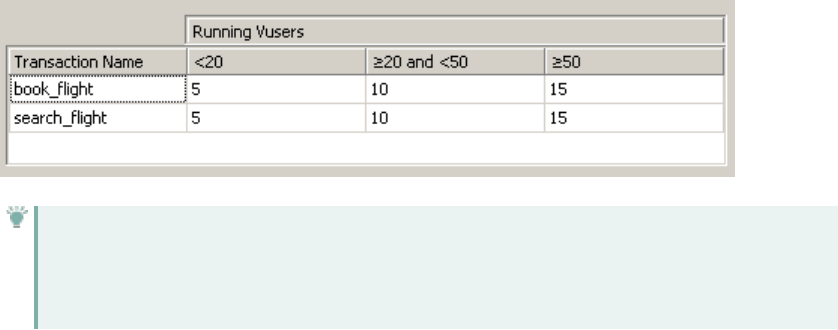
On the Set Threshold Values page, you define the acceptable average transaction response times
for the transactions, taking into account the defined load criteria.
In this case, define the same threshold values for both transactions as follows: for a light load, a
reasonable average response time can be up to 5 seconds, for an average load, up to 10 seconds,
and for a heavy load, up to 15 seconds.
Tip: To define the same thresholds for all the transactions, you can type the values in the
table nearer the bottom of the Set Threshold Values page, and click Apply to all
transactions.
7. Define a tracking period - optional
When SLA statuses for a measurement are determined at time intervals over a timeline, the
frequency of the time intervals is determined by the tracking period.
This step is optional because an internally-calculated tracking period of at least 5 seconds is
defined by default. You can change the tracking period in the Advanced Options dialog box:
a. In the Service Level Agreement pane, click the Advanced button.
b. Select Tracking period of at least X seconds, and select a tracking period. The time intervals
are calculated by Analysis according to a built-in algorithm and as a function of the value you
enter here.
Example:
If you select a tracking period of 10, and the aggregation granularity for the scenario (defined
in Analysis) is 6, then the tracking period is set to the nearest multiple of 6 that is greater than
or equal to 10, that is, Tracking Period = 12.
For details, see "Tracking Period" on page1175.
For user interface details, see "Advanced Options Dialog Box" on the next page.
8. Results
When analyzing your scenario run, Analysis applies your SLA settings to the default Summary
Report and the report is updated to include all the relevant SLA information.
For example, it displays the worst performing transactions in terms of defined SLAs, how specific
transactions performed over set time intervals, and overall SLA statuses.
For more information, see the HP LoadRunner Analysis User Guide.
User Guide
Controller
HP LoadRunner (12.50) Page 1178
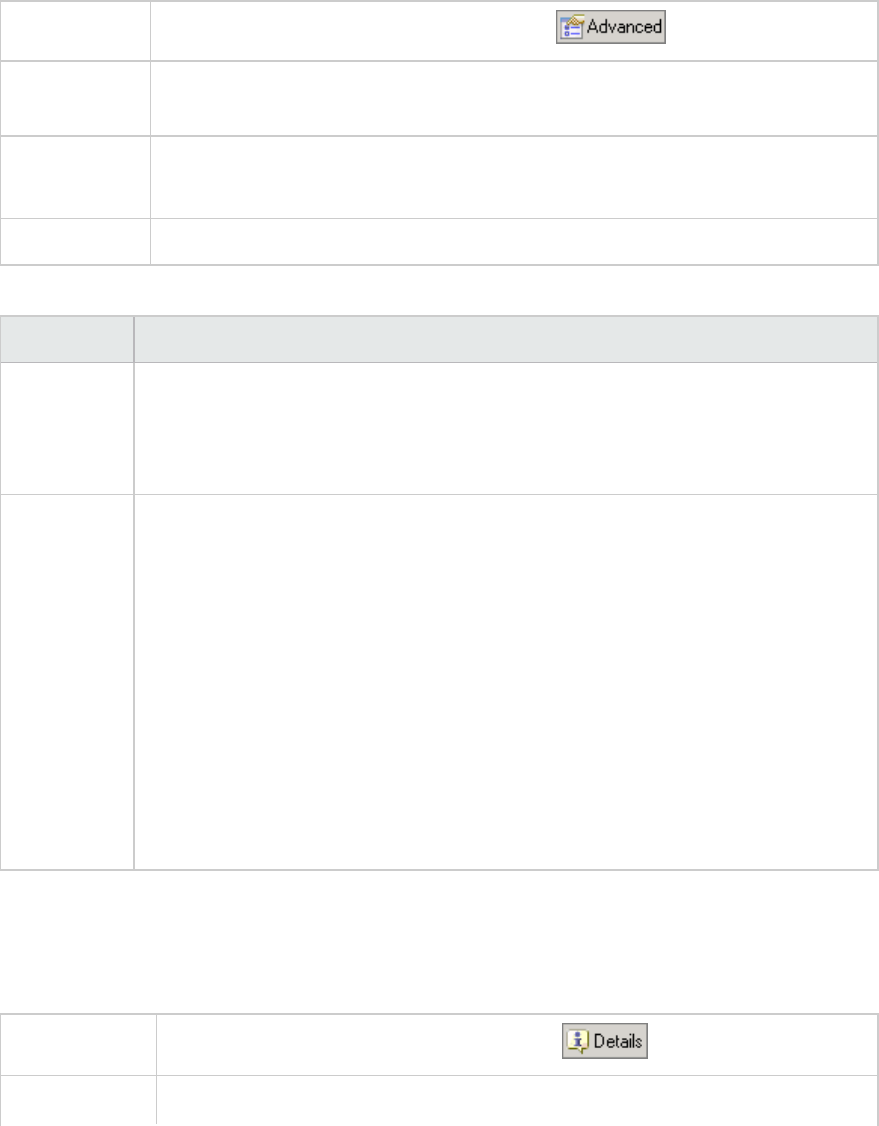
Advanced Options Dialog Box
This dialog box enables you to define a tracking period for load test scenario.
To access Design tab > Service Level Agreement pane >
Important
Information
The tracking period is calculated by Analysis according to a built-in algorithm and as
a function of the value entered here.
Relevant tasks l"How to Define Service Level Agreements" on page1175
l"How to Define Service Level Agreements - Use-Case Scenario" on page1176
See also "Service Level Agreements Overview" on page1174
User interface elements are described below:
UI Element Description
Internally
calculated
tracking
period
Analysis sets the tracking period to the minimum value possible, taking into account
the aggregation granularity defined for the scenario. This value is at least 5 seconds.
It uses the following formula:
Tracking Period = Max (5 seconds, aggregation granularity)
Tracking
period of at
least X
seconds
Determines the minimum amount of time for the tracking period. This value can
never be less than 5 seconds.
Analysis sets the tracking period to the nearest multiple of the scenario's
aggregation granularity that is greater than or equal to the value (X) that you
selected.
For this option, Analysis uses the following formula:
Tracking Period =
Max(5 seconds, m(Aggregation Granularity))
where mis a multiple of the scenario's aggregation granularity such that m
(Aggregation Granularity) is greater than or equal to X.
Example: If you select a tracking period of X=10, and the aggregation granularity for
the scenario is 6, then the tracking period is set to the nearest multiple of 6 that is
greater than or equal to 10, that is, Tracking Period = 12.
Goal Details Dialog Box
This dialog box displays the thresholds that were set for the selected SLA.
To access Design tab > Service Level Agreement pane >
Important If you defined load criteria as part of your SLA, the threshold values are displayed
User Guide
Controller
HP LoadRunner (12.50) Page 1179
information per the defined load value ranges.
See also "Service Level Agreements Overview" on page1174
, continued
Service Level Agreement Pane
This pane lists all the service level agreements (SLAs) defined for the scenario.
To access Design tab
Relevant Tasks l"How to Design a Goal-Oriented Scenario" on page1079
l"How to Design a Manual Scenario" on page1081
l"How to Define Service Level Agreements" on page1175
l"How to Define Service Level Agreements - Use-Case Scenario" on page1176
See also "Service Level Agreements Overview" on page1174
User interface elements are described below:
UI Element Description
Starts the Service Level Agreement wizard where you can define new goals for the
load test scenario.
Opens the Goal Details dialog box which displays a summary of the details of the
selected SLA.
Opens the Service Level Agreement wizard where you can modify the goals defined
in the SLA.
Deletes the selected SLA.
Opens the Advanced Options dialog box where you can adjust the tracking period
for measurements that are evaluated per time interval over a timeline.
For more information, see "Tracking Period" on page1175.
For user interface details, see "Advanced Options Dialog Box" on the previous page.
Service Level
Agreement list
Lists the SLAs defined for the scenario.
Service Level Agreement Wizard
This wizard enables you to define goals or service level agreements (SLAs) for your load test scenario.
User Guide
Controller
HP LoadRunner (12.50) Page 1180

To access Design tab > Service Level Agreement pane >
Important
information
There are two modes for the Service Level Agreement wizard. The pages
included in the wizard depend on the measurement that is selected. See the
wizard maps below.
Relevant tasks l"How to Design a Goal-Oriented Scenario" on page1079
l"How to Design a Manual Scenario" on page1081
l"How to Define Service Level Agreements" on page1175
l"How to Define Service Level Agreements - Use-Case Scenario" on
page1176
Wizard map - Goal
measured per time
interval
The "Service Level Agreement Wizard" on the previous page contains:
Welcome >"Select a Measurement Page" below > ("Select Transactions Page"
on the next page) > "Set Load Criteria Page" on page1183 >"Set Threshold
Values Page (Goal Per Time Interval)" on page1185
Wizard map - Goal
measured over
whole scenario run
The "Service Level Agreement Wizard" on the previous page contains:
Welcome >"Select a Measurement Page" below >"Set Threshold Values Page
(Goal Per Whole Run)" on page1186
See also "Service Level Agreements Overview" on page1174
Select a Measurement Page
This wizard page enables you to select a measurement for your goal.
Important
information
lGeneral information about this wizard is available here: "Service Level
Agreement Wizard" on the previous page.
lThere are two modes for the Service Level Agreement wizard. The wizard
pages that follow depend on the measurement that you select on this page.
See the wizard maps below.
Wizard map - Goal
measured per time
interval
The "Service Level Agreement Wizard" on the previous page contains:
Welcome >"Select a Measurement Page" above > ("Select Transactions Page"
on the next page) > "Set Load Criteria Page" on page1183 >"Set Threshold
Values Page (Goal Per Time Interval)" on page1185
Wizard map - Goal
measured over
whole scenario run
The "Service Level Agreement Wizard" on the previous page contains:
Welcome> "Select a Measurement Page" above >"Set Threshold Values Page
(Goal Per Whole Run)" on page1186
See also "Service Level Agreements Overview" on page1174
User interface elements are described below:
User Guide
Controller
HP LoadRunner (12.50) Page 1181

UI Element Description
SLA status determined over
the whole run
Evaluates a single SLA status for the whole scenario run. Select one of
the following measurements:
lTotal Hits per run
lAverage Hits (hits/second) per run
lTotal Throughput (bytes) per run
lAverage Throughput (bytes/second) per run
SLA status determined per
time intervals over a
timeline
Evaluates SLA statuses at set time intervals within the run. Select one
of the following measurements:
lAverage Transaction Response Time
lErrors per Second
The time intervals at which the SLA statuses are evaluated are known
as the tracking period. For details, see"Tracking Period" on
page1175.
Select Transactions Page
This wizard page enables you to select transactions to evaluate as part of your goal.
Important
information
lGeneral information about this wizard is available here: "Service Level
Agreement Wizard" on page1180.
lThis page is displayed only creating an SLA for Average Transaction
Response Time.
lIn order to define an SLA for Average Transaction Response Time, at least
one of the Vuser scripts participating in the scenario must include a
transaction.
lYou can select multiple transactions using the CTRL key.
Wizard map - Goal
measured per time
interval
The "Service Level Agreement Wizard" on page1180 contains:
Welcome > "Select a Measurement Page" on the previous page > (Select
Transactions Page ) > Set Load Criteria Page > "Set Threshold Values Page (Goal
Per Time Interval)" on page1185
See also "Service Level Agreements Overview" on page1174
User interface elements are described below:
UI Element Description
Available
Transactions
Lists the transactions in the Vuser scripts participating in the scenario.
To move a script to the Selected Transaction list, select it and click Add.
User Guide
Controller
HP LoadRunner (12.50) Page 1182

Selected
Transactions
Lists the transactions in the Vuser scripts participating in the scenario that have
been selected for the SLA.
To remove a script from this list, select it and click Remove.
Set Load Criteria Page
This wizard page enables you to select load criteria to take into account when testing your goal.
Important
information
lGeneral information about this wizard is available here: "Service Level
Agreement Wizard" on page1180.
lThis page is displayed only when defining an SLA that determines SLA statuses
per time interval over a timeline.
lIn the next wizard step (Set Threshold Values page), you will set different
thresholds per each of the load ranges that you select here.
Wizard map -
Goal measured
per time interval
The "Service Level Agreement Wizard" on page1180 contains:
Welcome > "Select a Measurement Page" on page1181 > ("Select Transactions
Page" on the previous page) > "Set Load Criteria Page" above >"Set Threshold
Values Page (Goal Per Time Interval)" on page1185
See also "Service Level Agreements Overview" on page1174
User interface elements are described below:
UI Element Description
Load Criteria The relevant load criteria that you want to use.
Example: If you want to see the impact of running Vusers on the measurement,
select Running Vusers.
To define an SLA without load criteria, select None.
Load Values Valid load value ranges are consecutive—there are no gaps in the range—and span
all values from zero to infinity.
lLess than. Enter the upper value for the lower range of values for the load
criteria.
The lower range is between 0 and the value you entered. It does not include the
upper value.
Example: If you enter 5, the lower range of values for the load criteria is between
0 and 5, but does not include 5.
lBetween. The in-between range of values for the load criteria. Enter lower and
upper values for this range. The lower range is included in this range; it does not
include the upper value.
Example: If you enter 5 and 10, the in-between range of values for the load
criteria is from 5 and up to, but not including, 10.
User Guide
Controller
HP LoadRunner (12.50) Page 1183
Note: You can set up to three in-between ranges.
lGreater than. Enter the lower value for the upper range of values for the load
criteria.
The upper range includes values from the value you entered and on.
Example: If you enter 10, the upper range of values for the load criteria is from 10
and on.
Selected
Measurement
The measurement selected for the goal.
Set Percentile Threshold Values Page
This wizard page enables you to select load criteria to take into account when testing your goal.
Important information lGeneral information about this wizard is available here: "Service Level
Agreement Wizard" on page1180.
lThe Percentile SLA enables you to measure whether the percentage
of transaction samples meets the defined threshold criteria.
lYou can enter a threshold value to 3 decimal places.
Wizard map - Goal
measured over whole
scenario run
The "Service Level Agreement Wizard" on page1180 contains:
Welcome > "Select a Measurement Page" on page1181 > ("Select
Transactions Page" on page1182) > "Set Percentile Threshold Values
Page" above
See also "Service Level Agreements Overview" on page1174
User interface elements are described below:
UI Element Description
Selected
Measurement
The measurement selected for the goal.
Percentile Percentage of transactions to measure against the configured threshold.
Provide
threshold
value for all
transactions
To apply one set of threshold values to all transactions selected for the goal, enter
the threshold value and click Apply to all. These values are applied to all the
transactions in the Thresholds table at the bottom of the page.
Transaction
name
The transaction from the scenario run.
Threshold The threshold value for the selected transaction.
User Guide
Controller
HP LoadRunner (12.50) Page 1184
Set Threshold Values Page (Goal Per Time Interval)
This wizard page enables you to set thresholds for the measurements you are evaluating in your goal.
Important
information
lGeneral information about this wizard is available here: "Service Level Agreement
Wizard" on page1180.
lIf you defined load criteria in the "Set Load Criteria Page" on page1183, you must
set thresholds per each of the defined load ranges. If you did not define load
criteria, you set one threshold value. For Average Transaction response time, you
set threshold values for each transaction.
Wizard map
- Goal
measured
per time
interval
The "Service Level Agreement Wizard" on page1180 contains:
Welcome > "Select a Measurement Page" on page1181 > ("Select Transactions Page"
on page1182) > "Set Load Criteria Page" on page1183 >"Set Threshold Values Page
(Goal Per Time Interval)" above
See also "Service Level Agreements Overview" on page1174
User interface elements are described below (unlabeled elements are shown in angle brackets):
UI Element Description
<Thresholds
table>
The thresholds for your goal. If you defined load criteria, enter thresholds for each
range of values.
Note: If the maximum threshold value is exceeded during a particular time
interval during the run, Analysis displays an SLA status of Failed for that
time interval.
Apply to all
(Average
Transaction
Response
Time goal
only)
To apply one set of threshold values to all transactions selected for the goal, enter
the threshold values in this table and click Apply to all transactions. These values
are applied to all the transactions in the Thresholds table at the top of the page.
Note: Threshold values for selected transactions do not have to be the
same. You can assign different values for each transaction.
Selected
Measurement
The measurement selected for the goal.
User Guide
Controller
HP LoadRunner (12.50) Page 1185
Set Threshold Values Page (Goal Per Whole Run)
This wizard page enables you to set minimum thresholds for the measurements you are evaluating in
your goal.
Important information General information about this wizard is available here: "Service
Level Agreement Wizard" on page1180.
Wizard map - Goal measured
over whole scenario run
The "Service Level Agreement Wizard" on page1180 contains:
Welcome > "Select a Measurement Page" on page1181 >"Set
Threshold Values Page (Goal Per Whole Run)" above
See also "Service Level Agreements Overview" on page1174
User interface elements are described below:
UI Element Description
Selected
measurement
The measurement selected for the goal.
Threshold The minimum threshold value for the selected measurement.
Note: If the value of the measurement is lower than this threshold during
the run, Analysis displays an SLA status of Failed for the entire run.
Multiple IP Addresses
Multiple IP Addresses Overview
Application servers and network devices use IP addresses to identify clients. The application server
often caches information about clients coming from the same machine. Network routers try to cache
source and destination information to optimize throughput. If many users have the same IP address,
both the server and the routers try to optimize. Since Vusers on the same load generator have the
same IP address, server and router optimizations do not reflect real-life situations.
LoadRunner's Multiple IP Address feature enables Vusers running on a single load generator to be
identified by many IP addresses. The server and router recognize the Vusers as coming from different
load generators and as a result, the testing environment is more realistic.
This feature can be implemented on Windows and Linux platforms with the following protocols: DNS,
IMAP, Oracle NCA, Oracle-Web, POP3, RTE, SAP-Web, Siebel-Web, SMTP, Web - HTTP/HTML, Web Services,
and Windows Sockets.
User Guide
Controller
HP LoadRunner (12.50) Page 1186
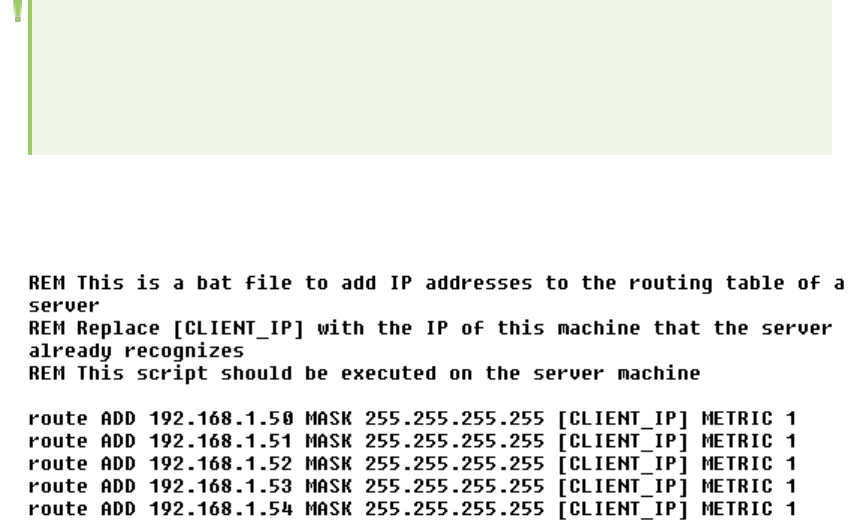
How to Add IP Addresses to a Load Generator
The following steps describe how to add IP addresses to a load generator.
1. Run the IP Wizard on the load generator
lWindows: LoadRunner includes an IP Wizard program that you run on Windows load generators
to create multiple IP addresses. You add new IP addresses to a machine once and use the
addresses for all scenarios.
Run the IP Wizard on the load generator to add a specified number of IP addresses.
For details, see "IP Wizard" on the next page.
lLinux: Manually configure the new IP addresses for Linux load generators.
2. Update the server's routing table with the new addresses
Once the client machine has new IP addresses, the server needs the addresses in its routing table,
so that it can recognize the route back to the client. If the server and client share the same
netmask, IP class, and network, the server's routing table does not require modification.
Note: If there is a router between the client and server machines, the server needs to
recognize the path via the router. Make sure to add the following to the server routing
table: route from the Web server to the router, and routes from the router to all of the IP
addresses on the load generator.
Update the Web server routing table as follows:
a. Edit the batch file that appears in the IP Wizard Summary screen. An example .bat file is shown
below.
b. For each occurrence of [CLIENT_IP], insert your IP address instead.
c. Run the batch file on the server machine.
3. Enable the Multiple IP Addresses feature from the Controller
Once you define multiple IP addresses, you set an option to tell the Controller to use this feature.
User Guide
Controller
HP LoadRunner (12.50) Page 1187
a. In the Controller Design view, select Scenario> Enable IP Spoofer.
Note: You must select this option before connecting to a load generator.
b. In the Controller's Tools > Options > General tab (Expert mode only), specify how the
Controller should allocate the IP addresses: per process or per thread. For details, see "Options
> General Tab" on page1214.
IP Wizard
This wizard enables you to create and save new IP addresses on Windows machines.
To access On the LoadRunner machine, select Start > All Programs > HP Software > HP
LoadRunner > Tools > IP Wizard
Important
information
This wizard resides on each load generator. It enables you to create and save new IP
addresses on Windows machines. The new addresses can be a range of addresses
defined by the Internet Assignment Numbers Authority. They are for internal use only,
and cannot connect to the Internet. This range of addresses is the default used by the
IP Wizard.
Relevant
tasks
"How to Add IP Addresses to a Load Generator" on the previous page
IP Wizard Welcome - Step 1 of 3
User interface elements are described below:
UI Element Description
Create new settings Enables you to define new IP settings on the load generator.
Load previous settings from file Enables you to use an existing file with IP address settings.
Restore Original Settings Restores original settings.
IP Wizard - Step 2 of 3 - Optional
User interface elements are described below (unlabeled elements are shown in angle brackets):
UI Element Description
<Web Server
Address box>
If you have more than one network card, enables you to choose the card to use for IP
addresses.
This step enables the IP Wizard to check the server's routing table to see if it
requires updating after new IP addresses are added to the load generator.
User Guide
Controller
HP LoadRunner (12.50) Page 1188

IP Wizard - Step 3 of 3 - Optional
User interface elements are described below:
UI
Element
Description
Add
button
Opens the Add dialog box where you can add a new IP address.
The Add dialog box contains the following options:
lPrivate Address Spaces. Classes that represents the correct submask for the
machine's IP addresses.
lFrom IP. Adds IP addresses starting with this number.
lSubmask. IP addresses include two components, a netid and hostid. The submask
determines where the netid portion of the address stops and where the hostid begins.
lNumber to add. The number of IP addresses to add.
lVerify that new IP addresses are not already in use. Instructs the IP Wizard to
check the new addresses. The IP Wizard adds only the addresses that are not already
in use.
Remove
button
Removes a selected IP Address.
IP
Address
The IP addresses on the load generator machine.
Subnet
Mask
The submasks of the IP addresses on the load generator machine.
Number
of IPs
added
The number of IP addresses added to the load generator machine.
Finish
button
Click Finish to exit the IP Wizard. The IP Wizard will run a netsh batch file to update the
NT device drivers with the new addresses.
IP Wizard - Summary
User interface elements are described below (unlabeled elements are shown in angle brackets):
UI
Element
Description
<Summary
area>
Displays a summary of the operations performed by the IP Wizard.
Take note of the location of the netsh batch file (.bat). This is used to update the
routing table, if necessary. See "How to Add IP Addresses to a Load Generator" on
User Guide
Controller
HP LoadRunner (12.50) Page 1189
page1187.
Configuring Terminal Services Settings
Terminal Services Overview
You can use LoadRunner's Terminal Services Manager to remotely manage multiple load generators
running in your load testing scenario on a terminal server. In addition, you can use a terminal server to
overcome the limitation of being able to run only a single GUI Vuser on a Windows-based load generator.
By opening a terminal server session for each GUI Vuser, you can run multiple GUI Vusers on the same
application.
A terminal server client can have multiple terminal sessions running simultaneously. Using LoadRunner's
Terminal Services Manager, you can select the number of terminals to be used in your scenario
(provided that you have sufficient terminal sessions running), and the maximum number of Vusers that
can be run per terminal. The Terminal Services Manager then evenly distributes the number of virtual
users among the client sessions.
Note: This feature is not supported if the Controller and the load generators connect over a
firewall. To configure terminal services on a load generator over a firewall, see "How to
Configure Terminal Sessions Over a Firewall" on page1192.
About Terminal Services
Terminal services allows centralized management of computing resources for each client connected to
the server, and provides each user with their own working environment. Using a terminal server client,
you can operate in a server-based computing environment from a remote machine. The terminal server
transmits applications over the network and displays them via terminal emulation software. Each user
logs on and sees only his individual session, which is managed transparently by the server's operating
system independent of any other client session.
Note: Only users with administrator privileges can connect from the Controller to a local load
generator via a terminal services session.
The following diagram illustrates how the LoadRunner components work together during a terminal
session.
User Guide
Controller
HP LoadRunner (12.50) Page 1190
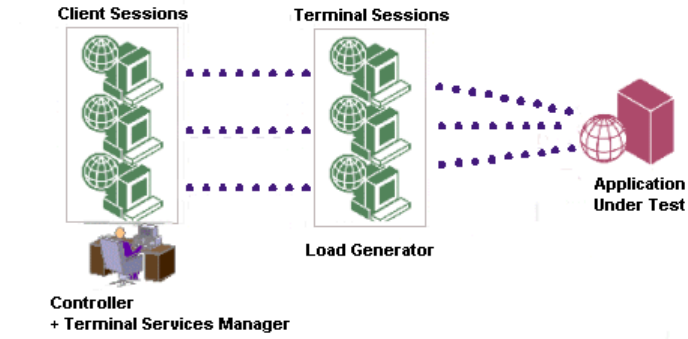
How to Use the Terminal Services Manager
This task describes how to set up and use LoadRunner's Terminal Services Manager.
1. Prerequisite
Make sure that a load generator has been installed on the terminal services machine. For more
information, see the HP LoadRunner Installation Guide.
2. Allow terminal services on the load generator
Add TSLauncher.exe to the list of allowed remote applications on all load generator machines.
3. Set up the LoadRunner agent on the load generator
Perform the following steps:
a. On the LoadRunner machine, select Start > All Programs> HP Software > HP LoadRunner >
Advanced Settings > Agent Configuration, or run <LR>\launch_service\bin\AgentConfig.exe
to open the Agent Configuration dialog box.
b. Select Enable Terminal Services, and click OK.
c. Restart the LoadRunner Agent as a process by double-clicking the shortcut on the desktop, or
from Start>All Programs > HP LoadRunner >Advanced Settings > LoadRunner Agent
Process. You need to run the LoadRunner Agent as a process for each terminal session that
you are running.
4. Launch a terminal client session
Be aware of the following:
lYou must open a Terminal Client session for each terminal that you want to run Vusers on
during the scenario.
lIf you are connecting to an existing Terminal Services session, you need to open a Terminal
Client session, log in to the session, and run the LoadRunner Agent as a process.
User Guide
Controller
HP LoadRunner (12.50) Page 1191
5. Distribute Vusers on the terminal server
In the Terminal Services tab of the Load Generator Information dialog box, select Enable Terminal
Services Manager and enter information about the terminals and Vusers that you want to use. For
more information, see "Load Generator Configuration > Terminal Services Tab" on page1139.
How to Configure Terminal Sessions Over a Firewall
This task describes how to configure a terminal sessions on a load generator that is located over a
firewall. You configure the terminal sessions as independent virtual load generators. Each virtual load
generator must have its own logical name.
Prerequisite
If the LoadRunner Agent is not running as a process, on the LoadRunner machine, select Start > All
Programs > HP Software > HP LoadRunner > Advanced Settings > Agent Process to run it as a
process. In icon-based desktops such as Windows 8, search for Agent Process.
Configure the terminal sessions as independent load generators
Perform the following steps:
1. On the LoadRunner machine, select Start > All Programs > HP Software > HP LoadRunner >
Advanced Settings > Agent Configuration to open the Agent Configuration dialog box.
2. Select Enable Firewall Agent and Enable Terminal Services.
3. Click Settings to open the Agent Configuration Over Firewall Settings dialog box.
4. In the Local Machine Key field, enter a logical virtual load generator name, for example, machine_
ofw.
5. Click OK.
6. Create one or more terminal sessions on the load generator console machine.
Keep in mind the following:
lFor each terminal session, run the agent configuration as above. For each session, specify a different
Local Machine Key name, for example, machine_ofw_1,machine _ofw_2, and so on.
lIf you stop the agent on a terminal session, you must reconfigure the settings for that particular
session before restarting the agent.
lWhen selecting the load generator for the scenario in the Controller, select the local machine key for
each individual virtual load generator used.
Running Load Test Scenarios
This section describes how to plan and create LoadRunner Controller scenarios.
User Guide
Controller
HP LoadRunner (12.50) Page 1192
What do you want to do?
lSet up an online monitor
lConfigure scenario options
lPrepare for a scenario run
lRun a scenario from the Controller
lRun a scenario from the command line
See also:
Rendezvous points
Using UFT tests
Integration with ALM
Continuous integration with Jenkins
Online Monitor Graphs
Online Monitor Graphs Overview
You can view the data collected by the online monitors using the online monitor graphs.
About Online Monitor Graphs
Online monitor graphs display performance measurements for those resources being monitored during
scenario run. Each measurement is represented on the graph by a colored line. Information about the
measurements is listed in the legend below the graph. The legend displays the measurements for the
selected graph only.
For details about selecting monitor graphs and customizing the graph display area, see "How to Display
Online Monitor Graphs" on the next page.
For details about customizing graph layout and measurements, see "How to Customize Online Graph
and Measurement Settings" on page1195.
Viewing Monitor Data Offline
After monitoring resources during a scenario run, you can view a graph of the data that was gathered
using HP LoadRunner Analysis. Analysis processes the data from the scenario run results files, and
generates a graph for each measurement that was monitored.
For details about working with Analysis at the end of the scenario run, see the HP LoadRunner Analysis
User Guide.
User Guide
Controller
HP LoadRunner (12.50) Page 1193

How to Display Online Monitor Graphs
This task describes how to open other monitor graphs and customize the graph display area.
Prerequisites
To see data in the online monitor graphs, the relevant monitoring environments must be configured. For
details, see "How to Set Up a Monitoring Environment" on page1301.
Open a monitor graph
By default, LoadRunner displays the following graphs in the graph display area:
lRunning Vusers
lTransaction Response Time
lHits per Second
lWindows Resources
You can open other graphs one at a time, as follows:
Method 1
1. Select Monitors>Online Graphs>Open a New Graph, or right-click a graph and select Open a
New Graph.
2. In the Open a New Graph dialog box, click the "+" in the left pane to expand the category nodes, and
select a graph. You can view a description of the selected graph in the Graph Description box.
3. Click Open Graph, or drag the selected graph into the right pane of the Run view.
Method 2
In the graph tree on the left of the Run tab, click the "+" to expand the category nodes. Double-click
a graph or, alternatively, select it and drag it to the graph display area on the right.
Note: If the graph tree is not displayed, select View>Show Available Graphs. To hide the
graph tree view, select View>Hide Available Graphs.
Customize the graph display area - Optional
By default, LoadRunner displays four graphs in the graph display area.
To change the number of graphs displayed, right-click a graph in the graph display area and select
ViewGraphs (or select View >ViewGraphs).
Do one of the following:
lSelect the number of graphs to display from the options given
lSelect Custom Number and enter a number of graphs to display.
User Guide
Controller
HP LoadRunner (12.50) Page 1194
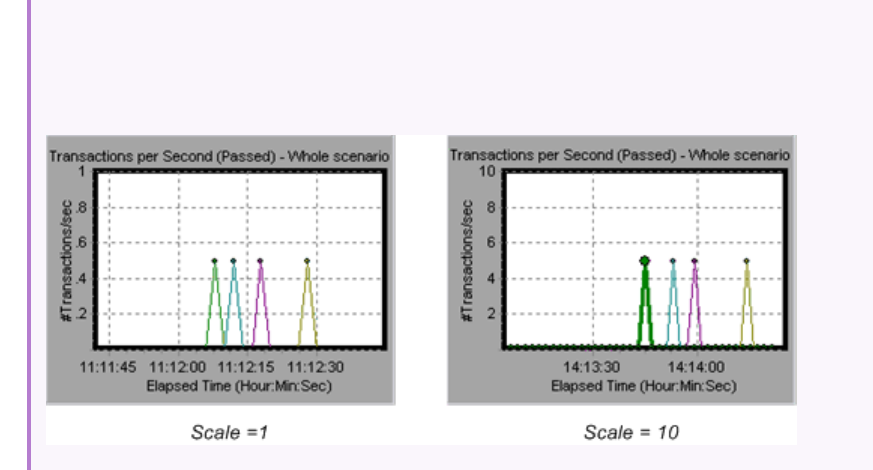
lTo display only one graph, double-click the graph displayed in the graph display area. To return to the
previous view, double-click the graph again.
How to Customize Online Graph and Measurement Settings
This task describes ways to customize online graphs and graph measurements.
Configure the graph settings
You can customize:
lThe type of graph display
lWhat to display on the x-axis and y-axis.
You can apply these settings to all graphs, or to a specific graph only.
To configure the graph settings, in the Run tab, select Monitors > Online Graphs > Configure, (or right-
click a graph and select Configure).
For user interface details, see "Graph Configuration Dialog Box" on page1198.
Configure the measurement settings
You can customize the appearance and scale of measurements in a graph, and select whether they
should be displayed in the graph or hidden from the graph.
In the Run tab, right-click a measurement in the graph or legend, and select Configure.
For user interface details, see "Measurement Configuration Dialog Box" on page1199.
Example: Measurement Scale
In the following example, the same graph is displayed with a scale of 1 and 10:
User Guide
Controller
HP LoadRunner (12.50) Page 1195
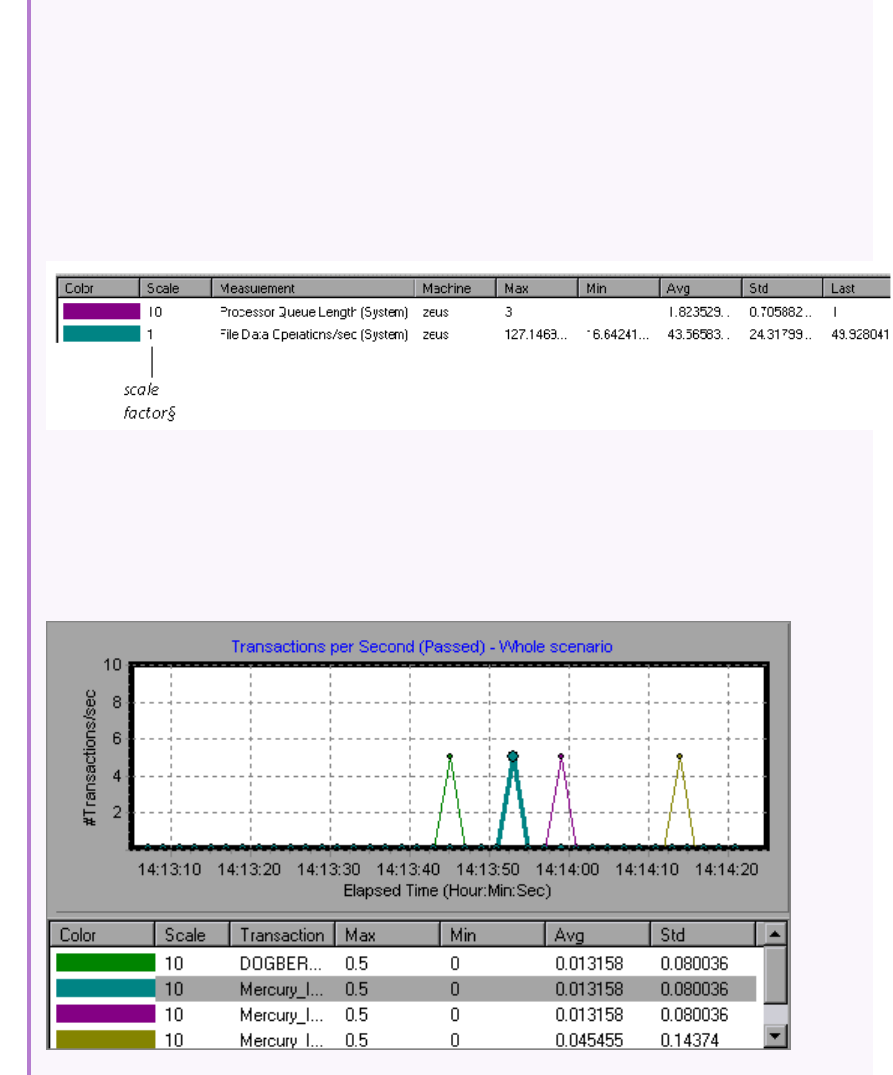
The actual graph values range from 0-1, as shown in the left graph. You can view the
information more accurately using a larger scale for the display, as shown in the right graph.
However, to obtain the actual values, you need to divide the displayed value by the scale. In the
example above, the highest value shown in the graph is 5. Since the scale is 10, the actual value
is 0.5.
The legend below the graph indicates the scale factor.
Example: Shown/Hidden Measurements
In the following example, the first image displays a line for each of the four measurements. In
the second image, the second measurement listed in the legend is hidden in the graph:
User Guide
Controller
HP LoadRunner (12.50) Page 1196
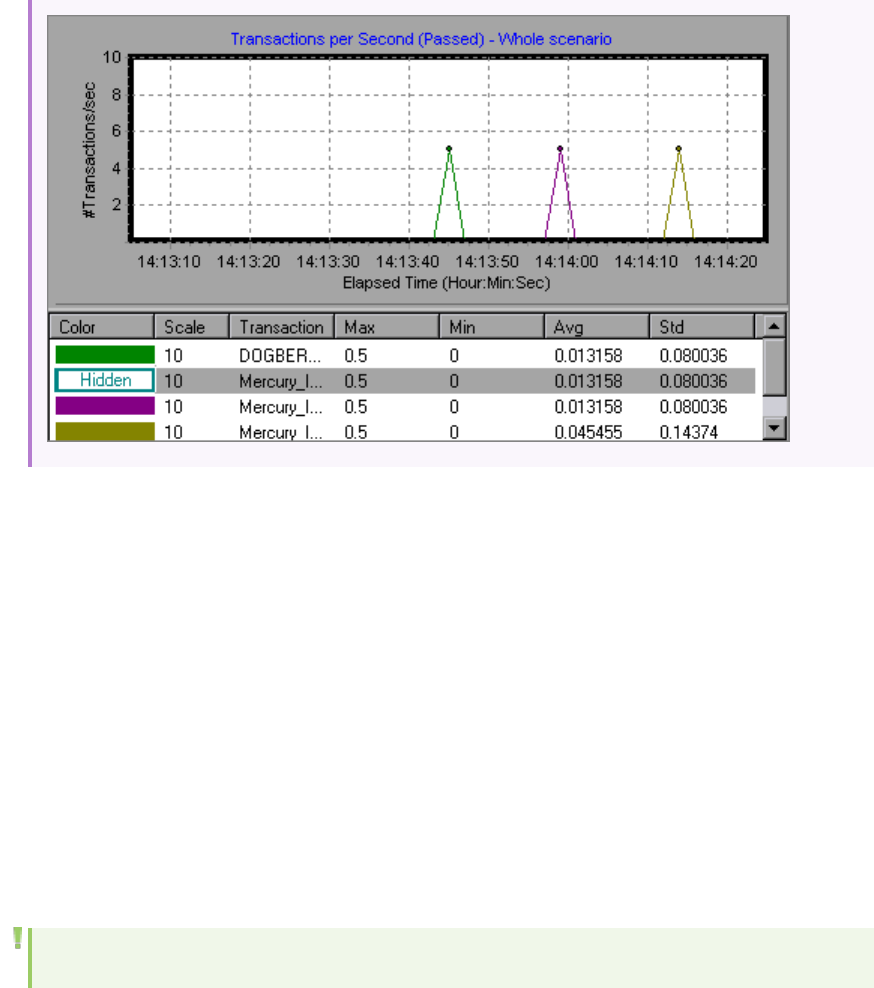
How to Manage Online Graphs
The following sections describe ways to work with the online monitor graphs.
Freeze graphs
You can pause a specific graph during a scenario run. Select the graph and select Monitors >
OnlineGraph >Freeze, or right-click the graph and select Freeze. To resume, repeat the above action.
When resumed, the graph displays the data for the paused period as well.
Overlay graphs
You can merge or overlay the results of two graphs from the same scenario into a single graph. This
enables you to compare several different measurements at once.
In the Run tab, right-click one of the online graphs you want to overlay, and select Overlay Graphs.
Note: The x-axis of both graphs must be the same measurement.
For details, see "Overlay Graphs Dialog Box" on page1202.
Export graphs to HTML
You can export graphs displayed on the Run tab to HTML format for offline viewing at a later stage.
When you export to HTML, the legend is also displayed with the graph.
You can export a single graph or all graphs in the online monitor display.
User Guide
Controller
HP LoadRunner (12.50) Page 1197
Export a single graph
1. Right-click the graph and select Export to HTML.
2. Specify a path and filename for the exported graph/report.
Graph Configuration Dialog Box
This dialog box enables you to customize the online graph settings.
To access Use one of the following:
lSelect Monitors > Online Graphs > Configure.
lRight-click a graph and select Configure.
Important information You can apply these settings to all graphs, or to a specific graph only.
Relevant tasks "How to Customize Online Graph and Measurement Settings" on page1195
User interface elements are described below:
UI
Element
Description
Apply to
all
graphs
Applies the dialog box settings to all graphs.
Apply to
selected
graph
Applies the dialog box settings to the selected graph.
Bar
Values
Type
If the Bar display type is selected, determines the type of value that will be displayed in
the bar graph: Average,Last Value,Minimum,Maximum.
Display
Type
The type of graph displayed: line graph or bar graph.
By default, each graph is displayed as a line graph.
Note: For the Network Delay graph, if you right-click the graph and select View
Segments, you can view the network segments of the graph as an area graph or a
pie graph.
Graph
Time
Indicates the scale for a graph's x-axis when it is time-based. A graph can show 60 to 3600
seconds of activity. To see the graph in greater detail, decrease the graph time. To view
the performance over a longer period of time, increase the graph time. The available
graph times are: Whole Scenario,60,180,600, and 3600 seconds.
User Guide
Controller
HP LoadRunner (12.50) Page 1198
Network
Delay
View
Available for the Network Delay Time graph only:
lSubPaths. Displays the delay measurements from the source machine to each of the
nodes along the network path.
lDNS name. Displays the DNS names of the measurements displayed in the legend.
Refresh
Rate
The interval at which the graph is refreshed with new data. By default, the graph is
refreshed every five seconds. If you increase the refresh rate, the data is refreshed less
frequently.
Note: In a large load test, it is recommended to use a refresh rate of three to five
seconds. This enables you to avoid problems with CPU resource usage.
Time Specifies how the graph displays the time (in seconds) on the x-axis:
lDon't Show. Instructs LoadRunner not to display values for the x-axis.
lClock Time. Displays the absolute time, based on the system clock.
lRelative to Scenario Start. Displays the time relative to the beginning of the scenario.
Note: If no step is running, clock time is displayed.
Example: In the left image below the time is not displayed on the x-axis. In the right
image, the time is displayed.
Y-Axis
Scale
Displays graphs using the selected y-axis scale:
lAutomatic. Displays the default y-axis values.
lMaximum Y-Axis Value. The maximum value for the y-axis.
lMinimum Y-Axis Value. The minimum value for the y-axis.
Measurement Configuration Dialog Box
This dialog box enables you to configure settings for measurements in a graph. You can:
User Guide
Controller
HP LoadRunner (12.50) Page 1199
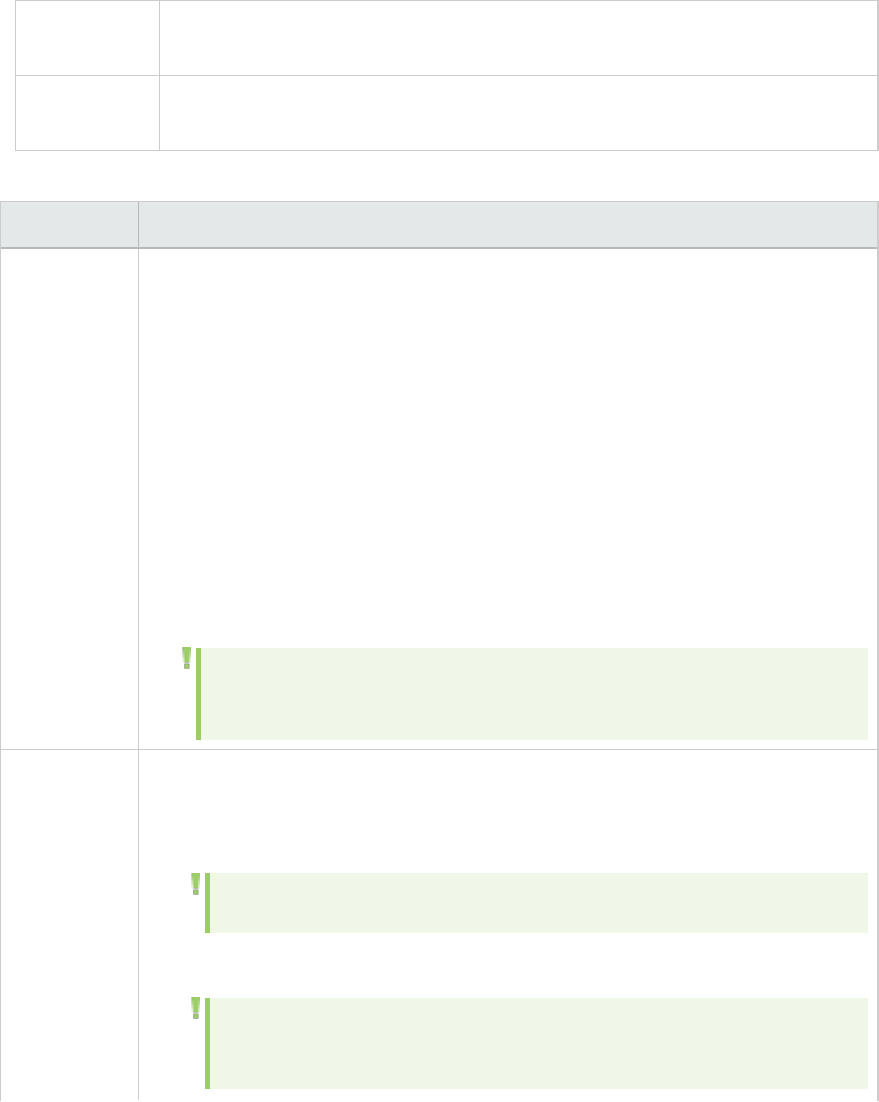
lChange line colors
lConfigure a measurement's scaling
lShow/hide measurements
lView descriptions of the measurements
To access In the Run tab, right-click a measurement in the graph or legend, and select
Configure.
Relevant
tasks
"How to Customize Online Graph and Measurement Settings" on page1195
User interface elements are described below:
UI Element Description
Configuration
tab
lColor. The color assigned to the selected measurement.
lScale. The relationship between the y-axis and the graph's actual value.
lAutoscale. Automatically scales the measurement by calculating the best ratio
for displaying the graph. For some graphs, this option is not available.
Default value: Autoscale
Example: A scale of 1indicates that the measurement's value is the value of the
y-axis. If you select a scale of 10, you must multiply the y-axis value by 10 to
obtain the true value of the measurement.
lShow / Hide. The resource selected in the legend is shown/hidden in the graph.
By default, all resource measurements are shown in the graph. To show only a
selected measurement, right-click the measurement, and select Show Only
Selected.
Note: Alternatively right-click a measurement in the graph legend and
select Show/Hide.
Description
tab
Information about the measurement:
lMachine. Displays the name of the machine whose resources are being
monitored.
Note: Displayed only when a machine's resources are being monitored.
lDescription. Displays a description of the selected measurement.
Note: Also accessible by right-clicking a measurement in the legend and
selecting Description.
User Guide
Controller
HP LoadRunner (12.50) Page 1200
Machine The name of the machine whose resources are being monitored.
Note: Displayed only when a machine's resources are being monitored.
Measurement The name of the selected measurement.
Network
Type
Appears only when monitoring a network path.
Open a New Graph Dialog Box
This dialog box enables you to open a new graph.
To access Use one of the following:
lRun tab > Monitors>Online Graphs>Open a New Graph
lRight-click a graph and select Open a New Graph.
Important
information
The graph selected in the graph display area will be replaced by the added
graph.
Relevant tasks "How to Display Online Monitor Graphs" on page1194
User interface elements are described below:
UI Element Description
Opens the selected graph and displays it in the graph tree view.
Display only
graphs
containing data
Select this option to view only those graphs that contain data. To view the entire
list of online monitor graphs (even those that do not contain data), clear this
option.
Graph
Description
Displays a description of the selected graph
Select Graph box Lists the online monitor graphs by category. To expand a category node, click the
"+" .
Tip: Graph names displayed in blue contain data.
Note: You can select only one graph at a time.
User Guide
Controller
HP LoadRunner (12.50) Page 1201
Overlay Graphs Dialog Box
This dialog box enables you to merge or overlay the results of two graphs from the same scenario into a
single graph. The merging enables you to compare several different measurements at once.
For example, you can make an overlaid graph that displays the Web Throughput and Hits per Second as
a function of the elapsed time.
To access In the Run tab, right-click one of the online graphs you want to overlay, and select
Overlay Graphs.
Important
information
lIn order to overlay graphs, the x-axis of both graphs must be the same
measurement.
lWhen you overlay the contents of two graphs that share a common x-axis, the left
y-axis on the overlaid graph shows the current graph's values. The right y-axis
shows the values of the graph that was overlaid.
Relevant
tasks
"How to Manage Online Graphs" on page1197
User interface elements are described below:
UI Element Description
Current Graph The name of the current graph.
Select graph to
overlay with
The name of the graph to be merged with the current graph.
Note: The drop-down list displays only the active graphs that have a
common x-axis with the current graph.
Title of overlaid
graph
The title given to the overlaid graph.
Available Graphs Tree
The Available Graphs Tree displays the online monitor graphs.
Tip: Graph names displayed in blue contain data.
To select measurements to monitor in a particular graph, see the monitor configuration instructions for
each specific monitor. For details, see "How to Set Up a Monitoring Environment" on page1301.
User Guide
Controller
HP LoadRunner (12.50) Page 1202

Graph Description
Running
Vusers
Provides information about the status of the Vusers running in the current scenario
on all load generators. The graph shows the number of running Vusers, while the
information in the legend indicates the number of Vusers in each state.
User-Defined
Data Points
Displays the real-time values of user-defined data points. You define a data point in
your Vuser script by inserting an lr_user_data_point function at the appropriate
place (user_data_point for GUI Vusers and lr.user_data_point for Java Vusers).
Error
Statistics
Provides details about the number of errors that accrue during each second of the
scenario run. The errors are grouped by error source—for example, the location in
the script or the load generator name.
Vusers with
Errors
Provides details about the number of Vusers that generate errors during scenario
execution. The errors are grouped by error source.
Transaction
Response
Time
Shows the average response time of transactions in seconds (y-axis) as a function of
the elapsed time in the scenario (x-axis).
Transaction
Per Second
(Passed)
Shows the number of successful transactions performed per second (y-axis) as a
function of the elapsed time in the scenario (x-axis).
Transaction
Per Second
(Failed,
Stopped
Shows the number of failed and stopped transactions per second (y-axis) as a
function of the elapsed time in the scenario (x-axis).
Total
Transactions
Per Second
(Passed)
Shows the total number of completed, successful transactions per second (y-axis) as
a function of the elapsed time in the scenario (x-axis).
Hits Per
Second
Shows the number of hits (HTTP requests) to the Web server (y-axis) as a function of
the elapsed time in the scenario (x-axis). You can compare this graph to the
Transaction Response Time graph to see how the number of hits affects transaction
performance.
Throughput Shows the amount of throughput on the Web server (y-axis) during each second of
the scenario run (x-axis). Throughput is measured in bytes and represents the
amount of data that the Vusers received from the server at any given second. You
can compare this graph to the Transaction Response Time graph to see how the
throughput affects transaction performance.
HTTP
Responses
Shows the number of HTTP status codes—which indicate the status of HTTP
requests, for example, "the request was successful," "the page was not found"—(y-
User Guide
Controller
HP LoadRunner (12.50) Page 1203

Graph Description
per Second axis) returned from the Web server during each second of the scenario run (x-axis),
grouped by status code. You can group the results shown in this graph by script
(using the "Group By" function) to locate scripts which generated error codes.
Pages
Downloaded
per Second
Shows the number of Web pages (y-axis) downloaded from the server during each
second of the scenario run (x-axis). This graph helps you evaluate the amount of load
Vusers generate, in terms of the number of pages downloaded.
Retries per
Second
Shows the number of attempted Web server connections (y-axis) as a function of the
elapsed time in the scenario x-axis). A server connection is retried when the initial
connection was unauthorized, when proxy authentication is required, when the initial
connection was closed by the server, when the initial connection to the server could
not be made, or when the server was initially unable to resolve the load generator's
IP address.
Connections Shows the number of open TCP/IP connections (y-axis) at each point in time of the
scenario (x-axis). One HTML page may cause the browser to open several
connections, when links on the page go to different Web addresses. Two connections
are opened for each Web server.
Connections
per Second
Shows the number of new TCP/IP connections (y-axis) opened and the number of
connections that are shut down each second of the scenario (x-axis).
SSLs per
Second
Shows the number of new and reused SSL Connections (y-axis) opened in each
second of the scenario (x-axis). An SSL connection is opened by the browser after a
TCP/IP connection has been opened to a secure server.
Windows
Resources
Shows the NT and Windows 2000 resources measured during the scenario. The NT
and Windows 2000 measurements correspond to the built-in counters available from
the Windows Performance Monitor.
UNIX
Resources
Shows the Linux resources measured during the scenario. The Linux measurements
include those available by the rstatd daemon: average load, collision rate, context
switch rate, CPU utilization, incoming packets error rate, incoming packets rate,
interrupt rate, outgoing packets error rate, outgoing packets rate, page-in rate,
page-out rate, paging rate, swap-in rate, swap-out rate, system mode CPU
utilization, and user mode CPU utilization.
SNMP Shows statistics for machines running an SNMP agent, using the Simple Network
Management Protocol (SNMP). The x-axis represents the elapsed time. The y-axis
represents the resource usage.
Network
Delay Time
Shows the delays for the complete path between the source and destination
machines (for example, the database server and Vuser load generator). The graph
maps the delay as a function of the elapsed scenario time.
User Guide
Controller
HP LoadRunner (12.50) Page 1204

Graph Description
Apache Displays statistics about the resource usage on the Apache server during the
scenario run. The x-axis represents the time that has elapsed since the start of the
scenario run. The y-axis represents the resource usage.
Microsoft IIS Shows server statistics as a function of the elapsed scenario time. The x-axis
represents the time that has elapsed since the start of the scenario run. The y-axis
represents the resource usage.
Microsoft
Active Server
Pages
Displays statistics about the resource usage on the ASP server during the scenario
run. The x-axis represents the time that has elapsed since the start of the scenario
run. The y-axis represents the resource usage.
Oracle Displays information from Oracle V$ tables: Session statistics, V$SESSTAT, system
statistics, V$SYSSTAT, and other table counters defined by the user in the custom
query.
SQL Server Shows the standard Windows resources on the SQL server machine. The x-axis
represents the time that has elapsed since the start of the scenario run. The y-axis
represents the resource usage.
HP Network
Virtualization
Graphs
Graphs that show information about the Network Virtualization: Average Latency,
Packet Loss, Average Throughput, Average Bandwidth Utilization, and Total
Throughput. For details, see "HP Network Virtualization Monitoring" on page1338.
HP Service
Virtualization
Shows statistics of the service virtualization, showing the Operations and Services
graphs. For details, see "Service Virtualization Integration" on page1374.
SiteScope Displays statistics about the resource usage on the SiteScope machine during the
scenario run. The x-axis represents the elapsed time. The y-axis represents the
resource usage.
Flex Measures statistics related to Flex RTMP connections and throughput, as well as
buffering time. For details, see "Flex Monitoring" on page1347.
Real Client Shows statistics on the RealPlayer client machine as a function of the elapsed
scenario time. The x-axis represents the time that has elapsed since the start of the
scenario run. The y-axis represents the resource usage.
Media Player
Client
Shows statistics on the Windows Media Player client machine as a function of the
elapsed scenario time. The x-axis represents the time that has elapsed since the
start of the scenario run. The y-axis represents the resource usage.
Siebel
Server
Manager
Shows the resource usage of your Siebel Server Manager server as a function of the
elapsed scenario time.
User Guide
Controller
HP LoadRunner (12.50) Page 1205
Graph Description
Citrix Server Displays statistics about resource usage on the Citrix server during the scenario run.
IBM
WebSphere
MQ
Shows the resource usage of IBM WebSphere MQ Server channel and queue
performance counters as a function of the elapsed scenario time.
Network
Client
Shows statistics for FTP, POP3, SMTP, IMAP, and DNS Vusers on the network client
machine as a function of the elapsed scenario time.
Configuring Scenario Options
Configuring Scenario Options Overview
Before you run a scenario, you can configure both the load generator and Vuser behavior for the
scenario. Although the default settings correspond to most environments, LoadRunner allows you to
modify the settings to customize the scenario behavior. The settings apply to all future scenario runs
and generally need to be set only once.
You configure these settings from the Tools > Options dialog box. Settings related to load generator
behavior apply to all the load generators in a scenario.
Note: You can configure settings for an individual load generator that override the global
settings for that particular load generator. For details, see "How to Modify Load Generator
Settings" on page1124.
Global scenario configuration settings are unrelated to the Vuser runtime settings. Runtime settings
apply to individual Vusers or scripts and contain information about logging, think time, and the network,
the number of iterations, and the browser. For information on setting runtime settings, see "Runtime
Settings Overview" on page280.
Expert Mode
Expert mode is intended to provide support personnel with access to system information. When you
work in the Expert mode, the Controller dialog boxes contain additional options for fine tuning the
Controller operation.
To activate the Expert mode, select Tools >Expert Mode.
To deactivate Expert mode, select Tools and clear the Expert Mode option.
User Guide
Controller
HP LoadRunner (12.50) Page 1206

Runtime File Storage Locations
When you run a scenario, by default the runtime files are stored locally on each load generator (the
machine running the Vuser script). The default location of the files is in the temporary folder specified
by the load generator's environment variables (on Windows, TEMP or TMP, and on Linux, $TMPDIR or
$TMP). If no environment variable is defined, the files are saved to the /tmp folder.
Alternatively, you can store the runtime files on a shared network. A shared network drive is a drive to
which the Controller and all the load generators in the scenario have read and write permission. If you
select to save runtime files on a shared network drive, you may need to perform path translation. Path
translation ensures that the specified results folder is recognized by the remote load generator. For
details about path translation see "Path Translation" below.
You select where to store runtime files in the Tools > Options > Runtime File Storage tab. For details,
see "Options > Runtime File Storage Tab" on page1218.
The primary runtime files are as follows:
Runtime
File
Type
Description
Vuser
Script
files
When you run a Vuser, the Controller sends a copy of the associated Vuser script to the
load generator. The script is stored in the load generator's temporary runtime folder.
If you specify that all Vusers access their Vuser scripts directly at some shared location, no
transfer of script files occurs at runtime. This method often necessitates path translation.
For details, see "Path Translation" below. This method may be useful in either of the
following situations:
lThe file transfer facility does not work.
lThe Vuser script files are large and therefore take a long time to transfer. Remember
that Vuser script files are transferred only once during a scenario.
Result
files
While you run a scenario, the participating Vusers write their results to the temporary
runtime file folder. After scenario execution, these result files are collated or
consolidated—results from all of the load generators are transferred to the results
folder. After collating the results, the temporary runtime folder is deleted.
For user interface details, see "Options > Runtime File Storage Tab" on page1218.
Path Translation
Path translation might be required when storing scripts and runtime data results from a scenario on a
shared network drive (Tools > Options > Runtime File Storage tab).
Path translation is a mechanism used by LoadRunner to convert a remote path name for the Controller
so that all participating machines recognize the same network drive.
User Guide
Controller
HP LoadRunner (12.50) Page 1207

Example 1
The scenario runs on a Windows-based machine and includes multiple Vusers running on both Windows-
based and Linux load generators. One remote load generator may map the network drive as F, while
another load generator maps the same drive as H. In a complex situation such as this, you need to
ensure that all participating load generators recognize the same network drive.
Example 2
The Scenario Groups/Scripts pane in the Design view contains a list of all the Vuser scripts associated
with a scenario, and their locations. A script's location (path) is always based on the Controller machine's
mapping of that location. If a load generator maps to the script's path using a different name, path
translation is required.
For example, assume that the scenario is running on a Windows-based machine named pc2, and that a
Vuser script is located on a network drive. The Controller machine maps the network drive as m:\lr_
tests. If the remote load generator hosting the Vusers also maps the path as m:\lr_tests, no translation
is necessary. However, if the remote machine maps the path as another drive or path, for example
r:\lr_tests, you must translate the path to enable the load generator to recognize the script location.
Note: If the Controller and load generator machines are all Windows machines, consider using
the Universal Naming Convention method instead of manually adding path translation
information. On Windows machines, you can tell the Controller to convert all paths to UNC, in
which case all the machines are able to recognize the path without requiring path translation.
An example of UNC format is \\machine_a\results.
How to Configure Scenario Options
The following sections describe how to configure options that will be relevant for all your scenarios. You
configure these options in the Options dialog box (Tools > Options).
Configure timeout options
Select Tools > Options > Timeout tab and specify timeout values for commands related to the load
generator. For user interface details, see "Options > Timeout Tab" on page1220.
If the command is not executed successfully within the timeout period, the load generator status
changes to Error.
Configure Vuser runtime settings
Select Tools > Options > Runtime Settings tab. You can specify:
lThe Vuser quota for a scenario
lHow to stop running Vusers
lWhether to use a seed number for random sequencing
User Guide
Controller
HP LoadRunner (12.50) Page 1208

For user interface details, see "Options > Runtime Settings Tab" on page1219.
Configure general scenario options for Expert mode
Select Tools > Options > General tab to specify the following general scenario settings that apply when
in Expert mode:
lSpecify the folder for data table storage
lDisable collation of log files after a scenario run. For details, see "How to Collate Scenario Run
Results" on page1260.
lEnable multiple IP address allocation. For details, see "Multiple IP Addresses" on page1186.
For user interface details, see "Options > General Tab" on page1214.
Configure the default schedule run mode
Select Tools > Options > Execution tab. Under Default Scheduler select a default run mode. For user
interface details, see "Options > Execution Tab" on page1213.
For details about schedule run modes, see "Schedule Run Modes" on page1154.
Define a command to run after scenario results are collated
Select Tools > Options > Execution tab. Under Post Collate Command, enter a command to run after
collating scenario results. For user interface details, see "Options > Execution Tab" on page1213.
For more details about collating run results, see "How to Collate Scenario Run Results" on page1260.
Configure global runtime file storage options
Select Tools > Options > Runtime File Storage tab, and specify where LoadRunner should save and
store scenario runtime files collected on remote load generators:
lOn the load generator
lOn a shared network drive
For user interface details, see "Options > Runtime File Storage Tab" on page1218.
Note:
lLoadRunner applies these settings to all the load generators participating in a scenario. You
can change the settings for individual load generators as described in "How to Modify Load
Generator Settings" on page1124.
lStoring the files on a shared network drive is not recommended as it increases network
traffic and necessitates path translation. For details about path translation, see "Path
Translation" on page1207.
User Guide
Controller
HP LoadRunner (12.50) Page 1209
Configure monitoring options
Select Tools > Options > Monitors tab, and configure the online monitoring settings. For user interface
details, see "Options > Monitors Tab" on page1215.
Configure debug information options (Expert mode only)
Select Tools > Options > Debug Information tab, and determine the extent of the trace to be
performed during a scenario run. For user interface details, see "Options > Debug Information Tab" on
page1212.
Configure output display options (Expert mode only)
Select Tools > Options > Output tab, and configure how to display running Vusers on the Controller
machine. For user interface details, see "Options > Output Tab" on page1217.
Path Translation Table
To translate a path from one Windows-based computer to another, or between Windows-based and
Linux machines, you create an entry in the Path Translation table. This table contains a list of paths
translated into formats that can be recognized by different machines.
Each line of the Path Translation table has the following format:
<controller_host> <controller_path> <remote_path> [<remote_host>]
where:
lcontroller_host is the name or type of the machine that is running the Controller.
The value of controller_host can be:
l<hostname>. The name of the machine running the Controller, for example, LOADPC1
lwin. The Controller is running on a Windows-based computer
lcontroller_path is the path of a specific folder—as recognized by the Controller. For example, if the
folder scripts is located on the network drive r—as mapped by the Controller—type the path
r:\scripts in the controller_path field.
lremote_path is the path of a specific folder—as recognized by the remote machine. For example, if
the folder scripts is located on the network drive n—as mapped by the remote load generator—type
the path n:\scripts in the remote_path field.
If a Vuser on the remote Linux load generator recognizes the above path as /m/tests, you would
type this path in the remote_path field.
lremote_host is the name or type of the remote load generator. For example, if all the remote
machines are Linux workstations, you could type Linux in the remote_host field. The options for the
remote_host field are the same as the options for the controller_host field, listed above. The
remote_host parameter is optional.
User Guide
Controller
HP LoadRunner (12.50) Page 1210
Examples
The examples below show the use of the Path Translation table for a Windows-based Controller called
Merlin.
lExample 1: Vusers are running on a Windows 2003 machine, Oasis. Merlin maps the network drive
as f:, while Oasis maps it as g:\loadtest.
merlin f:\ g:\loadtest\ Oasis
lExample 2: Vusers are running on a Linux machine, Ultra.Ultra maps the networks drive as
/u/tests/load.
merlin f:\ /u/tests/load/ Ultra
lExample 3: The mapping of the network drive by the remote load generator Jaguar, is identical to
the Controller's mapping, so no translation is required. This line can be excluded from the Path
Translation table.
merlin n:\ n:\ Jaguar
lExample 4: All Windows-based Vuser load generators map the network drive as m:\loadtest.
merlin l:\mnt\ m:\loadtest\ win
merlin l:\mnt\ m:\loadtest\
win
Options Dialog Box
This dialog box enables you to configure scenario options.
To access Tools > Options
Important
information
The settings configured in this dialog box:
lGenerally need to be set only once
lApply to all future scenarios
lApply globally to all the load generators in a scenario.
Note: You can change the settings for individual load generators (see "How
to Modify Load Generator Settings" on page1124). Individual load generator
settings override global scenario settings.
Relevant
tasks
"How to Configure Scenario Options" on page1208
User interface elements are described below:
UI Element Description
User Guide
Controller
HP LoadRunner (12.50) Page 1211

Debug
Information tab
(Expert mode only)
Enables you to determine the extent of the trace to be performed during a
scenario run.
For details, see "Options > Debug Information Tab" below.
Execution tab Enables you to configure the following miscellaneous scenario settings:
lThe default schedule run mode for a new scenario
lThe command to run after collating scenario results
For details, see "Options > Execution Tab" on the next page.
General tab
(Expert mode only)
Enables you to specify global settings for data table storage, log file collation,
and multiple IP address allocation.
For details, see "Options > General Tab" on page1214.
Monitors tab Enables you to configure the online monitoring settings.
For details, see "Options > Monitors Tab" on page1215.
Output tab
(Expert mode only)
Enables you to configure how running Vusers are displayed on the Controller
machine.
For details, see "Options > Output Tab" on page1217.
Path Translation
Table tab
Enables you to perform path translation when storing result and script files
stored on a shared network drive.
For details, see "Options > Path Translation Tab" on page1217.
Runtime File
Storage tab
Enables you to specify where LoadRunner should save and store the runtime
files.
Default value: On the current Vuser machine.
For details, see "Options > Runtime File Storage Tab" on page1218.
runtime settings
tab
Enables you to specify scenario runtime settings.
For details, see "Options > Runtime Settings Tab" on page1219.
Timeout tab Enables you to specify timeout values for certain commands related to the load
generator.
For details, see "Options > Timeout Tab" on page1220.
Options > Debug Information Tab
This tab enables you to configure the settings to determine the extent of the trace to be performed
during a scenario run.
To access Tools > Options > Debug Information tab
Important
information
lThis tab is available only when the Controller is operating in the Expert
mode.
lThe debug information is written to the Output window.
User Guide
Controller
HP LoadRunner (12.50) Page 1212
Relevant tasks "How to Configure Scenario Options" on page1208
See also "Output Window" on page1242
User interface elements are described below:
UI Element Description
Sets the default debug information settings.
Keep
temporary
files
The LoadRunner Agent and Controller create temporary files that collect information
such as the parameter file sent to the Vuser, the output compilation file, and the
configuration file. The Agent files are saved in brr folders in the TMP or TEMP folder of
the Agent machine. The Controller files are saved in lrr folders in the TMP or TEMP
folder of the Controller machine. At the end of the scenario, all these files are
automatically deleted.
When selected, this option instructs the Agent and Controller not to delete these files
so that you can use them for debugging.
Trace Flags For debugging purposes, you can configure the type of trace performed by
LoadRunner during the scenario run. Select the appropriate options to enable the
detailed trace. The available trace flags are:
lGeneral
lFile Transfer
lIncoming Communication
lOutgoing Communication
The trace information appears in the log file located in the specified Agent log
folder.
Note: Select only the flags relating to your problem. For example, if you
encounter specific problems with the transfer of files, select the File
Transfer flag.
Options > Execution Tab
This tab enables you to configure miscellaneous scenario execution settings.
To access Tools > Options > Execution tab
Relevant tasks "How to Configure Scenario Options" on page1208
See also "Schedule Run Modes" on page1154
User interface elements are described below:
User Guide
Controller
HP LoadRunner (12.50) Page 1213
UI Element Description
Default
Scheduler
Enables you to set the default schedule run mode for new scenarios.
lReal-world schedule. Runs the scenario according to a real-world set of events
lBasic schedule. Runs a basic schedule, starting the Vuser, running the for a given
amount of time, and stopping them.
For more details, see "Schedule Run Modes" on page1154.
Post Collate
Command
Enables you to define a command that the Controller will run directly after it collates
the results of a scenariorun.
Example: You can define a command to run a customer application that runs the
Analysis API to extract data.
Note: In the command, you can use the keyword, %ResultDir%, to refer to
the scenario's results folder. (This keyword is not case sensitive.)
Options > General Tab
This tab enables you to specify global settings for data table storage, log file collation, and multiple IP
address allocation.
To access Tools > Options > General tab
Important Information This tab is available only when the Controller is operating in Expert mode.
Relevant tasks l"How to Configure Scenario Options" on page1208
l"How to Add IP Addresses to a Load Generator" on page1187
User interface elements are described below:
UI
Element
Description
Multiple
IP
address
mode
Allocates IP addresses when the multiple IP address option is enabled (Scenario> Enable
IP Spoofer). The Controller can allocate an IP address per process or per thread.
Allocation per thread results in a more varied range of IP addresses in a scenario.
Note: If the IP Spoofer is not enabled, this option is not available.
Data
tables
global
directory
The network location for data tables used as a source for parameter values.
Note: This setting is only required for scripts created with earlier versions of
User Guide
Controller
HP LoadRunner (12.50) Page 1214
LoadRunner.
Do not
collate
log files
Instructs LoadRunner to collates only the result files, and not the log files.
Override
RDP file
Instructs LoadRunner to override the settings in the RDP file and use the terminal server
settings.This applies to RDP Vusers running on load generators for which the Terminal
Services Manager is enabled. This option requires you to have Remote Desktop access to
the load generator.
Options > Monitors Tab
In this tab you can enable the Transaction monitor, configure the behavior of the transaction data, and
set the data sampling rate, error handling, debugging, and frequency settings for the online monitors.
To access Tools > Options > Monitors tab
Relevant tasks "How to Configure Scenario Options" on page1208
See also "How to Set Up a Monitoring Environment" on page1301
User interface elements are described below:
UI Element Description
Sets the default timeout values.
Debug If Display debug messages is selected, debug-related messages are sent to the
Output window.
For the Network monitor the messages are sent according to the specified debug
level (1 - 9).
Error
Handling
Controls the way in which LoadRunner issues error messages:
lSend errors to the Output window.
lPop-up an error message box.
Send
(Expert
mode only)
lSummary. Sends a summary of the collected data back to the Controller. Use this
option if the speed at which the data is transferred is significant to you.
lRaw Data. Sends all of the data in raw form back to the Controller. Sending the
data in raw form saves time because the data does not need to be processed.
However, since all of the data is being transferred to the Controller, it may cause
more network traffic.
Transaction Configures the behavior of data for the Transaction, Data Point, and Web Resource
User Guide
Controller
HP LoadRunner (12.50) Page 1215
Data online graphs.
lEnable Transaction Monitor. Enables the online Vuser Transaction monitor to
start monitoring transactions at the start of a scenario.
lFrequency. The frequency, in seconds, at which the online monitor samples the
data to produce the Transaction, Data Point, and Web Resource online graphs. For
a small scenario, use a lower frequency, for example, 1. For a large scenario, use a
higher frequency, for example, 3 - 5. The higher the frequency, the less network
traffic there will be. The data is averaged for the frequency period defined, and
only one value is sent to the Controller.
Default value: 5 seconds
For information on enabling and disabling the Transaction monitor and Web Page
Diagnostics, see "Runtime and Transaction Monitoring" on page1307.
Note:
lDisabling this option conserves resources.
lYou cannot modify these settings during scenario execution; you must stop
the scenario before disabling the monitor or changing its frequency.
Resource
Monitoring
Indicates the sampling rate for resource monitors.
lData Sampling Rate. The sampling rate is the period of time (in seconds) between
consecutive samples. Enter the rate at which LoadRunner samples the scenario for
monitoring data. If you increase the sampling rate, the data is monitored less
frequently. The default rate is 3 seconds.
Note:
lThis data sampling rate is applied to all server monitors that are
subsequently activated. It is not applied to server monitors that have
already been activated. To apply the new data sampling rate to activated
server monitors, save your scenario and reopen it.
lWhile many monitors use the value provided in this field, some monitors
may use a different sampling rate than provided here. For example:
lMinimum rates. Some monitors limit the minimum sampling period. For
example, the Windows Resource monitor, limits the minimum sampling
period to 3 seconds. If you set value to less than 3, the monitor will still
use a 3 second interval.
lCustom settings. Other monitors ignore the Controller's settings and
use a sampling rate defined in their own configuration files. For
example, the minimum sampling rate for the Oracle monitor is 10
User Guide
Controller
HP LoadRunner (12.50) Page 1216
seconds. If the sampling rate is set here at less than 10 seconds, the
Oracle Monitor will continue to monitor data at 10 second intervals.
Options > Output Tab
This tab enables you to configure how to display running Vusers on the Controller machine.
To access Tools > Options > Output tab
Important information This tab is available only when the Controller is operating in Expert mode.
Relevant tasks "How to Configure Scenario Options" on page1208
See also "Output Window" on page1242
User interface elements are described below:
UI Element Description
Sets the default output options.
Configuration of the "Show
Vuser" operation
Specifies how to handle the Vuser logs:
lMax. simultaneously displayed. The maximum number of Vuser
logs that may be displayed simultaneously.
Default value: 10
lRefresh timeout (milliseconds). How often the Vuser log should
be refreshed.
Default value: Every 1000 milliseconds
Delete Output window
messages upon Reset
When selected, clears all messages in the Output window when you
reset a scenario.
Options > Path Translation Tab
This tab enables you to perform path translation when storing result and script files on a shared
network drive.
To access Tools > Options > Path Translation tab
Relevant tasks "How to Configure Scenario Options" on page1208
See also l"Runtime File Storage Locations" on page1207
l"Path Translation" on page1207
User Guide
Controller
HP LoadRunner (12.50) Page 1217
User interface elements are described below (unlabeled elements are shown in angle brackets):
UI Element Description
<Path
Translation
table>
Displays a list of paths translated into formats that can be recognized by different
machines.
You can insert comments by typing the #symbol at the start of a line in the table.
For details, see "Path Translation Table" on page1210.
Convert to UNC When selected, LoadRunner ignores the path translation table and converts all
paths to the Universal Naming Convention.
Note: This option can be used only when the Controller and load generator
machines are all Windows-based machines.
Mode The read/write permissions for the ppath.mnt file which contains the path
translation table.
Path The path to the ppath.mnt file which contains the path translation table.
Options > Runtime File Storage Tab
This tab enables you to specify where LoadRunner should save runtime files.
To access Tools > Options > Runtime File Storage tab
Important
information
The runtime file storage options described below apply to all the load generators in a
scenario. To change the settings for an individual load generators see "Load Generator
Configuration > Runtime File Storage Tab" on page1136.
Relevant
tasks
l"How to Configure Scenario Options" on page1208
l"How to Prepare a Scenario to Run" on page1221
See also "Runtime File Storage Locations" on page1207
User interface elements are described below:
UI
Element
Description
Scripts
and
results
stored
Select one of the following options:
lOn the current Vuser machine. Saves the runtime files on the load generator that is
running the Vuser script.
Note: If you select this option, you must collate the results before you can
User Guide
Controller
HP LoadRunner (12.50) Page 1218
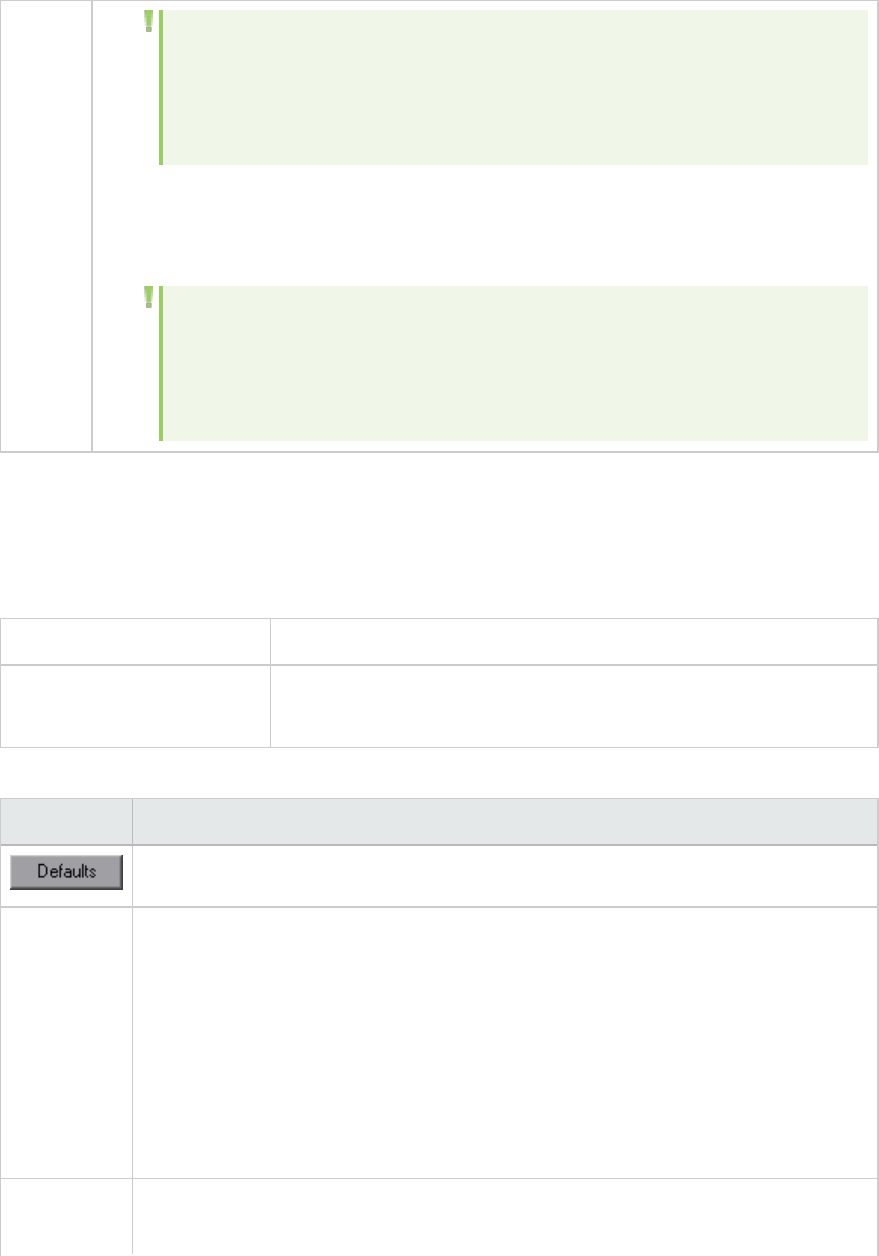
perform any analysis. You can wait for LoadRunner to collate the results when
you launch HP LoadRunner Analysis, or you can collate results by choosing
Results>CollateResults. Alternatively, select Results>Auto Collate Results
to automatically collate the results at the end of each scenario run.
lOn a shared network drive. Saves the scenario results and/or the Vuser scripts on a
shared network drive. A shared network drive is a drive to which the Controller and all
the load generators in the scenario have read and write permission.
Note: If you select this option, you may need to perform path translation. Path
translation ensures that the specified results folder is recognized by the
remote load generator. For information about path translation, see "Path
Translation" on page1207.
Options > Runtime Settings Tab
This tab enables you to specify scenario runtime settings relating to Vuser quotas, stopping Vusers, and
the seed for random sequences.
To access Tools > Options > Runtime Settings tab
Relevant tasks l"How to Configure Scenario Options" on page1208
l"How to Prepare a Scenario to Run" on page1221
User interface elements are described below:
UI Element Description
Sets the default runtime setting values.
Use random
sequence
with seed
Allows LoadRunner to use a seed number for random sequencing. Each seed value
represents one sequence of random values used for test execution. Whenever you
use this seed value, the same sequence of values is assigned to the Vusers in the
scenario. This setting applies to parameterized Vuser scripts using the Random
method for assigning values from a data file. It also affects the random percentage
of recorded think time (see "Runtime Settings Overview" on page280).
Enable this option if you discover a problem when running the test and want to repeat
the test using the same sequence of random values.
Default: 0
Vuser Quota To prevent your system from overloading, you can set quotas for Vuser activity. The
Vuser quotas apply to Vusers on all load generators.
User Guide
Controller
HP LoadRunner (12.50) Page 1219
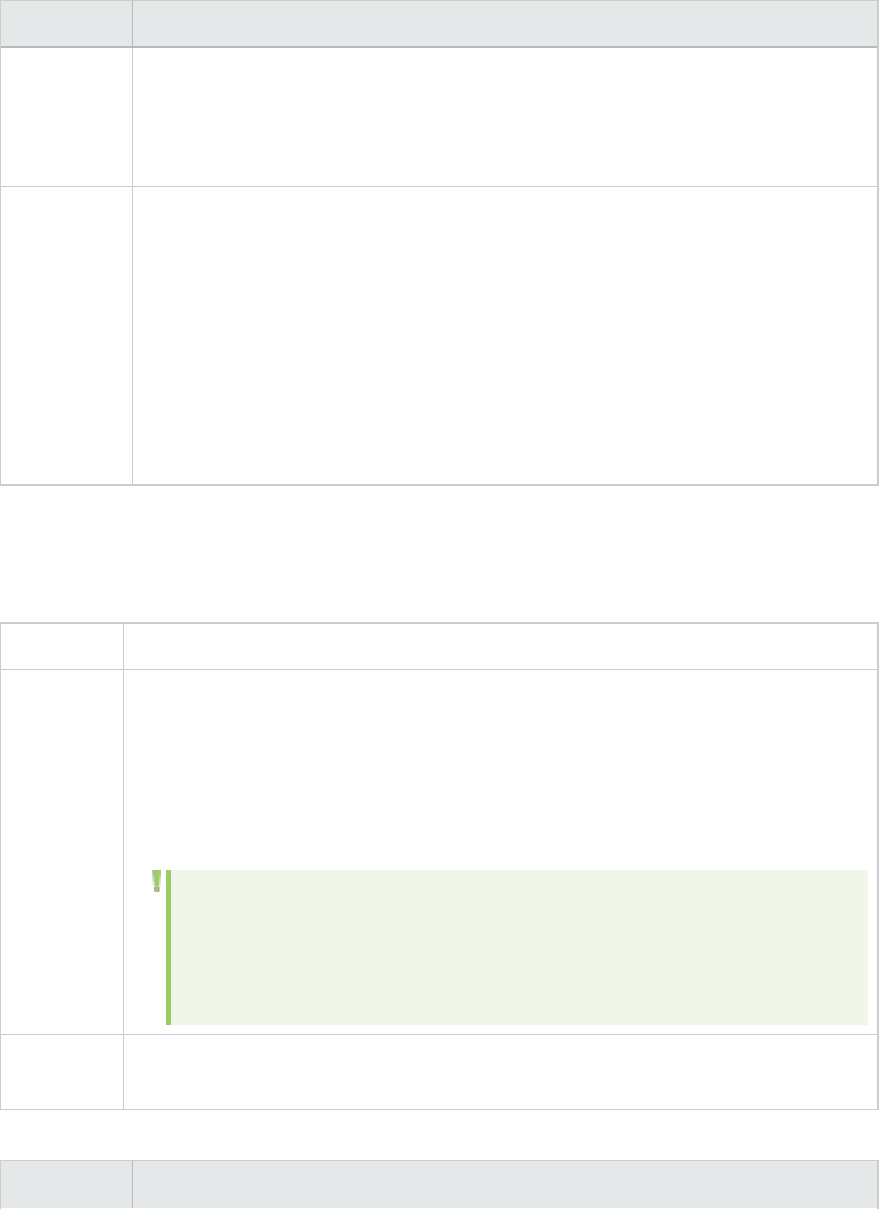
UI Element Description
lNumber of Vusers that may be initialized at one time - all load generators. The
maximum number of Vusers the load generator can initialize at a time (when an
Initialize command is sent).
Default: 999
When
stopping
Vusers
Controls how Vusers stop running when the Stop button is clicked.
lWait for the current iteration to end before stopping. (Default) The Vuser
completes the iteration it is running before stopping. The Vusers move to the
Gradual Exiting status and exit the scenario gradually.
lWait for the current action to end before stopping. The Vuser completes the
action it is running before stopping. The Vusers move to the Gradual Exitingstatus
and exit the scenario gradually.
lStop immediately. The Vusers stop running immediately. The Vusers move to the
Exiting status and exit the scenario immediately.
Options > Timeout Tab
This tab enables you to specify timeout values for certain commands related to the load generator.
To access Tools > Options > Timeout tab
Important
information
LoadRunner enables you to set the timeout interval for commands and Vuser elapsed
time.
The command timeouts are the maximum time limits for various LoadRunner
commands. When a command is issued by the Controller, you set a maximum time for
the load generator or Vuser to execute the command. If it does not complete the
command within the timeout interval, the Controller issues an error message.
Note: LoadRunner recognizes the fact that the number of active Vusers
influences the timeout values. For example, 1000 Vusers trying to initialize will
take much longer than 10 Vusers. LoadRunner adds an internal value, based on
the number of active Vusers, to the specified timeout value.
Relevant
tasks
"How to Configure Scenario Options" on page1208
User interface elements are described below:
UI Element Description
User Guide
Controller
HP LoadRunner (12.50) Page 1220

Sets the default timeout values.
Command
Timeout
(seconds)
If Enable timeout checks is selected, this area defines how LoadRunner should
monitor the status of load generators and Vusers after a command is issued by the
Controller. If the load generator or Vuser does not complete the command within the
timeout interval you specified, the Controller issues an error message.
If Enable timeout checks is not selected, LoadRunner waits an unlimited time for the
load generators to connect and disconnect, and for the Initialize, Run, Pause, and Stop
commands to be executed.
Command
Timeout:
Load
Generator
lConnect. The time limit that LoadRunner waits to connect to any load generator. If
a connection is not successful within this time, the status of the load generator
changes to Failed.
Default value: 120 seconds.
lDisconnect. The time limit that LoadRunner waits to disconnect from any load
generator. If a disconnection is not successful within this time, the status of the
load generator changes to Failed.
Default value: 120 seconds.
Command
Timeout:
Vuser
lInit. The timeout value for the Initialize command.
Default value: 180 seconds.
lRun. The timeout value for the Run command.
Default value: 120 seconds.
lPause. The timeout value for the Pause command.
Default value: 120 seconds.
lStop. The timeout value for the Stop command.
Default value: 120 seconds.
Update
Vuser
elapsed
time every
The frequency at which LoadRunner updates the value displayed in the Elapsed Time
column in the Vusers dialog box.
Default value: 4 seconds.
Example: If you select a Vuser and click the Initialize button, LoadRunner checks
whether the Vuser reaches the READY state within 180 seconds (the default Init
timeout period); if it does not, the Controller issues a message indicating that the Init
command timed out.
Before Running Your Scenario
How to Prepare a Scenario to Run
This task describes steps to take before you start running your scenario.
User Guide
Controller
HP LoadRunner (12.50) Page 1221

For details on designing the scenario, see "Designing Scenarios" on page1076.
Specify result file name and location
Select Results >Results Settings.
1. Enter a descriptive name for the result file.
This is especially useful for cross results analysis, in which LoadRunner superimposes the results of
several scenario runs in a single graph and lets you compare the results of multiple scenario runs.
Giving each run a descriptive name enables you to distinguish between the results of the multiple
runs displayed later in the analysis graph.
2. Enter the full path to the folder where the result file will be stored. This depends on the runtime
file storage options configured.
For details on setting global runtime file storage options, see "Options > Runtime File Storage Tab"
on page1218. To set runtime file storage options for an individual load generator, see "Load
Generator Configuration > Runtime File Storage Tab" on page1136.
lIf you are using the default file storage setting (local machine), specify a folder in which to store
all of the collated results after the scenario run.
lIf you specified a shared network drive as the file storage method, specify the folder to which
Vuser groups should write during scenario execution.
3. Select the appropriate options for subsequent scenario runs.
Note:
lWhen comparing the results of scenario runs in Analysis, the graph displays all the result
sets by name. For example, the image below displays the superimposed results sets of
two scenario runs, res12, and res15.
When naming the results files, avoid using the same name when saving to different
directories.
User Guide
Controller
HP LoadRunner (12.50) Page 1222
lYou can use HP's Web-based test management program, HP Application Lifecycle
Management, to store results to a project. For information, see "Managing Scenarios
Using Application Lifecycle Management" on page1268.
Specify Scenario Runtime Settings
You can instruct LoadRunner to allow an individual Vuser or the Vusers in a group to complete the
iterations they are running before stopping, to complete the actions they are running before stopping,
or to stop running immediately. For details, see "Options > Runtime Settings Tab" on page1219.
Set up the monitoring environment - optional
LoadRunner enables you to view data generated during the scenario run using the online monitors.
Before the run, specify the server machines that the Controller should monitor during the scenario run.
For details, see "How to Set Up a Monitoring Environment" on page1301.
Delete diagnostics log files from servers
lSiebel Diagnostics: Delete Siebel Diagnostics logs (*.sarm files) from all servers involved in the load
test.
lSiebel DB Diagnostics: Delete log files from all servers involved in the load test.
lOracle - Web Diagnostics: Delete trace log files from all servers involved in the load test.
User Guide
Controller
HP LoadRunner (12.50) Page 1223
Enable Automatic Result Collation - optional
If you are using the default file storage setting—local machine—prior to running the scenario you can
enable auto-collation. As soon as the scenario run is complete, LoadRunner automatically collates the
results from all the load generators.
Note: Alternatively, you can collate the results manually after the scenario run is complete. For
details, see "How to Collate Scenario Run Results" on page1260.
To enable automatic collation, select Results > Auto Collate Results. When this feature is enabled,
Auto Collate Results is displayed in the status bar.
If you are working in Expert mode, you can disable the collation of the log files. Select Tools > Options >
General tab > Do not collate log files.
To set a post-collation command, select Tools > Options > Execution tab, and enter the command in
the Post Collate Command box. For details, see "Options > Execution Tab" on page1213.
Enable Auto Load Analysis- optional
To invoke HP LoadRunner Analysis as soon as the scenario is finished running, select Results > Auto
Load Analysis. When this is enabled, Auto Load Analysis is displayed in the status bar.
Schedule scenario - Optional
Define a schedule for the scenario. For details, see "How to Define a Schedule for the Scenario -
Workflow" on page1155.
Provide scenario summary information - optional
Select Scenario > Summary Information, and enter the scenario's summary information.
For details, see "How to Define a Schedule for the Scenario - Workflow" on page1155.
Set up the scenario to run MMS (Media Player)- optional
This protocol is only supported for replay.
lWhen running a scenario in controller for an MMS script the scenario may fail if the runtime setting
Network >Speed Simulation is not set to Use maximum bandwidth, and Miscellaneous
>Multithreading setting is not "Run Vuser as a process".
lIf Media Player scripts fail with the error: Error -86801:Host access denied, <hostname> not available
or missing, add the
mms_disable_host_check function to the script.
User Guide
Controller
HP LoadRunner (12.50) Page 1224
Set up the scenario to run GUI Vusers - optional
If you have integrated a QuickTest or Unified Functional Testing script into the scenario:
lEnsure that QuickTest or Unified Functional Testing is closed before running the scenario.
lIn the runtime settings for script dialog box, only the General categories and sub-categories
(General,Iterations,Miscellaneous,Think Time) are relevant for QuickTest or Unified Functional
Testing tests. The Replay options are not relevant.
Note: You can run only one GUI Vuser concurrently per machine.
Set Results Directory Dialog Box
This dialog box enables you to set the location in which the Controller saves scenario run results.
To access Results > Results Settings
Important
information
If you have an open connection to an HP ALM project, the Controller saves the results
to a test set. You can also save the results directly to disk using the standard file
system.
Relevant
tasks
"How to Prepare a Scenario to Run" on page1221
User interface elements are described below:
UI Element Description
Automatically
create a results
directory for
each scenario
execution
Instructs LoadRunner to create a unique results folder for each scenario run. By
default, the result names are res1,res2,res3, and so on.
Automatically
overwrite
existing results
directory without
prompting for
confirmation
Instructs LoadRunner to automatically overwrite previous result sets, without
prompting the user.
Directory A location in the file system under the Results folder, to which the Controller
should save the results.
User Guide
Controller
HP LoadRunner (12.50) Page 1225

Note: Do not specify an admin/administrator folder, as non-admin users
without sufficient permissions may be unable to write to such a folder.
File System Displays the default LoadRunner folder path.
HP ALM
(only when
connected to HP
ALM)
Enables you to save the results to an Application Lifecycle Management test set.
Results Name Specify a name for the run results.
LoadRunner allows you to give descriptive names to each result set. This is
especially useful for cross results analysis, in which LoadRunner superimposes
the results of several scenario runs in a single Analysis graph and lets you
compare the results of multiple scenario runs. The descriptive graph names
enable you to distinguish between the results of the multiple runs.
Results Path Displays the location for the results as specified in Results Name and Directory.
Avoid using the same name with different paths. Only the names appear on the
Analysis graphs. If the result names are identical it will be difficult to distinguish
between the runs.
Summary Information Dialog Box
This dialog box enables you to provide a detailed description of the scenario.
To access Scenario > Summary Information
Relevant tasks "How to Prepare a Scenario to Run" on page1221
User interface elements are described below:
UI Element Description
Author The name of the scenario's author
Description A description of the scenario
Scenario Path The name and location of the scenario definition file
(.lrs)
Subject A subject name or short title for the scenario
Running Scenarios
User Guide
Controller
HP LoadRunner (12.50) Page 1226
Running Scenarios Overview
After planning, designing and scheduling your scenario, you run it to create load on your application and
to test its performance.
Before run
When running a manual scenario in Percentage mode, you can change the way LoadRunner loads the
Vusers. By default, when running a group assigned to use All Load Generators, the Controller calculates
the number of Vusers per load generator, and ramps up all Vusers, one load generator after another. If
the initialization section uses a lot of resources, this may affect the performance on the load
generators. LoadRunner allows you to distribute the Vusers in a round-robin fashion.
lFor Vusers in groups configured to use All Load Generators LoadRunner uses a round-robin method
to ramp up the groups between all of the load generators.
lFor all Vusers in a group not configured to run to use All Load Generators, LoadRunner uses a round-
robin method to ramp up the Vusers between all of the group’s load generators.
For details on how to enable round-robin ramp up, see "How to Run a Scenario" on the next page.
Start of run
When you instruct LoadRunner to begin the scenario run, the Controller checks the scenario
configuration information, invokes the applications that were selected to run with the scenario, and
then distributes each Vuser script to its designated load generator. When the Vusers are ready, they
start running their scripts.
As the scenario starts, in the Scenario Groups pane you can watch Vusers gradually start running.
During run
During the scenario run, you can see a synopsis of the running scenario in the Scenario Status pane. You
can also drill down to see which Vuser actions are causing the application problems.
The Controller's online graphs display performance data collected by the monitors. You use this
information to isolate potential problem areas in your system.
End of run
The scenario ends when all the Vusers have completed their scripts, when the duration runs out, or
when you terminate it.
At the conclusion of the test run, the Scenario Status pane shows the Down status. This indicates that
the Vusers have stopped running.
User Guide
Controller
HP LoadRunner (12.50) Page 1227
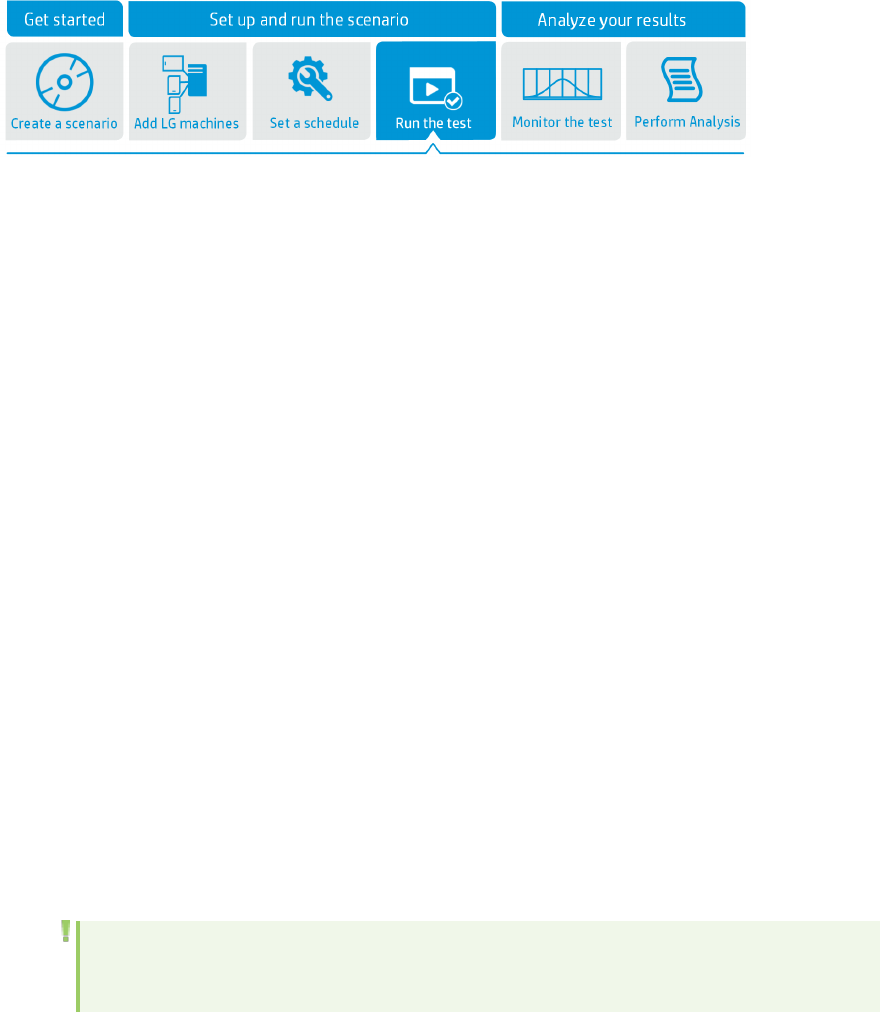
How to Run a Scenario
This task describes how to run a scenario.
1. Prerequisite
Open an existing scenario, or design a new one.
lTo design a manual scenario, see "How to Design a Manual Scenario" on page1081.
lTo design a goal-oriented scenario, see "How to Design a Goal-Oriented Scenario" on page1079.
2. Prepare to run the scenario
Before you run the scenario, specify a location for the scenario results and other runtime related
settings. For details, see "How to Prepare a Scenario to Run" on page1221.
3. Set the ramp up method to round-robin - optional
To enable the round-robin ramp up, search for the wlrun7.ini file, located in the %windir%. In the
[ScenarioDesign] section, set the DitributionByHostsInPrecentageMode flag to 1. For details, see
"Running Scenarios Overview" on the previous page.
4. Run the scenario
In the Run tab, click the Start Scenario button to begin running the scenario. The scenario runs
according to its defined schedule.
5. Manually control the behavior, addition, and stopping of Vusers during the
scenario run - optional
You can do the following during the scenario run:
Note: For a use-case scenario that explains the differences between the following options,
see "Control Vusers During a Scenario Run - Use-Case Scenario" on page1231.
lControl the behavior of Vuser groups. You can initialize, run, and stop Vuser groups during the
scenario run.
To initialize, run, or stop an entire Vuser group, select the group in the Scenario Groups pane, and
click the desired button on the main Controller toolbar:
User Guide
Controller
HP LoadRunner (12.50) Page 1228
oInitialize Vusers.
oRun Vusers.
oStop Vusers immediately.
oStop Vusers gradually.
lRun or stop individual Vusers. You can run or stop specific Vusers within a Vuser group. For
user interface details, see "Vusers Dialog Box" on page1109.
lInitialize/Run additional Vusers, or stop currently running Vusers. You can manually control
the addition of new Vusers to a running scenario, as well as stop running Vusers. For user
interface details, see "Run/Stop Vusers Dialog Box" on page1247.
6. View a log containing runtime information about each running Vuser - Optional
For user interface details, see "Vuser Script Log" on page1252.
7. Release Vusers from a rendezvous before the Controller releases them -
Optional
For more information, see "Rendezvous Points" on page1254.
8. Log execution notes during the scenario run - Optional
The Controller provides you with a dialog box in which you can log comments while a scenario is
running. To open the dialog box select Scenario > Execution Notes. The notes are automatically
saved by clicking OK to close the dialog box.
9. Monitor the scenario - optional
During the scenario run, you can view data collected by the online monitors using the online
monitor graphs. If you did not set up the monitors before you started the run, you can do so during
the run. The data collected by the monitors can be viewed using the LoadRunner online graphs.
lFor details about setting up the online monitors, see "How to Set Up a Monitoring Environment"
on page1301.
lFor details about viewing the monitor graphs, see "Online Monitor Graphs" on page1193.
10. Collate run results
If you are using the default file storage setting—local machine, when the scenario run is complete,
the run results must be collated or consolidated in preparation for result analysis. If LoadRunner is
not set up to collate the results automatically upon completion of the run, you need to collate the
results manually after the run.
Select Results >Collate Results> CollateResults. For details, see "How to Collate Scenario Run
Results" on page1260.
For details about result collation, see "Collating Run Data" on page1260.
User Guide
Controller
HP LoadRunner (12.50) Page 1229
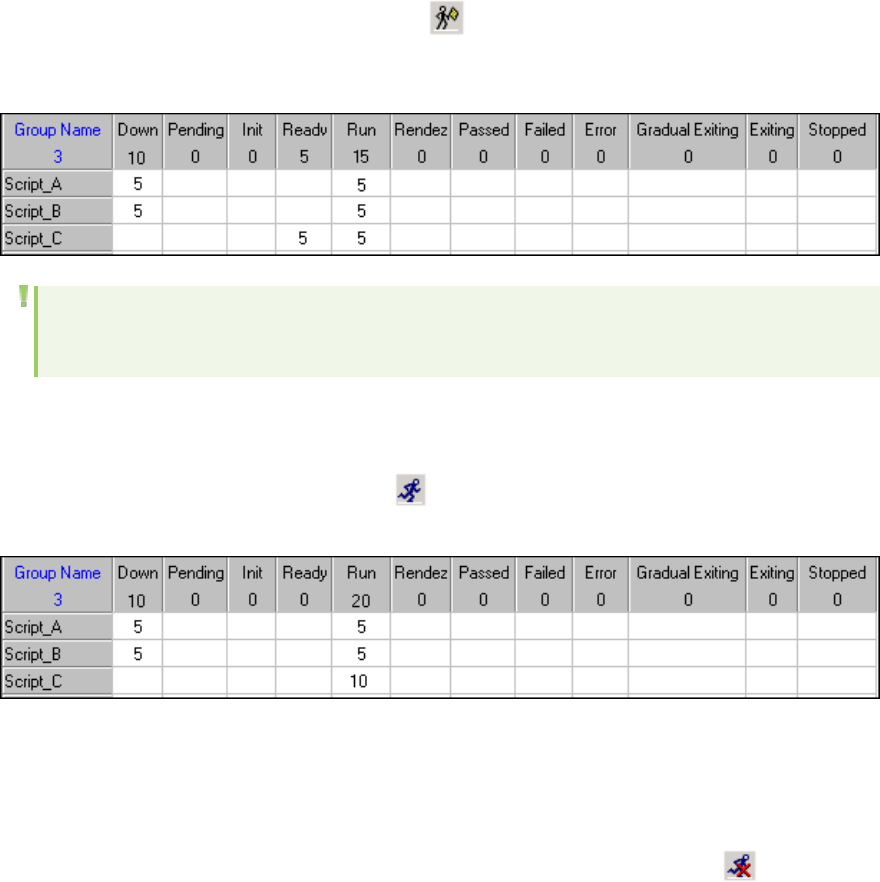
Initialize, Run, or Stop Vuser Groups - Use-Case Scenario
This use-case scenario describes how David can manipulate the behavior of the Vuser groups during the
scenario run, irrespective of their defined schedules. The examples will show how he can initialize, run,
and stop all the Vusers in a Vuser group simultaneously.
Initialize a Vuser group
If David wants to initialize all the Vusers in Script_C simultaneously, he selects the script in the Scenario
Groups pane and clicks the Initialize Vusers button on the Controller toolbar. All Vusers that are still
in the Down state are immediately initialized (in this case, only five). Their status changes from Down to
Pending to Initializing to Ready. They then run according to their defined schedules.
Note: Only Vusers that are in the Down state can be initialized. Vusers that have been initialized
already are unaffected.
Run a Vuser group
If David wants to run all the Vusers in Script_C simultaneously, he selects the script in the Scenario
Groups pane and clicks the Run Vusers button on the Controller toolbar. All Vusers in the group that
have not yet started running move to the Run state and begin executing their scripts.
Stop a Vuser Group
If David wants to stop all the Vusers in Script_C from running, he has two options:
lTo stop them immediately
He selects the script in the Scenario Groups pane and clicks the Stop Vusers button on the
Controller toolbar. All Vusers that have been initialized, or are already running, stop executing their
scripts immediately and move directly to the Stopped state.
User Guide
Controller
HP LoadRunner (12.50) Page 1230
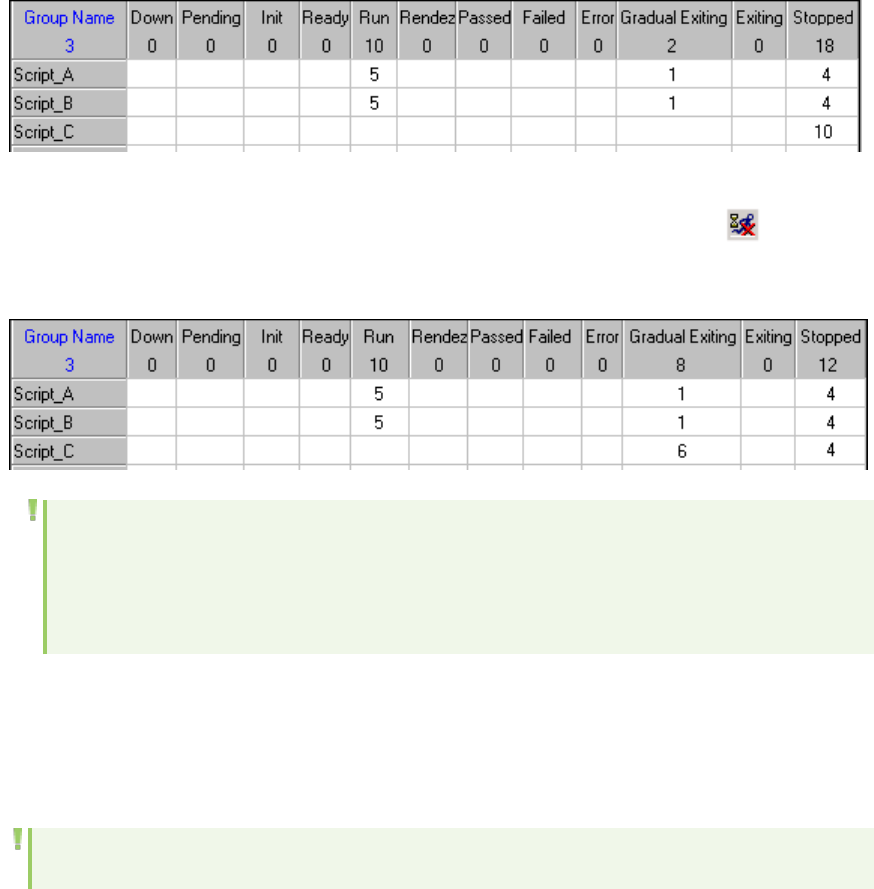
lTo stop them gradually
He selects the script in the Scenario Groups pane and clicks the Gradual Stop button on the
Controller toolbar. All Vusers that have been initialized, or are already running, move to the Gradual
Exiting state and then exit the scenario gradually as per their defined schedules.
Note: The group can only be stopped gradually if Wait for the current iteration to end before
exiting or Wait for the current action to endbefore exiting have been selected in the
RuntimeSetting tab of the Options dialog box. For more information, see "Options > Runtime
Settings Tab" on page1219.
Control Vusers During a Scenario Run - Use-Case Scenario
This use-case scenario describes how to override defined schedules and manually control the behavior,
addition, and stopping of Vusers during a scenario run.
Note: For a task related to this scenario, see "How to Run a Scenario" on page1228.
David Smith is a load tester at NewSoft Company, currently using LoadRunner to test a new product in
preparation for its upcoming release.
His load test contains three Vuser groups, Script_A,Script_B, and Script_C. Each group has been
assigned ten Vusers and been given the same schedule definitions, that is, to start two Vusers every
ten seconds, and to stop two Vusers every ten seconds.
If David were to leave these schedules as defined, the start and stop actions in the scenario groups
pane would look as follows:
Start
User Guide
Controller
HP LoadRunner (12.50) Page 1231
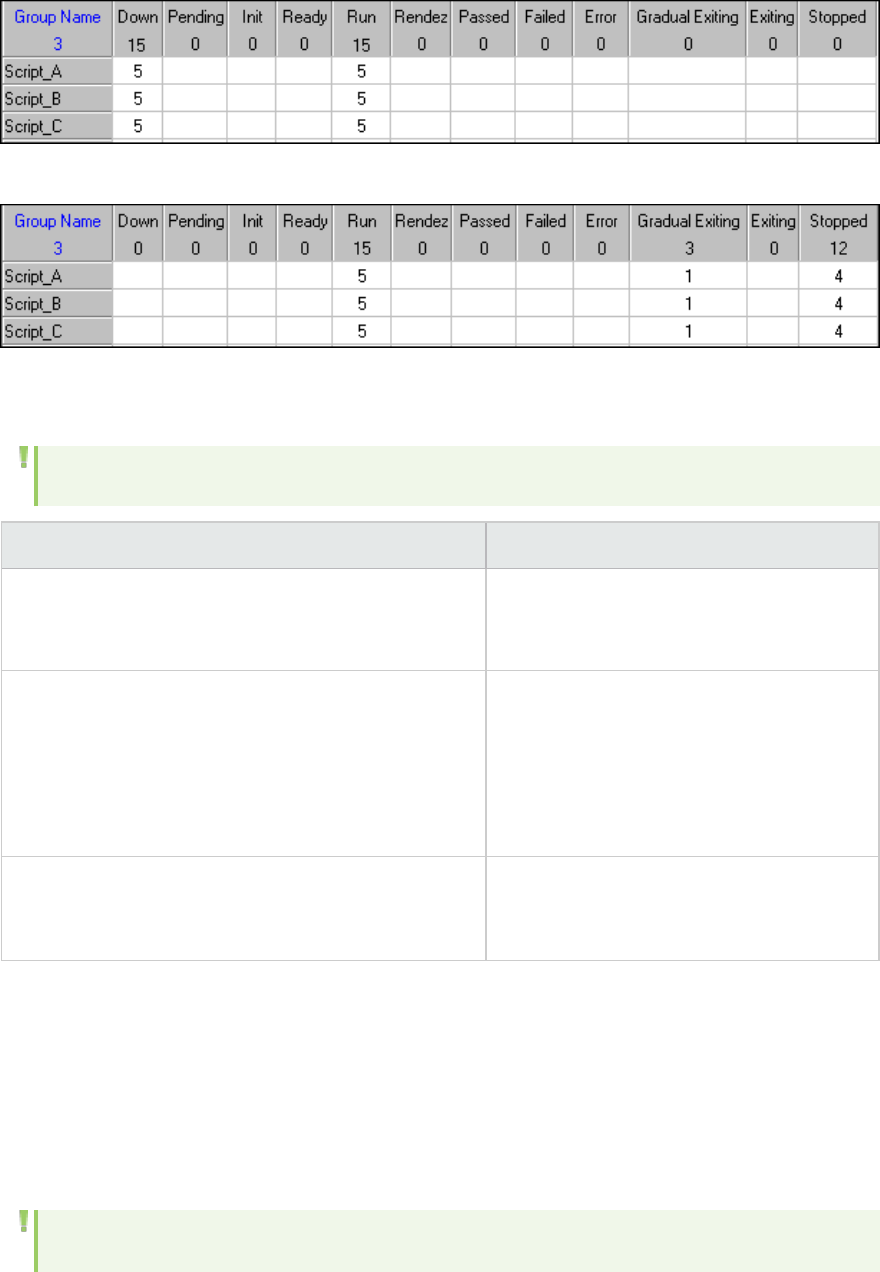
Stop
The following table shows the options available to David should he wish to override these defined
schedules and manually manipulate the way the Vusers start or stop:
Note: All the following use-case scenario options refer back to the scenario explained above.
Control Vusers Option Use-Case Scenario
Manipulate an entire Vuser group.
Example: Run or stop all the Vusers in a group
simultaneously.
"Initialize, Run, or Stop Vuser Groups - Use-
Case Scenario" on page1230
Run/Stop individual Vusers, or add new Vusers.
Example 1: Run/Stop a single Vuser currently in the
down/run state.
Example 2: (Vuser Group mode) Add a specified
number of Vusers to a group without initializing or
running them.
"Run/Stop Individual Vusers, or Add New
Vusers - Use-Case Scenario" below
Initialize/Run/Stop any number of Vusers within a
group.
"Initialize/Run Additional Vusers or Stop
Running Vusers - Use-Case Scenario" on
page1236
Run/Stop Individual Vusers, or Add New Vusers - Use-Case
Scenario
This use-case scenario describes how David can manipulate the behavior of individual Vusers during the
scenario run, irrespective of their defined schedules. The examples will show how he can run or stop
individual Vusers, as well as how he can add new Vusers to the scenario.
Note: The examples presented in this section demonstrate options in the Vusers dialog box. Not
User Guide
Controller
HP LoadRunner (12.50) Page 1232
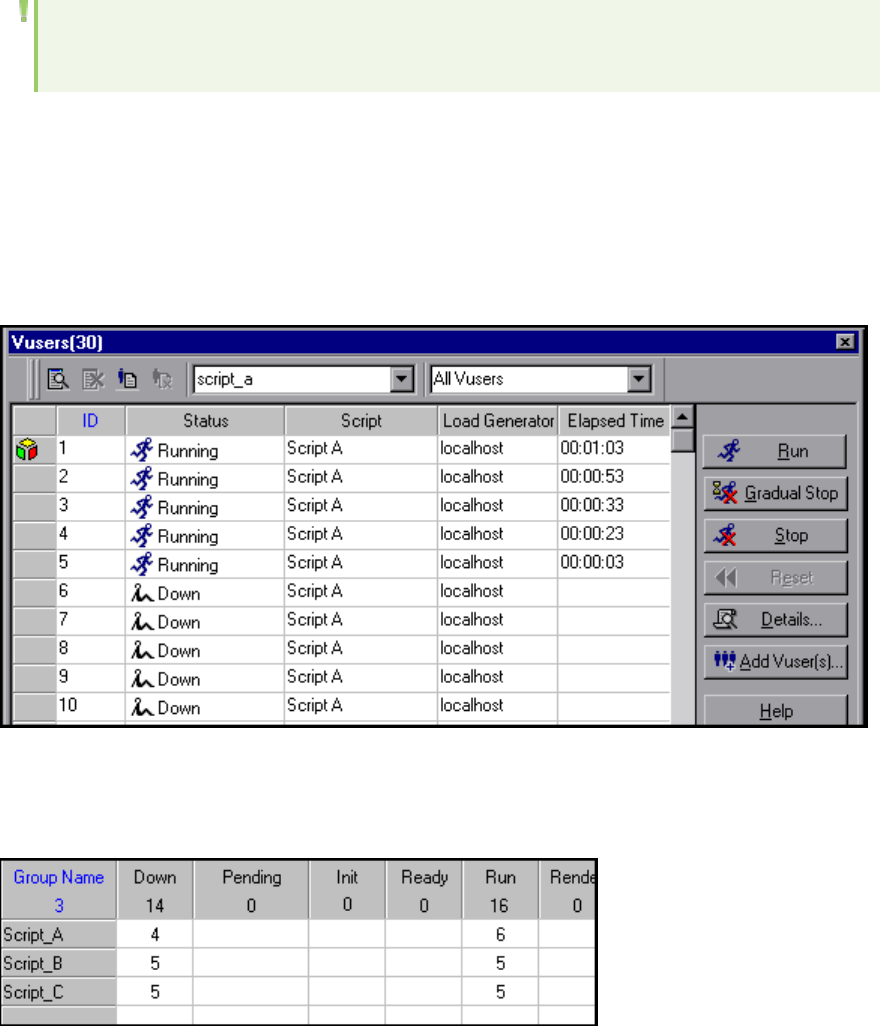
all information relevant for working with this dialog box necessarily appears here. For full
information about working with the Vusers dialog box, see "Vusers Dialog Box" on page1109.
Run an individual Vuser
If David wants to immediately run an additional Vuser from Script_A, in the Run tab, he clicks Vusers to
open the Vusers dialog box.
By selecting script_a, and All Vusers in the filter options at the top of the dialog box, the table displays
a list of all the Vusers in Script_A, and indicates that five are currently running, and that five are still
down.
David then selects Vuser number 6 (or any Vuser in the Down state that he wishes to run), and clicks
Run.
That Vuser is immediately initialized and moved to the Run state.
Stop an individual Vuser
If David wants to stop one of the running Vusers in Script_A, in the Run tab, he clicks Vusers to open the
Vusers dialog box.
User Guide
Controller
HP LoadRunner (12.50) Page 1233
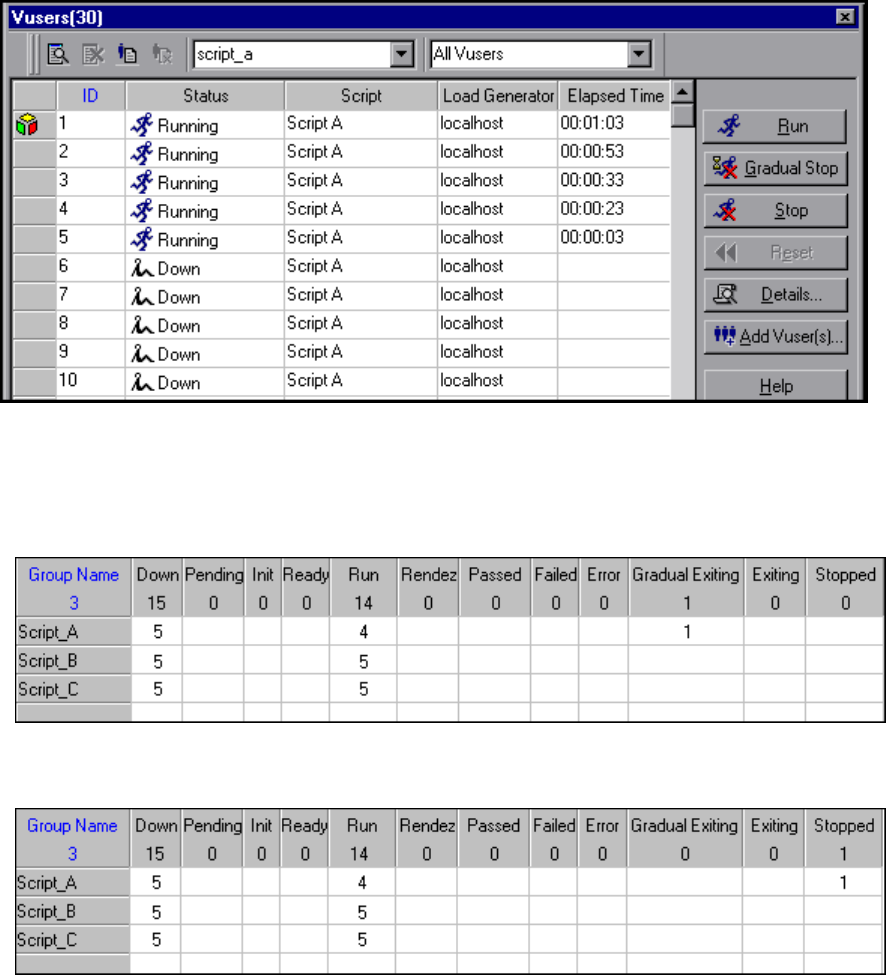
By selecting script_a, and All Vusers in the filter options at the top of the dialog box, the table displays
a list of all the Vusers in Script_A, and indicates that five are currently running, and that five are still
down.
He then selects Vuser number 1 (or any running Vuser that he wishes to stop), and then selects one of
the stopping options:
lStop the Vuser gradually. David clicks Gradual Stop, and the Vuser immediately moves from the Run
state to the Gradual Exiting state, where it completes its current iteration or action before stopping.
lStop the Vuser immediately. David clicks Stop, and the Vuser immediately stops running and moves
to the Stopped state.
Add new Vusers (Vuser Group mode only)
If David is working in Vuser Group mode, he can add new Vusers to a group without initializing them, as
follows:
User Guide
Controller
HP LoadRunner (12.50) Page 1234
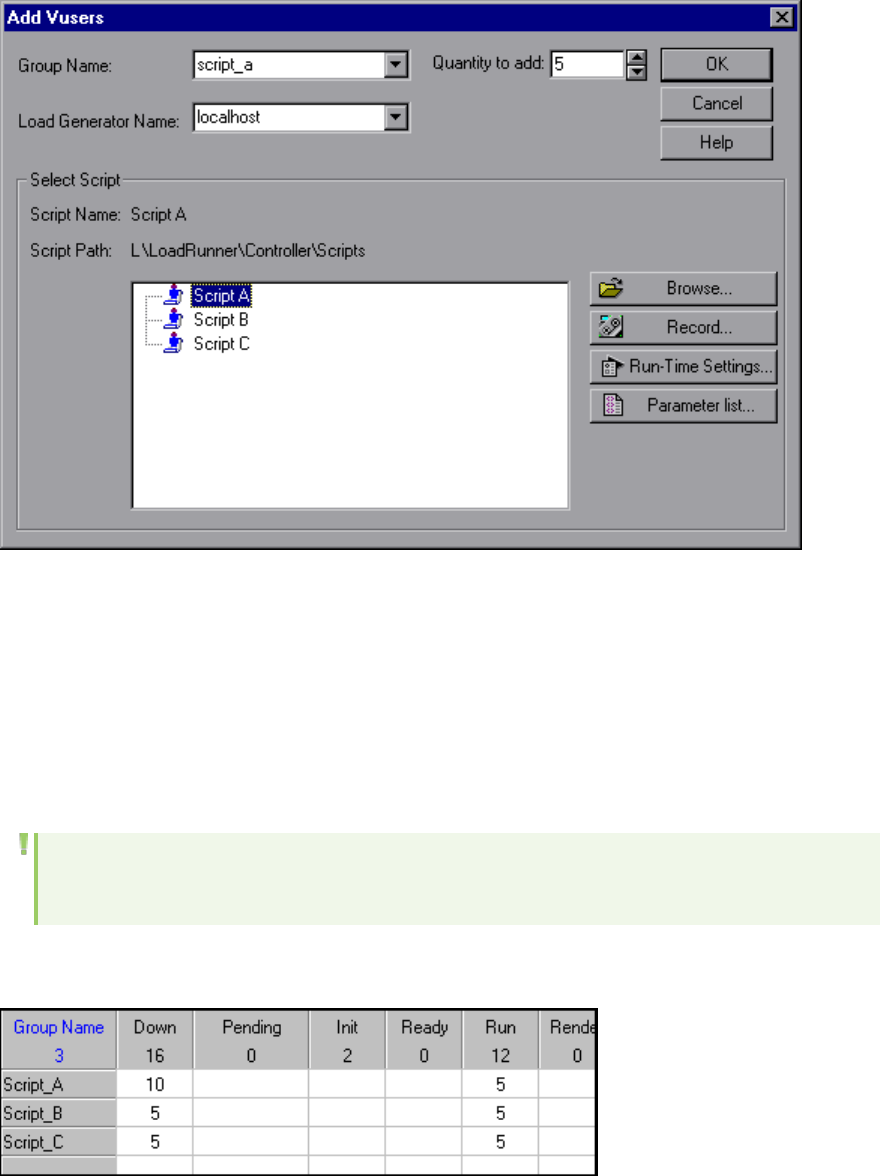
In the Run tab, he clicks Vusers to open the Vusers dialog box, then he clicks Add Vusers to open the
Add Vusers dialog box.
He then enters the following information (as shown in the image above):
lGroup Name. script_a
lQuantity to add. 5
lLoad Generator Name. localhost (or any load generator on which the group is running Vusers).
lSelect Script. Script_A
These settings instruct LoadRunner to add five Vusers to Script_A, and that the additional Vusers
should run Script_A when they run.
Note: For full information on how to work with the Add Vusers dialog box, see "Add Vusers Dialog
Box" on page1089.
He clicks OK. Five Vusers are added to Script_A in the down state, from where they run according to the
group's defined schedules.
User Guide
Controller
HP LoadRunner (12.50) Page 1235
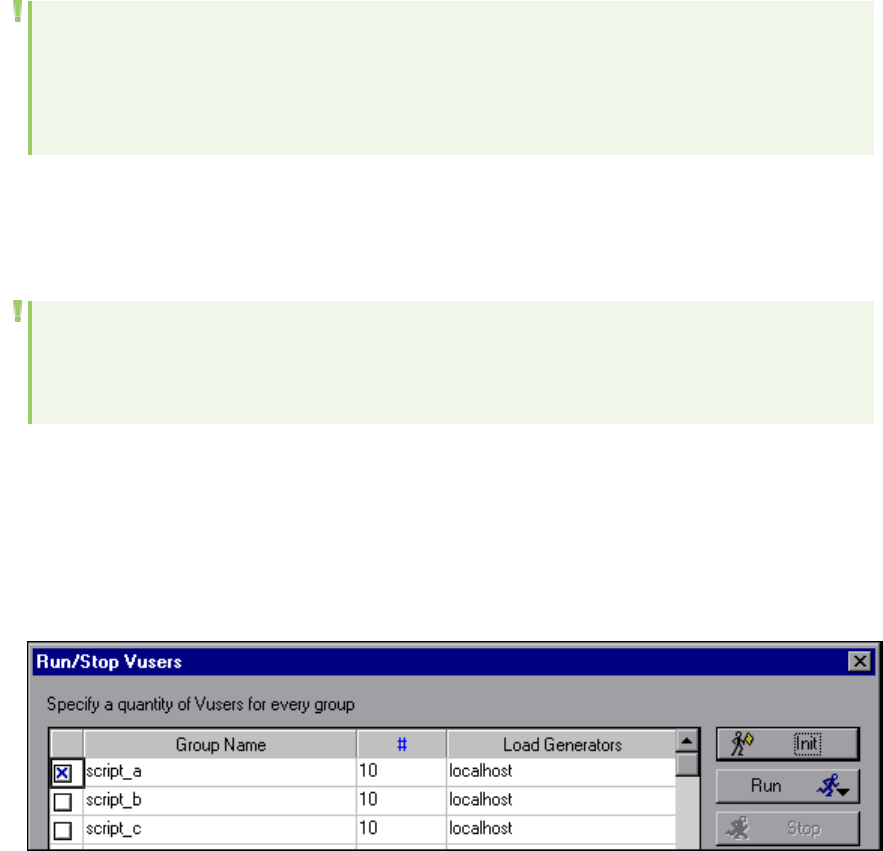
Initialize/Run Additional Vusers or Stop Running Vusers - Use-
Case Scenario
This use-case scenario describes how David can manipulate the behavior of Vusers during a scenario
run, irrespective of their defined schedules. The examples will show how he can initialize or run specified
numbers of additional Vusers, or stop specified numbers of running Vusers.
Note: The examples presented in this section demonstrate options in the Run/Stop Vusers
dialog box. Not all information relevant for working with this dialog box necessarily appears
here. For full information about working with the Run/Stop Vusers dialog box, see "Run/Stop
Vusers Dialog Box" on page1247.
Initialize/Run additional Vusers in Vuser group mode
The following procedure shows how David can initialize and run additional Vusers when he is working in
Vuser Group mode:
Note: The options to initialize or run additional Vusers can be done as two separate actions,
with no connection to each other. They are being shown here together as a single workflow for
demonstrative purposes only.
1. Initialize additional Vusers
If he wants to initialize ten Vusers in Script_A immediately, and not wait for them to initialize as per
their defined schedules, in the Run tab, he clicks Run/Stop Vusers to open the Run/Stop Vusers
dialog box.
In the dialog box, he makes sure that only the check box by script_a is selected, and he enters 10 in
the #(number) column.
To initialize these Vusers, he clicks Initialize. Ten Vusers are immediately initialized and move to the
Ready state. From there, they run according to their defined schedules.
User Guide
Controller
HP LoadRunner (12.50) Page 1236
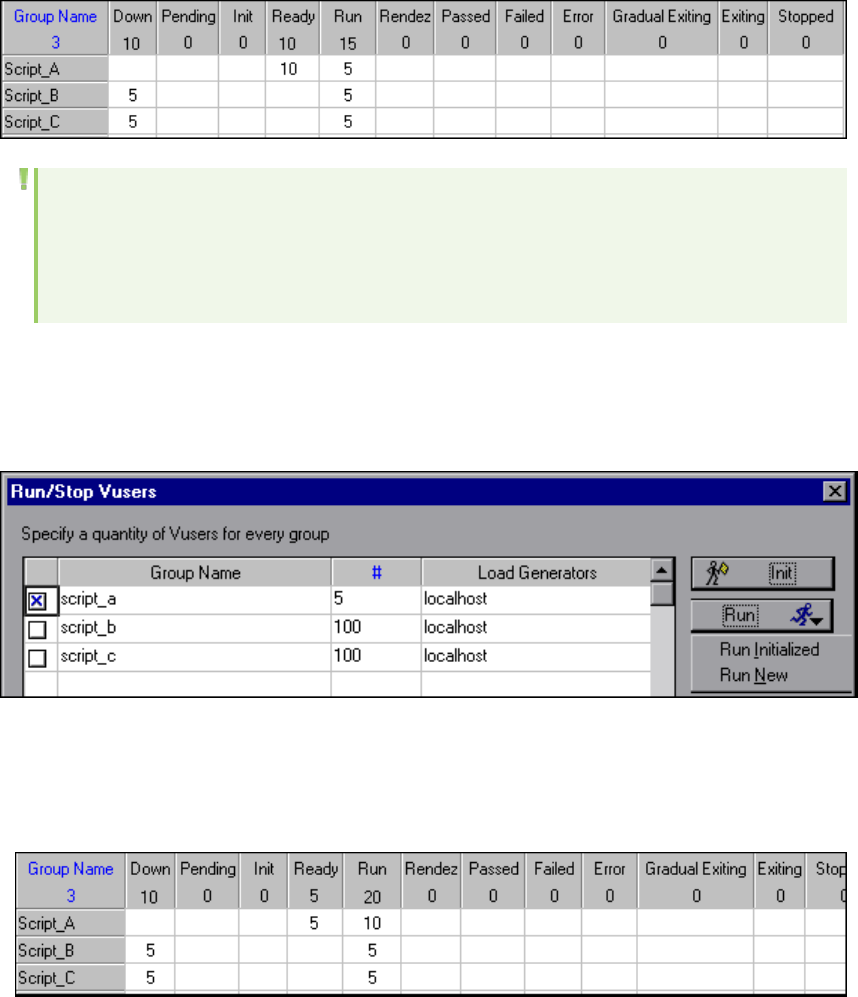
Note: The additional initialized Vusers are taken from the Vusers that are in the Down
state. If David initializes a greater number of Vusers than there are in the Down state, then
all of them will be initialized. In the example above, there were five Vusers in the Down
state. All of them have been initialized, while an additional five have been created.
2. Run additional Vusers
If David then wants to run five additional Vusers in Script_A immediately, and not wait for them to
run as per their defined schedules, in the Run/Stop Vusers dialog box, he makes sure that only the
check box by script_a is selected, and he enters 5in the #(number) column.
He then has the following two options for how to run these additional Vusers:
lRun initialized Vusers. He can run five Vusers from those he initialized in the previous step. To
do this, he clicks the arrow on the Run button and selects Run Initialized. Five Vusers
immediately move from the Ready state to the Run State.
lRun new Vusers. He can create and run five new Vusers, with no effect on those he initialized in
the previous step. To do this, he clicks the arrow on the Run button and selects Run New. Five
Vusers are immediately created and move directly to the Run state.
User Guide
Controller
HP LoadRunner (12.50) Page 1237
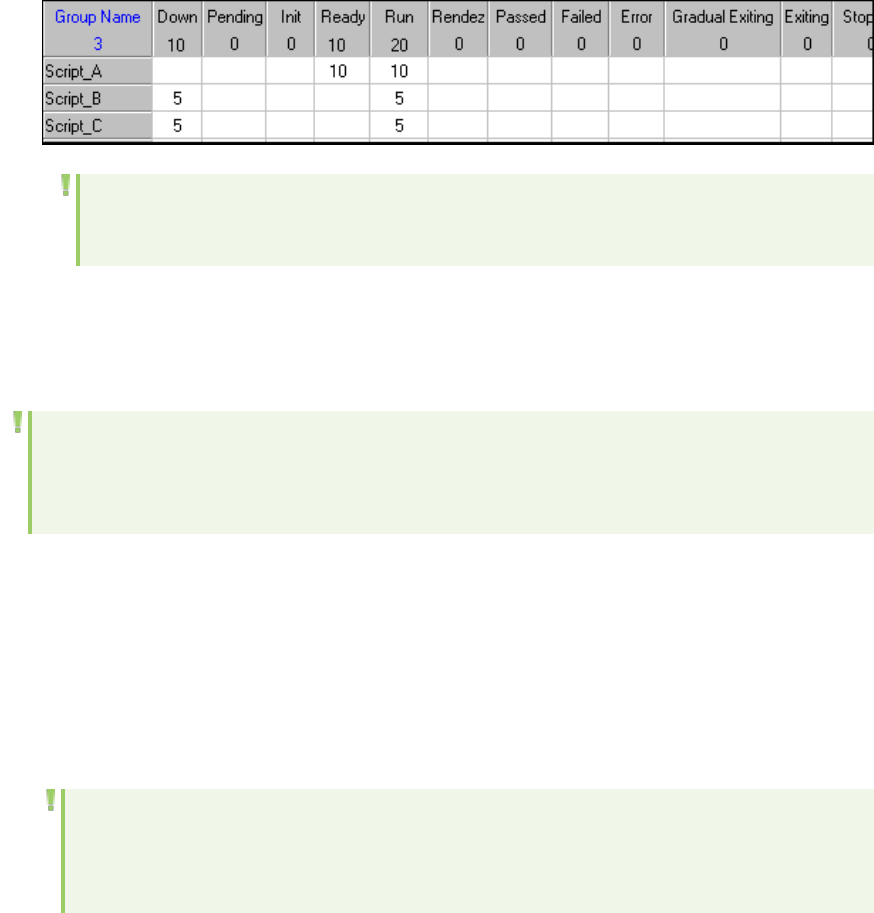
Note: If there were still Vusers in the Down state, the new Vusers would be taken from
them.
Initialize/Run additional Vusers in Percentage mode
The following procedure shows how David can initialize and run additional Vusers when he is working in
Percentage mode:
Note: The options to initialize or run additional Vusers can be done as two separate actions,
with no connection to each other. They are being shown here together as a single workflow for
demonstrative purposes only.
1. Initialize new Vusers
If he wants to initialize ten Vusers in Script_A immediately, and not wait for them to initialize as per
their defined schedules, in the Run tab, he clicks Run/Stop Vusers to open the Run/Stop Vusers
dialog box.
In the dialog box, he makes sure that only the check box by script_a is selected, and he enters 10 in
the Distribute X Vusers among all the scripts box. It is also important that the percentage values
for Script_B and Script_C are set to 0%. See the note below for a detailed explanation why.
Note: When a check box is deselected, no Vusers are distributed to that script. However, the
amount of Vusers that would have been assigned to it are not redistributed to the scripts
that remain selected, unless you specify 0% in the percentage column.
For example, in our use-case scenario, when David enters 10 in the Distribute X Vusers among all
the scripts box, LoadRunner automatically distributes these Vusers as equally as possible among
the available scripts, that is:
lscript_a. 4 Vusers
lscript_b. 3 Vusers
lscript_c. 3 Vusers
However, should David wish to distribute all 10 Vusers to script_a, it is not sufficient to simply
deselect script_b and script_c. This only ensures that no Vusers are added to these scripts, but it
does not change the original Vuser distribution.
User Guide
Controller
HP LoadRunner (12.50) Page 1238
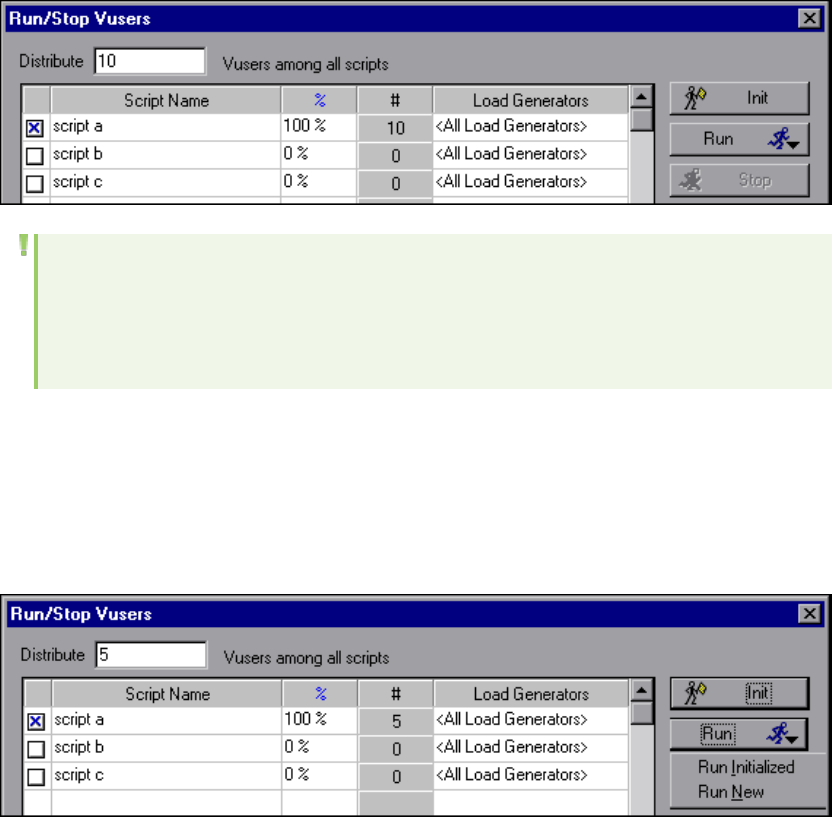
In other words, should David complete the step now, the four Vusers that are assigned to script_a
will be added, while the three each assigned to script_b and script_c will not, though they will still
appear under the #(number) column. To distribute these six Vusers to script_a instead, David
must first change the %(percentage) columns for these scripts to 0%.
He then clicks Initialize. Ten Vusers are immediately initialized and move to the Ready state.
From there, they run according to their defined Scheduler settings.
Note: The additional initialized Vusers are taken from the Vusers that are in the Down
state. If you initialize a greater number of Vusers than there are in the Down state, then
all of them will be initialized. In the example above, there were five Vusers in the Down
state. All of them have been initialized, while an additional five have been created.
lRun additional Vusers
If David then wants to run five additional Vusers in Script_A immediately, and not wait for them to
run as per their defined schedules, in the Run/Stop Vusers dialog box, he makes sure that only the
check box by script_a is selected, and he enters 5in the Distribute X Vusers among all the
scripts box at the top of the dialog box. It is also important that the percentage values for Script_
Band Script_C are set to 0%. See the note in the step above for a detailed explanation why.
He then has the following two options for how to actually run these additional Vusers:
lRun initialized Vusers. He can run five Vusers from those he initialized in the previous step. To
do this, he clicks the arrow on the Run button and selects Run Initialized. Five Vusers
immediately move from the Ready state to the Run State.
User Guide
Controller
HP LoadRunner (12.50) Page 1239
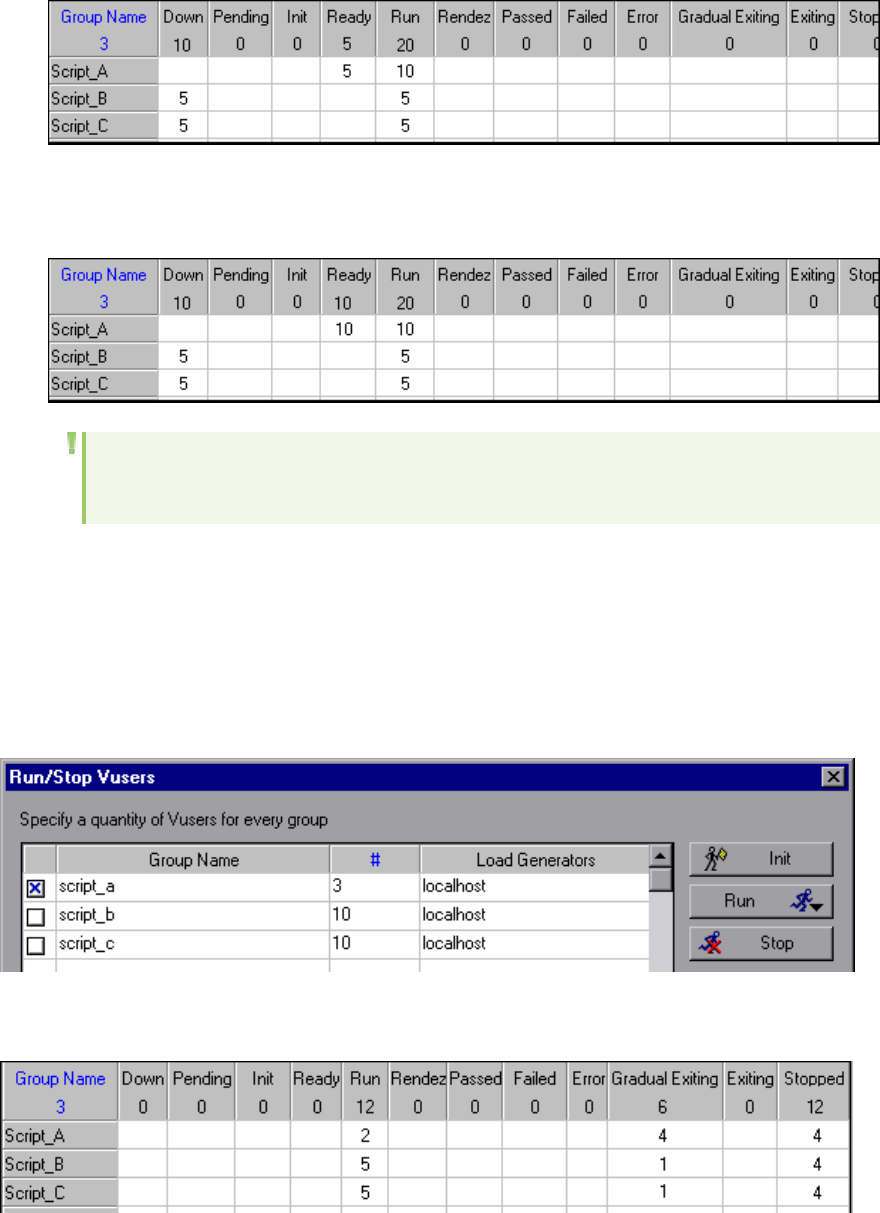
lRun new Vusers. He can create and run five new Vusers, with no effect on those he initialized in
the previous step. To do this, he clicks the arrow on the Run button and selects Run New. Five
Vusers are immediately created and move directly to the Run state.
Note: If there were still Vusers in the Down state, the new Vusers would be taken from
them.
Stop running Vusers in Vuser group mode
If David wants to stop three of the five running Vusers in Script_A, and not wait for them to stop as per
their defined schedules, in the Run tab, he clicks Run/Stop Vusers to open the Run/Stop Vusers dialog
box.
In the dialog box, he makes sure that only the check box by script_a is selected, and he enters 3in the #
(number) column.
He then clicks Stop. Three of the running Vusers in Script_A move from the Run state to the Gradual
Exiting state.
User Guide
Controller
HP LoadRunner (12.50) Page 1240
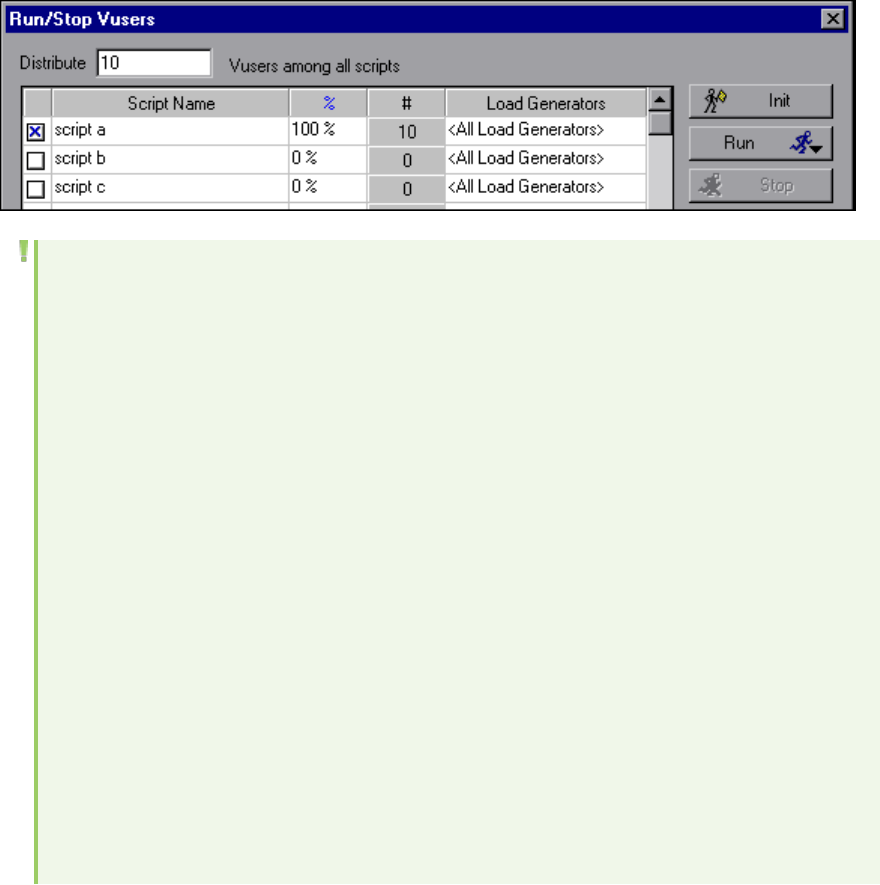
Stop running Vusers in Percentage mode
If David wants to stop three of the five running Vusers in Script_A, and not wait for them to stop as per
their defined schedules, in the Run tab, he clicks Run/Stop Vusers to open the Run/Stop Vusers dialog
box.
In the dialog box, he makes sure that only the check box by script_a is selected, and he enters 3in the
Distribute X Vusers among all the scripts box. It is also important that the percentage values for
Script_B and Script_C are set to 0%. See the note below for a detailed explanation why.
Note: When a check box is deselected, no Vusers are distributed to that script. However, the
amount of Vusers that would have been assigned to it are not redistributed to the scripts that
remain selected, unless you specify 0% in the percentage column.
For example, in our use-case scenario, when David enters 3in the Distribute X Vusers among
all the scripts box, LoadRunner automatically distributes these Vusers as equally as possible
among the available scripts, that is:
lscript_a. 1Vuser
lscript_b. 1Vuser
lscript_c. 1Vuser
However, should David wish to distribute all 3Vusers to script_a, it is not sufficient to simply
deselect script_b and script_c.This only ensures that no Vusers are added to these scripts, but
it does not change the original Vuser distribution.
In other words, should David complete the step now, the single Vuser that is assigned to script_
awill be stopped, while the one each assigned to script_b and script_c will not, though they will
still appear under the #(number) column. To distribute these two Vusers to script_a instead,
David must first change the %(percentage) columns for these scripts to 0%.
He then clicks Stop. Three of the running Vusers in Script_A move from the Run state to the Gradual
Exiting state.
User Guide
Controller
HP LoadRunner (12.50) Page 1241
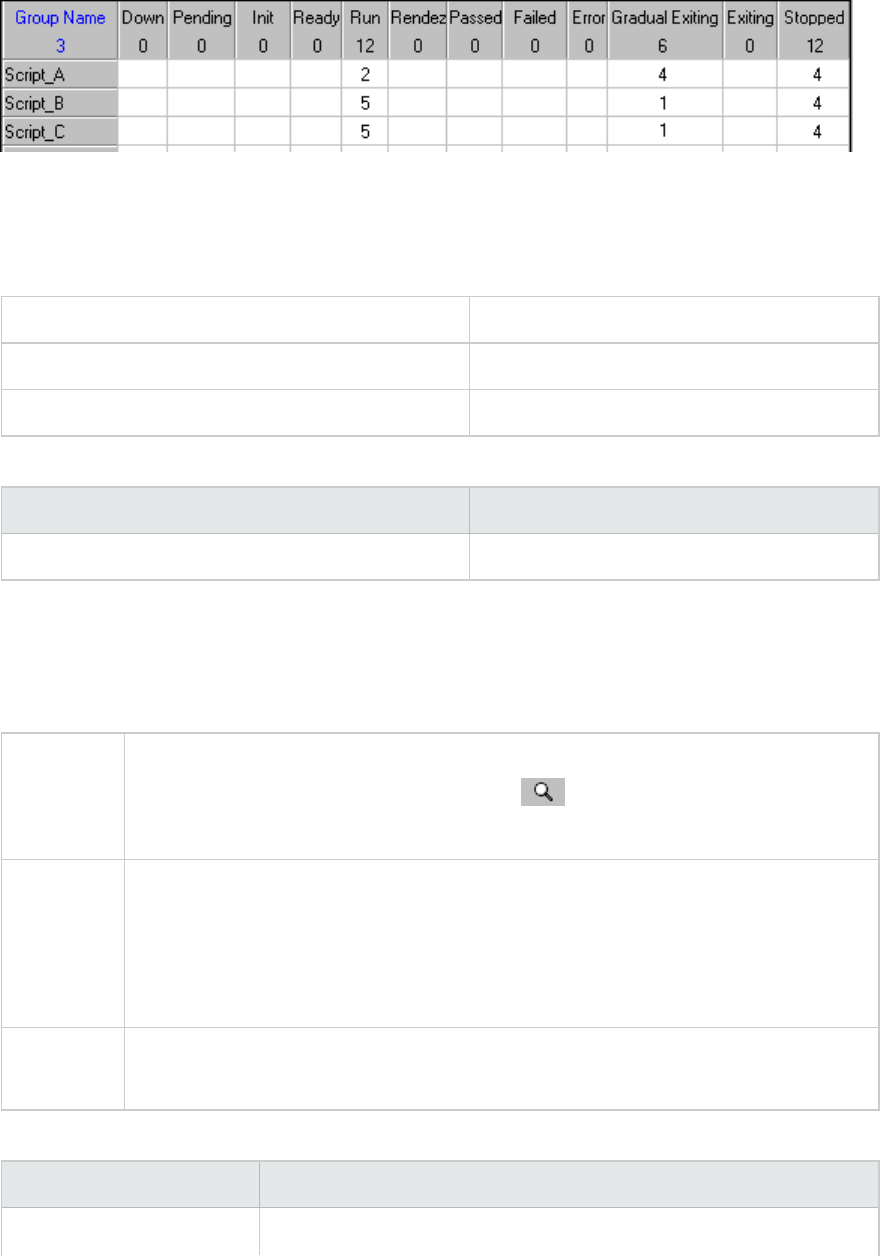
Execution Notes Dialog Box
This page dialog box enables you to log comments while a scenario is running.
To access Select Scenario >Execution Notes
Relevant tasks "How to Run a Scenario" on page1228
Important Information Only enabled while the scenario is running.
User interface elements are described below (unlabeled elements are shown in angle brackets):
UI Element Description
<note writing area> Enter your notes in this area.
Output Window
This window displays error, notification, warning, debug, and batch messages that are sent to the
Controller by the Vusers and load generators during a scenario run.
To access Use one of the following:
lRun tab > Scenario Status pane > Errors >
lSelect View >Show Output
Important
information
lLoadRunner clears the messages in the Output window at the start of each scenario
execution. If you reset a scenario, messages remain in the Output window unless
you instruct LoadRunner to delete messages from the window upon reset. For more
information, see "Options > Output Tab" on page1217.
lThe Summary tab is displayed by default when you open this window.
Relevant
tasks
l"How to Run a Scenario" on page1228
l"How to Configure Scenario Options" on page1208
User interface elements are described below:
UI Element Description
Filtered Tab See "Filtered Tab" on the next page
User Guide
Controller
HP LoadRunner (12.50) Page 1242
Summary Tab See "Summary Tab" on the next page
Filtered Tab
This tab displays a drilled down view by message, Vuser, script, or load generator. For example, if you
drill down on the Vuser column, the Filtered tab displays all the messages with the code you selected,
grouped by the Vusers that sent the messages.
To access Output window > Filtered tab. Click the blue link on the column about which you
wish to view more information.
Important
information
The tab appears when you click on a blue link in the Summary tab.
See also "Summary Tab" on the next page
User interface elements are described below (unlabeled elements are shown in angle brackets):
UI Element Description
Previous/Next View. Enables you to move between the various drill down levels.
Displays the full text of the selected output message in the Detailed Message Text
area at the bottom of the Output window.
Export the view. Saves the output to a specified file.
Refreshes the Filtered tab with new log information that arrived in the Output
window updated in the Summary tab.
<Message
icon>
Displays an icon indicating the type of message by which the current Output view is
filtered.
Active Filter Displays the category or categories by which the current Output view is filtered.
Viewed By Displays the name of the column on which you selected to drill down. The following
icons indicate the various message types:
lBatch
lDebug
lErrors
lNotifications
User Guide
Controller
HP LoadRunner (12.50) Page 1243
lWarnings
Detailed
Message
Text
Displays the full text of the selected output message when the Details button is
selected.
Message Displays all instances of the sample message text.
Script The script on which the message was generated. If you click the blue link, VuGen
opens displaying the script.
Action The action in the script where the message was generated. If you click the blue link,
VuGen opens the script to the relevant action.
Line # The line in the script where the message was generated. If you click the blue link,
VuGen opens the script and highlights the relevant line.
# Lines The total number of lines in the script where the Vuser failed.
Time The time the message was generated.
Iteration The iteration during which the message was generated.
Vuser The Vuser that generated the message.
Generator The load generator on which the message was generated. If you click the blue link,
the Load Generator dialog box opens.
# Messages The number of messages generated by a specific Vuser.
# Diff Texts
Summary Tab
This tab displays summary information about the messages sent during a scenario run.
To access Output window > Summary tab
Important information You can drill down further on any information displayed in blue.
See also "Filtered Tab" on the previous page
User interface elements are described below:
UI Element Description
Displays the full text of the selected output message in the Detailed Message Text
area at the bottom of the Output window.
User Guide
Controller
HP LoadRunner (12.50) Page 1244
Remove all messages. Clears all log information from the Output window.
Export the view. Saves the output to a specified file.
lFreeze. Stops updating the Output window with messages.
lResume. Resumes updating the Output window with messages. The newly
updated log information is displayed in a red frame.
Detailed
Message Text
Displays the full text of the selected output message when you click the Details
button.
Generators Displays the number of load generators that generated messages with the specified
message code.
Help Displays an icon if there is a link to troubleshooting for the message.
Message
Code
Displays the code assigned to all similar messages. The number in parentheses
indicates the number of different codes displayed in the Output window.
Sample
Message Text
Displays an example of the text of a message with the specified code.
Scripts Displays the number of scripts whose execution generated messages with the
specified code.
Total
Messages
Displays the total number of sent messages with the specified code.
Type The type of message being displayed. The following icons indicate the various
message types. For more information about each type, see Type of Message below:
lBatch
lDebug
lErrors
lNotifications
lWarnings
Type of
Message
Filters the output messages to display only certain message types. Select one of the
following filters:
lAll messages. Displays all message types.
User Guide
Controller
HP LoadRunner (12.50) Page 1245
lBatch. Sent instead of message boxes appearing in the Controller, if you are using
automation.
lDebug. Sent only if the debugging feature is enabled in the Controller. (Expert
mode: Tools > Options > Debug Information). For more information, see "Options
> Debug Information Tab" on page1212.
lErrors. Usually indicate that the script failed.
lNotifications. Provides runtime information, such as message sent using lr_
output_message.
lWarnings. Indicates that the Vuser encountered a problem, but the scenario
continued to run.
Vusers Displays the number of Vusers that generated messages with the specified code.
Run Tab
The Run tab enables you to run and monitor scenarios.
To access Run tab
Relevant tasks l"How to Run a Scenario" on page1228
l"Control Vusers During a Scenario Run - Use-Case Scenario" on
page1231
User interface elements are described below (unlabeled elements are shown in angle brackets):
UI Element Description
Instructs the Controller to initialize the Vusers and distribute them to their
designated load generators, where they begin running their Vuser scripts.
Note:
lThe Controller begins running the scenario according to the start
time defined in the scenario schedule.
lWe do not recommend changing the Time/Date and Time Zone
settings on the Controller and load generators during the load test
run.
Terminates the scenario.
The behavior depends on your selection in the Tools >Options >Runtime
Settings tab:
lIf you selected Stop immediately, all Vusers in the scenario move to the
Exiting status.
User Guide
Controller
HP LoadRunner (12.50) Page 1246
lIf you selected Wait for the current iteration to end before exiting, or
Wait for the current action to end before exiting, the button text
changes to Stop Now and the Vusers status changes to Gradual Exiting.
To stop the Vusers immediately, click Stop Now.
For more information about the runtime settings options, see "Options >
Runtime Settings Tab" on page1219.
Resets all Vuser groups to the Down status.
Opens the Vusers dialog box, where you can view the status of each of the
Vusers in a Vuser group.
Opens the Run/Stop Vusers dialog box, where you can activate additional
Vusers.
Pauses or resumes the scenario schedule.
<Graph Legend> Displays statistics for the selected graph. For more information, see "Online
Monitor Graphs" on page1193.
<Graph Viewing
Pane>
Displays the graphs that are listed in the Available Graphs pane. For more
information, see "Online Monitor Graphs" on page1193.
Default: Displays four graphs
Available Graphs Displays the available online monitor graphs. For more information, see
"Online Monitor Graphs" on page1193.
Scenario Groups
pane
Displays each Vuser group and it's current status. For more information. see
"Scenario Groups Pane" on page1250.
Scenario Status
pane
Displays a synopsis of the running scenario. For more information, see
"Scenario Status Pane" on page1251.
Run/Stop Vusers Dialog Box
This dialog box enables you to manually control the addition of new Vusers to a running scenario, as well
as to stop running Vusers.
To access Run tab > Scenario Groups pane >
Important
information
lThe dialog box differs depending on which mode you are working in.
lVuser group mode. You specify the number of new Vusers to be added to each
Vuser group, as well as the load generators on which these additional Vusers will
User Guide
Controller
HP LoadRunner (12.50) Page 1247
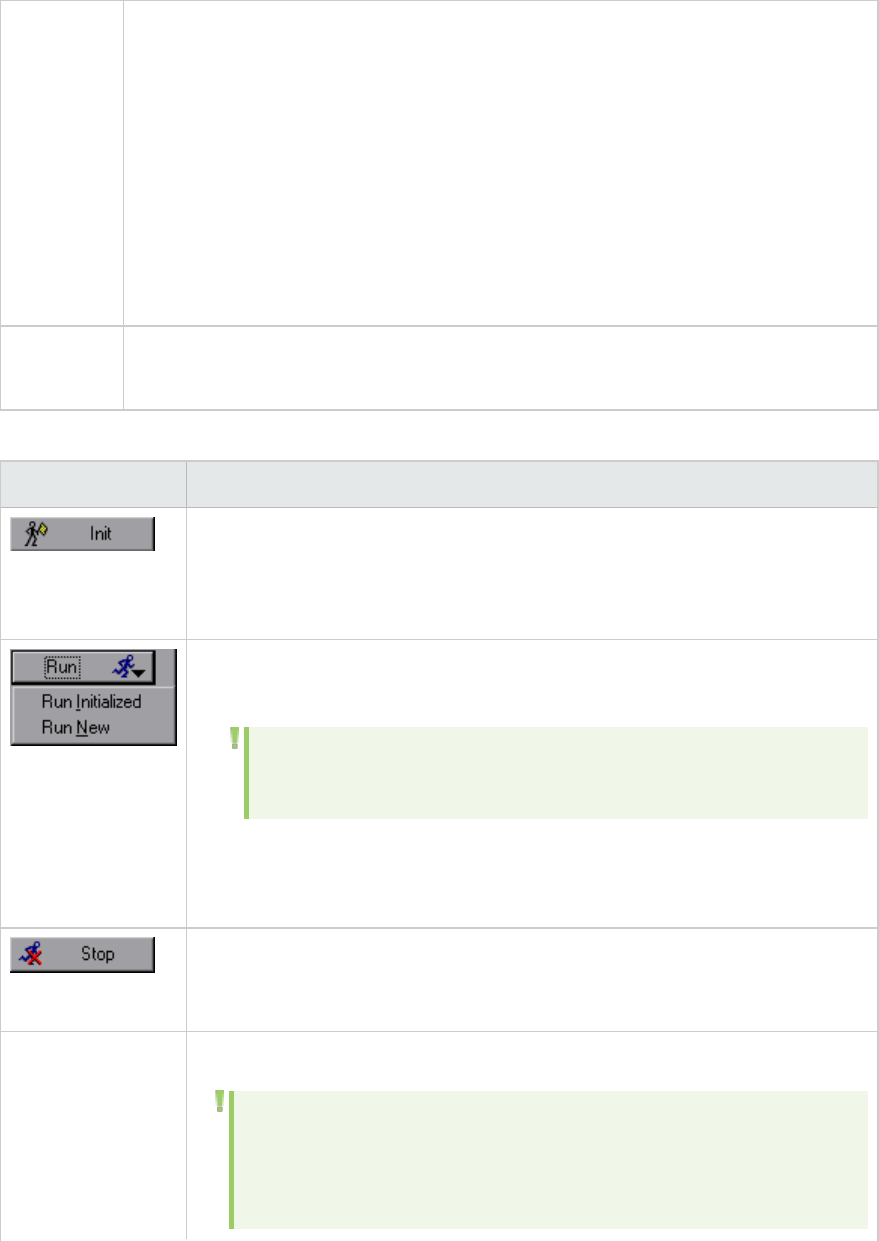
run.
lPercentage mode. You specify the percentage of Vusers to be added to each
script, as well as the load generators on which these additional Vusers will run.
lWhen you add Vusers to a running scenario or Vuser group, the current scheduler
settings are automatically applied to all new Vusers. For example, if the scenario or
Vuser group has a set duration of five minutes, all Vusers that are subsequently
added run only for the remaining part of that time period.
Vusers that are added to a scenario or Vuser group which has finished running, are
not affected by schedule settings and run according to the scenario runtime
settings.
Relevant
tasks
l"How to Run a Scenario" on page1228
l"Control Vusers During a Scenario Run - Use-Case Scenario" on page1231
User interface elements are described below (unlabeled elements are shown in angle brackets):
UI Element Description
Distributes the added Vusers to their designated load generators so that they
are ready to execute their scripts. The Controller first initializes the Vusers in
your scenario that have not yet run and then adds additional Vusers, as
required, to reach the defined quantity.
lRun Initialized. Runs the Vusers in the scenario that have already been
initialized.
Note: You cannot run more Vusers than are currently initialized using
this option.
lRun New. Runs the number of Vusers you specified. The Controller first runs
the Vusers in your scenario that have not yet been run and then adds
additional Vusers, as required, to reach the defined quantity.
Stops the Vusers that are running. The Controller stops the Vusers according to
the settings you defined in the runtime settings tab. For more information, see
"Options > Runtime Settings Tab" on page1219.
<check box> Selects the Vuser groups/scripts you add Vusers to.
Note:
lTo disable a Vuser group/script, clear the check box to the left of the
group/script name. A group/script automatically appear disabled if it
is disabled in the Design view.
User Guide
Controller
HP LoadRunner (12.50) Page 1248
lWhen you disable a Vuser group (Vuser Group mode), no Vusers are
added to the group.
lWhen you disable a script (Percentage mode), no Vusers are
distributed to the script, and the unused percentage of the Vusers
are not distributed among the remaining scripts, unless you define a
zero percent value for the disabled script.
Example: If you have three scripts, A,B, and C, and you enter 10 in the
Distribute X Vusers among all the scripts box, LoadRunner automatically
distributes these Vusers as equally as possible among the scripts, that is:
lA. 4 Vusers
lB. 3 Vusers
lC. 3 Vusers
However, if you want LoadRunner to distribute all 10 Vusers to A, it is not
sufficient to simply deselect Band C. This only ensures that no Vusers are
added to these scripts, but it does not change the original Vuser distribution.
In other words, if you were to finish the step now, the four Vusers that are
assigned to Awould be added to the script, while the three each assigned to
Band Cwould not, though they would still appear under the #(number)
column. To distribute these six Vusers to Ainstead, you must first change the
%(percentage) columns Band Cto 0%.
%
(Percentage mode)
Enter the percentage of Vusers to be distributed to each Vuser script.
#Indicates the number of Vusers distributed to each script.
Distribute x
Vusers among the
checked scripts
(Percentage mode)
Enter the number of Vusers to be distributed. The Vusers will be distributed
according to the values you entered in the percentage (%) column.
Load Generators The load generators assigned to the Vuser group/script.
If you select multiple load generators for a group/script, the Vusers assigned to
the Vuser group/script are distributed evenly among the load generators.
Default value (in Percentage mode): All Load Generators
Note: To add a load generator to the list, select Add from the list. For
more details see "Add New Load Generator/Load Generator
Information Dialog Box" on page1127.
User Guide
Controller
HP LoadRunner (12.50) Page 1249

Scenario Groups Pane
This pane enables you to monitor the actions of all the Vusers and Vuser groups in the scenario.
To access Run tab
Relevant tasks l"How to Run a Scenario" on page1228
l"Control Vusers During a Scenario Run - Use-Case Scenario" on page1231
User interface elements are described below (unlabeled elements are shown in angle brackets):
UI Element Description
<Right-click
menu>
Additional actions available only via the right-click menu:
lReset IDs. Resets the IDs of the Vusers in the group.
lRun Vusers Until Complete. Runs the selected Vusers until complete. If you run
Vusers in the Down or Error state, the Controller initializes and then runs the
Vusers.
lRun One Vuser Until Complete. Instructs the Controller to run a randomly selected
Vuser in the Vuser group, until it completes running. The Vuser Log opens,
displaying runtime information about the Vuser. For more information, see "Vuser
Script Log" on page1252.
lPause Vusers. Temporarily pauses running the Vusers group. The status of the
Vuser group changes from Running to Paused. Note that pausing a Vuser group
affects its transaction response time.
lEnable. Enables the Vuser group to participate in the scenario.
lDisable. Disables the Vuser group so that it no longer participates in the scenario.
lShow Vuser Log. Opens a script log containing runtime information for each Vuser
in the group. The Vuser script log is refreshed, by default, every 1000 milliseconds.
lHide Vuser Log. Closes the Vuser script logs.
lSort By Name. Sorts the groups alphabetically, by name.
Done/Failed The number of Vusers that have finished running and the script failed.
Done/Passed The number of Vusers that have finished running and the script passed.
Down The number of Vusers that have stopped running.
Error The number of Vusers that encountered problems. Check the Status field on the
Vuser dialog box or the output window for a complete explanation of the error.
Exiting The number of Vusers that have finished running or have been stopped, and are now
exiting.
User Guide
Controller
HP LoadRunner (12.50) Page 1250
Gradual
Exiting
The number of Vusers that are completing their iterations or actions before exiting
(as defined in Tools > Options > Runtime Settings).
Initializing The number of Vusers that are being initialized on the remote machine.
Pending The number of Vusers that are ready to be initialized and are waiting for an available
load generator, or are transferring files to the load generator.
Ready The number of Vusers that have already performed the init section of the script and
are ready to run.
Rendezvous The number of Vusers that have arrived at the rendezvous and are waiting to be
released by the Controller.
Running The number of Vusers that are running, and the Vuser script is being executed on a
load generator.
Stopped The Vuser stopped when the Stop command was invoked.
, continued
Scenario Status Pane
This pane displays a synopsis of the running scenario.
To access: Run tab
Important
Information
To detach the Scenario Status pane from the Run tab, click the detach pane
button in the upper right corner.
Relevant tasks "How to Run a Scenario" on page1228
User interface elements are described below:
UI Element Description
Elapsed Time Indicates how much time has elapsed since the scenario started running.
Errors Indicates the number of Vusers with errors.
To display the errors, click the Show Snapshot button to display the Output
Window. For more information, see "Output Window" on page1242.
Hits/Second Indicates how many hits (HTTP requests) there have been to the Web site being
tested per second that each Vuser has been running.
Passed/Failed
Transactions
Indicates how many transactions have been executed successfully or
unsuccessfully. For more information, see "Transactions Dialog Box" on the next
page.
User Guide
Controller
HP LoadRunner (12.50) Page 1251
RunningVusers Indicates the number of Vusers that are currently running.
Scenario
Status
Indicates whether the scenario is Running or Down.
Transactions Dialog Box
This dialog box indicates how many transactions have been executed successfully or unsuccessfully.
To access Run tab > Scenario Status pane. Click the Show Snapshot button by
Passed/Failed Transactions.
Important
information
VuGen automatically defines each Init,Action, and End unit as a transaction. In
addition, you can insert a static transaction in your script using the Start Transaction
and End Transaction functions. For details, see "How to Insert Transactions" on
page323.
Relevant
tasks
"How to Run a Scenario" on page1228
See also "Scenario Status Pane" on the previous page
User interface elements are described below:
UI Element Description
Failed The number of times the transaction failed.
Name The names of the individual transactions in a script.
Passed The number of times the transaction passed.
Stopped The number of times the transaction stopped.
TPS The number of times per second the transaction has run.
Vuser Script Log
This page enables you to view runtime information about each running Vuser.
To access Manual scenario > Run tab > Scenario Groups pane > Vusers . In the Vusers dialog
box select the Vuser whose log you want to view and click Show Vuser Log .
Important
information
lIf you disabled the logging feature in the runtime settings Log node, the Vuser script
log will contain output only if your script contains the lr_output_message or lr_
message function.
User Guide
Controller
HP LoadRunner (12.50) Page 1252
lIf you selected the Send messages only when an error occurs option in the Log
node, the Vuser script log will contain output only if there are script errors.
Relevant
tasks
"How to Run a Scenario" on page1228
User interface elements are described below (unlabeled elements are shown in angle brackets):
UI Element Description
Show Text/Tree View. Displays the runtime information in text/tree format. To
revert to the previous view, click the button again.
Display. Displays a snapshot of the Web page where an error occurred, when the
error is highlighted in the Vuser log.
Note:
lTo view a snapshot of the Web page where an error occurred, you must
select the Activate snapshot on error option in the General node of the
runtime settings dialog box before running the scenario.
lSnapshots on errors is supported for TruClient.
Find Text. Enables you to search for text in the Vuser log.
Expand/Collapse Node. Expands the node so that you can view additional runtime
information details about the Vuser. To revert to the collapsed tree view, click the
button again.
<message
icons>
The following icons may can appear in the script log:
lAction. Displays the name and description of an action.
lEnd iteration. Indicates the end of an iteration.
lErrors. Indicates that the Vuser encountered a problem, but test execution
continued. Displays the error code and a description of the error.
lNotifications. Provides action information.
lStart/End Transaction. Indicates the start or end of a transaction.
lStart iteration. Indicates the start of an iteration.
lStart User Script. Indicates the start of the Vuser script.
<Right-click lCopy. Enables you to copy selected text from the Vuser log.
User Guide
Controller
HP LoadRunner (12.50) Page 1253
options> lCopy path from status bar. Enables you to copy the path of the Vuser log.
Refresh
(every 1000
milliseconds)
When selected, instructs LoadRunner to refresh the runtime information displayed
every 1000 milliseconds.
Note: For information on how to change the default refresh settings, see
"Options > Output Tab" on page1217.
Rendezvous Points
Rendezvous Points Overview
During a scenario run, you can instruct multiple Vusers to perform tasks simultaneously by using
rendezvous points. A rendezvous point creates intense user load on the server and enables LoadRunner
to measure server performance under load.
Suppose you want to measure how a Web-based banking system performs when ten Vusers
simultaneously check account information. To emulate the required user load on the server, you
instruct all the Vusers to check account information at exactly the same time.
You ensure that multiple Vusers act simultaneously by creating a rendezvous point. When a Vuser
arrives at the rendezvous point, it is held there by the Controller. You then set a rendezvous policy
according to which the Controller releases the Vusers from the rendezvous point either when the
required number of Vusers arrives, or when a specified amount of time has passed.
You define rendezvous points in the Vuser script. For information about inserting rendezvous points into
Vuser scripts, see "Rendezvous Points" on page327.
Using the Controller, you can influence the level of server load by selecting:
lWhich of the rendezvous points will be active during the scenario
lHow many Vusers will take part in each rendezvous
For example, to test a bank server, you could create a scenario that contains two rendezvous points.
The first rendezvous ensures that 1000 Vusers simultaneously deposit cash. The second rendezvous
ensures that another 1000 Vusers simultaneously withdraw cash. If you want to measure how the
server performs when only 500 Vusers deposit cash, you can deactivate the withdraw rendezvous, and
instruct 500 Vusers to participate in the deposit rendezvous only.
How to Set Up a Rendezvous in a Scenario
This task describes set up rendezvous points and policies in a scenario.
1. Prerequisites
User Guide
Controller
HP LoadRunner (12.50) Page 1254

Add Vuser scripts that contain rendezvous points. For details, see "Rendezvous Points" on
page327.
Rendezvous points are only effective for group mode—not percentage mode. For details, see "How
to Change the Scenario Mode (Manual Scenario)" on page1083.
When you add a Vuser group or script to the scenario, LoadRunner scans the included scripts for
rendezvous points and adds them to a central list of rendezvous points. Select Scenario >
Rendezvous to view this list. For user interface details, see "Rendezvous Information Dialog Box"
below.
Note:
In goal-oriented scenarios, a script's rendezvous points are disabled.
2. Set the level of emulated user load
Select the rendezvous points to take part in the scenario, and the number of Vusers to participate
in each rendezvous.
You can temporarily disable a rendezvous and exclude it from the scenario. You can disable a
rendezvous point for all Vusers in a scenario, or you can temporarily disable specific Vusers from
participating in the rendezvous.
By disabling and enabling a rendezvous, you influence the level of server load.
3. Set the attributes for the rendezvous policy - Optional
In the Rendezvous Information dialog box, for each rendezvous:
a. Select the rendezvous, and click the Policy button.
b. In the Policy dialog box, set the policy attributes as follows:
oRelease. The number of Vusers to be released from a rendezvous at one time.
oTimeout. The time the Controller waits before releasing Vusers from a rendezvous.
For user interface details, see "Rendezvous Information Dialog Box" below.
Rendezvous Information Dialog Box
This dialog box enables you to view and modify the attributes of each rendezvous point in the scenario.
It displays general information about the rendezvous point: which script is associated with the
rendezvous, and release history.
To access Manual scenario > Design tab > Scenario >Rendezvous
Important
information
Available only if one of the Vuser scripts participating in the scenario
contains a rendezvous point.
Relevant tasks "How to Set Up a Rendezvous in a Scenario" on the previous page
User Guide
Controller
HP LoadRunner (12.50) Page 1255
User interface elements are described below:
UI Element Description
Disables the rendezvous, excluding it from the scenario, thereby influencing
the level of server load.
Enables a disabled rendezvous point.
Opens the Policy dialog box, where you can set the number Vusers to be
released from a rendezvous at a time, as well as the amount of time the
Controller waits before releasing Vusers from a rendezvous.
lRelease when X% of all Vusers arrive at the rendezvous. Releases the
Vusers only when the specified percentage of all Vusers arrives at the
rendezvous point.
Note: This option interferes with the scheduling of your scenario.
If you select this option, your scenario will not run as scheduled.
lRelease when X% of all running Vusers arrive at the rendezvous.
Releases the Vusers only when the specified percentage of all Vusers
running in the scenario arrives at the rendezvous point.
lRelease when X Vusers arrive at the rendezvous. Releases the Vusers
only when the specified number arrives at the rendezvous point.
lTimeout between Vusers. The timeout value (in seconds). After each
Vuser arrives at the rendezvous point, LoadRunner waits up to the
maximum timeout period specified for the next Vuser to arrive. If the
next Vuser does not arrive within the timeout period, the Controller
releases all the Vusers from the rendezvous. Each time a new Vuser
arrives, the timer is reset to zero. You set a timeout for each rendezvous
point.
Default value: 30 seconds
Disables a Vuser from taking part in the rendezvous.
Enables a Vuser to take part in the rendezvous.
Resets the Status Information, removing the information currently
displayed.
While a scenario is running, enables you to manually release Vusers from a
rendezvous before the Controller releases them. Use this option if you want
the scenario to continue running even though all the Vusers did not reach
the rendezvous.
User Guide
Controller
HP LoadRunner (12.50) Page 1256

Rendezvous The names of the rendezvous points in the scenario.
Scripts The Vuser scripts associated with the rendezvous points.
Status Information During and after a scenario, displays:
lCurrent Status. The number of Vusers that arrived at the rendezvous
point out of the total number of Vusers assigned to the rendezvous.
lTime. The time at which the Vusers at the rendezvous point were
released.
lReason. The reason the Vusers at the rendezvous point were released.
The possible reasons are Timeout or Arrived.
Vusers The Vusers associated with the rendezvous points.
Running the Controller from the Command Line
Controller Command Line Arguments Overview
When you invoke the Controller from the command line, you can pass arguments to instruct the
Controller how to behave. By passing arguments in the command line, you configure Controller scenario
settings without the need to manually define them using the Controller UI.
When invoked, the Controller checks all of the received arguments and sets its start-up environment
accordingly. If no arguments are passed, the Controller uses its default settings.
For example, you can instruct Controller to Connect to HP Application Lifecycle Management on start-up,
save results to a folder other than the folder defined in the scenario, and invoke Analysis upon scenario
termination.
For information on how to invoke the Controller from the command line, see "How to Invoke the
Controller from the Command Line" below.
For a list of rules relating to invoking the Controller from the command line, see "Tips for Using
Command Line Arguments" on the next page.
How to Invoke the Controller from the Command Line
This task describes how to invoke the Controller from the command line and enter command line
arguments.
Prerequisite
Before invoking the Controller from the command line, you should be familiar with the rules relating to
command line arguments. For details, see "Tips for Using Command Line Arguments" on the next page.
User Guide
Controller
HP LoadRunner (12.50) Page 1257

Invoke the Controller from the command line and enter the desired command line
arguments
Type wlrun in the command line, followed by the desired arguments.
Note:
lThe arguments are case sensitive.
lEach argument should be preceded by a dash.
Example:
wlrun -TestPath C:\LoadRunner\scenario\Scenario.lrs -Run
Tips for Using Command Line Arguments
When you invoke the Controller from the command line, the following rules apply:
lIf the Controller is invoked with no arguments in the command line, the Controller uses its default
settings.
lThe Controller will always overwrite results.
lThe Controller will automatically terminate upon scenario termination and results will be collected. If
you don't want the Controller to automatically terminate upon scenario termination, add the flag -
DontClose to the command line.
lThe Controller launched through the command line behaves normally except when using the -Run
option. Using the -Run option, dialogs and message boxes that usually open and require the user to
close them in a usual launch, do not open in a command line launch.
lThe Controller's settings are loaded from wlrun5.ini, located in Windows folder.
Application Lifecycle Management Arguments
These arguments define the LoadRunner integration with Application Lifecycle Management. For more
information about the LoadRunner Application Lifecycle Management integration, see "Managing
Scenarios Using Application Lifecycle Management" on page1268.
ConnectToQC Specifies whether the Controller should connect to ALM on startup (0/1 or
ON/OFF)
QCServer Application Lifecycle Management server name. Must be a machine where
Application Lifecycle Management is installed
QCDB Application Lifecycle Management database name. Use the format:
User Guide
Controller
HP LoadRunner (12.50) Page 1258

<Domain name>.<Project name>.
UserName User name for connecting to Application Lifecycle Management
Password Password corresponding to the user name
TestPath Path to scenario in Application Lifecycle Management database. For example,
"[TD]\Subject\LoadRunner\Scenario1"
If path includes blank spaces, use quotation marks.
TestId Test ID (used by ALM only)
ResultCleanName For use with ResultCycle only. Example: "Res1"
ResultCycle Application Lifecycle Management cycle. For example, "LR_60_SP1_247"
Note: The ResultCycle and ResultCleanNamearguments are required if you wish
to store the results within the Application Lifecycle Management database.
Runtime Arguments
These arguments specify the runtime related scenario settings. For more information on scenario
settings, see "Before Running Your Scenario" on page1221.
TestPath Path to the scenario, for example,
C:\LoadRunner\scenario\Scenario.lrs
This argument can also be used for a scenario residing in an Application Lifecycle
Management database. For example,
"[TD]\Subject\LoadRunner\Scenario1"
If the path includes blank spaces, use quotation marks.
Run Runs the scenario, dumps all output messages into res_dir\output.txt, and
closes Controller
InvokeAnalysis Instructs LoadRunner to invoke Analysis upon scenario termination. If this
argument is not specified, LoadRunner uses the scenario default setting.
ResultName Full results path. For example, "C:\Temp\Res_01"
ResultCleanName Results name. For example, "Res_01"
ResultLocation Results folder. For example, "C:\Temp"
After the Scenario Run
User Guide
Controller
HP LoadRunner (12.50) Page 1259
Post Scenario Run Procedures - Overview
After the scenario runs you analyze the results using HP LoadRunner Analysis. If the run results are
stored locally on each participating load generator, they need to be gathered into one location so that
they can be processed for analysis. This process is known as data collation.
For details about collating run results and diagnostics data, see "Collating Run Data" below.
For details about analyzing the scenario run, see the HP LoadRunner Analysis User Guide.
Collating Run Data
When you run a scenario, by default all the run data is stored locally on each load generator. After
scenario execution, the results must be collated—that is, the results from all of the load generators
must be gathered and transferred to the results folder–before any analysis data can be generated.
In addition, data from the diagnostics servers must be collated as well.
You can set LoadRunner to collate the run data automatically, as soon as the run is complete.
Alternatively, you can collate the run data manually after the run. This way, you can save and close a
scenario and collate the data after reopening the scenario in the Controller.
The data that is collated include the result, diagnostics, and log files. After LoadRunner has successfully
collated the data, these files are deleted from the load generators from which they were gathered.
Note: In Expert mode, you can disable the collation of the log file collation (see "How to
Configure Scenario Options" on page1208).
For details on how to collate run data, see "How to Collate Scenario Run Results" below.
How to Collate Scenario Run Results
This task describes how to collate results after a scenario run.
Note:
lData collation includes result, diagnostics, and log files. If you are working in Expert mode,
you can disable the collation of the log files. Before collating the results, select Tools >
Options > General tab > Do not collate log files.
lYou can set a command to run when collation is complete. Select Tools > Options >
Execution tab, and enter the command in the Post Collate Command box.
User Guide
Controller
HP LoadRunner (12.50) Page 1260
Collate results automatically
Select Results >AutoCollate Results.
Collate results manually
Select Results >Collate Results> CollateResults.
Stop the collation process
In the Collate Results dialog box, click Stop.
Resume the collation process
If you stopped the collation process, to resume select Results> Collate Results >
Continuestopped collation.
If collation fails due to a lack of disk space
To re-collate, select Results> Collate Results > Recollate. LoadRunner attempts to collate the results
again, without compressing the .eve file.
Results Folder File Structure
Before you run a scenario, you specify where the run results should be stored. LoadRunner saves all the
data it gathers during the run to the specified folder. A typical results folder has the following structure:
User Guide
Controller
HP LoadRunner (12.50) Page 1261
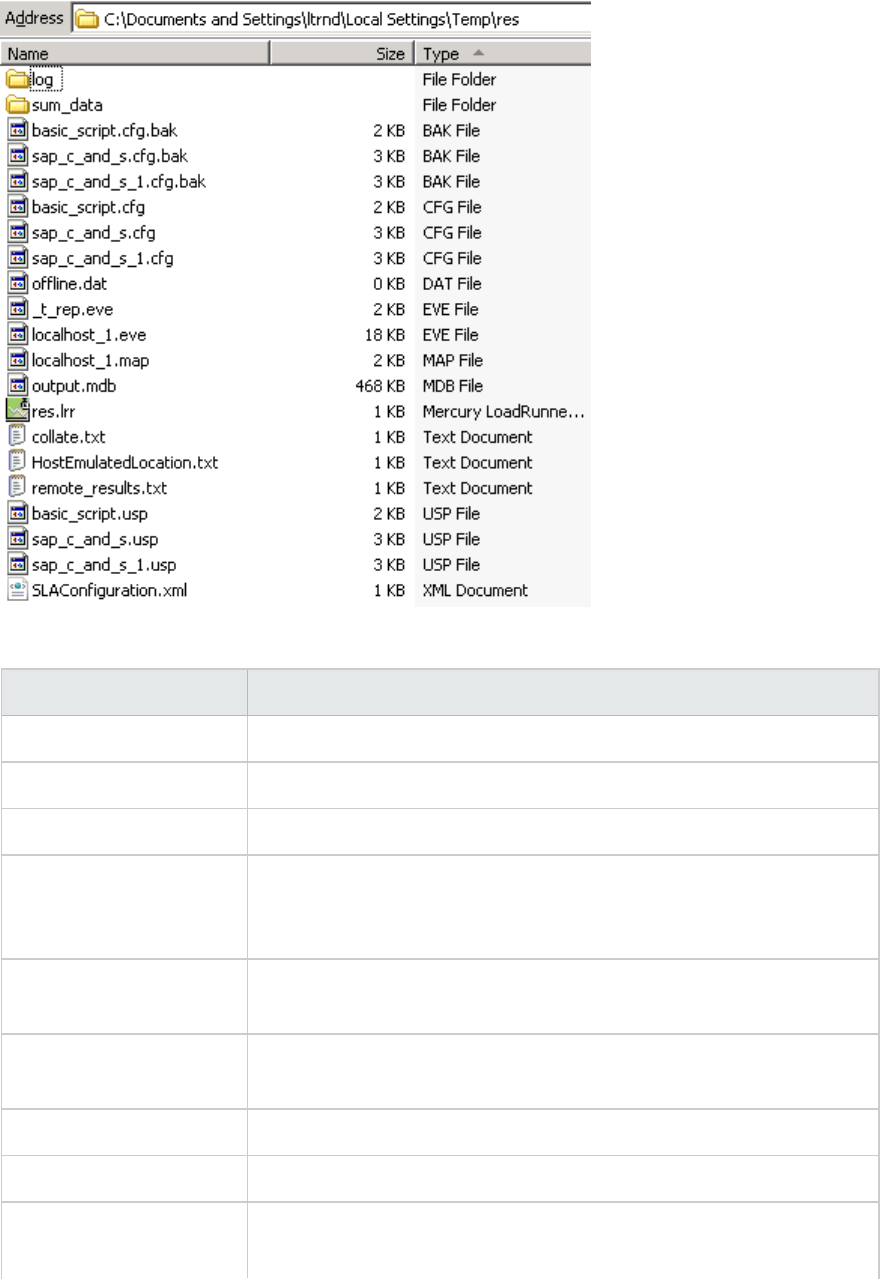
The content of the results folder are described in the following table:
Folder/File Description
log folder Output information generated during replay for each Vuser
sum_data folder Graph summary data (.dat) files.
*_bd directories Diagnostics breakdown information.
*.cfg files A listing of the script's runtime settings as defined in VuGen (think time,
iterations, log, Web, and so on). The results folder contains a .cfg file for
each script.
*.def files Definition files for graphs that describe the online and other custom
monitors.
*.usp files Contain the script's run logic, including how the actions sections run. The
results folder contains a .usp file for each script.
_t_rep.eve Contains Vuser and rendezvous information.
<Controller>.eve Contains information from the Controller host.
<Load_
Generator>.eve.gzl files
Information from the load generators in the scenario. These files are
zipped and saved to the results folder in .gzl format.
User Guide
Controller
HP LoadRunner (12.50) Page 1262
<Load_Generator>.map Maps transactions and data points on the load generator to IDs.
<results_name> folder The scenario run results.
<results_name>.lrr Information about the scenario run, such as the name, duration, scripts
included, and so on.
collate.txt The file paths of the result files and collation status information.
collateLog.txt The status (succeeded, failed) of result, diagnostics, and log file
collation from each load generator.
HostEmulatedLocation.txt Information about network virtualization such as the locations and
mode (per group or load generator).
offline.dat Sample monitor information.
output.mdb The database created by the Controller. Stores all the output messages
reported during the scenario run.
remote_results.txt The file paths for the host event files
SLAConfiguration.xml SLA definition information for the scenario.
When you generate analysis graphs and reports, the Analysis engine copies all of the scenario result
files (.eve and .lrr) to a database. After the database is created, Analysis works directly with the
database and does not use the result files.
Collate Results Dialog Box
This dialog box enables you to view the progress of result collation after a scenario run.
To
access
lResults>Collate Results >Collate Results
lIf Auto Collate Results is activated, this dialog box opens automatically when
LoadRunner starts collating the run results after a scenario run.
Relevant
tasks
l"How to Collate Scenario Run Results" on page1260
l"How to Prepare a Scenario to Run" on page1221
User interface elements are described below:
UI Element Description
Stops collating the results.
Close
automatically
Select to automatically close the Collate Results dialog box after collation is
completed.
User Guide
Controller
HP LoadRunner (12.50) Page 1263

General
Status
The collation status and file size of the Event, Diagnostics, and Log files.
Note: File size shown is before compression.
Progress
Details
The status (succeeded, failed) of result, diagnostics, and log file collation from each
load generator. This information is stored in the collateLog.txt file.
Using Unified Functional Testing Tests in LoadRunner
Using QuickTest or Unified Functional Testing Tests in
LoadRunner - Overview
HP Functional Testing software (QuickTest or Unified Functional Testing) enables you to create complex
tests that examine the full spectrum of your application's functionality.
LoadRunner can integrate QuickTest or Unified Functional Testing tests into a load testing scenario in
the form of GUI Vuser scripts. These tests, that have already been designed and debugged in QuickTest
or Unified Functional Testing can be used as the basis of your load test.
The main uses of running QuickTest or Unified Functional Testing tests in LoadRunner are:
lTo check how your application's functionality is affected by heavy load
lTo measure the response time that a typical user experiences on the client side while your
application is under load (end-to-end response time)
For example, you can add QuickTest or Unified Functional Testing tests to specific points in a
LoadRunner scenario to confirm that the application's functionality is not affected by the extra load at
those sensitive points.
Another advantage of using a GUI Vuser script as part of your LoadRunner scenario is that the GUI Vuser
script runs on your screen during the scenario, enabling you to watch the actual steps executed by the
Vuser in real time.
About GUI Vuser Scripts
GUI Vusers enable you to measure and monitor end-to-end user response times while your client/server
system is under load. A GUI Vuser emulates the complete environment of a human user.
For example, a human user sits at a machine, operates applications using the keyboard and the mouse,
and reads information on the machine's monitor. Similarly, a GUI Vuser runs on its own machine and
operates applications. A GUI Vuser can be programmed to read and act on information that appears on
its machine's display.
User Guide
Controller
HP LoadRunner (12.50) Page 1264

Suppose that you have a bank server that services many automatic teller machines (ATMs). You could
create a GUI Vuser script that:
lOpens the ATM application
lEnters an account number
lEnters the amount of cash to be withdrawn
lWithdraws cash from the account
lChecks the balance of the account
lCloses the ATM application
lRepeats the process
The actions of each GUI Vuser are described in a GUI Vuser script. You use QuickTest or Unified
Functional Testing to create GUI Vuser scripts.
You monitor and manage GUI Vusers using the LoadRunner Controller. For instance, you can use the
Controller to run, pause, or view Vusers, and to monitor scenario status.
Note: You cannot use VuGen to run a GUI Vuser script. You use the Controller to run a GUI Vuser
script as part of a scenario; you use QuickTest or Unified Functional Testing to run a GUI Vuser
script in standalone mode.
Understanding GUI Vuser Technology
GUI Vusers measure real end-to-end response times. End-to-end response times represent the total
time that a user waits for a response after submitting a request. End-to-end response times include
GUI response times as well as network and server response times.
User Guide
Controller
HP LoadRunner (12.50) Page 1265
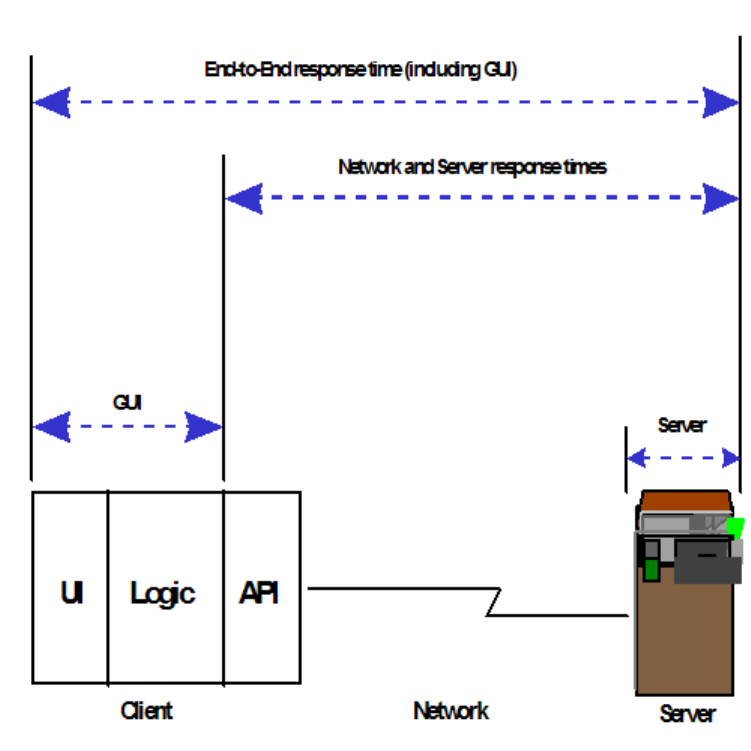
Guidelines for Using QuickTest or Unified Functional Testing
Tests in LoadRunner
When creating test scripts in QuickTest or Unified Functional Testing that are going to be used as GUI
Vuser scripts in a LoadRunner testing scenario, you need to follow certain guidelines to ensure smooth
integration of the script. For detailed explanations about creating tests in QuickTest or Unified
Functional Testing, see the QuickTest or Unified Functional Testing documentation.
Limitations
QuickTest or Unified Functional Testing offers several features that are designed specifically for
integration with LoadRunner. Some QuickTest or Unified Functional Testing features, however, may not
be available when they are integrated with LoadRunner. For more information about specific limitations,
see the QuickTest or Unified Functional Testing readme.
User Guide
Controller
HP LoadRunner (12.50) Page 1266

Including Transactions
To measure the performance of the server, you define transactions. A transaction represents an action
or a set of actions that you are interested in measuring. You define transactions within your Vuser
script by enclosing the appropriate sections of the script with start and end transaction statements.
For example, you can define a transaction that measures the time it takes for the server to process a
request to view the balance of an account and for the information to be displayed at the ATM.
Note: LoadRunner only provides performance information for data that is included within a
transaction. Therefore, your QuickTest or Unified Functional Testing test must include
transactions to be used by LoadRunner.
For more information about using transactions in QuickTest or Unified Functional Testing, see the
QuickTest or Unified Functional Testing documentation.
Adding Statements
You can use the Services object and its associated methods to insert statements that are specifically
relevant to performance testing. These include Abort,GetEnvironmentAttribute,LogMessage,
SetTransactionStatus,ThinkTime,UserDataPoint,StartTransaction and EndTransaction. For more
information on these methods, see the QuickTest or Unified Functional Testing documentation.
Designing Tests for LoadRunner
Consider the following design guidelines when designing tests for use with LoadRunner:
lThe QuickTest or Unified Functional Testing tests you use with LoadRunner should be simple tests,
designed to pinpoint specific operations.
lLoadRunner cannot run nested action iterations.
lDo not include references to external actions or other external resources, such as an external Data
Table file, environment variable file, shared object repositories, and so forth.
lInclude transactions in your QuickTest or Unified Functional Testing test since LoadRunner only
provides performance information for data that is included within a transaction.
How to Add a QuickTest or Unified Functional Testing Test to a
Load Test Scenario
This task describes how to integrate a QuickTest or Unified Functional Testing test into LoadRunner.
1. Navigate to the folder containing the test.
lFor a new scenario, click Browse in the New Scenario dialog box.
lWhen adding the test to an existing scenario, click Browse in the Add Group/Add Script dialog
box. The Open Test dialog box opens.
User Guide
Controller
HP LoadRunner (12.50) Page 1267

2. In the Files of Type box select QuickTest Tests or Unified Functional Testing Tests.
3. Navigate to the appropriate test and add it to your scenario.
Managing Scenarios Using Application Lifecycle
Management
Managing Scenarios Using Application Lifecycle Management -
Overview
The Controller works together with HPApplication Lifecycle Management (ALM), HP's Web-based test
management tool. HP ALM provides an efficient method for storing and retrieving Vuser scripts,
scenarios, and results. You can store scenarios in an ALM project and organize them into unique groups.
In order for the Controller to access an ALM project, you must connect it to the Web server on which HP
Application Lifecycle Management is installed. You can connect to either a local or remote Web server.
Note: Integration with ALM requires a full installation of ALM. It is not supported for the
Community and Express Editions of ALM.
For more information on working with Application Lifecycle Management, see the Application Lifecycle
Management User's Guide.
How to Work with Scenarios in ALM Projects
The following steps describe the workflow of how to work with scenarios saved in an Application
Lifecycle Management project.
1. Connect to ALM
Open a connection to the ALM server and project that contains the scenario. For task details, see
"How to Connect to ALM" on the next page.
2. Open the scenario
Select File > Open. The Open Scenario from HP ALM Project dialog box opens. Select the name and
location of the scenario to open.
3. Save the scenario
Select File > Save as. If the scenario is in a project that uses version control and is not checked
out, the scenario is only saved as a temporary file on your local machine.
User Guide
Controller
HP LoadRunner (12.50) Page 1268

How to Connect to ALM
To store and retrieve scenarios from ALM, you need to connect to an ALM project. You can connect or
disconnect from an ALM project at any time during the testing process.
You can connect to one version of HP ALM from Controller and a different version from your browser.
For more information, see the Important Information section in " HP ALM Connection Dialog Box
[Controller]" on the next page.
Connect to Application Lifecycle Management
1. Select Tools > HP ALM Connection. The HP ALM Connection dialog box opens.
2. Enter the required information in the HP ALM Connection dialog box, as described in " HP ALM
Connection Dialog Box [Controller]" on the next page.
3. To disconnect from ALM, click Disconnect.
Note: If you authenticated through CAC mode and disconnected from the ALM server, you need
to restart the Controller before reconnecting in CAC mode.
How to Save Scenarios to ALM Projects
The following steps describe how to save a scenario to an ALM project.
1. Open/create the scenario
Create or open the desired scenario.
2. Connect to HP Application Lifecycle Management
Open a connection to the ALM server and project in which you want to store the scenario. For task
details, see "How to Connect to ALM" above.
3. Define a test set
Define an Application Lifecycle Management test set where to save results as follows:
a. Select Results > Results Settings. The Set Results Directory dialog box opens.
b. Click HP ALM.
c. Enter the required information in the Set Results Directory dialog box. For user interface
details, see "Set Results Directory Dialog Box" on page1225.
d. Click OK.
4. Save the scenario to ALM
Select File > Save as and specify the location.
User Guide
Controller
HP LoadRunner (12.50) Page 1269

How to Add Vuser Scripts from an Application Lifecycle
Management Project
The following steps describe how to add Vuser scripts from an Application Lifecycle Management
project to the Controller's script list. You can add the script to either a manual or a goal-oriented
scenario.
1. Add a Vuser script to a manual scenario
a. Open a connection to the ALM server and project where the scripts are located. For task
details, see "How to Connect to ALM" on the previous page.
b. In the Scenario Groups pane, click the Add Group button .
c. In the Add Group dialog box, click Browse. The Open Test from HP ALM Project dialog box
opens.
d. Select the script and click OK. The Script Path field displays [TD], the full subject path, and the
script name.
For example:
[TD]\Subject\System\test_alm
e. Click OK. The script is displayed in the Scenario Groups pane.
2. Add a Vuser script to a goal-oriented scenario
a. Open a connection to the ALM server and project where the scripts are located. For task
details, see "How to Connect to ALM" on the previous page.
b. On the Scenario Scripts pane toolbar, click the Add Script button. The Add Script dialog
box opens. For details, see "Add Script Dialog Box" on page1088.
c. Click Browse. The Open Test from HP ALM Project dialog box opens and displays the test plan
tree.
d. Select the script and click OK. The Script Path field displays [TD], the full subject path, and the
script name.
For example:
[TD]\Subject\System\test_alm
e. Click OK to close the Add Script dialog box. The script appears in the Script Path column in the
Scenario Scripts pane.
HP ALM Connection Dialog Box [Controller]
This dialog box enables you to connect to an ALM project from within the Controller.
User Guide
Controller
HP LoadRunner (12.50) Page 1270
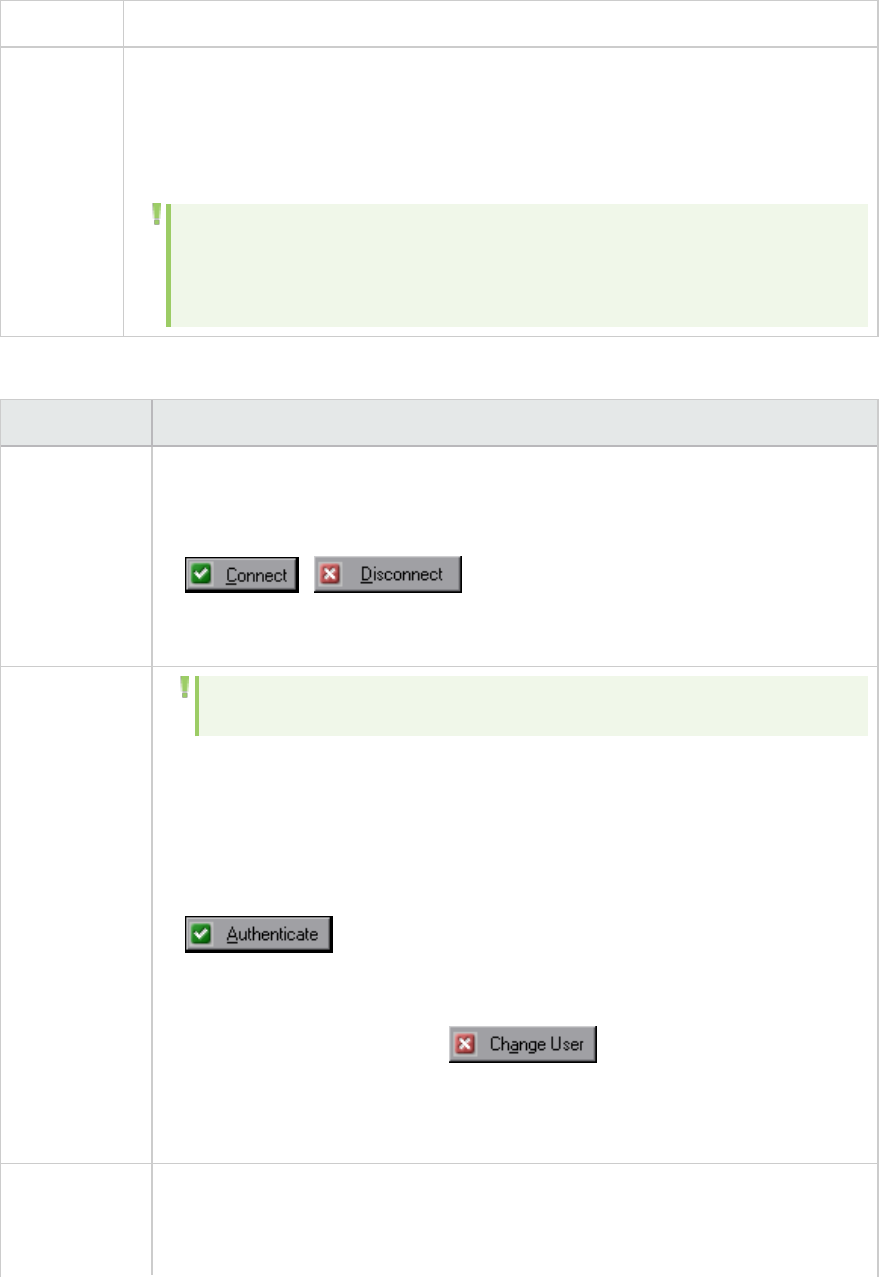
To access Tools > HP ALM Connection
Important
information
You can connect to one version of HP ALM from Controller and a different version of HP
ALM from your browser.
You can only connect to different versions of HP ALM if one of the versions is HP ALM
11.00 or higher.
Note: Before you connect to results stored on ALM through this dialog box, it is
recommended that you first connect to the HP ALM server through your
browser.This automatically downloads the ALM client files to your computer.
User interface elements are described below:
UI Element Description
Step 1:
Connect to
Server
lServer URL. The URL of the server on which ALM is installed.
lReconnect to server on startup. Automatically reconnect to the server every
time you start the Controller.
l/ . Connects to the server specified in the Server
URL box. Only one button is visible at a time, depending on your connection
status.
Step 2:
Authenticate
User
Information
Note: Step 2 is only visible after you successfully connect to a server.
lUser Name. Your ALM user name.
lPassword. Your ALM password.
lAuthenticate on startup. Authenticates your user information automatically,
the next time you open the application. This option is available only if you
selected Reconnect to server on startup above.
l.Authenticates your user information against the ALM server.
After your user information has been authenticated, the fields in the
Authenticate user information area are displayed in read-only format. The
Authenticate button changes to .
You can log in to the same ALM server using a different user name by clicking
Change User, entering a new user name and password, and then clicking
Authenticate again.
Step 3: Login
to Project
lDomain. The domain that contains the ALM project. Only those domains
containing projects to which you have permission to connect to are displayed.
lProject. Enter the ALM project name or select a project from the list. Only those
User Guide
Controller
HP LoadRunner (12.50) Page 1271
UI Element Description
projects that you have permission to connect to are displayed.
lLogin to project on startup. This option is enabled only when the Authenticate
on startup check box is selected.
l/ . Logs into and out of the ALM project.
, continued
Continuous Integration with Jenkins
As more software companies utilize continuous integration practices, you may also need to integrate
load tests into your testing process. This integration helps developers insure that new builds did not
introduce regressions.
The HP Application Automation Tools plugin for the Jenkins continuous integration server provides a
mechanism for executing LoadRunner Controller scenarios as part of a build script. This plugin allows
you to trigger an HP test as a build step and present the results in the Jenkin's user interface.
You can only integrate scenarios which have service level agreements (SLAs). This allows you to quickly
determine whether the test passed or failed and if performance was affected.
To begin the integration, you must first install the The HP Application Automation Tools plugin. For
information about installing plugins, refer to the Jenkins documentation.
Click https://wiki.jenkins-ci.org/display/JENKINS/HP+Application+Automation+Tools to open the HP
Application Automation Tools plugin page.
For a blog post describing load testing with continuous integration, click here.
Note: The Jenkins plugin requires an administrator account.
Working with Firewalls in LoadRunner
If you need to monitor servers that sit on the other side of a firewall, you need to set up your system
properly, including installing and configure a dedicated Monitor-Over-Firewall machine, configure the
LoadRunner agent to communicate with the MI Listener (which serves as a router between the
LoadRunner agent and the Controller), and then define the server measurements that you want the
Monitor-Over-Firewall machine to monitor.
To ensure a secure environment, you must also set up client-server authentication. LoadRunner
provides a security solution based on an industry standard SSL/TLS library (OpenSSL), which includes
both data encryption and authentication. Using this authentication method helps to protect your data
User Guide
Controller
HP LoadRunner (12.50) Page 1272

from being exposed to third-parties, and to prevent your LoadRunner components from being used by
unauthenticated users.
What do you want to do?
lDeploy LoadRunner over a firewall
lConfigure the LoadRunner Agent
lUse a digital certificate with a firewall
lSet up client-server authentication
See also
lNetwork and Security Manager utility
lTroubleshooting for firewalls
How to Set Up Your LoadRunner System Over Firewalls
The MI Listener and Monitor over Firewall setup files are provided in the DVD/Additional Components
folder.
Setting up your system to work with firewalls involves the following stages of configuration:
1. Install the Over-Firewall Components
To enable over firewall communication, ensure that you have installed the following LoadRunner
components:
lMI Listener. Serves as a router between the Controller and the LoadRunner agent. You install
the MI Listener component on a dedicated machine. To access the setup file, see "Additional
Components" on page1769.
Note: You can also use the Controller machine as the MI Listener without the need for a
separate installation. When acting as the MI Listener, the Controller machine cannot have
Vusers running on it. In this case, the Controller must be a pure Controller and not a
Controller + Load Generator.
lMonitor Over Firewall component. Used to monitor the servers that are located over a
firewall. You install the Monitors over Firewall component on a dedicated machine. To access
the setup file, see "Additional Components" on page1769.
2. Perform the Initial Configuration of the Over-Firewall system
See "How to Set Up an Over-Firewall Deployment" on the next page.
3. Configure the LoadRunner Agent
User Guide
Controller
HP LoadRunner (12.50) Page 1273
Configure the LoadRunner agent on the monitor-over-firewall machine as well as on each load
generator machine that will be running over the firewall, to communicate with the MI Listener
See "How to Configure the LoadRunner Agent" on page1277.
4. Connect the Controller to the Load Generator and MIListener machines
Configure the Controller to recognize the Load Generator and MIListener machines and then verify
the connection between the machines.
See "How to Create and Verify the Connection Between Controller and Agent Machines" on
page1279.
5. Define What to Monitor on Your Servers
Choose the server measurements that you want your Monitor Over Firewall machine to monitor.
See "How to Set Firewall Monitoring Preferences" on page1279.
6. Check Connectivity
After installing and configuring all the necessary components, check that you are able to establish
a connection between the LoadRunner agent, MI Listener, and the Controller machine. If you have
difficulties, see "Troubleshooting and Limitations for Firewalls" on page1391.
How to Set Up an Over-Firewall Deployment
This task describes how to configure the Over-Firewall System.
1. Prerequisites
Make sure you have installed the necessary components as described in the first step of "How to
Set Up Your LoadRunner System Over Firewalls" on the previous page.
2. Set Up Your Deployment (TCP or HTTPS)
To run Vusers or monitor servers over the firewall, configure your system according to one of the
following configurations. Note that these configurations contain a firewall on each LAN. There may
also be configurations where there is a firewall for the Over-Firewall LAN only.
lTCP Configuration
The TCP configuration requires every LoadRunner agent machine behind the customer's firewall
to be allowed to open a port in the firewall for outgoing communication.
User Guide
Controller
HP LoadRunner (12.50) Page 1274
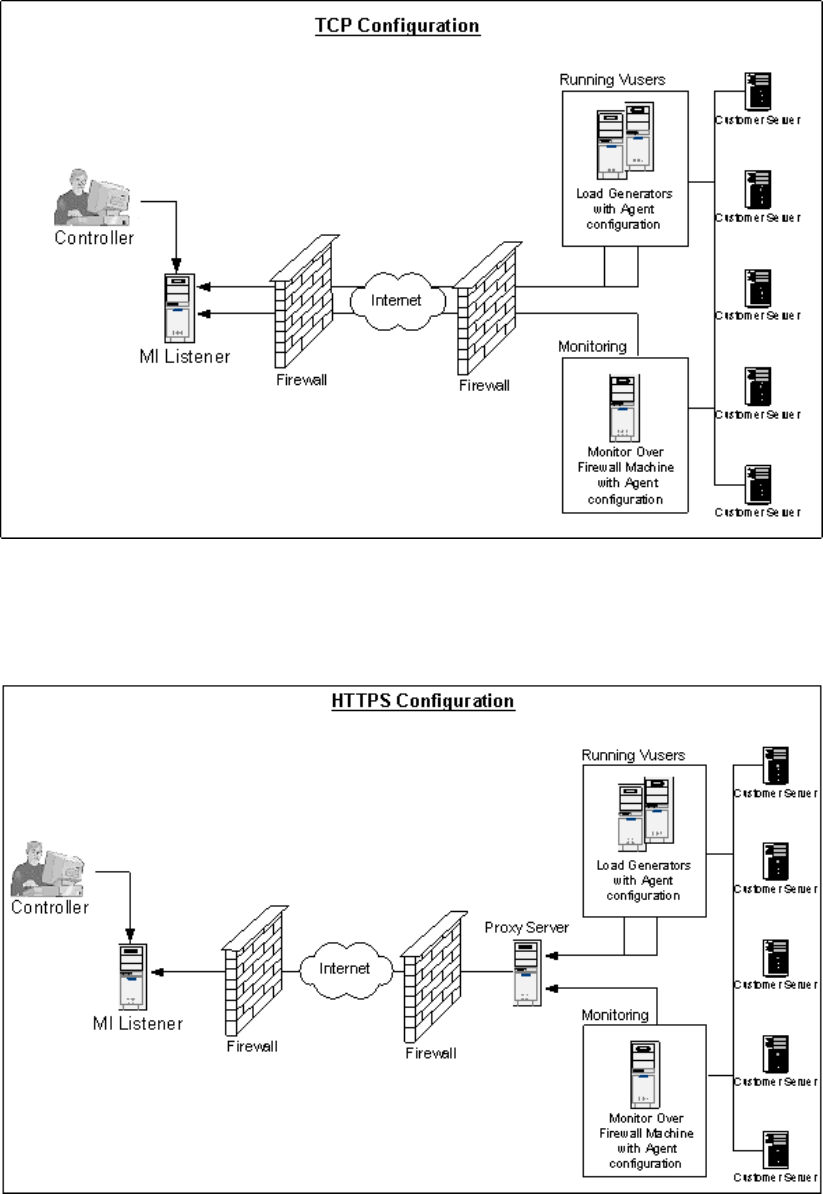
lHTTPS Configuration
In the HTTPS configuration, only one machine (the proxy server) is allowed to open a port in the
firewall. Therefore, it is necessary to tunnel all outgoing communications through the proxy
server.
User Guide
Controller
HP LoadRunner (12.50) Page 1275
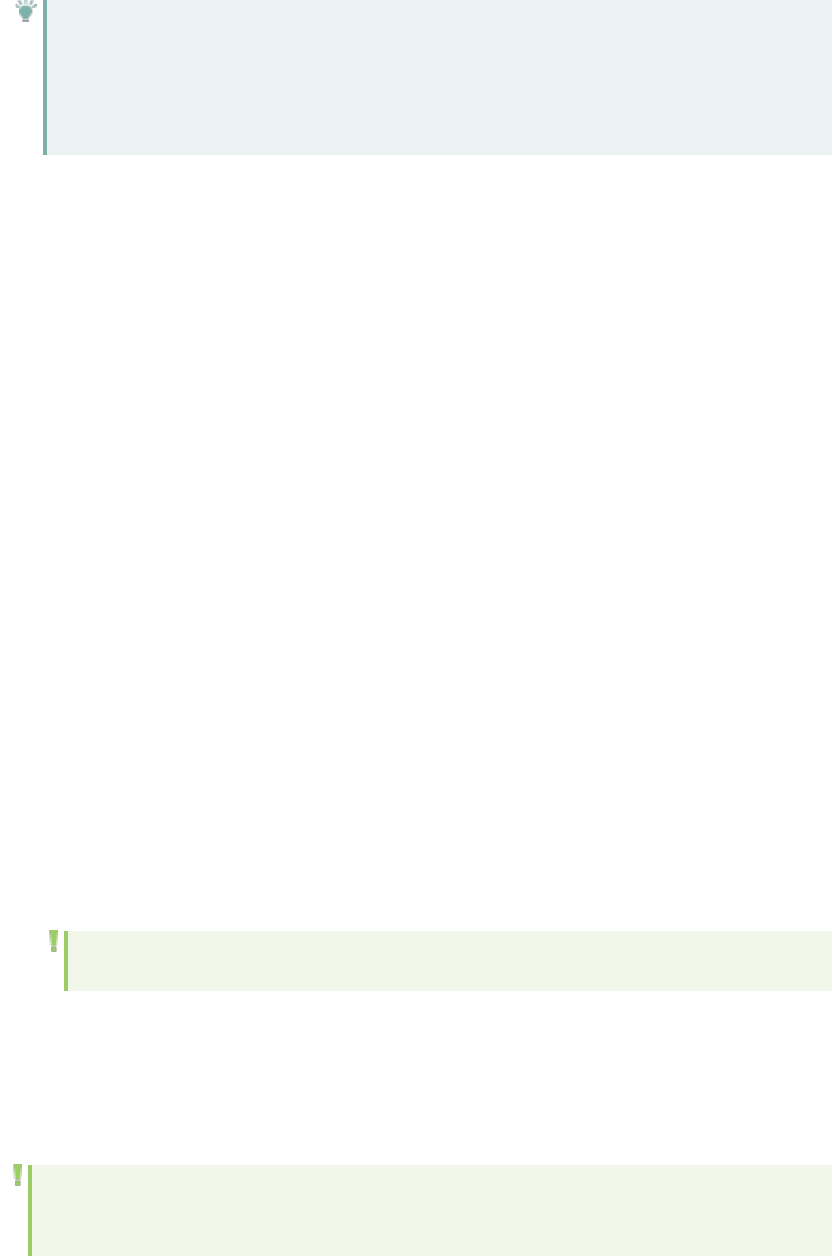
Tip: The LoadRunner standalone Load Generator (LG SA) and standalone Monitor over
Firewall (MOFW SA) cannot be installed on the same machine. However, LG SA can be used
for monitoring purposes, the same way as the MOFW SA. A single machine cannot be used
simultaneously for both running Vusers and monitoring.
3. Configure the Firewall to Allow Agent Access
Modify your firewall settings to enable communication between the machines inside the firewall
and machines outside the firewall.
a. If your system has a TCP configuration:
The LoadRunner agent attempts to establish a connection with the MI Listener using port 443,
at intervals specified in the Connection Timeout field in the Agent Configuration dialog box. To
enable this connection, allow an outgoing connection for HTTPS service on the firewall for port
443. The agent can then connect to the MI Listener, and the MI Listener can connect back to
the agent. From this point on, the agent listens to commands from the MI Listener.
b. If your system has an HTTPS configuration:
The LoadRunner agent attempts to establish a connection with the MI Listener, using the proxy
port specified in the Proxy Port field, and at intervals specified in the Connection Timeout field
in the Agent Configuration dialog box. When the connection is established, the proxy server
connects to the MI Listener. To enable this connection, allow an outgoing connection for HTTPS
service on the firewall for port 443. The proxy server can then connect to the MI Listener, and
the MI Listener can connect back to the agent through the proxy server. From this point on, the
agent listens to commands from the MI Listener.
c. If you intend to start the LR Agent service from the Local System account, you need to
grant it permissions:
i. Add a local user on the AUT machine with the same name and password as the local user
on Agent machine.
ii. Add the AUT local user to the Performance Monitor Users group
iii. Restart the Agent process.
Note: If you do not provide permissions, the monitor graph will not display any data.
4. Configure the MI Listener
To enable running Vusers or monitoring over a firewall, you need to install the MI Listener on one or
more machines in the same LAN as the Controller outside the firewall. For installation instructions,
see "Additional Components" on page1769.
Note:
lThe Controller installation automatically includes the MI Listener, so you can designate
User Guide
Controller
HP LoadRunner (12.50) Page 1276
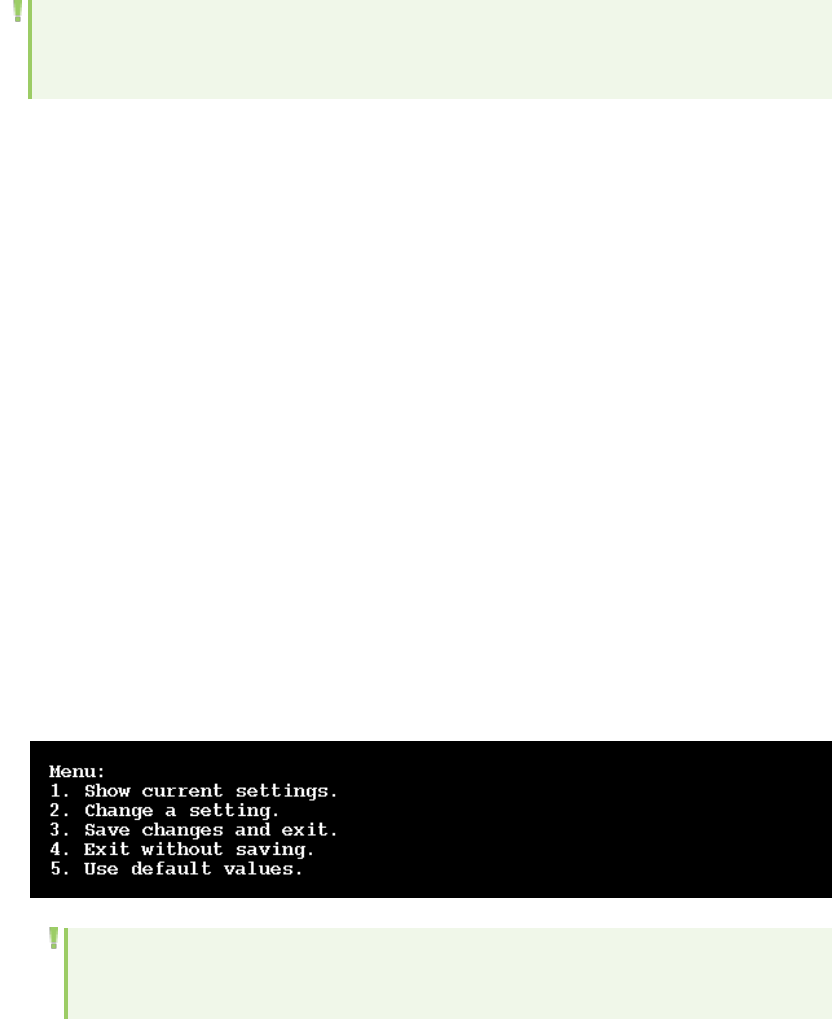
the Controller as the MI Listener machine.
lThe MI Listener can be installed only on Windows machines.
For information on how to configure the MI Listener, see "MI Listener Configuration Dialog Box" on
page1280.
How to Configure the LoadRunner Agent
On each load generator machine that will be running over a firewall and on each Monitor-Over-Firewall
machine, you configure the LoadRunner agent to communicate with the MI Listener. The MI Listener
serves as a router between the LoadRunner agent and the Controller.
1. Configure the Windows LoadRunner Agent
a. Stop the LoadRunner agent by right-clicking its icon in the system tray and selecting Close,
and then setting the options in the Agent Configuration dialog box as described in "Agent
Configuration Dialog Box" on page1283.
b. Restart the LoadRunner agent by double-clicking the shortcut on the desktop.
2. Configure and Run the Linux LoadRunner Agent
a. Open <LoadRunner root folder>/dat/br_lnch_server.cfg in a text editor.
b. In the Firewall section, set FireWallServiceActive to 1and save your changes.
c. Run agent_config from the <LoadRunner root folder>/bin folder to display the following
menu:
Note: If agent_config does not display the menu shown above, see "Troubleshooting
and Limitations for Firewalls" on page1391 for a possible solution.
d. Enter 1to display the current settings:
User Guide
Controller
HP LoadRunner (12.50) Page 1277
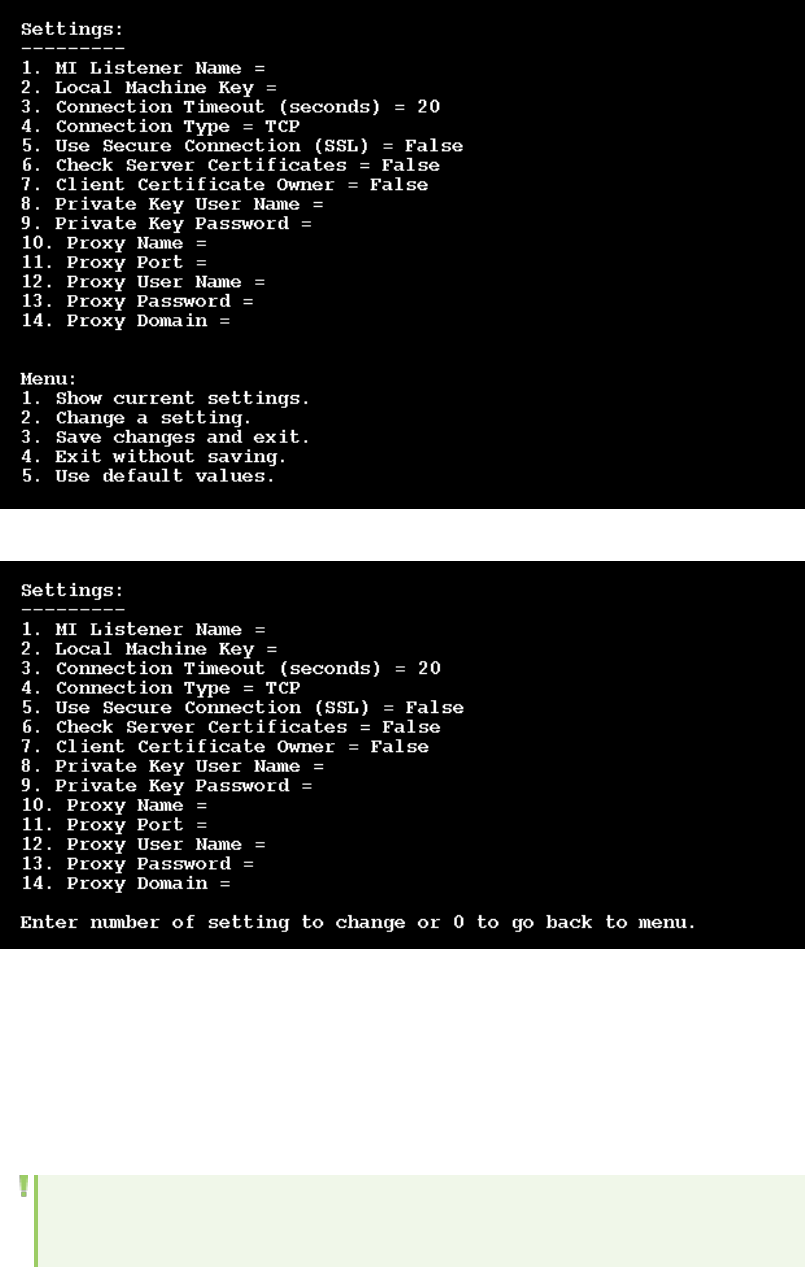
e. To change a setting, enter 2to display the settings menu:
Enter the setting and continue according to the menu instructions. Set each option according
to the "Agent Configuration Settings Dialog Box" on page1285.
3. Restart the LoadRunner Agent
a. To remove (turn off)the LoadRunner agent, run the command m_daemon_setup -remove
from the <LoadRunner root folder>/bin folder.
Note: When the LoadRunner agent is configured to run over a firewall, and the agent is
connected to the MI Listener, a file called <local_machine_key>_connected_to_MI_
User Guide
Controller
HP LoadRunner (12.50) Page 1278

Listener is created in the temporary folder of the LoadRunner agent machine. The
file is removed when the LoadRunner agent disconnects from the MI Listener.
b. To start the LoadRunner agent, run the command m_daemon_setup -install from the
<LoadRunner root folder>/bin folder.
How to Create and Verify the Connection Between Controller and
Agent Machines
This task describes how to set up your system to monitor the servers over a firewall.
1. Configure the Controller for Running Over a Firewall
To run or monitor Vusers over a firewall, you need to create a unique connection between the
Controller and the agent machines. Agent machines include load generator machines that will be
running over a firewall and all Monitor-Over-Firewall machines.
This connection is made through the MIListener, which serves as a router between the Controller
and the LoadRunner agent. To establish this connection, you configure the Controller machine to
define the agent machine as a load generator.
To configure the Controller for running Vusers or monitoring over the firewall:
a. Define the load generator settings in the Load Generators dialog box. For the server name, be
sure to use the same Local Machine Key setting as in the Agent Configuration. For Details, see
the "Load Generators Dialog Box" on page1144.
b. Define the settings in the "MI Listener Configuration Dialog Box" on the next page, using the
same MI Listener name as in the Agent Configuration.
Note: You cannot change the temporary folder on the host running or monitoring Vusers
over the firewall.
2. Enable and Confirm your Connection
After you have configured the LoadRunner Agent, the MI Listener and the Controller, select the
load generator in the Load Generators dialog box and click Connect.
A green or red light next to the LoadRunner agent in the system tray indicates a successful or
unsuccessful connection respectively.
How to Set Firewall Monitoring Preferences
After you have installed and configured the LoadRunner agent, the Monitors over Firewall component,
the MI Listener, and the Controller machine, you need to choose the server measurements that you
want the Monitor-Over-Firewall machine to monitor.
User Guide
Controller
HP LoadRunner (12.50) Page 1279
You configure the server monitor properties from the Monitor-Over-Firewall machine, using the
"Monitor Configuration Dialog Box" on the next page. You can select the type of monitors to run and the
server whose resources you want to monitor, add the measurements to monitor for each server, and
specify the frequency with which you want the monitored measurements to be reported.
The following steps describe how to configure monitors over a firewall:
1. Open the Monitor Configuration Dialog Box
On the LoadRunner machine, select Start > All Programs> HP Software > HP LoadRunner >
Advanced Settings > Monitor Configuration. For machines without the complete LoadRunner
installation, select Start > Programs > Server Monitor > Monitor Configuration .
2. Add Monitored Servers
a. To add servers, click the Add Server button . Type the name or IP address of the server
whose resources you want to monitor in the Monitored Server field.
Note: To add several servers simultaneously, separate the server names or IP ranges
with commas. For example: 255.255.255.0-255.255.255.5, server1, server2.
b. From the Available Monitors list, select the monitors appropriate for the server being
monitored.
Note: Data can only be viewed for the monitors that are enabled with your LoadRunner
license key. To preview your license key information, on the LoadRunner machine,
select Start>Programs>HP Software > HP LoadRunner > License > LoadRunner
License Utility. . In icon-based operating systems, such as Windows 8, search for
License Utility and run the LoadRunner License Utility program.
For certain monitors, LoadRunner displays default measurements in the Measurements to be
Monitored section. You can specify the frequency by which LoadRunner reports the
measurement in the Measurement Properties section. For details on selecting measurements,
see "How to Set Up a Monitoring Environment" on page1301.
3. (Optional) Clone a Monitored Server's Properties
If you want to monitor the same properties on different server machines, right-click the server you
want to clone, and select Clone. In the Monitored Server box, type the name or IP address of the
clone server you want to create.
MI Listener Configuration Dialog Box
This dialog box enables you to configure the MI Listener.
User Guide
Controller
HP LoadRunner (12.50) Page 1280
To access Do one of the following:
lSelect Start > All Programs> HP Software > HP LoadRunner > Advanced Settings
> MI Listener Configuration.
lRun <LoadRunner root folder>\launch_service\bin\MILsnConfig.exe.
Important
information
lBefore configuring the MI Listener:
lOpen incoming HTTPs service for port 443. The port settings are set by your
system administrator.
lStop the LoadRunner agent on the MI Listener machine by right-clicking it's icon in
the system tray and selecting Close from the popup menu.
lAfter configuring the MI Listener:
lRestart the LoadRunner agent by double-clicking the shortcut on the LoadRunner
machine's desktop, or by selecting Start > All Programs> HP Software > HP
LoadRunner > Advanced Settings > Agent Service.
lMake sure that no Web Servers are running on the MI Listener or Monitor-Over-
Firewall machine. These servers use port 443 and will not allow the access required
by the listening and monitoring processes.
Relevant
tasks
"How to Set Up an Over-Firewall Deployment" on page1274
User interface elements are described below:
UI Element Description
Check Client
Certificates
Select True to request that the client send an SSL certificate when connecting, and
to authenticate the certificate. Default value is False.
Private Key
Password
The password that may be required during the SSL certificate authentication
process. There is no default value.
Monitor Configuration Dialog Box
This dialog box enables you to select the type of monitors to run and the server whose resources you
want to monitor, add the measurements to monitor for each server, and specify the frequency with
which you want the monitored measurements to be reported.
User Guide
Controller
HP LoadRunner (12.50) Page 1281
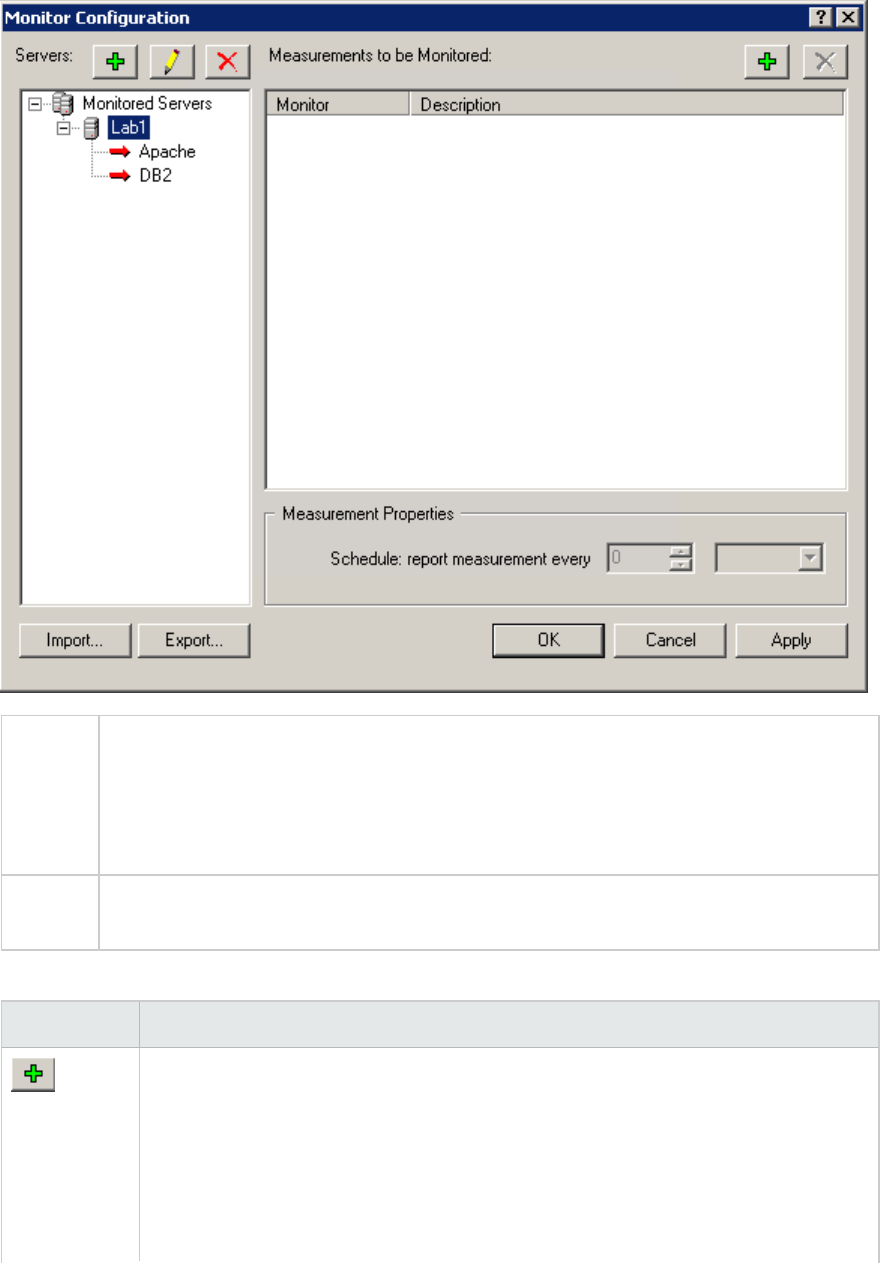
To
access
Start > All Programs > HP Software > HP LoadRunner > Advanced Settings > Monitor
Configuration. In icon-based operating systems, such as Windows 8, search for Monitor
Configuration .
For machines without the complete LoadRunner installation, select Start > All
Programs > Server Monitor > Monitor Configuration.
Relevant
tasks
"How to Set Firewall Monitoring Preferences" on page1279
User interface elements are described below:
UI Element Description
Adds a server (left pane) or measurement (right pane) to the monitored server list.
Type the name or IP address of the server whose resources you want to monitor in
the Monitored Server field.
From the Available Monitors list, select the monitors appropriate for the server
being monitored.
User Guide
Controller
HP LoadRunner (12.50) Page 1282
Note: Data can only be viewed for the monitors that are enabled with your
LoadRunner license key. To preview your license key information, on the
LoadRunner machine, select Start>Programs>LoadRunner. HP
LoadRunner opens. Click the License button to display the LoadRunner
license information.
Tip:
lTo add several servers simultaneously, separate the server names or IP
ranges with commas. For example: 255.255.255.0-255.255.255.5,
server1, server2.
lIf you want to monitor the same properties on different server machines,
right-click the server you want to clone, and select Clone. In the Monitored
Server box, type the name or IP address of the clone server you want to
create.
Removes a server or measurement.
Opens the Monitored Server Properties dialog box, allowing you to modify the
settings.
Measurement
Properties
pane
Allows you to set a measurement schedule for each measurement to be reported.
Select the configured server measurement you want to schedule and specify the
frequency at which you want LoadRunner to report the measurement. Click Apply to
save your settings.
Import /
Export
Imports or exports the monitor configuration details, including the server and their
measurements, to/from an XML file.
Agent Configuration Dialog Box
This dialog box enables you to enable and configure the LoadRunner agent on Windows machines.
To access Do one of the following on the LoadRunner machine:
lSelect Start > All Programs> HP Software > HP LoadRunner > Advanced Settings
> Agent Configuration.
lRun <LoadRunner root>\launch_service\bin\AgentConfig.exe.
Important lThe Agent icon does not appear in Windows 2008 when the HP Load Testing Agent
User Guide
Controller
HP LoadRunner (12.50) Page 1283

information Service is launched.
lWhen LoadRunner Agent runs as service (magentservice.exe), files that are stored
on remote network drives or referred to by UNC path cannot be accessed (script,
parameter file, etc.). If you want to access files this way, run the LoadRunner Agent
as process (magentproc.exe).
Workaround: To access network share, configure the HP Load Testing Agent Service
to run with an account that has network access permissions.
lWhen running the LoadRunner Agent as a service (magentservice.exe), and the
Agent Configuration as administrator under UAC or a standard user: If you click the
OK button and attempt to restart the HP Load Testing Agent Service, it issues the
warning "Access is denied" .
Workaround:
a. Run the Agent Configuration as administrator when UAC is on.
b. If the current user is administrator, or a user having the appropriate permission
to work with HP Load Testing Agent Services, go to Service Manager
(services.msc), and manually start the LoadRunnerAgent service (and for
Performance Center, the RemoteManagementAgent service).
c. You can also run <LR>\bin\subinacl.exe as administrator to grant a user (user1
in examples below) full access permission of the target service. For example,
For LoadRunner: subinacl.exe /service LoadRunnerAgent /grant=user1
For Performance Center: subinacl.exe /service RemoteManagementAgent
/grant=user1
Relevant
tasks
"How to Configure the LoadRunner Agent" on page1277
See also "Agent Configuration Settings Dialog Box" on the next page
User interface elements are described below:
UI Element Description
Enable
Firewall Agent
Select if you are enabling or running Vusers over a firewall.
Opens the Agent Configuration Settings dialog box. This button is enabled only
when the Enable Firewall Agent check box is selected.
Enable
Terminal
Services
Select to enable distributing Vusers on a terminal server.
User Guide
Controller
HP LoadRunner (12.50) Page 1284
Agent Configuration Settings Dialog Box
This dialog box enables you to define the relevant settings in order to enable the LoadRunner agent on
Windows machines.
To access Perform the following steps on the LoadRunner machine:
1. Select Start > All Programs> HP Software > HP LoadRunner > Advanced
Settings > Agent Configuration.
2. Click Settings.
Relevant
tasks
"How to Configure the LoadRunner Agent" on page1277
Important
information
The Network and Security Manager configuration tool provides greater flexibility for
defining the agent settings through the command line. For details, see "Network and
Security Manager - Command Line Tool" on page1293.
User interface elements are described below:
UI Element Description
MI Listener
Name
The name, full name, or IP address of the MI Listener.
Local Machine
Key
A symbolic string identifier used to establish a unique connection between the
Controller host and the agent machine, via the MI Listener machine.
Connection
Timeout
(seconds)
The length of time you want the agent to wait before retrying to connect to the MI
Listener machine. If zero, the connection is kept open from the time the agent is
run.
Default value: 20 seconds
MI Listener
User Name
The user name needed to connect to the MI Listener machine.
MI Listener
Password
The password needed to connect to the MI Listener machine.
Server
Domain
The domain name needed to connect to the MI Listener machine. This field is
required only if NTLM is used.
Connection
Type -
TCP/HTTP
Select either TCP or HTTP, depending on the configuration you are using.
Default: TCP
Connection The name of the proxy server. This field is mandatory if the Connection Type setting
is HTTP.
User Guide
Controller
HP LoadRunner (12.50) Page 1285

UI Element Description
Type - HTTP
Proxy Name
Connection
Type - HTTP
Proxy Port
The proxy server connection port. This field is mandatory if the Connection Type
setting is HTTP.
Connection
Type - HTTP
Proxy User
Name
The user name of a user with connection rights to the proxy server.
Connection
Type - HTTP
Proxy
Password
The password of the user with connection rights to the proxy server.
Connection
Type - HTTP
Proxy Domain
The user's domain if defined in the proxy server configuration. This option is
required only if NTLM is used.
Use Secure
Connection
(SSL)
Enable to connect using the Secure Sockets Layer protocol.
Default: disabled
Use Secure
Connection
(SSL) - Check
Server
Certificates
Authenticates the SSL certificates that are sent by the server. Select Medium to
verify that the server certificate is signed by a trusted Certification Authority. Select
High to verify that the sender IP matches the certificate information. This setting is
available only if Use Secure Connection is enabled.
Use Secure
Connection
(SSL) - Private
Key Password
The password that might be required during the SSL certificate authentication
process. This option is relevant only if the Client Certificate Owner option is
enabled.
Using Digital Certificates with Firewalls
When you configure your LoadRunner system to use SSLauthentication, the client initiates an SSL
request to negotiate the cipher suite, then the server responds by sending its own certificate and an
optional request to validate the client certificate. Finally, the client sends the encrypted shared key, and
its certificate if requested. All subsequent messages are encrypted using the shared key, and
authentication is completed by verifying the certificate on the other side.
User Guide
Controller
HP LoadRunner (12.50) Page 1286
For details of possible client-server configuration setups, see "Client-Server Authentication
Configurations" below.
A digital certificate is issued by a Certification Authority (CA). It contains the IP address of the machine
for which it is issued, a validation date, and the digital signature of the certificate-issuing authority.
Certificates created by LoadRunner utilities have following attributes:
lSignature hash algorithm: sha256
lEncryption algorithm: RSA (2048 Bits)
You can also use an existing CAcertificate from your own organization as long as it complies with the
following:
lbase64 encoded DER certificate (*.pem)
lenclosed between -----BEGIN CERTIFICATE----- and -----END CERTIFICATE-----.
When the MI Listener sends its Public Key to the LoadRunner agent, it always sends its certificate as well
(this is the server-side certificate). The LoadRunner agent can also be configured to authenticate the
certificate it received. If the agent is configured to authenticate the certificate, it can verify whether
the sender is really the machine that it claims to be by:
lComparing the certificate's IP address with the sender's IP address
lChecking the validation date
lLooking for the digital signature in its Certification Authorities list
The MI Listener may also require the LoadRunner agent to send a certificate at any point in the session.
This is called the client-side certificate. You can set this option in the "MI Listener Configuration Dialog
Box". If the LoadRunner agent owns a certificate, it sends it to the MI Listener for the same
authentication process. If the LoadRunner agent does not own a certificate, the communication might
not be continued.
LoadRunner provides a default SSLCAand SSLcertificate for all LoadRunner components. It is located in
the <LoadRunner installation>\dat\cert folder. However, for a more secure process, create your own
Certificate Authority, include it in the list, and issue matching certificates for your machines.
When a Load Generator connection is SSLenabled, it is indicated by a special SSLicon in Controller.
Client-Server Authentication Configurations
You instruct LoadRunner to apply client-server authentication by setting -check_client_cert to 1, using
the "Network and Security Manager - Command Line Tool". This setting forces the client machines to
comply with the server certificates.
You must set this option on the machine acting as the server. For this reason, you need to determine
which machine is acting as the server.
The following images illustrate three possibilities:
lController--Load Generator Communication. In this environment, the load generator machine is the
server and the Controller is the client. You activate the authentication on the load generator, and this
User Guide
Controller
HP LoadRunner (12.50) Page 1287
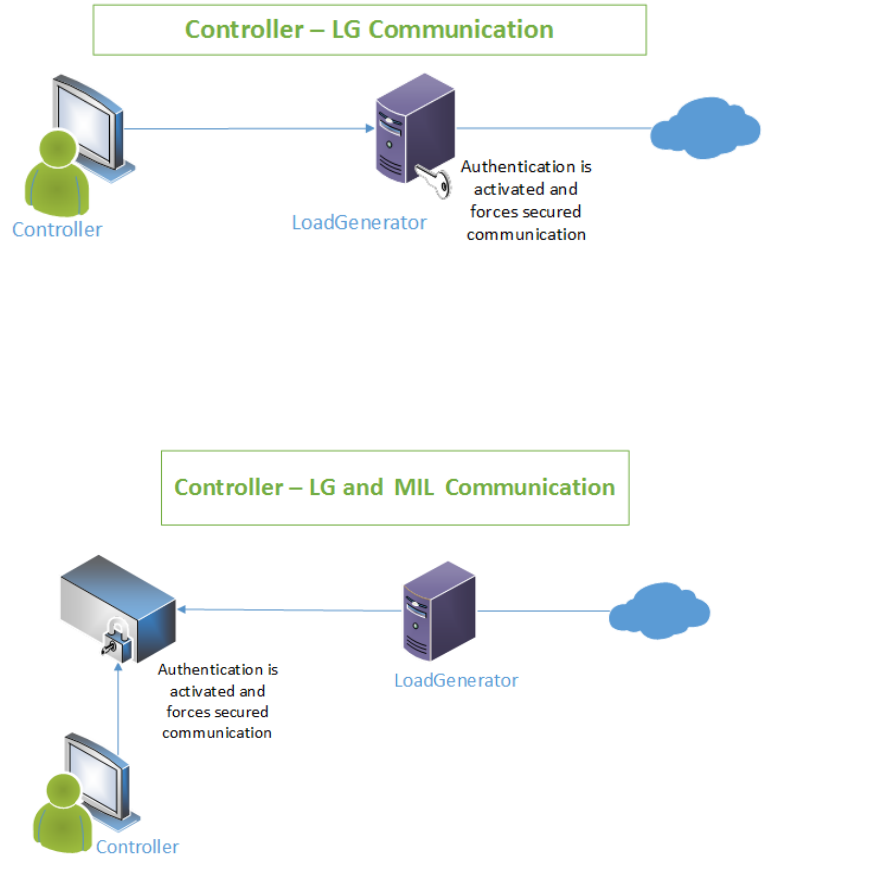
enforces the security between the machines.
lController--LoadGenerator--MIListener Communication. In this environment, the MI Listener
machine is the server and the Controller and load generators are the clients. You activate the
authentication on the MI Listener machine and this enforces the security facing the Controller and
load generators.
lController--MIListener--Load Generator--Monitor-Over-Firewall Communication. As in the
previous environment, in this layout the MI Listener machine is the server. The Monitor over Firewall,
Controller, and load generator machines are the clients. Once you activate authentication on the
server—the MI Listener, it enforces the security on the other machines.
User Guide
Controller
HP LoadRunner (12.50) Page 1288
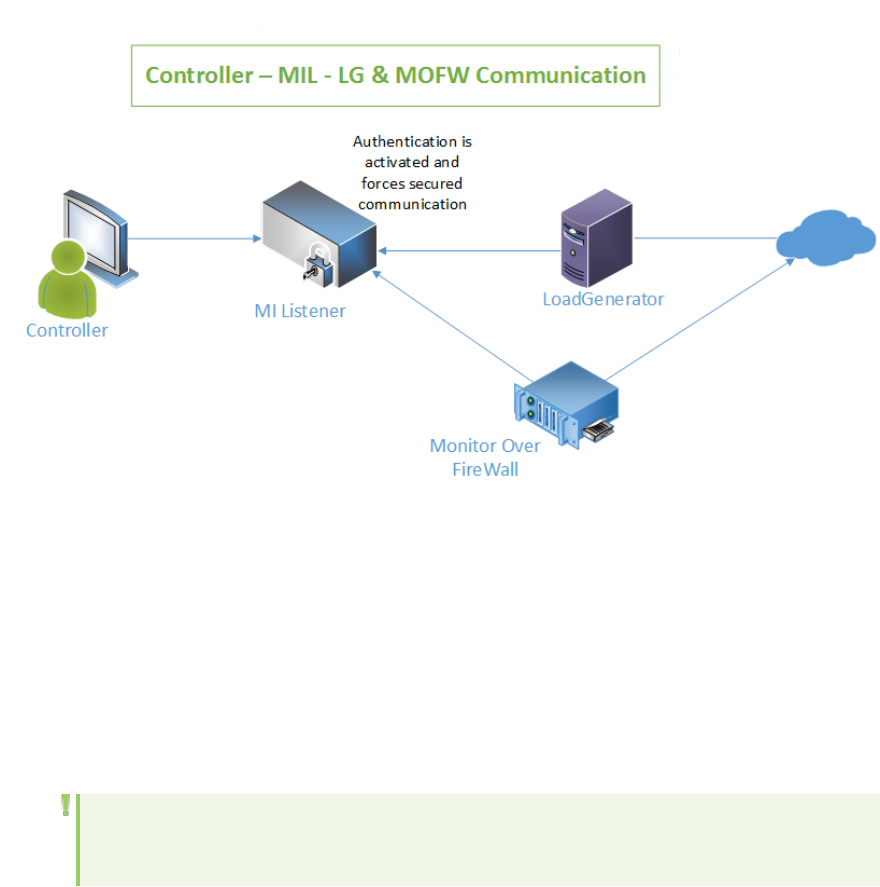
How To Configure Client-Server Authentication
This task describes the steps required to create, setup, and activate the CAand SSLcertificate
authentication on your LoadRunner system.
1. Create a Certificate Authority (CA) or ensure that you have a valid existing CA.
Use the gen_ca_cert utility. See This utility creates two files:cacert.cer and capvk.cer private key.
For details, see "How to Create a Certificate Authority (CA)" on the next page.
Note: If you already have a CAin your organization, you can use it instead of creating one in
LoadRunner.
2. Create the Digital Certificate for SSLcommunication. You can do this in one of 3 ways:
a. Use gen_cert.exe command-line tool.
b. Use Authentication Settings dialog, auto-generate option.
c. Use the Network &Security Manager command line.
For details, see "How to Create an SSL Digital Certificate" on page1291.
3. Install the CAand SSLDigital Certificate on all relevant LoadRunner machines in your system.
4. Determine which machine in your system is the server for client-server communications. For
details, see "Client-Server Authentication Configurations" on page1287.
5. Activate client authentication on the machine acting as the server.
Do one of the following:
User Guide
Controller
HP LoadRunner (12.50) Page 1289

lOn the machine acting as the server, use the "Agent Configuration Settings Dialog Box" on
page1285 to select the relevant certificate.
lUse the Network and Security Manager dialog box (Use Authentication Settings option)or
command line (-check_client_cert) to activate authentication for the host machine that is
acting as the server.
6. Configure Authentication Settings on the Controller.
On the Controller, in the "Authentication Settings Dialog Box" on page1292select the CAand SSLto
be used for the scenario run.
7. Activate server authentication on client machines (optional).
If you want your client machines to validate the server certificate, set this option for each client
machine. Do one of the following:
lOn each client machine in your system, enable the Use Secure Connection (SSL) - Check Server
Certificates option in the "Agent Configuration Settings Dialog Box" on page1285.
lUse the Network and Security Manager command line (-check_server_cert) from a single
location to activate server authentication on all relevant host machines.
Note: When provisioning Load Generators on the cloud, the certificates will be taken from
the Controller and automatically copied to the Load Generators, so the communication will
be secure by default. For details about working with load generators on the cloud, see
"Managing Cloud Accounts - Overview" on page1119.
How to Create a Certificate Authority (CA)
This task describes how to create a Certificate Authority (CA).
Note: If you already have a CAin your organization, you can use it instead of creating one in
LoadRunner.
1. Run the gen_ca_cert utility from the <LoadRunner root folder>\bin
folder.
2. Run the gen_ca_cert command with at least one of the following options:
l-country_name
l-organization_name
l-common_name
This process creates two files in the folder from which the utility was run: the CA Certificate
(cacert.cer), and the CA Private Key (capvk.cer). To provide different file names, use the -CA_cert_
file_name and the -CA_pk_file_name options respectively.
User Guide
Controller
HP LoadRunner (12.50) Page 1290
Note: By default, the CA is valid for three years from when it is generated. To change the
validation dates, use the -nb_time (beginning of validity) and/or -na_time(end of validity)
options.
The following example creates two files: ca_igloo_cert.cer and ca_igloo_pk.cer in the current
folder:
gen_ca_cert -country_name "North Pole" -organization_name "Igloo Makers" -
common_name "ICL" -CA_cert_file_name "ca_igloo_cert.cer" -CA_pk_file_name "ca_
igloo_pk.cer" -nb_time 10/10/2013 -na_time 11/11/2013
3. Install the CA using one of the following options:
l-install <name of certificate file>. Replaces any previous CA list and creates a new one that
includes this CA only.
l-install_add <name of certificate file>. Adds the new CA to the existing CA list.
Note: The -install and -install_add options install the certificate file only. Keep the
private key file in a safe place and use it only for issuing certificates.
How to Create an SSL Digital Certificate
There are several ways to create a Digital Certificate for SSLcommunications.
lUse the gen_cert Utility. If you use the gen_ca_cert utility to create a new CAcertificate, you may
want to follow that by using the gen_cert utility to create the SSLcertificate.
lAutomatically Generate the Certificate on the Controller. You use the Authentication Settings
dialog box to associate a certificate with a scenario in the Controller. While setting this, you can
instruct the dialog box to automatically generate an SSLdigital certificate for you.
lUse the Network and Security Manager Command Line. If you are using the Network and Security
Manager command line options to automate your certificate setup process, there is also a command
for creating a new digital certificate.
After you choose the method you want to use to create the digital certificate, follow the relevant
instructions below:
Use the gen_cert Utility
Note: If working on Windows, use the gen_cert.exe utility. If you are working on a Linux
platform, use the gen_cert utility.
"Authentication Settings Dialog Box"
User Guide
Controller
HP LoadRunner (12.50) Page 1291

To create a digital certificate using the gen_cert utility, perform the following steps:
1. Run the gen_cert utility from the <LoadRunner root folder>\bin folder.
2. Run the gen_cert command with at least one of the following options:
l-country_name
l-organization_name
l-organization_unit_name
l-eMail
l-common_name
It is important to note the following:
lThe CA Certificate and the CA Private Key files are necessary for the creation of the certificate.
By default, it is assumed that they are in the current folder, and are named cacert.cer and
capvk.cer respectively. In any other case, use the -CA_cert_file_name and -CA_pk_file_name
options to give the correct files and locations.
lThe certificate file is created in the folder from which the utility was run. By default, the file
name is cert.cer. To provide a different name, use the -cert_file_name option.
lYou can also run the gen_cert utility with the -install option to install the certificate that you
create.
Automatically Generate the Certificate on the Controller
Select the Generate a certificate automatically option in the "Authentication Settings Dialog Box"
Use the Network and Security Manager Command Line
Use the -generate_new_cert option command to create a digital certificate. For details, see "Network
and Security Manager - Command Line Tool" on the next page.
Authentication Settings Dialog Box
This dialog box enables you to select an SSLcertificate for your scenario run, or create one
automatically.
To access Controller > Tools > Authentication Settings
Important
information
lOnce you create a CA certificate, you must use it for all of the LoadRunner
components.
lAfter setting or modifying the certificates, you must restart the Controller to
apply the changes.
Relevant tasks "How To Configure Client-Server Authentication" on page1289
User interface elements are described below:
User Guide
Controller
HP LoadRunner (12.50) Page 1292
UI Element Description
CA certificate
file
The CA certificate file (with a .cer extension).
Generate a
certificate
automatically
Generates an SSL certificate based on the common name and CA private key.
You can specify a Common name and CA private key for the certificate.
For additional fields, click Advanced settings. These settings let you specify a
country, organization, organization unit, email, and validity range.
Note: If you make changes to the default CA, the connection will not be
secure.
Choose an
existing
certificate
file
The SSL certificate file (with a .cer extension). This certificate will be sent to a load
generator or MI Listener with enforced SSL client authentication. Only a certificate
issued on the other end by the same CA, will be trusted.
Network and Security Manager - Command Line Tool
The LoadRunner Network and Security Manager command line tool, lr_agent_settings, lets you update
and configure agent-related settings on local and remote machines. It allows you to make these change
through a single command.
lAgent ports
lAgent settings
lAuthentication
lHost security
To invoke this tool, you open a command line window and run the following file:
lWindows (LoadRunner, Standalone Load Generator, Standalone MI Listener, and Monitor Over
Firewall): <LR path>\bin\lr_agent_settings.exe.Note: The user running the tool should have write
permissions to the LoadRunner installation folder.
lLinux (Standalone Load Generator): <LG path>\bin\lr_agent_settings.exe. The following guidelines
apply on Linux machines:
a. You must have administrator privileges for running this on a Linux machine.
b. In Amazon cloud environments (AWS), you need to set the M_LROOT environment variable, as
shown in the following example: ~$ sudo M_LROOT=/opt/HP/HP_LoadGenerator /opt/HP/HP_
LoadGenerator/bin/lr_agent_settings -check_client_cert 0
If you want to automate your test and run it through the command line, use the lr_agent_settings.exe
tool described in this topic.
User Guide
Controller
HP LoadRunner (12.50) Page 1293
Below is a list of the command line arguments supported by this tool. To retrieve this list on the
LoadRunner machine, type lr_agent_settings.exe -usage or lr_agent_settings with no arguments.
Note:
* LoadRunner currently supports basic and NTLM proxy authentication.
* You can update the certificates on a remote machine only if:
1. A secure connection was established using SSL.
2. The client (the machine the tool is running on) was authenticated by the CA certificate on
the remote load generator.
3. Both of the above items were achieved by using certificates other than the defaults.
Option Arguments Description
Remote Update
Options
-remote_host remote host
name or IP
The names of the hosts to update with the new settings.
To access the local machine, specify localhost or
127.0.0.1.
For multiple machines, repeat the command: e.g. -
remote_host host1 - remote_host host2.
-remote_hosts_file file name The name of a file containing the host names or IP
addresses. Separate multiple host names with a line
break. For hosts over a firewall, specify a port. For
example,
myserver1
myserver2:my_ofw_unix
myserver2:my_ofw_1
Agent Port Options
-m_agent_port port The Load Generator m_agent listening port. Default:
54345
-al_agent_port port The Load Generator al_agent listening port. .Default:
54245
-mil_port_
controller
port MIL listening port from Controller. This option is not
available on Linux. Default: 50500
-mil_port_lg port MIL listening port from Load Generator over firewall. If you
change this port value, you should also change the port for
the Load Generator over firewall machine using -mil_port.
This option is not available on Linux. Default: 443
User Guide
Controller
HP LoadRunner (12.50) Page 1294

Load Generator
Over Firewall
Options
-is_ofw 0 | 1 Indicates whether to communicate over a firewall.
-mil_name Host name or IP
address
Changes the MI listener name or IP address from the side
of the load generator over a firewall.
-mil_port port number Changes the port for the MI listener from the side of the
load generator over a firewall. The default port is 443.
-local_machine_key Local machine
key
Changes the host symbol (or local machine key) for LG
over a firewall, to establish a unique connection from
behind the firewall.
-mil_string MILname:local
machine key
Changes the MI Listener name and the local machine key
in one string separated by a colon, ":".
-mil_username,-
mil_passwd,-mil_
domain
username,
password,
domain
-mil_username. Changes the user name with which to
connect to the MI Listener machine.
-mil_passwd. Changes the connection password.
-mil_domain. Changes the domain for MI Listener machine
(required only if NTLM is used).
-sampling_interval sampling interval
in seconds
Changes the sampling interval in seconds—the time the
agent waits before retrying to connect to MI Listener
machine. The Over Firewall load generator machine polls
the MI Listener regularly to see if any Controller needs to
use it for a test run. If no request is found, it closes the
connection and waits this specified timeout period, before
polling it again.
-channel_type TCP | HTTP Changes the connection type: HTTP or TCP.
-proxy_name,-
proxy_port
hostname, port -proxy_name. Changes the name of proxy server when
using HTTP connection.
-proxy_port xxxx: Changes the port of proxy server.
-proxy_string proxy
name:proxy port
Changes the proxy name and port in one string separated
by a colon, ":",
-proxy_username,-
proxy_passwd,-
proxy_domain
username,
password,
domain
-proxy_username. Changes the user name with which to
connect to the proxy server.
-proxy_passwd. Changes the connection password.
-use_ssl 0 | 1 Changes the flag to connect using Secure Sockets Layer
User Guide
Controller
HP LoadRunner (12.50) Page 1295
protocol.
-private_key_pwd username,
password,
domain
Changes the password that is optionally required during
SSL certificate authentication.
-check_server_cert None | Medium |
High
Indicates how to authenticate SSL certificates that are
sent by the server.
None. Does not authenticate the SSL certificate.
Medium. Verifies that the server certificates is signed by a
trusted Certification Authority.
High. Verifies that the sender IP matches the certificates
information.
Certificate
Authentication
Options
-check_client_cert 0 | 1 0. Do not enforce SSL connections, i.e. allow both SSL and
non-SSL connections.
1. Enforce SSL connections only and check if the client
certificate is trusted by the CA installed on the agent
machine.
Note: When monitoring over firewall, set this flag
to 1 on the server machine. For guidelines on
determining which machine is considered the
server, see MI Listener and Over Firewall Overview.
-CA_cert_file_name CA certificate file
name
Installs a CA certificate locally. It overwrites the
dat\cert\verify\cacert.cer file, but does not affect any
configuration file.
Note: You need to generate a CA certificate
before installing it. To generate the CA certificate,
run gen_ca_cert -common_name <your_selected_
common_name, e.g. LoadRunner or HP> from the
bin folder. Two files, cacert.cer and capvk.cer, will
be generated in the current directory, for the CA
certificate and private key. Store capvk.cer
securely in a designated folder. Install cacert.cer
User Guide
Controller
HP LoadRunner (12.50) Page 1296
as a CA certificate on all of your LR/PC
installations.
-cert_file_name full path of
certificate file
Installs authentication certificate locally. It overwrites the
dat\cert\verify\cacert.cer file, but does not affect any
configuration file.
Note: This step assumes you already generated
an SSL certificate ahead of time. Run gen_cert -
common_name <your_selected_common_name,
e.g. LoadRunner or HP> -CA_cert_file_name <CA_
cert_file_full_path> -CA_pk_file_name <CA_
private_key_file_full_path> from the bin folder to
generate a certificate. You can use it across all of
your LR/PC installations.
-generate_new_
cert_file -CA_
private_key_file_
name
CA_private_key_
file_full_path
Generates a new authentication certificate and installs it
to dat\cert\cert.cer.
Note: A CA private key is mandatory to generate a
self-signed certificates. The CA certificate will be
read from dat\cert\verify\cacert.cer from current
machine.
-private_key_file_
name
private key file
name
Sets the matching private key of the SSL certificate you
installed with gen_ca_cert -common_name (see above). If
you generate an SSL certificate using gen_cert or through
the -generate_new_cert_file option in this tool, you can
skip this step. You only need it if you use a certificate
which does not include a private key in the certificate file,
such as the openssl tool.
Host Security
Options
-security_key security channel
key
Changes the security key which is used to establish secure
communication between an LG and Controller.
-security_mode 0 | 1 Changes the security mode.
Restart Agent
Options
User Guide
Controller
HP LoadRunner (12.50) Page 1297
-restart_agent Restarts the magent or alagent. It automatically detects
whether it is running as a service or process.
Note: If the agent is running a s a process and you
want to use the command line to restart it as a
service, first use the "Agent Configuration
Settings Dialog Box" on page1285 to change
between the Process and Service mode for the
agent.
Read Input
Parameters
-prm parameter file Retrieves the value of input parameters listed in a file.
The prm file should have the following format:
-mil_name MyHost1 -local_machine_key my_ofw_win -
channel_type HTTP -proxy_name www.acme.com -proxy_
port 8080.
Note:
lWhen using the -prm argument in the
command line, all other arguments are ignored.
lThe parameter file should only contain
arguments for changing settings—not Remote
Update arguments, -remote_host and -remote_
file, which will be ignored.
Common Examples
Below are some examples for using the Network and Security Manager command line tool to change
settings for agent ports, load generator over firewall settings, host security settings, certificate
authentication, etc.
Note:
In order to use this utility on Linux load generators on an Amazon cloud environment (AWS), you
need to set the M_LROOT environment variable as shown in the following example:
~$ sudo M_LROOT=/opt/HP/HP_LoadGenerator /opt/HP/HP_LoadGenerator/bin/lr_agent_
User Guide
Controller
HP LoadRunner (12.50) Page 1298

settings -check_client_cert 0
Set the agent proxy and port, and the MI Listener over a firewall
lr_agent_settings.exe -proxy_name www.apache.com -proxy_port 8080
lr_agent_settings.exe -m_agent_port 54888
lr_agent_settings.exe -proxy_string web-proxy.sgp.hp.com:8080 (The string before ":" is proxy name,
the string after ":" is proxy port)
lr_agent_settings.exe -mil_string MyServer2:my_ofw_unix (The string before ":" is MIL name, the string
after ":" is the local machine key)
Read parameters from a file
lr_agent_settings.exe -prm C:\my_settings.prm
where the parameter file is a text file with the parameters you want to use to change the settings, e.g.
-mil_name MyServer3 -local_machine_key my_ofw_win -channel_type HTTP -proxy_name
www.apache.com -proxy_port 8080
Remote updates
lr_agent_settings.exe -remote_host MyServer1 -proxy_string www.apache.com:8080
lr_agent_settings.exe -remote_host MyServer1 -prm C:\my_settings.prm
lr_agent_settings.exe -remote_host MyServer2:my_ofw_unix -prm C:\my_settings.prm (MyServer2:my_
fow_unix says the remote host is OFW, the name before ":" is MIL name, the string after ":" is local
machine key)
lr_agent_settings.exe -remote_host localhost/127.0.0.1 -proxy_string www.apache.com:8080 (Updates
local host)
Remote updates - multiple
lr_agent_setttings.exe -remote_host MyServer1 -remote_host vmlrrnd192 -use_ssl 1
lr_agent_settings.exe -remote_host localhost -remote_host vmlrrnd192 -use_ssl 1
lr_agent_settings.exe -remote_host MyServer1 -remote_host MyServer2:my_ofw_unix -prm C:\my_
settings.prm
Remote updates - multiple from file
lr_agent_settings.exe -remote_file C:\remote_hosts.txt -proxy_string www.apache.com:8088
User Guide
Controller
HP LoadRunner (12.50) Page 1299
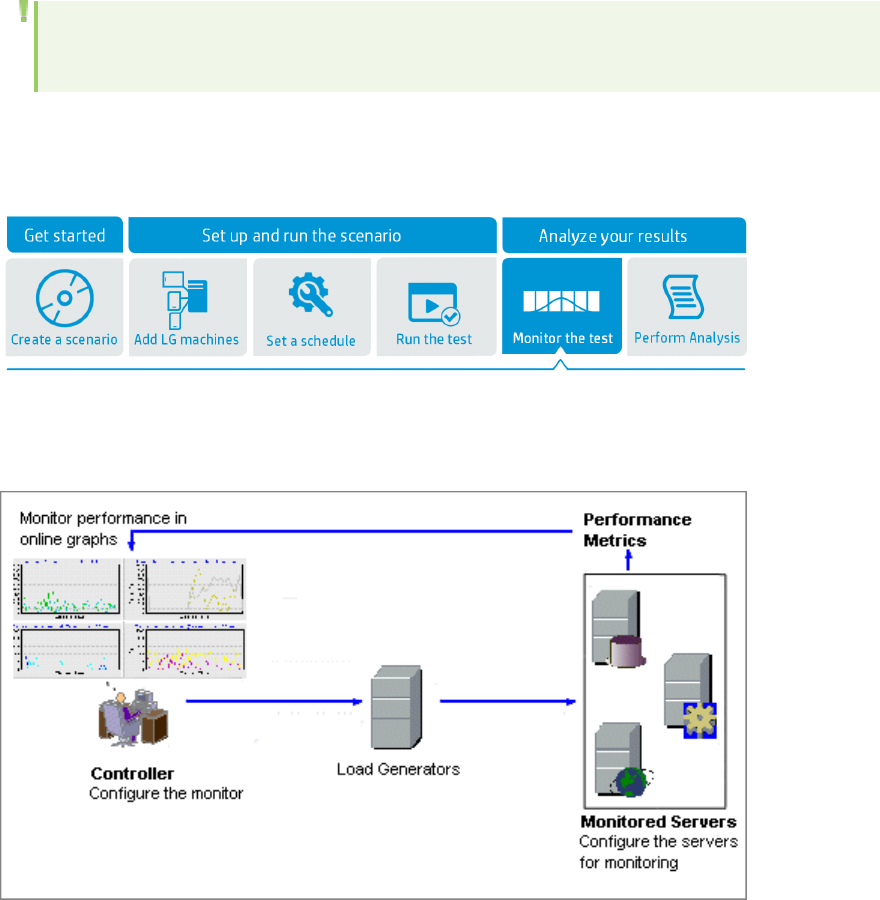
lr_agent_settings.exe -remote_file C:\remote_hosts.txt -prm C:\my_settings.prm
The file contains the hosts separated by line breaks":
myserver1
myserver2:my_ofw_unix
myserver2:my_ofw_1
Restarting the agent
lr_agent_settings.exe -is_ofw 1 -mil_string MyServer2:my_ofw_win -restart_agent
lr_agent_settings.exe -remote_host MyServer1 -remote_host MyServer2:my_ofw_unix -restart_agent
Note: If you encounter Access Denied warnings when restarting the service, see "Agent
Configuration Dialog Box" on page1283 for details.
Monitoring Load Test Scenarios
Before monitoring a scenario, you need to set up and configure the LoadRunner monitoring
components. Each monitor has different configuration requirements that are explained in the specific
monitoring chapters. The following diagram illustrates the LoadRunner monitoring process.
User Guide
Controller
HP LoadRunner (12.50) Page 1300

What would you like to do?
lSet up the monitoring environment
lLearn about the monitor types
lLearn about best practices
How to Set Up a Monitoring Environment
This task describes how to set up the LoadRunner online monitoring environment. You specify the
machines and measurements that the Controller will monitor during a scenario execution in the
Controller's Run tab. During scenario execution, the collected measurement data appears in the online
graphs.
Configure the monitoring environment on the server machine
To use the following monitors, you must first install or configure monitoring components on the server
machine. For details about configuring the monitoring components, see the specific monitoring
sections.
l"How to Set up the Citrix Monitoring Environment" on page1353
l"How to Set Up the IBM WebSphere MQ Monitor" on page1359
l"How to Configure a LoadRunner Scenario to use J2EE/.NET Diagnostics" on page1385
l"How to Set Up the Network Monitoring Environment" on page1320
l"How to Set Up the Oracle Monitoring Environment" on page1334
l"How to Set up the UNIX Monitoring Environment" on page1316
Note: For information on how to set up the SiteScope monitoring environment, refer to the
SiteScope documentation.
Add the monitored server to the Controller
Select the server whose monitors you want to configure.
To monitor a server from the Controller, you need to add the machine and the measurements that you
want to monitor.
1. Click the desired monitor graph in the graph tree, and drag it into the right pane of the Run tab.
lSome monitors are native LoadRunner monitors (by default), but you can also monitor through
the SiteScope monitor engine. To monitor through the SiteScope monitor, double-click it in the
Sitescope Graphs node.
2. Right-click the graph and select Add Measurements, or click anywhere on the graph and select
Monitors > Add Measurements. The <Monitor> dialog box opens.
User Guide
Controller
HP LoadRunner (12.50) Page 1301

3. In the Monitored Server Machines section of the <Monitor> dialog box, click Add. The Add Machine
dialog box opens.
lEnter the server name or IP address of the machine you want to monitor. Select the platform on
which the machine runs.
lFor SiteScope monitors, enter the name and port number of the SiteScope server, and specify
whether you are using a Secure HTTP connection. You can also provide different user credentials.
For details, see "Add Machine Dialog Box" on page1304.
Select the measurements that you want to monitor
1. Make sure that the monitor you are configuring is selected in the Monitored Server Machines area
of the <Monitor> dialog box.
2. In the Resource Measurements section of the <Monitor> dialog box, click Add. The <monitor>
Configuration dialog box opens. Choose the measurements for the specific server.
Note: For the Citrix monitor, if the dialog box freezes after clicking Add, you may need to
rebuild the localhost cache on the Citrix server machine.
For user interface details, see "<Monitor Type> Monitor Configuration Dialog Box" on page1305.
For details about each monitor's default measurements, refer to the relevant reference section for
the monitor.
Change the monitor's default counters - Optional
When you configure the System Resource, Microsoft IIS, Microsoft ASP, and SQL Server monitors, you
are presented with a list of default counters that you can measure on the server you are monitoring.
You can change the default counters for these monitors by editing the res_mon.dft file found in the
LoadRunner\dat folder.
1. Open a new scenario and click the Run tab.
2. For each of the monitors, select the counters you want to measure.
3. Save the scenario and open the scenario .lrs file and res_mon.dft file with an editor.
4. From the scenario .lrs file, copy the MonItemPlus section of the each counter you selected into the
res_mon.dft file.
5. Count the number of new counters in the res_mon.dft file and update the ListCount parameter
with this number.
Monitor Types
All of the monitors allow you to view a summary of the collected data at the conclusion of the scenario.
Using LoadRunner Analysis, you can generate a graph for any of the monitors. For more information,
see "Analysis Graphs" on page1502.
User Guide
Controller
HP LoadRunner (12.50) Page 1302

The online monitors are divided into the following categories:
Runtime Graphs Display the number and status of Vusers participating in the scenario, as well as
the number and types of errors that the Vusers generate. For more information,
see "Runtime and Transaction Monitoring" on page1307.
Transaction
Graphs
Display the transaction rate and response times. For more information, see
"Runtime and Transaction Monitoring" on page1307.
Web Resource
Graphs
Provide information about the number of Web connections, throughput volume,
HTTP responses, server retries, and downloaded pages at the Web servers
during the scenario run. For more information, see "Web Resource Monitors" on
page1309.
System Resource
Graphs
Measure the Windows, Linux, Server, and SNMP resources used during a scenario
run. For more information, see "System Resource Monitoring" on page1315.
Network Graphs Displays information about the network delays on your system. For more
information, see "Network Delay Monitoring" on page1319.
Web Server
Resource
Monitors
Measure statistics related to the Microsoft IIS and Apache Web servers during
the scenario run. For more information, see "Web Server Resource Monitoring"
on page1327.
Web Application
Server Graphs
Measure statistics related to the Microsoft ASP and WebLogic (SNMP) application
servers during the scenario run. For more information, see "Web Application
Server Monitoring" on page1330.
Database Server
Resource Graphs
Measure statistics related to Oracle and SQL Server databases during the
scenario run. For more information, see "Database Server Resource Monitoring"
on page1333.
TruClient Native
Mobile Graphs
Provide information about CPU utilization, free memory on the device, and
memory consumption for TruClient Native Mobile Vusers.
Network
Virtualization
Graphs
Measure statistics related to network virtualization, such as Packet Loss and
Latency. For information, see "HP Network Virtualization Monitoring" on
page1338.
HP Service
Virtualization
Graphs
Measure statistics related to HP Service Virtualization, per operation and service.
For information, see "Service Virtualization Monitors" on page1381.
SiteScope Graphs Use the SiteScope monitor and its counters to measure resources. For
information, see the documentation provided with SiteScope.
Flex Monitors Measure statistics related to Flex RTMP connections and throughput, as well as
buffering time. For details, see "Flex Monitoring" on page1347.
User Guide
Controller
HP LoadRunner (12.50) Page 1303

Streaming Media
Graphs
Measure statistics related to the RealPlayer Client and Media Player Client
servers during the scenario run. For more information, see "Streaming Media
Monitoring" on page1347.
ERP/CRM Server
Resource Graphs
Measure statistics related to the Siebel Server Manager Web server during the
scenario run. For more information, see "ERP/CRM Server Resource Monitoring"
on page1350.
Application
Deployment
Solutions Graphs
Measures statistics related to the Citrix server during a scenario run. For more
information, see "Application Deployment Solution Monitoring" on page1352.
Middleware
Performance
Graphs
Measure statistics related to IBM WebSphere MQ during a scenario run. For more
information, see "Middleware Performance Monitoring" on page1359.
Infrastructure
Resources Graphs
Displays information about network client data points during a scenario run
using the Network Client graph. For more information, see "Infrastructure
Resources Monitoring" on page1365.
The J2EE & .NET Diagnostics Monitor provides trace, time, and troubleshooting information for
individual transactions through J2EE Web, application, and database servers. This monitor requires an
additional installation, and is accessed from the Diagnostics for J2EE/NET tab in the Controller.. For
more information, contact your HP Sales representative.
Add Machine Dialog Box
This dialog box enables you to add the machine that you want to monitor to the Monitored Server
Machines list.
To access Right-click a graph > Add Measurements. In the dialog box that opens, click Add in the
Monitored Server Machinesection .
Relevant
tasks
"How to Set Up a Monitoring Environment" on page1301
Monitored Machine Information
User interface elements are described below:
UI
Element
Description
User Guide
Controller
HP LoadRunner (12.50) Page 1304
Name The name or IP address of the machine that you want to monitor.
lSNMP monitor: If the SNMP agent is running on a different port than the default SNMP
port, you need to define the port number using the format: <server name>:<port
number>
lMS IIS monitor: To monitor an IIS server through a firewall, use TCP, port 139.
Platform Type of platform (Windows or Linux) of the machine you want to monitor.
Note: This field is disabled for monitor configurations that do not have platform
specifications (such as Apache), or when the monitor is intended to be used with a single
platform type.
SiteScope Server Information
For SiteScope server monitoring there are additional user interface elements:
Note: In order to connect to a Sitescope server with specific credentials, you must first stop the
Sitescope monitor and remove all of its counters.
UI Element Description
Name The name of the SiteScope server.
Port The SiteScope port.
Default: 8888
Use Secure
HTTP
Uses a secure HTTP connection to the SiteScope server.
Use Account Instructs LoadRunner to use a specific SiteScope user account with the following
account details:
lAccount. Internal SiteScope account name.
lUsername. The display name of SiteScope account.
lPassword. The password for the SiteScope account.
<Monitor Type> Monitor Configuration Dialog Box
This dialog enables you to select the measurements to monitor during a scenario run.
To access Right-click a graph > Add Measurements
Click Add in the Resource Measurements section of <monitor name> dialog.
Important
information
For DB2 monitors: If there is no application working with a database, you can only
monitor the database manager instance.
User Guide
Controller
HP LoadRunner (12.50) Page 1305
Relevant
tasks
"How to Set Up a Monitoring Environment" on page1301
User interface elements are described below:
UI Element Description
Component/Counter
Description
Describes the selected component or counter.
Host The name of the monitored machine.
Measured
Components
A hierarchical view of the available components. Browse the tree and select
the components you want to monitor. A description of the highlighted
component appears in the Component/Counter Description box.
Performance
Counters
Select the required performance counters. For details about the default
monitor counters, see the relevant reference section for your monitor.
<monitor name> Dialog Box
This dialog box enables you to add monitored server machines and access the dialogs to configure the
measurements and data collection method.
To access Right-click a graph > Add Measurements
Important
information
Before configuring a monitor's measurements, many servers require initial setup. The
first step of "How to Set Up a Monitoring Environment" on page1301 contains links to
the setup instructions.
Relevant
tasks
"How to Set Up a Monitoring Environment" on page1301
User interface elements are described below:
UI Element Description
Advanced Disabled.
Description Displays a description of the selected resource measurement.
Monitored Server
Machines
The machines whose resources are being monitored.
Displays the Add Machine dialog box, which adds the
machine that you want to monitor to the existing list.
Removes the selected machine from the list.
User Guide
Controller
HP LoadRunner (12.50) Page 1306
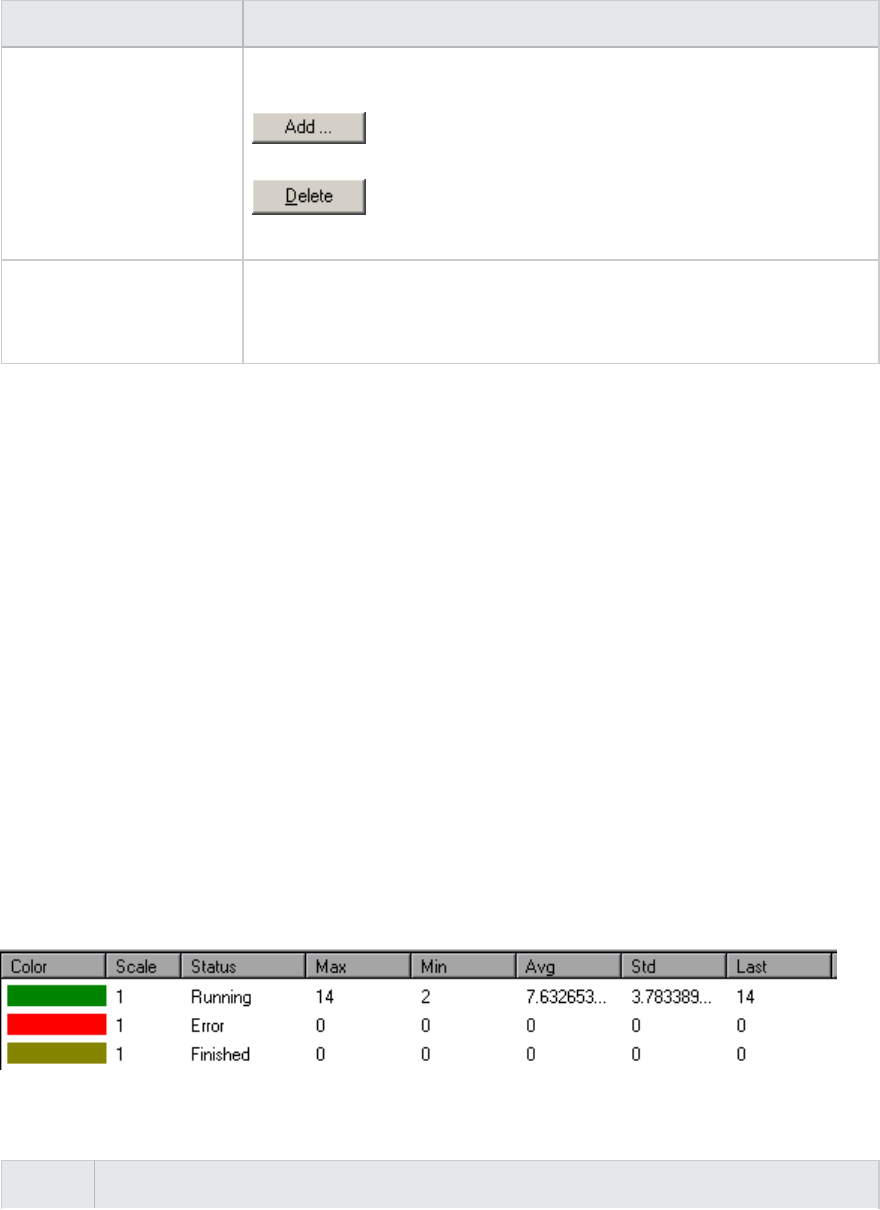
UI Element Description
Resource Measurements
on <machine name>
Displays the resource measurements being monitored on the selected
machine.
Displays the Resources dialog box that lets you create a
list of resource measurements on the selected machine.
Removes the selected resource measurement from the
list.
Import / Export
(for SiteScope monitor
only)
Allows you to save and restore SiteScope monitor settings to/from .SSM
files (XML format).
Runtime and Transaction Monitoring
Runtime Graphs Overview
The Runtime monitor provides information about the status of the Vusers participating in the scenario,
and the number and types of errors that the Vusers generate. In addition, the Runtime monitor provides
the User-Defined Data Points graph, which displays the real time values for user-defined points in a
Vuser script.
The Runtime monitor is enabled by default—it automatically begins monitoring Vusers at the start of a
scenario.
You can view the following Runtimemonitor graphs during a scenario run:
Running Vusers Graph
The monitor's Running Vusers graph provides information about the status of the Vusers running in the
current scenario on all load generator machines. The graph shows the number of running Vusers, while
the information in the legend indicates the number of Vusers in each state.
The Status field of each Vuser displays the current status of the Vuser. The following table describes
each Vuser status.
Status Description
User Guide
Controller
HP LoadRunner (12.50) Page 1307

Running The total number of Vusers currently running on all load generators.
Ready The number of Vusers that completed the initialization section of the script and are ready
to run.
Finished The number of Vusers that have finished running. This includes both Vusers that passed
and failed.
Error The number of Vusers whose execution generated an error. Check the Status field in the
Vuser view or the Output window for a complete explanation of the error.
User-Defined Data Points Graph
The User-Defined Data Points graph displays the real-time values of user-defined data points. You
define a data point in your Vuser script by inserting an lr_user_data_point function at the appropriate
place (user_data_point for GUI Vusers and lr.user_data_point for Java Vusers).
Action1()
{
lr_think_time(1);
lr_user_data_point ("data_point_1",1);
lr_user_data_point ("data_point_2",2);
return 0;
}
For Vuser protocols that support the graphical script representations such as Web, you insert a data
point as a user-defined step. Data point information is gathered each time the script executes the
function or step. For more information about data points, see the Function Reference.
By default, LoadRunner displays all of the data points in a single graph. The legend provides information
about each data point. If desired, you can hide specific data points using the legend below the graphs.
You can also view data points offline, after the completion of the scenario. For more information, see
the HP LoadRunner Analysis User Guide.
Error Statistics Graph
The monitor's Error Statistics graph provides details about the number of errors that accrue during
each second of the scenario run. The errors are grouped by error source—for example, the location in
the script or the load generator name.
Vusers with Errors Graph
The Vusers with Errors graph provides details about the number of Vusers that generate errors during
scenario execution. The errors are grouped by error source.
User Guide
Controller
HP LoadRunner (12.50) Page 1308

Transaction Monitor Graphs Overview
The Transaction monitor displays the transaction rate and response time during a scenario run. The
Transaction monitor is enabled by default—it automatically begins monitoring Vuser transactions at
the start of a scenario run. To conserve resources, you can disable the Transaction monitor from the
Controller.
You can view the following Transaction monitor graphs during a scenario run:
lThe Transaction Response Time graph shows the average response time of transactions in seconds
(y-axis) as a function of the elapsed time in the scenario (x-axis).
lThe Transactions per Second (Passed) graph shows the number of successful transactions
performed per second (y-axis) as a function of the elapsed time in the scenario (x-axis).
lThe Transactions per Second (Failed, Stopped) graph shows the number of failed and stopped
transactions per second (y-axis) as a function of the elapsed time in the scenario (x-axis).
lThe Total Transactions per Second (Passed) graph shows the total number of completed, successful
transactions per second (y-axis) as a function of the elapsed time in the scenario (x-axis).
Note:
lIf there are no transactions defined in your Vuser script or if no transactions are being
executed, no data will be displayed in the online monitor graphs.
lTo generate Web Page diagnostics for each transaction, configure the Diagnostics options
from the Controller.
Web Resource Monitors
Web Resource Monitoring Overview
The Web Resource monitor enables you to analyze the following resources on the Web server during a
scenario run: throughput, HTTP requests, downloaded pages, server retries, TCP/IP connections, and SSL
Connections.
You can view the following resource monitor graphs during a scenario run:
Hits per Second Graph
The Hits Per Second graph shows the number of hits (HTTP requests) to the Web server (y-axis) as a
function of the elapsed time in the scenario (x-axis). This graph can display the whole step, or the last
60, 180, 600, or 3600 seconds. You can compare this graph to the Transaction Response Time graph to
User Guide
Controller
HP LoadRunner (12.50) Page 1309
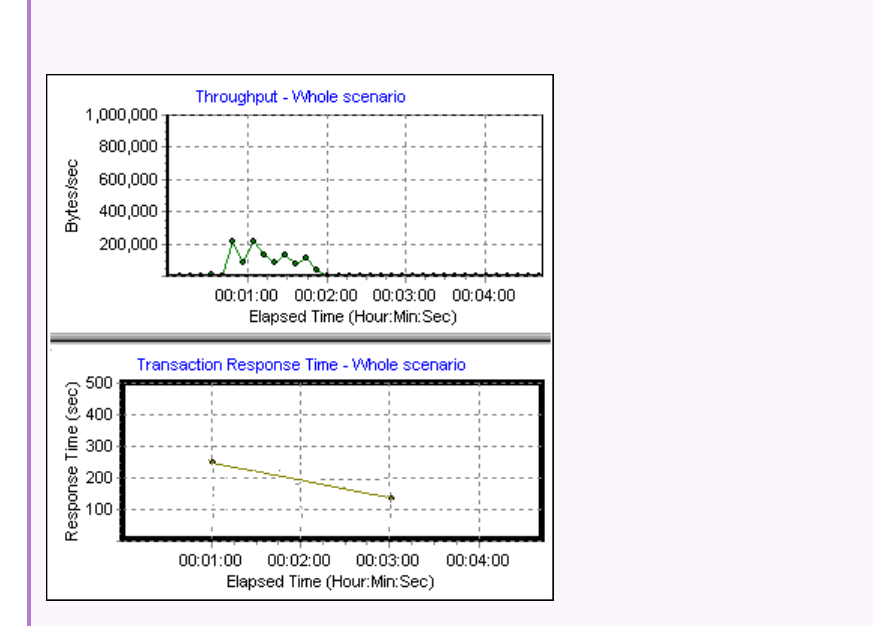
see how the number of hits affects transaction performance.
Throughput Graph
The Throughput graph shows the amount of throughput (y-axis) on the Web server during each second
of the scenario run (x-axis). Throughput is measured in bytes and represents the amount of data that
the Vusers received from the server at any given second. You can compare this graph to the
Transaction Response Time graph to see how the throughput affects transaction performance.
In the following example, the Transaction Response time graph is compared with the Throughput graph.
It is apparent from the graph that as the throughput decreases, the transaction response time also
decreases. The peak throughput occurred at approximately 1 minute into the step. The highest
response time also occurred at this time.
Example
HTTP Responses per Second Graph
The HTTP Responses per Second graph shows the number of HTTP status codes (y-axis)—which
indicate the status of HTTP requests, for example, "the request was successful" or "the page was not
found"—returned from the Web server during each second of the scenario run (x-axis).
The HTTP responses are grouped by status code. You can also group the results shown in this graph by
script (using the "Group By" function) to locate scripts which generated error codes.
For a list of status codes and their explanations, see "HTTP Status Codes" on page1328.
User Guide
Controller
HP LoadRunner (12.50) Page 1310

WebSocket Statistics Graph
The WebSocket Statistics graph provides you with WebSocket statistics for your test run: the number
of new connections, the number of bytes sent and received, and the number of failed connections.
For details, see "WebSocket Statistics Monitor" on page1313.
Pages Downloaded per Second Graph
The Pages Downloaded per Second graph shows the number of Web pages (y-axis) downloaded from
the server during each second of the scenario run (x-axis). This graph helps you evaluate the amount of
load Vusers generate, in terms of the number of pages downloaded.
Note: To view the Pages Downloaded per Second graph, you must select Pages per second
(HTML Mode only) from the script's runtime settings Preferences tab before running your
scenario.
Like throughput, downloaded pages per second is a representation of the amount of data that the
Vusers received from the server at any given second.
lThe Throughput graph takes into account each resource and its size (for example, the size of each
.gif file, the size of each Web page).
lThe Pages Downloaded per Second graph takes into account simply the number of pages.
In the following example, the Throughput graph is compared with the Pages Downloaded per Second
graph. It is apparent from the graph that throughput is not proportional to the number of pages
downloaded per second. For example, between 15 and 16 seconds into the scenario, the throughput
decreased while the number of pages downloaded per second increased.
Example
User Guide
Controller
HP LoadRunner (12.50) Page 1311
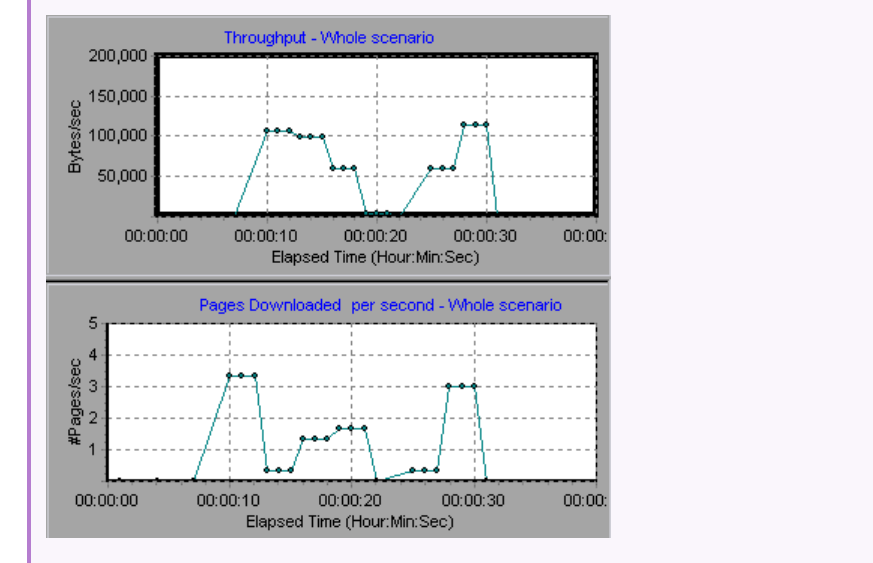
Retries per Second Graph
The Retries Per Second graph shows the number of attempted Web server connections (y-axis) as a
function of the elapsed time in the scenario (x-axis).
A server connection is retried when:
lThe initial connection was unauthorized
lProxy authentication is required
lThe initial connection was closed by the server
lThe initial connection to the server could not be made
lThe server was initially unable to resolve the load generator's IP address
Connections Graph
The Connections graph shows the number of open TCP/IP connections (y-axis) at each point in time of
the scenario (x-axis). One HTML page may cause the browser to open several connections, when links on
the page go to different Web addresses. Two connections are opened for each Web server.
This graph is useful in indicating when additional connections are needed. For example, if the number of
connections reaches a plateau, and the transaction response time increases sharply, adding
connections would probably cause a dramatic improvement in performance (reduction in the
transaction response time).
User Guide
Controller
HP LoadRunner (12.50) Page 1312

Connections per Second Graph
The Connections Per Second graph shows the number of new TCP/IP connections (y-axis) opened and
the number of connections that are shut down each second of the scenario (x-axis).
This number should be a small fraction of the number of hits per second, because new TCP/IP
connections are very expensive in terms of server, router and network resource consumption. Ideally,
many HTTP requests should use the same connection, instead of opening a new connection for each
request.
SSLs per Second Graph
The SSLs per Second graph shows the number of new and reused SSL Connections (y-axis) opened in
each second of the scenario (x-axis). An SSL connection is opened by the browser after a TCP/IP
connection has been opened to a secure server.
Because creating a new SSL connection entails heavy resource consumption, you should try to open as
few new SSL connections as possible; once you have established an SSL connection, you should reuse it.
There should be no more than one new SSL connection per Vuser.
If you set your runtime settings to simulate a new Vuser at each iteration (using the runtime settings
Browser Emulation node), you should have no more than one new SSL connection per Vuser per
iteration. Ideally, you should have very few new TCP/IP and SSL connections each second.
WebSocket Statistics Monitor
The WebSocket Statistics monitor provides you with statistics for the WebSocket data during the
scenario run, such as byte rate, connection status, and the number of messages.
X-axis Elapsed time since the start of the run.
Y-axis WebSockets per second throughout the whole scenario.
Note You cannot change the granularity of the x-axis to a value that is less than
the Web granularity you defined in the General tab of the Options dialog box.
User Guide
Controller
HP LoadRunner (12.50) Page 1313
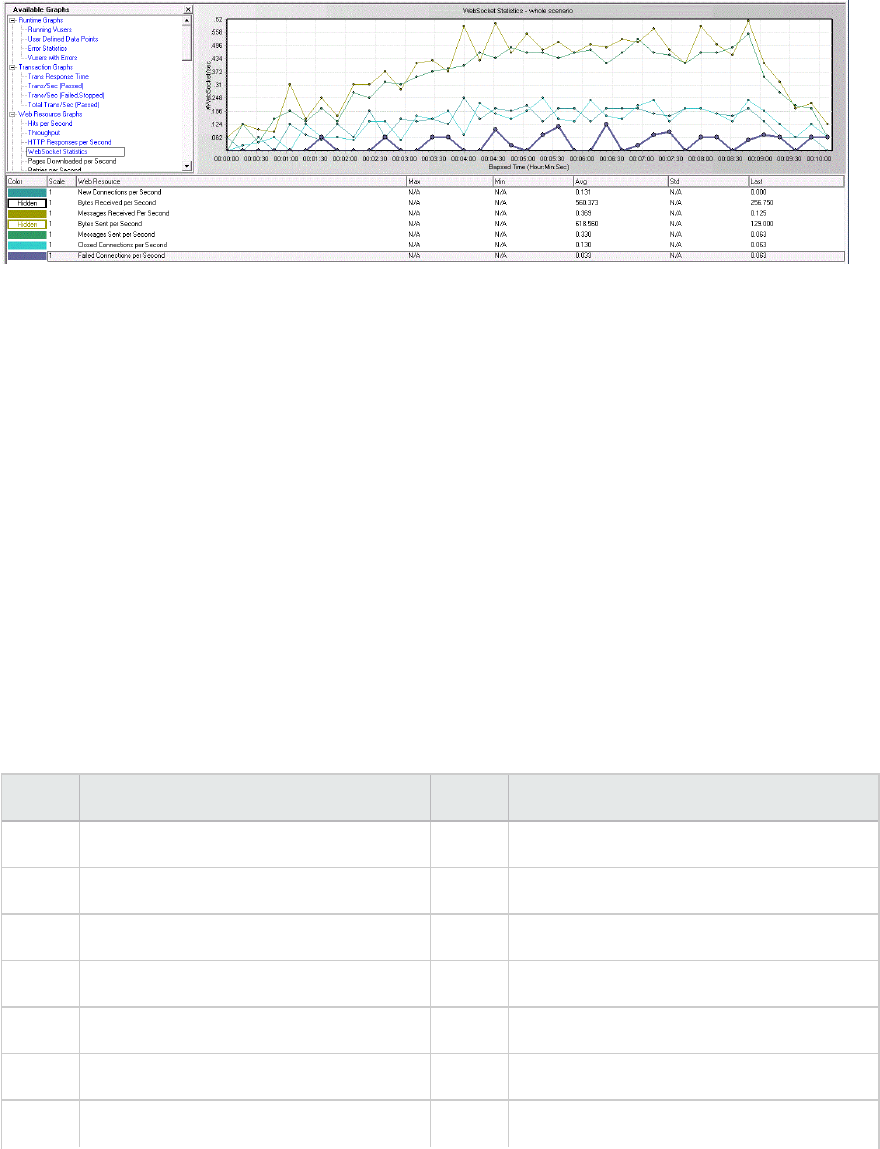
Example - WebSocket Statistics
In the following example, you can see that over 3000 bytes were sent per second.
Example - WebSocket Statistics
The measurements for this monitor are:
lNew Connections per second
lBytes Received per second
lMessages Received per second
lBytes Sent per second
lMessages Sent per second
lClosed Connections per second
lFailed Connections per second
HTTP Status Codes
The following table displays a list of HTTP status codes. These codes appear in the "Web Resource
Monitoring Overview" on page1309:
Code Description Code Description
200 OK 406 Not Acceptable
201 Created 407 Proxy Authentication Required
202 Accepted 408 Request Timeout
203 Non-Authoritative Information 409 Conflict
204 No Content 410 Gone
205 Reset Content 411 Length Required
206 Partial Content 412 Precondition Failed
User Guide
Controller
HP LoadRunner (12.50) Page 1314

300 Multiple Choices 413 Request Entity Too Large
301 Moved Permanently 414 Request - URI Too Large
302 Found 415 Unsupported Media Type
303 See Other 416 Requested range not satisfiable
304 Not Modified 417 Expectation Failed
305 Use Proxy 500 Internal Server Error
307 Temporary Redirect 501 Not Implemented
400 Bad Request 502 Bad Gateway
401 Unauthorized 406 Not Acceptable
402 Payment Required 407 Proxy Authentication Required
403 Forbidden 503 Service Unavailable
404 Not Found 504 Gateway Timeout
405 Method Not Allowed 505 HTTP Version not supported
For more information on the status codes above, see http://www.w3.org/Protocols/rfc2616/rfc2616-
sec10.html#sec10
System Resource Monitoring
System Resource Monitors Overview
You use LoadRunner's System Resource monitors to monitor a machine's system resource usage during
a scenario run and isolate server performance bottlenecks.
A primary factor in a transaction's response time is its system resource usage. Using the System
Resource monitors, you can monitor the Windows, UNIX, and SNMP resources on a machine during a
scenario run, and determine why a bottleneck occurred on a particular machine.
The resource monitors are automatically enabled when you execute a scenario. However, you must
specify the machine you want to monitor and which resources to monitor for each machine. You can
also add or remove machines and resources during the scenario run.
Windows Resource Monitoring
The Windows Resources monitor shows the Windows resources measured during the scenario run.
Windows measurements correspond to the built-in counters available from the Windows Performance
User Guide
Controller
HP LoadRunner (12.50) Page 1315

Monitor.
By default, LoadRunner monitors Windows resources using the native LoadRunner monitor engine.
If you are using the SiteScope monitor engine, ensure that SiteScope has been installed on a server. You
can install SiteScope on the same server as the Controller, or on a dedicated server.
If you want to monitor a remote Windows server that does not use Windows domain security, you must
authenticate the Controller on the remote Windows server. To authenticate the Controller, create an
account, or change the password of the account used to log on to the Controller so that it matches the
password and user name used to log on to the remote monitored Windows machine. When the remote
Windows machine requests another machine's resources, it sends the logged-in user name and
password of the machine requesting the resources.
Limited (non-admin) users cannot activate the monitoring using Windows Resource counters from a
remote machine. This is due to a Windows limitation described in the following document:
http://support.microsoft.com/kb/300702. You must log in with administrator permissions and verify
that the Remote Registry service is running on the remote machine.
UNIX Resource Monitoring
The UNIX Resources monitor shows the UNIX resources measured during the scenario. This graph helps
you determine the impact of Vuser load on the various system resources.
The UNIX kernel statistics measurements include those available by the rstatd daemon. For a
description of the measurements, see "UNIX Resources Performance Counters" on page1318.
Note: You must configure an rstatd daemon on all Linux machines being monitored. For
information, refer to the UNIX man pages, or see "How to Set up the UNIX Monitoring
Environment" below.
SNMP Resource Monitoring
The SNMP Resource monitor shows statistics for a Windows or UNIX machine using the Simple Network
Management Protocol (SNMP). The SNMP Resources monitor is available for monitoring any machine
that runs an SNMP agent.
How to Set up the UNIX Monitoring Environment
This task describes how to configure the UNIX environment before setting up the UNIX Resources
monitor.
1. Verify whether the rstatd daemon is already configured
The rstatd daemon might already be configured, because when a machine receives an rstatd
User Guide
Controller
HP LoadRunner (12.50) Page 1316

request, the inetd on that machine automatically activates the rstatd.
lThe rup command reports various machine statistics, including rstatd configuration. Run the
following command on the UNIX machine to view the machine statistics:
>rup host
lYou can also use lr_host_monitor and see if it returns any relevant statistics.
If the command returns meaningful statistics, the rstatd daemon is already configured and
activated. If not, or if you receive an error message, the rstatd daemon is not configured.
2. Configure the rstatd daemon
If the rstatd daemon is not yet configured, follow these steps to configure it:
a. On the UNIX machine, run the command: su root
b. Go to /etc/inetd.conf and look for the rstatd row (it begins with the word rstatd). If it is
commented out (with a #), remove the comment directive, and save the file.
c. From the command line, run:
kill -1 inet_pid
where inet_pid is the pid of the inetd process. This instructs the inetd to rescan the
/etc/inetd.conf file and register all daemons which are uncommented, including the rstatd
daemon.
d. Run rup again.
If the command still does not indicate that the rstatd daemon is configured, contact your
system administrator.
3. Configure the monitor for a UNIX machine over a firewall (optional)
To monitor a UNIX machine over a firewall, you must run a UNIX utility called rpcinfo and identify
the rstatd's port number.
Run rpcinfo -p <hostname>. You will receive a list of all RPC servers registered in the host's
portmapper, along with the port number. This list will not change until rstatd is stopped and rerun.
Some firewalls allow you to open an RPC program number instead of a port. In such cases, open
program 100001. If are prompted to include a version number, specify versions 3 and 4.
4. Configure the monitor measurements in the Controller
For task details, see "How to Set Up a Monitoring Environment" on page1301.
In the Resource Measurements on <machine> section of the UNIX Resources dialog box, click Add
to open the UNIX Kernel Statistics dialog box, and then select the available measurements and
server properties.
For a description of the available UNIX monitor measurements, see "UNIX Resources Performance
Counters" on the next page.
Note: In the Linux Kernel Statistics dialog box, selecting the Recover Connection check box
User Guide
Controller
HP LoadRunner (12.50) Page 1317
enables the Controller to try to recover a broken connection to a monitored Linux server. If
the Recover Connection check box is not selected, a broken connection will be maintained
until the end of the Controller session, and as a result server details will not be received
from the monitored server. By default, the Recover Connection check box is selected.
UNIX Resources Performance Counters
The following default measurements are available for the UNIX machine:
Measurement Description
Average load Average number of processes simultaneously in Ready state during the
last minute
Collision rate Collisions per second detected on the Ethernet
Context switches rate Number of switches between processes or threads, per second
CPU utilization Percent of time that the CPU is utilized
Disk rate Rate of disk transfers
Incoming packets error
rate
Errors per second while receiving Ethernet packets
Incoming packets rate Incoming Ethernet packets per second
Interrupt rate Number of device interrupts per second
Outgoing packets errors
rate
Errors per second while sending Ethernet packets
Outgoing packets rate Outgoing Ethernet packets per second
Page-in rate Number of pages read to physical memory, per second
Page-out rate Number of pages written to pagefile(s) and removed from physical
memory, per second
Paging rate Number of pages read to physical memory or written to pagefile(s), per
second
Swap-in rate Number of processes being swapped
Swap-out rate Number of processes being swapped
User Guide
Controller
HP LoadRunner (12.50) Page 1318
System mode CPU
utilization
Percent of time that the CPU is utilized in system mode
User mode CPU
utilization
Percent of time CPU is utilized in user mode
Note: In the Linux Kernel Statistics dialog box, selecting the Recover Connection check box
enables the Controller to try to recover a broken connection to a monitored Linux server. If the
Recover Connection check box is not selected, a broken connection will be maintained until the
end of the Controller session, and as a result server details will not be received from the
monitored server. By default, the Recover Connection check box is selected.
Add Windows Resources Measurements Dialog Box
This dialog box enables you to select the Windows resources to monitor. The Windows resources
correspond to the built-in counters available from the Windows Performance Monitor.
To access Right-click a graph > Add Measurements
In the Resource Measurements section of the Windows Resources dialog, click
Add.
Relevant
tasks
"How to Set Up a Monitoring Environment" on page1301
User interface elements are described below:
UI Element Description
Displays a description of the selected counter.
Counters/Measurements The resource counter/measurement to monitor. Select multiple counters
using the CTRL key. For a description of the measurements, see the
Description box in the lower section of the dialog box.
Instances If multiple instances of the selected counter are running, select one or
more instances to monitor for the selected counter.
Object The object to monitor on the specified Windows machine.
Network Delay Monitoring
User Guide
Controller
HP LoadRunner (12.50) Page 1319
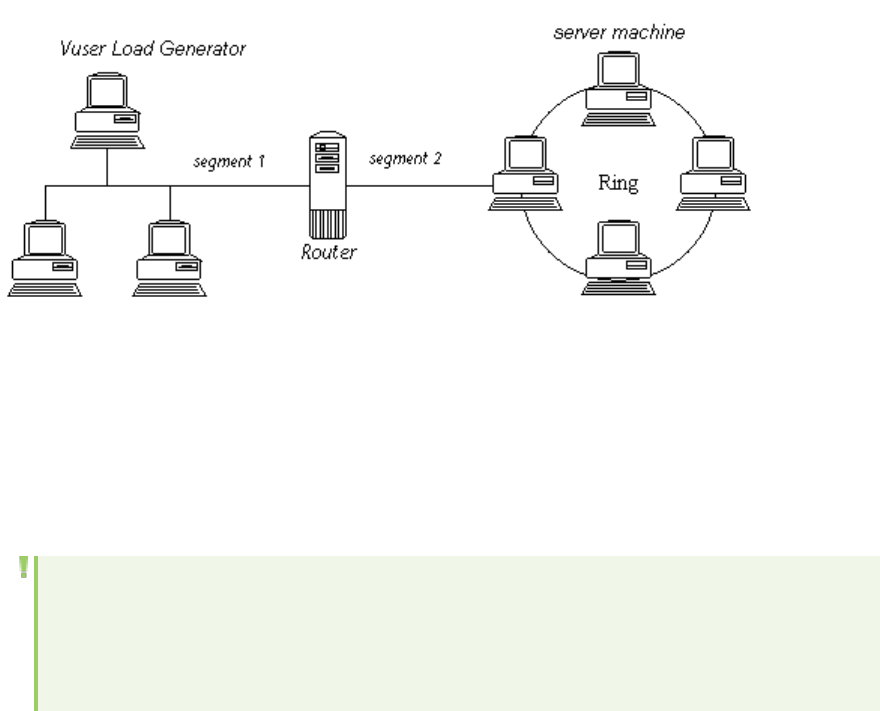
Network Monitoring Overview
Network configuration is a primary factor in the performance of applications. A poorly designed
network can slow client activity to unacceptable levels.
You use Network monitoring to determine whether your network is causing a delay in the scenario. You
can also determine the problematic network segment.
In a true Web or client/server system, there are many network segments. A single network segment
with poor performance can affect the entire system.
The following diagram shows a typical network. To go from the server machine to the Vuser machine,
data must travel over several segments.
The Network Delay Time monitor shows the delays for the complete path between the source and
destination machines (for example the database server and Vuser host). The graph maps the delay as a
function of the elapsed scenario time. Each defined path is represented by a separate line with a
different color in the graph.
To measure network performance, the Network monitor sends packets of data across the network.
When a packet returns, the monitor calculates the time it takes for the packet to go to the requested
node and return. This time is the delay which appears in the Network Delay Time graph.
Note: The delays from the source machine to each of the nodes are measured concurrently, yet
independently. It is therefore possible that the delay from the source machine to one of the
nodes could be greater than the delay for the complete path between the source and
destination machines.
How to Set Up the Network Monitoring Environment
This task describes how to prepare your environment for network monitoring.
1. Prerequisites
User Guide
Controller
HP LoadRunner (12.50) Page 1320

To enable network monitoring, you must install the LoadRunner agent on the source machine. You
do not have to install the LoadRunner agent on the destination machine.
To run the Network monitor, you must have administrator privileges on the Windows source
machine (unless you are using the ICMP protocol).
2. Configure the Linux source machine - optional
You can run the Network monitor on Linux source machines, using UDP or ICMP. Before running the
Network monitor from a Linux source machine, configure the source machine. For task details, see
"How to Configure the Linux Source Machine for Network Monitoring" on the next page.
3. Configure the firewall between the source and destination machines - Optional
If you are monitoring a network in which there are firewalls between the source and the
destination machines, you must configure the firewalls to allow the network data packets to reach
their destinations.
lIf you are using the TCP protocol, the firewall that protects the destination machine should not
block outgoing ICMP_TIMEEXCEEDED packets (packets that are sent outside the firewall from
the machine). In addition, the firewall protecting the source machine should allow ICMP_
TIMEEXCEEDED packets to enter, as well as TCP packets to exit.
lIf you are using the ICMP protocol, the destination machine's firewall should not block incoming
ICMP_ECHO_REQUEST packets, or outgoing ICMP_ECHO_REPLY and ICMP_ECHO_TIMEEXCEEDED
packets. In addition, the firewall protecting the source machine should allow ICMP_ECHO_REPLY
and ICMP_ECHO_TIMEEXCEEDED packets to enter, and ICMP_ECHO_REQUEST packets to exit.
lIf you are using the UDP protocol, ensure that the UDP protocol can access the destination
machine from the source machine. The destination machine's firewall should not block outgoing
ICMP_DEST_UNREACHABLE and ICMP_ECHO_TIMEEXCEEDED packets. In addition, the firewall
protecting the source machine should allow ICMP_DEST_UNREACHABLE and ICMP_ECHO_
TIMEEXCEEDED packets to enter.
Note: To run the Network Delay monitor when there are firewalls between the Controller
and the source machine, you must configure the LoadRunner agent, MI Listener, and
Network Delay monitor for monitoring over a firewall.
4. Specify the network monitor paths
In the Controller Run tab graph tree view, select the Network Delay Time graph and drag it into
the right pane. Right-click the graph and select Add Measurements. Define the paths using the
following three dialog boxes:
a. Add source and destinations machines. For details, see the "Network Delay Time Dialog Box" on
page1324.
b. Define the network monitor path. For details, see the "Adding Destination Machines for
Network Delay Monitoring Dialog Box" on page1323.
User Guide
Controller
HP LoadRunner (12.50) Page 1321

c. Configure the monitor settings for the defined path. For details, see the "Network Monitor
Settings for Defined Path Dialog Box" on page1325.
How to Configure the Linux Source Machine for Network
Monitoring
This task describes how to configure a Linux source machine before running the network monitor.
1. Assign permissions where LoadRunner is installed locally.
Follow these steps to assign root permissions to the merc_webtrace process:
a. Log in to the source machine as root.
b. Type: cd <LoadRunner_installation>/bin to change to the bin folder.
c. Type: chown root merc_webtrace to make the root user the owner of the merc_webtrace
file.
d. Type: chmod +s merc_webtrace to add the s-bit to the file permissions.
e. To verify, type ls -l merc_webtrace. The permissions should look like this: -rwsrwsr-x.
2. Assign permissions where LoadRunner is installed on the network.
In a LoadRunner network installation, the merc_webtrace process is on the network, not on the
source machine disk. The following procedure copies the merc_webtrace file to the local disk,
configures mdrv.dat to recognize the process, and assigns root permissions to merc_webtrace:
a. Copy merc_webtrace from <LoadRunner_installation>/bin to anywhere on the local disk of
the source machine. For example, to copy the file to the /local/<LoadRunner> folder, type: cp
/net/tools/LoadRunner_installation/bin/merc_webtrace /local/<LoadRunner>
Note: All of the source machines that use the same network installation must copy
merc_webtrace to the identical folder path on their local disk (for example,
/local/<LoadRunner>), since all of them use the same mdrv.dat.
b. Add the following line to the <LoadRunner_installation>/dat/mdrv. file, in the [monitors_
server] section:
ExtCmdLine=-merc_webtrace_path /local/xxx
c. Log in to the source machine as root.
d. Type: cd LoadRunner_installation/bin to change to the bin folder.
e. Type: chown root merc_webtrace to make the root user the owner of the merc_webtrace
file.
f. Type: chmod +s merc_webtrace to add the s-bit to the file permissions.
g. To verify, type ls -l merc_webtrace. The permissions should look like:
-rwsrwsr-x.
User Guide
Controller
HP LoadRunner (12.50) Page 1322

3. Connect to the Linux Source Machine through RSH
Follow these instructions if the Controller is connected to the source machine through RSH (default
connection mode). In this case you do not need to activate the agent daemon.
Before running the Network monitor the first time, you enter an encrypted user name and
password in the Network monitor configuration file.
a. On the Windows taskbar, click Start > All Programs> HP Software > HP LoadRunner > Tools
> Password Encoder. The Password Encoder window opens.
b. In the Password box, type your RSH user name and password, separated by a vertical bar
symbol. For example, myname|mypw.
c. Click Generate. An encoded string is displayed in the Encoded string field.
d. Click Copy to copy the encoded string to the clipboard.
e. Add the following line to the <LoadRunner_installation>/dat/monitors/ndm.cfg file, in the
[hosts] section:
Host = <encrypted string copied from clipboard>
f. Close and open the current scenario. LoadRunner will read the updated configuration file and
recognize the source machine for monitoring.
4. Connect to the Linux Source Machine through the Agent
Follow these instructions for activating agent daemon on the source machine if the Controller is
not connected to the source machine through RSH.
a. Type m_daemon_setup -install from the <LoadRunner_installation>/bin folder.
b. Make sure that the agent daemon is running whenever you activate the Network monitor.
c. To stop the Network Delay Monitor agent daemon, type m_daemon_setup -remove.
Adding Destination Machines for Network Delay Monitoring
Dialog Box
This dialog box enables you to add destination machines for network delay monitoring, and configure
additional network monitor settings.
To access Network Delay Time dialog box > To machine(s) section>Click Add
Important
information
The Network Delay Time Monitor cannot be configured to work in TCP mode on
Windows XP SP2 or Vista.
Relevant tasks "How to Set Up the Network Monitoring Environment" on page1320
User interface elements are described below:
UI Element Description
User Guide
Controller
HP LoadRunner (12.50) Page 1323
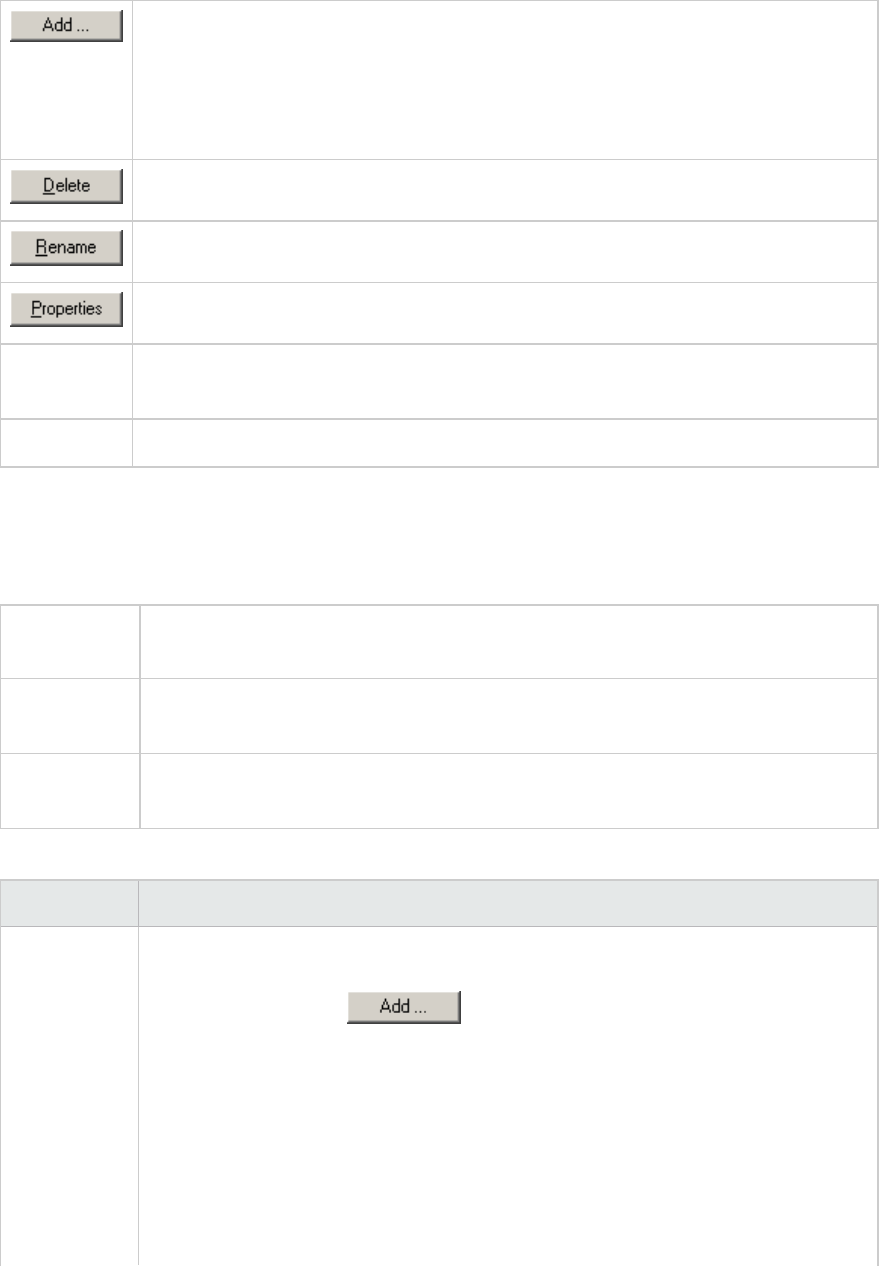
Enter the name or URL of the machine at the final destination of the path you want to
monitor in the New Machine Name dialog box. Repeat this for each path you want to
monitor.
Note: If the destination machine is localhost, enter the local machine's name and not
localhost.
Deletes the destination machine, to remove this path from the monitor graph.
Renames the destination machine.
Opens the Configuring Network Monitor Settings for Defined Path dialog box.
From
Machine
Displays the name of the source machine.
To Machines Displays the names or URLs of the destination machines.
Network Delay Time Dialog Box
This dialog box enables you to select the network path you want to monitor.
To access Right-click the Network Delay Time graph and select Add Measurements.
This dialog appears only when you add measurements for the first time.
Important
information
To run the Network monitor, you must have administrator privileges on the source
machine (unless you are using the ICMP protocol).
Relevant
tasks
"How to Set Up the Network Monitoring Environment" on page1320
User interface elements are described below:
UI Element Description
Monitor the
network
delay from
machine
Displays the name of the machine from which network monitoring begins (source
machine).
To add a machine, click and specify the server name or IP address and
machine platform.
Repeat this for each path you want to monitor.
Important: If there is a firewall between the Controller machine and the source
machine, enter the server name or IP address of the source machine according to
the following format:
<MI Listener machine>:<source machine local key>
where source machine local key is the Local Machine Key that you chose when
configuring the LoadRunner agent on the source machine. (See "Agent Configuration
User Guide
Controller
HP LoadRunner (12.50) Page 1324
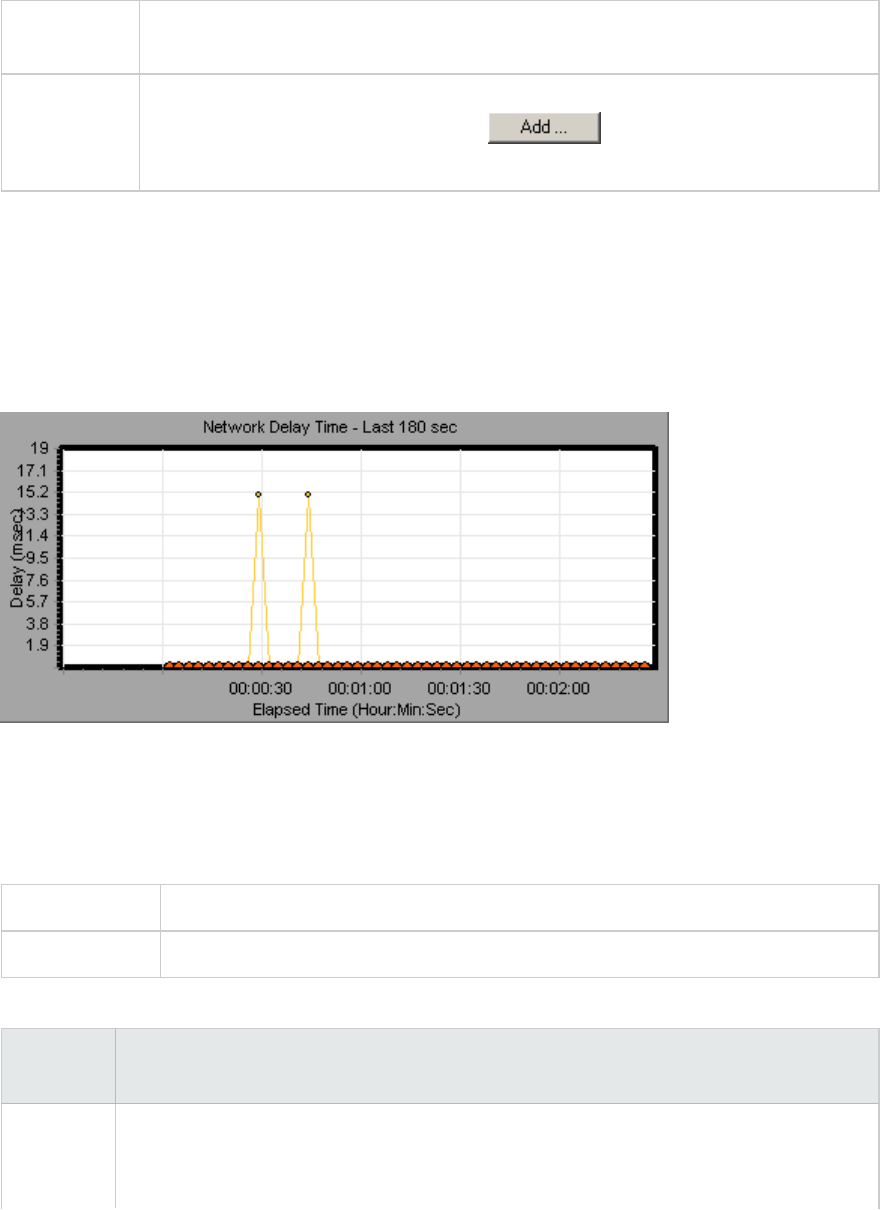
Settings Dialog Box" on page1285)
Example: 12..12.3:vds
To machine
(s)
Displays the network path in the format of sourcemachine -> destination machine.
To add a new destination machine, click and define the machine in the
Adding Destination Machines for Network Delay Monitoring dialog box.
Network Delay Time Graph
The Network Delay Time graph shows the delay for the complete path between the source and
destination machines (y-axis) as a function of the elapsed scenario time (x-axis).
Each path defined in the Add Destination Machines for Network Delay Monitoring dialog box is
represented by a separate line with a different color in the graph.
Network Monitor Settings for Defined Path Dialog Box
This dialog box enables you to set the network protocol, port, monitoring frequency, and monitoring
packet retries.
To access Add Destination Machines for Newtork Delay Monitoring > click Properties.
Relevant tasks "How to Set Up the Network Monitoring Environment" on page1320
User interface elements are described below:
UI
Element
Description
Monitor
Settings
lSend request using X protocol. Select the network protocol you want the monitor to
use: TCP, UDP, or ICMP. It is recommended that you use the default protocol. The
default in Windows is TCP, and in Linux is UDP.
User Guide
Controller
HP LoadRunner (12.50) Page 1325
Note: When you use TCP or UDP protocols, administrator privileges are
required on the source machine.
lSend request to port. Enter the port number to be used by the network path.
lEnable display of network nodes by DNS names. Enables you to view the DNS name
of each node along the network path, in addition to its IP address.
Note: Selecting this option will decrease the speed of the Network monitor.
Monitoring
Frequency
Send next packet X milliseconds after receipt of previous packet. Select the number
of milliseconds the monitor should wait between receiving a packet and sending out the
next packet.
Default: 3000 milliseconds.
Note: If you have a long, steady scenario, you can increase the interval by
several seconds.
Monitoring
Packet
Retries
lWait X seconds for packet to return before retrying. Select the maximum number
of seconds that the monitor should wait for a packet to return before it retries to
send the packet.
Default: 3 seconds.
Note: If your network is very large and loaded (an internet connection with a
low capacity), you should increase the value by several seconds. If you have a
small network (such as a LAN), you can decrease the value.
lNumber of retries. Select the number of times the monitor should try resending a
packet to a node if the packet is not initially returned.
Default: 0.
Troubleshooting and Limitations - Network Delay Monitor
This section describes troubleshooting for the Network Delay monitor.
If monitoring is unsuccessful and LoadRunner cannot locate the source or destination machines, make
sure that the specified machines are available to your machine. Perform a "ping" operation. At the
command line prompt, type:
ping server_name
To check the entire network path, use the trace route utility to verify that the path is valid.
For Windows, type tracert <server_name>.
User Guide
Controller
HP LoadRunner (12.50) Page 1326
For Linux, type traceroute <server_name>.
If the monitoring problem persists once you verify that the machines are accessible and that the
network path is valid, perform the following procedures:
1. If you are using the TCP protocol, run <LoadRunner root folder>\bin\webtrace.exe from the
source machine to determine whether the problem is related to the Controller, or the WebTrace
technology on which the Network Delay monitor is based. If you are using the UDP or ICMP
protocols, the problem must be related to the Controller and not WebTrace, since these protocols
are not WebTrace technology-based.
2. If you receive results by running webtrace.exe, the problem is related to the Controller. Verify that
the source machine is not a Linux machine, and contact the Customer Support Web site with the
following information:
lthe Controller log file, drv_log.txt, located in the temp folder of the Controller machine.
lthe traceroute_server log file, located on the source machine.
lthe debug information located in the TRS_debug.txt and WT_debug.txt files in the path folder.
These files are generated by adding the following line to the [monitors_server] section of the
<LoadRunner root folder>\dat\mdrv. file, and rerunning the Network monitor:
ExtCmdLine=-traceroute_debug path
3. If you do not receive results by running webtrace.exe, the problem is related to the WebTrace
technology, on which the Network Delay monitor is based. Perform the following procedures on the
source machine:
lVerify that the packet.sys file (the Webtrace driver) exists in the WINNT\system32\drivers
folder.
lCheck whether a driver (such as "Cloud" or "Sniffer") is installed on top of the network card
driver. If so, remove it and run WebTrace again.
lVerify that there are administrator permissions on the machine.
lUsing ipconfig /all, check that only one IP address is assigned to the network card. WebTrace
does not know how to handle multiple IP addresses assigned to the same card (IP spoofing).
lCheck the number of network cards installed. Run webtrace –devlist to receive a list of the
available network cards.
lIf there is more than one card on the list, run webtrace -dev <dev_name> <destination>,
where <dev_name> is one of the network card names shown in the list. If you discover that
WebTrace is binding to the wrong card, you can use webtrace set_device <dev_name> to set
a registry key that instructs WebTrace to use a specified card instead of the default one.
lVerify that the network card is of the Ethernet type.
lContact the Customer Support Web site with the output of webtrace.exe –debug (for example,
webtrace.exe –debug www.merc-int.com) and ipconfig /all on the machine.
Web Server Resource Monitoring
User Guide
Controller
HP LoadRunner (12.50) Page 1327
Web Server Resource Monitoring Overview
Web Server Resource monitors provide you with information about the resource usage of the Microsoft
IIS and Apache Web servers during performance test execution. To obtain this data, you need to
activate the online monitor for the server and specify which resources you want to measure before
executing the test.
Note: Certain measurements or counters are especially useful for determining server
performance and isolating the cause of a bottleneck during an initial stress test on a Web
server.
How to change the Apache default server properties
This task describes how to modify the Apache default server properties that are defined in the monitor
configuration file.
1. Open the apache.cfg file in the <performance center root folder>\dat\monitors folder.
2. Edit the following parameters after the Delimiter=: statement:
InfoURL. Server statistics information URL
ServerPort. Server port number
SamplingRate. Rate (milliseconds) at which the LoadRunner monitor will poll the server for the
statistics information. If this value is greater than 1000, LoadRunner will use it as its sampling rate.
Otherwise, it will use the sampling rate defined in the Monitors tab of the Options dialog box.
3. Save and close the file.
HTTP Status Codes
The following table displays a list of HTTP status codes. These codes appear in the "Web Resource
Monitoring Overview" on page1309:
Code Description Code Description
200 OK 406 Not Acceptable
201 Created 407 Proxy Authentication Required
202 Accepted 408 Request Timeout
203 Non-Authoritative Information 409 Conflict
204 No Content 410 Gone
User Guide
Controller
HP LoadRunner (12.50) Page 1328

205 Reset Content 411 Length Required
206 Partial Content 412 Precondition Failed
300 Multiple Choices 413 Request Entity Too Large
301 Moved Permanently 414 Request - URI Too Large
302 Found 415 Unsupported Media Type
303 See Other 416 Requested range not satisfiable
304 Not Modified 417 Expectation Failed
305 Use Proxy 500 Internal Server Error
307 Temporary Redirect 501 Not Implemented
400 Bad Request 502 Bad Gateway
401 Unauthorized 406 Not Acceptable
402 Payment Required 407 Proxy Authentication Required
403 Forbidden 503 Service Unavailable
404 Not Found 504 Gateway Timeout
405 Method Not Allowed 505 HTTP Version not supported
For more information on the status codes above, see http://www.w3.org/Protocols/rfc2616/rfc2616-
sec10.html#sec10
Microsoft IIS Performance Counters
The following table describes the measurements and server properties that can be monitored on the
Microsoft IIS Web server during the test run:
Object Measurement Description
Web Service Bytes Sent/sec The rate at which the data bytes are sent by the Web
service
Web Service Bytes
Received/sec
The rate at which the data bytes are received by the
Web service
Web Service Get Requests/sec The rate at which HTTP requests using the GET
method are made. Get requests are generally used
for basic file retrievals or image maps, though they
can be used with forms.
User Guide
Controller
HP LoadRunner (12.50) Page 1329

Web Service Post Requests/sec The rate at which HTTP requests using the POST
method are made. Post requests are generally used
for forms or gateway requests.
Web Service Maximum
Connections
The maximum number of simultaneous connections
established with the Web service
Web Service Current
Connections
The current number of connections established with
the Web service
Web Service Current
NonAnonymous
Users
The number of users that currently have a non-
anonymous connection using the Web service
Web Service Not Found
Errors/sec
The rate of errors due to requests that could not be
satisfied by the server because the requested
document could not be found. These are generally
reported to the client as an HTTP 404 error code.
Process Private Bytes The current number of bytes that the process has
allocated that cannot be shared with other
processes.
Apache Performance Counters
The following table describes the measurements and server properties that can be monitored on the
Apache Web server during the test run:
Measurement Description
# Busy Servers The number of servers in the Busy state
# Idle Servers The number of servers in the Idle state
Apache CPU Usage The percentage of time the CPU is utilized by the Apache
server
Hits/sec The HTTP request rate
KBytes Sent/sec The rate at which data bytes are sent from the Web server
Web Application Server Monitoring
User Guide
Controller
HP LoadRunner (12.50) Page 1330
Web Application Server Resource Monitoring Overview
You use LoadRunner's Web Application Server Resource monitors to monitor Microsoft Active Server
Pages during a scenario run and isolate application server performance bottlenecks.
lThe Microsoft Active Server Pages (ASP) monitor displays statistics about the resource usage on the
ASP server during the scenario run.
MS Active Server Pages Performance Counters
The following table describes the default counters that can be monitored:
Measurement Description
Errors per
Second
The number of errors per second.
Requests Wait
Time
The number of milliseconds the most recent request was waiting in the queue.
Requests
Executing
The number of requests currently executing.
Requests
Queued
The number of requests waiting in the queue for service.
Requests
Rejected
The total number of requests not executed because there were insufficient
resources to process them.
Requests Not
Found
The number of requests for files that were not found.
Requests/sec The number of requests executed per second.
Memory
Allocated
The total amount of memory, in bytes, currently allocated by Active Server Pages.
Errors During
Script
Runtime
The number of failed requests due to runtime errors.
Sessions Current The current number of sessions being serviced.
Transactions/sec The number of transactions started per second.
User Guide
Controller
HP LoadRunner (12.50) Page 1331
Microsoft Active Server Pages Dialog Box
This dialog box enables you to select the items to monitor on the MS Active Server Pages application
server.
To access Right-click a graph > Add Measurements
Click Add in the Resource Measurements section of Microsoft Active Server Pages
dialog.
Relevant
tasks
"How to Set Up a Monitoring Environment" on page1301
See also "MS Active Server Pages Performance Counters" on the previous page
User interface elements are described below:
UI Element Description
Adds the selected measurement to the list of measurements in the Measurements
on <machine> section of the Microsoft Active Server Pages dialog box.
Counters Select a resource counter to monitor. Select multiple counters using the CTRL key. For
a definition of each counter, click Explain.
Instances If multiple instances of the selected counter are running, select one or more
instances to monitor for the selected counter.
Object Select the object being monitored on the specified machine.
TruClient - Native Mobile Monitors
CPU Utilization Percentage Graph
This monitor graph displays the percentage of the CPU being utilized during the test run for TruClient
Native Mobile Vuser scripts.
Purpose Helps you evaluate the amount of CPU utilized by an application.
X-axis Elapsed time since the start of the scenario run.
Y-axis The percentage of the CPU utilized during the test run.
User Guide
Controller
HP LoadRunner (12.50) Page 1332
Total Free Memory In Device Monitor
This monitor displays the free memory on a mobile device as a function of time, for TruClient Native
Mobile scripts.
Purpose Helps you evaluate the amount of memory available on the device during the test run.
X-axis Elapsed time since the start of the scenario run.
Y-axis The amount of free memory in KBs.
Total Memory Consumed by Application Monitor
This graph displays the memory consumed by the application, as a function of time for TruClient Native
Mobile scripts.
Purpose Helps you evaluate the amount of memory used by the application.
X-axis Elapsed time since the start of the scenario run.
Y-axis The memory consumed by the application in KBs.
Database Server Resource Monitoring
Database Resource Monitoring Overview
LoadRunner's Database Server Resource monitors measure database resource usage statistics for
Oracle or SQL Servers during a scenario run. You use these monitors to isolate database server
performance bottlenecks.
The SQL Server monitor can be configured as a native LoadRunner monitor, or as a SiteScope monitor.
The Oracle monitor displays information from Oracle V$ tables: Session statistics, V$SESSTAT, system
statistics, V$SYSSTAT, and other table counters defined by the user in the custom query.
Before defining the monitoring measurements for the Oracle monitor in the Controller, you must set up
the monitoring environment on the database server:
Note: If there is no application working with a database, you can only monitor the database
manager instance.
lFor details about the Oracle monitor configuration, see "How to Set Up the Oracle Monitoring
Environment" on the next page.
User Guide
Controller
HP LoadRunner (12.50) Page 1333

You then enable each database resource monitor from the Controller by selecting the counters you
want the monitor to measure.
How to Set Up the Oracle Monitoring Environment
This task describes how to set up the monitor environment before monitoring an Oracle database
server using the native LoadRunner monitor.
Note: If a problem occurs in setting up the Oracle environment, check the Oracle server to view
the error messages.
1. Prerequisites
lEnsure that the Oracle client libraries are installed on the Controller machine.
lVerify that %OracleHome%\bin is included in the path environment variable. If it is not, add it.
lEnsure that the registries are updated for the version of Oracle that you are using and that
they have the following key: HKEY_LOCAL_MACHINE\SOFTWARE\ORACLE
lVerify that the Oracle server you want to monitor is up and running. Note that it is possible to
monitor several Oracle database servers concurrently.
Note: Only the 32-bit Oracle client should be installed on the Controller machine running
the Oracle monitor. If you have a 16-bit and a 32-bit Oracle client installation on the
Controller machine, the 16-bit installation should be uninstalled.
2. Configure the Oracle client/server connection
Set the connection parameters so the Oracle client (Controller machine) can communicate with the
Oracle server(s) you plan to monitor.
On the Controller machine, set the following configuration parameter either by editing the
tnsnames.ora file in a text editor, or using the Oracle service configuration tool (for example,
Start > Programs > Oracle for Windows NT > Oracle Net8 Easy Config):
la new service name (TNS name) for the Oracle instance
lTCP protocol
lthe host name (name of monitored server machine)
lthe port number (usually 1521)
lthe database SID (the default SID is ORCL)
For example:
User Guide
Controller
HP LoadRunner (12.50) Page 1334
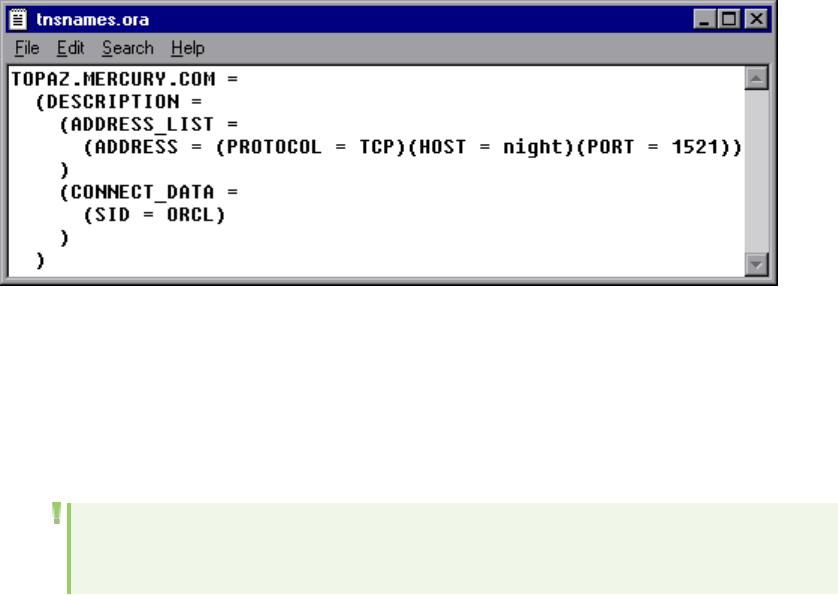
3. Connect to the monitored server machine and verify the connection
a. Obtain a username and password for the service from your database administrator, and
ensure that the Controller has database administrator privileges for the Oracle V$ tables
(V$SESSTAT,V$SYSSTAT,V$STATNAME,V$INSTANCE,V$SESSION).
b. Verify connection with the Oracle server by performing tns ping from the Controller machine.
Note: There may be a problem connecting if the Oracle server is behind a DMZ/firewall
that limits its communication to application servers accessing it.
c. Run SQL*Plus from the Controller and attempt to log in to the Oracle server(s) with the desired
username/password/server combination.
d. Type SELECT * FROM V$SYSSTAT to verify that you can view the V$SYSSTAT table on the
Oracle server. Use similar queries to verify that you can view the V$SESSTAT, V$SESSION,
V$INSTANCE, V$STATNAME, and V$PROCESS tables on the server.
4. Modify the monitoring sample rate (optional)
To change the length of each monitoring sample (in seconds), edit the dat\monitors\vmon.cfg file
in the LoadRunner root folder. The default rate is 10 seconds.
The minimum sampling rate for the Oracle Monitor is 10 seconds. If you set the sampling rate at
less than 10 seconds, the Oracle Monitor will continue to monitor at 10 second intervals.
5. Configure the Oracle monitor from the Controller
For task details (beginning with step 2), see "How to Set Up a Monitoring Environment" on
page1301.
Oracle Performance Counters
The following measurements are most commonly used when monitoring the Oracle server (from the
V$SYSSTAT table):
User Guide
Controller
HP LoadRunner (12.50) Page 1335

Measurement Description
CPU used by
this session
The amount of CPU time (in 10s of milliseconds) used by a session between the time
a user call started and ended. Some user calls can be completed within 10
milliseconds and, as a result, the start and end-user call time can be the same. In this
case, 0 milliseconds are added to the statistic. A similar problem can exist in the
operating system reporting, especially on systems that suffer from many context
switches.
Bytes
received via
SQL*Net from
client
The total number of bytes received from the client over Net8.
Logons
current
The total number of current logons
Opens of
replaced
files
The total number of files that needed to be reopened because they were no longer in
the process file cache.
User calls Oracle allocates resources (Call State Objects) to keep track of relevant user call
data structures every time you log in, parse, or execute. When determining activity,
the ratio of user calls to RPI calls gives you an indication of how much internal work is
generated as a result of the type of requests the user is sending to Oracle.
SQL*Net
roundtrips
to/from
client
The total number of Net8 messages sent to, and received from, the client.
Bytes sent
via SQL*Net
to client
The total number of bytes sent to the client from the foreground process(es).
Opened
cursors
current
The total number of current open cursors.
DB block
changes
Closely related to consistent changes, this statistic counts the total number of
changes that were made to all blocks in the SGA that were part of an update or
delete operation. These are changes that generate redo log entries and hence will
cause permanent changes to the database if the transaction is committed. This
statistic is a rough indication of total database work and indicates (possibly on a per-
transaction level) the rate at which buffers are being dirtied.
Total file
opens
The total number of file opens being performed by the instance. Each process needs
a number of files (control file, log file, database file) to work against the database.
User Guide
Controller
HP LoadRunner (12.50) Page 1336

SQL Server Performance Counters
The following table describes the default counters that can be monitored on version 6.5 of the SQL
Server:
Measurement Description
% Total
Processor Time
The average percentage of time that all the processors on the system are busy
executing non-idle threads. On a multi-processor system, if all processors are
always busy, this is 100%, if all processors are 50% busy this is 50% and if 1/4 of
the processors are 100% busy this is 25%. It can be viewed as the fraction of the
time spent doing useful work. Each processor is assigned an Idle thread in the Idle
process which consumes those unproductive processor cycles not used by any
other threads.
% Processor
Time
The percentage of time that the processor is executing a non-idle thread. This
counter was designed as a primary indicator of processor activity. It is calculated
by measuring the time that the processor spends executing the thread of the idle
process in each sample interval, and subtracting that value from 100%. (Each
processor has an idle thread which consumes cycles when no other threads are
ready to run). It can be viewed as the percentage of the sample interval spent
doing useful work. This counter displays the average percentage of busy time
observed during the sample interval. It is calculated by monitoring the time the
service was inactive, and then subtracting that value from 100%.
Cache Hit Ratio The percentage of time that a requested data page was found in the data cache
(instead of being read from disk).
I/O - Batch
Writes/sec
The number of 2K pages written to disk per second, using Batch I/O. The
checkpoint thread is the primary user of Batch I/O.
I/O - Lazy
Writes/sec
The number of 2K pages flushed to disk per second by the Lazy Writer.
I/O -
Outstanding
Reads
The number of physical reads pending.
I/O -
Outstanding
Writes
The number of physical writes pending.
I/O - Page
Reads/sec
The number of physical page reads per second.
I/O - The number of Transact-SQL command batches executed per second.
User Guide
Controller
HP LoadRunner (12.50) Page 1337

Transactions/sec
User
Connections
The number of open user connections.
HP Network Virtualization Monitoring
Network virtualization starts and stops automatically as you start and stop a scenario. Network
virtualization metrics are automatically collected during the scenario run, and displayed in the HP
Network Virtualization monitor.
The most typical network effects which you can configure with the network virtualization software are:
lLatency. The Latency value you define represents the time in milliseconds that it takes an IP packet
to cross the network. This is usually affected by geographical distance, the available bandwidth, the
network load on the route between the two ends, and whether this is a terrestrial link or not.
lPacket Loss. The Packet Loss value you define represents the chance of losing IP packets while data
travels through a network. Packets can get lost due to link faults or due to extreme network load.
lBandwidth. The Bandwidth value you define represents the capacity of your network to transfer
data.
For information on setting these parameters, see the Network Virtualization User Guide, available from
the Start menu on the machine with the NV installation. For icon-based interfaces such as Windows 8.1,
search for NV User Guide.
Average Latency Monitor
This graph shows the average recorded time required for a packet of data to travel from the indicated
source point to the required destination, measured in milliseconds in the last 60 seconds.
Purpose Helps you evaluate the time required for a packet of data to travel over the
network.
X-axis Elapsed time since the start of the run.
Y-axis The average latency—the time in milliseconds required for a packet of data
to reach its destination, per 60 second intervals.
Note You cannot change the granularity of the x-axis to a value that is less than
the Web granularity you defined in the General tab of the Options dialog box.
See also "HP Network Virtualization Monitoring" above
User Guide
Controller
HP LoadRunner (12.50) Page 1338
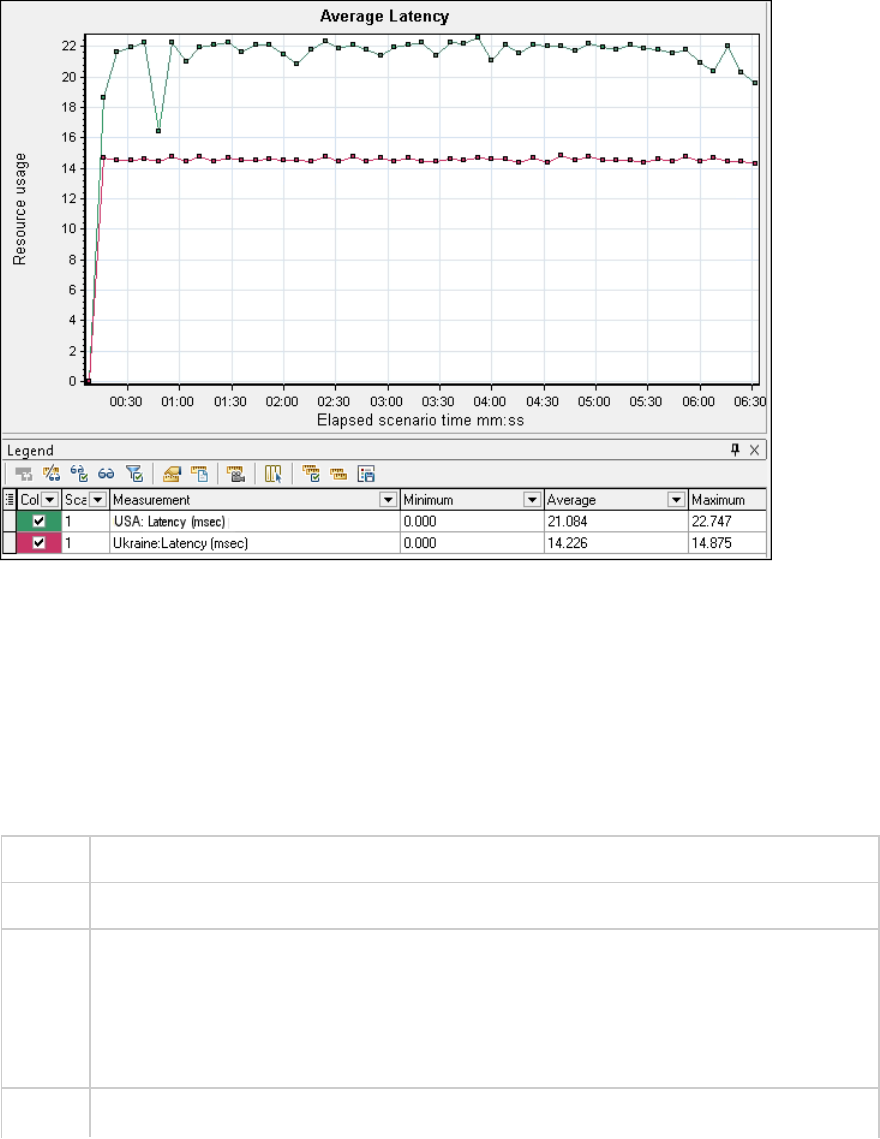
Example - Network Virtualization Per Group
In the following example, you can see that the latency for the USA group reached its peak at nearly 4
minutes into the scenario run, while the Ukraine group remained fairly constant at approximately 14
msec.
If you enabled Network Virtualization per load generator (and not per group), the graph shows the
measurements per load generator, as shown in the "Packet Loss Monitor" below.
Packet Loss Monitor
This graph shows packets lost during the last second of the scenario run. Packet loss occurs when data
packets fail to reach their destination. It can result from gateway overload, signal degradation, channel
congestion, or faulty hardware.
Purpose Helps you understand how many data packets were lost over a specific time interval.
X-axis Elapsed time since the start of the run.
Y-axis The following measurements:
lThe percentage of lost packets from all packets that were sent.
lThe number of data packets that were lost over 60 seconds.
lThe total number of packets that were lost.
Note You cannot change the granularity of the x-axis to a value that is less than the Web
User Guide
Controller
HP LoadRunner (12.50) Page 1339
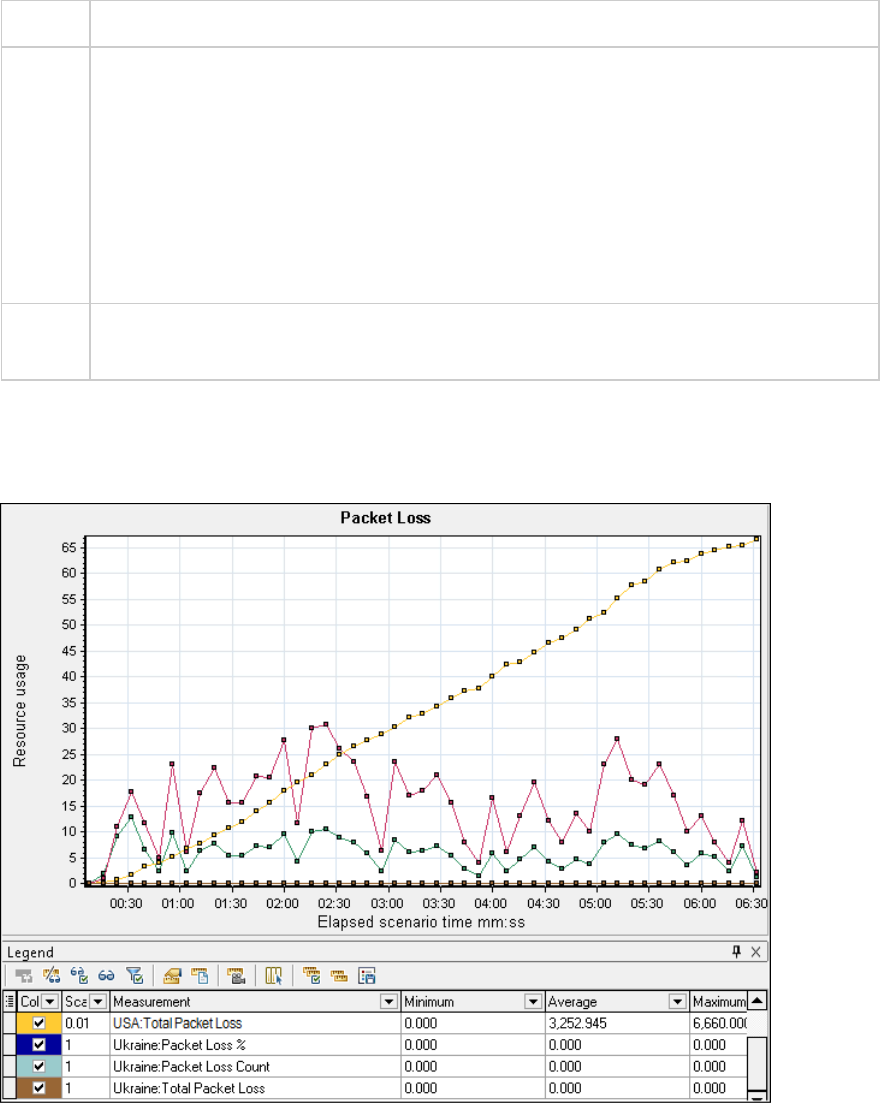
granularity you defined in the General tab of the Options dialog box.
Tip For LoadRunner Analysis (not applicable to monitoring graphs):
To view information for a specific location:
1. Click within the graph.
2. Select Set Filter/ Sort By from the right-click menu to open the Graph Settings dialog
box.
3. In the Filter condition section, select the Location Name row, and select the desired
location from the drop-down list.
See
also
"HP Network Virtualization Monitoring" on page1338
Example - Network Virtualization Per Group
The following example shows how the total of packet loss for the USA group increased as the scenario
progressed.
User Guide
Controller
HP LoadRunner (12.50) Page 1340
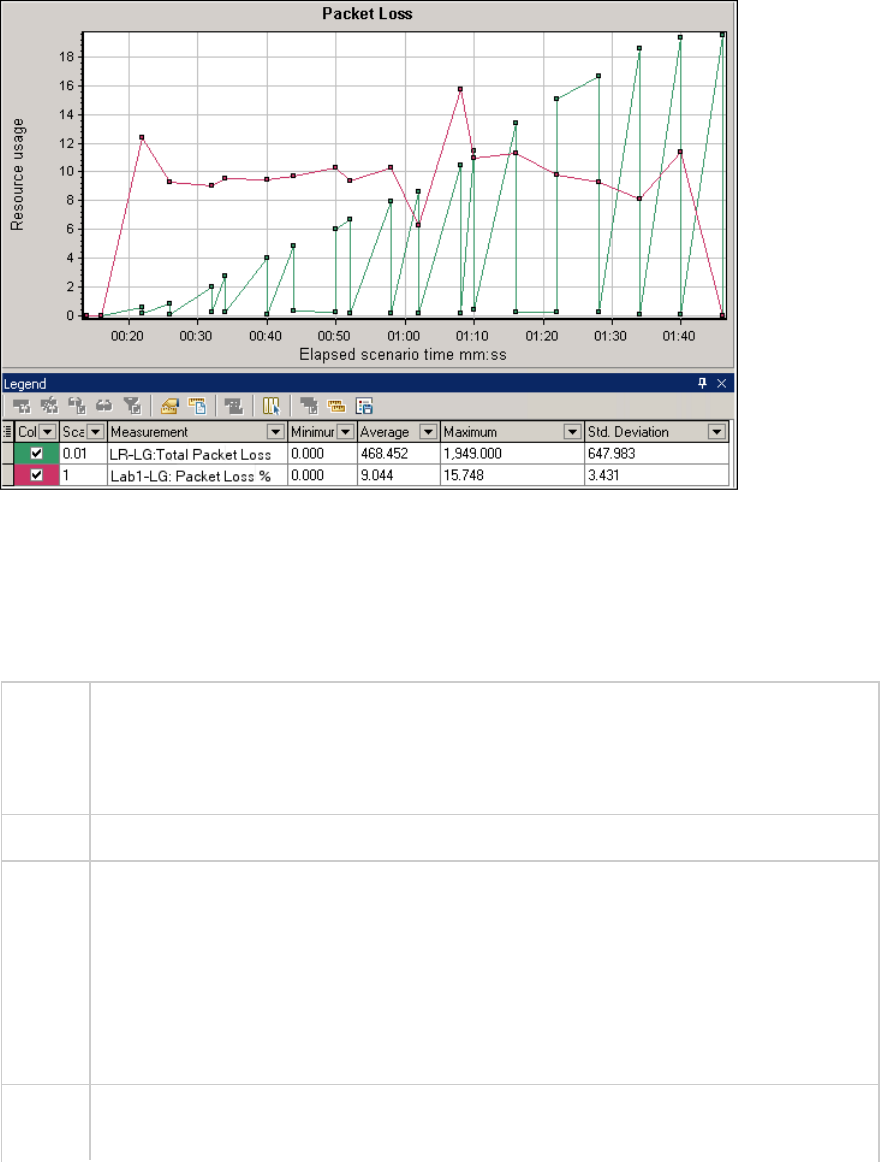
Example - Network Virtualization Per Load Generator
In the following example, you can see that the packet loss is grouped by load generator. This was the
mode selected when you enabled Network Virtualization for the scenario.
Average Throughput Monitor
This graph shows the average data traffic passing to or from the virtualized location, measured in
kilobytes per second (kbps).
Purpose Helps you evaluate the amount of load Vusers generate, in terms of the number of server
and client throughput. The graph shows metrics for input and output traffic for both the
server and client machines. Use the legend below the graph to determine the line color for
each metric.
X-axis Elapsed time since the start of the run.
Y-axis The rate of data passing to and from the virtual location, in kbps for the following metrics
per group or load generator:
lInput to the client machine
lOutput from the client machine
lInput to the server machine
lOutput from the server machine
Note You cannot change the granularity of the x-axis to a value that is less than the Web
granularity you defined in the General tab of the Options dialog box.
User Guide
Controller
HP LoadRunner (12.50) Page 1341
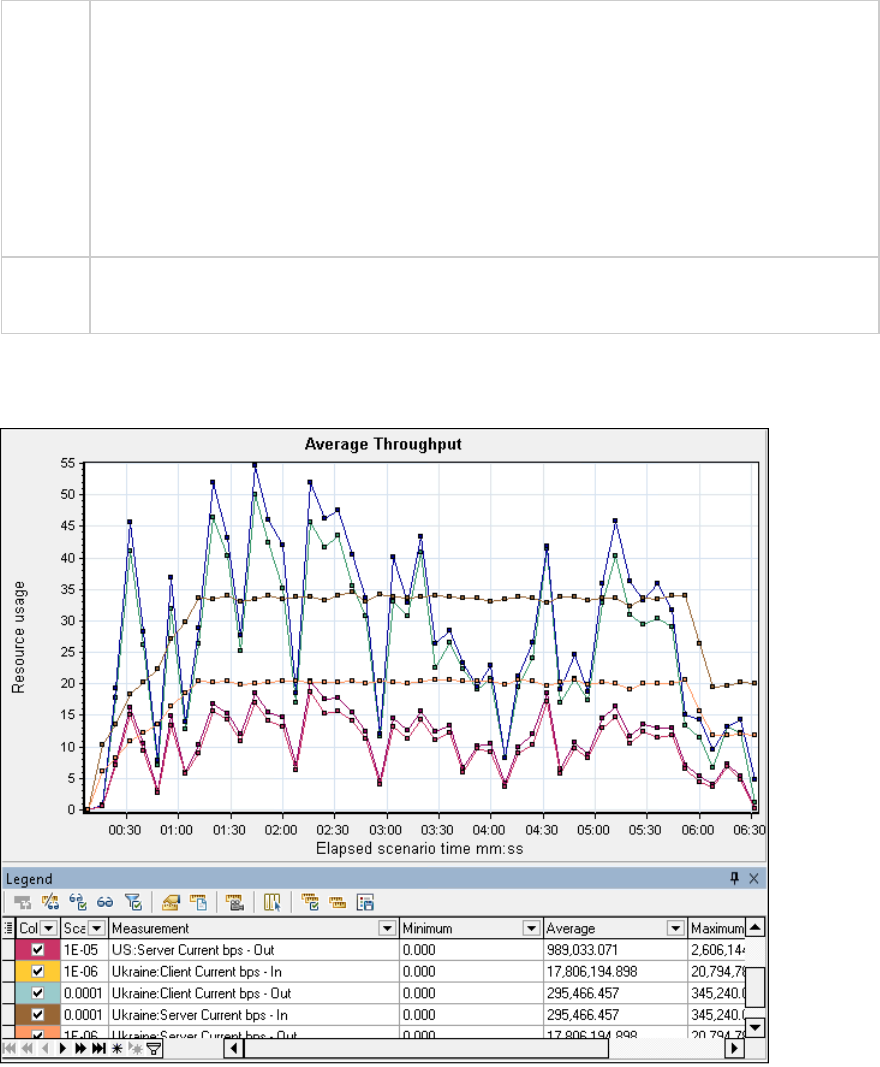
Tips For LoadRunner Analysis (not applicable to monitoring graphs):
To view information for a specific location:
1. Click within the graph.
2. Select Set Filter/ Sort By from the right-click menu to open the Graph Settings dialog
box.
3. In the Filter condition section, select the Location Name row, and select the desired
location from the drop-down list.
See
also
"Total Throughput Monitor" on page1344
Example
In the following example, the average server input throughput was the lowest for the Ukraine group.
If you enabled Network Virtualization per load generator (and not per group), the graph shows the
measurements per load generator, as shown in the "Packet Loss Monitor" on page1339.
User Guide
Controller
HP LoadRunner (12.50) Page 1342

Average Bandwidth Utilization Monitor
This graph shows the average bandwidth utilized by a virtual user or a virtualized location from the
maximal available bandwidth allocated for it during the last second, measured in percentages.
Purpose Helps you evaluate the bandwidth used over your network.
X-axis Elapsed time since the start of the run.
Y-axis The percentage of bandwidth utilization.
Note You cannot change the granularity of the x-axis to a value that is less than the Web
granularity you defined in the General tab of the Options dialog box.
Tips For LoadRunner Analysis (not applicable to monitoring graphs):
To view information for a specific location:
1. Click within the graph.
2. Select Set Filter/ Sort By from the right-click menu to open the Graph Settings dialog
box.
3. In the Filter condition section, select the Location Name row, and select the desired
location from the drop-down list.
See
also
"HP Network Virtualization Monitoring" on page1338
User Guide
Controller
HP LoadRunner (12.50) Page 1343
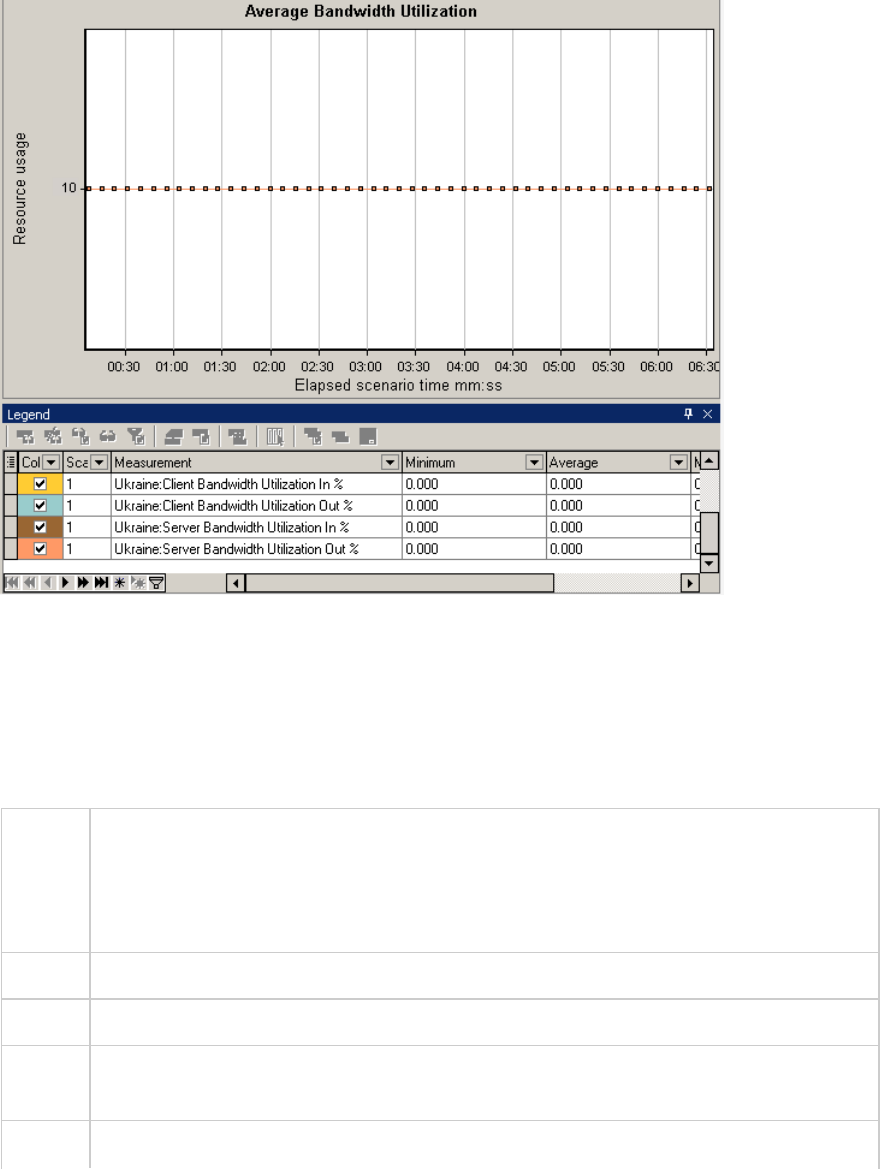
Example
In the following example, you can see that the bandwidth utilization for all locations and measurements,
was constant at 10%.
If you enabled Network Virtualization per load generator (and not per group), the graph shows the
measurements per load generator, as shown in the "Packet Loss Monitor" on page1339.
Total Throughput Monitor
Displays the total data traffic passing to or from the virtualized location, measured in kilobytes.
Purpose Helps you evaluate the total amount of load that Vusers generate while running a scenario
with network virtualization.
The graph shows metrics for input and output traffic for both the server and client
machines. The legend below the graph indicates the line color for each of these metrics.
X-axis Elapsed time since the start of the run.
Y-axis Throughput of the server, in kilobytes per second (Kbps).
Note You cannot change the granularity of the x-axis to a value that is less than the Web
granularity you defined in the General tab of the Options dialog box.
Tips For LoadRunner Analysis (not applicable to monitoring graphs):
User Guide
Controller
HP LoadRunner (12.50) Page 1344
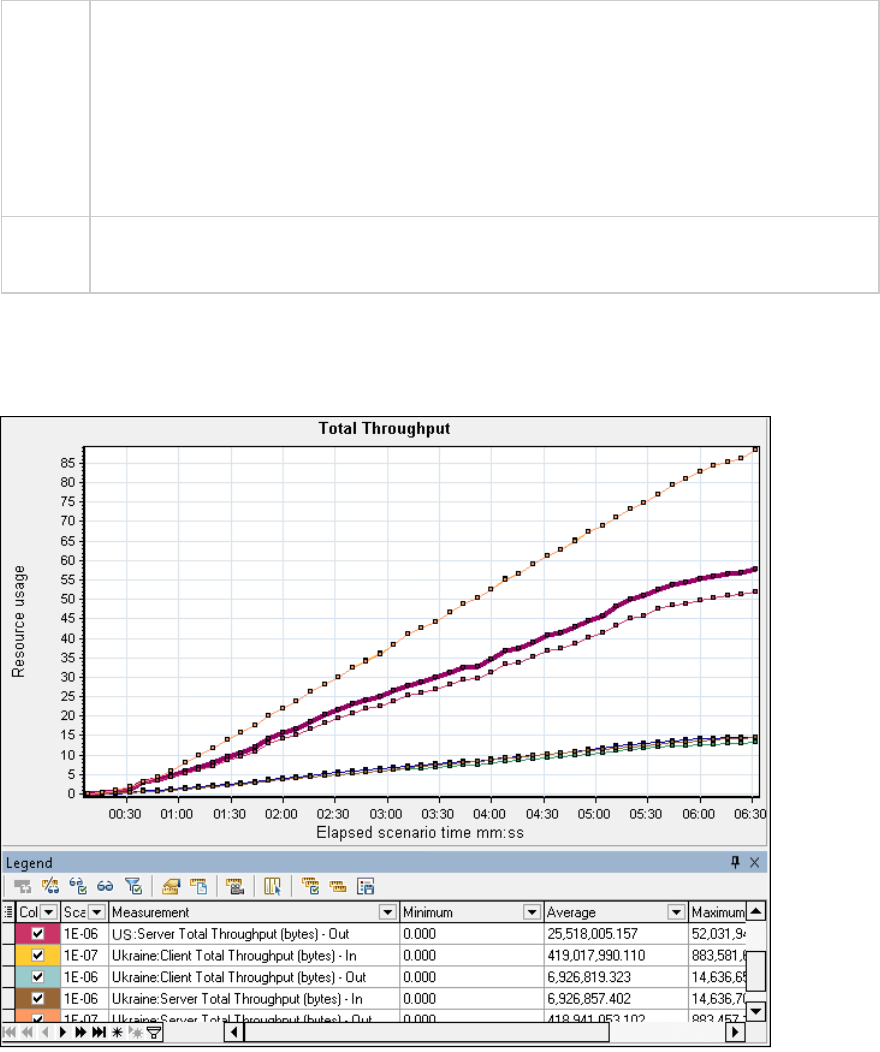
To view information for a specific location:
1. Click within the graph.
2. Select Set Filter/ Sort By from the right-click menu to open the Graph Settings dialog
box.
3. In the Filter condition section, select the Location Name row, and select the desired
location from the drop-down list.
See
also
"Average Throughput Monitor" on page1341
Example
In the following example, the highest throughput level was for the input data to the client, for the
Ukraine group.
If you enabled Network Virtualization per load generator (and not per group), the graph shows the
measurements per load generator, as shown in the "Packet Loss Monitor" on page1339.
SiteScope Server Monitoring
User Guide
Controller
HP LoadRunner (12.50) Page 1345

SiteScope Resource Monitoring
The SiteScope Resources monitor graph shows the SiteScope resources measured during the scenario
run. The SiteScope monitor can measure server, network, and processor performance counters. For
detailed information on the performance counters that SiteScope can monitor, refer to the relevant
SiteScope documentation.
Before setting up the SiteScope monitor, ensure that SiteScope has been installed on a server. You can
install SiteScope on the same machine as the Controller, or on a dedicated server. If SiteScope is
installed on a machine other than the Controller, verify that the SiteScope machine is accessible from
the Controller machine.
The information you need to provide for monitoring SiteScope machines differs slightly from other
monitors. The enhanced integration lets you set up SiteScope monitoring on machines that require user
authentication and Secure HTTP connections. For details, see the "Add Machine Dialog Box" on
page1304.
For details on setting up the SiteScope monitor, see "How to Set up the SiteScope Integration" below.
How to Set up the SiteScope Integration
This task describes how to set up your LoadRunner machine to integrate with the SiteScope monitor.
For an overview of the SiteScope monitor, see "SiteScope Resource Monitoring" above.
You can configure SiteScope to connect anonymously without authentication or with authentication.
Set up SiteScope without authentication
1. Open SiteScope and configure its monitors.
2. Open the URL: http://localhost:8888/SiteScope/cgi/go.exe/SiteScope?page=topazVerify and
confirm that you can see Topaz XML data.
3. Open the xmlmonitorshared.ini file, in the <LR_Install>\dat\monitors folder and edit the
SiteScope section as follows:
[SiteScope]
;ExtensionDll=SiteScopeMonExt.dll
MetricDataURL=SiteScope/cgi/go.exe/SiteScope?page=topaz
MetricListURL=SiteScope/cgi/go.exe/SiteScope?page=topaz&operation=config
DefaultPort=8888
DlgTitle=SiteScope Monitor
RefreshMetricList=1
EnableAccount=1
User Guide
Controller
HP LoadRunner (12.50) Page 1346

Set up SiteScope with authentication as a non-anonymous users
1. Open SiteScope and configure its monitors.
2. Modify the SiteScope administrator to have a user ID and password.
3. Add a new SiteScope user with a user ID and password.
4. Verify that you can see Topaz XML data at the URL
http://localhost:8888/SiteScope/cgi/go.exe/SiteScope?page=topaz&account=login1 (note that
Topaz requires a user index rather than a user name to view XML data)
5. Open C:\Program Files\HP\LoadRunner\dat\monitors\xmlmonitorshared.ini and edit the
SiteScope section as follows (changes noted in bold type):
[SiteScope]
;ExtensionDll=SiteScopeMonExt.dll
MetricDataURL=SiteScope/cgi/go.exe/SiteScope?page=topaz&account=login1
MetricListURL=SiteScope/cgi/go.exe/SiteScope?page=topaz&operation=config
&account=login1
DefaultPort=8888
DlgTitle=SiteScope Monitor
RefreshMetricList=1
EnableAccount=1
QueryLoginInfo=1
For more tips and guidelines, refer to the LoadRunner forums.
Flex Monitoring
Streaming Media Monitoring
Streaming Media Monitoring Overview
To isolate server and client performance bottlenecks during a scenario run, you monitor the Windows
Media Server and RealPlayer audio/video servers, as well as the RealPlayer and Media Player clients.
Note: For instructions on recording a script containing streaming media functions, see the HP
Virtual User Generator.
User Guide
Controller
HP LoadRunner (12.50) Page 1347
The streaming media monitors provide you with performance information for the Windows Media
Server and RealPlayer audio/video servers, as well as the RealPlayer and Media Player clients. To obtain
data for the Windows Media Server and RealPlayer Server, you need to activate the streaming media
monitor before executing the scenario, and indicate which statistics and measurements you want to
monitor. The RealPlayer Client and Media Player Client do not require pre-session or scenario activation
or configuration.
lThe Real Client monitor graph shows statistics on the RealPlayer client machine as a function of the
elapsed scenario time. The x-axis represents the time that has elapsed since the start of the
scenario run. The y-axis represents the resource usage.
lThe Media Player Client monitor graph shows statistics on the Windows Media Player client machine
as a function of the elapsed scenario time. The x-axis represents the time that has elapsed since the
start of the scenario run. The y-axis represents the resource usage.
RealPlayer Client Performance Counters
The following table describes the RealPlayer Client measurements that are monitored:
Measurement Description
Current Bandwidth
(Kbits/sec)
The number of kilobytes in the last second
Buffering Event Time (sec) The average time spent on buffering
Network Performance The ratio (percentage) between the current bandwidth and the
actual bandwidth of the clip
Percentage of Recovered
Packets
The percentage of error packets that were recovered
Percentage of Lost Packets The percentage of packets that were lost
Percentage of Late Packets The percentage of late packets
Time to First Frame
Appearance (sec)
The time for first frame appearance (measured from the start of
the replay)
Number of Buffering Events The average number of all buffering events
Number of Buffering Seek
Events
The average number of buffering events resulting from a seek
operation
Buffering Seek Time The average time spent on buffering events resulting from a seek
operation
Number of Buffering
Congestion Events
The average number of buffering events resulting from network
congestion
User Guide
Controller
HP LoadRunner (12.50) Page 1348

Buffering Congestion Time The average time spent on buffering events resulting from network
congestion
Number of Buffering Live
Pause Events
The average number of buffering events resulting from live pause
Buffering Live Pause Time The average time spent on buffering events resulting from live
pause
Media Player Client Performance Counters
The following table describes the Media Player Client measurements that are monitored:
Measurement Description
Average
Buffering
Events
The number of times Media Player Client had to buffer incoming media data due to
insufficient media content.
Average
Buffering
Time (sec)
The time spent by Media Player Client waiting for sufficient amount of media data in
order to continue playing media clip.
Current
bandwidth
(Kbits/sec)
The number of kbits per second received.
Number of
Packets
The number of packets sent by server for a particular media clip.
Stream
Interruptions
The number of interruptions encountered by media player client while playing a
media clip. This measurement includes the number of times Media Player Client had
to buffer incoming media data, and any errors that occurred during playback.
Stream
Quality
(Packet-
level)
The percentage ratio of packets received to total packets.
Stream
Quality
(Sampling-
level)
The percentage of stream samples received on time (no delays in reception).
Total number
of recovered
packets
The number of lost packets that were recovered. This value is only relevant during
network playback.
User Guide
Controller
HP LoadRunner (12.50) Page 1349

Total number
of lost
packets
The number of lost packets that were not recovered. This value is only relevant
during network playback.
ERP/CRM Server Resource Monitoring
ERP/CRM Server Resource Monitoring Overview
You use LoadRunner's ERP/CRM server resource monitors to monitor ERP/CRM servers during a
scenario run and isolate server performance bottlenecks.
The Siebel Server Manager monitor displays statistics about the resource usage of a Siebel Server
Manager during the scenario run.
Siebel Server Manager Performance Counters
The following table shows the default counters that can be measured:
Measurement Description
Average Connect Time The average connection time.
Average Reply Size The average size of a user reply.
Average Request Size The average size of a user request.
Average Requests Per
Session
The average number of user requests per session.
Average Response Time The average amount of time that it takes the server to respond to a
request.
Average Think Time The average amount of think time taken to respond to a request.
Avg SQL Execute Time The average SQL execute time.
Avg SQL Fetch Time The average SQL fetch time.
Avg SQL Parse Time The average SQL parse time.
CPU Time The CPU time used in the work process.
Elapsed Time The total amount of elapsed time.
Num of DBConn Retries The number of database connection retries.
User Guide
Controller
HP LoadRunner (12.50) Page 1350

Num of DLRbk Retries The number of DLRbk retries.
Num of Exhausted Retries The total number of retries that expired.
Number of SQL Executes The total number of SQL executes.
Number of SQL Fetches The total number of SQL fetches.
Number of SQL Parses The total number of SQL parses.
Number of Sleeps The number of sleeps.
Object Manager Errors The total number of object manager errors.
Reply Messages The total number of reply messages.
Request Messages The total number of request messages.
SQL Execute Time The total SQL execute time.
SQL Fetch Time The total SQL fetch time.
SQL Parse Time The total SQL parse time.
Sleep Time The total sleep time.
Tests Attempted The number of tests attempted.
Tests Failed The number of tests that failed.
Tests Successful The number of tests that were successful.
Total Reply Size The total reply size, measured in bytes.
Total Request Size The total request size, measured in bytes.
Total Response Time The total response time.
Total Tasks The total number of tasks.
Total Think Time The total think time.
Siebel Server Manager Configuration Dialog Box
This dialog box allows you to select the Siebel Server Manager resources to monitor.
To access Right-click a graph > Add Measurements
Click Add in the Resource Measurements section of Siebel Server Manager monitor
dialog box.
Relevant "How to Set Up a Monitoring Environment" on page1301
User Guide
Controller
HP LoadRunner (12.50) Page 1351
tasks
See also "Siebel Server Manager Performance Counters" on page1350
"Troubleshooting and Limitations - Siebel Server Manager Monitor " below
User interface elements are described below:
UI Element Description
Component/Counter
Description
Displays a description of the highlighted component.
Host Displays the name of the monitored machine.
Measured Components Displays the available components. Browse the tree and select the
component you want to monitor.
Performance Counters Displays the available counters for the selected component. Select the
resource counter to monitor.
Troubleshooting and Limitations - Siebel Server Manager
Monitor
This section describes troubleshooting for the Siebel Server Manager Monitor
The Siebel Server Manager monitor uses a Siebel command line utility (srvrmgr) to gather it's statistics.
If you are having trouble getting the Siebel Server Manager monitor to work, run this command from
the Siebel Server Manager client:
srvrmgr /s <server> /g <gateway> /e <enterprise> /u <user> /p <pw>
If this command works from the command line, but SiteScope has trouble executing the command,
open /sitescope/templates.applications/commandline.siebel, and verify that you can run the
following command from the command line:
CONNECT_COMMAND:$PATH$/srvrmgr /g $GATEWAY$ /e $ENTERPRISE$ /s $SERVERS$ /u
$USERNAME$ /p $PASSWORD$
Note: On a Windows 2000 Advanced Server platform this command must be changed to:
CONNECT_COMMAND:$PATH$\srvrmgr.exe /g $GATEWAY$ /e $ENTERPRISE$ /s $SERVERS$
/u $USERNAME$ /p $PASSWORD$
Application Deployment Solution Monitoring
User Guide
Controller
HP LoadRunner (12.50) Page 1352
Application Deployment Solution Monitoring Overview
Using LoadRunner's Application Deployment Solution monitor, you can isolate server performance
bottlenecks by monitoring the Citrix server during a scenario run.
LoadRunner's Citrix monitor provides you with information about the application deployment usage of
the Citrix server during scenario execution. The Citrix monitor allows you to monitor the server
performance statistics from Citrix servers. You can monitor multiple parameters (counters) with a
single monitor instance. This allows you to watch server loading for performance, availability, and
capacity planning.
To obtain performance data, you need to activate the online monitor for the server and specify which
resources you want to measure before executing the scenario.
How to Set up the Citrix Monitoring Environment
This task describes the working order for setting up the monitoring environment.
1. Prerequisites
lMake sure that Citrix Server has been installed and is running.
lIf Citrix Server machine is running Windows 2000, make sure that the server machine is also
running the Remote Registry service.
lMake sure that the LoadRunner machine has administrator privileges to access the Citrix
server.
lMeasurements that monitor instances are valid for the currently running Citrix session only. If
you run this test again, you will need to reconfigure the measurements that are instance-
oriented.
To monitor the different instances, ensure that the server login and logout procedures are
recorded in the Vuser_init and Vuser_end sections respectively, and not in the Action section of
the script. For more information, see "Vuser Script Sections" on page141.
2. Map the Network Drive
From the Controller machine, map a network drive to the Citrix server machine. This ensures that
the required authentication is provided to the Controller to access the resource counters.
3. Launch PerfMon
Launch PerfMon from the Controller machine to enable the counters on the Citrix server. This
allows you to monitor the same counters for the ICA Session object on the Citrix monitor.
4. Open the Connection with the Citrix Server
You can configure the Citrix monitor to view ICA Session object counters only if at least one session
User Guide
Controller
HP LoadRunner (12.50) Page 1353

is being run on the Citrix server. If no "real" user has opened a connection with the Citrix server, you
need to first initialize or run a Citrix Vuser against the server, and only then configure the Citrix
Monitor and add the ICA Session counters. If you configure the Citrix monitor without first
initializing or running a Citrix Vuser (or connecting to the Citrix server as a "real" user), you will not
be able to view the ICA Session object.
5. Configure the Citrix monitor from the Controller
For task details, see "How to Set Up a Monitoring Environment" on page1301.
Citrix Server Performance Counters
The following sections describe some of the counters that can be measured.
Non-Virtual Counters
The following table describes non-virtual counters:
Measurement Description
% Disk Time The percentage of elapsed time that the selected disk drive services read or write
requests.
% Processor
Time
The percentage of time that the processor executes a non-Idle thread. This counter
is a primary indicator of processor activity. It is calculated by measuring the time
that the processor spends executing the thread of the Idle process in each sample
interval, and subtracting that value from 100%. (Each processor has an Idle thread
which consumes cycles when no other threads are ready to run.) It can be viewed as
the percentage of the sample interval spent doing useful work. This counter
displays the average percentage of busy time observed during the sample interval.
It is calculated by monitoring the time the service was inactive, and then
subtracting that value from 100%.
File data
Operations/sec
The rate that the computer issues Read and Write operations to file system
devices. This does not include File Control Operations.
Interrupts/sec The average number of hardware interrupts the processor receives and services
per second. It does not include DPCs, which are counted separately. This value is an
indirect indicator of the activity of devices that generate interrupts, such as the
system clock, the mouse, disk drivers, data communication lines, network interface
cards and other peripheral devices. These devices normally interrupt the processor
when they have completed a task or require attention. Normal thread execution is
suspended during interrupts. Most system clocks interrupt the processor every 10
milliseconds, creating a background of interrupt activity. This counter displays the
difference between the values observed in the last two samples, divided by the
User Guide
Controller
HP LoadRunner (12.50) Page 1354

duration of the sample interval.
Output Session
Line Speed
This value represents the line speed from server to client for a session in bps.
Input Session
Line Speed
This value represents the line speed from client to server for a session in bps.
Page
Faults/sec
A count of the Page Faults in the processor. A page fault occurs when a process
refers to a virtual memory page that is not in its Working Set in main memory. A
Page Fault will not cause the page to be fetched from disk if that page is on the
standby list, and hence already in main memory, or if it is in use by another process
with whom the page is shared.
Pages/sec The number of pages read from the disk or written to the disk to resolve memory
references to pages that were not in memory at the time of the reference. This is
the sum of Pages Input/sec and Pages Output/sec. This counter includes paging
traffic on behalf of the system Cache to access file data for applications. This value
also includes the pages to/from non-cached mapped memory files. This is the
primary counter to observe if you are concerned about excessive memory pressure
(that is, thrashing), and the excessive paging that may result.
Pool Nonpaged
Bytes
The number of bytes in the Nonpaged Pool, a system memory area where space is
acquired by operating system components as they accomplish their appointed
tasks. Nonpaged Pool pages cannot be paged out to the paging file, but instead
remain in main memory as long as they are allocated.
Private Bytes The current number of bytes this process has allocated that cannot be shared with
other processes.
Processor
Queue Length
The instantaneous length of the processor queue in units of threads. This counter is
always 0 unless you are also monitoring a thread counter. All processors use a
single queue in which threads wait for processor cycles. This length does not include
the threads that are currently executing. A sustained processor queue length
greater than two generally indicates processor congestion. This is an instantaneous
count, not an average over the time interval.
Threads The number of threads in the computer at the time of data collection. Notice that
this is an instantaneous count, not an average over the time interval. A thread is
the basic executable entity that can execute instructions in a processor.
Latency –
Session
Average
This value represents the average client latency over the life of a session.
Latency – Last This value represents the last recorded latency measurement for this session.
User Guide
Controller
HP LoadRunner (12.50) Page 1355
Recorded
Latency –
Session
Deviation
This value represents the difference between the minimum and maximum
measured values for a session.
Input Session
Bandwidth
This value represents the bandwidth from client to server traffic for a session in
bps.
Input Session
Compression
This value represents the compression ratio for client to server traffic for a
session.
Output Session
Bandwidth
This value represents the bandwidth from server to client traffic for a session in
bps.
Output Session
Compression
This value represents the compression ratio for server to client traffic for a
session.
Output Session
Linespeed
This value represents the line speed from server to client for a session in bps.
Virtual Channel Counters
The following table describes virtual channel counters:
Measurement Description
Input Audio
Bandwidth
This value represents the bandwidth from client to server traffic on the audio
mapping channel. This is measured in bps.
Input Clipboard
Bandwidth
This value represents the bandwidth from client to server traffic on the
clipboard mapping channel. This is measured in bps.
Input COM1
Bandwidth
This value represents the bandwidth from client to server traffic on the COM1
channel. This is measured in bps.
Input COM2
Bandwidth
This value represents the bandwidth from client to server traffic on the COM2
channel. This is measured in bps.
Input COM
Bandwidth
This value represents the bandwidth from client to server traffic on the COM
channel. This is measured in bps.
Input Control
Channel
Bandwidth
This value represents the bandwidth from client to server traffic on the ICA
control channel. This is measured in bps.
Input Drive This value represents the bandwidth from client to server traffic on the client
User Guide
Controller
HP LoadRunner (12.50) Page 1356

Bandwidth drive mapping channel. This is measured in bps.
Input Font Data
Bandwidth
This value represents the bandwidth from client to server traffic on the local
text echo font and keyboard layout channel. This is measured in bps.
Input Licensing
Bandwidth
This value represents the bandwidth from server to client traffic on the
licensing channel. This is measured in bps.
Input LPT1
Bandwidth
This value represents the bandwidth from client to server traffic on the LPT1
channel. This is measured in bps.
Input LPT2
Bandwidth
This value represents the bandwidth from client to server traffic on the LPT2
channel. This is measured in bps.
Input
Management
Bandwidth
This value represents the bandwidth from client to server traffic on the client
management channel. This is measured in bps.
Input PN
Bandwidth
This value represents the bandwidth from client to server traffic on the
Program Neighborhood channel. This is measured in bps.
Input Printer
Bandwidth
This value represents the bandwidth from client to server traffic on the printer
spooler channel. This is measured in bps.
Input Seamless
Bandwidth
This value represents the bandwidth from client to server traffic on the
Seamless channel. This is measured in bps.
Input Text Echo
Bandwidth
This value represents the bandwidth from client to server traffic on the local
text echo data channel. This is measured in bps.
Input Thinwire
Bandwidth
This value represents the bandwidth from client to server traffic on the
Thinwire (graphics) channel. This is measured in bps.
Input VideoFrame
Bandwidth
This value represents the bandwidth from client to server traffic on the
VideoFrame channel. This is measured in bps.
Output Audio
Bandwidth
This value represents the bandwidth from server to client traffic on the audio
mapping channel. This is measured in bps.
Output Clipboard
Bandwidth
This value represents the bandwidth from server to client traffic on he clipboard
mapping channel. This is measured in bps.
Output COM1
Bandwidth
This value represents the bandwidth from server to client traffic on the COM1
channel. This is measured in bps.
Output COM2
Bandwidth
This value represents the bandwidth from server to client traffic on the COM2
channel. This is measured in bps.
Output COM This value represents the bandwidth from server to client traffic on the COM
User Guide
Controller
HP LoadRunner (12.50) Page 1357

Bandwidth channel. This is measured in bps.
Output Control
Channel
Bandwidth
This value represents the bandwidth from server to client traffic on the ICA
control channel. This is measured in bps.
Output Drive
Bandwidth
This value represents the bandwidth from server to client traffic on the client
drive channel. This is measured in bps.
Output Font Data
Bandwidth
This value represents the bandwidth from server to client traffic on the local
text echo font and keyboard layout channel. This is measured in bps.
Output Licensing
Bandwidth
This value represents the bandwidth from server to client traffic on the
licensing channel. This is measured in bps.
Output LPT1
Bandwidth
This value represents the bandwidth from server to client traffic on the LPT1
channel. This is measured in bps.
Output LPT2
Bandwidth
This value represents the bandwidth from server to client traffic on the LPT2
channel. This is measured in bps.
Output
Management
Bandwidth
This value represents the bandwidth from server to client traffic on the client
management channel. This is measured in bps.
Output PN
Bandwidth
This value represents the bandwidth from server to client traffic on the
Program Neighborhood channel. This is measured in bps.
Output Printer
Bandwidth
This value represents the bandwidth from server to client traffic on the printer
spooler channel. This is measured in bps.
Output Seamless
Bandwidth
This value represents the bandwidth from server to client traffic on the
Seamless channel. This is measured in bps.
Output Text Echo
Bandwidth
This value represents the bandwidth from server to client traffic on the local
text echo data channel. This is measured in bps.
Output Thinwire
Bandwidth
This value represents the bandwidth from server to client traffic on the
Thinwire (graphics) channel. This is measured in bps.
Output
VideoFrame
Bandwidth
This value represents the bandwidth from server to client traffic on the
VideoFrame channel. This is measured in bps.
Citrix Monitor Dialog Box
This dialog box enables you to configure the measurements for the Citrix monitor.
User Guide
Controller
HP LoadRunner (12.50) Page 1358
To access Right-click a graph > Add Measurements
Click Add in the Resource Measurements section of Citrix Monitor dialog.
Important
information
Note: For Citrix monitoring, if the dialog box freezes after clicking Add, you may need
to rebuild the localhost cache on the Citrix server machine.
Relevant
tasks
"How to Set up the Citrix Monitoring Environment" on page1353
See also "How to Set Up a Monitoring Environment" on page1301
User interface elements are described below:
UI Element Description
Adds the selected measurement to the list of measurements in the Measurements
on <machine> section of the Citrix dialog box.
Counters Select a resource counter to monitor. Select multiple counters using the CTRL key. For
a definition of each counter, click Explain.
Instances If multiple instances of the selected counter are running, select one or more
instances to monitor for the selected counter.
Object Select the object being monitored on the specified machine.
Middleware Performance Monitoring
Middleware Performance Monitoring Overview
A primary factor in a transaction's response time is the Middleware performance usage. LoadRunner's
Middleware Performance monitors provide you with information about the Middleware performance
usage of the IBM WebSphere MQ server during a scenario execution. To obtain performance data, you
need to activate the online monitor for the server and specify which resources you want to measure
before executing the scenario.
lThe IBM WebSphere MQ monitor is used to monitor channel and queue performance counters on an
IBM WebSphere MQ (version 5.x) Server.
How to Set Up the IBM WebSphere MQ Monitor
This task describes how to configure the Controller and IBM WebSphere MQ machines:
1. Prerequisites
Ensure that an IBM WebSphere MQ Client Connection (version 5.21 only) is installed on the
User Guide
Controller
HP LoadRunner (12.50) Page 1359

Controller machine.
2. Configure the server environment to monitor events
The LoadRunner MQ Monitor retrieves event messages from two standard MQSeries queues only:
lSYSTEM.ADMIN.PERFM.EVENT – performance events, such as "queue depth high"
lSYSTEM.ADMIN.CHANNEL.EVENT – channel events, such as "channel stopped"
Events must be enabled for the queue manager (and in many cases, on the applicable object, as
well). Performance events are enabled by setting attributes for the queue on the MQ Server.
Channel events are enabled by default, and cannot be disabled.
Note: The IBM WebSphere MQ monitor does not retrieve data from a queue manager
after the queue manager has been restarted.
a. Run the following MQSC command:
ALTER QMGR PERFMEV(ENABLED).
b. Set the queue attributes. For a list of queue attributes, "IBM WebSphere MQ Queue Attributes"
on page1363.
3. Add the monitored server to the Controller
a. In the Controller Run view, click the IBM WebSphere MQ graph in the graph tree, and drag it
into the right pane.
b. Right-click the graph and select Add Measurements, or click anywhere on the graph and select
Monitors > Add Measurements. The IBM WebSphere MQ dialog box opens.
In the Monitored Server Machines section, click Add. The Add Machine dialog box opens.
c. The first time that you add measurements, enter the server name or IP address of the
machine you want to monitor. The format of the server name is <machine name>:<port
number>. Select the platform on which the machine runs, and click OK.
d. In the Resource Measurements section of the IBM WebSphere MQ dialog box, click Add.
4. Configure the IBM WebSphere MQ monitor
The IBM WebSphere MQ monitor connects to the IBM WebSphere MQ server (via the MQ Client
Connection installed on the Controller machine). In MQ Client environments, the client machine
connects to an MQ Server instance, and uses the Server's resources as if they were local to the
client machine.
lSpecify the connection information and measurements in the MQ Monitor Add Measurements
dialog.
User Guide
Controller
HP LoadRunner (12.50) Page 1360

IBM WebSphere MQ Performance Counters
The following tables list the available IBM WebSphere MQ monitor measurements:
Queue Performance Counters
The following table describes the Queue Performance counters:
Measurement Description
Event - Queue Depth High
(events per second)
An event triggered when the queue depth reaches the configured
maximum depth.
Event - Queue Depth Low
(events per second)
An event triggered when the queue depth reaches the configured
minimum depth.
Event - Queue Full (events
per second)
An event triggered when an attempt is made to put a message on a
queue that is full.
Event - Queue Service
Interval High (events per
second)
An event triggered when no messages are put to or retrieved from a
queue within the timeout threshold.
Event - Queue Service
Interval OK (events per
second)
An event triggered when a message has been put to or retrieved
from a queue within the timeout threshold.
Status - Current Depth Current count of messages on a local queue. This measurement
applies only to local queues of the monitored queue manager.
Status - Open Input Count Current count of open input handles. Input handles are opened so
that an application may "put" messages to a queue.
Status - Open Output Count Current count of open output handles. Output handles are opened
so that an application may "get" messages from a queue.
Channel Performance Counters
The following table describes the Channel Performance counters:
Measurement Description
Event - Channel
Activated
(events per
second)
Event generated when a channel, waiting to become active but inhibited from
doing so due to a shortage of queue manager channel slots, becomes active due
to the sudden availability of a channel slot.
User Guide
Controller
HP LoadRunner (12.50) Page 1361

Event - Channel
Not Activated
(events per
second)
Event generated when a channel, attempts to become active but inhibited from
doing so due to a shortage of queue manager channel slots.
Event - Channel
Started (events
per second)
Event generated when a channel is started.
Event - Channel
Stopped (events
per second)
Event generated when a channel is stopped, regardless of source of stoppage.
Event - Channel
Stopped by User
(events per
second)
Event generated when a channel is stopped by a user.
Status -
Channel State
The current state of a channel. Channels pass through several states from
stopped (inactive state) to running (fully active state). Channel states range from
0 (stopped) to 6 (running).
Status -
Messages
Transferred
The count of messages that have been sent over the channel. If no traffic is
occurring over the channel, this measurement will be zero. If the channel has not
been started since the queue manager was started, no measurement will be
available.
Status - Buffer
Received
The count of buffers that have been received over the channel. If no traffic is
occurring over the channel, this measurement will be zero. If the channel has not
been started since the queue manager was started, no measurement will be
available.
Status - Buffer
Sent
The count of buffers that have been sent over the channel. If no traffic is
occurring over the channel, this measurement will be zero. If the channel has not
been started since the queue manager was started, no measurement will be
available.
Status - Bytes
Received
The count of bytes that have been received over the channel. If no traffic is
occurring over the channel, this measurement will appear as zero. If the channel
has not been started since the queue manager was started, no measurement will
be available.
Status - Bytes
Sent
The count of bytes that have been sent over the channel. If no traffic is occurring
over the channel, this measurement will appear as zero. If the channel has not
been started since the queue manager was started, no measurement will be
available.
User Guide
Controller
HP LoadRunner (12.50) Page 1362

IBM WebSphere MQ Queue Attributes
You set the following queue attributes using the MQSC command ALTER QMGR PERFMEV(ENABLED):
Measurement Set Event Attributes
Event - Queue
Depth High
lQDEPTHHI(integer) - where integer is a value expressed as a percentage of
maximum messages allowed, and is in the range of 0 to 100 inclusive.
lQDPHIEV(action) - where action is the word "ENABLED" or "DISABLED", enabling
or disabling the generation of the event, respectively.
Event - Queue
Depth Low
To enable the event for a queue, the following attributes of the queue must be set:
lQDEPTHLO(integer) - where integer is a value expressed as a percentage of
maximum messages allowed, and is in the range of 0 to 100 inclusive.
lQDPLOEV(action) - where action is the word "ENABLED" or "DISABLED", enabling
or disabling the generation of the event, respectively.
Event - Queue
Full
lQDEPTHHI(integer) – where integer is a value expressed as a percentage of
maximum messages allowed, and is in the range of 0 to 100 inclusive.
lQDPMAXEV(action) – where action is the word "ENABLED" or "DISABLED", enabling
or disabling the generation of the event, respectively.
Event - Queue
Service
Interval High
lQSVCINT(integer) – where integer is a value expressed as milliseconds, in the
range of 0 and 999,,999, inclusive. Note: this value is shared with Queue Service
Interval OK.
lQSVCIEV(type) – where type is the word "HIGH", "OK", or "NONE", enabling service
interval high events, enabling service interval ok events, or disabling the
generation of the event, respectively.
Event - Queue
Service
Interval OK
lQSVCINT(integer) – where integer is a value expressed as milliseconds, in the
range of 0 and 999,999,999, inclusive. Note: this value is shared with Queue
Service Interval High.
lQSVCIEV(type) – where type is the word "HIGH", "OK", or "NONE", enabling service
interval high events, enabling service interval ok events, or disabling the
generation of the event, respectively.
MQ Monitor Add Measurements Dialog Box
This dialog box enables you to configure the monitor by choosing which measurements to monitor on
the machine.
To access Right-click a graph > Add Measurements
Click Add in the Resource Measurements section of the IBM WebSphere MQ
User Guide
Controller
HP LoadRunner (12.50) Page 1363
dialog.
Important
information
User entries for any text box are limited to 48 characters.
Relevant tasks "How to Set Up the IBM WebSphere MQ Monitor" on page1359
See also "IBM WebSphere MQ Performance Counters" on page1361
User interface elements are described below:
UI Element Description
Alternate
Queue
If the event configured for monitoring is from a remote queue manager (other than
the one identified in the queue manager field of the IBM WebSphere MQ Add
Measurements dialog box), click Alternate Queue to enter the name of an alternate
queue manager.
Note: When you add an alternate queue manager, this becomes the default
queue manager for any events that you subsequently add. To return to the
queue manager to which you are connected, enter that name in the
Alternate Queue Manager dialog box.
Available
Measurements
Object Type.Select an object type from either Channel or Queue.
Object Name. Enter a name for object you want to monitor.
Event/Attribute. Select the events and attributes you want to monitor for the
selected object.
Filter System Objects. Select to enable the system objects filter.
Add Object. Enables you to add a new object name to the Object name list.
Add. Enables you to add an Event or Attribute to an object.
Remove. Enables you to remove a monitored object event or attribute from the
Object name list.
Alternate Queue. Enter the name of an alternate queue manager if the event is
from a remote queue manager.
Connections
Information
Server. The name of the server you are monitoring.
Client Channel. Enter the name of the channel through which a client connection is
made to an MQ Server.
l
Note: You can set up a specific channel on an MQ Server instance, or use
the default "SYSTEM.DEF.SVRCONN" channel. If the client channel is
undefined, the MQ Server will be inaccessible via client connections (the
MQ Monitor will not work, as it will not be able to connect to the queue
manager which it is supposed to monitor).
User Guide
Controller
HP LoadRunner (12.50) Page 1364

Queue Manager. Enter the name of the queue manager to be monitored.
l
Note: The monitor is not restricted to monitoring only the queue
manager to which it is connected. You can configure multiple queue
managers to write to the event queue of a central queue manager for
centralized monitoring (this applies to Events only, not polled object
attributes). All events contain a queue manager attribute identifying
their source.
l
Note: A queue manager can only be accessed by one Controller or
monitoring application at any one time.
Filter system
objects
By default, only user-defined objects are displayed in the Object name list. To show
all objects, clear the Filter System Objects check box. You can modify the filter
settings, in the <LoadRunner_installation>\dat\monitors\mqseries.cfg file.
Monitored
Object list
A list of monitored objects, including the object's name, events and attributes, and
alternate queue manager.
Infrastructure Resources Monitoring
Infrastructure Resources Monitoring Overview
Using LoadRunner's Network Client monitor, you can monitor network client resources for FTP, POP3,
SMTP, IMAP, and DNS Vusers during a scenario run and isolate client performance bottlenecks.
Activating the Network Client Monitor
The Network Client online monitor graph is only available during scenarios that run relevant scripts,
such as FTP, POP3, and so forth.
You can view this graph by dragging it from the Infrastructure Resources Graph section in the graph
tree into the right pane of the Run view. The graph appears in the graph view area.
Network Client Performance Counters
The following table describes the Network Client measurements that are monitored:
Measurement Description
Pings per sec Number of pings per second
User Guide
Controller
HP LoadRunner (12.50) Page 1365

Data transfer bytes per sec Number of data bytes transferred per second
Data receive bytes per sec Number of data bytes received per second
Connections per sec Number of connections per second
Accept connections per sec Number of connections accepted per seconds
SSL Connections per sec Number of SSL connections per second
SSL Data transfer bytes per sec Number of SSL data bytes transferred per second
SSL Data receive bytes per sec Number of SSL data bytes received per second
SSL Accept connections per sec Number of SSL connections accepted per seconds
Network Virtualization Integration
HP LoadRunner integrates with HP Network Virtualization (NV) to help you test point-to-point
performance of network-deployed products under real-world conditions.
By incorporating NV into your scenario, you can create more meaningful results by configuring Vuser
groups with unique network effects, depending on its route or location. For example, you could define a
location from New York to London and another one from Los Angeles to New York. As a result of this,
your scenario performs the test in a more realistic environment that better represents the actual
deployment of your application.
During the scenario run, you can run the NV monitors to verify that your scenario is performing network
virtualization. For details, see "HP Network Virtualization Monitoring" on page1338.
After the scenario run, you can view the results in Analysis. For details, see "Network Virtualization
Graphs" on page1565, or the "Transaction Response Time by Location Graph" on page1520.
Network virtualization can be used in conjunction with IP spoofing.
Installation
The LoadRunner setup wizard prompts you to install NV at the conclusion of the installation. If you did
not install the NV components as part of the LoadRunner installation, you can run the NV installations
manually at any time.
The installation files and guide are located in the <LoadRunner installation DVD>\Additional
Components\HP NV folder. Refer to the installation guide in that folder, to determine which NV
components to install on your machine.
Note: The appropriate LoadRunner version, 12.50 or later, must be installed before you can
install the NV components.
User Guide
Controller
HP LoadRunner (12.50) Page 1366
Licensing
You can only create virtual locations using the global virtualization settings, if you purchased a specific
license for Network Virtualization Vusers. If you only have the Community license, you are limited to two
NV Vusers.
See also
l"How to Run a Scenario with Network Virtualization" on the next page
lHP Network Virtualization product page
Network Virtualization Locations
Network Virtualization comes with pre-defined virtual location settings for your network virtualization
testing, which emulate conditions unique to specific geographic areas. In addition, you can define your
own custom locations.
You view and add locations in the "Virtual Locations Settings Dialog Box" on page1371. You can define
global virtualization settings or configure the settings for each of the locations separately.
After the scenario run, using LoadRunner Analysis, you can group the scenario results by the virtual
location name. For information on grouping metrics, see "Filtering and Sorting Graph Data" on
page1480 in the Analysis section.
Excluding Machines from Network Virtualization
In some situations, you may need to exclude certain machines that may affect the virtualization
emulation, from the network virtualization . A typical example is a software update server.
To exclude a machine, you configure the IP Filter settings of your network virtualization software. When
you exclude a machine, their network effects will not be included in the network virtualization results.
Which machines should you exclude? Any machine that if emulated, may affect the results of the actual
scenario during its run, (for example, the Controller) should be excluded. The following machines are
excluded by default:
lMI Listener, and proxy server machines
lThe Diagnostics Commander server
lA machine running SiteScope
The following are situations to consider excluding a machine from network virtualization:
lIn a Multiprotocol scenario that includes a Web server and a database server; where information
from the database server is not required as a part of the load test. In such a case, you would exclude
the database server.
User Guide
Controller
HP LoadRunner (12.50) Page 1367
lDeployment and software upgrade servers.
lServers that run and store scripts on a shared network drive.
How to Run a Scenario with Network Virtualization
This task describes how to run a scenario using network virtualization and view the metrics in Analysis.
1. Prerequisites
a. Make sure that you have HP Network Virtualization for LoadRunner and Performance Center
12.50 installed on your Controller and load generator machines. For details, see the HP
LoadRunner Installation Guide.
b. Make sure that you have Internet Explorer 9 or higher. Chrome and Firefox are not supported
for HP Network Virtualization.
c. Disconnect the load generators upon which you intend to perform network virtualization. On
the main Controller toolbar, click the Load Generator button to open the Load Generators
dialog box. If the load generator is connected, select it and click Disconnect.
2. Open the Virtual Locations Settings dialog box
On the Controller toolbar, click the Show Virtual Locations Settings button to open the dialog
box. For details, see "Virtual Locations Settings Dialog Box" on page1371.
3. Choose a virtualization method
a. Use the default Per Group to perform network virtualization per group. The per group options
enables you to assign multiple virtual locations to each script in the scenario. Use Per Load
Generator for all scripts to run on the same virtual location. For more information on the
different modes, see, "Per Group vs Per Load Generator" on page1373.
4. Set the global network virtualization settings
a. In the Virtual Locations Settings dialog box, click Common Settings to define the global options
for all virtual locations for that scenario. This opens the interface to the HP Network
Virtualization software.
b. In the HP Network Virtualization tabs, follow their configuration recommendations. For details,
see the NV User Guide in the Start menu.
c. In the IP Filter section, specify any machines that you may want to exclude from network
virtualization for all locations. For details on which machines to exclude, see "Excluding
Machines from Network Virtualization" on the previous page.
5. Add virtual location (optional)
If you do not want to use one of the built-in virtual locations, you can define your own custom
User Guide
Controller
HP LoadRunner (12.50) Page 1368
locations. In the Virtual Locations Settings dialog box, click in the Virtual Locations list and add one
or more location names. For location names, use the ANSI standard format. You cannot use the
following characters: \ / : “ ? ‘ < > | * % ^ , ! { } ( ) ; = #
To add a new location, type it in the next available line.
Note: For concept details about virtual locations, see "Network Virtualization Locations" on
page1367.
Configure the network virtualization settings per location
a. In the Virtual Locations Settings dialog box, select a location in the Virtual Locations list and
click Configure. This opens the interface to the HP Network Virtualization software. For details
on how to configure your virtual location see the NV User Guide in the Start menu.
Note: When defining bandwidth settings for your scenario, bandwidth can either be
shared between all Vusers or set per Vuser. The following protocols support shared
bandwidth only:
oCitrix ICA
oCOM/DCOM
oJava Record Replay
oJava Vuser
oMAPI
If you define a scenario with any of these protocols with individual bandwidth settings,
a warning is displayed when you run the scenario.
Close the Virtual Locations Settings dialog box.
6. For per Group mode: Set a location for each script
a. In the Scenario Scripts pane, click the Virtual Location box for the script and select a location
from the drop down list. If you do not want to use network virtualization for a specific group,
select None.
b. Repeat the above step for each group.
Note: If the script runs on a protocol that does not support the per Group mode, the
icon appears next to the virtual location showing that the script will run according
to the Load Generator settings.
User Guide
Controller
HP LoadRunner (12.50) Page 1369
7. For per Load Generator mode: Set a location for each load generator
a. On the main Controller toolbar, click the Load Generator button to open the Load
Generators dialog box.
b. Select the load generator and click Details.
c. Click the Network Virtualization tab, click the Default Virtual Location drop-down and select
a location for the Load Generator. If you do not want to use network virtualization for a
specific load generator, select None.
d. Repeat the above steps for each load generator.
8. Initiate the network virtualization monitors
a. In the bottom section of the Controller window, select the Run tab.
b. In the Available Graphs pane, locate the Network Virtualization node. Double-click the
metrics to monitor them. For details, see "HP Network Virtualization Monitoring" on page1338.
Note: If a load generator is connected over a firewall, add monitors manually using the
Monitor Over Firewall component. For details, see Monitors Over a Firewall.
9. Filter the measurements by location - optional
To view graphs for a specific location:
a. Click within a graph.
b. Select Set Filter/ Sort By from the right-click menu to open the Graph Settings dialog box.
c. In the Filter condition section, select the Location row, and specify the desired location.
To group the measurements by location:
a. Click within a graph and select Set Filter/ Sort By from the right-click menu.
b. In the Group by section, select Location in the Available groups pane.
c. Click the right arrow to move it into the Selected groups pane.
10. Export the virtual locations settings - optional
In the Virtual Locations Settings dialog box, click Export to save the settings to a file for future use.
11. Save and run the scenario.
Complete all other steps required to set up your scenario and save it. The network virtualization
settings are saved together with the scenario. Run the scenario in the normal way. Network
virtualization starts and stops automatically with the scenario. When a scenario runs with network
virtualization, it shows the icon in the status bar. View the metrics in the
monitors that you added earlier.
12. View the metrics in HP LoadRunner Analysis
User Guide
Controller
HP LoadRunner (12.50) Page 1370
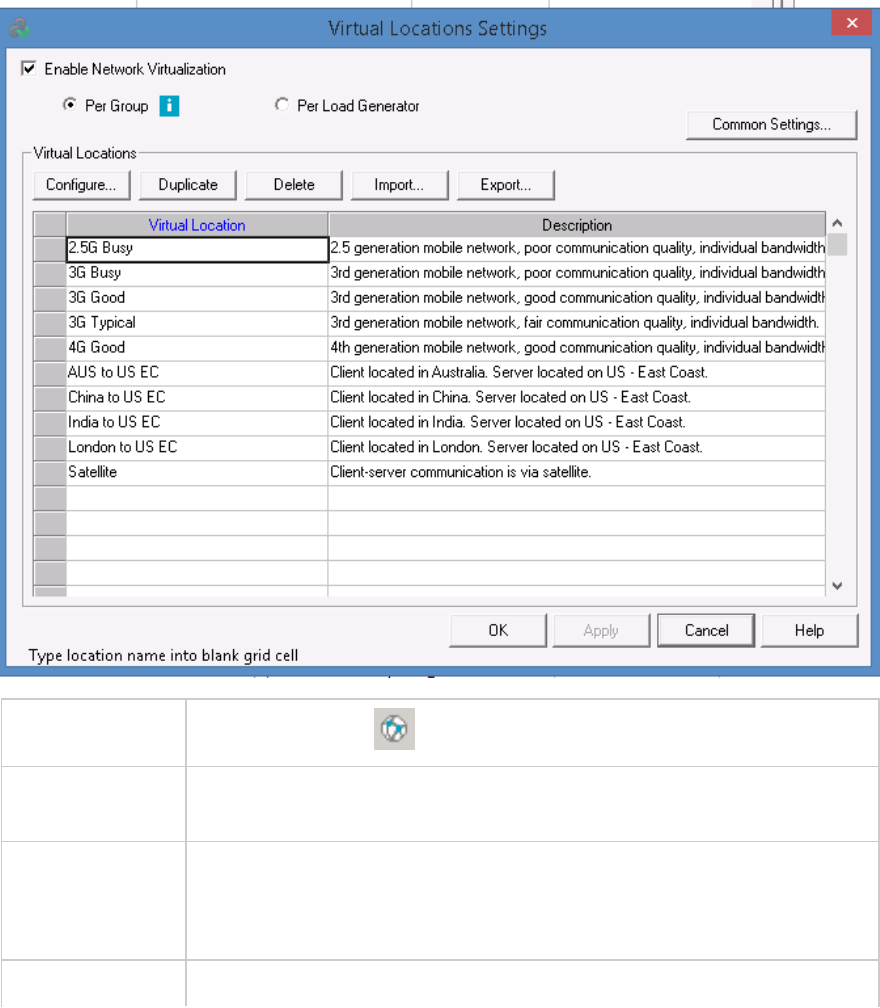
Network virtualization metrics are automatically collected during the scenario run. Open Analysis
and view the network virtualization metrics. You can group them by location, and correlate the
metrics with other data such as response time.
Virtual Locations Settings Dialog Box
This dialog box allows you to configure your virtual locations.
To access
Controller toolbar > Show Virtual Locations Settings button
Important
information
lTo access this dialog box, you must have HP Network Virtualization installed
on your machine.
Relevant tasks l"How to Run a Scenario with Network Virtualization" on page1368
l"How to Add a Load Generator to a Scenario" on page1113
l"How to Modify Load Generator Settings" on page1124
See also l"Network Virtualization Integration" on page1366
User Guide
Controller
HP LoadRunner (12.50) Page 1371

l"HP Network Virtualization Monitoring" on page1338
User interface elements are described below:
UI Element Description
Enable Network
Virtualization
Enables network virtualization when running a scenario. Choose between
running Network Virtualization:
lPer Group. Enables you to assign different virtual locations for each
group, even when several groups are run on the same Load Generator.
(Default)
lPer Load Generator. Assigns network virtualization locations per load
generator.
For more details, see "Per Group vs Per Load Generator" on the next page.
Global Settings Opens the HP Network Virtualization interface for defining the global
setting for the virtualization. This includes packet capture information,
record method, and IP filters on a global level, applied to all locations. For
details, see the relevant third party software documentation.
Configure Opens the HP Network Virtualization interface for setting the virtualization
properties and location options. These include imported parameters,
latency and packet loss values, and client bandwidth. For details, see the
relevant third party software documentation.
Duplicate Adds a new location with settings identical to the selected entry.
Delete Removes the selected location from the list.
Import/Export Imports or exports network virtualization settings to or from an XML file.
Location list A list of the locations to be used for network virtualization. To add new
location, type in the next available line.
Note: When working the Per Group mode, you cannot modify the
virtual locations in this dialog box for the following protocols: Citrix
ICA, Java Record/Replay, COM/DCOM and MAPI. For these protocols,
modify the locations in the Load Generators dialog box. For details,
see "Load Generators Dialog Box" on page1144.
Apply Applies all of the network virtualization settings without closing the dialog
box.
User Guide
Controller
HP LoadRunner (12.50) Page 1372
Per Group vs Per Load Generator
You can choose to assign different virtual locations to groups running simultaneously or to assign the
same virtual location to each group running on the machine. Selecting the Per Group mode enables you
to assign several virtual locations to the various groups available. The Per Load Generator setting
applies the same virtual location to each group.
The following protocols do not support the per group mode:
lCitrix ICA
lCOM/DCOM
lJava Record Replay
lJava Vuser
lMAPI
luser-defined protocols based on the Protocol SDK
These protocols always run per Load Generator—you can only assign one virtual location for any group
running on the machine. You can create scenarios which include a mixture of protocols that support per
group mode and protocols that do not support per group mode. In this case, the protocols that support
the per group mode are assigned their own virtual location while the protocols that do not support the
per group mode are assigned the same virtual location based on the Per Load Generator setting.
Troubleshooting and Limitations for Network
Virtualization
This section describes troubleshooting and limitations for running Vusers with HP Network
Virtualization.
lFor scenarios created with an earlier version of HP Network Virtualization (previously known as
Shunra NV) such as 8.6, the bandwidth utilization measurement will only be represented in the graphs
when the bandwidth is configured as Shared Bandwidth. If the bandwidth is configured as Individual
Bandwidth, bandwidth utilization data will not appear.
lFor very large tests, the report generation time may be slow.
lIf the HP Network Virtualization service is restarted during a scenario run, the network virtualization
may fail. Check the service and restart the scenario run. For HP Network Virtualization specific
limitations and system requirements, refer to its documentation,
http://www8.hp.com/us/en/software-solutions/network-virtualization/index.html.
lMonitoring over a firewall is not supported for scenarios with network virtualization.
lNetwork Virtualization integration does not comply with all of the accepted Internationalization
(I18N) conventions.
User Guide
Controller
HP LoadRunner (12.50) Page 1373

lThe Network Virtualization software may consume large amounts of memory, since the technology
delays traffic and captures traffic for later analysis. To verify that the load generator machine has
sufficient memory, compare the load generator memory consumption with and without the
virtualization.
lWhen running scenarios with virtual locations, Vusers must communicate with the application servers
over IPv4. Network Virtualization emulation is not supported for IPv6 network traffic.
lNetwork Virtualization software integration is not supported for the Linux platform.
lYou cannot run a scenario on the same load generator from two different Controller machines, if
they both have Network Virtualization enabled.
lLocations names cannot contain non-English characters.
lIn Windows 7, if the number of open filters is exceeded, the Network Virtualization setup may fail.
Solution: Increase the value of the registry key:
HKEY_LOCAL_MACHINE\SYSTEM\CurrentControlSet\Control\Network\MaxNumFilters
Service Virtualization Integration
As part of your system-wide load test, you will need to test all of the services that partake in your
business process. Some business processes contain services that are not available. For example, your
business process might include a service that is still in development or incurs a cost, such as processing
a credit card through a third-party vendor.
To facilitate load testing these business processes, LoadRunner Controller integrates with HP Service
Virtualization. This integration enables LoadRunner users to define services that will be virtualized
during test execution so that the tested business process is performed as required.
By using a virtual service, you can load test and replace actual services with virtual services that mirror
both the data model 1and the performance model2.
To learn more about Service Virtualization or to download it, see the HP Service Virtualization site. After
you install Service Virtualization, refer to the HP Service Virtualization User Guide for setup
information.
The workflow below explains how Service Virtualization integrates with LoadRunner processes:
1Definition of the data that is sent by the service to the server and the expected response. You can
define several data models for one service.
2Definition of the expected performance, such as reponse time, of the service.
User Guide
Controller
HP LoadRunner (12.50) Page 1374
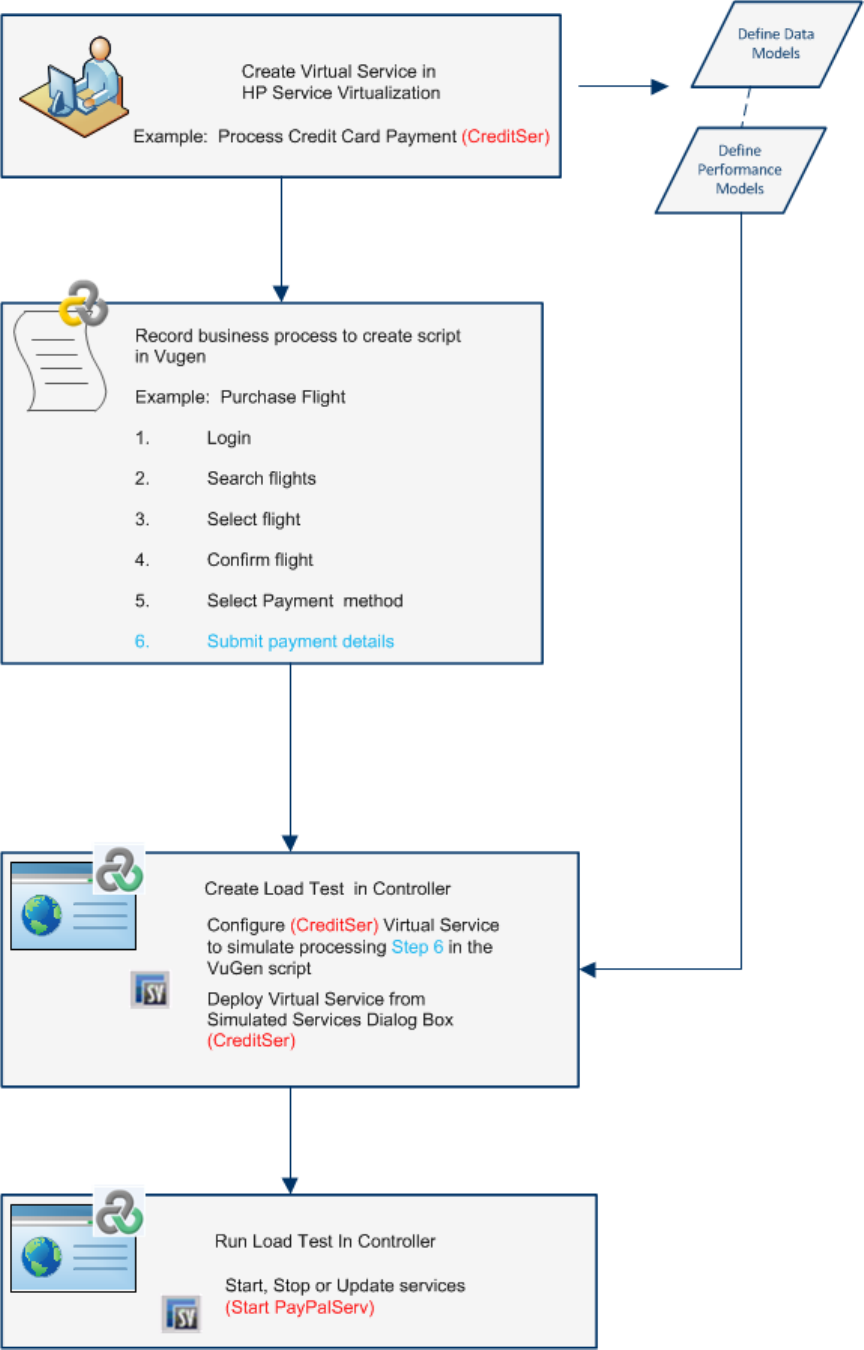
User Guide
Controller
HP LoadRunner (12.50) Page 1375
Virtual Service Locks
When your scenario contains virtualized services, these services are automatically locked and cannot be
used by other users while the scenario is running. Virtualized services may locked by you or other users
for editing, simulation, or deployment.
lIf your scenario includes a service that has been locked by another user, the run will fail and the
scenario will send an error message to the Output pane.
lIf your scenario is running and you update the scenario to include a service that has been locked by
another user, the scenario continues running and sends a warning message to the Output window.
Virtual Service Modes
The following modes apply to the virtual services.
lLearning mode. The virtual service works as a proxy to record and learn the behavior of a real
service. The virtual service forwards the real communication between a client and a service. In this
mode, any communication through the virtual service is added to the virtual service's simulation
models.
lStandby mode. The virtual service redirects requests to the real service, and redirects responses
from the real service back to the client. The virtual service is not learning, and not simulating.
lSimulating mode. The virtual service responds to client requests according to learned behavior. This
is the main use of the virtual service, and the mode you use for testing purposes.
See also
l"How to Use Service Virtualization when Designing Scenarios" below
l"HP Service Virtualization Setup Dialog Box" on page1378
l"HP Service Virtualization Runtime Dialog Box" on page1380
l"Service Virtualization Monitors" on page1381
How to Use Service Virtualization when Designing
Scenarios
You configure your test to work with virtualized services, using the "HP Service Virtualization Setup
Dialog Box" on page1378, accessible from the Design tab of a Manual or Goal-Oriented scenario.
The add a virtual service to your scenario, follow the procedures below.
lFor a manual scenario, perform the steps below after the Define a schedule for the scenario step in
the "How to Design a Manual Scenario" on page1081 task.
lFor a goal-oriented scenario, perform the steps below after the Assign each script a percentage of
the total scenario target step in the "How to Design a Goal-Oriented Scenario" on page1079task.
User Guide
Controller
HP LoadRunner (12.50) Page 1376

Prepare the environment
lIf your script requires the service to be running while you record your business process, open HP
Service Virtualization and start the virtualized service before recording.
lUpdate any configuration files or code that refer to the service. There are two scenarios in which you
may need to instruct your application to use the virtualized service in place of the actual one:
1. Application components that use the service are embedded in the code or in a configuration file. In
this case, you will need to update the code in your application or update the configuration file to
point to the new URL.
For example,
la .NET Desktop application that calls a Web service, whose URL is set using a constant:
stringURL = http://hp.com.
la service or back-end component uses the Web service and the URL is configured in the
app.config file.
2. Services that are consumed by accessing UDDI or another registry component (Systinet) and the
URL is retrieved during runtime. In this case, you will need to update the end point URL in
UDDI/Systinet.
Create a load test in the Controller
1. In the Design tab, click the Service Virtualization button .
2. In the "HP Service Virtualization Setup Dialog Box", click the Add Services button.
3. In the Add New Services dialog box select the source from which to load the services—Project or
Running Server.
4. For a Project, browse for the project containing the simulated services you want to run with your
load test.
For a Running Server, specify the URL of the server hosting HP Service Virtualization. Click Next.
Note: A service that you add from a running server cannot be deployed; you can however,
switch between modes. To deploy a virtualized service, you need to specify its project file.
Once the project is loaded, LoadRunner is able to deploy all of the services belonging to
that project.
If your project or service requires authentication or decryption, you will be prompted to provide the
details. Click Next. Wait for the services to be displayed in the HP Service Virtualization Setup
dialog box.
5. In the list of services, click the check boxes adjacent to the services you want to run.
6. For each selected service, select the relevant Data model and Performance model to associate
with the virtual service.
User Guide
Controller
HP LoadRunner (12.50) Page 1377
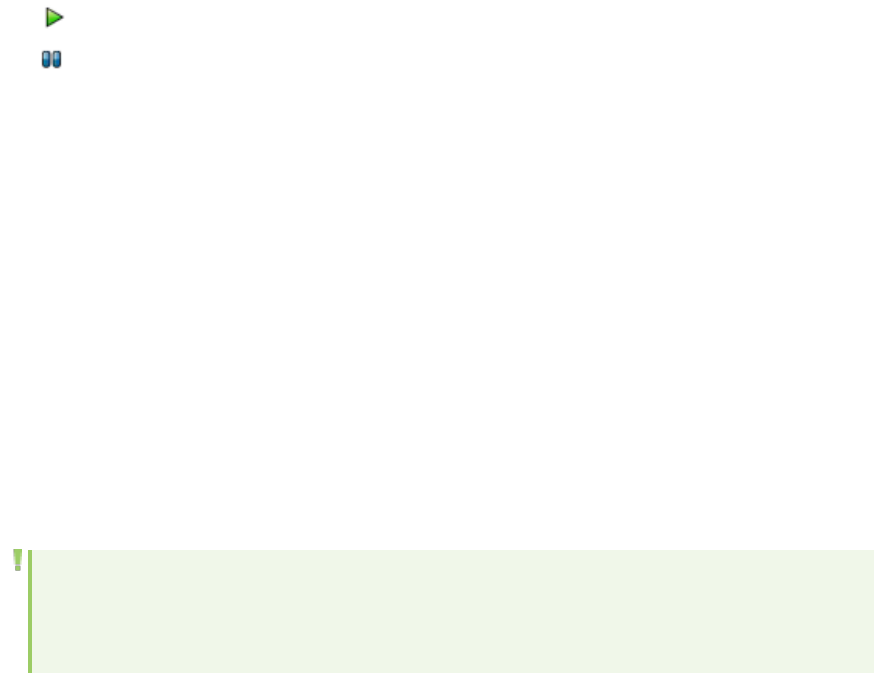
7. Click the <project name> link, and verify that the address of the virtualization server is correct. If
necessary, you can change the address of the simulation server.
8. Manually set a status, or use the Standy-By or Simulation links to set the service mode:
indicates the service is being simulated.
indicates the service is on Stand-By.
Run a load test In the Controller
Run the scenario in the normal way.
In the Controller's Run tab, view the Scenario Status pane and click the ONor OFF link in the Service
Virtualization status row, to open the "HP Service Virtualization Runtime Dialog Box".
Select one or more services and use the toolbar links to control the service: Simulate,Stop,Unlock,
Undeploy, etc.
Add a project to your running load test
To add or update a service during your load test, go back to the Design tab and add a new service as
described above, using the "HP Service Virtualization Setup Dialog Box".
View Online Monitors
For details, see "Service Virtualization Monitors" on page1381.
Note: If you intend to use the monitor credentials together with SSL credentials, the security
policy may prevent the project from being added to Controller. To overcome this issue, add the
SV Operators group to Performance Monitor Users.
HP Service Virtualization Setup Dialog Box
The Service Virtualization Setup dialog box allows you to add and configure the virtual services to use in
your test.
User Guide
Controller
HP LoadRunner (12.50) Page 1378
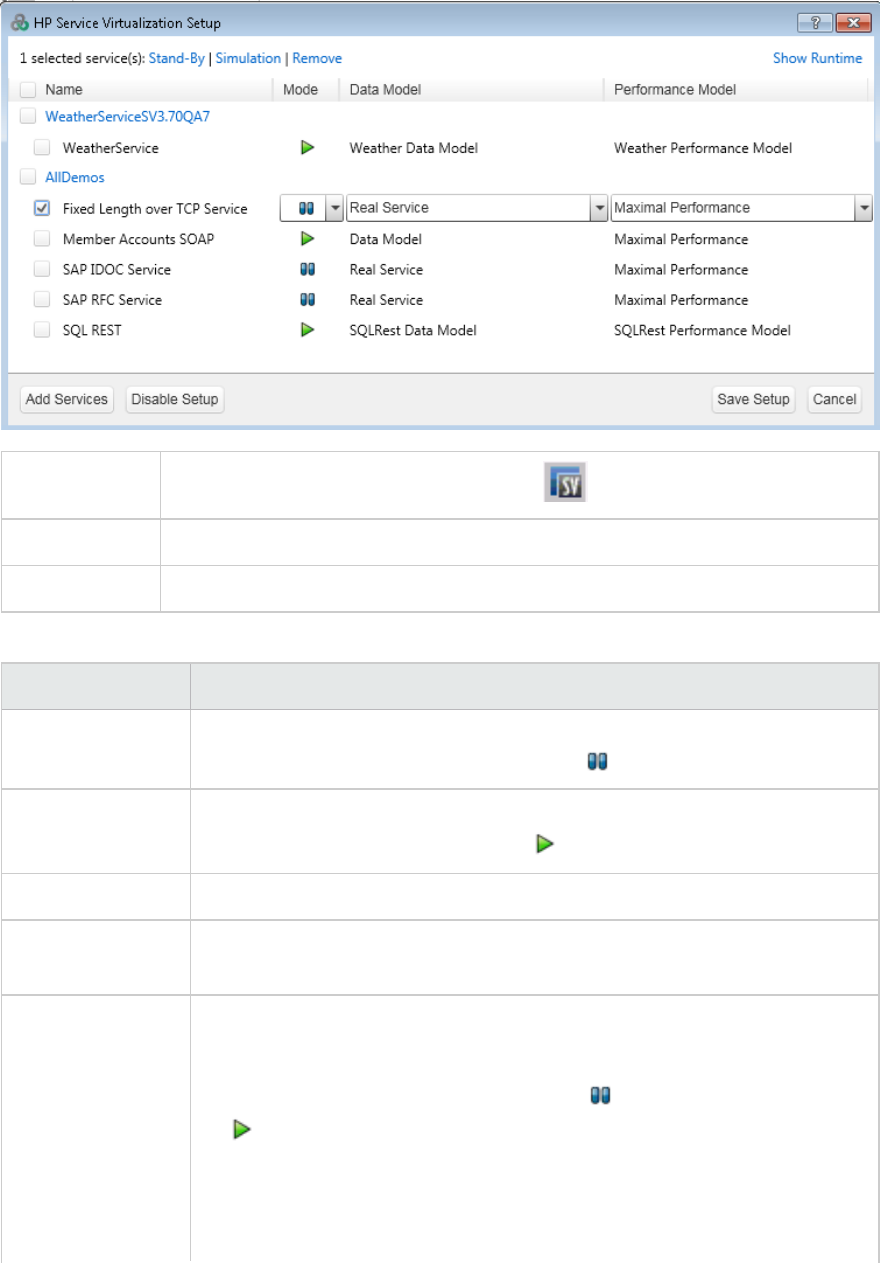
To access Click the Virtualized Service Settings button from the Controller toolbar.
Relevant tasks "How to Use Service Virtualization when Designing Scenarios" on page1376
See also "HP Service Virtualization Runtime Dialog Box" on the next page
User interface elements are described below(unlabeled elements are shown in angle brackets):
UI Element Description
Stand-By Places all selected services in stand-by (pass through) mode. The service
remains deployed. The Mode icons change to .
Simulation Places all selected services on in Simulation mode, deploying them when the
test begins. The Mode icons change to .
Remove Remove the selected service from the list of virtualized services.
Show Runtime Opens the HP Service Virtualization Runtime dialog box, displaying the states of
the services in runtime.
<Virtualization
services>
Lists the virtualized services displaying the following information:
lName. The name of the virtual service.
lMode. The mode of the service—Stand-By (non-active) or Simulation
(active).
lData Model. The defined set of data sent from the client (request) to the
application server and the expected data sent back to the client (response).
lPerformance Model. The model that defines how fast the response and
User Guide
Controller
HP LoadRunner (12.50) Page 1379
request are processed.
Opens the Add New Services dialog box, allowing you to add services defined in
a project or located on a running server.
Disables or enables the setting up of services. This is useful if you do not want
them to be accidentally simulated during your test run.
Saves the current setup and closes this window. When you reopen this dialog
box, it will show your most recent list of services, their selections, and their
modes.
HP Service Virtualization Runtime Dialog Box
The HP Service Virtualization Runtime dialog box lets you interact with the services during the test.
To
access
Do one of the following:
1. From the Design tab: Click the Service Virtualization button on the Controller
toolbar. In the HP Service Virtualization Setup dialog box, click Show Runtime in the
top right corner.
2. From the Run tab, during a scenario, view the Scenario Status pane and click the
ONor OFF link in the Service Virtualization row.
Relevant
tasks
"How to Use Service Virtualization when Designing Scenarios" on page1376
See also "HP Service Virtualization Setup Dialog Box" on page1378
User Guide
Controller
HP LoadRunner (12.50) Page 1380
User interface elements are described below(unlabeled elements are shown in angle brackets):
UI Element Description
<#> selected
service(s)
The number of active services selected in the list below.
Simulate Includes the selected services in the test. The Mode icons change to .
Stop Removes the selected services from the test. The Mode icons change to .
Unlock Removes the lock from the selected services.
Undeploy Undeploys the selected services.
<Virtualization
services>
Lists the virtualized services displaying the following information:
lName. The name of the virtual service.
lMode. The mode of the service—Stand-By (non-active) or Simulation
(active).
lData Model. The defined set of data sent from the client (request) to the
application server and the expected data sent back to the client (response).
lPerformance Model. The model that defines how fast the response and
request are processed.
lMessages. Indications about the service.
lProblems. A short description of the problems related to the service.
Service Virtualization Monitors
The HP Service Virtualization monitors enable you to analyze the status and performance of the
simulated services during the load test run.
For example, you may integrate a payment process service containing the following services and
operations into your script:
Type Example Name Example Description
Service CreditServ Process online credit card
payments
Operation CreditServ.PurchaseRequest Cardholder requests
product/service
Operation CreditServ.AuthorizationRequest Merchant request authorization
for payment
User Guide
Controller
HP LoadRunner (12.50) Page 1381
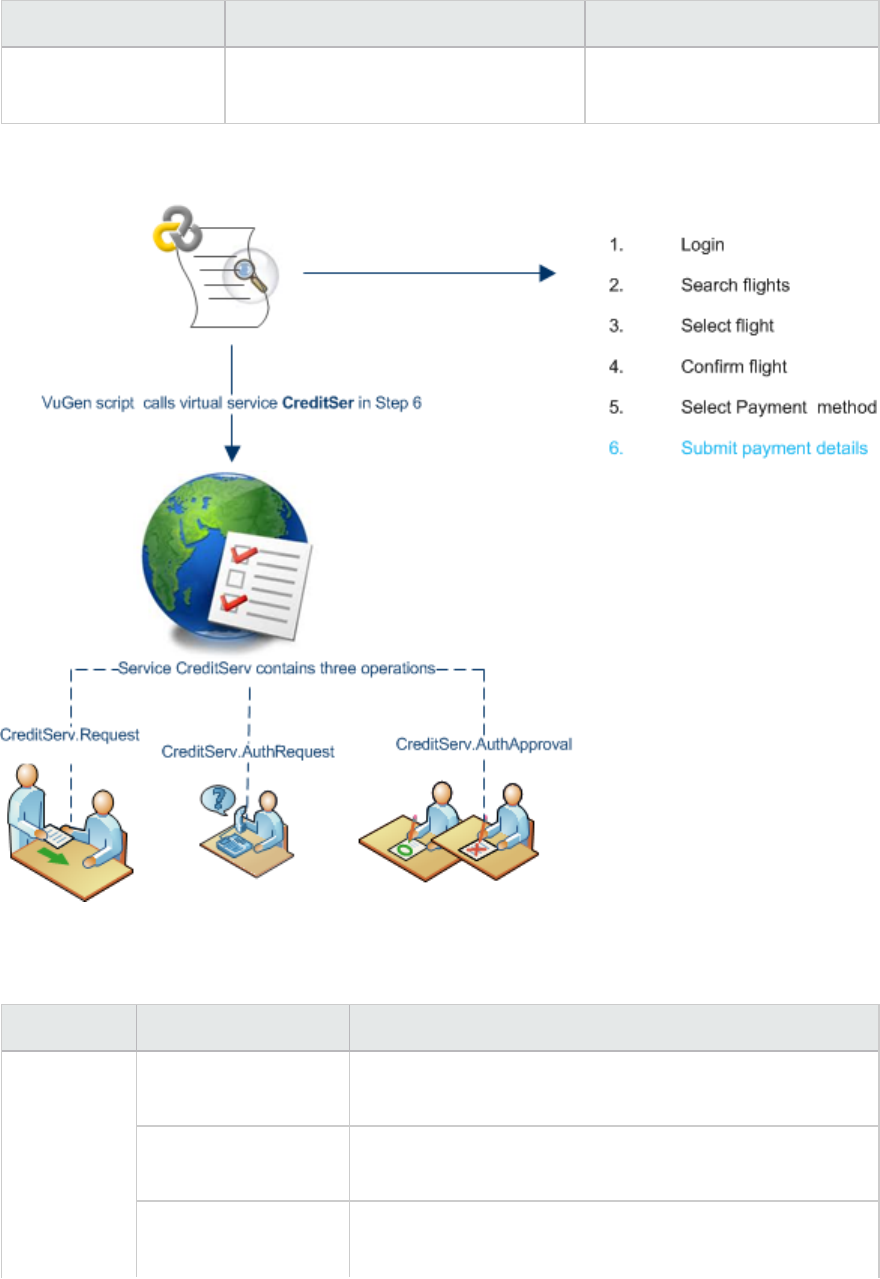
Type Example Name Example Description
Operation CreditServ.AuthorizationApproval Credit card company authorizes
or denies payment
The online monitors measure the overall behavior of the service and each operation. The following
flowchart illustrates using a service and operations for credit card payment.
Monitor Measurements Description
Operations Average Response
Time
Average response time of virtual service in milliseconds.
Hit Rate Number of requests per second of the virtual service
operation.
Throughput Data sent and received by virtual service operation
measured in megabytes.
User Guide
Controller
HP LoadRunner (12.50) Page 1382
Monitor Measurements Description
Services Average Response
Time
Average response time of virtual service in milliseconds.
Data Simulation
Accuracy
Accuracy of data model emulation on virtual service,
displayed as a percentage.
Hit Rate The number of requests per second of the virtual service.
Performance
Simulation Accuracy
Accuracy of performance model emulation on virtual
service, displayed as a percentage.
Throughput Data sent and received on virtual service measured in
megabytes.
Working with Diagnostics
Note: Integration with HP Diagnostics is supported for the following protocols: Web -
HTTP/HTML, Java over HTTP, Oracle - Web, SAP (Click & Script), SAP - Web, Siebel - Web,
TruClient - Firefox, Ajax (Click & Script), Web Services, and Flex.
The HP Diagnostics integration with LoadRunner allows you to monitor and analyze the performance of
Java 2 Enterprise Edition (J2EE), .NET-connected, and other complex environments.
User Guide
Controller
HP LoadRunner (12.50) Page 1383
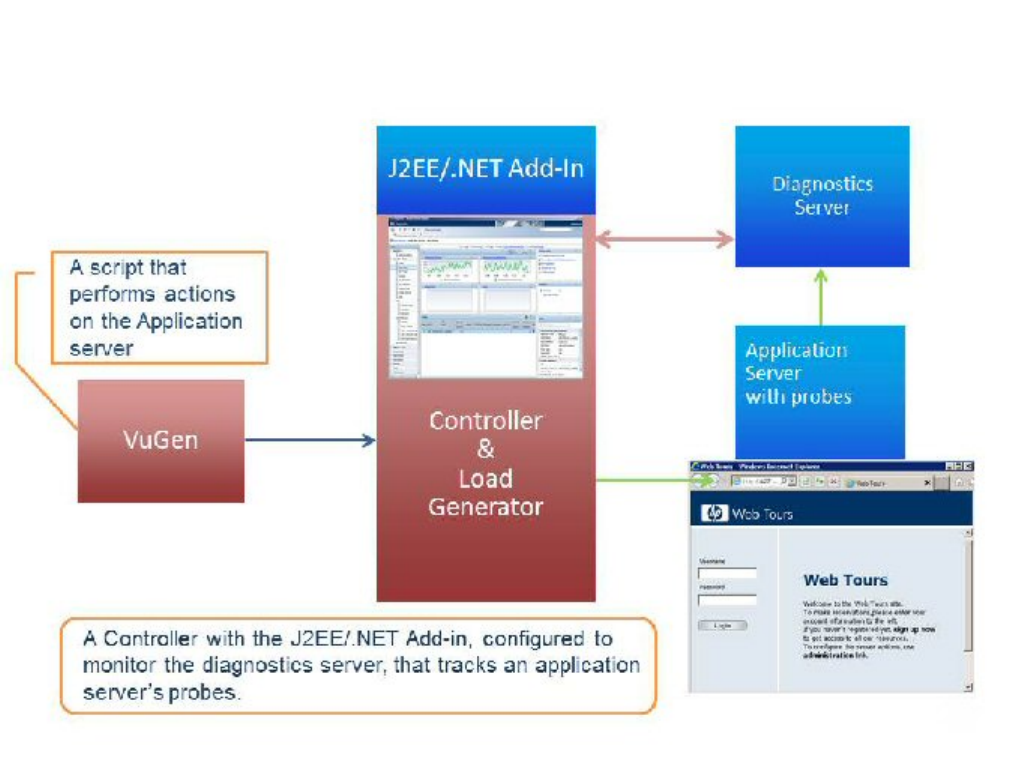
By configuring a LoadRunner scenario to use J2EE/.NET Diagnostics, you can instruct LoadRunner to
capture server requests which occur outside the context of a Vuser transaction.
The benefit of this functionality is that it can capture calls into a back-end virtual machine even when:
lThe probe is not capturing RMI calls
lRMI calls cannot be captured (perhaps because an unsupported application container is being used)
lThe application uses some other mechanism for communications between multiple virtual machines
For more information about working with diagnostics for J2EE and .NET, see the HP Diagnostics User
Guide available on the Diagnostics installation media.
What do you want to do?
lInstall the Diagnostics Add-in
lConfigure a scenario to use J2EE/.NET Diagnostics
lView Diagnostics data during a scenario run
lView Diagnostics results offline
User Guide
Controller
HP LoadRunner (12.50) Page 1384

How to Install the LoadRunner J2EE/.NET Diagnostics
Add-in
The integration between HP Diagnostics and HP LoadRunner requires the following installations:
lDiagnostics Server
lAn Application server with diagnostic probes, connected to the Diagnostics server, with diagnostic
probes on the
lApplication to monitor
lLoadRunner Controller and Load Generator to run the scenario
lLoadRunner Virtual User Generator (optional)
lLoadRunner Analysis (optional)
lLR Add-In for J2EE/.NET Diagnostics installed on the Controller machine (described below)
For details about installing the HP Diagnostic components, see the HP Diagnostics Installation and
Configuration Guide on the Diagnostics media.
After you have the relevant products installed, you complete the integration with LoadRunner by doing
the following:
1. Close the Controller if it is open.
2. Copy the LR_Addin folder from the Diagnostics media to the LoadRunner Controller machine, and
run the setup.exe file.
3. On the LoadRunner machine, select Start > All Programs> HP Software > HP LoadRunner >
Tools > Diagnostics for J2EE/.NET Setup. On machines with icon-based desktops, such as Windows
8, search for J2EE and select the Diagnostics for J2EE/.NET Setup. Indicate the server and port for
the Diagnostics server and the authentication information.You can use a server name or IP
address. Click Test to verify that the connection is valid. For details, see "HP Diagnostics for
J2EE/.NET Setup Dialog Box" on page1387.
Note: This step only needs to be performed the first time you run a scenario with
Diagnostics, or if you change the server or port information.
How to Configure a LoadRunner Scenario to use
J2EE/.NET Diagnostics
This task describes how to capture J2EE/.NET diagnostics metrics in a LoadRunner scenario and how to
select the probes that will be included in the scenario.
User Guide
Controller
HP LoadRunner (12.50) Page 1385
1. Prerequisites
lMake sure that the application server you are monitoring is started.
lMake sure that the load test scenario is not already running.
lMake sure to assign a unique transaction name for each scenario.
2. Prepare a VuGen script and scenario
lPrepare a VuGen script that emulates user's behavior on your application on the application
server.
lPrepare a LoadRunner scenario that runs the script.
3. Enable J2EE/.NET Diagnostics
In the Controller, select Diagnostics >Configuration to open the Diagnostics Distribution dialog
box. Then select Enable the following diagnostics. For details, see "Diagnostics Distribution Dialog
Box" on page1388.
4. Set a distribution percentage
Specify the percentage of Vusers for which you want to collect J2EE/.NET Diagnostics data.
5. Select the Probes
a. In the Diagnostics Distribution dialog box, locate the Online & Offline Diagnostics section and
click Configure. The Enable J2EE/.NET Diagnostics Configuration dialog box opens. For details,
see "J2EE/.NET Configuration Dialog Box" on page1390.
b. Select the Enable J2EE/.NET Diagnostics check box.
c. Select the probes that you want to include in the scenario run. Click OK.
6. View the graphs
a. Begin the scenario run. In the Controller, click the Diagnostics for J2EE/.NET tab to view the
online graphs.
b. After the scenario run is complete, open LoadRunner Analysis to view the J2EE & .NET
Diagnostics Graphs. If the graph is not visible, select Graph > Add New Graph. For details, see
"J2EE & .NET Diagnostics Graphs" on page1618.
How to View J2EE/.NET Diagnostics Data in
LoadRunner During a Scenario Run
This task describes how to view diagnostics data for J2EE/.NET Diagnostics in LoadRunner for the whole
scenario or for a specific transaction during a scenario run.
User Guide
Controller
HP LoadRunner (12.50) Page 1386
View diagnostics data for the whole scenario
In the Controller, select the Diagnostics for J2EE/.NET tab. HP Diagnostics opens, displaying the
Scenario Summary dashboard view.
The Scenario Summary dashboard view displays monitoring versions of the transactions, server
requests, load, and probe views for the current run.
Note: If you move to another tab during the scenario run and then return to the Diagnostics for
J2EE/.NET tab, the last screen that you viewed will be displayed.
View Diagnostics Data for a Specific Transaction
Perform the following steps:
1. Select one of the Transaction graphs (for example, Transaction Response Time), to open the
graph.
2. Right-click the relevant transaction in the graph legend and select Show J2EE/.NET server side.
HP Diagnostics opens, displaying the Transactions view, which contains performance metrics and
drill-down options for the selected transaction.
For more information about interpreting data in the Diagnostics Transactions view, see the HP
Diagnostics User Guide.
How to View Offline J2EE/.NET Diagnostics Results
1. Open Analysis
In the Run tab of the Controller, select Results > Analyze Results, or click the Analyze Results
button .
2. View results in the Analysis diagnostics graphs
You can use the Analysis diagnostics graphs and reports to view the performance data and drill
down to pinpoint problem areas in any layer of the application.
For specific information about J2EE/.NET diagnostics graphs, see "J2EE & .NET Diagnostics Graphs
Overview" on page1619.
HP Diagnostics for J2EE/.NET Setup Dialog Box
This dialog box enables you to update the LoadRunner configuration settings for HP Diagnostics.
User Guide
Controller
HP LoadRunner (12.50) Page 1387
To
access
On the LoadRunner machine, select Start > All Programs> HP Software > HP LoadRunner >
Tools > Diagnostics for J2EE/.NET Setup. On machine with icon-based desktops, such as
Windows 8, search for J2EE and select the Diagnostics for J2EE/.NET Setup.
User interface elements are described below:
UI Element Description
Click to verify that you entered the correct information for the Diagnostics Server in
Commander mode and that there is connectivity between the server and LoadRunner.
Login The user name with which you log in to Diagnostics.
Default: admin
Note: The user name that you specify should have view,change, and execute
privileges. For more information about user privileges, see the HP Diagnostics
Server Installation and Administration Guide.
Password Enter the password with which you log in to Diagnostics.
Default: admin
Port Enter the port number used by the Diagnostic server in Commander mode.
Default: 2006
Note: LoadRunner does not support communication with the Diagnostics
Server in Commander mode using HTTPS.
Server Name Enter the name of the machine that is to host the Diagnostics Server in Commander
mode.
Diagnostics Distribution Dialog Box
This dialog box enables you to enable and customize the Diagnostics integration.
To access In the Controller, select Diagnostics >Configuration
Important
information
lThe Diagnostics Distribution dialog box is disabled during scenario execution. You
must enable and configure the diagnostics modules before running the scenario.
lThe settings that you configure are per scenario. All scripts in the scenario will run
under the same diagnostics configuration.
Relevant
tasks
"How to Configure a LoadRunner Scenario to use J2EE/.NET Diagnostics" on page1385
User Guide
Controller
HP LoadRunner (12.50) Page 1388
User interface elements are described below:
UI Element Description
Enables/Disables Web Page Diagnostics graphs.
Click to enable and configure the relevant diagnostics graphs.
Indicates that the diagnostics type is disabled.
Indicates that the diagnostics type is enabled.
Enable the
following
diagnostics
Enables LoadRunner to generate offline Web Page Diagnostics graphs, and
online and offline J2EE & .NET Diagnostics graphs.
For X% of all the
relevant Vusers in
the current
scenario
Specify the percentage of Vusers for which you want to collect diagnostics
data. This value determines how many of the transactions on the application
server are reported to the Controller. Reducing this percentage will reduce the
overhead on the application server for Web Page, and J2EE & .NET Diagnostics.
Example: If you enter a sampling value of 25% and run 12 Vusers in
group1, 8 Vusers in group2, and 1 Vuser in group3, diagnostics data will
be collected for 3 Vusers in group1, 2 Vusers in group2, and 1 Vuser in
group3.
Note: The minimum percentage of Vuser sampling allowed is 1%, or 1
Vuser per group, whichever is more.
The maximum percentage allowed is the lowest of the Max. Vuser Sampling
values of all the selected diagnostics types.
Example: If you enable Web Page (max 10%), and J2EE/.NET (max
100%) diagnostics, the percentage of Vuser participation for J2EE/.NET
Diagnostics cannot exceed 5%.
Offline Diagnostics Generates offline Web Page Diagnostics graphs.
The maximum percentage of Vusers for which diagnostics data can be
collected is 10%.
Default: Enabled
See also: "Web Resources Graphs Overview" on page1522
User Guide
Controller
HP LoadRunner (12.50) Page 1389
Online & Offline
Diagnostics
Generates online and offline J2EE/.NET Diagnostics graphs.
The maximum percentage of Vusers for which J2EE/.NET Diagnostics data can
be collected is 100% of the amount of Vusers selected in the For X% of all the
relevant Vusers in the current scenario setting.
To enable and configure J2EE/.NET Diagnostics, click Configure. For details, see
"J2EE/.NET Configuration Dialog Box" below.
J2EE/.NET Configuration Dialog Box
This dialog box enables you to set up the J2EE/.NET Diagnostics module.
To access Select Diagnostics >Configuration. In the Online & Offline Diagnostics section,
click Configure.
Important
information
The dialog box is read- only while a scenario is running.
Relevant tasks "How to Configure a LoadRunner Scenario to use J2EE/.NET Diagnostics" on
page1385
See also "J2EE & .NET Diagnostics Graphs Overview" on page1619
User interface elements are described below:
UI Element Description
Enable J2EE/.NET
Diagnostics
Enables J2EE/.NET Diagnostics and allows you to configure the J2EE/.NET
Diagnostics settings
Select probes
table
Selects a probe for monitoring. At least one probe must be selected. Clear the
check box to disable a probe for the duration of the scenario.
Name. The name of the probe.
Group. The probe group.
Host Name. The host the probe is running on (or the application server on which
the probe is installed) la.
Note: If you upgraded your Diagnostics installation, probes from
existing scenarios may appear with a red status. Clear any probes that
appear in red.
MI Listener server Enter the name of the MI Listener server when the Diagnostics server is located
behind a firewall.
Monitor server
requests
Select to capture a percentage of server requests which occur outside the
context of any Vuser transaction. For more information,see "How to Install the
User Guide
Controller
HP LoadRunner (12.50) Page 1390
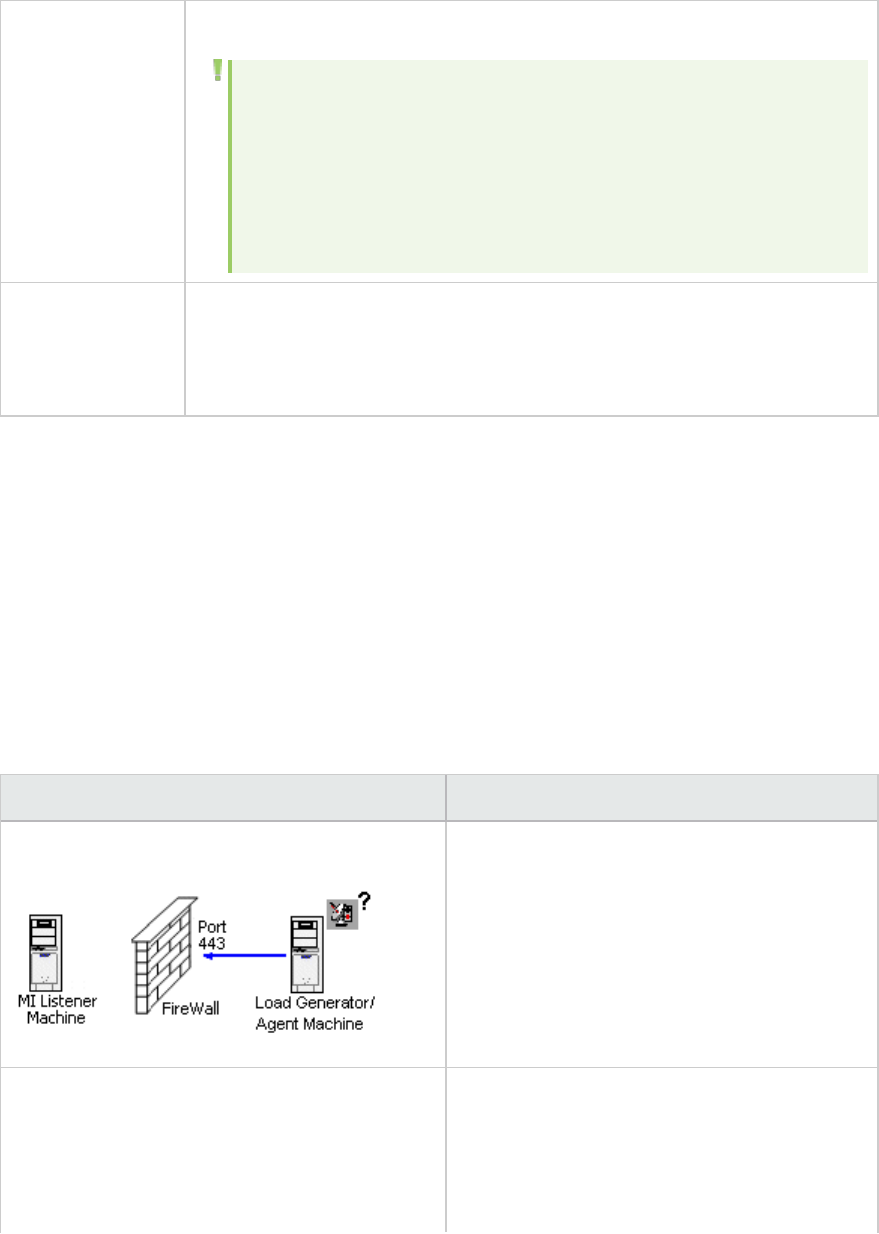
LoadRunner J2EE/.NET Diagnostics Add-in" on page1385.
Note:
lThe server requests will be captured at the same percentage that
was selected for the percentage of Vusers in the Diagnostics
Distribution dialog box.
lEnabling this option imposes an additional overhead on the probe.
Troubleshoot
Diagnostics for
J2EE/.NET
connectivity
Click to open the HP Diagnostics System Health Monitor to enable you to
investigate any connectivity issues between the Diagnostics components.
Troubleshooting and Limitations for Firewalls
This section describes troubleshooting for working with firewalls in LoadRunner.
Checking Connectivity
To run Vusers or monitor servers over a firewall, you must be able to establish a connection between
the LoadRunner agent, MI Listener, and the Controller machine.
If you encounter connectivity problems after installing and configuring all the necessary components,
check the table below for troubleshooting tips.
Check Solution
To check that the Firewall service was activated
on the agent machine:
There should be a light on the right side of the
LoadRunner Agent icon on the machine running/
monitoring Vusers over a firewall. If there is no
light, this indicates that
`FirewallServiceActive=1' is not set in the
[FireWall] section of the Agent Settings. See
"Agent Configuration Settings Dialog Box" on
page1285.
To check that port 443 is open: On the agent machine, open a Command Prompt
window, and type the following:
telnet <MI_Listener_IP>443
For example: telnet 111.111.111.1111 443
If port 443 is open, a new Telnet window will
User Guide
Controller
HP LoadRunner (12.50) Page 1391
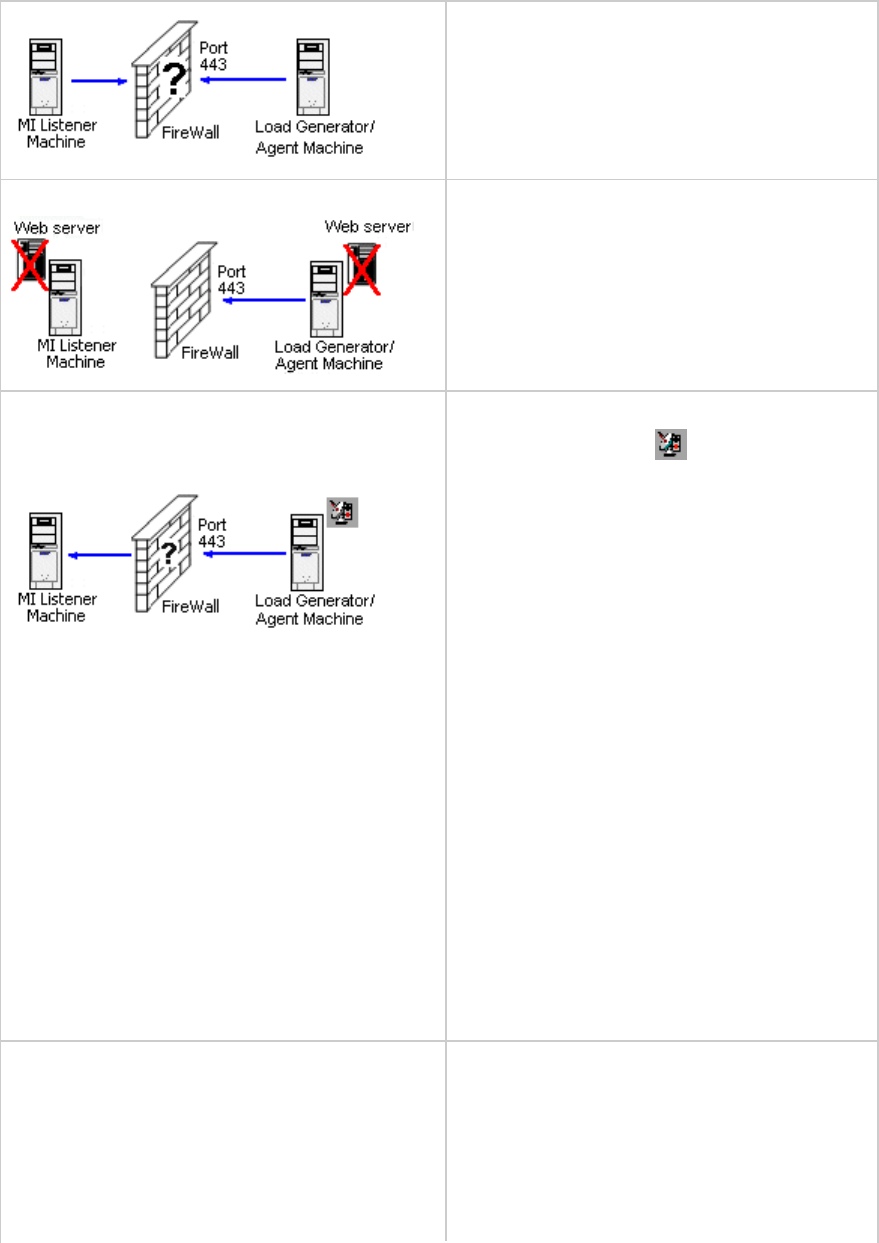
open. If port 443 is not open, contact your
network administrator.
To check that port 443 is available: If a Web server is running on the MI Listener or
Monitor-Over-Firewall machine, port 443 will not
allow the access required by the listening and
monitoring processes. Contact your network
administrator to change the Web server port.
To check connectivity between the agent and the
MI Listener, when running the LoadRunner agent
as a service:
If there is a red light on the right side of the
LoadRunner Agent icon when running the
LoadRunner agent as a service, do the following:
lCheck that port 443 is open. See the
troubleshooting tip "Troubleshooting and
Limitations for Firewalls" on the previous
page.
lCheck that the Agent Settings and Agent
Configuration are correctly set. See "Agent
Configuration Settings Dialog Box" on
page1285.
lRun the agent as a Process. Launch
<Installation>\Launch_service\bin\
magentproc.exe. If this works, this indicates
an authentication issue with the HP Load
Testing Agent Service. Browse to the Service
> LoadRunner Agent Service, and change
the properties of this service to System User
Account or provide the user name and
password of someone who has administrative
privileges on this machine.
To check connectivity between the agent and the
Controller, when monitoring over a firewall
lCheck that you entered the servers that you
want to monitor in the Monitor Configuration
dialog box. (See "Monitor Configuration Dialog
Box" on page1281.)
lStart the LoadRunner Agent Process on the
Monitor-Over-Firewall machine. (See "How to
User Guide
Controller
HP LoadRunner (12.50) Page 1392
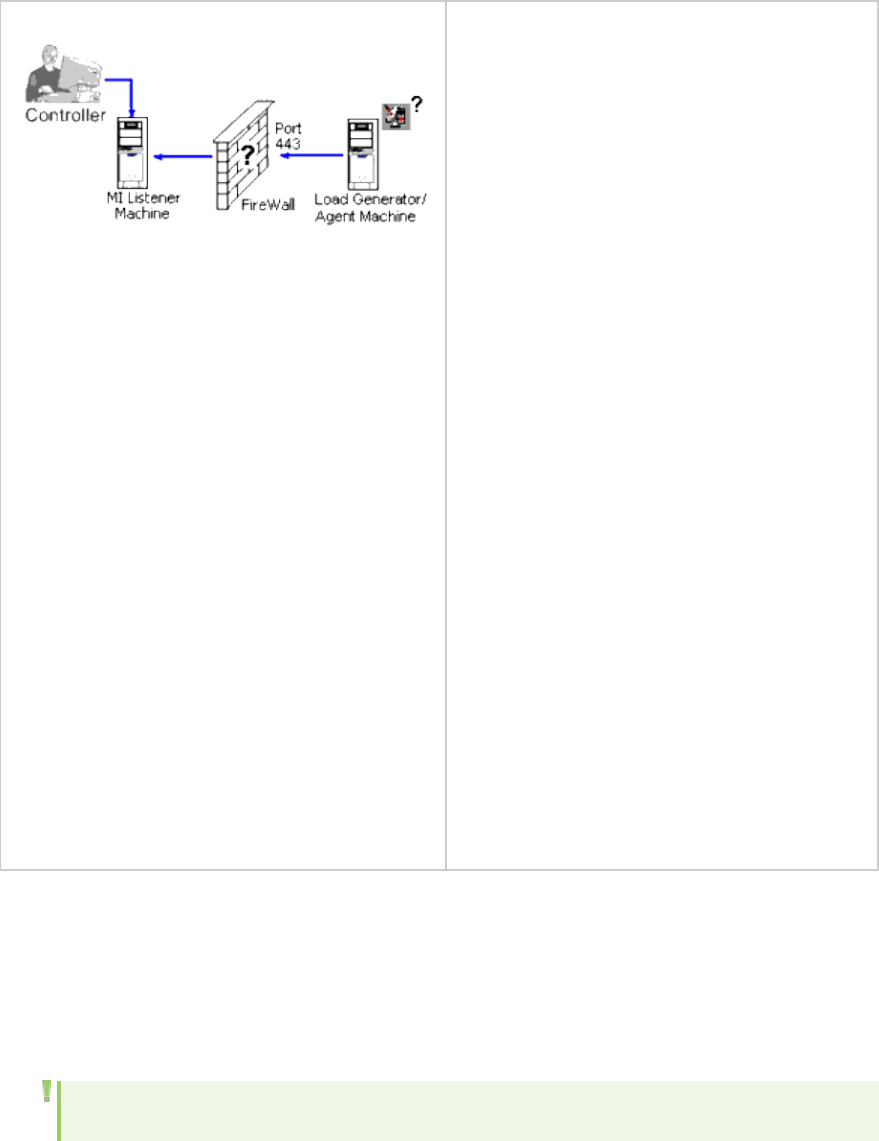
Configure the LoadRunner Agent" on
page1277)
lOn the Controller, enter the name of the
Monitor-Over-Firewall machine in the Load
Generators dialog box, and click Connect.
After about a minute, data should start
streaming in from the Monitor-Over-Firewall
machine through the MI Listener to the
Controller. (See "How to Set Firewall
Monitoring Preferences" on page1279.)
lIf no data arrives at the Controller, try
connecting the Controller to the MI Listener
as if the Listener was used as a load
generator. This will help identify the cause of
the problem. Examine the log file on the
Monitor-Over-Firewall machine by right-
clicking the LoadRunner Agent icon. There
should be no error messages.
lStart the MI Listener, and then manually start
the LoadRunner Agent Process by running
<installation>\launch_service\
bin\magnetproc.exe on the Monitor-Over-
Firewall machine. Allow the Monitor-Over-
Firewall machine sufficient time to connect to
the MI Listener, then connect the Controller
to the Monitor-Over-Firewall machine. If the
LoadRunner Agent Process crashes, either
restart the agent or reboot the Monitor Over
Firewall machine.
Windows Firewall Considerations
lIn most Windows environments, Windows Firewall is turned on by default. The firewall does not allow
certain LoadRunner components to communicate with each other. The Windows firewall therefore
needs to be turned off.
Note: Turning off Windows Firewall increases the risk to your computer's security.
User Guide
Controller
HP LoadRunner (12.50) Page 1393
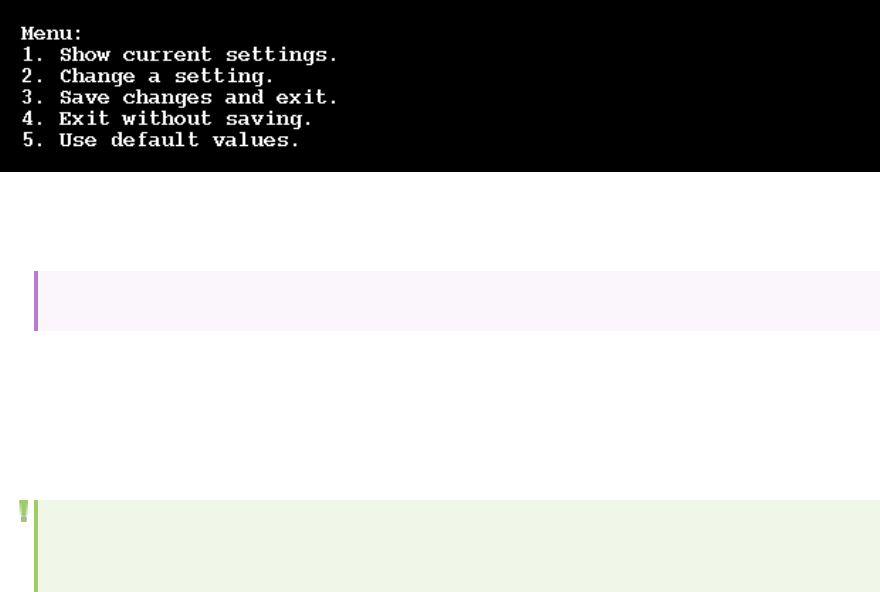
lFor each process that needs the firewall you can unblock the process by clicking the unblock button
in the popup window that indicates that the program needs it, or by manually tuning the Windows
firewall from the Exceptions tab.
Linux LoadRunner Agent Menu
When you configure the Linux LoadRunner Agent, you must run agent_config to display the following
menu:
For details, see "How to Configure the LoadRunner Agent" on page1277. If the menu does not display,
type the fWeollowing command to check if the M_LROOT environment variable is set:
echo $M_LROOT
If M_LROOT is not set, do either of the following:
1. Type sudo su - to inherit all environment variables of the current user.
2. Type source <LoadGenerator_directory>/env.sh to set all the Load Generator related
environment variables after switching to root (i.e. "sudo su").
Note: This limitation occurs on Amazon cloud Linux machines, usually when you log in to the
system using the special user named "ec2-user".
Troubleshooting and Limitations for Controller
Linux Machine Issues
This section describes how to troubleshoot problems with a test run on a Linux machine. For more
information, see the Linux section in the LoadRunner Installation Guide.
Error when running Load Generator on RedHat Enterprise Linux 5.x with SELinux enabled
During use of the Load Generator on RHEL 5.x, you might receive the following error:
User Guide
Controller
HP LoadRunner (12.50) Page 1394
"m_agent_daemon: error while loading shared libraries: /opt/HP/HP_
LoadGenerator/bin/liblwc_cryptolib.so: cannot restore segment prot after reloc:
Permission denied."
This problem occurs because SELinux is installed and enabled on the machine. SELinux is preventing the
specified shared library from loading.
Solution:
There are two possible workarounds:
1. Before using the Load Generator, disable SELinux using the command "setenforce 0".
2. If you want to keep SELinux enabled, you can change the security context of all problematic
libraries (for example, <Path_to_LoadGenerator>/bin/*.so" to "textrel_shlib_t").
To do this, execute the command: "chcon -t textrel_shlib_t <Path_to_LoadGenerator>/bin/*.so"
Shellshock Vulnerability
This section describes how to check if your load generator machine is vulnerable to the Shellshock
issue, and guides you high to apply a fix.
This fix applies to Linux load generator machines, and Azure cloud machines, for which you create
custom images. For details, see https://hpln.hp.com/page/cloud-testing-custom-images.
Check the machine for vulnerability
Run the following command:
env 'VAR=() { :;}; echo Bash is vulnerable!' 'FUNCTION()=() { :;}; echo Bash is
vulnerable!' bash -c "echo Bash Test"
lIf the result is: Bash is vulnerable!, then you need to apply the fix.
lIf the result is: Bash Test, your machine is not vulnerable, and no further action is required.
Apply the fix
To apply the fix, you update Bash to latest version. Run the following command:
apt-get:sudo apt-get update && sudo apt-get install --only-upgrade bash
lIf the result is: Bash is vulnerable!, then you need to apply the fix.
lIf the result is: Bash Test, your machine is not vulnerable, and no further action is required.
For more information about the affected releases, see the following websites:
lhttps://wiki.ubuntu.com/Releases
lhttps://www.debian.org/releases
lhttps://www.digitalocean.com/community/tutorials/how-to-protect-your-server-against-the-
shellshock-bash-vulnerability
Recheck the vulnerability
User Guide
Controller
HP LoadRunner (12.50) Page 1395
Check the vulnerability again as described in the first step.
User Guide
Controller
HP LoadRunner (12.50) Page 1396
Analysis
HP Analysis is a component of LoadRunner, enabling you to create graphs and reports for analyzing
system performance after a test run.
To learn more, see "Introducing Analysis" below.
Introducing Analysis
Welcome to LoadRunner Analysis, HP's tool for gathering and presenting load test data. When you
execute a load test scenario, Vusers generate result data as they perform their transactions. The
Analysis tool provides graphs and reports enabling you to view and understand the data, and analyze
system performance after a test run.
What do you want to do?
lSet up Analysis
lCreate graphs
lGenerate reports
lDefine a Service Level Agreement
See also:
lResults overview
lAnalysis API
Results Overview
To monitor the scenario performance during test execution, use the online monitoring tools described
in "Monitoring Load Test Scenarios" on page1300.
To view a summary of the results after test execution, use one or more of the following tools:
lVuser log files. These files contain a full trace of the load test scenario run for each Vuser. These
files are located in the scenario results folder. (When you run a Vuser script in standalone mode,
these files are stored in the Vuser script folder.)
lController Output window. The output window displays information about the load test scenario run.
If your scenario run fails, look for debug information in this window.
lAnalysis Graphs. Standard and protocol-specific graphs help you determine system performance
and provide information about transactions and Vusers.
User Guide
Analysis
HP LoadRunner (12.50) Page 1397
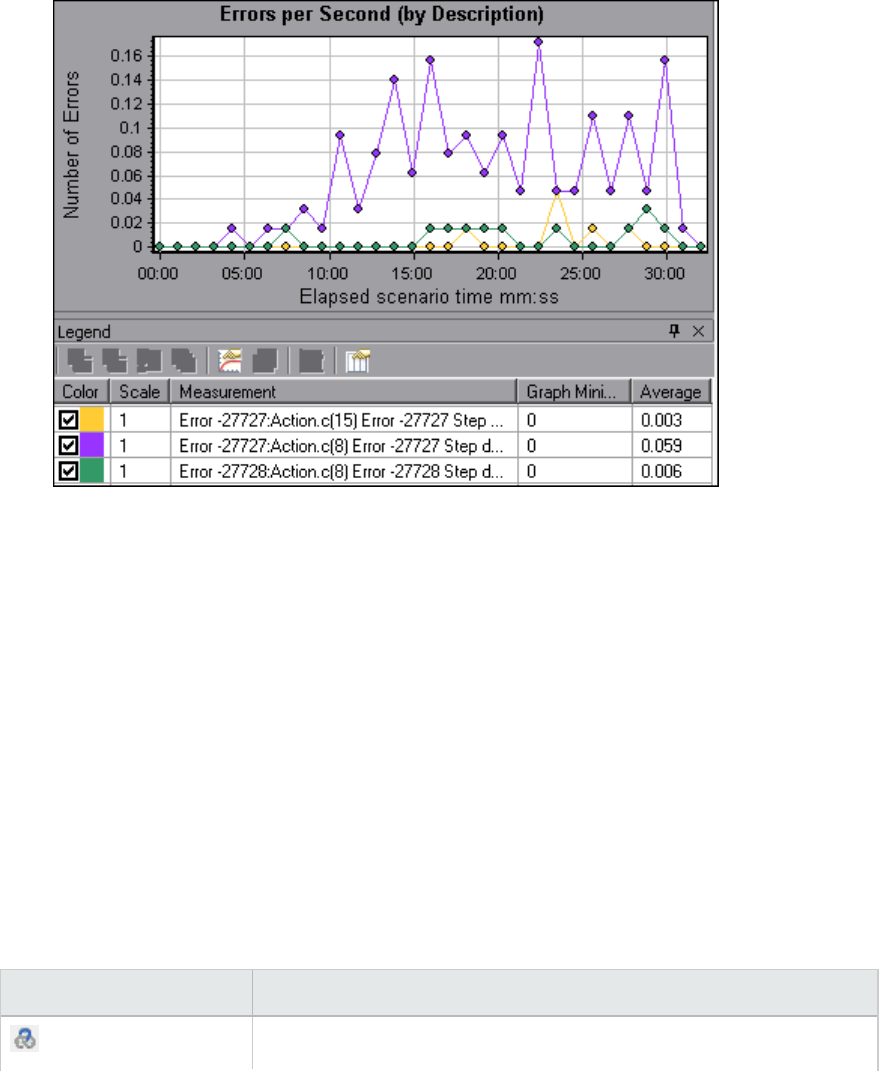
lYou can compare multiple graphs by combining results from several load test scenarios or
merging several graphs into one.
lEach graph has a legend which describes the metrics in the graph. You can also filter your data
and sort it by a specific field.
lAnalysis Graph Data and Raw Data Views. These views display the actual data used to generate the
graph in a spreadsheet format. You can copy this data into external spreadsheet applications for
further processing.
lAnalysis Reports. This utility enables you to generate a summary of each graph. The report
summarizes and displays the test's significant data in graphical and tabular format. You can
generate reports based on customizable report templates.
Analysis Toolbars
This section describes the buttons that you access from the main Analysis toolbars.
Common Toolbar
This toolbar is always accessible from the toolbar at top of the page and includes the following buttons:
User interface elements are described below:
UI Element Description
Create a new session.
User Guide
Analysis
HP LoadRunner (12.50) Page 1398
UI Element Description
Open an existing session.
Generate a Cross Result graph.
Save a session.
Print item.
Create an HTML report.
View runtime settings.
Set global filter options.
Configure SLA rules
Analyze a transaction.
Undo the most recent action.
Reapply the last action that was undone.
Apply filter on summary page
Export Summary to Excel
Graph Toolbar
This toolbar is accessible from the top of the page when you have a graph open and includes the
following buttons
User interface elements are described below:
UI Element Description
Set filter settings.
User Guide
Analysis
HP LoadRunner (12.50) Page 1399
UI Element Description
Clear filter settings.
Set granularity settings.
Merge graphs.
Configure auto correlation settings.
View raw data.
Add comments to a graph.
Add arrows to a graph.
Set display options.
Analysis API
The LoadRunner Analysis API enables you to write programs to perform some of the functions of the
Analysis user interface, and to extract data for use in external applications. Among other capabilities,
the API allows you to create an analysis session from test results, analyze raw results of an Analysis
session, and extract key session measurements for external use. You can also use the API to launch an
application from the LoadRunner Controller at the completion of a test.
To view this help from a LoadRunner machine, go to Start > All Programs > HP Software > HP
LoadRunner > Documentation > Analysis API Reference. In icon-based desktops, such as Windows 8,
search for API and select Analysis API Reference from the results.
Note: The Analysis API is only supported for 32-bit environments. If you use Visual Studio to
develop your script, make sure to define the platform as x86 in the project options.
Workflow
Click on one of the images below to learn more about the Analysis workflow.
User Guide
Analysis
HP LoadRunner (12.50) Page 1400

What do you want to do?
lConfigure Analysis
lDefine a Service Level Agreement
lCreate graphs
lGenerate reports
See also:
lAnalysis Basics
lTroubleshooting Analysis
Analysis Basics
Creating Analysis Sessions
When you run a load test scenario, LoadRunner stores the runtime data in a result file with an .lrr
extension. LoadRunner Analysis is the utility that processes this data and generates graphs and
reports.
When you work with the LoadRunner Analysis, you work within an Analysis session. This session contains
one or more sets of scenario results (.lrr file). Analysis stores the display information and layout
settings for the active graphs in a file with an .lra extension.
Starting Analysis
You can open Analysis as an independent application or directly from the Controller. To open Analysis as
an independent application, choose one of the following:
lStart>All Programs > HP Software > HP LoadRunner > Analysis
lThe Analysis shortcut on the desktop
To open Analysis directly from the Controller, click the Analysis button on the toolbar or select
Results >Analyze Result. This option is only available after running a load test scenario. Analysis takes
the latest result file from the current scenario, and opens a new session using these results. You can
also instruct the Controller to automatically open Analysis after it completes scenario execution by
selecting Results>Auto Load Analysis.
User Guide
Analysis
HP LoadRunner (12.50) Page 1401
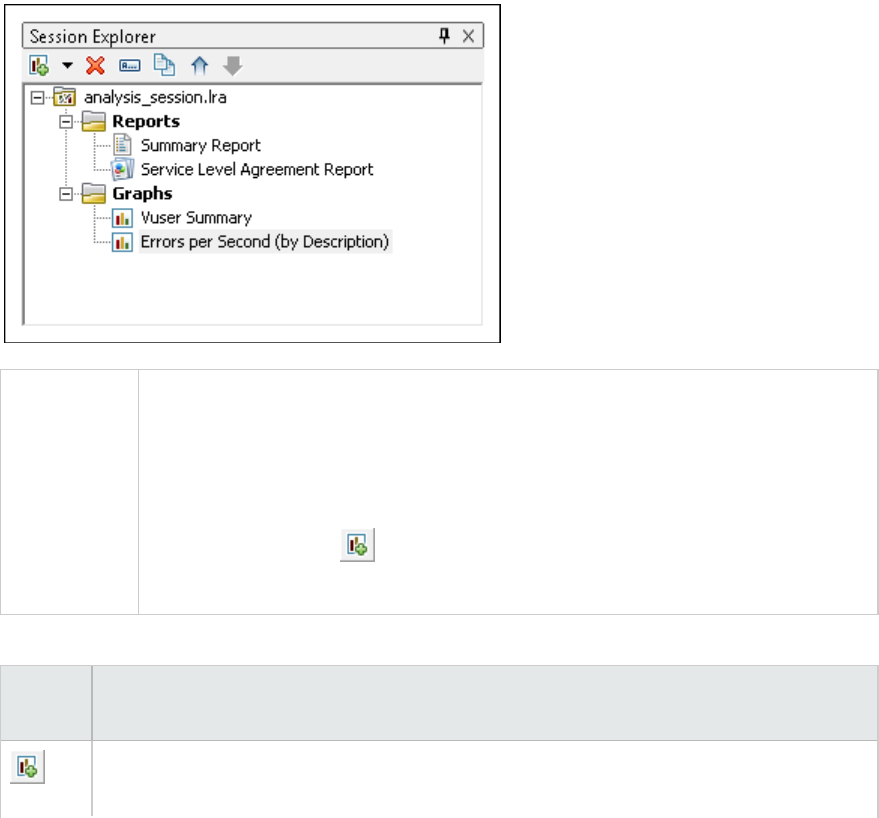
Collating Execution Results
When you run a load test scenario, by default all Vuser information is stored locally on each Vuser host.
After scenario execution, the results from all of the hosts are automatically collated or consolidated in
the results folder.
You disable automatic collation by choosing Results >AutoCollate Results from the Controller window,
and clearing the check mark adjacent to the option. To manually collate results, choose Results >
Collate Results. If your results have not been collated, Analysis will automatically collate the results
before generating the analysis data.
Session Explorer Window
This window displays a tree view of the items (graphs and reports) that are open in the current session.
When you click an item in the Session Explorer, it is activated in the main Analysis window.
To access Use one of the following:
lSession Explorer
lSession Explorer > Reports > Summary Report
lSession Explorer > Reports >Service Level Agreement Report
lSession Explorer > > Analyze Transaction
lSession Explorer > Graphs
User interface elements are described below:
UI
Element
Description
Add a new graph or report to the current Analysis session. Opens the Open a New Graph
dialog box. For details, see "Open a New Graph Dialog Box" on page1502
User Guide
Analysis
HP LoadRunner (12.50) Page 1402
UI
Element
Description
Delete the selected graph or report.
Rename the selected graph or report.
Create a copy of the selected graph.
Analysis Window Layouts
This section describes ways to customize the layout of the windows of the Analysis session.
Open Windows
You can open a window or restore a window that was closed by selecting the name of the relevant
window from the Windows menu.
Lock/Unlock the Layout of the Screen
Select Windows > Layout Locked to lock or unlock the layout of the screen.
Restore the Window Placement to the Default Layout
Select Windows > Restore Default Layout to restore the placement of the Analysis windows to their
default layout.
Note: This option is available only when no Analysis session is open.
Restore the Window Placement to the Classic Layout
Select Windows > Restore Classic Layout to restore the placement of the Analysis windows to their
classic layout. The classic layout resembles the layout of earlier versions of Analysis.
Note: This option is available only when no Analysis session is open.
Reposition and Dock Windows
You can reposition any window by dragging it to the desired position on the screen. You can dock a
window by dragging the window and using the arrows of the guide diamond to dock the window in the
desired position.
User Guide
Analysis
HP LoadRunner (12.50) Page 1403
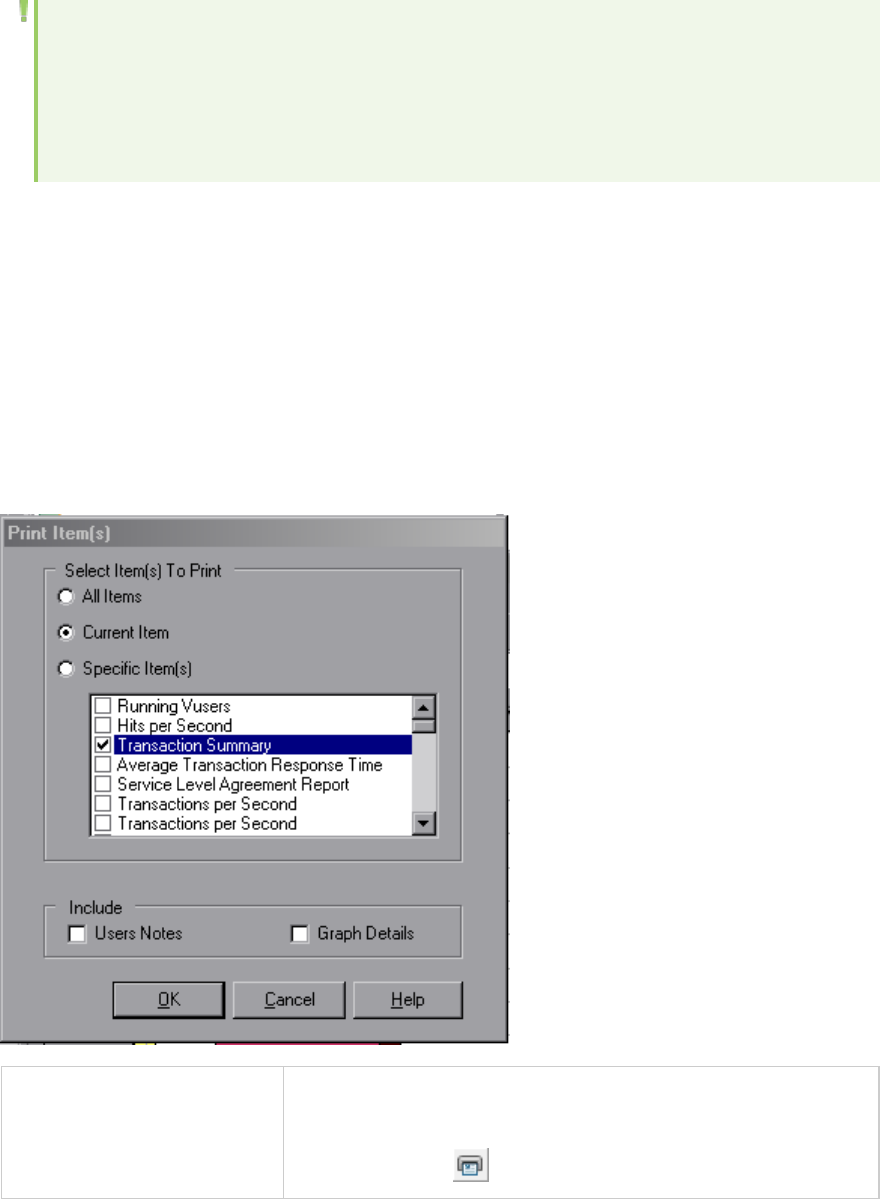
Note:
lOnly document windows (graphs or reports) can be docked in the center portion of the
screen.
lWindows > Layout Locked must not be selected when repositioning or docking windows.
Using Auto Hide
You can use the Auto Hide feature to minimize open windows that are not in use. The window is
minimized along the edges of the screen.
Click the Auto Hide button on the title bar of the window to enable or disable Auto Hide.
Printing Graphs or Reports
This dialog box enables you to print graphs or reports
To access Do one of the following:
lFile > Print
lMain toolbar >
User interface elements are described below:
User Guide
Analysis
HP LoadRunner (12.50) Page 1404

UI Element Description
Select Items to
Print
lAll Items. Prints all graphs and reports in the current session.
lCurrent Item. Prints the graph or report currently selected in the Session
Explorer.
lSpecific Item(s). Select the graphs or reports to print.
Include lUser Notes. Prints the notes in the User Notes window.
lGraph Details. Prints details such as graph filters and granularity settings.
Configuring Analysis
Summary Data Versus Complete Data
In large load test scenarios, with results exceeding 100 MB, it can take a long time for Analysis to
process the data. When you configure how Analysis generates result data from load test scenarios, you
can choose to generate complete data or summary data.
Complete data refers to the result data after it has been processed for use within Analysis.
Summary data refers to the raw, unprocessed data. The summary graphs contain general information
such as transaction names and times. Some fields are not available for filtering when you work with
summary graphs.
Note that some graphs will not be available when viewing only the summary data.
Importing Data Directly from the Analysis Machine
If you are using an SQL server / MSDE machine to store Analysis result data, you can configure Analysis
to import data directly from the Analysis machine.
Importing Data from the SQL Server
If you do not select the option to import data directly from the Analysis machine, Analysis creates CSV
files in a local temp folder. The CSV files are copied to a shared folder on the SQL Server machine. The
SQL server engine then imports the CSV files into the database. The following diagram illustrates the
data flow:
User Guide
Analysis
HP LoadRunner (12.50) Page 1405
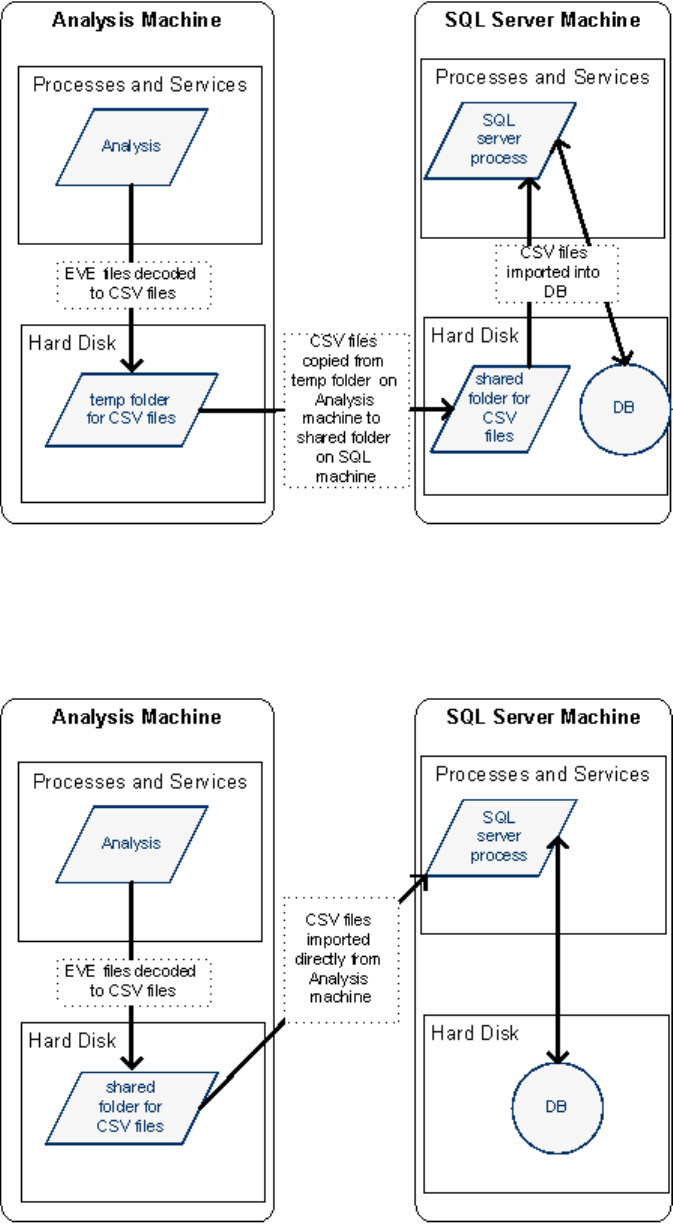
Importing Data from the Analysis Machine
If you selected the option to import data directly from the Analysis machine, Analysis creates the CSV
files in a shared folder on the Analysis machine and the SQL server imports these CSV files from the
Analysis machine directly into the database. The following diagram illustrates the data flow:
User Guide
Analysis
HP LoadRunner (12.50) Page 1406
How to Configure Settings for Analyzing Load Test Results
The following steps describe how to configure certain Analysis settings that significantly impact the way
in which Analysis analyzes load test results.
Configure how Analysis processes result data
You define how Analysis processes result data from load test scenarios in the Tools > Options > Result
Collection tab. For example, you can configure how Analysis aggregates result data, to what extent the
data is processed, and whether output messages are copied from the Controller. For details on the user
interface, see "Result Collection Tab (Options Dialog Box)" on page1410.
Configure template settings
For details on the user interface, see "Apply/Edit Template Dialog Box" on page1461.
Configure analysis of transactions
You configure how transactions are analyzed and displayed in the summary report in the Summary
Report area of the Tools > Options > General tab. For details, see the description of "General Tab
(Options Dialog Box)" below.
General Tab (Options Dialog Box)
This tab enables you to configure general Analysis options, such as date formats, temporary storage
location, and transaction report settings.
User Guide
Analysis
HP LoadRunner (12.50) Page 1407
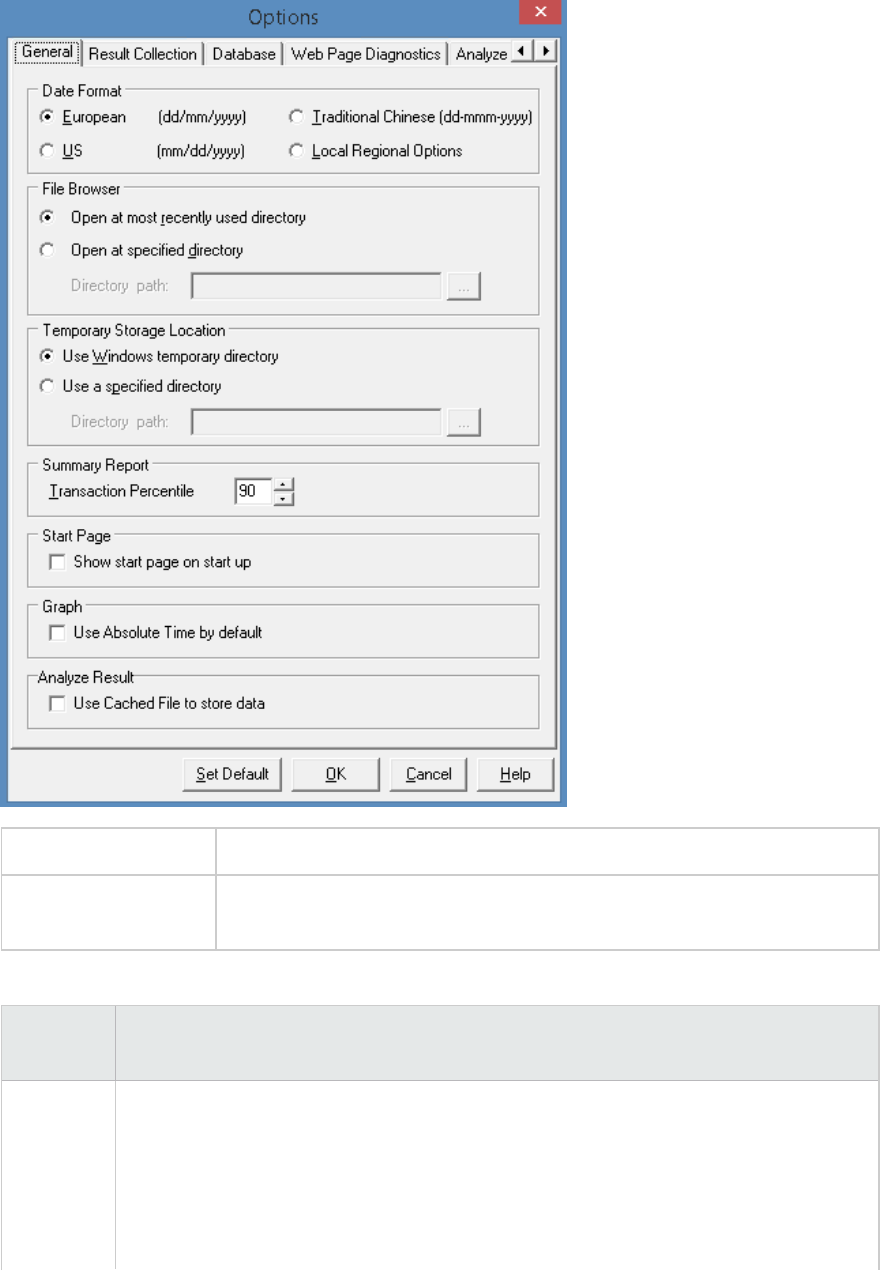
To access Tools > Options > General tab.
See Also "How to Configure Settings for Analyzing Load Test Results" on the previous
page
User interface elements are described below:
UI
Element
Description
Date
Format
Select a date format for storage and display. (For example, the date displayed in the
Summary report)
lEuropean. Displays the European date format.
lUS. Displays the U.S. date format.
lTraditional Chinese. Displays the Traditional Chinese date format.
User Guide
Analysis
HP LoadRunner (12.50) Page 1408

UI
Element
Description
lLocal Regional Options. Displays the date format as defined in the current user's
regional settings.
Note: When you change the date format, it only affects newly created Analysis sessions.
The date format of existing sessions is not affected.
File
Browser
Select the directory location at which you want the file browser to open.
lOpen at most recently used directory. Opens the file browser at the previously used
directory location.
lOpen at specified directory. Opens the file browser at a specified directory.
In the Directory path box, enter the directory location where you want the file
browser to open.
Temporary
Storage
Location
Select the directory location in which you want to save temporary files.
lUse Windows temporary directory. Saves temporary files in your Windows temp
directory.
lUse a specified directory. Saves temporary files in a specified directory.
In the Directory path box, enter the directory location in which you want to save
temporary files.
Summary
Report
Set the following transaction settings in the Summary Report:
lTransaction Percentile. The Summary Report contains a percentile column showing
the response time of 90% of transactions (90% of transactions that fall within this
amount of time). To change the value of the default 90 percentile, enter a new figure
in the Transaction Percentile box.
The Transaction Percentile value is only applied to newly created templates . To create
a new template, select Tools >Templates. For details, see "Apply/Edit Template Dialog
Box" on page1461.
Start Page Select Show start page on start up to display the Welcome to Analysis tab every time
you open the Analysis application.
Graph Select the way in which graphs shows the Elapsed Scenario Time on the x-axis.
Use Absolute time by default. Shows an elapsed time based on the absolute time of
the machine's system clock. If not checked, the graphs show the elapsed time relative
to the start of the scenario. The default is unchecked.
Analyze
Result
Use cached file to store data.Uses a cached file to store the analysis data.
This option should only be used when analyzing a large result file. Enabling this option
may increase the time required to analyze and open the results.
User Guide
Analysis
HP LoadRunner (12.50) Page 1409
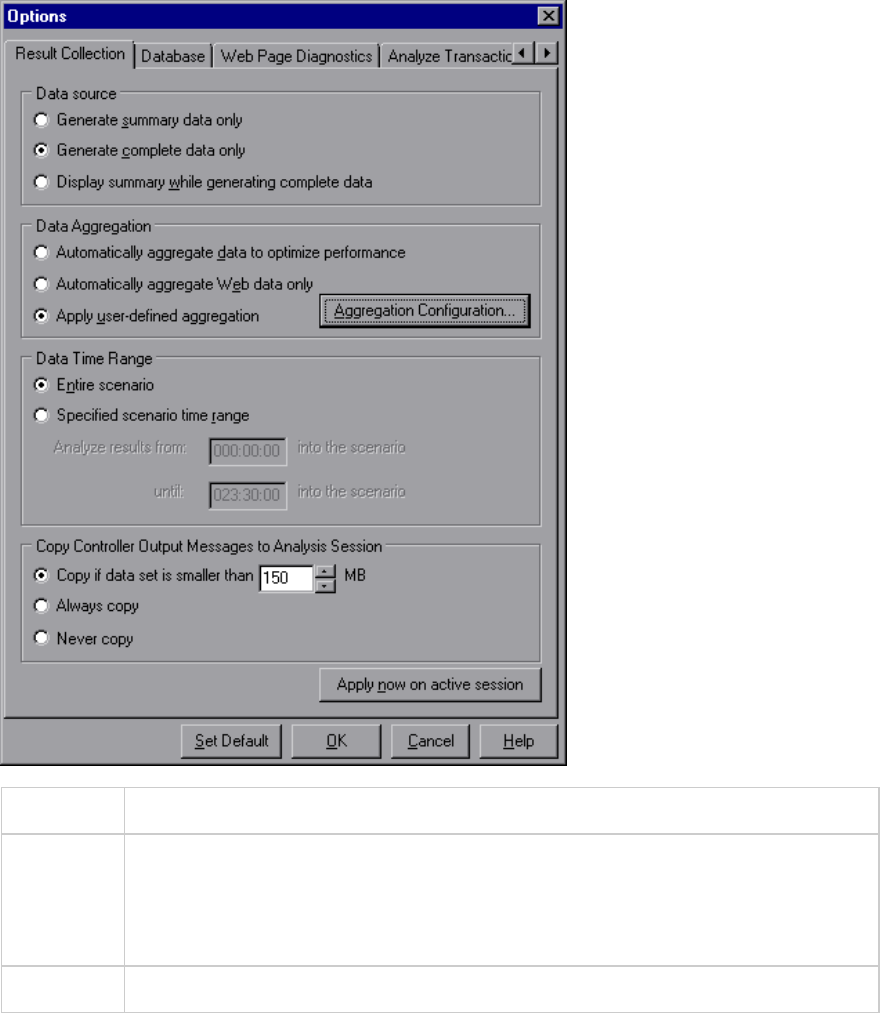
Result Collection Tab (Options Dialog Box)
This tab enables you to configure how Analysis processes result data from load test scenarios.
To access Tools > Options > Result Collection tab.
Important
information
The options in this tab are pre-defined with default settings. It is recommended to use
these default settings unless there is a specific need to change them. Changing some
of the settings, such as default aggregation, can significantly impact the amount of
data stored in the Analysis database.
See Also "How to Configure Settings for Analyzing Load Test Results" on page1407
User interface elements are described below:
User Guide
Analysis
HP LoadRunner (12.50) Page 1410
UI Element Description
Data Source In this area, you configure how Analysis generates result data from load
test scenarios.
Complete data refers to the result data after it has been processed for
use within Analysis. Summary data refers to the raw, unprocessed data.
The summary graphs contain general information such as transaction
names and times. For more details on summary data versus complete
data, see "Summary Data Versus Complete Data" on page1405.
Select one of the following options:
lGenerate summary data only. If this option is selected, Analysis will
not process the data for advanced use with filtering and grouping.
lGenerate complete data only. If this option is selected, the graphs can
then be sorted, filtered, and manipulated.
lDisplay summary data while generating complete data. Enables you
to view summary data while you wait for the complete data to be
processed.
Note: If you selected one of the options to generate complete
data, you can define how Analysis aggregates the complete data
in the Data Aggregation area.
Data Aggregation If you chose to generate complete data in the Data Source area, you use
this area to configure how Analysis aggregates the data.
Data aggregation is necessary in order to reduce the size of the database
and decrease processing time in large scenarios.
Select one of the following options:
lAutomatically aggregate data to optimize performance. Aggregates
data using built-in data aggregation formulas.
lAutomatically aggregate Web data only. Aggregates Web data only
using built-in data aggregation formulas.
lApply user-defined aggregation. Aggregates data using settings you
define.
Click the Aggregation Configuration button to open the Data
Aggregation Configuration Dialog Box and define your custom
aggregation settings. For details on the user interface, see "Data
Aggregation Configuration Dialog Box (Result Collection Tab)" on
page1413.
Data Time Range In this area you specify whether to display data for the complete duration
User Guide
Analysis
HP LoadRunner (12.50) Page 1411
UI Element Description
of the scenario, or for a specified time range only. Select one of the
following options:
lEntire scenario. Displays data for the complete duration of the load
test scenario
lSpecified scenario time range. Specify the time range using the
following boxes:
lAnalyze results from. Enter the amount of scenario time you want
to elapse (in hh:mm:ss format) before Analysis begins displaying
data.
luntil. Enter the point in the scenario (in hh:mm:ss format) at which
you want Analysis to stop displaying data.
Note:
lIt is not recommended to use the Specified scenario time
range option when analyzing the Oracle - Web and Siebel DB
Diagnostics graphs, since the data may be incomplete.
lThe Specified scenario time range settings are not applied to
the Connections and Running Vusers graphs.
Copy Controller Output
Messages to Analysis
Session
Controller output messages are displayed in Analysis in the Controller
Output Messages window. Select one of the following options for copying
output messages generated by the Controller to the Analysis session.
lCopy if data set is smaller than X MB. Copies the Controller output
data to the Analysis session if the data set is smaller than the amount
you specify.
lAlways Copy. Always copies the Controller output data to the Analysis
session.
lNever Copy. Never copies the Controller output data to the Analysis
session.
Click this button to apply the settings in the Result Collection tab to the
current session. The Controller output data is copied when the Analysis
session is saved.
User Guide
Analysis
HP LoadRunner (12.50) Page 1412
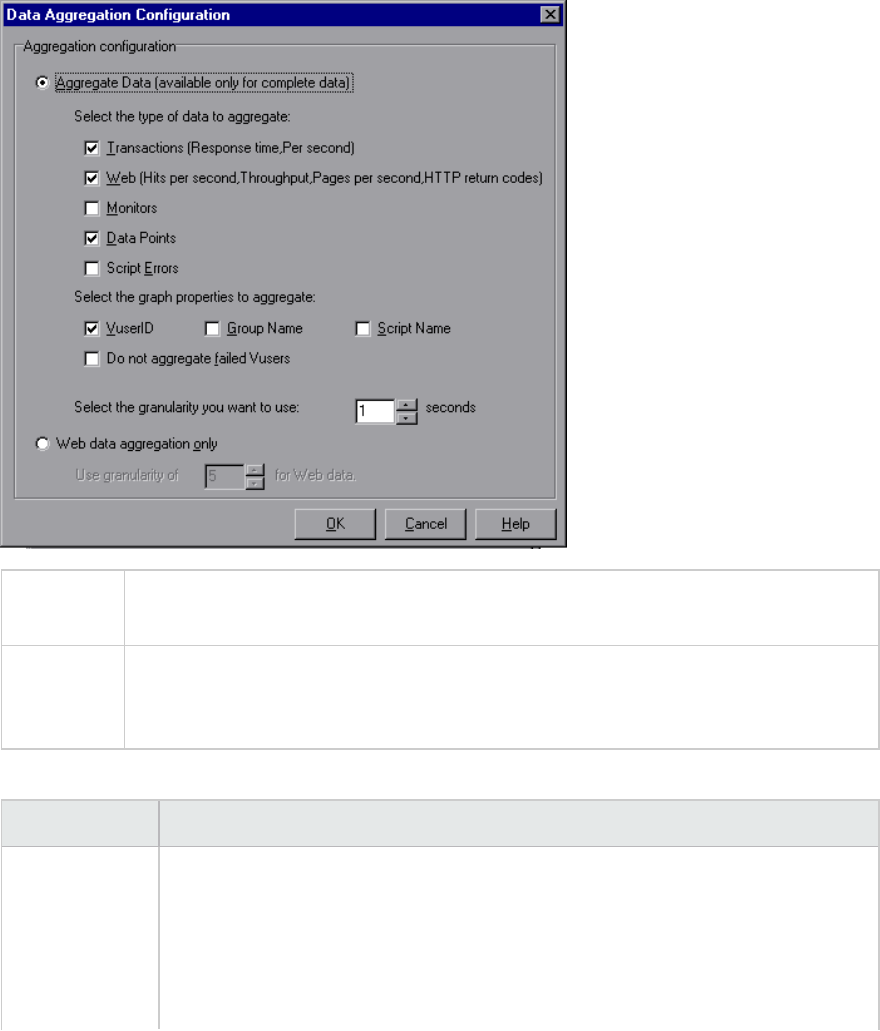
Data Aggregation Configuration Dialog Box (Result Collection
Tab)
If you choose to generate the complete data from the load lest scenario results, Analysis aggregates
the data using either built-in data aggregation formulas, or aggregation settings that you define. This
dialog box enables you to define custom aggregation settings.
To access Select Tools > Options > Result Collection. Select the Apply user-defined
aggregation option and click the Aggregation Configuration button.
Important
information
In this dialog box, you can select granularity settings. To reduce the size of the
database, increase the granularity. To focus on more detailed results, decrease the
granularity.
User interface elements are described below:
UI Element Description
Aggregate Data Select this option to define your custom aggregation settings using the following
criteria:
lSelect the type of data to aggregate. Use the check boxes to select the types
of graphs for which you want to aggregate data.
lSelect graph properties to aggregate. Use the check boxes to select the graph
User Guide
Analysis
HP LoadRunner (12.50) Page 1413
UI Element Description
properties you want to aggregate.
To exclude data from failed Vusers, select Do not aggregate failed Vusers.
Note: You will not be able to drill down on the graph properties you select
in this list.
lSelect the granularity you want to use. Specify a custom granularity for the
data. The minimum granularity is 1 second.
Web data
aggregation
only
Select this option to aggregate Web data only. In the Use Granularity of X for
Web data box, specify a custom granularity for Web data.
The minimum granularity is 1 second. By default, Analysis summarizes Web
measurements every 5 seconds.
Database Tab (Options Dialog Box)
This tab enables you to specify the database in which to store Analysis session result data and to
configure the way in which CSV files will be imported into the database.
User Guide
Analysis
HP LoadRunner (12.50) Page 1414
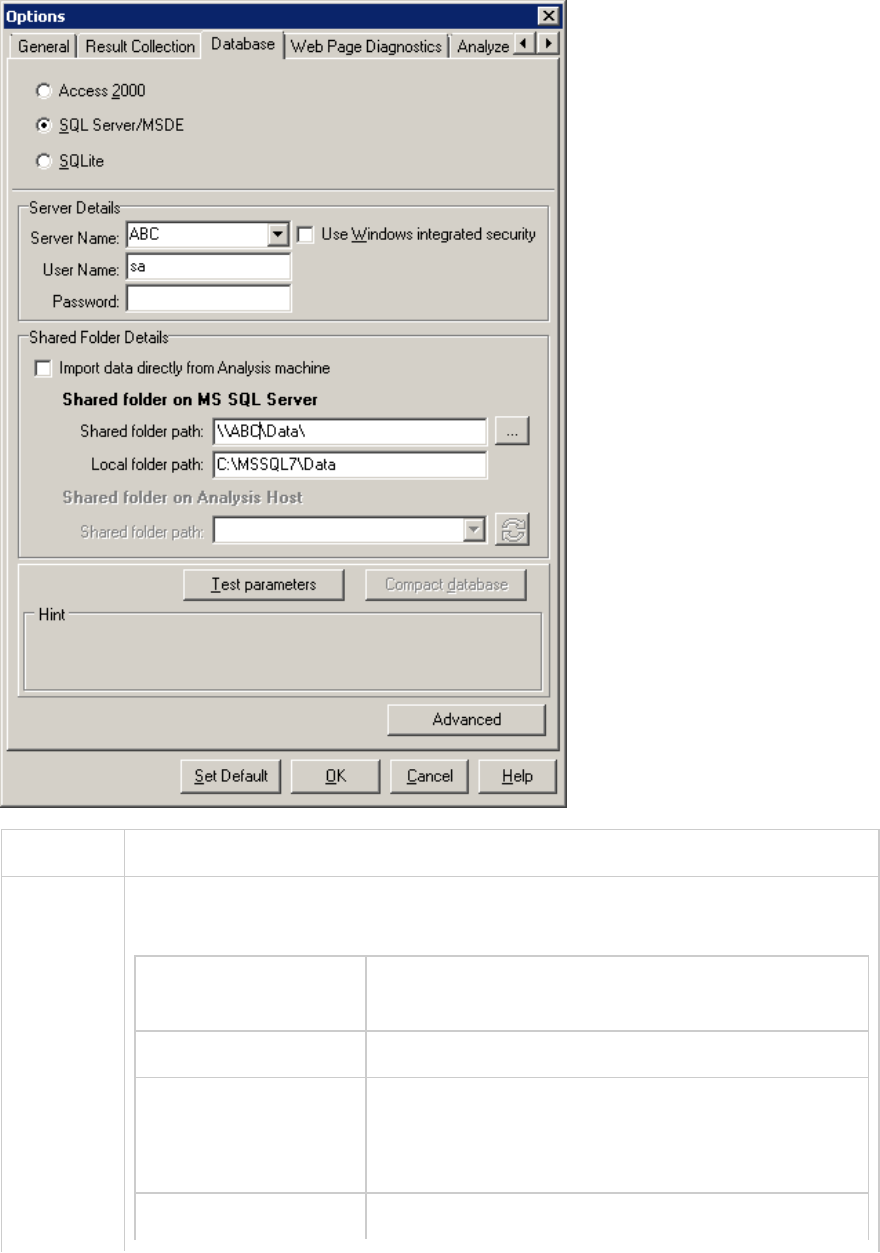
To access Analysis > Tools > Options > Database tab.
Important
information
Analysis data can be saved in one of three formats. Select the format based on the
size of the analysis session file, as shown in the table below:
Size of the Analysis
session file
Recommended format
lLess than 2 GB Access 2000
l2 GB to 10 GB SQLServer/MSDE
Select SQLServer/MSDE if you need to work in
multithread mode.
lMore than 10 GB SQLite
User Guide
Analysis
HP LoadRunner (12.50) Page 1415
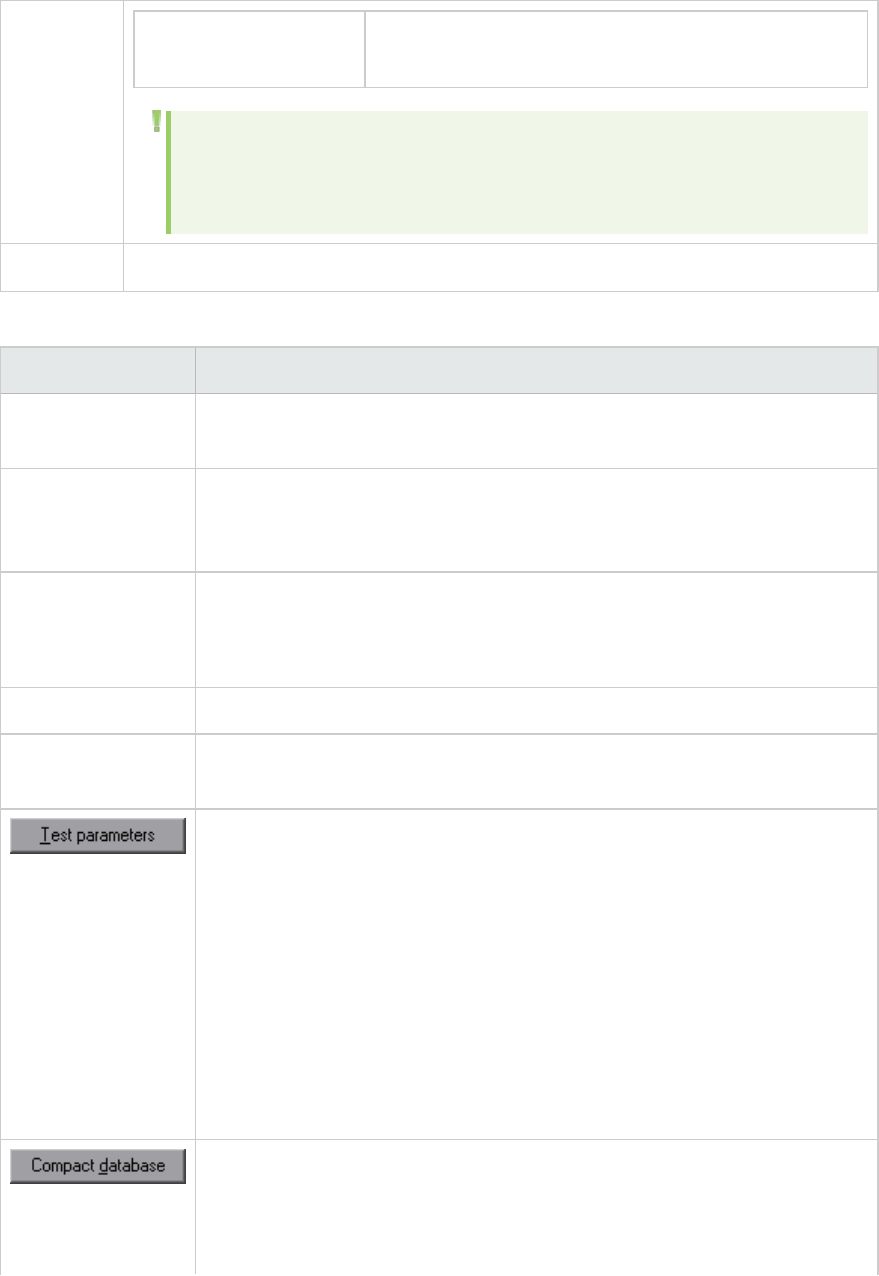
Note that the SQLite format allows you to store up to 32
terabytes of data.
Note: Both the Access 2000 database format and the SQLite format are
embedded databases. The session directory contains both the database and
the analysis data.
See also "Importing Data Directly from the Analysis Machine" on page1405
User interface elements are described below:
UI Element Description
Access 2000 Instructs LoadRunner to save Analysis result data in an Access 2000 database
format. This setting is the default.
SQL Server/MSDE Instructs LoadRunner to save Analysis result data on an SQL server / MSDE
machine. If you select this option, you have to complete the Server Details
and Shared Folder Details, described below.
SQLite Instructs LoadRunner to save Analysis result data in an SQLite database
format.
If you choose this format, you will not be able to work in multithread mode.
Server Details area SQL server / MSDE machine details. See description below.
Shared Folder
Details area
SQL server / MSDE machine shared folder details. See description below.
Depending on which database you are using, this button performs the
following action:
lFor Access. Checks the connection parameters to the Access database and
verifies that the delimiter on your machine's regional settings matches the
Microsoft JET delimiter on the database machine.
lFor SQL server / MSDE. Checks the connection parameters, the existence
of a shared server directory, whether there are write permissions on the
shared server directory, and whether the shared and physical server
directories are synchronized.
lFor SQLite. This button is disabled.
When you configure and set up your Analysis session, the database containing
the results may become fragmented. As a result, it will use excessive disk
space. For Access databases, the Compact database button enables you to
repair and compress your results and optimize your database. This button is
User Guide
Analysis
HP LoadRunner (12.50) Page 1416
UI Element Description
disabled if you choose SQLite.
Note: Long load test scenarios (duration of two hours or more) will
require more time for compacting.
Opens the Advanced Options dialog box, allowing you to increase performance
when processing LoadRunner results or importing data from other
sources.This button is disabled if you choose SQLite. For user interface details
see "Advanced Options Dialog Box (Database Tab)" on the next page.
Server Details Area
If you choose to store Analysis result data on an SQL server / MSDE machine, you need to complete the
server details. User interface elements are described below:
UI Element Description
Server Name The name of the machine on which the SQL server / MSDE is running.
Use Windows
integrated
security
Enables you to use your Windows login, instead of specifying a user name and
password. By default, the user name "sa" and no password are used for the SQL
server.
User Name The user name for the master database.
Password The password for the master database.
Shared Folder Details Area
If you store Analysis result data on an SQL server / MSDE machine, you need to provide the shared folder
details. User interface elements are described below:
UI Element Description
Import Data
Directly
from
Analysis
machine
Select this option to import data directly from the Analysis machine. For details on this
option, see "Importing Data Directly from the Analysis Machine" on page1405.
Shared
Folder on
MS SQL
lShared folder path. Enter a shared folder on the SQL server / MSDE machine. For
example, if your SQL server's name is fly, enter \\fly\<Analysis database
folder>\.
User Guide
Analysis
HP LoadRunner (12.50) Page 1417
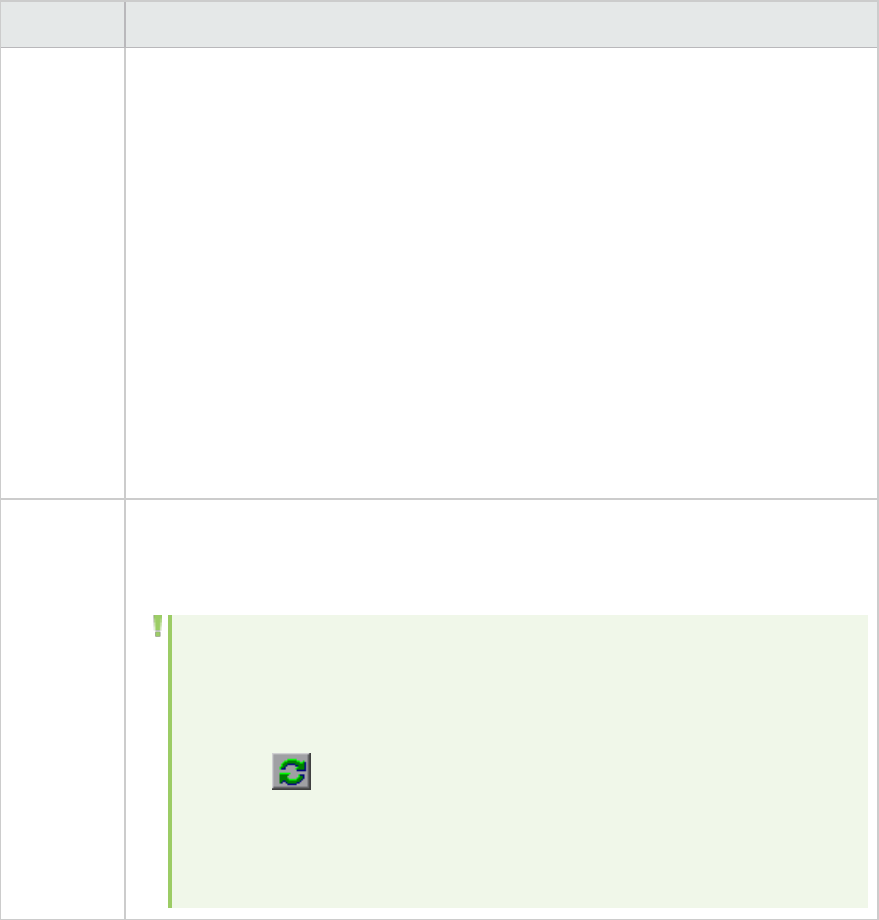
UI Element Description
Server This folder has different functions, depending on how you import the Analysis data:
lIf you did not select the option to import data directly from the Analysis
machine, this folder stores permanent and temporary database files. Analysis
results stored on an SQL server / MSDE machine can only be viewed on the
machine's local LAN.
lIf you selected the option to import data directly from the Analysis machine,
this folder is used to store an empty database template copied from the Analysis
machine.
lLocal folder path. Enter the real drive and folder path on the SQL server / MSDE
machine that correspond to the above shared folder path. For example, if the
Analysis database is mapped to an SQL server named fly, and fly is mapped to
drive D, enter D:\<Analysis database folder>.
If the SQL server / MSDE and Analysis are on the same machine, the logical storage
location and physical storage location are identical.
Shared
Folder on
Analysis
Host
If you selected the option to import data directly from the Analysis machine, the
Shared folder path box is enabled. Analysis detects all shared folders on your Analysis
machine and displays them in a drop-down list. Select a shared folder from the list.
Note:
lEnsure that the user running the SQL server (by default, SYSTEM) has
access rights to this shared folder.
lIf you add a new shared folder on your machine, you can click the refresh
button to display the updated list of shared folders.
lAnalysis creates the CSV files in this folder and the SQL server imports
these CSV files from the Analysis machine directly into the database. This
folder stores permanent and temporary database files.
Advanced Options Dialog Box (Database Tab)
This dialog box enables you to increase performance when processing LoadRunner results or importing
data from other sources.
User Guide
Analysis
HP LoadRunner (12.50) Page 1418
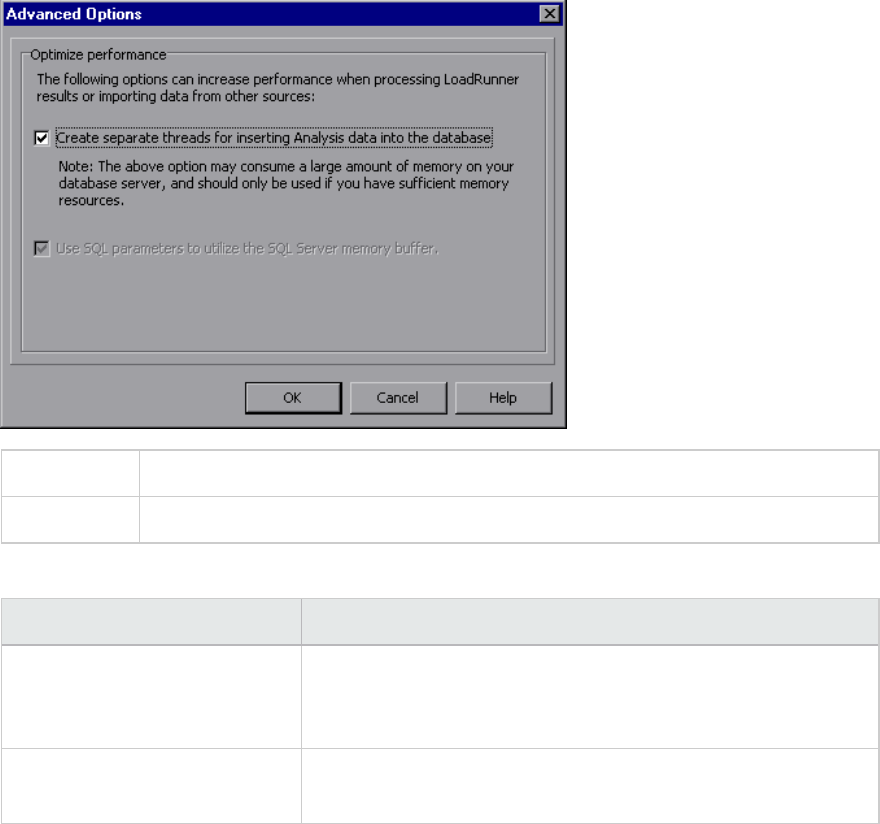
To access Analysis > Tools > Options > Database tab > Advanced button
See also "Database Tab (Options Dialog Box)" on page1414
User interface elements are described below:
UI Element Description
Create separate threads for
inserting Analysis data into the
database.
This option may consume a large amount of memory on your
database server, and should only be used if you have sufficient
memory resources.
Use SQL parameters to utilize
the SQL Server memory buffer.
This option is only enabled when you store Analysis result data on
an SQL server or MSDE machine.
Web Page Diagnostics Tab (Options Dialog Box)
This tab enables you to set Web page breakdown options. You can choose how to aggregate the display
of URLs that include dynamic information, such as a session ID. You can display these URLs individually,
or you can unify them and display them as one line with merged data points.
User Guide
Analysis
HP LoadRunner (12.50) Page 1419
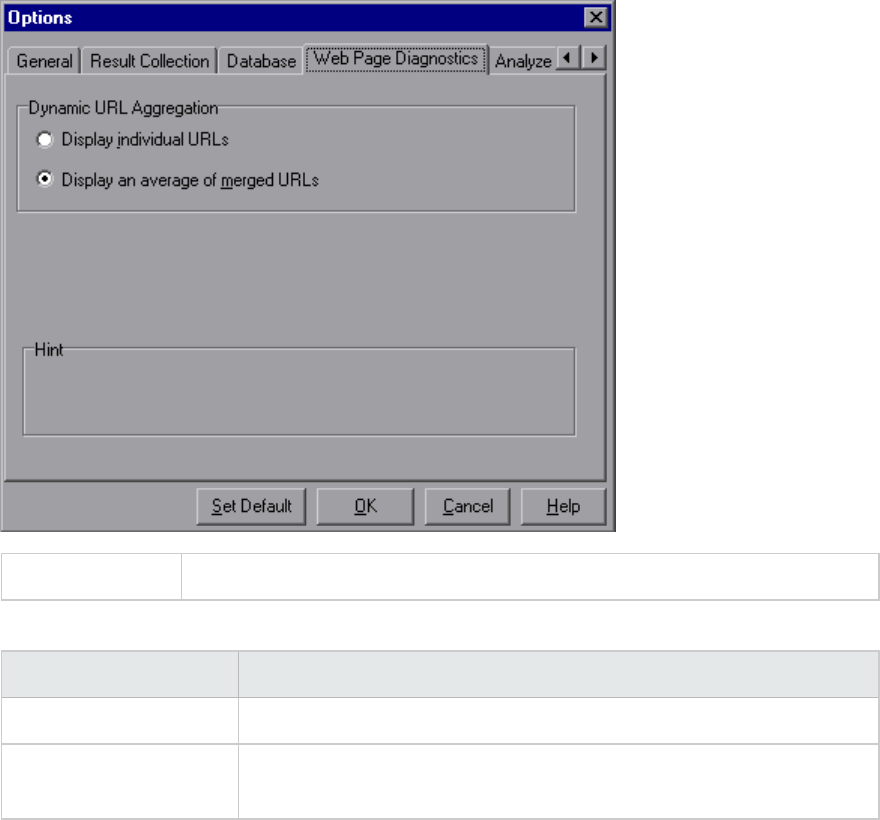
To access Tools > Options > Web Page Diagnostics tab
User interface elements are described below:
UI Element Description
Display individual URLs Displays each URL individually
Display an average of
merged URLs
Merges URLs from the same script step into one URL, and displays it with
merged (average) data points.
Session Information Dialog Box (Options Dialog Box)
This dialog box enables you to view a summary of the configuration properties of the current Analysis
session.
User Guide
Analysis
HP LoadRunner (12.50) Page 1420
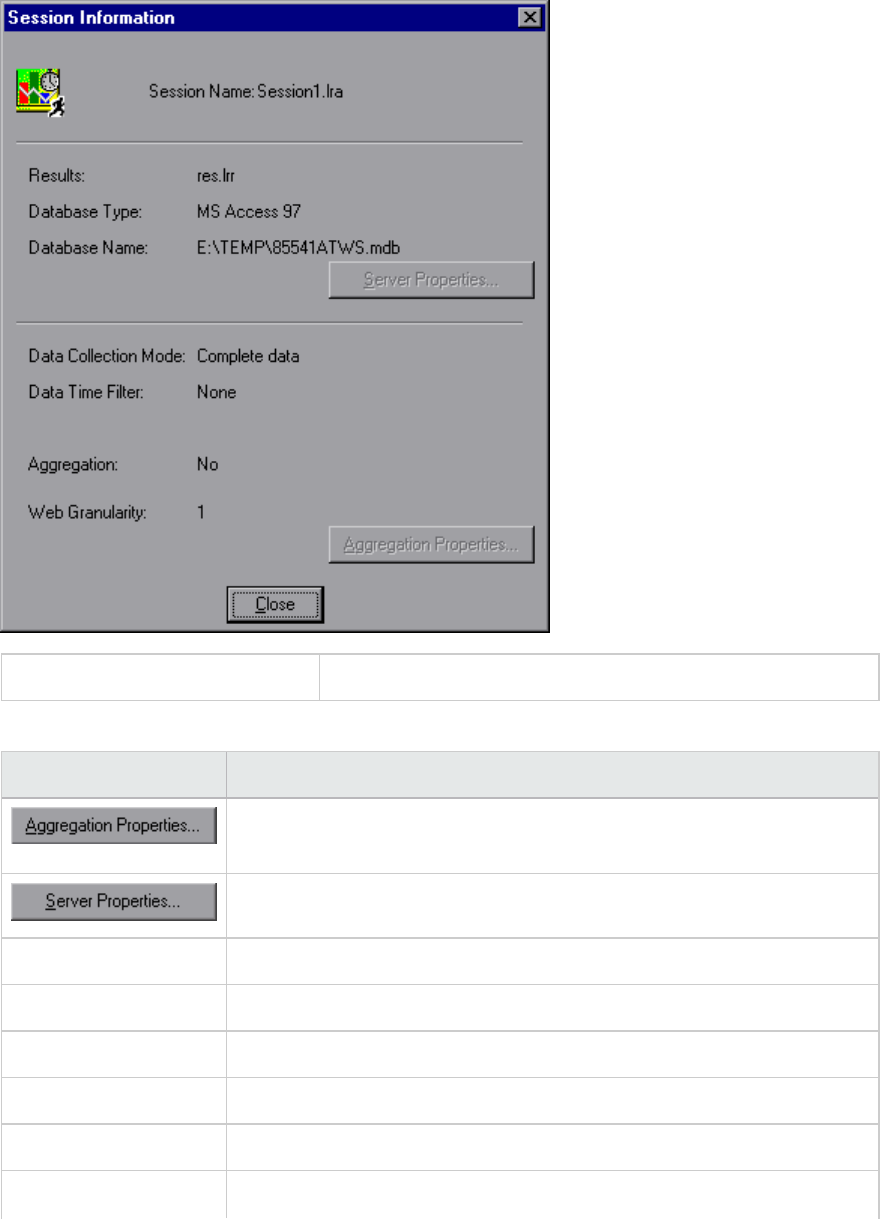
To access File > Session Information
User interface elements are described below:
UI Element Description
Displays the type of data aggregated, the criteria according to which it is
aggregated, and the time granularity of the aggregated data.
Displays the properties of the SQL server and MSDE databases.
Aggregation Indicates whether the session data has been aggregated.
Data Collection Mode Indicates whether the session displays complete data or summary data.
Data Time Filter Indicates whether a time filter has been applied to the session.
Database Name Displays the name and directory path of the database.
Database Type Displays the type of database used to store the load test scenario data.
Results Displays the name of the LoadRunner result file.
User Guide
Analysis
HP LoadRunner (12.50) Page 1421
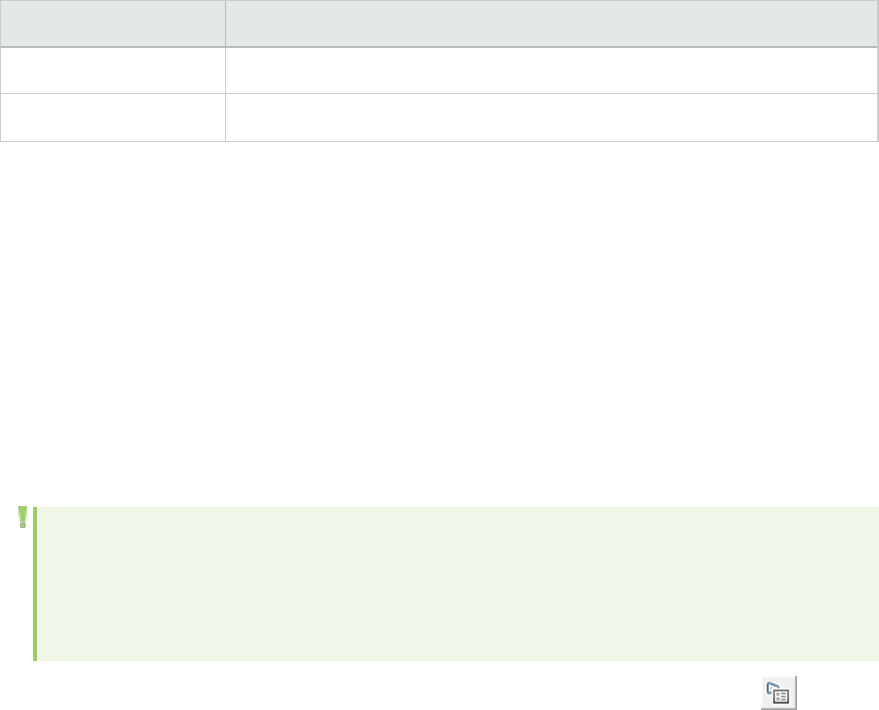
UI Element Description
Session Name Displays the name of the current session.
Web Granularity Displays the Web granularity used in the session.
Viewing Load Test Scenario Information
Viewing Load Test Scenario Information
In Analysis, you can view information about the load test scenario which you are analyzing. You can view
the scenario runtime settings and output messages that were generated by the Controller during the
scenario.
You can view information about the Vuser groups and scripts that were run in each scenario, as well as
the runtime settings for each script in a scenario, in the Scenario runtime settings dialog box.
Note: The runtime settings allow you to customize the way a Vuser script is executed. You
configure the runtime settings from the Controller or Virtual User Generator (VuGen) before
running a scenario. For information on configuring the runtime settings, refer to the online help
in those products.
Select File > View Scenario Runtime Settings, or click the View runtime settings button on the
toolbar.
The Scenario runtime settings dialog box opens, displaying the Vuser groups, scripts, and scheduling
information for each scenario. For each script in a scenario, you can view the runtime settings that were
configured in the Controller or VuGen before scenario execution.
User Guide
Analysis
HP LoadRunner (12.50) Page 1422
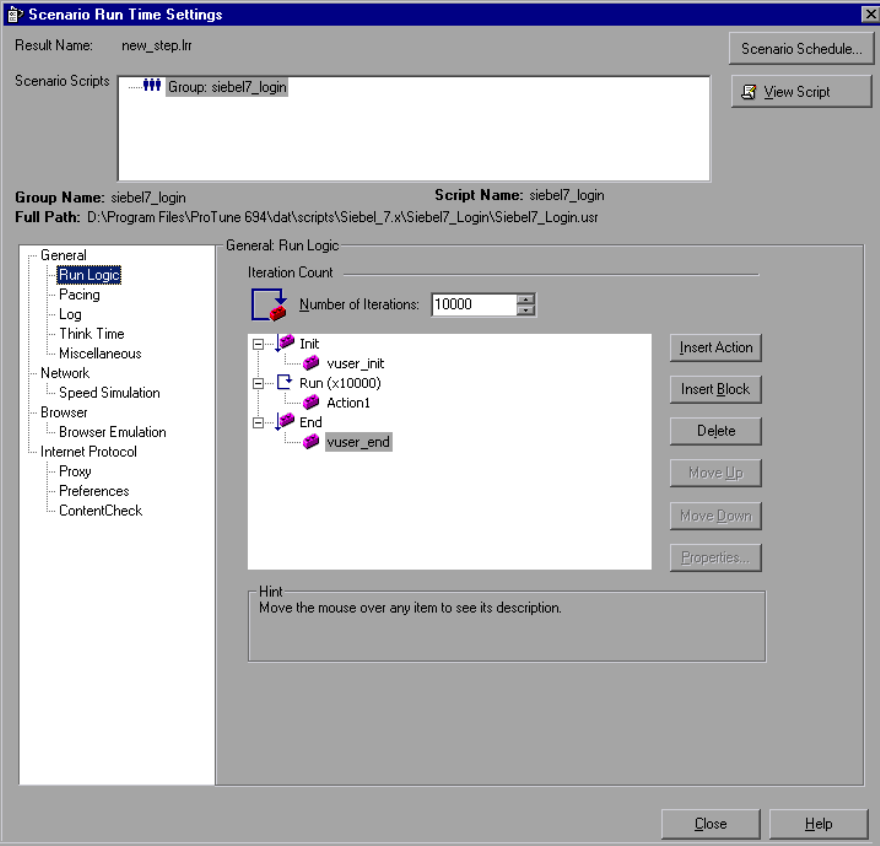
How to Configure Controller Output Messages Settings
This task describes how to configure settings for output messages.
1. Choose Tools > Options and select the Result Collection tab.
2. In the Copy Controller Output Messages to Analysis Session area, choose one of the following
options:
lCopy if data set is smaller than X MB. Copies the Controller output data to the Analysis session
if the data set is smaller than the amount you specify.
lAlways Copy. Always copies the Controller output data to the Analysis session.
lNever Copy. Never copies the Controller output data to the Analysis session.
3. Apply your settings.
User Guide
Analysis
HP LoadRunner (12.50) Page 1423
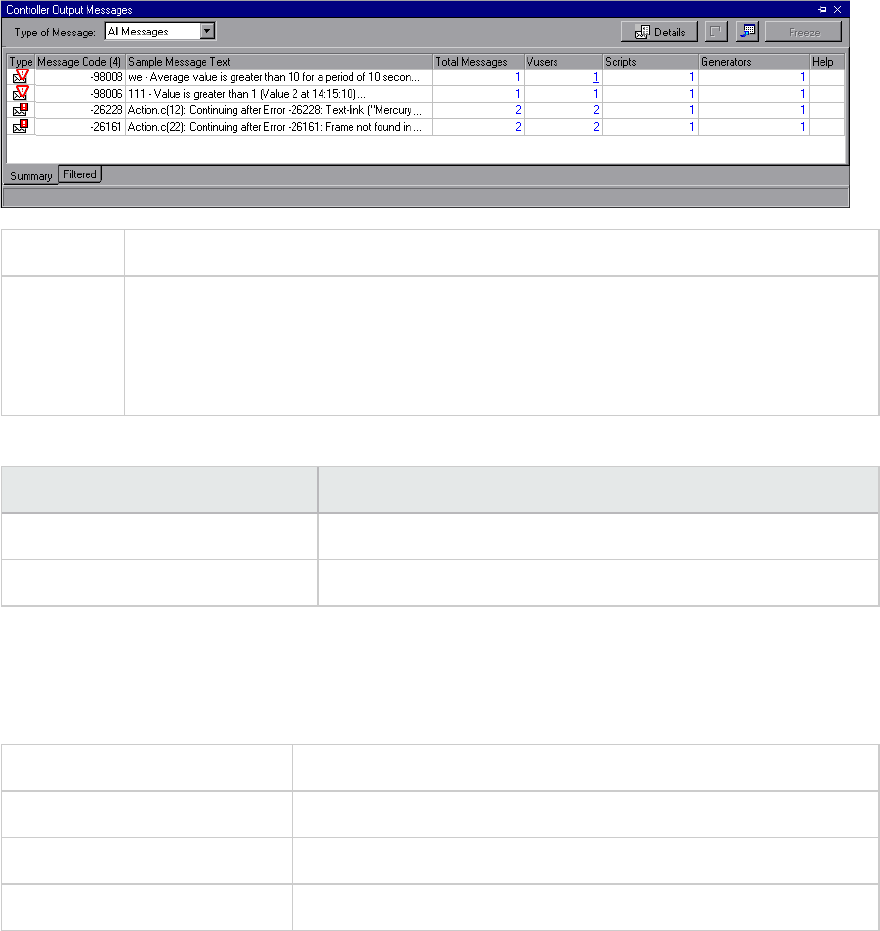
lTo apply these settings to the current session, click Apply now to active session.
lTo apply these settings after the current session is saved, click OK.
Controller Output Messages Window
This window displays error, notification, warning, debug, and batch messages that are sent to the
Controller by the Vusers and load generators during a scenario run.
To access Windows > Controller Output Messages
Important
information
lThe Summary tab is displayed by default when you open this window.
lAnalysis searches for the output data in the current Analysis session. If the data is
not found, it searches in the scenario results folder. If Analysis cannot locate the
results folder, no messages are displayed.
User interface elements are described below:
UI Element Description
Summary Tab See "Summary Tab" below
Filtered Tab See "Filtered Tab" on page1426
Summary Tab
This tab displays summary information about the messages sent during a scenario run.
To access Controller Output Messages window > Summary tab
Important Information You can drill down further on any information displayed in blue.
Parent topic "Controller Output Messages Window" above
See also "Filtered Tab" on page1426
User interface elements are described below:
User Guide
Analysis
HP LoadRunner (12.50) Page 1424
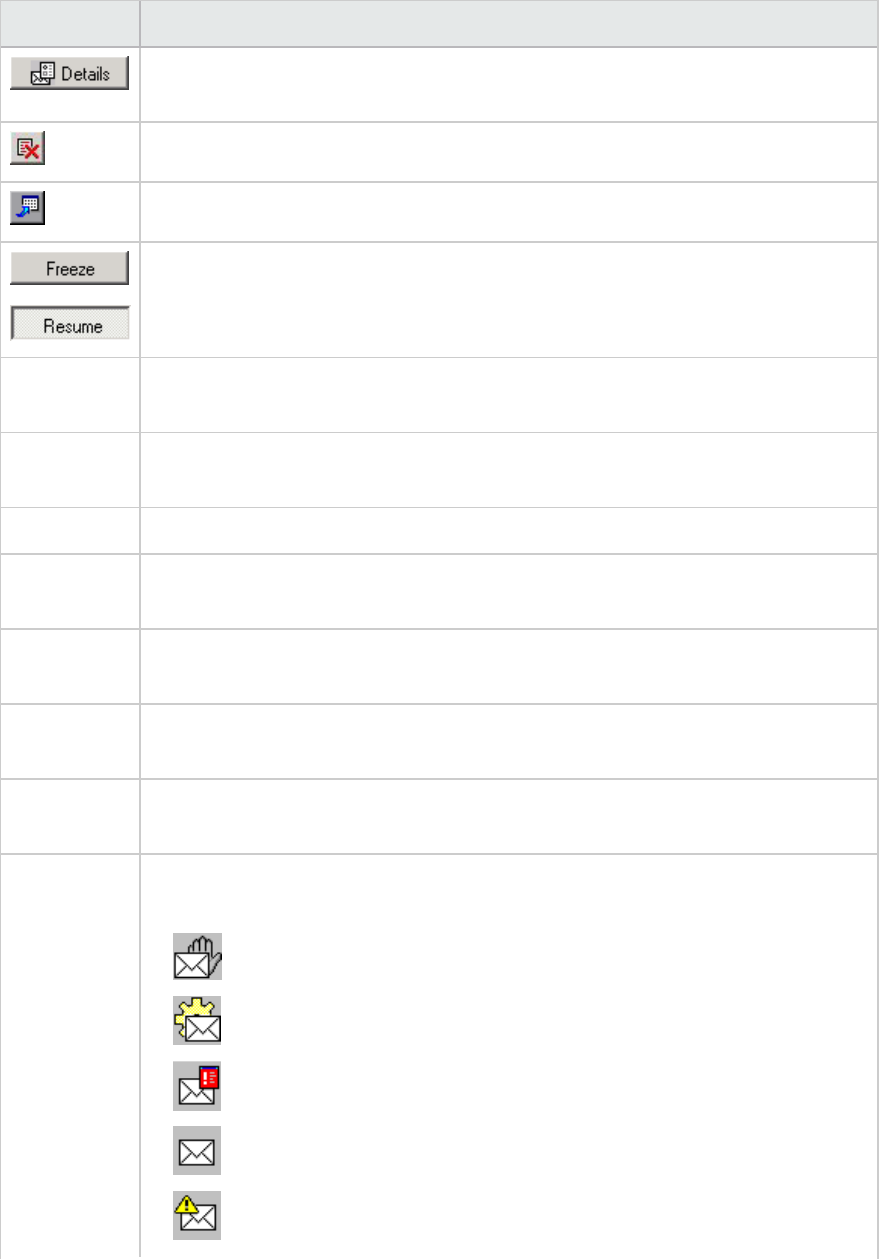
UI Element Description
Displays the full text of the selected output message in the Detailed Message Text
area at the bottom of the Output window.
Remove all messages. Clears all log information from the Output window.
Export the view. Saves the output to a specified file.
lFreeze. Stops updating the Output window with messages.
lResume. Resumes updating the Output window with messages. The newly
updated log information is displayed in a red frame.
Detailed
Message Text
Displays the full text of the selected output message when you click the Details
button.
Generators Displays the number of load generators that generated messages with the specified
message code.
Help Displays an icon if there is a link to troubleshooting for the message.
Message
Code
Displays the code assigned to all similar messages. The number in parentheses
indicates the number of different codes displayed in the Output window.
Sample
Message Text
Displays an example of the text of a message with the specified code.
Scripts Displays the number of scripts whose execution generated messages with the
specified code.
Total
Messages
Displays the total number of sent messages with the specified code.
Type The type of message being displayed. The following icons indicate the various
message types. For more information about each type, see Type of Message below:
lBatch
lDebug
lErrors
lNotifications
lWarnings
User Guide
Analysis
HP LoadRunner (12.50) Page 1425
UI Element Description
lAlerts
Type of
Message
Filters the output messages to display only certain message types. Select one of the
following filters:
lAll messages. Displays all message types.
lBatch. Sent instead of message boxes appearing in the Controller, if you are using
automation.
lDebug. Sent only if the debugging feature is enabled in the Controller. (Expert
mode: Tools > Options > Debug Information). For more information, see "Options
> Debug Information Tab" on page242.
lErrors. Usually indicate that the script failed.
lNotifications. Provides runtime information, such as message sent using lr_
output_message.
lWarnings. Indicates that the Vuser encountered a problem, but the scenario
continued to run.
lAlerts. Indicates a warning.
Vusers Displays the number of Vusers that generated messages with the specified code.
Filtered Tab
This tab displays a drilled down view by message, Vuser, script, or load generator. For example, if you
drill down on the Vuser column, the Filtered tab displays all the messages with the code you selected,
grouped by the Vusers that sent the messages.
To access Controller Output Messages window > Summary tab. Click the blue link on the
column that you wish to view more information about.
Important
information
The tab appears when you click on a blue link in the Summary tab.
See also "Summary Tab" on page1424
User interface elements are described below (unlabeled elements are shown in angle brackets):
UI Element Description
Previous/Next View. Enables you to move between the various drill down levels.
Displays the full text of the selected output message in the Detailed Message Text
area at the bottom of the Output window.
User Guide
Analysis
HP LoadRunner (12.50) Page 1426
UI Element Description
Export the view. Saves the output to a specified file.
Refreshes the Filtered tab with new log information that arrived in the Output
window updated in the Summary tab.
<Message
icon>
Displays an icon indicating the type of message by which the current Output view is
filtered.
Active Filter Displays the category or categories by which the current Output view is filtered.
Viewed By Displays the name of the column on which you selected to drill down. The following
icons indicate the various message types:
lBatch
lDebug
lErrors
lNotifications
lWarnings
lAlerts
Detailed
Message
Text
Displays the full text of the selected output message when the Details button is
selected.
Message Displays all instances of the sample message text.
Script The script on which the message was generated. If you click the blue link, VuGen
opens displaying the script.
Action The action in the script where the message was generated. If you click the blue link,
VuGen opens the script to the relevant action.
Line # The line in the script where the message was generated. If you click the blue link,
VuGen opens the script and highlights the relevant line.
# Lines The total number of lines in the script where the Vuser failed.
Time The time the message was generated.
Iteration The iteration during which the message was generated.
User Guide
Analysis
HP LoadRunner (12.50) Page 1427
UI Element Description
Vuser The Vuser that generated the message.
Generator The load generator on which the message was generated. If you click the blue link,
the Load Generator dialog box opens.
# Messages The number of messages generated by a specific Vuser.
Scenario Runtime Settings Dialog Box
This dialog box enables you to view information about executed load test scenarios, as well as the
runtime settings for each script in a scenario.
To access Toolbar >
See also "Viewing Load Test Scenario Information" on page1422
User interface elements are described below
UI Element Description
Result
Name
The name of the result file.
Scenario
Scripts
Displays the result set for each executed scenario, as well as the Vuser groups and
scripts that were run in the scenario.
Group Name Displays the name of the group to which the selected script belongs.
Full Path Displays the script's full directory path.
Script Name Displays the name of the selected script.
Scenario
Schedule
Displays goal-oriented or manual scenario scheduling information for the selected
scenario.
View Script Opens the Virtual User Generator, so that you can edit the script.
Defining Service Level Agreements
Service Level Agreements Overview
Service level agreements (SLAs) are specific goals that you define for your load test scenario. After a
scenario run, HP LoadRunner Analysis compares these goals against performance related data that was
gathered and stored during the course of the run, and determines whether the SLA passed or failed.
User Guide
Analysis
HP LoadRunner (12.50) Page 1428
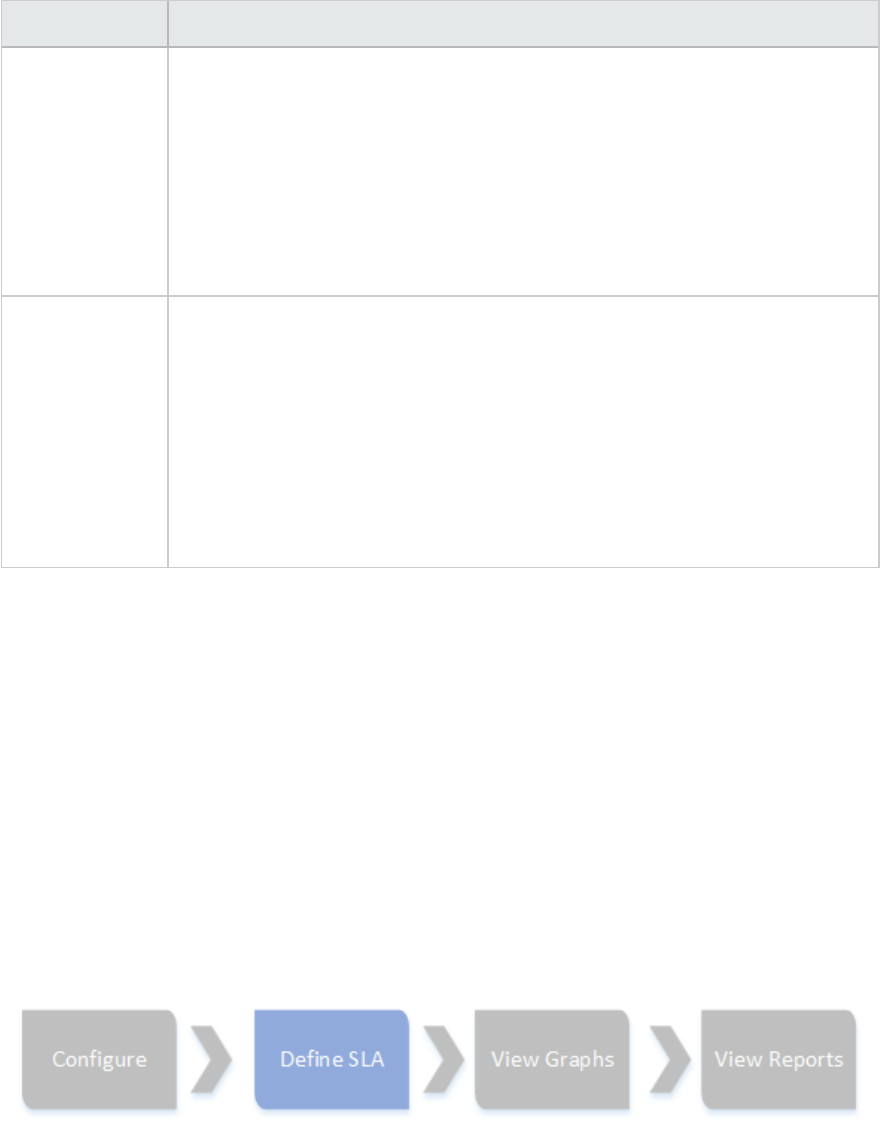
Depending on the measurements that you are evaluating for your goal, LoadRunner determines the SLA
status in one of the following ways:
SLA Type Description
SLA status
determined at
time intervals
over a timeline
Analysis displays SLA statuses at set time intervals over a timeline within the run.
At each time interval in the timeline—for example, every 10 seconds—Analysis
checks to see if the measurement's performance deviated from the threshold
defined in the SLA.
Measurements that can be evaluated in this way:
lTransaction Response Time (Average) per time interval
lErrors per Second per time interval
SLA status
determined over
the whole run
Analysis displays a single SLA status for the whole scenario run.
Measurements that can be evaluated in this way:
lTransaction Response Time (Percentile) per run
lTotal Hits per run
lAverage Hits (hits/second) per run
lTotal Throughput (bytes) per run
lAverage Throughput (bytes/second) per run
You can define and edit SLAs in the Controller or in Analysis.
Tracking Period
When you define service level agreements (SLAs)an SLA for measurements that are evaluated over a
timeline, Analysis determines SLA statuses at specified time intervals within that timeline. The
frequency of the time intervals is called the tracking period.
An internally-calculated tracking period is defined by default. You can change the tracking period by
entering a value in the Advanced Options dialog box which Analysis plugs into a built-in algorithm to
calculate the tracking period. For details, see "Advanced Options Dialog Box (Service Level Agreement
Pane)" on page1434.
How to Define Service Level Agreements
This task describes how to define service level agreements (SLAs).
User Guide
Analysis
HP LoadRunner (12.50) Page 1429

You can define service level agreements (SLAs) which measure scenario goals over time intervals, or
over a whole scenario run. For details, see "Service Level Agreements Overview" on page1428.
Tip: For a use-case scenario related to this task, see "How to Define Service Level Agreements -
Use-Case Scenario" on the next page.
1. Prerequisites
If you are defining an SLA for Average Transaction Response Time, your scenario must include a
script that contains at least one transaction.
2. Run through the SLA wizard
In the Service Level Agreement pane, click New to open the Service Level Agreement wizard. For
user interface details, see "Service Level Agreement Wizard" on page1435.
a. Select a measurement for the SLA.
b. If you are defining an SLA for Average Transaction Response Time or Transaction Response
Time (Percentile), select the transactions to include in your goal.
c. (Optional) When evaluating SLA statuses over a timeline, select load criteria to take into
account and define appropriate load value ranges for the load criteria. For an example, see
"How to Define Service Level Agreements - Use-Case Scenario" on the next page.
d. Set thresholds for the measurements.
oIf the Average Transaction Response Time or Errors per Second exceed the defined
thresholds, Analysis will produce a Failed SLA status.
oIf Transaction Response Time(Percentile),Total Hits per run,Average Hits (hits/second)
per run,Total Throughput (bytes) per run, or Average Throughput (bytes/second) per run
are lower than the defined threshold, Analysis will produce a Failed SLA status.
3. Define a tracking period - optional
For measurements whose SLA statuses are determined over time intervals, you need to define the
frequency of the time intervals, that is, the tracking period. For details, see "Tracking Period" on
the previous page.
For user interface details, see "Advanced Options Dialog Box (Service Level Agreement Pane)" on
page1434.
4. Results
When analyzing your scenario run, HP LoadRunner Analysis compares the data collected from the
scenario run against the SLA settings, and determines SLA statuses which are included in the
default Summary Report.
User Guide
Analysis
HP LoadRunner (12.50) Page 1430
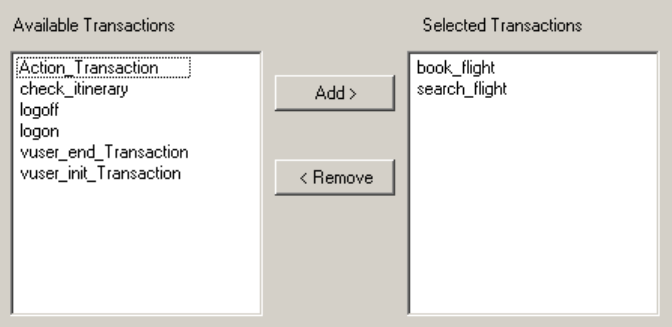
How to Define Service Level Agreements - Use-Case Scenario
This use-case scenario describes how to define a service level agreement (SLA) for Average Transaction
Response Time.
1. Background
The administrator of HP Web Tours would like to know when the average transaction response
time for booking a flight and searching for a flight exceeds a certain value. Assume that your
scenario includes a script that includes the following transactions: book_flight and search_flight.
2. Start the SLA wizard
In the Service Level Agreement pane, click New to open the Service Level Agreement wizard.
3. Select the measurement for the SLA
On the Select a Measurement page, under Select a Measurement for Your Goal, in the
Transaction Response Time box, select Average.
4. Select the transactions to evaluate in your goal
On the Select a Transaction page, select the transactions to be evaluated: book_flight and search_
flight.
5. Select a load criterion and define appropriate ranges of load- optional
On the Select Load Criteria page, select the load criterion to take into account when evaluating the
average transaction response time.
In this case, to see the effect that various quantities of Vusers running on the system has on the
average transaction response time of each transaction, in the Load Criteria box, select Running
Vusers.
Then set the value ranges for the running Vusers:
User Guide
Analysis
HP LoadRunner (12.50) Page 1431
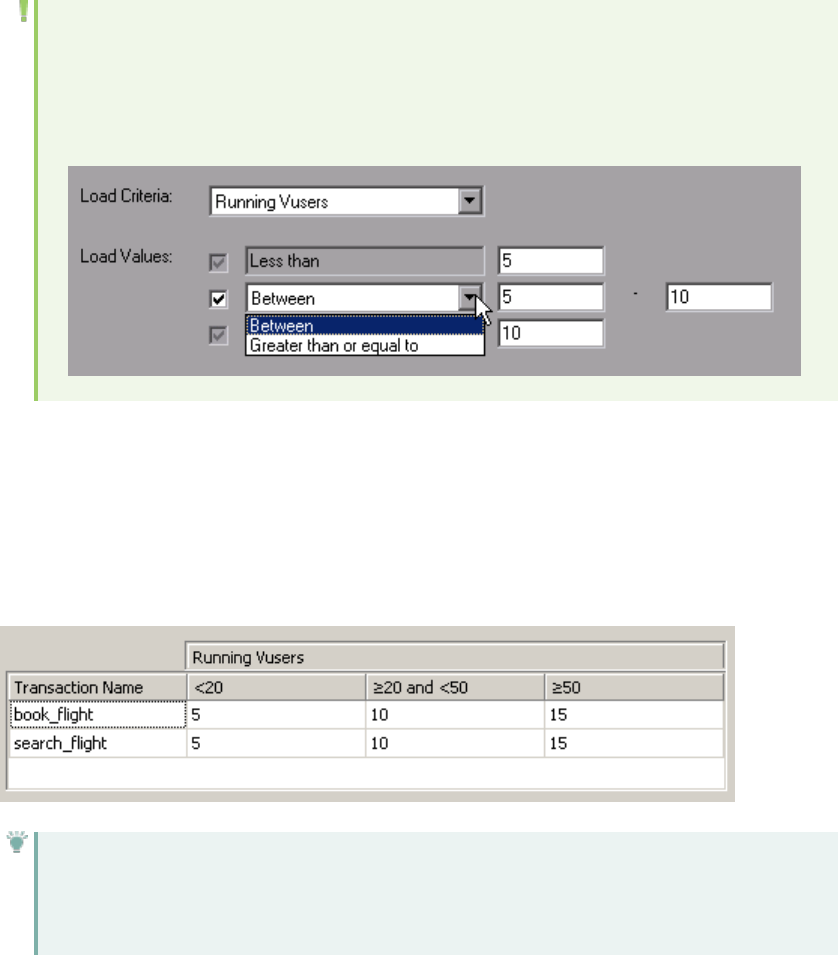
Consider less than 20 Vusers to be a light load, 20 – 50 Vusers an average load, and 50 Vusers or
more a heavy load. Enter these values in the Load Values boxes.
Note:
lYou can set up to three in-between ranges.
lValid load value ranges are consecutive—there are no gaps in the range—and span all
values from zero to infinity.
6. Set thresholds
On the Set Threshold Values page, you define the acceptable average transaction response times
for the transactions, taking into account the defined load criteria.
In this case, define the same threshold values for both transactions as follows: for a light load, a
reasonable average response time can be up to 5 seconds, for an average load, up to 10 seconds,
and for a heavy load, up to 15 seconds.
Tip: To define the same thresholds for all the transactions, you can type the values in the
table nearer the bottom of the Set Threshold Values page, and click Apply to all
transactions.
7. Define a tracking period - optional
When SLA statuses for a measurement are determined at time intervals over a timeline, the
frequency of the time intervals is determined by the tracking period.
This step is optional because an internally-calculated tracking period of at least 5 seconds is
defined by default. You can change the tracking period in the Advanced Options dialog box:
User Guide
Analysis
HP LoadRunner (12.50) Page 1432
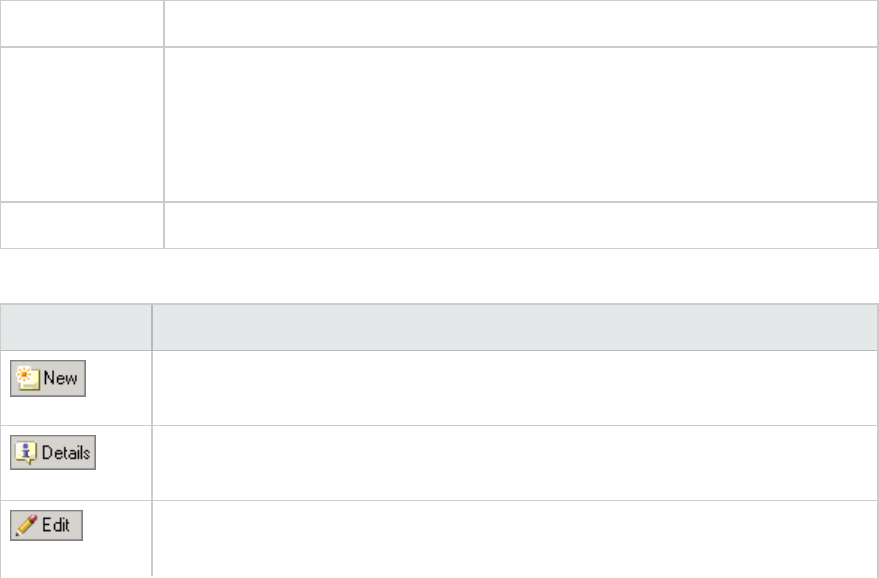
a. In the Service Level Agreement pane, click the Advanced button.
b. Select Tracking period of at least X seconds, and select a tracking period. The time intervals
are calculated by Analysis according to a built-in algorithm and as a function of the value you
enter here.
Example:
If you select a tracking period of 10, and the aggregation granularity for the scenario (defined
in Analysis) is 6, then the tracking period is set to the nearest multiple of 6 that is greater than
or equal to 10, that is, Tracking Period = 12.
For details, see "Tracking Period" on page1429.
For user interface details, see "Advanced Options Dialog Box (Service Level Agreement Pane)"
on the next page.
8. Results
When analyzing your scenario run, Analysis applies your SLA settings to the default Summary
Report and the report is updated to include all the relevant SLA information.
For example, it displays the worst performing transactions in terms of defined SLAs, how specific
transactions performed over set time intervals, and overall SLA statuses.
Service Level Agreement Pane
This pane lists all the service level agreements (SLAs) defined for the scenario.
To access Tools menu > Configure SLA Rules >Service Level Agreement pane
Relevant Tasks l"How to Design a Goal-Oriented Scenario" on page1079
l"How to Design a Manual Scenario" on page1081
l"How to Define Service Level Agreements" on page1429
l"How to Define Service Level Agreements - Use-Case Scenario" on page1431
See also "Service Level Agreements Overview" on page1428
User interface elements are described below:
UI Element Description
Starts the Service Level Agreement wizard where you can define new goals for the
load test scenario.
Opens the Goal Details dialog box which displays a summary of the details of the
selected SLA.
Opens the Service Level Agreement wizard where you can modify the goals defined
in the SLA.
User Guide
Analysis
HP LoadRunner (12.50) Page 1433
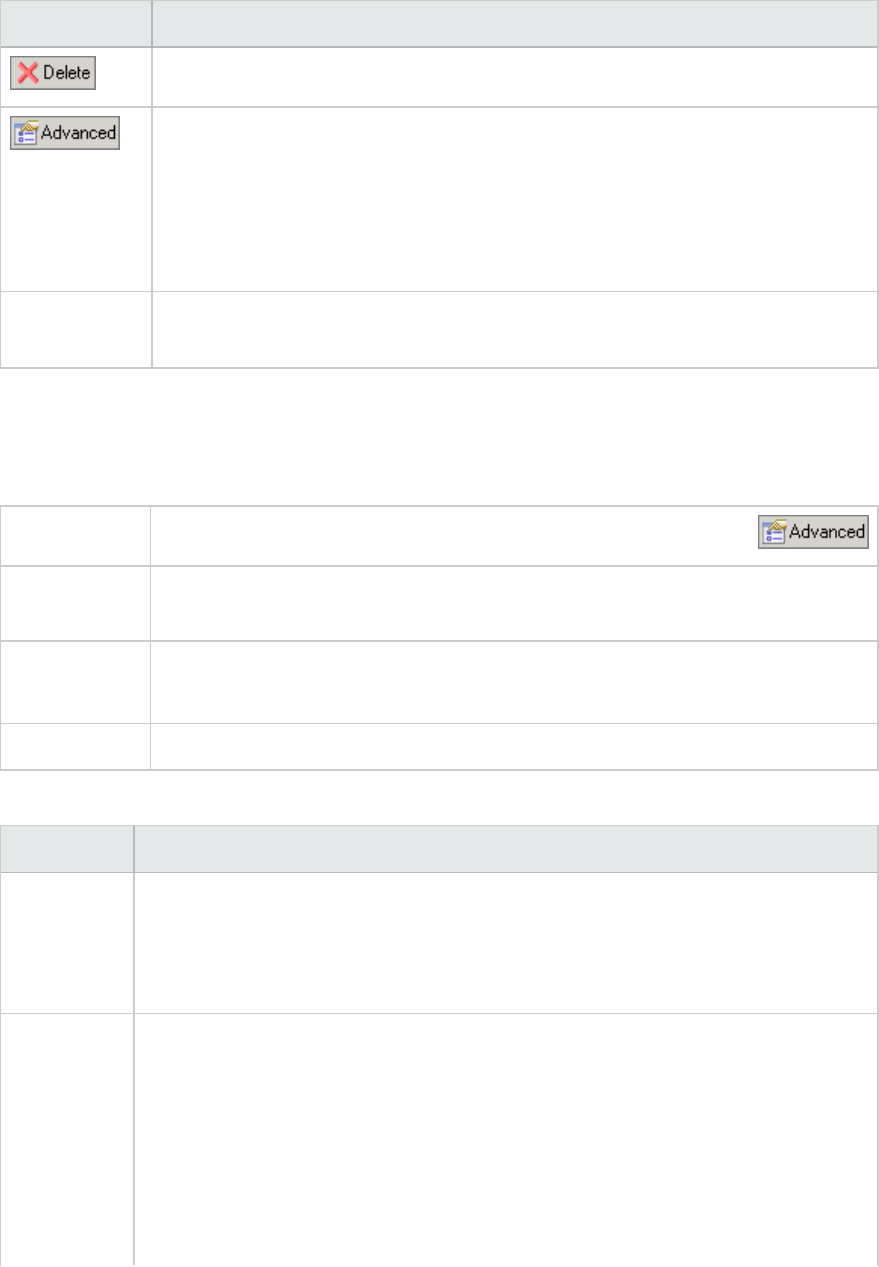
UI Element Description
Deletes the selected SLA.
Opens the Advanced Options dialog box where you can adjust the tracking period
for measurements that are evaluated per time interval over a timeline.
For more information, see "Tracking Period" on page1429.
For user interface details, see "Advanced Options Dialog Box (Service Level
Agreement Pane)" below.
Service Level
Agreement list
Lists the SLAs defined for the scenario.
Advanced Options Dialog Box (Service Level Agreement Pane)
This dialog box enables you to define a tracking period for load test scenario.
To access Tools menu > Configure SLA Rules >Service Level Agreement pane >
Important
information
The tracking period is calculated by Analysis according to a built-in algorithm and as
a function of the value entered here.
Relevant tasks l"How to Define Service Level Agreements" on page1429
l"How to Define Service Level Agreements - Use-Case Scenario" on page1431
See also "Service Level Agreements Overview" on page1428
User interface elements are described below:
UI Element Description
Internally
calculated
tracking
period
Analysis sets the tracking period to the minimum value possible, taking into account
the aggregation granularity defined for the scenario. This value is at least 5 seconds.
It uses the following formula:
Tracking Period = Max (5 seconds, aggregation granularity)
Tracking
period of at
least X
seconds
Determines the minimum amount of time for the tracking period. This value can
never be less than 5 seconds.
Analysis sets the tracking period to the nearest multiple of the scenario's
aggregation granularity that is greater than or equal to the value (X) that you
selected.
For this option, Analysis uses the following formula:
Tracking Period =
User Guide
Analysis
HP LoadRunner (12.50) Page 1434
UI Element Description
Max(5 seconds, m(Aggregation Granularity))
where mis a multiple of the scenario's aggregation granularity such that m
(Aggregation Granularity) is greater than or equal to X.
Example: If you select a tracking period of X=10, and the aggregation granularity for
the scenario is 6, then the tracking period is set to the nearest multiple of 6 that is
greater than or equal to 10, that is, Tracking Period = 12.
Goal Details Dialog Box (Service Level Agreement Pane)
This dialog box displays the thresholds that were set for the selected SLA.
To access Tools menu > Configure SLA Rules >Service Level Agreement pane >
Important
information
If you defined load criteria as part of your SLA, the threshold values are displayed
per the defined load value ranges.
See also "Service Level Agreements Overview" on page1428
Service Level Agreement Wizard
This wizard enables you to define goals or service level agreements (SLAs) for your load test scenario.
To access Tools menu > Configure SLA Rules >Service Level Agreement pane >
Important
information
There are two modes for the Service Level Agreement wizard. The pages
included in the wizard depend on the measurement that is selected. See the
wizard maps below.
Relevant tasks l"How to Define Service Level Agreements" on page1429
l"How to Define Service Level Agreements - Use-Case Scenario" on page1431
Wizard map - Goal
measured per time
interval
The Service Level Agreement Wizard contains:
Welcome >"Select a Measurement Page" on the next page > ("Select
Transactions Page" on page1437) > "Set Load Criteria Page" on page1437 >
"Set Threshold Values Page (Goal Per Time Interval)" on page1439
Wizard map - Goal
measured over
whole scenario run
The Service Level Agreement Wizard contains:
Welcome >"Select a Measurement Page" on the next page > ("Select
Transactions Page" on page1437) > "Set Threshold Values Page (Goal Per
User Guide
Analysis
HP LoadRunner (12.50) Page 1435

Whole Run)" on page1440
See also "Service Level Agreements Overview" on page1428
Select a Measurement Page
This wizard page enables you to select a measurement for your goal.
Important
information
lGeneral information about this wizard is available here: "Service Level
Agreement Wizard" on the previous page.
lThere are two modes for the Service Level Agreement wizard. The wizard
pages that follow depend on the measurement that you select on this
page. See the wizard maps below.
Wizard map - Goal
measured per time
interval
The "Service Level Agreement Wizard" on the previous page contains:
Welcome >Select a Measurement Page > ("Select Transactions Page" on the
next page) > "Set Load Criteria Page" on the next page >"Set Threshold Values
Page (Goal Per Time Interval)" on page1439
Wizard map - Goal
measured over
whole scenario run
The "Service Level Agreement Wizard" on the previous page contains:
Welcome >Select a Measurement Page > ("Select Transactions Page" on the
next page) > "Set Threshold Values Page (Goal Per Whole Run)" on page1440
See also "Service Level Agreements Overview" on page1428
User interface elements are described below:
UI Element Description
SLA status determined over
the whole run
Evaluates a single SLA status for the whole scenario run. Select one of
the following measurements:
lTransaction Response Time (Percentile)
lTotal Hits per run
lAverage Hits (hits/second) per run
lTotal Throughput (bytes) per run
lAverage Throughput (bytes/second) per run
SLA status determined per
time intervals over a
timeline
Evaluates SLA statuses at set time intervals within the run. Select one
of the following measurements:
lAverage Transaction Response Time
lErrors per Second
The time intervals at which the SLA statuses are evaluated are known
User Guide
Analysis
HP LoadRunner (12.50) Page 1436

UI Element Description
as the tracking period. For details, see "Tracking Period" on
page1429.
Select Transactions Page
This wizard page enables you to select transactions to evaluate as part of your goal.
Important
information
lGeneral information about this wizard is available here: "Service Level
Agreement Wizard" on page1435.
lThis page is displayed when creating an SLA for Transaction Response Time
by Average or by Percentile.
lIn order to define an SLA for Transaction Response Time by Average or by
Percentile, at least one of the Vuser scripts participating in the scenario must
include a transaction.
lYou can select multiple transactions using the CTRL key.
Wizard map -
Goal measured
per time interval
The "Service Level Agreement Wizard" on page1435 contains:
Welcome >"Select a Measurement Page" on the previous page > (Select
Transactions Page) > "Set Load Criteria Page" below >"Set Threshold Values
Page (Goal Per Time Interval)" on page1439
See also "Service Level Agreements Overview" on page1428
User interface elements are described below:
UI Element Description
Available
Transactions
Lists the transactions in the Vuser scripts participating in the scenario.
To move a script to the Selected Transaction list, select it and click Add.
Selected
Transactions
Lists the transactions in the Vuser scripts participating in the scenario that have
been selected for the SLA.
To remove a script from this list, select it and click Remove.
Set Load Criteria Page
This wizard page enables you to select load criteria to take into account when testing your goal.
Important
information
lGeneral information about this wizard is available here: "Service Level
Agreement Wizard" on page1435.
lThis page is displayed only when defining an SLA that determines SLA statuses
User Guide
Analysis
HP LoadRunner (12.50) Page 1437

per time interval over a timeline.
lIn the next wizard step (Set Threshold Values page), you will set different
thresholds per each of the load ranges that you select here.
Wizard map -
Goal measured
per time interval
The "Service Level Agreement Wizard" on page1435 contains:
Welcome >"Select a Measurement Page" on page1436 > ("Select Transactions
Page" on the previous page) > Set Load Criteria Page >"Set Threshold Values
Page (Goal Per Time Interval)" on the next page
See also "Service Level Agreements Overview" on page1428
User interface elements are described below:
UI Element Description
Load Criteria The relevant load criteria that you want to use
Example: If you want to see the impact of running Vusers on the measurement,
select Running Vusers.
To define an SLA without load criteria, select None.
Load Values Valid load value ranges are consecutive—there are no gaps in the range—and span
all values from zero to infinity.
lLess than. Enter the upper value for the lower range of values for the load
criteria.
The lower range is between 0 and the value you entered. It does not include the
upper value.
Example: If you enter 5, the lower range of values for the load criteria is between 0
and 5, but does not include 5.
lBetween. The in-between range of values for the load criteria. Enter lower and
upper values for this range. The lower range is included in this range; it does not
include the upper value.
Example: If you enter 5 and 10, the in-between range of values for the load criteria
is from 5 and up to, but not including, 10.
Note: You can set up to three in-between ranges.
lGreater than. Enter the lower value for the upper range of values for the load
criteria.
The upper range includes values from the value you entered and on.
Example: If you enter 10, the upper range of values for the load criteria is from 10
and on.
Selected The measurement selected for the goal.
User Guide
Analysis
HP LoadRunner (12.50) Page 1438

UI Element Description
Measurement
Set Percentile Threshold Values Page
This wizard page enables you to select load criteria to take into account when testing your goal.
Important information lGeneral information about this wizard is available here: "Service
Level Agreement Wizard" on page1435.
lThe Percentile SLA enables you to measure whether the percentage
of transaction samples meets the defined threshold criteria.
lYou can enter a threshold value to 3 decimal places.
Wizard map - Goal
measured over whole
scenario run
The "Service Level Agreement Wizard" on page1435 contains:
Welcome >"Select a Measurement Page" on page1436 > ("Select
Transactions Page" on page1437) > Set Percentile Threshold Values
Page
See also "Service Level Agreements Overview" on page1428
User interface elements are described below:
UI Element Description
Selected Measurement The measurement selected for the goal.
Percentile Percentage of transactions to measure against the configured
threshold.
Provide threshold value for
all transactions
To apply one set of threshold values to all transactions selected for
the goal, enter the threshold value and click Apply to all. These
values are applied to all the transactions in the Thresholds table at
the bottom of the page.
Transaction name The transaction from the scenario run.
Threshold The threshold value for the selected transaction.
Set Threshold Values Page (Goal Per Time Interval)
This wizard page enables you to set thresholds for the measurements you are evaluating in your goal.
Important
information
lGeneral information about this wizard is available here: "Service Level Agreement
Wizard" on page1435.
User Guide
Analysis
HP LoadRunner (12.50) Page 1439
lIf you defined load criteria in the "Set Load Criteria Page" on page1437, you must
set thresholds per each of the defined load ranges. If you did not define load
criteria, you set one threshold value. For Average Transaction response time, you
set threshold values for each transaction.
lYou can enter a threshold value to 3 decimal places.
Wizard map
- Goal
measured
per time
interval
The "Service Level Agreement Wizard" on page1435 contains:
Welcome >"Select a Measurement Page" on page1436 > ("Select Transactions Page"
on page1437) > "Set Load Criteria Page" on page1437 >Set Threshold Values Page
(Goal Per Time Interval)
See also "Service Level Agreements Overview" on page1428
User interface elements are described below (unlabeled elements are shown in angle brackets):
UI Element Description
<Thresholds
table>
The thresholds for your goal. If you defined load criteria, enter thresholds for each
range of values.
Note: If the maximum threshold value is exceeded during a particular time
interval during the run, Analysis displays an SLA status of Failed for that
time interval.
Apply to all
(Average
Transaction
Response
Time goal
only)
To apply one set of threshold values to all transactions selected for the goal, enter
the threshold values in this table and click Apply to all transactions. These values
are applied to all the transactions in the Thresholds table at the top of the page.
Note: Threshold values for selected transactions do not have to be the
same. You can assign different values for each transaction.
Selected
Measurement
The measurement selected for the goal.
Set Threshold Values Page (Goal Per Whole Run)
This wizard page enables you to set minimum thresholds for the measurements you are evaluating in
your goal.
Important information General information about this wizard is available here: "Service
Level Agreement Wizard" on page1435.
Wizard map - Goal measured The "Service Level Agreement Wizard" on page1435 contains:
User Guide
Analysis
HP LoadRunner (12.50) Page 1440
over whole scenario run Welcome >"Select a Measurement Page" on page1436 >Set
Threshold Values Page (Goal Per Whole Run)
See also "Service Level Agreements Overview" on page1428
User interface elements are described below:
UI Element Description
Selected
measurement
The measurement selected for the goal.
Threshold The minimum threshold value for the selected measurement.
Note: If the value of the measurement is lower than this threshold during
the run, Analysis displays an SLA status of Failed for the entire run.
Working with Application Lifecycle Management
Managing Results Using ALM - Overview
Analysis works together with HP Application Lifecycle Management (ALM). ALM provides an efficient
method for storing and retrieving scenario and analysis results. You can store results in an ALM project
and organize them into unique groups.
In order for the Analysis to access an ALM project, you must connect it to the Web server on which ALM
is installed. You can connect to either a local or remote Web server.
When working against an ALM server with Performance Center, the ALM integration has several
additional capabilities, such as the ability to save the Analysis session to a new location, and upload a
report from the file system to ALM. For details, see "How to Work with Results in ALM - With
Performance Center" on page1443.
For more information on working with ALM, see the Application Lifecycle Management User Guide.
How to Connect to ALM from Analysis
To store and retrieve Analysis results from ALM, you need to connect to an ALM project. You can connect
or disconnect from an ALM project at any time during the testing process.
You can connect to one version of HP ALM from Analysis and a different version from your browser. For
more information, see the Important Information section in "HP ALM Connection Dialog Box" on
page1446.
User Guide
Analysis
HP LoadRunner (12.50) Page 1441

Connect to ALM
1. Select Tools >HP ALM Connection. The HP ALM Connection dialog box opens.
2. Enter the required information in the HP ALM Connection dialog box, as described in "HP ALM
Connection Dialog Box" on page1446.
3. To disconnect from ALM, click Disconnect.
Note: There is no explicit option in the Analysis user interface for enabling CAC mode (as in
VuGen). Analysis automatically enables CAC mode if the ALM server machine supports it. .
How to Work with Results in ALM - Without Performance Center
The following steps describe the workflow for working with results saved in an ALM project, whose
server does not have a Performance Center installation.
When working against an ALM server with HP Performance Center, there are several differences. For
more information, see "How to Work with Results in ALM - With Performance Center" on the next page.
1. Connect to ALM
Open a connection to the ALM server and project that contains the LoadRunner result or Analysis
session files. For task details, see "How to Connect to ALM from Analysis" on the previous page.
2. Open an existing Analysis session file - optional
a. Select File > Open.
b. In the left pane select a script.
c. In the right pane, select the results for which the Analysis session file was created.
d. Click OK.
3. Create a new Analysis session file from the raw data - optional
This procedure describes how to create a new Analysis session file on the ALM server, from the raw
results file. If an Analysis session file already exists for the raw data, you can choose to overwrite
the existing file.
a. Select File > New.
b. In the left pane select a script.
c. In the right pane, select the results you want to analyze.
d. Click OK.
4. Save the LoadRunner results file
When you are finished analyzing your results and creating reports or graphs, save the changes.
Select File > Save. The Analysis session file is in the ALM project.
User Guide
Analysis
HP LoadRunner (12.50) Page 1442
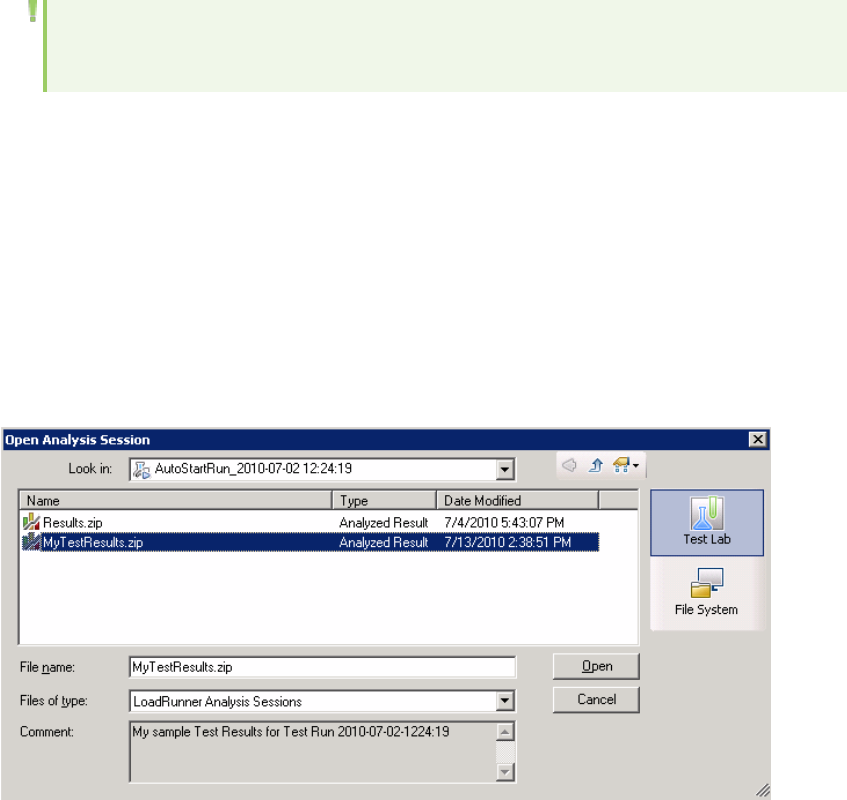
Note: When working with ALM without Performance Center, Save As is not supported—you
cannot save the Analysis session file to another location.
How to Work with Results in ALM - With Performance Center
ALM servers with Performance Center, allow you to perform the following operations:
Open an existing Analysis Session file
1. Select Tools > HP ALM Connection and make sure your connection to ALM is open.
2. Select File > Open.
3. Drill down to the Run level within the Test Plan module, and select an individual run.
4. Select a zip file containing the Analysis session file.
5. Click Open.
Open raw data and create a new Analysis session
1. Select Tools > HP ALM Connection and make sure your connection to ALM is open.
2. To create a new Analysis session file from the raw data, select File > New.
3. Drill down to the Run level within the Test Plan module, and select an individual run.
4. Select a zip file containing the run's raw data.
User Guide
Analysis
HP LoadRunner (12.50) Page 1443
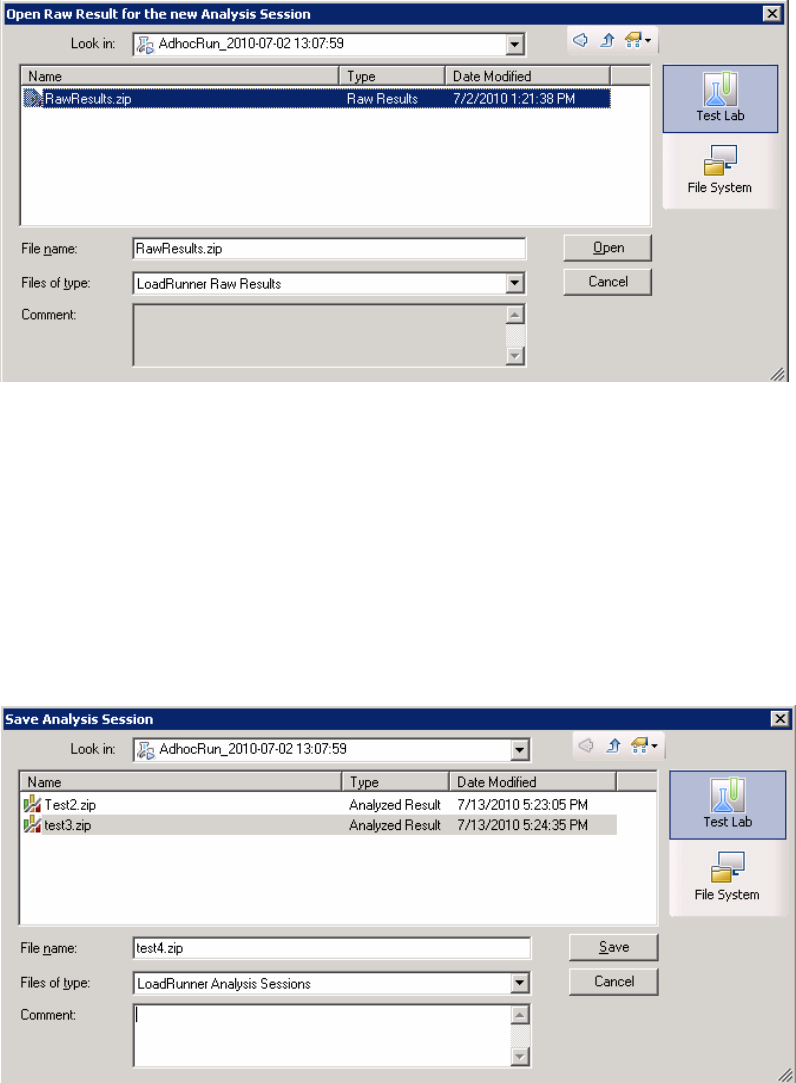
5. Click Open.
Save the changes to the Analysis session file
1. Complete your changes to the Analysis results.
2. Select Tools > HP ALM Connection and make sure your connection to ALM is open.
3. Select File > Save.
4. To save an Analysis session that was opened from the file system, click the Test Lab module
button.
5. Drill down to the Run level within the Test Plan module, and specify a name for the zip file.
6. Provide a comment about the Analysis session (optional).
7. Click Save.
User Guide
Analysis
HP LoadRunner (12.50) Page 1444
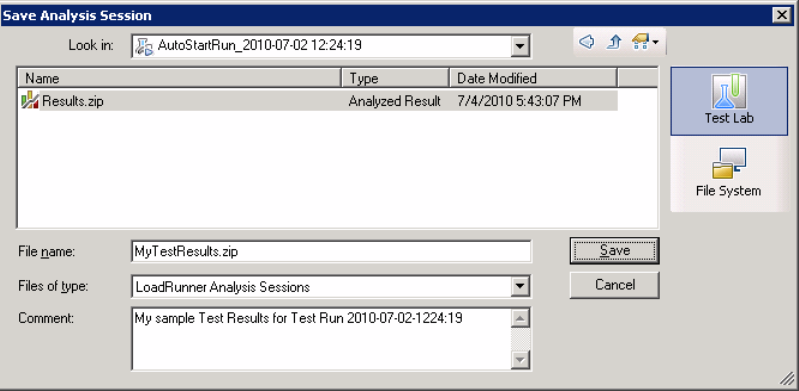
Save the Analysis session file to a new ALM location
1. Select Tools > HP ALM Connection and make sure your connection to ALM is open.
2. Open an Analysis session file from the file system, or from ALM as described above.
3. Select File > Save as.
4. Drill down to the Run level within the Test Plan module, and select an individual run.
5. Specify a name for the Analysis session zip file. The name Results is reserved.
6. Provide a comment about the Analysis session (optional).
7. Click Save.
Integration Methods - TestPlan or TestLab
Analysis uses different integration methods for ALM projects with Performance Center extensions,
depending on how it was invoked:
lThrough the Web-interface or from the Controller—TestPlan integration is used.
lThrough a manual launch, connected to a project through the HP ALM Connection dialog box—
TestLab integration is used.
How to Upload a Report to ALM
The following steps describe how to upload a report from the file system to an ALM's Test Lab module.
This capability is only available for ALM installation with Performance Center.
When working against an ALM server with HP Performance Center, there are several differences. For
more information, see "How to Work with Results in ALM - With Performance Center" on page1443.
1. Connect to ALM
Open a connection to the ALM server and project that contains the LoadRunner result or Analysis
User Guide
Analysis
HP LoadRunner (12.50) Page 1445
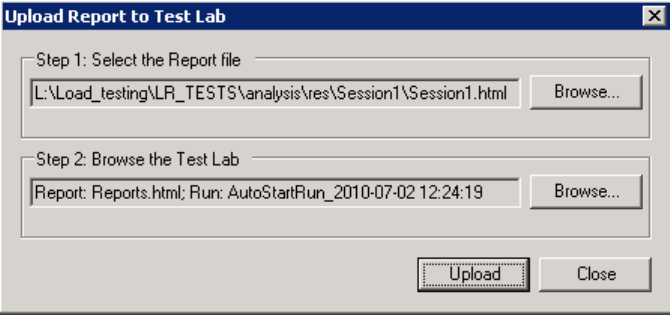
session files. For task details, see "How to Connect to ALM from Analysis" on page1441.
2. Open the Upload dialog box
Select Tools > Upload Report to Test Lab.
3. Select a report
Click Browse in the Step 1 section.The Select the Report file dialog box opens. Select an HTML or
XML file from the file system. Click Open.
4. Select a location on ALM
Click Browse in the Step 2 section.The Select Location for the Report dialog box opens. Navigate
to a Run level in the Test Lab module. Specify a name for the report and include any relevant
comments. Click OK.
5. Begin the upload
Click Upload. The upload begins.
HP ALM Connection Dialog Box
This dialog box enables you to connect to an ALM project.
User Guide
Analysis
HP LoadRunner (12.50) Page 1446
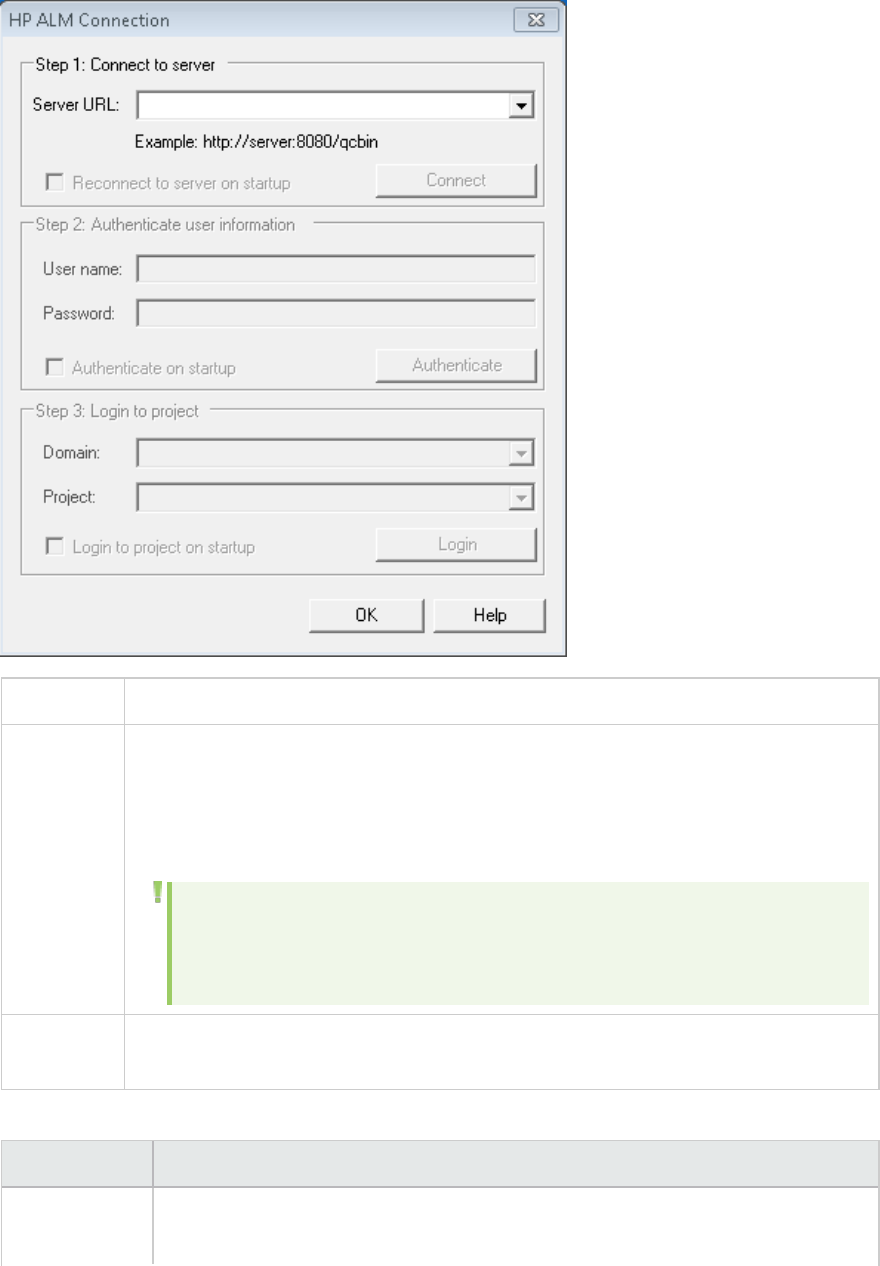
To access Tools > HP ALM Connection
Important
information
You can connect to one version of HP ALM from LoadRunner and a different version of
HP ALM from your browser.
You can only connect to different versions of HP ALM if one of the versions is HP ALM
11.00 or higher.
Note: Before you connect to ALM through the LoadRunner interface, it is
recommended that you first connect to the HPALMserver through your
browser.This automatically downloads the ALMclient files to your computer.
Relevant
tasks
"How to Connect to ALM from Analysis" on page1441
User interface elements are described below:
UI Element Description
Step 1:
Connect to
lServer URL. The URL of the server on which ALM is installed. The URL must be in
the following form http://<server_name:port>/qcbin.
User Guide
Analysis
HP LoadRunner (12.50) Page 1447
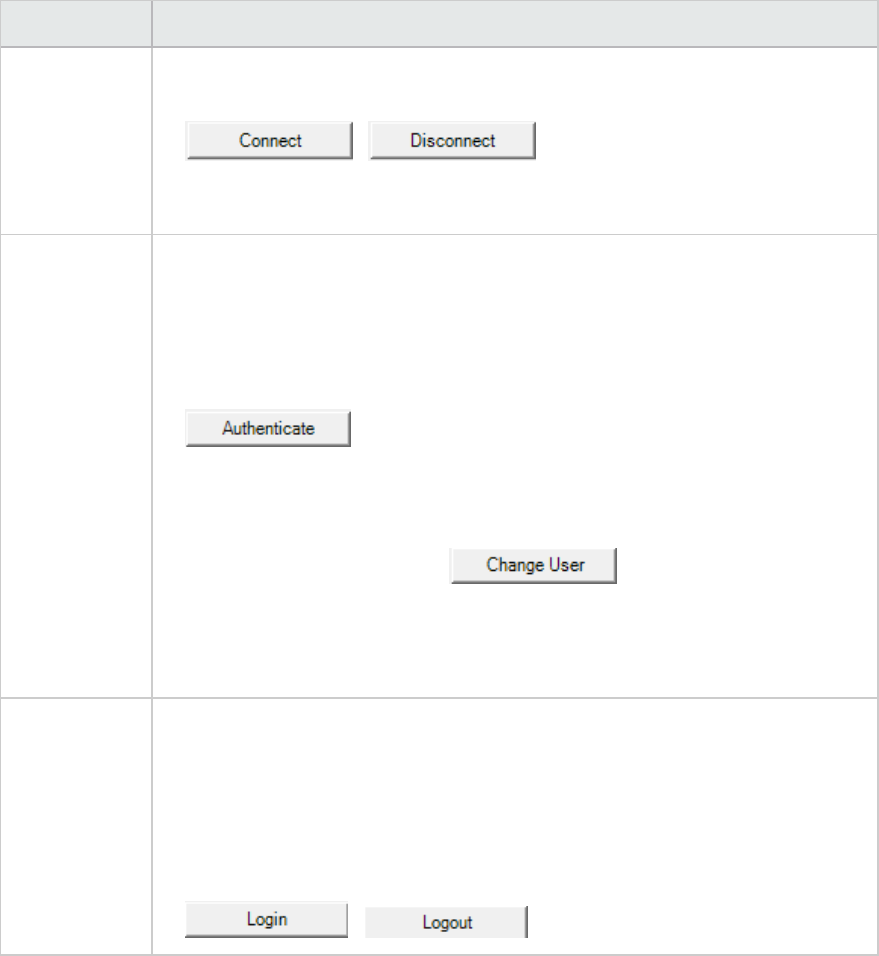
UI Element Description
Server lReconnect to server on startup. Automatically reconnect to the server every
time you start LoadRunner.
l/ . Connects to the server specified in
the Server URL box. Only one button is visible at a time, depending on your
connection status.
Step 2:
Authenticate
User
Information
lUser Name. Your ALM project user name.
lPassword. Your ALM project password.
lAuthenticate on startup. Authenticates your user information automatically,
the next time you open the application. This option is available only if you
selected Reconnect to server on startup above.
l. Authenticates your user information against the ALM
server.
After your user information has been authenticated, the fields in the
Authenticate user information area are displayed in read-only format. The
Authenticate button changes to .
You can log in to the same ALM server using a different user name by clicking
Change User, entering a new user name and password, and then clicking
Authenticate again.
Step 3: Login
to Project
lDomain. The domain that contains the ALM project. Only those domains
containing projects to which you have permission to connect to are displayed.
lProject. Enter the ALM project name or select a project from the list. Only those
projects that you have permission to connect to are displayed.
lLogin to project on startup. This option is only enabled when the Authenticate
on startup check box is selected.
l/ . Logs into and out of the ALM project.
Upload Report to Test Lab Dialog Box
This dialog box enables you to upload an Analysis report to an ALM project's Test Lab module.
User Guide
Analysis
HP LoadRunner (12.50) Page 1448
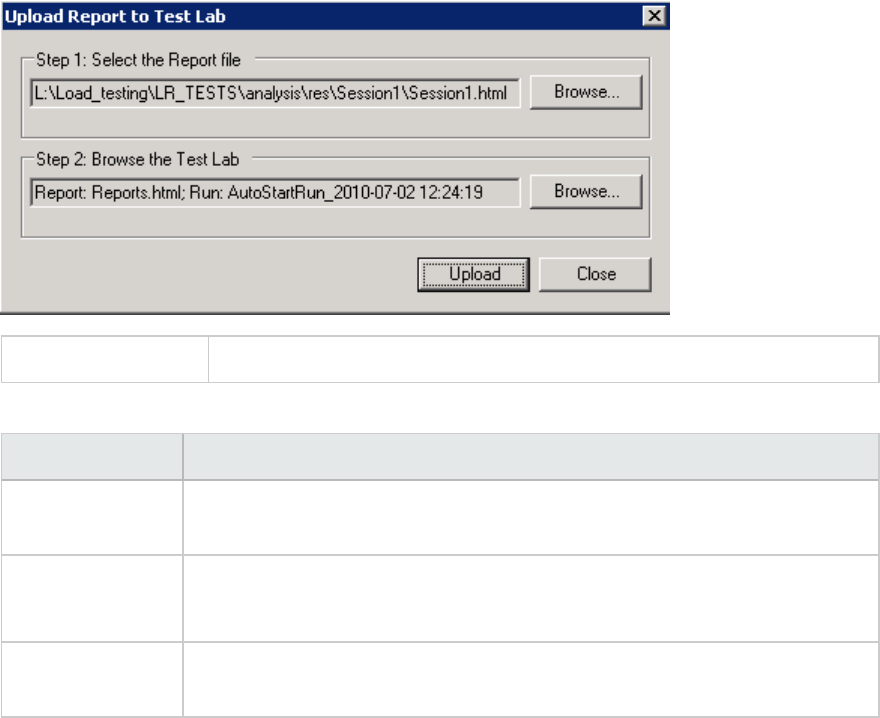
To access Reports > Upload Report to Test Lab
User interface elements are described below:
UI Element Description
Step 1: Select the
report file
Allows you to select an Analysis report from the file system. You can select an
HTML report, or Rich report in XML format.
Step 2: Browse
the test lab
Allows you to select an location within the Test Lab module, for the report.
Note: You must drill down to the level of a Run within the Test Lab module.
Upload Begins the uploading of the report. If the uploading succeeds, the Analysis
issues a message.
Setup
Configuring Graph Display
Analysis allows you to customize the display of the graphs and measurements in your session so that
you can view the data displayed in the most effective way possible.
How to Customize the Analysis Display
The following steps describes how to customize the display of analysis. You can customize the display of
the graphs and measurements in your session so that you can view the data displayed in the most
effective way possible.
User Guide
Analysis
HP LoadRunner (12.50) Page 1449
Enlarging a section of the graph
To zoom in or enlarge a section of the graph, move and hold down the left mouse button over the
section of the graph you want to enlarge.
Using comments in a graph
To add a comment to a graph, click and then click the mouse over the section of the graph where
you would like to add a comment. Type your comment in the Add Comment dialog box.
To edit, format or delete a comment from the graph, click the comment and apply your change in the
Edit Comments dialog box. In the left pane, verify the relevant comment is selected before you edit,
format or delete.
Using arrows in a graph
To add an arrow to a graph, click and then click the mouse button within the graph to position the
base of the arrow.
To delete an arrow from a graph, select the arrow and press Delete.
Using the User Notes Window
In the User Notes window (Windows > User Notes), you can enter text about the graph or report that is
currently open. The text in the User Notes window is saved with the session.
To view the text that you entered for a specific graph or report, select the relevant graph or report and
open the User Notes window (Windows > User Notes).
Display Options Dialog Box
This dialog box enables you to select the graph type and configure the display of the graph.
Note: This option is not available for all graph types.
User Guide
Analysis
HP LoadRunner (12.50) Page 1450
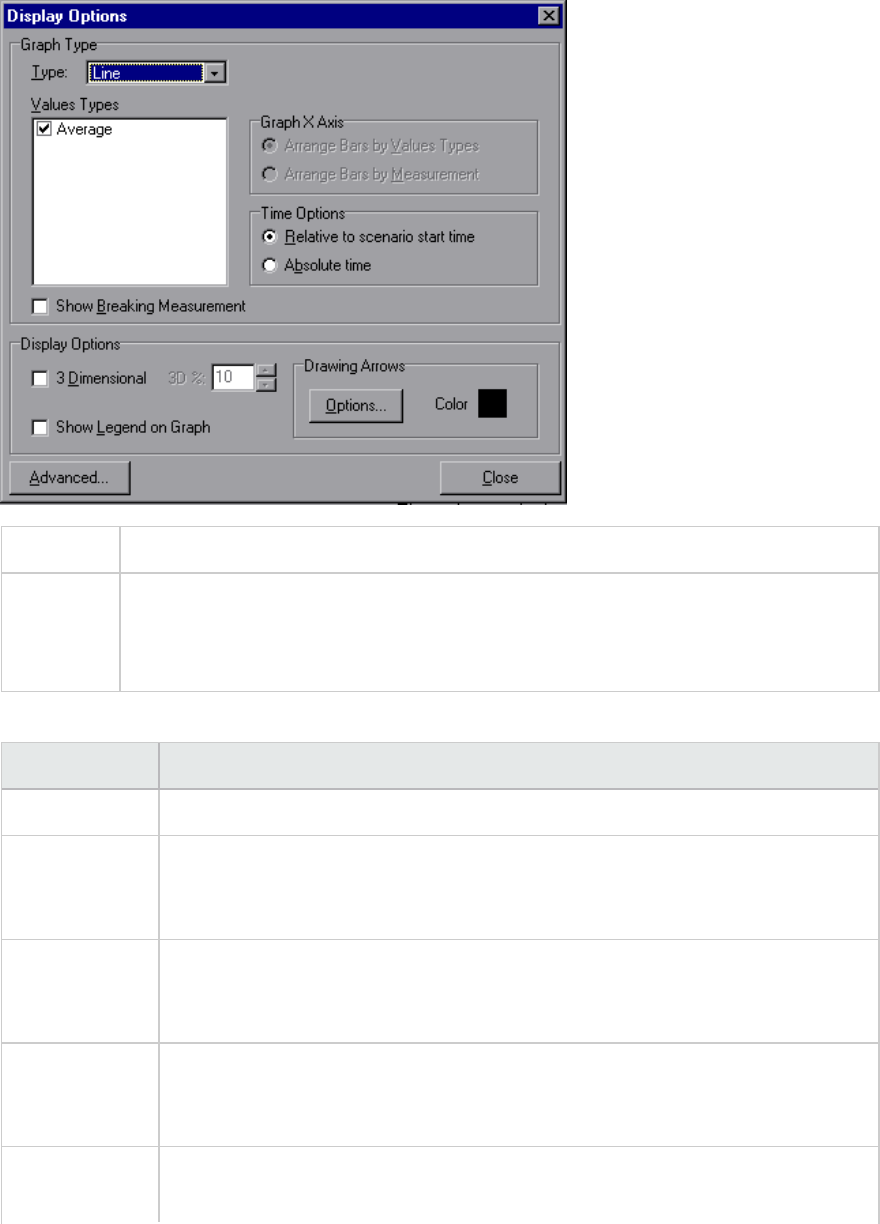
To access View > Display Options
See also l"Editing Main Chart Dialog Box (Display Options Dialog Box)" on the next page
l"Chart Tab (Editing MainChart Dialog Box)" on page1453
l"Series Tab (Editing MainChart Dialog Box)" on page1454
User interface elements are described below:
UI Elements Description
Type Select the type of graph to display from the drop-down list.
Values Types Select the type of display information from the list of available values. For
example, a bar graph displaying Average Transaction Response Time can be
configured to display minimum, maximum, average, STD, count, and sum averages.
Graph X Axis
(Bar graphs
only)
Select the bar arrangement along the x-axis. You can arrange the bars by value
types or measurement.
Time Options Select the way in which the graph shows the Elapsed Scenario Time on the x-axis.
You can choose an elapsed time relative to the beginning of the scenario or an
elapsed time from the absolute time of the machine's system clock.
Show Breaking
Measurement
Select this check box to display the name and properties of the breaking
measurement at the top of the graph (disabled by default).
User Guide
Analysis
HP LoadRunner (12.50) Page 1451
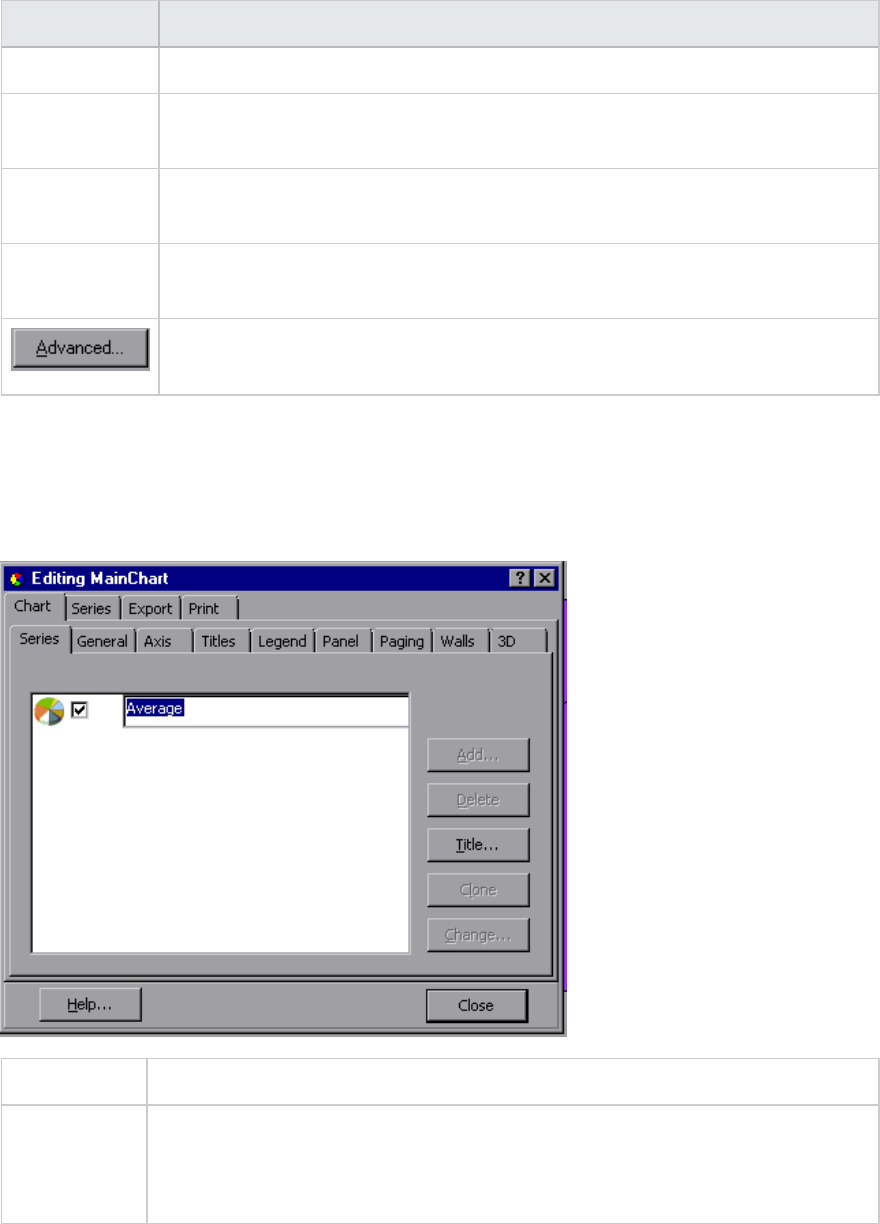
UI Elements Description
3 Dimensional Select this check box to enable a 3-dimensional display of the graph.
3D % Specify a percentage for the 3-dimensional aspect of lines in the graph. This
percentage indicates the thickness if the bar, grid, or pie chart.
Show Legend
on Graph
Select this check box to display a legend at the bottom of the graph.
Drawing
Arrows
Allows you to configure the style, color, and width of arrows you draw to highlight
graph information.
Opens the Editing MainChart dialog box. For more information, see "Editing Main
Chart Dialog Box (Display Options Dialog Box)" below.
Editing Main Chart Dialog Box (Display Options Dialog Box)
This dialog box enables you to configure the look and feel of your graph as well as its title and the
format of the data.
To access View > Display Options > Advanced button
See also l"Display Options Dialog Box" on page1450
l"Chart Tab (Editing MainChart Dialog Box)" on the next page
l"Series Tab (Editing MainChart Dialog Box)" on page1454
User interface elements are described below:
User Guide
Analysis
HP LoadRunner (12.50) Page 1452

UI
Element
Description
Chart
tab
Enables you to configure the look and feel of your entire graph. You set Chart preferences
using the following tabs: For details, see "Chart Tab (Editing MainChart Dialog Box)" below.
Series
tab
Enables you to control the appearance of the individual points plotted in the graph. You set
Series preferences using the following tabs. For details, see "Series Tab (Editing MainChart
Dialog Box)" on the next page.
Export
tab
Enables you to store the current graph to an image file in the format of your choice—BMP,
JPG, or EMF. You can also export the graph's data to HTML, Excel, or XML
Print
tab
Enables you to print only the graph itself without the legend and other data such as the
User Notes.
Chart Tab (Editing MainChart Dialog Box)
This tab enables you to configure the look and feel of your entire graph.
To access View > Display Options > Advanced button > Chart tab
See also l"Display Options Dialog Box" on page1450
l"Editing Main Chart Dialog Box (Display Options Dialog Box)" on the previous page
l"Series Tab (Editing MainChart Dialog Box)" on the next page
User interface elements are described below:
UI
Element
Description
Series
tab
Select the graph style (for example, bar or line), the hide/show settings, line and fill color,
and the title of the series.
General
tab
Select options for print preview, export, margins, scrolling, and magnification.
Axis tab Select which axes to show, as well as their scales, titles, ticks, and position.
Titles
tab
Set the title of the graph, its font, background color, border, and alignment.
Legend
tab
Set all legend related settings, such as position, fonts, and divider lines.
User Guide
Analysis
HP LoadRunner (12.50) Page 1453
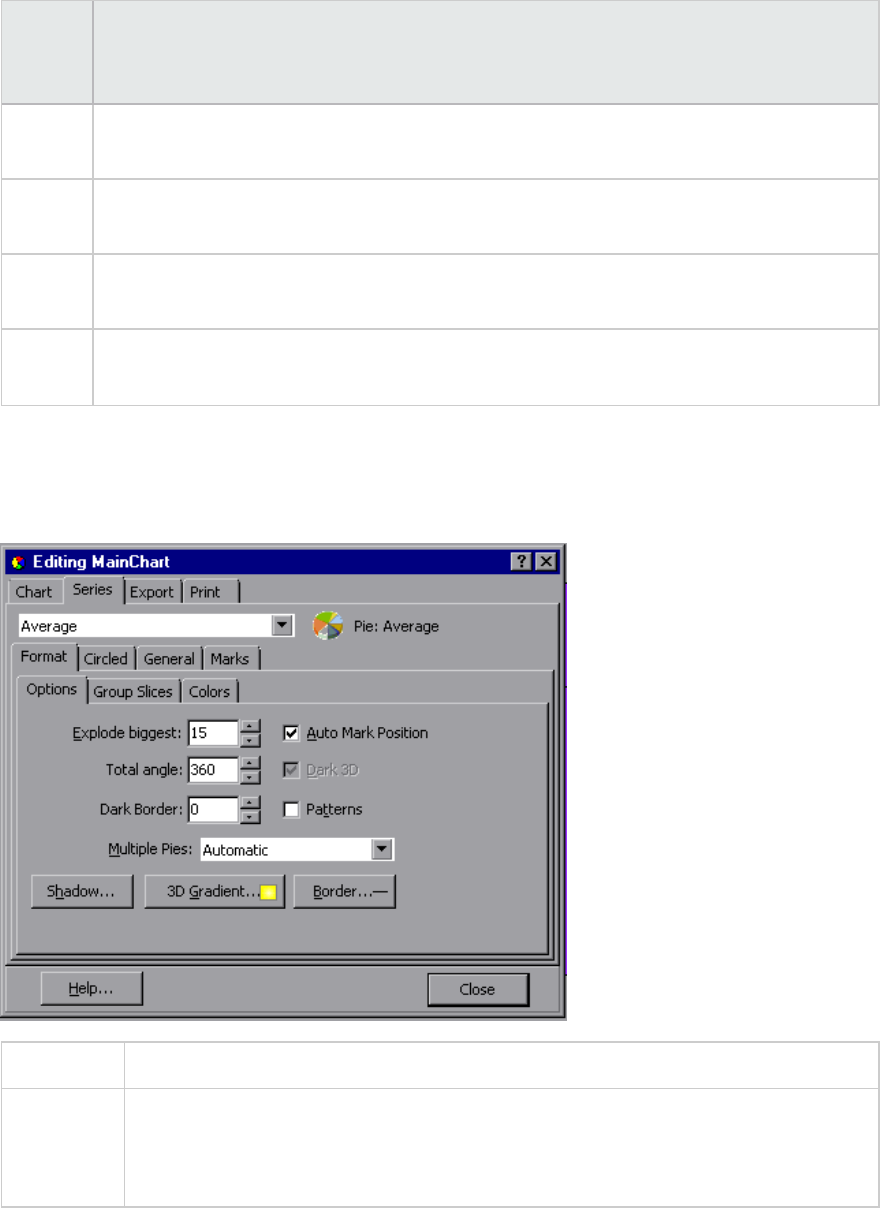
UI
Element
Description
Panel
tab
Show the background panel layout of the graph. You can modify its color, set a gradient
option, or specify a background image.
Paging
tab
Set all page related settings, such as amount of data per page, scale, and page numbering.
These settings are relevant when the graph data exceeds a single page.
Walls
tab
Set colors for the walls of 3-dimensional graphs.
3D Select the 3-dimensional settings, offset, magnification, and rotation angle for the active
graph.
Series Tab (Editing MainChart Dialog Box)
This page enables you to control the appearance of the individual points plotted in the graph.
To access View > Display Options > Advanced button > Series tab
See also l"Display Options Dialog Box" on page1450
l"Editing Main Chart Dialog Box (Display Options Dialog Box)" on page1452
l"Chart Tab (Editing MainChart Dialog Box)" on the previous page
User interface elements are described below:
User Guide
Analysis
HP LoadRunner (12.50) Page 1454
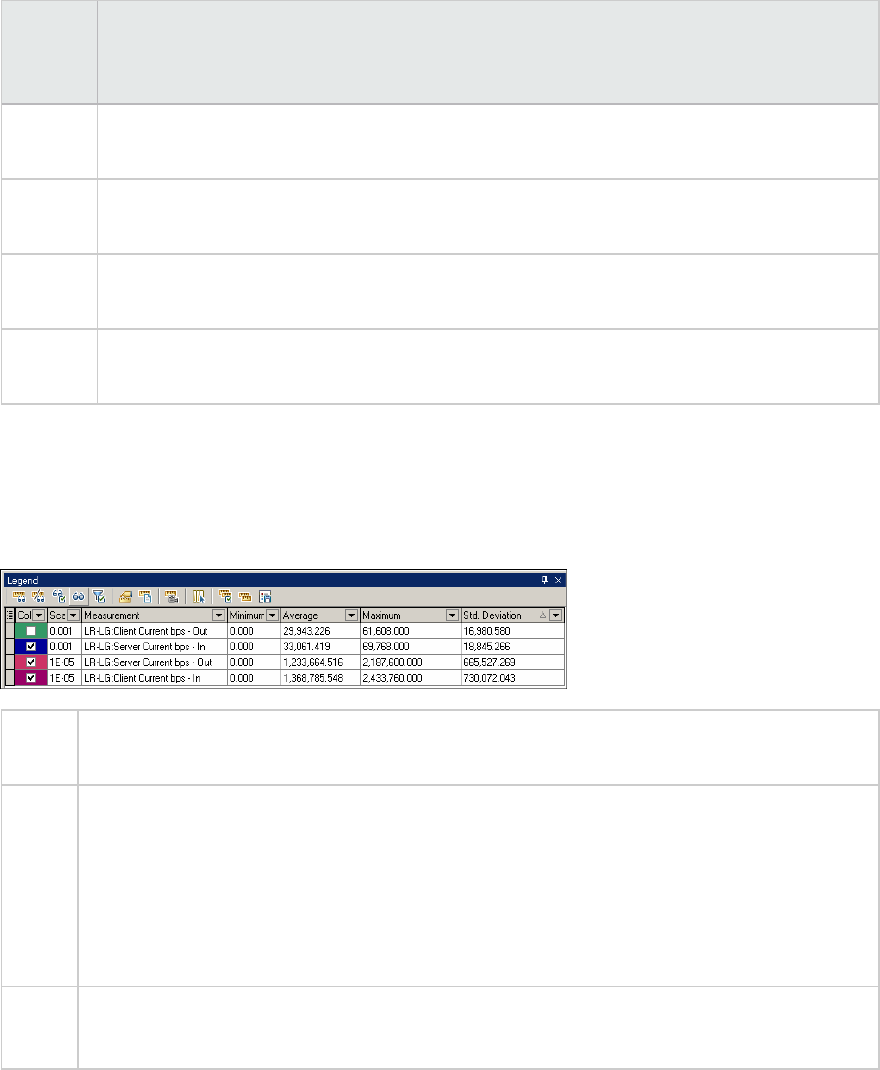
UI
Element
Description
Format
tab
Set the border color, line color, pattern, and invert property for the lines or bars in your
graph.
Point
tab
Set the size, color, and shape of the points that appear within your line graph.
General
tab
Select the type of cursor, the format of the axis values, and show/hide settings for the
horizontal and vertical axes.
Marks
tab
Configure the format for each point in the graph.
Legend Window
This window enables you to configure the color, scale, minimum, maximum, average, median, and
standard deviation of each measurement appearing in the graph.
To
access
Analysis Window > Legend window
Tip Filtering: To show only certain values, click the down arrow in the selected column and click
Custom. The Custom Filter dialog box opens. For details, see "Custom Filter Dialog Box" on
page1490.
Sorting: To sort the measurements by a specific metrics, select a column header once to
display the measurements in ascending order. Click it again to display them in descending
order.
See
also
l"Measurement Description Dialog Box" on page1458
l"Measurement Options Dialog Box" on page1459
User Guide
Analysis
HP LoadRunner (12.50) Page 1455
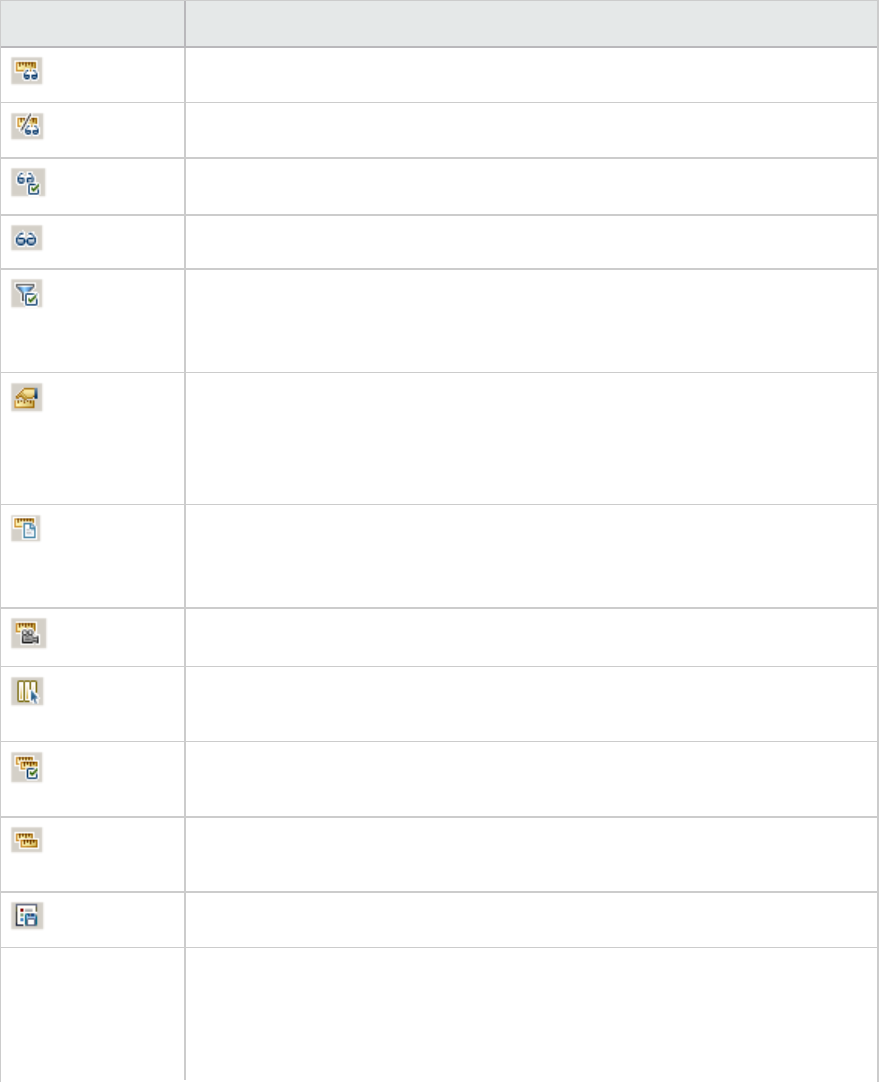
Legend Toolbar
User interface elements are described below:
UI Element Description
Show. Displays the selected measurements in the graph.
Hide. Hides the selected measurements in the graph.
Show only Selected. Displays the highlighted measurement only.
Show All. Displays all the available measurements in the graph.
Filter. Filters the graph by the measurements selected in the Legend window.
You can select multiple measurements. To clear the filter, select View > Clear
Filter/Group By.
Configure. Opens the Measurement Options dialog box that enables you to
configure measurement options (for example, set color and measurement
scale). For more information, see "Measurement Options Dialog Box" on
page1459.
Show Description. Opens the Measurement Description dialog box that displays
the name, monitor type, and description of the selected measurement. For
more information, see "Measurement Description Dialog Box" on page1458.
Animate. Displays the selected measurement as a flashing line.
Configure Columns. Opens the Legend Columns Options dialog box that enables
you to select the columns to display in the Legend window.
Copy Selection. Copies the selected rows to the clipboard. You can paste the
data in a text file or a spreadsheet.
Copy All. Copies all of the legend data to the clipboard, regardless of what is
selected. You can paste the data in a text file or a spreadsheet.
Export. Saves the legend data to a CSV file.
<Custom filter> After adding a custom filter (by expanding the down arrow in the column
headers), the window shows them at the bottom of the legend. Click the x
button to remove the filter, or clear the check box to disable it temporarily. For
details, see "Custom Filter Dialog Box" on page1490.
User Guide
Analysis
HP LoadRunner (12.50) Page 1456
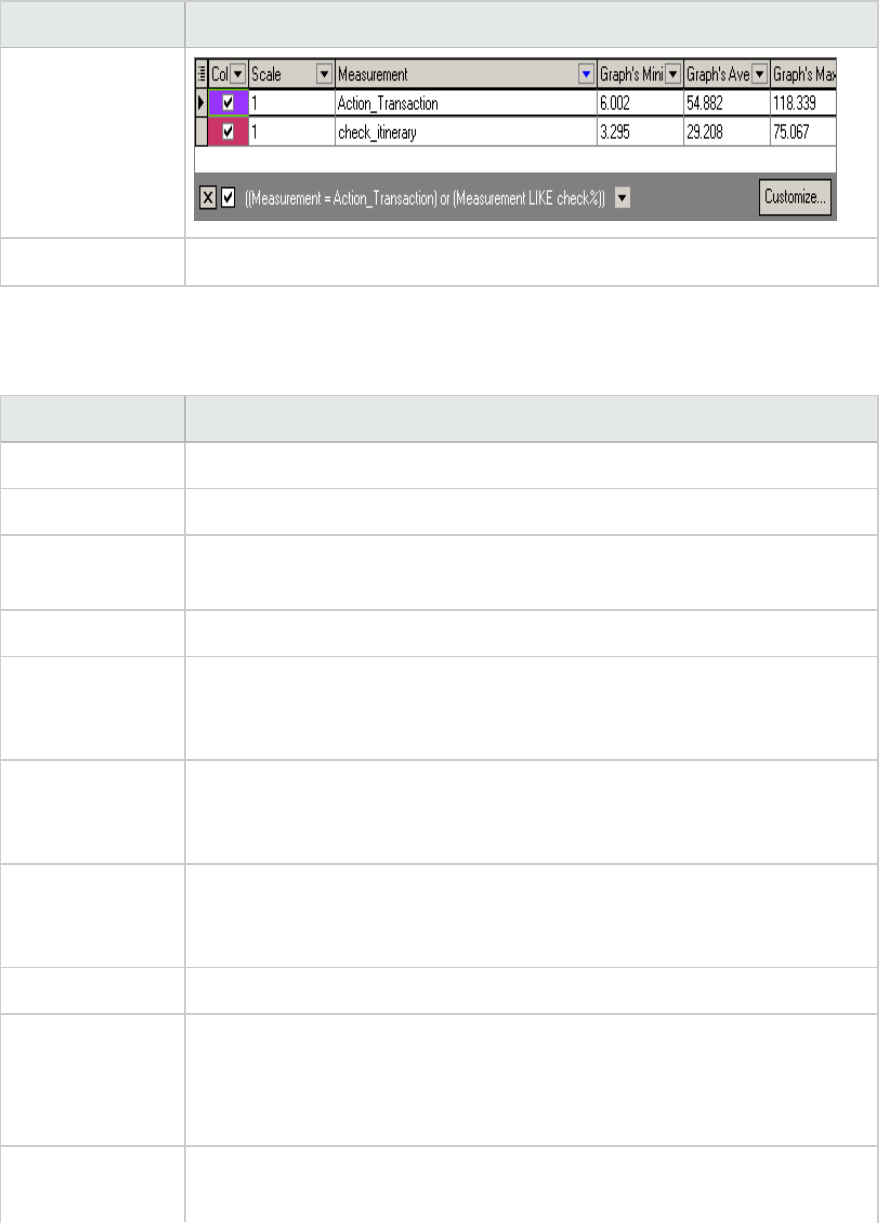
UI Element Description
Customize Opens the Filter Builder and allows you to save your filter settings to a file.
Legend grid shortcut menu
User interface elements are described below:
UI Element Description
Show Displays the selected measurements in the graph.
Hide Hides the selected measurements in the graph.
Show only
Selected
Displays the highlighted measurement only.
Show All Displays all the available measurements in the graph.
Filter Filters the graph by the measurements selected in the Legend window. You can
select multiple measurements. To clear the filter, select View > Clear
Filter/Group By.
Configure Opens the Measurement Options dialog box that enables you to configure
measurement options (for example, set color and measurement scale). For
more information, see "Measurement Options Dialog Box" on page1459.
Show Description Opens the Measurement Description dialog box that displays the name, monitor
type, and description of the selected measurement. For more information, see
"Measurement Description Dialog Box" on the next page.
Animate Displays the selected measurement as a flashing line.
Auto Correlate Opens the Auto Correlate dialog box that enables you to correlate the selected
measurement with other monitor measurements in the load test scenario. For
more information on auto correlation, see "Auto Correlating Measurements" on
page1470.
Configure Columns Opens the Legend Columns Options dialog box that enables you to select the
columns to display in the Legend window.
User Guide
Analysis
HP LoadRunner (12.50) Page 1457
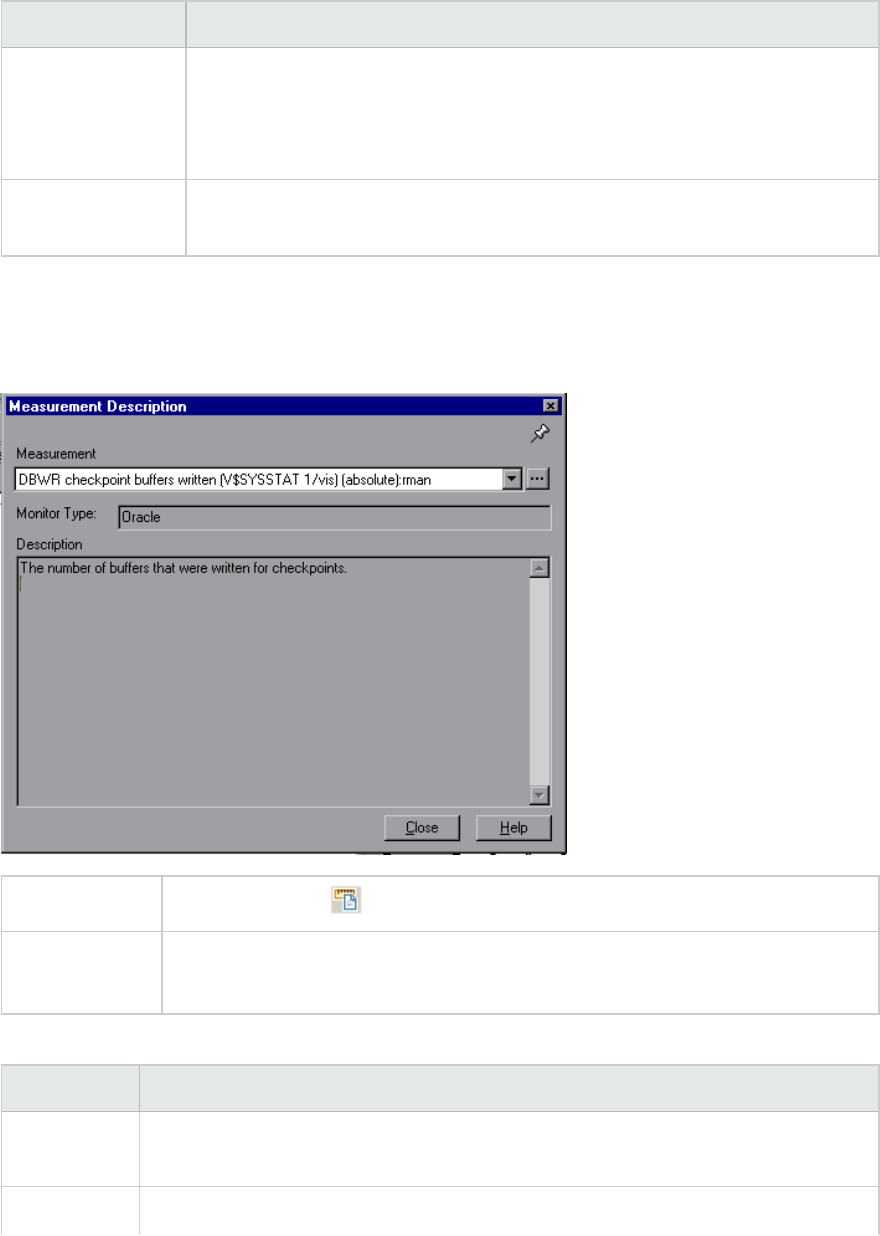
UI Element Description
Web Page
Diagnostics for
<selected
measurement>
Displays a Web Page Diagnostics graph for the selected transaction
measurement (only available for the Average Transaction Response Time and
Transaction Performance Summary graphs).
Break down Displays a graph with a breakdown of the selected page (only available for the
Web Page Diagnostics graphs).
Measurement Description Dialog Box
This dialog box shows you additional information about the selected measurement.
To access Legend Toolbar >
See also l"Legend Window" on page1455
l"Measurement Options Dialog Box" on the next page
User interface elements are described below:
UI Element Description
Measurement Displays the name of the selected measurement. Click the drop-down arrow to select
a different measurement.
Monitor Type Displays the type of monitor used to obtain the selected measurement.
User Guide
Analysis
HP LoadRunner (12.50) Page 1458
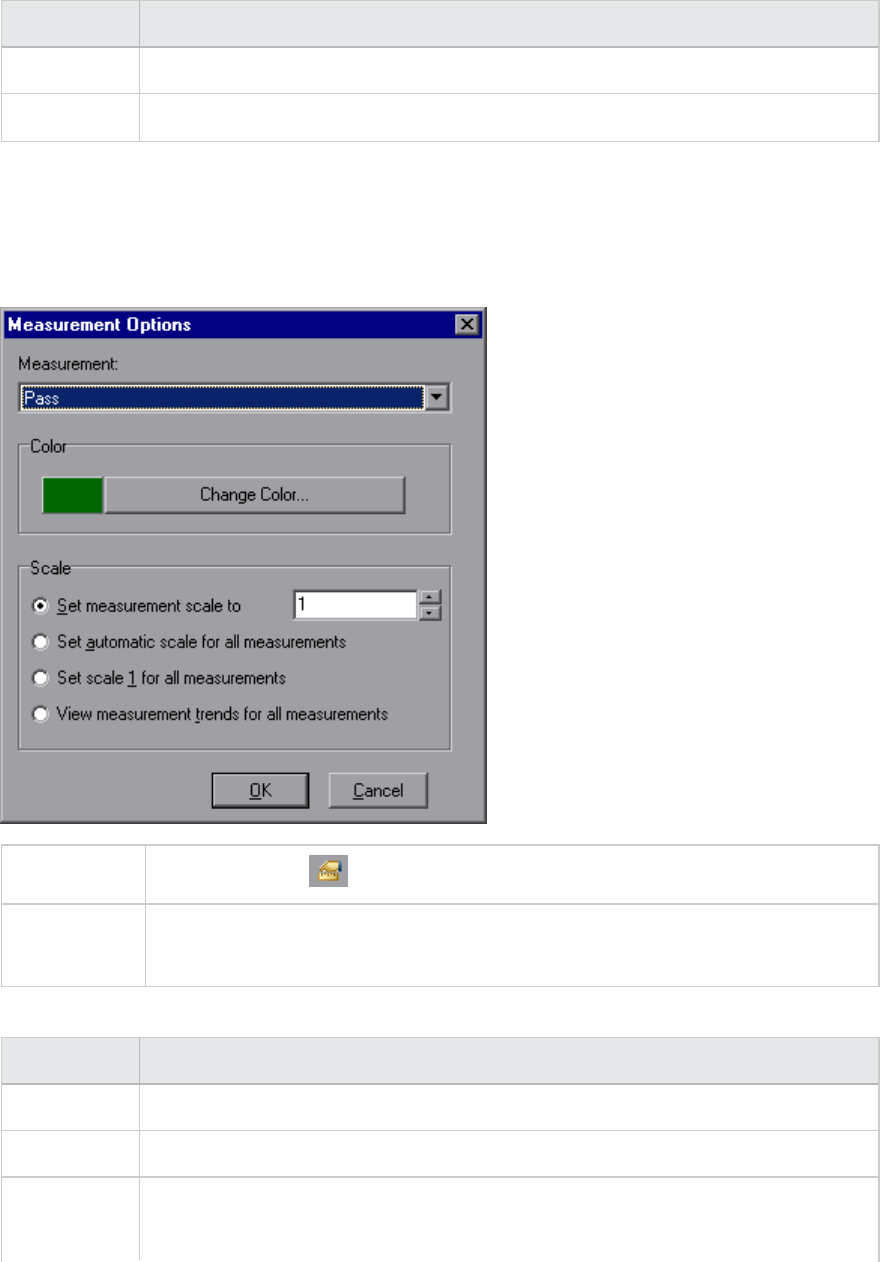
UI Element Description
Description Displays a description of the selected monitored measurement.
SQL If an SQL logical name is in use, displays the full SQL statement.
Measurement Options Dialog Box
This dialog box enables you to set the color and the scale for any measurement of the graph you
selected.
To access Legend Toolbar >
See also l"Legend Window" on page1455
l"Measurement Description Dialog Box" on the previous page
User interface elements are described below:
UI Element Description
Measurement Select a measurement to configure.
Change Color Select a new color for the selected measurement.
Scale Select the desired scale option:
lSet measurement scale to x. Select the scale with which you want to view the
User Guide
Analysis
HP LoadRunner (12.50) Page 1459
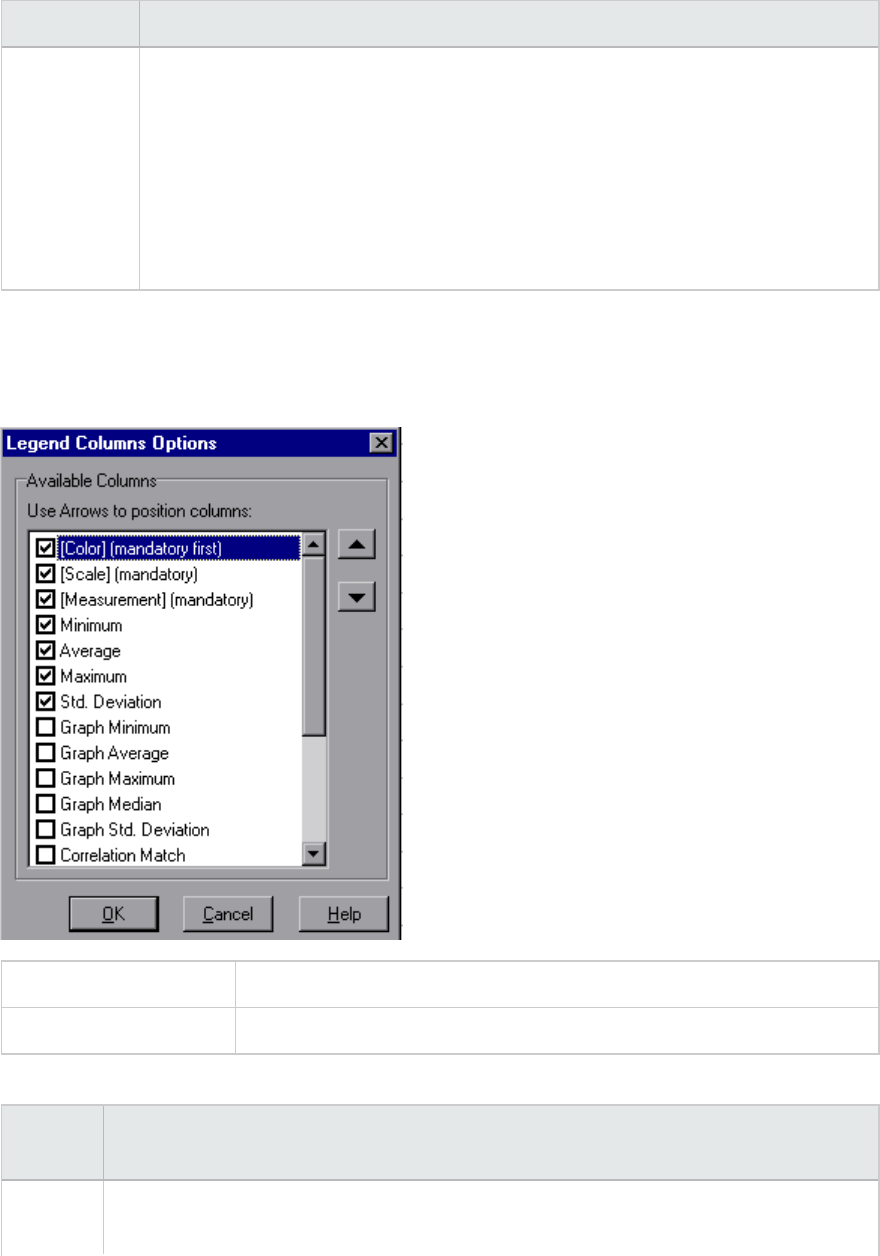
UI Element Description
lSet automatic scale for all measurements. Uses an automatic scale optimized to
display each measurement in the graph.
lSet scale 1 for all measurements. Sets the scale to one for all measurements in
the graph.
lView measurement trends for all measurements. Standardizes the y-axis values in
the graph, according to the following formula: New Y value = (Previous Y Value -
Average of previous values) / STD of previous values.
Legend Columns Options Dialog Box
This dialog box enables you to select the columns to be displayed.
To access View > Legend Columns
See also "Legend Window" on page1455
User interface elements are described below:
UI
Element
Description
Available
Columns
Select or deselect the check boxes to the left of the column names to show or hide the
columns respectively.
User Guide
Analysis
HP LoadRunner (12.50) Page 1460
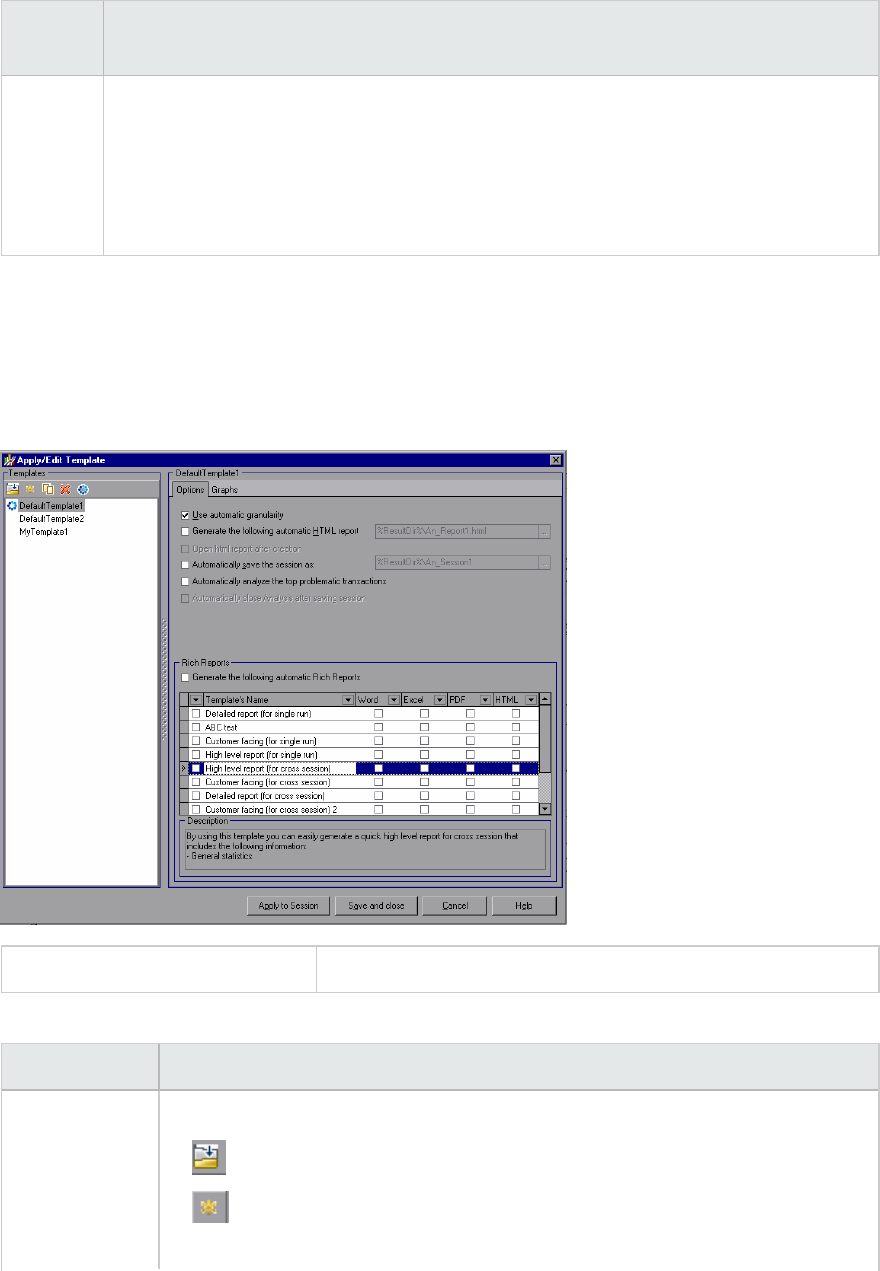
UI
Element
Description
Notes:
lThe Color, Scale, and Measurement columns are mandatory and cannot be deselected.
lTo rearrange the order in which the columns appear (from left to right), you use the
vertical arrows to the right of the Available Columns list to place the columns in the
desired order.
Apply/Edit Template Dialog Box
This dialog box enables you to configure template settings and select report template options. Using
this dialog box, you can create new templates, open existing ones, and set the default template for your
sessions.
To access Tools > Templates
User interface elements are described below (unlabeled elements are shown in angle brackets):
UI Element Description
Templates Select one of the following buttons:
lBrowse for a template.
lAdd a new template. Enter the title of the new template in the Add new
template dialog box.
User Guide
Analysis
HP LoadRunner (12.50) Page 1461
UI Element Description
lDuplicate the selected template.
lDelete the selected template.
lSet the selected template as the default.
Use automatic
granularity
Applies the default Analysis granularity (onesecond) to the template. For
information about setting Analysis granularity, see "Changing the Granularity of
the Data" on page1468.
Generate the
following
automatic
HTML report
Generates an HTML report using the template. Specify or select a report name. For
information about generating HTML reports, see "HTML Reports" on page1753.
Open html
report after
creation
If you selected the option of generating an automatic HTML report, select this
option to automatically open the HTML report after it is created.
Automatically
save the
session as
Automatically saves the session using the template you specify. Specify or select a
file name.
Automatically
analyze the top
problematic
transactions
Automatically generates Transaction Analysis reports for the transactions with the
worst SLA violations. Reports are generated for a maximum of five transactions.
For more information about Transaction Analysis reports, see "Analyze
Transactions Dialog Box" on page1738.
Automatically
close Analysis
after saving
session
Automatically closes Analysis after a session is automatically saved (using the
previous option). This prevents the running of multiple instances of Analysis.
Generate the
following
automatic Rich
Reports
The selected reports are added to the template.
<check box on
left of
Template's
Name>
Select to add report template to selected template. The reports are added to the
session.
Word Generates a report using the selected report template to MS Word.
User Guide
Analysis
HP LoadRunner (12.50) Page 1462
UI Element Description
Note: Take into account that the content load may affect the table format
within the MS Word document.
Excel Generates a report using the selected report template to Excel.
PDF Generates a report using the selected report template to PDF.
HTML Generates a report using the selected report template to HTML.
Graphs tab Displays the list of graphs that are included in the template. When the template is
applied to a session, the graphs are displayed under Graphs in Session Explorer. If
there is no data in the session, the graphs are not created.
Apply to
Session
Applies your changes to the current analysis session without closing the dialog box.
Color Palettes
Color Palettes allow you to define the colors that will be used in Analysis graphs and to allocate those
colors to specific series. There is a general, default palette and you can also define a Color Palette for a
specific session. You can add new colors to a palette and delete existing colors from a palette, but a
palette must contain at least thirty two colors.
When a new session is created, or when you open an existing session that does not have a Graph Colors
file, Analysis uses the general color palette. When you open an existing session that has a Graph Colors
file, Analysis uses the file from the session folder.
The colors are allocated to the graph in the order they appear in the palette. Colors allocated to a
series, are used to represent graph elements for the series in the order the colors were allocated. To
change the colors in the graph, update the palette, close and re-open the graph.
For more information, see "Color Palette Dialog Box" below.
Color Palette Dialog Box
This dialog box enables you to configure the colors that will be used in graphs. You use the General Color
Palette to define a default set of colors for all graphs and the Session Color Palette to define the set of
colors for a specific session.
User Guide
Analysis
HP LoadRunner (12.50) Page 1463
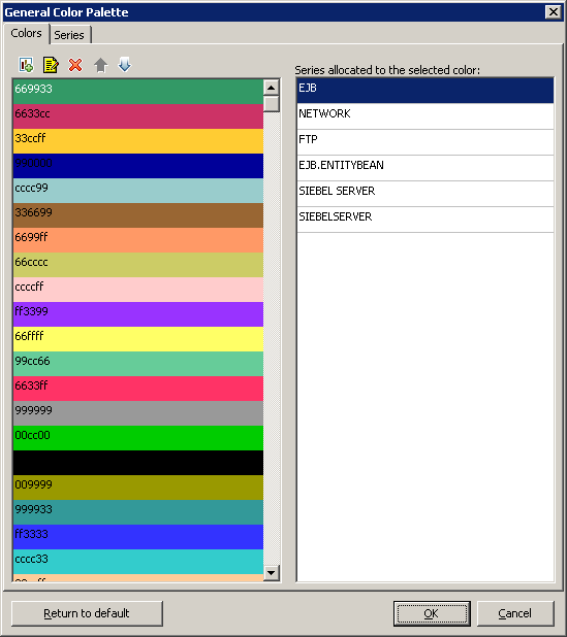
User Guide
Analysis
HP LoadRunner (12.50) Page 1464
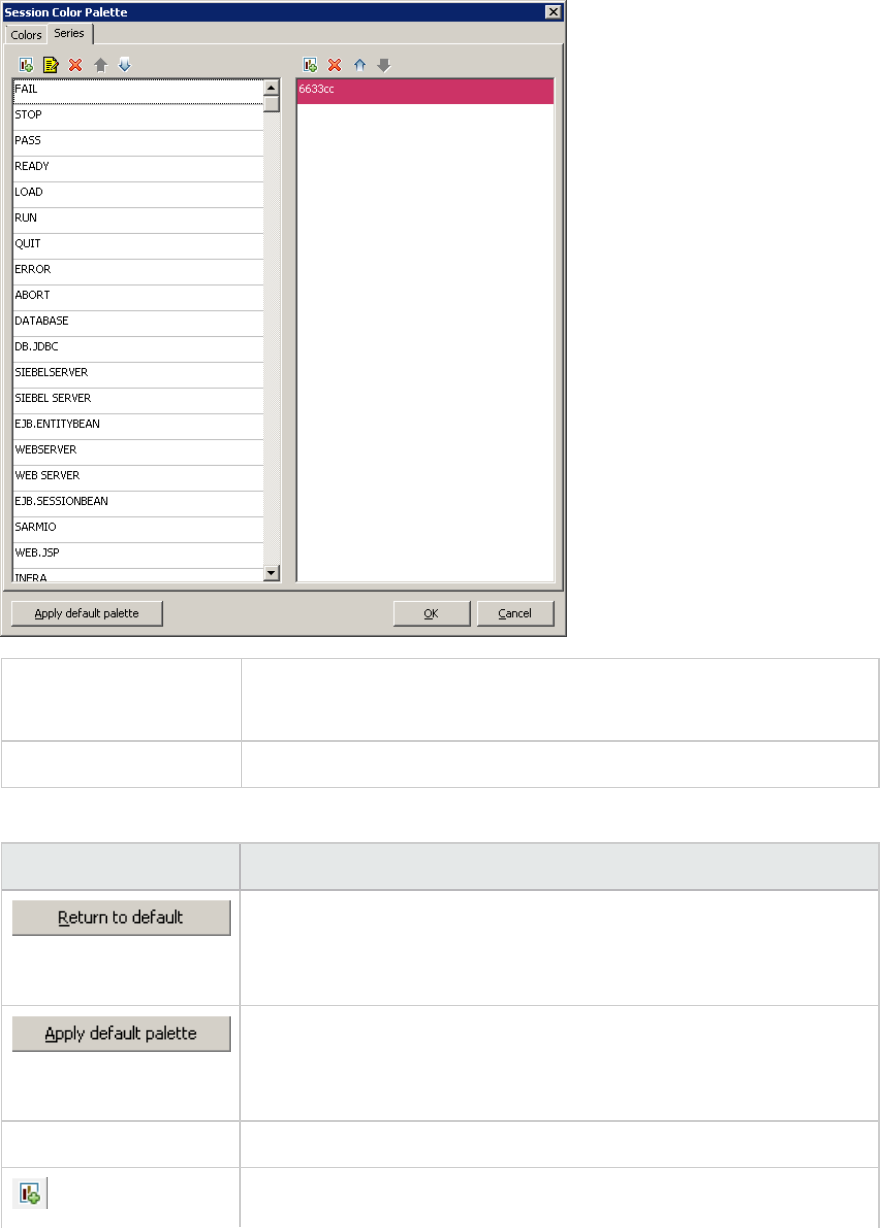
To access lTools > General Color Palette
lTools > Session Color Palette
See also "Color Palettes" on page1463
User interface elements are described below:
UI Elements> Description
Restores the palette to the currently saved General Palette.
This button appears on the General Color Palette, not on the Session
Color Palette.
Applies the default palette as the session palette.
This button appears on the Session Color Palette, not on the General
Color Palette.
Colors tab Allows you to configure the colors on the palette.
Add a new color to the palette.
User Guide
Analysis
HP LoadRunner (12.50) Page 1465
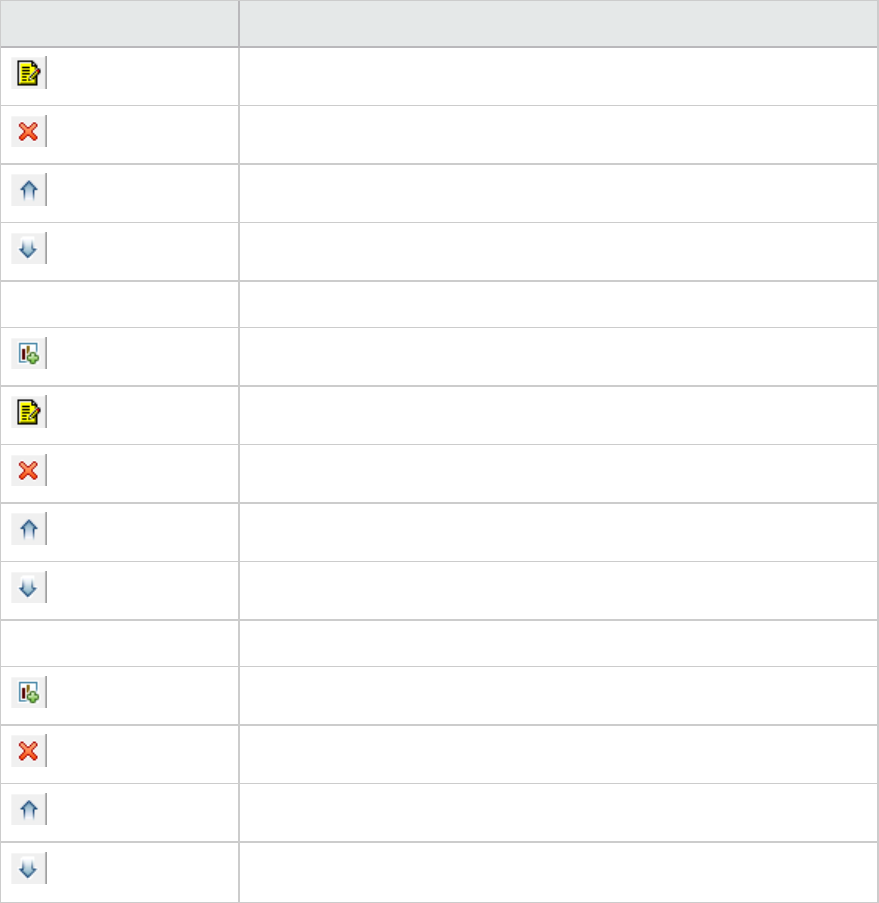
UI Elements> Description
Replace an existing color with a new color.
Delete a color from the palette.
Move the color upwards.
Move the color downwards.
Series tab - left pane Allows you to configure the series on the palette.
Add a new series to the palette.
Edit a series.
Delete a series from the palette.
Move the series upwards.
Move the series downwards.
Series tab - right pane Allows you to define colors for the selected series.
Add a color to the series.
Delete a color from the series.
Move the color upwards.
Move the color downwards.
Working with Analysis Graph Data
Analysis contains several utilities that enable you to manage graph data to most effectively view the
displayed data.
Determining a Point's Coordinates
You can determine the coordinates and values at any point in a graph. Place the cursor over the point
you want to evaluate and Analysis displays the axis values and other grouping information.
User Guide
Analysis
HP LoadRunner (12.50) Page 1466
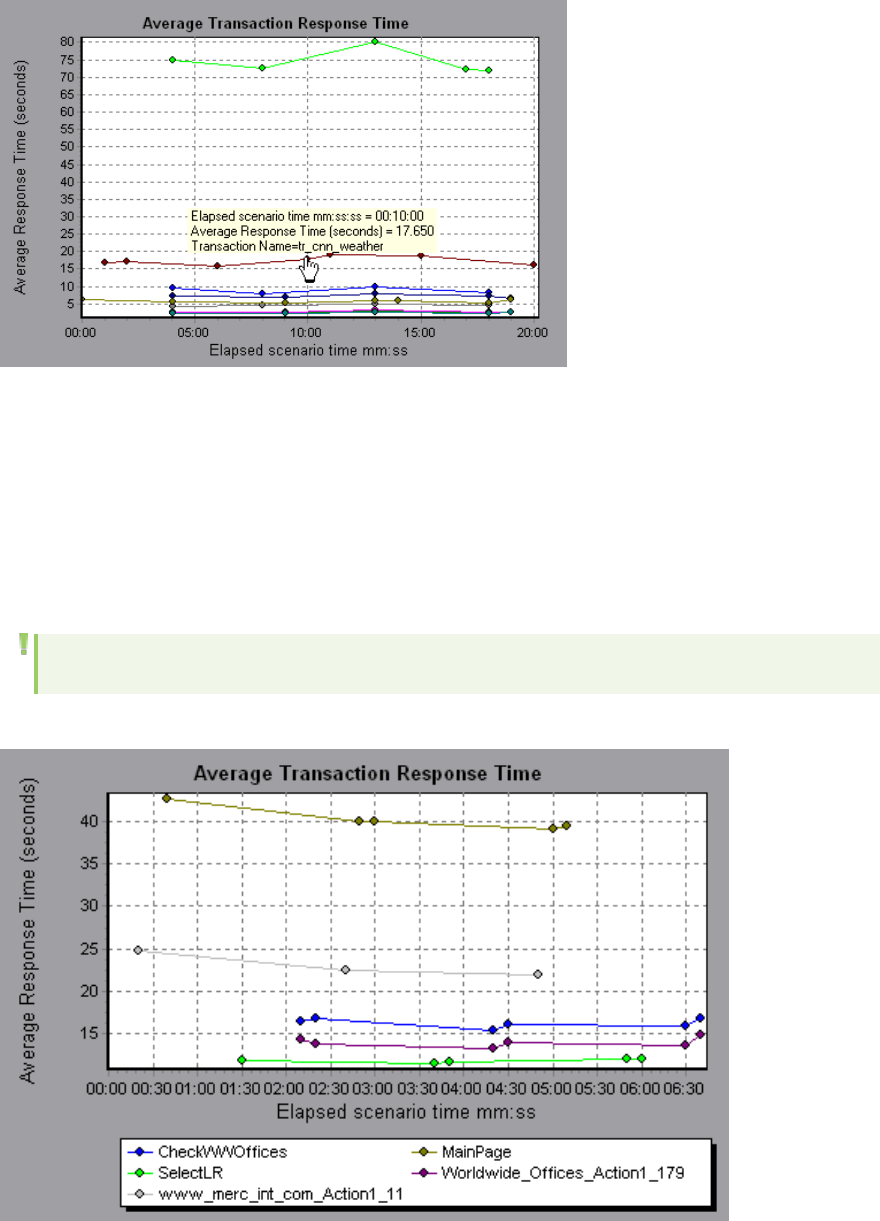
Drilling Down in a Graph
Drill down enables you to focus on a specific measurement within your graph and display it according to
a desired grouping. The available groupings depend on the graph. For example, the Average Transaction
Response Time graph shows one line per transaction. To determine the response time for each Vuser,
you drill down on one transaction and sort it according to Vuser ID. The graph displays a separate line
for each Vuser's transaction response time.
Note: The drill down feature is not available for the Web Page Diagnostics graph.
The following graph shows a line for each of five transactions.
User Guide
Analysis
HP LoadRunner (12.50) Page 1467
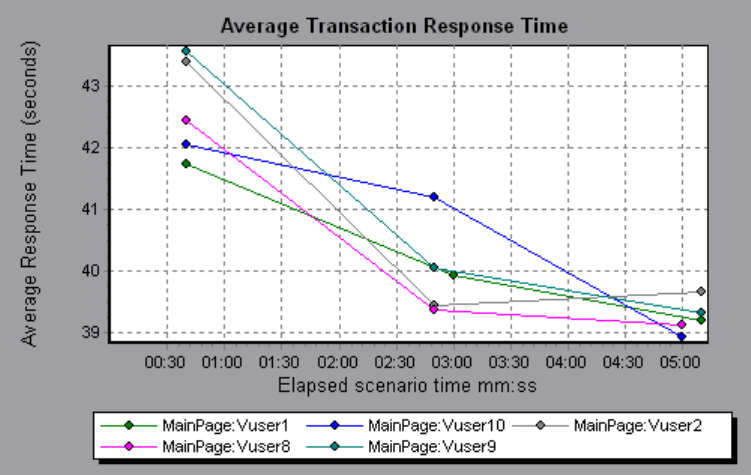
When you drill down on the MainPage transaction, grouped by Vuser ID, the graph displays the response
time only for the MainPage transaction, one line per Vuser.
You can see from the graph that the response time was longer for some Vusers than for others.
To determine the response time for each host, you drill down on one transaction and sort it according to
host. The graph displays a separate line for the transaction response time on each host. For more
information on drilling down in a graph, see "How to Manage Graph Data" on page1471.
Changing the Granularity of the Data
You can make the graphs easier to read and analyze by changing the granularity (scale) of the x-axis.
The maximum granularity is half of the graph's time range. To ensure readability and clarity, Analysis
automatically adjusts the minimum granularity of graphs with ranges of 500 seconds or more.
In the following example, the Hits per Second graph is displayed using different granularities. The y-axis
represents the number of hits per second within the granularity interval. For a granularity of 1, the y-
axis shows the number of hits per second for each one second period of the load test scenario.
For a granularity of 5, the y-axis shows the number of hits per second for every five-second period of
the scenario.
User Guide
Analysis
HP LoadRunner (12.50) Page 1468
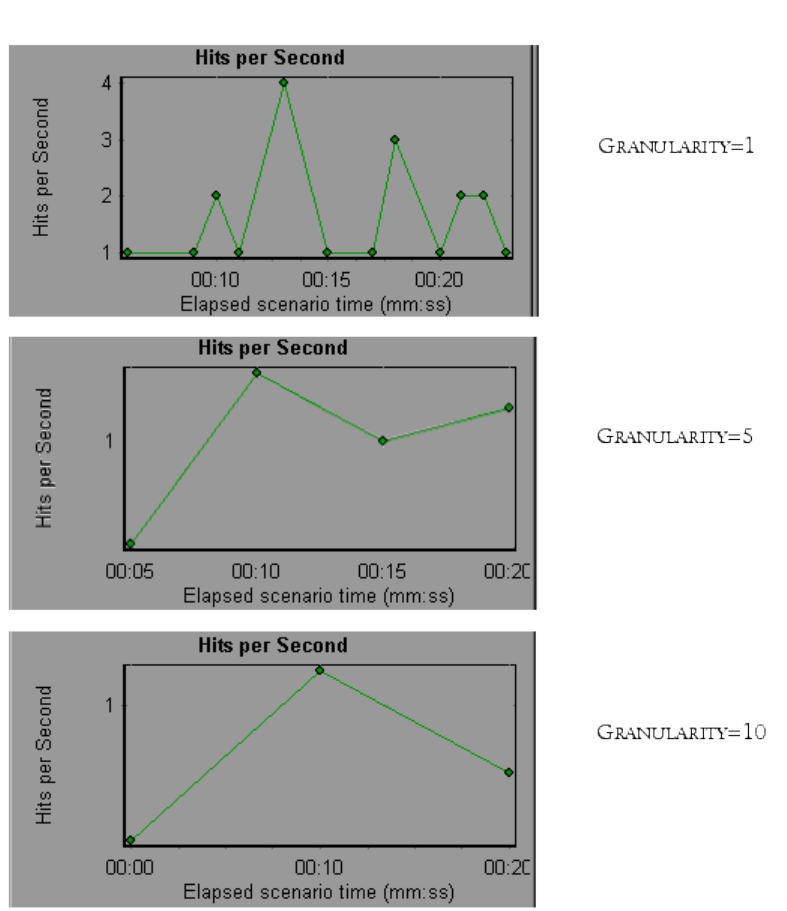
In the above graphs, the same load test scenario results are displayed in a granularity of 1, 5, and 10.
The lower the granularity, the more detailed the results. For example, using a low granularity as in the
upper graph, you see the intervals in which no hits occurred. It is useful to use a higher granularity to
study the overall Vuser behavior throughout the scenario.
By viewing the same graph with a higher granularity, you can see that overall, there was an average of
approximately 1 hit per second.
Viewing Measurement Trends
You can view the pattern of a line graph more effectively by standardizing the graph's y-axis values.
Standardizing a graph causes the graph's y-axis values to converge around zero. This cancels the
User Guide
Analysis
HP LoadRunner (12.50) Page 1469
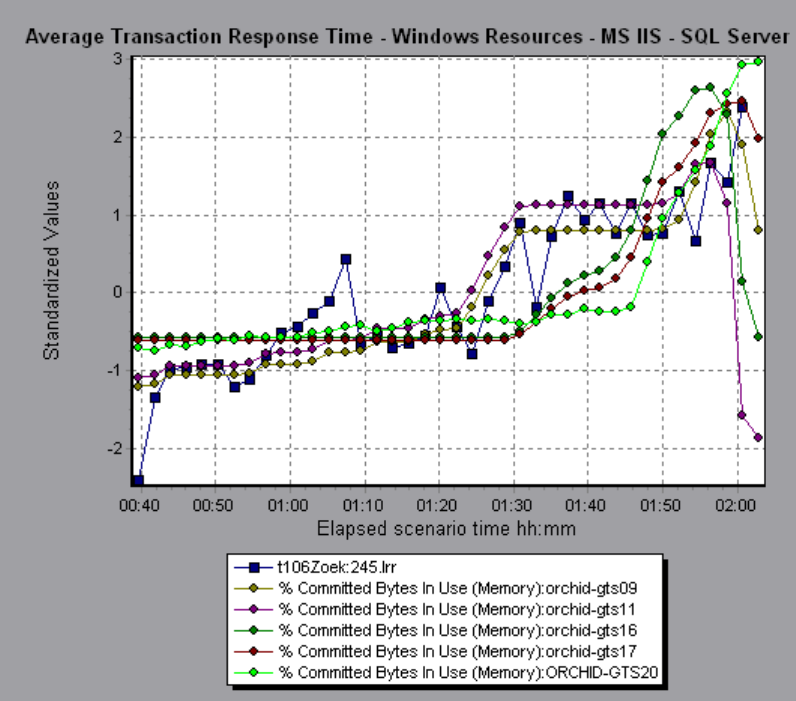
measurements' actual values and allows you to focus on the behavior pattern of the graph during the
course of the load test scenario.
Analysis standardizes the y-axis values in a graph according to the following formula:
New Y value = (Previous Y Value - Average of previous values) / STD of previous
values
Auto Correlating Measurements
You can detect similar trends among measurements by correlating a measurement in one graph with
measurements in other graphs. Correlation cancels the measurements' actual values and allows you to
focus on the behavior pattern of the measurements during a specified time range of the load test
scenario.
In the following example, the t106Zoek:245.lrr measurement in the Average Transaction Response
Time graph is correlated with the measurements in the Windows Resources, Microsoft IIS, and SQL
Server graphs. The five measurements most closely correlated with t106Zoek:245.lrr are displayed in
the graph below.
User Guide
Analysis
HP LoadRunner (12.50) Page 1470

Note: This feature can be applied to all line graphs except the Web Page Diagnostics graph.
Viewing Raw Data
You can view the actual raw data collected during test execution for the active graph. The Raw Data
view is not available for all graphs.
Viewing the raw data can be especially useful in the following cases:
lTo determine specific details about a peak—for example, which Vuser was running the transaction
that caused the peak value(s).
lTo perform a complete export of unprocessed data for your own spreadsheet application.
For user interface details, click "Graph/Raw Data View Table" on page1477.
How to Manage Graph Data
The following list includes the utilities you can use in Analysis to enable you to manage graph data to
most effectively view the displayed data.
Determine a point's coordinates
To determine the coordinates and values at any point in a graph, place the cursor over the point you
want to evaluate. Analysis displays the axis values and other grouping information.
Drill down in a graph
Drill down enables you to focus on a specific measurement within your graph and display it according to
the desired grouping.
1. Right-click on a line, bar, or segment within the graph, and select Drill Down. The Drill Down
Options dialog box opens, listing all of the measurements in the graph.
2. Select a measurement for drill down.
3. From the Group By box, select a group by which to sort.
4. Click OK. Analysis drills down and displays the new graph.
To undo the last drill down settings, choose Undo Set Filter/Group By from the right-click menu.
lTo perform additional drill-downs, repeat steps 1 to 4.
lTo clear all filter and drill down settings, choose Clear Filter/Group By from the right-click
menu.
Filter the data
This task describes how to filter the data and create custom filters.
User Guide
Analysis
HP LoadRunner (12.50) Page 1471
1. In the Legend window, click the column header of the measurement you want to use as a base for
the filter.
2. To show a single entry, expand the drop-down list and select that entry.
3. To create a custom filter, select Custom in the drop-down list. The Custom Filter dialog box opens.
4. Select an evaluation expression and provide a value. To use wildcards, use an underscore, _, to
represent a single character and %for multiple characters. For details, see "Custom Filter Dialog
Box" on page1490.
5. To provide additional criteria, select a logical operator, ANDor OR and set up the second
expression.
Change the granularity of the data
This task describes how to change the granularity of a graph.
1. Click inside a graph.
2. Select View >Set Granularity, or click theSet Granularity button . The Granularity dialog box
opens.
3. Enter the granularity of the x-axis and select a time measurement. The maximum granularity is
half of the graph's time range.
4. To ensure readability and clarity, LoadRunner automatically adjusts the minimum granularity of
graphs with ranges of 500 seconds or more.
5. Click OK.
View measurement trends
This task describes how to activate the View Measurements Trends option from a line graph.
1. Select View > View Measurement Trends, or right-click the graph and choose View Measurement
Trends. Alternatively, you can select View > Configure Measurements and check the View
measurement trends for all measurements box.
Note: The standardization feature can be applied to all line graphs except the Web Page
Diagnostics graph.
2. View the standardized values for the line graph you selected. The values in the Minimum, Average,
Maximum, and Std. Deviation legend columns are real values.
To undo the standardization of a graph, repeat step 1.
Note: If you standardize two line graphs, the two y-axes merge into one y-axis.
User Guide
Analysis
HP LoadRunner (12.50) Page 1472

Auto correlate measurements
You can detect similar trends among measurements by correlating a measurement in one graph with
measurements in other graphs. Correlation cancels the measurements' actual values and allows you to
focus on the behavior pattern of the measurements during a specified time range of the load test
scenario.
1. From a graph or legend, right-click the measurement you want to correlate and choose Auto
Correlate. The Auto Correlate dialog box opens with the selected measurement displayed in the
graph.
2. Select a suggested time range method and time range.
3. If you applied a time filter to your graph, you can correlate values for the complete scenario time
range by clicking the Display button in the upper right-hand corner of the dialog box.
4. To specify the graphs you want to correlate with a selected measurement and the type of graph
output to be displayed, perform the following:
lSelect the Correlation Options tab.
lSelect the graphs to correlate, the data interval, and output options, as described in "Drill Down
Options Dialog Box" below.
lOn the Time Range tab, click OK. Analysis generates the correlated graph you specified. Note the
two new columns—Correlation Match and Correlation—that appear in the Legend window
below the graph.
To specify another measurement to correlate, select the measurement from the Measurement to
Correlate box at the top of the Auto Correlate dialog box.
The minimum time range should be more than 5% of the total time range of the measurement.
Trends which are smaller than 5% of the whole measurement will be contained in other larger
segments.
Sometimes, very strong changes in a measurement can hide smaller changes. In cases like these,
only the strong change is suggested, and the Next button will be disabled.
Note: This feature can be applied to all line graphs except the Web Page Diagnostics graph.
Drill Down Options Dialog Box
This dialog box lists all the measurements in the graph.
User Guide
Analysis
HP LoadRunner (12.50) Page 1473
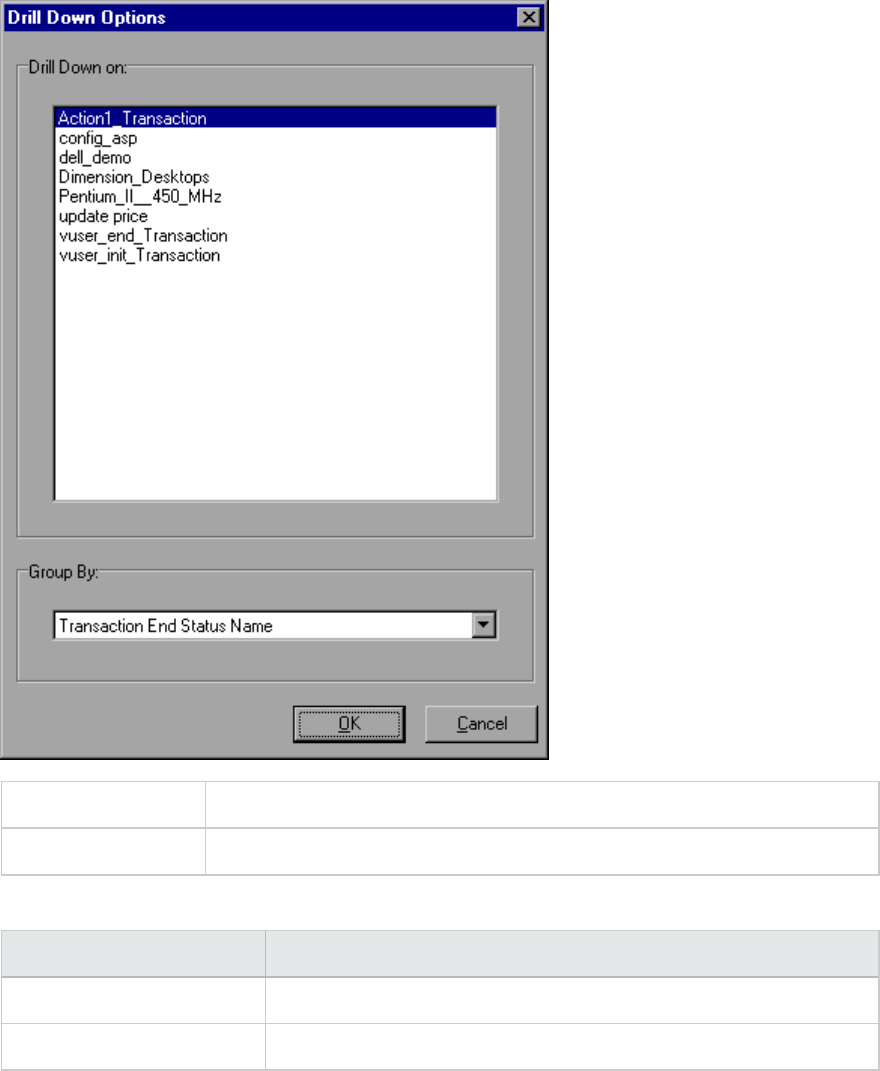
To access <Right-click> graph line/bar/segment > Drill Down
See also "Drilling Down in a Graph" on page1467
User interface elements are described below:
UI Element Description
Drill Down on Filter graph by selected transaction.
Group By The selected transaction is sorted by selected criteria.
Auto Correlate Dialog Box
This dialog box enables you to configure settings used to correlate measurements from the selected
graph with measurements in other graphs.
User Guide
Analysis
HP LoadRunner (12.50) Page 1474
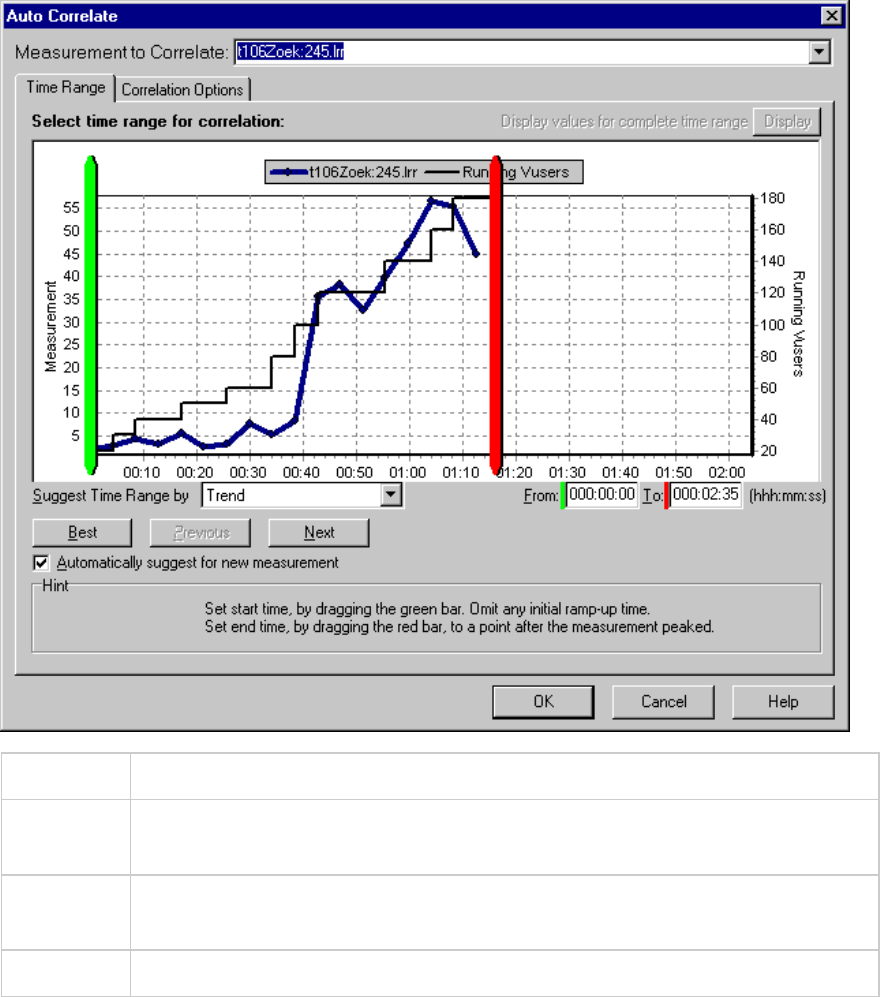
To access Click on a graph and select > Auto Correlate from the right-click menu
Important
information
You can also use the green and red vertical drag bars to specify the start and end
values for the scenario time range.
Note The granularity of the correlated measurements graph may differ from that of the
original graph, depending on the scenario time range defined.
See also "Auto Correlating Measurements" on page1470
Time Range Tab
The Time Range tab of the Auto Correlate dialog box enables you to specify a load test scenario time
range for the correlated measurement graph.
User interface elements are described below:
User Guide
Analysis
HP LoadRunner (12.50) Page 1475

UI Element Description
Measurement to
Correlate
Select the measurement you want to correlate.
Display values for
complete time range
Click Display to correlate values for the complete scenario time range.
This option is available only if you applied a time filter to your graph.
Suggest Time Range By Analysis automatically demarcates the most significant time period for
the measurement in the scenario.
lTrend. Demarcated an extended time segment which contains the most
significant changes.
lFeature. Demarcates a smaller dimension segment which forms the
trend.
Best Choose the time segment most dissimilar to its adjacent segments.
Next Suggest the next time segment for auto correlation. Each suggestion is
successively less dissimilar.
Previous Return to the previous suggestion of a time segment.
Automatically suggest
for new measurement
Generates new suggestions each time that the Measurement to Correlate
item changes.
From Specify a start value (in hh:mm:ss format) for the desired scenario time
range.
To Specify an end value (in hh:mm:ss format) for the desired scenario time
range.
Correlation Options tab
You use the Correlation Options tab to set the graphs to correlate, the data interval, and the output
options.
User interface elements are described below:
UI Element Description
Select
Graphs for
Correlation
Select the graphs whose measurements you want to correlate with your selected
measurement.
Data
Interval
Calculate the interval between correlation measurement polls.
lAutomatic. Uses an automatic value, determined by the time range.
User Guide
Analysis
HP LoadRunner (12.50) Page 1476
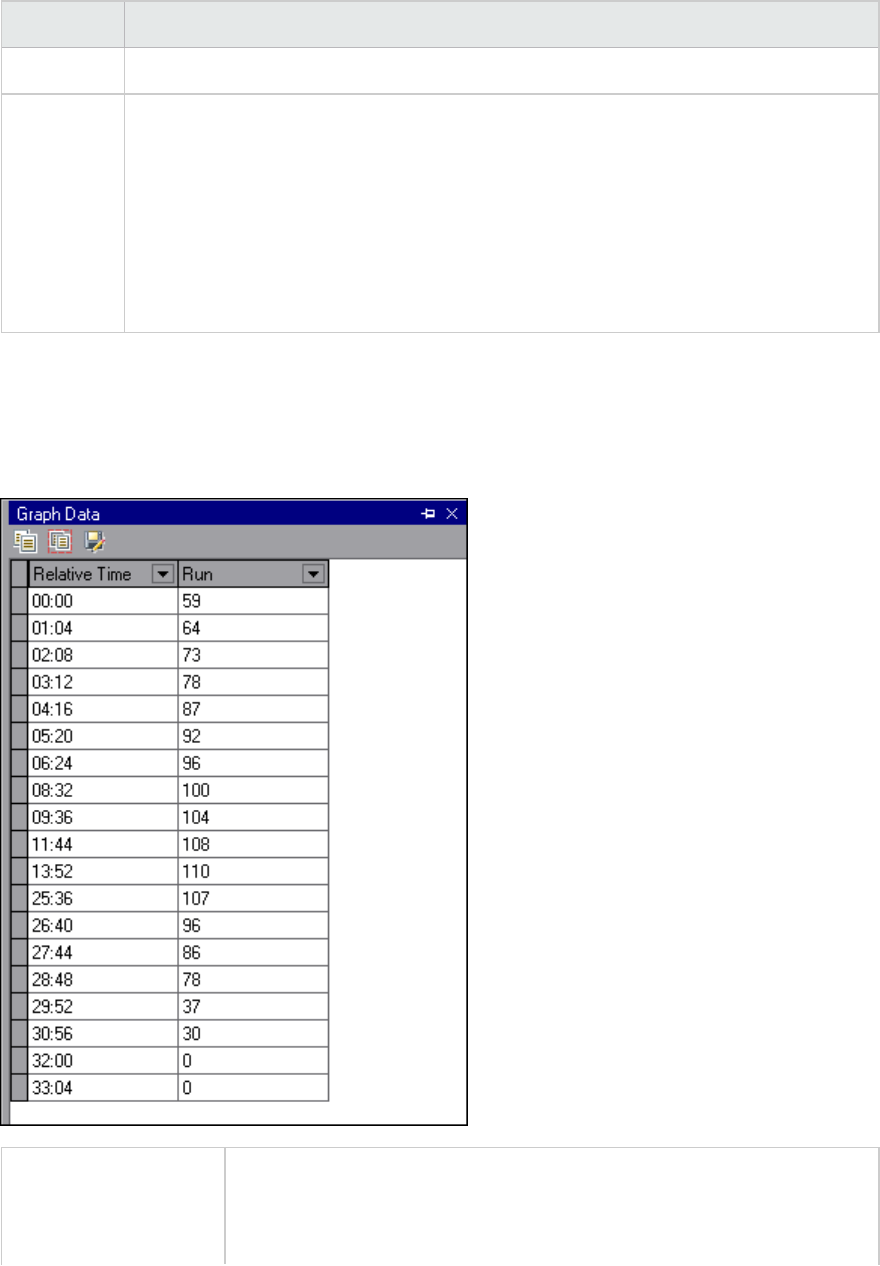
UI Element Description
lCorrelate data based on X second intervals. Enter a fixed value.
Output Choose the level of output displayed.
lShow the X most closely correlated measurements. Displays only the specified
number of measurements most closely related to the selected measurement. The
default value is 5.
lShow measurements with an influence factor of at least X%. Displays only those
measurements that converge to the specified percent with the selected
measurement. The default value is 50%.
Graph/Raw Data View Table
You can view graph data in spreadsheet view or raw data view. The data is instantly displayed on
request.
To access Click the appropriate tab on the right border of the Analysis window or do
one of the following:
lWindows > Graph Data
User Guide
Analysis
HP LoadRunner (12.50) Page 1477
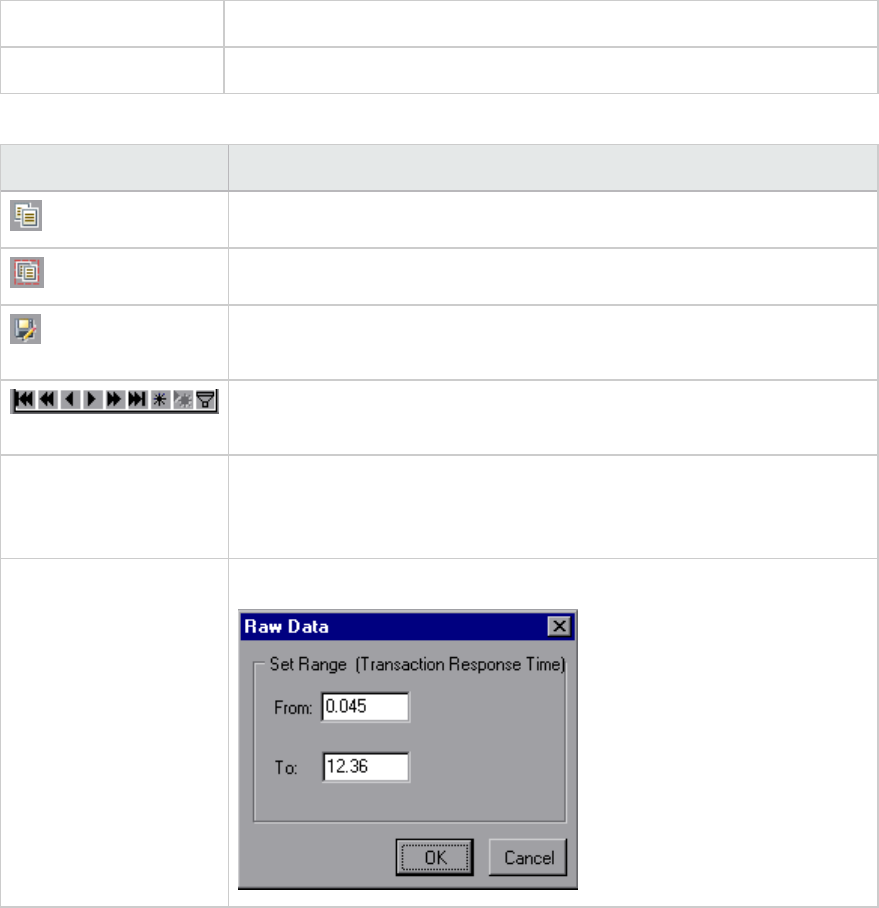
lWindows > Raw Data
Note Raw Data is not available for all graphs.
User interface elements are described below:
UI Element Description
Copies the data that you have selected.
Copies the spreadsheet to the clipboard. You can paste to a spreadsheet.
Saves the spreadsheet data to an Excel or CSV file. In Excel, you can
generate your own customized graphs.
Use the buttons on the toolbar to navigate through the table, and mark
any records for future reference.
Relative Time The first column in the Graph Data window. displays the elapsed scenario
time (the x-axis values). The following columns displays the relative y-axis
values for each measurement represented on the graph.
Raw Data dialog box In Set Range, set a time range.
Graph Properties Pane
This pane displays the details of the graph or report selected in the Session Explorer. Fields that appear
in black are editable. When you select an editable field, an edit button is displayed next to the selected
field value.
User Guide
Analysis
HP LoadRunner (12.50) Page 1478
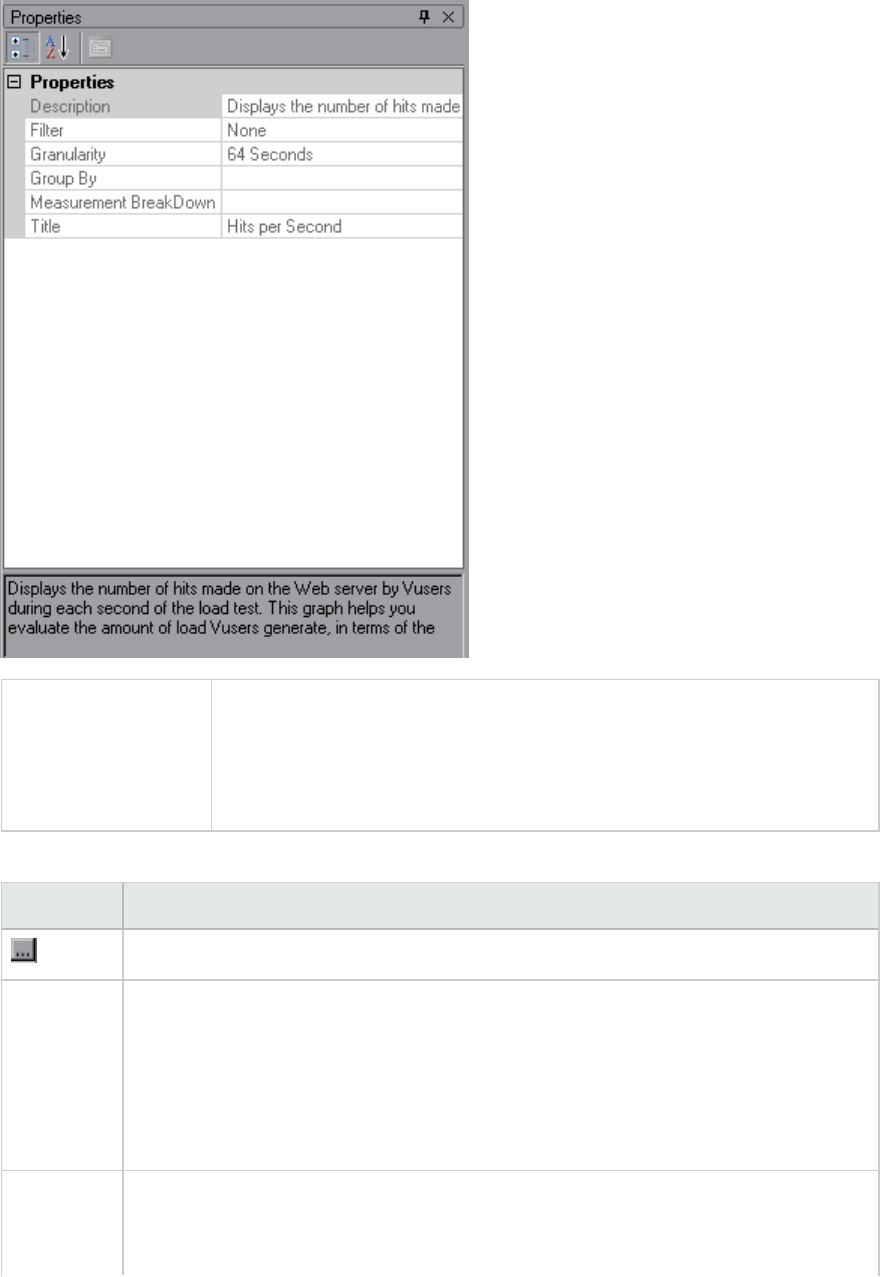
To access One of the following:
lWindows > Properties
lSelect a graph in the Session Explorer, and select Properties from the
right-click menu.
User interface elements are described below:
UI Element Description
Enables you to edit the value for the selected field.
Graph
fields
lFilter. Shows configured filter.
lGranularity. Shows configured granularity.
lGroup By. Shows the filter for selected group.
lMeasurement Breakdown. Shows the measurements of the graph.
lTitle. Shows the name of the graph in the graph display window.
Summary
Report
fields
lDescription. A short summary of what is included in the summary report.
lFilter. Shows configured filter for the summary report.
User Guide
Analysis
HP LoadRunner (12.50) Page 1479
UI Element Description
lPercentile. The Summary Report contains a percentile column showing the
response time of 90% of transactions (90% of transactions that fall within this
amount of time). To change the value of the default 90 percentile, enter a new
figure in the Transaction Percentile box.
lTitle. The name of the summary report.
Transaction
Analysis
Report
fields
When clicking the edit button for some of the fields, the Analyze Transaction Settings
dialog box opens, enabling you to edit some of the Analyze Transaction settings.
Filtering and Sorting Graph Data
Filtering Graph Data Overview
You can filter graph data to show fewer transactions for a specific segment of the load test scenario.
More specifically, you can display four transactions beginning from five minutes into the scenario and
ending three minutes before the end of the scenario.
You can filter for a single graph, in all graphs in a load test scenario, or in the summary graph.
The available filter conditions differ for each type of graph. The filter conditions also depend on your
scenario. For example, if you only had one group or one load generator machine in your scenario, the
Group Name and Load Generator Name filter conditions do not apply.
Note: You can also filter merged graphs. The filter conditions for each graph are displayed on
separate tabs.
Sorting Graph Data Overview
You can sort graph data to show the data in more relevant ways. For example, Transaction graphs can
be grouped by the Transaction End Status, and Vuser graphs can be grouped by Scenario Elapsed Time,
Vuser End Status, Vuser Status, and Vuser ID.
You can sort by one or several groups—for example by Vuser ID and then Vuser status. The results are
displayed in the order in which the groups are listed. You can change the grouping order by rearranging
the list.
User Guide
Analysis
HP LoadRunner (12.50) Page 1480
Filter Conditions
Common Filter Condition Options
The following filter conditions are common to many graphs:
Filter
Condition
Filters the graph according to...
Host Name The name of the Host machine. Select one or more hosts from the drop-down list.
Transaction
End Status
The end status of a transaction: pass, fail, stop.
Scenario
Elapsed
Time
The time that elapsed from the beginning to the end of the load test scenario. For
more information about setting the time range, see "Scenario Elapsed Time Dialog
Box" on page1494.
Vuser ID The Vuser ID. For more information, see "Vuser ID Dialog Box" on page1496.
Script
Name
The name of the script.
Group
Name
The name of the group to filter by.
Think Time The Think Time option in the graph filter for complete mode is turned off by default.
The transaction time displayed shows pure time.
Vuser Graphs
You can apply the following filter conditions to Vuser graphs:
Filter Condition Filters the graph according to...
Vuser Status The Vuser status: load, pause, quit, ready, run
Vuser End Status The status of the Vuser at the end of the transaction: error, failed,
passed, stopped.
Number of Released
Vusers
The number of Vusers that were released.
Rendezvous Name The name of the rendezvous point.
Error Graphs
You can apply the following filter conditions to Error graphs:
User Guide
Analysis
HP LoadRunner (12.50) Page 1481
Filter Condition Filters the graph according to...
Error Type The type of error (per error number).
Parent Transaction The parent transaction.
Line Number in Script The line number in the script.
Transaction Graphs
You can apply the following filter conditions to Transaction graphs:
Filter Condition Filters the graph according to...
Transaction
Name
The name of the transaction.
Transaction
Response Time
The response time of the transaction.
Transaction
Hierarchical
Path
The hierarchical path of the transaction. For more information on setting this
condition, see "Hierarchical Path Dialog Box" on page1494.
Web Resource Graphs
You can apply the following filter conditions to Web Resources graphs:
Filter Condition Filters the graph according to...
Web Resource Name The name of the Web resource.
Web Resource Value The value of the Web resource.
Web Server Resource Name The name of the Web Server resource.
Web Server Resource Value The value of the Web Server resource.
Web Page Diagnostics Graphs
You can apply the following filter conditions to Web Page Diagnostics graphs:
Filter Condition Filters the graph according to...
Component
Name
The name of the component.
Component The response time of the component.
User Guide
Analysis
HP LoadRunner (12.50) Page 1482

Filter Condition Filters the graph according to...
Response Time
Component DNS
Resolution Time
The amount of time the component needs to resolve the DNS name to an IP
address, using the closest DNS server.
Component
Connection Time
The time taken for the component to establish an initial connection with the Web
server hosting the specified URL.
Component First
Buffer Time
The time that passes from the component's initial HTTP request (usually GET)
until the first buffer is successfully received back from the Web server.
Component
Receive Time
The time that passes until the component's last byte arrives from the server and
the downloading is complete.
Component SSL
Handshaking
Time
The time take for the component to establish an SSL connection. (Applicable to
HTTPS communication only.)
Component FTP
Authentication
Time
The time taken for the component to authenticate the client. (Applicable to FTP
protocol communication only).
Component Error
Time
The average amount of time that passes from the moment a component's HTTP
request is sent until the moment an error message (HTTP errors only) is
returned.
Component Size
(KB)
The size of the component (in kilobytes).
Component Type The type of component: Application; Image; Page; Text
Component
Hierarchical Path
The hierarchical path of the component. For more information on setting this
condition, see "Hierarchical Path Dialog Box" on page1494.
Component
Network Time
The amount of time from the component's first HTTP request, until receipt of
ACK.
Component
Server Time
The amount of time from when the component receives of ACK, until the first
buffer is successfully received back from the Web server.
Component
Client Time
The average amount of time that passes while a component request is delayed
on the client machine due to browser think time or other client-related delays.
User Defined Data Point Graphs
You can apply the following filter conditions to User-Defined Data Point graphs:
User Guide
Analysis
HP LoadRunner (12.50) Page 1483
Filter Condition Filters the graph according to...
Datapoint Name The name of the data point.
Datapoint Value The value of the data point.
System Resources Graphs
You can apply the following filter conditions to System Resource graphs:
Filter Condition Filters the graph according to...
System Resource
Name
The name of the system resource.
System Resource
Value
The value of the system resource. See "Set Dimension Information Dialog Box"
on page1495.
Network Monitor Graphs
You can apply the following filter conditions to Network Monitor graphs:
Filter Condition Filters the graph according to...
Network Path Name The name of the network path.
Network Path Delay The delay of the network path.
Network Path Father The father of the network path.
Network SubPath Name The name of the network subpath.
Network SubPath Delay The delay of the network subpath.
Network Full Path The full network path.
Network Segment Name The name of the network segment.
Network Segment Delay The delay of the network segment.
Network Segment Full Path The full network segment path.
Firewall Graphs
You can apply the following filter conditions to Firewall graphs:
Filter Condition Filters the graph according to...
Firewall Resource The name of the Firewall resource.
User Guide
Analysis
HP LoadRunner (12.50) Page 1484
Filter Condition Filters the graph according to...
Name
Firewall Resource
Value
The value of the firewall resource. See "Set Dimension Information Dialog Box"
on page1495.
Web Server Resource Graphs
You can apply the following filter conditions to Web Server Resource graphs:
Filter Condition Filters the graph according to...
Measurement
Name
The name of the measurement.
Measurement
Value
The measurement value. See "Set Dimension Information Dialog Box" on
page1495.
Web Application Server Resource Graphs
You can apply the following filter conditions to Web Application Server Resource graphs:
Filter Condition Filters the graph according to...
Resource Name The name of the resource.
Resource Value The value of the resource. See "Set Dimension Information Dialog Box" on
page1495.
Database Server Resource Graphs
You can apply the following filter conditions to Database Server Resource graphs:
Filter Condition Filters the graph according to...
Database Resource
Name
The name of the database resource.
Database Resource
Value
The value of the database resource. See "Set Dimension Information Dialog
Box" on page1495.
Streaming Media Graphs
You can apply the following filter conditions to Streaming Media graphs:
User Guide
Analysis
HP LoadRunner (12.50) Page 1485

Filter Condition Filters the graph according to...
Streaming Media
Name
The name of the streaming media.
Streaming Media
Value
The value of the streaming media. See "Set Dimension Information Dialog Box"
on page1495.
ERP/CRM Server Resource Graphs
You can apply the following filter conditions to ERP/CRM Server Resource graphs:
Filter Condition Filters the graph according to...
ERP/CRM Server
Resource Name
The name of the ERP/CRM server resource.
ERP/CRM Server
Resource Value
The value of the ERP/CRM Server resource. See "Set Dimension
Information Dialog Box" on page1495.
ERP Server Resource
Name
The name of the ERP server resource.
ERP Server Resource
Value
The value of the ERP server resource. See "Set Dimension Information
Dialog Box" on page1495.
Siebel Diagnostics Graphs
You can apply the following filter conditions to Siebel Diagnostics graphs:
Filter Condition Filters the graph according to...
Siebel Transaction Name The name of the Siebel transaction.
Siebel Request Name The name of the Siebel request.
Siebel Layer Name The name of the Siebel layer.
Siebel Area Name The name of the Siebel area.
Siebel Sub-Area Name The name of the Siebel sub-area.
Siebel Server Name The name of the Siebel server.
Siebel Script Name The name of the Siebel script.
Response Time The response time of the Siebel transaction.
Siebel Chain of Calls The chain of calls for the Siebel transaction.
User Guide
Analysis
HP LoadRunner (12.50) Page 1486
Siebel DB Diagnostics Graphs
You can apply the following filter conditions to Siebel DB Diagnostics graphs:
Filter Condition Filters the graph according to...
Transaction Name - SIEBEL The name of the Siebel DB transaction.
SQL Chain of Calls The SQL chain of calls for the Siebel DB transaction.
SQL Alias Name The SQL alias name for the Siebel DB transaction.
SQL Response Time The SQL response time of the Siebel DB transaction.
Oracle - Web Diagnostics Graphs
You can apply the following filter conditions to Oracle - Web Diagnostics graphs:
Filter Condition Filters the graph according to...
Transaction Name - ORACLE The name of the Oracle transaction.
SQL Chain of Calls The SQL chain of calls for the Oracle transaction.
SQL Alias Name - Oracle The SQL alias name for the Oracle transaction.
SQL Response Time The SQL response time of the Oracle transaction.
Oracle SQL Parse Time The SQL parse time of the Oracle transaction.
Oracle SQL Execute Time The SQL execute time of the Oracle transaction.
Oracle SQL Fetch Time The SQL fetch time of the Oracle transaction.
Oracle SQL Other Time Other SQL time for the Oracle transaction.
Java Performance Graphs
You can apply the following filter conditions to Java Performance graphs:
Filter Condition Filters the graph according to...
Java Performance Resource Name The name of the Java performance resource.
Java Performance Resource Value The value of the Java performance resource.
J2EE & .NET Diagnostics Graphs
You can apply the following filter conditions to J2EE & .NET Diagnostics graphs:
User Guide
Analysis
HP LoadRunner (12.50) Page 1487

Filter Condition Filters the graph according to...
Transaction
Name
The name of the Java transaction.
Method Chain of
Calls
The chain of calls for the Java method.
Layer Name The name of the layer.
Class Name The name of the class.
Method Name The name of the method.
SQL Logical
Name
The SQL logical name for the Java transaction.
Response Time The response time of the Java transaction.
Host Name -
J2EE/.NET
The name of the host for the J2EE & .NET transaction.
Application Host
Name - (VM)
The name of the application host for the VM.
Transaction
Request
The request for the transaction.
Transaction
Hierarchical
Path
The hierarchical path of the transaction. For more information on setting this
condition, see "Hierarchical Path Dialog Box" on page1494.
Application Component Graphs
You can apply the following filter conditions to Application Component graphs:
Filter Condition Filters the graph according to...
Component Resource
Name
The resource name of the component.
Component Resource
Value
The value of the component resource. See "Set Dimension Information
Dialog Box" on page1495.
COM+ Interface The interface of the COM+ component.
COM+ Response Time The response time of the COM+ component.
COM+ Call Count The call count of the COM+ component.
User Guide
Analysis
HP LoadRunner (12.50) Page 1488
Filter Condition Filters the graph according to...
COM+ Method The method of the COM+ component.
.NET Resource Name The resource name of the .NET component.
.NET Value The .NET resource value. See "Set Dimension Information Dialog Box" on
page1495.
.NET Class The class of the .NET component.
.NET Response Time The response time of the .NET component.
.NET Call Count The call count of the .NET component.
.NET Method The method of the .NET component.
Application Deployment Graphs
You can apply the following filter conditions to Application Deployment graphs:
Filter Condition Filters the graph according to...
Citrix Resource
Name
The name of the Citrix resource.
Citrix Resource
Value
The value of the Citrix resource. See "Set Dimension Information Dialog Box" on
page1495.
Middleware Performance Graphs
You can apply the following filter conditions to Middleware Performance graphs:
Filter Condition Filters the graph according to...
Message Queue
Resource Name
The name of the message queue resource.
Message Queue
Resource Value
The value of the Message Queue resource. See "Set Dimension Information
Dialog Box" on page1495.
Infrastructure Resource Graphs
You can apply the following filter conditions to Infrastructure Resource graphs:
Filter Condition Filters the graph according to...
Network Client The name of the network client.
User Guide
Analysis
HP LoadRunner (12.50) Page 1489
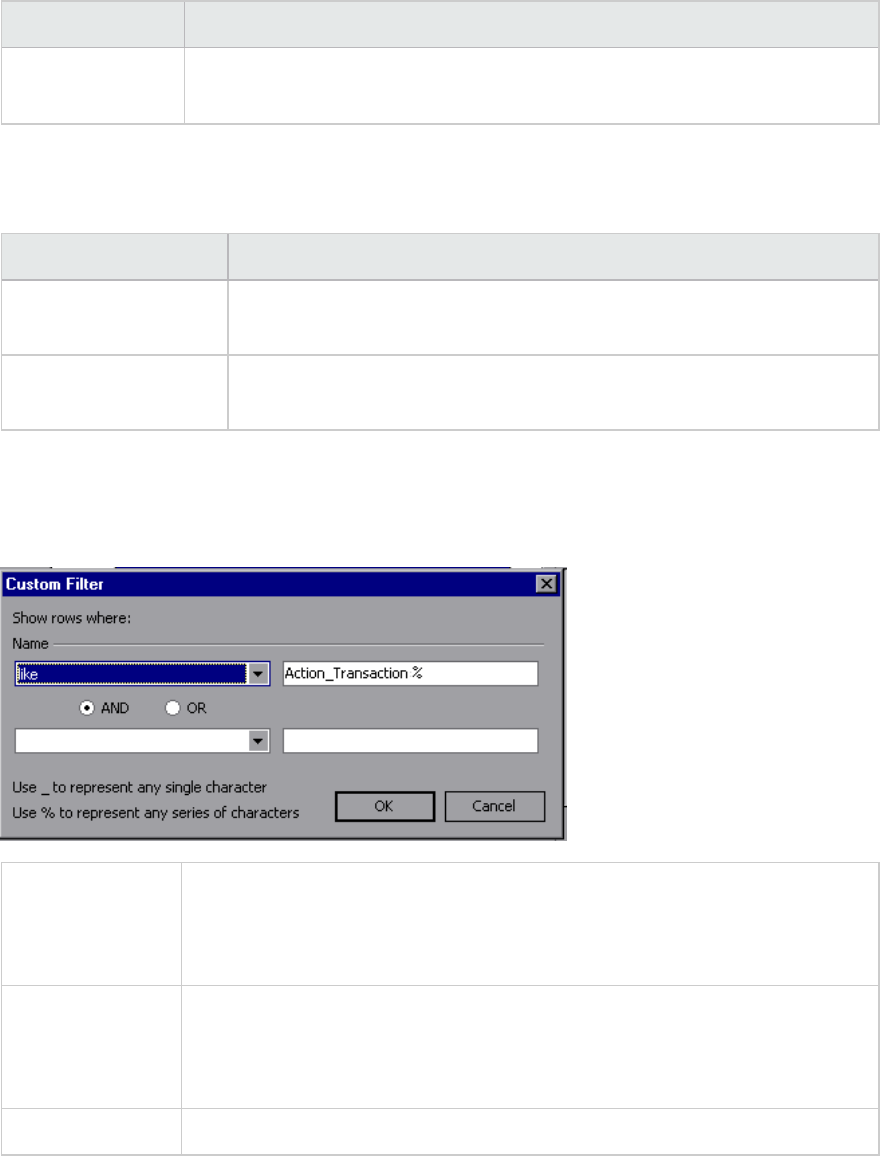
Filter Condition Filters the graph according to...
Network Client
Value
The value of the network client. See "Set Dimension Information Dialog Box" on
page1495.
External Monitor Graphs
You can apply the following filter conditions to External Monitor graphs:
Filter Condition Filters the graph according to...
External Monitor
Resource Name
The name of the external monitor resource.
External Monitor
Resource Value
The value of the external monitor resource. See "Set Dimension
Information Dialog Box" on page1495.
Custom Filter Dialog Box
This dialog box enables you to customize your filter criteria.
To access Do the following:
1. In a Legend window, click a column header.
2. Expand the down arrow and choose (Custom).
Tip You can use wildcards:
lUse _to represent a single character.
lUse %to represent a series of characters.
See also "Legend Window" on page1455
User interface elements are described below:
User Guide
Analysis
HP LoadRunner (12.50) Page 1490
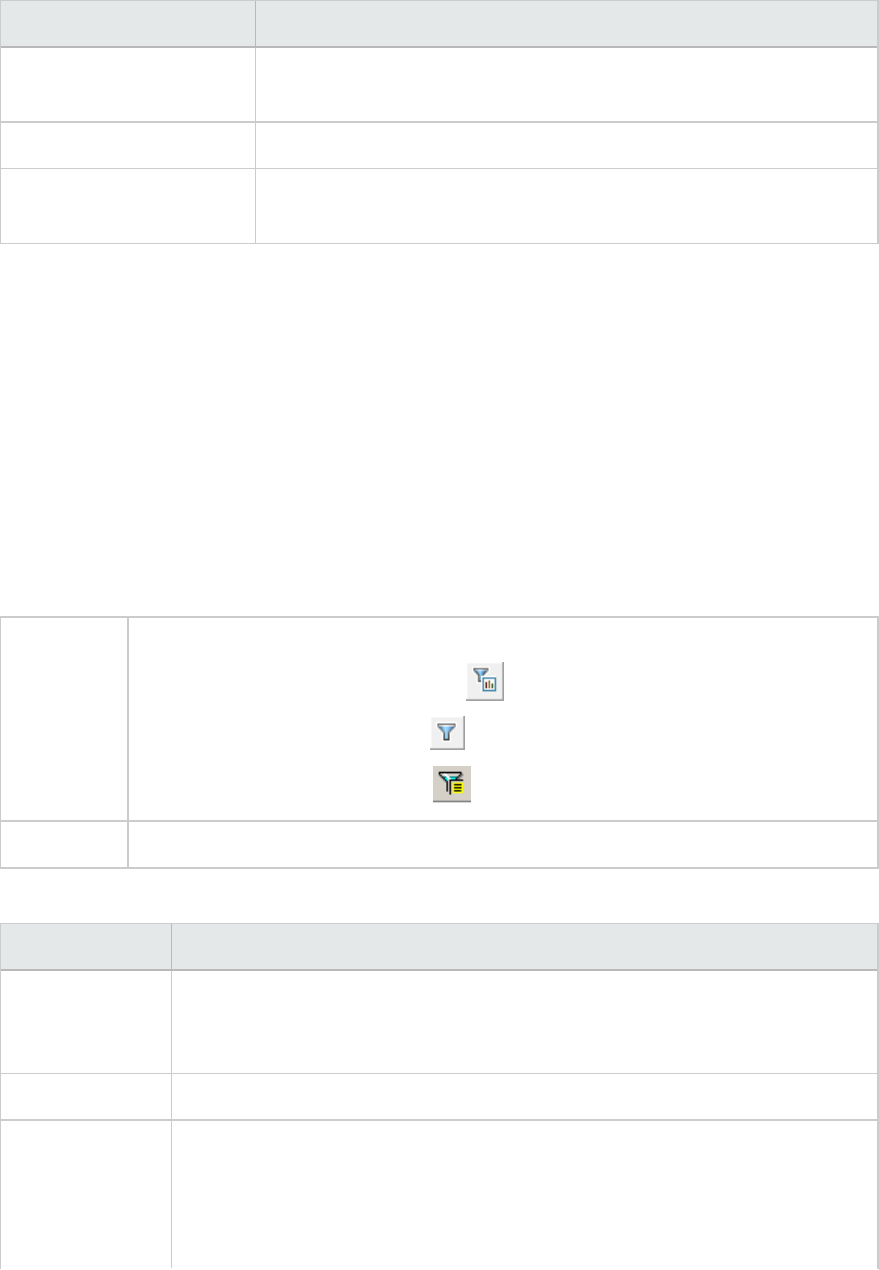
UI Element Description
<First Evaluator
Expression>
A drop-down list of evaluation expressions such as equals,is greater
than,like, and so forth, followed by a value.
Operator The logical operator by which to add a second expression: AND or OR.
<Second Evaluator
Expression>
A drop-down list of evaluation expressions such as equals,is greater
than,like, and so forth, followed by a value.
For example, the above image shows how to filter the data for transactions that begin with the phrase
"Action_Transaction", using Like and Action_Transaction%.
After you save a customization for one of the metrics, the Analysis displays it in the lower section of the
Legend window.
Filter Dialog Boxes
The filter dialog boxes (Graph Settings, Global Filter, and Analysis Summary Filter) enable you to filter
the data that is displayed in the graph or report.
When adding a graph, the filter and sort button is displayed which enables you to filter and sort data
before the graph is displayed.
To access Use one of the following:
lView > Set Filter/Group By or click
lFile > SetGlobal Filter or click
lView > Summary Filter or click
Note Some of the following fields are not displayed in all of the filter boxes.
User interface elements are described below:
UI Element Description
Filter Condition Select criteria and values for each filter condition that you want to employ. The
applicable filter conditions are displayed for each graph. For details on each
graphs filter conditions, see the chapter on the relevant graph.
Criteria Select "=" (equals) or "<>" (does not equal).
Values The filter conditions are grouped into three value types (discrete, continuous,
and time-based).
A discrete value is a distinct integer (whole number) or string value such as
Transaction Name or Vuser ID. Select the check box(es) of the value(s) that you
User Guide
Analysis
HP LoadRunner (12.50) Page 1491
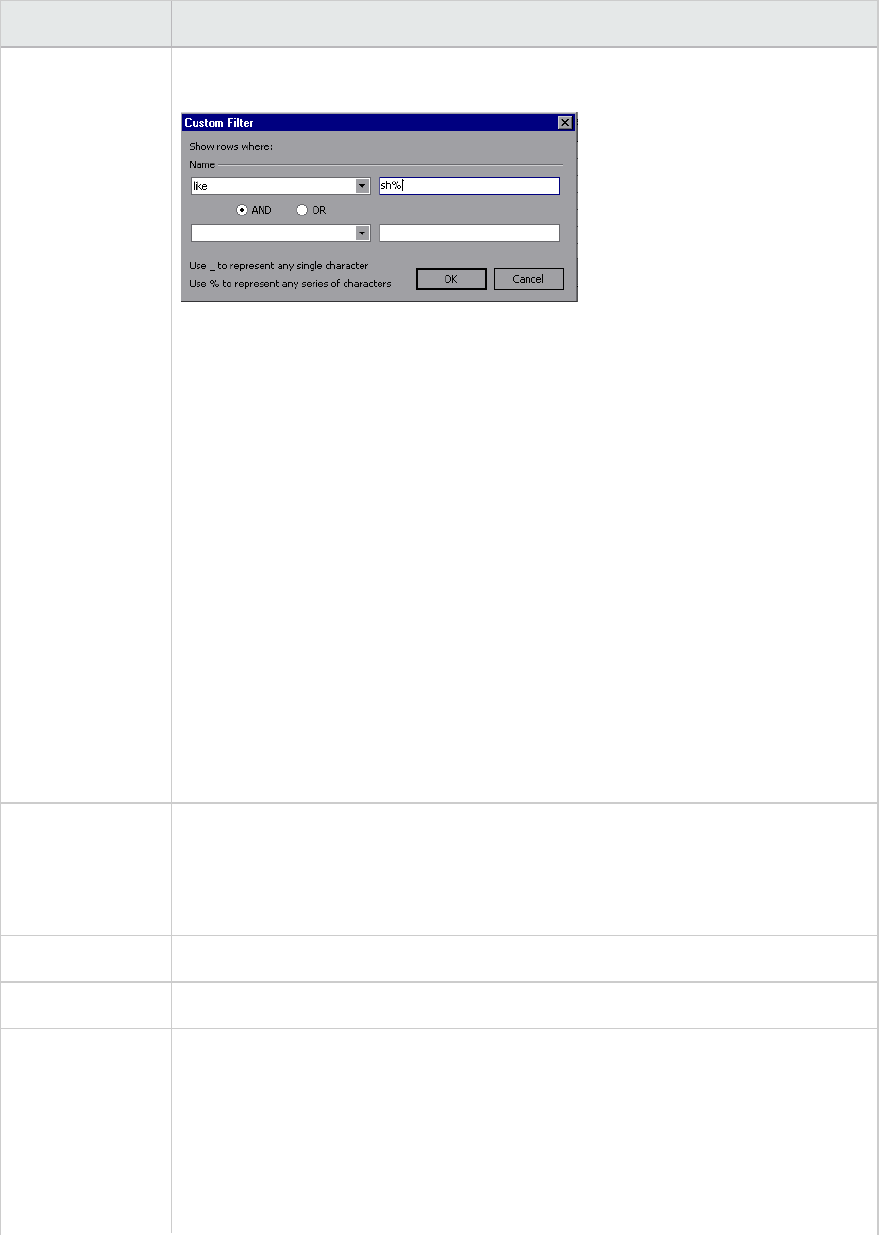
UI Element Description
want to include in your filter. You can also customize your filter by entering wild
cards to depict any single character or any series of characters.
lA continuous value is a variable dimension that can take any value within the
minimum and maximum range limits, such as Transaction Response Time. You
set the dimension information for each measurement in the "Set Dimension
Information Dialog Box" on page1495.
lA time-based value is a value that is based on time relative to the start of the
load test scenario. Scenario Elapsed Time is the only condition that uses time-
based values. You specify time-based values in the "Scenario Elapsed Time
Dialog Box" on page1494.
For some filter conditions, one of the following dialog boxes opens to enable you
to specify additional filtering details:
l"Set Dimension Information Dialog Box" on page1495
l"Vuser ID Dialog Box" on page1496
l"Scenario Elapsed Time Dialog Box" on page1494
l"Hierarchical Path Dialog Box" on page1494: Enables you to display the
hierarchical path of a transaction or component, or a method chain of calls.
Transaction
Percentile
The Summary Report contains a percentile column showing the response time of
90% of transactions (90% of transactions that fall within this amount of time). To
change the value of the default 90 percentile, enter a new figure in the
Transaction Percentile box.
Set Default Displays the default criteria and values for each filter condition.
Clear All Deletes all of the information you entered in the dialog box.
Group By
settings
Use these settings to sort the graph display by grouping the data. You can group
the data by:
lAvailable groups. Select the group by which you want to the sort the results,
and click the right arrow.
lSelected groups. Displays a list of all the selected groups by which the results
will be sorted. To remove a value, select it and click the left arrow.
User Guide
Analysis
HP LoadRunner (12.50) Page 1492

UI Element Description
Reset all graphs
to their defaults
prior to applying
the Global Filter
All graphs filter settings are reverted to their default.
Filter Builder Dialog Box
The Filter Builder dialog box enable you to design, add, and edit filters for your graph.
To access Use one of the following:
1. In the Legend pane, expand the down arrow in a column header.
2. Select Custom to open the Custom Filter dialog box. Provide filter details and click
OK.
3. Click Customize in the filter entry in the lower part of the Legend pane.
See also "Custom Filter Dialog Box" on page1490
User interface elements are described below:
UI
Element
Description
Filter
button
Opens a menu with the following options:
lAdd Condition. Add another condition for the current filter.
lAdd Group. Adds a second condition, joined by a logical operator AND or OR, to the last
condition in the list.
lClear All. Removes all of the conditions in the window.
Opens a menu with the following options:
lAdd Condition. Add another condition for the current filter.
lAdd Group. Adds a second condition, joined by a logical operator AND or OR, to the
selected condition in the list.
lRemove Row. Removes the selected condition.
Open Opens an .flt file saved from a previous session.
Save as Saves all of the conditions to an .flt file.
User Guide
Analysis
HP LoadRunner (12.50) Page 1493
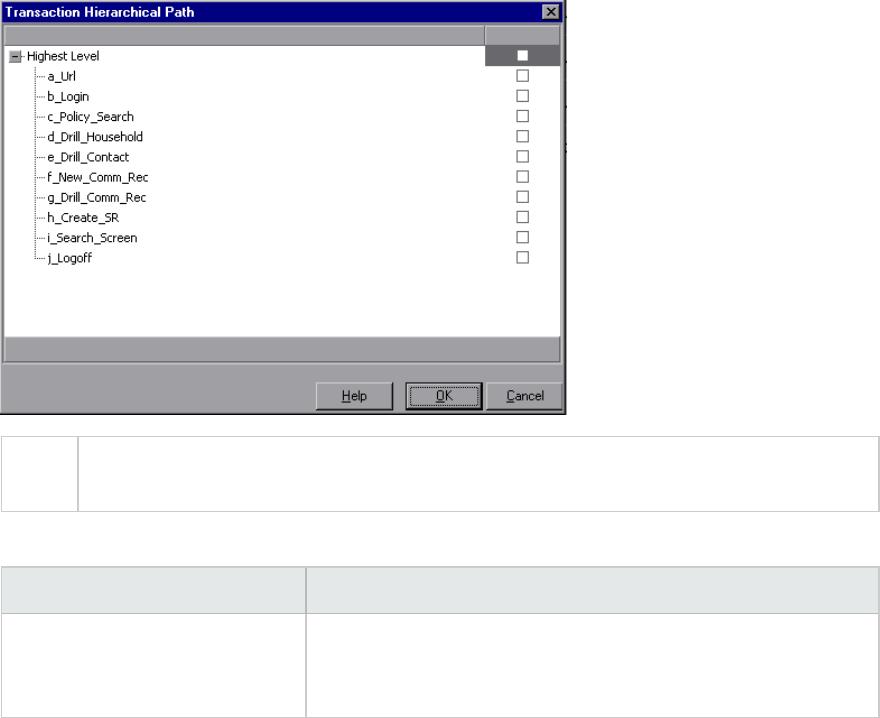
Hierarchical Path Dialog Box
This dialog box enables you to display the hierarchical path of a transaction or component, or a method
chain of calls.
To
access
View menu > Set Filter/Group by >Filter condition pane > Transaction, Component
Hierarchical Path or a method chain of calls
User interface elements are described below:
UI Element Description
Transaction, Component
Hierarchical Path or a method
chain of calls
Select the box for the path where you want to start to see
results. Only the selected path and its immediate sub-nodes will
be displayed.
Scenario Elapsed Time Dialog Box
This dialog box enables you to specify the start and end time range for the graph's x-axis.
User Guide
Analysis
HP LoadRunner (12.50) Page 1494
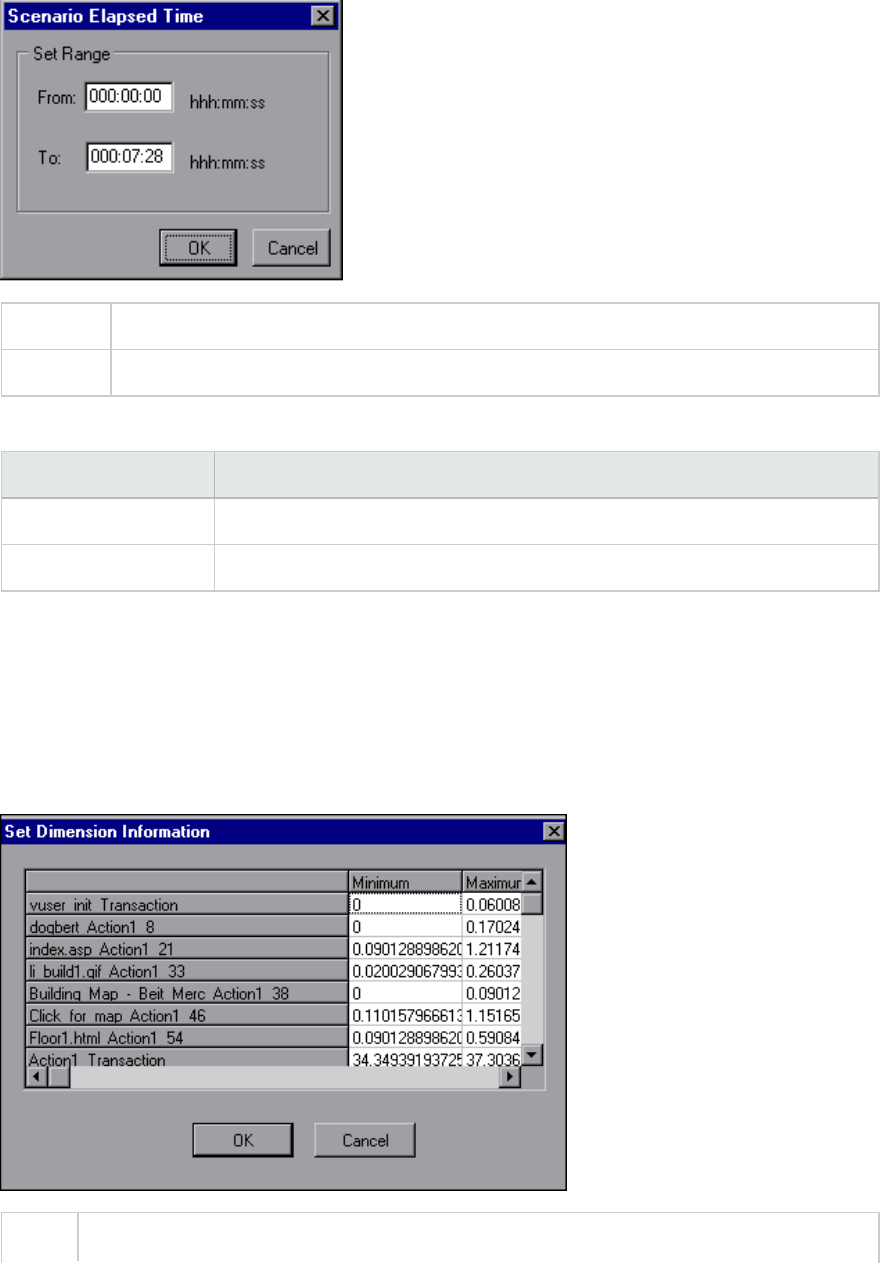
To access View menu > Set Filter/Group by >Filter condition pane > Scenario Elapsed Time
Note The time is relative to the start of the scenario.
User interface elements are described below:
UI Element Description
From Specify a start value for the desired range.
To Specify an end value for the desired range.
Set Dimension Information Dialog Box
This dialog box enables you to set the dimension information for each measurement (transaction,
number of released Vusers, resource) in the result set. You specify the minimum and maximum values
for each measurement you want in the analysis. By default, the full range of values for each
measurement is displayed.
To You can open this dialog box from the following locations:
User Guide
Analysis
HP LoadRunner (12.50) Page 1495
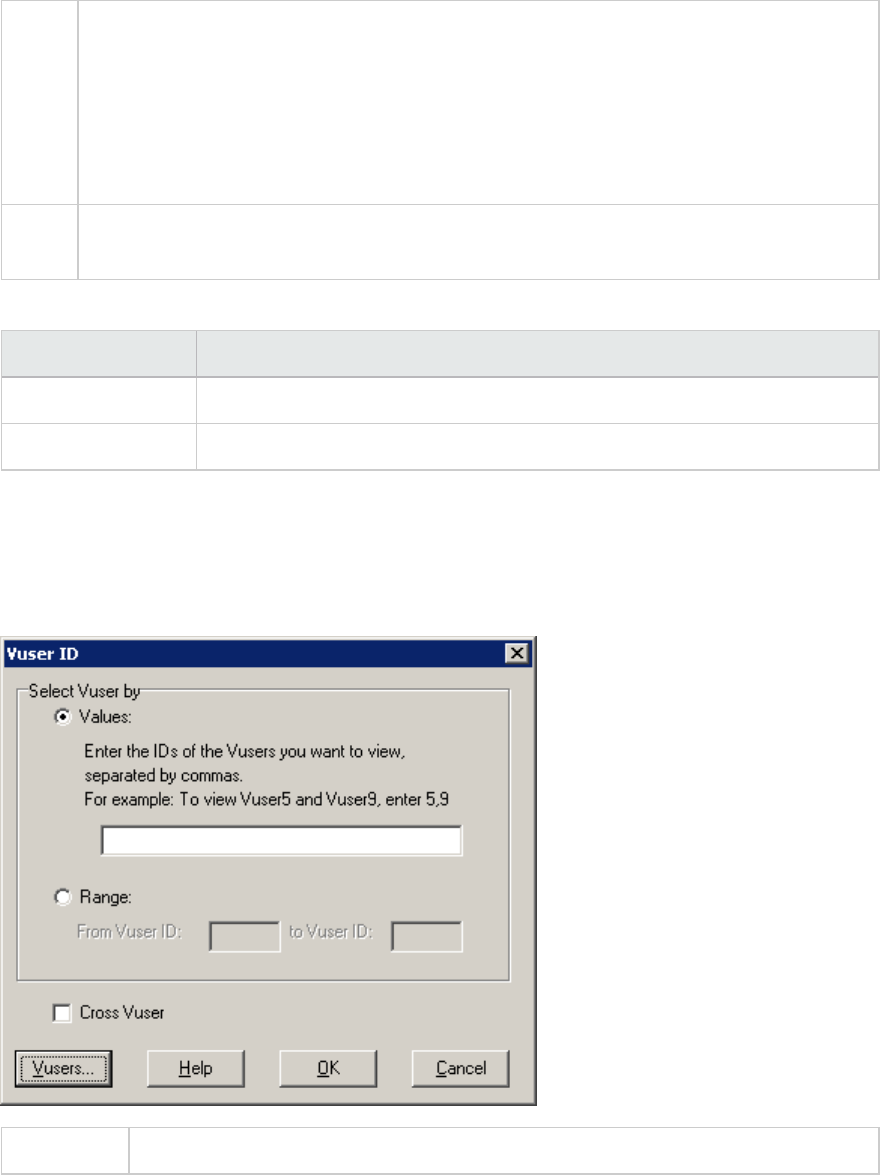
access lTransaction graphs > View menu > Set Filter/Group by >Filter condition pane >
Transaction Response Time
lVusers graph > Rendezvous graph > View menu > Set Filter/Group by >Filter condition
pane > Number of Released Vusers
lAll graphs that measure resources (Web Server,Database Server, and so on) > View
menu > Set Filter/Group by >Filter condition pane > Resource Value
Note If you are specifying the start and end time for a transaction (in minutes:seconds format),
the time is relative to the beginning of the load test scenario.
User interface elements are described below:
UI Element Description
Minimum Specify a minimum value for the measurement.
Maximum Specify a maximum value for the measurement.
Vuser ID Dialog Box
This dialog box opens to enable the entering of additional filter information for the Vuser ID filter
condition.
To access View menu > Set Filter/Group by > Filter condition pane > Vuser ID
User interface elements are described below:
User Guide
Analysis
HP LoadRunner (12.50) Page 1496
UI
Element
Description
Value Enter the Vuser IDs of the Vusers you want the graph(s) to display, separated by commas.
Range Specify the beginning and end of the desired range of Vusers you want the graph(s) to
display.
Cross
Vuser
Cross Vuser transactions are transactions that start with one Vuser and end with a
different Vuser, such as sending an email. Selecting this check box places the value
"CrossVuser" in the Vuser ID filter. By default, the check box is not selected.
Note: Only transaction graphs have Cross Vuser data.
Vusers Displays the existing Vuser IDs from which you can choose.
Cross Result and Merged Graphs
Comparing results is essential for determining bottlenecks and problems. You use Cross Result graphs
to compare the results of multiple load test scenario runs. You create Merged graphs to compare
results from different graphs within the same scenario run.
Cross Result and Merged Graphs Overview
Comparing results is essential for determining bottlenecks and problems. You use Cross Result graphs
to compare the results of multiple load test scenario runs. You create Merged graphs to compare
results from different graphs within the same scenario run.
Cross Result Graphs Overview
Cross Result graphs are useful for:
lBenchmarking hardware
lTesting software versions
lDetermining system capacity
If you want to benchmark two hardware configurations, you run the same load test scenario with both
configurations and compare the transaction response times using a single Cross Result graph.
Suppose that your vendor claims that a new software version is optimized to run quicker than a
previous version. You can verify this claim by running the same scenario on both versions of the
software, and comparing the scenario results.
User Guide
Analysis
HP LoadRunner (12.50) Page 1497
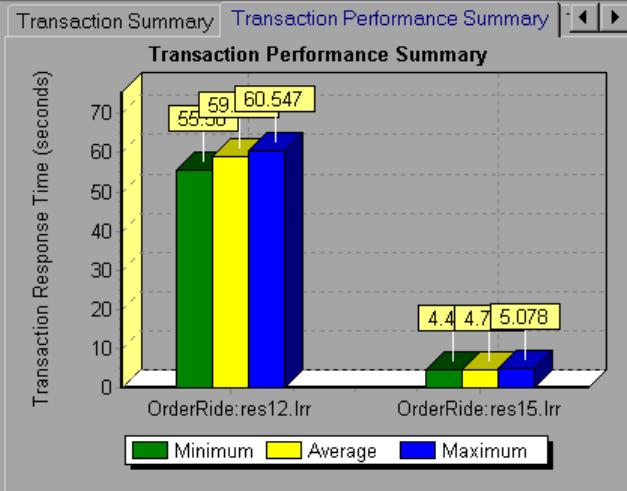
You can also use Cross Result graphs to determine your system's capacity. You run scenarios using
different numbers of Vusers running the same script. By analyzing Cross Result graphs, you can
determine the number of users that cause unacceptable response times.
In the following example, two scenario runs are compared by crossing their results, res12, and res15.
The same script was executed twice—first with 100 Vusers and then with 50 Vusers.
In the first run, the average transaction time was approximately 59 seconds. In the second run, the
average time was 4.7 seconds. It is apparent that the system works much slower with a greater load.
The Cross Result graphs have an additional filter and group by category: Result Name. The above graph
is filtered to the OrderRide transaction for results res12, and res15, grouped by Result Name.
Merging Types Overview
Analysis provides three types of merging:
Overlay
Superimpose the contents of two graphs that share a common x- axis. The left y-axis on the merged
graph shows the current graph's values. The right y-axis shows the values of the graph that was
merged. There is no limit to the number of graphs that you can overlay. When you overlay two graphs,
the y-axis for each graph is displayed separately to the right and left of the graph. When you overlay
more than two graphs, Analysis displays a single y-axis, scaling the different measurements accordingly.
In the following example, the Throughput and Hits per Second graph are overlaid with one another.
User Guide
Analysis
HP LoadRunner (12.50) Page 1498
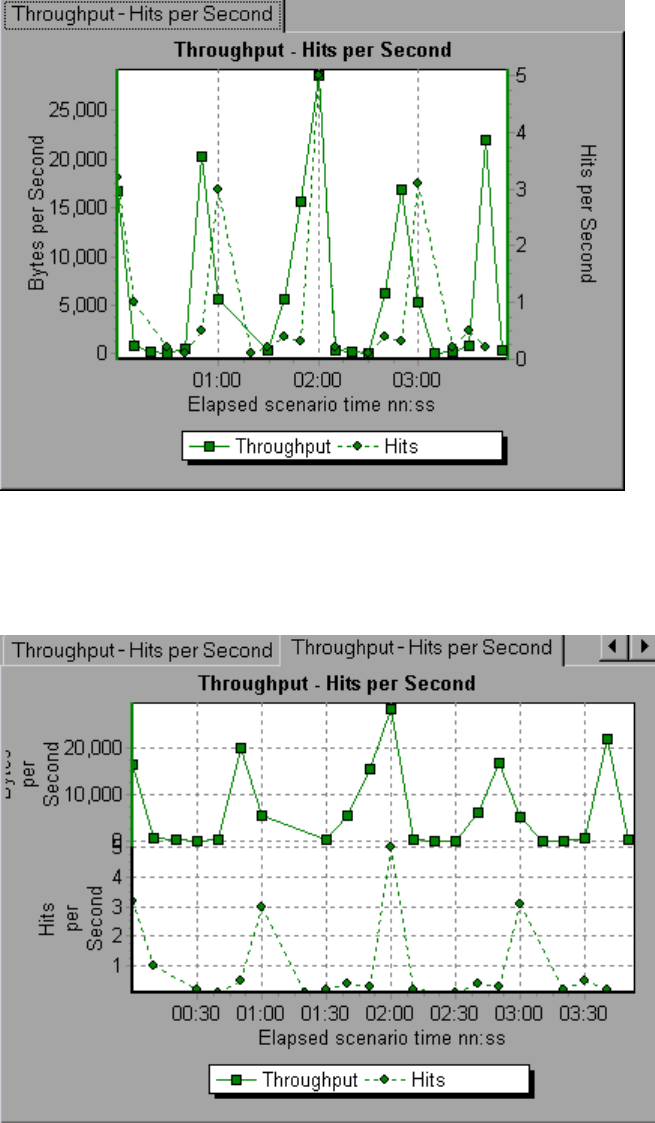
Tile
View contents of two graphs that share a common x-axis in a tiled layout, one above the other. In the
following example the Throughput and Hits per Second graph are tiled one above the other.
Correlate
Plot the y-axis of two graphs against each other. The active graph's y-axis becomes the x-axis of the
User Guide
Analysis
HP LoadRunner (12.50) Page 1499
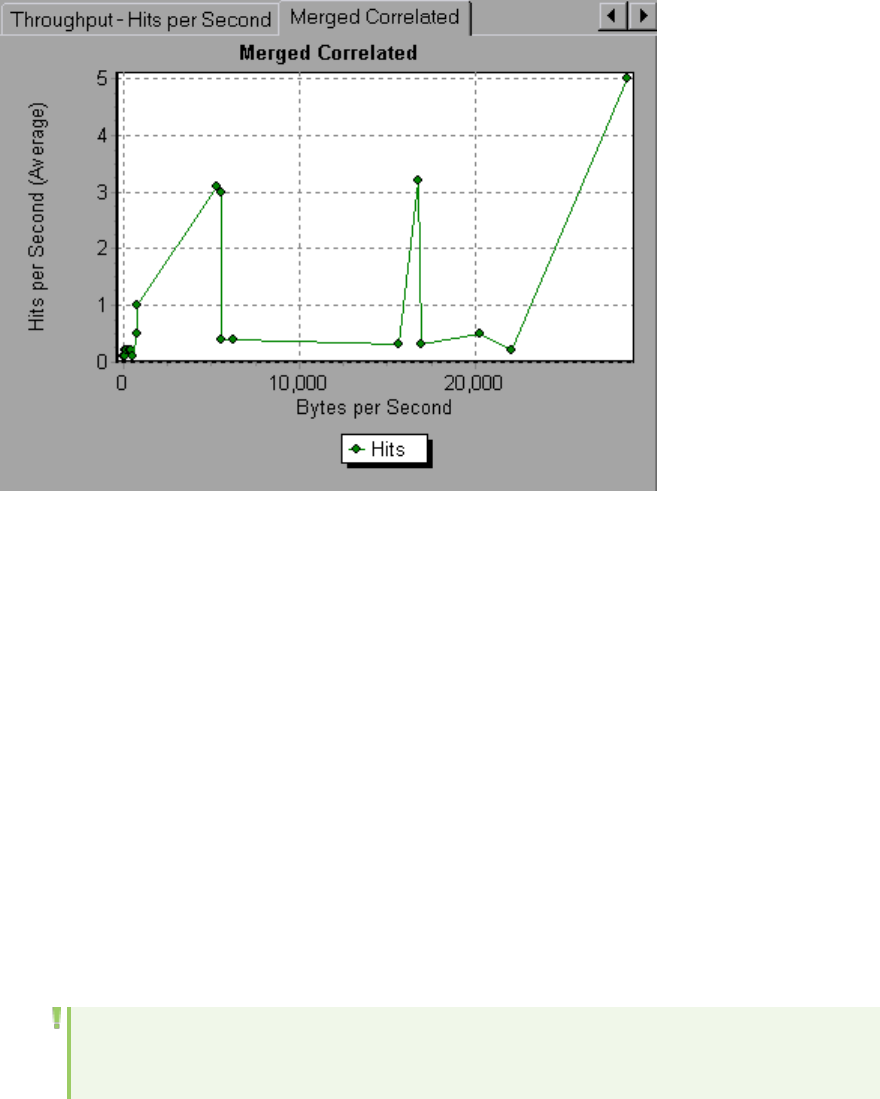
merged graph. The y-axis of the graph that was merged, becomes the merged graph's y-axis.
In the following example, the Throughput and Hits per Second graph are correlated with one another.
The x-axis displays the bytes per second (the Throughput measurement) and the y-axis shows the
average hits per second.
How to Generate Cross Results Graphs
This task describes how to create a Cross Result graph for two or more result sets. The Cross Result
dialog box enables you to compare the results of multiple load test scenario runs.
1. Choose File >Cross With Result. The Cross Results dialog box opens.
2. Click Add to add an additional result set to the Result List. The Select Result Files for Cross Results
dialog box opens.
3. Locate a results folder and select its result file (.lrr). Click OK. The scenario is added to the Result
List.
4. Repeat steps 2 and 3 until all the results you want to compare are in the Result List.
5. When you generate a Cross Result graph, by default it is saved as a new Analysis session. To save it
in an existing session, clear the Create New Analysis Session for Cross Result box.
6. Click OK. Analysis processes the result data and asks for a confirmation to open the default
graphs.
Note: When generating a Cross Results Session, verify that the transaction names do not
contain a <_> or <@> symbol. This will cause errors to occur when attempting to open the
User Guide
Analysis
HP LoadRunner (12.50) Page 1500
Cross Results graphs.
After you generate a Cross Result graph, you can filter it to display specific scenarios and
transactions. You can also manipulate the graph by changing the granularity, zoom, and scale.
You can view a summary report for the Cross Result graph.
How to Generate Merged Graphs
This task describes how to merge the results of two graphs from the same load test scenario into a
single graph. The merging allows you to compare several different measurements at once. For example,
you can make a merged graph to display the network delay and number of running Vusers, as a function
of the elapsed time.
You can merge all graphs with a common x-axis.
1. Select a graph in the Session Explorer or select its tab to make it active.
2. Choose View > Merge Graphs or click Merge Graphs. The Merge Graphs dialog box opens and
displays the name of the active graph.
3. Select a graph with which you want to merge your active graph. Only the graphs with a common x-
axis to the active graph are available.
4. Select the merge type and a title for the merged graph. By default, Analysis combines the titles of
the two graphs being merged. For more information, see "Merge Graphs Dialog Box" below.
5. Click OK.
6. Filter the graph just as you would filter any ordinary graph.
Merge Graphs Dialog Box
This dialog box enables you to merge two graphs into a single graph.
To access View > Merge Graphs
Important
information
In order to merge graphs, the graphs' x-axes must be the same measurement. For
example, you can merge Web Throughput and Hits per Second graphs, because their x-
axes are Scenario Elapsed Time.
See also "Merging Types Overview" on page1498
User interface elements are described below:
UI
Element
Description
Select The drop-down list shows all of the open graphs that share a common x-axis
User Guide
Analysis
HP LoadRunner (12.50) Page 1501
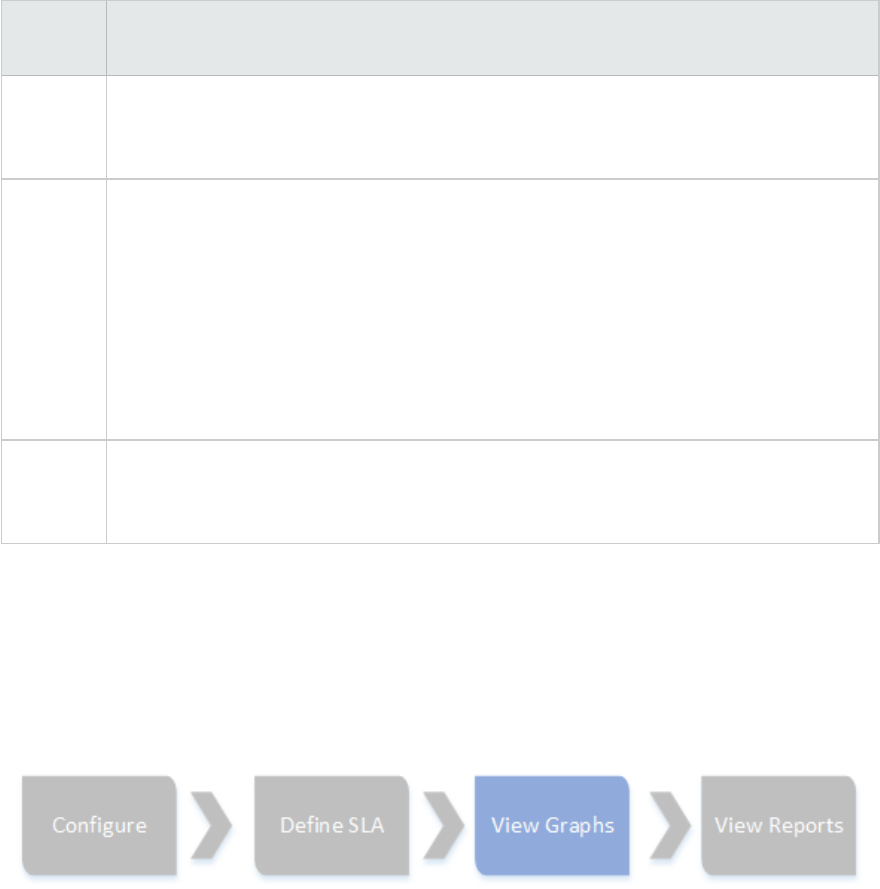
UI
Element
Description
Graph to
merge
with
measurement with the current graph. Select one of the graphs in the list.
Select
type of
merge
lOverlay. View contents of two graphs that share a common x-axis. The left y-axis on
the merged graph shows the current graph's values. The right y-axis shows the values
of the graph that was merged with the current graph.
lTile. View contents of two graphs that share a common x-axis in a tiled layout, one
above the other.
lCorrelate. Plot the y-axes of two graphs against each other. The active graph's y-axis
becomes the x-axis of the merged graph. The y-axis of the graph that was merged,
becomes the merged graph's y-axis.
Title of
Merged
Graph
Enter a title for the merged graph. This title will appear in the Session Explorer (Windows
> Session Explorer).
Analysis Graphs
Open a New Graph Dialog Box
User Guide
Analysis
HP LoadRunner (12.50) Page 1502
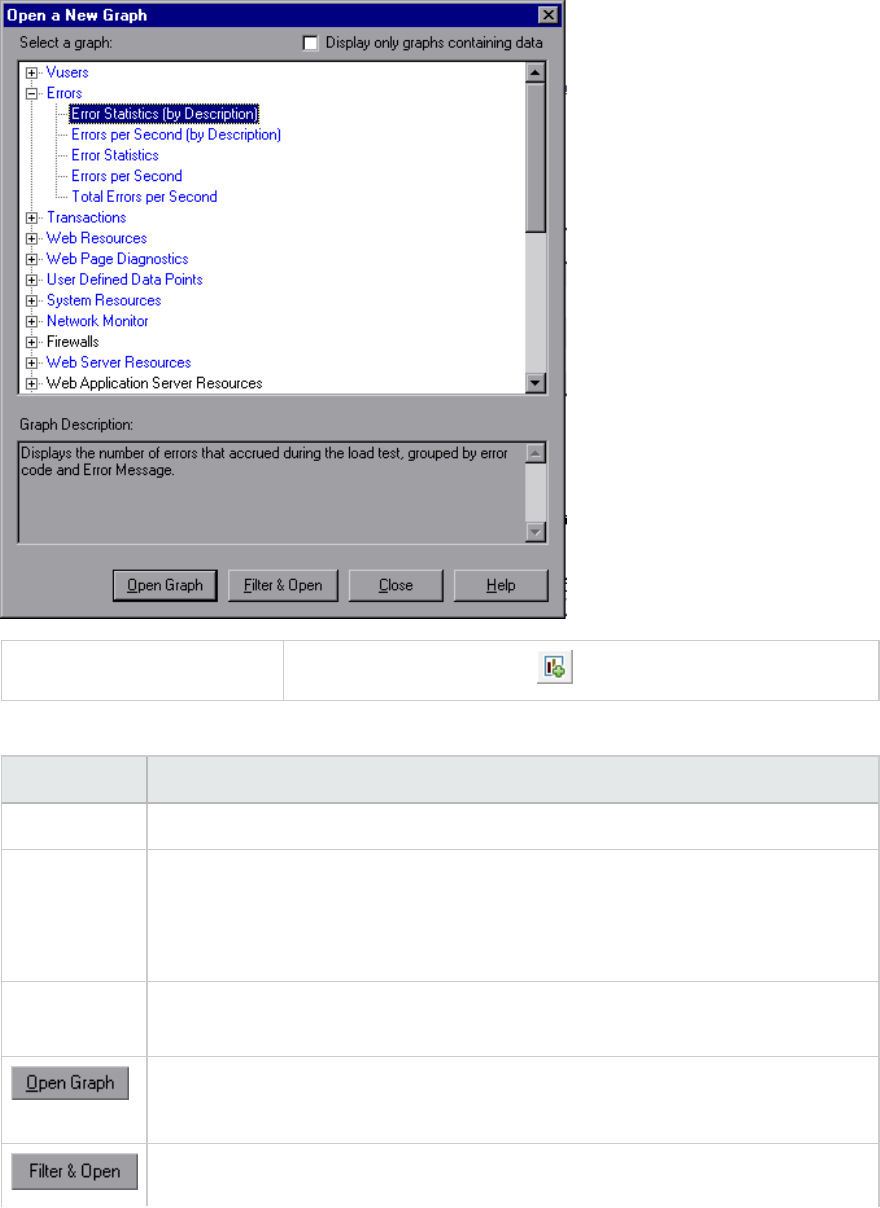
The Open a New Graph dialog box enables you to select the graph type to activate in the main Analysis
window.
To access Session Explorer > Graphs >
User interface elements are described below:
UI Element Description
Select a graph Displays list of graph types.
Display only
graphs
containing
data
If checked, only graphs that contain data are listed (in blue) in the Select a graph
area.
Graph
Description
Displays detailed information about the selected graph.
Analysis generates the selected graph and adds it to the
Session Explorer.
Opens the graphs Graph Settings dialog box. For details, see "Filter Dialog Boxes" on
User Guide
Analysis
HP LoadRunner (12.50) Page 1503

UI Element Description
page1491. This option enables you to apply filter conditions on the selected graph
before the graph is displayed.
Vuser Graphs
During load test scenario execution, Vusers generate data as they perform transactions. The Vuser
graphs let you determine the overall behavior of Vusers during the scenario. They display the Vuser
states, the number of Vusers that completed the script, and rendezvous statistics. Use these graphs in
conjunction with Transaction graphs to determine the effect of the number of Vusers on transaction
response time. For more information about Transaction graphs, see "Transaction Graphs" on
page1512.
Rendezvous Graph (Vuser Graphs)
During a scenario run, you can instruct multiple Vusers to perform tasks simultaneously by using
rendezvous points. A rendezvous point creates intense user load on the server and enables LoadRunner
to measure server performance under load. For more information about using rendezvous points, see
the HP Virtual User Generator User Guide.
This graph indicates when Vusers were released from rendezvous points, and how many Vusers were
released at each point.
Purpose Helps you understand transaction performance times.
X-axis Elapsed time since the start of the run.
Y-axis Number of Vusers that were released from the rendezvous.
Tips Compare this to the Average Transaction Response Time graph. When you so this, you
can see how the load peak created by a rendezvous influences transaction times.
See
also
"Vuser Graphs" above
Example
User Guide
Analysis
HP LoadRunner (12.50) Page 1504
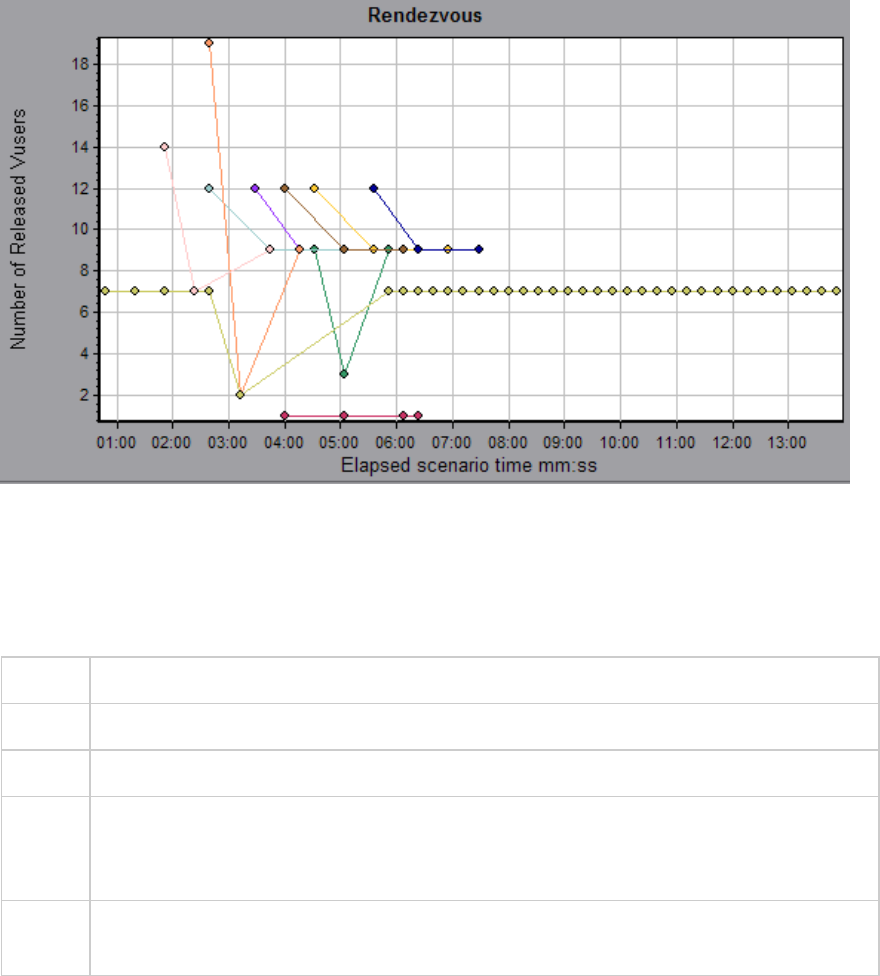
Running Vusers Graph
This graph displays the number of Vusers that executed Vuser scripts and their status during each
second of the test.
Purpose Helps you determine the Vuser load on your server at any given moment.
X-axis Elapsed time since the start of the run.
Y-axis Number of Vusers in the scenario.
Note By default, this graph only shows the Vusers with a Run status. To view another Vuser
status, set the filter conditions to the desired status. For more information, see "Filtering
and Sorting Graph Data" on page1480.
See
also
"Vuser Graphs" on the previous page
Example
User Guide
Analysis
HP LoadRunner (12.50) Page 1505
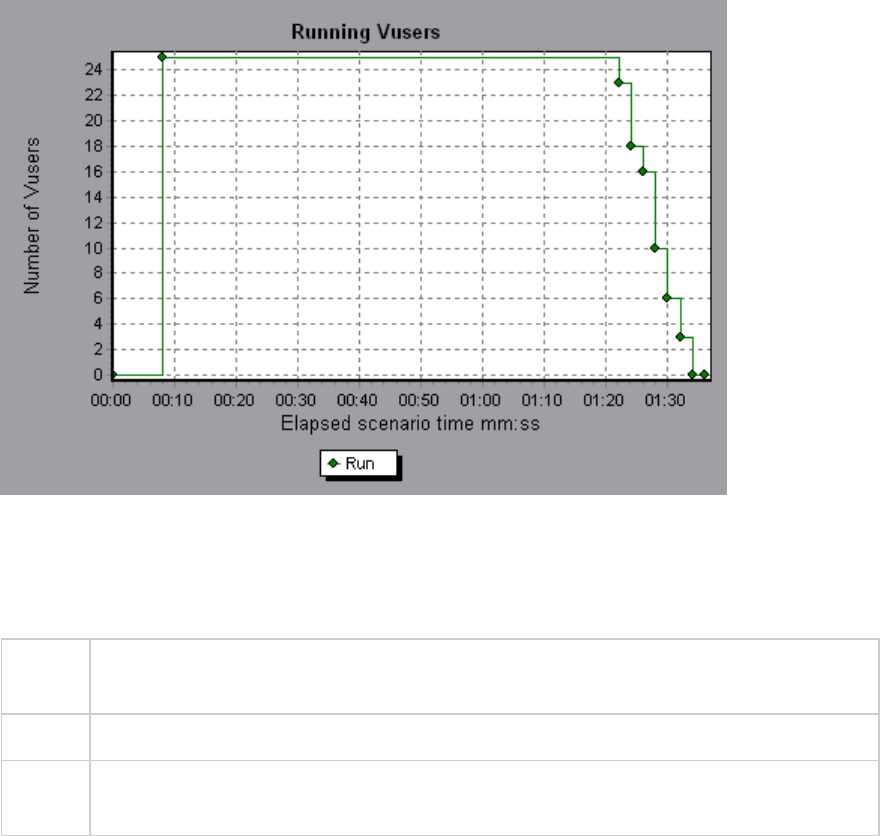
Vuser Summary Graph
This graph displays a summary of Vuser performance.
Purpose Lets you view the number of Vusers that successfully completed the load test scenario run
relative to those that did not.
Note This graph may only be viewed as a pie.
See
also
"Vuser Graphs" on page1504
Example
User Guide
Analysis
HP LoadRunner (12.50) Page 1506
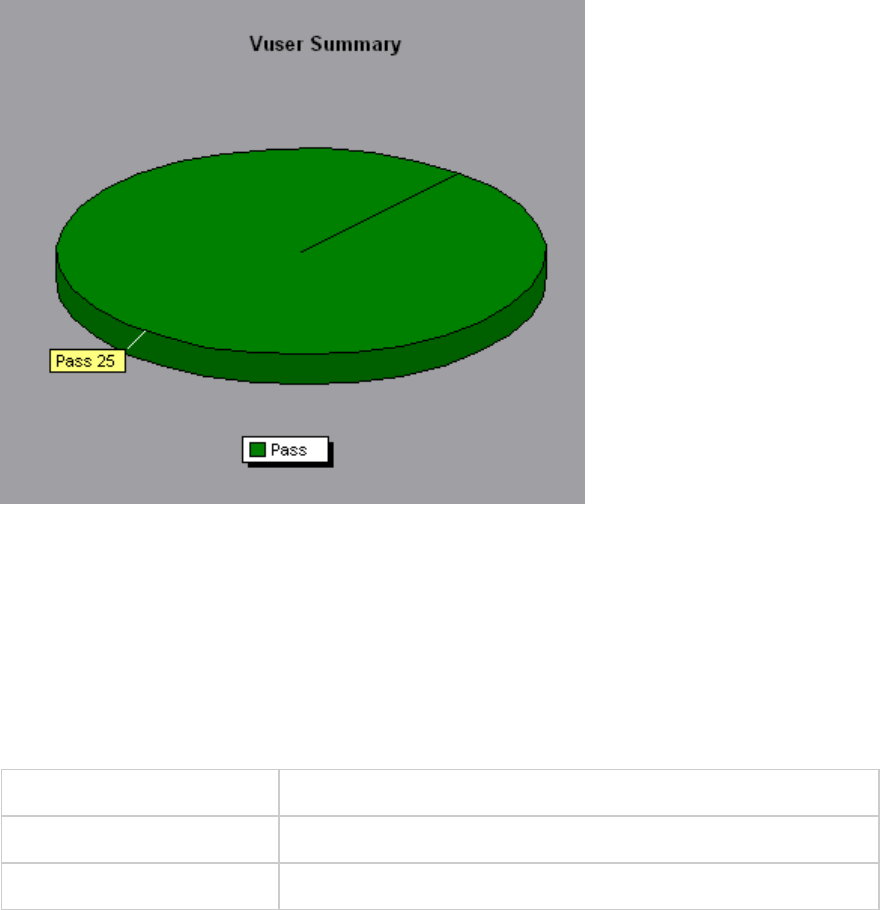
Error Graphs
Errors per Second (by Description) Graph
This graph displays the average number of errors that occurred during each second of the load test
scenario run, grouped by error description. The error description is displayed in the legend.
X-axis Elapsed time since the start of the run.
Y-axis Number of errors.
See also "Error Graphs" above
Example
User Guide
Analysis
HP LoadRunner (12.50) Page 1507
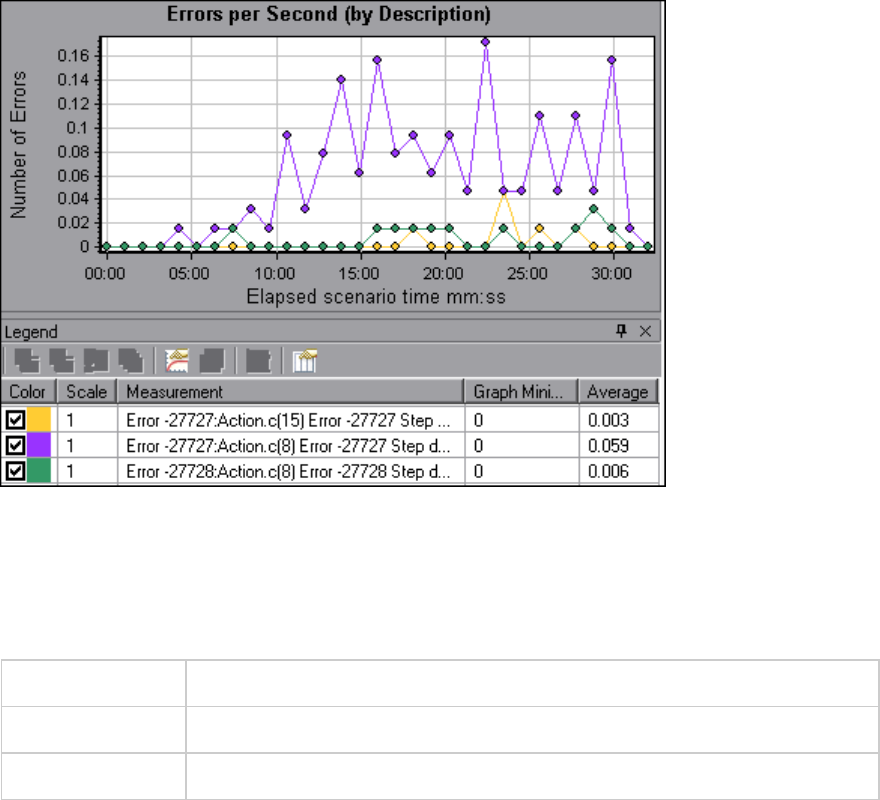
Errors per Second Graph
This graph displays the average number of errors that occurred during each second of the load test
scenario run, grouped by error code.
X-axis Elapsed time since the start of the run.
Y-axis Number of errors.
See also "Error Graphs" on the previous page
Example
User Guide
Analysis
HP LoadRunner (12.50) Page 1508
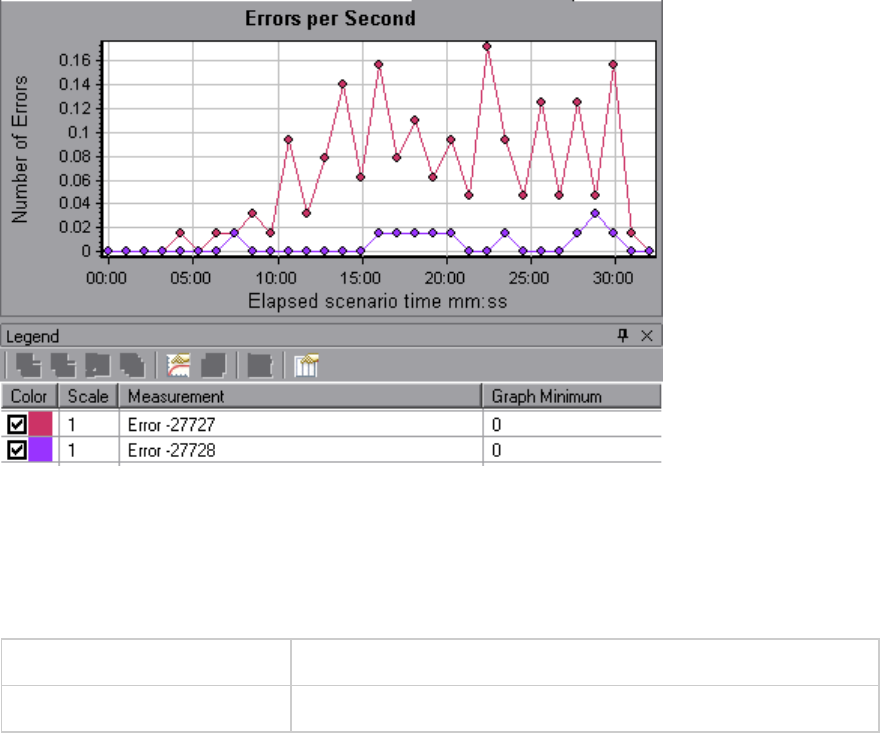
Error Statistics (by Description) Graph
This graph displays the number of errors that accrued during load test scenario execution, grouped by
error description. The error description is displayed in the legend.
Note This graph may only be viewed as a pie.
See also "Error Graphs" on page1507
Example
User Guide
Analysis
HP LoadRunner (12.50) Page 1509
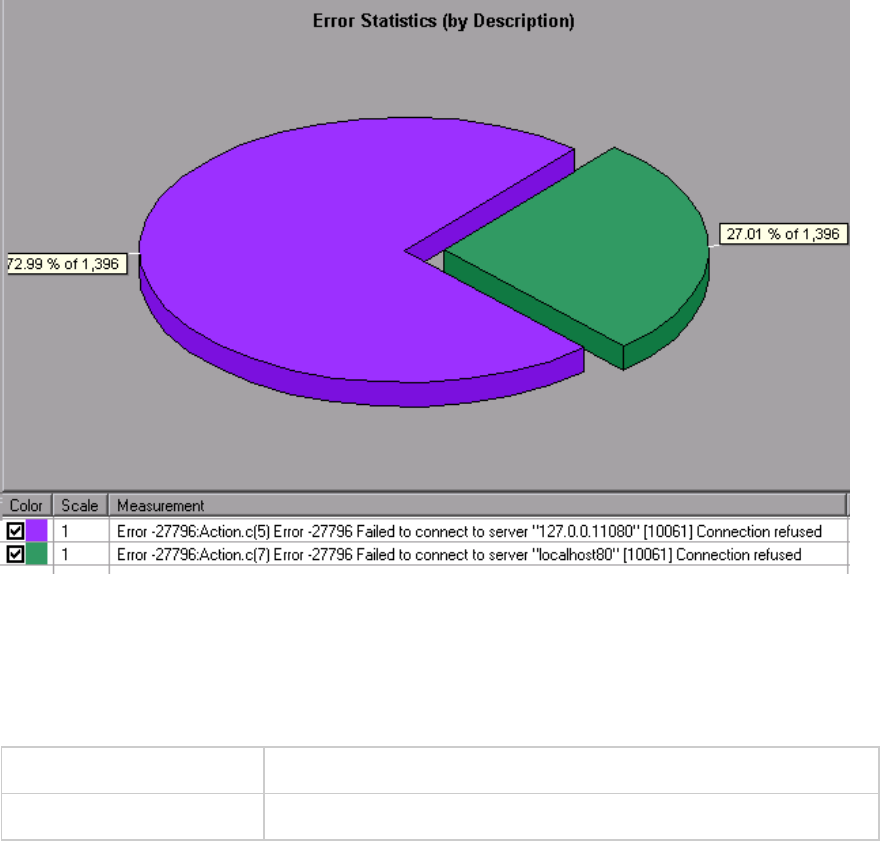
Error Statistics Graph
This graph displays the number of errors that accrued during load test scenario execution, grouped by
error code.
Note This graph may only be viewed as a pie.
See also "Error Graphs" on page1507
Example
In the following example, out of a total of 178 errors that occurred during the scenario run, the second
error code displayed in the legend occurred twelve times, comprising 6.74% of the errors.
User Guide
Analysis
HP LoadRunner (12.50) Page 1510
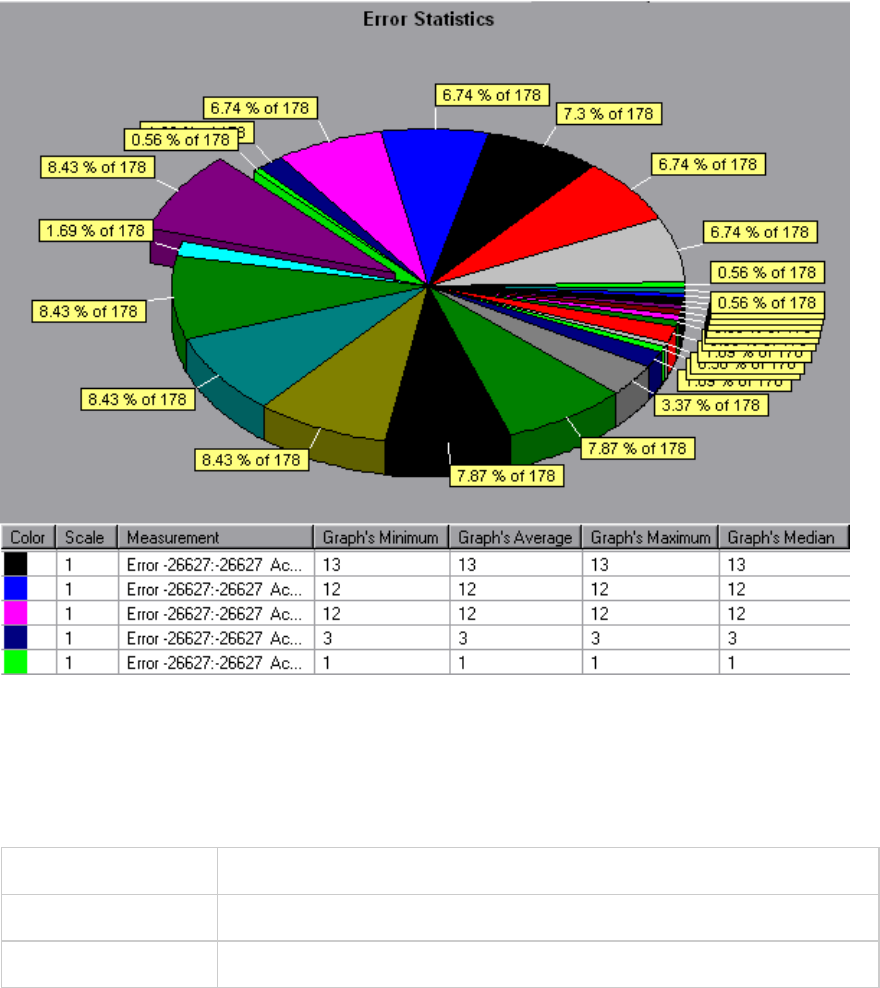
Total Errors per Second Graph
This graph displays the average number of errors that occurred during each second of the load test
scenario run. (complete: add sentence about being sum of all errors)
X-axis Elapsed time since the start of the run.
Y-axis Number of errors.
See also "Error Graphs" on page1507
Example
User Guide
Analysis
HP LoadRunner (12.50) Page 1511
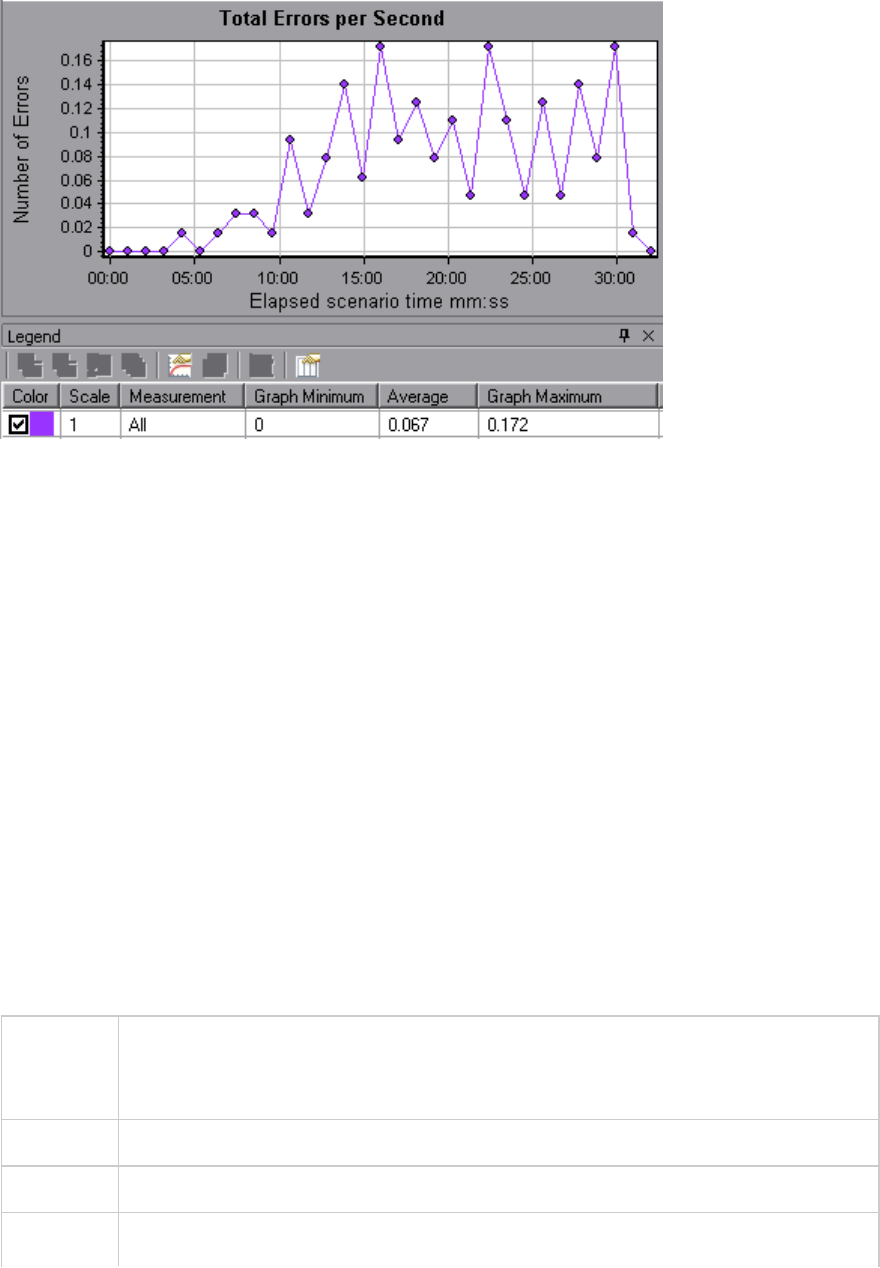
Transaction Graphs
During load test scenario execution, Vusers generate data as they perform transactions. Analysis
enables you to generate graphs that show the transaction performance and status throughout script
execution.
In addition, when working with HP Network Virtualization, you can view the transaction response times
per virtual location.
You can use additional Analysis tools such as merging and crossing results to understand your
transaction performance graphs. You can also sort the graph information by transactions and the
locations in which they were performed.
For more information, see the transaction graphs below.
Average Transaction Response Time Graph
This graph displays the average time taken to perform transactions during each second of the load test
scenario run.
Purpose If you have defined acceptable minimum and maximum transaction performance times,
you can use this graph to determine whether the performance of the server is within
the acceptable range.
X-axis Elapsed time since the start of the run.
Y-axis Average response time (in seconds) of each transaction
Breakdown Transaction Breakdown
User Guide
Analysis
HP LoadRunner (12.50) Page 1512

options You can view a breakdown of a transaction by right-clicking the transaction in the
graph and selecting Show Transaction Breakdown Tree. In the Transaction
Breakdown Tree, right-click the transaction you want to break down, and select Break
Down <transaction name>. The Average Transaction Response Time graph displays
data for the sub-transactions. For more details, see "Transaction Breakdown Tree" on
page1515.
Web Page Breakdown
To view a breakdown of the Web page(s) included in a transaction or sub-transaction,
right-click it and select Web Page Diagnostics for <transaction name>. For more
information on the Web Page Diagnostics graphs, see "Web Page Diagnostics Graphs"
on page1534.
Tips Granularity
This graph is displayed differently for each granularity. The lower the granularity, the
more detailed the results. However, it may be useful to view the results with a higher
granularity to study the overall Vuser behavior throughout the scenario. For example,
using a low granularity, you may see intervals when no transactions were performed.
However, by viewing the same graph with a higher granularity, you will see the graph
for the overall transaction response time. For more information on setting the
granularity, see "How to Manage Graph Data" on page1471.
Compare with Running Vusers
You can compare the Average Transaction Response Time graph to the Running
Vusers graph to see how the number of running Vusers affects the transaction
performance time. For example, if the Average Transaction Response Time graph
shows that performance time gradually improved, you can compare it to the Running
Vusers graph to see whether the performance time improved due to a decrease in
the Vuser load.
Note By default, only transactions that passed are displayed.
See also "Transaction Graphs" on the previous page
User Guide
Analysis
HP LoadRunner (12.50) Page 1513
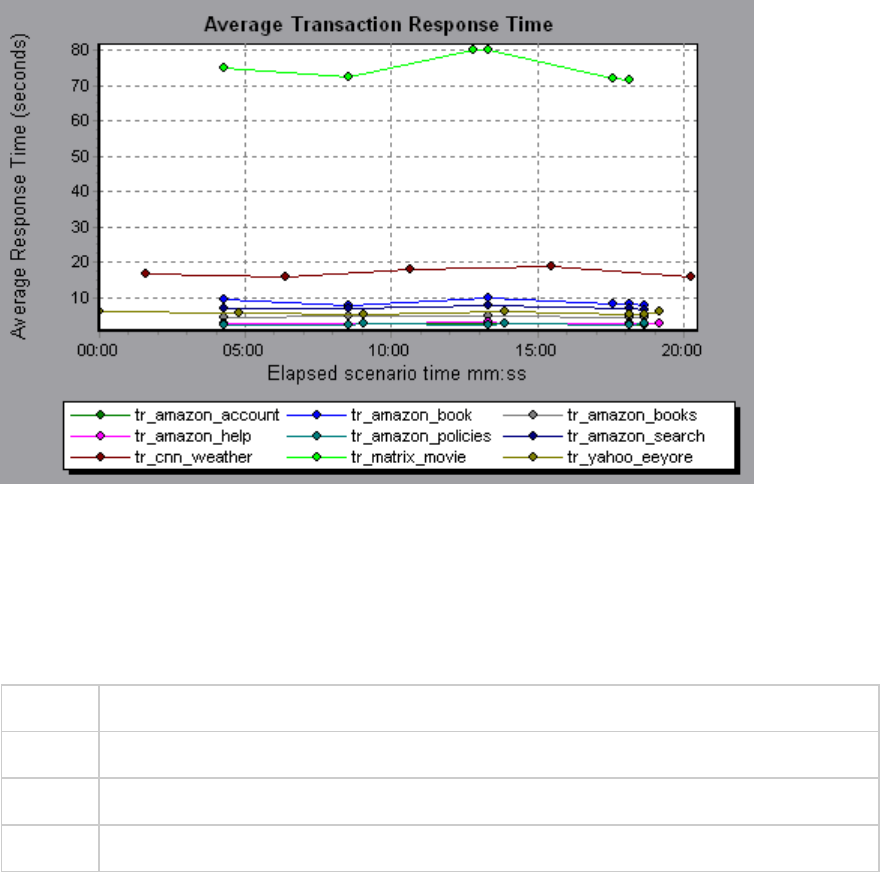
Example
Total Transactions per Second Graph
This graph displays the total number of transactions that passed, the total number of transactions that
failed, and the total number of transactions that were stopped, during each second of a load test
scenario run.
Purpose Helps you determine the actual transaction load on your system at any given moment.
X-axis Elapsed time since the start of the run.
Y-axis Total number of transactions performed during the scenario run.
See also "Transaction Graphs" on page1512
User Guide
Analysis
HP LoadRunner (12.50) Page 1514
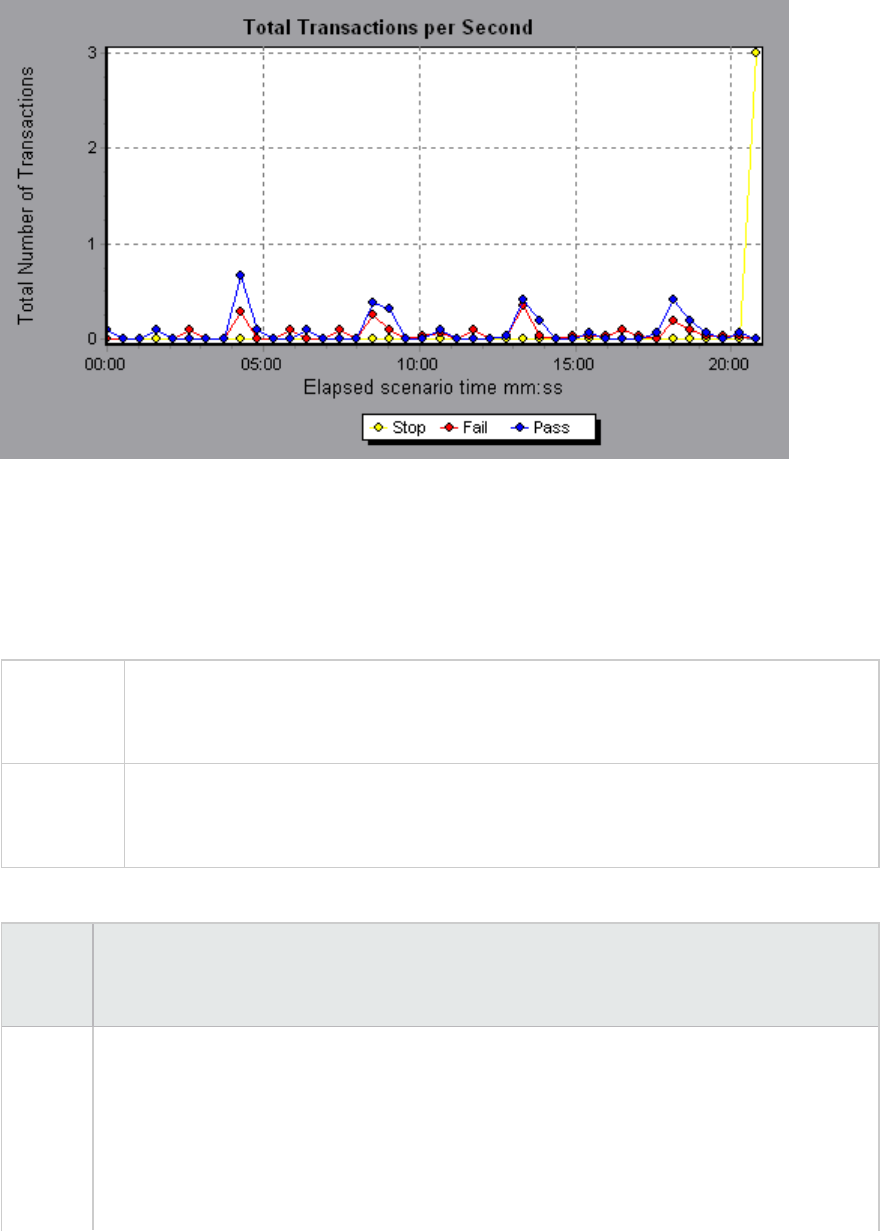
Example
Transaction Breakdown Tree
The Transaction Breakdown Tree displays a tree view of the transactions and sub-transactions in the
current session. From the tree, you can breakdown transactions and view the results of the breakdown
in either the Average Transaction Response Time or Transaction Performance Summary graph.
To access In either the Average Transaction Response Time or Transaction Performance
Summary graph, right-click in the graph and select Show Transaction Breakdown
Tree.
Important
information
After you breakdown a transaction, you can return to the original transaction graph by
reapplying the global filter (File > Set Global Filter) or by undoing your breakdown
actions using Edit > Undo Last Action.
User interface elements are described below (unlabeled elements are shown in angle brackets):
UI
Element
Description
<Right-
click
menu>
lBreak Down From Highest Level. Displays data for the highest level hierarchical path
of a transaction.
lBreak Down <transaction name>. Displays data for the sub-transactions in the
Average Transaction Response Time or Transaction Performance Summary graph.
lShow Only <transaction name>. Displays data only for the selected transaction/sub-
transaction.
User Guide
Analysis
HP LoadRunner (12.50) Page 1515
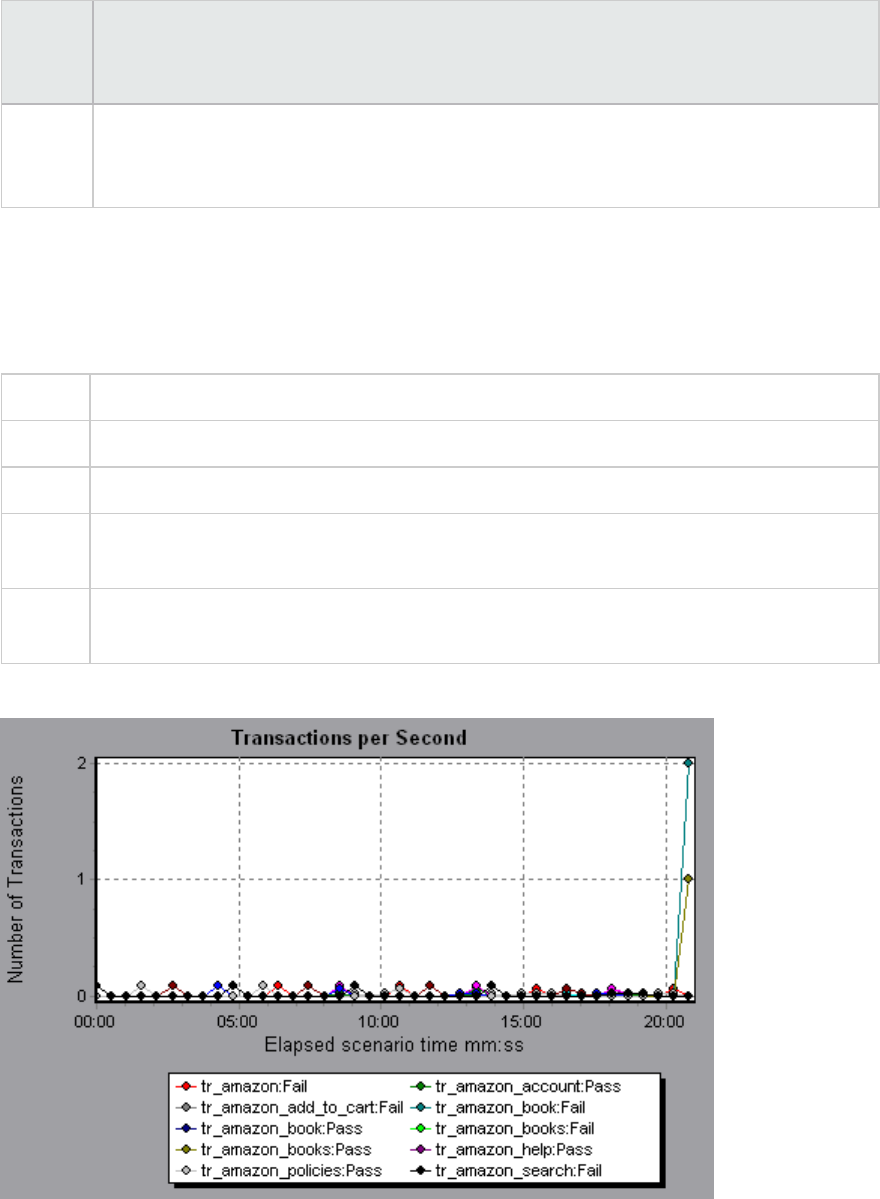
UI
Element
Description
lWeb Page Diagnostics for <page name>. Displays a breakdown of the Web page(s)
included in a transaction or sub-transaction in the Web Page Diagnostics graphs. For
details, see "Web Page Diagnostics Graphs" on page1534.
Transactions per Second Graph
This graph displays, for each transaction, the number of times it passed, failed, and stopped during
each second of a load test scenario run.
Purpose Helps you determine the actual transaction load on your system at any given moment.
X-axis Elapsed time since the start of the run.
Y-axis Number of transactions performed during the scenario run.
Tips Compare with the Average Transaction Response Time Graph. Doing this helps you
analyze the effect of the amount of transactions upon the performance time.
See
also
"Transaction Graphs" on page1512
Example
User Guide
Analysis
HP LoadRunner (12.50) Page 1516
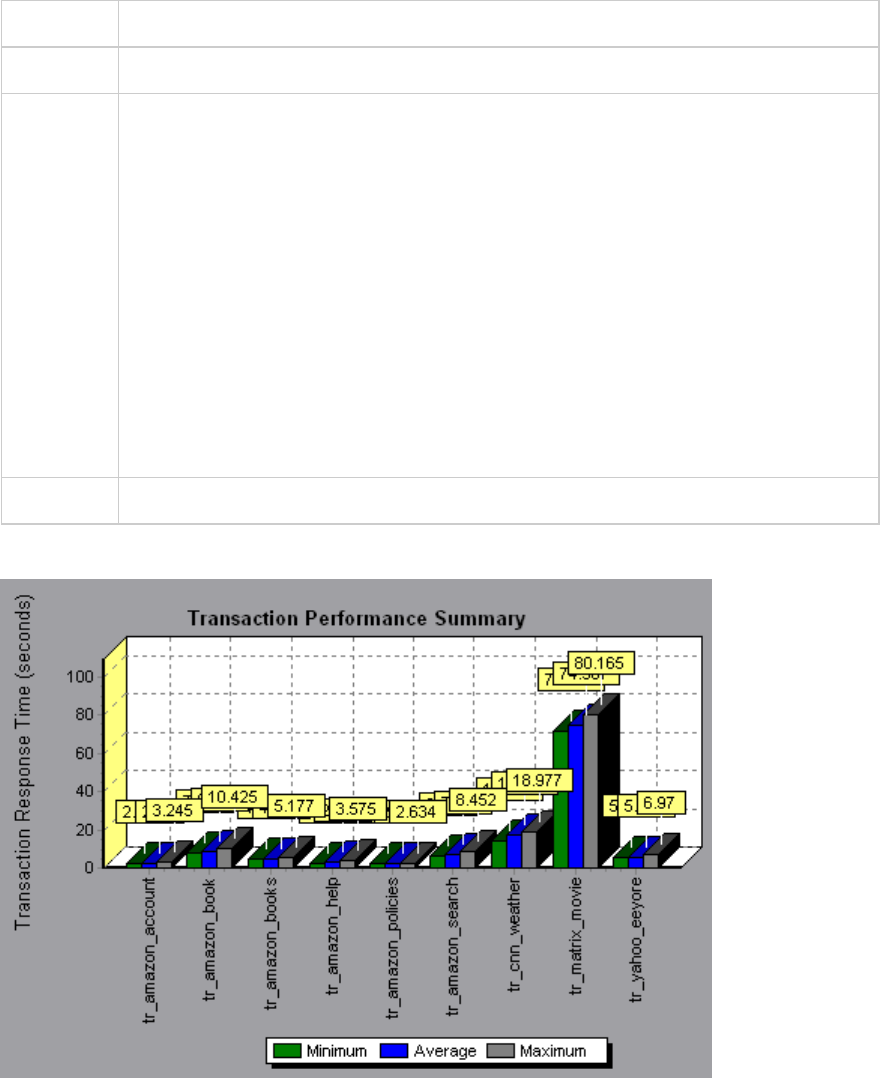
Transaction Performance Summary Graph
This graph displays the minimum, maximum and average performance time for all the transactions in
the load test scenario.
X-axis Name of the transaction.
Y-axis Response time—rounded off to the nearest second—of each transaction.
Breakdown
options
Transaction Breakdown
You can view breakdown of a transaction in the Transaction Performance Summary
graph by right-clicking the transaction in the graph and selecting Show Transaction
Breakdown Tree. In the Transaction Breakdown Tree, right-click the transaction you
want to break down, and select Break Down <transaction name>. The Transaction
Performance Summary graph displays data for the sub-transactions. For more
details, see "Transaction Breakdown Tree" on page1515.
Web Page Breakdown
To view a breakdown of the Web page(s) included in a transaction or sub-transaction,
right-click it and select Web Page Diagnostics for <transaction name>. For more, see
"Web Page Diagnostics Graphs" on page1534.
See also "Transaction Graphs" on page1512
Example
User Guide
Analysis
HP LoadRunner (12.50) Page 1517
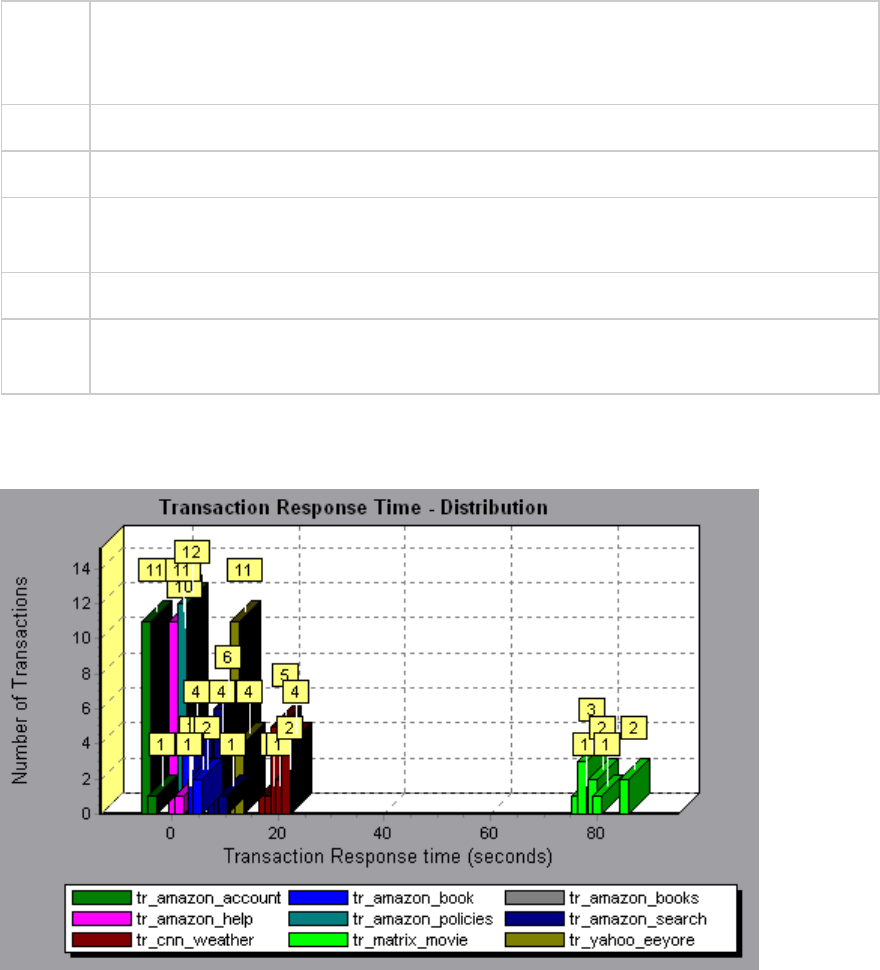
Transaction Response Time (Distribution) Graph
This graph displays the distribution of the time taken to perform transactions in a load test scenario.
Purpose If you have defined acceptable minimum and maximum transaction performance times,
you can use this graph to determine whether the performance of the server is within the
acceptable range.
X-axis Transaction response time (rounded down to the nearest second).
Y-axis Number of transactions executed during the scenario.
Tips Compare with Transaction Performance Summary Graph to see how the average
performance was calculated.
Note This graph can only be displayed as a bar graph.
See
also
"Transaction Graphs" on page1512
Example
In the following example, most of the transactions had a response time of less than 20 seconds.
Transaction Response Time (Percentile) Graph
This graph analyzes the percentage of transactions that were performed within a given time range.
User Guide
Analysis
HP LoadRunner (12.50) Page 1518
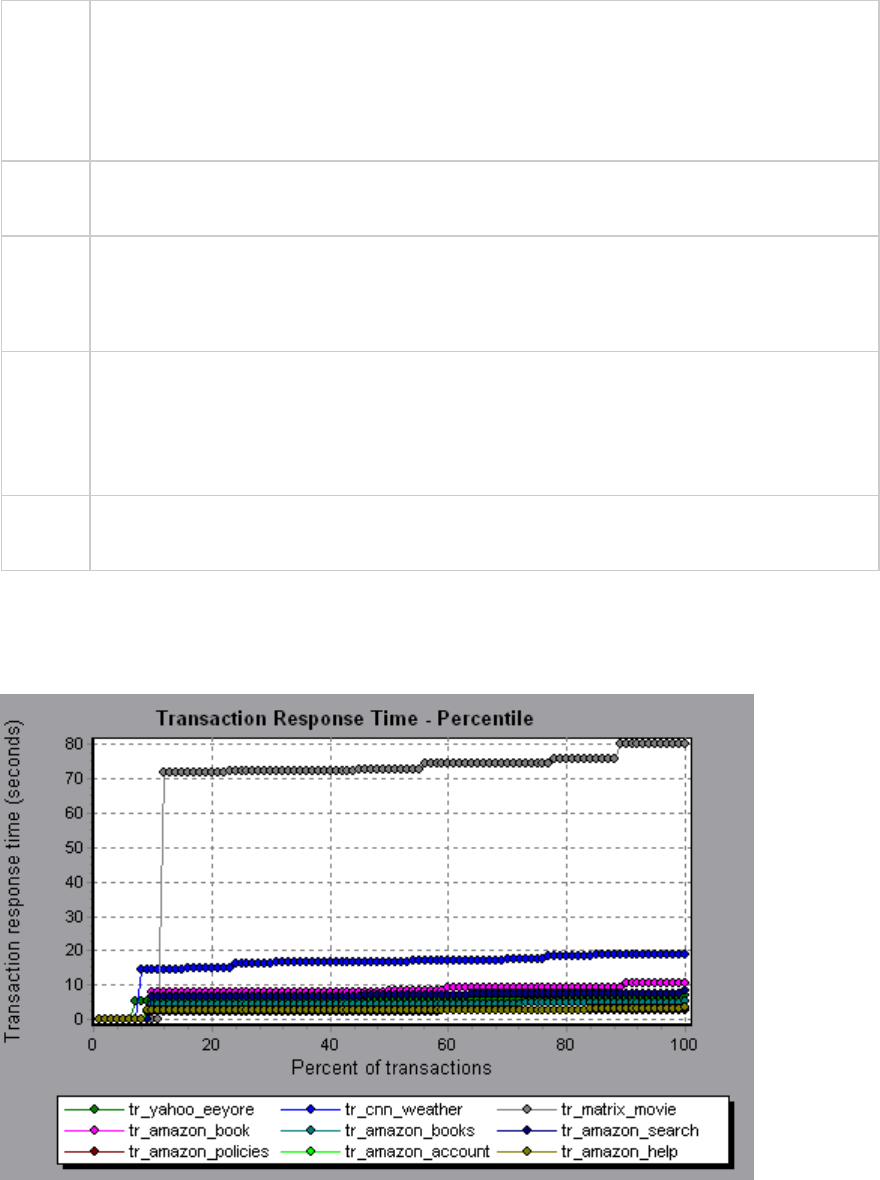
Purpose Helps you determine the percentage of transactions that met the performance criteria
defined for your system. In many instances, you need to determine the percent of
transactions with an acceptable response time. The maximum response time may be
exceptionally long, but if most transactions have acceptable response times, the overall
system is suitable for your needs.
X-axis Percentage of the total number of transactions measured during the load test scenario
run.
Y-axis Maximum transaction response time (in seconds).
Note: Analysis approximates the transaction response time for each available percentage
of transactions. The y-axis values, therefore, may not be exact.
Tips Compare with the Average Response Time Graph.
A high response time for several transactions may raise the overall average. However, if
the transactions with a high response time occurred less than five percent of the time,
that factor may be insignificant.
See
also
"Transaction Graphs" on page1512
Example
In the following example, fewer than 20 percent of the tr_matrix_movie transactions had a response
time less than 70 seconds.
User Guide
Analysis
HP LoadRunner (12.50) Page 1519
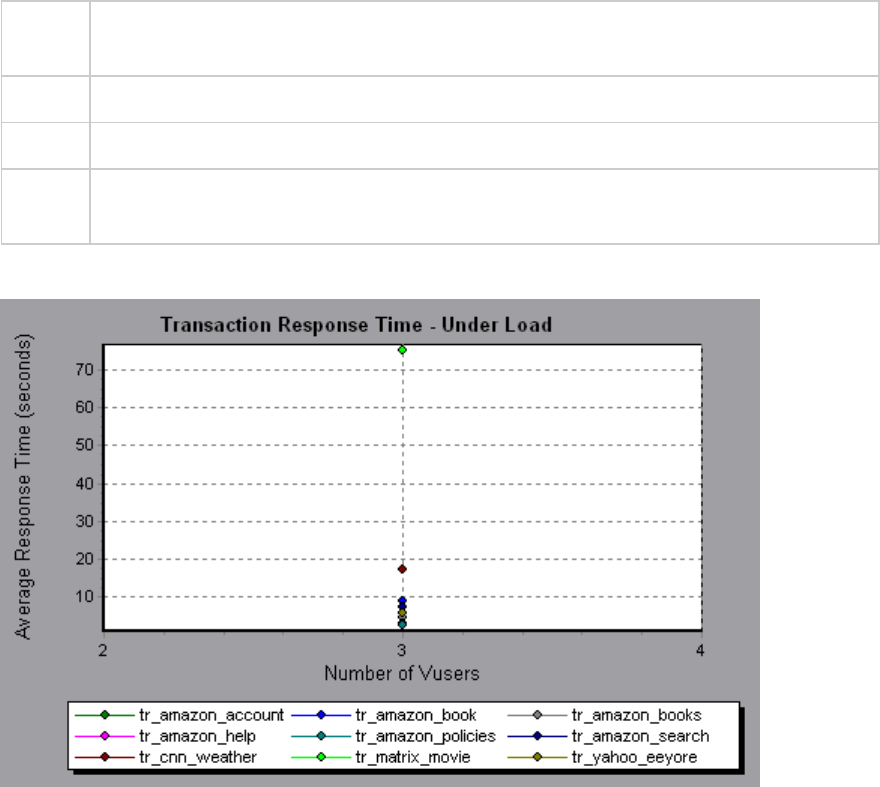
Transaction Response Time (Under Load) Graph
This graph is a combination of the Running Vusers and Average Transaction Response Time graphs and
indicates transaction times relative to the number of Vusers running at any given point during the load
test scenario.
Purpose Helps you view the general impact of Vuser load on performance time and is most useful
when analyzing a scenario with a gradual load.
X-axis Number of running Vusers
Y-axis Average response time (in seconds) of each transaction.
See
also
"Transaction Graphs" on page1512
Example
Transaction Response Time by Location Graph
This graph indicates the transaction response times relative to the virtual locations in which they were
performed.
This graph is used in conjunction with Network Virtualization. Using HP Network Virtualization, you set up
a scenario that runs Vusers on several virtual locations. This graph lets you compare the transaction
response times of the various locations. For details, see "Network Virtualization Integration" on
page1366.
User Guide
Analysis
HP LoadRunner (12.50) Page 1520
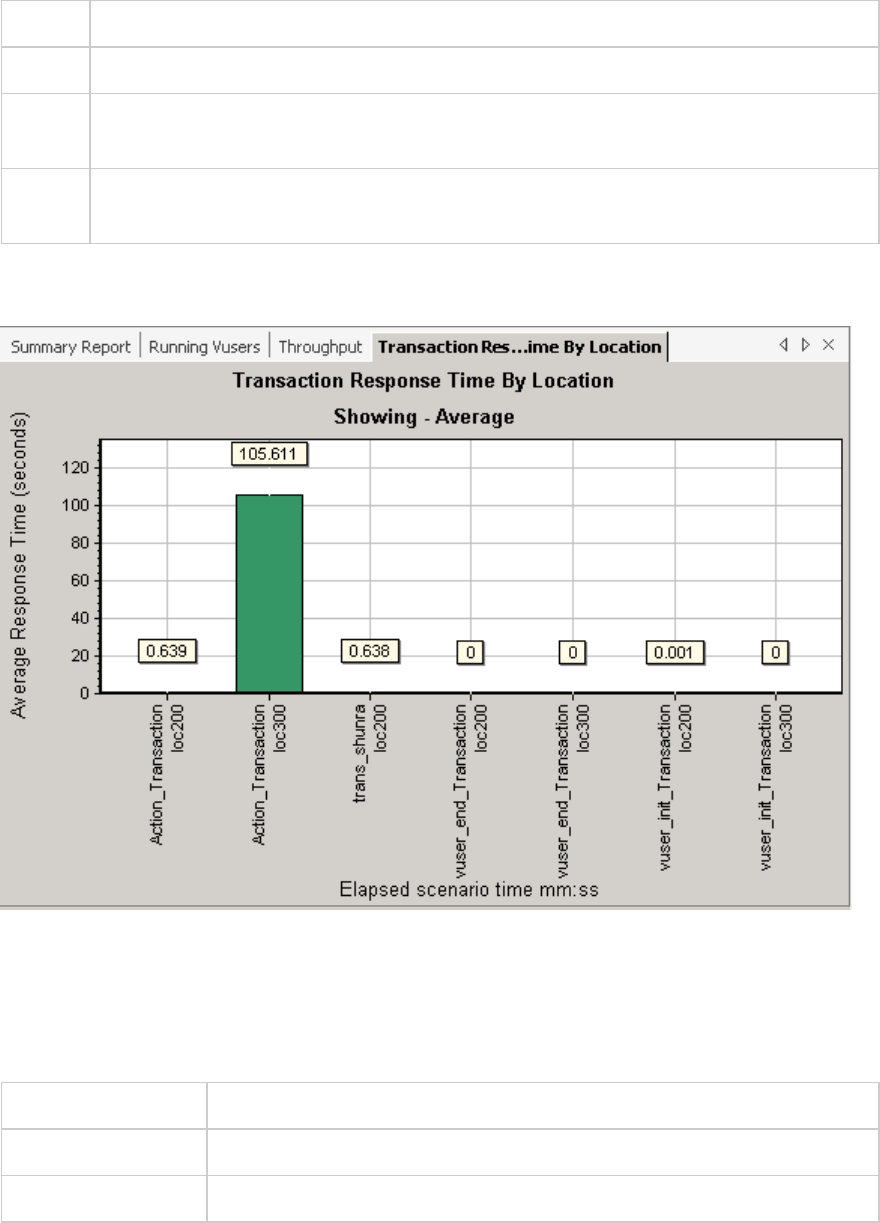
Purpose Helps you view the general impact of Vuser load on performance time per virtual location.
X-axis Elapsed scenario time in mm:ss
Y-axis Average response time (in seconds) of each transaction, per virtual location. A bar chart
and annotation, show the average response times.
See
also
"Transaction Graphs" on page1512
The following example shows the transaction response time for several locations. It is evident that the
response time was excessive in location loc300.
Transaction Summary Graph
This graph summarizes the number of transactions in the load test scenario that failed, passed,
stopped, and ended in error.
X-axis Name of the transaction
Y-axis Number of transactions performed during the scenario run.
See also "Transaction Graphs" on page1512
User Guide
Analysis
HP LoadRunner (12.50) Page 1521
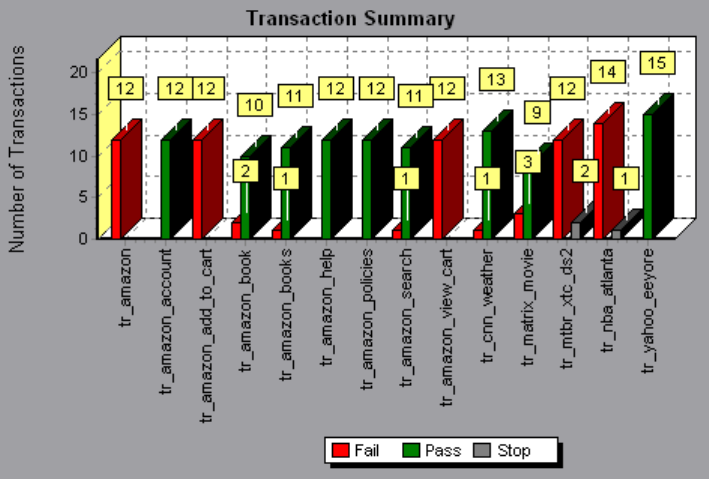
Example
Web Resources Graphs
Web Resources Graphs Overview
Web Resource graphs provide you with information about the performance of your Web server. You use
the Web Resource graphs to analyze the following data:
lThroughput on the Web server
lThe number of hits per second
lThe number of HTTP responses per second
lThe HTTP status codes returned from the Web server
lThe number of downloaded pages per second
lThe number of server retries per second
lA summary of the server retries during the load test scenario
lThe number of open TCP/IP connections
lThe number of TCP/IP connections per second
lThe number of new and reused SSL connections opened per second
User Guide
Analysis
HP LoadRunner (12.50) Page 1522
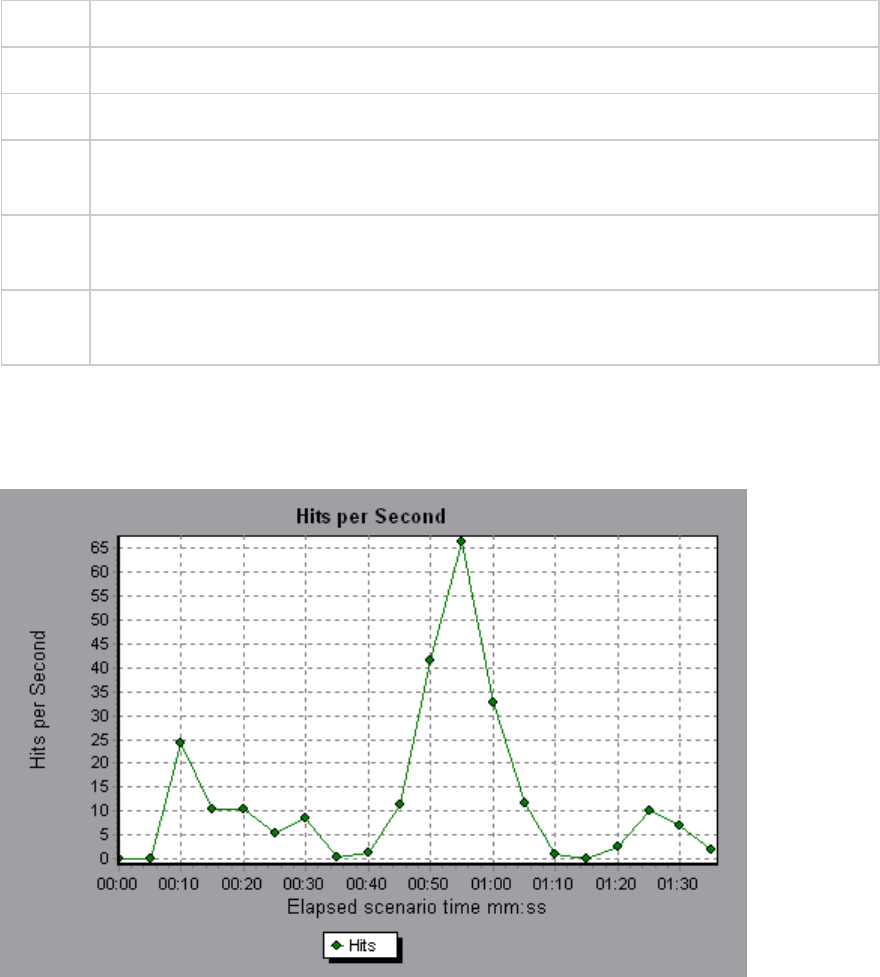
Hits per Second Graph
This graph shows the number of HTTP requests made by Vusers to the Web server during each second
of the load test scenario run.
Purpose Helps you evaluate the amount of load Vusers generate, in terms of the number of hits.
X-axis Elapsed time since the start of the run.
Y-axis Number of hits on the server.
Tips Compare to the Average Transaction Response Time graph to see how the number of hits
affects transaction performance.
Note You cannot change the granularity of the x-axis to a value that is less than the Web
granularity you defined in the General tab of the Options dialog box.
See
also
"Web Resources Graphs Overview" on the previous page
Example
In the following example, the most hits per second took place during the fifty-fifth second of the
scenario.
User Guide
Analysis
HP LoadRunner (12.50) Page 1523
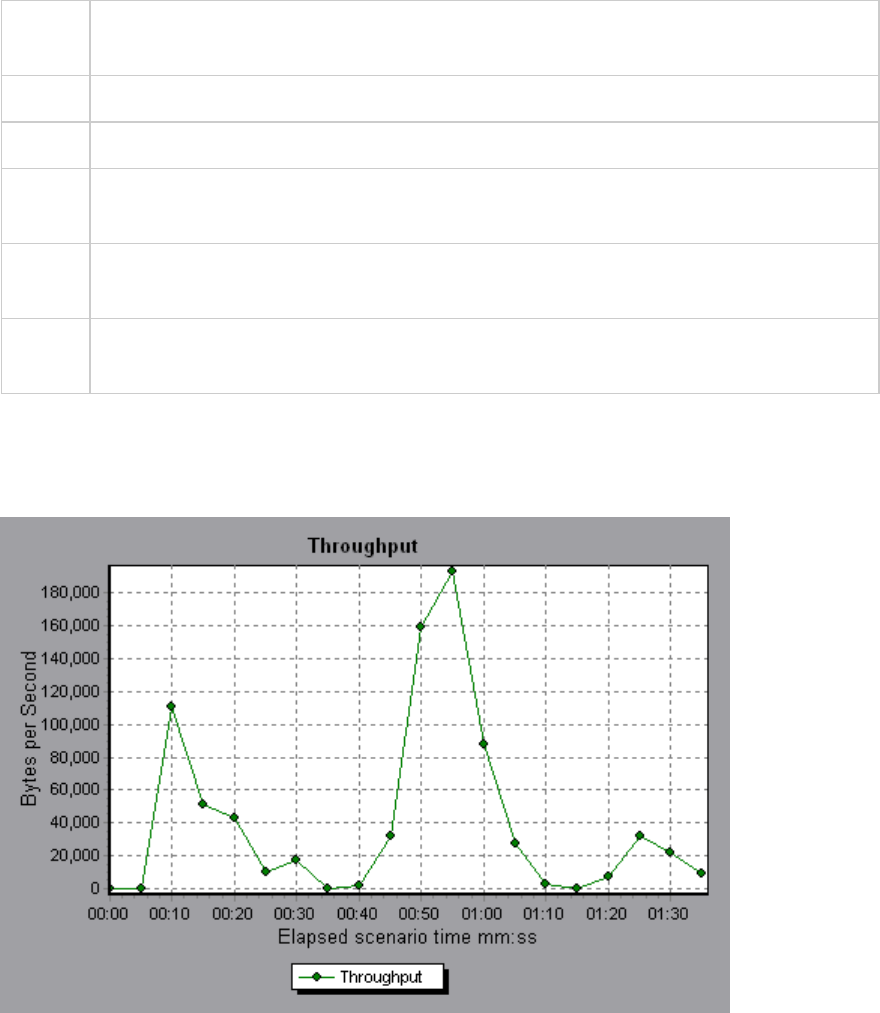
Throughput Graph
This graph shows the amount of throughput on the server during each second of the load test scenario
run. Throughput is measured in bytes or megabytes and represents the amount of data that the Vusers
received from the server at any given second. To view throughput in megabytes, use the Throughput
(MB) graph.
Purpose Helps you evaluate the amount of load that Vusers generate, in terms of server
throughput.
X-axis Elapsed time since the start of the scenario run.
Y-axis Throughput of the server, in bytes or megabytes.
Tips Compare to the Average Transaction Response Time graph to see how the throughput
affects transaction performance.
Note You cannot change the granularity of the x-axis to a value that is less than the Web
granularity you defined in the General tab of the Options dialog box.
See
also
"Web Resources Graphs Overview" on page1522
Example
In the following example, the highest throughput is 193,242 bytes during the fifty-fifth second of the
scenario.
User Guide
Analysis
HP LoadRunner (12.50) Page 1524
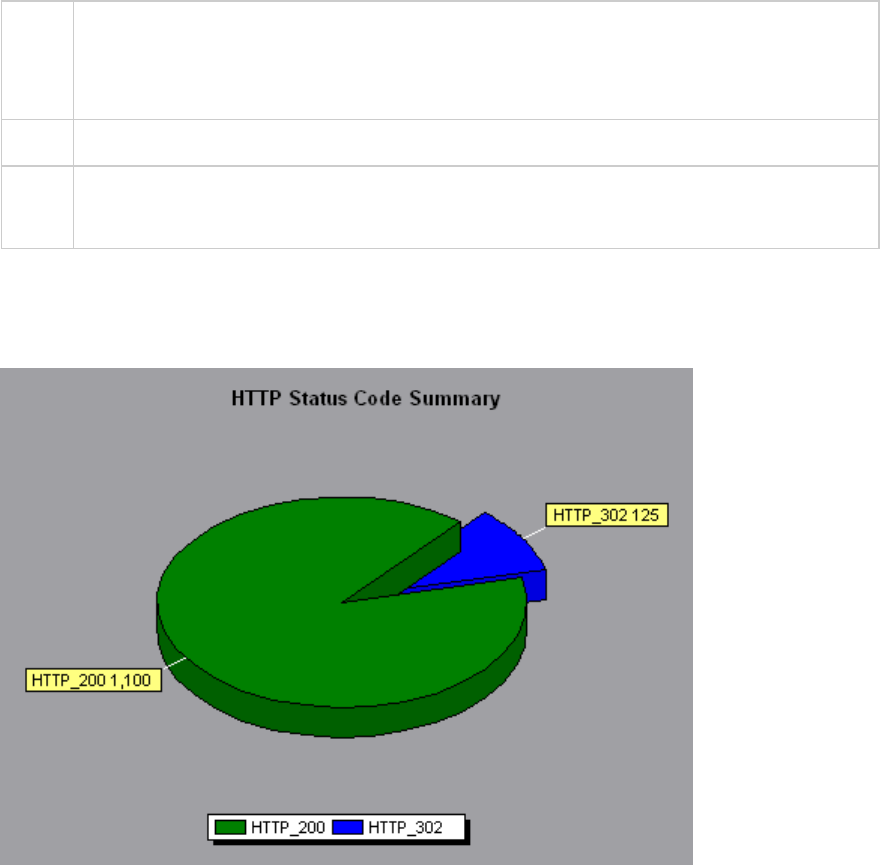
HTTP Status Code Summary Graph
This graph shows the number of HTTP status codes returned from the Web server during the load test
scenario run, grouped by status code. HTTP status codes indicate the status of HTTP requests, for
example, "the request was successful","the page was not found".
Tips Locate scripts which generated error codes
Use this graph together with the HTTP Responses per Second graph to locate those scripts
which generated error codes.
Note This graph can only be viewed as a pie.
See
also
l"Web Resources Graphs Overview" on page1522
l"HTTP Status Codes" below
Example
In the following example, the graph shows that only the HTTP status codes 200 and 302 were generated.
Status code 200 was generated 1,100 times, and status code 302 was generated 125 times.
HTTP Status Codes
The following table displays a list of HTTP status codes:
User Guide
Analysis
HP LoadRunner (12.50) Page 1525

Code Description
200 OK
201 Created
202 Accepted
203 Non-Authoritative Information
204 No Content
205 Reset Content
206 Partial Content
300 Multiple Choices
301 Moved Permanently
302 Found
303 See Other
304 Not Modified
305 Use Proxy
307 Temporary Redirect
400 Bad Request
401 Unauthorized
402 Payment Required
403 Forbidden
404 Not Found
405 Method Not Allowed
406 Not Acceptable
407 Proxy Authentication Required
408 Request Timeout
409 Conflict
410 Gone
411 Length Required
User Guide
Analysis
HP LoadRunner (12.50) Page 1526

Code Description
412 Precondition Failed
413 Request Entity Too Large
414 Request - URI Too Large
415 Unsupported Media Type
416 Requested range not satisfiable
417 Expectation Failed
500 Internal Server Error
501 Not Implemented
502 Bad Gateway
503 Service Unavailable
504 Gateway Timeout
505 HTTP Version not supported
For more information on the above status codes and their descriptions, see http://www.w3.org.
HTTP Responses per Second Graph
This graph shows the number of HTTP status codes returned from the Web server during each second
of the load test scenario run, grouped by status code. HTTP status codes indicate the status of HTTP
requests, for example, "the request was successful", "the page was not found".
X-
axis
Elapsed time since the start of the run.
Y-
axis
Number of HTTP responses per second.
Tips Locate scripts which generated error codes
You can group the results shown in this graph by script (using the "Group By" function) to
locate scripts which generated error codes. For more information on the "Group By" function,
see "Filtering and Sorting Graph Data" on page1480.
See
also
l"Web Resources Graphs Overview" on page1522
l"HTTP Status Codes" on page1525
Example
User Guide
Analysis
HP LoadRunner (12.50) Page 1527
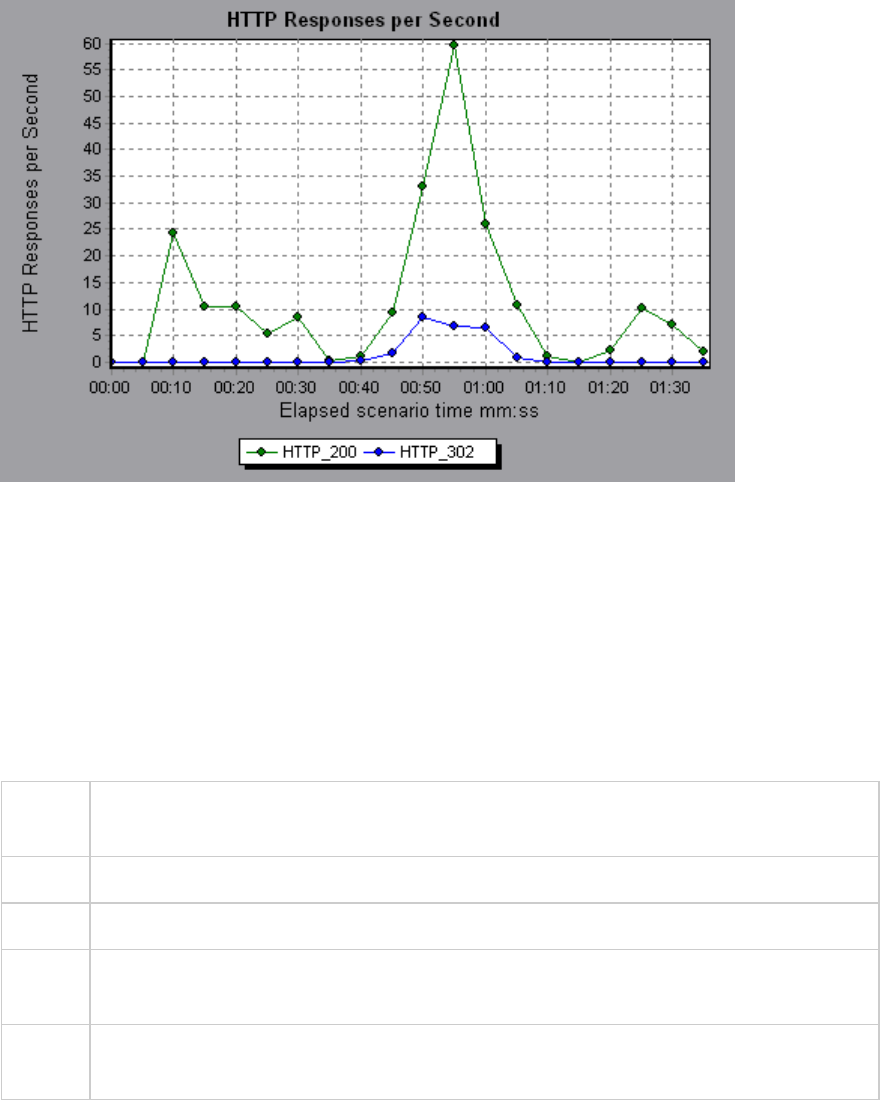
In the following example, the greatest number of 200 status codes, 60, was generated in the fifty-fifth
second of the scenario run. The greatest number of 302 codes, 8.5, was generated in the fiftieth second
of the scenario run.
Pages Downloaded per Second Graph
This graph shows the number of Web pages downloaded from the server during each second of the load
test scenario run.
Like the Throughput graph, the Pages Downloaded per Second graph represents the amount of data
that the Vusers received from the server at any given second. However, the Throughput graph takes
into account each resource and its size (for example, the size of each .gif file, the size of each Web
page). The Pages Downloaded per Second graph takes into account only the number of pages.
Purpose Helps you evaluate the amount of load Vusers generate, in terms of the number of pages
downloaded.
X-axis Elapsed time since the start of the run.
Y-axis Number of Web pages downloaded from the server.
Note To view the Pages Downloaded per Second graph, you must select Pages per second (HTML
Mode only) from the runtime settings Preferences tab before running your scenario.
See
also
"Web Resources Graphs Overview" on page1522
Example 1
User Guide
Analysis
HP LoadRunner (12.50) Page 1528
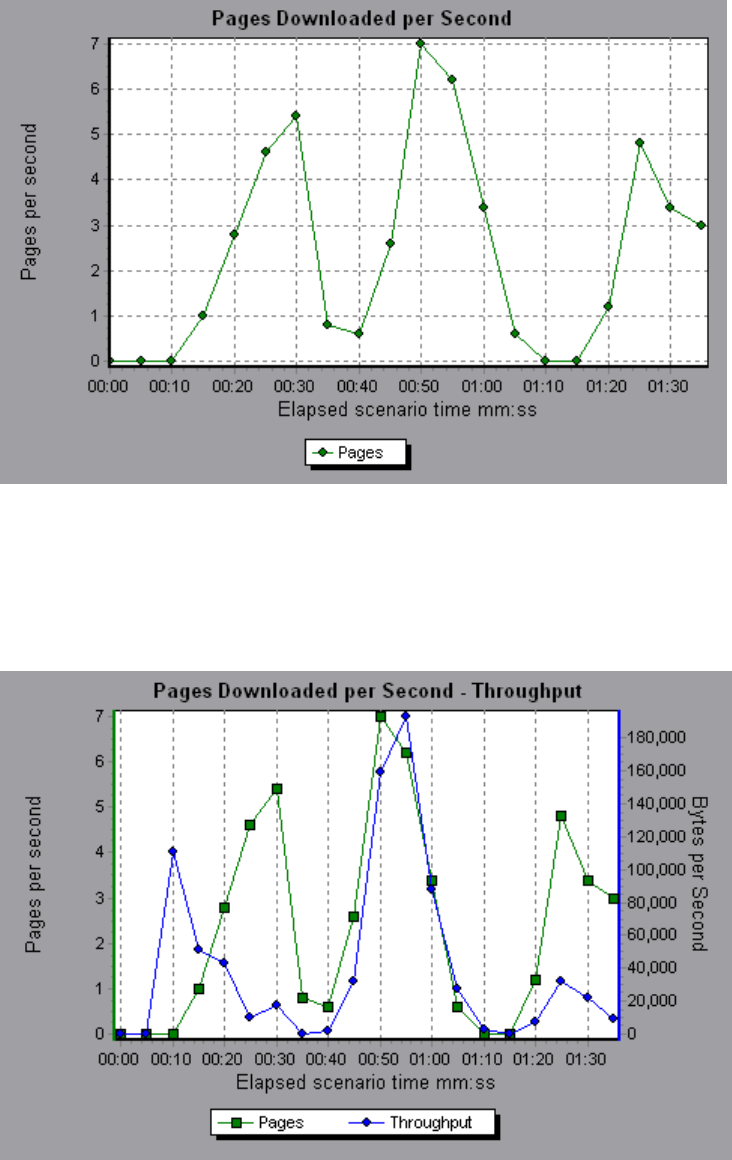
In the following example, the greatest number of pages downloaded per second, about 7, occurred in
the fiftieth second of the scenario run.
Example 2
In the following example, the Throughput graph is merged with the Pages Downloaded per Second
graph. It is apparent from the graph that throughput is not completely proportional to the number of
pages downloaded per second. For example, between 10 and 25 seconds into the scenario run, the
number of pages downloaded per second increased while the throughput decreased.
User Guide
Analysis
HP LoadRunner (12.50) Page 1529
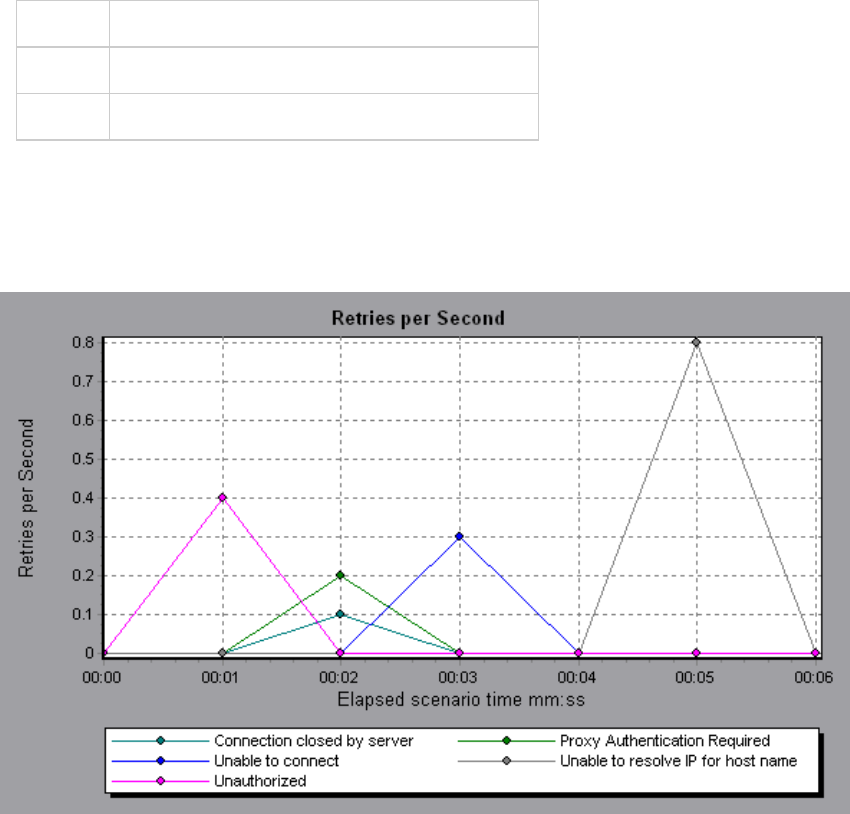
Retries per Second Graph
This graph displays the number of attempted server connections during each second of the load test
scenario run. A server connection is retried when:
lthe initial connection was unauthorized
lproxy authentication is required
lthe initial connection was closed by the server
lthe initial connection to the server could not be made
lwhen the server was initially unable to resolve the load generator's IP address
X-axis Elapsed time since the start of the run.
Y-axis Number of server retries per second.
See also "Web Resources Graphs Overview" on page1522
Example
In the following example, the graph shows that during the first second of the scenario, the number of
retries was 0.4, whereas in the fifth second of the scenario, the number of retries per second rose to
0.8.
User Guide
Analysis
HP LoadRunner (12.50) Page 1530
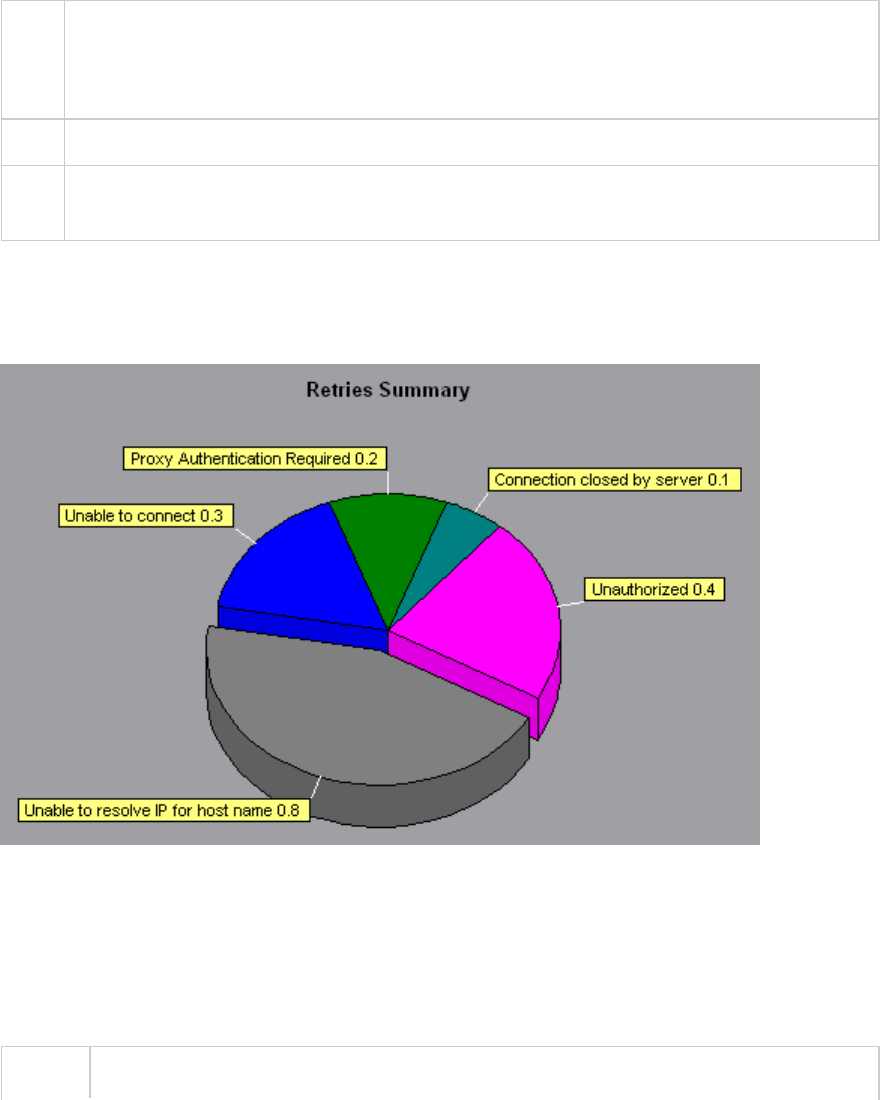
Retries Summary Graph
This graph shows the number of attempted server connections during the load test scenario run,
grouped by the cause of the retry.
Tips Determine when server retries were attempted
Use this graph together with the Retries per Second graph to determine at what point
during the scenario the server retries were attempted.
Note This graph may only be viewed as a pie.
See
also
"Web Resources Graphs Overview" on page1522
Example
In the following example, the graph shows that the server's inability to resolve the load generator's IP
address was the leading cause of server retries during the scenario run.
Connections Graph
This graph shows the number of open TCP/IP connections (y-axis) at each point in time of the load test
scenario (x-axis). Depending on the emulated browser type, each Vuser may open several simultaneous
connections per Web server.
Purpose This graph is useful in indicating when additional connections are needed. For example, if
User Guide
Analysis
HP LoadRunner (12.50) Page 1531
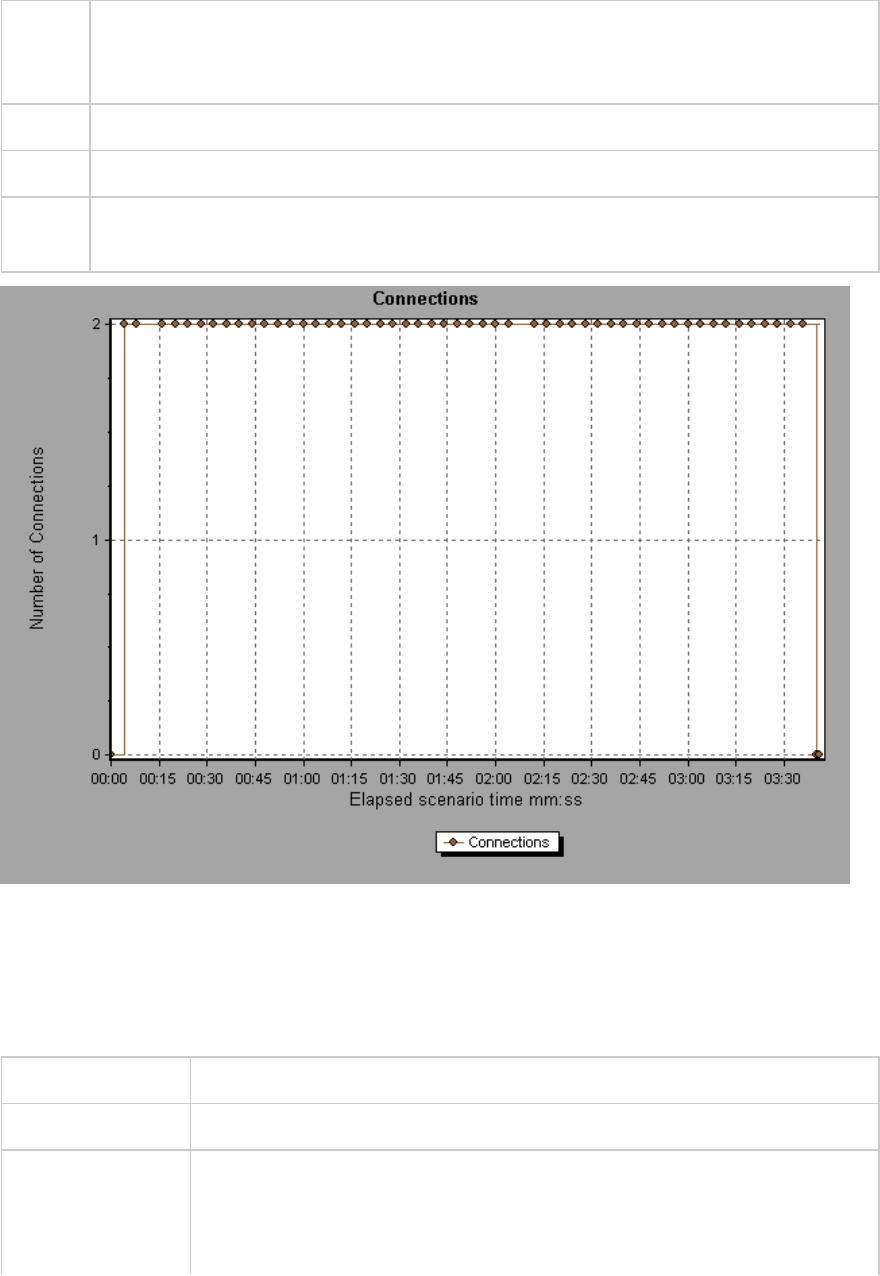
the number of connections reaches a plateau, and the transaction response time
increases sharply, adding connections would probably cause a dramatic improvement in
performance (reduction in the transaction response time).
X-axis Elapsed time since the start of the run.
Y-axis Open TCP/IP connections.
See
also
"Web Resources Graphs Overview" on page1522
Connections per Second Graph
This graph shows the number of new TCP/IP connections (y-axis) opened and the number of connections
that are shut down for each second of the load test scenario (x-axis).
X-axis Elapsed time since the start of the run.
Y-axis TCP/IP connections per second.
Tips New connections versus hits per second:
The number of new connections should be a small fraction of the number of
hits per second, because new TCP/IP connections are very expensive in terms
User Guide
Analysis
HP LoadRunner (12.50) Page 1532
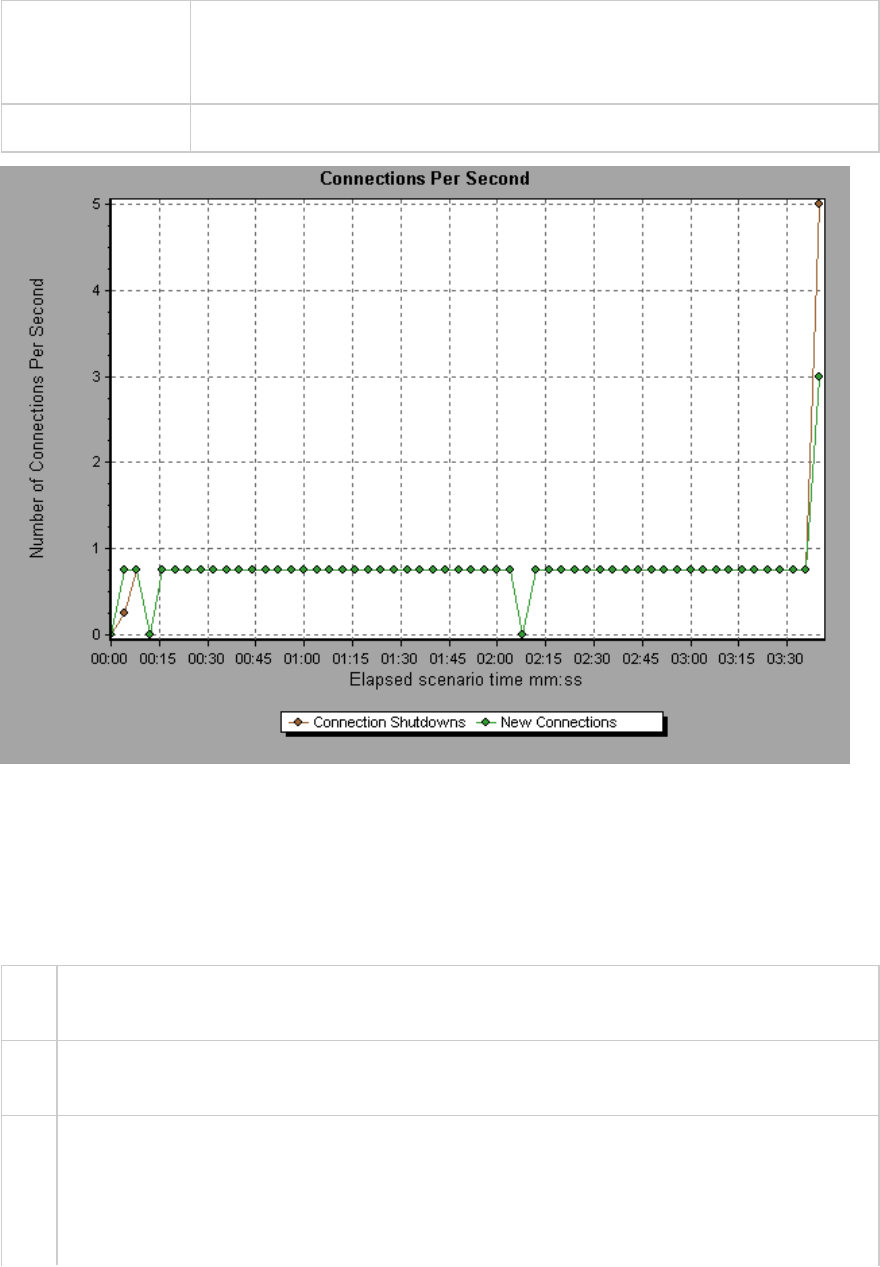
of server, router and network resource consumption. Ideally, many HTTP
requests should use the same connection, instead of opening a new
connection for each request.
See also "Web Resources Graphs Overview" on page1522
SSLs per Second Graph
This graph shows the number of new and reused SSL Connections (y-axis) opened in each second of the
load test scenario (x-axis). An SSL connection is opened by the browser after a TCP/IP connection has
been opened to a secure server.
X-
axis
Elapsed time since the start of the run.
Y-
axis
Number of SSL Connections
Tips Reduce SSL connections
Creating a new SSL connection entails heavy resource consumption. Therefore, you should
try to open as few new SSL connections as possible. Once you've established an SSL
connection, you should reuse it. There should be no more than one new SSL connection per
User Guide
Analysis
HP LoadRunner (12.50) Page 1533
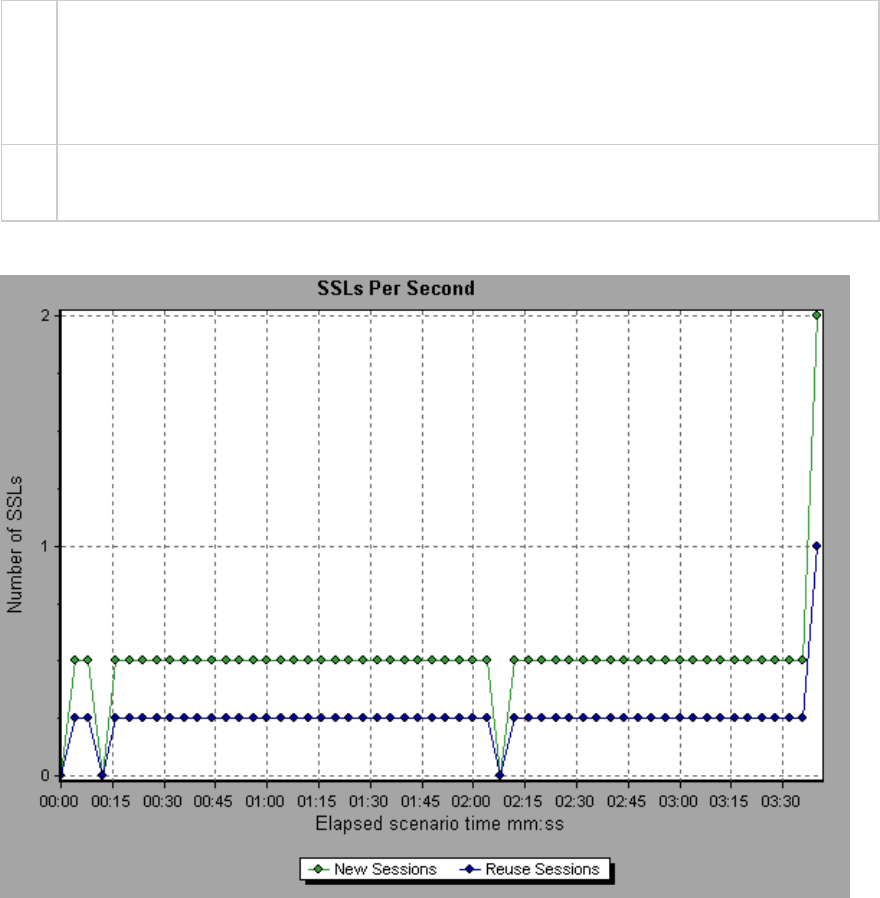
Vuser.
In cases where you reset TCP connections between iterations (VuGen Runtime Settings >
Browser Emulation node > Simulate a new user on each iteration), you should have no
more than one new SSL connection per iteration.
See
also
"Web Resources Graphs Overview" on page1522
Example
Web Page Diagnostics Graphs
Web Page Diagnostics Tree View Overview
The Web Page Diagnostics tree view displays a tree view of the transactions, sub-transactions, and Web
pages for which you can view Web Page Diagnostics graphs. For more information about Web Page
Diagnostics graphs, see "Web Page Diagnostics Graph" on page1538.
User Guide
Analysis
HP LoadRunner (12.50) Page 1534
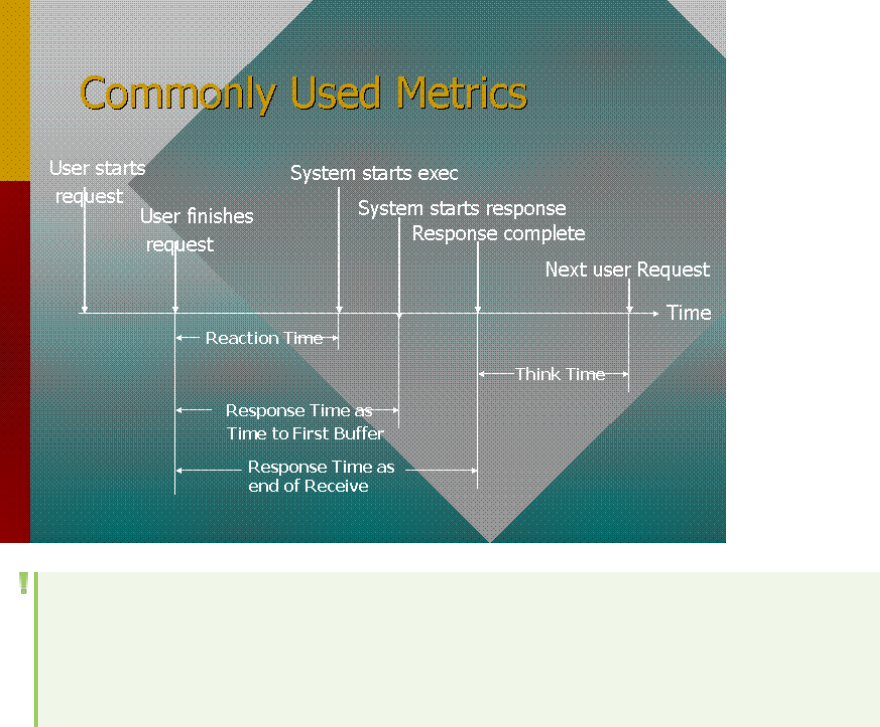
The Web Page Diagnostics graphs enable you to assess whether transaction response times were
affected by page content. Using the Web Page Diagnostics graphs, you can analyze problematic
elements—for example, images that download slowly, or broken links—of a Web site.
Web Page Diagnostics Graphs Overview
Web Page Diagnostics graphs provide you with performance information for each monitored Web page
in your script. You can view the download time of each page in the script and its components, and
identify at what point during download time problems occurred. In addition, you can view the relative
download time and size of each page and its components. Analysis displays both average download time
and download time over time data.
You correlate the data in the Web Page Diagnostics graphs with data in the Transaction Performance
Summary and Average Transaction Response Time graphs in order to analyze why and where problems
are occurring, and whether the problems are network- or server-related.
The following diagram illustrates the sequence of events from the time an HTTP request is sent:
Note: Because server time is being measured from the client, network time may influence this
measurement if there is a change in network performance from the time the initial HTTP
request is sent until the time the first buffer is sent. The server time displayed, therefore, is
estimated server time and may be slightly inaccurate.
You begin analyzing the Transaction Performance Summary and Average Transaction Response Time
graphs with the Web Page Diagnostics graph, which displays the average download time (in seconds) for
User Guide
Analysis
HP LoadRunner (12.50) Page 1535
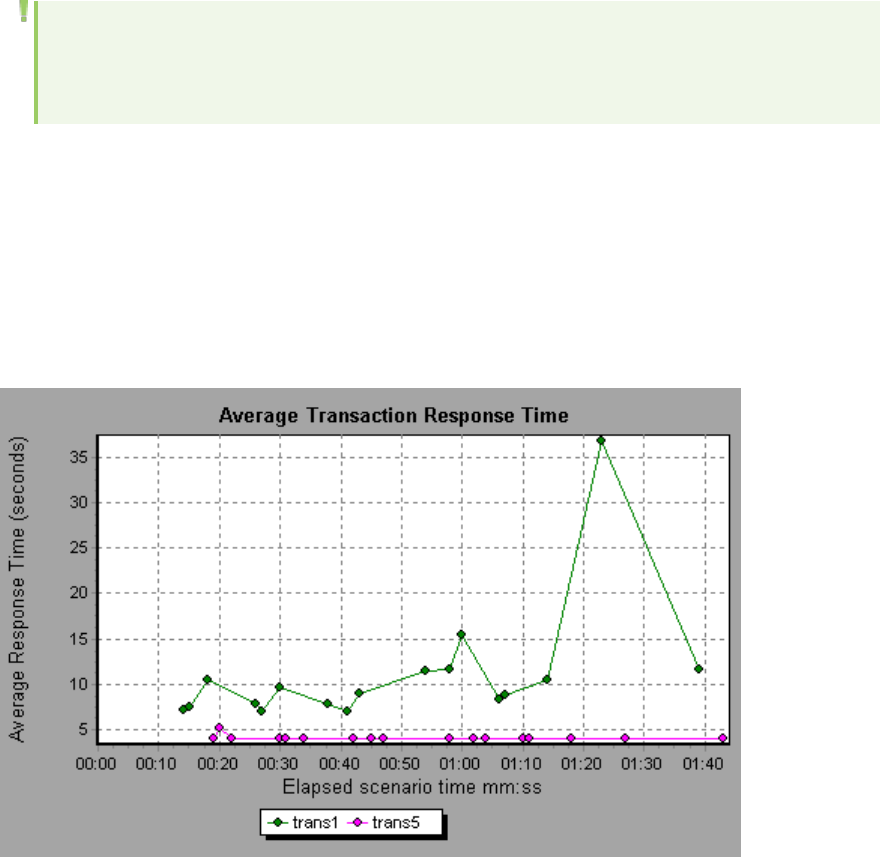
each monitored Web page during each second of the load test scenario run. The x-axis represents the
elapsed time from the beginning of the scenario run. The y-axis represents the average download time
(in seconds) for each Web page.
These graphs can also be used for analyzing mobile applications using the Mobile Application -
HTTP/HTML protocol.
In order for Analysis to generate Web Page Diagnostics graphs, you must enable the Web Page
Diagnostics feature in the Controller before running your scenario.
1. From the Controller menu, choose Diagnostics > Configuration and select the Enable the
following diagnostics check box.
2. In the Offline Diagnostics section, if the button to the right of Web Page Diagnostics (Max. Vuser
Sampling: 10%) says Enable, click it.
Note: When preparing a Web HTTP/HTML Vuser script for which you want to perform Web
diagnostics, it is recommended that you create an HTML-based script (using the Recording tab
in the Recording Options).
For more information on recording scripts, refer to the VuGen section in the LoadRunner User Guide.
How to View the Breakdown of a Transaction
The Web Page Diagnostics graphs are most commonly used to analyze a problem detected in the
Transaction Performance Summary or Average Transaction Response Time graphs. For example, the
Average Transaction Response Time graph below demonstrates that the average transaction response
time for the trans1 transaction was high.
User Guide
Analysis
HP LoadRunner (12.50) Page 1536
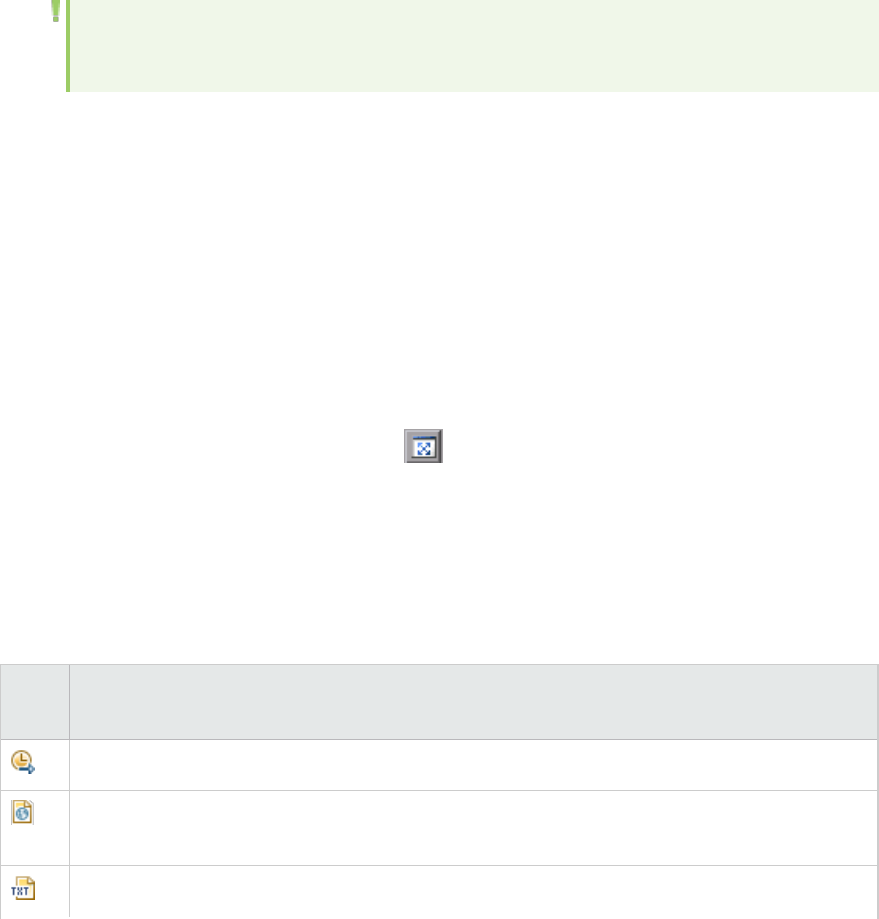
Using the Web Page Diagnostics graphs, you can pinpoint the cause of the delay in response time for
the trans1 transaction.
This task describes how to breakdown a transaction.
1. Right-click trans1 and select Web Page Diagnostics for trans1. The Web Page Diagnostics graph
opens and the Web Page Diagnostics tree appear. An icon appears next to the page name
indicating the page content. See "Web Page Diagnostics Content Icons" below.
2. In the Web Page Diagnostics tree, right-click the problematic page you want to break down, and
select Break Down <component name>. Alternatively, select a page in the Select Page to Break
Down box that appears under the Web Page Diagnostics graph. The Web Page Diagnostics graph
for that page appears.
Note: You can open a browser displaying the problematic page by right-clicking the page in
the Web Page Diagnostics tree and selecting View page in browser.
3. Select one of the following available breakdown options:
lDownload Time. Displays a table with a breakdown of the selected page's download time. The
size of each page component (including the component's header) is displayed. See the "Page
Download Time Breakdown Graph" on page1542 for more information about this display.
lComponent (Over Time). Displays the "Page Component Breakdown (Over Time) Graph" on
page1541 for the selected Web page.
lDownload Time (Over Time). Displays the "Page Download Time Breakdown (Over Time) Graph"
on page1544 for the selected Web page.
lTime to First Buffer (Over Time). Displays the "Time to First Buffer Breakdown (Over Time)
Graph" on page1549 for the selected Web page.
To display the graphs in full view, click the button. You can also access these graphs, as well
as additional Web Page Diagnostics graphs, from the Open a New Graph dialog box.
Web Page Diagnostics Content Icons
The following icons appear in the Web Page Diagnostics tree. They indicate the HTTP content of the
page.
Name Description
Transaction. Specifies that the ensuing content is part of the transaction.
Page Content. Specifies that the ensuing content, which may include text, images, and so on,
is all part of one logical page.
Text content. Textual information. Plain text is intended to be displayed as-is. Includes HTML
User Guide
Analysis
HP LoadRunner (12.50) Page 1537
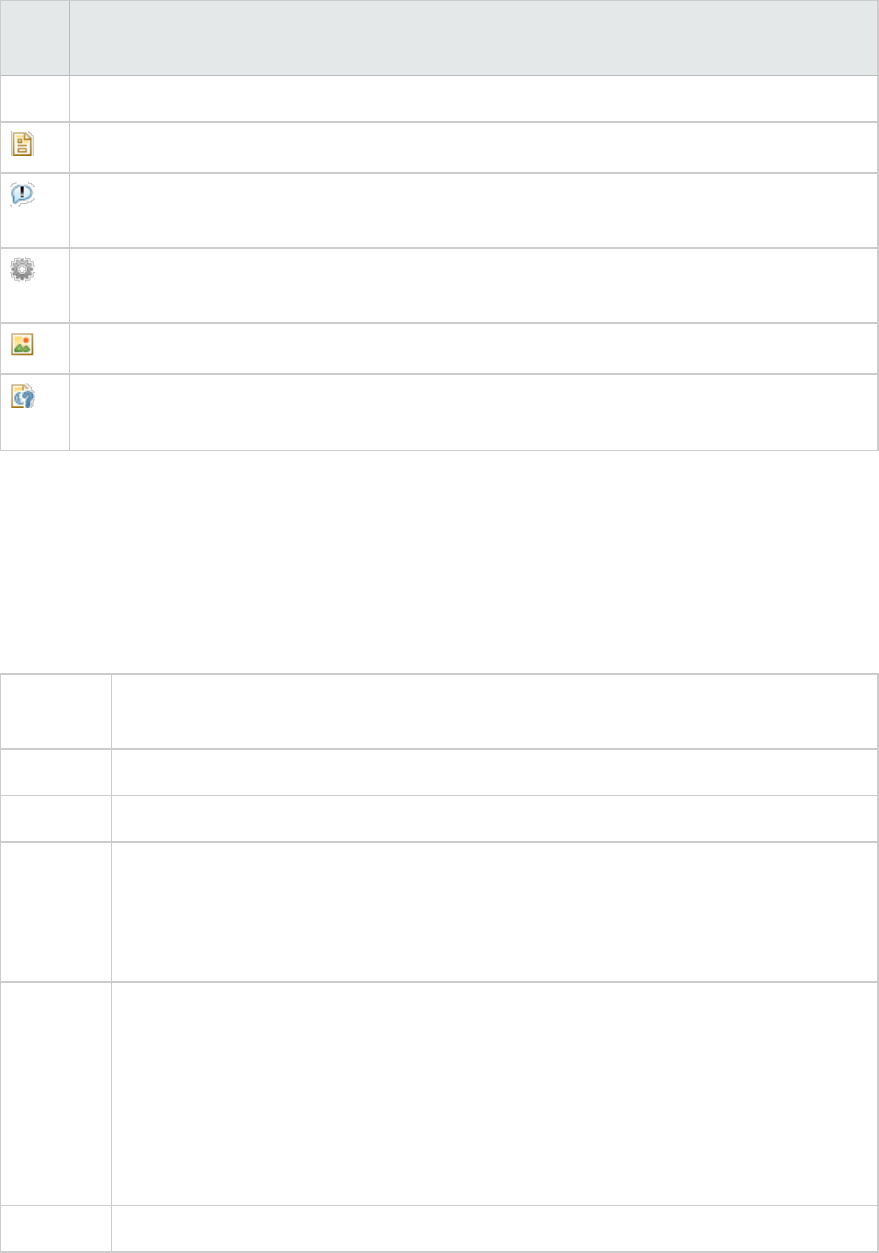
Name Description
text and style sheets.
Multipart content. Data consisting of multiple entities of independent data types.
Message content. An encapsulated message. Common subtypes are news, or external-body
which specifies large bodies by reference to an external data source.
Application content. Some other kind of data, typically either uninterpreted binary data or
information to be processed by an application. An example subtype is Postscript data.
Image content. Image data. Two common subtypes are the jpeg and gif format.
Resource content. Other resources not listed above. Also, content that is defined as "not
available" is likewise included.
Web Page Diagnostics Graph
The Web Page Diagnostics graph provides you with performance information for each monitored Web
page in your script. You can view the download time of each page in the script and its components, and
identify at what point during download time problems occurred. In addition, you can view the average
download time of each page and its components.
Purpose This graph enables you to determine at what point during scenario execution a network
or server problem occurred, that may have affected access to the Web page.
X-axis Elapsed time from the beginning of the scenario run.
Y-axis The download time (in seconds) for each Web page in the download process.
Tips lChoose a page in the Select Page to Break Down drop-down box.
lTo isolate the most problematic components, you can sort the legend window
according to the average number of seconds taken to download a component. To
sort the legend by average, double-click the Average column heading.
Diagnostic
Options
You can choose one of the following options to drill down on the results. For sample
graphs, see below.
lDownload Time - as a bar graph
lComponent (Over Time) - as a line graph
lDownload Time (Over Time) - as an area graph
lTime to First Buffer (Over Time) - as an area graph
See also "Web Page Diagnostics Tree View Overview" on page1534
User Guide
Analysis
HP LoadRunner (12.50) Page 1538
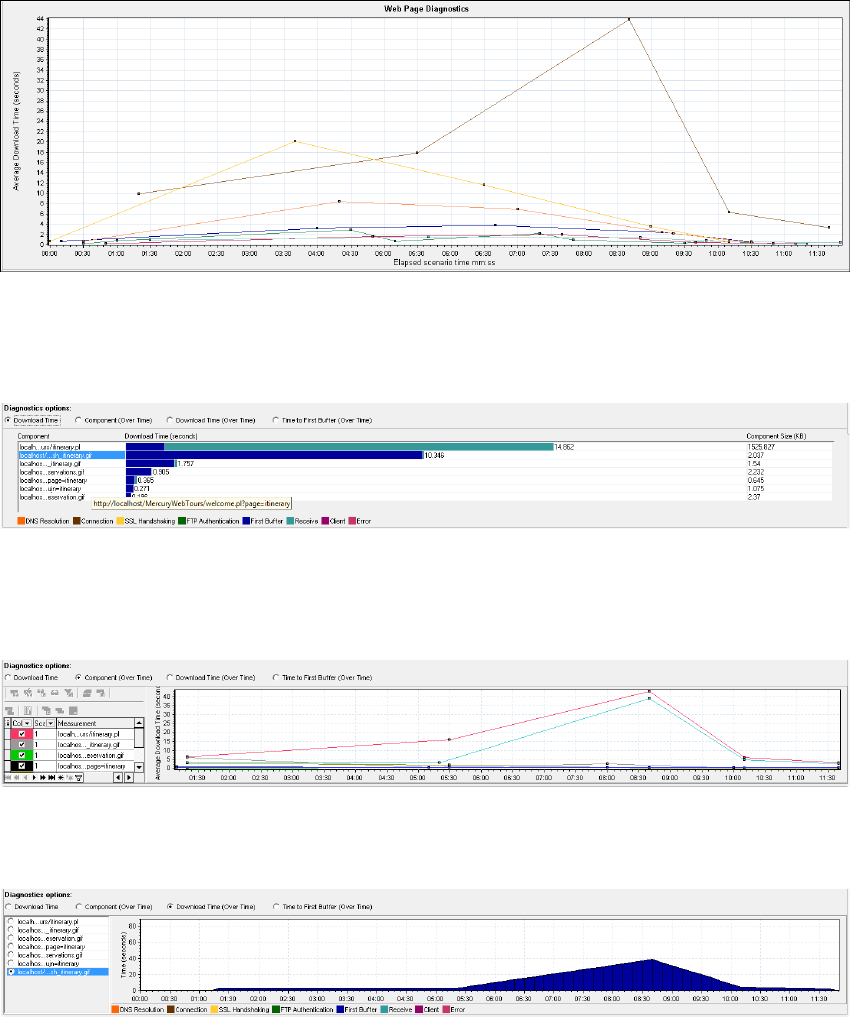
Example
This graph enables you to monitor the download time during the scenario execution, to determine at
what point network or server problems occurred.
Download Time
In the following example, the download time for the itinerary.pl page was the greatest during the
Receive stage.
Component(Over Time)
In the following example, the download time for the itinerary.pl component was the greatest at
approximately 8:40 into the scenario.
Download Time (Over Time)
The following graph shows the download time for the itinerary.pl page as an area graph.
Time to First Buffer (Over Time)
In the following example, the download time for the splash_itinerary.gif file was the greatest
approximately 8:40 into the scenario.
User Guide
Analysis
HP LoadRunner (12.50) Page 1539
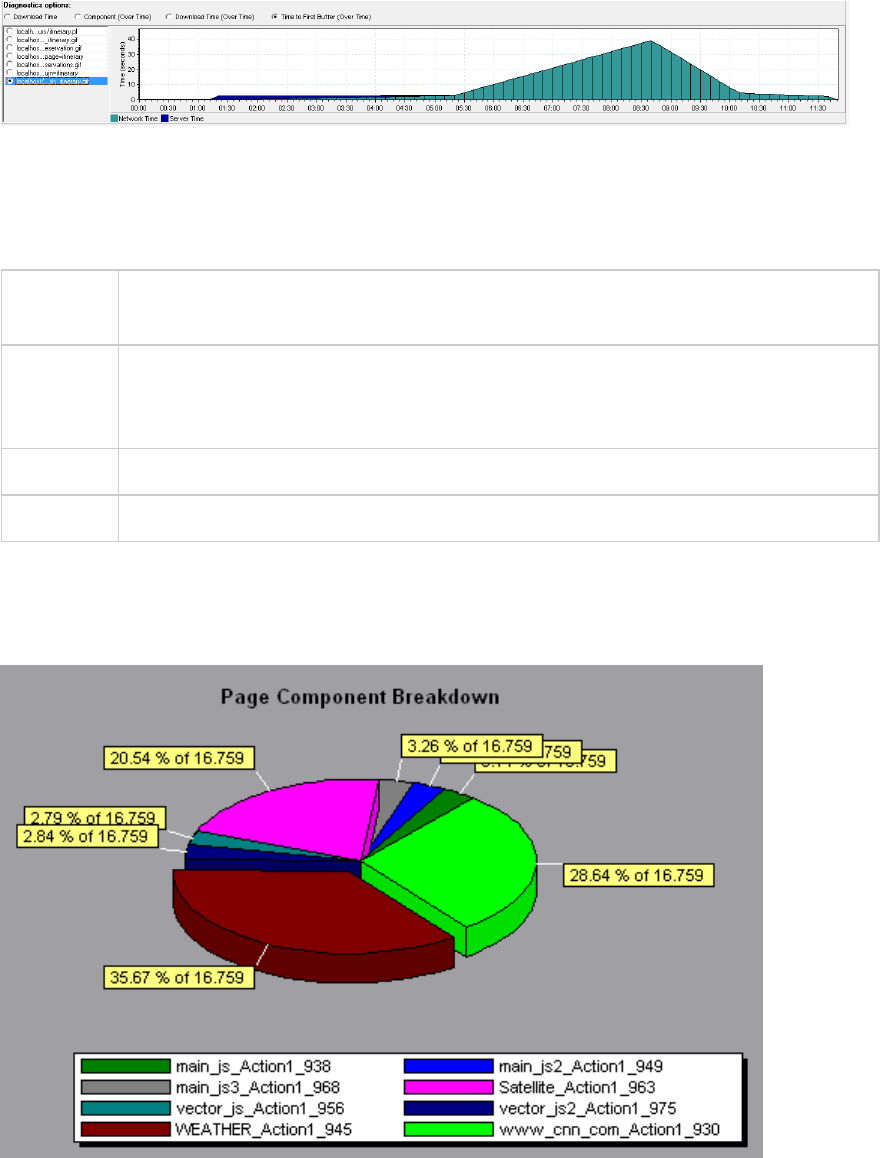
Page Component Breakdown Graph
This graph displays the average download time (in seconds) for each Web page and its components.
Breakdown
options
To ascertain which components caused the delay in download time, you can break down
the problematic URL by double-clicking it in the Web Page Diagnostics tree.
Tips To isolate problematic components, it may be helpful to sort the legend according to
the average number of seconds taken to download a component. To sort the legend by
average, click the Graph's Average column.
Note The graph can only be viewed as a pie.
See also "Web Page Diagnostics Graphs Overview" on page1535
Example
The following graph demonstrates that the main cnn.com URL took 28.64% of the total download time,
compared to 35.67% for the www.cnn.com/WEATHER component.
Example
The graph shows that the main cnn.com/WEATHER component took the longest time to download
(8.98% of the total download time).
User Guide
Analysis
HP LoadRunner (12.50) Page 1540
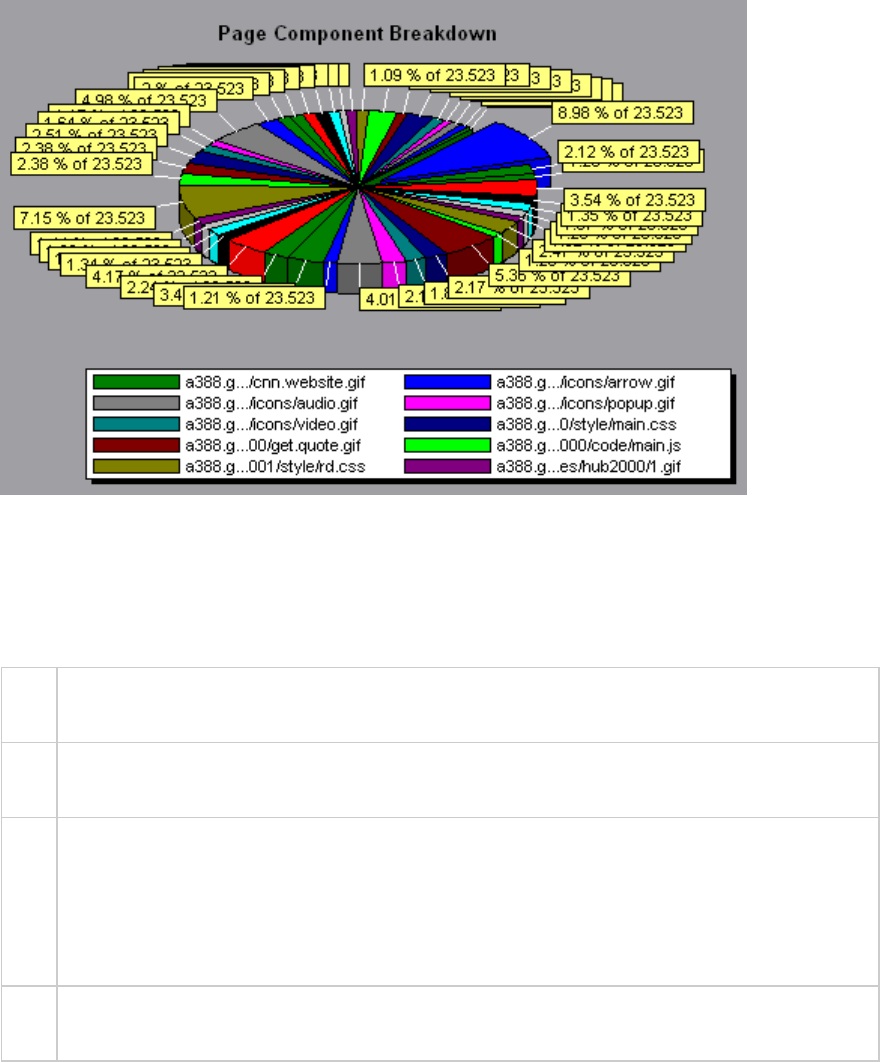
Page Component Breakdown (Over Time) Graph
This graph displays the average response time (in seconds) for each Web page and its components
during each second of the load test scenario run.
X-
axis
The elapsed time from the beginning of the scenario run.
Y-
axis
The average response time (in seconds) for each component.
Tips lTo isolate the most problematic components, it may be helpful to sort the legend window
according to the average number of seconds taken to download a component. To sort the
legend by average, double-click the Average column heading.
lTo identify a component in the graph, you can select it. The corresponding line in the legend
window is selected.
See
also
"Web Page Diagnostics Graphs Overview" on page1535
Example
The following graph demonstrates that the response time for Satellite_Action1_963 was significantly
greater, throughout the scenario, than the response time for main_js_Action1_938.
User Guide
Analysis
HP LoadRunner (12.50) Page 1541
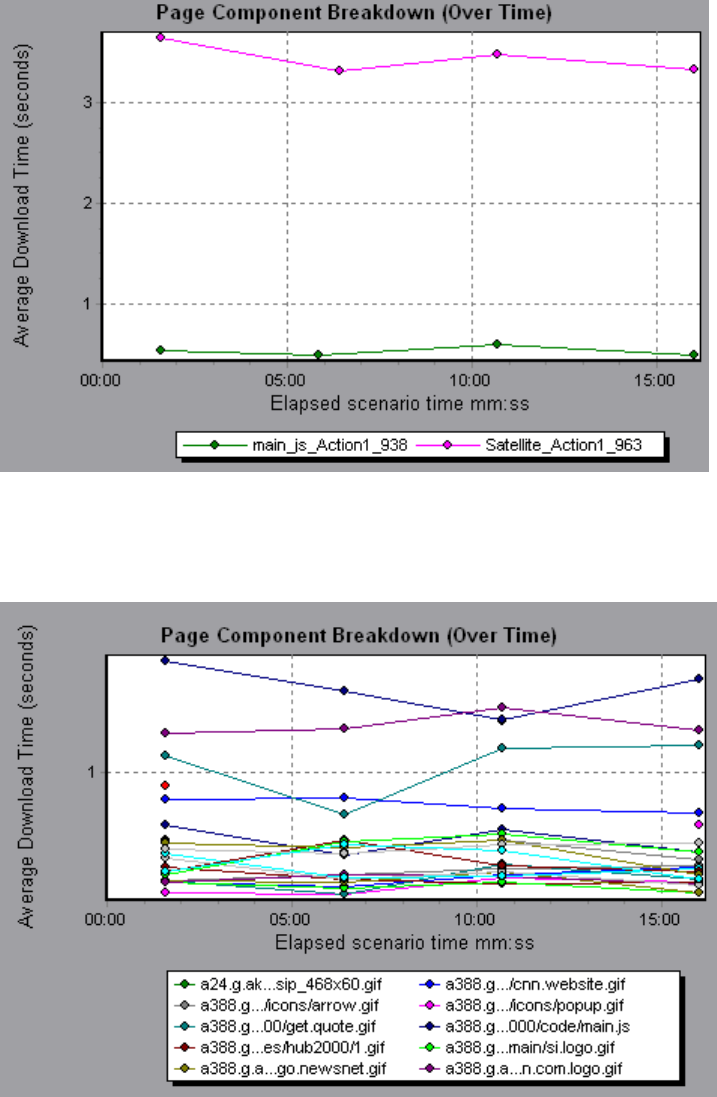
Example
Using the graph, you can track which components of the main component were most problematic, and
at which point(s) during the scenario the problem(s) occurred.
Page Download Time Breakdown Graph
This graph displays a breakdown of each page component's download time.
User Guide
Analysis
HP LoadRunner (12.50) Page 1542
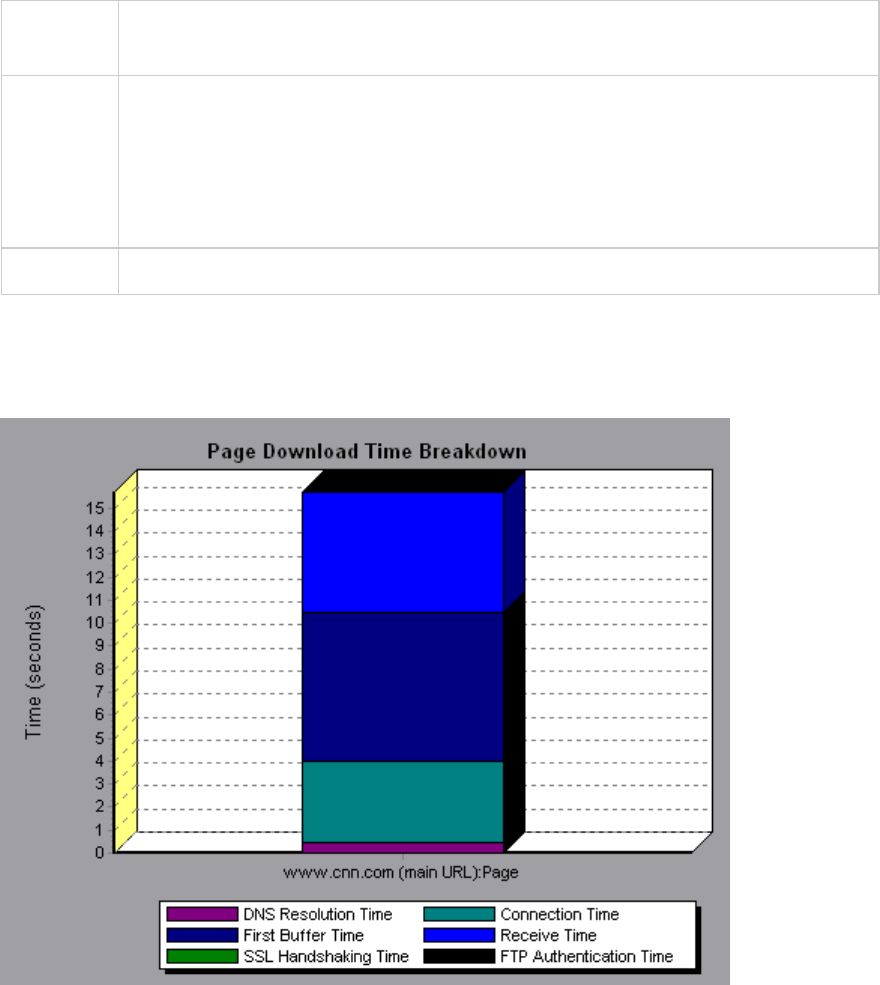
Purpose Enables you to determine whether slow response times are being caused by network or
server errors during Web page download.
Breakdown
options
For breakdown options, see "Page Download Time Breakdown Graph Breakdown
Options" on page1546.
Note: Each measurement displayed on the page level is the sum of that measurement
recorded for each page component. For example, the Connection Time for
www.cnn.com is the sum of the Connection Time for each of the page's components.
See also "Web Page Diagnostics Graphs Overview" on page1535
Example
The Page Download Time Breakdown graph demonstrates that receive time, connection time, and first
buffer time accounted for a large portion of the time taken to download the main cnn.com URL.
Example
If you break the cnn.com URL down further, you can isolate the components with the longest download
time, and analyze the network or server problems that contributed to the delay in response time.
Breaking down the cnn.com URL demonstrates that for the component with the longest download time
(the www.cnn.com component), the receive time accounted for a large portion of the download time.
User Guide
Analysis
HP LoadRunner (12.50) Page 1543
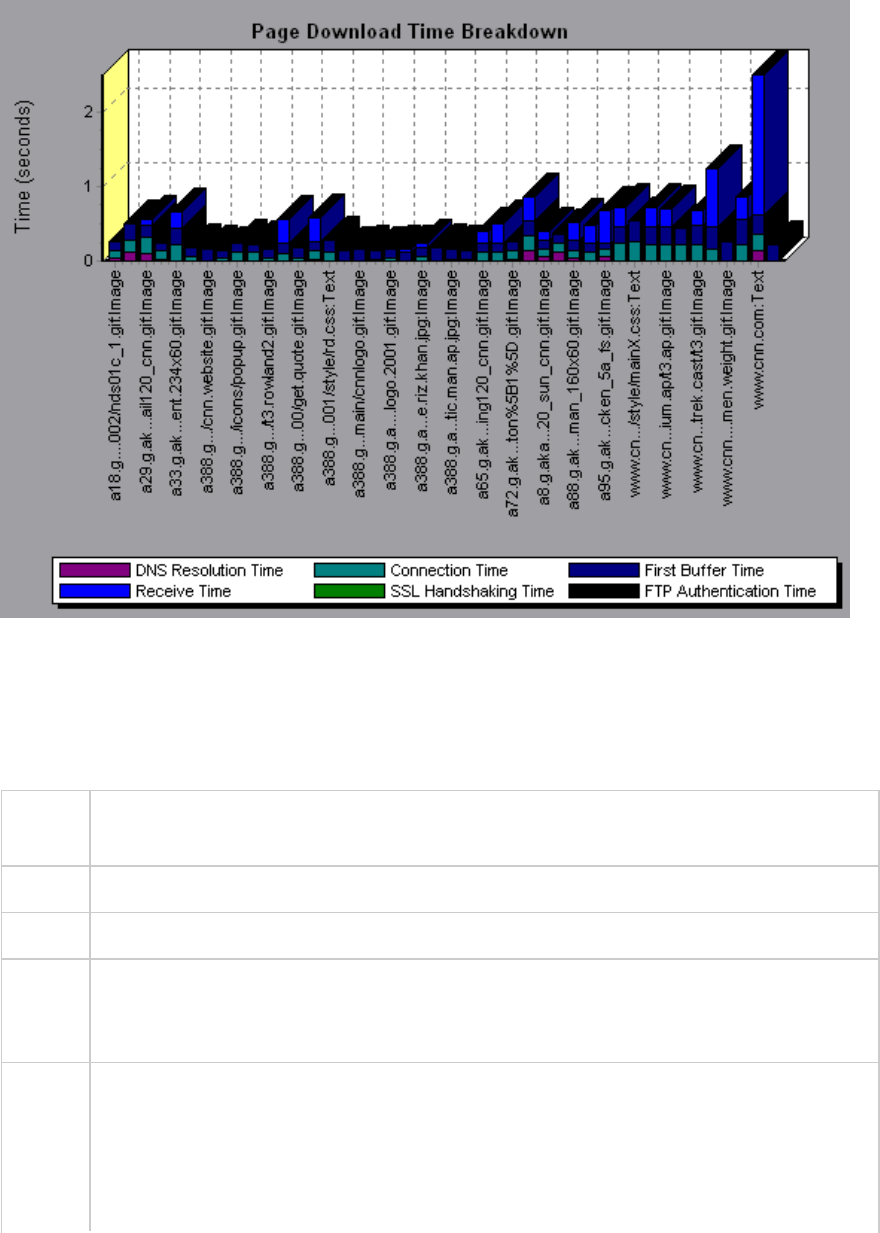
Page Download Time Breakdown (Over Time) Graph
The graph displays a breakdown of each page component's download time during each second of the
load test scenario run.
Purpose This graph enables you to determine at what point during scenario execution network or
server problems occurred.
X-axis Elapsed time from the beginning of the scenario run.
Y-axis Time (in seconds) taken for each step in the download process.
Tips To isolate the most problematic components, you can sort the legend window according to
the average number of seconds taken to download a component. To sort the legend by
average, double-click the Average column heading.
Notes lEach measurement displayed on the page level is the sum of that measurement
recorded for each page component. For example, the Connection Time for www.cnn.com
is the sum of the Connection Time for each of the page's components.
lWhen the Page Download Time Breakdown (Over Time) graph is selected from the Web
Page Diagnostics graph, it appears as an area graph.
User Guide
Analysis
HP LoadRunner (12.50) Page 1544
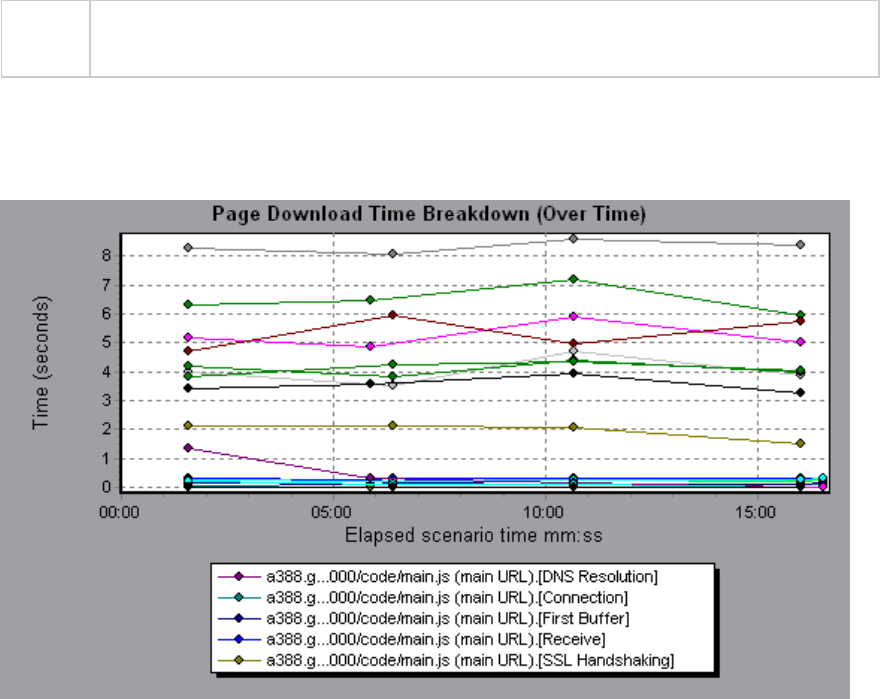
See
also
"Web Page Diagnostics Graphs Overview" on page1535
Example
This graph enables you to determine at what point during scenario execution network or server
problems occurred.
Example
In the example in the previous section, it is apparent that cnn.com was the most problematic
component. If you examine the cnn.com component, the Page Download Time Breakdown (Over Time)
graph demonstrates that First Buffer and Receive time remained high throughout the scenario, and
that DNS Resolution time decreased during the scenario.
User Guide
Analysis
HP LoadRunner (12.50) Page 1545
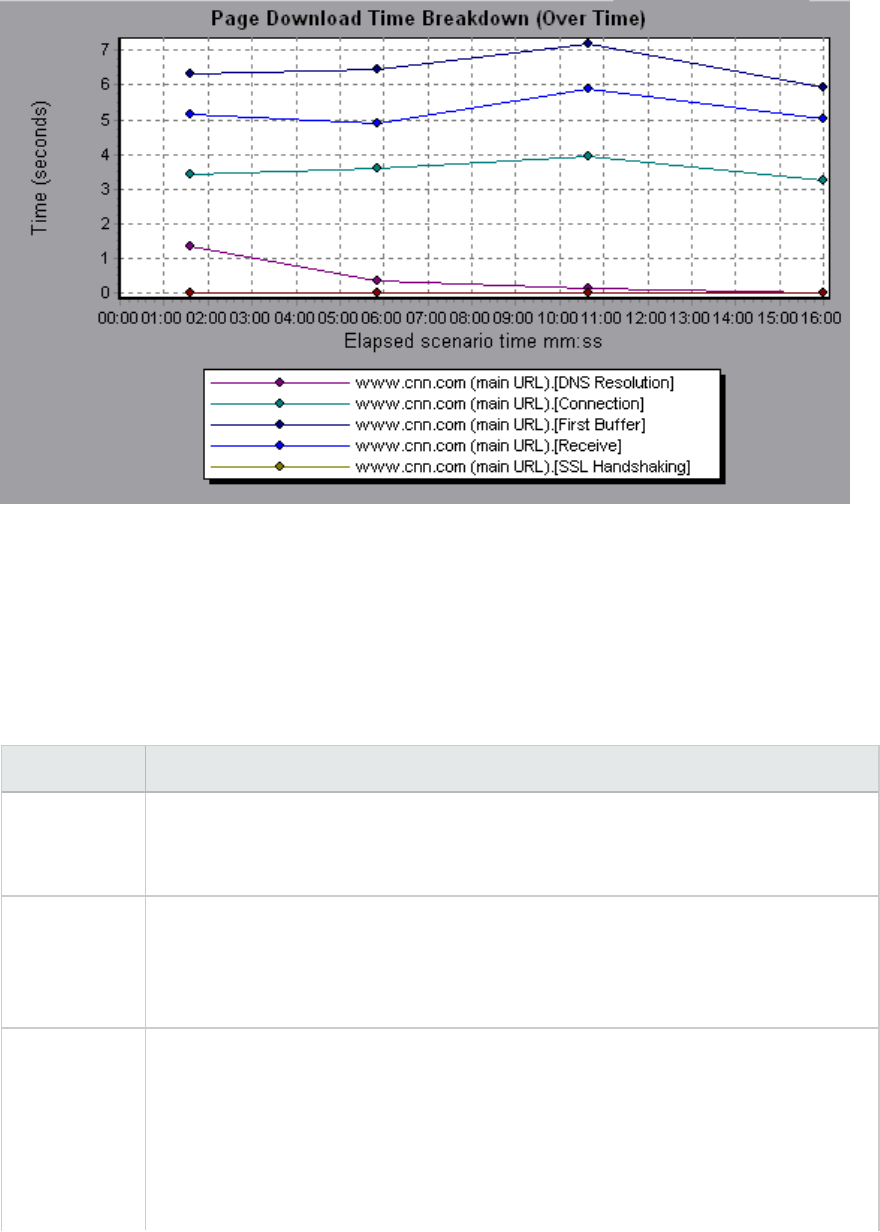
Page Download Time Breakdown Graph Breakdown Options
The Page Download Time Breakdown graph breaks down each component by DNS resolution time,
connection time, time to first buffer, SSL handshaking time, receive time, FTP authentication time,
client time, and error time.
These breakdowns are described below:
Name Description
DNS
Resolution
Displays the amount of time needed to resolve the DNS name to an IP address, using
the closest DNS server. The DNS Lookup measurement is a good indicator of
problems in DNS resolution, or problems with the DNS server.
Connection Displays the amount of time needed to establish an initial connection with the Web
server hosting the specified URL. The connection measurement is a good indicator
of problems along the network. It also indicates whether the server is responsive to
requests.
First Buffer Displays the amount of time that passes from the initial HTTP request (usually GET)
until the first buffer is successfully received back from the Web server. The first
buffer measurement is a good indicator of Web server delay as well as network
latency.
Note: Since the buffer size may be up to 8K, the first buffer might also be the time it
takes to completely download the element.
User Guide
Analysis
HP LoadRunner (12.50) Page 1546
Name Description
SSL
Handshaking
Displays the amount of time taken to establish an SSL connection (includes the
client hello, server hello, client public key transfer, server certificate transfer, and
other—partially optional—stages). After this point, all the communication between
the client and server is encrypted.
The SSL Handshaking measurement is only applicable for HTTPS communications.
Receive Displays the amount of time that passes until the last byte arrives from the server
and the downloading is complete.
The Receive measurement is a good indicator of network quality (look at the
time/size ratio to calculate receive rate).
FTP
Authentication
Displays the time taken to authenticate the client. With FTP, a server must
authenticate a client before it starts processing the client's commands.
The FTP Authentication measurement is only applicable for FTP protocol
communications.
Client Time Displays the average amount of time that passes while a request is delayed on the
client machine due to browser think time or other client-related delays.
Error Time Displays the average amount of time that passes from the moment an HTTP
request is sent until the moment an error message (HTTP errors only) is returned.
Time to First Buffer Breakdown Graph
This graph displays each Web page component's relative server/network time (in seconds) for the
period of time until the first buffer is successfully received back from the Web server.
Note: This graph is only relevant when the load generator does not use a proxy to connect to
the application under test. If the load generator is connected through a proxy, this graph will
only show the proxy latency—not the AUT latency.
Purpose If the download time for a component is high, you can use this graph to determine
whether the problem is server- or network-related.
X-axis Specifies the name of the component.
Y-axis Shows the average network/server time (in seconds) for each component.
Measurements lNetwork time is defined as the average amount of time that passes from the
moment the first HTTP request is sent until receipt of ACK.
lServer time is defined as the average amount of time that passes from the
User Guide
Analysis
HP LoadRunner (12.50) Page 1547
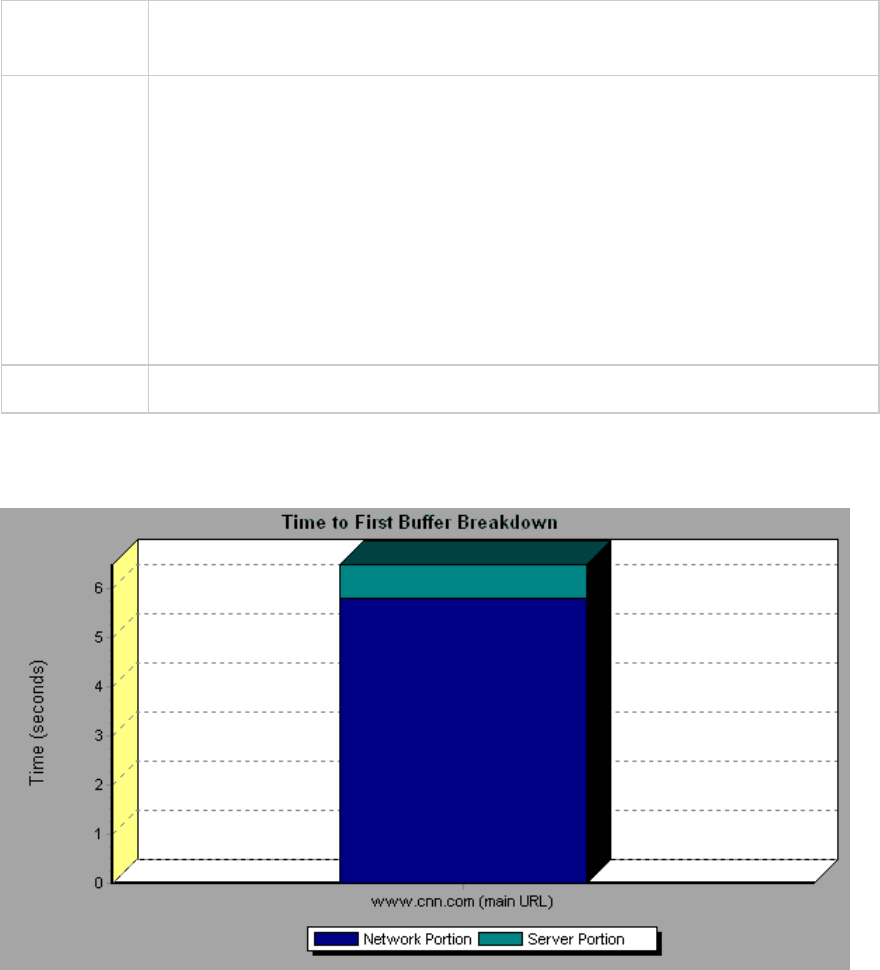
receipt of ACK of the initial HTTP request (usually GET) until the first buffer is
successfully received back from the Web server.
Note lEach measurement displayed on the page level is the sum of that measurement
recorded for each page component. For example, the network time for
www.cnn.com is the sum of the network time for each of the page's components.
lBecause server time is being measured from the client, network time may
influence this measurement if there is a change in network performance from
the time the initial HTTP request is sent until the time the first buffer is sent. The
server time displayed, therefore, is estimated server time and may be slightly
inaccurate.
lThe graph can only be viewed as a bar graph.
See also "Web Page Diagnostics Graphs Overview" on page1535
Example
In the following example it is apparent that network time is greater than server time.
Example
In the following example shows that you can break the main cnn.com URL down further to view the time
to first buffer breakdown for each of its components. It is apparent that for the main cnn.com
component (the first component on the right), the time to first buffer breakdown is almost all network
time.
User Guide
Analysis
HP LoadRunner (12.50) Page 1548
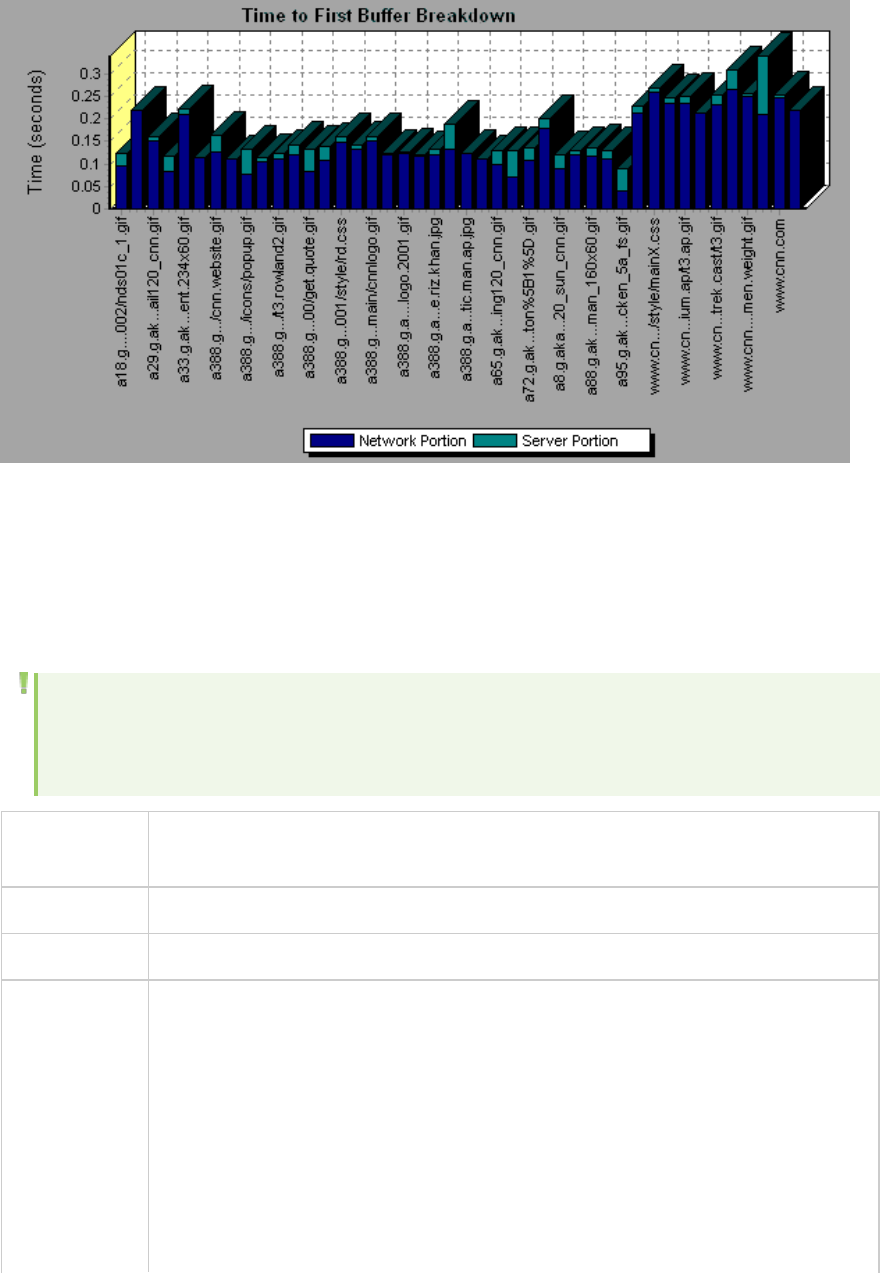
Time to First Buffer Breakdown (Over Time) Graph
This graph displays each Web page component's server and network time (in seconds) during each
second of the load test scenario run, for the period of time until the first buffer is successfully received
back from the Web server.
Note: This graph is only relevant when the load generator does not use a proxy to connect to
the application under test. If the load generator is connected through a proxy, this graph will
only show the proxy latency—not the AUT latency.
Purpose You can use this graph to determine when during the scenario run a server- or
network-related problem occurred.
X-axis Elapsed time from the beginning of the scenario run.
Y-axis Average network or server time (in seconds) for each component.
Measurements lNetwork time is defined as the average amount of time that passes from the
moment the first HTTP request is sent until receipt of ACK.
lServer time is defined as the average amount of time that passes from the
receipt of ACK of the initial HTTP request (usually GET) until the first buffer is
successfully received back from the Web server.
Note: Because server time is being measured from the client, network time may
influence this measurement if there is a change in network performance from the
time the initial HTTP request is sent until the time the first buffer is sent. The
server time displayed, therefore, is estimated server time and may be slightly
User Guide
Analysis
HP LoadRunner (12.50) Page 1549
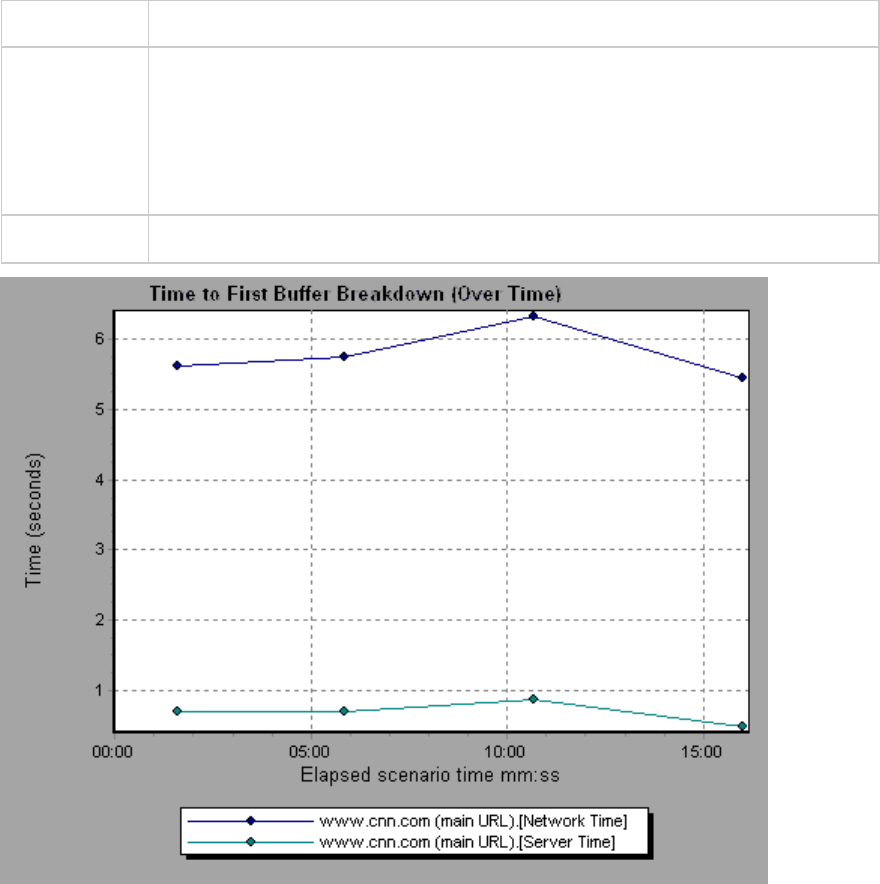
inaccurate.
Note lEach measurement displayed on the page level is the sum of that measurement
recorded for each page component. For example, the network time for
www.hp.com is the sum of the network time for each of the page's components.
lWhen the Time to First Buffer Breakdown (Over Time) graph is selected from the
Web Page Diagnostics graph, it appears as an area graph.
See also "Web Page Diagnostics Graphs Overview" on page1535
User Guide
Analysis
HP LoadRunner (12.50) Page 1550
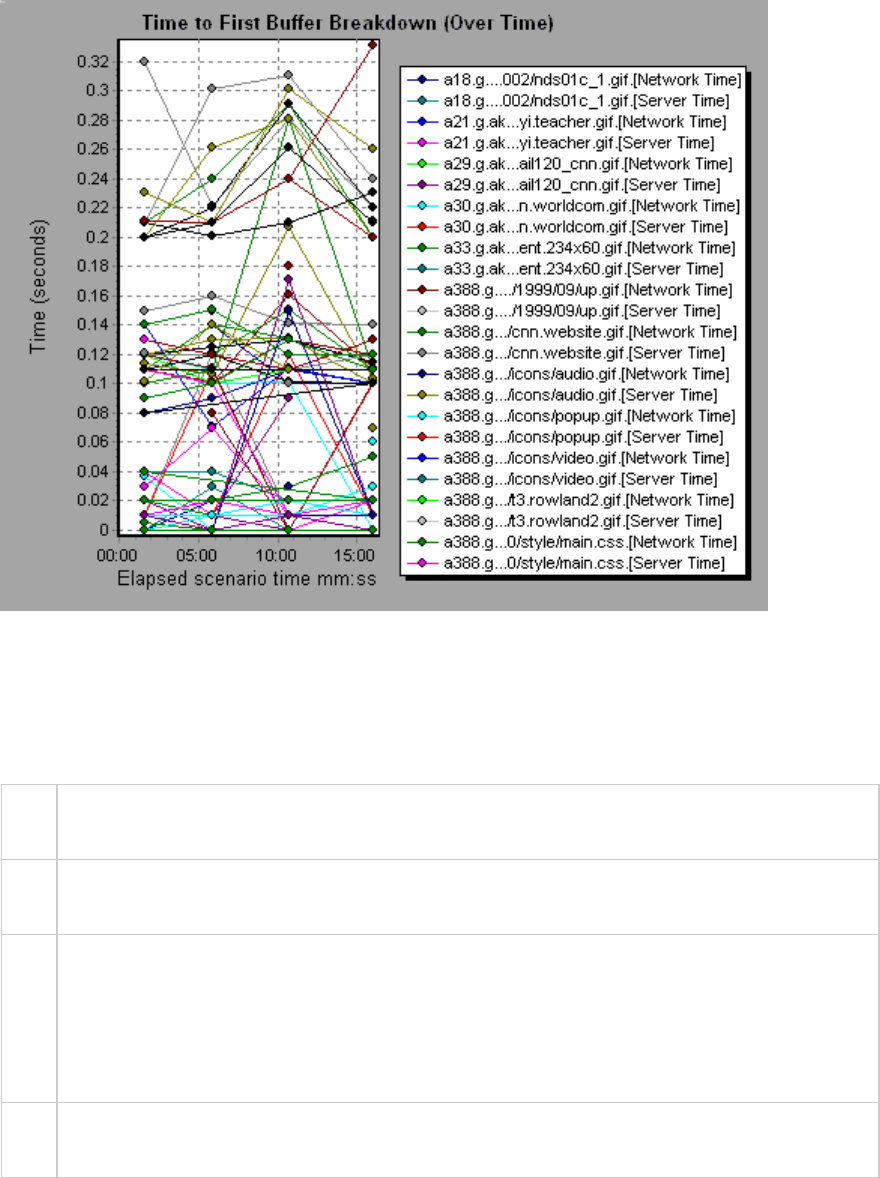
Example
In the following example you can break the main cnn.com URL down further to view the time to first
buffer breakdown for each of its components.
Client Side Breakdown (Over Time) Graph
This graph displays the client side breakdown of each transaction during each second of the load test
scenario run.
X-
axis
The elapsed time from the beginning of the scenario run.
Y-
axis
The average response time (in seconds) for each transaction.
Tips lTo isolate the most problematic transactions, it may be helpful to sort the legend window
according to the average number of seconds taken for the transaction to run. To sort the
legend by average, double-click the Average column heading.
lTo identify a transaction in the graph, you can select it. The corresponding line in the legend
window is selected.
See
also
"Web Page Diagnostics Graph" on page1538
User Guide
Analysis
HP LoadRunner (12.50) Page 1551
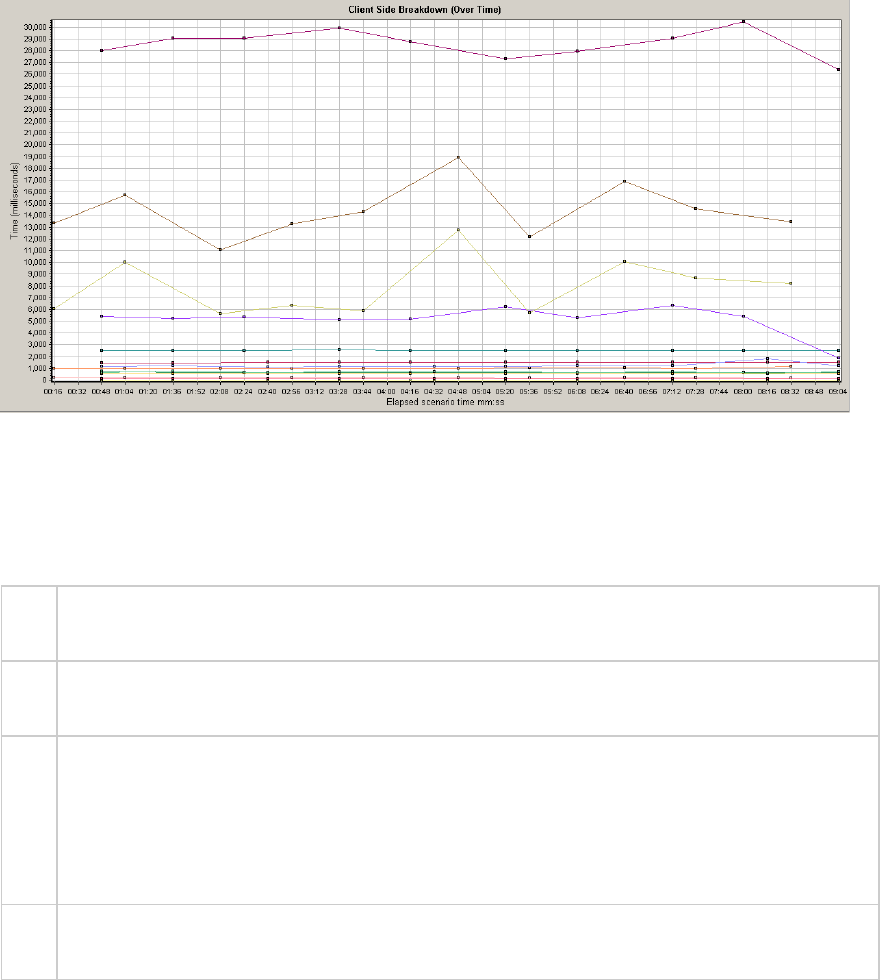
Example
Using the graph, you can track which transactions on the client side were most problematic, and at
which point(s) during the scenario the problem(s) occurred.
Client Side Java Script Breakdown (Over Time) Graph
This graph displays the client side breakdown of each JavaScript transaction during each second of the
load test scenario run.
X-
axis
The elapsed time from the beginning of the scenario run.
Y-
axis
The average response time (in seconds) for each transaction.
Tips lTo isolate the most problematic transactions, it may be helpful to sort the legend window
according to the average number of seconds taken for the transaction to run. To sort the
legend by average, double-click the Average column heading.
lTo identify a transaction in the graph, you can select it. The corresponding line in the legend
window is selected.
See
also
"Web Page Diagnostics Graph" on page1538
Example
Using the graph, you can track which transactions on the client side were most problematic, and at
which point(s) during the scenario the problem(s) occurred.
User Guide
Analysis
HP LoadRunner (12.50) Page 1552
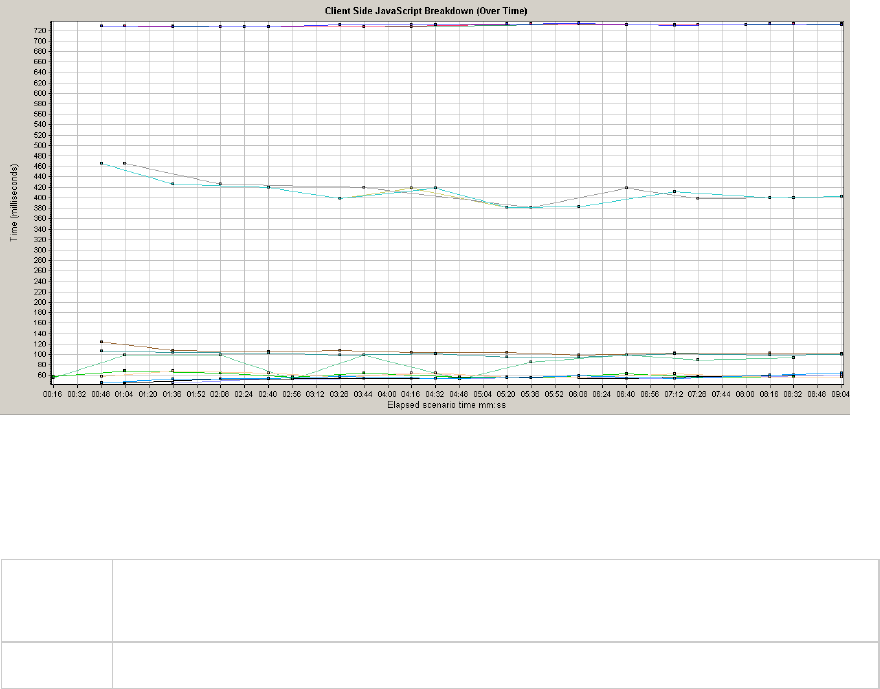
Downloaded Component Size Graph
This graph displays the size of each Web page component.
Note lThe Web page size is a sum of the sizes of each of its components.
lThe Downloaded Component Size graph can only be viewed as a pie graph.
See also "Web Page Diagnostics Graphs Overview" on page1535
Example
In the following example the www.cnn.com/WEATHER component is 39.05% of the total size, whereas
the main cnn.com component is 34.56% of the total size.
User Guide
Analysis
HP LoadRunner (12.50) Page 1553
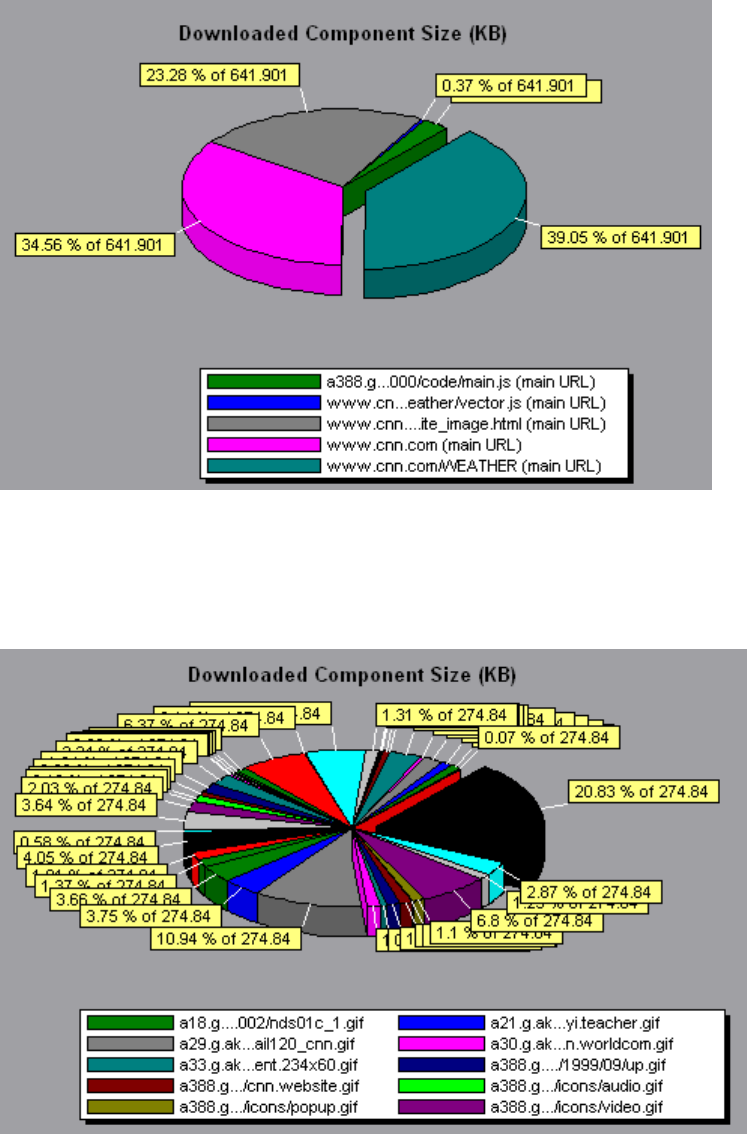
Example
In the following example the cnn.com component's size (20.83% of the total size) may have contributed
to the delay in its downloading. To reduce download time, it may help to reduce the size of this
component.
User-Defined Data Point Graphs
User Guide
Analysis
HP LoadRunner (12.50) Page 1554

User-Defined Data Point Graphs Overview
The User-Defined Data Point graphs display the values of user-defined data points. You define a data
point in your Vuser script by inserting an lr_user_data_point function at the appropriate place (user_
data_point for GUI Vusers and lr.user_data_point for Java Vusers).
Action1()
{
lr_think_time(1);
lr_user_data_point ("data_point_1",1);
lr_user_data_point ("data_point_2",2);
return 0;
}
For Vuser protocols that support the graphical script representations such as Web and Oracle NCA, you
insert a data point as a User Defined step. Data point information is gathered each time the script
executes the function or step. For more information about data points, refer to the Function Reference.
Data points, like other Analysis data, are aggregated every few seconds, resulting in less data points
shown on the graph than actually recorded. For more information, see "Changing the Granularity of the
Data" on page1468.
Data Points (Average) Graph
This graph shows the average values that were recorded for user-defined data points during the load
test scenario run.
Purpose This graph is typically used in cases where the actual value of the measurement is
required. Suppose that each Vuser monitors CPU utilization on its machine and records it
as a data point. In this case, the actual recorded value of CPU utilization is required. The
Average graph displays the average value recorded throughout the scenario.
X-axis Elapsed time since the start of the run.
Y-axis The average values of the recorded data point statements.
See
also
"User-Defined Data Point Graphs Overview" above
Example
In the following example, the CPU utilization is recorded as the data point user_data_point_val_1. It is
shown as a function of the elapsed scenario time.
User Guide
Analysis
HP LoadRunner (12.50) Page 1555
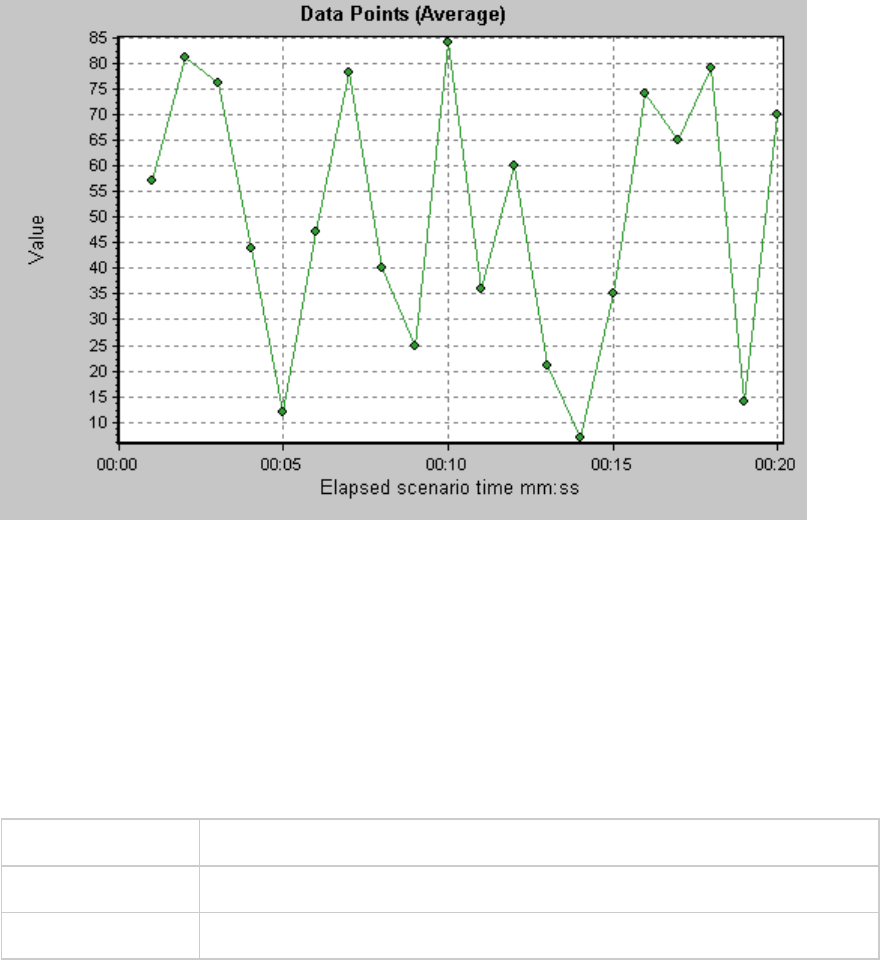
Data Points (Sum) Graph
This graph shows the sum of the values for user-defined data points throughout the load test scenario
run.
This graph typically indicates the total amount of measurements which all Vusers are able to generate.
For example, suppose only a certain set of circumstances allow a Vuser to call a server. Each time it
does, a data point is recorded. In this case, the Sum graph displays the total number of times that
Vusers call the function.
X-axis Elapsed time since the start of the run.
Y-axis The sum of the recorded data point values.
See also "User-Defined Data Point Graphs Overview" on the previous page
Example
In the following example, the call to the server is recorded as the data point user_data_point_val_1. It is
shown as a function of the elapsed scenario time.
User Guide
Analysis
HP LoadRunner (12.50) Page 1556
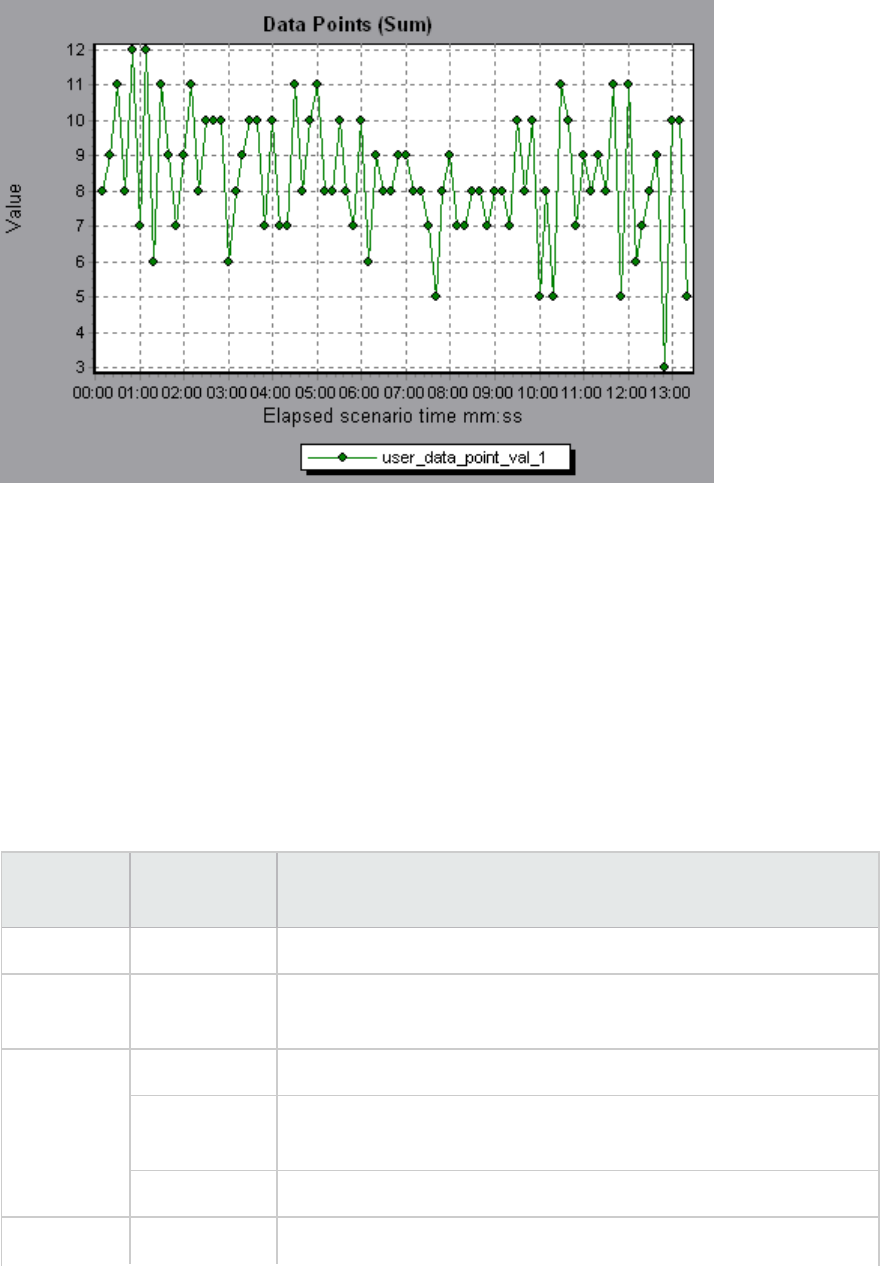
System Resource Graphs
System Resource graphs display the system resource usage measured by the online monitors during
the load test scenario run. These graphs require that you specify the resources you want to measure
before running the scenario. For more information, see the section on online monitors in the
LoadRunner Controller documentation.
Server Resources Performance Counters
The following table describes the available counters:
Monitor Measurements Description
CPU Monitor Utilization Measures CPU utilization.
Disk Space
Monitor
Disk space Measures the amount (in MB) free disk space and the percentage of
disk space used.
Memory
Monitor
MB free Measures the amount of free memory (in MB).
Pages/sec Measures the number of virtual memory pages that are moved
between main memory and disk storage.
Percent used Measures the percentage of memory and paging file space used.
Services Monitors processes locally or on remote systems. Can be used to
User Guide
Analysis
HP LoadRunner (12.50) Page 1557

Monitor Measurements Description
Monitor verify that specific processes are running.
Linux Resources Default Measurements
The following default measurements are available for Linux machines:
Measurement Description
Average load Average number of processes simultaneously in `Ready' state during the
last minute.
Collision rate Collisions per second detected on the Ethernet.
Context switches rate Number of switches between processes or threads, per second.
CPU utilization Percent of time that the CPU is utilized.
Disk rate Rate of disk transfers.
Incoming packets error
rate
Errors per second while receiving Ethernet packets.
Incoming packets rate Incoming Ethernet packets per second.
Interrupt rate Number of device interrupts per second.
Outgoing packets errors
rate
Errors per second while sending Ethernet packets.
Outgoing packets rate Outgoing Ethernet packets per second.
Page-in rate Number of pages read to physical memory, per second.
Page-out rate Number of pages written to pagefile(s) and removed from physical
memory, per second.
Paging rate Number of pages read to physical memory or written to
pagefile(s), per second.
Swap-in rate The rate by which disk content is swapped into the machine's memory in
Kbps.
Swap-out rate The rate by which the machine's memory is being swapped out to disk in
Kbps.
System mode CPU Percent of time that the CPU is utilized in system mode.
User Guide
Analysis
HP LoadRunner (12.50) Page 1558

Measurement Description
utilization
User mode CPU
utilization
Percent of time that the CPU is utilized in user mode.
Windows Resources Default Measurements
The following default measurements are available for Windows Resources:
Object Measurement Description
System % Total
Processor
Time
The average percentage of time that all the processors on the
system are busy executing non-idle threads. On a multi-processor
system, if all processors are always busy, this is 100%, if all
processors are 50% busy this is 50% and if 1/4 of the processors are
100% busy this is 25%. It can be viewed as the fraction of the time
spent doing useful work. Each processor is assigned an Idle thread in
the Idle process which consumes those unproductive processor
cycles not used by any other threads.
Processor % Processor
Time
The percentage of time that the processor is executing a non-idle
thread. This counter was designed as a primary indicator of
processor activity. It is calculated by measuring the time that the
processor spends executing the thread of the idle process in each
sample interval, and subtracting that value from 100%. (Each
processor has an idle thread which consumes cycles when no other
threads are ready to run.) It can be viewed as the percentage of the
sample interval spent doing useful work. This counter displays the
average percentage of busy time observed during the sample
interval. It is calculated by monitoring the time the service was
inactive, and then subtracting that value from 100%.
System File Data
Operations/sec
The rate at which the computer issues read and write operations to
file system devices. This does not include File Control Operations.
System Processor
Queue Length
The instantaneous length of the processor queue in units of
threads. This counter is always 0 unless you are also monitoring a
thread counter. All processors use a single queue in which threads
wait for processor cycles. This length does not include the threads
that are currently executing. A sustained processor queue length
greater than two generally indicates processor congestion. This is
an instantaneous count, not an average over the time interval.
User Guide
Analysis
HP LoadRunner (12.50) Page 1559

Object Measurement Description
Memory Page
Faults/sec
This is a count of the page faults in the processor. A page fault
occurs when a process refers to a virtual memory page that is not in
its Working Set in the main memory. A page fault will not cause the
page to be fetched from disk if that page is on the standby list (and
hence already in main memory), or if it is in use by another process
with which the page is shared.
PhysicalDisk % Disk Time The percentage of elapsed time that the selected disk drive is busy
servicing read or write requests.
Memory Pool Nonpaged
Bytes
The number of bytes in the non-paged pool, a system memory area
where space is acquired by operating system components as they
accomplish their appointed tasks. Non-paged pool pages cannot be
paged out to the paging file. They remain in main memory as long as
they are allocated.
Memory Pages/sec The number of pages read from the disk or written to the disk to
resolve memory references to pages that were not in memory at
the time of the reference. This is the sum of Pages Input/sec and
Pages Output/sec. This counter includes paging traffic on behalf of
the system cache to access file data for applications. This value also
includes the pages to/from non-cached mapped memory files. This
is the primary counter to observe if you are concerned about
excessive memory pressure (that is, thrashing), and the excessive
paging that may result.
System Total
Interrupts/sec
The rate at which the computer is receiving and servicing hardware
interrupts. The devices that can generate interrupts are the system
timer, the mouse, data communication lines, network interface
cards, and other peripheral devices. This counter provides an
indication of how busy these devices are on a computer-wide basis.
See also Processor:Interrupts/sec.
Objects Threads The number of threads in the computer at the time of data
collection. Notice that this is an instantaneous count, not an average
over the time interval. A thread is the basic executable entity that
can execute instructions in a processor.
Process Private Bytes The current number of bytes that the process has allocated that
cannot be shared with other processes.
User Guide
Analysis
HP LoadRunner (12.50) Page 1560
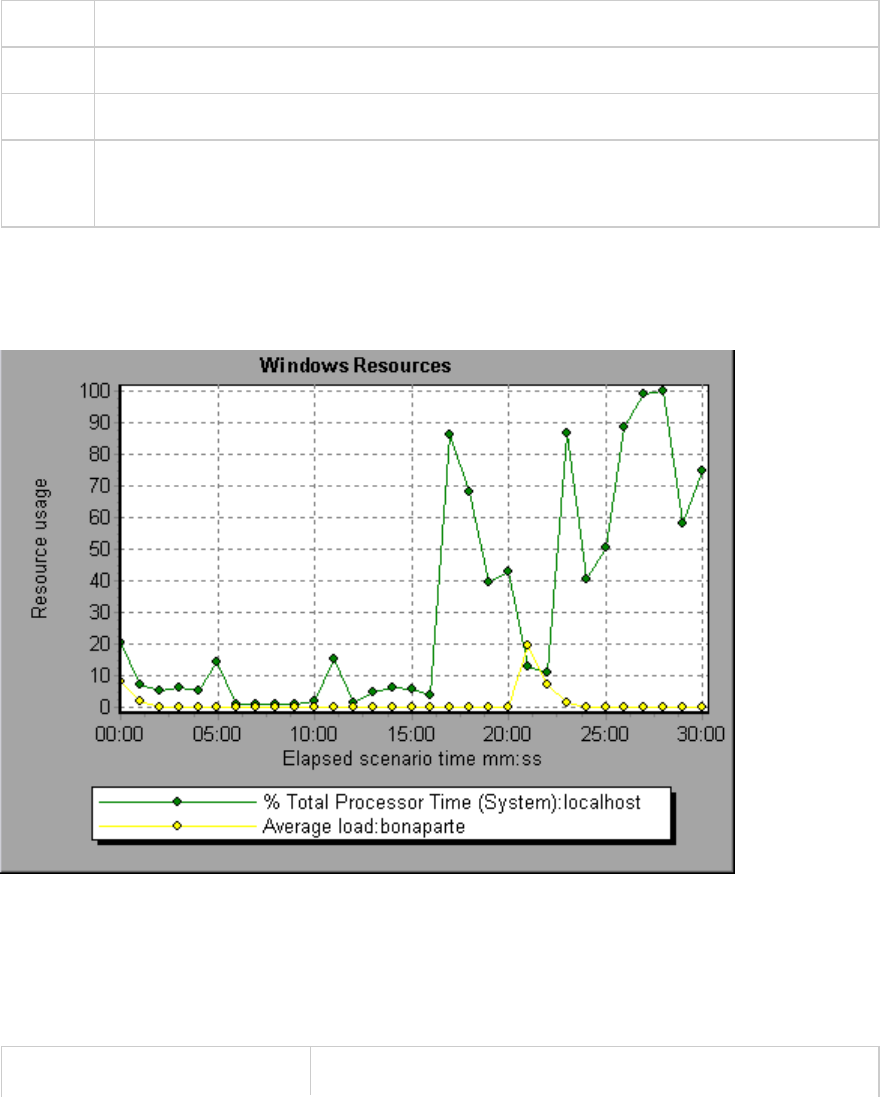
Server Resources Graph
This graph shows the resources (CPU, disk space, memory, or services) used on remote Linux servers
measured during the load test scenario.
Purpose This graph helps you determine the impact of Vuser load on the various system resources.
X-axis Elapsed time since the start of the run.
Y-axis The usage of resources on the Linux server.
See also "System Resource Graphs" on page1557
"Server Resources Performance Counters" on page1557
Example
In the following example, Windows resource utilization is measured during the load test scenario. It is
shown as a function of the elapsed scenario time.
Host Resources Graph
This graph displays a summary of the System Resources usage for each Windows based Performance
Center host (Controller and Load Generators). measured during the load test scenario.
Purpose This graph helps you determine the impact of Vuser load on the
User Guide
Analysis
HP LoadRunner (12.50) Page 1561
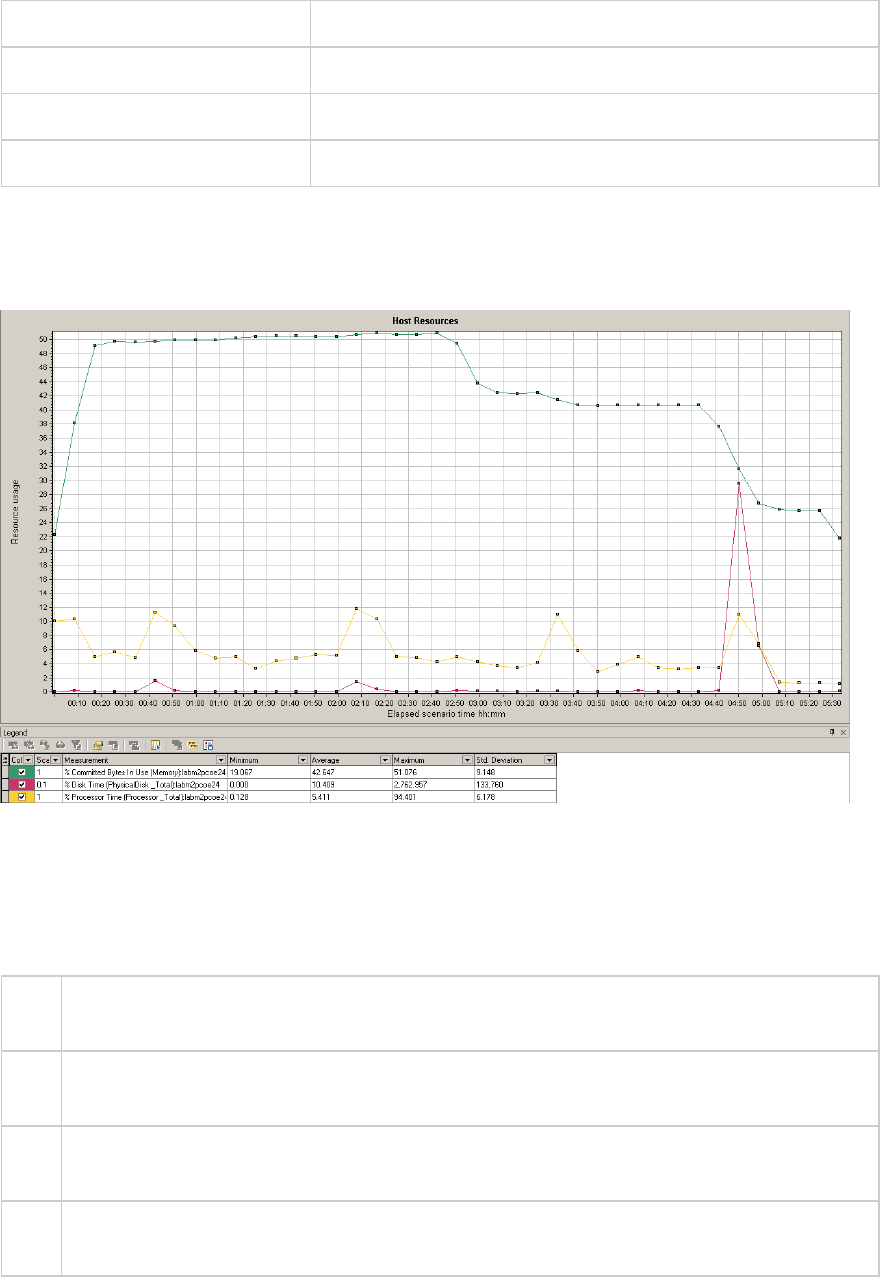
various host resources.
X-axis Elapsed time since the start of the run.
Y-axis The usage of resources on the Windows hosts.
See also "System Resource Graphs" on page1557
Example
In the following example, you can see a peak in the usage of Disk Time and Processor Time as the
Memory Usage gets less towards the end of the load test.
SNMP Resources Graph
This graph shows statistics for machines running an SNMP agent, using the Simple Network
Management Protocol (SNMP).
X-
axis
Elapsed time since the start of the run.
Y-
axis
The usage of resources on a machine running the SNMP agent.
Note To obtain data for this graph, you need to enable the SNMP monitor (from the Controller) and
select the default measurements you want to display, before running the scenario.
See
also
"System Resource Graphs" on page1557
User Guide
Analysis
HP LoadRunner (12.50) Page 1562
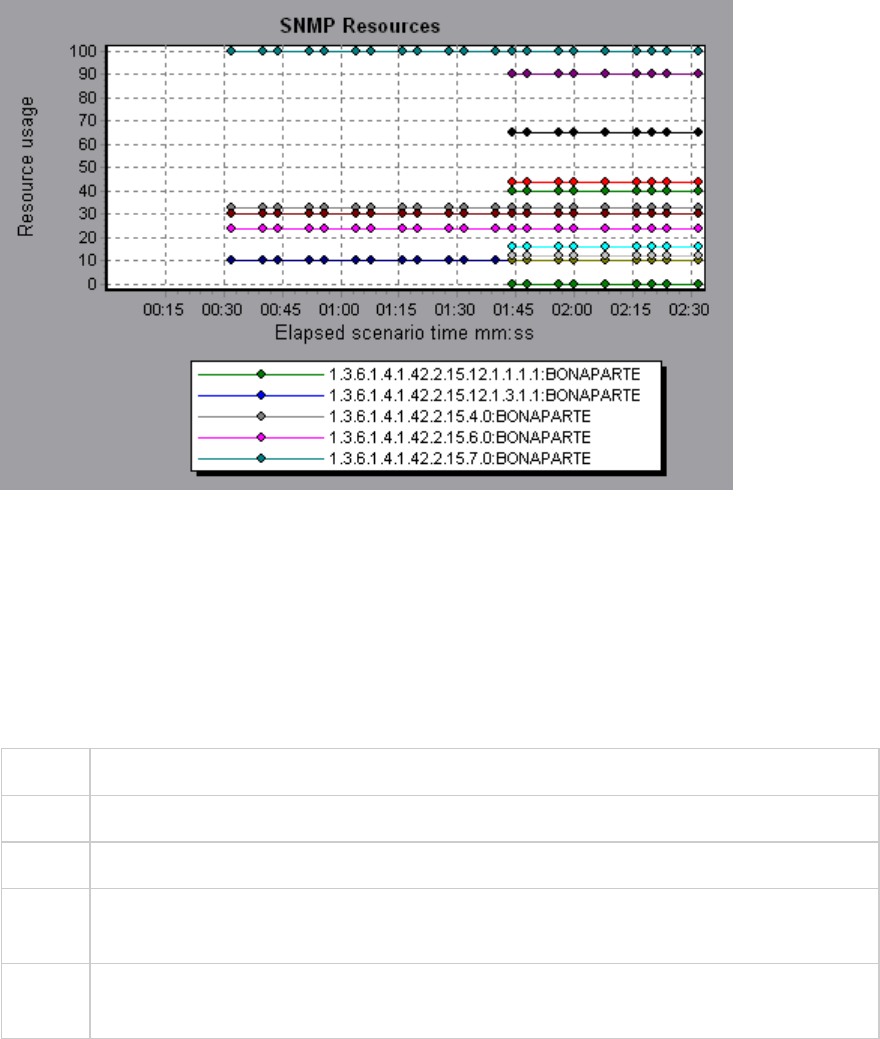
Example
In the following example SNMP measurements are displayed for a machine called bonaporte.
Linux Resources Graph
This graph shows the Linux resources measured during the load test scenario. The Linux measurements
include those available by the rstatd daemon: average load, collision rate, context switch rate, CPU
utilization, incoming packets error rate, incoming packets rate, interrupt rate, outgoing packets error
rate, outgoing packets rate, page-in rate, page-out rate, paging rate, swap-in rate, swap-out rate,
system mode CPU utilization, and user mode CPU utilization.
Purpose This graph helps you determine the impact of Vuser load on the various system resources.
X-axis Elapsed time since the start of the run.
Y-axis The usage of resources on the Linux machine.
Note To obtain data for this graph, you need to select the desired measurements for the online
monitor (from the Controller) before running the scenario.
See
also
"Linux Resources Default Measurements" on page1558
Example
In the following example Linux resources are measured during the load test scenario.
User Guide
Analysis
HP LoadRunner (12.50) Page 1563
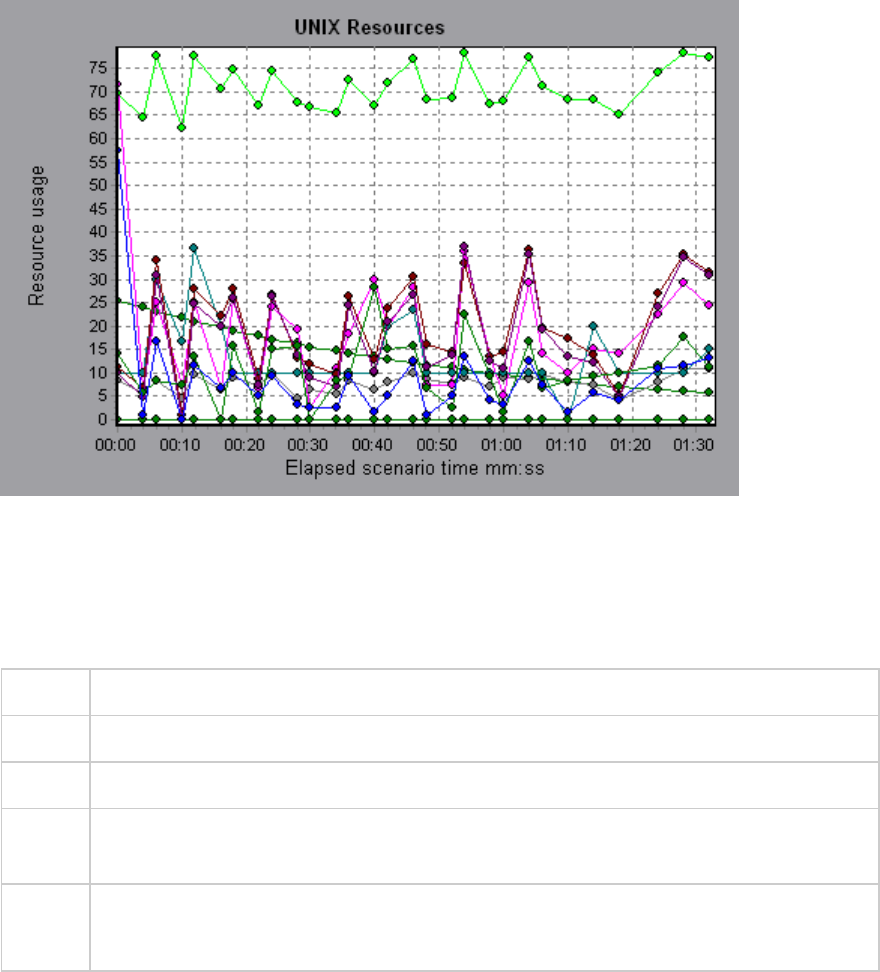
Windows Resources Graph
This graph shows the Windows resources measured during the load test scenario. The Windows
measurements correspond to the built-in counters available from the Windows Performance Monitor.
Purpose This graph helps you determine the impact of Vuser load on the various system resources.
X-axis Elapsed time since the start of the run.
Y-axis The usage of resources on the Windows machine running the load test scenario.
Note To obtain data for this graph, you need to select the desired measurements for the online
monitor (from the Controller) before running the scenario.
See
also
"System Resource Graphs" on page1557
"Windows Resources Default Measurements" on page1559
Example
In the following example Windows resources are measured on the server running the load test scenario.
User Guide
Analysis
HP LoadRunner (12.50) Page 1564
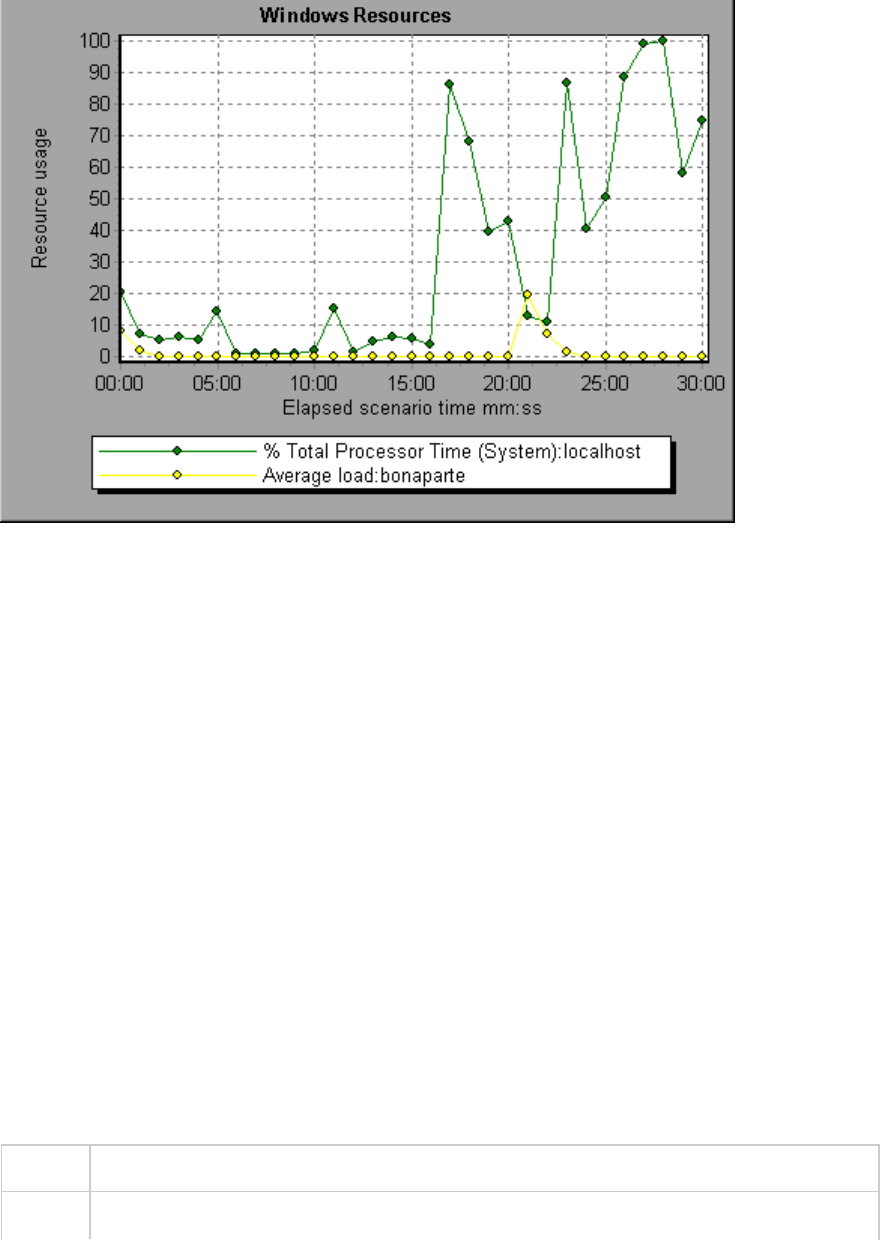
Network Virtualization Graphs
LoadRunner integrates with HP Network Virtualization. This enables you to test point-to-point
performance of WAN or other network deployed products under real-world network conditions. By
installing software on your load generators, you introduce highly probable effects such as latency,
packet loss, and link faults over your network. As a result of this, your scenario performs the test in an
environment that better represents the actual deployment of your application.
You can create more meaningful results by configuring multiple load generator machines or groups on a
single load generator with the same unique set of network effects, and by giving each set a unique
location name, such as NY- London. When viewing scenario results in Analysis, you can group the metrics
according to their location names.
For details about the integration, see "Network Virtualization Integration" on page1366.
Packet Loss Graph
This graph shows packets lost during the last second of the scenario run. Packet loss occurs when data
packets fail to reach their destination. It can result from gateway overload, signal degradation, channel
congestion, or faulty hardware.
Purpose Helps you understand how many data packets were lost over a specific time interval.
X-axis Elapsed time since the start of the run.
User Guide
Analysis
HP LoadRunner (12.50) Page 1565

Y-axis The following measurements:
lThe percentage of lost packets from all packets that were sent.
lThe number of data packets that were lost over 60 seconds.
lThe total number of packets that were lost.
Note You cannot change the granularity of the x-axis to a value that is less than the Web
granularity you defined in the General tab of the Options dialog box.
Tip For LoadRunner Analysis (not applicable to monitoring graphs):
To view information for a specific location:
1. Click within the graph.
2. Select Set Filter/ Sort By from the right-click menu to open the Graph Settings dialog
box.
3. In the Filter condition section, select the Location Name row, and select the desired
location from the drop-down list.
See
also
"Network Virtualization Graphs" on the previous page
User Guide
Analysis
HP LoadRunner (12.50) Page 1566
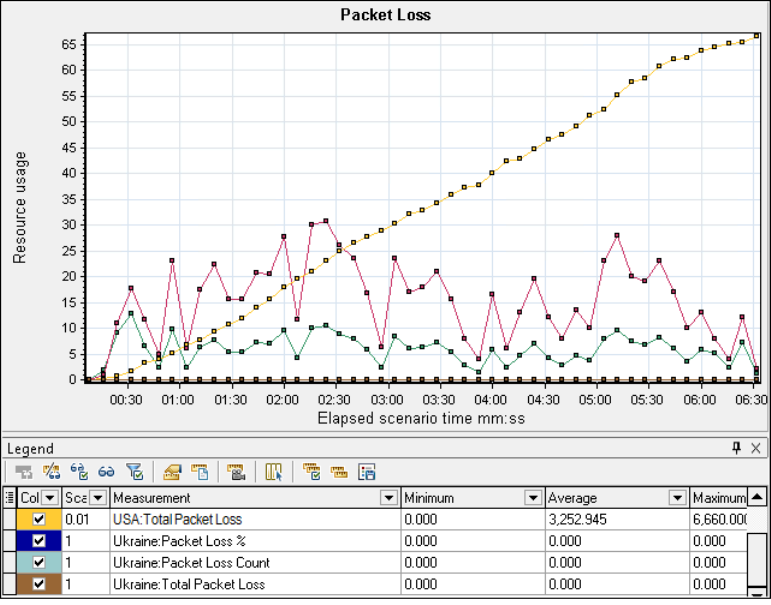
Example - Network Virtualization Per Group
The following example shows how the total of packet loss for the USA group increased as the scenario
progressed.
User Guide
Analysis
HP LoadRunner (12.50) Page 1567
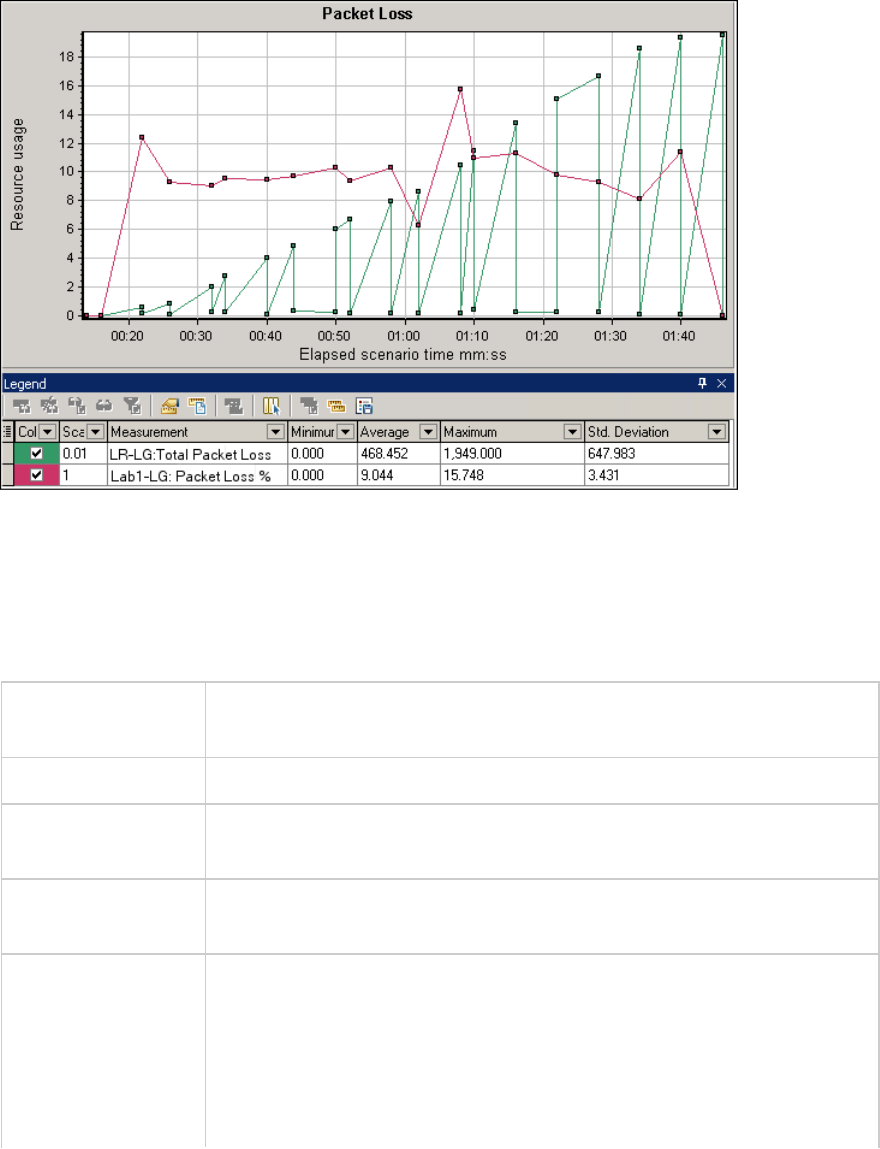
Example - Network Virtualization Per Load Generator
In the following example, you can see that the packet loss is grouped by load generator. This was the
mode selected when you enabled Network Virtualization for the scenario.
Average Latency Graph
This graph shows the average recorded time required for a packet of data to travel from the indicated
source point to the required destination, measured in milliseconds in the last 60 seconds.
Purpose Helps you evaluate the time required for a packet of data to travel over the
network.
X-axis Elapsed time since the start of the run.
Y-axis The average latency—the time in milliseconds required for a packet of data
to reach its destination, per 60 second intervals.
Note You cannot change the granularity of the x-axis to a value that is less than
the Web granularity you defined in the General tab of the Options dialog box.
Tips For LoadRunner Analysis (not applicable to monitoring graphs):
To view information for a specific location:
1. Click within the graph.
2. Select Set Filter/ Sort By from the right-click menu to open the Graph
Settings dialog box.
User Guide
Analysis
HP LoadRunner (12.50) Page 1568
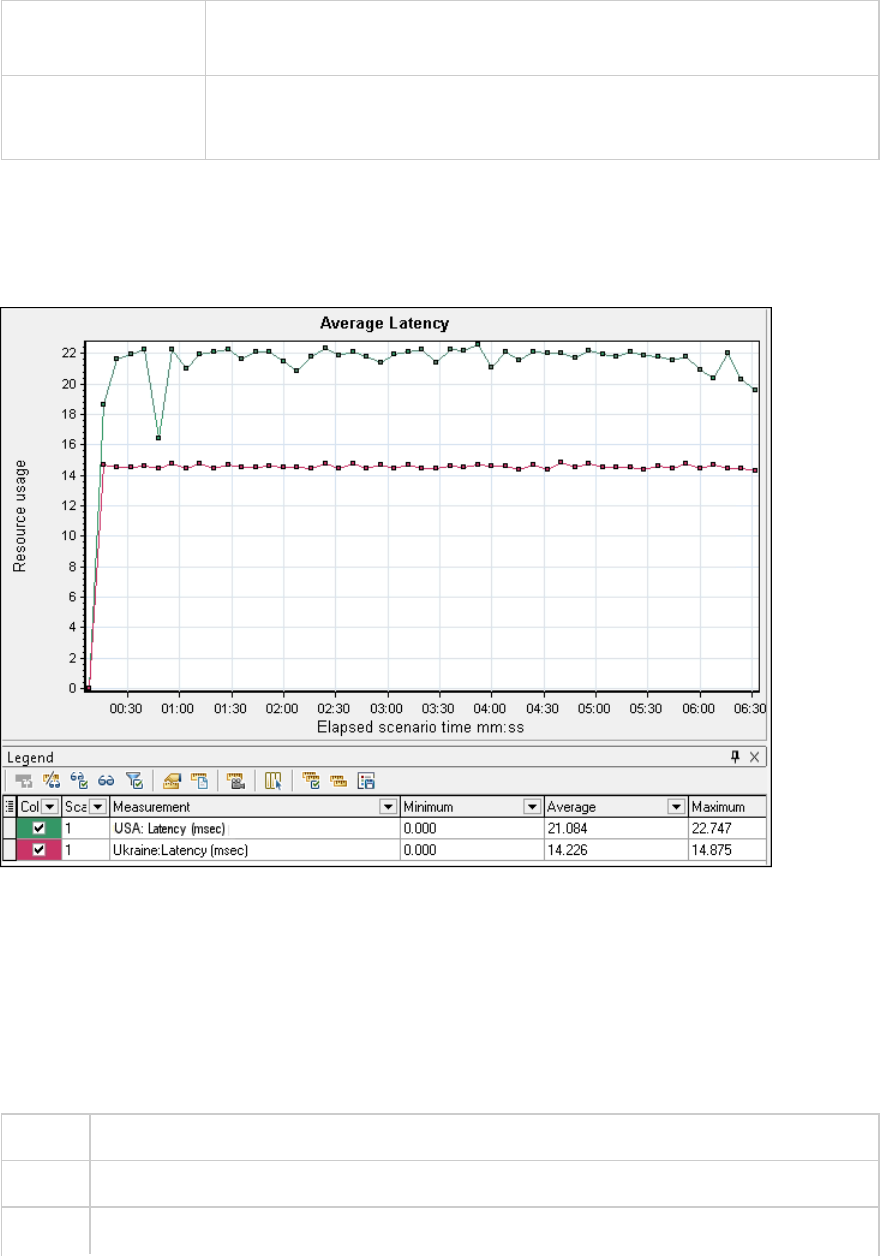
3. In the Filter condition section, select the Location Name row, and select
the desired location from the drop-down list.
See also l"Network Virtualization Graphs" on page1565
l"Custom Filter Dialog Box" on page1490
Example - Network Virtualization Per Group
In the following example, you can see that the latency for the USA group reached its peak at nearly 4
minutes into the scenario run, while the Ukraine group remained fairly constant at approximately 14
msec.
If you enabled Network Virtualization per load generator (and not per group), the graph shows the
measurements per load generator, as shown in the "Packet Loss Graph" on page1565.
Average Bandwidth Utilization Graph
This graph shows the average bandwidth utilized by a virtual user or a virtualized location from the
maximal available bandwidth allocated for it during the last second, measured in percentages.
Purpose Helps you evaluate the bandwidth used over your network.
X-axis Elapsed time since the start of the run.
Y-axis The percentage of bandwidth utilization.
User Guide
Analysis
HP LoadRunner (12.50) Page 1569
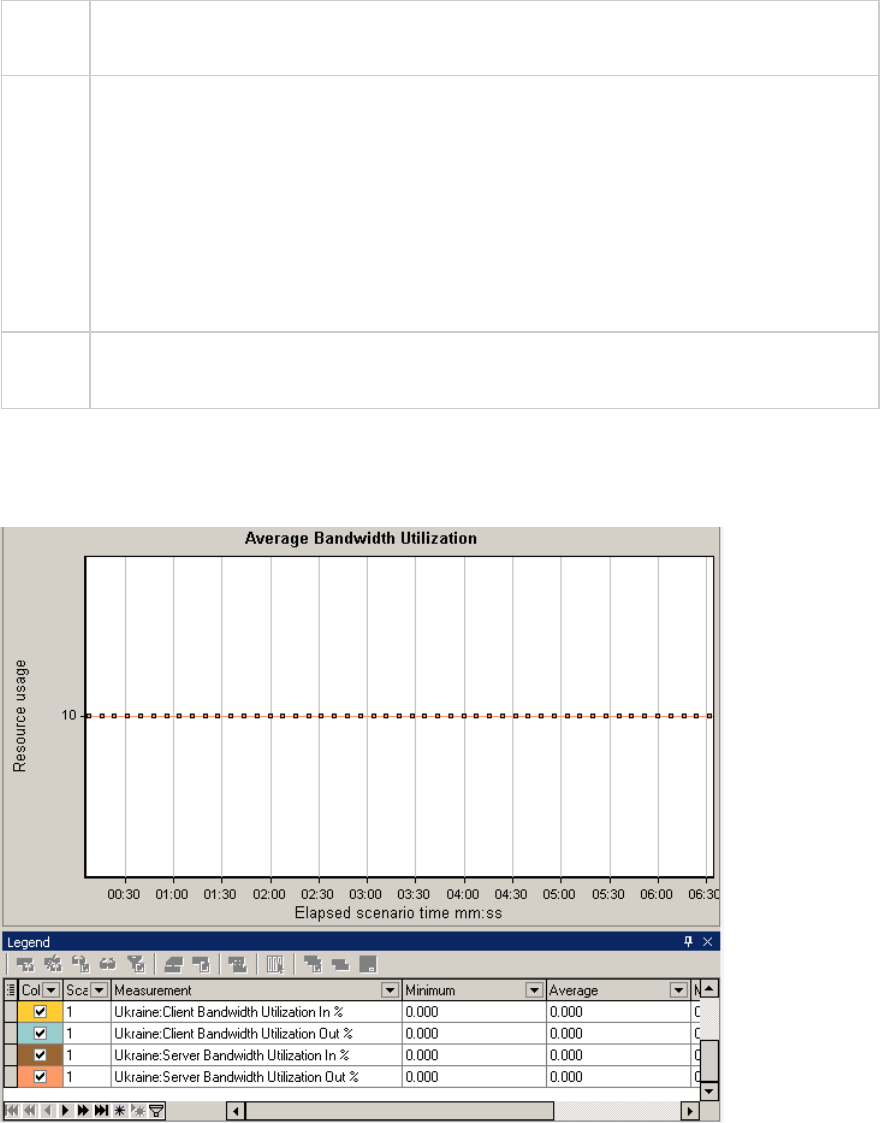
Note You cannot change the granularity of the x-axis to a value that is less than the Web
granularity you defined in the General tab of the Options dialog box.
Tips For LoadRunner Analysis (not applicable to monitoring graphs):
To view information for a specific location:
1. Click within the graph.
2. Select Set Filter/ Sort By from the right-click menu to open the Graph Settings dialog
box.
3. In the Filter condition section, select the Location Name row, and select the desired
location from the drop-down list.
See
also
"Network Virtualization Graphs" on page1565
Example
In the following example, you can see that the bandwidth utilization for all locations and measurements,
was constant at 10%.
If you enabled Network Virtualization per load generator (and not per group), the graph shows the
measurements per load generator, as shown in the "Packet Loss Graph" on page1565.
User Guide
Analysis
HP LoadRunner (12.50) Page 1570

Average Throughput Graph
This graph shows the average data traffic passing to or from the virtualized location, measured in
kilobytes per second (kbps).
Purpose Helps you evaluate the amount of load Vusers generate, in terms of the number of server
and client throughput. The graph shows metrics for input and output traffic for both the
server and client machines. Use the legend below the graph to determine the line color for
each metric.
X-axis Elapsed time since the start of the run.
Y-axis The rate of data passing to and from the virtual location, in kbps for the following metrics
per group or load generator:
lInput to the client machine
lOutput from the client machine
lInput to the server machine
lOutput from the server machine
Note You cannot change the granularity of the x-axis to a value that is less than the Web
granularity you defined in the General tab of the Options dialog box.
Tips For LoadRunner Analysis (not applicable to monitoring graphs):
To view information for a specific location:
1. Click within the graph.
2. Select Set Filter/ Sort By from the right-click menu to open the Graph Settings dialog
box.
3. In the Filter condition section, select the Location Name row, and select the desired
location from the drop-down list.
See
also
"Total Throughput Graph" on the next page
User Guide
Analysis
HP LoadRunner (12.50) Page 1571
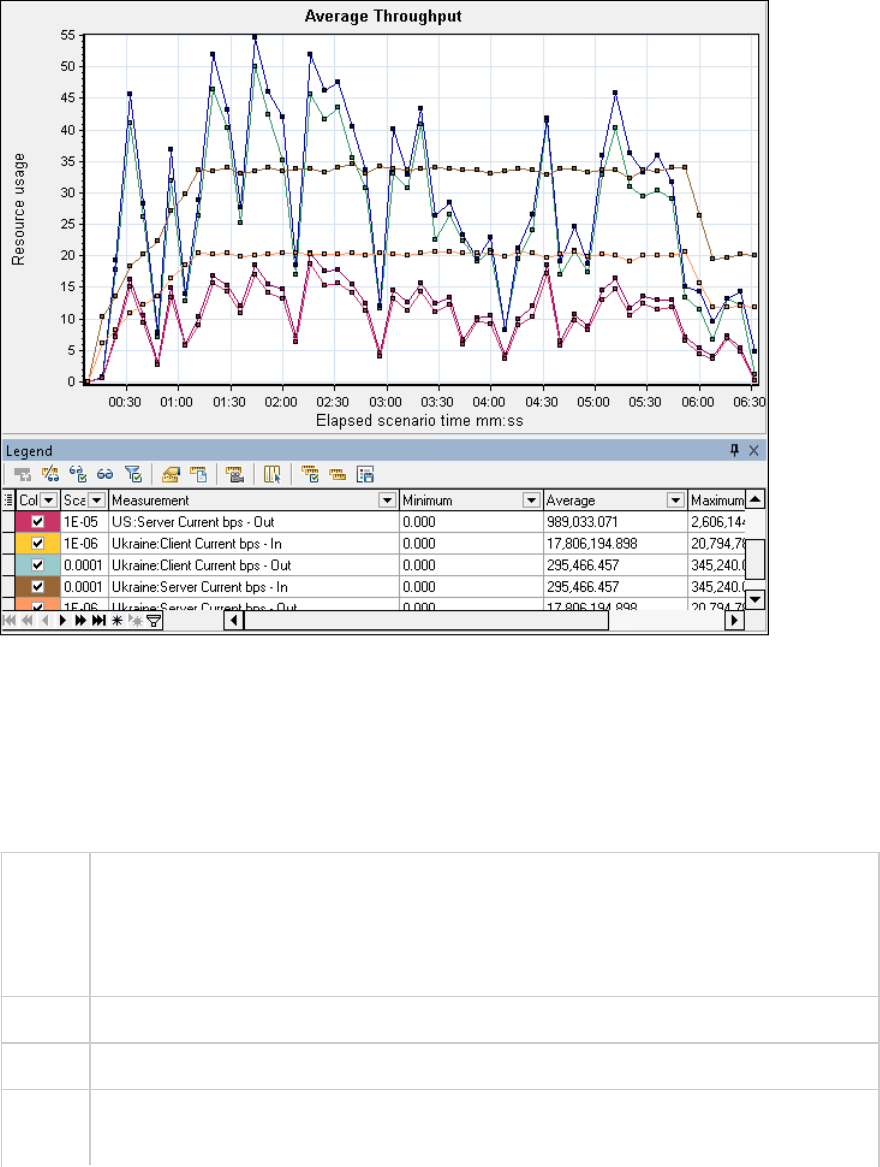
Example
In the following example, the average server input throughput was the lowest for the Ukraine group.
If you enabled Network Virtualization per load generator (and not per group), the graph shows the
measurements per load generator, as shown in the "Packet Loss Graph" on page1565.
Total Throughput Graph
Displays the total data traffic passing to or from the virtualized location, measured in kilobytes.
Purpose Helps you evaluate the total amount of load that Vusers generate while running a scenario
with network virtualization.
The graph shows metrics for input and output traffic for both the server and client
machines. The legend below the graph indicates the line color for each of these metrics.
X-axis Elapsed time since the start of the run.
Y-axis Throughput of the server, in kilobytes per second (Kbps).
Note You cannot change the granularity of the x-axis to a value that is less than the Web
granularity you defined in the General tab of the Options dialog box.
User Guide
Analysis
HP LoadRunner (12.50) Page 1572
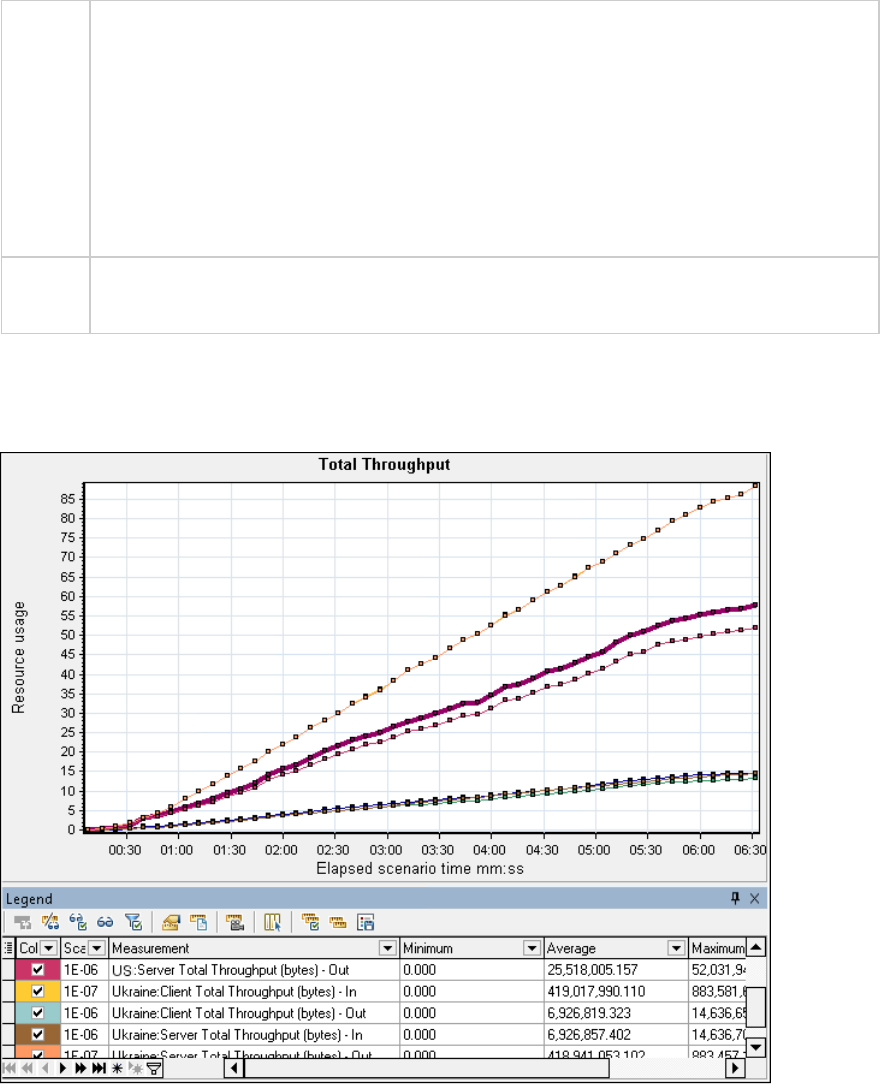
Tips For LoadRunner Analysis (not applicable to monitoring graphs):
To view information for a specific location:
1. Click within the graph.
2. Select Set Filter/ Sort By from the right-click menu to open the Graph Settings dialog
box.
3. In the Filter condition section, select the Location Name row, and select the desired
location from the drop-down list.
See
also
"Average Throughput Graph" on page1571
Example
In the following example, the highest throughput level was for the input data to the client, for the
Ukraine group.
If you enabled Network Virtualization per load generator (and not per group), the graph shows the
measurements per load generator, as shown in the "Packet Loss Graph" on page1565.
Network Monitor Graphs
User Guide
Analysis
HP LoadRunner (12.50) Page 1573

Network Monitor Graphs Overview
Network configuration is a primary factor in the performance of applications and Web systems. A poorly
designed network can slow client activity to unacceptable levels. In an application, there are many
network segments. A single network segment with poor performance can affect the entire application.
The following diagram shows a typical network. To go from the server machine to the Vuser machine,
data must travel over several segments.
To measure network performance, the Network monitor sends packets of data across the network.
When a packet returns, the monitor calculates the time it takes for the packet to go to the requested
node and return.
The Network Sub-Path Time graph displays the delay from the source machine to each node along the
path. The Network Segment Delay graph displays the delay for each segment of the path. The Network
Delay Time graph displays the delay for the complete path between the source and destination
machines.
Using the Network Monitor graphs, you can determine whether the network is causing a bottleneck. If
the problem is network-related, you can locate the problematic segment so that it can be fixed.
In order for Analysis to generate Network monitor graphs, you must activate the Network monitor
before executing the load test scenario. In the Network monitor settings, you specify the path you want
to monitor. For information about setting up the Network monitor, see "Network Delay Monitoring" on
page1319.
Network Delay Time Graph
This graph shows the delays for the complete path between the source and destination machines (for
example, the database server and Vuser load generator). The graph maps the delay as a function of the
elapsed load test scenario time.
Each path defined in the Controller is represented by a separate line with a different color in the graph.
X- Elapsed time since the start of the run.
User Guide
Analysis
HP LoadRunner (12.50) Page 1574
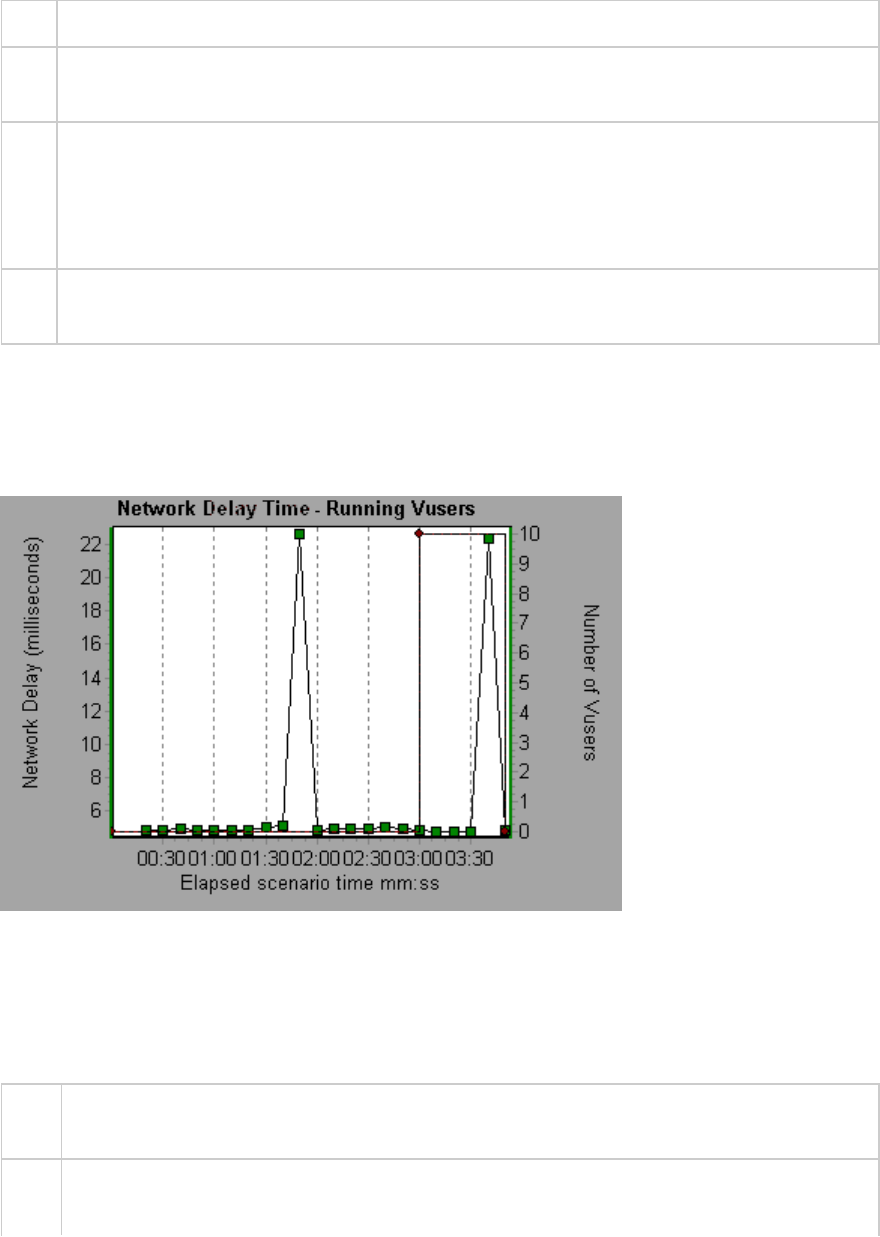
axis
Y-
axis
Network delay time.
Tips Merge graphs to determine network bottleneck
You can merge various graphs to determine if the network is a bottleneck. For example,
using the Network Delay Time and Running Vusers graphs, you can determine how the
number of Vusers affects the network delay.
See
also
"Network Monitor Graphs Overview" on the previous page
Example
In the following example of a merged graph, the network delays are compared to the running Vusers.
The graph shows that when all 10 Vusers were running, a network delay of 22 milliseconds occurred,
implying that the network may be overloaded.
Network Segment Delay Graph
This graph shows the delay for each segment of the path according to the elapsed load test scenario
time. Each segment is displayed as a separate line with a different color.
X-
axis
Elapsed time since the start of the run.
Y-
axis
Network delay time.
User Guide
Analysis
HP LoadRunner (12.50) Page 1575
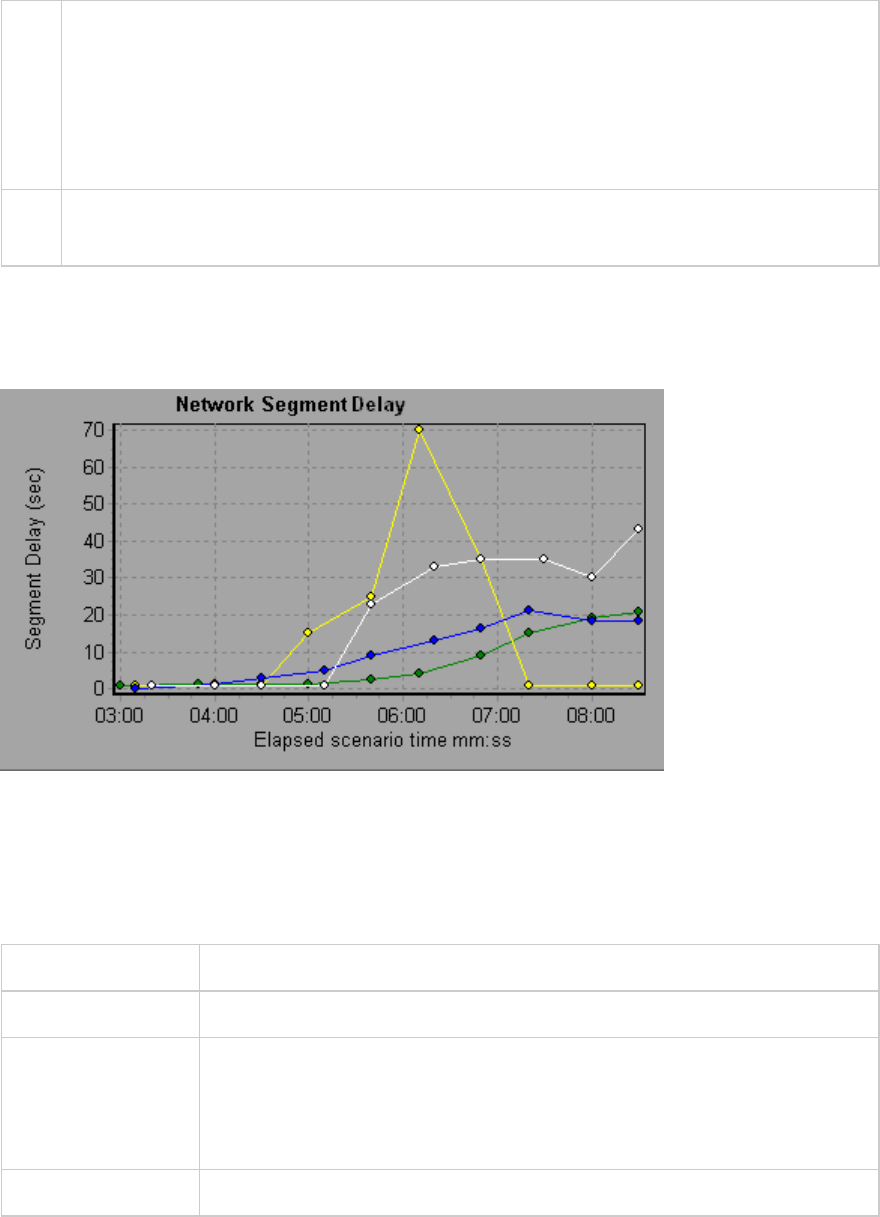
Note The segment delays are measured approximately, and do not add up to the network path
delay which is measured exactly. The delay for each segment of the path is estimated by
calculating the delay from the source machine to one node and subtracting the delay from the
source machine to another node. For example, the delay for segment B to C is calculated by
measuring the delay from the source machine to point C, and subtracting the delay from the
source machine to point B.
See
also
"Network Monitor Graphs Overview" on page1574
Example
In the following example, four segments are shown. The graph indicates that one segment caused a
delay of 70 seconds in the sixth minute.
Network Sub-Path Time Graph
This graph displays the delay from the source machine to each node along the path according to the
elapsed load test scenario time. Each segment is displayed as a separate line with a different color.
X-axis Elapsed time since the start of the run.
Y-axis Network delay time.
Note The delays from the source machine to each of the nodes are measured
concurrently, yet independently. It is therefore possible that the delay from
the source machine to one of the nodes could be greater than the delay for
the complete path between the source and destination machines.
See also "Network Monitor Graphs Overview" on page1574
Example
User Guide
Analysis
HP LoadRunner (12.50) Page 1576
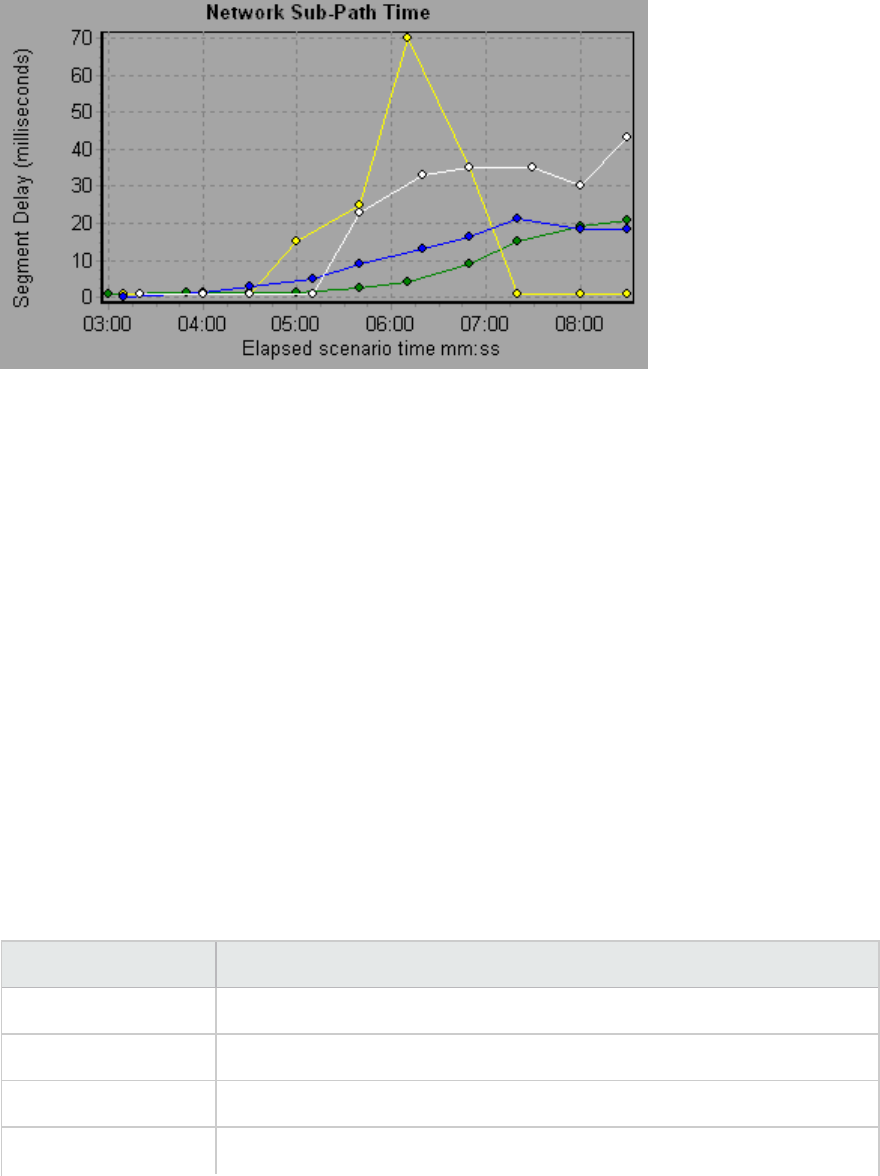
In the following example, four segments are shown. The graph indicates that one segment caused a
delay of 70 milliseconds in the sixth minute.
Web Server Resource Graphs
Web Server Resource Graphs Overview
Web Server Resource graphs provide you with information about the resource usage of the Apache and
Microsoft IIS Web servers. In order to obtain data for these graphs, you need to activate the online
monitor for the server and specify which resources you want to measure before running the load test
scenario. For information on activating and configuring the Web Server Resource monitors, see "Web
Server Resource Monitoring Overview" on page1328.
In order to display all the measurements on a single graph, Analysis may scale them. The Legend window
indicates the scale factor for each resource. To obtain the true value, multiply the scale factor by the
displayed value.
Apache Server Measurements
The following default measurements are available for the Apache server:
Measurement Description
# Busy Servers The number of servers in the Busy state
# Idle Servers The number of servers in the Idle state
Apache CPU Usage The percentage of time the CPU is utilized by the Apache server
Hits/sec The HTTP request rate
User Guide
Analysis
HP LoadRunner (12.50) Page 1577

Measurement Description
KBytes Sent/sec The rate at which data bytes are sent from the Web server
IIS Server Measurements
The following default measurements are available for the IIS server:
Object Measurement Description
Web
Service
Bytes Sent/sec The rate at which the data bytes are sent by the Web service.
Web
Service
Bytes
Received/sec
The rate at which the data bytes are received by the Web service.
Web
Service
Get
Requests/sec
The rate at which HTTP requests using the GET method are made. Get
requests are generally used for basic file retrievals or image maps,
though they can be used with forms.
Web
Service
Post
Requests/sec
The rate at which HTTP requests using the POST method are made. Post
requests are generally used for forms or gateway requests.
Web
Service
Maximum
Connections
The maximum number of simultaneous connections established with the
Web service.
Web
Service
Current
Connections
The current number of connections established with the Web service.
Web
Service
Current
NonAnonymous
Users
The number of users that currently have a non-anonymous connection
using the Web service.
Web
Service
Not Found
Errors/sec
The rate of errors due to requests that could not be satisfied by the
server because the requested document could not be found. These are
generally reported to the client as an HTTP 404 error code.
Process Private Bytes The current number of bytes that the process has allocated that cannot
be shared with other processes.
Apache Server Graph
This graph shows server statistics as a function of the elapsed load test scenario time.
X-
axis
Elapsed time since the start of the run.
User Guide
Analysis
HP LoadRunner (12.50) Page 1578
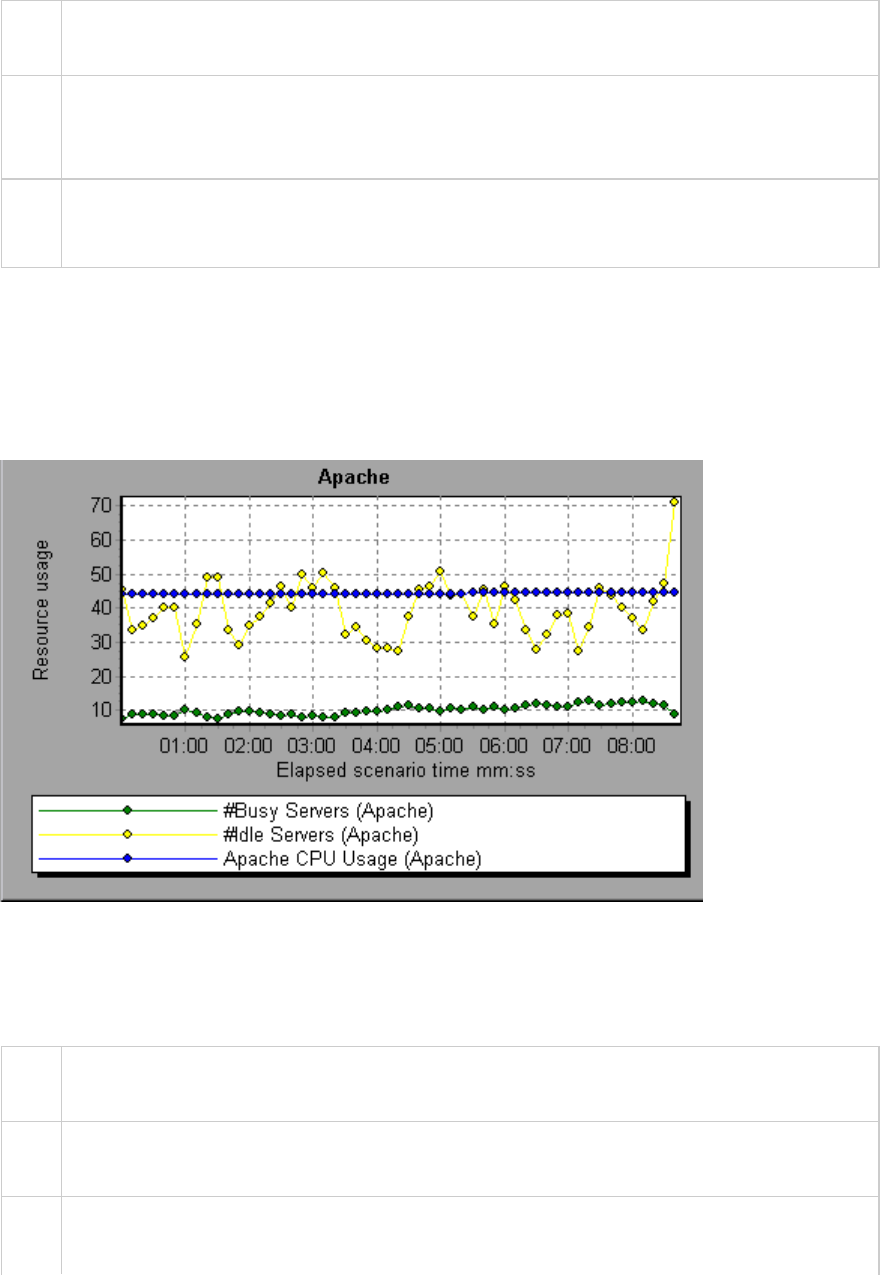
Y-
axis
The resource usage on the Apache server during the scenario run.
Note To obtain data for this graph, you need to enable the Apache online monitor (from the
Controller) and select the default measurements you want to display, before running the
scenario.
See
also
"Web Server Resource Graphs Overview" on page1577
"Apache Server Measurements" on page1577
Example
In the following example, the CPU usage remained steady throughout the scenario. At the end of the
scenario, the number of idle servers increased. The number of busy servers remained steady at 1
throughout the scenario, implying that the Vuser only accessed one Apache server.
The scale factor for the Busy Servers measurement is 1/10 and the scale factor for CPU usage is 10.
Microsoft Information Internet Server (IIS) Graph
This graph shows server statistics as a function of the elapsed load test scenario time.
X-
axis
Elapsed time since the start of the run.
Y-
axis
The resource usage on the MS IIS.
Note To obtain data for this graph, you need to enable the MS IIS online monitor (from the
Controller) and select the default measurements you want to display, before running the
User Guide
Analysis
HP LoadRunner (12.50) Page 1579
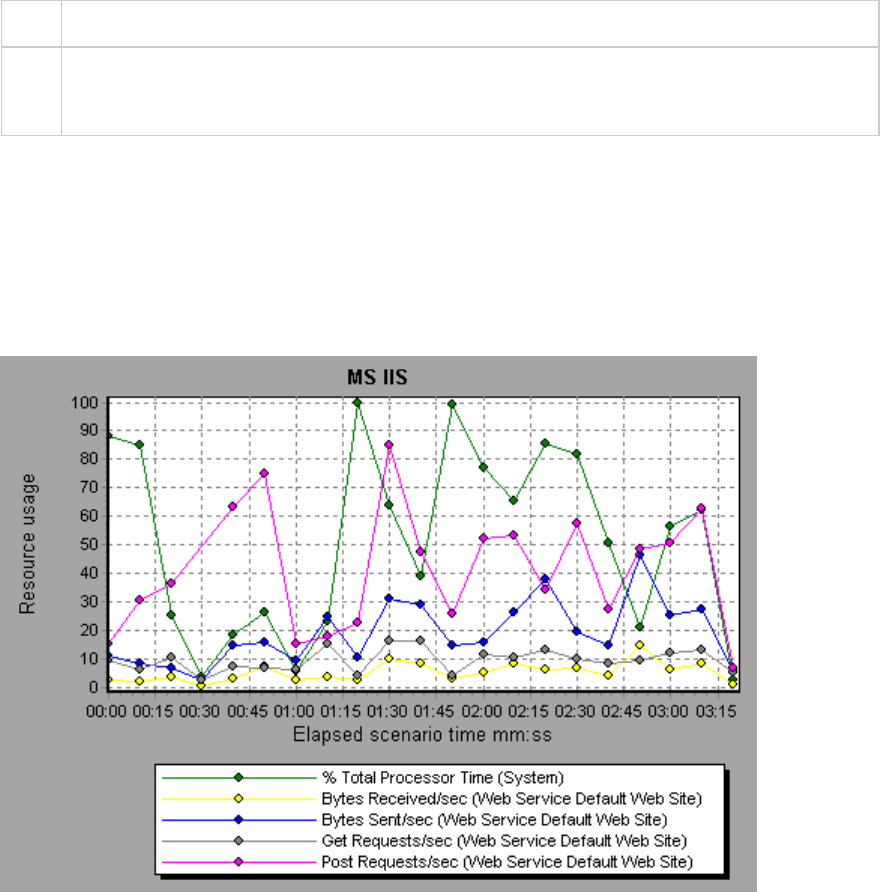
scenario.
See
also
"Web Server Resource Graphs Overview" on page1577
"IIS Server Measurements" on page1578
Example
In the following example the Bytes Received/sec and Get Requests/sec measurements remained fairly
steady throughout the scenario, while the % Total Processor Time,Bytes Sent/sec, and Post
Requests/sec measurements fluctuated considerably.
The scale factor for the Bytes Sent/sec and Bytes Received/sec measurements is 1/100, and the scale
factor for the Post Requests/sec measurement is 10.
Web Application Server Resource Graphs
Web Application Server Resource Graphs Overview
Web Application Server Resource graphs provide you with resource usage information about the Ariba,
ATG Dynamo, BroadVision, ColdFusion, Fujitsu INTERSTAGE, iPlanet (NAS), Microsoft ASP, Oracle9iAS
HTTP, SilverStream, WebLogic (SNMP), WebLogic (JMX), and WebSphere application servers.
In order to obtain data for these graphs, you need to activate the online monitor for the application
server and specify which resources you want to measure before running the load test scenario. For
User Guide
Analysis
HP LoadRunner (12.50) Page 1580

information on activating and configuring the Web Application Server Resource monitors, see "Web
Application Server Resource Monitoring Overview" on page1331. For more information, see the
Monitors section the LoadRunner Controller documentation.
When you open a Web Application Server Resource graph, you can filter it to show only the relevant
application. When you need to analyze other applications, you can change the filter conditions and
display the desired resources.
In order to display all the measurements on a single graph, Analysis may scale them. The Legend window
indicates the scale factor for each resource. To obtain the true value, multiply the scale factor by the
displayed value. For more information on scaled measurements, see the example in "Web Server
Resource Graphs Overview" on page1577.
Web Application Server Resource Graphs Measurements
Microsoft Active Server Pages (ASP) Measurements
The following default measurements are available for Microsoft Active Server Pages:
>Measurement Description
Errors per Second The number of errors per second.
Requests Wait Time The number of milliseconds the most recent request was waiting in the
queue.
Requests Executing The number of requests currently executing.
Requests Queued The number of requests waiting in the queue for service.
Requests Rejected The total number of requests not executed because there were insufficient
resources to process them.
Requests Not Found The number of requests for files that were not found.
Requests/sec The number of requests executed per second.
Memory Allocated The total amount of memory (in bytes) currently allocated by Active Server
Pages.
Errors During Script
Runtime
The number of failed requests due to runtime errors.
Sessions Current The current number of sessions being serviced.
Transactions/sec The number of transactions started per second.
User Guide
Analysis
HP LoadRunner (12.50) Page 1581

Oracle9iAS HTTP Server Modules
The following table describes some of the modules that are available for the Oracle9iAS HTTP server:
Measurement Description
mod_mime.c Determines document types using file extensions.
mod_mime_
magic.c
Determines document types using "magic numbers".
mod_auth_
anon.c
Provides anonymous user access to authenticated areas.
mod_auth_
dbm.c
Provides user authentication using DBM files.
mod_auth_
digest.c
Provides MD5 authentication.
mod_cern_
meta.c
Supports HTTP header metafiles.
mod_digest.c Provides MD5 authentication (deprecated by mod_auth_digest).
mod_
expires.c
Applies Expires: headers to resources.
mod_
headers.c
Adds arbitrary HTTP headers to resources.
mod_proxy.c Provides caching proxy abilities.
mod_
rewrite.c
Provides powerful URI-to-filename mapping using regular expressions.
mod_
speling.c
Automatically corrects minor typos in URLs.
mod_info.c Provides server configuration information.
mod_status.c Displays server status.
mod_
usertrack.c
Provides user tracking using cookies.
mod_dms.c Provides access to DMS Apache statistics.
mod_perl.c Allows execution of Perl scripts.
User Guide
Analysis
HP LoadRunner (12.50) Page 1582

Measurement Description
mod_
fastcgi.c
Supports CGI access to long-lived programs.
mod_ssl.c Provides SSL support.
mod_plsql.c Handles requests for Oracle stored procedures.
mod_isapi.c Provides Windows ISAPI extension support.
mod_
setenvif.c
Sets environment variables based on client information.
mod_
actions.c
Executes CGI scripts based on media type or request method.
mod_imap.c Handles imagemap files.
mod_asis.c Sends files that contain their own HTTP headers.
mod_log_
config.c
Provides user-configurable logging replacement for mod_log_common.
mod_env.c Passes environments to CGI scripts.
mod_alias.c Maps different parts of the host file system in the document tree, and redirects
URLs.
mod_
userdir.c
Handles user home directories.
mod_cgi.c Invokes CGI scripts.
mod_dir.c Handles the basic directory.
mod_
autoindex.c
Provides automatic directory listings.
mod_
include.c
Provides server-parsed documents.
mod_
negotiation.c
Handles content negotiation.
mod_auth.c Provides user authentication using text files.
mod_
access.c
Provides access control based on the client host name or IP address.
User Guide
Analysis
HP LoadRunner (12.50) Page 1583
Measurement Description
mod_so.c Supports loading modules (.so on UNIX, .dll on Win32) at runtime.
mod_
oprocmgr.c
Monitors JServ processes and restarts them if they fail.
mod_jserv.c Routes HTTP requests to JServ server processes. Balances load across multiple
JServs by distributing new requests in round-robin order.
mod_ose.c Routes requests to the JVM embedded in Oracle's database server.
http_core.c Handles requests for static Web pages.
Oracle9iAS HTTP Server Counters
The following table describes the counters that are available for the Oracle9iAS HTTP server:
Measurement Description
handle.minTime The minimum time spent in the module handler.
handle.avg The average time spent in the module handler.
handle.active The number of threads currently in the handle processing phase.
handle.time The total amount of time spent in the module handler.
handle.completed The number of times the handle processing phase was completed.
request.maxTime The maximum amount of time required to service an HTTP request.
request.minTime The minimum amount of time required to service an HTTP request.
request.avg The average amount of time required to service an HTTP request.
request.active The number of threads currently in the request processing phase.
request.time The total amount of time required to service an HTTP request.
request.completed The number of times the request processing phase was completed.
connection.maxTime The maximum amount of time spent servicing any HTTP connection.
connection.minTime The minimum amount of time spent servicing any HTTP connection.
connection.avg The average amount of time spent servicing HTTP connections.
User Guide
Analysis
HP LoadRunner (12.50) Page 1584
Measurement Description
connection.active The number of connections with currently open threads.
connection.time The total amount of time spent servicing HTTP connections.
connection.completed The number of times the connection processing phase was completed.
numMods.value The number of loaded modules.
childFinish.count The number of times the Apache parent server started a child server, for
any reason.
childStart.count The number of times "children"finished "gracefully."There are some
ungraceful error/crash cases that are not counted in childFinish.count.
Decline.count The number of times each module declined HTTP requests.
internalRedirect.count The number of times that any module passed control to another module
using an "internal redirect".
cpuTime.value The total CPU time utilized by all processes on the Apache server (measured
in CPU milliseconds).
heapSize.value The total heap memory utilized by all processes on the Apache server
(measured in kilobytes).
pid.value The process identifier of the parent Apache process.
upTime.value The amount of time the server has been running (measured in
milliseconds).
WebLogic (SNMP) Server Table Measurements
The Server Table lists all WebLogic (SNMP) servers that are being monitored by the agent. A server must
be contacted or be reported as a member of a cluster at least once before it will appear in this table.
Servers are only reported as a member of a cluster when they are actively participating in the cluster,
or shortly thereafter.
Measurement Description
ServerState The state of the WebLogic server, as inferred by the SNMP agent. Up
implies that the agent can contact the server. Down implies that the
agent cannot contact the server.
ServerLoginEnable True if client logins are enabled on the server.
ServerMaxHeapSpace The maximum heap size for this server (in KB).
User Guide
Analysis
HP LoadRunner (12.50) Page 1585
Measurement Description
ServerHeapUsedPct The percentage of heap space currently in use on the server.
ServerQueueLength The current length of the server execute queue.
ServerQueueThroughput The current throughput of execute queue, expressed as the number
of requests processed per second.
ServerNumEJBDeployment The total number of EJB deployment units known to the server.
ServerNumEJBBeansDeployed The total number of EJB beans actively deployed on the server.
WebLogic (SNMP) Listen Table Measurements
The Listen Table is the set of protocol, IP address, and port combinations on which servers are listening.
There will be multiple entries for each server: one for each (protocol, ipAddr, port) combination. If
clustering is used, the clustering-related MIB objects will assume a higher priority.
Measurement Description
ListenPort Port number.
ListenAdminOK True if admin requests are allowed on this (protocol, ipAddr, port) combination;
otherwise false.
ListenState Listening if the (protocol, ipAddr, port) combination is enabled on the server; Not
Listening if it is not. The server may be listening but not accepting new clients if its
server Login Enable state is false. In this case, existing clients will continue to
function, but new ones will not.
WebLogic (SNMP) ClassPath Table Measurements
The ClassPath Table is the table of classpath elements for Java, WebLogic (SNMP) server, and servlets.
There are multiple entries in this table for each server. There may also be multiple entries for each path
on a server. If clustering is used, the clustering-related MIB objects will assume a higher priority.
Measurement Description
CPType The type of CP element: Java, WebLogic, servlet. A Java CPType means the CP
element is one of the elements in the normal Java classpath. A WebLogic CPType
means the CP element is one of the elements in weblogic.class.path. A servlet CPType
means the CP element is one of the elements in the dynamic servlet classpath.
CPIndex The position of an element within its path. The index starts at 1.
User Guide
Analysis
HP LoadRunner (12.50) Page 1586
Websphere Application Server Monitor Runtime Resource Measurements
Contains resources related to the Java Virtual Machine runtime, as well as the ORB.
Measurement Description
MemoryFree The amount of free memory remaining in the Java Virtual Machine.
MemoryTotal The total memory allocated for the Java Virtual Machine.
MemoryUse The total memory in use on the Java Virtual Machine.
Websphere Application Server Monitor BeanData Measurements
Every home on the server provides performance data, depending on the type of bean deployed in the
home. The top level bean data holds an aggregate of all the containers.
Measurement Description
BeanDestroys The number of times an individual bean object was destroyed. This applies
to any bean, regardless of its type.
StatelessBeanDestroys The number of times a stateless session bean object was destroyed.
StatefulBeanDestroys The number of times a stateful session bean object was destroyed.
Websphere Application Server Monitor BeanObjectPool Measurements
The server holds a cache of bean objects. Each home has a cache and there is therefore one
BeanObjectPoolContainer per container. The top level, BeanObjectPool, holds an aggregate of all the
containers data.
Measurement Description
NumGetFound The number of calls to the pool that resulted in finding an available bean.
NumPutsDiscarded The number of times releasing a bean to the pool resulted in the bean being
discarded because the pool was full.
Websphere Application Server Monitor OrbThreadPool Measurements
These are resources related to the ORB thread pool that is on the server.
Measurement Description
ActiveThreads The average number of active threads in the pool.
User Guide
Analysis
HP LoadRunner (12.50) Page 1587
Measurement Description
TotalThreads The average number of threads in the pool.
PercentTimeMaxed The average percent of the time that the number of threads in the pool
reached or exceeded the desired maximum number.
Websphere Application Server Monitor DBConnectionMgr Measurements
These are resources related to the database connection manager. The manager consists of a series of
data sources, as well as a top-level aggregate of each of the performance metrics.
Measurement Description
ConnectionWaitTime The average time (in seconds) of a connection grant.
ConnectionTime The average time (in seconds) that a connection is in use.
ConnectionPercentUsed The average percentage of the pool that is in use.
Websphere Application Server Monitor TransactionData Measurements
These are resources that pertain to transactions.
Measurement Description
NumTransactions The number of transactions processed.
ActiveTransactions The average number of active transactions.
TransactionRT The average duration of each transaction.
RolledBack The number of transactions rolled back.
Timeouts The number of transactions that timed out due to inactivity timeouts.
TransactionSuspended The average number of times that a transaction was suspended.
Websphere Application Server Monitor ServletEngine Measurements
These are resources that are related to servlets and JSPs.
Measurement Description
ServletErrors The number of requests that resulted in an error or an exception.
Websphere Application Server Monitor Session Measurements
These are general metrics regarding the HTTP session pool.
User Guide
Analysis
HP LoadRunner (12.50) Page 1588

Measurement Description
SessionsInvalidated The number of invalidated sessions. May not be valid when using sessions in
the database mode.
Microsoft Active Server Pages (ASP) Graph
This graph displays statistics about the resource usage on the ASP server during the load test scenario
run.
X-
axis
Elapsed time since the start of the run.
Y-
axis
The resource usage on the ASP server.
Note To obtain data for this graph, you need to enable the Microsoft ASP online monitor (from the
Controller) and select the default measurements you want to display, before running the
scenario.
See
also
"Web Application Server Resource Graphs Overview" on page1580
"Web Application Server Resource Graphs Measurements" on page1581
Oracle9iAS HTTP Server Graph
This graph displays statistics about the resource usage on the Oracle9iAS HTTP server during the load
test scenario run.
X-
axis
Elapsed time since the start of the run.
Y-
axis
The resource usage on the Oracle9iAS HTTP server.
Note To obtain data for this graph, you need to enable the Oracle9iAS HTTP online monitor (from
the Controller), and select the default measurements you want to display, before running the
scenario.
See
also
"Web Application Server Resource Graphs Overview" on page1580
"Web Application Server Resource Graphs Measurements" on page1581
User Guide
Analysis
HP LoadRunner (12.50) Page 1589

WebLogic (SNMP) Graph
This graph displays statistics about the resource usage on the WebLogic (SNMP) server (version 6.0 and
earlier) during the load test scenario run.
X-
axis
The elapsed time since the start of the run.
Y-
axis
The resource usage on the WebLogic (SNMP) server.
Note To obtain data for this graph, you need to enable the WebLogic (SNMP) online monitor (from
the Controller) and select the default measurements you want to display, before running the
scenario.
See
also
"Web Application Server Resource Graphs Overview" on page1580
"Web Application Server Resource Graphs Measurements" on page1581
WebSphere Application Server Graph
This graph displays statistics about the resource usage on the WebSphere application server during the
load test scenario run.
X-
axis
Elapsed time since the start of the run.
Y-
axis
The resource usage on the WebSphere Application server.
Note To obtain data for this graph, you need to configure the WebSphere Application Server online
monitor (from the Controller) and select the default measurements you want to display,
before running the scenario.
See
also
"Web Application Server Resource Graphs Overview" on page1580
"Web Application Server Resource Graphs Measurements" on page1581
Database Server Resource Graphs
The Database Server Resource graphs show statistics for several database servers. Currently DB2,
Oracle, SQL server, and Sybase databases are supported. These graphs require that you specify the
resources you want to measure before running the load test scenario. For more information, see the
section on online monitors in the LoadRunner Controller documentation.
User Guide
Analysis
HP LoadRunner (12.50) Page 1590

DB2 Database Manager Counters
Measurement Description
rem_cons_in The current number of connections initiated from remote clients to the instance of
the database manager that is being monitored.
rem_cons_
in_exec
The number of remote applications that are currently connected to a database and
are currently processing a unit of work within the database manager instance being
monitored.
local_cons The number of local applications that are currently connected to a database within
the database manager instance being monitored.
local_cons_
in_exec
The number of local applications that are currently connected to a database within
the database manager instance being monitored and are currently processing a unit
of work.
con_local_
dbases
The number of local databases that have applications connected.
agents_
registered
The number of agents registered in the database manager instance that is being
monitored (coordinator agents and subagents).
agents_
waiting_on_
token
The number of agents waiting for a token so they can execute a transaction in the
database manager.
idle_agents The number of agents in the agent pool that are currently unassigned to an
application and are therefore "idle".
agents_
from_pool
The number of agents assigned from the agent pool.
agents_
created_
empty_pool
The number of agents created because the agent pool was empty.
agents_
stolen
The number of times that agents are stolen from an application. Agents are stolen
when an idle agent associated with an application is reassigned to work on a
different application.
comm_
private_mem
The amount of private memory that the instance of the database manager has
currently committed at the time of the snapshot.
inactive_gw_
agents
The number of DRDA agents in the DRDA connections pool that are primed with a
connection to a DRDA database, but are inactive.
User Guide
Analysis
HP LoadRunner (12.50) Page 1591
Measurement Description
num_gw_
conn_
switches
The number of times that an agent from the agents pool was primed with a
connection and was stolen for use with a different DRDA database.
sort_heap_
allocated
The total number of allocated pages of sort heap space for all sorts at the level
chosen and at the time the snapshot was taken.
post_
threshold_
sorts
The number of sorts that have requested heaps after the sort heap threshold has
been reached.
piped_sorts_
requested
The number of piped sorts that have been requested.
piped_sorts_
accepted
The number of piped sorts that have been accepted.
DB2 Database Counters
Measurement Description
appls_cur_
cons
Indicates the number of applications that are currently connected to the database.
appls_in_db2 Indicates the number of applications that are currently connected to the database,
and for which the database manager is currently processing a request.
total_sec_
cons
The number of connections made by a sub-agent to the database at the node.
num_assoc_
agents
At the application level, this is the number of sub-agents associated with an
application. At the database level, it is the number of sub-agents for all applications.
sort_heap_
allocated
The total number of allocated pages of sort heap space for all sorts at the level
chosen and at the time the snapshot was taken.
total_sorts The total number of sorts that have been executed.
total_sort_
time
The total elapsed time (in milliseconds) for all sorts that have been executed.
sort_
overflows
The total number of sorts that ran out of sort heap and may have required disk
space for temporary storage.
User Guide
Analysis
HP LoadRunner (12.50) Page 1592

Measurement Description
active_sorts The number of sorts in the database that currently have a sort heap allocated.
total_hash_
joins
The total number of hash joins executed.
total_hash_
loops
The total number of times that a single partition of a hash join was larger than the
available sort heap space.
hash_join_
overflows
The number of times that hash join data exceeded the available sort heap space.
hash_join_
small_
overflows
The number of times that hash join data exceeded the available sort heap space by
less than 10%.
pool_data_l_
reads
The number of logical read requests for data pages that have gone through the
buffer pool.
pool_data_p_
reads
The number of read requests that required I/O to get data pages into the buffer
pool.
pool_data_
writes
Indicates the number of times a buffer pool data page was physically written to disk.
pool_index_
l_reads
The number of logical read requests for index pages that have gone through the
buffer pool.
pool_index_
p_reads
The number of physical read requests to get index pages into the buffer pool.
pool_index_
writes
The number of times a buffer pool index page was physically written to disk.
pool_read_
time
The total amount of elapsed time spent processing read requests that caused data
or index pages to be physically read from disk to buffer pool.
pool_write_
time
The total amount of time spent physically writing data or index pages from the
buffer pool to disk.
files_closed The total number of database files closed.
pool_async_
data_reads
The number of pages read asynchronously into the buffer pool.
pool_async_
data_writes
The number of times a buffer pool data page was physically written to disk by either
an asynchronous page cleaner, or a pre-fetcher. A pre-fetcher may have written dirty
pages to disk to make space for the pages being pre-fetched.
User Guide
Analysis
HP LoadRunner (12.50) Page 1593

Measurement Description
pool_async_
index_writes
The number of times a buffer pool index page was physically written to disk by either
an asynchronous page cleaner, or a pre-fetcher. A pre-fetcher may have written dirty
pages to disk to make space for the pages being pre-fetched.
pool_async_
index_reads
The number of index pages read asynchronously into the buffer pool by a pre-
fetcher.
pool_async_
read_time
The total elapsed time spent reading by database manager pre-fetchers.
pool_async_
write_time
The total elapsed time spent writing data or index pages from the buffer pool to disk
by database manager page cleaners.
pool_async_
data_read_
reqs
The number of asynchronous read requests.
pool_lsn_
gap_clns
The number of times a page cleaner was invoked because the logging space used
had reached a pre-defined criterion for the database.
pool_drty_
pg_steal_
clns
The number of times a page cleaner was invoked because a synchronous write was
needed during the victim buffer replacement for the database.
pool_drty_
pg_thrsh_
clns
The number of times a page cleaner was invoked because a buffer pool had reached
the dirty page threshold criterion for the database.
prefetch_
wait_time
The time an application spent waiting for an I/O server (pre-fetcher) to finish loading
pages into the buffer pool.
pool_data_
to_estore
The number of buffer pool data pages copied to extended storage.
pool_index_
to_estore
The number of buffer pool index pages copied to extended storage.
pool_data_
from_estore
The number of buffer pool data pages copied from extended storage.
pool_index_
from_estore
The number of buffer pool index pages copied from extended storage.
direct_reads The number of read operations that do not use the buffer pool.
direct_writes The number of write operations that do not use the buffer pool.
User Guide
Analysis
HP LoadRunner (12.50) Page 1594

Measurement Description
direct_read_
reqs
The number of requests to perform a direct read of one or more sectors of data.
direct_write_
reqs
The number of requests to perform a direct write of one or more sectors of data.
direct_read_
time
The elapsed time (in milliseconds) required to perform the direct reads.
direct_write_
time
The elapsed time (in milliseconds) required to perform the direct writes.
cat_cache_
lookups
The number of times that the catalog cache was referenced to obtain table
descriptor information.
cat_cache_
inserts
The number of times that the system tried to insert table descriptor information into
the catalog cache.
cat_cache_
overflows
The number of times that an insert into the catalog cache failed due the catalog
cache being full.
cat_cache_
heap_full
The number of times that an insert into the catalog cache failed due to a heap-full
condition in the database heap.
pkg_cache_
lookups
The number of times that an application looked for a section or package in the
package cache. At a database level, it indicates the overall number of references
since the database was started, or monitor data was reset.
pkg_cache_
inserts
The total number of times that a requested section was not available for use and
had to be loaded into the package cache. This count includes any implicit prepares
performed by the system.
pkg_cache_
num_
overflows
The number of times that the package cache overflowed the bounds of its allocated
memory.
appl_
section_
lookups
Lookups of SQL sections by an application from its SQL work area.
appl_
section_
inserts
Inserts of SQL sections by an application from its SQL work area.
sec_logs_
allocated
The total number of secondary log files that are currently being used for the
database.
User Guide
Analysis
HP LoadRunner (12.50) Page 1595

Measurement Description
log_reads The number of log pages read from disk by the logger.
log_writes The number of log pages written to disk by the logger.
total_log_
used
The total amount of active log space currently used (in bytes) in the database.
locks_held The number of locks currently held.
lock_list_in_
use
The total amount of lock list memory (in bytes) that is in use.
deadlocks The total number of deadlocks that have occurred.
lock_escals The number of times that locks have been escalated from several row locks to a
table lock.
x_lock_
escals
The number of times that locks have been escalated from several row locks to one
exclusive table lock, or the number of times an exclusive lock on a row caused the
table lock to become an exclusive lock.
lock_
timeouts
The number of times that a request to lock an object timed-out instead of being
granted.
lock_waits The total number of times that applications or connections waited for locks.
lock_wait_
time
The total elapsed time waited for a lock.
locks_
waiting
The number of agents waiting on a lock.
rows_deleted The number of row deletions attempted.
rows_
inserted
The number of row insertions attempted.
rows_
updated
The number of row updates attempted.
rows_
selected
The number of rows that have been selected and returned to the application.
int_rows_
deleted
The number of rows deleted from the database as a result of internal activity.
int_rows_ The number of rows updated from the database as a result of internal activity.
User Guide
Analysis
HP LoadRunner (12.50) Page 1596

Measurement Description
updated
int_rows_
inserted
The number of rows inserted into the database as a result of internal activity caused
by triggers.
static_sql_
stmts
The number of static SQL statements that were attempted.
dynamic_
sql_stmts
The number of dynamic SQL statements that were attempted.
failed_sql_
stmts
The number of SQL statements that were attempted, but failed.
commit_sql_
stmts
The total number of SQL COMMIT statements that have been attempted.
rollback_sql_
stmts
The total number of SQL ROLLBACK statements that have been attempted.
select_sql_
stmts
The number of SQL SELECT statements that were executed.
uid_sql_
stmts
The number of SQL UPDATE, INSERT, and DELETE statements that were executed.
ddl_sql_
stmts
The number of SQL Data Definition Language (DDL) statements that were executed.
int_auto_
rebinds
The number of automatic rebinds (or recompiles) that have been attempted.
int_commits The total number of commits initiated internally by the database manager.
int_rollbacks The total number of rollbacks initiated internally by the database manager.
int_
deadlock_
rollbacks
The total number of forced rollbacks initiated by the database manager due to a
deadlock. A rollback is performed on the current unit of work in an application
selected by the database manager to resolve the deadlock.
binds_
precompiles
The number of binds and pre-compiles attempted.
User Guide
Analysis
HP LoadRunner (12.50) Page 1597

DB2 Application Counters
Measurement Description
agents_
stolen
The number of times that agents are stolen from an application. Agents are stolen
when an idle agent associated with an application is reassigned to work on a
different application.
num_assoc_
agents
At the application level, this is the number of sub-agents associated with an
application. At the database level, it is the number of sub-agents for all applications.
total_sorts The total number of sorts that have been executed.
total_sort_
time
The total elapsed time (in milliseconds) for all sorts that have been executed.
sort_
overflows
The total number of sorts that ran out of sort heap and may have required disk
space for temporary storage.
total_hash_
joins
The total number of hash joins executed.
total_hash_
loops
The total number of times that a single partition of a hash join was larger than the
available sort heap space.
hash_join_
overflows
The number of times that hash join data exceeded the available sort heap space
hash_join_
small_
overflows
The number of times that hash join data exceeded the available sort heap space by
less than 10%.
pool_data_l_
reads
The number of logical read requests for data pages that have gone through the
buffer pool.
pool_data_p_
reads
The number of read requests that required I/O to get data pages into the buffer
pool.
pool_data_
writes
The number of times a buffer pool data page was physically written to disk.
pool_index_
l_reads
The number of logical read requests for index pages that have gone through the
buffer pool.
pool_index_
p_reads
The number of physical read requests to get index pages into the buffer pool.
User Guide
Analysis
HP LoadRunner (12.50) Page 1598

Measurement Description
pool_index_
writes
The number of times a buffer pool index page was physically written to disk.
pool_read_
time
The total amount of elapsed time spent processing read requests that caused data
or index pages to be physically read from disk to buffer pool.
prefetch_
wait_time
The time an application spent waiting for an I/O server (pre-fetcher) to finish loading
pages into the buffer pool.
pool_data_
to_estore
The number of buffer pool data pages copied to extended storage.
pool_index_
to_estore
The number of buffer pool index pages copied to extended storage.
pool_data_
from_estore
The number of buffer pool data pages copied from extended storage.
pool_index_
from_estore
The number of buffer pool index pages copied from extended storage.
direct_reads The number of read operations that do not use the buffer pool.
direct_writes The number of write operations that do not use the buffer pool.
direct_read_
reqs
The number of requests to perform a direct read of one or more sectors of data.
direct_write_
reqs
The number of requests to perform a direct write of one or more sectors of data.
direct_read_
time
The elapsed time (in milliseconds) required to perform the direct reads.
direct_write_
time
The elapsed time (in milliseconds) required to perform the direct writes.
cat_cache_
lookups
The number of times that the catalog cache was referenced to obtain table
descriptor information.
cat_cache_
inserts
The number of times that the system tried to insert table descriptor information into
the catalog cache.
cat_cache_
overflows
The number of times that an insert into the catalog cache failed due to the catalog
cache being full.
cat_cache_ The number of times that an insert into the catalog cache failed due to a heap-full
User Guide
Analysis
HP LoadRunner (12.50) Page 1599

Measurement Description
heap_full condition in the database heap.
pkg_cache_
lookups
The number of times that an application looked for a section or package in the
package cache. At a database level, it indicates the overall number of references
since the database was started, or monitor data was reset.
pkg_cache_
inserts
The total number of times that a requested section was not available for use and
had to be loaded into the package cache. This count includes any implicit prepares
performed by the system.
appl_
section_
lookups
Lookups of SQL sections by an application from its SQL work area.
appl_
section_
inserts
Inserts of SQL sections by an application from its SQL work area.
uow_log_
space_used
The amount of log space (in bytes) used in the current unit of work of the monitored
application.
locks_held The number of locks currently held.
deadlocks The total number of deadlocks that have occurred.
lock_escals The number of times that locks have been escalated from several row locks to a
table lock.
x_lock_
escals
The number of times that locks have been escalated from several row locks to one
exclusive table lock, or the number of times an exclusive lock on a row caused the
table lock to become an exclusive lock.
lock_
timeouts
The number of times that a request to lock an object timed-out instead of being
granted.
lock_waits The total number of times that applications or connections waited for locks.
lock_wait_
time
The total elapsed time waited for a lock.
locks_
waiting
The number of agents waiting on a lock.
uow_lock_
wait_time
The total amount of elapsed time this unit of work has spent waiting for locks.
rows_deleted The number of row deletions attempted.
User Guide
Analysis
HP LoadRunner (12.50) Page 1600

Measurement Description
rows_
inserted
The number of row insertions attempted.
rows_
updated
The number of row updates attempted.
rows_
selected
The number of rows that have been selected and returned to the application.
rows_written The number of rows changed (inserted, deleted or updated) in the table.
rows_read The number of rows read from the table.
int_rows_
deleted
The number of rows deleted from the database as a result of internal activity.
int_rows_
updated
The number of rows updated from the database as a result of internal activity.
int_rows_
inserted
The number of rows inserted into the database as a result of internal activity caused
by triggers.
open_rem_
curs
The number of remote cursors currently open for this application, including those
cursors counted by `open_rem_curs_blk'.
open_rem_
curs_blk
The number of remote blocking cursors currently open for this application.
rej_curs_blk The number of times that a request for an I/O block at server was rejected and the
request was converted to non-blocked I/O.
acc_curs_blk The number of times that a request for an I/O block was accepted.
open_loc_
curs
The number of local cursors currently open for this application, including those
cursors counted by `open_loc_curs_blk'.
open_loc_
curs_blk
The number of local blocking cursors currently open for this application.
static_sql_
stmts
The number of static SQL statements that were attempted.
dynamic_
sql_stmts
The number of dynamic SQL statements that were attempted.
failed_sql_
stmts
The number of SQL statements that were attempted, but failed.
User Guide
Analysis
HP LoadRunner (12.50) Page 1601

Measurement Description
commit_sql_
stmts
The total number of SQL COMMIT statements that have been attempted.
rollback_sql_
stmts
The total number of SQL ROLLBACK statements that have been attempted.
select_sql_
stmts
The number of SQL SELECT statements that were executed.
uid_sql_
stmts
The number of SQL UPDATE, INSERT, and DELETE statements that were executed.
ddl_sql_
stmts
This element indicates the number of SQL Data Definition Language (DDL)
statements that were executed.
int_auto_
rebinds
The number of automatic rebinds (or recompiles) that have been attempted.
int_commits The total number of commits initiated internally by the database manager.
int_rollbacks The total number of rollbacks initiated internally by the database manager.
int_
deadlock_
rollbacks
The total number of forced rollbacks initiated by the database manager due to a
deadlock. A rollback is performed on the current unit of work in an application
selected by the database manager to resolve the deadlock.
binds_
precompiles
The number of binds and pre-compiles attempted.
Oracle Server Monitoring Measurements
The following measurements are most commonly used when monitoring the Oracle server (from the
V$SYSSTAT table):
Measurement Description
CPU used by
this session
The amount of CPU time (in tens of milliseconds) used by a session between the time
a user call started and ended. Some user calls can be completed within 10
milliseconds and, as a result, the start- and end-user call time can be the same. In
this case, 0 milliseconds are added to the statistic. A similar problem can exist in the
operating system reporting, especially on systems that suffer from many context
switches.
Bytes The total number of bytes received from the client over Net8.
User Guide
Analysis
HP LoadRunner (12.50) Page 1602

Measurement Description
received via
SQL*Net from
client
Logons
current
The total number of current logons.
Opens of
replaced
files
The total number of files that needed to be reopened because they were no longer in
the process file cache.
User calls Oracle allocates resources (Call State Objects) to keep track of relevant user call
data structures every time you log in, parse, or execute. When determining activity,
the ratio of user calls to RPI calls gives you an indication of how much internal work is
generated as a result of the type of requests the user is sending to Oracle.
SQL*Net
roundtrips
to/from
client
The total number of Net8 messages sent to, and received from, the client.
Bytes sent
via SQL*Net
to client
The total number of bytes sent to the client from the foreground process(es).
Opened
cursors
current
The total number of current open cursors.
DB block
changes
Closely related to consistent changes, this statistic counts the total number of
changes that were made to all blocks in the SGA that were part of an update or
delete operation. These are changes that generate redo log entries and hence cause
permanent changes to the database if the transaction is committed. This statistic is
a rough indication of total database work and indicates (possibly on a per-
transaction level) the rate at which buffers are being dirtied.
Total file
opens
The total number of file opens being performed by the instance. Each process needs
a number of files (control file, log file, database file) in order to work against the
database.
User Guide
Analysis
HP LoadRunner (12.50) Page 1603

SQL Server Default Counters
Measurement Description
% Total
Processor Time
The average percentage of time that all the processors on the system are busy
executing non-idle threads. On a multi-processor system, if all processors are
always busy, this is 100%, if all processors are 50% busy this is 50% and if 1/4 of
the processors are 100% busy this is 25%. It can be viewed as the fraction of the
time spent doing useful work. Each processor is assigned an Idle thread in the Idle
process which consumes those unproductive processor cycles not used by any
other threads.
Cache Hit Ratio The percentage of time that a requested data page was found in the data cache
(instead of being read from disk).
I/O - Batch
Writes/sec
The number of pages written to disk per second, using Batch I/O. The checkpoint
thread is the primary user of Batch I/O.
I/O - Lazy
Writes/sec
The number of pages flushed to disk per second by the Lazy Writer.
I/O -
Outstanding
Reads
The number of physical reads pending.
I/O -
Outstanding
Writes
The number of physical writes pending.
I/O - Page
Reads/sec
The number of physical page reads per second.
I/O -
Transactions/sec
The number of Transact-SQL command batches executed per second.
User
Connections
The number of open user connections.
% Processor
Time
The percentage of time that the processor is executing a non-idle thread. This
counter was designed as a primary indicator of processor activity. It is calculated
by measuring the time that the processor spends executing the thread of the idle
process in each sample interval, and subtracting that value from 100%. (Each
processor has an idle thread which consumes cycles when no other threads are
ready to run). It can be viewed as the percentage of the sample interval spent
doing useful work. This counter displays the average percentage of busy time
observed during the sample interval. It is calculated by monitoring the time the
User Guide
Analysis
HP LoadRunner (12.50) Page 1604
Measurement Description
service was inactive, and then subtracting that value from 100%.
Sybase Server Monitoring Measurements
The following tables describe the measurements that can be monitored on a Sybase server:
Object Measurement Description
Network Average packet
size (Read)
Reports the number of network packets received.
Average packet
size (Send)
Reports the number of network packets sent.
Network bytes
(Read)
Reports the number of bytes received, over the sampling interval.
Network bytes
(Read)/sec
Reports the number of bytes received, per second.
Network bytes
(Send)
Reports the number of bytes sent, over the sampling interval.
Network bytes
(Send)/sec
Reports the number of bytes sent, per second.
Network packets
(Read)
Reports the number of network packets received, over the
sampling interval.
Network packets
(Read)/sec
Reports the number of network packets received, per second.
Network packets
(Send)
Reports the number of network packets sent, over the sampling
interval.
Network packets
(Send)/sec
Reports the number of network packets sent, per second.
Memory Memory Reports the amount of memory (in bytes) allocated for the page
cache.
User Guide
Analysis
HP LoadRunner (12.50) Page 1605

Object Measurement Description
Disk Reads Reports the number of reads made from a database device.
Writes Reports the number of writes made to a database device.
Waits Reports the number of times that access to a device had to wait.
Grants Reports the number of times access to a device was granted.
Engine Server is busy
(%)
Reports the percentage of time during which the Adaptive Server is
in a "busy" state.
CPU time Reports how much "busy" time was used by the engine.
Logical pages
(Read)
Reports the number of data page reads, whether satisfied from
cache or from a database device.
Pages from disk
(Read)
Reports the number of data page reads that could not be satisfied
from the data cache.
Pages stored Reports the number of data pages written to a database device.
Stored
Procedures
Executed
(sampling
period)
Reports the number of times a stored procedure was executed,
over the sampling interval.
Executed
(session)
Reports the number of times a stored procedure was executed,
during the session.
Average
duration
(sampling
period)
Reports the time (in seconds) spent executing a stored procedure,
over the sampling interval.
Average
duration
(session)
Reports the time (in seconds) spent executing a stored procedure,
during the session.
User Guide
Analysis
HP LoadRunner (12.50) Page 1606

Object Measurement Description
Locks % Requests Reports the percentage of successful requests for locks.
Locks count Reports the number of locks. This is an accumulated value.
Granted
immediately
Reports the number of locks that were granted immediately,
without having to wait for another lock to be released.
Granted after
wait
Reports the number of locks that were granted after waiting for
another lock to be released.
Not granted Reports the number of locks that were requested but not granted.
Wait time (avg.) Reports the average wait time for a lock.
SqlSrvr Locks/sec Reports the number of locks. This is an accumulated value.
% Processor
time (server)
Reports the percentage of time that the Adaptive Server is in a
"busy" state.
Transactions Reports the number of committed Transact-SQL statement blocks
(transactions).
Deadlocks Reports the number of deadlocks.
Cache % Hits Reports the percentage of times that a data page read could be
satisfied from cache without requiring a physical page read.
Pages (Read) Reports the number of data page reads, whether satisfied from
cache or from a database device.
Cache Pages (Read)
/sec
Reports the number of data page reads, whether satisfied from
cache or from a database device, per second.
Pages from disk
(Read)
Reports the number of data page reads that could not be satisfied
from the data cache.
Pages from disk
(Read)/sec
Reports the number of data page reads, per second, that could not
be satisfied from the data cache.
Pages (Write) Reports the number of data pages written to a database device.
Pages (Write)
/sec
Reports the number of data pages written to a database device,
per second.
Process % Processor
time (process)
Reports the percentage of time that a process running a given
application was in the "Running" state (out of the time that all
processes were in the "Running" state).
Locks/sec Reports the number of locks, by process. This is an accumulated
User Guide
Analysis
HP LoadRunner (12.50) Page 1607

Object Measurement Description
value.
% Cache hit Reports the percentage of times that a data page read could be
satisfied from cache without requiring a physical page read, by
process.
Pages (Write) Reports the number of data pages written to a database device, by
process.
Transaction Transactions Reports the number of committed Transact-SQL statement blocks
(transactions), during the session.
Transaction Rows (Deleted) Reports the number of rows deleted from database tables during
the session.
Inserts Reports the number of insertions into a database table during the
session.
Updates Reports the updates to database tables during the session.
Updates in place Reports the sum of expensive, in-place and not-in-place updates
(everything except updates deferred) during the session.
Transactions/sec Reports the number of committed Transact-SQL statement blocks
(transactions) per second.
Rows (Deleted)
/sec
Reports the number of rows deleted from database tables, per
second.
Inserts/sec Reports the number of insertions into a database table, per
second.
Updates/sec Reports the updates to database tables, per second.
Updates in
place/sec
Reports the sum of expensive, in-place and not-in-place updates
(everything except updates deferred), per second.
DB2 Graph
This graph shows the resource usage on the DB2 database server machine as a function of the elapsed
load test scenario time.
X-
axis
Elapsed time since the start of the run.
Y- The resource usage on the DB2 database server.
User Guide
Analysis
HP LoadRunner (12.50) Page 1608

axis
Note In order to monitor the DB2 database server machine, you must first set up the DB2 monitor
environment. You then enable the DB2 monitor (from the Controller) by selecting the counters
you want the monitor to measure.
See
also
"Database Server Resource Graphs" on page1590
"DB2 Database Manager Counters" on page1591
"DB2 Database Counters" on page1592
"DB2 Application Counters" on page1598
Oracle Graph
This graph displays information from Oracle V$ tables: Session statistics, V$SESSTAT, system statistics,
V$SYSSTAT, and other table counters defined by the user in the custom query.
X-
axis
Elapsed time since the start of the run.
Y-
axis
The resource usage on the Oracle server.
Note To obtain data for this graph, you need to enable the Oracle online monitor (from the
Controller) and select the default measurements you want to display, before running the
scenario.
See
also
"Database Server Resource Graphs" on page1590
"Oracle Server Monitoring Measurements" on page1602
Example
In the following example, the V$SYSSTAT resource values are shown as a function of the elapsed load
test scenario time:
User Guide
Analysis
HP LoadRunner (12.50) Page 1609
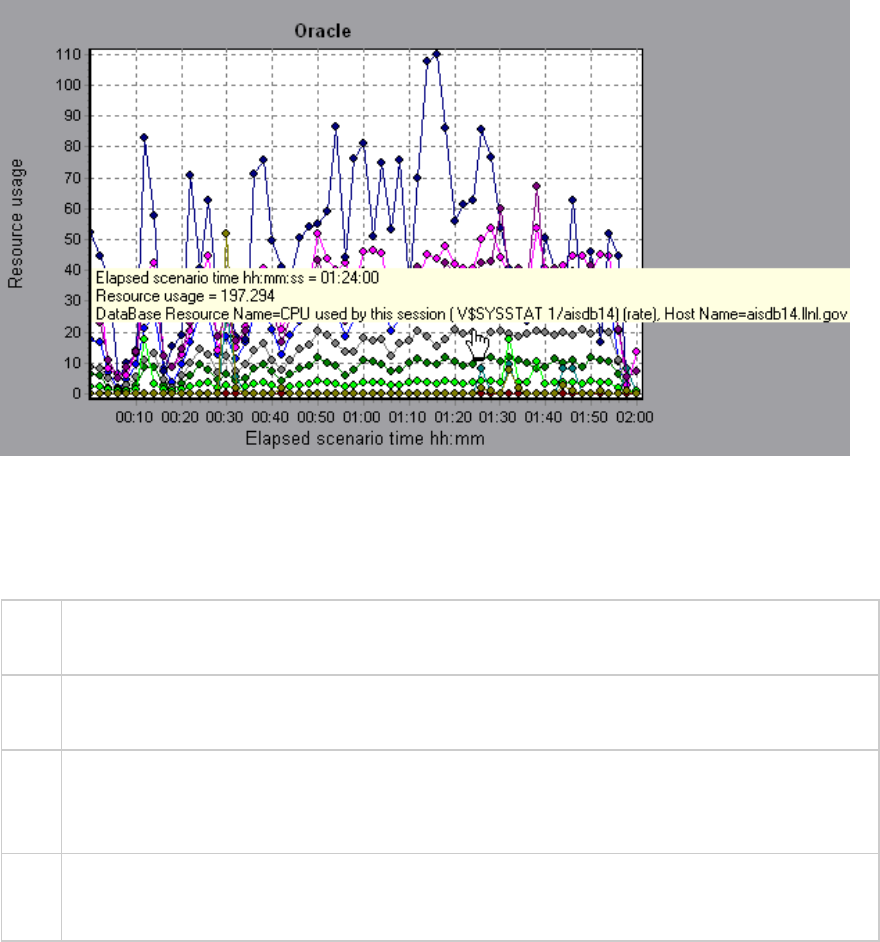
SQL Server Graph
This graph shows the standard Windows resources on the SQL server machine.
X-
axis
Elapsed time since the start of the load test scenario run.
Y-
axis
Resource usage
Note To obtain data for this graph, you need to enable the SQL Server online monitor (from the
Controller) and select the default measurements you want to display, before running the
scenario.
See
also
"Database Server Resource Graphs" on page1590
"SQL Server Default Counters" on page1604
Example
User Guide
Analysis
HP LoadRunner (12.50) Page 1610
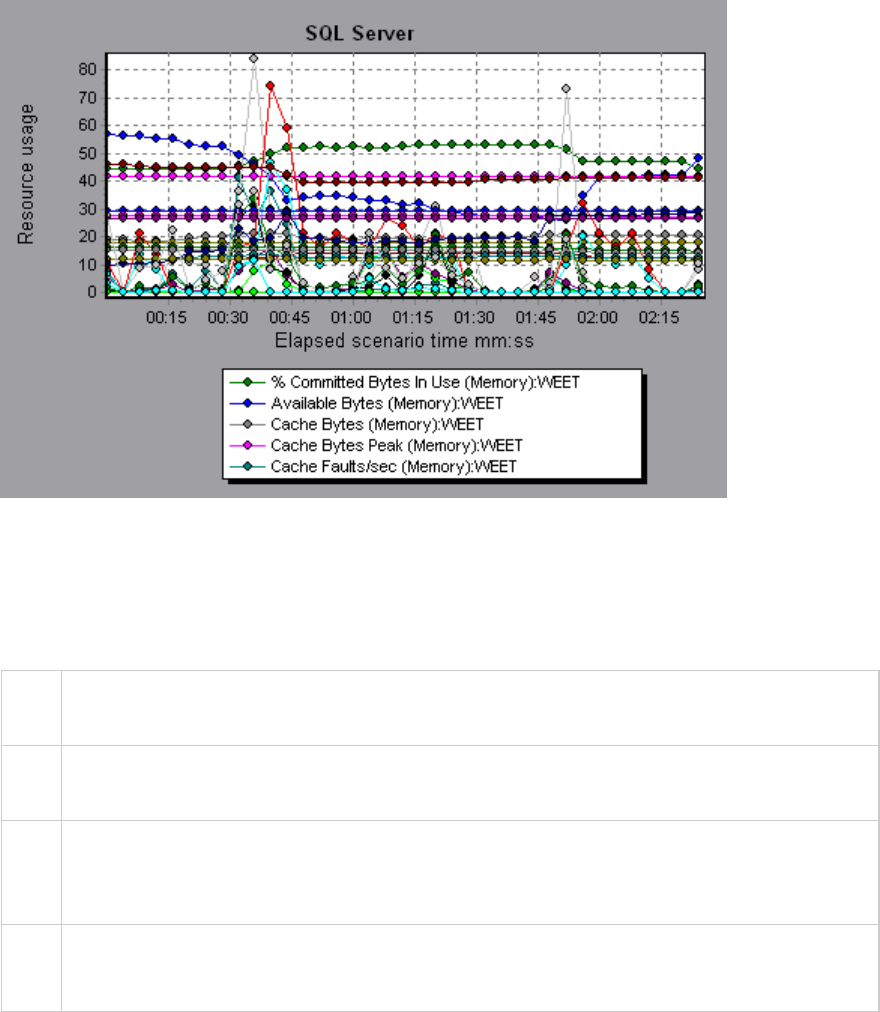
Sybase Graph
This graph shows the resource usage on the Sybase database server machine as a function of the
elapsed load test scenario time.
X-
axis
Elapsed time since the start of the run.
Y-
axis
The resource usage on the Sybase database server.
Note In order to monitor the Sybase database server machine, you must first set up the Sybase
monitor environment. You then enable the Sybase monitor (from the Controller) by selecting
the counters you want the monitor to measure.
See
also
"Database Server Resource Graphs" on page1590
"SQL Server Default Counters" on page1604
Streaming Media Graphs
Streaming Media Graphs Overview
Streaming Media Resource graphs provide you with performance information for the RealPlayer Client,
RealPlayer Server, Windows Media Server, and Media Player Client machines.
User Guide
Analysis
HP LoadRunner (12.50) Page 1611

In order to obtain data for Streaming Media Resource graphs, you need to install the RealPlayer Client
and activate the online monitor for the RealPlayer Server or Windows Media Server before running the
load test scenario.
When you set up the online monitor for the RealPlayer Server or Windows Media Server, you indicate
which statistics and measurements to monitor. For more information on installing and configuring the
Streaming Media Resource monitors, see "Media Player Client Performance Counters" on page1349.
In order to display all the measurements on a single graph, Analysis may scale them. The Legend window
indicates the scale factor for each resource. To obtain the true value, multiply the scale factor by the
displayed value.
Media Player Client Monitoring Measurements
The following table describes the Media Player Client measurements that are monitored:
Measurement Description
Average
Buffering
Events
The number of times Media Player Client had to buffer incoming media data due to
insufficient media content.
Average
Buffering
Time (sec)
The time spent by Media Player Client waiting for sufficient amount of media data in
order to continue playing media clip.
Current
bandwidth
(Kbits/sec)
The number of kbits per second received.
Number of
Packets
The number of packets sent by server for a particular media clip.
Stream
Interruptions
The number of interruptions encountered by Media Player Client while playing a
media clip. This measurement includes the number of times Media Player Client had
to buffer incoming media data, and any errors that occurred during playback.
Stream
Quality
(Packet-
level)
The percentage ratio of packets received to total packets.
Stream
Quality
(Sampling-
level)
The percentage of stream samples received on time (no delays in reception).
Total number The number of lost packets that were recovered. This value is only relevant during
User Guide
Analysis
HP LoadRunner (12.50) Page 1612

Measurement Description
of recovered
packets
network playback.
Total number
of lost
packets
The number of lost packets that were not recovered. This value is only relevant
during network playback.
RealPlayer Client Monitoring Measurements
The following table describes the RealPlayer Client measurements that are monitored:
Measurement Description
Current Bandwidth
(Kbits/sec)
The number of kilobytes in the last second.
Buffering Event Time (sec) The average time spent on buffering.
Network Performance The ratio (percentage) between the current bandwidth and the
actual bandwidth of the clip.
Percentage of Recovered
Packets
The percentage of error packets that were recovered.
Percentage of Lost Packets The percentage of packets that were lost.
Percentage of Late Packets The percentage of late packets.
Time to First Frame
Appearance (sec)
The time for first frame appearance (measured from the start of
the replay).
Number of Buffering Events The average number of all buffering events.
Number of Buffering Seek
Events
The average number of buffering events resulting from a seek
operation.
Buffering Seek Time The average time spent on buffering events resulting from a seek
operation.
Number of Buffering
Congestion Events
The average number of buffering events resulting from network
congestion.
Buffering Congestion Time The average time spent on buffering events resulting from network
congestion.
Number of Buffering Live
Pause Events
The average number of buffering events resulting from live pause.
User Guide
Analysis
HP LoadRunner (12.50) Page 1613

Measurement Description
Buffering Live Pause Time The average time spent on buffering events resulting from live
pause.
RealPlayer Server Monitoring Measurements
The following table describes the RealPlayer Client measurements that are monitored:
Measurement Description
Current Bandwidth
(Kbits/sec)
The number of kilobytes in the last second.
Buffering Event Time (sec) The average time spent on buffering.
Network Performance The ratio (percentage) between the current bandwidth and the
actual bandwidth of the clip.
Percentage of Recovered
Packets
The percentage of error packets that were recovered.
Percentage of Lost Packets The percentage of packets that were lost.
Percentage of Late Packets The percentage of late packets.
Time to First Frame
Appearance (sec)
The time for first frame appearance (measured from the start of
the replay).
Number of Buffering Events The average number of all buffering events.
Number of Buffering Seek
Events
The average number of buffering events resulting from a seek
operation.
Buffering Seek Time The average time spent on buffering events resulting from a seek
operation.
Number of Buffering
Congestion Events
The average number of buffering events resulting from network
congestion.
Buffering Congestion Time The average time spent on buffering events resulting from network
congestion.
Number of Buffering Live
Pause Events
The average number of buffering events resulting from live pause.
Buffering Live Pause Time The average time spent on buffering events resulting from live
pause.
User Guide
Analysis
HP LoadRunner (12.50) Page 1614

Windows Media Server Default Measurements
Measurement Description
Active Live
Unicast
Streams
(Windows)
The number of live unicast streams that are being streamed.
Active
Streams
The number of streams that are being streamed.
Active TCP
Streams
The number of TCP streams that are being streamed.
Active UDP
Streams
The number of UDP streams that are being streamed.
Aggregate
Read Rate
The total, aggregate rate (bytes/sec) of file reads.
Aggregate
Send Rate
The total, aggregate rate (bytes/sec) of stream transmission.
Connected
Clients
The number of clients connected to the server.
Connection
Rate
The rate at which clients are connecting to the server.
Controllers The number of controllers currently connected to the server.
HTTP
Streams
The number of HTTP streams being streamed.
Late Reads The number of late read completions per second.
Pending
Connections
The number of clients that are attempting to connect to the server, but are not yet
connected. This number may be high if the server is running near maximum capacity
and cannot process a large number of connection requests in a timely manner.
Stations The number of station objects that currently exist on the server.
Streams The number of stream objects that currently exist on the server.
Stream
Errors
The cumulative number of errors occurring per second.
User Guide
Analysis
HP LoadRunner (12.50) Page 1615
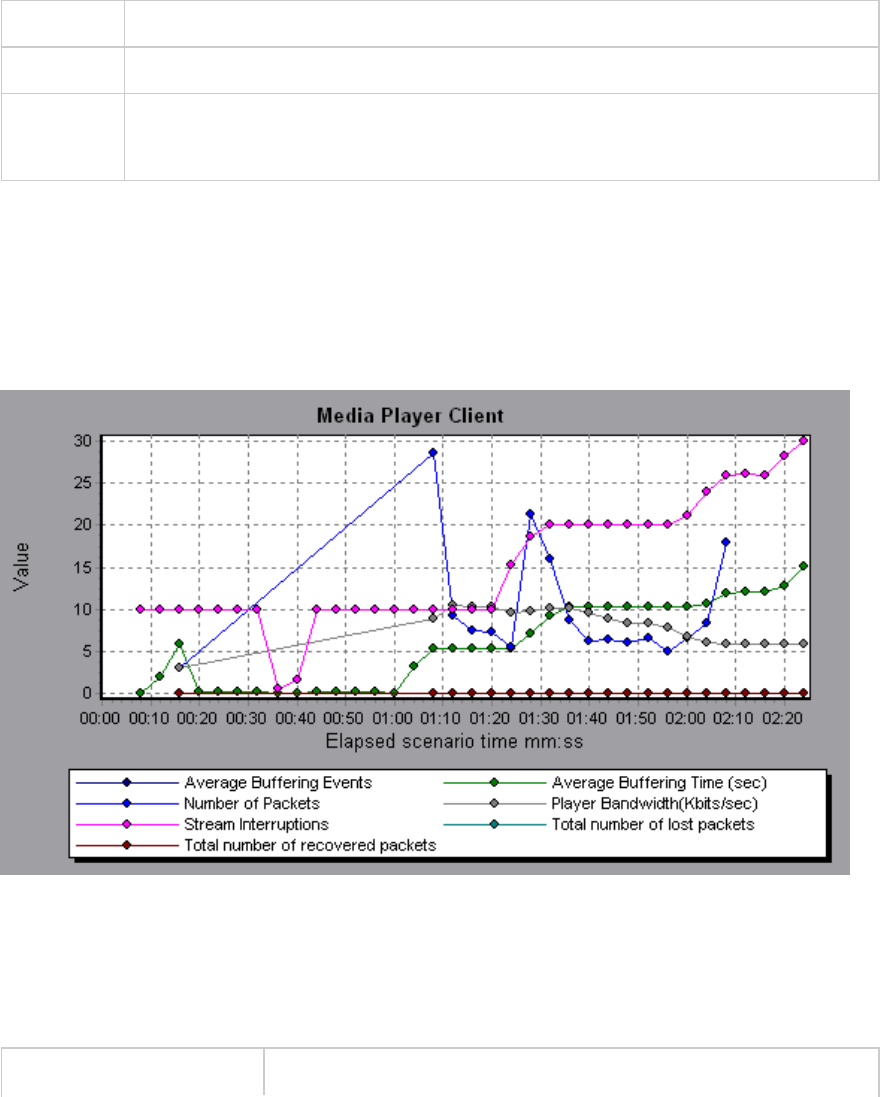
Media Player Client Graph
This graph shows statistics on the Windows Media Player client machine as a function of the elapsed
load test scenario time.
X-axis Elapsed time since the start of the run.
Y-axis The resource usage on the Windows Media Player client machine.
See also "Streaming Media Graphs Overview" on page1611
"Media Player Client Monitoring Measurements" on page1612
Example
In the following example the Total number of recovered packets remained steady during the first two
and a half minutes of the scenario. The Number of Packets and Stream Interruptions fluctuated
significantly. The Average Buffering Time increased moderately, and the Player Bandwidth increased
and then decreased moderately. The scale factor for the Stream Interruptions and Average Buffering
Events measurements is 10, and the scale factor for Player Bandwidth is 1/10.
Real Client Graph
This graph shows statistics on the RealPlayer client machine as a function of the elapsed load test
scenario time.
X-axis Elapsed time since the start of the run.
User Guide
Analysis
HP LoadRunner (12.50) Page 1616
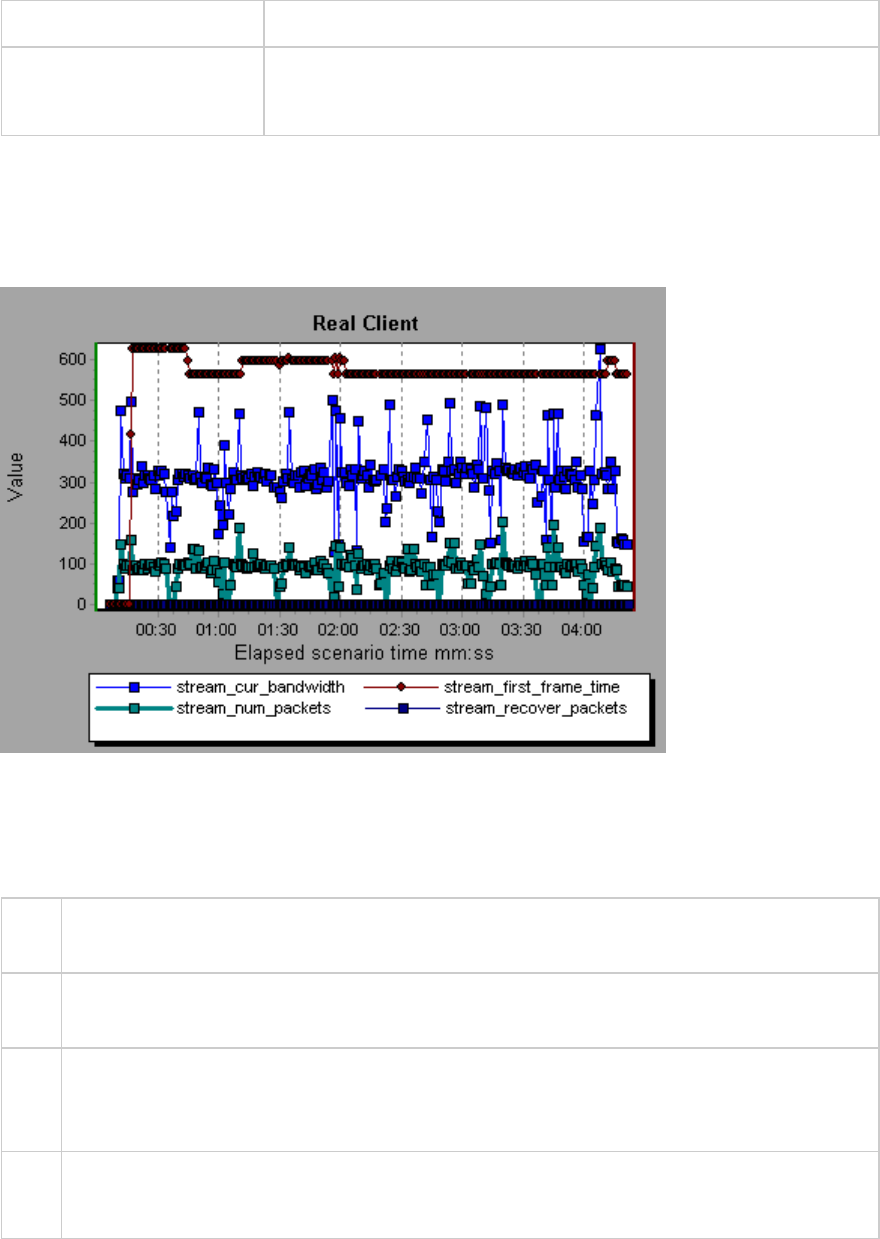
Y-axis The resource usage on the RealPlayer client machine.
See also "Streaming Media Graphs Overview" on page1611
"RealPlayer Client Monitoring Measurements" on page1613
Example
In the following example this graph displays the Total Number of Packets, Number of Recovered
Packets, Current Bandwidth, and First Frame Time measurements during the first four and a half
minutes of the scenario. The scale factor is the same for all of the measurements.
Real Server Graph
This graph shows RealPlayer server statistics as a function of the elapsed load test scenario time.
X-
axis
Elapsed time since the start of the run.
Y-
axis
The resource usage of the RealPlayer server machine.
Note To obtain data for this graph, you need to enable the RealPlayer Server online monitor (from
the Controller) and select the default measurements you want to display, before running the
scenario.
See
also
"Streaming Media Graphs Overview" on page1611
"RealPlayer Server Monitoring Measurements" on page1614
Example
User Guide
Analysis
HP LoadRunner (12.50) Page 1617
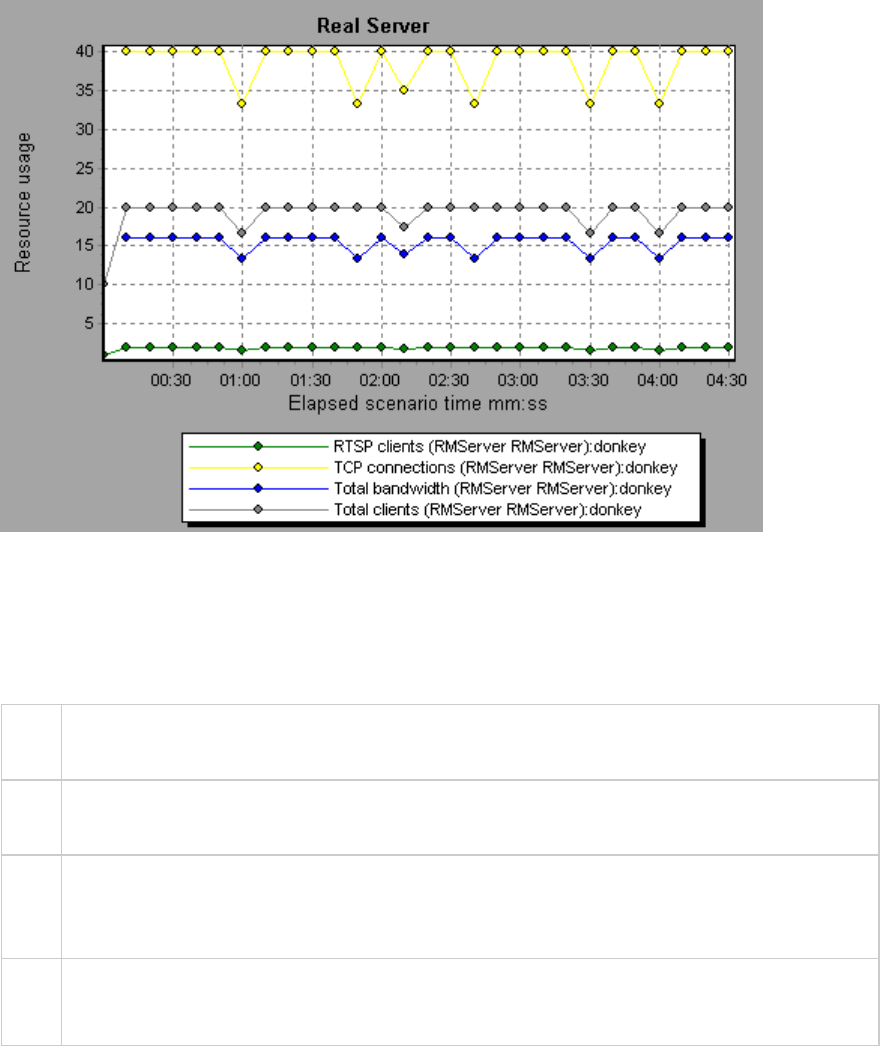
In the following example this graph displays the Total Number of Packets, Number of Recovered
Packets, Current Bandwidth, and First Frame Time measurements during the first four and a half
minutes of the scenario. The scale factor is the same for all of the measurements.
Windows Media Server Graph
This graph shows the Windows Media server statistics as a function of the elapsed load test scenario
time.
X-
axis
Elapsed time since the start of the run.
Y-
axis
Resource usage.
Note To obtain data for this graph, you need to enable the Windows Media Server online monitor
(from the Controller) and select the default measurements you want to display, before
running the scenario.
See
also
"Streaming Media Graphs Overview" on page1611
"Windows Media Server Default Measurements" on page1615
J2EE & .NET Diagnostics Graphs
User Guide
Analysis
HP LoadRunner (12.50) Page 1618

J2EE & .NET Diagnostics Graphs Overview
The J2EE & .NET Diagnostics graphs in LoadRunner Analysis enable you to trace, time, and troubleshoot
individual transactions and server requests through J2EE & .NET Web, application, and database
servers. You can also pinpoint problem servlets and JDBC calls to maximize business process
performance, scalability, and efficiency.
The J2EE & .NET Diagnostics graphs are comprised of two groups:
lJ2EE & .NET Diagnostics Graphs. These graphs show you the performance of requests and methods
generated by virtual user transactions. They show you the transaction that generated each request.
lJ2EE & .NET Server Diagnostics Graphs. These graphs show you the performance of all the requests
and methods in the application you are monitoring. These include requests generated by virtual user
transactions and by real users.
How to Enable Diagnostics for J2EE & .NET
To generate Diagnostics for J2EE & .NET data, you must first install HP Diagnostics.
Before you can use HP Diagnostics with LoadRunner, you need to ensure that you have specified the
Diagnostics Server details in LoadRunner. Before you can view Diagnostics for J2EE & .NET data in a
particular load test scenario, you need to configure the Diagnostics parameters for that scenario. For
more information, see the section on online monitors in the LoadRunner Controller documentation.
Note: To ensure that valid J2EE/.NET diagnostics data is generated during the scenario run, you
must manually mark the beginning and end of each transaction in the Vuser script, rather than
using automatic transactions.
Viewing J2EE to SAP R3 Remote Calls
The Remote Function Call (RFC) protocol in SAP allows communication to take place between SAP J2EE
and SAP R3 environments. When remote calls take place between SAP J2EE and SAP R3 environments,
Analysis displays information about the RFC functions, including the name of each function.
You view information about RFC functions by breaking down the SAP R3 layer. You can view the RFC
function information in a graph display or in the Chain Of Calls window.
1. Go to the J2EE/.NET Diagnostics Usage section of the Summary Report. Next to the relevant
transaction, click the color representing the SAP.R3 layer.
User Guide
Analysis
HP LoadRunner (12.50) Page 1619
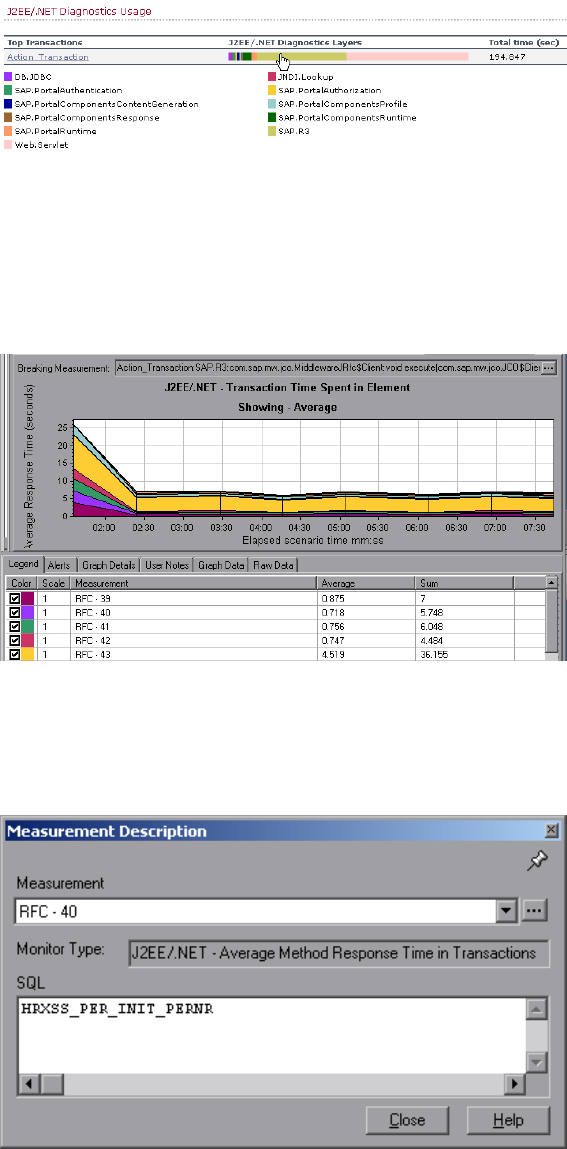
The J2EE/.NET - Transaction Time Spent in Element graph opens, representing the SAP.R3 layer.
2. Right click the graph and choose J2EE/.NET Diagnostics > Break down the class to methods.
3. Break down the graph further by right clicking the graph and choosing J2EE/.NET Diagnostics >
Break down the method to SQLs.
The graph is broken down into the different RFC functions.
4. To view the name of each RFC function, right click an RFC measurement in the Measurement
column in the graph legend and choose Show measurement description.
The Measurement Description dialog box opens. The name of the RFC function is displayed in the
SQL box.
User Guide
Analysis
HP LoadRunner (12.50) Page 1620
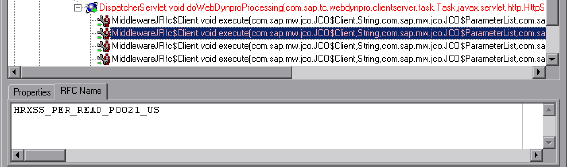
View RFC function information in the Chain Of Calls window
1. Go to the J2EE/.NET Diagnostics Usage section of the Summary Report. Next to the relevant
transaction, click the color representing the SAP.R3 layer.
The J2EE/.NET - Transaction Time Spent in Element graph opens, representing the SAP.R3 layer.
2. Right click the graph and choose J2EE/.NET Diagnostics > Show chain of calls.
The Transaction chain of calls window opens. When you click any of the RFC functions, in the
Measurement column, the name of the function is displayed in the lower pane in the RFC Name tab.
J2EE & .NET Diagnostics Data
The J2EE & .NET Diagnostics graphs provide an overview of the entire chain of activity on the server side
of the system. At the same time, you can break down J2EE/.NET layers into classes and methods to
enable you to pinpoint the exact location where time is consumed. In addition, you can view custom
classes or packages that you set the J2EE/.NET probe to monitor. You can also view the transaction
chain of calls and call stack statistics to track the percentage of time spent on each part of the
transaction.
You can correlate the end user response time with the Web server activity (Servlets and JSPs data),
application server activity (JNDIs), and back-end activity of database requests (JDBC methods and SQL
queries).
Example Transaction Breakdown
The following graphs illustrate the breakdown of a transaction to its layers, classes, and methods.
Transaction Level
The following figure shows the top level Average Transaction Response Time graph. The graph displays
several transactions: Birds,Bulldog,Checkout,Start, and so on.
User Guide
Analysis
HP LoadRunner (12.50) Page 1621
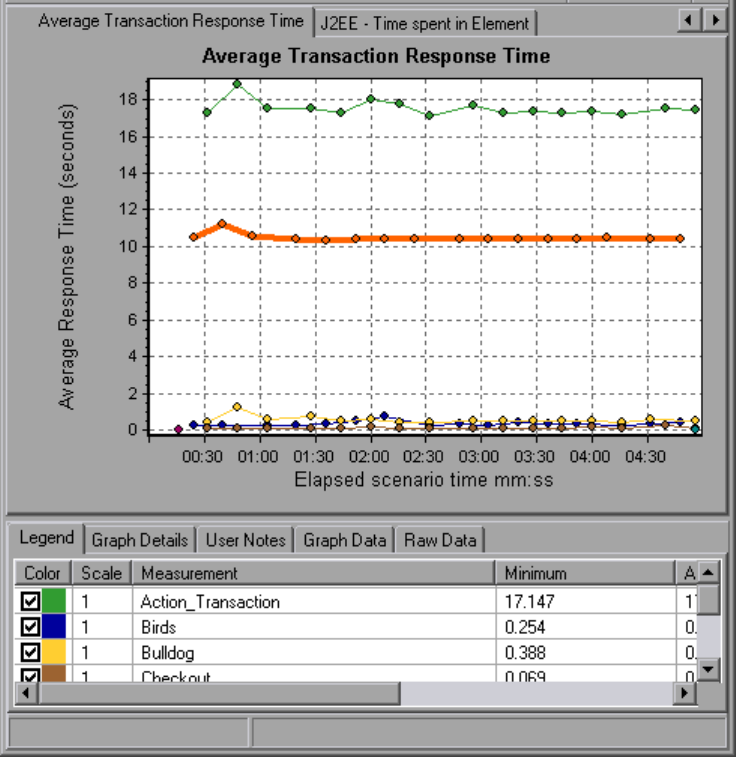
Layer Level
In the following figure, the Start transaction has been broken down to its layers (DB, EJB, JNDI, and
Web). In J2EE/.NET transactions, the Web layer is generally the largest.
User Guide
Analysis
HP LoadRunner (12.50) Page 1622
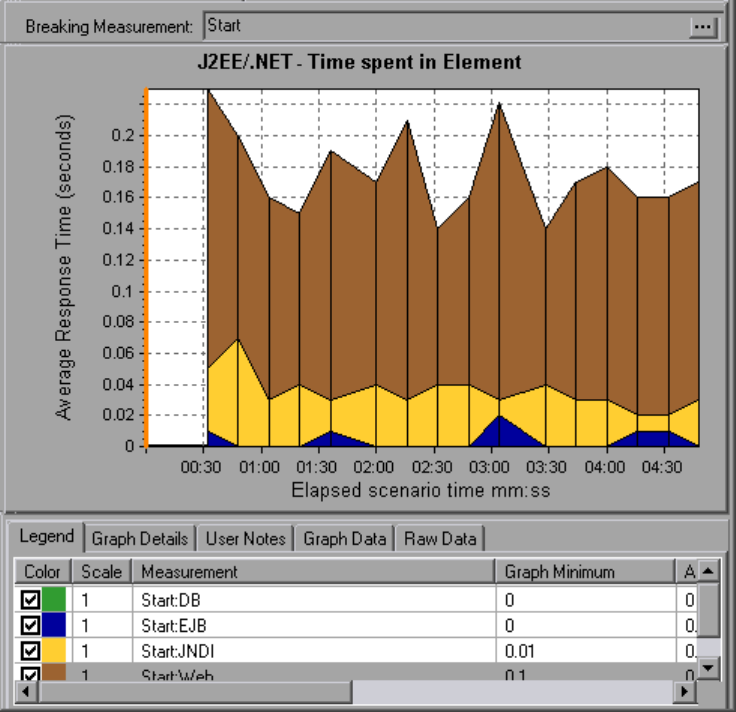
Class Level
In the following figure, the Web layer of the Start transaction has been broken down to its classes.
User Guide
Analysis
HP LoadRunner (12.50) Page 1623
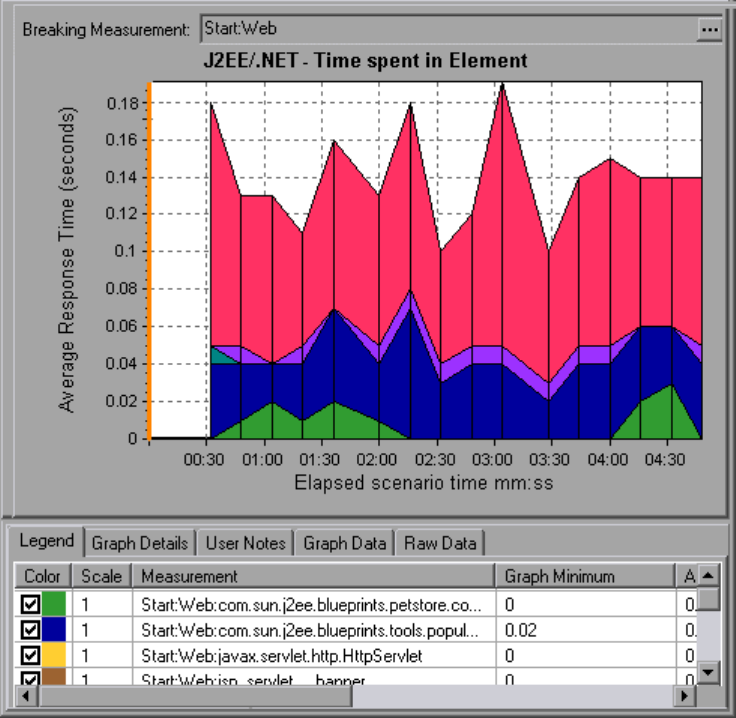
Method/Query Level
In the following figure, the weblogic.servlet.FileServlet component of the Web layer of the Start
transaction has been broken down to its methods.
User Guide
Analysis
HP LoadRunner (12.50) Page 1624
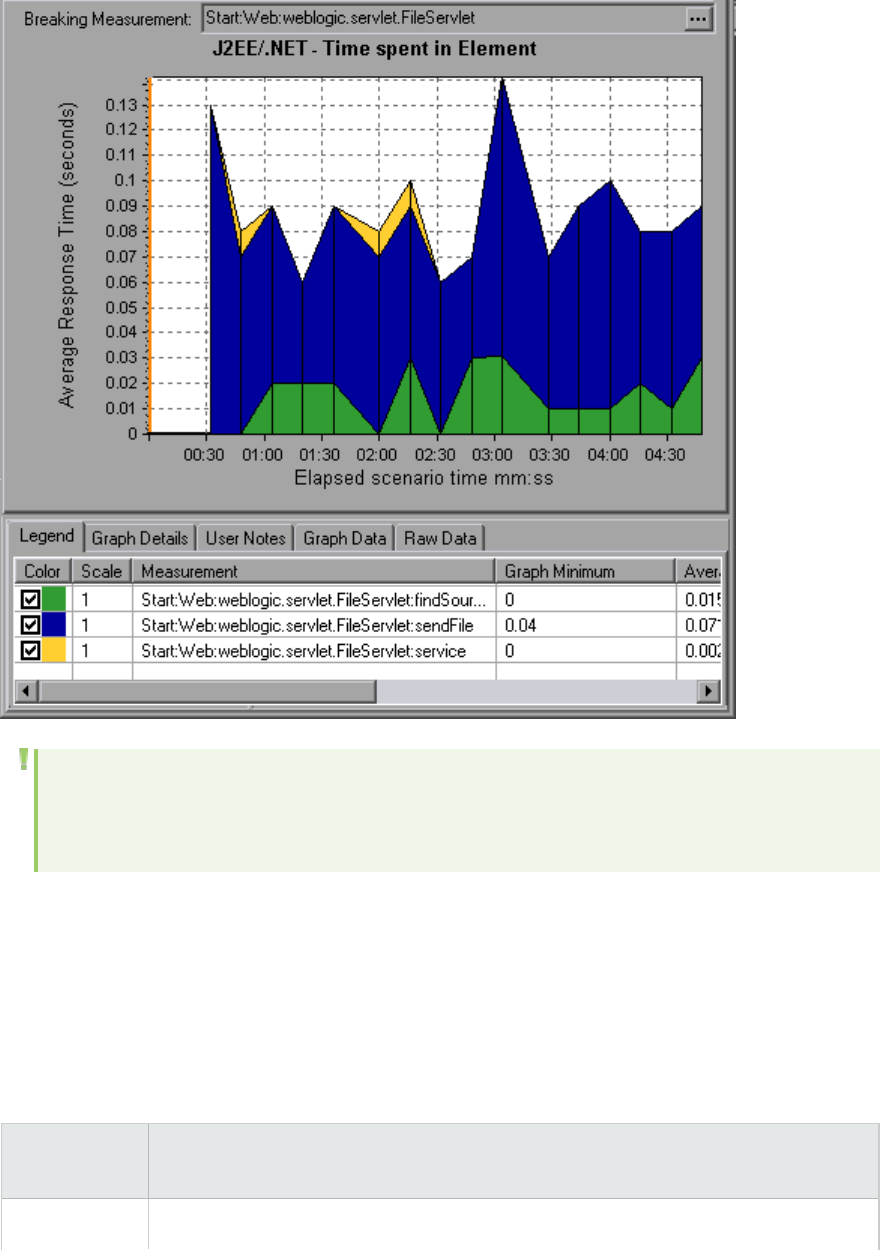
Note: Some JDBC methods can invoke SQLs which can be broken down further. In this case there
is another level of breakdown, that is SQL Statements. For the methods that can not be further
broken down into SQL statements when reaching this level of breakdown, you see NoSql.
Cross VM Analysis
When a server request makes a remote method invocation, the J2EE & .NET Diagnostics graphs display
certain measurements relating to the classes and methods involved in these requests. These
measurements are displayed at a layer, class and method level. The VM making the call is referred to as
the caller VM, and the VM that executes the remote call is the callee VM.
The measurements are described below:
Measurements Description
Cross VM A measurement that represents a dummy layer that integrates the data from the
User Guide
Analysis
HP LoadRunner (12.50) Page 1625
Measurements Description
Layer remote classes and methods in server requests that take place across two or more
virtual machines.
Remote-Class A measurement that represents a dummy class that integrates the data from the
remote methods in server requests that take place across two or more virtual
machines.
Remote-Class:
Remote
Method
A measurement that represents a dummy method. Remote-Class: Remote Method
measures the total time, call count, exclusive latency, minimum and maximum
values, standard deviation, and so on of the methods that are executed remotely,
relative to the caller virtual machine.
Note: Since this data is measured on the caller virtual machine the exclusive latency will include
all of the time required for making the remote method invocation such as network latency.
Using the J2EE & .NET Breakdown Options
J2EE & .NET breakdown options are described.
To
access
Use one of the following to access breakdown options:
l<J2EE & .NET Graphs> View > J2EE & .NET Diagnostics
l<J2EE & .NET Diagnostics Graphs> > select transaction >short-cut menu > J2EE & .NET
Diagnostics
lSee toolbar options for each breakdown level
Notes lThe breakdown menu options and buttons are not displayed until an element
(transaction, server request, layer) is selected.
lIf there is no URI in the SQL, URI-None appears in front of the full measurement
description in the Measurement Description dialog box.
See
also
"J2EE & .NET Diagnostics Graphs Overview" on page1619
User interface elements are described below :
UI Element Description
<Right-
click>
Choose J2EE/.NET Diagnostics > Show Server Requests. A new graph opens showing the
breakdown of the selected transaction. The name of the transaction is displayed in the
User Guide
Analysis
HP LoadRunner (12.50) Page 1626
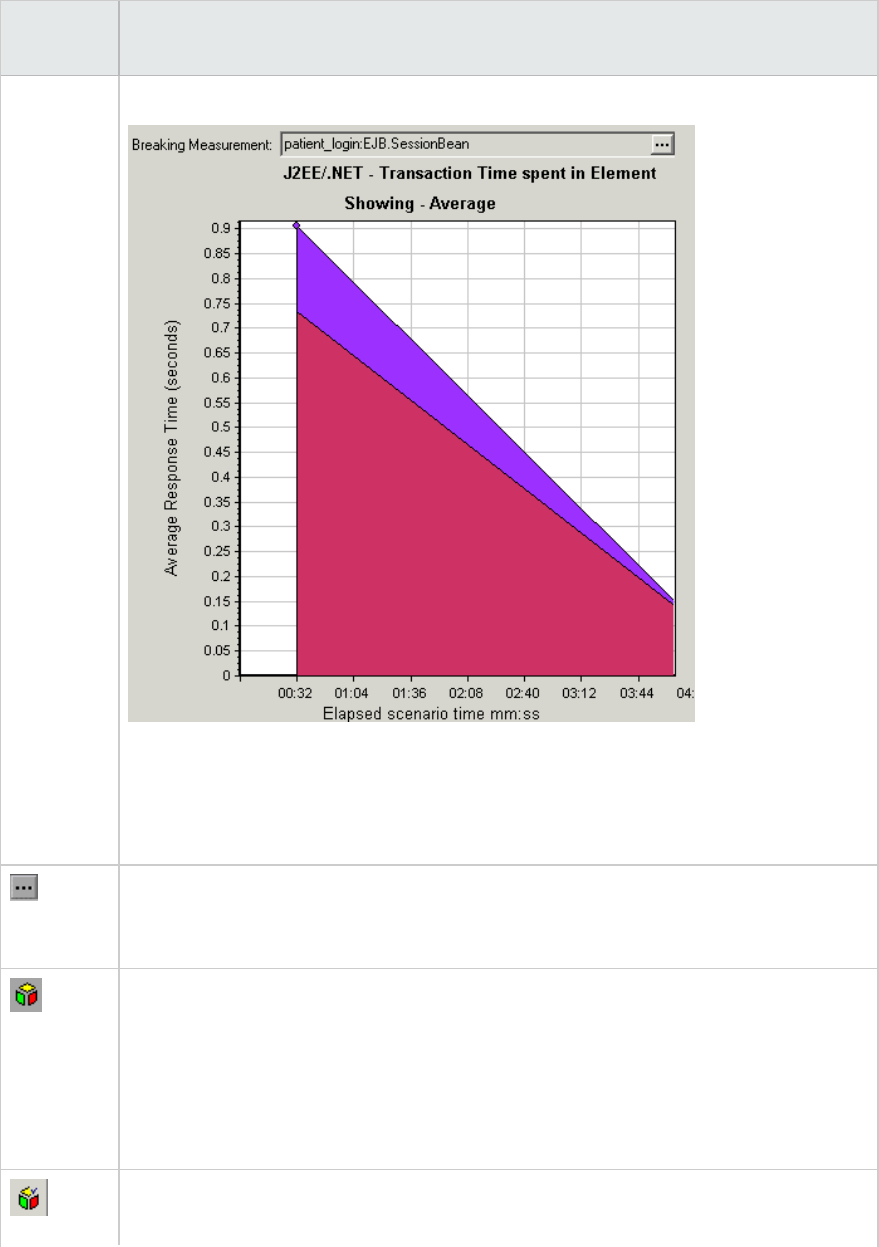
UI Element Description
transaction
in Average
Response
Time
Graph
Breaking Measurement box.
You can view the full SQL statement for a selected SQL element by choosing Show
measurement description from the Legend window right-click menu. The
Measurement Description dialog box opens displaying the name of the selected
measurement and the full SQL statement.
To view transaction properties for the breakdown measurement, click the Breaking
Measurement button. To disable this feature, choose View > Display Options, and
clear the Show Breaking Measurement check box.
Select View>J2EE/.NET Diagnostics > Break down the server request to layers, or
click the measurement breakdown button in the toolbar above the graph.
Note: The option in the J2EE/.NETDiagnostics menu, and the tool tip of the
measurementbreakdown button, vary according to the element that you want to
break down. For example, when you select a server request, the menu option and tool
tip are Break down server request to layers.
Select View>J2EE/.NET Diagnostics > ShowVM, or click the Show VM button in the
toolbar above the graph. This breaks the data down to the application host name (VM).
User Guide
Analysis
HP LoadRunner (12.50) Page 1627

UI Element Description
Select View>J2EE/.NET Diagnostics > UndoBreak down the server request to
layers, or click the Undo<MeasurementBreakdown>button in the toolbar above the
graph.
Note: The option in the J2EE/.NETDiagnostics menu, and the tool tip of the
measurementbreakdown button, vary according to the element whose breakdown you
want to undo. For example, when you select a layer, the menu option and tool tip are
Undo break down server request to layers.
Select View>J2EE/.NET Diagnostics > HideVM, or click the HideVM button in the
toolbar above the graph.
Display the chain of call or call stack statistics in the measurements tree window: Drag
the orange time line on to the graph to the time specifying the end of the period for
which you want to view data, and select
View>J2EE/.NET Diagnostics >Show ChainofCalls, or click the ShowChainofCalls
button in the toolbar above the graph.
Note: A measurement that is broken down in the Average Method Response Time in
Transactions graph will be different from the same measurement broken down in the
J2EE/.NET - Transaction Time Spent in Element graph. This is because the J2EE/.NET -
Average Method Response Time in Transactions graph displays the average transaction
time, whereas the J2EE/.NET - Transaction Time Spent in Element graph displays the
average time per transaction event (sum of method execution time).
Viewing Chain of Calls and Call Stack Statistics
You can view the chain of calls for transactions and methods. The chain of calls answers the question
"Whom did I call?"
You can also view the call stack statistics for methods. Call stack statistics answer the question "Who
called me?"
Chain of call and call stack statistics data are shown in the measurements tree window. The title of the
window changes depending on which kind of data you are viewing.
lTo set the point to which the measurements tree window relates, you must drag the orange time line
to the desired spot.
lTo view transaction call chains, right-click a component and choose
J2EE/.NETDiagnostics>ShowChainofCalls. The ChainofCalls window opens displaying the chain
of calls from the parent transaction downwards.
lTo view method statistics, in the ChainofCalls window right-click a method and choose Show Method
Chain of Calls or Show Method Call Stack Statistics.
User Guide
Analysis
HP LoadRunner (12.50) Page 1628
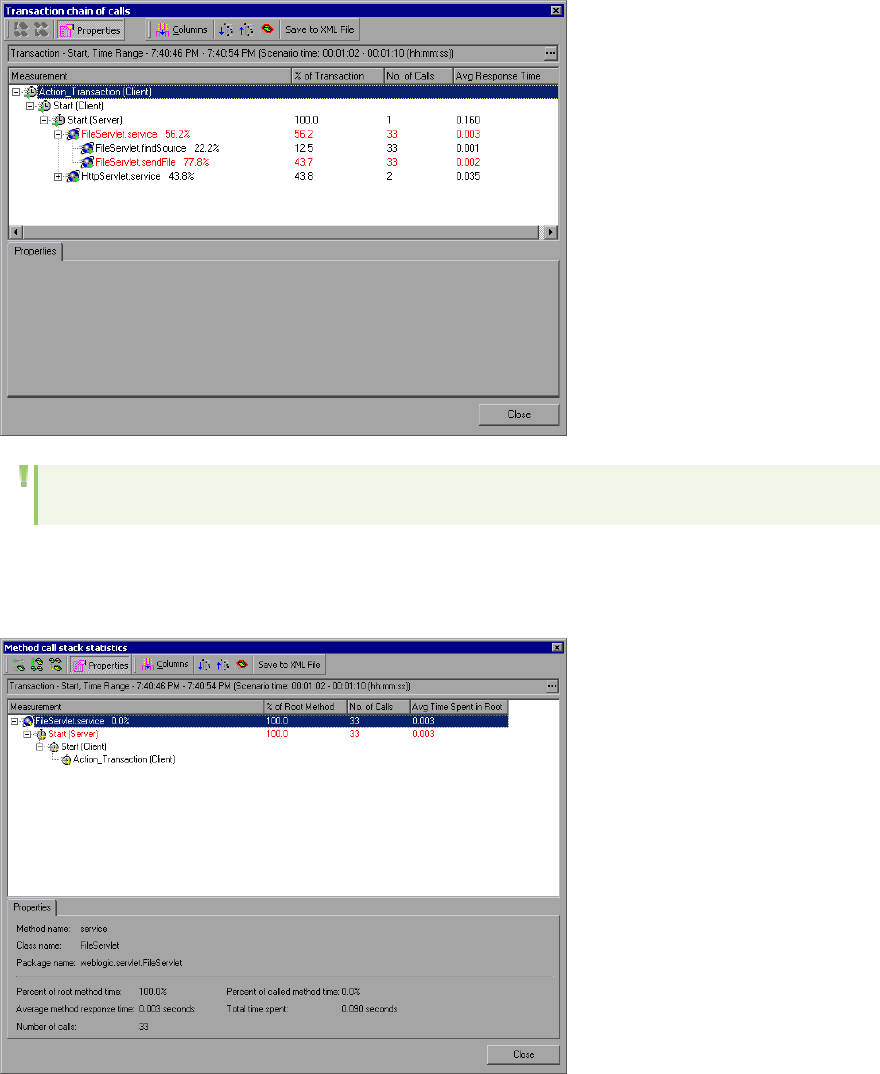
The Chain of Calls Windows
You use the Chain of Calls window to view the components that the selected transaction or method
called. In the following figure, all the calls in the critical path of the Start server-side transaction are
displayed.
Note: Each red node signifies the most time consuming child of its parent.
You use the Call Stack Statistics window to view which components called the selected component. In
the following figure, the FileServlet.service was called by Start (Server), which was called by Start
(Client), and so on, down to the transaction at the bottom of the chain.
User Guide
Analysis
HP LoadRunner (12.50) Page 1629
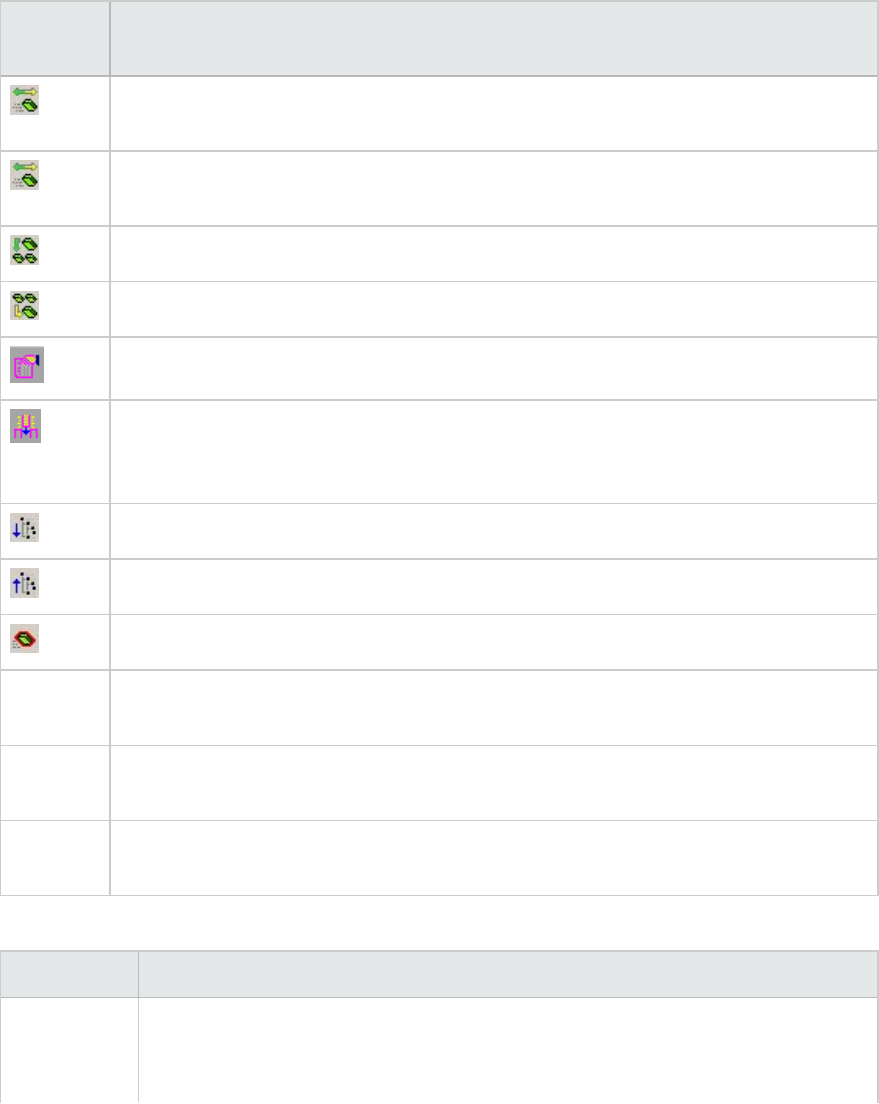
Understanding the Chain of Calls Window
User interface elements are described below:
UI
Element
Description
Switch to Method Chain of Calls. When the call stack statistics data is displayed,
displays the method chain of calls data (only if the root is a method).
Switch to Method Call Stack Statistics. When the method chain of calls data is
displayed, displays the method call stack statistics data (only if the root is a method).
Show Method Chain of Calls. Displays the Chain of Calls window.
Show Method Call Stack Statistics. Displays the Call Stack Statistics window.
Properties. Hides or displays the properties area (lower pane).
Columns. Enables you to select the columns shown in the Calls window. To display
additional fields, drag them to the desired location in the Calls window. To remove fields,
drag them from the Calls window back to the Columns chooser.
Expand All. Expands the entire tree.
Collapse All. Collapses the entire tree.
Expand Worst Path. Expands only the parts of the path on the critical path.
Save to
XML File
Saves the tree data to an XML file.
Method
Properties
Area.Displays the full properties of the selected method.
SQL Query Displays the SQL query for the selected method. (For Database only.)The following
columns are available in the Chain of Calls window:
The following columns are available in the Chain of Calls window:
Column Description
Measurement Name of the method, displayed as ComponentName:MethodName. In the case of a
database call, query information is also displayed. The percent shown indicates the
percentage of calls to this component from its parent.
User Guide
Analysis
HP LoadRunner (12.50) Page 1630
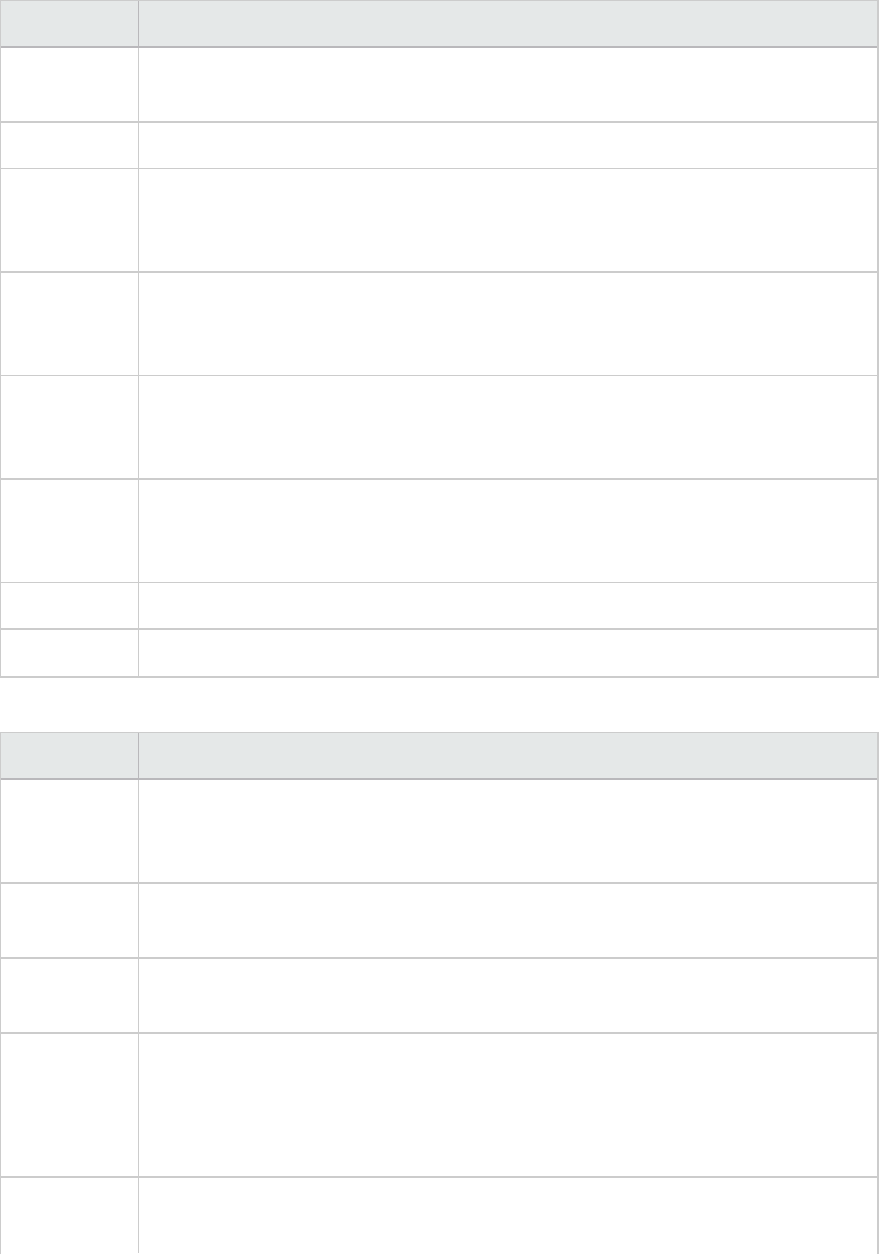
Column Description
% of Root
Method
Percentage of the total time of the method from the total time of the root tree item.
No of Calls Displays the amount of times this transaction or method was executed.
Avg
Response
Time
Response time is the time from the beginning of execution until the end. Average
response time is the total response time divided by the number of divided by the
number of instances of the method.
STD
Response
Time
The standard deviation response time.
Min
Response
Time
The minimum response time.
Max
Response
Time
The maximum response time.
% of Caller Displays the percentage of method time in relation the parent method time.
Total time Displays the total method execution time, including the child execution time.
The following columns are available in the Call Stack Statistics window:
Column Description
Measurement Name of the method, displayed as ComponentName.MethodName. In the case of a
database call, query information is also displayed. The percent shown indicates the
percentage of calls to this component from its child.
% of Root
Method
Percentage of the total time of the transaction (or method) from the total time of
the root tree item.
No. of Calls
to Root
Displays the amount of times this transaction or method was executed.
Avg Time
Spent in Root
Time spent in root is the time that the sub-area spent in the root sub-
area/area/transaction.
Average Time Spent in Root time is the total time spent in the root divided by the
number of instances of the method.
STD Time
Spent in Root
The standard deviation time spent in the root.
User Guide
Analysis
HP LoadRunner (12.50) Page 1631
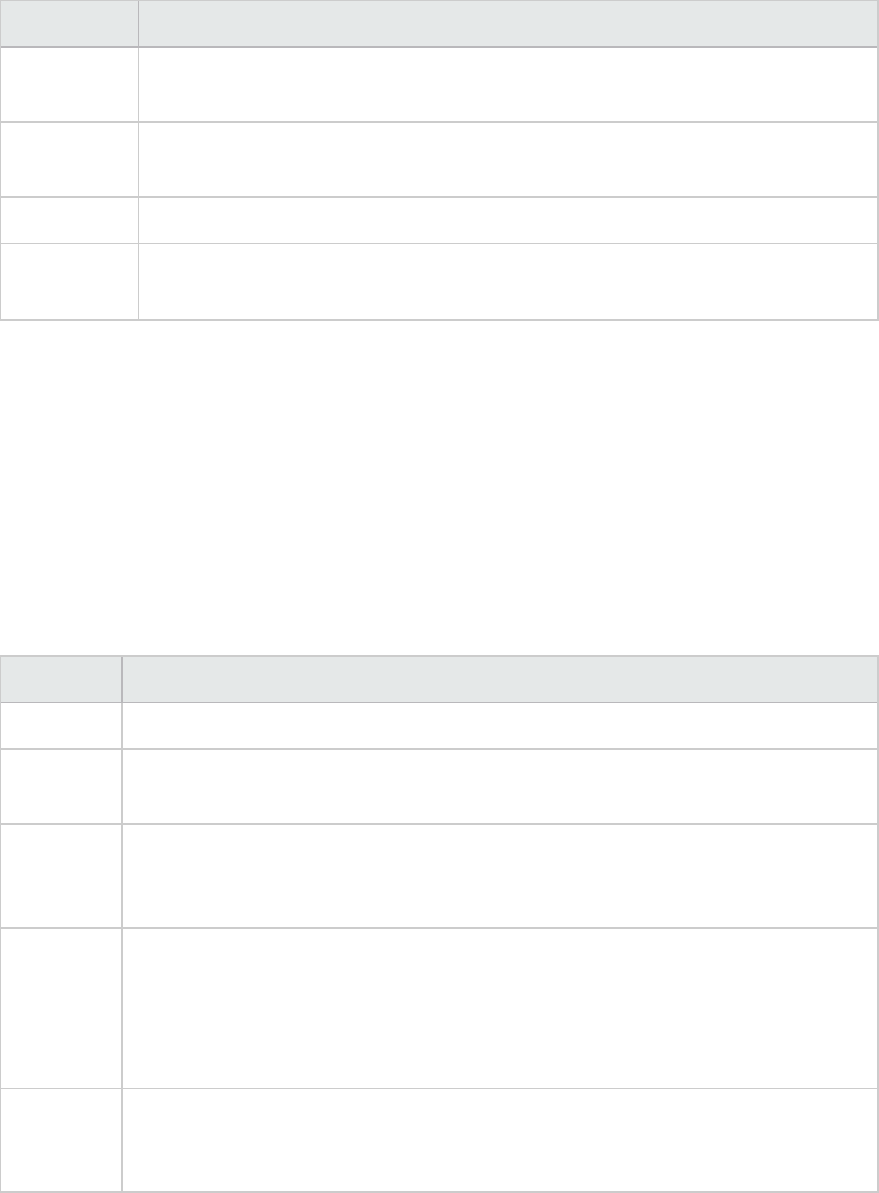
Column Description
Min Time
Spent in Root
The minimum time spent in the root.
Max Time
Spent in Root
The maximum time spent in the root.
% of Called Displays the percentage of method time in relation the child method time.
Total Time
Spent in Root
Displays the total method execution time, including the child execution time.
Graph Filter Properties
You can filter the J2EE & .NET Diagnostics graphs so that the displayed data is more suitable to your
needs. You can filter using the following methods:
lBefore opening a graph, enter filter criteria in the Graph Properties box of the Open Graph dialog
box. For more information, see "Open a New Graph Dialog Box" on page1502.
lFrom an open graph, enter filter criteria in the Filter condition fields in a filter dialog box. For more
information, see "Filter Dialog Boxes" on page1491 and "Drilling Down in a Graph" on page1467.
User interface elements are described below:
UI Element Description
Class Name Shows data for specified classes.
Layer
Name
Shows data for specified layers.
Scenario
Elapsed
Time
Shows data for transactions that ended during the specified time.
SQL Logical
Name
Shows data for specified SQL logical names. Due to the length of some SQL names,
after you choose an SQL statement it is assigned a "logical name." This logical name is
used in the filter dialog, legend, grouping, and other places in place of the full SQL
statement. You can view the full SQL statement in the Measurement Description dialog
box (View>Show Measurement Description).
Transaction
Name -
J2EE/.NET
Shows data for a specified transaction.
Some JDBC methods have the ability to invoke SQL's (each method can invoke several different SQL's)
so there is another level of breakdown which is the SQL statements.
User Guide
Analysis
HP LoadRunner (12.50) Page 1632
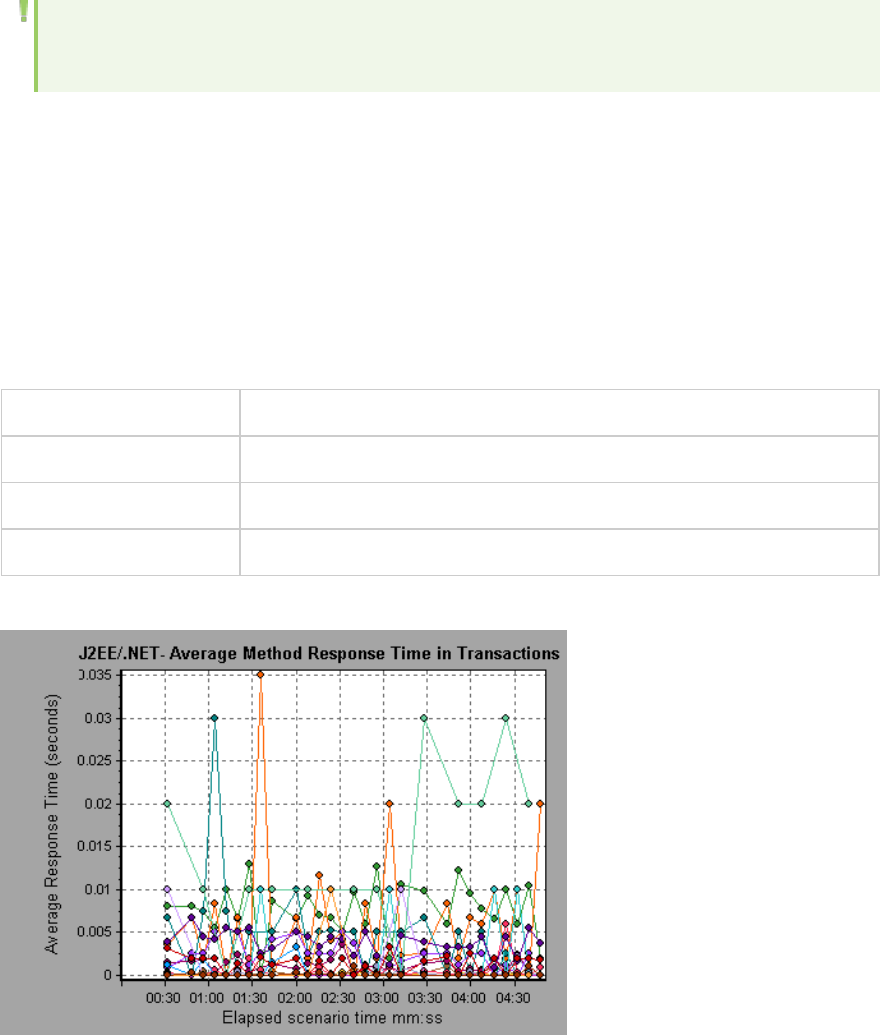
Note: For the methods that do not have SQL statement when reaching this level of breakdown
you see NoSql.
J2EE/.NET - Average Method Response Time in Transactions
Graph
This graph displays the average response time for the server side methods, computed as Total Method
Response Time/Number of Method calls. For example, if a method was executed twice by an instance of
transaction A and once by another instance of the same transaction, and it took three seconds for each
execution, the average response time is 9/3, or 3 seconds. The method time does not include calls made
from the method to other methods.
X-axis Elapsed time.
Y-axis Average response time (in seconds) per method
Breakdown options "Using the J2EE & .NET Breakdown Options" on page1626
See also "J2EE & .NET Diagnostics Graphs Overview" on page1619
Example
J2EE/.NET - Average Number of Exceptions in Transactions
Graph
This graph displays the average number of code exceptions per method, transaction, or request that
were monitored during the selected time range.
User Guide
Analysis
HP LoadRunner (12.50) Page 1633
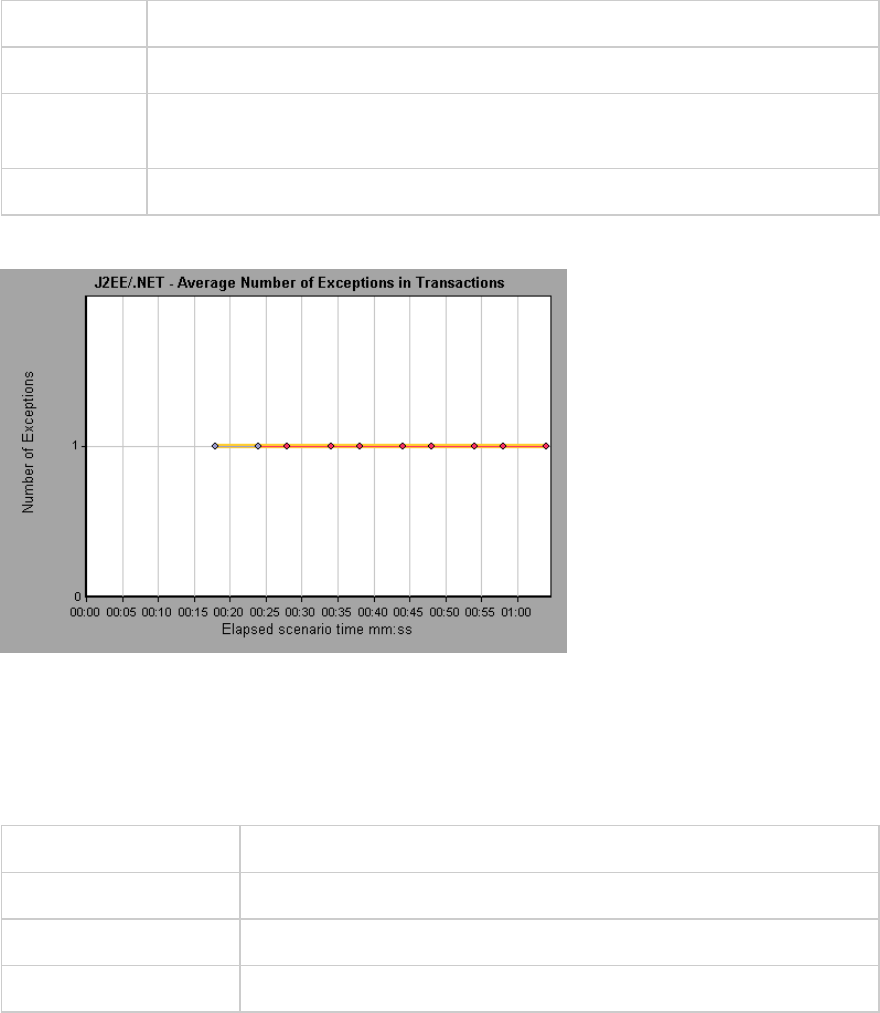
X-axis Elapsed time.
Y-axis Represents the number of events.
Breakdown
options
To break the displayed elements down further, see "Using the J2EE & .NET
Breakdown Options" on page1626.
See also "J2EE & .NET Diagnostics Graphs Overview" on page1619
Example
J2EE/.NET - Average Number of Exceptions on Server Graph
This graph displays the average number of code exceptions per method that were monitored during the
selected time range.
X-axis Elapsed time of the scenario run.
Y-axis Number of events.
Breakdown options "Using the J2EE & .NET Breakdown Options" on page1626
See also "J2EE & .NET Diagnostics Graphs Overview" on page1619
Example
User Guide
Analysis
HP LoadRunner (12.50) Page 1634
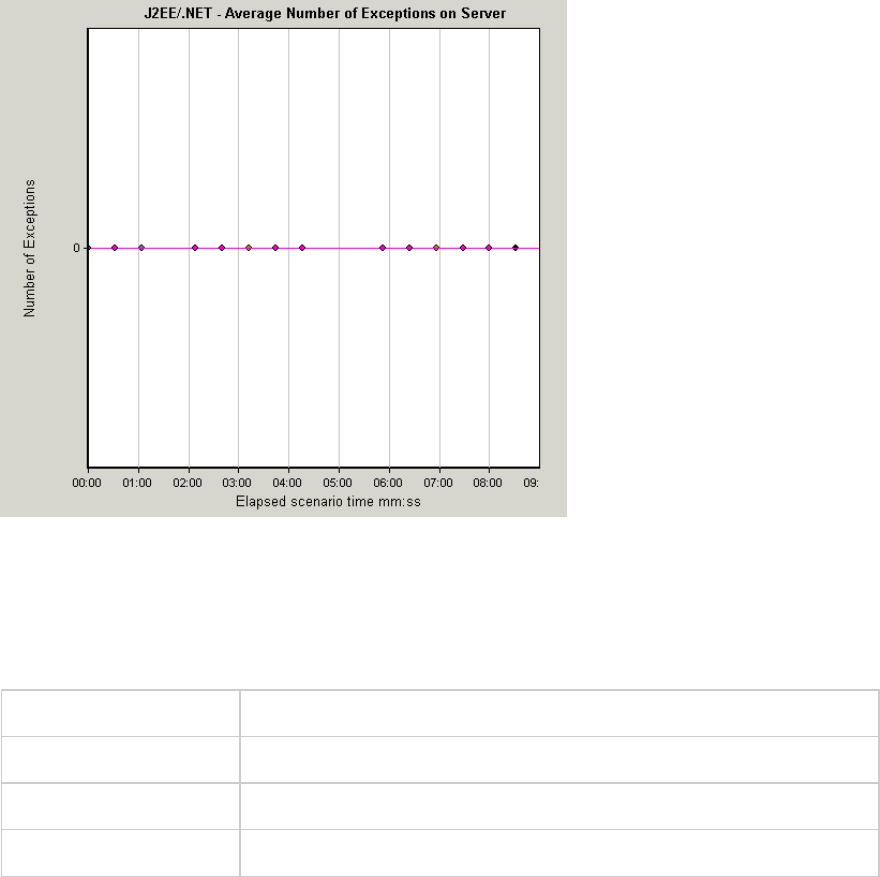
J2EE/.NET - Average Number of Timeouts in Transactions Graph
This graph displays the average number of timeouts per method, transaction, or request that were
monitored during the selected time range.
X-axis Elapsed time since the scenario run.
Y-axis Represents number of events.
Breakdown options "Using the J2EE & .NET Breakdown Options" on page1626
See also "J2EE & .NET Diagnostics Graphs Overview" on page1619
Example
User Guide
Analysis
HP LoadRunner (12.50) Page 1635
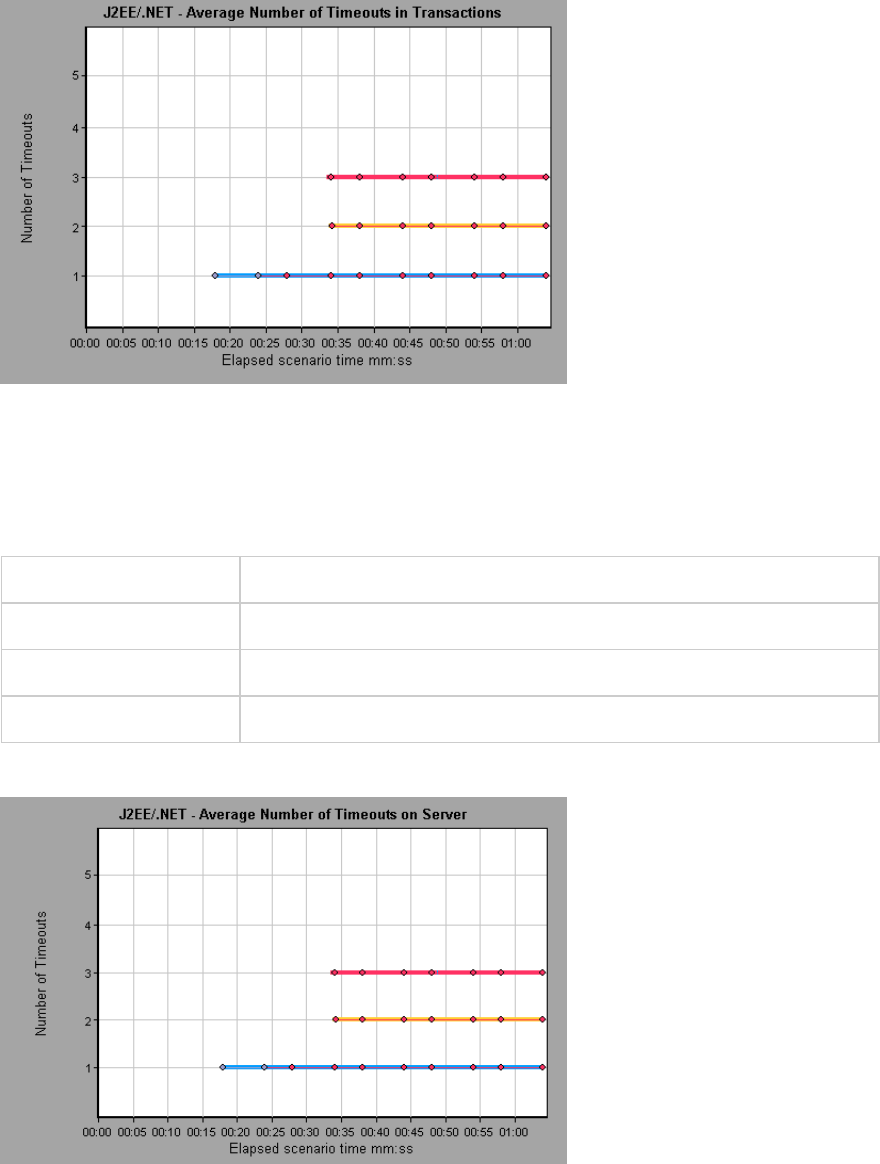
J2EE/.NET - Average Number of Timeouts on Server Graph
This graph displays the average number of timeouts per method that were monitored during the
selected time range.
X-axis Elapsed time since the scenario run.
Y-axis Number of events.
Breakdown options "Using the J2EE & .NET Breakdown Options" on page1626
See also "J2EE & .NET Diagnostics Graphs Overview" on page1619
Example
User Guide
Analysis
HP LoadRunner (12.50) Page 1636
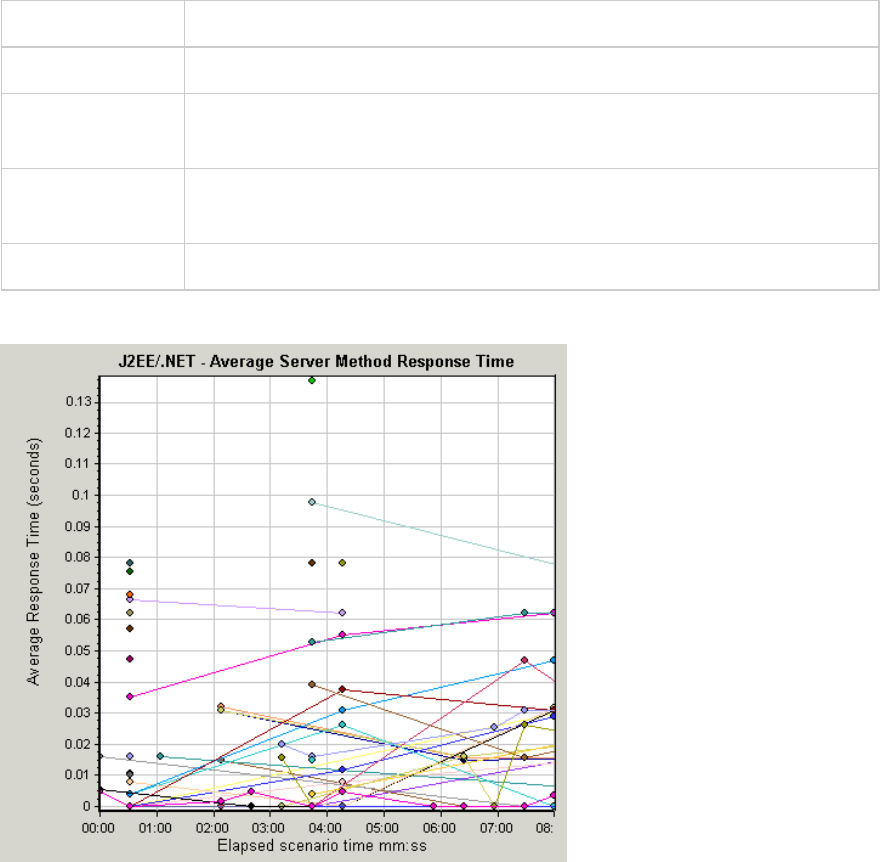
J2EE/.NET - Average Server Method Response Time Graph
This graph displays the average response time for the server side methods, computed as Total Method
Response Time/Number of Method calls.
X-axis Elapsed time since the scenario run.
Y-axis Average response time (in seconds) per method.
Breakdown
options
"Using the J2EE & .NET Breakdown Options" on page1626
Note The method time does not include calls made from the method to other
methods.
See also "J2EE & .NET Diagnostics Graphs Overview" on page1619
Example
J2EE/.NET - Method Calls per Second in Transactions Graph
This graph displays the number of completed sampled transactions during each second of a load test
scenario run.
The number of transactions included in the sample is determined by the sampling percentage set in the
Diagnostics Distribution dialog box in the Controller (Diagnostics > Configuration).
User Guide
Analysis
HP LoadRunner (12.50) Page 1637
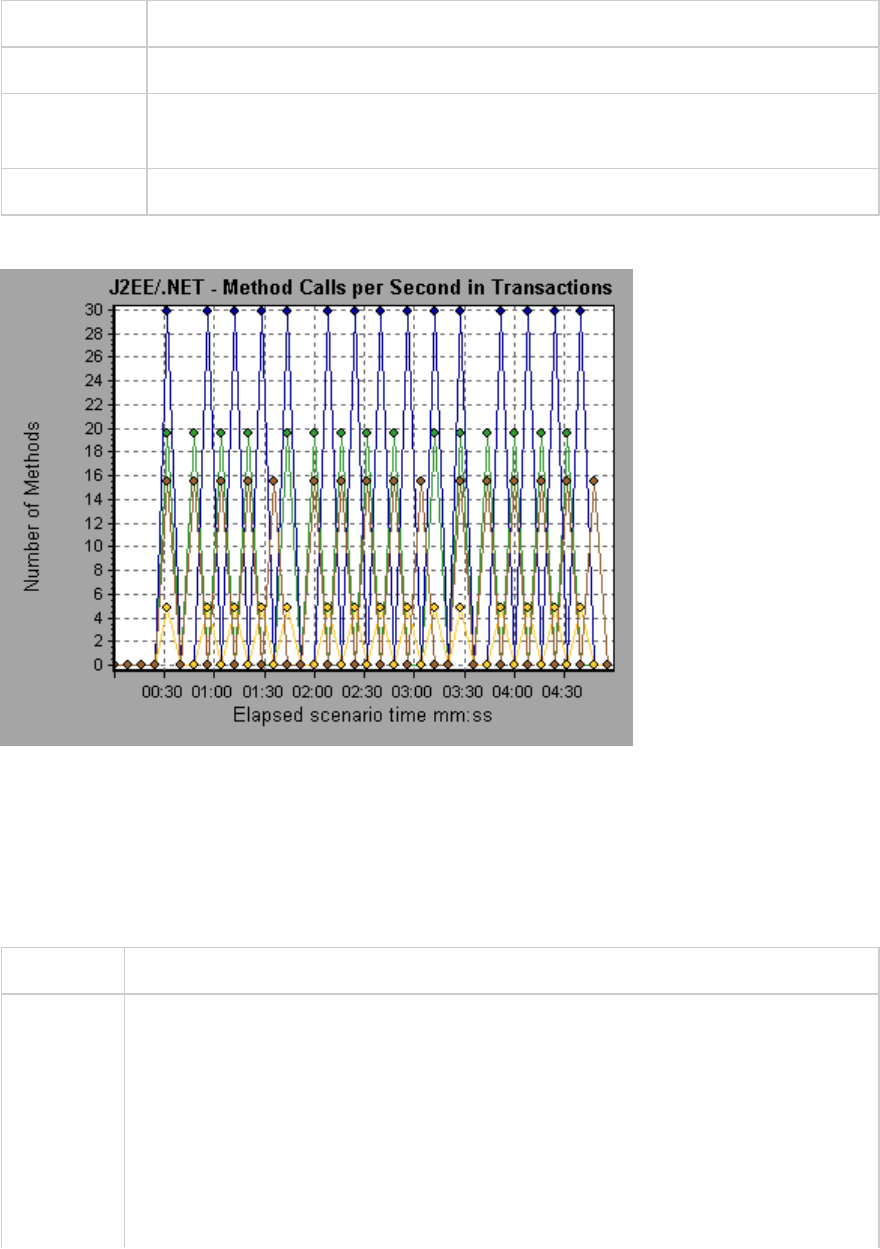
X-axis Elapsed time.
Y-axis Represents the number of completed sampled transactions per second.
Breakdown
options
To break the displayed elements down further, see "Using the J2EE & .NET
Breakdown Options" on page1626.
See also "J2EE & .NET Diagnostics Graphs Overview" on page1619
Example
J2EE/.NET - Probes Metrics Graph
This graph displays performance metrics collected by HP Diagnostics probes. Metrics include JVM
related data such as Heap usage and Garbage Collection, application server specific metrics, JDBC (Java
Database Connectivity) metrics, and more.
X-axis Elapsed time since the scenario run.
Y-axis Resource usage. The following probe metric data is provided for offline analysis:
lHeapUsed
lGC Collections/sec
lGC time Spent in Collections
To include additional Probe metric data in offline Analysis, you use the Diagnostics
configuration file, etc./offline.xml. For more information, see the HP Diagnostics
Server Installation and Administration Guide.
User Guide
Analysis
HP LoadRunner (12.50) Page 1638
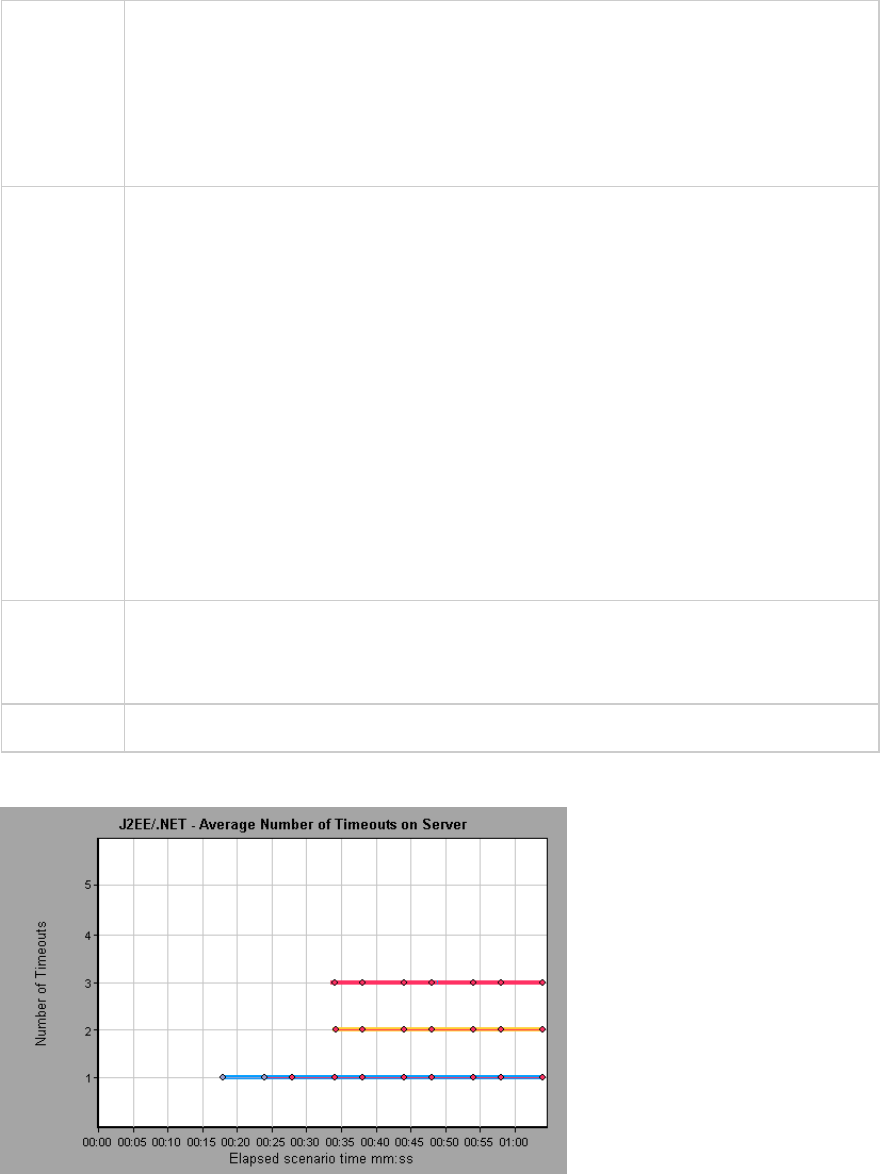
Data
Grouping
By default, the data in the graph is grouped by Category Name (the Diagnostics metric
category name) and Probe Name. As a result, the default format for the measurement
name is the graph is:
<Name of metric from Diagnostics (unit of metric)>:<Diagnostics metric category
name>:<Probe name>
If the measurement unit is a count, no unit name is displayed in parentheses.
Important
Information
By default, the following probe metric data is provided for offline analysis: HeapUsed,
GC Collections/sec, and GC time Spent in Collections. To include additional Probe
metric data in offline Analysis, you use the Diagnostics configuration file,
etc/offline.xml. For more information, see the HP Diagnostics LoadRunner and
Performance Center-Diagnostics Integration Guide .
For example, for the following measurement name:
lthe name of the metric is GC Time Spent in Collections.
lthe value is measured as a percentage.
lthe metric category name is GC.
lthe Probe name is MyJBossDev
In addition to the regular Analysis filter criteria, you can also filter and group by the
Diagnostics metrics collector name and the host name.
Note You need to synchronize the operating system time settings on the Controller machine
and the Diagnostics Servers to ensure accurate display of the elapsed scenario time in
the Probe Metrics graph.
See also "J2EE & .NET Diagnostics Graphs Overview" on page1619
Example
User Guide
Analysis
HP LoadRunner (12.50) Page 1639
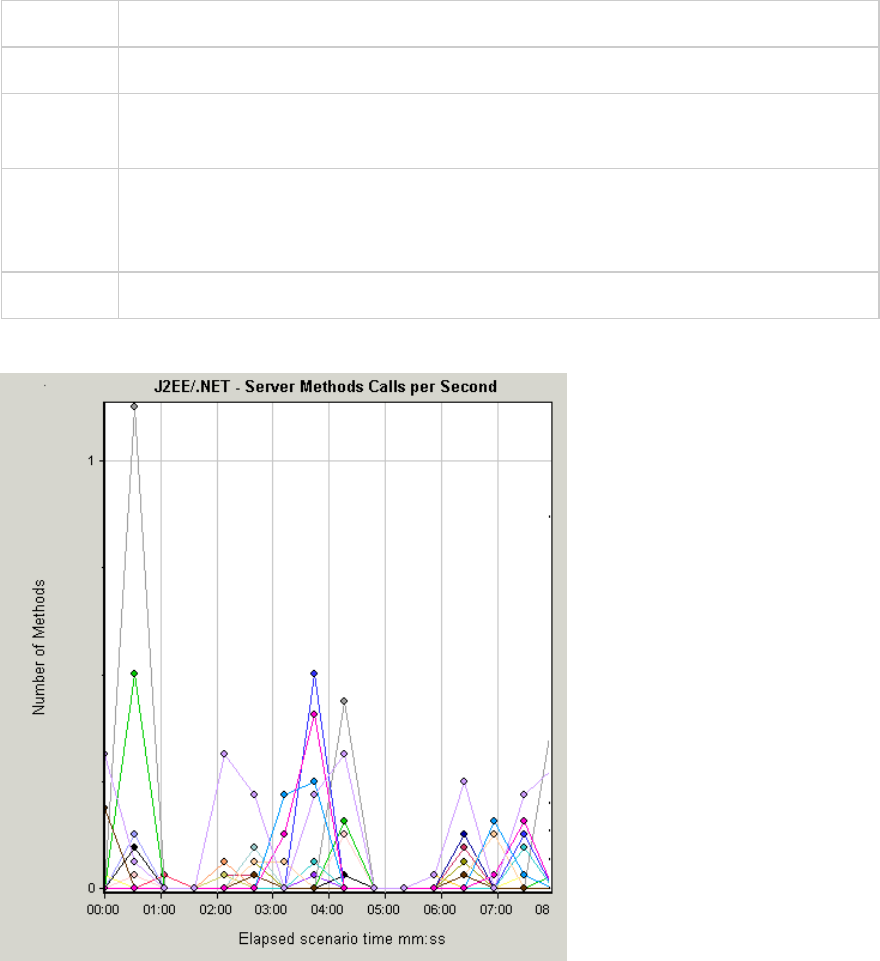
J2EE/.NET - Server Methods Calls per Second Graph
This graph displays the number of completed sampled methods during each second of a load test
scenario run.
X-axis Elapsed time of the scenario run.
Y-axis Number of completed sampled methods per second.
Breakdown
options
"Using the J2EE & .NET Breakdown Options" on page1626
Note The number of methods included in the sample is determined by the sampling
percentage set in the Diagnostics Distribution dialog box in the Controller
(Diagnostics>Configuration).
See also "J2EE & .NET Diagnostics Graphs Overview" on page1619
Example
User Guide
Analysis
HP LoadRunner (12.50) Page 1640
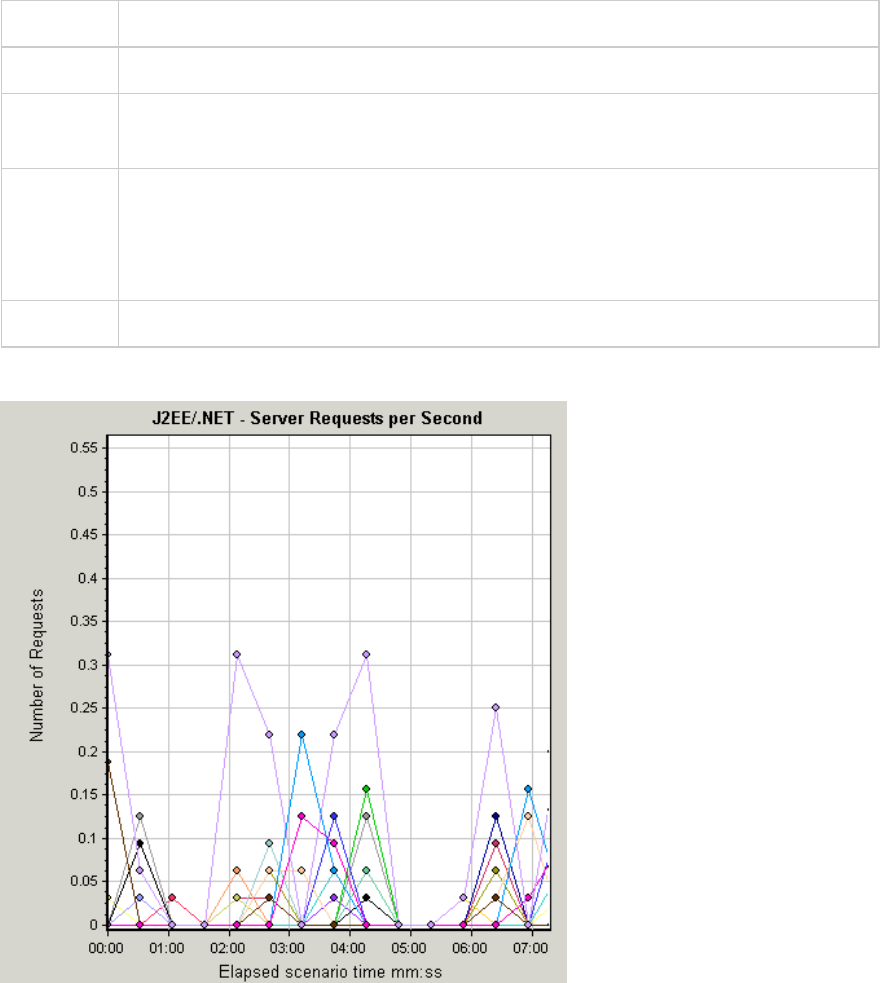
J2EE/.NET - Server Requests per Second Graph
This graph displays the number of completed sampled requests during each second of a load test
scenario run.
X-axis Elapsed time of the scenario run.
Y-axis Number of completed sampled requests per second.
Breakdown
options
"Using the J2EE & .NET Breakdown Options" on page1626
Note The number of requests included in the sample is determined by the sampling
percentage set in the Diagnostics Distribution dialog box in the Controller
(Diagnostics>Configuration). For more information, see the section on online
monitors in the LoadRunner Controller documentation.
See also "J2EE & .NET Diagnostics Graphs Overview" on page1619
Example
User Guide
Analysis
HP LoadRunner (12.50) Page 1641
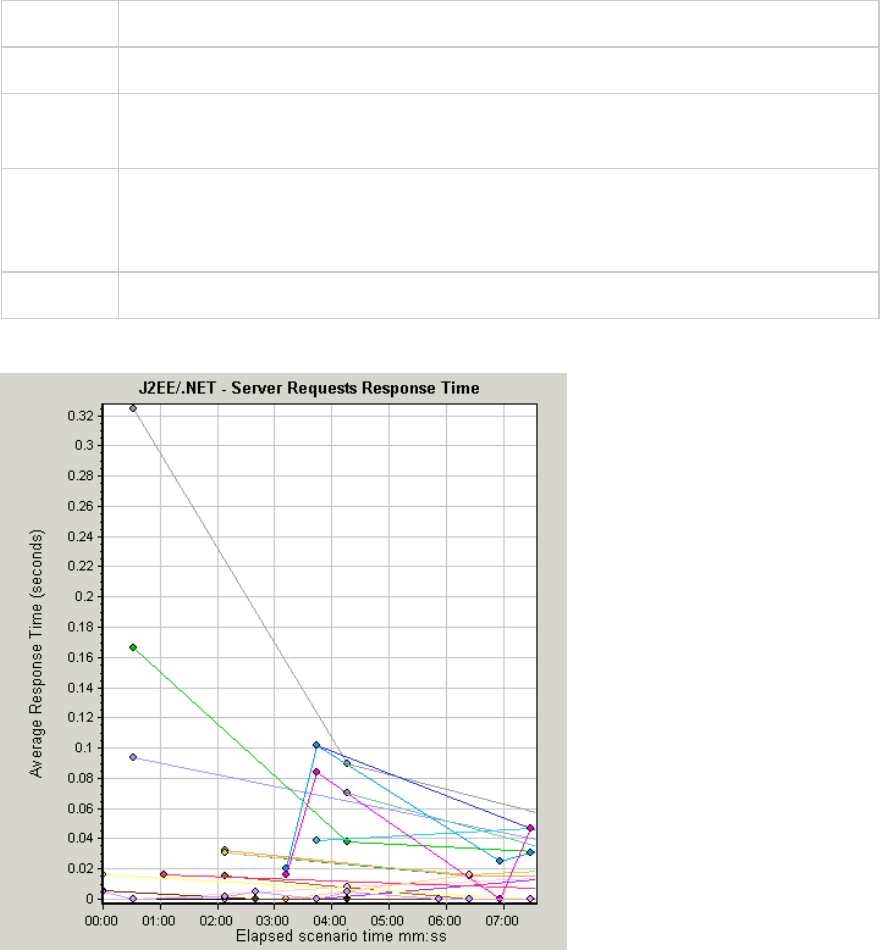
J2EE/.NET - Server Request Response Time Graph
This graph displays the server response time of requests that include steps that cause activity on the
J2EE/.NET backend.
X-axis Elapsed time of the scenario time.
Y-axis Average time (in seconds) taken to perform each request.
Breakdown
options
"Using the J2EE & .NET Breakdown Options" on page1626
Note The reported times, measured from the point when the request reached the Web
server to the point it left the Web server, include only the time that was spent in the
J2EE/.NET backend.
See also "J2EE & .NET Diagnostics Graphs Overview" on page1619
Example
J2EE/.NET - Server Request Time Spent in Element Graph
This graph displays the server response time for the selected element (layer, class, or method) within
each server request.
User Guide
Analysis
HP LoadRunner (12.50) Page 1642

Purpose The time is computed as Total Response Time/Total Number of Server Requests. For
example, if a method was executed twice by an instance of server request A and once
by another instance of the same server request, and it took three seconds for each
execution, the average response time is 9/2, or 4.5 seconds. The server request time
does not include the nested calls from within each server request.
X-axis Elapsed time of the scenario run.
Y-axis Average response time (in seconds) per element within the server request.
Breakdown
options
"Using the J2EE & .NET Breakdown Options" on page1626
Filtering
properties
The display of the graph is determined by the Graph Properties selected when the
graph is opened, as described:
None
lTime spent in each server request
Server request
lFiltered by server request. Grouped by layer.
Server request and layer
lFiltered by server request and layer. Grouped by class.
Server request, layer, and class
lFiltered by server request, layer, and class. Grouped by method.
Tips To obtain data for this graph, you must first install HP Diagnostics. Before you can view
Diagnostics for J2EE & .NET data in a particular load test scenario, you need to
configure the Diagnostics parameters for that scenario. For more information, see the
section on online monitors in the LoadRunner Controller documentation.
See also "J2EE & .NET Diagnostics Graphs Overview" on page1619
Example
User Guide
Analysis
HP LoadRunner (12.50) Page 1643
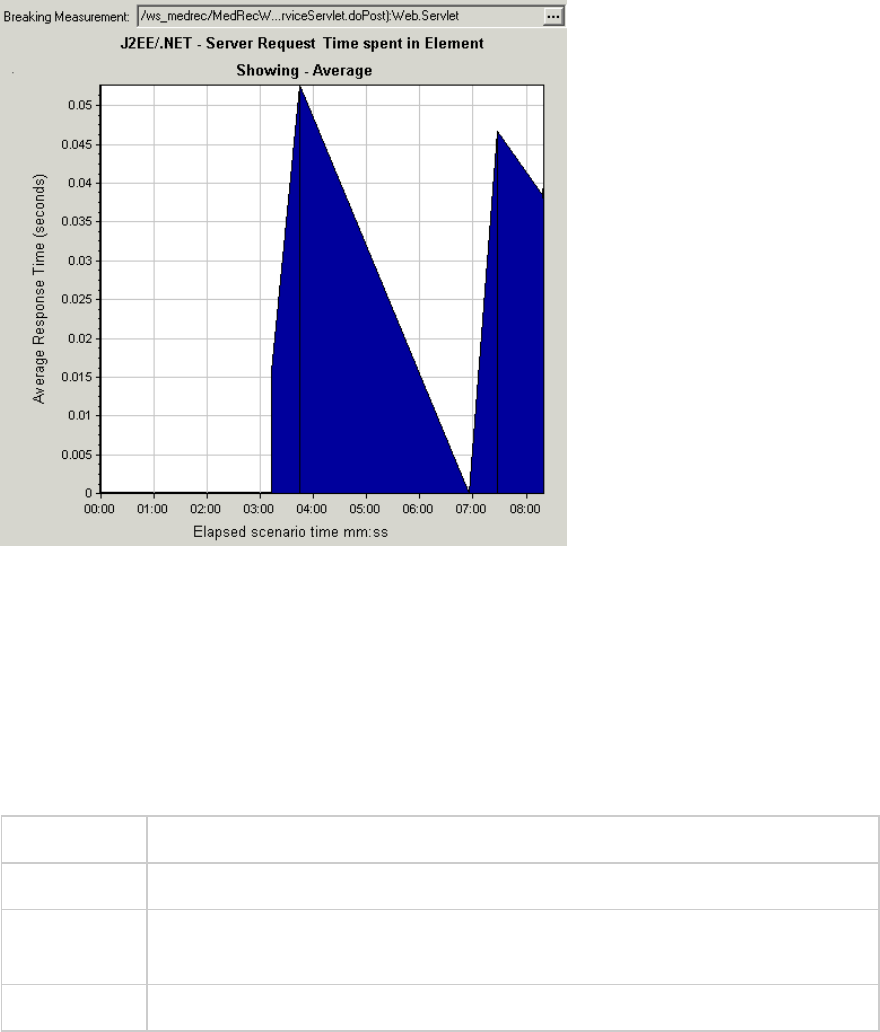
J2EE/.NET - Transactions per Second Graph
This graph displays the number of completed sampled transactions during each second of a load test
scenario run.
The number of transactions included in the sample is determined by the sampling percentage set in the
Diagnostics Distribution dialog box in the Controller (Diagnostics > Configuration). For more
information, see the section on online monitors in the LoadRunner Controller documentation.
X-axis Elapsed time.
Y-axis Number of completed sampled transactions per second
Breakdown
options
To break the displayed elements down further, see "Using the J2EE & .NET
Breakdown Options" on page1626.
See also "J2EE & .NET Diagnostics Graphs Overview" on page1619
Example
User Guide
Analysis
HP LoadRunner (12.50) Page 1644
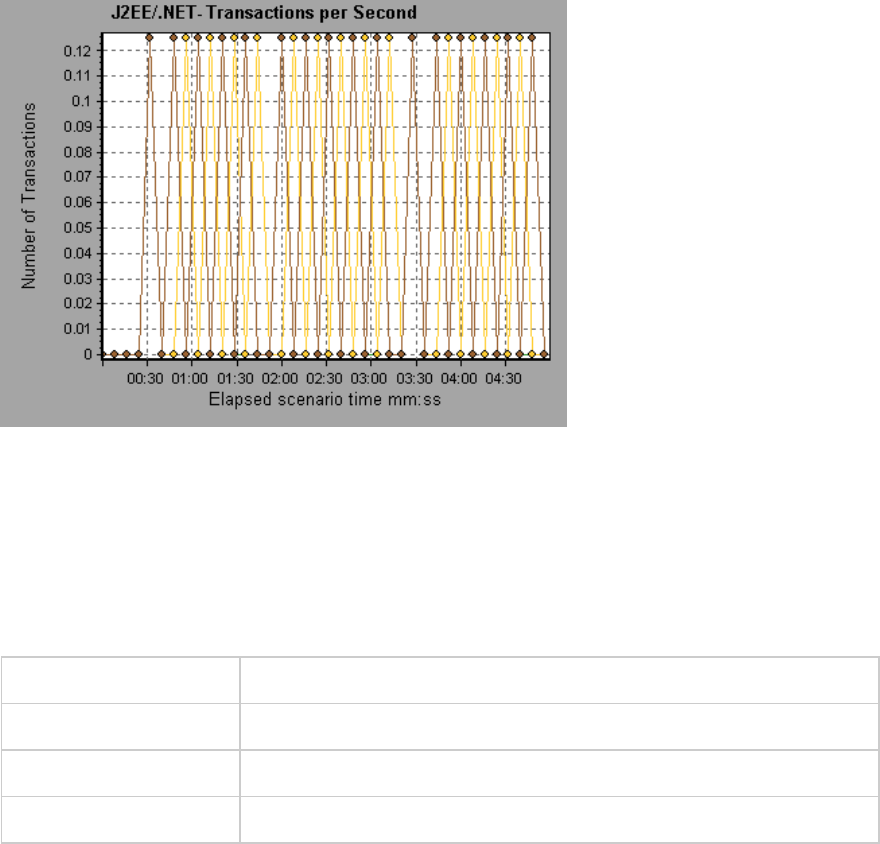
J2EE/.NET - Transaction Response Time Server Side Graph
This graph displays the transaction server response time of transactions that include steps that cause
activity on the J2EE/.NET backend. The reported times, measured from the point when the transaction
reached the Web server to the point it left the Web server, include only the time that was spent in the
J2EE/.NET backend.
X-axis Elapsed time.
Y-axis Average response time (in seconds) of each transaction.
Breakdown options "Using the J2EE & .NET Breakdown Options" on page1626
See also "J2EE & .NET Diagnostics Graphs Overview" on page1619
Example
User Guide
Analysis
HP LoadRunner (12.50) Page 1645
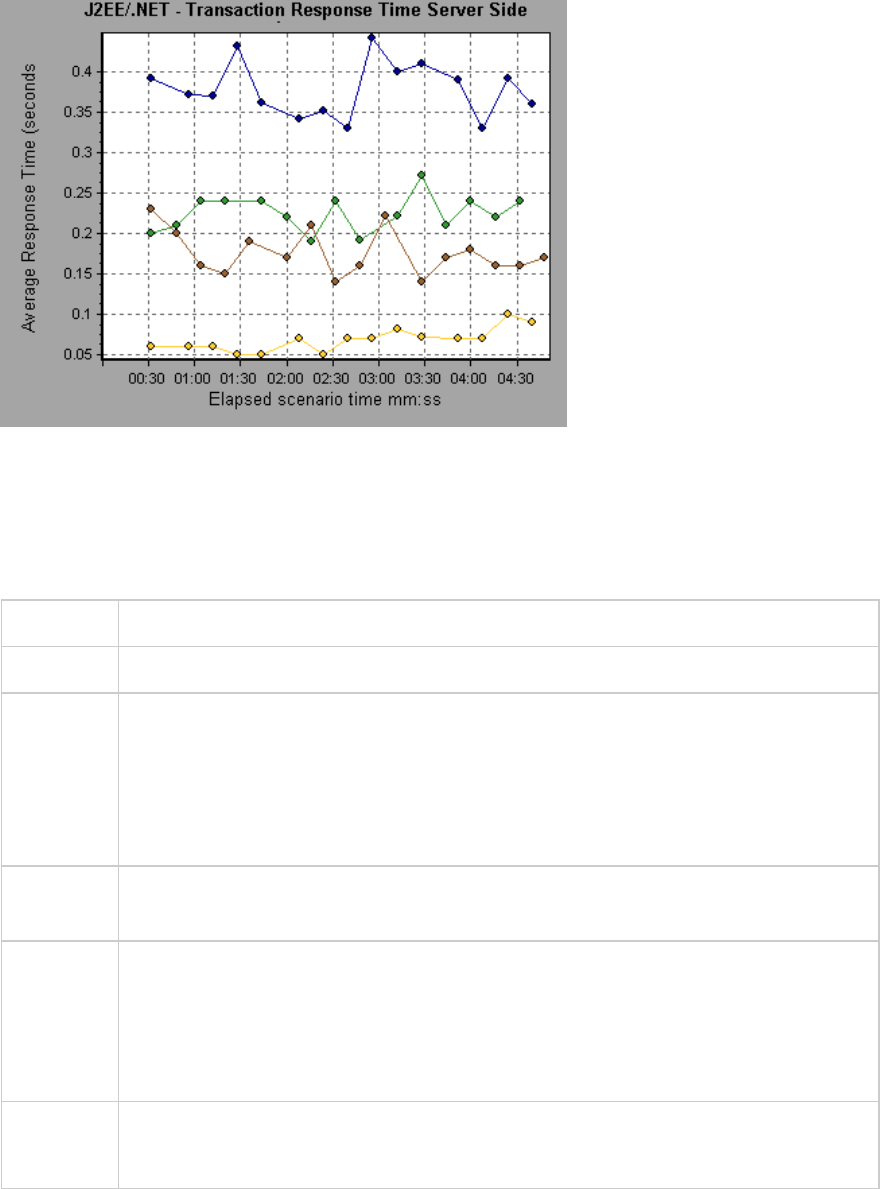
J2EE/.NET - Transaction Time Spent in Element Graph
This graph displays the server response time for the selected element (layer, class, or method) within
each transaction.
X-axis Elapsed time.
Y-axis Average response time (in seconds) per element within the transaction.
Breakdown
options
The display of graph data is determined by the graph properties selected when the
graph was opened, as described in the following table: For information on filtering on
graph data, see "Filtering Graph Data Overview" on page1480.
You can break down the displayed elements. For more information, see "Using the J2EE
& .NET Breakdown Options" on page1626.
Tips To obtain data for this graph, you must enable the J2EE & .NET Diagnostics module
(from the Controller) before running the load test scenario.
Note The time is computed as Total Response Time/Total Number of Transactions. For
example, if a method was executed twice by an instance of transaction A and once by
another instance of the same transaction, and it took three seconds for each
execution, the average response time is 9/2, or 4.5 seconds. The transaction time does
not include the nested calls from within each transaction.
See also "J2EE & .NET Diagnostics Graphs Overview" on page1619
"Filtering and Sorting Graph Data" on page1480
Example
User Guide
Analysis
HP LoadRunner (12.50) Page 1646
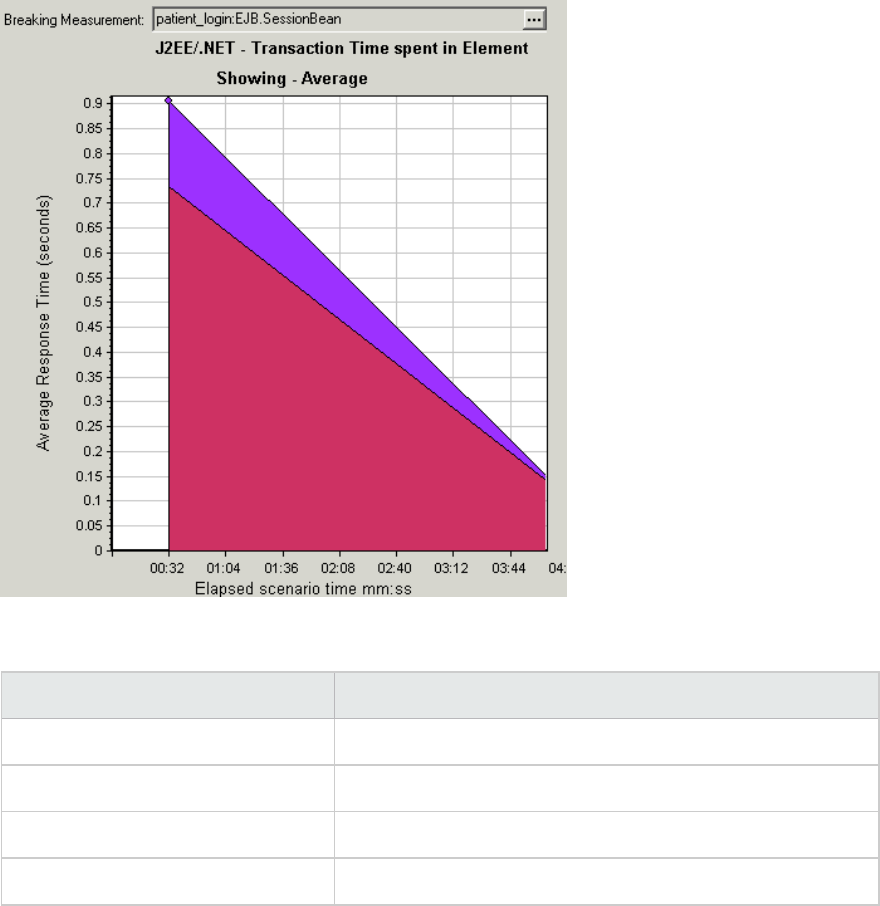
Graph Data Display
If you filter by these properties... The graph data is displayed like this
None Time spent in each transaction.
Transaction Filtered by transaction. Grouped by layer.
Transaction and layer Filtered by transaction and layer. Grouped by class.
Transaction, layer, and class Filtered by transaction, layer, and class. Grouped by method.
Application Component Graphs
Microsoft COM+ performance graphs provide you with performance information for COM+ interfaces
and methods.
To obtain data for these graphs, you need to activate the various Microsoft COM+ performance
monitors before running the load test scenario.
When you set up the Microsoft COM+ performance online monitors, you indicate which statistics and
measurements to monitor.
User Guide
Analysis
HP LoadRunner (12.50) Page 1647
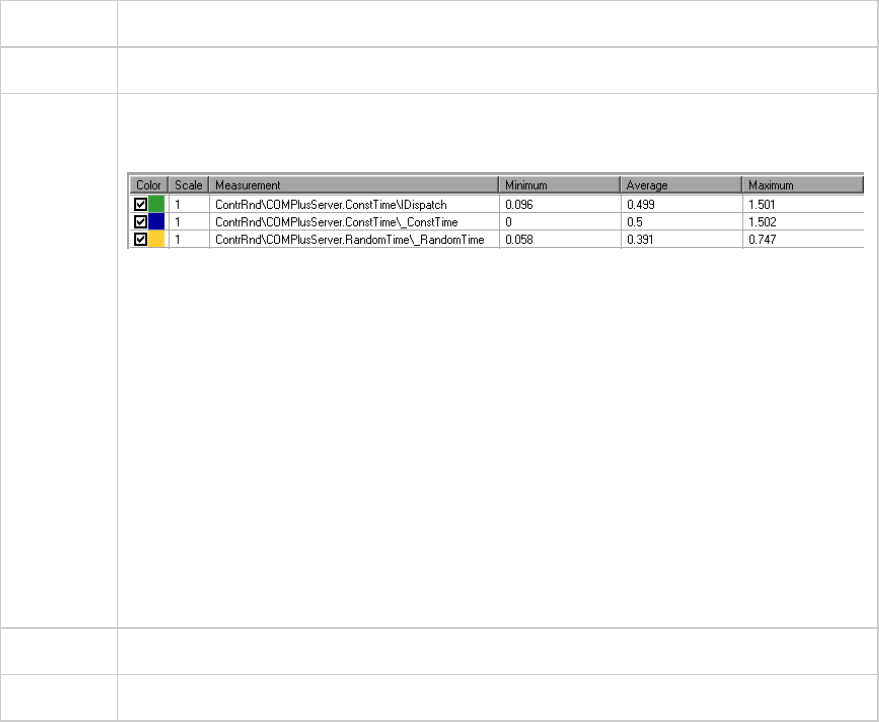
The .NET CLR performance graphs provide you with performance information for .NET classes and
methods. To obtain data for these graphs, you must activate the .NET CLR performance monitor before
running the load test scenario run.
Displayed measurements are specified using the .NET monitor.
For more information, see the section on online monitors in the LoadRunner Controller documentation.
COM+ Average Response Time Graph
This graph specifies the average time COM+ interfaces or methods take to perform during the load test
scenario.
X-axis Elapsed time from the beginning of the scenario run.
Y-axis Average response time of a COM+ interface or method.
Breakdown
options
Each interface or method is represented by a different colored line on the graph. The
legend frame (which is found below the graph) identifies the interfaces by color:
This legend shows that the blue colored line belongs to the COM+ interface _
ConstTime. Looking at the graph above, we see that this interface has higher response
times than all other COM+ interfaces. At 2:10 minutes into the scenario, it records an
average response time of 0.87 seconds.
Note: The 0.87 second data point is an average, taken from all data points recorded
within a 10 second interval (the default granularity). You can change the length of this
sample interval.
Viewing CON+ Methods
The table initially displays COM+ interfaces, but you can also view the list of COM+
methods by using drill-down or filtering techniques. For more information, see "Filtering
and Sorting Graph Data" on page1480 and "Drilling Down in a Graph" on page1467.
Tips To highlight a specific interface line in the graph, select the interface row in the legend.
See also "Application Component Graphs" on the previous page
User Guide
Analysis
HP LoadRunner (12.50) Page 1648
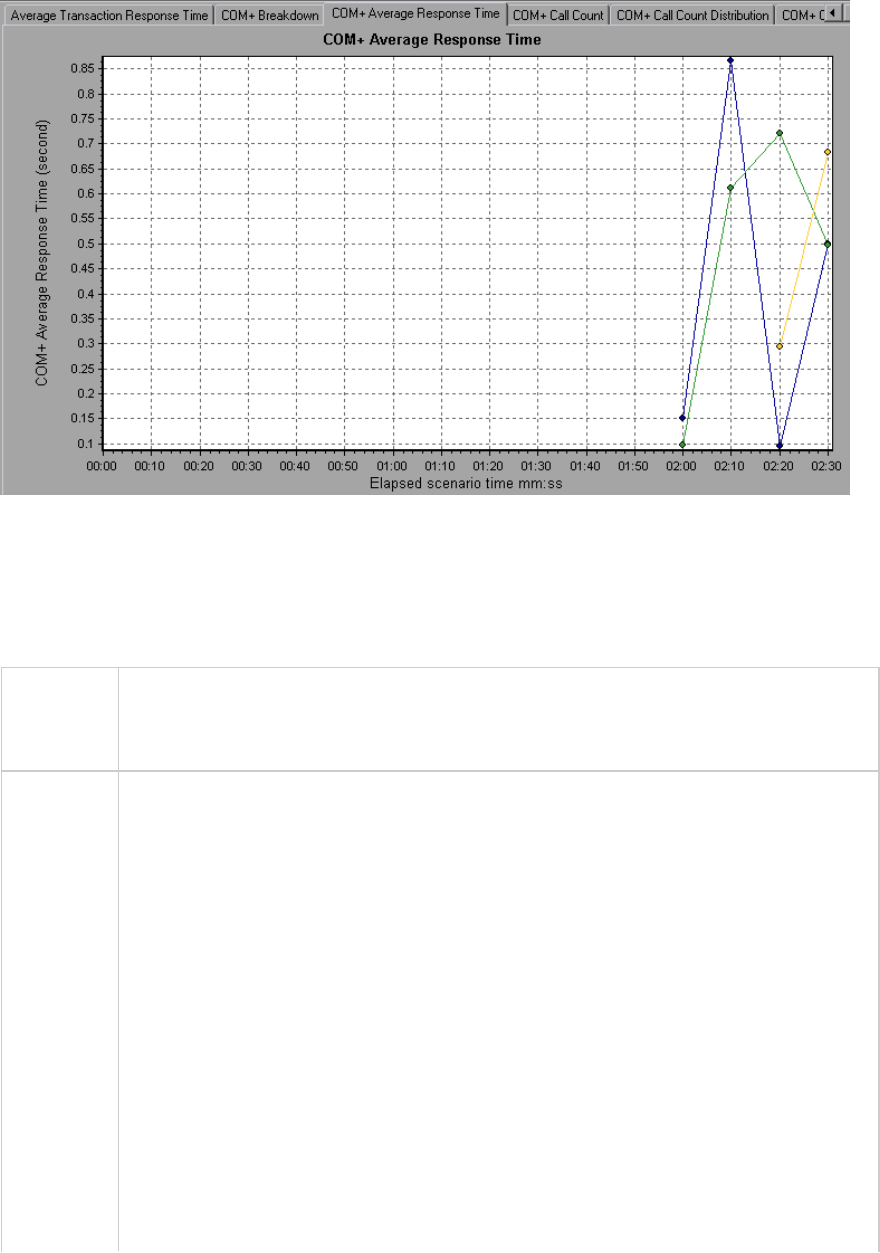
COM+ Breakdown Graph
This graph summarizes fundamental result data about COM+ interfaces or methods and presents it in
table format.
Purpose Using the COM+ Breakdown table, you can identify the COM+ interfaces or methods
which consume the most time during the test. The table can be sorted by column, and
the data can be viewed either by COM+ interface or COM+ method.
Breakdown
options
Average Response Time
The Average Response Time column shows how long, on average, an interface or
method takes to perform. The graphical representation of this column is the "COM+
Average Response Time Graph" on the previous page.
Call Count
The next column, Call Count, specifies the number of times the interface or method
was invoked. The graphical representation of this column is the "COM+ Average
Response Time Graph" on the previous page.
Total Response Time
The final column, Total Response Time, specifies how much time was spent overall on
the interface or method. It is calculated by multiplying the first two data columns
together. The graphical representation of this column is the "COM+ Average Response
Time Graph" on the previous page.
User Guide
Analysis
HP LoadRunner (12.50) Page 1649
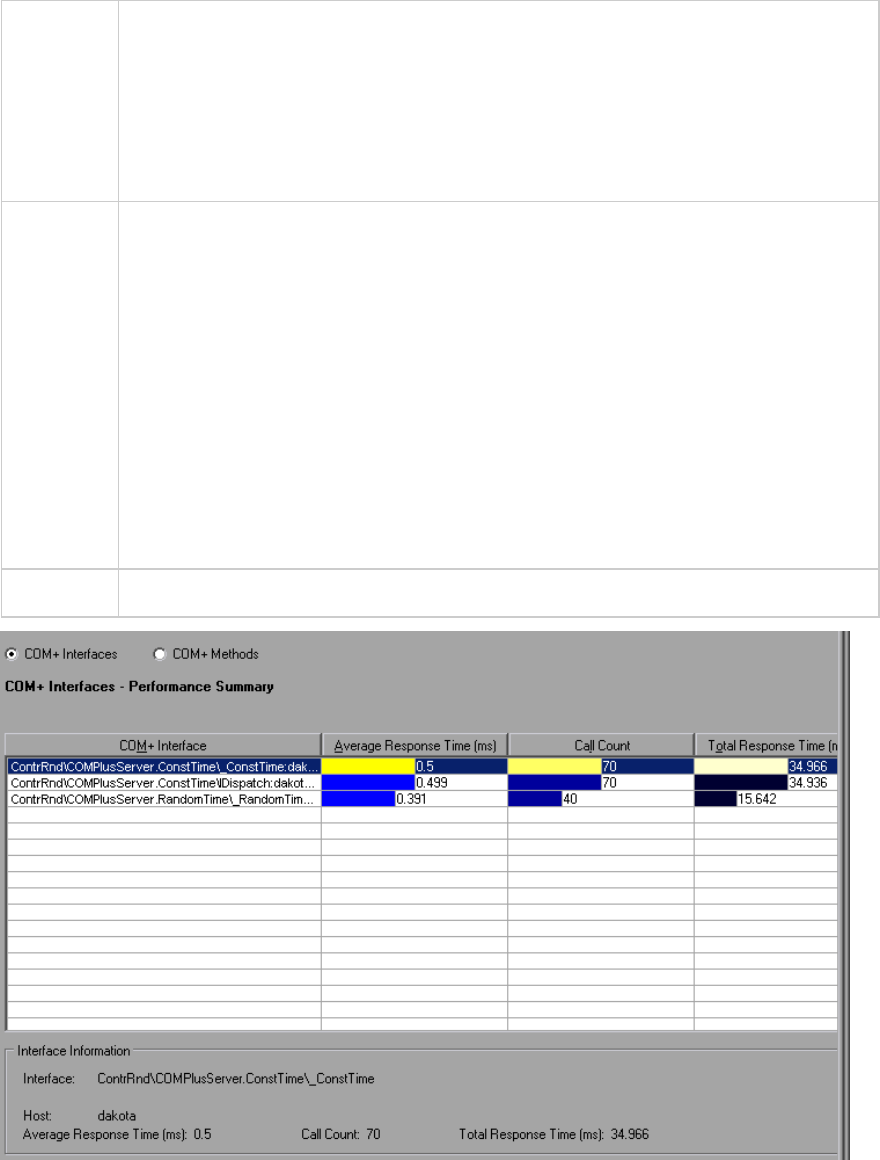
The graphical representations of each of these columns are the "COM+ Average
Response Time Graph" on page1648, the "COM+ Call Count Distribution Graph" on the
next page and the "COM+ Total Operation Time Distribution Graph" on page1654
Interfaces are listed in the COM+ Interface column in the form Interface:Host. In the
table above, the _ConstTime interface took an average of .5 seconds to execute and
was called 70 times. Overall, this interface took 34.966 seconds to execute.
Tips Sorting List
To sort the list by a column, click on the column heading. The list above is sorted by
Average Response Time which contains the triangle icon specifying a sort in
descending order.
Viewing COM+ Methods
The table initially displays COM+ interfaces, but you can also view the list of COM+
methods.
To view the methods of a selected interface, select the COM+ Methods option. You
can also double-click on the interface row to view the methods. The methods of the
specified interface are listed in the COM+ Method column.
See also "Application Component Graphs" on page1647
User Guide
Analysis
HP LoadRunner (12.50) Page 1650
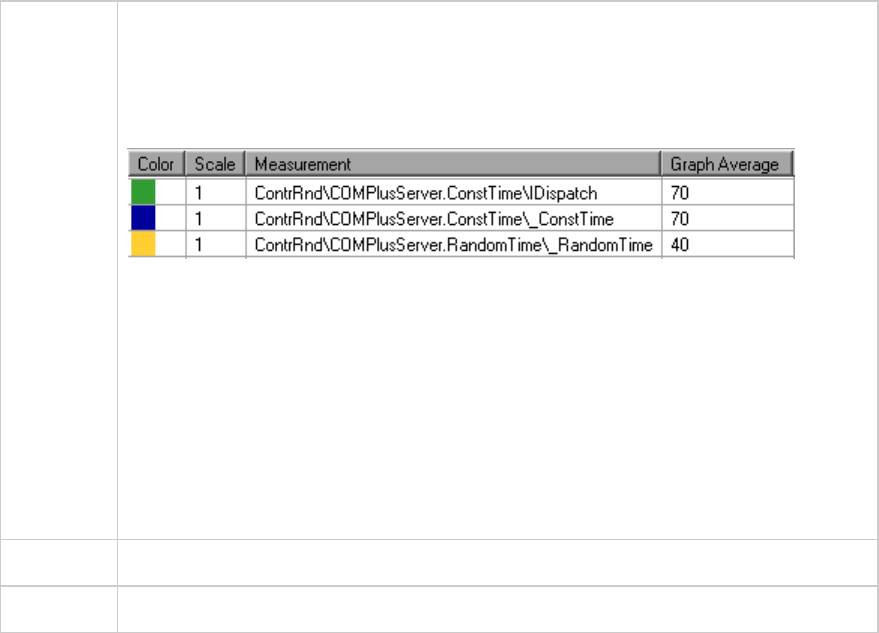
COM+ Call Count Distribution Graph
This graph shows the percentage of calls made to each COM+ interface compared to all COM+
interfaces. It can also show the percentage of calls made to a specific COM+ method compared to other
methods within the interface
Breakdown
options
The number of calls made to the interface or method is listed in the Call Count column
of the "COM+ Breakdown Graph" on page1649 table.
Each interface or method is represented by a different colored area on the pie graph.
The legend frame (which is found below the graph) identifies the interfaces by color:
This legend shows that the green colored area belongs to the COM+ interface
IDispatch. Looking at the example graph below, we see that 38.89% of calls are made
to this interface. The actual figures can be seen in the Call Count column of the "COM+
Breakdown Graph" on page1649 table.
Viewing COM+ Methods
The table initially displays COM+ interfaces, but you can also view the list of COM+
methods by using drill-down or filtering techniques. For more information, see "Filtering
and Sorting Graph Data" on page1480 and "Drilling Down in a Graph" on page1467.
Tips To highlight a specific interface line in the graph, select the interface row in the legend.
See also "Application Component Graphs" on page1647
User Guide
Analysis
HP LoadRunner (12.50) Page 1651
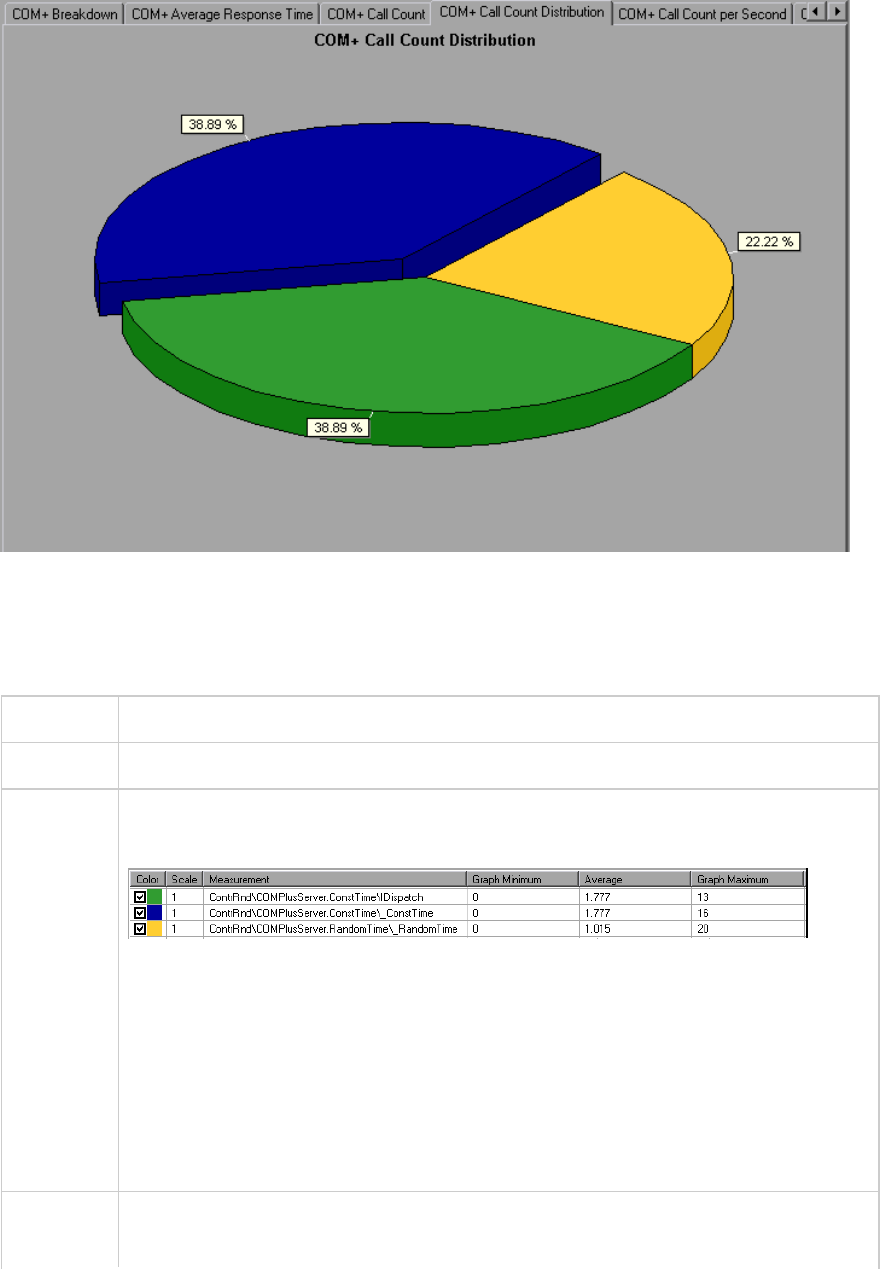
COM+ Call Count Graph
This graph displays the number of times COM+ interfaces and methods are invoked during the test.
X-axis Elapsed time from the beginning of the scenario run.
Y-axis How many calls were made to a COM+ interface or method.
Breakdown
options
Each interface or method is represented by a different colored line on the graph. The
legend frame (which is found below the graph) identifies the interfaces by color:
This legend shows that the yellow colored line belongs to the COM+ interface _
RandomTime. Looking at the graph above, we see that calls to this interface begin at
the beginning of the scenario run. There are 20 calls at the 2:20 minute point.
Viewing COM+ Methods
The table initially displays COM+ interfaces, but you can also view the list of COM+
methods by using drill-down or filtering techniques. For more information, see "Filtering
and Sorting Graph Data" on page1480 and "Drilling Down in a Graph" on page1467.
Note The call count is computed by multiplying the call frequency by a time interval. As a
result, the reported measurement may be rounded.
User Guide
Analysis
HP LoadRunner (12.50) Page 1652
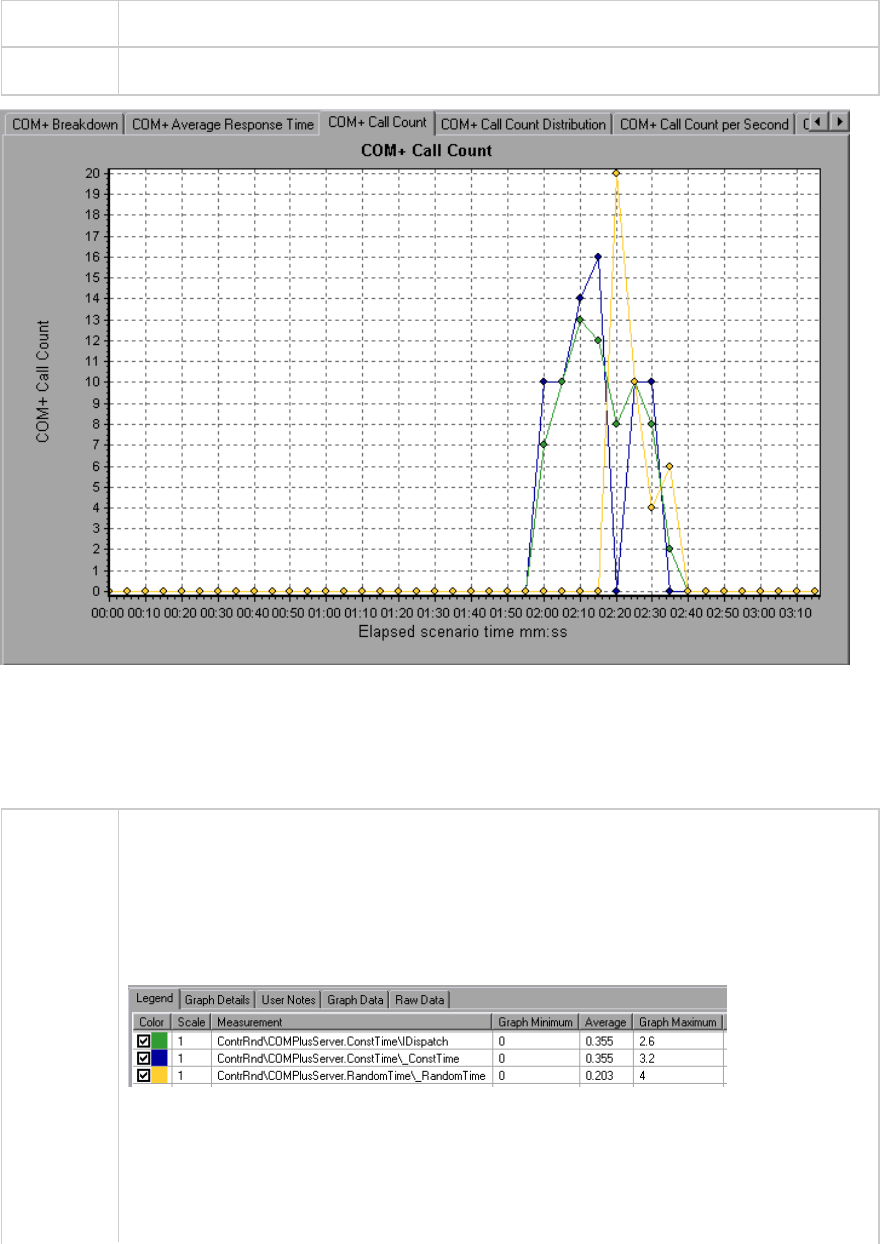
Tips To highlight a specific interface line in the graph, select the interface row in the legend.
See also "Application Component Graphs" on page1647
COM+ Call Count Per Second Graph
This graph shows the number of times per second a COM+ interface or method is invoked.
Breakdown
options
This graph is similar to the "COM+ Call Count Graph" on the previous page except that
the y-axis indicates how many invocations were made to a COM+ interface or method
per second.
Each interface or method is represented by a different colored line on the graph. The
legend frame (which is found below the graph) identifies the interfaces by color:
This legend shows that the green colored line belongs to the COM+ interface IDispatch.
Looking at the graph above, we see that calls to this interface begins 1:55 minutes into
the scenario run. There is an average of 2.5 calls per second at the 2:10 minute mark.
Viewing COM+ Methods
User Guide
Analysis
HP LoadRunner (12.50) Page 1653
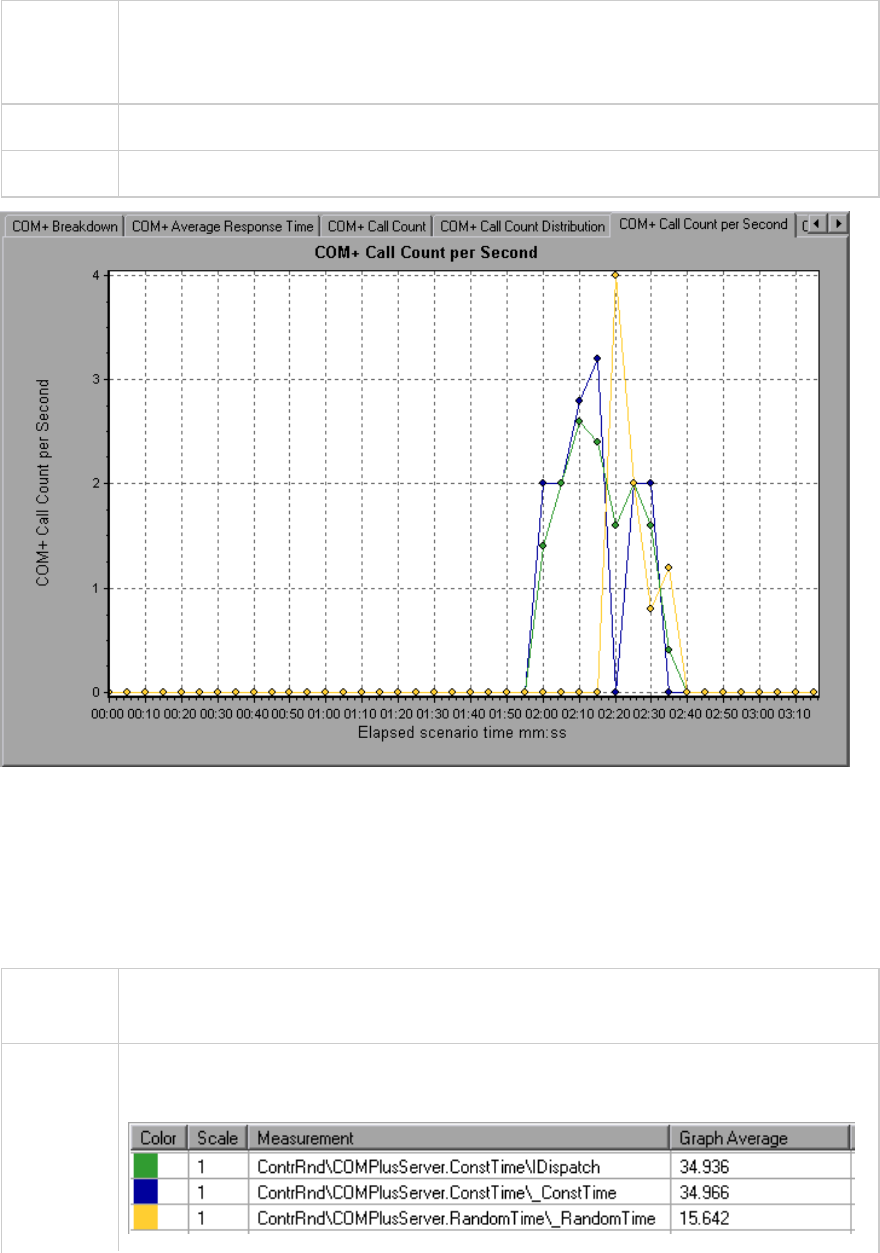
To view the average response time of the individual methods within a COM+ interface,
see "Filtering and Sorting Graph Data" on page1480 and "Drilling Down in a Graph" on
page1467.
Tips To highlight a specific interface line in the graph, select the interface row in the legend.
See also "Application Component Graphs" on page1647
COM+ Total Operation Time Distribution Graph
This graph shows the percentage of time a specific COM+ interface takes to execute in relation to all
COM+ interfaces. It can also show the percentage of time a COM+ method takes to execute in relation
to all COM+ methods within the interface.
Purpose Use it to identify those interfaces or methods which take up an excessive amount of
time.
Breakdown
options
Each interface or method is represented by a different colored area on the pie graph.
The legend frame (which is found below the graph) identifies the interfaces by color:
User Guide
Analysis
HP LoadRunner (12.50) Page 1654
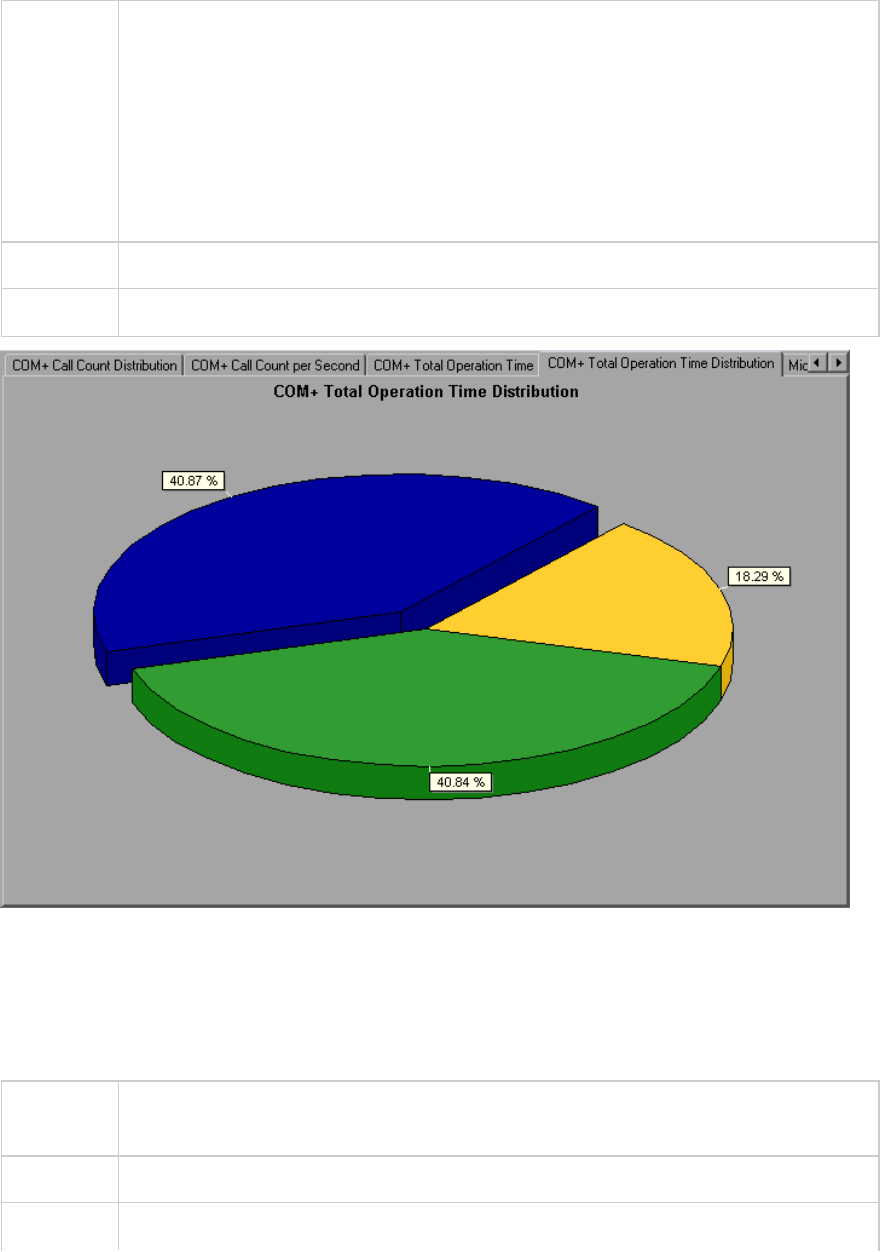
This legend shows that the green colored line belongs to the COM+ interface IDispatch.
Looking at the graph above, we see that this interface takes up 40.84% of the COM+
operational time.
Viewing COM+ Methods
To view the average response time of the individual methods within a COM+ interface,
see "Filtering and Sorting Graph Data" on page1480 and "Drilling Down in a Graph" on
page1467.
Tips To highlight a specific interface line in the graph, select the interface row in the legend.
See also "Application Component Graphs" on page1647
COM+ Total Operation Time Graph
This graph displays the amount of time each COM+ interface or method takes to execute during the
test.
Purpose Use it to identify those interfaces or methods which take up an excessive amount of
time.
X-axis Elapsed time from the beginning of the scenario run.
Y-axis Total time a COM+ interface or method is in operation.
User Guide
Analysis
HP LoadRunner (12.50) Page 1655
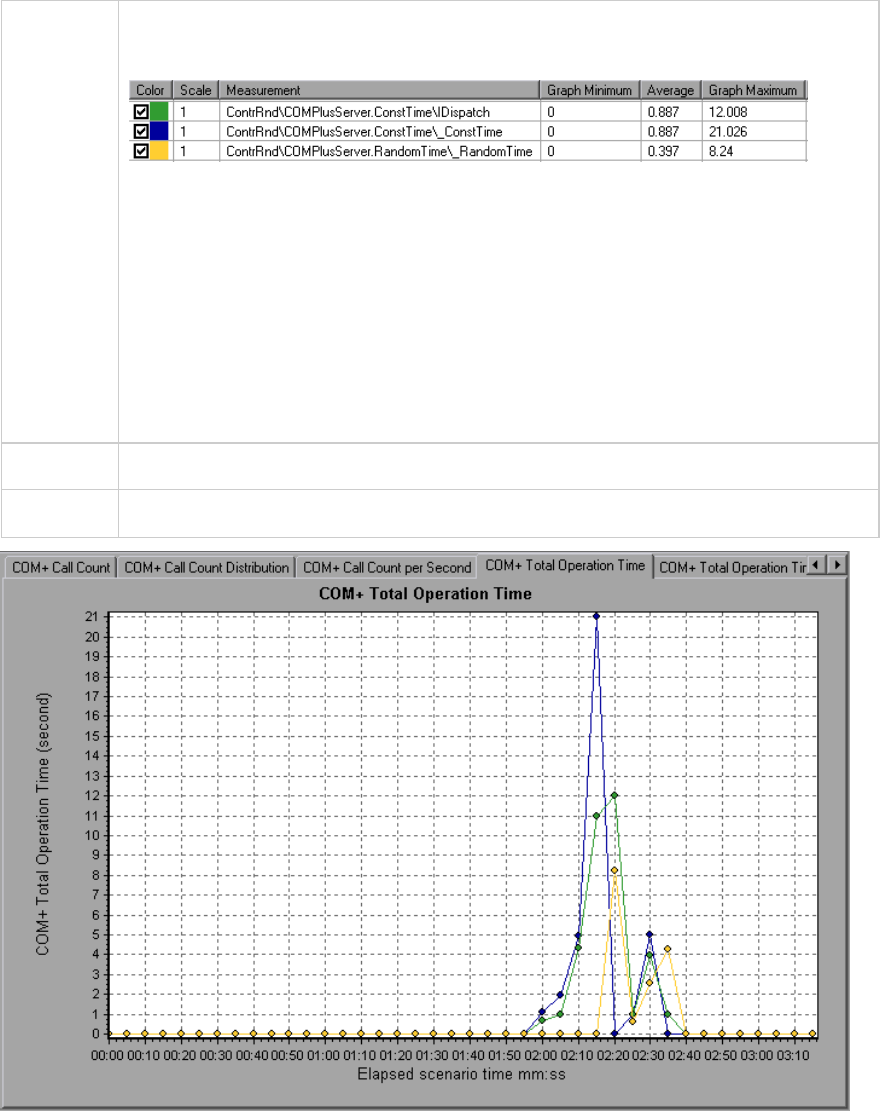
Breakdown
options
Each interface or method is represented by a different colored line on the graph. The
legend frame (which is found below the graph) identifies the interfaces by color:
This legend shows that the blue colored line belongs to the COM+ interface _
ConstTime. Looking at the graph above, we see that throughout the scenario, this
interface consumes more time than any other, especially at 2 minutes and 15 seconds
into the scenario run, where the calls to this interface take an average of 21 seconds.
Viewing COM+ Methods
The table initially displays COM+ interfaces, but you can also view the list of COM+
methods by using drill-down or filtering techniques. For more information, see "Filtering
and Sorting Graph Data" on page1480 and "Drilling Down in a Graph" on page1467.
Tips To highlight a specific interface line in the graph, select the interface row in the legend.
See also "Application Component Graphs" on page1647
Microsoft COM+ Graph
This graph shows the resource usage of COM+ objects as a function of the elapsed load test scenario
time.
User Guide
Analysis
HP LoadRunner (12.50) Page 1656
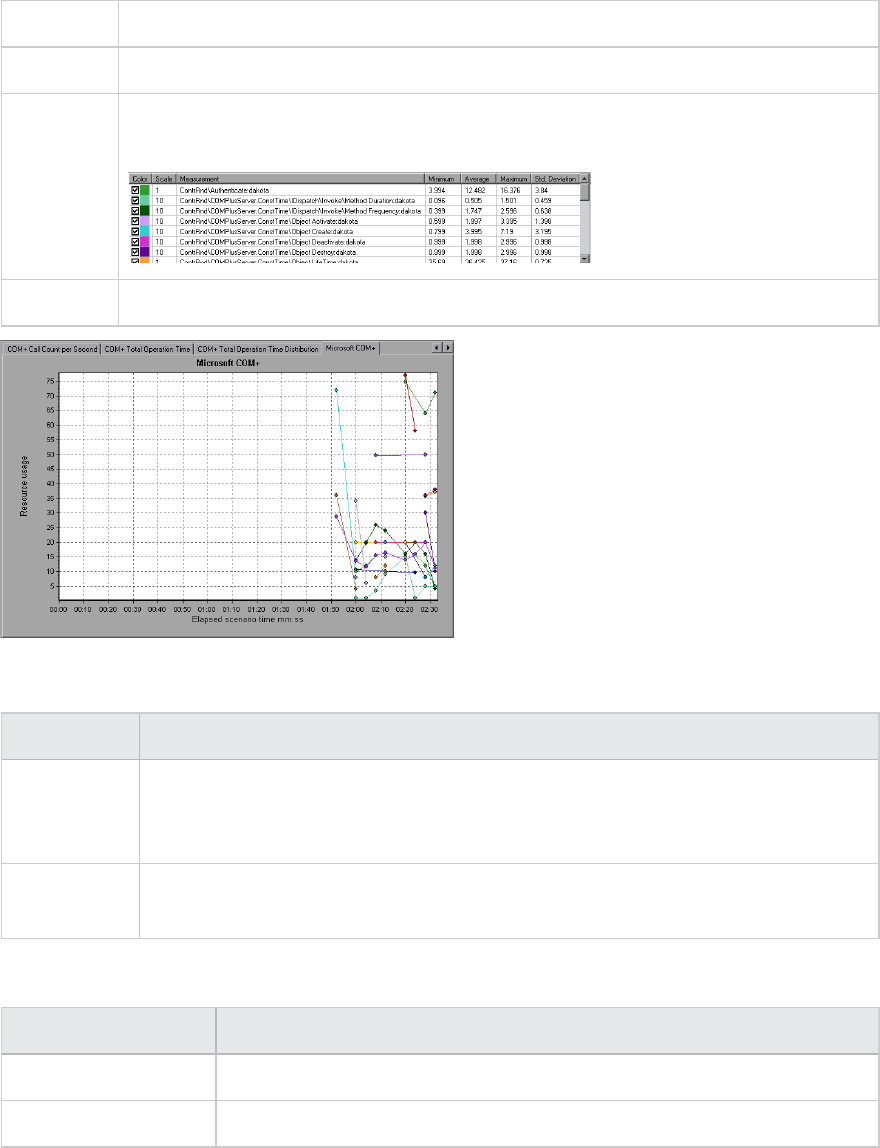
X-axis Elapsed time since the start of the run.
Y-axis The resource usage of COM+ objects.
Breakdown
Options
Each COM+ object is represented by a different colored line on the graph. The legend
frame (which is found below the graph) identifies the objects by color:
See also "Application Component Graphs" on page1647
Authentication Metrics
Measurement Description
Authenticate Frequency of successful method call level authentication. When you set an
authentication level for an application, you determine what degree of authentication
is performed when clients call into the application.
Authenticate
Failed
Frequency of failed method call level authentication.
Application Event
Measurement Description
Activation Frequency of application activation or startup.
Shutdown Frequency of application shutdown or termination.
User Guide
Analysis
HP LoadRunner (12.50) Page 1657
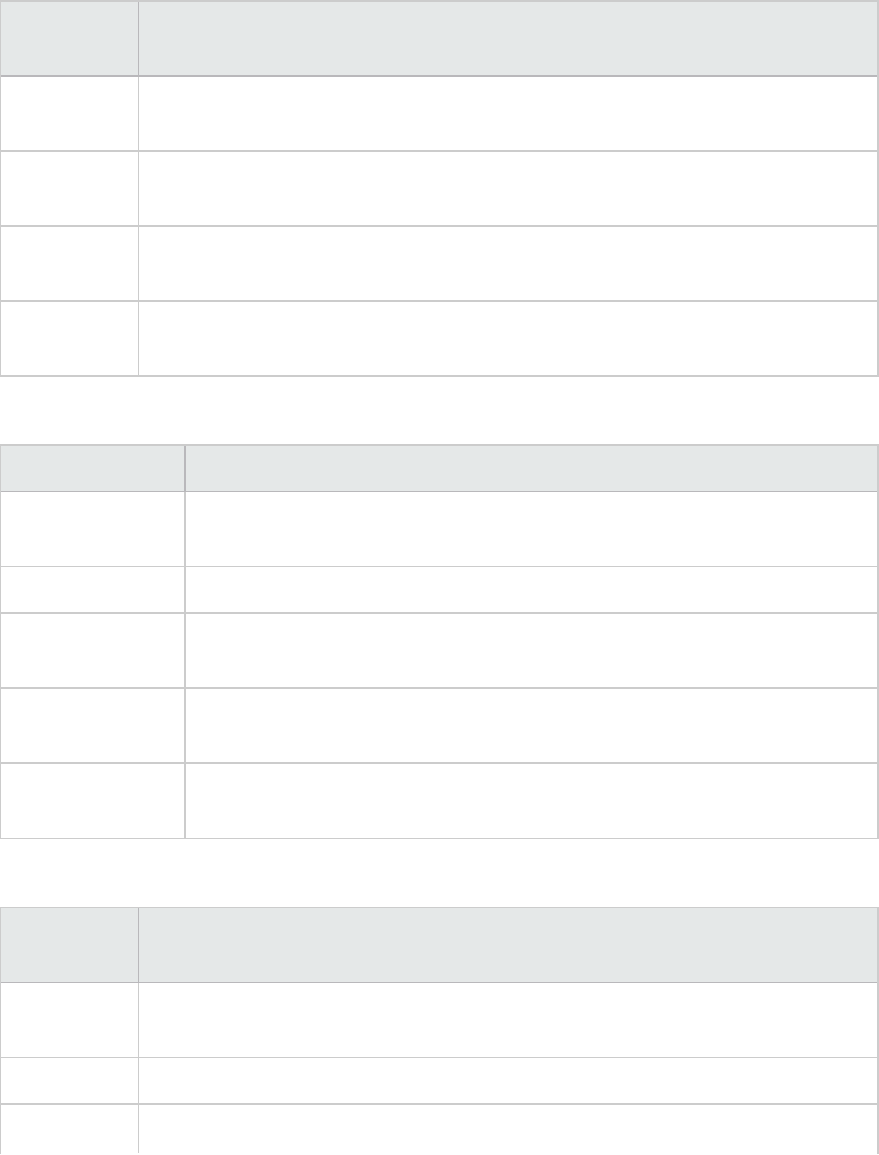
Thread Event
Measurement Description
Thread Start Rate at which single-threaded apartment (STA) thread for application have been
started.
Thread
Terminate
Rate at which single-threaded apartment (STA) thread for application have been
terminated.
Work Enque Event sent if a work is queued in single thread apartment object (STA). Note: These
events are not signaled/sent in Windows Server 2003 and later.
Work Reject Event sent if a work is rejected from single thread apartment object (STA). Note:
These events are not signaled/sent in Windows Server 2003 and later.
Transaction Events
Measurement Description
Transaction
Duration
Duration of COM+ transactions for selected application.
Transaction Start Rate at which transactions have started.
Transaction
Prepared
Rate at which transactions have completed the prepare phase of the two-
phase protocol.
Transaction
Aborted
Rate at which transactions have been aborted.
Transaction
Commit
Rate at which transactions have completed the commit protocol.
Object Events
Measurement Description
Object Life
Time
Duration of object existence (from instantiation to destruction).
Object Create Rate at which new instances of this object are created.
Object Rate at which instances of the object are destroyed.
User Guide
Analysis
HP LoadRunner (12.50) Page 1658

Measurement Description
Destroy
Object
Activate
Rate of retrieving instances of a new JIT-activated object.
Object
Deactivation
Rate of freeing JIT-activated object via SetComplete or SetAbort.
Disable
Commit
Rate of client calls to DisableCommit on a context. DisableCommit declares that the
object's transactional updates are inconsistent and can't be committed in their
present state.
Enable
Commit
Rate of client calls to EnableCommit on a context. EnableCommit declares that the
current object's work is not necessarily finished, but that its transactional updates
are consistent and could be committed in their present form.
Set Complete Rate of client calls to SetComplete on a context. SetComplete declares that the
transaction in which the object is executing can be committed, and that the object
should be deactivated on returning from the currently executing method call.
Set Abort Rate of client calls to SetAbort on a context. SetAbort declares that the transaction
in which the object is executing must be aborted, and that the object should be
deactivated on returning from the currently executing method call.
Method Events
Measurement Description
Method Duration Average duration of method.
Method Frequency Frequency of method invocation.
Method Failed Frequency of failed methods (i.e. methods that return error HRESULT codes).
Method Exceptions Frequency of exceptions thrown by selected method.
.NET Average Response Time Graph
This graph specifies the average time that .NET classes or methods took to perform during the load
test scenario run.
X-axis Elapsed time from the beginning of the scenario run.
Y-axis Average response time of a .NET class or method.
User Guide
Analysis
HP LoadRunner (12.50) Page 1659
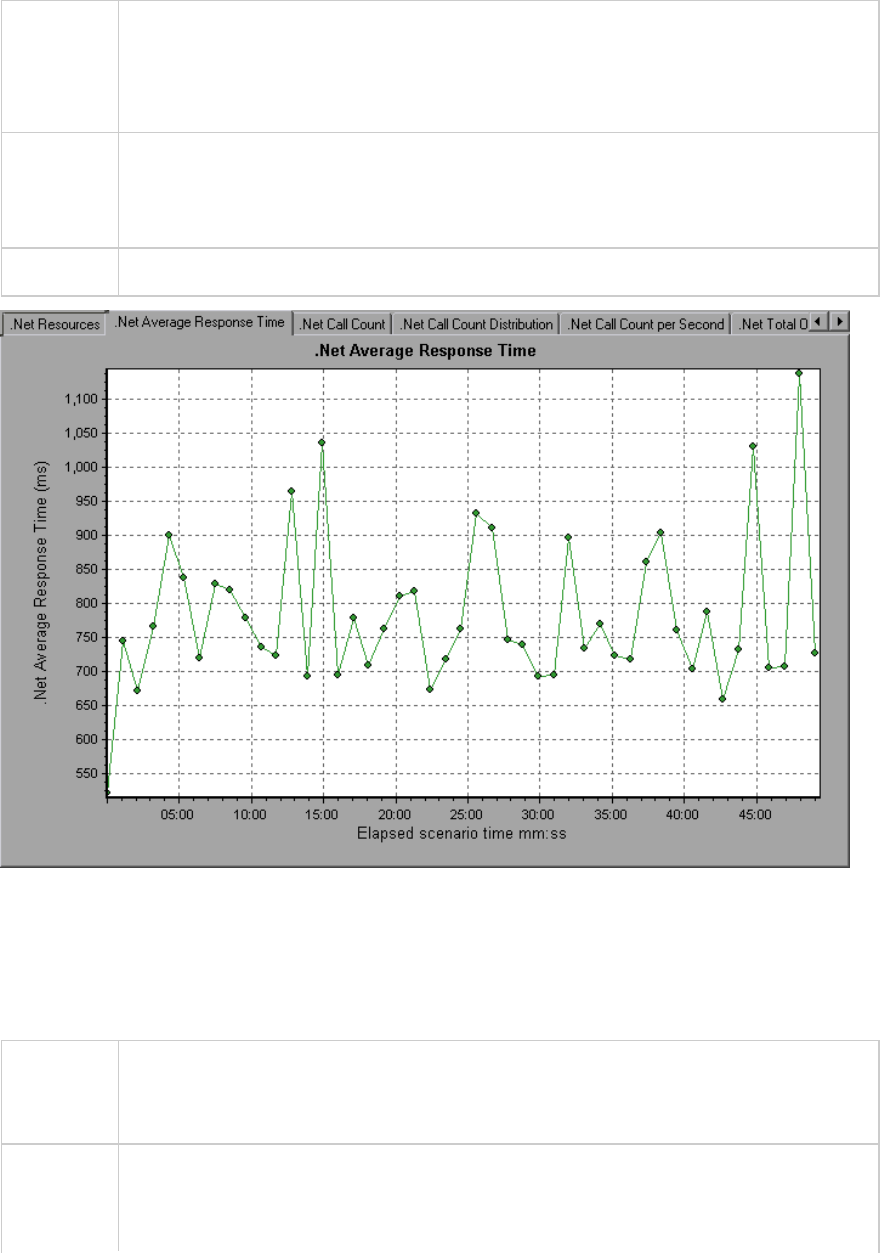
Breakdown
options
The graph initially displays .NET classes, but you can also view the individual methods
within a .NET class by using drill-down or filtering techniques. For more information, see
"Filtering and Sorting Graph Data" on page1480 and "Drilling Down in a Graph" on
page1467.
Tips You can change the length of the sample interval.
Hint: To highlight a specific class line in the graph, select the class row in the legend
(displayed below the graph).
See also "Application Component Graphs" on page1647
.NET Breakdown Graph
This graph summarizes fundamental result data about .NET classes or methods and presents it in table
format.
Purpose Using the .NET Breakdown table, you can identify the .NET classes or methods which
consume the most time during the test. The table can be sorted by column, and the
data can be viewed either by .NET class or .NET method.
Breakdown
options
The Average Response Time column shows how long, on average, a class or method
took to perform. The next column, Call Count, specifies the number of times the class
or method was invoked. The final column, Total Response Time, specifies how much
User Guide
Analysis
HP LoadRunner (12.50) Page 1660
time was spent overall on the class or method. It is calculated by multiplying the results
from the first two columns together.
Classes are listed in the .NET Class column in the form Class:Host. In the table above,
the AtmMachineSample.AtmTeller class took an average of 783 seconds to execute
and was called 50,912 times. Overall, this class took 39,316 seconds to execute.
To sort the list by a column, click the column heading.
Each column in the .NET Breakdown graph is graphically represented by another graph.
The table initially displays .NET classes, but you can also view the list of .NET methods.
To view .NET methods, select the .NET Methods option, or double-click the class row.
The methods of the specified class are listed in the .NET Method column.
See also "Application Component Graphs" on page1647
.NET Breakdown graph
.NET Breakdown Column Graphical Representation
Average Response Time .NET Average Response Time Graph.
Call Count .NET Call Count Graph.
Total Response Time .NET Total Operation Time Distribution Graph.
.NET Call Count Distribution Graph
This graph shows the percentage of calls made to each .NET class compared to all .NET classes. It can
also show the percentage of calls made to a specific .NET method compared to other methods within
User Guide
Analysis
HP LoadRunner (12.50) Page 1661
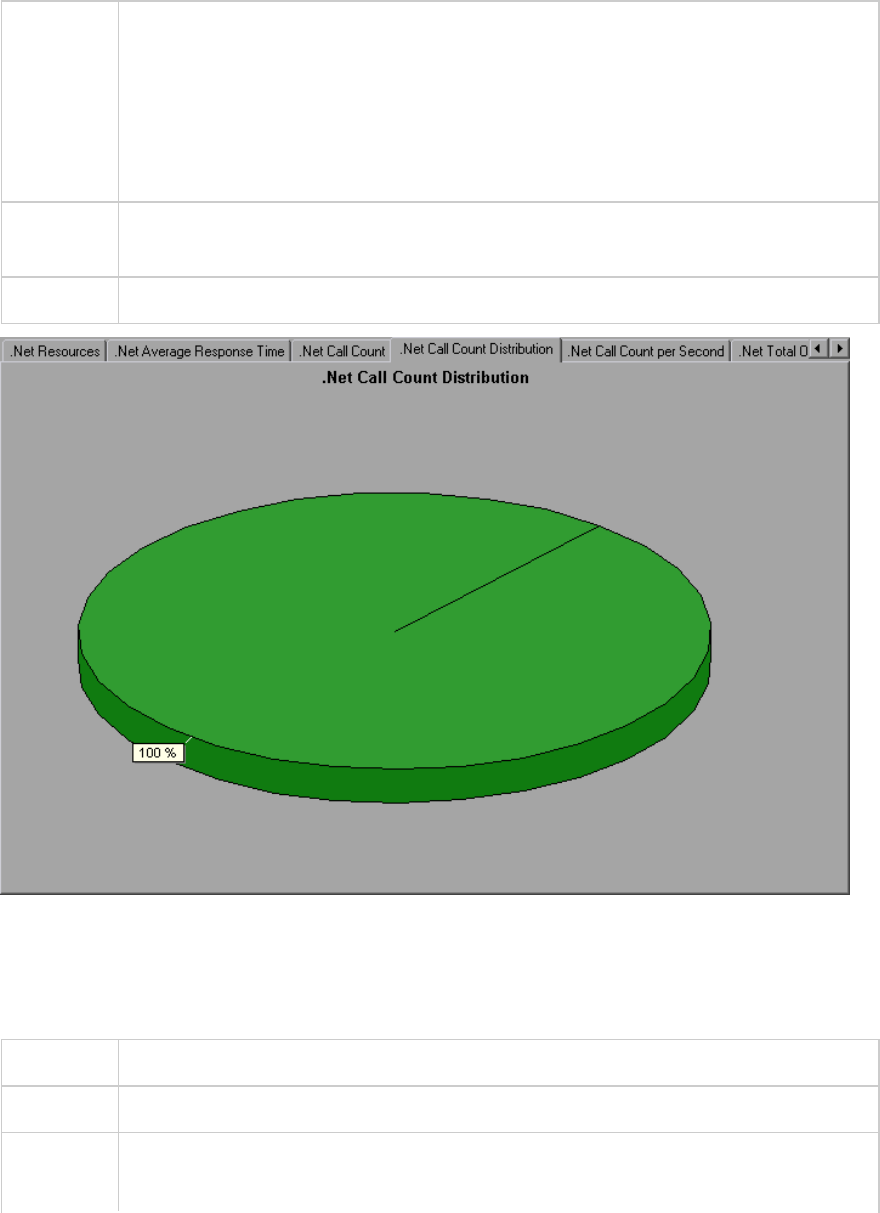
the class
Breakdown
options
The number of calls made to the class or method is listed in the Call Count column of
the .NET Breakdown graph table.
The graph initially displays .NET classes, but you can also view the individual methods
within a .NET class by using drill-down or filtering techniques. For more information, see
"Filtering and Sorting Graph Data" on page1480 and "Drilling Down in a Graph" on
page1467.
Tips To highlight a specific class line in the graph, select the class row in the legend
(displayed below the graph).
See also "Application Component Graphs" on page1647
.NET Call Count Graph
This graph displays the number of times that .NET classes and methods are invoked during the test.
X-axis Elapsed time from the beginning of the scenario run.
Y-axis Indicates how many calls were made to a .NET class or method.
Breakdown
options
The graph initially displays .NET classes, but you can also view the individual methods
within a .NET class by using drill-down or filtering techniques. For more information, see
User Guide
Analysis
HP LoadRunner (12.50) Page 1662
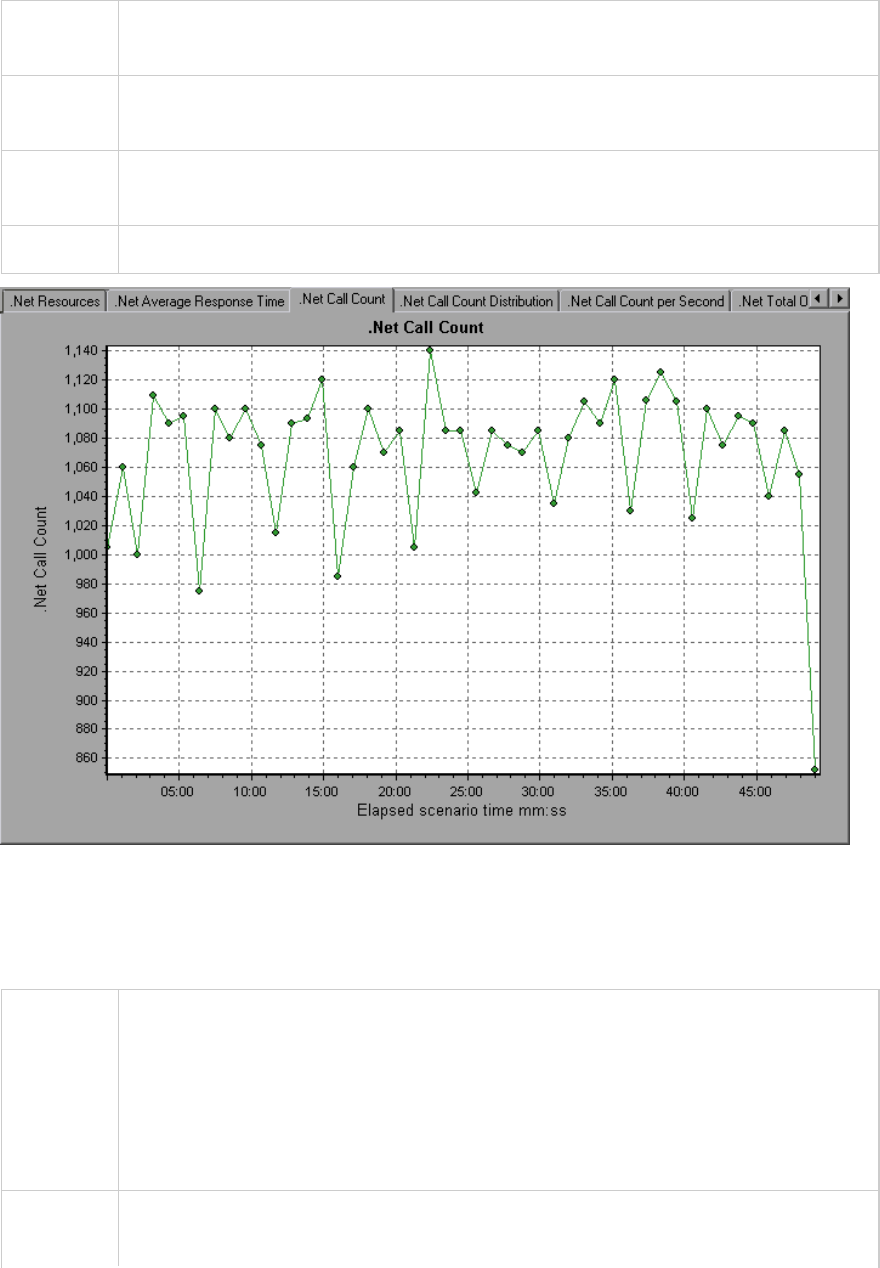
"Filtering and Sorting Graph Data" on page1480 and "Drilling Down in a Graph" on
page1467.
Tips To highlight a specific class line in the graph, select the class row in the legend
(displayed below the graph).
Note The call count is computed by multiplying the call frequency by a time interval. As a
result, the reported measurement may be rounded.
See also "Application Component Graphs" on page1647
.NET Call Count per Second Graph
This graph shows the number of times per second that a .NET class or method is invoked.
Breakdown
options
This graph is similar to the .NET Call Count graph except that the y-axis indicates how
many invocations were made to a .NET class or method per second.
The graph initially displays .NET classes, but you can also view the individual methods
within a .NET class by using drill-down or filtering techniques. For more information, see
"Filtering and Sorting Graph Data" on page1480 and "Drilling Down in a Graph" on
page1467.
Tips To highlight a specific class line in the graph, select the class row in the legend
(displayed below the graph).
User Guide
Analysis
HP LoadRunner (12.50) Page 1663
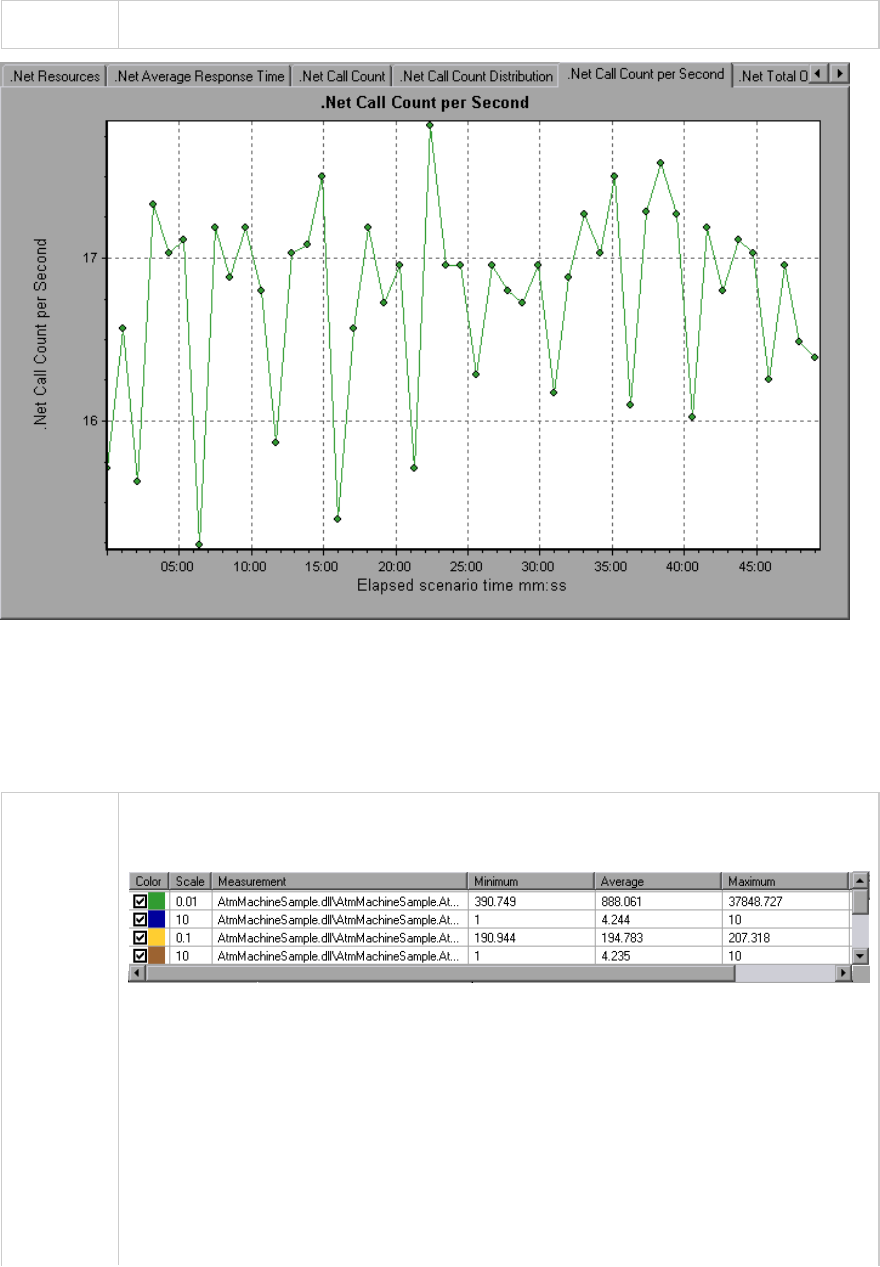
See also "Application Component Graphs" on page1647
.NET Resources Graph
This graph shows the resource usage of .NET methods as a function of the elapsed load test scenario
time.
Breakdown
options
Each .NET method is represented by a different colored line on the graph. The legend
frame (located below the graph) identifies the methods by color:
You can monitor .NET counters at the application, assembly, class, and method levels.
Measurements that take place before the application is fully loaded (such as Assembly
Load Time, that measures the time it takes to load an assembly) will not be measured.
The following tables describe the counters that can be measured at each level. All
durations are reported in seconds, and all frequencies are reported per five-second
polling periods. For example, if 20 events occur in a 5 second polling period, the
reported frequency is 4.
l"Application Level" on the next page
User Guide
Analysis
HP LoadRunner (12.50) Page 1664
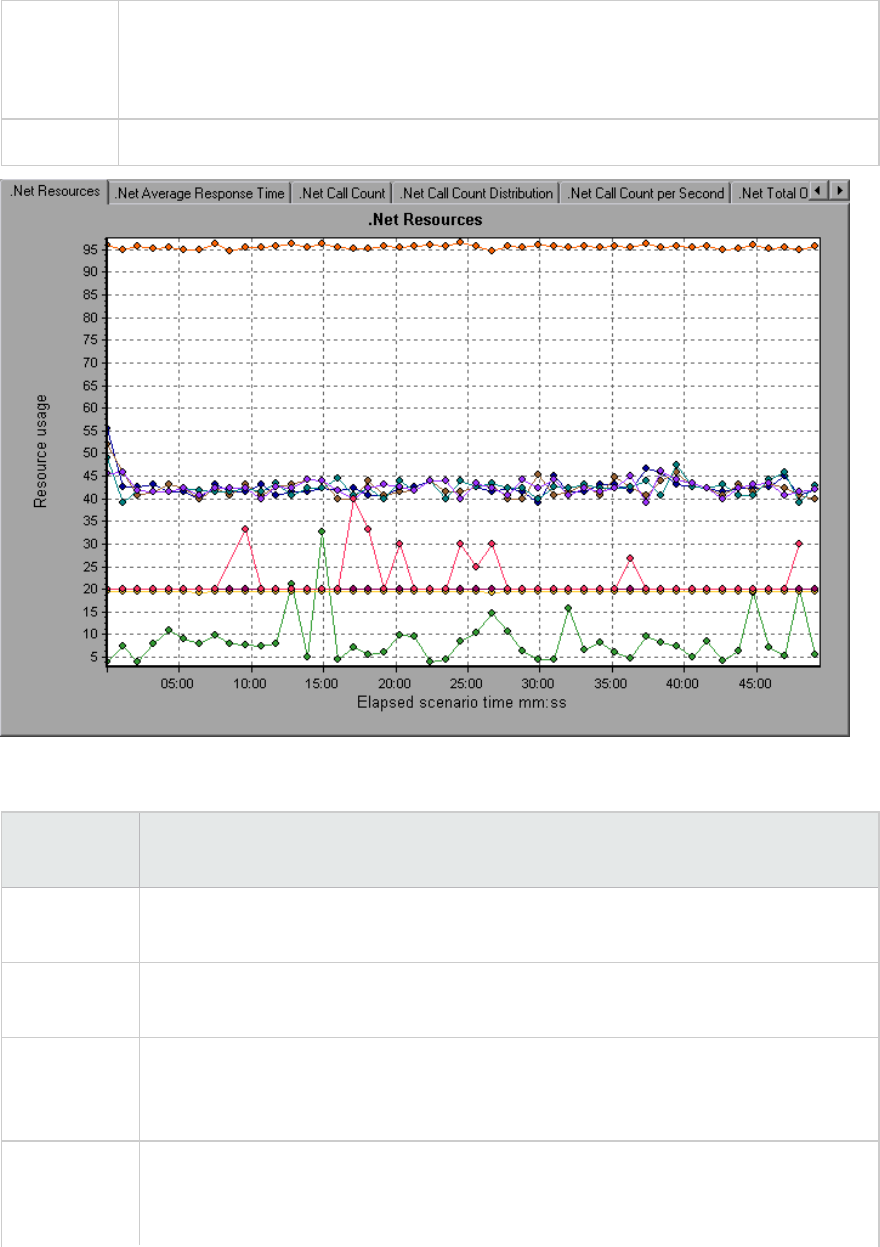
l"Assembly Level" on page1667
l"Class Level" on page1667
l"Method Level" on page1667
See also "Application Component Graphs" on page1647
Application Level
Measurement Description
Application
Lifetime
Monitors the duration of the application in seconds.
Exception
Frequency
Monitors the number of exceptions per second, in the five second polling period.
JIT (Just In
Time)
Duration
Monitors the time (in seconds) it takes for the JIT to compile code.
Thread
Creation
Frequency
Monitors the number of threads that are created in a polling period.
User Guide
Analysis
HP LoadRunner (12.50) Page 1665

Measurement Description
Thread
Lifetime
Monitors the duration of threads.
Domain
Creation
Frequency
Monitors the number of domain creations in a polling period. (Domains protect areas
of code. All applications run in a domain which keeps them encapsulated, so that they
cannot interfere with other applications outside the domain.)
Domain Load
Time
Monitors the time it takes to load a domain. (Domains protect areas of code. All
applications run in a domain which keeps them encapsulated, so that they cannot
interfere with other applications outside the domain).
Domain
Unload Time
Monitors the time it takes to unload a domain. (Domains protect areas of code. All
applications run in a domain which keeps them encapsulated, so that they cannot
interfere with other applications outside the domain).
Domain
Lifetime
Monitors the duration of a domain. (Domains protect areas of code. All applications
run in a domain which keeps them encapsulated, so that they cannot interfere with
other applications outside the domain).
Module
Creation
Frequency
Monitors the number of modules that get created in a polling period. (Modules are
groups of assemblies that make up a DLL or EXE).
Module Load
Time
Monitors the time it takes to load a module. (Modules are groups of assemblies that
make up a dll or exe).
Module
Unload Time
Monitors the time it takes to unload a module. (Modules are groups of assemblies
that make up a dll or exe).
Module
Lifetime
Monitors the duration of a module. (Modules are groups of assemblies that make up
a dll or exe).
Garbage
Collection
Duration
Monitors the duration between the start and stop of Garbage Collection.
Garbage
Collection
Frequency
Monitors the number of breaks for Garbage Collections in a polling period.
Unmanaged
Code
Duration
Monitors the duration of the calls to unmanaged code.
User Guide
Analysis
HP LoadRunner (12.50) Page 1666
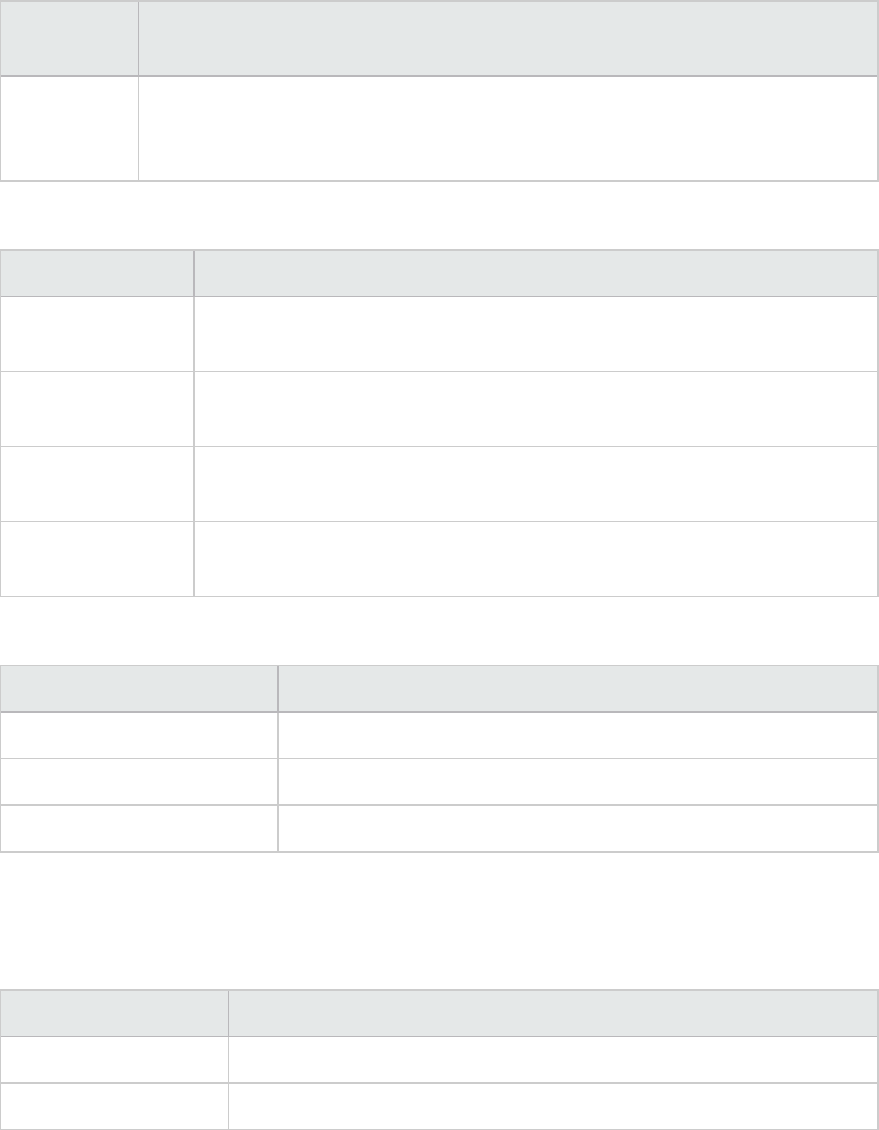
Measurement Description
Unmanaged
Code
Frequency
Monitors the number of calls to unengaged code in a polling period.
Assembly Level
Measurement Description
Assembly Creation
Frequency
Monitors the number of assembly creations in a polling period. (Assemblies
hold the .NET byte code and metadata).
Assembly Load
Time
Monitors the time it takes to load an assembly. (Assemblies hold the .NET byte
code and metadata).
Assembly Unload
Time
Monitors the time it takes to unload an assembly. (Assemblies hold the .NET
byte code and metadata).
Assembly Lifetime Monitors the duration of an assembly. (Assemblies hold the .NET byte code and
metadata).
Class Level
Measurement Description
Class Lifetime Monitors the duration of a class.
Class Load Time Monitors the time it takes to load a class.
Class Unload Time Monitors the time it takes to unload a class.
Method Level
At the method level, the measured time is per method, exclusive of other methods, calls to unmanaged
code, and garbage collection time.
Measurement Description
Method Duration Monitors the duration of a method.
Method Frequency Monitors the number of methods called in a polling period.
User Guide
Analysis
HP LoadRunner (12.50) Page 1667
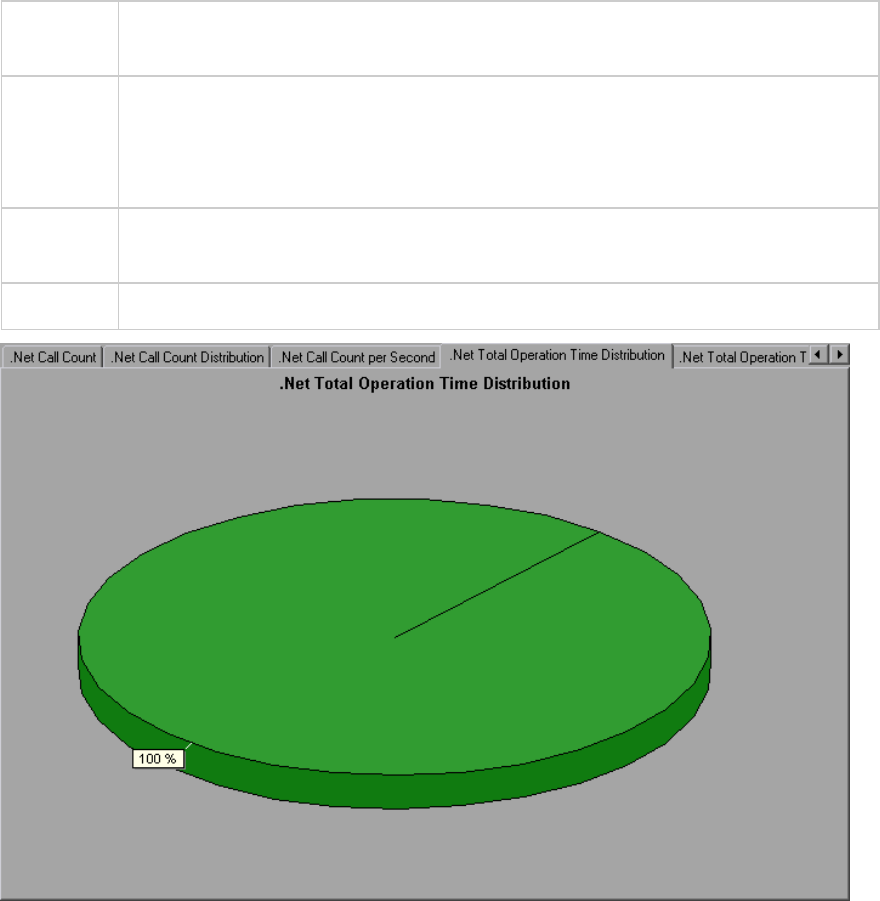
.NET Total Operation Time Distribution Graph
This graph shows the percentage of time that a specific .NET class took to execute in relation to all the
.NET classes. It can also show the percentage of time that a .NET method took to execute in relation to
all the .NET methods within the class.
Purpose Use this graph to identify those classes or methods that take an excessive amount of
time.
Breakdown
options
The graph initially displays .NET classes, but you can also view the individual methods
within a .NET class by using drill-down or filtering techniques. For more information, see
"Filtering and Sorting Graph Data" on page1480 and "Drilling Down in a Graph" on
page1467.
Tips To highlight a specific class line in the graph, select the class row in the legend
(displayed below the graph).
See also "Application Component Graphs" on page1647
.NET Total Operation Time Graph
This graph displays the amount of time that each .NET class or method took to execute during the test.
User Guide
Analysis
HP LoadRunner (12.50) Page 1668
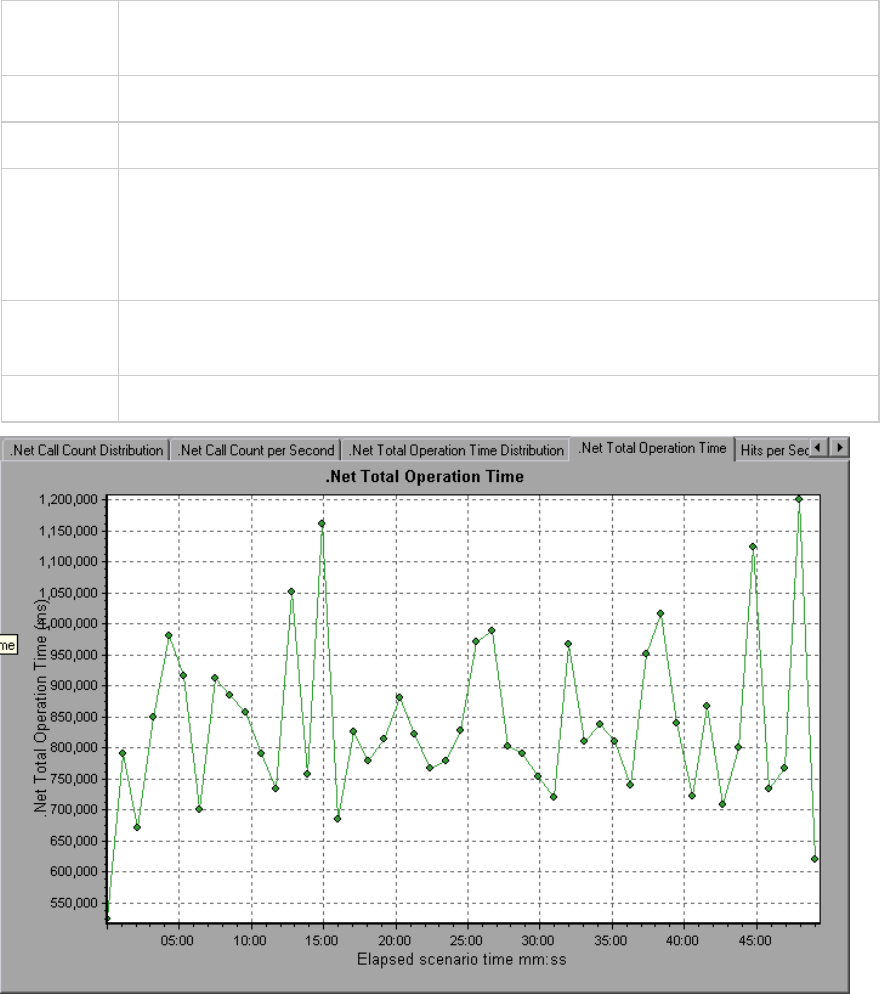
Purpose Use this graph to identify those classes or methods that take an excessive amount of
time.
X-axis Elapsed time from the beginning of the scenario run.
Y-axis Total time a .NET class or method is in operation.
Breakdown
options
The graph initially displays .NET classes, but you can also view the individual methods
within a .NET class by using drill-down or filtering techniques. For more information, see
"Filtering and Sorting Graph Data" on page1480 and "Drilling Down in a Graph" on
page1467.
Tips To highlight a specific class line in the graph, select the class row in the legend
(displayed below the graph).
See also "Application Component Graphs" on page1647
Application Deployment Solutions Graphs
LoadRunner's Citrix Server monitor provides you with information about the application deployment
usage of the Citrix server during a load test scenario execution. In order to obtain performance data,
before you execute the scenario you need to activate the online monitor for the server and specify
which resources you want to measure.
User Guide
Analysis
HP LoadRunner (12.50) Page 1669

For more information on activating and configuring the Citrix monitors, see the section on online
monitors in the LoadRunner Controller documentation.
Citrix Measurements
Non-Virtual Counters
Measurement Description
% Disk Time The percentage of elapsed time that the selected disk drive services read or write
requests.
% Processor
Time
The percentage of time that the processor executes a non-Idle thread. This counter
is a primary indicator of processor activity. It is calculated by measuring the time
that the processor spends executing the thread of the Idle process in each sample
interval, and subtracting that value from 100%. (Each processor has an Idle thread
which consumes cycles when no other threads are ready to run.) It can be viewed as
the percentage of the sample interval spent doing useful work. This counter
displays the average percentage of busy time observed during the sample interval.
It is calculated by monitoring the time the service was inactive, and then
subtracting that value from 100%.
File data
Operations/sec
The rate that the computer issues Read and Write operations to file system
devices. It does not include File Control Operations.
Interrupts/sec The average number of hardware interrupts the processor receives and services
per second. It does not include DPCs, which are counted separately. This value is an
indirect indicator of the activity of devices that generate interrupts, such as the
system clock, the mouse, disk drivers, data communication lines, network interface
cards and other peripheral devices. These devices normally interrupt the processor
when they have completed a task or require attention. Normal thread execution is
suspended during interrupts. Most system clocks interrupt the processor every 10
milliseconds, creating a background of interrupt activity. This counter displays the
difference between the values observed in the last two samples, divided by the
duration of the sample interval.
Output Session
Line Speed
This value represents the line speed from server to client for a session in bps.
Input Session
Line Speed
This value represents the line speed from client to server for a session in bps.
Page
Faults/sec
A count of the Page Faults in the processor. A page fault occurs when a process
refers to a virtual memory page that is not in its Working Set in main memory. A
Page Fault will not cause the page to be fetched from disk if that page is on the
User Guide
Analysis
HP LoadRunner (12.50) Page 1670

Measurement Description
standby list, and hence already in main memory, or if it is in use by another process
with whom the page is shared.
Pages/sec The number of pages read from the disk or written to the disk to resolve memory
references to pages that were not in memory at the time of the reference. This is
the sum of Pages Input/sec and Pages Output/sec. This counter includes paging
traffic on behalf of the system Cache to access file data for applications. This value
also includes the pages to/from non-cached mapped memory files. This is the
primary counter to observe if you are concerned about excessive memory pressure
(that is, thrashing), and the excessive paging that may result.
Pool Nonpaged
Bytes
The number of bytes in the Nonpaged Pool, a system memory area where space is
acquired by operating system components as they accomplish their appointed
tasks. Nonpaged Pool pages cannot be paged out to the paging file, but instead
remain in main memory as long as they are allocated.
Private Bytes The current number of bytes this process has allocated that cannot be shared with
other processes.
Processor
Queue Length
The instantaneous length of the processor queue in units of threads. This counter is
always 0 unless you are also monitoring a thread counter. All processors use a
single queue in which threads wait for processor cycles. This length does not include
the threads that are currently executing. A sustained processor queue length
greater than two generally indicates processor congestion. This is an instantaneous
count, not an average over the time interval.
Threads The number of threads in the computer at the time of data collection. Notice that
this is an instantaneous count, not an average over the time interval. A thread is
the basic executable entity that can execute instructions in a processor.
Latency –
Session
Average
The average client latency over the life of a session.
Latency – Last
Recorded
The last recorded latency measurement for this session.
Latency –
Session
Deviation
The difference between the minimum and maximum measured values for a
session.
Input Session
Bandwidth
The bandwidth (in bps) from client to server traffic for a session in bps.
Input Session The compression ratio for client to server traffic for a session.
User Guide
Analysis
HP LoadRunner (12.50) Page 1671
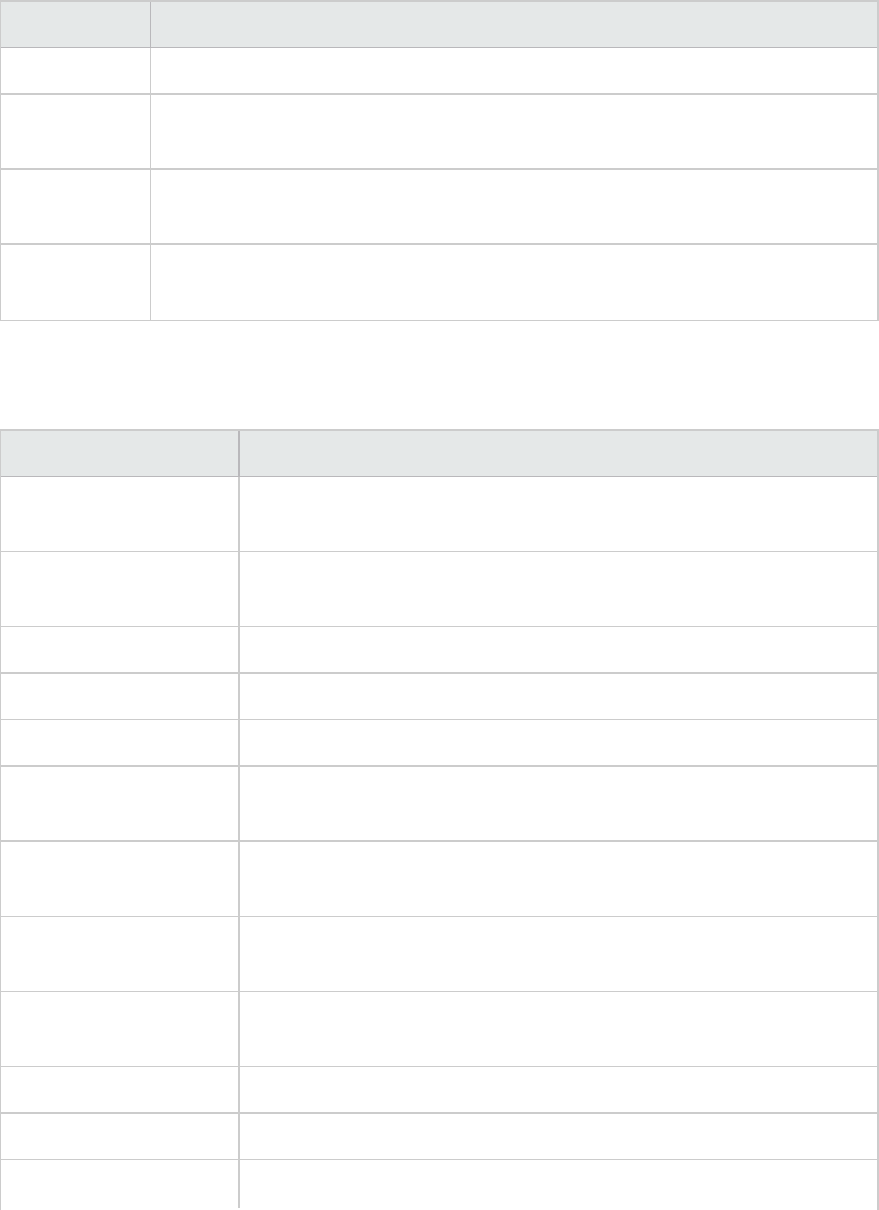
Measurement Description
Compression
Output Session
Bandwidth
The bandwidth (in bps) from server to client traffic for a session.
Output Session
Compression
The compression ratio for server to client traffic for a session.
Output Session
Linespeed
The line speed (in bps) from server to client for a session.
Virtual Channel Counters
All the counters in the following table are measured in bytes per second (bps):
Measurement Description
Input Audio Bandwidth The bandwidth from client to server traffic on the audio mapping
channel.
Input Clipboard
Bandwidth
The bandwidth from client to server traffic on the clipboard mapping
channel.
Input COM1 Bandwidth The bandwidth from client to server traffic on the COM1 channel.
Input COM2 Bandwidth The bandwidth from client to server traffic on the COM2 channel.
Input COM Bandwidth The bandwidth from client to server traffic on the COM channel.
Input Control Channel
Bandwidth
The bandwidth from client to server traffic on the ICA control channel.
Input Drive Bandwidth The bandwidth from client to server traffic on the client drive mapping
channel.
Input Font Data
Bandwidth
The bandwidth from client to server traffic on the local text echo font
and keyboard layout channel.
Input Licensing
Bandwidth
The bandwidth from server to client traffic on the licensing channel.
Input LPT1 Bandwidth The bandwidth from client to server traffic on the LPT1 channel.
Input LPT2 Bandwidth The bandwidth from client to server traffic on the LPT2 channel.
Input Management The bandwidth from client to server traffic on the client management
User Guide
Analysis
HP LoadRunner (12.50) Page 1672

Measurement Description
Bandwidth channel.
Input PN Bandwidth The bandwidth from client to server traffic on the Program
Neighborhood channel.
Input Printer Bandwidth The bandwidth from client to server traffic on the printer spooler
channel.
Input Seamless
Bandwidth
The bandwidth from client to server traffic on the Seamless channel.
Input Text Echo
Bandwidth
The bandwidth from client to server traffic on the local text echo data
channel.
Input Thinwire
Bandwidth
The bandwidth from client to server traffic on the Thinwire (graphics)
channel.
Input VideoFrame
Bandwidth
The bandwidth from client to server traffic on the VideoFrame channel.
Output Audio Bandwidth The bandwidth from server to client traffic on the audio mapping
channel.
Output Clipboard
Bandwidth
The bandwidth from server to client traffic on the clipboard mapping
channel.
Output COM1 Bandwidth The bandwidth from server to client traffic on the COM1 channel.
Output COM2 Bandwidth The bandwidth from server to client traffic on the COM2 channel.
Output COM Bandwidth The bandwidth from server to client traffic on the COM channel.
Output Control Channel
Bandwidth
The bandwidth from server to client traffic on the ICA control channel.
Output Drive Bandwidth The bandwidth from server to client traffic on the client drive channel.
Output Font Data
Bandwidth
The bandwidth from server to client traffic on the local text echo font
and keyboard layout channel.
Output Licensing
Bandwidth
The bandwidth from server to client traffic on the licensing channel.
Output LPT1 Bandwidth The bandwidth from server to client traffic on the LPT1 channel.
Output LPT2 Bandwidth The bandwidth from server to client traffic on the LPT2 channel.
Output Management The bandwidth from server to client traffic on the client management
User Guide
Analysis
HP LoadRunner (12.50) Page 1673

Measurement Description
Bandwidth channel.
Output PN Bandwidth The bandwidth from server to client traffic on the Program
Neighborhood channel.
Output Printer
Bandwidth
The bandwidth from server to client traffic on the printer spooler
channel.
Output Seamless
Bandwidth
The bandwidth from server to client traffic on the Seamless channel.
Output Text Echo
Bandwidth
The bandwidth from server to client traffic on the local text echo data
channel.
Output Thinwire
Bandwidth
The bandwidth from server to client traffic on the Thinwire (graphics)
channel.
Output VideoFrame
Bandwidth
The bandwidth from server to client traffic on the VideoFrame channel.
Citrix Server Graph
This graph is an Application Deployment solution which delivers applications across networks. The Citrix
Server monitor is an Application Deployment Solution monitor, which provides performance information
for the Citrix server.
X-
axis
Elapsed time since the start of the run.
Y-
axis
The resource usage on the Citrix server.
Note To obtain data for this graph, you need to enable the Citrix Server monitor (from the
Controller) and select the default measurements you want to display, before running the
scenario.
See
also
"Application Deployment Solutions Graphs" on page1669
"Citrix Measurements" on page1670
User Guide
Analysis
HP LoadRunner (12.50) Page 1674
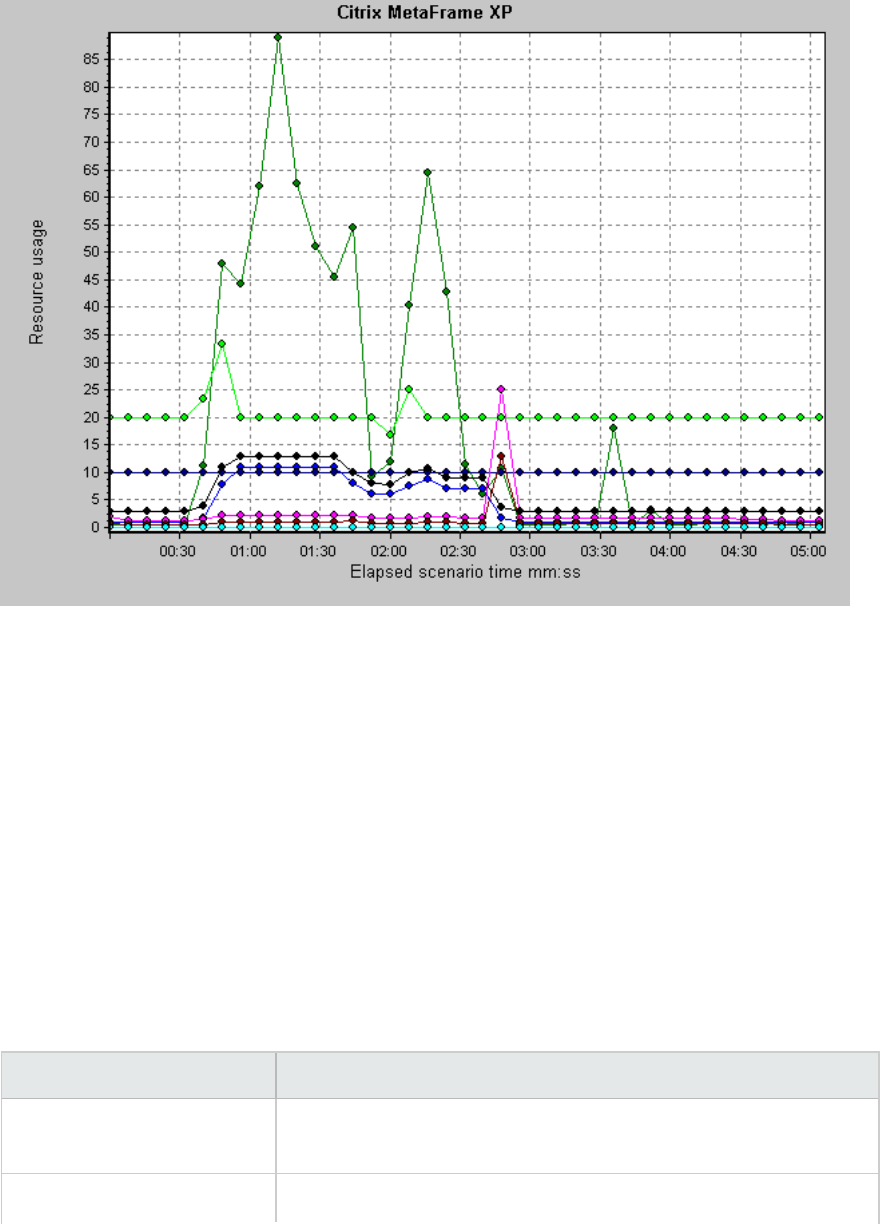
Middleware Performance Graphs
A primary factor in a transaction's response time is the middleware performance usage. LoadRunner's
Middleware Performance monitors provide you with information about the middleware performance
usage of the Tuxedo and IBM WebSphere MQ servers during a load test scenario execution. To obtain
performance data, you need to activate the online monitor for the server and specify which resources
you want to measure before executing the scenario.
For more information, see the section on online monitors in the LoadRunner Controller documentation.
IBM WebSphere MQ Counters
Queue Performance Counters
Measurement Description
Event - Queue Depth High
(events per second)
An event triggered when the queue depth reaches the configured
maximum depth.
Event - Queue Depth Low An event triggered when the queue depth reaches the configured
User Guide
Analysis
HP LoadRunner (12.50) Page 1675
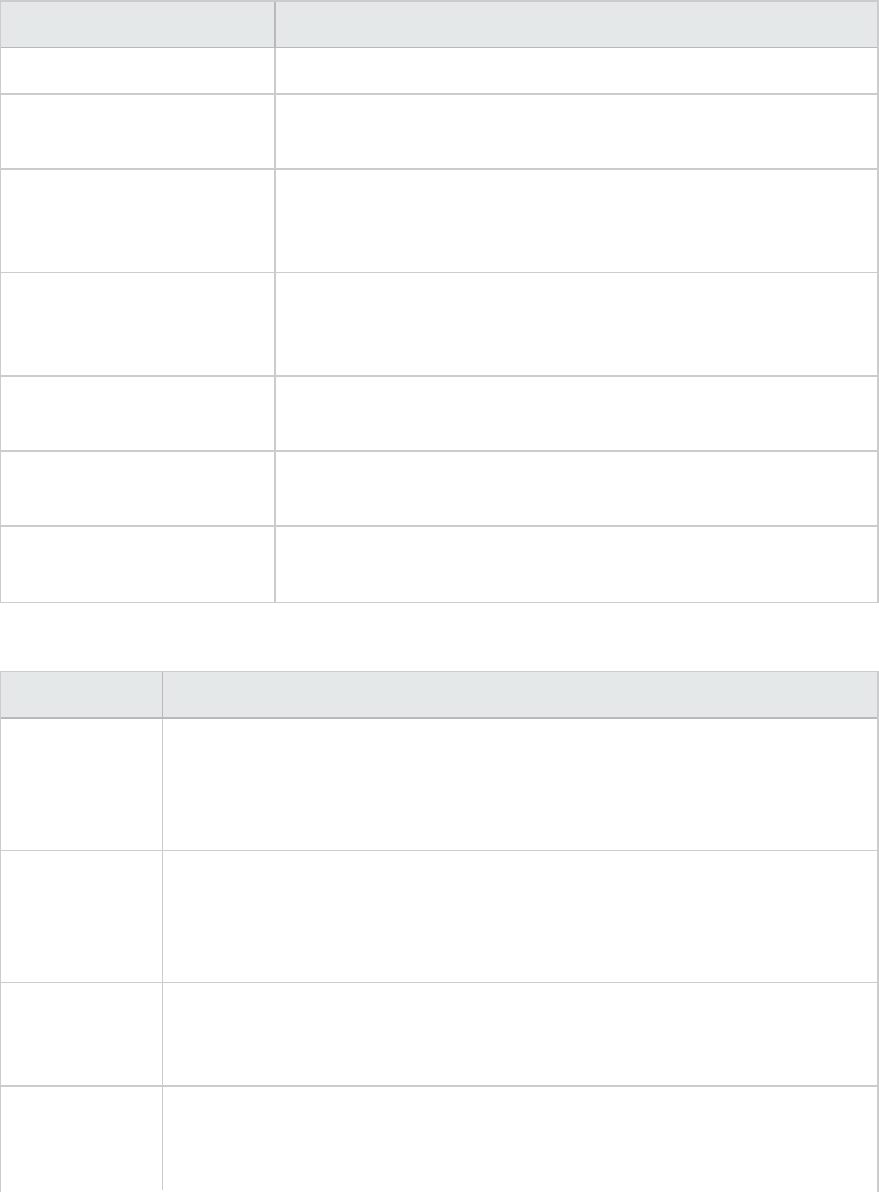
Measurement Description
(events per second) minimum depth.
Event - Queue Full (events
per second)
An event triggered when an attempt is made to put a message on a
queue that is full.
Event - Queue Service
Interval High (events per
second)
An event triggered when no messages are put to or retrieved from a
queue within the timeout threshold.
Event - Queue Service
Interval OK (events per
second)
An event triggered when a message has been put to or retrieved
from a queue within the timeout threshold.
Status - Current Depth The current count of messages on a local queue. This measurement
applies only to local queues of the monitored queue manager.
Status - Open Input Count The current count of open input handles. Input handles are opened
so that an application may "put" messages to a queue.
Status - Open Output Count The current count of open output handles. Output handles are
opened so that an application may "get" messages from a queue.
Channel Performance Counters
Measurement Description
Event - Channel
Activated
(events per
second)
An event generated when a channel, waiting to become active but inhibited from
doing so due to a shortage of queue manager channel slots, becomes active due
to the sudden availability of a channel slot.
Event - Channel
Not Activated
(events per
second)
An event generated when a channel attempts to become active but is inhibited
from doing so due to a shortage of queue manager channel slots.
Event - Channel
Started (events
per second)
An event generated when a channel is started.
Event - Channel
Stopped (events
per second)
An event generated when a channel is stopped, regardless of source of stoppage.
User Guide
Analysis
HP LoadRunner (12.50) Page 1676

Measurement Description
Event - Channel
Stopped by User
(events per
second)
An event generated when a channel is stopped by a user.
Status -
Channel State
The current state of a channel. Channels pass through several states from
stopped (inactive state) to running (fully active state). Channel states range from
0 (stopped) to 6 (running).
Status -
Messages
Transferred
The count of messages that have been sent over the channel. If no traffic is
occurring over the channel, this measurement will be zero. If the channel has not
been started since the queue manager was started, no measurement will be
available.
Status - Buffer
Received
The count of buffers that have been received over the channel. If no traffic is
occurring over the channel, this measurement will be zero. If the channel has not
been started since the queue manager was started, no measurement will be
available.
Status - Buffer
Sent
The count of buffers that have been sent over the channel. If no traffic is
occurring over the channel, this measurement will be zero. If the channel has not
been started since the queue manager was started, no measurement will be
available.
Status - Bytes
Received
The count of bytes that have been received over the channel. If no traffic is
occurring over the channel, this measurement will appear as zero. If the channel
has not been started since the queue manager was started, no measurement will
be available.
Status - Bytes
Sent
The count of bytes that have been sent over the channel. If no traffic is occurring
over the channel, this measurement will appear as zero. If the channel has not
been started since the queue manager was started, no measurement will be
available.
Tuxedo Resources Graph Measurements
The following table describes the default counters that can be measured. It is recommended to pay
particular attention to the following measurements: %Busy Clients, Active Clients, Busy Clients, Idle
Clients, and all the queue counters for relevant queues.
Monitor Measurements
Machine % Busy Clients. The percentage of active clients currently logged in to the Tuxedo
application server that are waiting for a response from the application server.
User Guide
Analysis
HP LoadRunner (12.50) Page 1677

Monitor Measurements
Active Clients. The total number of active clients currently logged in to the Tuxedo
application server.
Busy Clients. The total number of active clients currently logged in to the Tuxedo
application server that are waiting for a response from the application server.
Current Accessers. The number of clients and servers currently accessing the
application either directly on this machine or through a workstation handler on this
machine.
Current Transactions. The number of in use transaction table entries on this machine.
Idle Clients. The total number of active clients currently logged in to the Tuxedo
application server that are not waiting for a response from the application server.
Workload Completed/second. The total workload on all the servers for the machine
that was completed, per unit time.
Workload Initiated/second. The total workload on all the servers for the machine that
was initiated, per unit time.
Queue % Busy Servers. The percentage of active servers currently handling Tuxedo
requests.
Active Servers. The total number of active servers either handling or waiting to
handle Tuxedo requests.
Busy Servers. The total number of active servers currently busy handling Tuxedo
requests.
Idle Servers. The total number of active servers currently waiting to handle Tuxedo
requests.
Number Queued. The total number of messages which have been placed on the queue.
Server Requests/second. The number of server requests handled per second.
Workload/second. The workload is a weighted measure of the server requests. Some
requests could have a different weight than others. By default, the workload is always
50 times the number of requests.
Workstation
Handler
(WSH)
Bytes Received/sec. The total number of bytes received by the workstation handler,
per second.
Bytes Sent/sec. The total number of bytes sent back to the clients by the workstation
handler, per second.
Messages Received/sec. The number of messages received by the workstation
User Guide
Analysis
HP LoadRunner (12.50) Page 1678

Monitor Measurements
handler, per second.
Messages Sent/sec. The number of messages sent back to the clients by the
workstation handler, per second.
Number of Queue Blocks/sec. The number of times the queue for the workstation
handler blocked, per second. This gives an idea of how often the workstation handler
was overloaded.
IBM WebSphere MQ Graph
This graph shows the resource usage of IBM WebSphere MQ Server channel and queue performance
counters as a function of the elapsed load test scenario time.
X-
axis
Elapsed time since the start of the run.
Y-
axis
The resource usage of the IBM WebSphere MQ Server channel and queue performance
counters.
Note To obtain data for this graph, you need to enable the IBM WebSphere MQ monitor (from the
Controller) and select the default measurements you want to display, before running the
scenario.
See
also
"Middleware Performance Graphs" on page1675
"IBM WebSphere MQ Counters" on page1675
User Guide
Analysis
HP LoadRunner (12.50) Page 1679
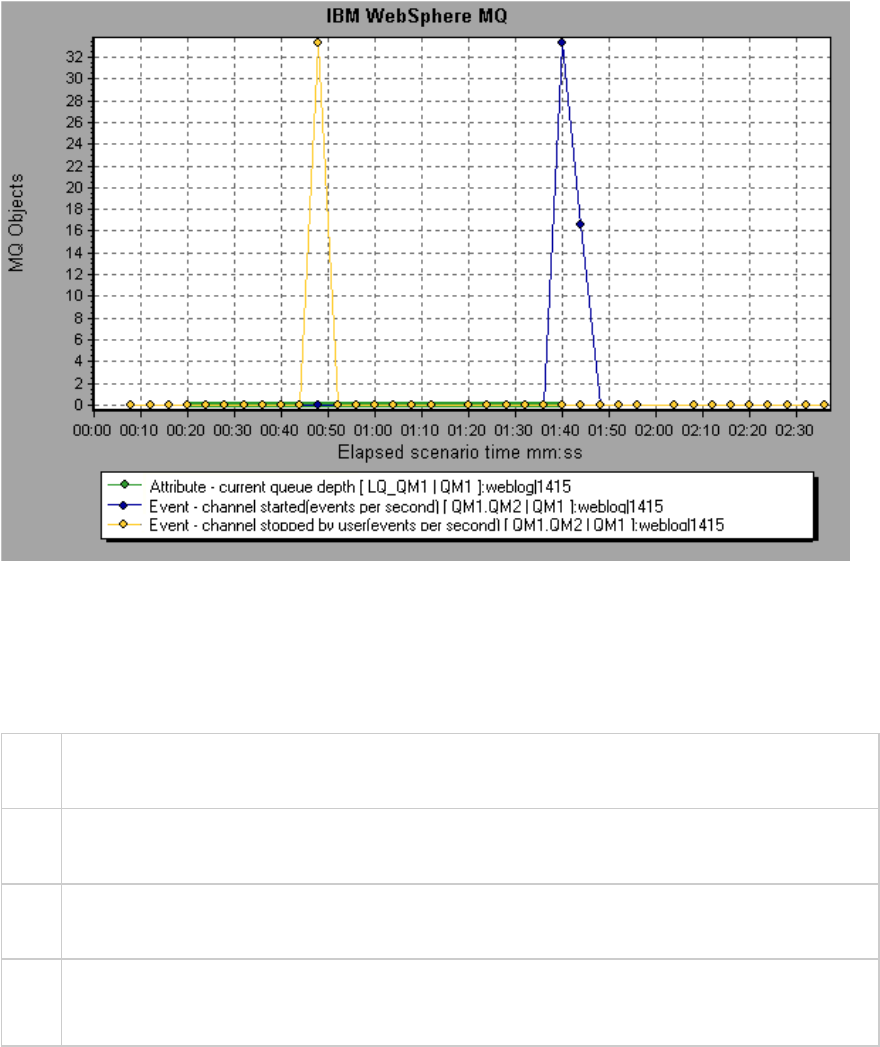
Tuxedo Resources Graph
This graph provides information about the server, load generator machine, workstation handler, and
queue in a Tuxedo system.
X-
axis
Elapsed time since the start of the run.
Y-
axis
The resource usage on the Tuxedo system.
Note To obtain data for this graph, you need to enable the TUXEDO monitor (from the Controller)
and select the default measurements you want to display, before running the scenario.
See
also
"Middleware Performance Graphs" on page1675
"Tuxedo Resources Graph Measurements" on page1677
User Guide
Analysis
HP LoadRunner (12.50) Page 1680
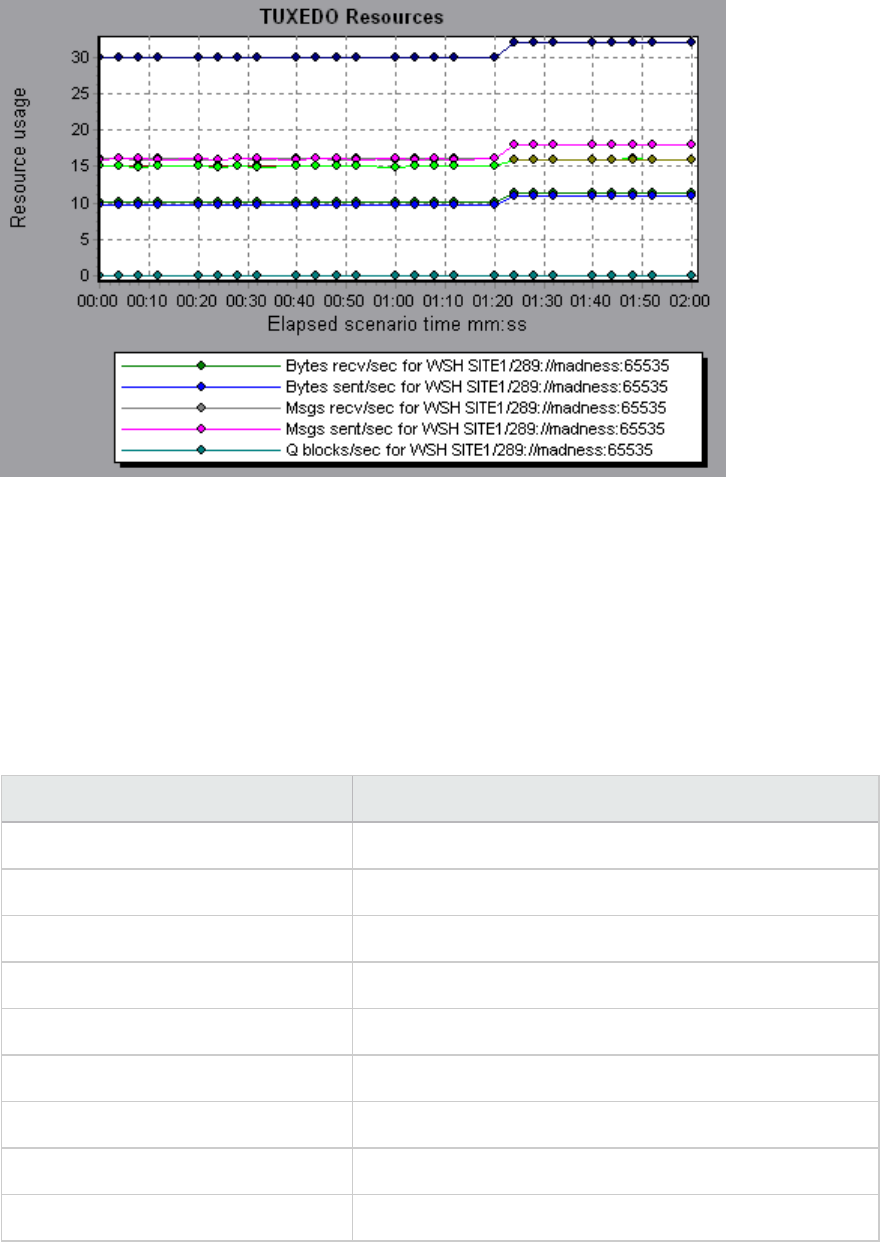
Infrastructure Resources Graphs
LoadRunner's Infrastructure Resources monitor provides you with information about the performance
of FTP, POP3, SMTP, IMAP, and DNS Vusers on the network client during load test scenario execution.
Network Client Measurements
Measurement Description
Pings per sec Number of pings per second.
Data transfer bytes per sec Number of data bytes transferred per second.
Data receive bytes per sec Number of data bytes received per second.
Connections per sec Number of connections per second.
Accept connections per sec Number of connections accepted per seconds.
SSL Connections per sec Number of SSL connections per second.
SSL Data transfer bytes per sec Number of SSL data bytes transferred per second.
SSL Data receive bytes per sec Number of SSL data bytes received per second.
SSL Accept connections per sec Number of SSL connections accepted per seconds.
User Guide
Analysis
HP LoadRunner (12.50) Page 1681
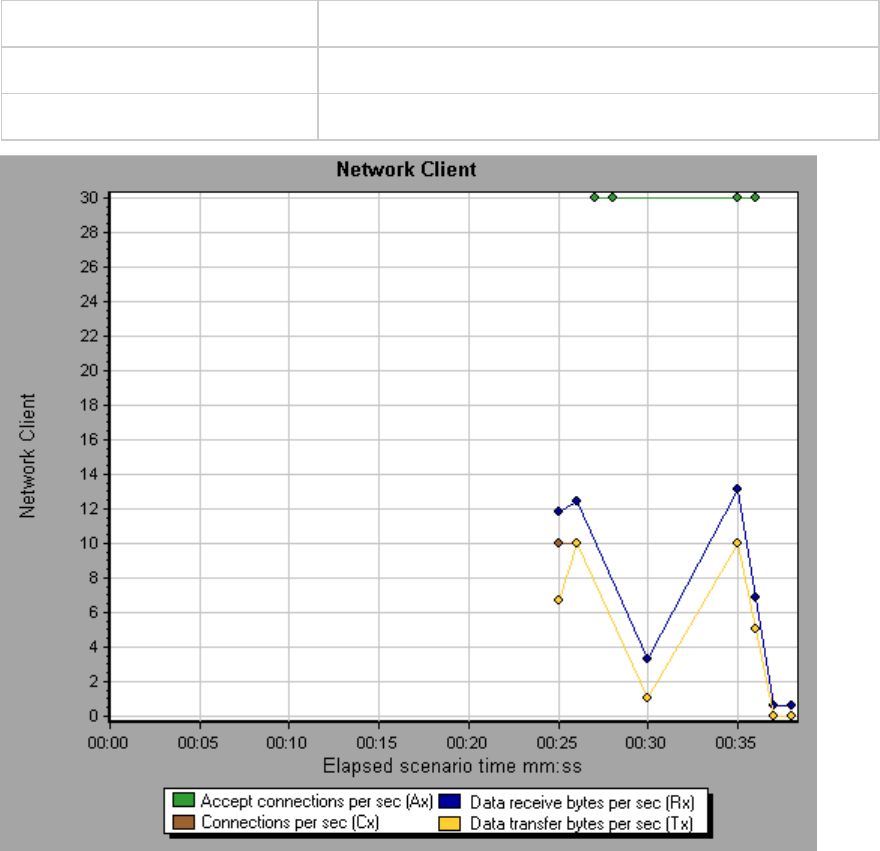
Network Client Graph
This graph displays network client data points for FTP, POP3, SMTP, IMAP, and DNS Vusers during a load
test scenario run.
X-axis Elapsed time since the start of the run.
Y-axis The resource value of the network client data points..
See also "Infrastructure Resources Graphs" on the previous page
HP Service Virtualization Graphs
The Service Virtualization graphs are similar to the corresponding monitors used by the LoadRunner
Controller. For details, see "Service Virtualization Monitors" on page1381.
User Guide
Analysis
HP LoadRunner (12.50) Page 1682
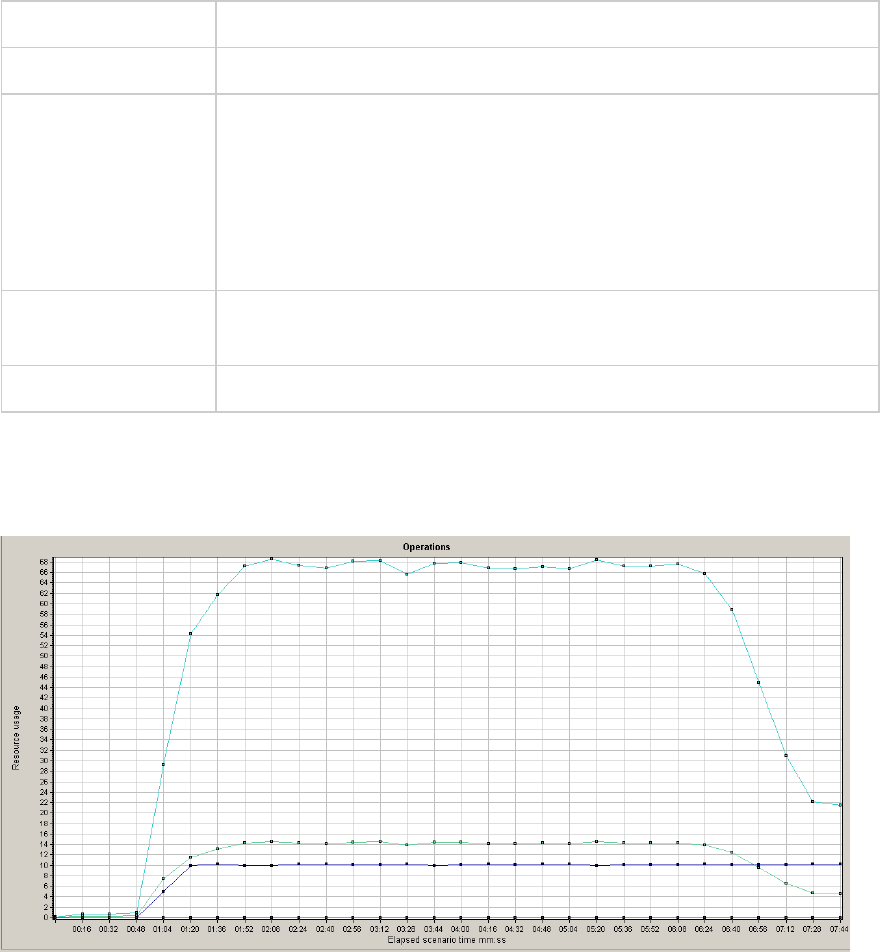
Service Virtualization Graphs Overview
The Service Virtualization graphs are similar to the corresponding monitors used by the LoadRunner
Controller. For details, see "Service Virtualization Monitors" on page1381.
HP Service Virtualization Operations Graph
This graph displays a summary for HP Service Virtualization - Operations.
X-axis The elapsed time from the beginning of the scenario run.
Y-axis The number of resources used.
Tips lTo isolate the measurement with the most problems, it may be helpful to
sort the legend window according to the average number of resources
used. To sort the legend by average, double-click the Average column
heading.
lTo identify a measurement in the graph, you can select it. The
corresponding line in the legend window is selected.
Note To use this graph, you must first open a Service Virtualization project in the
Controller.
See also Web Page Diagnostics Graph
Example
Using the graph, you can track which resources were most problematic, and at which point(s) during the
scenario the problem(s) occurred.
User Guide
Analysis
HP LoadRunner (12.50) Page 1683
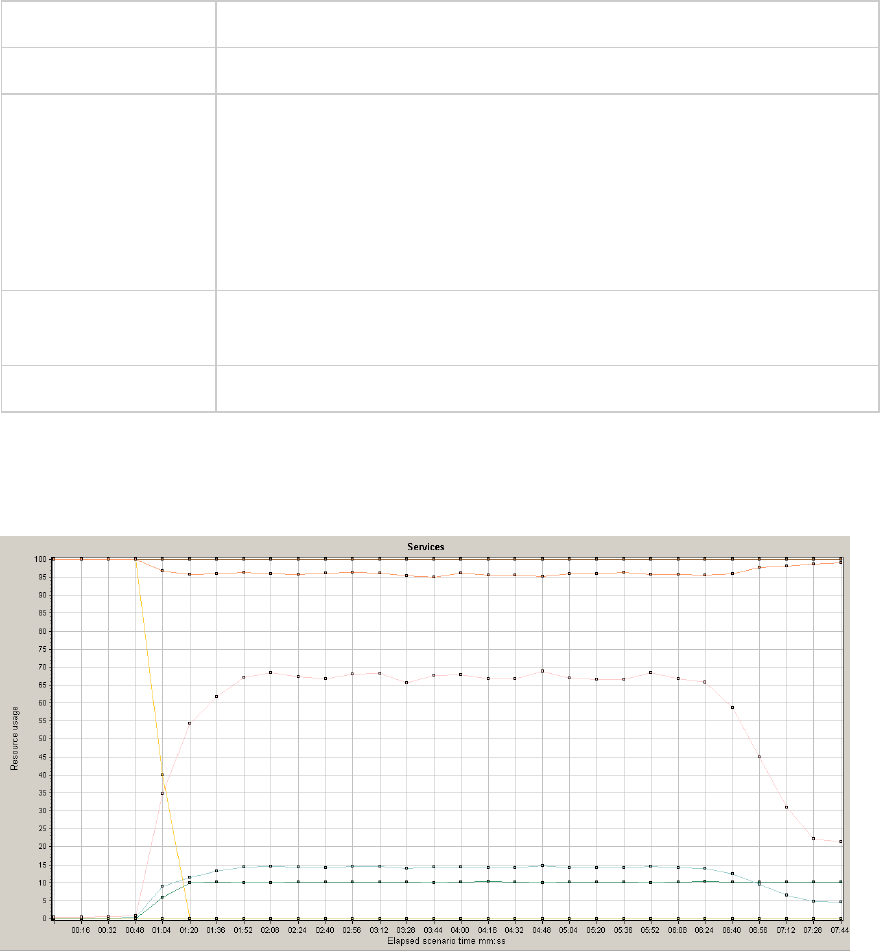
HP Service Virtualization Services Graph
This graph displays a summary for HP Service Virtualization - Services.
X-axis The elapsed time from the beginning of the scenario run.
Y-axis The number of resources used.
Tips lTo isolate the measurement with the most problems, it may be helpful to
sort the legend window according to the average number of resources
used. To sort the legend by average, double-click the Average column
heading.
lTo identify a measurement in the graph, you can select it. The
corresponding line in the legend window is selected.
Note To use this graph, you must first open a Service Virtualization project in the
Controller scenario.
See also Web Page Diagnostics Graph
Example
Using the graph, you can track which resources were most problematic, and at which point(s) during the
scenario the problem(s) occurred.
Flex Graphs
Flex graphs provide you with information about the performance of your Flex server. You use the Flex
graphs to analyze the following data:
User Guide
Analysis
HP LoadRunner (12.50) Page 1684
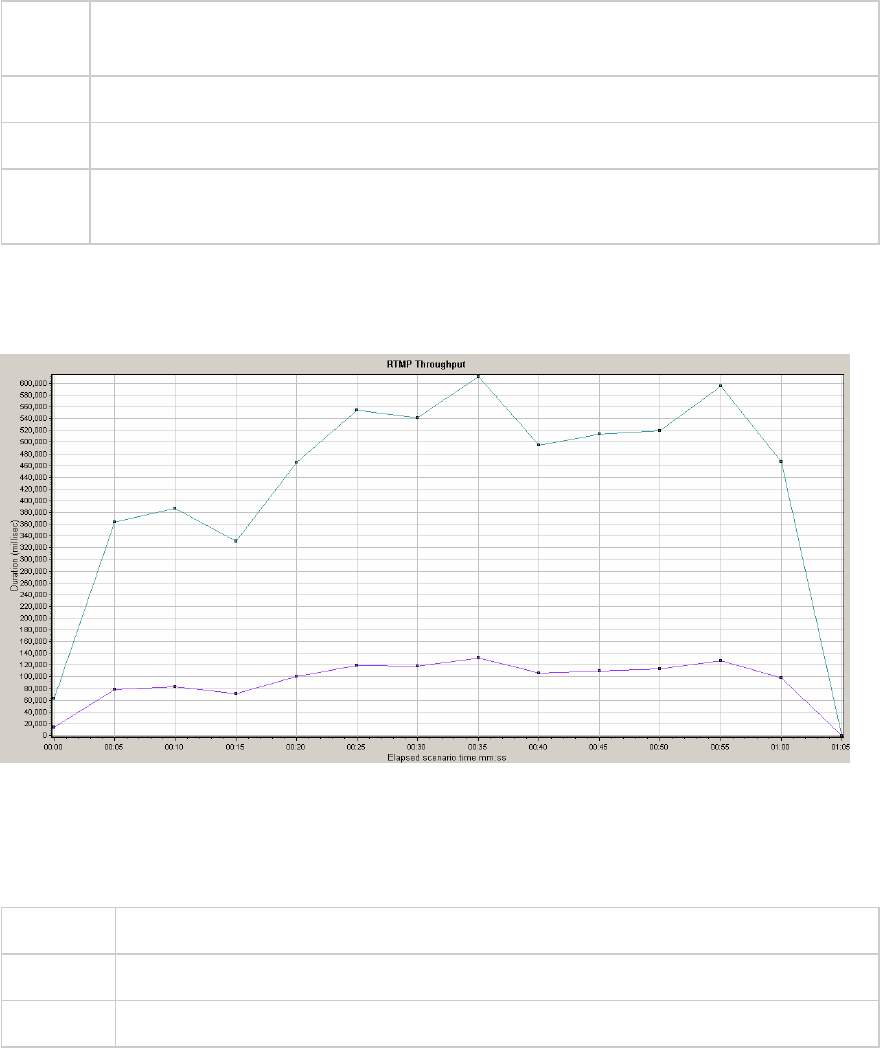
Flex RTMP Throughput Graph
This graph shows the amount of throughput (in bytes) on the RTMP/T server during each second of the
load test scenario run. The throughput represents the amount of data that the Vusers received from
the server or sent to the server at any given second.
Purpose Helps you evaluate the amount of load that Vusers generate, in terms of server
throughput.
X-axis Elapsed time since the start of the scenario run.
Y-axis Throughput of the server in bytes
Note You cannot change the granularity of the x-axis to a value that is less than the Web
granularity you defined in the General tab of the Options dialog box.
Example
In the following example, the highest throughput is over 600,000 bytes during the thirty-fifth second of
the scenario.
Flex RTMP Other Statistics Graph
This graph shows various statistics about Flex RTMP Vusers.
Purpose The graph shows the duration taken to perform various RTMP tasks.
X-axis Elapsed time since the start of the scenario run.
Y-axis Task duration (in milliseconds).
User Guide
Analysis
HP LoadRunner (12.50) Page 1685
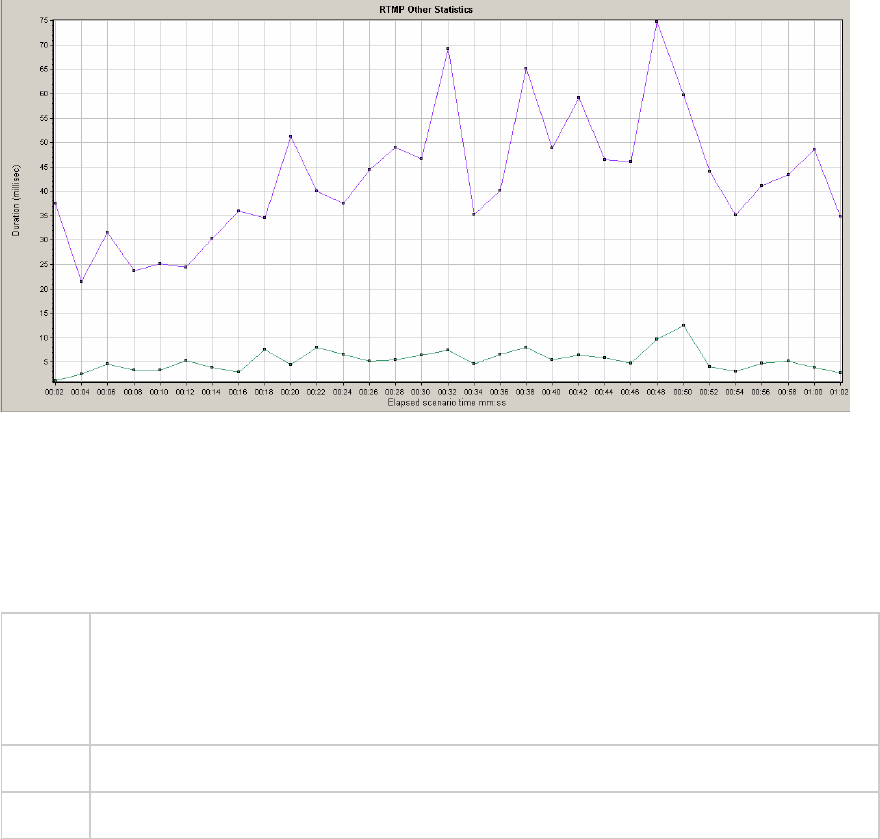
Example
In the following example,the RTMP Handshake has a duration of seventy five milliseconds at the forty
eighth second of the scenario.
Flex RTMP Connections Graph
This graph shows the number of open RTMP connections at any time during the load test scenario run.
The throughput represents the amount of data that the Vusers received from the server or sent to the
server at any given second.
Purpose This graph is useful in indicating when additional connections are needed. For example, if
the number of connections reaches a plateau, and the transaction response time
increases sharply, adding connections would probably cause a dramatic improvement in
performance (reduction in the transaction response time).
X-axis Elapsed time since the start of the scenario run.
Y-axis Number of connections.
Example
In the following example,between the forty-eighth second and the fifty-sixth second of the scenario
there are eighty open connections.
User Guide
Analysis
HP LoadRunner (12.50) Page 1686
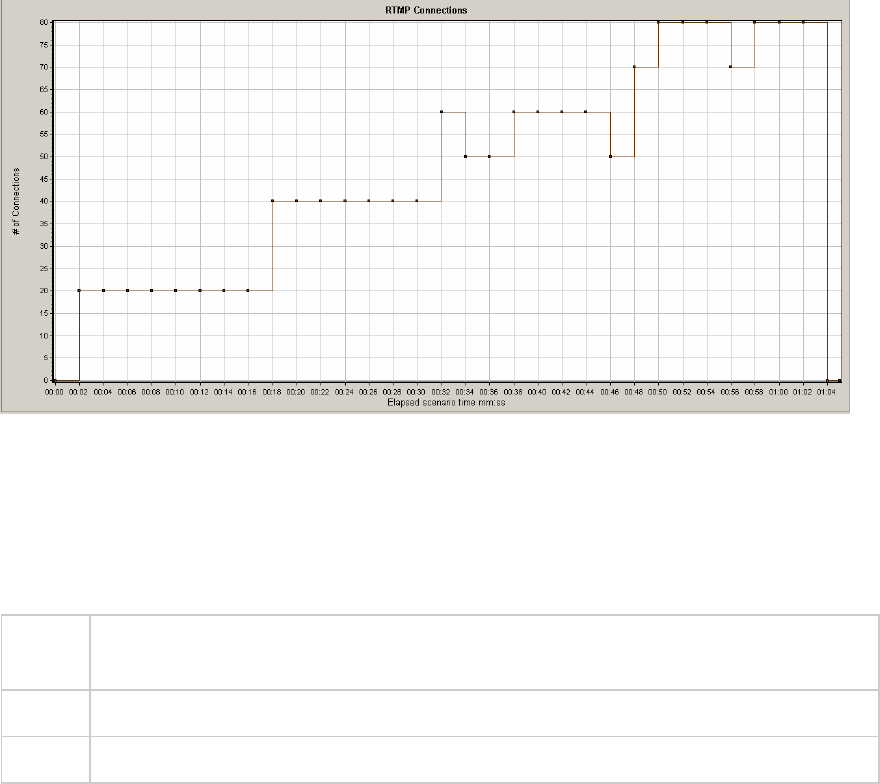
TruClient CPU Utilization Percentage Graph
This graph displays the total number of streams that were successfully delivered by the server. A
successful delivery is indicated when the server initiates a "NetStream.Stop" message at the end of the
requested stream.
Purpose Helps you evaluate the amount of load that Vusers generate, in terms of server
throughput.
X-axis Elapsed time since the start of the scenario run.
Y-axis Number of streams delivered
Example
In the following example, the graph rises at a forty five degree angle, indicating a constant number of
streams being delivered over time.
User Guide
Analysis
HP LoadRunner (12.50) Page 1687
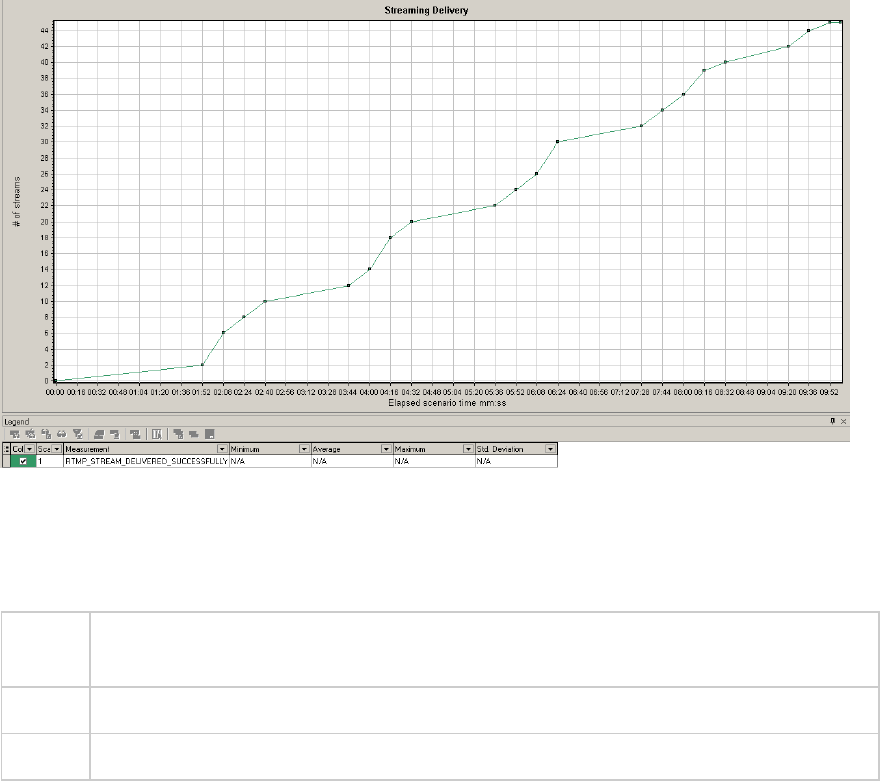
Flex Average Buffering Time Graph
This graph displays the average buffering time for RTMP streams.
Purpose Helps you evaluate the amount of load that Vusers generate, in terms of time spent for
streams in the buffer.
X-axis Elapsed time since the start of the scenario run.
Y-axis Buffering time in milliseconds
Example
In the following example, the buffering time reaches its lowest after 4 minutes and 32 seconds of the
scenario before climbing up to a peak again. You should compare it to other graphs to see what
happened at that time.
User Guide
Analysis
HP LoadRunner (12.50) Page 1688
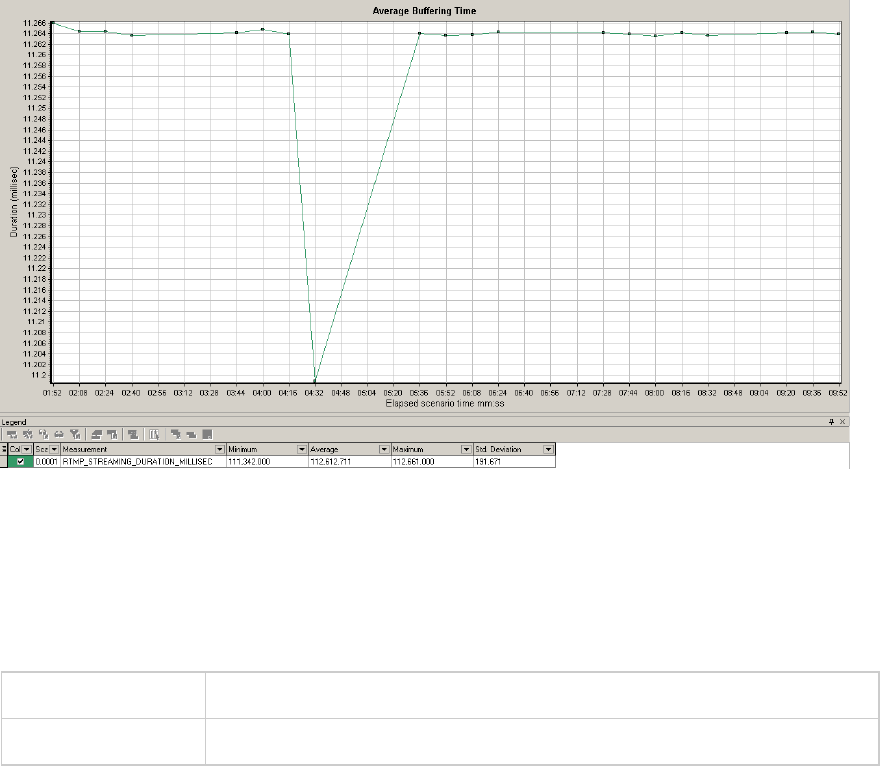
WebSocket Statistics Graphs
The WebSocket Statistics graphs provides you with statistics for the WebSocket data during the
scenario run, such as byte rate, connection status, and the number of messages.
X-axis Elapsed time since the start of the run.
Y-axis WebSocket per second throughout the whole scenario.
The WebSocket Statistics graphs are:
lWebSocket Bytes per second. This graph shows the number of bytes that were sent and received
per second.
lWebSocket Connections per second. This graph shows the number of new, failed, and closed
connections. I
lWebSocket Messages per second. This graph shows the number of WebSocket messages that were
sent, per second.
To gather these statistics, enable the WebSocket Statistics monitors before running your scenario. For
details, see "WebSocket Statistics Monitor" on page1313.
Diagnostics Graphs
You can open Diagnostics graphs that were generated in earlier versions of LoadRunner.
User Guide
Analysis
HP LoadRunner (12.50) Page 1689
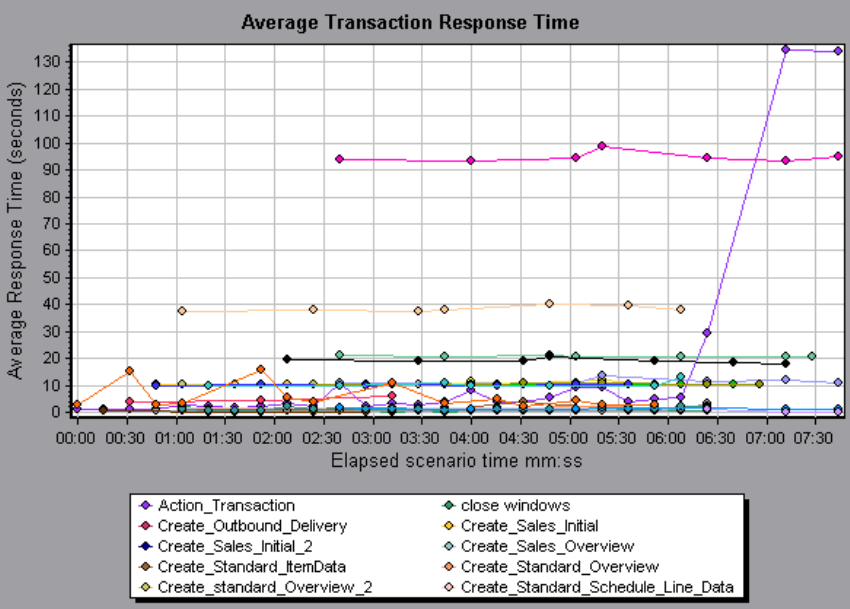
Siebel Diagnostics Graphs
Siebel Diagnostics Graphs Overview
Siebel Diagnostics graphs enable you to trace, time, and troubleshoot individual transactions through
Web, application, and database servers.
To analyze where problems are occurring, you correlate the data in the Siebel Diagnostics graphs with
data in the Transaction Response Time graphs.
You begin analyzing these graphs with the transaction graphs that display the average transaction
response time during each second of the load test scenario run. For example, the following Average
Transaction Response Time graph demonstrates that the average transaction response time for the
Action_Transaction transaction was high.
Using the Siebel Diagnostics graphs, you can pinpoint the cause of the delay in response time for this
transaction.
Alternatively, you can use the Summary Report to view individual transactions broken down into Web,
application, and database layers, and the total usage time for each transaction. For more information,
see "Siebel Diagnostics Graphs Summary Report" on page1700.
User Guide
Analysis
HP LoadRunner (12.50) Page 1690
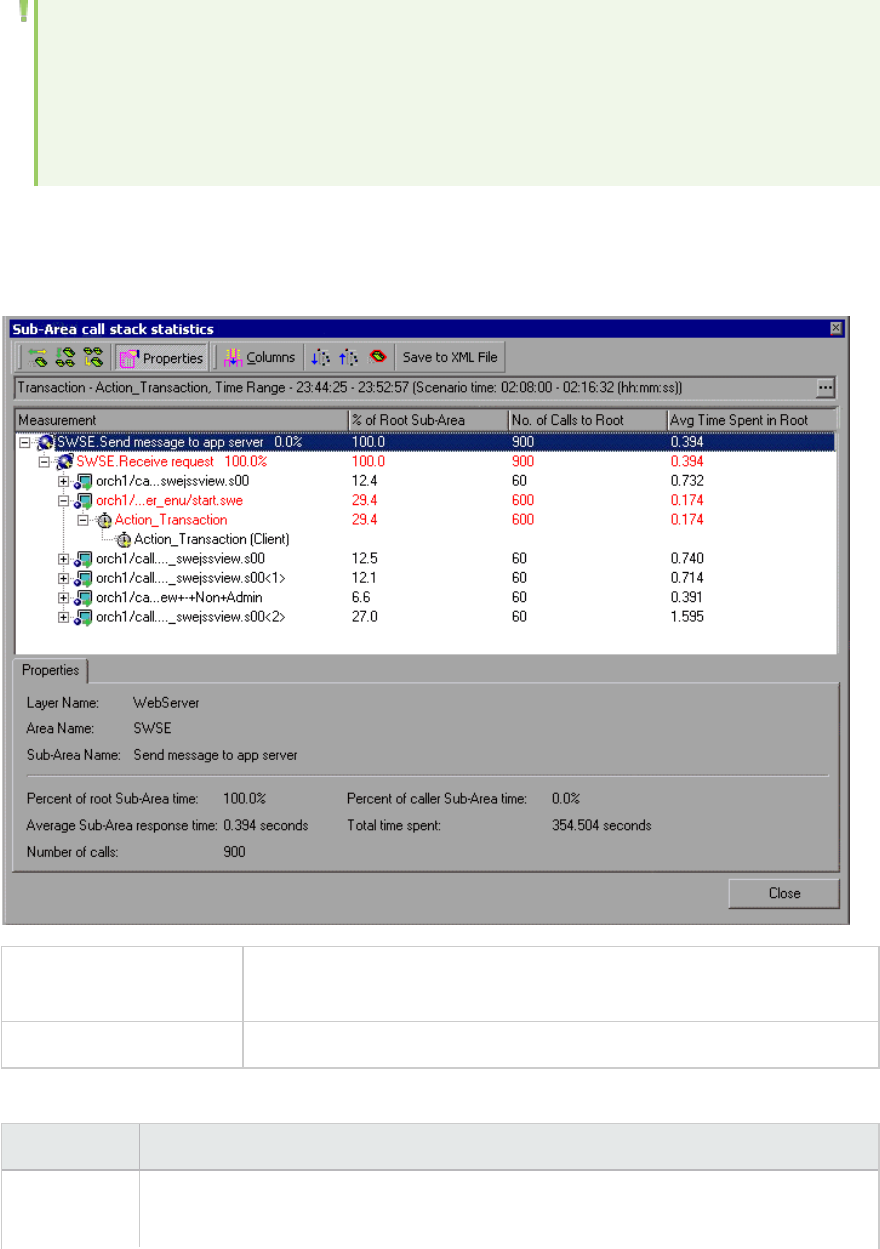
Note: A measurement that is broken down in the Average Transaction Response Time graph will
be different from the same measurement broken down in the Siebel Diagnostics graph. This is
because the Average Transaction Response Time graph displays the average transaction
response time, whereas the Siebel Diagnostics graph displays the average time per transaction
event (sum of Siebel Area response time).
Call Stack Statistics Window
This window enables you to view which components called the selected component.
To access Analysis window > <Siebel> graph > right click sub-area and select Siebel
Diagnostics > Show Sub-Area Call Stack Statistics
See also "Siebel Diagnostics Graphs Overview" on the previous page
User interface elements are described below:
UI Element Description
Measurement Name of the sub-area, displayed as AreaName:SubAreaName. In the case of a
database call, query information is also displayed. The percent shown indicates the
User Guide
Analysis
HP LoadRunner (12.50) Page 1691
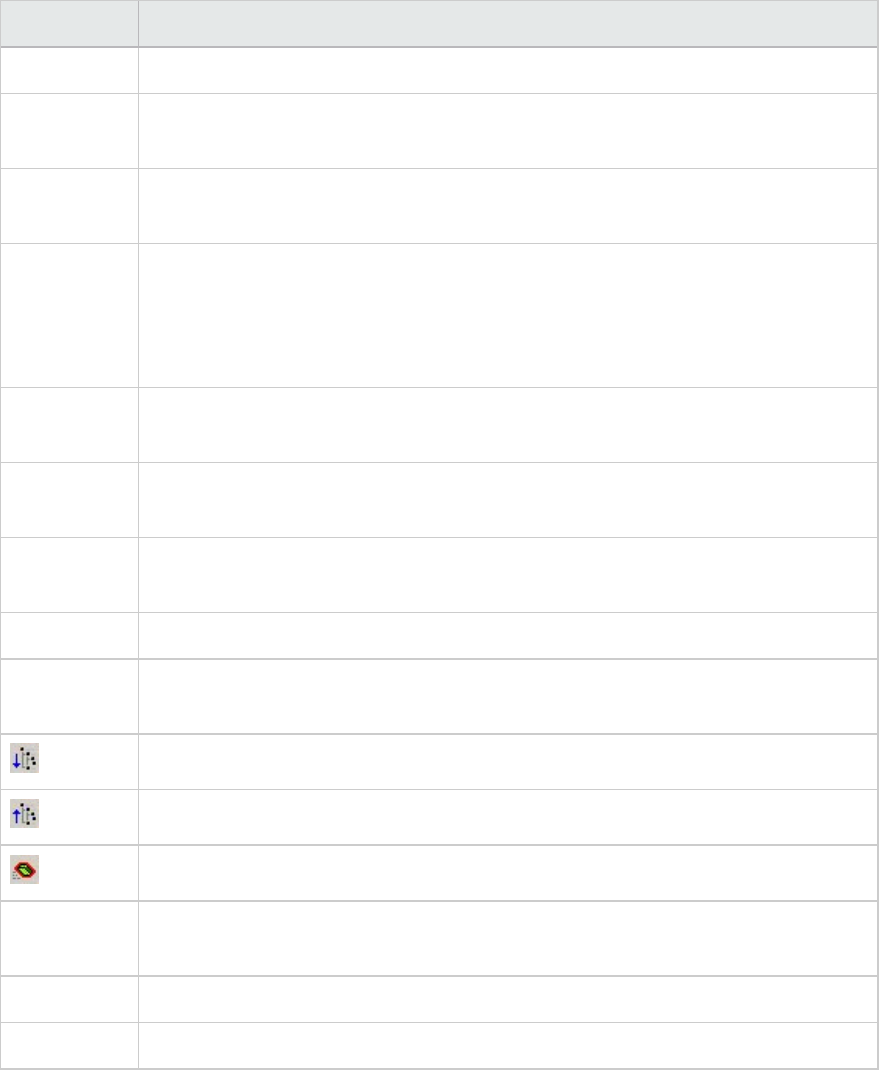
UI Element Description
percentage of calls to this component from its child.
% of Root
Sub-Area
Displays the percentage of sub-area time in relation the total root sub-area time.
No. of Calls
to Root
Displays the amount of times this transaction or sub-area was executed.
Avg Time
Spent in Root
Time spent in root is the time that the sub-area spent in the root sub-
area//transaction.
Average Time Spent in Root time is the total time spent in the root divided by the
number of instances of the sub-area.
STD Time
Spent in Root
The standard deviation time spent in the root.
Min Time
Spent in Root
The minimum time spent in the root.
Max Time
Spent in Root
The maximum time spent in the root.
% of Called Displays the percentage of sub-area time in relation the child sub-area time.
Total Time
Spent in Root
Displays the total sub-area execution time, including the child execution time.
Expand All. Expands the entire tree.
Collapse All. Collapses the entire tree.
Expand Worst Path. Expands only the parts of the path on the critical path.
Save to XML
File
Saves the tree data to an XML file.
Properties Properties Area.Displays the full properties of the selected sub-area.
SQL Query SQL Query. Displays the SQL query for the selected sub-area (For Database only).
Chain of Calls Window
This window enables you to view the components that the selected transaction or sub-area called. The
following figure shows all the calls in the critical path of the parent Action_Transaction server-side
transaction are displayed.
User Guide
Analysis
HP LoadRunner (12.50) Page 1692
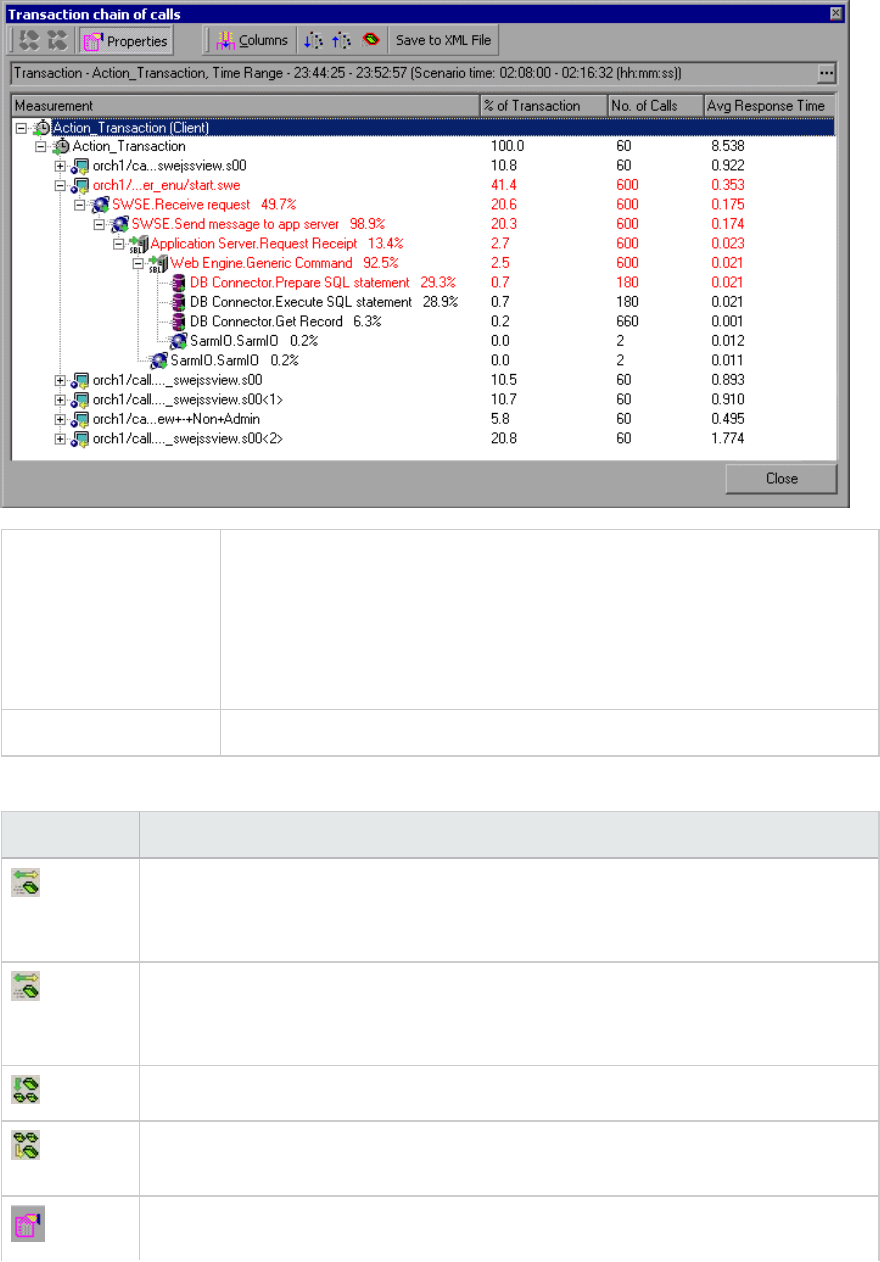
To access Use one of the following:
lTo view transaction call chains - right click a component and select
Siebel Diagnostics > Show Chain of Calls
lTo view sub-area statistics - right click sub-area and select Show Sub-
Area Chain of Calls
Note Each red node signifies the most time consuming child to its parent.
User interface elements are described below:
UI Element Description
Switch to Sub-Area Chain of Calls. When the sub-area call stack statistics data is
displayed, this displays the sub-area chain of calls data (only if the root is a sub-
area).
Switch to Sub-Area Call Stack Statistics. When the sub-area chain of calls data is
displayed, this displays the sub-area call stack statistics data (only if the root is a
sub-area).
Show Sub-Area Chain of Calls. Displays the Sub-Area Chain of Calls window.
Show Sub-Area Call Stack Statistics. Displays the Sub-Area Call Stack Statistics
window.
Properties. Hides or displays the properties area (lower pane).
User Guide
Analysis
HP LoadRunner (12.50) Page 1693

UI Element Description
Columns. Enables you to select the columns shown in the Calls window. To display
additional fields, drag them to the desired location in the Calls window. To remove
fields, drag them from the Calls window back to the Columns chooser.
Measurement Name of the sub-area, displayed as AreaName:SubAreaName. In the case of a
database call, query information is also displayed. The percent shown indicates the
percentage of calls to this component from its parent.
% of
Transaction/
Root Sub-
Area
Displays the percentage of sub-area time in relation the total transaction/root sub-
area time.
No of Calls Displays the amount of times this transaction or sub-area was executed.
Avg
Response
Time
Response time is the time from the beginning of execution until the end. Average
response time is the total response time divided by the number of instances of the
area/sub-area.
STD
Response
Time
The standard deviation response time.
Min
Response
Time
The minimum response time.
Max
Response
Time
The maximum response time.
% of Caller Displays the percentage of sub-area time in relation the parent sub-area time.
Total time Displays the total sub-area execution time, including the child execution time.
Siebel Area Average Response Time Graph
This graph displays the average response time for the server side areas, computed as the total area
response time divided by the number of area calls.
Purpose For example, if an area was executed twice by one instance of transaction A, and once
by another instance of the same transaction, and it took three seconds for each
execution, then the average response time is 9/3, or 3 seconds. The area time does not
include calls made from the area to other areas.
User Guide
Analysis
HP LoadRunner (12.50) Page 1694
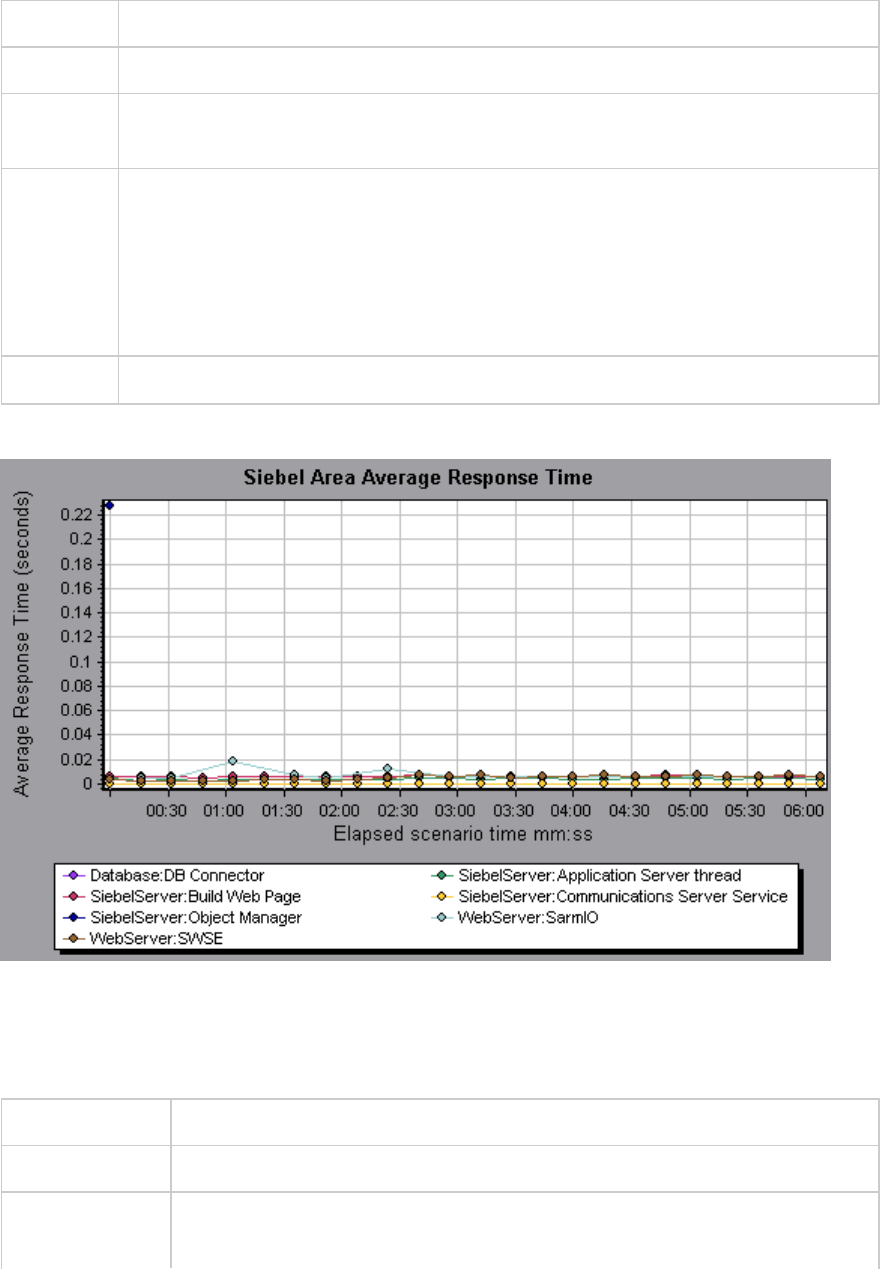
X-axis Elapsed time since the start of the run.
Y-axis Average response time (in seconds) per area.
Breakdown
options
For breakdown options, see "Siebel Breakdown Levels" on page1697.
Tips You can filter the Siebel graphs by the following fields:
lTransaction Name. Shows data for the specified transaction.
lScenario Elapsed Time. Shows data for transactions that ended during the specified
time.
For more information on filtering, see "Filtering and Sorting Graph Data" on page1480.
See also "Siebel Breakdown Levels" on page1697
Example
Siebel Area Call Count Graph
This graph displays the number of times that each Siebel area is called.
X-axis Elapsed time since the start of the run.
Y-axis The call count.
Breakdown
options
For breakdown options, see "Siebel Breakdown Levels" on page1697.
User Guide
Analysis
HP LoadRunner (12.50) Page 1695

Tips You can filter the Siebel graphs by the following fields:
lTransaction Name. Shows data for the specified transaction.
lScenario Elapsed Time. Shows data for transactions that ended during the
specified time.
For more information on filtering, see "Filtering and Sorting Graph Data" on
page1480.
See also "Siebel Diagnostics Graphs Overview" on page1690
Siebel Area Total Response Time Graph
This graph displays the total response time of each Siebel area.
X-axis Elapsed time since the start of the run.
Y-axis Average response time (in seconds) per area.
Breakdown
options
For breakdown options, see "Siebel Breakdown Levels" on the next page.
Tips You can filter the Siebel graphs by the following fields:
lTransaction Name. Shows data for the specified transaction.
lScenario Elapsed Time. Shows data for transactions that ended during the
specified time.
For more information on filtering, see "Filtering and Sorting Graph Data" on
page1480.
See also "Siebel Diagnostics Graphs Overview" on page1690
Example
User Guide
Analysis
HP LoadRunner (12.50) Page 1696
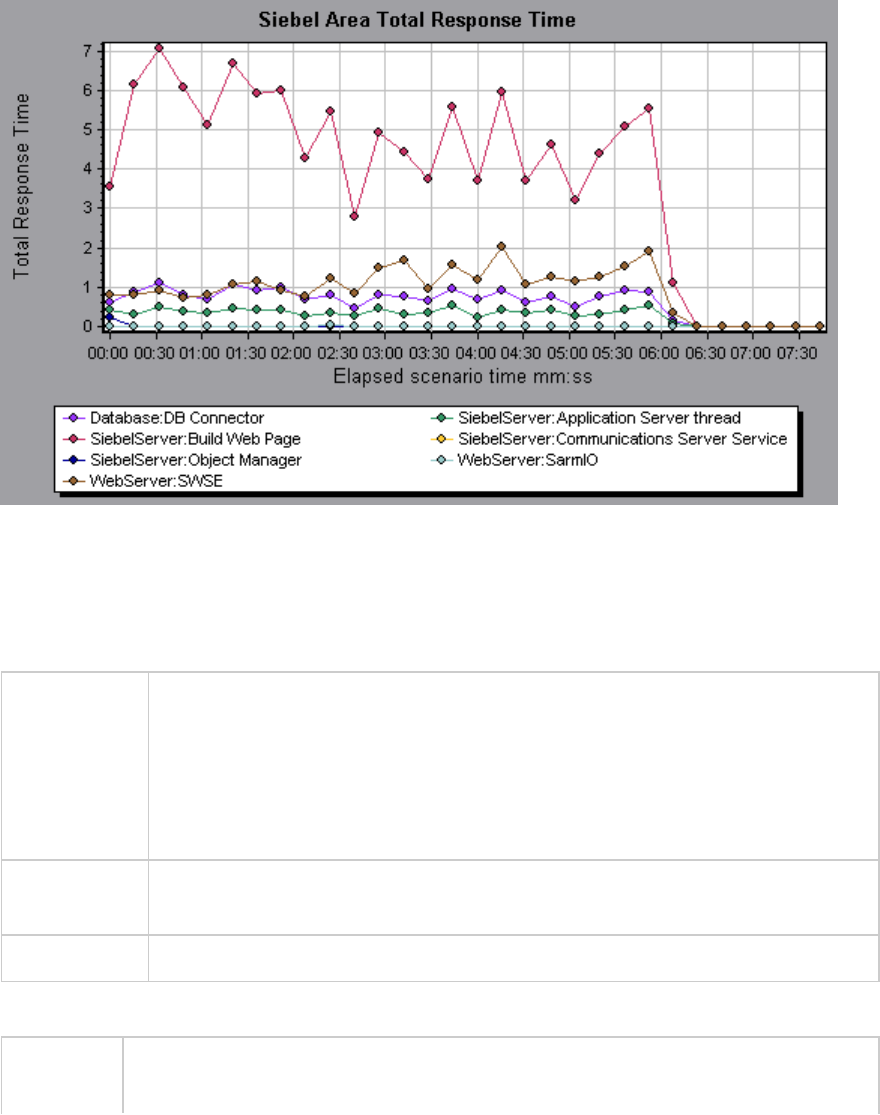
Siebel Breakdown Levels
You can break down Siebel layers into areas, sub-areas, servers, and scripts to enable you to pinpoint
the exact location where time is consumed.
To access Use one of the following to access breakdown options:
l<Siebel Diagnostics Graphs> > View > Siebel Diagnostics
l<Siebel Diagnostics Graphs> > select transaction >short-cut menu > Siebel
Diagnostics
See toolbar options for each breakdown level.
Important
Information
The breakdown menu options and buttons are not displayed until an element
(transaction, layer, area, sub-area) is selected.
See also "Siebel Diagnostics Graphs Overview" on page1690
Siebel Breakdown Levels are described below:
Transaction
Level
The following figure displays the top level Average Transaction Response Time graph.
The graph displays several transactions.
User Guide
Analysis
HP LoadRunner (12.50) Page 1697
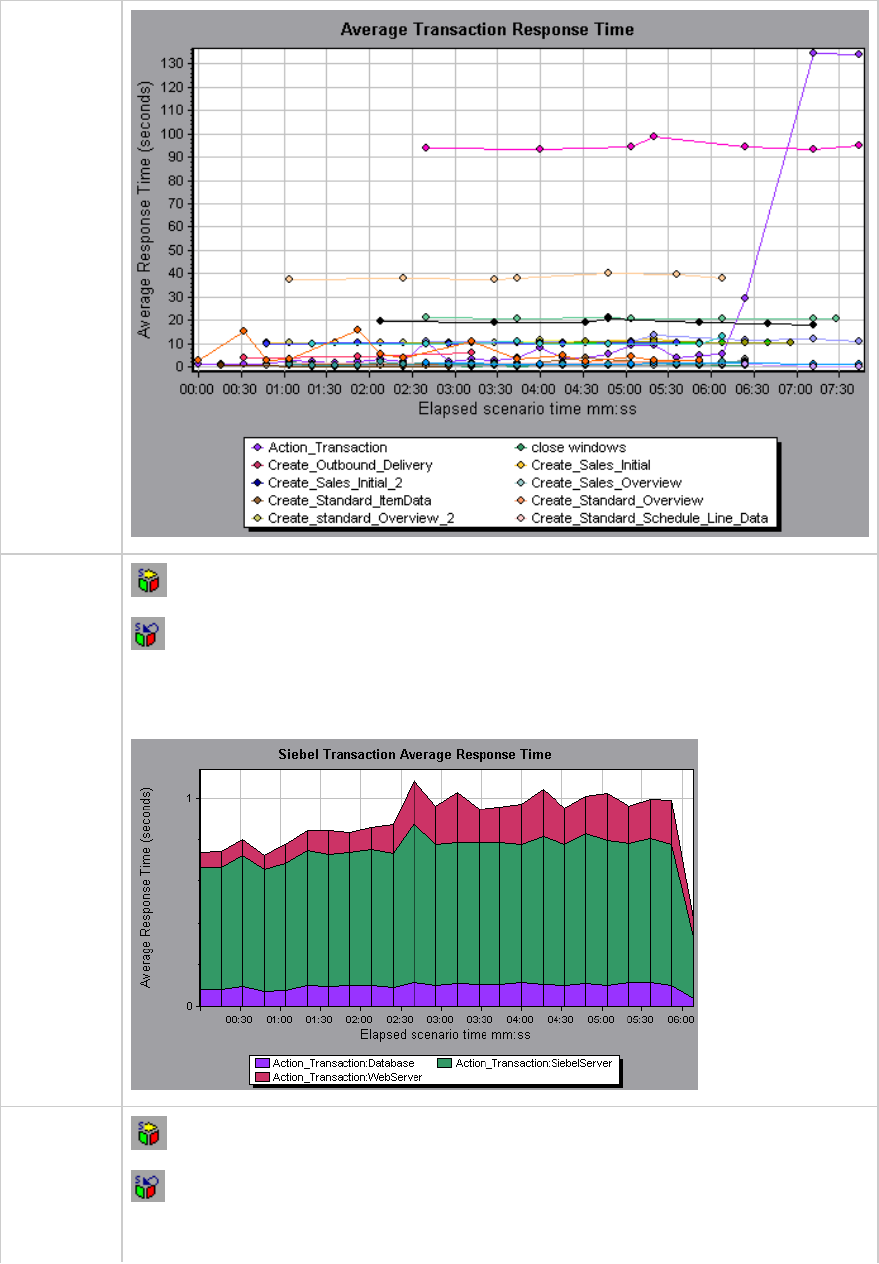
Layer Level Siebel Layer Breakdown button shows the breakdown of the selected transaction.
Undo Siebel Layer Breakdown returns the graph to the transaction level.
In the following figure, the Action_Transaction transaction has been broken down to its
layers (Siebel Database, Application, and Web).
Area Level Siebel Area Breakdown button breaks the data down to its Siebel areas.
Undo Siebel Area Breakdown button returns the graph to the layer level.
In the following figure, the Web layer of the Action_Transaction transaction has been
User Guide
Analysis
HP LoadRunner (12.50) Page 1698
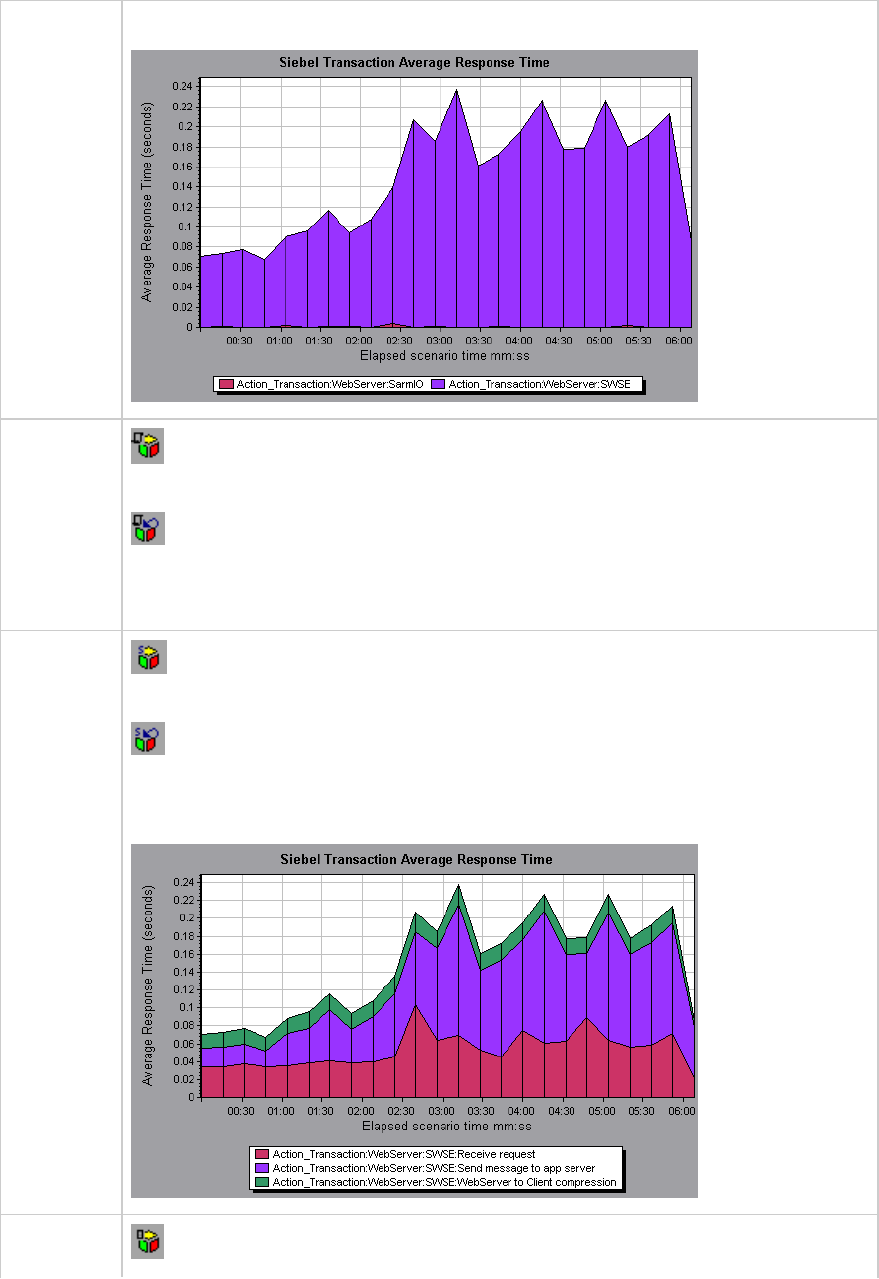
broken down to its Siebel areas.
Script
Level Siebel Script Breakdown button breaks the data down to its Siebel scripts. You can
only break down to the script level from the scripting engine area.
Undo Siebel Script Breakdown button returns the graph to the sub-area level.
You can break a transaction down further to its Siebel script level. You can only break
down to the script level from the scripting engine area.
Sub-Area
Level Siebel Sub-Area Breakdown button breaks the data down to its Siebel sub-areas.
You can only break down to the sub-area level from the area level.
Undo Siebel Sub-Area Breakdown button returns the graph to the area level.
In the following figure, the area level of the Action_Transaction transaction has been
broken down to its Siebel sub-area.
Server Siebel Server Breakdown button to group the data by Siebel server.
User Guide
Analysis
HP LoadRunner (12.50) Page 1699
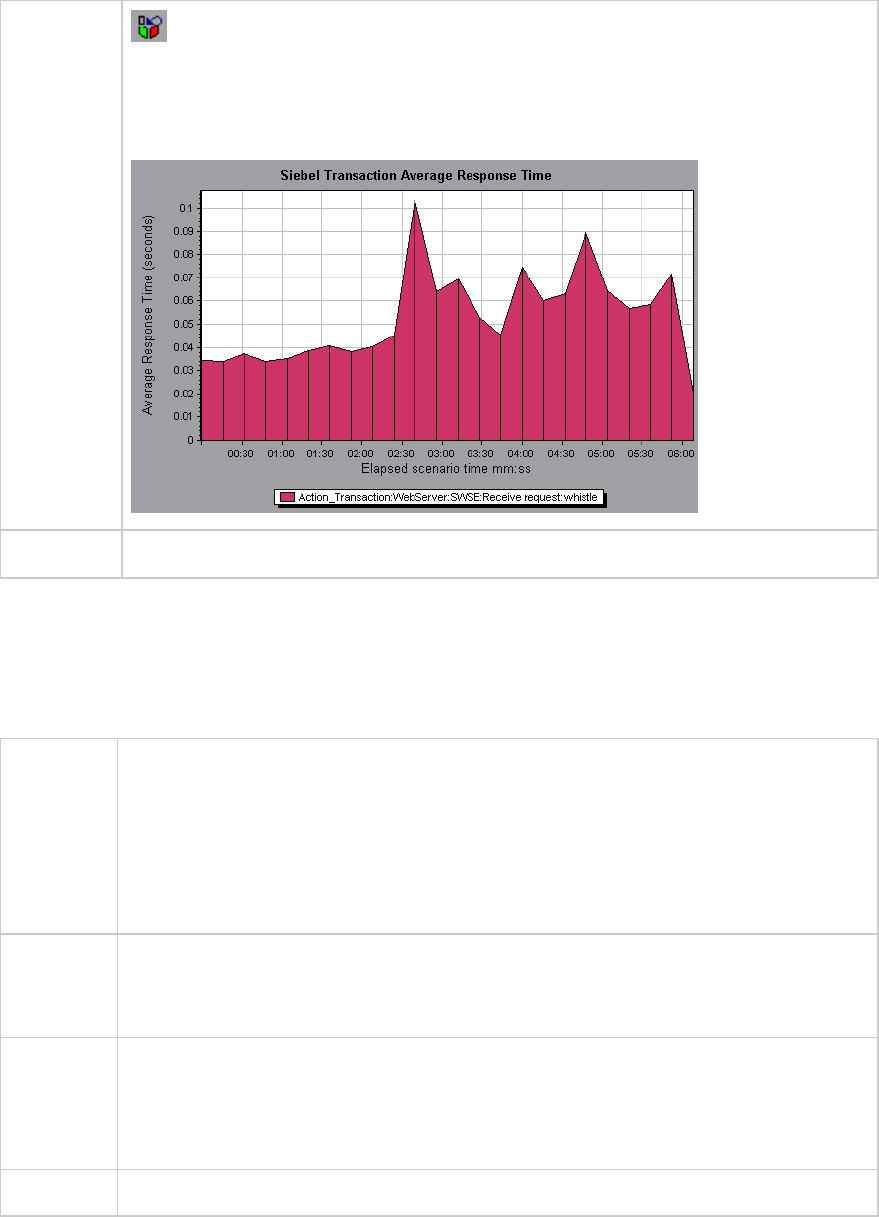
Level Undo Siebel Server Breakdown button ungroups data in the graph.
In the following figure, the Action_Transaction;WebServer:SWSE:Receive Request
transaction has been broken down to its Siebel servers. Server level breakdown is
usual for pin pointing overloaded servers and for load balancing.
See also "Siebel Diagnostics Graphs Overview" on page1690
Siebel Diagnostics Graphs Summary Report
The Siebel Usage section of the Summary Report provides a usage chart for the Siebel layer breakdown.
This report is available from the Session Explorer or as a tab in the Analysis window.
Breakdown
options
The Siebel Layer Usage section breaks the individual transactions into:
lWeb Server
lSiebel Server
lDatabase Layers
lTotal usage time for each transaction
Tips To view server side diagnostics data from the Summary Report, click the Siebel layer on
which you want to perform transaction breakdown. The Siebel Transaction Response
Time graph opens displaying the breakdown of the selected transaction.
Note If you do not see diagnostics data on the Summary Report, check if you are using a
user-defined template. To view relevant data, choose a different template from the list
of templates, or create and apply a new template. For more information about using
templates, see "Apply/Edit Template Dialog Box" on page1461.
See also "Siebel Diagnostics Graphs Overview" on page1690
User Guide
Analysis
HP LoadRunner (12.50) Page 1700

Siebel Request Average Response Time Graph
This graph displays the response time per HTTP request.
Purpose The time is computed as the total request response time divided by the total number of
instances of the specific request. For example, if a request was executed twice by one
instance of transaction A, and once by a second instance of transaction A, and it took
three seconds to execute each request, then the average response time is 9/3, or 3
seconds. The request time does not include the nested calls from within each request.
X-axis Elapsed time since the start of the run.
Y-axis Average response time (in seconds) per area.
Breakdown
options
For breakdown options, see "Siebel Breakdown Levels" on page1697.
Tips You can filter the Siebel graphs by the following fields:
lTransaction Name. Shows data for the specified transaction.
lScenario Elapsed Time. Shows data for transactions that ended during the specified
time.
For more information on filtering, see "Filtering and Sorting Graph Data" on page1480.
See also "Siebel Diagnostics Graphs Overview" on page1690
Example
User Guide
Analysis
HP LoadRunner (12.50) Page 1701
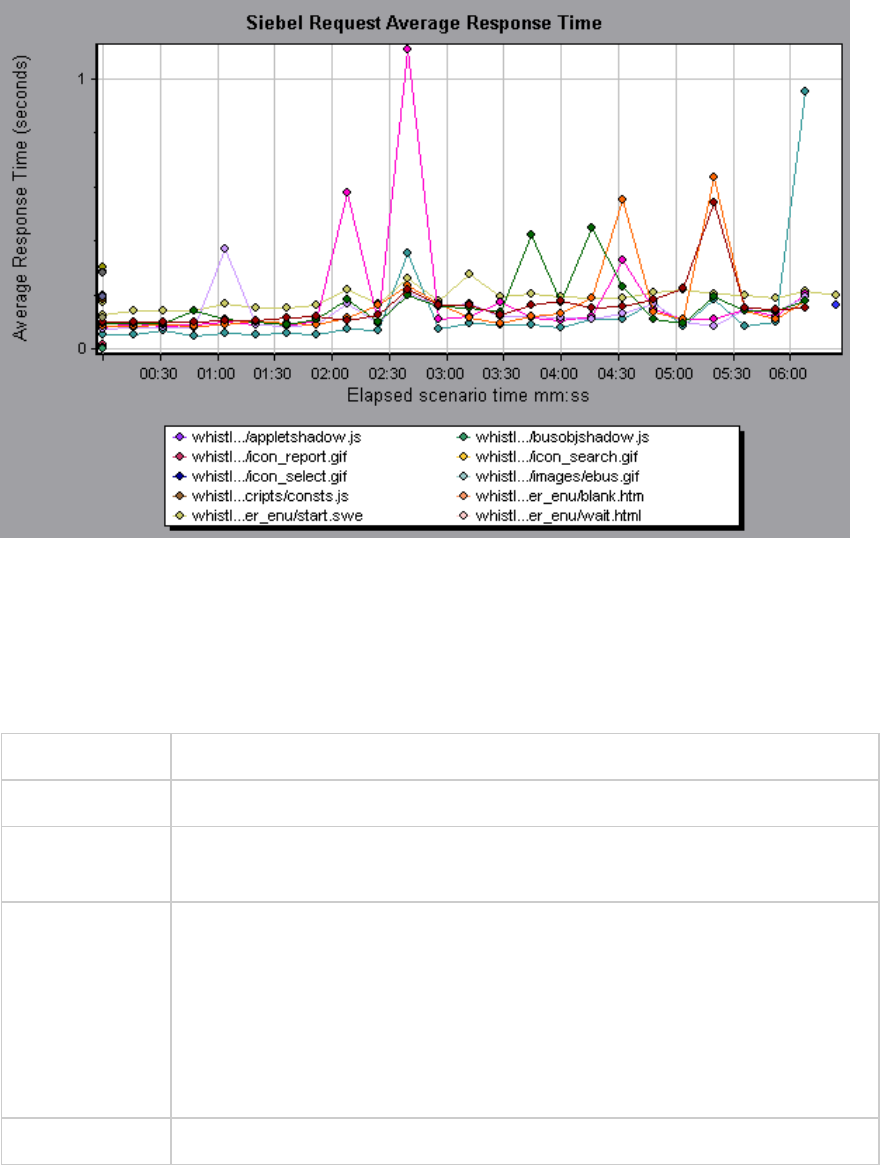
Siebel Transaction Average Response Time Graph
This graph displays the server response time for the selected area (layer, area, or sub-area) within each
transaction, computed as the total response time for that layer or area divided by the total number of
relevant transactions.
X-axis Elapsed time since the start of the run.
Y-axis Average response time (in seconds) per area.
Breakdown
options
For breakdown options, see "Siebel Breakdown Levels" on page1697.
Tips You can filter the Siebel graphs by the following fields:
lTransaction Name. Shows data for the specified transaction.
lScenario Elapsed Time. Shows data for transactions that ended during the
specified time.
For more information on filtering, see "Filtering and Sorting Graph Data" on
page1480.
See also "Siebel Breakdown Levels" on page1697
Example
User Guide
Analysis
HP LoadRunner (12.50) Page 1702
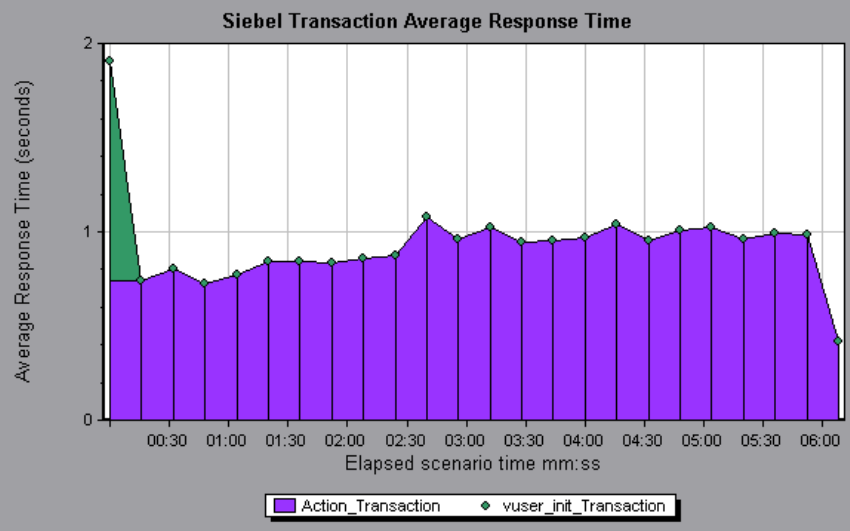
Siebel DB Diagnostics Graphs
Siebel DB Diagnostics Graphs Overview
Siebel DB Diagnostics graphs provide you with performance information for SQLs generated by
transactions on the Siebel system. You can view the SQLs for each transaction, identify the problematic
SQL queries of each script, and identify at what point problems occurred.
To analyze where problems are occurring, you correlate the data in the Siebel DB Diagnostics graphs
with data in the Transaction Response Time graphs.
You begin analyzing these graphs with the transaction graphs that display the average transaction
response time during each second of the load test scenario run. For example, the following Average
Transaction Response Time graph demonstrates that the average transaction response time for the
query_for_contact transaction was high.
User Guide
Analysis
HP LoadRunner (12.50) Page 1703
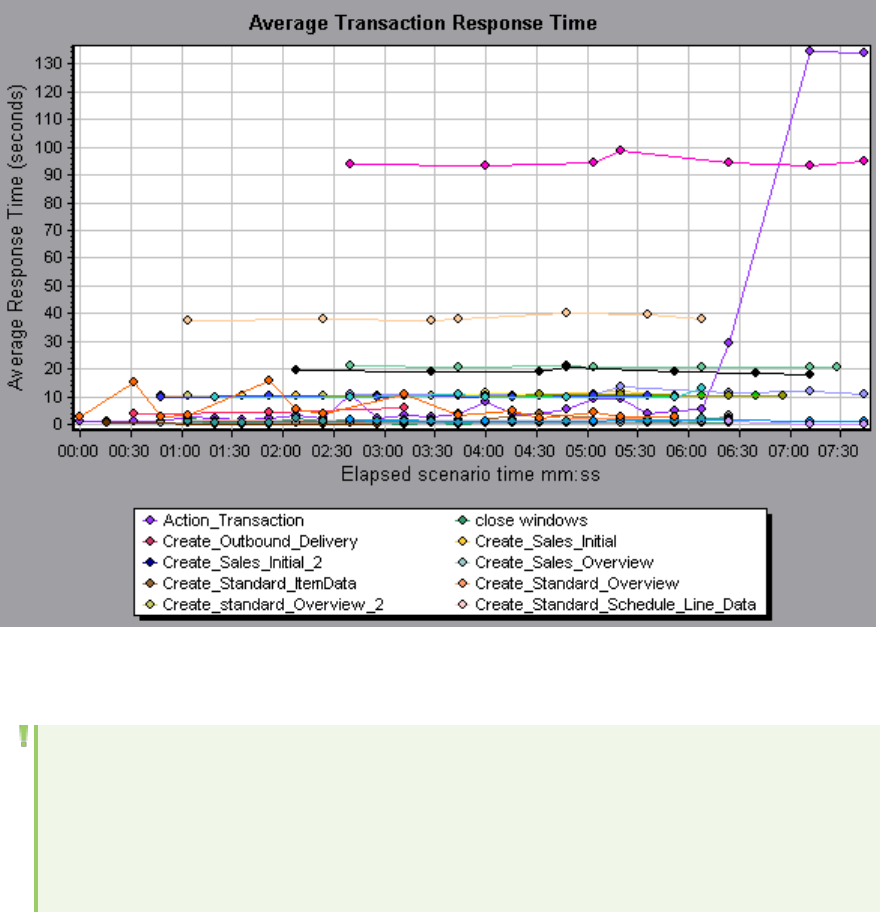
Using the Siebel DB Diagnostics graphs, you can pinpoint the cause of the delay in response time for this
transaction.
Note: A measurement that is broken down in the Average Transaction Response Time graph will
be different from the same measurement broken down in the Siebel DB Side Transactions
graph. This is because the Average Transaction Response Time graph displays the average
transaction time, whereas the Siebel DB Side Transactions graph displays the average time per
transaction event (sum of SQL component response times).
How to Synchronize Siebel Clock Settings
This task describes how to synchronize the Load Generator and Siebel application server clocks to
ensure that the correlation of SQLs to transactions is correct.
1. Choose Tools>Siebel Database Diagnostics Options.
2. Select Apply Application Server time settings.
3. Click Add and enter the information as described in "Siebel Database Diagnostics Options Dialog
Box" on page1708.
4. Click OK to save the data and close the dialog box.
User Guide
Analysis
HP LoadRunner (12.50) Page 1704
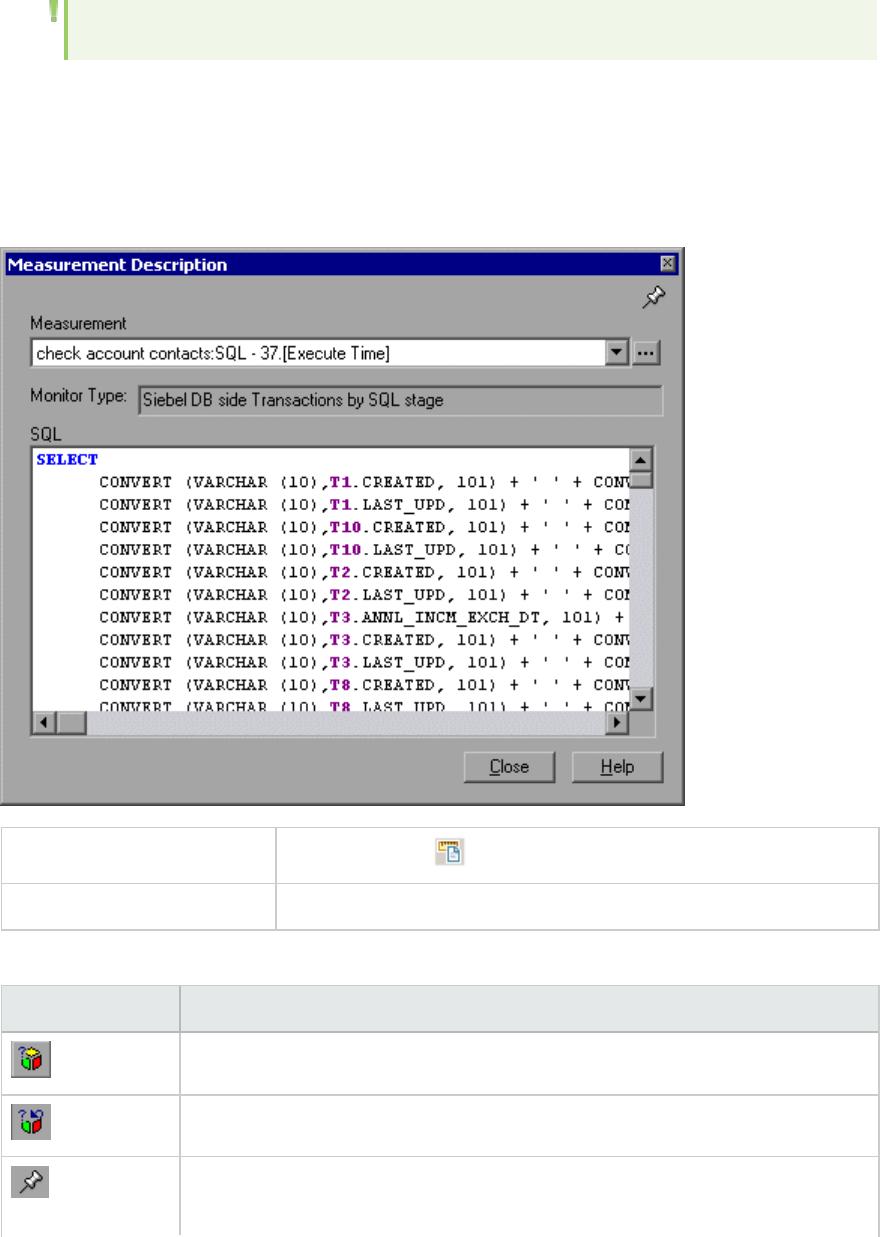
Note: You must reopen the results file for time synchronization to take effect.
Measurement Description Dialog Box
You can view the full SQL statement for a selected SQL element by choosing Show measurement
description from the Legend window. The Measurement Description dialog box opens displaying the
name of the selected measurement and the full SQL statement.
To access Legend window >
See also "Siebel Database Breakdown Levels" on the next page
User interface elements are described below:
UI Element Description
Break the data down to a lower level.
Return to the previous level.
To keep the focus on the Measurement Description dialog box, click the Stay on
Top button. This enables you to view the full SQL statement of any
User Guide
Analysis
HP LoadRunner (12.50) Page 1705
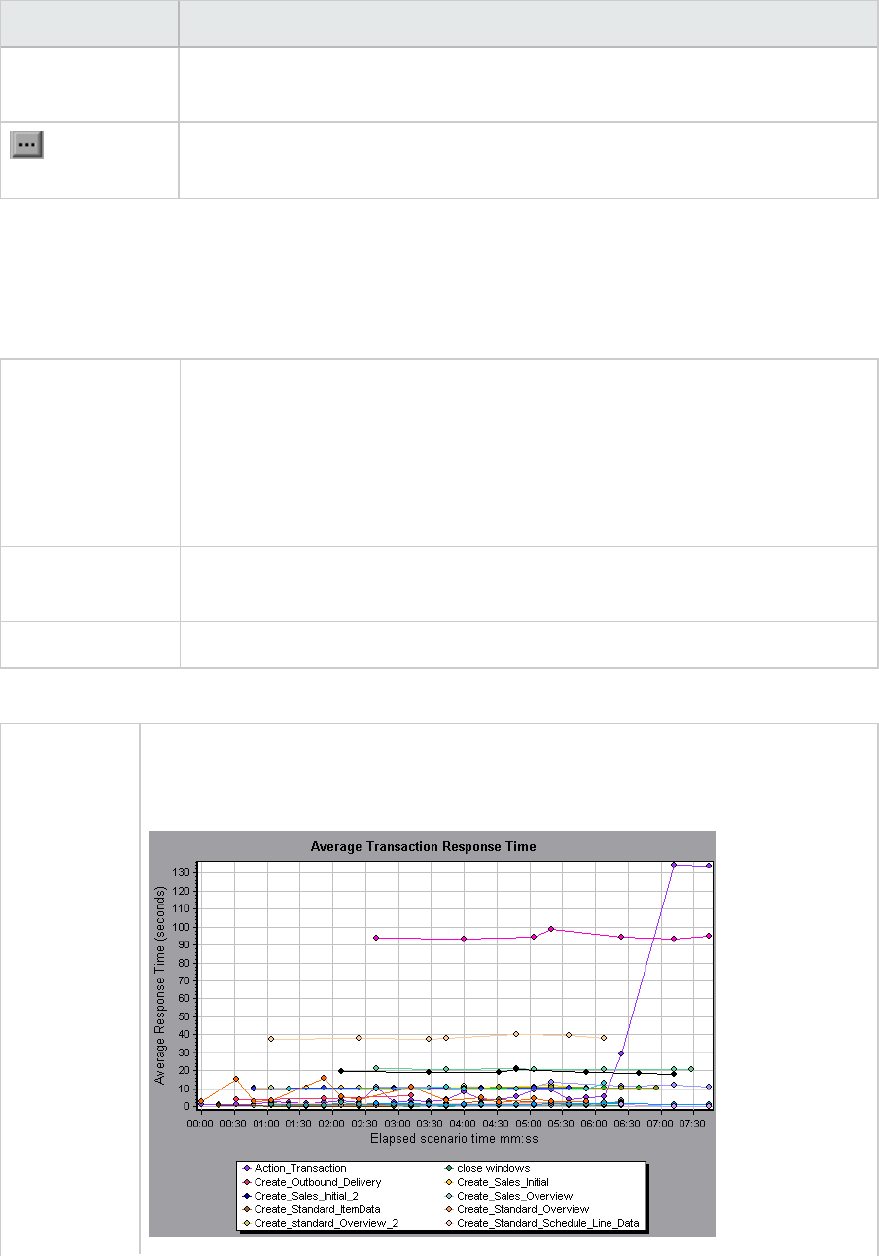
UI Element Description
measurement by selecting it in the Legend window. Click the button again to
remove the focus.
Click the Breaking Measurement button to display the Transaction Name and
SQL Alias Name of the selected measurement.
Siebel Database Breakdown Levels
You can break down Siebel layers into areas, sub-areas, servers, and scripts to enable you to pinpoint
the exact location where time is consumed.
To access Use one of the following to access breakdown options:
l<Siebel DB Diagnostics Graphs> > View > Siebel DB Diagnostics
l<Siebel DB Diagnostics Graphs> > select transaction >short-cut menu >
Siebel DB Diagnostics
lSee toolbar options for each breakdown level
Important
information
The breakdown menu options and buttons are not displayed until a transaction
is selected.
See also "Siebel DB Diagnostics Graphs Overview" on page1703
Siebel Breakdown Levels are described below:
Transaction
Level
The following figure displays the top level Average Transaction Response Time
graph. The graph displays several transactions. You can break this graph down to
show the SQL statements and the SQL stages level.
User Guide
Analysis
HP LoadRunner (12.50) Page 1706
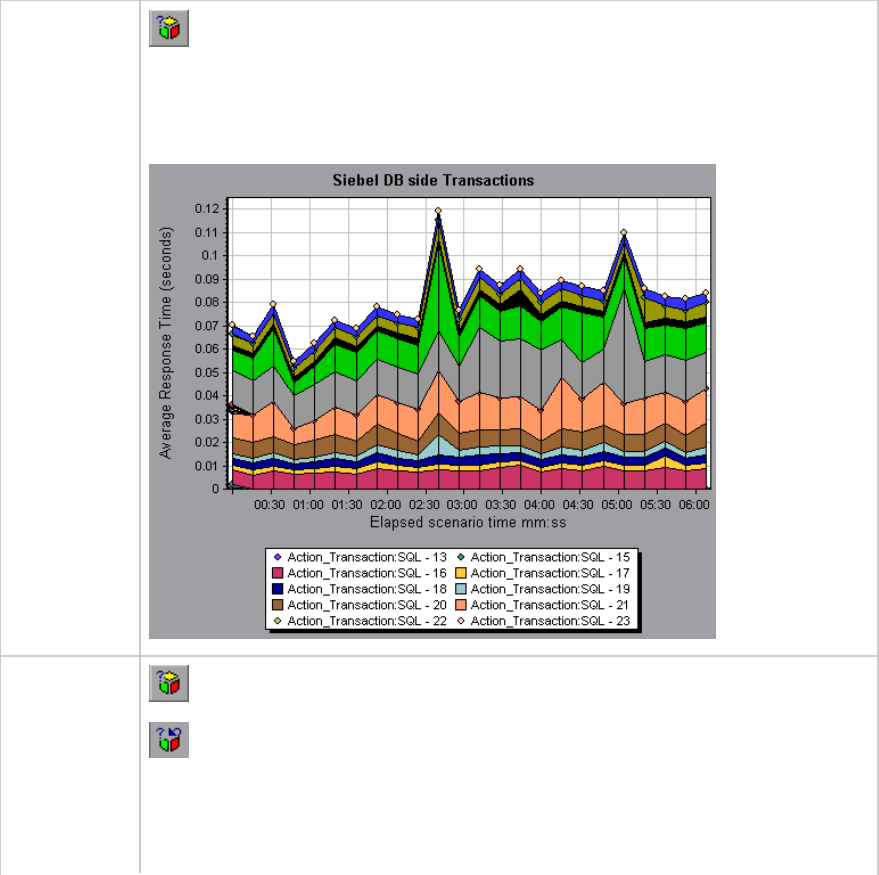
SQL
Statements
Level
Siebel SQL Statements Breakdown button shows the breakdown of the
selected transaction.
In the following figure, the Siebel DB Side Transactions graph displays the Action_
Transaction broken down to its SQL statements.
SQL Stages
Level Measurement Breakdown button breaks the data down to a lower level.
Undo Breakdown Measurement button returns to the previous level.
In the following figure, the Siebel DB Side Transactions by SQL Stage graph displays
Action_Transaction:SQL-33 broken down to its SQL stage: Prepare, Execute, and
Initial Fetch.
User Guide
Analysis
HP LoadRunner (12.50) Page 1707
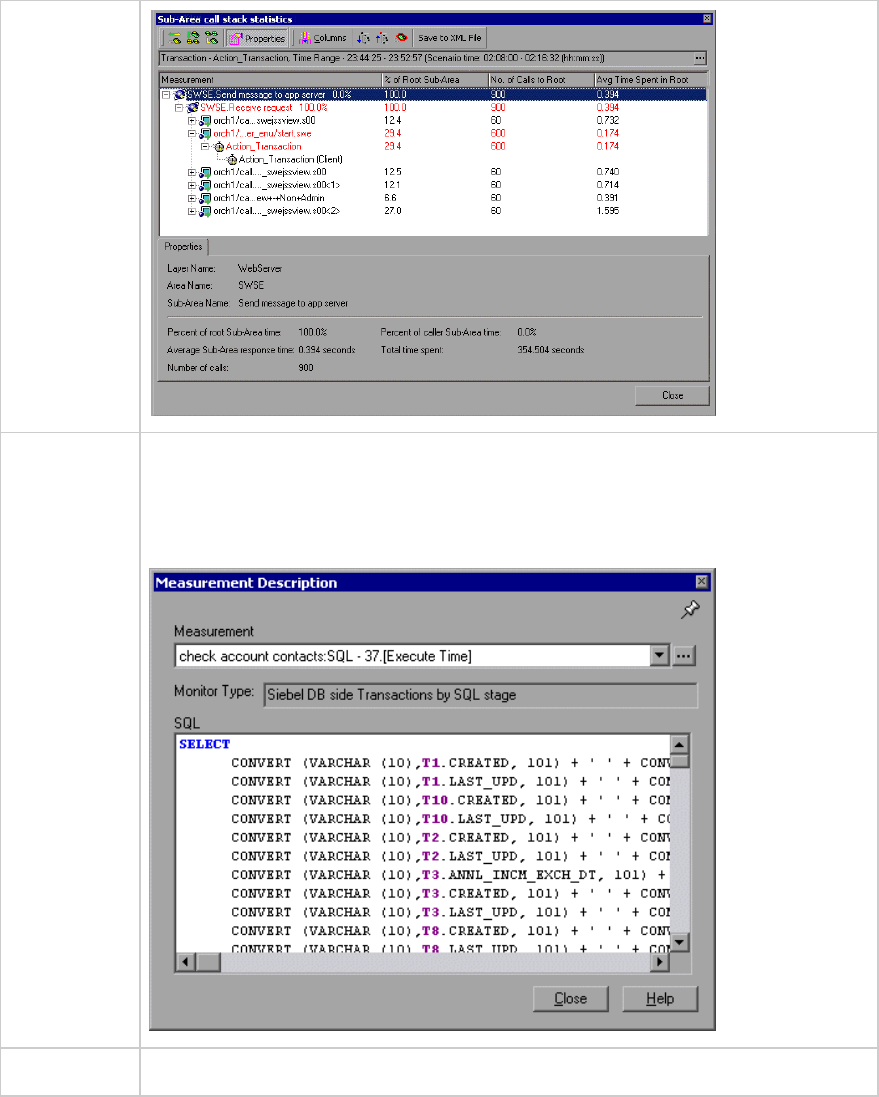
Show
measurement
description
You can view the full SQL statement for a selected SQL element by choosing Show
measurement description from the Legend window. The Measurement Description
dialog box opens displaying the name of the selected measurement and the full SQL
statement.
See also "Siebel DB Diagnostics Graphs Overview" on page1703
Siebel Database Diagnostics Options Dialog Box
This dialog box enables you to synchronize the Load Generator and Siebel application server clocks.
User Guide
Analysis
HP LoadRunner (12.50) Page 1708
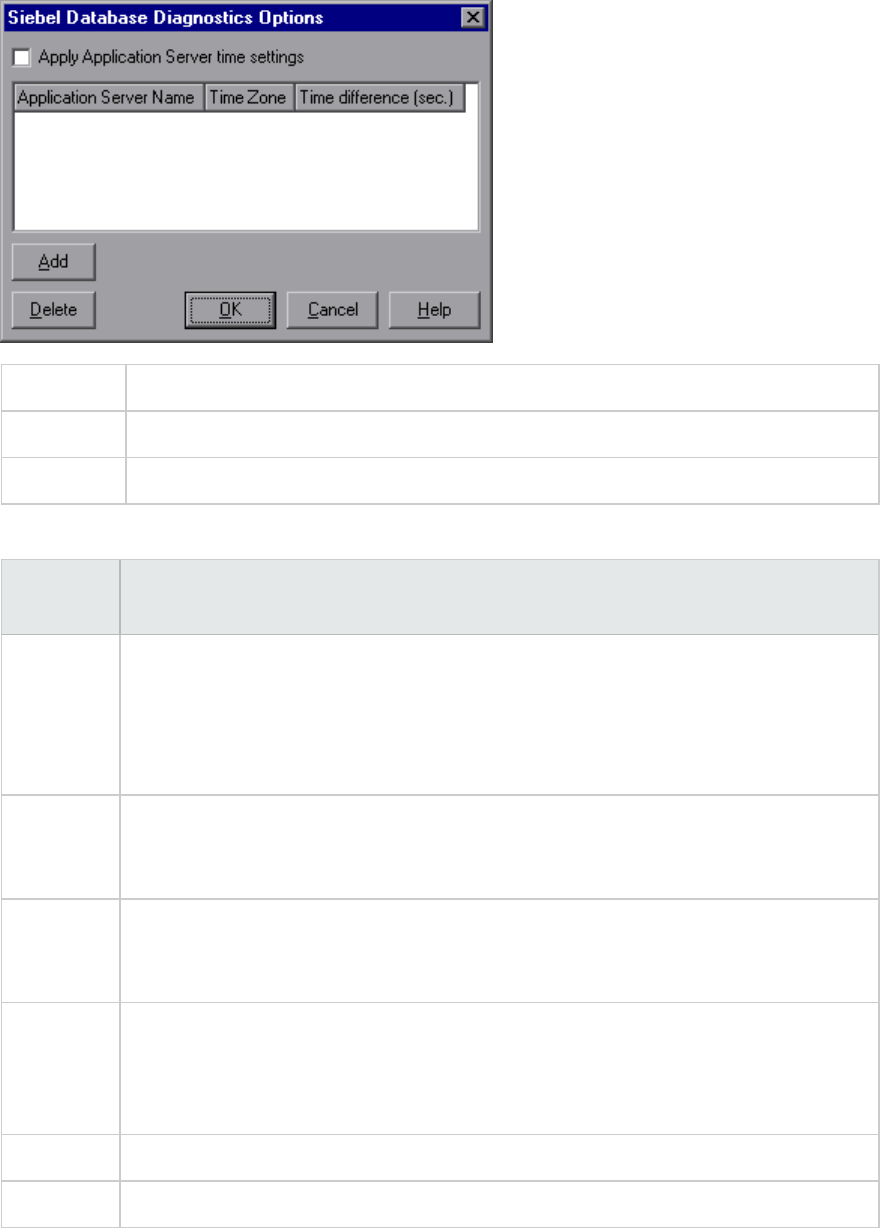
To access Tools > Siebel Database Diagnostics Options
Note You must reopen the results file for time synchronization to take effect.
See also "How to Synchronize Siebel Clock Settings" on page1704
User interface elements are described below:
UI Element Description
Apply
Application
Server
time
settings
Enables the synchronized time settings option.
Application
Server
Name
Enter the name of the Siebel application server.
Time Zone Enter the time zone of the Siebel application server (GMT or Local). GMT means the
application server time is reported in GMT time, and local means the application server
time is reported in local time.
Time
Difference
(sec.)
Enter the time difference (in seconds) between the load generator and the Siebel
application server. Use the minus sign ("-") if the time on Siebel application server is
ahead of the load generator. For example, if the application server time is two minutes
ahead of the load generator time, enter -120 in the time difference field.
Add Enables you to add an application server's time settings to the list.
Delete Deletes the server breakdown time settings from the list.
User Guide
Analysis
HP LoadRunner (12.50) Page 1709
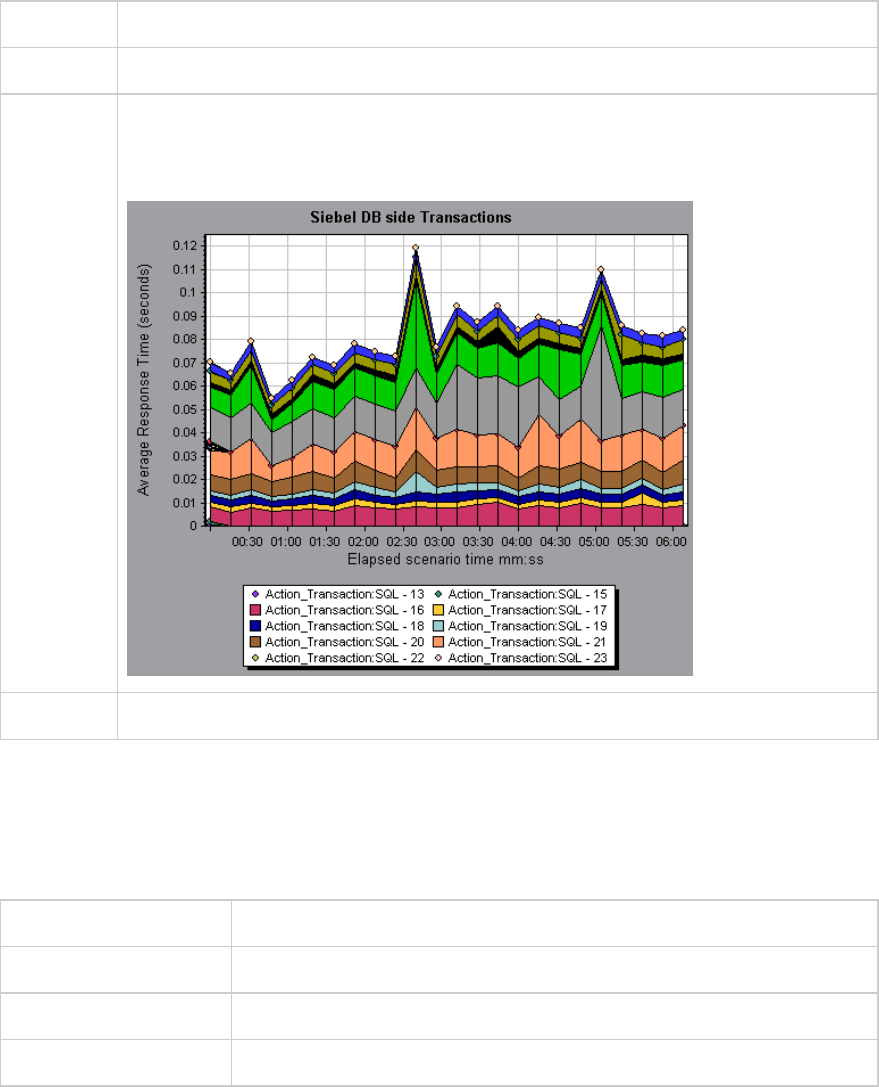
Siebel DB Side Transactions Graph
This graph displays the average transaction execution time in the Siebel database.
X-axis Elapsed time since the start of the run.
Y-axis Average response time (in seconds) of each transaction.
Breakdown
options
You can break down a transaction in the Siebel DB Side Transactions graph to view its
SQL statements. In the following figure, the Action_Transaction transaction is broken
down to its SQL statements.
See also "Siebel DB Diagnostics Graphs Overview" on page1703
Siebel DB Side Transactions by SQL Stage Graph
This graph displays the time taken by each SQL, grouped by SQL stage: Prepare, Execute, and Initial
Fetch.
X-axis Elapsed time since the start of the run.
Y-axis Average time (in seconds) taken to perform each SQL stage.
Breakdown options "Siebel Database Breakdown Levels" on page1706
See also "Siebel DB Diagnostics Graphs Overview" on page1703
User Guide
Analysis
HP LoadRunner (12.50) Page 1710

Siebel SQL Average Execution Time Graph
This graph displays the average execution time of each SQL performed in the Siebel database.
Purpose This enables you to identify problematic SQLs regardless of the transaction that
produced them. You can then choose Show measurement description from the Legend
window to view the full SQL statement. The SQL statements are listed by a numeric ID.
X-axis Elapsed time since the start of the run.
Y-axis Average response time (in seconds) of each SQL.
Breakdown
options
"Siebel Database Breakdown Levels" on page1706
See also "Siebel DB Diagnostics Graphs Overview" on page1703
Oracle - Web Diagnostics Graphs
Oracle - Web Diagnostics Graphs Overview
Oracle - Web Diagnostics graphs provide you with performance information for SQLs generated by
transactions on the Oracle NCA system. You can view the SQLs for each transaction, identify the
problematic SQL queries of each script, and identify at what point problems occurred.
To analyze where problems are occurring, you correlate the data in the Oracle - Web Diagnostics graphs
with data in the Transaction Response Time graphs.
You begin analyzing these graphs with the transaction graphs that display the average transaction
response time during each second of the load test scenario run. For example, the following Average
Transaction Response Time graph demonstrates that the average transaction response time for the
enter transaction was high.
User Guide
Analysis
HP LoadRunner (12.50) Page 1711
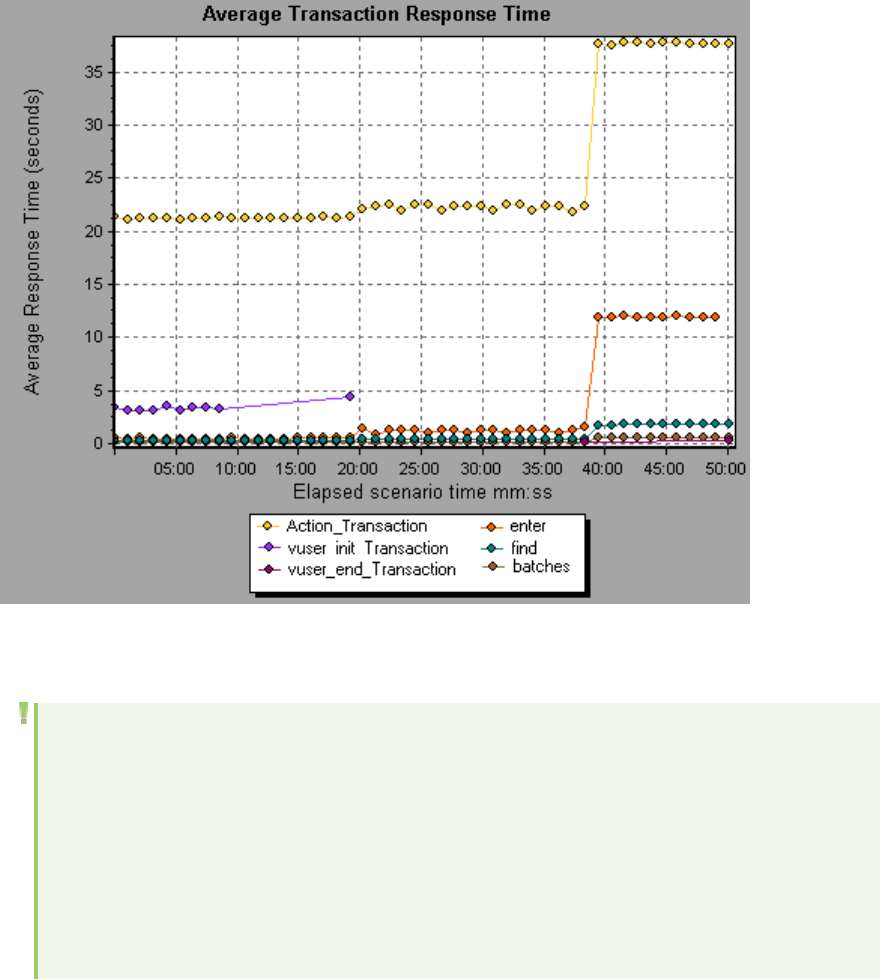
Using the Oracle - Web Diagnostics graphs, you can pinpoint the cause of the delay in response time for
this transaction.
Note:
lA measurement that is broken down in the Average Transaction Response Time graph will be
different from the same measurement broken down in the Oracle - Web(DB) Side
Transactions graph. This is because the Average Transaction Response Time graph displays
the average transaction time, whereas the Oracle - WebDB Side Transactions graph displays
the average time per transaction event (sum of SQL component response times).
lvuser_init and vuser_end actions in Oracle cannot be broken down.
Measurement Description Dialog Box
This dialog box enables you to view the full SQL statement for a selected SQL element.
User Guide
Analysis
HP LoadRunner (12.50) Page 1712
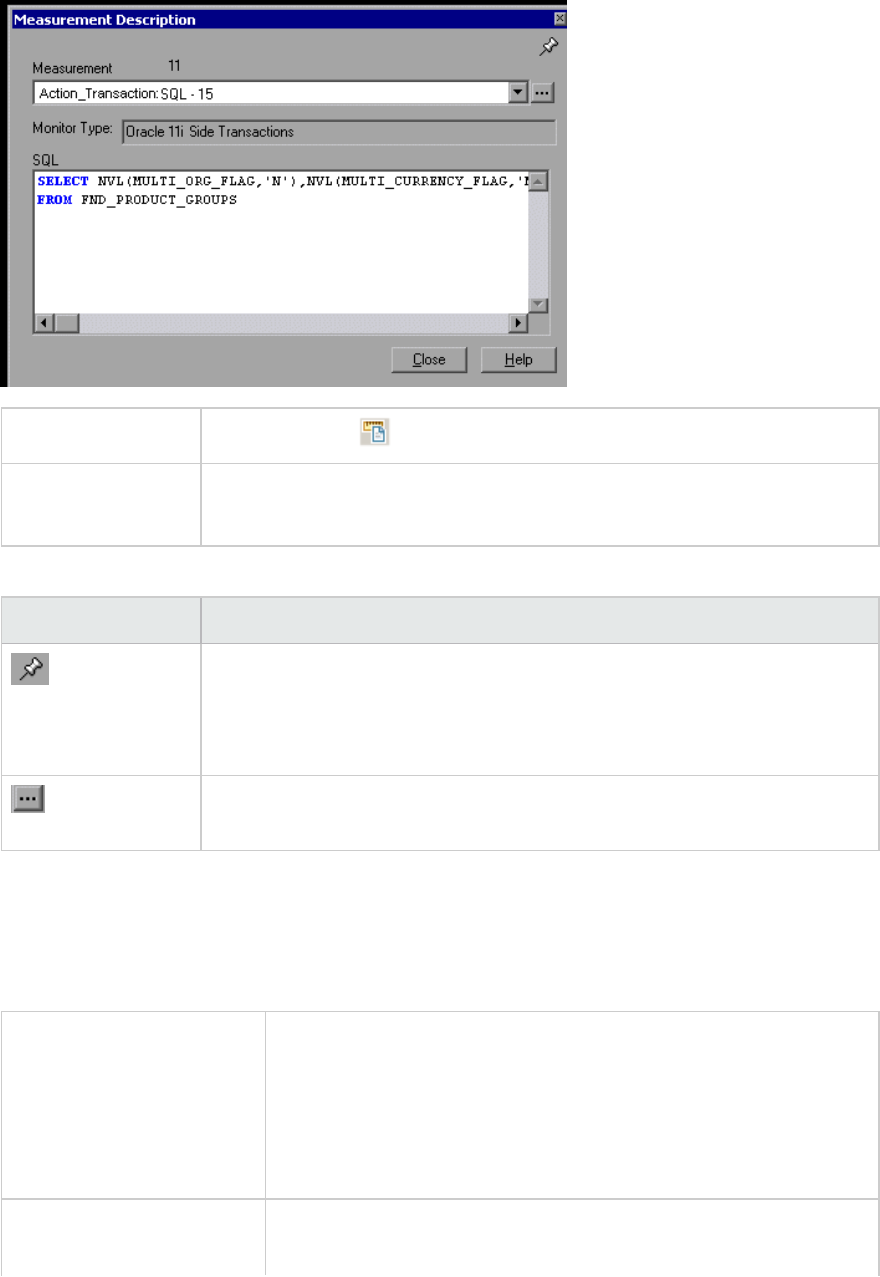
To access Legend window >
See also l"Oracle - Web Diagnostics Graphs Overview" on page1711
l"Oracle Breakdown Levels" below
User interface elements are described below:
UI Element Description
To keep the focus on the Measurement Description dialog box, click the Stay
on Top button. This enables you to view the full SQL statement of any
measurement by selecting it in the Legend window. Click the button again to
remove the focus.
Click the Breaking Measurement button to display the Transaction Name and
SQL Alias Name of the selected measurement.
Oracle Breakdown Levels
After you have enabled Oracle - Web Diagnostics on the Controller machine and run the load test
scenario, you can view the diagnostics data.
To access Use one of the following to access breakdown options:
l<Oracle Diagnostics Graphs> > View > Oracle Diagnostics
l<Oracle Diagnostics Graphs> > select transaction >shortcut
menu > Oracle Diagnostics
lSee toolbar options for each breakdown level
Important Information The breakdown menu options and buttons are not displayed until a
transaction is selected.
User Guide
Analysis
HP LoadRunner (12.50) Page 1713
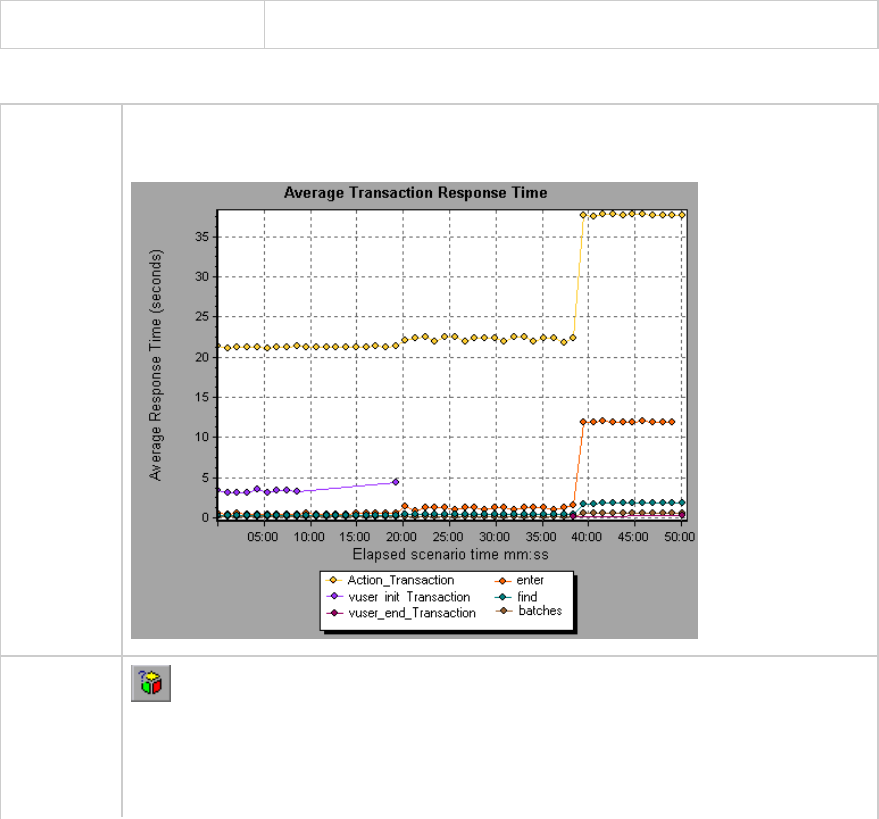
See also "Oracle - Web Diagnostics Graphs Overview" on page1711
Oracle Breakdown Levels are described below:
Transaction
Level
The following figure illustrates the top level Average Transaction Response Time
graph. The graph displays several transactions.
SQL
Statements
Level
Oracle SQL Statement Breakdown button shows the breakdown of the selected
transaction.
In the following figure, the Oracle - WebDB Side Transactions graph displays the
Action_Transaction transaction broken down to its SQL statements.
User Guide
Analysis
HP LoadRunner (12.50) Page 1714
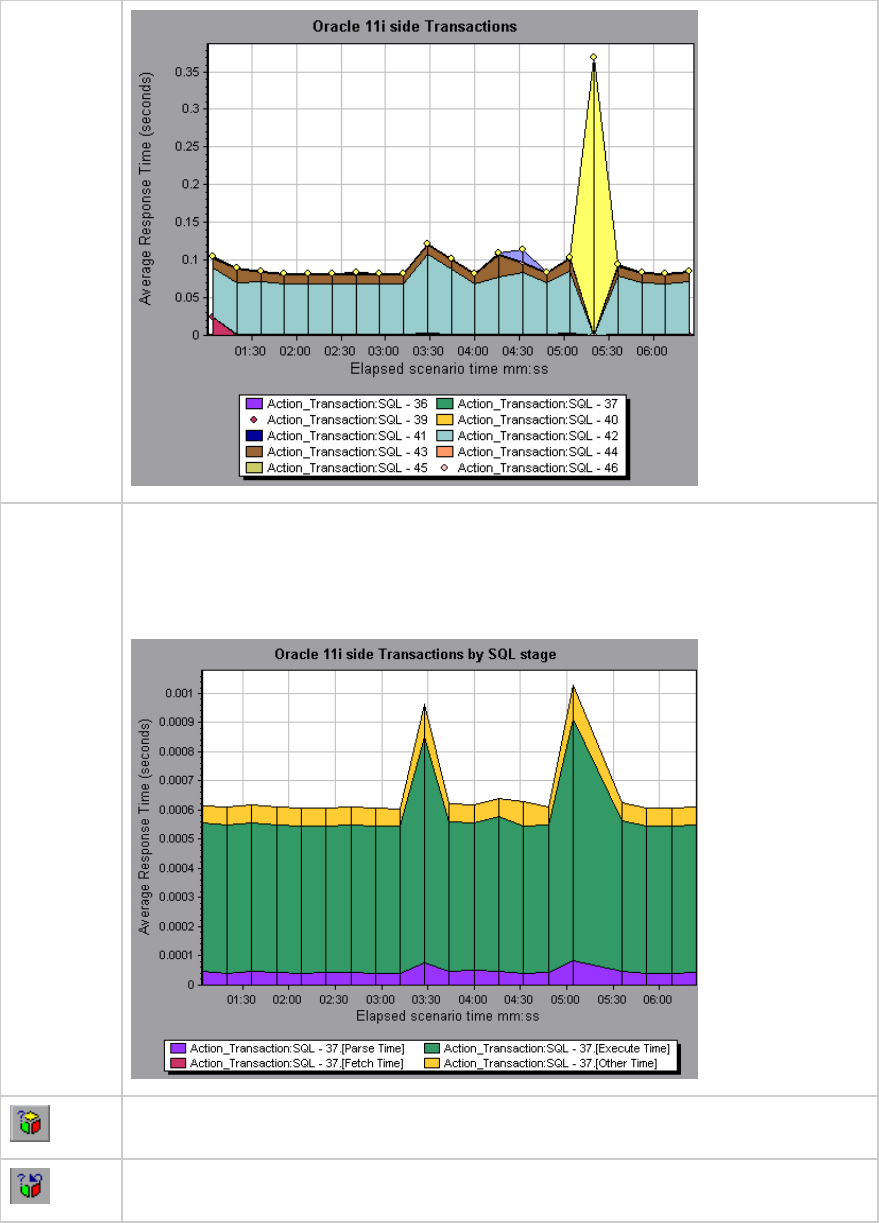
SQL Stages
Level
In the following figure, the Oracle - WebDB Side Transactions by SQL Stage graph
displays Action_Transaction:SQL-37 broken down to its SQL stages: Parse Time,
Execute Time, Fetch Time, and Other Time. Other Time includes other database time
such as bind time.
You can break the data down to a lower level.
Enables you to return to a previous level.
User Guide
Analysis
HP LoadRunner (12.50) Page 1715
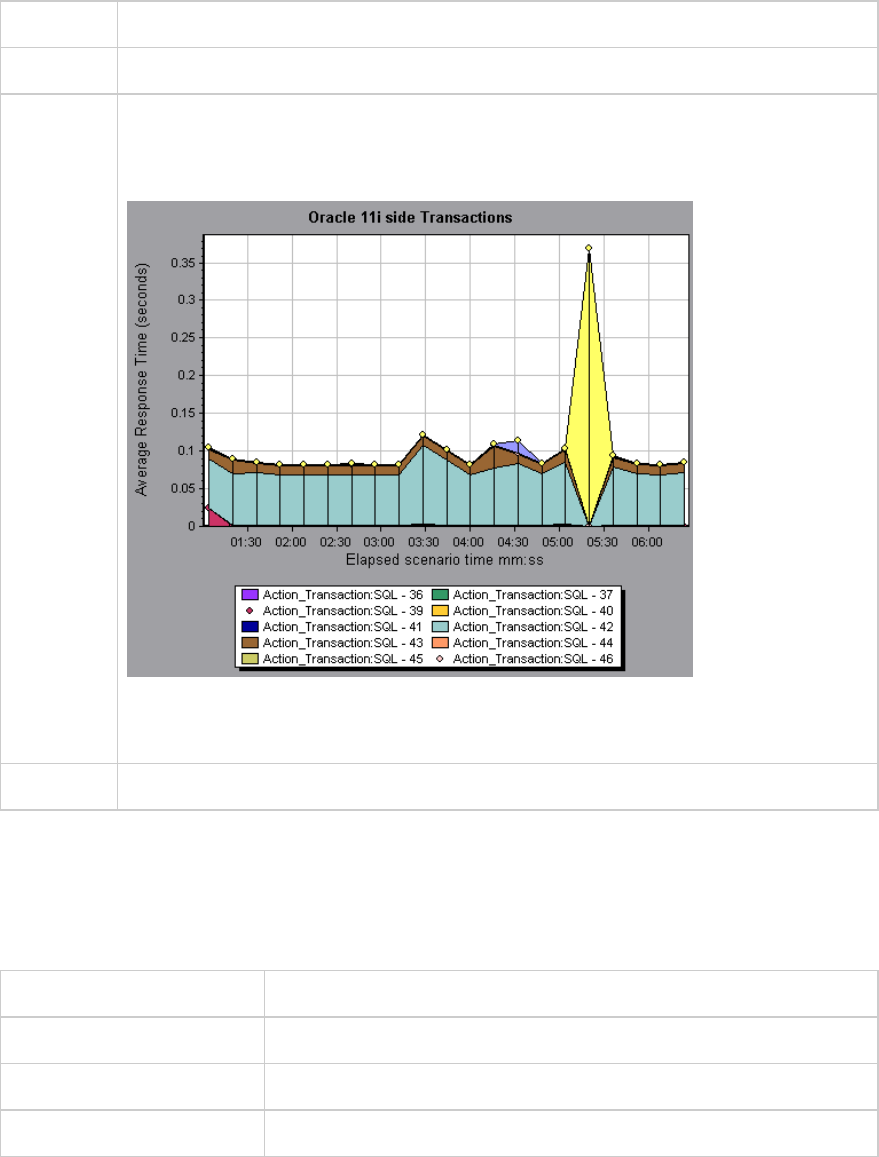
Oracle - WebDB Side Transactions Graph
This graph displays the average transaction execution time in the Oracle database.
X-axis Elapsed time of the scenario run.
Y-axis Response time (in seconds) of each transaction.
Breakdown
options
You can break down a transaction in the Oracle - WebDB Side Transactions graph to
view its SQL statements. In the following figure, the Action_Transaction transaction is
broken down to its SQL statements.
To break the displayed elements down further, see "Oracle Breakdown Levels" on
page1713.
See also "Oracle - Web Diagnostics Graphs Overview" on page1711
Oracle - WebDB Side Transactions by SQL Stage Graph
This graph displays the time taken by each SQL, divided by the SQL stages: Parse Time, Execute Time,
Fetch Time, and Other Time. Other Time includes other database time such as bind time.
X-axis Elapsed time since the scenario run.
Y-axis Average response time (in seconds) of each SQL stage.
Breakdown options "Oracle Breakdown Levels" on page1713
See also "Oracle - Web Diagnostics Graphs Overview" on page1711
User Guide
Analysis
HP LoadRunner (12.50) Page 1716

Oracle - Web SQL Average Execution Time Graph
This graph displays the average execution time of each SQL performed in the Oracle database.
Purpose The graph enables you to identify problematic SQLs regardless of the transaction
that produced them.
X-axis Elapsed time since the scenario run.
Y-axis Average response time (in seconds) of each SQL.
Breakdown
options
"Oracle Breakdown Levels" on page1713
Tips You can select Show measurement description from the Legend window to view
the full SQL statement.
Note The SQL statements are shortened to a numeric indicator.
See also "Oracle - Web Diagnostics Graphs Overview" on page1711
SAP Diagnostics Graphs
SAP Diagnostics Graphs Overview
SAP Diagnostics enables you to pinpoint the root cause of a certain problem (for example, DBA, Network,
WAS, Application, OS/HW) quickly and easily, and engage with the relevant expert only, without having to
present the problem to a whole team of people.
Using SAP Diagnostics, you can create graphs and reports, which you can present to the relevant expert
when discussing the problems that occurred.
SAP Diagnostics also allow an SAP performance expert (in one of the areas of expertise) to perform the
required root-cause analysis more quickly and easily.
How to Configure SAP Alerts
SAP Diagnostics comes with a set of alert rules with pre-defined threshold values.
When you open a LoadRunner results file (.lrr) in Analysis, these alert rules are applied to the load test
scenario results, and if a threshold value is exceeded, Analysis generates an alert that there is a
problem.
Before opening a LoadRunner results file, you can define new threshold values for the alert rules using
the Alerts Configuration dialog box. Then, when you open the results file, the customized alert rules are
applied.
User Guide
Analysis
HP LoadRunner (12.50) Page 1717

Note: When an Analysis session is open, the Alerts Configuration dialog box is not editable. To
edit thresholds in the Alerts Configuration dialog box, close all open sessions.
This task describes how to define threshold values for alert rules when analyzing load test scenario
results.
1. Close all open Analysis sessions.
2. From the Tools menu, select SAP Diagnostics Alerts Configuration.
3. The Generate alert if column lists the rules. Set the threshold for each rule in the Threshold
column.
4. By default, all pre-defined alert rules are enabled. To disable an alert rule, clear the check box next
to that rule.
5. Click OK to apply your changes and close the Alerts Configuration dialog box.
Note: Modifying the alert rules does not affect the results of a saved Analysis session. You need
to re-analyze the results in order for new settings to take effect.
SAP Diagnostics - Guided Flow Tab
You open the SAP Diagnostics graphs from the Analysis Summary Report or from Session Explorer >
Graphs > SAP Diagnostics - Guided Flow.
This tab remains open throughout the Analysis application flow, and its content varies according to the
breakdown flow.
User Guide
Analysis
HP LoadRunner (12.50) Page 1718
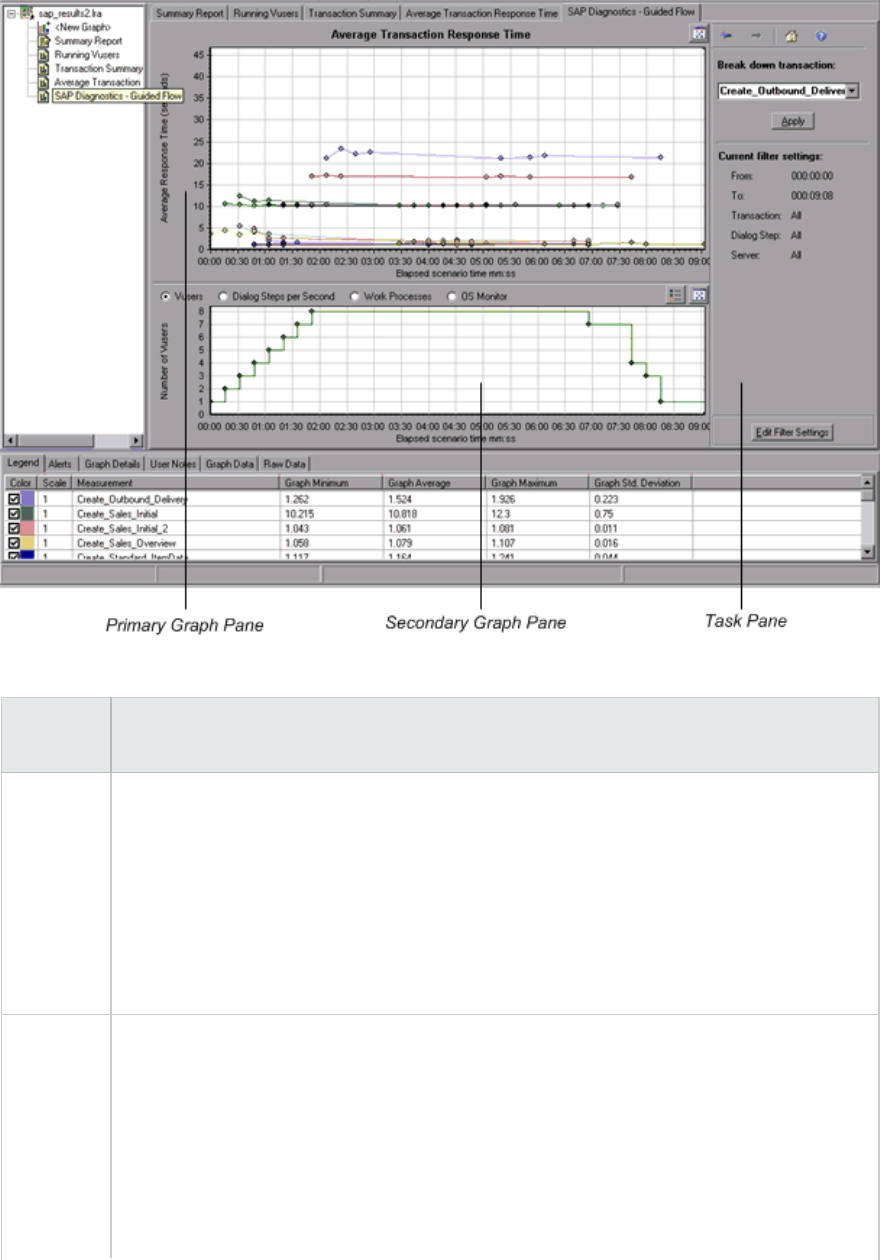
User interface elements are described below:
UI
Element
Description
Primary
Graph
Pane
The upper pane of the SAP Diagnostics - Guided Flow tab is referred to as the primary
graph pane. This pane displays graphs of the transactions and their broken down dialog
steps or components, and other associated resources.
You break down the graphs displayed in this pane using the breakdown options provided
in the right pane of the guided flow (see "SAP Breakdown Task Pane" on page1726).
You can open the displayed graph in full view by clicking the Enlarge Graph button in the
top right corner of this pane. An enlarged version of the graph opens in a new tab.
Secondary
Graph
Pane
The lower pane of the SAP Diagnostics - Guided Flow tab is referred to as the secondary
graph pane and displays graphs showing secondary information supporting the graph
displayed in the primary graph pane.
To see the legend for the graph displayed in this pane, click the Graph Legend button in
the top right corner. To see all the data in the Legend, scroll along the horizontal scroll
bar.
You can open the displayed graph in full view by clicking the Enlarge Graph button in the
User Guide
Analysis
HP LoadRunner (12.50) Page 1719
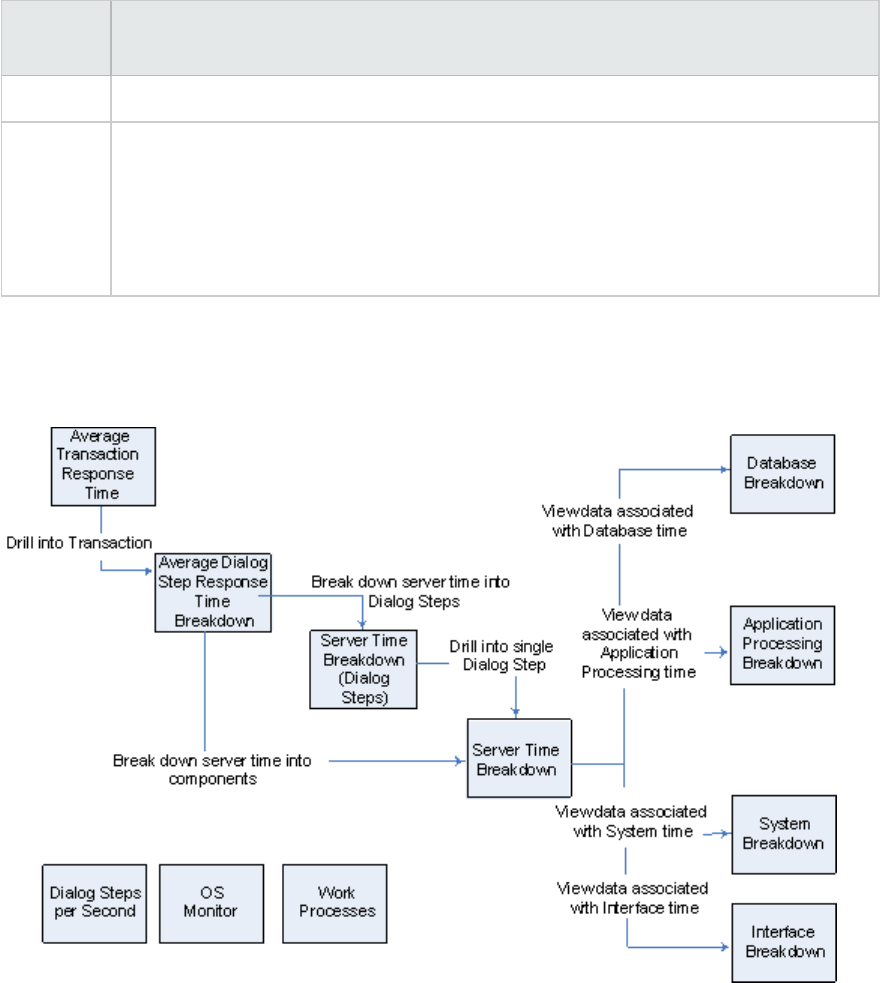
UI
Element
Description
top right corner of this pane. An enlarged version of the graph opens in a new tab.
Task Pane The pane on the right side of the SAP Diagnostics - Guided Flow tab is referred to as the
task pane. You use the task pane to choose the level of breakdown you want to view, to
filter and group transaction and server information, and to navigate backwards and
forwards through the broken down graphs.
For more information, see "SAP Breakdown Task Pane" on page1726.
SAP Diagnostics Application Flow
The following diagram depicts the general flow of SAP Diagnostics:
The main view of SAP Diagnostics displays all of the transactions in a scenario run for which there is SAP
diagnostics data. Each transaction can be broken down into server-time components, or first into the
dialog steps that comprise a transaction, and then into server-time components. The server
components can further be broken down into sub-components or other related data.
There are three independent/parallel views: Dialog Steps per Second,OS Monitor, and Work Processes.
These do not generally participate in the breakdown flow, and you may choose to display or hide them.
User Guide
Analysis
HP LoadRunner (12.50) Page 1720
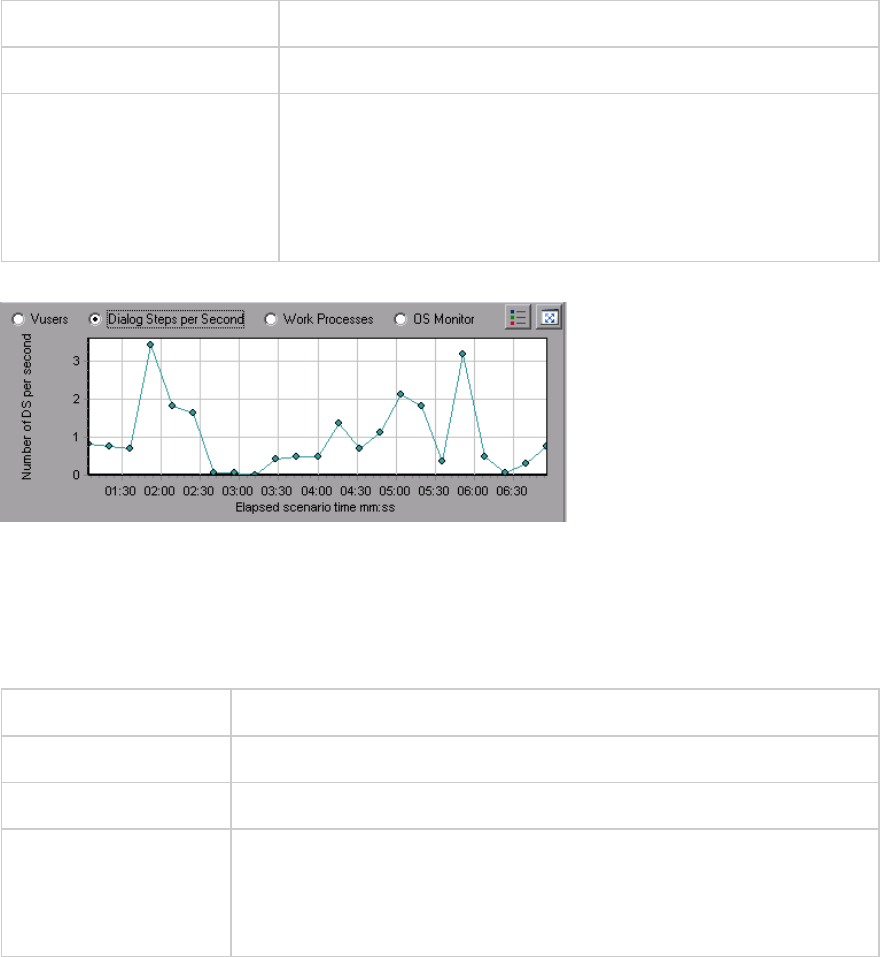
Dialog Steps per Second Graph
This graph represents the number of dialog steps that ran on all the servers during each second of the
load test scenario run.
X-axis Elapsed scenario time (in hh:mm:ss).
Y-axis Number of dialog steps per second.
See also "SAP Breakdown Task Pane" on page1726
"Vuser Graphs" on page1504
"Work Processes Graph" on page1733
"OS Monitor Graph" below
Example
OS Monitor Graph
This graph represents the operating system resources that were measured throughout the load test
scenario run.
X-axis Elapsed scenario time (in hh:mm:ss).
Y-axis Resource value.
Note This graph is available only when a single server filter is applied.
See also "SAP Breakdown Task Pane" on page1726
"Dialog Steps per Second Graph" above
"Work Processes Graph" on page1733
Example
User Guide
Analysis
HP LoadRunner (12.50) Page 1721
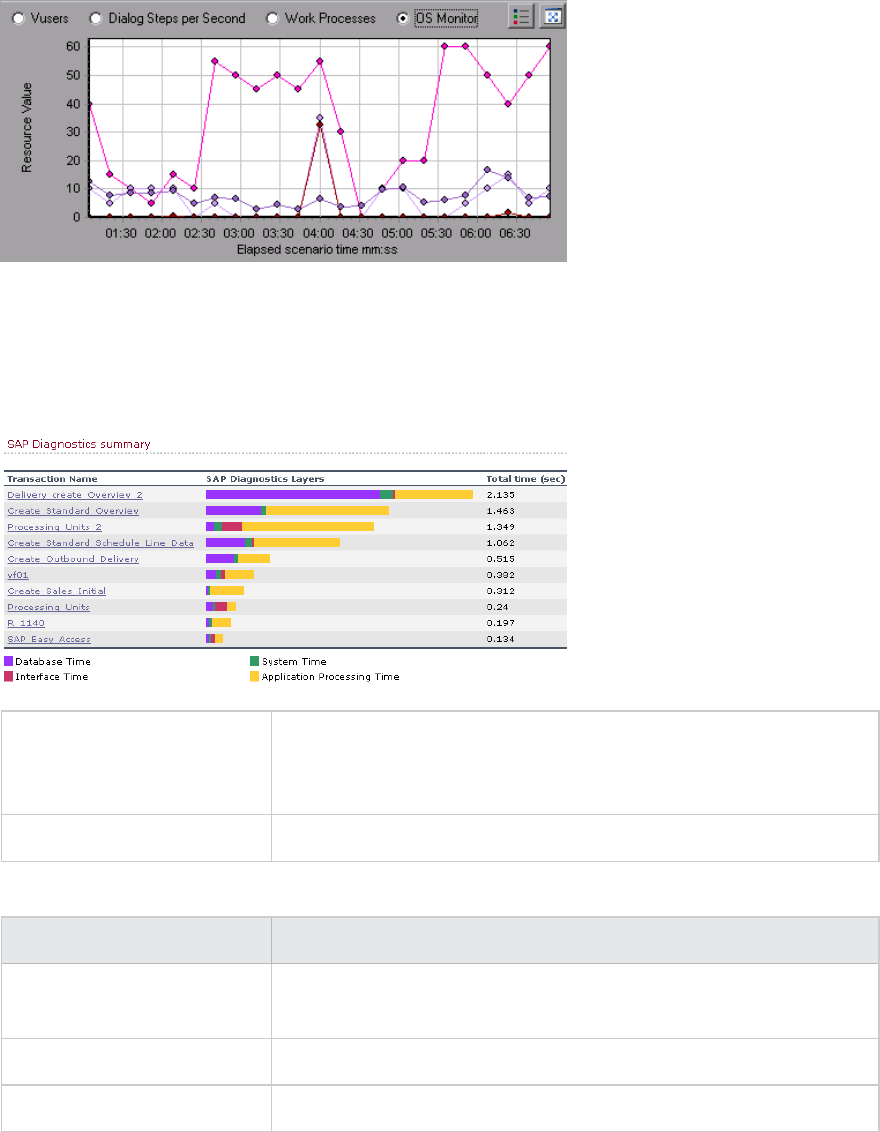
SAP Alerts Configuration Dialog box
This dialog box enables you to define threshold values for alert rules used when opening the results file
(.lrr) in Analysis.
Important information Modifying the alert rules does not affect the results of a saved
Analysis session. You need to re-analyze the results in order for new
settings to take effect.
See also "SAP Diagnostics Graphs Overview" on page1717
User interface elements are described below:
UI Element Description
Enabled By default, all pre-defined alert rules are enabled. To disable an alert
rule, clear the check box next to that rule.
Generate alert if The Generate alert if column lists the rules.
Threshold Set the threshold for each rule in the Threshold column.
User Guide
Analysis
HP LoadRunner (12.50) Page 1722
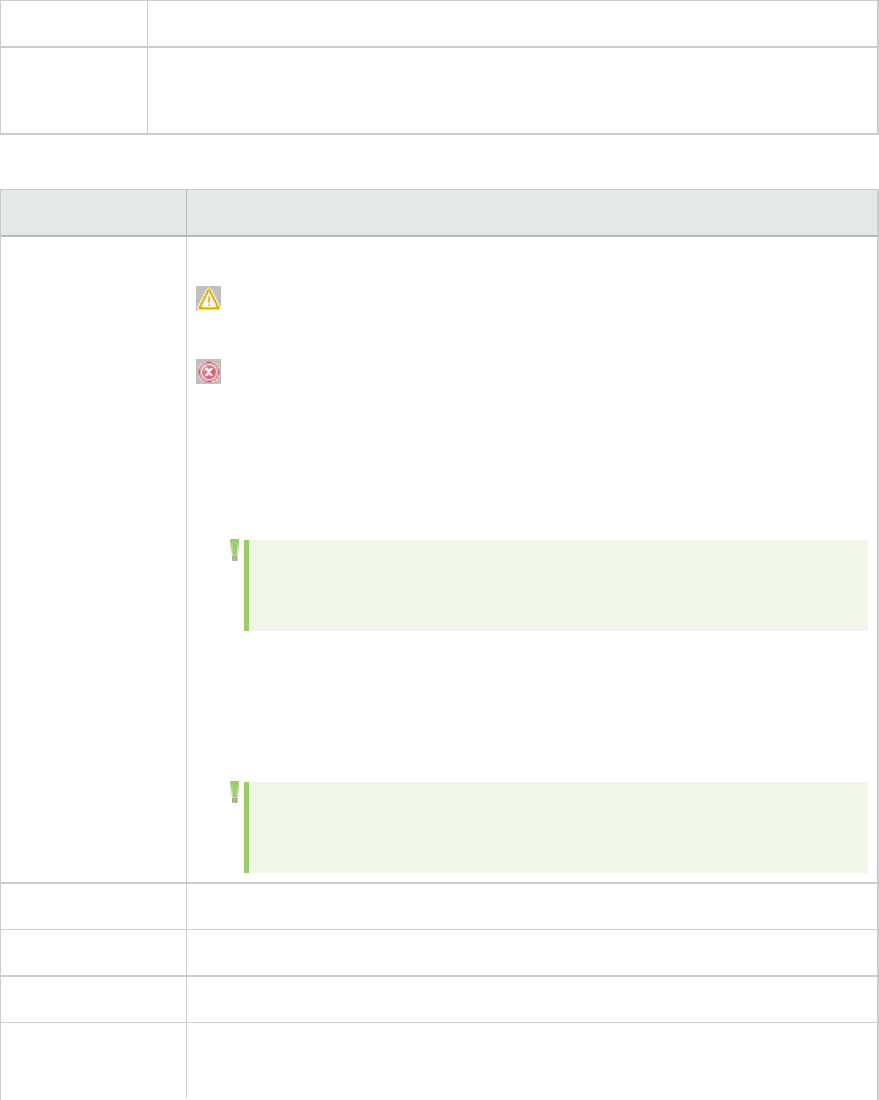
SAP Alerts Window
This Window displays a list of alerts related to the data displayed in the current graph(s) shown in the
Analysis window.
To access Windows > SAP Alerts
See also "SAP Alerts Configuration Dialog box" on the previous page
"How to Configure SAP Alerts" on page1717
User interface elements are described below:
UI Element Description
Type Displays one of the following icons indicating the type of alert:
Standard Alert. This alert is generated in the context of a transaction
and/or server if the conditions of a pre-defined alert rule are met.
Major Alert. There are two types of alerts:
lGeneral Application Problem Alert. If a standard alert was generated in the
context of a transaction, and the same alert was generated in the context of
all other transactions running in the same time frame, then a major alert of
this type is generated, indicating that there is a general application problem.
Note: If a Dialog Step filter is applied (for a single dialog step), then
this alert is not generated.
lServer-Specific Problem Alert. This alert is generated for a specific server
if a certain measurement on that server exceeds its threshold, while the
overall server performance for that measurement is satisfactory. This type
of alert indicates that there is a server related problem.
Note: Server-Specific Problem alerts are generated only when the
current server context is "All Servers".
Time interval The time interval during which the problem occurred.
Transaction/Server The name of the transaction and server where problem occurred.
Description A description of the alert.
Recommended
Step
Recommends what to do in order to understand the problem on a deeper level.
User Guide
Analysis
HP LoadRunner (12.50) Page 1723
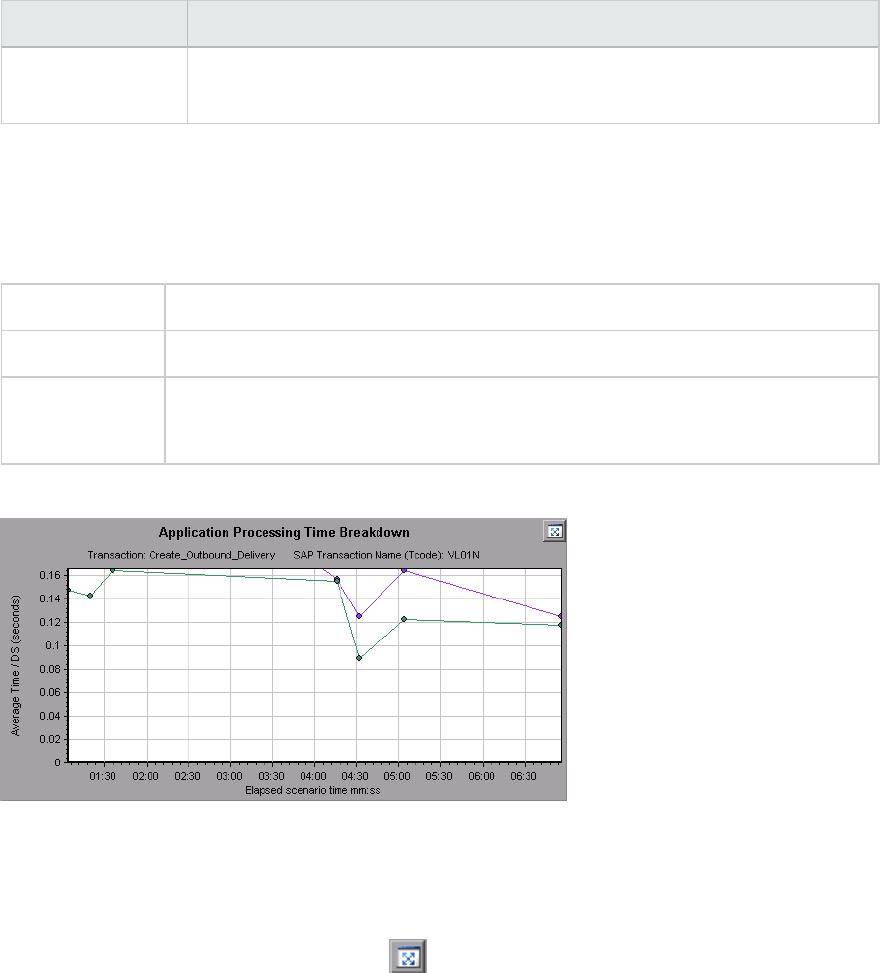
UI Element Description
Action A link to a graph representing the data described in the alert, allowing for a
more graphic display of the alert. Double-click the link to open the graph.
SAP Application Processing Time Breakdown Graph
This graph displays the behavior of resources associated with application processing time, namely ABAP
time and CPU time.
X-axis Elapsed load test scenario time (in hh:mm:ss).
Y-axis Average time per dialog step (in seconds).
See also "SAP Breakdown Task Pane" on page1726
"SAP Secondary Graphs" on page1733
Example
SAP Primary Graphs
You view the SAP Diagnostics graphs in the primary graph pane.
You can open the graph in full view by clicking in the top right corner of the primary graph pane. An
enlarged version of the graph opens in a new tab.
To filter or group data displayed in these graphs, see "SAP Breakdown Task Pane" on page1726.
SAP Average Dialog Step Response Time Breakdown Graph
This graph represents a breakdown of the average dialog step response time of a specific transaction.
The graph displays the Network Time, Server Response Time, (including the GUI time), and Other Time
(the time taken for the client to process the dialog step) of a single transaction.
User Guide
Analysis
HP LoadRunner (12.50) Page 1724
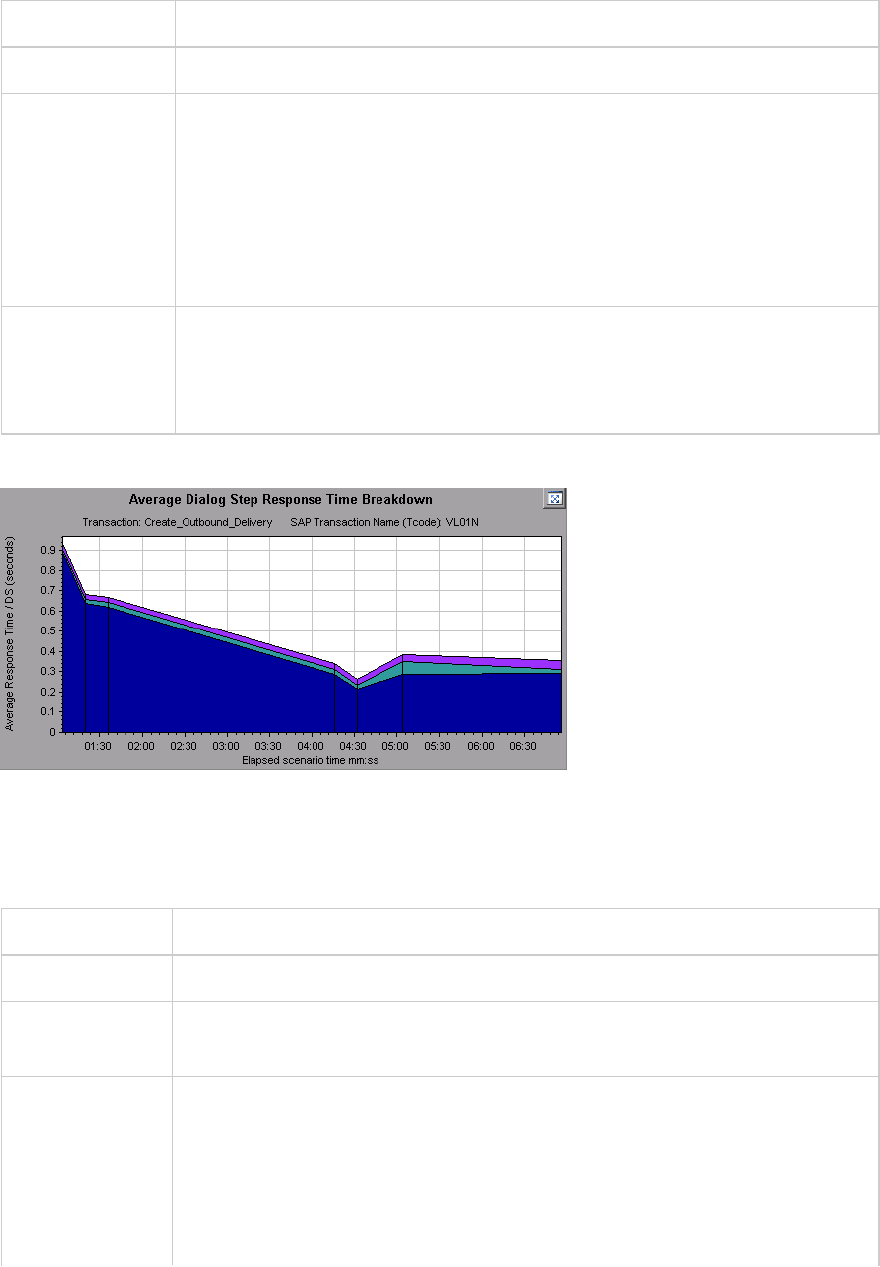
X-axis Elapsed time since the start of the run (in hh:mm:ss).
Y-axis The average response time divided by the number of dialog steps (in seconds).
Breakdown
options
Components
This option opens the "SAP Server Time Breakdown Graph" on page1729
Dialog Steps
This option opens the "SAP Server Time Breakdown (Dialog Steps) Graphs" on
page1728
See also "SAP Breakdown Task Pane" on the next page
"SAP Secondary Graphs" on page1733
"SAP Breakdown Task Pane" on the next page
Example
SAP Average Transaction Response Time Graph
This graph displays all the SAP-related transactions in the load test scenario.
X-axis Elapsed time since the start of the run.
Y-axis Average response time (in seconds) of each transaction
Breakdown
graph
"SAP Average Dialog Step Response Time Breakdown Graph" on the previous
page
Tips Select a transaction in one of the following ways:
lSelect the transaction from the Breakdown transaction: list in the task pane.
lHighlight the transaction by selecting the line representing it in the graph.
lSelect the transaction from the graph legend. This highlights the line in the
graph.
User Guide
Analysis
HP LoadRunner (12.50) Page 1725
See also "SAP Breakdown Task Pane" below
"SAP Secondary Graphs" on page1733
"SAP Breakdown Task Pane" below
SAP Breakdown Task Pane
The task pane enables you to choose the level of breakdown you want to view, to filter and group
transaction and server information, and to navigate backwards and forwards through the broken down
graphs.
To access Session Explorer > Graphs > SAP Diagnostics > SAP Diagnostics - Guided Flow
See also "SAP Diagnostics Graphs Overview" on page1717
SAP Breakdown Toolbar
User interface elements are described below:
UI Element Description
Back. Click to view previous breakdown graph, or to ungroup grouped data.
Next. Click to view next breakdown graph.
Home. Click to return to the initial SAP Average Transaction Response Time
graph.
Help. Click to get help on the breakdown options.
Breakdown Options
To break down SAP diagnostics data, choose the breakdown and filter options from the task pane.
User interface elements are described below:
UI Element Description
Break down
transaction
Select a transaction from this list to display the average dialog step response
time breakdown.
Break down
server time into
Displays the breakdown options for the Average Dialog Step Response Time
Breakdown graph.
lSelect Components to view a breakdown of the transaction's server
User Guide
Analysis
HP LoadRunner (12.50) Page 1726
UI Element Description
components, namely database time, interface time, application processing
time, and system time.
lSelect Dialog Steps to view a breakdown of the transaction's dialog steps.
Break down dialog
step <dialog step>
Break down a dialog step into its server-time components, namely database
time, interface time, application processing time, and system time.
View data
associated with
<component>
Break down a server-time component (database time; interface time;
application processing time; system time) to view data associated with it.
No available
breakdown
There are no further breakdown options.
Apply Click to apply the selected breakdown option.
Current filter settings
This section displays the filter/grouping settings of the graph currently displayed in the primary graph
pane.
User interface elements are described below:
UI Element Description
From/To Enter values (in hh:mm:ss) to filter the graph over a specified time interval.
Transaction Displays the name of the transaction represented in the graph.
Dialog Step Displays the name of the dialog step represented in the graph.
Server Displays the name of the server represented in the graph.
Edit filter settings
Click this button to modify filter or grouping settings. When you click Edit Filter Settings the
filter/grouping options become editable.
User interface elements are described below:
UI
Element
Description
Filter Use this option to filter the current graph by time interval, transaction, dialog step, and/or
server.
User Guide
Analysis
HP LoadRunner (12.50) Page 1727

UI
Element
Description
lFrom/To. Enter values (in hh:mm:ss) to filter the graph over a specified time interval.
lBy Transaction. Filter the graph to display information about a specific transaction by
selecting the transaction from the list.
lBy Dialog Step. Filter the graph to display information about a specific dialog step by
selecting the dialog step from the list.
lBy Server. Filter the graph to display information about a server by selecting the server
name from the list.
Note: Only servers associated with the data displayed in the current graph are listed in the
By Server list
Group Use this option to group the data represented in the graph by transaction or by server.
Select a transaction, component or subcomponent from the list.
lBy Transaction. Select this check box to group by transaction.
lBy Server. Select this check box to group by server.
Note: After applying grouping to a graph, you need to ungroup the data in order to apply
further breakdown options. To ungroup grouped data, click the Back button on the
toolbar.
Important: When you open a saved session, the Back is disabled. If you have grouped data,
you need to click the Home button, or open a new SAP Diagnostics - Guided Flow tab to
restart SAP breakdown.
OK Click OK to apply the chosen filter/grouping settings. The Current filter settings area
displays the chosen settings in non-editable mode.
Notes:
lGlobal filtering is enabled when viewing SAP Diagnostics graphs (special SAP view) but
cannot be applied on these graphs.
lLocal filtering is disabled in the SAP Diagnostics - Guided Flow tab. To apply local filters
to a SAP Diagnostics graph displayed in the Guided Flow tab, open the graph in a new
tab by clicking the Enlarge Graph button.
SAP Server Time Breakdown (Dialog Steps) Graphs
This graph displays the dialog steps of a particular transaction.
X-axis Elapsed time since the start of the run (in hh:mm:ss).
User Guide
Analysis
HP LoadRunner (12.50) Page 1728
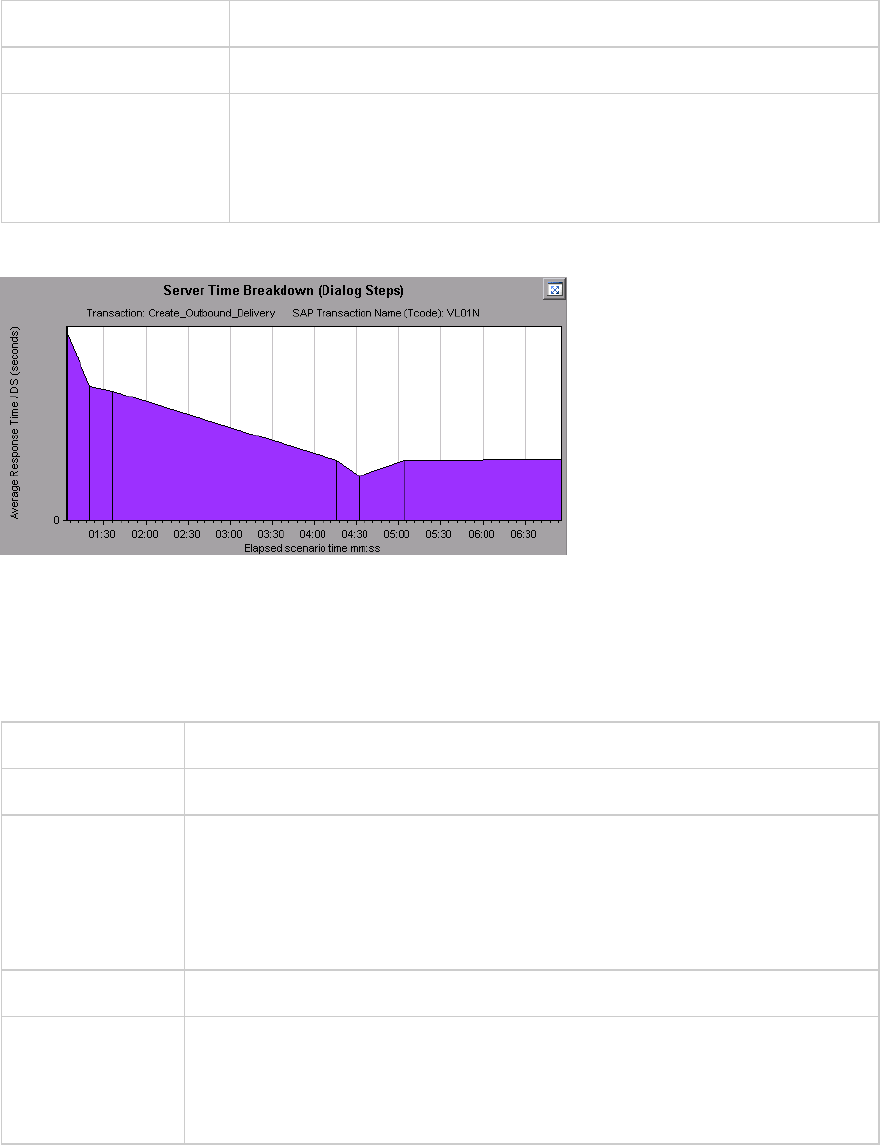
Y-axis The average response time per dialog step (in seconds).
Breakdown graph "SAP Server Time Breakdown Graph" below
See also "SAP Breakdown Task Pane" on page1726
"SAP Secondary Graphs" on page1733
"SAP Breakdown Task Pane" on page1726
Example
SAP Server Time Breakdown Graph
This graph represents the server-time components of a single transaction, namely database time,
application processing time, interface time, and system time.
X-axis Elapsed time since the start of the run (in hh:mm:ss).
Y-axis Represents the average response time per dialog step (in seconds).
Breakdown graphs l"SAP Database Time Breakdown Graph" on the next page
l"SAP Application Processing Time Breakdown Graph" on page1724
l"SAP System Time Breakdown Graph" on page1732
l"SAP Interface Time Breakdown Graph" on page1732
Tips In the task pane, select a component from the View data associated with box.
See also "SAP Breakdown Task Pane" on page1726
"SAP Secondary Graphs" on page1733
"SAP Breakdown Task Pane" on page1726
Example
User Guide
Analysis
HP LoadRunner (12.50) Page 1729
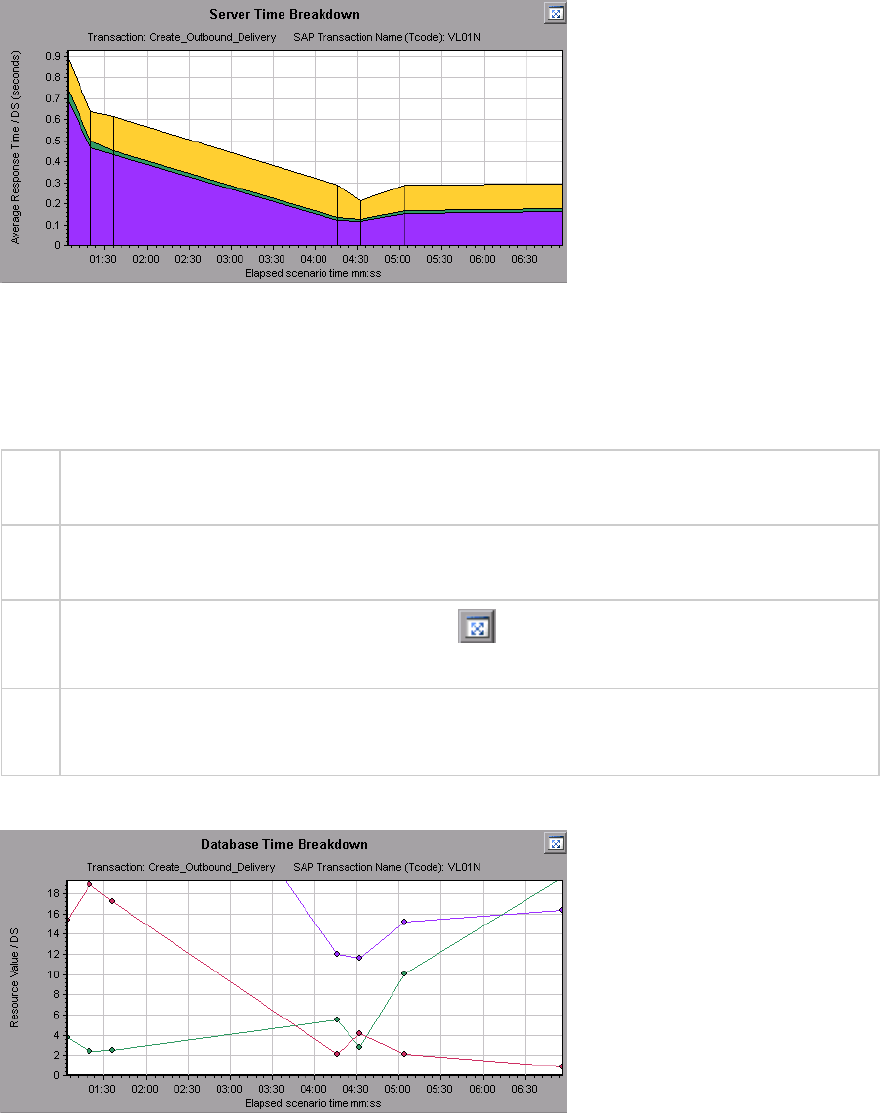
SAP Database Time Breakdown Graph
This graph displays the behavior of resources associated with database time, namely time taken to
access a record, database time, and the number of records accessed per dialog step.
X-
axis
Elapsed time since the start of the run (in hh:mm:ss).
Y-
axis
Represents the resource value per dialog step (in msec).
Tips You can open the graph in full view by clicking in the top right corner of the primary graph
pane. An enlarged version of the graph opens in a new tab.
See
also
"SAP Breakdown Task Pane" on page1726
"SAP Secondary Graphs" on page1733
Example
SAP Diagnostics Summary Report
This report displays a list of major alerts generated when opening the Analysis session, and a summary
of the SAP diagnostics data.
User Guide
Analysis
HP LoadRunner (12.50) Page 1730
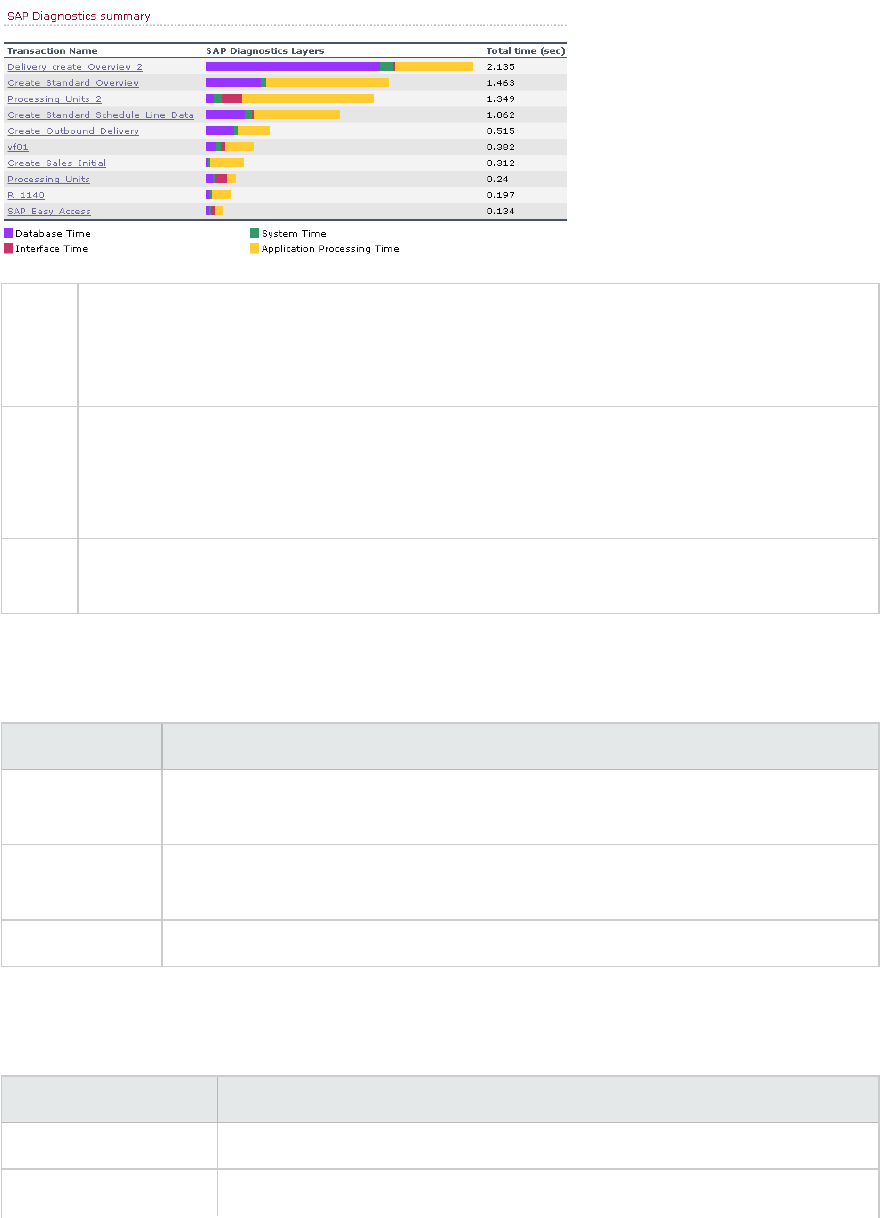
To
access
Use one of the following:
lSession Explorer > Reports > Summary Report > Major Alerts
lSession Explorer > Reports > Summary Report > SAP Diagnostics Summary
Note If you do not see diagnostics data on the Summary Report, check if you are using a user-
defined template. To view relevant data, choose a different template from the list of
templates, or create and apply a new template. For more information about using
templates, see "Apply/Edit Template Dialog Box" on page1461.
See
also
"SAP Diagnostics Graphs Overview" on page1717
SAP Diagnostics Summary
User interface elements are described below:
UI Element Description
Transaction Individual transactions. You can click a transaction name to display the server time
breakdown for that transaction.
SAP Diagnostics
Layers
Relative server-time breakdown in layers. Click a layer to display data associated
with the component.
Total time Total usage time for each transaction.
Major Alerts
User interface elements are described below:
UI Element Description
Time Interval The time during which the problem occurred.
Transaction/Server Which transaction and server were involved.
User Guide
Analysis
HP LoadRunner (12.50) Page 1731
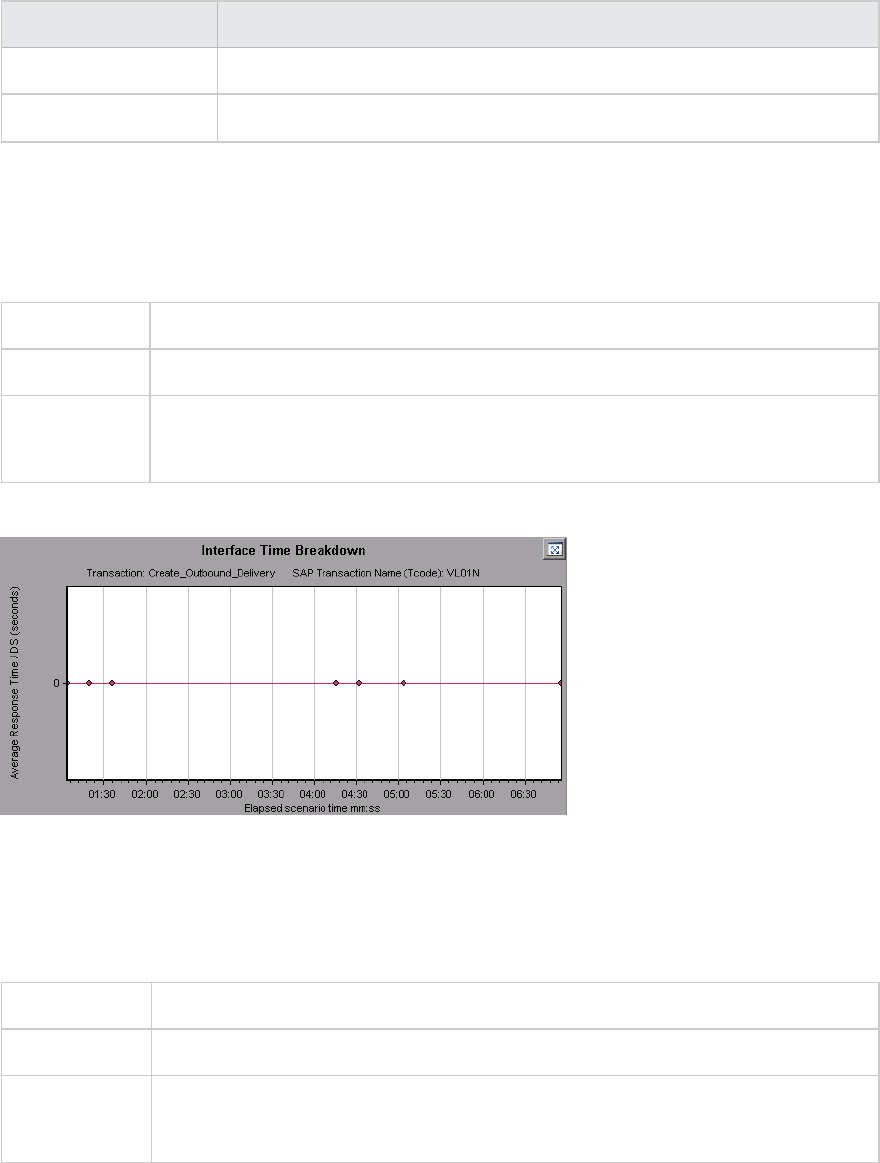
UI Element Description
Description A description of the alert.
Action This column provides a link to a graphic depiction of the problem.
SAP Interface Time Breakdown Graph
This graph displays the behavior of resources associated with interface time, namely GUI time, RFC
time, and roll-wait time.
X-axis Elapsed load test scenario time (in hh:mm:ss)
Y-axis Average response time per dialog step (in seconds).
See also "SAP Breakdown Task Pane" on page1726
"SAP Secondary Graphs" on the next page
Example
SAP System Time Breakdown Graph
This graph displays the behavior of the sub-components of the system time component, namely the
dispatcher wait time, the load and generation time, and the roll-in and roll-out times.
X-axis Elapsed load test scenario time (in hh:mm:ss)
Y-axis Average response time per dialog step (in seconds)
See also "SAP Breakdown Task Pane" on page1726
"Secondary Graph Pane" on page1719
Example
User Guide
Analysis
HP LoadRunner (12.50) Page 1732
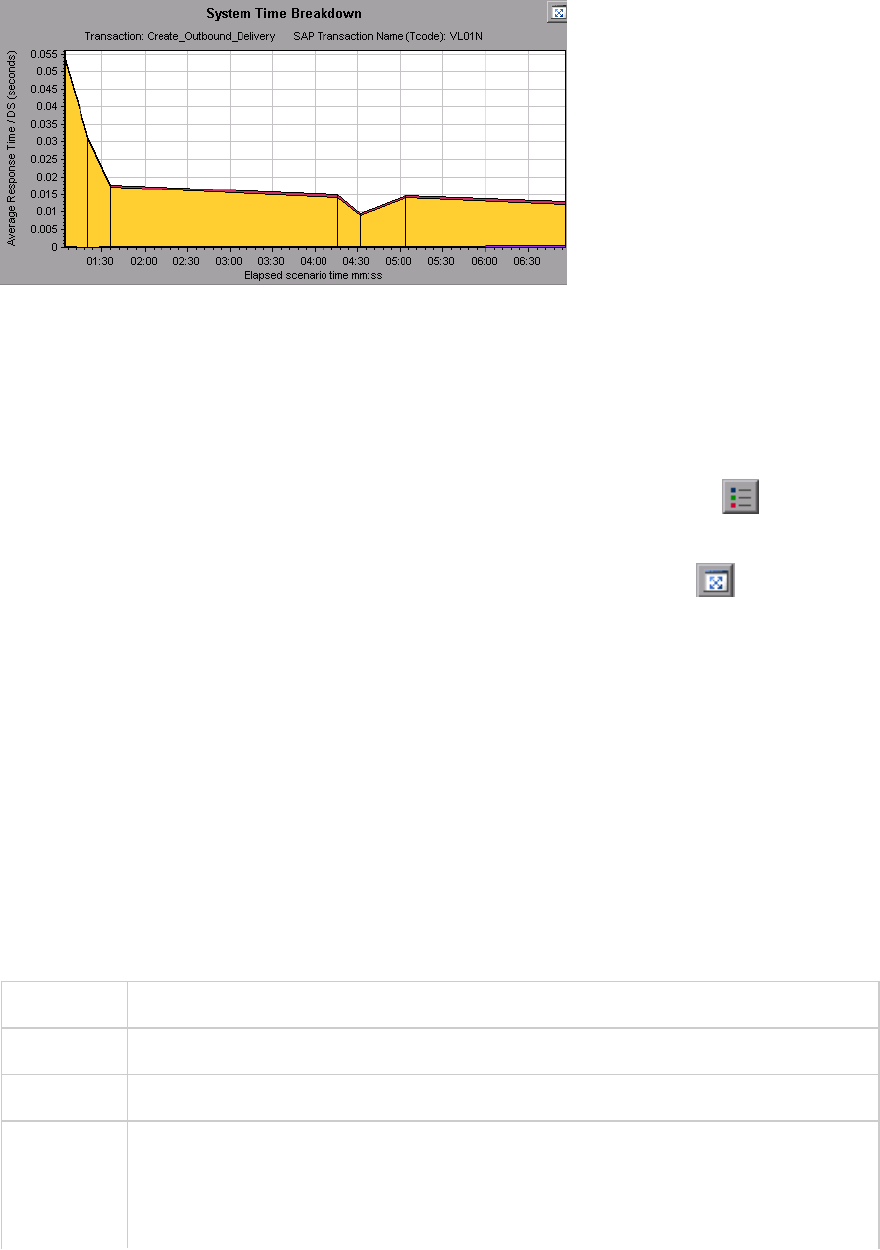
SAP Secondary Graphs
The secondary graph pane of the SAP Diagnostics - Guided Flow tab displays graphs that support the
graph displayed in the primary graph pane. You can correlate over time only one graph displayed in the
secondary graph pane.
To see the legend for the graph displayed in this pane, click the Graph Legend button in the top
right corner. To see all the data in the Legend, scroll along the horizontal scroll bar.
You can open the displayed graph in full view by clicking the Enlarge Graph button in the top right
corner of this pane. An enlarged version of the graph opens in a new tab.
You view the following graphs in the secondary graph pane:
l"Vuser Graphs" on page1504
l"Dialog Steps per Second Graph" on page1721
l"Work Processes Graph" below
l"OS Monitor Graph" on page1721
Work Processes Graph
This graph represents the number and distribution of work processes that ran throughout the load test
scenario.
X-axis Elapsed scenario time (in hh:mm:ss).
Y-axis Number of work processes.
Note This graph is available only when a single server filter is applied.
See also "SAP Breakdown Task Pane" on page1726
"Vuser Graphs" on page1504
"Dialog Steps per Second Graph" on page1721
User Guide
Analysis
HP LoadRunner (12.50) Page 1733
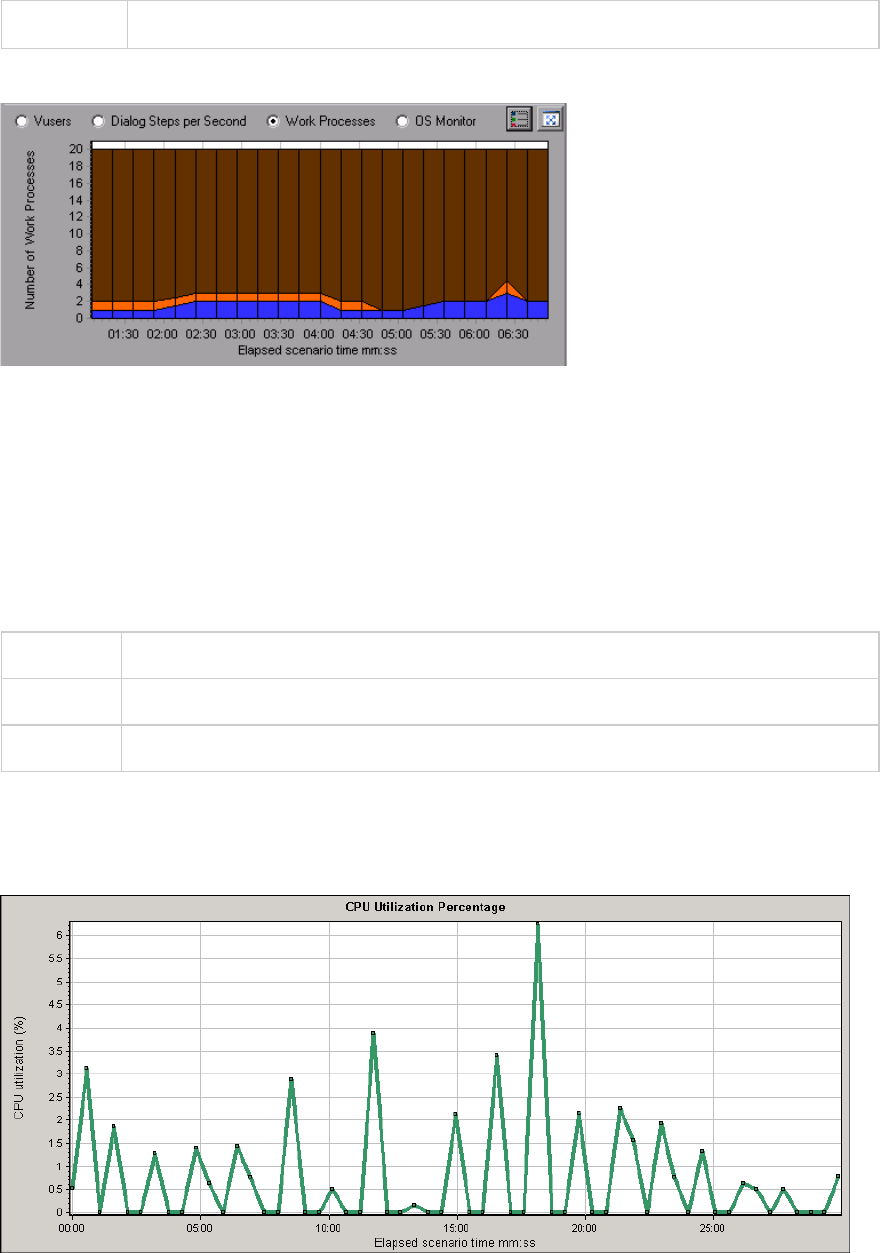
"OS Monitor Graph" on page1721
Example
TruClient - Native Mobile Graphs
TruClient CPU Utilization Percentage Graph
This graph displays the percentage of the CPU utilized during the test run for TruClient Native Mobile
Vuser scripts.
Purpose Helps you evaluate the amount of CPU utilized by an application.
X-axis Elapsed time since the start of the scenario run.
Y-axis The percentage of the CPU utilized during the test run.
Example
In the following example, the CPU utilization peaked to approximately 6% at 18 minutes into the test
run.
User Guide
Analysis
HP LoadRunner (12.50) Page 1734
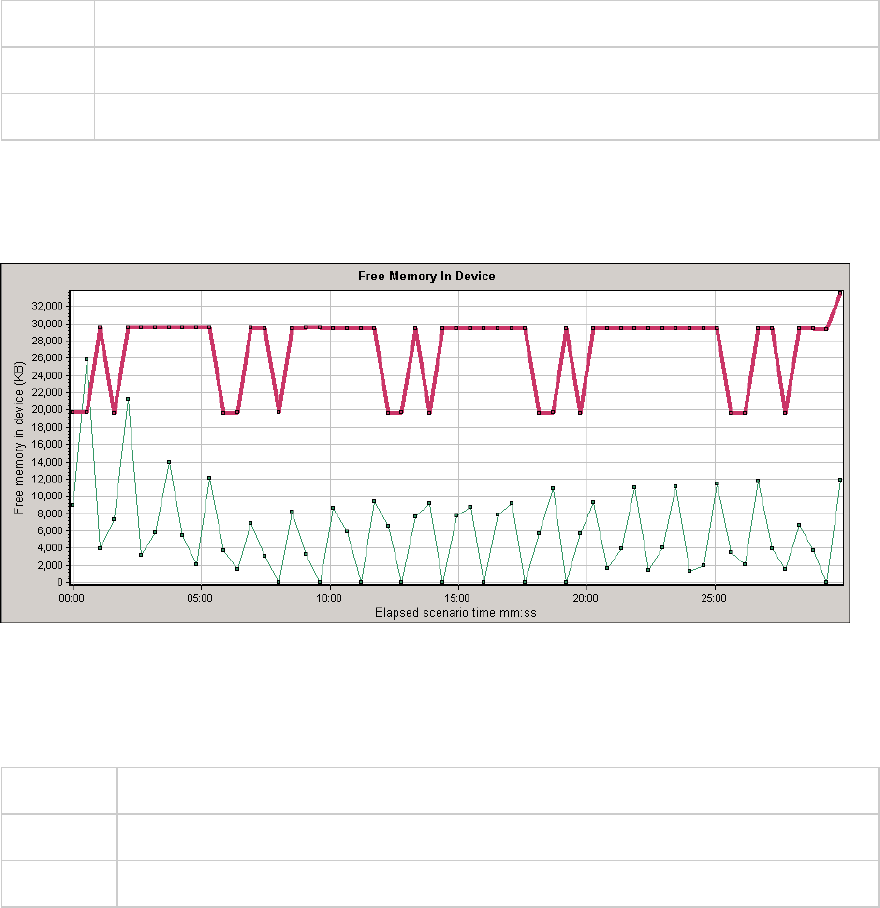
TruClient Free Memory In Device Graph
This graph displays the free memory on a mobile device as a function of time, for TruClient Native
Mobile scripts.
Purpose Helps you evaluate the amount of memory available on the device during the test run.
X-axis Elapsed time since the start of the scenario run.
Y-axis The amount of free memory in KBs.
Example
In the following example, the graph shows a free memory of over 33 MBs, at 30 minutes into the test
run for one of the transactions.
TruClient Memory Consumed by Application Graph
This graph displays the memory consumed by the application, as a function of time.
Purpose Helps you evaluate the amount of memory used by the application.
X-axis Elapsed time since the start of the scenario run.
Y-axis The memory consumed by the application in KBs.
Example
In the following example, the memory consumption peaked to 1337 KBs at 30 minutes into the test, for
one of the transactions.
User Guide
Analysis
HP LoadRunner (12.50) Page 1735
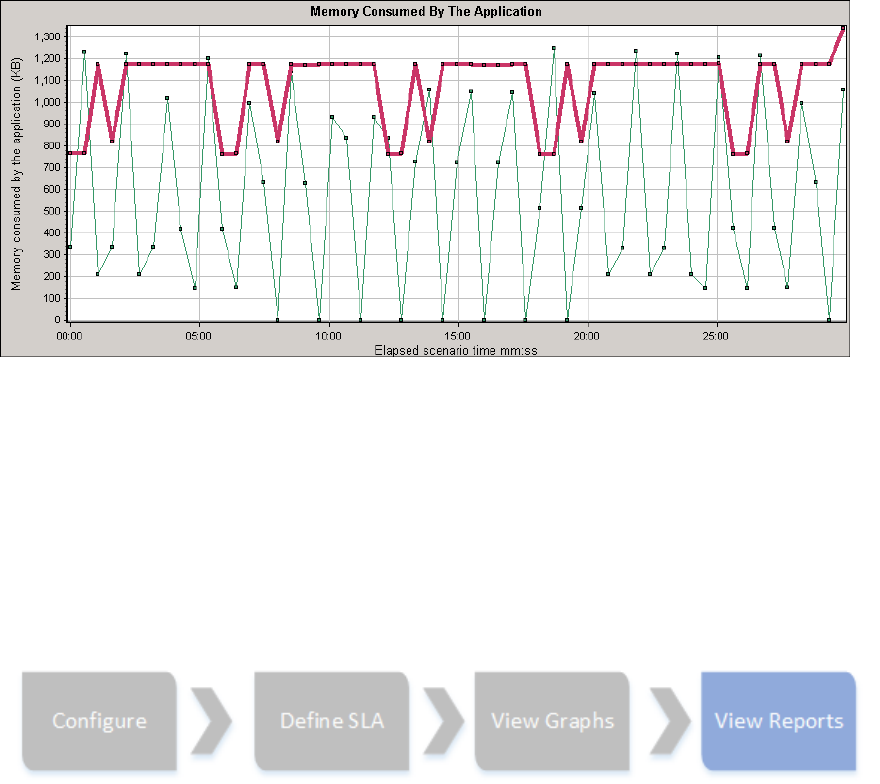
Analysis Reports
Understanding Analysis Reports
Analysis Reports Overview
After running a load test scenario, you can view reports that summarize your system's performance.
Analysis provides the following reporting tools:
l"Summary Report" on page1749
l"SLA Reports" on page1754
l"Transaction Analysis Report" on page1755
l"HTML Reports" on page1753
The Summary report provides general information about the scenario run. You can access the Summary
report at any time from the Session Explorer.
The SLA report provides an overview of the defined SLAs (Service Level Agreements) with succeeded or
failed status.
The Transaction Analysis report provides a detailed analysis of a specific transaction over a specific
time period.
User Guide
Analysis
HP LoadRunner (12.50) Page 1736
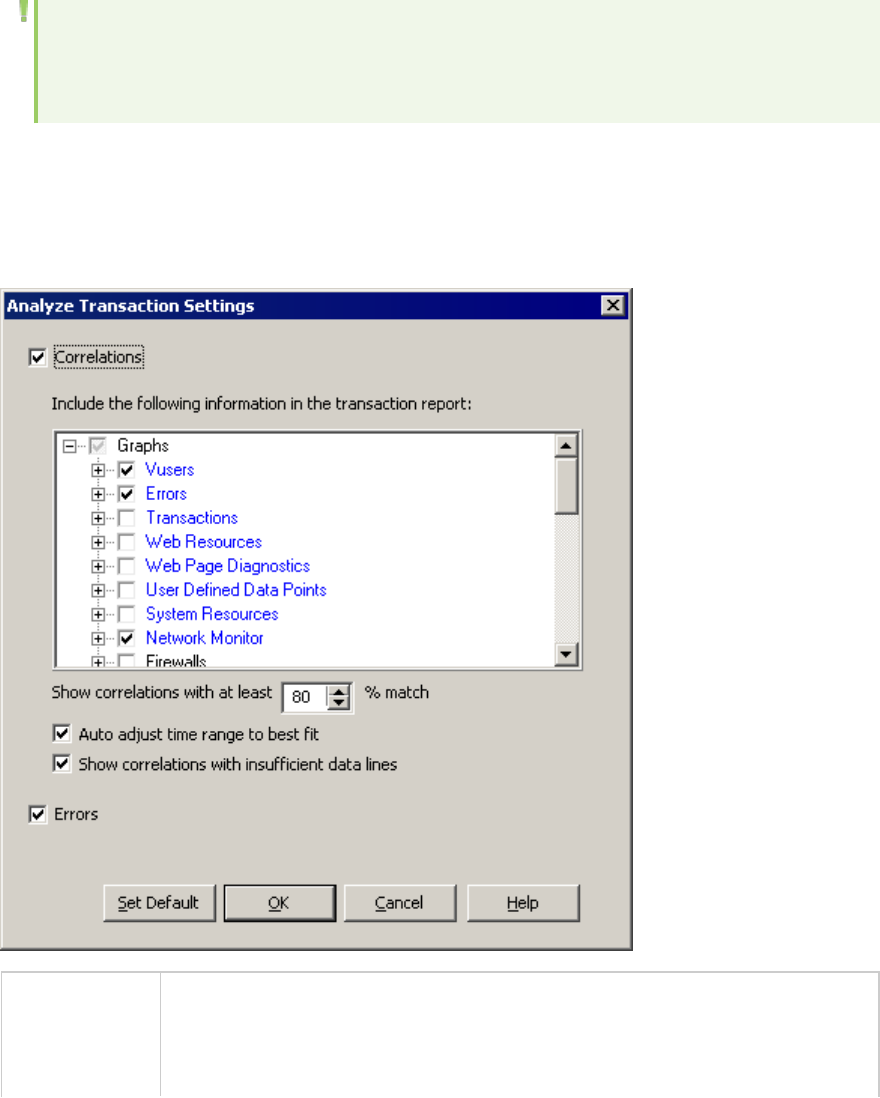
You can instruct Analysis to create an HTML report. The HTML report contains a page for each open
graph, the Summary report, the SLA report, and the Transaction Analysis report.
Transaction reports provide performance information about the transactions defined within the Vuser
scripts. These reports give you a statistical breakdown of your results and allow you to print and export
the data.
Note: SLA reports and Transaction Analysis reports are not available when generating Cross
Result graphs. For more information on Cross Result graphs, see "Cross Result and Merged
Graphs" on page1497.
Analyze Transaction Settings Dialog Box
This dialog box enables you to configure the Transaction Analysis Report to show correlations between
the graph of the analyzed transaction and other graphs that you select.
To access Use one of the following:
lReports > Analyze Transaction > Settings
lTools > Options > Analyze Transaction Settings tab
User Guide
Analysis
HP LoadRunner (12.50) Page 1737

See also "Analyze Transactions Dialog Box" below
User interface elements are described below:
UI Element Description
Correlations Defines which graphs you want Analysis to match to the graph of the transaction you
selected. Graphs where data is available appear in blue.
Show
correlations
with at
least x%
match
The positive or negative percentage correlation between the graph of the analyzed
transaction and the graphs selected above. You can change the percentage by
entering a value in the box. The default is 20%.
Auto adjust
time range
to best fit
Analysis adjusts the selected time range to focus on the SLA violations within and
around that time period. This option only applies when the Transaction Analysis report
is generated directly from the Summary report (from the X Worst transactions or
Scenario behavior over time sections).
Show
correlations
with
insufficient
data lines
Displays correlations where one of the measurements contains less than 15 units of
granularity.
Errors Displays errors in the Transaction Analysis Report if selected.
Analyze Transactions Dialog Box
You use the Analyze Transaction dialog box to define the criteria that will be used to analyze the
selected transaction in the Transaction Analysis Report. You can analyze a transaction even if you have
not defined an SLA.
User Guide
Analysis
HP LoadRunner (12.50) Page 1738
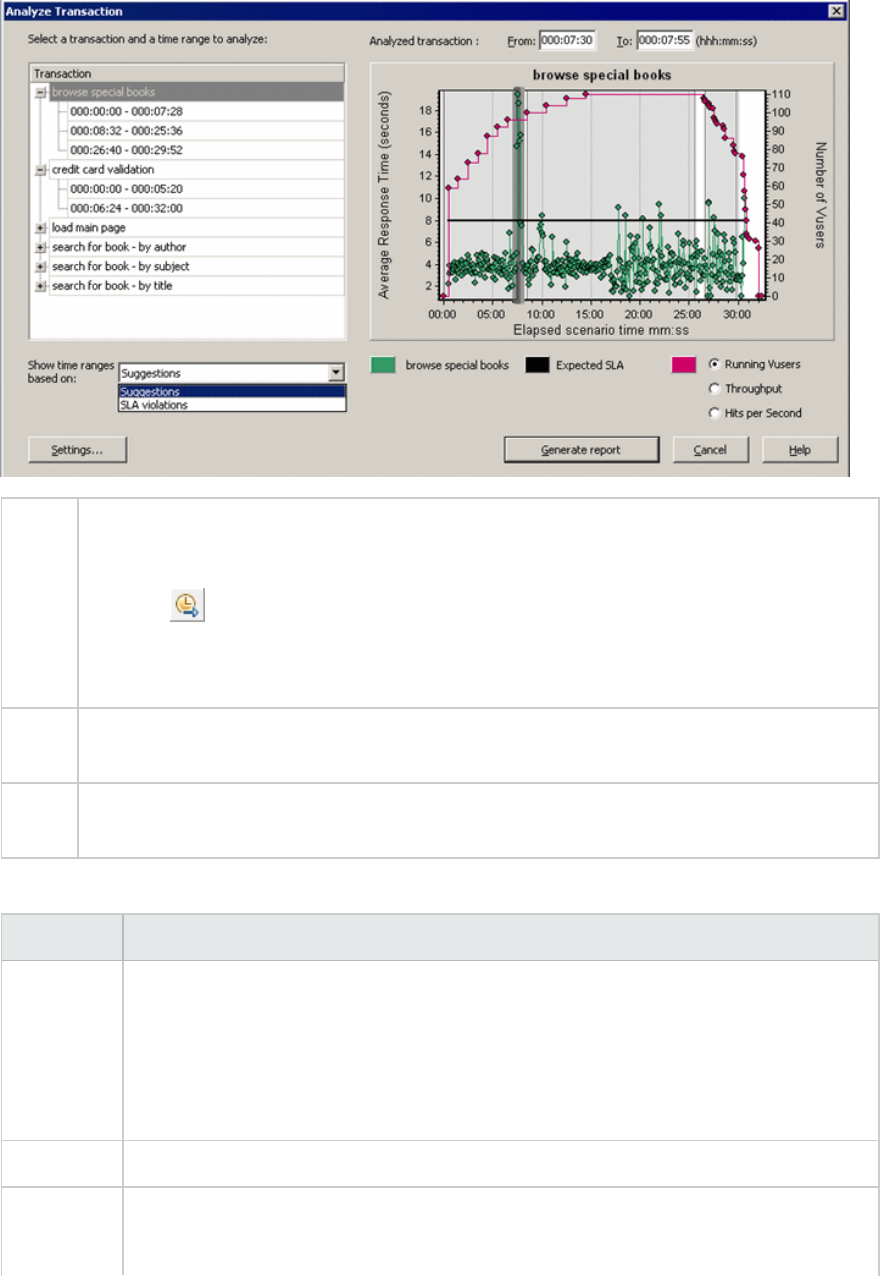
To
access
Reports > Analyze Transaction
Summary Report > right-click menu > Add New Item > Analyze Transaction
Toolbar >
Summary Report with no SLA > Statistics Summary section > Analyze Transaction tool
link
Note Analysis data (for example, transactions) that has been excluded by the Summary Filter will
not be available for analysis in the Transaction Analysis report.
See
also
"Filtering and Sorting Graph Data" on page1480
User interface elements are described below (unlabeled elements are shown in angle brackets):
UI Element Description
Show time
ranges
based on
box
Select one of the display options:
lSuggestions. Lists all transactions and time ranges from the scenario run.
lSLA Violations. Lists only those transactions and time ranges where the
transaction exceeded the SLA. This option does not appear if there were no
transactions that exceeded the SLA.
Transaction Select the transaction to analyze from the Transaction tree.
<Time
Range>
Select the time range to analyze in one of the following ways:
lSelect the time range from the Transaction tree.
User Guide
Analysis
HP LoadRunner (12.50) Page 1739

UI Element Description
lEnter the time range in the From and To boxes above the graph.
lSelect the time range by dragging the bars on the graph.
<Display
options>
Select one of the following:
lRunning Vusers
lThroughput
lHits per Second
The option you select is displayed on the graph and will appear on the snapshot of the
graph that appears on the Transaction Analysis Report. Note that your choice only
affects the display of the graph and not the calculation for correlations.
Settings Click Settings to define the Analyze Transaction settings in the Analyze Transaction
Settings dialog box. For more information, see "Analyze Transaction Settings Dialog
Box" on page1737.
Note: You can also define the Analyze Transaction settings in the Analyze Transaction
Settings tab of the Options dialog box (Tools > Options).
Generate
report
The Transaction Analysis Report opens. Once the report has been created, you can
access it at any time from the Session Explorer.
New Report Dialog Box
This dialog box enables you to create a report based on the report template selected. You can adjust
the report template settings to generate a report that corresponds to the required report layout.
User Guide
Analysis
HP LoadRunner (12.50) Page 1740
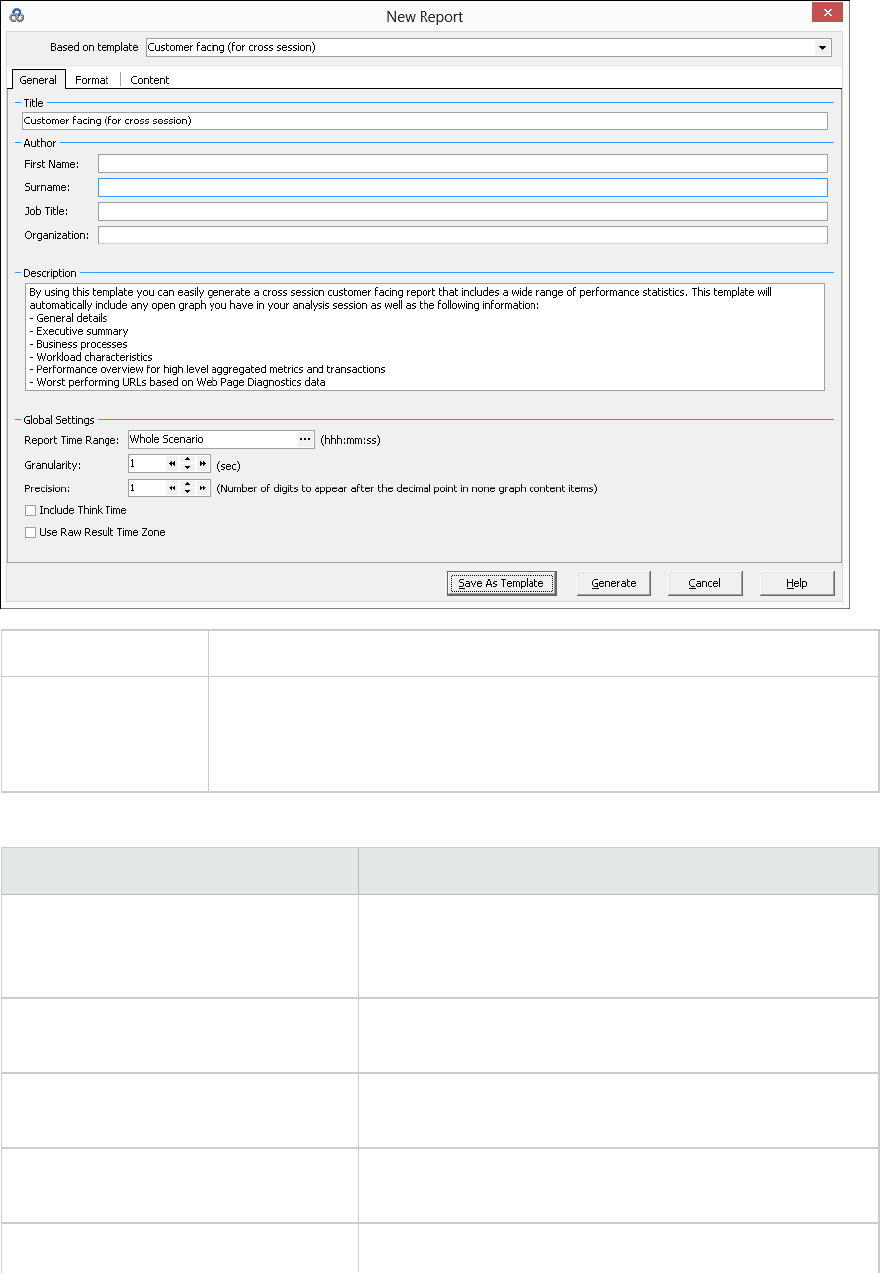
To access Reports > New Report
See also "Report Templates Dialog Box" on the next page
Note: This dialog box and the Report Templates dialog box utilize the same
components.
User interface elements are described below:
UI Element Description
Based on Template The template upon which to build the report. After you
select a template, the corresponding settings of the report
template appear.
General tab For user interface details, see "Report Templates - General
Tab" on page1744.
Format tab For user interface details, see "Report Templates - Format
Tab" on page1745.
Content tab For user interface details, see "Report Templates - Content
Tab" on page1747.
Save As Template Prompts you for a template name that will be added to the
User Guide
Analysis
HP LoadRunner (12.50) Page 1741
UI Element Description
report template list.
Generate Generates the report according to your settings.
Analysis Report Templates
Report Templates Overview
You can use Report Templates to create and customize templates which are used when generating
reports. Report templates can be used across similar scenario runs and saves time and effort on
recreating reports each time.
Using the Report Templates dialog box, you can record document details, define the format of the
report, and select the content items to include in the report and configure each content item
accordingly.
A list of report templates is displayed in the Templates dialog box, under Rich Reports. Select this
option if you want to generate the report in the load run session in word, excel, HTML or PDF format. For
more information on templates, see "Apply/Edit Template Dialog Box" on page1461.
Report Templates Dialog Box
This dialog box enables you to add, modify, import, export, or duplicate a report template.
User Guide
Analysis
HP LoadRunner (12.50) Page 1742
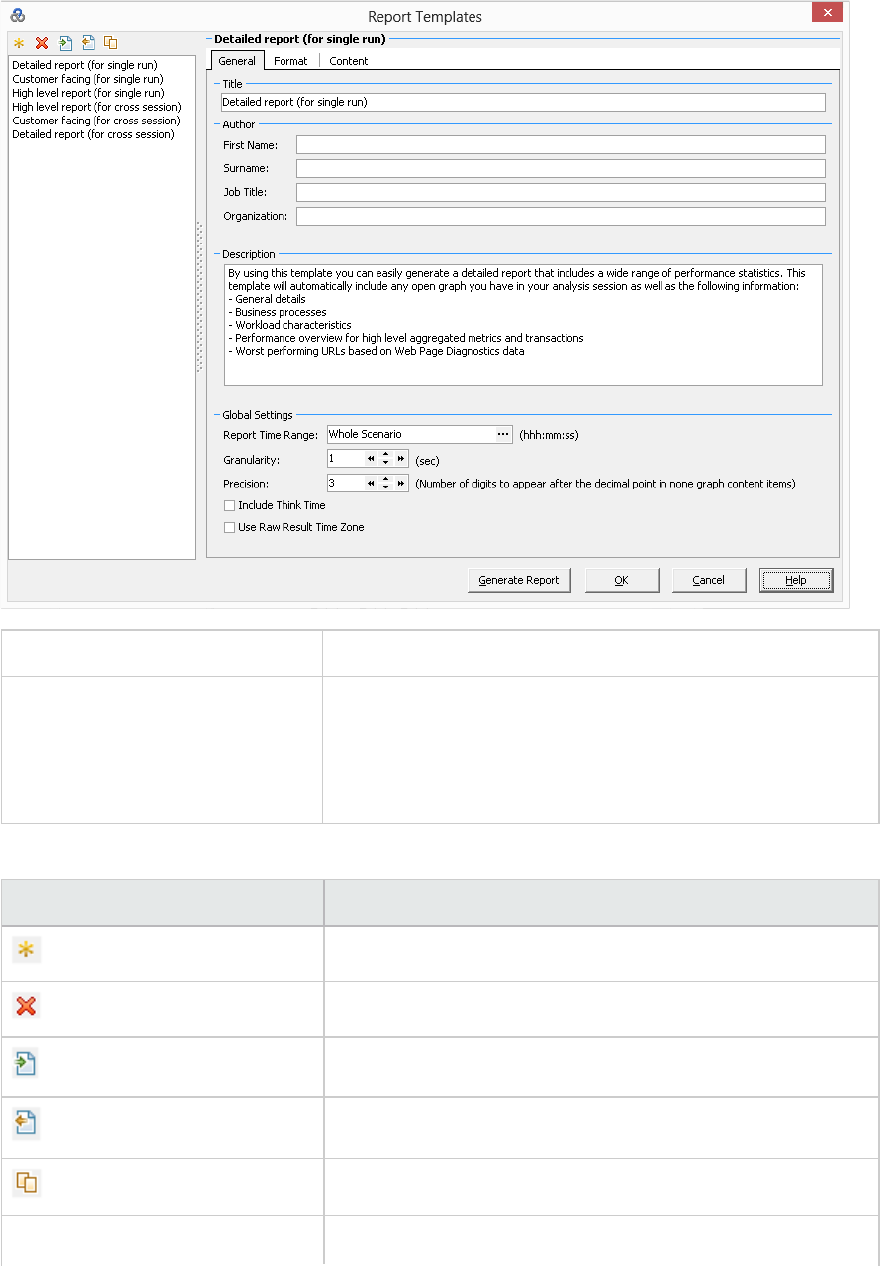
To access Reports > Report Templates
See also l"Report Templates Overview" on the previous page
l"New Report Dialog Box" on page1740
Note: This dialog box and the New Report dialog box utilize the
same components.
User interface elements are described below:
UI Element Description
New. Adds a new report template.
Delete. Removes the selected template.
Import. Imports a report template from an XML file.
Export. Saves the selected template as an XML file.
Duplicate.Creates a copy of the selected template.
General tab For user interface details, see "Report Templates - General
User Guide
Analysis
HP LoadRunner (12.50) Page 1743
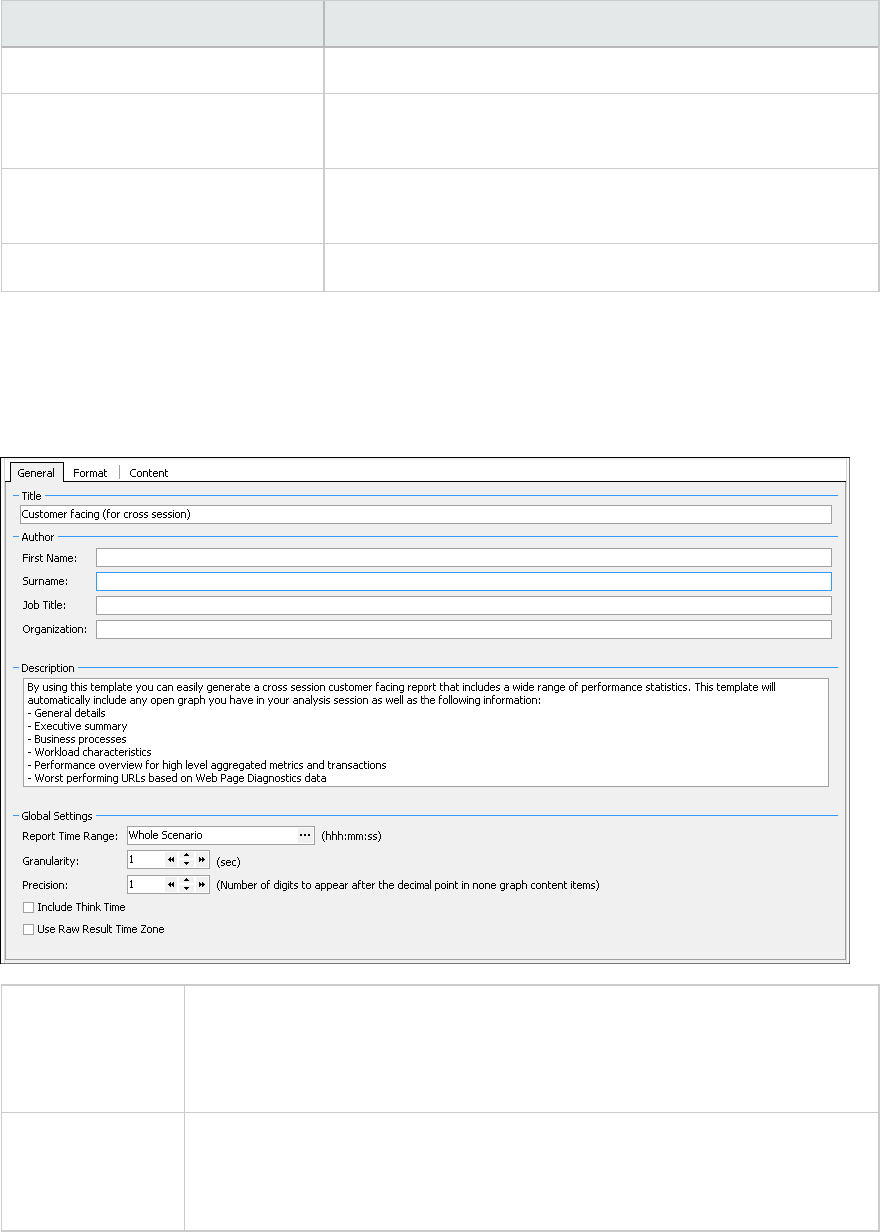
UI Element Description
Tab" on the next page.
Format tab For user interface details, see "Report Templates - Format
Tab" on the next page.
Content tab For user interface details, see "Report Templates - Content
Tab" on page1747.
Generate Report button Generates the report according to your settings.
Report Templates - General Tab
This tab enables you to record document details, such as title, author name and title and set global
settings, such as Report Time Range and granularity.
To Access Reports >New Report… >General tab
or
Reports >Report Templates… >General tab
See also l"Report Templates Overview" on page1742
l"New Report Dialog Box" on page1740
l"Report Templates Dialog Box" on page1742
User interface elements are described below:
User Guide
Analysis
HP LoadRunner (12.50) Page 1744
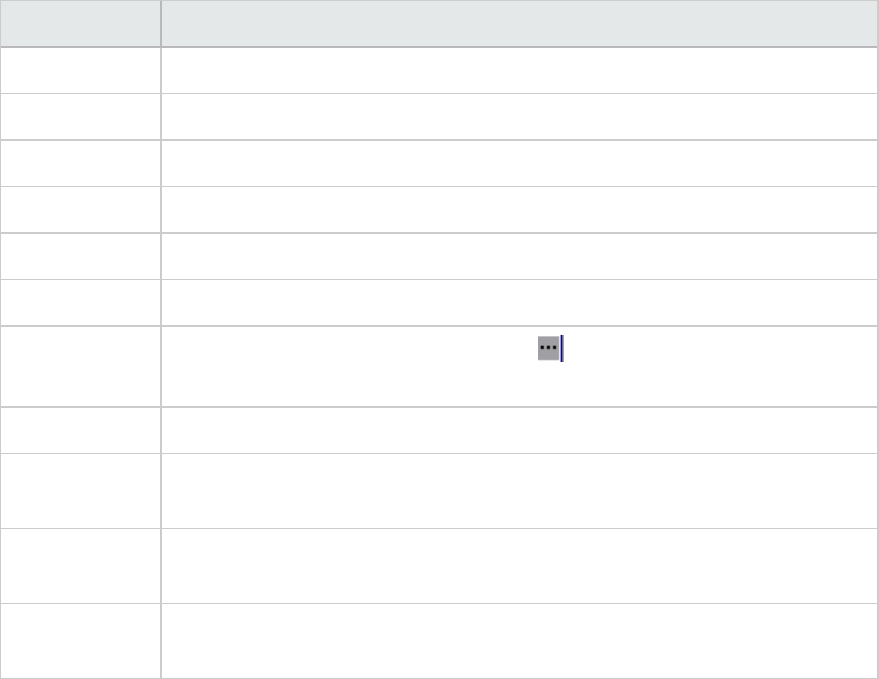
UI Element Description
Title A description of the template.
First Name The first name of the person to display on the report.
Surname The last name of the person to display on the report.
Job title The job title of the person to display on the report.
Organization The name of the organization to display on the report.
Description You can enter a description and include details of the report template.
Report Time
Range
The default setting is Whole Scenario. Click to set the start and end time range
of the scenario runtime to display on the report.
Granularity Define granularity settings (in seconds).
Precision The number of digits to appear after the decimal point in none graph content
items.
Include Think
Time
Include think time when processing the Analysis data. This data is then used when
generating reports.
Use Raw Result
Time Zone
When creating the report, use the time zone that was generated in the raw data
results.
Report Templates - Format Tab
This tab enables you to define the format of report template.
User Guide
Analysis
HP LoadRunner (12.50) Page 1745
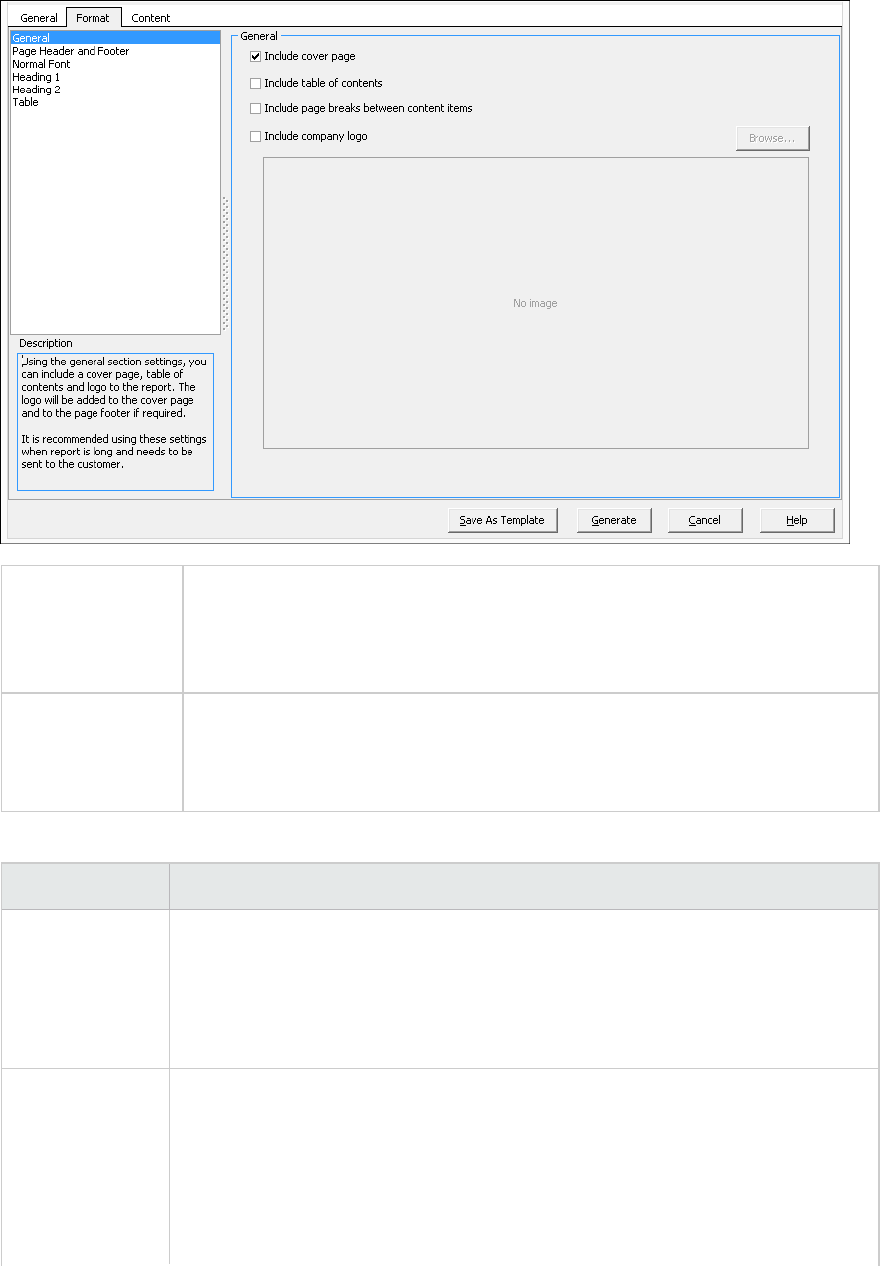
To access Reports >New Report… >Format tab
or
Reports >Report Templates… >Format tab
See also l"Report Templates Overview" on page1742
l"New Report Dialog Box" on page1740
l"Report Templates Dialog Box" on page1742
User interface elements are described below:
UI Element Description
General General options such as:
linclude a cover page
linclude table of contents
linclude company logo
Page Header and
Footer
Header and footer options:
lFont type, size and color
lBold, italicize, or underline
lRight, center or left align
lYou can add tags, such as date, name or organization.
User Guide
Analysis
HP LoadRunner (12.50) Page 1746
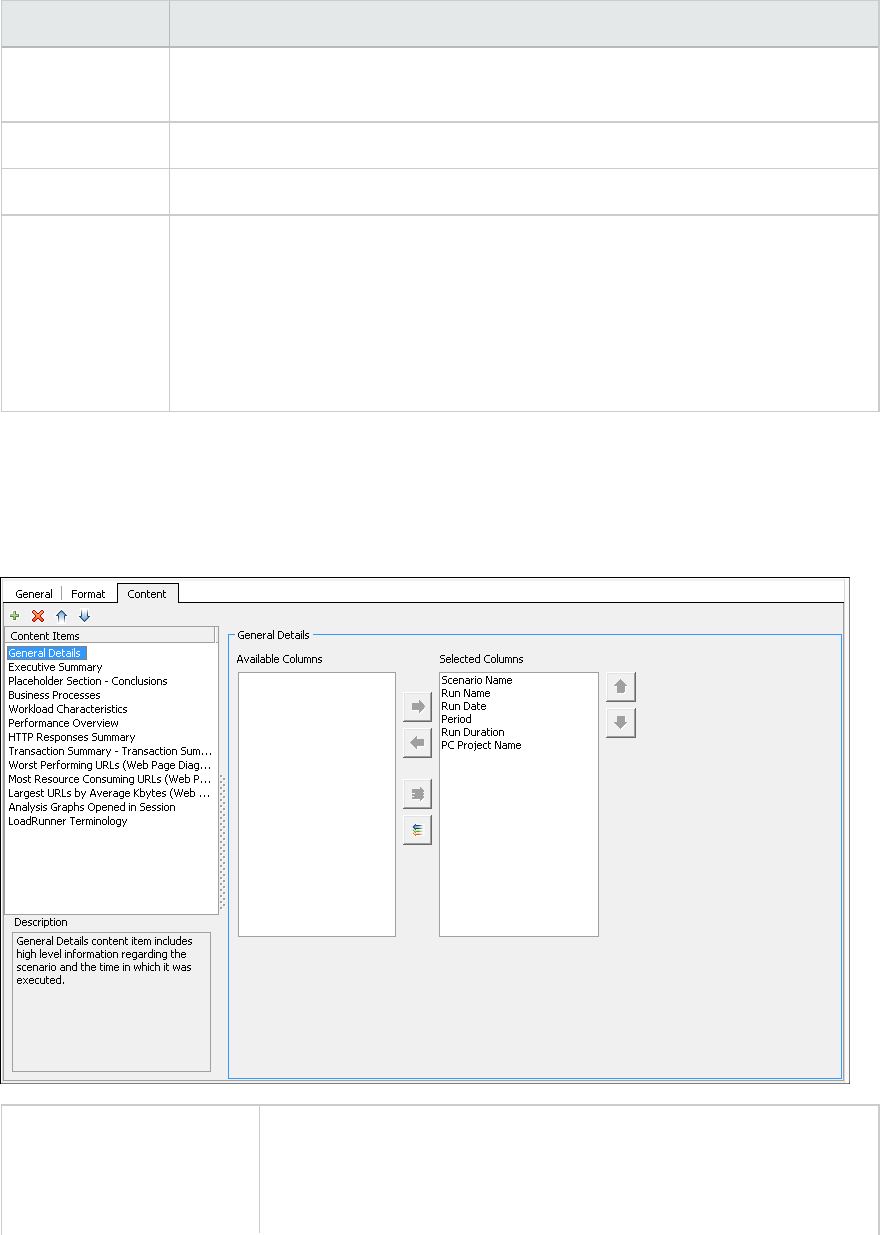
UI Element Description
lYou can include required details such as page count, date, name, and so forth
on the left, center or right column.
Normal Font The type of font to use in the report template.
Heading 1/2 The style for your headings.
Table Table format options:
lFont type, size and color
lBackground color
lBold, italicize, or underline
lRight, center or left align
Report Templates - Content Tab
This tab enables you to select the content items to include in the report and configure each item
accordingly.
To access Reports >New Report… >Content tab
or
Reports >Report Templates… >Content tab
User Guide
Analysis
HP LoadRunner (12.50) Page 1747
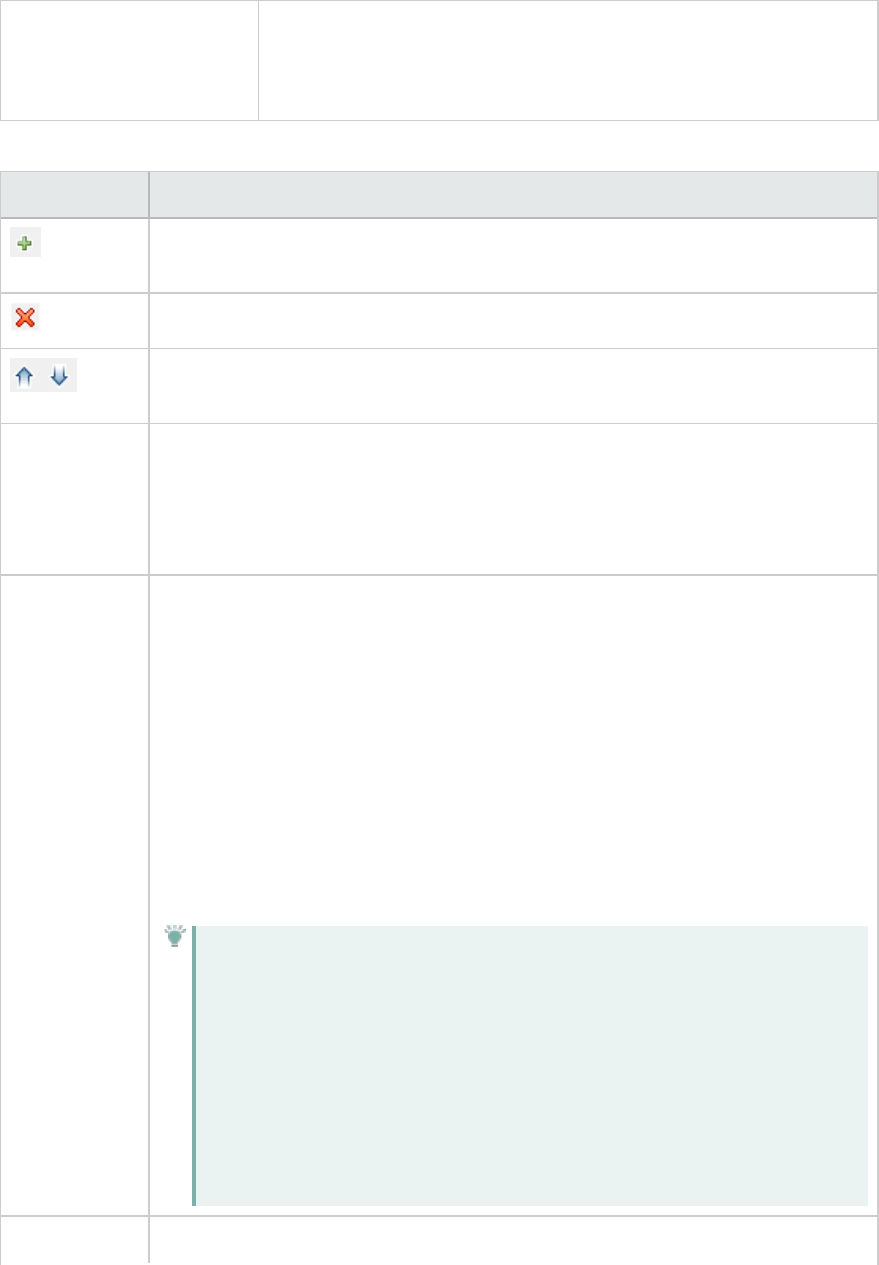
See also l"Report Templates Overview" on page1742
l"New Report Dialog Box" on page1740
l"Report Templates Dialog Box" on page1742
User interface elements are described below:
UI Element Description
Add Content. Opens the Add Content Items pane. Select one or more items from
the grid and click OK.
Delete Content. Removes the selected items from the Content Items pane.
Reorder. Reorders the content items, determining how they will be shown in the
report.
Contents Item
pane
A list of the content items to be included in the report.
lTo add more items, click the Add Content button.
lTo learn about a content item, select it and view the information in the
Description pane beneath it.
<Configuration
pane>
Settings for the selected content item. The components and tabs in this pane vary,
based on the selected content item.
lParameters tab. Settings such as integer values for percentiles or number of
elements.
lColumns tab. Allows you to select the columns to include in the report. To include
a column, make sure it appears in the Selected Columns pane.
lFilter tab. Allows you to enter criteria for including a specific range of a
measurement.
lText area. A rich text box for enter free text, such as in a Placeholder Section or
an Executive Summary.
Tip: For the Performance Summary content item, you can retrieve
different information about transactions such as the total number of
passed or failed transactions. The item, Weighted Average of Transaction
Response timeis calculated based on the following formula: Round (Sum of
Average value in transaction response time / Sum of transactions). For
example if you have three transactions with the response times of 0.005,
0.004, and 0.003, the weighted Average of Transaction Response Time is
Round((0.005 + 0.004 + 0.003)/3) = 0.004
Generate Generates the report according to your settings.
User Guide
Analysis
HP LoadRunner (12.50) Page 1748
UI Element Description
Report
Analysis Report Types
Summary Report Overview
The Summary report provides general information about load test scenario execution. This report is
always available from the Session Explorer or as a tab in the Analysis window.
The Summary report lists statistics about the scenario run and provides links to the following graphs:
Running Vusers, Throughput, Hits Per Second, HTTP Responses per Second, Transaction Summary, and
Average Transaction Response Time.
The appearance of the Summary report and the information displayed, will vary depending on whether
an SLA (Service Level Agreement) was defined.
An SLA defines goals for the scenario. LoadRunner measures these goals during the scenario run, and
analyzes them in the Summary report. For more information on defining an SLA, see "SLA Reports" on
page1754
A Summary report is also provided for Cross Result graphs. For more information about Cross Result
graphs, see "Cross Result Graphs Overview" on page1497.
Note: You can save the Summary reports to an Excel file by selecting View > Export Summary
to Excel or by clicking the Export Summary to Excel button on the toolbar.
Summary Report
The Summary report provides general information about load test scenario execution. It lists statistics
about the scenario run and provides links to the following graphs: Running Vusers, Throughput, Hits Per
Second, HTTP Responses per Second, Transaction Summary, and Average Transaction Response Time.
To access Session Explorer > Reports > Summary Report
Important
information
The Summary report for SAP Diagnostics, J2EE /.NET Diagnostics, and Siebel
Diagnostics provides a usage chart that links to and displays each individual
transaction's Web, application, and database layers, and provides the total usage time
for each transaction.
Relevant
tasks
You can save the Summary reports to an Excel file by selecting View > Export
Summary to Excel or by clicking on the toolbar.
User Guide
Analysis
HP LoadRunner (12.50) Page 1749

See also The Summary reports for the various diagnostics environments are discussed in detail
in the following sections:
"SAP Diagnostics Summary Report" on page1730
J2EE & .NET Diagnostics Graphs Summary Report
"Siebel Diagnostics Graphs Summary Report" on page1700
Summary Report with No SLA
User interface elements are described below:
UI Element Description
Scenario
Details
Shows the basic details of the load test scenario being analyzed.
Statistics
Summary
This section shows a breakdown of the transaction statistics and also provides links to
the following:
lThe SLA configuration wizard. For more information on defining an SLA, see "SLA
Reports" on page1754
lThe Analyze Transaction tool. For more information on analyzing transactions, see
"Analyze Transactions Dialog Box" on page1738
Transaction
Summary
This section displays a table containing the load test scenario's diagnostics data.
Included in this data is a percentile column (x Percent). This column indicates the
maximum response time for that percentage of transactions performed during the
run.
Note: You can change the value in the percentile column in one of the following ways:
lOpen the Options dialog box (Tools > Options). Click the General tab and in the
Summary Report section enter the desired percentile in the Transaction Percentile
box.
lSelect View > Summary Filter or click on the toolbar. The Analysis Summary
Filter dialog box opens. In the Additional Settings area enter desired percentile.
HTTP
Responses
Summary
This section shows the number of HTTP status codes returned from the Web server
during the load test scenario, grouped by status code.
Note: There are additional Diagnostics sections that may appear at the end of the
Summary report, depending on the configuration of your system.
Summary Report with SLA
User interface elements are described below:
User Guide
Analysis
HP LoadRunner (12.50) Page 1750

UI Element Description
Scenario
details
This section shows the basic details of the load test scenario being analyzed.
Statistics
Summary
This section shows a breakdown of the transaction statistics.
X Worst
Transactions
The X Worst Transactions table shows the worst transactions in terms of how often
the transactions exceeded the SLA boundary during the run, and by how much. Click
here to see an example of the 5 Worst transactions section of the summary report.
Note: You choose how many transactions are displayed in this table in the Summary
Report section on the General tab of the options dialog box. Open the dialog box
(Tools >Options) and enter the number of transactions to display. The default is 5.
You expand a transaction to get more information. When expanded, the following
information appears for each transaction:
Failure Ratio
lThe percentage of time intervals where the transaction exceeded the SLA. You
can see this graphically in the Scenario Behavior Over Time section below.
Failure Value
lThe average percentage by which the transaction exceeded the SLA over the
whole run.
Avg exceeding ratio
lThe average percentage by which the transaction exceeded the SLA over a
specific time interval. For example, in the first time interval in the screenshot
above, the figure is 4.25%. This means that during that time interval, the
transaction may have exceeded the SLA boundary several times, each time by a
different percentage margin, the average percentage being 4.25%.
Max exceeding ratio
lThe highest percentage by which the transaction exceeded the SLA over a
specific time interval. For example, using the same time interval as above, the
transaction may have exceeded the SLA several times, each time by a different
percentage margin. The highest percentage being 7.39%
Analysis allows you to analyze a specific transaction in more detail. You open the
Analyze Transaction tool from this section by clicking the Analyze Transaction
button. For more information on Transaction Analysis Reports, see "Analyze
Transactions Dialog Box" on page1738.
User Guide
Analysis
HP LoadRunner (12.50) Page 1751
)

UI Element Description
Scenario
Behavior
Over Time
This section shows how each transaction performed in terms of the SLA over time
intervals. The green squares show time intervals where the transaction performed
within the SLA boundary. Red squares show time intervals where the transaction
failed and gray squares show where no relevant SLA was defined.
Note: The time intervals displayed in the Scenario Behavior Over Time section may
vary for each interval. The time interval set in the tracking period of the SLA is only
the minimum time interval that will be displayed.
It is only the display that varies. The SLA is still determined over the time interval you
choose in the Advanced Settings section.
Analysis allows you to analyze a specific transaction in more detail. You open the
Analyze Transaction tool from the Scenario Behavior Over Time section in one of the
following ways:
lSelect the transaction to analyze from the list and enter the time interval in the
From and To boxes. Then click Analyze Transaction.
lDrag the mouse over the desired transaction and time range to analyze. Then click
Analyze Transaction.
For more information on Transaction Analysis Reports, see "Analyze Transactions
Dialog Box" on page1738.
Transaction
Summary
This section displays a table containing the load test scenario's diagnostics data.
Included in this data is a percentile column (x Percent). This column indicates the
maximum response time for that percentage of transactions performed during the
run. For example, in the table below, the value in the 88 Percent column for browse
special books is 8.072. This means that the response time for 88% of the browse
special books transactions was less that 8.072 seconds. Click here to see an example
of a Transaction Summary.
Note: You can change the value in the percentile column in the Summary Report
section of the General tab of the Options dialog box. Open the dialog box (Tools >
Options) and enter the desired percentage.
Alternatively, you can also change the value in the Summary Filter (View > Summary
Filter) .
HTTP
Responses
Summary
This section shows the number of HTTP status codes returned from the Web server
during the load test scenario, grouped by status code.
Note: There are additional Diagnostics sections that may appear at the end of the
Summary report, depending on the configuration of your system.
User Guide
Analysis
HP LoadRunner (12.50) Page 1752
)
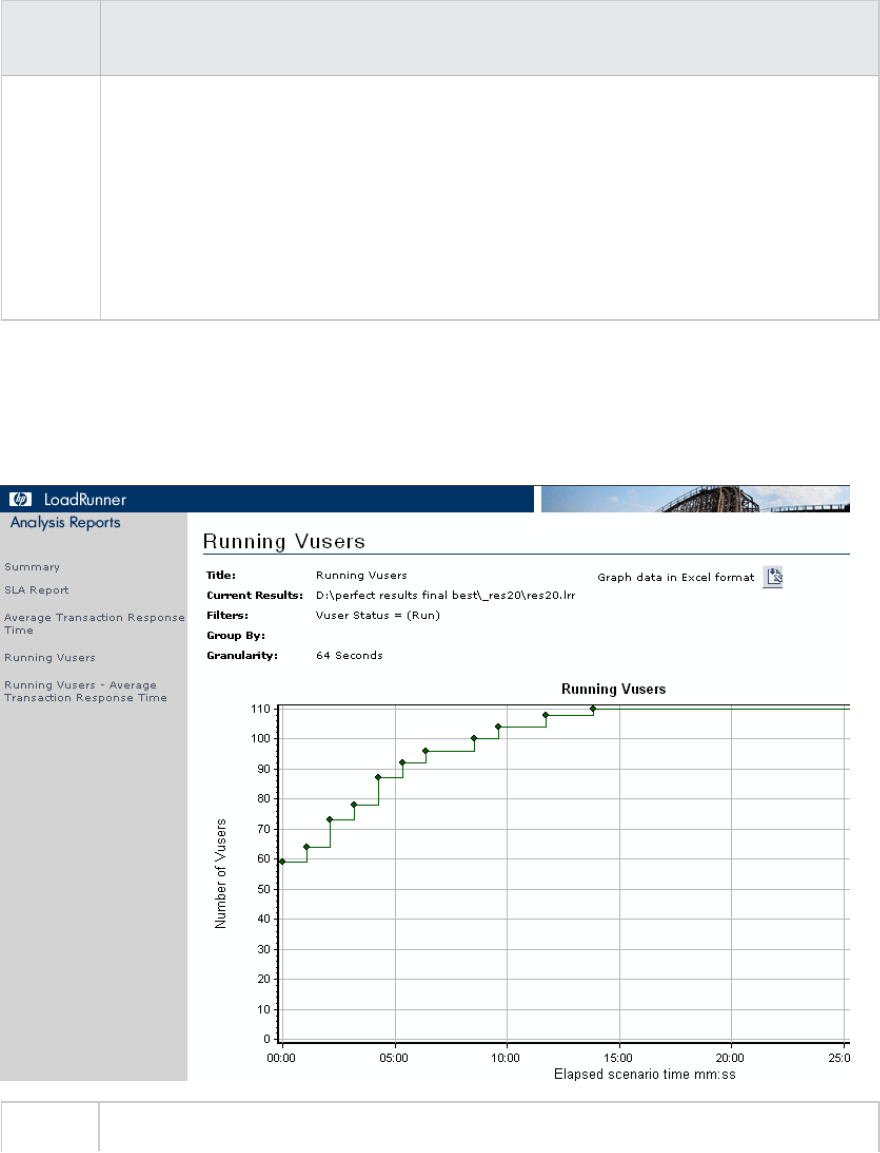
Summary reports for Cross Result Graphs
User interface elements are described below:
UI
Element
Description
<graphs> Displays summary information for the scenarios that you are comparing. The information
is displayed in a way that enables you to compare data from the different scenarios.
Includes the same type of information as the regular Summary report except for the
following:
lSLA information
lDiagnostics information
lScenario behavior over time
HTML Reports
Analysis enables you to create HTML reports for your load test scenario run. It creates a separate page
for each one of the open graphs and reports.
To Use one of the following:
User Guide
Analysis
HP LoadRunner (12.50) Page 1753
access lReports > HTML Report
lToolbar >
Relevant
tasks
lOpen all graphs that you want to include in the report.
lSpecify a path and file name for the HTML report and click Save. Analysis saves a
Summary report which has the same name as the file in the selected folder. The rest
of the graphs are saved in a folder with the same name as the Summary report's file
name. When you create an HTML report, Analysis opens your default browser and
displays the Summary report.
lTo copy the HTML reports to another location, be sure to copy the filename and the
folder with the same name. For example, if you named your HTML report test1, copy
test1.html and the folder test1 to the desired location
User interface elements are described below:
UI Element Description
<Graphs> menu
left frame
Click the graph link to view an HTML report for that graph.
You can view an Excel file containing the graph data, by clicking the Graph data in
Excel format button on the relevant graph page.
SLA Reports
An SLA (Service Level Agreement) defines goals for the load test scenario. LoadRunner measures these
goals during the scenario run and analyzes them in the Summary report. The SLA Report shows the
succeeded or failed status of all SLAs that were defined for the scenario run.
Note: Analysis data (for example, transactions) that has been excluded by the Summary Filter
will not be available for analysis in the SLA report.
To access You create the SLA Report in one of the following ways:
Reports > Analyze SLA
Right-click the Summary pane > Add New Item > Analyze SLA
Summary Report >
Relevant tasks "Defining Service Level Agreements" on page1428
User interface elements are described below:
User Guide
Analysis
HP LoadRunner (12.50) Page 1754
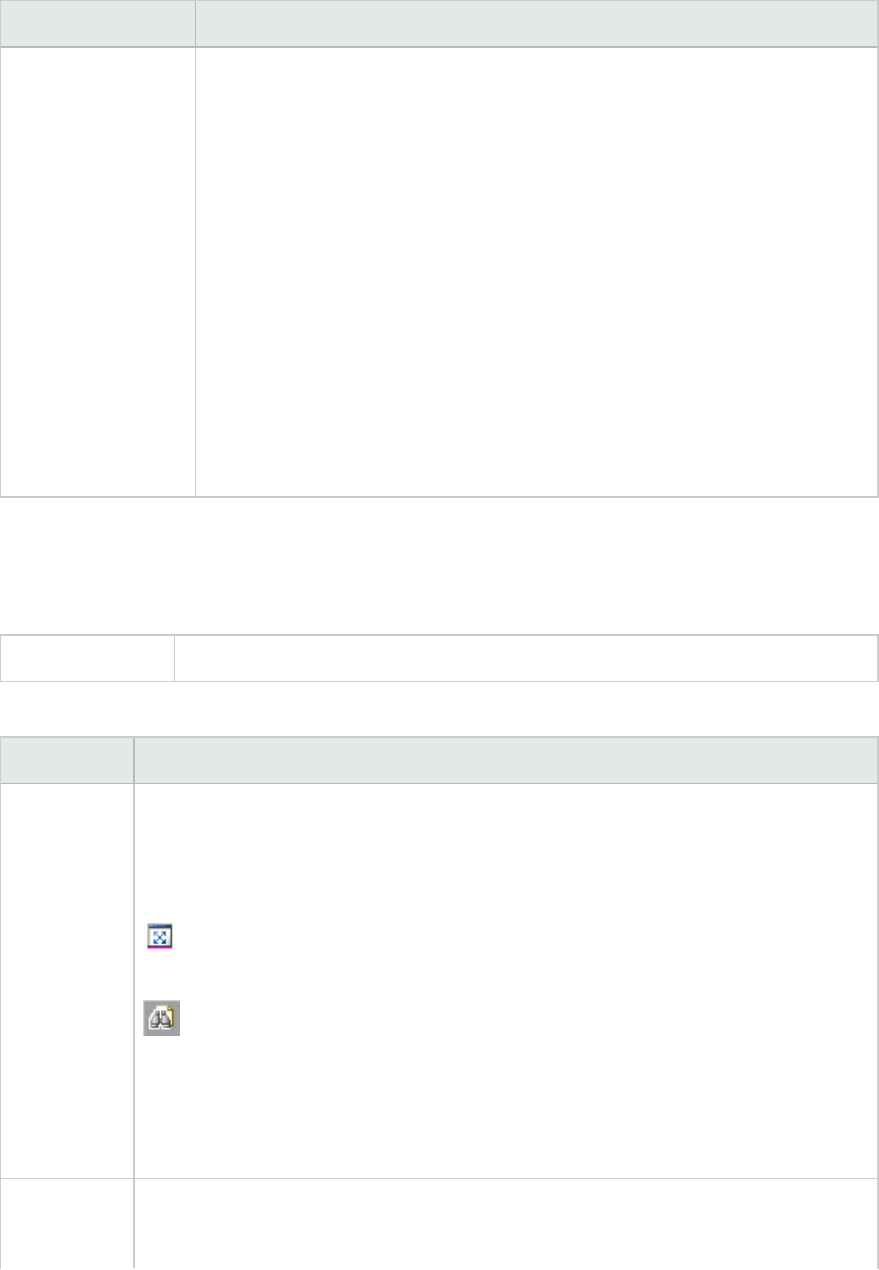
UI Element Description
Display of SLA
statuses
SLA Status per goal definition
lWhere the SLA was defined over the whole run, the report displays a
single SLA status for each goal definition.
SLA status for each transaction per time interval
lWhere the SLA was defined per time interval within the run, the report
displays the status of the SLA for each transaction per time interval. The
green squares show time intervals where the transaction performed
within the SLA boundary. Red squares where the transaction failed and
gray squares show where no relevant SLA was defined.
SLA goal definitions
lWhere the SLA was defined per time interval within the run, a further
section appears detailing the goal definitions for the SLA.
Transaction Analysis Report
This report enables you to individually examine each of the transactions from the load test scenario run.
To access Reports > Analyze Transaction > Generate Report button
User interface elements are described below:
UI Element Description
Observations This section shows both positive and negative correlations between the graph of the
transaction being analyzed, and other graphs based on the settings you chose in the
Analyze Transaction Dialog Box. When two graphs are correlated, it means that their
behavior matches each other by a certain percentage.
To view the correlating graph, select one of the results and then click the View
Graph icon at the bottom of the section. The graph comparison opens.
You can return to the Transaction Analysis Report from the graph comparison at
anytime by clicking the Back to <transaction name> icon on the toolbar.
Note: The correlations are automatically calculated according to a default ratio of
20%. You can adjust this ratio by clicking the arrows next to the percentage. Then
click Recalculate.
Errors This section is divided into two sub-sections.
lApplication Under Test errors. Shows errors that occurred during the transaction
User Guide
Analysis
HP LoadRunner (12.50) Page 1755

UI Element Description
that were direct results of Vuser activity.
lAll errors. Shows Application Under Test errors as well as errors that were not
related to Vuser activity, and which affected your system and not the application
under test.
Observation
Settings
This section displays a summary of the settings that were selected in the Advanced
Settings section of the Analyze Transaction dialog box.
Graph The Graph section displays a snapshot of selected transaction and time range for
analysis merged with the display option you selected (Running Vusers, Throughput, or
Hits per Second). Note that it is only a snapshot and can not be manipulated like
normal graphs.
Importing Data
What do you want to do?
lImport data
lDefine a custom file format
See also:
lSupported file types
lImport Data dialog box
Import Data Tool Overview
The LoadRunner Analysis Import Data tool enables you to import and integrate non-HP data into a
LoadRunner Analysis session. After the import procedure, you can view the data files as graphs within
the session, using all the capabilities of the Analysis tool.
Suppose an NT Performance Monitor runs on a server and measures its behavior. Following a
LoadRunner scenario on the server, you can retrieve the results of the Performance Monitor, and
integrate the data into LoadRunner's results. This enables you to correlate trends and relationships
between the two sets of data: LoadRunner's and the Performance Monitor's.
In this case, the results of the NT Performance Monitor are saved as a .csv file. You launch the Import
Data tool, direct it to the .csv file, and specify its format. LoadRunner reads the file and integrates the
results into its own Analysis session.
For a list of data formats that are supported, see "Supported File Types" on page1758. To define your
own custom data files, see "How to Define Custom File Formats" on page1758.
User Guide
Analysis
HP LoadRunner (12.50) Page 1756
How to Use the Import Data Tool
This task describes how to import data files to integrate into your analysis session.
1. Choose Tools > External Monitors > Import Data. The Import Data dialog box opens.
2. Select the format of the external data file from the File format list box.
3. Click Add File. In the Select File to Import dialog box that opens, the Files of type list box shows
the type chosen in step 2.
4. Set other file format options, as described in "Import Data Dialog Box" on page1763. You must
enter a machine name.
5. To specify character separators and symbols, click Advanced. For more information, see
"Advanced Settings Dialog Box (Import Data Dialog Box)" on page1760.
6. Click Next. The Import Data dialog box opens.
7. Select the type of monitor that generated the external data file. If your monitor type does not
exist, you can add it, as described in How to Customize Monitor Types for Import.
When opening a new graph, you will see your monitor added to the list of available graphs under this
particular category. (See "Open a New Graph Dialog Box" on page1502.)
8. Click Finish. LoadRunner Analysis imports the data file or files, and refreshes all graphs currently
displayed in the session.
User Guide
Analysis
HP LoadRunner (12.50) Page 1757

Note: When importing data into a scenario with two or more cross results, the imported
data will be integrated into the last set of results listed in the File > Cross with Result
dialog box. For more information, see "How to Generate Merged Graphs" on page1501.
How to Define Custom File Formats
This task describes how to define a custom format, if the file format of your import file is not
supported.
If the file format of your import file is not supported, you can define a custom format.
1. Choose Tools > External Monitors > Import Data. The Import Data dialog box opens.
2. From the File Format list, select <Custom File Format>. The Enter New Format Name dialog box
opens.
3. Enter a name for the new format (in this case, my_monitor_format).
4. Click OK. The Define External Format dialog box opens.
5. Specify the mandatory and optional data, as described in "Define External Format Dialog Box" on
page1761.
6. Click Save.
Supported File Types
The following file types are supported:
NT Performance Monitor (.csv)
The default file type of the NT Performance monitor, in comma separated value (CSV) format.
For example:
Reported on \\WINTER
Date: 03/06/15
Time: 10:06:01 AM
Data: Current Activity
Interval: 1.000 seconds
,,% Privileged Time,% Processor Time,% User Time,
,,0,0,0,
,,,,,,
,,Processor,Processor,Processor,
Date,Time,\\WINTER,\\WINTER,
User Guide
Analysis
HP LoadRunner (12.50) Page 1758
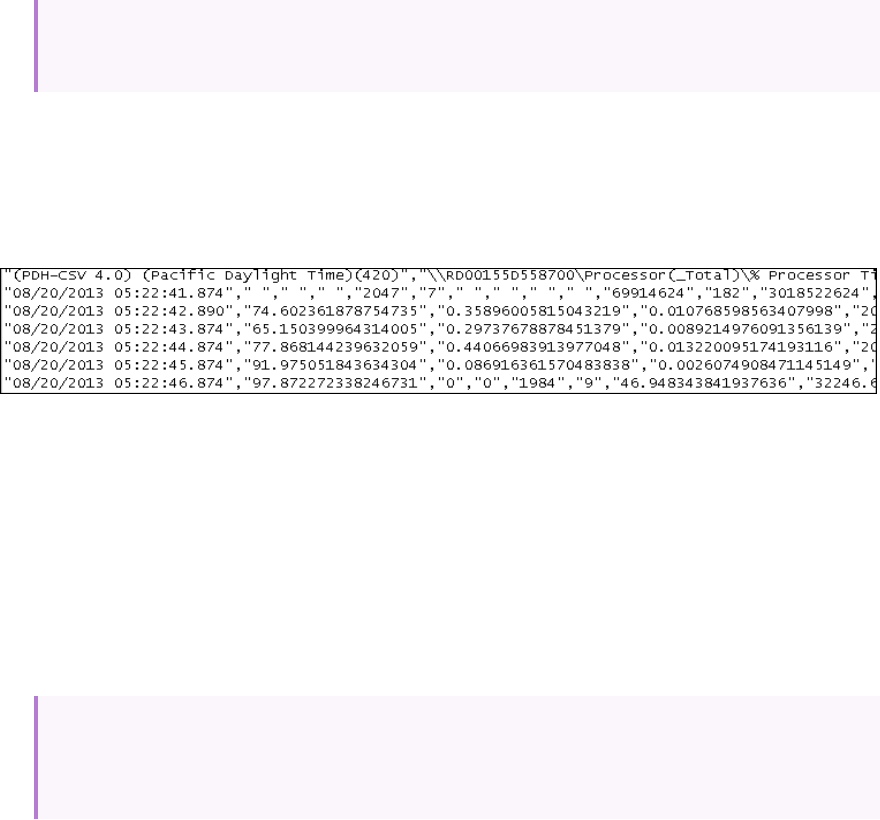
03/06/15,10:06:00 AM , 0.998, 1.174, 0.000,
03/06/15,10:06:00 AM , 0.000, 0.275, 0,000,
Windows Performance Monitor (.csv)
The default file type for the Windows 2000, 2008 server, Windows 7, etc. performance monitor, in CSV
format.
For example:
Standard Comma Separated File (.csv)
This file type has the following format:
date, time, measurement_1,measurement_2, ...
where fields are comma separated and first row contains column titles.
The following example from a standard CSV file shows 3 measurements: an interrupt rate, a file IO rate
and a CPU usage. The first row shows an interrupt rate of 1122.19, an IO rate of 4.18, and a CPU busy
percentage of 1.59:
date, time, interrupt rate, File IO rate, CPU busy percent
03/06/15,10:06:01,1122.19,4.18,1.59
03/06/15,10:06:01,1123.7,6.43,1.42
Master-Detail Comma Separated File (.csv)
This file type is identical to Standard Comma Separated Files except for an additional Master column
which specifies that row's particular breakdown of a more general measurement. For example, a
Standard CSV file may contain data points of a machine's total CPU usage at a given moment:
Date,Time,CPU_Usage
However, if the total CPU usage can be further broken up into CPU time per-process, then a Master-
Detail CSV file can be created with an extra column ProcessName, containing the name of a process.
Each row contains the measurement of a specific process's CPU usage only. The format will be the
following:
Date,Time,ProcessName,CPU_Usage
as in the following example:
User Guide
Analysis
HP LoadRunner (12.50) Page 1759
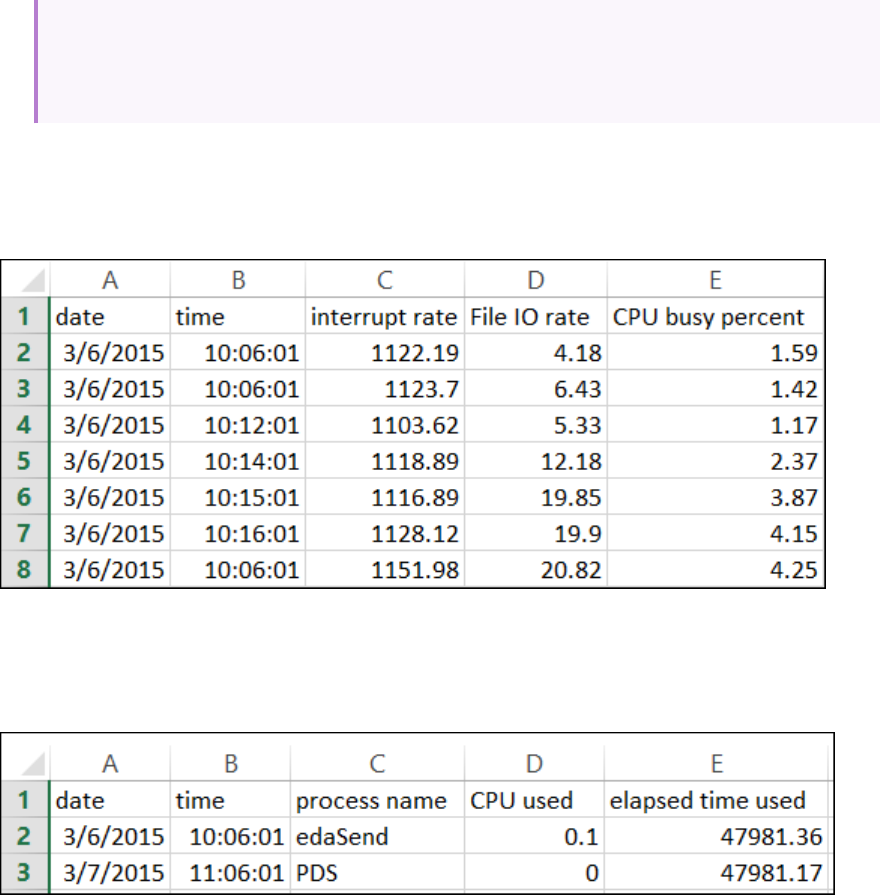
date, time, process name, CPU used, elapsed time used
03/06/15,10:06:01,edaSend,0.1,47981.36
03/06/15,10:06:01,PDS,0,47981.17
Microsoft Excel File (.xls)
Created by the Microsoft Excel application. The first row contains column titles. (.xlxs format is not
supported.)
Master-Detail Microsoft Excel file (.xls)
Created by Microsoft's Excel application. The first row contains column titles. It contains an extra
Master column. (.xlxs format is not supported.)
Advanced Settings Dialog Box (Import Data Dialog Box)
This dialog box enables you to define the data format of the imported file to settings other than of the
regional configuration.
User Guide
Analysis
HP LoadRunner (12.50) Page 1760
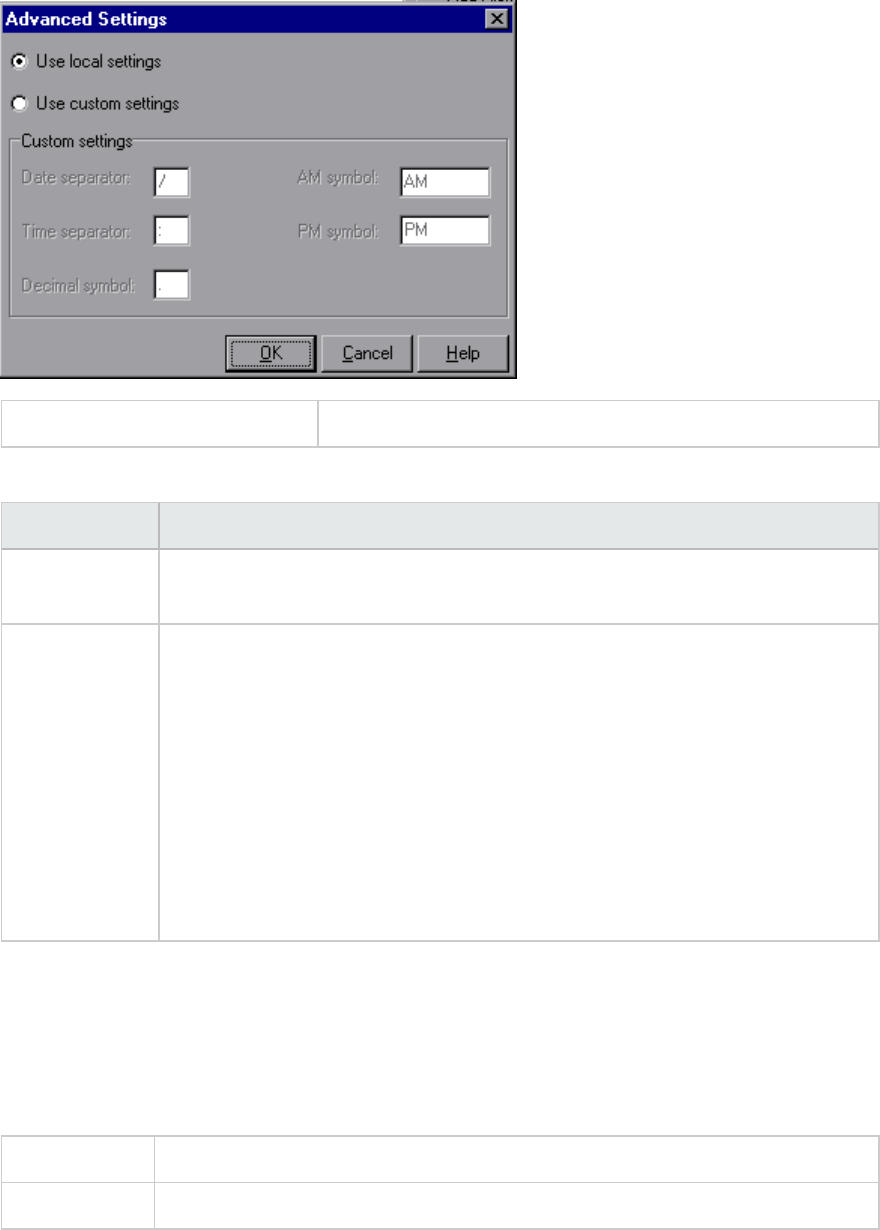
To access Tools > External Monitors > Import Data > Advanced
User interface elements are described below:
UI Element Description
Use local
settings
Keep default settings of the regional configuration. Disables the Custom Settings
area of the dialog box.
Use custom
settings
Define your own settings. Enables the Custom Settings area of the dialog box.
lDate Separator. Enter a custom symbol, for example, the slash (`/') character in
11/10/02
lTime Separator. Enter a custom symbol, for example, the colon `:' character in
9:54:19
lDecimal symbol. Enter a custom symbol, for example, the `.' character in the
number 2.5
lAM symbol. Enter a custom symbol for the hours between midnight and noon.
lPM symbol. Enter a custom symbol for the hours between noon and midnight.
Define External Format Dialog Box
This dialog box enables you to define a new file format for external data files not supported by Analysis.
The Define External Format dialog box is divided into mandatory and optional information.
To access Tools > External Monitors > Import data > File Format > <Custom File Format>
Relevant tasks "How to Define Custom File Formats" on page1758
User Guide
Analysis
HP LoadRunner (12.50) Page 1761
Mandatory tab
User interface elements are described below:
UI
Element
Description
Date
Column
Number
Enter the column that contains the date. If there is a master column (see "Supported File
Types" on page1758), specify its number.
Time
Column
Number
Enter the column that contains the time.
Use
Master
Column
Select this if the data file contains a master column. A master column specifies the row's
particular breakdown of a more general measurement.
File
Extension
Enter the file suffix.
Field
Separator
Enter the character that separates a field in a row from its neighbor. To select a field
separator character, click Browse and select a character from the define Field Separator
dialog box.
Optional tab
User interface elements are described below:
UI Element Description
Date Format Specify the format of the date in the imported data file. For example, for European
dates with a 4 digit year, choose DD/MM/YYYY.
Time Zone Select the time zone where the external data file was recorded. LoadRunner Analysis
aligns the times in the file with local time zone settings to match LoadRunner results.
(LoadRunner does not alter the file itself).
Machine
Name
Specify the machine name the monitor runs on. This associates the machine name
with the measurement.
Exclude
Columns
Indicate which columns are to be excluded from the data import, such as columns
containing descriptive comments. When there is more than one column to be
excluded, specify the columns in a comma-separated list. For example, 1,3,8.
Convert file Monitors often run on UNIX machines. Check this option to convert data files to
User Guide
Analysis
HP LoadRunner (12.50) Page 1762
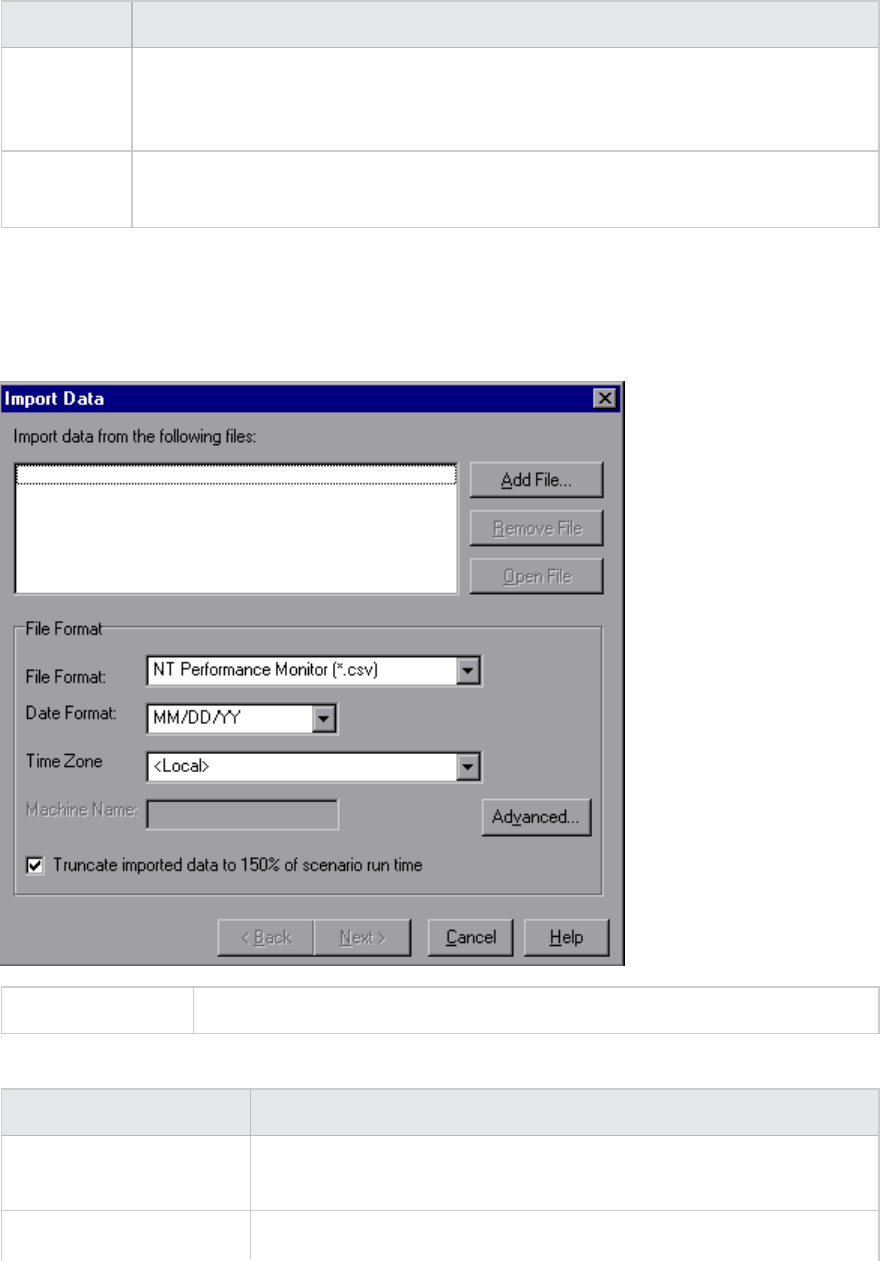
UI Element Description
from UNIX
to DOS
format
Windows format. A carriage return (Ascii character 13) is appended to all line feed
characters (Ascii character 10) in the UNIX file.
Skip the
first [] lines
Specify the number of lines at the start of the file to ignore before reading in data.
Typically, the first few lines in a file contain headings and sub-headings.
Import Data Dialog Box
This dialog box enables you to import and integrate non-HP data files into Analysis session.
To access Tools > External Monitors > Import Data
User interface elements are described below (unlabeled elements are shown in angle brackets):
UI Element Description
Import data from the
following files
Displays the files that you selected for import.
Add file Select an external data file to import. A dialog box opens to enable you
User Guide
Analysis
HP LoadRunner (12.50) Page 1763

UI Element Description
to select files.
Remove file Delete an external data file from the list.
Open File Open an external data file using the associated application.
File Format Set the file format options.
lFile Format. Choose the format of the external data file. For an
explanation of available formats, see "Supported File Types" on
page1758.
lDate Format. Specify the format of the date in the imported data
file. For example, for European dates with a 4 digit year, choose
DD/MM/YYYY.
Time Zone Select the time zone where the external data file was recorded.
LoadRunner Analysis compensates for the various international time
zones and aligns the times in the file with local time zone settings in
order to match LoadRunner results. If the times in the imported file are
erroneous by a constant offset, you can synchronize the time.
<Synchronize with
scenario start time>
Time Zone also contains the option <Synchronize with scenario start
time>. Choose this to align the earliest measurement found in the data
file to the start time of the LoadRunner scenario.
Machine Name Specify the machine name the monitor runs on. This associates the
machine name with the measurement. For example, a file IO rate on the
machine fender will be named File IO Rate:fender. This enables
you to apply Graph settings by the machine name. For more
information, see "Filtering and Sorting Graph Data" on page1480.
Advanced For more information, see "Advanced Settings Dialog Box (Import Data
Dialog Box)" on page1760.
Truncate imported data
to 150% of scenario
runtime
In certain cases, the external monitor may have collected data over a
time period that was larger than the actual load test. This option
deletes data that was collected while the load test was not running,
limiting the data collection period to 150% of the load testing period.
Troubleshooting and Limitations for Analysis
This section contains troubleshooting and limitations for Analysis.
User Guide
Analysis
HP LoadRunner (12.50) Page 1764
General
lIf the behavior of Analysis is unpredictable and unexpected messages appear, this might be a result
of UAC Virtualization having been enabled for Analysis. You can disable UAC Virtualization on the
Analysis.exe process in the Windows Task Manager.
lAnalysis API works only on x86 platforms. If you are using Visual Studio, define the platform as x86 in
the project options.
lWhen analyzing results from a load test in which the Web Vusers accesses the AUT through a proxy
server, the Time to First Buffer Breakdown graph shows only zero values for Network Time and
Server Time. This is because the "time to first buffer" metric is turned off when working behind a
proxy, and the time values can only be calculated to the proxy server.
lLoad results that contain transactions with the '@' or ',' characters may conflict with existing
transactions. This is because Analysis attempts to replace those characters with the '_', and if this
results in a transaction name conflict, an error will occur.
Workaround: Avoid using the '@' and ',' characters in transaction names.
lThe following Analysis default settings have been modified: Include Think Time is disabled and
Display summary while generating complete data is enabled.
lWhen exporting Analysis reports to MS Word, the content load may affect the table format within the
document. The recommended format is RTF.
lIf the results take a long time to load, make sure that the Use cached file to store data option in
Tools > Options > General tab is disabled. You should only enable this for very large result files. For
details, see "General Tab (Options Dialog Box)" on page1407.
User Guide
Analysis
HP LoadRunner (12.50) Page 1765
Graphs
lWhen the Analysis results consists of a large number of similar measurements, you may experience
spikes in graphs, or an Out of memory message.
Workaround: For 64-bit Windows, make sure that you have 4 GB or more memory. F or 32-bit
Windows, Select Start > Run, and type msconfig. In the Boot tab, click Advanced Options. Select
Maximum memory and set it to the maximum value.
lAfter running a Language Pack, the Analysis data generated from the sample session (in the <LR
Installation>\tutorial folder) is displayed in English and filtering cannot be applied.
Workaround: Regenerate the graphs.
lThe Transaction Response Time (Percentile) graph may show inaccurate results.
Workaround: Follow these steps:
a. Close the Analysis application.
b. Open the C:\Program Files (x86)\HP\LoadRunner\bin\dat\percentile.def file
c. In the [Graph Definition] section, set BasicTableName to an empty string:
[Graph Definitions]
BasicTableName=
d. Open Analysis again and view the graph.
ALM Integration
lWhen trying to save an Analysis session to the ALM repository with CAC on IIS, you may encounter an
error message indicating that the session cannot be saved and that the connection is unavailable..
Workaround: Increase the size of the uploadReadAHeadSize parameter to 16 MB or higher, and
restart IIS. You can use the command line: C:\Windows\System32\inetsrv\appcmd.exe set
config "Default Web Site" -section:system.webServer/ServerRuntime
/uploadReadAheadSize:16777216 /commit:apphost
lAfter running a Language Pack, the Analysis data generated from the sample session (in the <LR
Installation>\tutorial folder) is displayed in English and filtering cannot be applied.
Workaround: Regenerate the graphs.
Microsoft SQL Server
lIf you are using your own policy in an MS SQL server, you may need to add your own account to the
Analysis database template (in the <LR Installation>\bin\dat folder).
lAnalysis may fail to load results created through an MS SQL database, if the decimal separator on the
Analysis machine is different from the decimal separator on the MS SQL Server machine (common on
non-English operating systems).
User Guide
Analysis
HP LoadRunner (12.50) Page 1766
Workaround:Change the decimal separator on Analysis machine to be the same as the MS SQL Server
machine.
lFiltering of transactions for MS Access and SQL queries is limited to 100 transactions.
lIf you are using Microsoft SQL Server 2000, you need to either migrate Analysis data, or upgrade to
Microsoft SQL Server 2005. The following tasks describe how to migrate and upgrade.
To migrate legacy Analysis data to a SQL 2005 server:
1. From the SQL Server Management Studio, using Object Explorer, connect to an instance of SQL
Server Database Engine.
2. Expand Databases, right-click Analysis database, select Tasks\Copy Database.
3. Follow the instructions in the wizard.
To upgrade SQL 2000 to SQL 2005:
1. Uninstall SQL 2000.
2. Install SQL 2005.
3. Restore Analysis data from backup. (http://msdn.microsoft.com/en-us/library/ms177429
(SQL.90).aspx)
User Guide
Analysis
HP LoadRunner (12.50) Page 1767
User Guide
HP LoadRunner (12.50) Page 1768

Additional Components
You can install additional components that provide advanced features for working with LoadRunner.
The setup files are located in the Additional Components folder inside the root folder of the
LoadRunner installation DVD or download folder.
The table below indicates which additional components are available, and where you should install each
component:
Folder Component Description Install on...
Agent for Citrix Server SetupCitrixAgent.exe Installs the Citrix
Agent which enhances
VuGen’s capabilities in
identifying Citrix client
objects during Citrix
protocol record and
replay. For installation
instructions, see
"Install the
LoadRunner Citrix
Agent on the Citrix
Server (Optional)" on
page448.
The agent also
enables you to use
additional Citrix API
functions. For details,
see the LoadRunner
Function Reference.
Citrix server
Agent for Microsoft
Terminal Server
SetupMSTerminalAgent.exe Installs a utility that
enhances the RDP
protocol’s recording
mechanism in VuGen.
For installation
instructions, see
"Installing the
Microsoft Terminal
Server Agent" on
page1047.
RDP server
Assembly Crawler for AssemblyCrawlerConsole.exe Installs a command- LoadRunner
User Guide
Additional Components
HP LoadRunner (12.50) Page 1769

Folder Component Description Install on...
Analysis API line utility to build a
.NET configuration file
for a LoadRunner
Analysis API
application. For more
information, open the
Analysis API
Reference from the
Start >
Documentation menu
on the LoadRunner
machine (not available
with VuGen
Standalone).
Analysis
machine
HostID Generator Host ID Generator tool,
licidgenerator.exe
Opens the Host ID
Generator utility that
displays the
computer’s Host ID.
This is useful when
requesting a license.
For details, see
"LoadRunner License
Utility" on page1058.
LoadRunner
Controller
machine
HP NV (Network
Virtualization)
NV4HPControllerSetup.exe
NV4HPLGSetup.exe
Installs HP Network
Virtualization for the
Controller or load
generator machine.
For details, see
"Network
Virtualization
Integration" on
page1366.
LoadRunner
Controller
and load
generator
machines
IDE Add-Ins hp.lr.vugeneclipse42addin.jar
LRVS2010IDEAddInSetup.exe
LRVS2012IDEAddInSetup.exe
Installs add-ins for
Visual Studio or
Eclipse enabling you to
create Vuser scripts in
your standard
development
environment using the
LoadRunner API. This
Visual
Studio /
Eclipse
machine
with VuGen
User Guide
Additional Components
HP LoadRunner (12.50) Page 1770

Folder Component Description Install on...
integration also allows
you to run the test
directly from Visual
Studio or Eclipse, to
test its functionality.
For details, see
"Creating Scripts in
External IDEs" on
page1001.
IDE Add-Ins Dev LREclipseIDEAddInDevSetup.exe
LRVS2010IDEAddInDevSetup.exe
LRVS2012IDEAddInDevSetup.exe
Setup files for
developer add-ins for
Visual Studio 2010/
2012 and Eclipse,
enabling you to create
NUnit or JUnit tests in
your standard
development
environment using the
LoadRunner API. For
details, see "Creating
Scripts in External
IDEs" on page1001.
Visual
Studio or
Eclipse
machine
with VuGen
LoadRunnerProtocolSDK SetupLoadRunnerProtocolSDK.exe Allows you to create
and distribute custom
LoadRunner protocols.
For details, see
"Protocol SDK" on
page1045.
Any machine
with VS
2012 and
WiX Toolset
3.8 or higher
mobile
RemoteAgent
Executable files for several
platforms
Starts the Mongoose
Web server to provide
mobile functionality.
For details, see "How
to Record and Analyze
Traffic (for Mobile
Applications)" on
page579.
Mobile AUT
backend
server
SAP Tools SapSpy.exe
VerifyScripting.exe
lSAPGUI Spy.
Examines the
VuGen
machine
User Guide
Additional Components
HP LoadRunner (12.50) Page 1771

Folder Component Description Install on...
hierarchy of GUI
Scripting objects,
on open windows of
SAPGUI Client for
Windows.
lSAPGUI Verify
Scripting. Verifies
that the SAPGUI
Scripting API is
enabled.
For details, see "How
to Configure the SAP
Environment" on
page653.
with SAPGUI
client
Third Parties Source files The folder contains
the source code of
some third party
software components
which are being used
in LoadRunner.
N/A
Virtual Table Server SetupVTS.exe Virtual Table Server
(VTS) offers an
alternative to
standard LoadRunner
parameterization. For
details, see
"Parameterizing
Overview" on
page341.
Any machine
Standalone Applications
The following LoadRunner standalone applications are available in the DVD/Standalone Applications
folder.
Folder Component Description Install on...
Analysis
Standalone
SetupAnalysis.exe Installs LoadRunner Analysis as a
standalone application. Install this to
Any machine
User Guide
Additional Components
HP LoadRunner (12.50) Page 1772

Folder Component Description Install on...
open LoadRunner results and create
graphs and reports on a separate
machine. For details, see "Introducing
Analysis" on page1397.
Load Generator SetupLoadGenerator.exe Installs the LoadRunner agent on the
machine in order to run load tests.
After you install this software, you
access this machine from the
Controller. For details, see "Load
Generators" on page1110.
Any machine
MI Listener SetupMIListener.exe Installs the HPMI Listener, which
servers as a router between the
Controller and the LoadRunner
agent. For details, see "How to Set Up
Your LoadRunner System Over
Firewalls" on page1273.
Dedicated
machine
Monitors Over
Firewall
SetupMoFW.exe Installs the HP Monitors Over Firewall
component, allowing you to monitor
servers located over a firewall. For
details, see "How to Set Up Your
LoadRunner System Over Firewalls"
on page1273.
Dedicated
machine
TruClient
Standalone
SetupTruClient.exe Installs LoadRunner TruClient as a
standalone application. Install this to
tool to record Web applications with
TruClient technology. You save the
recordings to a script that can be
used in a LoadRunner test run. For
details, see "TruClient Protocol" on
page673.
Any machine
VuGen
Standalone
SetupVuGen.exe Installs LoadRunner Virtual User
Generator (VuGen) as a standalone
application, allowing you to create
scripts for a load test. For details,
see "Introducing VuGen" on page48.
Any machine
User Guide
Additional Components
HP LoadRunner (12.50) Page 1773

Function Reference
The HP LoadRunner Function Reference describes functions that can be used in Vuser scripts in several
HP products. They can be used with supported protocols in scripts maintained in HP Virtual User
Generator for use in load testing, application management (HPALM), and functional testing (HP Unified
Functional Testing). For information about applicability, refer to the product documentation.
To open the Function Reference from a machine with LoadRunner, click Start > All Programs > HP
Software > HP LoadRunner > Documentation > Function Reference. In icon-based desktops, such as
Windows 8, search for Function and select Function Reference from the results.
Send Us Feedback
Let us know how we can improve your experience with the User Guide.
Send your email to:sw-doc@hp.com
User Guide
Function Reference
HP LoadRunner (12.50) Page 1774
