Set In Georgia 50pt WFC CLO Style Guide
User Manual: Pdf
Open the PDF directly: View PDF ![]() .
.
Page Count: 34
- The Guide to the CLO Style Guide
- Slide Number 2
- Slide Number 3
- Slide Number 4
- Slide Number 5
- Slide Number 6
- Slide Number 7
- Slide Number 8
- Slide Number 9
- Slide Number 10
- Slide Number 11
- Slide Number 12
- Slide Number 13
- Slide Number 14
- Slide Number 15
- Slide Number 16
- Slide Number 17
- Slide Number 18
- Slide Number 19
- Slide Number 20
- Slide Number 21
- Slide Number 22
- Slide Number 23
- Slide Number 24
- Slide Number 25
- Slide Number 26
- Slide Number 27
- Slide Number 28
- Slide Number 29
- Slide Number 30
- Slide Number 31
- Slide Number 32
- Slide Number 33
- Slide Number 34

The Guide to the CLO Style Guide
October 10, 2017
David Preston, CFA
CLO and Commercial ABS Research
(704) 410-3080
david.preston@wellsfargo.com
Geoff Horton, CFA
CLO and Commercial ABS Research
(704) 410-3352
geoffrey.horton@wellsfargo.com
Mackenzie Miller
CLO and Commercial ABS Research
(704) 410-3358
mackenzie.miller@wellsfargo.com
Please see page 32 for the rating definitions, important disclosures and
required analyst certifications. 10/10/17 at 3:00 p.m. ET
This report is available on wellsfargoresearch.com and on Bloomberg WFRE
All estimates/forecasts are as of 10/10/17 unless otherwise stated.

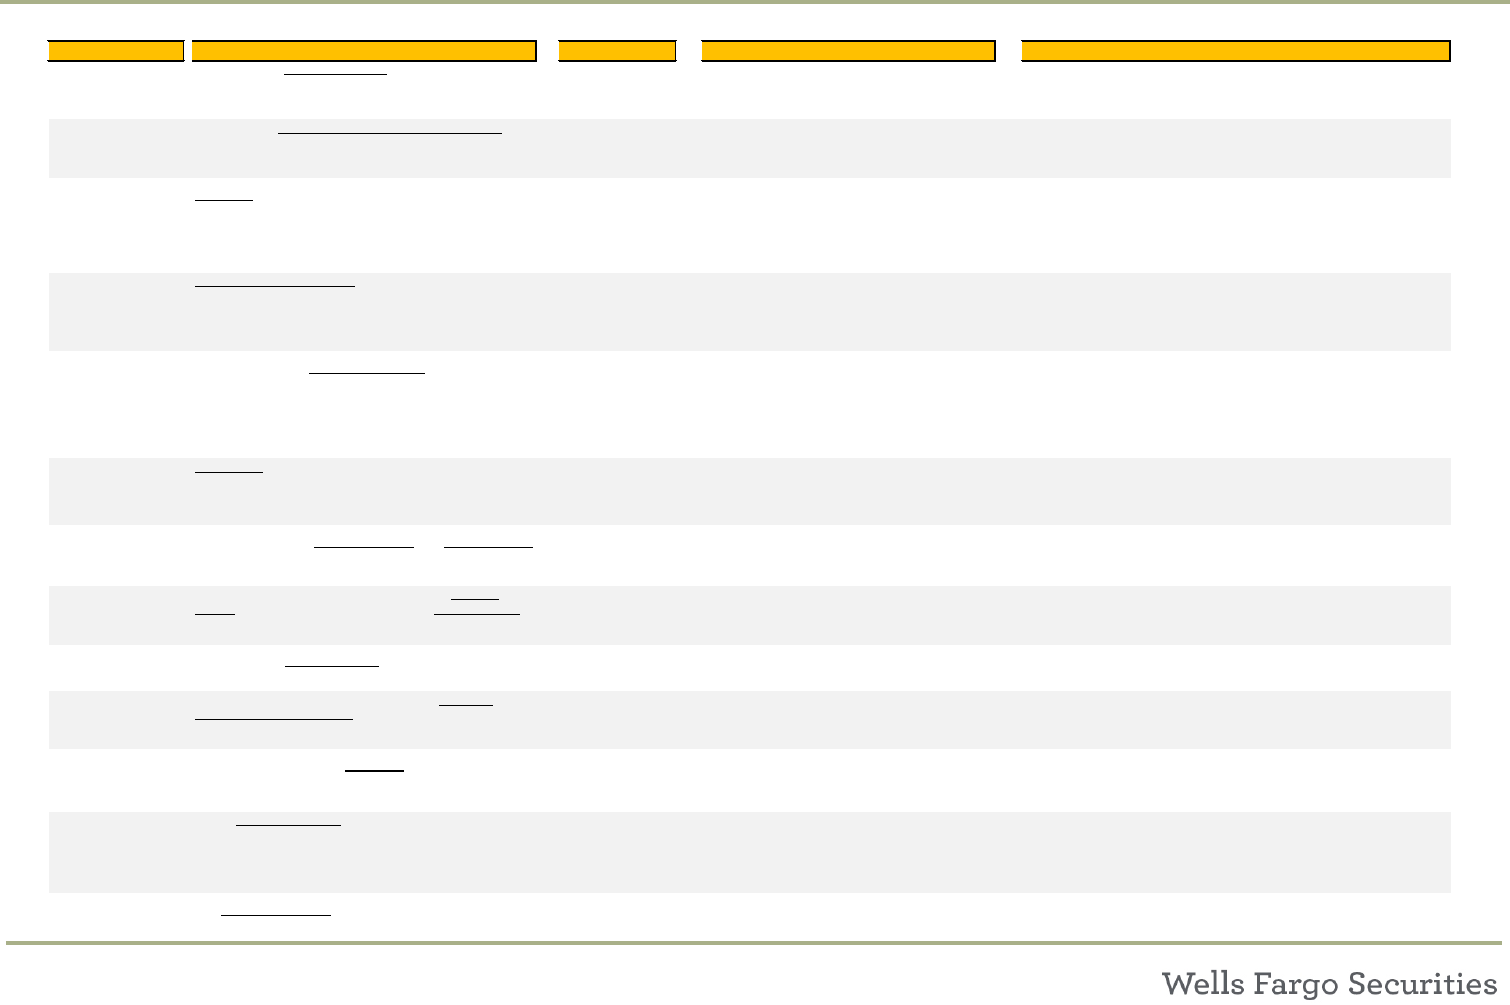
Contents
2
Introduction Min. OC Cushion
Overview / Caveats 3Summary 18
Metric Summary Table 5History / Common Metric Pairings 19
WAS Caa/CCC
Summary 6Summary 20
History / Common Metric Pairings 7History / Common Metric Pairings 21
WARF 2nd Lien Exposure
Summary 8Summary 22
History / Common Metric Pairings 9History / Common Metric Pairings 23
Adj. NAV < 80 Exposure
Summary 10 Summary 24
History / Common Metric Pairings 11 History / Common Metric Pairings 25
Diversity Score Wt. Avg Bid Depth
Summary 12 Summary 26
History / Common Metric Pairings 13 History / Common Metric Pairings 27
Normalized Eq. Pmt MV NAV
Summary 14 Summary 28
History / Common Metric Pairings 15 History / Common Metric Pairings 29
Leverage BB MVOC
Summary 16 Summary 30
History / Common Metric Pairings 17 History / Common Metric Pairings 31

We present The Guide to the CLO Style Guide, a companion to our monthly CLO
Manager Style Guide.
We believe that evaluating manager performance should always be viewed within the
appropriate context. This report intends to give investors the tools needed to evaluate
the CLOs in their respective portfolios.
We provide descriptions and strengths/weaknesses for 14 different metrics. Investors
may prioritize certain performance metrics; using these metrics, investors can
evaluate holdings using market and manager data for a specific metric.
The data are only a snapshot (based on each deal’s most recent Intex update), yet
investors can also use the data to infer prior tactical or strategic maneuvers.
Investors can compare relative position within various metrics. We urge investors not
to focus on the specific number; differences can be small.
CLO Style Guide Data: Overview and Caveats
3

In addition to the individual strengths and weaknesses listed, we also note that ALL the
metrics listed are subject to the following drawbacks:
All the data are a snapshot - as of the latest Intex update within the three months prior to the
Style Guide (with the exception of price data, leverage and equity payment data), and does not
account for the starting point or the path taken to the current point.
Therefore, the managers’ style may have changed over time. A manager could have had a high-
spread portfolio in 2014 but have since rotated to lower-spread assets.
Deals with lower OC cushions may have been issued with tighter cushion.
Similarly, loans <80 do not account for purchase price. A manager may have purchased loans
at 50 versus purchasing the loans at new issue.
All the metrics are averages, and may mask distortions, such as barbelling.
All the data are subject to vintage biases – for example, 2016 deals have a very different profile
than 2013 or 2014 deals. Therefore, if a manager’s outstanding deals are overweight one vintage,
their data may be skewed.
We believe that even given these drawbacks, the metrics, when combined, can provide a
directional look at manager style / performance.
4
CLO Style Guide Data: Overview and Caveats
Metric Description Curr. Mkt Avg. Strength Weakness
WAS
The calculated Wt. Avg Spread of the portfolio – giving
no credit for LIBOR or for LIBOR floors
357
Straightforward - loan market's perception of
risk expressed as average coupon
Does not account for liquidity
May not match CLO reported WAS
WARF
Measures the weighted average Moody's rating of
the assets.
Lower WARF = Higher average credit rating
Higher WARF = Lower average credit rating
2802
Commonly used, expresses average rating of
portfolio
Assumes ratings are a good proxy for risk
May not be calculated the same way across all deals
Adj. NAV
Adj. NAV is the equity NAV of the CLO, but not carrying
all loans at their current market value.
Calculated using loans trading at 85+ carried at par; 75 -
85 = 80; and < 75 = 65.
67.1%
Compensates for weaknesses of liquidation NAV
and par based NAV
Less intiutive;
Does not adequately punish very low priced loans (< 50)
NAV is affected by vintage and how notes/equity are sold at new issue
Div.
Moody’s diversity score: based on how many assets,
how many industries and how big the positions are. A
par weighted calculation that indicates collateral
concentration in terms of both issuer and industry
concentration.
74
Commonly used measure of portfolio
concentration
Diversity score may not be correlated with credit quality
Industry classifications may not be standardized
Norm. Eq. Pmt
The total sum of all equity payments made during
reinvestment, converted to an average quarterly
payment. Equity distribution is the quarterly equity
payment divided by the equity notional value.
4.3%
Looks at avg equity pmt over time
Adjusts for the fact that the first equity pmts
often differ in payment period length, and
differing first pmt periods can produce high or
low first pmts
Does not account for debt cost or vintage differences
Not adjusted for refi/ reset, which can affect equity NAV & payments
Lev.
Leverage provided by CLO structure; Total initial deal
balance / equity notional balance.
10.8
Easy to calculate in Intex
Uses equity notional balance - similar to equity
pmt data
Based on structural leverage, not actual asset leverage, which
technically would be more accurate
Min. OC
Difference between actual OC level and OC Test limit
for the tightest OC test in the deal (not including Int.
Diversion tests – only true OC tests)
419
Intuitive & commonly used
Lower OC cushion are typically indicative of
losses or stressed assets
Does not account for initial structuring or OC calculation differences
Only a snapshot; does not show OC gained or lost
Caa/CCC
Intex’s fields show % of the portfolio rated Caa or
below, and the % of the portfolio rated CCC or below
4.3% / 3.8%
Intuitive & commonly used
Quick measure of lower rated assets
May be calculated differently from deal to deal Also, the data reported
in Intex may refer to concentration limits, not to Excess Caa or Excess
CCC Test levels used for OC test calculation
May not include data from deals not rated by that rating agy
2nd Lien
The percent of 2nd lien loans held by the CLO 1.77 The percent of 2nd lien loans held by the CLO Not much differentiation; may not serve as a stand alone proxy for risk
<80
Average # of loans in the pool that have current
market prices below 80
2.4%
Current data on loan market's view of more
likely default candidates
Commonly used metric for tail risk in CLO
portfolios
Does not account for purchase price
At times, $80 may be not be the right cut-off price
Bid Depth
Weighted average of the # of bids on the loans in the
CLO portfolio.
4.9
Proxy for liqudity of underlying loans - which
can be used as a proxy for holdings of smaller
or "lightly syndicated" loans
Does not account for quality/size of bids in the market
NAV
Equity Net Asset Value; the current liquidation valueo
of the portfolio, less outstanding note balance.
58.0% Commonly used metric for equity valuation
CLO is not a mark to market vehicle; liklely is only an estimate of true
liquidation value due to transaction costs and management fees senior
to equity.
NAV is affected by vintage and how notes/equity are sold at new issue
BB MVOC
The Market Value OC Ratio of the BB notes (Portfolio
liquidation value coverage of BB notes)
107.0 Commonly used metric CLO is not a mark to market vehicle
CLO Metric Summary
5
CLO Metrics: Weighted Average Spread (WAS)
6
Metric Weighted Average Spread (WAS)
Description/ Uses
Time
Median Level Chg. From Current
Current (Sep 2017)
357
12M Ago (Sep 2016)
384 -27
18M Ago (Mar 2016)
381 -24
Higher equity payments Lower equity payments
More risky assets - higher WARF/ Caa/ CCC/ 2nd Lien Less risky assets - lower WARF/ Caa/ CCC/ 2nd Lien
Lower market-value metrics - NAV, Adj. NAV, BB MVOC Higher market-value metrics - NAV, Adj. NAV, BB MVOC
Asset Holding ($mm) 3mL + Spread
Loan 1 53mL + 300
Loan 2 2.5 3mL + 350
Loan 3 2.5 3mL + 425
Weighted Avg. Spread 3mL + 344
Data Source Intex
● Easy to calculate/provided in Intex
●
Straightforward - loan market's perception of risk
expressed as average coupon
● Strong relationship with Equity Payments
The calculated Wt. Avg Spread of the portfolio – giving no credit for LIBOR or for LIBOR floors
i.e. if all the loans are L+350, the metric would be 350 bps
Can infer risk appetite / risk profile of the loan pool.
All else equal, a lower spread manager should have less risky assets. if a manager has low spread – and low equity
distributions – investors may expect a higher NAV, since they are taking less risk in the portfolio.
Calculation Example
Market Stats
Weaknesses
Lower Spread Pool
Metric Analysis
Common Metric
Pairs/Tradeoffs
● Subject to vintage bias - spread levels are dependent on
loans available in the market
● Managers that have a larger share of deals issued in
2016/2017 may have lower WAS levels than managers with
a larger share of 2013/2014 deals
● May not account for liquidity / size of underlying loans
Higher Spread Pool
Strengths
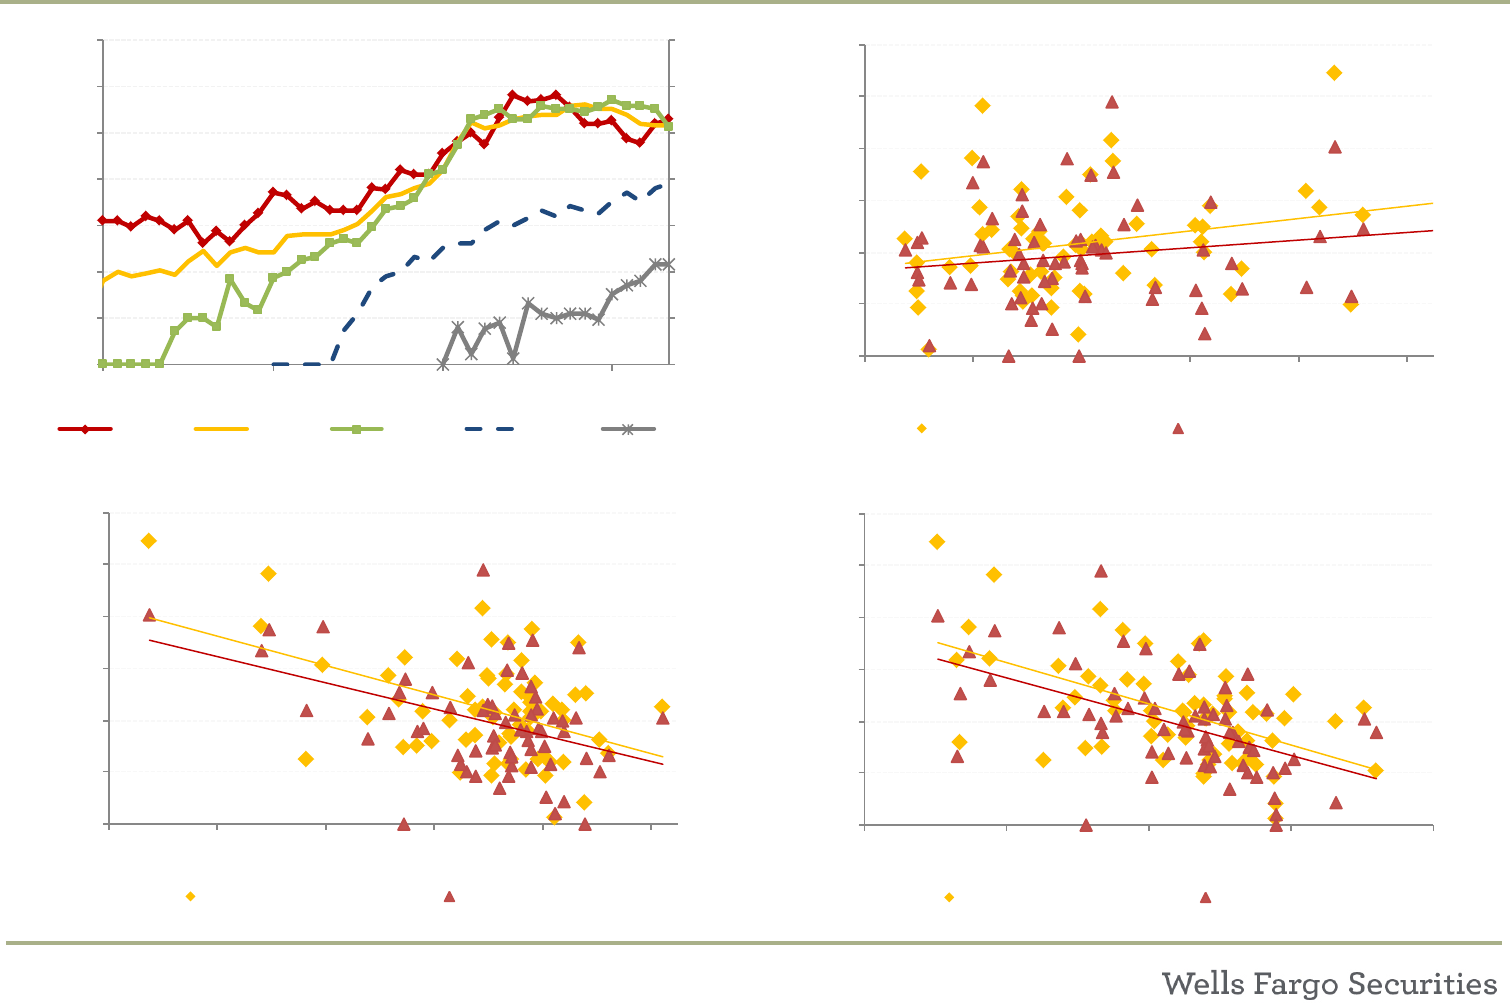
CLO Metrics: Weighted Average Spread (WAS)
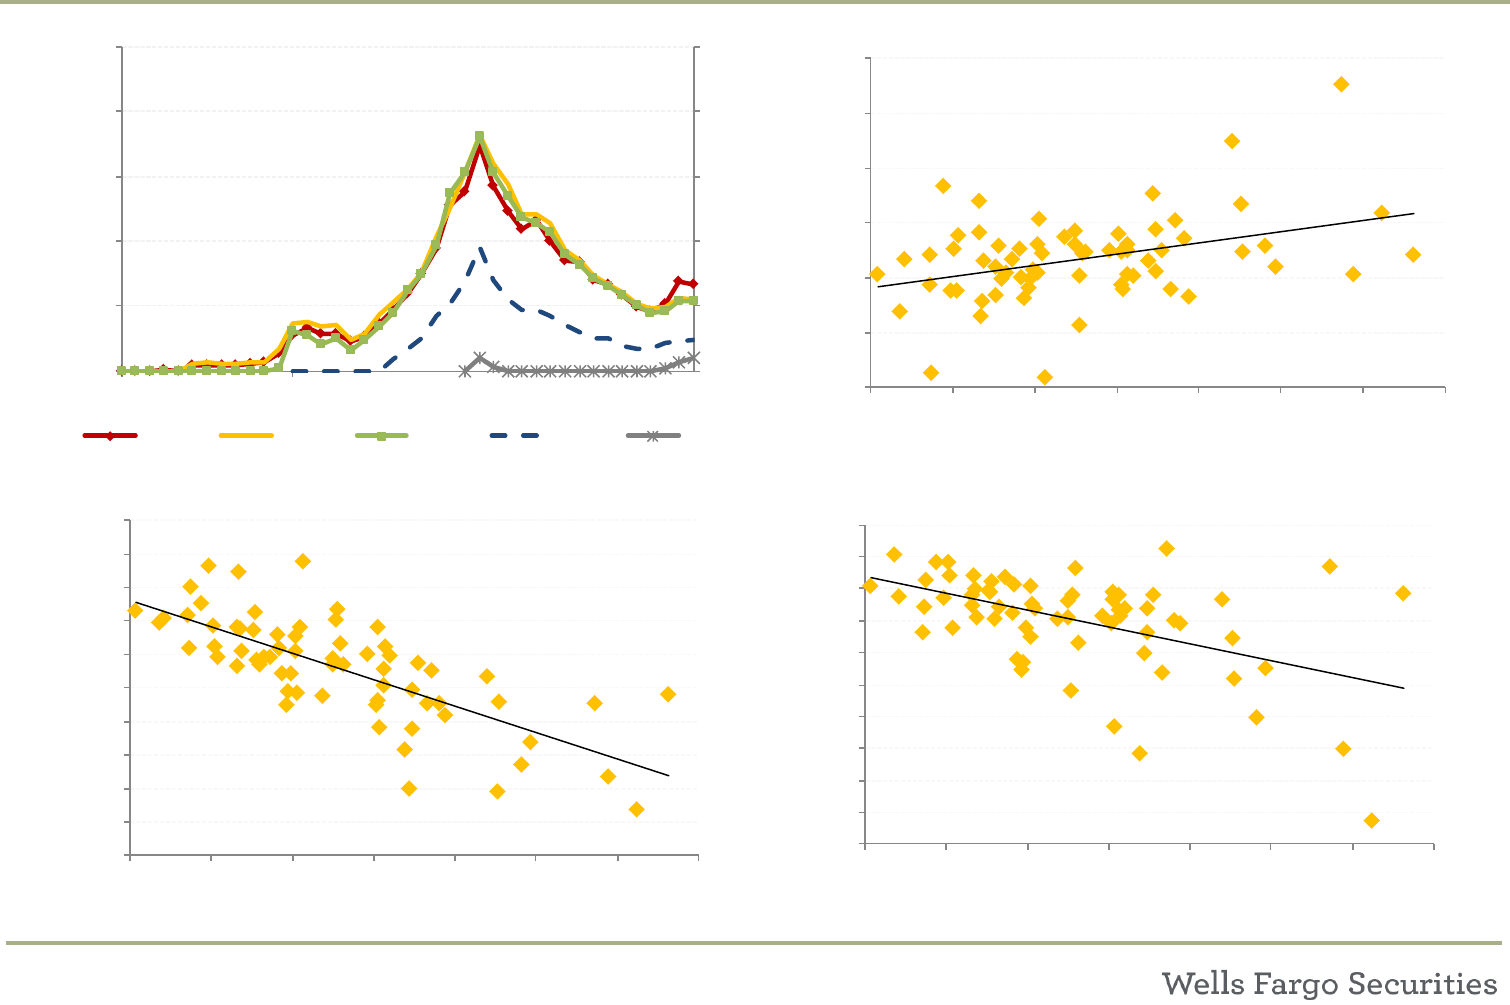
7
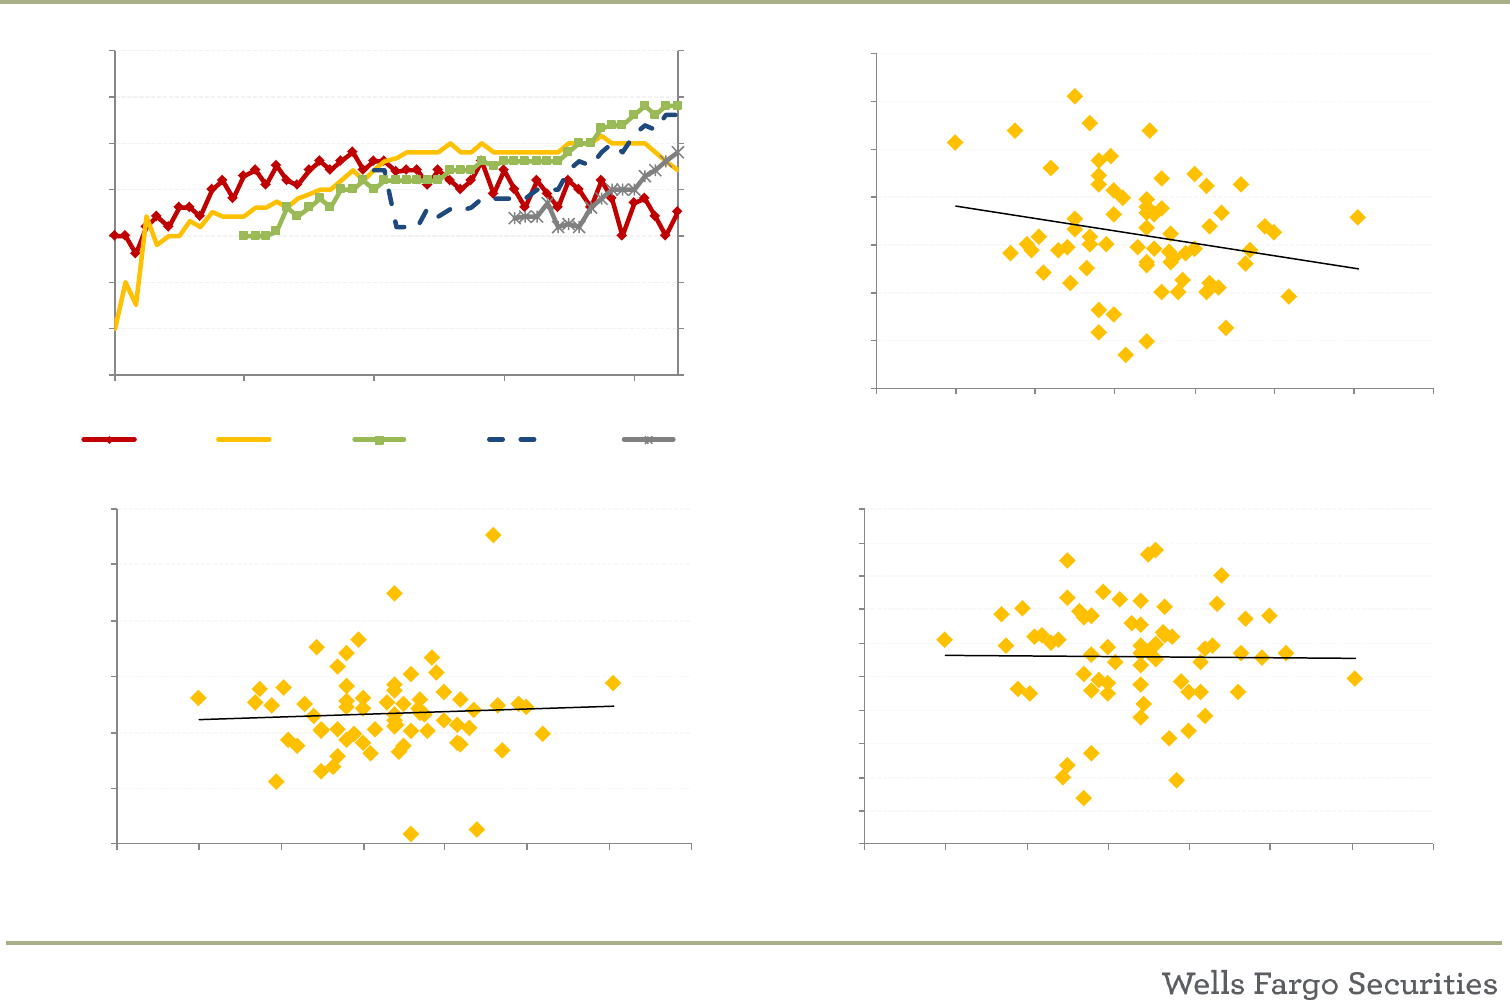
3.50
3.70
3.90
4.10
4.30
3.50
3.70
3.90
4.10
4.30
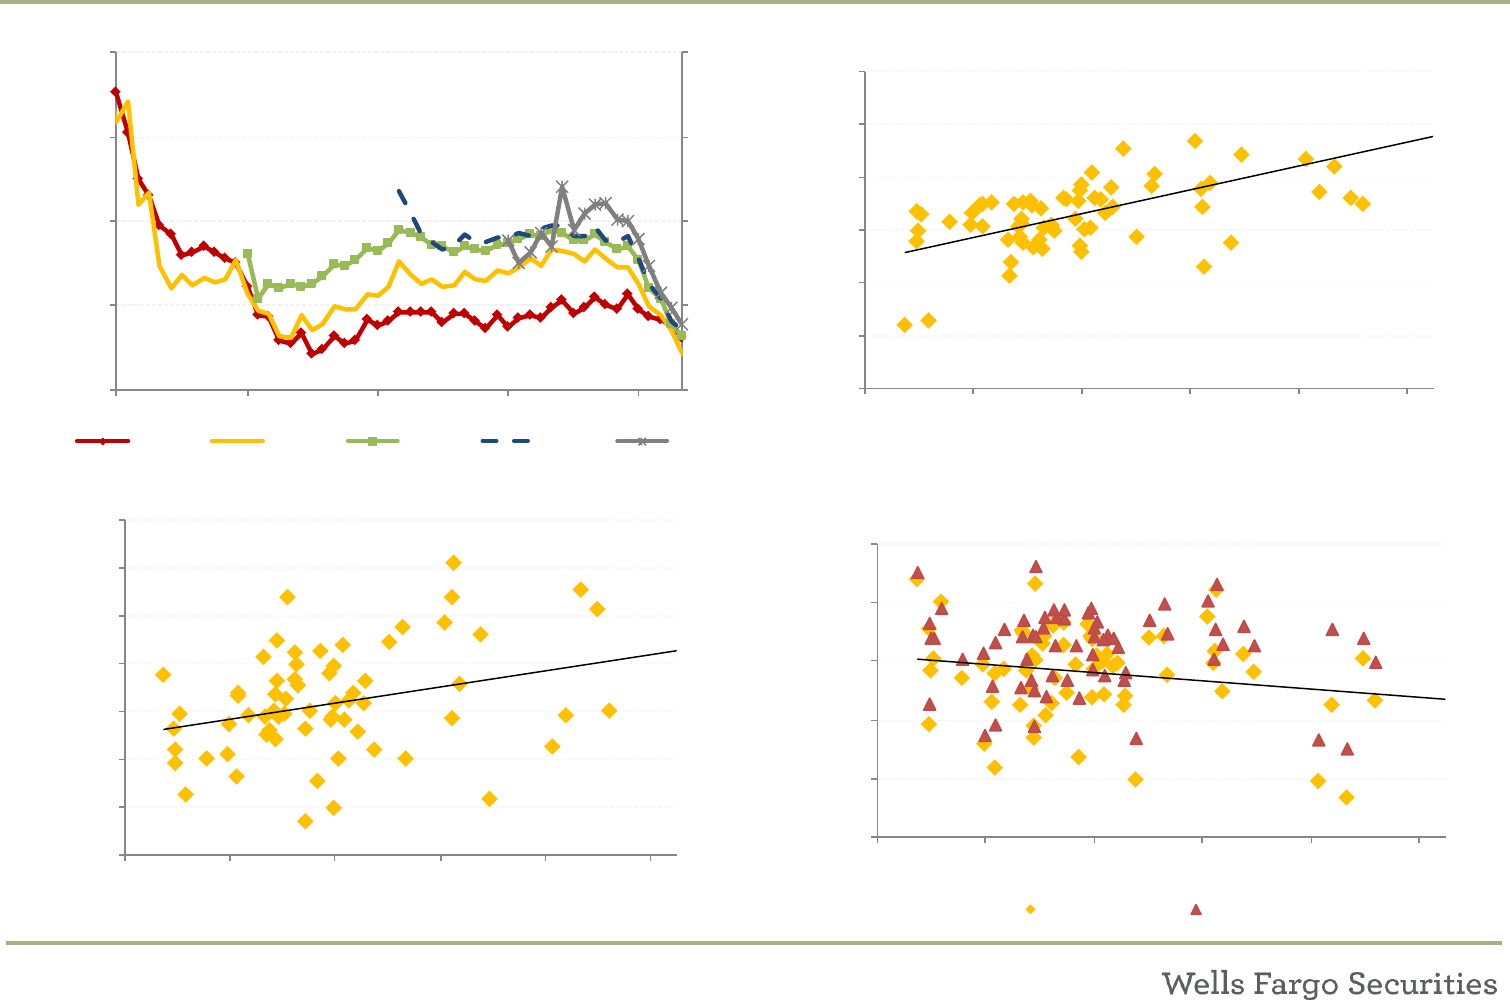
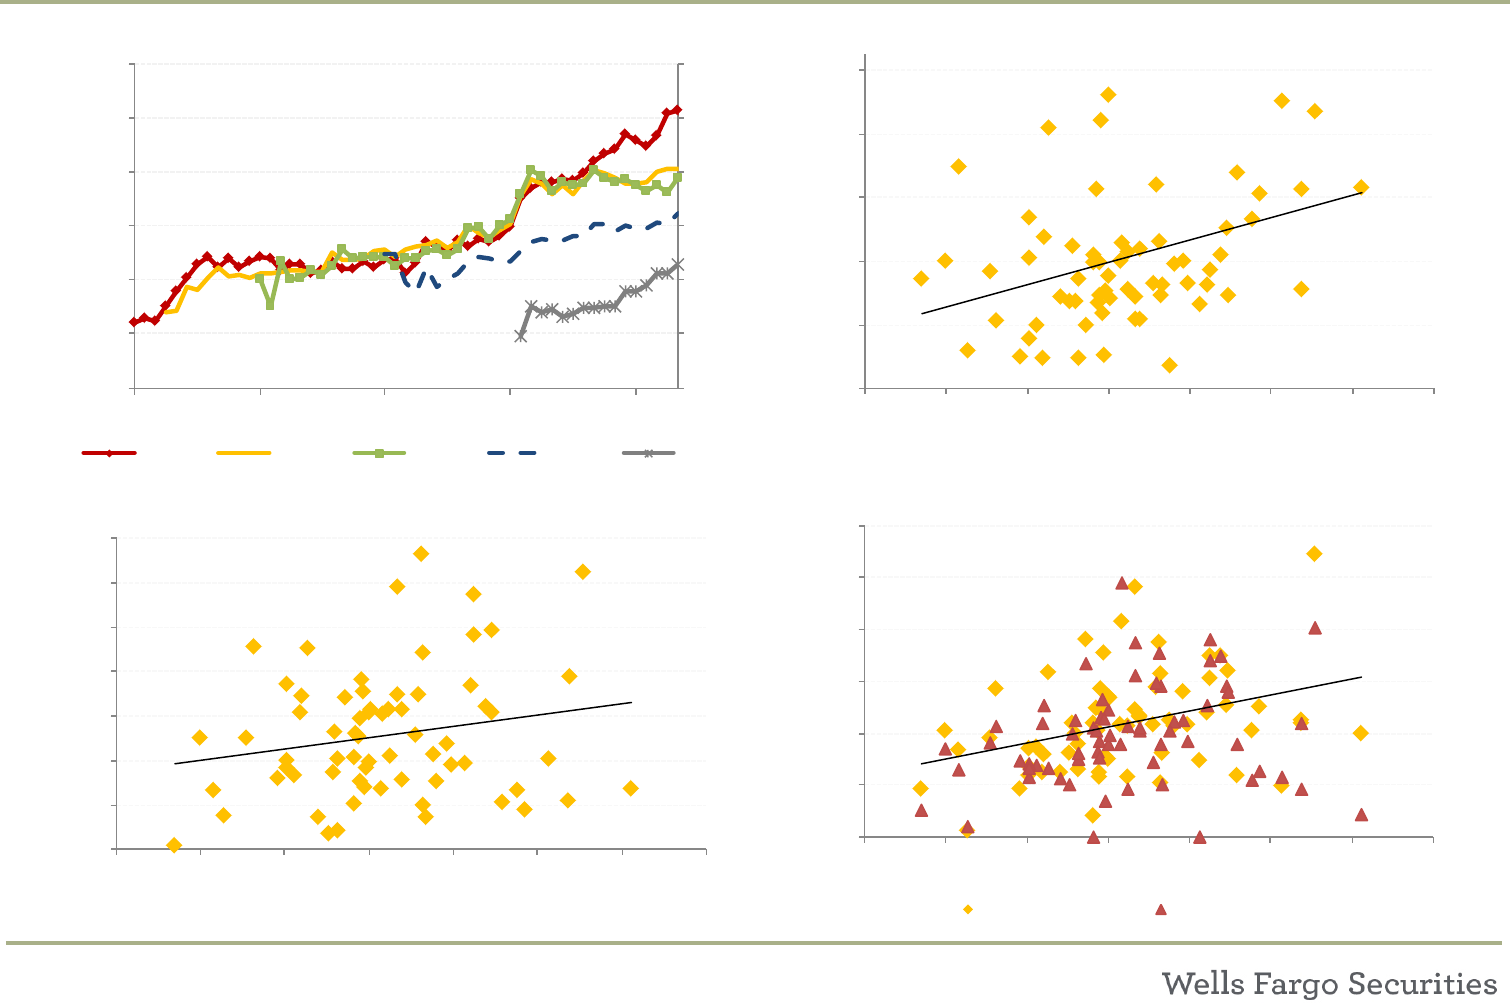
Jan-13 Jan-14 Jan-15 Jan-16 Jan-17
Median WAS by Vintage
The Median WAS has dropped
over the past 18 Months
2012 2013 2014 2015 2016
2,500
2,600
2,700
2,800
2,900
3,000
3,100
3,200
320 340 360 380 400 420
WARF
WAS
Higher WAS Often Associated with
Higher WARF (Lower-Rated Assets)
0%
20%
40%
60%
80%
100%
320 340 360 380 400 420
NAV and Adj. NAV
WAS
Higher WAS Often Associated with
Lower Market Value Metrics
MV NAV Adj. NAV
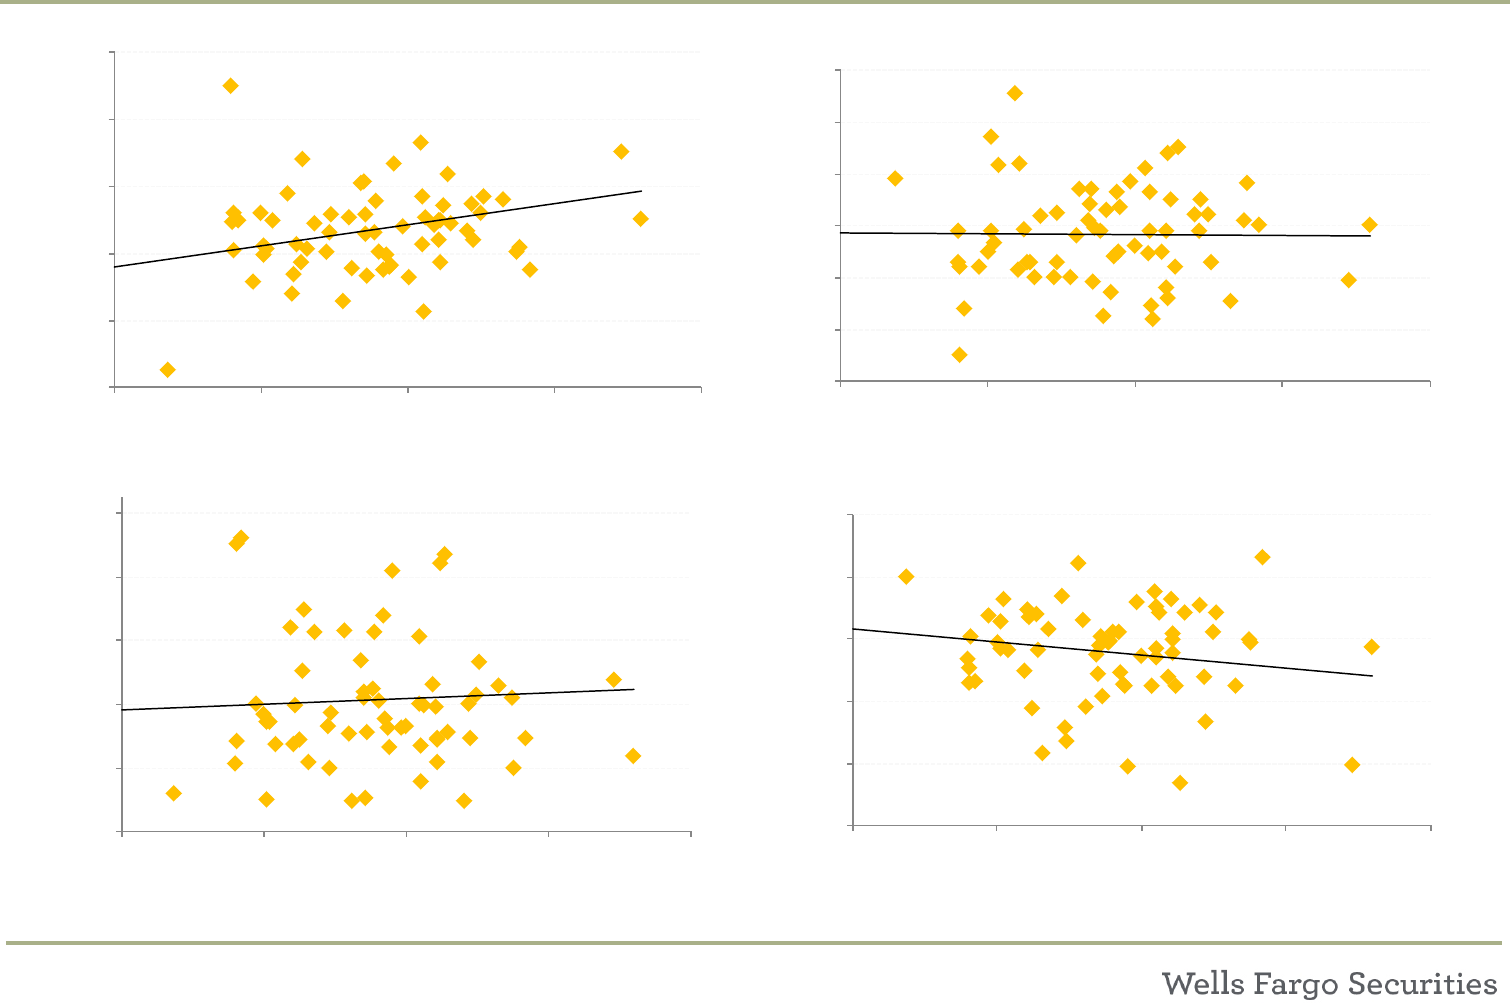
Sources: Intex, LPC Collateral
Scatter plots show manager median data from the 9/2017 Style Guide
1%
2%
3%
4%
5%
6%
7%
320 340 360 380 400 420
Norm. Equity Pmt.
WAS
Higher WAS Often Associated with
Higher Equity Pmts.
CLO Metrics: Weighted Average Rating Factor (WARF)
8
Metric Weighted Average Rating Factor (WARF)
Description/ Uses
Time
Median Level Chg. From Current
Current (Sep 2017)
2802
12M Ago (Sep 2016)
2861 -59
18M Ago (Mar 2016)
2801 1
Higher WAS and potentially higher equity payments Lower WAS and potentially lower equity payments
Lower rated assets - more exposure to Caa/ CCC/ 2nd Lien Higher rated assets - Less exposure to Caa/ CCC/ 2nd Lien
Lower market-value metrics - NAV, Adj. NAV, BB MVOC Higher market-value metrics - NAV, Adj. NAV, BB MVOC
Data Source Intex
Calculation Notes
Measures the weighted average Moody's rating of the assets. Used to determine the risk in the pool.
Lower WARF = Higher average credit rating
Higher WARF = Lower average credit rating
Some investors may view WARF as a "filter" metric; for example, an investor prefers deals with WARF below a certain level.
For reference, a CLO with a WARF of 2,833 is roughly equivalent to a B2 rating.
Market Stats
Common Metric
Pairs/Tradeoffs
Higher WARF Pool
Lower WARF Pool
Metric Analysis
Strengths
Weaknesses
● Easy to calculate/provided in Intex
● Assumes ratings are a good proxy for risk
● May not be calculated the same way across all deals
Each obligor is assigned a Rating Factor based on Moody's
Default Probability Rating; this represents the idealized default
rate at a 10-year time horizon, multiplied by 10,000. For
example: an Obligor with a rating of Baa3 may have a Rating
Factor of 610, or a 610/10,000 (6.1%) probability that it will
default within a 10-year time horizon.
**Many CLOs use the Moody's Corporate Family Rating (CFR)
when calculating WARF. CFRs may be 1-2 notches lower than the
rating on a 1st lien sr secured loan. Also, the Moody’s rating for
WARF may be adjusted if the loan is on watch or outlook.
Moody's
Rating
Equiv.
S&P
Rating
Factor
Moody's
Rating
Equiv.
S&P
Rating
Factor
Aaa AAA 1Ba1 BB+ 940
Aa1 AA+ 10 Ba2 BB 1,350
Aa2 AA 20 Ba3 BB- 1,766
Aa3 AA- 40 B1 B+ 2,220
A1 A+ 70 B2 B2,720
A2 A120 B3 B- 3,490
A3 A- 180 Caa1 CCC+ 4,770
Baa1 BBB+ 260 Caa2 CCC 6,500
Baa2 BBB 360 Caa3 CCC- 8,070
Baa3 BBB- 610 Ca CC 10,000
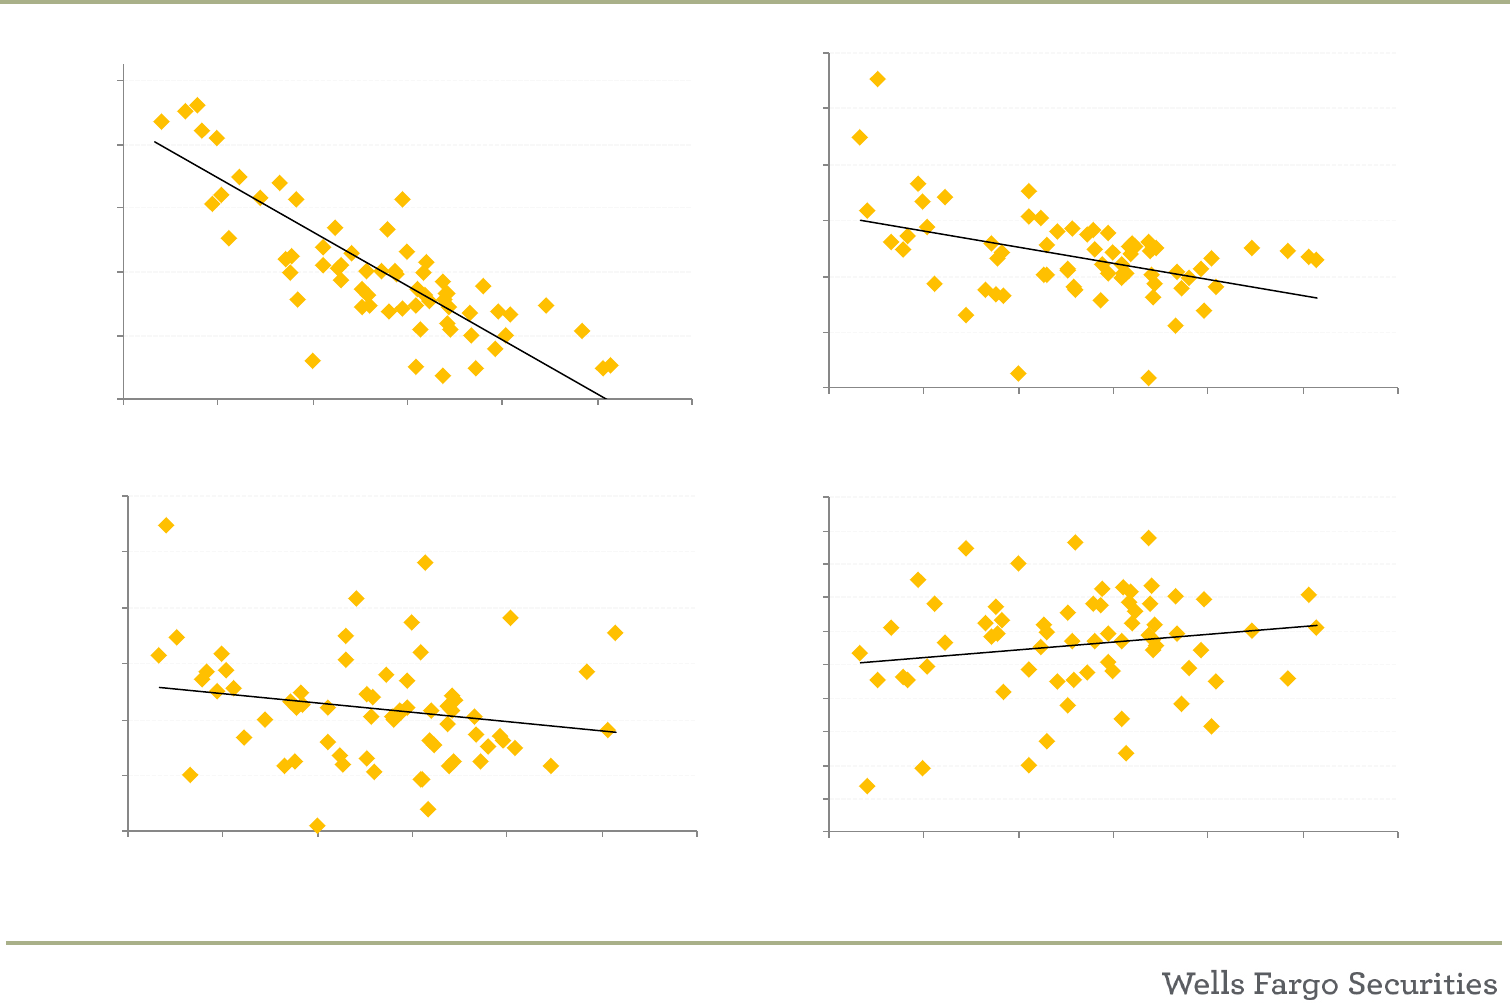
CLO Metrics: Weighted Average Rating Factor (WARF)
9
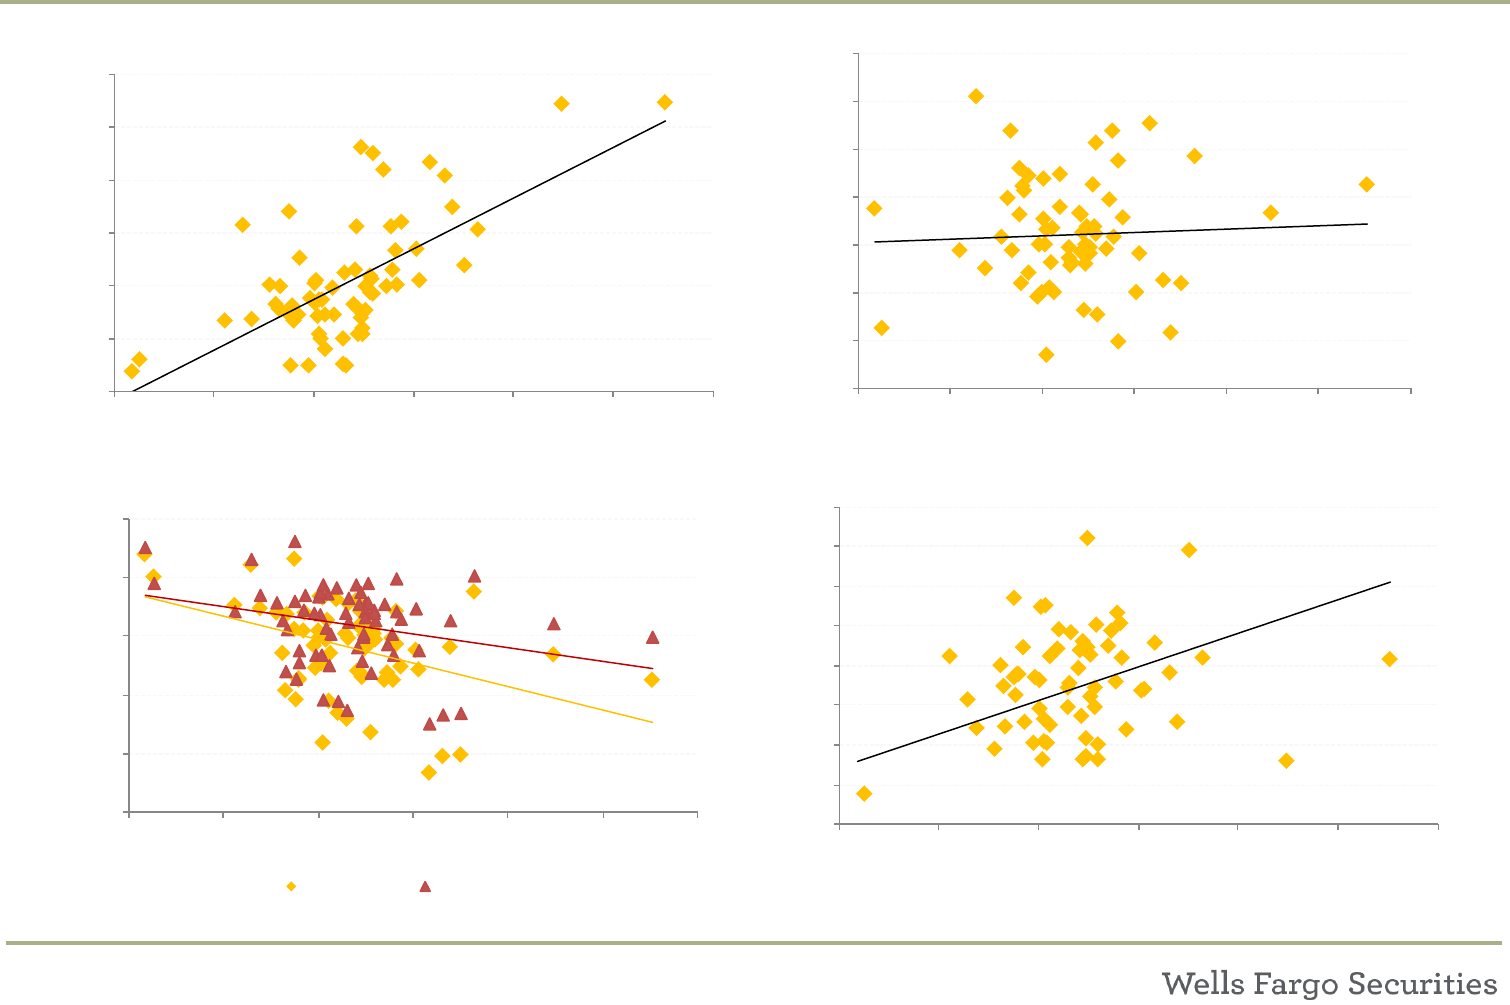
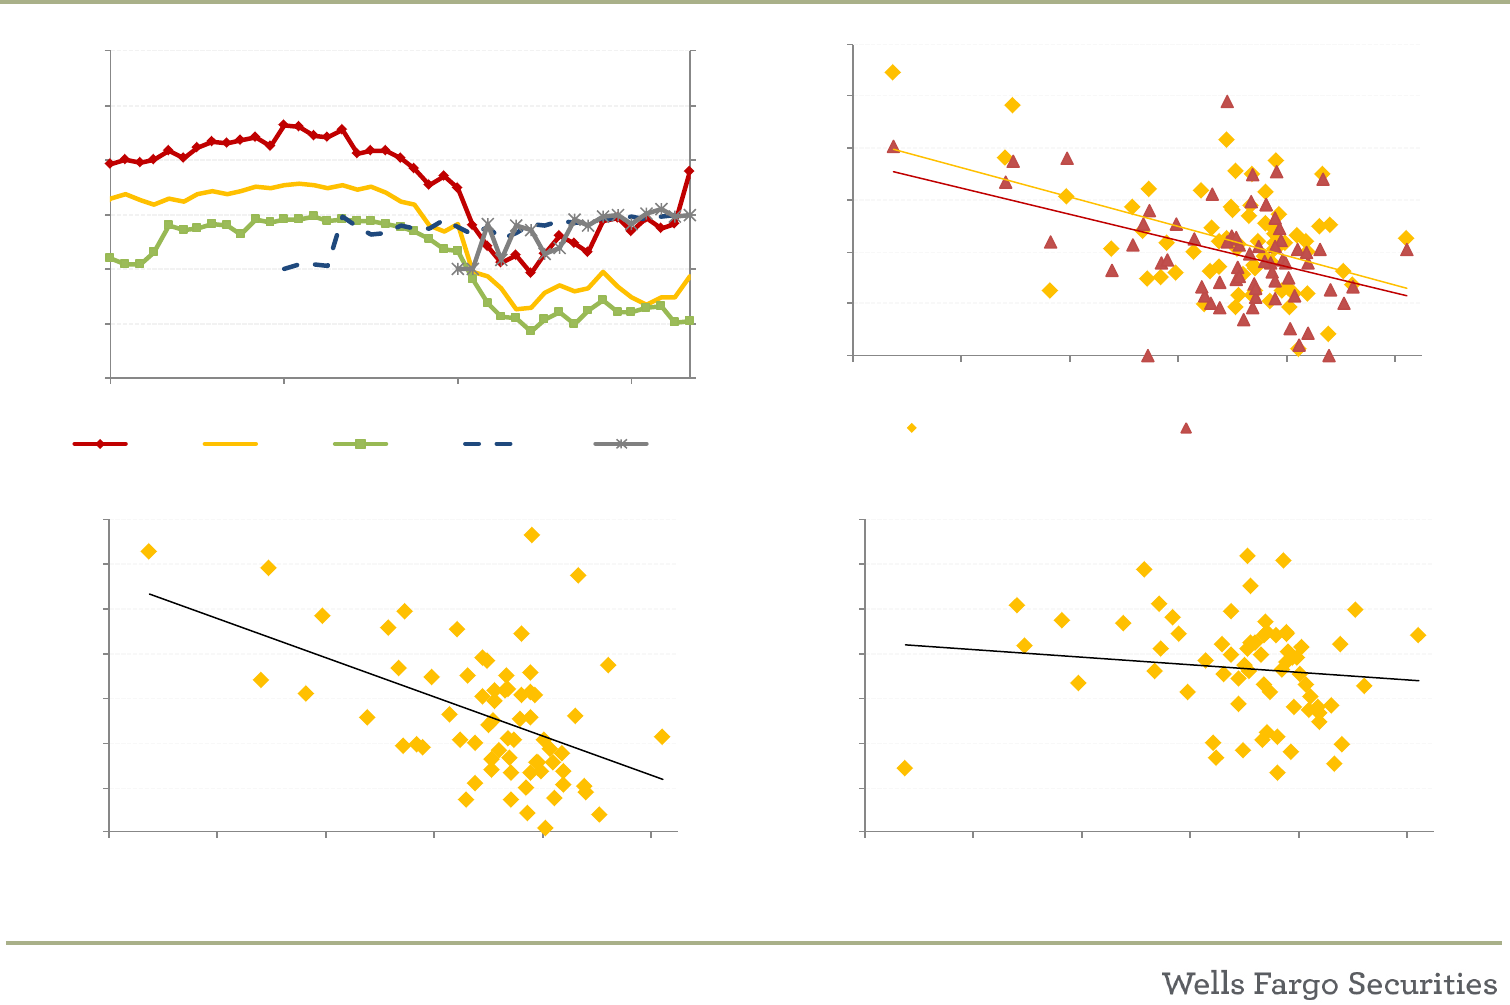
Sources: Intex, LPC Collateral
Scatter plots show manager median data from the 9/2017 Style Guide
320
340
360
380
400
420
2,500 2,600 2,700 2,800 2,900 3,000 3,100 3,200
WAS
WARF
Higher WARF Often Associated with
Higher WAS (Higher-Spread Pools)
0%
2%
4%
6%
8%
10%
12%
2,500 2,600 2,700 2,800 2,900 3,000 3,100 3,200
Caa and CCC %
WARF
Lower WARF Often Associated with
Lower Caa or CCC Exposure
% Caa Exposure % CCC Exposure
0%
1%
2%
3%
4%
5%
6%
7%
2,500 2,600 2,700 2,800 2,900 3,000 3,100 3,200
% < $80
WARF
Lower WARF Often Associated with
Lower Exposure to Loans < $80
2,500
2,600
2,700
2,800
2,900
3,000
3,100
2,500
2,600
2,700
2,800
2,900
3,000
3,100
Jan-13 Jan-14 Jan-15 Jan-16 Jan-17
Median WARF by Vintage
The Median WARF has Increased Since 2013
2012 2013 2014 2015 2016
CLO Metrics: Adjusted Net Asset Value (Adj. NAV)
10
Metric Adjusted Net Asset Value (Adj. NAV)
Description/ Uses
Time
Median Level Chg. From Current
Current (Sep 2017)
67.1%
12M Ago (Sep 2016)
53.9% 13.2%
18M Ago (Mar 2016)
41.1% 26.0%
Lower risky-asset exposure (Caa/CCC/ 2nd liens)
Higher risky-asset exposure (Caa/CCC/2nd liens)
Higher BB MVOC Lower BB MVOC
Lower equity distributions Higher equity distributions
Tranche Rating Size Assets $ Holdings Mkt. Px NAV Adj. NAV
AAAA 307,500 Loans 1-105 240,000 100.3 100.3 100.0
BAA 63,750 Loans 106-130 120,000 99.5 99.5 100.0
C A 28,125 Loans 131-160 80,000 94.0 94.0 100.0
DBBB 31,250 Loans 161-171 28,000 84.0 84.0 80.0
EBB 29,375 Loans 171-176 10,000 74.5 74.5 65.0
F B 5,938 Loans 176-180 14,000 63.0 63.0 65.0
Subord NR 44,385 Par or Mkt Val 492,000 475,110 478,000
Total 510,323 NAV 21% 27%
Data Source Intex, Wells Fargo Securities
Calculation Example
Adjusted NAV is an attempt to compensate for the weaknesses of both pure market value NAV and a par-based measurement.
Adj. NAV is the equity NAV of the CLO, but not carrying all loans at their current market value.
Calculated using loans trading at 85+ carried at par; 75 - 85 carried at 80; and < 75 carried at 65 (low end of hist. recovery).
Market Stats
Common Metric
Pairs/Tradeoffs
Higher Adj. NAV Pool
Lower Adj. NAV Pool
Metric Analysis
Strengths
Weaknesses
● Compensates for weaknesses of pure market-value NAV
and is less volatile
● Used as a proxy for how many loans are “money good”
(Loans 85+) – so this NAV would be a proxy for ultimate
terminal value for the equity – a PO estimate – as opposed
to liquidation value.
● Not easily provided in Intex
● NAV metrics affected by vintage & equity / note prices
● May not adequately punish very low priced loans (ex <$50)
● Only provides a snapshot of the loan prices on a specific
day;this applies to all market-value metrics (NAV, loans < 80,
BB MVOC).
Liabilities
Assets
In a loan market selloff, if the average loan price drops to $96 or $94, the loans would likely still be money good but the typical
MV NAV would look worse; Adj. NAV would hold these loans at par.
CLO Metrics: Adjusted Net Asset Value (Adj. NAV)
11
Sources: Intex, LPC Collateral
Scatter plots show manager median data from the 9/2017 Style Guide
0%
2%
4%
6%
8%
10%
12%
20% 40% 60% 80% 100%
Caa and CCC %
Adj. NAV
Higher Adj. NAV Often Associated with
Lower Caa or CCC Exposure
% Caa Exposure % CCC Exposure
103
104
105
106
107
108
109
110
20% 40% 60% 80% 100%
BB MVOC
Market Value Metrics Tend to Move Together
Adj. NAV NAV
320
340
360
380
400
420
20% 40% 60% 80% 100%
WAS
Adj. NAV
Higher Adj. NAV Often Associated with
Lower WAS (Lower-Spread Pools)
20
30
40
50
60
70
80
90
100
20
30
40
50
60
70
80
90
100
Jan-13 Jan-14 Jan-15 Jan-16 Jan-17
Adj. NAV by Vintage
The Median Adj. NAV is ~60%
2012 2013 2014 2015 2016
CLO Metrics: Moody’s Diversity Score
12
Metric Moody's Diversity Score
Description/ Uses
Time
Median Level Chg. From Current
Current (Sep 2017)
74
12M Ago (Sep 2016)
70 4
18M Ago (Mar 2016)
68 6
Data Source Intex
Calculation Notes
Moody's diversity score is provided in Intex.
A deal's minimum diversity limit is calculated based on the Moody's Matrix, which is a sliding scale based on WAS, WARF, loan
recovery levels and diversity.
● More diversity is generally associated with low er
idiosyncratic risk and industry risk.
● On the flip side, extremely diverse pools could be
overweight smaller names or industries relative to the
market.
● Low er diversity could be a sign of manager conviction in a
certain name or industry.
Metric Analysis
Strengths
Weaknesses
● Easy to calculate/provided in Intex
● Diversity score may not be correlated with credit quality
● Managers may increase diversity to help with matrix tests
● Industry classifications may not be standardized
Moody’s diversity score: based on how many assets, how many industries and how big the positions are. A par weighted
calculation that indicates collateral concentration in terms of both issuer and industry concentration.
The Moody’s Diversity score has three primary inputs: 1) number of industries, 2) number of assets and 3) par value of each
asset. The drivers of a higher diversity score are one or more of the following: more assets, less correlated assets (widely
distributed across more industries) and more evenly distributed par amount of the assets.
Market Stats
Common Metric
Pairs/Tradeoffs
Higher Diversity Pool
Lower Diversity Pool
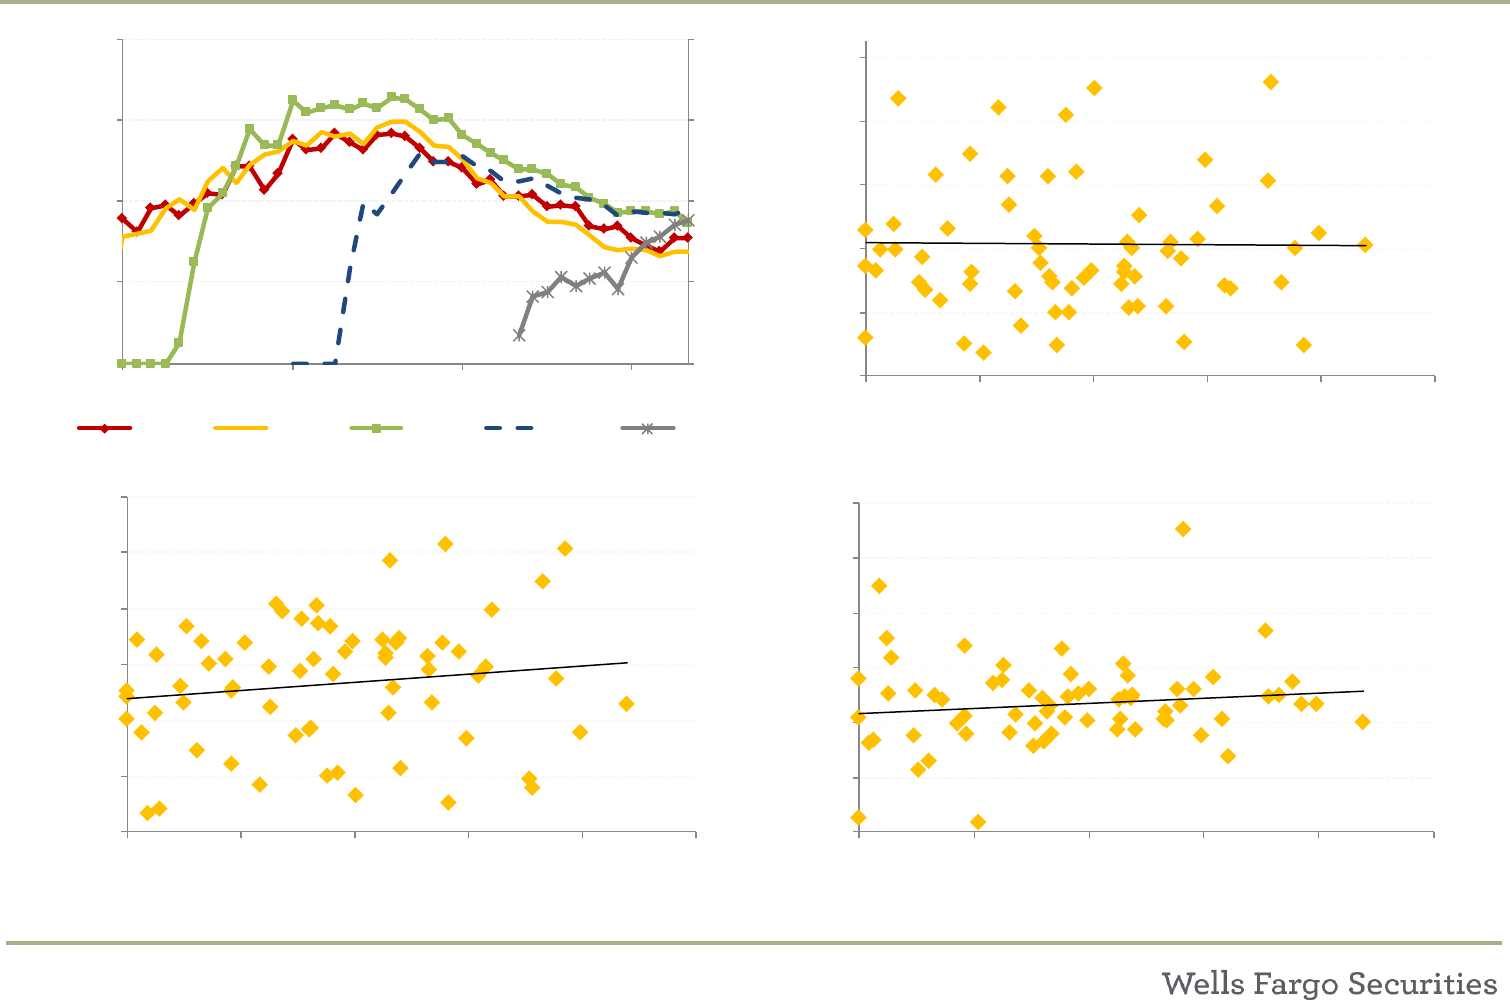
CLO Metrics: Moody’s Diversity Score
13
Sources: Intex, LPC Collateral
Scatter plots show manager median data from the 9/2017 Style Guide
45
50
55
60
65
70
75
80
45
50
55
60
65
70
75
80
Jan-13 Jan-14 Jan-15 Jan-16 Jan-17
Diversity by Vintage
The Median Div. Score for newer post-crisis
vintages has ticked up in recent months.
2012 2013 2014 2015 2016
2,500
2,600
2,700
2,800
2,900
3,000
3,100
3,200
40 50 60 70 80 90 100 110
WARF
Diversity
Higher Diversity Often Associated with
Lower WARF
2%
3%
4%
5%
6%
7%
8%
40 50 60 70 80 90 100 110
Norm. Eq Pmt.
Diversity
Higher Diversity Has Slightly Positive
Relationship with Norm. Eq Pmts.
0%
10%
20%
30%
40%
50%
60%
70%
80%
90%
100%
40 50 60 70 80 90 100 110
MV NAV
Diversity
Higher Diversity Generally Unrelated to NAV
CLO Metrics: Normalized Equity Payment
14
Metric Median Normalized Quarterly Equity Payment
Description/ Uses
Time
Median Level Chg.
Current (Sep 2017)
4.3%
12M Ago (Sep 2016)
4.8% -0.5%
Example: 2016-Vintage Deal Payment Dates Payment Not. Equity Bal.
Issue Date 4/7/2016 10/27/2016 8,382,123 44,900,000
Days Outstanding as of last payment date 470 1/27/2017 1,646,869 44,900,000
Qtrs Outstanding as of last payment date 5.15 4/27/2017 1,567,600 44,900,000
Payments / Equity Balance 29.8% 7/27/2017 1,798,126 44,900,000
Normalized Qtrly Payment/Equity Balance 5.79% Total 13,394,718
Data Source Intex, Wells Fargo Securities
Total Equity Distributions (during Reinvest. Period), converted to quarterly payments. The total sum of all equity payments
made during reinvestment, converted to an average quarterly payment. Equity distribution is the quarterly equity payment
divided by the equity notional value.
We can think of the quarterly distributions (the IO) and the NAV (the PO) as the two parts of the return – with the total return
as the distributions received to date plus the current portfolio value. If a manager has a low WAS portfolio – and low equity
distributions – then, all else equal, they should have a higher NAV, since they are taking less risk in the portfolio.
Market Stats
Common Metric
Pairs/Tradeoffs
Higher Normalized Equity Payments
Lower Normalized Equity Payments
● Higher WAS - and potentially higher exposure to riskier
assets (Caa/CCC/2nd lien)
● Higher leverage
● Low er market-value metrics (Eq. NAV, BB MVOC)
● Low er WAS - and potentially cleaner pools (low er
Caa/CCC/2nd lien)
● Lower leverage
● Higher market-value metrics (Eq. NAV, BB MVOC)
Calculation Notes
Metric Analysis
Strengths
Weaknesses
● Looks at average equity payments over time
● Adjusts for the fact that the first equity payments often differ
in payment period length, and differing first payment periods
can produce high or low first payments.
● Not provided in Intex
● Does not take into account the PO value of the pool
● Not adjusted for refi/ reset, which can affect equity NAV
& payments.
● Does not account for debt cost or vintage differences.
CLO Metrics: Normalized Equity Payment
15
Sources: Intex, LPC Collateral
Scatter plots show manager median data from the 9/2017 Style Guide
0%
20%
40%
60%
80%
100%
2% 3% 4% 5% 6% 7% 8%
NAV and Adj. NAV
Norm. Eq. Pmts.
Higher Eq. Pmts. Often Associated with
Lower Market Value Metrics
MV NAV Adj. NAV
320
340
360
380
400
420
440
2% 3% 4% 5% 6% 7% 8%
WAS
Norm. Eq. Pmts.
Higher Equity Pmts. Strongly Associated with
Higher WAS
9.0
9.5
10.0
10.5
11.0
11.5
12.0
12.5
13.0
2% 3% 4% 5% 6% 7% 8%
Leverage
Norm. Eq. Pmts.
Higher Equity Pmts. Often Associated with
Higher Leverage
2,500
2,600
2,700
2,800
2,900
3,000
3,100
3,200
2% 3% 4% 5% 6% 7% 8%
WARF
Norm. Eq. Pmts.
Higher Eq. Pmts. Often Associated with
Higher WARF (Lower-Rated Assets)
CLO Metrics: Leverage
16
Metric Median Leverage
Description/ Uses
Time
Median Level Chg.
Current (Sep 2017)
10.8
12M Ago (Sep 2016)
10.5 0.3
18M Ago (Mar 2016)
10.4 0.4
Tranche Rating Size
AAAA 372,000
BAA 84,000
C A 36,000 Leverage = 608,000 / 56,000
DBBB 36,000 10.9
EBB 24,000
Subord NR 56,000
Total 608,000
Data Source Intex, Wells Fargo Securities
Structural Leverage
Metric Analysis
Strengths
Weaknesses
● Easy to calculate in Intex
● Uses equity notional balance - similar to equity payment data
● Less volatile than calculating based on asset leverage which
is constantly changing
● More levered deals will show faster moves in market value
metrics (NAV, MVOC)
● Based on structural leverage, not actual asset leverage
– not based on assets/ (assets-debt), which technically
would be more accurate; based on total deal balance /
equity notional.
● We use structural leverage because a) equity pmts are
frequently quoted as a pct of notional par and b) the asset
balance is constantly changing.
Calculation Example
● Total initial deal balance / equity notional balance.
● The leverage category can be used to show how the manager is w orking to achieve equity returns: structural leverage vs.
leverage in the assets. When structuring a CLO, there are certain trade-offs – all else equal, a lower WARF (higher rated
assets) or higher diversity should allow for more leverage on the pool.
Market Stats
Common Metric
Pairs/Tradeoffs
Higher Leverage
Lower Leverage
● One manager style is to add an extra turn or tw o of
leverage, but with a very clean pool (below avg WAS, better
than avg WARF).
● Higher structural leverage allow s more room for low er asset
leverage (potentially lower WAS or WARF)
● Higher diversity
● Higher WARF (low er rated assets)
● Low er diversity
CLO Metrics: Leverage
17
Sources: Intex, LPC Collateral
Scatter plots show manager median data from the 9/2017 Style Guide
2%
3%
4%
5%
6%
7%
9 10 11 12 13
Norm. Equity Pmt.
Leverage
Higher Leverage Often Associated with
Higher Equity Pmts.
45
55
65
75
85
95
105
9 10 11 12 13
Diversity
Leverage
Higher Leverage Could be Offset by
Higher Diversity
320
340
360
380
400
420
9 10 11 12 13
WAS
Leverage
Higher Leverage Often Associated with
Higher WAS (Higher-Spread Pools)
0%
20%
40%
60%
80%
100%
9 10 11 12 13
MV NAV
Leverage
Higher Leverage Often Associated with
Lower MV NAV
CLO Metrics: Min. OC Cushion
18
Metric Median Minimum Overcollateralization Cushion (Min OC Cushion)
Description/ Uses
Time
Median Level Chg.
Current (Sep 2017)
419
12M Ago (Sep 2016)
391 28
18M Ago (Mar 2016)
425 -5
Tranche Rating Size Numer. Curr. Val Trigger Cushion (bps) P/F
A-1 AAA 372 600 1.61 PASS
A-2 AA 84 600 1.32 1.21 1058 PASS
B A 36 600 1.22 1.14 795 PASS
CBBB 36 600 1.14 1.08 564 PASS
DBB 24 600 1.09 1.05 400 PASS
Subord NR 56
Total Liabilities 608
OC Ratio Numerator This example deal has a min. OC cushion of 400 bps.
595
Total Assets 600
Data Source Intex, Wells Fargo Securities
Denominator Calc
[372 + 84 + 36 + 36 + 24]
Metric Analysis
Strengths
Weaknesses
● Included in Intex
● Provides a proxy for par building
● Haircut for excess Caa / CCC exposure, defaulted
assets and discount purchases
● Some deals may have single B OC tests (~ 20-30% of
single-B tranches have OC tests)
● Does not account for initial structuring or OC calculation
differences.
● Only a snapshot; does not show OC gained or lost
Calculation Example
[372]
[372 + 84]
Agg. Principal Value of Underlying Assets
Cash & Eligible Investments
[372 + 84 + 36]
[372 + 84 + 36 + 36]
5
● Difference betw een actual OC level and OC Test limit for the tightest OC test in the deal (not including Int. Diversion
tests – only true OC tests). Used to show how close an equity cashflow diversion is.
● OC Test: Par-based asset/liability coverage test. Given a tranche, X, the OC ratio = Adj. Principal Value of Collateral / Sum
of prin. for tranche X and all tranches senior to X
Market Stats
Common Metric
Pairs/Tradeoffs
Higher Min. OC
Lower Min. OC
● Low er Caa / CCC / Defaulted asset exposure - w hich
can sometimes be haircut in the min. OC cushion
calculation
d h ( ll l b l $ )
● In theory, we would hope a manager with low er Min. OC
cushion would have recently cleaned up their pool/sold
assets at a discount at the cost of min. OC
CLO Metrics: Min. OC Cushion
19
Sources: Intex, LPC Collateral
Scatter plots show manager median data from the 9/2017 Style Guide
3.0
3.5
4.0
4.5
5.0
5.5
6.0
3.0
3.5
4.0
4.5
5.0
5.5
6.0
Jan-14 Jan-15 Jan-16 Jan-17
Median Min OC Cushion
The median Min. OC Cushion Declined in H1 2016
but has since remained generally flat
2012 2013 2014 2015 2016
0%
2%
4%
6%
8%
10%
12%
50 150 250 350 450 550
Caa and CCC %
Min OC Cushion
Higher Min OC Often Associated with
Lower Caa or CCC Exposure
% Caa Exposure % CCC Exposure
0%
1%
2%
3%
4%
5%
6%
7%
50 150 250 350 450 550
Loans < $80
Min. OC Cushion
Higher Min OC Often Associated with
Lower Loans < $80
3.0
3.5
4.0
4.5
5.0
5.5
6.0
6.5
50 150 250 350 450 550
Bid Depth
Min. OC Cushion
Higher Min OC Slightly Associated with
Lower Bid Depth
CLO Metrics: Caa Exposure and CCC Exposure
20
Metric Median Caa Exposure and Median CCC Exposure
Description/ Uses
Time
Med. Caa Chg. Med. CCC Chg.
Current (Sep 2017)
4.30 3.80
12M Ago (Sep 2016)
4.88 -0.58 3.93 -0.13
18M Ago (Mar 2016)
3.97 0.33 2.45 1.35
Security Prin. Bal. MDY Rtg S&P Rtg Caa Exp CCC Exp
Company 1 3.0 B3 CCC 3.0
Company 2 2.9 B3 CCC+ 2.9
Company 3 2.9 Caa1 CCC- 2.9 2.9
Company 4 2.5 Caa3 CCC- 2.5 2.5
Company 5 3.7 Caa1 CCC 3.7 3.7
Company 6-200 479.3 B2 BB Total Caa or CCC 9.1 15.0
Total Assets 494.3 494.3
Total Asset Bal 494.3 % Exposure 1.8% 3.0%
Calculation Example
● Intex’s fields show % of the portfolio rated Caa or below , and the % of the portfolio rated CCC or below
● Generally, we have found that Moody's Caa exposure in a CLO is based on facility rating, while S&P's CCC exposure is based
on issuer rating.
Market Stats
Common Metric
Pairs/Tradeoffs
Higher Caa or CCC Exposure
Lower Caa or CCC Exposure
● Higher spread assets (higher WAS)
● Higher WARF
● Low er Min OC Cushion
● Low er market-value metrics (NAV, Adj. NAV, BB MVOC)
● Cleaner pools - low er WARF
● Low er spread pools
● Higher Min OC Cushion
● Higher market-value metrics (NAV, BB MVOC)
Metric Analysis
Strengths
Weaknesses / Caveats
● Included in Intex
● Clear calculation of low er-rated assets in the portfolio
● May be calculated differently from deal to deal.
● Also, the data reported in Intex may refer to concentration
limits, not to Excess Caa or Excess CCC Test levels used for
OC test calculation; Actual Caa or CCC holdings may be
higher or lower.
● May not include data from deals not rated by that rating
agy. If Moody's did not rate the deal, we may not have Caa%
data.
CLO Metrics: Caa Exposure and CCC Exposure
21
Sources: Intex, LPC Collateral
Scatter plots show manager median data from the 9/2017 Style Guide
0.0
1.0
2.0
3.0
4.0
5.0
6.0
7.0
0.0
1.0
2.0
3.0
4.0
5.0
6.0
7.0
Jan-14 Jan-15 Jan-16 Jan-17
Med. Reported Caa Holdings
Median Caa Exposure Increased During 2016
but has Since Flattened or Dropped
2012 2013 2014 2015 2016
0%
2%
4%
6%
8%
10%
12%
320 340 360 380 400 420
Caa and CCC %
WAS
Higher Caa or CCC Often Associated with
Higher WAS
% Caa Exposure % CCC Exposure
0%
2%
4%
6%
8%
10%
12%
50 150 250 350 450 550
Caa and CCC %
Min OC Cushion
Higher Caa or CCC Often Associated with
Lower Min OC Cushion
% Caa Exposure % CCC Exposure
0%
2%
4%
6%
8%
10%
12%
20% 40% 60% 80% 100%
Caa and CCC %
Adj. NAV
Higher Caa or CCC Exposure Often Associated
with Lower MV Metrics
% Caa Exposure % CCC Exposure
CLO Metrics: Second Lien Exposure
22
Metric Median 2nd Lien Exposure
Description/ Uses
Time
Med. Caa Chg.
Current (Sep 2017)
1.77
12M Ago (Sep 2016)
2.14 -0.37
18M Ago (Mar 2016)
2.64 -0.87
Provided in Intex as a percent of the deal's asset balance
Data Source Intex, Wells Fargo Securities
Calculation Example
● The percent of 2nd lien loans held by the CLO
● Used as a proxy for portfolio risk
Market Stats
Common Metric
Pairs/Tradeoffs
Higher 2nd Lien Exposure
Lower 2nd Lien Exposure
● In general, we would expect higher 2nd liens to be
associated with:
● Higher spread assets (higher WAS)
● Higher WARF
● Low er market-value metrics (NAV, Adj. NAV, BB MVOC)
However, some managers appear to employ a barbell
approach, where higher second lien exposure doesn't
necessarily equate to a riskier portfolio
● Cleaner pools - low er WARF
● Low er spread pools
● Higher market-value metrics (NAV, BB MVOC)
Metric Analysis
Strengths
Weaknesses / Caveats
● Included in Intex
● Clear calculation of se cond-lien assets in portfolio
● Does not stand alone as a proxy for risk - managers may
employ a barbell approach in choosing assets
● Deals with high 2nd lien holdings may see a disconnect
between Caa and CCC % (facility rating vs. issuer rating)
CLO Metrics: Second Lien Exposure
23
Sources: Intex, LPC Collateral
Scatter plots show manager median data from the 9/2017 Style Guide
0.0
1.0
2.0
3.0
4.0
0.0
1.0
2.0
3.0
4.0
Jan-14 Jan-15 Jan-16 Jan-17
Med. 2nd Lien Exposure
Second Lien Exposure has declined since Jan
2015 but has recently ticked up
2012 2013 2014 2015 2016
320
340
360
380
400
420
- 1.0 2.0 3.0 4.0 5.0
WAS
2nd Liens (% Exp)
Higher 2nd Liens Generally Unrelated to
WAS Level
3.5
4.0
4.5
5.0
5.5
6.0
6.5
- 1.0 2.0 3.0 4.0 5.0
Bid Depth
2nd Liens (% Exp)
Higher 2nd Lien managers tend to have more
liquid portfolios (higher bid depth)
2%
3%
4%
5%
6%
7%
8%
- 1.0 2.0 3.0 4.0 5.0
Norm. Eq Pmt.
2nd Liens (% Exp)
Higher 2nd Liens Have Slightly Positive
Relationship with Norm. Eq Pmts.
CLO Metrics: < $80 Exposure
24
Metric Median Exposure to Loans Trading < $80
Description/ Uses
Time
Loans < $80 Chg.
Current (Sep 2017)
2.4%
12M Ago (Sep 2016)
4.5% -2.1%
18M Ago (Mar 2016)
9.5% -7.1%
Calculation Example Provided in LPC Collateral's Database by Deal
Data Source LPC Collateral
Metric Analysis
Strengths
Weaknesses / Caveats
● Trading prices can be a good proxy for whether market
believes a loan will default
● Commonly used metric for tail risk in CLO portfolios
● Does not account for purchase price. Manager could have
bought a loan at $0.25 which now trades at $0.79 and it
would still be included in our metric.
● Also, at various points, <80 is arguably too high or too low
a cut-off for tail risk.
● Based on a snapshot of the loan prices on the day we
determine the underlying portfolio market value - this applies
to all market-value metrics (NAV, loans < 80, BB MVOC).
● Average # of loans in the pool that have current market prices below 80 – the traditional cut-off for a ‘distressed loan’ in the
loan market.
● Used to illustrate tail risk or as a proxy for near term (12-24 month) default risk in the pool.
● If average recoveries (measured by post default trading price) are ~65, then a loan trading below 80 is typically trading as if
the market thinks it will default.
Market Stats
Common Metric
Pairs/Tradeoffs
Higher Loans < $80
Lower Loans < $80
● Higher spread assets (higher WAS)
● Higher WARF
● Low er Min OC Cushion
● Low er market-value metrics (NAV, Adj. NAV, BB MVOC)
● Cleaner pools - low er WARF
● Low er spread pools
● Higher Min OC Cushion
● Higher market-value metrics (NAV, Adj. NAV, BB MVOC)
CLO Metrics: < $80 Exposure
25
Sources: Intex, LPC Collateral
Scatter plots show manager median data from the 9/2017 Style Guide
0%
3%
6%
9%
12%
15%
0%
3%
6%
9%
12%
15%
Jan-14 Jan-15 Jan-16 Jan-17
Med. Pct. of Loans < 80
Loans below $80 have
ticked up in recent months
2012 2013 2014 2015 2016
2%
3%
4%
5%
6%
7%
8%
0% 1% 2% 3% 4% 5% 6% 7%
Norm. Eq Pmt.
Loans < $80
Higher Loans < $80 Have Positive Relationship
with Norm. Eq Pmts.
0%
10%
20%
30%
40%
50%
60%
70%
80%
90%
100%
0% 1% 2% 3% 4% 5% 6% 7%
MV NAV
Loans < $80
Higher Loans < $80 Associated with
Lower MV Metrics
50
100
150
200
250
300
350
400
450
500
550
0% 1% 2% 3% 4% 5% 6% 7%
Min OC Cushion
Loans < $80
Higher Loans < $80 Have Negative Relationship
with Min OC Cushion
CLO Metrics: Wtd. Avg. Bid Depth
26
Metric Median Weighted Average Bid Depth
Description/ Uses
Time
Bid Depth Chg.
Current (Sep 2017)
4.90
12M Ago (Sep 2016)
4.42 0.48
Assets $ Holdings Bid Depth
Loans 1-70 161,676 1
Loans 71-144 136,292 2
Loans 145-193 103,743 3
Loans 194-257 135,003 5
Loans 258-304 125,990 7
Loans 305-341 63,643 9
Loans 341-363 64,052 10
Total 790,399
Wtd. Avg. Bid Depth 4.45
Data Source LPC Collateral
Calculation Example
Example Deal: Assets
Metric Analysis
Strengths
Weaknesses / Caveats
● Can help investors understand how a CLO manager may
be achieving higher spread pools or driving a favorable
WAS/WARF ratio.
● Does not account for quality/size of bids in the market.
● Average of the # of bids on the loans in the CLO portfolio used in our portfolio pricing, per our CLO asset pricing tool
● Avg. Bid depth is an attempt to show the level of liquidity on assets in underlying CLO portfolios. Used to show which
managers are taking liquidity risk – typically, we would think of loans with fewer bids as smaller loans – ‘upper middle market’
or ‘lightly syndicated loans.’
● Because a CLO is not a mark to market vehicle, and the CLO does not have forced liquidation provisions, we believe liquidity
risk within a CLO portfolio is acceptable – however, we also want CLO investors to understand how certain managers may be
achieving higher spread pools or driving a favorable WAS/WARF ratio.
Market Stats
Common Metric
Pairs/Tradeoffs
Higher Bid Depth
Lower Bid Depth
● More volatile market-value metrics, due to increased
liquidity
● Low er spread pools
● Typically, a lower bid depth corresponds with higher spread
portfolios.
● More stable market-value metrics, due to less liquidity—but
may face larger jumps in prices in a stress period.
CLO Metrics: Wtd. Avg. Bid Depth
27
Sources: Intex, LPC Collateral
Scatter plots show manager median data from the 9/2017 Style Guide
320
340
360
380
400
420
3.5 4.0 4.5 5.0 5.5 6.0 6.5
WAS
Bid Depth
Lower Bid Depth Often Associated with
Higher WAS (Higher-Spread Pools)
2%
3%
4%
5%
6%
7%
8%
3.5 4.0 4.5 5.0 5.5 6.0 6.5
Normalized Eq. Pmt
Bid Depth
Lower Bid Depth Often Associated with
Higher Eq. Pmts.
0%
2%
4%
6%
8%
10%
12%
3.5 4.0 4.5 5.0 5.5 6.0 6.5
Caa %
Bid Depth
Lower Bid Depth Often Associated with
Higher Caa Exposure
0%
10%
20%
30%
40%
50%
60%
70%
80%
90%
100%
3.5 4.0 4.5 5.0 5.5 6.0 6.5
MV NAV
Bid Depth
Lower Bid Depth Often Associated with
Lower MV NAVs
CLO Metrics: MV NAV
28
Metric Market Value NAV
Description/ Uses
Time
Median Level Chg.
Current (Sep 2017) 58.0%
12M Ago (Sep 2016) 42.3% 15.7%
18M Ago (Mar 2016) -0.8% 58.8%
Lower risky-asset exposure (Caa/CCC/ 2nd liens) Higher risky-asset exposure (Caa/CCC/2nd liens)
Lower loans < $80 exposure Higher loans < $80 exposure
Tranche Rating Size Assets $ Holdings Mkt. Px
AAAA 314,100 Loans 1-105 240,000 100.3
BAA 60,900 Loans 106-130 120,000 99.5
C A 36,000 Loans 131-160 86,000 98.0
DBBB 25,700 Loans 161-171 28,000 87.0
EBB 23,300 Loans 171-180 20,000 70.0
Subord NR 52,500 Par or Mkt Val 494,000 482,760
Total 512,500 NAV 43%
Data Source Markit, Wells Fargo Securities
Calculation Example
Liabilities
Assets
The equity market value NAV of the CLO equity tranche (expressed as a pct of equity notional balance). Can be thought of as
the liquidation value of the CLO – the value to the equity if the manager sold all the assets and paid off the notes. Calculated
by taking the market value of the portfolio minus the face value of all debt tranches outstanding, divided by equity notional.
May not account for incentive mgmt. fees or deferred fees.
Market Stats
Common Metric
Pairs/Tradeoffs
Higher NAV Pool
Lower NAV Pool
Metric Analysis
Strengths
Weaknesses
● Provides proxy for liquidation value of the CLO - if
we sold the assets today and paid off all the debts
● Can be used to proxy total returns to equity -
Equitiy NAV (PO) + Cashflows paid to date
● Commonly used in pricing and trading secondary
equity.
● CLO is not a mark to market vehicle, and the CLO does not have
forced liquidation provisions. A CLO provides the equity investor
with term leverage with no mark to market pressure, and investors
can’t force a liquidation prior to the call – so measuring daily loan
price movements may not always make sense. For example – if loan
outflows lead to loan market selling, all loans may fall in price. If half
the pool drops from 99 to 94, the NAV drops 25 points – but we
wouldn’t think the actual credit quality has actually changed.
● A snapshot of the loan prices on the day we determine the
underlying portfolio market value
● Not adjusted for refi/ reset, which can affect NAV and eq. pmts.
● Does not account for initial structuring differences.
CLO Metrics: MV NAV
29
Sources: Intex, LPC Collateral
Scatter plots show manager median data from the 9/2017 Style Guide
103
104
105
106
107
108
109
110
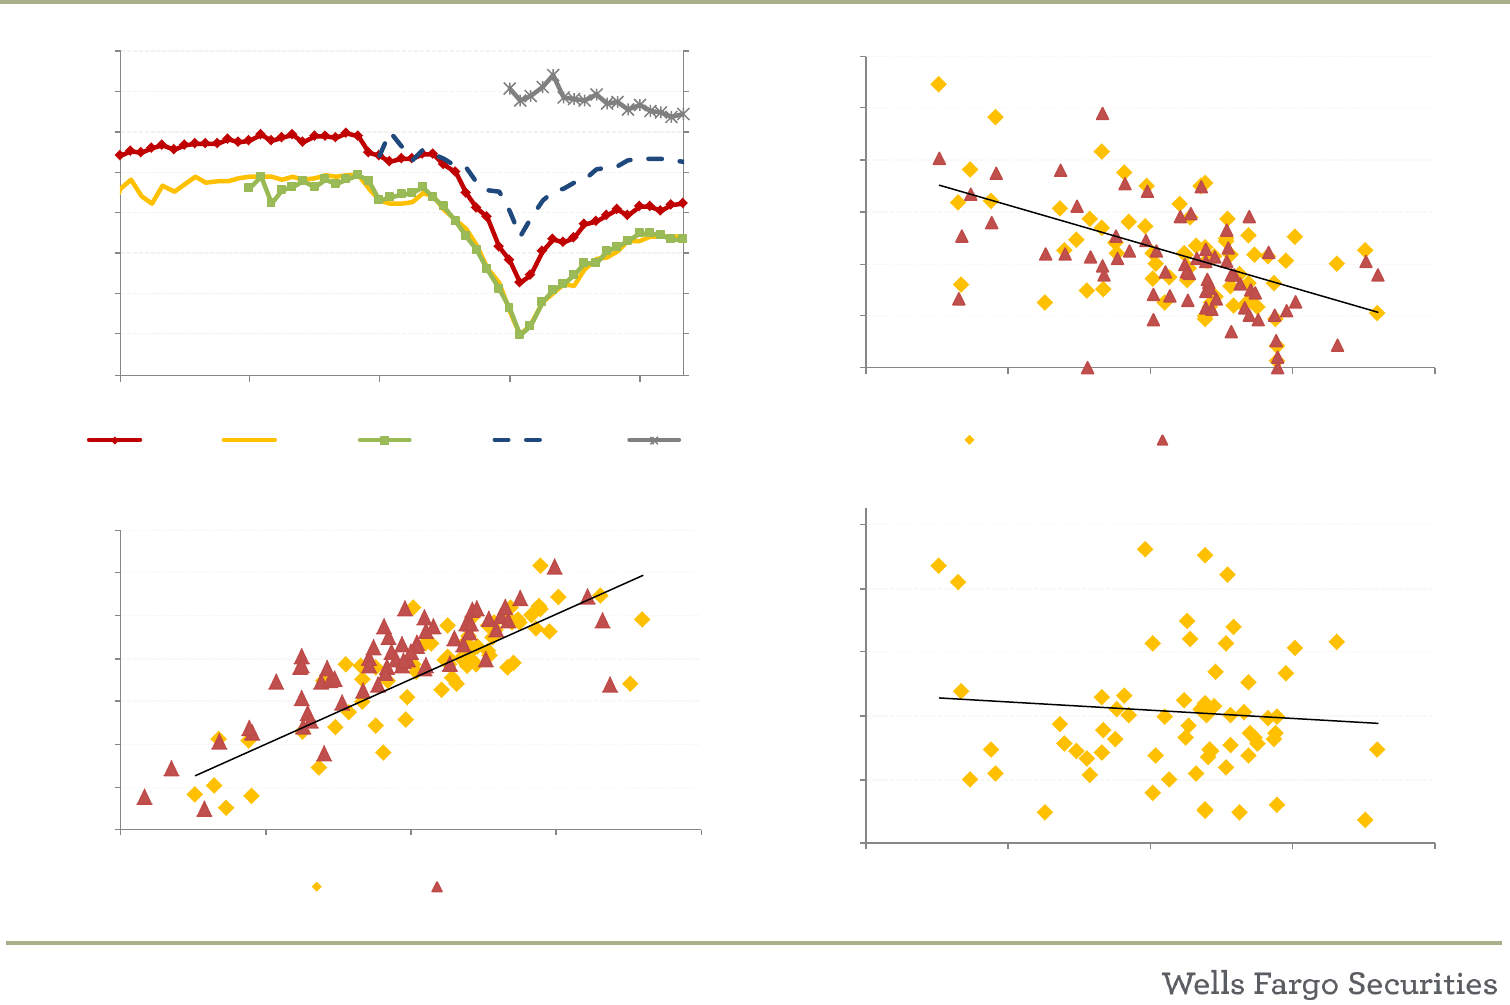
20% 40% 60% 80% 100%
BB MVOC
Market Value Metrics Tend to Move Together
Adj. NAV NAV
320
340
360
380
400
420
20% 40% 60% 80% 100%
WAS
MV NAV
Higher MV NAV Often Associated with
Lower WAS (Lower-Spread Pools)
1%
2%
3%
4%
5%
6%
7%
8%
20% 40% 60% 80% 100%
Norm. Eq. Pmts.
MV NAV
Higher MV NAV (PO) Often Associated with
Lower Equity Pmts. (IO)
-20
0
20
40
60
80
100
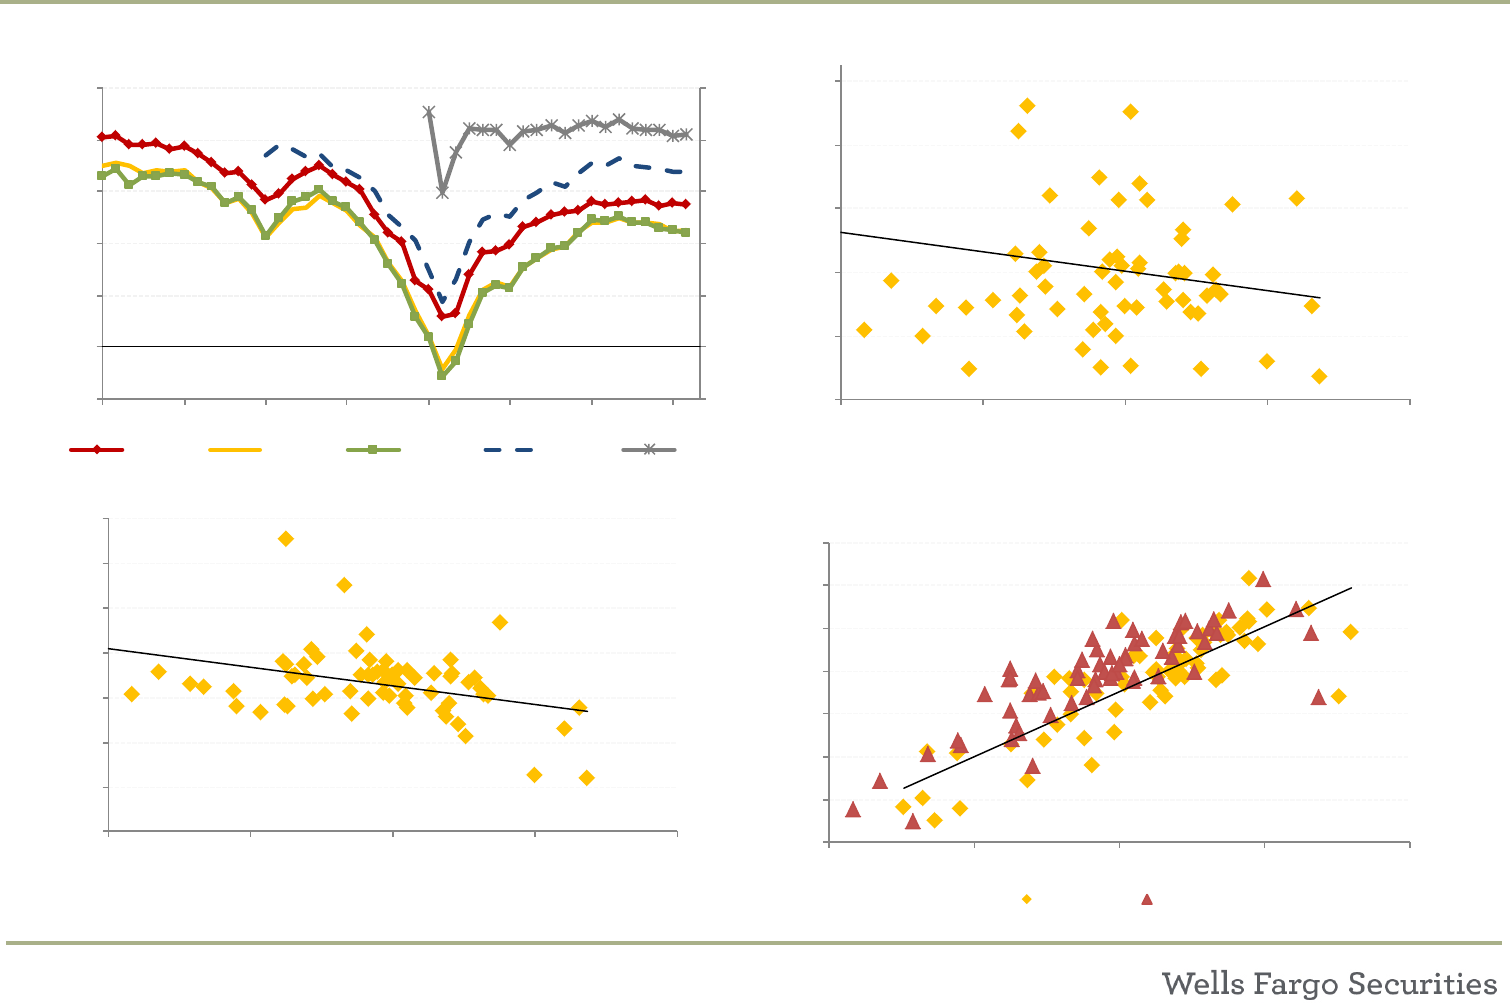
-20
0
20
40
60
80
100
Jan-14 Jul-14 Jan-15 Jul-15 Jan-16 Jul-16 Jan-17 Jul-17
Median Equity NAV
MV NAV has moved sideways in 2017 due to
limited loan market volatility
2012 2013 2014 2015 2016
CLO Metrics: BB MVOC
30
Metric BB MVOC
Description/ Uses
Time
Median Level Chg.
Current (Sep 2017) 107.0
12M Ago (Sep 2016) 105.7 1.3
18M Ago (Mar 2016) 101.1 5.9
Lower risky-asset exposure (Caa/CCC/ 2nd liens) Higher risky-asset exposure (Caa/CCC/2nd liens)
Lower loans < $80 exposure Higher loans < $80 exposure
Tranche Rating Size OC Coverage OC Ratio
AAAA 314 = 490 / [314] 156.0
BAA 61 = 490 / [314+61] 130.7
C A 36 = 490 / [314+61+36] 119.2
DBBB 26 = 490 / [314+61+36+26] 112.2
EBB 23 = 490 / [314+61+36+26+23] 106.5
Subord NR 53
Par Value of Liabilities 513
Market Value of Assets 490
Data Source Markit, Wells Fargo Securities
Calculation Example
Liabilities
OC Calculations
The BB tranche is 1.06x covered on a market value basis
● The Market Value OC Ratio of the BB notes. For example, if we liquidated the pool today, how covered are BB notes. OC ratio
uses the most recent market value of the collateral instead of the par / haircut value.
● Class B MVOC = market value of collateral / (Par value class A notes + Par value class B notes outstanding).
Market Stats
Common Metric
Pairs/Tradeoffs
Higher BB MVOC Pool
Lower BB MVOC Pool
Metric Analysis
Strengths
Weaknesses
● Provides proxy for market value coverage of the BB
tranche
● Commonly used in pricing and trading secondary
tranches
● Data is based on a snapshot of the loan prices on the day we
determine the underlying portfolio market value
● Does not account for initial structuring differences. Deals may have
higher or lower OC cushion at issuance due to trade-offs in the
structuring process.
● CLO is not a mark to market vehicle, and the CLO does not have
forced liquidation provisions. A CLO provides the equity investor with
term leverage with no mark to market pressure, and investors can’t
force a liquidation prior to the call – so measuring daily loan price
movements may not always make sense.
CLO Metrics: BB MVOC
31
Sources: Intex, LPC Collateral
Scatter plots show manager median data from the 9/2017 Style Guide
103
104
105
106
107
108
109
110
20% 40% 60% 80% 100%
BB MVOC
Market Value Metrics Tend to Move Together
Adj. NAV NAV
320
340
360
380
400
420
103 104 105 106 107 108 109
WAS
BB MVOC
Higher BB MVOC Often Associated with
Lower WAS (Lower-Spread Pools)
1%
2%
3%
4%
5%
6%
7%
8%
103 104 105 106 107 108 109
Norm. Eq. Pmts.
BB MVOC
Higher MV Metrics (like BB MVOC) Often
Associated with Lower Equity Pmts. (IO)
98
100
102
104
106
108
110
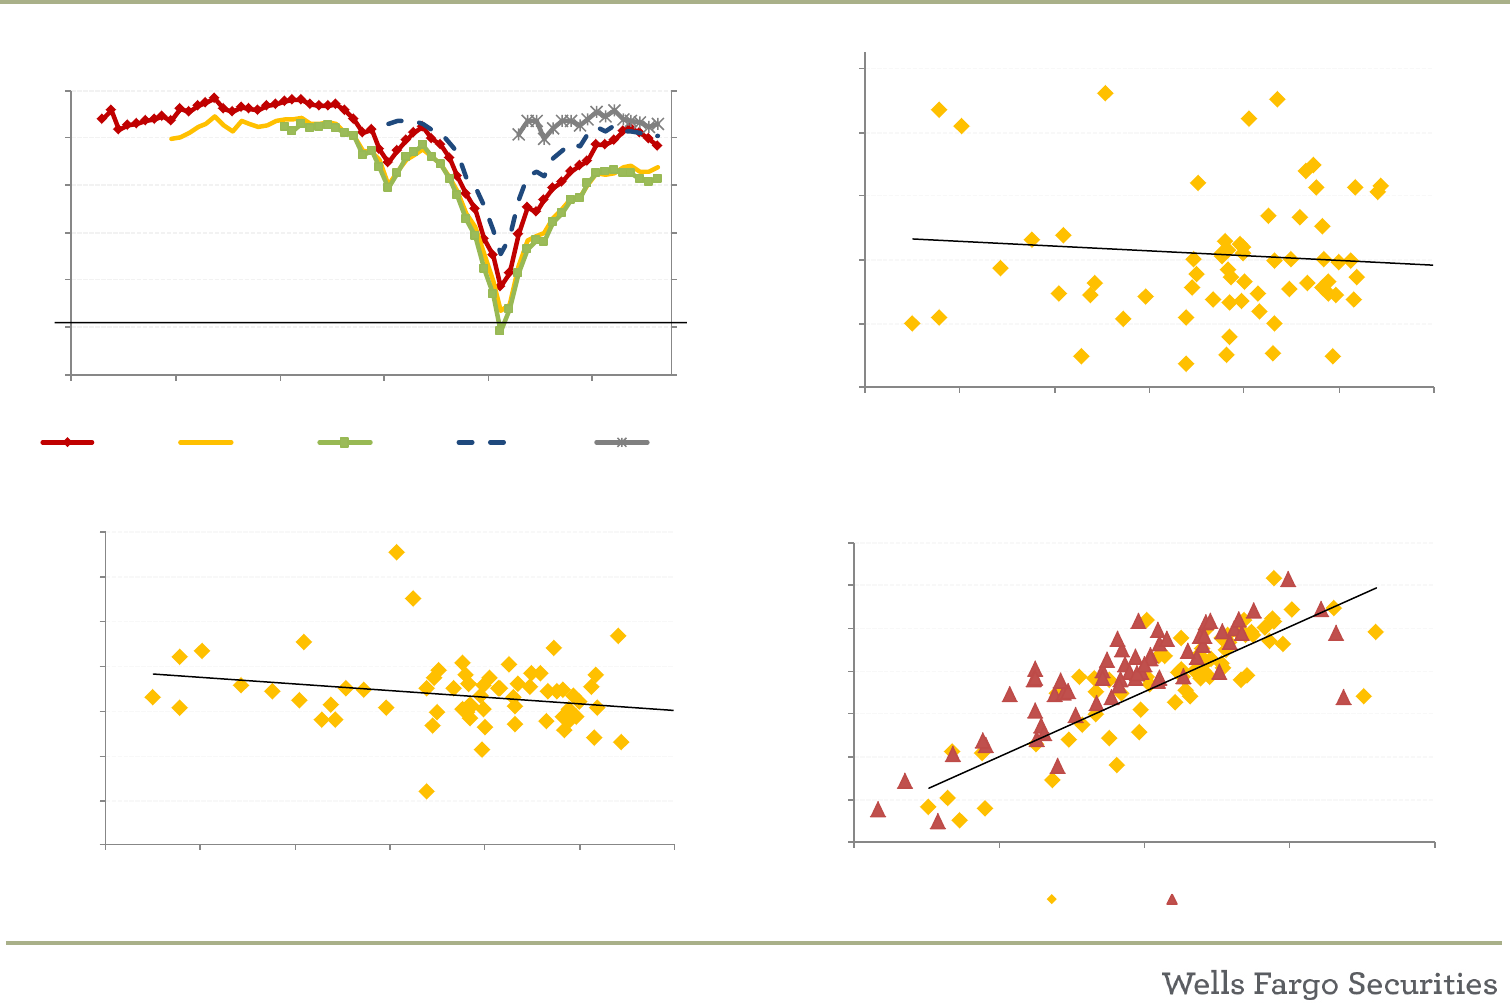
Jan-12 Jan-13 Jan-14 Jan-15 Jan-16 Jan-17 98
100
102
104
106
108
110
At the trough of 2016 volatility, the average BB
tranche was not covered on a MV basis
2012 2013 2014 2015 2016

Disclosure Appendix
32
Additional information is available on request.
Analyst’s Certification
The research analyst(s) principally responsible for the report certifies to the following: all views expressed in this research report accurately reflect the analysts’ personal
views about any and all of the subject securities or issuers discussed; and no part of the research analysts’ compensation was, is, or will be, directly or indirectly, related
to the specific recommendations or views expressed by the research analyst(s) in this research report.
Important Disclosures Relating to Conflicts of Interest and Potential Conflicts of Interest
Wells Fargo Securities does not compensate its research analysts based on specific investment banking transactions. Wells Fargo Securities research analysts receive
compensation that is based on and affected by the overall profitability of their respective department and the firm, which includes, but is not limited to, investment
banking revenue. Wells Fargo Securities may sell or buy the subject securities to/from customers on a principal basis or act as a liquidity provider in such securities.
Wells Fargo Securities Fixed Income Research analysts interact with the firm’s trading and sales personnel in the ordinary course of business. The firm trades or may
trade as a principal in the securities or related derivatives mentioned herein. The firm’s interests may conflict with the interests of investors in those instruments.
About Wells Fargo Securities
Wells Fargo Securities is the global brand name for the capital markets and investment banking services of Wells Fargo & Company and its subsidiaries, including but
not limited to Wells Fargo Securities, LLC, a U.S. broker-dealer registered with the U.S. Securities and Exchange Commission and a member of NYSE, FINRA, NFA and
SIPC, Wells Fargo Prime Services, LLC, a member of FINRA, NFA and SIPC, Wells Fargo Bank, N.A., Wells Fargo Securities Asia Limited, a Hong Kong Incorporated
investment firm licensed and regulated by the Securities and Futures Commission to carry Types 1, 4, 6 and 9 regulated activities and Wells Fargo Securities
International Limited, a U.K. entity investment firm authorized and regulated by the Financial Conduct Authority. The Wells Fargo Securities legal entity that takes
responsibility for the production of the Product is the legal entity which the first named author is employed by. Non-US analysts may not be associated persons of Wells
Fargo Securities, LLC. and therefore may not be subject to FINRA Rule 2242 restrictions on communications with subject company, public appearances and trading
securities by the analysts, but will be subject to their own local regulatory requirements.
Notice to U.S. Investors
Unless prohibited by the provisions of Regulation S of the 1933 Act, this material is distributed in the U.S., by Wells Fargo Securities, LLC, which takes responsibility for
its contents in accordance with the provisions of Rule 15a-6 and the guidance thereunder, under the U.S. Securities Exchange Act of 1934. Any transactions in securities
identified herein may be effected only with or through Wells Fargo Securities, LLC.

Disclosure Appendix
33
Important Information for Non-U.S. Clients
EEA
The securities and related financial instruments described herein may not be eligible for sale in all jurisdictions or to certain categories of investors. For recipients in the
EEA, Wells Fargo Securities International Limited (“WFSIL”) disseminates Research which has been approved for the purposes of Section 21 of the Financial Services
and Markets Act 2000 (“the Act”). WFSIL is a U.K. incorporated investment firm authorized and regulated by the Financial Conduct Authority. For the purposes of
Section 21 of the Act, WFSIL does not deal with retail clients. The FCA rules made under the Financial Services and Markets Act 2000 for the protection of retail clients
will therefore not apply, nor will the Financial Services Compensation Scheme be available. This report is not intended for, and should not be relied upon by, retail
clients.
Australia
Each of Wells Fargo Securities, LLC, Wells Fargo Securities Asia Limited and Wells Fargo Securities International Limited is exempt from the requirements to hold an
Australian financial services license in respect of the financial services it provides to wholesale clients in Australia. Wells Fargo Securities, LLC is regulated under U.S.
laws, Wells Fargo Securities Asia Limited is regulated under Hong Kong law, and Wells Fargo Securities International Limited is regulated under U.K. law, all of which
differ from Australian laws. Any offer or documentation provided to Australian recipients by Wells Fargo Securities in the course of providing the financial services will
be prepared in accordance with the laws of the United States, Hong Kong or U.K. and not Australian laws.
Hong Kong
This report is issued and distributed in Hong Kong by Wells Fargo Securities Asia Limited (“WFSAL”), a Hong Kong incorporated investment firm licensed and regulated
by the Securities and Futures Commission ("SFC") to carry on types 1, 4, 6 and 9 regulated activities (as defined in the Securities and Futures Ordinance (Cap. 571 of The
Laws of Hong Kong), “the SFO”). This report is not intended for, and should not be relied on by, any person other than professional investors (as defined in the SFO).
Any securities and related financial instruments described herein are not intended for sale, nor will be sold, to any person other than professional investors (as defined in
the SFO). The author or authors of this report may or may not be licensed by the SFC. Professional investors who receive this report should direct any queries regarding
its contents to Mark Jones at WFSAL (email: wfsalresearch@wellsfargo.com ).
Japan
This report is distributed in Japan by Wells Fargo Securities (Japan) Co., Ltd, registered with the Kanto Local Finance Bureau to conduct broking and dealing of type 1
and type 2 financial instruments and agency or intermediary service for entry into investment advisory or discretionary investment contracts. This report is intended for
distribution only to professional investors (Tokutei Toushika) and is not intended for, and should not be relied upon by, ordinary customers (Ippan Toushika).
The ratings stated on the document are not provided by rating agencies registered with the Financial Services Agency of Japan (JFSA) but by group companies of JFSA-
registered rating agencies. These group companies may include Moody’s Investors Services Inc, Standard & Poor’s Rating Services and/or Fitch Ratings. Any decisions
to invest in securities or transactions should be made after reviewing policies and methodologies used for assigning credit ratings and assumptions, significance and
limitations of the credit ratings stated on the respective rating agencies’ websites.
Disclosure Appendix
34
Published reports and additional disclosure information are available at www.wellsfargoresearch.com.
This report is for your information only and is not an offer to sell, or a solicitation of an offer to buy, the securities or
instruments named or described in this report. Interested parties are advised to contact the Wells Fargo entity in their
local jurisdiction with which they deal, or the entity that provided this report to them, if they desire further information
or if they wish to effect transactions in the security discussed in this report. The information in this report has been
obtained or derived from sources believed by Wells Fargo Securities, to be reliable, but Wells Fargo Securities does not
represent that this information is accurate or complete. Certain text, images, graphics, screenshots and audio or video
clips included in this report are protected by copyright law and owned by third parties (collectively, “Third Party
Content”). Third Party Content is made available to clients by Wells Fargo under license or otherwise in accordance
with applicable law. Any use or publication of Third Party Content included in this report for purposes other than fair
use requires permission from the copyright owner. Certain website links included in this publication are not
maintained, controlled or operated by Wells Fargo Securities. Wells Fargo Securities does not provide the products and
services on these external websites and the views expressed on these websites do not necessarily represent those of
Wells Fargo Securities. Please review the applicable privacy and security policies and terms and conditions for the
website you are visiting. Credit Strategists focus on investment themes across the credit markets and sectors. Any
discussion within a Credit Strategy report of specific securities is not intended to provide a fundamental analysis of any
individual company described therein. The information provided in Credit Strategy reports is subject to change
without notice, and investors should not expect continuing information or additional reports relating to any security
described therein. Any opinions or estimates contained in this report represent the judgment of Wells Fargo Securities
at this time, and are subject to change without notice. For the purposes of the U.K. Financial Conduct Authority's rules,
this report constitutes impartial investment and substantive research. Each of Wells Fargo Securities, LLC, and Wells
Fargo Securities International Limited is a separate legal entity and distinct from affiliated banks. Copyright © 2017
Wells Fargo Securities, LLC.
This report was prepared by Wells Fargo Securities, LLC.
SECURITIES: NOT FDIC-INSURED * NOT BANK-GUARANTEED * MAY LOSE VALUE
