Manual
User Manual: Pdf
Open the PDF directly: View PDF ![]() .
.
Page Count: 126 [warning: Documents this large are best viewed by clicking the View PDF Link!]
- abname_molis
- age
- age.group
- all
- antibiotics_list
- any
- as.basenumber
- as.percent
- as.tibble
- certedb
- certedb_checkmmb_mtrlcodes
- certedb_check_tbls
- certedb_close
- certedb_getmmb
- certedb_query
- certedb_tbls
- chi2.test
- choose.dir
- citations
- codonlist
- colour.name
- colourpicker
- complete_rows
- concat
- conf.lvl
- cqv
- crosstab
- cv
- date_generic
- day
- db
- diff.text
- element
- ewma
- exact.test
- export.clipboard
- export.csv
- export.excel
- export.R
- filter_group_size
- fivenum
- format2
- g.test
- gather
- getplottitle
- gps_from_address
- import
- import.clipboard
- import.excel
- import.R
- independence.test
- inputname
- install.fonts
- is.double2
- lin.reg
- manual
- maps_api_key
- matrix.2x2
- max
- md5
- mean
- mean_geometric
- mean_harmonic
- median
- melt
- midhinge
- min
- month
- nelson.defaultminrun
- nelson.rule1
- nelson.rule2
- nelson.rule3
- nelson.rule4
- nelson.rule5
- nelson.rule6
- nelson.rule7
- nelson.rule8
- nelson.text
- p.symbol
- pivot
- plot2
- plot2.add
- plot2.axis
- plot2.elements
- plot2.errorbar
- plot2.interactive
- plot2.listlayers
- plot2.map
- plot2.movelayer
- plot2.opendir
- plot2.pie
- plot2.save
- plot2.text
- pmax
- pmin
- preset
- print.data.frame
- prod
- project_dashboard
- qc.test
- qry
- quantile
- range
- rdate
- remember
- rr_ewma
- rsi_table
- SaveAsVersion
- sd
- se
- sha1
- sha2
- sha256
- sha512
- size.env
- size_humanreadable
- split.every.n
- spread
- str2
- strip_name
- strsplit.select
- sum
- summary
- summary_interactive
- sumofsquares
- Sys.isdecimalcomma
- tbl_address
- tbl_anonymise
- tbl_binary2logical
- tbl_first_isolates
- tbl_guess_columns
- tbl_markdown
- tbl_removeNULLs
- templatedoc
- theme_certe
- toproper
- unmelt
- update_certedata
- var
- vector2ratio
- vlookup
- year
- %===%
- Index
Package ‘certedata’
April 27, 2018
Version 2.40.0
Date 2018-04-27
Title Tools for Data Analysis at Certe
Description Tools to make microbiological, epidemiological and
quality control data analysis easier for data analysis at Certe,
a medical laboratory in the Netherlands (<https://www.certe.nl>).
Depends R (>= 3.4.3)
Imports AMR (>= 0.2.0),
backports,
data.table,
DBI (>= 0.8),
dbplyr,
devtools,
dplyr (>= 0.7.4),
extrafont,
forcats (>= 0.3.0),
ggmap,
ggplot2,
knitr,
lubridate,
miniUI,
openssl,
plotly,
purrr,
readr,
readxl,
reshape2,
rlang,
RMariaDB,
rstudioapi,
rvest,
scales,
shiny,
shinydashboard,
svglite,
tibble (>= 1.4.0),
tidyr,
viridis,
xml2,
1
2Rtopics documented:
writexl
URL https://www.certe.nl
BugReports https://github.com/msberends/certedata/issues
License GPL-2 | file LICENSE
Encoding UTF-8
LazyData true
RoxygenNote 6.0.1.9000
Rtopics documented:
abname_molis........................................ 5
age.............................................. 6
age.group .......................................... 6
all .............................................. 7
antibiotics_list........................................ 8
any.............................................. 8
as.basenumber........................................ 9
as.percent .......................................... 10
as.tibble........................................... 10
certedb............................................ 11
certedb_checkmmb_mtrlcodes ............................... 12
certedb_check_tbls ..................................... 12
certedb_close ........................................ 13
certedb_getmmb ...................................... 13
certedb_query........................................ 17
certedb_tbls......................................... 19
chi2.test........................................... 20
choose.dir.......................................... 21
citations........................................... 21
codonlist........................................... 22
colour.name......................................... 22
colourpicker......................................... 23
complete_rows ....................................... 25
concat............................................ 26
conf.lvl ........................................... 27
cqv.............................................. 27
crosstab ........................................... 28
cv .............................................. 28
date_generic......................................... 29
day.............................................. 30
db .............................................. 31
diff.text ........................................... 32
element ........................................... 33
ewma ............................................ 33
exact.test .......................................... 34
export.clipboard....................................... 35
export.csv.......................................... 35
export.excel......................................... 36
export.R........................................... 36
Rtopics documented: 3
filter_group_size ...................................... 37
fivenum ........................................... 37
format2 ........................................... 38
g.test............................................. 39
gather ............................................ 40
getplottitle.......................................... 41
gps_from_address...................................... 41
import............................................ 42
import.clipboard....................................... 43
import.excel......................................... 44
import.R........................................... 44
independence.test...................................... 45
inputname.......................................... 45
install.fonts ......................................... 46
is.double2.......................................... 46
lin.reg ............................................ 48
manual............................................ 48
maps_api_key........................................ 49
matrix.2x2.......................................... 49
max ............................................. 50
md5 ............................................. 51
mean............................................. 52
mean_geometric....................................... 53
mean_harmonic....................................... 53
median............................................ 54
melt ............................................. 55
midhinge .......................................... 55
min ............................................. 56
month ............................................ 57
nelson.defaultminrun .................................... 58
nelson.rule1......................................... 58
nelson.rule2......................................... 59
nelson.rule3......................................... 60
nelson.rule4......................................... 60
nelson.rule5......................................... 61
nelson.rule6......................................... 62
nelson.rule7......................................... 63
nelson.rule8......................................... 63
nelson.text.......................................... 64
p.symbol........................................... 65
pivot............................................. 65
plot2............................................. 66
plot2.add .......................................... 70
plot2.axis .......................................... 71
plot2.elements........................................ 72
plot2.errorbar ........................................ 72
plot2.interactive....................................... 73
plot2.listlayers........................................ 73
plot2.map .......................................... 74
plot2.movelayer....................................... 75
plot2.opendir ........................................ 75
plot2.pie........................................... 76
4Rtopics documented:
plot2.save .......................................... 77
plot2.text .......................................... 78
pmax ............................................ 79
pmin............................................. 81
preset ............................................ 82
print.data.frame....................................... 83
prod ............................................. 84
project_dashboard...................................... 85
qc.test ............................................ 85
qry.............................................. 86
quantile ........................................... 87
range ............................................ 87
rdate............................................. 88
remember .......................................... 89
rr_ewma........................................... 90
rsi_table........................................... 91
SaveAsVersion ....................................... 91
sd .............................................. 92
se .............................................. 92
sha1 ............................................. 93
sha2 ............................................. 94
sha256............................................ 95
sha512............................................ 96
size.env ........................................... 97
size_humanreadable..................................... 97
split.every.n ......................................... 98
spread............................................ 98
str2 ............................................. 99
strip_name.......................................... 99
strsplit.select ........................................100
sum .............................................101
summary ..........................................102
summary_interactive ....................................102
sumofsquares ........................................103
Sys.isdecimalcomma ....................................103
tbl_address .........................................104
tbl_anonymise........................................104
tbl_binary2logical......................................105
tbl_first_isolates.......................................105
tbl_guess_columns .....................................107
tbl_markdown........................................108
tbl_removeNULLs .....................................109
templatedoc.........................................110
theme_certe.........................................110
toproper...........................................112
unmelt............................................113
update_certedata ......................................114
var..............................................114
vector2ratio .........................................116
vlookup ...........................................117
year .............................................118
%===%...........................................118

abname_molis 5
Index 120
abname_molis Naam van antibioticum
Description
Hiermee kan een MOLIS-code omgezet worden naar een (triviale) antibioticumnaam of ATC-code,
of andersom.
Usage
abname_molis(abcode, from = "molis", to = "trivial_nl",
textbetween = " + ", tolower = FALSE)
Arguments
abcode Een antibioticumcode of -naam, zoals "amox","cftr" of "J01CA04".
from Standaard is "molis". Type om van te transformeren. Geldige opties zijn alle
variabelen van antibiotics.
to Standaard is "trivial_nl". Type om naar te transformeren. Geldige opties zijn
alle variabelen van antibiotics.
textbetween Standaard is "+". De tekst die tussen twee of meer middelen komt te staan.
tolower Standaard is FALSE. Uitkomst als kleine letters weergeven met de functie tolower.
Source
antibiotics
Examples
abname("amcl")
# "Amoxicilline/clavulaanzuur"
abname("amcl+gent")
# "Amoxicilline/clavulaanzuur + gentamicine"
abname(c("amox", "amcl"))
# "Amoxicilline" "Amoxicilline/clavulaanzuur"
abname("amcl", to = "official")
# "amoxicillin and enzyme inhibitor"
abname("amcl", to = "atc")
# "J01CR02"
abname("J01CR02", from = "atc", to = "umcg")
# "AMCL"

6age.group
age Leeftijd uitrekenen
Description
Rekent leeftijd uit op basis van geboortedatum en referentiedatum.
Usage
age(date.birth, date.ref = Sys.Date())
Arguments
date.birth Geboortedatum
date.ref Standaard is vandaag. Datum op basis waarvan berekend moet worden.
Value
Getal
age.group Leeftijdsgroep bepalen
Description
Hiermee wordt op basis van de leeftijd een groep bepaald; 00-17, 18-64, 65-84 en 85+. Met
split.children = TRUE worden kinderen bovendien gesplitst in 00, 01, 02-03, 04-05, 06-12
en 13-17.
Usage
age.group(age, split.children = FALSE, split.every10 = FALSE)
Arguments
age Een getal tussen 0 en 120.
split.children Standaard is FALSE. Kinderen splitsen in 0, 1, 2-3, 4-5, 6-12 en 13-17.
split.every10 Standaard is FALSE. Splitst de leeftijd per 10 jaar: 0-9, 10-19, enz. Hiermee
wordt split.children genegeerd.
Value
Factor

all 7
all Are All Values True?
Description
Given a set of logical vectors, are all of the values true?
Usage
all(..., na.rm = TRUE)
Arguments
... zero or more logical vectors. Other objects of zero length are ignored, and the
rest are coerced to logical ignoring any class.
na.rm logical. If true NA values are removed before the result is computed.
Details
This is a generic function: methods can be defined for it directly or via the Summary group generic.
For this to work properly, the arguments ... should be unnamed, and dispatch is on the first
argument.
Coercion of types other than integer (raw, double, complex, character, list) gives a warning as this
is often unintentional.
This is a primitive function.
Value
The value is a logical vector of length one.
Let xdenote the concatenation of all the logical vectors in ... (after coercion), after removing NAs
if requested by na.rm = TRUE.
The value returned is TRUE if all of the values in xare TRUE (including if there are no values), and
FALSE if at least one of the values in xis FALSE. Otherwise the value is NA (which can only occur if
na.rm = FALSE and ... contains no FALSE values and at least one NA value).
S4 methods
This is part of the S4 Summary group generic. Methods for it must use the signature x, ..., na.rm.
References
Becker, R. A., Chambers, J. M. and Wilks, A. R. (1988) The New S Language. Wadsworth &
Brooks/Cole.
See Also
any, the ‘complement’ of all, and stopifnot(*) which is an all(*) ‘insurance’.

8any
antibiotics_list Antibioticalijst per klinisch specialisme of materiaal
Description
Retourneert een lijst met antibiotics die relevant zijn voor het gekozen specialism.
Usage
antibiotics_list(specialism = NA, specimen = NA)
Arguments
specialism Naam van de specialist, zoals "Longarts","Internist" of "Uroloog".
specimen Naam van materiaal, zoals "Bloed","Urine" of "Respiratoir".
Value
Tekst
any Are Some Values True?
Description
Given a set of logical vectors, is at least one of the values true?
Usage
any(..., na.rm = TRUE)
Arguments
... zero or more logical vectors. Other objects of zero length are ignored, and the
rest are coerced to logical ignoring any class.
na.rm logical. If true NA values are removed before the result is computed.
Details
This is a generic function: methods can be defined for it directly or via the Summary group generic.
For this to work properly, the arguments ... should be unnamed, and dispatch is on the first
argument.
Coercion of types other than integer (raw, double, complex, character, list) gives a warning as this
is often unintentional.
This is a primitive function.

as.basenumber 9
Value
The value is a logical vector of length one.
Let xdenote the concatenation of all the logical vectors in ... (after coercion), after removing NAs
if requested by na.rm = TRUE.
The value returned is TRUE if at least one of the values in xis TRUE, and FALSE if all of the values
in xare FALSE (including if there are no values). Otherwise the value is NA (which can only occur if
na.rm = FALSE and ... contains no TRUE values and at least one NA value).
S4 methods
This is part of the S4 Summary group generic. Methods for it must use the signature x, ..., na.rm.
References
Becker, R. A., Chambers, J. M. and Wilks, A. R. (1988) The New S Language. Wadsworth &
Brooks/Cole.
See Also
all, the ‘complement’ of any.
as.basenumber Getallen octaal of hexadecimaal weergeven
Description
Getallen octaal of hexadecimaal weergeven
Usage
as.basenumber(x, from.base = 10, to.base)
Arguments
xWaarde(n).
from.base Standaard is 10 (decimaal). Grondtal van berekeningen; 8, 10 of 16.
to.base Grondtal van berekeningen; 8, 10 of 16.

10 as.tibble
as.percent Class ’percent’
Description
Dit is een nieuwe class voor procentuele weergave van de class double.
Usage
as.percent(x, ...)
is.percent(x)
Arguments
xWaarde.
... Paramters die doorgegeven worden aan as.double.
Value
Nieuwe class percent
as.tibble Coerce lists and matrices to data frames
Description
as.data.frame() is effectively a thin wrapper around data.frame, and hence is rather slow (be-
cause it calls data.frame() on each element before cbinding together). as_tibble is a new S3
generic with more efficient methods for matrices and data frames.
Usage
as.tibble(x, ...)
Arguments
xA list. Each element of the list must have the same length.
... Other arguments passed on to individual methods.
Details
This is an S3 generic. tibble includes methods for data frames (adds tbl_df classes), tibbles (returns
unchanged input), lists, matrices, and tables. Other types are first coerced via as.data.frame()
with stringsAsFactors = FALSE.
as_data_frame and as.tibble are aliases.
Source
as.tibble uit het pakket tibble.

certedb 11
certedb Verbinding maken met MySQL-/MariaDB-database
Description
Dit maakt verbinding met een MySQL-/MariaDB-database zoals de Certe-databaseserver.
Usage
certedb(host = Sys.getenv("DB_HOST"), port = Sys.getenv("DB_PORT"),
username = Sys.getenv("DB_USERNAME"),
password = Sys.getenv("DB_PASSWORD"), dbname = "certemmb", info = FALSE)
Arguments
host, port, username, password
Standaard zijn omgevingsvariabelen van de huidige gebruiker: "DB_HOST" (bij
ontbreken wordt dit localhost), "DB_PORT" (bij ontbreken wordt dit 3306),
"DB_USERNAME" en "DB_PASSWORD". Inloggegevens voor de MySQL/MariaDB-
server.
dbname Standaard is "certemmb". Naam van de database die geselecteerd moet worden.
info Standaard is FALSE. Weergeven van informatie over het verbinden.
See Also
certedb_query voor het direct gebruik van query’s en certedb_close voor het sluiten van een
verbinding.
Examples
## Not run:
# gegevens direct downloaden naar tibble:
locaties <- certe_db() %>%
tbl("temporary_certemm_locaties") %>%
collect()
# alleen query weergeven en niet uitvoeren:
locaties <- certe_db() %>%
tbl("temporary_certemm_locaties") %>%
show_query()
# rest werkt met dpylr, zoals filter() en select():
locaties <- certe_db() %>%
tbl("temporary_certemm_locaties") %>%
filter(zkhgroepcode > 0, cu_sd == "Noord") %>%
select(instelling) %>%
collect()
# gebruik head() zoals LIMIT in MySQL:
locaties <- certe_db() %>%
tbl("temporary_certemm_locaties") %>%
head(5) %>%

12 certedb_check_tbls
collect()
## End(Not run)
certedb_checkmmb_mtrlcodes
Controleren van nieuwe materiaal- en testcodes
Description
Controleert originele materiaal- en testcodes en vergelijkt ze met de nieuwe temporary_*-tabellen.
Usage
certedb_checkmmb_mtrlcodes(...)
certedb_checkmmb_testcodes(info = TRUE, ...)
Arguments
... Parameters die doorgegeven worden aan certedb_query.
certedb_check_tbls Tabellen valideren in MySQL-/MariaDB-database
Description
Hiermee worden tabellen opgezocht in een MySQL-/MariaDB-database. Niet-bestaande tabellen
worden hoofdletterongevoelig vergeleken met bestaande tabellen. Wanneer een niet-bestaande tabel
wel voorkomt met een prefix eindigend op een underscore ("_", wordt de tabelnaam overschreven
door de bestaande tabelnaam die alfabetisch als laatste voorkomt.
Usage
certedb_check_tbls(tbls, con = NULL, dbname = "certemmb", info = TRUE)
Arguments
tbls Tabellen in de database die gecontroleerd moeten worden.
con Standaard is leeg, waarmee de verbinding gemaakt wordt op basis van de omgev-
ingsvariabelen van de huidige gebruiker: "DB_HOST","DB_PORT","DB_USERNAME"
en "DB_PASSWORD".
dbname Standaard is "certemmb". Naam van de database die geselecteerd moet worden.
Wordt genegeerd als con al een bestaande verbinding is.
info Standaard is TRUE. Waarschuwing weergeven over niet-bestaande tabellen die
vervangen worden door bestaande tabellen.

certedb_close 13
certedb_close Disconnect (close) a connection
Description
This closes the connection, discards all pending work, and frees resources (e.g., memory, sockets).
Usage
certedb_close(conn, ...)
Arguments
conn ADBIConnection object, as returned by dbConnect().
... Other parameters passed on to methods.
Value
dbDisconnect() returns TRUE, invisibly.
Specification
A warning is issued on garbage collection when a connection has been released without calling
dbDisconnect(), but this cannot be tested automatically. A warning is issued immediately when
calling dbDisconnect() on an already disconnected or invalid connection.
See Also
certedb_query voor het direct gebruik van query’s.
certedb_getmmb MMB-gegevens ophalen van MySQL-/MariaDB-database
Description
Gegevens van Certe Medische Microbiologie uit de Certe-database downloaden. De benodigde
tabellen worden als LEFT JOIN automatisch toegevoegd op basis van de input bij where en select.
Nadien kan met qry de query bekeken worden, die als eigenschap bij het object opgeslagen wordt.
certedb_getmmb haalt orders en resultaten op, met uitslagen.
certedb_getmmb_tat haalt van deze orders de doorlooptijden op (TAT = Turn Around Time).
14 certedb_getmmb
Usage
certedb_getmmb(startdate = NULL, enddate = NULL, where = NULL,
select_preset = "mmb", select = NULL, add_cols = NULL, limit = 1e+07,
con = NULL, dbname = "certemmb", info = TRUE, first_isolates = FALSE,
EUCAST_rules = TRUE, MIC = FALSE, tat_hours = FALSE,
only_real_patients = TRUE, only_conducted_tests = TRUE,
only_show_query = FALSE, ...)
certedb_getmmb_tat(startdate = NULL, enddate = NULL, where = NULL,
add_cols = NULL, limit = 1e+07, con = NULL, dbname = "certemmb",
info = TRUE, only_real_patients = TRUE, only_conducted_tests = TRUE,
only_show_query = FALSE, ...)
Arguments
startdate Standaard is de eerste dag van het huidige jaar. De oudste datum die opgehaald
moet worden.
enddate Standaard is de laatste dag van het jaar van startdate. De nieuwste datum die
opgehaald moet worden.
where Standaard is leeg. Syntax om toe te voegen aan de WHERE-clausule.
R-syntax wordt omgezet naar SQL-syntax, zie Examples. Deze syntax wordt
geëvalueerd, dus gebruik van variabelen is ook mogelijk, zoals certedb_getmmb(where = where(o.jaar == mijnjaar)).
NB. Wanneer tabelvelden in meerdere brontabellen voorkomen, moet de tabel-
referentie opgegeven worden. Zie Details voor de tabelreferenties en Examples
voor voorbeelden.
select_preset Standaard is "mmb" of "tat" bij doorlooptijden. Variabelen om te selecteren
volgens de voorgedefinieerde lijst met variabelen, zie preset.list. Kan ook
een vector met meerdere presets zijn. Voor het selecteren van de eerste preset
uit de huidige map, gebruik select_preset = preset.thisfolder().
select Standaard is leeg. Variabelen om handmatig te selecteren. Deze moeten gese-
lecteerd worden met db en dit overschrijft select_preset.
add_cols Standaard is leeg. Variabelen om extra te selecteren. Deze moeten geselecteerd
worden met db.
limit Standaard is 10.000.000. Het aantal rijen dat maximaal opgehaald moet worden.
con Standaard is leeg, waarmee de verbinding gemaakt wordt op basis van de omgev-
ingsvariabelen van de huidige gebruiker: "DB_HOST","DB_PORT","DB_USERNAME"
en "DB_PASSWORD".
dbname Standaard is "certemmb". Naam van de database die geselecteerd moet worden.
Wordt genegeerd als con al een bestaande verbinding is.
info Standaard is TRUE. Printen van voortgang en het uiteindelijke aantal rijen en
kolommen dat gedownload is.
first_isolates Standaard is FALSE. Bepaling van eerste isolaten toevoegen.
EUCAST_rules Standaard is TRUE. EUCAST expert rules toepassen op de antibiotica-kolommen
met interpretive_reading.
MIC Standaard is FALSE. Toevoegen van MIC’s aan alle RSI-kolommen van de de
standaard query (i.e. zonder dat select gebruikt wordt).
certedb_getmmb 15
tat_hours Standaard is TRUE. Turn-around-times toevoegen in uren (alleen voor doorloop-
tijden).
only_real_patients
Standaard is TRUE. Hiermee worden alleen daadwerkelijke patiënten gedown-
load (geen rondzendingen en testorders). Dit voegt automatisch AND u.pat_is_ordernr = 0
toe aan de WHERE.
only_conducted_tests
Standaard is TRUE. Hiermee worden alleen verrichte testen gedownload (geen
testen die niet verricht zijn). Dit voegt automatisch AND u.is_verricht = 1
toe aan de WHERE.
only_show_query
Standaard is FALSE. Draait de query niet, maar toont hem alleen.
... Overige parameters die doorgegeven worden aan certedb_query, zoals auto_transform
en timezone.
Details
Voor gebruik van where staan hieronder de tabelreferenties. Deze zijn ook beschikbaar via de list
db:
•aanvr
temporary_certemm_aanvragers_praktijken
•beh
temporary_certemm_aanvragers_praktijken
•b
temporary_certemm_bacterienlijst
•d
temporary_certemm_aanmaakdatums
•dlt (alleen voor doorlooptijden)
temporary_certemm_doorlooptijden_2
•i
temporary_certemm_isolaten_met_interp_read
•l_extern
temporary_certemm_locaties
•l_intern
temporary_certemm_locaties
•m
temporary_certemm_materiaalgroepen
•o
certemm_ord
•p
certemm_pat
•t
temporary_certemm_testgroepen
•u
temporary_certemm_uitslag_mettekst
See Also
certedb_query voor het direct gebruik van query’s.
16 certedb_getmmb
Examples
################
# MMB-gegevens #
################
mmb.2017_Q1 <- certedb_getmmb(startdate = "2017-01-01",
enddate = "2017-03-31")
mmb.2018 <- certedb_getmmb(2018)
# GEBRUIK VAN PRESETS:
# zoeken naar preset_mmb.sql in de map Sys.getenv("R_REFMAP")
data <- certedb_getmmb(2018,
select_preset = "mmb")
# zoeken naar preset_VOLUMES.sql in de map Sys.getenv("R_REFMAP")
data <- certedb_getmmb(2018,
select_preset = "VOLUMES")
# zoeken naar eerste preset_*.sql in huidige map
data <- certedb_getmmb(2018,
select_preset = preset.thisfolder())
# GEBRUIK VAN WHERE:
# Het object `db`is een lijst met alle tabelvelden.
# Typ de WHERE in gewone SQL-taal:
data <- certedb_getmmb(2018,
where = "o.instelling = 'MZ'")
data <- certedb_getmmb(startdate = 2015,
enddate = 2018,
where = "a.zorglijn = 'Eerste lijn'")
# Of in R-syntax; dit wordt vertaald naar SQL-syntax, dus dit werkt hetzelfde:
data <- certedb_getmmb(2018,
where = db$a.postcode %in% c("1234AA", "1234BB"))
data <- certedb_getmmb(2018,
where = a.postcode %in% c("1234AA", "1234BB"))
data <- certedb_getmmb(2018,
where = "a.postcode IN ('1234AA','1234BB')")
# Wanneer de WHERE gevat wordt in de functie `where`,
# kan deze op de plaats van `enddate`(2e parameter) komen:
data <- certedb_getmmb(2018,
where = where(db$a.postcode %in% c("1234AA", "1234BB")))
data <- certedb_getmmb(2018,
where(db$a.postcode %in% c("1234AA", "1234BB")))
# Reguliere expressie:
data <- certedb_getmmb(2018,
where = db$a.postcode %like% "1234")

certedb_query 17
data <- certedb_getmmb(2018,
where(db$a.postcode %like% "1234"))
data <- certedb_getmmb(2018,
where = "a.postcode REGEXP '1234'")
# Logische negatie:
data <- certedb_getmmb(2018,
where(!db$a.postcode %like% "1234"))
data <- certedb_getmmb(2018,
where = "a.postcode NOT REGEXP '1234'")
# Variabelen uit de Global Environment:
postcodelijst <- c("1234AA", "1234BB")
data <- certedb_getmmb(2018,
where(db$a.postcode %in% postcodelijst))
data <- certedb_getmmb(2018,
where = "a.postcode IN ('1234AA','1234BB')")
# Getallenbereik:
data <- certedb_getmmb(where = where(db$o.jaar %in% c(2012:2015)
& db$o.kwartaal %in% 1:3))
data <- certedb_getmmb(where = "o.jaar IN (2012, 2013, 2014, 2015)
AND o.kwartaal IN (1, 2, 3)")
# (deze laatste overschrijft `startdate`en `enddate`)
##################
# Doorlooptijden #
##################
# voorbeelden voor GeneXpert-testen:
data <- certedb_getmmb_tat(2018,
where(db$t.testcode %like% "^PX"))
data <- certedb_getmmb_tat(2018,
where(db$t.apparaat == "GeneXpert"))
data <- certedb_getmmb_tat(2018,
where(db$t.testcode == "PXNORO"))
certedb_query SQL-query uitvoeren op MySQL-/MariaDB-database
Description
Een SQL-query uitvoeren op een MySQL-/MariaDB-database van bijv. Certe. De output krijgt een
qry-attribuut, dat met qry opgehaald kan worden.
Usage
certedb_query(query, limit = 1e+07, con = NULL, dbname = "certemmb",
info = TRUE, check_mtrl_test_codes = TRUE, binary_as_logical = TRUE,
auto_append_prefix = TRUE, auto_transform = TRUE, datenames = "en",
dateformat = "%Y-%m-%d", timeformat = "%H:%M", decimal.mark = ".",
big.mark = "", timezone = "Europe/Amsterdam", na = c("", "NULL", "NA"))
18 certedb_query
Arguments
query (Bestand met) SQL-tekst die uitgevoerd moet worden. Tabelnamen in de query
hoeven geen "temporary_" of "certemm_" te bevatten en zijn hoofdletterongevoelig.
Deze query wordt bij het object opgeslagen als eigenschap query dat bekeken
kan worden met de functie link{qry}.
limit Standaard is 10.000.000. Het aantal rijen dat maximaal opgehaald moet worden.
con Standaard is leeg, waarmee de verbinding gemaakt wordt op basis van de omgev-
ingsvariabelen van de huidige gebruiker: "DB_HOST","DB_PORT","DB_USERNAME"
en "DB_PASSWORD".
dbname Standaard is "certemmb". Naam van de database die geselecteerd moet worden.
Wordt genegeerd als con al een bestaande verbinding is.
info Standaard is TRUE. Printen van voortgang van run/fetch en het uiteindelijke aan-
tal rijen en kolommen dat gedownload is.
check_mtrl_test_codes
Standaard is TRUE. Controleren van materiaal- en testcodes in de tijdelijke tabellen
van de database. Hiervoor moet ook info = TRUE zijn.
binary_as_logical
Standaard is TRUE. Kolommen die alleen de waarden 0en/of 1bevatten, tran-
formeren naar logical m.b.v. tbl_binary2logical.
auto_append_prefix
Standaard is TRUE. Wanneer tabellen die voorkomen in de query niet bestaan,
wordt gezocht naar tabellen met dezelfde naam die beginnen met "temporary_"
of "certemm_". Wanneer zo’n tabel gevonden, wordt die gebruikt.
auto_transform Standaard is TRUE. Automatisch alle gedownloade kolommen transformeren met
tbl_guess_columns.
datenames (alleen wanneer auto_transform = TRUE)
Standaard is "en". Taal van de datenames (zoals weekdagen en maanden).
dateformat (alleen wanneer auto_transform = TRUE)
Standaard is "%Y-%m-%d". Accepteert ook Excel-formaten, zoals "dd-mm-yy"
en "dd-mm-jjjj".
timeformat (alleen wanneer auto_transform = TRUE)
Standaard is "%H:%M". Accepteert ook Excel-formaten, zoals "HH:MM:SS".
decimal.mark (alleen wanneer auto_transform = TRUE)
Standaard is ".". Scheidingsteken voor decimale getallen.
big.mark (alleen wanneer auto_transform = TRUE)
Standaard is "". Groepsteken voor getallen, zoals 1.000.000.
timezone (alleen wanneer auto_transform = TRUE)
Standaard is "Europe/Amsterdam". Zomertijd is gelijk aan CEST (Central Eu-
ropean Summer Time) en loopt 2 uur voor op UTC, wintertijd is gelijk aan CET
(Central European Time) en loopt 1 uur voor op UTC.
na (alleen wanneer auto_transform = TRUE)
Standaard is c("", "NULL", "NA"). Waarden die vertaald moeten worden als
NA.
See Also
certedb voor alleen het verbinden met de Certe-databaseserver en certedb_getmmb om ineens alle
relevante MMB-gegevens te downloaden.

certedb_tbls 19
Examples
## Not run:
locaties <- certedb_query("SELECT * FROM temporary_certemm_locaties")
locaties <- certedb_query("SELECT * FROM temporary_certemm_locaties", limit = 5)
# Door `auto_append_prefix = TRUE`wordt:
locaties <- certedb_query("SELECT * FROM locaties")
# vertaald naar:
locaties <- certedb_query("SELECT * FROM temporary_certemm_locaties")
## End(Not run)
certedb_tbls Tabellen ophalen uit MySQL-/MariaDB-database
Description
Alle tabellen uit een MySQL-/MariaDB-database zoals de Certe-database ophalen en in een list
plaatsen, waarbij elke waarde in de lijst ook de naam is van het element in de lijst.
Usage
certedb_tbls(con = NULL, dbname = "certemmb")
Arguments
con Standaard is leeg, waarmee de verbinding gemaakt wordt op basis van de omgev-
ingsvariabelen van de huidige gebruiker: "DB_HOST","DB_PORT","DB_USERNAME"
en "DB_PASSWORD".
dbname Standaard is "certemmb". Naam van de database die geselecteerd moet worden.
Wordt genegeerd als con al een bestaande verbinding is.
Value
list met alle gevonden SQL-tabellen.
See Also
certedb_query voor het direct gebruik van query’s.

20 chi2.test
chi2.test Chi^2-berekening van matrix
Description
Hiermee wordt een uitgebreide Chi^2-berekening uitgevoerd op een matrix en een eventueel advies
gegeven voor een G-test (g.test).
Usage
chi2.test(x, y = NULL, correct = TRUE, p = rep(1/length(x), length(x)),
rescale.p = FALSE, simulate.p.value = FALSE, B = 2000, alpha = 0.05,
info = TRUE)
Arguments
xa numeric vector or matrix. xand ycan also both be factors.
ya numeric vector; ignored if xis a matrix. If xis a factor, yshould be a factor of
the same length.
correct a logical indicating whether to apply continuity correction when computing the
test statistic for 2 by 2 tables: one half is subtracted from all |O−E|differences;
however, the correction will not be bigger than the differences themselves. No
correction is done if simulate.p.value = TRUE.
pa vector of probabilities of the same length of x. An error is given if any entry
of pis negative.
rescale.p a logical scalar; if TRUE then pis rescaled (if necessary) to sum to 1. If
rescale.p is FALSE, and pdoes not sum to 1, an error is given.
simulate.p.value
a logical indicating whether to compute p-values by Monte Carlo simulation.
Ban integer specifying the number of replicates used in the Monte Carlo test.
alpha Standaard is 0.05. Waarde waartegen p-waarde getoetst moet worden.
info Standaard is TRUE. Geeft een tekstoverzicht van de analyse. Met FALSE wordt
alleen de p-waarde geretourneerd.
Value
Tekst
See Also
g.test exact.test

choose.dir 21
choose.dir Choose a Folder Interactively
Description
Aangepaste functie om ook gebruik om macOS mogelijk te maken.
Usage
choose.dir()
Details
This brings up the Windows shell folder selection widget. With the default default = "", ‘My
Computer’ (or similar) is initially selected.
To workaround a bug, on Vista and later only folders under ‘Computer’ are accessible via the
widget.
Value
A length-one character vector, character NA if ‘Cancel’ was selected.
Source
http://grokbase.com/t/r/r-sig-mac/12bxhv5xcz/equivalent-of-choose-dir
See Also
choose.files
citations Referenties van geladen pakketten
Description
Print een lijst met alle geladen pakketten als wetenschappelijke referenties.
Usage
citations(url = FALSE, rstudio = TRUE)
Arguments
url Standaard is FALSE. Print ook de URL van het pakket als deze opgegeven is.
rstudio Standaard is TRUE. Print ook de referentie van RStudio.
Value
Tekst (lijst)

22 colour.name
codonlist Codons van 20 essentiele aminozuren
Description
Een dataset waarin alle 20 essentiele aminozuren met hun DNA-codes opgenomen zijn.
Usage
codonlist
Format
Een dataframe met 64 observaties en 3 variabelen:
dna DNA-code van het aminozuur.
aminoacid Naam van het aminozuur.
slc Single Letter Code van het aminozuur.
Details
Om data op te slaan in een R-pakket: devtools::use_data(codonlist, internal = FALSE, overwrite = TRUE)
colour.name Kleurnaam van RGB-code of HTML-code
Description
Print een kleurnaam van een RGB-code of HTML-code.
Usage
colour.name(htmlcode)
color.name(htmlcode)
Arguments
htmlcode Een tekst zoals "#FFFFFF", of een formule die dit retourneert, zoals rgb(1, 1, 1).
Value
Tekst

colourpicker 23
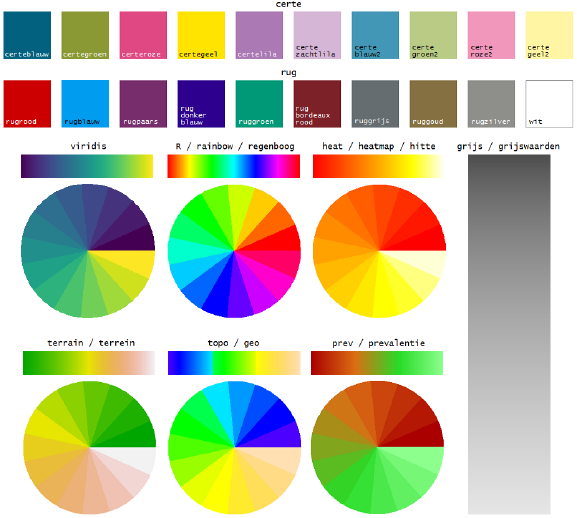
colourpicker Kleuren uit de huisstijl van Certe en meer
Description
Hiermee kunnen alle Certe-kleuren gebruikt worden, maar daarnaast ook de huisstijl van de RuG,
het kleurenblindheid-veilige viridis en nog 6 andere continue kleurenpaletten. Druk op F1 voor
een voorbeeldplaatje van alle beschikbare kleuren.
Usage
colourpicker(x, length = 1, opacity = 0)
colorpicker(x, length = 1, opacity = 0)
Arguments
xKleur. Moet een geldige kleur zijn uit colors (zoals "black","red"), een
HTML-code (zoals "#ffffaa","#ffa"), een lege waarde (NA of NULL), of:
"certe"
Huisstijlkleuren van Certe. Deze kleuren kunnen ook als input gebruikt worden:
"certeblauw","certegroen","certeroze","certegeel","certelila","certezachtlila",
"certeblauw2","certegroen2","certeroze2","certegeel2","certelila2",
"certezachtlila2","certeblauw3","certegroen3","certeroze3","certegeel3",
"certelila3" en "certezachtlila3". De rest wordt aangevuld met grijswaar-
den. Gebruik "certe2" of "certe3" om direct de zachtere tinten te gebruiken.
"rug" of "ug"
Huisstijlkleuren van de Rijkuniversiteit Groningen. Deze kleuren kunnen ook
als input gebruikt worden: "rugrood","rugblauw","rugpaars","rugdonkerblauw",
"ruggroen","rugbordeauxrood","ruggrijs","ruggoud" en "rugzilver".
De rest wordt aangevuld met grijswaarden.
"viridis"
Kleurenblindheid-veilig, zie verderop en viridis.
"R","rainbow" of "regenboog"
Standaardkleuren van R, zie rainbow
"heat","heatmap" of "hitte"
Zie heat.colors
"terrain" of "terrein"
Zie terrain.colors
"topo" of "geo"
Zie topo.colors
"prev" of "prevalentie"
24 colourpicker
"grijs","grijswaarden","greyscale" of "grayscale"
"colourbrewer" of "colorbrewer"
Gebaseerd op de 4 meest divergerende kleuren die kleurenblindveilig, print-
vriendelijk en kopieerveilig zijn volgens ColorBrewer (die advies biedt voor
cartografie): oranje, gelig, licht- en donkerblauw. Zie deze pagina van Color-
Brewer 2.0.
"ggplot"
Kleuren die in de eerste versie van ggplot gebruikt werden als Set1.
"ggplot2"
Kleuren die in ggplot2 gebruikt worden als Set2.
length Standaard is 1. Aantal kleuren dat geretourneerd moet worden.
opacity Standaard is 0. Transparantie, een waarde tussen 0-1.
Details
About viridis:
These colour scales are designed to be:
•Colourful, spanning as wide a palette as possible so as to make differences easy to see,
•Perceptually uniform, meaning that values close to each other have similar-appearing colours
and values far away from each other have more different-appearing colors, consistently across
the range of values,
•Robust to colourblindness, so that the above properties hold true for people with common
forms of colourblindness, as well as in gray scale printing.

complete_rows 25
Value
RGB-kleur(en) in HTML-tekst, zoals "#849A42" voor x = "certegroen".
Examples
colourpicker("certegroen")
# spectra uitproberen:
tibble(x = c(1:500), y = 1) %>%
ggplot(aes(x, y)) +
theme(
panel.grid.minor.x = element_blank(),
panel.grid.major.x = element_blank(),
panel.grid.minor.y = element_blank(),
panel.grid.major.y = element_blank()
) +
geom_col(
width = 1,
fill = colourpicker("heat", length = 500))
## Not run:
..., col = colourpicker("certeblauw", nrow(tbl)), ...
## End(Not run)
complete_rows Data completeren met extra rijen
Description
Data opvullen met missende rijen. Standaard worden rijen aangevuld tussen de min en max van
variabele.
Usage
complete_rows(data, variable, newvalue = 0, start_with_1 = FALSE)
Arguments
data data.frame waarin rijen missen.
variable Variabele die numerieke waarden bevat en op basis waarvan de tabel aangevuld
moet worden.
newvalue Standaard is 0. Waarde die ingevuld moet worden in de kolommen.
start_with_1 Standaard is FALSE. Waarde 1als minimum voor variabele gebruiken, waar-
door het hele bereik ingevuld wordt.

26 concat
Examples
a <- data.frame(week = c(3, 5, 6),
x = c(14, 23, 16),
y = c(34, 31, 28))
a
# week x y
# 1 3 14 34
# 2 5 23 31
# 3 6 16 28
a %>% complete_rows(week)
# week x y
# 1 3 14 34
# 2 4 0 0
# 3 5 23 31
# 4 6 16 28
a %>% complete_rows(week, start_with_1 = TRUE)
# week x y
# 1 1 0 0
# 2 2 0 0
# 3 3 14 34
# 4 4 0 0
# 5 5 23 31
# 6 6 16 28
a %>% complete_rows(week, NA, start_with_1 = TRUE)
# week x y
# 1 1 NA NA
# 2 2 NA NA
# 3 3 14 34
# 4 4 NA NA
# 5 5 23 31
# 6 6 16 28
concat Samenvoegen van vector
Description
Samenvoegen van items in een vector. Dit is gelijk aan paste(..., sep = "", collapse = "").
Usage
concat(x, sep = "")
Arguments
xEen vector met tekst.
sep Standaard is "". Tekst om xop te splitsen.

conf.lvl 27
conf.lvl Betrouwbaarheidsinterval (Confidence Level, CL)
Description
Berekent het gemiddelde, het 95% betrouwbaarheidsinterval en de linker en rechter zijde van de
fout.
Usage
conf.lvl(x, info = FALSE)
Arguments
xData
info Standaard is FALSE. Print het gemiddelde en de linker en rechter zijde van de
fout.
cqv Spreidingscoefficient (CQV)
Description
Gebruikt de interkwartielafstand om spreiding te bepalen: (Q3 - Q1) / (Q3 + Q1), alsmede de
halve interkwartielafstand ((Q3 - Q1) / 2) gedeeld door de midhinge. Engels: Coefficient of
dispersion, of coefficient of quartile variation (CQV). (Bonett et al., 2006: Confidence interval for
a coefficient of quartile variation).
Usage
cqv(x, percent = FALSE, na.rm = TRUE)
Arguments
xWaarde.
percent Standaard is FALSE. Print de uitkomst als percentage met as.percent.
na.rm Standaard is TRUE. Lege waarden negeren.
Value
Waarde
See Also
cv

28 cv
crosstab Kruistabel (contingency table) maken van data.frame
Description
Hiermee wordt een kruistabel gemaakt. De output is een matrix.
Usage
crosstab(data, column1, condition1, column2, condition2, expected = FALSE,
totals = FALSE)
Arguments
data data.frame of tibble met gegevens, waarin kolommen column1 en column2
voorkomen.
column1 Kolom met waarden.
condition1 Voorwaarde om column1 te scheiden van de groep "Rest".
column2 Kolom met waarden.
condition2 Voorwaarde om column2 te scheiden van de groep "Rest".
expected Standaard is FALSE. In plaats van de observaties, de verwachte waarden re-
tourneren (E_i = N / n, waarbij een discrete uniforme verdeling verwacht
wordt).
totals Standaard is FALSE. Voegt rij- en kolomtotalen toe.
Value
matrix
See Also
matrix.2x2
cv Variatiecoefficient (CV)
Description
Standaarddeviatie gedeeld door het gemiddelde. Engels: Coefficient of variation (CV).
Usage
cv(x, percent = FALSE, na.rm = TRUE)
Arguments
xWaarde.
percent Standaard is FALSE. Print de uitkomst als percentage met as.percent.
na.rm Standaard is TRUE. Lege waarden negeren.

date_generic 29
Value
Waarde
See Also
cqv midhinge
date_generic Datum-/tijd-formaat van Excel transformeren naar Unix-formaat
Description
Retourneert het formaat in Unix-vorm, bijv. "d mmmm yyyy" -> "%e %B %Y".
Usage
date_generic(format)
Arguments
format Formaat om te transformeren, zoals "d mmmm yyyy". Zie detais.
Details
De volgende formaten worden ondersteund:
Tijd:
-"H" (0-23, geen voorloopnul)
-"HH" (00-23, wel voorloopnul)
-"MM" (00-59)
-"SS" (00-59)
- Combinaties
"H:MM:SS": 9:12:01, enz.
"HH:MM:SS": 09:12:01, enz.
Dagen:
-"d" (1-31, geen voorloopnul)
-"dd" (01-31, wel voorloopnul)
-"ddd" (ma-zo)
-"dddd" (maandag-zondag)
- Combinaties
"dddd d mmmm": maandag 1 januari, dinsdag 2 januari, enz.
Weken:
-"w" of "ww" (01-53)
- Combinaties
"yyyy-ww": 2018-01, 2018-02, enz.

30 day
"yyyy_iso-ww", bijv.: format2("2017-01-01", "yyyy_iso-ww") = 2016-52.
Volgens ISO 8601 (Nederland); dit weeknummer wijkt af van het Amerikaanse weeknummer.
Maanden:
-"mm" (01-12)
-"mmm" (jan-dec)
-"mmmm" (januari-december)
- Combinaties
"mm (mmmm)": 01 (januari), 02 (februari), enz.
"mm-mmm": 01-jan, 02-feb, enz.
Kwartalen:
-"q" of "k" (1-4)
-"qq" of "QQ" (Q1-Q4)
-"kk" of "KK" (K1-K4)
- Combinaties
"yyyy-qq": 2018-Q1, 2018-Q2, enz.
Jaren:
-"jj" of "yy" (00-99)
-"jjjj" of "yyyy" (1900-2099)
-"jj_iso" of "yy_iso" (00-99)
-"jjjj_iso" of "yyyy_iso" (1970-2099)
Volgens ISO 8601 (Nederland, bijv.: format2("2017-01-01", "yyyy_iso") = 2016).
Overig:
"iso" datumformaat volgens ISO 8601: yyyy-mm-dd
"unix" aantal seconden sinds Epoch (1 jan 1970 0:00:00): een Unix Timestamp
Value
Tekst
day Get/set days component of a date-time
Description
Get/set days component of a date-time
Usage
day(x)
Arguments
xa POSIXct, POSIXlt, Date, chron, yearmon, yearqtr, zoo, zooreg, timeDate, xts,
its, ti, jul, timeSeries, or fts object.

db 31
Details
day() and day<-() are aliases for mday() and mday<-() respectively.
Value
wday() returns the day of the week as a decimal number or an ordered factor if label is TRUE.
Source
day uit het pakket lubridate.
See Also
yday(),mday()
db Lijst met certedb-tabellen
Description
Dit is een list met alle tabelvelden die in de where van certedb-functies gebruikt kan worden.
Usage
db$...
Format
list
Examples
postcodelijst <- c("1234AA", "1234BB")
certedb_getmmb(2017,
2018,
where(db$a.postcode %in% postcodelijst),
only_show_query = TRUE)

32 diff.text
diff.text Levenshteinafstand berekenen
Description
Hiermee wordt het aantal verschillen tussen twee tekstreeksen berekend. Een insertie, deletie en
substitutie tellen allen als 1. Dit volgt het algoritme van Levenshtein et al., 1965.
Usage
## S3 method for class 'text'
diff(a, b, ignore = c(" ", ":", "!", "?", ";", ".", ",",
"<br>"), info = FALSE)
Arguments
aTekst a.
bTekst b.
ignore Standaard is c(" ", ".", ",", "<br>"). Te negeren tekens in tekst aen tekst
b.
info Standaard is FALSE. Print een specificatie van het aantal inserties, deleties en
substituties.
Value
getal
See Also
adist
Examples
## Not run:
diff.text("test", "testa") # = 1
diff.text("test", "vest") # = 1
diff.text("test", "vespa") # = 3
## End(Not run)

element 33
element Selecteren van een element
Description
Selecteert een element uit een data.frame, list of andere vector. Dit kan gebruikt worden om van
een list iedere waarde van names(list) te retourneren.
Usage
element(.data, e = 1)
Arguments
.data Een data.frame, list, matrix, of vector van tekst of getallen.
eStandaard is 1. Het te selecteren element. Ondersteunt tidyverse-achtige quasiquo-
tation.
Examples
## Not run:
df %>% plot2(...) %>% element(data) # gelijk aan: plot2(df, ...)$data
df %>% element(1:3) # gelijk aan: df %>% select(1:3)
LETTERS[1:10] %>% element(1:5)
df %>% plot2() %>% names()
[1] "data" "layers" "scales" "mapping" "theme"
"coordinates" "facet" "plot_env" "labels"
df %>% plot2() %>% element(mapping)
* fill -> zkhgroep_locatie
* group -> zkhgroep_locatie
* x -> testnaam
* y -> aantal
## End(Not run)
ewma Exponentieel gewogen zwevend gemiddelde (EWMA)
Description
De Exponentially Weighted Moving Average (EWMA) houdt het exponentieel gewogen zwevend
gemiddelde bij van alle voorgaande steekproefgemiddelden.
Usage
ewma(x, lambda, m = mean(x))

34 exact.test
Arguments
xGegevensreeks.
lambda Het gewicht dat gegeven worden aan het meest recente rationele subgroepgemid-
delde.
mStandaard is mean(x). Gemiddelde van de reeks van x.
Value
Lijst.
See Also
rr_ewma
Examples
## Not run:
ewma(x, 0.9)
## End(Not run)
exact.test Fisher’s Exact test van matrix of vector
Description
Hiermee wordt een ’Exact-test of independence’ uitgevoerd op een matrix, of een ’Exact-test of
goodness-of-fit’ op een vector.
Usage
exact.test(x, y = NULL, alpha = 0.05, info = TRUE, minimum = 0)
Arguments
xEen vector met waarden, of een matrix die als input gebruikt wordt. Deze kan
gemaakt worden met matrix.2x2 of crosstab.
yDe geschatte waarden van x. Dit wordt automatisch bepaald wanneer dit leegge-
laten wordt. Hier kan ook de uitkomst van een ratio van xopgegeven worden
met vector2ratio.
alpha Standaard is 0.05. Waarde waartegen p-waarde getoetst moet worden.
info Standaard is TRUE. Geeft een tekstoverzicht van de analyse. Met FALSE wordt
alleen de p-waarde geretourneerd.
minimum Standaard is 0. Minimale grootte van iedere afzonderlijke statum. Gebruik
minimum = 30 bij epidemiologische analyse van isolaten.
Value
Tekst

export.clipboard 35
See Also
chi2.test g.test
export.clipboard Exporteren naar klembord
Description
Hiermee wordt een data.frame uit R naar het klembord geëxporteerd als tekst. De maximale
hoeveelheid data die geëxporteerd kan worden is evenveel als de beschikbare hoeveelheid RAM-
geheugen.
Usage
export.clipboard(tbl, sep = "\t", na = "", header = TRUE,
format.NL = Sys.isdecimalcomma(), structure.R = FALSE)
Arguments
tbl Tabel die naar het klembord moet worden gekopieerd.
sep Standaard is "\t". Het scheidingsteken waardoor de velden in elke rij geschei-
den worden.
na Standaard is "". Teken voor lege waarden. Geldt niet wanneer structure.R = TRUE.
header Standaard is TRUE. Kolomnamen als koptekst exporteren.
format.NL Standaard is TRUE. Hiermee worden getallen met een komma als decimaal teken
geëxporteerd.
structure.R Standaard is FALSE. Dit gebruikt dump om de tabel te exporteren in R-structuur,
met behoud van alle tabeleigenschappen.
export.csv Exporteren naar CSV-structuur
Description
Hiermee kan een tabel naar nieuw CSV-bestand geschreven worden. export.csv schrijft een be-
stand als standaard CSV (komma-gescheiden), export.csv2 schrijft een bestand als een West-
Europese CSV (puntkomma-gescheiden) die ook door Nederlandse versies van Excel gelezen kan
worden.
Usage
export.csv(tbl, filename = NA)
export.csv2(tbl, filename = NA)
Arguments
tbl Tabel met gegevens.
filename Standaard is NA, waarmee de naam van tbl gebruikt wordt. De (nieuwe) be-
standsnaam van het CSV-bestand.

36 export.R
export.excel Exporteren naar Excel
Description
Hiermee kan een tabel naar nieuw Excel-bestand geschreven worden.
Usage
export.excel(tbl, filename = NA)
Arguments
tbl Tabel met gegevens.
filename Standaard is NA, waarmee de naam van tbl gebruikt wordt. De (nieuwe) be-
standsnaam van het Excel-bestand.
export.R Exporteren naar R-structuur
Description
Hiermee kan een tabel naar nieuw R-bestand geschreven worden. Dit bestand is gecomprimeerd.
Gebruik import.R om het weer te gebruiken.
Usage
export.R(tbl, filename = NA)
Arguments
tbl Tabel met gegevens.
filename Standaard is NA, waarmee de naam van tbl gebruikt wordt. De (nieuwe) be-
standsnaam van het R-bestand.
Source
saveRDS
Examples
## Not run:
export.R(starwars)
starwars2 <- import.R("starwars.rds")
identical(starwars, starwars2) # TRUE
## End(Not run)

filter_group_size 37
filter_group_size inherit dplyr::filter
Description
inherit dplyr::filter
Usage
filter_group_size(.data, min = NULL, max = min)
Arguments
min minimal group size, use min = NULL to filter on maximal group size only
max maximal group size, use max = NULL to filter on minimal group size only
Source
Stack Overflow answer by docendo discimus, https://stackoverflow.com/a/43110620/4575331
fivenum Tukey Five-Number Summaries
Description
Returns Tukey’s five number summary (minimum, lower-hinge, median, upper-hinge, maximum)
for the input data.
Usage
fivenum(x, na.rm = TRUE)
Arguments
xnumeric, maybe including NAs and ±Infs.
na.rm logical; if TRUE, all NA and NaNs are dropped, before the statistics are computed.
Value
A numeric vector of length 5 containing the summary information. See boxplot.stats for more
details.
See Also
IQR,boxplot.stats,median,quantile,range.

38 format2
format2 Nieuwe formaatweergave
Description
Formateer een Robject voor mooie weergave.
Usage
format2(x, ...)
## Default S3 method:
format2(x, format = "d mmmm yyyy", percent = FALSE,
round = ifelse(percent, 1, 2), force.decimals = ifelse(percent, TRUE,
FALSE), format.NL = Sys.isdecimalcomma(), ...)
## S3 method for class 'percent'
format2(x, round = 1, force.decimals = TRUE,
format.NL = Sys.isdecimalcomma(), ...)
## S3 method for class 'POSIXct'
format2(x, format = "d mmmm yyyy", ...)
## S3 method for class 'POSIXlt'
format2(x, format = "d mmmm yyyy", ...)
## S3 method for class 'POSIXt'
format2(x, format = "HH:MM:SS", ...)
## S3 method for class 'hms'
format2(x, format = "HH:MM:SS", round = 2,
force.decimals = FALSE, format.NL = Sys.isdecimalcomma(), ...)
## S3 method for class 'difftime'
format2(x, round = 2, force.decimals = FALSE,
format.NL = Sys.isdecimalcomma(), ...)
## S3 method for class 'Date'
format2(x, format = "d mmmm yyyy", ...)
## S3 method for class 'numeric'
format2(x, round = ifelse(percent, 1, 2),
force.decimals = ifelse(percent, TRUE, FALSE), non.scientific = FALSE,
format.NL = Sys.isdecimalcomma(), min.length = 0, percent = FALSE, ...)
Arguments
xWaarde(n) die getransformeerd moet(en) worden.
format Formaat dat gebruikt moet worden. Ondersteunt leesbare formaten zoals "d mmmm yyyy"
d.m.v. date_generic, maar ook UNIX zoals "%e %B %Y".

g.test 39
round Aantal decimalen waarop afgerond moet worden.
force.decimals Forceren van decimale getallen, zelfs als het laatste decimale getal volgens
round een 0 is.
format.NL Zie Sys.isdecimalcomma. Hiermee worden getallen met een komma als deci-
maal teken weergegeven.
non.scientific Met TRUE wordt een reguliere, niet-wetenschappelijke notatie geforceerd.
min.length De minimale lengte van de output. Dit overschrijft force.decimals.
Details
Zie voor ondersteunde tekst voor de parameter format voor datum en tijd: data_generic.
g.test G-test van matrix of vector
Description
Hiermee wordt een ’G–test of independence’ uitgevoerd op een matrix, of een ’G–test of goodness-
of-fit’ op een vector.
Usage
g.test(x, y = NULL, alpha = 0.05, info = TRUE, minimum = 0)
Arguments
xEen vector met waarden, of een matrix die als input gebruikt wordt. Deze kan
gemaakt worden met matrix.2x2 of crosstab.
yDe geschatte waarden van x. Dit wordt automatisch bepaald wanneer dit leegge-
laten wordt. Hier kan ook de uitkomst van een ratio van xopgegeven worden
met vector2ratio.
alpha Standaard is 0.05. Waarde waartegen p-waarde getoetst moet worden.
info Standaard is TRUE. Geeft een tekstoverzicht van de analyse. Met FALSE wordt
alleen de p-waarde geretourneerd.
minimum Standaard is 0. Minimale grootte van iedere afzonderlijke statum. Gebruik
minimum = 30 bij epidemiologische analyse van isolaten.
Details
De formule om de G-statistic uit te rekenen is:
G <- 2 * sum(x * log(x / x.expected))
Omdat dit chi-kwadraat verdeeld is, kan de p-waarde uitgerekend worden met:
p <- 1 - stats::pchisq(G, df))
waarbij df het aantal vrijheidsgraden is: max(NROW(x) - 1, 1) * max(NCOL(x) - 1, 1).
Value
Tekst

40 gather
See Also
chi2.test
gather Gather columns into key-value pairs.
Description
Gather takes multiple columns and collapses into key-value pairs, duplicating all other columns as
needed. You use gather() when you notice that you have columns that are not variables.
Usage
gather(data, key = "key", value = "value", ..., na.rm = FALSE,
convert = FALSE, factor_key = FALSE)
Arguments
data A data frame.
key Names of new key and value columns, as strings or symbols.
This argument is passed by expression and supports quasiquotation (you can
unquote strings and symbols). The name is captured from the expression with
rlang::quo_name() (note that this kind of interface where symbols do not rep-
resent actual objects is now discouraged in the tidyverse; we support it here for
backward compatibility).
value Names of new key and value columns, as strings or symbols.
This argument is passed by expression and supports quasiquotation (you can
unquote strings and symbols). The name is captured from the expression with
rlang::quo_name() (note that this kind of interface where symbols do not rep-
resent actual objects is now discouraged in the tidyverse; we support it here for
backward compatibility).
... A selection of columns. If empty, all variables are selected. You can supply bare
variable names, select all variables between x and z with x:z, exclude y with
-y. For more options, see the dplyr::select() documentation. See also the
section on selection rules below.
na.rm If TRUE, will remove rows from output where the value column in NA.
convert If TRUE will automatically run type.convert() on the key column. This is
useful if the column names are actually numeric, integer, or logical.
factor_key If FALSE, the default, the key values will be stored as a character vector. If TRUE,
will be stored as a factor, which preserves the original ordering of the columns.
Rules for selection
Arguments for selecting columns are passed to tidyselect::vars_select() and are treated spe-
cially. Unlike other verbs, selecting functions make a strict distinction between data expressions
and context expressions.
• A data expression is either a bare name like xor an expression like x:y or c(x, y). In a data
expression, you can only refer to columns from the data frame.

getplottitle 41
• Everything else is a context expression in which you can only refer to objects that you have
defined with <-.
For instance, col1:col3 is a data expression that refers to data columns, while seq(start, end)
is a context expression that refers to objects from the contexts.
If you really need to refer to contextual objects from a data expression, you can unquote them with
the tidy eval operator !!. This operator evaluates its argument in the context and inlines the result
in the surrounding function call. For instance, c(x, !! x) selects the xcolumn within the data
frame and the column referred to by the object xdefined in the context (which can contain either a
column name as string or a column position).
Source
gather uit het pakket tidyr.
getplottitle Titel ophalen van title
Description
Titel ophalen van title
Usage
getplottitle(plot, validfilename = TRUE)
Arguments
plot Grafiek
validfilename Standaard is TRUE. Verandert de te retourneren tekst zodanig, dat dit een geldige
bestandsnaam is.
gps_from_address Adresgegevens ophalen van Google Maps
Description
Hiermee worden adreseigenschappen opgehaald m.b.v. de Google Maps Geocoding API. Het limiet
is ca. 15.000 requests per dag en ca. 300 requests per seconde.
Usage
gps_from_address(address, type = NA, country = "Nederland")
Arguments
address Een of meerdere adressen om naar te zoeken. Mag alles zijn dat Google Maps
begrijpt (zelfs "Certe", dit wordt vertaald naar Damsterdiep 191, Groningen).
type Standaard is NA voor alle eigenschappen. Geldige opties zijn: "lat","lng",
"straat","nummer","postcode","plaats","gemeente","provincie","land",
"landcode" of NA voor alle eigenschappen.
country Standaard is "Nederland". Deze tekst wordt toegevoegd aan address.

42 import
Value
Lijst of tekst
Source
maps_api_key
import Importeren van bestand
Description
Hiermee wordt (MMB-)data (bijv. aanvraaggegevens of doorlooptijden) geïmporteerd van een be-
stand. De functies import.csv,import.csv2 en import.tsv zijn hier wrappers van.
Gebruik alleen een bestandsnaam om de omgevingsvariabele R_REFMAP te gebruiken als map. Het
transformeert datumkolommen naar geldige datums en alle booleankolommen naar geldige logicals.
Daarnaast worden alle velden die leeg zijn of "NULL" bevatten getransformeerd naar NA.
Usage
import(file, sep = "auto", info = TRUE, startrow = 1, headerrow = 1,
datenames = "en", dateformat = "%Y-%m-%d", timeformat = "%H:%M",
decimal.mark = ".", big.mark = "", na = c("", "NULL", "NA"))
import.csv(file, ...)
import.csv2(file, ...)
import.tsv(file, ...)
Arguments
file Locatie van het bestand. Wanneer een bestandsnaam opgegeven is, wordt de
omgevingsvariabele R_REFMAP gebruikt als map. Bij Windows-locaties moet \
vervangen worden door \\.
sep Standaard is "auto", waardoor het sep bepaald wordt op basis van de bestand-
sextensie. Het scheidingsteken waardoor de velden in elke rij gescheiden wor-
den.
info Standaard is TRUE. Printen van voortgang van importeren en de uiteindelijke
datagrootte met aantal rijen en kolommen.
startrow Standaard is 1. Eerste rij die geïmporteerd moet worden.
headerrow Standaard is 1. De rij waarin de koppen zich bevinden. Gebruik headerrow = NA
of headerrow = 0 om geen koppen te importeren.
datenames Standaard is "en". Taal van de datenames (zoals weekdagen en maanden).
dateformat Standaard is "%Y-%m-%d". Accepteert ook Excel-formaten, zoals "dd-mm-yy"
en "dd-mm-jjjj".
timeformat Standaard is "%H:%M". Accepteert ook Excel-formaten, zoals "HH:MM:SS".
decimal.mark Standaard is ".". Scheidingsteken voor decimale getallen.

import.clipboard 43
big.mark Standaard is "". Groepsteken voor getallen, zoals 1.000.000.
na Standaard is c("", "NULL", "NA"). Waarden die vertaald moeten worden als
NA.
... Parameters die doorgegeven worden aan import.
Value
data.frame
See Also
import,import.csv,import.csv2,import.tsv,date_generic
Examples
## Not run:
mmb <- import.csv("2016.csv") # met komma als sep en punt als decimal.mark
mmb <- import.csv2("2016.csv") # met puntkomma als sep en komma als decimal.mark
mmb <- import.tsv("2016.tsv")
mmb <- import("2016.txt", sep = "|")
(met forward slash, moet enkel)
mmb <- import.csv("Z:/Data_Management/Data-analyse/Totaalanalyse MMB/2016.csv")
(met backslash, Windows-standaard, moet wel dubbel)
mmb <- import.csv("Z:\\Data_Management\\Data-analyse\\Totaalanalyse MMB\\2016.csv")
## End(Not run)
import.clipboard Importeren van klembord
Description
Hiermee wordt een tabel uit het klembord in R geïmporteerd als data.frame.
Usage
import.clipboard(sep = "\t", header = TRUE, na = c("", "NA", "NULL"),
format.NL = Sys.isdecimalcomma(), startrow = 1)
Arguments
sep Standaard is "\t". Het scheidingsteken waardoor de velden in elke rij geschei-
den worden.
header Standaard is TRUE. Koptekst als kolomnamen importeren.
na Standaard is c("", "NA", "NULL"). Waarden die als NA gelezen moeten wor-
den.
format.NL Standaard is TRUE. Hiermee worden getallen met een komma als decimaal teken
geïmporteerd.
startrow Standaard is 1. Eerste rij die geïmporteerd moet worden.

44 import.R
Value
data.frame
import.excel Importeren van Excel-bestand
Description
Hiermee wordt een tabblad uit een Excel-bestand in R geïmporteerd als data.frame.
Usage
import.excel(file, sheet = NA)
Arguments
file Locatie van het Excel-bestand. Wanneer een bestandsnaam opgegeven is, wordt
de omgevingsvariabele R_REFMAP gebruikt als map. Bij Windows-locaties moet
\vervangen worden door \\.
sheet Standaard is NA. Het sheet dat geïmporteerd moet worden.
Value
data.frame
import.R Importeren van R-structuur
Description
Hiermee wordt een data uit een RDS-bestand in R geïmporteerd, nadat deze geëxporteerd was met
de functie export.R.
Usage
import.R(filename)
Arguments
filename De bestandsnaam van het RDS-bestand.
Source
readRDS
Examples
## Not run:
export.R(starwars)
starwars2 <- import.R("starwars.rds")
identical(starwars, starwars2) # TRUE
## End(Not run)

independence.test 45
independence.test Onafhankelijkheidstest op basis van aantal observaties
Description
Dit voert een g.test uit wanneer de totale som van xis groter dan 1000. Bij een kleiner aantal
wordt een exact.test uitgevoerd.
Usage
independence.test(x, y = NULL, ...)
Arguments
x, y, ... Parameters die doorgegeven worden aan de verschillende tests.
See Also
exact.test g.test
inputname Naam van input
Description
Vertaling van input naar tekst. Voorbeeld: inputname(tbl1$x) = "tbl1$x".
Usage
inputname(x)
Arguments
xInputfunctie of -tekst

46 is.double2
install.fonts Extra lettertypen installeren
Description
Dit is nodig om Calibri te kunnen gebruiken, en Arial (voor PLOS One)
Usage
install.fonts()
Examples
## Not run:
pakketupdaten()
## End(Not run)
is.double2 Double-Precision Vectors
Description
Dit werkt hetzelfde als is.double en as.double, maar toetst en transformeert respectievelijk door
eerst komma’s als punt te lezen. De functie is.double2 toetst door middel van reguliere expressies,
dus wordt ook TRUE bij bijvoorbeeld "3306".
Usage
is.double2(x, dec = c(".", ","), na.rm = TRUE)
as.double2(x)
Arguments
xobject to be coerced or tested.
dec Standaard is c(".", ","). Tekens die als decimaal teken gelezen moeten wor-
den.
na.rm Standaard is TRUE. lege waarden negeren.
is.double2 47
Details
double creates a double-precision vector of the specified length. The elements of the vector are all
equal to 0. It is identical to numeric.
as.double is a generic function. It is identical to as.numeric. Methods should return an object of
base type "double".
is.double is a test of double type.
Rhas no single precision data type. All real numbers are stored in double precision format. The
functions as.single and single are identical to as.double and double except they set the at-
tribute Csingle that is used in the .C and .Fortran interface, and they are intended only to be used
in that context.
Value
double creates a double-precision vector of the specified length. The elements of the vector are all
equal to 0.
as.double attempts to coerce its argument to be of double type: like as.vector it strips attributes
including names. (To ensure that an object is of double type without stripping attributes, use
storage.mode.) Character strings containing optional whitespace followed by either a decimal
representation or a hexadecimal representation (starting with 0x or 0X) can be converted, as can
special values such as "NA","NaN","Inf" and "infinity", irrespective of case.
as.double for factors yields the codes underlying the factor levels, not the numeric representation
of the labels, see also factor.
is.double returns TRUE or FALSE depending on whether its argument is of double type or not.
Double-precision values
All Rplatforms are required to work with values conforming to the IEC 60559 (also known as IEEE
754) standard. This basically works with a precision of 53 bits, and represents to that precision a
range of absolute values from about 2×10−308 to 2×10308. It also has special values NaN (many
of them), plus and minus infinity and plus and minus zero (although Racts as if these are the same).
There are also denormal(ized) (or subnormal) numbers with absolute values above or below the
range given above but represented to less precision.
See .Machine for precise information on these limits. Note that ultimately how double precision
numbers are handled is down to the CPU/FPU and compiler.
In IEEE 754-2008/IEC60559:2011 this is called ‘binary64’ format.
Note on names
It is a historical anomaly that Rhas two names for its floating-point vectors, double and numeric
(and formerly had real).
double is the name of the type.numeric is the name of the mode and also of the implicit class. As
an S4 formal class, use "numeric".
The potential confusion is that Rhas used mode "numeric" to mean ‘double or integer’, which
conflicts with the S4 usage. Thus is.numeric tests the mode, not the class, but as.numeric (which
is identical to as.double) coerces to the class.

48 manual
References
Becker, R. A., Chambers, J. M. and Wilks, A. R. (1988) The New S Language. Wadsworth &
Brooks/Cole.
https://en.wikipedia.org/wiki/IEEE_754-1985,https://en.wikipedia.org/wiki/IEEE_
754-2008,https://en.wikipedia.org/wiki/Double_precision,https://en.wikipedia.org/
wiki/Denormal_number.
http://grouper.ieee.org/groups/754/ for links to information on the standards.
See Also
integer,numeric,storage.mode.
lin.reg Lineair regressiemodel
Description
Berekent alle attributen van een lineair regressiemodel.
Usage
lin.reg(x, plot = FALSE, na.rm = TRUE, title = "")
Arguments
xWaarden
plot Standaard is TRUE. Maakt een plot van het lineaire model.
na.rm Standaard is TRUE. Verwijdert lege waarden. Bij na.rm = FALSE worden waar-
den met NA vervangen door 0.
title Titel van de plot.
Value
Waarde
manual Handleiding (PDF) openen
Description
Hiermee wordt de handleiding van dit pakket geopend in het standaard PDF-programma.
Usage
manual()
Details
In het ontwikkelingsproject van dit pakket wordt deze functie gebruikt om de PDF te maken.

maps_api_key 49
maps_api_key Willekeurige Google Maps Geocoding API-sleutel
Description
Deze API-sleutels worden gebruikt voor het ophalen van gps_from_address. Er zijn 6 sleutels
aangemaakt met elk een limiet van 2.500 requests per dag en 50 requests per seconde. De sleutel
wordt iedere keer willekeurig geselecteerd met sample.
Usage
maps_api_key()
Value
Tekst
See Also
gps_from_address tbl_address plot2.map
matrix.2x2 Nieuwe 2x2 matrix maken
Description
Hiermee kan snel een 2x2 matrix gemaakt worden, door de waarden per ’cel’ op te geven.
Usage
matrix.2x2(r1c1 = 0, r1c2 = 0, r2c1 = 0, r2c2 = 0, row.names = c("",
""), col.names = c("", ""))
Arguments
r1c1, r1c2, r2c1, r2c2
Standaard is 0. Waarden om weer te geven, waarbij r= rij en c= kolom.
row.names Standaard is leeg. Namen van de rijen.
col.names Standaard is leeg. Namen van de kolommen.
Value
matrix
See Also
crosstab

50 max
max Maxima and Minima
Description
Returns the (regular or parallel) maxima and minima of the input values.
pmax*() and pmin*() take one or more vectors as arguments, recycle them to common length and
return a single vector giving the ‘parallel’ maxima (or minima) of the argument vectors.
Usage
max(..., na.rm = TRUE)
Arguments
... numeric or character arguments (see Note).
na.rm a logical indicating whether missing values should be removed.
Details
max and min return the maximum or minimum of all the values present in their arguments, as
integer if all are logical or integer, as double if all are numeric, and character otherwise.
If na.rm is FALSE an NA value in any of the arguments will cause a value of NA to be returned,
otherwise NA values are ignored.
The minimum and maximum of a numeric empty set are +Inf and -Inf (in this order!) which
ensures transitivity, e.g., min(x1, min(x2)) == min(x1, x2). For numeric x max(x) == -Inf
and min(x) == +Inf whenever length(x) == 0 (after removing missing values if requested).
However, pmax and pmin return NA if all the parallel elements are NA even for na.rm = TRUE.
pmax and pmin take one or more vectors (or matrices) as arguments and return a single vector
giving the ‘parallel’ maxima (or minima) of the vectors. The first element of the result is the
maximum (minimum) of the first elements of all the arguments, the second element of the result is
the maximum (minimum) of the second elements of all the arguments and so on. Shorter inputs (of
non-zero length) are recycled if necessary. Attributes (see attributes: such as names or dim) are
copied from the first argument (if applicable, e.g., not for an S4 object).
pmax.int and pmin.int are faster internal versions only used when all arguments are atomic vec-
tors and there are no classes: they drop all attributes. (Note that all versions fail for raw and complex
vectors since these have no ordering.)
max and min are generic functions: methods can be defined for them individually or via the Summary
group generic. For this to work properly, the arguments ... should be unnamed, and dispatch is on
the first argument.
By definition the min/max of a numeric vector containing an NaN is NaN, except that the min/max of
any vector containing an NA is NA even if it also contains an NaN. Note that max(NA, Inf) == NA
even though the maximum would be Inf whatever the missing value actually is.
Character versions are sorted lexicographically, and this depends on the collating sequence of the
locale in use: the help for ‘Comparison’ gives details. The max/min of an empty character vector
is defined to be character NA. (One could argue that as "" is the smallest character element, the
maximum should be "", but there is no obvious candidate for the minimum.)

md5 51
Value
For min or max, a length-one vector. For pmin or pmax, a vector of length the longest of the input
vectors, or length zero if one of the inputs had zero length.
The type of the result will be that of the highest of the inputs in the hierarchy integer < double <
character.
For min and max if there are only numeric inputs and all are empty (after possible removal of NAs),
the result is double (Inf or -Inf).
S4 methods
max and min are part of the S4 Summary group generic. Methods for them must use the signature
x, ..., na.rm.
References
Becker, R. A., Chambers, J. M. and Wilks, A. R. (1988) The New S Language. Wadsworth &
Brooks/Cole.
See Also
range (both min and max) and which.min (which.max) for the arg min, i.e., the location where an
extreme value occurs.
‘plotmath’ for the use of min in plot annotation.
md5 Vectorized hash/hmac functions
Description
All hash functions either calculate a hash-digest for key == NULL or HMAC (hashed message au-
thentication code) when key is not NULL. Supported inputs are binary (raw vector), strings (character
vector) or a connection object.
Usage
md5(x, key = NULL)
Arguments
xcharacter vector, raw vector or connection object.
key string or raw vector used as the key for HMAC hashing
Details
Functions are vectorized for the case of character vectors: a vector with nstrings returns nhashes.
When passing a connection object, the contents will be stream-hashed which minimizes the amount
of required memory. This is recommended for hashing files from disk or network.
The sha2 family of algorithms (sha224, sha256, sha384 and sha512) is generally recommended for
sensitive information. While sha1 and md5 are usually sufficient for collision-resistant identifiers,
they are no longer considered secure for cryptographic purposes.

52 mean
In applications where hashes should be irreversible (such as names or passwords) it is often recom-
mended to use a random key for HMAC hashing. This prevents attacks where we can lookup hashes
of common and/or short strings. See examples. A common special case is adding a random salt to
a large number of records to test for uniqueness within the dataset, while simultaneously rendering
the results incomparable to other datasets.
The blake2b and blake2s algorithms are only available if your system has libssl 1.1 or newer.
Source
md5 uit het pakket openssl.
References
Digest types: https://www.openssl.org/docs/manmaster/man1/dgst.html
mean Arithmetic Mean
Description
Generic function for the (trimmed) arithmetic mean.
Usage
mean(x, ..., na.rm = TRUE)
Arguments
xAn Robject. Currently there are methods for numeric/logical vectors and date,
date-time and time interval objects. Complex vectors are allowed for trim = 0,
only.
... further arguments passed to or from other methods.
na.rm a logical value indicating whether NA values should be stripped before the com-
putation proceeds.
Value
If trim is zero (the default), the arithmetic mean of the values in xis computed, as a numeric or
complex vector of length one. If xis not logical (coerced to numeric), numeric (including integer)
or complex, NA_real_ is returned, with a warning.
If trim is non-zero, a symmetrically trimmed mean is computed with a fraction of trim observa-
tions deleted from each end before the mean is computed.
References
Becker, R. A., Chambers, J. M. and Wilks, A. R. (1988) The New S Language. Wadsworth &
Brooks/Cole.
See Also
weighted.mean,mean.POSIXct,colMeans for row and column means.

mean_geometric 53
mean_geometric Geometric mean
Description
The geometric mean is defined as the nth root of the product of n numbers.
Usage
mean_geometric(x, ..., na.rm = TRUE)
Arguments
xData
... Parameters die doorgegeven worden aan mean.
na.rm Standaard is TRUE. Lege waarden negeren.
mean_harmonic Harmonic mean
Description
The harmonic mean can be expressed as the reciprocal of the arithmetic mean of the reciprocals.
Usage
mean_harmonic(x, ..., na.rm = TRUE)
Arguments
xData.
... Parameters die doorgegeven worden aan mean.
na.rm Standaard is TRUE. Lege waarden negeren.

54 median
median Median Value
Description
Compute the sample median.
Usage
median(x, na.rm = TRUE, ...)
Arguments
xan object for which a method has been defined, or a numeric vector containing
the values whose median is to be computed.
na.rm a logical value indicating whether NA values should be stripped before the com-
putation proceeds.
... potentially further arguments for methods; not used in the default method.
Details
This is a generic function for which methods can be written. However, the default method makes
use of is.na,sort and mean from package base all of which are generic, and so the default method
will work for most classes (e.g., "Date") for which a median is a reasonable concept.
Value
The default method returns a length-one object of the same type as x, except when xis logical or
integer of even length, when the result will be double.
If there are no values or if na.rm = FALSE and there are NA values the result is NA of the same type
as x(or more generally the result of x[FALSE][NA]).
References
Becker, R. A., Chambers, J. M. and Wilks, A. R. (1988) The New S Language. Wadsworth &
Brooks/Cole.
See Also
quantile for general quantiles.

melt 55
melt Convert an object into a molten data frame.
Description
This the generic melt function. See the following functions for the details about different data
structures:
Usage
melt(data, ..., na.rm = FALSE, value.name = "value")
Arguments
data Data set to melt
... further arguments passed to or from other methods.
na.rm Should NA values be removed from the data set? This will convert explicit
missings to implicit missings.
value.name name of variable used to store values
Details
•melt.data.frame for data.frames
•melt.array for arrays, matrices and tables
•melt.list for lists
Source
melt uit het pakket reshape2.
See Also
cast
midhinge Gemiddelde van het 1e en 3e kwartiel
Description
Berekent het gemiddelde van het 1e en 3e kwartiel, de midhinge. Gebruikt niet de standaard
kwantielberekening volgens R, maar volgens SPSS (zie quantile).
Usage
midhinge(x, na.rm = TRUE)

56 min
Arguments
xWaarde
na.rm Standaard is TRUE. Lege waarden negeren.
Value
Waarde
See Also
cqv
min Maxima and Minima
Description
Returns the (regular or parallel) maxima and minima of the input values.
pmax*() and pmin*() take one or more vectors as arguments, recycle them to common length and
return a single vector giving the ‘parallel’ maxima (or minima) of the argument vectors.
Usage
min(..., na.rm = TRUE)
Arguments
... numeric or character arguments (see Note).
na.rm a logical indicating whether missing values should be removed.
Details
max and min return the maximum or minimum of all the values present in their arguments, as
integer if all are logical or integer, as double if all are numeric, and character otherwise.
If na.rm is FALSE an NA value in any of the arguments will cause a value of NA to be returned,
otherwise NA values are ignored.
The minimum and maximum of a numeric empty set are +Inf and -Inf (in this order!) which
ensures transitivity, e.g., min(x1, min(x2)) == min(x1, x2). For numeric x max(x) == -Inf
and min(x) == +Inf whenever length(x) == 0 (after removing missing values if requested).
However, pmax and pmin return NA if all the parallel elements are NA even for na.rm = TRUE.
pmax and pmin take one or more vectors (or matrices) as arguments and return a single vector
giving the ‘parallel’ maxima (or minima) of the vectors. The first element of the result is the
maximum (minimum) of the first elements of all the arguments, the second element of the result is
the maximum (minimum) of the second elements of all the arguments and so on. Shorter inputs (of
non-zero length) are recycled if necessary. Attributes (see attributes: such as names or dim) are
copied from the first argument (if applicable, e.g., not for an S4 object).
pmax.int and pmin.int are faster internal versions only used when all arguments are atomic vec-
tors and there are no classes: they drop all attributes. (Note that all versions fail for raw and complex
vectors since these have no ordering.)

month 57
max and min are generic functions: methods can be defined for them individually or via the Summary
group generic. For this to work properly, the arguments ... should be unnamed, and dispatch is on
the first argument.
By definition the min/max of a numeric vector containing an NaN is NaN, except that the min/max of
any vector containing an NA is NA even if it also contains an NaN. Note that max(NA, Inf) == NA
even though the maximum would be Inf whatever the missing value actually is.
Character versions are sorted lexicographically, and this depends on the collating sequence of the
locale in use: the help for ‘Comparison’ gives details. The max/min of an empty character vector
is defined to be character NA. (One could argue that as "" is the smallest character element, the
maximum should be "", but there is no obvious candidate for the minimum.)
Value
For min or max, a length-one vector. For pmin or pmax, a vector of length the longest of the input
vectors, or length zero if one of the inputs had zero length.
The type of the result will be that of the highest of the inputs in the hierarchy integer < double <
character.
For min and max if there are only numeric inputs and all are empty (after possible removal of NAs),
the result is double (Inf or -Inf).
S4 methods
max and min are part of the S4 Summary group generic. Methods for them must use the signature
x, ..., na.rm.
References
Becker, R. A., Chambers, J. M. and Wilks, A. R. (1988) The New S Language. Wadsworth &
Brooks/Cole.
See Also
range (both min and max) and which.min (which.max) for the arg min, i.e., the location where an
extreme value occurs.
‘plotmath’ for the use of min in plot annotation.
month Get/set months component of a date-time
Description
Date-time must be a POSIXct, POSIXlt, Date, Period, chron, yearmon, yearqtr, zoo, zooreg, time-
Date, xts, its, ti, jul, timeSeries, and fts objects.
Usage
month(x, label = TRUE, abbr = TRUE, locale = "Dutch")

58 nelson.rule1
Arguments
xa date-time object
label logical. TRUE will display the month as a character string such as "January."
FALSE will display the month as a number.
abbr logical. FALSE will display the month as a character string label, such as "Jan-
uary". TRUE will display an abbreviated version of the label, such as "Jan".
abbr is disregarded if label = FALSE.
locale for month, locale to use for month names. Default to current locale.
Value
the months element of x as a number (1-12) or character string. 1 = January.
Source
month uit het pakket lubridate.
nelson.defaultminrun Standaardwaarde voor min.run
Description
Bepaal de standaardwaarde van min.run volgens Nelson per regel.
Usage
nelson.defaultminrun(rule)
Arguments
rule Nelson regel
nelson.rule1 Nelson QC regel 1
Description
Detecteer waarnemingen >3 sd.
Usage
nelson.rule1(x, m = mean(x), s = sd(x))
Arguments
xGegevensreeks
mStandaard is mean(x). Gemiddelde.
sStandaard is sd(x). Standaardafwijking.

nelson.rule2 59
Alle Nelson QC regels
•nelson.rule1: Detecteer waarnemingen >3 sd
•nelson.rule2: Detecteer reeks van >= 9 waarnemingen aan dezelfde kant van het gemiddelde
•nelson.rule3: Detecteer strikte toename of afname bij >= 6 waarnemingen op een rij
•nelson.rule4: Detecteer 14 waarnemingen op een rij alternerend in richting van het gemid-
delde, of alternerend in toename en afname
•nelson.rule5: Detecteer 2 van de 3 >2 sd van gemiddelde in dezelfde richting
•nelson.rule6: Detecteer 4 van de 5 >1 sd van gemiddelde in dezelfde richting
•nelson.rule7: Detecteer >= 15 waarnemingen op een rij binnen 1 sd van het gemiddelde
•nelson.rule8: Detecteer >= 8 waarnemingen op een rij allen buiten 1sd
nelson.rule2 Nelson QC regel 2
Description
Detecteer reeks van >= 9 waarnemingen aan dezelfde kant van het gemiddelde.
Usage
nelson.rule2(x, m = mean(x), min.run = nelson.defaultminrun(2))
Arguments
xGegevensreeks
mStandaard is mean(x). Gemiddelde.
min.run Standaard is nelson.defaultminrun(2). Minimaal aantal opeenvolgende waarne-
mingen waaraan de regel moet voldoen.
Alle Nelson QC regels
•nelson.rule1: Detecteer waarnemingen >3 sd
•nelson.rule2: Detecteer reeks van >= 9 waarnemingen aan dezelfde kant van het gemiddelde
•nelson.rule3: Detecteer strikte toename of afname bij >= 6 waarnemingen op een rij
•nelson.rule4: Detecteer 14 waarnemingen op een rij alternerend in richting van het gemid-
delde, of alternerend in toename en afname
•nelson.rule5: Detecteer 2 van de 3 >2 sd van gemiddelde in dezelfde richting
•nelson.rule6: Detecteer 4 van de 5 >1 sd van gemiddelde in dezelfde richting
•nelson.rule7: Detecteer >= 15 waarnemingen op een rij binnen 1 sd van het gemiddelde
•nelson.rule8: Detecteer >= 8 waarnemingen op een rij allen buiten 1sd

60 nelson.rule4
nelson.rule3 Nelson QC regel 3
Description
Detecteer strikte toename of afname bij >= 6 waarnemingen op een rij.
Usage
nelson.rule3(x, min.run = nelson.defaultminrun(3))
Arguments
xGegevensreeks
min.run Standaard is nelson.defaultminrun(3). Minimaal aantal opeenvolgende waarne-
mingen waaraan de regel moet voldoen.
Alle Nelson QC regels
•nelson.rule1: Detecteer waarnemingen >3 sd
•nelson.rule2: Detecteer reeks van >= 9 waarnemingen aan dezelfde kant van het gemiddelde
•nelson.rule3: Detecteer strikte toename of afname bij >= 6 waarnemingen op een rij
•nelson.rule4: Detecteer 14 waarnemingen op een rij alternerend in richting van het gemid-
delde, of alternerend in toename en afname
•nelson.rule5: Detecteer 2 van de 3 >2 sd van gemiddelde in dezelfde richting
•nelson.rule6: Detecteer 4 van de 5 >1 sd van gemiddelde in dezelfde richting
•nelson.rule7: Detecteer >= 15 waarnemingen op een rij binnen 1 sd van het gemiddelde
•nelson.rule8: Detecteer >= 8 waarnemingen op een rij allen buiten 1sd
nelson.rule4 Nelson QC regel 4
Description
Detecteer 14 waarnemingen op een rij alternerend in richting van het gemiddelde, of alternerend in
toename en afname.
Usage
nelson.rule4(x, m = mean(x), min.run = nelson.defaultminrun(4),
direction.mean = FALSE)

nelson.rule5 61
Arguments
xGegevensreeks
mStandaard is mean(x). Gemiddelde.
min.run Standaard is nelson.defaultminrun(4). Minimaal aantal opeenvolgende waarne-
mingen waaraan de regel moet voldoen.
direction.mean Standaard is FALSE. Met TRUE test deze functie op 14 waarnemingen op een rij
alternerend in richting van het gemiddelde.
Alle Nelson QC regels
•nelson.rule1: Detecteer waarnemingen >3 sd
•nelson.rule2: Detecteer reeks van >= 9 waarnemingen aan dezelfde kant van het gemiddelde
•nelson.rule3: Detecteer strikte toename of afname bij >= 6 waarnemingen op een rij
•nelson.rule4: Detecteer 14 waarnemingen op een rij alternerend in richting van het gemid-
delde, of alternerend in toename en afname
•nelson.rule5: Detecteer 2 van de 3 >2 sd van gemiddelde in dezelfde richting
•nelson.rule6: Detecteer 4 van de 5 >1 sd van gemiddelde in dezelfde richting
•nelson.rule7: Detecteer >= 15 waarnemingen op een rij binnen 1 sd van het gemiddelde
•nelson.rule8: Detecteer >= 8 waarnemingen op een rij allen buiten 1sd
nelson.rule5 Nelson QC regel 5
Description
Detecteer 2 van de 3 >2 sd van gemiddelde in dezelfde richting.
Usage
nelson.rule5(x, m = mean(x), s = sd(x), min.run = nelson.defaultminrun(5))
Arguments
xGegevensreeks
mStandaard is mean(x). Gemiddelde.
sStandaard is sd(x). Standaardafwijking.
min.run Standaard is nelson.defaultminrun(5). Minimaal aantal opeenvolgende waarne-
mingen waaraan de regel moet voldoen.

62 nelson.rule6
Alle Nelson QC regels
•nelson.rule1: Detecteer waarnemingen >3 sd
•nelson.rule2: Detecteer reeks van >= 9 waarnemingen aan dezelfde kant van het gemiddelde
•nelson.rule3: Detecteer strikte toename of afname bij >= 6 waarnemingen op een rij
•nelson.rule4: Detecteer 14 waarnemingen op een rij alternerend in richting van het gemid-
delde, of alternerend in toename en afname
•nelson.rule5: Detecteer 2 van de 3 >2 sd van gemiddelde in dezelfde richting
•nelson.rule6: Detecteer 4 van de 5 >1 sd van gemiddelde in dezelfde richting
•nelson.rule7: Detecteer >= 15 waarnemingen op een rij binnen 1 sd van het gemiddelde
•nelson.rule8: Detecteer >= 8 waarnemingen op een rij allen buiten 1sd
nelson.rule6 Nelson QC regel 6
Description
Detecteer 4 van de 5 >1 sd van gemiddelde in dezelfde richting.
Usage
nelson.rule6(x, m = mean(x), s = sd(x), min.run = nelson.defaultminrun(6))
Arguments
xGegevensreeks
mStandaard is mean(x). Gemiddelde.
sStandaard is sd(x). Standaardafwijking.
min.run Standaard is nelson.defaultminrun(6). Minimaal aantal opeenvolgende waarne-
mingen waaraan de regel moet voldoen.
Alle Nelson QC regels
•nelson.rule1: Detecteer waarnemingen >3 sd
•nelson.rule2: Detecteer reeks van >= 9 waarnemingen aan dezelfde kant van het gemiddelde
•nelson.rule3: Detecteer strikte toename of afname bij >= 6 waarnemingen op een rij
•nelson.rule4: Detecteer 14 waarnemingen op een rij alternerend in richting van het gemid-
delde, of alternerend in toename en afname
•nelson.rule5: Detecteer 2 van de 3 >2 sd van gemiddelde in dezelfde richting
•nelson.rule6: Detecteer 4 van de 5 >1 sd van gemiddelde in dezelfde richting
•nelson.rule7: Detecteer >= 15 waarnemingen op een rij binnen 1 sd van het gemiddelde
•nelson.rule8: Detecteer >= 8 waarnemingen op een rij allen buiten 1sd

nelson.rule7 63
nelson.rule7 Nelson QC regel 7
Description
Detecteer >= 15 waarnemingen op een rij binnen 1 sd van het gemiddelde.
Usage
nelson.rule7(x, m = mean(x), s = sd(x), min.run = nelson.defaultminrun(7))
Arguments
xGegevensreeks
mStandaard is mean(x). Gemiddelde.
sStandaard is sd(x). Standaardafwijking.
min.run Standaard is nelson.defaultminrun(7). Minimaal aantal opeenvolgende waarne-
mingen waaraan de regel moet voldoen.
Alle Nelson QC regels
•nelson.rule1: Detecteer waarnemingen >3 sd
•nelson.rule2: Detecteer reeks van >= 9 waarnemingen aan dezelfde kant van het gemiddelde
•nelson.rule3: Detecteer strikte toename of afname bij >= 6 waarnemingen op een rij
•nelson.rule4: Detecteer 14 waarnemingen op een rij alternerend in richting van het gemid-
delde, of alternerend in toename en afname
•nelson.rule5: Detecteer 2 van de 3 >2 sd van gemiddelde in dezelfde richting
•nelson.rule6: Detecteer 4 van de 5 >1 sd van gemiddelde in dezelfde richting
•nelson.rule7: Detecteer >= 15 waarnemingen op een rij binnen 1 sd van het gemiddelde
•nelson.rule8: Detecteer >= 8 waarnemingen op een rij allen buiten 1sd
nelson.rule8 Nelson QC regel 8
Description
Detecteer >= 8 waarnemingen op een rij allen buiten 1sd.
Usage
nelson.rule8(x, m = mean(x), s = sd(x), min.run = nelson.defaultminrun(8))

64 nelson.text
Arguments
xGegevensreeks
mStandaard is mean(x). Gemiddelde.
sStandaard is sd(x). Standaardafwijking.
min.run Standaard is nelson.defaultminrun(8). Minimaal aantal opeenvolgende waarne-
mingen waaraan de regel moet voldoen.
Alle Nelson QC regels
•nelson.rule1: Detecteer waarnemingen >3 sd
•nelson.rule2: Detecteer reeks van >= 9 waarnemingen aan dezelfde kant van het gemiddelde
•nelson.rule3: Detecteer strikte toename of afname bij >= 6 waarnemingen op een rij
•nelson.rule4: Detecteer 14 waarnemingen op een rij alternerend in richting van het gemid-
delde, of alternerend in toename en afname
•nelson.rule5: Detecteer 2 van de 3 >2 sd van gemiddelde in dezelfde richting
•nelson.rule6: Detecteer 4 van de 5 >1 sd van gemiddelde in dezelfde richting
•nelson.rule7: Detecteer >= 15 waarnemingen op een rij binnen 1 sd van het gemiddelde
•nelson.rule8: Detecteer >= 8 waarnemingen op een rij allen buiten 1sd
nelson.text Tekst van Nelson regels
Description
Dit geeft de uitleg van iedere Nelson regel.
Usage
nelson.text(rule, min.run = nelson.defaultminrun(rule))
Arguments
rule Nelson regel
min.run Standaard is de standaardwaarde volgens Nelson. Minimaal aantal opeenvol-
gende waarnemingen waaraan de regel moet voldoen.

p.symbol 65
p.symbol Symbool van een p-waarde
Description
Retourneert het symbool behorend bij de p-waarde: 0 ’***’ 0.001 ’**’ 0.01 ’*’ 0.05 ’.’ 0.1 ’ ’ 1
Usage
p.symbol(p, emptychar = " ")
Arguments
pp-waarde.
emptychar Standaard is " ". De tekst die weergegeven wordt bij p > 0.1.
Value
Tekst
pivot Draaien van tabel (pivoteren)
Description
Hiermee wordt een tabel gepivoteerd, d.w.z. een kwartslag gedraaid.
Usage
pivot(tbl, col.prefix = "Kolom", firstcol.as.header = FALSE)
Arguments
tbl Tabel die gepivoteerd moet worden
col.prefix Standaard is "Kolom". Prefix van de nieuwe kolomnamen: Kolom1, Kolom2,
enz.
firstcol.as.header
Standaard is FALSE. De eerste kolom als kolomkoppen gebruiken. Met TRUE
wordt eerst een kolom toegevoegd en wordt daarna pas gepivoteerd, zodat deze
nieuwe kolom als kolomkoppen gebruikt wordt.
Examples
## Not run:
tbl %>%
group_by(ziekenhuis) %>%
summarise(amox = rsi(amox),
cipr = rsi(cipr)) %>%
pivot()
## End(Not run)

66 plot2
plot2 Grafiek van tabel of reeks
Description
Grafiek van tabel of reeks met Certe-kleuren. De data wordt automatsch geinterpreteerd en zonodig
getransformeerd voordat de grafiek getekend wordt.
Voor x,y,x.category,y.category en datalabels wordt quasiquotation ondersteund.
Geldige types (type) zijn "bar","barpercent","boxplot","column","density","frequency",
"histogram","line","point","rsi" en "mic".
De plot2.*-functies zijn hier wrappers van.
Usage
plot2(...)
plot2.bar(...)
plot2.barpercent(...)
plot2.boxplot(...)
plot2.line(...)
plot2.point(...)
plot2.density(y, x.lbl = "", y.lbl = "Dichtheid", y.percent = TRUE, ...)
plot2.frequency(y, x.lbl = "", y.lbl = "Aantal", bins = NULL, ...)
plot2.histogram(y, x.lbl = "", y.lbl = "Aantal", bins = NULL, ...)
plot2.mic(...,
x.lbl = 'MIC-waarde',
y.lbl = 'Aantal',
title = 'Overzicht MIC-waarden')
plot2.rsi(...,
x.lbl = 'Antibiotica-interpretatie',
y.lbl = 'Aantal',
title = 'Gevoeligheidsanalyse')
Arguments
data data.frame met gegevens.
xStandaard is eerste kolom van data. Naam van kolom (als tekst) met gegevens
voor de x-as. Wanneer in deze kolom waarden meerdere keren voorkomen,
worden daarvan de waarden van ybij elkaar opgeteld.
yStandaard is tweede of derde kolom van data. Naam van kolom (als tekst) met
gegevens voor de y-as. Het is ook mogelijk om hier namen aan te geven, om de
tekst in de legenda aan te passen; zie voorbeelden.
y.category Standaard is tweede kolom van data. Naam van kolom (als tekst) met gegevens
voor de y-as.
x.category Standaard is NA. Splitsen in verschillende plots door middel van facet_wrap(scales = "free").
Zie aldaar voor meer parameters.
plot2 67
type Standaard is "column", in tegenstelling tot de standaard type = "p" van plot.
Geldige opties zijn "bar" ("b"), "barpercent","boxplot" ("box"), "column"
("c","col"), "density" ("d","dens"), "frequency" ("f","freq"), "histogram"
("h","hist"), "line" ("l"), "point" ("p"), "rsi" en "mic".
x.lbl, y.lbl Standaard is de kolomnaam van xof y. Beschrijving van de x- en y-as. Laat
deze ongedefinieerd om de kolomtitels van de data te gebruiken. Tekst tussen
*enkele sterren* wordt cursief gemaakt, tekst tussen **dubbele sterren** wordt
vet gemaakt.
title Standaard is NA, waarmee de asnamen van y en x weergegeven worden als
"y per x". Titel van de grafiek. Tekst tussen *enkele sterren* wordt cursief
gemaakt, tekst tussen **dubbele sterren** wordt vet gemaakt. De teksten n()
en n_distinct(kolomnaam) worden vertaald.
subtitle Standaard is leeg. Ondertitel van de grafiek. Tekst tussen *enkele sterren* wordt
cursief gemaakt, tekst tussen **dubbele sterren** wordt vet gemaakt. De tek-
sten n() en n_distinct(kolomnaam) worden vertaald.
x.category.fill
Standaard is NA; doorzichtig. Kleur die doorgegeven wordt aan colourpicker.
x.category.position
Standaard is "top". Geldige opties zijn "left","right","top","bottom".
x.category.bold
Standaard is TRUE. Tekst van x.category vetgedrukt weergeven.
x.category.size
Standaard is 10 pt. Grootte van de tekst van x.category.
x.category.repeat.lbls
Standaard is FALSE. Herhalen van de aslabels bij elke deelgrafiek.
colours Standaard is "certe". Een tekst of vector van tekst die doorgegeven wordt aan
colourpicker.
x.lbl.angle Standaard is 0. De hoek in graden waaronder de labels van de x-as weergegeven
worden. Gebruik voor verticale weergave een hoek van 90 (richting onder naar
boven) of 270 (richting boven naar onder).
x.lbl.align Standaard is NA, waardoor het uitlijnen berekend wordt op basis van x.lbl.angle.
Andere geldige opties zijn "left","center" en "right". Deze kunnen afgekort
worden.
x.lbl.italic Standaard is FALSE. De categorieën van de x-as cursief maken. Dit is nodig bij
namen van micro-organismen.
x.remove Standaard is FALSE. De eenheden van x-as verwijderen. Om de tekst (label) van
de x-as te verwijderen, gebruik x.lbl = "".
x.position Standaard is "bottom". Geldige opties zijn "left","right","top","bottom".
x.max Standaard is NA. Maximaal aantal verschillende waarden op de x-as.
x.max.txt Standaard is "(rest, x %n)". Tekst die weergegeven wordt bij waarden op de
x-as die buiten x.max vallen. Gebruik "%n" om het aantal overige categorieën
weer te geven.
y.remove Standaard is FALSE. De eenheden van y-as verwijderen. Om de tekst (label) van
de y-as te verwijderen, gebruik y.lbl = "".
y.24h Standaard is FALSE. De primaire lijnen van de y-as per 24 uur weergeven.
y.age Standaard is FALSE. De primaire lijnen van de y-as per leeftijdsgroep weergeven
(zie age.group).
68 plot2
y.percent Standaard is FALSE. Toont de y-as als percentage.
y.scale Standaard is automatisch. Hiermee kan de schaal van de y-as aangepast worden,
met bijvoorbeeld y.scale = c(0, 25). Standaard wordt in tegenstelling tot
ggplot wordt altijd y=0weergegeven. De hoogste waarde op de y-as is
standaard 1,25x de hoogst voorkomende y-waarde en de laagste waarde op de
y-as is standaard 0 (of 1,25x de laagst voorkomende y-waarde wanneer dit lager
is dan 0).
y.position Standaard is "left", behalve bij type = "barpercent". Geldige opties zijn
"left","right","top","bottom".
sort.x, sort.y.category
Standaard is TRUE. Sorteren van de xen/of y.category. Geldige waarden zijn:
-TRUE, bij factors op levels sorteren, anders zoals "asc" sorteren.
-FALSE, zoals volgorde in de data voortkomt sorteren.
-"asc" of "alpha", oplopend alfabetisch sorteren; ascending.
-"desc", aflopend alfabetisch sorteren; descending.
-"order", zoals FALSE sorteren.
-"freq", aflopend volgens de frequentie (summarise_function) van ysorteren
(hoogste waarde eerst).
-"freq-asc", oplopend zoals "freq" sorteren (hoogste waarde laatst).
datalabels Standaard is TRUE, wat de waarden weergeeft van y. Geeft datalabels weer bij
de kolommen, lijnen of punten. Dit kan een kolomnaam van data zijn, of een
lijst met waarden. Gebruik datalabels = FALSE of datalabels = NA om geen
datalabels weer te geven.
datalabels.round
Standaard is if_else(y.percent == FALSE, 2, 1). Aantal decimalen waarop
datalabels afgerond wordt, wanneer dit (decimale) getallen zijn.
datalabels.fill
Standaard is 'white'. De achtergrondkleur van de labels die doorgegeven wordt
aan colourpicker. Gebruik datalabels.fill = NA om geen achtergrond
weer te geven.
summarise_function
Standaard is sum. De functie die gebruikt wordt voor link{summarise} om de
waarden van yte berekenen wanneer waarden van xvaker voorkomen. Kan ook
uit een ander pakket komen: plot2(summarise_function = base::mean).
stacked Standaard is FALSE. Met FALSE worden de kolommen naast elkaar geplaatst, in
plaats van op elkaar.
stackedpercent Standaard is FALSE. Hiermee kan een 100% gestapelde grafiek gemaakt worden.
horizontal Standaard is FALSE. Horizontale orientatie van de kolommen. Met TRUE worden
er horizontale balken weergegeven.
reverse Standaard is horizontal, waardoor de waarde van horizontal overgenomen
wordt. Hiermee worden gestapelde balken omgekeerd. Dit is soms nodig om de
legenda synchroon te houden met de kleuren van de balken. Kan ook TRUE of
FALSE zijn.
smooth Standaard is FALSE. Lijnen vloeiend weergeven.
size Standaard is if_else(type == "line", 0.75, 2). Dikte van de lijnen in
geval van een lijngrafiek en punten in geval van een puntgrafiek.
bins Standaard is 20 of, wanneer dit lager is, het unieke aantal waarden gedeeld door
3. Bij een histogram het aantal ’bins’.
plot2 69
show.mean Standaard is FALSE. Bij boxplots de gemiddelde lijn ook weergeven.
break.S Standaard is NA. De hoogste MIC die geïnterpreteerd wordt als S.
break.R Standaard is break.S. De laagste MIC die geïnterpreteerd wordt als R.
legend.position
Standaard is "top". Geldige opties zijn "none" ("geen"), "left" ("links"),
"right" ("rechts"), "top" ("boven"), "bottom" ("onder"), of een vector met
2 cijfers: bijv. legend.position = c(0, 0) voor linksonder of legend.position = c(1, 1)
voor rechtsboven.
legend.lbl Standaard is "". Tekst bij de legenda.
print Standaard is FALSE. Hiermee wordt de grafiek direct met print weergegeven.
Met FALSE kan de output gebruikt worden om door te geven aan een variabele.
font.family Standaard is "Calibri". Het lettertype dat gebruikt moet worden voor tekst in
de grafiek. Om alle lettertypen te kunnen gebruiken die momenteel in Windows
geïnstalleerd zijn, moet de functie install.fonts eerst eenmalig gebruikt wor-
den.
text.factor Standaard is 1. Factor van de grootte van alle tekst.
format.NL Standaard is Sys.isdecimalcomma(), zie Sys.isdecimalcomma. Getallen Ned-
erlands weergeven, met een komma als decimaal scheidingsteken.
misses.data, misses.x, misses.y, misses.y.category
Wordt alleen intern gebruikt.
... Parameters voor oudere versies, die intern vertaald worden.
Value
Een ggplot-model.
See Also
plot2.save om een grafiek direct op te slaan.
plot2.map om een prevalentiegrafiek met Google Maps te maken.
plot2.pie om een taartgrafiek te maken.
Examples
## Not run:
plot2.column(mmb.orders, 'jaar','aantal orders')
# Direct vanuit dplyr:
df %>%
group_by(jaar, specialisme) %>%
summarise(aantal = n()) %>%
plot2(type = "column")
# Legenda gedefinieerde namen geven:
df %>%
filter(...) %>%
group_by(...) %>%
summarise(aantal = n()
monsters = n_distinct(ordernr)) %>%
plot2(y = c('Aantal orders'='aantal',

70 plot2.add
'Aantal monsters'='monsters'),
title = 'Aanvragen in 2018',
type = 'c')
## End(Not run)
plot2.add Extra element toevoegen aan grafiek
Description
Dit maakt een extra element in een grafiek.
Usage
plot2.add(plot, type, move = 0, size = if_else(type == "line", 0.75, 2),
colour = "certeroze", ...)
Arguments
plot Een ggplot-model waaraan de lijn toegevoegd moet worden.
type Type element dat toegevoegd moet worden. Voor een lijst van mogelijkheden:
plot2.elements.
move Standaard is 0. Nieuwe type verplaatsen m.b.v. plot2.movelayer.
size Standaard is if_else(type == "line", 0.75, 2). Dikte van de lijnen in
geval van een lijngrafiek en punten in geval van een puntgrafiek.
colour Standaard is "certeroze". Kleur van het type. Ondersteunt colourpicker.
... Parameters die doorgegeven worden aan het type, zoals colour,fill en size,
maar ook inherit.aes en mapping. Ondersteunt colourpicker. Variabelen
uit de data van plot worden automatisch vertaald, zie Examples.
Value
Een ggplot-model.
See Also
plot2
Examples
# Variabelen uit plot$data worden vertaald, zoals hier uit `rr_ewma`:
plot2(y = (runif(52) * 100) + 300, type = "line") %>%
plot2.add(y = rr_ewma(y, lambda = 0.75))
# hier met gefingeerde weekaantallen
tibble(week = 1:52,
meetpuntjes = (runif(52) * 100) + 30) %>%
plot2(type = "point",
size = 2,

plot2.axis 71
colour = "gray") %>%
plot2.add("line",
colour = "gray",
size = 0.5) %>%
# rrEWMA
plot2.add("line",
y = rr_ewma(meetpuntjes,
lambda = 0.9)) %>%
# 90e percentiel
plot2.add("line",
y = quantile(meetpuntjes,
0.9,
info = FALSE),
linetype = 2,
colour = "certeblauw") %>%
# en een leesbaardere x-as: elke 4 weken en beginnen bij 1
plot2.axis("x",
breaks = c(1, seq(from = 0, to = 52, by = 4)))
plot2.axis Aanpassen van plot2-assen
Description
Hierbij kunnen de x- en y-as van een ggplot-model aangepast worden.
Usage
plot2.axis(plot, axis, breaks = waiver(), date_breaks = waiver(),
minor_breaks = waiver(), date_minor_breaks = waiver(),
labels = waiver(), date_labels = waiver(), limits = NULL,
position = if_else(axis == "x", "bottom", "left"), log = FALSE,
trans = NULL)
Arguments
plot Een ggplot-model waarvan de as(sen) aangepast moet(en) worden.
axis As die aangepast moet worden: "x","y","xy" of c("x", "y").
breaks, date_breaks, minor_breaks, date_minor_breaks, labels, date_labels, limits, position, log
Zie scale_x_continuous,scale_x_discrete en scale_x_date voor alle mo-
gelijkheden.
trans Transformaties die gedaan kunnen worden aan een continuous schaal, zoals
"asn","atanh","boxcox","exp","identity","log","log10","log1p",
"log2","logit","probability","probit","reciprocal","reverse" en
"sqrt".

72 plot2.errorbar
plot2.elements Lijst met elementen
Description
Lijst met mogelijke elementen die toegevoegd kunnen worden aan een plot2, door middel van
plot2.add.
Usage
plot2.elements()
plot2.errorbar Foutbalken toevoegen aan grafiek
Description
Dit voegt foutbalken in op de aangegeven plaatsen.
Usage
plot2.errorbar(plot, ymin, ymax, x = colnames(plot$data)[1], size = 1,
linetype = 1, width = 0.33, colour = colourpicker("black", opacity =
0.5), type = "errorbar")
Arguments
plot De grafiek waaraan de lijn toegevoegd moet worden.
ymin, ymax, x Kolomnaam in plot$data. Waarden met NA worden genegeerd.
size Standaard is 1. Dikte van de lijnen in millimeters. Zie size.
linetype Standaard is 2. Het type lijn. Uit linetype:0 = blank, 1 = solid, 2 = dashed, 3 = dotted, 4 = dotdash, 5 = longdash, 6 = twodash.
width Standaard is 0.33. Breedte van de lijnen.
colour Standaard is colourpicker("black"). Kleur van de lijnen. Zie ook colourpicker.
type Standaard is "errorbar". Geldige opties zijn "errorbar" en "ribbon".
Value
Een ggplot-model.
See Also
plot2
Examples
plot2(...) %>%
plot2.errorbar(ymin = "se_min",
ymax = "se_max")

plot2.interactive 73
plot2.interactive Interactieve grafiek maken
Description
Dit maakt van een plot2-model een interactief plotly-model.
Usage
plot2.interactive(plot, ...)
Arguments
plot Een ggplot-model.
... Parameters die doorgegeven worden aan ggplotly.
plot2.listlayers Weergeven van alle lagen van een ggplot-model
Description
Hiermee wordt een overzicht gegeven van alle lagen van een ggplot-model (of plot2).
Usage
plot2.listlayers(plot, as.data.frame = FALSE)
Arguments
plot Een ggplot-model.
as.data.frame Standaard is FALSE. Overzicht printen als data.frame.
Value
Tekst
Examples
## Not run:
plot2(..) %>%
plot2.listlayers()
## End(Not run)

74 plot2.map
plot2.map Prevalentiegrafiek van tabel
Description
Dit plot adressen op een Google Maps kaart met prevalentiekleuren.
Usage
plot2.map(tbl, coord.round = 2, dot.size = 10, dot.alpha = 0.75,
text.show = TRUE, text.size = 4, text.colour = "white", print = FALSE,
colours = "prev")
Arguments
tbl De tabel met gegevens die geplot moet worden. De tabel moet de kolommen
lat en lng bevatten.
coord.round Standaard is 2. Afronden van coordinaten. Met minder decimalen krijgen co-
ordinaten betrekking op een groter gebied. Punten met dezelfde coordinaten
worden opgeteld.
dot.size Standaard is 10. Grootte van de stippen.
dot.alpha Standaard is 0.75. De zichtbaarheid van de stippen, een waarden tussen 0 en 1.
text.show Standaard is TRUE. Met FALSE worden alleen stippen weergegeven.
text.size Standaard is 4. Grootte van de tekst in de stippen.
text.colour Standaard is "white". Kleur van de tekst in de stippen.
print Standaard is FALSE. Hiermee wordt de grafiek direct met print weergegeven.
Met FALSE kan de output gebruikt worden om door te geven aan een variabele.
colours Standaard is "prev". Zie colourpicker.
Value
Een ggmap-model.
See Also
tbl_address gps_from_address
Examples
## Not run:
plot2.map(tbl = tbl_address("Van Swietenlaan 2, Groningen"))
## End(Not run)

plot2.movelayer 75
plot2.movelayer Verplaatsen van een laag van een ggplot-model
Description
Hiermee kan een laag binnen een ggplot (plot2) verplaatst worden, zodat ook na het maken van een
plot toch de volgorde van de lagen veranderd kan worden.
Usage
plot2.movelayer(plot, layer = length(plot$layers), move, info = TRUE)
Arguments
plot De grafiek waaraan de lijn toegevoegd moet worden.
layer Standaard is de laatste laag. De index van de laag die verplaatst moet worden.
move Een positief of negatief getal die aangeeft hoeveel posities de laag layer ver-
plaatst moet worden.
info Standaard is TRUE. Printen van de oude en nieuwe laagindeling.
Value
Een ggplot-model.
Examples
## Not run:
plot2(..) %>%
plot2.errorbar(..) %>%
plot2.movelayer(move = -2)
## End(Not run)
plot2.opendir Map openen van laatste plot2.save().
Description
De locatie van de laatste plot2-grafiek openen in een nieuw scherm van Windows Verkenner.
Usage
plot2.opendir()
Details
De locatie van de laatste plot2-grafiek wordt opgeslagen met de functie options, onder variabele
plot2.lastsave. Daarom kan de locatie opgehaald worden met de functie getOption("plot2.lastsave")
of options()$plot2.lastsave.

76 plot2.pie
See Also
plot2.save
plot2.pie Taartgrafiek van tabel
Description
Dit maakt een taartgrafiek met Certe-kleuren.
Usage
plot2.pie(data, x = NA, y = NA, title = NA, show.percent = TRUE,
show.count = FALSE, show.labels = TRUE, sort.size = TRUE, round = 2,
restgroup.threshold = 90, restgroup.info = TRUE, clockwise = TRUE,
colours = "certe", font.family = "Calibri", prefix.count = "n = ")
Arguments
data Tabel met gegevens.
xStandaard is de eerste kolom van data. Tekstlabels voor elke taartpunt.
yStandaard is de tweede kolom van data. Gegevens voor de taartpunten.
title Standaard is leeg. Titel van de grafiek.
show.percent Standaard is TRUE. Onder de labels het percentage weergeven.
show.count Standaard is FALSE. Onder de labels het aantal weergeven.
show.labels Standaard is TRUE. Met FALSE worden helemaal geen labels weergegeven.
sort.size Standaard is TRUE. De taartpunten sorteren van groot naar klein.
round Standaard is 2. Aantal decimalen waarop de grootte van nafgerond moet wor-
den.
restgroup.threshold
Standaard is 90. Het percentage dat gedefinieerd moet zijn voordat de rest onder
de restgroep gevat wordt (mits er meer dan 1 waarde over is). De restgroepg-
rootte is dus tussen de 0 en (100 - restgroup.threshold) procent. Gebruik
een waarde van NA of 100 om geen restgroep te maken. Waarden tussen 0 en 1
worden ook ondersteund.
restgroup.info Standaard is TRUE. Printen van de waarnemingen die in de restgroep vallen naar
de console.
clockwise Standaard is TRUE. Gegevens met de klok mee weergeven.
colours Standaard is "certe". Zie colourpicker.
font.family Standaard is "Calibri". Het lettertype dat gebruikt moet worden voor tekst in
de grafiek.
Value
Grafiek

plot2.save 77
Examples
## Not run:
plot2.pie(mmb$aanvragen, mmb$artsnaam, 'Overzicht')
## End(Not run)
plot2.save Grafiek opslaan op schijf
Description
Hiermee wordt een plot2-grafiek opgeslagen op de schijf in de huidige werkmap. Het bestandstype
wordt bepaald op basis van de extensie die gegeven wordt aan filename.
Usage
plot2.save(plot, width = 800, height = 500, size = NA, portrait = FALSE,
text.factor = 1, filename = paste0(if_else(is.na(getplottitle(plot)),
format(Sys.time(), format = "%Y%m%d-%H%M%S"), getplottitle(plot)),
".png"), selectdir = FALSE, returnplot = TRUE)
Arguments
plot Grafiek die opgeslagen moet worden.
width Standaard is 800. Breedte van de grafiek in pixels.
height Standaard is 500. Hoogte van de grafiek in pixels.
size Standaard is NA. Kan gebruikt worden in plaats van width en height om de
grootte aan te geven. Dit kan een waarde zijn als:
-"1200 * 800", voor een resolutie;
-"Office","vector","PowerPoint" of "Word" voor een vectorafbeelding
zonder kwaliteitsverlies (hierbij wordt altijd het .emf-bestandstype gebruikt);
- in geval van PDF: "A0" t/m "A6";
- een schermresolutie (niet-hoofdlettergevoelig): "SVGA","XGA","WXGA","SXGA",
"HD","WXGA","WSXGA","FHD","FullHD","WUXGA","WQHD","UltraHD" of
"4K".
portrait Standaard is FALSE. Bij PDF de pagina staand (portrait) weergeven, wordt an-
ders liggend (landscape).
text.factor Standaard is 1. Een factor tussen 0.5 en 2die voor tekst in de grafiek gebruikt
wordt. Op basis hiervan wordt intern het aantal dots per inch (DPI) en afbeeld-
ingsgrootte in inch berekend:
breedte (inch) = width / (text.factor * 100), en
hoogte (inch) = height / (text.factor * 100)
filename Standaard is de titel van plot of (wanneer deze niet beschikbaar is) de datum
en tijd op deze manier: "YYYYMMDD-hhmmss". Daarna wordt de extensie .png
toegevoegd. Wordt opgeslagen in de huidige werkmap, tenzij selectdir = TRUE.
De bestandsnaam kan eindigen op "png","bmp","jpeg","tiff","pdf","svg",
"eps","ps","tex","wmf" of "emf".
selectdir Standaard is FALSE. Een popup weergeven zodat de map geselecteerd kan wor-
den.
returnplot Standaard is TRUE. De plot niet alleen opslaan, maar ook retourneren.

78 plot2.text
Details
De maplocatie van de plot2-grafiek die met deze functie opgeslagen wordt, wordt vastgelegd in de
functie options met de variabele plot2.lastsave. Zie plot2.opendir voor meer informatie.
See Also
plot2.opendir om de map te openen waarin de afbeelding geplaatst is en ggsave voor de functie
die intern gebruikt wordt.
Examples
## Not run:
tbl %>%
filter(...) %>%
group_by(...) %>%
summarise(...) %>%
plot2() %>%
plot2.save(1200, 800)
tbl %>%
plot2() %>%
plot2.save(size = "1200 * 800")
tbl %>%
plot2() %>%
plot2.save(size = "FullHD", text.factor = 1.25)
tbl %>%
plot2() %>%
plot2.save(size = "PowerPoint", filename = "Test") # will output `Test.emf`
## End(Not run)
plot2.text Tekst toevoegen aan grafiek
Description
Dit voegt een annotatie toe aan een grafiek. De tekst wordt links uitgelijnd. BELANGRIJK: hier-
voor moet een andere grafiekfunctie gebruikt worden met print = FALSE.
Usage
plot2.text(plot, text, y, x = 0.5, colour = "certeroze", fill = NA,
size = 4, bold = FALSE, formula = FALSE, font.family = "Calibri", ...)
Arguments
plot De grafiek waaraan de tekst toegevoegd moet worden
text De tekst die geplot moet worden.
yPlaats op de y-as.
xStandaard is "0.5". Plaats op de x-as.

pmax 79
colour Standaard is colourpicker("certeroze"). Kleur van de tekst. Zie ook colourpicker.
fill Standaard is NA. Kleur van de achtergrond. Zie ook colourpicker.
size Standaard is "4". Grootte van de tekst.
bold Standaard is FALSE. Tekst vetgedrukt maken.
formula Standaard is FALSE. Wanneer de tekst een formule is (zoals text = "R^2 =="),
moet parse = TRUE gebruikt worden.
font.family Standaard is "Calibri". Het lettertype dat gebruikt moet worden voor tekst in
de grafiek.
... Andere parameters die doorgegeven worden aan layer.
Value
Een ggplot-model.
Examples
## Not run:
plot2.text('90e pct', 275)
## End(Not run)
pmax Maxima and Minima
Description
Returns the (regular or parallel) maxima and minima of the input values.
pmax*() and pmin*() take one or more vectors as arguments, recycle them to common length and
return a single vector giving the ‘parallel’ maxima (or minima) of the argument vectors.
Usage
pmax(..., na.rm = TRUE)
Arguments
... numeric or character arguments (see Note).
na.rm a logical indicating whether missing values should be removed.
Details
max and min return the maximum or minimum of all the values present in their arguments, as
integer if all are logical or integer, as double if all are numeric, and character otherwise.
If na.rm is FALSE an NA value in any of the arguments will cause a value of NA to be returned,
otherwise NA values are ignored.
The minimum and maximum of a numeric empty set are +Inf and -Inf (in this order!) which
ensures transitivity, e.g., min(x1, min(x2)) == min(x1, x2). For numeric x max(x) == -Inf
and min(x) == +Inf whenever length(x) == 0 (after removing missing values if requested).
However, pmax and pmin return NA if all the parallel elements are NA even for na.rm = TRUE.
80 pmax
pmax and pmin take one or more vectors (or matrices) as arguments and return a single vector
giving the ‘parallel’ maxima (or minima) of the vectors. The first element of the result is the
maximum (minimum) of the first elements of all the arguments, the second element of the result is
the maximum (minimum) of the second elements of all the arguments and so on. Shorter inputs (of
non-zero length) are recycled if necessary. Attributes (see attributes: such as names or dim) are
copied from the first argument (if applicable, e.g., not for an S4 object).
pmax.int and pmin.int are faster internal versions only used when all arguments are atomic vec-
tors and there are no classes: they drop all attributes. (Note that all versions fail for raw and complex
vectors since these have no ordering.)
max and min are generic functions: methods can be defined for them individually or via the Summary
group generic. For this to work properly, the arguments ... should be unnamed, and dispatch is on
the first argument.
By definition the min/max of a numeric vector containing an NaN is NaN, except that the min/max of
any vector containing an NA is NA even if it also contains an NaN. Note that max(NA, Inf) == NA
even though the maximum would be Inf whatever the missing value actually is.
Character versions are sorted lexicographically, and this depends on the collating sequence of the
locale in use: the help for ‘Comparison’ gives details. The max/min of an empty character vector
is defined to be character NA. (One could argue that as "" is the smallest character element, the
maximum should be "", but there is no obvious candidate for the minimum.)
Value
For min or max, a length-one vector. For pmin or pmax, a vector of length the longest of the input
vectors, or length zero if one of the inputs had zero length.
The type of the result will be that of the highest of the inputs in the hierarchy integer < double <
character.
For min and max if there are only numeric inputs and all are empty (after possible removal of NAs),
the result is double (Inf or -Inf).
S4 methods
max and min are part of the S4 Summary group generic. Methods for them must use the signature
x, ..., na.rm.
References
Becker, R. A., Chambers, J. M. and Wilks, A. R. (1988) The New S Language. Wadsworth &
Brooks/Cole.
See Also
range (both min and max) and which.min (which.max) for the arg min, i.e., the location where an
extreme value occurs.
‘plotmath’ for the use of min in plot annotation.

pmin 81
pmin Maxima and Minima
Description
Returns the (regular or parallel) maxima and minima of the input values.
pmax*() and pmin*() take one or more vectors as arguments, recycle them to common length and
return a single vector giving the ‘parallel’ maxima (or minima) of the argument vectors.
Usage
pmin(..., na.rm = TRUE)
Arguments
... numeric or character arguments (see Note).
na.rm a logical indicating whether missing values should be removed.
Details
max and min return the maximum or minimum of all the values present in their arguments, as
integer if all are logical or integer, as double if all are numeric, and character otherwise.
If na.rm is FALSE an NA value in any of the arguments will cause a value of NA to be returned,
otherwise NA values are ignored.
The minimum and maximum of a numeric empty set are +Inf and -Inf (in this order!) which
ensures transitivity, e.g., min(x1, min(x2)) == min(x1, x2). For numeric x max(x) == -Inf
and min(x) == +Inf whenever length(x) == 0 (after removing missing values if requested).
However, pmax and pmin return NA if all the parallel elements are NA even for na.rm = TRUE.
pmax and pmin take one or more vectors (or matrices) as arguments and return a single vector
giving the ‘parallel’ maxima (or minima) of the vectors. The first element of the result is the
maximum (minimum) of the first elements of all the arguments, the second element of the result is
the maximum (minimum) of the second elements of all the arguments and so on. Shorter inputs (of
non-zero length) are recycled if necessary. Attributes (see attributes: such as names or dim) are
copied from the first argument (if applicable, e.g., not for an S4 object).
pmax.int and pmin.int are faster internal versions only used when all arguments are atomic vec-
tors and there are no classes: they drop all attributes. (Note that all versions fail for raw and complex
vectors since these have no ordering.)
max and min are generic functions: methods can be defined for them individually or via the Summary
group generic. For this to work properly, the arguments ... should be unnamed, and dispatch is on
the first argument.
By definition the min/max of a numeric vector containing an NaN is NaN, except that the min/max of
any vector containing an NA is NA even if it also contains an NaN. Note that max(NA, Inf) == NA
even though the maximum would be Inf whatever the missing value actually is.
Character versions are sorted lexicographically, and this depends on the collating sequence of the
locale in use: the help for ‘Comparison’ gives details. The max/min of an empty character vector
is defined to be character NA. (One could argue that as "" is the smallest character element, the
maximum should be "", but there is no obvious candidate for the minimum.)

82 preset
Value
For min or max, a length-one vector. For pmin or pmax, a vector of length the longest of the input
vectors, or length zero if one of the inputs had zero length.
The type of the result will be that of the highest of the inputs in the hierarchy integer < double <
character.
For min and max if there are only numeric inputs and all are empty (after possible removal of NAs),
the result is double (Inf or -Inf).
S4 methods
max and min are part of the S4 Summary group generic. Methods for them must use the signature
x, ..., na.rm.
References
Becker, R. A., Chambers, J. M. and Wilks, A. R. (1988) The New S Language. Wadsworth &
Brooks/Cole.
See Also
range (both min and max) and which.min (which.max) for the arg min, i.e., the location where an
extreme value occurs.
‘plotmath’ for the use of min in plot annotation.
preset Voorgedefinieerde variabelen selecteren
Description
Dit downloadt bestanden uit de map Sys.getenv("R_REFMAP") die de structuur preset_*.sql
hebben. Gebruik een of meerdere van deze (zelf te maken) bestanden als parameter select_preset
in de functies certedb_getmmb en certedb_getmmb_tat. Zie Details.
Usage
preset.list(prefix = FALSE)
preset.exists(name)
preset.read(name)
preset.add(name, vector)
preset.thisfolder()
Arguments
prefix Standaard is FALSE. Bestandsnamen weergeven met prefix prefix_.
name Tekst(vector) om te zoeken in de map Sys.getenv("R_REFMAP").
vector Tekst(vector) met kolomnamen die opgeslagen moet worden als nieuwe preset.
Deze kunnen geselecteerd worden met db.

print.data.frame 83
Details
Gebruik:
-preset.list voor het weergeven van alle presets in de map Sys.getenv("R_REFMAP");
-preset.add voor het toevoegen van een nieuwe preset;
-preset.read voor het uitlezen van een preset;
-preset.thisfolder voor het weergeven van de eerst gevonden preset in de huidge map;
-preset.exists voor toetsen of een preset bestaat.
print.data.frame Printing Data Tables and Tibbles
Description
Print a data table or tibble. It prints:
- The first and last rows like data.tables are printed by the data.table package,
- A header and left aligned text like tibbles are printed by the tibble package with info about
grouped variables,
-Unchanged values and support for row names like data.frames are printed by the base pack-
age.
Usage
## S3 method for class 'data.frame'
print(x, nmax = 10, header = TRUE, row.names = TRUE,
right = FALSE, width = 1, na = "<NA>", ...)
Arguments
xobject of class data.frame.
nmax amount of rows to print in total. When the total amount of rows exceeds this
limit, the first and last nmax / 2 rows will be printed. Use nmax = NA to print
all rows.
header print header with information about data size and tibble grouping
row.names logical (or character vector), indicating whether (or what) row names should be
printed.
right logical, indicating whether or not strings should be right-aligned. The default is
right-alignment.
width amount of white spaces to keep between columns, must be at least 1
na value to print instead of NA
... optional arguments to print or plot methods.

84 prod
prod Product of Vector Elements
Description
prod returns the product of all the values present in its arguments.
Usage
prod(..., na.rm = TRUE)
Arguments
... numeric or complex or logical vectors.
na.rm logical. Should missing values be removed?
Details
If na.rm is FALSE an NA value in any of the arguments will cause a value of NA to be returned,
otherwise NA values are ignored.
This is a generic function: methods can be defined for it directly or via the Summary group generic.
For this to work properly, the arguments ... should be unnamed, and dispatch is on the first
argument.
Logical true values are regarded as one, false values as zero. For historical reasons, NULL is accepted
and treated as if it were numeric(0).
Value
The product, a numeric (of type "double") or complex vector of length one. NB: the product of an
empty set is one, by definition.
S4 methods
This is part of the S4 Summary group generic. Methods for it must use the signature x, ..., na.rm.
References
Becker, R. A., Chambers, J. M. and Wilks, A. R. (1988) The New S Language. Wadsworth &
Brooks/Cole.
See Also
sum,cumprod,cumsum.
‘plotmath’ for the use of prod in plot annotation.

project_dashboard 85
project_dashboard Project Dashboard
Description
Dit opent een Shiny-applicatie voor projectmanagement van Certe.
Usage
project_dashboard(active_path = NULL)
qc.test Kwaliteitsanalyse o.b.v. Nelson, Westgard of anders
Description
Met deze functie kan een gegevensreeks getoetst worden op kwaliteitsregels. Daarnaast wordt
getoetst of er een significante lineaire trend bestaat.
Usage
qc.test(x, dates = rep(NA, length(x)), m = mean(x), s = sd(x),
round = 2, type = "Nelson", text.show = TRUE, plot.show = TRUE,
title = paste("Kwaliteitscontrole volgens", type), subtitle = "",
subtitle.colour = colourpicker("certeblauw"), plot.withoutrule1 = FALSE,
plot.print = TRUE, x.lbl = "Waarneming", y.lbl = "Waarde",
markdown = FALSE, force = FALSE)
nelson.test(x, ...)
westgard.test(x, ...)
plot2.qcc(x, ..., plot.print = FALSE)
Arguments
xGegevensreeks.
dates Standaard is rep(NA, length(x)). Datums van gegevenswaarden.
mStandaard is mean(x). Gemiddelde van xdat gebruikt wordt in de kwaliteit-
sregels.
sStandaard is sd(x). Standaardafwijking van xdat gebruikt wordt in de kwaliteit-
sregels.
round Standaard is 2. Aantal decimalen waarop alle getallen afgerond worden.
type Standaard is "Nelson". Geldige opties zijn "Nelson","Westgard","AIAG",
"Montgomery" of "Healthcare". Zie Rules list (onderaan) voor meer infor-
matie.
text.show Standaard is TRUE. Tekstanalyse weergeven.

86 qry
plot.show Standaard is TRUE. Grafiek weergeven met gemiddelde (zie mean), EWMA (zie
ewma), 1-3x de standaardafwijking (zie sd) en de waarnemingen met eventueel
overtreden kwaliteitsregels.
title Standaard is paste("Kwaliteitscontrole volgens", type). Titel van de
toets en de grafiek. Tekst tussen sterretjes wordt cursief gemaakt.
subtitle Standaard is "". Ondertitel van de grafiek. Tekst tussen sterretjes wordt cursief
gemaakt.
subtitle.colour
Standaard is colourpicker("certeblauw"). Zie ook colourpicker. Kleur
van de ondertitel.
plot.withoutrule1
Standaard is FALSE. Als regel 1 overtreden wordt (zie nelson.rule1), de plot
opnieuw weergeven met data zonder deze waarnemingen.
plot.print Standaard is TRUE. De grafiek direct printen met de functie print. Met FALSE
wordt de grafiek als ggplot-model geretourneerd.
x.lbl Standaard is "Waarneming". De tekst op de x-as.
y.lbl Standaard is "Waarde". De tekst op de y-as.
markdown Standaard is FALSE. Tekstanalyse afdrukken in markdown-formaat met tbl_markdown.
force Standaard is FALSE. Bij grote afwijkingen wordt de analyse gestaakt. Gebruik
deze optie om de analyse te forceren.
... Parameters die doorgegeven worden aan qc.test.
Rules list
Voor parameter type:
Nelson (N), Westgard (W), AIAG (A), Montgomery (M), Healthcare (H): N W A M H
————————————————————————————— —– —– —– —– —–
#1 Waarnemingen >3 sd 1 1 1 1 1
#2 Reeks van >= nwaarnemingen aan dezelfde kant van het gemiddelde 9 9 7 8 8
#3 Strikte toename of afname bij >=nwaarnemingen op een rij 6 - 6 6 6
#4 nwaarnemingen op een rij alternerend (gemiddelde of toename/afname) 14 - 14 14 -
#5 n-1 van de n>2 sd van gemiddelde in dezelfde richting 3 3 3 3 3
#6 n-1 van de n>1 sd van gemiddelde in dezelfde richting 5 5 5 5 -
#7 >=nwaarnemingen op een rij binnen 1 sd van het gemiddelde 15 - 15 15 15
#8 >=nwaarnemingen op een rij allen buiten 1sd 8 - 8 8 -
Bron: https://www.qimacros.com/control-chart/nelson-juran-rules.jpg
qry Query van een object
Description
Hiermee kan snel de eigenschap (attribute)qry van een object weergegeven worden of aan een ob-
ject toegewezen worden. Deze eigenschap worden altijd toegewezen aan de output van certedb_query
en vóór toewijzing gevalideerd.

quantile 87
Usage
qry(x)
qry(x) <- value
Arguments
xObject.
value Waarde om toe te kennen.
Examples
## Not run:
data <- certedb_query("SELECT * FROM certemm_ord LIMIT 1")
qry(data)
## End(Not run)
quantile Steekproefkwantielen volgens SPSS met na.rm = TRUE
Description
Zie quantile. Er wordt een beschrijving gegeven bij de gekozen methode (parameter type). Type
6 is de manier volgens SPSS dat hier standaard gekozen is om aan te sluiten bij SPSS-gebruikers.
Type 7 is de standaard manier volgens R (en daarvoor S). Type 8 wordt aangeraden door de auteurs
van de quantile-functie: prof. dr. Rob Hyndman et al. (1996, 2004).
Usage
quantile(x, ..., na.rm = TRUE, type = 6, info = TRUE)
Arguments
x, ..., na.rm, type
Parameters die doorgegeven worden aan quantile.
info Standaard is TRUE. Tekstuitleg bij type geven.
range Range of Values
Description
range returns a vector containing the minimum and maximum of all the given arguments.
Usage
range(..., na.rm = TRUE)

88 rdate
Arguments
... any numeric or character objects.
na.rm logical, indicating if NA’s should be omitted.
Details
range is a generic function: methods can be defined for it directly or via the Summary group generic.
For this to work properly, the arguments ... should be unnamed, and dispatch is on the first
argument.
If na.rm is FALSE,NA and NaN values in any of the arguments will cause NA values to be returned,
otherwise NA values are ignored.
If finite is TRUE, the minimum and maximum of all finite values is computed, i.e., finite = TRUE
includes na.rm = TRUE.
A special situation occurs when there is no (after omission of NAs) nonempty argument left, see
min.% Extremes.Rd
S4 methods
This is part of the S4 Summary group generic. Methods for it must use the signature x, ..., na.rm.
References
Becker, R. A., Chambers, J. M. and Wilks, A. R. (1988) The New S Language. Wadsworth &
Brooks/Cole.
See Also
min,max.
The extendrange() utility in package grDevices.
rdate Willekeurige datum
Description
Retourneert een vector met willekeurige dates binnen een bepaald bereik. Datums kunnen meerdere
keren voorkomen. Standaard worden dates gesorteerd van oud naar nieuw.
Usage
rdate(x, min = paste0(format(Sys.Date(), "%Y"), "-01-01"),
max = paste0(format(Sys.Date(), "%Y"), "-12-31"), sort = TRUE)
Arguments
xAantal dates
min Standaard is de eerste dag van dit jaar. Eerste mogelijke datum.
max Standaard is de laatste dag van dit jaar. Laatste mogelijke datum.
sort Standaard is TRUE. Sorteert de dates van oud naar nieuw.

remember 89
Source
sample,seq
remember Waarde tijdelijk opslaan in Global Environment
Description
Dit kan gebruikt worden in een dplyr-syntax om een waarde later in de syntax te herinneren. Werkt
voor maximaal 5 waarden, die tijdelijk naar de Global Environment opgeslagen worden.
Usage
remember(.data, tmp_1 = NA, tmp_2 = NA, tmp_3 = NA, tmp_4 = NA,
tmp_5 = NA)
recall(tmp = 1, delete = TRUE)
Arguments
.data Tabel die na de functie weer ongewijzigd doorgegeven wordt.
tmp_1, tmp_2, tmp_3, tmp_4, tmp_5
Standaard is NA. Waarde die onthouden moet worden. Kan ook een functie zijn
die over tbl berekend wordt.
tmp Standaard is 1. Waarde die opgehaald moet worden.
delete Standaard is TRUE. Waarde na recall() weer verwijderen.
Details
Waarden kunnen geslagen worden met remember() en opgehaald (en verwijderd) worden met
recall().
Examples
## Not run:
tbl %>%
filter(...) %>%
remember(nrow(.)) %>%
group_by(...) %>%
summarise(...) %>%
plot2(title = "Test",
subtitle = paste("n =",
recall()))
tbl %>%
filter(...) %>%
remember(tmp_1 = nrow(.)) %>%
group_by(...) %>%
summarise(...) %>%
plot2(title = "Test",
subtitle = paste("n =",
recall(tmp = 1)))

90 rr_ewma
## End(Not run)
rr_ewma Omgekeerd gerecombineerde exponentieel gewogen zwevend gemid-
delde (rrEWMA)
Description
Deze Reversed-Recombined EWMA is een aanpassing van de ewma-functie door het gemiddelde
te berekenen van een EWMA die van het begin tot het einde van een reeks berekend is, met een
EWMA die van het einde tot het begin van een reeks berekend is.
Usage
rr_ewma(x, lambda, m = mean(x))
Arguments
xGegevensreeks.
lambda Het gewicht dat gegeven worden aan het meest recente rationele subgroepgemid-
delde.
mStandaard is mean(x). Gemiddelde van de reeks van x.
Value
Lijst.
See Also
ewma
Examples
## Not run:
rr_ewma(x, 0.9)
## End(Not run)

rsi_table 91
rsi_table Gevoeligheidstabel maken tussen ziekenhuizen
Description
Maakt een tabel van een gevoeligheidsvergelijking tussen ziekenhuizen. Voert een G-test uit bij
>1000 observaties of een Exact-test bij minder.
Usage
rsi_table(ab_list, hospitalname, df_all, df_thishospital = NULL,
df_otherhospitals = NULL)
Arguments
ab_list Lijst met antibiotica. Zie antibiotics.
hospitalname Naam van het ziekenhuis dat met andere ziekenhuizen vergeleken wordt.
df_all data.frame met alle gegevens.
df_thishospital
data.frame met alle gegevens van het te onderzoeken ziekenhuis.
df_otherhospitals
data.frame met alle gegevens van de overige ziekenhuizen.
See Also
g.test die uitgevoerd bij > 1000 observaties; exact.test die uitgevoerd bij <= 1000 observaties.
Examples
## Not run:
rsi_table(ab_list, 'MZ', df)
## End(Not run)
SaveAsVersion Huidig document opslaan als nieuwe versie
Description
Hiermee wordt het geopende document opgeslagen als nieuwe versie. Er wordt automatisch een
hoger versienummer en daarnaast de initialen van de huidige gebruiker toegevoegd.
Usage
SaveAsVersion(myname = Sys.getenv("R_USERNAME"), olddir = "Oude versies")
Arguments
myname Standaard is Sys.getenv("R_USERNAME"). De naam van de huidige gebruiker.
olddir Standaard is "Oude versies". De map in de huidige map waarnaar oude versies
verplaatst worden.

92 se
sd Standard Deviation
Description
This function computes the standard deviation of the values in x. If na.rm is TRUE then missing
values are removed before computation proceeds.
Usage
sd(x, na.rm = TRUE)
Arguments
xa numeric vector or an Robject which is coercible to one by as.double(x).
na.rm logical. Should missing values be removed?
Details
Like var this uses denominator n−1.
The standard deviation of a zero-length vector (after removal of NAs if na.rm = TRUE) is not defined
and gives an error. The standard deviation of a length-one vector is NA.
See Also
var for its square, and mad, the most robust alternative.
se Standaardfout met na.rm = TRUE
Description
De standaardfout-berekening: de sd / wortel(lengte), of de wortel(variantie / lengte). Lege waarden
worden genegeerd met na.rm = TRUE en na.omit(x).
Usage
se(x, na.rm = TRUE)
Arguments
xWaarde.
na.rm Standaard is TRUE. Lege waarden negeren.
Value
Waarde

sha1 93
sha1 Vectorized hash/hmac functions
Description
All hash functions either calculate a hash-digest for key == NULL or HMAC (hashed message au-
thentication code) when key is not NULL. Supported inputs are binary (raw vector), strings (character
vector) or a connection object.
Usage
sha1(x, key = NULL)
Arguments
xcharacter vector, raw vector or connection object.
key string or raw vector used as the key for HMAC hashing
Details
Functions are vectorized for the case of character vectors: a vector with nstrings returns nhashes.
When passing a connection object, the contents will be stream-hashed which minimizes the amount
of required memory. This is recommended for hashing files from disk or network.
The sha2 family of algorithms (sha224, sha256, sha384 and sha512) is generally recommended for
sensitive information. While sha1 and md5 are usually sufficient for collision-resistant identifiers,
they are no longer considered secure for cryptographic purposes.
In applications where hashes should be irreversible (such as names or passwords) it is often recom-
mended to use a random key for HMAC hashing. This prevents attacks where we can lookup hashes
of common and/or short strings. See examples. A common special case is adding a random salt to
a large number of records to test for uniqueness within the dataset, while simultaneously rendering
the results incomparable to other datasets.
The blake2b and blake2s algorithms are only available if your system has libssl 1.1 or newer.
Source
sha1 uit het pakket openssl.
References
Digest types: https://www.openssl.org/docs/manmaster/man1/dgst.html

94 sha2
sha2 Vectorized hash/hmac functions
Description
All hash functions either calculate a hash-digest for key == NULL or HMAC (hashed message au-
thentication code) when key is not NULL. Supported inputs are binary (raw vector), strings (character
vector) or a connection object.
Usage
sha2(x, size = 256, key = NULL)
Arguments
xcharacter vector, raw vector or connection object.
size must be equal to 224 256 384 or 512
key string or raw vector used as the key for HMAC hashing
Details
Functions are vectorized for the case of character vectors: a vector with nstrings returns nhashes.
When passing a connection object, the contents will be stream-hashed which minimizes the amount
of required memory. This is recommended for hashing files from disk or network.
The sha2 family of algorithms (sha224, sha256, sha384 and sha512) is generally recommended for
sensitive information. While sha1 and md5 are usually sufficient for collision-resistant identifiers,
they are no longer considered secure for cryptographic purposes.
In applications where hashes should be irreversible (such as names or passwords) it is often recom-
mended to use a random key for HMAC hashing. This prevents attacks where we can lookup hashes
of common and/or short strings. See examples. A common special case is adding a random salt to
a large number of records to test for uniqueness within the dataset, while simultaneously rendering
the results incomparable to other datasets.
The blake2b and blake2s algorithms are only available if your system has libssl 1.1 or newer.
Source
sha2 uit het pakket openssl.
References
Digest types: https://www.openssl.org/docs/manmaster/man1/dgst.html

sha256 95
sha256 Vectorized hash/hmac functions
Description
All hash functions either calculate a hash-digest for key == NULL or HMAC (hashed message au-
thentication code) when key is not NULL. Supported inputs are binary (raw vector), strings (character
vector) or a connection object.
Usage
sha256(x, key = NULL)
Arguments
xcharacter vector, raw vector or connection object.
key string or raw vector used as the key for HMAC hashing
Details
Functions are vectorized for the case of character vectors: a vector with nstrings returns nhashes.
When passing a connection object, the contents will be stream-hashed which minimizes the amount
of required memory. This is recommended for hashing files from disk or network.
The sha2 family of algorithms (sha224, sha256, sha384 and sha512) is generally recommended for
sensitive information. While sha1 and md5 are usually sufficient for collision-resistant identifiers,
they are no longer considered secure for cryptographic purposes.
In applications where hashes should be irreversible (such as names or passwords) it is often recom-
mended to use a random key for HMAC hashing. This prevents attacks where we can lookup hashes
of common and/or short strings. See examples. A common special case is adding a random salt to
a large number of records to test for uniqueness within the dataset, while simultaneously rendering
the results incomparable to other datasets.
The blake2b and blake2s algorithms are only available if your system has libssl 1.1 or newer.
Source
sha256 uit het pakket openssl.
References
Digest types: https://www.openssl.org/docs/manmaster/man1/dgst.html

96 sha512
sha512 Vectorized hash/hmac functions
Description
All hash functions either calculate a hash-digest for key == NULL or HMAC (hashed message au-
thentication code) when key is not NULL. Supported inputs are binary (raw vector), strings (character
vector) or a connection object.
Usage
sha512(x, key = NULL)
Arguments
xcharacter vector, raw vector or connection object.
key string or raw vector used as the key for HMAC hashing
Details
Functions are vectorized for the case of character vectors: a vector with nstrings returns nhashes.
When passing a connection object, the contents will be stream-hashed which minimizes the amount
of required memory. This is recommended for hashing files from disk or network.
The sha2 family of algorithms (sha224, sha256, sha384 and sha512) is generally recommended for
sensitive information. While sha1 and md5 are usually sufficient for collision-resistant identifiers,
they are no longer considered secure for cryptographic purposes.
In applications where hashes should be irreversible (such as names or passwords) it is often recom-
mended to use a random key for HMAC hashing. This prevents attacks where we can lookup hashes
of common and/or short strings. See examples. A common special case is adding a random salt to
a large number of records to test for uniqueness within the dataset, while simultaneously rendering
the results incomparable to other datasets.
The blake2b and blake2s algorithms are only available if your system has libssl 1.1 or newer.
Source
sha512 uit het pakket openssl.
References
Digest types: https://www.openssl.org/docs/manmaster/man1/dgst.html

size.env 97
size.env Grootte van Global Environment
Description
Retourneert een tabel met de grootte in MB van alle elementen in het Global Environment.
Usage
size.env(min.MB = 1)
Arguments
min.MB Standaard is 1. Alleen weergeven vanaf dit aantal MB’s.
size_humanreadable Bytes weergeven in kB/MB/GB
Description
De bestandsgrootte (als double) weergeven als kB/MB/GB.
Usage
size_humanreadable(bytes, decimals = 1)
Arguments
bytes Grootte als getal
decimals Aantal tekens achter de komma.
Examples
size_humanreadable(123456) # 121 kB
size_humanreadable(12345678) # 11.8 MB

98 spread
split.every.n Splitsen in vaste breedte
Description
Hiermee kan een tekst of getal gesplitst worden op elk aangegeven aantal tekens.
Usage
## S3 method for class 'every.n'
split(x, n)
Arguments
xTekst of getal
nDe input xsplitsen op elke ntekens.
Examples
256 %>% split.every.n(1) # c(2, 5, 6)
256 %>% split.every.n(2) # c(25, 6)
"Certe" %>% split.every.n(1) # c("C", "e", "r", "t", "e")
"Certe" %>% split.every.n(4) # c("Cert", "e")
spread Spread a key-value pair across multiple columns.
Description
Spread a key-value pair across multiple columns.
Usage
spread(data, key, value, fill = NA, convert = FALSE, drop = TRUE,
sep = NULL)
Arguments
data A data frame.
key Column names or positions. This is passed to tidyselect::vars_pull().
These arguments are passed by expression and support quasiquotation (you can
unquote column names or column positions).
value Column names or positions. This is passed to tidyselect::vars_pull().
These arguments are passed by expression and support quasiquotation (you can
unquote column names or column positions).
fill If set, missing values will be replaced with this value. Note that there are two
types of missingness in the input: explicit missing values (i.e. NA), and implicit
missings, rows that simply aren’t present. Both types of missing value will be
replaced by fill.

str2 99
convert If TRUE,type.convert() with asis = TRUE will be run on each of the new
columns. This is useful if the value column was a mix of variables that was
coerced to a string. If the class of the value column was factor or date, note
that will not be true of the new columns that are produced, which are coerced to
character before type conversion.
drop If FALSE, will keep factor levels that don’t appear in the data, filling in missing
combinations with fill.
sep If NULL, the column names will be taken from the values of key variable. If non-
NULL, the column names will be given by "<key_name><sep><key_value>".
Source
spread uit het pakket tidyr.
str2 Structuur en inhoud van R-object bekijken
Description
Dit lijkt op str, maar analyseert een dataframe helemaal en retourneert ook het aantal unieke waar-
den en de beschikbaarheid per kolom.
Usage
str2(object, format.NL = Sys.isdecimalcomma())
Arguments
object Een Robject.
format.NL Standaard is Sys.isdecimalcomma(), zie Sys.isdecimalcomma. Hiermee wor-
den getallen met een komma als decimaal teken weergegeven.
See Also
str
ls.str
summary
strip_name Verwijderen van titel en voorletters van naam
Description
Dit transformeert een naam als "Dhr AA van der Molen" naar "V/d Molen" en een naam als
"Prof dr AB Jansen" naar "Jansen". Verwijdert alle academische titels voor de naam (Prof, Dr,
Ir, enz) en achter de naam (Ph.D., MD, enz.) en ook Nederlandse voor- en achtervoegsels zoals
Mw, Dhr en Jr of Sr.

100 strsplit.select
Usage
strip_name(name)
Arguments
name Naam van persoon
Value
Tekst
Examples
## Not run:
tbl$artsnaam <- strip_name(tbl$artsnaam)
## End(Not run)
strsplit.select Splits tekst en selecteer element
Description
Splits tekst en selecteer element
Usage
strsplit.select(x, element, split = " ", fixed = FALSE, perl = FALSE,
useBytes = FALSE)
Arguments
xcharacter vector, each element of which is to be split. Other inputs, including a
factor, will give an error.
element The nth element that should be returned.
split character vector (or object which can be coerced to such) containing regular
expression(s) (unless fixed = TRUE) to use for splitting. If empty matches
occur, in particular if split has length 0, xis split into single characters. If
split has length greater than 1, it is re-cycled along x.
fixed logical. If TRUE match split exactly, otherwise use regular expressions. Has
priority over perl.
perl logical. Should Perl-compatible regexps be used?
useBytes logical. If TRUE the matching is done byte-by-byte rather than character-by-
character, and inputs with marked encodings are not converted. This is forced
(with a warning) if any input is found which is marked as "bytes" (see Encoding).
See Also
strsplit

sum 101
Examples
## Not run:
tbl %>%
mutate(genus = strsplit.select(microorganisme, 1),
species = strsplit.select(microorganisme, 2))
## End(Not run)
sum Sum of Vector Elements
Description
sum returns the sum of all the values present in its arguments.
Usage
sum(..., na.rm = TRUE)
Arguments
... numeric or complex or logical vectors.
na.rm logical. Should missing values (including NaN) be removed?
Details
This is a generic function: methods can be defined for it directly or via the Summary group generic.
For this to work properly, the arguments ... should be unnamed, and dispatch is on the first
argument.
If na.rm is FALSE an NA or NaN value in any of the arguments will cause a value of NA or NaN to be
returned, otherwise NA and NaN values are ignored.
Logical true values are regarded as one, false values as zero. For historical reasons, NULL is accepted
and treated as if it were integer(0).
Loss of accuracy can occur when summing values of different signs: this can even occur for
sufficiently long integer inputs if the partial sums would cause integer overflow. Where possible
extended-precision accumulators are used, but this is platform-dependent.
Value
The sum. If all of ... are of type integer or logical, then the sum is integer, and in that case the
result will be NA (with a warning) if integer overflow occurs. Otherwise it is a length-one numeric
or complex vector.
NB: the sum of an empty set is zero, by definition.
S4 methods
This is part of the S4 Summary group generic. Methods for it must use the signature x, ..., na.rm.
‘plotmath’ for the use of sum in plot annotation.

102 summary_interactive
References
Becker, R. A., Chambers, J. M. and Wilks, A. R. (1988) The New S Language. Wadsworth &
Brooks/Cole.
See Also
colSums for row and column sums.
summary summary met tibble check
Description
Zie voor verdere informatie summary.
Usage
summary(object, ...)
Arguments
object R-object.
... Parameters die doorgegeven kunnen worden aan summary.
summary_interactive Interactive summary
Description
Dit opent een Shiny-applicatie voor interactieve samenvatting van alle data van een tibble of dataframe.
Typ de tekst van een object in een document of in de Console en selecteer de optie in het menu
Addins (of stel het in als sneltoets, bijvoorbeeld F2).
Usage
summary_interactive(dfname = NA)
Arguments
dfname Standaard is leeg. Een object of de naam ervan. Controleert eerst of er een tekst
geselecteerd is in een document, of dat er tekst in de Console staat.

sumofsquares 103
sumofsquares Sum of Squares (kwadratensom)
Description
Dit berekent de Sum of Squares.
Usage
sumofsquares(x, correct_mean = TRUE, na.rm = TRUE)
Arguments
xData
correct_mean Standaard is TRUE. Gebruik TRUE om te corrigeren voor het gemiddelde, waarmee
de som bepaald van ieder kwadraat van xwaar het gemiddelde van xeerst
afgetrokken is, zodat dit iets zegt over de spreiding van de data. Met FALSE
worden simpelweg alle x^2 bij elkaar opgeteld, zodat dit iets zegt over de lig-
ging van de data.
na.rm Standaard is TRUE. Lege waarden negeren.
See Also
https://www.thoughtco.com/sum-of-squares-formula-shortcut-3126266
Sys.isdecimalcomma Controleer of de locale West-Europees is
Description
Deze functie wordt gebruikt binnen andere functies van certedata om te controleren of de sys-
teemtaal West-Europees is, om vervolgens getallen en datums zodanig op te maken (bijv. komma
als scheidingsteken bij getallen). Zie Source voor de lijst met landen die hieronder vallen.
Usage
Sys.isdecimalcomma()
Value
logical
Source
https://en.wikipedia.org/wiki/Decimal_mark#Countries_using_Arabic_numerals_with_
decimal_comma

104 tbl_anonymise
tbl_address Tabel maken van adressen
Description
Hiermee worden adressen omgezet naar een tbl met het adres, de lengte- en de breedtegraad.
Usage
tbl_address(address)
Arguments
address Een of meerdere adressen om naar te zoeken. Mag alles zijn dat Google Maps
begrijpt (zelfs "Certe", dit wordt vertaald naar Damsterdiep 191, Groningen).
Value
Tabel
tbl_anonymise Verwijderen van privacygevoelige kolommen
Description
Verwijdert de volgende kolommen uit een dataframe: geslachtsnaam,naam,achternaam,geboortedatum,
postcode,plaats,woonplaats,provincie, en "lastname","name","dob","birthdate" en
"city".
Usage
tbl_anonymise(tbl)
Arguments
tbl Dataframe met gegevens.
Value
data.frame
Examples
## Not run:
tbl <- tbl_anonymise(tbl)
## End(Not run)

tbl_binary2logical 105
tbl_binary2logical Binaire kolommen transformeren naar logical
Description
Hiermee worden kolommen die uitsluitend waarden 0 en 1 bevatten, omgezet naar de class logical.
Usage
tbl_binary2logical(tbl)
Arguments
tbl Tabel waarvan kolommen getransformeerd moeten worden.
tbl_first_isolates Bepaling eerste isolaten
Description
Hiermee worden direct alle eerste isolaten toegevoegd aan een tabel, zie first_isolate.
Usage
tbl_first_isolates(tbl, col_date = "ontvangstdatum",
col_patient_id = "patidnb", col_bactid = "bacteriecode",
col_genus = "genus", col_species = "species", col_testcode = NA,
col_specimen = "mtrlgroep", col_icu = "is_ic", episode_days = 365,
testcodes_exclude = "", icu_exclude = FALSE, output_logical = TRUE,
ignore_I = TRUE, info = TRUE, timestamp = FALSE)
Arguments
tbl Een data.frame met isolaten.
col_date Standaard is "ontvangstdatum". De kolomnaam van de datum van ontvangst
of uitslag.
col_patient_id Standaard is "patidnb". De kolomnaam van de unieke ID’s van de patient.
col_bactid Standaard is "bacteriecode". De kolomnaam van de bacteriecodes voor het
bepalen van sleutelantibiotica.
col_genus Standaard is "genus". De kolomnaam van de genus van het micro-organisme.
col_species Standaard is "species". De kolomnaam van de species van het micro-organisme.
col_testcode Standaard is "testcode". De kolomnaam van de testcode van de order. Gebruik
col_testcode = NA om de testcodes niet als exclusiecriterium te gebruiken. In
dit geval wordt testcodes_exclude genegeerd.
col_specimen Standaard is "mtrlgroep". De kolomnaam van de materiaalgroep van de order.
col_icu Standaard is "is_ic". De kolomnaam van de logical of een afdeling/aanvrager
bij de Intensive Care hoort.
106 tbl_first_isolates
episode_days Standaard is 365. De episode in dagen waarna een isolaat opnieuw een ’eerste
isolaat’ genoemd moet worden.
testcodes_exclude
Standaard is leeg. De lijst met testcodes waarvan de isolaten genegeerd moeten
worden (hoofdletterONgevoelig). Gebruik voor het uitsluiten van screeningskweken
testcodes_exclude = c("KARE", "KBRMO", "KESBL", "KMNS", "KMR", "KMRP", "KVRE", "KWA22", "KWA35", "KWA37", "KWE", "KWKS", "KWKSD", "KWL", "KWS", "RESDEP").
icu_exclude Standaard is FALSE. Negeert alle isolaten waarbij col_icu == TRUE.
output_logical Standaard is TRUE. Geeft een resultaatset terug met waarden TRUE of FALSE, of
anders de waarden 0of 1.
info Standaard is TRUE. Printen van voortgang.
timestamp Standaard is FALSE. Printen van timestamp.
points_threshold
Standaard is 1. points until the comparison of key antibiotics will lead to inclu-
sion of an isolate, see Details.
Details
To compare key antibiotics, the difference between antimicrobial interpretations will be measured.
A difference from I to S|R (or vice versa) means 0.5 points. A difference from S to R (or vice versa)
means 1 point. When the sum of points exceeds points_threshold, an isolate will be (re)selected
as a first weighted isolate.
Value
tabel
Examples
## Not run:
# snel alles toevoegen:
tbl <- tbl_first_isolates(tbl)
# of per type (AMR-pakket):
tbl$sleutelab <- key_antibiotics(tbl)
tbl$eerste_isolaat <-
first_isolate(tbl)
tbl$eerste_isolaat_gewogen <-
first_isolate(tbl,
col_keyantibiotics = 'sleutelab')
tbl$eerste_bloedisolaat <-
first_isolate(tbl,
filter_specimen = 'Bloed')
tbl$eerste_bloedisolaat_gewogen <-
first_isolate(tbl,
filter_specimen = 'Bloed',
col_keyantibiotics = 'sleutelab')
# enz.

tbl_guess_columns 107
## End(Not run)
tbl_guess_columns Class van elke kolom schatten
Description
Transformeert een data.frame door de class van elke kolom te schatten met parse_guess en
forceert daarbij UTF-8-encoding voor ondersteuning van speciale tekens zoals klinkers met ac-
centen. Wanneer een kolom de class factor of character bezit, wordt het Unicode-teken 00EB
(ASCII escape character) vervangen door een spatie, worden kolommen die uitsluitend de waarden
c(NA, "", "S", "I", "R") bevatten getransformeerd met as.rsi, en worden kolommen met
kolomnamen die eindigen op _mic getransformeerd met as.mic.
Usage
tbl_guess_columns(tbl, datenames = "en", dateformat = "%Y-%m-%d",
timeformat = "%H:%M", decimal.mark = ".", big.mark = "",
timezone = "Europe/Amsterdam", na = c("", "NULL", "NA", "<NA>"))
Arguments
tbl Tabel.
datenames Standaard is "en". Taal van de datenames (zoals weekdagen en maanden).
dateformat Standaard is "%Y-%m-%d". Accepteert ook Excel-formaten, zoals "dd-mm-yy"
en "dd-mm-jjjj".
timeformat Standaard is "%H:%M". Accepteert ook Excel-formaten, zoals "HH:MM:SS".
decimal.mark Standaard is ".". Scheidingsteken voor decimale getallen.
big.mark Standaard is "". Groepsteken voor getallen, zoals 1.000.000.
timezone Standaard is "Europe/Amsterdam". Zomertijd is gelijk aan CEST (Central Eu-
ropean Summer Time) en loopt 2 uur voor op UTC, wintertijd is gelijk aan CET
(Central European Time) en loopt 1 uur voor op UTC.
na Standaard is c("", "NULL", "NA", "<NA>"). Waarden die vertaald moeten
worden als NA.
Value
Met behoud van oorspronkelijke class: data.frame (forceert geen tibble)

108 tbl_markdown
tbl_markdown Tabel printen in Markdown, LaTeX of HTML
Description
Drukt een tabel af (forceert print) in Markdown, LaTeX of HTML m.b.v. kable, met standaard
vette kolomnamen en naar Nederlands getransformeerde formaten voor datums, getallen en per-
centages.
Usage
tbl_markdown(tbl, row.names = FALSE, column.names = colnames(tbl),
align = NULL, padding = 2, caption = "", na = "",
format.tbl = "markdown", format.dates = "dd-mm-yyyy",
format.NL = Sys.isdecimalcomma(), columns.percent = NA,
columns.bold = TRUE, round.numbers = 2, round.percent = 1,
newlines.leading = 2, newlines.trailing = 2)
Arguments
tbl Een data.frame met gegevens.
row.names Standaard is FALSE. Weer te geven rijnamen.
column.names Standaard is colnames(tabel). Weer te geven kolomnamen.
align Standaard is NULL, waardoor kolommen met getallen rechts worden uitgelijnd
en andere kolommen links worden uitgelijnd.
padding Standaard is 2. Extra ruimte in de cellen.
caption Standaard is "". Bijschrift bij de tabel.
na Standaard is "". Tekst voor ontbrekende waarden.
format.tbl Standaard is "markdown". Geldige opties zijn "latex","html","markdown",
"pandoc" en "rst".
format.dates Standaard is "dd-mm-yyyy". Zie format2.
format.NL Standaard is Sys.isdecimalcomma(), zie Sys.isdecimalcomma. Hiermee wor-
den getallen met een komma als decimaal teken weergegeven.
columns.percent
Standaard is NA. De kolomindices weergeven als percentage met format2. Voor-
beeld: columns.percent = c(2, 3). Makkelijk is om deze kolommen vooraf
te transformeren met as.percent, zo blijven de bronwaarden namelijk gelijk.
columns.bold Standaard is TRUE. Kolomnamen vet weergeven.
round.numbers Standaard is 2. Aantal decimalen om op af te ronden bij getallen.
round.percent Standaard is 1. Aantal decimalen om op af te ronden wanneer columns.percent
gebruikt wordt.
newlines.leading
Standaard is 2. Aantal witregels om te printen voor de tabel.
newlines.trailing
Standaard is 2. Aantal witregels om te printen na de tabel.

tbl_removeNULLs 109
Details
Wanneer in een R Markdown-rapport een tabel met deze functie voorafgegaan wordt door een ander
object (zoals een grafiek), printen de kolomkoppen alleen goed wanneer newlines.leading >= 2,
of door handmatig gebruik van cat("\n\n") alvorens de tabel te printen.
Value
Tekst
See Also
kable
tbl_removeNULLs Vervangen van "NULL" door NA in een dataframe
Description
Retourneert een dataframe waarin alle velden met "NULL" vervangen zijn door NA.
Usage
tbl_removeNULLs(tbl)
Arguments
tbl Dataframe met gegevens.
Value
data.frame
Examples
## Not run:
tbl <- tbl_removeNULLs(tbl)
## End(Not run)

110 theme_certe
templatedoc Referentiedocumenten voor analyses en rapporten
Description
Een set van verschillende sjablonen die gebruikt kunnen worden voor analyses en rapporten.
Usage
templatedoc(type = "refdoc")
Arguments
type Standaard is "refdoc". Het type sjabloon dat gebruikt moet worden. Geldige
opties zijn "refdoc","certeblauw","certegeel","certegroen","certelila".
Examples
# Begin van een Rmd-document (R Markdown):
#
# ---
# title: "Titel"
# subtitle: "Ondertitel"
# output:
# word_document:
# reference_docx: "" # <- hier het resultaat van templatedoc()
# ---
theme_certe Certe-thema voor ggplot-grafieken
Description
Hiermee kan aan een ggplot-model het Certe-thema meegegeven worden.
Usage
theme_certe(subtitle.colour = colourpicker("certeblauw"), x.lbl.angle = 0,
x.lbl.align = 0.5, horizontal = FALSE, font.family = "Calibri",
legend.position = "top", text.factor = 1,
x.category.fill = colourpicker(NA), x.category.bold = TRUE,
x.category.size = 10)
Arguments
subtitle.colour
Standaard is colourpicker("certeblauw"). Kleur van de ondertitel. Zie
colourpicker.
x.lbl.angle Standaard is 0. De hoek in graden waaronder de labels van de x-as weergegeven
worden. Gebruik voor verticale weergave een hoek van 90 (richting onder naar
boven) of 270 (richting boven naar onder).
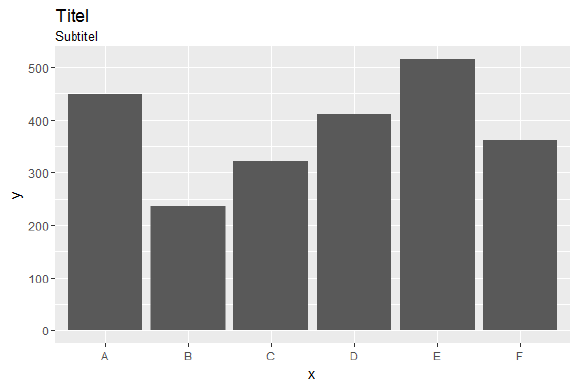
theme_certe 111
x.lbl.align Standaard is 0.5, waardoor er centraal uitgelijnd wordt. Andere geldige opties
zijn "links","midden" en "rechts".
horizontal Standaard is FALSE. Voor horizontale orientatie van kolommen of boxplots. Met
TRUE worden de lijnen van de y-as vervangen door lijnen op de x-as.
font.family Standaard is "Calibri". Het lettertype dat gebruikt wordt voor tekst in de
grafiek.
legend.position
Standaard is "top". Geldige opties zijn "none" ("geen"), "left" ("links"),
"right" ("rechts"), "top" ("boven"), "bottom" ("onder"), of een vector met
2 cijfers: bijv. legend.position = c(0, 0) voor linksonder of legend.position = c(1, 1)
voor rechtsboven.
text.factor Standaard is 1. Factor van de grootte van alle tekst.
x.category.fill
Standaard is "certeblauw3". Kleur die doorgegeven wordt aan colourpicker.
Details
Zonder theme_certe():
Met theme_certe():
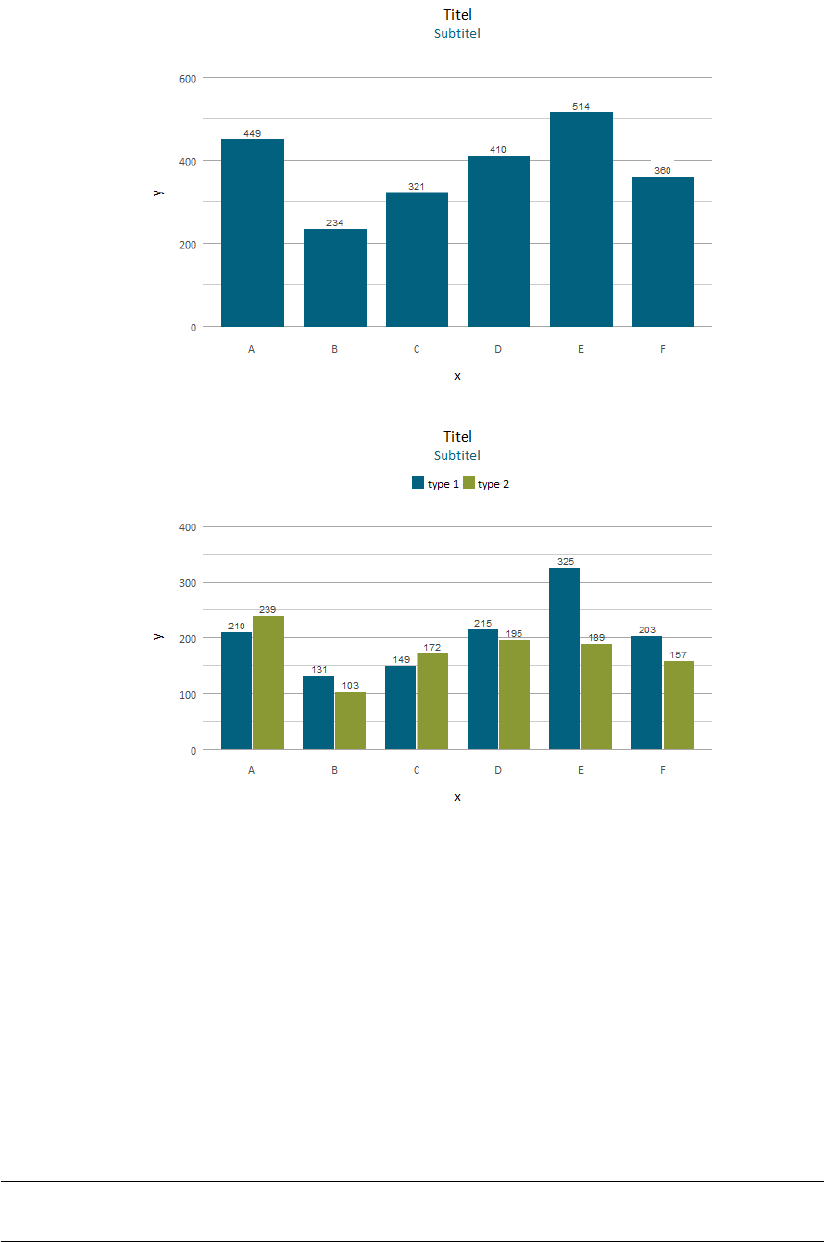
112 toproper
Value
Thema
Examples
## Not run:
ggplot(tbl, aes(x = col1, y = col2)) + theme_certe()
## End(Not run)
toproper Transformeren naar Zoals een zin.

unmelt 113
Description
Dit transformeert de hoofdletters van een tekst naar de vorm "Zoals een zin." of, wanneer every.word = TRUE
wordt gebruikt, "Zoals Een Zin.".
Usage
toproper(text, every.word = FALSE, intelligent = FALSE)
Arguments
text De tekst die getransformeerd moet worden
every.word Standaard is FALSE. Ieder woord met een hoofdletter laten beginnen.
intelligent Standaard is FALSE. Woorden van maximaal 4 tekens met maximaal 1 klinker
niet transformeren (zoals "MCL" en "UMCG"), en 1-letterwoorden niet capitalis-
eren.
Value
Tekst
Examples
tolower("TJONGERSCHANS") # wordt "tjongerschans"
toupper("Tjongerschans") # wordt "TJONGERSCHANS"
toproper("TJONGERSCHANS") # wordt "Tjongerschans"
toproper(c("TJONGERSCHANS", "ANTONIUS", "MCL", "UMCG"))
# wordt c("Tjongerschans", "Antonius", "Mcl", "Umcg")
toproper(c("TJONGERSCHANS", "ANTONIUS", "MCL", "UMCG"), intelligent = TRUE)
# wordt c("Tjongerschans", "Antonius", "MCL", "UMCG")
unmelt Unmelt
Description
Doet het tegenovergestelde van melt.
Usage
unmelt(x, id = colnames(x)[1], variables = colnames(x)[2])
Arguments
xTabel
id Standaard is de eerste kolom. De kolomnaam die blijft staan
variabele Standaard is de tweede kolom. De kolom waarvan de unieke waarden nieuwe
kolommen worden

114 var
update_certedata Dit R-pakket updaten
Description
Hiermee wordt de laatste versie van certedata geinstalleerd, zoals die gevonden wordt in de map
van de omgevingsvariabele R_REFMAP.
Usage
update_certedata(force = FALSE, GitHub = FALSE, version = "master")
Arguments
force Standaard is FALSE. Forceert het installeren, waarmee bijv. dezelfde versie over-
schreven kan worden.
GitHub Standaard is FALSE. Gebruik de laatste versie van GitHub, in plaats van de laatste
locale versie.
version Standaard is "master". Wordt gebruikt als GitHub == TRUE.
Examples
## Not run:
update_certedata()
## End(Not run)
var Correlation, Variance and Covariance (Matrices)
Description
var,cov and cor compute the variance of xand the covariance or correlation of xand yif these are
vectors. If xand yare matrices then the covariances (or correlations) between the columns of xand
the columns of yare computed.
cov2cor scales a covariance matrix into the corresponding correlation matrix efficiently.
Usage
var(x, ..., na.rm = TRUE)
Arguments
xa numeric vector, matrix or data frame.
... Parameters die doorgegeven worden aan cor.
na.rm logical. Should missing values be removed?
var 115
Details
For cov and cor one must either give a matrix or data frame for xor give both xand y.
The inputs must be numeric (as determined by is.numeric: logical values are also allowed for
historical compatibility): the "kendall" and "spearman" methods make sense for ordered inputs
but xtfrm can be used to find a suitable prior transformation to numbers.
var is just another interface to cov, where na.rm is used to determine the default for use when that is
unspecified. If na.rm is TRUE then the complete observations (rows) are used (use = "na.or.complete")
to compute the variance. Otherwise, by default use = "everything".
If use is "everything",NAs will propagate conceptually, i.e., a resulting value will be NA whenever
one of its contributing observations is NA.
If use is "all.obs", then the presence of missing observations will produce an error. If use is
"complete.obs" then missing values are handled by casewise deletion (and if there are no complete
cases, that gives an error).
"na.or.complete" is the same unless there are no complete cases, that gives NA. Finally, if use
has the value "pairwise.complete.obs" then the correlation or covariance between each pair of
variables is computed using all complete pairs of observations on those variables. This can result in
covariance or correlation matrices which are not positive semi-definite, as well as NA entries if there
are no complete pairs for that pair of variables. For cov and var,"pairwise.complete.obs" only
works with the "pearson" method. Note that (the equivalent of) var(double(0), use = *) gives
NA for use = "everything" and "na.or.complete", and gives an error in the other cases.
The denominator n−1is used which gives an unbiased estimator of the (co)variance for i.i.d.
observations. These functions return NA when there is only one observation (whereas S-PLUS has
been returning NaN), and fail if xhas length zero.
For cor(), if method is "kendall" or "spearman", Kendall’s τor Spearman’s ρstatistic is used to
estimate a rank-based measure of association. These are more robust and have been recommended
if the data do not necessarily come from a bivariate normal distribution.
For cov(), a non-Pearson method is unusual but available for the sake of completeness. Note that
"spearman" basically computes cor(R(x), R(y)) (or cov(., .)) where R(u) := rank(u, na.last = "keep").
In the case of missing values, the ranks are calculated depending on the value of use, either based
on complete observations, or based on pairwise completeness with reranking for each pair.
When there are ties, Kendall’s τbis computed, as proposed by Kendall (1945).
Scaling a covariance matrix into a correlation one can be achieved in many ways, mathematically
most appealing by multiplication with a diagonal matrix from left and right, or more efficiently
by using sweep(.., FUN = "/") twice. The cov2cor function is even a bit more efficient, and
provided mostly for didactical reasons.
Value
For r <- cor(*, use = "all.obs"), it is now guaranteed that all(abs(r) <= 1).
References
Becker, R. A., Chambers, J. M. and Wilks, A. R. (1988) The New S Language. Wadsworth &
Brooks/Cole.
Kendall, M. G. (1938) A new measure of rank correlation, Biometrika 30, 81–93. https://dx.
doi.org/10.1093/biomet/30.1-2.81
Kendall, M. G. (1945) The treatment of ties in rank problems. Biometrika 33 239–251. https:
//dx.doi.org/10.1093/biomet/33.3.239

116 vector2ratio
See Also
cor.test for confidence intervals (and tests).
cov.wt for weighted covariance computation.
sd for standard deviation (vectors).
vector2ratio Vector transformeren volgens ratio
Description
Een vector transformeren naar een vooraf ingestelde ratio.
Usage
vector2ratio(x, ratio)
Arguments
xVector met waarden.
ratio Vector met ratio’s van, en met dezelfde lengte als, x(zoals ratio = c(1, 2, 1))
of tekst met tekens ":","-" of "," (zoals ratio = "1:2:1" of zelfs ratio = "1:2:1.25").
Source
Voor de voorbeelden:
McDonald, J.H. 2014. Handbook of Biological Statistics, 3rd ed. Sparky House Publishing, Balti-
more, Maryland.
http://www.biostathandbook.com/gtestgof.html
See Also
g.test
Examples
# = EXAMPLE 1 =
# Shivrain et al. (2006) crossed clearfield rice (which are resistant
# to the herbicide imazethapyr) with red rice (which are susceptible to
# imazethapyr). They then crossed the hybrid offspring and examined the
# F2 generation, where they found 772 resistant plants, 1611 moderately
# resistant plants, and 737 susceptible plants. If resistance is controlled
# by a single gene with two co-dominant alleles, you would expect a 1:2:1
# ratio.
x <- c(772, 1611, 737)
x.expected <- vector2ratio(x, ratio = "1:2:1")
x.expected
# 780 1560 780
g.test(x, x.expected)
# p = 0.12574.

vlookup 117
# There is no significant difference from a 1:2:1 ratio.
# Meaning: resistance controlled by a single gene with two co-dominant
# alleles, is plausible.
# = EXAMPLE 2 =
# Red crossbills (Loxia curvirostra) have the tip of the upper bill either
# right or left of the lower bill, which helps them extract seeds from pine
# cones. Some have hypothesized that frequency-dependent selection would
# keep the number of right and left-billed birds at a 1:1 ratio. Groth (1992)
# observed 1752 right-billed and 1895 left-billed crossbills.
x <- c(1752, 1895)
x.expected <- vector2ratio(x, ratio = c(1, 1))
x.expected
# 1823.5 1823.5
g.test(x, x.expected)
# p = 0.01787343
# There is a significant difference from a 1:1 ratio.
# Meaning: there are significantly more left-billed birds.
vlookup Verticaal zoeken naar waarde in tabel
Description
Dit is een vrije exacte nabouw van de functie VLOOKUP (of VERT.ZOEKEN in Nederlands) van Mi-
crosoft Excel.
Usage
vlookup(lookup_value, table_array, col_index_num, range_lookup = FALSE,
search_column = 1)
Arguments
lookup_value The value you want to look up, also called the lookup value.
table_array The range where the lookup value is located. Remember that the lookup value
should always be in the first column in the range for VLOOKUP to work cor-
rectly.
col_index_num The column number in the range that contains the return value.
range_lookup Optionally, you can specify TRUE if you want an approximate match or FALSE
if you want an exact match of the return value.
search_column Zie het schuingedrukte deel van de tweede parameter. Dit is R, dus dat bepalen
we zelf even.
Source
https://support.office.com/en-us/article/VLOOKUP-function-0bbc8083-26fe-4963-8ab8-93a18ad188a1

118 %===%
year Get/set years component of a date-time
Description
Date-time must be a POSIXct, POSIXlt, Date, Period, chron, yearmon, yearqtr, zoo, zooreg, time-
Date, xts, its, ti, jul, timeSeries, and fts objects.
isoyear() returns years according to the ISO 8601 week calendar.
epiyear() returns years according to the epidemilogical week calendars.
Usage
year(x)
Arguments
xa date-time object
Details
year does not yet support years before 0 C.E.
Value
the years element of x as a decimal number
Source
year uit het pakket lubridate.
References
http://en.wikipedia.org/wiki/ISO_week_date http://www.cmmcp.org/epiweek.htm
%===% Test Objects for Exact Equality
Description
The safe and reliable way to test two objects for being exactly equal. It returns TRUE in this case,
FALSE in every other case.
Usage
x %===% y
Arguments
xany Robjects.
yany Robjects.
%===% 119
Details
A call to identical is the way to test exact equality in if and while statements, as well as in
logical expressions that use && or ||. In all these applications you need to be assured of getting a
single logical value.
Users often use the comparison operators, such as == or !=, in these situations. It looks natural,
but it is not what these operators are designed to do in R. They return an object like the arguments.
If you expected xand yto be of length 1, but it happened that one of them was not, you will not
get a single FALSE. Similarly, if one of the arguments is NA, the result is also NA. In either case, the
expression if(x == y).... won’t work as expected.
The function all.equal is also sometimes used to test equality this way, but was intended for
something different: it allows for small differences in numeric results.
The computations in identical are also reliable and usually fast. There should never be an error.
The only known way to kill identical is by having an invalid pointer at the C level, generating a
memory fault. It will usually find inequality quickly. Checking equality for two large, complicated
objects can take longer if the objects are identical or nearly so, but represent completely independent
copies. For most applications, however, the computational cost should be negligible.
If single.NA is true, as by default, identical sees NaN as different from NA_real_, but all NaNs
are equal (and all NA of the same type are equal).
Character strings are regarded as identical if they are in different marked encodings but would agree
when translated to UTF-8.
If attrib.as.set is true, as by default, comparison of attributes view them as a set (and not a
vector, so order is not tested).
If ignore.bytecode is true (the default), the compiled bytecode of a function (see cmpfun) will
be ignored in the comparison. If it is false, functions will compare equal only if they are copies of
the same compiled object (or both are uncompiled). To check whether two different compiles are
equal, you should compare the results of disassemble().
You almost never want to use identical on datetimes of class "POSIXlt": not only can different
times in the different time zones represent the same time and time zones have multiple names, but
several of the components are optional.
Note that identical(x, y, FALSE, FALSE, FALSE, FALSE) pickily tests for exact equality.
Value
A single logical value, TRUE or FALSE, never NA and never anything other than a single value.
References
Chambers, J. M. (1998) Programming with Data. A Guide to the S Language. Springer.
See Also
all.equal for descriptions of how two objects differ; Comparison for operators that generate ele-
mentwise comparisons. isTRUE is a simple wrapper based on identical.
Index
∗Topic API
maps_api_key,49
∗Topic CQV
cqv,27
cv,28
∗Topic CV
cqv,27
cv,28
∗Topic Google
maps_api_key,49
∗Topic IQR
midhinge,55
∗Topic aantal
colourpicker,23
∗Topic ab
abname_molis,5
∗Topic address
gps_from_address,41
tbl_address,104
∗Topic adist
diff.text,32
∗Topic adres
maps_api_key,49
plot2.map,74
∗Topic age
age.group,6
∗Topic anoniem
tbl_anonymise,104
∗Topic anonymise
tbl_anonymise,104
∗Topic antibiotics
abname_molis,5
antibiotics_list,8
∗Topic api
maps_api_key,49
∗Topic bins
plot2,66
∗Topic case
toproper,112
∗Topic chart
plot2,66
plot2.add,70
plot2.errorbar,72
plot2.map,74
plot2.pie,76
plot2.text,78
theme_certe,110
∗Topic chi
chi2.test,20
crosstab,28
exact.test,34
g.test,39
∗Topic citation
citations,21
∗Topic cit
citations,21
∗Topic coefficient
cqv,27
cv,28
midhinge,55
∗Topic colour.list
plot2,66
∗Topic contingency
crosstab,28
∗Topic cqv
cqv,27
cv,28
∗Topic cv
cqv,27
cv,28
∗Topic datalabels.round
plot2,66
∗Topic datalabels
plot2,66
∗Topic datasets
codonlist,22
db,31
∗Topic data
plot2,66
∗Topic date
date_generic,29
∗Topic datum
date_generic,29
∗Topic display
str2,99
∗Topic eerste
120
INDEX 121
tbl_first_isolates,105
∗Topic error
se,92
∗Topic ewma
ewma,33
rr_ewma,90
∗Topic excel
import.excel,44
∗Topic exporteren
export.csv,35
export.excel,36
export.R,36
∗Topic export
export.csv,35
export.excel,36
export.R,36
∗Topic fit
lin.reg,48
∗Topic font.family
plot2,66
theme_certe,110
∗Topic font
install.fonts,46
∗Topic formaat
date_generic,29
∗Topic format.NL
plot2,66
∗Topic format
date_generic,29
∗Topic gegevens
export.clipboard,35
export.csv,35
export.excel,36
export.R,36
import,42
import.clipboard,43
import.excel,44
import.R,44
∗Topic ggplot
theme_certe,110
∗Topic grafiek
plot2,66
plot2.map,74
plot2.pie,76
plot2.text,78
theme_certe,110
∗Topic hoofdletters
toproper,112
∗Topic hoofdletter
toproper,112
∗Topic horizontal
plot2,66
theme_certe,110
∗Topic importeren
export.clipboard,35
import,42
import.clipboard,43
import.excel,44
import.R,44
∗Topic import
export.clipboard,35
import,42
import.clipboard,43
import.excel,44
import.R,44
∗Topic input
inputname,45
∗Topic interval
conf.lvl,27
∗Topic isolaat
tbl_first_isolates,105
∗Topic isolaten
tbl_first_isolates,105
∗Topic kable
tbl_markdown,108
∗Topic kleur
colour.name,22
colourpicker,23
∗Topic knitr
tbl_markdown,108
∗Topic leeftijd
age,6
∗Topic legend.position
plot2,66
theme_certe,110
∗Topic lettertype
install.fonts,46
∗Topic levenshtein
diff.text,32
∗Topic lijn
plot2.add,70
plot2.errorbar,72
plot2.text,78
∗Topic linreg
lin.reg,48
∗Topic mean
mean_geometric,53
mean_harmonic,53
rdate,88
∗Topic midhinge
midhinge,55
∗Topic name
strip_name,99
∗Topic na
122 INDEX
tbl_removeNULLs,109
∗Topic nelson
nelson.defaultminrun,58
nelson.rule1,58
nelson.rule2,59
nelson.rule3,60
nelson.rule4,60
nelson.rule5,61
nelson.rule6,62
nelson.rule7,63
nelson.rule8,63
nelson.text,64
qc.test,85
∗Topic null
tbl_removeNULLs,109
∗Topic palette
colourpicker,23
∗Topic pie
plot2.pie,76
∗Topic plot2
plot2.add,70
plot2.errorbar,72
∗Topic plot
plot2,66
plot2.add,70
plot2.errorbar,72
plot2.map,74
plot2.pie,76
plot2.text,78
∗Topic print
plot2,66
∗Topic proper
toproper,112
∗Topic qcc
qc.test,85
∗Topic qc
qc.test,85
∗Topic quantile
quantile,87
∗Topic referentie
citations,21
∗Topic ref
citations,21
∗Topic rr_ewma
ewma,33
rr_ewma,90
∗Topic rrewma
ewma,33
rr_ewma,90
∗Topic rstudio
citations,21
∗Topic size
plot2,66
∗Topic smooth
plot2,66
∗Topic som
sumofsquares,103
∗Topic split
split.every.n,98
∗Topic spreiding
cqv,27
cv,28
∗Topic squared
crosstab,28
∗Topic stackedpercent
plot2,66
∗Topic stacked
plot2,66
∗Topic standard
cqv,27
cv,28
midhinge,55
se,92
∗Topic str2
str2,99
∗Topic str
str2,99
∗Topic subtitle.colour
theme_certe,110
∗Topic subtitle
plot2,66
∗Topic summary
lin.reg,48
str2,99
∗Topic sum
sumofsquares,103
∗Topic tabel
tbl_markdown,108
∗Topic table
crosstab,28
∗Topic tekens
diff.text,32
∗Topic tekst
diff.text,32
∗Topic tint
colourpicker,23
∗Topic title
plot2,66
∗Topic tolower
toproper,112
∗Topic toproper
toproper,112
∗Topic toupper
toproper,112
INDEX 123
∗Topic type
plot2,66
∗Topic update
update_certedata,114
∗Topic url
citations,21
∗Topic variantie
midhinge,55
∗Topic variatie
cqv,27
cv,28
∗Topic var
cqv,27
cv,28
midhinge,55
∗Topic verschil
diff.text,32
∗Topic westgard
qc.test,85
∗Topic x.lbl,y.lbl
plot2,66
∗Topic x.lbl.align
plot2,66
theme_certe,110
∗Topic x.lbl.angle
plot2,66
theme_certe,110
∗Topic x.remove
plot2,66
∗Topic x
plot2,66
∗Topic y.24h
plot2,66
∗Topic y.age
plot2,66
∗Topic y.category
plot2,66
∗Topic y.percent
plot2,66
∗Topic y.remove
plot2,66
∗Topic y.scale
plot2,66
∗Topic y
plot2,66
.C,47
.Fortran,47
.Machine,47
%===%,118
abname_molis,5
adist,32
age,6
age.group,6,67
all,7,9
all.equal,119
antibiotics,5,91
antibiotics_list,8
any,7,8
as.basenumber,9
as.data.frame(),10
as.double,10,46
as.double2 (is.double2),46
as.mic,107
as.percent,10,27,28,108
as.rsi,107
as.tibble,10,10
as.vector,47
attributes,50,56,80,81
boxplot.stats,37
cast,55
cbind,10
certedb,11,18
certedb_check_tbls,12
certedb_checkmmb_mtrlcodes,12
certedb_checkmmb_testcodes
(certedb_checkmmb_mtrlcodes),
12
certedb_close,11,13
certedb_getmmb,13,18,82
certedb_getmmb_tat,82
certedb_getmmb_tat (certedb_getmmb),13
certedb_query,11–13,15,17,19,86
certedb_tbls,19
chi2.test,20,35,40
choose.dir,21
choose.files,21
citations,21
class,47
cmpfun,119
codonlist,22
colMeans,52
color.name (colour.name),22
colorpicker (colourpicker),23
colors,23
colour.name,22
colourpicker,23,67,68,70,72,74,76,79,
86,110,111
colSums,102
Comparison,50,57,80,81,119
complete_rows,25
concat,26
conf.lvl,27
cor,114
124 INDEX
cor.test,116
cov.wt,116
cqv,27,29,56
crosstab,28,34,39,49
cumprod,84
cumsum,84
cv,27,28
data.frame(),10
data_generic,39
Date,54
date,52
date-time,52
date_generic,29,38,43
day,30,31
db,14,15,31,82
dbConnect(),13
DBIConnection,13
diff.text,32
dim,50,56,80,81
disassemble,119
double,47,50,56,79,81
dplyr::select(),40
dump,35
element,33
Encoding,100
ewma,33,86,90
exact.test,20,34,45,91
export.clipboard,35
export.csv,35
export.csv2 (export.csv),35
export.excel,36
export.R,36,44
extendrange,88
facet_wrap,66
factor,47
filter_group_size,37
first_isolate,105
fivenum,37
format2,38,108
g.test,20,35,39,45,91,116
gather,40,41
getplottitle,41
ggplotly,73
ggsave,78
gps_from_address,41,49,74
heat.colors,23
import,42,43
import.clipboard,43
import.csv,43
import.csv2,43
import.excel,44
import.R,36,44
import.tsv,43
independence.test,45
Inf,37
inputname,45
install.fonts,46,69
integer,48,50,56,79,81
interpretive_reading,14
IQR,37
is.double,46
is.double2,46
is.numeric,115
is.percent (as.percent),10
isTRUE,119
kable,108,109
layer,79
lin.reg,48
linetype,72
list,19
ls.str,99
mad,92
manual,48
maps_api_key,42,49
matrix,20,28,34,39,49
matrix.2x2,28,34,39,49
max,50,88
md5,51,52
mday(),31
mean,52,53,86
mean.POSIXct,52
mean_geometric,53
mean_harmonic,53
median,37,54
melt,55,55,113
melt.array,55
melt.data.frame,55
melt.list,55
midhinge,27,29,55
min,56,88
mode,47
month,57,58
NA,37,88,115
NA_real_,119
names,50,56,80,81
NaN,37,47,119
nelson.defaultminrun,58,59–64
INDEX 125
nelson.rule1,58,59–64,86
nelson.rule2,59,59,60–64
nelson.rule3,59,60,60,61–64
nelson.rule4,59,60,60,61–64
nelson.rule5,59–61,61,62–64
nelson.rule6,59–62,62,63,64
nelson.rule7,59–63,63,64
nelson.rule8,59–63,63,64
nelson.test (qc.test),85
nelson.text,64
numeric,47,48,88
options,75
p.symbol,65
parse_guess,107
pivot,65
plot,67
plot2,66,70,72
plot2.add,70,72
plot2.axis,71
plot2.elements,70,72
plot2.errorbar,72
plot2.interactive,73
plot2.listlayers,73
plot2.map,49,69,74
plot2.movelayer,70,75
plot2.opendir,75,78
plot2.pie,69,76
plot2.qcc (qc.test),85
plot2.save,69,76,77
plot2.text,78
plotmath,51,57,80,82,84,101
pmax,79
pmin,81
preset,82
preset.list,14
preset.thisfolder,14
primitive,7,8
print,108
print.data.frame,83
prod,84
project_dashboard,85
qc.test,85
qry,13,17,86
qry<- (qry),86
quantile,37,54,55,87,87
quasiquotation,40,66,98
rainbow,23
range,37,51,57,80,82,87
rdate,88
readRDS,44
recall (remember),89
regular expression,100
remember,89
rlang::quo_name(),40
rr_ewma,34,90
rsi_table,91
sample,49,89
SaveAsVersion,91
saveRDS,36
scale_x_continuous,71
scale_x_date,71
scale_x_discrete,71
sd,86,92,116
se,92
seq,89
sha1,93,93
sha2,94,94
sha256,95,95
sha512,96,96
size,72
size.env,97
size_humanreadable,97
split.every.n,98
spread,98,99
stopifnot,7
storage.mode,47,48
str,99
str2,99
strip_name,99
strsplit,100
strsplit.select,100
sum,84,101
Summary,7–9,50,51,57,80–82,84,88,101
summary,99,102,102
summary_interactive,102
sumofsquares,103
sweep,115
Sys.isdecimalcomma,39,69,99,103,108
tbl_address,49,74,104
tbl_anonymise,104
tbl_binary2logical,18,105
tbl_first_isolates,105
tbl_guess_columns,18,107
tbl_markdown,86,108
tbl_removeNULLs,109
templatedoc,110
terrain.colors,23
theme_certe,110
tibble,107
tidyselect::vars_pull(),98
