Plantower Pms5003 Manual Annotated
User Manual: Pdf
Open the PDF directly: View PDF ![]() .
.
Page Count: 15
2016 product data manual of PLANTOWER
Digital universal particle concentration sensor
PMS5003 series data manual
Writer
Zhou Yong
Version
V2.3
Verifier
Zheng Haoxin
Date
2016-06-01
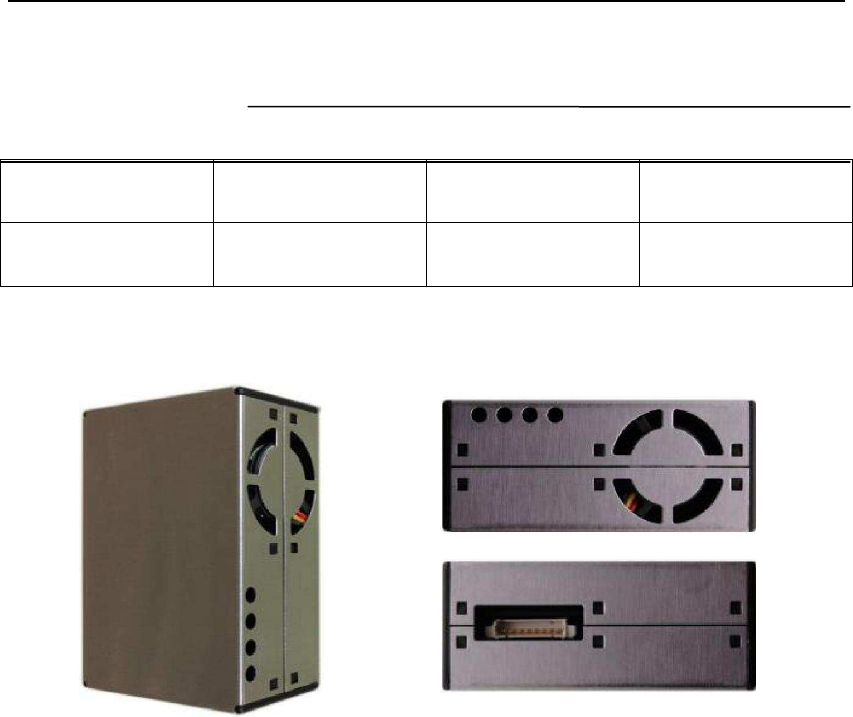
Main characteristics
Zero false alarm rate
Real-time response
Correct data
Minimum distinguishable particle diameter :0.3 micrometer
High anti-interference performance because of the patent structure of six
sides shielding
Optional direction of air inlet and outlet in order to adapt the different
design
rsmith@xs4all.nl
2016 product data manual of PLANTOWER
Overview
PMS5003 is a kind of digital and universal particle concentration sensor,
which can be used to obtain the number of suspended particles in the air,
i.e. the concentration of particles, and output them in the form of digital
interface. This sensor can be inserted into variable instruments related to
the concentration of suspended particles in the air or other environmental
improvement equipments to provide correct concentration data in time.
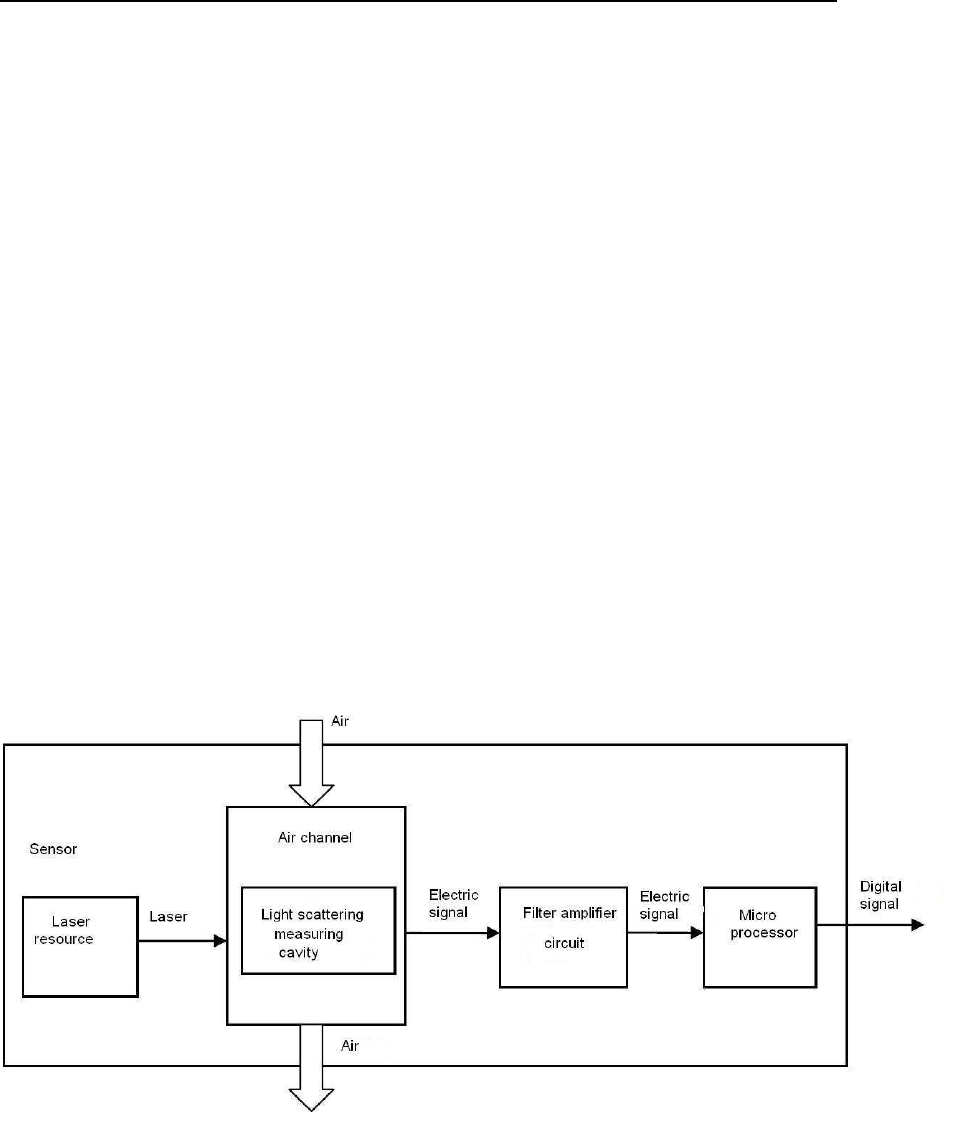
Working principle
Laser scattering principle is used for such sensor, i.e. produce scattering by
using laser to radiate suspending particles in the air, then collect scattering
light in a certain degree, and finally obtain the curve of scattering light change
with time. In the end, equivalent particle diameter and the number of particles
with different diameter per unit volume can be calculated by microprocessor
based on MIE theory. Please find the functional diagram of each part of sensor
from Figure 1 as follows.
Figure 1 Functional block diagram of sensor

2016 product data manual of PLANTOWER
Technical Index
Parameter
Index
unit
Range of measurement
0.3~1.01.0~2.52.5~10
Micrometerμm
Counting Efficiency
50%@0.3μm 98%@>=0.5μm
Effective RangePM2.5
standard
0~500
μg/m
Maximum RangePM2.5
standard*
1000
μg/m
Resolution
1
μg/m
Maximum Consistency Error
(PM2.5 standard data)*
±10%@100~500μg/m
±10μg/m@0~100μg/m
Standard Volume
0.1
LitreL
Single Response Time
1
Seconds
Total Response Time
10
Seconds
DC Power Supply
Typ:5.0 Min:4.5 Max: 5.5
VoltV
Active Current
100
MilliamperemA
Standby Current
200
MicroampereμA
Interface Level
L <0.8 @3.3 H >2.7@3.3
VoltV
Working Temperature Range
-10~+60
℃
Working Humidity Range
0~99%
Storage Temperature Range
-40~+80
℃
MTTF
3
YearY
Physical Size
50×38×21
Millimetermm
Note 1: Maximum range means that the highest output value of the PM2.5 standard
data is not less than 1000.
Note 2:“PM2.5 standard data” is the “data2” in the appendix.
2016 product data manual of PLANTOWER
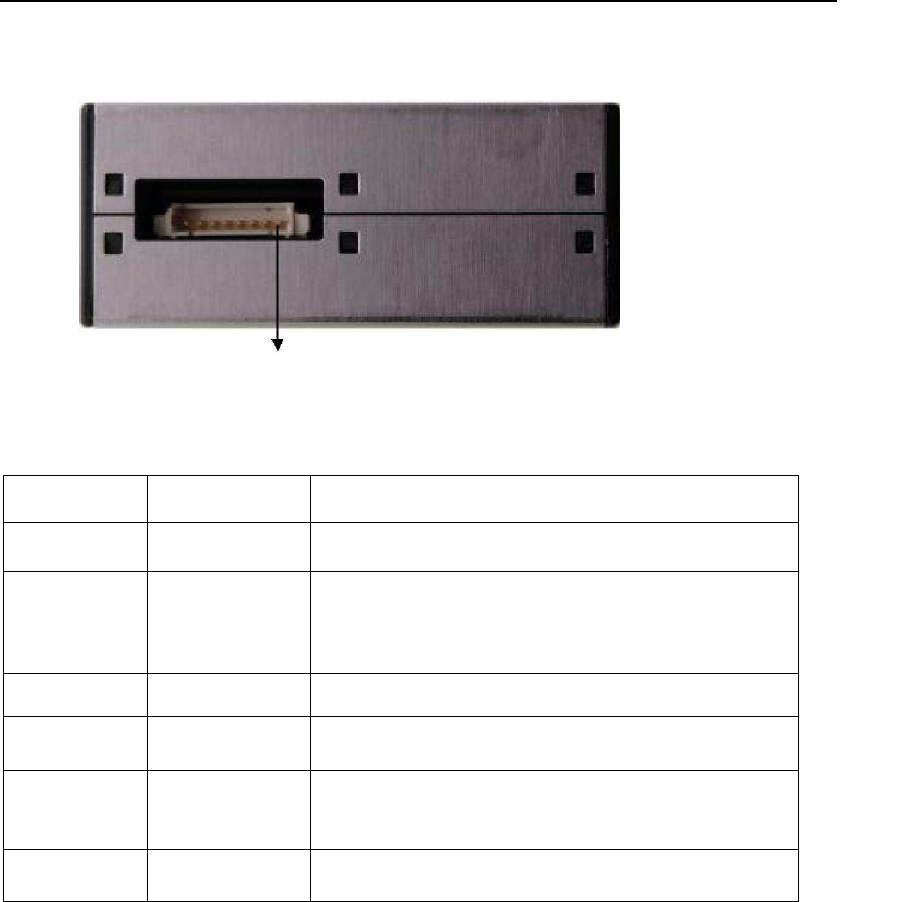
Pin Definition
PIN1
Figure 2 Connector Definition
PIN1
VCC
Positive power 5V
PIN2
GND
Negative power
PIN3
SET
Set pin /TTL level@3.3V,high level or
suspending is normal working status, while
low level is sleeping mode.
PIN4
RX
Serial port receiving pin/TTL level@3.3V
PIN5
TX
Serial port sending pin/TTL level@3.3V
PIN6
RESET
Module reset signal /TTL level@3.3V,low
reset.
PIN7/8
NC
Output result
Mainly output as the quality and number of each particles with different size
per unit volume, the unit volume of particle number is 0.1L and the unit of
mass concentration is μg/m.
There are two options for digital output: passive and active. Default mode
is active after power up. In this mode sensor would send serial data to the
host automatically .The active mode is divided into two sub-modes: stable
mode and fast mode. If the concentration change is small the sensor
would run at stable mode with the real interval of 2.3s.And if the change is
big the sensor would be changed to fast mode automatically with the
interval of 200~800ms, the higher of the concentration, the shorter of the
interval.
2016 product data manual of PLANTOWER
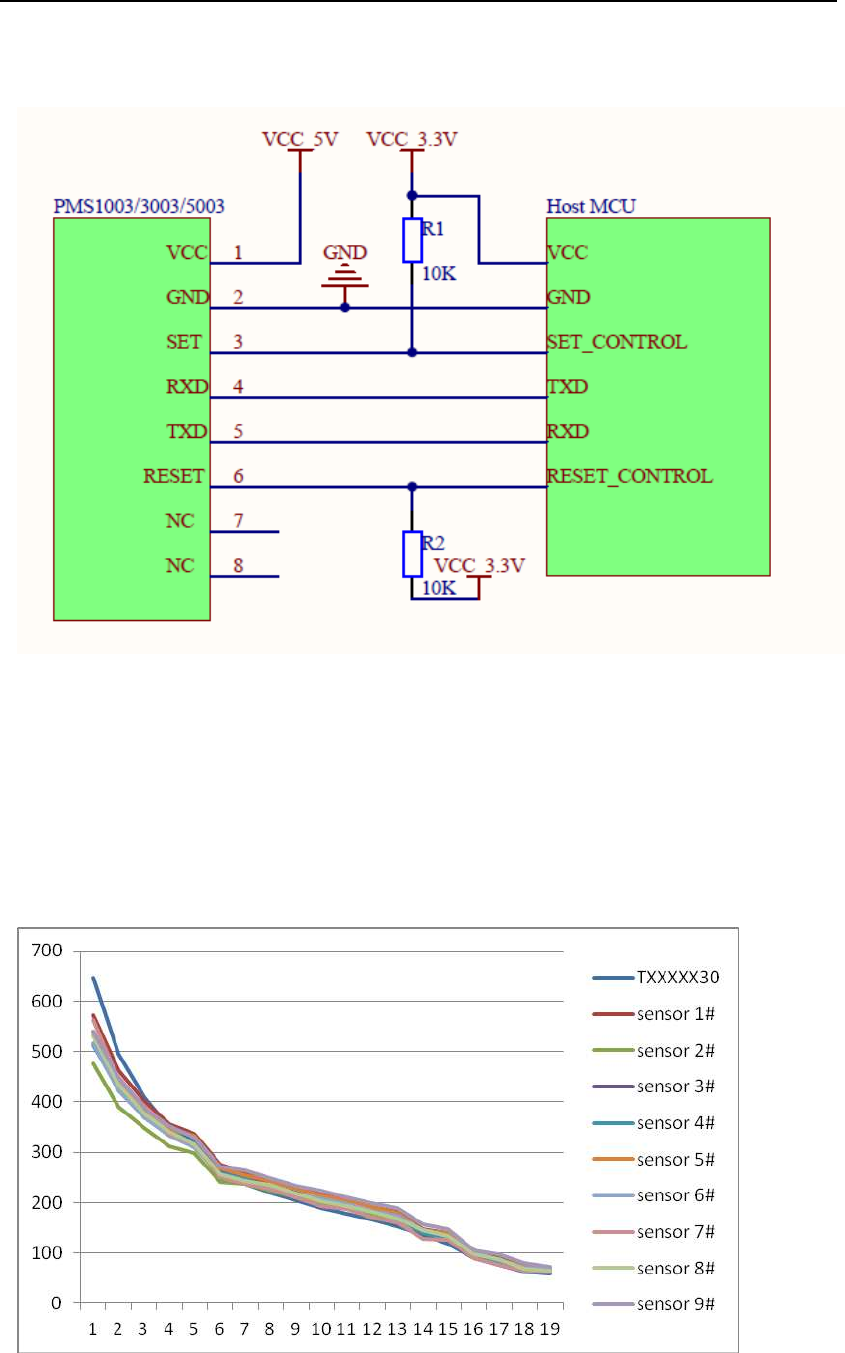
Typical Circuit
Figure 3 Typical Circuit
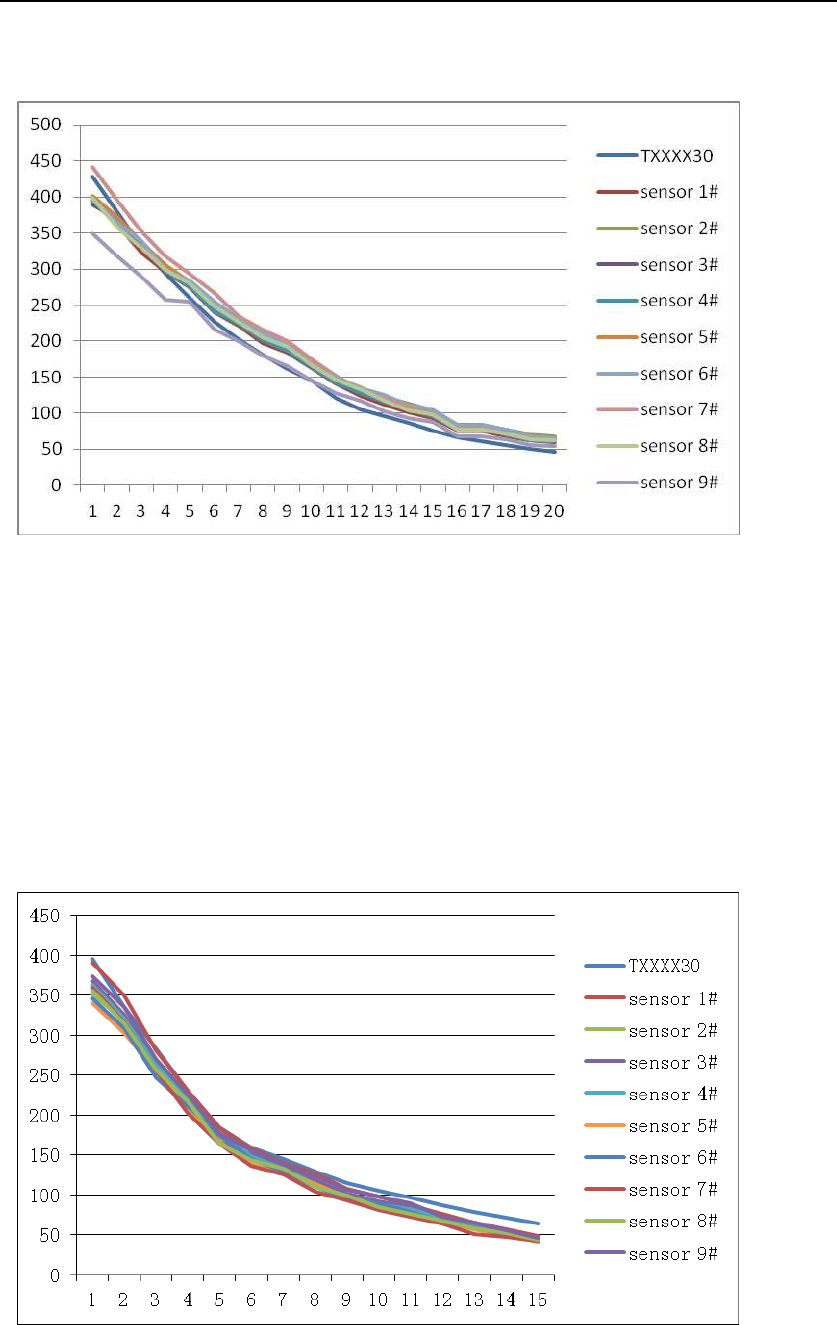
Typical Output Characteristic
Definition of axis Y: PM2.5 concentration , unit: μg/m
Definition of axis X: number of samples, unit: time
Figure 4-1 Consistency at 20℃
set reset not
2016 product data manual of PLANTOWER
Figure 4-2 Consistency at 43℃
Figure 4-3 Consistency at -5℃
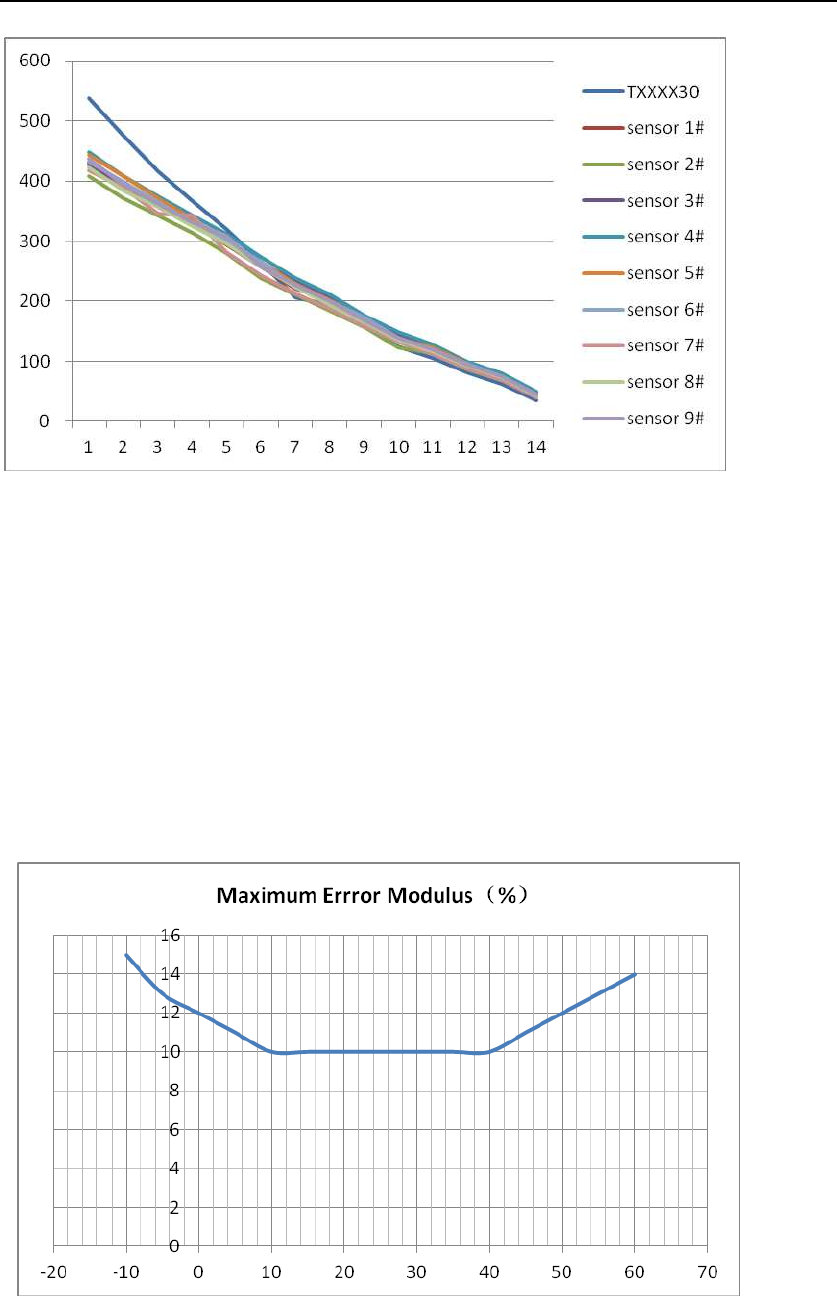
2016 product data manual of PLANTOWER
Figure 4-4 Consistency after 30 days’ running
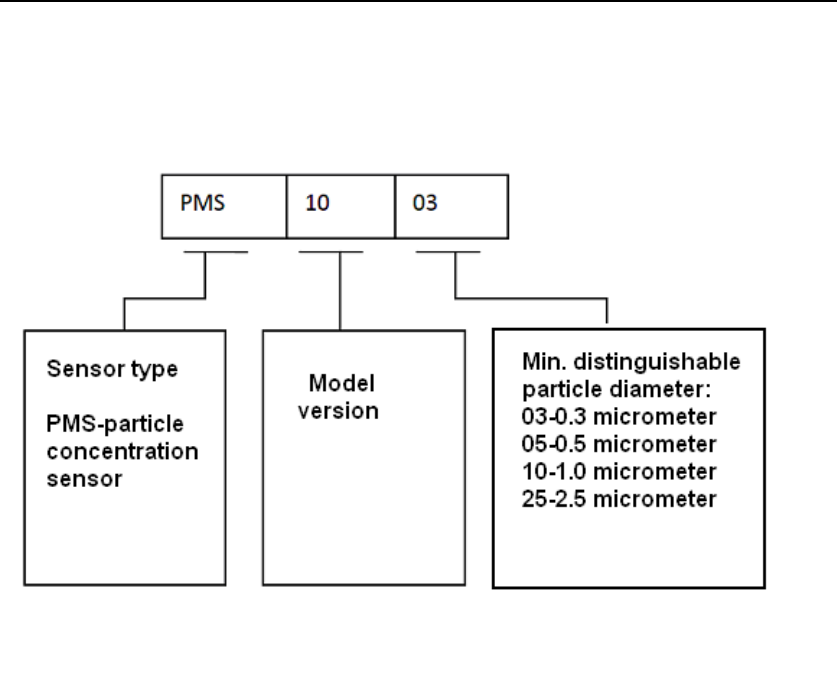
Relationship of Temperature and Consistency
Definition of axis Y: Maximum Error Modulus(%)
Definition of axis X: Temperature(℃)
Figure 5 Consistency Vs Temperature

2016 product data manual of PLANTOWER
Endurance Characteristics
No
Item
Test Method
Characteristics
n
C
1
Long Running
1. 10 ㎡ closed Lab,,20~25℃,
humidity 30%~70%,particle
generator and air cleaner
2. DC 5V power supply
3. Check consistency after 720
hours’ running
10 samples during
0~500μg/m
0~100μg/m
Maximum Error
±15μg/m
100~500μg/m
Maximum Error
±15%
FAN does not
screeched
n=30
C=0
2
High
Temperature
Operation
1. 10 ㎡ constant temperature Lab
2. 43℃,humidity 70%,
3. particle generator and air
cleaner
4. DC 5V power supply
5. Check consistency
n=10
C=0
3
Cold
Operation
1. 10 ㎡ constant temperature Lab
2. -5℃,humidity 30%,
3. particle generator and air
cleaner
4. DC 5V power supply
5. Check consistency
n=10
C=0
4
Vibration
1. 10 ㎡ closed Lab,,20℃,humidity
50%,particle generator and air
cleaner
2. DC 5V power supply and check
consistency
3. Frequency50Hz
4. acceleration9.8/ S
5. DirectionXYZ
6. Vibration Amplitude±2mm
7. TimeXYZ –way, Per 1 hour
n=5
C=0
5
High
Temperature
and Humidity
Storage
1. Constant temperature cabinet
2. 70℃,humidity 90%~95,
3. Check consistency after 500
hours’ storage
10 samples during
0~500μg/m
0~100μg/m
Maximum Error
±10μg/m
100~500μg/m
Maximum Error
±10%
n=10
C=0
6
Cold Storage
1. Constant temperature cabinet
2. -30℃,humidity 90%~95,
3. Check consistency after 500
hours’ storage
n=10
C=0
7
Variation of
4. 10 ㎡ closed Lab,,20℃,humidity
n=5

2016 product data manual of PLANTOWER
Power Supply
50%,particle generator and air
cleaner
5. Power varies as the cycles of 4.5V
to 5.5V ,then 5.5V to 4.5V with
the pace of 0.1V/min for 2 hours.
6. Check consistency during
Variation
FAN does not
screeched
C=0
8
Power On-Off
Cycle
1. 10 ㎡ closed Lab,,20℃,humidity
50%,particle generator and air
cleaner
2. DC 5V power supply,keep On-Off
frequency 0.5Hz for 72 hours and
check consistency
n=10
C=0
9
Sleep Set
On-Off
Cycle
1. 10 ㎡ closed Lab,,20℃,humidity
50%,particle generator and air
cleaner
2. DC 5V power supply,keep Sleep
Set Pin High-Low frequency 0.5Hz
for 72 hours and check
consistency
n=10
C=0
10
Laser On-Off
Cycle
1. 10 ㎡ closed Lab,,20℃,humidity
50%,particle generator and air
cleaner
2. keep laser On-Off frequency
50Hz for 240 hours and check
consistency
n=10
C=0
11
Salt Spray
5% industrial salt water, hydrolysis
spray 100 hours, clean with
purified water and store for 48
hours
No rust and
discoloration of
metal parts
n=1
C=0

2016 product data manual of PLANTOWER
Circuit Attentions
1) DC 5V power supply is needed because the FAN should be driven by 5V.
But the high level of data pin is 3.3V. Level conversion unit should be
used if the power of host MCU is 5V.
2) The SET and RESET pins are pulled up inside so they should not be
connected if without usage.
3) PIN7 and PIN8 should not be connected.
4) Stable data should be got at least 30 seconds after the sensor wakeup
from the sleep mode because of the fan’s performance.
Installation Attentions
1) Metal shell is connected to the GND so be careful not to let it shorted with
the other parts of circuit except GND.
2) The best way of install is making the plane of inset and outset closely to
the plane of the host. Or some shield should be placed between inset and
outset in order to prevent the air flow from inner loop.
3) The blowhole in the shell of the host should not be smaller than the inset.
4) The sensor should not be installed in the air flow way of the air cleaner or
should be shielded by some structure.
5) The sensor should be installed at least 20cm higher than the grand in
order to prevent it from blocking by the floc dust.
6) Do not break up the sensor.
7) M2 self-tapping strew should be used to fix the sensor but it should not be
deeper than 5mm into the sensor.
Other Attentions
1) Only the consistency of all the PM sensors of PLANTOWER is promised
and ensured. And the sensor should not be checked with any third party
equipment.
2) The sensor is usually used in the common indoor environment. So some
protection must be added if using in the conditions as followed:
a) The time of concentration ı300μg/mϢ is longer than 50% of the
whole year or concentrationı500μg/mϢ is longer than20% of the
whole year.
b) Kitchen
c) Water mist condition such as bathroom or hot spring.
d) outdoor
2016 product data manual of PLANTOWER
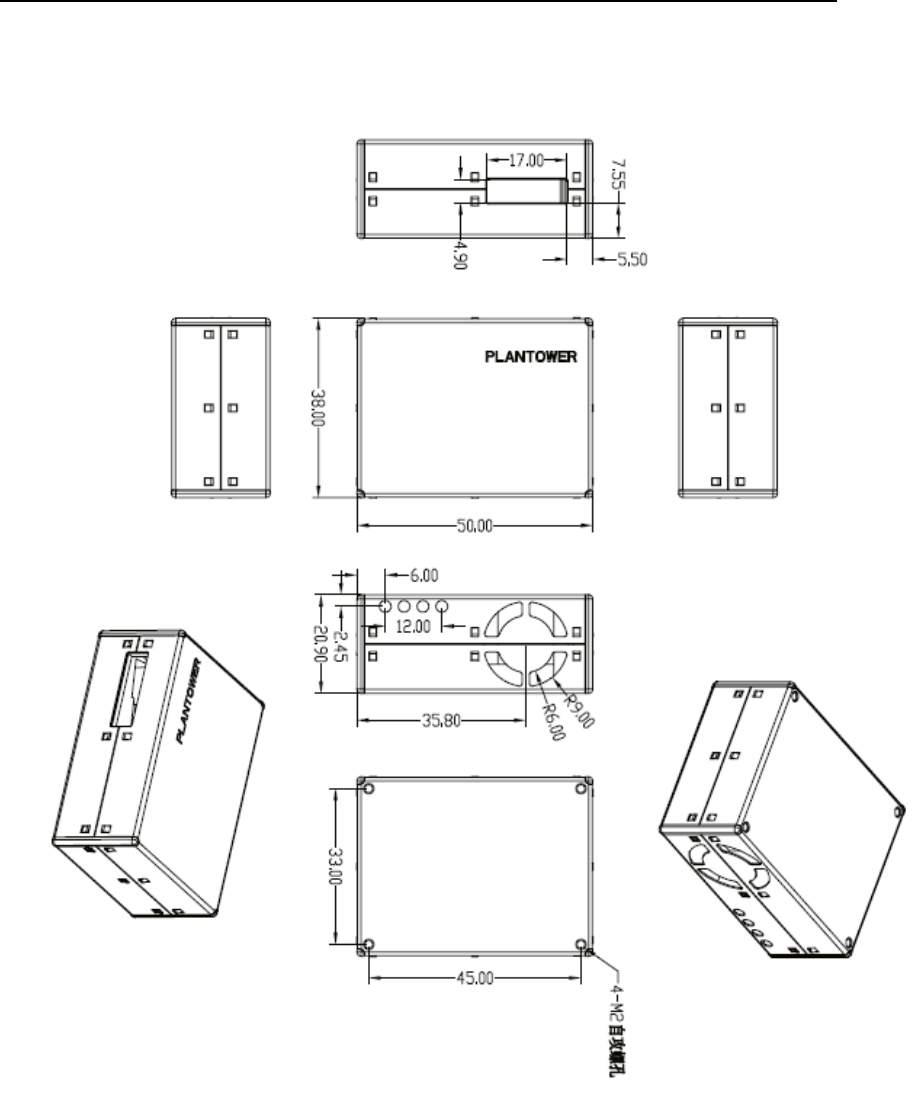
Part Number Definition
2016 product data manual of PLANTOWER
Physical Size (mm)

2016 product data manual of PLANTOWER
Appendix IPMS5003 transport protocol-Active Mode
Default baud rate9600bps Check bitNone Stop bit1 bit
32 Bytes
Start character 1
0x42
(Fixed)
Start character 2
0x4d
(Fixed)
Frame length high
8 bits
……
Frame length=2x13+2(data+check bytes)
Frame length low 8
bits
……
Data 1 high 8 bits
……
Data 1 refers to PM1.0 concentration unit
μ g/m3CF=1,standard particle*
Data 1 low 8 bits
……
Data 2 high 8 bits
……
Data 2 refers to PM2.5 concentration unit
μ g/m3CF=1,standard particle
Data 2 low 8 bits
……
Data 3 high 8 bits
……
Data 3 refers to PM10 concentration unit
μ g/m3CF=1,standard particle
Data 3 low 8 bits
……
Data 4 high 8 bits
……
Data 4 refers to PM1.0 concentration unit *
μ g/m3under atmospheric environment
Data 4 low 8 bits
……
Data 5 high 8 bits
……
Data 5 refers to PM2.5 concentration unit
μ g/m3under atmospheric environment
Data 5 low 8 bits
……
Data 6 high 8 bits
…….
Data 6 refers to concentration unit (under
atmospheric environment) μ g/m3
Data 6 low 8 bits
……
Data 7 high 8 bits
……
Data 7 ind icates the num ber of
particles with diameter beyon d 0.3 um
in 0.1 L of air.
Data 7 low 8 bits
……
Data 8 high 8 bits
……
Data 8 indicates the number of
particles with diameter beyon d 0.5 um
in 0.1 L of air.
Data 8 low 8 bits
……
Data 9 high 8 bits
……
Data 9 indicates the number of
particles with diameter beyon d 1.0 um
in 0.1 L of air.
Data 9 low 8 bits
……
pm pm ≤
pm ≤
pm ≤

2016 product data manual of PLANTOWER
Data 10 high 8 bits
……
Data 10 indicate s the number of
particles with diameter beyon d 2.5 um
in 0.1 L of air.
Data 10 low 8 bits
……
Data 11 high 8 bits
……
Data 11 indicate s the number of
particles with diameter beyon d 5.0 um
in 0.1 L of air.
Data 11 low 8 bits
……
Data 12 high 8 bits
……
Data 12 indicates the number of
particles with diamet er beyond 10 um
in 0.1 L of air.
Data 12 low 8 bits
……
Data 13 high 8 bits
……
Data 13 Reserved
Data 13 low 8 bits
……
Data and check
high 8 bits
……
Check code=Start character 1+ Start
character 2+……..+data 13
Low 8 bits
Data and check
low 8 bits
……
Note: CF=1 should be used in the factory environment
.
struct
bytes data
numbers = struct.unpack('>HHHHHHHHHHHHHHHH', data)
cksum = sum(data[0:30])
numbers[-1]
note:

2016 product data manual of PLANTOWER
Appendix IIPMS5003 transport protocol-Passive Mode
Default baud rate9600bps Check bitNone Stop bit1 bit
Host Protocol
Start Byte
1
Start Byte
2
Command
Data 1
Data 2
Verify Byte
1
Verify Byte
2
0x42
0x4d
CMD
DATAH
DATAL
LRCH
LRCL
1. Command Definition
CMD
DATAH
DATAL
说明
0xe2
X
X
Read in passive
mode
0xe1
X
00H-passive
01H-active
Change mode
0xe4
X
00H-sleep
01H-wakeup
Sleep set
2. Answer
0xe2: 32 bytes , same as appendix I
3. Verify Bytes :
Add of all the bytes except verify bytes.
0x00 0x00
0x00
0x00
42 4D E2 00 00 01 71
42 4D E1 00 00 01 70
42 4D E1 00 01 01 71
42 4D E4 00 00 01 73
42 4D E4 00 01 01 74
hex(0x42 + 0x4d + 0xe4 + 0x00 + 0x01)
0x174
