Roche Diabetes Care 126 blood glucose meter User Manual UserManual newTeil3
Roche Diagnostics Operations, Inc. blood glucose meter UserManual newTeil3
Contents
- 1. UserManual_newTeil1.pdf
- 2. UserManual_newTeil2.pdf
- 3. UserManual_newTeil3.pdf
- 4. UserManual_newTeil4.pdf
UserManual_newTeil3.pdf
61
Meter Settings 5
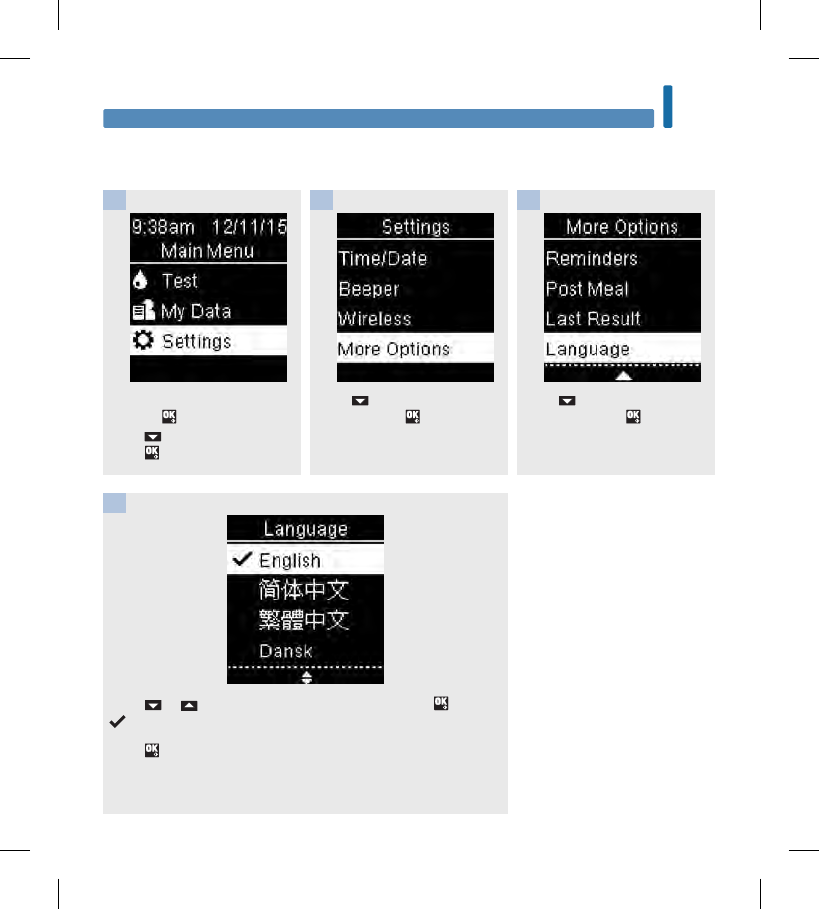
Language
Choose the language that appears on the meter.
Turn the meter on by briefly
pressing . From Main Menu,
press to highlight Settings.
Press .
Press to highlight More
Options. Press .
Press to highlight
Language. Press .
123
Press or to highlight the desired language. Press to move
to the option.
Press to set the language and return to the previous menu.
4
Language
52926_07414587001_EN.indb 61 6/2/16 2:53 PM

62
Meter Settings
5
52926_07414587001_EN.indb 62 6/2/16 2:53 PM

63
Review Your Data 6
Overview
• Blood glucose results are stored from the newest to the oldest.
• The meter automatically stores up to 720blood glucose results in memory with the time and date of the
test and any test result comments.
• Once 720blood glucose results are in memory, adding a new blood glucose result deletes the oldest
blood glucose result.
• Only test results that have been marked with a fasting, before meal, after meal, or bedtime comment are
included in the average for that comment.
• All test results are included in the overall 7, 14, 30, and 90‑day averages regardless of what comment
is added.
• Control results are stored in memory but cannot be reviewed on the meter. To view stored control
results, transfer them to a compatible software application.
• Control results are not included in the averages or blood glucose reports.
• Once 32control results are in memory, adding a new control result deletes the oldest control result.
wWARNING
Do not change your therapy based on an individual test result in memory. Talk to your healthcare
professional before changing therapy based on test results in memory.
Chapter 6: Review Your Data
52926_07414587001_EN.indb 63 6/2/16 2:53 PM
64
Review Your Data
6
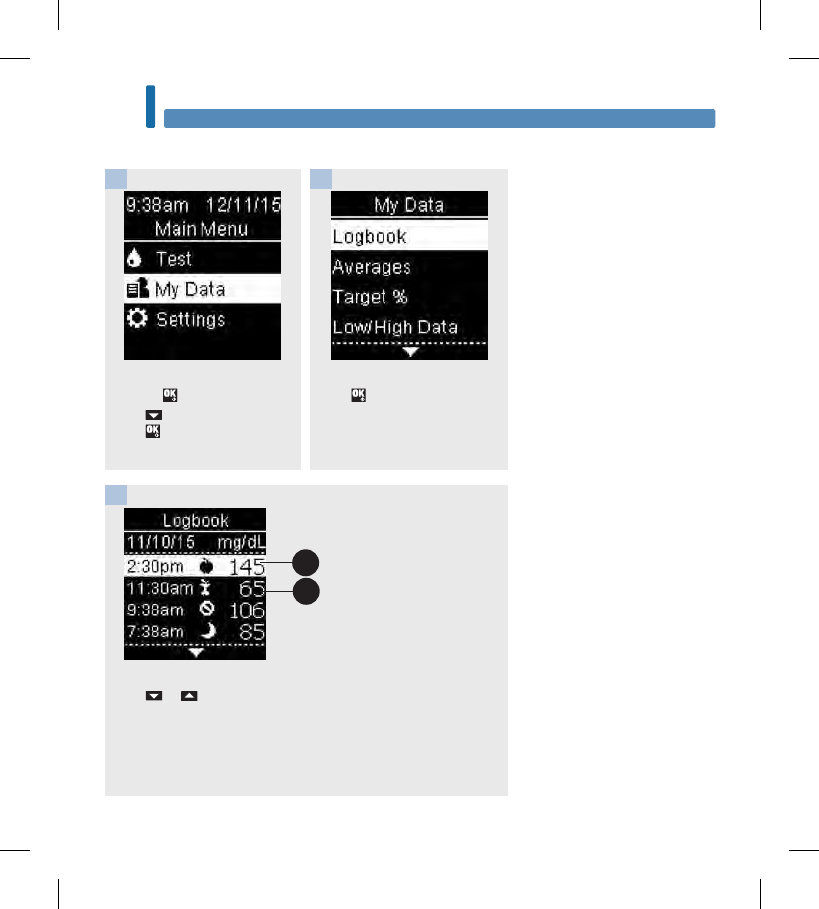
Turn the meter on by briefly
pressing . From Main Menu,
press to highlight My Data.
Press .
1
Logbook is highlighted.
Press .
2
Press or to scroll through Logbook.
The most recent test result 1.
The 2nd most recent test result 2.
3
Logbook
Logbook
2
1
52926_07414587001_EN.indb 64 6/2/16 2:53 PM
65
Review Your Data 6
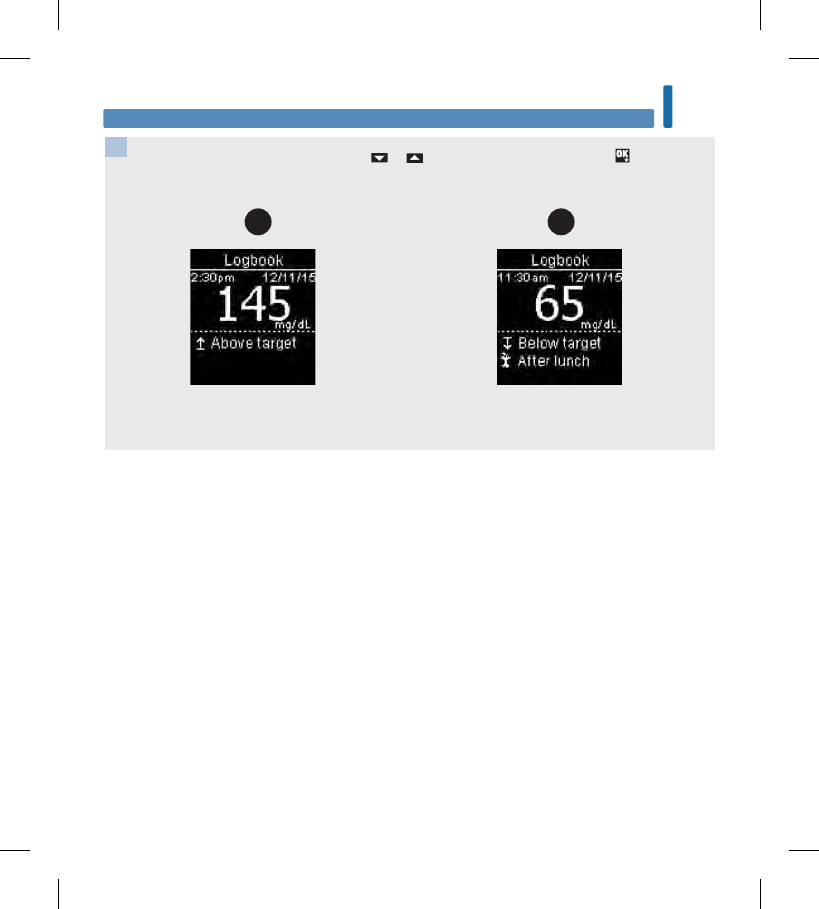
4To view details about a test result, press or to highlight the test result. Press . Test result
details shown below only appear if Target Ranges is On or comments were added to a test result.
The most recent test result. The 2nd most recent test result.
1 2
Logbook
52926_07414587001_EN.indb 65 6/2/16 2:53 PM
66
Review Your Data
6
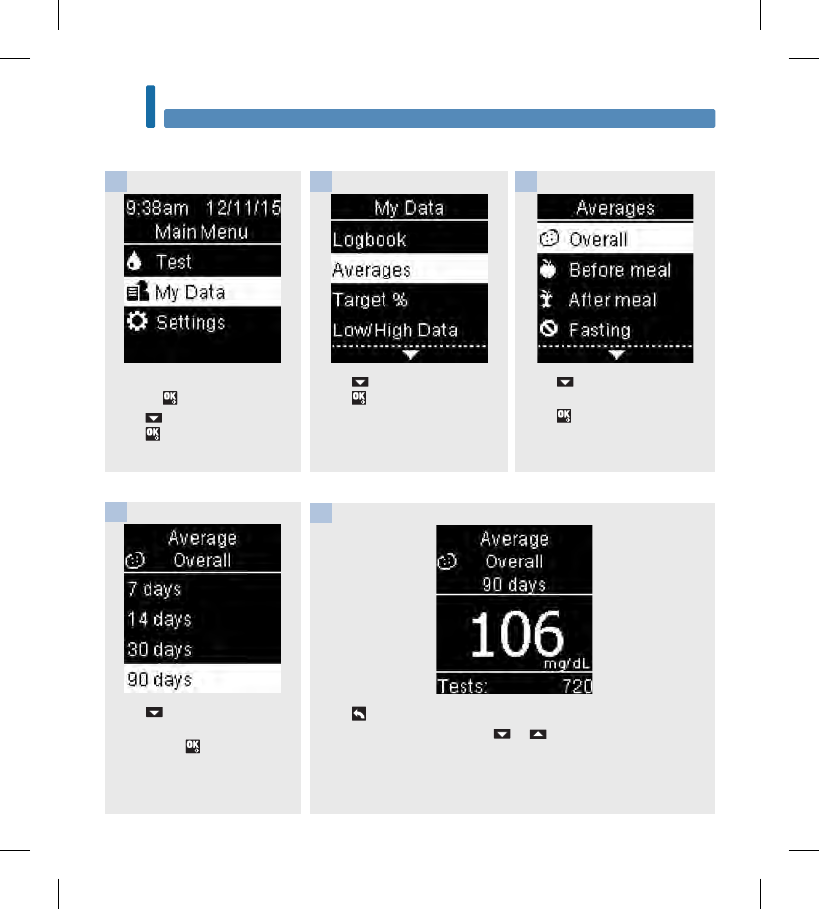
Press to highlight a category
(the example here is Overall).
Press .
3
Press to highlight a time
period (the example here is 90
days). Press .
4
Turn the meter on by briefly
pressing . From Main Menu,
press to highlight My Data.
Press .
1
Press to highlight Averages.
Press .
2
Press to return to the previous menu if you want to review a
different time period OR press or to move through different
averages.
5
Averages
Averages
52926_07414587001_EN.indb 66 6/2/16 2:53 PM
67
Review Your Data 6
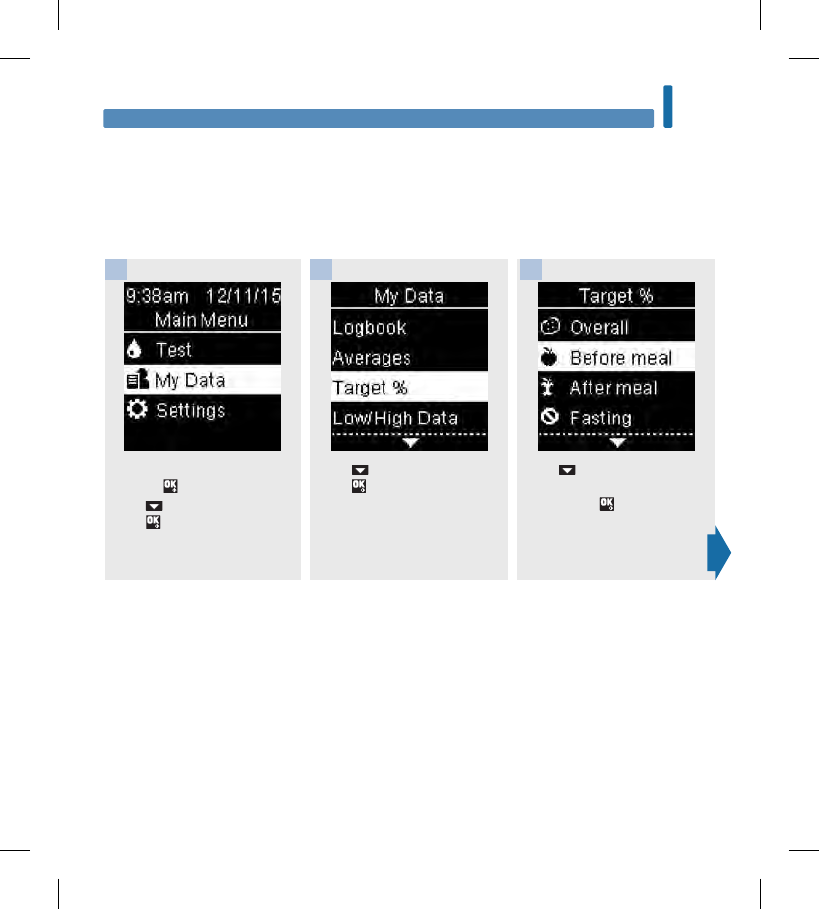
Target Percent (%)
Target Percent (%) allows you to view the percentage of your Overall, Before meal, After meal, Fasting, and
Bedtime blood glucose results that are above, within, or below your target ranges.
• Target % results can be viewed for 7, 14, 30, or 90‑day time periods.
• Target Ranges must be set in the meter to review Target % results.
Turn the meter on by briefly
pressing . From Main Menu,
press to highlight My Data.
Press .
1
Press to highlight Target %.
Press .
2
Press to highlight a category
(the example here is Before
meal). Press to select the
option.
3
Target Percent (%)
52926_07414587001_EN.indb 67 6/2/16 2:53 PM
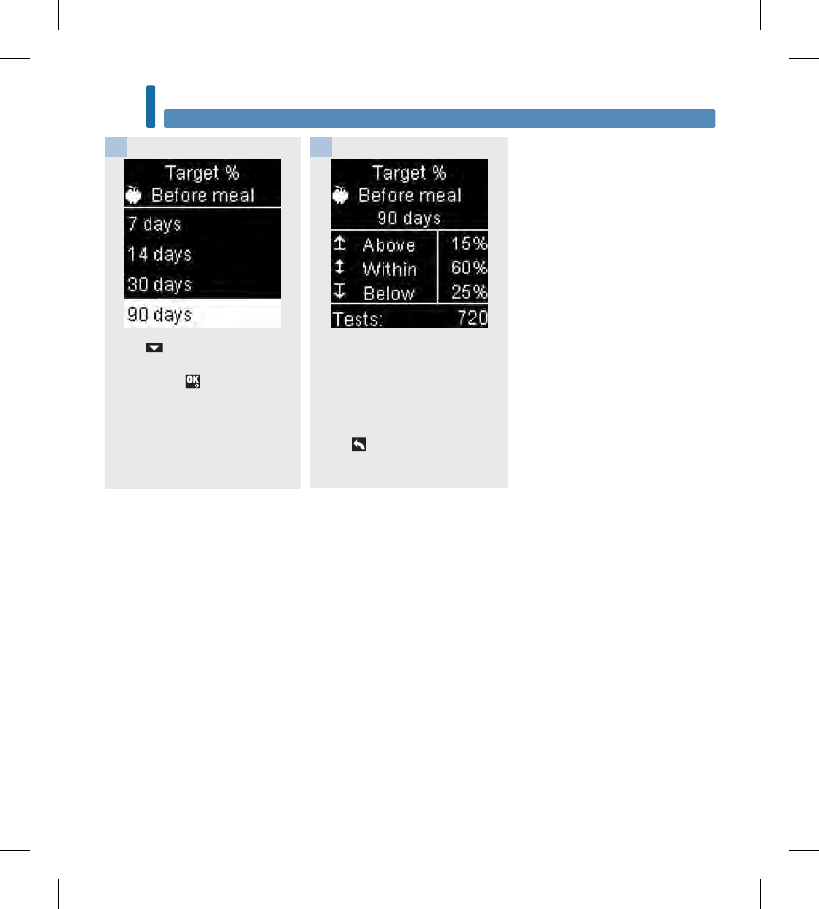
68
Review Your Data
6
Press to highlight a time
period (the example here is 90
days). Press .
4
The Target % appears (for the
Before meal example). The
number of total tests included
in the Target % appears at the
bottom of the display.
Press to return to the
previous menu.
5
Target Percent (%)
52926_07414587001_EN.indb 68 6/2/16 2:53 PM
69
Review Your Data 6
NOTE
Analyzing your blood glucose results stored in the meter is an eective way for you and your
healthcare professional to determine how well you are controlling your diabetes. This analysis is a
valuable tool for making improvements to your diabetes management. Use care when adding
comments to blood glucose results. Incorrect comments can cause inaccurate patterns to be detected
by the meter if Patterns is On.
Low/High Data
Your healthcare professional can tell you what blood glucose range is appropriate for you. It is very
important to stay within your target range.
• Target Ranges must be set in the meter to track Low/High Data test results (see the Target Ranges
section in the chapter Meter Settings for details).
• Low BG or High BG Data includes only results that fall above or below the target ranges set
in the meter.
• Low BG or High BG Data is tracked in the meter for 30 days.
Low/High Data
52926_07414587001_EN.indb 69 6/2/16 2:53 PM
70
Review Your Data
6
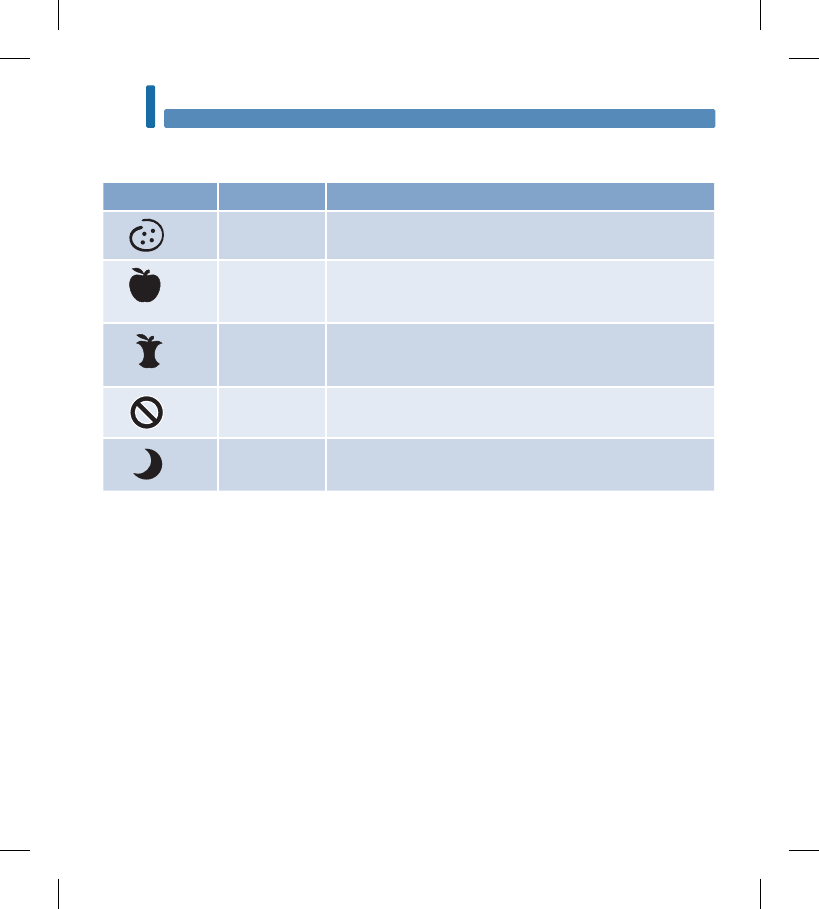
You can select Low BG and High BG results for Overall, Before meal, After meal, Fasting, or Bedtime blood
glucose results.
Symbol Name Description
Overall Includes high and low blood glucose results based on Target
Ranges set in the meter.
Before meal You may view low or high test results marked with a Before
Meal comment for Overall, Before breakfast, Before lunch,
Before dinner, and Before snack blood glucose results.*
After meal You may view low or high test results marked with an After
Meal comment for Overall, After breakfast, After lunch, After
dinner, and After snack blood glucose results.*
Fasting Includes high or low fasting blood glucose results marked as
Fasting in comments.
Bedtime Includes high or low bedtime blood glucose results marked as
Bedtime in comments.
*Test results for Before and After specific meals are only available if Patterns is set to On.
Low/High Data
52926_07414587001_EN.indb 70 6/2/16 2:53 PM
71
Review Your Data 6
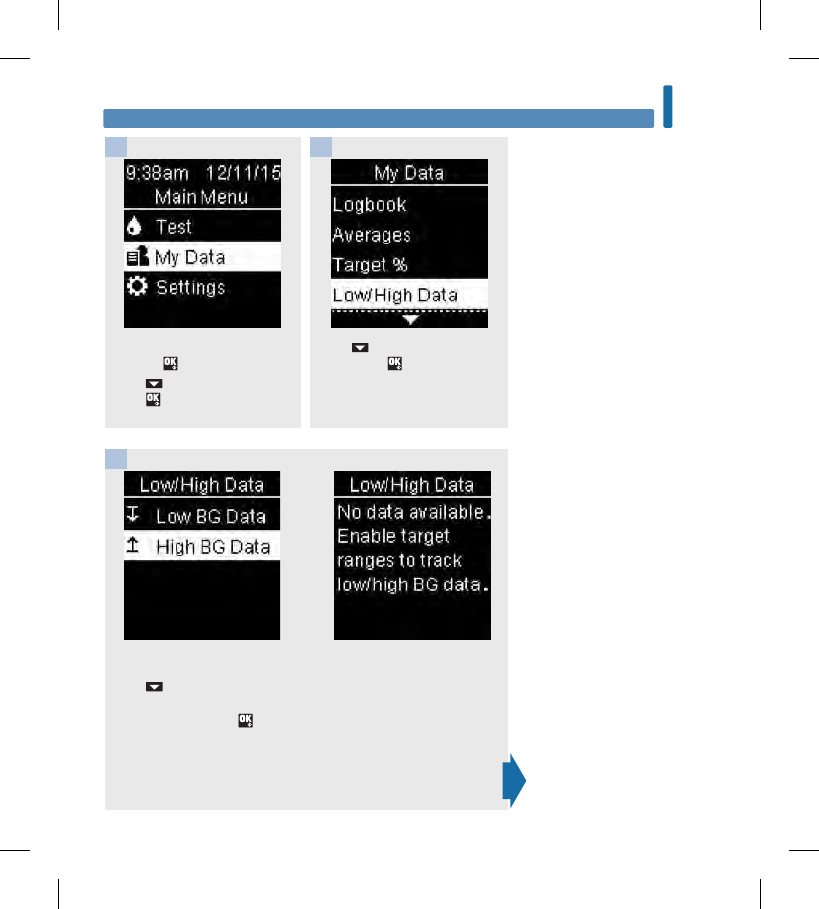
Turn the meter on by briefly
pressing . From Main Menu,
press to highlight My Data.
Press .
1
Press to highlight Low/High
Data. Press .
2
If Target Ranges is set to On:
Press to select Low or High
BG Data. (the example here is
High BG Data). Press .
If Target Ranges have NOT
been On within the last 30
days:
This message appears on the
meter (to turn on Target Ranges
see the Target Ranges section
in the chapter Meter Settings
for details).
3
or
Low/High Data
52926_07414587001_EN.indb 71 6/2/16 2:53 PM
72
Review Your Data
6
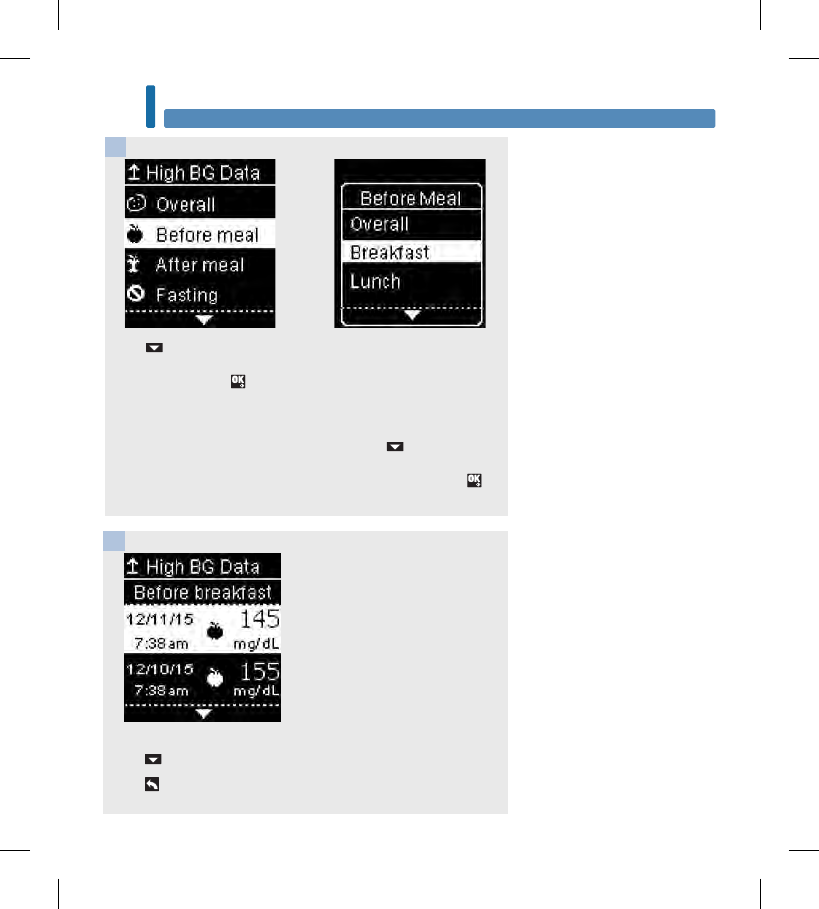
Press to highlight a
category (the example here is
Before meal). Press .
If test results with detailed
meal comments are saved in
the Logbook:
The meter may prompt you to
select detailed categories to
view. Press to highlight a
category (the example here is
before Breakfast). Press .
4
The selected data appears (the example here is High BG Data).
Press to scroll through the test results.
Press to return to the previous menu.
5
Low/High Data
52926_07414587001_EN.indb 72 6/2/16 2:53 PM
73
Review Your Data 6
NOTE
Analyzing your blood glucose results stored in the meter is an eective way for you and your
healthcare professional to determine how well you are controlling your diabetes. This analysis is a
valuable tool for making improvements to your diabetes management. Use care when adding
comments to blood glucose results. Incorrect comments can cause inaccurate patterns to be detected
by the meter if Patterns is On.
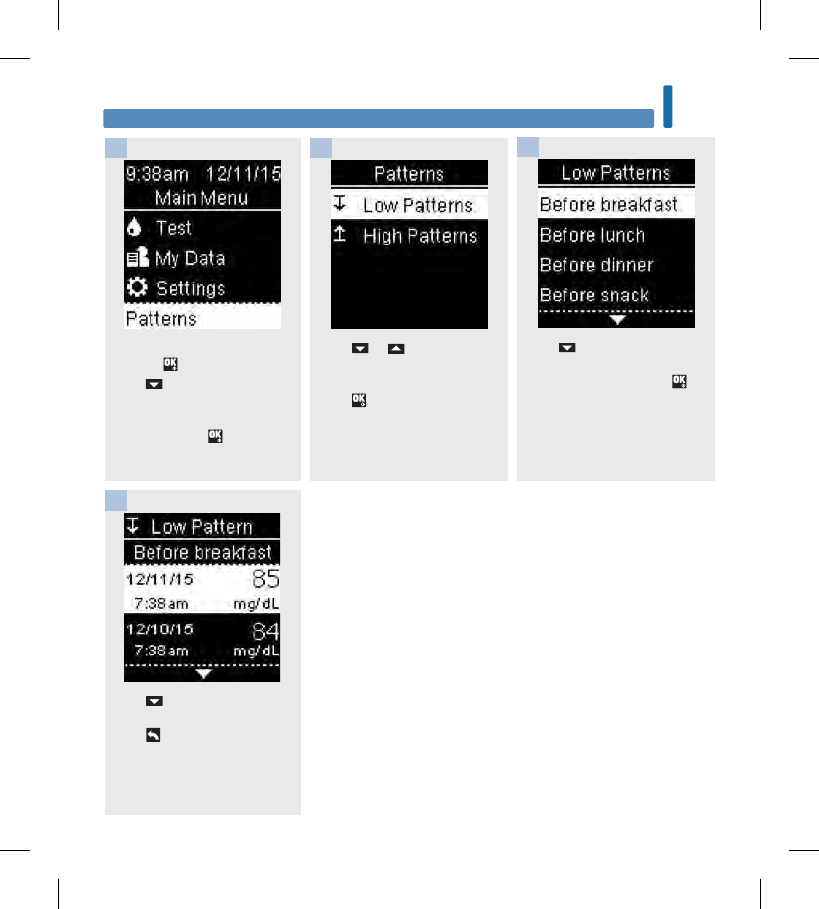
Patterns
• Patterns displays only active Low Patterns or High Patterns based on comments added to blood glucose
results within the last 7days.
• A Pattern is generated when 2below‑target or 3above‑target test results with the same comment are
detected within a 7‑day period.
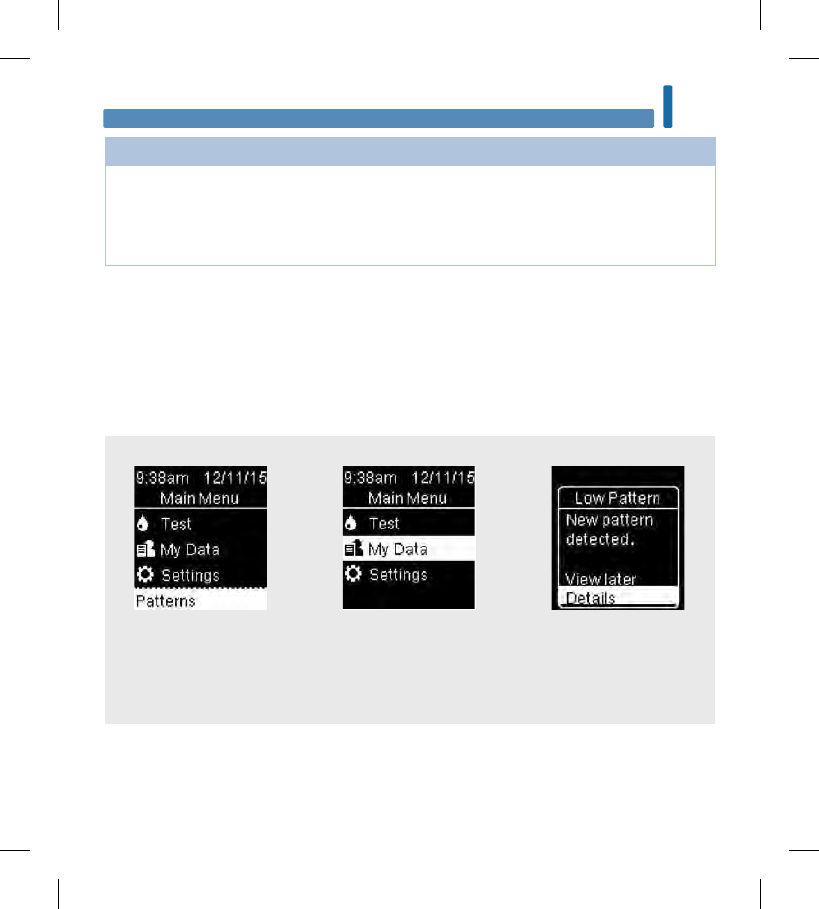
Patterns may be viewed on the meter in 3 ways:
when a Patterns option is
displayed at the bottom of
Main Menu.
from My Data on Main Menu. if a New pattern detected
message appears on the
display when performing a
blood glucose test.
Patterns
or or
52926_07414587001_EN.indb 73 6/2/16 2:53 PM
74
Review Your Data
6
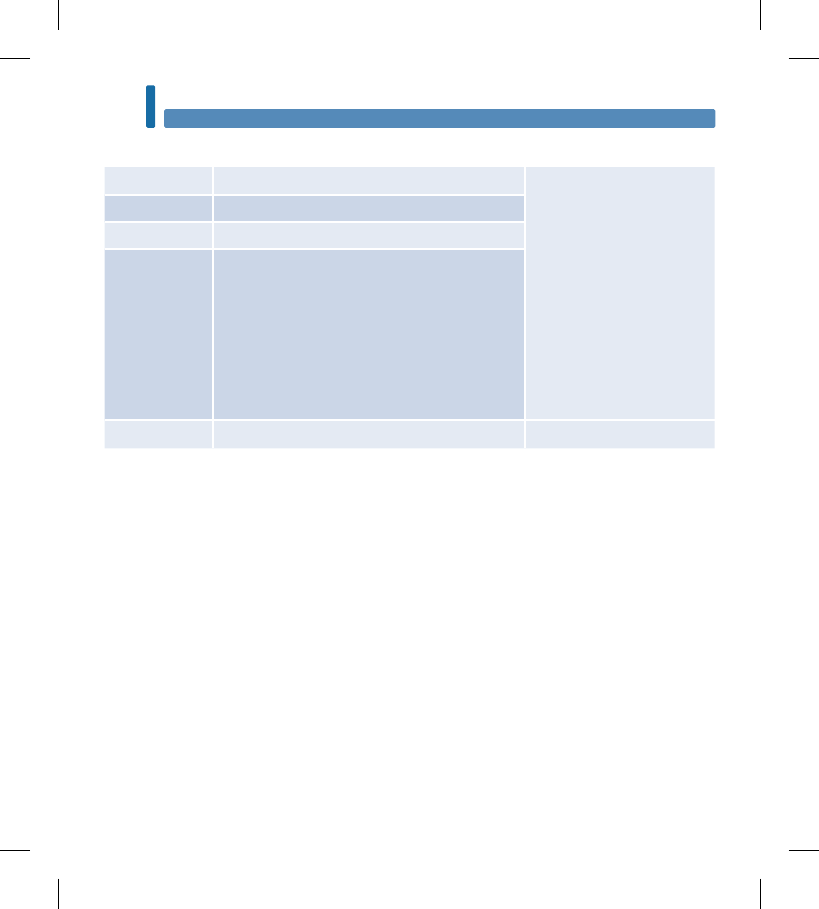
Patterns High and low patterns have been detected Patterns may include the
following blood glucose
results marked with
comments:
Before breakfast, After
breakfast, Before lunch, After
lunch, Before dinner, After
dinner, Before snack, After
snack, Fasting, or Bedtime.
(see the Adding Comments
to Blood Glucose Results
section in the chapter Blood
Glucose Tests).
High Pattern(s) One or more high patterns have been detected
Low Pattern(s) One or more low patterns have been detected
No Patterns No active pattern based on results from last 7 days
Blank Patterns feature is set to O
Patterns detected by the meter may be displayed on the Main Menu as:
Patterns
52926_07414587001_EN.indb 74 6/2/16 2:53 PM
75
Review Your Data 6
Press to scroll through test
results.
Press to return to the
previous menu.
4
Patterns
Turn the meter on by briefly
pressing . From Main Menu,
press to highlight the
Patterns option at the bottom of
the screen (the example here is
Patterns). Press .
Press to highlight a category
to review (the example here is
Before breakfast). Press .
13
Press or to highlight Low
Patterns or High Patterns (the
example here is Low Patterns).
Press to select the option.
2
52926_07414587001_EN.indb 75 6/2/16 2:53 PM
76
Review Your Data
6
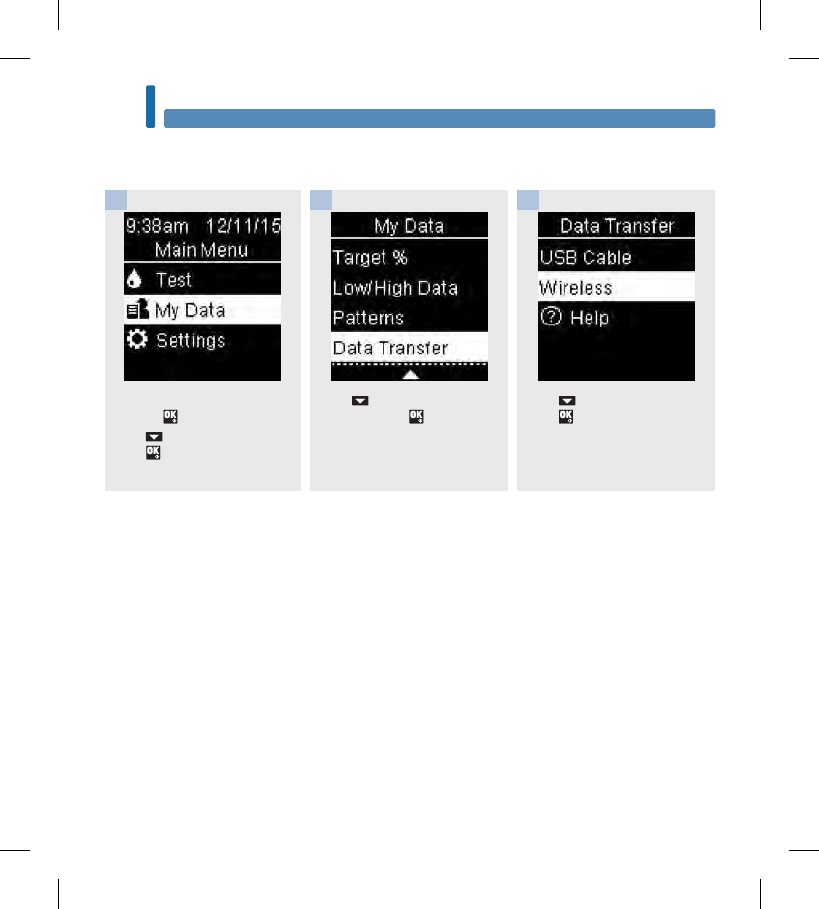
Turn the meter on by briefly
pressing . From Main Menu,
press to highlight My Data.
Press .
1
Press to highlight Data
Transfer. Press .
Press to select Wireless.
Press .
2 3
Data Transfer Using Wireless
Data Transfer Using Wireless
This feature allows you to transfer data wirelessly from your meter to another device.
52926_07414587001_EN.indb 76 6/2/16 2:53 PM
77
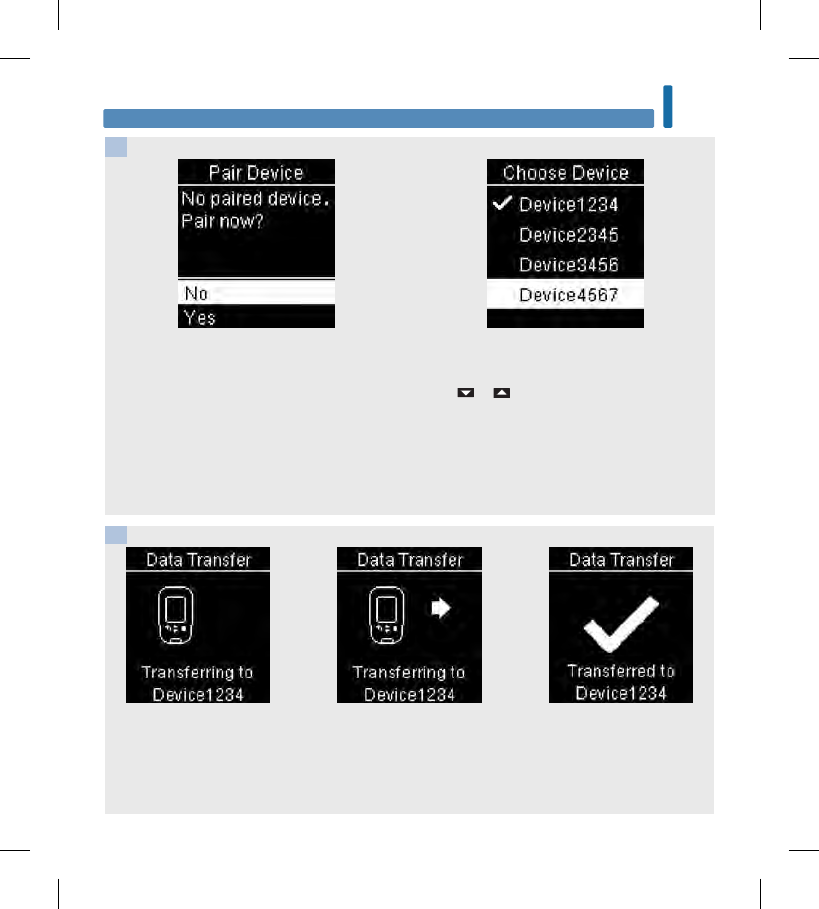
Review Your Data 6
If a device has not been paired with your
meter:
The meter prompts you to pair a device to the
meter. (see the First‑Time Pairing section in the
chapter Wireless Communication and Meter
Pairing for details).
If the meter has already been paired with at
least one device:
Press or to choose a wireless device for
data transfer.
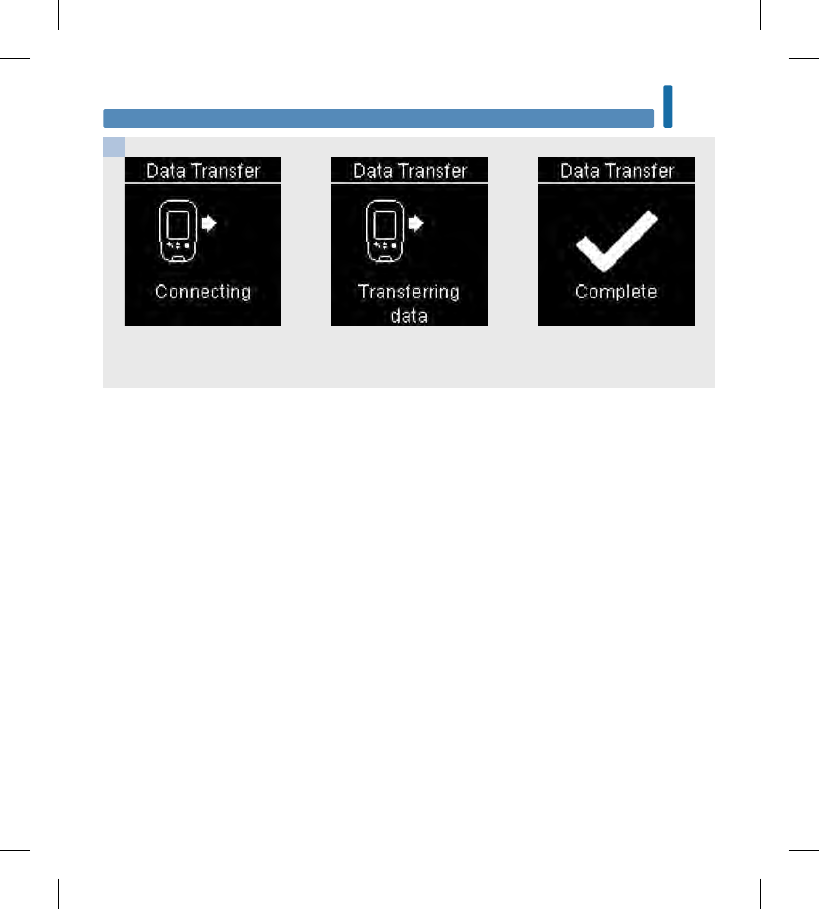
The meter transfers the data to the device.
4
5
or
Data Transfer Using Wireless
52926_07414587001_EN.indb 77 6/2/16 2:53 PM
78
Review Your Data
6
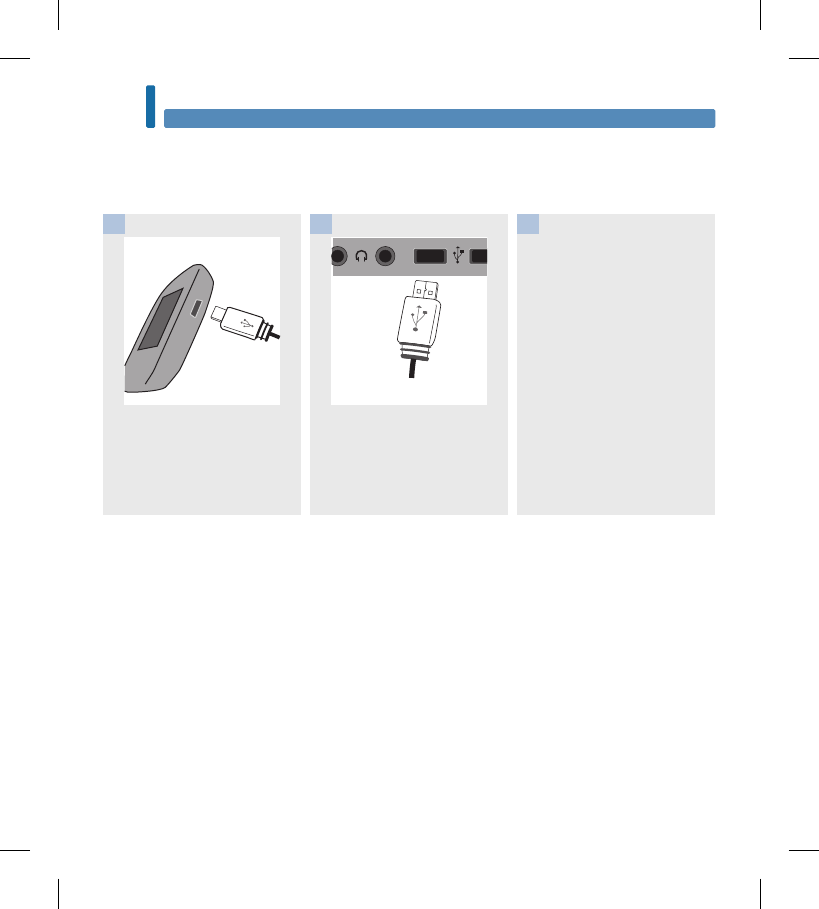
Start the software for data
analysis and initiate a data
transfer.
Data Transfer Using USB Cable
This feature allows you to transfer data from your meter to special software for diabetes management on
a PC using a USB cable.
Plug the small end of the USB
cable into the meter.
1
Plug the large end of the USB
cable into a USB port on the PC.
If the meter is o, it turns on.
2 3
Data Transfer Using USB Cable
52926_07414587001_EN.indb 78 6/2/16 2:53 PM
79
Review Your Data 6
The meter transfers the data to the software.
4
Data Transfer Using USB Cable
52926_07414587001_EN.indb 79 6/2/16 2:53 PM

80
Review Your Data
6
52926_07414587001_EN.indb 80 6/2/16 2:53 PM
81
Wireless Communication and Meter Pairing 7
Overview
You can wirelessly and automatically synchronize your diabetes information with a mobile device. The
process of creating a connection between the meter and the other device is called pairing. You need an
application on your mobile device that can accept the meter’s data.
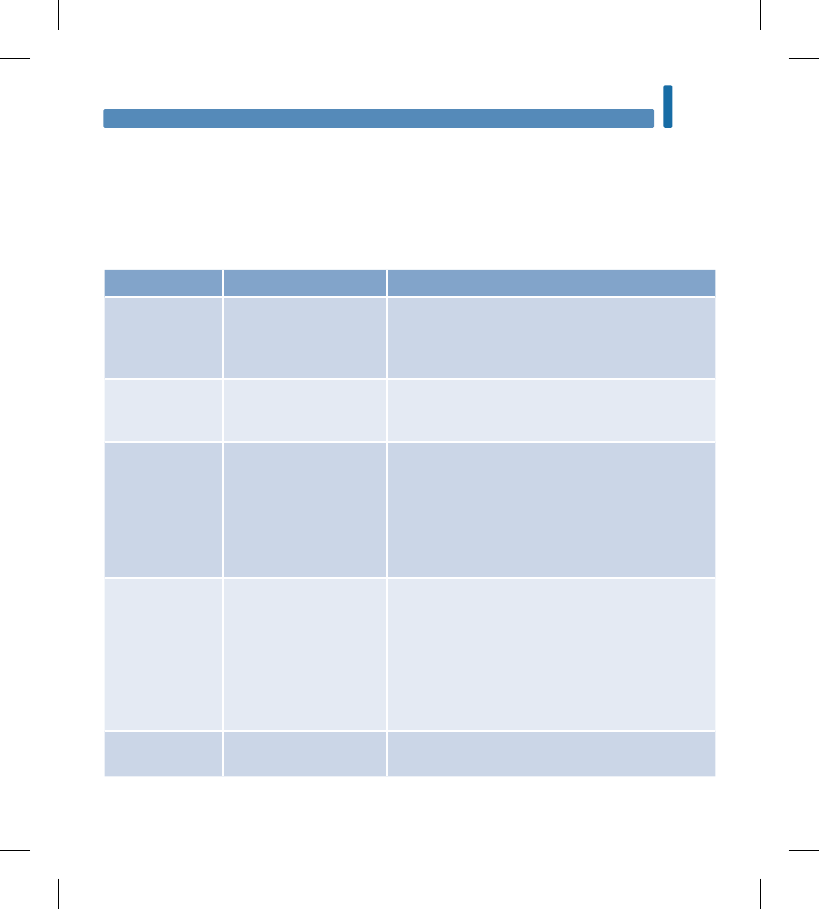
Setting Options Function
Flight Mode On / O Select whether wireless communication is available.
On – wireless communication is not available.
O – wireless communication is available.
Default Device List of devices paired
with the meter
If more than 1device is paired, select the device with
which the Auto‑Send and Sync Time features will
communicate.
Auto‑Send On / O Select whether data is automatically sent to the
default paired device after each test.
On – data is automatically sent to the default paired
device.
O – data is not automatically sent to the default
paired device.
Sync Time On / O Select whether to synchronize the time and date to
the default paired device.
On – the time and date on the meter synchronize to
the time and date on the default paired device.
O – the time and date on the meter do not
synchronize to the time and date on the default
paired device.
Pairing Pair Device / Delete
Pairing
Select whether to pair a device or to delete a paired
device.
Chapter 7: Wireless Communication and Meter Pairing
52926_07414587001_EN.indb 81 6/2/16 2:53 PM
82
Wireless Communication and Meter Pairing
7
First‑Time Pairing
The steps below are for first‑time pairing.
Up to 5devices can be paired with the meter at any time.
Each device must be paired with the meter one at a time.
The meter and the device to be paired should be within 1meter of each other.
Prepare the device for pairing.
Refer to the device’s
instructions for information
about pairing.
1
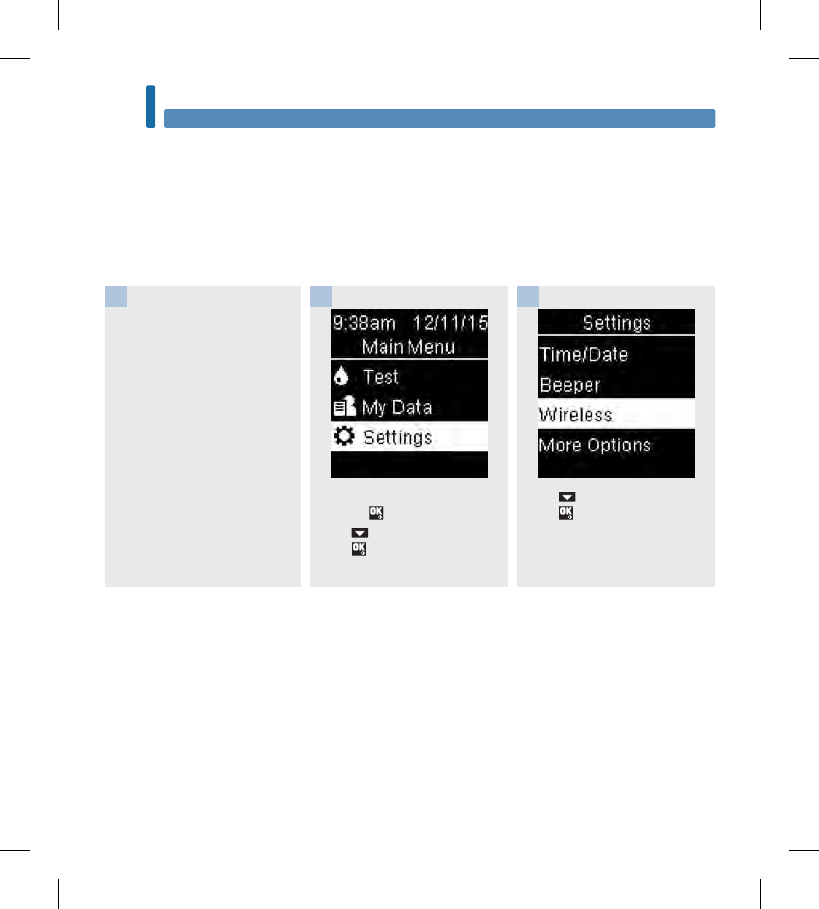
Turn the meter on by briefly
pressing . From Main Menu,
press to highlight Settings.
Press .
2
Press to highlight Wireless.
Press .
3
First‑Time Pairing
52926_07414587001_EN.indb 82 6/2/16 2:53 PM
83
Wireless Communication and Meter Pairing 7
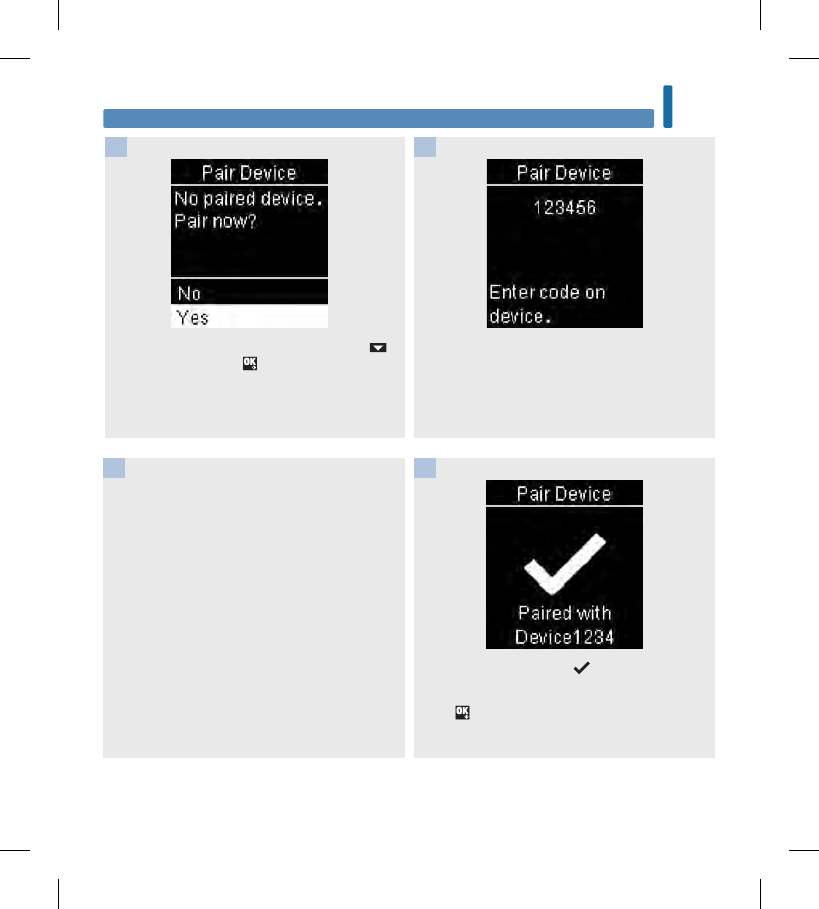
Pair Device appears. To pair a device, press
to highlight Yes. Press .
4
The meter displays its code.
5
The mobile device displays a list of found devices,
including the meter. Select the meter from the
list. When prompted, enter the code displayed on
the meter from Step5 into the device to be
paired.
6
When pairing is complete, and the name of
the paired device appear.
Press to return to the previous menu.
7
First‑Time Pairing
52926_07414587001_EN.indb 83 6/2/16 2:53 PM
84
Wireless Communication and Meter Pairing
7
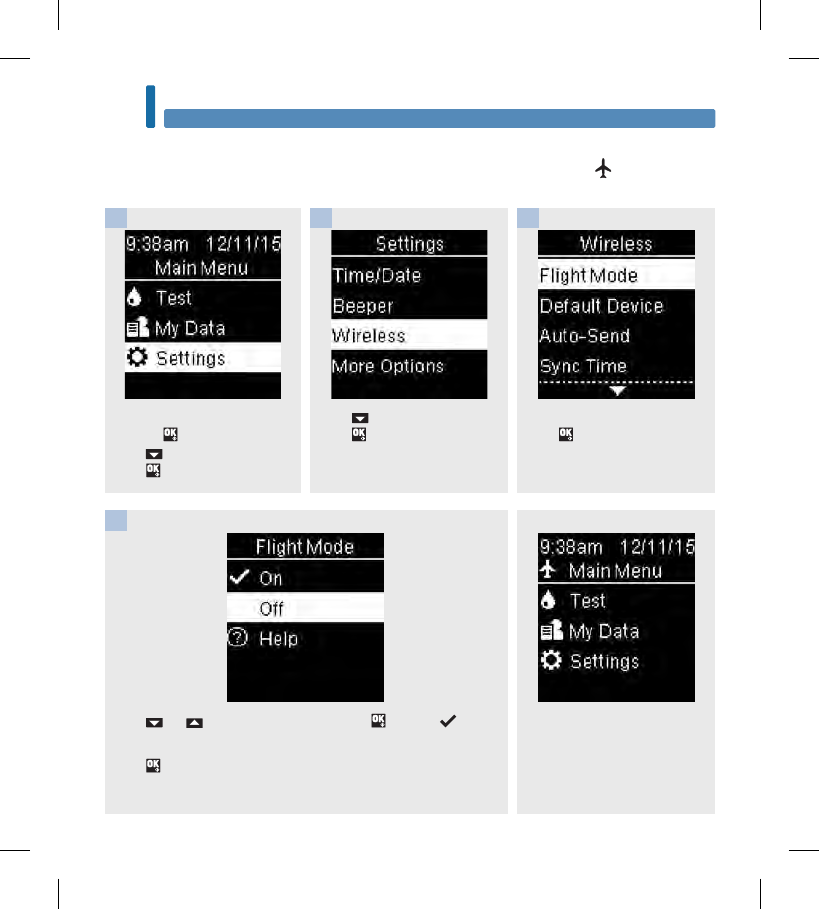
Main Menu with meter in Flight
Mode.
Flight Mode
Select whether wireless communication is available or not. When Flight Mode is on, appears in the
title bar and wireless communication is not available.
Turn the meter on by briefly
pressing . From Main Menu,
press to highlight Settings.
Press .
1
Press to highlight Wireless.
Press .
2
Flight Mode is highlighted.
Press .
3
Press or to highlight On or Off. Press to move to the
option.
Press to set the option and return to the previous menu.
4
Flight Mode
52926_07414587001_EN.indb 84 6/2/16 2:53 PM