Samsung Electronics Co SMT515 Tablet User Manual SAMSUNG SM T515 RF Test Report 2G 3G rev01 Part1
Samsung Electronics Co Ltd Tablet SAMSUNG SM T515 RF Test Report 2G 3G rev01 Part1
Contents
- 1. A3LSMT515_User Manual
- 2. SAMSUNG SM-T515 RF Test Report_2G 3G_rev01_Part1
SAMSUNG SM-T515 RF Test Report_2G 3G_rev01_Part1
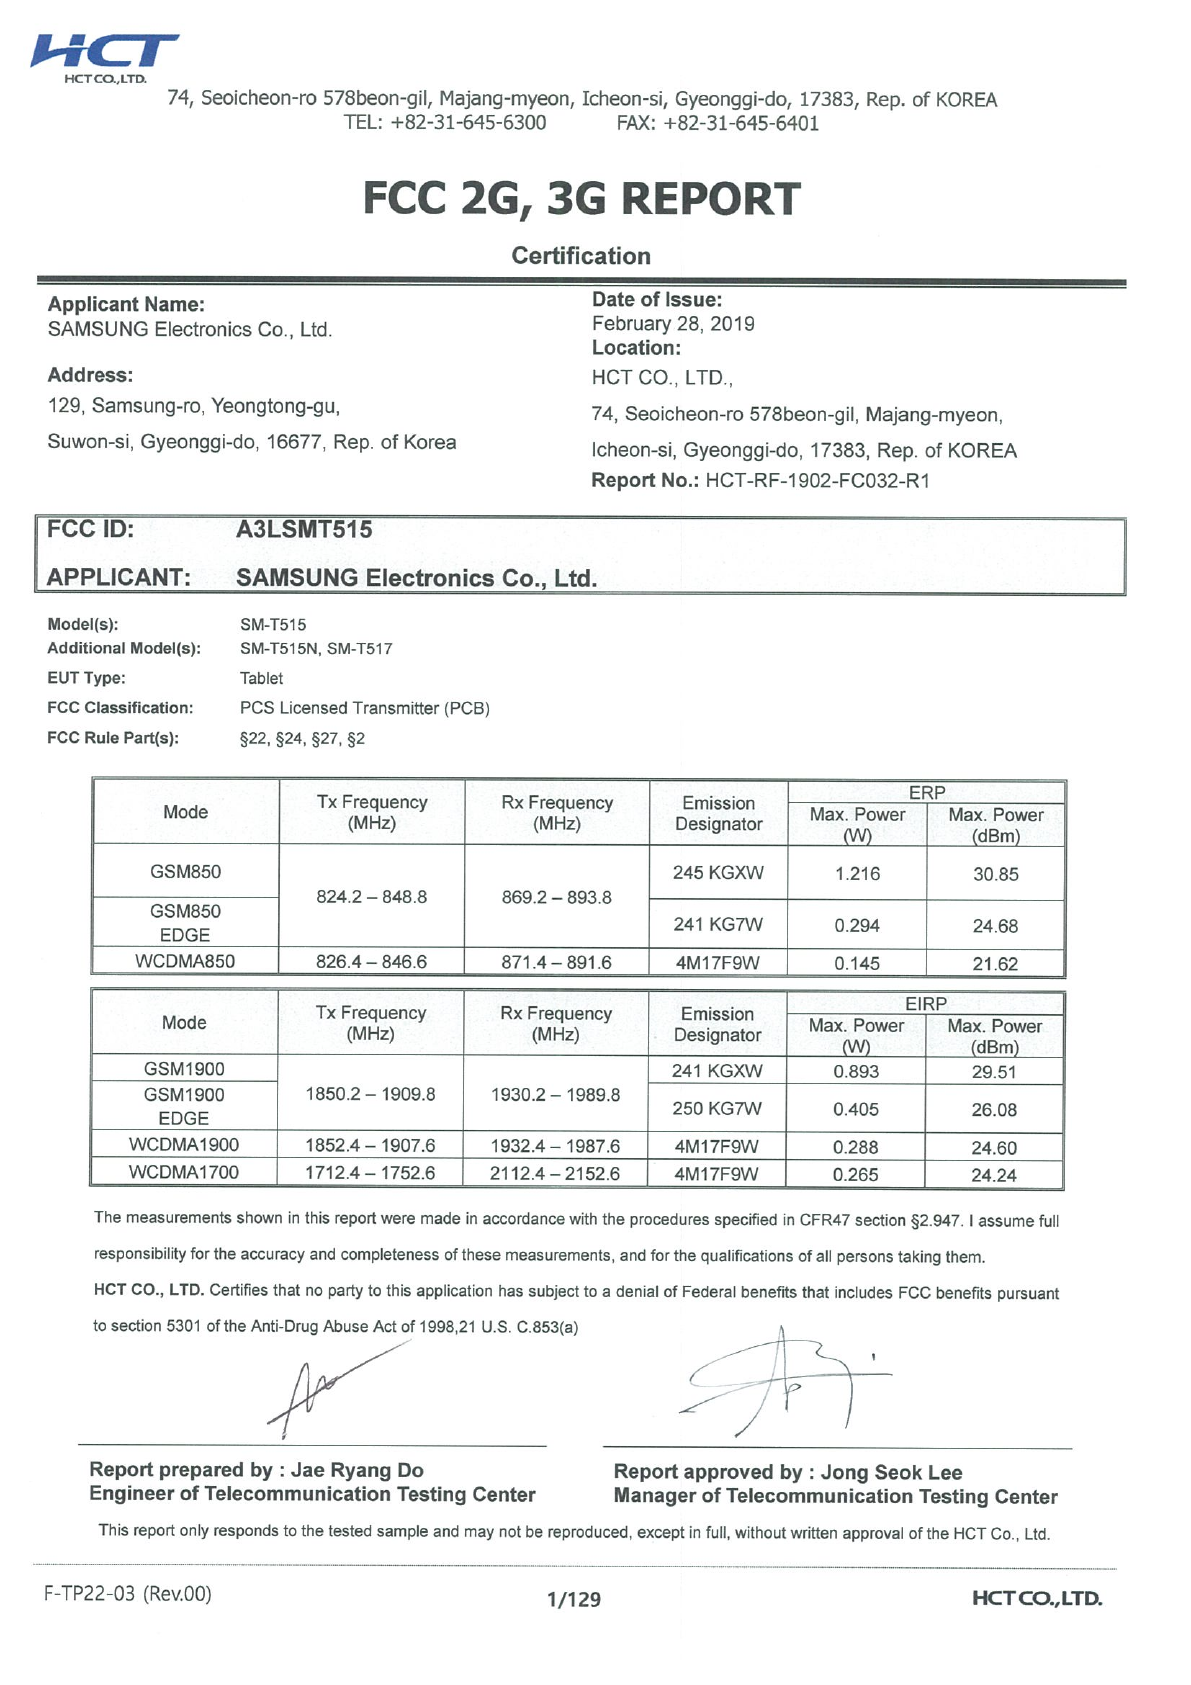
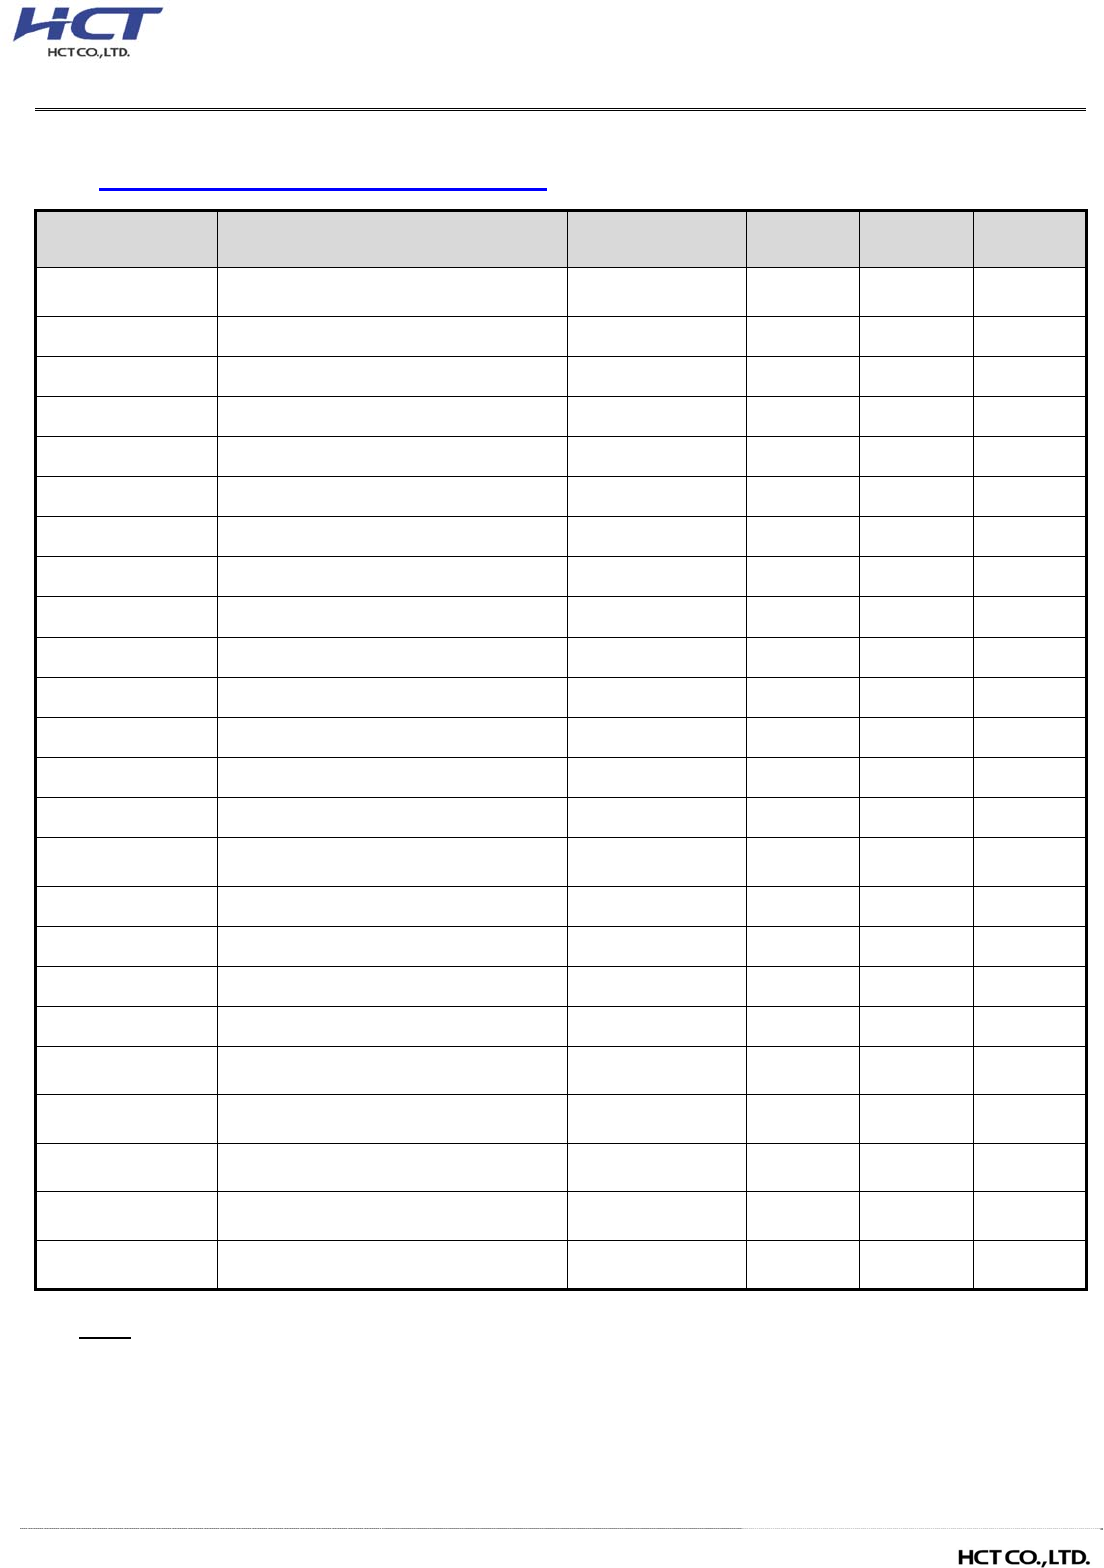
Report No.: HCT-RF-1902-FC032-R1 FCC ID: A3LSMT515
F-TP22-03 (Rev.00)
2/129
Version
TEST REPORT NO. DATE DESCRIPTION
HCT-RF-1902-FC032 February 22, 2019 - First Approval Report
HCT-RF-1902-FC032-R1
February 28, 2019 - Modified Equipment Class

Report No.: HCT-RF-1902-FC032-R1 FCC ID: A3LSMT515
F-TP22-03 (Rev.00)
3/129
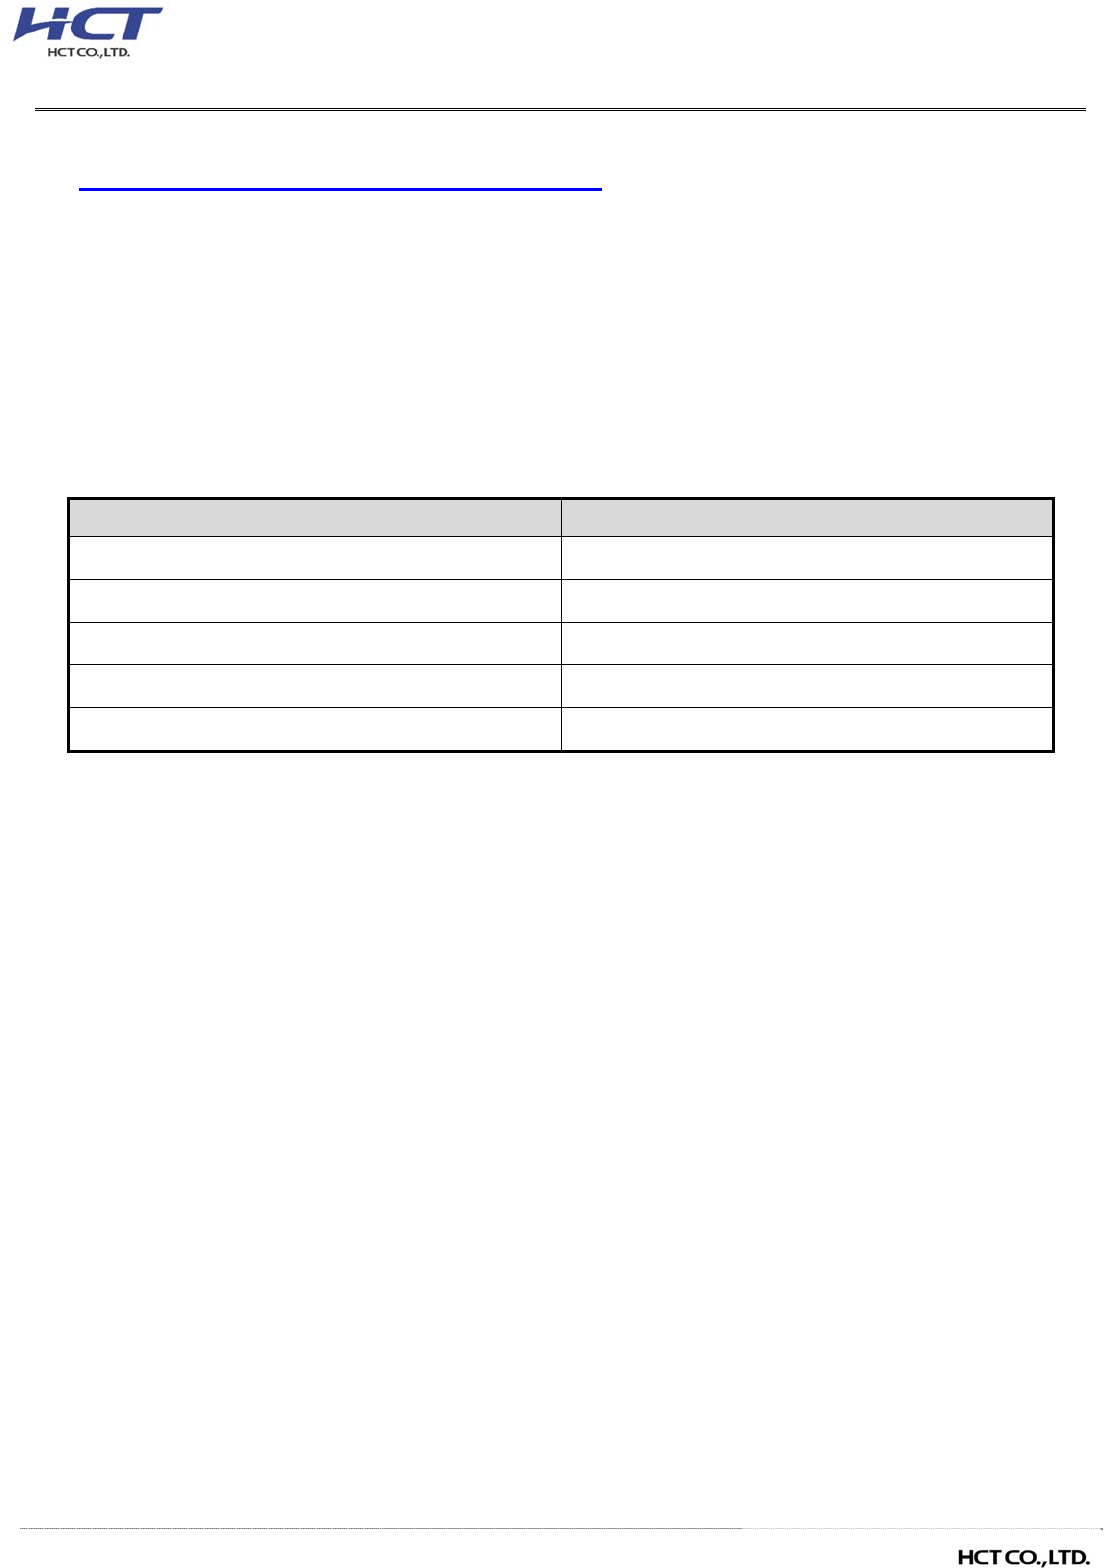
Table of Contents
1. GENERAL INFORMATION .......................................................................................................................... 4
2. INTRODUCTION ........................................................................................................................................... 5
2.1. DESCRIPTION OF EUT ..................................................................................................................... 5
2.2. MEASURING INSTRUMENT CALIBRATION .................................................................................... 5
2.3. TEST FACILITY .................................................................................................................................. 5
3. DESCRIPTION OF TESTS ........................................................................................................................... 6
3.1 TEST PROCEDURE ............................................................................................................................ 6
3.2 RADIATED POWER ............................................................................................................................ 7
3.3 RADIATED SPURIOUS EMISSIONS .................................................................................................. 8
3.4 PEAK- TO- AVERAGE RATIO ............................................................................................................ 9
3.5 OCCUPIED BANDWIDTH. ................................................................................................................ 11
3.6 SPURIOUS AND HARMONIC EMISSIONS AT ANTENNA TERMINAL .......................................... 12
3.7 BAND EDGE ..................................................................................................................................... 13
3.8 FREQUENCY STABILITY / VARIATION OF AMBIENT TEMPERATURE ...................................... 14
3.9 WORST CASE(CONDUCTED TEST) ............................................................................................... 15
3.10 WORST CASE(RADIATED TEST) .................................................................................................. 16
4. LIST OF TEST EQUIPMENT ...................................................................................................................... 17
5. MEASUREMENT UNCERTAINTY ............................................................................................................. 18
6. SUMMARY OF TEST RESULTS ................................................................................................................ 19
7. SAMPLE CALCULATION .......................................................................................................................... 20
8. TEST DATA ................................................................................................................................................ 22
8.1 EFFECTIVE RADIATED POWER ..................................................................................................... 22
8.2 EQUIVALENT ISOTROPIC RADIATED POWER ............................................................................. 23
8.3 RADIATED SPURIOUS EMISSIONS ................................................................................................ 24
8.4 PEAK-TO-AVERAGE RATIO ............................................................................................................ 29
8.5 OCCUPIED BANDWIDTH ................................................................................................................. 30
8.6 CONDUCTED SPURIOUS EMISSIONS ........................................................................................... 31
8.7 BAND EDGE ..................................................................................................................................... 31
8.8 FREQUENCY STABILITY / VARIATION OF AMBIENT TEMPERATURE ...................................... 32
9. TEST PLOTS .............................................................................................................................................. 43
10. APPENDIX A_ TEST SETUP PHOTO .................................................................................................... 129

Report No.: HCT-RF-1902-FC032-R1 FCC ID: A3LSMT515
F-TP22-03 (Rev.00)
4/129
MEASUREMENT REPORT
1. GENERAL INFORMATION
Applicant Name: SAMSUNG Electronics Co., Ltd.
Address: 129, Samsung-ro, Yeongtong-gu, Suwon-si, Gyeonggi-do, 16677, Rep. of
Korea
FCC ID: A3LSMT515
Application Type: Certification
FCC Classification: PCS Licensed Transmitter (PCB)
FCC Rule Part(s): §22, §24, §27, §2
EUT Type: Tablet
Model(s): SM-T515
Additional Model(s): SM-T515N, SM-T517
Tx Frequency: 824.20 - 848.80 MHz (GSM850)
826.40 - 846.60 MHz (WCDMA850)
1 850.20 - 1 909.80 MHz (GSM1900)
1 852.4 – 1 907.6 MHz (WCDMA1900)
1 712.4 – 1 752.6 MHz (WCDMA1700)
Rx Frequency: 869.20 - 893.80 MHz (GSM850)
871.40 - 891.60 MHz (WCDMA850)
1 930.20 - 1 989.80 MHz (GSM1900)
1 932.4 – 1 987.6 MHz (WCDMA1900)
2 112.4 – 2 152.6 MHz (WCDMA1700)
Date(s) of Tests: February 02, 2019~ February 18, 2019

Report No.: HCT-RF-1902-FC032-R1 FCC ID: A3LSMT515
F-TP22-03 (Rev.00) 5/129
2. INTRODUCTION
2.1. DESCRIPTION OF EUT
The EUT was a Tablet with GSM/GPRS/EGPRS/UMTS and LTE.
It also supports IEEE 802.11 a/b/g/n/ac (HT20/40/80), ANT+, Bluetooth, BT LE.
2.2. MEASURING INSTRUMENT CALIBRATION
The measuring equipment, which was utilized in performing the tests documented herein, has been
calibrated in accordance with the manufacturer's recommendations for utilizing calibration equipment, which
is traceable to recognized national standards.
2.3. TEST FACILITY
The Fully-anechoic chamber and conducted measurement facility used to collect the radiated data are
located at the 74, Seoicheon-ro 578beon-gil, Majang-myeon, Icheon-si, Gyeonggi-do, 17383, Rep. of
KOREA.

Report No.: HCT-RF-1902-FC032-R1 FCC ID: A3LSMT515
F-TP22-03 (Rev.00)
6/129
3. DESCRIPTION OF TESTS
3.1 TEST PROCEDURE
Test Description Test Procedure Used
Occupied Bandwidth
- KDB 971168 D01 v03r01 – Section 4.3
- ANSI C63.26-2015 – Section 5.4.4
Band Edge
- KDB 971168 D01 v03r01 – Section 6.0
- ANSI C63.26-2015 – Section 5.7
Spurious and Harmonic Emissions at Antenna
Terminal
- KDB 971168 D01 v03r01 – Section 6.0
- ANSI C63.26-2015 – Section 5.7
Conducted Output Power - N/A (See SAR Report)
Peak- to- Average Ratio
- KDB 971168 D01 v03r01 – Section 5.7
- ANSI C63.26-2015 – Section 5.2.3.4
- ANSI C63.26-2015 – Section 5.2.6(only GSM)
Frequency stability - ANSI C63.26-2015 – Section 5.6
Effective Radiated Power/
Effective Isotropic Radiated Power
- KDB 971168 D01 v03r01 – Section 5.2 & 5.8
- ANSI C63.26-2015 – Section 5.2
- ANSI/TIA-603-E-2016 – Section 2.2.17
Radiated Spurious and Harmonic Emissions
- KDB 971168 D01 v03r01 – Section 6.2
- ANSI/TIA-603-E-2016 – Section 2.2.12

Report No.: HCT-RF-1902-FC032-R1 FCC ID: A3LSMT515
F-TP22-03 (Rev.00)
7/129
3.2 RADIATED POWER
Test Overview
Radiated tests are performed in the Fully-anechoic chamber.
The equipment under test is placed on a non-conductive table 3-meters away from the receive antenna in
accordance with ANSI/TIA-603-E-2016 Clause 2.2.17.
Test Settings
1. Radiated power measurements are performed using the signal analyzer’s “channel power”
measurement capability for signals with continuous operation.
2. RBW = 1 – 5% of the expected OBW, not to exceed 1MHz
3. VBW ≥ 3 x RBW
4. Span = 1.5 times the OBW
5. No. of sweep points > 2 x span / RBW
6. Detector = RMS
7. Trigger is set to “free run” for signals with continuous operation with the sweep times set to “auto”.
8. The integration bandwidth was roughly set equal to the measured OBW of the signal for signals with
continuous operation.
9. Trace mode = trace averaging (RMS) over 100 sweeps
10. The trace was allowed to stabilize
Test Note
1. The turntable is rotated through 360 degrees, and the receiving antenna scans in order to determine the
level of the maximized emission.
2. A half wave dipole is then substituted in place of the EUT. For emissions above 1GHz, a horn antenna is
substituted in place of the EUT. The substitute antenna is driven by a signal generator and the previously
recorded signal was duplicated.
The power is calculated by the following formula;
P
d(dBm)
= Pg
(dBm)
– cable loss
(dB)
+ antenna gain
(dB)
Where: P
d
is the dipole equivalent power and P
g
is the generator output power into the substitution antenna.
3. The maximum value is calculated by adding the forward power to the calibrated source plus its
appropriate gain value.
These steps are repeated with the receiving antenna in both vertical and horizontal polarization. the
difference between the gain of the horn and an isotropic antenna are taken into consideration
4. The EUT was tested in three orthogonal planes(X, Y, Z) and in all possible test configurations and
positioning.
5. All measurements are performed as RMS average measurements while the EUT is operating at its
maximum duty cycle, at maximum power, and at the appropriate frequencies.

Report No.: HCT-RF-1902-FC032-R1 FCC ID: A3LSMT515
F-TP22-03 (Rev.00)
8/129
3.3 RADIATED SPURIOUS EMISSIONS
Test Overview
Radiated tests are performed in the Fully-anechoic chamber.
Radiated Spurious Emission Measurements at 3 meters by Substitution Method according to
ANSI/TIA-603-E-2016.
Test Settings
1. RBW = 100kHz for emissions below 1GHz and 1MHz for emissions above 1GHz
2. VBW ≥ 3 x RBW
3. Span = 1.5 times the OBW
4. No. of sweep points > 2 x span / RBW
5. Detector = Peak
6. Trace mode = Max Hold
7. The trace was allowed to stabilize
8. Test channel : Low/ Middle/ High
9. Frequency range : We are performed all frequency to 10
th
harmonics from 9 kHz.
Test Note
1. Measurements value show only up to 3 maximum emissions noted, or would be lesser
if no specific emissions from the EUT are recorded (ie: margin > 20 dB from the applicable limit)
and considered that's already beyond the background noise floor.
2. The EUT was tested in three orthogonal planes(X, Y, Z) and in all possible test configurations and
positioning.
The worst case emissions are reported with the EUT positioning, modulations, RB sizes and offsets,
and channel bandwidth configurations shown in the test dat
Report No.: HCT-RF-1902-FC032-R1 FCC ID: A3LSMT515
F-TP22-03 (Rev.00)
9/129
3.4 PEAK- TO- AVERAGE RATIO
Test setup
① CCDF Procedure for PAPR
Test Settings
1. Set resolution/measurement bandwidth ≥ signal’s occupied bandwidth;
2. Set the number of counts to a value that stabilizes the measured CCDF curve;
3. Set the measurement interval as follows:
.- for continuous transmissions, set to 1 ms,
.- or burst transmissions, employ an external trigger that is synchronized with the EUT burst timing
sequence, or use the internal burst trigger with a trigger level that allows the burst to stabilize and set
the measurement interval to a time that is less than or equal to the burst duration.
4. Record the maximum PAPR level associated with a probability of 0.1%.

Report No.: HCT-RF-1902-FC032-R1 FCC ID: A3LSMT515
F-TP22-03 (Rev.00)
10/129
② Alternate Procedure for PAPR
Use one of the procedures presented in 5.2(ANSI C63.26-2015) to measure the total peak power and
record as P
Pk
.
Use one of the applicable procedures presented 5.2(ANSI C63.26-2015) to measure the total average
power and record as P
Avg
. Determine the P.A.R. from:
P.A.R
(dB)
= P
Pk (dBm)
– P
Avg (dBm)
(P
Avg
= Average Power + Duty cycle Factor)
Test Settings(Peak Power)
The measurement instrument must have a RBW that is greater than or equal to the OBW of the
signal to be measured and a VBW ≥ 3 × RBW.
1. Set the RBW ≥ OBW.
2. Set VBW ≥ 3 × RBW.
3. Set span ≥ 2 × OBW.
4. Sweep time ≥ 10 × (number of points in sweep) × (transmission symbol period).
5. Detector = peak.
6. Trace mode = max hold.
7. Allow trace to fully stabilize.
8. Use the peak marker function to determine the peak amplitude level.
Test Settings(Average Power)
1. Set span to 2 × to 3 × the OBW.
2. Set RBW ≥ OBW.
3. Set VBW ≥ 3 × RBW.
4. Set number of measurement points in sweep ≥ 2 × span / RBW.
5. Sweep time:
Set ≥ [10 × (number of points in sweep) × (transmission period)] for single sweep
(automation-compatible) measurement. The transmission period is the (on + off) time.
6. Detector = power averaging (rms).
7. Set sweep trigger to “free run.”
8. Trace average at least 100 traces in power averaging (rms) mode if sweep is set to auto-couple. (To
accurately determine the average power over the on and off period of the transmitter, it can be
necessary to increase the number of traces to be averaged above 100 or, if using a manually
configured sweep time, increase the sweep time.)
9. Use the peak marker function to determine the maximum amplitude level.
10. Add [10 log (1/duty cycle)] to the measured maximum power level to compute the average power
during continuous transmission. For example, add [10 log (1/0.25)] = 6 dB if the duty cycle is a
constant 25%.
Report No.: HCT-RF-1902-FC032-R1 FCC ID: A3LSMT515
F-TP22-03 (Rev.00)
11/129
3.5 OCCUPIED BANDWIDTH.
Test setup
The width of a frequency band such that, below the lower and above the upper frequency limits, the mean
powers emitted are each equal to a specified percentage 0.5 % of the total mean power of a given emission.
The EUT makes a call to the communication simulator.
The conducted occupied bandwidth used the power splitter via EUT RF power connector between simulation
base station and spectrum analyzer.
The communication simulator station system controlled a EUT to export maximum output power under
transmission mode and specific channel frequency. Use OBW measurement function of Spectrum analyzer
to measure 99 % occupied bandwidth
Test Settings
1. The signal analyzer’s automatic bandwidth measurement capability was used to perform the 99%
occupied bandwidth and the 26dB bandwidth. The bandwidth measurement was not influenced by
any intermediate power nulls in the fundamental emission.
2. RBW = 1 – 5% of the expected OBW
3. VBW ≥ 3 x RBW
4. Detector = Peak
5. Trace mode = max hold
6. Sweep = auto couple
7. The trace was allowed to stabilize
8. If necessary, steps 2 – 7 were repeated after changing the RBW such that it would be within
1 – 5% of the 99% occupied bandwidth observed in Step 7
Report No.: HCT-RF-1902-FC032-R1 FCC ID: A3LSMT515
F-TP22-03 (Rev.00)
12/129
3.6 SPURIOUS AND HARMONIC EMISSIONS AT ANTENNA TERMINAL
Test setup
Test Overview
The level of the carrier and the various conducted spurious and harmonic frequencies is measured by means
of a calibrated spectrum analyzer. The spectrum is scanned from the lowest frequency generated in the
equipment up to a frequency including its 10th harmonic. All out of band emissions are measured with a
spectrum analyzer connected to the antenna terminal of the EUT while the EUT is operating at its maximum
duty cycle, at maximum power, and at the appropriate frequencies. All data rates were investigated to
determine the worst case configuration. All modes of operation were investigated and the worst case
configuration results are reported in this section.
Test Settings(GSM)
1. RBW = 1 MHz
2. VBW ≥ 3 MHz
3. Detector = Peak
4. Trace Mode = max hold
5. Sweep time = auto
6. Number of points in sweep ≥ 2 * Span / RBW
Test Settings(WCDMA)
1. RBW = 1 MHz
2. VBW ≥ 3 MHz
3. Detector = RMS
4. Trace Mode = trace average
5. Sweep time = auto
6. Number of points in sweep ≥ 2 * Span / RBW
Report No.: HCT-RF-1902-FC032-R1 FCC ID: A3LSMT515
F-TP22-03 (Rev.00)
13/129
3.7 BAND EDGE
Test setup
Test Overview
All out of band emissions are measured with a spectrum analyzer connected to the antenna terminal of the
EUT while the EUT is operating at its maximum duty cycle, at maximum power, and at the appropriate
frequencies. All data rates were investigated to determine the worst case configuration. All modes of
operation were investigated and the worst case configuration results are reported in this section.
Test Settings
1. Start and stop frequency were set such that the band edge would be placed in the center of the plot
2. Span was set large enough so as to capture all out of band emissions near the band edge
3. RBW > 1% of the emission bandwidth
4. VBW > 3 x RBW
5. Detector = RMS
6. Number of sweep points ≥ 2 x Span/RBW
7. Trace mode = trace average
8. Sweep time = auto couple
9. The trace was allowed to stabilize
Test Notes
According to FCC 22.917, 24.238, 27.53 specified that power of any emission outside of The authorized
operating frequency ranges must be attenuated below the transmitting power (P) by a factor of at least 43 +
10 log(P) dB. In the 1 MHz bands immediately outside and adjacent to the frequency block a resolution
bandwidth of at least one percent of the emission bandwidth of the fundamental emission of the transmitter
may be employed.
All measurements were done at 2 channels(low and high operational frequency range.)
The band edge measurement used the power splitter via EUT RF power connector between simulation base
station and spectrum analyzer.

Report No.: HCT-RF-1902-FC032-R1 FCC ID: A3LSMT515
F-TP22-03 (Rev.00)
14/129
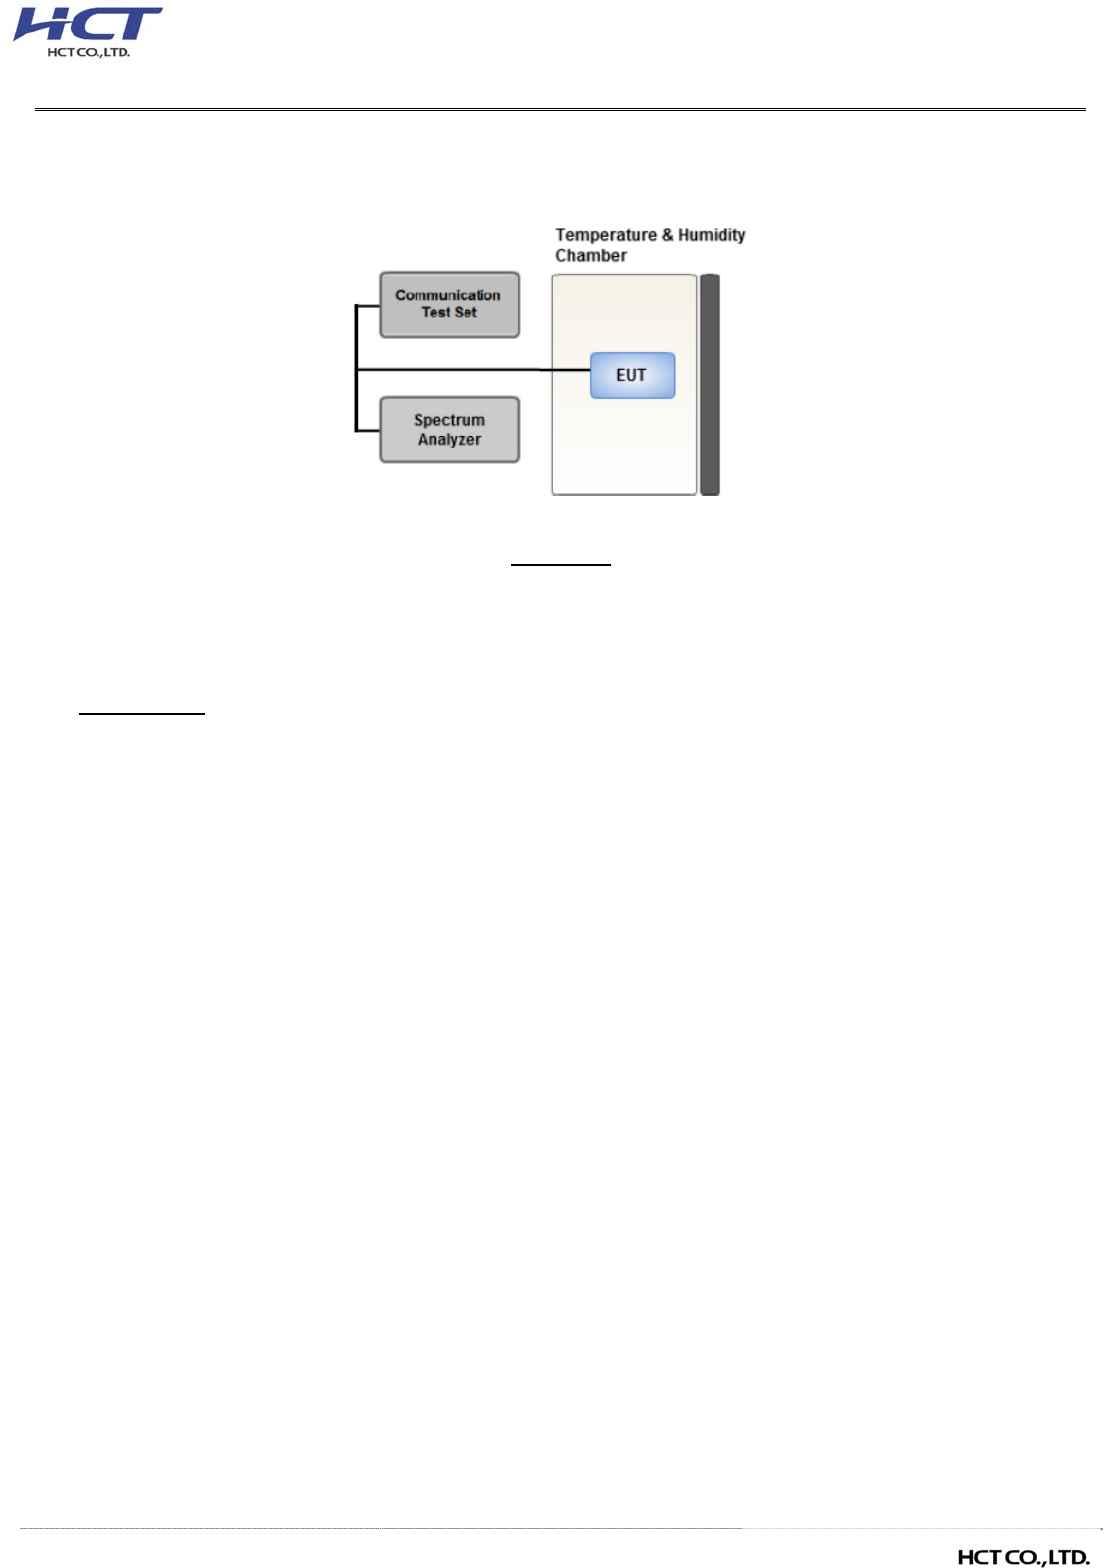
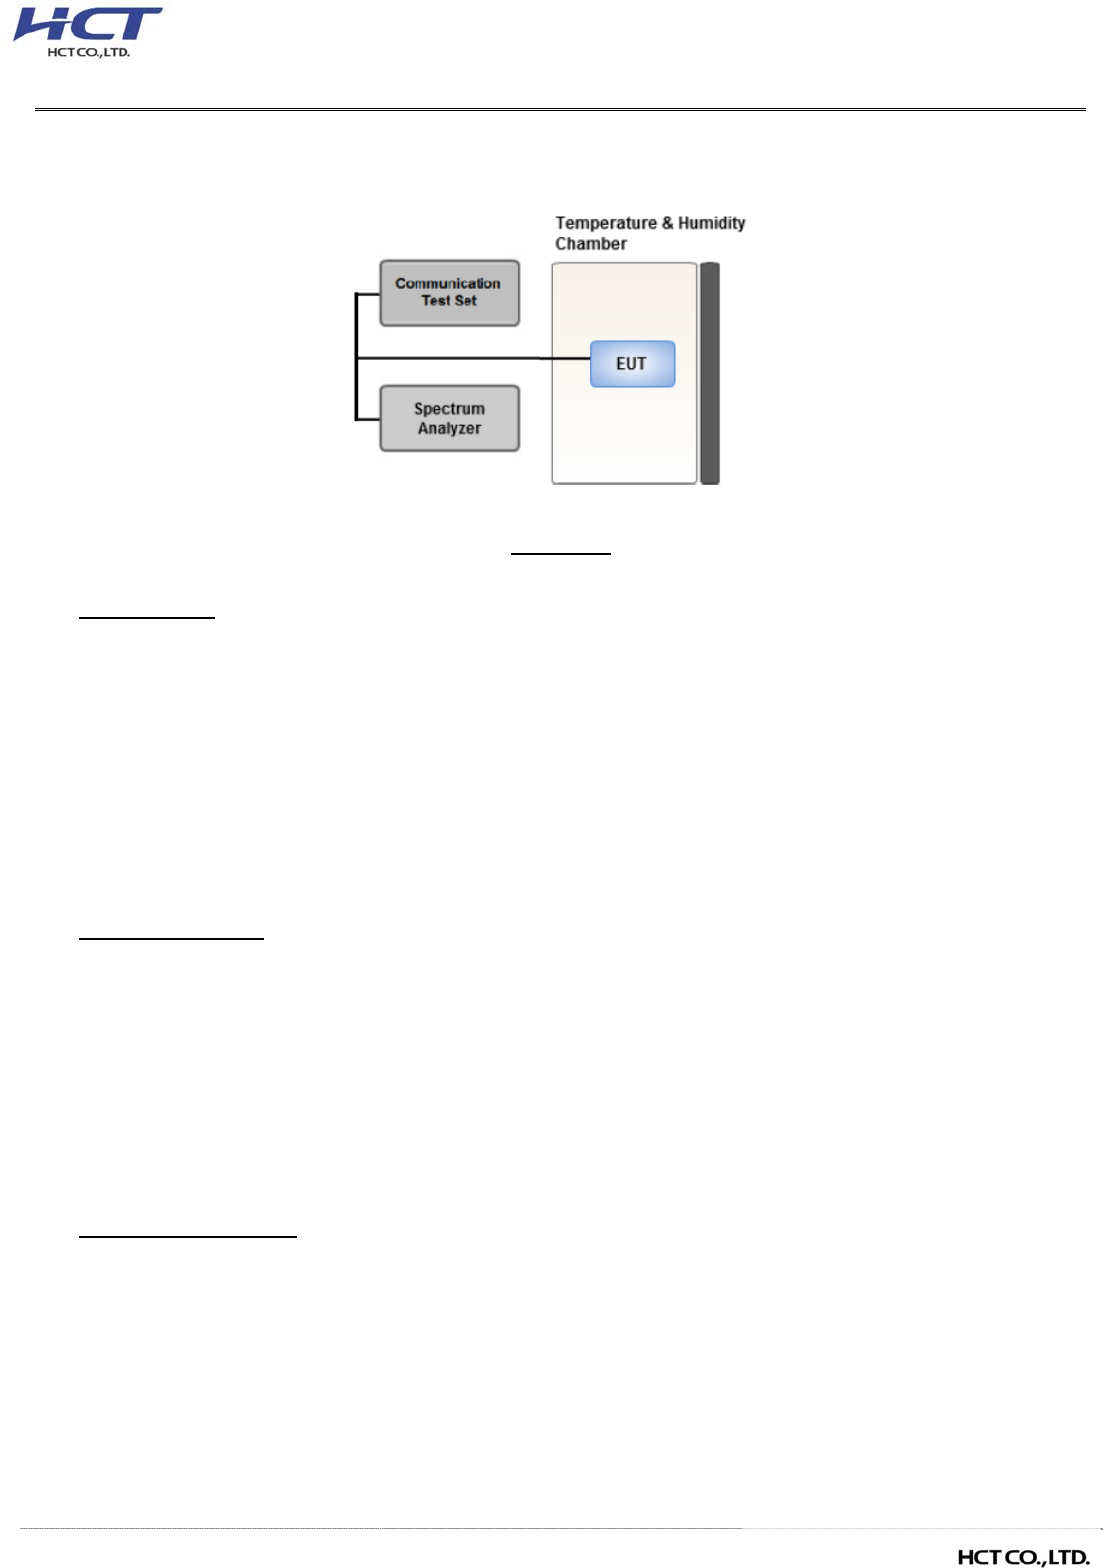
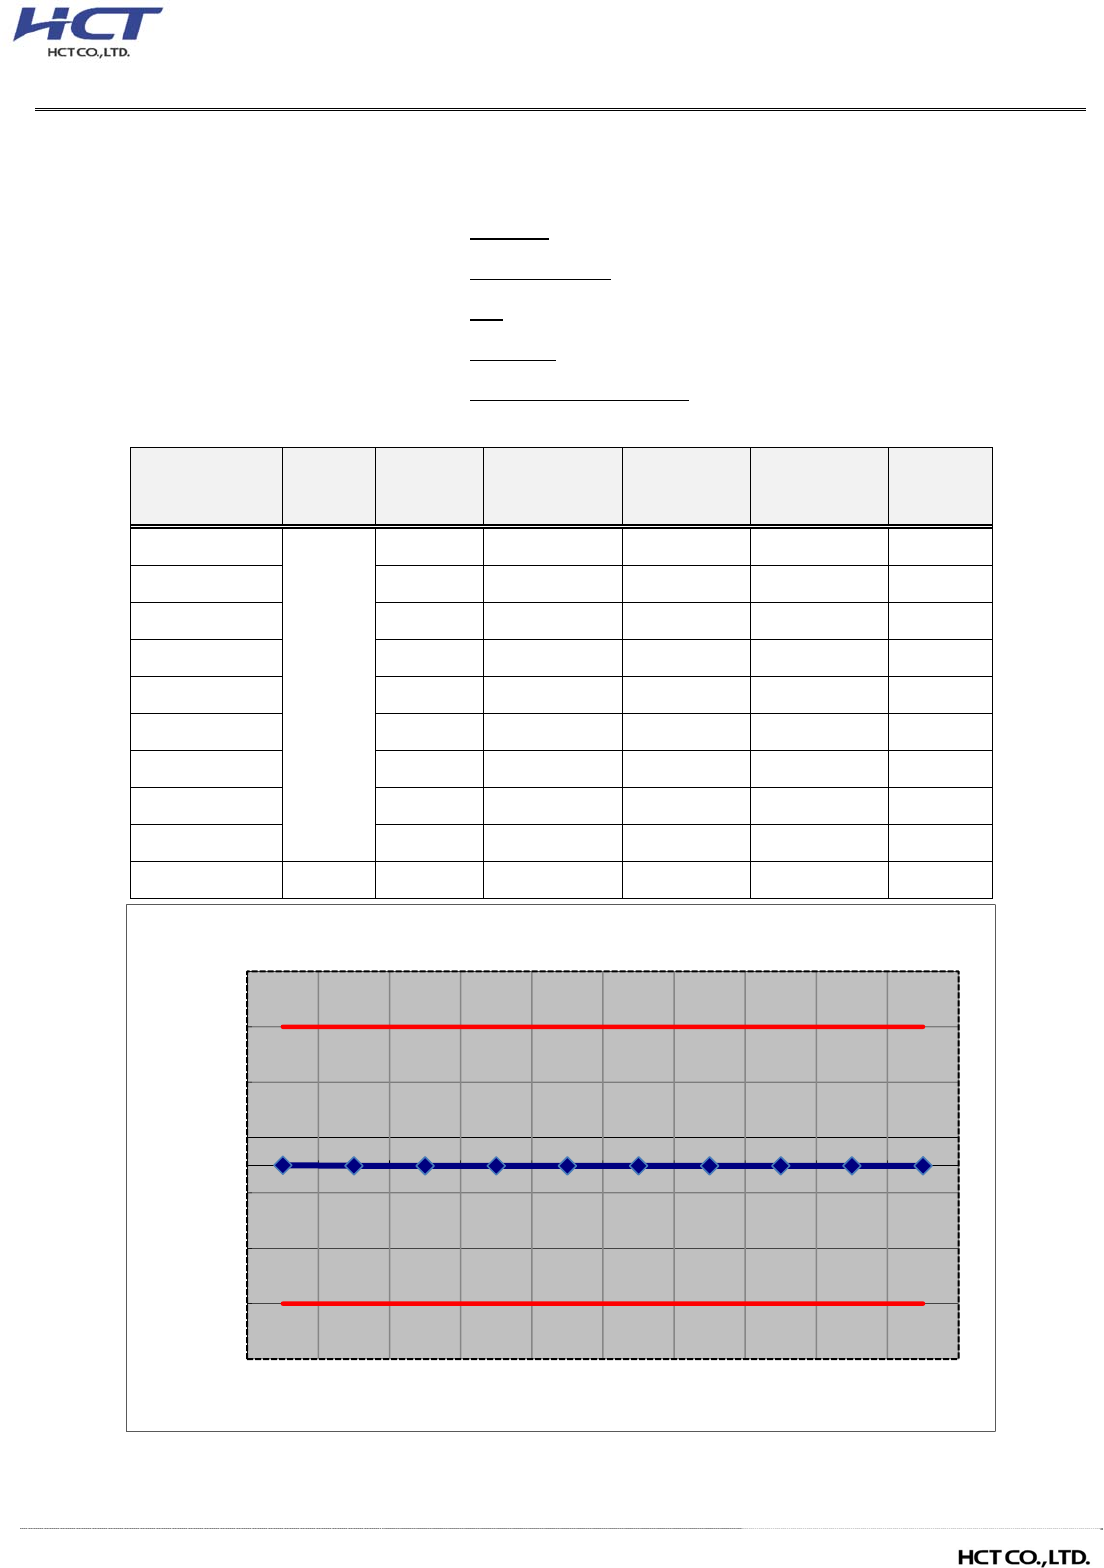
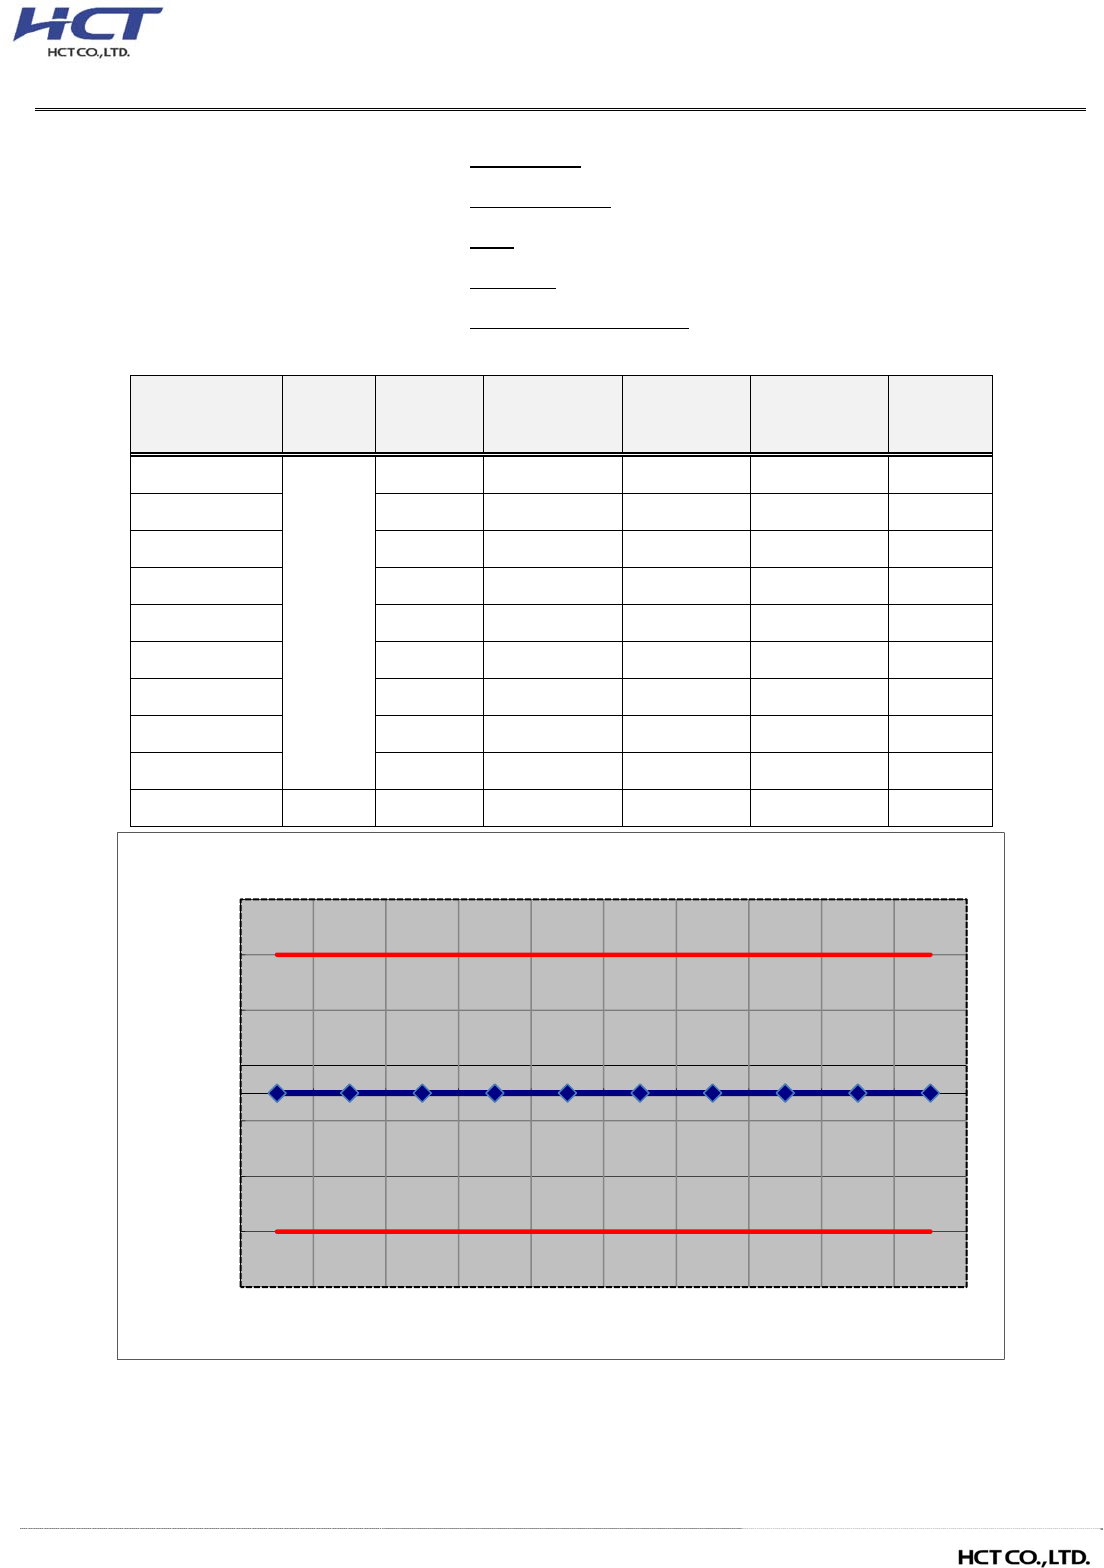
3.8 FREQUENCY STABILITY / VARIATION OF AMBIENT TEMPERATURE
Test setup
Test Overview
Frequency stability testing is performed in accordance with the guidelines of ANSI C63.26-2015.
The frequency stability of the transmitter is measured by:
1. Temperature:
The temperature is varied from -30°C to +50°C in 10°C increments using an environmental chamber.
2. Primary Supply Voltage:
.- Unless otherwise specified, vary primary supply voltage from 85% to 115% of the nominal value
for other than hand carried battery equipment.
.- For hand carried, battery powered equipment, reduce the primary ac or dc supply voltage to the
battery operating end point, which shall be specified by the manufacturer.
Test Settings
1. The carrier frequency of the transmitter is measured at room temperature
(20°C to provide a reference).
2. The equipment is turned on in a “standby” condition for fifteen minutes before applying power to the
transmitter. Measurement of the carrier frequency of the transmitter is made within one minute after
applying power to the transmitter.
3. Frequency measurements are made at 10°C intervals ranging from -30°C to +50°C. A period of at
least one half-hour is provided to allow stabilization of the equipment at each temperature level.
Report No.: HCT-RF-1902-FC032-R1 FCC ID: A3LSMT515
F-TP22-03 (Rev.00)
15/129
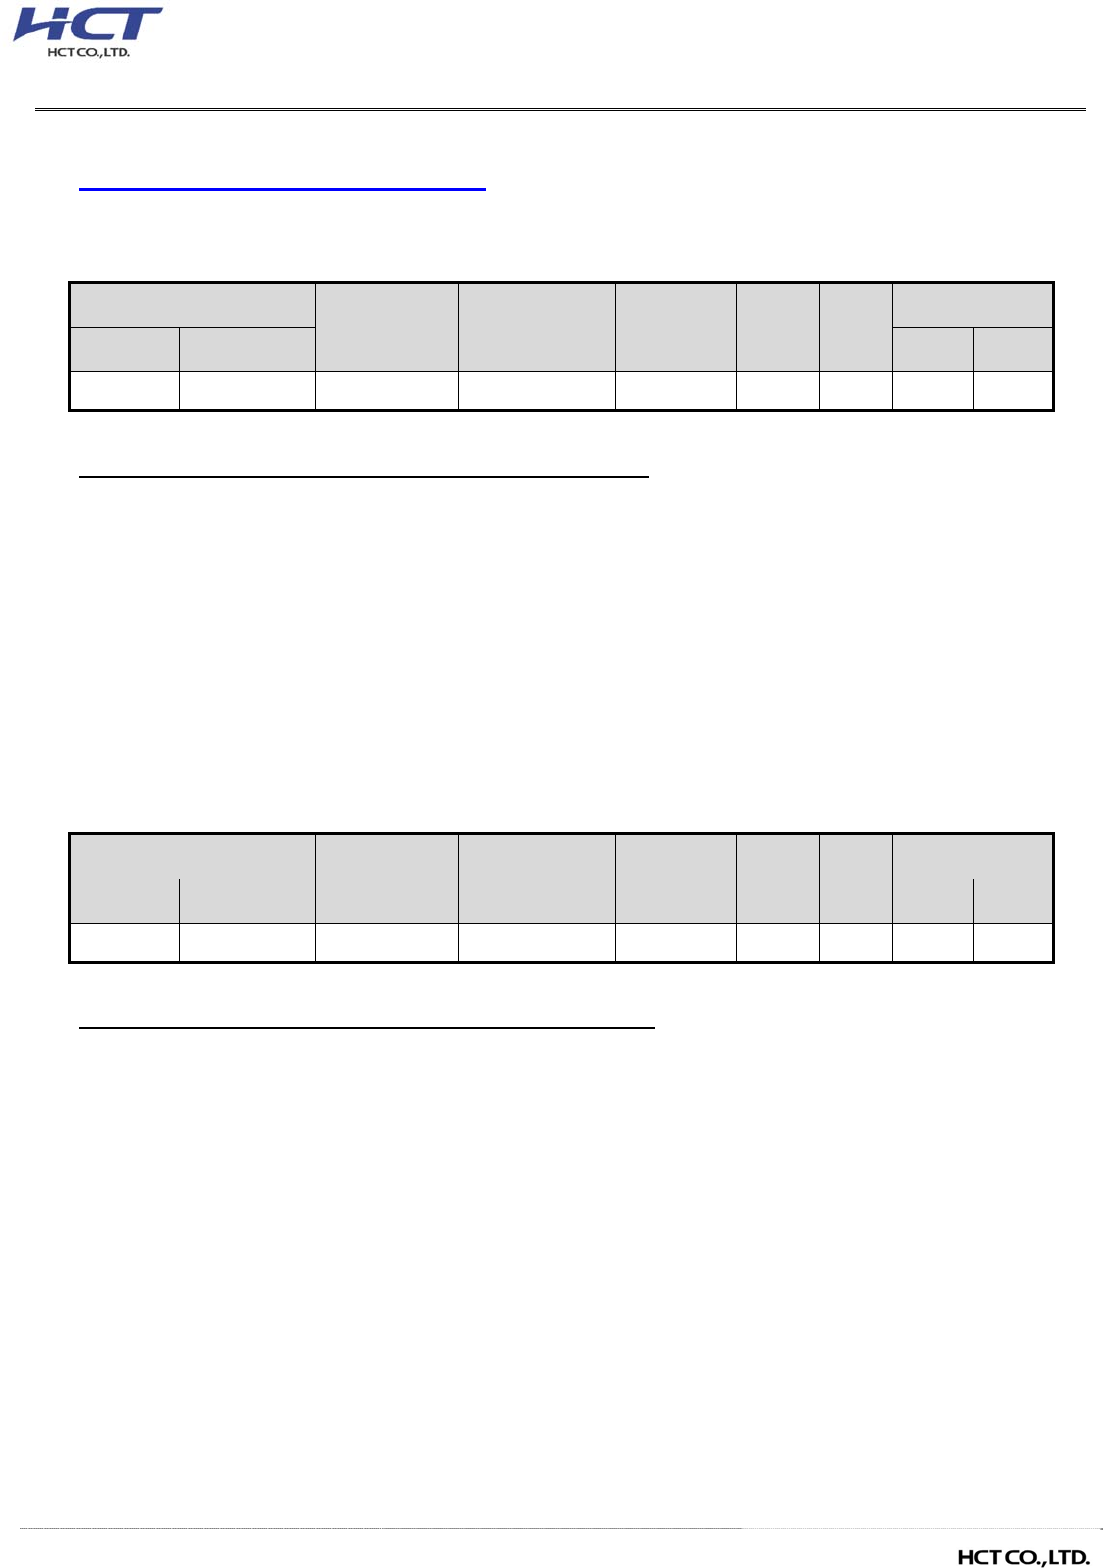
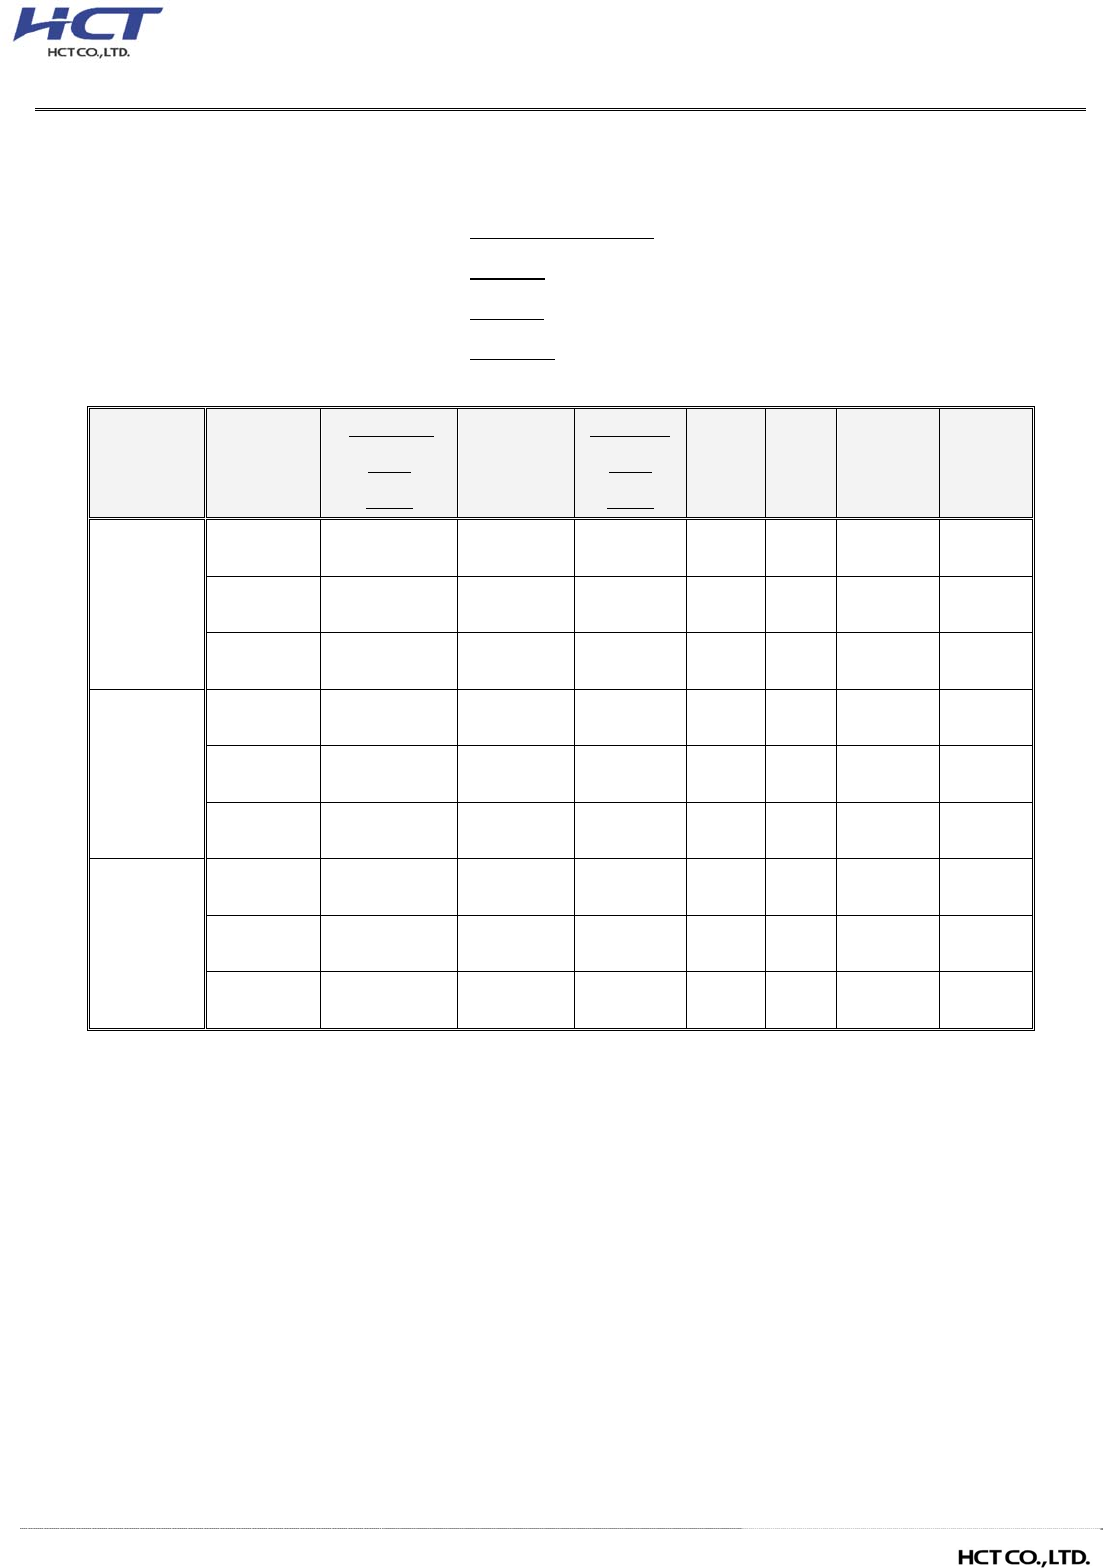
3.9 WORST CASE(CONDUCTED TEST)
- All modes of operation were investigated and the worst case configuration results are reported.
[ Worst case ]
Test Description Modulation Test Channel
Occupied Bandwidth
2G : Voice & EDGE(1 TX Slot)
3G : QPSK Low, Mid, High
2G : EDGE(1 TX Slot) Low, Mid, High
Band Edge 2G : Voice & EDGE(1 TX Slot)
3G : QPSK Low, High
Spurious and Harmonic Emissions at
Antenna Terminal
2G : Voice
3G : QPSK Low, Mid, High
[ Test Channel ]
UplinkChannel
2G
(GSM850)
2G
(GSM1900)
3G
(WCDMA B2)
3G
(WCDMA B4)
3G
(WCDMA B5)
Low 128 512 9262 1312 4132
Mid 190 661 9400 1412 4183
High 251 810 9538 1513 4233
Note:
- SM-T515 & additional models were tested and the worst case results are reported.
(Worst case : SM-T515)
Report No.: HCT-RF-1902-FC032-R1 FCC ID: A3LSMT515
F-TP22-03 (Rev.00)
16/129
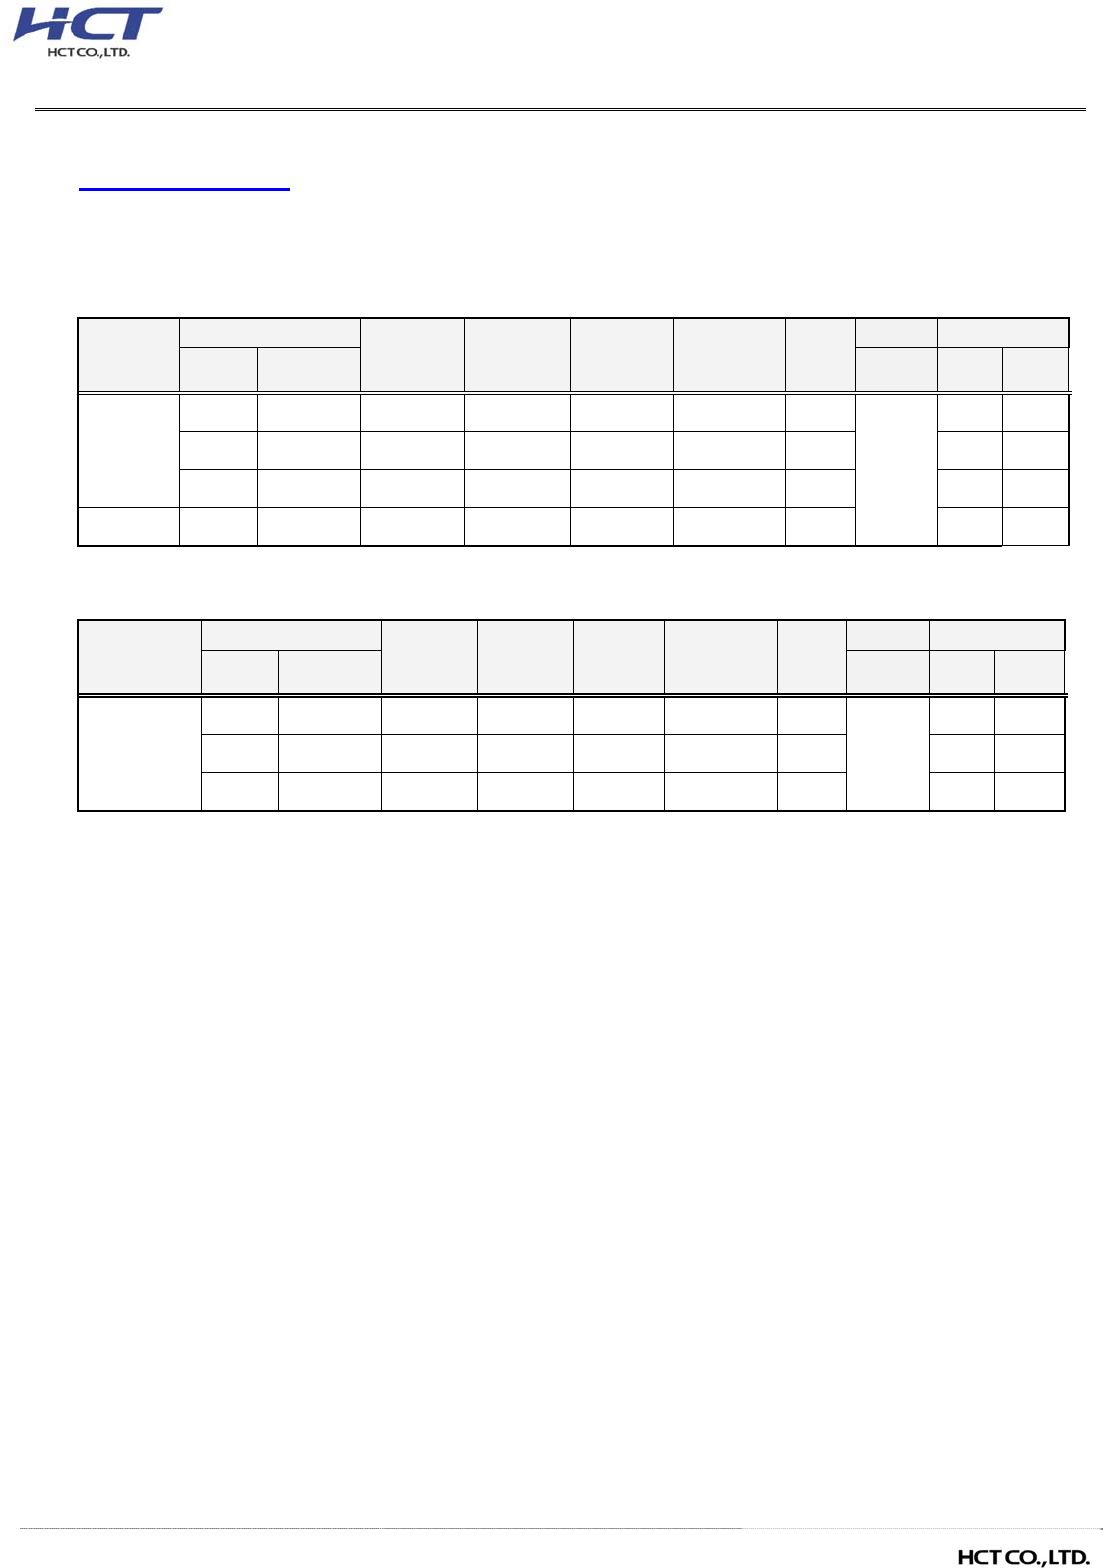
3.10 WORST CASE(RADIATED TEST)
- The EUT was tested in three orthogonal planes(X, Y, Z) and in all possible test configurations and
positioning.
- All modes of operation were investigated and the worst case configuration results are reported.
- The worst case is reported with the EUT positioning, modulations, and paging service configurations
shown in the test data.
- Please refer to the table below.
[ Worst case_3G ]
Test Description Modulation Paging Service
Axis Test Channel
Effective Radiated Power,
Effective Isotropic Radiated Power
QPSK
(WCDMA)
12.2 kbps
RMC
WCDMA B2 : Z
WCDMA B4 : Z
WCDMA B5 : X
Low, Mid, High
Radiated Spurious and Harmonic
Emissions
QPSK
(WCDMA)
12.2 kbps
RMC
WCDMA B2 : Y
WCDMA B4 : Z
WCDMA B5 : X
Low, Mid, High
[ Worst case_2G ]
Test Description Mod Axis Test Channel
Effective Radiated Power,
Effective Isotropic Radiated Power
Voice GSM850 : X
GSM1900 : Z Low, Mid, High
EDGE(1 TX Slot) GSM850 : X
GSM1900 : Z
GSM 850 : High
GSM1900 : Mid
Radiated Spurious and Harmonic Emissions
Voice GSM850 : Z
GSM1900 : Z Low, Mid, High
[ Test Channel ]
UplinkChannel
2G
(GSM850)
2G
(GSM1900)
3G
(WCDMA B2)
3G
(WCDMA B4)
3G
(WCDMA B5)
Low 128 512 9262 1312 4132
Mid 190 661 9400 1412 4183
High 251 810 9538 1513 4233
Note:
- SM-T515 & additional models were tested and the worst case results are reported.
(Worst case : SM-T515)
Report No.: HCT-RF-1902-FC032-R1 FCC ID: A3LSMT515
F-TP22-03 (Rev.00)
17/129
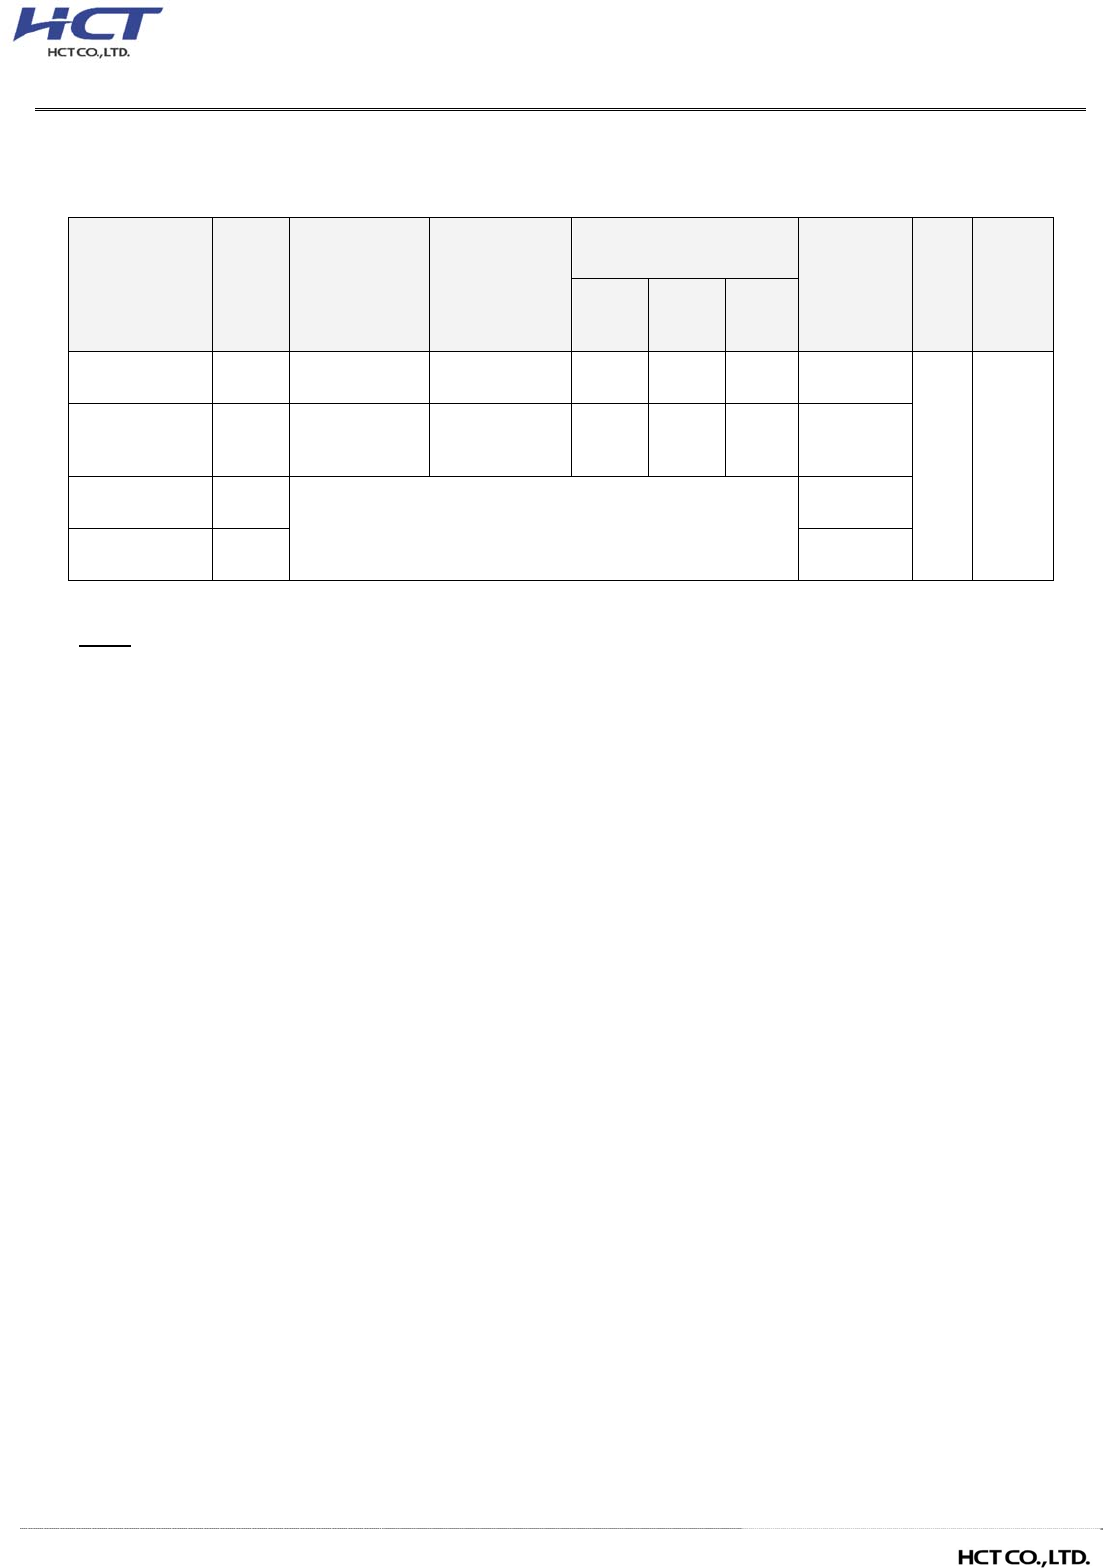
4. LIST OF TEST EQUIPMENT
Manufacture Model/ Equipment Serial
Number
Calibration
Date
Calibration
Interval
Calibration
Due
REOHDE &
SCHWARZ SCU 18 / AMPLIFIER 10094 04/17/2018
Annual 04/17/2019
Wainwright WHK1.2/15G-10EF/H.P.F 4 04/04/2018
Annual 04/04/2019
Wainwright WHK3.3/18G-10EF/H.P.F 2 04/04/2018
Annual 04/04/2019
Hewlett Packard 11667B / Power Splitter(DC~26.5 GHz) 5001 06/07/2018
Annual 06/07/2019
Agilent E3632A/DC Power Supply KR75303243 05/09/2018
Annual 05/09/2019
Schwarzbeck UHAP/ Dipole Antenna 557 03/31/2017
Biennial 03/31/2019
Schwarzbeck UHAP/ Dipole Antenna 558 03/31/2017
Biennial 03/31/2019
ESPEC SU-642 / Chamber 93000718 08/07/2018
Annual 08/07/2019
Schwarzbeck BBHA 9120D/ Horn Antenna(1~18GHz) 147 09/14/2018
Annual 09/14/2019
Schwarzbeck BBHA 9120D/ Horn Antenna(1~18GHz) 9120D-1298 10/04/2018
Annual 10/04/2019
Schwarzbeck BBHA 9170/ Horn Antenna(15~40GHz) BBHA9170342 04/25/2017
Biennial 04/25/2019
Schwarzbeck BBHA 9170/ Horn Antenna(15~40GHz) BBHA9170124 04/25/2017
Biennial 04/25/2019
Agilent N9020A/Signal Analyzer(10Hz~26.5GHz) MY52090906 06/08/2018
Annual 06/08/2019
Hewlett Packard 8493C/ATTENUATOR(20dB) 17280 06/21/2018
Annual 06/21/2019
REOHDE &
SCHWARZ FSV40/Spectrum Analyzer(10Hz~40GHz) 100931 10/22/2018
Annual 10/22/2019
Agilent 8960 (E5515C)/ Base Station MY48360800 09/27/2018
Annual 09/27/2019
Schwarzbeck FMZB1513/ Loop Antenna(9kHz~30MHz) 1513-175 08/23/2018
Biennial 08/23/2020
Schwarzbeck VULB9160/ Bilog Antenna 9160-3368 08/09/2018
Biennial 08/09/2020
Schwarzbeck VULB9160/ Hybrid Antenna 760 04/06/2017
Biennial 04/06/2019
Anritsu Corp. MT8821C/Wideband Radio Communication
Tester 6201502997 08/13/2018
Annual 08/13/2019
Anritsu Corp. MT8820C/Wideband Radio Communication
Tester 6201026545 01/30/2019
Annual 01/30/2020
REOHDE &
SCHWARZ
SMB100A/ SIGNAL GENERATOR
(100kHz~40GHz) 177633 07/19/2018
Annual 07/19/2019
REOHDE &
SCHWARZ ESU40 / EMI TEST RECEIVER 100524 07/27/2018
Annual 07/27/2019
HCT CO., LTD., FCC LTE Mobile Conducted RF Automation
Test Software - - - -
Note:
1. Equipment listed above that has a calibration due date during the testing period, the testing is completed
before equipment expiration date.
Report No.: HCT-RF-1902-FC032-R1 FCC ID: A3LSMT515
F-TP22-03 (Rev.00)
18/129
5. MEASUREMENT UNCERTAINTY
The measurement uncertainties shown below were calculated in accordance with the requirements of ANSI
C63.4:2014.
All measurement uncertainty values are shown with a coverage factor of k = 2 to indicate a 95 % level of
confidence. The measurement data shown herein meets or exceeds the U
CISPR
measurement uncertainty
values specified in CISPR 16-4-2 and, thus, can be compared directly to specified limits to determine
compliance.
Parameter Expanded Uncertainty (±dB)
Conducted Disturbance (150 kHz ~ 30 MHz) 1.82
Radiated Disturbance (9 kHz ~ 30 MHz) 3.40
Radiated Disturbance (30 MHz ~ 1 GHz) 4.80
Radiated Disturbance (1 GHz ~ 18 GHz) 5.70
Radiated Disturbance (18 GHz ~ 40 GHz) 5.71

Report No.: HCT-RF-1902-FC032-R1 FCC ID: A3LSMT515
F-TP22-03 (Rev.00)
19/129
6. SUMMARY OF TEST RESULTS
6.1 Test Condition : Conducted Test
Test Description
FCC Part
Section(s)
Test Limit Test Result
Occupied Bandwidth §2.1049 N/A PASS
Band Edge / Spurious and Harmonic
Emissions at Antenna Terminal.
§2.1051,
§22.917(a),
§24.238(a),
§27.53(h)
< 43 + 10log10 (P[Watts]) at Band Edge
and for all out-of-band emissions
PASS
Conducted Output Power §2.1046 N/A See Note1
Peak- to- Average Ratio
§24.232(d),
§27.50(d)(5)
< 13 dB PASS
Frequency stability / variation of
ambient temperature
§2.1055,
§ 22.355
< 2.5 ppm PASS
§24.235, §27.54
Emission must remain in band PASS
Note:
1. See SAR Report
6.2 Test Condition : Radiated Test
Test Description
FCC Part
Section(s)
Test Limit Test Result
Effective Radiated Power §22.913(a)(5) < 7 Watts max. ERP PASS
Equivalent Isotropic Radiated Power
§24.232(c),
§27.50(d)(4)
< 2 Watts max. EIRP
< 1 Watts max. EIRP
PASS
Radiated Spurious and Harmonic
Emissions
§2.1053,
§22.917(a),
§24.238(a),
§27.53(h)
< 43 + 10log10 (P[Watts]) for
all out-of band emissions
PASS
Report No.: HCT-RF-1902-FC032-R1 FCC ID: A3LSMT515
F-TP22-03 (Rev.00)
20/129
7. SAMPLE CALCULATION
7.1 ERP Sample Calculation
Ch./ Freq. Measured
Level(dBm)
Substitute
Level(dBm)
Ant. Gain
(dBd)
C.L Pol.
ERP
channel Freq.(MHz) W dBm
128 824.20 -21.37 38.40 -10.61 0.95 H 0.483
26.84
ERP = Substitute LEVEL(dBm) + Ant. Gain – CL(Cable Loss)
1) The EUT mounted on a non-conductive turntable is 2.5 meter above test site ground level.
2) During the test , the turn table is rotated until the maximum signal is found.
3) Record the field strength meter’s level.
4) Replace the EUT with dipole/Horn antenna that is connected to a calibrated signal generator.
5) Increase the signal generator output till the field strength meter’s level is equal to the item (3).
6) The signal generator output level with Ant. Gain and cable loss are the rating of effective radiated power.
7.2 EIRP Sample Calculation
Ch./ Freq. Measured
Level(dBm)
Substitute
Level(dBm)
Ant. Gain
(dBi)
C.L Pol.
EIRP
channel Freq.(MHz) W dBm
20175 1,732.50 -15.75 18.45 9.90 1.76 H 0.456
26.59
EIRP = Substitute LEVEL(dBm) + Ant. Gain – CL(Cable Loss)
1) The EUT mounted on a non-conductive turntable is 2.5 meter above test site ground level.
2) During the test , the turn table is rotated until the maximum signal is found.
3) Record the field strength meter’s level.
4) Replace the EUT with dipole/Horn antenna that is connected to a calibrated signal generator.
5) Increase the signal generator output till the field strength meter’s level is equal to the item (3).
6) The signal generator output level with Ant. Gain and cable loss are the rating of equivalent isotropic
radiated power.

Report No.: HCT-RF-1902-FC032-R1 FCC ID: A3LSMT515
F-TP22-03 (Rev.00)
21/129
7.3. Emission Desi0gnator
GSM Emission Designator EDGE Emission Designator
Emission Designator = 249KGXW
GSM BW = 249 kHz
G = Phase Modulation
X = Cases not otherwise covered
W = Combination (Audio/Data)
Emission Designator = 249KG7W
GSM BW = 249 kHz
G = Phase Modulation
7 = Quantized/Digital Info
W = Combination (Audio/Data)
WCDMA Emission Designator QPSK Modulation
Emission Designator = 4M17F9W
WCDMA BW = 4.17 MHz
F = Frequency Modulation
9 = Composite Digital Info
W = Combination (Audio/Data)
Emission Designator = 4M48G7D
LTE BW = 4.48 MHz
G = Phase Modulation
7 = Quantized/Digital Info
D = Data transmission; telemetry; telecommand
16QAM Modulation
Emission Designator = 4M48W7D
LTE BW = 4.48 MHz
W = Amplitude/Angle Modulated
7 = Quantized/Digital Info
D = Data transmission; telemetry; telecommand
Report No.: HCT-RF-1902-FC032-R1 FCC ID: A3LSMT515
F-TP22-03 (Rev.00)
22/129
8. TEST DATA
8.1 EFFECTIVE RADIATED POWER
Mode
Ch./ Freq. Measured
Level
(dBm)
Substitute
LEVEL
(dBm)
Ant. Gain
(dBi) C.L Pol.
Limit EIRP
channel
Freq.(MHz)
W W dBm
GSM850
128 824.2 -19.96
41.32 -10.27
0.86 H
< 7.00
1.045
30.19
190 836.6 -20.37
41.93 -10.21
0.87 H 1.216
30.85
251 848.8 -21.16
41.31 -10.16
0.87 H 1.067
30.28
EDGE 251 848.8 -26.54
35.76 -10.21
0.87 H 0.294
24.68
Mode
Ch./ Freq. Measured
Level
(dBm)
Substitute
LEVEL
(dBm)
Ant. Gain
(dBd) C.L Pol.
Limit ERP
channel
Freq.(MHz)
W W dBm
WCDMA850
4132 826.4 -29.53
31.88
-10.26
0.86 H
< 7.00
0.119
20.76
4183 836.6 -29.60
32.70
-10.21
0.87 H 0.145
21.62
4233 846.6 -30.80
31.54
-10.17
0.87 H 0.112
20.50

Report No.: HCT-RF-1902-FC032-R1 FCC ID: A3LSMT515
F-TP22-03 (Rev.00)
23/129
8.2 EQUIVALENT ISOTROPIC RADIATED POWER
Mode
Ch./ Freq. Measured
Level
(dBm)
Substitute
LEVEL
(dBm)
Ant. Gain
(dBi) C.L Pol.
Limit EIRP
channel
Freq.(MHz)
W W dBm
GSM1900
512 1850.2
-11.81
20.23 10.27 1.34 H
< 2.00
0.824
29.16
661 1880.0
-11.64
20.49 10.29 1.36 H 0.875
29.42
810 1909.8
-11.96
20.57 10.31 1.37 H 0.893
29.51
EDGE 661 1909.8
-15.39
17.14 10.31 1.37 H 0.405
26.08
Mode
Ch./ Freq. Measured
Level
(dBm)
Substitute
LEVEL
(dBm)
Ant. Gain
(dBi) C.L Pol.
Limit EIRP
channel
Freq.(MHz)
W W dBm
WCDMA1900
9262 1852.4
-17.32
14.72
10.27
1.34 H
< 2.00
0.232
23.65
9400 1880.0
-16.85
15.28
10.29
1.36 H 0.264
24.21
9538 1907.6
-16.87
15.66
10.31
1.37 H 0.288
24.60
Mode
Ch./ Freq. Measured
Level
(dBm)
Substitute
LEVEL
(dBm)
Ant. Gain
(dBi) C.L Pol.
Limit EIRP
channel
Freq.(MHz)
W W dBm
WCDMA1700
1312 1712.4
-17.70
14.09
9.92 1.29 H
< 1.00
0.187
22.72
1412 1732.4
-16.94
14.88
10.00
1.28 H 0.229
23.60
1513 1752.6
-16.39
15.43
10.10
1.29 H 0.265
24.24
Report No.: HCT-RF-1902-FC032-R1 FCC ID: A3LSMT515
F-TP22-03 (Rev.00)
24/129
8.3 RADIATED SPURIOUS EMISSIONS
▣ MEASURED OUTPUT POWER: 30.85 dBm = 1.216 W
▣ MODULATION SIGNAL: GSM850
▣ DISTANCE: 3 meters
▣ LIMIT: 43 + 10 lo
g10
(W) = 43.85 dBc
Ch. Freq.(MHz)
Measured
Level
[dBm]
Ant. Gain
(dBd)
Substitute
Level
[dBm]
C.L Pol.
Result
(dBm)
dBc
128
(824.2)
1,648.40 -32.81 7.46 -41.70 1.27
H -37.66
68.51
2,472.60 -42.10 8.64 -48.04 1.58
V -43.13
73.99
3,296.80 -56.39 10.25 -62.38 1.86
H -56.14
87.00
190
(836.6)
1,673.20 -33.92 7.53 -42.91 1.28
V -38.81
69.66
2,509.80 -45.63 8.83 -51.95 1.62
H -46.89
77.74
3,346.40 -55.79 10.51 -62.11 1.91
H -55.66
86.51
251
(848.8)
1,697.60 -36.25 7.74 -45.25 1.29
V -40.95
71.80
2,546.40 -46.46 8.86 -52.49 1.62
H -47.40
78.25
3,395.20 -56.10 10.57 -62.24 1.95
V -55.77
86.62

Report No.: HCT-RF-1902-FC032-R1 FCC ID: A3LSMT515
F-TP22-03 (Rev.00)
25/129
▣ MEASURED OUTPUT POWER: 29.51 dBm = 0.893 W
▣ MODULATION SIGNAL: GSM1900
▣ DISTANCE: 3 meters
▣ LIMIT: 43 + 10 lo
g10
(W) = 42.51 dBc
Ch. Freq.(MHz)
Measured
Level
[dBm]
Ant. Gain
(dBi)
Substitute
Level
[dBm]
C.L Pol.
Result
(dBm)
dBc
512
(1850.2)
3,700.40 -57.31 12.51 -64.11 1.98
V -53.58
83.09
5,550.60 -56.91 13.62 -58.19 2.72
V -47.29
76.80
7,400.80 -57.92 11.50 -52.91 2.92
H -44.33
73.84
661
(1880.0)
3,760.00 -57.02 12.40 -63.46 2.00
V -53.06
82.57
5,640.00 -57.28 13.78 -58.11 2.70
V -47.03
76.54
7,520.00 -57.50 11.57 -52.29 2.93
H -43.65
73.16
810
(1909.8)
3,819.60 -56.31 12.52 -62.55 2.05
V -52.08
81.58
5,729.40 -57.25 13.69 -57.20 2.72
V -46.23
75.74
7,639.20 -57.47 11.99 -52.67 2.93
V -43.61
73.12

Report No.: HCT-RF-1902-FC032-R1 FCC ID: A3LSMT515
F-TP22-03 (Rev.00)
26/129
▣ MEASURED OUTPUT POWER: 21.62 dBm = 0.145 W
▣ MODULATION SIGNAL: WCDMA850
▣ DISTANCE: 3 meters
▣ LIMIT: 43 + 10 lo
g10
(W) = 34.62 dBc
Ch. Freq.(MHz)
Measured
Level
[dBm]
Ant. Gain
(dBd)
Substitute
Level
[dBm]
C.L Pol.
Result
(dBm)
dBc
4,132
(826.4)
1,652.80 -50.12 7.46 -59.01 1.27
H -54.97
76.59
2,479.20 -49.54 8.71 -55.91 1.60
H -50.95
72.57
3,305.60 -57.76 10.32 -63.79 1.87
H -57.49
79.11
4,183
(836.6)
1,673.20 -52.30 7.53 -61.29 1.28
H -57.19
78.81
2,509.80 -45.45 8.83 -51.77 1.62
H -46.71
68.33
3,346.40 -56.86 10.51 -63.18 1.91
V -56.73
78.35
4,233
(846.6)
1,693.20 -53.32 7.67 -62.35 1.28
H -58.11
79.74
2,539.80 -45.13 8.85 -50.91 1.61
H -45.82
67.44
3,386.40 -56.59 10.56 -62.87 1.93
V -56.39
78.01

Report No.: HCT-RF-1902-FC032-R1 FCC ID: A3LSMT515
F-TP22-03 (Rev.00)
27/129
▣ MEASURED OUTPUT POWER: 24.60 dBm = 0.288 W
▣ MODULATION SIGNAL: WCDMA1900
▣ DISTANCE: 3 meters
▣ LIMIT: 43 + 10 lo
g10
(W) = 37.60dBc
Ch. Freq.(MHz)
Measured
Level
[dBm]
Ant. Gain
(dBi)
Substitute
Level
[dBm]
C.L Pol.
Result
(dBm)
dBc
9262
(1852.4)
3,704.80 -56.87 12.50 -63.50 1.99
H -52.99
77.59
5,557.20 -55.27 13.64 -56.51 2.71
H -45.58
70.18
7,409.60 -57.59 11.50 -52.30 2.93
V -43.73
68.33
9400
(1880.0)
3,760.00 -58.00 12.40 -64.44 2.00
V -54.04
78.64
5,640.00 -57.78 13.78 -58.61 2.70
H -47.53
72.13
7,520.00 -58.57 11.57 -53.36 2.93
H -44.72
69.32
9538
(1907.6)
3,815.20 -57.20 12.52 -63.57 2.06
H -53.10
77.70
5,722.80 -57.62 13.70 -57.31 2.72
V -46.33
70.93
7,630.40 -57.61 11.95 -52.80 2.98
V -43.83
68.42
Report No.: HCT-RF-1902-FC032-R1 FCC ID: A3LSMT515
F-TP22-03 (Rev.00)
28/129
▣ MEASURED OUTPUT POWER: 24.24 dBm = 0.265 W
▣ MODULATION SIGNAL: WCDMA1700
▣ DISTANCE: 3 meters
▣ LIMIT: 43 + 10 lo
g10
(W) = 37.24 dBc
Ch. Freq.(MHz)
Measured
Level
[dBm]
Ant. Gain
(dBi)
Substitute
Level
[dBm]
C.L Pol.
Result
(dBm)
dBc
1312
(1712.4)
3,424.80 -57.50 12.69 -65.50 1.90
V -54.71
78.95
5,137.20 -56.48 12.75 -58.19 2.52
V -47.96
72.20
6,849.60 -42.82 12.52 -40.06 2.81
H -30.35
54.59
1412
(1732.4)
3,464.80 -57.66 12.60 -65.25 1.97
V -54.62
78.86
5,197.20 -56.92 13.17 -58.83 2.54
H -48.20
72.44
6,929.60 -45.24 12.46 -41.91 2.83
H -32.28
56.52
1513
(1752.6)
3,505.20 -57.17 12.44 -64.43 1.92
V -53.91
78.15
5,257.80 -57.62 13.48 -60.43 2.59
V -49.54
73.78
7,010.40 -54.58 12.24 -51.60 2.84
H -42.20
66.44
Report No.: HCT-RF-1902-FC032-R1 FCC ID: A3LSMT515
F-TP22-03 (Rev.00)
29/129
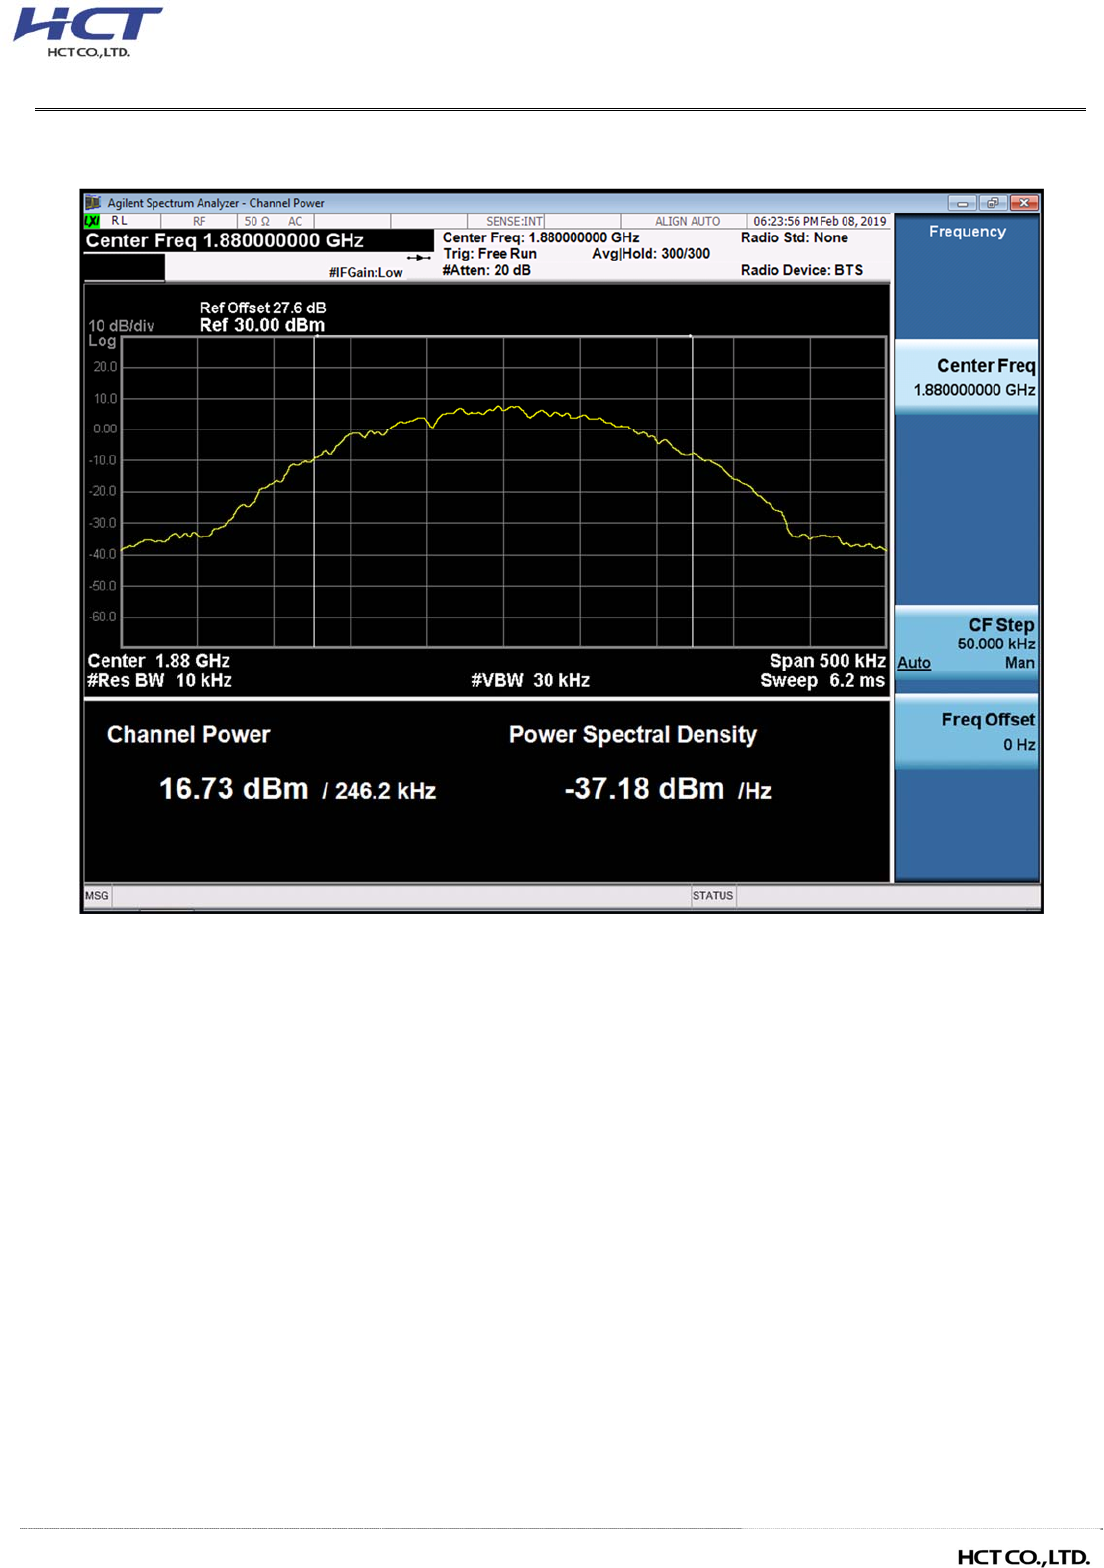
8.4 PEAK-TO-AVERAGE RATIO
Note:
1. Plots of the EUT’s Peak- to- Average Ratio are shown Page 61 ~ 68.
2. Only GSM(include EDGE) Mode was tested by alternate procedure for PAPR
P.A.R
(dB)
= P
Pk (dBm)
– P
Avg (dBm)
(P
Avg
= Average Power + Duty cycle Factor)
Duty cycle Factor = 10 log (1/x), x = Tx
On
/ Tx
Total
Band Ch.
Measured P
Pk
(dBm)
Measured P
Avg
(dBm)
P
Avg
(Duty Cycle) P.A.R.
= P
Pk
- P
Avg
(dB)
Limit
(dB)
Pass /
Fail
Tx
Total
(ms)
Tx
On
(ms)
Factor
(dB)
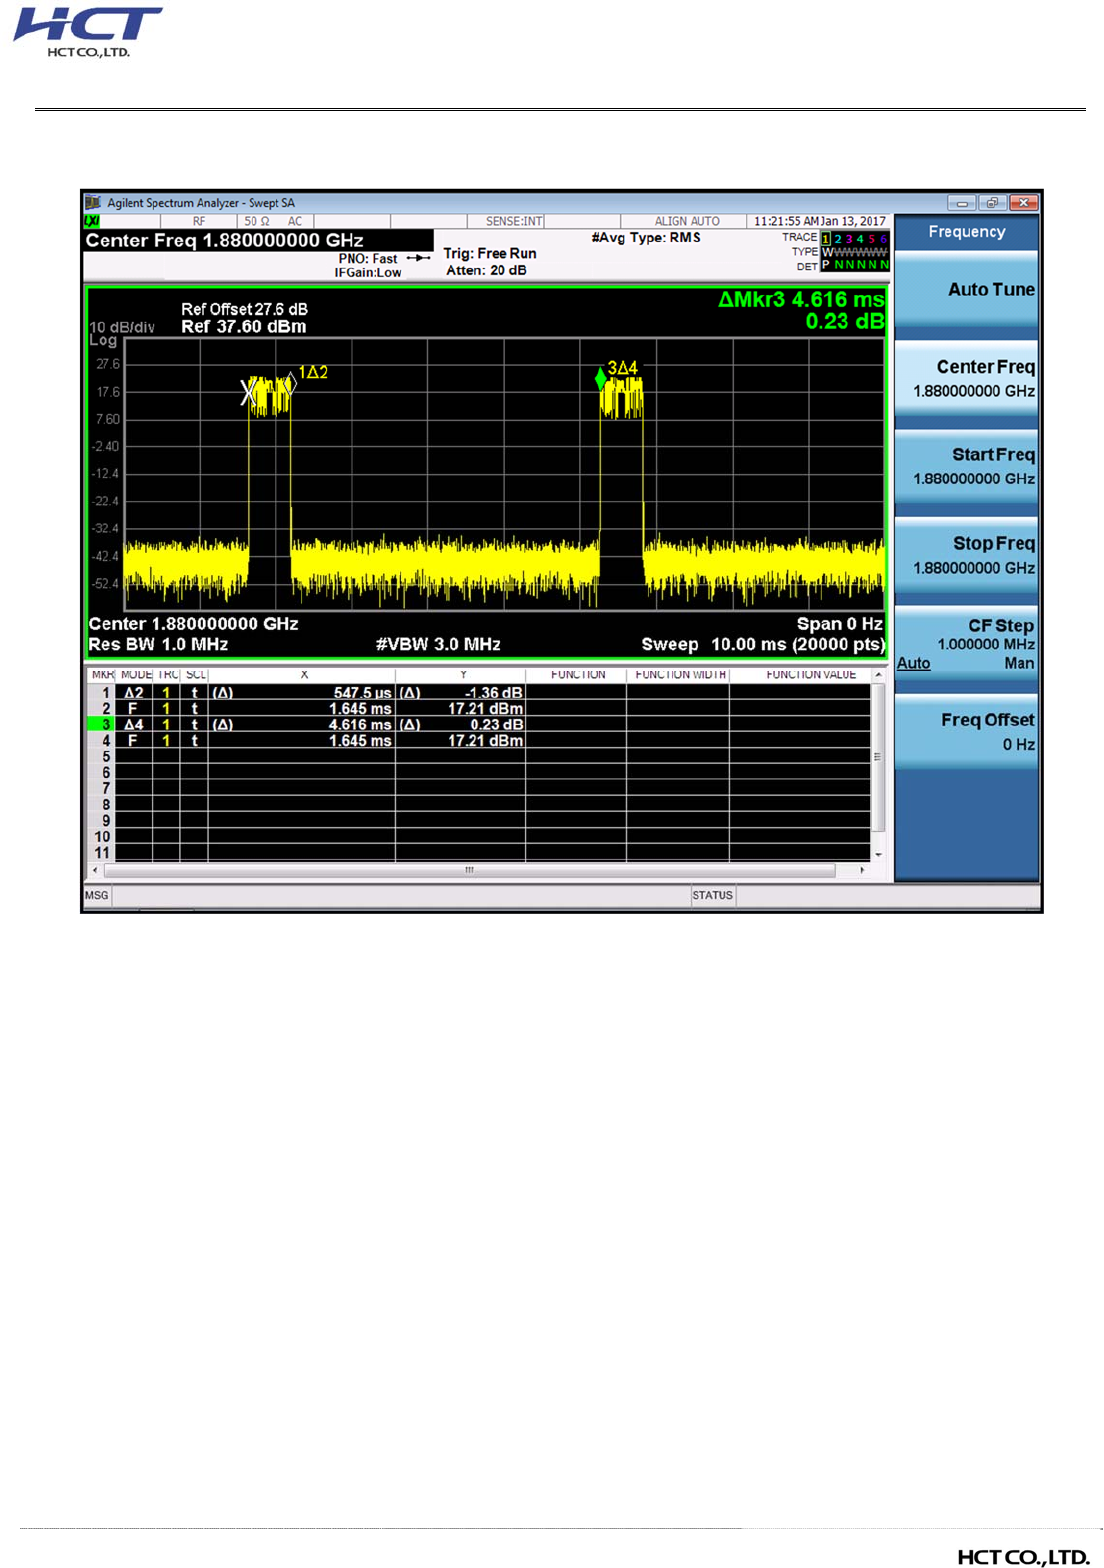
GSM1900 661 30.264 20.25 4.6160
0.5475
9.26
0.75
13 Pass
GSM1900
EDGE
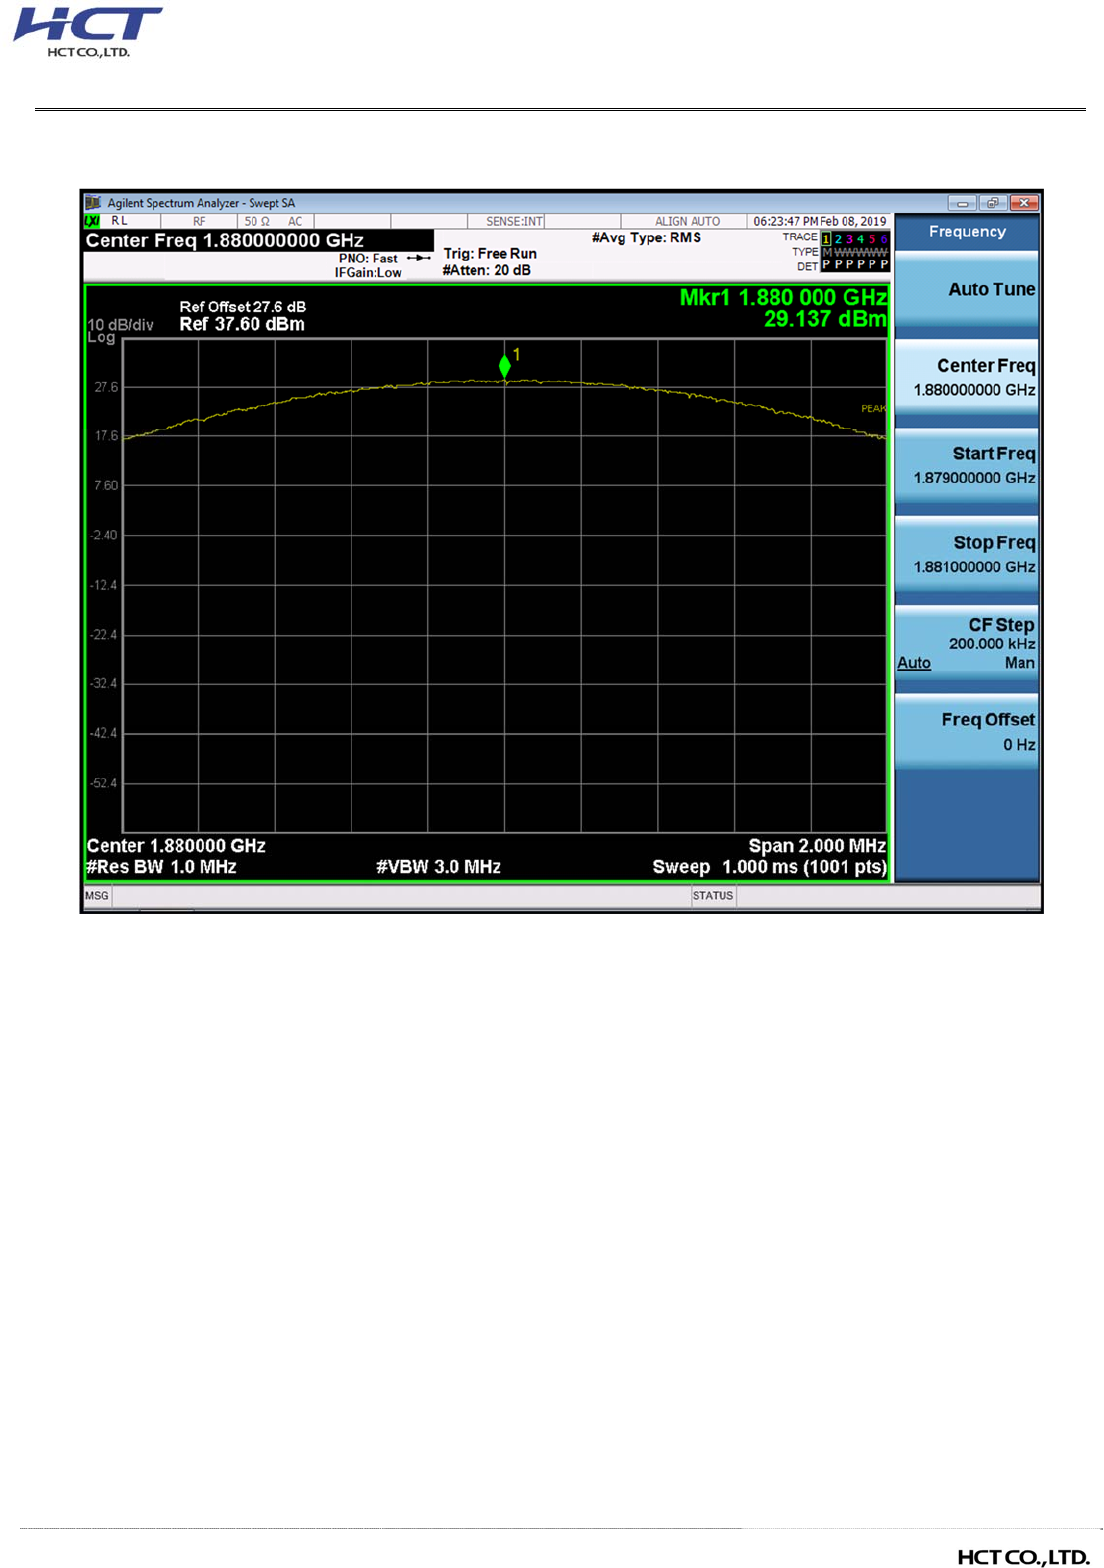
661 29.137 16.73 4.616
0.5475
9.26 3.15
WCDMA1900
9400
CCDF Procedure
2.78
WCDMA1700
1732.4
3.13

Report No.: HCT-RF-1902-FC032-R1 FCC ID: A3LSMT515
F-TP22-03 (Rev.00)
30/129
8.5 OCCUPIED BANDWIDTH
Note:
1. Plots of the EUT’s Occupied Bandwidth are shown Page 44 ~ 60.
Band Channel Frequency(MHz)
Data (GSM: kHz /
WCDMA : MHz)
GSM850
128 824.20 239.90
190 836.60 241.79
251 848.80 244.77
GSM850 EDGE
128 824.20 237.50
190 836.60 241.30
251 848.80 239.20
GSM1900
512 1,850.20 239.41
661 1,880.00 237.32
810 1,909.80 240.57
GSM1900 EDGE
512 1,850.20 247.54
661 1,880.00 246.19
810 1,909.80 250.38
WCDMA850
4132 826.40 4.1695
4183 836.60 4.1605
4233 846.60 4.1514
WCDMA1900
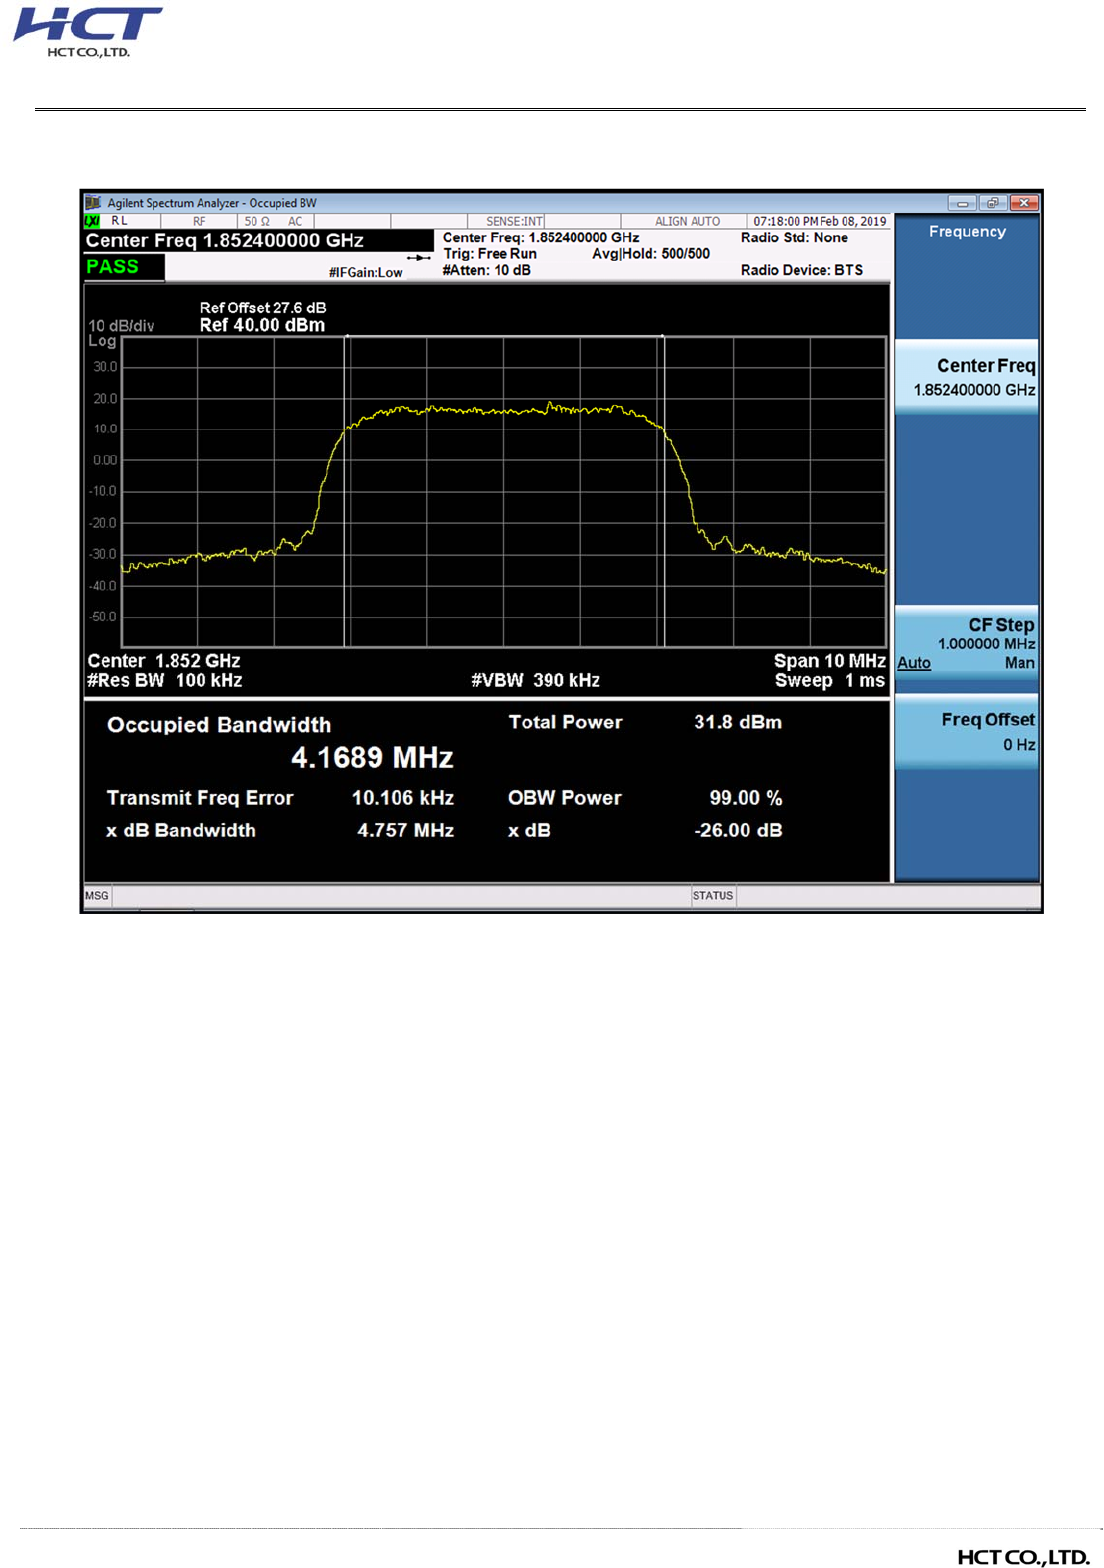
9262 1852.40 4.1689
9400 1880.00 4.1660
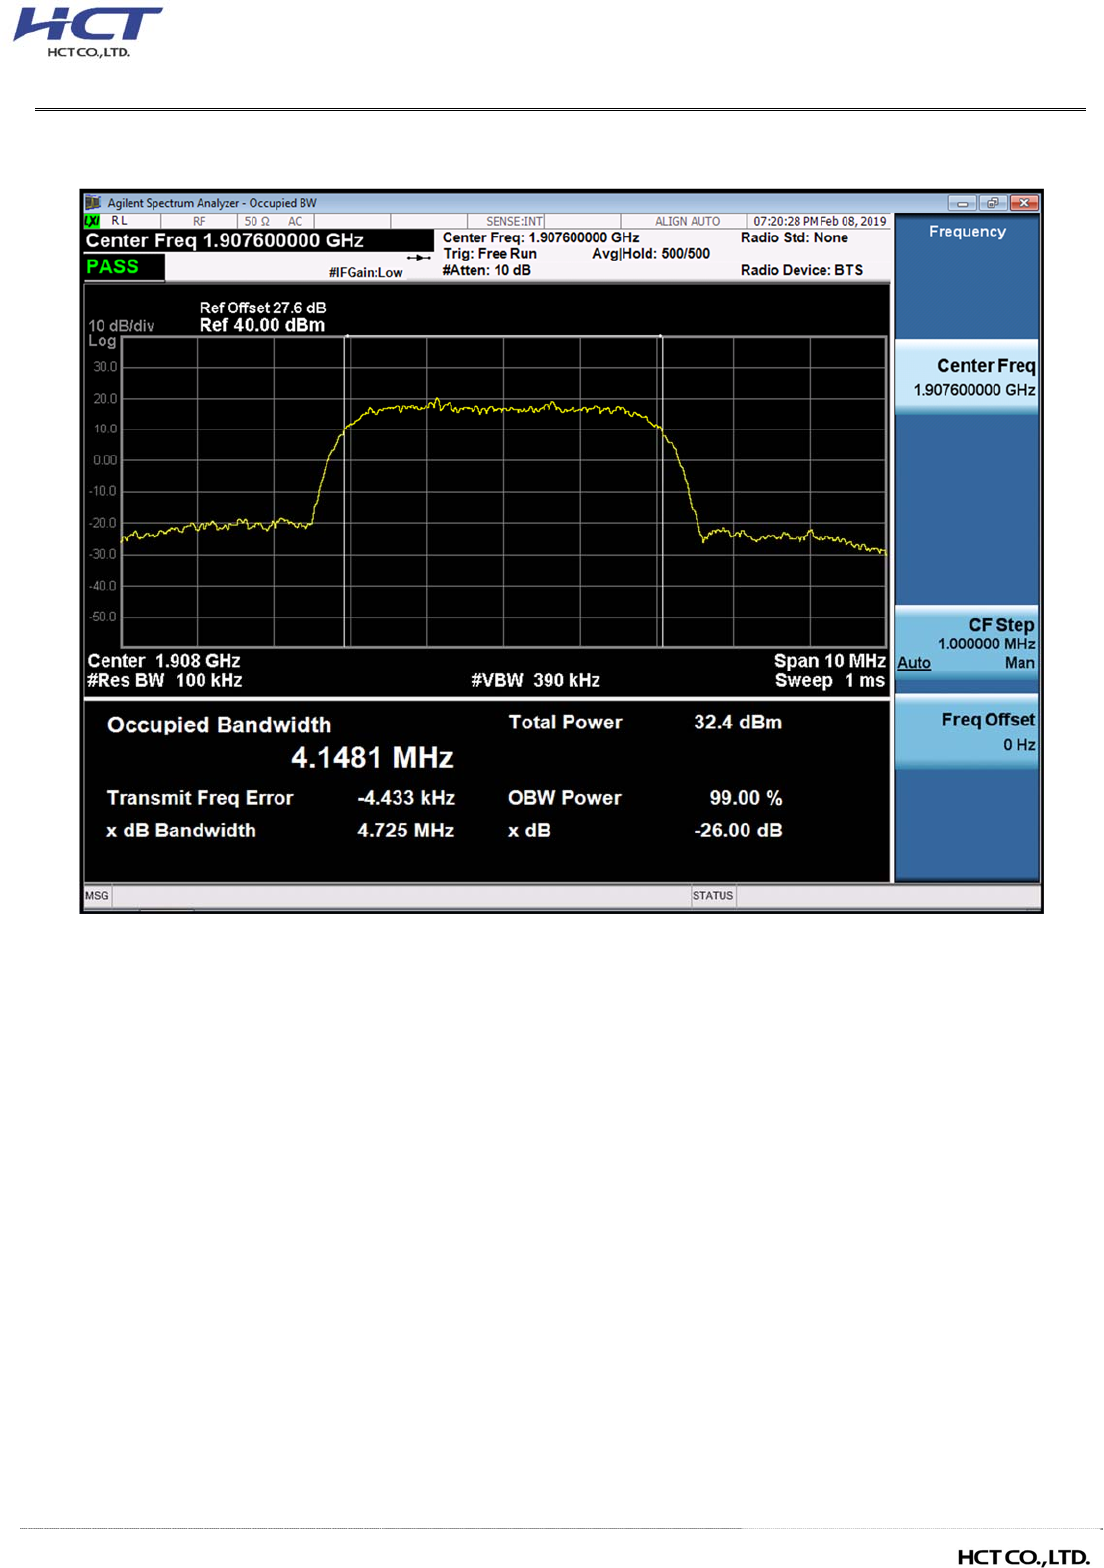
9538 1907.60 4.1481
WCDMA1700
1312 1712.40 4.1396
1412 1732.40 4.1478
1513 1752.60 4.1683
Report No.: HCT-RF-1902-FC032-R1 FCC ID: A3LSMT515
F-TP22-03 (Rev.00)
31/129
8.6 CONDUCTED SPURIOUS EMISSIONS
Note:
1. Plots of the EUT’s Conducted Spurious Emissions are shown Page 105 ~ 128.
2. Result (dBm) = Measurement Maximum Data (dBm) + Factor (dB)
3. Factor(dB) = Cable Loss + Attenuator + Power Splitter
Frequency Range (GHz) Factor [dB]
0.03 – 1 25.270
1 – 5 27.976
5 – 10 28.591
10 – 15 29.116
15 – 20 29.489
Above 20 30.131
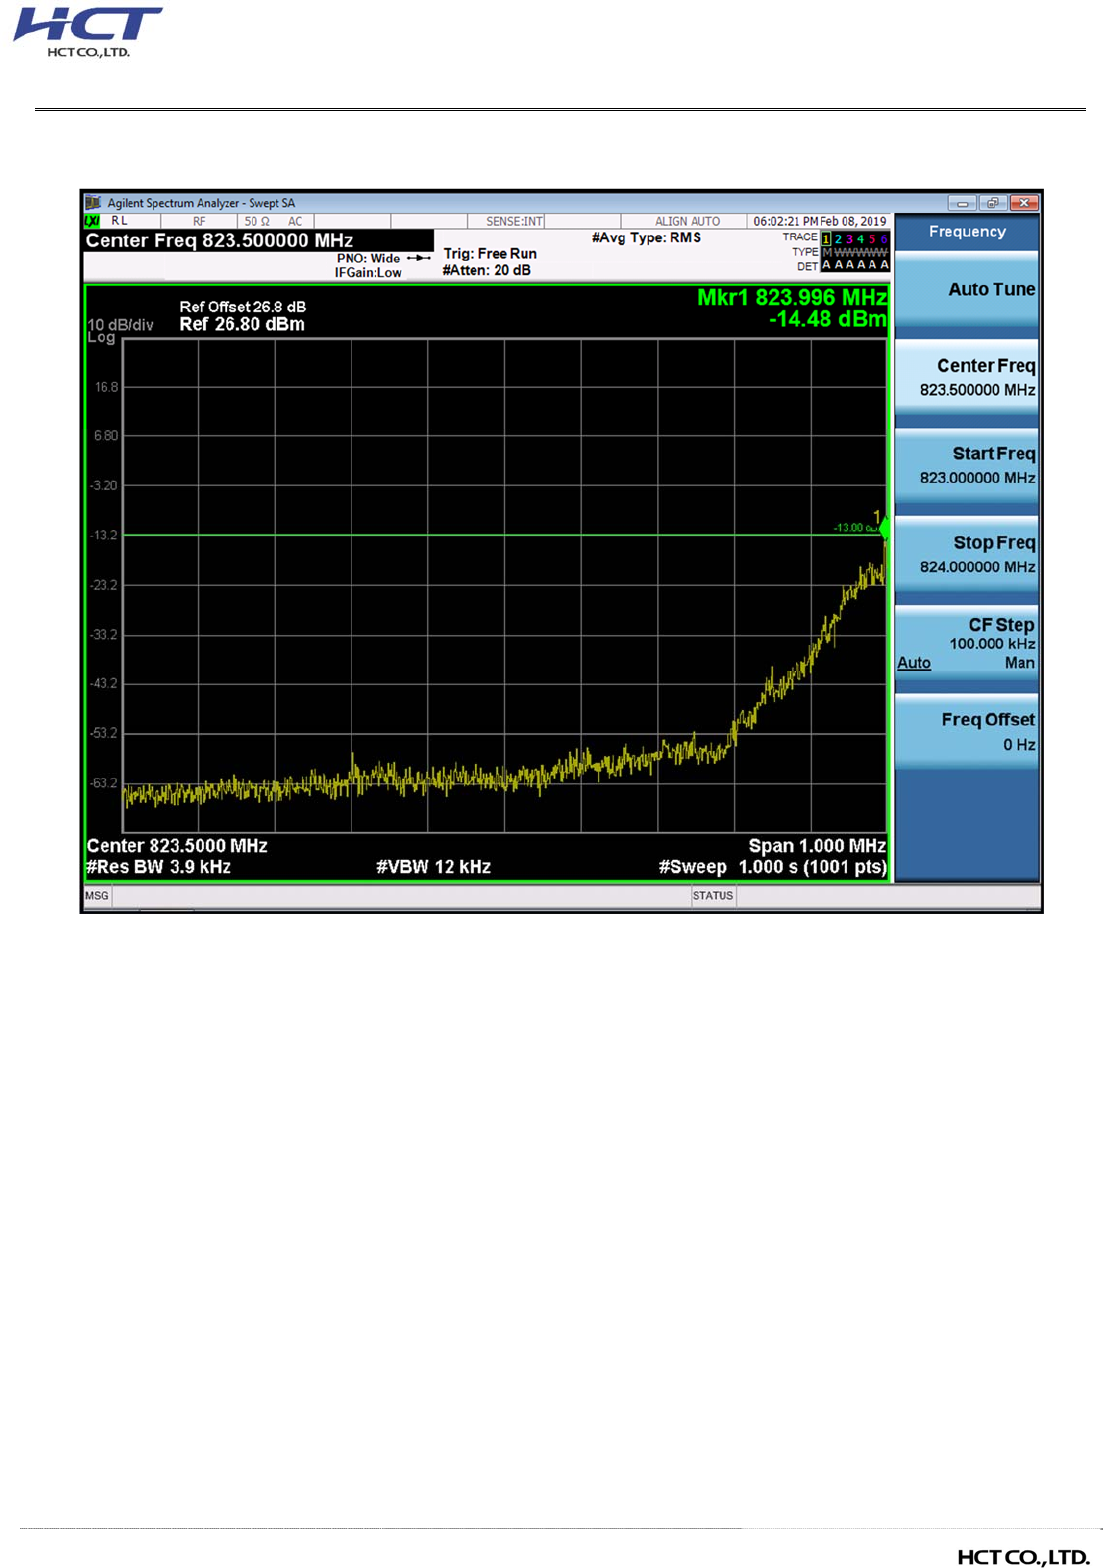
8.7 BAND EDGE
- Plots of the EUT’s Band Edge are shown Page 69 ~ 104.
Band Channel
Frequency of
Maximum Harmonic
(GHz)
Factor (dB)
Measurement
Maximum Data
(dBm)
Result
(dBm)
GSM850
128 2.4731 27.976 -57.10 -29.121
-13.00
190 3.7099 27.976 -57.45 -29.476
251 3.6865 27.976 -56.96 -28.981
GSM1900
512 18.87897 29.489 -53.160 -23.671
661 19.51774 29.489 -52.480 -22.991
810 17.00918 29.489 -52.890 -23.401
WCDMA850
4132 3.6950 27.976 -77.191 -49.215
4183 3.6965 27.976 -77.257 -49.281
4233 3.7039 27.976 -77.217 -49.241
WCDMA1900
9262 18.9262 29.489 -72.811 -43.322
9400 18.9177 29.489 -72.657 -43.168
9538 18.8965 29.489 -72.809 -43.320
WCDMA1700
1712 18.91372 29.489 -72.825 -43.336
1732 18.88797 29.489 -73.064 -43.575
1753 18.93197 29.489 -73.147 -43.658
Report No.: HCT-RF-1902-FC032-R1 FCC ID: A3LSMT515
F-TP22-03 (Rev.00)
32/129
8.8 FREQUENCY STABILITY / VARIATION OF AMBIENT TEMPERATURE
▣ MODE: GSM850
▣ OPERATING FREQUENCY: 836,600,000 Hz
▣ CHANNEL: 190
▣ REFERENCE VOLTAGE: 3.85 VDC
▣ DEVIATION LIMIT: ± 0.000 25 % or 2.5 ppm
Voltage Power Temp. Frequency Frequency Deviation
ppm
(%) (VDC) (℃) (Hz) Error (Hz) (%)
100%
3.850
+20(Ref) 836 599 991 0.0 0.000 000 0.0000
100%
-30
836 599 982
-9.1
-0.000 001
-0.0108
100%
-20
836 599 981
-9.5
-0.000 001
-0.0113
100%
-10
836 599 981
-9.5
-0.000 001
-0.0114
100%
0
836 599 981
-9.5
-0.000 001
-0.0114
100%
+10
836 599 982
-9.1
-0.000 001
-0.0109
100%
+30
836 599 981
-9.7
-0.000 001
-0.0116
100%
+40
836 599 981
-9.6
-0.000 001
-0.0115
100%
+50
836 599 981
-9.5
-0.000 001
-0.0114
Batt. Endpoint
3.600
+20 836 599 982 -8.7 -0.000 001 -0.0105
-3.5
-2.5
-1.5
-0.5
0.5
1.5
2.5
3.5
+20(Ref) -30 -20 -10 0 +10 +30 +40 +50 +20
Deviation (ppm)
Temperature (℃)
Frequency Stability
Report No.: HCT-RF-1902-FC032-R1 FCC ID: A3LSMT515
F-TP22-03 (Rev.00)
33/129
▣ Mode: GSM1900
▣ OPERATING FREQUENCY: 1850,200,000 Hz
▣ CHANNEL: 512
▣ REFERENCE VOLTAGE: 3.85 VDC
▣ DEVIATION LIMIT: Emission must remain in band
Voltage Power Temp. Frequency Frequency Deviation
ppm
(%) (VDC) (℃) (Hz) Error (Hz) (%)
100%
3.850
+20(Ref) 1850 200 011
0.0 0.000 000 0.0000
100%
-30
1850 200 019
8.3
0.000 000
0.0045
100%
-20
1850 200 020
8.9
0.000 000
0.0048
100%
-10
1850 200 020
9.5
0.000 001
0.0052
100%
0
1850 200 019
8.0
0.000 000
0.0043
100%
+10
1850 200 020
9.2
0.000 000
0.0050
100%
+30
1850 200 019
8.2
0.000 000
0.0044
100%
+40
1850 200 020
9.5
0.000 001
0.0051
100%
+50
1850 200 020
9.3
0.000 001
0.0050
Batt. Endpoint
3.400
+20 1850 200 019
7.9 0.000 000 0.0043
-3.5
-2.5
-1.5
-0.5
0.5
1.5
2.5
3.5
+20(Ref) -30 -20 -10 0 +10 +30 +40 +50 +20
Deviation (ppm)
Temperature (℃)
Frequency Stability
Report No.: HCT-RF-1902-FC032-R1 FCC ID: A3LSMT515
F-TP22-03 (Rev.00)
34/129
▣ Mode: GSM1900
▣ OPERATING FREQUENCY: 1880,000,000 Hz
▣ CHANNEL: 661
▣ REFERENCE VOLTAGE: 3.85 VDC
▣ DEVIATION LIMIT: Emission must remain in band
Voltage Power Temp. Frequency Frequency Deviation
ppm
(%) (VDC) (℃) (Hz) Error (Hz) (%)
100%
3.850
+20(Ref) 1880 000 008
0.0 0.000 000
0.000
100%
-30
1880 000 016
8.1
0.000 000
0.004
100%
-20
1880 000 017
8.7
0.000 000
0.005
100%
-10
1880 000 017
9.6
0.000 001
0.005
100%
0
1880 000 015
7.6
0.000 000
0.004
100%
+10
1880 000 017
9.1
0.000 000
0.005
100%
+30
1880 000 017
9.3
0.000 000
0.005
100%
+40
1880 000 016
8.1
0.000 000
0.004
100%
+50
1880 000 018
10.1
0.000 001
0.005
Batt. Endpoint
3.400
+20 1880 000 018
10.0 0.000 001
0.005
-3.5
-2.5
-1.5
-0.5
0.5
1.5
2.5
3.5
+20(Ref) -30 -20 -10 0 +10 +30 +40 +50 +20
Deviation (ppm)
Temperature (℃)
Frequency Stability
Report No.: HCT-RF-1902-FC032-R1 FCC ID: A3LSMT515
F-TP22-03 (Rev.00)
35/129
▣ Mode: GSM1900
▣ OPERATING FREQUENCY: 1909,800,000 Hz
▣ CHANNEL: 810
▣ REFERENCE VOLTAGE: 3.85 VDC
▣ DEVIATION LIMIT: Emission must remain in band
Voltage Power Temp. Frequency Frequency Deviation
ppm
(%) (VDC) (℃) (Hz) Error (Hz) (%)
100%
3.850
+20(Ref) 1909 800 008
0.0 0.000 000
0.000
100%
-30
1909 800 017
9.3
0.000 000
0.005
100%
-20
1909 800 016
7.9
0.000 000
0.004
100%
-10
1909 800 016
8.1
0.000 000
0.004
100%
0
1909 800 016
7.7
0.000 000
0.004
100%
+10
1909 800 017
8.9
0.000 000
0.005
100%
+30
1909 800 016
8.2
0.000 000
0.004
100%
+40
1909 800 017
8.4
0.000 000
0.004
100%
+50
1909 800 016
7.8
0.000 000
0.004
Batt. Endpoint
3.400
+20 1909 800 017
8.9 0.000 000
0.005
-3.5
-2.5
-1.5
-0.5
0.5
1.5
2.5
3.5
+20(Ref) -30 -20 -10 0 +10 +30 +40 +50 +20
Deviation (ppm)
Temperature (℃)
Frequency Stability
Report No.: HCT-RF-1902-FC032-R1 FCC ID: A3LSMT515
F-TP22-03 (Rev.00)
36/129
▣ Mode: WCDMA850
▣ OPERATING FREQUENCY: 836,600,000 Hz
▣ CHANNEL: 4183
▣ REFERENCE VOLTAGE: 3.85 VDC
▣ DEVIATION LIMIT: ± 0.000 25 % or 2.5 ppm
Voltage Power Temp. Frequency Frequency Deviation
ppm
(%) (VDC) (℃) (Hz) Error (Hz) (%)
100%
3.850
+20(Ref) 836 600 001 0.0 0.000 000 0.0000
100%
-30
836 600 004
2.1
0.000 000
0.0025
100%
-20
836 600 003
1.9
0.000 000
0.0022
100%
-10
836 600 003
1.9
0.000 000
0.0023
100%
0
836 600 004
2.2
0.000 000
0.0026
100%
+10
836 600 003
1.8
0.000 000
0.0022
100%
+30
836 600 004
2.1
0.000 000
0.0025
100%
+40
836 600 005
3.2
0.000 000
0.0038
100%
+50
836 600 003
1.8
0.000 000
0.0021
Batt. Endpoint
3.400
+20 836 600 004 2.1 0.000 000 0.0025
-3.5
-2.5
-1.5
-0.5
0.5
1.5
2.5
3.5
+20(Ref) -30 -20 -10 0 +10 +30 +40 +50 +20
Deviation (ppm)
Temperature (℃)
Frequency Stability

Report No.: HCT-RF-1902-FC032-R1 FCC ID: A3LSMT515
F-TP22-03 (Rev.00)
37/129
▣ Mode: WCDMA1900
▣ OPERATING FREQUENCY: 1,852,400,000 Hz
▣ CHANNEL: 9262
▣ REFERENCE VOLTAGE: 3.85 VDC
▣ DEVIATION LIMIT: Emission must remain in band
Voltage Power Temp. Frequency Frequency Deviation
ppm
(%) (VDC) (℃) (Hz) Error (Hz) (%)
100%
3.850
+20(Ref) 1852 399 998
0.0 0.000 000 0.0000
100%
-30
1852 399 996
-2.2
0.000 000
-0.0012
100%
-20
1852 399 996
-2.6
0.000 000
-0.0014
100%
-10
1852 400 001
2.7
0.000 000
0.0015
100%
0
1852 400 002
3.6
0.000 000
0.0019
100%
+10
1852 400 001
2.5
0.000 000
0.0014
100%
+30
1852 399 997
-1.4
0.000 000
-0.0008
100%
+40
1852 400 001
2.6
0.000 000
0.0014
100%
+50
1852 400 000
1.9
0.000 000
0.0010
Batt. Endpoint
3.400
+20 1852 399 996
-1.8 0.000 000 -0.0010
-3.5
-2.5
-1.5
-0.5
0.5
1.5
2.5
3.5
+20(Ref) -30 -20 -10 0 +10 +30 +40 +50 +20
Deviation (ppm)
Temperature (℃)
Frequency Stability

Report No.: HCT-RF-1902-FC032-R1 FCC ID: A3LSMT515
F-TP22-03 (Rev.00)
38/129
▣ Mode: WCDMA1900
▣ OPERATING FREQUENCY: 1,880,000,000 Hz
▣ CHANNEL: 9400
▣ REFERENCE VOLTAGE: 3.85 VDC
▣ DEVIATION LIMIT: Emission must remain in band
Voltage Power Temp. Frequency Frequency Deviation
ppm
(%) (VDC) (℃) (Hz) Error (Hz) (%)
100%
3.850
+20(Ref) 1880 000 002
0.0 0.000 000 0.0000
100%
-30
1880 000 001
-1.5
0.000 000
-0.0008
100%
-20
1879 999 999
-3.1
0.000 000
-0.0017
100%
-10
1880 000 004
2.1
0.000 000
0.0011
100%
0
1880 000 006
3.6
0.000 000
0.0019
100%
+10
1880 000 004
2.1
0.000 000
0.0011
100%
+30
1880 000 005
2.2
0.000 000
0.0012
100%
+40
1879 999 999
-3.3
0.000 000
-0.0018
100%
+50
1879 999 999
-3.0
0.000 000
-0.0016
Batt. Endpoint
3.400
+20 1880 000 005
2.6 0.000 000 0.0014
-3.5
-2.5
-1.5
-0.5
0.5
1.5
2.5
3.5
+20(Ref) -30 -20 -10 0 +10 +30 +40 +50 +20
Deviation (ppm)
Temperature (℃)
Frequency Stability
Report No.: HCT-RF-1902-FC032-R1 FCC ID: A3LSMT515
F-TP22-03 (Rev.00)
39/129
▣ Mode: WCDMA1900
▣ OPERATING FREQUENCY: 1,907,600,000 Hz
▣ CHANNEL: 9538
▣ REFERENCE VOLTAGE: 3.85 VDC
▣ DEVIATION LIMIT: Emission must remain in band
Voltage Power Temp. Frequency Frequency Deviation
ppm
(%) (VDC) (℃) (Hz) Error (Hz) (%)
100%
3.850
+20(Ref) 1907 599 997
0.0 0.000 000 0.0000
100%
-30
1907 599 999
2.2
0.000 000
0.0012
100%
-20
1907 600 000
2.7
0.000 000
0.0014
100%
-10
1907 600 000
2.9
0.000 000
0.0015
100%
0
1907 599 994
-2.5
0.000 000
-0.0013
100%
+10
1907 600 000
3.4
0.000 000
0.0018
100%
+30
1907 599 995
-1.9
0.000 000
-0.0010
100%
+40
1907 599 995
-1.7
0.000 000
-0.0009
100%
+50
1907 599 999
2.4
0.000 000
0.0013
Batt. Endpoint
3.400
+20 1907 599 995
-2.3 0.000 000 -0.0012
-3.5
-2.5
-1.5
-0.5
0.5
1.5
2.5
3.5
+20(Ref) -30 -20 -10 0 +10 +30 +40 +50 +20
Deviation (ppm)
Temperature
Frequency Stability

Report No.: HCT-RF-1902-FC032-R1 FCC ID: A3LSMT515
F-TP22-03 (Rev.00)
40/129
▣ Mode: WCDMA1700
▣ OPERATING FREQUENCY: 1,712,400,000 Hz
▣ CHANNEL: 1312
▣ REFERENCE VOLTAGE: 3.85 VDC
▣ DEVIATION LIMIT: Emission must remain in band
Voltage Power Temp. Frequency Frequency Deviation
ppm
(%) (VDC) (℃) (Hz) Error (Hz) (%)
100%
3.850
+20(Ref) 1712 399 997
0.0 0.000 000 0.0000
100%
-30
1712 399 994
-3.8
0.000 000
-0.0022
100%
-20
1712 399 995
-1.9
0.000 000
-0.0011
100%
-10
1712 400 000
2.4
0.000 000
0.0014
100%
0
1712 400 000
2.5
0.000 000
0.0014
100%
+10
1712 399 999
1.2
0.000 000
0.0007
100%
+30
1712 399 995
-2.4
0.000 000
-0.0014
100%
+40
1712 399 996
-1.6
0.000 000
-0.0009
100%
+50
1712 400 000
2.4
0.000 000
0.0014
Batt. Endpoint
3.400
+20 1712 399 999
2.0 0.000 000 0.0012
-3.5
-2.5
-1.5
-0.5
0.5
1.5
2.5
3.5
+20(Ref) -30 -20 -10 0 +10 +30 +40 +50 +20
Deviation (ppm)
Temperature (℃)
Frequency Stability
Report No.: HCT-RF-1902-FC032-R1 FCC ID: A3LSMT515
F-TP22-03 (Rev.00)
41/129
▣ Mode: WCDMA1700
▣ OPERATING FREQUENCY: 1,732,400,000 Hz
▣ CHANNEL: 1412
▣ REFERENCE VOLTAGE: 3.85 VDC
▣ DEVIATION LIMIT: Emission must remain in band
Voltage Power Temp. Frequency Frequency Deviation
ppm
(%) (VDC) (℃) (Hz) Error (Hz) (%)
100%
3.850
+20(Ref) 1732 400 005
0.0 0.000 000 0.0000
100%
-30
1732 400 007
2.3
0.000 000
0.0013
100%
-20
1732 400 007
2.3
0.000 000
0.0013
100%
-10
1732 400 009
3.7
0.000 000
0.0021
100%
0
1732 400 009
3.9
0.000 000
0.0022
100%
+10
1732 400 007
2.3
0.000 000
0.0013
100%
+30
1732 400 009
3.5
0.000 000
0.0020
100%
+40
1732 400 008
2.9
0.000 000
0.0017
100%
+50
1732 400 009
3.9
0.000 000
0.0022
Batt. Endpoint
3.400
+20 1732 400 009
3.9 0.000 000 0.0023
-3.5
-2.5
-1.5
-0.5
0.5
1.5
2.5
3.5
+20(Ref) -30 -20 -10 0 +10 +30 +40 +50 +20
Deviation (ppm)
Temperature (℃)
Frequency Stability

Report No.: HCT-RF-1902-FC032-R1 FCC ID: A3LSMT515
F-TP22-03 (Rev.00)
42/129
▣ Mode: WCDMA1700
▣ OPERATING FREQUENCY: 1,752,600,000 Hz
▣ CHANNEL: 1513
▣ REFERENCE VOLTAGE: 3.85 VDC
▣ DEVIATION LIMIT: Emission must remain in band
Voltage Power Temp. Frequency Frequency Deviation
ppm
(%) (VDC) (℃) (Hz) Error (Hz) (%)
100%
3.850
+20(Ref) 1752 600 002
0.0 0.000 000 0.0000
100%
-30
1752 600 004
1.8
0.000 000
0.0010
100%
-20
1752 600 005
2.6
0.000 000
0.0015
100%
-10
1752 600 005
3.1
0.000 000
0.0018
100%
0
1752 600 005
2.6
0.000 000
0.0015
100%
+10
1752 600 006
3.4
0.000 000
0.0019
100%
+30
1752 600 005
3.0
0.000 000
0.0017
100%
+40
1752 600 005
3.1
0.000 000
0.0018
100%
+50
1752 600 005
2.8
0.000 000
0.0016
Batt. Endpoint
3.400
+20 1752 600 005
2.5 0.000 000 0.0015
-3.5
-2.5
-1.5
-0.5
0.5
1.5
2.5
3.5
+20(Ref) -30 -20 -10 0 +10 +30 +40 +50 +20
Deviation (ppm)
Temperature (℃)
Frequency Stability

Report No.: HCT-RF-1902-FC032-R1 FCC ID: A3LSMT515
F-TP22-03 (Rev.00)
43/129
9. TEST PLOTS
Report No.: HCT-RF-1902-FC032-R1 FCC ID: A3LSMT515
F-TP22-03 (Rev.00)
44/129
■ GSM850 MODE (128 CH.) Occupied Bandwidth

Report No.: HCT-RF-1902-FC032-R1 FCC ID: A3LSMT515
F-TP22-03 (Rev.00)
45/129
■ GSM850 MODE (190 CH.) Occupied Bandwidth

Report No.: HCT-RF-1902-FC032-R1 FCC ID: A3LSMT515
F-TP22-03 (Rev.00)
46/129
■ GSM850 MODE (251 CH.) Occupied Bandwidth

Report No.: HCT-RF-1902-FC032-R1 FCC ID: A3LSMT515
F-TP22-03 (Rev.00)
47/129
■ GSM850 EDGE (190 CH.) Occupied Bandwidth

Report No.: HCT-RF-1902-FC032-R1 FCC ID: A3LSMT515
F-TP22-03 (Rev.00)
48/129
■ GSM1900 MODE (512 CH.) Occupied Bandwidth

Report No.: HCT-RF-1902-FC032-R1 FCC ID: A3LSMT515
F-TP22-03 (Rev.00)
49/129
■ GSM1900 MODE (661 CH.) Occupied Bandwidth

Report No.: HCT-RF-1902-FC032-R1 FCC ID: A3LSMT515
F-TP22-03 (Rev.00)
50/129
■ GSM1900 MODE (810 CH.) Occupied Bandwidth

Report No.: HCT-RF-1902-FC032-R1 FCC ID: A3LSMT515
F-TP22-03 (Rev.00)
51/129
■ GSM1900 EDGE (810 CH.) Occupied Bandwidth

Report No.: HCT-RF-1902-FC032-R1 FCC ID: A3LSMT515
F-TP22-03 (Rev.00)
52/129
■ WCDMA850 MODE (4132 CH.) Occupied Bandwidth

Report No.: HCT-RF-1902-FC032-R1 FCC ID: A3LSMT515
F-TP22-03 (Rev.00)
53/129
■ WCDMA850 MODE (4183 CH.) Occupied Bandwidth

Report No.: HCT-RF-1902-FC032-R1 FCC ID: A3LSMT515
F-TP22-03 (Rev.00)
54/129
■ WCDMA850MODE (4233 CH.) Occupied Bandwidth
Report No.: HCT-RF-1902-FC032-R1 FCC ID: A3LSMT515
F-TP22-03 (Rev.00)
55/129
■ WCDMA1900 MODE (9262 CH.) Occupied Bandwidth

Report No.: HCT-RF-1902-FC032-R1 FCC ID: A3LSMT515
F-TP22-03 (Rev.00)
56/129
■ WCDMA1900 MODE (9400 CH.) Occupied Bandwidth
Report No.: HCT-RF-1902-FC032-R1 FCC ID: A3LSMT515
F-TP22-03 (Rev.00)
57/129
■ WCDMA1900 MODE (9538 CH.) Occupied Bandwidth

Report No.: HCT-RF-1902-FC032-R1 FCC ID: A3LSMT515
F-TP22-03 (Rev.00)
58/129
■ WCDMA1700 MODE (1712.4 CH.) Occupied Bandwidth

Report No.: HCT-RF-1902-FC032-R1 FCC ID: A3LSMT515
F-TP22-03 (Rev.00)
59/129
■ WCDMA1700 MODE (1732.4 CH.) Occupied Bandwidth

Report No.: HCT-RF-1902-FC032-R1 FCC ID: A3LSMT515
F-TP22-03 (Rev.00)
60/129
■ WCDMA1700 MODE (1752.6 CH.) Occupied Bandwidth

Report No.: HCT-RF-1902-FC032-R1 FCC ID: A3LSMT515
F-TP22-03 (Rev.00)
61/129
■ GSM1900 MODE (661 CH.) Peak-to-Average Ratio P
Pk

Report No.: HCT-RF-1902-FC032-R1 FCC ID: A3LSMT515
F-TP22-03 (Rev.00)
62/129
■ GSM1900 MODE (661 CH.) Peak-to-Average Ratio P
Avg

Report No.: HCT-RF-1902-FC032-R1 FCC ID: A3LSMT515
F-TP22-03 (Rev.00)
63/129
■ GSM1900 MODE (661 CH.) Peak-to-Average Ratio Duty
Report No.: HCT-RF-1902-FC032-R1 FCC ID: A3LSMT515
F-TP22-03 (Rev.00)
64/129
■ GSM1900 EDGE (661 CH.) Peak-to-Average Ratio Duty
Report No.: HCT-RF-1902-FC032-R1 FCC ID: A3LSMT515
F-TP22-03 (Rev.00)
65/129
■ GSM1900 EDGE (661 CH.) Peak-to-Average Ratio P
Pk
Report No.: HCT-RF-1902-FC032-R1 FCC ID: A3LSMT515
F-TP22-03 (Rev.00)
66/129
■ GSM1900 EDGE (661 CH.) Peak-to-Average Ratio P
Avg

Report No.: HCT-RF-1902-FC032-R1 FCC ID: A3LSMT515
F-TP22-03 (Rev.00)
67/129
■ WCDMA1900 MODE (9400 CH.) Peak-to-Average Ratio

Report No.: HCT-RF-1902-FC032-R1 FCC ID: A3LSMT515
F-TP22-03 (Rev.00)
68/129
■ WCDMA1700 MODE (1412 CH.) Peak-to-Average Ratio

Report No.: HCT-RF-1902-FC032-R1 FCC ID: A3LSMT515
F-TP22-03 (Rev.00)
69/129
■ GSM850 MODE (128 CH.) Block Edge 1
Report No.: HCT-RF-1902-FC032-R1 FCC ID: A3LSMT515
F-TP22-03 (Rev.00)
70/129
■ GSM850 MODE (128 CH.) Block Edge 2

Report No.: HCT-RF-1902-FC032-R1 FCC ID: A3LSMT515
F-TP22-03 (Rev.00)
71/129
■ GSM850 MODE (128 CH.) Block Edge 3