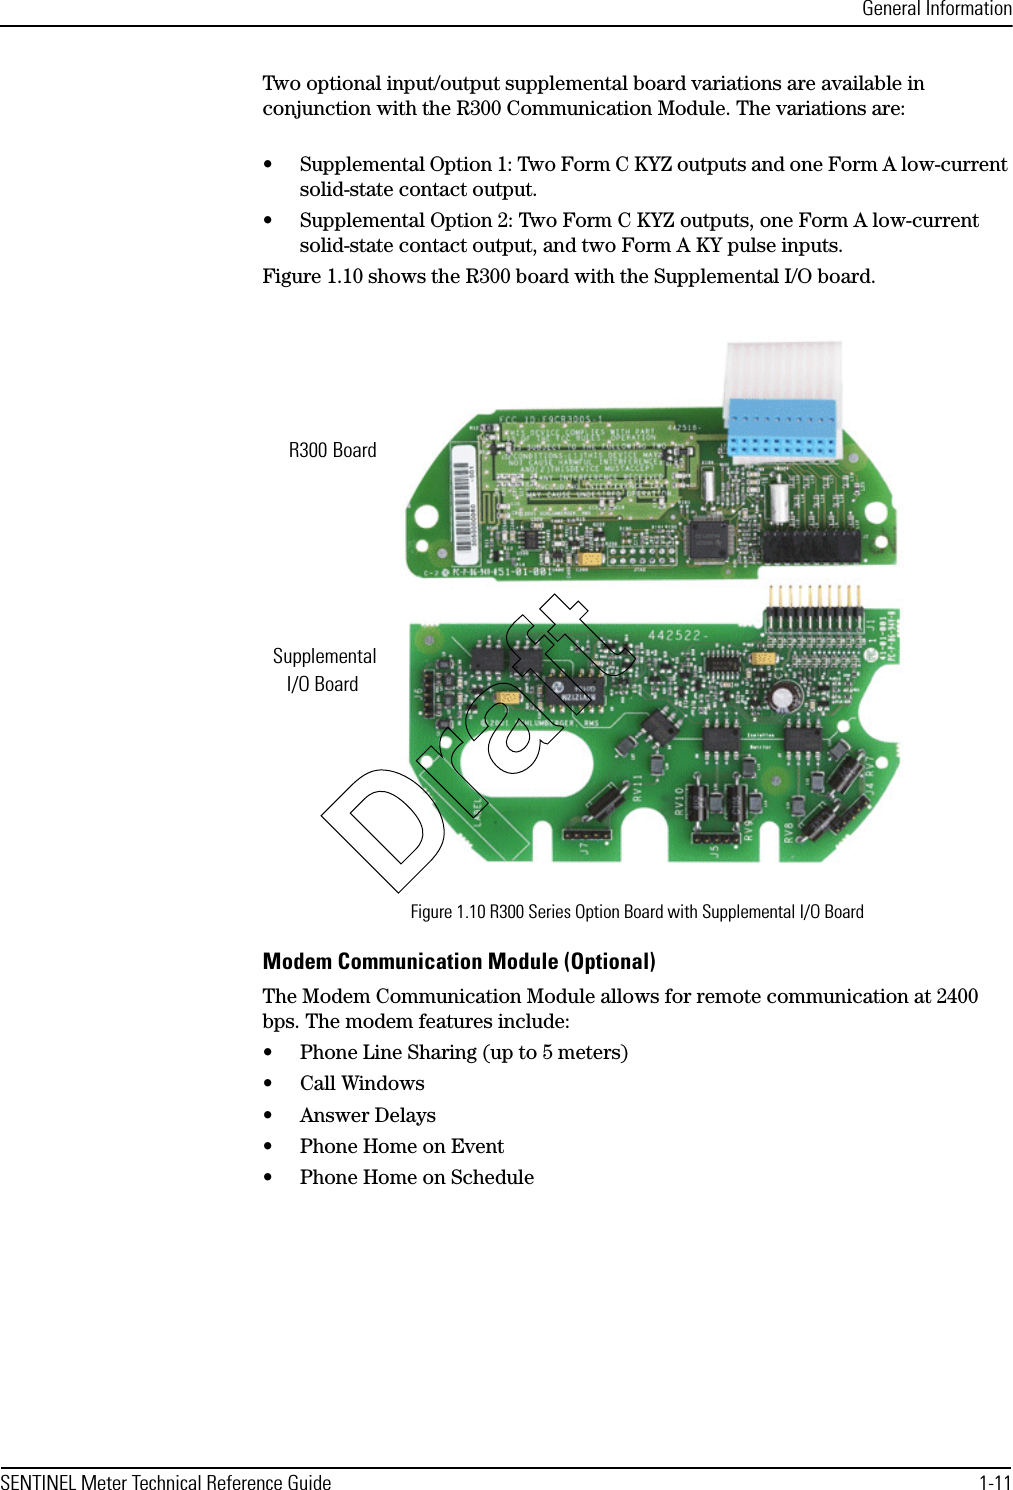
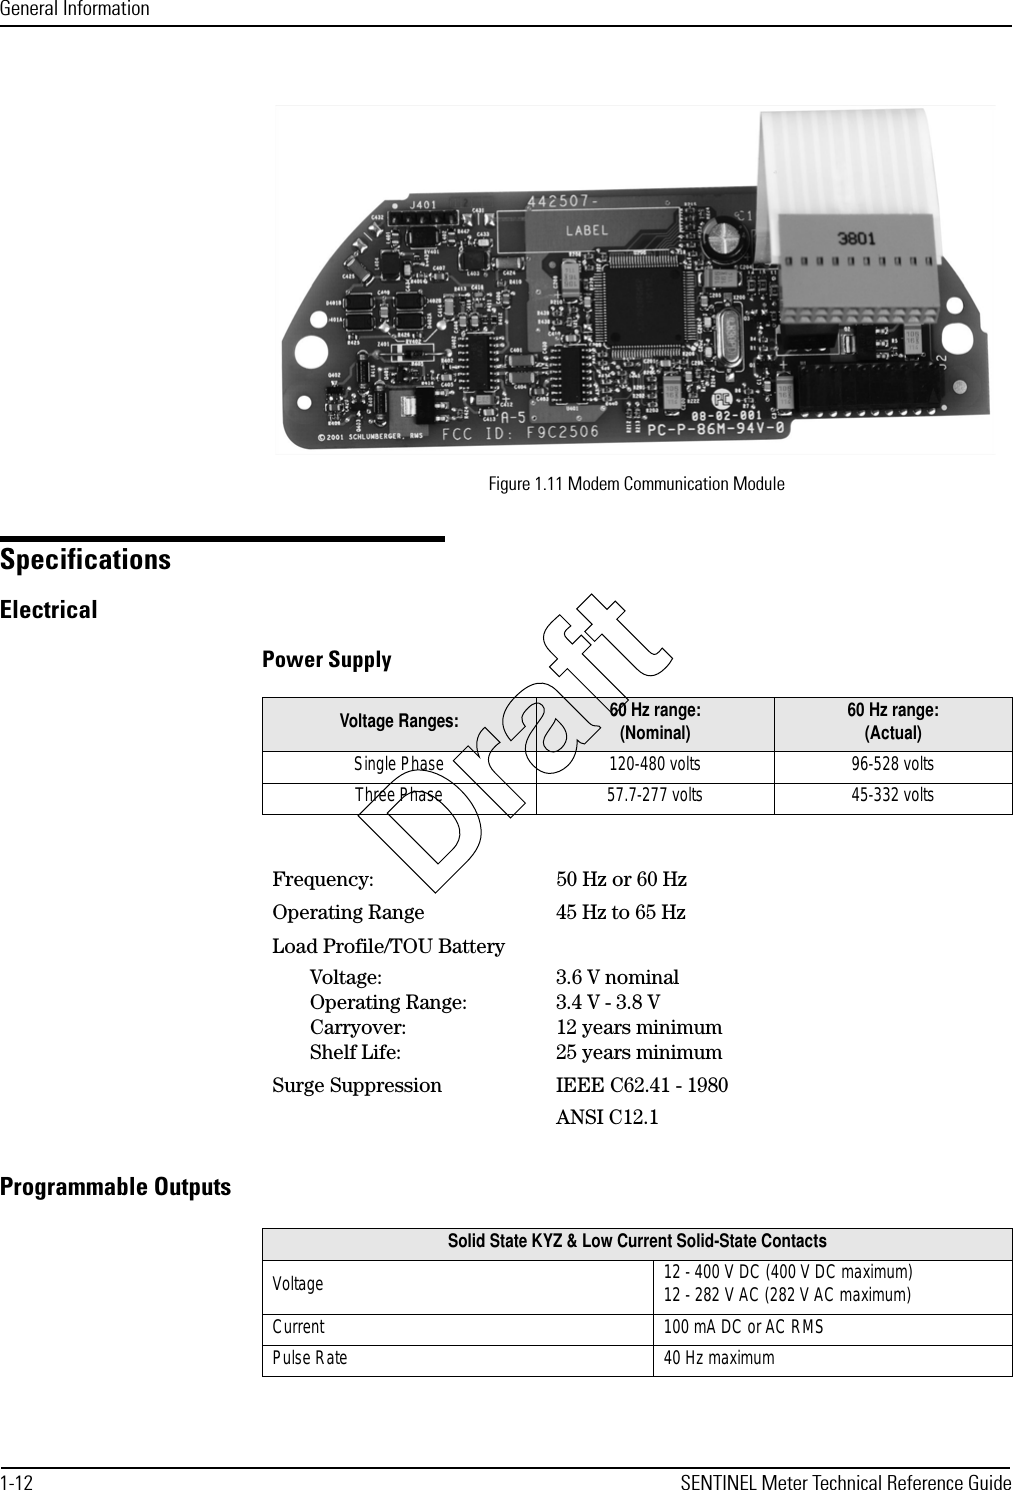
Schlumberger Sema SMFMM-1 Wireless LAN Radio User Manual
Schlumberger Sema Wireless LAN Radio
UserManual.wiki
>
Schlumberger Sema
>
SMFMM 1 User Manual
revised users manual
Navigation menu
Upload a User Manual
Namespaces
Wiki Guide
HTML
PDF
Info
Views
User Manual
Discussion / Help
Navigation


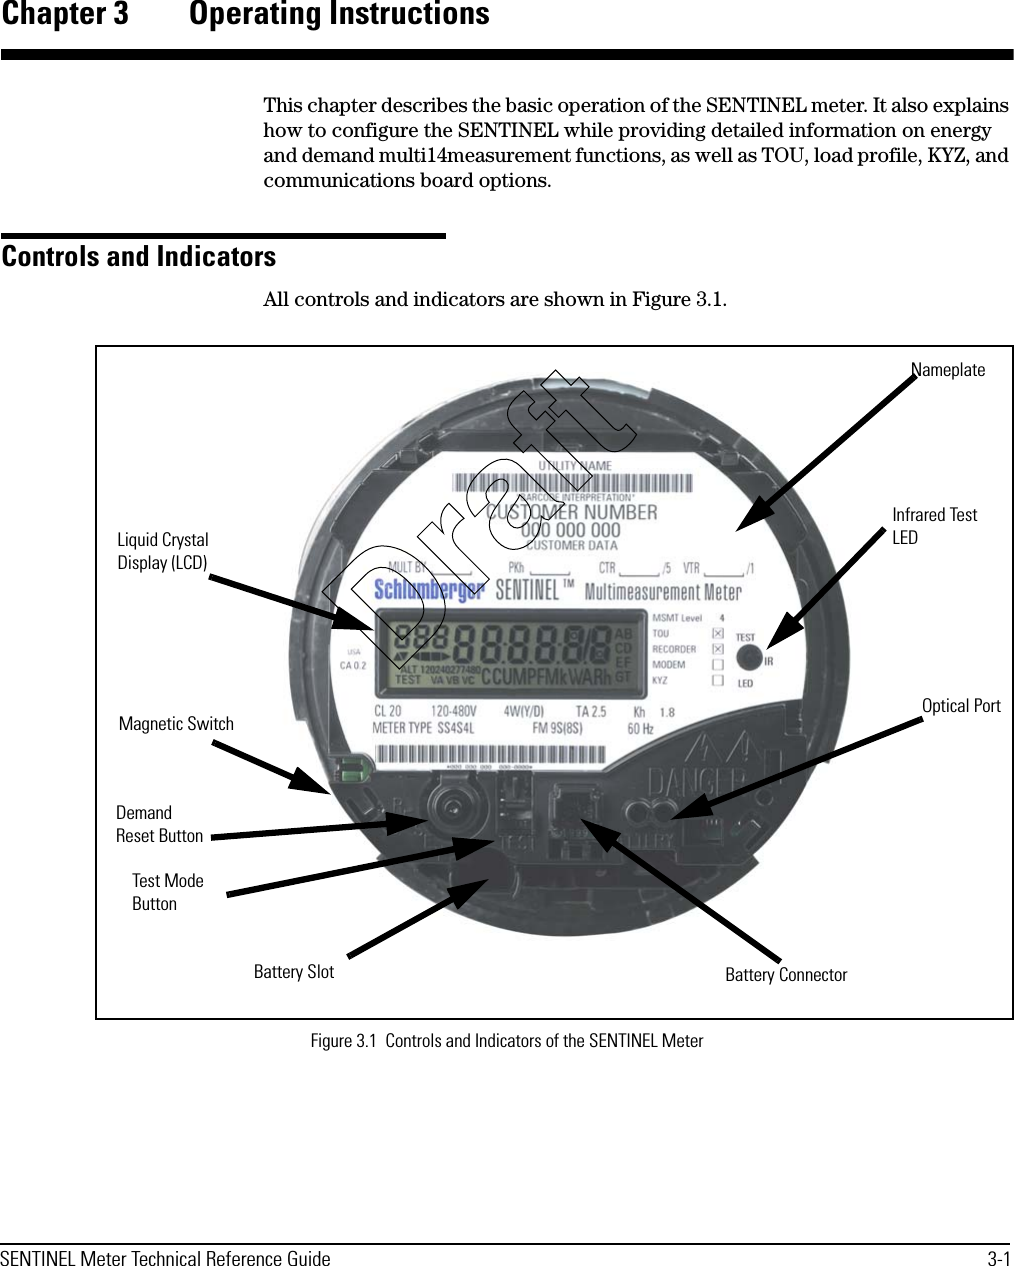
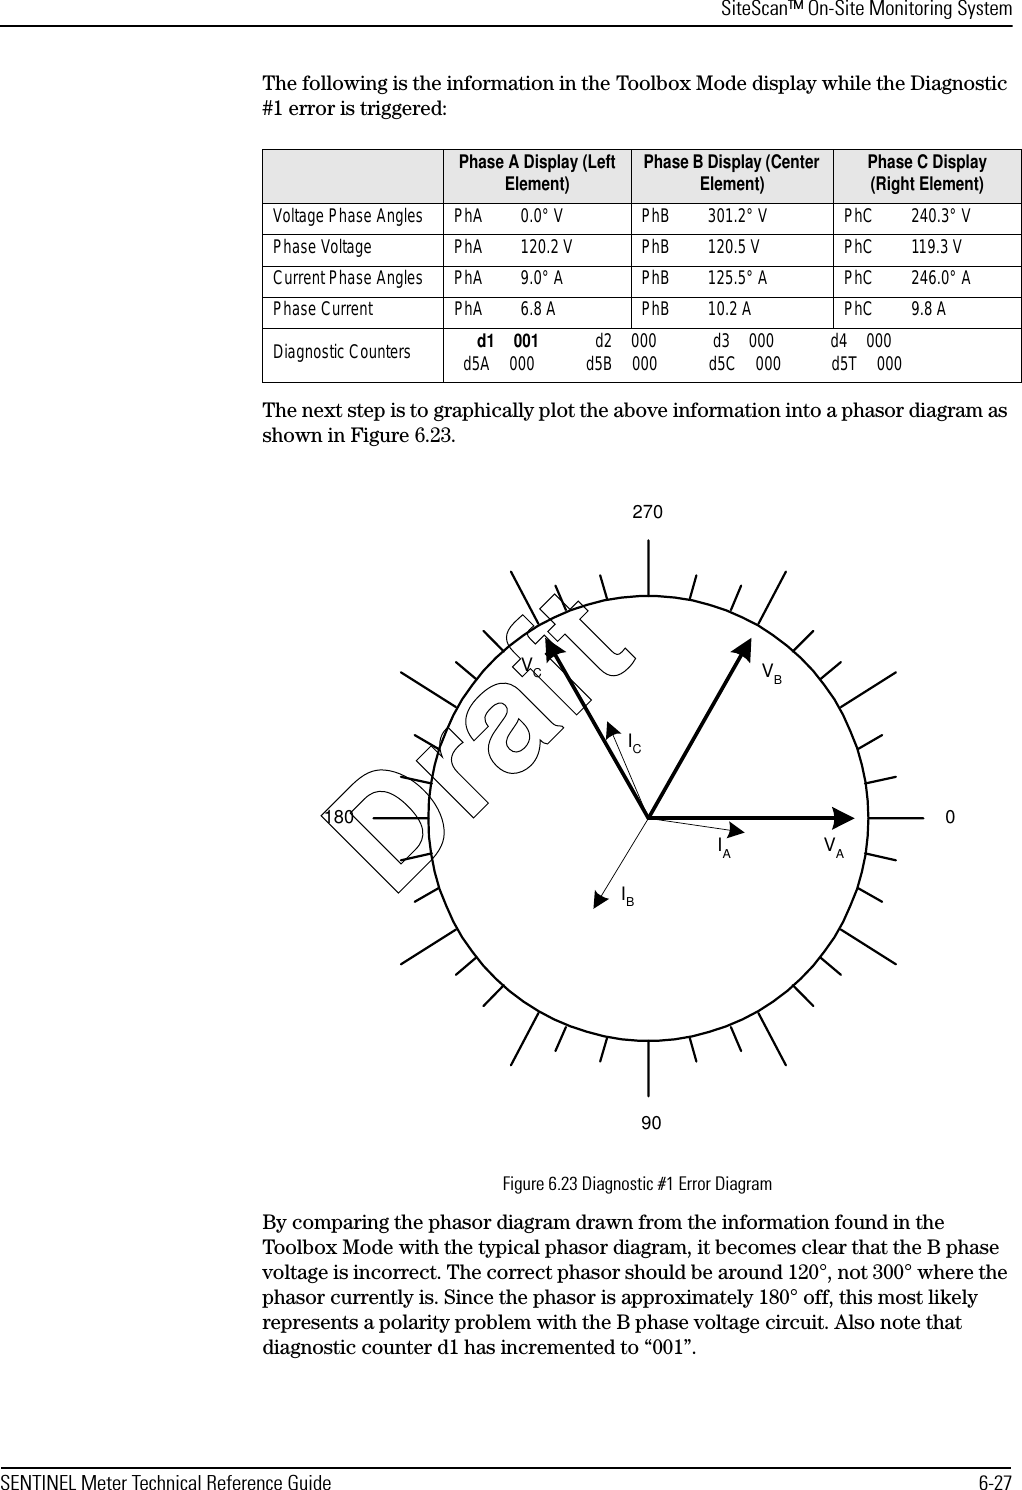
![Operating InstructionsSENTINEL Meter Technical Reference Guide 3-3Liquid Crystal Display (LCD)The SENTINEL meter features a versatile 9-character LCD display. The LCD with all segments lit is shown in Figure 3.2. There are several static indicators available on the LCD as described in Table 3.1.Figure 3.2 SENTINEL LCDTable 3.1 Static IndicatorsIndicator DescriptionLoad Emulator (-> for positive, <- for negative)888 888888 Nine digits (7 segments each) for display of alphanumeric informationVA, VB, VC Indicators for phase voltages being presentReactive Load Indicator:No arrow for unity PFfor positive [delivered] (lag)for negative [received] (lead)120 240 277 480 Nominal Voltage Indicator (one value appears at a time)EOI End of Interval (Registers - Dmd)Scr Loc Scroll Lock (indicates temporary scroll lock of a display item)SEL nor, SEL Alt, SEL tooL Selection of Normal, Alternate, or Toolbox display sequencenor diSP Entry into Normal Mode.TEST Entry into Test Mode.ALT TEST Entry into Test Alternate Mode.The indicators shown in Table 3.1 actually display in a digital readout font; somecharacters may display as upper case.Draft](https://usermanual.wiki/Schlumberger-Sema/SMFMM-1/User-Guide-297972-Page-41.png)

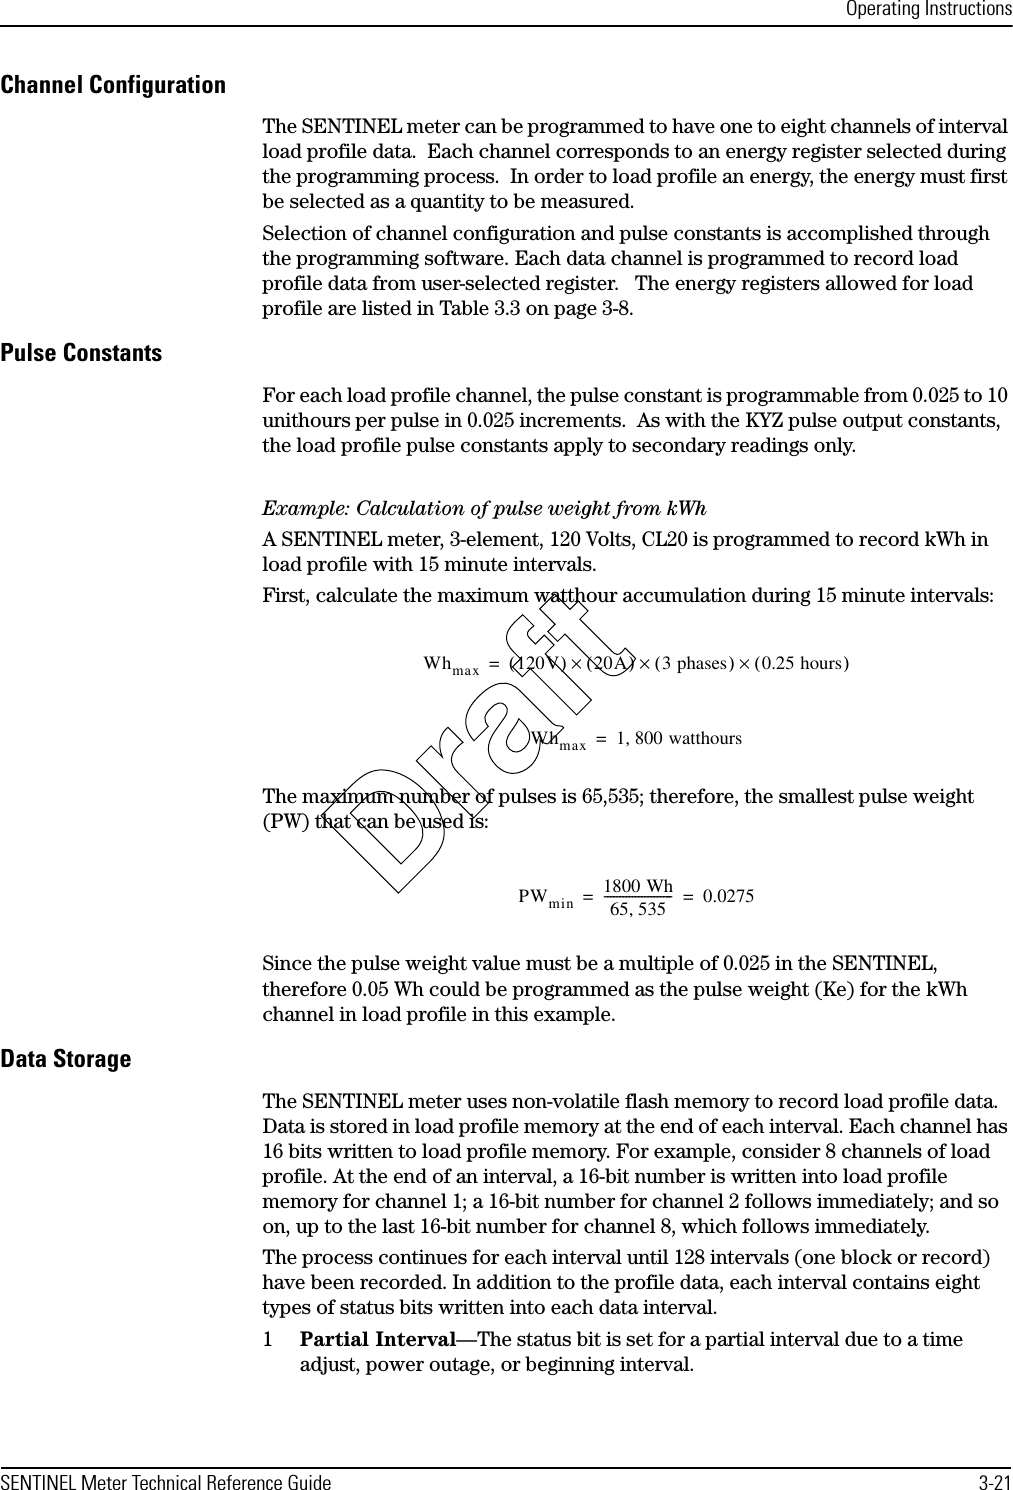
![Operating Instructions3-8 SENTINEL Meter Technical Reference GuideNumerical values may be displayed in various formats depending on configuration. For example, kilo units, mega units, fixed decimal point, floating decimal point, and leading zeros can all be configured.The user may program the behavior that the meter should exhibit for every specific error condition. The possible actions in order of increasing severity are ignore the error (do not display the error code), scroll the error code (an error is automatically displayed after each display item), or lock the error, showing only the error code (do not display anything else).Table 3.3 through Table 3.6 show, in alphabetical order, items programmable for display in the modes indicated. Detailed information about display items is also provided in the PC-PRO+ 98 SENTINEL Device User’s Manual.Energy DataDemand DataTable 3.3 Energy Data Display ItemsDisplay Item Display ModeNormal Alternate Test ToolboxWh (delivered, received, net) X X XVarh (delivered [lag], received [lead], net delivered, net received, Q1-Q4) XXXVAh (delivered, received) X X XVAh lag (vectorial) X X XQh XXXVh (Phase A, Phase B, Phase C, Average) X XAh (Phase A, Phase B, Phase C, Neutral) X XV2h Aggregate XXA2h Aggregate XXTable 3.4 Demand Data Display ItemsDisplay Item Display ModeNormal Alternate Test ToolboxW Delivered (Max, Present, Previous, Projected, Cumulative, Continuous Cumulative) XXXW Received (Max, Present, Previous, Projected, Cumulative, Continuous Cumulative) XXXW Net (Max) XXXVar Q1-Q4 (Max, Present, Previous, Projected, Cumulative, Continuous Cumulative) XXXVar Delivered [lag: Q1+Q2] (Max, Present, Previous, Projected, Cumulative, Continuous Cumulative) XXXDraft](https://usermanual.wiki/Schlumberger-Sema/SMFMM-1/User-Guide-297972-Page-46.png)
![Operating InstructionsSENTINEL Meter Technical Reference Guide 3-9Instantaneous DataVar Net Delivered [Q1+Q4] (Max, Present, Previous, Projected, Cumulative, Continuous Cumulative) XXXVar Received [lead: Q3+Q4] (Max, Present, Previous, Projected, Cumulative, Continuous Cumulative) XXXVar Net Received [Q2+Q3] (Max, Present, Previous, Projected, Cumulative, Continuous Cumulative) XXXVA Delivered [arithmetic or vectorial] (Max, Present, Previous, Projected, Cumulative, Continuous Cumulative) XXXVA Received [arithmetic or vectorial] (Max, Present, Previous, Projected, Cumulative, Continuous Cumulative) XXXVA Lag (Max, Present, Previous, Projected, Cumulative, Continuous Cumulative) XXXMax A (per phase: A, B, C) X XPF Average X XMin P.F. X XCoincident Demands (up to 4) X XTable 3.4 Demand Data Display ItemsDisplay Item Display ModeNormal Alternate Test ToolboxTable 3.5 Instantaneous Data Display ItemsDisplay Item Display ModeNormal Alternate Test ToolboxInstantaneous W X X XInstantaneous Var X X XInstantaneous VA X X XInstantaneous Volts (A, B, C) X X XInstantaneous Amps (A, B, & C) X X XInstantaneous Amps (N) X XInstantaneous P.F. X XInstantaneous Frequency (Hz) X XInstantaneous Current Phase Angles (A, B, C) XInstantaneous Voltage Phase Angles (A, B, C) XDraft](https://usermanual.wiki/Schlumberger-Sema/SMFMM-1/User-Guide-297972-Page-47.png)

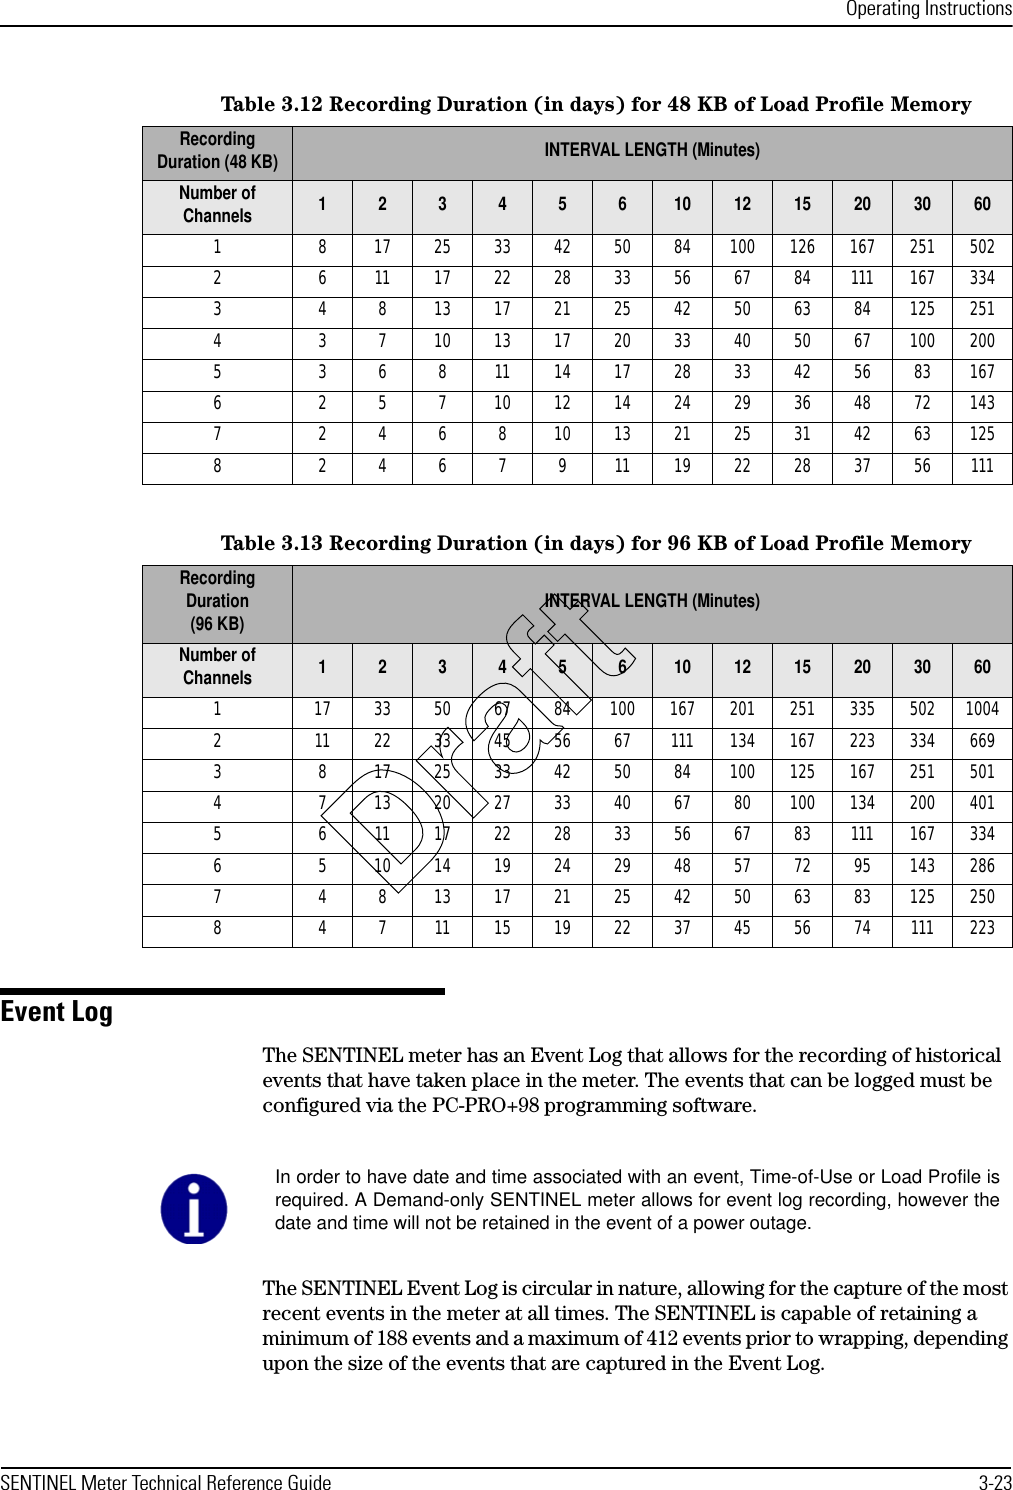
![Operating Instructions3-14 SENTINEL Meter Technical Reference GuideDiagnostic DisplaysThe user may program the behavior that the meter should exhibit for every specific error condition. The possible actions in order of increasing severity are ignore the error (do not display the error code); scroll its error code (an error code is automatically displayed after each display item); or lock the display, showing only the error code (do not display anything else).RegistersThere are five register types in the SENTINEL: energy, demand, instantaneous, self read (or snapshot), and Information.Energy RegistersThe SENTINEL can measure numerous energy quantities (Table 3.8) from which the user can configure any eight to be registered.Table 3.8 SENTINEL Energy QuantitiesMeasured Quantity Type Phases DirectionsWatthours aggregate deliveredreceivedVarhours aggregatedeliveredreceivednet deliverednet receivedper quadrantVA-hours (vectorial or arithmetic [RMS]) aggregate deliveredreceivedlaggingVolt-hours (Vh)phase Aphase Bphase CaverageAmp-hours (Ah)phase Aphase Bphase CneutralV2haggregateA2haggregateQ-hours aggregate deliveredDraft](https://usermanual.wiki/Schlumberger-Sema/SMFMM-1/User-Guide-297972-Page-52.png)
![Operating InstructionsSENTINEL Meter Technical Reference Guide 3-15Demand RegistersDemands can be calculated from any of the 8 selected energy quantities. The user can configure up to 10 demand registers. The SENTINEL can compute three types of demand: Block Demand, Rolling Demand, or Thermal Demand.Instantaneous RegistersThe SENTINEL is capable of displaying Primary or Secondary Instantaneous registers, with the following exceptions: Frequency, P.F., and Phase Angles. The user can configure the CT and VT multipliers (transformer ratios) using PC-PRO+ 98 Programming Software.Table 3.9 SENTINEL Demand QuantitiesMeasured Quantity Type Demand Registers Phases DirectionsWatthours Block, Rolling, Thermal aggregate deliveredreceivedVarhours Block, Rolling, Thermal aggregate deliveredreceivedper quadrantVA-hours (vectorial or arithmetic [RMS]) Block, Rolling, Thermal aggregate deliveredreceivedlaggingVolt-hours (Vh) nophase Aphase Bphase CaverageAmp-hours (Ah) Blockphase Aphase Bphase CneutralV2hno aggregateA2hno aggregateQ-hours no aggregate deliveredTable 3.10 Instantaneous RegistersQuantity Directions (Types) [Range] PhasesW Signed (+) Delivered or (-) Received AggregateVar Signed (+) Delivered or (-) Received AggregateVA (Vectorial or Arithmetic) None AggregateV None A, B, CA None A, B, C, NPF None AverageFrequency None APhase Angles Va = 0° Vb, Vc, Ia, Ib, IcDraft](https://usermanual.wiki/Schlumberger-Sema/SMFMM-1/User-Guide-297972-Page-53.png)
![Operating Instructions3-22 SENTINEL Meter Technical Reference Guide2Long Interval—The status bit is set for a long interval due to a time adjust backwards.3Skipped Interval—The status bit is set for a skipped interval due to either a power outage, Test Mode, or time adjusted forward during the interval.4Test Mode—The status bit is set for Test Mode due to the meter being in test mode during the interval.5DST—The status bit is set for DST due to DST being in effect during the interval.6Power Outage—The status bit is set for each interval during which a power outage occurs (greater than the minimum time programmed in software).7Time adjust forward—The status bit is set for time adjust forward during the interval.8Time adjust backward—The status bit is set for time adjust backward during the interval.In addition to the interval profile data and the interval status data, each block contains a time tag specifying the month, day, hour, and second of the end of the data block.Recording DurationThe following equation can be used to determine the recording duration of the load profile:Recording Duration (days) = (M x I x 1024) / (1,440 x [(2 x C + 2) + ((6 x C + 4) / 128)])M = Memory size in kilobytesC = Number of channelsI = Interval Length in minutesTable 3.12 shows the recording duration for 48 kilobytes (KB) load profile memory size; Table 3.13 shows the recording duration for 96 KB load profile memory size.Refer to the PC-PRO+ 98 Online Help for a list of Load Profile Status Codes.Draft](https://usermanual.wiki/Schlumberger-Sema/SMFMM-1/User-Guide-297972-Page-60.png)


![Theory of Operation4-6 SENTINEL Meter Technical Reference GuideFigure 4.3 Power Supply BoardSwitching Power SupplyThe switching power supply is a classic isolated flyback topology supply. This topology provides high power conversion efficiency and is optimal for wide-ranging input voltages. The immediate output of the switching supply is 12[Vdc]. The 12[Vdc] is linearly regulated to 3[Vdc] for the meter electronics.A large capacitor on the 12[Vdc] output stores the energy needed to write billing data to non-volatile memory upon an outage.Surge ProtectionSurge protection for the electronics in the SENTINEL meter is provided by Metal Oxide Varistors (MOVs). MOVs are clamping devices that allow voltage up to a limit, and then increasingly conduct current to prevent the voltage from exceeding the limit. The MOVs on the power supply board are connected directly across the voltage inputs to the meter. Although this approach requires very large MOVs, it prevents high voltages from appearing on or near the electronic boards giving the SENTINEL superior performance when exposed to extremely high-voltage surges.EMI FilteringThe EMI filtering prevents high frequency noise from the meter’s power and digital circuits from radiating out onto the power lines. Resistors, inductors, and capacitors work together to provide the needed filtering.Current Transformer ConnectionsNoiseSuppressionPolyphase Supply OptionPolyphase Supply OptionSurge Suppression+3.8Vdc SupplySurge Suppression+12Vdc SupplyThe SENTINEL meter is not line isolated. The circuit board ground is electrically linkedto the external meter neutral connection. The internal meter ground could be as muchas 480V above earth ground in certain metering installations.Draft](https://usermanual.wiki/Schlumberger-Sema/SMFMM-1/User-Guide-297972-Page-72.png)
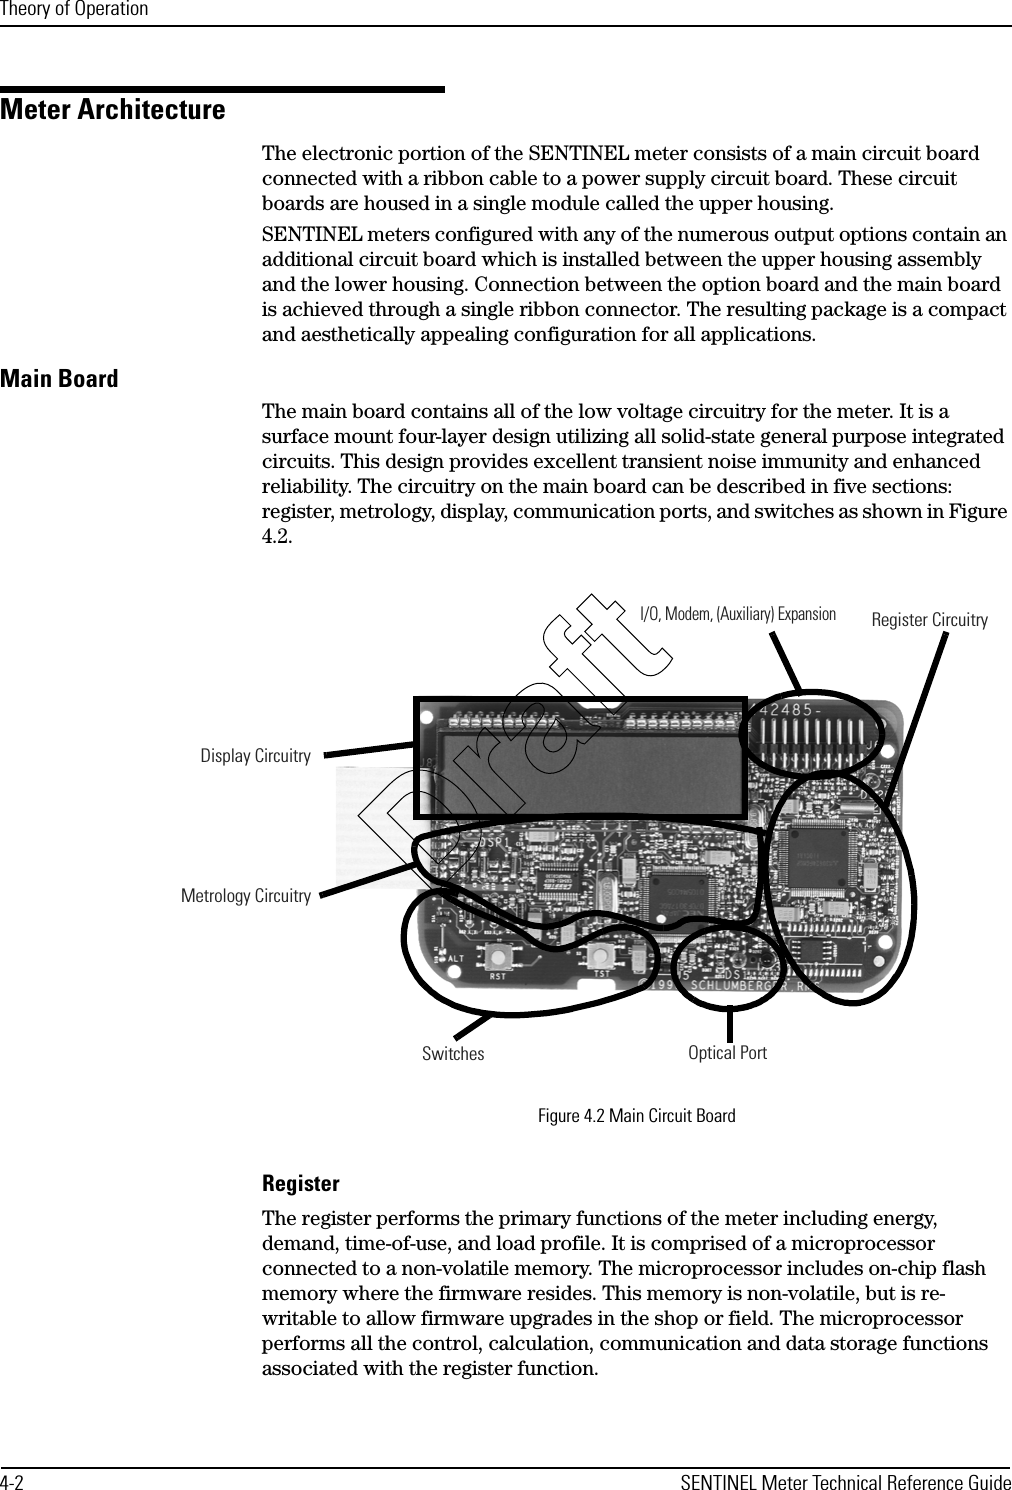
![Theory of OperationSENTINEL Meter Technical Reference Guide 4-7Measurement TechniquesThe SENTINEL uses voltage dividers to sense voltage and current transformers to sense current. Use of this type of voltage circuit requires that the ground for electronics be connected to line neutral. These sensors produce low-level signals that are exactly proportional to the service voltage and current. These low level signals are sampled simultaneously by 6 analog-to-digital converters packaged in a single device. The voltage and current waveforms from each meter phase are sampled 1953 times per second.Special techniques employed in the digital sampling process ensure that the sample measurements track the waveform shape exactly, even when the normal 50/60 Hz sine wave becomes distorted. These techniques make the SENTINEL meter much more accurate than standard induction meters under high harmonic conditions because high frequency waveform components do not go undetected.A dedicated microprocessor analyzes the rapid succession of voltage and current samples and computes instantaneous values and energy quantities. Because processing is done at the sample rate, the meter can determine both active and reactive power.Another processor accumulates the desired active energy, reactive energy, demand, Time-of-Use (TOU), and load profile quantities. In addition, this processor maintains an LCD and real-time clock.A current mode flyback switching power supply supports the SENTINEL meter’s circuitry. The power supply provides +3 VDC for analog and digital circuit operation. SENTINEL meter functions are implemented in a combination of hardware and firmware. The operation of some of these functions depends on parameters that are programmed within the meter using PC-PRO+ 98.CalibrationFactory calibration corrects for normal part-to-part variations for each component that impacts metrological accuracy. Although these components vary in initial value, they have been chosen by design to be stable over time and temperature. Field verification of the metrological accuracy can be done many ways, but field calibration is not required. Factory calibration of the SENTINEL meter is accomplished by corrective digital signal processing. During the manufacturing process, precision instrumentation is used to compute correction coefficients for each phase under a variety of load and power factor conditions. At the end of the calibration, the correction coefficients are written into a protected non-volatile memory that can never be erased. The meter is then immediately verified for accuracy with the calibration coefficients applied.SamplingThe six analog-to-digital converters sample each phase voltage and current signal every 512 µs (independent of the line frequency) and send the digital values immediately to the microprocessor. This amounts to approximately 32 samples per cycle at 60[Hz]. Each time a new set of digital samples are received by the microprocessor, it calculates all of the selected metrological quantities.Draft](https://usermanual.wiki/Schlumberger-Sema/SMFMM-1/User-Guide-297972-Page-73.png)