Sensors and Software PE-PRO-HF250 Ground Penetrating Radar User Manual pEPROLF Manual
Sensors & Software Inc. Ground Penetrating Radar pEPROLF Manual
UserManual.wiki
>
Sensors and Software
>
PE-PRO-HF250 User Manual
>
Users Manual 2 of 2
Contents
1.
Users Manual 1 of 2
2.
Users Manual 2 of 2
Users Manual 2 of 2
Navigation menu
Upload a User Manual
Namespaces
Wiki Guide
HTML
PDF
Info
Views
User Manual
Discussion / Help
Navigation
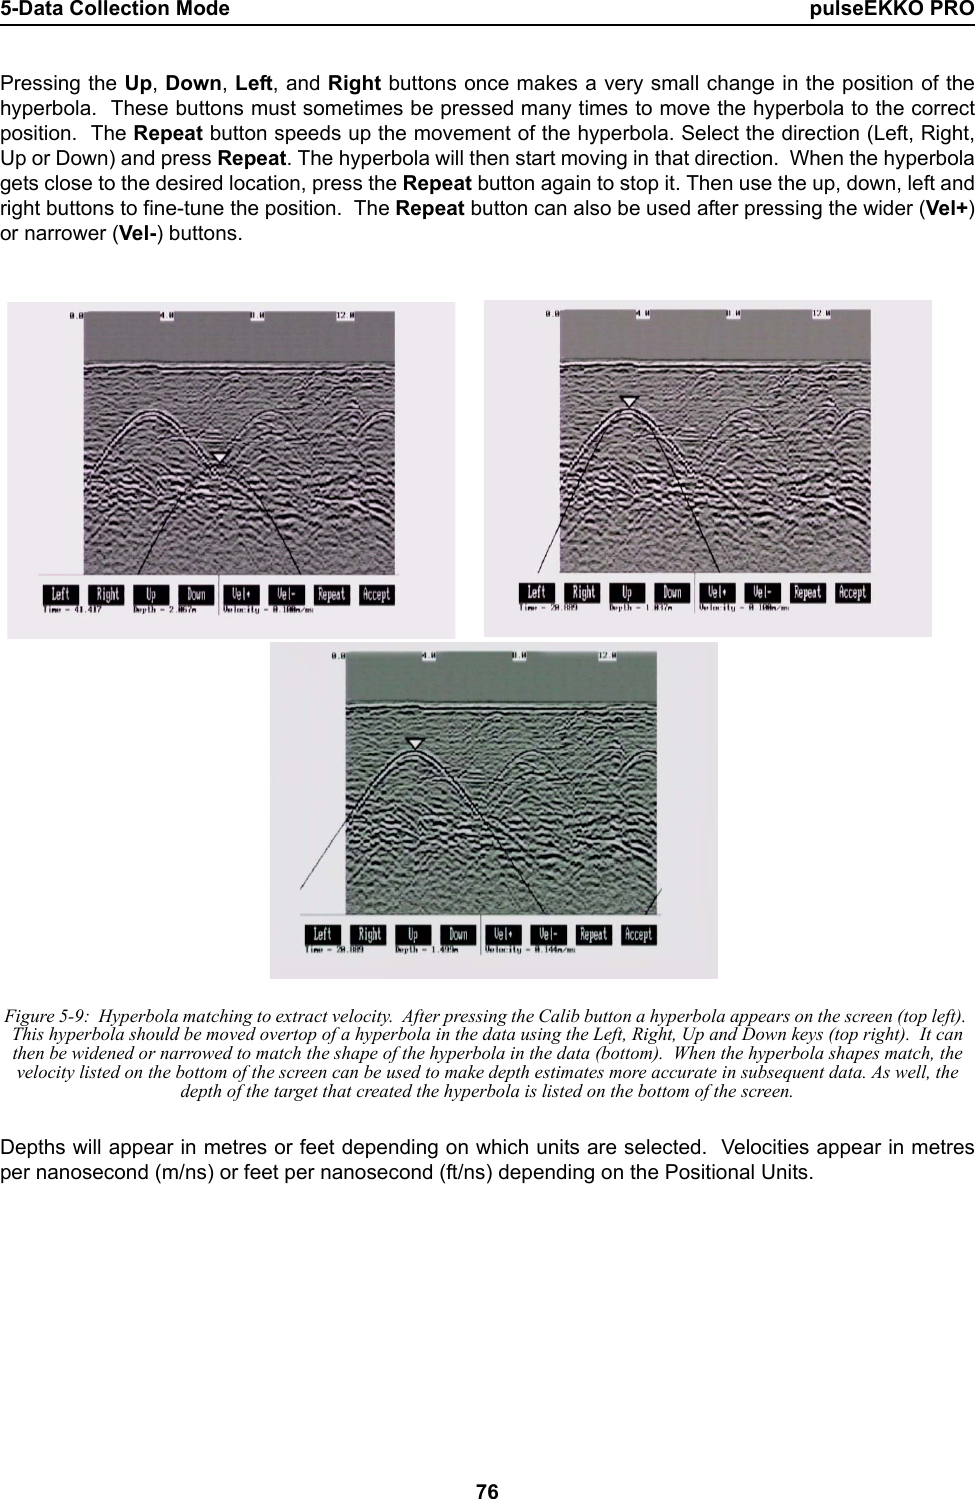
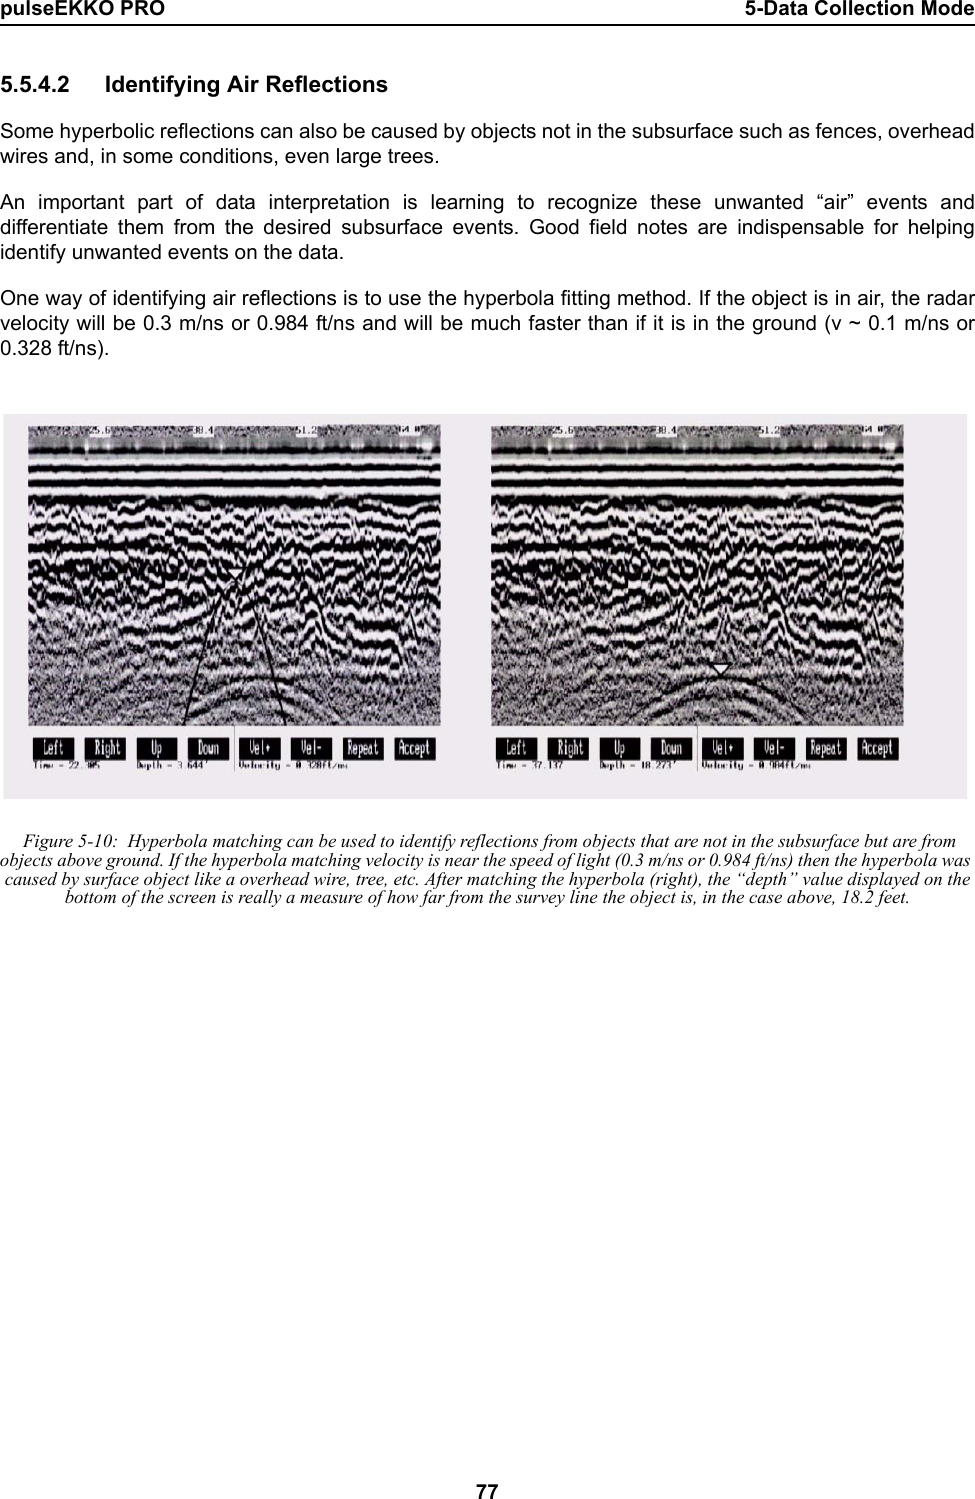
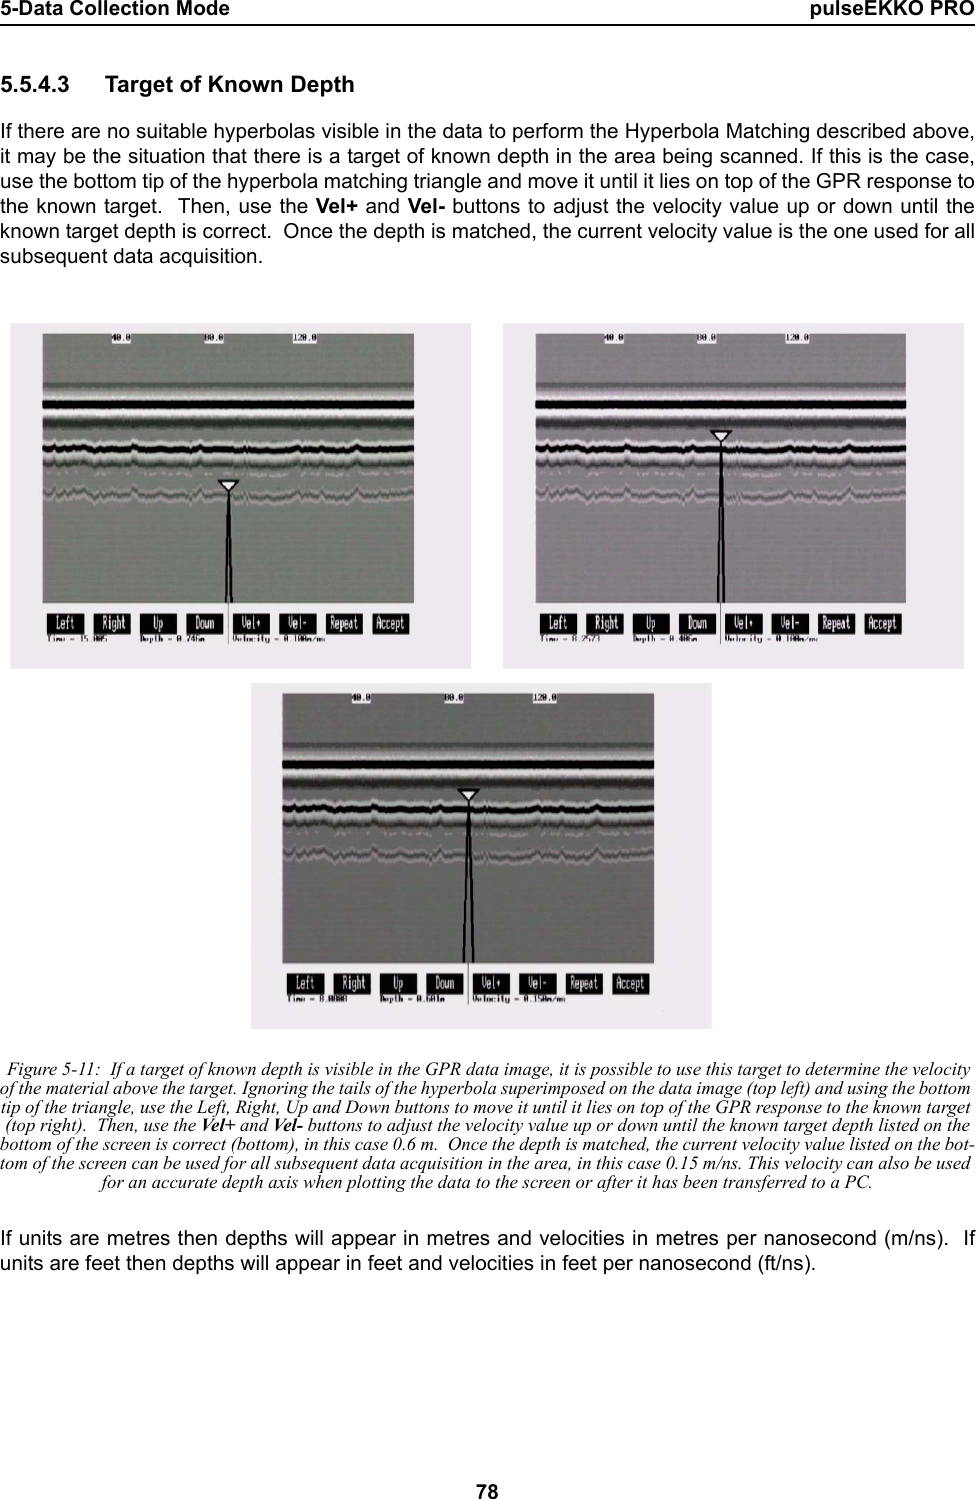
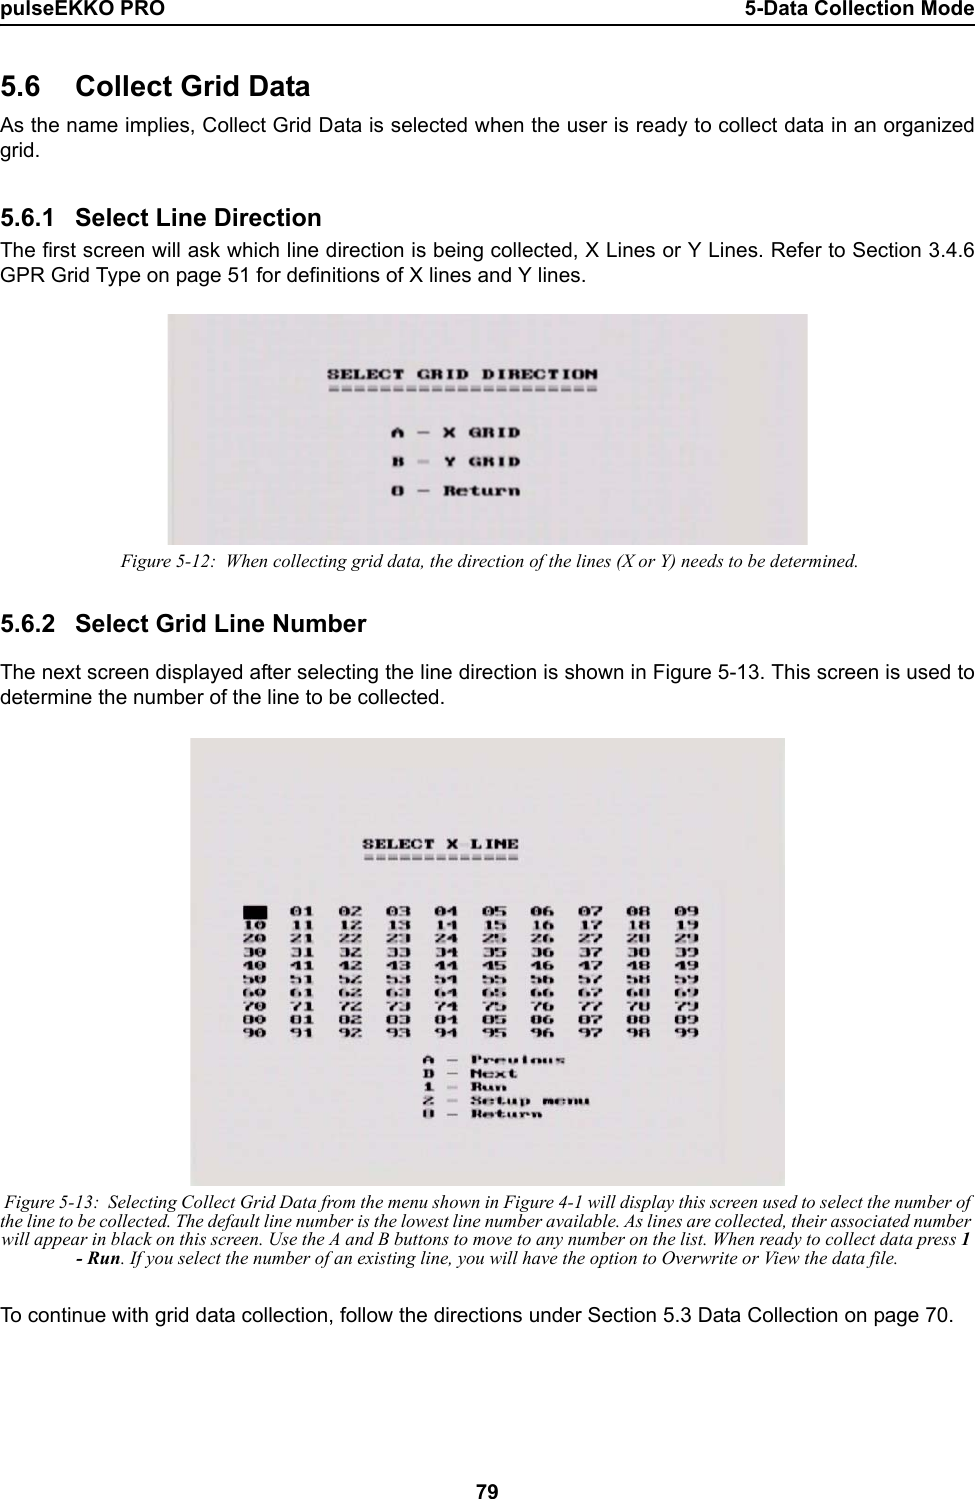
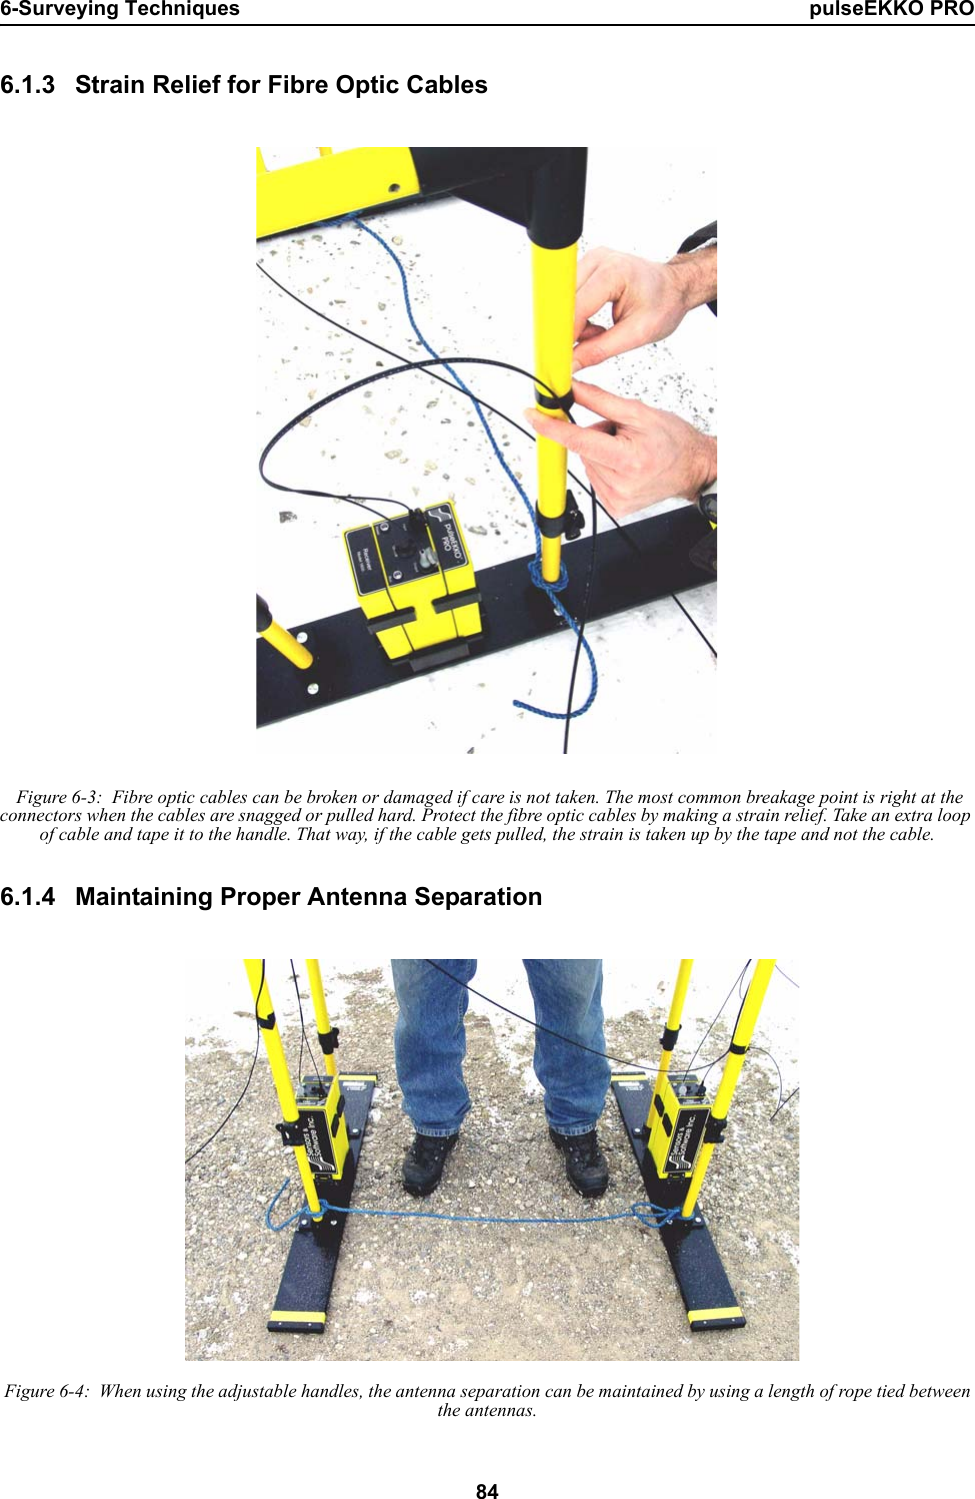
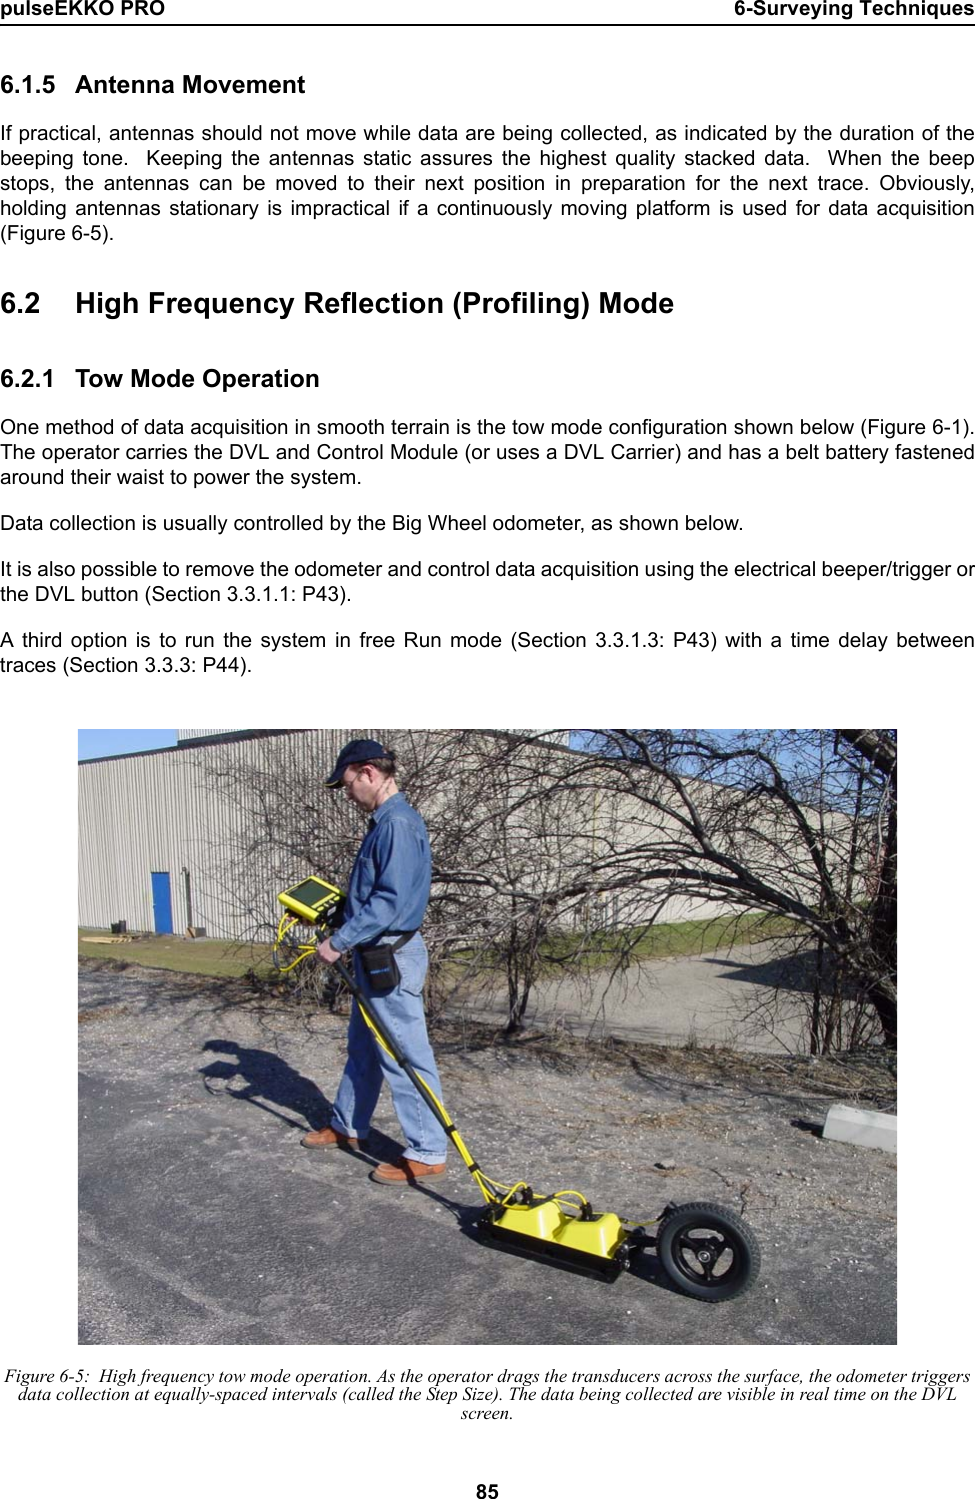
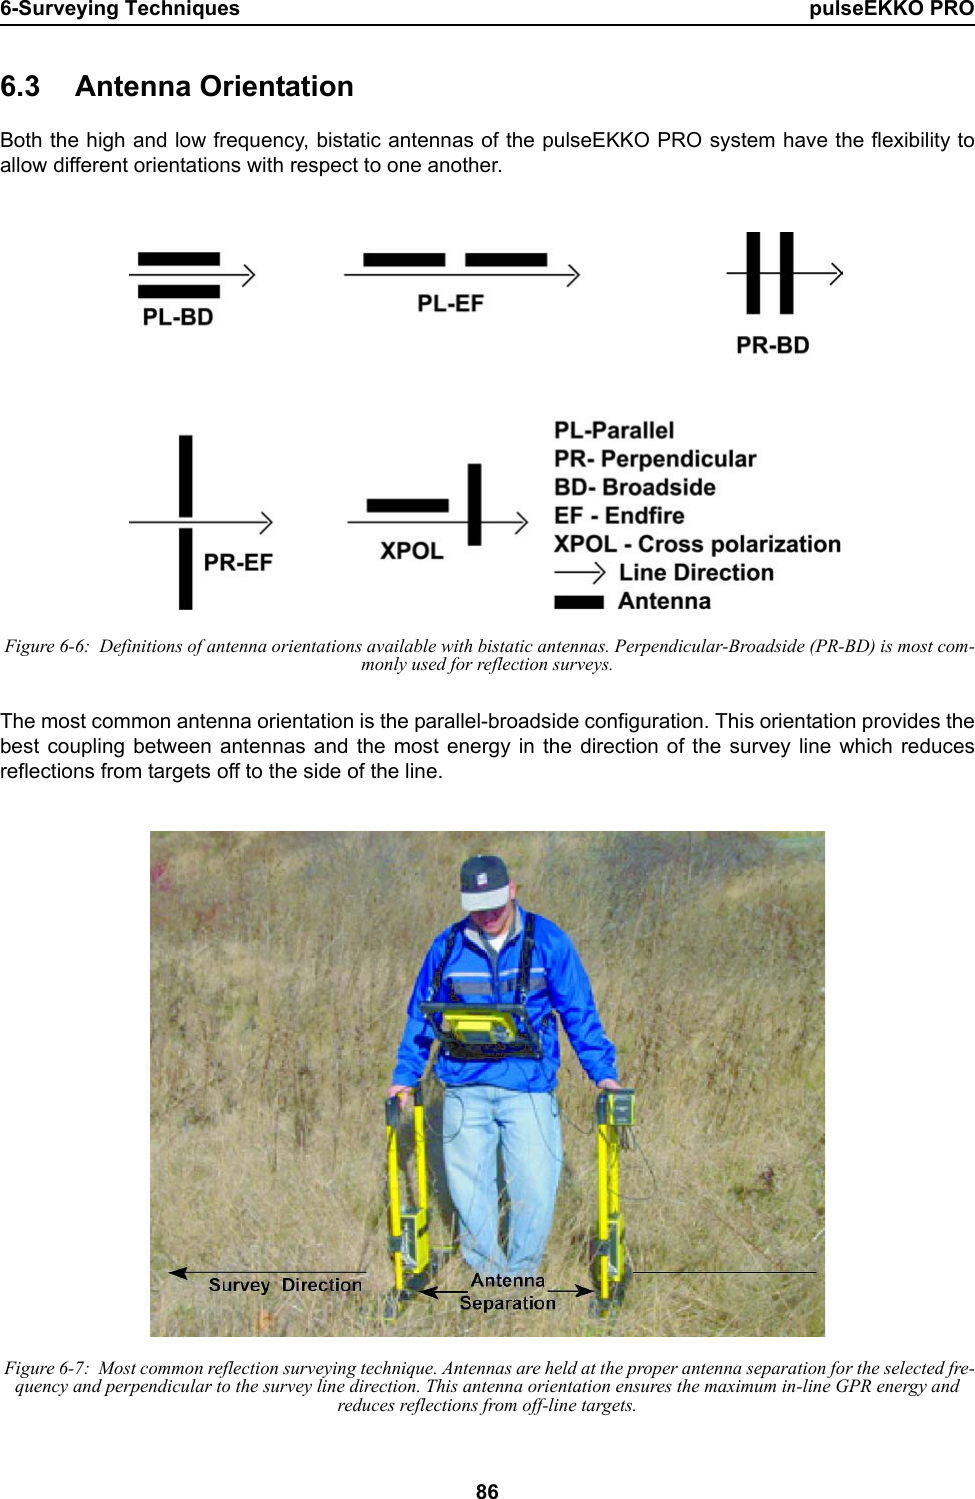
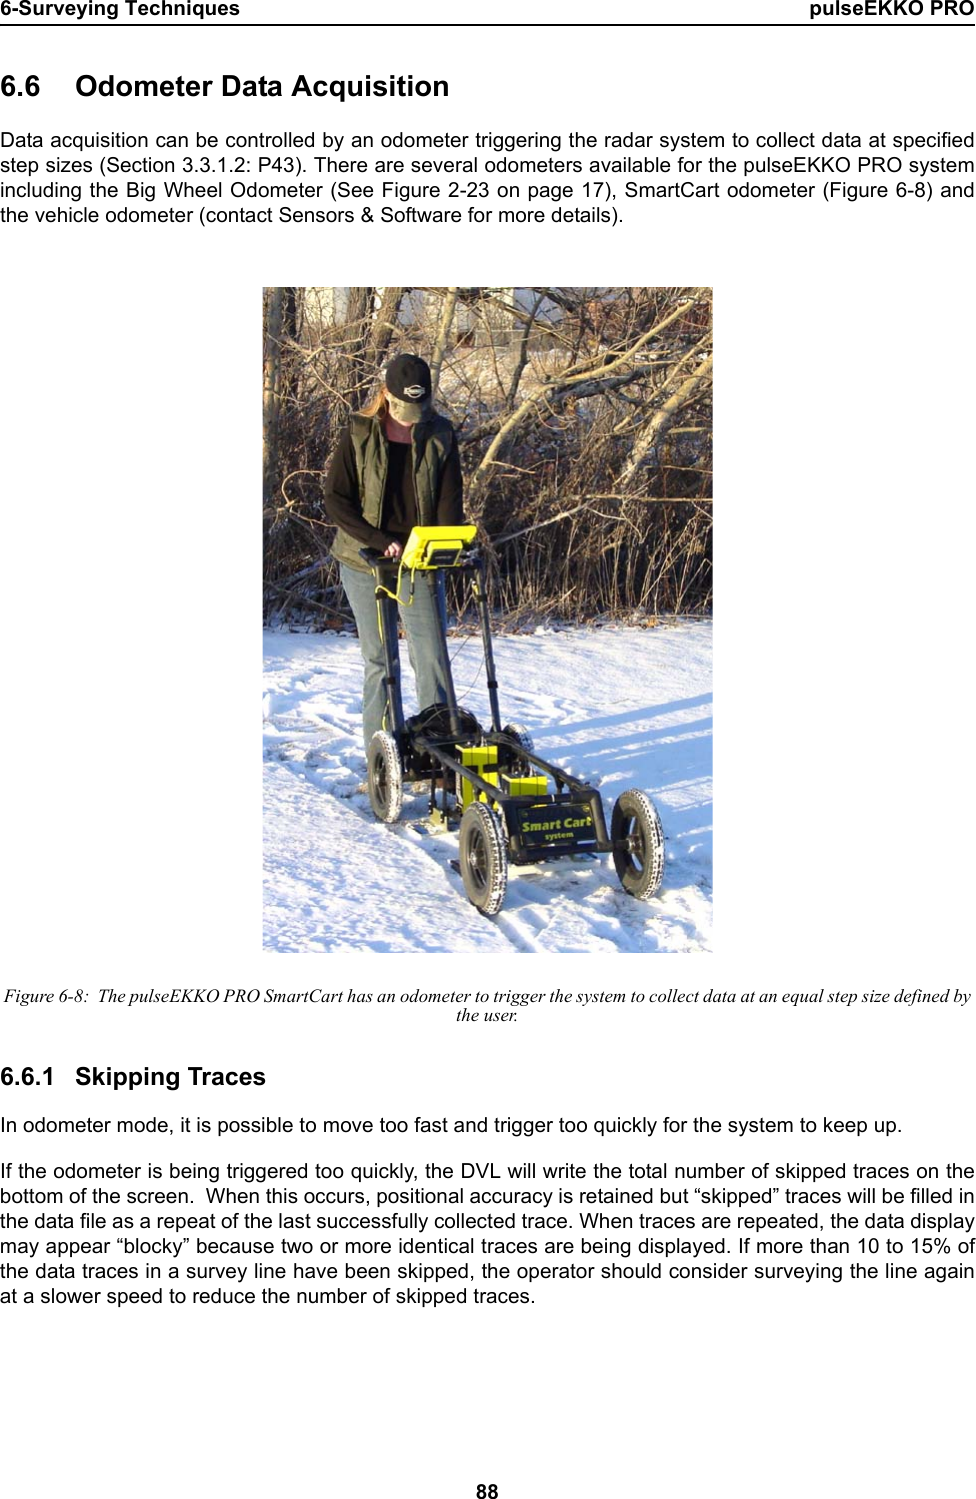
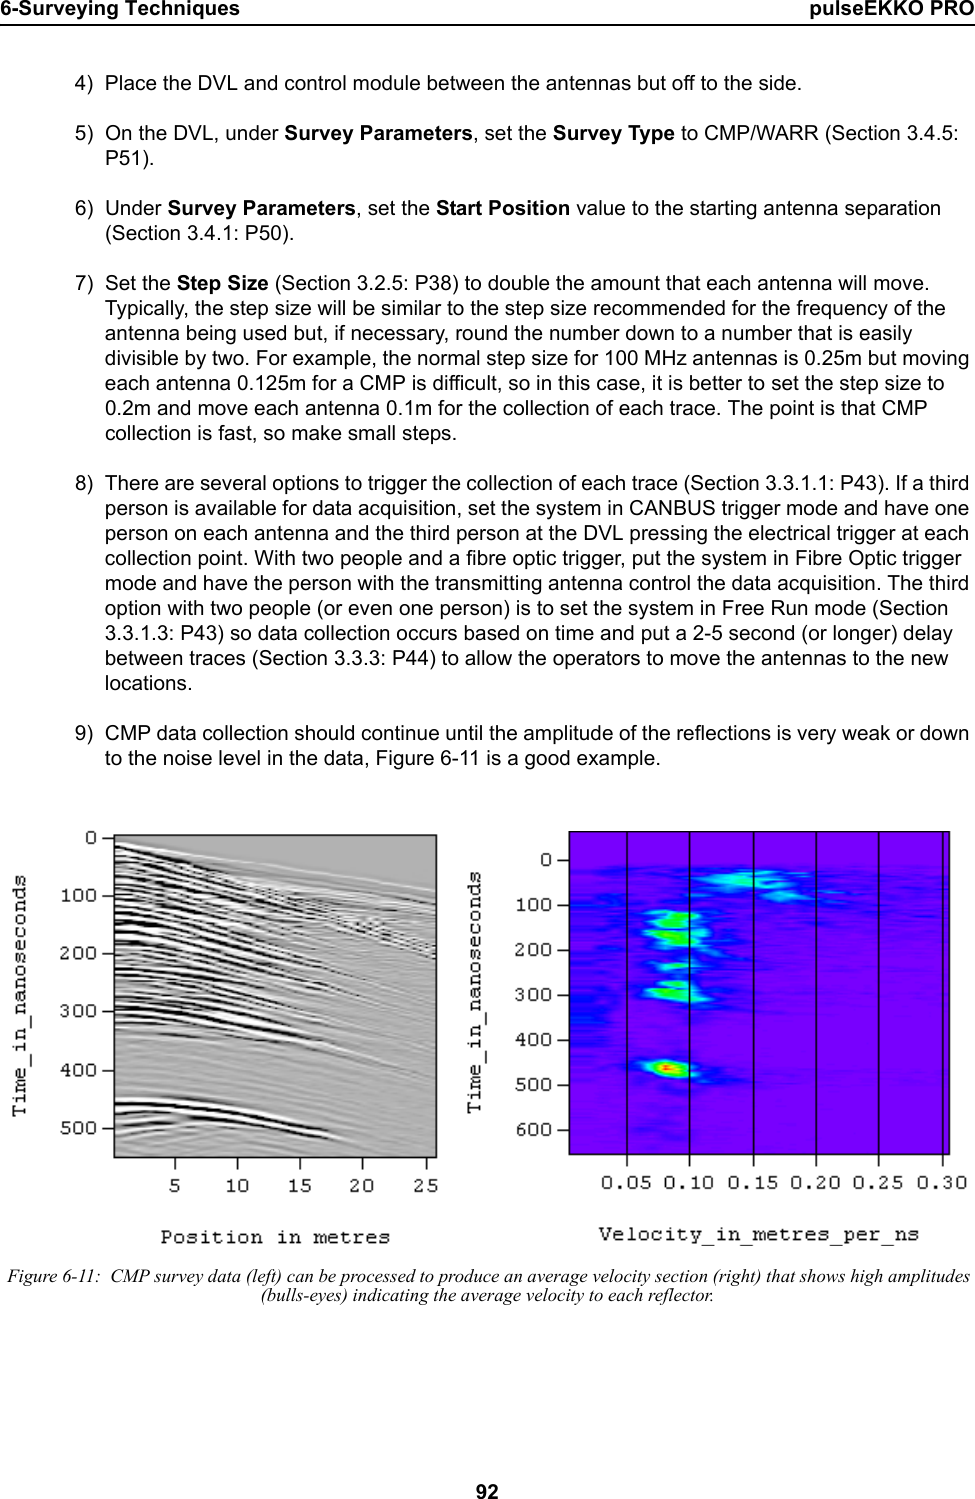
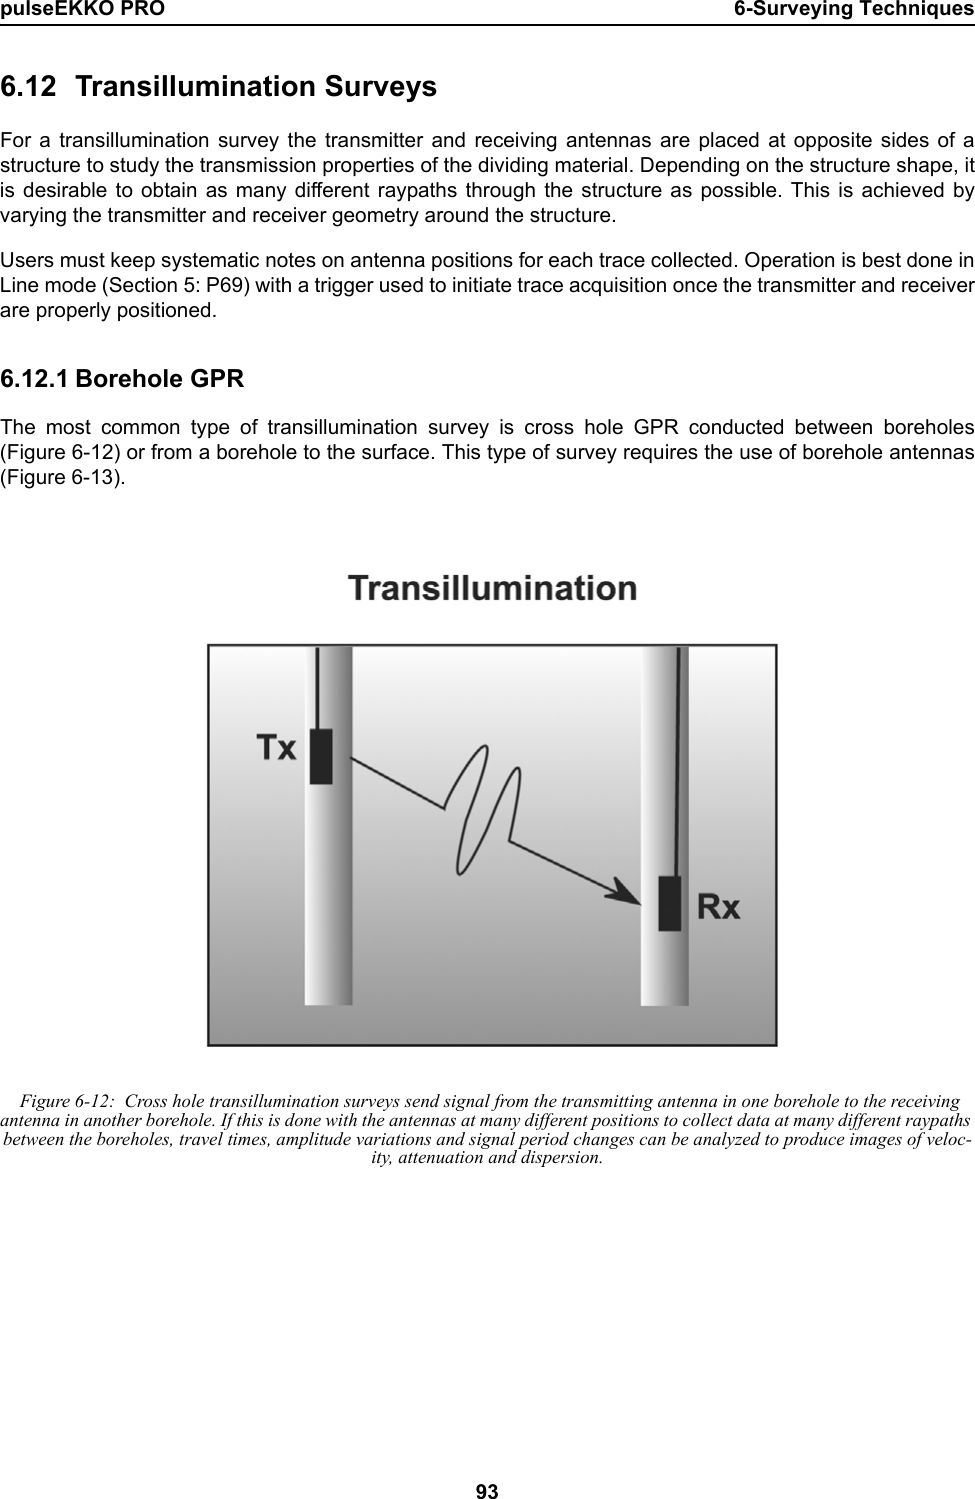
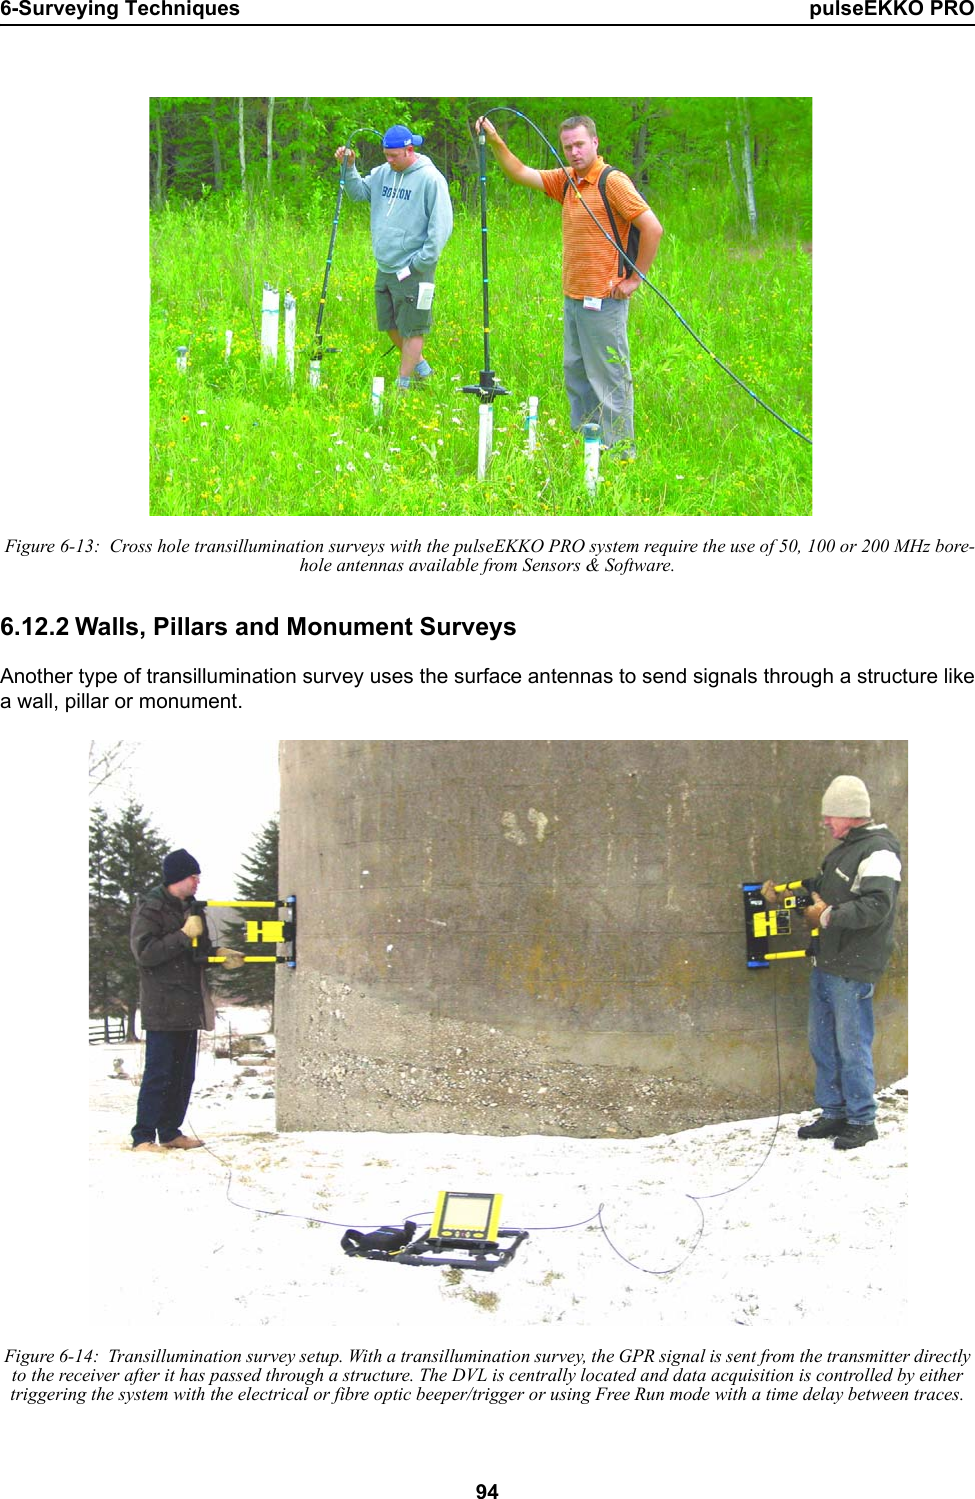
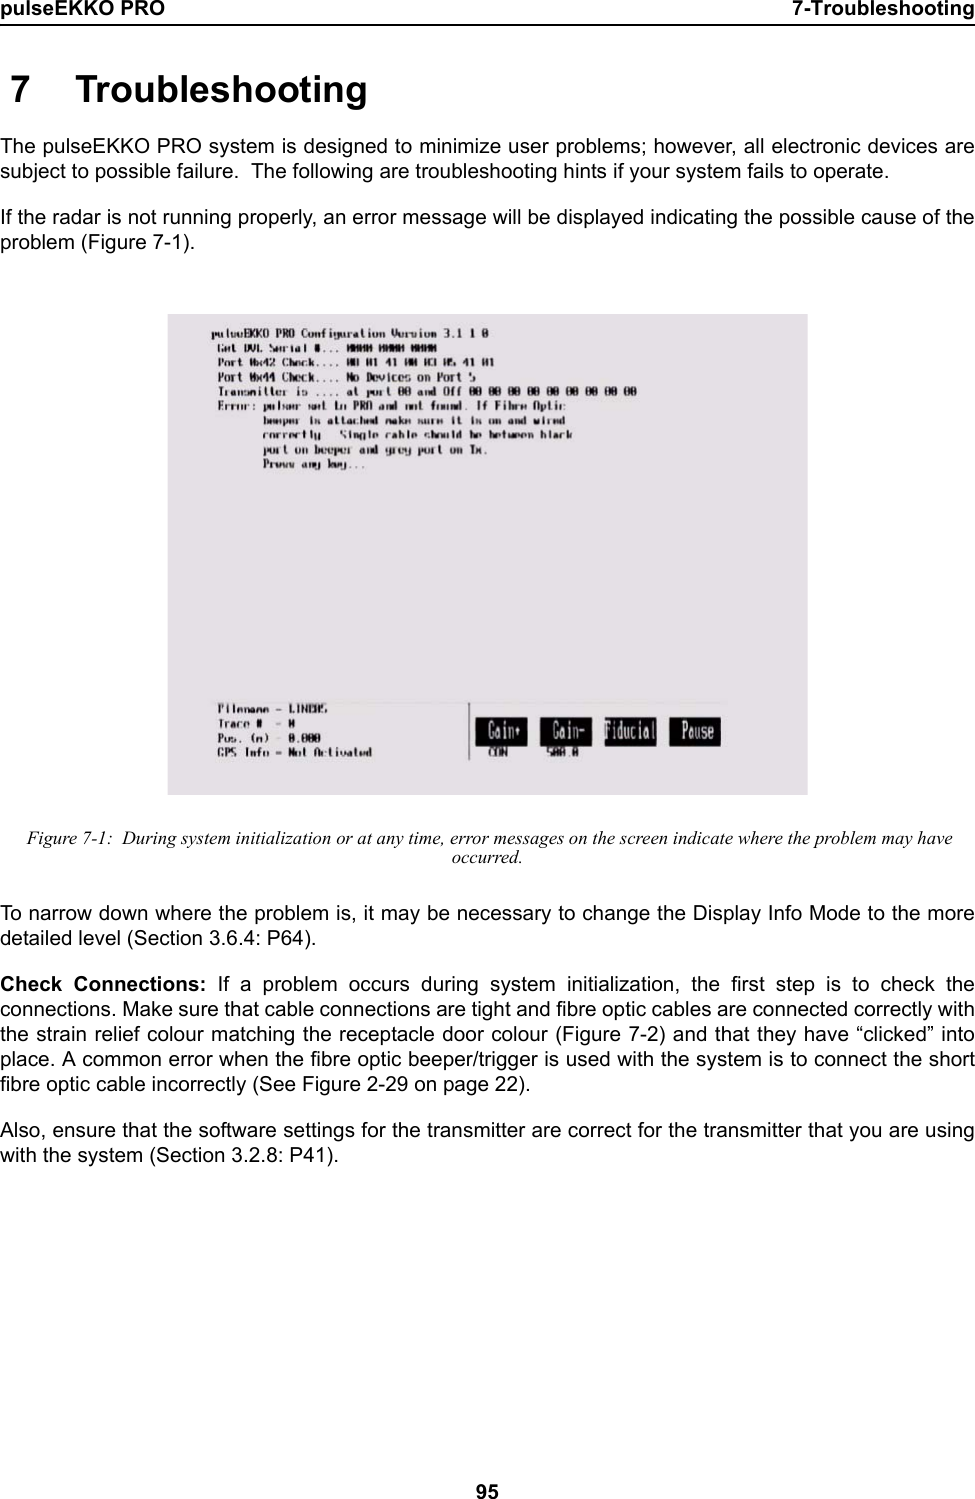
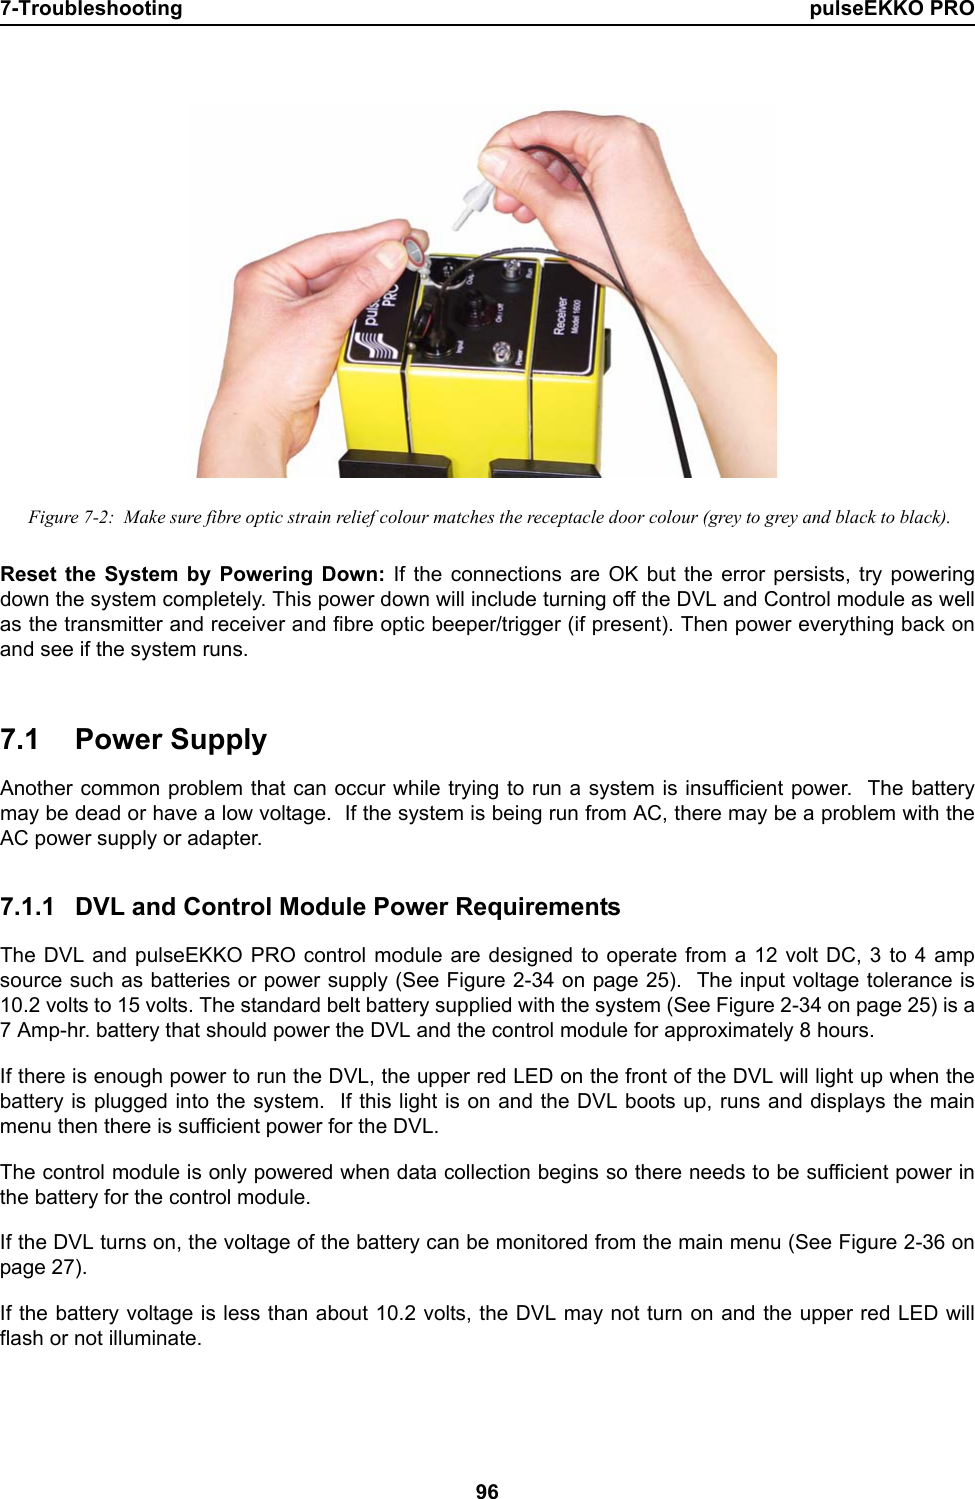
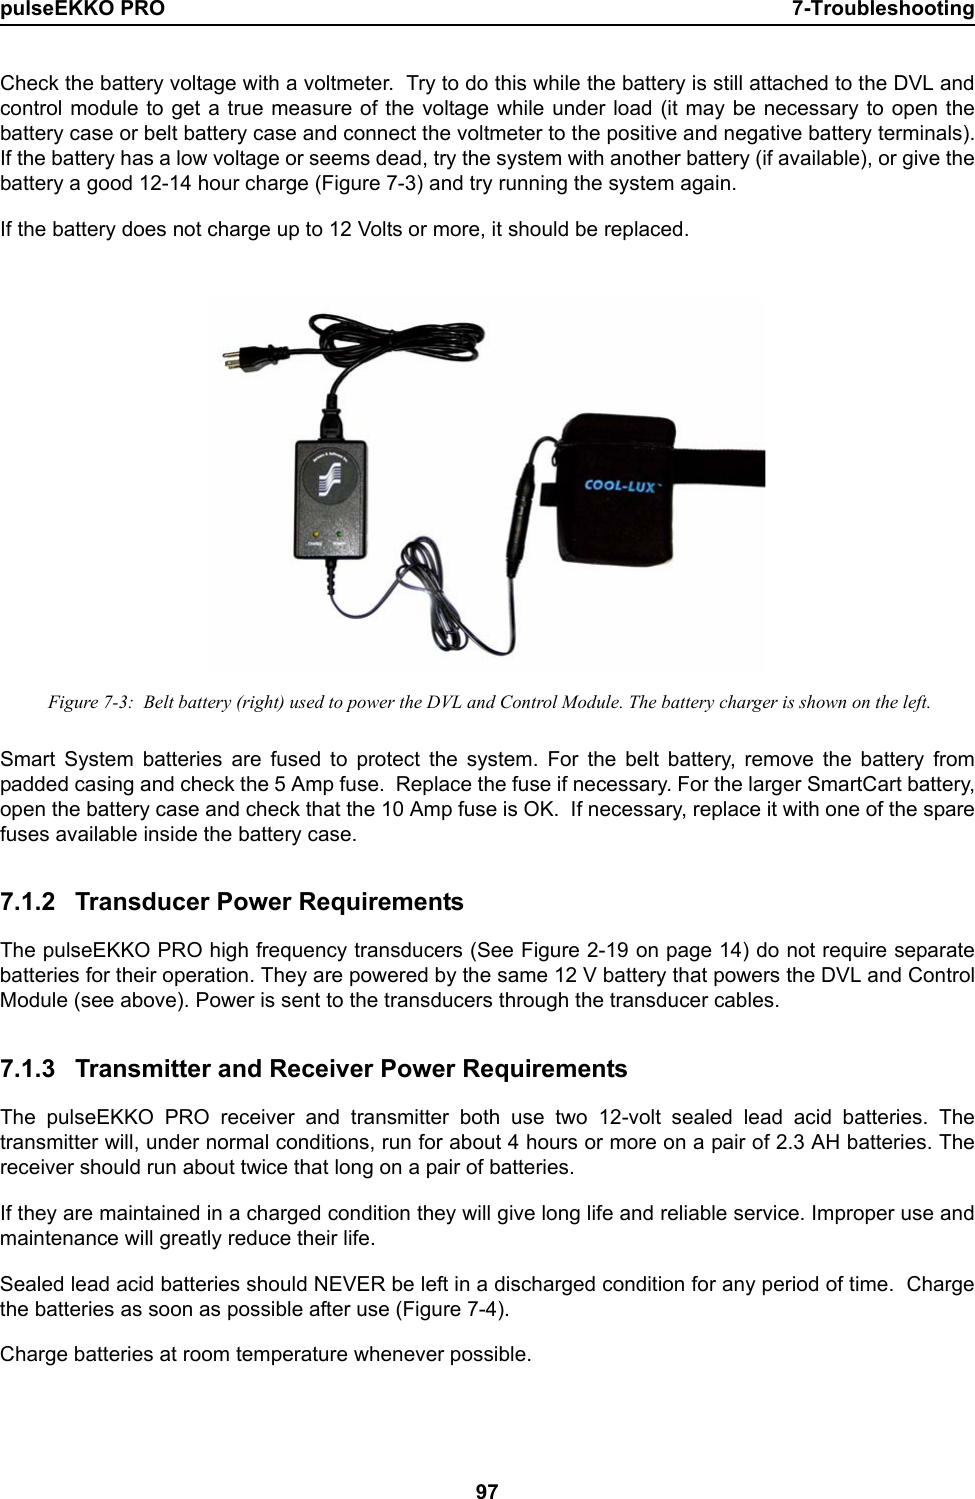
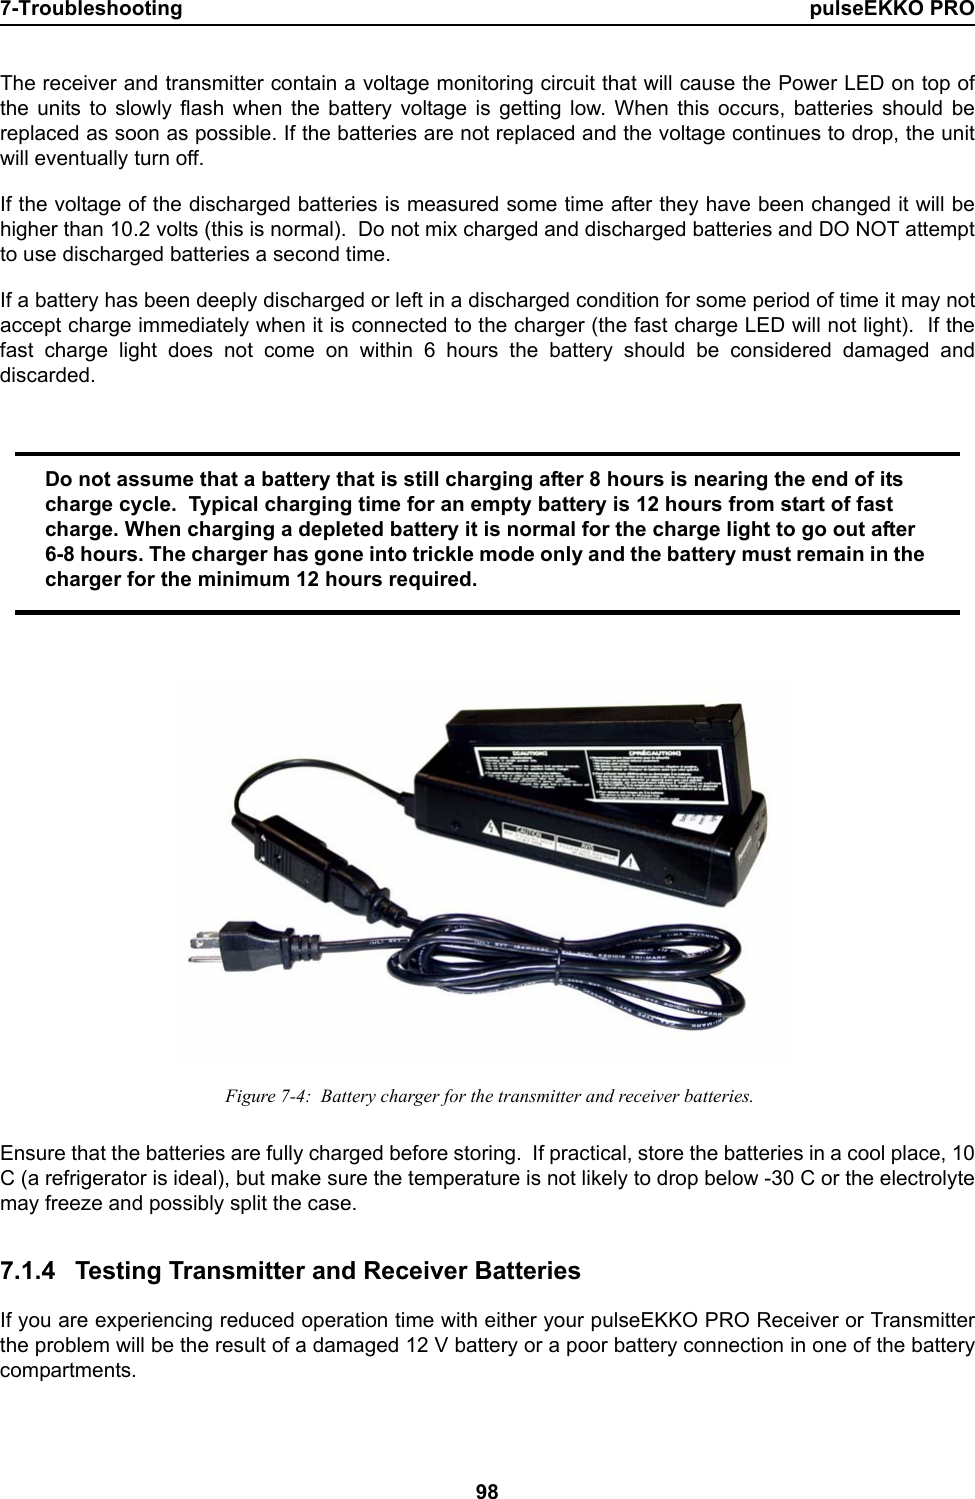
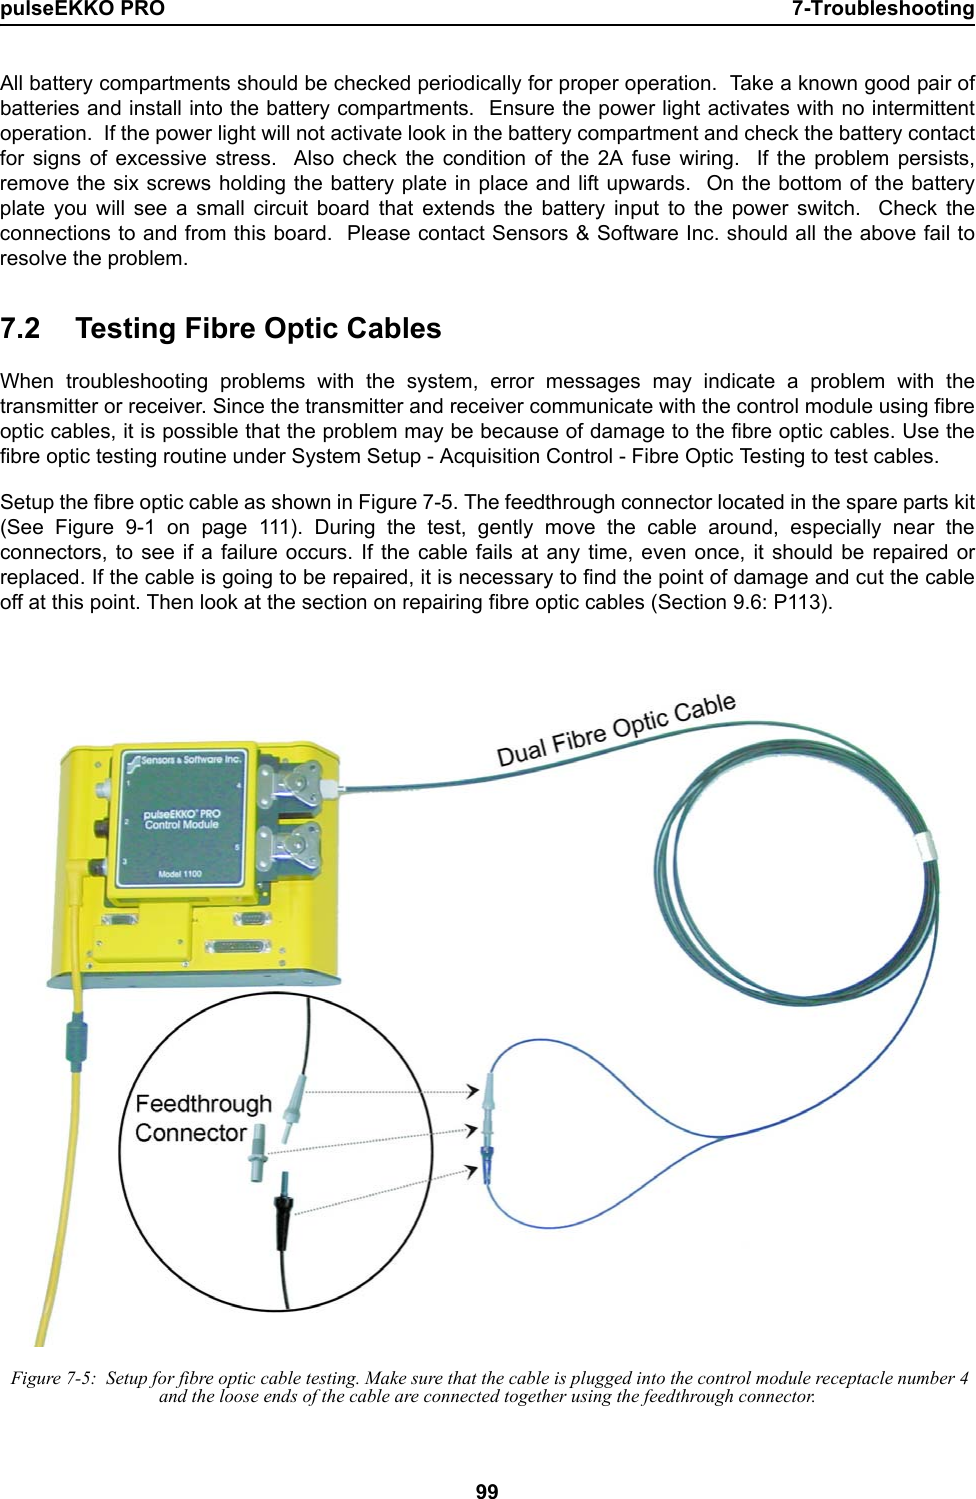
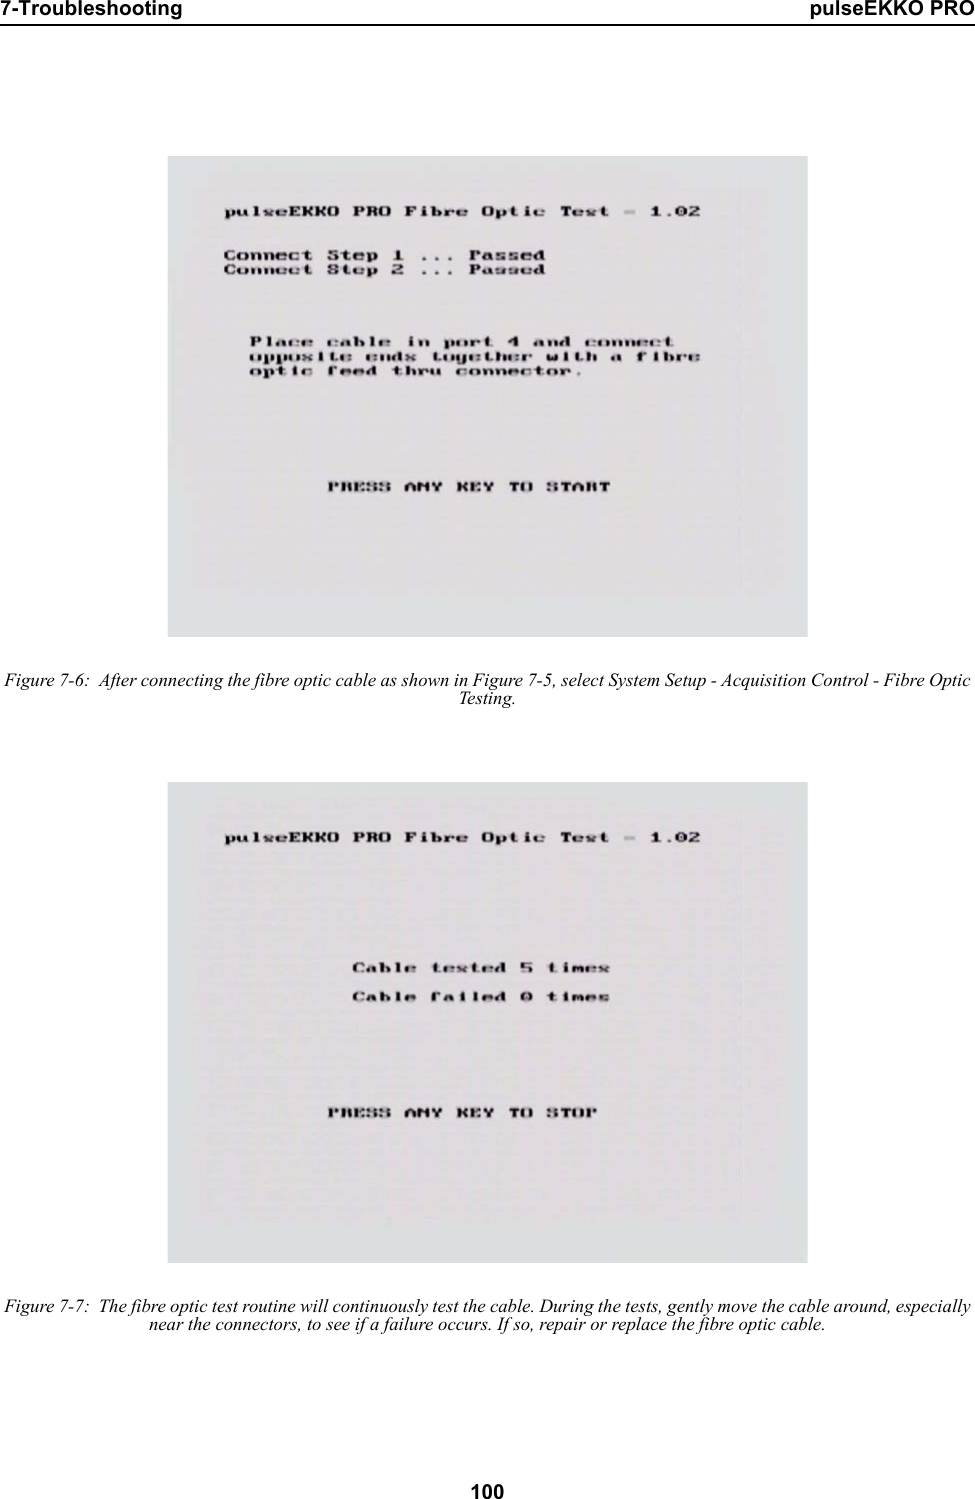
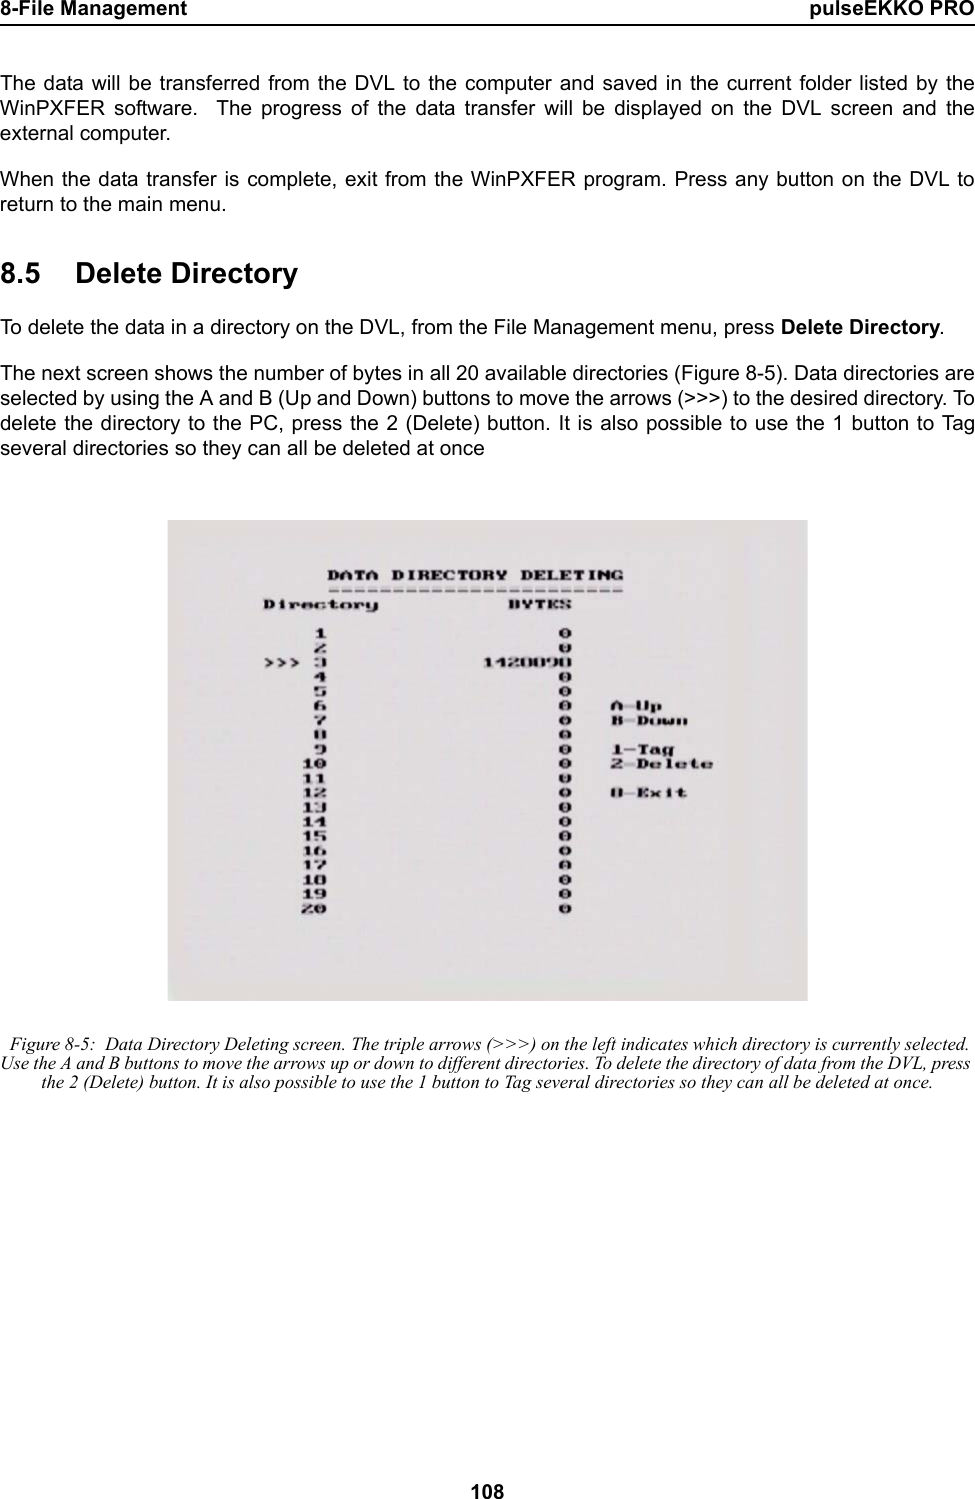
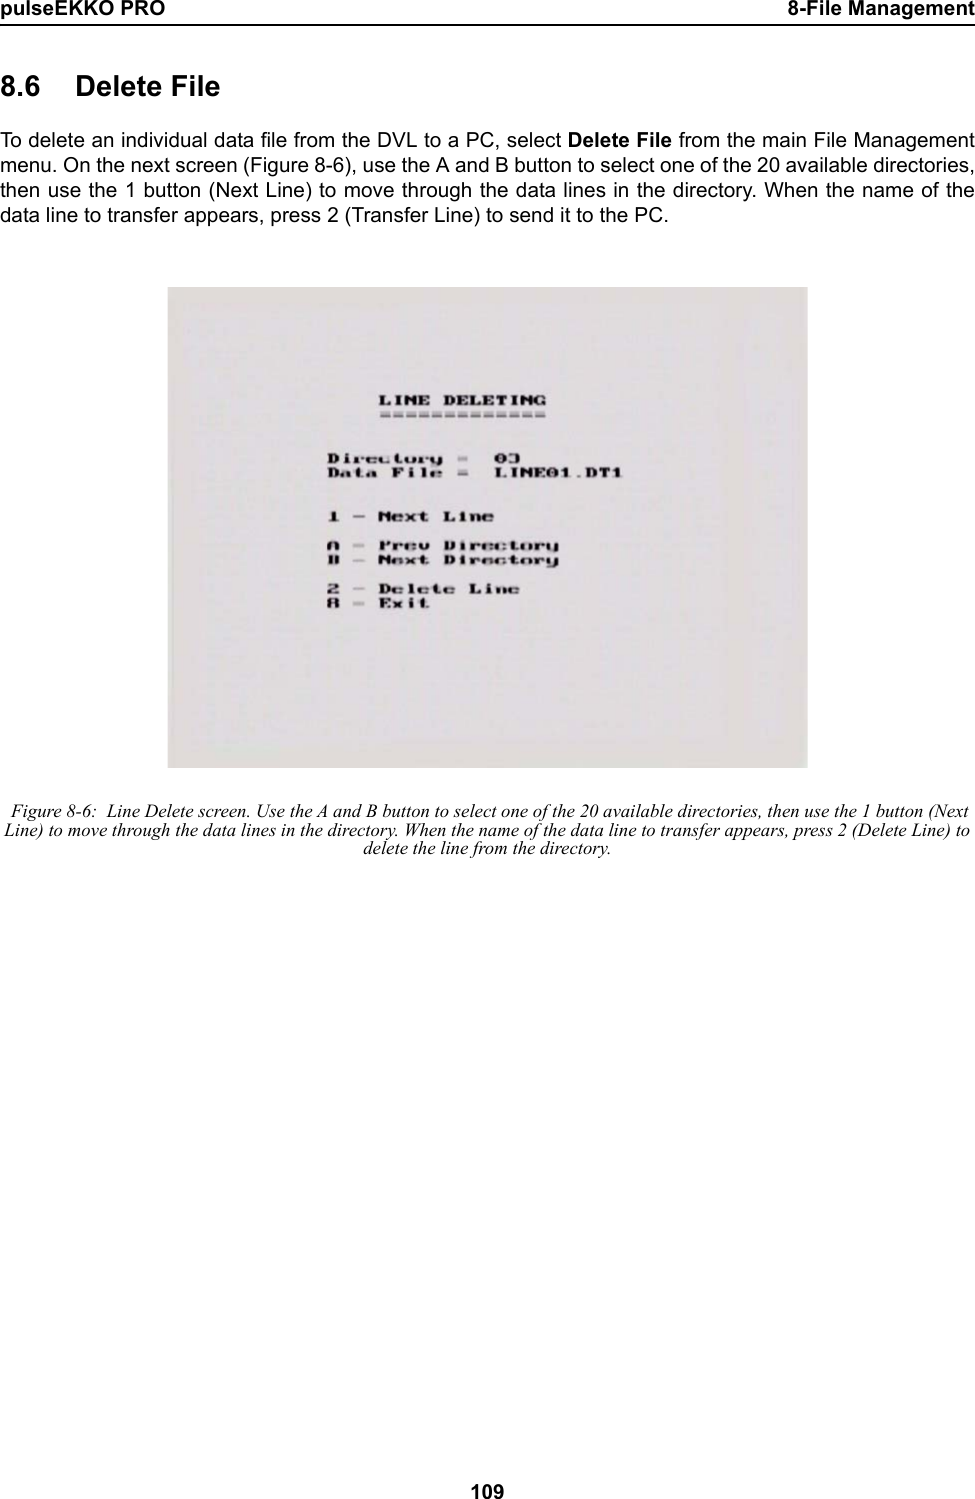
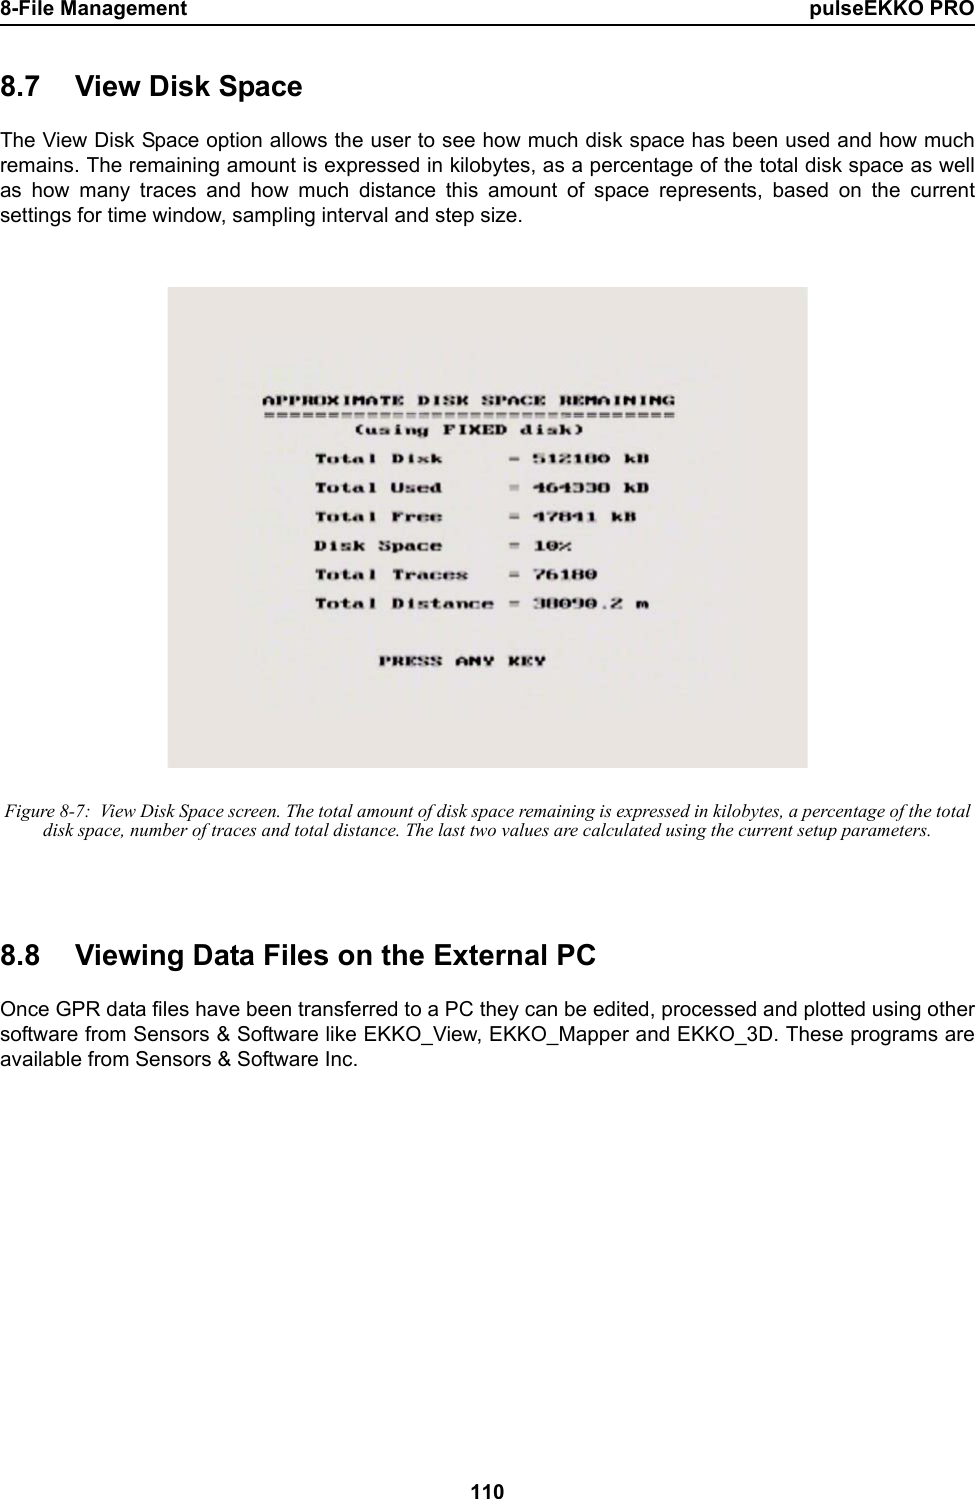
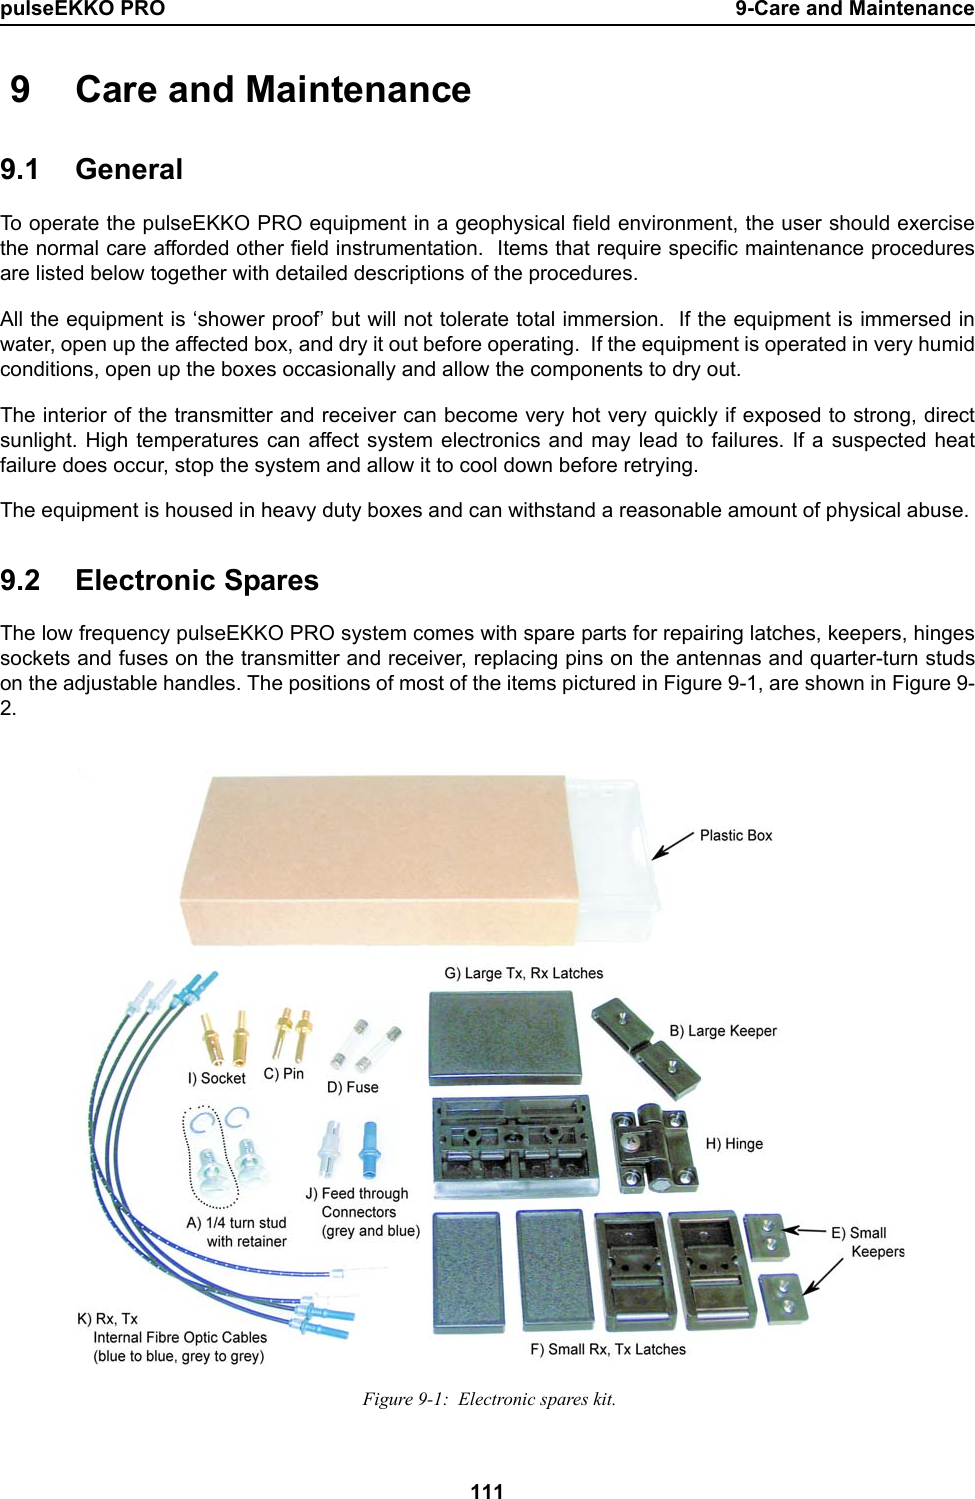

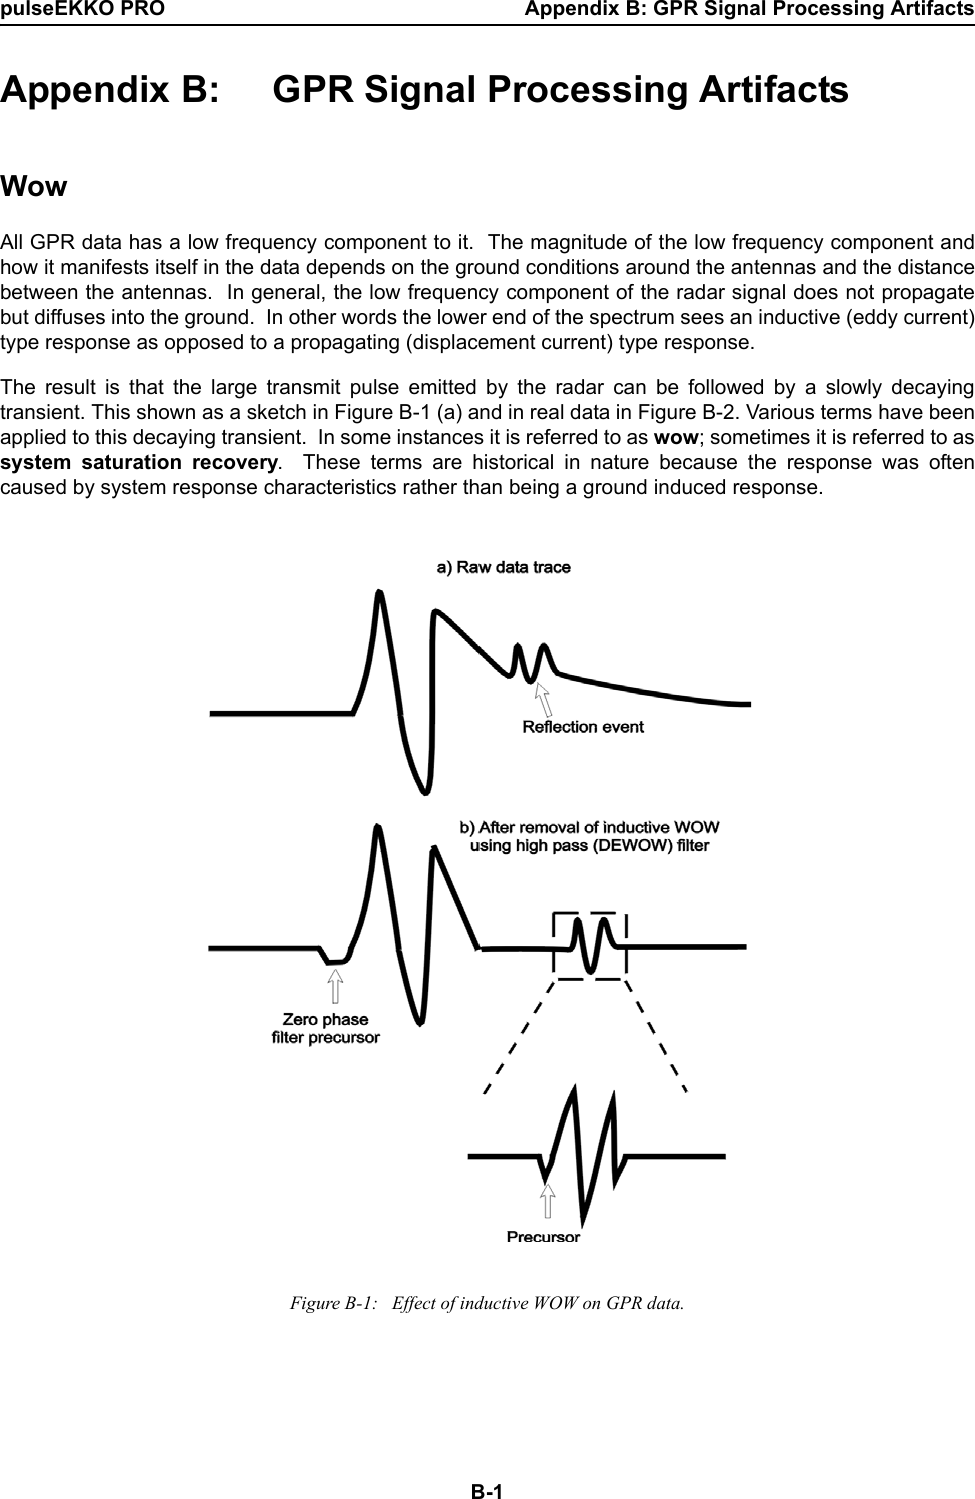
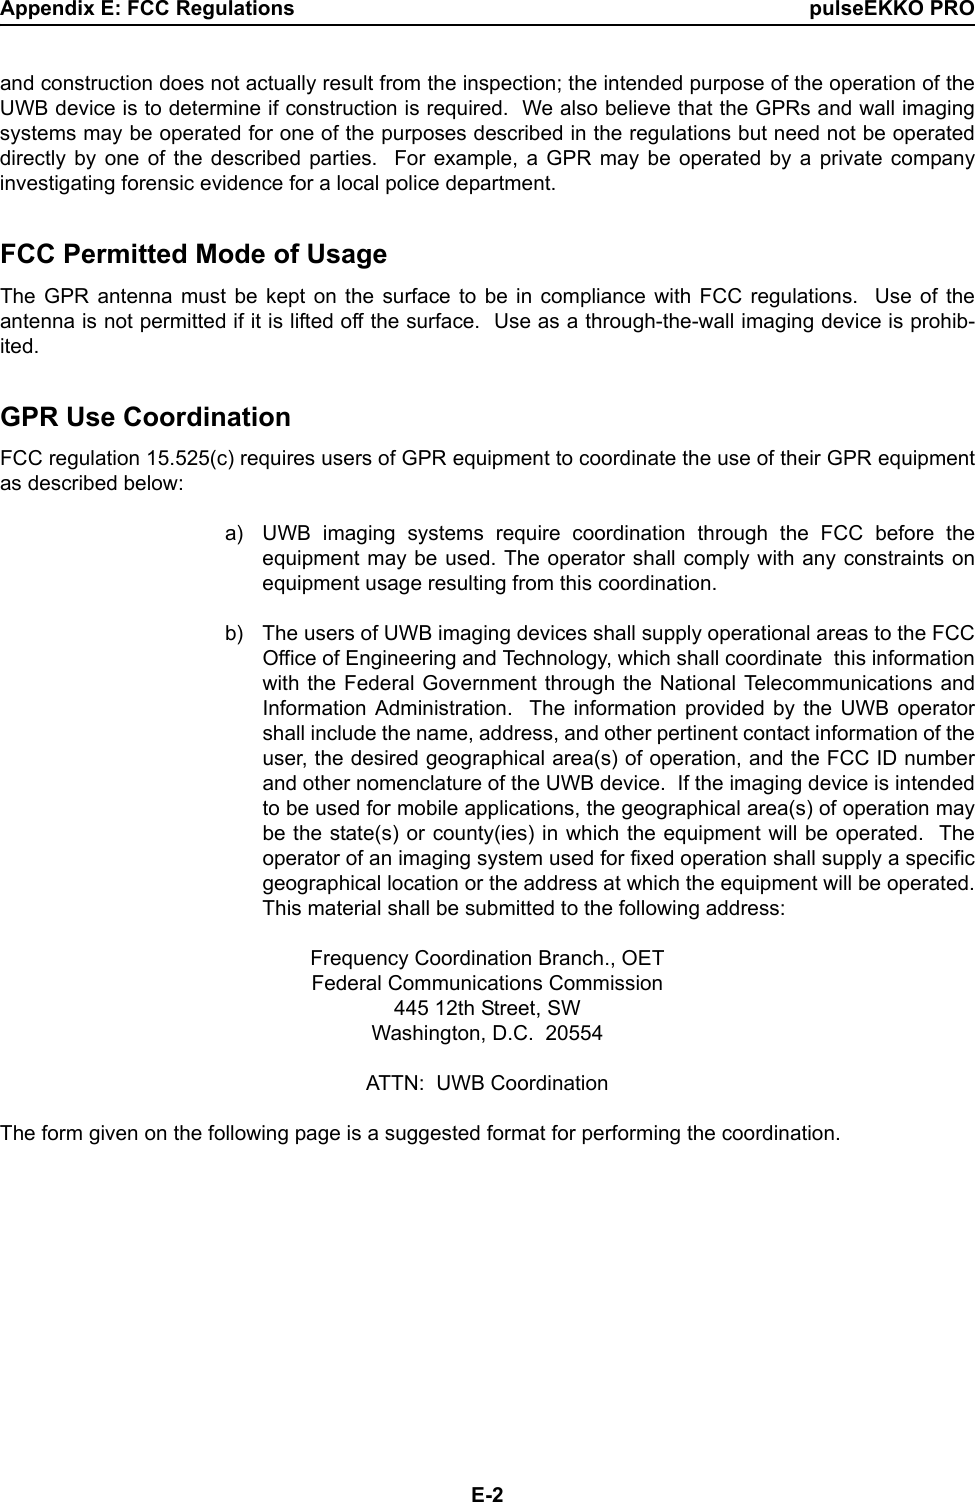
![pulseEKKO PRO Appendix E: FCC RegulationsE-3FCC GROUND PENETRATING RADAR COORDINATION NOTICE NAME:ADDRESS:CONTACT INFORMATION [CONTACT NAME AND PHONE NUMBER]:AREA OF OPERATION [COUNTIES, STATES OR LARGER AREAS]:FCC ID: [E.G. QJQ-PE-PRO-TLF-A)]EQUIPMENT NOMENCLATURE: [ E.G. PULSEEKKO PRO TLF-A] Send the information to:Frequency Coordination Branch., OETFederal Communications Commission445 12th Street, SWWashington, D.C. 20554ATTN: UWB CoordinationFax: 202-418-1944INFORMATION PROVIDED IS DEEMED CONFIDENTIAL](https://usermanual.wiki/Sensors-and-Software/PE-PRO-HF250.Users-Manual-2-of-2/User-Guide-555195-Page-63.png)