Sensors and Software PE-PRO-HF250 Ground Penetrating Radar User Manual pEPROLF Manual
Sensors & Software Inc. Ground Penetrating Radar pEPROLF Manual
Contents
- 1. Users Manual 1 of 2
- 2. Users Manual 2 of 2
Users Manual 2 of 2
pulseEKKO PRO 5-Data Collection Mode
69
5 Data Collection Mode
After timezero has been properly set up (Section 4: P65), data collection can begin.
Ensure that the transmitter and receiver are fully powered and initialized by checking that the Power LED
on the top of the unit has stopped flashing.
Select Run pulseEKKO to initiate data collection. Collect mode will collect data or replay previously
collected data.
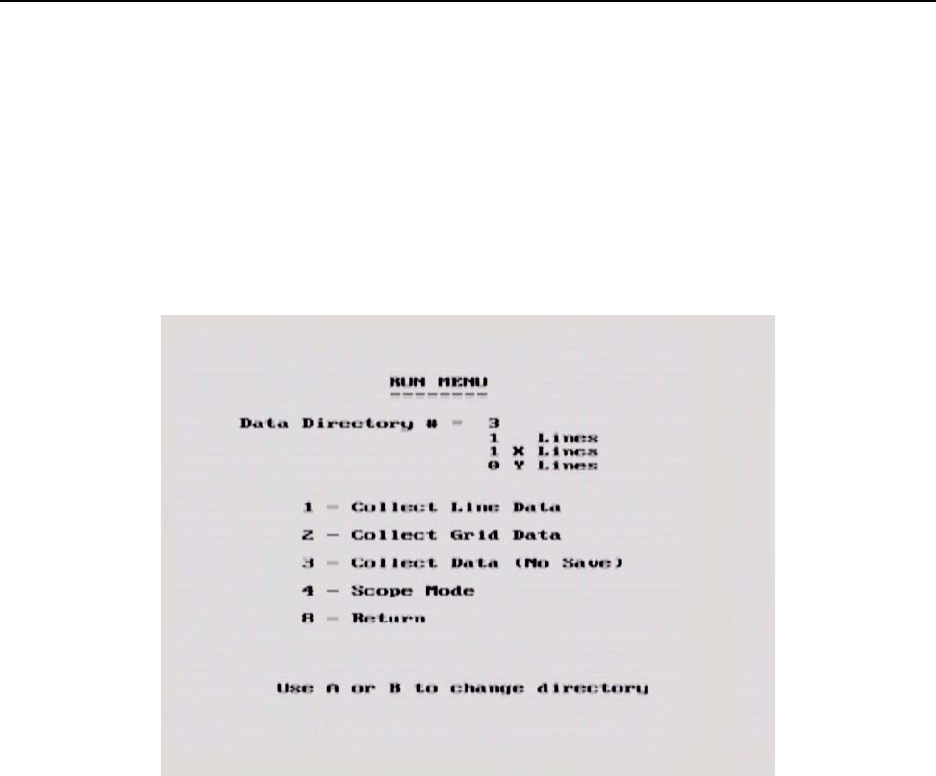
Figure 5-1: The Run menu allows the operator to find the pulse and set up timezero in Scope mode, collect Line data, Grid data
or collect data without saving. If data are to be saved, the data directory number is selected using the A and B buttons.
5.1 Data Directory
The current directory number is listed on the Run Menu screen. There are 20 directories available and the
current directory number can be changed using the A and B buttons. In general, related data files should
be saved in the same directory number.
The directory number can also be changed in the Survey Parameters menu (Section 3.4.4: P51).
As the name implies, Collect Line Data is selected when the user is ready to collect data.
5.2 Select Line Number
The first screen displayed after selecting Collect Line Data is shown in Figure 5-2. This screen is used to
determine the number of the line to be collected.
5-Data Collection Mode pulseEKKO PRO
70
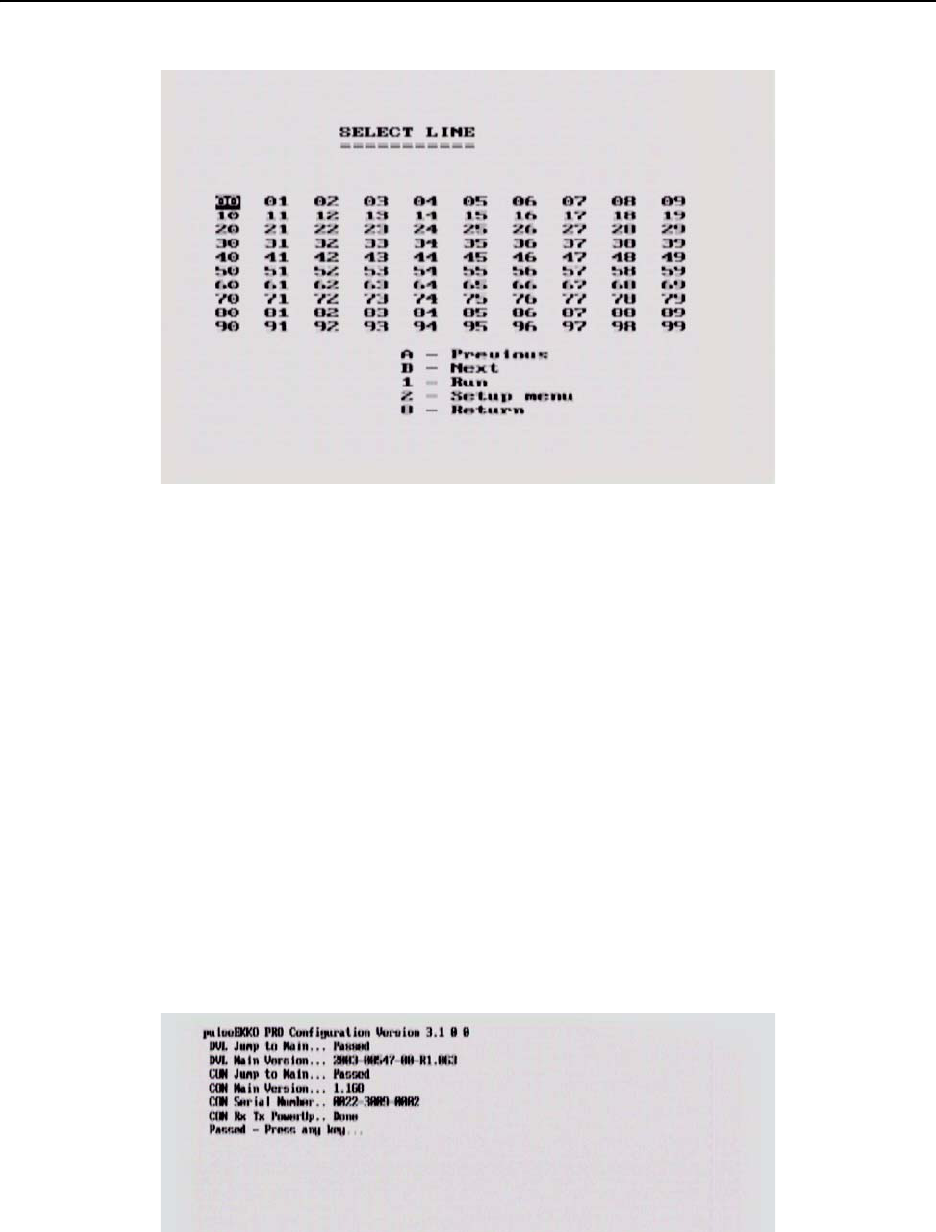
Figure 5-2: Selecting Collect Line Data will display this screen. The user can select the line number to be collected. The default
line number is the lowest line number available. As lines are collected, their associated number will appear in black on this screen.
Use the A and B buttons to move to any number on the list. When ready to collect data press 1 - Run. If you select the number of an
existing line, you will have the option to Overwrite or View the data file.
5.3 Data Collection
Once the line number or Collect Data (No Save) is selected, the program begins data collection.
Antennas: Before starting data collection, the user must make sure that the antennas are in their correct
starting positions and are ready to be moved to the next position when required.
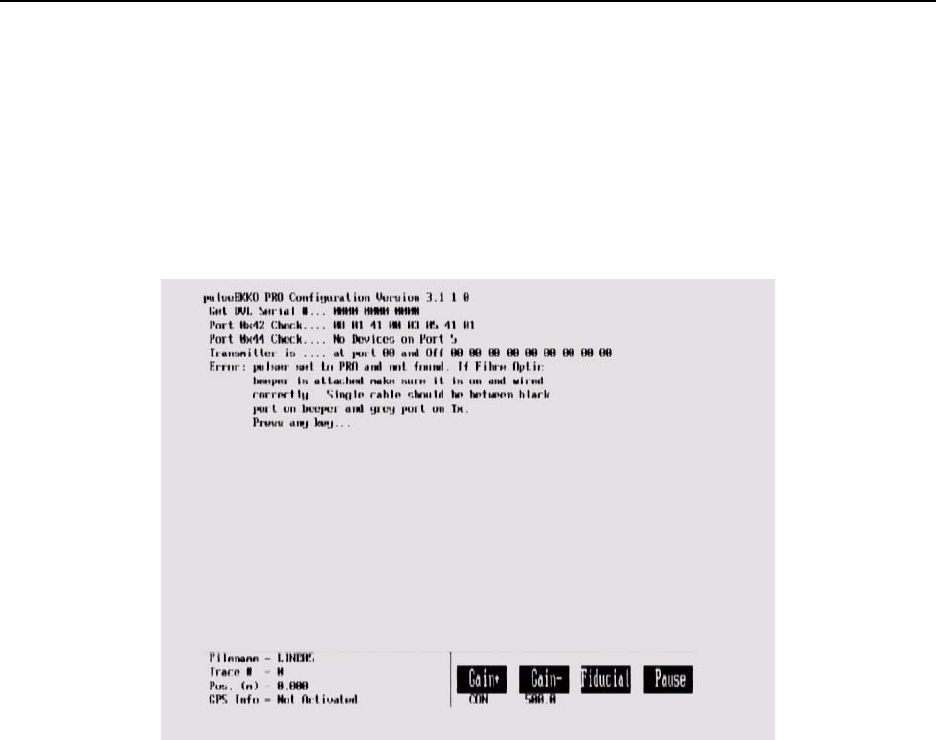
System Initialization Messages: Before data collection begins, the system conducts an initialization
process where it attempts to communicate with all the components and ready them for data acquisition.
During this process, comments are written to the screen indicating what component is being initialized
(Figure 5-3). The level of detail in these messages is control by the Display Info Mode (Section 3.6.4: P64).
If an error occurs during this process, a message is written to the screen indicating where the problem
occurred and how it might be solved (Section 7: P95).
Figure 5-3: After a line name is selected, the system initialization process attempts to communicate with all the components and
ready them for data acquisition. During this process, comments are written to the screen. If an error occurs during this process, a
message will appear indicating where the problem occurred and how it might be solved.
pulseEKKO PRO 5-Data Collection Mode
71
Error Messages: Messages will be displayed if any system connection is incorrect or if there is a problem
with the system (Section 7: P95).
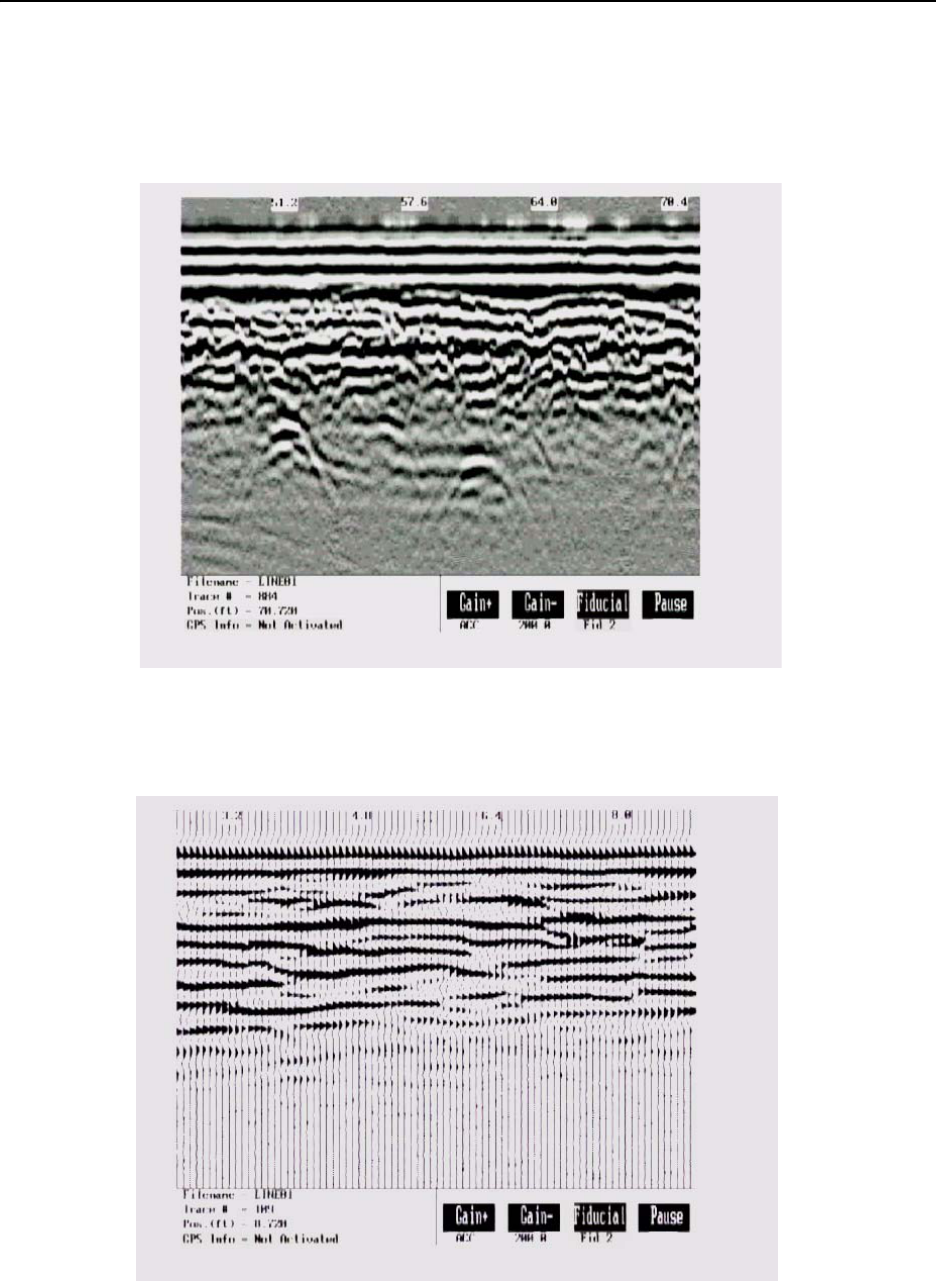
Collect Screen: A sample of a screen data plot while in COLLECT mode is shown in Figure 5-4.
Figure 5-4: Data collection screen with traces plotted in grey scale. The horizontal distance of data plotted on the screen depends
on the pixel width of the traces (Section 3.5.1: P56)
Figure 5-5: Data collection screen with traces plotted in wiggle trace mode with shading on the right (Section 3.5.1: P56)

5-Data Collection Mode pulseEKKO PRO
72
Trace Type: Depending on the user’s choice for Trace Plotting Type (Section 3.5.1: P56) the data will be
plotted as either grey scale (Figure 5-4) or wiggle traces (Figure 5-5).
In general, wiggle traces are commonly used for deep geological sounding where horizontal and vertical
distances are similar. Grey scale plots work better when exploration is shallow and traces must be
squeezed together because the vertical depth is much smaller than the horizontal distance on the display.
Axes: Time is plotted vertically from top to bottom and position is plotted horizontally from left to right on
the data image. Periodically, position values are displayed on the top of the data image. That position
corresponds to the left of the white box displaying the position.
On the bottom line of the screen the file name, trace number and position of the current trace are listed. It
also displays the GPS status.
Gain: The data are displayed with the current gain applied to the data. The gain value can be modified by
the user by pressing the Gain+ button to increase the gain or pressing the Gain- button to decrease the
gain. If the gain is changed in this way, the gain value is not saved and the next line collected will be
displayed with the current gain applied (Section 3.5.2: P58).
No matter which gain function has been selected, the data are ALWAYS stored in raw format WITHOUT
any gain applied. Gain is only applied for real-time display purposes.
More details about the actual data stored can be found in the section on formatting in Appendix A: Data
File Formats.
Pressing the Pause key suspends data collection and displays a menu with further options (Section 5.5:
P73).
5.4 Fiducial Markers
A fiducial marker flags a specific position on the data section during data acquisition. Adding these
markers during data collection is useful for recording significant landmarks or objects with known positions,
e.g. a survey stake, encountered during the survey.
Figure 5-6: Fiducial markers can be added to the data by pressing the Fiducial button during data acquisition. Fiducial markers
are written to the trace header of the next trace collected and displayed on the bottom of the data trace. Fiducial markers are
always an “F” followed by an incrementing number, i.e. F1, F2, F3, etc.

pulseEKKO PRO 5-Data Collection Mode
73
A fiducial marker is activated by pressing the Fiducial button or the A button on the keypad during data
acquisition (see Figure 5-4).
The position and name of the object encountered at each marker can be recorded in a field notebook.
The fiducial marker is written to the trace header of the next trace to be collected. Fiducial markers are
numbered sequentially (F1, F2 etc.). When the data are transferred to a PC and reviewed, these markers
can assist with data interpretation.
5.4.1 Fiducial Markers for Rubberbanding
Fiducial markers are useful when the data line is to be “rubberbanded”. If fiducial markers corresponding to
known positions are added to the data during data acquisition, these known positions can be used to
stretch or squeeze the data line to a constant step size. This makes it possible to estimate the required
step size and collect data without a tape measure or other measuring device, as long as there are a few
locations along the survey line where the position is known.
The rubberbanding routine is a post-processing step available in the EKKO_View Enhanced and
EKKO_View Deluxe software packages.
5.4.2 Fiducial Markers for GPS
If a GPS receiver is attached to the DVL, a file containing GPS information can be saved (Section 3.3.4:
P44). In “On a Tag” mode, a line of GPS information will be added to the GPS file (Section 3.3.4.1: P45)
whenever a fiducial marker is added to the data.
5.5 Data Collection Pause Menu
Pressing the Pause button suspends the data collection cycle and displays a menu that is displayed at the
bottom of the screen. The menu items are:
5.5.1 Exit
Exit from the data acquisition of the current line and go back to the Line Number screen (See Figure 5-2 on
page 70) to prepare for the collection of the next line.
5.5.2 Continue
Go back to Collect mode and continue with the data collection of the current line.
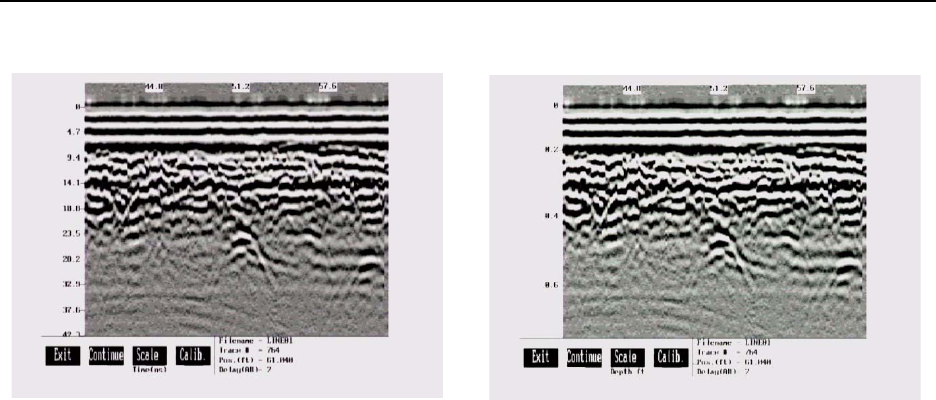
5.5.3 Scale
During data acquisition, the time axis is not plotted on the image. To view the time axis, pause the data
collection and select Scale. When Scale is pressed once a time axis will appear on the left of the data
image (Figure 5-7, left). If Scale is pressed a second time, a depth axis will appear on the left of the data
image (Figure 5-7, right).
5-Data Collection Mode pulseEKKO PRO
74
Figure 5-7: A time axis (left) and depth axis (right) can be plotted on the left of the data image by pausing the data collection and
pressing Scale once for a time axis and twice for a depth axis.
The user should be aware that if an accurate depth axis is desired, the proper radar wave propagation
velocity (see Section 3.2.6 Radar Velocity on page 39) must be used to generate the correct depth.
pulseEKKO PRO 5-Data Collection Mode
75
5.5.4 Calib - Velocity Calibration
GPR systems can be used to scan into many different materials including soil, rock, concrete, snow, ice
and wood. The radio wave emitted by a GPR system will travel at different velocities depending on the
material being scanned. As discussed earlier (Section 3.2.2.1: P35), depth estimates are only accurate if
the system has been properly calibrated to determine the velocity of the material being scanned.
The Calibration function is a tool for determining the velocity of the material being scanned. A velocity
value can be input directly or determined in one of two different ways depending on the situation:
Hyperbola matching and Target of known depth.
5.5.4.1 Hyperbola Matching
The most accurate way of determining the velocity of the material being scanned is to use the hyperbola
fitting method because it extracts the speed from data collected in the area. This method may not work in
all situations because it depends on having a good quality hyperbola (or inverted U) in the data.
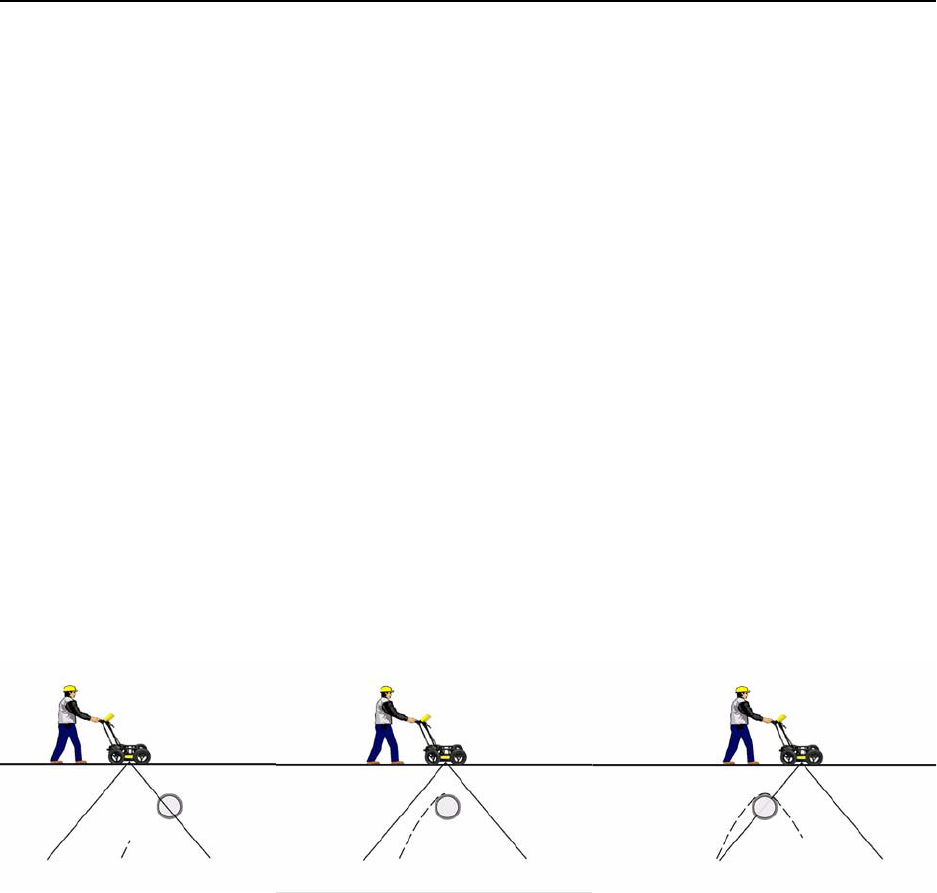
A hyperbola is the characteristic GPR response from a small point target like a pipe, rock or even a tree
root. This phenomenon occurs because radar energy does not radiate as a pencil-thin beam but more like
a 3D cone. Reflections can appear on the record even though they are not directly below the radar system.
Thus, the radar system “sees” the pipe before and after going over top of it and forms a hyperbolic
reflection.
Figure 5-8: Hyperbolas in the data result from the conical shape of the GPR energy as it goes into the ground. Targets, like pipes,
are detected as the GPR approaches them (left), passes over them (middle) and after it has passed by them (right) because the GPR
energy propagates both in front and behind the instrument.
If the hyperbola has long tails on it, we can match the shape of the hyperbola and determine the velocity of
the material in the area.
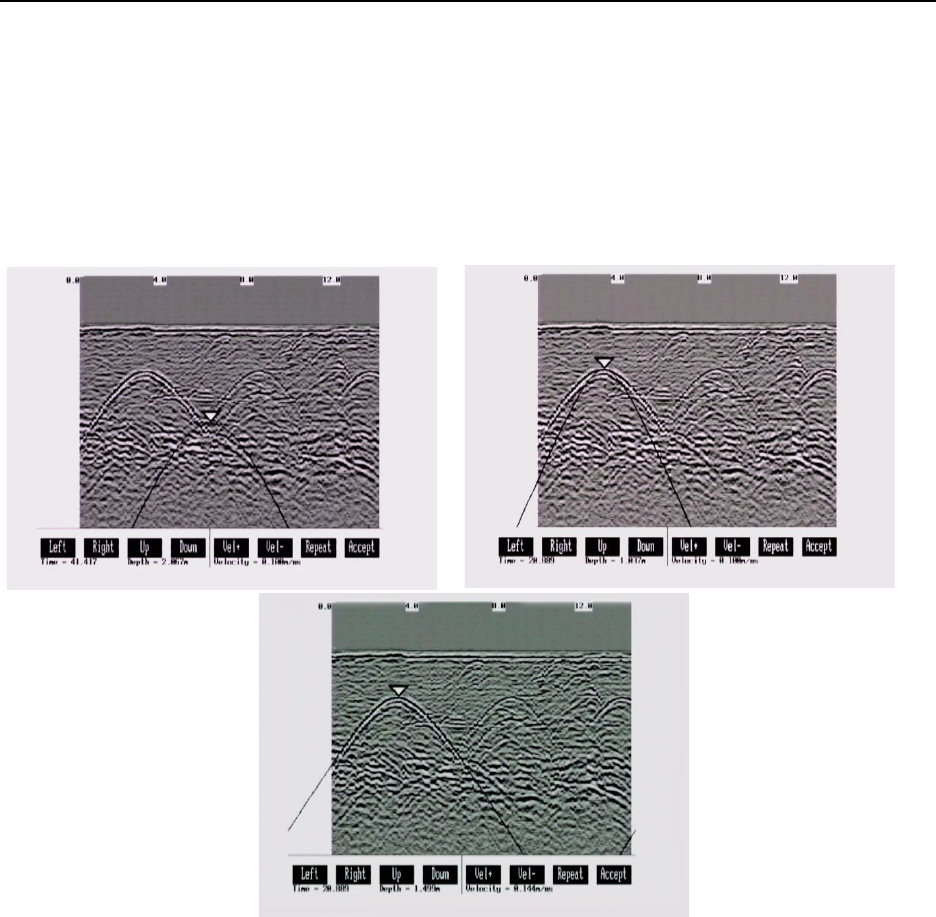
With the hyperbola visible on the DVL screen, select the Calib button. This will superimpose a hyperbola
on the data. This hyperbola can be moved up, down, left and right using the appropriate buttons. The goal
is move the hyperbola until it lies on top of the hyperbola in the data (see Figure 5-9). Then, the user can
adjust the width of the hyperbola to make it wider (Vel+) or narrower (Vel-) until the shape of the hyperbola
matches the shape of the hyperbola in the data. After matching the hyperbola, the velocity value is
extracted and used for all subsequent data acquisition.
5-Data Collection Mode pulseEKKO PRO
76
Pressing the Up, Down, Left, and Right buttons once makes a very small change in the position of the
hyperbola. These buttons must sometimes be pressed many times to move the hyperbola to the correct
position. The Repeat button speeds up the movement of the hyperbola. Select the direction (Left, Right,
Up or Down) and press Repeat. The hyperbola will then start moving in that direction. When the hyperbola
gets close to the desired location, press the Repeat button again to stop it. Then use the up, down, left and
right buttons to fine-tune the position. The Repeat button can also be used after pressing the wider (Vel+)
or narrower (Vel-) buttons.
Figure 5-9: Hyperbola matching to extract velocity. After pressing the Calib button a hyperbola appears on the screen (top left).
This hyperbola should be moved overtop of a hyperbola in the data using the Left, Right, Up and Down keys (top right). It can
then be widened or narrowed to match the shape of the hyperbola in the data (bottom). When the hyperbola shapes match, the
velocity listed on the bottom of the screen can be used to make depth estimates more accurate in subsequent data. As well, the
depth of the target that created the hyperbola is listed on the bottom of the screen.
Depths will appear in metres or feet depending on which units are selected. Velocities appear in metres
per nanosecond (m/ns) or feet per nanosecond (ft/ns) depending on the Positional Units.
pulseEKKO PRO 5-Data Collection Mode
77
5.5.4.2 Identifying Air Reflections
Some hyperbolic reflections can also be caused by objects not in the subsurface such as fences, overhead
wires and, in some conditions, even large trees.
An important part of data interpretation is learning to recognize these unwanted “air” events and
differentiate them from the desired subsurface events. Good field notes are indispensable for helping
identify unwanted events on the data.
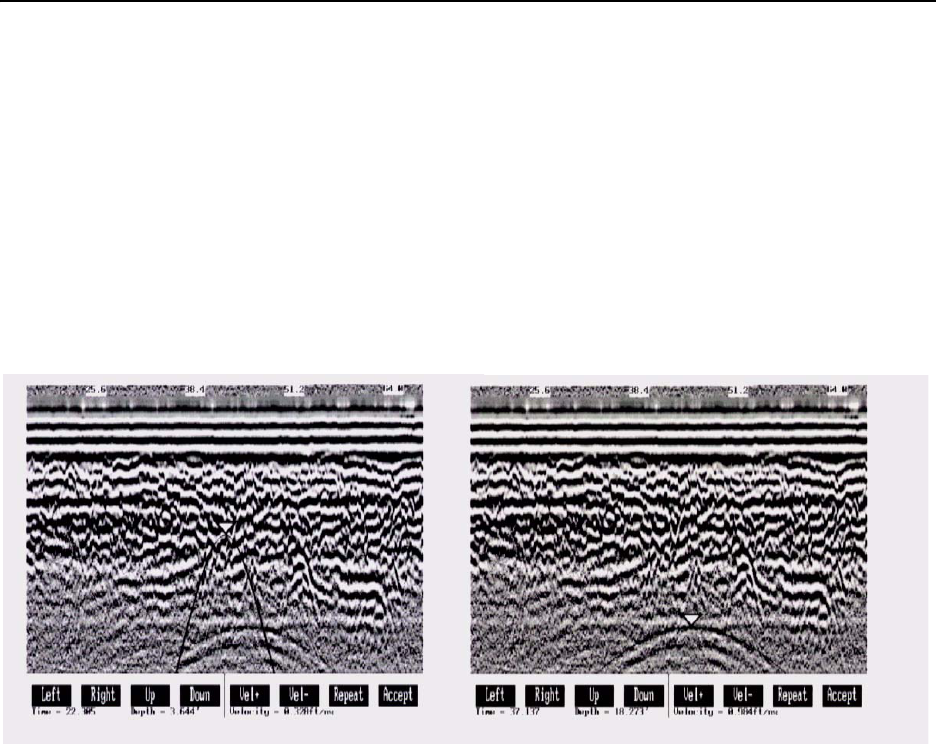
One way of identifying air reflections is to use the hyperbola fitting method. If the object is in air, the radar
velocity will be 0.3 m/ns or 0.984 ft/ns and will be much faster than if it is in the ground (v ~ 0.1 m/ns or
0.328 ft/ns).
Figure 5-10: Hyperbola matching can be used to identify reflections from objects that are not in the subsurface but are from
objects above ground. If the hyperbola matching velocity is near the speed of light (0.3 m/ns or 0.984 ft/ns) then the hyperbola was
caused by surface object like a overhead wire, tree, etc. After matching the hyperbola (right), the “depth” value displayed on the
bottom of the screen is really a measure of how far from the survey line the object is, in the case above, 18.2 feet.
5-Data Collection Mode pulseEKKO PRO
78
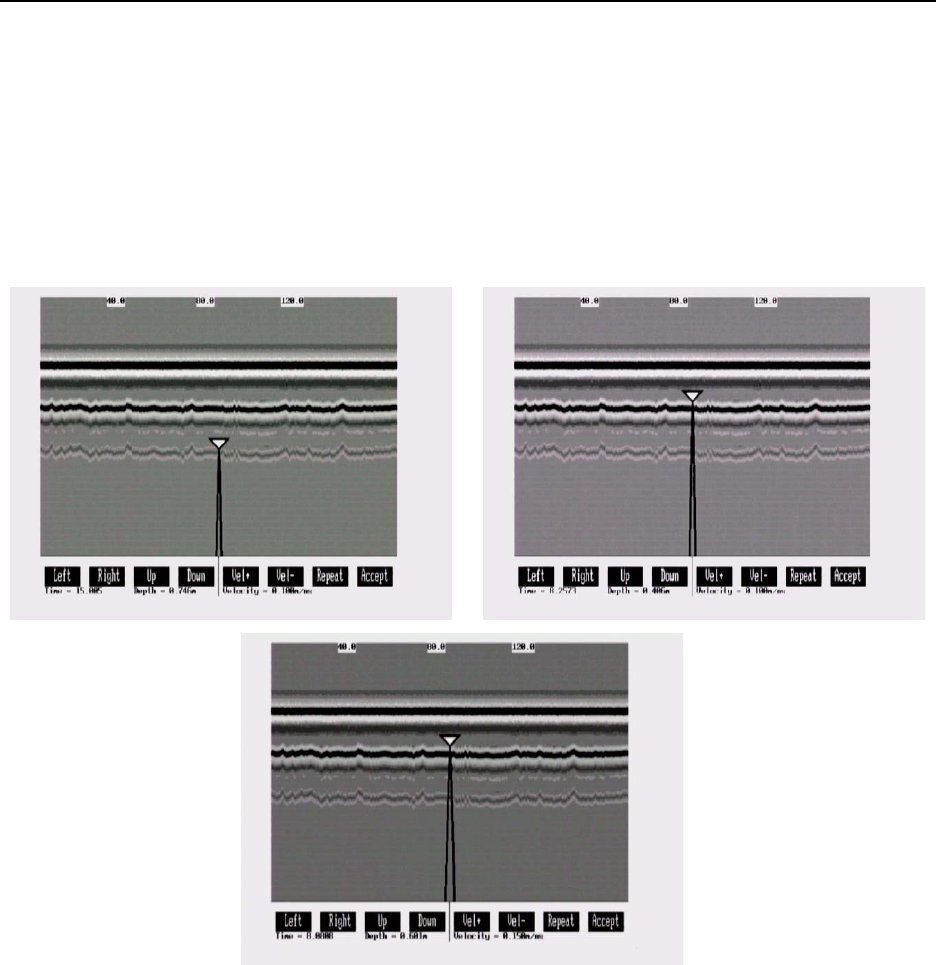
5.5.4.3 Target of Known Depth
If there are no suitable hyperbolas visible in the data to perform the Hyperbola Matching described above,
it may be the situation that there is a target of known depth in the area being scanned. If this is the case,
use the bottom tip of the hyperbola matching triangle and move it until it lies on top of the GPR response to
the known target. Then, use the Vel+ and Vel- buttons to adjust the velocity value up or down until the
known target depth is correct. Once the depth is matched, the current velocity value is the one used for all
subsequent data acquisition.
Figure 5-11: If a target of known depth is visible in the GPR data image, it is possible to use this target to determine the velocity
of the material above the target. Ignoring the tails of the hyperbola superimposed on the data image (top left) and using the bottom
tip of the triangle, use the Left, Right, Up and Down buttons to move it until it lies on top of the GPR response to the known target
(top right). Then, use the Ve l + and Vel- buttons to adjust the velocity value up or down until the known target depth listed on the
bottom of the screen is correct (bottom), in this case 0.6 m. Once the depth is matched, the current velocity value listed on the bot-
tom of the screen can be used for all subsequent data acquisition in the area, in this case 0.15 m/ns. This velocity can also be used
for an accurate depth axis when plotting the data to the screen or after it has been transferred to a PC.
If units are metres then depths will appear in metres and velocities in metres per nanosecond (m/ns). If
units are feet then depths will appear in feet and velocities in feet per nanosecond (ft/ns).
pulseEKKO PRO 5-Data Collection Mode
79
5.6 Collect Grid Data
As the name implies, Collect Grid Data is selected when the user is ready to collect data in an organized
grid.
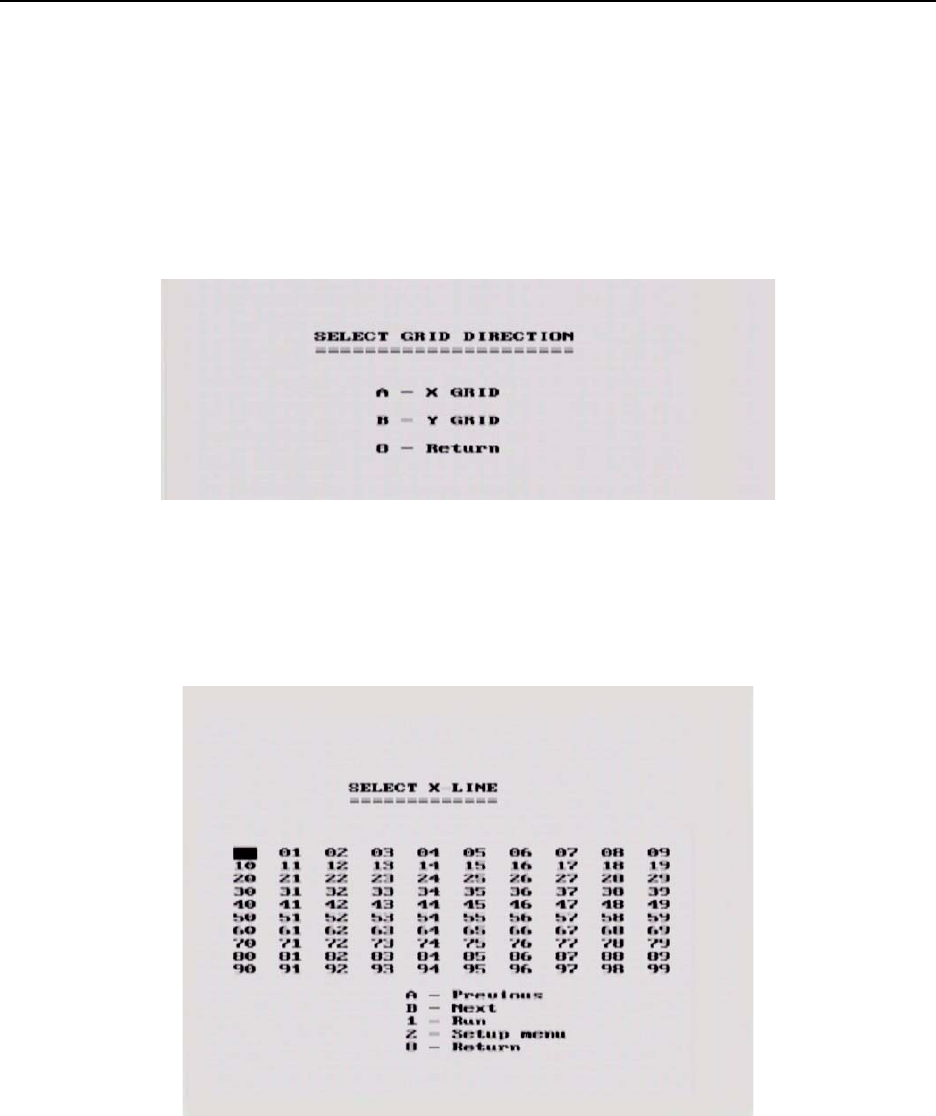
5.6.1 Select Line Direction
The first screen will ask which line direction is being collected, X Lines or Y Lines. Refer to Section 3.4.6
GPR Grid Type on page 51 for definitions of X lines and Y lines.
Figure 5-12: When collecting grid data, the direction of the lines (X or Y) needs to be determined.
5.6.2 Select Grid Line Number
The next screen displayed after selecting the line direction is shown in Figure 5-13. This screen is used to
determine the number of the line to be collected.
Figure 5-13: Selecting Collect Grid Data from the menu shown in Figure 4-1 will display this screen used to select the number of
the line to be collected. The default line number is the lowest line number available. As lines are collected, their associated number
will appear in black on this screen. Use the A and B buttons to move to any number on the list. When ready to collect data press 1
- Run. If you select the number of an existing line, you will have the option to Overwrite or View the data file.
To continue with grid data collection, follow the directions under Section 5.3 Data Collection on page 70.
5-Data Collection Mode pulseEKKO PRO
80
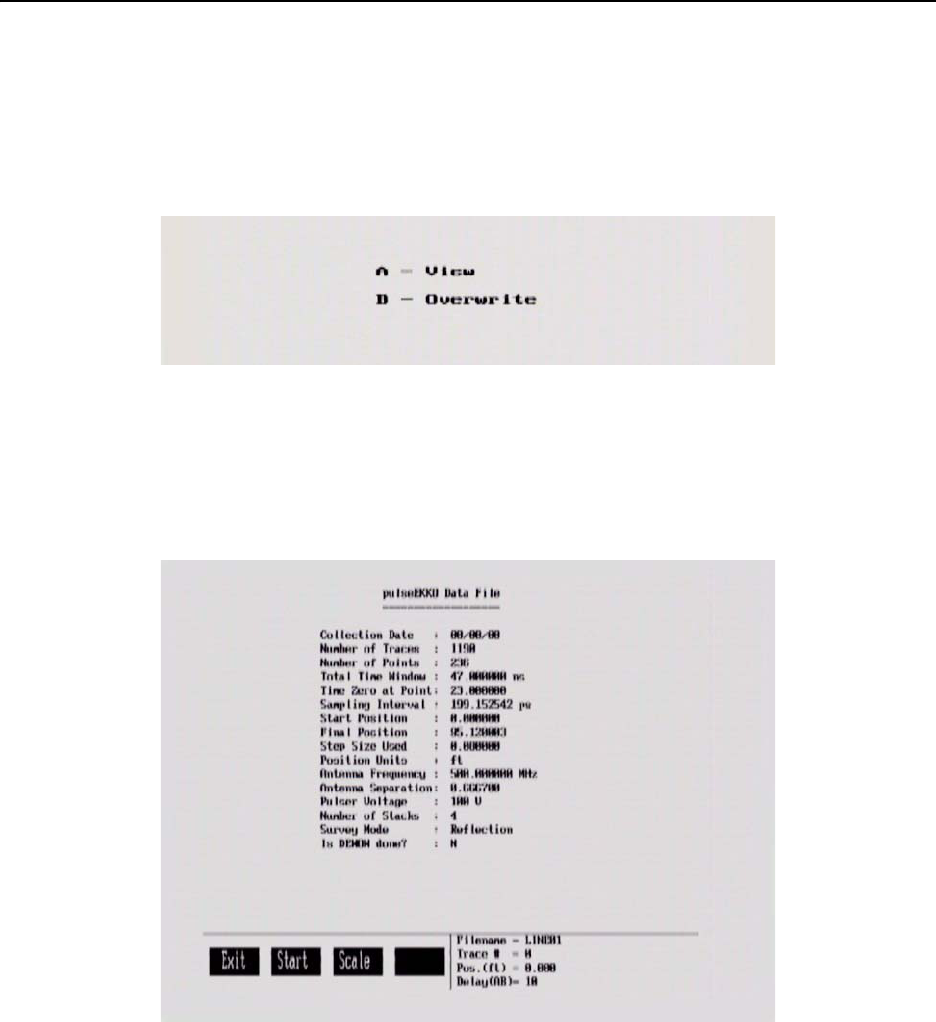
5.7 View Previously Collected Lines
After GPR data files have been collected, it is possible to view them on the DVL screen by using the
Collect Line Data or Collect Grid Data option and selecting an existing file. When asked to Overwrite or
View the file, select the View option.
Figure 5-14: To view a previously collected data line on the DVL screen, select Collect Data and select an existing line number.
When asked if you want to view the file or overwrite it, select View.
When viewing an existing file, the header (.HD) file containing the survey parameter information is
displayed first.
Figure 5-15: When viewing an existing file, the header (.HD) file containing all the survey parameters is displayed first.
To see the data image press Start. The data image will scroll on the screen just like it does when data are
being collected. Note that the scroll speed can be increased by decreasing the Delay Time between traces
using the A and B buttons.
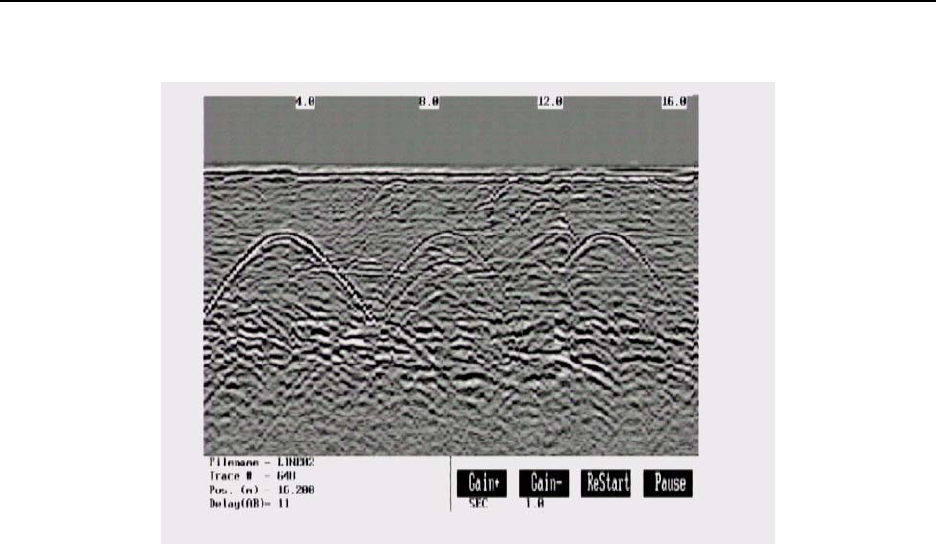
pulseEKKO PRO 5-Data Collection Mode
81
Figure 5-16: Viewing an existing data line. The data image scrolls onto the screen just like during real data collection. The scroll
speed can be increased and decreased using the A and B buttons. The line can be plotted with a different gain or use the Gain+
and Gain- buttons to increase and decrease the current gain value. ReStart will plot the line again.
Replaying data can be very useful because it allows the user to quickly modify the plot with different gains
(Section 3.5.2: P58), and Trace Plotting Type (Section 3.5.1: P56) to try and enhance the feature of
interest.
Pressing the Pause allows access to the Calib button so that a Velocity Calibration can be used to
determine the velocity in the material being scanned or check for airwave reflectors (Section 5.5.4: P75).
Each time the ReStart button is pressed the data is replotted so if settings are changed, the modified
image replaces the old one.
5.8 Collect Data (No Save)
This selection allows data to be acquired and plotted to the screen but not saved to a file. Once the data
scrolls off the screen or when the line is exited, it can no longer be viewed.
This option is useful when the operator just wants to collect a test line to see what conditions are like,
perhaps to decide on the best antenna frequency to use in the area or the length of the time window.
During data acquisition, the bottom of the screen will indicate that data are not being saved.
6-Surveying Techniques pulseEKKO PRO
82
6 Surveying Techniques
6.1 Low Frequency Reflection (Profiling) Mode
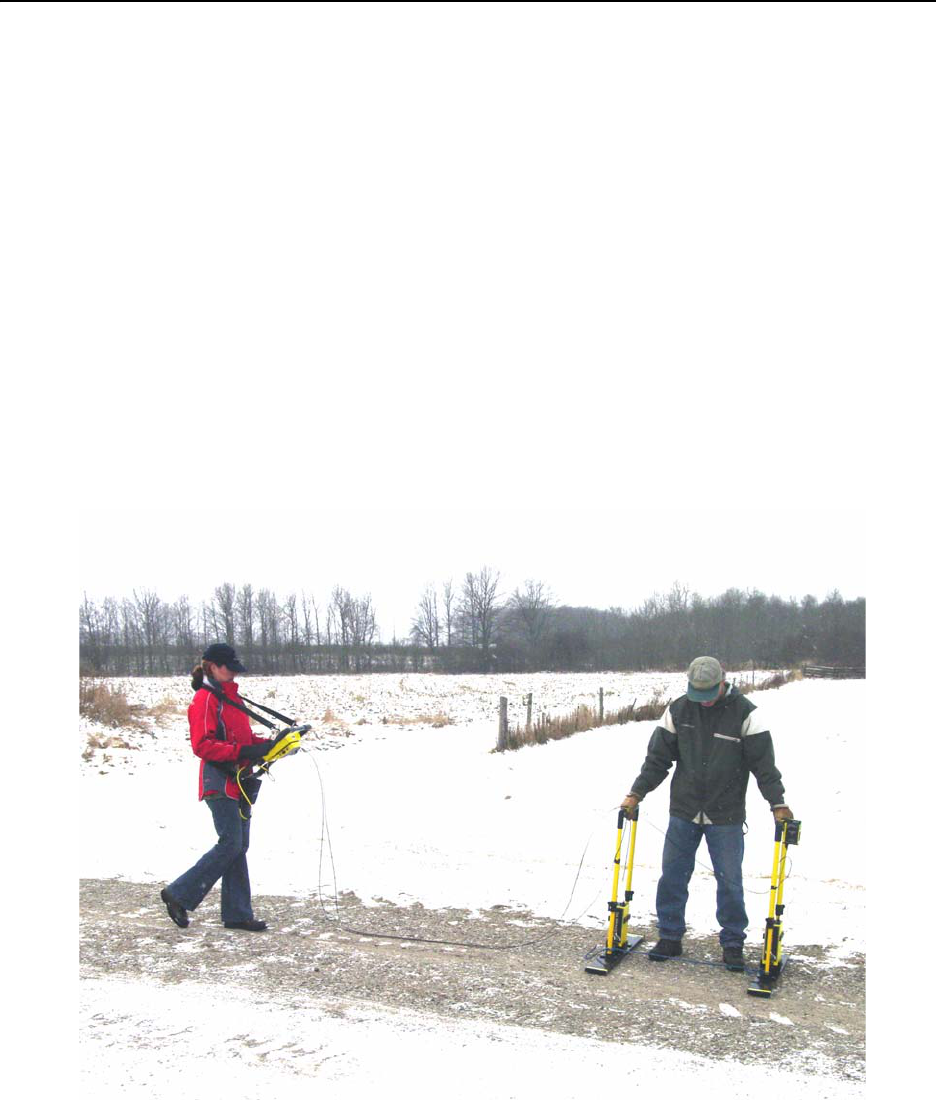
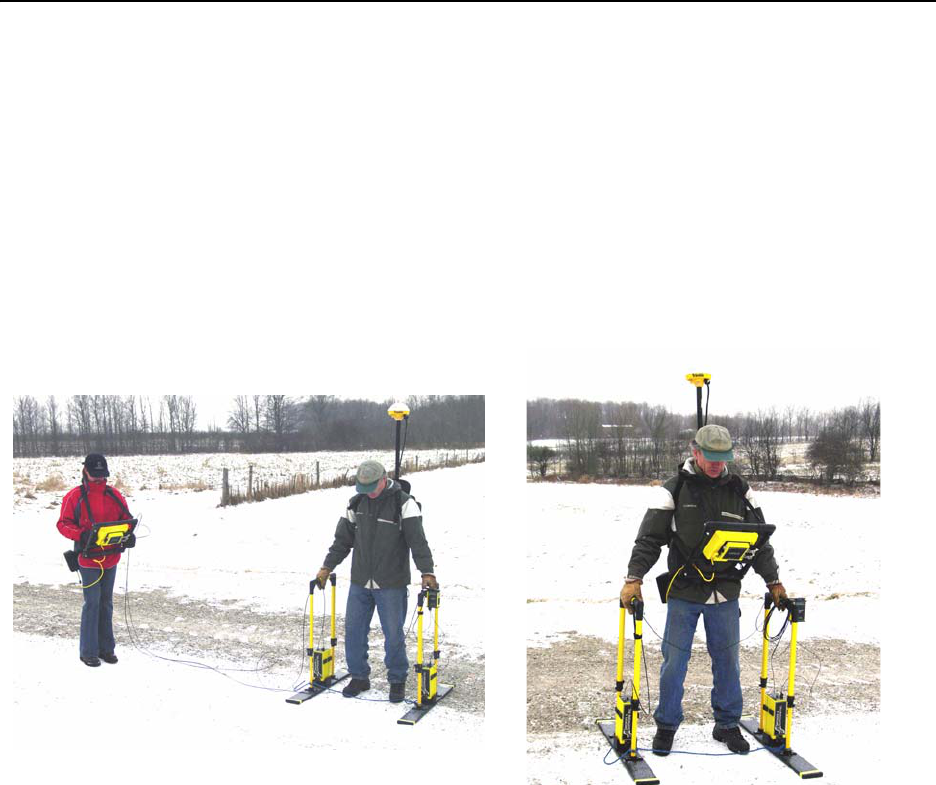
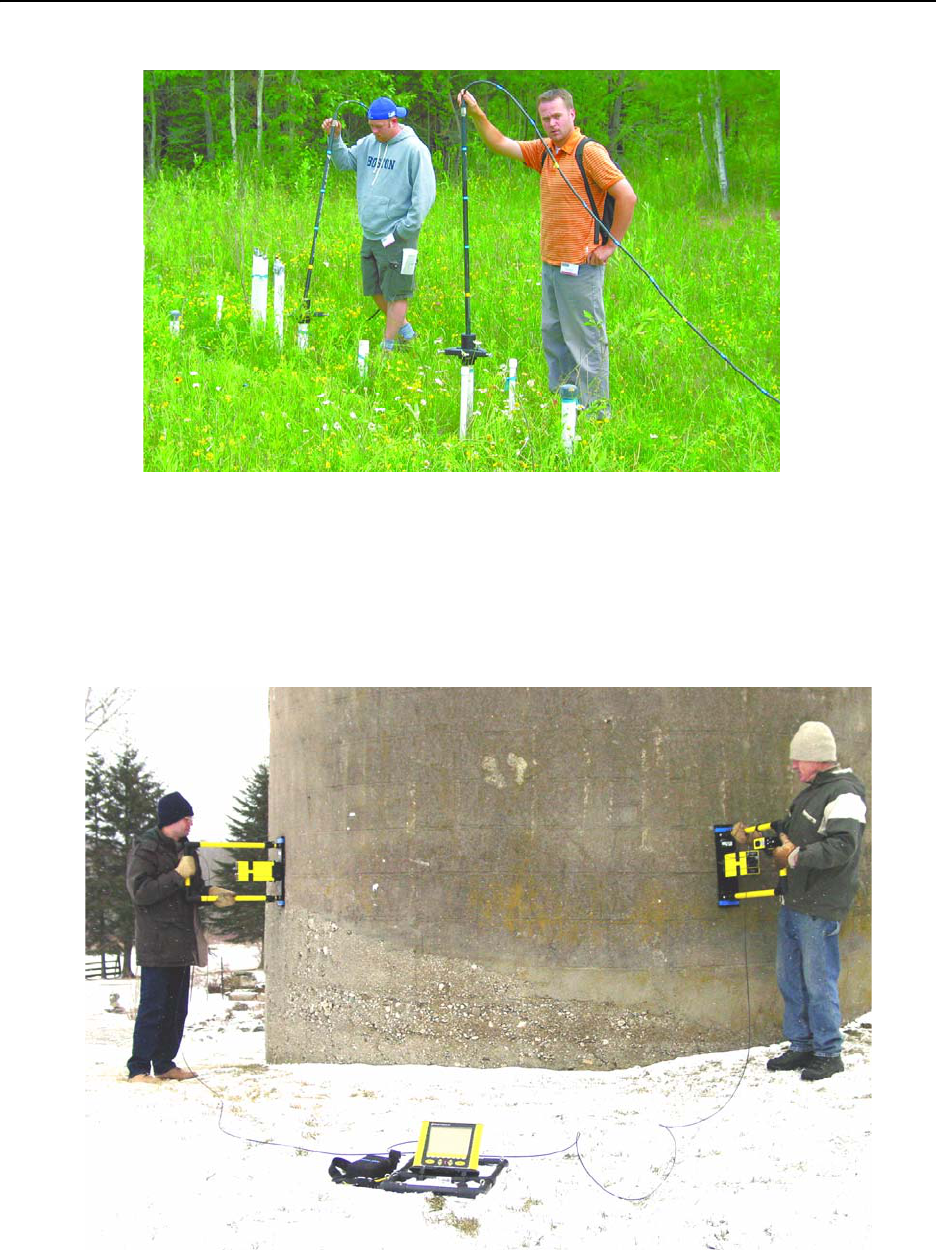
6.1.1 Two Person Operation
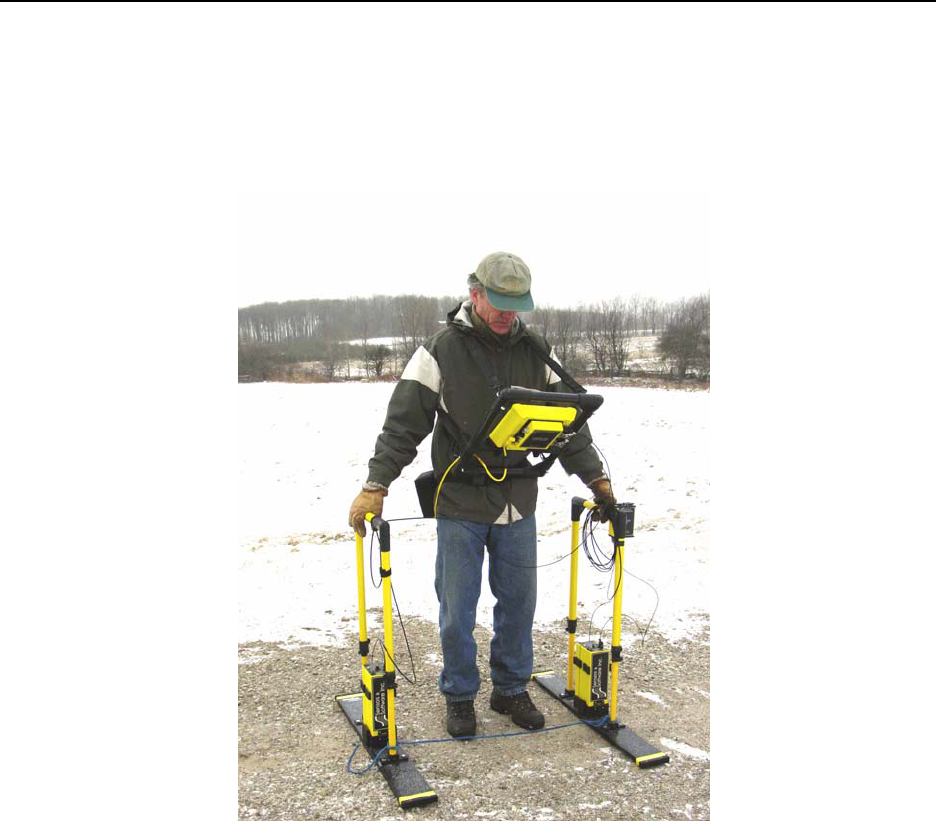
The most common method of data acquisition in rough terrain will be with two people in a configuration
shown below (Figure 6-1). The person carrying the DVL and Control module has a belt battery fastened
around their waist to power these units. The optional DVL carrier shown is not a necessity for the DVL
operator. They may be just as comfortable carrying the DVL in their hands.
Data collection can be controlled by the DVL operator using the electrical beeper/trigger or the DVL button.
If the optional fibre optic beeper/trigger is available, data collection can be controlled by the antenna
operator (Section 3.3.1.1: P43). A third option is to run the system in free Run mode (Section 3.3.1.3: P43)
with a time delay between traces (Section 3.3.3: P44).
Figure 6-1: Two person data collection with the pulseEKKO PRO system. The antenna operator moves the antennas to each data
location point. The data trace is collected by the DVL operator using the electrical beeper/trigger or the DVL button. The data
trace can also be collected by the antenna operator using the fibre optic beeper/trigger. The data are visible in real time on the
DVL screen.
The antennas can be held at a constant separation by using a rope tied between them (Figure 6-4).
pulseEKKO PRO 6-Surveying Techniques
83
6.1.2 One Person Operation
One person operation is performed in the configuration shown below (Figure 6-2) with the optional DVL
carrier (Section 2.5.3: P23) and the fibre optic beeper/trigger (Section 2.5.2: P20).
Figure 6-2: One person operation setup. The operator moves the antennas to each data location point and collects the trace using
the fibre optic beeper trigger. The data are visible in real time on the DVL screen.
6-Surveying Techniques pulseEKKO PRO
84
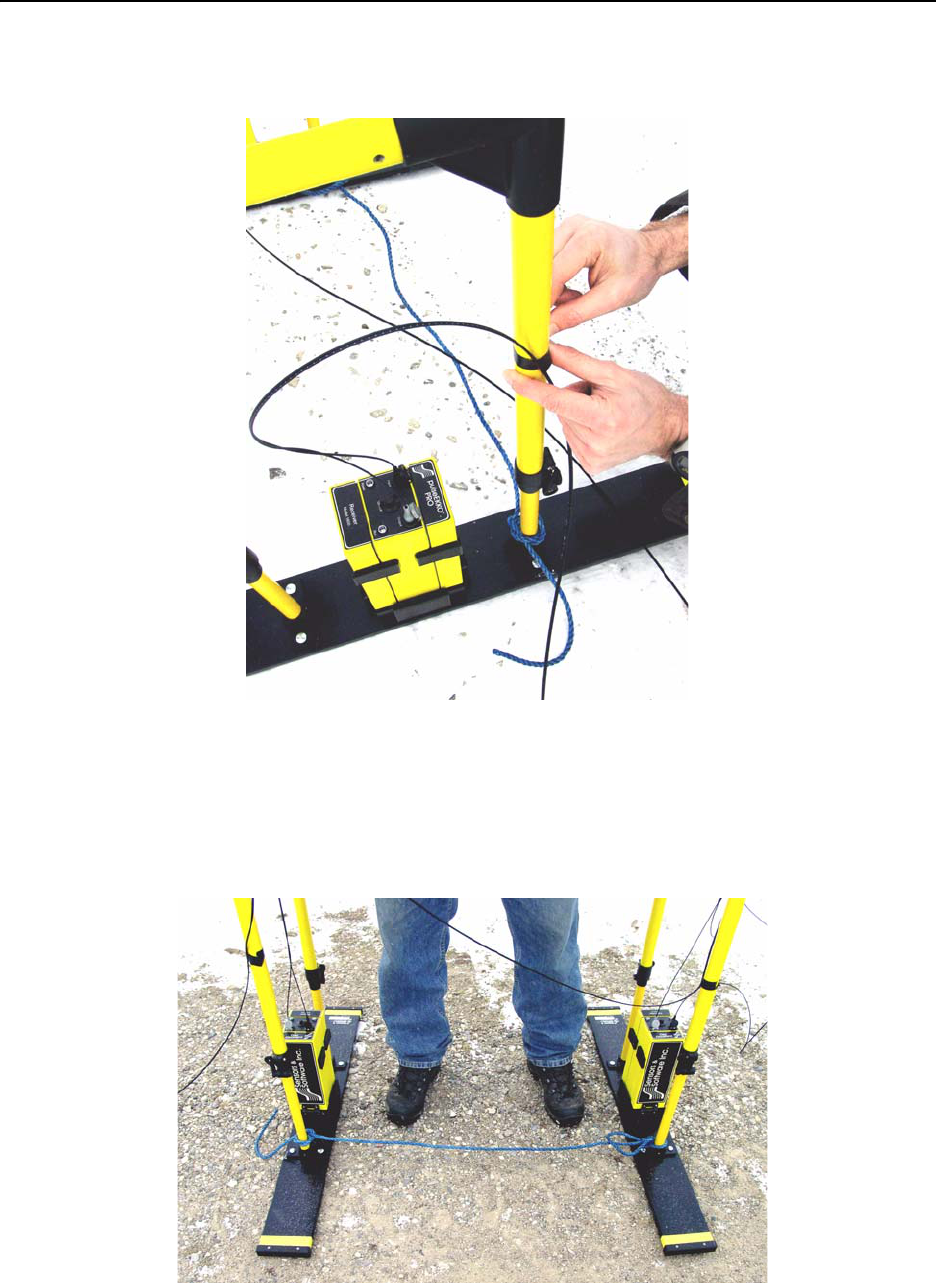
6.1.3 Strain Relief for Fibre Optic Cables
Figure 6-3: Fibre optic cables can be broken or damaged if care is not taken. The most common breakage point is right at the
connectors when the cables are snagged or pulled hard. Protect the fibre optic cables by making a strain relief. Take an extra loop
of cable and tape it to the handle. That way, if the cable gets pulled, the strain is taken up by the tape and not the cable.
6.1.4 Maintaining Proper Antenna Separation
Figure 6-4: When using the adjustable handles, the antenna separation can be maintained by using a length of rope tied between
the antennas.

pulseEKKO PRO 6-Surveying Techniques
85
6.1.5 Antenna Movement
If practical, antennas should not move while data are being collected, as indicated by the duration of the
beeping tone. Keeping the antennas static assures the highest quality stacked data. When the beep
stops, the antennas can be moved to their next position in preparation for the next trace. Obviously,
holding antennas stationary is impractical if a continuously moving platform is used for data acquisition
(Figure 6-5).
6.2 High Frequency Reflection (Profiling) Mode
6.2.1 Tow Mode Operation
One method of data acquisition in smooth terrain is the tow mode configuration shown below (Figure 6-1).
The operator carries the DVL and Control Module (or uses a DVL Carrier) and has a belt battery fastened
around their waist to power the system.
Data collection is usually controlled by the Big Wheel odometer, as shown below.
It is also possible to remove the odometer and control data acquisition using the electrical beeper/trigger or
the DVL button (Section 3.3.1.1: P43).
A third option is to run the system in free Run mode (Section 3.3.1.3: P43) with a time delay between
traces (Section 3.3.3: P44).
Figure 6-5: High frequency tow mode operation. As the operator drags the transducers across the surface, the odometer triggers
data collection at equally-spaced intervals (called the Step Size). The data being collected are visible in real time on the DVL
screen.
6-Surveying Techniques pulseEKKO PRO
86
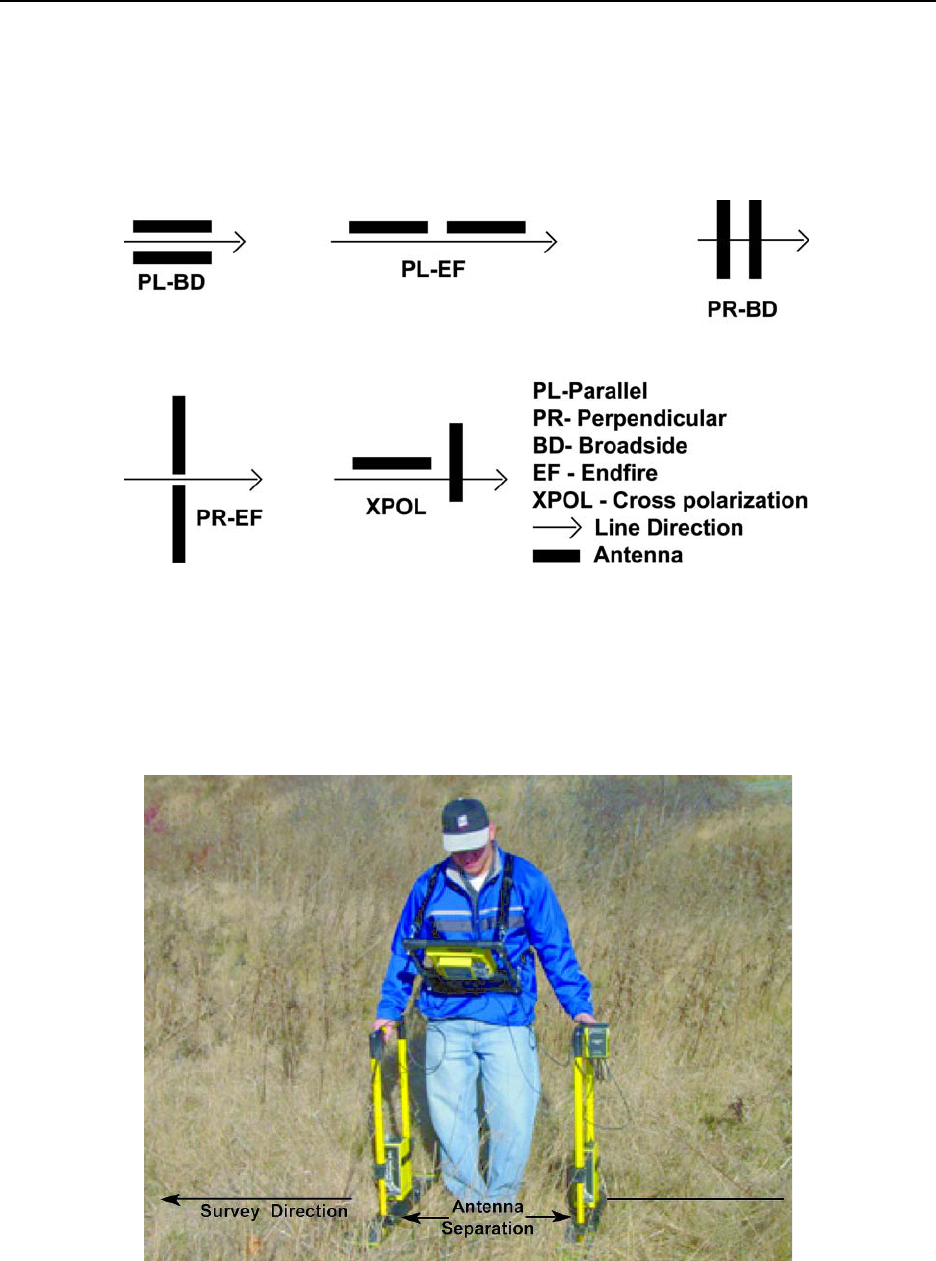
6.3 Antenna Orientation
Both the high and low frequency, bistatic antennas of the pulseEKKO PRO system have the flexibility to
allow different orientations with respect to one another.
Figure 6-6: Definitions of antenna orientations available with bistatic antennas. Perpendicular-Broadside (PR-BD) is most com-
monly used for reflection surveys.
The most common antenna orientation is the parallel-broadside configuration. This orientation provides the
best coupling between antennas and the most energy in the direction of the survey line which reduces
reflections from targets off to the side of the line.
Figure 6-7: Most common reflection surveying technique. Antennas are held at the proper antenna separation for the selected fre-
quency and perpendicular to the survey line direction. This antenna orientation ensures the maximum in-line GPR energy and
reduces reflections from off-line targets.

pulseEKKO PRO 6-Surveying Techniques
87
6.4 Triggers
If the Trigger Method is set to CANBUS, Fibre-Optic or DVL Key (B), the following data collection
sequence is followed:
a) Set the antennas at the correct separation and centred on the starting position for the survey
line. The antennas should be oriented perpendicularly to the survey line direction as shown in
Figure 6-7.
b) The data collection screen on the DVL should display “Press Trigger”.
c) The operator presses the DVL B button, electrical or Fibre Optic trigger.
d) The system starts to beep, indicating that data are being collected. The antennas should be
kept in contact with the ground surface while the system is beeping.
e) When the beeping stops, one trace has been collected.
f) Move the antennas together along the survey line a distance equal to the Step Size distance.
g) Repeat from step b)
h) During data collection, fiducial markers (Section 5.4.1: P73) can be added at known positions
so the data can be “rubberbanded” during post-survey editing.
6.5 Free Run
If the Trigger Method is set to Free Run, the radar will go through the following cycle:
a) Set the antennas at the correct separation and centred on the starting position for the survey
line. The antennas should be oriented perpendicularly to the survey line direction as shown in
Figure 6-7.
b) Press the Start button on the DVL screen.
c) The system starts to beep, indicating that data are being collected. The antennas should be
kept in contact with the ground surface while the system is beeping.
d) When the beeping stops, one trace has been collected.
e) The system will pause for the number of seconds specified under Free Run Trace Delay. In
that time, move the antennas together along the survey line a distance equal to the Step Size
distance.
f) then back to c) to repeat the cycle.
g) During data collection fiducial markers (Section 5.4.1: P73) can be added at known positions
so the data can be “rubberbanded” during post-survey editing.
6-Surveying Techniques pulseEKKO PRO
88
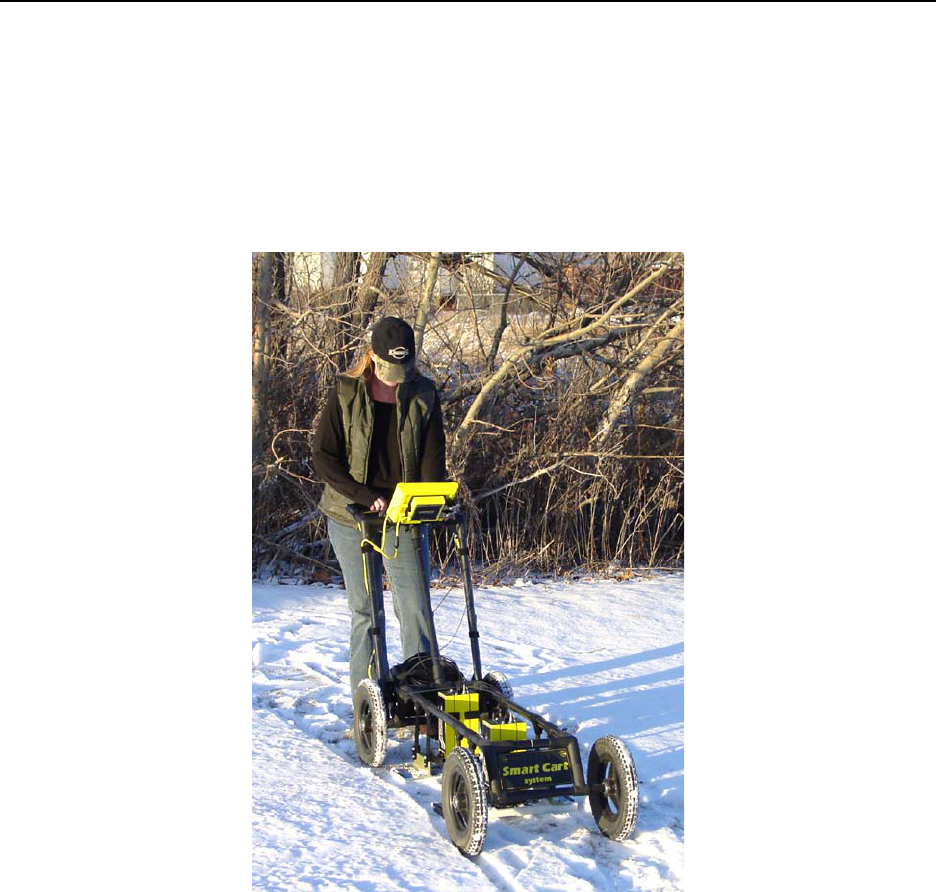
6.6 Odometer Data Acquisition
Data acquisition can be controlled by an odometer triggering the radar system to collect data at specified
step sizes (Section 3.3.1.2: P43). There are several odometers available for the pulseEKKO PRO system
including the Big Wheel Odometer (See Figure 2-23 on page 17), SmartCart odometer (Figure 6-8) and
the vehicle odometer (contact Sensors & Software for more details).
Figure 6-8: The pulseEKKO PRO SmartCart has an odometer to trigger the system to collect data at an equal step size defined by
the user.
6.6.1 Skipping Traces
In odometer mode, it is possible to move too fast and trigger too quickly for the system to keep up.
If the odometer is being triggered too quickly, the DVL will write the total number of skipped traces on the
bottom of the screen. When this occurs, positional accuracy is retained but “skipped” traces will be filled in
the data file as a repeat of the last successfully collected trace. When traces are repeated, the data display
may appear “blocky” because two or more identical traces are being displayed. If more than 10 to 15% of
the data traces in a survey line have been skipped, the operator should consider surveying the line again
at a slower speed to reduce the number of skipped traces.

pulseEKKO PRO 6-Surveying Techniques
89
If maintaining speed is important, the other option is to reduce the time window (Section 3.2.2: P35) or
number of stacks (Section 3.2.7: P40) to allow the traces to be collected faster. Data trace acquisition
speed can also be increased by increasing the temporal sampling interval but it is important to make sure
that the temporal sampling interval does not exceed twice the recommended value or the data will be
aliased and may become uninterpretable (Section 3.2.3: P36).
6.6.2 Backing up to Pinpoint Target Positions
The Big Wheel and SmartCart odometers allow the user to stop the GPR system in the middle of a survey
line and back up. When this is done, an arrow and vertical line appear on the data image and move back
along the image as the system moves backwards. This makes it possible to correlate a target in the data
image to an exact location on the ground. Once the arrow lines up with the target, mark the ground at the
mid point of the antennas.
When the system is moved forward again to continue with the survey, the GPR system does not start
collecting data again until you reach the position where you stopped at. This feature is useful for producing
a continuous data image even if the system is backed up during the survey line.
Note that it is not possible to back up and have the arrow indicator move more than one screen.
6.7 Signal Polarity
In the course of collecting data along a profile line or lines, it is important to keep the relative antenna
orientation the same (note: it is the electronic unit orientation which controls the polarity, antenna direction
alone does not affect polarity), especially after any interruption in data collection to change batteries, etc.
One way to control polarity is to always have the pulseEKKO name pointed in the direction of antenna
movement. If this precaution is not followed, the signals may have reverse polarity (this can be corrected in
EKKO_View Deluxe program if necessary).
6.8 Spatially Aliasing the Data
Increasing production by increasing the step size is not always a good idea. Undersampling the data with
a step size that is too large can make interpretation difficult. Use the guidelines to set step size properly
(Section 3.2.5: P38).
If you are surveying for a large target, it is possible to increase the step size to maximize productivity and
minimize the data volume but keep in mind that the step size should still be small enough that one or more
traces are collected over top of the target. For example, if your target is 0.3m (1 foot) in diameter the
maximum step size should be about 0.1m (0.33 feet).
If the objective of the survey is to follow a flat-lying layer like a soil layer or asphalt that varies little laterally,
the step size could be increased to 1.0m or more. As a rule of thumb its better to collect more data than not
enough.
6-Surveying Techniques pulseEKKO PRO
90
6.9 Creating a Test Line for Data Quality
One of the best ways of detecting problems with the GPR system is, shortly after receiving the system and
getting comfortable with its operation, to collect a line of data at a convenient, easily accessible location.
The line does not have to be too long but 100 - 200 traces is a good guide. This data line should be saved
electronically and perhaps plotted out on paper and dated. The test line could be collected say, every 6
months and, by reviewing the previous data, system problems can be detected early. As well, if there is a
suspected problem with the system, this test line could be collected and compared with earlier tests.
6.10 Adding GPS for Positioning
Figure 6-9: Two person (left) and one person (right) system configurations with GPS added. Ideally, the GPS should be posi-
tioned near the mid-point of the GPR antennas.
pulseEKKO PRO 6-Surveying Techniques
91
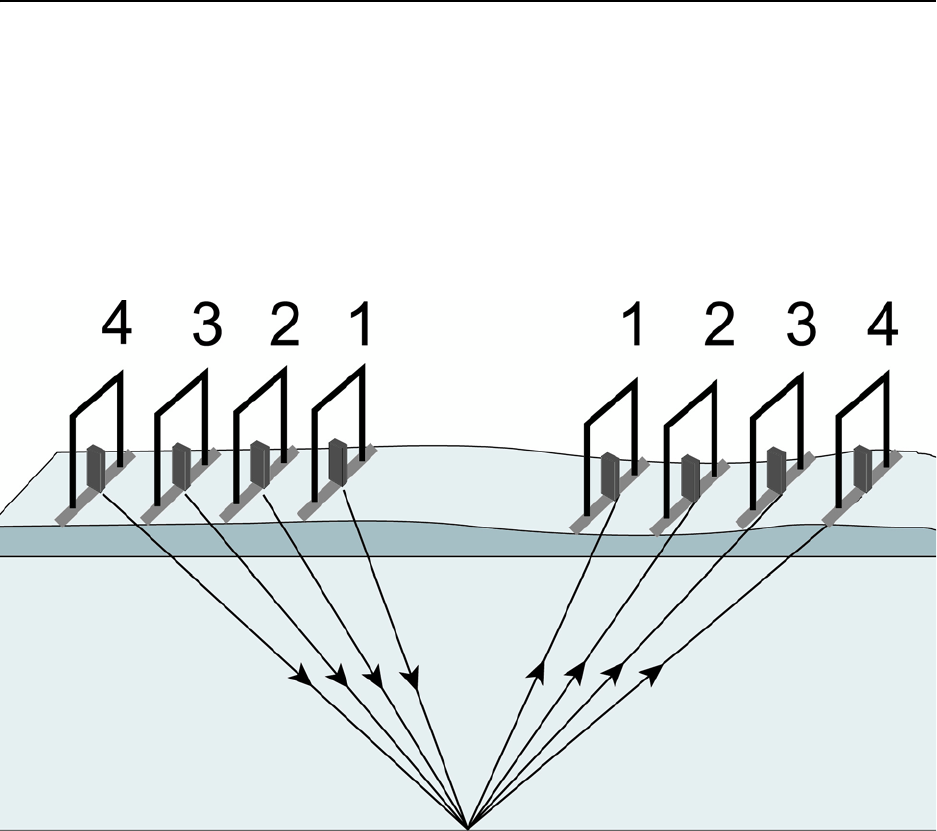
6.11 Common Mid-Point (CMP) Survey
A Common Mid Point (CMP) survey is performed to measure GPR velocity in the survey area. A CMP
survey is best done in an area with flat lying reflectors and relies on changing the antenna separation to
increase the signal path length from the mid point reflector (Figure 6-10). The resulting data can then be
processed using a semblance analysis routine to extract average velocities to the reflectors (Figure 6-11).
The extracted velocities can then be used when adding a depth axis for other GPR survey lines collected
in the area of the CMP.
Figure 6-10: CMP setup. CMP surveys are used to measure the GPR velocity to a reflector or series of reflectors. Each trace is
collected with the antennas at a larger separation resulting in an increased travel path length and therefore increased travel time.
The data can be analyzed with a semblance analysis routine to extract the average velocity to the reflector.
Conducting a CMP survey efficiently normally requires two people and may require the use of the optional
20m fibre optic cables (available from Sensors & Software) rather than the standard 5m fibre optic cables.
Follow this procedure when collecting CMP data:
1) Conduct a CMP survey after the reflection survey lines have been collected in the area
because it is best to identify a location with at least one strong, flat-lying reflector.
2) Place a tape measure (Section 10.2: P117) on the ground in the direction that the antennas will
be expanded about the central point. Try to make the central point correspond to a round
number on the tape measure, i.e. 5m, 10m, 20 feet, so that moving the antennas to the new
location for each trace is easy for the operators.
3) Set the antennas on the ground at the usual antenna separation distance for the selected
frequency (Section 3.2.4: P37). The antennas should be centred on the central point.
6-Surveying Techniques pulseEKKO PRO
92
4) Place the DVL and control module between the antennas but off to the side.
5) On the DVL, under Survey Parameters, set the Survey Type to CMP/WARR (Section 3.4.5:
P51).
6) Under Survey Parameters, set the Start Position value to the starting antenna separation
(Section 3.4.1: P50).
7) Set the Step Size (Section 3.2.5: P38) to double the amount that each antenna will move.
Typically, the step size will be similar to the step size recommended for the frequency of the
antenna being used but, if necessary, round the number down to a number that is easily
divisible by two. For example, the normal step size for 100 MHz antennas is 0.25m but moving
each antenna 0.125m for a CMP is difficult, so in this case, it is better to set the step size to
0.2m and move each antenna 0.1m for the collection of each trace. The point is that CMP
collection is fast, so make small steps.
8) There are several options to trigger the collection of each trace (Section 3.3.1.1: P43). If a third
person is available for data acquisition, set the system in CANBUS trigger mode and have one
person on each antenna and the third person at the DVL pressing the electrical trigger at each
collection point. With two people and a fibre optic trigger, put the system in Fibre Optic trigger
mode and have the person with the transmitting antenna control the data acquisition. The third
option with two people (or even one person) is to set the system in Free Run mode (Section
3.3.1.3: P43) so data collection occurs based on time and put a 2-5 second (or longer) delay
between traces (Section 3.3.3: P44) to allow the operators to move the antennas to the new
locations.
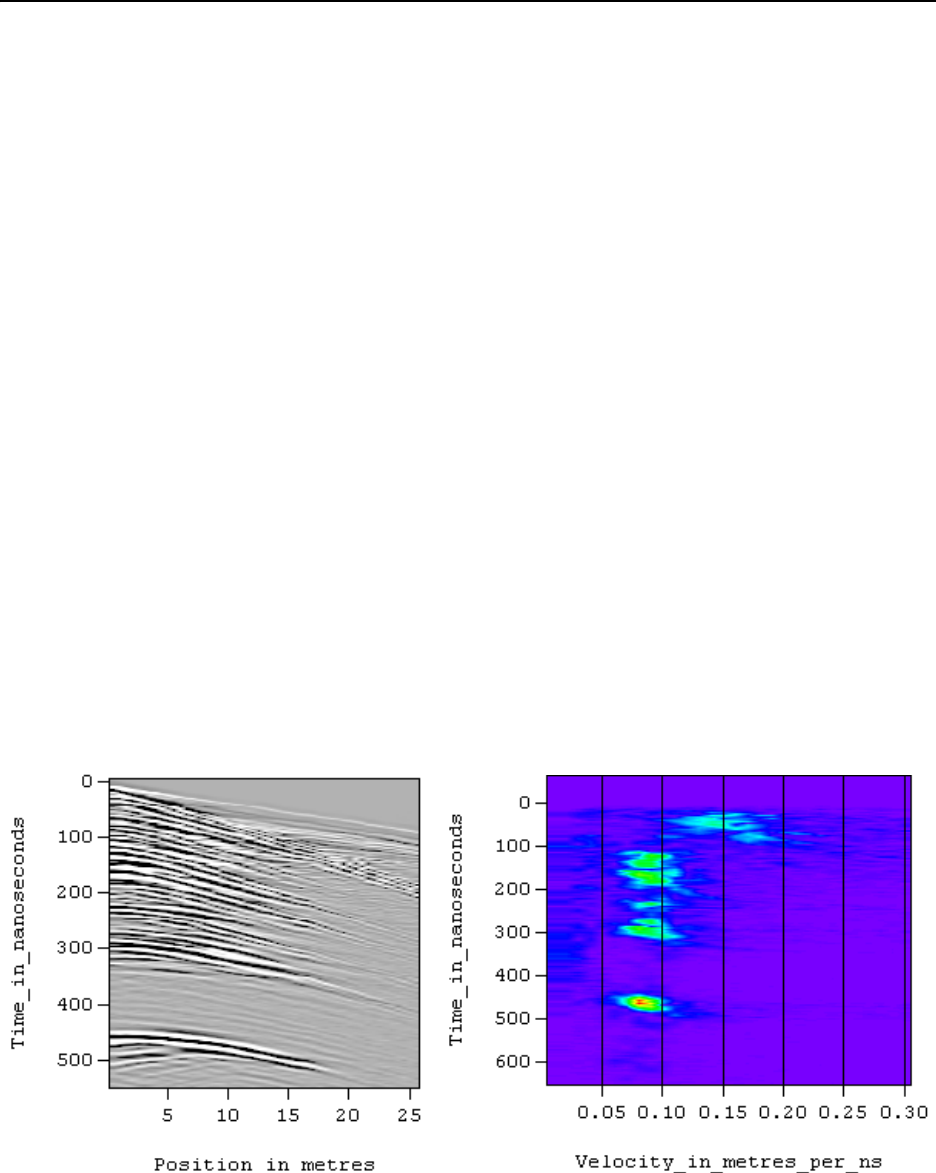
9) CMP data collection should continue until the amplitude of the reflections is very weak or down
to the noise level in the data, Figure 6-11 is a good example.
Figure 6-11: CMP survey data (left) can be processed to produce an average velocity section (right) that shows high amplitudes
(bulls-eyes) indicating the average velocity to each reflector.
pulseEKKO PRO 6-Surveying Techniques
93
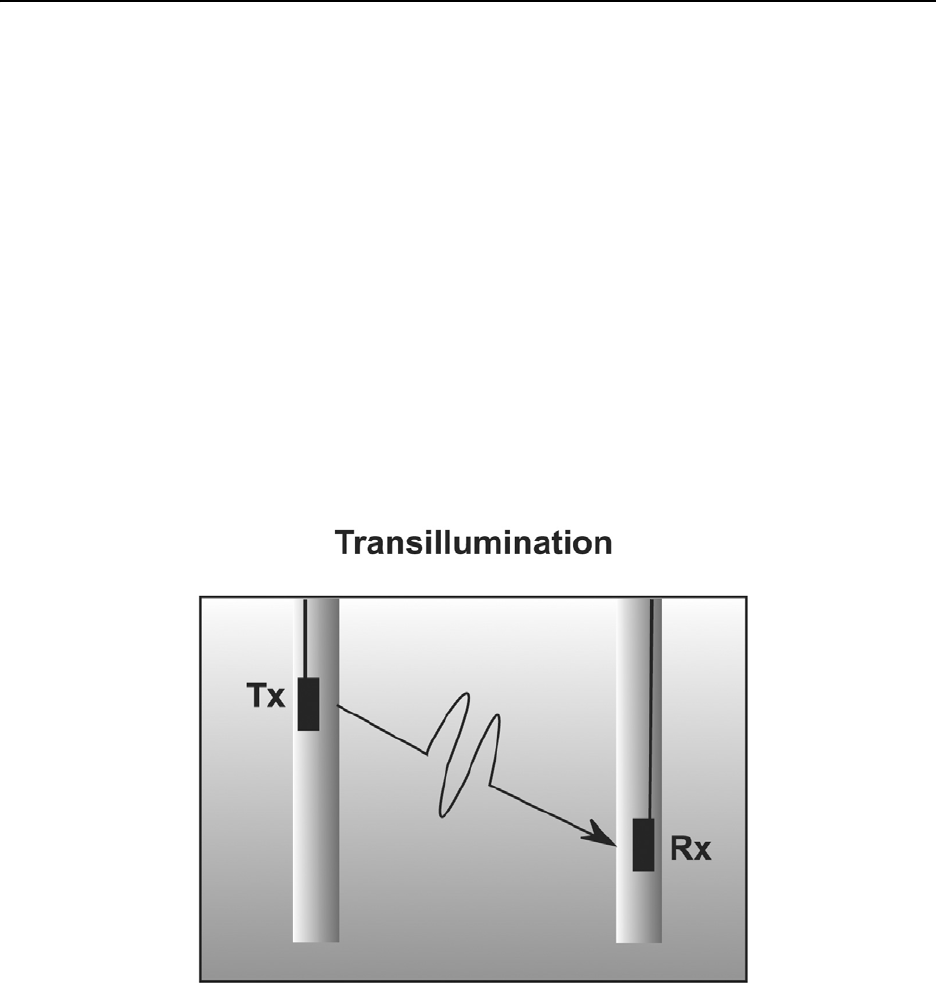
6.12 Transillumination Surveys
For a transillumination survey the transmitter and receiving antennas are placed at opposite sides of a
structure to study the transmission properties of the dividing material. Depending on the structure shape, it
is desirable to obtain as many different raypaths through the structure as possible. This is achieved by
varying the transmitter and receiver geometry around the structure.
Users must keep systematic notes on antenna positions for each trace collected. Operation is best done in
Line mode (Section 5: P69) with a trigger used to initiate trace acquisition once the transmitter and receiver
are properly positioned.
6.12.1 Borehole GPR
The most common type of transillumination survey is cross hole GPR conducted between boreholes
(Figure 6-12) or from a borehole to the surface. This type of survey requires the use of borehole antennas
(Figure 6-13).
Figure 6-12: Cross hole transillumination surveys send signal from the transmitting antenna in one borehole to the receiving
antenna in another borehole. If this is done with the antennas at many different positions to collect data at many different raypaths
between the boreholes, travel times, amplitude variations and signal period changes can be analyzed to produce images of veloc-
ity, attenuation and dispersion.
6-Surveying Techniques pulseEKKO PRO
94
Figure 6-13: Cross hole transillumination surveys with the pulseEKKO PRO system require the use of 50, 100 or 200 MHz bore-
hole antennas available from Sensors & Software.
6.12.2 Walls, Pillars and Monument Surveys
Another type of transillumination survey uses the surface antennas to send signals through a structure like
a wall, pillar or monument.
Figure 6-14: Transillumination survey setup. With a transillumination survey, the GPR signal is sent from the transmitter directly
to the receiver after it has passed through a structure. The DVL is centrally located and data acquisition is controlled by either
triggering the system with the electrical or fibre optic beeper/trigger or using Free Run mode with a time delay between traces.
pulseEKKO PRO 7-Troubleshooting
95
7 Troubleshooting
The pulseEKKO PRO system is designed to minimize user problems; however, all electronic devices are
subject to possible failure. The following are troubleshooting hints if your system fails to operate.
If the radar is not running properly, an error message will be displayed indicating the possible cause of the
problem (Figure 7-1).
Figure 7-1: During system initialization or at any time, error messages on the screen indicate where the problem may have
occurred.
To narrow down where the problem is, it may be necessary to change the Display Info Mode to the more
detailed level (Section 3.6.4: P64).
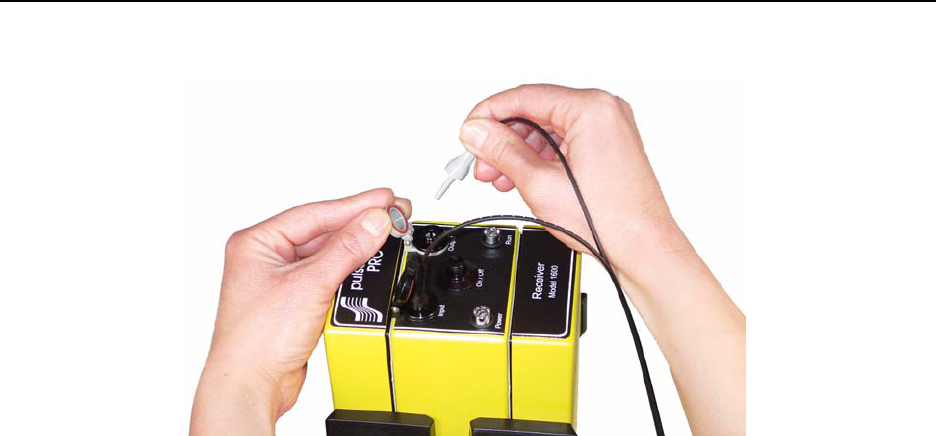
Check Connections: If a problem occurs during system initialization, the first step is to check the
connections. Make sure that cable connections are tight and fibre optic cables are connected correctly with
the strain relief colour matching the receptacle door colour (Figure 7-2) and that they have “clicked” into
place. A common error when the fibre optic beeper/trigger is used with the system is to connect the short
fibre optic cable incorrectly (See Figure 2-29 on page 22).
Also, ensure that the software settings for the transmitter are correct for the transmitter that you are using
with the system (Section 3.2.8: P41).
7-Troubleshooting pulseEKKO PRO
96
Figure 7-2: Make sure fibre optic strain relief colour matches the receptacle door colour (grey to grey and black to black).
Reset the System by Powering Down: If the connections are OK but the error persists, try powering
down the system completely. This power down will include turning off the DVL and Control module as well
as the transmitter and receiver and fibre optic beeper/trigger (if present). Then power everything back on
and see if the system runs.
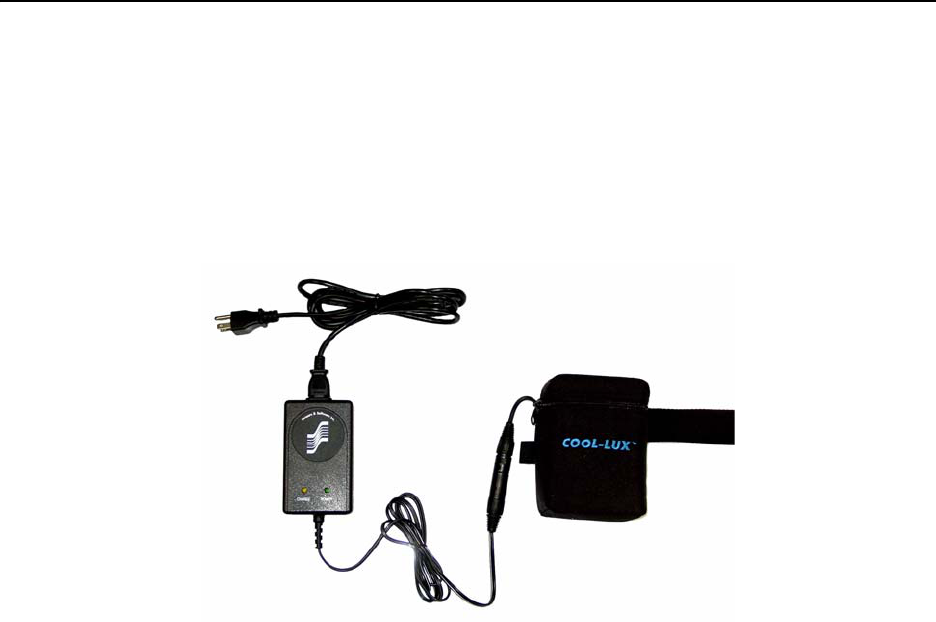
7.1 Power Supply
Another common problem that can occur while trying to run a system is insufficient power. The battery
may be dead or have a low voltage. If the system is being run from AC, there may be a problem with the
AC power supply or adapter.
7.1.1 DVL and Control Module Power Requirements
The DVL and pulseEKKO PRO control module are designed to operate from a 12 volt DC, 3 to 4 amp
source such as batteries or power supply (See Figure 2-34 on page 25). The input voltage tolerance is
10.2 volts to 15 volts. The standard belt battery supplied with the system (See Figure 2-34 on page 25) is a
7 Amp-hr. battery that should power the DVL and the control module for approximately 8 hours.
If there is enough power to run the DVL, the upper red LED on the front of the DVL will light up when the
battery is plugged into the system. If this light is on and the DVL boots up, runs and displays the main
menu then there is sufficient power for the DVL.
The control module is only powered when data collection begins so there needs to be sufficient power in
the battery for the control module.
If the DVL turns on, the voltage of the battery can be monitored from the main menu (See Figure 2-36 on
page 27).
If the battery voltage is less than about 10.2 volts, the DVL may not turn on and the upper red LED will
flash or not illuminate.
pulseEKKO PRO 7-Troubleshooting
97
Check the battery voltage with a voltmeter. Try to do this while the battery is still attached to the DVL and
control module to get a true measure of the voltage while under load (it may be necessary to open the
battery case or belt battery case and connect the voltmeter to the positive and negative battery terminals).
If the battery has a low voltage or seems dead, try the system with another battery (if available), or give the
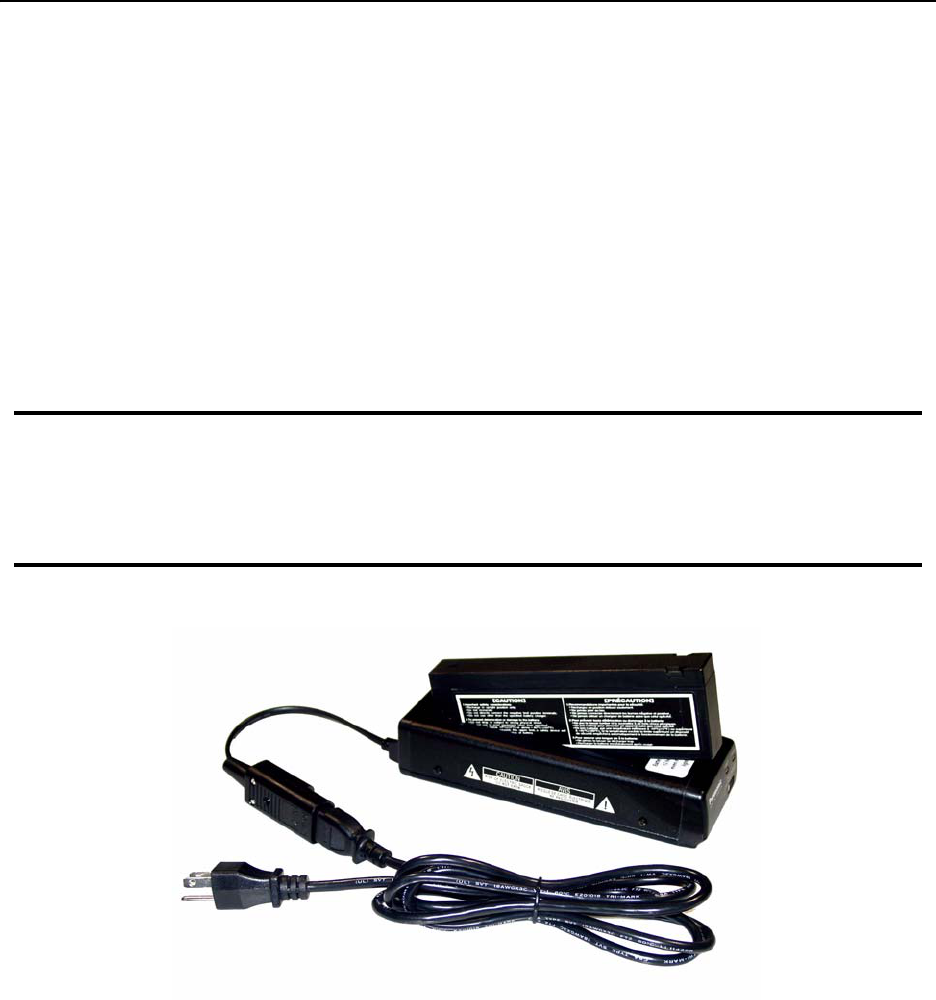
battery a good 12-14 hour charge (Figure 7-3) and try running the system again.
If the battery does not charge up to 12 Volts or more, it should be replaced.
Figure 7-3: Belt battery (right) used to power the DVL and Control Module. The battery charger is shown on the left.
Smart System batteries are fused to protect the system. For the belt battery, remove the battery from
padded casing and check the 5 Amp fuse. Replace the fuse if necessary. For the larger SmartCart battery,
open the battery case and check that the 10 Amp fuse is OK. If necessary, replace it with one of the spare
fuses available inside the battery case.
7.1.2 Transducer Power Requirements
The pulseEKKO PRO high frequency transducers (See Figure 2-19 on page 14) do not require separate
batteries for their operation. They are powered by the same 12 V battery that powers the DVL and Control
Module (see above). Power is sent to the transducers through the transducer cables.
7.1.3 Transmitter and Receiver Power Requirements
The pulseEKKO PRO receiver and transmitter both use two 12-volt sealed lead acid batteries. The
transmitter will, under normal conditions, run for about 4 hours or more on a pair of 2.3 AH batteries. The
receiver should run about twice that long on a pair of batteries.
If they are maintained in a charged condition they will give long life and reliable service. Improper use and
maintenance will greatly reduce their life.
Sealed lead acid batteries should NEVER be left in a discharged condition for any period of time. Charge
the batteries as soon as possible after use (Figure 7-4).
Charge batteries at room temperature whenever possible.
7-Troubleshooting pulseEKKO PRO
98
The receiver and transmitter contain a voltage monitoring circuit that will cause the Power LED on top of
the units to slowly flash when the battery voltage is getting low. When this occurs, batteries should be
replaced as soon as possible. If the batteries are not replaced and the voltage continues to drop, the unit
will eventually turn off.
If the voltage of the discharged batteries is measured some time after they have been changed it will be
higher than 10.2 volts (this is normal). Do not mix charged and discharged batteries and DO NOT attempt
to use discharged batteries a second time.
If a battery has been deeply discharged or left in a discharged condition for some period of time it may not
accept charge immediately when it is connected to the charger (the fast charge LED will not light). If the
fast charge light does not come on within 6 hours the battery should be considered damaged and
discarded.
Do not assume that a battery that is still charging after 8 hours is nearing the end of its
charge cycle. Typical charging time for an empty battery is 12 hours from start of fast
charge. When charging a depleted battery it is normal for the charge light to go out after
6-8 hours. The charger has gone into trickle mode only and the battery must remain in the
charger for the minimum 12 hours required.
Figure 7-4: Battery charger for the transmitter and receiver batteries.
Ensure that the batteries are fully charged before storing. If practical, store the batteries in a cool place, 10
C (a refrigerator is ideal), but make sure the temperature is not likely to drop below -30 C or the electrolyte
may freeze and possibly split the case.
7.1.4 Testing Transmitter and Receiver Batteries
If you are experiencing reduced operation time with either your pulseEKKO PRO Receiver or Transmitter
the problem will be the result of a damaged 12 V battery or a poor battery connection in one of the battery
compartments.
pulseEKKO PRO 7-Troubleshooting
99
All battery compartments should be checked periodically for proper operation. Take a known good pair of
batteries and install into the battery compartments. Ensure the power light activates with no intermittent
operation. If the power light will not activate look in the battery compartment and check the battery contact
for signs of excessive stress. Also check the condition of the 2A fuse wiring. If the problem persists,
remove the six screws holding the battery plate in place and lift upwards. On the bottom of the battery
plate you will see a small circuit board that extends the battery input to the power switch. Check the
connections to and from this board. Please contact Sensors & Software Inc. should all the above fail to
resolve the problem.
7.2 Testing Fibre Optic Cables
When troubleshooting problems with the system, error messages may indicate a problem with the
transmitter or receiver. Since the transmitter and receiver communicate with the control module using fibre
optic cables, it is possible that the problem may be because of damage to the fibre optic cables. Use the
fibre optic testing routine under System Setup - Acquisition Control - Fibre Optic Testing to test cables.
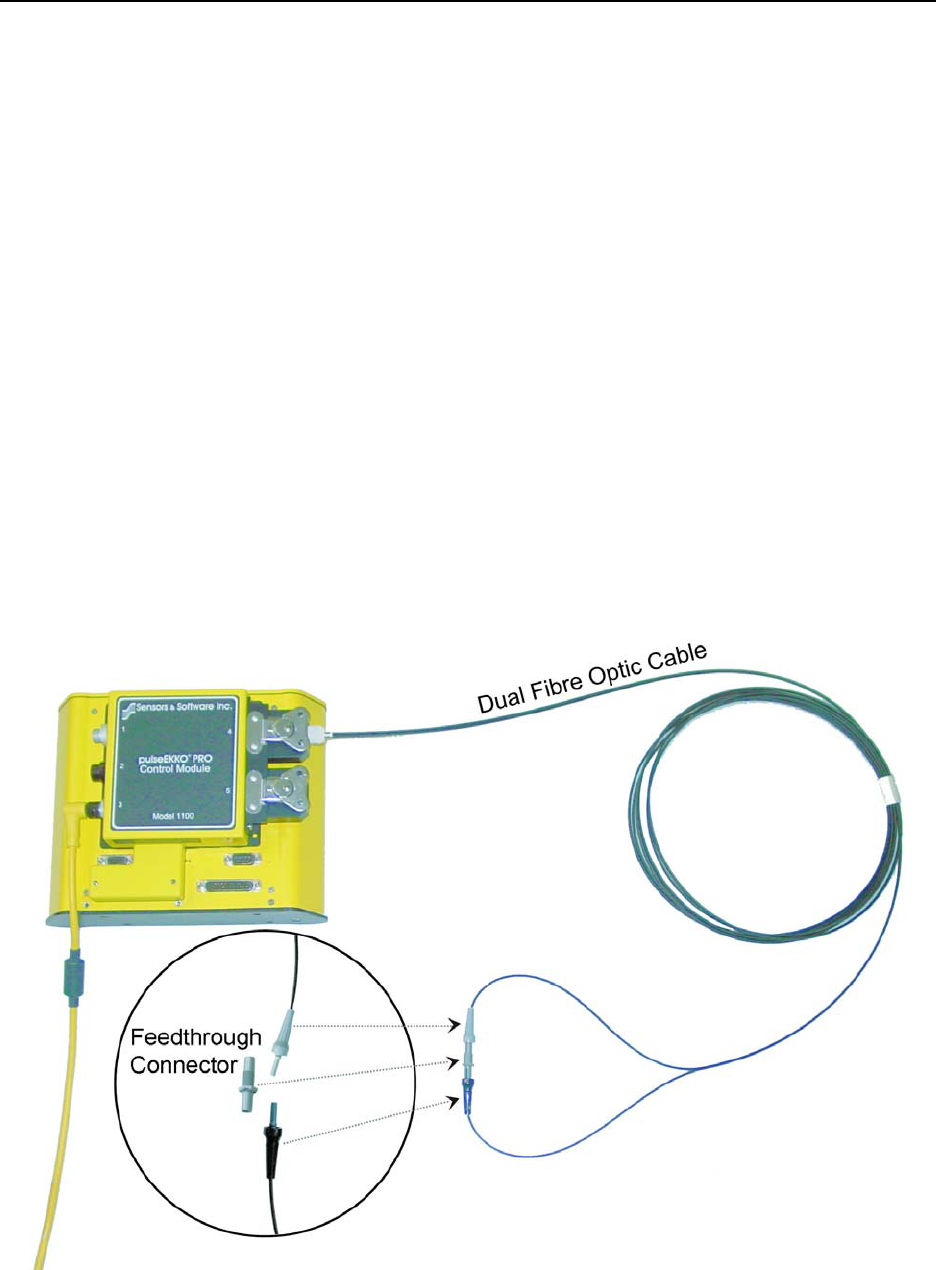
Setup the fibre optic cable as shown in Figure 7-5. The feedthrough connector located in the spare parts kit
(See Figure 9-1 on page 111). During the test, gently move the cable around, especially near the
connectors, to see if a failure occurs. If the cable fails at any time, even once, it should be repaired or
replaced. If the cable is going to be repaired, it is necessary to find the point of damage and cut the cable
off at this point. Then look at the section on repairing fibre optic cables (Section 9.6: P113).
Figure 7-5: Setup for fibre optic cable testing. Make sure that the cable is plugged into the control module receptacle number 4
and the loose ends of the cable are connected together using the feedthrough connector.
7-Troubleshooting pulseEKKO PRO
100
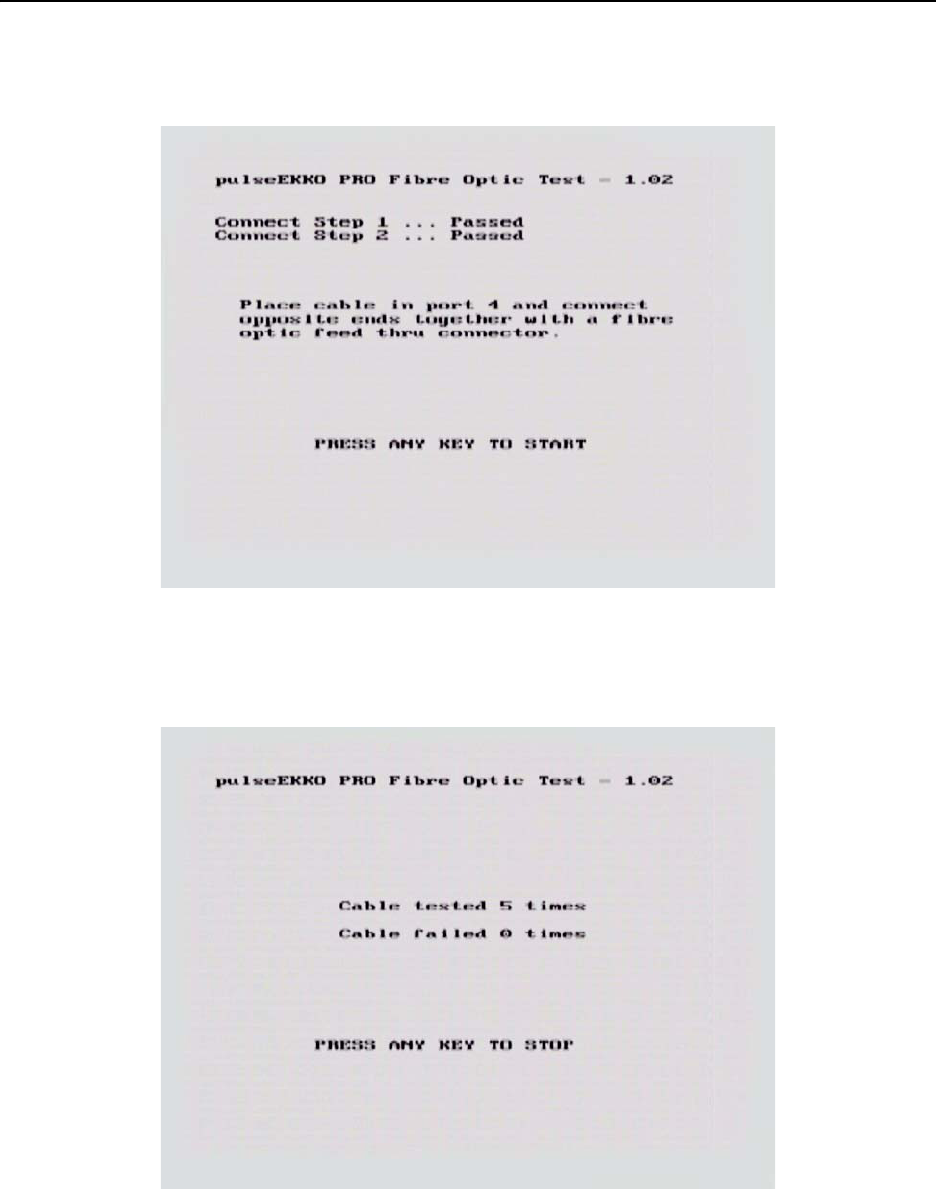
Figure 7-6: After connecting the fibre optic cable as shown in Figure 7-5, select System Setup - Acquisition Control - Fibre Optic
Testing.
Figure 7-7: The fibre optic test routine will continuously test the cable. During the tests, gently move the cable around, especially
near the connectors, to see if a failure occurs. If so, repair or replace the fibre optic cable.

pulseEKKO PRO 7-Troubleshooting
101
7.3 Control Module Related Errors
Control Module related errors are generated whenever the DVL fails to communicate with the control
module for any reason.
The most common causes of these errors are the following:
a) Control Module-to-DVL connection is loose or faulty.
b) The Control Module is damaged.
The following checks should be carried out.
a) With the system completely hooked up turn the DVL and control module OFF then back ON
again and retry the system.
b) If you are still having problems running the radar system, the problem is either with the control
module itself or the DVL. The control module or DVL may need factory service.
7.4 Receiver Related Errors
If a receiver error is encountered, check that the receiver is turned on, that the batteries for the receiver are
properly charged and that the receiver to control module fibre optic cable is not damaged and is properly
connected.
Perform the following checks:
1) Check that the red POWER light on the top of the receiver is ON. If not, then press the ON/
OFF switch once to see if the light comes ON. If it does, retry the system to see if it will run. If
the red POWER light still does not light up or flashes, check to make sure the batteries are fully
charged.
2) Check the condition of the fibre optic cables. Look for any sign of stress or damage. Replace,
if possible.
If neither of the above solutions solve the problem, contact Sensors & Software Inc.
7.5 Transmitter Problem: No Signal on Screen
In Scope mode try the Auto timezero search. Keep the antennas about one antenna length apart.
If the pulse still cannot be found do the following checks:
1) Make sure the transmitter batteries are properly charged and connected.
2) Check the condition of the single fibre optic cable to the transmitter, looking for any signs of
stress or damage. Replace or repair if needed.
3) Check that the brass antenna sockets in the bottom of the transmitter and receiver and that the
brass antenna pins in the top of the antennas are properly tightened. Also check that there is a
good contact between them.

7-Troubleshooting pulseEKKO PRO
102
4) With the system running, find the fibre optic cable from the transmitter and disconnect it at the
control module and look for a red light coming from the top hole in the control module. Plug this
cable back in and unplug the Input (black) cable at the transmitter. Check for a red light coming
from the cable.
If the signal is still not found, contact Sensors & Software Inc. (Section 7.10: P103).
7.6 System Overheating
The pulseEKKO PRO system is designed to operate to a maximum internal temperature of 70 C or 158 F.
In situations of high ambient temperatures or long exposure to direct sun, this maximum internal
temperature may be exceeded and cause the system to fail. While the temperature displayed on the DVL
in the lower left corner of the main menu indicates the internal temperature of the DVL and not the GPR
system, this temperature should give an idea of whether the pulseEKKO PRO transmitter and receiver are
overheating.
If you suspect that the system is overheating, shut it off and give it a chance to cool down in a shady
location before trying to run it again.
If the situation is such that the high temperatures or direct sun cannot be avoided, it may be a good idea to
put some sort of shade over the system.
Contact Sensors & Software Inc. if the problem persists as there may be defective electronic components
that need to be replaced (Section 7.10: P103).
7.7 DVL Problem
While the DVL has been ruggedized as much as possible, it should be handled in much the same way a
notebook computer is. If the DVL does not power up and boot up, there may be a problem with the CPU or
the storage media. If this occurs, contact Sensors & Software Inc. (Section 7.10: P103).
If, when trying to run the radar system, you are getting a consistent control module error and none of the
suggestions under Control Module Errors have worked, the problem may be DVL related.
7.8 Timezero Jitter
If the first break is shifting up and down as shown below:
Figure 7-8: Time zero jitter is caused by damaged fibre optic cables.

pulseEKKO PRO 7-Troubleshooting
103
This is an indication that the fibre optic cables are damaged. Check all cables (Section 7.2: P99) and
replace or repair. There are also short fibre optic cables located inside the transmitter and receiver that
may be causing the problem (see item K in Figure 9-1). Before attempting to clean or replace these cables,
contact Sensors & Software (see below).
7.9 System Runs But Data Does Not Look Right
There may be cases when the system does not actually fail and cause error messages but the data being
collected does not seem “right”, because of perhaps excess noise, banding or very weak signals. The best
way to determine whether the strange data is a result of local conditions in the survey area or real problem
with the system is to, shortly after receiving the system and periodically afterwards, collect a test line of
data at a designated location (Section 6.9: P90). Then, suspected system problems can be confirmed or
dismissed by collecting data on the test line and comparing it to earlier data collected along the same line.
7.10 Contacting Sensors & Software Inc.
If you develop problems with your GPR system, contact your agent or Sensors & Software Inc.
Sensors & Software Inc.’s hours of operation are 9:00 AM to 5:00 PM Eastern Standard Time, Monday to
Friday. You can contact Sensors & Software Inc. at:
Sensors & Software Inc.
1040 Stacey Court
Mississauga, Ontario
Canada L4W 2X8
Tel: (905) 624-8909
Fax: (905) 624-9365
E-mail: sales@sensoft.ca
When contacting Sensors & Software Inc., please have the following information available:
DVL, Control Module, Transmitter and Receiver Serial Numbers.
Version number of the data acquisition software.
The error number or message appearing.
A brief description of when the error is happening and the operating conditions (temperature, humidity,
sunshine, system and survey setup, etc.).
8-File Management pulseEKKO PRO
104
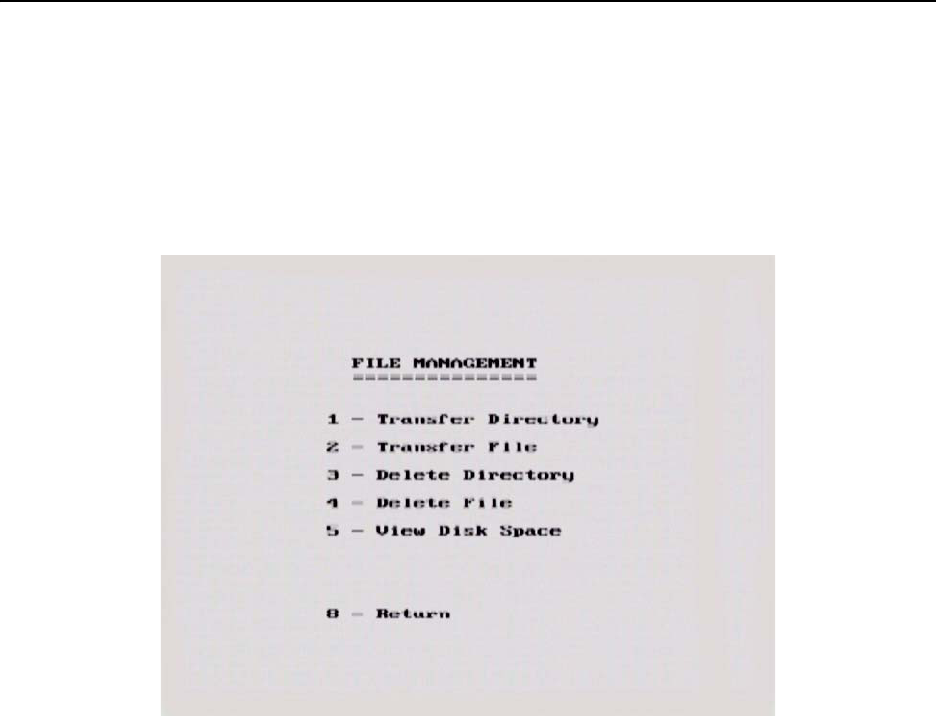
8 File Management
From the main menu (See Figure 2-36 on page 27), pressing the 2 button selects File Management.
GPR data directories and files collected on a DVL can be transferred to an external computer or deleted
from the DVL.
File Management Options 1 and 2 (Transfer Directory and Transfer File) require that the DVL be
connected to a PC to allow for data transfer.
pulseEKKO PRO 8-File Management
105
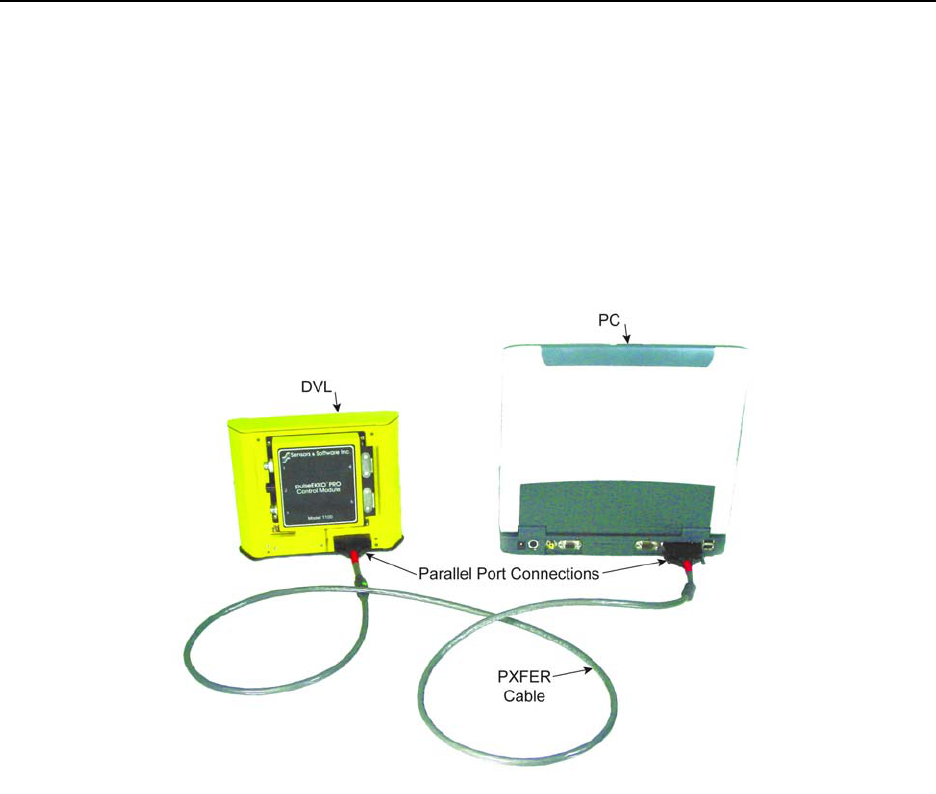
8.1 Connecting the DVL to a PC
To transfer all the data files in one directory from the DVL to an external computer, the computer must be
connected to the DVL using the special parallel PXFER cable that is supplied with the system (Figure 8-1).
Note that this is a special cable and standard 25 pin to 25 pin or Laplink cables will not work. As well, the
computer must have the utility program called WinPXFER running on it (Section 8.2 on page 106).
To transfer data from a DVL a cable called the parallel XFER (PXFER) cable is required. This cable is
designed to connect the DVL to an external computer.
Figure 8-1: Parallel PXFER cable connections
The 2 connections that must be made before attempting to transfer data are:
1) Attach the 25 socket parallel connector to the 25 socket parallel port on back of the Digital Video Logger,
and
2) Attach the 25 socket parallel connector the parallel port of the external computer.
WARNING: To avoid damaging any of the components, turn off the DVL and computer before making any
of these connections.
8-File Management pulseEKKO PRO
106
8.2 Installing and Running the WinPXFER Software on a PC
The system will come with a CD containing the WinPXFER software installation. This will be the
WinPXFER folder on the CD. Run the SETUP.EXE program to install WinPXFER. If necessary, refer to the
software installation document that came with the system. This same document in electronic format is in
the root folder of the CD.
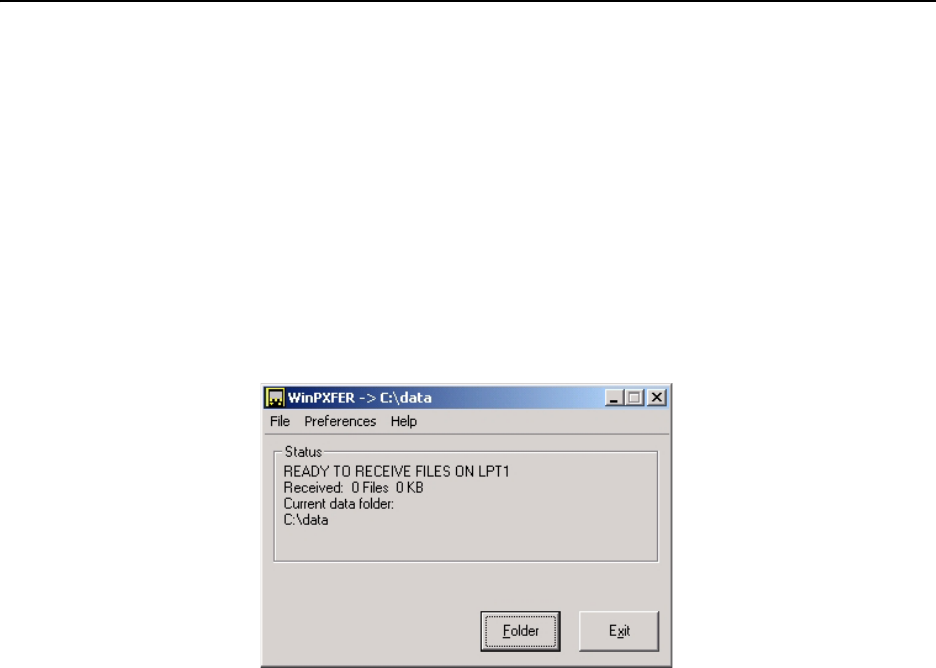
Once the WinPXFER program has been installed on the computer and the user is ready to transfer data to
the computer, the WinPXFER program needs to be run. Double-click the WinPXFER icon on the desktop
or go to Start - Program Files - Sensors & Software GPR - WinPXFER.
The first time that WinPXFER is run, it will install a driver.
Figure 8-2: The WinPXFER software needs to be installed on the PC that the GPR data files are to be transferred to. The main
WinPXFER screen is shown above. The user can use the Folder button to specify or create a folder to copy the GPR data into.
8.3 Transfer Directory
Once the parallel XFER cable is connected (Section 8.1 on page 105) and the WinPXFER software is
installed and running (Section 8.2 on page 106), it is now possible to transfer data to the external
computer.
On the DVL, from the File Management menu, press Transfer Directory.
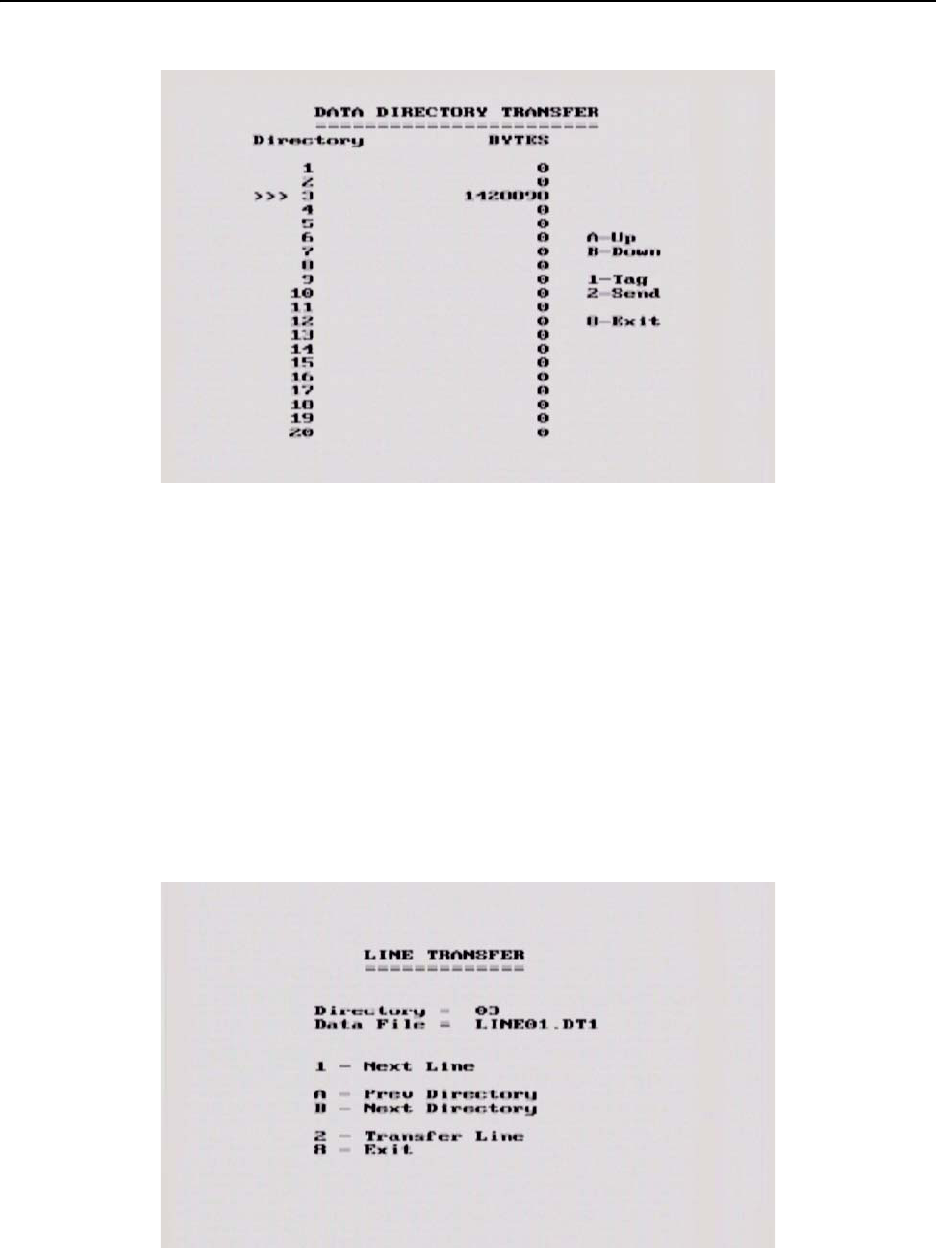
The next screen shows the number of bytes in all 20 available directories (Figure 8-3). Data directories are
selected by using the A and B (Up and Down) buttons to move the arrows (>>>) to the desired directory. To
transfer the directory to the PC, press the 2 (Send) button. It is also possible to use the 1 button to Tag
several directories so they can all be sent at once
The data will be transferred from the DVL to the computer and saved in the current folder listed by the
WinPXFER software. The progress of the data transfer will be displayed on the DVL screen and the
external computer.
When the data transfer is complete, exit from the WinPXFER program. Press any button on the DVL to
return to the main menu.
It is best to always copy data to a new folder on the PC. Since the data files are given set names like
LINE01, LINEX01, etc., existing data files in the folder on the PC will be overwritten by the new data files
being transferred without warning.
pulseEKKO PRO 8-File Management
107
Figure 8-3: Data Directory Transfer screen. The triple arrows (>>>) on the left indicates which directory is currently selected.
Use the A and B buttons to move the arrows up or down to different directories. To transfer the directory to the PC, press the 2
(Send) button. It is also possible to use the 1 button to Tag several directories so they can all be sent at once.
8.4 Transfer File
Once the parallel XFER cable is connected (Section 8.1 on page 105) and the WinPXFER software is
installed and running (Section 8.2 on page 106), it is now possible to transfer data to the external
computer.
To transfer an individual data file from the DVL to a PC, select Transfer File from the main File
Management menu. On the next screen (Figure 8-4), use the A and B button to select one of the 20
available directories, then use the 1 button (Next Line) to move through the data lines in the directory.
When the name of the data line to transfer appears, press 2 (Transfer Line) to send it to the PC.
Figure 8-4: Line Transfer screen. Use the A and B button to select one of the 20 available directories, then use the 1 button (Next
Line) to move through the data lines in the directory. When the name of the data line to transfer appears, press 2 (Transfer Line) to
send it to the PC.
8-File Management pulseEKKO PRO
108
The data will be transferred from the DVL to the computer and saved in the current folder listed by the
WinPXFER software. The progress of the data transfer will be displayed on the DVL screen and the
external computer.
When the data transfer is complete, exit from the WinPXFER program. Press any button on the DVL to
return to the main menu.
8.5 Delete Directory
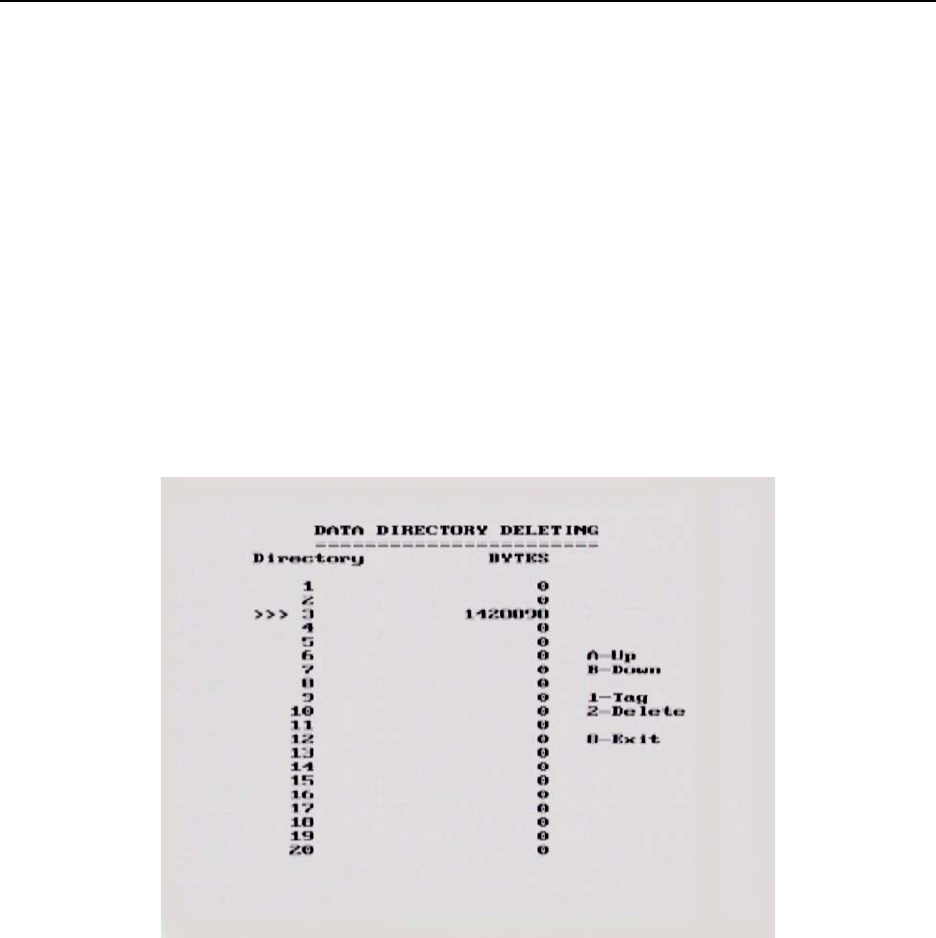
To delete the data in a directory on the DVL, from the File Management menu, press Delete Directory.
The next screen shows the number of bytes in all 20 available directories (Figure 8-5). Data directories are
selected by using the A and B (Up and Down) buttons to move the arrows (>>>) to the desired directory. To
delete the directory to the PC, press the 2 (Delete) button. It is also possible to use the 1 button to Tag
several directories so they can all be deleted at once
Figure 8-5: Data Directory Deleting screen. The triple arrows (>>>) on the left indicates which directory is currently selected.
Use the A and B buttons to move the arrows up or down to different directories. To delete the directory of data from the DVL, press
the 2 (Delete) button. It is also possible to use the 1 button to Tag several directories so they can all be deleted at once.
pulseEKKO PRO 8-File Management
109
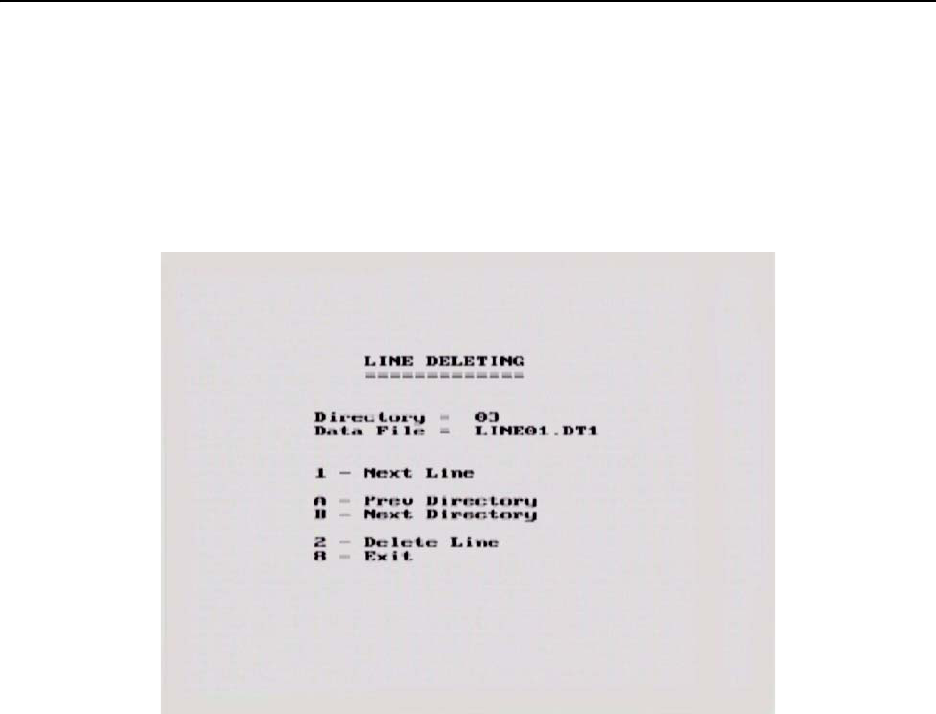
8.6 Delete File
To delete an individual data file from the DVL to a PC, select Delete File from the main File Management
menu. On the next screen (Figure 8-6), use the A and B button to select one of the 20 available directories,
then use the 1 button (Next Line) to move through the data lines in the directory. When the name of the
data line to transfer appears, press 2 (Transfer Line) to send it to the PC.
Figure 8-6: Line Delete screen. Use the A and B button to select one of the 20 available directories, then use the 1 button (Next
Line) to move through the data lines in the directory. When the name of the data line to transfer appears, press 2 (Delete Line) to
delete the line from the directory.
8-File Management pulseEKKO PRO
110
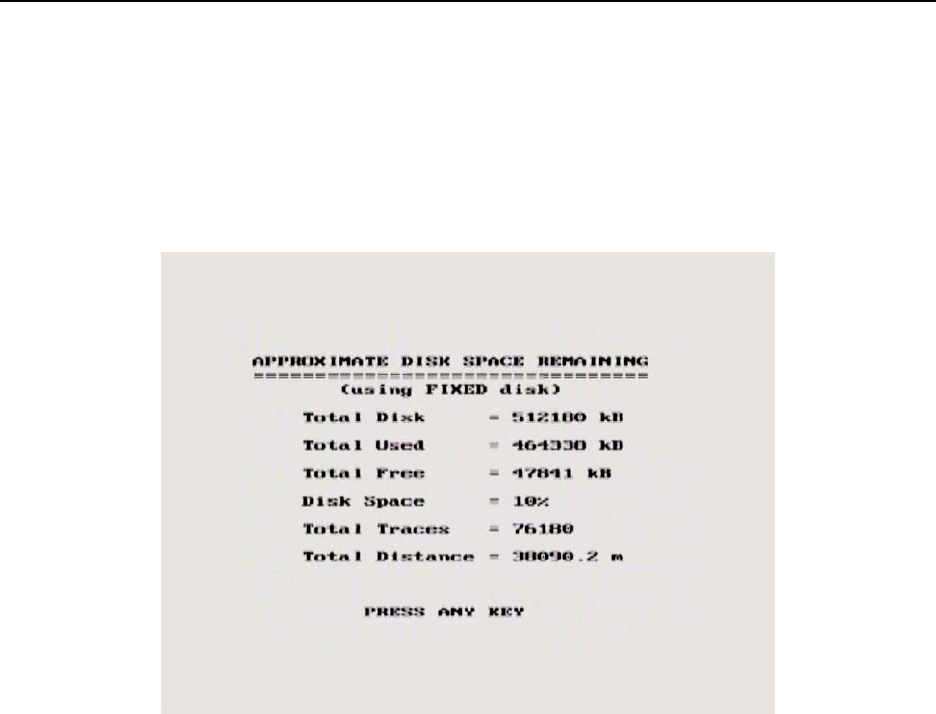
8.7 View Disk Space
The View Disk Space option allows the user to see how much disk space has been used and how much
remains. The remaining amount is expressed in kilobytes, as a percentage of the total disk space as well
as how many traces and how much distance this amount of space represents, based on the current
settings for time window, sampling interval and step size.
Figure 8-7: View Disk Space screen. The total amount of disk space remaining is expressed in kilobytes, a percentage of the total
disk space, number of traces and total distance. The last two values are calculated using the current setup parameters.
8.8 Viewing Data Files on the External PC
Once GPR data files have been transferred to a PC they can be edited, processed and plotted using other
software from Sensors & Software like EKKO_View, EKKO_Mapper and EKKO_3D. These programs are
available from Sensors & Software Inc.
pulseEKKO PRO 9-Care and Maintenance
111
9 Care and Maintenance
9.1 General
To operate the pulseEKKO PRO equipment in a geophysical field environment, the user should exercise
the normal care afforded other field instrumentation. Items that require specific maintenance procedures
are listed below together with detailed descriptions of the procedures.
All the equipment is ‘shower proof’ but will not tolerate total immersion. If the equipment is immersed in
water, open up the affected box, and dry it out before operating. If the equipment is operated in very humid
conditions, open up the boxes occasionally and allow the components to dry out.
The interior of the transmitter and receiver can become very hot very quickly if exposed to strong, direct
sunlight. High temperatures can affect system electronics and may lead to failures. If a suspected heat
failure does occur, stop the system and allow it to cool down before retrying.
The equipment is housed in heavy duty boxes and can withstand a reasonable amount of physical abuse.
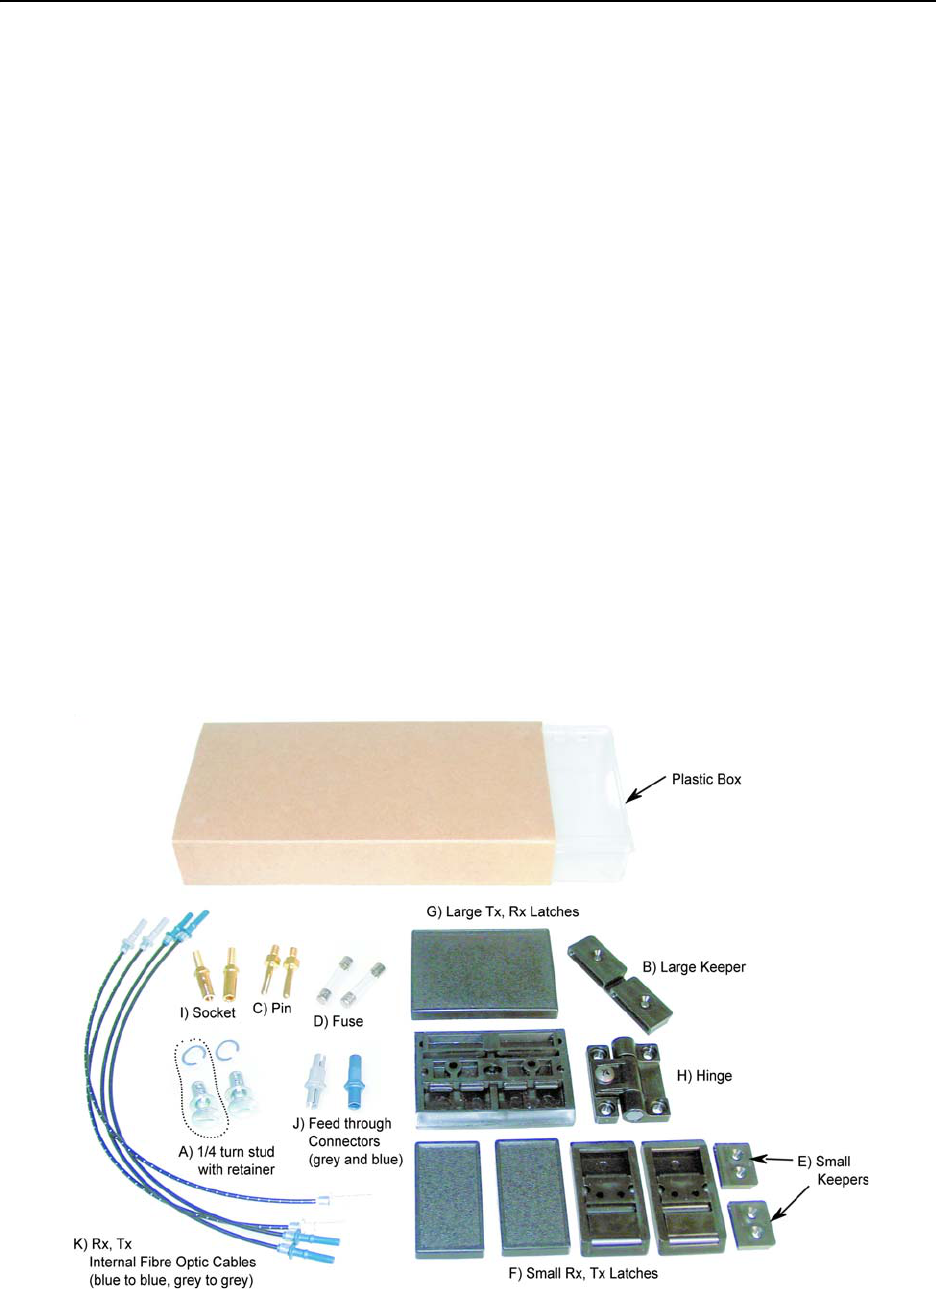
9.2 Electronic Spares
The low frequency pulseEKKO PRO system comes with spare parts for repairing latches, keepers, hinges
sockets and fuses on the transmitter and receiver, replacing pins on the antennas and quarter-turn studs
on the adjustable handles. The positions of most of the items pictured in Figure 9-1, are shown in Figure 9-
2.
Figure 9-1: Electronic spares kit.
9-Care and Maintenance pulseEKKO PRO
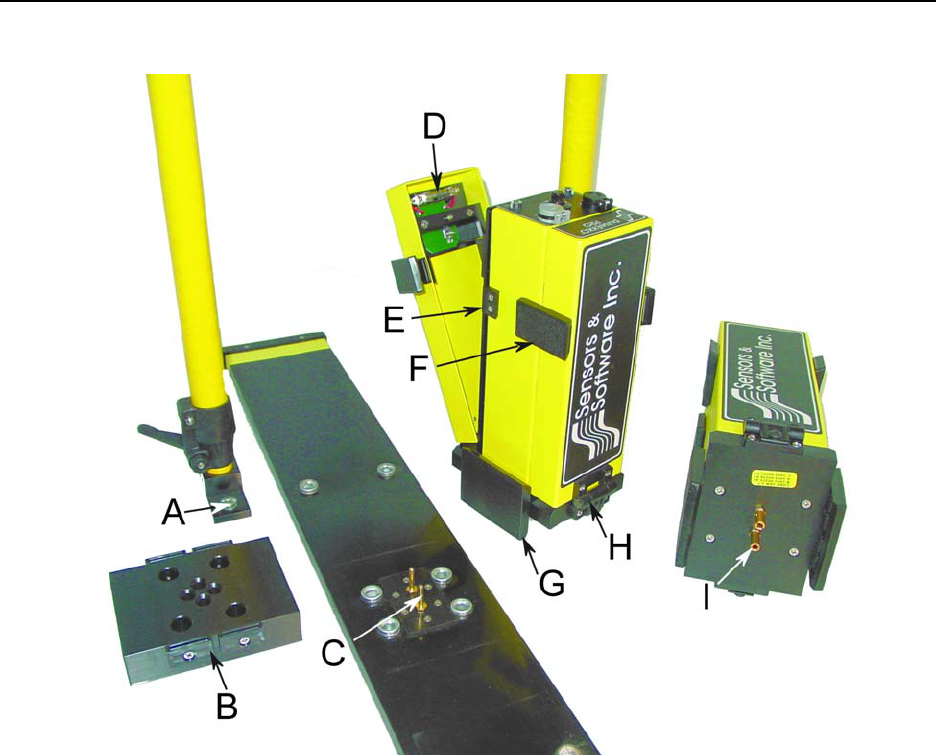
112
Figure 9-2: Location of spare parts shown in Figure 9-1.
9.3 Radar Unit
If operated in dusty conditions the control module, transmitter and receiver fibre optic sockets may become
dusty inside. In such conditions open the unit up on a regular basis and blow out or vacuum all the dust.
9.4 Antenna Electronics Connection Pins
Ensure that they are protected by leaving the antenna mounting block installed or by covering them with a
block of Styrofoam or, better still, removing them when transporting them.
9.5 Fibre Optics Cables
The fibre optic cables are the most fragile component in the system. They can be easily damaged by
misuse.
When handling the fibre optic cables always roll and unroll them as if they were on a spool. DO NOT roll
them around your arm like a rope or extension cord. Also, these cables do not twist, therefore laying the
roll on the ground and pulling the cable off will cause the cables to tangle.
pulseEKKO PRO 9-Care and Maintenance
113
Always push in and remove the cable by holding the strain relief jacket or the plastic end connector.
Pulling on the cable will loosen the crimp and damage the cable. After connecting the fibre optic cables to
the antenna electronic boxes, loosely loop the cable and tape off some slack onto the handles (Figure 6-3).
Most breaks occur right at the cable ends when they are accidentally pulled.
These cables can stand a great deal of abrasive wear but the user should avoid sharp bends in the cable,
pulling the cable at right angles close to the fibre optics connectors, or allowing the unprotected ends to get
dirty or scratched. Erratic timezero jumps usually indicate a cracked cable (Section 7.8: P102). If
problems are encountered with the fibre optics cables, repair is very straightforward and is outlined in detail
below. The best policy is to carry spares. Short fibre optic cables are located inside each of the units (see
item K in Figure 9-1). These short cables may need cleaning and polishing from time to time.
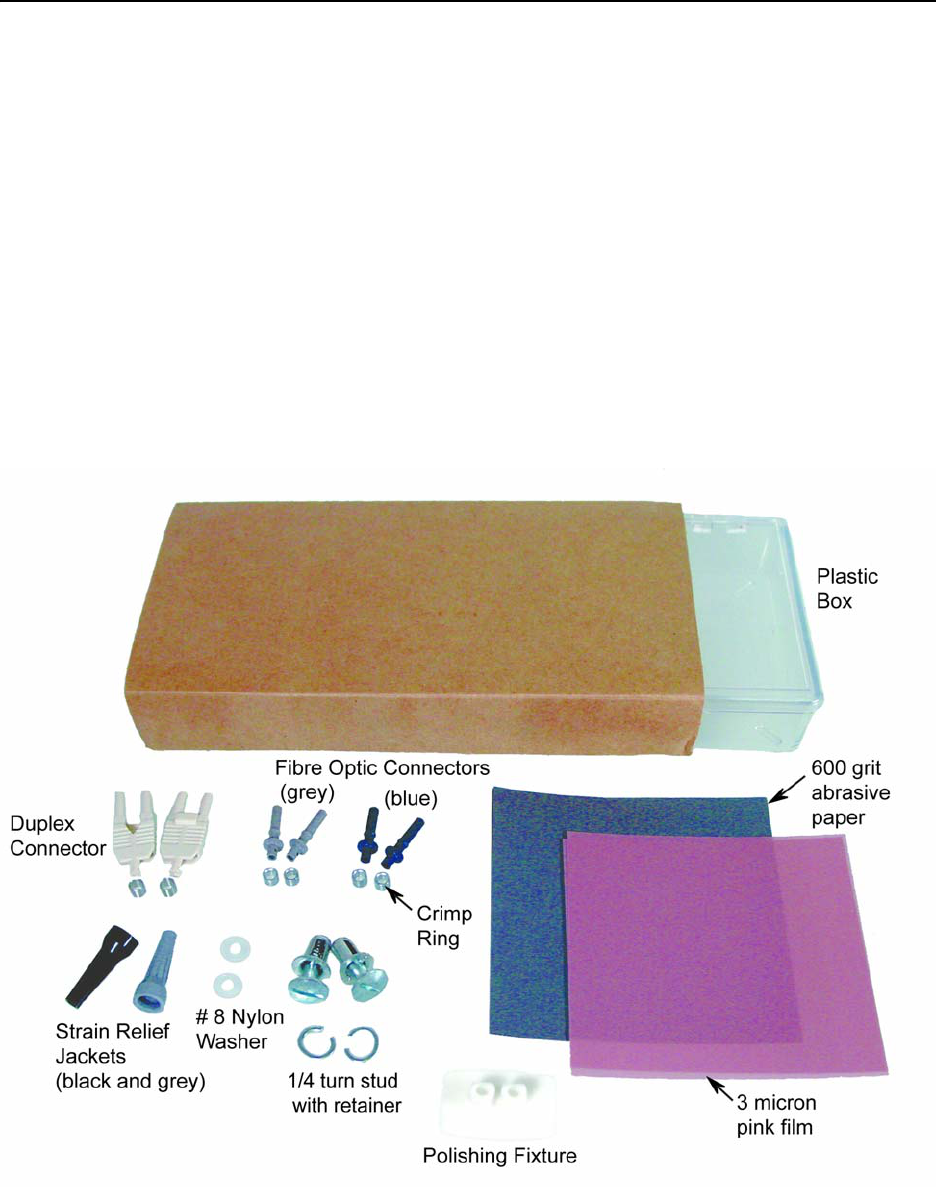
9.6 Fibre Optics Cable Repair
The low frequency pulseEKKO PRO comes with a fibre optic repair kit (Figure 9-3).
Figure 9-3: Fibre optic cable repair kit.
9-Care and Maintenance pulseEKKO PRO
114
The following procedure describes how to repair the fibre optics cables that link the pulseEKKO PRO unit
to the transmitter and receiver units. The procedure and materials used are described in the Hewlett-
Packard Opto-Electronic Data Book excerpts of which are provided in Appendix C: Excerpts from the HP
Fiber Optic Handbook.
Connecting the cable is accomplished using the polishing kit consisting of polishing fixture, 600 grit
abrasive paper and 3 micron pink lapping film. No adhesive material is needed to secure the cable and the
connector can be used immediately after polishing.
Connectors may be easily installed on the cable end with readily available tools. Materials needed for the
procedure are:
1) Fibre optic cable
2) Polishing Kit
3) Grey/Blue connector and crimp ring
4) Grey and black strain relief jackets
5) #8 nylon washers
6) Industrial razor blade or wire cutters (not supplied)
7) 16 gauge latching wire strippers (not supplied)
8) Crimp tool (not supplied but available from Sensors & Software)
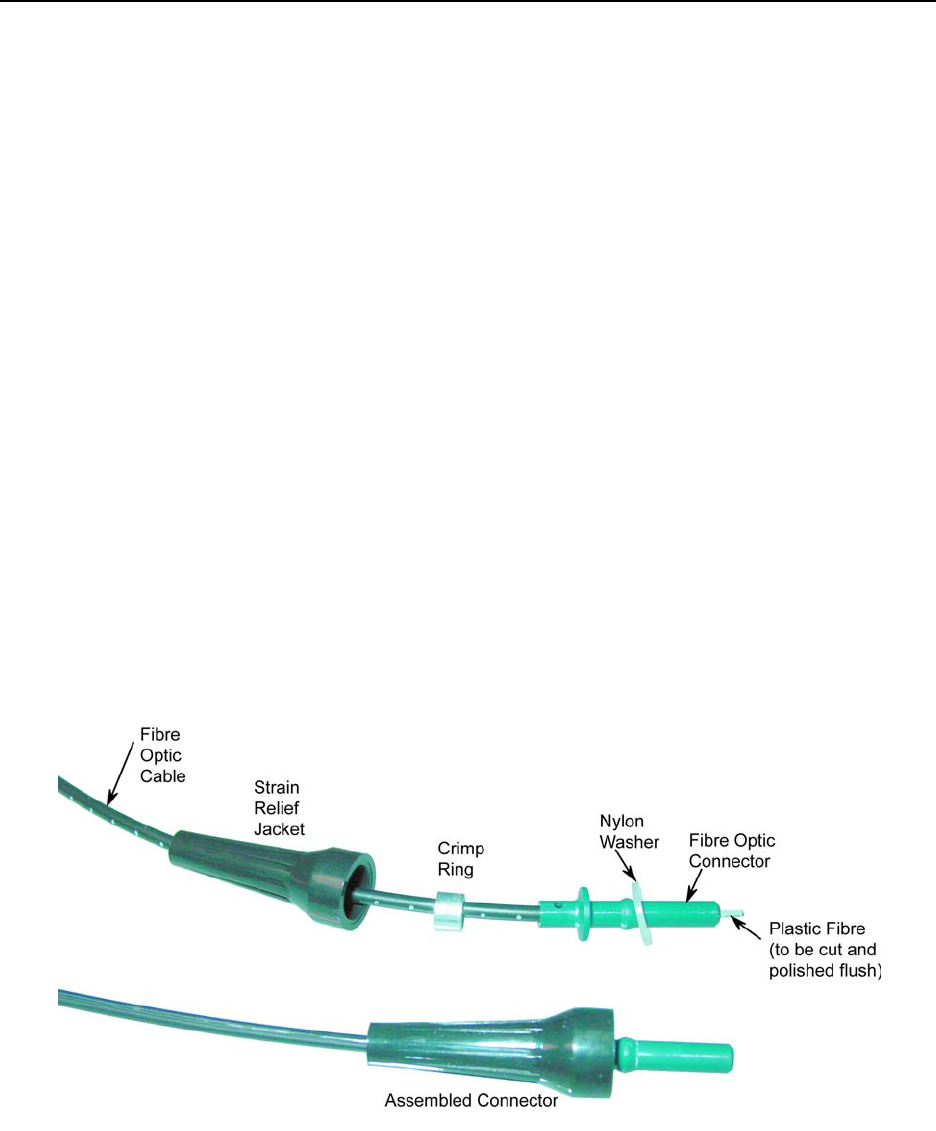
Figure 9-4: Assembling fibre optic connectors.
Step 1
If the duplex cable is being connected, split the two fibres 2 to 3 inches back from the ends.
Trim off any excess webbing and strip off about 0.3 inch (8 mm) of the outer jacket with the 16 gauge wire
strippers.

pulseEKKO PRO 9-Care and Maintenance
115
Step 2
Slide the two strain relief jackets over the fibres remembering that the blue fibre optic connector will
correspond with the black strain relief jacket and the grey fibre optic connector with the grey strain relief
jacket.
Step 3
Place the crimp ring and the connector over the end of the cable; the fibre should protrude about 0.12 inch
(3 mm) through the end of the connector. Carefully position the ring so that it is entirely on the connector
and then crimp the ring in place with the crimping tool.
NOTE: Place the grey connector on the cable end to be connected to the fibre optic output
(grey strain relief jacket) and the blue connector on the cable end to be connected to the
fibre optic input (black strain relief jacket) to maintain the color coding (both connectors
are the same mechanically).
Step 4
Slide one of the plastic washers provided in your pulseEKKO PRO spares kit over the fibre optic connector.
This washer will now be inserted into the strain relief jacket.
NOTE: You may also use #8 stainless steel flat washers should you run out of the nylon
ones. Being very careful not to damage or bend the cable, force the washer into the strain
relief jacket. You may find it useful to use a 3/16 inch nut driver to push the washer into
its strain relief jacket as the fibre optic connector will slide inside the driver and even
force can be applied to the washer.
Step 5
Any excess fibre protruding from the connector may be cut off; however the trimmed fibre should protrude
at least 0.04 inch (1 mm) from the connector end.
Insert the connector fully into the polishing fixture and the connector end protruding from the bottom of the
fixture.
NOTE: The four dots on the bottom of the fixture are wear indicators. Replace the fixture
when the dots are no longer visible.
Place the 600 grit abrasive paper on a flat smooth surface. Pressing down on the connector, polish the
fibre and the connector until the connector is flush with the end of the polishing fixture. Wipe the connector
and the fixture with a clean cloth or tissue.

9-Care and Maintenance pulseEKKO PRO
116
Step 6
Place the flush connector and the polishing fixture on the dull side of the 3 micron pink lapping film and
continue polishing the fibre and the connector for approximately 25 strokes. The fibre end should be flat,
smooth and clean.
The cable is now ready for use.

pulseEKKO PRO 10-Helpful Hints
117
10 Helpful Hints
10.1 Batteries
Replace batteries before they go dead. Nothing is more annoying than losing data in the middle of a
traverse. Carry plenty of spares.
10.2 Measuring Position
When performing a profile where the accuracy need only be accurate to the nearest metre, set the step
size equal to some fraction of your antenna spacing. On the rope used to hold the antennas at a fixed
spacing, mark the step size. Each time the antennas are moved mark the ground (take note of a mark or
feature) where the next antenna placement will be based on the mark on the string. For accurate
positioning a tape measure laid out on the survey line is most effective.
If a tape measure is being used make sure it is NOT metal or does NOT have a metal center. Some cloth
tape measures do have metal centers. Odd effects can appear in data when such measuring tapes are
used.
10.3 Data Files
Backup data often or at least at the end of each survey day.
10.4 Spares
When going out on a trip, make sure you have plenty of spares. It is much easier to carry a spare fibre
optic cable than try and repair one in the field. Remember fuses and a Philips screw driver. A volt/ohm
meter is also useful.

10-Helpful Hints pulseEKKO PRO
118

pulseEKKO PRO Appendix A: Data File Formats
A-1
Appendix A: Data File Formats
pulseEKKO Data File Format
HEADER (.HD) FILE:
The header file, identified by the file extension .HD, is an ASCII file. An example is shown below.
1234
Data Collected with pulseEKKO PRO
2005-01-12
NUMBER OF TRACES = 136
NUMBER OF PTS/TRC = 409
TIMEZERO AT POINT = 96
TOTAL TIME WINDOW = 327
STARTING POSITION = 9.500000
FINAL POSITION = 77.000000
STEP SIZE USED = 0.500000
POSITION UNITS = metres
NOMINAL FREQUENCY = 100.000000
ANTENNA SEPARATION = 1.000000
PULSER VOLTAGE (V) = 400
NUMBER OF STACKS = 128
SURVEY MODE = Reflection
DVL Serial# = 0000-0000-3333
Console Serial# = 0022-3009-0024
Transmitter Serial# = 0026-3171-0005
Receiver Serial# = 0025-3172-0004
It can be read and/or printed using any Word Processor.
DATA (.DT1) FILE:
The data file contains as many records as there are traces. Each record in turn consists of a header sec-
tion and a data section. The header section consists of an array of 25 real*4 numbers and a string of 28
characters which is used for annotation. The 25 element real array contains the following information:
Item # Description
1 Trace number
2 Position
3 Number of points per trace
4 Topographic data, if available
5 (not used)
6 # bytes/point (always 2 for Rev 3 firmware)
7 Time Window
8 # of stacks
9 Time window
9-10 reserved for GPS X position (double*8 number)
11-12 reserved for GPS Y position (double*8 number)
13-14 reserved for GPS Z position (double*8 number)
15 reserved for receiver x position
16 reserved for receiver y position
17 reserved for receiver z position
18 reserved for transmitter x position
19 reserved for transmitter y position
20 reserved for transmitter z position
21 timezero adjustment
where:point(x)= point(x+adjustment)

Appendix A: Data File Formats pulseEKKO PRO
A-2
22 Zero flag: 0 = data okay, 1=zero data
23 (not used)
24 Time of day data collected in seconds past midnight.
25 Comment flag: 1 = comment attached.
26 - 32 Comment
The data section consists of an array of two-byte integers, one value for every data point.
pulseEKKO PRO Appendix B: GPR Signal Processing Artifacts
B-1
Appendix B: GPR Signal Processing Artifacts
Wow
All GPR data has a low frequency component to it. The magnitude of the low frequency component and
how it manifests itself in the data depends on the ground conditions around the antennas and the distance
between the antennas. In general, the low frequency component of the radar signal does not propagate
but diffuses into the ground. In other words the lower end of the spectrum sees an inductive (eddy current)
type response as opposed to a propagating (displacement current) type response.
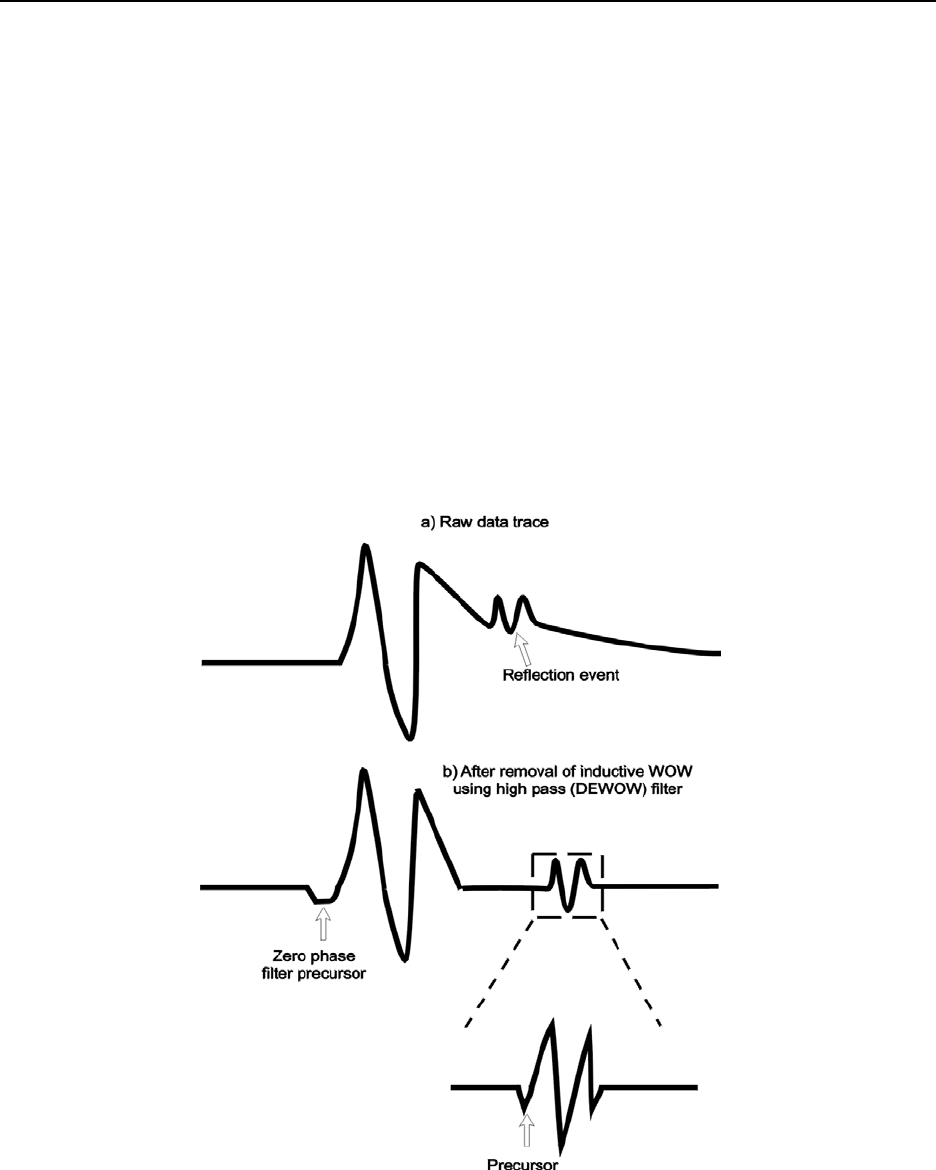
The result is that the large transmit pulse emitted by the radar can be followed by a slowly decaying
transient. This shown as a sketch in Figure B-1 (a) and in real data in Figure B-2. Various terms have been
applied to this decaying transient. In some instances it is referred to as wow; sometimes it is referred to as
system saturation recovery. These terms are historical in nature because the response was often
caused by system response characteristics rather than being a ground induced response.
Figure B-1: Effect of inductive WOW on GPR data.
Appendix B: GPR Signal Processing Artifacts pulseEKKO PRO
B-2
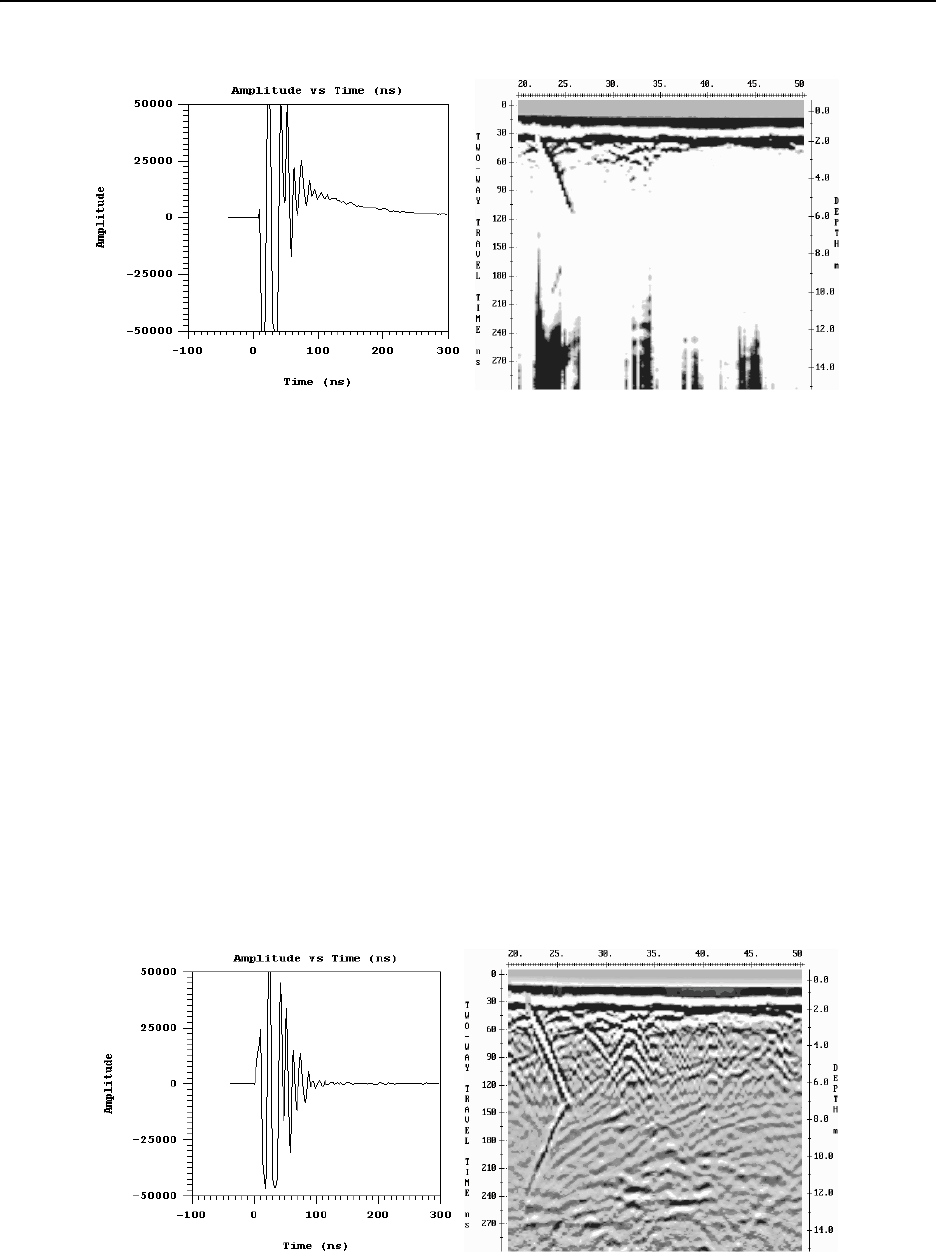
Figure B-2: Display of a single data trace (left) and data section (right) with the low frequency WOW component present. Com-
pare these plots to the figure below where the WOW has been removed with the DEWOW high pass filter.
Turn the DEWOW filter off to see this low frequency component of the data when plotting the data with
Windows-based software.
Dewow Filter
With this wow usually being present, it is common practice that GPR data is high pass (DEWOW) filtered.
DEWOW is a high pass filter optimized to pass the transmitted signal spectral peak for the specific antenna
center frequency with fidelity and suppress the low frequency wow in the data. The wow is removed from
the data by applying a running average filter on each trace. A window with a width the same as that of one
pulse width at the nominal frequency is set on the trace. The average value of all the points in this window
is calculated and subtracted from the central point. The window is then moved along the trace by one
point and the process is repeated.
In the initial software releases, this high pass filtering was integral to all of the plotting and display
programs. As a result the user was, in many situations, unaware of this wow or low frequency component
in the data. The raw recorded data, however, always retained this information.
Figure B-3: Display of a single data trace (left) and data section (right) where the Wow seen in the figure above has been
removed with the Dewow high pass filter.
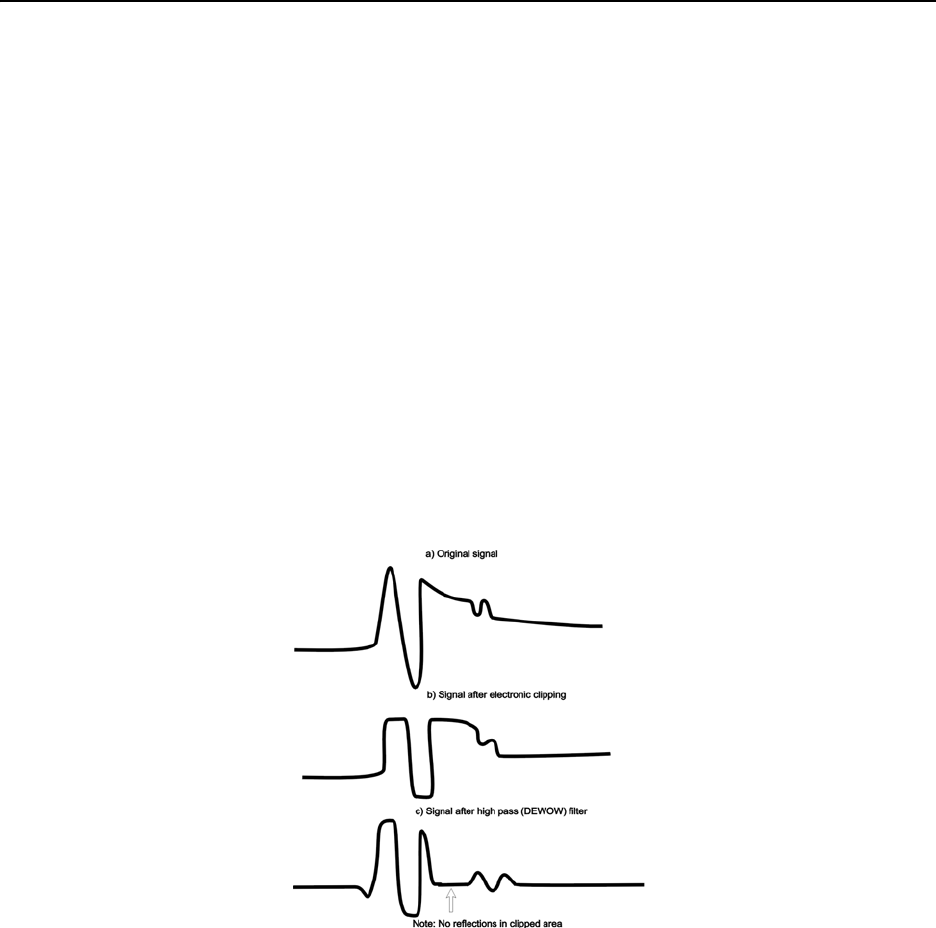
pulseEKKO PRO Appendix B: GPR Signal Processing Artifacts
B-3
Dewow Artifacts
1) Pulse Precursor
The result of high pass filtering can induce two types of artifacts into the plotted data sections. The first is
a pre-cursor to the onset of a pulse (Figure B-1 (b) and Figure B-3, left). When the original data are high
pass filtered the wavelet is stretched in time with additional oscillations occurring before and after the
original pulse. This is what gives rise to a pre-cursor in the data before time-zero when looking at the
plotted sections.
2) Clipping
The second artifact is caused by electronic clipping. The basic concept is depicted in Figure B-4a, b and c.
The original signal which is acquired by the antenna and presented to the receiver electronics looks like
that sketched in Figure B-4a. The radar electronics clip any signals above the 50 millivolt level. Figure B-
4b shows the type of result that will be measured if clipping occurs in the signal pre-conditioning circuitry.
When these data are finally high pass filtered, a blank zone in the area where the original signal had a
large wow above the clipping level of the electronics can appear. This results in a blank section on the
record with no reflections visible.
Figure B-4: Inductive WOW clipping.
In the second case where signal saturation clipping occurs, there is no software correction for this. The
user must be aware that this can occur in some geologic settings and the antenna spacing should be
increased to reduce the wow signal amplitude below the clipping level of the receiver electronics. As a
general rule, we recommend using an antenna separation at least equal to the length of the antenna being
employed. For example, 100 MHz antennas should have an antenna spacing of at least 1 metre, a 50
MHz antenna system should use an antenna spacing of 2 metres. Obviously this rule depends on the level
of wow or inductive response present at the particular site. Again note that the processing affects only
displayed data, not recorded data.

Appendix B: GPR Signal Processing Artifacts pulseEKKO PRO
B-4
Other Types of Filters
For dealing with the inductive wow response, high pass filtering is necessary. If an alternative high pass
filter is available or the user wishes to try a different type of high pass filtering, the raw data contains all of
the information and experimentation can be carried out using the raw data.
A DC removal can also be used to remove a DC level from all the traces in the input data set. This is done
by taking all the points in each trace and calculating the average signal level for that trace. This value is
then subtracted from each point in the trace. This process is repeated for each trace in the data set.
Typically, traces will have approximately the same DC shift in a given data set.
DC removal, in some cases, can be used instead of DEWOW. For example, a DC shift correction applied
to high frequency radar data rather than a DEWOW correction may be more effective in reducing artifacts.
If you are unsure about which correction to apply use DEWOW.
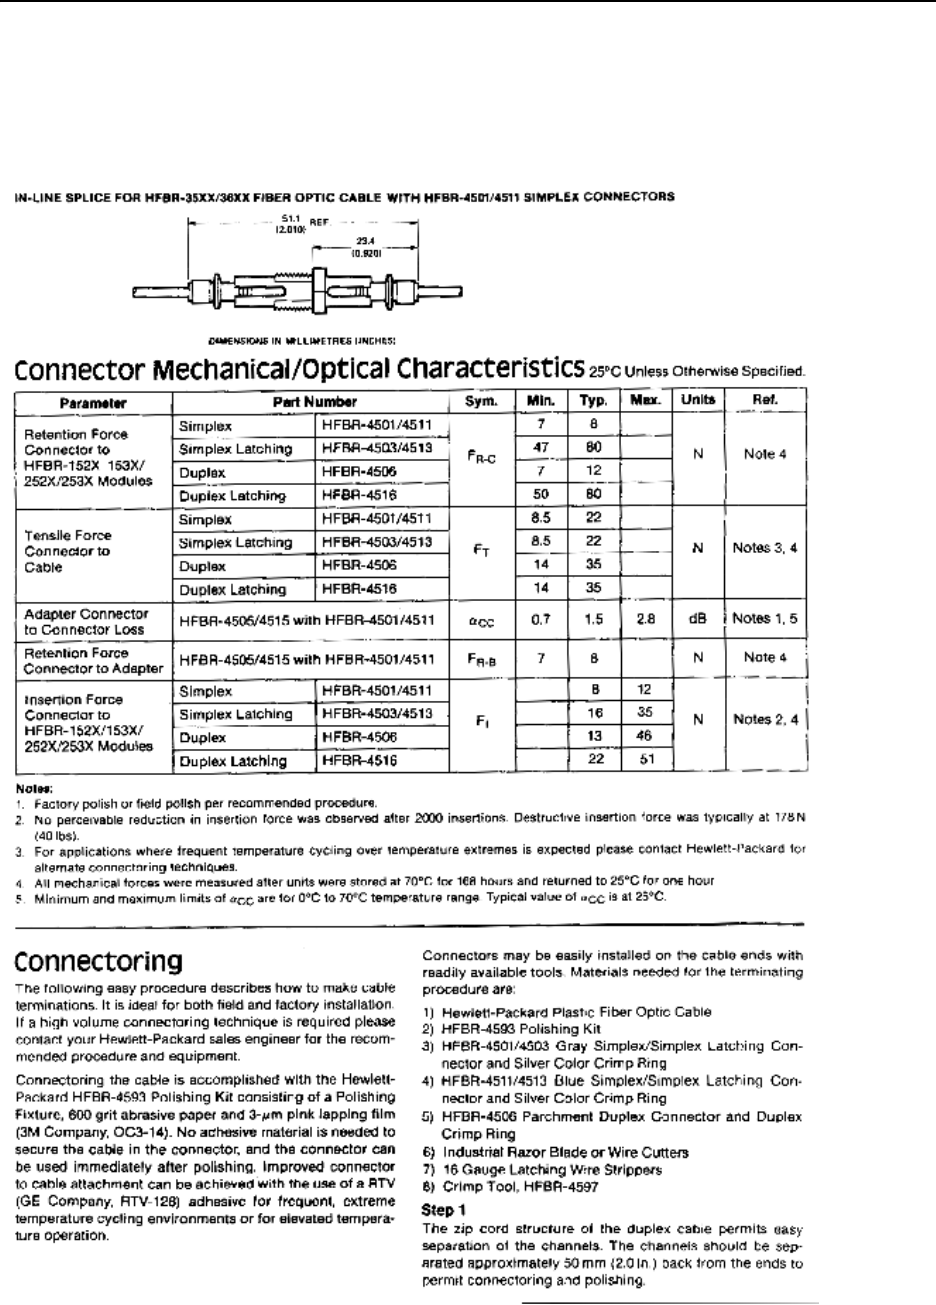
pulseEKKO PRO Appendix C: - Excerpts from the HP Fiber Optic Handbook
C-1
Appendix C: Excerpts from the HP Fiber Optic Hand-
book
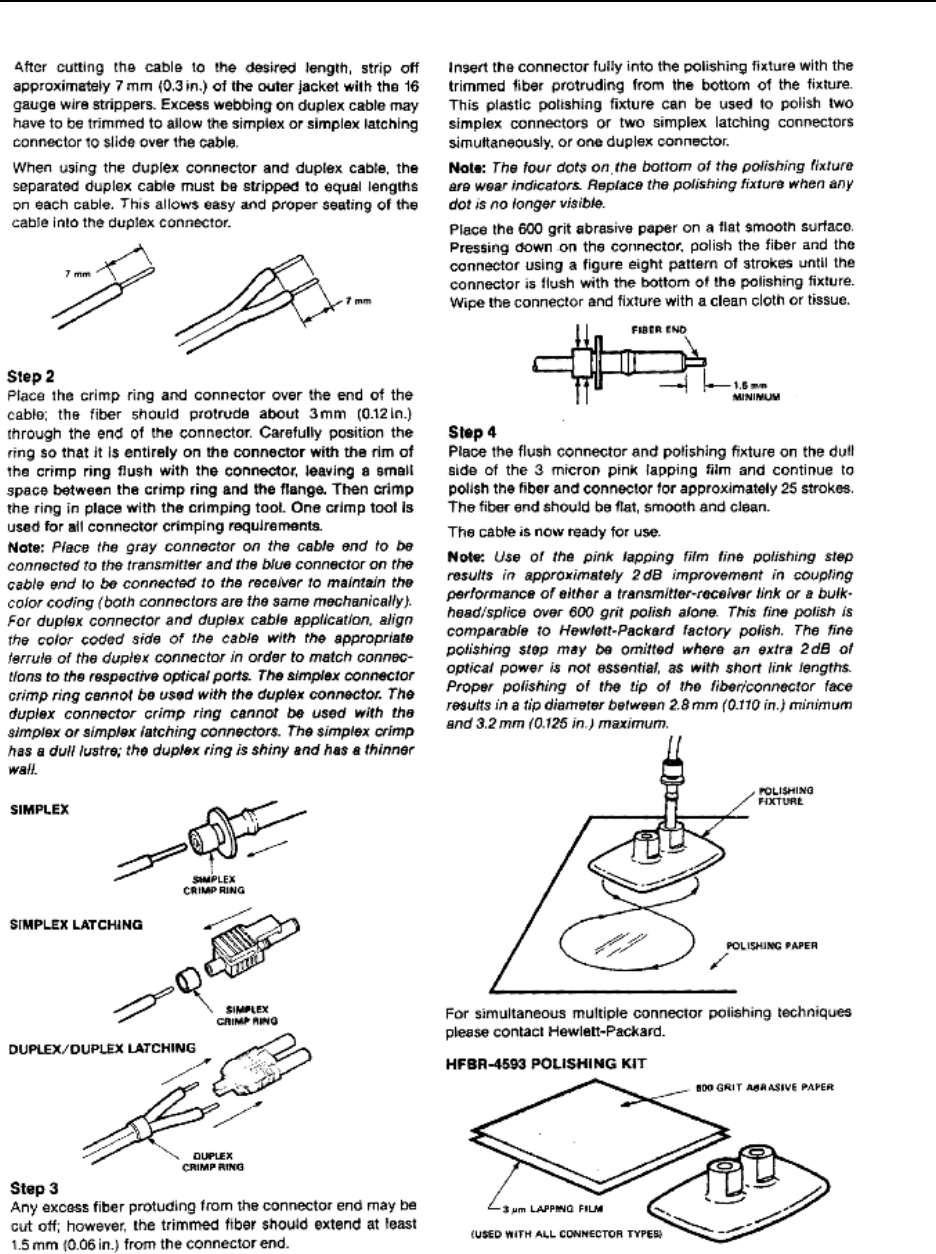
Appendix C: - Excerpts from the HP Fiber Optic Handbook pulseEKKO PRO
C-2
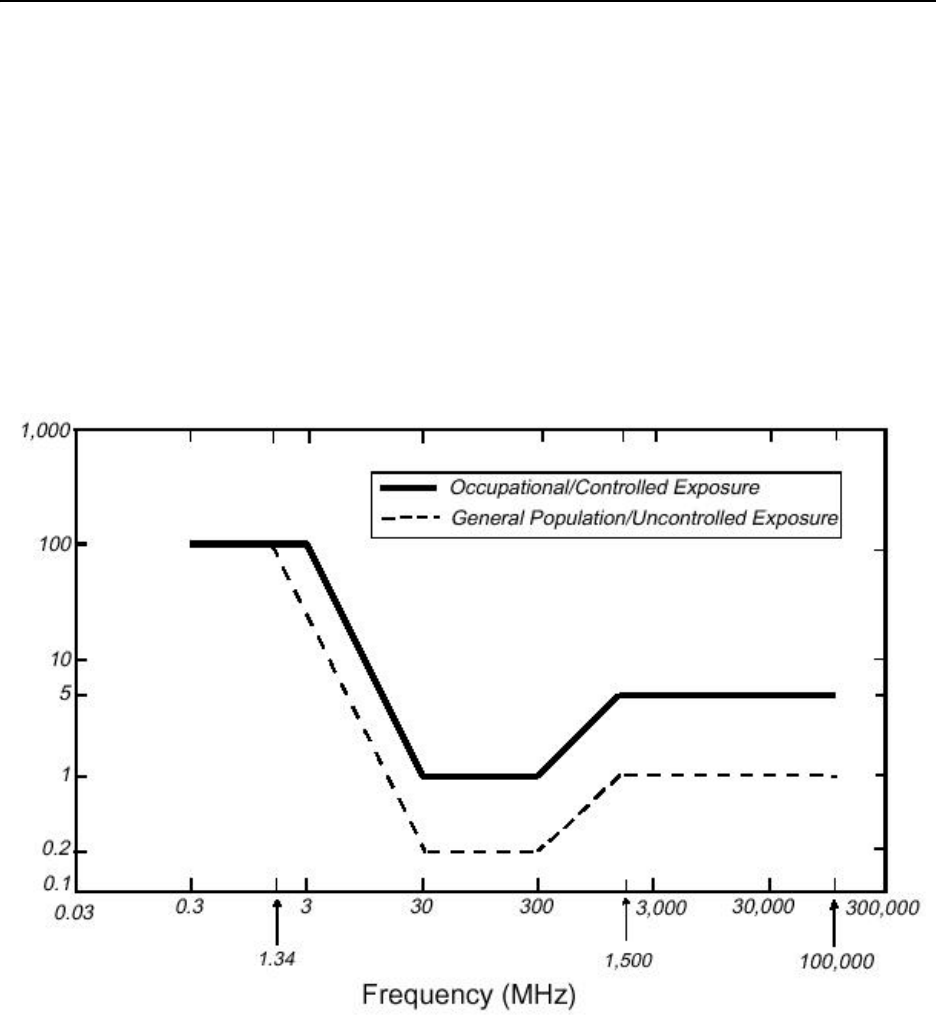
pulseEKKO PRO Appendix D: Health & Safety Certification
D-1
Appendix D: Health & Safety Certification
Radio frequency electromagnetic fields may pose a health hazard when the fields are intense. Normal
fields have been studied extensively over the past 30 years with no conclusive epidemiology relating elec-
tromagnetic fields to health problems. Detailed discussions on the subject are contained in the references
and the web sites listed below.
The USA Federal Communication Commission (FCC) and Occupational Safety and Health Administration
(OSHA) both specify acceptable levels for electromagnetic fields. Similar power levels are mandated by
corresponding agencies in other countries. Maximum permissible exposures and time duration specified
by the FCC and OSHA vary with excitation frequency. The lowest threshold plane wave equivalent power
cited is 0.2 mW/cm2 for general population over the 30 to 300 MHz frequency band. All other applications
and frequencies have higher tolerances as shown in graphically in Figure D-1.
Figure D-1: FCC limits for maximum permissible exposure (MPE) plane-wave equivalent power density mW/cm2.
All Sensors & Software Inc. pulseEKKO, Noggin and Conquest products are normally operated at least 1
m from the user and as such are classified as “mobile” devices according to the FCC. Typical power den-
sity levels at a distance of 1 m or greater from any Sensors & Software Inc. product are less than 10-3 mW/
cm2 which are 200 to 10,000 times lower than mandated limits. As such, Sensors & Software Inc. products
pose no health and safety risk when operated in the normal manner of intended use.

Appendix D: Health & Safety Certification pulseEKKO PRO
D-2
References
1. Questions and answers about biological effects and potential hazards of radio-frequency electromag-
netic field
USA Federal Communications Commission, Office of Engineering & Technology
OET Bulletin 56
(Contains many references and web sites)
2. Evaluation Compliance with FCC Guidelines for Human Exposure to Radio Frequency Electromag-
netic Fields.
USA Federal Communications Commission, Office of Engineering & Technology
OET Bulletin 56
(Contains many references and web sites)
3. USA Occupational Safety and Health Administration regulations paragraph 1910.67 and 1910.263.
Web Sites
www.fcc.gov/Bureau/EngineeringTechnlogy/Documents/bulletin
www.osha-slc.gov/SLTC (see radio frequency)

pulseEKKO PRO Appendix E: FCC Regulations
E-1
Appendix E: FCC Regulations
This device complies with Part 15 of the USA Federal Communications Commission (FCC) Rules. Opera-
tion in the USA is subject to the following two conditions:
(1) this device may not cause harmful interference and
(2) this device must accept any interference received, including interference that may cause undesired
operation.
Part 15 – User Information
This equipment has been tested and found to comply with the limits for a Class A digital device, where
applicable, and for an ultrawide bandwidth (UWB) device where applicable, pursuant to Part 15 of the FCC
Rules. These limits are designed to provide reasonable protection against harmful interference when the
equipment is operated in a commercial environment. This equipment generates, uses and can radiate
radio frequency energy and, if not installed and used in accordance with the instruction manual, may cause
harmful interference to radio communications. Operation of this equipment in a residential area is likely to
cause harmful interference in which case the user will be required to correct the interference at his own
expense.
WARNING
Changes or Modifications not expressly approved by Sensors & Software Inc. could void the user’s author-
ity to operate the equipment.
Certification of this equipment has been carried out using approved cables and peripheral devices. The
use of non-approved or modified cables and peripheral devices constitutes a Change or Modification out-
lined in the warning above.
Operating Restrictions
Operation of this device is limited to purposes associated with law enforcement, fire fighting, emergency
rescue, scientific research, commercial mining, or construction. Parties operating this equipment must be
eligible for licensing under the provisions of Part 90 of this chapter.
FCC Interpretation of Operation Restrictions issued July 12, 2002
(FCC Order DA02-1658, paragraph 9)
The regulations contain restrictions on the parties that are eligible to operate imaging systems. 1 Under the
new regulations, GPRs and wall imaging systems may be used only by law enforcement, fire and emer-
gency rescue organizations, by scientific research institutes, by commercial mining companies, and by
construction companies. Since the adoption of the Order, we have received several inquiries from the
operators of GPRs and wall imaging systems noting that these devices often are not operated by the users
listed in the regulations but are operated under contract by personnel specifically trained in the operation of
these devices. We do not believe that the recent adoption of the UWB rules should disrupt the critical
safety services that can be performed effectively only through the use of GPRs and wall imaging systems.
We viewed these operating restrictions in the broadest of terms. For example, we believe that the limita-
tion on the use of GPRs and wall imaging systems by construction companies encompasses the inspec-
tion of buildings, roadways, bridges and runways even if the inspection finds no damage to the structure
1. See 47 C.F.R. §§15.509(b), 15.511(b), and 15.513(b)

Appendix E: FCC Regulations pulseEKKO PRO
E-2
and construction does not actually result from the inspection; the intended purpose of the operation of the
UWB device is to determine if construction is required. We also believe that the GPRs and wall imaging
systems may be operated for one of the purposes described in the regulations but need not be operated
directly by one of the described parties. For example, a GPR may be operated by a private company
investigating forensic evidence for a local police department.
FCC Permitted Mode of Usage
The GPR antenna must be kept on the surface to be in compliance with FCC regulations. Use of the
antenna is not permitted if it is lifted off the surface. Use as a through-the-wall imaging device is prohib-
ited.
GPR Use Coordination
FCC regulation 15.525(c) requires users of GPR equipment to coordinate the use of their GPR equipment
as described below:
a) UWB imaging systems require coordination through the FCC before the
equipment may be used. The operator shall comply with any constraints on
equipment usage resulting from this coordination.
b) The users of UWB imaging devices shall supply operational areas to the FCC
Office of Engineering and Technology, which shall coordinate this information
with the Federal Government through the National Telecommunications and
Information Administration. The information provided by the UWB operator
shall include the name, address, and other pertinent contact information of the
user, the desired geographical area(s) of operation, and the FCC ID number
and other nomenclature of the UWB device. If the imaging device is intended
to be used for mobile applications, the geographical area(s) of operation may
be the state(s) or county(ies) in which the equipment will be operated. The
operator of an imaging system used for fixed operation shall supply a specific
geographical location or the address at which the equipment will be operated.
This material shall be submitted to the following address:
Frequency Coordination Branch., OET
Federal Communications Commission
445 12th Street, SW
Washington, D.C. 20554
ATTN: UWB Coordination
The form given on the following page is a suggested format for performing the coordination.

pulseEKKO PRO Appendix E: FCC Regulations
E-3
FCC GROUND PENETRATING RADAR COORDINATION NOTICE
NAME:
ADDRESS:
CONTACT INFORMATION [CONTACT NAME AND PHONE NUMBER]:
AREA OF OPERATION [COUNTIES, STATES OR LARGER AREAS]:
FCC ID: [E.G. QJQ-PE-PRO-TLF-A)]
EQUIPMENT NOMENCLATURE: [ E.G. PULSEEKKO PRO TLF-A]
Send the information to:
Frequency Coordination Branch., OET
Federal Communications Commission
445 12th Street, SW
Washington, D.C. 20554
ATTN: UWB Coordination
Fax: 202-418-1944
INFORMATION PROVIDED IS DEEMED CONFIDENTIAL

Appendix E: FCC Regulations pulseEKKO PRO
E-4

pulseEKKO PRO Appendix F: Instrument Interference
F-1
Appendix F: Instrument Interference
Immunity regulations place the onus on instrument/apparatus/device manufacturers to assure that extra-
neous interference will not unduly cause an instrument/apparatus/device to stop functioning or to function
in a faulty manner.
Based on independent testing house measurements, Sensors & Software Inc. systems comply with such
regulations in Canada, USA, European Community and most other jurisdictions. GPR devices can sense
electromagnetic fields. External sources of electromagnetic fields such as TV stations, radio stations and
cell phones, can cause signals detectable by a GPR which may degrade the quality of the data that a GPR
device records and displays.
Such interference is unavoidable but sensible survey practice and operation by an experienced GPR prac-
titioner can minimize such problems. In some geographic areas emissions from external sources may be
so large as to preclude useful measurements. Such conditions are readily recognized and accepted by the
professional geophysical community as a fundamental limitation of geophysical survey practice. Such
interference being present in the GPR recordings is not considered as an equipment fault or as a failure to
comply with immunity regulations.

Appendix F: Instrument Interference pulseEKKO PRO
F-2

pulseEKKO PRO Appendix G: Safety Around Explosive Devices
G-1
Appendix G: Safety Around Explosive Devices
Concerns are expressed from time to time on the hazard of GPR products being used near blasting caps
and unexploded ordnance (UXO). Experience with blasting caps indicates that the power of Sensors &
Software Inc.’s GPR products are not sufficient to trigger blasting caps. Based on a conservative indepen-
dent testing house analysis, we recommend keeping the GPR transmitters at least 5 feet (2m) from blast-
ing cap leads as a precaution. Some customers do experimental trials with their particular blasting devices
to confirm with safety. We strongly recommend that GPR users routinely working with explosive devices
develop a systematic safety methodology in their work areas.
The UXO issue is more complex and standards on fuses do not exist for obvious reasons. To date, no
problems have been reported with any geophysical instrument used for UXO. Since proximity and vibration
are also critical for UXO, the best advice is to be cautious and understand the risks.

Appendix G: Safety Around Explosive Devices pulseEKKO PRO
G-2