Spacelabs Healthcare 76A90341-WMTS 90341-05 User Manual 2 of 3
Spacelabs Healthcare, Inc. 90341-05 2 of 3
Contents
- 1. User Manual 1 of 3
- 2. User Manual 2 of 3
- 3. User Manual 3 of 3
User Manual 2 of 3
9-1
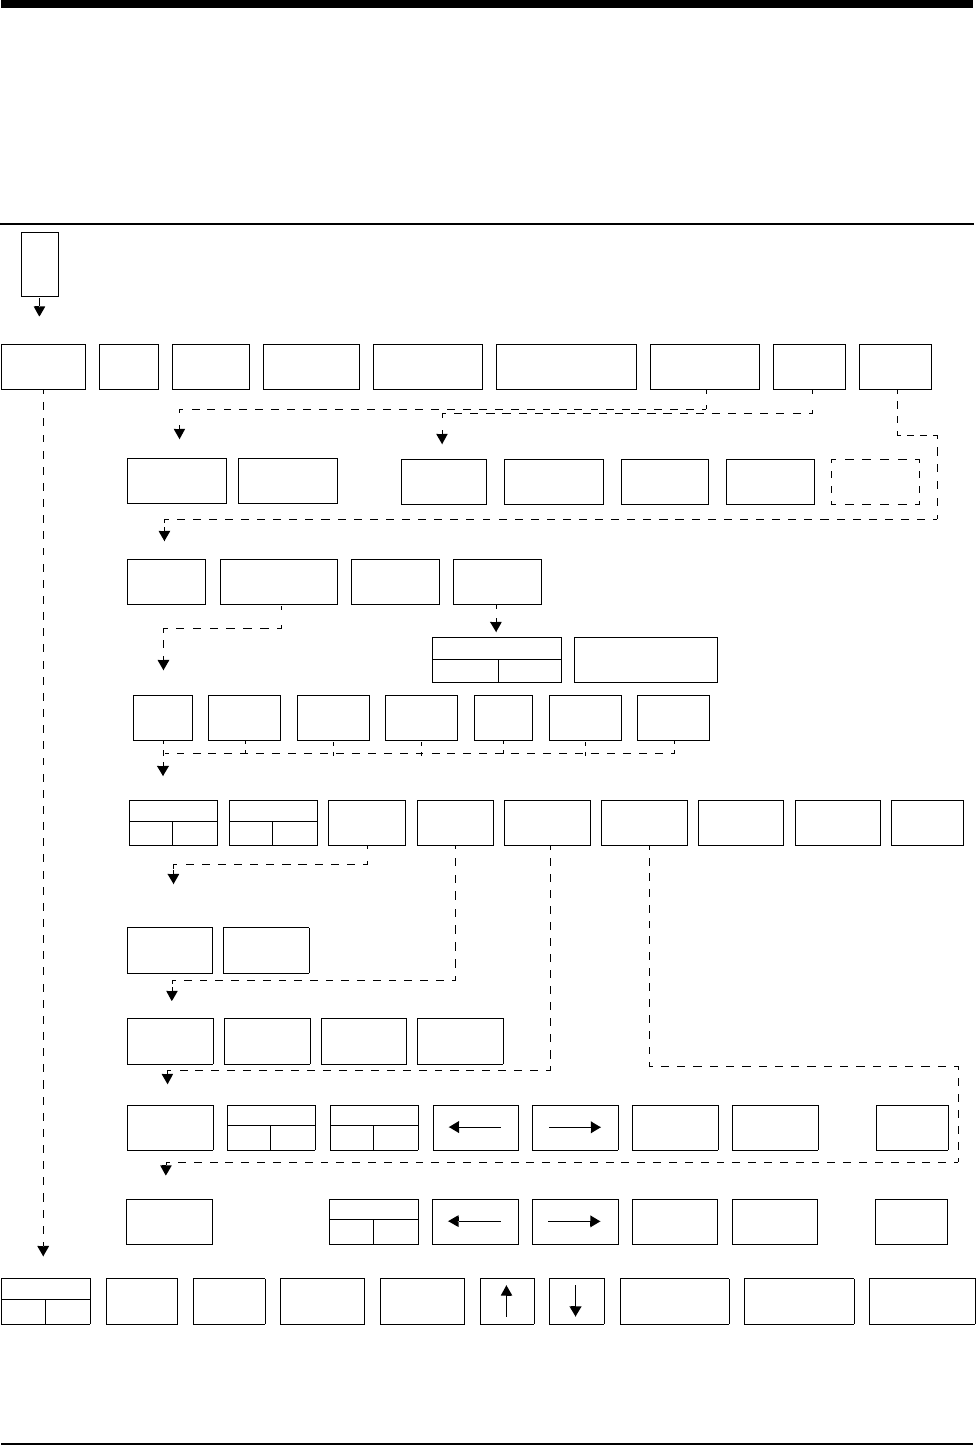
!
• Based on features purchased, more or fewer keys may appear here than on your menu screens.
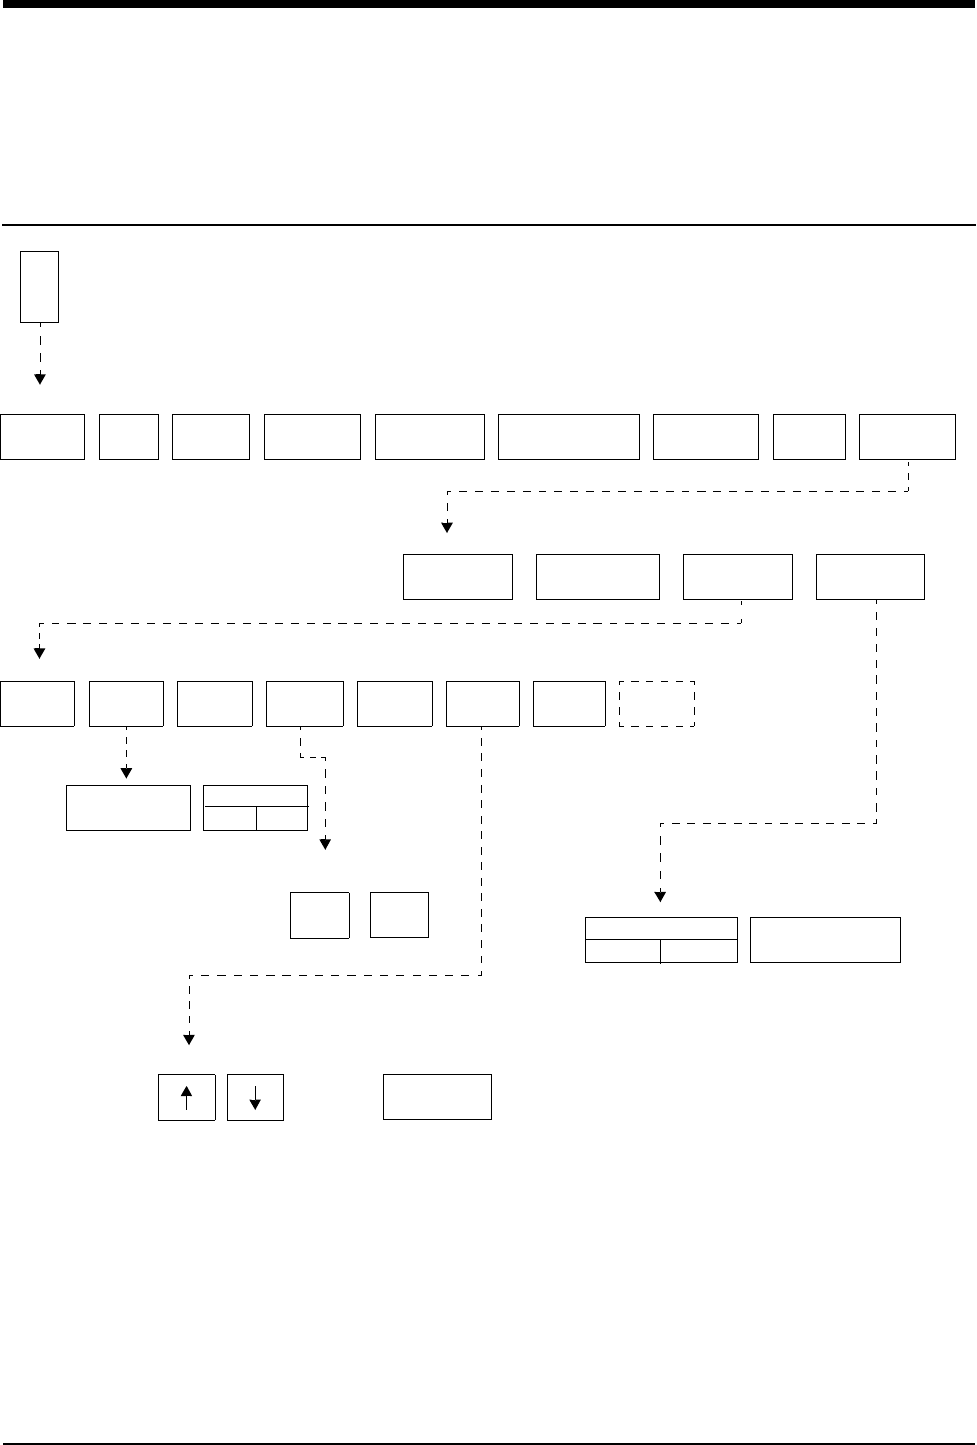
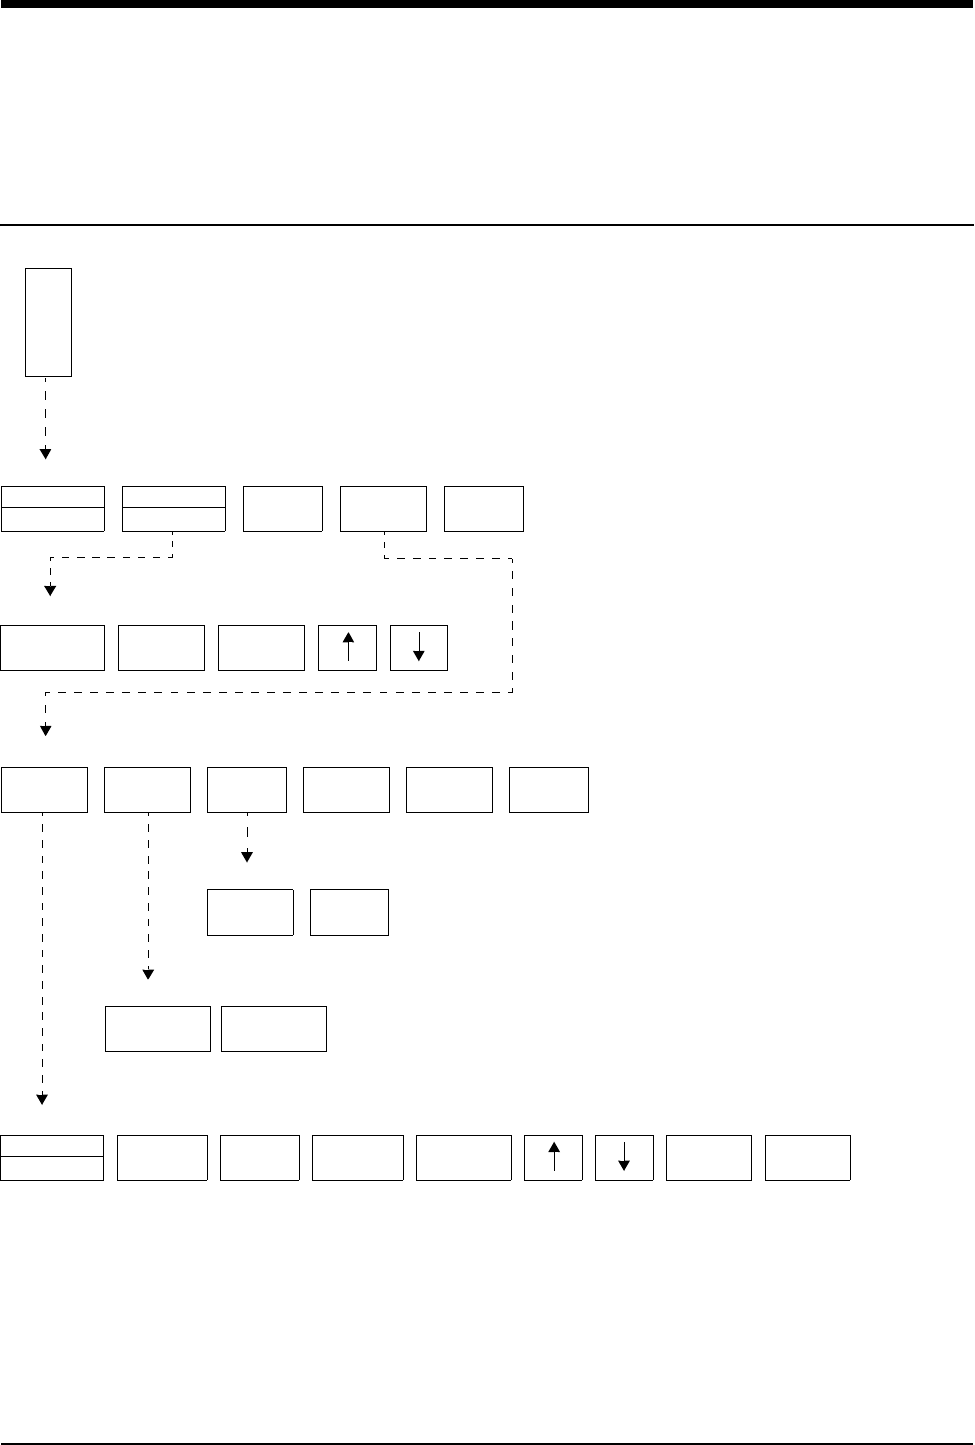
Arrhythmia Directory
Directory of Keys
E
C
G
ECG MENU
ALARM
LIMITS SIZE SETUP LEAD
CONTROL
DISPLAY
FORMAT
SUSPEND
PROCESSING REVIEWPRINTRELEARN
ARR
CLASSES
ST
SEGMENTS
ALL
LEADS
PRINT
ALL
CANCEL
PRINT
ECG - PRINT
CLEAR
MEMORY
SAVE
MEMORY
ECG - RELEARN
ST
REVIEW
ARRHYTHMIA
REVIEW
REPORT
REVIEW
REAL TIME
ST TREND
ECG REVIEW
TREND TIMEBASE
15 MIN/30 MIN
TREND DISPLAY
OFFON
RUN
1TACHDOM CPL
0
ABN
3
PAUSE
8
PACED
8
REVIEW
MERGE CLASS
TREND
LEAD
IIVI
ALARM
NOYES CLEAR GROUP
TREND
PRIOR
CLASS
NEXT
CLASS PRINT
ARRHYTHMIA REVIEW
ENTIRE
CLASS
LAST
EVENT
Do you wish to clear the entire
class or the most recent occurrence?
MERGE
CLASSES
MERGE
TRENDS
PRIOR
CLASS
NEXT
CLASS
Merge these classes or select another class.
TIMEBASE
6 HOURS
INCLUDE
NOYES
CURSOR
RL
PRIOR
CLASS
NEXT
CLASS PRINT
CLASS TREND
TIMEBASE
6 HOURS
CURSOR
RL
PRIOR
CLASS
NEXT
CLASS PRINT
GROUP TREND
ALARMS
OFFON
HI=
130
LO=
40
ABN IN
ROW=5
ABN PER
MIN=OFF
SINGLE
ST = 1.00
MULTI
ST = 0.50
ST
LEADS
ECG - ALARM LIMITS


Contents
9-3
Overview . . . . . . . . . . . . . . . . . . . . . . . . . . . . . . . . . . . . . . . . . . . . . . . . . . . . . . . 3
Setting Up Arrhythmia Monitoring . . . . . . . . . . . . . . . . . . . . . . . . . . . . . . . . . . . . 4
Setting and Adjusting Alarms. . . . . . . . . . . . . . . . . . . . . . . . . . . . . . . . . . . . . . . . 6
Reviewing Arrhythmias . . . . . . . . . . . . . . . . . . . . . . . . . . . . . . . . . . . . . . . . . . . . 8
Display Detail. . . . . . . . . . . . . . . . . . . . . . . . . . . . . . . . . . . . . . . . . . . . . . . . . . . . 9
Controlling Arrhythmia Alarms . . . . . . . . . . . . . . . . . . . . . . . . . . . . . . . . . . . . . . 10
Clearing a Class or Event . . . . . . . . . . . . . . . . . . . . . . . . . . . . . . . . . . . . . . . . . 10
Merging Classes/Trends . . . . . . . . . . . . . . . . . . . . . . . . . . . . . . . . . . . . . . . . . . 10
Plotting Arrhythmia Trend Graphs . . . . . . . . . . . . . . . . . . . . . . . . . . . . . . . . . . . 12
Printing Arrhythmia Data . . . . . . . . . . . . . . . . . . . . . . . . . . . . . . . . . . . . . . . . . . 13
Arrhythmia Problem Solving . . . . . . . . . . . . . . . . . . . . . . . . . . . . . . . . . . . . . . . 14
Arrhythmia Troubleshooting Guide . . . . . . . . . . . . . . . . . . . . . . . . . . . . . . . . . . 16
Arrhythmia
Overview
Two levels of arrhythmia detection and review are available in Spacelabs Medical
monitors.
The Multiview I option provides enhanced arrhythmia detection and alarms for
ventricular tachycardia, couplets, and single abnormal beats in addition to the
detection and alarm capabilities for high and low heart rates, ventricular fibrillation,
and asystole.
The Multiview II option expands arrhythmia detection to include pauses and
tachycardias of a supraventricular origin. This option also offers storage
capabilities so that trends of arrhythmia episodes as well as dominant and paced
rhythms can be reviewed, edited and printed.
!
• No arrhythmia detection system can correctly detect and
classify all arrhythmias 100% of the time. Use sound clinical
judgement when monitoring patients with arrhythmias.
• You can define your own default settings for such
characteristics as alarm limits and display configuration. Refer
to Module Configuration Manager on page 7-5 for further
details.

Ultraview Care Network
9-4
Setting Up Arrhythmia Monitoring
With the Multiview I or II option, the ARR ON/OFF key (located in the Config menu
under Setup) can be used to selectively enable or disable arrhythmia detection
functions. Arrhythmia detection must be enabled if you wish to establish a new
dominant waveform (refer to Relearning the Dominant Waveform on page 9-5 for
more details).
When you turn arrhythmia detection ON
• IN LEARN appears above the ECG tracing in the first zone
• the RELEARN key is present in the ECG menu
• ABN IN ROW and ABN PER MIN keys are present in the Alarm Limits menu
• ECG alarms are momentarily deactivated until the learn sequence completes
• Rate and ST alarm limits are initialized
• Abnormals in a Row and Abnormals per Minute alarm limits are initialized
When you turn arrhythmia detection OFF
• IN LEARN appears above the ECG tracing in the first zone
• no arrhythmia detection features or menus are displayed
• ECG alarms are momentarily deactivated until the learn sequence completes
• Rate and ST alarm limits are initialized
Learning the Dominant Waveform
During the learn sequence, IN LEARN is displayed on the monitor while the
system establishes the heart rate and begins to classify each beat. Rate alarms
are set based on this learned heart rate (if they have not been previously set to
Fixed in the Module Configuration Manager). The first non-premature beat that
occurs ten times is established as the dominant class. When the learn sequence
is completed, the IN LEARN message disappears.
Examples of actions that initiate a learn sequence are:
• Power ON
• Module insertion
• Changing patient type (adult/infant)
• Enabling/disabling arrhythmia detection
• Patient admission via the Admit/Discharge menu
The system will not classify a paced beat as the dominant class. If the patient is
100% paced and there is no dominant class at the end of the learn sequence, the
first single, non-paced beat detected five times becomes the dominant class.
!
• The Arrhythmia ON/OFF key is only available in modules with
the Multiview I or II options.
To set up arrhythmia monitoring:
1Set up system and patient for
standard ECG monitoring.
2Touch ECG.
3Touch SETUP.
4Touch CONFIG.
5Ensure ADULT is selected.
6Select ARR ON.
To disable arrhythmia detection:
1Touch ECG.
2Touch SETUP.
3Touch CONFIG.
4Select ARR OFF.

Arrhythmia
9-5
Detecting Abnormal Beats
The system compares each incoming beat with the dominant class. It examines
morphology and the intervals between both the previous and following beats to
determine whether the beat does or does not match the dominant. If the system
determines the beat is abnormal, it compares the new beat with each of the
abnormal shapes categorized since the learn sequence was completed. If the
current beat fails to match any of the existing shapes (and after five occurrences),
the system classifies it as a new abnormal class.
Detecting Pauses
The system classifies an R-R interval that is 1.8 times (or 80%) longer than the
average R-R interval as a pause.
The last beat detected preceding the pause is displayed to the left of center in the
pause class. The system does not count two consecutive, long R-R intervals both
in the pause class. Instead, it assumes that a sudden rate change occurred and
updates the heart rate immediately.
Detecting Paced Beats
If the Paced mode is enabled in the ECG Setup menu and the system does not
detect a paced beat during the learn sequence, a paced class will be created once
the system detects the first paced beat.
The system identifies two different types of paced beats:
•paced
• AV-paced
The paced class is created for ventricular-paced beats defined as a QRS complex
which is preceded by a single pacemaker pulse.
The AV-paced class is created for beats that are preceded by two pacemaker
pulses.
The QRS complex must follow the pacemaker pulse within 150 msec for the beat
to be classified into either paced class. If the pacemaker pulse precedes the QRS
complex by more than 150 msec, the beat may be triggered by an atrial
pacemaker and is not classified in either paced class.
Relearning the Dominant Waveform
You can relearn the dominant rhythm and establish a new dominant at any time
during monitoring. After touching the RELEARN key, you can either clear the
memory or save the memory. Once a selection is made, the relearn sequence is
initiated during which ECG alarms are suspended. The old dominant is labeled as
exdominant and stored as an abnormal class.
WARNING:
• Until the patient’s rate and morphology are learned, ECG
alarms for high rate, low rate, run, couplet, abnormal per
minute, and tachycardia are not active.
To relearn the dominant
waveform:
1Touch ECG.
2Touch RELEARN.
3Select SAVE MEMORY or
CLEAR MEMORY.

Ultraview Care Network
9-6
Selecting CLEAR MEMORY clears all arrhythmia and ST segment data and
resets the Abnormals per Minute, Abnormals in a Row, and ST segment alarms.
Upon completion of the learn sequence, ECG alarms are enabled and rate alarms
limits are reset.
Selecting SAVE MEMORY saves all previously-acquired arrhythmia and ST
segment data. Once the learn sequence is completed, ECG alarms are enabled
and rate alarms are reset. The Abnormals per Minute and Abnormals in a Row
alarms remain unchanged. If ST segment level alarms were enabled prior to the
relearn sequence, they will be reset.
Automatic Dominant Class Update
The system uses the following rules to update the dominant class:
• An abnormal class that occurs more frequently than 50% of all beats in the
previous 60-seconds, and occurs three beats more frequently than the
current dominant during that period, automatically becomes the new
dominant class.
• The old dominant is put into an abnormal class and given the status
EXDOMINANT. This class can become dominant again and has the same
characteristics as any other active class.
The message, NEW DOMINANT, is displayed above the ECG trace for
60-seconds after the new dominant is established.
Setting and Adjusting Alarms
In addition to the alarms described in ECG on page 8-3, the Multiview I or II
options provide alarms for these additional conditions.
Abnormals in a Row Alarm
Following the learn sequence, the Abnormals in a Row alarm limit is set based on
either factory defaults or user-defined settings. You can adjust the alarm limit from
two to ten or you can deactivate it.
• Setting the Abnormals in a Row alarm limit to three or greater will initiate a
RUN ALARM message when three or more consecutive abnormal beats (at a
rate greater than 90 BPM) occur.
• Setting the Abnormals in a Row alarm limit to two will initiate a COUPLET
ALARM message when two consecutive abnormal beats occur.
The factory default setting for the Abnormals in a Row limit is five.
Abnormals per Minute Alarm
Following the learn sequence, the Abnormals per Minute alarm limit is set based
on either factory defaults or user-defined settings. You can adjust the alarm limit
from 1 to 99, or it can be deactivated.
To set or adjust alarms for
abnormal beats (arrhythmia
detection must be enabled):
1Touch ECG.
2Touch ALARM LIMITS.
3Touch ALARMS ON.
4Select ABN IN ROW = or ABN
PER MIN =.
5Use arrow keys to adjust.

Arrhythmia
9-7
The factory default setting for the Abnormals per Minute limit is OFF.
Table 1 describes the arrhythmias detected with the Multiview I or II options (with
arrhythmia detection enabled).
* Prematurity is defined as an instantaneous R-R interval that is
(1) 15% premature as compared to the average R-R interval and,
(2) <666 msec for couplets and runs, and <500 msec for tachycardias of a
supraventricular origin.
** Template-forming classes.
!
• If the alarm limit for high rate, low rate, ABN/MIN, or ABN IN
ROW is displayed in reverse video, this is an indication that
alarm tone, alarm recording, and alarm watch have been
disabled for the indicated alarm.
Table 1: Classification of Events
Type of Class Defining
Characteristics
Prematurity
Required
Max # of
Classes
Allowed
Type of Waveform
Storage
ABNORMAL ** 1 beat of abnormal
morphology No
12
Qualifying occurrence
(5th) + most recent
COUPLET ** 2 consecutive beats of
abnormal morphology
No for the first beat;
Yes for the second
beat *
Qualifying occurrence
(3rd) + most recent
RUN
3 or more consecutive
beats of abnormal
morphology
No for the first beat;
Yes for each
subsequent beat *32
6-seconds of each
occurrence. First in, first
out. Saves longest Run
and Pause
PAUSE
An R-R interval that is
1.8 x (or 80%) longer
than normal
No
ASYSTOLE Absence of QRS for
5-seconds or more No NA
6-seconds of last
occurrence stored as a
pause when following
normal beats
PACED
1 pacemaker flag
followed by a QRS
(within 150 msec)
No 1
First paced beat
occurrence each minute
(PACED key must be set
to YES)
AV PACED 2 pacemaker flags
followed by a QRS No 1
First paced beat
occurrence each minute
(PACED key must be set
to YES)
TACH
(SUPRA
VENTRICULAR)
≥ 5 or more premature
dominant beats in a
row
Yes * 1
6-seconds of last
occurrence
VFIB NA No 1 6-seconds of last
occurrence
DOMINANT ** NA NA 1
Qualifying occurrence
(10th) + the most recent
each minute

Ultraview Care Network
9-8
Reviewing Arrhythmias
Selecting Arrhythmia Classes
The numerical value for each arrhythmia key indicates the number of occurrences
that the system has stored. If none have been detected, the numerical value
inside the key is 0 and the key outline is dotted. For classes that only store the last
occurrence of that type of arrhythmia (for example, tachycardias of a
supraventricular origin), a value is not displayed. The system updates the menu
as new classes are created.
Selecting Leads for Review
When you access the Arrhythmia Review menu, the LEAD key text changes to
indicate which leads were being monitored the last time the displayed event
occurred. The lead associated with the currently displayed waveform is
highlighted. You can change the lead selection by touching the LEAD key.
Multiple Arrhythmia Classes
The system distinguishes between classes of the same type that have different
morphologies by assigning numbers to each class. The class number is displayed
to the right of the class type; for example, ABNORMAL 1.
The system will display, in sequence, up to 32 different runs and/or pauses.
However, the system always keeps the longest run or pause. If the system detects
one more pause and/or run than it can store, it replaces the oldest run or pause
with the new one (that is, first in-first out).
Updating Classes
The system updates the review waveform once each minute for the dominant,
paced and AV paced classes. Otherwise, it updates with each occurrence.
!
• Arrhythmia Review and Edit functions are only available in
modules with the Multiview II option in the ADULT mode, and
with both arrhythmia detection and review enabled.
To review arrhythmias:
1Touch ECG.
2Touch REVIEW.
3Select an arrhythmia class type
for review.
4Select NEXT CLASS or PRIOR
CLASS keys to progress
through the review.
Arrhythmia
9-9
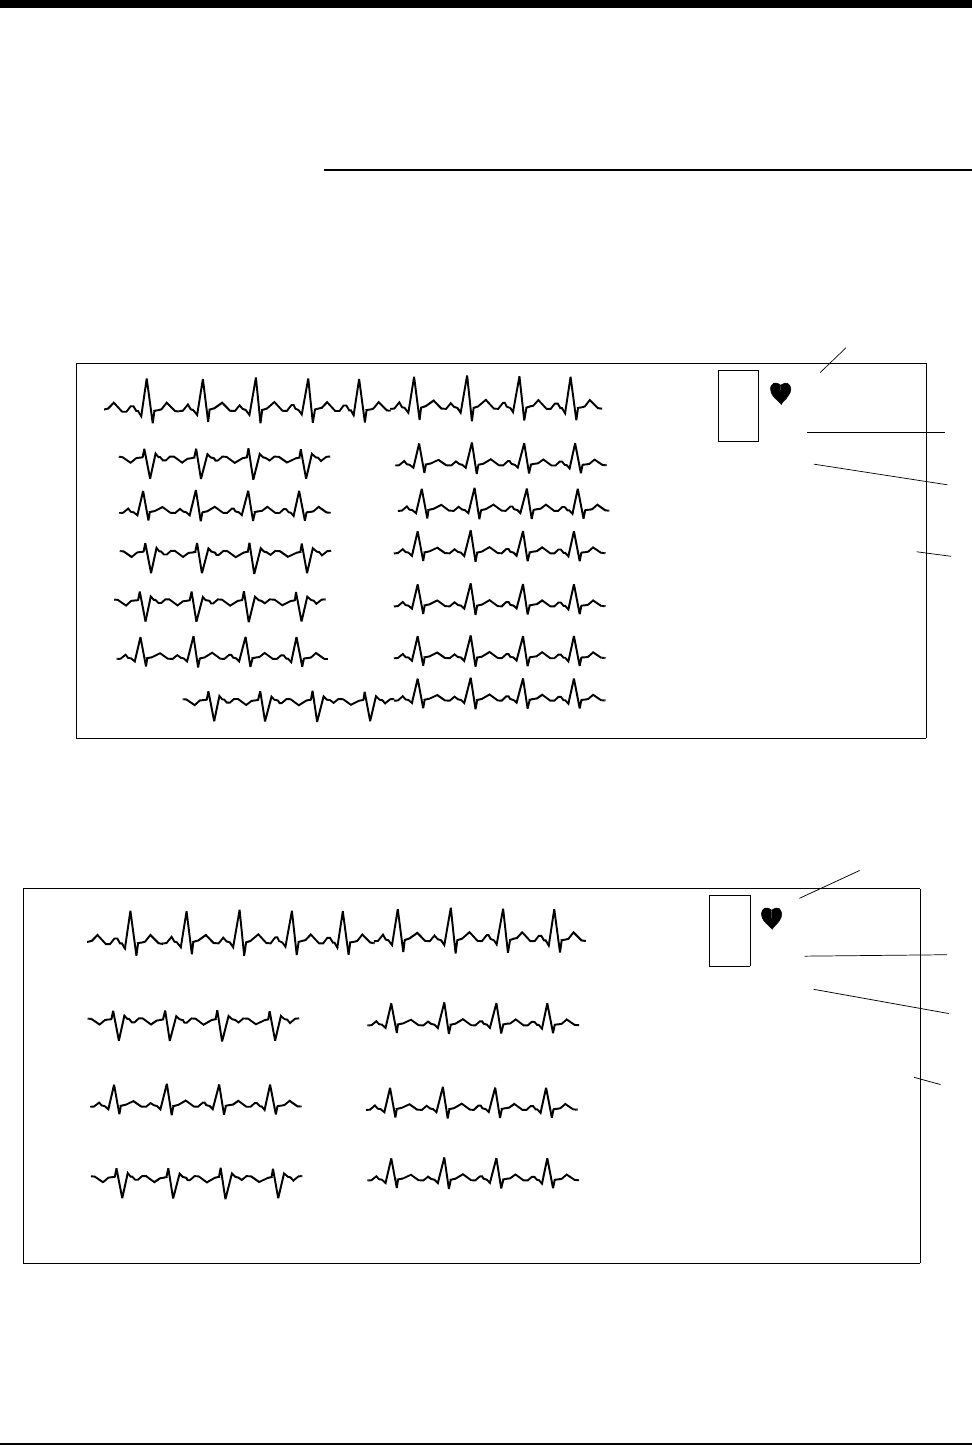
Display Detail
The system stores and displays arrhythmia review data in two categories:
non-template forming classes and template-forming classes.
The non-template forming class displays a waveform that is 6.25-seconds long
and is representative of the most recent occurrence.
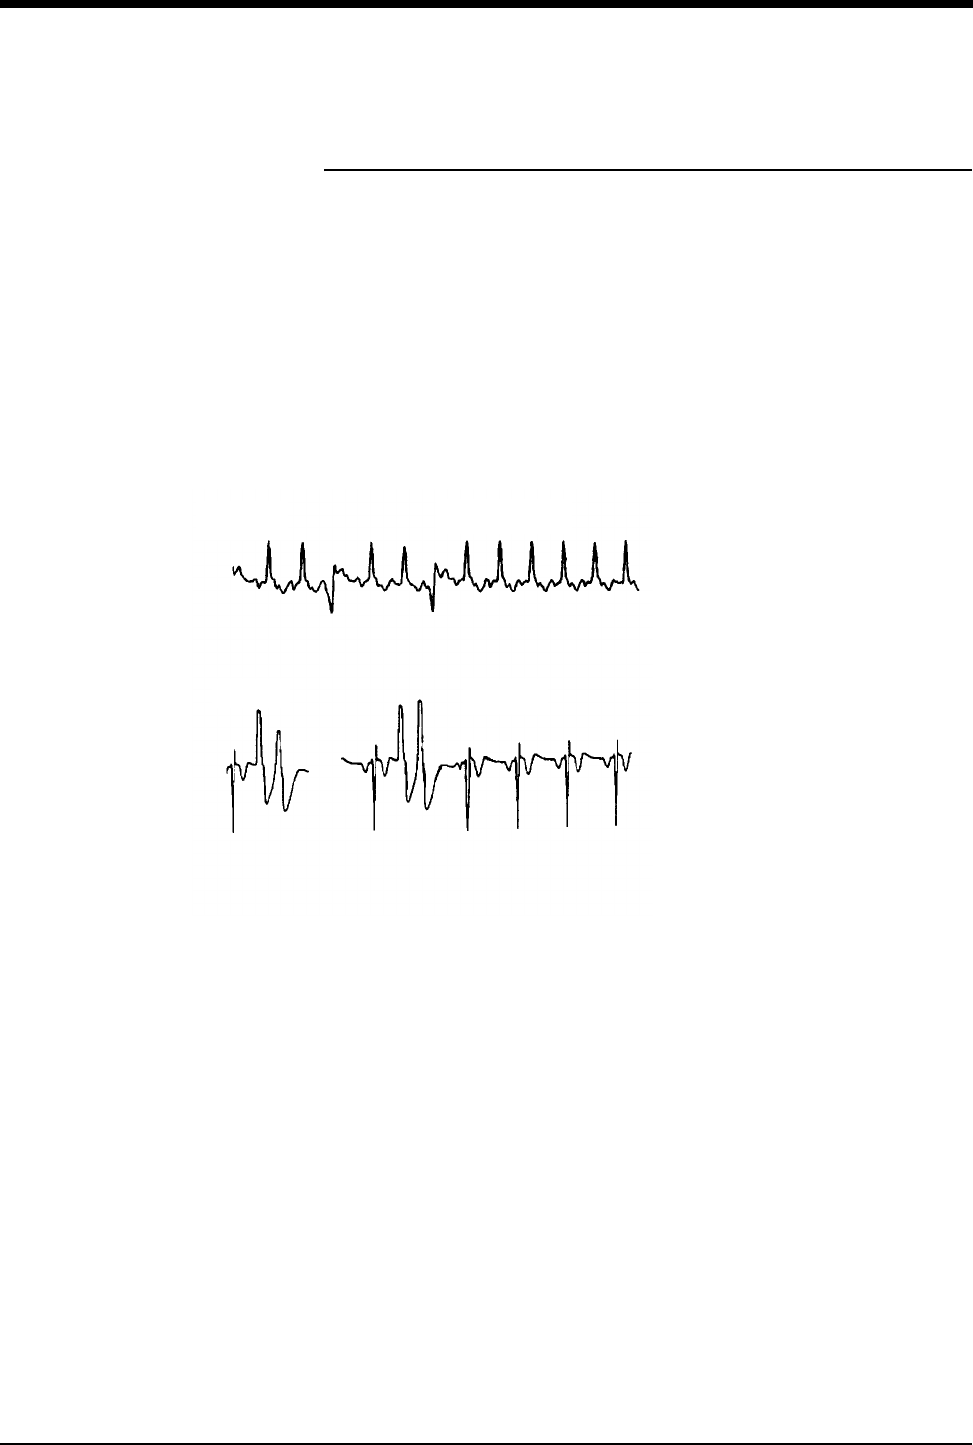
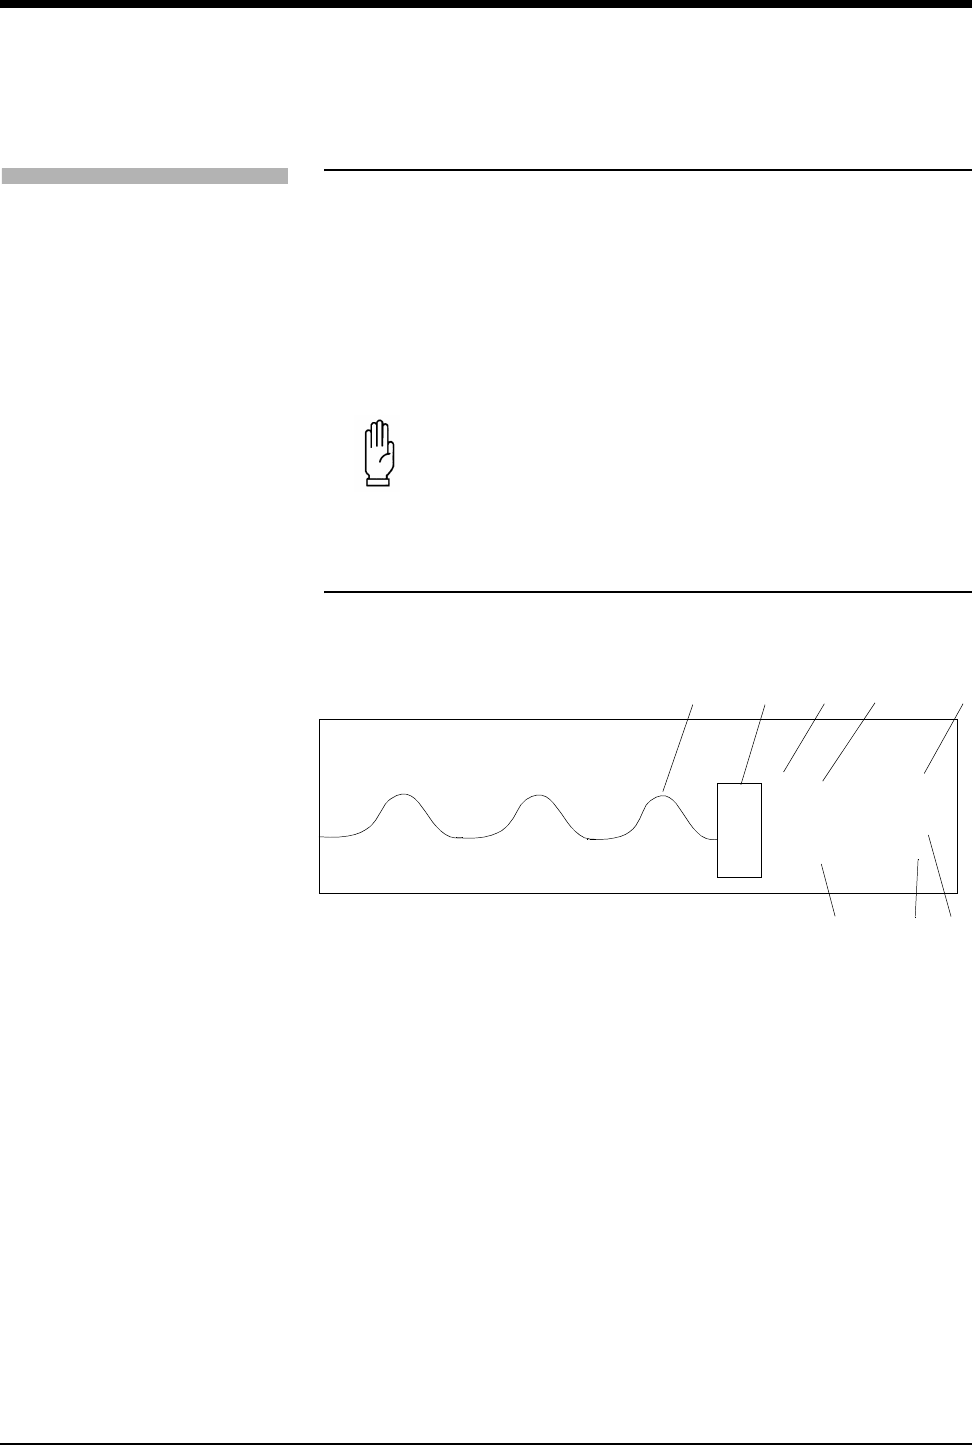
The template-forming class displays two waveforms. The waveform on the left is
1.25-seconds long; the arrhythmia that originated the class is centered. The
waveform on the right is 4.5-seconds in length and the most recent occurrence of
the class is centered.
The lead, frequency, and time and date of last occurrence appear to the right of
each presentation.
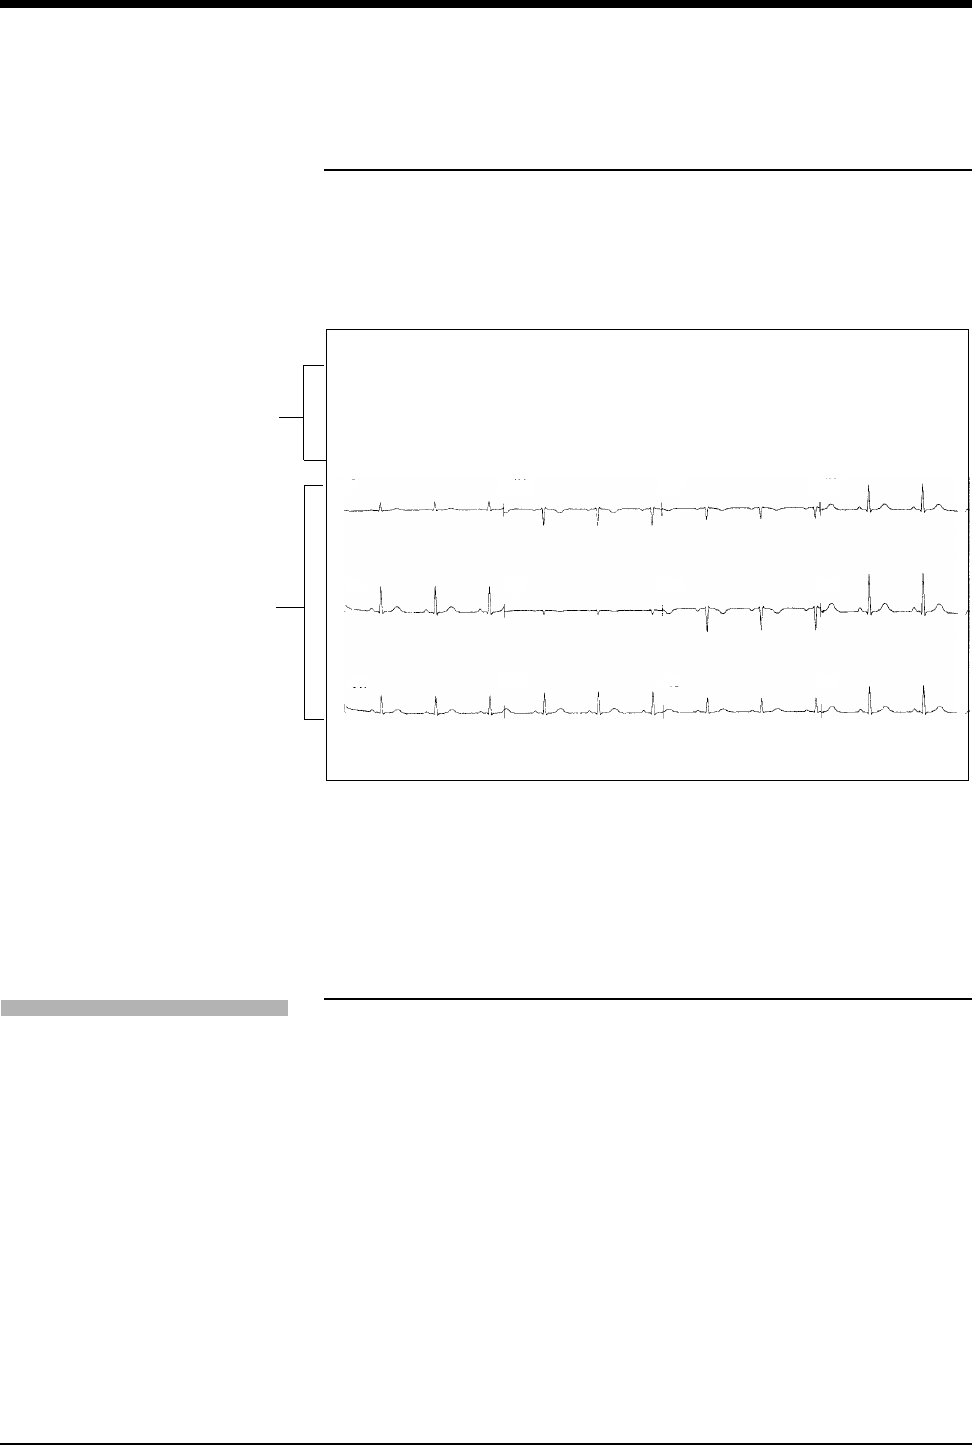
Figure 9-1: Arrhythmia waveforms
Non-template Forming Class Example
Template Forming Class Example
Lead II
Last MINUTE: 1
Last HOUR: 1
Last
OCCURRENCE:
04:44AM
5 Jun 2003
Lead VI
Last MINUTE: 2
Last HOUR: 6
Last
OCCURRENCE:
04:40PM
5 Jun 2003
(Tachycardia)
(Couplet)

Ultraview Care Network
9-10
Controlling Arrhythmia Alarms
Touch ALARM YES or NO to enable or disable alarms for couplets, single
abnormals, or tachycardia. Disabling alarms for a specific arrhythmia prevents
alarm generation for subsequent detection of that arrhythmia class. At least one
episode of the class must be stored before the alarm can be disabled.
Clearing a Class or Event
When you clear a class, the system removes it from memory. Touch the ENTIRE
CLASS key to clear the displayed class and template from memory and from the
trend buffer. When the system finishes clearing the class, the Arrhythmia Review
menu appears and displays the next class.
Touch the LAST EVENT key to remove only the most recent occurrence of the
displayed class from memory. The LAST EVENT key is only active for abnormal
and couplet classes.
When you clear the most recent event:
• the system removes the most recent occurrence of that class from memory.
• the system displays the message The last occurrence of this class was
deleted in place of the cleared waveform.
• the system updates the frequency and last occurrence totals. The system
does not redisplay the updated information until you redisplay the class.
Merging Classes/Trends
Merging enables you to take two different classes or trends from the same group
and merge them together into a single class, combining the trend history and time
of last occurrence. When the module is frequently storing a single morphology as
two different classes, merging the classes opens up storage for new classes while
saving all arrhythmia data.
Merging Classes
Two classes may be merged when the system interprets two abnormal beats as
different classes but the clinician sees them as the same class. This could occur if
a patient's dominant beat is experiencing frequent changes in polarity or when the
electrodes have been repositioned.
At the start of merging two classes, one class appears on the left side of the
screen and the second class appears on the right side. The message “Merge
these classes or select another class” appears at the bottom of the screen.
If the two classes look clinically the same, they can be merged by touching the
MERGE CLASSES key. Once merged, the first beat will be displayed as a
template on the left side of the screen with the message (M1) following the class
title. Any subsequent beat that fits any of the merged templates will then be stored
in that class.
To control arrhythmia alarms:
1Touch ECG.
2Touch REVIEW.
3Touch ARRHYTHMIA
REVIEW.
4Select CPL, ABN or TACH.
5Select ALARM YES or NO.
To clear a class or the most
recent event in a class:
1Touch ECG.
2Touch REVIEW.
3Touch ARRHYTHMIA
REVIEW.
4Select an arrhythmia class.
5Touch CLEAR.
6Select ENTIRE CLASS or
LAST EVENT.
To merge class or trend data:
1Touch ECG.
2Touch REVIEW.
3Touch ARRHYTHMIA
REVIEW.
4Select an arrhythmia class.
5Touch MERGE.
6Use PRIOR CLASS or NEXT
CLASS to display the two
classes you wish to merge.
7Select MERGE CLASSES or
MERGE TRENDS.

Arrhythmia
9-11
You can merge a maximum of two classes into a third class. The following
constraints apply to merging classes:
• Two single templates can be merged into a class with one template.
• One class of two (previously merged) templates can be merged with one
additional template.
• If a class has been merged once, then (M1) follows the class number, for
example, ABNORMAL 12 (M1).
• If a class has been merged twice, then (M2) follows the class number, for
example, ABNORMAL 12 (M2).
Merging Trends
There is no limit to the number of trends that you can merge. Merging trends of
arrhythmia data deletes the template for the class that has been merged. If an
arrhythmia event occurs that matches the merged class, a new class will be
created.
If you want to combine the data for two routinely recurring arrhythmia classes,
merge the classes rather than merge the trends. Merging classes permits the two
classes to be stored and trended together on an ongoing basis.
If you want to combine an active arrhythmia class with an inactive class, merge
the trends. An example of an inactive arrhythmia class is the dominant
morphology associated with a previous lead selection.
Merge Constraints
The following additional constraints apply to merging individual classes or trends:
• If the system cannot merge any of the existing classes or trends, the MERGE
key is disabled (the key will appear dotted) in menus for those classes/trends.
• Only classes/trends that the system can merge are presented.
• Single abnormal classes/trends can be merged with each other, or with the
dominant, paced, or AV paced classes/trends.
• Couplets can only be merged with couplets.
• Runs and pauses cannot be merged.
Ultraview Care Network
9-12
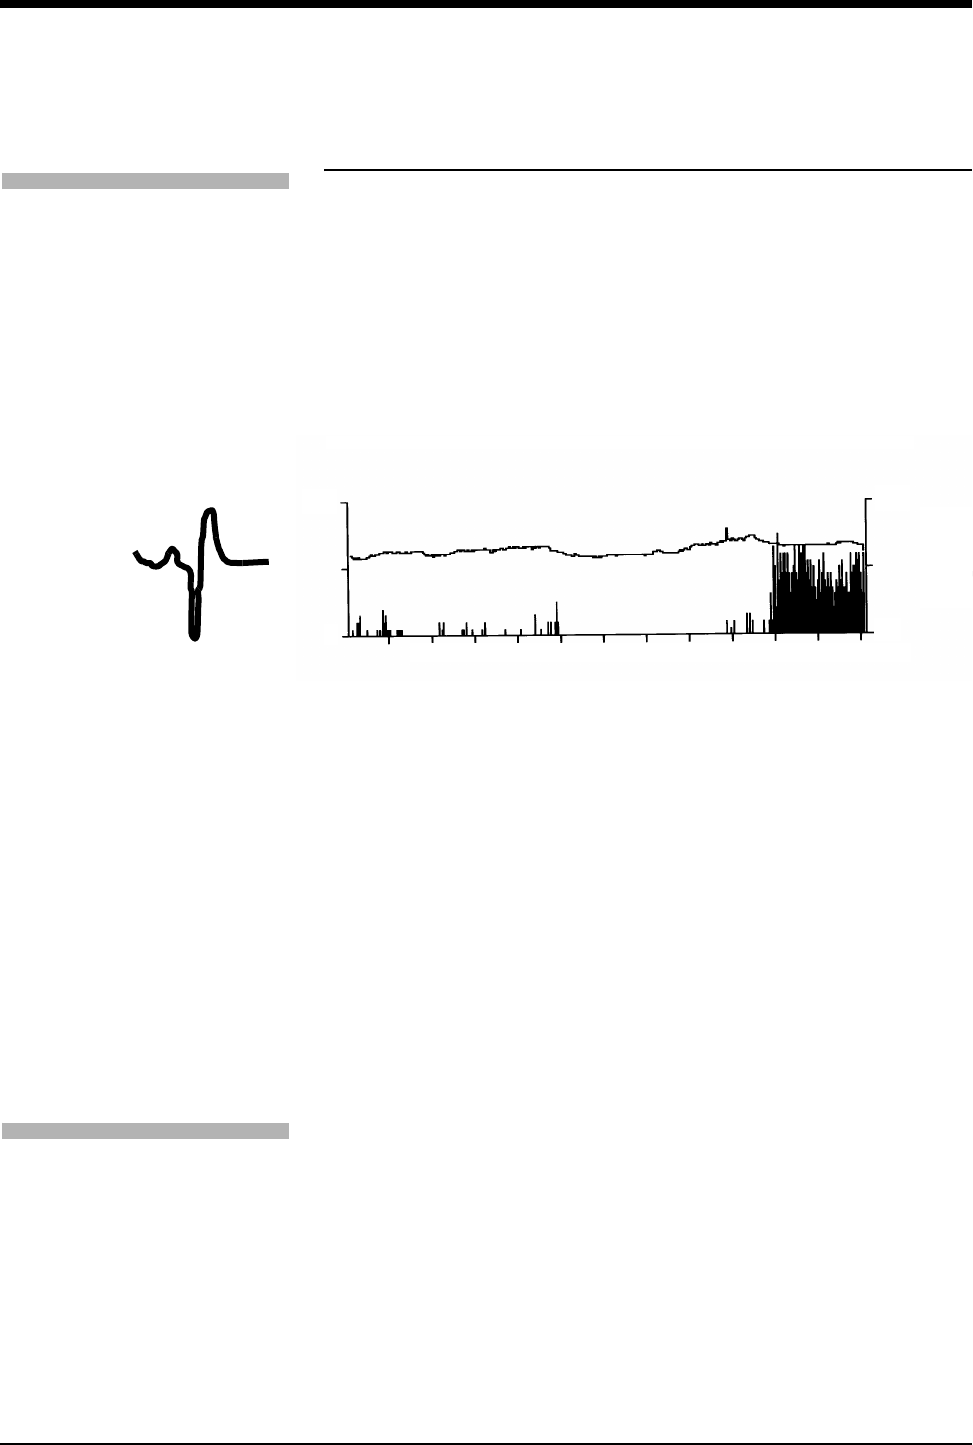
Plotting Arrhythmia Trend Graphs
When you plot trend graphs the display area consists of:
• a 1.5-second segment of the selected class waveform on the left (individual
class trends only).
• a trend graph of the selected class, or group of classes, on the right. Refer to
Figure 9-2: Abnormal class trend.
When you select CLASS TREND, the trend graph plots occurrences of events
that match that particular class. The total number of events that occurred during
the time period between the cursors appears below the trend graph.
Figure 9-2: Abnormal class trend
When you select GROUP TREND, the trend graph plots occurrences of all events
in that group of classes along with the average heart rate. For example, the group
trend for abnormals plots the occurrences of all single abnormals regardless of
the class in which they were stored.
• The dominant group trend graph displays the total of all abnormal beats,
including beats in runs, over the selected timebase.
• A total of all events specific to the selected class over the selected timebase
is displayed for all other trended classes.
Each trend graph is displayed with two scales:
• the scale on the left represents heart rate.
• the scale on the right displays the number of arrhythmias over the trended
period.
Scales are automatically selected, based on the heart rate and arrhythmia values.
Selecting a Timebase
You can also select the time period over which the system trends arrhythmia data.
The factory default setting is 6-hours. Resolution for each timebase is shown
below.
Resolution Timebase
1-minute = 6-hour trend graph
2-minutes = 12-hour trend graph
4-minutes = 24-hour trend graph
To plot a trend graph:
1Touch ECG.
2Touch REVIEW.
3Touch ARRHYTHMIA
REVIEW.
4Select an arrhythmia class for
review.
5Select CLASS TREND or
GROUP TREND.
100
0From 12:18 to 18:17 18:17
0
20
50
HR
10
12:17 Total = 612
PER
1
MIN
ABNORMAL 1
To select a timebase for class or
group trends:
1Touch ECG.
2Touch REVIEW.
3Touch ARRHYTHMIA
REVIEW.
4Select an arrhythmia class.
5Select CLASS TREND or
GROUP TREND.
6Select TIMEBASE (6-,12-, or
24-hours).

Arrhythmia
9-13
Excluding Classes from Trends
Use this function to exclude specific classes from the group trend for that class as
well as from the dominant trend graph (only valid with CPL and ABN classes).
This function defaults to YES indicating that all classes will be included. When you
select a class, the template for that class displays on the screen. It is followed by a
trend graph that plots all of the occurrences of that class over the selected trend
graph timebase.
Positioning the Cursors
The cursors are small, bright lines that move along the bottom of the trend display
and allow you to view the number of trended events that occurred between any
two points in time displayed on the trend graph.
Initially, the left (L) cursor is located flush with the left edge of the trend graph, and
the right (R) cursor is located flush with the right edge of the trend graph. The
number of trended events between, and inclusive of, the cursor points appear
below the trend graph. If the cursors move past each other, the L cursor becomes
the R cursor and vice versa. The highlighted L or R portion of the CURSOR key
changes accordingly.
Printing Arrhythmia Data
All printouts of ECG or arrhythmia data are annotated with the following data:
• Bed identification
• Time and date of the printout
• Lead designator
You can print all arrhythmia data for all classes or individually selected classes.
You can also print individually selected arrhythmia trend plots.
Selecting PRINT ALL prints all ST events and all arrhythmia classes. PRINT ALL
also prints all leads.
To exclude a class in a group
trend:
1Touch ECG.
2Touch REVIEW.
3Touch ARRHYTHMIA
REVIEW.
4Select an arrhythmia class.
5Touch CLASS TREND.
6Select INCLUDE NO.
To position the cursors on the
trend graph:
1Touch the CURSOR to highlight
either the L or R portion.
2Touch the trend plot to position
the cursor near the desired
point.
3Use the arrow keys for
adjustment of the cursor.
To print recordings of ALL
arrhythmia events:
1Touch ECG.
2Touch PRINT.
-OR-
3Touch PRINT ALL.
4Touch ARR CLASSES.
To print selected arrhythmia
classes:
1Touch ECG.
2Touch REVIEW.
3Touch ARRHYTHMIA
REVIEW.
4Select an arrhythmia class.
5Touch PRINT.
To print selected arrhythmia
trends:
1Touch ECG.
2Touch REVIEW.
3Touch ARRHYTHMIA
REVIEW.
4Select an arrhythmia class.
5Select CLASS TREND or
GROUP TREND.
6Touch PRINT.

Ultraview Care Network
9-14
Arrhythmia Problem Solving
Refer to ECG on page 8-3 for additional monitoring tips.
False Alarms
Careful attention to good monitoring techniques, especially during setup, will
reduce false alarms. When false alarms occur, check the following:
• Multiple classes with atrial fibrillation or flutter waveforms. Either 1) merge
these classes with the dominant or another abnormal class, 2) deactivate the
alarms for these classes, or 3) consider deactivating the Abnormals per
Minute alarm.
• Repetitive artifact mimicking QRS complexes. Review the morphology of
abnormal classes that are triggering alarms. Either merge these abnormal
classes together or deactivate the alarm for these classes.
• In some cases VFIB may resemble previously classified abnormal beats
which may cause VFIB to be detected as a RUN. If this occurs, use the
waveform display as the primary indication of condition.
• Some beats may not be recognized as morphologically different from the
learned, dominant beat. You may be able to improve performance by
changing electrode positions or switching to a lead setting that provides
better differentiation between the dominant and abnormal beats.
Abnormal Beats Mis-classified
There are a number of possible situations that might cause beats to be improperly
classified (either too many or too few).
• If the message NOISY SIGNAL is displayed, too much noise is present on
either one, or both, ECG channels.
• If the message ECG VOLTAGE TOO LOW is displayed, the signal level is
below the threshold for QRS detection.
• Some beats are not recognized as being different from the learned dominant
beat.
You may be able to improve performance in these cases by changing electrode
positions or by switching to a lead setting that provides a better signal or allows
abnormal beats to be more clearly differentiated from dominant beats.
No Couplet or Run Alarms
If alarms do not occur as expected, check the following:
• Abnormal in a Row alarm limit may be set too high to generate alarm for
couplets. When you wish to be alerted for couplets, set Abnormal in a Row
alarm limit to 2.
• Abnormal beat(s) may not meet the classification criteria of 15% prematurity
(for the second beat in a couplet or subsequent beats — at 90 BPM — in a
run) and R-R intervals of less than or equal to 666 msec. No action is
indicated. An Abnormal in a Row alarm (COUPLET or RUN) will not be
generated unless both criteria are met.
• Processing may have been suspended or the signal quality may be poor.
Resume processing or check electrodes for other causes of a poor signal.

Arrhythmia
9-15
Previous Abnormal Classes Missing in Arrhythmia
Review
If you find that previously classified abnormal beats are no longer stored for
review, one of the following conditions have occurred:
• The class has been cleared.
• Memory was cleared using the RELEARN key or data was purged during the
Admit/Discharge function.
• A module error recovery reset occurred.
Classes Full
The total number of abnormal and couplet classes that can be stored is 12. When
the system detects the 13th class, the message CLASSES FULL is displayed with
an alert tone (if tone is set to ON). All subsequent alarm events will initiate an
alarm, even if classes are full.
A “classes full” condition can be cleared by:
• Merging one or more classes
• Merging one or more trends
• Deleting one or more abnormal or couplet classes
!
• All alarm events occurring when classes are full will initiate an
appropriate alarm.

9-16
Arrhythmia Troubleshooting Guide
Clinical Situation Possible Cause Solution
Abnormal beat not
detected
■Module receiving inadequate signal;
NOISY SIGNAL or ECG VOLTAGE
TOO LOW messages appear. Noise
level is over allowable range, or
signal level is below QRS detection
threshold.
■Make the necessary adjustments to
restore good signal.
■Check all leads to determine a better
monitoring lead or select another
lead.
■Remove the cause of the noise.
■Some beats not recognized as
morphologically different from the
learned dominant beat.
■No action required; some events that
may be diagnosed as abnormal by a
skilled clinician may not meet the
module’s criteria for abnormality.
■System has not seen 5 abnormals or
3 couplets of like morphology to
generate a class.
■No action is required.
■Arrhythmia detection is not enabled. ■Enable arrhythmia detection through
the ECG Setup menu.
False Alarms NOTE: Careful attention to good monitoring technique, especially setup, will keep false
alarms at a low level. If false alarms do occur, however, check the following.
■Noise on the signal caused by poor
electrode application is the most
common cause of false alarms.
■Remove the cause of the noise.
■Deactivate alarm for the classes that
fill up with repetitive artifact; do not
clear these classes.
■Multiple abnormal classes with atrial
fibrillation or flutter waveforms.
■Merge the class with the dominant or
another abnormal class.
■Deactivate alarm for these classes,
or consider deactivating the ABN
PER MIN alarm.
■Atrial fibrillation continually triggering
TACH alarm.
■Consider deactivating TACH alarm.
■Limits set too close to patient’s heart
rate.
■Check and adjust the alarm limits.
■Amplitude of ECG signal has
dropped below threshold of R-wave
detector.
■Reposition electrodes and relearn
patient’s rhythm.
10-1
!
• Based on features purchased, more or fewer keys may appear here than on your menu screens.
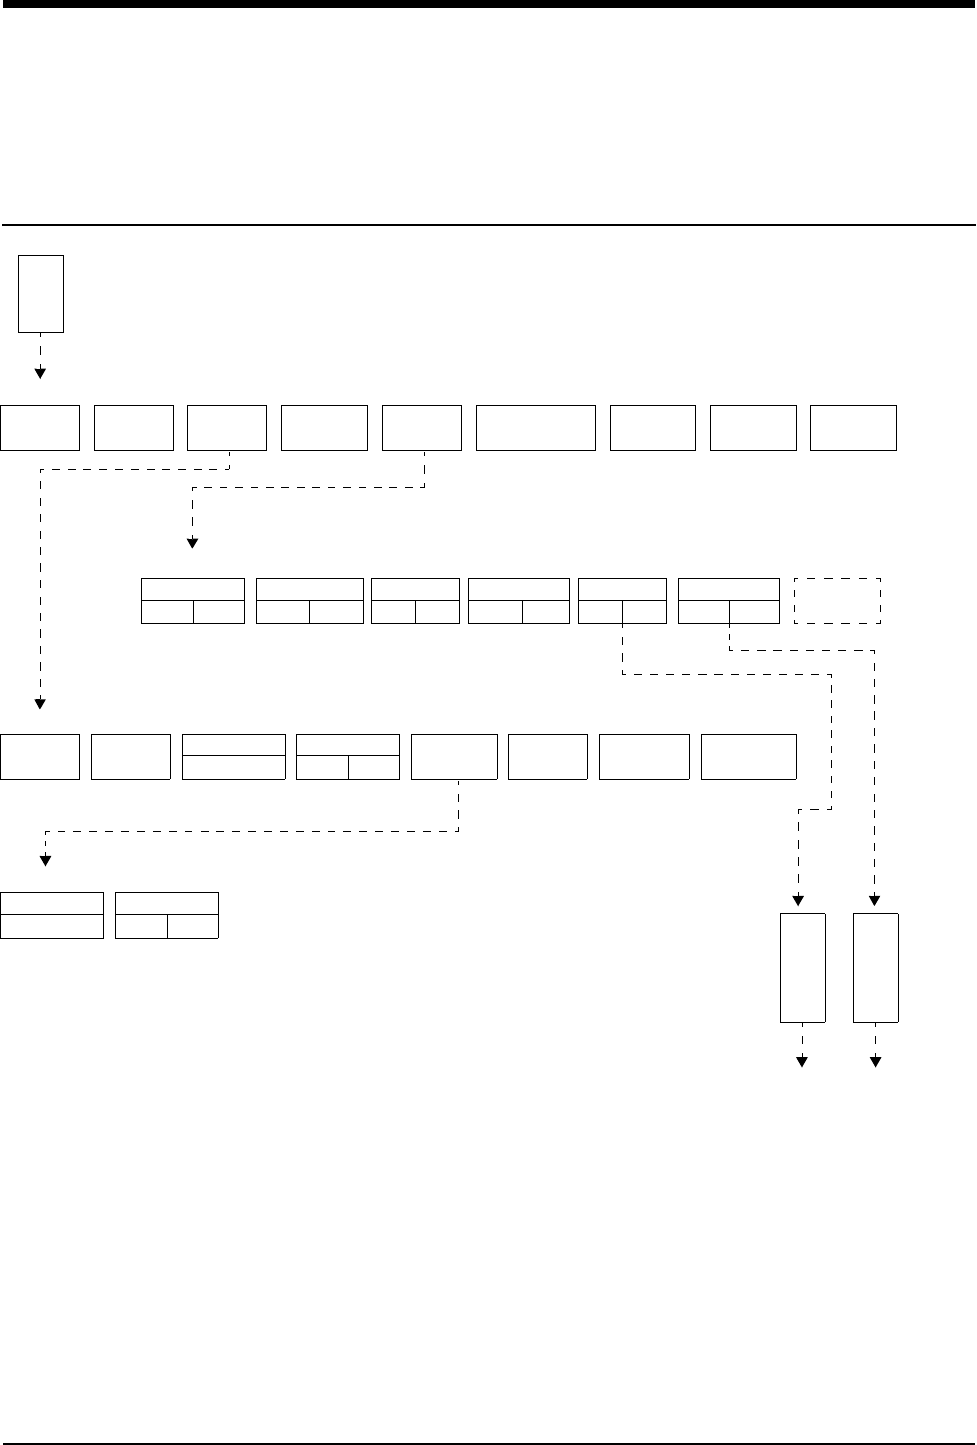
ST Analysis Directory
Directory of Keys
IIIIII V1 V2 V3 V4 V5 V6 AVF
Highlighted leads are included in ST alarms. Touch to include or exclude.
AVL AVR
E
C
G
ECG MENU
ALARM
LIMITS SIZE SETUP LEAD
CONTROL
DISPLAY
FORMAT
SUSPEND
PROCESSING REVIEWPRINTRELEARN
ST
REVIEW
ARRHYTHMIA
REVIEW
REPORT
REVIEW
REAL TIME
ST TREND
ECG REVIEW
TREND TIMEBASE
15 MIN/30 MIN
TREND DISPLAY
OFFON
ST
TREND
TIME SAVE
NOYES
CLEAR PRIOR
SET PRINT
NEXT
SET
SAVE
SET
TIMEBASE
6 HOURS PRINT
ST
SCALE
ST REVIEW - ST SEGMENT LEVELS at HR:MIN DAY-MONTH-YEAR
TREND OF ST SEGMENT LEVEL
Do you wish to clear the displayed ST data?
YES NO
ALARMS
OFFON
HI=
130
LO=
40
ABN IN
ROW=5
ABN PER
MIN=OFF
SINGLE
ST = 1.00
MULTI
ST = 0.50
ST
LEADS
ECG - ALARM LIMITS


Contents
10-3
Overview . . . . . . . . . . . . . . . . . . . . . . . . . . . . . . . . . . . . . . . . . . . . . . . . . . . . . . 3
Display Detail. . . . . . . . . . . . . . . . . . . . . . . . . . . . . . . . . . . . . . . . . . . . . . . . . . . 4
Setting Up ST Monitoring. . . . . . . . . . . . . . . . . . . . . . . . . . . . . . . . . . . . . . . . . . 5
Adjusting Alarms . . . . . . . . . . . . . . . . . . . . . . . . . . . . . . . . . . . . . . . . . . . . . . . . 5
Selecting Leads for ST Alarms . . . . . . . . . . . . . . . . . . . . . . . . . . . . . . . . . . . . . 7
Reviewing ST Data . . . . . . . . . . . . . . . . . . . . . . . . . . . . . . . . . . . . . . . . . . . . . . 8
Clearing ST Data . . . . . . . . . . . . . . . . . . . . . . . . . . . . . . . . . . . . . . . . . . . . . . . . 8
Viewing ST Trends . . . . . . . . . . . . . . . . . . . . . . . . . . . . . . . . . . . . . . . . . . . . . . 9
Selecting the ST Trend Timebase . . . . . . . . . . . . . . . . . . . . . . . . . . . . . . . . . . . 9
Printing ST Data . . . . . . . . . . . . . . . . . . . . . . . . . . . . . . . . . . . . . . . . . . . . . . . 10
ST Analysis Troubleshooting Guide . . . . . . . . . . . . . . . . . . . . . . . . . . . . . . . . 11
ST Analysis
Overview
The ST analysis function monitors changes to the ST segment level.
Since the ST segment is composed of frequencies at the lower end of the
frequency range (0.05 Hz), the system automatically analyzes the ST segment at
0.05 Hz regardless of whether the display mode is set to monitor or extended.
ST segment analysis starts during the ECG learn sequence. Based on the
dominant waveform, the PR (isoelectric), J, and ST points are automatically
identified for each beat. The amplitude difference between the ST point and the
PR point is referred to as the ST segment level.
!
• The significance of ST changes can only be determined by a
clinician.
• The value of ST segment measurements may be affected by:
- wide complex QRS’s (for example, bundle branch block).
- Wolff-Parkinson-White (WPW) syndrome.
- fusion beats classified as dominants.
!
• You can define your own default settings for alarm limits. Refer
to Default Alarm Limits on page 2-3 for further details.
Ultraview Care Network
10-4
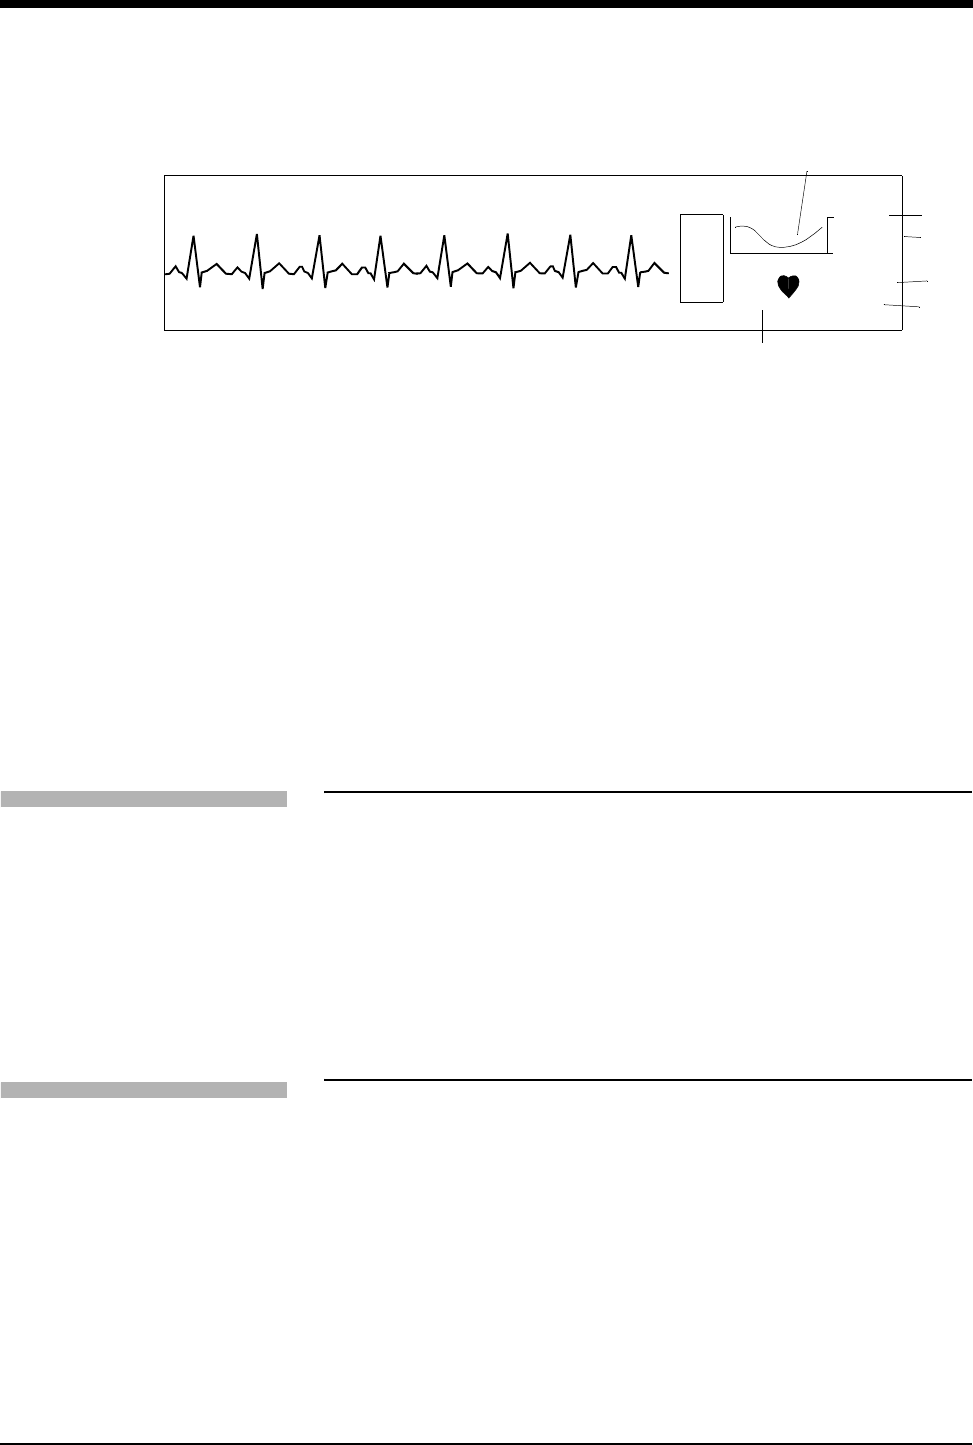
Display Detail
The current ST segment level is displayed for all leads to the right of the ECG
parameter key in the split view and the full view modes. Question marks (???) are
displayed when the current ST segment level is not available, or as OFF when the
lead is not connected.
Figure 10-1: ST segment display (full view)
Figure 10-2: ST segment display (split view)
I 0.16 AVR 0.16
II 0.00 AVL 0.24
III 1.44 AVR 0.16
V1 -1.44 V4 0.16
V2 2.88 V5 0.16
V3 4.32 V6 0.16
ᕡ
ᕤ
E
C
G
II MON
A=0
A/M 10
ROW 4
120
40
70
AVR
AVL
AVF
V4
V5
V6
V1
V2
V3
III
II
Iᕢ
ᕣ
E
C
G
II MON
A=0
A/M 10
ROW 4
120
40
70
V4
V6
V1
V2
V3
V5
ᕡ
ᕢ
ᕣ
ᕤ
E
C
G
I 0.16 AVR 0.16
II 0.00 AVL 0.24
III 1.44 AVR 0.16
V1 -1.44 V4 0.16
V2 2.88 V5 0.16
V3 4.32 V6 0.16
ST Analysis
10-5
Figure 10-3: Real-time ST trend display
ᕡECG lead designator
ᕢAbnormals per minute counter
ᕣCurrent heart rate
ᕤST segment levels (updates at 30-second intervals)
ᕥST segment level (single lead); asterisk indicates ST alarms are enabled
ᕦReal-time ST trend
ᕧAmplitude scale in millivolts
ᕨTime scale - either 15- or 30-minutes
Setting Up ST Monitoring
ST analysis is performed on all available ECG leads, even if they are not currently
displayed. Setup for ST monitoring is the same as for ECG monitoring. Refer to
ECG on page 8-1 for setup details.
Adjusting Alarms
You can adjust alarm limits in increments of 0.25 mm as needed for both single
lead ST and multiple lead ST.
ST alarms can be activated manually or automatically once the system has
acquired an ST segment measurement. Typically, the system acquires this data
within 30- to 60-seconds after completion of the learn sequence.
!
• ST Analysis and Review functions are only available in the adult
mode in modules with the ST option.
!
• Disabling ECG alarms also disables ST alarms.
E
C
GST = X.XX
70
ᕣ
ᕡ
V2
5.00
30 MIN
0.00
ᕦ
ᕧ
ᕨ
ᕥ
To set up ST monitoring:
1Set up system and patient for
standard ECG monitoring.
2Touch ECG.
3Touch SETUP.
4Touch CONFIG.
5Select ADULT.
To set or adjust ST alarms:
1Touch ECG.
2Touch ALARM LIMITS.
3Select SINGLE ST or MULTI
ST.
4Use arrow keys to adjust.

Ultraview Care Network
10-6
The SINGLE ST alarm allows you to monitor for localized changes that may only
be detectable in a single lead. An ST alarm for a SINGLE LEAD will activate if the
ST level for any one lead exceeds the SINGLE ST alarm limit, with respect to its
current reference level.
The factory default setting for the single lead ST alarm limit is 1.00 mm.
The MULTI ST alarm allows you to monitor for global changes that may be
detectable in multiple leads. An ST alarm for MULTIPLE LEADS will activate if the
ST level for three or more leads exceeds the MULTI ST alarm limit, with respect to
each lead’s current reference level.
The factory default setting for the multi-lead ST alarm limit is 0.50 mm.
At the time that ST monitoring is initiated, the current reference level for all leads
is set to 0.00 mm (isoelectric). A SINGLE ST alarm will activate if any lead has an
initial ST level that exceeds the SINGLE ST alarm limit. Or, a MULTI ST alarm will
activate if three or more leads have initial ST levels that exceed the MULTI ST
alarm limit.
Whenever a SINGLE or MULTI ST alarm is activated, the reference level for all
leads is automatically reset based on each lead’s current ST level. This allows
changes in ST levels to be dynamically tracked throughout the patient’s course of
treatment.
As shown in Figure 10-4: ST segment alarm function, when the patient’s ST
segment trend line rises and violates the first alarm threshold, a new baseline and
a new upper alarm threshold are established (the amount of change needed to set
off another alarm is denoted by Delta). The lower alarm threshold remains
unchanged. Though the patient’s ST segment continues to climb, it does not
reach the new alarm threshold, so a new upper limit is not set. When the ST level
declines, the alarm threshold also declines until the original alarm thresholds are
re-established. As the patient’s ST level continues to decline, a new threshold is
established when an alarm condition occurs.
Figure 10-4: ST segment alarm function
!
• The MULTI ST alarm limit cannot be set above the SINGLE ST
alarm limit if both alarms are enabled.
Thick line is the measured ST level.
Solid line is the ST alarm baseline.
Dashed line is the alarm threshold.

ST Analysis
10-7
As a second example, assume the SINGLE ST alarm is set at 1.00 mm. The initial
ST amplitude for a particular lead is +0.60 mm. Based on the initial reference level
of 0.00 mm, an alarm would activate if the ST level exceeds +1.00 mm. Therefore,
no alarm occurs. Instantaneously, the ST level increases to +1.20 mm. SINGLE
ST alarm occurs and the new reference level for the lead is set to +1.20 mm. The
next ST alarm for that lead, assuming no changes are made in other leads, would
be activated at +2.20 mm.
Selecting Leads for ST Alarms
Touching the ST LEADS key allows you to select which leads are to be used to
generate ST alarms. Leads that are not clinically relevant for a patient can be
disabled to allow tighter limits to be placed on more clinically significant leads.
All highlighted leads will be used to generate ST alarms.
The factory default setting is all leads included.
Displaying Real-Time ST Trends
To facilitate the assessment of short-term changes in ST-segment levels,
measurements for a single lead can be displayed as a real-time trend.
The amplitude scale for the trend display is dynamically adjusted to show the
maximum and minimum values for the selected time scale.
The time scale for the trend display is user-selectable — either 15-minutes or
30-minutes.
Trend data is continuously updated at 3-second intervals.
To select or deselect leads for ST
alarms:
1Touch ECG.
2Touch ALARM LIMITS.
3Touch ST LEADS.
4Select or deselect leads.
To display a real-time ST trend:
1Touch ECG.
2Touch REVIEW.
3Touch REAL TIME ST TREND.
4Select ON.
5Select TREND TIMEBASE of
15- or 30-minutes.
Ultraview Care Network
10-8
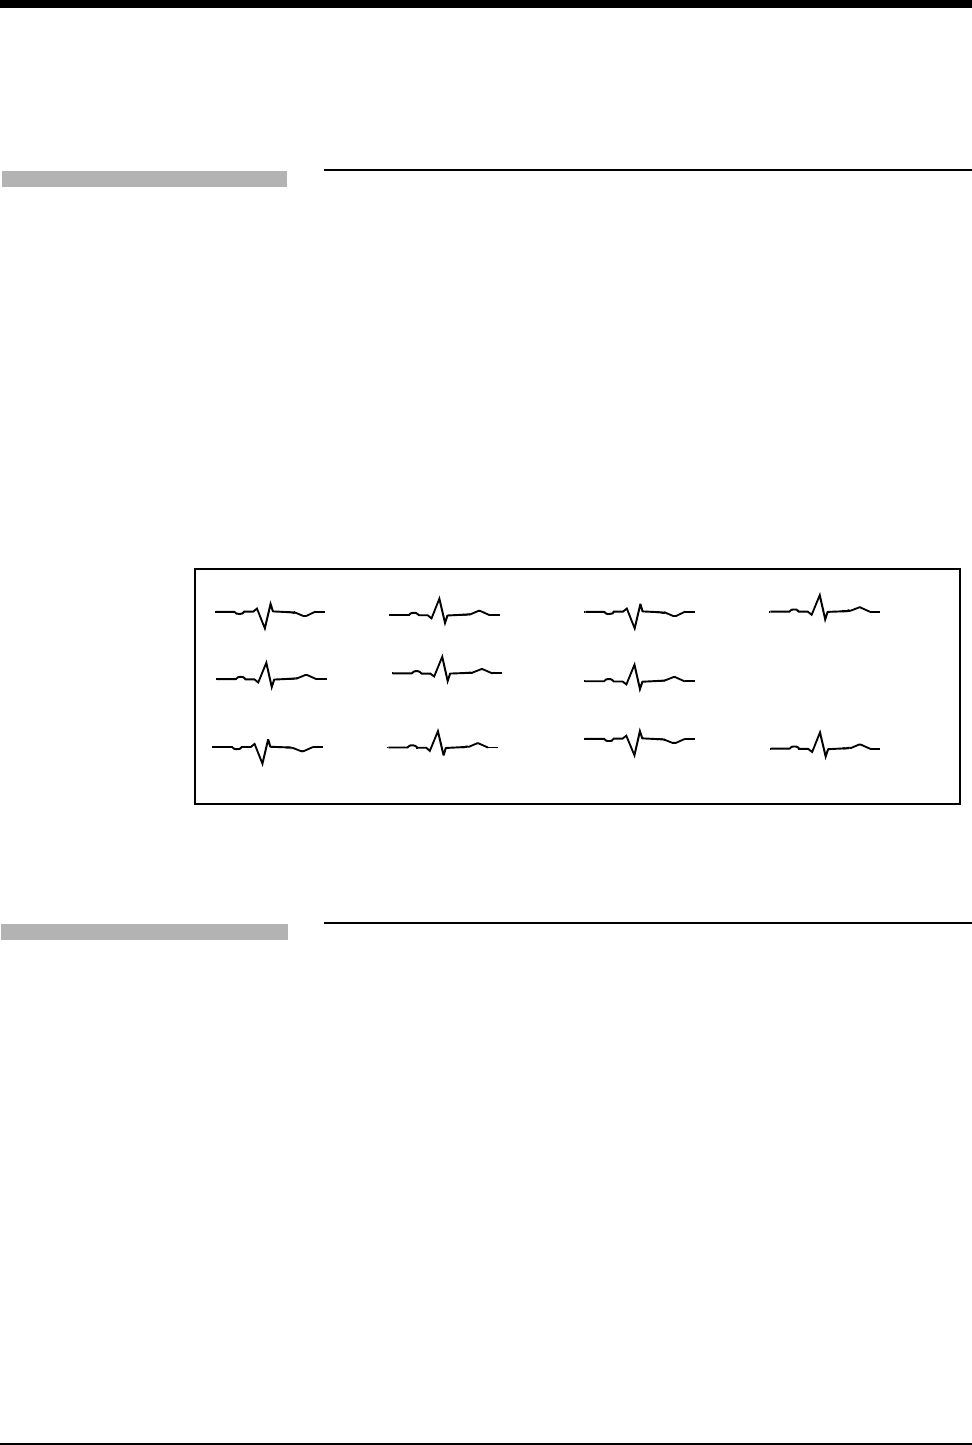
Reviewing ST Data
Use the ST Review menu to display and review ST segment data. A snapshot of
ST segments for all available leads is displayed. The time and date of the ST
snapshot is displayed on the menu prompt line. Touch the PRIOR SET or NEXT
SET key to display ST data at other time points. Figure 10-5 is an example of a ST
segment snapshot.
Nine ST snapshots can be stored for display. The oldest ST snapshot, not marked
as SAVED, will be deleted to make room to store a new snapshot. To save an ST
snapshot, touch the SAVE SET key.
ST snapshots are automatically stored whenever an ST alarm occurs or at pre-
selected time intervals. To store the ST snapshots at periodic intervals, select
TIME SAVE YES. Available intervals are 5-, 10-, 15-, 30- or 60-minutes (only
available in the Module Configuration Manager).
The factory default setting for the time save interval is 15-minutes.
Figure 10-5: ST segment display
Clearing ST Data
Touching the CLEAR key and then confirming your choice by selecting YES
clears the currently displayed data for all leads from memory. Data is also cleared
from the trends.
To review ST data:
1Touch ECG.
2Touch REVIEW.
3Touch ST REVIEW.
AVR
AVF
V4
V6
V1
V2
V3
III
II
I
-0.16 mm
-0.16 mm
0.16 mm
2.88 mm
4.32 mm
0.16 mm
0.16 mm
0.16 mm
0.00 mm
1.44 mm
AVL
0.24 mm
To clear the displayed ST data:
1Touch ECG.
2Touch REVIEW.
3Touch ST REVIEW.
4Touch CLEAR.
5Select YES.
ST Analysis
10-9
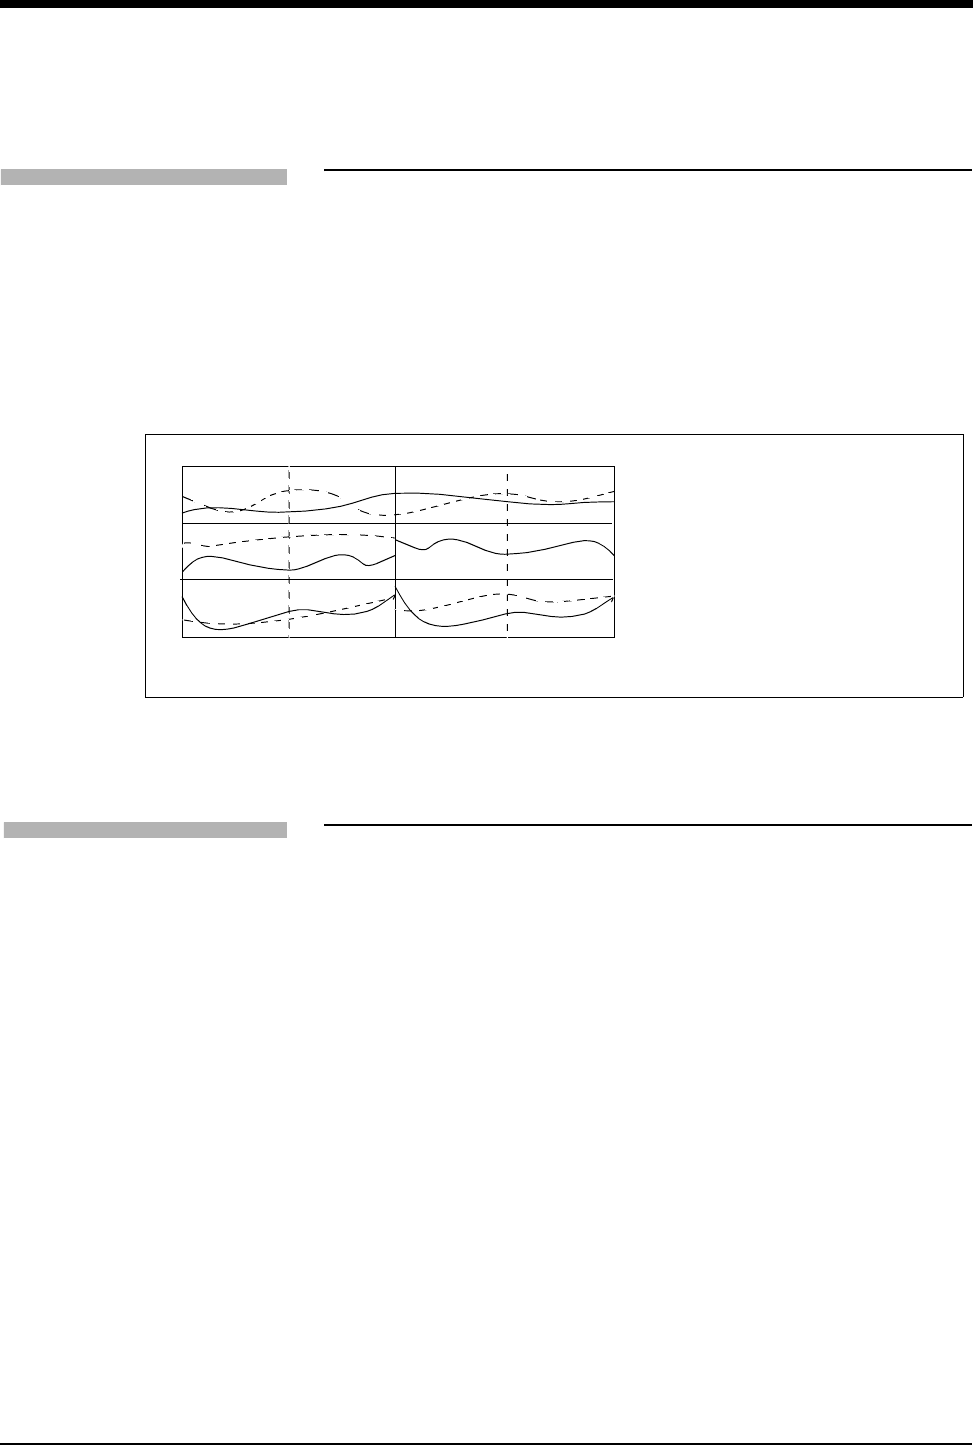
Viewing ST Trends
Trends showing deviations in ST segment level are displayed for each lead
monitored in the past 24-hours. Touching the trend graph or one of the arrow keys
in the menu produces a cursor on the baseline of the trend plot. Position this
cursor at a point of interest in the trend to determine the ST segment level for all
displayed leads at that time. A measurement for each lead is displayed in the
table to the right of the trend display.
Figure 10-6: ST trend display shows an example of a trend display. The graph
plots deviations in ST segment level over time.
Figure 10-6: ST trend display
Selecting the ST Trend Timebase
You can select the time period over which the ST data is displayed in a trended
format. Resolution for each timebase is shown below.
Available timebases are 1.5-, 3-, 6-, 12-, or 24-hours. The factory default setting
for the ST trend timebase is 6-hours.
Resolution Timebase
30-seconds 1.5-hours
1-minute 3-hours
2-minutes 6-hours
4-minutes 12-hours
8-minutes 24-hours
To view ST trends:
1Touch ECG.
2Touch REVIEW.
3Touch ST REVIEW.
4Touch ST TREND.
5Touch the trend plot near the
desired data point. Then use
arrow keys to adjust the cursor
position.
AVR
V4
AVL
V5
AVF
V6
I
V1
II
V2
III
V3
00:00 06:00 00:00 06:00
SCALE -2 mm to 2 mm
I 0.16 AVR 0.16
II 0.00 AVL 0.24
III 1.44 AVR 0.16
V1 -1.44 V4 0.16
V2 2.88 V5 0.16
V3 4.32 V6 0.16
ST VALUES at 03:38
To select a timebase:
1Touch ECG.
2Touch REVIEW.
3Touch ST REVIEW.
4Touch ST TREND.
5Select TIMEBASE of 1.5-, 3-,
6-, 12-, or 24-hours.

Ultraview Care Network
10-10
Printing ST Data
Printouts of ST segment data are annotated with the following:
• Bed identification
• Time and date of the printout
• Lead designator
ST segment waveforms can be printed from either the PRINT or ST REVIEW
menu.
To print all the available ST segment waveforms, use the PRINT menu.
To print only selected ST segment waveforms or ST trends, use the ST REVIEW
menu.
!
• ST Segment data cannot be printed with the 90449 printer
module.
To print all ST segment data:
1Touch ECG.
2Touch PRINT.
3Touch ST SEGMENTS.
To print selected ST segments:
1Touch ECG.
2Touch REVIEW.
3Touch ST REVIEW.
4Touch PRINT.
To print the current trend data:
1Touch ECG.
2Touch REVIEW.
3Touch ST REVIEW.
4Touch ST TREND.
5Touch PRINT.

10-11
ST Analysis Troubleshooting Guide
Clinical Situation Possible Cause Solution
No access to ST analysis
functions
■The system must learn the ST
segment level before it can provide
access to ST analysis functions.
■Wait until the system analyzes
sufficient QRS complexes to
calculate the ST segment level
(approximately one minute).
ST = ?? is displayed ■Infrequent occurrence of dominant
beats.
■ST analysis not performed on paced,
premature dominant or abnormal
beats.
■ECG amplitude may be insufficient
to detect QRS complexes.
■Check QRS amplitude.

11-1
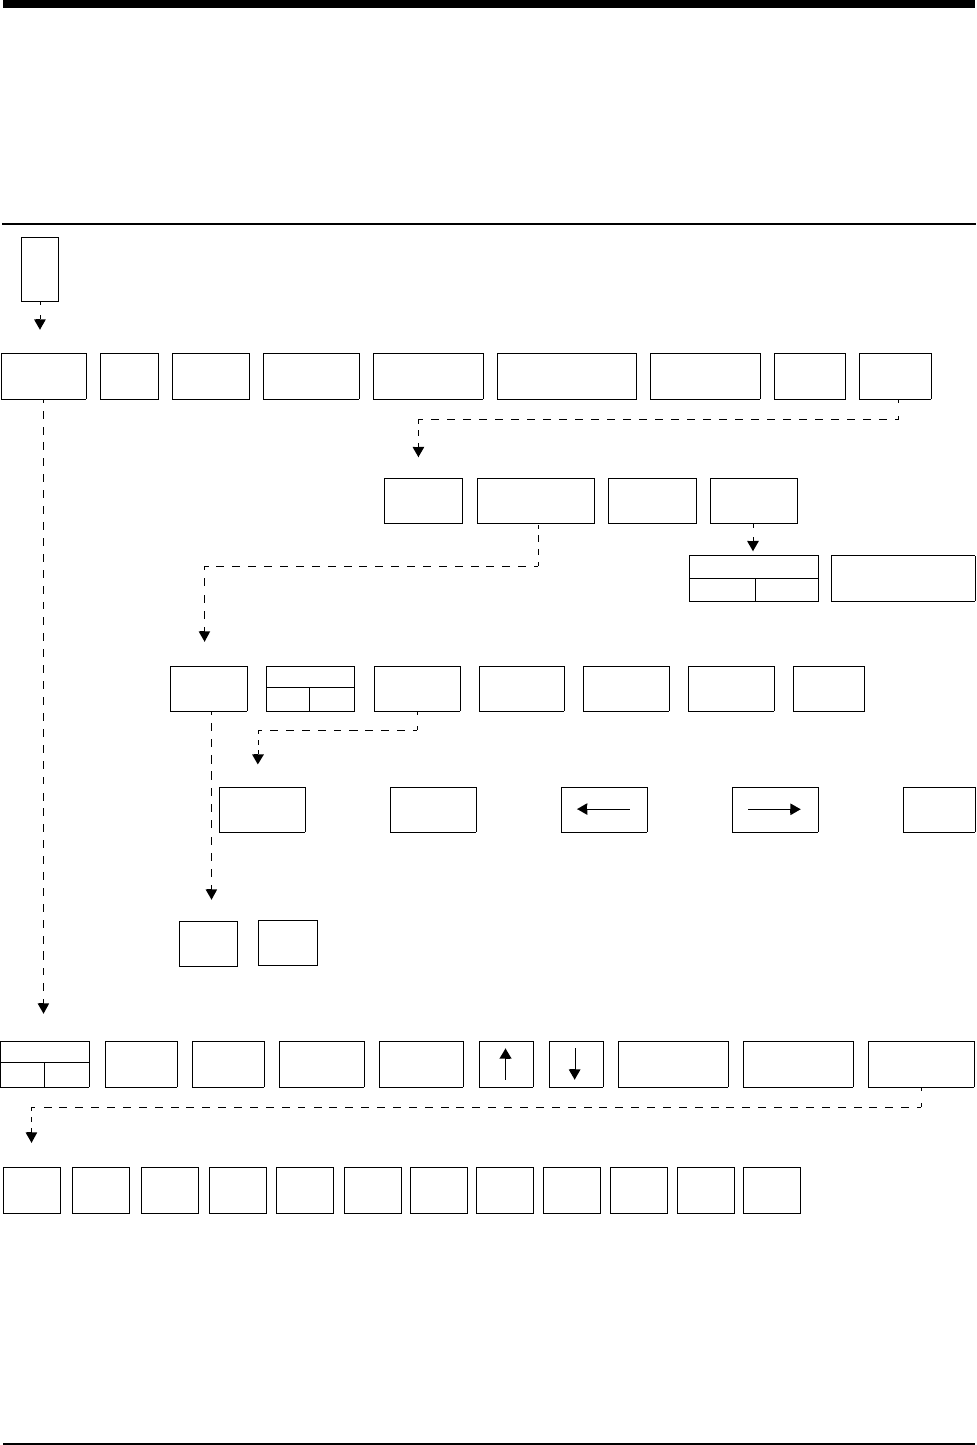
!
• Based on features purchased, more or fewer keys may appear here than on your menu screens.
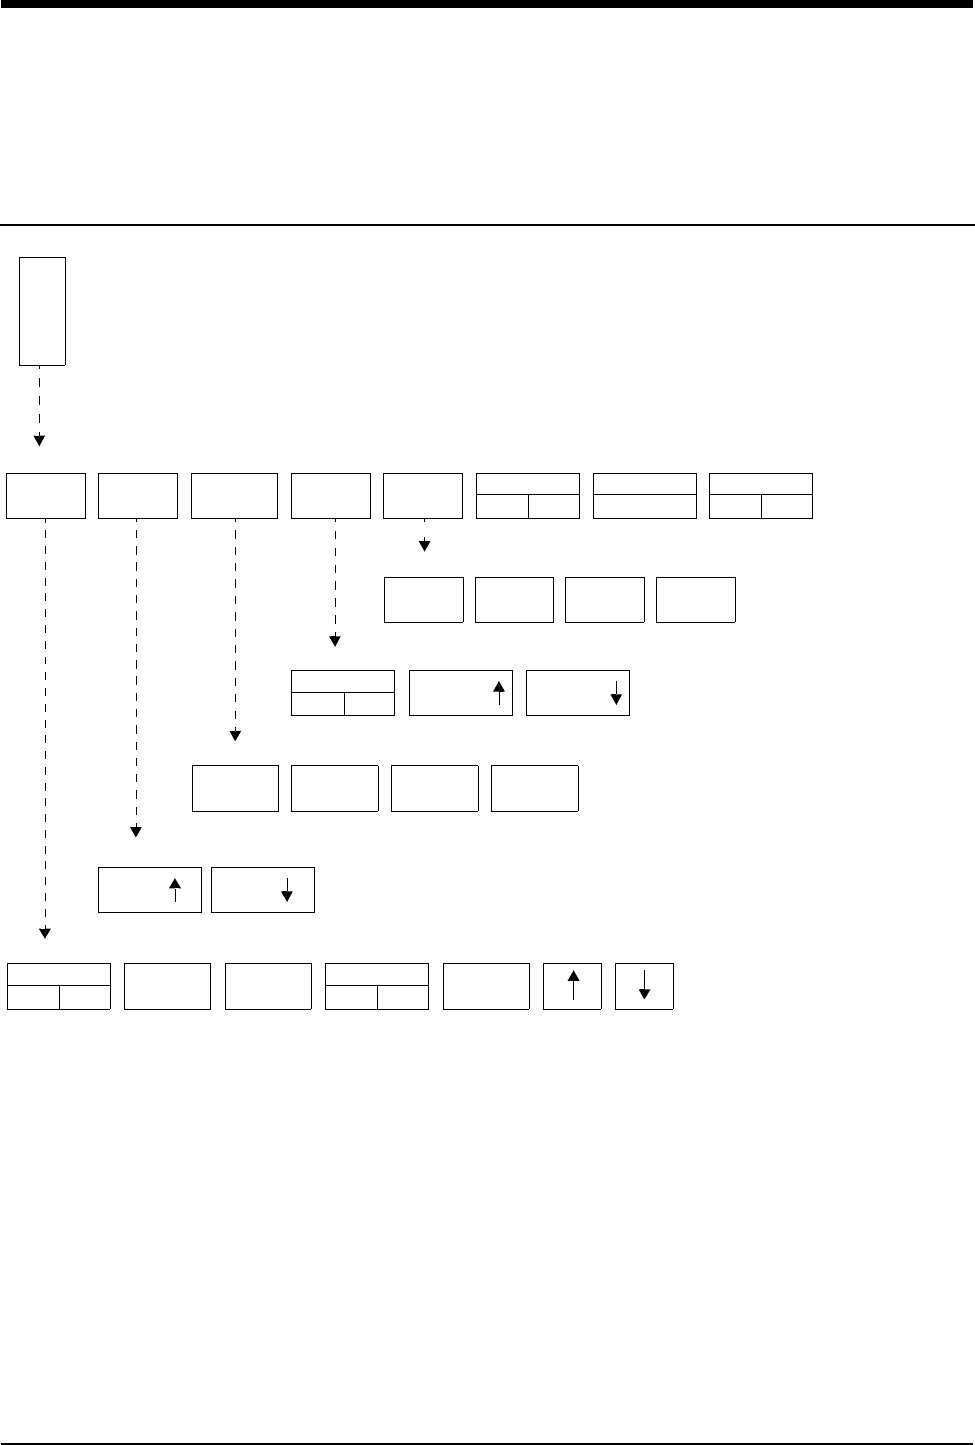
12-Lead Diagnostics Directory
Directory of Keys
CLEAR
Do you wish to clear
ECG - REVIEW
ST
REVIEW
REPORT
REVIEW
ALARM
LIMITS SIZE SETUP LEAD
CONTROL
DISPLAY
FORMAT
SUSPEND
PROCESSING RELEARN PRINT
ECG MENU
REVIEW
MORE
TEXT
E
C
G
ARRHYTHMIA
REVIEW
ECG - REPORT REVIEW HR:MN DAY-MONTH-YEAR
PRINTSAVE
STAT
REPORT
AUTO REPORT
XX MIN
DIR
DISPLAY
ECG - REPORT DIRECTORY
AUTO PRINT
OFF
REAL TIME
ST TREND
the displayed ECG report?
TREND DISPLAY
ON OFF
TREND TIMEBASE
15 MIN / 30 MIN
ON
YES NO
REPORT
SETUP
SEND
ECG*
*This box will only
display if the Module
Configuration Manager
Send ECG Report
setting is set to manual

Contents
11-3
Directory of Keys . . . . . . . . . . . . . . . . . . . . . . . . . . . . . . . . . . . . . . . . . . . . . . . . . 1
Overview . . . . . . . . . . . . . . . . . . . . . . . . . . . . . . . . . . . . . . . . . . . . . . . . . . . . . . . 3
Display Detail. . . . . . . . . . . . . . . . . . . . . . . . . . . . . . . . . . . . . . . . . . . . . . . . . . . . 4
Initiating a 12-Lead Report . . . . . . . . . . . . . . . . . . . . . . . . . . . . . . . . . . . . . . . . . 4
Automatic Scheduling of 12-Lead Reports . . . . . . . . . . . . . . . . . . . . . . . . . . . . . 5
Saving and Clearing 12-Lead Reports. . . . . . . . . . . . . . . . . . . . . . . . . . . . . . . . . 5
Sending 12-Lead Reports . . . . . . . . . . . . . . . . . . . . . . . . . . . . . . . . . . . . . . . . . . 5
Report Directory Display . . . . . . . . . . . . . . . . . . . . . . . . . . . . . . . . . . . . . . . . . . . 6
Patient Demographics . . . . . . . . . . . . . . . . . . . . . . . . . . . . . . . . . . . . . . . . . . . . . 6
12-Lead Diagnostics
Overview
The 12-lead report function acquires and displays 12 ECG vectors in the same
format as an electrocardiograph.
Diagnostic electrocardiographic devices obtain conventional ECG signatures that
accurately represent both the detailed waveforms in each cardiac cycle and the
beat-to-beat variability to determine cardiac rhythm. Prior to analysis, the ECG
data is split into two different paths: one to the module’s monitoring functions and
the other to the diagnostic functions. The ANSI/AAMI specifications for diagnostic
electrocardiographic devices, as required by the data in the diagnostic path, is
acquired at 500 samples per second.
The output from both the monitoring and diagnostic functions are combined and
transferred to the bedside monitor for display and distribution to the Ultraview
Care Network.
!
• No automated analysis is completely reliable. A physician
should read all ECG results.
• Special problems exist with pediatric ECGs because of the
considerable differences in the signal characteristics of adult
and infants and because of the evolution of the ECG patterns
from birth to adolescence.
• Digital systems produce a noticeable modulating effect from
one cycle to the next, particularly in pediatric ECGs. This
phenomenon, which is not physiologic, is due to the
asynchronism between data acquisition sample rate and the
peak of the QRS waveform.
Ultraview Care Network
11-4
Display Detail
The 12-lead report display shows 2.5-seconds of waveform data per lead.
Presentation of the leads may be in a standard format (refer to Figure 11-1) or the
Cabrera format. When analysis is complete, measurements and diagnostic
statements are displayed above the waveform data (requires option D).
Figure 11-1: 12-lead report display
ᕡMeasurement and interpretation data (requires Option D)
ᕢECG traces for 12 leads (2.5-seconds/lead)
Initiating a 12-Lead Report
You can acquire a 12-lead report by touching STAT REPORT. Initiating a STAT
REPORT will not affect the automatic schedule.
!
• When monitoring paced patients, ECG processing and the
pacepulse detection function will be suspended for 10-seconds
whenever acquisition of an ECG report is in process.
Temporarily suspending these functions allows the actual
pacepulse to be displayed/printed in the 12-lead report without
interfering with arrhythmia analysis.
• If the STAT REPORT key is labeled LEADS OFF, one or more
of the 12 leads is disconnected. Check all electrode
connections before proceeding.
ᕡ
ᕢ
Vent. rate: 60 BPM SINUS BRADYCARDIA
PR interval: 162 ms NORMAL ECG
QRS duration: 88 ms
QT/QTc: 360/360 ms
P-QRS-T axes: 50 44 51
I AVR V1 V4
II AVL V2 V5
III AVF V3 V6
To initiate a 12-lead ECG report:
1Touch ECG.
2Touch REVIEW.
3Touch REPORT REVIEW.
4Touch STAT REPORT.

12-Lead Diagnostics
11-5
Automatic Scheduling of 12-Lead
Reports
12-lead reports can be acquired automatically by selecting an interval time using
the AUTO REPORT key. User-selectable intervals include 30-minutes or 1-, 2-,
4-, 8-, or 24-hours. Selecting OFF will disable this feature.
12-lead reports can be printed as they are acquired by selecting AUTO PRINT
ON, or saved in memory for review and printing at a later time by selecting
AUTO PRINT OFF.
Touching the PRINT key at any time will print the displayed diagnostic report.
Saving and Clearing 12-Lead Reports
All 12-lead reports are stored in the module’s memory. The module can store
multiple 12-lead reports (the exact number depends upon the ECG waveforms).
When the module’s report memory is full, the oldest report that has not been
saved is replaced by the newest report.
To retain the currently displayed report in memory indefinitely, touch the SAVE
key.
To clear the currently displayed report from memory, touch the CLEAR key and
then confirm your choice by selecting YES.
Sending 12-Lead Reports
12-lead ECG reports can be manually sent to an ECG Management System as
they are acquired. To establish this as the default, use the Send ECG Report
feature in the Module Configuration Manager and change the user setting to
Manual. Refer to Table 1 ECG Parameter Configuration on page 7-9 for more
information.
If you select Manual, all reports are sent only to an ECG Management System
when you touch SEND ECG.
!
• Automatic 12-lead reports are inhibited whenever the ECG
signal is not of sufficient quality to produce a diagnostic report.
!
• If your monitoring system is interfaced to an ECG Management
System and you are using a single module to acquire 12-lead
reports at multiple bedsides, clear the 12-lead report(s) from
memory before proceeding to the next patient’s bedside.
!
• The SEND ECG key is not displayed if the Send ECG Report
feature is set to Automatic.
• The default setting is Automatic.
To schedule 12-lead ECG
reports:
1Touch ECG.
2Touch REVIEW.
3Touch REPORT REVIEW.
4Touch REPORT SETUP.
5Select AUTO REPORT of
30-minutes, 1-hour, 2-hours,
4-hours, 8-hours, or 24-hours.
6Touch AUTO PRINT ON or
OFF.
To save/clear a 12-lead ECG
report:
1Touch ECG.
2Touch REVIEW.
3Touch REPORT REVIEW.
4a Touch SAVE (while the report is
displayed).
-OR-
4b Touch CLEAR (while the report
is displayed).
4c Touch YES to confirm (for
CLEAR only).
To manually send 12-lead ECG
reports:
1Touch ECG.
2Touch REVIEW.
3Touch REPORT REVIEW.
4Touch SEND ECG.

Ultraview Care Network
11-6
Report Directory Display
Touching the DIR key will display a directory of 12-lead reports. The time and date
of each report is shown with the summary diagnosis.
Use the arrow keys to select the report of interest, then touch the DISPLAY key to
display the selected diagnostic report.
Reports that have been saved will be marked as YES in column three.
Figure 11-2: Report directory display
Patient Demographics
The patient’s gender, date of birth, height, and weight are required by the
diagnostic ECG algorithm. This information is entered via the patient Admit
function.
If patient demographic information is not entered, the diagnostic ECG algorithm
will use the following defaults:
!
• A summary statement (column 4) is only displayed if option D is
present.
TIME DATE SAVED DIAGNOSIS
1:00 28 AUG YES ABNORMAL ECG
1:30 28 AUG NORMAL ECG
2:00 28 AUG NORMAL ECG
2:30 28 AUG NORMAL ECG
3:00 28 AUG YES ABNORMAL ECG
3:30 AM 28 AUG YES NORMAL ECG
Table 1: Patient Demographic Default Values
Demographic Default Value
Date of Birth 40 years
Gender Male
Height 5’10”
Weight 180 lbs
!
•For an accurate diagnosis, the patient’s demographics must be
entered correctly.
To view directory of 12-lead ECG
reports:
1Touch ECG.
2Touch REVIEW.
3Touch REPORT REVIEW.
4Touch DIR.
12-1
!
• Based on features purchased, more or fewer keys may appear here than on your menu screens.
Respiration Directory
Directory of Keys - ECG
ECG MENU
SUSPEND
PROCESSING
ALARM
LIMITS SIZE SETUP LEAD
CONTROL
DISPLAY
FORMAT PRINT
FULL VIEW SPLIT VIEW RESP VARITREND NEXT
ECG - DISPLAY FORMAT
RELEARN REVIEW
E
C
G
Respiration
Refer to
2 LEAD CASCADE
R
E
S
P
VIEW
V
A
R
I
Varitrend 3
Refer to
ECG - SETUP
ECG - CONFIG
ON OFF ON OFF ON OFF ON OFF ON OFF ON OFF
SWEEP
SPEED
QRS
TONE
MONITOR
EXTENDED
PACED
YES NO CONFIG RATE
SOURCE
RESTORE
SETTINGS
TRANSFER
DATA
ADULT
INFANT
ARR
ON OFF
Respiration Directory
!
• Based on features purchased, more or fewer keys may appear here than on your menu screens.
12-2
Directory of Keys - Respiration
RESP - SWEEP SPEED
RESP - TONE
RESP - LEAD SELECT
RESP - ALARM LIMITS
RESP - SIZE
RESP MENU
R
E
S
P
ALARM
LIMITS SIZE SWEEP
SPEED
RESP
TONE
LEAD
SELECT
SHALLOW
NORMAL
CVA FILTER
ON OFF
WAVEFORM
ON OFF
RL - LA RA - LA RA - LL RL - LL
TONE
ON OFF VOLUME VOLUME
25
mm/sec
12.5
mm/sec
6.25
mm/sec
1.56
mm/sec
SIZE SIZE
HI/LO
ON OFF
HI =
20
LO =
10
APNEA
ON OFF
APNEA =
OFF
12-3
!
• Based on features purchased, more or fewer keys may appear here than on your menu screens.
Respiration Directory
Directory of Keys - Varitrend 3
VARITREND MENU
V
A
R
I
SIZE EVENT
TREND
1.5 MIN
3.0 MIN
SPO2
SCALE
RESP RATE
RESP WAVE PRINT
HR
SCALE
RESP WAVE
SIZE
VARITREND - SIZE MENU
DEFINE
EVENT
CLEAR
EVENT
PRIOR
EVENT
NEXT
EVENT
TREND PRINT
VARITREND - EVENT TREND MENU
TIMEBASE
6 HOURS PRINT
VARITREND - TREND MENU
CLEAR THIS
EVENT
VARITREND - CLEAR MENU
CLEAR ALL
EVENTS
ON
OFF PRINT
TACH
OFF
APNEA
20 sec
SPO2
85%
VARITREND - DEFINE EVENT MENU
BRADY
HR 100 ENTER


Contents
12-5
Overview . . . . . . . . . . . . . . . . . . . . . . . . . . . . . . . . . . . . . . . . . . . . . . . . . . . . . . 5
Setting Up Respiration Monitoring . . . . . . . . . . . . . . . . . . . . . . . . . . . . . . . . . . . 6
Display Detail. . . . . . . . . . . . . . . . . . . . . . . . . . . . . . . . . . . . . . . . . . . . . . . . . . . 6
Selecting Adult or Infant Mode. . . . . . . . . . . . . . . . . . . . . . . . . . . . . . . . . . . . . . 7
Setting and Adjusting Alarms. . . . . . . . . . . . . . . . . . . . . . . . . . . . . . . . . . . . . . . 7
Turning Respiratory Waveform On/Off . . . . . . . . . . . . . . . . . . . . . . . . . . . . . . . 8
Adjusting Waveform Size. . . . . . . . . . . . . . . . . . . . . . . . . . . . . . . . . . . . . . . . . . 8
Adjusting Sweep Speed. . . . . . . . . . . . . . . . . . . . . . . . . . . . . . . . . . . . . . . . . . . 8
Adjusting Respiration Tone . . . . . . . . . . . . . . . . . . . . . . . . . . . . . . . . . . . . . . . . 8
Selecting Respiration Leads . . . . . . . . . . . . . . . . . . . . . . . . . . . . . . . . . . . . . . . 8
Adjusting Respiration Sensitivity . . . . . . . . . . . . . . . . . . . . . . . . . . . . . . . . . . . . 9
Using the Cardiovascular Artifact Filter . . . . . . . . . . . . . . . . . . . . . . . . . . . . . . . 9
Restoring User-Defined Settings . . . . . . . . . . . . . . . . . . . . . . . . . . . . . . . . . . . 10
Recording Respiration Waveforms . . . . . . . . . . . . . . . . . . . . . . . . . . . . . . . . . 10
Configuring Varitrend 3 Graphs . . . . . . . . . . . . . . . . . . . . . . . . . . . . . . . . . . . . 10
Printing Varitrend 3 Graphs . . . . . . . . . . . . . . . . . . . . . . . . . . . . . . . . . . . . . . . 13
Respiration Troubleshooting Guide . . . . . . . . . . . . . . . . . . . . . . . . . . . . . . . . . 14
Respiration
Overview
The respiration function detects and displays a waveform that:
• represents each breath.
• provides the respiration rate.
• detects and rejects cardiovascular artifact.
• initiates alarms when limits are violated for either the respiration rate or
apnea.
Changes in thoracic impedance during patient inspiration and expiration provide
respiration data through the use of the ECG cable. Lead selection for respiration is
independent of lead selection for ECG, even though both receive data from the
same electrodes.
Varitrend 3, an optional feature in some modules, generates a graph that plots
heart rate, SpO2, and respiratory rates. You can view this plot on the monitor or
print it on a system or bedside printer.
The Event Trend feature of Varitrend 3 enables you to screen for apparent life
threatening events such as bradycardia, with desaturation, or apnea accompanied
by a change in heart rate. This feature plots bradycardia, tachycardia, apnea and
desaturation trends for viewing and printing. A 24-hour trend of events is
maintained and up to 48 events are stored in memory. Refer to Configuring
Varitrend 3 Graphs on page 12-10 for more details.
!
• You can define your own default settings for alarm limits and the
display configuration. Refer to Setting User-Defined Default
Values on page 7-7 for further details.
Ultraview Care Network
12-6
Setting Up Respiration Monitoring
Refer to the Directory of Keys - Respiration on page 12-2 for a flow diagram of
respiration keys and menus.
Display Detail
Respiration appears on the monitor in the following format:
Figure 12-1: Respiration display
ᕡRespiration trace
ᕢRespiration parameter key
ᕣRespiration indicator (flashes once per detected breath)
ᕤSelected lead for respiration
ᕥApnea alarm limit in seconds
ᕦHigh respiratory rate alarm limit
ᕧLow respiratory rate alarm limit
ᕨCurrent respiratory rate
!
• If the RESP ON/OFF key does not appear in the ECG Display
Format menu, your module does not include the respiration
option.
• The RESP key must be ON in the ECG Display Format menu to
display the RESP parameter key.
CAUTION:
• If you suspend ECG processing using the SUSPEND
PROCESSING key in the ECG menu, you also suspend
respiration processing.
To set up respiration monitoring:
1Attach the patient ECG leads.
2Plug the ECG cable into the
module’s ECG input.
3Touch ECG.
4Touch DISPLAY FORMAT.
5Select RESP ON.
6Touch RESP.
7Select additional keys as
necessary.
R
E
S
P
APN 15s
RA-LA
20
15
*
18 20
15
ᕡᕢᕣᕤ ᕥ
ᕦ
ᕧᕨ

Respiration
12-7
Selecting Adult or Infant Mode
The respiration function provides both adult and infant operational modes to
optimize monitoring accuracy.
When you select adult or infant, RESP alarm limits and breath detection sensitivity
are adjusted based upon your selection.
Setting and Adjusting Alarms
The factory default setting for respiratory rate alarms is OFF in the adult mode and
ON in the infant mode. Once respiratory alarms are enabled, the factory default
settings are as follows:
The factory default setting for apnea alarms is OFF in the adult mode and ON in
the infant mode. When active, the factory default setting is 20-seconds in both
modes. The apnea alarm setting is adjustable from 5- to 40-seconds, or the alarm
can be disabled.
Refer to Setting Alarm Limits on page 2-4 for details on system alarm operation.
Apnea Alarms
Apnea alarm limit is the maximum duration allowed between breaths before the
respiration rate is set to zero. The apnea alarm limit may be set from 5- to
40-seconds in 5-second increments.
• If the APNEA ALARM is turned ON, the APNEA ALARM will sound after the
apnea limit is reached.
• If the APNEA ALARM is turned OFF, the respiration rate will be set to zero
after 20-seconds or when the apnea alarm limit is reached, whichever is
greater. If the low rate alarm is ON, it will sound 10-seconds after the rate is
set to zero.
CAUTION:
• When the system is in the infant mode, respiration alarm
activation can be delayed for up to 3-minutes. (The factory
default setting for alarm delay is 3-minutes.) Closely
observe the patient during this period.
High Rate Low Rate
Adult 150% of learned rate; not
below 30 breaths/minute 0 breaths/minute
Infant 100 breaths/minute 10 breaths/minute
!
• If the alarm limit for high rate or low rate is displayed in reverse
video, the alarm tone, alarm recording, and alarm watch have
been disabled.
To specify the patient type:
1Touch ECG.
2Touch SETUP.
3Touch CONFIG.
4Select ADULT or INFANT.
To set or adjust rate alarms:
1Touch RESP.
2Touch ALARM LIMITS.
3Select HI/LO ON.
4Select HI= or LO=.
5Use arrow keys to adjust.
To set or adjust apnea alarms:
1Touch RESP.
2Touch ALARM LIMITS.
3Select APNEA ON.
4Touch APNEA=.
5Use arrow keys to adjust.

Ultraview Care Network
12-8
Turning Respiratory Waveform On/Off
You may choose to turn the respiration waveform OFF and display only the
respiration numeric values.
The factory default setting for respiration waveform is ON.
Adjusting Waveform Size
You can increase or decrease the size of the respiration waveform display. This
changes the displayed size only, and does not affect the signal gain or breath
detection sensitivity.
Adjusting Sweep Speed
The sweep speed determines the rate at which the respiration waveform moves
across the screen. Sweep speed selections are 25, 12.5 (factory default), 6.25, or
1.56 mm/sec.
Adjusting Respiration Tone
You can select an audible tone to sound with each respiratory cycle. The tone
volume is adjustable or can be disabled.
The factory default setting for tone is OFF.
Selecting Respiration Leads
Respiration lead selections are RL-LA, RA-LA, RA-LL, and RL-LL.
• RA-LA represents the line of maximum respiratory effort in adults and chest-
breathing infants.
• RA-LL represents the line of maximum respiratory effort in abdominal-
breathing infants.
• The factory default setting for respiration lead selection is RA-LA.
!
• When a good respiration signal cannot be attained from the
selected lead, the message LOSS OF SIGNAL is displayed and
??? appears in place of the respiratory rate.
To turn the respiration waveform
display ON or OFF:
1Touch RESP.
2Select WAVEFORM ON/OFF.
To adjust respiratory waveform
size:
1Touch RESP.
2Touch SIZE.
3Adjust waveform size using
SIZE ↑ or SIZE ↓.
To select a respiration sweep
speed:
1Touch RESP.
2Touch SWEEP SPEED.
3Touch the appropriate mm/sec
key.
To adjust the respiration tone
volume:
1Touch RESP.
2Touch RESP TONE.
3Select TONE ON.
4Adjust tone volume using
VOLUME↑ or VOLUME↓.
To select respiration leads:
1Touch RESP.
2Touch LEAD SELECT.
3Select the appropriate lead
configuration.

Respiration
12-9
Figure 12-2: Infant electrode placement
Adjusting Respiration Sensitivity
Two input sensitivities for respiration monitoring are available. You can set them
based on the patient’s respiratory effort; shallow or normal. Use the shallow mode
if the monitor has difficulty counting the respiratory rate and/or the waveform is
difficult to read. Selecting the SHALLOW mode also lowers the detection
sensitivity nearer to the low amplitude waveform of infants.
The factory default for sensitivity is NORMAL in the adult mode, and SHALLOW in
the infant mode.
Using the Cardiovascular Artifact Filter
Respiration is monitored based on impedance changes which occur with the
expansion and contraction of the chest. However, the physical action of the heart
pumping blood and the flow of blood through the vasculature also creates
changes in impedance known as cardiovascular artifact (CVA).
In the absence of respiration, for example, during episodes of apnea, it is possible
for a waveform to appear in the respiration zone which represents CVA rather
than true respirations. In such cases, the rate of the CVA would be the same as
the heart rate.
LA
RA
LL
Alternate Method:
Position RA and LA electrodes
at the 2nd intercostal space,
midclavicular line.
Position LL below the
diaphragm, preferably below
the umbilicus.
RA LA
LL
Maximum Impedance Change:
Position RA and LA electrodes at the
nipple level, midaxillary line.
Position LL below the diaphragm,
preferably below the umbilicus.
To adjust respiration monitoring
sensitivity:
1Touch RESP.
2Select SHALLOW or NORMAL.
To enable the CVA filter:
1Touch RESP.
2Select CVA FILTER ON.
To disable the CVA filter:
1Touch RESP.
2Select CVA FILTER OFF.

Ultraview Care Network
12-10
The Spacelabs Medical CVA detection filter provides a method of discriminating
between true respiratory effort and cardiac activity. The filter checks for
coincidence between the respiratory and the heart rate. If the rates are the same,
the digital display for respiratory rate changes to CVA, a CVA message appears in
the waveform zone, and an apnea alarm is triggered if the apnea alarm has been
enabled. This minimizes the possibility of apneic episodes being undetected due
to CVA. Episodes of CVA will be reflected as a respiratory rate of zero in the
trends.
If the patient’s respiratory and heart rates are actually identical, you may want to
disable the CVA filter.
Restoring User-Defined Settings
With the Restore Settings feature, you can restore the user-configurable settings
to the defaults previously stored as user settings. User-configurable options are
listed in Setting User-Defined Default Values on page 7-7
Recording Respiration Waveforms
You can print Respiration waveforms and values. Refer to Printing on page 4-7 for
additional information.
Configuring Varitrend 3 Graphs
In Varitrend 3, trends for heart rate and SpO2 are displayed in the upper half of the
zone. Either the respiration rate trend or the compressed respiration waveform is
displayed in the lower half of the zone.
WARNING:
• If you disable the CVA detection filter, you will not be
alerted to the presence of CVA if it replaces the respiration
waveform.
!
• Module Configuration Manager is an optional feature for some
modules. Your module may not contain this option.
• RESTORE SETTINGS changes the user-configurable settings
for all parameters in the module.
• Once restored, alarm ON/OFF status and alarm limits are reset
to the previously stored user settings.
!
• If the VARITREND ON/OFF key does not appear in the ECG
Display Format menu, your module does not include the
Varitrend option.
To restore user-defined settings:
1Touch ECG.
2Touch SETUP.
3Touch RESTORE SETTINGS.
4Select YES.
To print Respiration waveforms:
1Touch RECORD.
2Touch flashing RESP
parameter key.
To turn Varitrend 3 ON or OFF:
1Touch ECG.
2Touch DISPLAY FORMAT.
3Select VARITREND ON or
OFF.

Respiration
12-11
Setting the Time Scale
You can set the time scale for the horizontal axis at either 1.5- or 3.0-minutes.
Selecting Respiratory Display Type
The lower graph displays the trend for either the respiration rate or the
compressed respiration waveform.
• RESP RATE displays the current respiration rate trend.
• RESP WAVE displays a compressed respiration waveform.
Selecting Respiratory Rate Scale
You can adjust the scale for the respiration rate trend. Scale selections include
0-50, 0-100, 0-150, or 0-200 breaths/minute.
Selecting Respiratory Waveform Size
You can trend a compressed respiration waveform. In this mode, the message
RESP WAVEFORM appears next to the vertical axis instead of scale values.
Selecting Heart Rate Scale
You can plot heart rate. Scale selections include 0-100, 0-150, 0-200, 0-250,
0-300, 50-150, 100-200, 100-250, and 100-300 beats/minute.
Selecting SpO2 Scale
You can plot SpO2. Scale selections include 0-100, 25-100, 50-100, and
75-100%.
To set the horizontal time scale:
1Touch VARI.
2Select 1.5 MIN or 3.0 MIN.
To select the type of respiratory
display:
1Touch VARI.
2Select RESP RATE or RESP
WAVE.
To select respiration rate scale:
1Touch VARI.
2Touch RESP RATE.
3Touch SIZE.
4Touch RESP RATE SCALE.
5Use arrow keys to adjust.
To select a respiration waveform:
1Touch VARI.
2Touch SIZE.
3Touch RESP WAVE SIZE.
4Use arrow keys to adjust.
To select heart rate scale:
1Touch VARI.
2Touch SIZE.
3Touch HR SCALE.
4Use arrow keys to adjust.
To select an SpO2 scale:
1Touch VARI.
2Touch SIZE.
3Touch SPO2 SCALE.
4Use arrow keys to adjust.

Ultraview Care Network
12-12
Defining Events
The Event Trend feature of Varitrend 3 enables you to store events that represent
a change in a patient’s condition based on multiple variables. You can define
criteria for up to five different events. For example, you may want to store
episodes where the heart rate drops to less than 100 bpm, apnea lasts for more
than 20-seconds, or the SpO2 value drops to less than 85%.
The patient’s status will be continually checked against each event definition. If
any of the criteria are violated, a snapshot of the Varitrend 3 display representing
this deviation will be stored. The event will also be added to the event trend.
Displaying Event Trends
Events are trended according to their duration and frequency. Regardless of the
defining criteria, all events are plotted (grouped) together in the event trend graph.
You can select to view these trends in 6-, 12-, or 24-hour time periods. Resolution
for each timebase is shown below (15-minutes for a 6-hour trend, 30-minutes for
a 12-hour trend, 60-minutes for a 24-hour trend).
The top trend displays the duration of the longest event in each time period. The
bottom trend displays the number of events that occurred during each time period.
Scaling, for the vertical axis for each trend, is automatically adjusted based upon
patient data.
Figure 12-3: Event trend graph
Clearing Events
If you choose to clear a single event the data that represents that episode will be
removed from the event trends. You may also clear all events and trends. This will
have no effect on the event definitions.
!
• Events longer than 4-minutes will be reported as 4-minute
events.
To access Event Trend:
1Touch VARI.
2Touch EVENT TREND.
To define an event:
1Touch VARI.
2Touch EVENT TREND.
3Touch DEFINE EVENT.
4Select event(s) to define.
5Use arrow keys to adjust.
6Touch ENTER.
To display event trends:
1Touch VARI.
2Touch EVENT TREND.
3Touch TREND.
To clear events:
1Touch VARI.
2Touch EVENT TREND.
3Touch CLEAR EVENT.
4Select CLEAR THIS EVENT or
CLEAR ALL EVENTS.
To print events:
1Touch VARI.
2Touch EVENT TREND.
3Touch PRINT.
To print event trends:
1Touch VARI.
2Touch EVENT TREND.
3Touch TREND.
4Touch PRINT.
60
30
0
18:30 06:30 18:30
Event
bar graph
10
5
0
60-minute
resolution
Longest
EVENT
(seconds)
Number
of
Events

Respiration
12-13
Printing Varitrend 3 Graphs
You may produce a recording of the currently displayed Varitrend 3 graph. Refer
to Printing on page 4-1 for a complete overview of printer functions.
To print a Varitrend 3 graph:
1Touch VARI.
2Touch PRINT.

12-14
Respiration Troubleshooting Guide
Clinical Situation Possible Cause Solution
Inaccurate respiratory rate
or 0 displayed. Question
marks displayed instead
of rate
■Respiration too shallow for normal
detection.
■Touch the SHALLOW/NORMAL key to
highlight SHALLOW.
■ECG electrode contact or
placement poor.
■Apply new electrodes. Make sure to
properly prepare the skin; position
electrodes on the chest where the
chest expansion is the greatest.
■Incorrect lead selection for
respiration.
■Select the appropriate lead. Best lead
selection is typically RA-LA for adults
and RA-LL for infants.
■CVA artifact. ■Assess the patient for apnea. Reselect
lead for better signal quality.
No respiration waveform.
LOSS OF SIGNAL
message is displayed
■ECG electrodes or patient cable not
attached.
■Select another lead.
■Reconnect the leads or the patient
cable.
No respiration waveform
is displayed
■Channels have not been configured
to display respiration.
■Select RESP ON in the ECG Display
Format menu.
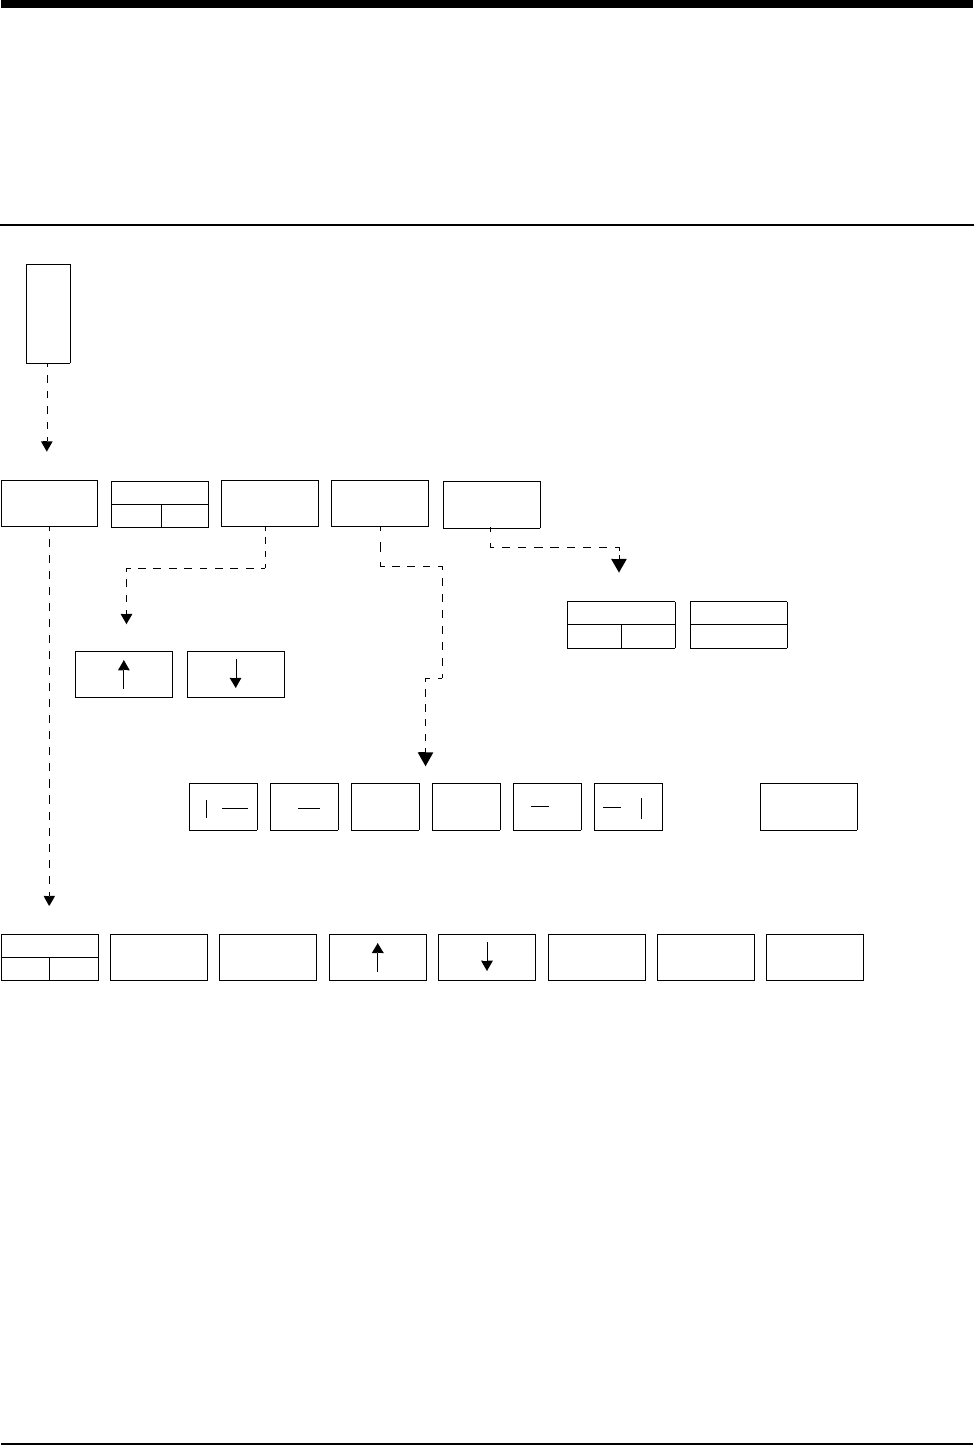
13-1
!
• Based on features purchased, more or fewer keys may appear here than on your menu screens.
NIBP Directory
Directory of Keys
ADULT NIBP - ALARM LIMITS
NIBP - CHANGE CONFIGURATION
TIME INTERVAL for automatic readings = q xx yyy
N
I
B
P
ADULT NIBP - MENU
ALARM
LIMITS
TIME
INTRVL
CHANGE
CONFIG.
DISPLAY PR
ON OFF
ADULT
NEONATAL
ALARMS
ON OFF
HI=
150
LO=
100 SYS DIA MEAN
AUTO
ON OFF REVIEW
PRINT
<<
>> >>
<<
→
←


Contents
13-3
Overview . . . . . . . . . . . . . . . . . . . . . . . . . . . . . . . . . . . . . . . . . . . . . . . . . . . . . . 3
Setting Up NIBP Monitoring. . . . . . . . . . . . . . . . . . . . . . . . . . . . . . . . . . . . . . . . 4
Display Detail. . . . . . . . . . . . . . . . . . . . . . . . . . . . . . . . . . . . . . . . . . . . . . . . . . . 6
Setting and Adjusting Alarm Limits . . . . . . . . . . . . . . . . . . . . . . . . . . . . . . . . . . 7
Selecting Adult or Neonatal Mode . . . . . . . . . . . . . . . . . . . . . . . . . . . . . . . . . . . 8
Displaying Heart (Pulse) Rate Data. . . . . . . . . . . . . . . . . . . . . . . . . . . . . . . . . . 8
Initiating a Manual Measurement. . . . . . . . . . . . . . . . . . . . . . . . . . . . . . . . . . . . 8
Setting Automatic Measurements . . . . . . . . . . . . . . . . . . . . . . . . . . . . . . . . . . . 9
Stopping a Measurement in Progress . . . . . . . . . . . . . . . . . . . . . . . . . . . . . . . . 9
Recording Measurements . . . . . . . . . . . . . . . . . . . . . . . . . . . . . . . . . . . . . . . . 10
Reviewing Measurements . . . . . . . . . . . . . . . . . . . . . . . . . . . . . . . . . . . . . . . . 10
Recording Waveforms . . . . . . . . . . . . . . . . . . . . . . . . . . . . . . . . . . . . . . . . . . . 10
Restoring User-Defined Settings . . . . . . . . . . . . . . . . . . . . . . . . . . . . . . . . . . . 10
Status Messages . . . . . . . . . . . . . . . . . . . . . . . . . . . . . . . . . . . . . . . . . . . . . . . 11
NIBP Troubleshooting Guide . . . . . . . . . . . . . . . . . . . . . . . . . . . . . . . . . . . . . . 12
NIBP
Overview
Noninvasive blood pressure (NIBP) uses oscillometric monitoring to measure
systolic (S), diastolic (D), and mean (M) arterial blood pressures. The Ultraview
Care Network monitor displays these readings and the time the measurement was
initiated. You can also display heart rate. The monitor can display up to ten
readings at one time and store up to 120 readings.
!
• Blood pressure measurements determined with this module are
equivalent to those obtained by a trained observer using the
cuff/stethoscope auscultation method, within the limits
prescribed by the American National Standard, Electronic or
automated sphygmomanometers.
• Use only cuffs specified by Spacelabs Medical. Other cuffs may
adversely affect performance and measurement accuracy.
• There are no hazards associated with using non-invasive blood
pressure equipment during defibrillation or high-frequency
electrosurgery because both the cuff and cuff tubing are non-
conductive materials.
• You can define your own default settings for such
characteristics as alarm limits and display configuration. Refer
to Setting User-Defined Default Values on page 7-7 for further
information.

Ultraview Care Network
13-4
Setting Up NIBP Monitoring
Proper cuff selection and application is essential in ensuring the accuracy of NIBP
readings. To select the proper cuff, first measure the circumference of the limb at
its midpoint. Match the limb measurement to the range of appropriate
circumferences (in centimeters) specified on each cuff. When applied, the index
line on a correctly sized cuff will fall within the designated range markings on the
cuff. If the cuff is too wide for the patient, the reading will be falsely lowered. If too
narrow, the reading will be falsely elevated. The cuff results in the greatest chance
of error, so a variety of cuff sizes should be available to accommodate your full
patient population.
The cuff should be snugly applied. When the cuff is properly applied to an adult,
you should be able to insert one finger between the cuff and the limb. If you can
insert two fingers, the cuff is too loose which may result in falsely elevated
readings. Ensure that the inflation tube is not kinked or occluded when the cuff is
applied.
During blood pressure measurement, the inflated cuff reduces blood flow to the
limb to which it is applied. Do not apply a cuff to a limb that has restricted blood
flow. Check the patient periodically to ensure cuff application does not impair limb
circulation.
WARNING:
• Cuff tubing connectors may incorporate luer fittings.
Exercise caution when used in proximity with intravenous
fluid lines.
• Inadvertent connection of cuff tubing with luer fittings to
intravascular fluid systems could allow air to be pumped
into a blood vessel.
CAUTION:
• Do not use extensions or adapters with the neonatal
inflation tube, other than those specified.
• Do not apply the cuff to an extremity with restricted or
otherwise compromised blood flow.
• Do not apply the cuff to a limb being monitored with a
pulse oximetry sensor. SpO2 readings will be affected
during NIBP monitoring.
• Do not apply the cuff to any extremity being used for
intravenous infusion or catheterization.
• Do not apply the cuff to any area of breached or injured
skin.
To set up NIBP monitoring:
1Attach the cuff tube to the
appropriate module front panel
connector.
2Attach the cuff to the patient.
3Touch NIBP.
4Touch additional screen keys as
needed.

NIBP
13-5
Patient Factors Affecting Readings
Excess patient movement, speech, or muscle contractions (as a result of severe
pain or shivering) can interfere with automated NIBP readings. Ensure that the
patient is quiet and not moving during NIBP readings just as you would during
manual readings. Avoid applying external pressure to the cuff during readings.
Institute measures to minimize shivering and alleviate pain.
Some arrhythmias may cause beat-to-beat pressure fluctuations that can make
obtaining NIBP readings more difficult. Increased variability of readings can result
from these pressure variations. If it becomes difficult to obtain readings in the
presence of arrhythmia, pressure should be temporarily verified using another
method. Pressure also varies cyclically with normal respiration. With deep
respirations, or in certain patients, this effect may be enhanced, increasing
reading variability.
For patients in shock, indirect methods of measuring pressure (auscultatory,
oscillometric, doppler) may not be reliable because of peripheral vascular
changes. These changes include peripheral vasoconstriction and diminished
peripheral circulation resulting from shunting of blood to central organs. In some
cases, peripheral pulses or Korotkoff sounds may be diminished or disappear in
spite of adequate blood pressure. In such cases, measuring a cuff pressure may
be impossible or give misleading results. Direct (invasive) blood pressure
measurements should be considered in patients with signs of shock or any patient
who rapidly becomes unstable for unknown reasons.
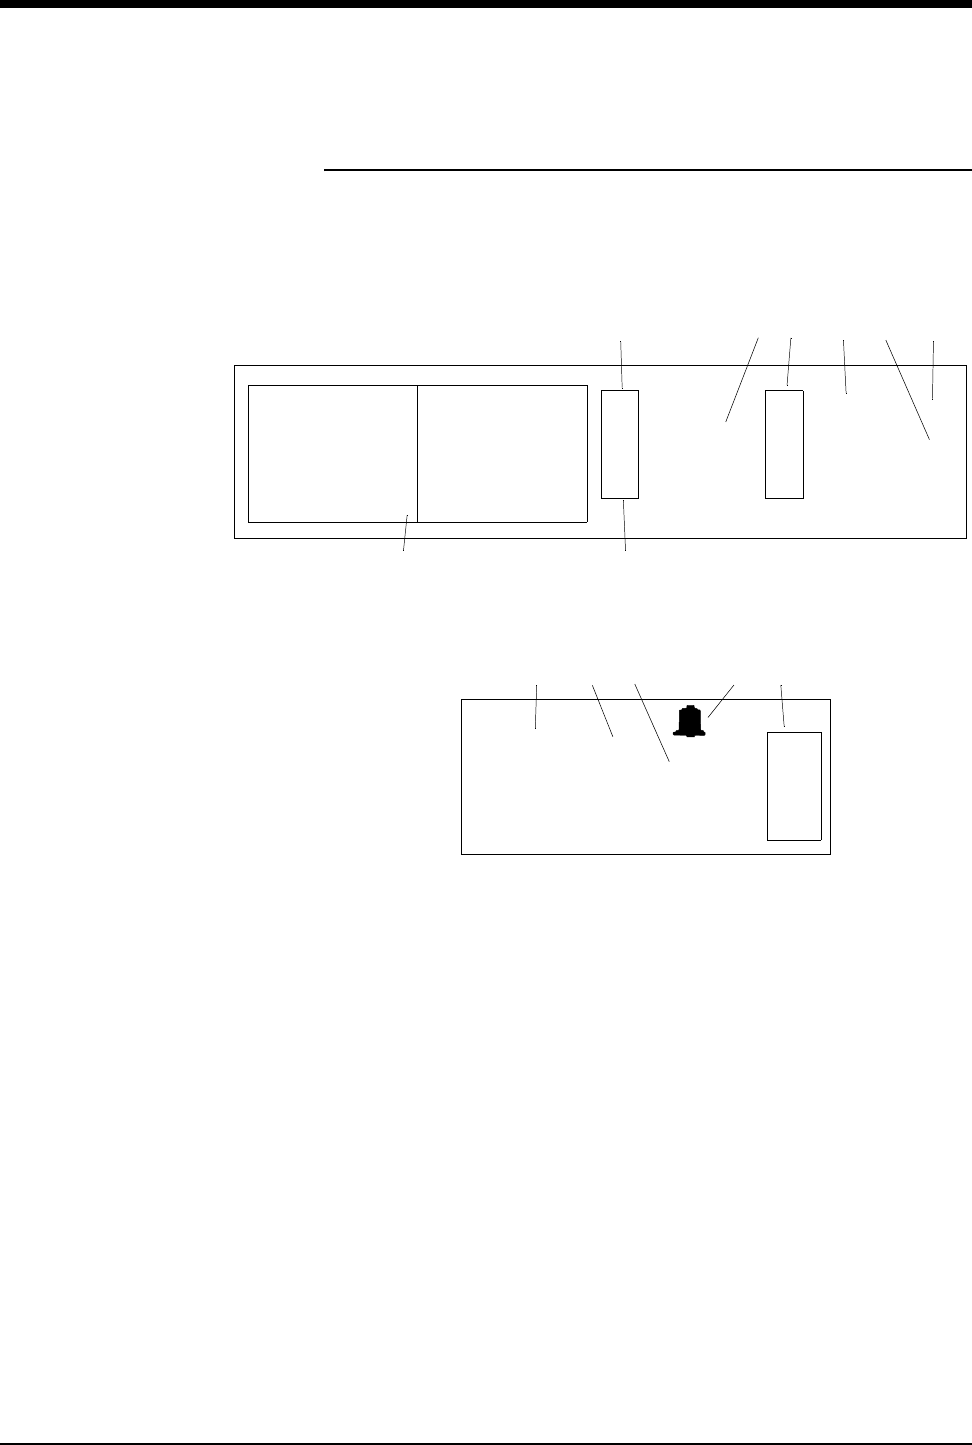
Ultraview Care Network
13-6
Display Detail
Figure 13-1 and Figure 13-2 illustrate typical NIBP displays. You can view NIBP
readings from any Ultraview Care Network bedside or central monitor on a
network. The NIBP display on a split-screen central monitor appears in a format
slightly different from that of a bedside or full-screen central monitor.
Figure 13-1: Bedside monitor display
Figure 13-2: Central monitor, split-screen display
ᕡSTAT key initiates an immediate blood pressure measurement. While a
measurement is in progress the key label changes to STOP.
ᕢNIBP key.
ᕣLast systolic and diastolic readings.
ᕤNIBP alarm limits. Split-screen central monitors display a bell symbol when
alarms are enabled. Bedside monitors display the high and low alarm limits
for systole and diastole. The asterisk indicates alarms are enabled for mean
pressure.
ᕥMean reading.
ᕦCurrent interval for automatic readings (q 15 min). q’ in place of q indicates
that the reduced delay of 5-seconds between readings is active (refer to
Setting Automatic Measurements on page 13-9).
ᕧNIBP measurement table.
ᕨTime and date of the last reading.
08:30 am 128/67 (80)
08:45 am 132/67 (83)
09:00 am 134/69 (85)
09:15 am 140/72 (89)
09:30 am 141/72 (91)
09:45 am 138/73 (88)
10:00 am 140/73 (90)
10:15 am 142/76 (92)
10:30 am 144/77 (95)
10:45 am 165/97 (120)
INTERVAL
q 15 min
10:45
06/03
LAST BP =
N
I
B
P
165
97
m
m
H
g
(120)
S
D
150
100
100
60
*
ᕧᕨ
ᕦᕢ ᕣ ᕤ ᕥ
S
T
A
T
ᕡ
N
I
B
P
165/97 10:45
06/03
LAST BP =
mmHg
(120)
BED 01 DAVIS, J.
ᕣᕥᕨ ᕤᕢ

NIBP
13-7
Bedside monitors show an NIBP table displaying a chronological listing of NIBP
readings. The oldest data is at the top of the left column. Each reading contains
the time of the measurement and the pressure values for systolic, diastolic, and
mean. As new measurements are taken, the oldest data moves off the screen.
Central monitors display the last NIBP reading only.
Setting and Adjusting Alarm Limits
You can define alarm limits for systolic, diastolic and mean values. The factory
default setting for NIBP alarms is OFF. The default alarm limits settings for both
the adult and the neonate modes are listed in Table 1.
!
• If you remove one NIBP module and insert another without
purging data (via ADMIT/DISCHARGE), the NIBP table may
display data for two patients.
Table 1: Alarm Limits
HIGH LOW
Neonatal Systolic 85 mmHg (11.5 kPa) 55 mmHg (7.5 kPa)
Diastolic 75 mmHg (10.0 kPa) 45 mmHg (6.0 kPa)
Mean 80 mmHg (10.5 kPa) 50 mmHg (6.5 kPa)
Adult Systolic 150 mmHg (20.0 kPa) 100 mmHg (13.5 kPa)
Diastolic 100 mmHg (13.5 kPa) 60 mmHg (8.0 kPa)
Mean 110 mmHg (14.5 kPa) 90 mmHg (12.0 kPa)
To set or adjust alarms:
1Touch NIBP.
2Touch ALARM LIMITS.
3Select SYS, DIA, or MEAN.
4Select ALARM ON.
5Select HI= or LO=.
6Use arrow keys to adjust.

Ultraview Care Network
13-8
Selecting Adult or Neonatal Mode
In modules that offer both adult and neonatal modes, you can determine the
current mode by observing which key is highlighted or by reading the menu
prompt in the NIBP menu. The factory default setting is adult.
The following events occur with each change of mode:
• The monitor erases current NIBP readings from the display but retains them
in memory.
• Previous NIBP readings appear immediately if present in memory. If not,
readings appear as the measurements are taken.
• Alarm limits and state (ON/OFF) are automatically changed for the new mode
(adult or neonatal).
• Active NIBP alarms reset; alarms in violation terminate and suspended
alarms end.
Displaying Heart (Pulse) Rate Data
Non-invasive pressure measurements may be displayed with or without a pulse
rate. If you choose to display pulse rate, only five measurements may be
displayed in the NIBP table. Otherwise, ten measurements may be displayed as
shown in Figure 13-1: Bedside monitor display. Pulse rate is obtained from ECG,
arterial pressure (ART), SpO2, and NIBP (in that order), depending on the
availability of these parameters.
Initiating a Manual Measurement
You can start a measurement at any time by touching the STAT key.
If an initial measurement attempt is not successful, a single retry will be initiated
after a 5-second interval (short-term mode) or 30-second internal (long-term
mode).
WARNING:
• The mode (adult or neonatal) selected must correlate with
the hose connected to the module and the patient type.
!
• New measurements cannot be initiated if another measurement
is already in progress.
To select the patient type:
1Touch NIBP.
2Touch CHANGE CONFIG.
3Select ADULT or NEONATAL.
To display heart rate on NIBP
table:
1Touch NIBP.
2Touch CHANGE CONFIG.
3Select DISPLAY PR ON.
To start an immediate
measurement:
1Touch STAT.

NIBP
13-9
Setting Automatic Measurements
The NIBP module always powers ON with automatic measurements set to OFF.
The current time interval for automatic measurements is displayed on the
message line above the arrow keys.
The factory default setting for automatic time interval is 15-minutes.
For automatic time intervals of less than 5-minutes, the module makes special
allowances for a rapid succession of readings. For the first 15-minutes after you
set up a reading (turn AUTO mode ON or select a new time interval), the minimum
delay between readings is only 5-seconds. When this five-second delay is active,
the interval message will appear with an apostrophe, after the q (q’). After the
15-minute period, the minimum delay between readings becomes 30-seconds.
Measurement Intervals
Adult and neonatal measurement intervals are as follows:
• between 1- and 10-minutes in 1-minute increments,
• between 10- and 60-minutes in 5-minute increments, or
• 1-, 2-, 4-, or 8-hours.
Automatic Reading Times
Turning automatic mode ON or changing the interval, initiates a new
measurement schedule. When the selected interval is a multiple of 5-minutes,
automatic readings will always begin at the next five-minute division. Selecting
AUTO ON shortly before the desired five-minute division can be used to
synchronize measurements to exact clock times.
For example, if at 8:03 you select a time interval of 15-minutes, automatic
readings will occur at 8:05 and 8:20. If at 8:22 the interval is changed to
7-minutes, the next automatic readings will occur at 8:29 and 8:36.
Stopping a Measurement in Progress
To stop an NIBP measurement currently in progress, press the red Deflate button
on the front of the module or the STOP key on the display. The next automatic
reading will begin on schedule.
WARNING:
• During blood pressure readings the inflated cuff reduces
blood flow to the limb to which it is applied. Consider this
when selecting short time intervals.
!
• Touching STAT BP will take an immediate reading without
affecting scheduled reading times.
To determine automatic
measurement intervals:
1Touch NIBP.
2Select AUTO ON.
3Touch TIME INTRVL.
4Use arrow keys to adjust
interval.

Ultraview Care Network
13-10
Recording Measurements
You can choose to print out either the complete NIBP display or only the numeric
values of the last reading.
Reviewing Measurements
You can review a patient’s NIBP measurements by scrolling through the
measurement table line-by-line or page-by-page. (A page is limited to five
measurements if the pulse rate is displayed. Otherwise, a page is ten
measurements.)
To scroll line-by-line, touch the single arrow keys:
• To review earlier measurements, touch the ← key.
• To review later measurements, touch the → key.
To scroll page-by-page, touch the double arrow keys:
• To review earlier measurements, touch the «key.
• To review later measurements, touch the »key.
To page to the earliest five (or ten) measurements, touch the |« key.
To page to the latest five (or ten) measurements, touch the »|key.
Recording Waveforms
You can print NIBP waveforms and values. Refer to Printing on page 4-7 for
additional information.
Restoring User-Defined Settings
With the Restore Settings feature, you can restore the user-configurable settings
to the defaults previously stored as user settings. User-configurable settings are
listed in Setting User-Defined Default Values on page 7-7.
!
• RESTORE SETTINGS changes the user-configurable settings
for all parameters in the module.
To print the NIBP measurements
currently displayed:
1Touch NIBP.
2Touch REVIEW.
3Touch PRINT.
To print the most recent
measurement (no table):
1Touch RECORD (monitor key).
2Touch NIBP.
To review NIBP measurements:
1Touch NIBP.
2Touch REVIEW.
To print NIBP waveforms:
1Touch RECORD.
2Touch flashing NIBP parameter.
key.
To restore user-defined settings:
1Touch ECG.
2Touch SETUP.
3Touch RESTORE SETTINGS.
4Select YES.

NIBP
13-11
Status Messages
At the beginning of a blood pressure measurement:
• The mean value of the previous reading disappears.
• The message READING IN PROGRESS replaces the diastolic value.
• A bleed step replaces the previously displayed systolic pressure.
If the system fails to complete an initial measurement reading, the message
SECOND READING REQUIRED will be displayed along with a description of the
cause of the failure. A second measurement automatically begins either 5- or
30-seconds later, depending on whether the short-term automatic mode is active.
If the second attempt fails:
• The message NO READING is displayed.
• An alarm sounds (if alarms are turned ON).
• One of the following messages is displayed:
INFLATE ERROR
HW ERROR
NO DATA
If the Deflate button on the front of the module or the STOP key on the display is
pressed during a reading, the reading will end and the messages NO READING
and CUFF DEFLATE will be displayed.
If the system detects unstable beat-to-beat blood pressures during
measurements, one of two messages will be displayed:
• In the neonatal mode, MOTION is displayed.
• In the adult mode, ARTIFACT is displayed.
If an error status message is displayed and the system is unable to proceed with
its current operation, you must correct the fault before the system can continue. If
you are unable to correct the fault, contact a qualified service person.
If NIBP SYSTEM FAILURE ERROR NUMBER = XX (bedside only), or HW
ERROR (bedside and remote) displays, it indicates that a hardware problem has
caused the NIBP portion of the module to be inoperable. The module must be
serviced by a qualified service person before NIBP measurements can be taken.
If the error message CUFF CAN NOT BE DEFLATED displays, it indicates that
the deflate hardware is blocked and the cuff cannot be deflated. Remove the cuff
from the limb immediately and have the module serviced. The module must be
serviced by a qualified service person before NIBP measurements can be taken.
If either of the above messages are displayed, a RESET NIBP key will be present
in the Change Config menu. Touch the RESET NIBP key to re-enable non-
invasive blood pressure monitoring.
!
• If these messages occur repeatedly, discontinue NIBP
monitoring and contact a qualified service person.

13-12
NIBP Troubleshooting Guide
Clinical Situation Possible Cause Solution
No NIBP screen key is
displayed
■Module not inserted correctly. ■Remove and re-insert the module.
No NIBP readings can be
obtained
■Incorrect or inoperative cuff in use. ■Replace with the cuff known to be
operative.
■Cuff tubing is attached to an adult
outlet, but monitor is configured in
the neonatal mode (or vice versa).
■Connect tubing to the correct outlet.
Correlate monitor mode, cuff and
patient type.
■Tubing is kinked. ■Locate kink and straighten tubing.
■Some arrhythmias (for example,
atrial fibrillation and frequent
ventricular ectopy) may cause a
single or repeated failure to obtain
a reading (may be due to true
beat-to-beat variations in
pressure).
■Document arrhythmia if present, verify
pressure with another method, then
follow hospital procedure for care of
this type of patient.
■Excessive patient motion or
muscle contractions associated
with shivering or severe pain.
■Ensure that patient is quiet with
minimal movement during NIBP
readings. Minimize the patient’s
shivering.
■Blood pressure outside of
measurement range.
■Verify extremely high or low pressures
with another method.
Intermittent or complete
failure to operate
■Hardware error (codes 10, 20, and
30) detected during previous
measurement.
■Check the presence of the RESET
NIBP key in the CHANGE CONFIG
menu. Touch RESET NIBP to
re-enable monitoring.
■Remove the module from service and
call a qualified service person if this
condition occurs repeatedly.
Apparent incorrect value ■Wrong size cuff for patient. ■Measure patient’s limbs at the
midpoint. Match limb measurement to
the range specified on the cuff
(undersizing the cuff results in the
greatest degree of error).
■Cuff is damaged. ■Replace with a good cuff.
■Excessive patient motion,
shivering or severe pain.
■Ensure the patient is quiet with minimal
movement during NIBP readings.
Minimize the patient’s shivering.
■False high readings may be the
result of venous congestion
caused by frequent readings.
■Reduce the frequency of the readings.
■Cuff too loose or positioned
incorrectly.
■Tighten the cuff or reposition it
appropriately.

13-13
Variable readings occur ■Some arrhythmias may cause
beat-to-beat pressure and NIBP
readings.
■Document the arrhythmia, if present.
Verify the pressure using another
method, then follow hospital procedure
for care of this type of patient.
■Larger than normal influence of
respiratory phases on blood
pressure (inspiratory fall in blood
pressure; expiratory rise).
■NIBP software usually compensates for
normal variation.
No NIBP readings or
questionable values in the
presence of shock
■Peripheral vascular changes
experienced during shock may
reduce the reliability of blood
pressure readings obtained with
any indirect method. Peripheral
pulses may be diminished or
absent.
■Consider invasive pressure
measurements in patients with
symptoms of shock or in any patient
who rapidly becomes unstable for
unknown reasons.
Clinical Situation Possible Cause Solution

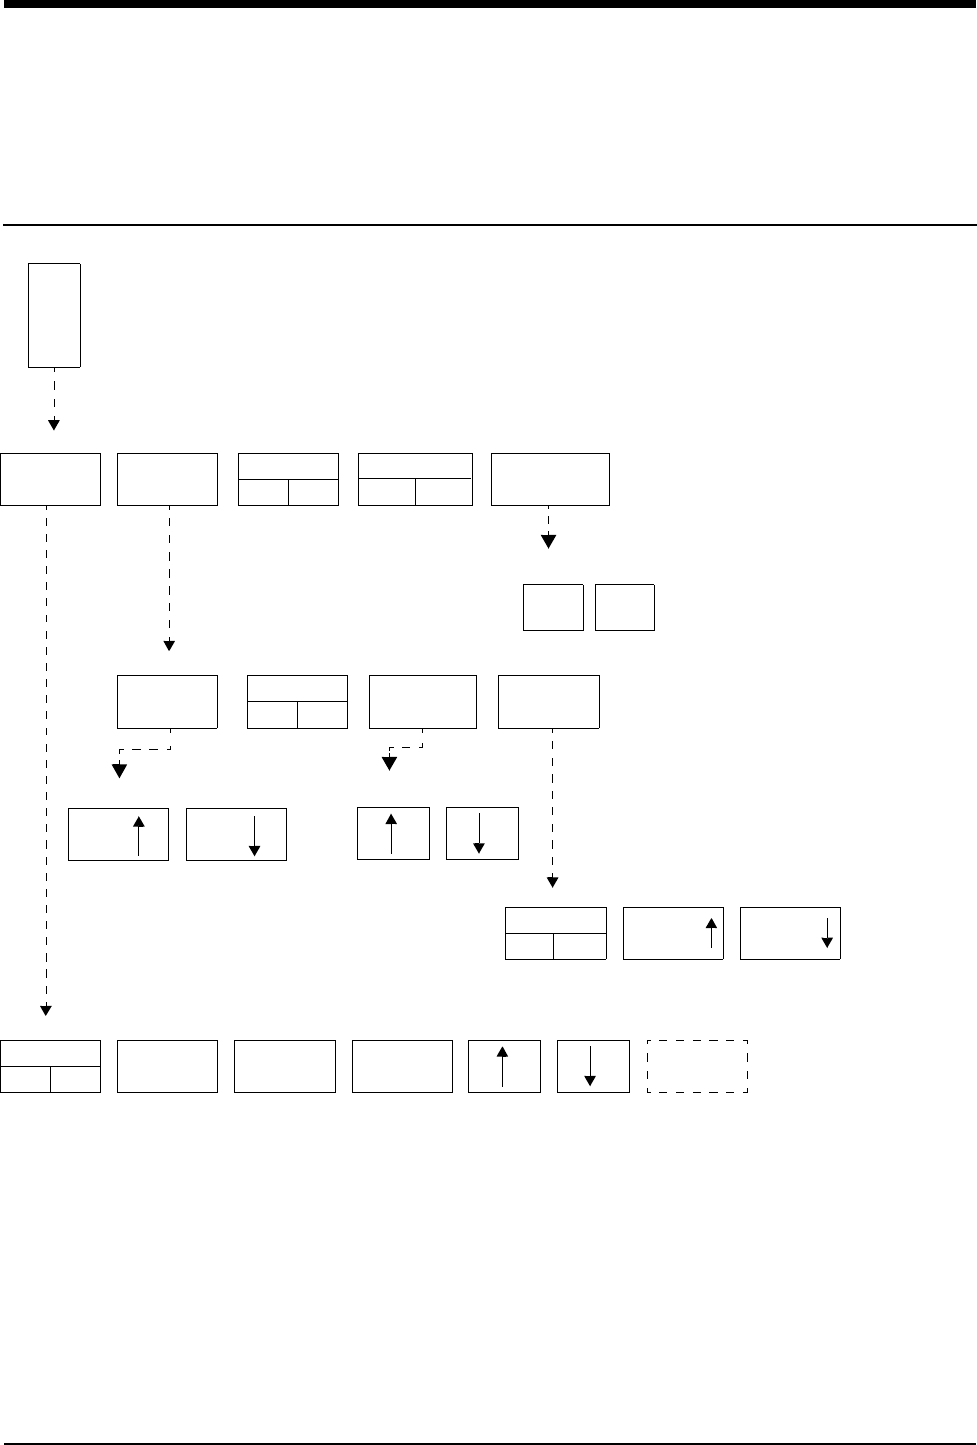
14-1
!
• Based on features purchased, more or fewer keys may appear here than on your menu screens.
SpO2 Directory
Directory of Keys
ALARM
LIMITS SETUP IABP
YES NO
PULSE RATE
ON OFF
S
P
O
2
SPO2 MENU
SIZE WAVEFORM
ON OFF AVERAGING TONE
SPO2 - SETUP
SPO2 - ALARM LIMITS
ALARMS
ON OFF
HI =
100
LO =
85
ALM DELAY
15s
MSG ALARM
DELAY 30s
MSG ALARM KEY is displayed
only when its value is other
than 20 seconds.
SIZE SIZE
TONE
ON OFF VOLUME VOLUME
SPO2 - WAVEFORM SIZE SPO2 - DATA AVERAGING
TIME XXs
SPO2 - TONE
SUSPEND
PROCESSING
YES
SPO2 - SUSPEND PROCESSING
NO


Contents
14-3
SpO2
Overview
Pulse oximetry allows continuous noninvasive monitoring of a patient’s
hemoglobin oxygen saturation. The oximetry sensor contains two light emitting
diodes (LEDs) that transmit specific wavelengths (typically 660 and
940 nanometers) of light that are received by a photo detector.
Oxygen saturated blood absorbs light differently compared to unsaturated blood.
The amount of light absorbed by the blood can be used to calculate the ratio of
oxygenated hemoglobin to total hemoglobin in arterial blood. The monitor displays
this ratio as percent SpO2. Normal values range from 95 to 100%.
WARNING:
• A pulse oximeter should NOT be used as an apnea monitor.
• A pulse oximeter should be considered an early warning
device. If a trend towards patient deoxygenation is
indicated, blood samples should be analyzed by a
laboratory co-oximeter to completely understand the
patient's condition.
• When used according to the manufacturers’ instructions,
sensors have no adverse effect on tissues.
Overview . . . . . . . . . . . . . . . . . . . . . . . . . . . . . . . . . . . . . . . . . . . . . . . . . . . . . . 3
Setting Up SpO2 Monitoring . . . . . . . . . . . . . . . . . . . . . . . . . . . . . . . . . . . . . . . 4
Dual SpO2 Monitoring . . . . . . . . . . . . . . . . . . . . . . . . . . . . . . . . . . . . . . . . . . . . 5
Display Detail. . . . . . . . . . . . . . . . . . . . . . . . . . . . . . . . . . . . . . . . . . . . . . . . . . . 5
Ensuring Accurate Monitoring . . . . . . . . . . . . . . . . . . . . . . . . . . . . . . . . . . . . . . 6
Using the Sensorwatch Feature . . . . . . . . . . . . . . . . . . . . . . . . . . . . . . . . . . . . 6
Setting and Adjusting Alarm Limits . . . . . . . . . . . . . . . . . . . . . . . . . . . . . . . . . . 6
Selecting Data Averaging Period. . . . . . . . . . . . . . . . . . . . . . . . . . . . . . . . . . . . 7
Using SpO2 with Intra-Aortic Balloon Pumps . . . . . . . . . . . . . . . . . . . . . . . . . . 7
Adjusting Tone Volume . . . . . . . . . . . . . . . . . . . . . . . . . . . . . . . . . . . . . . . . . . . 8
Modifying Waveform Display . . . . . . . . . . . . . . . . . . . . . . . . . . . . . . . . . . . . . . . 8
Viewing Pulse Rate . . . . . . . . . . . . . . . . . . . . . . . . . . . . . . . . . . . . . . . . . . . . . . 8
Restoring User-Defined Settings . . . . . . . . . . . . . . . . . . . . . . . . . . . . . . . . . . . . 9
Suspending/Resuming SpO2 Processing . . . . . . . . . . . . . . . . . . . . . . . . . . . . . 9
Recording SpO2 Waveforms . . . . . . . . . . . . . . . . . . . . . . . . . . . . . . . . . . . . . . . 9
Error Messages . . . . . . . . . . . . . . . . . . . . . . . . . . . . . . . . . . . . . . . . . . . . . . . . 10
Sensors . . . . . . . . . . . . . . . . . . . . . . . . . . . . . . . . . . . . . . . . . . . . . . . . . . . . . . 12
SpO2 Troubleshooting Guide . . . . . . . . . . . . . . . . . . . . . . . . . . . . . . . . . . . . . 13

Ultraview Care Network
14-4
Setting Up SpO2 Monitoring
When you connect the adapter cable to the module the SPO2 key will be
displayed. Attach the sensor to the patient and then to the adapter cable.
An adapter cable is required between the sensor and the module. Do not discard
the adapter cable when you have finished using a disposable oximetry sensor.
Disconnect the sensor cable from the adapter cable before discarding the sensor.
Connect the SpO2 adapter cable to the module or telemetry transmitter by aligning
the cable with the notch on the SpO2 connector on the front of the module or
telemetry transmitter. Push the cable straight into the connector. To remove the
cable, press the latch release on the bottom of the cable and pull the cable
straight out.
!
• Pulse oximetry may interfere with magnetic resonance imaging
(MRI) procedures. Refer to your hospital’s protocols for specific
instructions.
• You can define your own default settings for such
characteristics as alarm limits and display configuration. Refer
to Setting User-Defined Default Values on page 7-7 for further
information.
• The ECG lead wires of the 90343 telemetry transmitter must be
connected to the patient in order to perform ECG and blood
oxygen saturation monitoring.
CAUTION:
• Use only patient sensors specified by Spacelabs Medical. If
you use sensors other than those specified, it may degrade
performance and could damage the monitor during
defibrillation.
• Spacelabs Medical recommends the use of sensors
repaired or remanufactured by the original manufacturer
only.
• Check the sensor site frequently. Do not allow the sensor
to remain on one site for a prolonged period of time,
especially when monitoring neonates. Refer to the sensor
manufacturer's instructions.
• Never attach an SpO2 sensor on a limb being monitored
with a blood pressure cuff or a limb with restricted blood
flow.
• A poorly applied sensor may give incorrect saturation
values. The Sensorwatch signal strength indicator is used
to identify a poorly applied sensor or a poorly chosen site.
Re-apply the sensor. Refer to Using the Sensorwatch
Feature on page 14-6 for further details.
• Choose a site with sufficient perfusion to ensure accurate
oximetry values.
To set up SpO2 monitoring
(non-telemetry):
1Connect the adapter cable to
the module.
2Attach the sensor to the patient
and connect the sensor cable to
the adapter cable.
3Touch SPO2.
To set up SpO2 monitoring
(telemetry):
1Connect the SpO2 adapter
cable to the transmitter.
2Attach the sensor to the patient
and connect the sensor cable to
the SpO2 adapter cable.
3Initiate ECG monitoring.
4Touch ECG.
5Touch CHANNEL FORMAT.
6Touch SPO2 ON.
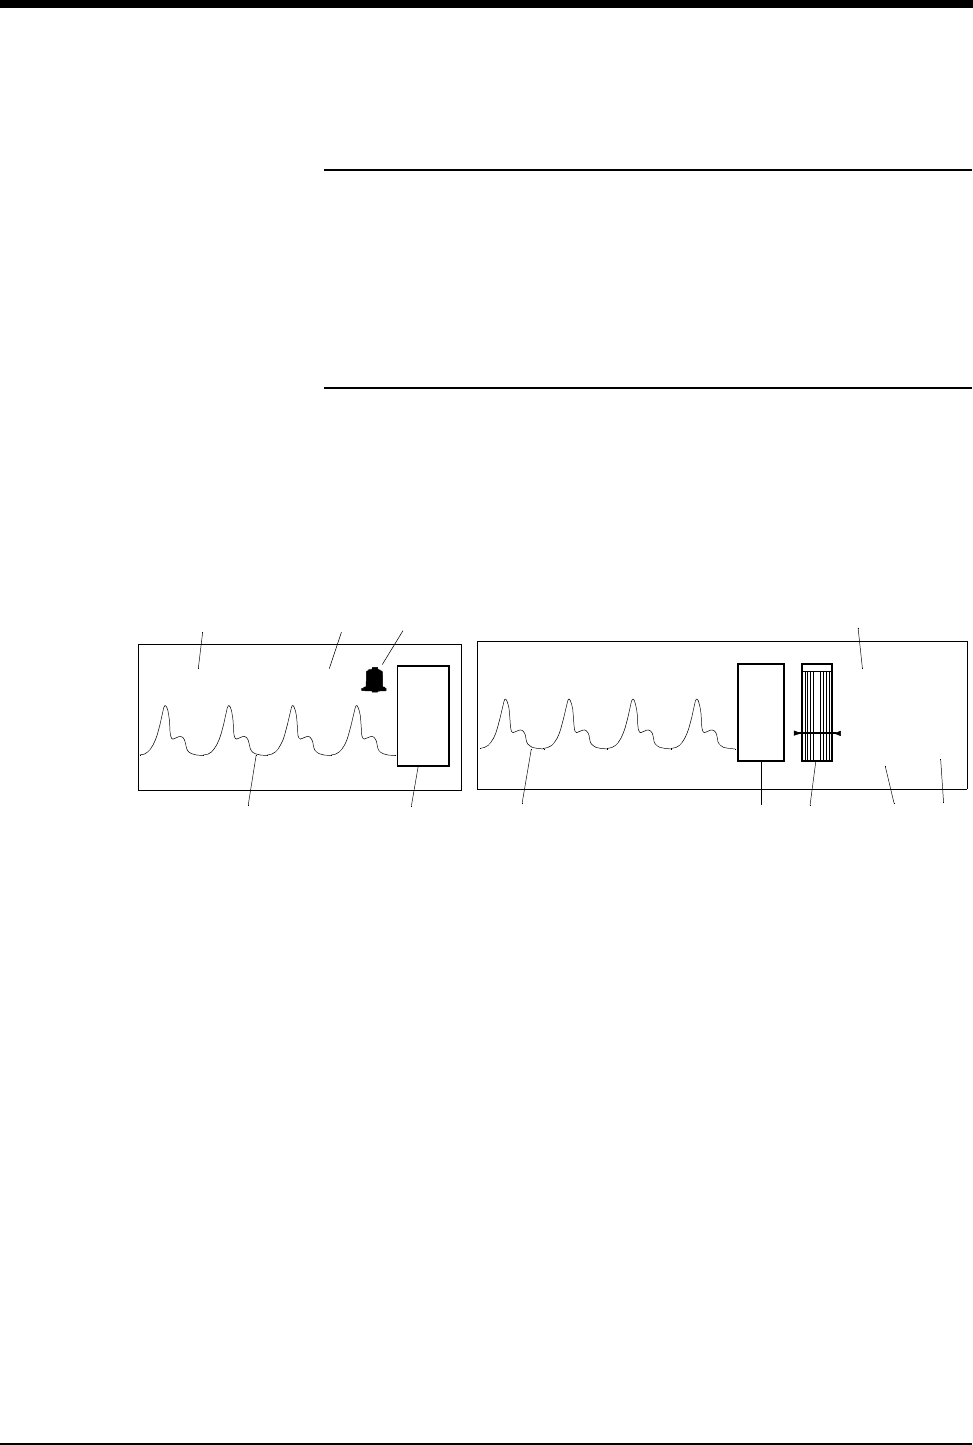
SpO2
14-5
Dual SpO2 Monitoring
Some modules support real-time monitoring of dual SpO2 sites. To employ this
option, insert a second Spacelabs Medical SpO2 module into an available slot in
the monitor. The new parameter will be displayed below the first SpO2 channel.
Affix a label to the monitor’s bezel to indicate the sensor site location (for example,
right hand, left foot) for each SpO2 parameter displayed on the monitor.
Display Detail
These figures illustrate a typical SpO2 display. You can view oximetry values from
any Ultraview Care Network bedside or central monitor on a network.
ᕡPulse plethysmographic waveform
ᕢSPO2 key
ᕣSensorwatch signal strength indicator
Shaded area (waveform index, WFI) expands up proportionally to signal
strength; horizontal line indicates minimum signal level.
No shading (lowest waveform index) corresponds to no detected signal
strength or a faulty sensor.
ᕤSpO2 pulse rate (asterisk flashes when pulse is detected - on bedside
monitors only)
ᕥCurrent SpO2 value (percent)
ᕦHigh and low SpO2 alarm limits
ᕧThe bell indicates that alarms are enabled (on split screen central only)
!
• For telemetry display information refer to Display Detail on page
17-12.
99
109 bpm
%
100
85
*
SPO2=99% PULSE RATE = 109 bpm
Figure 14-1: Split screen central monitor Figure 14-2: Bedside monitor
ᕥᕤᕧ
ᕡᕢᕡᕢᕣ
ᕤ
ᕥᕦ
S
P
O
2
S
P
O
2

Ultraview Care Network
14-6
Ensuring Accurate Monitoring
While each sensor requires site specific application procedures, the following
general points aid in ensuring oximetry monitoring success.
• Choose a site that provides proper alignment of the LEDs and receiving
photodetector.
• Reduce light interference when monitoring a neonate under bright light by
using a diaper or other light block over the sensor.
• Select a site that has unrestricted blood flow and can remain as immobile as
possible to reduce or eliminate movement artifact.
• Do not restrict blood flow when securing a sensor with tape.
• Do not select a site near potential electrical interference (electrical cords, for
example).
• The Sensorwatch bar should be above the minimum signal level.
Using the Sensorwatch Feature
The Sensorwatch feature is a graphical presentation of the amplitude of the signal
received from the sensor. It can be used to determine the best sensor site and
application.
Changes in the displayed shaded level signify the changes in the patient’s
perfusion or changes in the application of the sensor. The horizontal line near the
bottom fourth of the graphic represents the minimum signal level that results in
accurate saturation values. When the shading is just below this point, the
message LOW SIGNAL STRENGTH - REPOSITION OR REPLACE SENSOR is
displayed and SENSORWATCH flashes.
When the shading is below the line:
• Reposition the sensor to a different site to provide better perfusion.
• Reposition the sensor so that better contact is made with the skin and the
LEDs and photodetector are aligned better.
• Replace a defective sensor.
• Wait for the patient to warm and the perfusion to increase.
Setting and Adjusting Alarm Limits
Pulse oximetry alarm limits and delays are based either on factory default limits or
user-defined limits. The factory default settings for alarm limits are 100% for high
and 85% for low. For alarm delays, the factory default settings are 15-seconds for
alarm limit delay and 20-seconds for message alarm delay. Refer to Alarms on
page 2-3 for further information concerning Ultraview Care Network alarm
operations.
Refer to SpO2 on page 7-31 for SpO2 parameter tables listing available user
settings and factory defaults for this parameter. Refer to Table 3 ECG Parameter
Configuration (Telemetry Only) on page 7-13 and Table 4 ECG Alarm Attributes
(Telemetry Only) on page 7-16 for telemetry information.
To set or adjust SpO2 alarms
(non-telemetry):
1Touch SPO2.
2Touch ALARM LIMITS.
3Touch ALARMS ON.
4Touch HI=, LO=, ALM DELAY,
or MSG ALARM DELAY
(if present).
5Use arrow keys to adjust.

SpO2
14-7
Additional Information for Telemetry Products
When SpO2 alarms are enabled, a bell symbol is displayed between the SPO2
label and the SpO2 measured saturation value. When an SpO2 alarm is detected,
the displayed parameter value blinks yellow if the alarm priority is Low or Medium,
and blinks red if the alarm priority is High.
Selecting Data Averaging Period
Use this feature to smooth the oximetry saturation value by averaging patient
input values over 4-, 8-, or 16-seconds. The default value is 8-seconds.
• For non-telemetry products, the data averaging period is displayed in the
menu prompt line of the AVERAGING menu.
• For telemetry products, refer to the 90343, 90347, 90478, 90479-A Ultraview
Digital Telemetry Service Manual (P/N 070-0744-xx) for setting up the data
averaging period.
Using SpO2 with Intra-Aortic Balloon
Pumps
Enabling the intra-aortic balloon pump (IABP) feature informs the SpO2 software
that an IABP is in use. The SpO2 software must differentiate between true arterial
pulsations and those produced by the IABP. With the IABP feature enabled, the
transmitter excludes the IABP-generated pulsations from the calculation for SpO2.
The IABP feature also may be useful with patients experiencing irregular heart
rhythms. Enabling the IABP feature permits the transmitter to reject irregular
pulses, providing a more accurate SpO2 measurement.
!
• When the IABP feature is enabled, the pulse rate obtained from
SpO2 may not match the heart rate obtained from ECG.
• In cases of excessive patient motion or artifact, the accuracy of
the SpO2 measurement may be compromised when the IABP
feature is enabled.
• (90343 only) When the IABP operation is selected, the SPO2
status key in the Channel Format menu indicates IABP. The
Service Manual describes how to configure the telemetry
transmitter for use with an IABP.
To set or adjust SpO2 alarms
(telemetry):
1Touch ECG.
2Touch ALARM LIMITS.
3Touch SPO2 ALARM LIMITS.
4Select SPO2 ALARMS ON.
5Select HI=, LO=, ALM DELAY,
and MSG ALARM DELAY.
6Use arrow keys to adjust.
To specify a data averaging
period:
1Touch SPO2.
2Touch SETUP.
3Touch AVERAGING.
4Use arrow keys to adjust.
To use with balloon pump
(non-telemetry):
1Touch SPO2.
2Touch IABP YES.

Ultraview Care Network
14-8
Adjusting Tone Volume
Use this function to turn the pulse tone ON or OFF. The pitch varies according to
the SpO2 value. The higher the oxygen saturation, the higher the pitch.
The default setting for the pulse tone is OFF.
Modifying Waveform Display
Use this function to turn the plethysmographic waveform display ON or OFF. The
default setting is ON.
Use the SIZE key to change the height of the displayed waveform as necessary
for clarity. This changes the displayed size only and does not affect the signal
gain.
Viewing Pulse Rate
You can obtain and view a pulse rate derived from the saturation data. The pulse
rate is displayed within the range of 30 to 250 beats per minute ±3 beats per
minute.
The default setting for the pulse rate display is ON for non-telemetry products.
For telemetry products, the heart rate for display is obtained directly from the
acquired ECG leads or an alternate rate source. SpO2 can be used as the
alternate source if it is set for continuous measurement, but not when SpO2 is set
for episodic measurement.
!
• This feature is not supported in telemetry products.
!
• Amplitude of the displayed waveform is not proportional to the
pulse amplitude.
• This feature is not supported in telemetry products.
To adjust tone volume
(non-telemetry):
1Touch SPO2.
2Touch SETUP.
3Touch TONE.
4Touch TONE ON.
5Use arrow keys to adjust.
To modify display of the
waveform (non-telemetry):
1Touch SPO2.
2Touch SETUP.
3Verify WAVEFORM ON.
4Touch SIZE.
5Touch SIZE↑ or SIZE↓ to
adjust.
To modify the pulse rate display
(non-telemetry):
1Touch SPO2.
2Touch PULSE RATE ON/OFF.
To display heart rate from SpO2
sensor (telemetry):
1Touch ECG.
2Touch SETUP.
3Touch RATE SOURCE.
4Select SpO2 ON.
5Select SpO2 as rate source.

SpO2
14-9
Restoring User-Defined Settings
With the Restore Settings feature, you can restore the user-configurable settings
to the defaults previously stored as user settings. User-configurable settings are
listed in Setting User-Defined Default Values on page 7-7.
Suspending/Resuming SpO2 Processing
When you touch YES in the Suspend Processing menu, analysis and display of
the SpO2 data is suspended. If you touch NO, the display returns to the SpO2
menu without affecting processing.
When you suspend SpO2 processing:
• The message SPO2 PROCESSING SUSPENDED appears in the SpO2
waveform zone.
• Question marks replace the SpO2 and pulse rate values.
• The message SPO2 ALM OFF replaces the alarm limits.
• The keys in the SpO2 Alarm Limits menu display outline to indicate they are
disabled.
• The SUSPEND PROCESSING key changes to RESUME PROCESSING.
Recording SpO2 Waveforms
You can print SpO2 waveforms and values. Refer to Printing on page 4-7 for
additional information.
!
• RESTORE SETTINGS changes the user-configurable settings
for all parameters in the module.
• Once restored, alarm ON/OFF status and alarm limits are reset
to the previously stored user settings.
!
• This feature is not supported in telemetry products.
To restore user-defined settings:
Configurations with ECG
1Touch ECG.
2Touch SETUP.
3Touch RESTORE SETTINGS.
4Touch YES.
To restore user-defined settings:
Configurations without ECG
1Touch TEMP.
2Touch RESTORE SETTINGS.
3Touch YES.
To suspend SpO2 processing:
1Touch SPO2.
2Touch SUSPEND
PROCESSING.
3Touch YES.
To resume SpO2 processing:
1Touch SPO2.
2Touch RESUME
PROCESSING.
3Touch YES.
To print SpO2 waveforms:
1Touch RECORD.
2Touch flashing SPO2
parameter key.

Ultraview Care Network
14-10
Error Messages
When error messages are displayed, the saturation value and pulse rate
immediately change to ??? and an alarm may occur if your module is configured
to do so. If it occurs, this alarm does not begin until after the message alarm delay
time has elapsed.
If your module has been configured for an alarm using the Module Configuration
Manager feature, the parameter key will flash red for high priority alarms or yellow
for medium and low priority alarms. Refer to Module Configuration Manager on
page 7-5 for more information.
Telemetry products use different text for their SpO2 error messages than non-
telemetry products. Table 1 serves as a key for interpreting the telemetry
messages. Telemetry products also display their error messages within ECG’s
display zone, so the following ECG alarm messages take priority over other SpO2
messages.
• LEADS OFF
• NOISY SIGNAL
• ECG ALARMS SUSPENDED
WARNING:
• Error messages indicate a problem or condition which may
affect accurate monitoring values. Do not ignore these
messages. Correct any fault before continuing.
Table 1: Telemetry Message Equivalent
SpO2 Message Equivalent Telemetry SpO2
Message
ADAPTER DISCONNECTED – CHECK
CONNECTION AT MODULE
SPO2 UNAVAILABLE
FAULTY SENSOR – REPLACE SENSOR SPO2 FAULTY SENSOR
SENSOR DISCONNECTED – CHECK
CONNECTION AT ADAPTER CABLE
SPO2 SENSOR
DISCONNECTED
SENSOR OFF PATIENT – CHECK
CONNECTION AT PATIENT
SPO2 SENSOR OFF
PATIENT
INSUFFICIENT SIGNAL – REPOSITION OR
REPLACE SENSOR
SPO2 INSUFFICIENT
SIGNAL
AMBIENT LIGHT INTERFERENCE – COVER
SENSOR AREA
SPO2 AMBIENT LIGHT INTF.
NOISY SIGNAL SPO2 NOISY SIGNAL
LOW SIGNAL STRENGTH – REPOSITION
OR REPLACE SENSOR
SPO2 INSUFFICIENT
SIGNAL

SpO2
14-11
ADAPTER DISCONNECTED — CHECK CONNECTION AT MODULE
• The module does not detect an adapter cable connected to the front panel.
Check proper adapter cable connection.
• If the message persists and the adapter cable is secure, replace the adapter
cable.
• The channel will drop and the alarm will stop after approximately 10-seconds.
• On remote view, there may be no audible alarm on the remote monitor before
the channel drops.
SENSOR DISCONNECTED — CHECK CONNECTION AT ADAPTER CABLE
• The module does not detect a sensor. Check the proper connection of the
sensor with adapter cable.
• If the message persists, replace the sensor and/or the adapter cable.
SENSOR OFF PATIENT — CHECK CONNECTION AT PATIENT
• The module does not detect a valid sensor input signal. Check the patient for
proper sensor placement.
• The tissue between the LED and photodiode is too transmissive. If the sensor
placement seems correct and the message persists, try a sensor site with a
thicker tissue bed.
FAULTY SENSOR — REPLACE SENSOR
• The LED and/or photodiode have failed. Replace the sensor.
AMBIENT LIGHT INTERFERENCE — COVER SENSOR AREA
• The sensor is receiving external light interference from a bright light source
near the sensor. Shield the sensor from the external light source.
• The sensor photodiode and LEDs are misaligned on flexible sensors thereby
allowing light to enter. Realign the sensor photodiode with LEDs.
• If the message persists, replace the sensor.
INSUFFICIENT SIGNAL — REPOSITION OR REPLACE SENSOR
• Insufficient signal for proper operation as evidenced by a low deflection on
Sensorwatch signal strength bar.
• Poor sensor application or site. Correctly re-apply or reposition to a better
perfused site or massage site.
• If the message persists, replace the sensor.
!
• This message is not available with disposable SpO2 sensors or
non-clip type sensors.

Ultraview Care Network
14-12
NOISY SIGNAL
• Sensor signal disturbed by motion or other interference. Eliminate sensor
movement. Message disappears when the value is obtained.
• Sensor placement adjacent to power cords or other electrically noisy devices.
Move the noisy device or move the sensor to another site.
• If the message persists, replace the sensor.
LOW SIGNAL STRENGTH — REPOSITION OR REPLACE SENSOR
When this message appears the saturation and pulse rate continue to be
displayed; however, the Sensorwatch flashes as a indication of a possible error
condition.
• Insufficient blood flow between the sensor light emitter and detector. Move
the sensor to an area of higher perfusion.
• Poor sensor application. Reposition to place active components closer to skin
or locate to a better perfused site.
• Sensor site is below the blood pressure cuff. Move to another site.
• If the message persists, replace the sensor.
Sensors
For further information about biocompatibility or sensor disposal, refer to the
Spacelabs Medical Product Specification sheets and to the manufacturer's
instructions enclosed with each sensor.

14-13
SpO2 Troubleshooting Guide
Clinical Situation Possible Cause Solution
No SpO2 parameter key
is displayed
■Module not inserted correctly. ■Remove and reinsert the module.
■Adapter cable not connected to
module properly.
■Correctly connect the adapter cable.
■Sensor not connected to adapter
cable.
■Correctly connect the sensor.
■SpO2 is not enabled at the 90343
transmitter.
■Call a qualified service person to
check transmitter DIP switch 1 and 2.
■SpO2 is not enabled at the 90478
receiver.
■Call a qualified service person to set
transmitter DIP switch 8 to OFF.
SpO2 value displays ??? ■Sensor not connected to patient. ■Reattach the sensor.
■Excessive patient motion. ■Urge patient to remain still while
reading is in progress.
■Module is in the initialization phase
(the first 15-seconds after sensor
application).
■Wait until the initialization is
complete.
■Adapter cable not connected to the
module properly.
■Correctly connect the adapter cable.
■Sensor not connected to the adapter
cable.
■Correctly connect the sensor.
■Low battery indicator constantly
illuminated.
■Call a qualified service person.
Low signal strength ■Sensor placement not optimum. ■Move the sensor to a site which has
better perfusion.
■Align the LED with the sensor photo
detector.
■Sensor is placed below blood pressure
cuff.
■Move the sensor to an alternate limb.
Intermittent or complete
failure to operate
■Module error. ■Call a qualified service person.

14-14
Factors which cause
significant variances in
sensor accuracy
■Presence of dysfunctional
hemoglobins (COHb, MetHb).
■Follow hospital procedure for
determining oxygenation in these
patients.
■Presence of intravascular dyes
(indocyamine green, methylene blue)
depending on their concentration in
the blood stream.
■Follow hospital procedure for
determining oxygenation in these
patients.
■High ambient light level. ■Reduce light levels near the patient.
■Electrosurgical interference. ■Follow hospital procedure for
determining oxygenation in these
patients.
■Patient is significantly anemic (Hb less
than 5g/dl) or patient has received
large amounts of IV solutions.
■Follow hospital procedure for
determining oxygenation in these
patients.
No SpO2 alarms are
displayed
(telemetry only)
■ECG “Leads Off” condition exists. ■Re-attach ECG lead wires to patient
and resume ECG monitoring to clear
pending ECG alarms.
■Higher priority alarm condition is
present.
■Clear current alarm condition and/or
re-prioritize SpO2 alarms of interest in
the Module Configuration Manager.
■When SpO2 alarms are set ON, all
SpO2 alarm conditions will cause the
parameter value (or ???) to blink
according to the alarm priority set by
using the Module Configuration
Manager.
Clinical Situation Possible Cause Solution
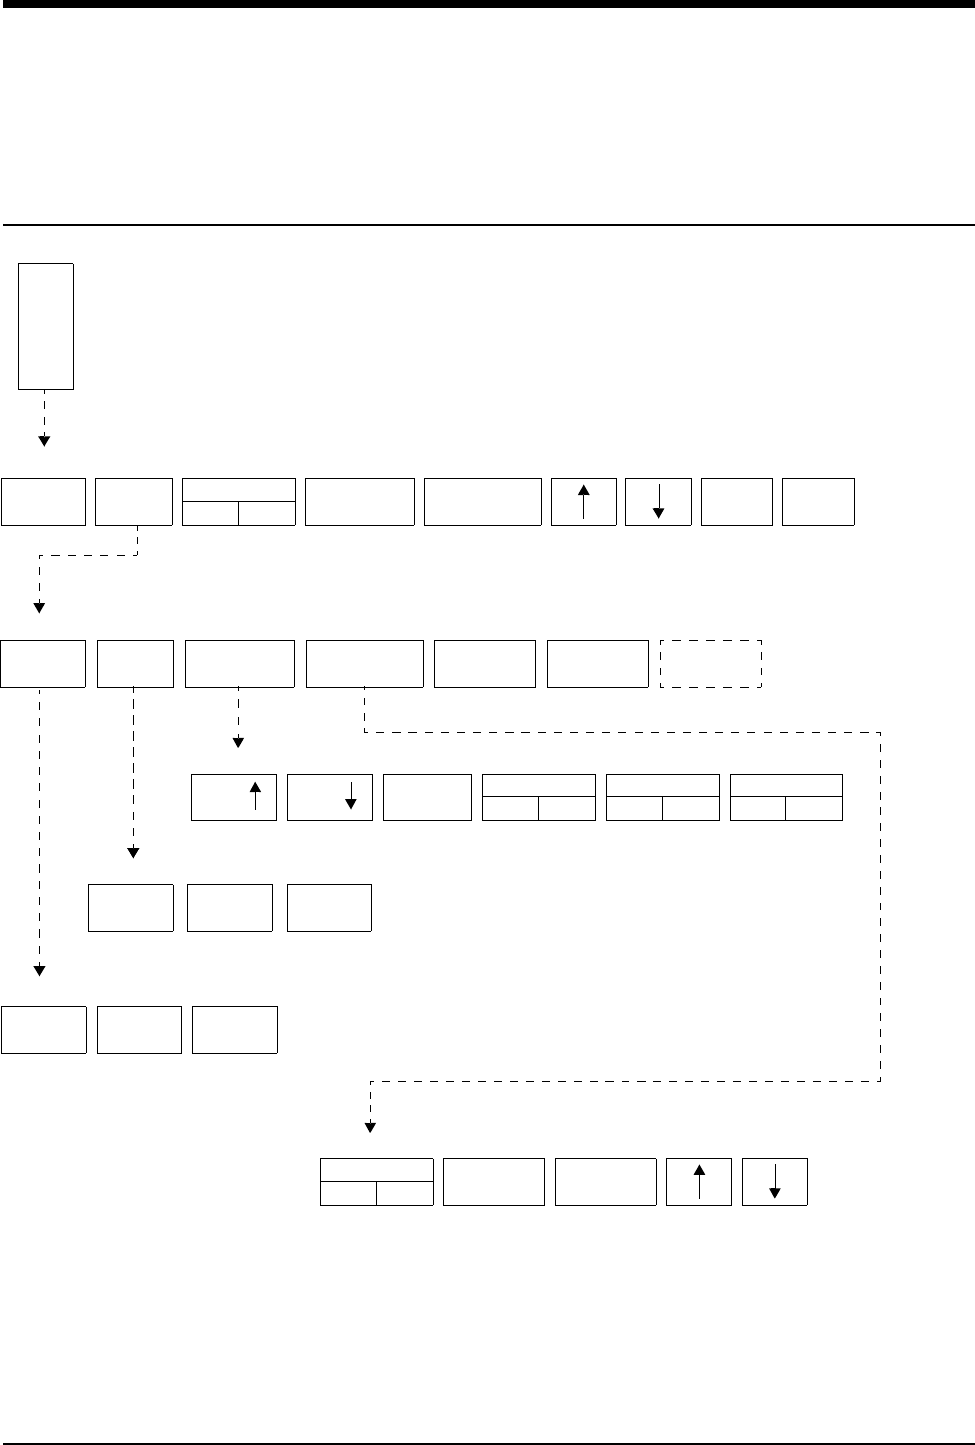
15-1
!
• Based on features purchased, more or fewer keys may appear here than on your menu screens.
Fetal Monitoring Directory
Directory of Keys
F
E
T
FETAL MAIN MENU
TWIN
SHIFT
TOCO FETAL
ECG
A
L
FETAL SETUP MENU
RESET SETUP RECORDER PAPER
FEED
AUDIO X
XX% UA REFMARK
ON OFF
SENS
RESTORE
SETTINGS
PRINT
PERIOD
FETAL - FETAL ECG MENU
LOW
mm/sec
X
MEDIUM
FETAL - TOCO SENS MENU
SIZE SIZE
HIGH
AUTO MANUAL
FETAL - TWIN SHIFT MENU
NO SHIFT
FETAL - F-ALERT LIMITS MENU
F ALERT
LIMITS
F-ALERT
HIDDEN
KEY
WAVEFORM
ON OFF
ECG PLOT
ON OFF
ECG HR EDIT
ON OFF
F-ALERT
ON OFF
HI=
XXX
LO=
XXX


Contents
15-3
Overview . . . . . . . . . . . . . . . . . . . . . . . . . . . . . . . . . . . . . . . . . . . . . . . . . . . . . . 3
Fetal Display Detail . . . . . . . . . . . . . . . . . . . . . . . . . . . . . . . . . . . . . . . . . . . . . . 3
Starting Operation . . . . . . . . . . . . . . . . . . . . . . . . . . . . . . . . . . . . . . . . . . . . . . . 5
Ultrasound Monitoring . . . . . . . . . . . . . . . . . . . . . . . . . . . . . . . . . . . . . . . . . . . . 7
Uterine Activity. . . . . . . . . . . . . . . . . . . . . . . . . . . . . . . . . . . . . . . . . . . . . . . . . . 9
ECG Monitoring . . . . . . . . . . . . . . . . . . . . . . . . . . . . . . . . . . . . . . . . . . . . . . . . 10
Intrauterine Pressure Monitoring . . . . . . . . . . . . . . . . . . . . . . . . . . . . . . . . . . . 11
Main Menu . . . . . . . . . . . . . . . . . . . . . . . . . . . . . . . . . . . . . . . . . . . . . . . . . . . . 13
Fetal Heart Rate Alerts . . . . . . . . . . . . . . . . . . . . . . . . . . . . . . . . . . . . . . . . . . 13
Bradycardia Alert . . . . . . . . . . . . . . . . . . . . . . . . . . . . . . . . . . . . . . . . . . . . . . . 14
Tachycardia Alert. . . . . . . . . . . . . . . . . . . . . . . . . . . . . . . . . . . . . . . . . . . . . . . 16
Recorder Operations . . . . . . . . . . . . . . . . . . . . . . . . . . . . . . . . . . . . . . . . . . . . 17
Module Configuration Manager . . . . . . . . . . . . . . . . . . . . . . . . . . . . . . . . . . . . 23
Telemetry Option . . . . . . . . . . . . . . . . . . . . . . . . . . . . . . . . . . . . . . . . . . . . . . . 26
Mermaid Option . . . . . . . . . . . . . . . . . . . . . . . . . . . . . . . . . . . . . . . . . . . . . . . . 27
Fetal Monitoring
Overview
This chapter describes the fetal monitor functionality of the Spacelabs Medical
Maternal Obstetrical Monitor™ (MOM™). For instructions on optional maternal
parameters such as ECG, SpO2, temperature, and NIBP refer to the appropriate
chapter of this manual.
Fetal Display Detail
The fetal module automatically allocates a single display zone when it establishes
communication with the Maternal Obstetrical Monitor. This zone consists of
numeric values and messages. When an internal fetal ECG electrode is applied to
the patient, a second zone displays the fetal ECG waveform from channel 1. This
zone does not display when using ultrasound-monitoring technique.
For singleton births, this display will appear as follows:
Figure 15-1: Singleton birth display
F
E
T
A
L
67
FHR1 (US)
PATIENT’S NAME
ROOM 1003
144
UC (EXT)
ALERT ON
♥
144
FHR1 (US)
25
UA (EXT)
✑✓
✑✓
TIME and DATE
PATIENT’S NAME RM 1003
PAPER OUT
ᕡᕣᕤ ᕦᕨ
µ
¸
ᕧᕥᕢ
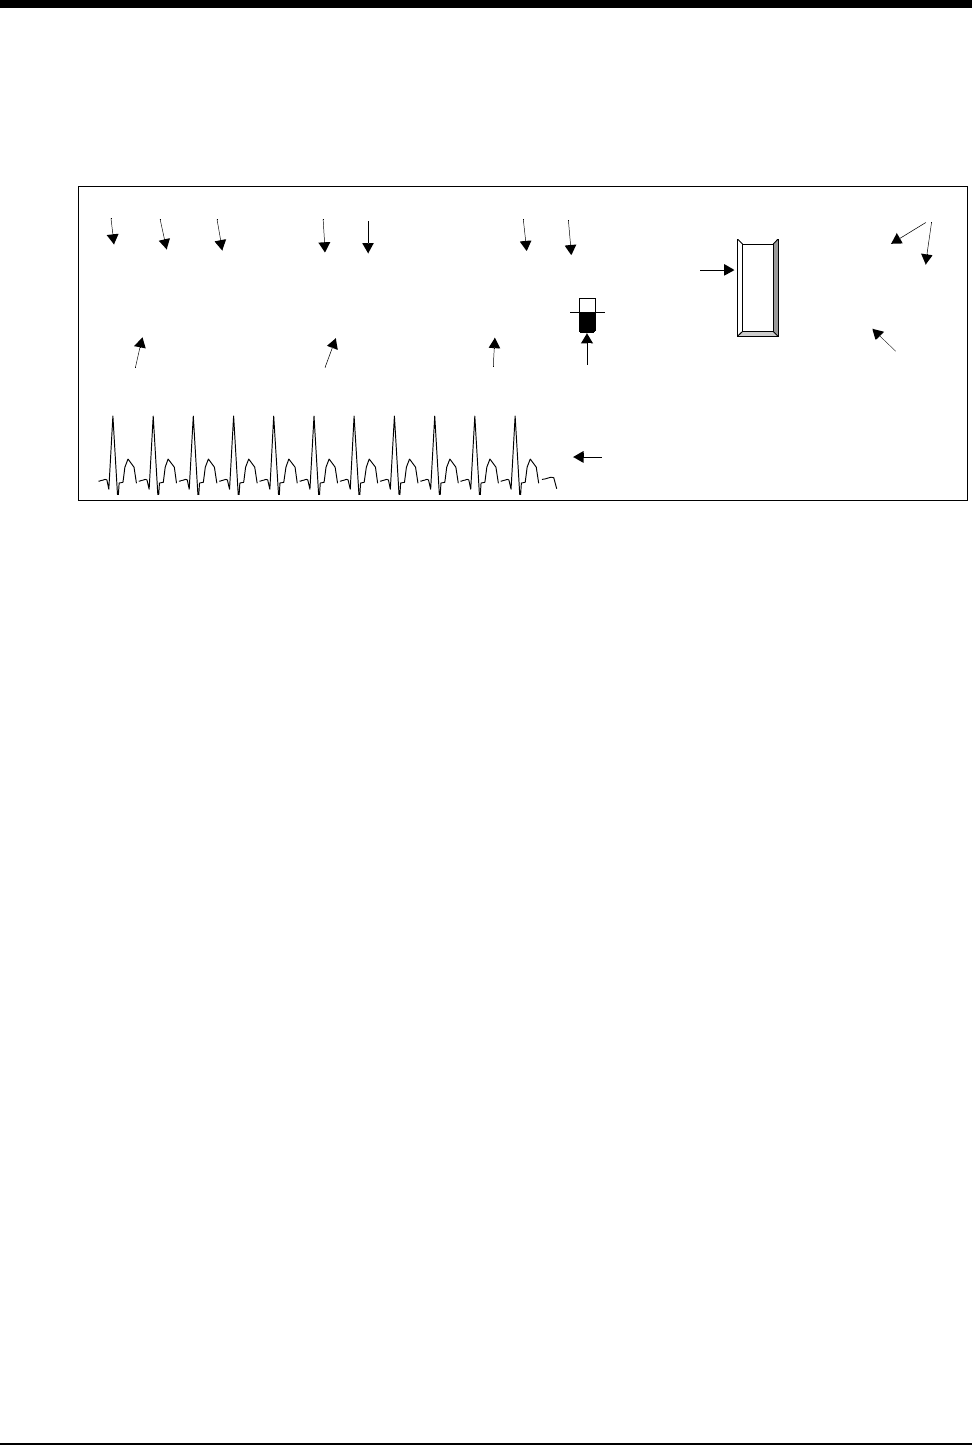
Ultraview Care Network
15-4
For a twin pregnancy, the display appears as follows:
Figure 15-2: Twin display
ᕡHeart beat indicator (flashes once per detected beat)
ᕢChannel 1 heart rate (beats per minute)
ᕣFHR channel label
ᕤSource of heart rate signal (US = ultrasound, ECG = spiral ECG)
ᕥSignal indicator
(full = good signal; half full = adequate; empty = poor or no signal)
ᕦUA channel label
ᕧUterine activity measure (units for toco; mmHg or kPa for IUP)
ᕨSource (EXT for toco; mmHg, or kPa for IUP)
ᕩChannel 2 heart rate (beats per minute)
µFetal parameter key
¸Status messages (appear when appropriate)
¹Time, date, patient name and room number
ƸFetal ECG trace from spiral electrode
F
E
T
A
L
67
FHR1 (US)
PATIENT’S NAME
ROOM 1003
144
UC (EXT)
ALERT ON
♥FHR1 (ECG)
32
UA (EXT) ♥
125
FHR2 (US)
136
TIME and DATE
PATIENT’S NAME RM 1003
PAPER OUT
ᕡᕣ ᕤ ᕦᕨ ᕣᕤ
µ
¸
ᕥᕩᕧᕢ
¹
Ƹ

Fetal Monitoring
15-5
Starting Operation
Power ON
To prepare the monitor for operation:
1. Plug the appropriate end of the power supply cord into the monitor’s right side
panel receptacle labeled J1.
2. Secure the connector with the screw that is provided.
3. Plug the other end of the power cord into a properly grounded three-wire outlet
marked Hospital Grade or Hospital Only.
4. Press the main power switch ON. The monitor will perform a self-test.
Standalone unit (not connected to BirthNet):
The patient’s name will flash on the display if all the following conditions are met:
• The patient’s name has been admitted through the monitor setup.
• The patient was not discharged from the monitor before powering OFF the
monitor.
• The unit was not powered OFF for a period greater than 3-minutes.
If the flashing name is correct, the clinician should confirm the identity of the
patient by touching the F-ALERT RESET key. Following confirmation, the
patient’s name will print on the fetal strip and will continue to print every
20-minutes.
If incorrect, use the MONITOR SETUP/ADMIT DISCHARGE key to admit the new
patient.
Under standalone conditions, the patient’s name will also flash if no fetal heart
rate data has been received for a period of 10-minutes on channel 1. Touch the F-
ALERT RESET key to confirm the patient’s name.
When connected to BirthNet, the patient’s name will flash the first time the monitor
intercepts a name from BirthNet (after power ON) to inform the clinician of the
identity of the patient. Touch the F-ALERT RESET key to confirm the information.
The patient name will also automatically print on the fetal strip. Subsequent
admission through BirthNet will not cause the name to flash if the monitor has not
been powered OFF between patients.
!
• If the MOM unit is powered OFF for a period of 3-minutes, all
data, including the patient’s name, is purged from memory.
!
• The Admit/Discharge feature of the monitor is primarily a
standalone feature. Use of this feature when connected to
BirthNet might create a situation where the name of the patient
entered under ADMIT in Monitor Setup will appear on the
maternal strip while the fetal strip is identified with the patient’s
name from BirthNet. If the hospital chooses to use the
Admit/Discharge function, it is recommend that the monitor be
powered OFF for 3-minutes between patients.

Ultraview Care Network
15-6
Under standalone or BirthNet connections, when the monitor is in fetal heart rate
alert status, the clinician will have to first touch the F-ALERT RESET to reset the
alert, and again, to confirm the patient’s name.
Loading Chart Paper
To load chart paper:
1. Press the Recorder Release button and slide the drawer out to reveal the
paper bin.
2. Pull out one or two sheets of paper from the top of a new packet and place the
remaining packet of paper into the recorder drawer. Position the top of the
paper (fetal heart rate scale) toward the left of the drawer with the printed side
facing up.
3. Slide the recorder door back until it snaps securely in place. Make sure that
the leading two sheets of paper hang out of the monitor.
Calibration
Calibration provides a functional check of the equipment and helps ensure a
reliable recording. Calibration should be performed before beginning a recording
and can be done at any time during monitoring.
To calibrate:
1. Touch the FETAL key.
2. Touch the PAPER FEED key.
3. FHR 1–150, UA –50, and FHR 2–180 will be displayed and the recorder will
print corresponding lines on the fetal strip chart.
!
• For the protection and proper performance of the recorder, use
only paper approved by Spacelabs Medical. Failure to use
approved paper may result in a malfunction.
!
• Following calibration, check that the recorder printed a line at
150 and 180 to ensure the paper is the correct scale.
To advance and calibrate the
fetal recorder paper:
1Touch PAPER FEED.

Fetal Monitoring
15-7
Ultrasound Monitoring
Channel 1
The ultrasound transducer sends sound waves into the uterine cavity and detects
echoes returning from objects in the path. The monitor uses auto-correlation to
analyze these echoes from moving objects, specifically the fetal heart. The rhythm
of the motion is used to compute the fetal heart rate. To produce a reliable
recording, the transducer must be positioned properly to send sound waves
directly at the fetal heart.
Ultrasound Transducer Preparation and Application
The transducer connections are color-coded and uniquely keyed.
1. Plug the ultrasound transducer (green) connector into the FHR1 (green)
connector on the front of the monitor. The groove on the transducer connector
must be aligned properly.
2. Apply a generous amount of gel over the face of the ultrasound transducer.
3. Adjust the volume as necessary to hear the fetal heart sounds while
positioning the ultrasound transducer.
4. Place the transducer on the mother’s abdomen and gently move it along the
abdomen to locate the sharpest and clearest fetal heart sounds.
5. The transducer should be held securely in place with the transducer belts
without causing discomfort to the patient.
6. Check the mother’s pulse. Be sure it does not coincide with the displayed heart
rate. If it does, the transducer may be detecting the maternal blood flow, rather
than the fetal heart beat. Reposition the transducer toward the fetal heart.
!
• To obtain consistent, reliable information, proper application of
transducers is essential.
!
• The gel is necessary to ensure that good signals are produced
by the transducer. Use enough gel to cover the flat transducer
face before it is placed on the mother’s abdomen. Add
additional gel, if necessary, to improve the signal.
!
• Remember to calibrate the monitor each time you begin a
monitoring session. Refer to Calibration on page 15-6.
!
• Keep the transducer face in contact with the abdomen. Tilt the
transducer to locate the clearest heart sounds, then reposition it
in the direction of the tilt until you hear the best signal while the
transducer is flat on the abdomen.

Ultraview Care Network
15-8
Channel 2
The monitor is equipped with a second FHR connector to provide simultaneous
monitoring of twins. Both fetuses can be monitored using ultrasound transducers.
Ultrasound transducer preparation and application for the second fetus is the
same as for a single fetus. Volume controls for both channels are located on
screen.
Differentiation of Fetal Heart Rate
To aid in distinguishing twin fetal heart rates, the operator can select one of three
modes for presentation of the fetal heart rate data for the second fetus. The three
modes are:
• FHR2 prints on the same scale as FHR1
• FHR2 prints on a scale 30 bpm below FHR1 (twin shift manual setting)
• FHR2 shifts to a scale 30 bpm below FHR1 when the monitor detects the two
FHRs to be in proximity to each other (auto setting). To differentiate twin
FHRs on the fetal strip chart, the FHR2 trend prints in a light gray compared
to the darker FHR1 trend. When twin fetal heart rates intersect, the FHR2
trend prints dots only, rather than a line, to enhance the distinction between
the two. Finally, the recorder prints HR2 every 10-minutes with a dotted line
pointing to the FHR2 trend. If the 30-bpm offset is activated, the message will
read HR2, Add 30.
Coincidence Recognition
The system has a coincidence recognition feature to detect the same heart rates
between FHR1 and FHR2 over a period of time. When a coincidence is
suspected, the monitor prints a question mark (?) on the strip chart to notify the
clinician.
!
• Make sure that both transducers are not directed at the same
fetus. Review the information on Differentiation of Fetal Heart
Rate on page 15-8 and Coincidence Recognition on page 15-8.
!
• Once shifted, FHR2 will remain on this alternate scale until the
monitor detects a consistent pattern of baseline separation
between the two fetal heart rates. In many cases, this alternate
scale may remain in effect throughout the delivery.
!
• If these marks appear, the FHR1 and FHR2 signals may be
from the same fetus. Re-check the ultrasound transducer
positions. If necessary, reposition the transducers to capture the
fetal heart rates from different fetuses.
• This detection may not occur if channel 1 is in ECG mode and
channel 2 is ultrasound, because of the difference in signal
processing.
• This detection may not occur if one or both of the ultrasound
channels have a poor signal quality.
To set the twin FHR shift:
1Touch the SETUP key on the
main fetal menu.
2Touch the TWIN SHIFT key.
3Select MANUAL, AUTO, or NO
SHIFT mode.

Fetal Monitoring
15-9
Uterine Activity
The toco transducer detects uterine activity by sensing changes in tension on the
abdomen. Although absolute uterine pressure cannot be measured by this
method, the toco transducer does provide a reliable indication of the timing and
approximate duration of contractions.
Toco Transducer Preparation and Application
1. Plug the toco transducer (yellow) connector into the UA (yellow) connector on
the front of the monitor. The groove on the toco transducer connector must be
aligned properly.
2. Position the transducer on the maternal abdomen. The best location is usually
midline between the fundus and the umbilicus.
3. The transducer should be held securely in place with the transducer belts
without causing discomfort to the patient.
4. To initialize, touch the UA REF key. The UA display will reset to 20 units
momentarily.
!
• Do not use any kind of gel on the toco transducer.
!
• Toco sensitivity can be set at three different levels enabling you
to adjust the sensitivity to meet the specific needs of a particular
patient.
To initialize uterine activity:
1Touch the UA REF key.
2Touch YES to confirm.
To set the Toco sensitivity:
1Touch the SETUP key on the
main fetal menu.
2Touch the TOCO SENS key.
3Select LOW, MEDIUM, or
HIGH sensitivity.

Ultraview Care Network
15-10
ECG Monitoring
In addition to ultrasound, channel 1 is designed to monitor fetal heart rate using
an invasive spiral electrode to obtain the fetal ECG and derive the heart rate. The
ECG (internal) mode is generally considered the most accurate and reliable
method to obtain a fetal heart rate.
Fetal ECG Electrode Preparation and Application
1. Prepare an area on the patient’s upper thigh or, preferably, on the lower
abdomen by cleaning with an alcohol swab. Allow to dry.
2. Apply a pre-gelled ECG skin electrode to the prepared area.
3. Plug the leg clip (green) connector into the FHR 1 (green) connector on the
front of the monitor. The groove on the transducer connector must be aligned
properly.
4. Apply the fetal spiral electrode according to the instructions on the
manufacturer’s packaging.
5. Once the spiral electrode has been attached, press the top of each push post
on the leg clip to reveal a slot. Insert each wire (two) from the electrode into
each slot on the leg clip. There are no color-coded requirements, either wire
can be inserted into either post.
6. Gently pull the wires to make sure they are firmly attached to the leg clip. They
should not disconnect.
7. Attach the leg clip to the pre-gelled skin ECG electrode on the patient’s thigh
or abdomen.
8. Check that the monitor is receiving appropriate signals, and adjust the audio
key to hear the tone (R-wave detection), as necessary.
WARNING:
• Because the tip of the fetal spiral electrode is designed to
penetrate the fetal skin, it may present the possibility of
trauma, hemorrhage, or infection. Therefore, these
electrodes should only be used under aseptic conditions.
Refer to contraindications and application instructions on
the electrode manufacturer’s packaging.
• To apply the fetal ECG spiral electrode, the membranes
must be ruptured.
!
• If both the fetal heart rate and uterine activity are to be
monitored using internal techniques, it is generally
recommended that the intra-uterine catheter be inserted before
the attachment of the spiral electrode.
!
• To acquire ECG data, the leg clip must be connected to FHR
channel 1.
• The leg clip does not work on FHR channel 2.

Fetal Monitoring
15-11
Intrauterine Pressure Monitoring
Actual intrauterine pressure, including contraction frequency, duration, intensity,
and uterine tone (pressure between contractions), is measured using an
intrauterine catheter and pressure transducer. Application techniques for internal
pressure catheters are considered to be beyond the scope of this manual. Consult
the manufacturer’s instructions included with the package for proper application
techniques.
Pressure Transducer Preparation and Application:
Reusable Pressure Transducer (Fluid Filled Catheter)
1. Follow manufacturer’s instructions on the preparation and insertion of the
intrauterine catheter.
2. Level the pressure transducer with the maternal xiphoid or the top of the
fundus.
3. Plug the pressure transducer (yellow) connector into the UA (yellow)
connector on the front of the monitor. The groove on the transducer connector
must be aligned properly.
4. Attach a 3-way stopcock (from the intrauterine catheter kit) to the side port of
the pressure transducer (strain gauge). Attach a pressure relief valve or dead-
end stopper to the top port.
5. Once the intrauterine catheter has been inserted, remove the catheter guide,
and attach the catheter to the 3-way stopcock.
6. Fill a 20 cc syringe with sterile water and attach it to the 3-way stopcock.
7. Turn the handle of the stopcock toward the pressure transducer and flush the
catheter with at least 5 cc of sterile water.
8. Turn the handle of the stopcock toward the catheter.
9. Lift the cap on the pressure relief valve or remove the dead-end stopper on the
top of the pressure transducer (strain gauge) dome to vent the dome. Flush
the transducer with 1 to 2 cc of sterile water.
10. Touch the RECORDER key to turn the recorder ON.
11. Touch the UA REF key to initialize.
WARNING:
• When inserting the intrauterine pressure catheter, the
membranes must be ruptured.
!
• Check to ensure that all of the air bubbles have been removed.
• If there are still air bubbles in the dome, repeat the process.
CAUTION:
• Do not attempt to force water into the transducer dome
unless it is vented to the air. Permanent damage to the
transducer may result.

Ultraview Care Network
15-12
12. Press Yes to confirm the initialization. The UA display should read 0 (zero).
Release the cap on the pressure relief valve or replace the dead-end stopper
to reseal the dome.
13. Turn the handle of the stopcock toward the syringe to begin recording uterine
activity.
If, during monitoring, the UA channel does not appear to be accurately recording
contractions or the tracing of the contractions looks jagged or angular, either the
catheter has collected debris from the amniotic fluid or it contains air bubbles. If
this happens, take the following steps:
1. Turn the 3-way stopcock toward the pressure transducer.
2. Flush with 5-10 ml of sterile water.
3. Turn the handle of the stopcock toward the syringe.
4. Check the recording.
Transducer-Tipped Catheter Disposable
Application techniques for internal pressure transducers are considered to be
beyond the scope of this manual. Consult the manufacturers instructions included
with the package for proper application technique.
1. Plug the intrauterine pressure catheter (yellow) connector into the UA (yellow)
connectors on the front of the monitor.
2. Touch the UA REF key to initialize.
3. Press Yes to confirm the initialization. The UA display on the monitor should
read 0 (zero) and the strip chart should record 0 (zero).
4. Follow manufacturer’s instructions on the preparation and application of the
intrauterine pressure catheter.
!
• Check to see that all of the air bubbles have been removed.
• If there are still air bubbles in the dome, repeat the process.
!
• Between contractions, the UA channel should not return to zero.
This is the measure of the uterine resting tone.
!
• To check that the system is operational, it is often helpful to ask
the patient to cough. This should produce an artifact on the fetal
strip chart recording.
• Utah Medical IPC 400 is the only catheter-tipped transducer
recommended for use with this monitor.
To initialize uterine activity:
1Touch the UA REF key.
2Press Yes to confirm.

Fetal Monitoring
15-13
Main Menu
When the FETAL key is touched, the menu will appear at the bottom of the
screen. This menu will remain on screen during the monitoring session, unless the
operator accesses another menu screen. To return the to Main menu, touch the
FETAL key.
Fetal Heart Rate Alerts
The fetal module provides two alert conditions for fetal heart rate: operator-set
limits and pattern recognition.
The fetal heart rate pattern recognition alert function activates if the bradycardia or
tachycardia alert limits are violated for a preset period of time or if heart rate
patterns described below occur. The alert function serves the purpose of notifying
the care giver of a potential condition that might be developing and should not
replace any of the care giver’s functions.
The monitor will generate an alert when twenty consecutive, one-second samples
of fetal heart rate are below the operator-set limit. The factory default is 84 bpm.
!
• When an alert condition occurs, the monitor provides several
indications. Alert reset removes these indications.
• A message flashes Heart Rate F-Alert.
• The FETAL key will flash.
• A tone will sound if tones are enabled.
To turn F-Alert ON or OFF:
1Touch the SETUP key on the
main fetal menu.
2Touch the F-ALERT limits key.
3Select F-ALERT ON or OFF.
To set fetal alert limits:
1Touch the SETUP key on the
main fetal menu.
2Touch the F-ALERT limits key.
3Select F-ALERT ON.
4Select the HI= or LO= key.
5Use the arrow keys to adjust
the limits.
To silence and reset the alert:
1Touch F-ALERT RESET.
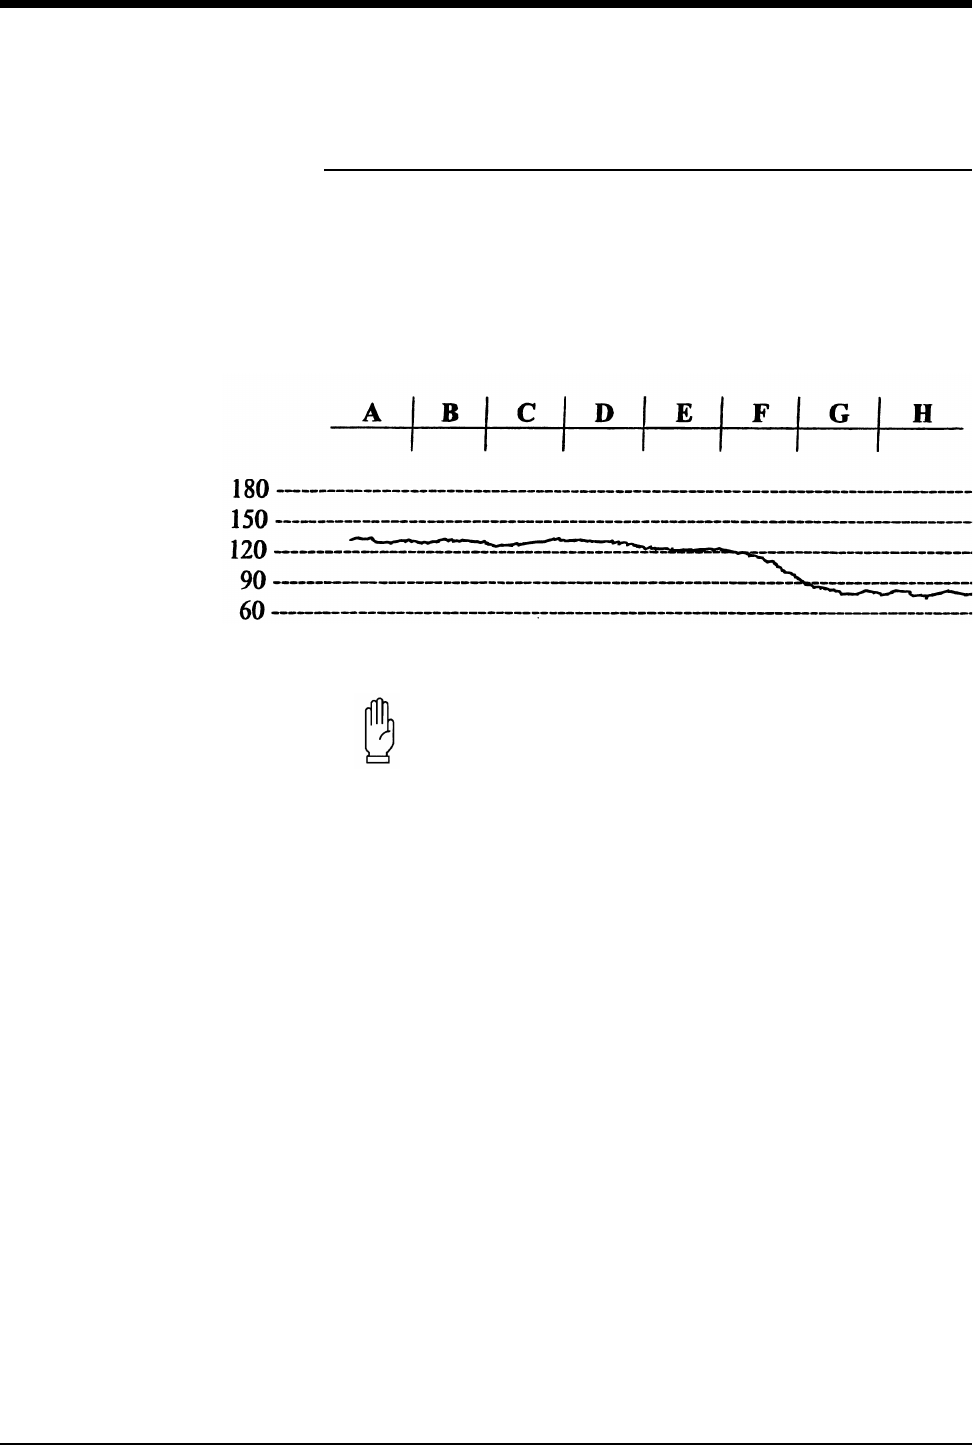
Ultraview Care Network
15-14
Bradycardia Alert
Type 1
The heart rate is divided into eight groups of 20-seconds each. Group H
represents the current 20-seconds.
An alert will activate if Groups Gand Hare below 90 bpm.
Figure 15-3: Type 1 bradycardia alert
CAUTION:
• Any time the alert activates, the heart rate must return to
normal before the Alert can be reactivated. Reset the alert
by pressing the F-ALERT RESET key on the screen.
• If a group of heart rates is less than 30 bpm, the algorithm
considers this condition a loss of signal and a NO ALERT
will occur.
!
• All representations of fetal heart rates in this chapter are
computer generated.
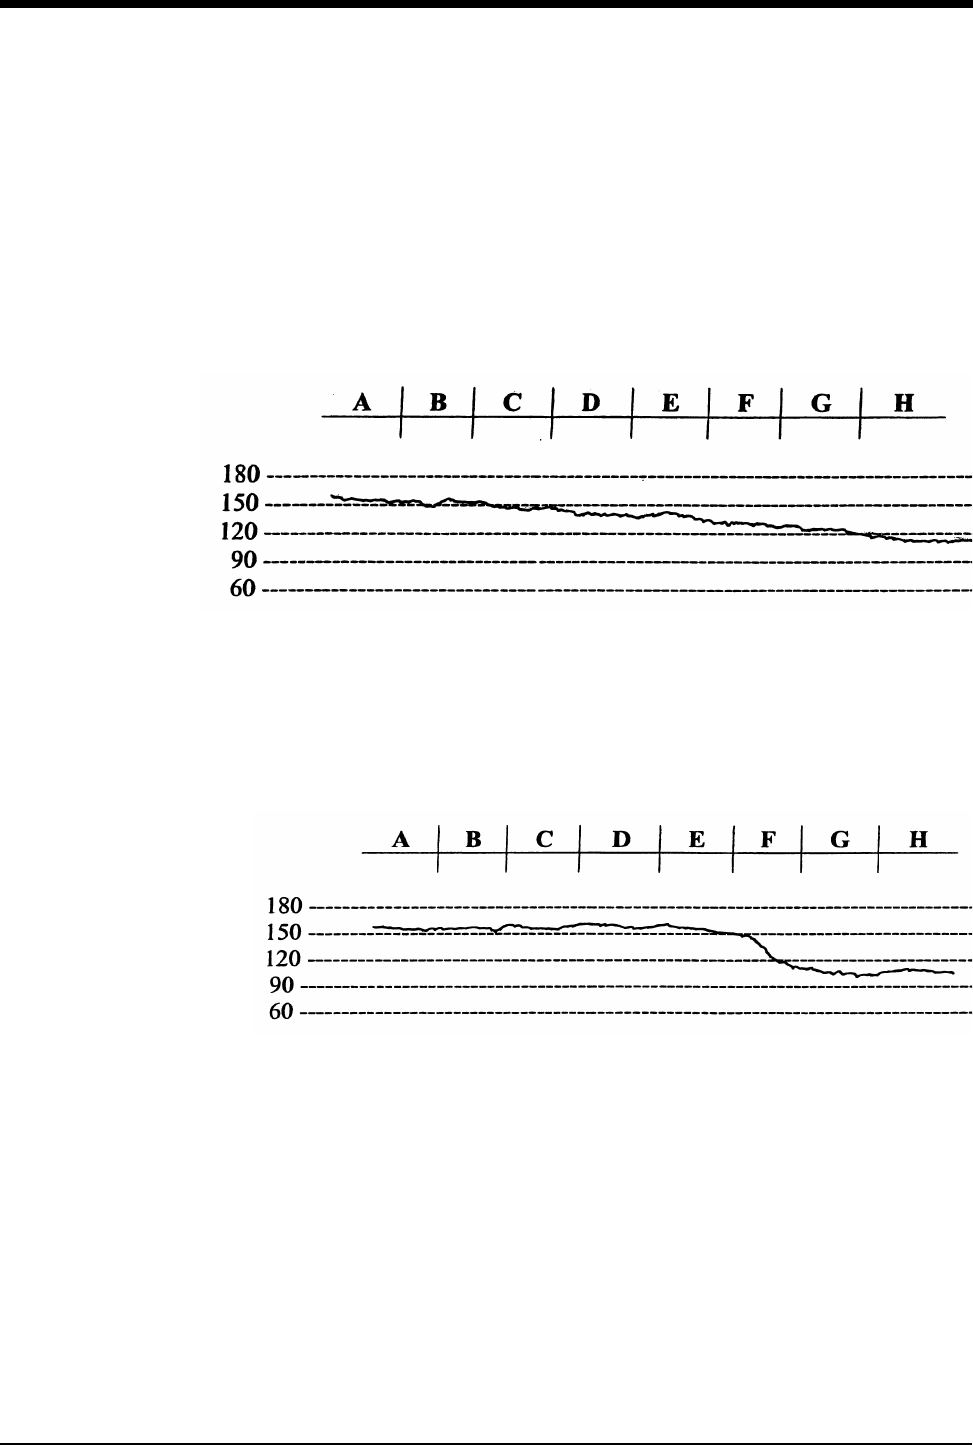
Fetal Monitoring
15-15
Type 2
An alert will activate if:
•Group His less than Group F; and
•Group Gis less than Group E; and
•Group Fis less than Group D; and
•Group Eis less than Group C; and
•Group His below Group Cby more than 30 bpm.
Figure 15-4: Type 2 bradycardia alert
Type 3
An alert will activate if the average of Groups Gand His lower than the average of
Groups A,B,C, and Dby more than 40 bpm.
Figure 15-5: Type 3 bradycardia alert
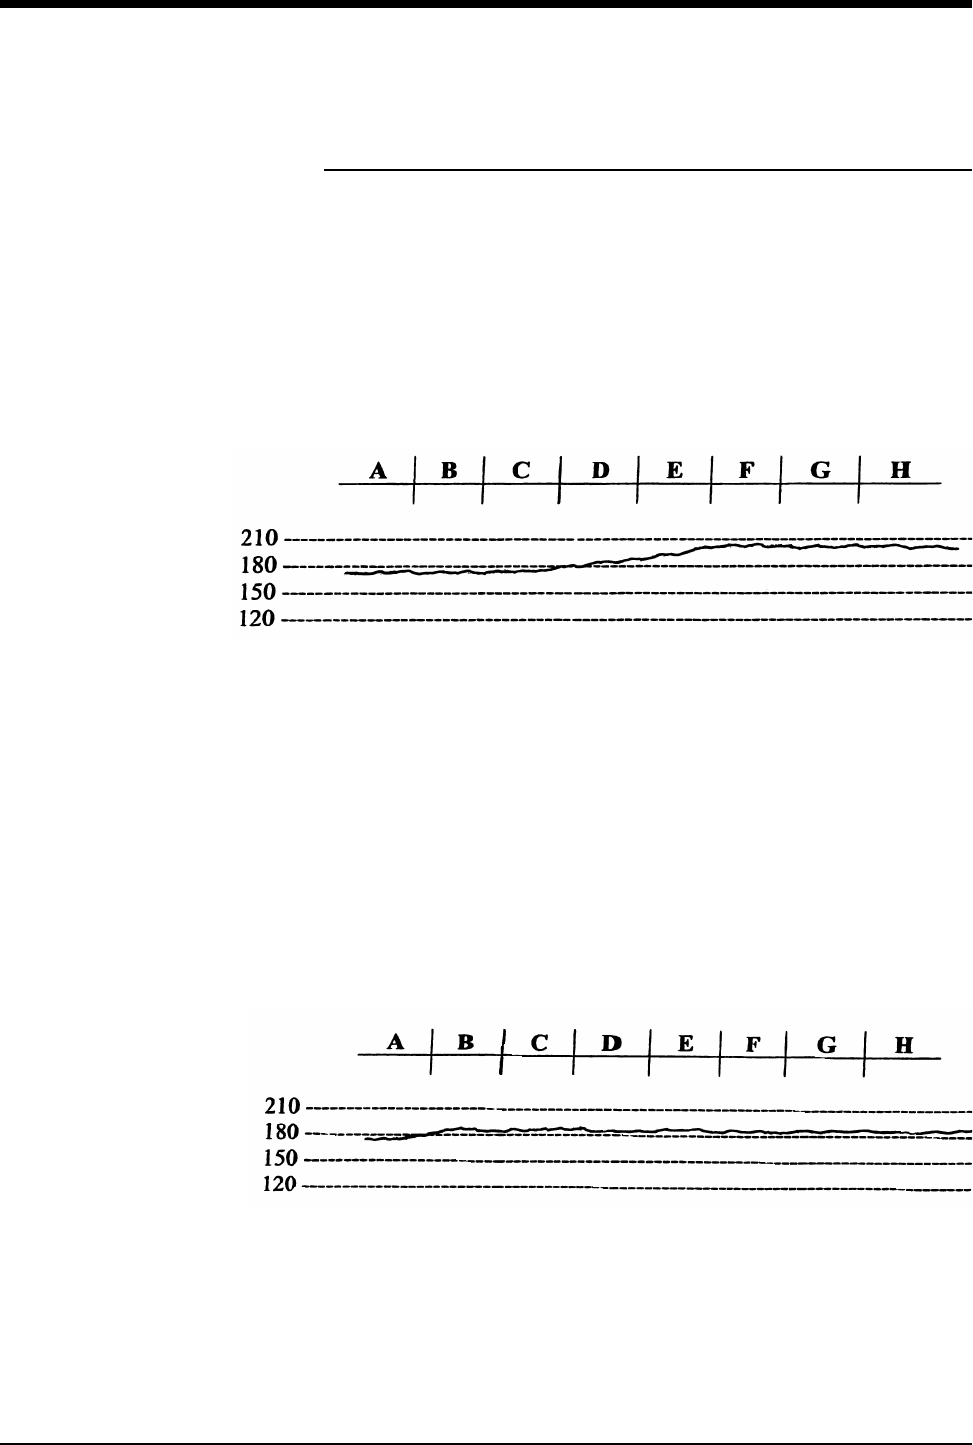
Ultraview Care Network
15-16
Tachycardia Alert
The monitor analyzes the fetal heart rate for tachycardia using the following
algorithms. The heart rate is divided into eight groups of 20-seconds each.
Type 1
An alert will activate if:
•Group Cis less than 180 bpm, and
•Groups F,G, and Hare each greater than or equal to 190 bpm.
Figure 15-6: Type 1 tachycardia alert
Type 2
An alert will activate if Group Ais less than the tachycardia limit set by the
operator, and Groups B,C,D,E,F,G, and Hare each greater than or equal to the
tachycardia limit set by the operator. The example shown below has the limit set
at 180 bpm.
Figure 15-7: Type 2 tachycardia alert
!
• The most recent Heart Rate Group is H; Heart Rate Group A
must not be zero.
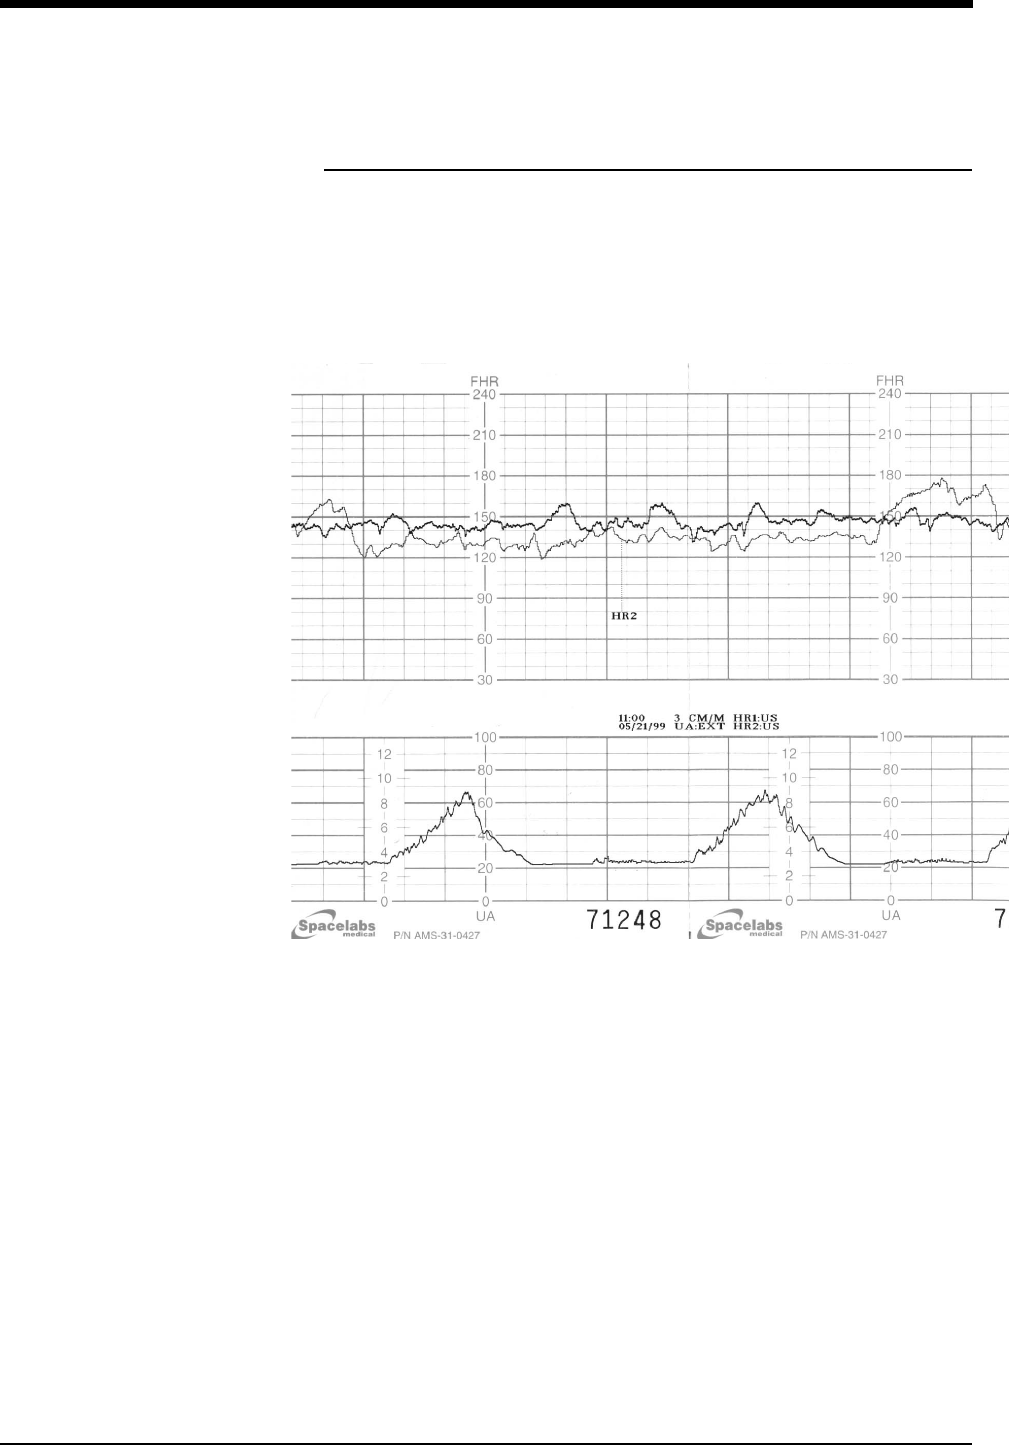
Fetal Monitoring
15-17
Recorder Operations
The monitor is automatically programmed to print predetermined data items on
the fetal strip chart. The following two strips identify the data items and illustrate
how twin FHRs print on the strip. The recorder will also print values from maternal
monitoring parameters. When installed with the BirthNet Obstetrical Data
Management System, designated data items entered in BirthNet will also print on
the strip.
Figure 15-8: Twin fetal heart rates on the same scale
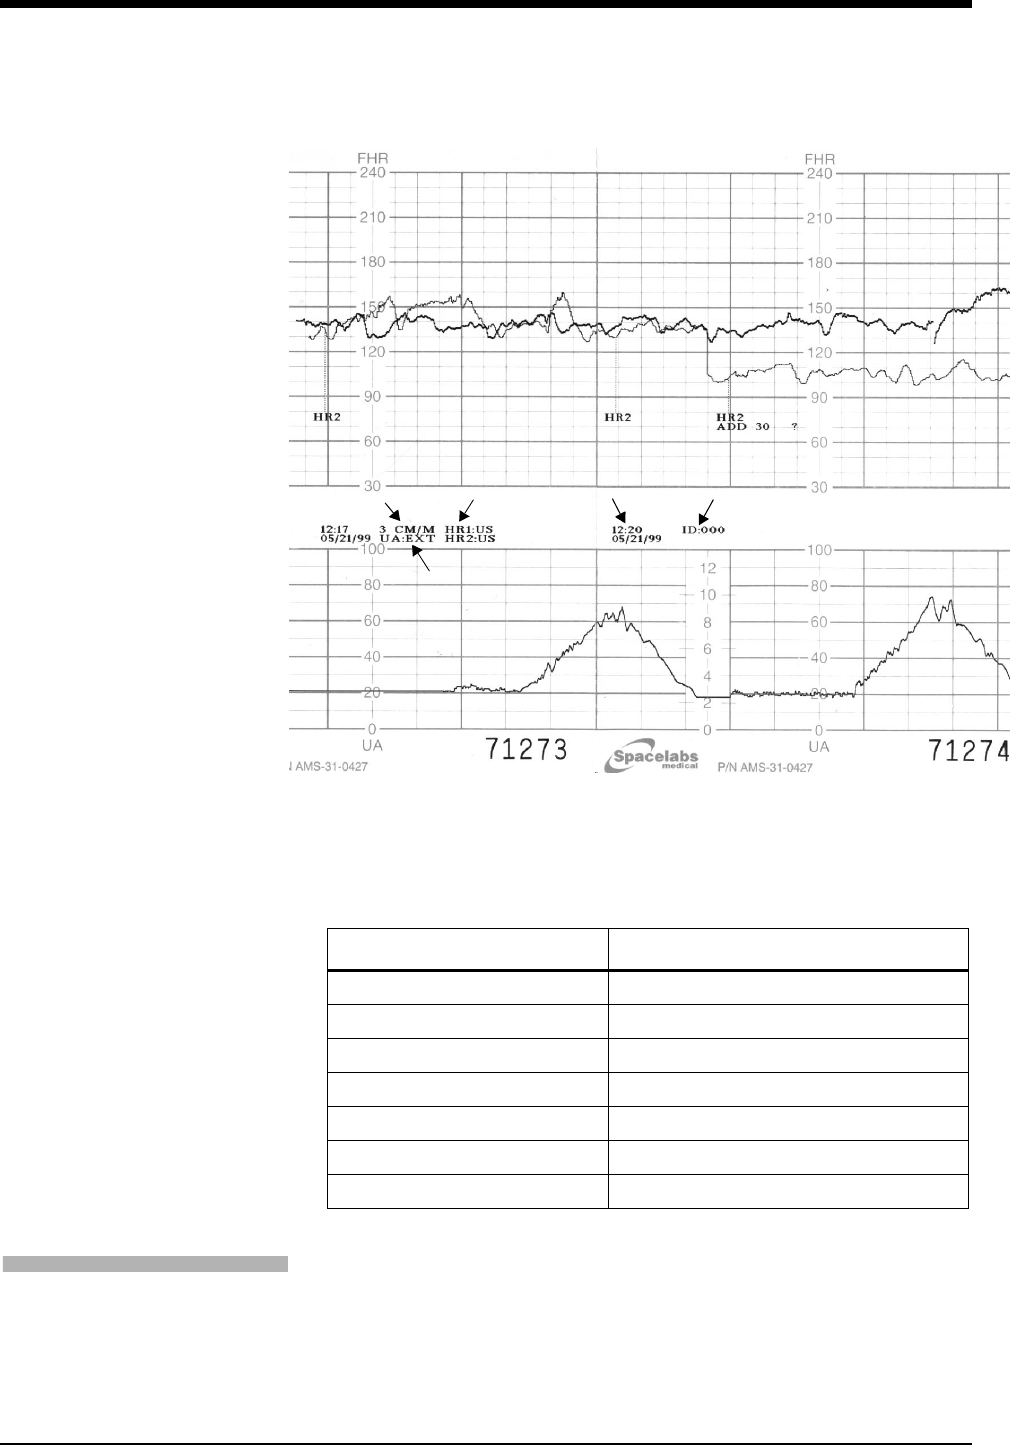
Ultraview Care Network
15-18
Figure 15-9: Twin fetal heart rates on same scale,
then shifted to separate scales
These messages print according to the following schedule:
Event Marker Functions
To mark an event on the strip chart recorder, touch the MARK key on the screen.
The recorder will print a black bar at the top of the heart rate scale. The monitor is
also equipped with an external Event Marker. When the external Event Marker is
pressed, the recorder prints an arrow at the top of the heart rate scale.
Table 1: Print Time Intervals
DATA ITEM TIME INTERVALS
ᕡ Time and Date Every 5-minutes
ᕢ Recorder Speed 5-, 20-, 35-, and 50-minutes after the hour
ᕣ HR Mode 5-, 20-, 35-, and 50-minutes after the hour
ᕤ Uterine contraction mode 5-, 20-, 35-, and 50-minutes after the hour
ᕥ Monitor ID # 10-, 25-, 40-, and 55-minutes after the hour
Twin Shift (when selected) Every 10-minutes “HR2 add 30” prints
? (for signal coincidence) Upon detection
ᕢᕣᕡ
ᕤ
ᕥ
To mark an event on the fetal
strip:
1Touch the MARK key.

Fetal Monitoring
15-19
Printing Heart Rates Over 240 bpm (ECG only)
When a spiral electrode is in use and the heart rate exceeds 240 bpm, the
numeric value (up to 300) is displayed on the screen. On the fetal strip chart, the
monitor will automatically plot the scale at half-rate when the heart rate is over
240 bpm (i.e., if the heart rate is 250 bpm, it plots at 125 bpm). A two-dot bar
prints on the top of the fetal strip chart to indicate this half-rate scale is in effect.
When the heart rate falls below 240 bpm, the monitor resumes normal plotting
procedures.
Maternal Parameters
The maternal physiological data (such as SpO2, NIBP, etc.) from the Ultraview
Command Module or other Spacelabs Medical modules are printed on the fetal
strip at designated intervals (1- to 60-minutes).
ECG HR Edit
The fetal module can recognize and edit fetal heart rate changes between two
consecutive heart beats that are greater than 30 beats per minute. If ECG edit is
ON, connecting (slew) lines between consecutive heart rates are not plotted.
Under these circumstances, the tracing appears to have gaps.
ECG Plots
When monitoring in the ECG mode (spiral electrode), the monitor can be setup to
print short “rhythm strips”. If a change in heart rate greater than 20 bpm between
two consecutive fetal ECG complexes is detected, this change triggers the
monitor to plot the ECG rhythm strip, representing approximately 4-seconds of
data: 2-seconds before and 2-seconds after the triggering event.
The ECG rhythm strip feature can also be triggered manually. When the Event
Marker is pressed (and the ECG HR is not plotting), a small arrow appears on the
strip and the ECG rhythm strip plots.
The ECG data is presented at standard 25 mm/sec, although the monitor runs at 3
cm/min. It will take about three and a half minutes at 3 cm/min. for an entire ECG
rhythm strip to print.
!
• Maternal SpO2and heart rate values are printed on the strip as
MSpO2 and MHR.
!
• The monitor does not recognize another triggering event until
the rhythm plot is complete. Following completion, the monitor
will recognize and plot the next event.
• Artifacts may also trigger the monitor to plot the fetal ECG.
!
• Arrows indicate the triggering event.
To set the time interval for SpO2
and MHR parameters to print on
the fetal strip:
1Touch the SETUP key on the
main fetal menu.
2Touch PRINT PERIOD.
3Select numeric value equal to
the number of minutes to set the
time interval for SpO2 and MHR
parameters to print on the fetal
strip.
To set ECG HR Edit:
1Touch the SETUP key on the
main fetal menu.
2Touch the FETAL ECG key.
3Select ECG HR Edit ON or
OFF.
To set ECG plot:
1Touch the SETUP key on the
main fetal menu.
2Touch the FETAL ECG key.
3Select ECG PLOT ON or OFF.
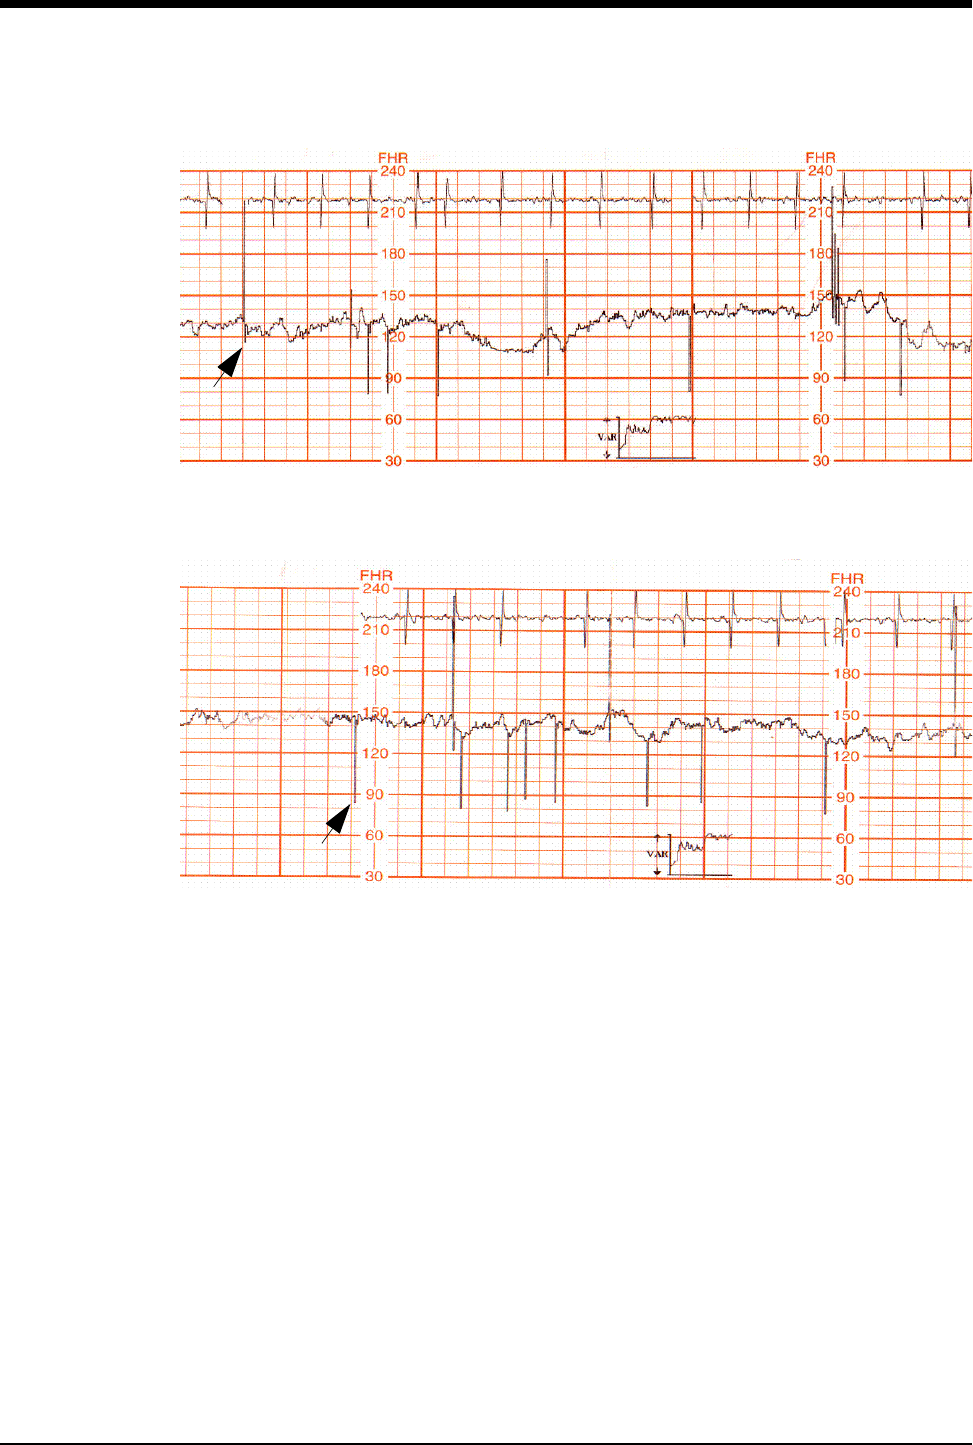
Ultraview Care Network
15-20
Figure 15-10: ECG rhythm strip
Figure 15-11: ECG rhythm strip
Variability Trend Plots
When operating in ECG mode, a trend of fetal heart rate variability is automatically
calculated and plotted. This X-Y graph, printed every 10-minutes, is computed by
combining long-term and short-term heart rate variability. One point is plotted for
each 128 heart beats.
The X-axis corresponds to time, and the Y-axis corresponds to the value of
variability for each measurement. The Y-axis is divided into three levels of
variability:
• above average
•average
• below average
The most recent data is represented at the right side of the graph and it takes
approximately 100-minutes of monitoring for the variability plot to reach its full
capacity.
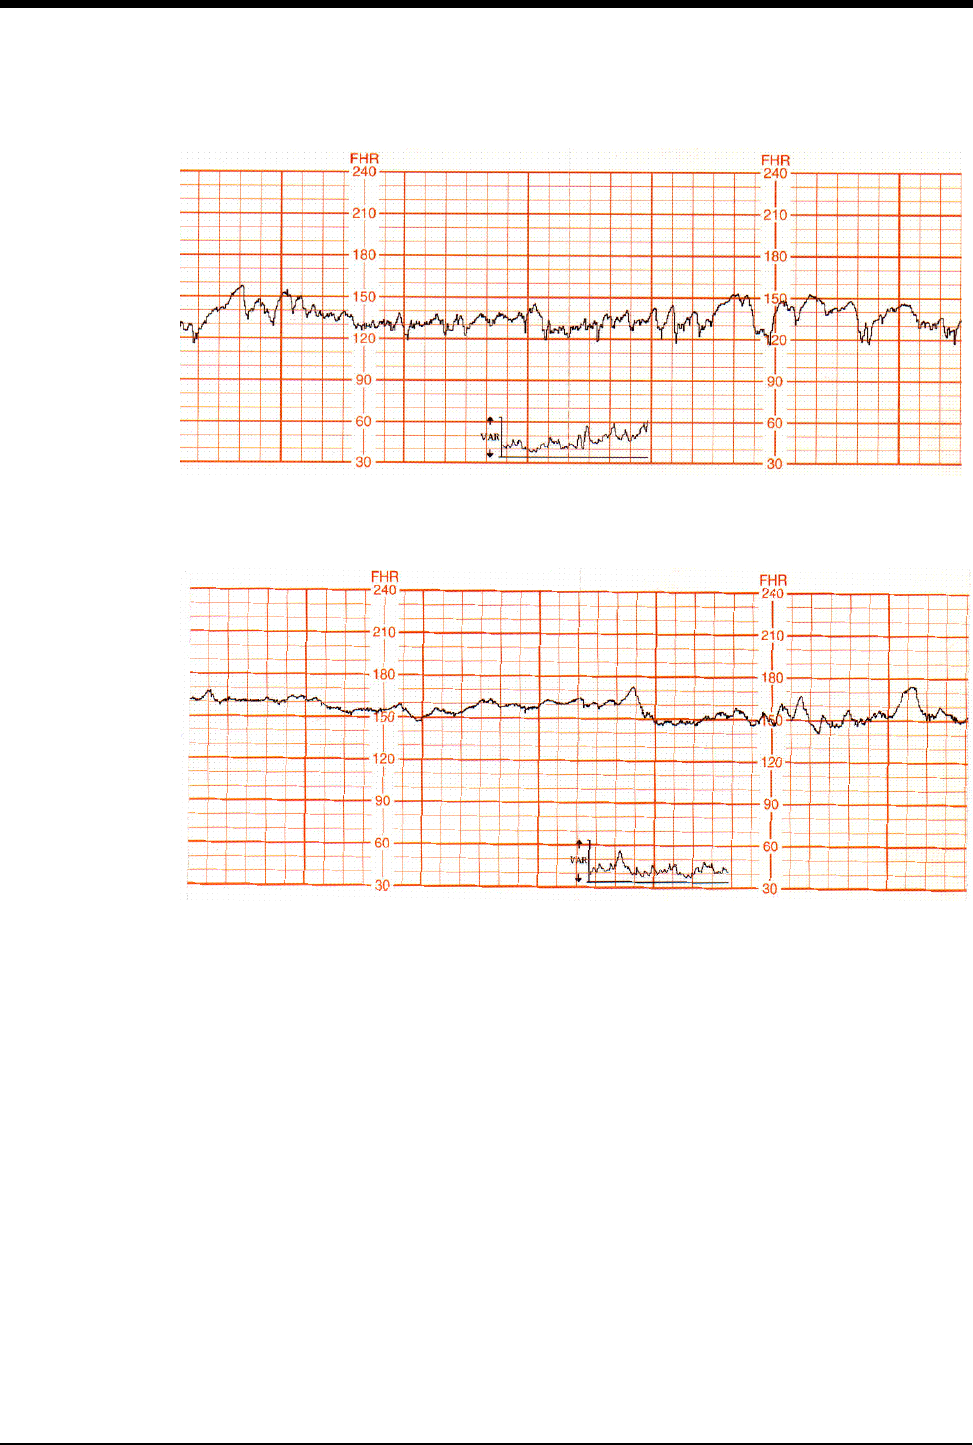
Fetal Monitoring
15-21
Figure 15-12: Above-average variability plot
Figure 15-13: Average variability plot
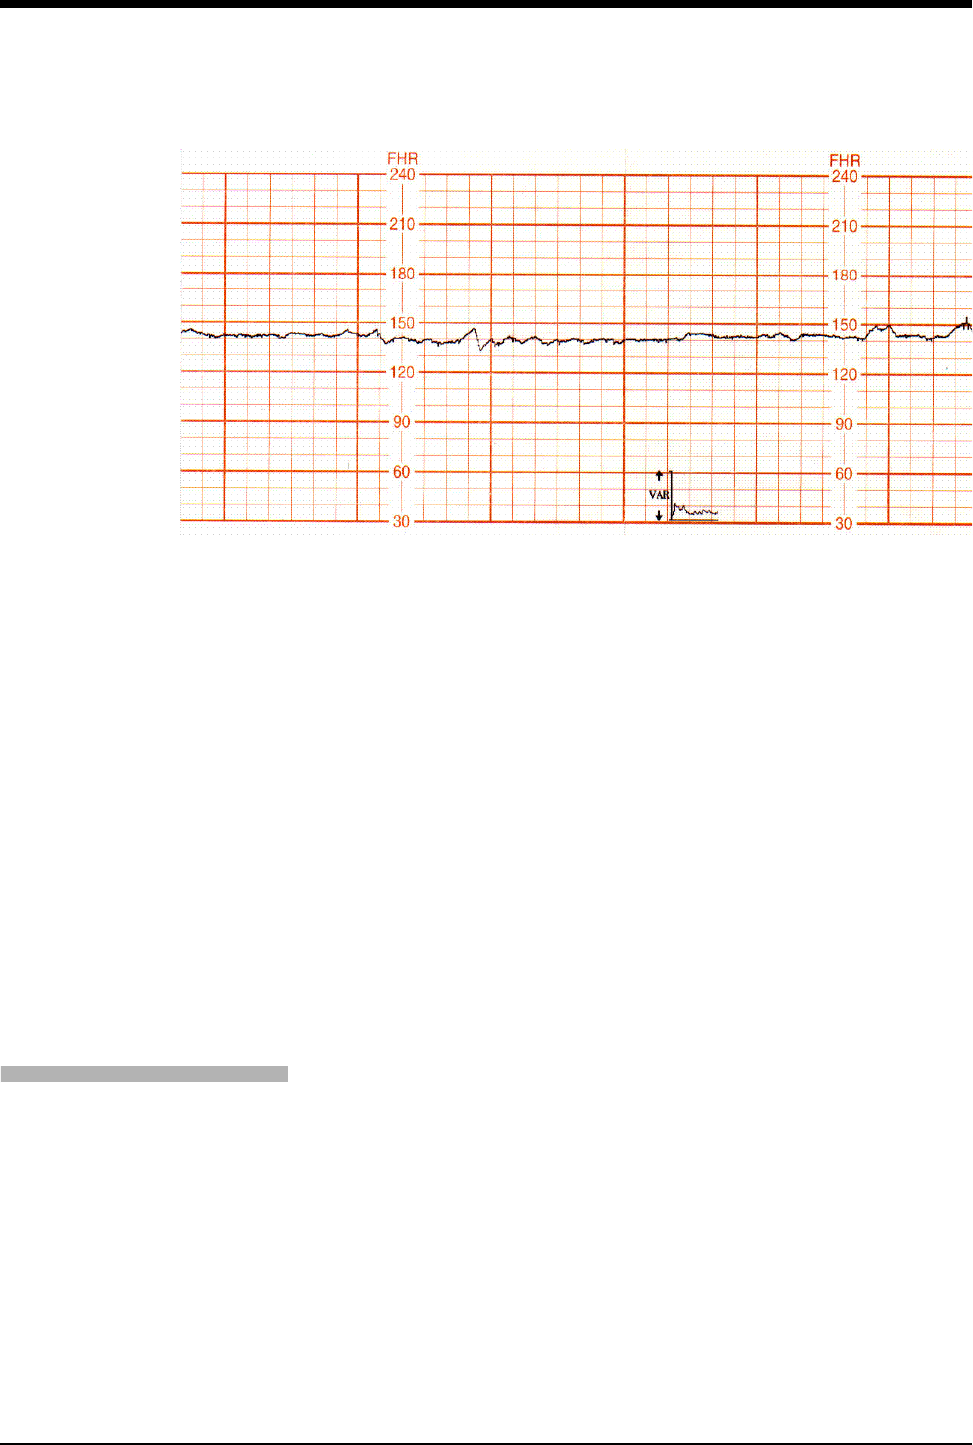
Ultraview Care Network
15-22
Figure 15-14: Below-average variability plot
Paper Out Memory
If the recorder runs out of chart paper, the screen flashes PAPER OUT in the
dedicated status area on the screen.
When this condition occurs, the monitor continues to collect and store fetal heart
rate and uterine activity data up to one hour (40-minutes if monitoring twins). Once
the paper is replaced, the monitor prints the stored data at 12 times real time. A
vertical line marks the start and end points, along with the messages MEM
START and MEM END. When the stored data has been printed, normal (real-
time) recording resumes.
!
• The Variability Trend Graph is only generated in direct ECG
mode from FHR channel 1.
• Variability data is not meant to indicate the status or well being
of the fetus.
• Variability data is a mathematical expression of the variability of
the fetal heart rate displayed in a convenient way.
!
• All collected data is erased when the recorder is powered OFF.
• If you wish to print the collected data, do not power OFF the
recorder when replacing the paper.
• To terminate a print session on the fetal strip chart, select
RECORDER OFF.
To disable the fetal recorder:
1Select RECORDER OFF.
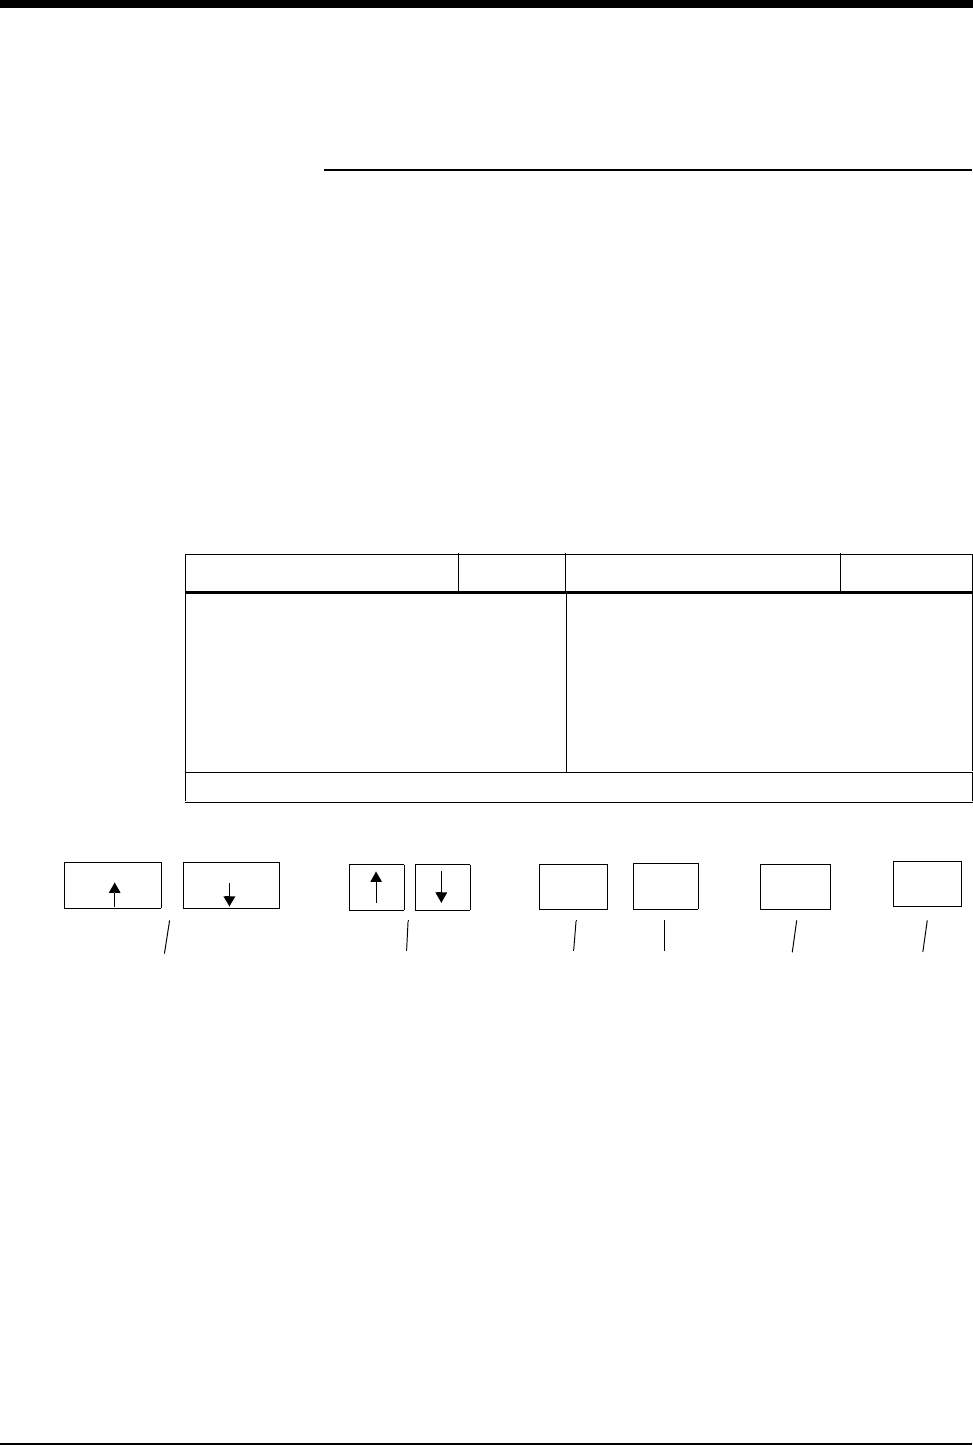
Fetal Monitoring
15-23
Module Configuration Manager
The Module Configuration Manager feature provides the capability to define and
store all user-configurable options for the fetal parameter. Once configured, these
settings control its operation whenever the monitor is powered ON.
Display Detail
The User Settings screens list all user-configurable options. From these screens
you can change and store the options in your monitor.
Figure 15-15 illustrates the User Settings screen which is used to change and
store fetal rate alarm limits.
The parameter configuration table in this chapter lists all available options, the
available user settings, and the factory defaults for each parameter.
Figure 15-15: User settings
ᕡCURSOR ↑ and CURSOR ↓ keys scroll through the two columns of
parameters on the screen.
ᕢ↑ and ↓ keys scroll the list of valid settings for the highlighted parameter.
ᕣPREV PAGE key returns to the previous screen.
ᕤNEXT PAGE key advances to the next screen.
ᕥPRINT PAGE key prints the current screen.
ᕦSTORE key stores the currently selected settings as defaults.
PARAMETER DESCRIPTION VALUE PARAMETER DESCRIPTION VALUE
FETAL RATE ALERT OFF ECG RATE ALARMS (INFANT) NO SHIFT
• HIGH RATE 180 TOCO SENSITIVITY MEDIUM
• LOW RATE 84 ECG PLOT ON
FETAL ECG WAVEFORM ON ECG EDIT OFF
• FECG WAVEFORM SIZE 1.00 EXTERNAL DEVICE NONE
• FECG SWEEP SPEED 25 PRINT PERIOD 10
Enable/Disable Fetal Rate Alert
ᕦᕥᕢᕣᕡᕤ
STORE
SELECT PARAMETER
CURSOR CURSOR
CHANGE VALUE PAGE X OF X
PRINT
PAGE
NEXT
PAGE
PREV
PAGE

Ultraview Care Network
15-24
Setting User-Defined Default Values
Use the User Settings screens to change and store settings. If the setting for the
selected parameter cannot be changed, the message THIS SETTING CANNOT
BE CHANGED will be displayed.
The ability to access the Module Configuration Manager screens can either be
visible to all users or remain hidden. The factory default setting is INVISIBLE.
Adjust the SYSTEM SETUP key to the VISIBLE setting to enable user access to
this function.
Storing Changed Settings
Touch the STORE key after entering configuration changes for any page. This
action stores the currently selected settings for all entries.
The Patient Admit/Discharge function allows you to SAVE the changes in the
alarm limit settings as the default settings for future patients, or RESTORE the
original default settings upon discharge of that patient or admission of a new
patient.

Fetal Monitoring
15-25
Parameter Configurations
Table 2: Fetal Parameter Configuration
Parameter Available User
Settings
Factory
Defaults
User
Settings
Fetal Rate Alert On/Off Off
High Rate Limit 160-210 bpm 180 bpm
Low Rate Limit 70-130 bpm 84 bpm
FECG Waveform On/Off On
FECG Waveform Size 0.10-2.00 1.00
FECG Sweep Speed 25 or 50 mm/sec 25 mm/sec
Twin Shift Auto/Manual/No shift No shift
Toco Sensitivity High/Medium/Low Medium
ECG Plot On/Off On
ECG Edit On/Off Off
External Device None/Nellcor FSpO2None
Print Period 1- to 60-minutes 10-minutes
Chart Recorder On/Off On
Speed 1, 2, or 3 cm/minute 3 cm/minute
Heat 1/2/3 2
Alignment 0-10 3
Scale USA/INTL USA
Variability Plot On/Off On
FHR1 Audio Level Off, 50% - 100% 75%
FHR2 Audio Level Off, 50% - 100% 75%
Patient Name Source Auto/Manual Auto
Time/Date Format USA/INTL USA
CIM Protocol A/B A
CIM Baud Rate 9.6k/19.2k 9.6k
Modem ID 0-255 0
Simulator On/Off Off
Begin Address 0-127 0
End Address 0-127 0
Increment 1-63 0
System Setup Key Visible/Invisible Invisible
Patient Admit/Discharge Save/Restore Restore
To review or change settings:
1Touch FETAL.
2Touch SETUP.
3Touch the hidden key 3 times.
4Touch DEFAULT STORAGE.
5Touch USER SETTINGS.
6Use CURSOR↑ and CURSOR↓
to scroll through the parameter
description list.
7Use ↑ and ↓ to change the
settings.
8Touch NEXT PAGE to continue
to next screen of parameters.
9Touch STORE to save the new
settings.
10 Touch YES when the Yes/No
message is displayed.

Ultraview Care Network
15-26
Telemetry Option
Each fetal monitor can be equipped with a fetal telemetry system to provide
continuous monitoring of an ambulatory patient. The patient carries a small
transmitting device that transmits signals to the fetal monitor for recording. The
fetal telemetry system transmits ultrasound, Toco, and nurse call information to a
corresponding receiver connected to the fetal monitor.
Fetal Monitor Telemetry Operating Instructions
1. Open the battery compartment and install a fresh 9-volt alkaline battery.
2. Insert the antenna into the antenna jack on the transmitter.
3. Ensure that either the whip antenna or extended range antenna system is
attached to the fetal monitor. The whip antenna should be extended at least
two sections.
4. Power ON the transmitter.
5. Apply the ultrasound transducer and toco transducer. (Refer to Ultrasound
Transducer Preparation and Application on page 15-7 and Toco Transducer
Preparation and Application on page 15-9.) The data from the telemetry unit is
transmitted to the fetal monitor for display and printing on the strip chart.
6. The unit is supplied with headphones that allow the patient to listen to the fetal
heart sounds. The patient should continually hear fetal heart sounds through
the earphones. She should be instructed to move the ultrasound transducer
slightly if the sound quality diminishes. If unable to reestablish the heart
sounds, the patient should notify her clinician.
7. When the red Nurse Call button on the transmitter is pressed, an audible tone
emits from the fetal monitor. To cancel the tone, touch the F-ALERT RESET
key on the Fetal Main menu.
Table 3: Fetal Alert Attributes
Alarm Type Tone Type Alarm Recording Alarm Watch
Available User
Settings
Factory Defaults
User Settings
Available User
Settings
Factory Defaults
User Settings
Available User
Settings
Factory Defaults
User Settings
Fetal Heart
Rate Alert Medium Medium N N Y/N N

Fetal Monitoring
15-27
Mermaid Option
The Mermaid option is designed to enhance the birthing experience for mothers
who require continuous monitoring but would like to relax in a shower or tub, or to
move around without being “tethered” to a monitor. The patient wears a small
transmit badge that is attached to the waterproof ultrasound and toco transducers
by a short cable. Mermaid differs from telemetry in that the transmission of the
fetal heart rate and uterine contractions take place through infrared technology
rather than radio frequencies. The transducers run on batteries that will operate
for 8-hours (typical) before batteries must be changed. Recharge time is about
one hour. You may have some minor interference from lights in the patient’s room,
or the patient may move beyond the range of the system. If this should happen,
either move the receiver to a location with a better view of the patient, or have the
patient move closer to the antenna.
Monitoring Procedure
1. Make sure that the Maternal Obstetrical Monitor is attached to the Mermaid
receiver system. The connector is located on the right side panel of the
Maternal Obstetrical Monitor.
2. Attach a battery pack (a) to the Mermaid toco transducer by aligning the ridge
with the transducer cable connector (b). The battery pack should fall into the
transducer element with a noticeable movement.
!
• When the transmitter is powered ON, it should emit a short tone
to indicate that the battery is good. If the battery is low, the
transmitter emits a steady tone until depleted. Replace the
battery if the transmitter is emitting a steady tone or is depleted.
• If the patient exceeds the receiving range, the signal may be
weak or may drop out. The patient should return to within range
of the fetal monitor.
• Certain locations may require that the whip antenna be fully
extended to enhance reception.
• Each telemetry unit (transmitter) operates on a specific radio
frequency and is uniquely paired with a receiver internal to the
fetal module. These must remain together to operate properly.

Ultraview Care Network
15-28
Figure 15-16: Wireless transducer Mermaid system
3. Twist the battery pack clockwise slightly to lock it into the Toco transducer.
Repeat the procedure for the Mermaid ultrasound transducer.
4. Pin the transmit badge (c) to the patient’s clothing (preferably at shoulder
level) with the clasp or use the necklace provided. Clothing or blankets must
not cover the badge.
5. Attach either of the blue connectors (d) on the transmit badge to the Mermaid
Toco transducer.
6. Position the Mermaid Toco transducer on the patient’s abdomen using the
same technique as conventional transducers. Refer to Toco Transducer
Preparation and Application on page 15-9 for more information.
7. Attach the other blue connector (d) on the transmit badge to the Mermaid
ultrasound transducer.
8. Position the Mermaid Ultrasound transducer using the same technique as
conventional transducers. Refer to Ultrasound Transducer Preparation and
Application on page 15-7 for more information.
9. When the monitoring session is finished, remove the battery packs and the
transmit badge from the transducers. Follow hospital procedures for cleaning
the equipment. Refer to Cleaning and Sterilization on page 32-1.
10. Store the transducer elements and transmit badge in the compartment in the
rear of the recharger unit.
11. Store the battery in the charger by following the steps outlined below.
CAUTION:
• Patients wearing Mermaid transducers should not wander
into areas where another Mermaid system is operating.
This would interfere with the other patient’s data.
b
d
c
a

Fetal Monitoring
15-29
Recharging Batteries
1. The battery packs are enclosed in the top half of the Mermaid ultrasound and
Toco transducers (Figure 15-17). To remove the packs (a) from the transducer
elements, twist the pack counterclockwise. There will be a noticeable
movement. Simply pull the battery pack to disengage.
2. Insert a battery pack (a) in the docking station (e) on the recharger by aligning
the ridge with the red dot. The battery pack should fall into the docking station
with a noticeable movement.
Figure 15-17: Wireless transducer Mermaid system
3. Twist the battery pack clockwise slightly to lock it into the docking station. The
bottom of the transducers do not need to be charged and should be stored
along with the transmit badge in the compartment located in the rear of the
recharger unit (f).
!
• Thoroughly dry the battery pack before inserting it into the
charger.
• The Mermaid battery charger may be used in the patient vicinity
if it is powered by one of the following certified, medical-grade,
power supplies:
- Ault, Model SW172; Rated Input: 100-240VAC, 0.75-0.35A,
50/60Hz; Rated Output: 12VDC, 2.75A (P/N 010-1554-00)
- Ault, Model VM100AMB1203B01; Rated Input: 100-250VAC,
0.3A, 50/60Hz; Rated Output: 12VDC, 0.85A (P/N 1043900-
108)
• These power supplies are designated Class I by the applicable
safety standards. Medical-grade, grounded outlets and power
cords are required to ensure patient safety margins.
• Three lights indicate a full charge and 8-hours (typical) of
operation. Two lights indicate that 2-hours (minimum) of
monitoring time is left. One light indicates that less than 2-hours
of monitoring time is left. When the one light starts to flash, less
than 15-minutes of battery capacity is left.
c
f
e
h
gi
a

Ultraview Care Network
15-30
4. The amber light (g) on the recharger unit indicates that the battery pack is
being charged. A green light (h) indicates that charging is complete. It may
take up to one hour to reach a full charge. The battery packs may be left on
the charger when the transducers are not in use.
5. Each battery pack has three green lights (i) to indicate the remaining charge.
The lights automatically power ON whenever the battery pack is attached to
the transducer or is being charged.
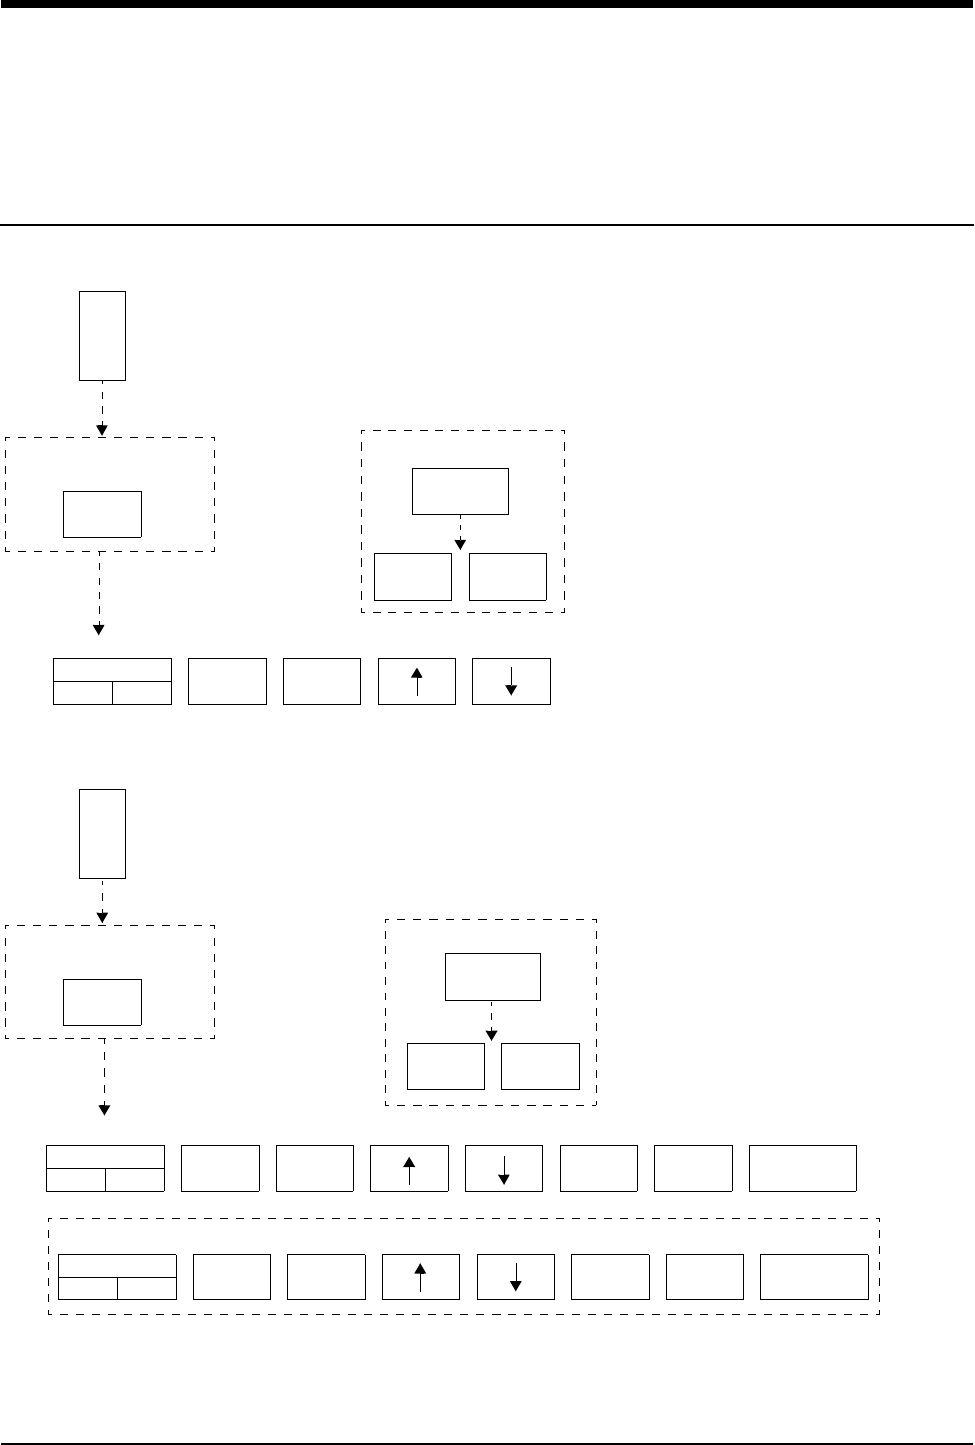
16-1
!
• Based on features purchased, more or fewer keys may appear here than on your menu screens.
Temperature Directory
Directory of Keys
ALARM
LIMITS
HI=
OFF
LO=
OFF
HI=
OFF
LO=
OFF TEMP 1 TEMP 2 DELTA
TEMP
One Temperature
TEMP - ALARM LIMITS
TEMP - ALARM LIMITS
TEMP MENU
ALARMS
ON OFF
ALARMS
ON OFF
RESTORE
SETTINGS
YES NO
RESTORE
SETTINGS
HI=
OFF
LO=
OFF TEMP 3 TEMP 4 DELTA
TEMP
ALARMS
ON OFF
Alternate key display
YES NO
keys may not be displayed
keys may not be displayed
keys may not be displayed
T
E
M
P
ALARM
LIMITS
TEMP MENU
keys may not be displayed
ALARM
LIMITS
TEMP MENU
keys may not be displayed
T
E
M
P
Two Temperatures (same module)


Contents
16-3
Overview . . . . . . . . . . . . . . . . . . . . . . . . . . . . . . . . . . . . . . . . . . . . . . . . . . . . . . 3
Setting Up Temperature Monitoring. . . . . . . . . . . . . . . . . . . . . . . . . . . . . . . . . . 3
Display Detail. . . . . . . . . . . . . . . . . . . . . . . . . . . . . . . . . . . . . . . . . . . . . . . . . . . 4
Setting or Adjusting Temperature Alarm Limits . . . . . . . . . . . . . . . . . . . . . . . . . 5
Recording Temperatures . . . . . . . . . . . . . . . . . . . . . . . . . . . . . . . . . . . . . . . . . . 5
Restoring User-Defined Settings . . . . . . . . . . . . . . . . . . . . . . . . . . . . . . . . . . . . 5
Temperature Troubleshooting Guide. . . . . . . . . . . . . . . . . . . . . . . . . . . . . . . . . 6
Temperature
Overview
Either one or two temperature inputs can be monitored. Whenever two
temperatures from the same module are monitored, a delta value (temperature
difference between the two readings) is calculated.
Temperatures are displayed in degrees centigrade only. You can set independent
high and low alarm limits for each temperature, and the delta temperature.
Setting Up Temperature Monitoring
Attach the temperature probe(s) to the patient and then to the module. The TEMP
key and temperature values now appear on the monitor screen. Touch TEMP to
display the Temperature menu.
!
• You can define your own default settings for alarm limits. Refer
to Setting User-Defined Default Values on page 7-7 for further
details.
To set up temperature
monitoring:
1Attach the temperature probe(s)
to the patient.
2Plug the temperature probe(s)
into the module.
3Touch TEMP.
4Select additional keys as
needed during monitoring.

Ultraview Care Network
16-4
Display Detail
Temperature readings appear on the monitor screen as soon as you plug a
temperature probe into the module.
Figure 16-1: Temperature display
ᕡTemperature parameter key
ᕢSingle channel temperature reading
ᕣTemperature label
ᕤHigh and low temperature alarm limits
ᕥTwo temperatures (T1/T2 or T3/T4)
ᕦDelta temperature (DT)
ᕧStatus of temperature alarms
!
• When alarm limits are set on more than one temperature, the
alarm limits for only one temperature will be displayed. To view
the alarm limits, touch TEMP, then ALARM LIMITS, then select
the TEMP 1, TEMP 2, TEMP 3, TEMP 4, or DELTA TEMP key.
38.0oC
38.5
37.5
T
E
M
P
ᕢᕡᕣ
T
E
M
P
T1 ON
T2 ON
DT OFF
ᕤ ᕥ
38.0oC
35.1T1
T2
DT
2.9 ᕧ
T1
ᕦ

Temperature
16-5
Setting or Adjusting Temperature Alarm
Limits
High and low alarm limits can be set for T1 (T3), T2 (T4), and the temperature
difference (DT) between two temperatures.
The factory default settings for high and low temperature alarms are 37.5°C and
36.5°C. Refer to Default Alarm Limits on page 2-3 for details on system alarm
operation.
Recording Temperatures
You can send currently displayed temperature readings to a bedside recorder or
system printer. Refer to Printing on page 4-5 for an overview of system printing
information.
Restoring User-Defined Settings
With the Restore Settings feature, you can restore the user-configurable settings
to the defaults previously stored as user settings. User-configurable settings are
listed in Setting User-Defined Default Values on page 7-7.
!
• RESTORE SETTINGS changes the user-configurable settings
for all parameters in the module.
To set or adjust alarm limits
1Touch TEMP.
2Touch ALARM LIMITS.
3Select TEMP 1, TEMP 2,
TEMP 3, TEMP 4, or
DELTA TEMP.
4Select ALARMS ON.
5Select HI= or LO=.
6Use arrow keys to adjust limit.
To print a strip chart of current
temperature readings:
1Touch RECORD.
2Touch TEMP while it flashes.
To restore user-defined settings:
Configurations with ECG
1Touch ECG.
2Touch SETUP.
3Touch RESTORE SETTINGS.
4Select YES.
To restore user-defined settings:
Configurations without ECG
1Touch TEMP.
2Touch RESTORE SETTINGS.
3Select YES.

16-6
Temperature Troubleshooting Guide
Clinical Situation Possible Cause Solution
Intermittent or no operation ■Module error. ■Call a qualified service person.
Temperature not displayed ■Module not inserted correctly. ■Reinsert the module.
■Probe not connected to module. ■Reconnect the probe.
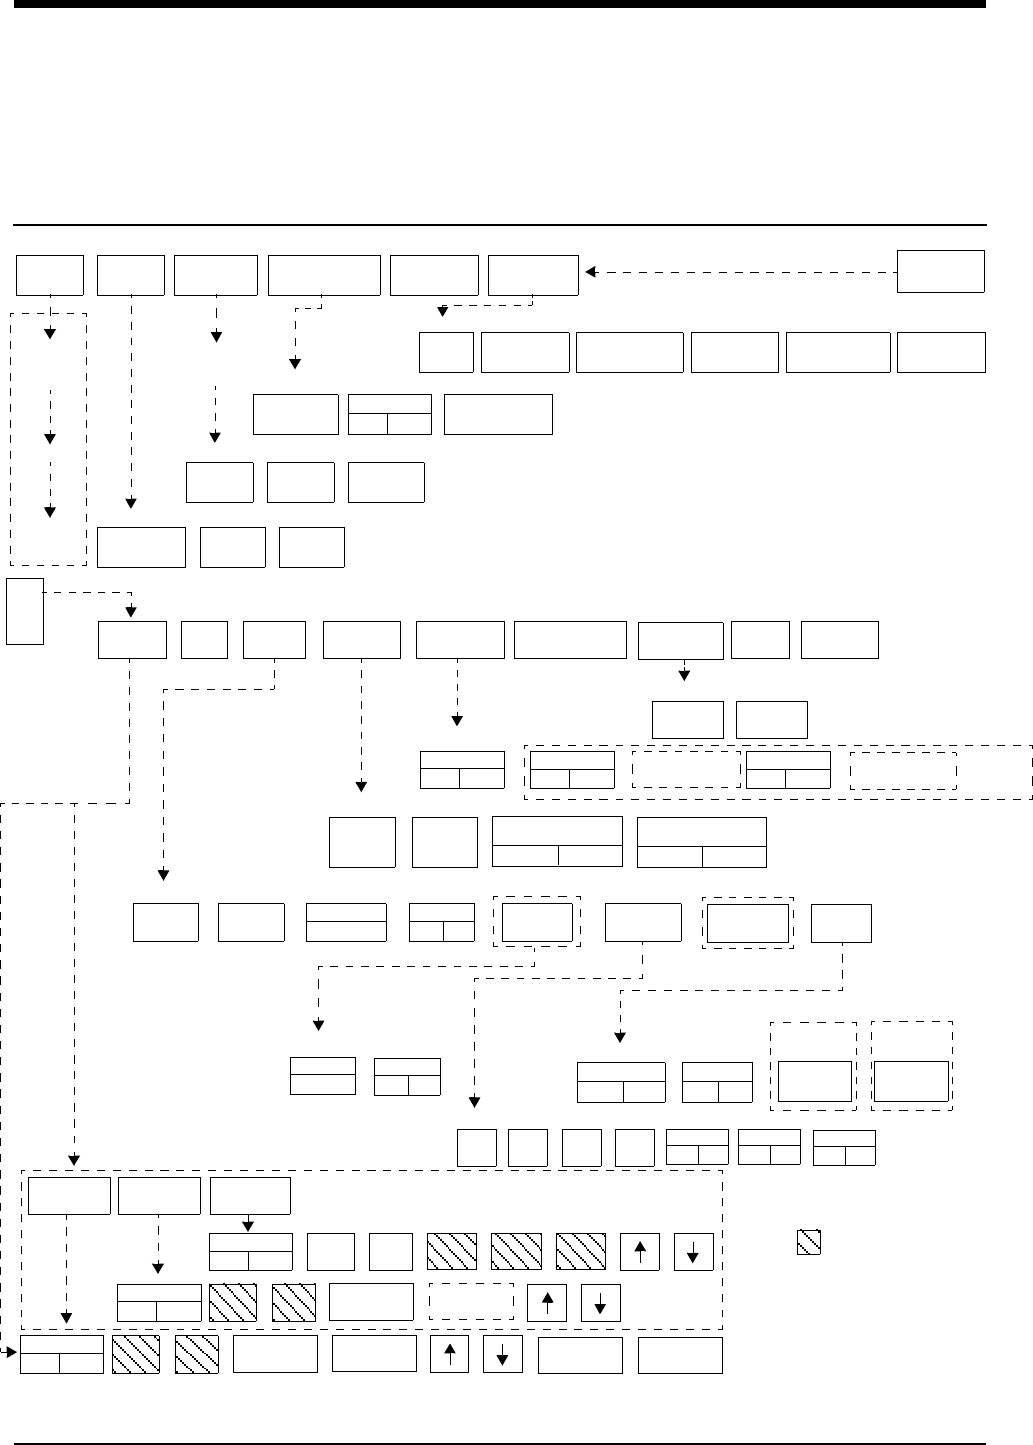
17-1
Digital Telemetry Directory
Directory of Keys
SCREEN
FORMAT TONES MONITOR
CONFIG.
PRIVILEGED
ACCESS.
MONITOR
SETUP
BRIGHTNESS
ADMIT CHANGE
DATA DISCHARGE
TIME/
DATE
REMOTE
ALARMS
ALARM
WATCH
KEY
TONE
CLINICAL LEVEL: Select Parameter
MONITOR CONFIGURATION
ADMIT/DISCHARGE - Select Function (see Admit/Discharge)
MONITOR SETUP - Select type of tone to change (see Alarms)
MONITOR SETUP
E
C
G
CLEAR
MEMORY
SAVE
MEMORY
ECG - RELEARN
2nd LEAD
ON OFF
RATE
SOURCE
SWEEP
SPEED
QRS MONITOR PACED
YES NO CONFIG**
TONE EXTENDED
ADULT
INFANT
Select primary heart rate source
ECG - CHANNEL FORMAT
ECG - SETUP
ECG - CONFIG
ALARM
LIMITS SIZE SETUP LEAD
SELECT
CHANNEL
FORMAT **
SUSPEND
PROCESSING PRINT
ECG MENU - (Multi-Lead) (Multiview II option with Arrhythmia and Review ON - used with 90341/90343/90347 transmitter)
REVIEW
2nd LEAD
xx
1st LEAD
xx ON OFF
ECG ART UA SPO2
Enable alternate rate source(s)
ARR
ON OFF
UA
ON OFF
ART
ON OFF
SPO2
ON OFF
TM
SETUP
RESTORE
SETTINGS**
AUTO LEAD SWITCH
ASSIGN
TM BED
PT RECORD
YES NO
LO BAT
ON OFF
SET TM
CHAN
ECG - TM SETUP **
Central
only **
Bedside
only **
Bedside
monitors only
select bed
(or subnet,
then bed)
RELEARN
SpO2
ON OFF
NIBP
ON OFF
SpO2(IABP)(NEO)
(RATE)(AVG)
90343 only
ECG ALM
ON OFF
ST LIMITS
CH 1
ABN IN
ROW=XX
ABN PER
MIN=XX
ST LIMITS
CH 2
ABN IN
ROW=XX
HI=
XXX
LO=
XXX
SPO2 ALM
ON OFF
ALM DELAY
=XXs
MSG ALM
DELAY =XXs
HI=
XXX
LO=
XXX
NIBP ALM
ON OFF
HI=
XXX
LO=
XXX
NIBP ACTIVE
(NO CABLE)
SPO2 ALARM
LIMITS
NIBP ALARM
LIMITS
LIMITS
90341,
90347
(and
90343
with
SpO2
and
NIBP
turned
OFF)
90343
select ECG 1
Select
zone
waveform
select bed
(or subnet,
then bed)
RECORDER
DESTINATION
ECG - LEAD SELECT
ON OFF
SINGLE LEAD ALARM
ECG ALARM
CLOCK
ON OFF
ACTIVATE
SCREEN SAVER
PRESELECTED
RECORDINGS
UNITS OF
MEASURE
USER ACCESS
ENABLE
ALARM
SETUP
ADMIT/
DISCHARGE
MPT=ON *
90343 only MPT=ON *
* Multi-parameter Telemetry (MPT):
required settings in
Module Configuration Manager
DIA MEANSYS Limit keys will flash on alarm
** Not shown in Remote Views
RECORDER
CONFIG.
CONTRAST


Contents
17-3
Digital Telemetry
General Telemetry Overview
The 90478 digital telemetry receiver module, when used in conjunction with
Spacelabs Medical telemetry transmitters, an Ultraview monitor, and 90479-A
modular receiver housing, provides continuous monitoring of electrocardiographic
signals in order to detect abnormal cardiac rhythms, including asystole, ventricular
fibrillation, and ventricular tachycardia. In addition, when used with the 90343
digital telemetry multi-parameter transmitter and the 90217 Ambulatory Blood
Pressure (ABP) monitor, monitoring of electrocardiographic signals is augmented
by the availability of continuous or episodic SpO2 measurements and episodic
noninvasive blood pressure (NIBP) measurements.
One operational mode is available with the 90343 and the 90347 multi-lead
transmitters. When all electrodes are connected to the patient, leads I, II, III, AVR,
AVL, AVF, and Vx are available. When no chest lead is applied, leads I, II, III,
AVR, AVL, and AVF are available using the remaining connected electrodes.
ECG monitoring in telemetry is identical to hardwired ECG monitoring. Refer to
ECG Setup on page 8-4 for more information.
For more information on SpO2 and NIBP monitoring refer to Setting Up SpO2
Monitoring on page 14-4 and Multiparameter Telemetry (NIBP) on page 17-17.
General Telemetry Overview . . . . . . . . . . . . . . . . . . . . . . . . . . . . . . . . . . . . . . . 3
Multiparameter Telemetry Overview . . . . . . . . . . . . . . . . . . . . . . . . . . . . . . . . . 5
Intended Use . . . . . . . . . . . . . . . . . . . . . . . . . . . . . . . . . . . . . . . . . . . . . . . . . . . 6
Transmitters. . . . . . . . . . . . . . . . . . . . . . . . . . . . . . . . . . . . . . . . . . . . . . . . . . . . 6
Selecting Options for the 90341 Lead Display. . . . . . . . . . . . . . . . . . . . . . . . . . 8
Cleaning. . . . . . . . . . . . . . . . . . . . . . . . . . . . . . . . . . . . . . . . . . . . . . . . . . . . . . 10
Digital Telemetry Receiver Module . . . . . . . . . . . . . . . . . . . . . . . . . . . . . . . . . 10
Display Detail. . . . . . . . . . . . . . . . . . . . . . . . . . . . . . . . . . . . . . . . . . . . . . . . . . 12
Assigning a Telemetry Channel. . . . . . . . . . . . . . . . . . . . . . . . . . . . . . . . . . . . 14
Tuning a Telemetry Receiver. . . . . . . . . . . . . . . . . . . . . . . . . . . . . . . . . . . . . . 14
Entering Patient Information . . . . . . . . . . . . . . . . . . . . . . . . . . . . . . . . . . . . . . 15
Setting or Adjusting Alarm Limits. . . . . . . . . . . . . . . . . . . . . . . . . . . . . . . . . . . 15
Acknowledging Signal Loss . . . . . . . . . . . . . . . . . . . . . . . . . . . . . . . . . . . . . . . 15
Discharging a Patient. . . . . . . . . . . . . . . . . . . . . . . . . . . . . . . . . . . . . . . . . . . . 16
Setting Battery Status Alarms . . . . . . . . . . . . . . . . . . . . . . . . . . . . . . . . . . . . . 16
Controlling Patient-Initiated Recordings . . . . . . . . . . . . . . . . . . . . . . . . . . . . . 16
Telemetry Alarm Message Summary . . . . . . . . . . . . . . . . . . . . . . . . . . . . . . . 16
Multiparameter Telemetry (NIBP) . . . . . . . . . . . . . . . . . . . . . . . . . . . . . . . . . . 17
Setting or Adjusting Alarm Limits. . . . . . . . . . . . . . . . . . . . . . . . . . . . . . . . . . . 22
Displaying New or Previous Readings. . . . . . . . . . . . . . . . . . . . . . . . . . . . . . . 22
NIBP Alarm Message Summary . . . . . . . . . . . . . . . . . . . . . . . . . . . . . . . . . . . 22
NIBP Troubleshooting Guide . . . . . . . . . . . . . . . . . . . . . . . . . . . . . . . . . . . . . . 24

Ultraview Care Network
17-4
!
• Spacelabs Medical’s telemetry equipment complies with Part 15
and Part 95 of the FCC Rules and with RSS-210 of Industry
Canada and with requirements of other national spectrum
management authorities. Repeated here are operational
cautions for biomedical telemetry from the FCC Rules
(47CFR15.242(f)):
“Biomedical telemetry devices must not cause harmful
interference to licensed TV broadcast stations or to other
authorized radio services, such as operations on the
broadcast frequencies under subpart G and H of part 74 of
this chapter, land mobile stations operating under part 90 of
this chapter in the 470-512 MHz band, and radio astronomy
operation in the 608-614 MHz band. (See section 15.5). If
harmful interference occurs, the interference must either be
corrected or the device must immediately cease operation
on the occupied frequency. Further, the operator of the
biomedical telemetry device must accept whatever level of
intereference is received from other radio operations. The
operator, i.e., the health care facility, is responsible for
resolving any interference that occurs subsequent to the
installation of these devices.”
• Medical telemetry equipment is only for installation and use in
hospitals and health care facilities. It is not permitted for use in
vehicles that operate outside of the medical facility premises.
The user of this equipment is not authorized to make any
changes or alterations that could compromise the national
certifications.
• Operation of telemetry equipment in the 608 - 614 MHz, part of
the Wireless Medical Telemetry Service (WMTS) and in
authorized spectrum of each country, may be geographically
restricted by government regulation. Operation of this
equipment in U.S. WMTS bands requires coordination and
registration with the FCC designated frequency coordinator.
• Both the standard and limb lead modes for the 90341 work
correctly with or without the right leg electrode attached.
However, for optimum performance, the right leg electrode
should always be used.
• The RA lead wire for the 90343 and the 90347 must be
connected to the transmitter at all times. This lead wire also
serves as the transmitter’s antenna.
WARNING:
• Operating television receivers or other CRT displays near
the transmitter (within 2 to 3 feet), or operation of some
pacemaker programmers may suppress the ECG
waveform, preventing QRS detection and rate counting. An
erroneous asystole alarm may result.

Digital Telemetry
17-5
Multiparameter Telemetry Overview
The 90343 digital telemetry multiparameter transmitter sends NIBP data acquired
by the 90217 ambulatory blood pressure (ABP) monitor to the 90478 digital
telemetry receiver. The 90478 displays the patient’s episodic NIBP data and
trigger alarms based on thresholds set at the patient monitor. Refer to Setting Up
NIBP Monitoring on page 17-17 for information on configuring and using ABP
monitors with multiparameter telemetry.
The 90217 ABP monitor is a small, lightweight, battery-powered unit designed to
take blood pressure measurements. Refer to the 90207/90217 ABP Monitors
Operations Manual (P/N 070-0137-xx) and the 90121 ABP Report Management
System Operations Manual (P/N 070-0529-xx) for more detailed information on
this product, its initialization by a direct PC interface, patient preparation, and
event codes.
NIBP uses oscillometric monitoring to measure systolic (S), diastolic (D), and
mean (M) arterial blood pressures. The pressure readings are sent from the
90217 ABP monitor to the 90343 transmitter by a connecting cable. The 90343
transmitter includes the NIBP readings in the communications to the 90478
receiver using the radio frequency data link. NIBP measurements are checked to
eliminate the possibility of erroneous readings and valid measurements are
displayed on the monitor and stored for trending. The Ultraview monitor displays
valid measurements and the time the measurement was acquired. The most
recent reading is displayed by the Ultraview monitor. The most recent
120 readings are stored and may be displayed by the monitor.
!
• All system connections must be made by Spacelabs Medical
personnel only.
• Leakage currents are not affected by the high level output in the
90478. The patient is electrically isolated from the patient
monitor by the RF link.
• The 90217 ABP monitor is intended for use with adult patients
only and, when used with the 90343 Digital Telemetry
Transmitter, must also involve ECG monitoring.
• The ECG lead wires of the 90343 must be connected to the
patient in order to perform ECG, SpO2 and NIBP monitoring.
• The 90217 ABP monitor, when used with the 90343 Digital
Telemetry Transmitter, purges its measurements as they are
successfully sent. This operation differs from when the 90217
ABP monitor is used in a stand-alone manner and stores a
maximum of 240 NIBP readings and event codes.
• NIBP readings which are not successfully transmitted by the
90217 to the 90478 within 24-hours of their measurement are
unavailable for display or trending.
WARNING:
• Changes or modifications not expressly approved by
Spacelabs Medical will void the user’s authority to operate
the equipment.
90217 ABP Monitor

Ultraview Care Network
17-6
Intended Use
As an option, on adult patients, additional abnormal cardiac rhythms, such as
ventricular runs, tachycardia, and ST segment deviations can be detected. The
Ultraview Digital Telemetry System also provides a means for the episodic
monitoring of NIBP signals to detect abnormal events such as high and low blood
pressure. Finally, it provides a means for both continuous and episodic monitoring
of blood oxygen saturation signals in order to detect oxygen desaturation caused
by abnormal pulmonary/circulatory functions.
The Spacelabs Medical 90341, 90343, and 90347 Ultraview Digital Telemetry
Systems are intended for use with either adult or neonatal patients in a hospital
environment. When the NIBP option is selected in the 90343 configuration, the
NIBP feature is to be used with adult patients only.
Transmitters
The transmitter is a small, battery-powered device carried by the patient that
monitors ECG activity and SpO2/NIBP (90343 only) data, and transmits this
information to the telemetry receiver module.
• The 90341 transmits two leads of ECG and uses up to five lead wires. Two
leads may be displayed simultaneously.
• The 90343 and 90347 transmit four leads of ECG and use up to five lead
wires. However, only two leads may be displayed simultaneously.
• The 90343 is also capable of transmitting numerical NIBP and SpO2 data.
This data is displayed simultaneously with that of the ECG waveform data.
Each telemetry channel requires its own transmitter operating on a unique radio
frequency. Channel receivers are tuned from the Ultraview monitor touchscreen to
receive the available transmitter frequencies.
!
• Episodic monitoring of NIBP values and continuous and
episodic monitoring of blood oxygen saturation values are only
supported in conjunction with ECG monitoring. SpO2 and NIBP
alarms are inhibited by ECG leads-off condition.
WARNING:
• The Ultraview Digital Telemetry transmitters are
contraindicated for use with other medical instrumentation
(e.g., respiration monitors using impedance
pneumography, electrocautery, etc.) that source electrical
current through the patient. Further, telemetry monitoring
is contraindicated for the Operating Room environment.
!
• Operation of this equipment may be subject to licensing
requirements by your local telecommunications authority.
Please check with your Spacelabs Field Service Engineer.

Digital Telemetry
17-7
Up to five standard disposable silver/silver chloride chest electrodes are
connected to the patient. The ECG lead wires are attached to these electrodes
and connected to the transmitter. A patient-operated RECORD button initiates an
ECG strip at the system printer, if this feature is enabled at the central or bedside
monitor.
WARNING:
• Medical telemetry spectrum allocations may be assigned
to frequencies already allotted to other priority users. This
means that telemetry operations may be exposed to radio
frequency interference that may disrupt or impede
telemetry patient monitoring during the life of this
equipment. You are urged to regularly consult with
applicable local and federal regulatory agencies (e.g., FCC,
FDA, etc.) regarding the locations and frequencies of other
spectrum users in your geographic area. A Spacelabs
Medical field service engineer may be able to assist you in
reconfiguring your equipment frequencies to reduce the
risk of interference. Spacelabs Medical cannot, and does
not, guarantee interference-free telemetry operation.
CAUTION:
• This device has a limited bandwidth range of .05 to 30 Hz,
which may adversely affect the recording of high
frequency components in the ECG signal, especially when
the morphology of the ECG changes rapidly.
• This device has a limited dynamic range of ±4 mV, which
may render the device vulnerable to saturation by ECG
signals with amplitudes higher than 4 mV.
• To clean the transmitter, use only the following solutions
per the manufacturer’s labeling: isopropyl alcohol (70%),
hydrogen peroxide, Cidex, Betadine, and Clorox. Use of
cleaning solutions other than those listed will VOID the
warranty of the digital telemetry transmitter cases.
• Patients should not use any type of electronic equipment
(e.g., portable radios, cellular telephones, pagers, personal
computers, etc.) while connected to any medical electronic
device without in-situ evaluation by the biomedical
engineering staff.
• Use of 2-way radio equipment and other personal
communication devices must be evaluated in-situ to
assess the potential for disruption of monitoring.
!
• Clean the transmitter after each use. The transmitter does not
require any preventive maintenance other than cleaning.

Ultraview Care Network
17-8
Selecting Options for the 90341
Lead Display
There are two operational modes available with the 90341 dual-lead transmitter:
(1) the standard mode which offers a choice of one V lead (V1-6), plus lead II, or
(2) the limb lead mode which offers choices of the leads I, II, III, AVR, AVL, or
AVF. The standard mode is available if the chest lead is applied. The limb lead
mode is available when there is not a chest lead applied. Loss of the chest
electrode changes the ECG - Lead Select menu to the limb lead mode if the left
arm, left leg, and right arm electrodes are intact. Refer to Patient Preparation and
Electrode Application on page 8-6 for lead placement illustrations.
!
• Both modes work correctly with or without the right leg electrode
attached. However, for optimum performance, the right leg
electrode should always be used.
Connected Electrodes
(X) Valid Lead Vectors
CLA LL RA
X X X X V1-6 and II (standard mode)
X X X III (standard mode)
X X X I (standard mode)
XX total lead failure
(standard mode)
X X X II (standard mode)
X X None (lead failure)
X X None (lead failure)
X None (lead failure)
X None (lead failure)
X None (lead failure)
X None (lead failure)
None (lead failure)
X X III (limb lead mode)
X X I (limb lead mode)
X X II (limb lead mode)
XX X
I, II, III, AVR, AVL, AVF
(limb lead mode)
!
• If one of the leads fails, a lead fault message will display in the
upper left corner of the waveform zone. If there is not a valid
lead vector, the message LEADS OFF displays and an alarm
tone sounds.

Digital Telemetry
17-9
Transmitter Batteries
A 9-volt alkaline battery is recommended for standard use in the digital telemetry
transmitter. A 9-volt lithium battery may also be used for applications requiring
more extended battery service life.
Always observe the battery position and polarity as illustrated at the bottom of the
battery compartment. After battery installation, close and latch the compartment
cover. The transmitter begins transmitting as soon as the battery is in place.
Battery Disposal
The 90341, 90343 and 90347 Ultraview Digital Telemetry transmitters are
operated by 9-volt, primary (non-rechargeable) batteries that must be properly
disposed of when discharged. The batteries specified may be of either alkaline or
lithium chemistry. Attempting to recharge these batteries is not recommended and
can result in leaking, venting, or explosion.
Disposing of used batteries may be subject to national, state/provincial, and/or
local regulation, which varies depending on jurisdiction.
Follow the battery manufacturer’s recommended handling procedure for both
types of batteries: Collect and transport the batteries in a manner that prevents
short circuit, compacting, mutilation, or any other physical abuse or electric
handling that would destroy their physical integrity. Exposure to high temperatures
or fire can cause the batteries to leak, vent, or explode.
The recommended disposal procedure for alkaline batteries is to transport them to
a hazardous waste landfill. Since these batteries may not be classified as
hazardous waste, they may be transported to the disposal facility as non-
hazardous waste.
The recommended disposal procedure for lithium batteries is to transport them as
hazardous waste to a hazardous waste facility. If the batteries are physically
sound, disposal of these discharged batteries in a hazardous waste landfill may
be permissible. If the batteries are leaking, cracked, opened, vented, or otherwise
not physically sound, they must be transported to a qualified hazardous waste
facility.
!
• Whenever the transmitter is not in use, the battery should be
removed. Insert a battery only when the transmitter is being
used with a patient.
• When the battery level falls below approximately 7.0 volts, the
low battery LED on the transmitter will flash once every
15-seconds. The LOW BATTERY message may appear after
the low battery LED on the transmitter begins to flash. When the
battery level falls below 6.0 volts, the low battery LED will flash
once every 2-seconds. When the battery level falls below
5.5 volts, the SpO2 and NIBP functions will shut down.
• The LOW BATTERY message appears and an alarm tone
sounds (if LO BAT is set to ON) when the transmitter battery
voltage falls below approximately 7.0 volts. When this message
appears, the transmitter has approximately 3-hours of operating
time left, depending on transmitter type, selected options, and
the type of battery.

Ultraview Care Network
17-10
Cleaning
The transmitter does not require any preventive maintenance other than cleaning
but should be cleaned after each use.
To clean the transmitter, use only the following agents.
• Mild soap and water solution
• U.S. Pharmacopoeia (USP) green soap
• Sodium hypochlorite solution (1:10 dilution of household bleach in water)
• Phenolic germicidal detergent solutions (1% aqueous solutions)
• Isopropyl alcohol solution (70%)
Digital Telemetry Receiver Module
The 90478 telemetry receiver module plugs into a bedside or transport monitor, or
into a digital telemetry module housing. The receiver module receives patient vital
signs data from the transmitter. This data is reconstructed by the receiver module,
displayed on the monitor and analyzed as described in ECG on page 8-3,
Arrhythmia on page 9-3, and ST Analysis on page 10-3. Refer also to SpO2 on
page 14-3.
Digital Telemetry Receiver Housing
The telemetry receiver housing can hold up to eight separate telemetry receiver
modules. Except for the ON/OFF switches, there are no operator controls on the
module housing. For normal operation with AC mains power applied, the AC
WARNING:
• Telemetry systems may be more susceptible to
interference than hardwired systems, which may impact
signal quality.
• Operation of hand-held, wireless telephone equipment
(cordless telephones, cellular telephones) near telemetry
systems may cause interference and should be
discouraged. While personal communication devices are
turned on, a separation of >6.5 feet (>2 meters) should be
maintained between personal communication devices and
interior walls, the patient cables, and any electronic
medical device to which the patient may be connected.
Patients should not use any type of electronic
communication equipment while connected to any
electronic medical device without an on-site evaluation by
the biomedical staff. Two-way radio equipment and other
personal communication devices must be evaluated on
site to determine if additional space limitations are needed.
• Do not install a telemetry receiver module into a bedside
that is currently equipped with any other ECG module,
hardwired or telemetry (or SpO2module or NIBP module, if
the 90343 is operating with that specific receiver module).
Doing so may cause inaccurate patient data displays at
remote monitors.
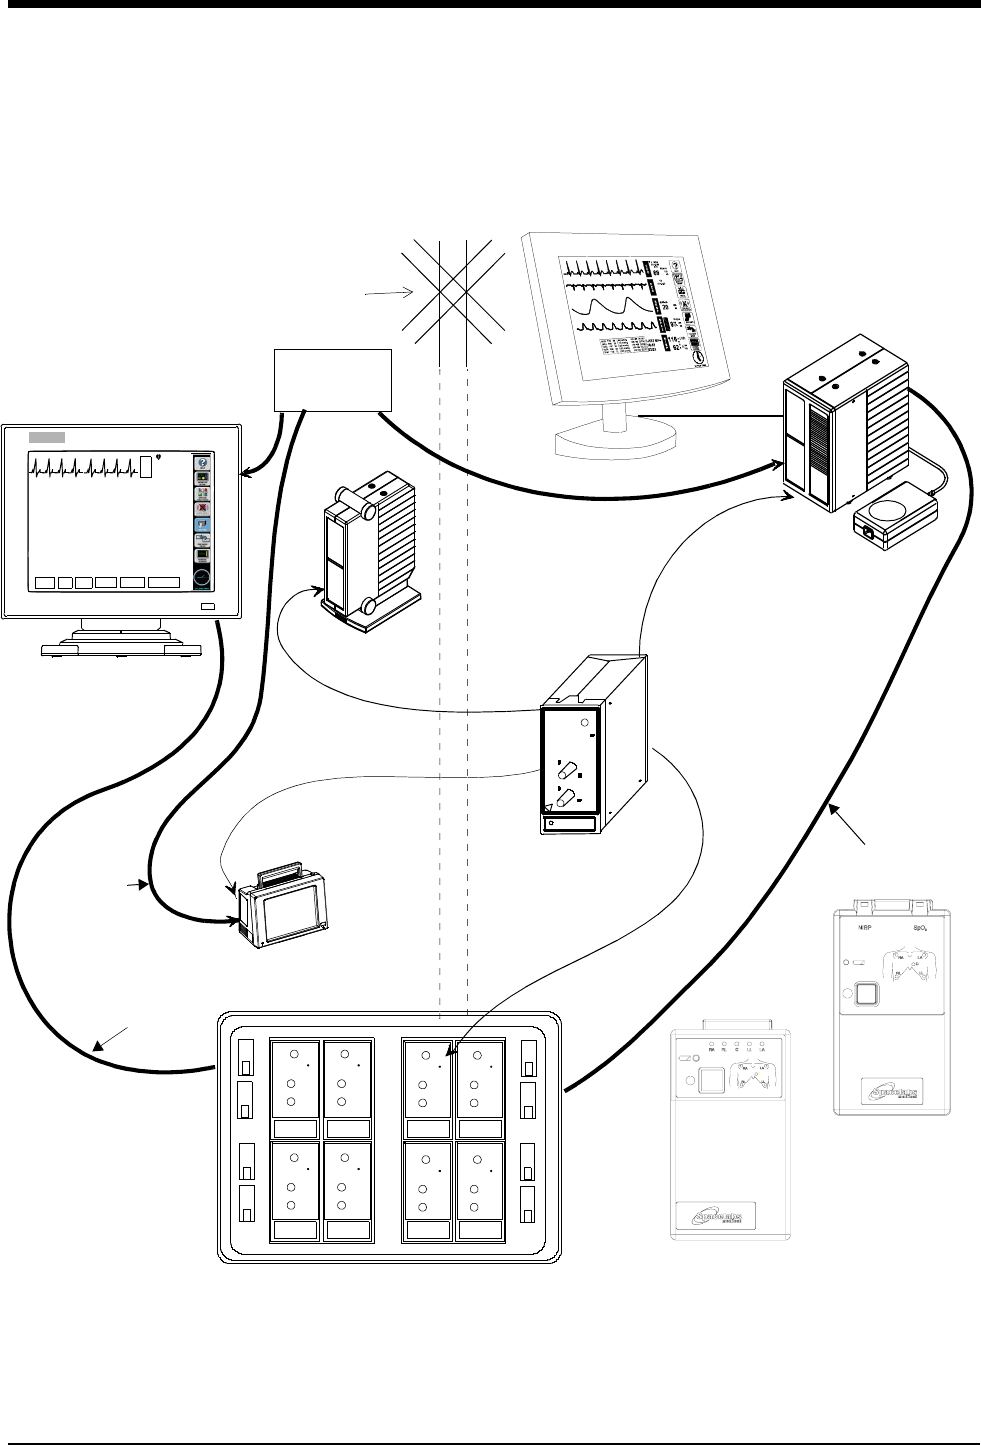
Digital Telemetry
17-11
mains indicator light on the front panel of the housing must be illuminated.
Operating the system without AC mains power is limited to 10-minutes of battery
backup time.
Figure 17-1: Ultraview digital telemetry system
Diversity
Antenna
System
Ultraview 1700
receiver module
Digital Telemetry Module Housing
SDLC
90479-A
90478-Q
E
C
G
VI
ST=0.00
A=3
70
HELP: Acce ss controls that pertain t o ECG
ECG MENU
ALARM
LIMITS SIZE SETUP LEAD
SELECT
CHANNEL
FORMAT
SUSPEND
PROCESSING
UCW bedside or central
remote module
90341/90347
SDLC
NOTE: The UCW bedside connects to
the remote module housing, and the
UCW central connects to the digital te-
lemetry module housing.
Digital Telemetry
Ultraview 1050/1030
Ultraview 1500 or
ECG Transmitter
housing
shown with flat
panel display
ETHERNET
HUB
10BaseT
Ethernet
Option
90343
Digital Telemetry
Multiparameter
Transmitter
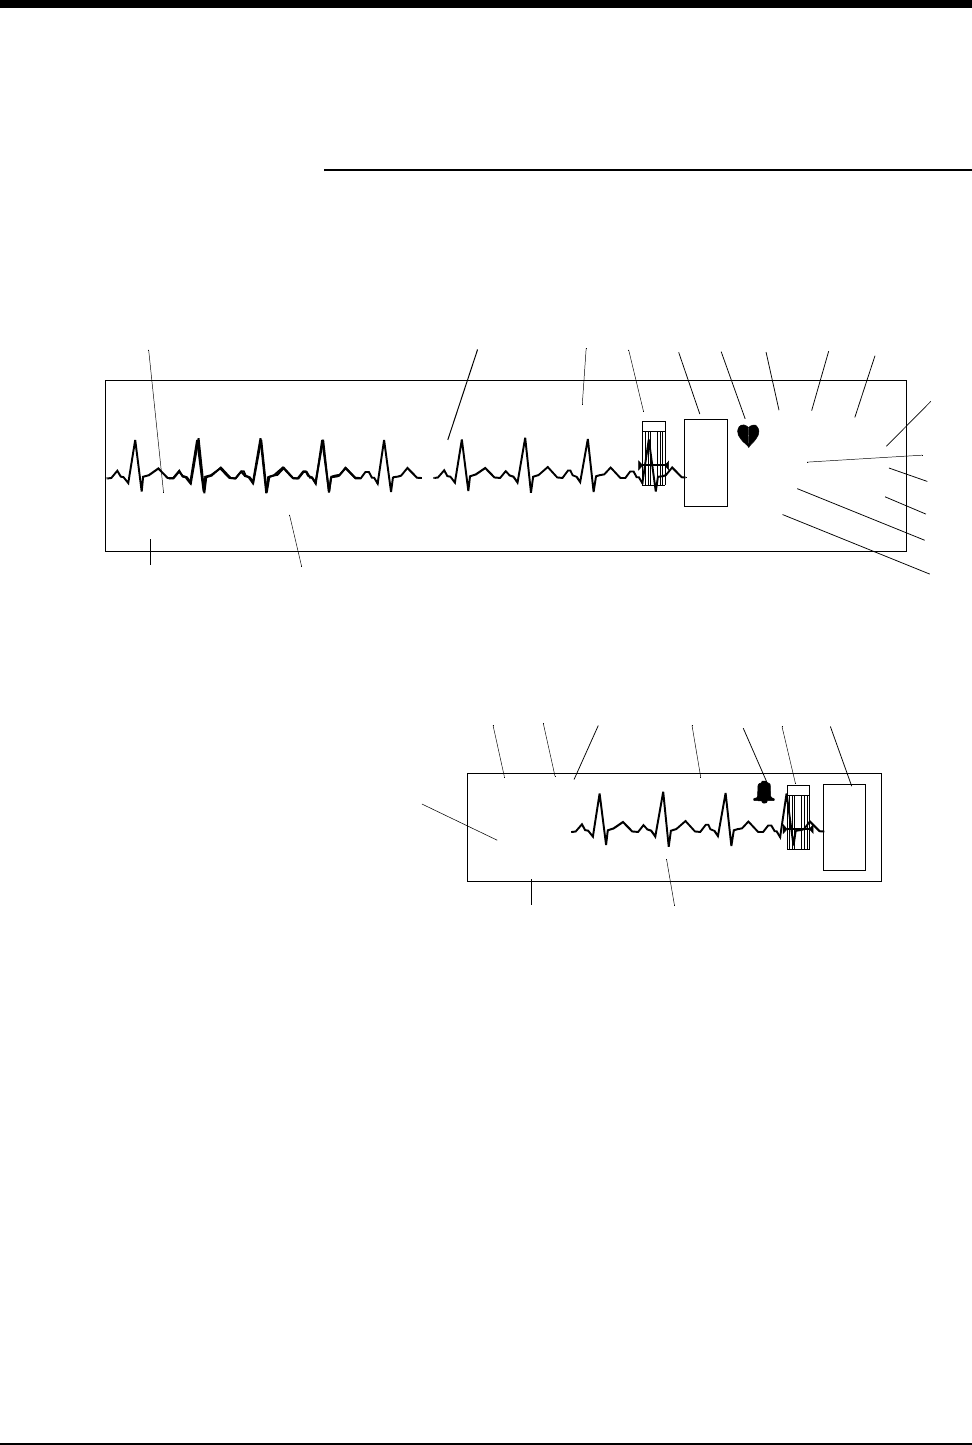
Ultraview Care Network
17-12
Display Detail
Signal detection is indicated on your monitor when an ECG signal appears next to
the ECG parameter key in the zone assigned to receive the transmitted telemetry
channel. The transmitter’s channel number is always identified above the
waveform, to the left of the ECG key.
Figure 17-2: Display zone — full screen
Figure 17-3: Display zone — split screen
ᕡECG trace for first lead
ᕢBed name
ᕣECG key for first lead
ᕤQRS indicator (flashes once per detected beat)
ᕥECG lead designator
ᕦDisplay resolution (monitor or extended)
ᕧPaced operation indication (pacemaker detection is enabled)
!
• Due to the similarity between ECG and Digital Telemetry
displays, the items described below are consistently numbered
in both chapters. Refer to Display Detail on page 8-9.
E
C
G
II MON PACED
ST=0.00
A=3
A/M 10
ROW 4
120
40
70
***
*
*
BED 01 DANIELS,R
ᕢ
ƽ
Ƹ
¹
¸
ᕩ
µ
ᕨ*
ᕧᕦ
ƾ
ᕤᕣƺƹᕡ
NIBP=120/68(94) 15:15 SpO2=98% 15:12
CHAN 2241
ᕥ
E
C
G
HR= 70 A=3 II
NIBP=120/68(94) 15:15 SpO2=98% 15:12
CHAN 2241
ᕣƺƹƸ ¹
BED 01 DANIELS,R
ᕢ
ᕥ
ƾ
ƽ
¸

Digital Telemetry
17-13
ᕨAbnormals per minute alarm limit *
ᕩST segment level for first lead**
(the asterisk indicates ST alarms are enabled)
µAbnormals in a row alarm limit *
¸ECG rate alarm limits. Split-screen central monitors display a bell symbol
when alarms are enabled; bedside monitors display the rate alarm limits
(120/40)
¹Abnormals per minute counter *
ƸCurrent heart rate
ƹTelemetry channel number
ƺSensorwatch signal strength indicator
Shaded area (waveform index, WFI) expands up proportionally to signal
strength; horizontal line indicates minimum signal level.
No shading (lowest waveform index) corresponds to no detected signal
strength or a faulty sensor.
ƻSpO2 level
ƼRefer to Display Detail in ECG (not used)
ƽNon-invasive blood pressure — systolic/diastolic (mean)
Equal sign becomes bell symbol when NIBP alarms are enabled
Hour and minutes of last reading
ƾSpO2 reading and time of last reading
Equal sign becomes bell symbol when SpO2 alarms are enabled
Hour and minutes of last reading
* Only appears with the Multiview I or II option in the adult mode with Arrhythmia
detection enabled.
** Only appears in adult mode with the ST segment analysis option.

Ultraview Care Network
17-14
Assigning a Telemetry Channel
Your central monitor can only display a telemetry channel after that channel has
been assigned a specific bed name. Refer to the steps to the left to assign a
specific bed name to a telemetry channel.
After a bed name is assigned, the central monitor may need to be configured to
display data associated with that bed name in a specific display zone. Refer to the
steps to the left to assign the bed to a specific display zone, if needed.
Tuning a Telemetry Receiver
A telemetry receiver module must be tuned to a transmitter’s assigned frequency
before it can receive data from that transmitter. Qualified personnel can use the
ECG TM SETUP menu to tune the receiver module.
!
• Your central monitor may be configured to remember beds that
are assigned to individual telemetry channels using the Module
Configuration Manager feature. These beds are permanently
assigned until you unassign or reassign them. Refer to Module
Configuration Manager on page 7-5 for more information.
!
• Telemetry transmitters have preassigned channel frequencies
(or numbers) that cannot be changed. The channel number is
identified on the back of the transmitter’s case.
• Only qualified personnel should tune telemetry receiver
modules to receive data from a telemetry transmitter. Telemetry
receiver modules must be used with a transmitter on the same
frequency.
• Qualified service personnel should set the telemetry
transmitter’s frequency band via the Module Configuration
Manager feature.
• Telemetry channel assignment is not accessible in REMOTE
VIEW displays.
To initiate telemetry ECG
monitoring:
1Select a transmitter.
2Note its channel number.
3Attach lead wires to transmitter.
4Attach lead wires to electrodes.
5Apply electrodes to patient.
6Install a transmitter battery.
7Close the transmitter case.
To set up the central for ECG (if
bed name not remembered):
1Touch key label that matches
transmitter’s frequency.
2Select bed/room number for
transmitter channel.
To set up the central for ECG
(MPT=OFF):
1Touch MONITOR SETUP.
2Touch SCREEN FORMAT.
3Select subnet and bed/room
number.
4Select ECG and then desired
zone.
To tune a receiver module:
1Touch ECG.
2Touch SETUP.
3Touch TM SETUP.
4Access the SET TM CHANNEL
menu.
5Select the digit to change. Use
the ↑↓ keys to select the value
for that digit.
6Repeat for all digits as
necessary.
7Touch STORE.

Digital Telemetry
17-15
Entering Patient Information
Refer to Admit/Discharge on page 3-3 for information on this subject.
Setting or Adjusting Alarm Limits
Alarm limits for multiparameter telemetry are adjusted the same way as the alarm
limits in other parameters. The only difference is that the multiparameter telemetry
requires you to select a specific parameter to adjust. Once that selection is made,
adjustments are made as described in Setting and Adjusting Alarms on page 8-
13, Setting and Adjusting Alarm Limits on page 13-7, and Setting and Adjusting
Alarm Limits on page 14-6.
Acknowledging Signal Loss
When a telemetry signal is lost because the transmitter is out of range or the
battery is removed, the receiver indicates this condition by replacing the normal
ECG waveform with the triangular squelch waveform. The text SQUELCH is
included in the annotation for any strip chart recording initiated during this period.
The ECG waveform is automatically displayed if the lost signal returns.
After 8-seconds of signal loss, the monitor displays the INTERMITTENT SIGNAL
LOSS message in the waveform zone and initiates the signal loss alarm. Select
YES to discharge the patient (refer to Discharging a Patient below), or select NO
to suspend this alarm.
WARNING:
•SpO
2 and NIBP data cannot be displayed when the
INTERMITTENT SIGNAL LOSS message is displayed.
• All monitors that display the telemetry channel display the
message IS SIGNAL LOSS PERMANENT? in the waveform
zone, but only the monitor that is hosting this telemetry
channel displays YES and NO keys below this message.
To set or adjust multiparameter
telemetry alarms:
1Touch ECG.
2Touch ALARM LIMITS.
3a Touch ECG ALARM LIMITS
-OR-
4a Touch NIBP ALARM LIMITS
-OR-
5a Touch SPO2 ALARM LIMITS.
6a For ECG and NIBP — Touch
HI = or LO = key.
6b For SpO2 — Touch HI=, LO=,
ALM DELAY, or MSG ALARM
DELAY (if present).
7Use the arrow keys to adjust.
To acknowledge signal loss,
select NO.

Ultraview Care Network
17-16
Discharging a Patient
The process of discharging a patient begins by removing the battery from the
transmitter. The monitor responds to this as described Acknowledging Signal
Loss on page 17-15.
The monitor that is hosting this telemetry channel displays keys labeled YES and
NO below this message (other monitors do not display these keys). Selecting NO
to this message (or any of the following messages) cancels the discharge
process, redisplays the IS SIGNAL LOSS PERMANENT? message, and cancels
the intermittent signal loss alarm.
Selecting YES to this message indicates that the signal loss is permanent and
continues the discharge process by changing the message to DISCHARGE THIS
PATIENT?. Select YES to continue the discharge process or NO to cancel the
discharge process.
If YES was selected, the message changes to PURGES DATA - ARE YOU
SURE?. Select YES a third time to discharge the patient, erase all patient data
from memory, and cancel the intermittent signal loss alarm. Touch NO to cancel
the discharge process.
Setting Battery Status Alarms
The telemetry battery alarm tone and a LOW BATTERY message displayed in the
ECG zone alert you to a low battery condition in the transmitter. You can disable
the low battery alarm tone if your bedside or central is configured to do so.
The factory default setting for this alarm is ON.
Controlling Patient-Initiated Recordings
If the Patient Record function is activated (PT RECORD is YES) in the ECG TM
SETUP menu, the patient may initiate a recording by pressing the RECORD
button on the front of the transmitter.
Telemetry Alarm Message Summary
The following are general telemetry messages and apply to the 90341, 90343 and
90347 transmitters.
INTERMITTENT SIGNAL LOSS
The intermittent signal loss message indicates that the patient may be out of
antenna range or the battery is depleted. Return the patient into antenna range.
Check that the battery is functioning properly. A low priority alarm tone sounds
after 10-seconds in this condition.
LOW BATTERY
A low battery message indicates that the battery is weak. After this message
appears, the battery has approximately 3-hours of useful life left (depending on
the type of battery used). Install a new battery. A low priority alarm tone sounds if
the SETUP menu’s LOW BAT ON/OFF key is set to ON.
To discharge a patient:
1Remove battery.
2Disconnect the transmitter from
the patient.
3Touch YES to confirm signal
loss permanent.
4Touch YES to discharge.
5Touch YES to purge data.
To control low battery alarms:
1Touch ECG.
2Touch SETUP.
3Touch TM SETUP.
4Select LO BAT ON or OFF.
To control transmitter’s Patient
Record function:
1Touch ECG.
2Touch SETUP.
3Touch TM SETUP.
4Select PT RECORD YES or
NO.

Digital Telemetry
17-17
SIGNAL INTERFERENCE
The signal interference message indicates, via the displayed triangle squelch
waveform, that an interfering signal has been detected. A signal can no longer be
detected because of interference from a stronger signal source lasting more than
0.5-seconds. A low priority alarm tone sounds whenever this message is
displayed in the waveform zone.
IS SIGNAL LOSS PERMANENT?
The permanent signal loss message indicates that no RF signal is being detected.
Multiparameter Telemetry (NIBP)
Setting Up NIBP Monitoring
Proper cuff selection and application is critical in ensuring the accuracy of NIBP
readings. To ensure proper cuff selection, first measure the circumference of the
limb at its midpoint. Match the limb measurement to the range of appropriate
circumferences (in centimeters) specified on each cuff. If the cuff bladder is too
wide for the patient, the reading will be falsely lowered; if it is too narrow, the
reading will be falsely elevated. Undersizing the cuff results in the greatest chance
of error, so a variety of cuff sizes should be available to accommodate your full
patient population.
Apply the cuff snugly. When the cuff is properly applied to an adult, you should be
able to insert one finger between the cuff and the arm. If you can insert two
fingers, the cuff is too loose, which may result in falsely elevated readings. Ensure
that the hose is not kinked when the cuff is applied.
During blood pressure measurement, the inflated cuff reduces blood flow to the
limb to which it is applied. Do not apply a cuff to a limb that has restricted blood
flow. Check the patient periodically.
!
• Do not apply a blood pressure cuff to a limb being monitored
with a pulse oximetry sensor, because SpO2 is affected during
NIBP readings. Avoid applying a cuff to a limb that has an
intravenous line in place. Do not apply a cuff to a limb that has
restricted blood flow.
• Use only single hose cuffs to ensure proper operation.
Spacelabs Medical’s hoses are non-conductive with respect to
defibrillator discharge effects.

Ultraview Care Network
17-18
Patient Factors Affecting Readings
Excess patient movement, speech, or muscle contractions as a result of severe
pain or shivering can interfere with automated NIBP readings. Ensure that the
patient is quiet and not moving during NIBP readings just as you would manual
readings. The patient must avoid applying external pressure to the cuff during
readings. Institute measures to minimize shivering and alleviate pain.
Some arrhythmias may cause beat-to-beat pressure fluctuations that can make
obtaining NIBP readings more difficult. If it becomes difficult to obtain readings in
the presence of arrhythmia, pressure should be temporarily verified using another
method (i.e., ausculatory, oscillometric, Doppler). Pressure also varies cyclically
with normal respiration. With deep respirations or in certain patients this effect
may be enhanced, increasing reading variability.
For patients in shock, indirect methods of measuring pressure (auscultatory,
oscillometric, Doppler) may not be reliable because of peripheral vascular
changes. These changes include peripheral vasoconstriction and diminished
peripheral circulation resulting from shunting of blood to central organs. In some
cases, peripheral pulses or Korotkoff sounds may be diminished or disappear in
spite of adequate blood pressure. In such cases, measuring a cuff pressure may
be impossible or give misleading results. Direct blood pressure measurements
(invasive) should be considered in patients with signs of shock or any patient who
rapidly becomes unstable for unknown reasons.
Setting Up the ABP Monitor
The 90217 ABP monitor must be initialized prior to the monitoring of each patient.
Initialization is accomplished using the 90121 ABP Report Management System.
(Refer to Setting Up the ABP Monitor in the 90207/90217 ABP Monitors
Operations Manual, P/N 070-0137-xx.)
After the monitor has been initialized, prepare the patient for monitoring as
follows:
1. Turn on the monitor and wait for the monitor to perform self-tests. When the
LCD displays the current time, the monitor is ready for operation.
2. Strap the monitor to the patient on the hip opposite the side on which the cuff
is worn. Secure the monitor using the patient’s own belt or the ABP pouch
strapped over the opposite shoulder. When using the shoulder strap, use the
belt supplied with the monitor, or the patient’s belt, to provide additional
security.
3. To select the proper cuff, measure the circumference of the limb at the point
where the cuff is to be applied. Match the limb measurement to the range of
appropriate circumferences (in centimeters) specified on each cuff (refer to
Table 1: Cuff Size by Limb Circumference on page 17-19).
CAUTION:
• Failure to initialize the ABP monitor as specified may result
in the display and storage of measurements that are
incorrect or that were acquired from a prior patient. The
operator must initialize the ABP monitor before each
patient use.
To set up NIBP monitoring:
1Initialize the ABP monitor as
described in the ABP
Operations Manual.
2Apply appropriate cuff to
patient.
3Attach cuff to ABP monitor.
4Connect NIBP adapter cable
(012-0588-xx) between ABP
monitor and 90343 transmitter.
5Touch ECG.
6Touch CHANNEL FORMAT.
7Select NIBP ON.

Digital Telemetry
17-19
4. Position the cuff so that the center of the inflatable bladder is directly over the
brachial artery. The center of the bladder location is marked on the outside of
the cuff. Once the proper position is determined, the cuff must be tightened to
ensure that it is equally snug at the top and bottom edges and that it is not
kinked. This is especially important on larger arms. Insert a finger between the
cuff and the limb to ensure it is not too tight. It may be necessary to wrap the
cuff with its tail at an angle to achieve uniform tightness. If the cuff is not
equally snug at the top and bottom edges, the number of readings available
will be limited and the monitor may indicate that the cuff is improperly applied.
5. Once the cuff is applied, the arm should be relaxed at the patient’s side. To
avoid reading errors due to hydrostatic pressure differences, the level of the
cuff on the arm should be near the level of the heart.
6. Lead the hose up the arm with the cuff and place it across the back of the
patient. Drape the hose so it does not cause the patient discomfort and is not
pinched shut by too tight a radius. Figure 17-4 displays the most common
positions for the cuff hose.
Table 1: Cuff Size by Limb Circumference
Cuff Size Limb Circumference
Pediatric 13 to 20 cm
Small adult 17 to 26 cm
Average adult 24 to 32 cm
Large adult 32 to 42 cm
Extra-large adult 38 to 50 cm
!
• Use only Spacelabs Medical cuffs with this monitor. Using other
manufacturer’s cuffs may result in inaccurate readings, even if
the manufacturer’s recommended size is observed.
• If the cuff is too small, pressure readings may be falsely high; a
cuff that is too large produces a falsely low reading. The bladder
can be positioned in the cuff for either the left or right arm.
CAUTION:
• Avoid compression or restriction of pressure in the NIBP
patient connector tubes. Check that operation of the
equipment does not result in prolonged impairment of
circulation.
• Do not apply cuff to areas of breached or injured skin.
• Cuff hose connections use luer fittings. Be careful not to
connect the ABP monitor into an intravenous fluid line
when working close to them.
• This product contains natural latex rubber components to
which some people may be allergic. These components
include the bladder and the first four inches of tubing
extending from the cuff.
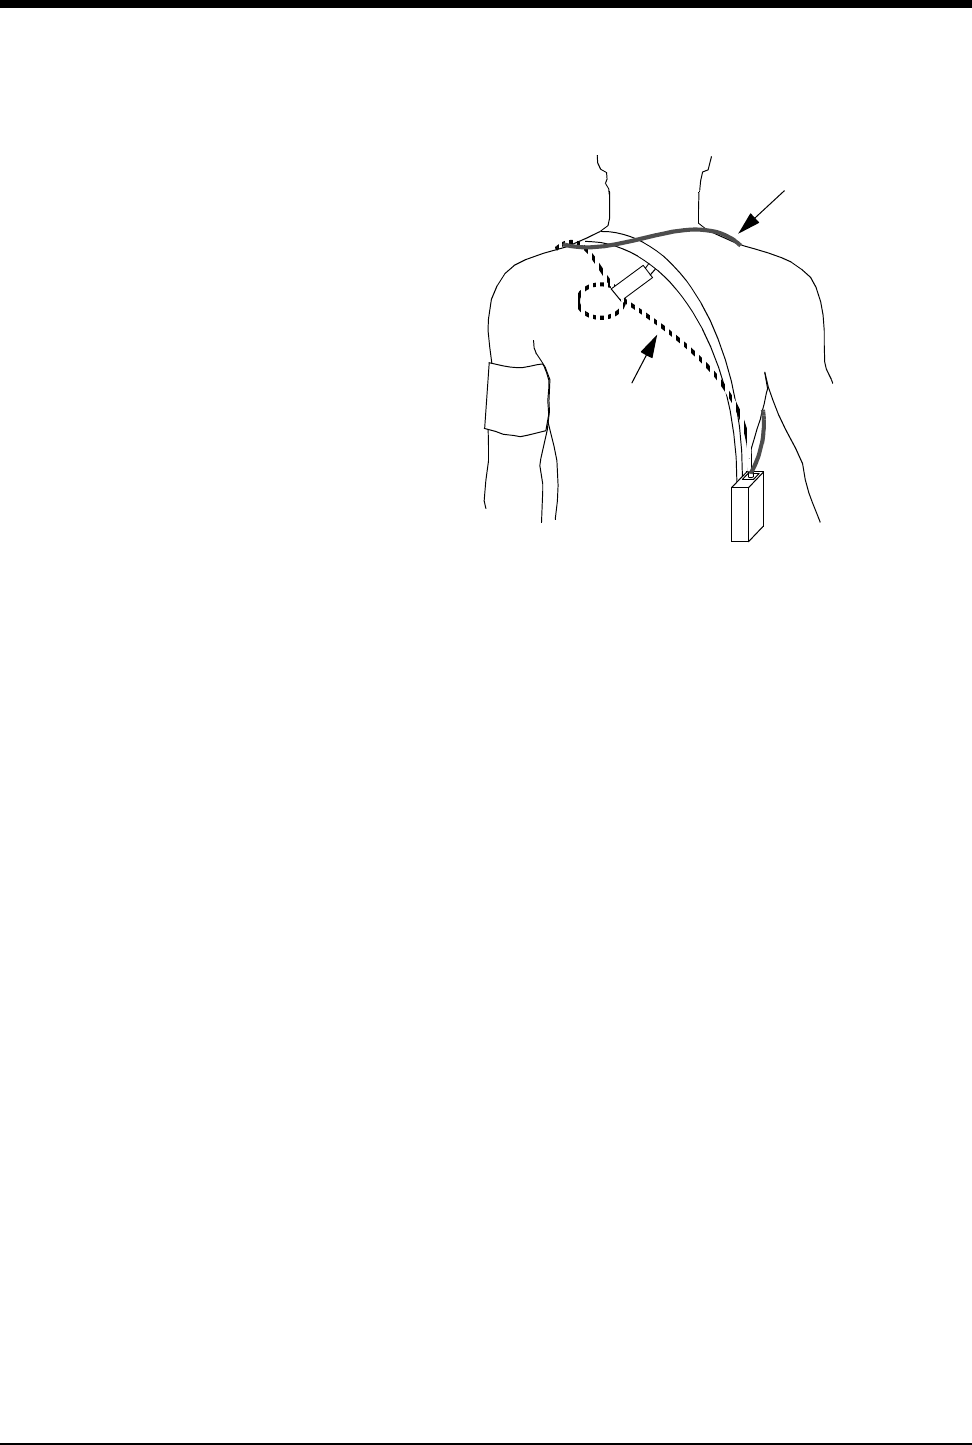
Ultraview Care Network
17-20
Figure 17-4: Common cuff hose positions
7. Connect the hose to the monitor.
8. To verify proper monitor operation, take one or more blood pressure readings.
Push the START/STOP key to begin a measurement.
9. The 90343 transmitter must be configured for use with the 90217 ABP monitor
by opening the battery compartment door, removing the battery, and setting
DIP switches 5 ON and 8 OFF. Refer to Figure 17-2 on page 17-12.
10. The 90478 receiver must be configured for operation with the 90343
transmitter and attached 90217 ABP monitor. Touch the ECG key to display
the main menu. Touch CHANNEL FORMAT, then touch NIBP ON. The
monitor will display the NIBP measurement in a numeric format in the display
zone. The values of the measurement are displayed as ??? until a valid NIBP
measurement has been taken.
alternative #1
alternative #2
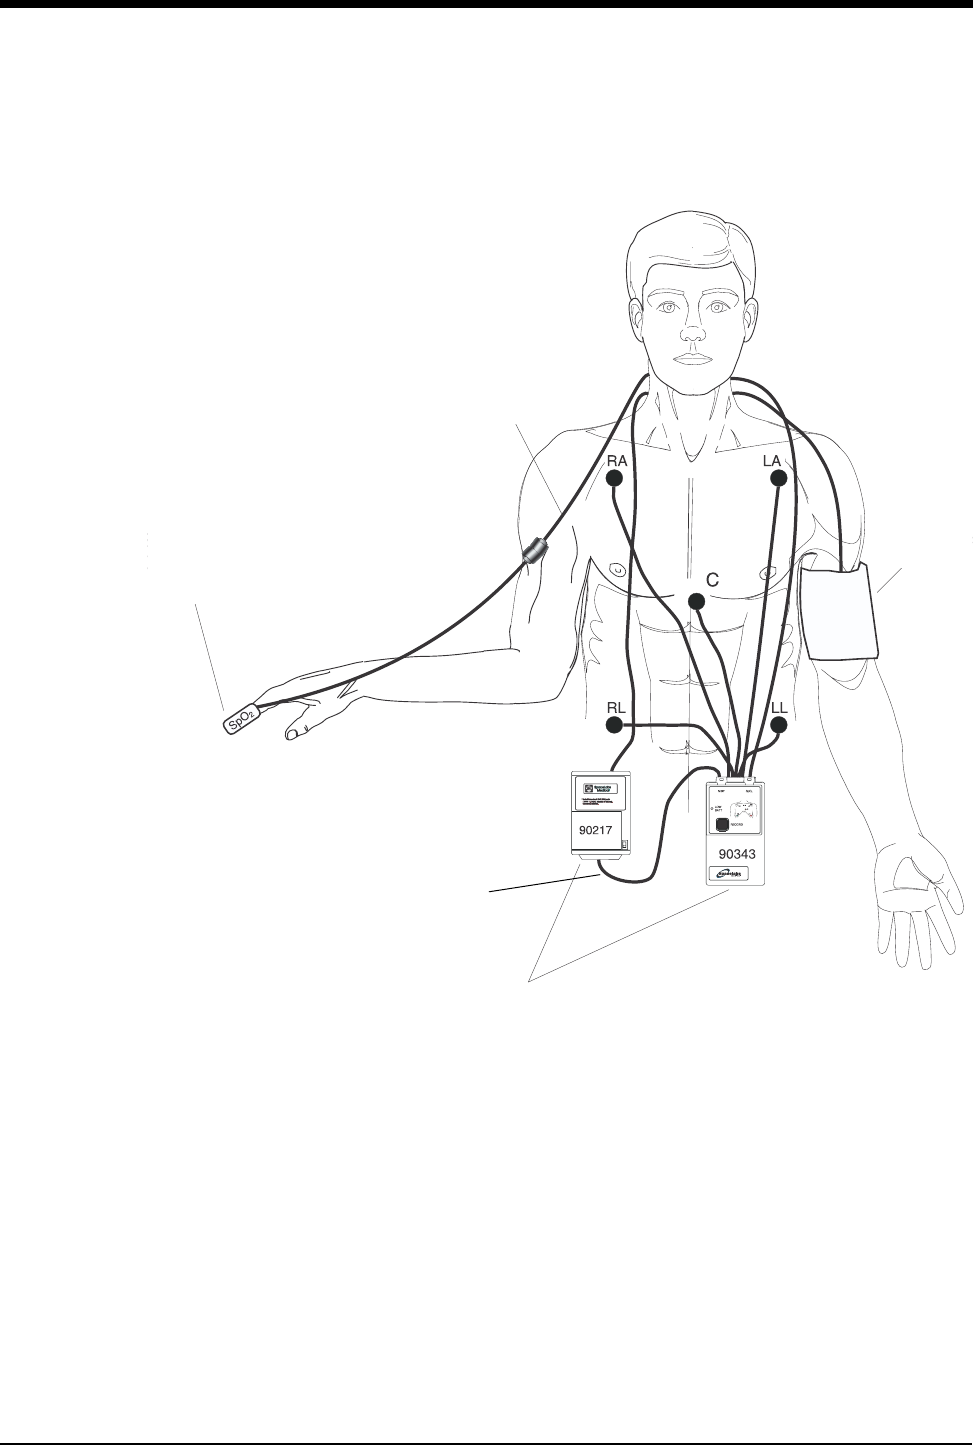
Digital Telemetry
17-21
11. Interconnect the adapter cable between the communications port on the ABP
monitor and the NIBP port on the 90343 as shown in Figure 17-5.
Figure 17-5: Transmitter ECG, SpO2, and ABP monitor connections
Figure 17-2 and Figure 17-3 illustrate typical NIBP displays. You can view NIBP
readings from any Ultraview bedside or central monitor on a network. NIBP
displays on a split-screen central monitor appear in a format slightly different from
that of bedside or full-screen central monitors.
SpO2 sensor
NIBP adapter cable
NIBP cuff
SpO2
adapter cable
90217 & 90343 mount in
pouches to patient’s belt.

Ultraview Care Network
17-22
Setting or Adjusting Alarm Limits
Refer to NIBP on page 13-3.
Displaying New or Previous Readings
The current (or latest) NIBP reading taken may be displayed when the NIBP
parameter is enabled and the 90217 ABP monitor is correctly setup. The current
reading is displayed just below the isoelectric line showing systolic, diastolic, and
mean values with the time of the reading. The displayed values are replaced by
??? when no valid values have been acquired from the 90217.
The previous NIBP readings may be displayed using the Tabular Trend or
Graphic Trend monitor functions. The parameter trend information is collected
from the module on a minute-by-minute basis and stored in system memory for
retrieval. The collected NIBP trend readings may be displayed in the same
manner as any other monitored parameter. Refer to Trends on page 26-3 for more
information.
NIBP Alarm Message Summary
The 90217 ABP monitor provides an extensive set of result codes that indicate the
status of the monitor and the potential causes of an inability to take a valid
reading.
When any alarm message is displayed, the NIBP parameter value is immediately
changed to ??? and an alarm is triggered. If your module has been configured for
an alarm using the Module Configuration Manager, the parameter display will
blink yellow for Low and Medium priority alarms, and will blink red for High priority
alarms. The alarm condition will persist until a new NIBP reading is taken. (Refer
to Module Configuration Manager on page 7-5 for more information).
The monitor displays the following messages to provide ABP status information to
the caregiver. These messages summarize the 90217 event codes. Some of
these messages include an event code in parentheses to provide more detailed
analysis of the event. A complete list of the event codes can be found in the
90207/90217 ABP Monitors Operations Manual,P/N 070-0137-xx.
Telemetry products display their error messages within ECG’s display zone, so
the following ECG alarm messages take priority over other NIBP messages.
• LEADS OFF
• NOISY SIGNAL
• ECG ALARMS SUSPENDED
NIBP UNAVAILABLE (xx)
Displayed when the 90217 ABP monitor has detected an internal condition,
defined by the code (xx). Typically, this indicates a hardware or software failure
that requires that the transmitter be removed from service.
To set or adjust NIBP alarms:
1Touch ECG.
2Touch ALARM LIMITS.
3Touch NIBP ALARM LIMITS.
4Select NIBP ALM ON.
5Select SYS, DIA, or MEAN.
6Select HI= or LO=.
7Use arrow keys to adjust.
To display the current reading:
1Touch ECG.
2Touch CHANNEL FORMAT.
3Select NIBP ON.

Digital Telemetry
17-23
NIBP READING FAILURE (xx)
Displayed when the ABP monitor was unable to make a reading. The code (xx)
defines the cause of failure.
NIBP AIR LEAK
Displayed when an air leak has been detected in the pneumatic system,
preventing a reading from being taken.
NIBP LOOSE OR NO CUFF
Displayed when the cuff was able to be inflated in a manner indicating that it was
not attached to the patient correctly.
NIBP PATIENT CANCELLED
Displayed when the patient has pressed the START/STOP button on the ABP
monitor, halting a reading in progress.
NIBP LOW BATTERY
Displayed when the primary (3xAA) battery voltage is low. Replace with fresh
batteries.
NIBP KINKED HOSE
Displayed when the pressure value increased too rapidly indicating a kinked hose
or other restriction.
NIBP EVENT CODE (xx)
Displayed when the event code returned from the ABP monitor is not defined into
one of the other messages.

17-24
NIBP Troubleshooting Guide
Clinical Situation Possible Cause Solution
No NIBP displays ■Adapter cable not inserted
correctly.
■Remove and re-insert adapter cable.
■NIBP not enabled on 90343 or
90478.
■Enable NIBP function by setting transmitter
DIP switch 5 ON and setting DIP switch 8
OFF.
■90217 ABP not properly initialized. ■Re initialize 90217 ABP using 90121.
■90343 Low battery indicator
constantly illuminated.
■Call qualified service person.
No NIBP readings can
be obtained
■Incorrect or inoperative cuff in use. ■Replace with cuff known to be operative.
■Tubing is kinked. ■Locate kink and straighten tubing.
■Some arrhythmias (e.g., atrial
fibrillation and frequent ventricular
ectopy) may cause a single or
repeated failure to obtain a reading
(may be due to true beat-to-beat
variations in pressure).
■Document arrhythmia if present, verify
pressure with another method, then follow
hospital procedure for care of this type of
patient.
■Excessive patient motion or muscle
contractions associated with
shivering or severe pain.
■Ensure that patient is quiet with minimal
movement during NIBP readings; minimize
patient’s shivering.
■Blood pressure outside of
measurement range.
■Verify extremely high or low pressure with
another method.
Intermittent or complete
failure to operate
■90217 ABP error. ■Remove 90217 ABP from service; record
event code; and call qualified service person.
Apparent incorrect
value
■Wrong size cuff for patient. ■Measure patient’s limbs at the midpoint;
match limb measurement to range specified
on cuff (undersizing the cuff results in the
greatest degree of error).
■Cuff is damaged. ■Replace with good cuff.
■Excessive patient motion, shivering
or severe pain.
■Ensure patient is quiet with minimal
movement during NIBP readings; minimize
patient’s shivering.
■False high readings may be the
result of venous congestion caused
by frequent readings.
■Reduce frequency of readings.
■Cuff too loose or positioned
incorrectly.
■Tighten cuff or reposition appropriately.

17-25
90217 ABP Display is
incorrect
■Data not retained. ■Replace backup battery.
■Low or no power. ■Check the batteries for a full charge; if
needed, replace or recharge the batteries.
■May be one of the following: time-
out, no reading due to air leak in the
system, improper cuff size, cuff size
not properly attached to the 90217
ABP.
■Isolate cause and correct.
No NIBP alarms are
displayed
■ECG “Leads Off” condition exists.
■Higher priority alarm condition is
present.
■Re-attach ECG lead wires to the patient and
resume ECG monitoring to clear pending
ECG alarms.
■Clear current alarm condition and/or re-
prioritize NIBP alarms of interest in the
Module Configuration Manager.
■When NIBP alarms are set ON, all NIBP
alarm conditions will cause the parameter
value (or ???) to blink according to the alarm
priority set by using the Module Configuration
Manager.
Variable readings occur ■Some arrhythmias may cause beat-
to-beat pressure and NIBP
readings.
■Document arrhythmia if present, verify
pressure using another method, then follow
hospital procedure for care of this type of
patient.
■Larger than normal influence of
respiratory phases on blood
pressure (inspiratory fall in blood
pressure; expiratory rise).
■NIBP software usually compensates for
normal variation.
No NIBP readings or
questionable values in
the presence of shock
■Peripheral vascular changes
experienced during shock may
reduce the reliability of blood
pressure readings obtained with
any indirect method; peripheral
pulses may be diminished or
absent.
■Consider invasive pressure measurements in
patients with symptoms of shock or in any
patient who rapidly becomes unstable for
unknown reasons.
90217 displays “LLL”
and alarm sounds
■Low main battery condition. ■Turn off and replace batteries within
60-seconds after removal to continue
monitoring.
Cuff too tight ■Cuff placed on patient too tightly. ■Reposition the cuff.
■Air pump staying on too long. ■Return unit to Spacelabs Medical for service.
Cuff too loose ■Cuff placed on patient too loosely. ■Reposition the cuff.
■Air pump not staying on long
enough.
■Return unit to Spacelabs Medical for service.
Clinical Situation Possible Cause Solution

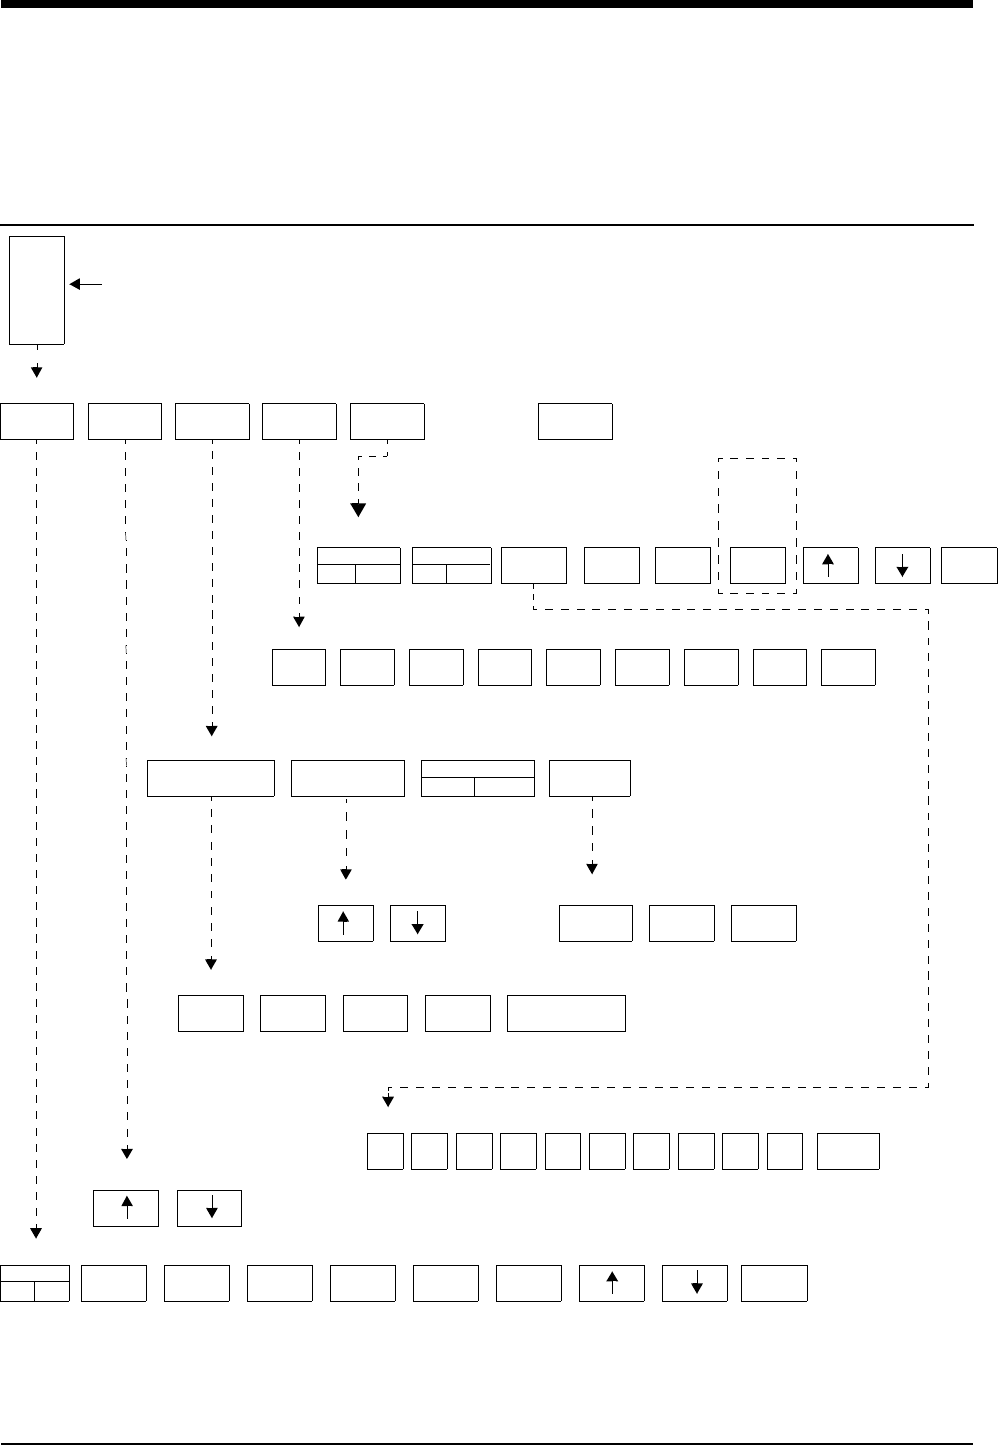
18-1
!
• Based on features purchased, more or fewer keys may appear here than on your menu screens.
Pressure Directory
Directory of Keys
ALARM
LIMITS
SELECT
LABEL
SIZE SETUP SCALES ZERO
SCALES
ON OFF
FREEZE
ON OFF
SCALE
0-180
SAVE
SYS
SAVE
MEAN ZERO
SAVE
DIA
ART PA CVP RAP LAP ICP UA UV PRS
SWEEP SPEED
25 mm/sec.
FILTER
12 Hz
ART REJ
ON OFF
NUMERIC
SIZE
50
mm/sec.
25
mm/sec.
12.5
mm/sec.
6.25
mm/sec. SAME AS ECG
SYS
HI=150
SYS
LO=90
DIA
HI=150
DIA
LO=90
MEAN
HI=OFF
MEAN
LO=OFF
ALARM
OFF
ALL
OFF
0123456789ENTER
PRESSURE MAIN MENU
PRESSURE SCALES Menu CURSOR = 95
PRESSURE Label Select Menu
PRESSURE Setup Menu
PRESSURE Waveform Size Menu
PRESSURE Alarm Limits Menu
The scale is now 0 - 180. Enter the new scale setting: 0
FILTER 12 HZ
This key
becomes
SAVE
PCWP
with PA
The pressure label you select will appear here
PRESSURE Sweep Speed Menu
SYS/DIA
LARGE
MEAN
LARGE
ALL
LARGE
PRESSURE Numeric Size Menu
ON


Contents
18-3
Pressure
Overview
A pressure key and waveform will automatically be displayed as soon as you
connect a transducer to the module. Immediately after connection, you can relabel
the catheter site or zero the system. Pressure labels may be pre-defined (refer to
Selecting Alarm Attributes on page 7-7) or you can select from the following:
Disconnecting the pressure cable or the transducer will cause the pressure key
and waveform to disappear from the display.
Pressure Label Description
ART arterial pressure
CVP central venous pressure
ICP intracranial pressure
LAP left atrial pressure
PA pulmonary artery pressure
RAP right atrial pressure
PRS generic pressure
UA umbilical artery pressure
UV umbilical vein pressure
Directory of Keys . . . . . . . . . . . . . . . . . . . . . . . . . . . . . . . . . . . . . . . . . . . . . . . . 1
Overview . . . . . . . . . . . . . . . . . . . . . . . . . . . . . . . . . . . . . . . . . . . . . . . . . . . . . . 3
Setting Up Pressure Monitoring. . . . . . . . . . . . . . . . . . . . . . . . . . . . . . . . . . . . . 4
Zeroing the Pressure Transducer . . . . . . . . . . . . . . . . . . . . . . . . . . . . . . . . . . . 4
Display Detail. . . . . . . . . . . . . . . . . . . . . . . . . . . . . . . . . . . . . . . . . . . . . . . . . . . 5
Setting and Adjusting Alarms. . . . . . . . . . . . . . . . . . . . . . . . . . . . . . . . . . . . . . . 6
Adjusting Waveform Size. . . . . . . . . . . . . . . . . . . . . . . . . . . . . . . . . . . . . . . . . . 6
Selecting Numeric Display Size. . . . . . . . . . . . . . . . . . . . . . . . . . . . . . . . . . . . . 6
Adjusting Sweep Speed. . . . . . . . . . . . . . . . . . . . . . . . . . . . . . . . . . . . . . . . . . . 7
Displaying Waveforms with Scales . . . . . . . . . . . . . . . . . . . . . . . . . . . . . . . . . . 7
Freezing the Scaled Display . . . . . . . . . . . . . . . . . . . . . . . . . . . . . . . . . . . . . . . 7
Changing the Waveform Scale . . . . . . . . . . . . . . . . . . . . . . . . . . . . . . . . . . . . . 7
Selecting the Waveform Measurement Value . . . . . . . . . . . . . . . . . . . . . . . . . . 7
Storing Values for Trending . . . . . . . . . . . . . . . . . . . . . . . . . . . . . . . . . . . . . . . . 8
Recording Waveforms . . . . . . . . . . . . . . . . . . . . . . . . . . . . . . . . . . . . . . . . . . . . 8
Setting Artifact Rejection . . . . . . . . . . . . . . . . . . . . . . . . . . . . . . . . . . . . . . . . . . 8
Selecting a Filter Frequency . . . . . . . . . . . . . . . . . . . . . . . . . . . . . . . . . . . . . . . 9
Restoring User-Defined Settings . . . . . . . . . . . . . . . . . . . . . . . . . . . . . . . . . . . . 9
Factory Default Pressure Alarm Settings. . . . . . . . . . . . . . . . . . . . . . . . . . . . . 10
Invasive Pressure Troubleshooting Guide. . . . . . . . . . . . . . . . . . . . . . . . . . . . 11

Ultraview Care Network
18-4
Systolic, diastolic, and mean pressure values are displayed for arterial, pulmonary
artery, umbilical artery, umbilical vein and generic pressures. Only the mean value
is displayed for other pressure types. Refer to the Display Detail on page 18-5 for
a sample arterial pressure and intracranial pressure display on the bedside
monitor.
Setting Up Pressure Monitoring
Connect the cable end of either a reusable or disposable transducer to the
pressure connector located on the front of the module using a Spacelabs Medical
pressure cable.
When setting up an invasive pressure system, take all measures to maintain
system sterility and to prevent the introduction of air into the system. Air bubbles
are the most common cause of inaccurate pressure readings. The transducer,
stopcocks, connectors and tubing must be completely free of air to ensure
maximum performance.
Zeroing the Pressure Transducer
Before you can begin monitoring you must zero the system. Zeroing has two
purposes: 1) to establish atmospheric pressure as zero, and 2) to compensate for
the hydrostatic effect of fluid in the catheter-tubing system.
WARNING:
• Systolic and diastolic pressures displayed numerically for
patients being treated with an Intra-Aortic Balloon Pump
(IABP) therapy may not be accurate. Display the waveform
with scales to verify or determine pressures for these
patients.
!
• With the Module Configuration Manager feature, you can define
your own default settings for such characteristics as alarm limits
and display configuration. Refer to the Module Configuration
Manager on page 7-5 for further details.
!
• Refer to the catheter, tubing, or transducer manufacturer’s
instructions or your hospital’s protocol for specific instructions
on removing air from the system.
• Invasive pressure systems specified by Spacelabs Medical are
compatible with high-frequency electrosurgical and defibrillation
equipment. No special precautions are required.
!
• If after you have followed the instructions to zero the pressure
transducer and a ZERO REJECTED message appears, you
may have a transducer problem. Follow the transducer
manufacturer's directions to correct this problem before you
continue.
To zero the pressure transducer:
1Touch the desired pressure
parameter key.
2Open stopcock to air/close to
patient (at phlebostatic axis).
3Touch ZERO.
4Close stopcock to air/open to
patient.
5Begin monitoring after the
pressure values appear.
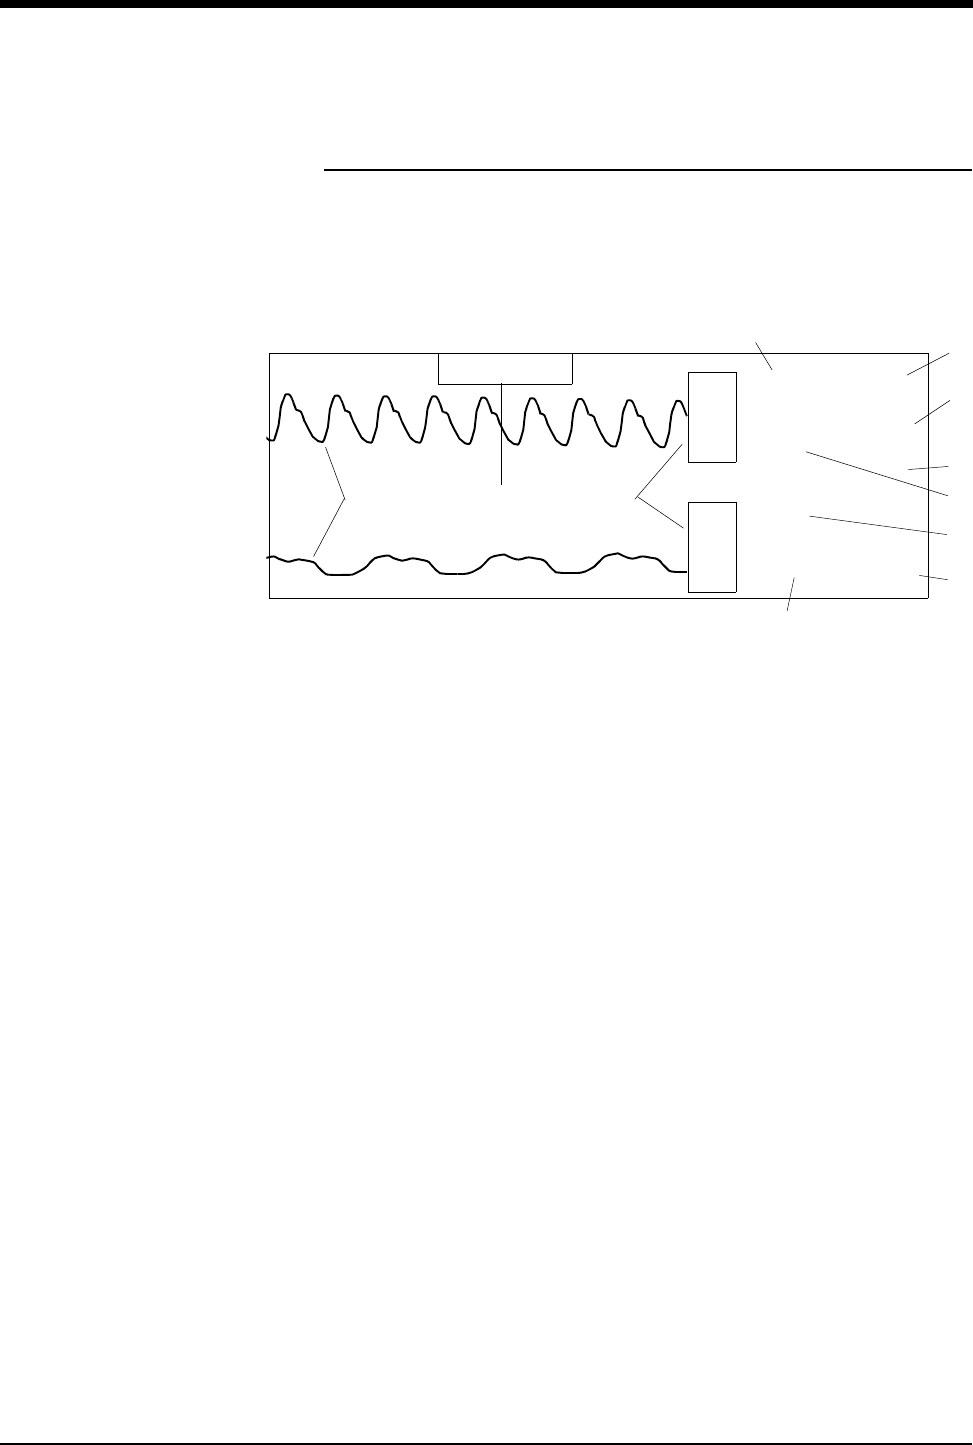
Pressure
18-5
Display Detail
A pressure display appears once you select a pressure label and zero the
transducer. Figure 18-1 shows an example of the display for ART and ICP. The
system identifies the specific pressure type in the parameter key and menu title
(PA, CVP, LAP, etc.).
Figure 18-1: Bedside monitor pressure display
ᕡPressure waveforms
ᕢPressure parameter keys
ᕣSystolic pressure
ᕤMean pressure
ᕥSystolic pressure alarm limits
ᕦDiastolic pressure alarm limits
ᕧDiastolic pressure
ᕨCerebral perfusion pressure
ᕩMean pressure alarm limits
µMean pressure
¸CHECK CATHETER key (for UA pressures only)
133
70
6
CPP= 86
(92)
150
120
15
5
A
R
T
M
I
C
P
S
m
m
H
g120
60
D
m
m
H
g
CHECK CATHETER
ᕡᕢ¸
µ
ᕣᕤ
ᕥ
ᕦ
ᕧ
ᕨ
ᕩ

Ultraview Care Network
18-6
Setting and Adjusting Alarms
Pressure alarm limits can be defined for systolic, diastolic, and mean values for
ART, PA, UA, UV, and PRS. Alarm limits can only be set for the mean value for all
other pressures.
The Alarm Limits menu for ICP provides a cerebral perfusion pressure key (CPP)
used to set CPP alarm limits. CPP is computed as mean arterial pressure minus
intracranial pressure (MAP-ICP). The value CPP=xxx displays at the top of the
digital zone above the ICP value if ICP and at least one peripheral invasive arterial
pressure are being monitored. If the system cannot compute a pressure (for
example, no mean arterial pressure is available), then the message CPP=???
displays.
Alarms can be independently set for each pressure channel.
The CHECK CATHETER alarm may be set when umbilical artery pressure is
being monitored. This alarm will sound whenever the pulse rate drops below 60
BPM or the pressure approaches 0 mmHg. Touching the CHECK CATHETER key
will silence the alarm.
Adjusting Waveform Size
You can increase or decrease the size of the pressure waveform display. This
only changes the displayed size and does not affect the signal gain. The
waveform size may not be adjusted while the scales are displayed.
Selecting Numeric Display Size
You can select from three different display formats for pressure numerics (for
ART, PA, PRS, UA and UV only). In each of the three display formats, mean
pressure is 92, systolic pressure is 133 and diastolic pressure is 70.
Figure 18-2: Display formats
!
• Specific alarm limits are not displayed in the All Large display
format.
To set or adjust alarm limits:
1Touch the desired pressure
parameter key.
2Touch ALARM LIMITS.
3Select desired alarm.
4Select ALARM ON.
5Use arrow keys to adjust a limit
value.
To change the waveform size:
1Touch the desired pressure
parameter key.
2Touch SIZE.
3Select SIZE ↑ or SIZE ↓.
To change the numeric display
size:
1Touch the desired pressure
parameter key.
2Touch SETUP.
3Touch NUMERIC SIZE.
4Select a display size. 133
70 92
(92)
70
133 92
70
133
m
m
H
g
m
m
H
g
m
m
H
g
SYSTOLIC/ MEAN LARGE ALL LARGE
DIASTOLIC LARGE

Pressure
18-7
Adjusting Sweep Speed
The sweep speed determines the rate at which the pressure waveform moves
across the screen. Sweep speed selections are: 50, 25, 12.5, 6.25 mm/second, or
the same sweep speed as ECG.
Displaying Waveforms with Scales
You can superimpose a vertical reference scale over pressure waveforms. Up to
four pressures can be scaled at one time.
Touching a parameter key and then the SCALES key displays scales when the
pressure parameter key is activated. Selecting SCALES ON maintains the
selected pressure display in scaled format until SCALES OFF is selected.
Freezing the Scaled Display
You can freeze a pressure waveform display to stabilize the waveform for
obtaining measurements.
To unfreeze the waveform display, select FREEZE OFF or exit the pressure menu
by touching either the PREVIOUS MENU or NORMAL SCREEN keys.
Changing the Waveform Scale
You can increase or decrease the pressure waveform scale. The bottom of the
scale is always 0 (zero). You may set the top of the scale to be any value from
10 to 500 mmHg by typing in the desired value and touching ENTER.
Selecting the Waveform Measurement
Value
You can obtain a measurement at any part of the pressure waveform by using the
horizontal cursor. The measurement value displays as CURSOR = xx in the
message line above the Pressure menu. The most common use of this function is
to obtain a pulmonary capillary wedge pressure (PCWP) value from the
pulmonary artery catheter.
To select a pressure waveform
sweep speed:
1Touch the desired pressure
parameter key.
2Touch SETUP.
3Touch SWEEP SPEED.
4Select a sweep speed.
To configure the display of
pressure waveforms with a
vertical scale:
1Touch the desired pressure
parameter key.
2Touch SCALES.
3Select SCALES ON if the
pressure is to remain in scales.
To freeze the pressure display:
1Touch the desired pressure
parameter key.
2Touch SCALES.
3Select FREEZE ON.
To change the pressure
waveform scale:
1Touch the desired pressure
parameter key.
2Touch SCALES.
3Select SCALE 0-xxx.
4Type a new scale.
5Touch ENTER.
To obtain a pulmonary capillary
wedge pressure (PCWP):
1Touch PA.
2Inflate PA catheter balloon.
3Touch SCALES.
4Touch FREEZE ON.
5Deflate PA catheter balloon.
6Use arrow keys to position
cursor.
7Touch SAVE PCWP.

Ultraview Care Network
18-8
Storing Values for Trending
You can store values into memory for pressure trend displays for use in clinical
calculations.
Recording Waveforms
You can print pressure waveforms and values. Refer to Printing on page 4-5 for
additional information.
Setting Artifact Rejection
Variations in intrathoracic pressures during the respiratory cycle can influence
invasive pressures; especially PA, PCWP and CVP. The respiratory artifact
rejection feature minimizes the impact of such variations by automatically
selecting data from waveform peaks that have little change in amplitude from
peak to peak. End-expiration is typically the time with the least variation. The
artifact rejection feature works equally well in both mechanically-ventilated and
spontaneously-breathing patients.
In patients with chronic obstructive pulmonary disease, intrathoracic pressures
during respiration are different than those in patients with normal lung function.
Disable artifact rejection when monitoring these patients.
The factory default for artifact rejection is ON for PA pressure only, and OFF for all
other pressure labels.
!
• The pressure scales should not be changed during a recording.
This may lead to an annotation on the recorded strip that does
not match the actual scale of the recording.
To store values in memory:
1Touch the desired pressure
parameter key.
2Touch SCALES.
3Use arrow keys to position
cursor.
For ART, PRS, UA and UV
4Select SAVE SYS, SAVE DIA
or SAVE MEAN.
For CVP, RAP, LAP or ICP
5Touch SAVE MEAN.
For PA
6Touch SAVE PCWP.
To print pressure waveforms:
1Touch RECORD.
2Touch flashing PRESSURE
parameter key.
To activate respiration artifact
rejection:
1Touch the desired pressure
parameter key.
2Touch SETUP.
3Select ART REJ ON.

Pressure
18-9
Selecting a Filter Frequency
When noise and other interference appears on the pressure waveform, you can
adjust the filter frequency to minimize its effect.
A higher filter frequency shows greater detail, but can also produce more artifact.
A lower filter frequency smooths the waveform and may help diagnose transducer
or catheter problems such as under damping or ringing.
The filter frequency may be set within the range of 3 to 40 Hz.
Restoring User-Defined Settings
With the Restore Settings feature, you can restore the user-configurable settings
to the defaults previously stored as user settings. User-configurable settings are
listed in Setting User-Defined Default Values on page 7-7.
!
• RESTORE SETTINGS changes the user-configurable settings
for all parameters.
• Once restored, alarm ON/OFF status and alarm limits are reset
to the previously stored user settings.
To adjust the filter frequency:
1Touch the desired pressure
parameter key.
2Touch SETUP.
3Touch FILTER.
4Touch the arrow keys to choose
the desired setting.
To restore user-defined settings:
Configurations with ECG
1Touch ECG.
2Touch SETUP.
3Touch RESTORE SETTINGS.
4Select YES.
To restore user-defined settings:
Configurations without ECG
1Touch TEMP.
2Touch RESTORE SETTINGS.
3Select YES.

Ultraview Care Network
18-10
Factory Default Pressure Alarm Settings
Arterial (ART), Generic Pressure (PRS), Umbilical Artery and Vein (UA and UV),
Cerebral Perfusion (CPP-mean only)
Systolic *
mmHg High Low
-50 to 79 +30 -05
80 to 109 +30 -10
110 to 119 +30 -15
120 to 129 +25 -20
130 to 139 +20 -20
140 to 149 +15 -20
150 to 159 +10 -20
160 to 169 +10 -25
170 to 179 +10 -30
180 to 189 +10 -35
190 to 300 +10 -40
Systolic *
kPa High Low
-6.7 - 10.5 +4.0 -0.7
10.6 - 14.5 +4.0 -1.3
14.6 - 15.9 +4.0 -2.0
16.0 - 17.2 +3.3 -2.7
17.3 - 18.5 +2.7 -2.7
18.6 - 19.9 +2.0 -2.7
20.0 - 21.2 +1.3 -2.7
21.3 - 22.5 +1.3 -3.3
22.6 - 23.8 +1.3 -4.0
23.9 - 25.1 +1.3 -4.7
25.2 - 40.0 +1.3 -5.3
Mean
mmHg High Low
-50 to 69 +30 -05
70 to 79 +30 -10
80 to 99 +30 -15
100 to 109 +30 -20
110 to 119 +30 -25
120 to 129 +25 -30
130 to 139 +20 -30
140 to 149 +15 -30
150 to 179 +10 -30
180 to 300 +10 -35
Mean
kPa High Low
-6.7 - 9.2 +4.0 -0.7
9.3 - 10.5 +4.0 -1.3
10.6 - 13.2 +4.0 -2.00
13.3 - 14.5 +4.0 -2.7
14.6 - 15.8 +4.0 -3.3
15.9 - 17.2 +3.33 -4.0
17.3 - 18.5 +2.7 -4.0
18.6 - 19.8 +2.00 -4.0
19.9 - 23.8 +1.3 -4.0
23.9 - 40.0 +1.3 -4.7
* Example: If systolic is between 80
and 109 mmHg, then HI alarm
defaults to 30 mmHg above actual
value; LO alarm defaults to 10
mmHg below actual value.
Diastolic
mmHg High Low
-50 to 69 +30 -05
70 to 79 +20 -10
80 to 89 +20 -15
90 to 99 +15 -15
100 to 109 +10 -20
110 to 119 +05 -25
120 to 300 +05 -30
Diastolic
kPa High Low
-6.7 - 9.2 +4.0 -0.7
9.3 - 10.6 +2.7 -1.3
10.7 - 11.8 +2.7 -1.9
11.9 - 13.2 +2.00 -1.9
13.3 - 14.5 +1.3 -2.7
14.6 - 15.8 +0.7 -3.3
15.9 - 40.0 +0.7 -4.0
Pulmonary Artery (PA), Right Atrial (RAP), Central Venous (CVP), Left Atrial
(LAP), and Intracranial (ICP-mean only)
Systolic, Diastolic, and Mean
mmHg High Low kPa High Low
-50 to 25 +05 -05 -6.7 - 3.3 +0.67 -0.67
26 to 300 +20% -20% 3.4 to 40.0 +20% -20%

18-11
Invasive Pressure Troubleshooting Guide
Clinical Situation Possible Cause Solution
Intermittent or no operation ■Module error. ■Call a qualified service person.
No pressure key appears ■Module not inserted correctly. ■Reinsert the module.
■Transducer not connected. ■Reconnect the transducer.
Numeric display does not
settle
■Respiration artifact too high. ■Select ART REJ ON.
Pressure display disappears ■Cable disconnected from the
module.
■Reconnect cable.
■Cable disconnected from the
transducer.
■Reconnect cable.
Pressure shows NOT
ZEROED
■Pressure has not been zeroed. ■Zero pressure with the ZERO key
after opening transducer to air.
Shows constant pressure ■Stopcock(s) are positioned
incorrectly.
■Reposition stopcock(s) to connect
the patient to the transducer
(a waveform will appear on the
screen).
ZERO REJECTED message
appears
■Stopcock(s) are positioned
incorrectly.
■Reposition stopcock(s) to open the
transducer to air. Zero pressure with
the zero key.
■Still unable to zero. ■Follow transducer manufacturer’s
instructions to correct the problem.
CHECK CATHETER key
appears on the monitor
■Stopcock(s) are positioned
incorrectly.
■Reposition stopcock(s) to connect
the patient to the transducer
(a waveform will appear on the
screen).
■UA catheter has become dislodged
or occluded.
■Check UA catheter.
■Upon completion of the above, touch
the CHECK CATHETER key to
silence the alarm.
