Spacelabs Healthcare 76A90341-WMTS 90341-05 User Manual 3 of 3
Spacelabs Healthcare, Inc. 90341-05 3 of 3
Contents
- 1. User Manual 1 of 3
- 2. User Manual 2 of 3
- 3. User Manual 3 of 3
User Manual 3 of 3
19-1
!
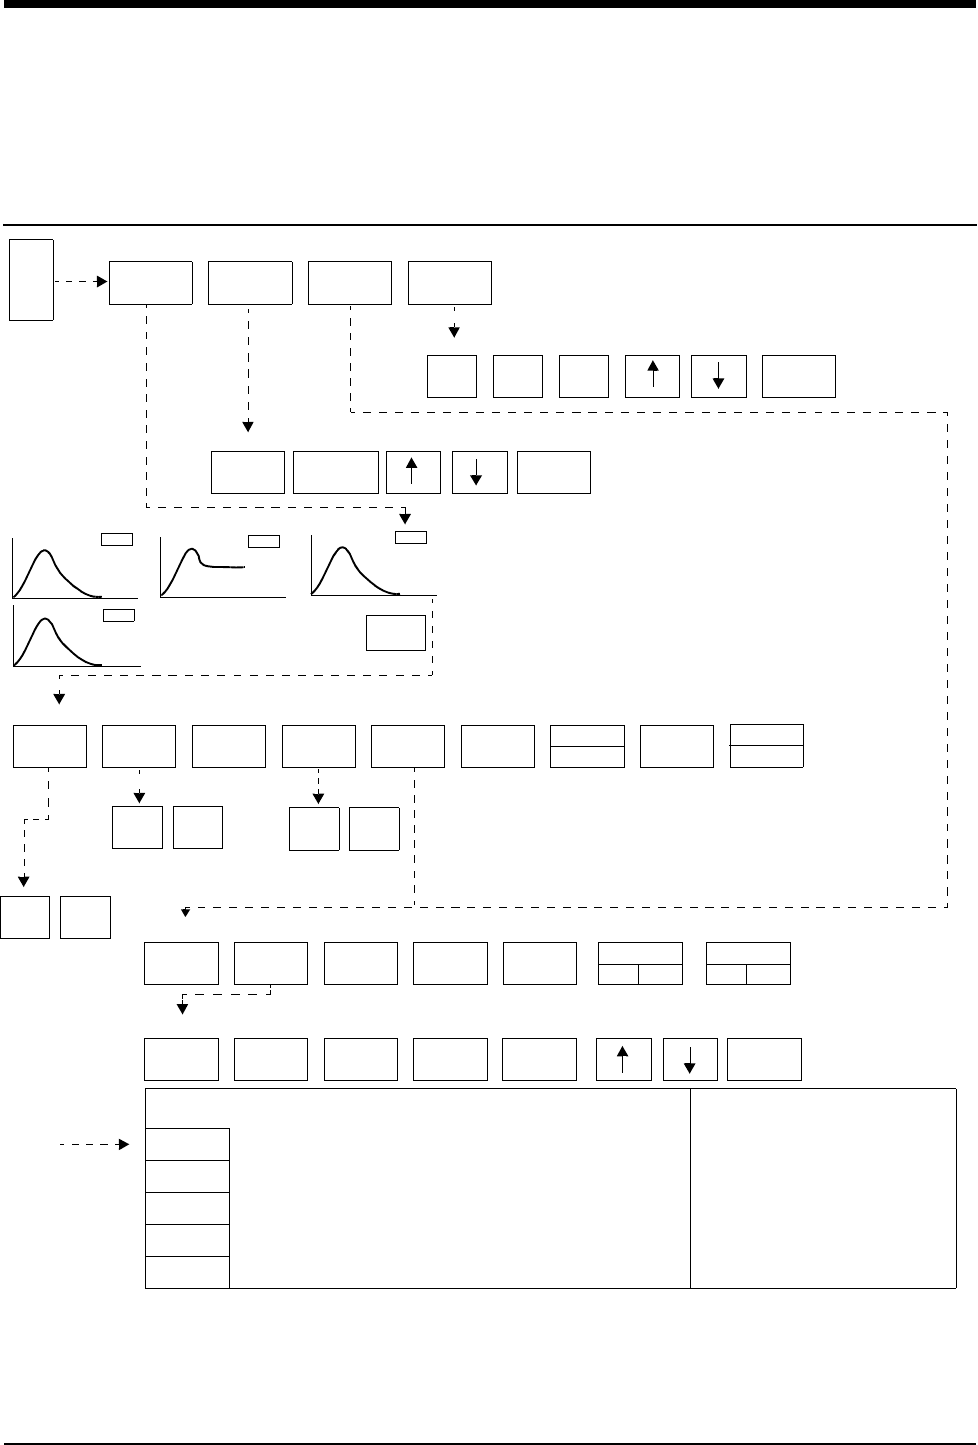
• Based on features purchased, more or fewer keys may appear here than on your menu screens.
Cardiac Output Directory
Directory of Keys
CARDIAC
OUTPUT
HEIGHT/
WEIGHT CALCS
0.5 5 0
HEIGHT =
170 CM
WEIGHT =
70 KG
CLEAR CANCEL STORE CALCS PRINT
AVERAGE
ALL
YES NO
YES NO
YES NO
ENTER
ENTER
START
CO#1 BAD CURVE
5.8
Inject when ready
Enter computational constant
BSA = ?.? Must enter patient height and weight for calculations
Inject when ready (if auto) Touch START then INJECT (if manual)
Press YES to
Press YES to confirm
Press YES to confirm
CC =
.550
C
O
CO - MENU
confirm STORE
CLEAR
AVERAGE ALL
STOP
CURVE
CO#2 CO#3
CO#4
TB XX.XoC
TI X.XoC
5.8
5.8
data by pressing
the key
corresponding to
the day/time
desired
CO
CO/CI
Select a row of DAY/TIME CO CI SV SV SVR PVR LVSW RVSW HR MAP CVP MPA PCWP
26/02:25p 5.1 2.9 70.8 40.4 1629 235 54.9 10.4 72 110 6 25 10
27/09:30p 4.9 2.8 65.3 37.8 1712 211 51.4 9.2 75 112 7 25 12
28/10:15p 4.5 2.5 56.2 32.1 1917 213 44.5 7.8 80 115 7 25 13
29/07:30a 4.0 2.2 47.0 26.8 2237 219 38.2 6.5 85 120 8 26 15
30/08:30a 4.0 2.2 47.0 26.8 2237 219 38.2 6.5 85 120 8 26 15
HEIGHT/
WEIGHT
VITAL
SIGNS
SCROLL
UP
SCROLL
DOWN PRINT
MAP =
xxx mmHg
CVP =
xx mmHg
MPA =
xx mmHg
PCWP =
xx mmHg ENTER
VR INDEX
ON OFF
SW INDEX
ON OFF
CALCULATIONS
VITAL SIGNS - Adjust vital signs, then touch ENTER
HR =
xxx
AUTO
MANUAL


Contents
19-3
Overview . . . . . . . . . . . . . . . . . . . . . . . . . . . . . . . . . . . . . . . . . . . . . . . . . . . . . . 3
Setup Procedure . . . . . . . . . . . . . . . . . . . . . . . . . . . . . . . . . . . . . . . . . . . . . . . . 4
Display Detail. . . . . . . . . . . . . . . . . . . . . . . . . . . . . . . . . . . . . . . . . . . . . . . . . . . 5
Entering the Computational Constant . . . . . . . . . . . . . . . . . . . . . . . . . . . . . . . . 6
Entering Patient Height/Weight . . . . . . . . . . . . . . . . . . . . . . . . . . . . . . . . . . . . . 6
Measuring Cardiac Output. . . . . . . . . . . . . . . . . . . . . . . . . . . . . . . . . . . . . . . . . 6
Averaging Cardiac Output . . . . . . . . . . . . . . . . . . . . . . . . . . . . . . . . . . . . . . . . . 7
Clearing Cardiac Output Curves . . . . . . . . . . . . . . . . . . . . . . . . . . . . . . . . . . . . 7
Storing Cardiac Output Curves . . . . . . . . . . . . . . . . . . . . . . . . . . . . . . . . . . . . . 7
Stopping Curve Drawing and Acquisition . . . . . . . . . . . . . . . . . . . . . . . . . . . . . 7
Selecting Index Normalization . . . . . . . . . . . . . . . . . . . . . . . . . . . . . . . . . . . . . . 8
Displaying Cardiac Index and Cardiac Output Values. . . . . . . . . . . . . . . . . . . . 8
Displaying Calculations Table . . . . . . . . . . . . . . . . . . . . . . . . . . . . . . . . . . . . . . 9
Editing Vital Sign Values . . . . . . . . . . . . . . . . . . . . . . . . . . . . . . . . . . . . . . . . . 10
View Additional Table Data . . . . . . . . . . . . . . . . . . . . . . . . . . . . . . . . . . . . . . . 10
Recording Cardiac Output Curves. . . . . . . . . . . . . . . . . . . . . . . . . . . . . . . . . . 11
Error Messages . . . . . . . . . . . . . . . . . . . . . . . . . . . . . . . . . . . . . . . . . . . . . . . . 11
Cables and Probes . . . . . . . . . . . . . . . . . . . . . . . . . . . . . . . . . . . . . . . . . . . . . 12
Cardiac Output Troubleshooting Guide . . . . . . . . . . . . . . . . . . . . . . . . . . . . . . 13
Cardiac Output
Overview
Cardiac output (CO) monitoring enables you to evaluate the patient’s fluid status
and the pumping ability of the heart, as well as calculate and display various
hemodynamic values.
Cardiac output is calculated by the thermodilution technique using a variation of
the Stewart-Hamilton formula. Thermodilution involves injecting a cooled fluid
(injectate) through a flow-through housing into an intravascular catheter. The
catheter delivers the injectate directly to the right atrium and monitors the
temperature downstream from the delivery site at the pulmonary artery.
Cardiac output is determined by measuring the change in blood temperature
downstream from the delivery site with respect to time. The change in
temperature is inversely proportional to the flow of blood through the right heart. If
the flow is large, the volume of blood that the injectate mixes with is large as well,
so the monitor detects a small change in temperature. When a smaller flow of
blood is diluted by the same volume of injectate, the change in temperature is
larger. The injectate has a larger influence on the temperature as measured in the
pulmonary artery.
The system displays cardiac output by plotting a curve for each injection. The
vertical axis of the curve represents temperature and the horizontal axis
represents time.
Spacelabs Medical’s cardiac output monitoring automatically captures vital sign
values at the moment each CO curve is completed. This data is used to produce
hemodynamic calculations.
Ultraview Care Network
19-4
Setup Procedure
The setup procedure that follows assumes that the pulmonary artery catheter has
been placed. Follow your standard hospital procedure to properly place the
pulmonary artery catheter in the patient.
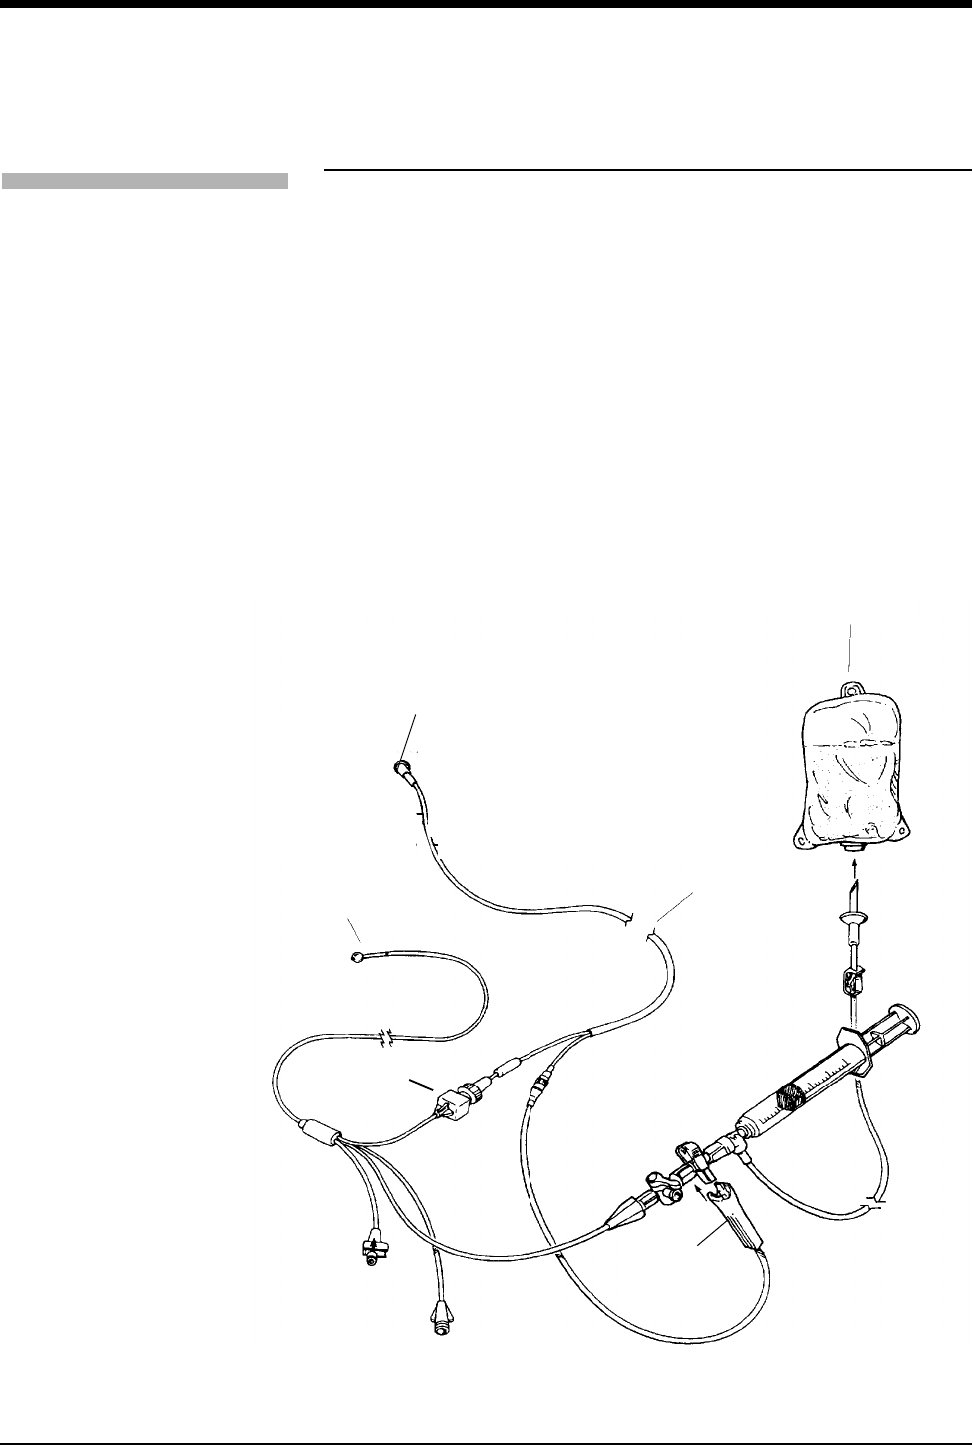
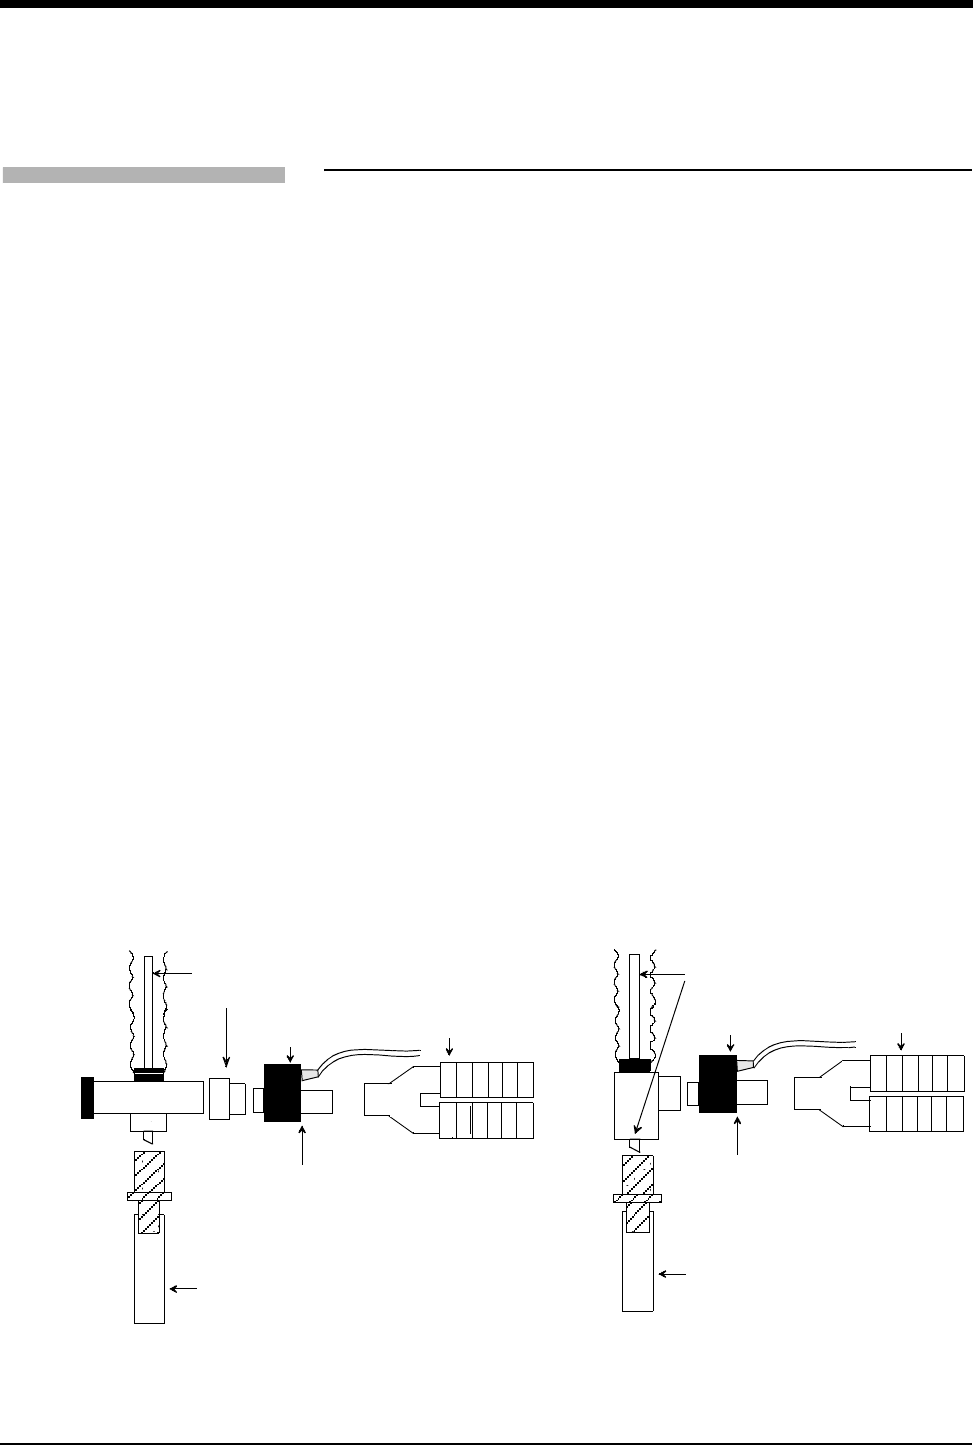
Figure 19-1 illustrates the components used for CO monitoring. When using a
reference solution injectate temperature probe, it should be inserted into the
cardiac output cable in place of the in-line injectate temperature probe.
When you connect the thermistor connector port of the catheter to the cardiac
output cable, the system monitors patient blood temperature (TB) and displays the
value on the screen. When you connect the injectate temperature probe, the
system detects the temperature of the injectate (TI) and displays it on the screen,
but does not trend the data. The system displays a message instructing you to
connect the probe or catheter, or to enter the computational constant (CC).
If you connect the cardiac output cable only to the catheter or only to the injectate
probe, you can enter or adjust the computational constant but you cannot monitor
cardiac output.
Figure 19-1: Cardiac output monitoring setup
To set up the system for
monitoring cardiac output:
1Insert the cardiac output cable
into the module.
2Attach the thermodilution
catheter to the cardiac output
cable.
3Connect either an in-line
injectate temperature probe or
a reference solution injectate
probe to the cardiac output
cable.
Cardiac output
cable
In
j
ectate
Thermodilu-
tion catheter
In-line
injectate
temperature
probe
Thermistor
connector
Connect to module
Cardiac Output
19-5
Display Detail
The CO key is displayed once you connect the CO cable to the module. To
display the CO main menu, touch the CO key and curves will appear as the
system detects the flow for each injection. The message INJECT WHEN READY
is displayed when the system is ready to plot a new output curve.
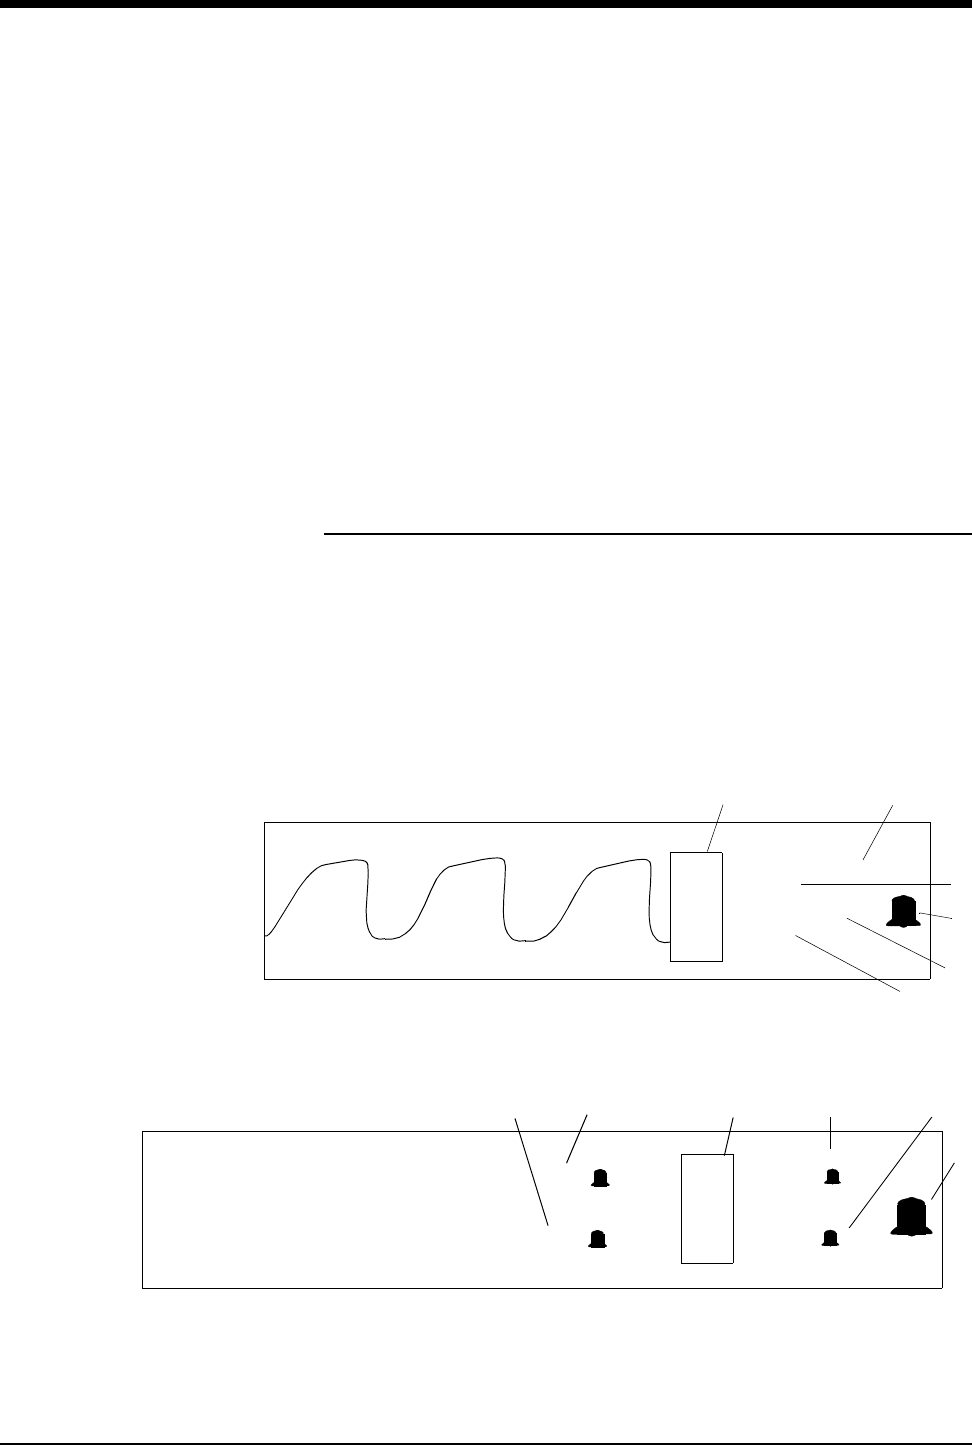
Figure 19-2 illustrates the cardiac output display when curves are being acquired,
on a bedside monitor.
Figure 19-2: Cardiac output display
Cardiac output curve
Cardiac output (liters/minute)
Curve ID number key (used to select a curve)
Blood temperature
Injectate temperature
Cardiac output (average)
Time and date of averaging
Stop curve key (only displayed during curve drawing)
Cardiac index value
쐅Cardiac index value (average)
CO#1 CO#2 CO#3
5.8 5.8
6.0
TB 36.5 oC
TI
5.8
0.2 oC
01:07 P
01/09
STOP
CURVE
CO#1
5.8
CO
CI 3.7
CI =
3.7
쐅

Ultraview Care Network
19-6
Entering the Computational Constant
To generate calculations, you must first enter the computational constant (CC)
and verify that the system is correctly configured. Refer to your thermodilution
catheter package insert for current constants.
The temperature of the injectate changes due to contact with the catheter wall and
the surrounding blood. To account for this interaction, the system includes a
correction factor in the equation. The correction factor (K or CT) is a function of
catheter and flow-through housing dimension, internal volume, and injectate
temperature and differs among catheter models and manufacturers.
Once you enter a value for the computational constant, the value is displayed on
the CC= key and remains in system memory. Until you enter the computational
constant, the message CC REQUIRED is displayed, and ENTER
COMPUTATIONAL CONSTANT is displayed on the message line after the CC=
key is selected.
Entering Patient Height/Weight
To perform indexed hemodynamic calculations, you must enter the patient’s
height and weight before you generate CO curves. CO uses the patient’s height
and weight entered during the admit function.
The valid range for height is 10 to 85 in (25 to 215 cm). The valid range for weight
is 2 to 400 pounds (1 to 180 kg). After you enter both height and weight values,
the system automatically calculates and displays the patient’s body surface area
(BSA).
Measuring Cardiac Output
To maintain the accuracy of the readings, you must allow the catheter to warm up
between injections. When in AUTO mode, wait until the INJECT WHEN READY
message appears between injections. When in MANUAL mode, wait until the
TOUCH START THEN INJECT message appears.
Five curves can be displayed at one time. Some curves may automatically be
classified as “bad,” in which case they are then labeled BAD CURVE and are
automatically excluded from averaging. CO curves are numbered consecutively
from 1 to 99.
A 15-minute timer begins after acquisition of the first good curve. After
15-minutes, the AUTO/MANUAL and START keys become invalid (dotted), and
the messages MUST SELECT CURVES, AVERAGE, STORE, or CLEAR CO
appear. Cardiac output injections are disabled until you perform one of these
actions. Injections may resume as soon as the INJECT WHEN READY or TOUCH
START, THEN INJECT message appears.
!
• To obtain all hemodynamic calculations remember to enter
height and weight, and to store a PCWP prior to initiating
measurement of CO.
To enter the computational
constant:
1Touch CO.
2Touch CC =.
3Touch the appropriate keys
(tenths, hundredths, and then
thousandths) and use arrow
keys to adjust.
4Touch ENTER.
To enter patient height and
weight:
1Touch CO.
2Touch HEIGHT/WEIGHT.
3Select HEIGHT = and/or
WEIGHT =.
4Use arrow keys to adjust.
5Touch ENTER.
To obtain CO measurements:
1Touch CO.
2Touch CARDIAC OUTPUT.
3Select AUTO or MANUAL.
4a Wait for the INJECT WHEN
READY or the TOUCH START
THEN INJECT message to
display.
-OR-
4b If in manual mode, touch
START.
5Inject the prepared injectate
into the proximal lumen of the
thermodilution catheter.

Cardiac Output
19-7
Averaging Cardiac Output
This function computes the average using the data from up to five, good,
displayed curves. Curves labeled as “bad” are not included in the average.
You can perform cardiac output averaging as soon as the system has measured
and displayed at least two acceptable curves.
When the cardiac output averaging is complete:
• The CO zone displays the curves used in the average, the averaged cardiac
output, and cardiac index values.
• The time and date of the last curve displays.
Clearing Cardiac Output Curves
Occasionally you may want to delete a curve prior to averaging or storing. All
curves, or only selected curves, can be cleared. If a “bad” curve is displayed when
you select to average, store, or clear another displayed curve, the “bad” curve is
also cleared.
When you clear an individual CO curve or all CO curves, the INJECT WHEN
READY message is displayed in the first available curve position, so the curves
displayed on the screen may not appear in numerical order.
Storing Cardiac Output Curves
This feature enables you to store all of the acceptable, displayed curves at once
or individually. The system stores the vital signs and cardiac output value it
acquired at the end of curve acquisition, along with the time it displayed each
curve. The curves clear from the screen as they are stored. The system does not
store “bad” curves. After you store the acceptable curves, the system clears all
curves from the screen.
Stopping Curve Drawing and Acquisition
This feature enables you to stop the curve drawing and data acquisition of a
cardiac output curve in progress. The STOP CURVE key only appears during
curve drawing. Touching this key will invalidate all curve data for that injection.
Once the blood temperature is again stable, the INJECT WHEN READY message
will appear if in AUTO mode. The TOUCH START THEN INJECT message will
appear if in MANUAL mode.
To average all cardiac output
curves:
1Touch CO.
2Touch CARDIAC OUTPUT.
3Touch AVERAGE ALL.
4Touch YES.
To clear or store all curves:
1Touch CO.
2Touch CARDIAC OUTPUT.
3Select CLEAR or STORE.
4Touch YES.
To clear or store selected
curves:
1Touch CO.
2Touch CARDIAC OUTPUT.
3Touch the CO# keys adjacent
to the curves (up to 5) that you
wish to clear or store.
4Select CLEAR or STORE.
5Touch YES.
To stop a curve in progress:
1Touch STOP CURVE.

Ultraview Care Network
19-8
Selecting Index Normalization
To individualize the values to the patient, the system calculates them with the
BSA. Cardiac Index (CI) and Stroke Volume Index (SVI) are automatically
displayed.
You can display either the Systemic Vascular Resistance (SVR) and the
Pulmonary Vascular Resistance (PVR) or their indexed values (SVRI and PVRI),
but not both simultaneously. Similarly, you can display the Left Ventricular Stroke
Work (LVSW) and the Right Ventricular Stroke Work (RVSW) or their indexed
values (LVSWI and RVSWI), but not both simultaneously.
Displaying Cardiac Index and Cardiac
Output Values
The cardiac output or both cardiac output/index values can be displayed with the
curves. If the CO portion of the CO|CO/CI key is highlighted, only the cardiac
output value will be displayed. To activate the display for the cardiac output and
cardiac index values, touch the CO|CO/CI key to highlight the CO/CI segment. If
the cardiac index value is available, then it is displayed when the CO parameter is
inactive.
To select indexing:
1Touch CO.
2Touch CARDIAC OUTPUT.
3Touch CALCS.
4Select VR INDEX ON or
SW INDEX ON.
To display both cardiac output
and cardiac index values:
1Touch CO|CO/CI.

Cardiac Output
19-9
Displaying Calculations Table
You can view hemodynamic calculations after storing or averaging data. The table
includes only those calculations that have been stored or averaged.
Table 1 shows an example of the hemodynamic calculations table displayed when
you touch the CALCS key. Each horizontal row is one complete set of data. Each
new value appears at the bottom of the table. The system defaults to VR INDEX
OFF and SW INDEX OFF.
The system automatically calculates and enters CO and CI values in the table.
Values in the columns SV, SVI, SVR, PVR, LVSW, and RVSW are automatically
calculated from the vital sign values entered in the columns HR, MAP, CVP, MPA,
and PCWP.
The values under the columns HR, MAP, CVP, MPA, and PCWP are parameter
values obtained from other channels in the bedside monitor at the time a CO
value is calculated or those values you have entered manually. To enter values in
these columns refer to Editing Vital Sign Values on page 19-10.
If you do not enter height and weight values prior to generating CO curves, the
monitor displays any value that uses BSA (e.g. CI, SVI, LVSWI and RVSWI)
as ?.?. If a calculated value is out of the displayable range, the monitor displays
the value as ++++. If any of the vital signs in the hemodynamics table are
negative, the system uses the value 0 (zero) in the calculations.
The equations used for the hemodynamics table are defined in the table to the
left.
Table 1: Sample Calculations
DAY/TIME CO CI SV SVI SVR PVR LVSW RVSW HR MAP CVP MPA PCWP
26/02:25p 5.1 2.9 70.8 40.4 1629 235 54.9 10.4 72 110 6 25 10
27/09:30p 4.9 2.8 65.3 37.8 1712 211 51.4 9.2 75 112 7 25 12
28/10:15p 4.5 2.5 56.2 32.1 1917 213 44.5 7.8 80 115 7 25 13
29/07:30a 4.0 2.2 47.0 26.8 2237 219 38.2 6.5 85 120 8 26 15
30/08:30a 4.0 2.2 47.0 26.8 2237 219 38.2 6.5 85 120 8 26 15
!
• The vital sign values shown in Table 1 are typical if your
monitor's UNITS OF MEASURE key is set to mmHg. Consult
your system administrator if your display is different from that
shown here.
To display the calculations table:
1Touch CO.
2Touch CALCS.
Hemodynamic Equations
BSA = Ht 0.725 x Wt 0.425 x
0.007184
CI = CO/BSA
SV = (CO/HR) x 1000
SVI = SV/BSA
SVR = 79.9 x [(MAP-
CVP)/CO]
SVRI
= 79.9 x [(MAP-CVP)/CI]
= 79.9 x [(MAP-
CVP)]/[CO/BSA]
= 79.9 x [(MAP-
CVP)]/[CO x 1/BSA]
= 79.9 x [(MAP-
CVP)/CO] x BSA
= SVR x BSA
PVR = 79.9 x [(MPA-
PCWP)/CO]
PVRI
= 79.9 x [(MPA-
PCWP)/CI]
= 79.9 x [(MPA-
PCWP)]/[CO/BSA]
= 79.9 x [(MPA-
PCWP)]/[CO x 1/BSA]
= 79.9 x [(MPA-
PCWP)/CO] x BSA
= PVR x BSA

Ultraview Care Network
19-10
Editing Vital Sign Values
Select a row of data in the hemodynamic calculations table to turn the vital signs
keys ON.
Default values are supplied if you touch the VITAL SIGNS key and no prior value
is available. When you edit a value, the system recalculates the hemodynamic
calculation values using the new vital sign value.
A CVP value is used in calculations if it is available. If only a RAP value is
available, then the RAP value is used in place of CVP. If neither CVP nor RAP
pressure is available, the system cannot automatically calculate SVR, SVRI,
RVSW, or RVSWI. A CVP or RAP value can be manually entered using this edit
process.
A PCWP value is used in calculations if the last stored PCWP value is less than
15-minutes old. If no such PCWP value is present, an LAP value is substituted. If
neither PCWP nor LAP values are available, the system cannot automatically
calculate PVR, PVRI, LVSW, nor LVSWI and the monitor displays the message
NO PCWP VALUE AVAILABLE WITHIN THE LAST 15-MINUTES. You can add a
PCWP value manually using this edit process.
View Additional Table Data
Five sets of values display at any one time. Additional sets of values can be
displayed by scrolling through the data.
Thirty sets of values are saved in the monitor’s hemodynamic calculations table
so you can remove and re-insert the module without losing hemodynamic values.
You can erase these values by discharging a patient or by powering the monitor
OFF.
Table 2: Hemodynamic and Vital Signs Values
Label Name Units Default
Value
Valid
Range
HR Heart Rate beats/min 70 0 - 300
MAP Mean Arterial Pressure mmHg
kPa
80
10.7
0 - 300
0.0 - 40.0
CVP Central Venous Pressure mmHg
kPa
10
1.3
0 - 99
0.0 - 13.2
MPA Mean Pulmonary Artery
Pressure
mmHg
kPa
15
2.0
0 - 99
0.0 - 13.2
PCWP Pulmonary Capillary
Wedge Pressure
mmHg
kPa
10
1.3
0 - 99
0.0 - 13.2
!
• To ensure that a RAP/CVP value can be registered,
immediately reopen the stopcock to the patient after you inject
the bolus so that flow is reinstated.
To edit vital sign values:
1Touch CO.
2Touch CARDIAC OUTPUT.
3Touch CALCS.
4Touch DAY/TIME in the row
you wish to select.
5Touch VITAL SIGNS.
6Select the vital sign you wish to
edit.
7Use arrow keys to edit the
displayed value.
8Press ENTER.
To view additional sets of data:
1Touch CO.
2Touch CALCS.
3Touch SCROLL UP to scroll the
data up one row, touch
SCROLL DOWN to scroll the
data down one row.

Cardiac Output
19-11
Recording Cardiac Output Curves
If a bedside or system printer is installed, you can record all curves in the CO
display area. You can also record the calculations table when it is displayed on
the screen.
Error Messages
Catheter Fault
There is a problem with the thermodilution catheter. Connect or replace the
catheter.
TB Out Of Range
The blood temperature (TB) is unacceptable. The temperature must be between
27° and 43°C.
Probe Fault
There is a problem with the probe. Connect or replace the probe.
TI Too Warm
The injectate temperature (TI) is greater than 25.5°C. Cool down injectate.
Bad Curve
There are a number of different possible causes: unsteady baseline, irregular
curve from shunts or poor injection, delayed curve, catheter or probe fault during
curve recording. Delete the bad curves as necessary to perform additional cardiac
output determination.
Injectate Temperature Error
The temperature difference between the injectate and body is less than 8°C. Cool
the injectate down.
To record thermodilution curves:
1Touch CO.
2Touch CARDIAC OUTPUT.
3Touch PRINT.

Ultraview Care Network
19-12
Cables and Probes
Refer to Spacelabs Medical Supplies Products catalog for part numbers and
specifications for cables, probes, and injectate systems.
Computation Constants/Catheter Compatibility
Nominal resistance @ 37°C 14,004 Ω + 15%
Refer to the instructions provided with your catheter for the computation constants
for your specific catheter, setup injectate temperature, and injectate volume.
Contact your local thermodilution catheter sales representative for further
information.
Refer to Calculations on page 25-5 for hemodynamic and vital sign value tables.
!
• Cardiac output function is compatible with the Baxter Edwards
Critical-Care REF™ and REF-Ox™ catheters for cardiac output
measurement, but cannot perform the REF function.
WARNING:
• For 3 cc injectate volumes, the 0° - 5°C injectate
temperature is required for consistent results.

19-13
Cardiac Output Troubleshooting Guide
Clinical Situation Possible Cause Solution
Invalid pressure reading ■Stopcock of the CVP or RAP line
may not have been turned OFF
quickly enough after injection was
made.
■Turn the stopcock off immediately after
making the injection to provide the
module with the correct pressure value
at the time it obtains the curve.
Erroneous CO values
using room temperature
injectate
■Injectate too warm. ■Injectate temperature is above 25.5° C.
■Injection rate too slow. ■Administer bolus smoothly at a rate of
< 10 cc/4-seconds.
Unable to obtain indexed
values for calcs
■Did not enter height and/or weight
prior to averaging curves.
■Enter the height/weight and reinject the
curves.
■If the Calcs option is installed, enter the
height/weight in hemocalcs to obtain
index values without reinjecting curves.
Value of calcs variable
displays as +++
■Measured value is out of range. ■Check computation constant (CC)
values for validity.
Spontaneous CO curves
drawn while in AUTO
mode
■Infusion of IV drips or medications
through proximal port.
■Turn off the IV solutions temporarily.
■Mechanically ventilated patient
causing shifts in PA temperature.
■Use the Manual mode.
■Cardiac arrhythmias causing blood
flow variance.
■Use the Manual mode and time the
injection during stable ECG rhythm.
Substantial variance in
CO values/irregular
curves
■Varied temperature in bolus.
■Injection delivered at varying points
in the respiratory cycle.
■Standardize the temperature of bolus.
■Use the Manual mode and time the
injection at end expiration, if desired.
■Movement. ■Standardize the patient position during
procedure.
■Physiological problems. ■Any of the following conditions can
affect accurate readings: ventricular
arrhythmias, low stroke volume, and/or
valve insufficiency.
■Injectate rate too slow. ■Administer the bolus smoothly at a
consistent rate.
No curve drawn after
bolus injected
■Insufficient time has elapsed
between injections to allow blood
temperature stabilization.
■Wait 60- to 90-seconds between
injections.

20-1
!
• Based on features purchased, more or fewer keys may appear here than on your menu screens.
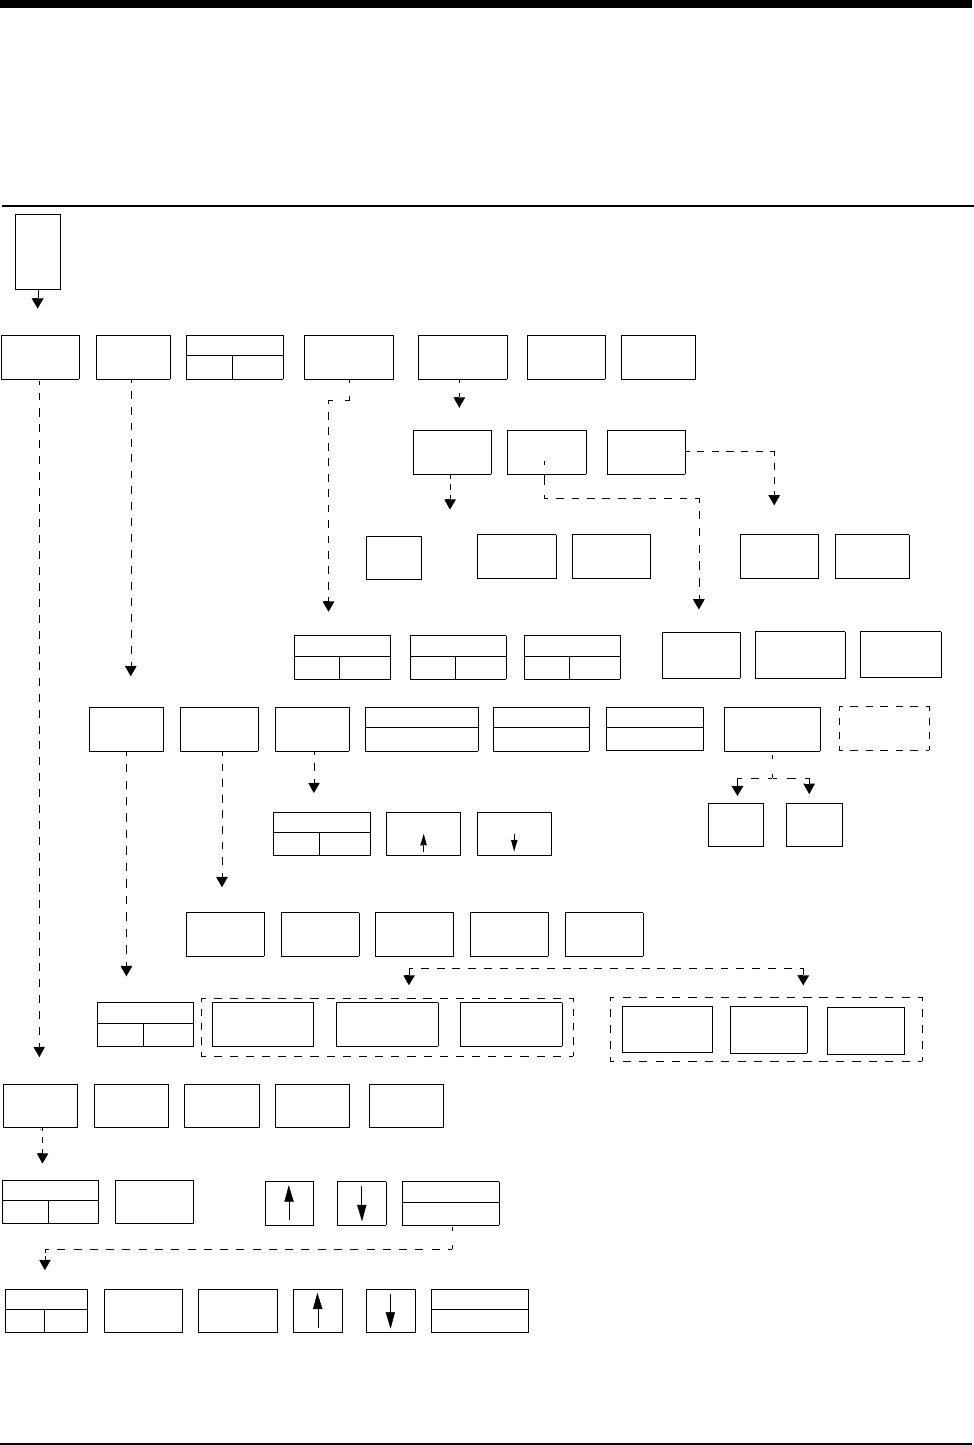
SvO2
Directory of Keys
SVO2 MENU
11:55 av DO2 = 4.61 Ca = 19.80 Cv = 15.20 ml/dl O2AV = 990 VO2 = 250 ml/min
S
V
O
2
ALARM
LIMITS
TIMEBASE
2 HOURS
INTENSITY
DISPLAY CALIBRATE STORE
READ PRINT SCALES CALCS
STORE READ
YES NO YES NO
SVO2
TREND
CALC
RESULTS
PRE-
INSERTION
IN
VIVO
LIGHT
INTENSITY
YES NO YES NO YES NO
ENTER
ENTER
1
HOUR
2
HOUR
4
HOUR
8
HOUR
16
HOUR
ALARMS
ON OFF
HI =
80
LO =
80
LIGHT INT
ON OFF
PaO2 = PvO2 = CO = SaO2 = SvO2 = Hgb =


Contents
20-3
SvO2
Overview
Measurements of venous oxygen saturation (SvO2) provide a status indicator of
the oxygen transport system in the critically ill patient.
Low or rapidly decreasing saturation values indicate an imbalance between
oxygen consumption and oxygen delivery. Normal values reflect a balance of the
oxygen transport system or the patient’s ability to successfully compensate for
alterations in oxygen supply or demand. Continuous SvO2 monitoring can reduce
the frequency of additional invasive measurements and enhance the timeliness of
intervention in the critically ill patient.
This system utilizes three-wavelength reflectance spectrophotometry to sense the
amount of light absorbed by the blood. The use of three wavelengths
compensates for changes in light reflectance from red blood cell surfaces, blood
vessel walls, and for variations in hematocrit values. Digital filtering reduces
vessel-wall artifacts.
Data acquisition begins when an Abbott Opticath catheter is positioned at a site
within the pulmonary artery. The catheter connects to an Abbott Oximetrix optical
module which contains three LEDs emitting red and infrared wavelengths of light.
The catheter returns reflected light through a second optical fiber to the optical
module. Here the light is converted to an electrical signal which the SvO2 module
recognizes and displays as a saturated venous oximetry value (percent SvO2).
Overview . . . . . . . . . . . . . . . . . . . . . . . . . . . . . . . . . . . . . . . . . . . . . . . . . . . . . . 3
Setting Up SvO2 Monitoring . . . . . . . . . . . . . . . . . . . . . . . . . . . . . . . . . . . . . . . 4
Display Detail. . . . . . . . . . . . . . . . . . . . . . . . . . . . . . . . . . . . . . . . . . . . . . . . . . . 4
Preparing the Catheter . . . . . . . . . . . . . . . . . . . . . . . . . . . . . . . . . . . . . . . . . . . 5
Performing Pre-insertion (in vitro) Calibration . . . . . . . . . . . . . . . . . . . . . . . . . . 6
Inserting the Catheter . . . . . . . . . . . . . . . . . . . . . . . . . . . . . . . . . . . . . . . . . . . . 7
Performing Light Intensity Calibration . . . . . . . . . . . . . . . . . . . . . . . . . . . . . . . . 7
Performing In Vivo Calibration . . . . . . . . . . . . . . . . . . . . . . . . . . . . . . . . . . . . . . 8
Displaying Intensity Data . . . . . . . . . . . . . . . . . . . . . . . . . . . . . . . . . . . . . . . . . . 8
Setting Alarm Limits. . . . . . . . . . . . . . . . . . . . . . . . . . . . . . . . . . . . . . . . . . . . . . 8
Setting the Light Intensity Alarm . . . . . . . . . . . . . . . . . . . . . . . . . . . . . . . . . . . . 9
Adjusting Trend Display. . . . . . . . . . . . . . . . . . . . . . . . . . . . . . . . . . . . . . . . . . . 9
Obtaining Oximetry Calculations . . . . . . . . . . . . . . . . . . . . . . . . . . . . . . . . . . . 10
Printing Oximetry Data. . . . . . . . . . . . . . . . . . . . . . . . . . . . . . . . . . . . . . . . . . . 10
Storing or Reading Data . . . . . . . . . . . . . . . . . . . . . . . . . . . . . . . . . . . . . . . . . 10
Correcting Out-of-Range Light Intensity . . . . . . . . . . . . . . . . . . . . . . . . . . . . . 11
Correcting Insufficient Light Intensity. . . . . . . . . . . . . . . . . . . . . . . . . . . . . . . . 12
Correcting Calibration Errors . . . . . . . . . . . . . . . . . . . . . . . . . . . . . . . . . . . . . . 12
Correcting Optical Module Errors . . . . . . . . . . . . . . . . . . . . . . . . . . . . . . . . . . 12
Correcting SvO2 Display Error . . . . . . . . . . . . . . . . . . . . . . . . . . . . . . . . . . . . 13
Ensuring Catheter Function . . . . . . . . . . . . . . . . . . . . . . . . . . . . . . . . . . . . . . . 13
SvO2 Troubleshooting Guide . . . . . . . . . . . . . . . . . . . . . . . . . . . . . . . . . . . . . 14
Ultraview Care Network
20-4
Setting Up SvO2Monitoring
In addition to the Spacelabs Medical module, venous oximetry monitoring requires
an Abbott Oximetrix 3 optical module with connecting cable and an Abbott
Opticath catheter. You must correctly connect all necessary cables, prepare the
catheter and patient for this invasive procedure, and calibrate the catheter to
begin monitoring.
The system provides two calibration methods. The patient’s current status
determines the proper calibration method. You can calibrate the catheter:
• while in its sterile package, or
• after it has been placed within the pulmonary artery, and you can verify
adequate light intensity during monitoring.
Refer to Preparing the Catheter on page 20-5 and Performing Pre-insertion (in
vitro) Calibration on page 20-6 for more details.
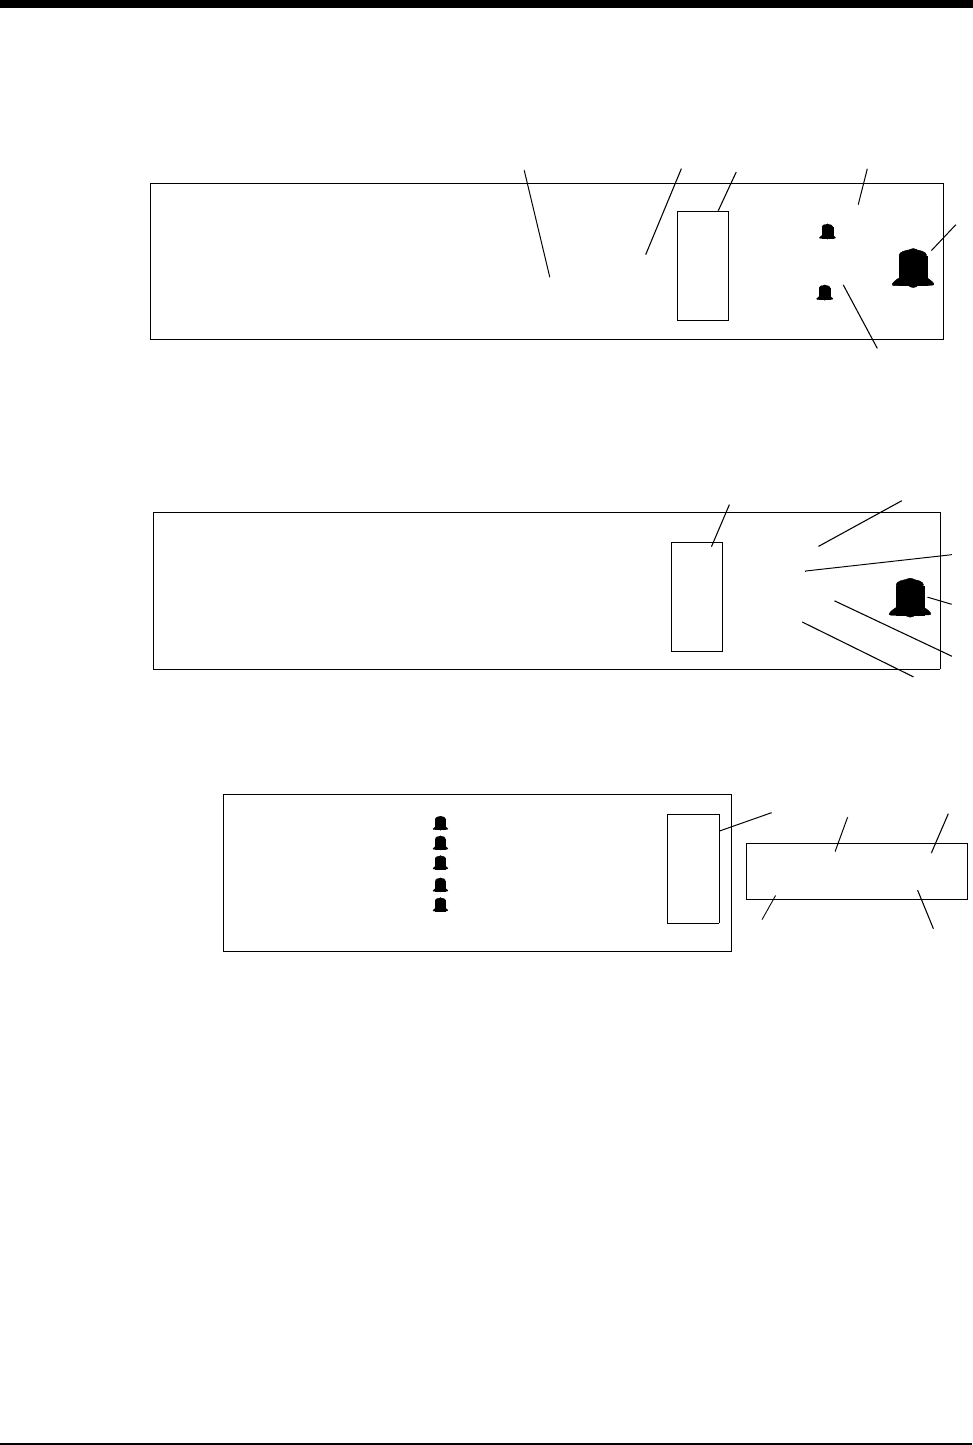
Display Detail
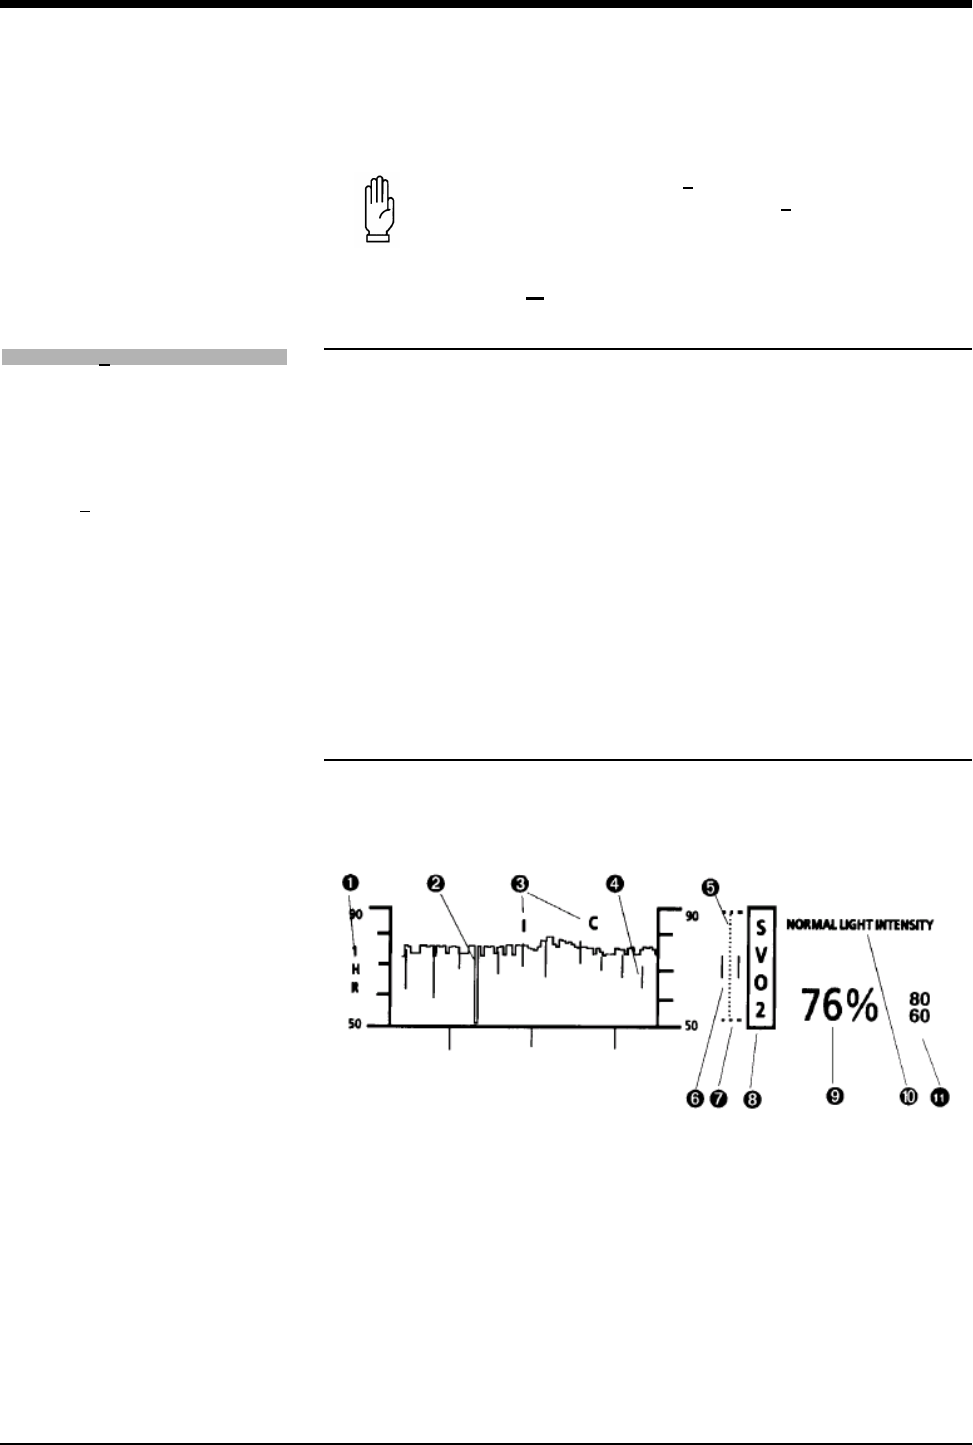
Figure 20-1 provides a trend of oximetry values and the current light intensity
value.
Figure 20-1: Typical venous oximetry display
Current time base — 1HR
Venous oximetry trend graph
Event marks — I (in vivo calibration initiated), C (in vivo calibration complete)
Light intensity display marks (vertical lines) superimposed over trend graph
Light intensity bar graph (light meter)
Real time intensity signal level (two vertical lines)
CAUTION:
• The Spacelabs Medical SvO2module will not correctly
operate with any other catheter for SvO2monitoring.
To set up SvO2 monitoring:
1Place the catheter’s optical
connector into the optical
module on the connecting
cable.
2Insert the connecting cable into
the SvO2module.
SvO2
20-5
Markers for normal intensity levels (two horizontal lines)
SvO2 parameter key
Current venous oximetry value — 76%
쐅Status or error message area
쐈Current alarm limits — high 80, low 60
Preparing the Catheter
Each Abbott Opticath catheter is packaged in a sterile, disposable tray which
includes a disposable optical reference. Inspect the catheter tray carefully. If you
suspect damage to the tray DO NOT USE THE CATHETER.
Perform the catheter setup according to the instructions included with the
catheter. Setup instructions are included here as a convenience.
1. Peel back the outer wrap. Do not break the seal of the inner wrap.
2. Peel back the lift tab to uncover the optical connector at the end of the tray.
3. Pull the optical connector slightly away from the tray. Place the optical module
in the recess at the open end of the catheter tray.
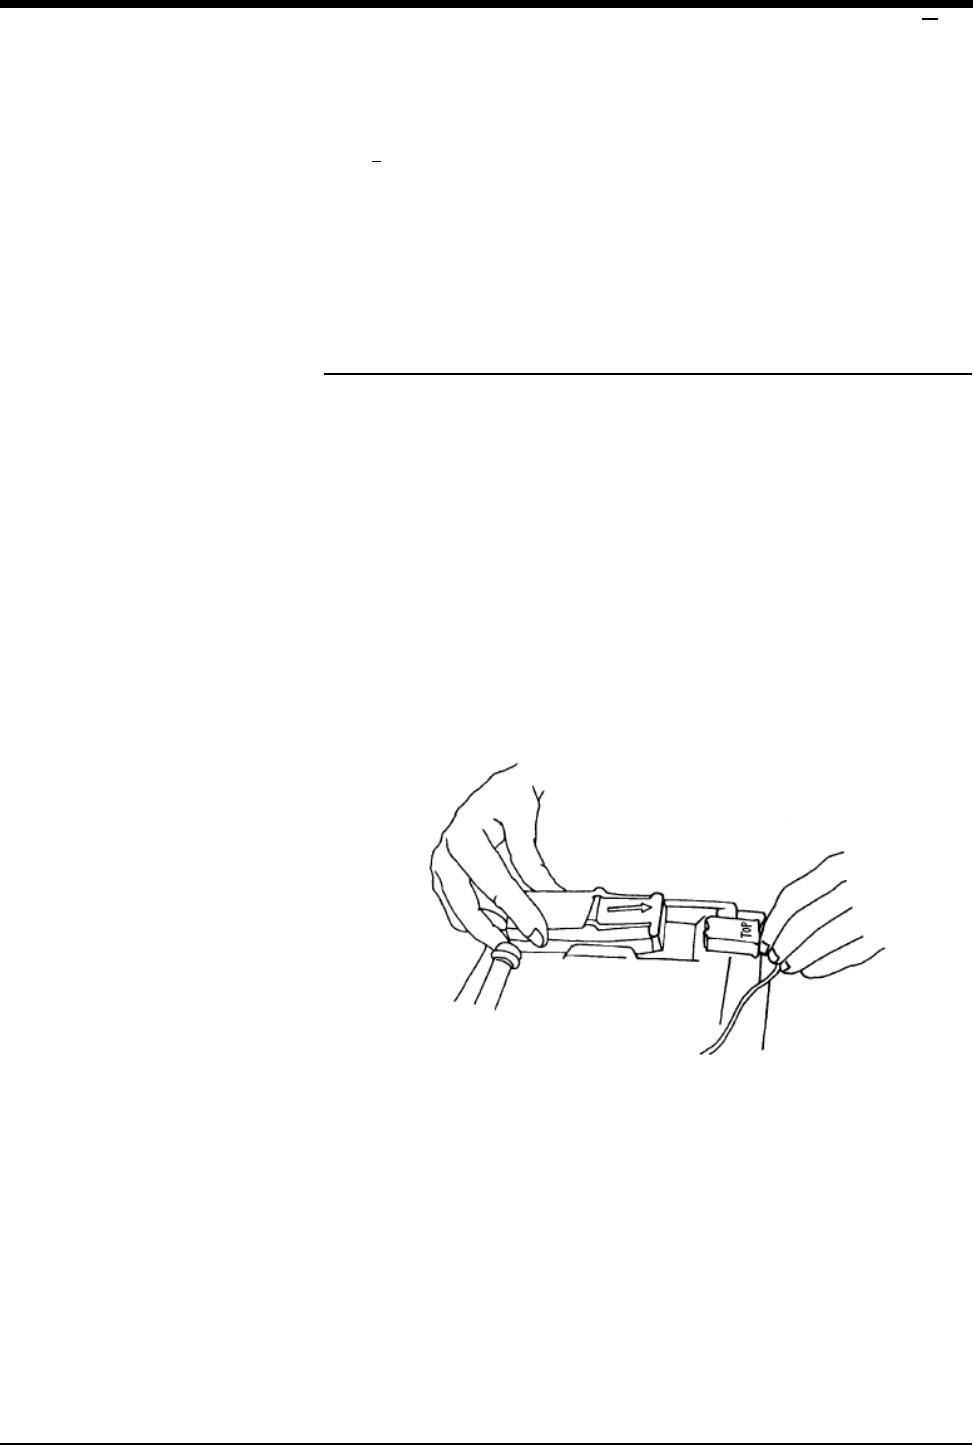
4. Open the end of the optical module by pulling straight out in the direction of the
arrow (refer to Figure 20-2). The monitor will display an INSUFFICIENT LIGHT
message.
Figure 20-2: Placing the optical module into the catheter tray

Ultraview Care Network
20-6
5. Place the optical connector into the optical module with the word TOP facing
up. Close the module (refer to Figure 20-3).
Figure 20-3: Placing the optical connector into the optical module
6. With the inner wrap still in place, press down on the black optical reference at
the point labeled PUSH. Listen for a click.
The catheter is now ready for pre-insertion calibration. After you complete the
calibration, prepare the patient for catheter insertion.
Performing Pre-insertion (in vitro)
Calibration
This calibration procedure tales up to 72-seconds. When calibration is successful,
the message PRE-INS CAL COMPLETE displays and the event mark P displays
on the oximetry trend.
If the catheter fails calibration, verify the following:
• A secure cable connection exists between the optical and SvO2 modules.
• The catheter tip is inserted properly within the optical connector.
• You have pressed the optical reference with enough force to hear the click,
indicating a secure connection.
• You tested the catheter by replacing it with a known good catheter to ensure
proper catheter function.
Repeated calibration failure with a known good catheter may indicate a defective
optical module. Replace the optical module if necessary.
To initiate pre-insertion
calibration:
1Touch SVO2.
2Touch CALIBRATE.
3Touch PRE-INSERTION.
4Touch YES.

SvO2
20-7
Inserting the Catheter
Follow standard hospital procedure to prepare the patient for catheter insertion.
1. Using sterile procedures, peel back the remaining inner wrap from the catheter
tray. Pull the retainer (white tab) to release the catheter.
2. Grasp the catheter at approximately the 5 cm mark and gently pull it straight
out from the optical reference.
3. Prepare the catheter and insert it into the patient according to hospital
procedure. Oxygen saturation readings will immediately display on the
bedside monitor.
4. When the catheter is positioned properly, verify the light intensity signal is
within the correct operating range (i.e., the bars on the graph extend at least
two vertical dots within the high and low range markers).
5. Perform a light intensity calibration.
6. Begin continuous mixed venous oxygen saturation monitoring.
Performing Light Intensity Calibration
This procedure adjusts the optical module’s light intensity reference level to match
the light intensity returned through the catheter from the patient’s blood. The SvO2
module stores this value and signals an alarm if the detected light differs
significantly from the stored light levels.
Perform a light intensity calibration only when the catheter is in the proper position
in the patient.
CAUTION:
• The optical fibers can be damaged if you do not draw the
catheter out carefully.
!
• Do not begin a light intensity calibration if the signal is out of
range. If this occurs, refer to Correcting Out-of-Range Light
Intensity on page 20-11.
To initiate light intensity
calibration:
1Touch SVO2.
2Touch CALIBRATE.
3Touch LIGHT INTENSITY.
4Touch YES.

Ultraview Care Network
20-8
Performing In Vivo Calibration
In vivo calibration compares a drawn (measured) blood gas value with the value
displaying on the monitor. The catheter manufacturer recommends that the
oxygenation value be checked periodically. Several conditions may necessitate in
vivo calibration.
• Catheter was placed without pre-insertion calibration.
• Catheter has been in place for an extended period of time.
• Decaying light intensity values indicate possible damage to the fiber optics
(in this case, the catheter manufacturer recommends checking the
oxygenation value every 12-hours).
• You believe the saturation reading is incorrect.
Perform an in vivo calibration only when the patient’s oxygen saturation is
relatively stable and the intensity signal is within normal limits. When calibration
begins, the optical module stores the preceding 5-seconds of oxygen saturation
data.
Displaying Intensity Data
You can display a history of light intensity values superimposed over the
saturation trend graph. This combined display can be valuable for troubleshooting
because the quality of light passing the catheter tip directly affects the accuracy of
the saturation value. Successful monitoring ensures light intensity values remain
within the limits of the bar graph display.
Real time maximum and minimum intensity values display as vertical bars to each
side of a vertical row of dots. This display updates every 6-seconds. Horizontal
lines represent the recommended operating limits for light intensity.
Removing display of the intensity data does not affect storage of the data in
monitor memory, and the current intensity continues to display in the intensity bar.
Setting Alarm Limits
The current limits for venous oximetry display to the right of the parameter key.
You can set high or low saturation limits.
The alarm default is OFF. When you turn alarms ON:
• they default to a high of 80% and low of 60%.
• the exceeded limit key flashes.
• the limit value is displayed in the message area of the screen.
!
• Use only measured oxyhemoglobin saturation values from a co-
oximeter. Do not use values calculated from a laboratory blood
gas analyzer. Oxyhemoglobin values calculated on the basis of
PO2, pH, and temperature have been shown to be inaccurate.
To initiate in vivo calibration:
1Touch SVO2.
2Touch CALIBRATE.
3Touch IN VIVO.
4Touch YES.
5Draw blood from the distal
lumen when the message
DRAW BLOOD is displayed
and send to lab for analysis.
6Use arrow keys to adjust value
if displayed value differs from
lab value by more than four
saturation units.
To display a history of light
intensity values:
1Touch SVO2.
2Touch INTENSITY DISPLAY.
To set or adjust alarm limits:
1Touch SVO2.
2Touch ALARM LIMITS.
3Select ALARMS ON.
4Select HI= or LO=.
5Use arrow keys to adjust.

SvO2
20-9
Setting the Light Intensity Alarm
If the light intensity alarm is turned ON, a second-level alarm will sound in the
event of an intensity alert.
Adjusting Trend Display
The most recent minute of mixed venous oxygen saturation data is displayed as a
point on the right side of the trend graph. As the module acquires new data, the
older data points move left to create a record of data.
Select Timebase
The SvO2module stores the most recent 16-hours of saturation trend data. You
can view this data graphically in 1-, 2-, 4-, 8-, or 16-hour time bases. Data is
displayed in 1-minute increments on 1- to 4-hour graphs, in 2-minute increments
on the 8-hour graph, and in4-minute increments on the 16-hour graph.
Select Scale
You can select one of three sizes for the trend graph:
•30% to 70%
•40% to 80%
• 50% to 90% (default)
Event Marks
The system automatically displays event marks along the top of the trend graph to
note the point when any of the following events occur:
P — pre-insertion calibration initiated
I — in vivo calibration initiated
C — in vivo calibration complete
L — light intensity calibration complete
F — calibration failure
R — light intensity range error
To set the light intensity alarm:
1Touch SVO2.
2Touch ALARM LIMITS.
3Select LIGHT IN - ON or OFF.
To select a timebase:
1Touch SVO2.
2Touch TIMEBASE x HOURS.
3Select hours.
To change trend graph size:
1Touch SVO2.
2Touch SCALES.
3Use arrows to adjust.

Ultraview Care Network
20-10
Obtaining Oximetry Calculations
You can use the calculations feature to obtain specific values for the oximetry
measurements listed below.
Arterial oxygen content — Ca
CaO2 = (1.34 x Hgb x SaO2/100) + (0.0031 x PaO2)
Venous oxygen content — Cv
CvO2 = (1.34 x Hgb x SvO2/100) + (0.0031 x PvO2)
Arterial-venous oxygen content difference
avDO2 = CaO2 - CvO2
Oxygen availability or oxygen delivery
O2AV = CaO2 x CO x 10
Oxygen consumption
VO2 = avDO2 x CO x 10
Values for cardiac output (CO), pulse oximetry (SpO2), and venous oxygen
saturation (SvO2) are automatically displayed when data is available in the
Ultraview Care Network system. You must manually enter laboratory values for
PaO2, PvO2, and hemoglobin (Hgb) to obtain calculations.
Printing Oximetry Data
You can print venous oximetry data in two formats: the current trend or the results
of the most recent set of oxygenation calculations. Refer to Printing on page 4-5
for more details on system and bedside printers.
Storing or Reading Data
The last 15-minutes of data gathered by the SvO2module may be stored in the
optical module’s memory before disconnection. That data can be read back into
the SvO2 module. The stored data includes the year, month, hour, and minute of
collection.
!
• If an SaO2value is available, it may be used in place of the
SpO2value.
To obtain oxygenation
calculations:
1Touch SVO2.
2Touch CALCS.
3Select a manually entered
value(s) for PaO2, PvO2, Hgb.
4Use arrow keys to adjust.
5Touch ENTER.
To print saturation data:
1Touch SVO2.
2Touch PRINT.
3Select SvO2TREND or CALC
RESULTS.
To read or store data in the
optical module:
1Touch SVO2.
2Touch STORE READ.
3Select STORE or READ.
4Touch YES.
SvO2
20-11
Correcting Out-of-Range Light Intensity
Each time you perform a light intensity calibration, the oximetry module stores the
intensity value and signals an alarm or error message if the current light level
differs significantly from the stored level. Light intensity error messages serve as a
reference to determine if the light at the catheter tip is adequate for accurate
monitoring. Do not ignore these messages.
The module alerts you to this condition when:
• an INTENSITY ALERT or SVO2 DATA OUT OF RANGE message is
displayed; or
• a second level alarm begins.
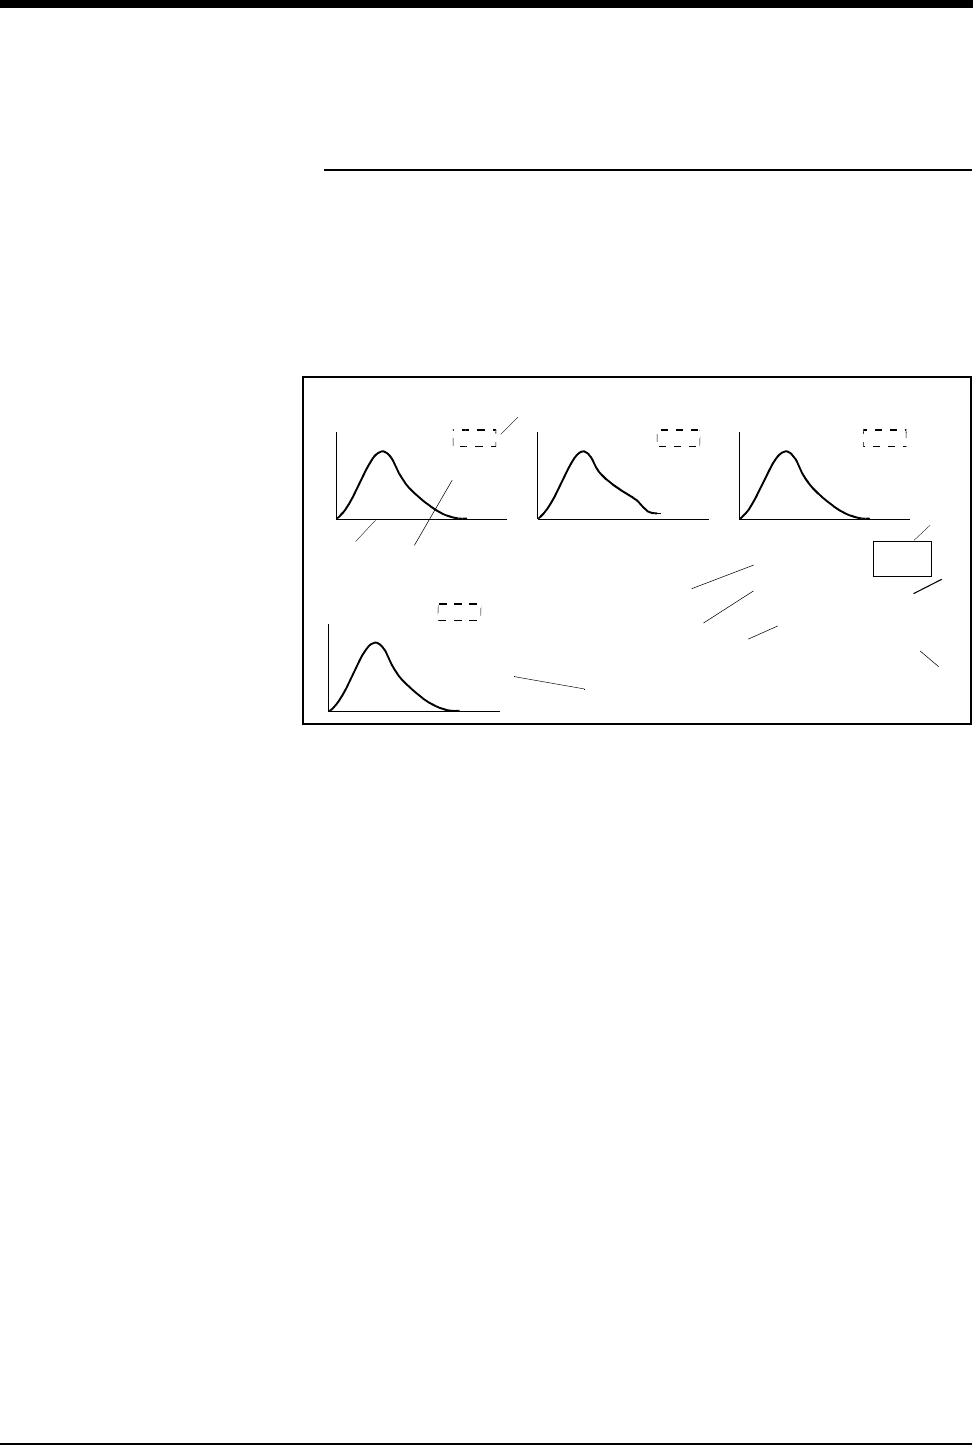
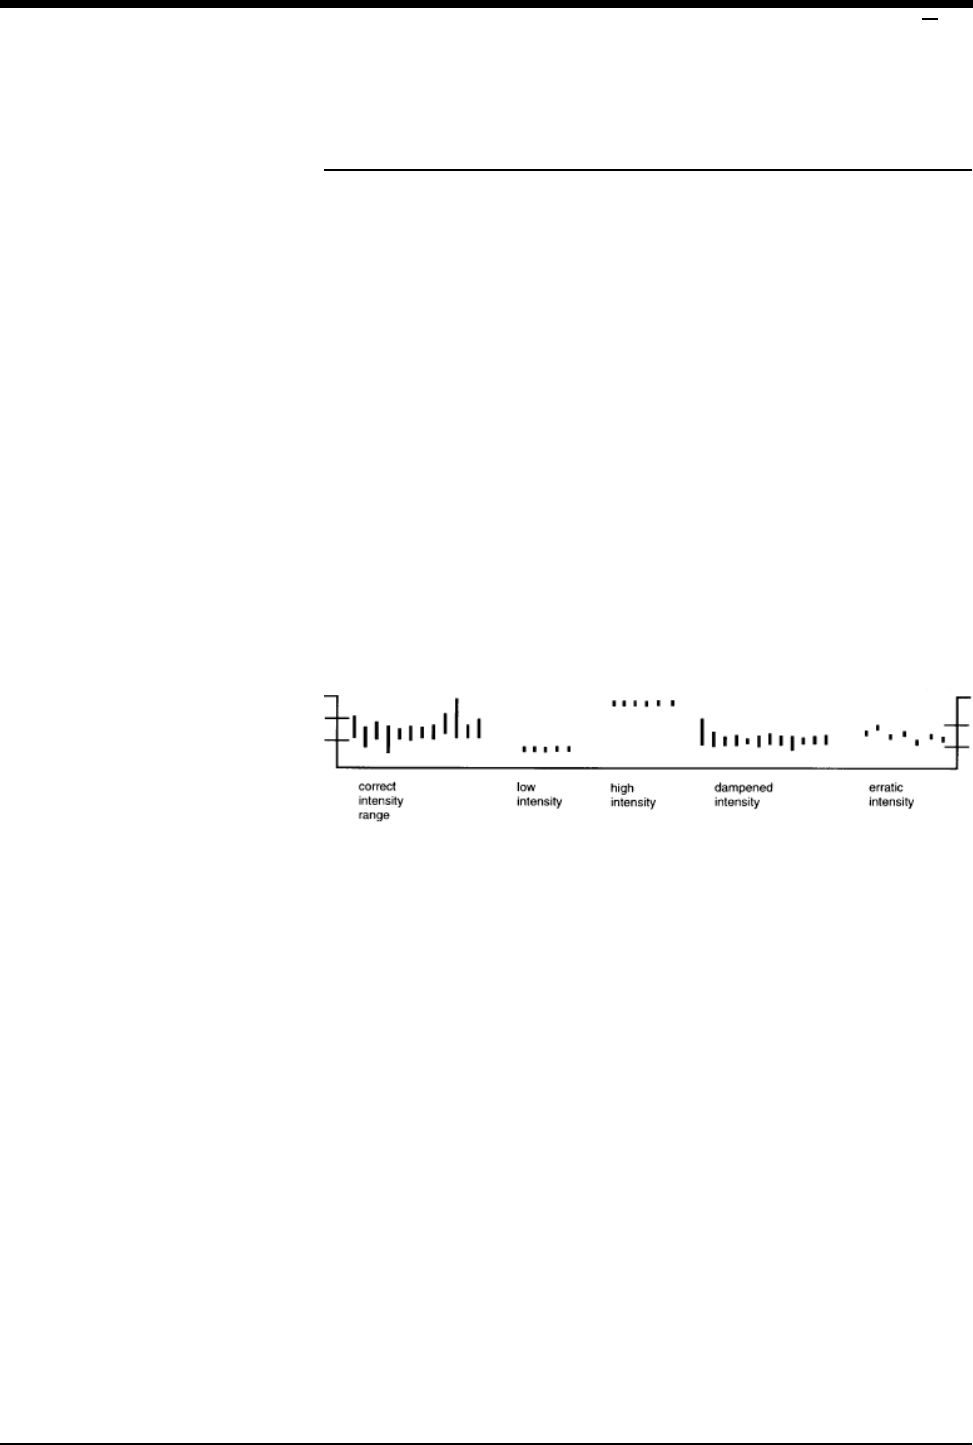
When the monitor displays the SVO2 DATA OUT OF RANGE or INTENSITY
ALERT message, select the intensity display feature to view a history of light
intensity values. Refer to Figure 20-4 to identify the type of abnormal intensity.
Refer to the following list of possible causes and solutions.
• High — check the position of the catheter as the tip may lie against the vessel
wall. Reposition the catheter according to your hospital protocol.
• Low, dampened, or erratic — check the blood flow past the catheter as a clot
may have formed over the catheter tip.
Figure 20-4: Abnormal intensities
Take the following actions:
• If a Spacelabs Medical invasive pressure module is being used, examine the
pulmonary artery (PA) pressure waveform for spontaneous wedge indicating
the catheter tip may lie against the vessel wall. If this occurs, reposition the
catheter.
• If a Spacelabs Medical invasive pressure module is being used for pulmonary
artery pressure monitoring, examine the pressure waveform for dampening,
indicating clotting over the tip of the catheter. If this occurs, follow hospital
procedure to flush the distal lumen. Reposition the catheter if necessary.
• Abnormal resistance when you push the catheter through the distal lumen
indicates damage to catheter fiber optics. Reposition the catheter and replace
if necessary.
• If connections between the catheter optical connector and the optical module
appear loose, tighten the connections.
• If the catheter contains obvious kinks, the optical fibers may be damaged.
Replace the catheter.

Ultraview Care Network
20-12
Correcting Insufficient Light Intensity
The message INSUFFICIENT LIGHT displays when an unusually small amount of
light is being received during monitoring or during pre-insertion calibration.
Take the following actions:
• If this message displays while the catheter is exposed to room light during
pre-insertion calibration, take no action. It disappears when the catheter is
placed in the patient.
• If this message displays during pre-insertion calibration while the catheter is
connected to the optical module, verify proper connection to the module.
• Check that the tip is fully inserted into the optical reference and firmly press
PUSH on the optical reference until you hear a click. Do not use the catheter
if the tip is pulled out of the optical reference when you receive the catheter
tray.
• Disconnect the optical module from the catheter, close the optical module lid,
and place the optical module in an area out of direct light. If the message
disappears, replace the catheter. If the message remains, contact your
system administrator.
• Examine the catheter for kinking. If optical fibers are damaged, replace the
catheter.
Correcting Calibration Errors
The message CALIBRATION REJECTED displays when pre-insertion or in vivo
calibration is not successful.
Take the following action as indicated:
• Check for secure catheter connection to the optical module. Reconnect the
catheter if necessary.
• Check the status message on the monitor screen to verify sufficient, stable
light intensity. If the INSUFFICIENT LIGHT message displays, refer to the
previous section which describes steps to correct this condition.
• Allow the optical module to warm up for one more minute, then retry.
The message NOT CALIBRATED displays and an alert sounds (if alarms are ON)
if you begin monitoring before you calibrate the system. The message disappears
after you complete a successful calibration.
Correcting Optical Module Errors
The SvO2module performs constant memory checks to ensure data is not lost or
changed erroneously. When the OPTICAL MODULE MEMORY ERROR
message displays, replace the optical module with a known good unit.
Expect the NO OPTICAL MODULE message whenever you disconnect the
optical module from the SvO2module because this suspends SvO2monitoring.
If this message appears when the optical module is not disconnected, replace the
module or contact a qualified service person.

SvO2
20-13
Correcting SvO2 Display Error
If the oxygen saturation value is out of the display range, the display changes from
a percentage to ???.
Take the following action as indicated:
• Verify proper function of the optical module; no error messages display.
Replace with a known good module if necessary.
• Display light intensity history to verify proper catheter function (refer to
Correcting Insufficient Light Intensity on page 20-12).
• Perform in vivo calibration.
Ensuring Catheter Function
The catheter fiber optics are sensitive to damage. Avoid kinking, excessive
manipulation, or grasping with forceps or a hemostat. Damage to the fiber optics
reduces transmission of light to and from the blood which significantly
compromises oxygen saturation accuracy.
Damage is indicated by one or more of the following:
• Low intensity display.
• Intensity error message displays.
• Intensity alarms begin if alarms are ON.
• Oxygen saturating values are inaccurate.

20-14
SvO2 Troubleshooting Guide
Clinical Situation Possible Cause Solution
INTENSITY ALERT or
SVO2 DATA OUT OF
RANGE message is
displayed
■Faulty catheter position within vessel. ■Check for spontaneous wedge or
balloon inflation; if present reposition
the catheter.
■Clot over catheter tip. ■Flush distal lumen.
■Loose connections between catheter
optical connector and optical module.
■Tighten the connections.
■Kinked or damaged fiber optics in
catheter.
■Replace the catheter.
INSUFFICIENT LIGHT
message is displayed
■Catheter exposed to room light
during pre-insertion calibration.
■No action required; status message
only.
■Catheter is kinked. ■Check the catheter.
■Faulty connection between catheter
and optical module.
■Fully insert the tip into the optical
reference.
CALIBRATION REJECTED
message is displayed
■Faulty connection between catheter
and optical module.
■Reconnect.
■Optical module not warmed up. ■Wait one minute and retry.
??? is displayed in place
of SvO2 value
■Value out of range. ■If optical module error message also
is displayed, replace optical module.
■Poor light intensity. ■Display light intensity history to
verify.
■Pre-insertion calibration insufficient. ■Perform in vivo calibration.
!
• Catheters should be handled according to your hospital’s protocol.
21-1
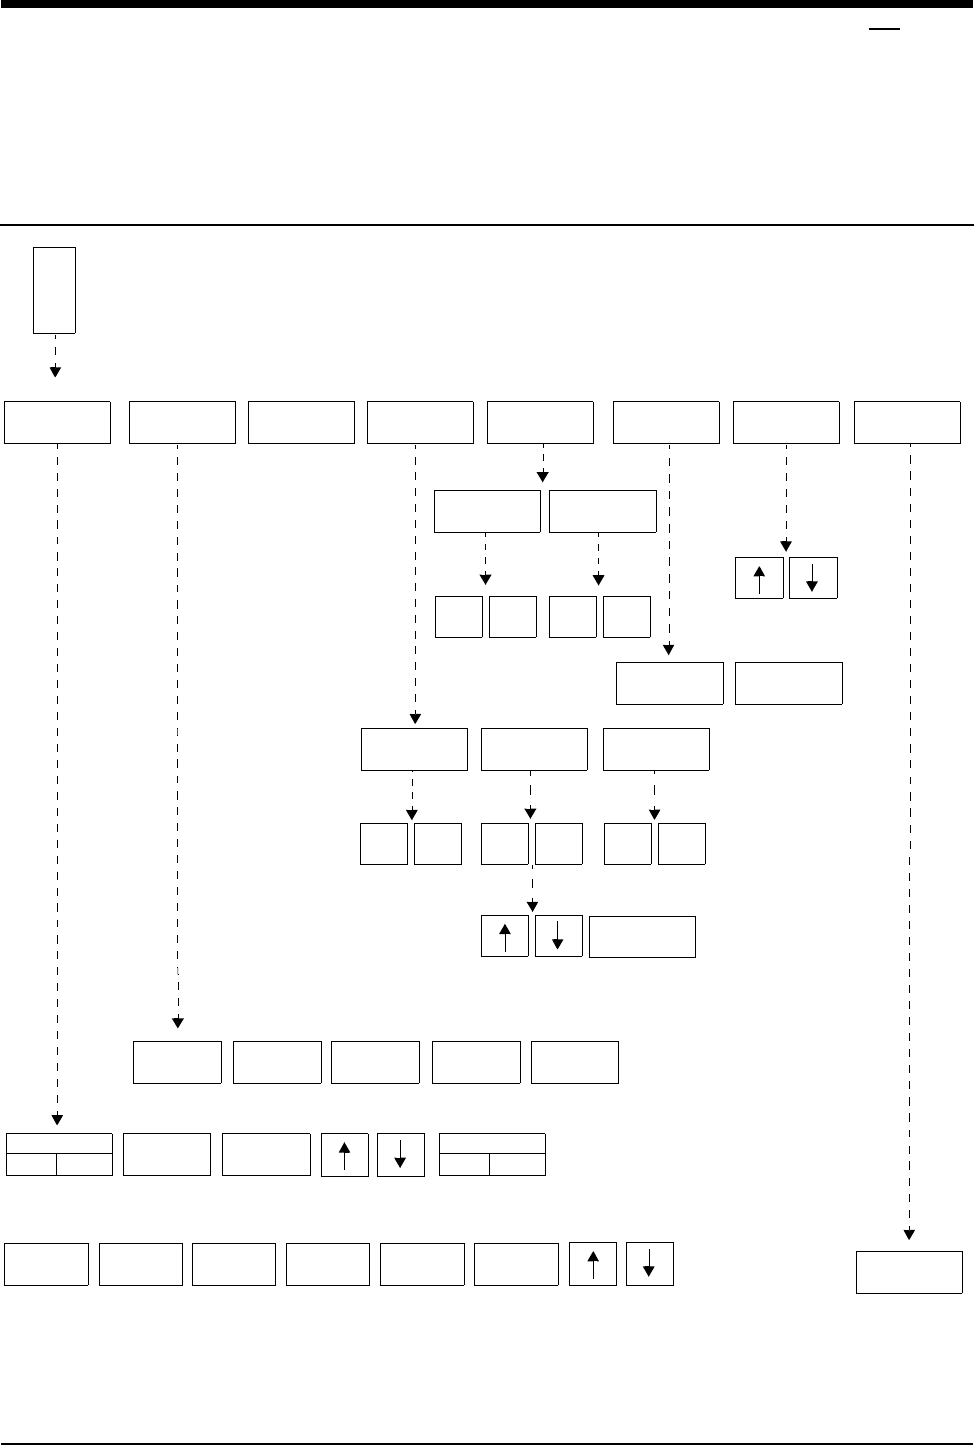
!
• Based on features purchased, more or fewer keys may appear here than on your menu screens.
Capnography Directory
Directory of Keys
GAS - CAL MENU - O2 CAL
LIMITS
ALARM FREEZE
ON OFF
SETUP CAL VIEW
ALARMS PRINT
ROOM O2
SPAN 100%
O2 SPAN
ZERO
TONE
SIZE SWEEP
SPEED
PERCENT
mmHg (kPa)
LARGE TXT
SMALL TXT
RESP TONE
ON OFF
VOLUMEVOLUME
25
mm/sec
12.5
mm/sec
6.25
mm/sec
3.12
mm/sec
1.56
mm/sec
WAVEFORM
ON OFF
0-80 0-60 0-40
APNEA RR ETCO2 O2 MINCO2
APNEA
ON OFF
APNEA =
OFF
APNEA
RR
APNEA
RR
HI =
OFF
LO =
OFF
RR
ON OFF
G
A
S
GAS - ALARM LIMITS MENU - APNEA
GAS - ALARM LIMITS MENU - RR
GAS - ALARM LIMITS MENU
GAS - MAIN MENU
GAS - SETUP MENU
GAS - SETUP MENU - RESP TONE
GAS - SETUP MENU - SWEEP SPEED
GAS - SETUP MENU - SIZE
COMP
GAS - COMP
N2O
ON OFF
O2
AUTO MAN
O2
ON OFF
GAS - CAL MENU
O2
CAL
CO2
CHECK
GAS - CAL MENU - CO2 CHECK
CO2
= XX.X
NEXT
READING
BarPres
= XXX
ADAPTER
CAL
CANCEL
START
RESP
mmHg mmHg mmHg
RESTORE
SETTINGS
YES NO
GAS - CAL MENU - ADAPTER CAL
CAPNO
O2 ONLY
0-5.3 kPa0-10.7 kPa 0-8.0 kPa
HIDDEN
KEY


Contents
21-3
Overview . . . . . . . . . . . . . . . . . . . . . . . . . . . . . . . . . . . . . . . . . . . . . . . . . . . . . . 3
Patient Connection . . . . . . . . . . . . . . . . . . . . . . . . . . . . . . . . . . . . . . . . . . . . . . 5
Display Detail. . . . . . . . . . . . . . . . . . . . . . . . . . . . . . . . . . . . . . . . . . . . . . . . . . . 6
Setting Alarm Limits. . . . . . . . . . . . . . . . . . . . . . . . . . . . . . . . . . . . . . . . . . . . . . 8
Adjusting the Waveform Size. . . . . . . . . . . . . . . . . . . . . . . . . . . . . . . . . . . . . . 10
Turning the Waveform Display On/Off. . . . . . . . . . . . . . . . . . . . . . . . . . . . . . . 10
Selecting a Unit of Measure. . . . . . . . . . . . . . . . . . . . . . . . . . . . . . . . . . . . . . . 10
Selecting a Sweep Speed . . . . . . . . . . . . . . . . . . . . . . . . . . . . . . . . . . . . . . . . 10
Respiration Tone . . . . . . . . . . . . . . . . . . . . . . . . . . . . . . . . . . . . . . . . . . . . . . . 10
Selecting a Text Format. . . . . . . . . . . . . . . . . . . . . . . . . . . . . . . . . . . . . . . . . . 11
Freezing the Waveform . . . . . . . . . . . . . . . . . . . . . . . . . . . . . . . . . . . . . . . . . . 11
Recording Waveforms . . . . . . . . . . . . . . . . . . . . . . . . . . . . . . . . . . . . . . . . . . . 11
Calibrating the Sensors . . . . . . . . . . . . . . . . . . . . . . . . . . . . . . . . . . . . . . . . . . 11
Selecting Gas Compensation . . . . . . . . . . . . . . . . . . . . . . . . . . . . . . . . . . . . . 13
Restoring Default Settings . . . . . . . . . . . . . . . . . . . . . . . . . . . . . . . . . . . . . . . . 13
Capnography Troubleshooting Guide . . . . . . . . . . . . . . . . . . . . . . . . . . . . . . . 14
Capnography
Overview
The 90516 Ultraview Capnograph module is a mainstream gas analyzer,
designed to measure the concentration of carbon dioxide in a gas mixture to aid in
determining the patient’s ventilatory, circulatory, and metabolic status. The
capnograph module has a small, lightweight sensor that continuously measures
the end-tidal and minimum CO2 levels in the patient’s airway. Respiration can be
monitored via airway and endotracheal or tracheostomy tubes. Both adults and
neonates can be monitored with this type of capnograph (using separate adult
and neonatal airway adapters).
The sensor head contains a small infrared transducer that accurately measures
the CO2 in the airway. The sensor is connected to the airway by an airway
adapter. These adapters may either be disposable or reusable and are available
in adult and neonatal sizes.
The capnograph automatically compensates for the ambient barometric pressure
to ensure accurate readings. A connector is included to allow measurement of O2
in the airway using a fuel cell type O2 sensor. A full calibration menu is provided to
easily calibrate and use the O2 sensor. A separate adapter is used for O2
monitoring.

Ultraview Care Network
21-4
CAUTION:
• Although the 90516 capnograph module detects and
reports apnea conditions, it is not intended to be a primary
diagnostic apnea monitor and/or apnea recording device.
• Use only Spacelabs Medical sensors with this monitor.
Other sensors may plug in, but will not operate.
• Use only Spacelabs Medical airway adapters with
Spacelabs Medical sensors. The monitor may not function
if other airway adapters are used, and sensor damage may
result.
• If the patient’s airway is configured with a closed
suctioning system, make sure the airway adapter is placed
close to the suctioning system (on the ventilator side). This
will help ensure that the sampling adapter is not impaired
during and after suctioning.
• U.S. Federal law restricts this device to sale by or on the
order of a physician.
!
• If your module is equipped with the Module Configuration
Manager feature, you can define your own default settings for
such characteristics as alarm limits and display configuration.
Refer to Module Configuration Manager on page 7-5 for further
details.
Capnography
21-5
Patient Connection
Respiration can be monitored via an endotracheal or tracheostomy tube.
Mainstream capnography is a highly accurate method of measuring respiratory
gas values. There are several variations of closed circuit tracheal suction systems
that can be used with Spacelabs Medical capnography units. Spacelabs Medical
recommends the Ballard style tracheal suction system.
Closed Circuit Tracheal Suction Systems
Closed circuit tracheal suction systems (such as those provided by Ballard)
extend the life of the endotracheal tube and associated tubing by allowing the
endotracheal tube to be periodically suctioned without detaching it from the
ventilator circuit. Spacelabs Medical recommends use of Ballard Model #221
elbow closed tracheal suction systems, or similar systems, with Spacelabs
Medical capnography units. Such a system allows the Spacelabs Medical airway
adapter to be placed outside the tube through which fluids are being suctioned,
reducing the chance of occluding the airway.
Spacelabs Medical does not recommend use of traditional setups that require the
airway adapter to be in line with the endotracheal tube. However, if you prefer a
traditional setup such as the Ballard Model 2205 style, using the Ballard Model
112 adapter moves the airway adapter away from the suction catheter.
Figure 21-1 shows examples of setups using the Ballard Model #221 and Model
2205 style (with Model 112 adapter). Similar closed systems, such as the Concord
Portex (not shown), must be placed in the ventilator circuit in the same positions
as shown in Figure 21-1.
Figure 21-1: Ballard setups
To start capnography
monitoring:
1Plug the module into the
monitor.
2Plug the sensor connector into
the monitor.
3Perform sensor calibration, if
necessary.
4Prepare the patient according
to hospital procedures.
5Select appropriate airway
adapter (neonate or adult).
6Verify that windows are clean
and dry.
7Place sensor head over the
airway adapter and perform an
adapter calibration, if
necessary.
8Remove the airway adapter
from the sensor head.
9Insert the airway adapter into
the ventilator circuit and Ballard
style tracheal suction system (if
present) as shown in Figure
21-1.
10 Attach the sensor head to
airway adapter.
11 Ensure that the sensor head is
always positioned above the
ventilator circuit so that
moisture will not enter the
adapter.
suction catheter
Ballard Adapter #112
ventilator circuit
mainstream airway
endotracheal tube
Ballard closed tracheal suction system
endotracheal tube
ventilator circuit
suction catheter
with adapter (Model 2205/Adapter #112)
Ballard elbow closed tracheal suction
system (Model 221)
or
adapter adapter
mainstream airway
sensor head
sensor head
Ultraview Care Network
21-6
When you first power on the module, the GAS parameter key is displayed
adjacent to a flat waveform.
Display Detail
When you connect the capnography device to a monitor, the waveform area is
displayed in one of four formats, the large and small text formats in normal or view
alarms modes. Instructions for choosing a format are detailed later in this manual.
The full screen, large text format is the default display for bedside monitors. The
full screen, small text format in VIEW ALARMS is the only display format for the
full screen remote view monitors. The split screen central format is available only
for central monitors operating in split screen mode. Refer to Figure 21-2 through
Figure 21-6.
Figure 21-2: Bedside screen in small text (waveform ON)
Figure 21-3: Bedside screen in large text (waveform OFF)
!
• Capnography is not analyzed during unit warm-up.
• The typical initial warm-up period is 2- to 5-minutes (5-minutes
is the maximum warm-up time). This time varies based upon the
temperature of the sensor.
• The capnograph is protected against the effects of a cardiac
defibrillation discharge and is safe to use on patients with a
cardiac pacemaker or other electrical stimulation.
• The airway adapter may require regular cleaning or
replacement if the capnograph is used on patients that emit
excessive mucous.
쐄
쐃쐇
쐋
쐏
ETCO2= 30 mmHg
MINCO2= 0 mmHg
O2= 20%
RR= 6 BPM
쐂
G
A
S
쐄쐃쐇쐋
쐏
쐂
O2 COMP ON
N2O COMP ON 6RR
BPM
MINCO2
mmHg
0
G
A
S
30 ETCO2
mmHg
O2
%
20
Capnography
21-7
Figure 21-4: Bedside screen in large text during View Alarms
(waveform OFF)
Figure 21-5: Full remote view (waveform OFF)
Figure 21-6: Split screen
쐃GAS key
쐇End tidal carbon dioxide data
쐋Oxygen data
쐏Alarms ON bell (refer to Table 1)
쐄Minimum inspired carbon dioxide data
쐂Respiratory rate
쐄쐃 쐇
쐋
쐏
쐂
O2 COMP ON
N2O COMP ON
ETCO2
O2
45
0
80
15
APNEA 30
30
1
5
RR
MINCO2
30 ETCO2
mmHg
O2
%
20
G
A
S
쐄
쐃쐇
쐋
쐏
쐂
O2 COMP ON
N2O COMP ON ETCO2
O2
45
0
80
15
APNEA 30
30
1
5
RR
MINCO2
ETCO2= 40 mmHg
MINCO2= 2 mmHg
O2= 18%
RR= 12 BPM
G
A
S
쐏
쐃쐇쐋
쐄
ETCO2= 3.2
MINCO2= 0.5
O2= 21
RR= 23
Numeric key
ETCO2= 40 mmHg
APNEA= 30 s
O2= 18%
RR= 12 BPM
MINCO2= 32 mmHg
G
A
S

Ultraview Care Network
21-8
Setting Alarm Limits
You can set high and low alarm limits for respiratory rate (RR), EtCO2, O2,
minimum CO2 (high limit only), and the apnea alarm delay time.
When alarm limits for EtCO2 and RR are initially enabled, the limit values depend
upon the patient’s current readings for those parameters (these limit values are
learned). Alarm limits for all other monitored parameters, when enabled; always
have the same fixed values.
You can modify limits for any of the monitored parameters. Factory-set default
values appear for alarm limits when you initially power up the unit. Factory default
settings and ranges for alarm limits are shown on the table below. Refer to Alarms
on page 2-3 for additional information on alarms.
Table 1: Alarm Status and Display
Alarm Status Bell Display
At least one alarm ON Present
At least one alarm ON
and violated Flashing
All alarms OFF Replaced with GAS ALM OFF in reverse video
At least one alarm ON;
alarms temporarily
suspended by monitor
Replaced with GAS ALM SUSP in reverse video
(flashes if any alarm is violated)
!
• The VIEW ALARMS format with small text selected is the
default display for all full screen remote. In this format, all text is
cleared from the waveform zone and the labels and alarm limits
of respiratory rate, EtCO2, O2, minimum CO2, and apnea are
displayed. The VIEW ALARMS screen is the only format that
displays the alarm limits.
To set gas alarm limits:
1Touch GAS.
2Touch ALARM LIMITS.
3Select the parameter for which
you wish to set alarm limits.
4Touch ON for the parameter
selected in step 3.
5Select the HI=, LO=, or
APNEA= alarm.
6Use the arrow keys to set the
high and/or low alarm limits or
the apnea alarm delay time.
7Touch PREVIOUS MENU to
select another parameter for
setting alarm limits.
8Repeat steps 3 through 7 until
all limits are set.

Capnography
21-9
* The current barometric pressure measurement affects the maximum high and
low alarm limits for EtCO2 when measured in %.
** Learned Alarm Limits
The respiration rate alarm limits default as shown below:
Condition Limit
RR < 12 LO = 1 BPM
RR > 12 LO = RR* 0.5 (truncated to the next lower resolution)
RR < 20 HI = 30 BPM
RR > 20 HI = RR* 1.5 (rounded to the next higher resolution)
The EtCO2 high alarm limit defaults to the displayed value + 15% and is rounded
to the next higher resolution, when needed.
The EtCO2 low alarm limit defaults to the displayed value – 15% and is truncated
to the next lower resolution, when needed.
Table 2: Alarm Limit Ranges
Monitored
Parameter Units
Low Alarm High Alarm
Resolution
Minimum Default Maximum Minimum Default Maximum
EtCO2%0.0** 9.9 *0.1 ** 10.0 *0.1
EtCO2 mmHg 0 ** 75 1 ** 76 1
EtCO2kPa 0.0 ** 9.9 0.1 ** 10.0 0.1
RR BPM 1 ** 145 15 ** 150 1 for 1 — 30
5 when > 30
APNEA sec - - - 20 30 45 5
MINCO2% - - - 0.1 1.0 9.9 0.1
MINCO2mmHg - - - 1 8 76 1
MINCO2kPa - - - 0.1 1.0 9.9 0.1
O2% 15 18 95 20 100 100 1 for 1 — 30
5 when > 30
!
• If the current EtCO2 reading is 0 when the alarms are first
turned ON, special EtCO2 limits are defined. If mmHg is
selected, the high and low limits are set to 0 and 1, respectively.
If % or kPa is selected, the high and low limits are set to 0.0 and
0.1, respectively.

Ultraview Care Network
21-10
Adjusting the Waveform Size
The capnography waveform can appear on your monitor in three scale sizes: 0 to
40 mmHg (0 to 5.3 kPa), 0 to 60 mmHg (0 to 8.0 kPa), or 0 to 80 mmHg
(0 to 10.7 kPa).
Turning the Waveform Display On/Off
You can turn the capnography waveform ON or OFF.
Selecting a Unit of Measure
You can monitor capnography values as a percentage or with the monitor’s
selected units of measurement for pressures (mmHg or kPa).
Selecting a Sweep Speed
You can view capnography waveforms at any of the following sweep speeds: 25,
12.5, 6.25, 3.12, or 1.56 mm/second.
Respiration Tone
You can turn the respiration cycle tone ON or OFF, and adjust the volume of the
respiration cycle tone that sounds at the peak of the respiration cycle.
To adjust the waveform scale
size:
1Touch GAS.
2Touch SETUP.
3Touch SIZE.
4Select the desired scale.
To turn the waveform display ON
or OFF:
1Touch GAS.
2Touch SETUP.
3Touch SIZE.
4Select WAVEFORM ON or
OFF.
To select a measurement unit:
1Touch GAS.
2Touch SETUP.
3Select PERCENT or mmHg
(kPa).
To select a sweep speed:
1Touch GAS.
2Touch SETUP.
3Touch SWEEP SPEED.
4Select desired sweep speed.
To turn tone OFF:
1Touch GAS.
2Touch SETUP.
3Touch RESP TONE.
4Select RESP TONE OFF.
To adjust the tone volume:
1Touch GAS.
2Touch SETUP.
3Touch RESP TONE.
4Select RESP TONE ON.
5Use arrow keys to adjust the
volume.

Capnography
21-11
Selecting a Text Format
You can change display formats for capnography by switching between large and
small text (refer to Display Detail on page 21-6).
Freezing the Waveform
You can freeze the waveform display at any time. The waveform stays frozen until
you press the FREEZE ON/OFF key again or until you press the NORMAL
SCREEN key.
Recording Waveforms
You can print Capnography waveforms and values. Refer to Printing on page 4-7
for additional information.
Calibrating the Sensors
Calibrating O2
A ZERO calibration establishes baseline values for the oxygen channel. You are
prompted to perform a ZERO calibration if it is required.
A room O2 span calibration calibrates the oxygen sensor using room air.
A 100% O2 span calibration sets the level for oxygen so that the display reads
100% when pure oxygen is input to the unit. For improved accuracy, a 100% O2
span calibration should be performed whenever the patient is receiving more than
60% O2.
!
• To minimize patient disruptions, perform O2 zero and span
procedures before the O2 adapter is placed in the ventilator
circuit.
!
• Authorized service personnel also use the 100% O2 span
calibration to calibrate the oxygen sensor’s response to
100% O2.
To switch text formats:
1Touch GAS.
2Touch SETUP.
3Select LARGE TXT or SMALL
TXT.
To freeze the gas waveform:
1Touch GAS.
2Select FREEZE ON.
To print gas waveforms:
1Touch RECORD.
2Touch flashing GAS parameter.
key.
To calibrate O2 using room air
1Touch GAS.
2Touch CAL.
3Touch O2CAL.
4Disconnect O2 cell and touch
ZERO.
5Reconnect O2 cell.
6Ensure that O2 cell is in room air
7Wait for the O2 reading to
stabilize.
8Touch ROOM O2 SPAN.
To calibrate O2by performing a
100% O2 span
1Touch GAS.
2Touch CAL.
3Touch O2 CAL.
4Flow 100% O2 through the O2
airway adapter and wait for O2
readings to stabilize.
5Touch 100% O2 SPAN.

Ultraview Care Network
21-12
Calibrating the Airway Adapter
Adapter calibration compensates for the optical differences between the adult and
neonatal airway adapters. Adapter calibration needs to be performed each time
you switch from an adult airway adapter to a neonatal airway adapter.
Calibrating the CO2 Sensor
The CO2 sensor does not require calibration at each power up. Calibration is only
necessary the first time the sensor is connected, or when a CAL REQUIRED
message is displayed.
Once calibrated, the sensor can be unplugged and reconnected without being
recalibrated. However, a sensor calibration is required whenever the CO2 sensor
is changed.
!
• During calibration, keep the sensor and airway adapter away
from all sources of CO2 (including the patient’s and your own
exhaled breath, and ventilator exhaust valves).
!
• To maintain optimum performance of the sensor and
capnograph, you should perform a calibration verification of the
sensor at least once a week.
To calibrate the airway adapter:
1Touch GAS.
2Touch CAL.
3Select appropriate airway
adapter (neonate or adult).
4Place sensor head over the
airway adapter.
5Place the sensor and adapter
away from all sources of CO2.
6Touch ADAPTER CAL.
7Touch START.
To calibrate the CO2 sensor:
1Remove the airway adapter
from the sensor head (if
present).
2Place the sensor on the zero
cell.
3When the message ZERO CAL
COMPLETE appears, remove
the sensor from the zero cell
and place it on the reference
cell.
4When the message
CALIBRATION VERIFIED
appears, remove the sensor
from the reference cell (An
airway adapter calibration may
be required).
5Sensor is ready for use.
To verify the sensor calibration:
1Remove the airway adapter
from the sensor head
(if present).
2Place the sensor on the
reference cell.
3When the message
CALIBRATION VERIFIED
appears, remove the sensor
from the reference cell (An
airway adapter calibration may
be required).
4Sensor is ready for use.

Capnography
21-13
Selecting Gas Compensation
The measurement of CO2 by infrared analysis is affected by the presence of
oxygen and nitrous oxide. The module must be set up with the appropriate
compensations turned on in order to obtain accurate end-tidal CO2 readings when
increased levels of O2 (greater than 60%), or N2O (greater than 50%) are present
in the airway.
Restoring Default Settings
With the Module Configuration Manager feature, you can restore all default
settings. User-configurable options are listed in Setting User-Defined Default
Values on page 7-7.
!
• High concentrations of O2 will cause a lower than expected CO2
reading.
• High N2O level will cause a higher than expected CO2 reading.
To select gas compensation:
1Touch GAS.
2Touch COMP.
3Select N2O ON, if N2O is
greater than 50%.
4Touch O2 AUTO to
automatically select COMP, if
O2cell is present.
5Select O2 MAN, if no O2 cell is
present.
6Select O2 ON, if O2 is greater
than 60%.
To restore default settings:
1Touch GAS.
2Touch SETUP.
3Touch RESTORE SETTINGS.
4Select YES.

21-14
Capnography Troubleshooting Guide
The capnography module displays error messages in the gas waveform zone. Many of these messages also trigger an
alarm. If the menu line is available, the monitor displays messages there as well. The table below provides the text,
meaning and suggested response to these messages.
Problem or
Message Probable Cause(s) Suggested Response Alarm
Sounds
SERVICE REQUIRED -
Send for repair
■Incompatible or faulty sensor.
■Barometric pressure reading
error.
■Module self-test failure.
■Return to factory for repair or
use compatible sensor.
■Yes
SENSOR OVER
TEMPERATURE
■Sensor is exposed to extreme
heat.
■Remove the excessive heat
source from the sensor. If
problem persists, return to
factory for repairs.
■Yes
WARMING UP ■Module or sensor was just
plugged in.
■Allow 2- to 5-minutes to warm
up.
■No
PLACE ADAPTER IN RM
AIR
■The adapter calibration menu is
accessed.
■Either place the sensor head
and the airway adapter in
room air and start an airway
adapter calibration, or leave
the adapter calibration menu.
■No
ADAPTER CAL IN
PROGRESS
■An airway adapter calibration
sequence is in progress.
■Wait until adapter calibration
is completed and message
goes away.
■No
ADAPTER CAL ERROR -
Perform adapter
calibration
■An error was found during the
airway adapter calibration.
■Place the sensor head and
the airway adapter in room air
and away from any source of
CO2 and perform an airway
adapter calibration. If the
problem persists, return to
factory for repairs.
■Yes
NOT CALIBRATED -
Place adapter in room air
■An airway adapter calibration
was started, but either the
sensor was not ready, or the
sensor was on the zero or
reference cell, or some CO2 or a
breath has been detected in the
last 20-seconds.
■Place the sensor head and
the airway adapter in room air
and away from any source of
CO2 and perform an airway
adapter calibration. If problem
persists, return to factory for
repairs.
■Yes

21-15
ADAPTER ERROR -
Check airway adapter
■Airway adapter was removed
from the sensor head.
■Snap airway adapter back
into the sensor head.
■Yes
■Optical blockage on airway
adapter windows.
■Clean or replace the airway
adapter.
■Yes
■Adapter calibration was not
performed.
■Perform an airway adapter
calibration.
■Yes
CO2 CAL IN PROGRESS ■A zero calibration of the CO2
sensor is in progress.
■Wait for the message ZERO
CAL COMPLETE to appear.
■No
ZERO CAL COMPLETE -
Place sensor on REF cell
■A zero calibration of the CO2
sensor was completed
successfully.
■Remove the sensor head
from the zero cell and place it
over the reference cell.
■No
CO2 ZERO CAL ERROR -
Perform zero calibration
■An error was found during the
sensor zero calibration
■Perform a zero and a
reference calibration. If the
problem persists, return
sensor to factory for repairs.
■Yes
SENSOR ERROR -
CO2 zero cal required
■A drift of the source current is
detected since the last time that
the sensor was either plugged in
or zeroed.
■Perform a zero and a
reference calibration. If the
problem persists, return
sensor to factory for repairs.
■Yes
CHECKING CALIBRATION ■A span or reference calibration
of the CO2 sensor is in progress.
■Wait for the CALIBRATION
VERIFIED message to
appear.
■No
CALIBRATION VERIFIED -
Remove sensor from cell
■A reference calibration of the
CO2 sensor was completed
successfully.
■Remove the sensor head
from the reference cell and
place it over the airway
adapter.
■No
!
• The unit does not analyze patient data while the monitor displays the above messages.
Problem or
Message Probable Cause(s) Suggested Response Alarm
Sounds

21-16
Problem or
Message Probable Cause(s) Suggested Response Alarm
Sounds
Low or high CO2 values
are observed
■An airway adapter and/or sensor
calibration is needed.
■Perform a zero and a
reference calibration, make
sure an appropriate airway
adapter is selected, and
perform an airway adapter
calibration. If problem persists,
return to factory for repairs.
■No
ADAPTER CALIBRATION
ABORTED
■The airway adapter calibration
was aborted by the user.
■Wait for the message to go
away.
■No
O2 ZERO COMPLETE ■The zero calibration of the O2
sensor was completed
successfully.
■Wait for the message to go
away.
■No
O2 ZERO REJECTED
Zero value too high
■O2 cell was connected during
zero.
■Disconnect O2 cell and repeat
the O2 zero.
■No
21% O2 SPAN
COMPLETE
■The span calibration of the O2
sensor in room air was completed
successfully.
■Wait for the message to go
away.
■No
O2 SPAN REJECTED -
Span value out of range
■O2 cell was not functioning during
the room O2 span.
■Replace O2 cell perform room
O2 span. If problem persists,
return to factory for repairs.
■No
■O2 cell was not in room air. ■Place the O2 sensor in room
air and away from any source
of higher level oxygen and
perform room O2 span. If
problem persists, return to
factory for repairs.
■No
100% O2 SPAN
COMPLETE
■The span calibration of the O2
sensor using 100% oxygen was
completed successfully.
■Wait for the message to go
away.
■No
100% O2 SPAN FAILED -
O2 cell bad or 100% O2
not present
■O2 cell is wearing out. ■Replace O2 cell and perform
100% O2 span. If problem
persists, return to factory for
repairs.
■No
■100% oxygen was not present in
the O2 sensor airway adapter.
■Make sure 100% O2 is present
in the O2 sensor airway
adapter and perform 100% O2
span. If problem persists,
return to factory for repairs.
■No

21-17
O2 SPAN REQUIRED -
Perform a ROOM O2
SPAN
■O2 cell requires new span when
initially plugged in.
■Place the sensor in room air
and away from any source of
oxygen and perform room O2
span. If problem persists,
return to factory for repairs.
■No
■A drift in the O2 cell output voltage
level was detected.
■Place the sensor in room air
and away from any source of
oxygen and perform room O2
span. If problem persists,
return to factory for repairs.
■No
Problem or
Message Probable Cause(s) Suggested Response Alarm
Sounds

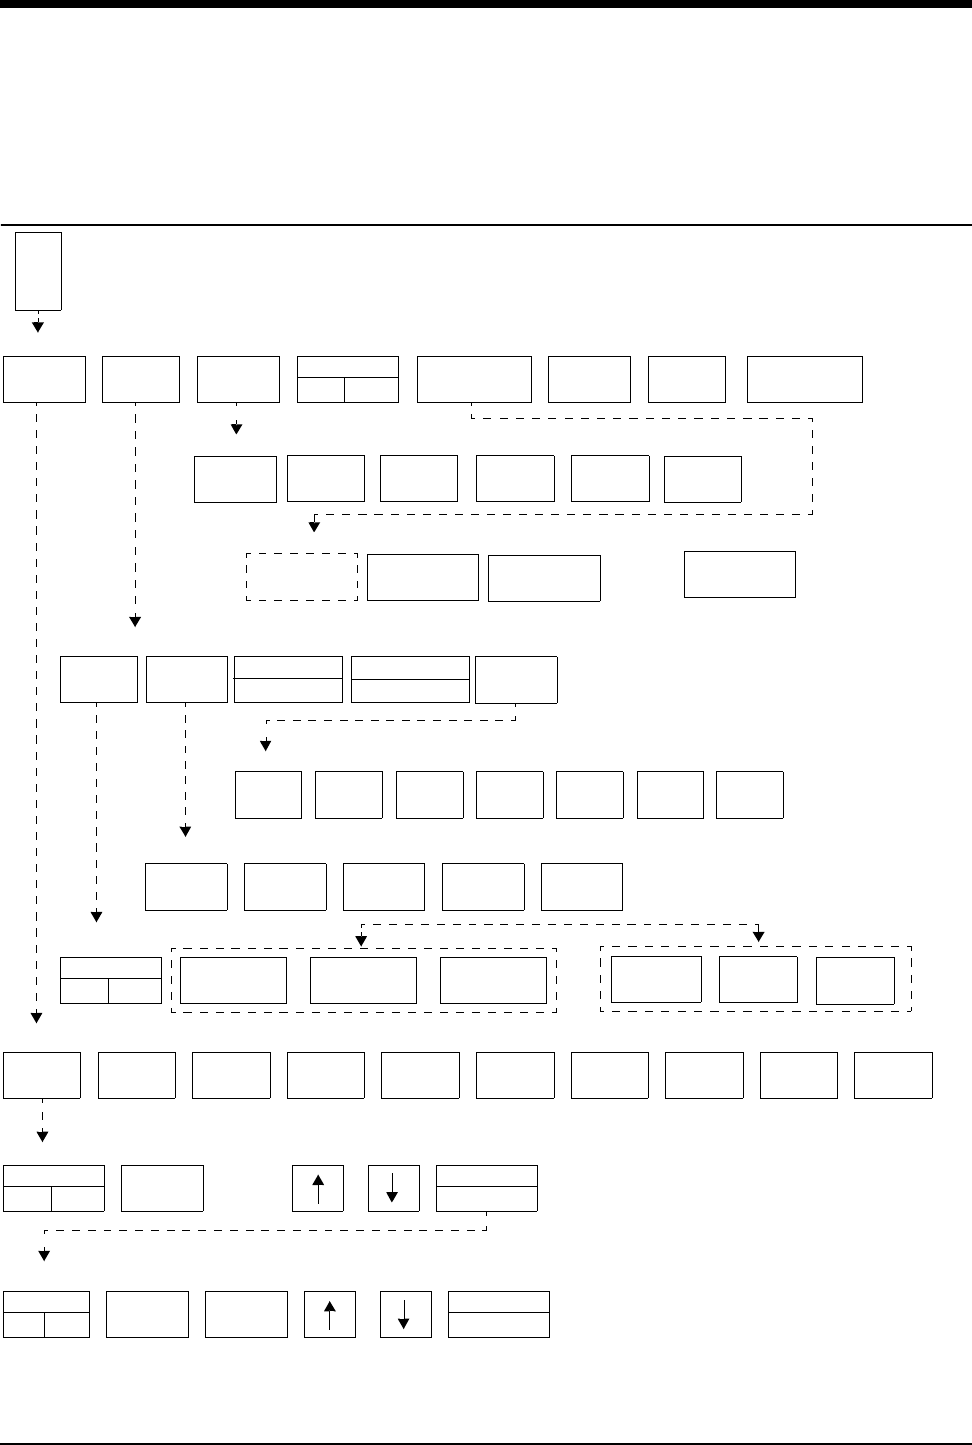
22-1
!
• Based on features purchased, more or fewer keys may appear here than on your menu screens.
Multigas Directory
Directory of Keys
GAS - CAL MENU
LIMITS
ALARM FREEZE
ON OFF
SETUP CAL VIEW
ALARMS PRINT
CHECK O2
SENSOR
BAR. PRESS.
SIZE SWEEP
SPEED
LARGE TEXT
SMALL TEXT
25
mm/sec
12.5
mm/sec
6.25
mm/sec
3.12
mm/sec
1.56
mm/sec
WAVEFORM
ON OFF 0-80 mmHg 0-60 mmHg 0-40 mmHg
APNEA RR ETCO2 I CO2 FiO2 I N2O I AGNT
APNEA
ON OFF
HI =
OFF
APNEA
RR
APNEA
RR
HI =
OFF
LO =
OFF
RR
ON OFF
G
A
S
GAS - ALARM LIMITS MENU - APNEA
GAS - ALARM LIMITS MENU - RR
GAS - ALARM LIMITS MENU
GAS - MAIN MENU
GAS - SETUP MENU
GAS - SETUP MENU - SWEEP SPEED
GAS - SETUP MENU - SIZE
0-5.0 kPa
SUSPEND
SAMPLING
PUMP
SPEED
50
ml/min
100
ml/min
150
ml/min
75
ml/min
125
ml/min
175
ml/min
200
ml/min
XXX mmHg
E N2O
GAS - SETUP MENU - PUMP SPEED
PERCENT
mmHg (kPa)
E AGNT
AGENT
SELECT
HAL ENF ISO SEV
GAS - SELECT AGENT MENU - AGENT TYPE DETECTED: XXX
DES
ID
AUTO
0-10.0 kPa
FeO2
0-7.5 kPa
100% O2
SPAN
SERVICE
CAL MODE
See your
System Administrator
for access to this key


Contents
22-3
Multigas
Overview
The Spacelabs Medical Multigas Analyzer simultaneously monitors gas
concentrations and alerts clinical personnel when the concentration of anesthetic
agents, oxygen, carbon dioxide, or nitrous oxide falls outside of defined limits. The
anesthetic agent being administered is automatically identified.
The analyzer is for use primarily in the operating room, but can be used with any
Ultraview monitor.
Although the analyzer sounds an alarm when the duration between monitored
breaths exceeds user-defined limits, it is not intended to be a primary diagnostic
apnea monitor and/or recording device.
Overview . . . . . . . . . . . . . . . . . . . . . . . . . . . . . . . . . . . . . . . . . . . . . . . . . . . . . . 3
Warnings and Cautions . . . . . . . . . . . . . . . . . . . . . . . . . . . . . . . . . . . . . . . . . . . 4
Analyzer Controls and Indicators. . . . . . . . . . . . . . . . . . . . . . . . . . . . . . . . . . . . 6
Multigas Setup . . . . . . . . . . . . . . . . . . . . . . . . . . . . . . . . . . . . . . . . . . . . . . . . . . 7
Patient Connection . . . . . . . . . . . . . . . . . . . . . . . . . . . . . . . . . . . . . . . . . . . . . . 8
Operation . . . . . . . . . . . . . . . . . . . . . . . . . . . . . . . . . . . . . . . . . . . . . . . . . . . . . 10
Replacing the Water Trap . . . . . . . . . . . . . . . . . . . . . . . . . . . . . . . . . . . . . . . . 12
Replacing the Gas Analyzer Filter . . . . . . . . . . . . . . . . . . . . . . . . . . . . . . . . . . 12
Display Detail. . . . . . . . . . . . . . . . . . . . . . . . . . . . . . . . . . . . . . . . . . . . . . . . . . 12
Setting Alarm Limits. . . . . . . . . . . . . . . . . . . . . . . . . . . . . . . . . . . . . . . . . . . . . 15
Waveform Display . . . . . . . . . . . . . . . . . . . . . . . . . . . . . . . . . . . . . . . . . . . . . . 17
Selecting a Text Format. . . . . . . . . . . . . . . . . . . . . . . . . . . . . . . . . . . . . . . . . . 17
Selecting a Unit of Measure. . . . . . . . . . . . . . . . . . . . . . . . . . . . . . . . . . . . . . . 17
Selecting an Agent ID . . . . . . . . . . . . . . . . . . . . . . . . . . . . . . . . . . . . . . . . . . . 18
Selecting Stand By Mode . . . . . . . . . . . . . . . . . . . . . . . . . . . . . . . . . . . . . . . . 19
Selecting a Pump Speed . . . . . . . . . . . . . . . . . . . . . . . . . . . . . . . . . . . . . . . . . 19
Initiating a Calibration . . . . . . . . . . . . . . . . . . . . . . . . . . . . . . . . . . . . . . . . . . . 19
Suspending Sampling . . . . . . . . . . . . . . . . . . . . . . . . . . . . . . . . . . . . . . . . . . . 22
Multigas Troubleshooting Guide . . . . . . . . . . . . . . . . . . . . . . . . . . . . . . . . . . . 23

Ultraview Care Network
22-4
Warnings and Cautions
Warnings
The life or health of a patient, clinical staff member, multigas analyzer operator, or
other persons may be endangered if the items in this Warnings section are not
followed.
WARNING:
• Always test the sampling line adapter for a tight
connection and proper operation before attaching to a
patient.
• To protect the patient’s safety, do not silence, suspend, or
disable audible alarms without providing continuous,
direct observation of the patient.
• Connect the sample gas outlet on the monitor’s rear panel
to the scavenging system to prevent pollution of the room
air.
• Always turn the power off and unplug the analyzer before
cleaning to protect against electrical shock.
• To avoid explosion hazards, flammable anesthetic agents
such as ether and cyclopropane must not be used in the
analyzer.
• Only halothane (HAL), enflurane (ENF), isoflurane (ISO),
sevoflurane (SEV), and desflurane (DES) are suitable for
use with the analyzer. If any other halogenated anesthetic
agent is present, it will be misidentified and/or will interfere
with the reported anesthetic agent concentrations.
• The use of antistatic or electrically conductive breathing
tubes when using high-frequency electrosurgery
equipment may increase the risk of burns and is, therefore,
not recommended in any application of this anesthetic
monitor.
• The analyzer is not intended for use in an MRI
environment.

Multigas
22-5
Cautions
Equipment may be damaged or cease to function properly if the items in this
Cautions section are not followed.
CAUTION:
• When administering anesthetic agents, incorrect agent
identification may occur when a mixture of two or more
anesthetic agents occurs in the sample circuit.
• Always verify your vaporizer setting when administering
anesthetic agents.
• Use only original Spacelabs Medical sampling lines and
accessories; other sampling lines may cause inaccurate
readings and malfunctions.
• The diameter of the scavenging system line must be two to
three times larger than the sample line tubing to avoid
changes in the operating pressure of the monitor, and
consequential inaccurate readings or internal damage.
• Route the scavenger hose so that it does not kink during
operation of the monitor. A kinked or partially kinked
scavenger hose can impair performance of the monitor.
• If the patient’s airway is configured with a closed
suctioning system, the airway adapter must be placed near
the suctioning system (on the ventilator side). This helps
to ensure that the sampling adapter is not impaired during
and after suctioning.
• Do not use cellular phones or other wireless
communications equipment near the analyzer.
!
• Check the disposable water trap regularly during monitoring.
Replace the water trap when full.
• Between patients, replace the sampling line and check the
disposable water trap. Replace the water trap when full.
• The Spacelabs Medical sampling lines are for single-patient
use only. Cleaning deteriorates the properties of the sampling
line, resulting in slower response time and more frequent
occlusions
• Before you administer nebulized drugs to a patient that is
connected to the multigas analyzer, you must disconnect the
sample line from the patient or stop the pump by using the
SUSPEND SAMPLING key.
• To facilitate disconnecting and reconnecting the sample line,
use a T-connector in the patient airway circuit and keep the
sampling suspended, until all nebulized drugs have cleared
from the patient’s airway.
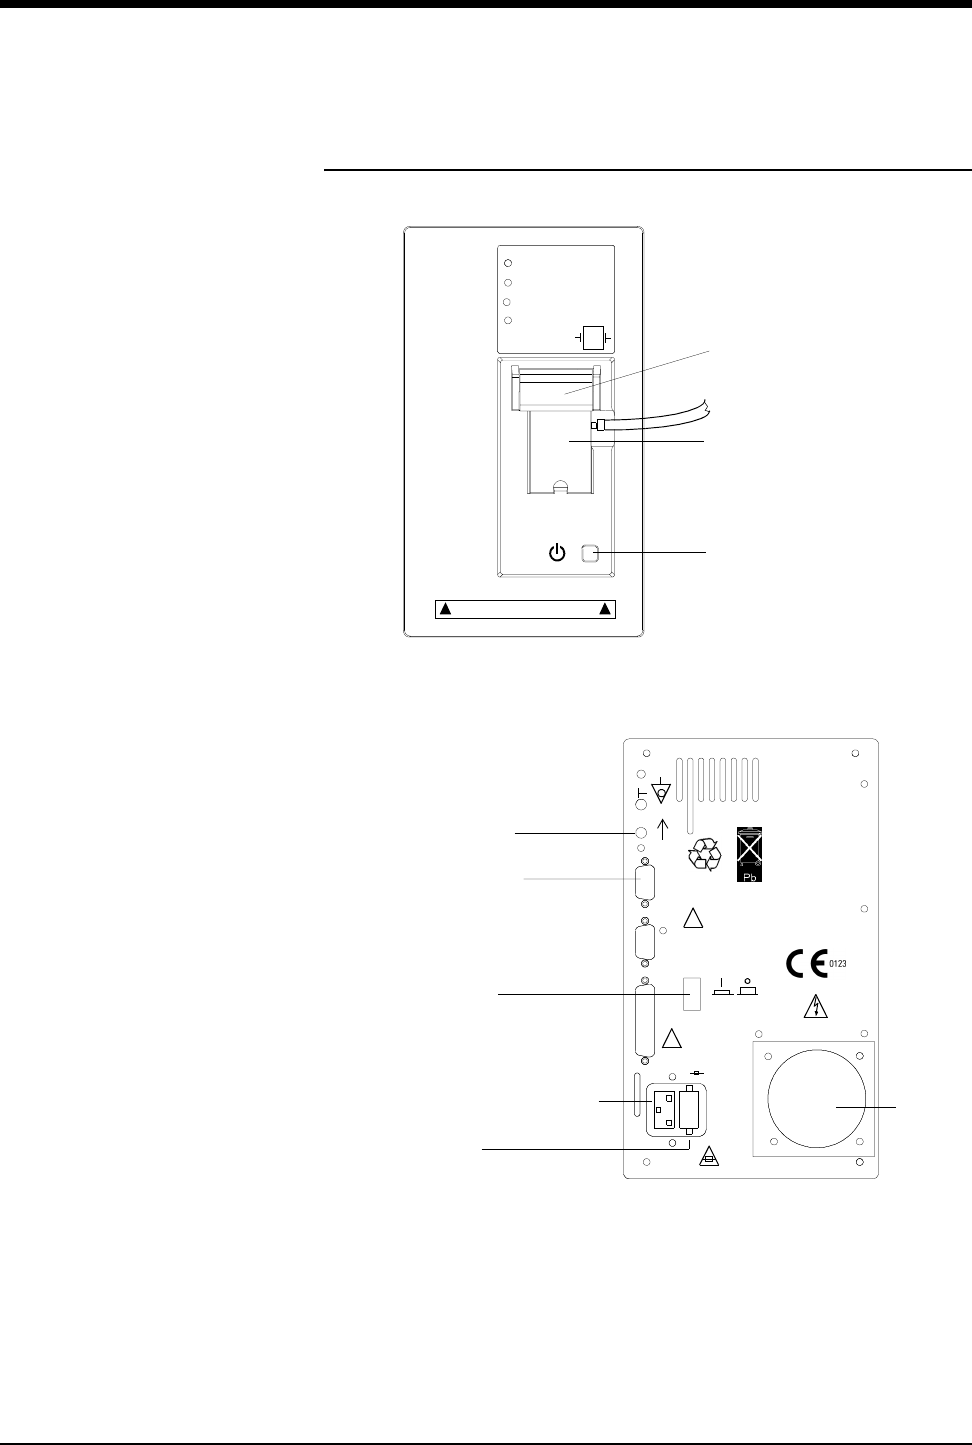
Ultraview Care Network
22-6
Analyzer Controls and Indicators
Figure 22-1: Analyzer front panel controls and indicators
Figure 22-2: Analyzer rear panel controls and indicators
POWER ON
OCCLUSION
WATER TRAP FULL
STAND BY
Gas analyzer filter
Water trap
Stand by switch
Sample line
access door
Product Orientation Up
SDLC connector
Fuse block
Power switch
Scavenger port
AC power input receptacle Fan grill
!
!
SDLC
J2
J3
J4
MAINS
USE SPECIFIED FUSES
50/60 Hz
1A/100-240V~
T1.0A/250V
Pb
CAUTION
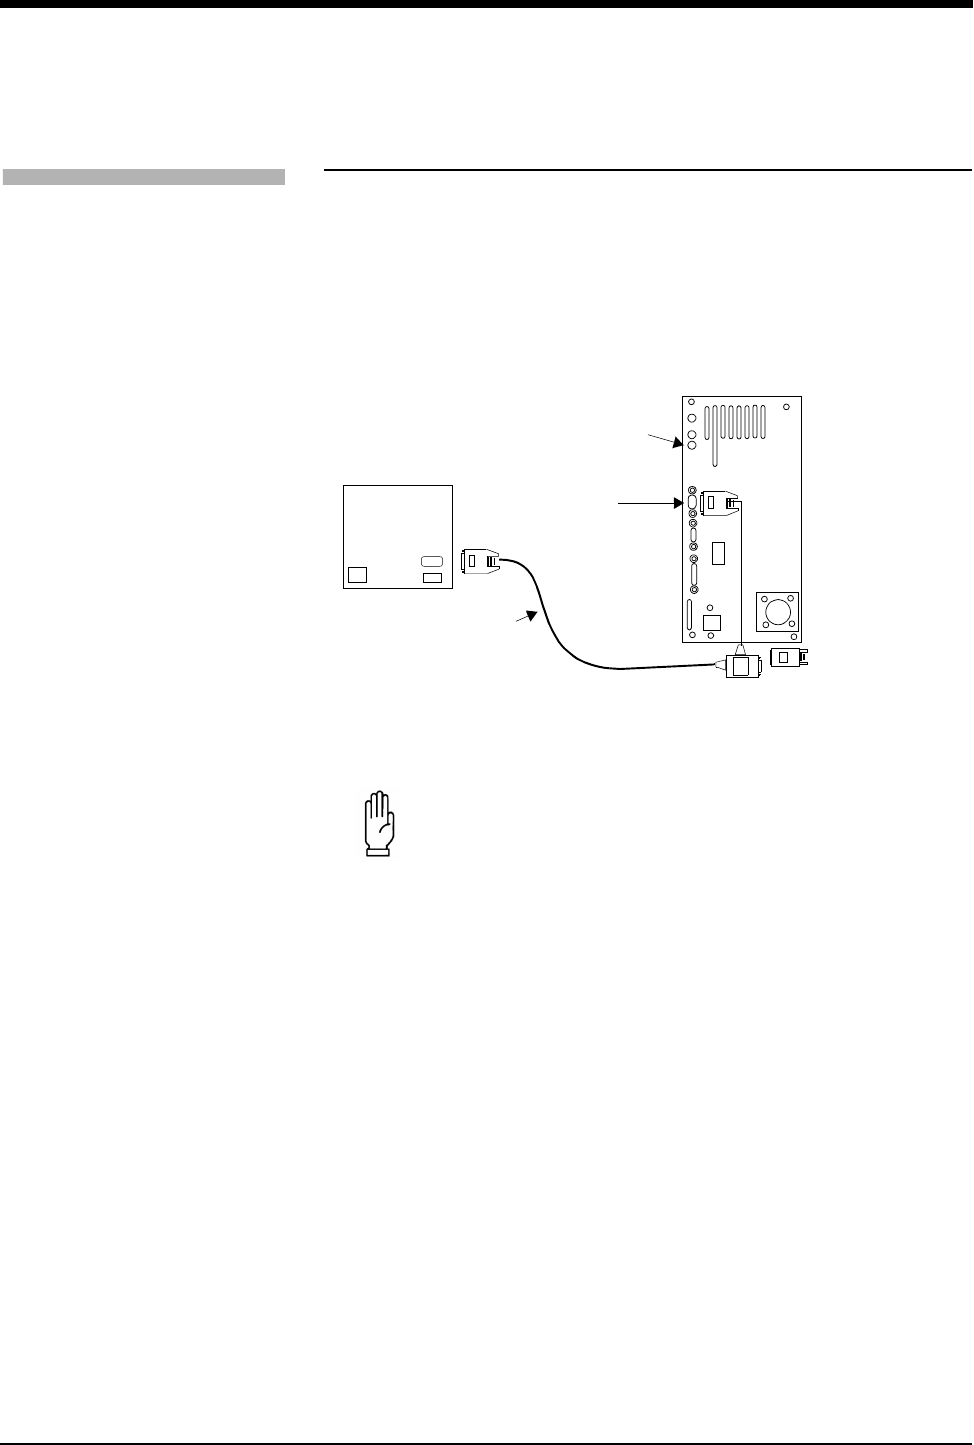
Multigas
22-7
Multigas Setup
Before you put the unit into service, it must be unpacked and the exterior
inspected for visible damage. A biomedical technician or an authorized Spacelabs
Medical customer service representative should inspect the interior and exterior of
the analyzer for signs of visible damage. Instructions for these procedures are in
the 90518 Multigas Analyzer Service Manual (P/N 070-0643-xx).
Figure 22-3: Monitor connection
CAUTION:
• The diameter of the scavenging system line must be two to
three times larger than the sample-out tubing to avoid
changes in the operating pressure of the monitor, and
consequential inaccurate readings or internal damage.
• Route the scavenger hose so that it does not kink during
operation of the monitor. A kinked or partially kinked
scavenger hose can impair performance of the monitor.
To connect the multigas
analyzer:
1Verify that the power cord is
connected as required by local
standards.
2Assemble the cables
necessary for the desired
configuration. (Refer to 90518
Multigas Analyzer Service
Manual,P/N 070-0643-xx.)
3Connect the T-cable assembly
between the multigas analyzer
and the monitor.
4Connect the SDLC terminator
to the T-cable.
5Connect the hospital
scavenging system to the
scavenger port.
Multigas Analyzer
SDLC terminator
SDLC
connector
....
.....
T cable
included with the analyzer
Monitor
Scavenger
port
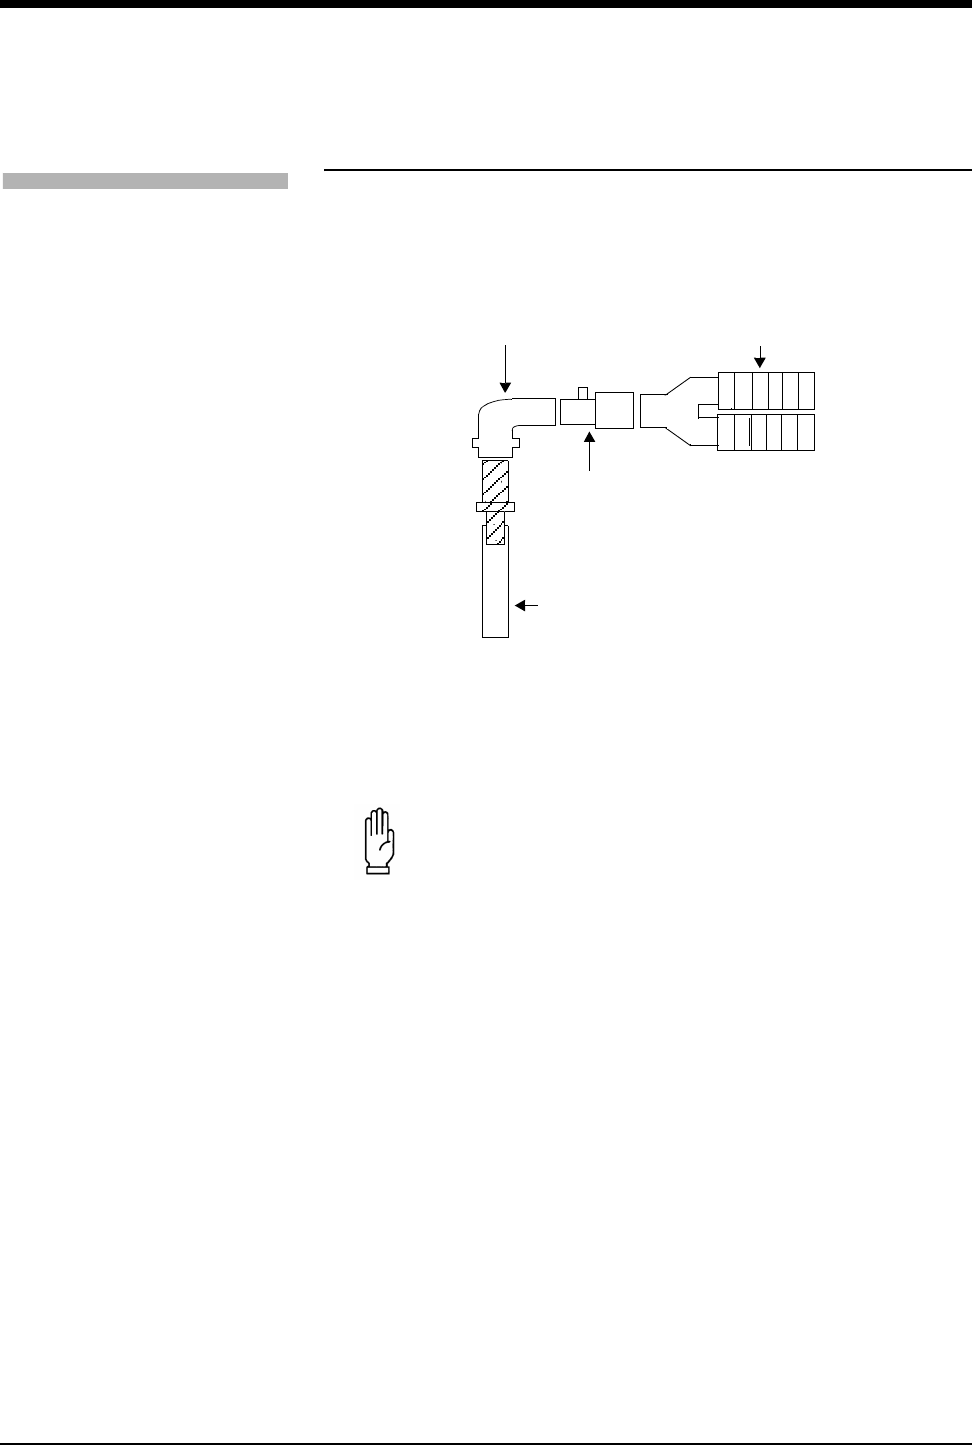
Ultraview Care Network
22-8
Patient Connection
Respiration can be monitored via a nasal cannula, an oxygen mask, or an airway
and endotracheal or tracheostomy tube. There are several variations of closed
circuit tracheal suction systems that can be used with Spacelabs Medical multigas
units.
Figure 22-4: Example of sidestream multigas setup for an adult
The sample line must be connected to the disposable water trap and patient
circuit. Connect the line to the water trap prior to the insertion of the water trap
onto the analyzer to protect the sample port.
CAUTION:
• If the multigas analyzer is powered on before the patient
monitor, communication might not be initiated. Make sure
the patient monitor is powered on first.
• Use only original Spacelabs Medical sampling lines and
accessories. Other sampling lines may cause inaccurate
readings and malfunctions. The analyzer must use a
sample line that is fabricated from a special material. Use of
other sample lines results in erroneous readings. This
sample line is color-coded as blue and is available from
Spacelabs Medical.
• If you use the multigas analyzer with setups that do not
include the Spacelabs Medical approved gas analyzer
filters, and service inspection determines that patient fluids
have contaminated the unit, your warranty will be nullified.
!
• Use the filtered gas sampling tee when you operate the
analyzer on patients that emit excessive mucous. This prevents
patient fluids from clogging the sample line.
To start multigas monitoring
when the unit is OFF:
1Plug the device power cord into
an AC power outlet and assure
that the unit is connected to a
monitor.
2If not present, insert the gas
analyzer filter above the water
trap and close the lid.
3If not present, insert the water
trap with the patient connector
on the right side.
4Check to make certain the
Stand By switch is OFF (in the
“out” position).
5Turn power to patient monitor
ON.
6Turn power to gas analyzer ON
(ON/OFF switch on back of
unit).
7Prepare the patient according
to hospital procedures.
8Allow the analyzer to warm up
for a minimum of 2-minutes.
Full accuracy is achieved after
30-minutes.
9Connect one end of the gas
sample line to the gas sampling
tee or breathing circuit and
connect the other end to the
water trap luer connection.
10 Check for a good seal at the top
of the water trap.
11 During the use of anesthetic
agents, ensure that the
scavenge line connects to the
scavenger port on the multigas
analyzer's rear panel.
ventilator circuit
endotracheal tube
gas sampling
tee
elbow
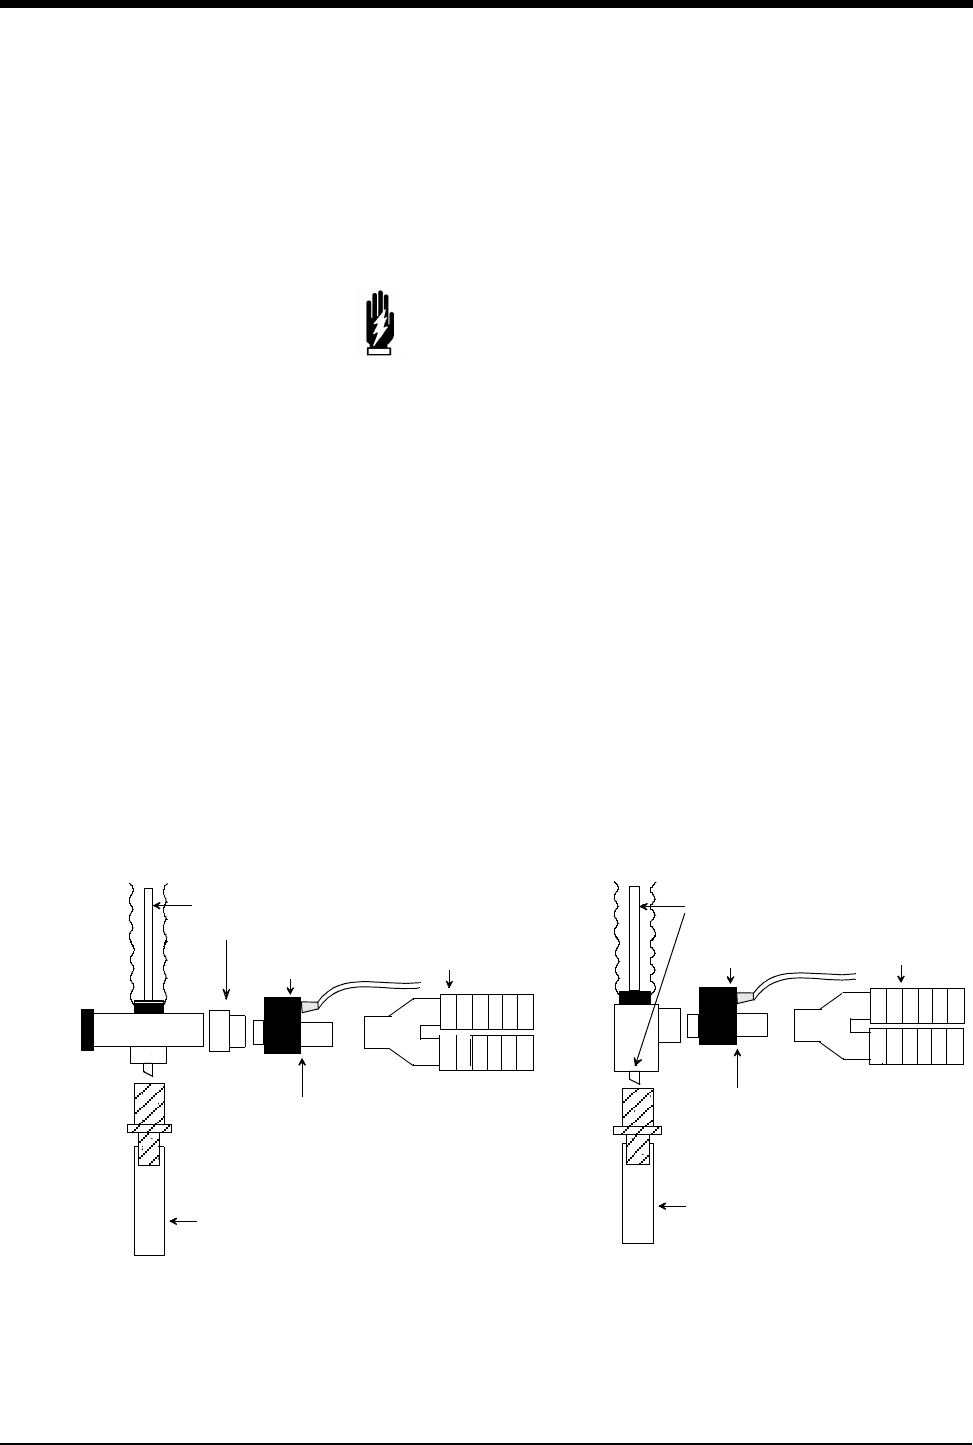
Multigas
22-9
Prior to connecting to the patient airway, verify that there are no leaks in the
sample line, water trap, and gas analyzer filter by sealing the end of the sample
line with your thumb. After approximately 15-seconds, the Occlusion LED lights
and an occlusion message appears on the monitor. If this does not occur within
30-seconds, check for an air leak by removing and carefully reinstalling the water
trap, the gas analyzer filter, and/or the sample line. Repeat the test.
Closed Circuit Tracheal Suction Systems
Closed circuit tracheal suction systems (such as those provided by Ballard)
extend the life of the endotracheal tube and associated tubing by allowing the
endotracheal tube to be periodically suctioned without detaching it from the
ventilator circuit. Spacelabs Medical recommends use of Ballard Model #221
elbow closed tracheal suction systems, or similar systems, with Spacelabs
Medical capnography units. Such a system allows the Spacelabs Medical airway
adapter to be placed outside the tube through which fluids are being suctioned,
reducing the chance of occluding the airway.
Spacelabs Medical does not recommend use of traditional setups that require the
airway adapter to be in line with the endotracheal tube. However, if you prefer a
traditional setup such as the Ballard Model 2205 style, using the Ballard Model
112 adapter moves the airway adapter away from the suction catheter.
Figure 22-5 shows examples of setups using the Ballard Model #221 and Model
2205 style (with Model 112 adapter). Similar closed systems, such as the Concord
Portex (not shown), must be placed in the ventilator circuit in the same positions
as shown in Figure 22-5.
Figure 22-5: Ballard setups
WARNING:
• Always test the sampling line adapter for a tight
connection and proper operation before attaching to a
patient.
suction catheter
Ballard Adapter #112
ventilator circuit
mainstream airway
endotracheal tube
Ballard closed tracheal suction system
endotracheal tube
ventilator circuit
suction catheter
with adapter (Model 2205/Adapter #112)
Ballard elbow closed tracheal suction
system (Model 221)
or
adapter adapter
mainstream airway
sensor head
sensor head

Ultraview Care Network
22-10
Operation
CO2, N2O, and anesthetic agents are measured by drawing a sample gas stream
into the measuring chamber. The absorption of different infrared light wavelengths
is measured here. These measurements are compared to a zero concentration
light level to calculate the different gas concentrations.
Oxygen concentration is measured using the micro-fuel cell sensing technology.
During the sensing process, the oxygen molecules in the sampled gas diffuse
through the sensing membrane and become reduced at the sensing electrode,
creating a current signal. The current signal is proportional to the oxygen partial
pressure in the sampled gas. The fast response of the oxygen measurement is
achieved by combining a unique design of the pneumatic sampling system, fast
sensing membrane, and state-of-the-art signal processing electronics. Because
this method of measurement has a fast response time, inspired and expired
values of O2 can be reported. This method of O2measurement requires periodic
replacement of the sensor. The user must perform routine calibration checks to
determine when replacement is needed. Refer to Initiating a Calibration on page
22-19 for further details.
The analyzer uses a side-stream sampling technique to acquire respiratory gases
from an endotracheal tube, nasal cannula, or mask. A constant-flow vacuum
system maintains the flow rate through the sample line.
The analyzer is equipped with an external water trap to prevent humidity, water
drops, and patient secretions from contaminating the unit or affecting the accuracy
of the gas measurements. The water trap collects water drops that condense in
the sample line. A “Water Trap Full” indicator warns you that the water trap should
be replaced. The analyzer is also equipped with a filter as a second line of
defense in case the water trap overflows or nebulized drugs are accidently drawn
into the sample line. After the gas sample passes through the water trap and filter,
it passes through a Nafion tube that is inside the analyzer. This helps to equalize
the humidity of the gas sample so that it is close to the humidity of ambient air.
WARNING:
• If any halogenated anesthetic agent other than halothane,
enflurane, isoflurane, sevoflurane, or desflurane is present,
it will be misidentified and/or will interfere with the reported
anesthetic agent concentrations.
CAUTION:
• When administering anesthetic agents, incorrect agent
identification may occur when a mixture of two or more
anesthetic agents occurs in the sample circuit.
• Always verify your anesthetic vaporizer setting when
administering anesthetic agents.

Multigas
22-11
The analyzer automatically compensates for the ambient barometric pressure to
ensure accurate readings. Both CO2 values may appear in partial pressure (in
mmHg or kPa) or in percent.
Powering ON the Unit
Before powering the multigas analyzer ON, make sure it is attached to a patient
monitor and the Stand By switch on the gas analyzer is OFF (in the “out” position).
Press POWER ON/OFF located on the rear panel of the analyzer. The patient
monitor must be powered on prior to powering on the analyzer.
When you first power ON a properly installed multigas device, the green power-on
LED lights within 5-seconds. Within 30-seconds the patient monitor displays the
vertical GAS parameter key adjacent to a flat waveform.
If this does not occur, verify that the POWER ON/OFF button is pressed and
appears green, and that the front panel STAND BY button is not pressed. The
analyzer must be connected to an AC power outlet. Verify that the appropriate
SDLC cable and terminator are connected from the unit to the monitor (refer to the
90518 Multigas Analyzer Service Manual, P/N 070-0643-xx). If the monitor or the
module housing has a SDLC switch, check that the switch is in correct position
(refer to the operations manual for the monitor or module housing). If the GAS
parameter key does not display on the monitor, turn the power to the analyzer
OFF, then turn the power to the monitor OFF. Power ON the monitor again, and
then power on the analyzer again.
CAUTION:
• The analyzer cannot be operated without a water trap and a
gas analyzer filter installed.
• Replace the water trap and gas analyzer filter as needed.
Verify the water trap is not broken as a result of connecting
the sample line fitting too tightly or by tugging on the
sample line. To verify, place a finger over the end of the
sample line and wait for the alarm. Check the sample line
connection on the water trap for damage. A broken water
trap results in low values due to room air entrainment. If a
span calibration is performed with a broken water trap,
patient values will be unusually high. Refer to Initiating a
Calibration on page 22-19 and Replacing the Gas Analyzer
Filter on page 22-12 for details.
!
• Check the disposable water trap regularly during monitoring.
Replace the water trap when full.
• Between patients, replace the sampling line and check the
disposable water trap. Replace the water trap when full.
% Gas = PARTIAL PRESSURE GAS x 100%
BAROMETRIC PRESSURE
!
• Respiration rate and alarm limit accuracies are not specified
above 100 breaths per minute.

Ultraview Care Network
22-12
No multigas analyzer data appears during the warm-up period following power-on.
Data first appears during the stabilization period.
Upon initiation of power, all factory-default settings will be re-established. Any
modifications made to the default settings (alarm limits, text display, etc.) prior to
cessation of power will be lost.
Replacing the Water Trap
The water trap must be disposed of when full. To remove the water trap, grasp the
water trap firmly and pull it down from underneath, then lower it from the
assembly.
To install a new water trap, grasp it from the bottom and insert it up and into the
assembly.
Replacing the Gas Analyzer Filter
The gas analyzer filter must be disposed of when occluded. To remove the gas
analyzer filter, lift the filter door, grasp the filter tab, lift up, and remove.
To install the filter, open the filter door, hold the filter by the tab (with the gasket
down) and place it into the recess. Close the door after insertion.
Display Detail
When you connect the multigas device to a monitor, the waveform area is
displayed in one of four formats, the large and small text formats in normal or
VIEW ALARMS modes. Instructions for choosing a format are detailed later in this
manual.
The full screen, large text format is the default display for bedside monitors. The
full screen, small text format in VIEW ALARMS is the only display format for the
full screen remote view monitors. The split screen central format is available only
for central monitors operating in split screen mode. (Refer to Figure 22-10).
!
• The analyzer is protected against the effects of a cardiac
defibrillation discharge, and it is safe to use on patients with a
cardiac pacemaker or other electrical stimulation.
CAUTION:
• The warm-up period is less than 2-minutes with full
accuracy after 30-minutes. You may use it prior to full
warm up but be aware of possible inaccuracies in gas
analysis.
WARNING:
• The used water trap and gas analyzer filter may contain
hazardous fluids and should be disposed of in accordance
with hospital procedures.
Multigas
22-13
Figure 22-6: Full screen, large text
Figure 22-7: Full screen, small text
Figure 22-8: Full screen, large text, with VIEW ALARMS
Figure 22-9: Full screen, small text, with VIEW ALARMS
I N2O
6 2.5
1.7
21
17
0.5
20
%
I AGNT
E AGNT
%
FeO2
%
FiO2
%
I CO2
%
쐃
RR
bpm G
A
S
5E N2O
%
%
5.2 ETCO2
%
쐅
쐈
G
A
S
ETCO2=5.2%
RR=20BPM
FiO2=21%
I N2O=6%
I AGNT=2.5%
G
A
S
ETCO2 7.5
2.5
2.0
I CO2
APNEA
RR
I N2O FiO2
FeO2 30
30
10
15 40
20
25
15
I AGNT
E AGNT
4.5
0.0
3.0
0.0
5
E N2O 15
0
0.5 I CO2
%
5.2 ETCO2
%
쐈
G
A
S
ETCO2=5.2%
RR=20BPM
FiO2=21%
I N2O=6%
I AGNT=2.5%
ETCO2 7.5
2.5
2.0
I CO2
APNEA
RR
I N2O FiO2
FeO2 30
30
10
15 40
20
25
15
I AGNT
E AGNT
4.5
0.0
3.0
0.0
5
E N2O 15
0

Ultraview Care Network
22-14
Figure 22-10: Split screen, central with numeric key display
Agent Parameter Label View
When in AUTO ID mode, the inspired and expired agent labels are displayed in
normal video, and in the MANUAL mode, the labels are displayed in reverse
video.
In MANUAL mode, full-screen large text view, the mixed condition is reported by
displaying MIX under the parameter label area next to the units of measure. In the
full-screen small text view, the parameter labels alternate between the mix label
and agent type label. In AUTO ID mode, the agent labels are replaced by “I MIX”
and “E MIX”.
No Breath Mode View
Normal mode of operation is in effect as long as breathing is detected. Twenty
seconds after the last breath is detected, the analyzer switches to “no breath
mode” automatically and the EtCO2, Resp rate, expired agent, FeO2, and expired
N2O numeric values are shown as ???. The momentary data is displayed in place
of the inspired numeric values.
Inspired nitrous oxide data Fractional expired O2
Inspired agent Expired agent
Fractional inspired O2쐅Expired nitrous oxide data
Respiration rate in breaths/minute 쐈Inspired carbon dioxide data
Alarms ON bell (refer to Table 1 on page 22-15) 쐉Apnea alarm setting (the delay value)
End tidal carbon dioxide data 씈Bed ID and patient name (remote displays only)
Gas screen key
G
A
S
BED1 DANIELS, R
I CO2=0.5%
RR=20BPM
FiO2= 21%
I AGNT=2.5%
I N2O=6%
ETCO2=5.2%
APNEA=30s
FeO2=17%
E AGNT=1.7%
E N2O=5%
RR=20BPM
FiO2= 21%
I N2O=6%
ETCO2=5.2%
Numeric key display
쐈
쐉
씈
쐅

Multigas
22-15
Setting Alarm Limits
You may set alarm limits for the following:
• Apnea (delay is measured in seconds) - high limit
• RR (respiratory rate) - high and low limits
•EtCO
2- high and low limits
•I CO
2- high limit
•FiO
2 - high and low limits
•FeO
2 - high and low limits
• Inspired and Expired N2O - high and low limits
• Inspired and Expired Agent - high and low limits
When alarm limits for EtCO2 and RR are initially enabled, the limit values depend
upon the patient’s current readings for those parameters (these limit values are
learned). Alarm limits for all other monitored parameters, when enabled, always
have the same fixed values.
Factory-set default values appear for alarm limits when you initially power up the
multigas unit. You may modify limits for any of the monitored parameters. These
modifications will remain in check until the unit is turned off or placed on Standby.
Default settings and ranges for alarm limits are shown in Table 2 on page 22-16.
Refer to Alarms on page 2-3 for additional information on alarms.
The VIEW ALARMS display format is the default for all full screen remote and
central monitors. In this format, all text is cleared from the waveform zone and ten
sets of parameter labels and their alarm limits are displayed. This is the only mode
that displays all alarm limits.
Table 1: Alarm Status and Display
Alarm Status Bell Display
At least one alarm ON Present
At least one alarm ON and
violated Flashing
All alarms OFF Replaced with GAS ALM OFF in reverse video
At least one alarm ON;
alarms temporarily
suspended by monitor
Replaced with GAS ALM SUSP in reverse video
(flashes if any alarm is violated)
To set gas alarm limits:
1Touch GAS.
2Touch ALARM LIMITS.
3Select the parameter for which
you wish to set alarm limits.
4Touch ON for the parameter
selected in step 3.
5Use the arrow keys to set the
high and low alarm limit or the
apnea alarm delay time.
6Touch PREVIOUS MENU to
select another parameter for
setting alarm limits.
7Repeat steps 3 through 6 until
all limits are set.

Ultraview Care Network
22-16
* The current barometric pressure measurement affects the maximum high and
low alarm limits for EtCO2 when measured in %.
** Learned Alarm Limits
The respiration rate alarm limits default as shown below:
Condition Limit
RR < 12 LO = 1 BPM
RR > 12 LO = RR x 0.5 (truncated to the next lower resolution)
RR < 20 HI = 30 BPM
RR > 20 HI = RR x 1.5 (rounded to the next higher resolution)
The EtCO2 high alarm limit defaults to the displayed value + 15% and is
rounded to the next higher resolution, when needed.
The EtCO2 low alarm limit defaults to the displayed value – 15% and is
truncated to the next lower resolution, when needed.
Table 2: Alarm Limit Ranges
Monitored
Parameter Units
Low Alarm High Alarm
Resolution
Minimum Default Maximum Minimum Default Maximum
EtCO2 %0.0 ** 9.9 *0.1 ** 10.0 *0.1
EtCO2 mmHg 0 ** 79 1 ** 80 1
EtCO2 kPa 0.0 ** 9.9 0.1 ** 10.0 0.1
I N2O%0075580805
E N2O%0075580805
RR BPM 0 ** 170 15 ** 175 1 for 1 - 30
5 when > 30
APNEA sec - - - 20 30 45 5
I CO2% - - - 0.1 1.0 9.9 0.1
I CO2 mmHg - - - 1 8 80 1
I CO2 kPa - - - 0.1 1.0 9.9 0.1
O2 Inspired
(FiO2)- 18 18 95 20 100 100 5 when > 30
Otherwise 1
O2 Expired
(FeO2)- 15 18 95 20 100 100 5 when > 30
Otherwise 1
Inspired Agent
HAL, ISO,
ENF, DES,
SEV
% 0.0 0.0 19.9 0.1 3.0 20 0.1
Expired Agent
HAL, ISO,
ENF, DES,
SEV
% 0.0 0.0 19.9 0.1 3.0 20 0.1
!
• If the current EtCO2 reading is 0 when the alarms are first
turned on, special EtCO2 limits are defined. If mmHg is
selected, the high and low limits are set to 0 and 1, respectively.
If % or kPa is selected, the high and low limits are set to 0.0
and 0.1, respectively.

Multigas
22-17
Waveform Display
Adjusting Waveform Size
The CO2 waveform can appear on your monitor in any of three scale sizes: 0 to
80 mmHg, 0 to 60 mmHg or 0 to 40 mmHg (0 to 10.0 kPa, 0 to 7.5 kPa, or 0 to
5.0 kPa).
Turning the Waveform Display Off
To reduce display clutter, the multigas waveform can be turned off while leaving
the numerics visible. When the waveform is off, the size adjustment, sweep
speed, and freeze keys are disabled.
Selecting a Sweep Speed
You can view this waveform at any of the following sweep speeds: 25, 12.5, 6.25,
3.12, or 1.56 mm/second.
Freezing the Waveform
You can freeze the gas waveform display at any time. The waveform stays frozen
until you press the FREEZE ON/OFF key again or until you press the NORMAL
SCREEN key. When the waveform is frozen, the SIZE key in the SETUP menu is
disabled.
Selecting a Text Format
You can change display formats for multigas by switching between large and
small text (refer to Display Detail on page 22-12).
Small text allows clear visualization of the waveform. However, It is recommended
that large text be used for routine monitoring.
Selecting a Unit of Measure
You can monitor CO2 values as a percentage (%), as millimeters of mercury
(mmHg) or kilo Pascal (kPa). If you want to use % as the measurement, press the
PERCENT/mmHg (kPa) key until PERCENT is highlighted. If you want to
measure in mmHg (kPa), press the PERCENT/mmHg (kPa) key until mmHg (kPa)
is highlighted.
To adjust the waveform scale
size:
1Touch GAS.
2Touch SETUP.
3Touch SIZE.
4Select the desired scale size.
To turn the waveform display
OFF:
1Touch GAS.
2Touch SETUP.
3Touch SIZE.
4Select WAVEFORM OFF.
To select a sweep speed:
1Touch GAS.
2Touch SETUP.
3Touch SWEEP SPEED.
4Select desired sweep speed.
To freeze the gas waveform:
1Touch GAS.
2Select FREEZE ON.
To switch text formats:
1Touch GAS.
2Touch SETUP.
3Select LARGE TEXT or SMALL
TEXT.
To select a measurement unit:
1Touch GAS.
2Touch SETUP.
3Select PERCENT or mmHg
(kPa).

Ultraview Care Network
22-18
Selecting an Agent ID
You can manually choose an agent type by touching the SELECT AGENT key in
the main menu which opens the agent selection sub-menu. The prompt line above
the sub-menu identifies the detected agent: DES, SEV, ISO, HAL, ENF. MIX is
displayed if more than one agent is detected, and NONE if the agent type is not
identified.
Touching the AUTO ID key sets the analyzer to automatically use the agent type
detected. The five agent keys are the manual agent selection keys. Selecting one
of the agent keys forces the analyzer to use and report the concentration levels
based upon coefficient factors of the manually selected agent.
Agent ID Conflict Detection
In AUTO ID mode, if nonzero concentration levels are reported for more than
2-minutes and the agent type is not detected, a conflict is declared and the AUTO
ID key flashes.
In manual mode, when an agent type other than the selected agent type is
detected, a conflict is declared and the key with the detected agent type flashes.
When a conflict is declared, the agent parameter areas flash on all screens also.
The conflict is confirmed and the flashing of the keys and agent parameter areas
stops when either a selection is made in the Select Agent menu (a key is touched)
or the Select Agent menu is exited.
Conflict detection is restarted if:
• the agent concentration level goes to zero for more than 2-minutes.
• an agent type is selected that is not the type currently selected and not the
first agent type in conflict.
WARNING:
• In the event an agent is selected manually, but not
administered, the analyzer will detect the difference and
begin flashing the agent parameter label area and the
detected agent’s key. This is to alert the clinician to
possible errors.
CAUTION:
• If you see AGNT or MIX next to the numeric values on the
display, wait until HAL, ISO, ENF, SEV, or DES only appear
on the screen to indicate that the multigas analyzer
recognizes the agent you are using. The displayed values
are based on the coefficient factors of the last detected or
selected agent type. If the last detected or selected agent is
different than the agent you are using, you may receive
inaccurate values. Confirm the agent type before you
continue with patient treatment.
To select Auto Agent ID:
1Touch GAS.
2Touch SELECT AGENT.
3Touch AUTO ID.
To select Agent ID manually:
1Touch GAS.
2Touch SELECT AGENT.
3Select HAL, ENF, ISO, SEV,
DES.
Multigas
22-19
Selecting Stand By Mode
Stand By mode should be used for short durations only (for example, case
turnover). The Stand By feature keeps the unit warmed up.
The Stand By mode is not to be used in place of the power on/off. If the unit is in
Stand By mode and loses power (for example, if the unit is unplugged during
moving), when power is re-initiated, the analyzer may not display on the patient
monitor. It is best to use Stand By mode under supervision.
Press the front panel STAND BY button to initiate the Stand By mode. The pumps
stop drawing sampled gases, the analyzer display disappears from the monitor
screen, and the STAND BY light illuminates. Press STAND BY again to return the
analyzer to its normal operating mode when multigas monitoring is needed again.
Selecting a Pump Speed
You may select any of the following volumes of sampled gases that are drawn for
use in measuring gas values: 50, 75, 100, 125, 150, 175, or 200 ml/min, or you
may suspend sampling (pumps off). The unit defaults to 175 ml/min whenever it is
turned on.
Initiating a Calibration
Daily O2 Sensor Test
The oxygen channel may drift slightly over time; therefore, an O2 sensor test
should be performed daily. This test uses room air to check for aging of the
oxygen sensor and may be performed at any time (except during the first
4-minutes of operation). This check does not require special equipment or
additional gases.
If drift or aging of the sensor is detected, the 100% O2 SPAN REQUIRED
message will be displayed and a 100% O2 span must then be performed to
calibrate the O2 sensor for high concentration levels (>60%) of oxygen.
Further action is needed if an O2 SPAN FAILURE message or an O2 SPAN
REQUIRED message displays on the screen. However, the gas analyzer is still
functioning and all Agent, CO2, and N2O values remain accurate. The unit can be
used until the required calibrations can be performed. To remove the message
from the screen, simply touch the GAS key and then the NORMAL SCREEN key
of the monitor.
CAUTION:
• If the unit is taken out of Stand By and the analyzer display
does not appear on the patient monitor, turn the unit off
and then power on correctly.
WARNING:
• The gas analyzer calibrations must be performed by
qualified personnel.
• The calibration should occur when the unit is not actively
monitoring a patient.
To start multigas monitoring
from Stand By mode:
1Press STAND BY to deactivate
the Stand By mode (switch is
“out”).
2If the disposable water trap
and filter are not present,
install them now.
3When multigas monitoring is
no longer needed, press
STAND BY (switch is “in”) or
turn unit OFF (on back of unit).
Do not disconnect power to
the analyzer or the monitor.
To select a pump speed:
1Touch GAS.
2Touch SETUP.
3Touch PUMP SPEED.
4Select desired pump speed.
To check O2 sensor:
1Turn unit on and allow warm up
to occur (4-minutes).
2Touch GAS.
3Touch CAL.
4Touch CHECK O2 SENSOR.
5At completion of successful
test, normal monitoring will
resume.

Ultraview Care Network
22-20
100% O2 Span Calibration
The 100% O2 Span is used to calibrate the response of the oxygen sensor to
100% O2. This function sets the level for oxygen so the monitor displays 100%
when pure oxygen is input to the unit.
The 100% O2 Span calibration should be performed monthly or whenever the
FiO2 value is not between 98% and 100% when sampling pure (100%) oxygen.
The 100% O2 calibration must be done correctly. A source of pure O2 with
adequate flow is required to perform this calibration. Some institutions rely on their
biomedical engineering department to perform this calibration. When the 100% O2
calibration is completed successfully, the monitor displays a normal screen with
measured values of all gases.
Further action is needed if an O2 SPAN FAILURE message or an O2 CELL
REPLACEMENT REQUIRED message displays on the screen. However, the gas
analyzer is still functioning and all Agent, CO2, and N2O values remain accurate.
The unit can continue to be used until the required action can be performed. To
remove the message from the screen, simply touch the GAS key and then the
NORMAL SCREEN key of the monitor.
O2 Cell Replacement
To change an O2 cell, plan on the analyzer to be out of operation for
approximately 2-hours. Therefore, if the day begins with a CHECK O2 SENSOR
calibration and it is found that additional calibration or O2 sensor replacement is
required, you can simply schedule that within your department (when the
biomedical engineers are available). You may continue to use the analyzer until
there is time to re-calibrate the unit or change the sensor.
Autozero Calibration
To guarantee accurate readings, the zero reference of the multigas analyzer is
automatically calibrated on a regular basis. Autozero calibrations last less than
1.5-seconds and are performed without notice to the user.
The interval between autozero calibrations depends upon the amount of time the
unit operates (either in normal or stand by mode). After the unit has been ON for
at least 30-minutes, and has become thermally stable, autozero occurs in normal
mode at approximately 10-minute intervals.
CAUTION:
• If the message ??? appears in the numerics of FiO2and
FeO2 at any time you are monitoring a patient, you must
perform a check O2 sensor test.
CAUTION:
• Performing a 100% O2 span calibration without using the
proper concentration and flow of oxygen will result in span
calibration failure.
To span calibrate O2 sensor with
100% O2:
1Allow unit to stabilize for
30-minutes.
2Touch GAS.
3Touch CAL.
4Disconnect the sample line
from patient.
5Connect the sample line to the
sampling port of an airway
T-adapter.
6Connect the airway T-adapter
to a source of 100% oxygen
supply.
7Adjust the oxygen supply to
flow through the T-adapter at a
rate of approximately 500
ml/min.
8Wait for O2 value to stabilize.
9Touch 100% O2 SPAN.
10 Select YES.
11 At completion of successful
test, normal monitoring will
resume.

Multigas
22-21
Pump Calibration
This function is used by service personnel to adjust the pump flow rate. Refer to
the 90518 Multigas Analyzer Service Manual P/N 070-0643-xx for details.
Gas Span Calibration
A gas span calibration is recommended whenever gas values appear to be too
low or too high. Always perform a leak test first to verify that the suspected values
are not the result of a leak (poor connection, cracked water trap, etc.).
The gas calibration (SPAN) procedure is used to recalibrate the gas channels for
CO2, N2O, and anesthetic agents. This procedure should be done every
30-90 days. Equipment required for this calibration includes a gas mixture for the
calibration, calibration adapter kit, gas pressure regulator, and flow meter. This
equipment can be purchased from Spacelabs Medical Supplies Products.
Refer to the 90518 Multigas Analyzer Service Manual (P/N 070-0643-xx) for
details on calibrating the analyzer.
WARNING:
• Performing a gas span calibration without the calibrated
gas mixture connected adversely affects the accuracy of
the analyzer.
• Gas span calibrations must be performed by trained
personnel only.
!
• The waveform display and the numeric values may disappear
during calibration.

Ultraview Care Network
22-22
Suspending Sampling
Sampling may be suspended by touching the SUSPEND SAMPLING key under
the following conditions:
• When suctioning a patient
• Use (by the patient) is temporarily discontinued
• Nebulized drugs are being used
This stops the sampling pump and keeps the system free of debris. Touch the
RESUME SAMPLING key to resume sampling.
When sampling is suspended, the CAL key is disabled.
Refer to Patient Connection on page 22-8 for examples of recommended suction
system setups.
CAUTION:
• The sampling must be resumed for proper monitoring of
respiratory gases.
To suspend sampling:
1Touch GAS.
2Touch SUSPEND SAMPLING.
3Touch RESUME SAMPLING
when finished.

22-23
Multigas Troubleshooting Guide
The analyzer displays error messages in the gas waveform zone. Many of these messages also trigger an alarm. If the
prompt line is available, the monitor displays messages there as well.
Clinical Situation Possible Cause Solution Alarm
Sounds
FILTER DOOR OPEN -
Close filter access
door
■The gas analyzer filter door is
ajar.
■Close the door by pressing it
downward.
■Yes
OCCLUSION -
Check T-adapter,
sample line
■The sample line is blocked. ■Check the sample line for
blockage or crimps, and replace
as necessary.
■Yes
■The gas analyzer filter is
plugged.
■Replace the gas analyzer filter
cartridge.
■Yes
SPAN IN PROGRESS ■One of the span calibration
procedures is in progress.
■Wait until span calibration is
completed and message goes
away.
■No
WARMING UP ■The unit is self testing or
warming up.
■Wait until warm up completes
before operating.
■No
WATER TRAP ABSENT
- Install water trap
■There is no water trap
installed in the holder.
■Install a water trap. ■Yes
WATER TRAP FULL -
Replace or empty
■The water trap is full. ■Replace the water trap. ■Yes
!
• The unit does not analyze sampled gases while the monitor displays any of the above messages.

22-24
Clinical
Situation Possible Cause Solution Alarm
Sounds
100% O2 SPAN
FAILED - Check 100%
O2 gas supply, Check
for leaks
■Sampled gas supply does not
have 100% O2 present when
compared to room air O2.
■Verify the O2 supply. Allow the
analyzer to warm up for at least
30-minutes before attempting a
100% O2 span.
■Yes
■Air leak in external sample circuit. ■Check water trap, gas analyzer
filter, and sample lines for air
leaks. Replace all leaking
components.
■Yes
■Air leak in internal sample circuit. ■Perform a unit leak test. Service
may be required.
■Yes
■External/internal pressures may
be out of operating range or
measurement of the pressures
has failed.
■Check that the cell pressure in
SERVICE CAL MODE is between
525-825 mmHg. If the cell
pressure is greater than the
barometric pressure, external
sample circuit is over pressured,
adjust circuit.
■Yes
■O2 cell linearity error. ■Contact your Biomed or your
Spacelabs Medical service
representative.
■Yes
■O2 concentration may be more
than 23% or less than 19% in
vicinity of the analyzer.
■Check the room air around the
analyzer for high O2
concentrations. Successful
completion of O2 span is not
possible under this condition.
■Yes
■Repeat 100% O2 SPAN (refer to
To span calibrate O2 sensor with
100% O2 on page 22-20). Contact
a qualified service person if the
span fails again after the above
checks.
100% O2 SPAN
FAILED -
O2 cell replacement
required
■O2 cell output is below acceptable
levels, O2 values are disabled.
■Contact your Biomed or your
Spacelabs Medical service
representative.
■Yes
100% O2 SPAN
REQUIRED
■Initial 100% O2 CAL required. ■Perform 100% O2 Span. ■Yes
■CHECK O2 SENSOR determined
need for 100% O2 Span to restore
specified O2 accuracy.
■Perform 100% O2 Span. ■Yes
O2 CELL
REPLACEMENT
REQUIRED
■Previous O2 span determined that
O2 cell has aged to the point of
needing replacement.
■Contact your Biomed or your
Spacelabs Medical service
representative.
■Yes

22-25
O2 INSTALLATION
FAILED - O2 install
cal requires new O2
cell
■Install cal detected an O2 cell
output above or below the
allowable threshold for a new O2
cell.
■Contact your Biomed or your
Spacelabs Medical service
representative.
■Yes
O2 SPAN FAILED -
Check exhaust port
■Scavenger port is blocked. ■Remove scavenger port blockage
and repeat the SPAN. If the SPAN
fails again, contact a qualified
service person.
■Yes
■O2 sensor assembly output is very
negative.
■After checking exhaust port, if
RAW = 0 in SERVICE CAL
MODE, service is required.
Replacement of the O2 sensor
electronics assembly is indicated.
■Yes
CAL GAS SPAN
FAILED -
Check span gas
supply
■The unit could not calibrate the
gas channel.
■Repeat the span. Contact a
qualified service person if the span
fails again.
■Yes
!
• The unit does not analyze sampled gases while the monitor displays any of the above messages.
• For the above messages, you can touch the GAS key and then the NORMAL SCREEN key to remove
the message from the waveform zone and stop the alarm tone. However, the message will continue to
display on the monitor’s prompt line. Whenever a span failure occurs, the previous calibration factors are
not lost. The analyzer continues to function and report the gas values, but the full accuracy of the values
are not guaranteed.
Clinical
Situation Possible Cause Solution Alarm
Sounds

22-26
Clinical Situation Possible Cause Solution Alarm
Sounds
HIGH VALUES
OBSERVED
■A span calibration was
performed while there
was a leak in the
sample circuit.
■Check connections and check for a
broken water trap. Perform leak test.
Verify the anesthesia delivery
devices and vaporizer calibrations.
Refer to the 90518 Multigas
Analyzer Service Manual
(P/N 070-0643-xx) for details.
■Assure vaporizer accuracy.
■No
LOW VALUES OBSERVED ■A leak exists at the
sample line
connection, a water
trap is broken at the
luer connection, or a
gas analyzer filter is
leaking.
■Check connections and check for a
broken water trap. Perform leak test.
Verify the anesthesia delivery
devices and vaporizer calibrations.
Refer to the 90518 Multigas
Analyzer Service Manual
(P/N 070-0643-xx) for details.
■No
■Assure vaporizer accuracy. ■No
Minimum waveform
deflection and very low or
zero numeric values when
breathing normally
through a new or unused
sample line
■Clogged or missing gas
analyzer filter.
■Replace or install gas analyzer filter
underneath the door above the
water trap.
■No
■A large leak in the
sample circuit.
■Check connections and perform a
leak test. Refer to the 90518
Multigas Analyzer Service Manual
(P/N 070-0643-xx) for details.
■No
MIX
NOTE: This message
appears in agent
numerics area.
■Agent mixture
detected.
■The analyzer is not designed to
simultaneously measure multiple
anesthetic agents. Inaccurate
numeric concentration values may
be displayed when two or more
agents are mixed.
■No
■The displayed value of the mixed
condition is based on the combined
value of agents using the coefficient
factors of the last detected or
selected agent type.
■No

22-27
■When the analyzer detects an agent
mixture:
• In Auto ID Mode — The mixed
condition is reported by
displaying I MIX and E MIX as the
agent labels on all screens.
• In Manual ID Mode — In large
text screen, the mixed condition
is reported by displaying the word
MIX under the parameter label
area next to the units of measure.
In the small text screen or the
split screen central, the
parameter labels will alternate
between the mix labels in normal
video and the selected agent-
type labels in reverse video.
■The display zones will continue with
the above displays, until the mix of
the agents has flushed from the
patient and delivery system and a
single agent identity has been
detected.
■Depending on the agents used, the
residue in the patient, and the
breathing or delivery system, mixed
conditions can last for more than an
hour.
■If the message persists, contact a
qualified service person.
Zeros or ??? are
displayed for one or more
of the inspired gases (I
N2O, I AGNT, FiO2, or I
CO2)
■No gas is being
administered.
■Administer gas. ■No
■Sample line is not
connected.
■Check sample line connections, the
water trap, and the filter above the
water trap.
■No
■A leak in the system. ■Perform a leak test; refer to the
90518 Multigas Analyzer Service
Manual (P/N 070-0643-xx) for more
details.
■No
■Failure in one of the
internal electronics
parts.
■Cycle the power to the analyzer. If
the problems persist, contact a
qualified service person.
■No
Clinical Situation Possible Cause Solution Alarm
Sounds

23-1
!
• Based on features purchased, more or fewer keys may appear here than on your menu screens.
BIS Directory
Directory of Keys
BIS - MAIN MENU
ALARM
LIMITS SETUP TEST
ELECT PRINT START
ALARM LIMITS MENU
HI=
XX
BIS SETUP MENU
TIME SCALES MENU
1
HR
YES NO
EXIT
ELECT
B
I
S
CAUTION
ON OFF
ALARMS
ON OFF
PLOT SCALES MENU
0-100 40-100 20-80
SIZE MENU
0-60
PROCED
CLEAR DATA?
LO=
YY
DISPLAY
FORMAT
TIME
SCALES SIZE SWEEP
SPEED
PLOT
SCALES
ADV
SETUP
DISPLAY FORMAT MENU
13AUTO
ZONE ZONE ZONE
2
HR
4
HR
8
HR
12
HR
24
HR
SWEEP SPEED MENU
15 mm/sec 30 mm/sec 50 mm/sec
ADVANCED SETUP MENU
LOW
FREQ
RESTORE
SETTINGS
HIGH
FREQ
LINE
FREQ
SAVE
SETTINGS
LOW FREQ MENU
0.25 HZ 1.0 HZ 2.0 HZ
HIGH FREQ MENU
30 HZ 50 HZ 70 HZ NONE
LINE FREQ MENU
50 HZ 60 HZ


Contents
23-3
BIS
Overview
The Spacelabs Medical 90482 Bispectral Index® (BIS®) Analysis module acquires
and processes real-time EEG data into a BIS number between 0 and 100. The
EEG data is also displayed as:
•BIS
• Spectral Edge Frequency (SEF)
• Median Power (MF)
• EMGL (EMG energy in the 70–110 Hz band)
• Signal Quality Index (SQI)
• Suppression Ratio (SR)
The BIS module may be used in any of the Spacelabs Medical monitors listed in
Table 1, with or without other Spacelabs Medical modules.
The BIS module uses disposable BIS sensors from Aspect Medical, Inc., a Digital
Signal Converter (DSC), and a patient interface cable.
Table 1: BIS Compatibility
Model Description
Minimum Version of
Software Required For
Compatibility
90363 Ultraview 1500 1.01.10
90364 Ultraview 1600 1.03.08
90369 Ultraview 1050 1.01.10
90367 Ultraview 1030 1.01.12
90385/6 UCW/RDI 1.04.33
90387 Ultraview 1700 1.05.56
Overview . . . . . . . . . . . . . . . . . . . . . . . . . . . . . . . . . . . . . . . . . . . . . . . . . . . . . . . 3
Patient Preparation . . . . . . . . . . . . . . . . . . . . . . . . . . . . . . . . . . . . . . . . . . . . . . . 6
Initialization . . . . . . . . . . . . . . . . . . . . . . . . . . . . . . . . . . . . . . . . . . . . . . . . . . . . . 6
Normal Bedside Display Format . . . . . . . . . . . . . . . . . . . . . . . . . . . . . . . . . . . . . 8
Remote View Display Format . . . . . . . . . . . . . . . . . . . . . . . . . . . . . . . . . . . . . . 11
Split Screen Display Format . . . . . . . . . . . . . . . . . . . . . . . . . . . . . . . . . . . . . . . 12
Numeric Key Format . . . . . . . . . . . . . . . . . . . . . . . . . . . . . . . . . . . . . . . . . . . . . 12
BIS Main Menu . . . . . . . . . . . . . . . . . . . . . . . . . . . . . . . . . . . . . . . . . . . . . . . . . 13
Status Messages . . . . . . . . . . . . . . . . . . . . . . . . . . . . . . . . . . . . . . . . . . . . . . . . 16
Definitions . . . . . . . . . . . . . . . . . . . . . . . . . . . . . . . . . . . . . . . . . . . . . . . . . . . . . 18
Care and Maintenance . . . . . . . . . . . . . . . . . . . . . . . . . . . . . . . . . . . . . . . . . . . 19
Ultraview Care Network
23-4
Figure 23-1: Module, DSC, PIC, and sensor
CAUTION:
• Place the sensors as far away from the electrosurgery site
as possible because considerable high frequency current
may flow into the electrodes. This can cause patient burns,
especially if a defect is present in the neutral cable of the
electrosurgical unit. Placing electrodes too close to the
electrosurgery site can also cause a noisy EEG trace.
• Do not allow conductive parts of sensors or connectors,
including the neutral electrode, to contact other conductive
parts, including the ground.
• Detach all connectors and cables by grasping the
connectors and pulling them straight out. Do not detach
connectors and cables by pulling on the cables
themselves.
BIS module
digital signal converter (DSC)
patient interface cable (PIC)
BIS sensor
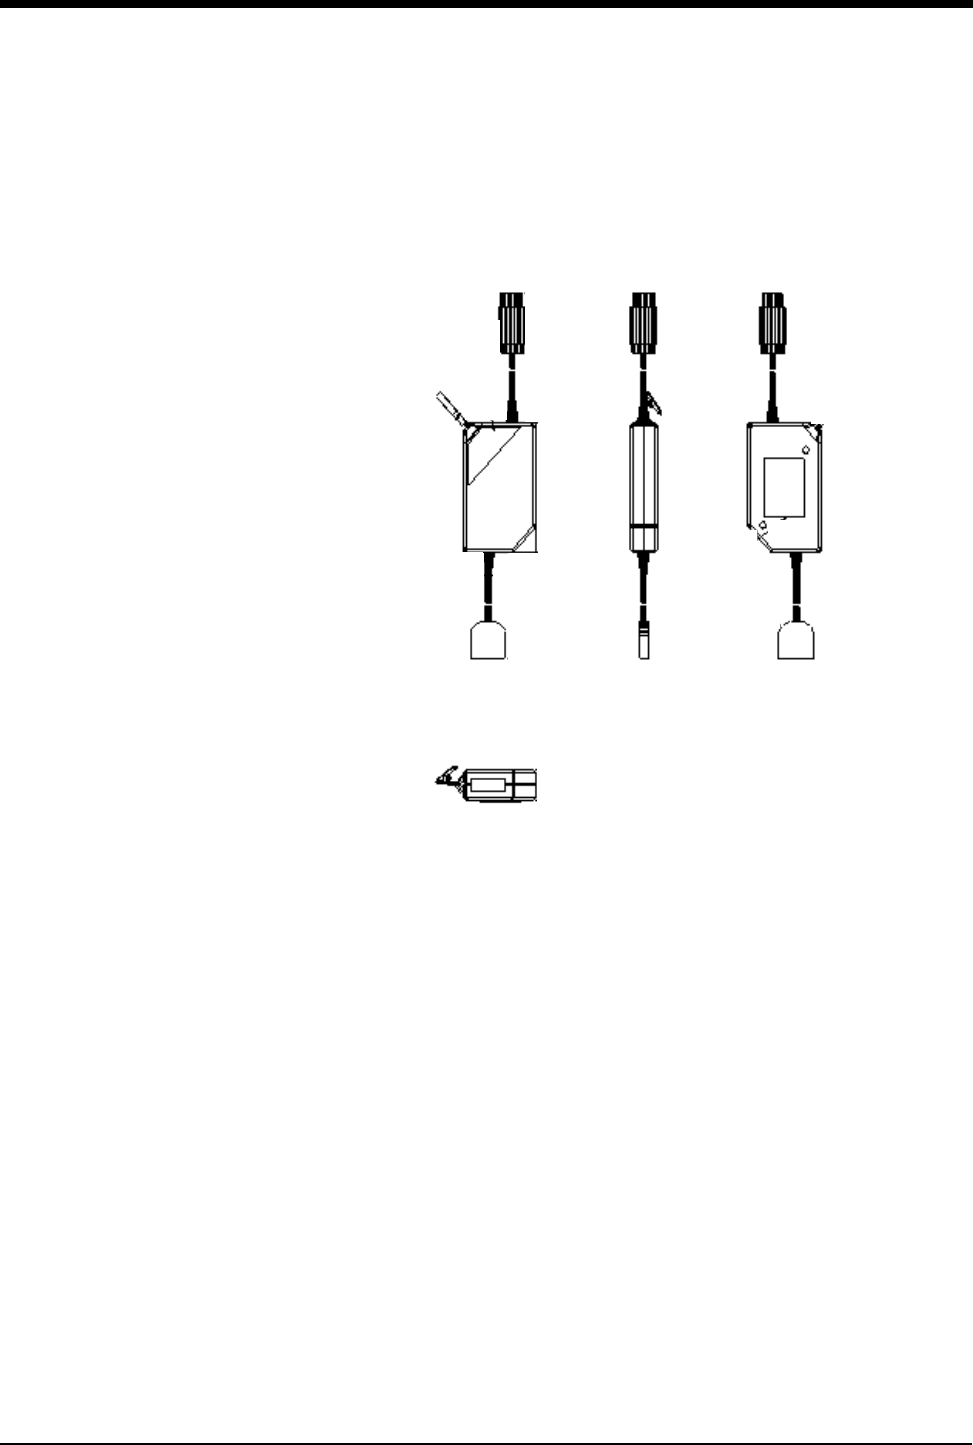
BIS
23-5
Digital Signal Converter
The digital signal converter (DSC) receives the EEG input from the patient and
converts it to digital information that is processed by the module.
Figure 23-2: Digital signal converter
The DSC plugs into the front of the module as shown in Figure 23-1.
Patient Interface Cable
The patient interface cable (PIC) is attached to the three-foot cable on the DSC
and connects to the BIS sensor as shown in Figure 23-1.
To attach the PIC to the BIS sensor:
1. Remove the BIS sensor from its packaging.
2. Locate the small, raised arrows on both the light-blue end of the PIC connector
and the BIS sensor connector.
Plug the BIS sensor into the PIC so that the arrows are on the same side and
point toward each other. You may attach the BIS sensor to the PIC cable either
before or after the sensor is placed on the patient.
!
•The PIC is not a disposable cable. Do not dispose of it when
you dispose of the attached BIS Sensor.
• A cable tie is provided with the PIC to secure it to the DSC
cable to prevent accidental disposal of the PIC.
top view side view bottom view
end view

Ultraview Care Network
23-6
To replace a faulty or damaged PIC:
1. Remove and discard the unusable cable.
2. Locate the end with a yellow dot on the PIC connector.
3. Engage the PIC connector and the DSC cable connector with the yellow dots
oriented the same way, ensuring that they are fully seated.
Patient Preparation
To prepare the patient for monitoring:
1. Make sure the skin surface is clean and dry.
2. Position BIS sensor circle #1 and BIS sensor circle #2 high on the center of
the patient’s forehead approximately 1.5 inches above the bridge of the nose.
3. Apply BIS sensor circle #3 on either temple between the corner of the patient’s
eye and the hairline.
4. Insert the tab into the patient interface cable until it is fully engaged (if you
prefer, you may do this step before applying the sensor to the patient).
5. Using your finger, trace around the adhesive areas of the sensor, including the
space between circles #1 and #2 to assure good adhesion and to prevent any
bridging between the sensor elements.
6. Press each circle firmly and hold for 5-seconds to assure adequate prepping
and to maximize sensor performance.
Initialization
Before processing data, the BIS sensor must be applied to the patient.
When the sensor is applied and the PIC and DSC are connected to the module,
you are ready to begin BIS monitoring.
1. Touch BIS.
2. Touch START PROCED
(refer to START/STOP PROCED Key on page 23-16).
3. Touch YES at the Clear Data? prompt, and the module will automatically
perform an impedance test.
CAUTION:
• The BIS sensor will only work if it is placed on the patient’s
forehead. Accordingly, it should not be used with any
surgical procedure that precludes such placement.
CAUTION:
• Do not expose the BIS sensor to surgical skin preparation
solutions. This may result in harm to the patient’s skin.
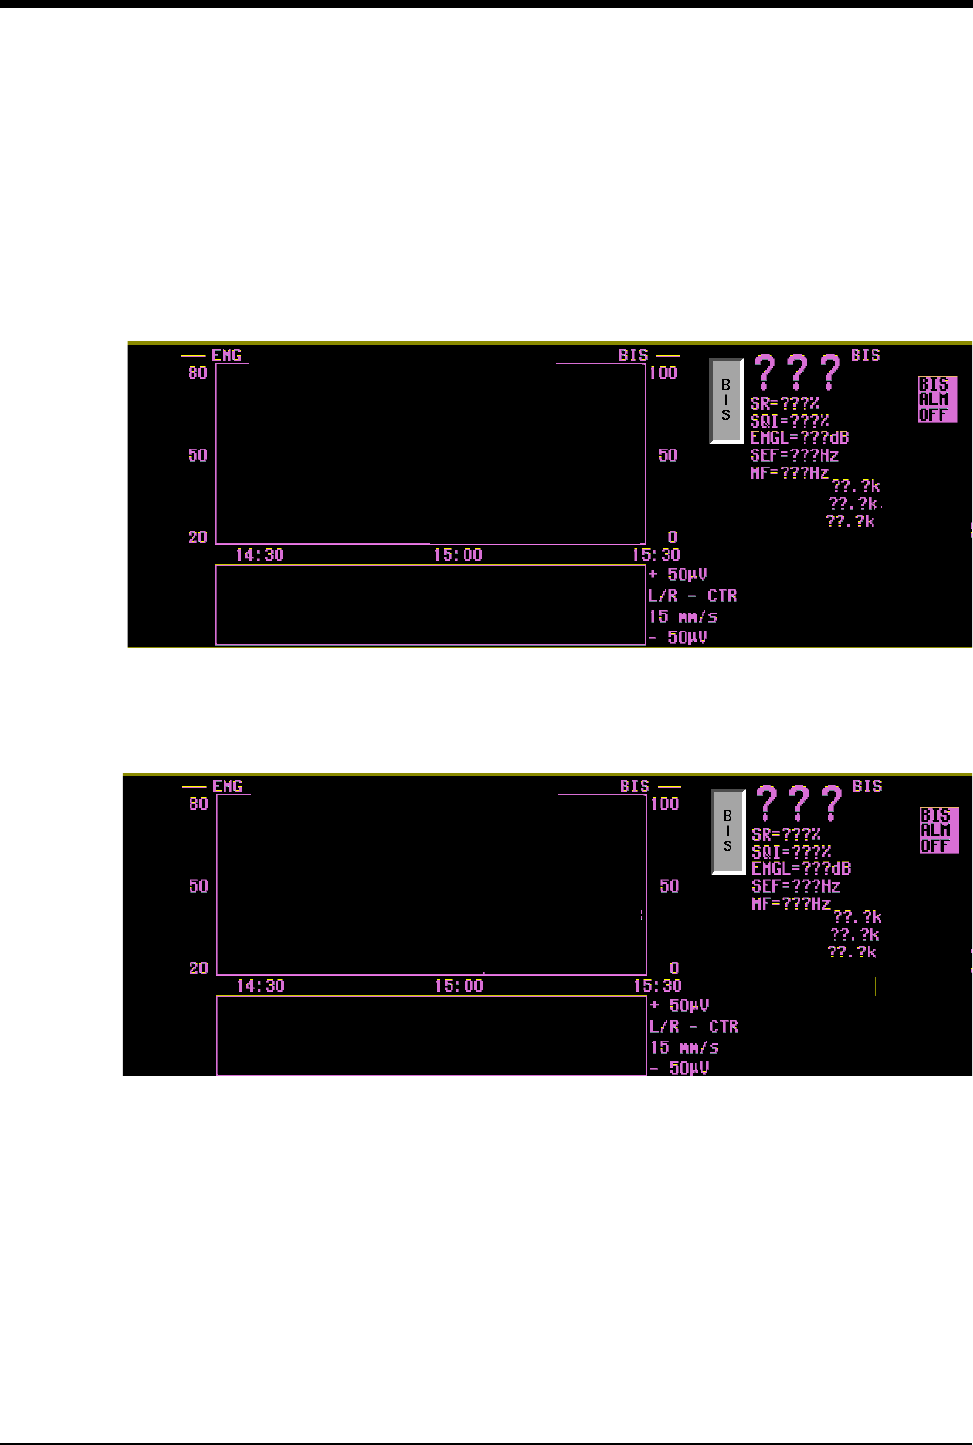
BIS
23-7
If the test passes, an Impedance Test Passed message displays (Figure 23-3).
Figure 23-3: Impedance Test Passed message
If the test fails, an Impedance Test Failed message displays (Figure 23-4).
Figure 23-4: Impedance Test Failed message
!
• You do not need to test electrode placement because this is
done automatically when you touch START PROCED.
Impedance Test PassedImpedance Test Fa
i
ledImpedance Test PassedImpedance Test Passed
Impedance Test Fa
i
led
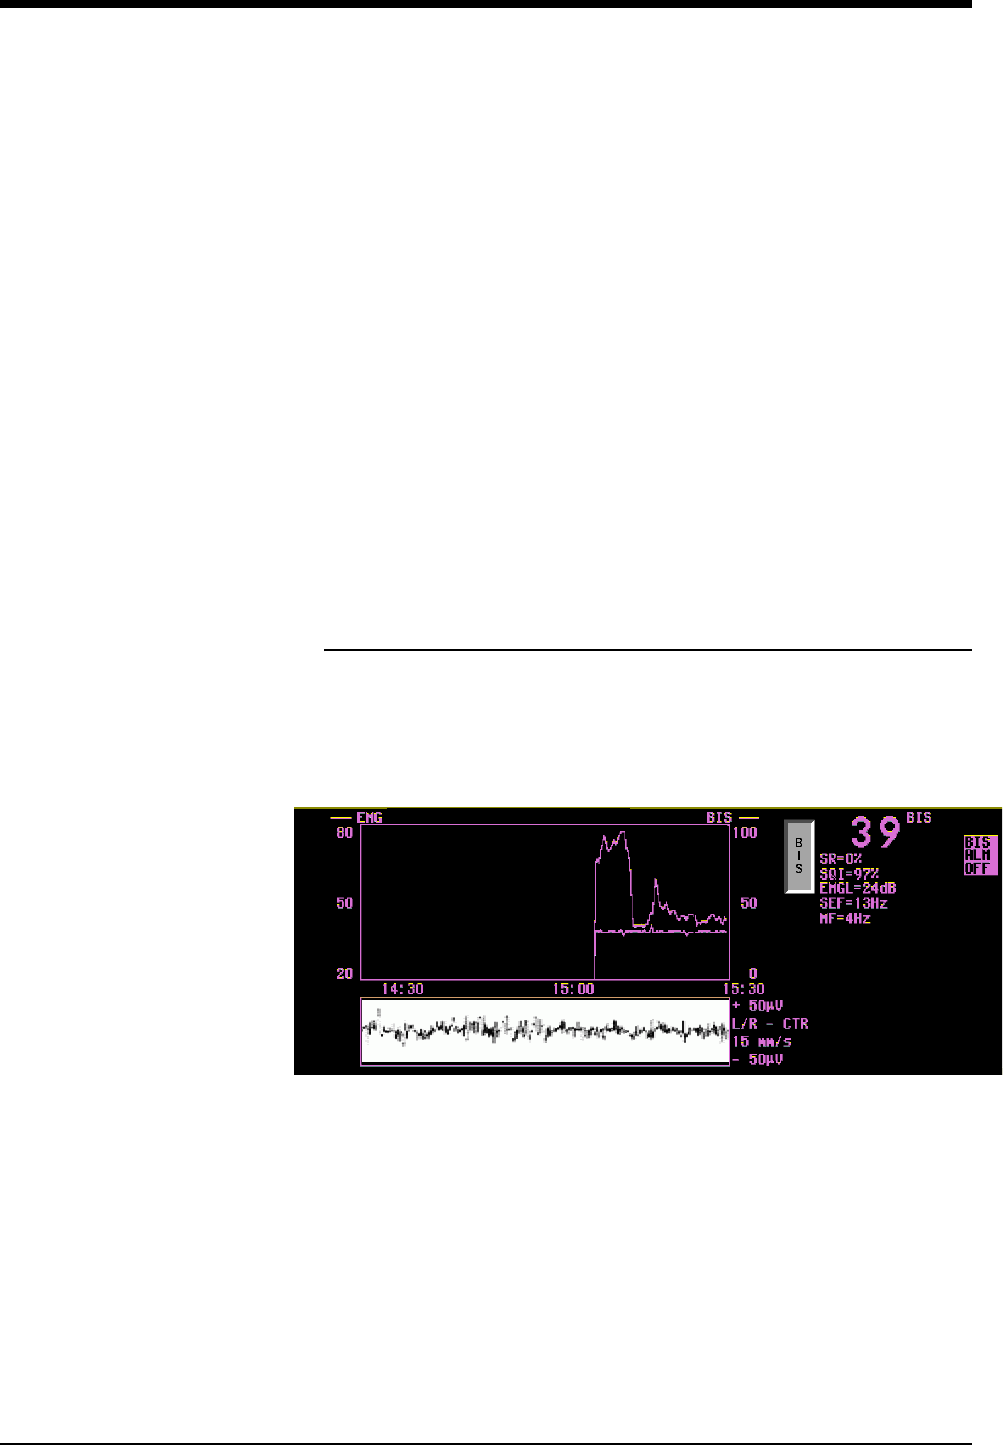
Ultraview Care Network
23-8
Impedance Values
If the impedance value is too high, it could indicate that the BIS sensor is no
longer making good contact and needs to be examined. Usually artifacts will
signal this fact.
After touching the TEST ELECT key, additional feedback is given to the user by
flashing the impedance value when the value exceeds the threshold. (Refer to
Impedance Montage on page 23-11 and TEST ELECT Key on page 23-15.)
The Pass/Fail thresholds for the terminals are:
• Ground < 100 Kohms
• Center < 7.5 Kohms
• Left/Right < 7.5 Kohms
Normal Bedside Display Format
Monitor Software
The full bedside view requires three waveform zones. The example in Figure 23-5
displays the BIS plot and EMGL trends.
Figure 23-5: BIS bedside display (3 zones)
Analog Waveform
A single waveform is displayed in a box that is 300 pixels wide by 60 pixels high.
With this display, roughly 8-seconds of waveform data can be displayed at a
sweep speed of 15 mm/sec, 4-seconds at 30 mm/sec, and 2.4-seconds at
50 mm/sec.
!
• In normal use, the typical impedance value for the ground is
less than or equal to 6 Kohms, while the values for the center
and left/right terminals are between 0.5 and 1.5 Kohms.
• The user cannot control the impedance thresholds.
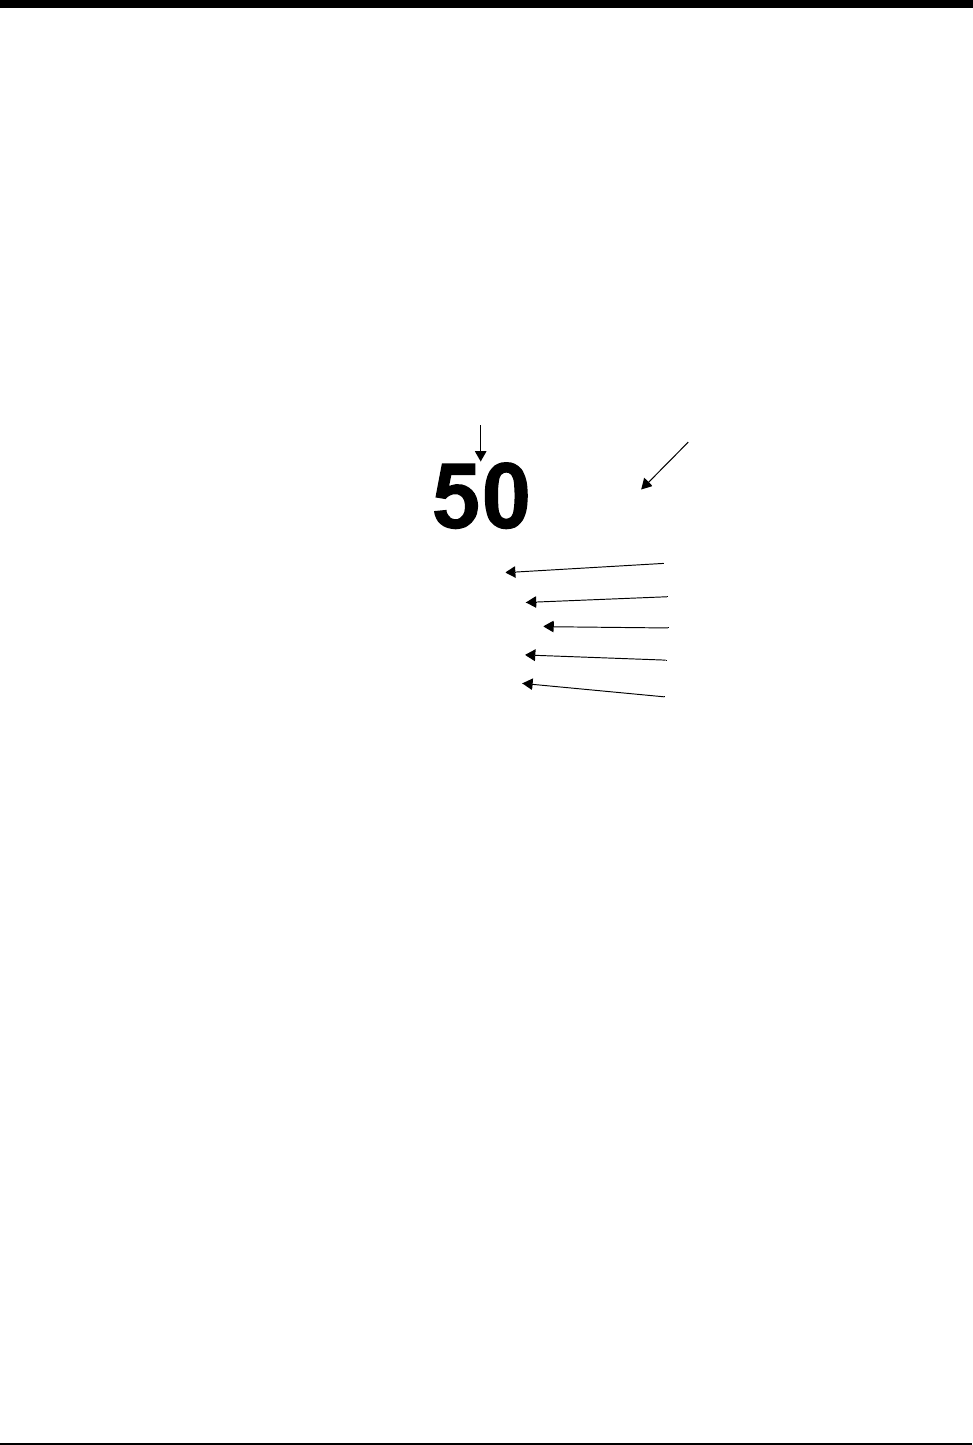
BIS
23-9
Numeric Zone
The numeric zone is to the right of the plot and the moving waveform on the
monitor and is usually updated every 2-seconds. Some items, such as sweep
speed, are only updated when the selection is changed.
Display Fonts:
• The BIS value is displayed in a large font.
• The units of measure are displayed in a small font.
• The remaining text is displayed in a small font.
Figure 23-6: Plot area numerics
Alarm Display
When the alarms are turned ON, the high and low alarm limit values are
displayed. When the alarms are turned OFF, BIS ALM OFF is displayed. When
the alarms are temporarily suspended, BIS ALM SUSP is displayed.
The alarm display consists of a block of reverse video text containing either BIS
ALM OFF or BIS ALM SUSP. They are mutually exclusive, and only one will be
displayed in the numeric area.
• Turn the alarms OFF by touching ALARM OFF on the Alarm Limits menu.
• Temporarily suspend the alarms by pressing the ALARM SUSPEND button
on the monitor.
Alarm Suspend
Press the ALARM SUSPEND button on the monitor to temporarily turn off the
audible alarm for 3-minutes. The text BIS ALM SUSP replaces the alarm limits.
The BIS number continues to flash if the limit is exceeded.
When the temporary time has elapsed, the display returns to normal behavior. If
the audible alarm is enabled, the alarm tone will sound again, and the limit
number will flash.
In the split screen display, the bell symbol displays in reverse video when the
alarms are enabled but suspended. During an alarm violation, the bell symbol
flashes in reverse video.
SR=0%
SQI=100%
EMGL=20dB
SEF=30Hz
MF=30Hz
BIS
BIS value
Suppression Ratio value
Signal Quality Index value
Alarm limits
EMGL value
Spectral Edge Frequency value
Median Power Frequency value
60
45
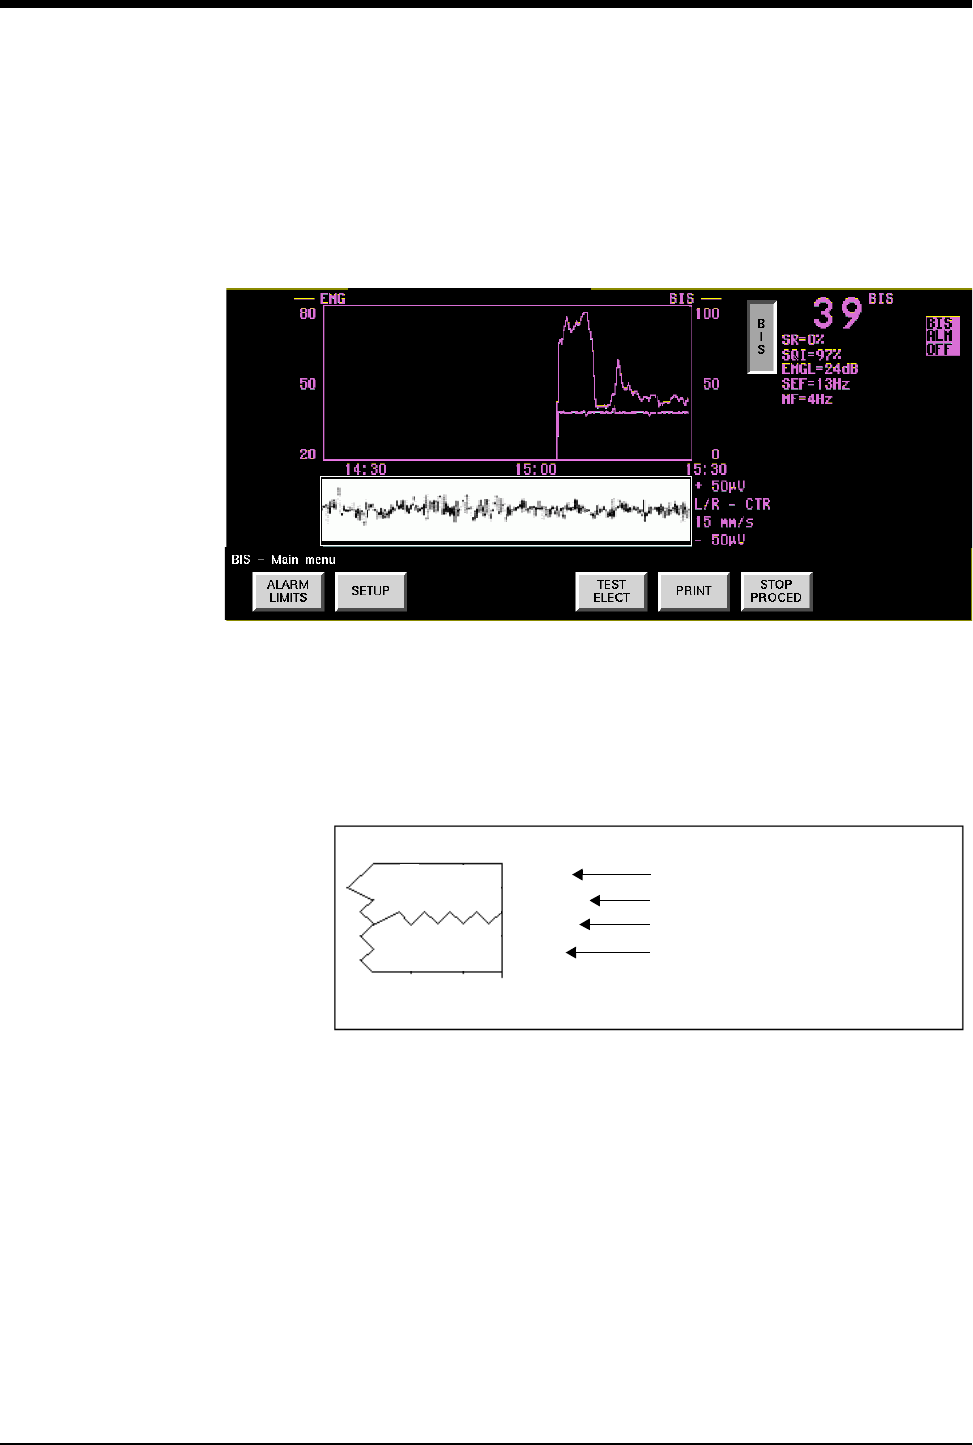
Ultraview Care Network
23-10
Top Line Annotation
The top of the plot area contains two labels:
• Primary trend label (BIS)
• Secondary trend label (EMGL)
Figure 23-7: BIS primary and secondary trends
Waveform Annotation
Waveform annotations are placed to the right of the moving EEG waveform (refer
to Figure 23-8).
Figure 23-8: Waveform zone annotations
The analog scale size can be set at ±2, ±5, ±10, ±20, ±50, ±100, or ±200 µV. The
analog scale limits are displayed with ± and µV in the label.
+ 50µV
L/R - CTR
15 mm/s
-50µV
waveform upper size scale
BIS sensor labels
sweep speed
waveform lower size scale
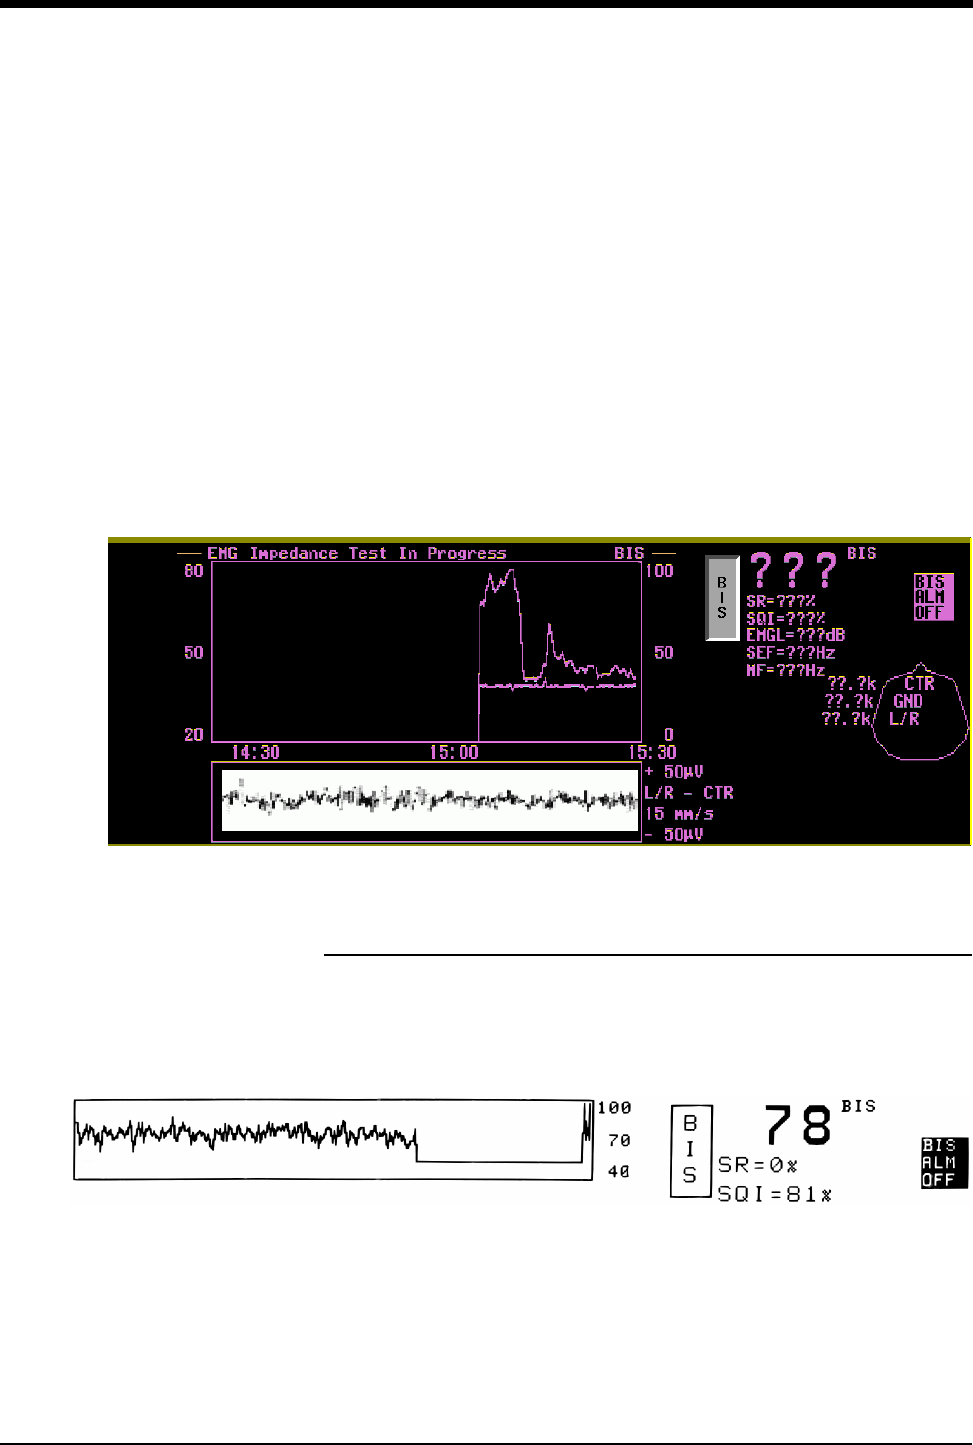
BIS
23-11
Impedance Montage
If, during BIS monitoring, you wish to test impedance without losing your trended
data, you can perform an impedance test. An impedance test is automatically
checked (or tested) every 10-minutes.
The impedance montage is a temporary display that appears when the BIS
sensor is connected to a patient and you touch the TEST ELECT key (refer to
TEST ELECT Key on page 23-15).
The montage displays on the right side of the screen to the right of the second
wave zone area from the top.
Figure 23-9: Impedance test display
Remote View Display Format
The “Remote View” software option on Ultraview monitors allows you to view the
BIS parameter from a remote monitor. This display shows the BIS plot in a single
display zone format. No analog waveforms are available in this mode.
Figure 23-10: Remote display
Remote monitors permit one display zone to be used to display remote channels
from other monitors, regardless of the type and the number of zones that are in
use at the bedside monitor. When viewing the BIS from another monitor, the lower
part of the BIS trend will not be visible due to the patient’s name being there.
!
• All processing is suspended until you stop the impedance test
by touching EXIT ELECT.
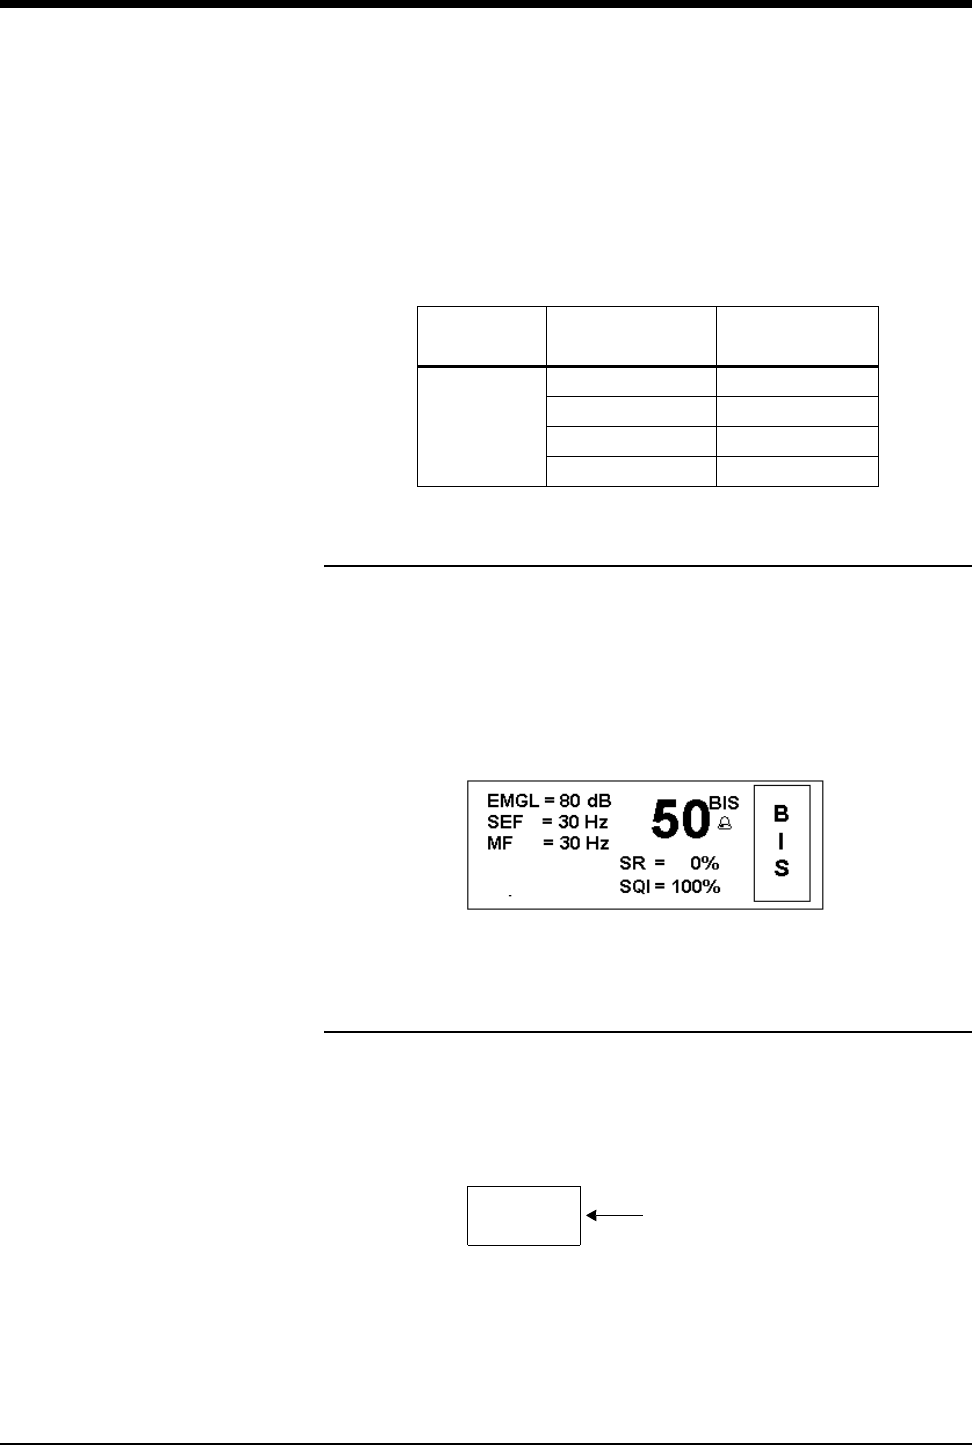
Ultraview Care Network
23-12
In the one zone or remote view mode, all numeric text must be compacted into
one display zone height.
In the remote view only, the BIS plot can have variable scaling and only the BIS
value can be plotted.
The scaling options for remote view are shown in Table 2.
Split Screen Display Format
The split screen display is shown in Figure 23-11.
Figure 23-11: Split screen display
Numeric Key Format
The numeric parameter key is labeled with the combined Bispectral Index value.
You can display the BIS parameter as an icon on the bottom of the monitor
screen. This allows other parameters to be displayed in the waveform zone. The
full BIS display is restored whenever this icon is touched.
Table 2: BIS Variable Scaling
Parameter Scaling Value for the
Labels
BIS
0-100 0, 50, 100
40-100 40, 70, 100
20-80 20, 50, 80
0-60 0, 30, 60
!
• A split screen display is available only on central monitors.
2
12
5
/R=9.9 20%
0%
Imp L/R = 0.5K
BIS=50 Bispectral Index value

BIS
23-13
BIS Main Menu
The Main menu is the initial menu that displays when you touch the BIS key.
Refer to the following sections for descriptions of each key:
•ALARM LIMITS Key on page 23-13
•SETUP Key on page 23-14
•TEST ELECT Key on page 23-15
•PRINT Key on page 23-16
•START/STOP PROCED Key on page 23-16
ALARM LIMITS Key
Touch ALARM LIMITS on the Main menu to display the Alarm Limits menu.
This menu turns the BIS alarms ON or OFF, sets the upper and lower BIS alarm
limits, and turns the Caution alarm ON or OFF.
Setting Alarm Limits
To raise or lower each alarm limit setting, first touch the HI or LO key, then touch
the up or down arrow key. Each touch of an arrow key raises or lowers the alarm
limit by five units. There are separate values for the low limit and the high limit.
Caution Alarm
Touch CAUTION ON to enable the caution alarm.
When the caution alarm is enabled, you will be warned when the BIS value is
within five units of either alarm limit.
When the BIS value is within the caution zone, the BIS number flashes.
!
• In the remote view, only the ALARM LIMITS, SETUP, and
PRINT keys are active. All other keys are disabled.
!
• The alarm limits appear on the HI and LO keys as they are
changed.
!
• No tone is emitted for the caution alarm.
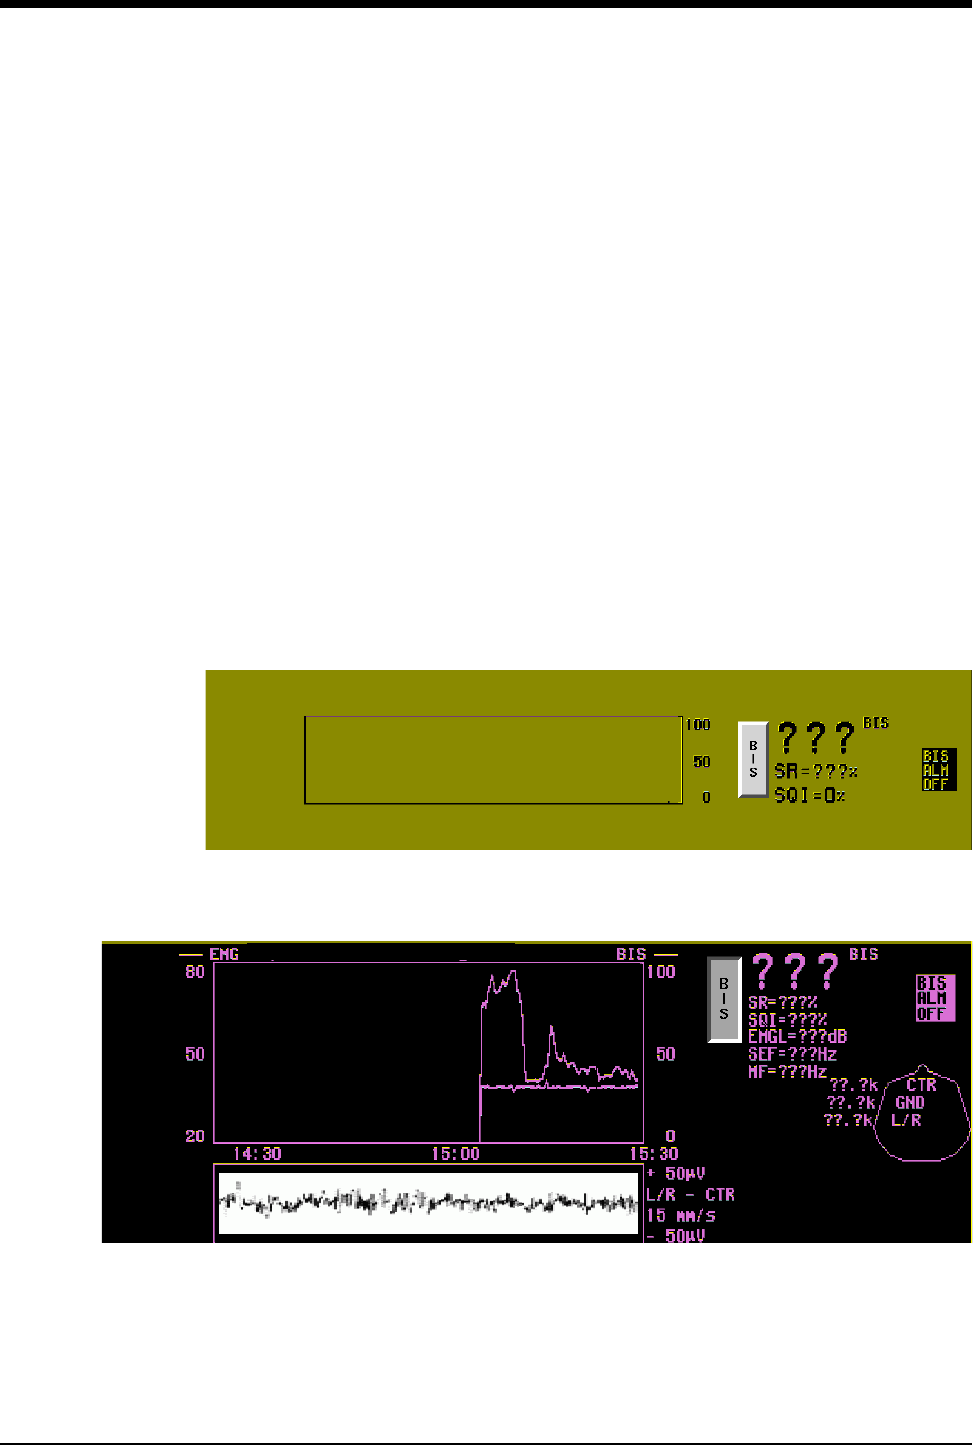
Ultraview Care Network
23-14
SETUP Key
This menu enables you to set the display parameters to be used during the
procedure. Refer to the following sections for descriptions of each key:
•DISPLAY FORMAT Key on page 23-14
•PLOT SCALES Key on page 23-15
•TIME SCALES Key on page 23-15
•SIZE Key on page 23-15
•SWEEP SPEED Key on page 23-15
•ADVANCED SETUP Key on page 23-15
DISPLAY FORMAT Key
From this menu, you can set the type of display you want to use.
• Touch 1 ZONE to display the single waveform zone format (Figure 23-12).
• Touch 3 ZONE to display the full bedside view format (Figure 23-13).
• Touching AUTO ZONE displays either format as follows:
- 3-zone format if the BIS parameter key is touched.
- 1-zone format if the BIS parameter key is not touched.
Figure 23-12: One-zone display
Figure 23-13: Three-zone display

BIS
23-15
PLOT SCALES Key
Select the vertical display scale range options for the graphical BIS trend display
in the one-zone or remote view format only. The selections are: 0–100, 40–100,
20–80, or 0–60.
TIME SCALES Key
This menu is used to select the time base for the BIS and EMGL trend plots to
indicate the total number of hours represented by the x-axis of the BIS plot
display. Available time base options are 1-, 2-, 4-, 8-, 12-, and 24-hours.
SIZE Key
From this menu, you can modify the amplitude scale of the analog waveforms.
The available amplitude scales (full scale) can be set at ±2, ±5, ±10, ±20, ±50,
±100, and ±200 µV. Touching the ↑ or ↓ key changes the scale to the next value
up or down. The default setting is ±50.
SWEEP SPEED Key
This menu allows you to modify the sweep speed of the analog waveform(s). The
selections are 15, 30, or 50 mm/sec.
ADVANCED SETUP Key
This menu allows you to control a variety of functions. (On a remote display, only
the BIS SCALES key is available.)
LOW FREQ — Touch LOW FREQ on the Advanced Setup menu to set the
lowest frequency that is displayed and processed. The options are 0.25 Hz,
1.0 Hz, and 2.0 Hz.
HIGH FREQ — Touch HIGH FREQ on the Advanced Setup menu to set the
highest frequency that is displayed and processed. The options are 30 Hz, 50
Hz, and 70 Hz. Selecting NONE disables any high frequency filtering.
LINE FREQ —Touch LINE FREQ on the Advanced Setup menu to select
either a 50 Hz or 60 Hz line frequency.
SAVE SETTINGS — Touch SAVE SETTINGS to store the current selections
in memory for later recall.
RESTORE SETTINGS — Touch RESTORE SETTINGS to recall the stored
settings from memory and reset all the current settings. The display may
change with this operation.
TEST ELECT Key
Touch TEST ELECT to initiate a continuous impedance check of all electrodes
(refer to Impedance Montage on page 23-11). Touching this key displays the
Impedance Montage, and the key label changes to EXIT ELECT.
When you touch EXIT ELECT, the Impedance Montage display disappears and
the key label changes to TEST ELECT again.

Ultraview Care Network
23-16
PRINT Key
Touch PRINT to print a bitmap display of the BIS and EMGL trends. The analog
waveform is not printed using this key. Press the RECORD button on the monitor
and touch the BIS parameter key to print the analog waveform.
START/STOP PROCED Key
Touch START PROCED to denote the beginning of a procedure to be recorded.
If prior data has been stored for the patient, you have the option of retaining
archived data or clearing it.
• Touch NO to append the new data to the existing data.
• Touch YES to erase the trend memory and clear the trend display.
When you touch START PROCED, its function and label change to STOP
PROCED.
When you touch STOP PROCED, the label changes to START PROCED again.
Status Messages
Status messages are displayed in the waveform zone when in 3-zone format.
Processing may be suspended when any of these messages are displayed. The
numeric data may be displayed as question marks. The EEG waveform may have
artifacts.
The status message will continue to display until all faults are corrected.
Table 3: Status Messages
Message User Action
Impedance Test In
Progress The impedance test is in progress; this should normally last 10- to 15-seconds.
Re-prep Ground Electrode The impedance test has failed; check to see that all the electrodes are
connected properly. The module will not collect data until the test passes.
DSC Test in Progress The system is performing a hardware self test of the DSC cable.
DSC Not Connected
Check that the PIC cable is connected to the DSC and at the front of the
module. If connected, and the DSC doesn’t work, the DSC or module may
require service.
DSC Shut Down - Restart
Module
Too many fatal errors (overcurrent, voltage regulation) have occurred with this
DSC, and the module has stopped communicating. Remove the module and
reinsert it. If this problem persists, the DSC and/or module may require service.
Illegal DSC ID: DSC Turned
Off
An unrecognized DSC has been connected to the module. Connect correct
DSC. If error persists, the DSC and/or the module may require service.
Illegal PIC ID An unrecognized Patient Interface Cable has been connected to the DSC. The
PIC may be defective. Replace the PIC.
Check the Sensor
The BIS sensor has an impedance which is too high. Check the cable
connections and correct as necessary. If the message persists, check the
impedance of the sensor and replace the sensor as necessary.
PIC Not Connected The Patient Interface Cable may be disconnected from the DSC. Check the
cable connections. The PIC may be defective. Replace the PIC.

BIS
23-17
Last Impedance Test Not
Completed
At least one BIS element failed during the last impedance test and the test was
ended by pressing the STOP PROCED key. Repress the element that failed.
Re-test the impedance. This message will also appear if the test was ended
prematurely by pressing STOP PROCED.
Poor Signal Quality
The Signal Quality Index is poor and the numeric display blinks. Check BIS
Sensor. This may occur as a result of artifacts such as those generated from
motion or the presence of electrocautery devices.
Bad Signal Quality
The Signal Quality Index is unacceptable, therefore, the Primary Trend variable
cannot be calculated. Check BIS Sensor. This may occur as a result of artifacts
such as those generated from motion or the presence of electrocautery
devices.
Iso-electric EEG Detected No discernible EEG activity is detected for several minutes, SR = 100. Check
the patient. Check the BIS Sensor for proper connection.
Check BIS Sensor (GND
Element)
The ground element on the patient has an impedance that is too high. Check
the Sensor and cable connections, and correct as necessary. If the message
persists, check the impedances of the BIS Sensor. Re-prep the patient’s scalp
if necessary.
Hardware Error, Service
Required Major problems in the DSC, BIS engine or module. Requires servicing.
Table 3: Status Messages (continued)
Message User Action

Ultraview Care Network
23-18
Definitions
BIS — Bispectral Index Analysis. A mathematical calculation derived from the
frequency, power, and phase throughout the entire frequency range of the EEG.
The Index is a number between 0 and 100.
DSC — The Digital Signal Converter. The DSC contains the input connector,
amplifiers, and digitizer for the 90482 one channel EEG. The DSC is configured
for referential montage monitoring.
EEG — Electroencephalogram. Real-time electrical activity of the brain. The EEG
waveform can be further separated (digitized) into elements. The signal can be
processed in time, frequency, and Fourier analysis.
EMG — Electromyogram. Electrical activity of the muscles. Processed as the
absolute power in the frequency (Hz) range. This product calculates EMGL, which
is over a fixed 70 to 110 Hz frequency range.
EMGL — EMG Low. Refer to EMG.
Epoch — The time during which the bispectral index is calculated.
MF — Median Power Frequency measured in Hz. The frequency at which 50% of
the total power lies equally on either side. The frequency range is between 0.5
and 30 Hz.
Montage — A pattern of linking electrodes together over the scalp to generate a
display of EEG channels in a particular way. Montages can be bipolar or
referential.
PIC — The Patient Interface Cable. Used by the BIS module. This cable is
configured to tell the DSC and module to automatically use a single channel
montage for the BIS Sensor. The BIS Sensor is normally placed on the left or right
side of the forehead.
SEF — Spectral Edge Frequency. The frequency (measured in Hz) at which 95%
of the total EEG power lies below it and 5% lies above it. Frequency range is
between 0.5 and 30 Hz.
SQI — Signal Quality Index. The percentage of good epochs in the last
60-seconds that are used to calculate the Bispectal Index and spectral variables.
Not affected by the suppression ratio. Percentage values range between 1 and
100.
SR — Suppression Ratio. The percentage of time in the last 60-seconds in which
the EEG signal is considered suppressed. Percentage values range from 0.0 to
100.

BIS
23-19
Care and Maintenance
BIS Module and Host Monitor Cleaning
To clean monitor screens and covers, modules, processors, and printers use a
cloth or swab that has been slightly dampened in a solution of warm water and a
mild detergent. Avoid solvents that may damage the product cases. Follow your
hospital protocol.
Digital Signal Converter Cleaning
Clean all visible blood, liquids, and soil as soon as possible from the Digital Signal
Converter (DSC), cabling, and connectors. Use a lint-free, absorbent towel that
has been moistened (damp, but not dripping) with a solution of mild detergent and
lukewarm, clean water. Using light pressure, thoroughly clean all surfaces. Dilute
and handle detergents and disinfectants according to their instructions. Dispose of
the towels properly.
Before cleaning, wipe thoroughly. Apply an approved disinfectant for the DSC with
a germicidal, disposable wipe, such as the SANI-CLOTH. Active ingredients in the
approved wipe are: n-Alkyl dimethyl benzyl ammonium choride (0.1%), and n-
Alkyl dimethyl ethylbenzyl ammonium chloride (0.1%). Be sure the disinfectant is
not dripping from the wipe. Using light pressure, wipe the surface of the DSC, its
cabling, and connectors as indicated by manufacturer’s instructions. Dispose of
the wipes properly.
BIS Sensor Disposal
The BIS Sensor is a patient-connected, single-use sensor that must be disposed
of after each use. Dispose of the sensor per your applicable hospital practice.
CAUTION:
• Using cleaning agents other than those listed may cause
degradation to the product’s plastic enclosure and labels.
Refer to Cleaning and Sterilization on page 32-1 for
questions or concerns regarding cleaning.
CAUTION:
• When cleaning the connectors (or other small features of
the DSC), do not let dirt, moisture, or lint get trapped in the
cracks or cavities of the receptacle or pin ends.
• Do not autoclave any of the components of the BIS
monitoring system. Autoclaving will seriously damage the
components.

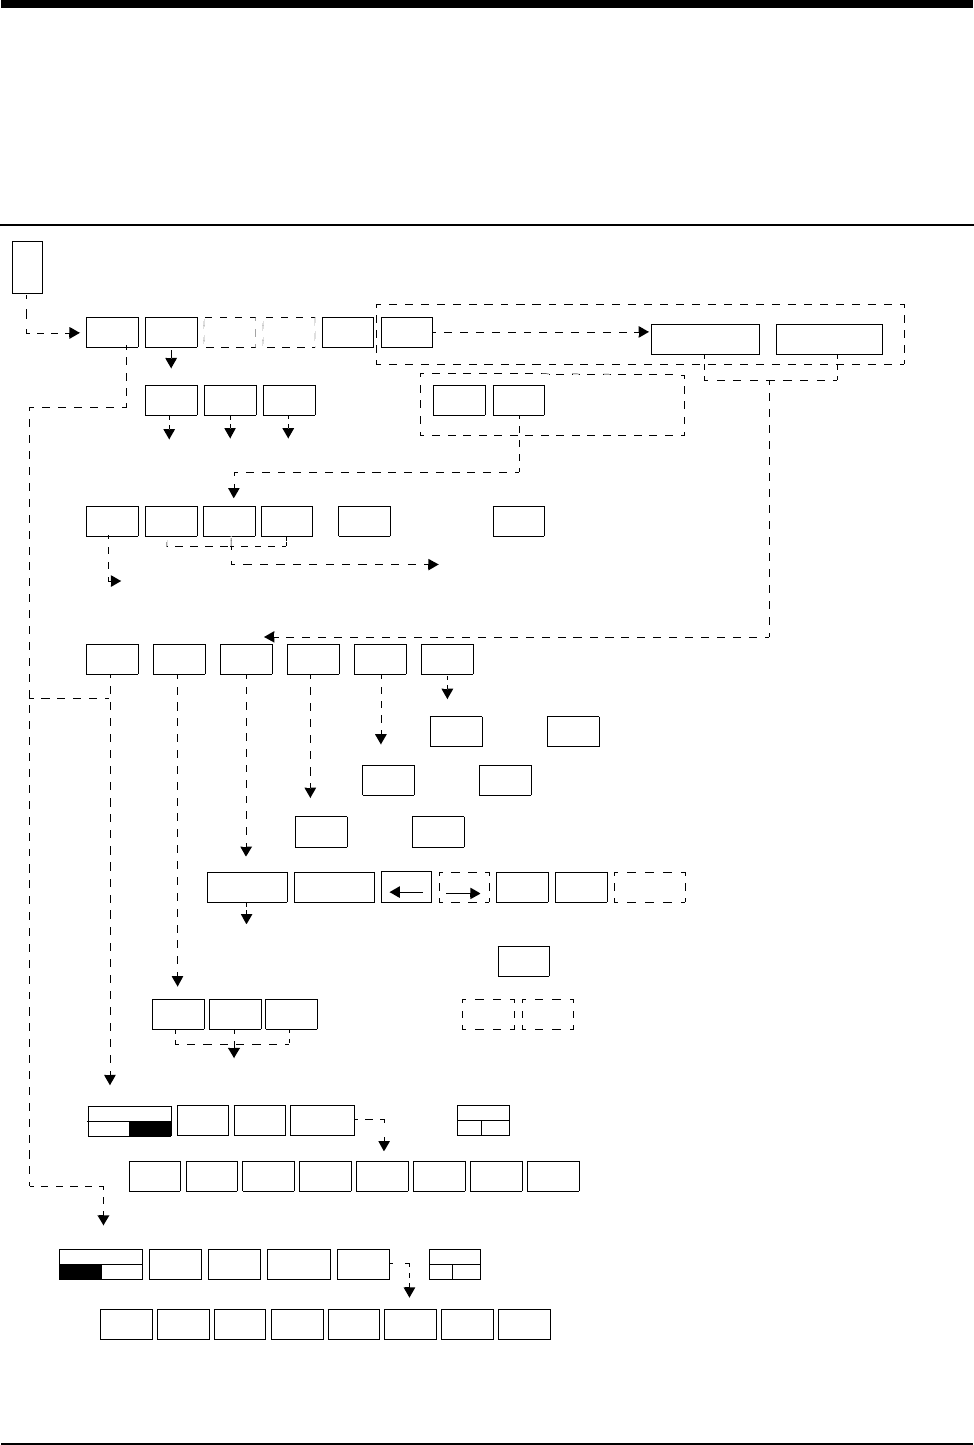
24-1
!
• Based on features
purchased and setup
configuration, more or
fewer keys may appear
here than on your menu
screens.
EEG
Directory of Keys
DISPLAY
FORMAT SETUP MARK
EVENT PRINT START
PROC
STOP
PROC
E
E
G
DISPLAY
FORMAT SETUP MARK
EVENT PRINT
EEG - MAIN MENU (SETUP # X)
EEG MAIN MENU (SETUP # X)
DSA &
ANALOG
DSA &
TREND
TREND &
ANALOG
TWO
TRENDS
EEG - DISPLAY FORMAT
DSA ANALOG TREND
EEG SETUP
STORE
SNAPSHOT
RECALL
SNAPSHOT
LIVE
DATA
ERASE
SNAPSHOT*
EEG - ARCHIVE
STORE SNAPSHOT - SNAPSHOT = 1 (11 Snapshots Available)
STORE
Review DSA/TRENDS
YES NO
YES NO
YES NO
RETAIN ARCHIVED
EEG DATA
ERASE ARCHIVED
EEG DATA
EEG- STOP PROC
EEG - PRINT DSA/TRENDS
EEG - MARK EVENT ‘a’
ARCHIVE
ARCHIVE
DSA ANALOG TREND FREEZE
ON OFF
EEG - DISPLAY FORMAT
MAG 1 MAG 2 FBR 1 FBR 2 SEF PPF EMGMPF
FREEZE
ON OFF
MAG 1 MAG 2 FBR 1 FBR 2 SEF PPF EMGMPF
DSA ANALOG TREND
EEG - SETUP
RECALL
SETUP
INITIAL
SETUP
DSA ANALOG TREND
INITIAL SETUP MENU
RECALL
SETUP
STORE
SETUP
SYSTEM
PARAMS
Continued on next page (System Params)
refer to DSA, ANALOG and Trend on page 24-3
EEG - START PROC
PRINT
REVIEW REVIEW
RECALL
SETUP
INITIAL
SETUP
TREND DISPLAY SELECTION Upper = MAG1 Lower = SEF
TREND DISPLAY SELECTION
Processing Off
Processing On
*not displayed at remote monitors
(Dual
Format
OFF)
(Dual
Format
On)
These keys are functional
only when Processing
refer to DSA, ANALOG and Trend on page 24-3
is in the “OFF” mode *
DUAL FORMAT
OFFON
DUAL FORMAT
ON OFF
see DSA, ANALOG and Trend on page 3
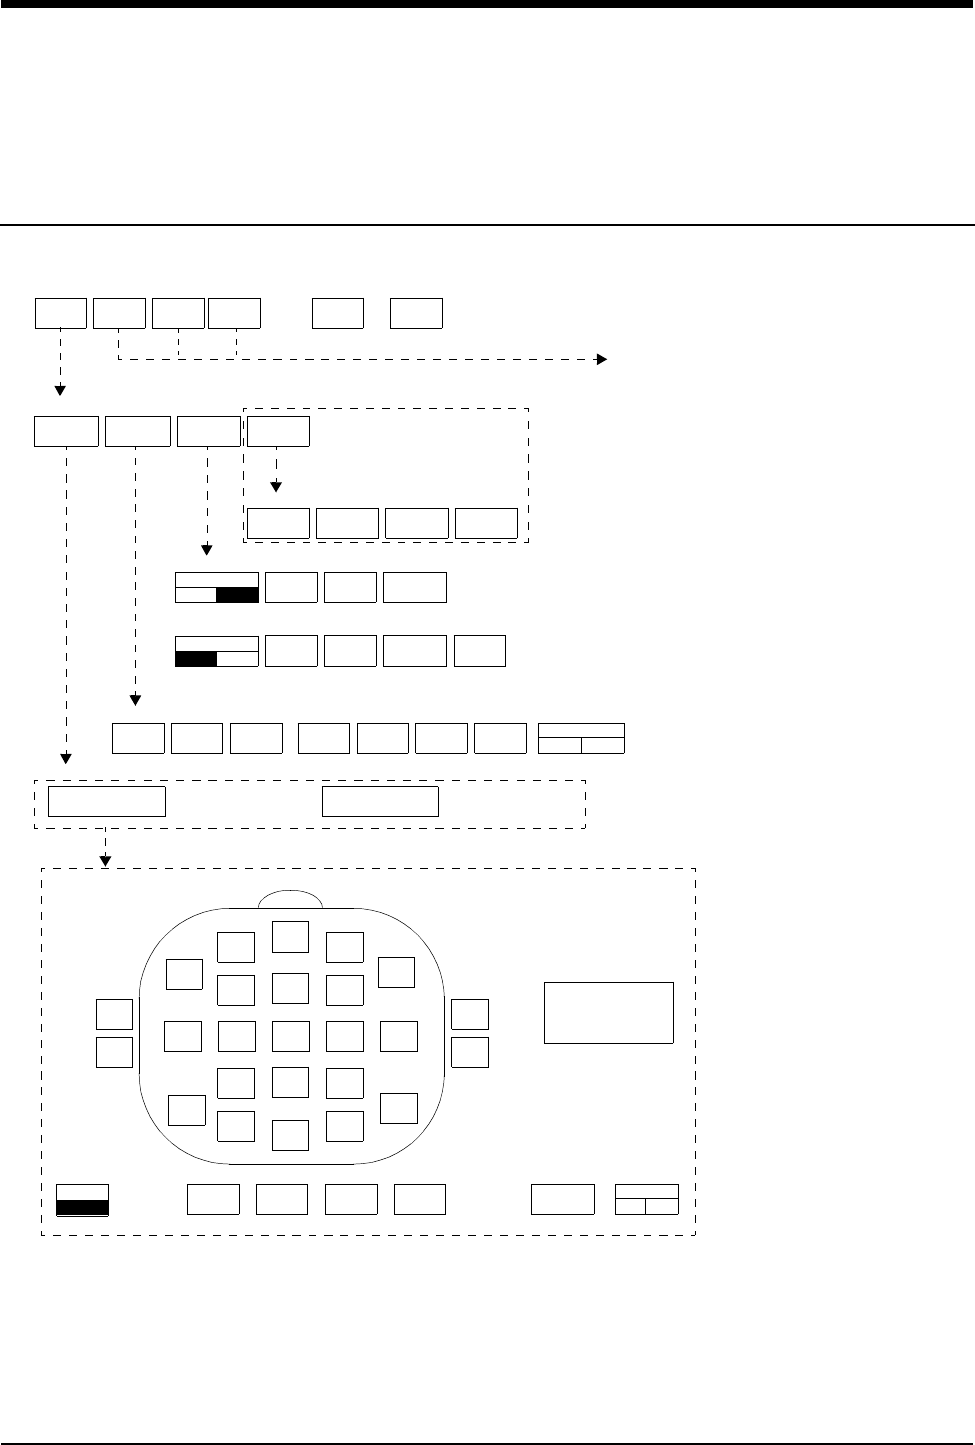
EEG
!
• Based on features purchased and setup configuration, more or fewer keys may appear here than on your
menu screens.
24-2
Directory of Keys - Processing Off
DSA ANALOG TREND
INITIAL SETUP MENU
RECALL
SETUP
STORE
SETUP
SYSTEM
PARAMS
MONTAGE
SYSTEM PARAMS
FILTERS SELECT
LABEL
DISPLAY
FORMAT
0.5
Hz
1.0
Hz
5.0
Hz
20
Hz
32
Hz
50
Hz
70
Hz
LOW CUTOFF HIGH CUTOFF
FILTERS -
EEG1 EEG2 EEG3 EEG4
SELECT LABEL
DUAL FORMAT
OFFON DSA ANALOG TREND
EEG - DISPLAY FORMAT (Dual Format OFF)
DSA &
TREND
DSA &
ANALOG
TREND &
ANALOG
TWO
TRENDS
EEG - DISPLAY FORMAT (Dual Format ON)
MONTAGE
T3 C3 Cz C4 T4
Fp1
Fpz
Fp2
F7
F3 Fz F4
F8
P3 Pz P4
T5
O1 Oz O2
T6
A1
M1
A2
M2
Left FRONTAL Right
2 CH
4 CH
+ CH1 -
—
+ CH2 -
—
+ CH3 -
—
+ CH4 -
—
CLEAR
CHANNEL
EMG
CONTINUOUS
IMPEDANCE
LINE FREQ
50HZ 60HZ
RETAIN ARCHIVED
EEG DATA
ERASE ARCHIVED
EEG DATA
These keys appear only
when data is stored in
the module.
The Select Label key is displayed
only when more than one EEG module
is in use.
DUAL FORMAT
ON OFF
ON OFF
SYSTEM PARAMETERS
refer to page 24-3
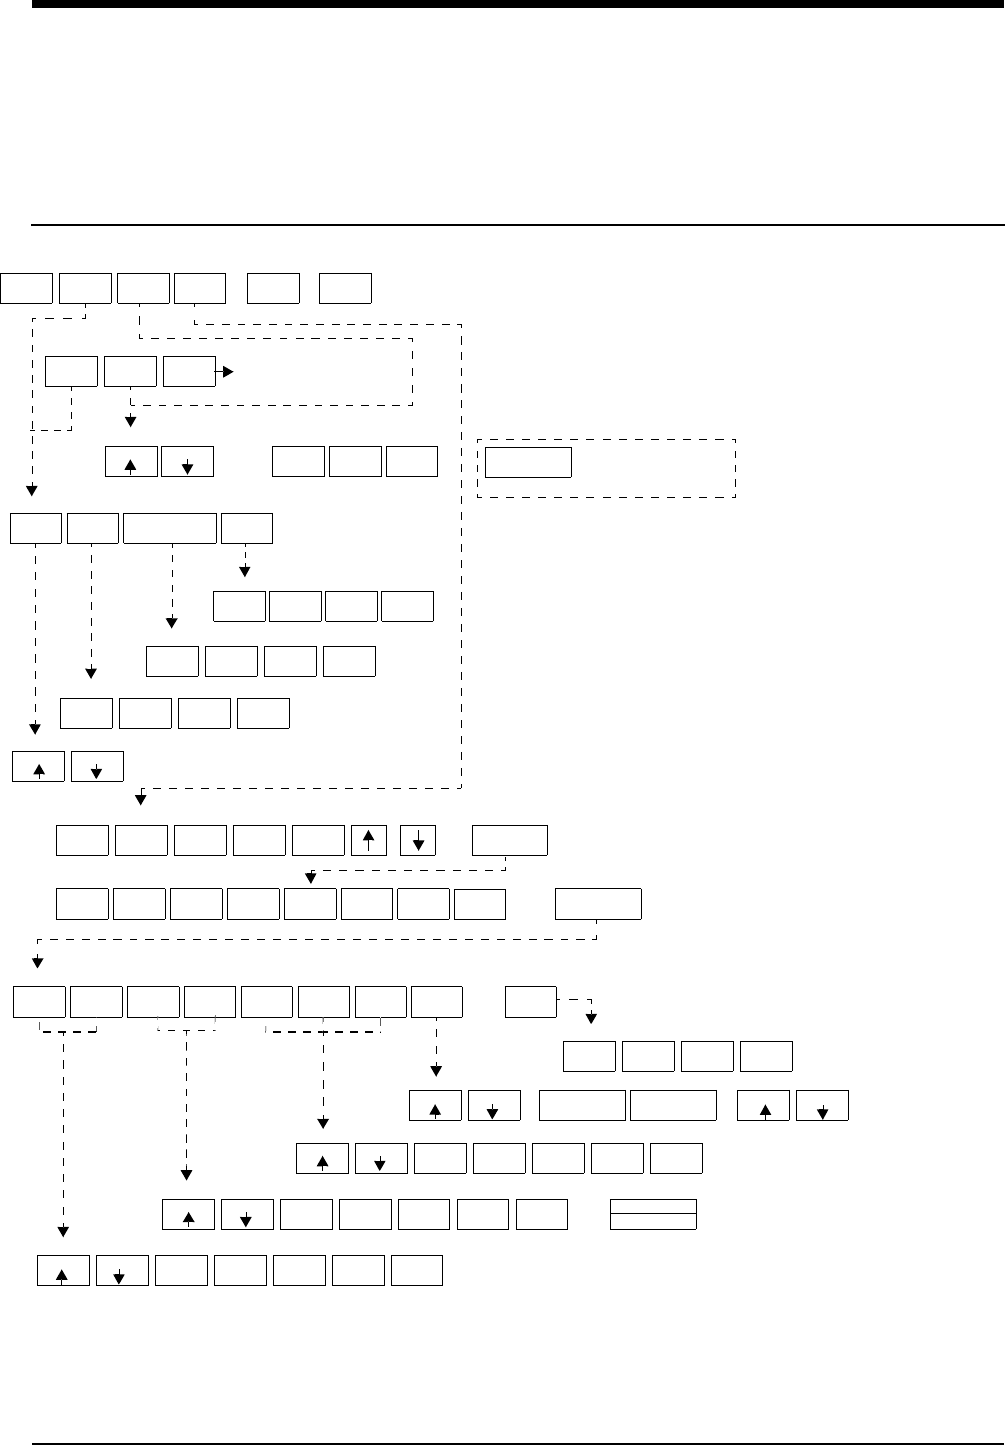
24-3
!
• Based on features
purchased and setup
configuration, more or
fewer keys may appear
here than on your menu
screens.
EEG
Directory of Keys
SIZE SIZE 50
mm/sec
30
mm/sec
15
mm/sec
ANALOG - SIZE = (+/-) 50 uV SWEEP SPEED
DSA ANALOG TREND
INITIAL SETUP MENU
SYSTEM
PARA MS
TREND - BAND FREQUENCY (Hz) = 0.0 - 3.5
DELTA
(∆)
THETA
(θ)
ALPHA
(α)
BETA1
(β1)
BETA2
(β2)
SELECT
TRENDS
MAG 1 MAG 2 FBR 1 FBR 2 SEF PPF MPF
SELECT TRENDS
SET TREND
PARAMETERS
MAG 1 MAG 2 FBR 1 FBR 2 SEF PPF MPF TIME
BASE
TREND SETUP (only trends selected in the SELECT TRENDS menu will display in this menu)
5
Min
10
Min
20
MIn
40
Min
TIME BASE
SIZE SIZE DELTA
(∆)
THETA
(θ)
ALPHA
(α)
BETA1 BETA2
(β2)
SIZE SIZE DELTA
(∆)
THETA
(θ)
ALPHA
(α)
BETA1
(β1)
BETA2
(β2)
SEF/PPF/MPF - SIZE =30Hz BAND ∆ - β2
MAG 1/ MAG 2 - SIZE =100uV BAND ∆ - β2
SIZE SIZE DELTA
(∆)
THETA
(θ)
ALPHA
(α)
BETA1
(β1)
BETA2
(β2)
FBR1/FBR2- SIZE= 100% BAND ∆/∆ - β2
NUMERATOR
DENOMINATOR
EMG
EMG
FREQ FREQ
HI FREQ =
200
LO FREQ =
10
SIZE SIZE
EMG - SIZE = 200uV
RECALL
SETUP
STORE
SETUP
SIZE TIME
BASE
FREQUENCY
RANGE
DSA
TREND
SIZE SIZE
DSA - SIZE = 100 uV2
5
Min
10
Min
20
Min
40
Min
DSA - TIME BASE
10
Hz
15
Hz
20
Hz
30
Hz
DSA - FREQUENCY RANGE
SEF PPF MPF TREND
OFF
DSA - DSA TREND
DSA SETUP
CONTINUOUS
IMPEDANCE
This key appears
only when Processing
mode turned “ON”
DSA ANALOG TREND
EEG - SETUP
(refer to TREND SETUP below)
(β1)

Contents
24-5
Overview . . . . . . . . . . . . . . . . . . . . . . . . . . . . . . . . . . . . . . . . . . . . . . . . . . . . . . 5
Setting Up the EEG Module. . . . . . . . . . . . . . . . . . . . . . . . . . . . . . . . . . . . . . . . 6
Configuring the EEG Module . . . . . . . . . . . . . . . . . . . . . . . . . . . . . . . . . . . . . . . 7
Initial Setup . . . . . . . . . . . . . . . . . . . . . . . . . . . . . . . . . . . . . . . . . . . . . . . . . . . . 7
Storing a Setup . . . . . . . . . . . . . . . . . . . . . . . . . . . . . . . . . . . . . . . . . . . . . . . . 12
Recalling a Setup. . . . . . . . . . . . . . . . . . . . . . . . . . . . . . . . . . . . . . . . . . . . . . . 12
EEG Displays. . . . . . . . . . . . . . . . . . . . . . . . . . . . . . . . . . . . . . . . . . . . . . . . . . 13
EMG Display . . . . . . . . . . . . . . . . . . . . . . . . . . . . . . . . . . . . . . . . . . . . . . . . . . 19
Archiving EEG . . . . . . . . . . . . . . . . . . . . . . . . . . . . . . . . . . . . . . . . . . . . . . . . . 20
Marking Events . . . . . . . . . . . . . . . . . . . . . . . . . . . . . . . . . . . . . . . . . . . . . . . . 21
Storing DSA/Trend Snapshots. . . . . . . . . . . . . . . . . . . . . . . . . . . . . . . . . . . . . 21
Recalling DSA/Trend Snapshots . . . . . . . . . . . . . . . . . . . . . . . . . . . . . . . . . . . 22
Erasing Snapshots. . . . . . . . . . . . . . . . . . . . . . . . . . . . . . . . . . . . . . . . . . . . . . 22
Printing EEG . . . . . . . . . . . . . . . . . . . . . . . . . . . . . . . . . . . . . . . . . . . . . . . . . . 22
Patient Preparation . . . . . . . . . . . . . . . . . . . . . . . . . . . . . . . . . . . . . . . . . . . . . 23
Remote Monitors . . . . . . . . . . . . . . . . . . . . . . . . . . . . . . . . . . . . . . . . . . . . . . . 28
EEG
Overview
The Spacelabs Medical Electroencephalograph (EEG) module is a two or four
channel processed EEG monitor, used to acquire, process, and display brain
electrical activity. The module also includes one channel of EMG
(electromyogram) for measuring and displaying muscle electrical activity.
The EEG can be displayed as an analog waveform or as processed EEG. The
analog EEG is displayed as a moving waveform similar to ECG. The analog signal
is converted to the frequency domain using the Fast Fourier Transform (FFT)
algorithm, and displayed as a spectral plot (density spectral array) or as trended
parameters.
EEG data is displayed in a left/right hemisphere orientation for both the analog
and processed data. The data appearing on the left part of the display indicates
left hemisphere EEG, while the right part of the display shows right hemisphere
EEG. This right and left orientation of the display remains consistent throughout
the various display types. Display formats include analog EEG, density spectral
array (DSA), and various EEG trends.
EEG can be viewed in single or dual format. The single format displays one type
of EEG at a time. If you wish to see two EEG formats at one time, choose dual
format display. With dual format display, you can see both DSA and analog, trend
and analog, DSA and trend, or two trends.
A snapshot of DSA and trends can be stored and recalled. EEG data can also be
marked with an event label to facilitate recall for later examination.

Ultraview Care Network
24-6
The EEG is commonly divided into four frequency bands. From lowest to highest,
they are: Delta (less than 4 Hz), Theta (4 to 8 Hz), Alpha (8 to 13 Hz), and Beta
(13 Hz and higher). Delta waves emanate from the central region of the brain, and
occur most frequently if a patient is an infant or a sleeping adult. Theta waves,
also from the central region, occur in children and lightly sleeping adults. Alpha
waves originate primarily from the occipital region of the brain, and occur in adults
that are relaxed or drowsy. Finally, Beta waves emanate from the parietal and
frontal regions of the brain, and indicate that the patient is alert and awake.
Normal EEG patterns are influenced by cerebral blood flow, medications, and
anesthetic levels.
The beta band can be divided into two bands. The low beta band is labeled beta1
and usually represents signals between about 13 Hz and 20 Hz. The high beta
band is labeled beta2 and usually represents signals between about 20 Hz and 30
Hz. It is clinically useful to separate the beta band for trending purposes,
especially when looking at high frequency activity.
Setting Up the EEG Module
Up to six setup configurations can be saved and recalled as needed. To recall a
particular EEG display setup requires only that you touch one of the six recall
setup keys.
After determining what your EEG monitoring needs are, Spacelabs Medical
recommends that you pre-configure the EEG module and store your configuration
setup. Module configurations should be set up and stored prior to connecting a
patient for monitoring. In this way, you can simply select a pre-configured setup
after you connect the patient.
Also, some of the configuration menus are not available after EEG processing has
started. Therefore, it is recommended that you pre-configure the module, defining
the trend parameters, frequency ranges, and other variables (such as those
outlined in the bulleted list below), before processing starts. This way, you will not
have to stop processing to change some parameters.
The following sections describe:
• How to change the module’s EEG monitoring parameters and store them
• The EEG displays
• How to prepare the patient for monitoring
• How to connect the patient to the module
• Bedside and central monitors
CAUTION:
• The Spacelabs Medical model 90481 EEG module should
only be used by someone with a knowledge of and/or
background in EEG monitoring.

EEG
24-7
Configuring the EEG Module
There are several different ways to configure the EEG module. You can monitor
EEG in either two or four channel mode. You may also elect to monitor EMG. The
EEG module also allows you to choose several formats for the EEG display, from
analog waveforms to trend displays. Since the EEG module can store up to six
setups, you will want to determine which setups best suit your needs, and store
them in the module. You can then recall any of these configurations simply by
recalling a setup you have pre-configured.
Some of the factors to consider when configuring a setup are:
• Electrode placement; what lead placement locations are best for your
application?
• Filters; what should the low cutoff, high cutoff and line frequency settings be?
• Display format; what type of data display is best?
• Size; what size best shows the data you have chosen?
• Time base; which time base best reflects the information you need?
• Frequency range; what range do you wish to monitor?
• Trends; do you want to trend an EEG parameter?
• Sweep speed; what speed should an analog display use?
• EEG band frequencies; what frequency ranges do you want to apply to the
delta, theta, alpha and beta bands?
• Trends; what size do you want your trends to be? What frequency bands
should the trends reflect?
Initial Setup
Touching the INITIAL SETUP key will display the Initial Setup menu. The Initial
Setup menu has four general categories of parameters:
• System Parameters
•DSA
•Analog
•Trends
!
• When the module is first inserted into the module housing,
processing is stopped. To access the Initial Setup menus after
the EEG module is processing information, first turn the
processing off.
• The following instructions on accessing the initial setup menus
assumes that processing is off. The quickstart steps addressing
initial setup procedures also assume that processing is off.
To access the initial setup
menus: (processing must be off)
1Touch EEG.
2Touch SETUP.
3Touch INITIAL SETUP.

Ultraview Care Network
24-8
System Parameters
The system parameters sub-menu accesses the montage display, where
electrode lead placement is entered and EMG is enabled, the filters sub-menu,
used to set the high and low cutoff and line frequency filters, the display format
menu, used to choose the data format and the EEG label selecting sub-menu.
To enter electrode lead
placement: (processing must be
off)
1Touch EEG.
2Touch SETUP.
3Touch INITIAL SETUP.
4Touch SYSTEM PARAMS.
5Touch MONTAGE.
6Touch ERASE ARCHIVED
EEG DATA (if data is stored in
module).
7Touch MONTAGE.
8Select 2 or 4 channel.
9Select desired channel.
10 Touch CLEAR CHANNEL.
11 Select desired electrode
placement sites.
12 Repeat steps 9 through 11 until
all channels are defined.
To set low cutoff, high cutoff and
line frequency filters:
1Touch EEG.
2Touch SETUP.
3Touch INITIAL SETUP.
4Touch SYSTEM PARAMS.
5Touch FILTERS.
6Select desired low cutoff, high
cutoff and line frequency
values).
To display EEG in dual format:
1Touch EEG.
2Touch DISPLAY FORMAT.
3Select DUAL FORMAT ON.
To select an EEG label (if using
more than one EEG module in
one monitor):
1Touch EEG.
2Stop processing (if started).
3Touch SETUP.
4Touch INITIAL SETUP.
5Touch SYSTEM PARAMS.
6Touch SELECT LABEL.
7Select desired label.

EEG
24-9
DSA
The DSA sub-menu offers the following choices:
•SIZE
Use the up and down arrows to size the DSA. When you touch SIZE (after
processing has started), the display will show a histogram of the EEG data
(Histogram Display on page 24-18). As you touch the up and down arrows to
change size, you will notice that the histogram changes size.
Choose a histogram size which gives the best DSA contrast for your application.
• TIME BASE
Touch TIME BASE to choose the amount of time the X-axis display represents.
Touch either 5,10, 20, or 40 min to select a DSA screen time. The active key will
highlight.
• FREQUENCY RANGE
Touch the FREQUENCY RANGE key to choose the DSA frequency range. Touch
either 10Hz, 15Hz, 20Hz, or 30Hz. The active key will highlight.
• DSA TREND
Touch DSA TREND to choose the type of trend you wish to display on top of the
DSA. Choose either SEF, PPF, MPF, or TREND OFF. The active key will
highlight.
Analog
Touch the ANALOG key to show the sub-menu that allows you to set the SIZE of
the analog trace, and the SWEEP SPEED of the display. Use the arrow keys to
change the size. Touch the desired sweep speed to select.
!
• The trend time base will change to track the DSA time base.
To set the size of DSA:
1Touch EEG.
2Touch SETUP.
3Touch DSA.
4Touch SIZE.
5Adjust size.
To set DSA time base:
1Touch EEG.
2Touch SETUP.
3Touch DSA.
4Touch TIME BASE.
5Select time base.
To set DSA frequency range:
1Touch EEG.
2Touch SETUP.
3Touch DSA.
4Touch FREQUENCY RANGE.
5Select frequency range.
To set DSA trend:
1Touch EEG.
2Touch SETUP.
3Touch DSA.
4Touch DSA TREND.
5Select trend.
To display analog EEG:
1Touch EEG.
2Touch DISPLAY FORMAT.
3Select DUAL FORMAT OFF.
4Touch ANALOG.
To set the analog size:
1Touch EEG.
2Touch SETUP.
3Touch ANALOG.
4Select size
To select sweep speed:
1Touch EEG.
2Touch SETUP.
3Touch ANALOG.
4Select sweep speed.

Ultraview Care Network
24-10
Trends
Touch the TREND key in the INITIAL SETUP menu to access the Band
Frequency sub-menu. This sub-menu allows you to set the frequency ranges for
the five EEG frequency bands (DELTA, THETA, ALPHA, BETA1, BETA 2). Touch
the up or down arrow keys to change the upper frequency range for each band.
The lowest frequency for each band is set by the upper frequency of the band to
its left.
The SELECT TRENDS key allows you to choose the various trends to be
available for selection from the DISPLAY FORMAT, SETUP, and ARCHIVE
menus.
You can select any combination of MAG1, MAG2, FBR1, FBR2, SEF, PPF, MPF,
or EMG. You may not see all the trend options when you enter the trends sub-
menus. This is because you must select which trends appear in the trend sub-
menus. Select those trends you wish to have available by accessing the Initial
Setup menu, and choosing the trends you want.
Setting Trend Parameters
MAG1, MAG2, SEF, PPF, MPF
The sub-menu provides keys for changing the trend size and frequency band.
BAND
Trend parameters are calculated and displayed for the frequency bands set in this
menu. For example, magnitude in the alpha band can be calculated by selecting
the alpha frequency band for MAG1. You define the frequency range for each
band in the Initial Setup Menu.
Touch the appropriate keys to select the frequency band for each trend. If more
than one band is required, first touch the lowest frequency band (it will be
highlighted), then touch the highest (it will also be highlighted). The keys in-
between the lowest and highest frequency will be highlighted to indicate that these
bands have been selected.
The frequency band setting is displayed above the frequency band keys on the
message line as follows:
BAND x-y
x is the lowest frequency band, and y is the highest.
If only one band is selected, y is blank since the lowest and highest frequency
bands are the same.
SIZE
Trend size should be set using the SIZE ↑ or SIZE ↓ keys so that the trend
parameter lies close to the middle of the graph.
!
• Greek symbols are used to represent the delta, theta, alpha,
and beta bands.
To add or delete trend:
1Touch EEG.
2Touch SETUP.
3Touch INITIAL SETUP.
4Touch TREND.
5Touch SELECT TRENDS
6Select or de-select trends.
To select the trend band:
1Touch EEG.
2Touch SETUP.
3Touch INITIAL SETUP.
4Touch TREND.
5Select band.
6Set frequency.
To set the trend size:
1Touch EEG.
2Touch SETUP.
3Touch TREND.
4Select trend.
5Adjust size.

EEG
24-11
FBR1, FBR2
The frequency band ratio trends are a trend plot of the ratio (in percent) of total
power in one frequency band divided by the total power in a second frequency
band.
Frequency band ratio trend parameters (FBR1, FBR 2) require a frequency band
for the numerator and denominator. The frequency range for each band is defined
in the Initial Setup menu.
SIZE
Trend size should be set using the SIZE ↑ or SIZE ↓ keys so that the trend
parameter lies close to the middle of the graph.
NUMERATOR DENOMINATOR
Touch the NUMERATOR/DENOMINATOR key and select NUMERATOR. Touch
the appropriate keys (DELTA, THETA, ALPHA, BETA 1, BETA 2) to select the
frequency band for the numerator. Now touch the DENOMINATOR key, and again
choose an appropriate band for the denominator.
If more than one band is required, first touch the lowest frequency band, then the
highest.
The frequency band setting is displayed above the frequency band keys on the
message line. You will see the following format for the display:
BAND x1-y1/x2-y2
where x1 is the lowest frequency band for the numerator, and y1 is the highest
frequency band for the numerator. The lowest frequency band for the denominator
is x2, and the highest, y2.
Time base
Touch TIME BASE to choose the amount of time the X-axis display represents.
Touch either 5,10, 20, or 40 min to select a trend screen time. The active key will
highlight.
EMG
SIZE
Trend size should be set using the SIZE ↑ or SIZE ↓ keys so that the trend
parameter lies close to the middle of the graph.
FREQUENCY
Select either HI FREQ= or LO FREQ=. Press the FREQ ↑ or FREQ ↓ key until the
desired value appears in the XFREQ= key. Repeat for the other key.
!
• The DSA time base will change to track the trend time base.

Ultraview Care Network
24-12
Storing a Setup
Once you have set the EEG module’s parameters the way you want them, you
may store the current settings to one of six setup keys. Access the Initial Setup
menu by first touching the SETUP key from the Main menu, then touching INITIAL
SETUP. From the Initial Setup menu, touch STORE SETUP. You will then see six
setup keys labeled SETUP #1, SETUP #2, etc. Store the current settings by
touching one of the setup keys.
Recalling a Setup
To recall a setup, make sure processing is stopped, then touch the SETUP key.
Touch RECALL SETUP. You will then see the retain or erase archived EEG data
keys if data is stored in the module. If you want to change your setup, you will
have to erase any archived EEG data. If you choose to retain archived EEG data,
you cannot select another setup.
EEG Electrode Lead Selection (Montage)
To select which leads you have placed and their placement sites, touch the
MONTAGE key (under SYSTEM PARAMS in the Initial Setup) to enter a sub-
menu in which the electrodes can be selected and the impedance of each
electrode can be measured. First, select either two or four channels for EEG
recording. If two channel recording is selected, the CH3 and CH4 keys will be
inactive, and the electrode names are removed.
The following procedure is used to select electrode names for each channel:
1. Touch the desired channel key (CH1, CH2, CH3, CH4).
2. Touch the CLEAR CHANNEL key to delete previously defined electrodes for
the channel.
3. Touch one of the 25 keys in the montage to select the first electrode. The key
will flash on and off, and appear in the channel key as the positive input. Select
a second electrode. The key will again flash on and off, and your selection will
appear in the channel key as the negative or reference input.
!
• Processing must be stopped before a setup can be stored.
• The message EEG Setup Successfully Stored is displayed on
the message line when the setup is stored.
!
• The first electrode name displayed in the channel key is the
positive input, while the second electrode name is the negative
or reference input.
• When selecting the next channel, the electrodes that were
selected for the first channel will stop flashing, but will remain
highlighted.
To store a setup:
1Touch EEG.
2Touch SETUP.
3Touch INITIAL SETUP.
4Change desired parameters.
5Touch STORE SETUP
6Touch the setup key to which
you want to store the current
setup.
To recall a setup: (processing
must be off)
1Touch EEG.
2Touch SETUP.
3Touch RECALL SETUP.
4Touch ERASE ARCHIVED
EEG DATA (if data is stored in
module).
5Touch RECALL SETUP
6Select desired setup
To select EEG electrode leads:
1Touch EEG.
2Touch SETUP.
3Touch INITIAL SETUP
4Touch SYSTEM PARAMS.
5Touch MONTAGE.
6Touch ERASE ARCHIVED
EEG DATA (if data is stored in
the module).
7Select 2 or 4 channel.
8Select desired channel.
9Touch CLEAR CHANNEL.
10 Select desired electrode
placement sites.
11 Repeat steps 8 through 10 until
all channels are defined.
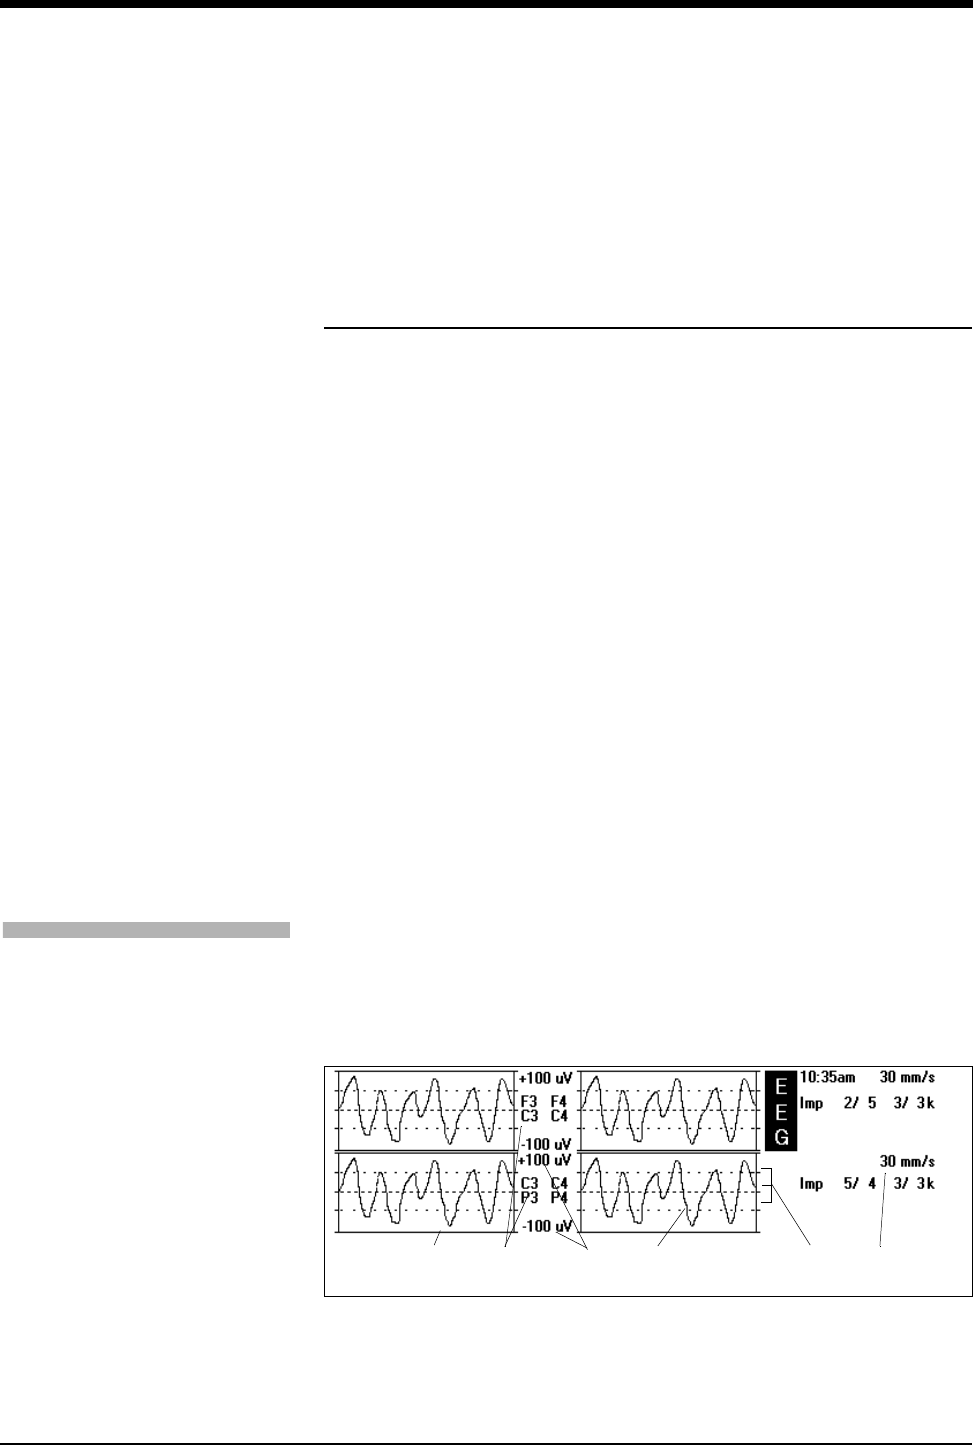
EEG
24-13
4. Touch the CLEAR CHANNEL key to erase both electrode names if you make
an error when entering the electrode names. Re-enter the pair of electrode
names after you clear them.
5. Touch each of the channel (CH1, CH2, CH3, CH4) keys in succession to
complete the setup.
EEG Displays
Display Formats
The EEG module can display several formats. The formats can be grouped into
two types: dual display format, and single display format.
The single format displays are:
•DSA
•ANALOG
• TREND
The dual display formats are:
• DSA & TREND
• DSA & ANALOG
• TREND & ANALOG
• TWO TRENDS
Analog EEG Display
Analog EEG is displayed as a moving waveform for each channel. The trace
moves from left to right. The analog waveform clips or flat-lines when the
amplitude exceeds full scale.
Figure 24-1: Four-channel analog EEG display
!
• When the format is Two Trends, the message line indicates
whether the upper or lower trend is selected by displaying the
trend in reverse video.
To display analog EEG:
1Touch EEG.
2Touch DISPLAY FORMAT.
3Select DUAL FORMAT OFF.
4Touch ANALOG.

Ultraview Care Network
24-14
Sweep Speed — This number represents the sweep speed of the displayed
and recorded analog trace. The sweep speed can be set to 15, 30, or
50 mm/sec. All EEG channels use the same sweep speed.
Amplitude Grid — This grid is drawn under the analog trace and divides the
amplitude scale into four segments. A dashed line is drawn at the baseline or
center of each display zone. Solid lines are drawn at the top and bottom edge
of the zone (peak values), and dotted lines are drawn halfway between the
edge of the zone and the baseline. Tick marks are drawn on the Y-axis at
each division. Each division represents peak amplitude divided by four.
Analog Waveform — This trace sweeps from left to right, reflecting brain
electrical activity for the channel monitored.
Peak to Peak Signal Amplitude — These numbers indicate the maximum and
minimum amplitude ranges of the analog signal (set by user).
Electrode labels — These number-letter combinations indicate the electrode
lead placement.
Time Axis — Time is measured along the X-axis for each analog trace. Each
waveform window displays 4-seconds at a sweep speed of 15 mm/sec,
2-seconds at 30 mm/sec, and 1.2-seconds at 50 mm/sec.
Freezing the Display
To freeze the analog waveform, touch the FREEZE ON/OFF key. The ON section
of the key will highlight. Touch the key again to turn off the freeze, and the OFF
section of the key will highlight. Freeze mode is used to stop the moving waveform
so transient features can be captured and inspected.
To enable EMG with trend overlay
and analog EEG:
1Touch EEG.
2Touch DISPLAY FORMAT.
3Select FREEZE ON.
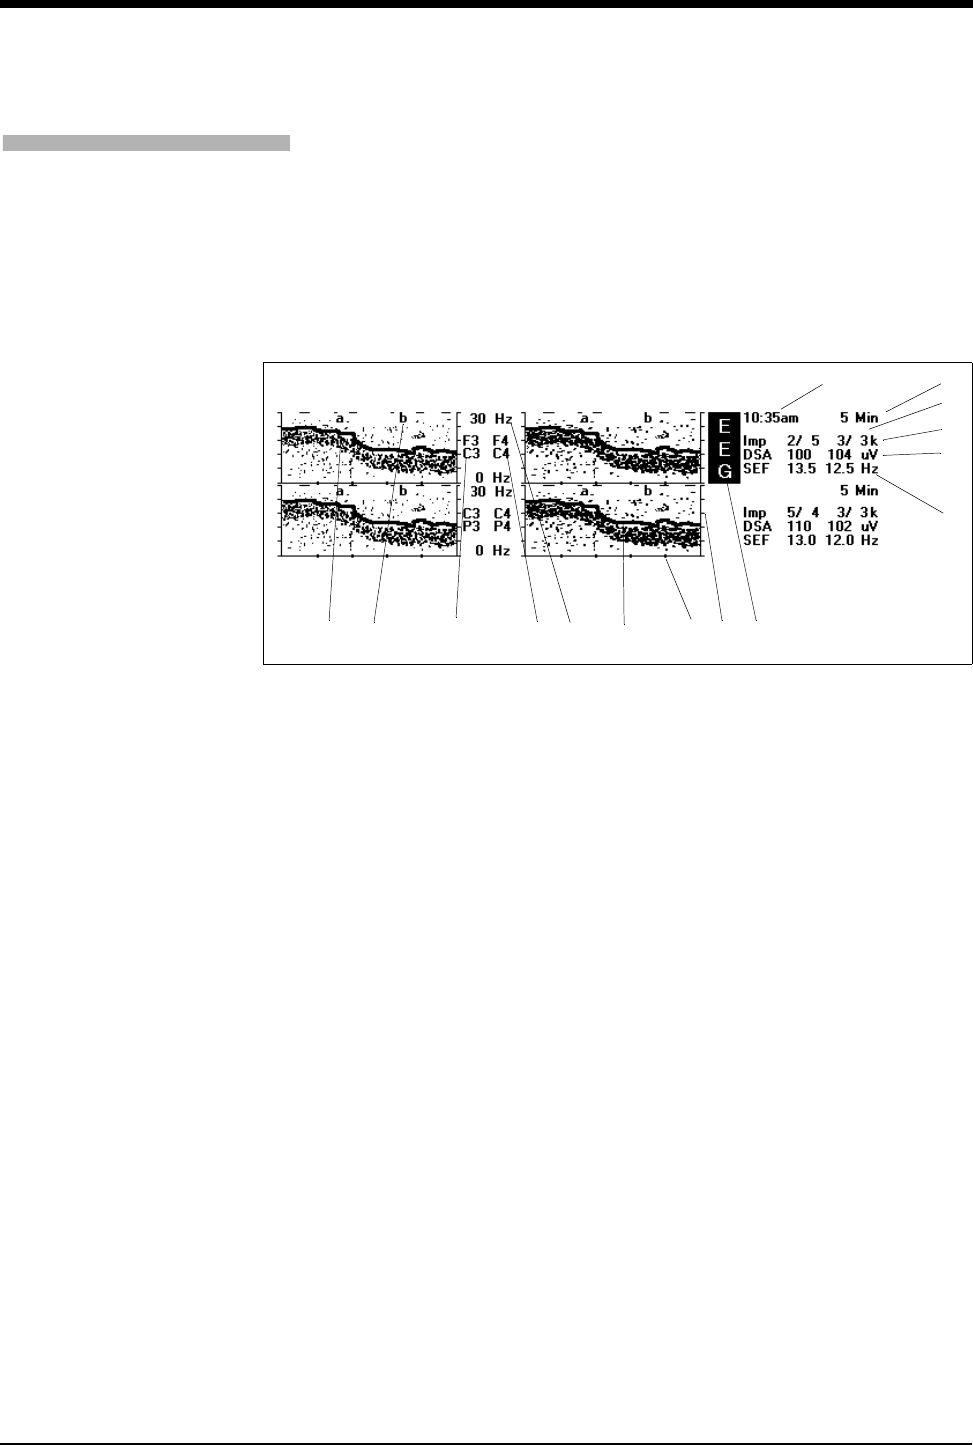
EEG
24-15
Density Spectral Array (DSA) EEG Display With Trend
Overlay
Processed EEG is displayed as a Density Spectral Array (DSA) similar to the
pattern shown in the four channel EEG below. The DSA pattern is shown with a
SEF trend overlay.
Data moves from right to left, and is updated every 4-seconds (5-minute time
base).
Figure 24-2: Four-channel DSA EEG display with trend overlay
Real-time Clock — Displays the time the last epoch was acquired.
Time Base — Total time of the DSA plot; ranges from 5- to 40-minutes.
Message Line — The following messages can be displayed: NOT
PROCESSING, REDISPLAYING, REVIEWED, RECALLED.
Electrode Impedance — Electrode impedances are automatically measured
and displayed every 5-minutes after processing is started. If electrode
impedances are greater than the acceptable range (5 K ohms for each
electrode or 2 K ohms differential between the pairs) the impedance values
will flash if the impedance of any electrode exceeds 5 K ohms, or if the
difference between the electrode pairs exceeds 2 K ohms. If the impedance
exceeds 99 K ohms, ++ is displayed.
DSA Magnitude (DSA) — Total magnitude of the EEG in the frequency range
displayed for the last epoch for channels 1 and 2. The number on the left
indicates the left hemisphere magnitude, the right value shows right
hemisphere magnitude.
Overlay Trend Parameter — Numeric value for channels 1 and 2 of either the
Spectral Edge Frequency (SEF), Peak Power Frequency (PPF), or Median
Power Frequency (MPF) for the last epoch displayed. The number on the left
is the frequency for the left hemisphere of the brain, while the right number is
the frequency of the right hemisphere.
Artifact Flag — Artifact detection is marked by lighting a pixel on the top line.
On color monitors, artifacts will be marked with a red pixel.
Event Marker — Used to tag significant clinical events. Can place 52 unique
letters; a-z and A-Z. Used in identifying and recalling stored DSA data.
To display DSA EEG with trend
overlay:
1Touch EEG.
2Touch DISPLAY FORMAT.
3Select DUAL FORMAT OFF.
4Touch DSA.
5Touch PREVIOUS MENU.
6Touch SETUP.
7Touch DSA.
8Touch DSA TREND.
9Select desired trend.
쐅쐈 쐉 씈씉씊

Ultraview Care Network
24-16
Left Hemisphere Electrode Labels — EEG channels are labeled with lead
names selected in the Initial Setup Menu. Here, the left anterior EEG channel
is labeled F3-C3, and the left posterior channel is labeled C3-P3.
쐅Right Hemisphere Electrode Labels — In this setup, the label for the right
anterior channel is F4-C4, and the right posterior channel is labeled C4-P4.
쐈Frequency Axis Label — Frequency is displayed along the vertical, or Y axis.
The labels indicate the range displayed. The bottom line will always read 0
Hz. The top line will show 10, 15, 20, or 30 Hz, depending on what maximum
frequency is chosen.
쐉Density Spectral Array (DSA) Display With Trend Overlay — For
monochrome monitors, the DSA pattern is formed by packing dots in
proportion to signal amplitude at each frequency. Frequencies with higher
power have higher dot densities. For color monitors, the DSA pattern is
formed using seven levels of grey. The intensity of each pixel is proportional
to signal amplitude at each frequency. The Trend Overlay is drawn on top of
the DSA pattern. The overlay can indicate the Spectral Edge Frequency
(SEF), Median Power Frequency (MPF), or Peak Power Frequency (PPF).
On color monitors, it appears as a magenta line.
씈Time Axis — The horizontal, or X axis represents time. Two vertical columns
of pixels are drawn each update period. The display update rate depends on
the time base selected. The time base is the total time of the displayed DSA,
and can be set to 5-, 10-, 20- or 40-minutes. The time axis is divided into five
equal segments using intensified dots.
씉Frequency Axis — The vertical or Y axis represents the DSA frequency. The
vertical axis is divided into five segments. Each segment is equal to the total
frequency displayed, divided by five.
씊EEG parameter Key — Touch this key to access all EEG menus. If there is
more than one EEG module connected to the monitor, then you can label the
keys EEG1, EEG2, EEG3, or EEG4.
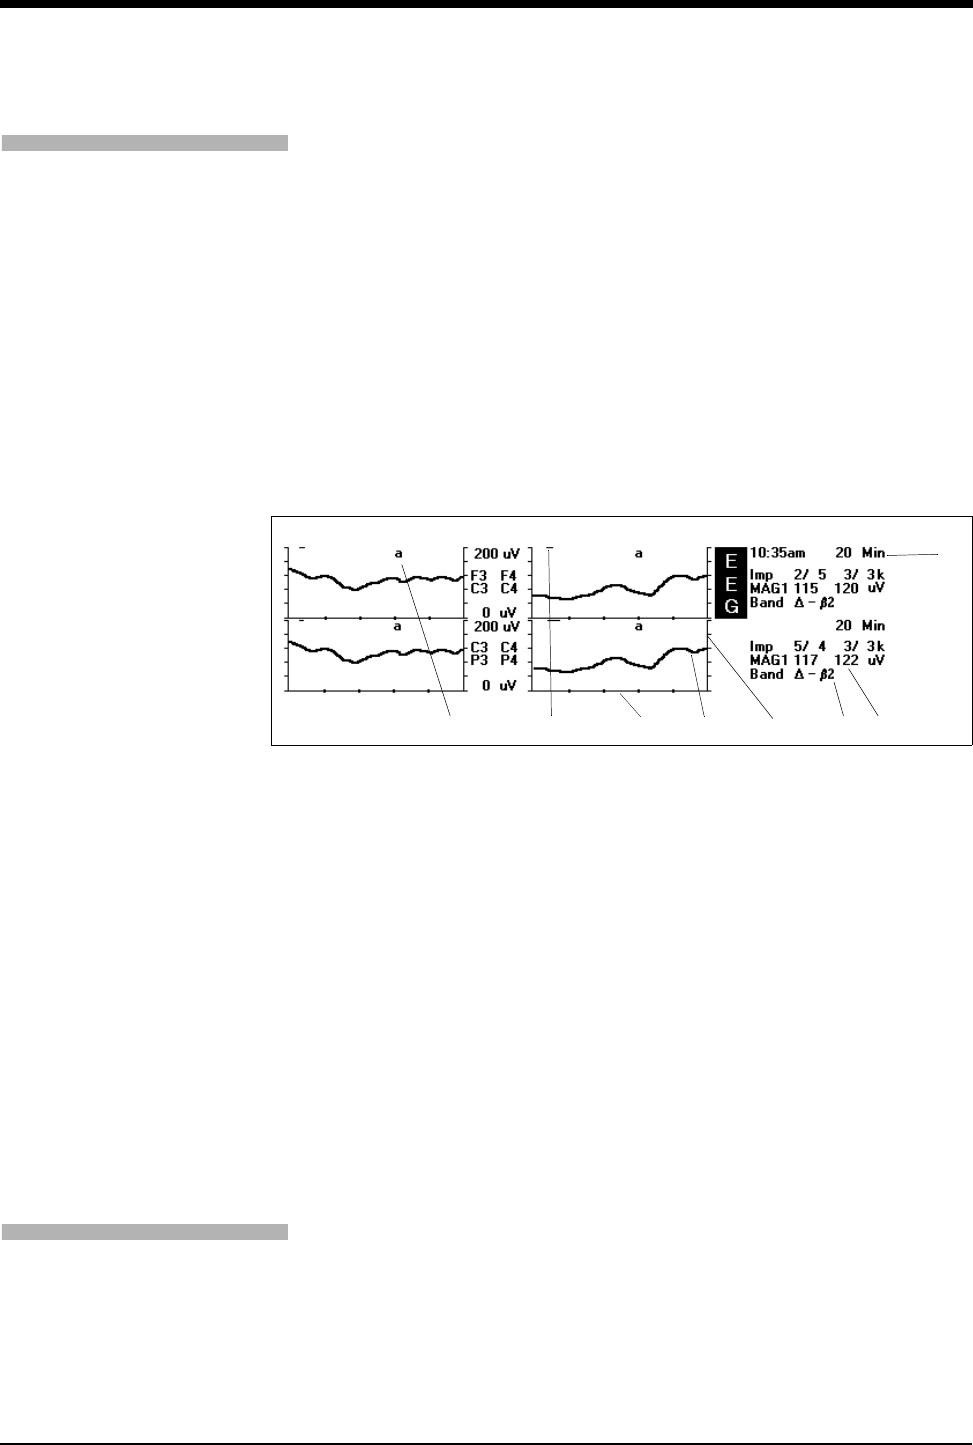
EEG
24-17
Trend Displays
The EEG module can trend up to seven EEG parameters:
• Two magnitude parameters (MAG 1 and MAG 2)
• Two frequency band ratio parameters (FBR 1 and FBR 2)
• Spectral edge frequency (SEF)
• Peak power frequency (PPF)
• Median power frequency (MPF)
All trends should be selected before processing starts. Select the frequency band
for each trend in the Setup menu. In the figure below, the magnitude of the EEG
(MAG 1) is calculated for the frequency bands delta to beta2 and trended. One
trend parameter can be displayed at a time for each EEG channel when dual
format is off. The trend is drawn as a double wide line. A five point moving
average filter is used to smooth the data on the trend plot.
Figure 24-3: Four-channel EEG trend display
Event Marker — Used to tag significant clinical events. Can place 52 unique
letters; a-z and A-Z. Used in identifying and recalling stored trend data.
Artifact Flag — Artifact detection is marked by lighting a pixel on the top line.
On color monitors, artifacts will be marked with a red pixel.
Horizontal Axis — The horizontal, or X-axis represents time. The time base is
the total time of the displayed trend, and can be set to 5-, 10-, 20- or
40-minutes. The time axis is divided into five equal segments using
intensified dots.
Trend Line — The trend line represents the trended EEG parameter and
moves from right to left.
Vertical Axis — The vertical, or Y-axis represents either the magnitude (in
microvolts), frequency (in hertz), or ratio (in percent). When MAG 1, MAG 2,
or EMG are displayed, magnitude is shown (values range from 2µV to
900 µV). When SEF, PPF, or MPF are displayed, frequency is shown (values
are 5 Hz, 10 Hz, 15Hz, 20Hz, 30Hz). When FBR 1 or FBR 2 are displayed,
percent is shown (values range from 10% to 900%).
Band — The EEG band trended (Delta, Theta, Alpha, Beta1, Beta2, or
combination. Greek letters are displayed to represent each band).
Trend Value — Shows the type of trend displayed and its numeric value.
MAG 1 indicates a magnitude trend.
Time Base — Total time of the trend plot; ranges from 5- to 40-minutes.
To display EEG trends:
1Touch EEG.
2Touch DISPLAY FORMAT.
3Select DUAL FORMAT OFF.
4Touch TREND.
5Select desired trend.
To change the trend time base:
1Touch EEG.
2Touch SETUP.
3Touch TREND.
4Touch TIMEBASE.
5Select timebase.
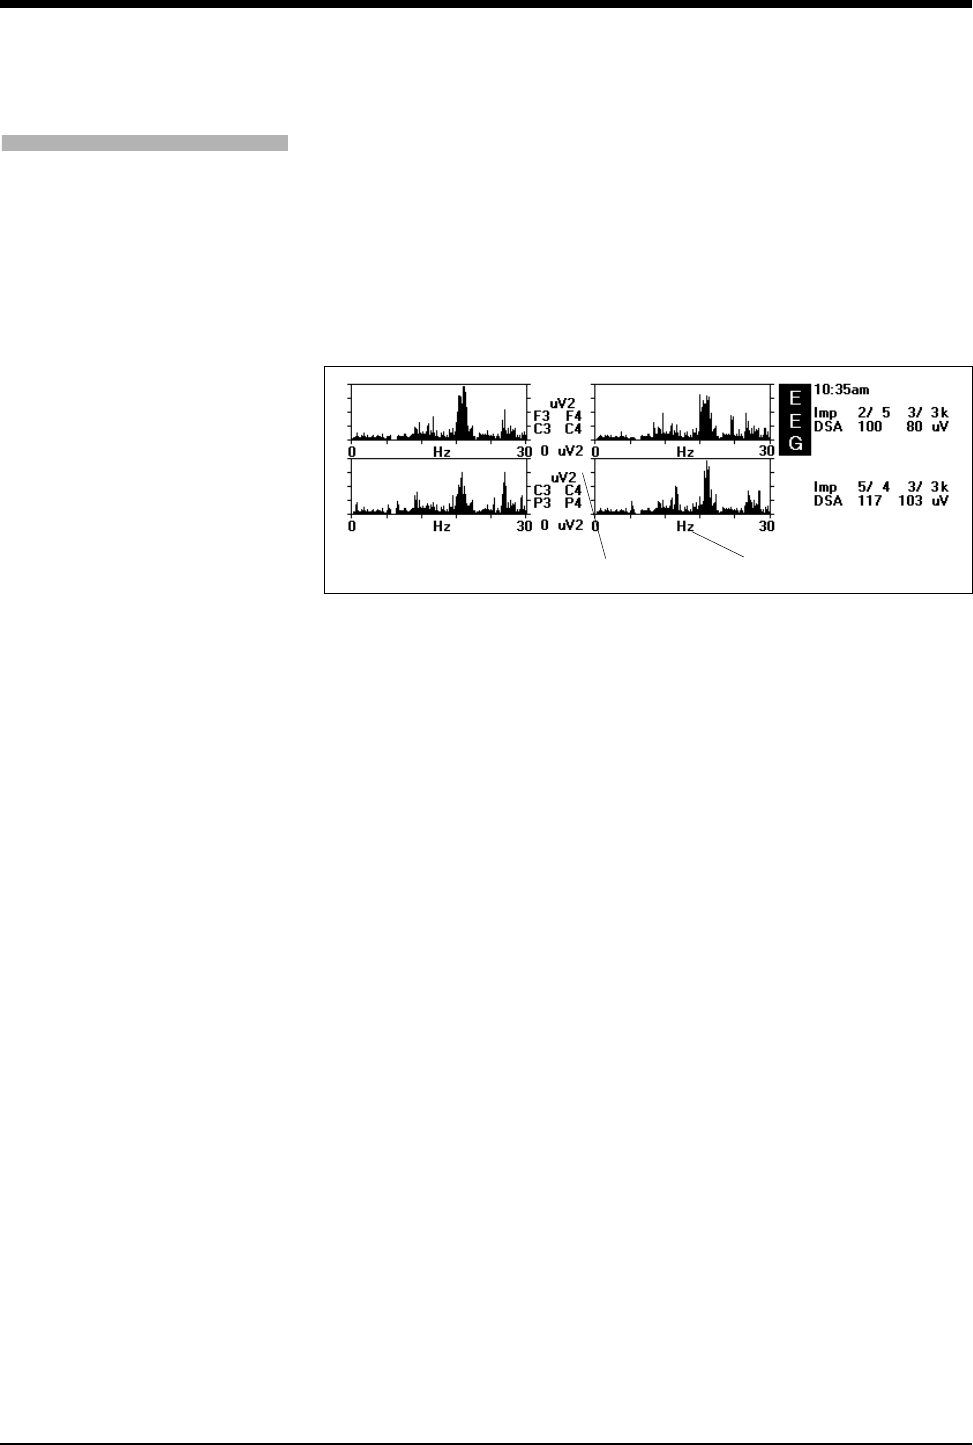
Ultraview Care Network
24-18
Histogram Display
The histogram display is used to set the appropriate scale or size for the DSA
display. This helps to optimize the DSA display contrast. The histogram vectors
should fill as much of the window as possible without saturating. The histogram
display can also be used to see EEG power and frequency changes in each
epoch. It provides expanded information for each column of DSA data. The
histogram display is only accessed when changing the DSA size after processing
has been started.
Figure 24-4: EEG display of histograms (4 channels)
Amplitude Axis — The vertical, or Y-axis represents the amplitude. The
bottom of the Y-axis is always labeled as 0 uV2 (zero microvolts squared).
The top of the Y-axis is labeled with the maximum power you select. The
power displayed in the above figure (100 uV2) indicates full scale power of
the histogram vectors.
Frequency Axis — The horizontal, or X-axis represents the frequency range
(0 to 30Hz) and is divided into five equal sections with tic marks.
To change DSA size:
1Touch EEG.
2Touch SETUP.
3Touch DSA.
4Touch SIZE.
5Set DSA size.
5 Min
100
100
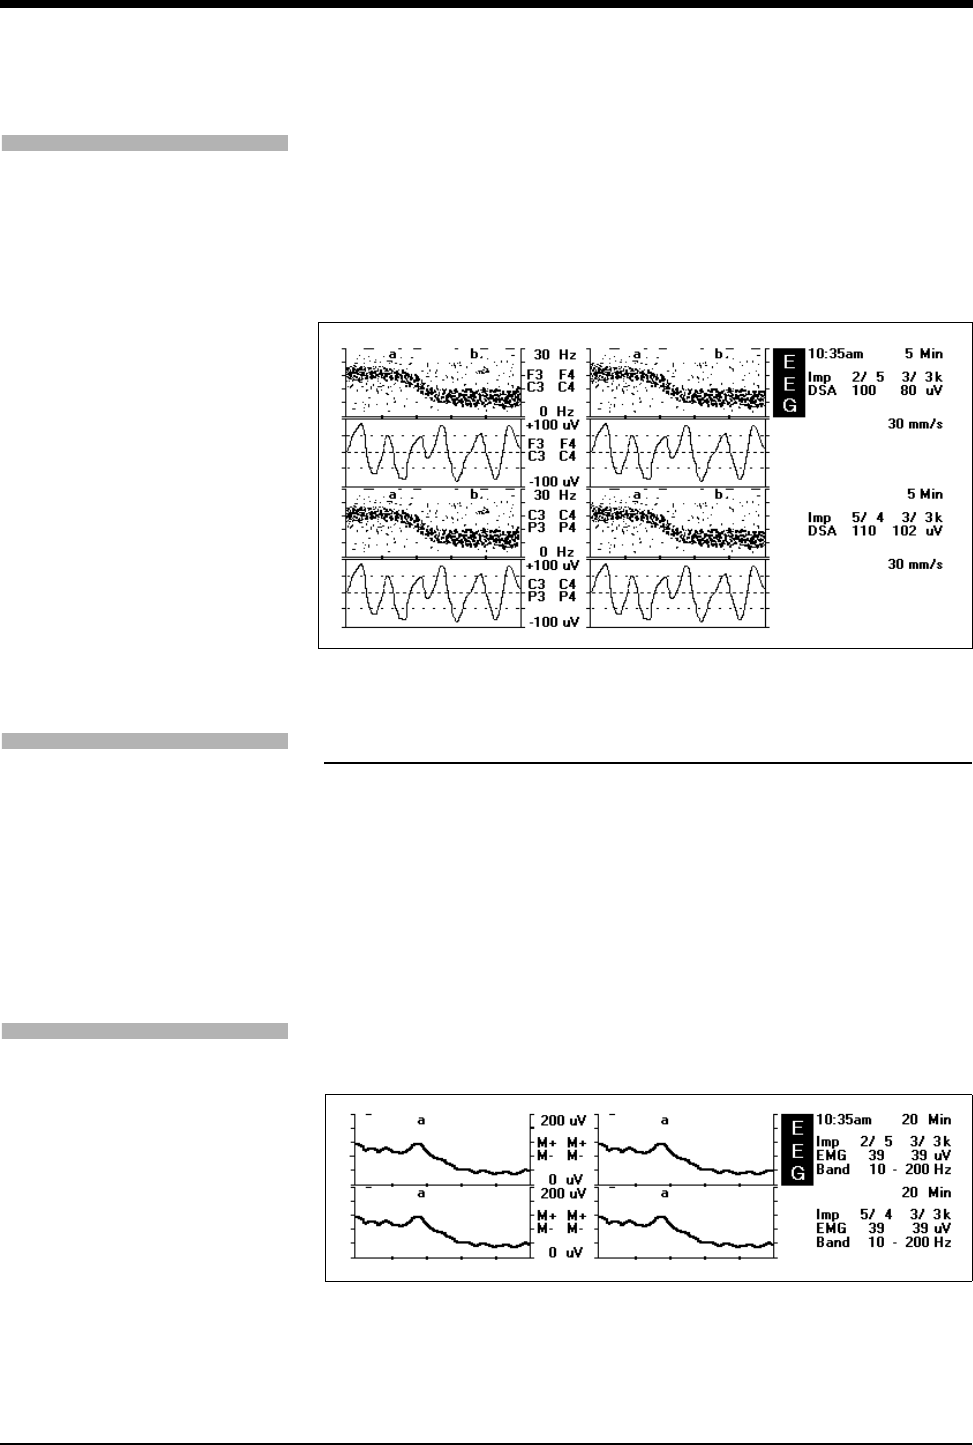
EEG
24-19
Dual Format Display
You can display the EEG in two formats simultaneously. Enable dual format from
the DISPLAY FORMAT menu. This allows the display of DSA and analog, DSA
and trend, trend and analog, or two different trends. In addition, the second
display zone can be used to show recalled snapshots of DSA or trends,
simultaneously with live DSA or trend data.
Figure 24-5: Dual format DSA and analog EEG
EMG Display
There is one EMG channel that can be used to monitor muscle electrical activity.
Select EMG with the EMG ON /OFF key in the Montage menu. The ON section of
the key will be highlighted when it is on. Touch the key and select OFF to turn off
the EMG channel. The OFF portion of the key will be highlighted.
Although EMG uses only one channel, the EMG trend is displayed in each
channel so it can be used to compare against EEG when dual format is on.
Figure 24-6: EMG display
!
• EMG is displayed only as a trend.
To display DSA EEG with trend
overlay and analog EEG:
1Touch EEG.
2Touch DISPLAY FORMAT.
3Select DUAL FORMAT ON.
4Touch DSA & ANALOG.
5Touch EEG.
6Touch SETUP.
7Touch DSA.
8Touch DSA TREND.
9Select desired trend.
To enable EMG processing:
1Touch EEG.
2Touch SETUP.
3Touch INITIAL SETUP.
4Touch SYSTEM PARAMS.
5Touch MONTAGE.
6Touch ERASE ARCHIVED
EEG DATA (if data is stored in
the module).
7Touch MONAGE.
8Select EMG ON.
To view EMG trend:
1Touch EEG.
2Touch DISPLAY FORMAT.
3Select DUAL FORMAT OFF.
4Touch TREND.
5Touch EMG.

Ultraview Care Network
24-20
Archiving EEG
Reviewing EEG Data
The module continuously stores the last 2- to 24-hours of DSA and trend data.
The number of hours it can store depends on the amount of memory installed.
You can scroll back and forth in half screen increments using the left and right
REVIEW keys. Data is not displayed until you remove your finger from the left and
right arrow keys. If you keep your finger pressed on one of the arrow keys, you
can rapidly scroll to the approximate place in the data. Time and date information
for the position in the data is displayed on the message line, as well as any event
marks placed in the data.
When reviewed data is being displayed, the message REVIEWED is shown in
reverse video on line two of the numeric zone.
Recalled EEG data (Dual Format Off)
You can store and recall snapshots of DSA and trended data. Recalled data is
displayed in the same format as live data.
When dual format is off, recalled EEG data replaces live data for each channel.
When recalled data is being displayed, the message RECALLED is displayed in
reverse video on line two of the numeric zone.
Recalled EEG Data (Dual Format On)
When dual format is on, two data formats (e.g., DSA and analog) are displayed. If
recalled data is requested, the recalled EEG data is displayed in the second zone.
Recalled data is always displayed below the live data. The message RECALLED
tells you that the data in the second zone is recalled data. This can be used to
display baseline data below the live data.
Live Data
Touch the LIVE DATA key to resume displaying live DSA, analog, or trends. This
key provides an easy means to return to live data after displaying reviewed data
or recalled snapshots.
!
• When DSA & TRENDS are displayed simultaneously in Dual
Format mode, the Review keys scroll through DSA and trend
data.
To display live data:
1Touch EEG.
2Touch ARCHIVE.
3Touch LIVE DATA.

EEG
24-21
Marking Events
An event can be identified on the DSA or Trend displays by placing an event label
on the display at the point where the event occurs. Up to 52 event labels
(a-z; A-Z) can be placed on the DSA and Trend displays. The event label is stored
and displayed with the DSA and all Trend displays in all four channels.
After touching the MARK EVENT key, touch the YES key to place an event label.
Touch the NO key to cancel marking an event. Touching either key returns you to
the main menu.
The next event label to be placed is displayed above the YES/NO keys on the
message line. The message appears as follows:
MARK EVENT ‘X’
‘X’ is a letter a-z; A-Z. If the event label is ‘Z,’ the message Z is the last event mark
that can be placed is displayed and the Mark Event key will appear dotted after Z
is placed.
Storing DSA/Trend Snapshots
From the Main menu, touch the ARCHIVE key, touch the STORE SNAPSHOT
key then touch the STORE key.
The following messages are displayed on the message line:
SNAPSHOT = UU (ZZ Snapshots Available)
UU is the snapshot number (1 to 44) and ZZ is the number (0 to 44) of snapshots
that can still be stored.
The number of snapshots that can be stored depends on the amount of memory
in the EEG module. The base module can store 11 four-channel or
22 two-channel snapshots. If the module has sufficient memory, then up to 44
snapshots (four-channel) can be stored.
!
• Event labels will be placed as close in time as possible to the
event. The Mark Event key appears dotted when an event label
cannot be placed.
To mark an event:
1Touch EEG.
2Touch MARK EVENT.
3Touch YES
To store a DSA or trend
snapshot:
1Touch EEG.
2Touch ARCHIVE.
3Touch STORE SNAPSHOT.
4Touch STORE.

Ultraview Care Network
24-22
Recalling DSA/Trend Snapshots
Touch the RECALL SNAPSHOT key. Use the arrow keys to choose a snapshot.
Touch the RECALL key, then touch DSA to display the density spectral array for
the selected snapshot, or touch a trend key to display the trended EEG.
Erasing Snapshots
Touch ERASE SNAPSHOT to erase DSA/TRENDS snapshots.
Touch the left or right arrow keys to select the snapshot to be deleted.
DSA/Trends snapshots are identified by snapshot number, marked events and
time and date at which the snapshot was stored.
Touch the ERASE key to erase the selected snapshot of DSA/Trends.
Printing EEG
From the Main menu, touch the PRINT key to display a sub-menu in which all
displayed DSA and Trends are printed. One print key controls all four EEG
channels. The printout is a screen dump of the entire DSA or trend display zone,
including all data displayed in the numeric zone (on the right side of the EEG key).
Touch the YES key to print the DSA and trend display. Touch the NO key to
cancel the printout.
!
• You can use marked events as a method for keeping track of
snapshots that you want to recall. Use the arrow keys to move
through the stored data. The message prompt will indicate
whether there are any marked events in the snapshot. Note
which marked events appear in the message prompt, then
recall the snapshot when you see the event label you want. The
time and date of each snapshot is also displayed in the
message prompt.
!
• Analog EEG is not printed using the print key. Use the monitors
RECORD key to print Analog EEG.
• Recording could be terminated if the analog size is changed
during the recording.
To recall a DSA or trend
snapshot:
1Touch EEG.
2Touch ARCHIVE.
3Touch RECALL SNAPSHOT.
4Select desired snapshot.
5Touch Recall.
6Select DSA or trend parameter.
To print a stored snapshot:
1Touch EEG.
2Touch ARCHIVE.
3Touch RECALL SNAPSHOT.
4Select desired snapshot.
5Touch Recall.
6Select DSA or trend parameter.
7Touch PRINT.
8Touch YES.
To erase a DSA/ TREND
snapshot:
1Touch EEG.
2Touch ARCHIVE.
3Touch ERASE SNAPSHOT.
4Select desired DSA/TREND
snapshot.
5Touch ERASE.
To print DSA or Trends:
1Touch EEG.
2Touch PRINT.
3Touch YES.

EEG
24-23
Patient Preparation
Patient Preparation
Electrodes must be properly placed on the patient to obtain the optimum signal.
Use small ECG silver/silver chloride electrodes, EEG cup electrodes (silver or
gold), or their equivalent. Electrodes are available from Spacelabs Medical.
Attach lead wires to the electrodes before applying them to the patient. If you
apply lead wires after applying the electrodes, you may displace some of the
conductive gel, resulting in signal degradation. Connect all electrodes needed for
EEG monitoring. You will need six electrodes (minimum) for four channel
operation, and five electrodes (minimum) for two channel monitoring. Missing
electrodes will result in loss of EEG waveforms.
Prepare the patient for electrode placement as follows:
• If possible, choose a site that avoids hair interference, and is as high on the
scalp as possible.
• Clean each site with a medically approved abrasive cleaner (such as
OmniPrep™ or NuPrep™) using a cotton tip applicator in a circular motion to
mildly abrade the skin. (The abrasive cleaner should not be used on patients
with a history of skin allergies to cosmetics or lotions. As a substitute, use a
skin degreaser such as alcohol.)
• Use alcohol wipes to further clean each site and remove residual OmniPrep.
Then, using dry gauze, rub site briskly, avoiding excessive abrasion of the
skin surface.
• Ensure that gel is moist in each electrode.
• Attach lead wires to electrodes before applying to patient.
CAUTION:
• Only use patient cables specified by Spacelabs Medical.
Other cables may degrade performance and may damage
the UCW or PCMS monitor during defibrillation. Do not use
stainless steel electrodes.
WARNING:
• To ensure against any possibility of electric shock, do not
touch lead electrodes, or the monitor during defibrillation.
The conductive parts of electrodes or any other patient
connection should not contact other conductive parts,
including the neutral electrode and earth (ground).
• Keep the monitor and its power cord and cables away from
the electrosurgery unit and its associated cables and power
cord.
• If electrodes are used adjacent to the electrosurgical site,
considerable high frequency current may flow through
them, causing patient burns, especially if a defect is
present in the return pad of the electrosurgical unit. For this
reason, electrodes should be placed as far away from the
surgery site as possible.
To setup EEG or EMG
monitoring:
1Attach lead wires to EEG or
EMG electrodes.
2Apply electrodes
3Attach electrode lead wires to
patient cable.
4Insert module into module slot.
5Attach EEG patient cable to
module.

Ultraview Care Network
24-24
• Apply electrodes to the site by pressing around the outer edge of the
electrode. DO NOT press on the center of the electrode since this may
interfere with proper adhesion. The electrode, especially its center, must lie
flat against the patient’s skin.
• Select CONTINUOUS IMPEDANCE and measure electrode impedances
after all electrodes have been placed and lead wires and patient cable are
connected. Acceptable maximum impedances: 5 K ohms for each electrode,
2 K ohms differential between the pairs.
Figure 24-7: Electrode application
Position as high as possible on the
placement sites. Avoid hair interference.
Smooth electrode adhesive area to
the skin with a circular motion.
!
• Electrode impedances are automatically measured and
displayed every 5-minutes after processing is started. If
electrode impedances are greater than the acceptable range
(5 K ohms for each electrode or 2 K ohms differential between
the pairs) the impedance values will flash if the impedance of
any electrode exceeds 5 K ohms, or if the difference between
the electrode pairs exceeds 2 K ohms. If the impedance
exceeds 99 K ohms, ++ is displayed.
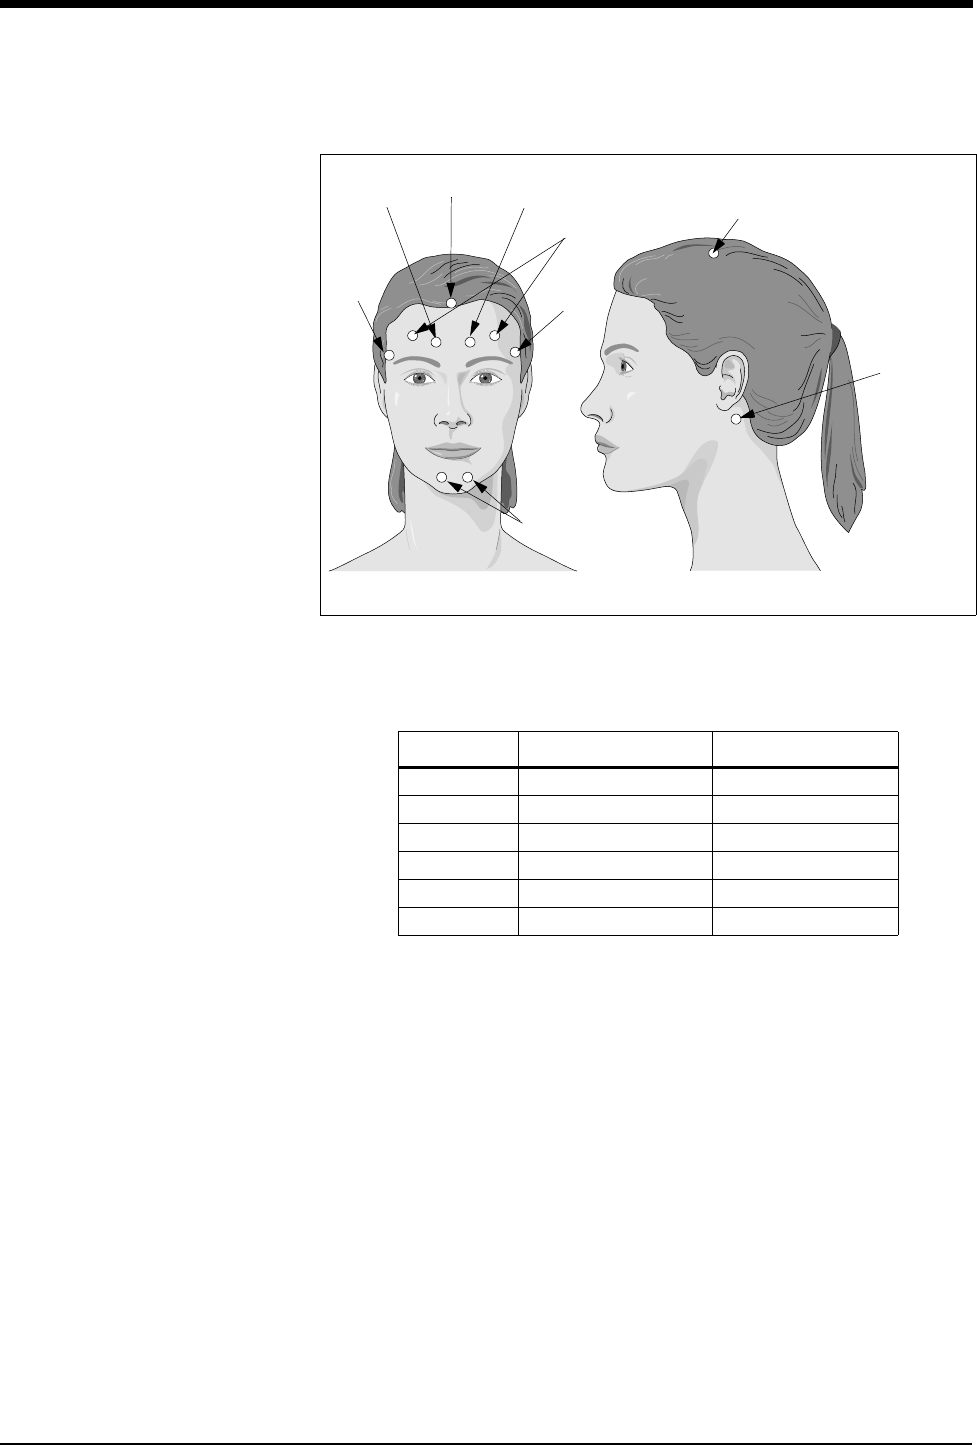
EEG
24-25
EEG Electrode Placement
Figure 24-8: Recommended electrode lead placement for the operating room
You have the choice of monitoring in two channel or four channel mode. Note the
changes in the color of the leads when using two channel as opposed to four
channel mode. Also, if using the four channel mode, note that an extra lead
(CZ - Red Wire) is necessary.
Channel # 4 Channel 2 Channel
Channel 1 CZ-F7 (Red/Red) F7-M1 (Red/Red)
Channel 2 CZ-F8 (Red/Black) F8-M2 (Black/Black)
Channel 3 CZ-M1 (Red/Brown)
Channel 4 CZ-M2 (Red/White)
Channel 5 EMG (two yellow) EMG (two yellow)
2 Ch & 4 Ch Ground (Green) Ground (Green)
!
• Use the special adaptor to connect CZ (red wire) to the + input
of each channel. Use a silver cup for electrode CZ. Attach with
conductive paste or collodion.
Green Wire
(Ground)
Red Wire (4 Channel Only)
(Right side has
Front View Left Side View
White wire for
4 Channel, Black
for 2 channel)
Brown wire for
4 channel, Red
for 2 channel
(M1)
(M2)
(Fp1)(Fp2) (CZ)
Yellow Wires (EMG)
Black Wire
(F8)
Red Wire
(F7)
(EMG)
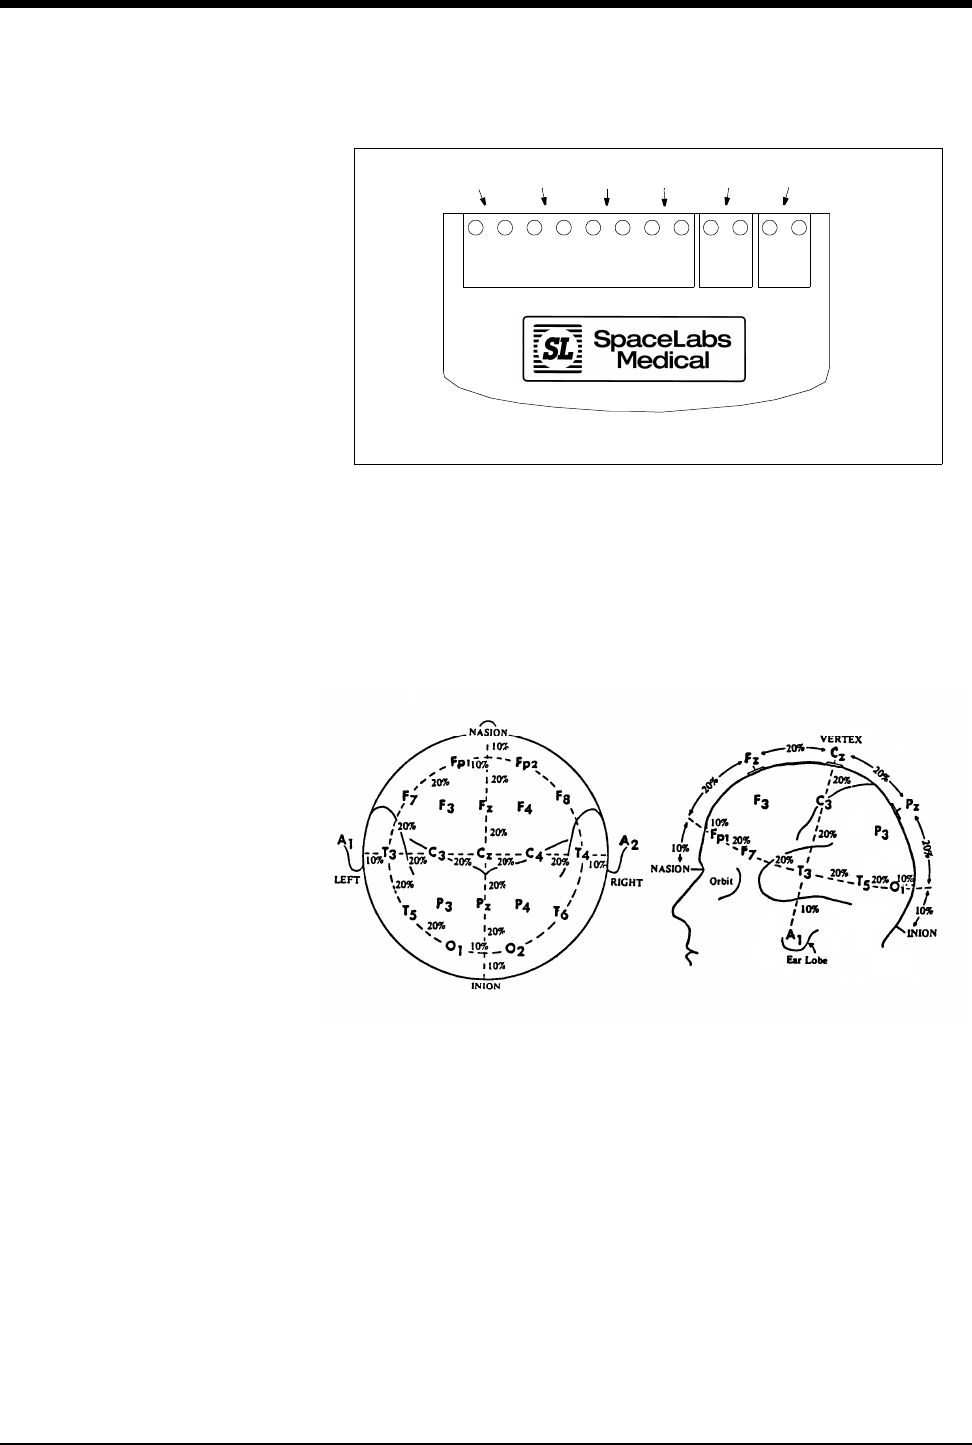
Ultraview Care Network
24-26
Figure 24-9: EEG patient connector
Figure 24-10: 10-20 International electrode placement system
The EEG module contains an electrosurgical interference suppression (ESIS)
filter which automatically provides some noise suppression when electrocautery
interference is detected.
EMG Electrode Placement
Use two yellow EMG lead wires and place the electrodes as shown in the
electrode lead placement illustration. The EMG is displayed as a trend, and uses
channel five in the EEG module.
!
• Spacelabs Medical recommends the 10-20 International
Electrode Placement System for charting electrode placement
on a patient. Use this reference if you require additional
information regarding electrode placement.
+-+-+-+-+-+-
CH 1 CH 2 CH 3 CH 4 GND CH 5
EMGEEG
RED BLACK BROWN WHITE GREEN YELLOW

EEG
24-27
Starting and Stopping Processing
The EEG module can operate in either the processing on or off mode. To set up
the module, you need to have processing turned off. Processing off is the default
mode when you first insert the module into the module housing.
The Initial Setup menu allows you to access other menus needed for defining the
various configurations you may want to store.
Only analog EEG is displayed when the power has first been turned on, or the
processing has been stopped. Processing of the data and the display of DSA or
trends will start when the START PROC key is touched.
START PROC
Touch the RETAIN ARCHIVED EEG DATA key to begin processing without
erasing EEG data stored in the module. This is useful if processing is suspended,
then resumes on the same patient. The key will change to STOP PROC after it is
pressed.
Touch the ERASE ARCHIVED EEG DATA key to erase all EEG data presently
stored in the module. Processing begins and START PROC changes to STOP
PROC.
STOP PROC
Touch the YES key to stop processing and return to the main menu. The STOP
PROC key changes back to START PROC. Touch the NO key to return to the
main menu without interrupting processing.
Continuous Impedance
Touch the CONTINUOUS IMPEDANCE key to put the module in continuous
mode. In continuous mode, the impedance of each electrode is measured and
displayed every 2-seconds. Use this mode when the electrodes are first placed on
the scalp or when the impedance of an electrode is out of range (absolute above
5 K ohms and differential above 2 K ohms), and must be re-applied.
Touch the CONTINUOUS IMPEDANCE key again to un-highlight it, and turn off
continuous checking. This places the impedance checking in auto mode, which
updates every 5-minutes when processing is on.
!
• You can only access the Initial Setup menu when processing is
off.
!
• EEG/EMG data is corrupted when continuous impedance is
selected.
To start processing:
1Touch EEG.
2Touch START PROC.
3a Touch ERASE ARCHIVED
EEG DATA for each new
patient.
3b Touch RETAIN ARCHIVED
EEG DATA if the data in the
module is to be saved.
To stop processing:
1Touch EEG.
2Touch STOP PROC.
3Touch YES.
To put the module in continuous
impedance mode from the
Montage screen:
1Touch EEG.
2Touch SETUP.
3Touch INITIAL SETUP.
4Touch SYSTEM PARAMS.
5Touch MONTAGE.
6Touch CONTINUOUS
IMPEDANCE.
To put the module in continuous
impedance mode:
1Touch EEG.
2Touch SETUP.
3Touch ANALOG.
4Touch CONTINUOUS
IMPEDANCE.

Ultraview Care Network
24-28
The displayed impedance value will flash to alert you if the values are out of
range.
Filters
You can set the low and high cutoff filters and line frequency filter in the system
parameter menu. The low cutoff filter determines the lowest frequency that is
displayed and processed, and the high cutoff filter determines the highest
frequency that is displayed and processed. The LINE FREQ key selects either
50Hz or 60Hz line frequency.
Touch the FILTERS key to enter the sub-menu where the high cutoff, low cutoff
and line frequency filters are set.
Touch one of the keys (0.5Hz, 1.0Hz, 5.0Hz) to select the desired low cutoff filter.
The key will be highlighted.
Touch one of the keys (20Hz, 32Hz, 50Hz, 70Hz) to select the desired high cutoff
filter. The key will be highlighted.
Touch LINE FREQ and select 50Hz or 60Hz. The selection will be highlighted.
Remote Monitors
This section covers the differences in display format and user menus between the
local bedside monitor and remote monitors. EEG cannot be displayed on a split-
screen central monitor and remote monitors do not have access to all keys and
functions that are available at the local bedside.
Bed Name / Patient Name Interference
If the EEG key is not selected then bed name and patient name are displayed at
the bottom of the display zone on remote monitors. This conflicts with display of
the EEG data. When the EEG key is selected bed name is displayed on the
message line instead.
Display Formats - Remote Bedside
EEG uses one, two or four display zones at the local bedside, depending on how
you configure the module. Remote views at bedside monitors only use one
display zone to display the remote EEG data.
Case #1 - One display zone used at the local bedside (2 EEG channels, dual
format off).
In this case, the remote display of EEG data is almost identical to the local
bedside’s display of that data (refer to Figure 24-11).
!
• Continuous Impedance is automatically turned off when leaving
the montage or analog setup menus.
To set the low cutoff, high cutoff
or line frequency filters:
1Touch EEG.
2Touch SETUP.
3Touch INITIAL SETUP.
4Touch SYSTEM PARAMS
5Touch FILTERS
6Select desired filter settings.
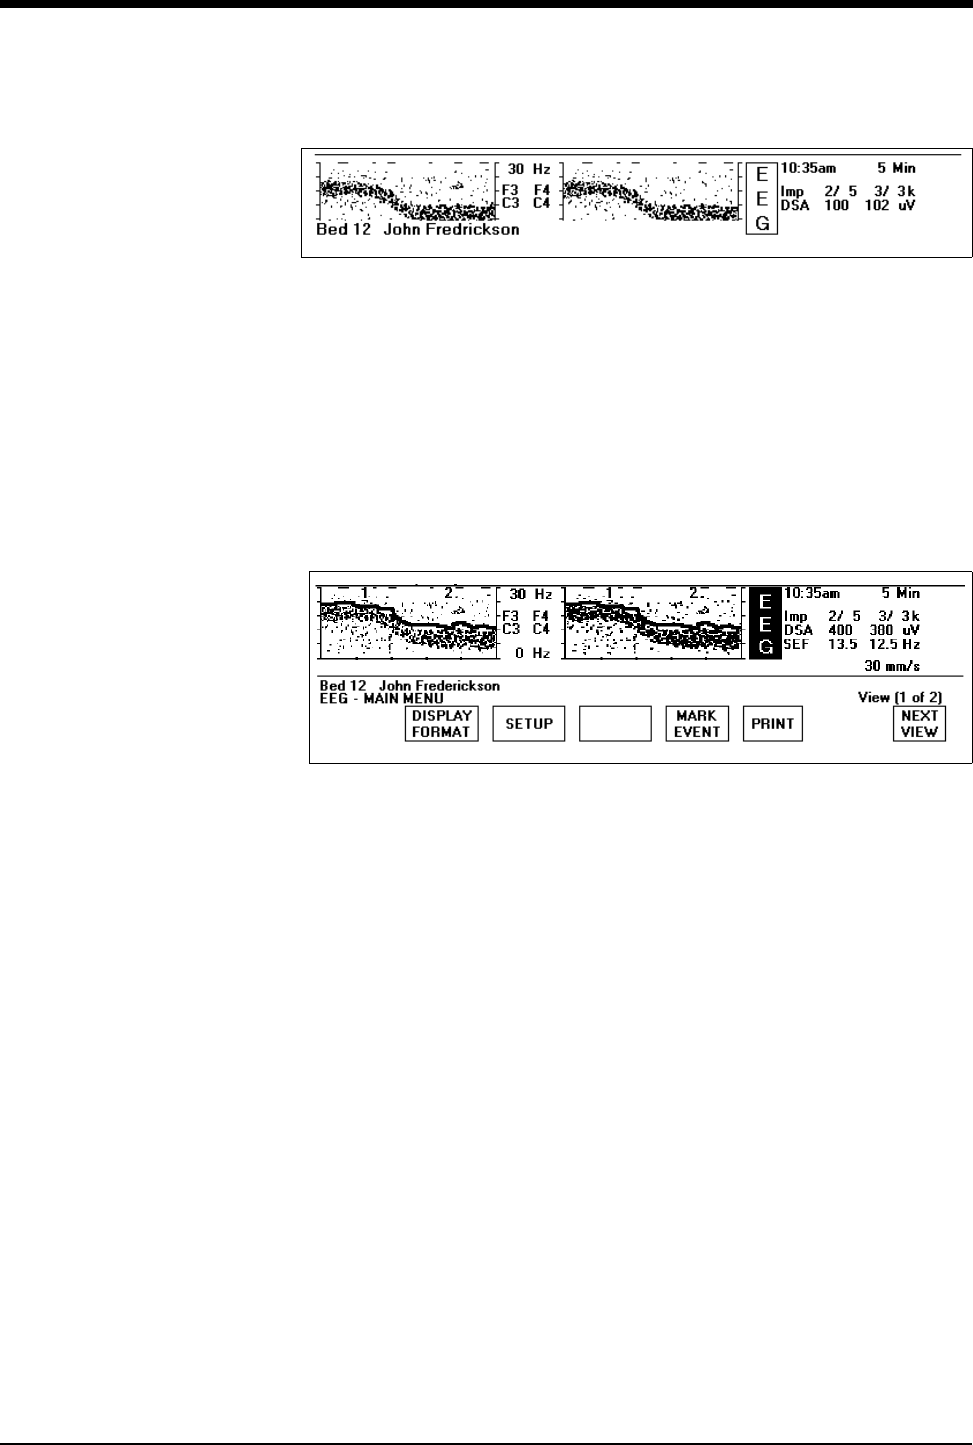
EEG
24-29
Figure 24-11: EEG remote display
patient name/bed name ON
Case #2 - Two display zones used at the local bedside (4 EEG channels, dual
format on or 2 EEG channels, dual format off).
The local bedside requires two display zones to display EEG data for all EEG
channels. The remote bedside can only use one display zone for EEG data, so a
special key, labeled NEXT VIEW, is displayed in the EEG menu. This key allows
you to toggle between each EEG view. The text displayed above this key
indicates how many views are available and which is currently being displayed
(refer to Figure 24-12).
Figure 24-12: EEG remote bedside display
patient name/bed name OFF
Multiple views with NEXT VIEW key
Case #3 - Four display zones used at the bedside (4 EEG channels, dual format
on).
The local bedside requires four display zones to display EEG data for all EEG
channels. The remote bedside can only use one display zone for EEG data, so a
special key, labeled NEXT VIEW, is displayed in the EEG menu. This key allows
you to cycle between each EEG view. The text displayed above this key indicates
how many views are available and which is currently being displayed.
ARCHIVE

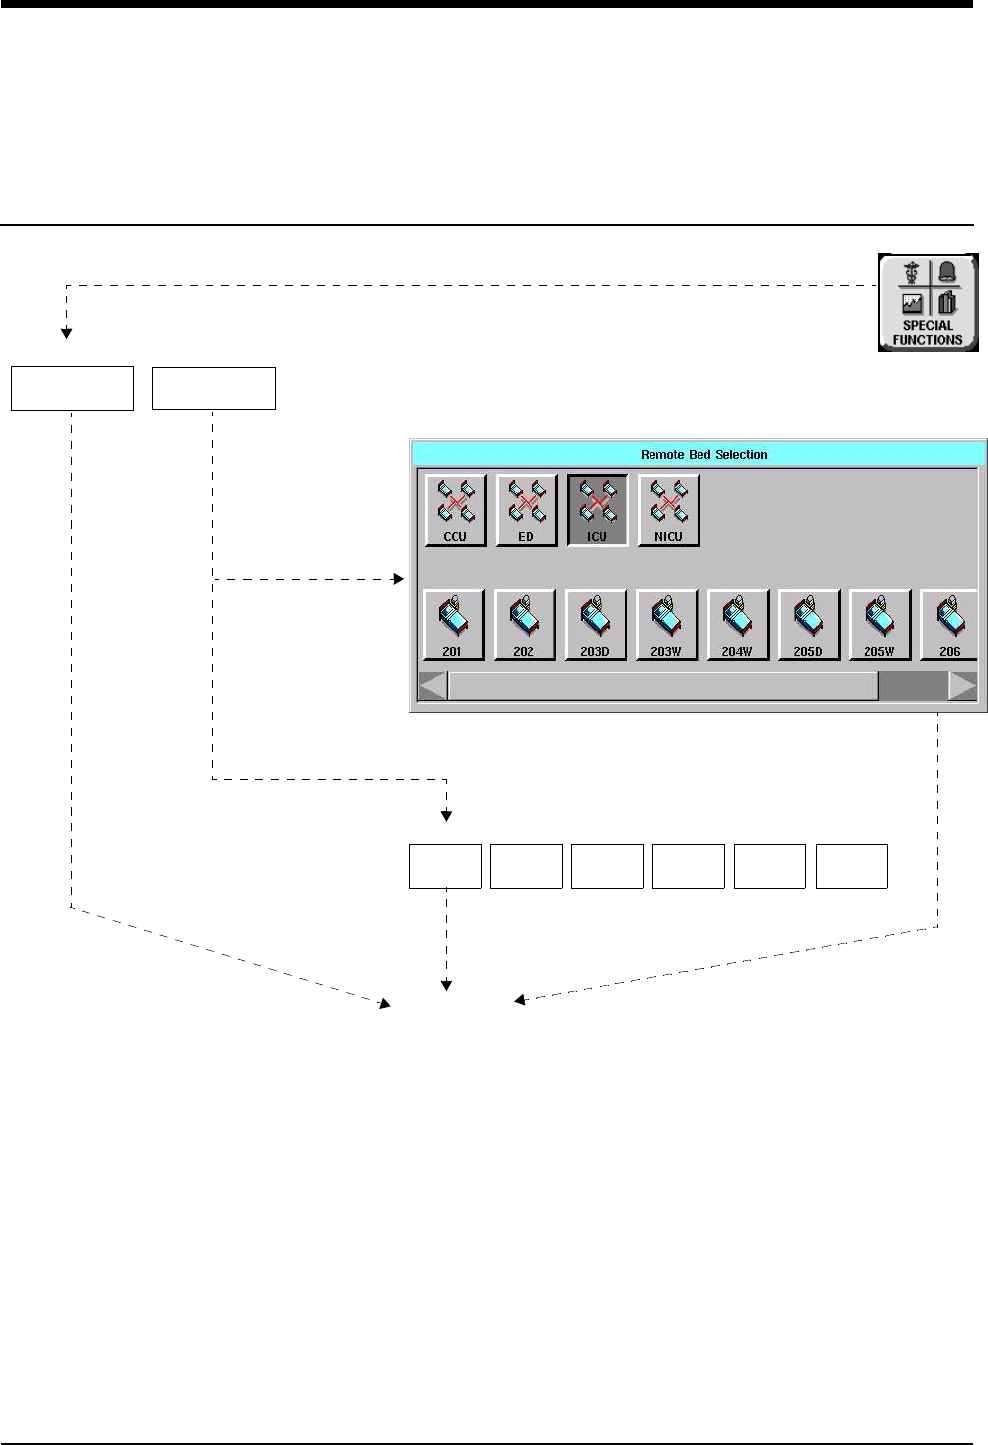
25-1
!
• Based on features purchased, more or fewer keys may appear here than on your menu screens.
Calculations Directory
Directory of Keys - Remote Calcs
LOCAL
TRENDS/CALCS
REMOTE
TRENDS/CALCS
BED 1 BED 2 BED 3 BED 4 BED 5 MORE
SPECIAL FUNCTIONS
REMOTE TRENDS/CALCS - Select bed
See next page
UCW/Ultraview 1700
Ultraview 1030/1050/1500/1600
NOTE: Requires Trend/Calcs enabled
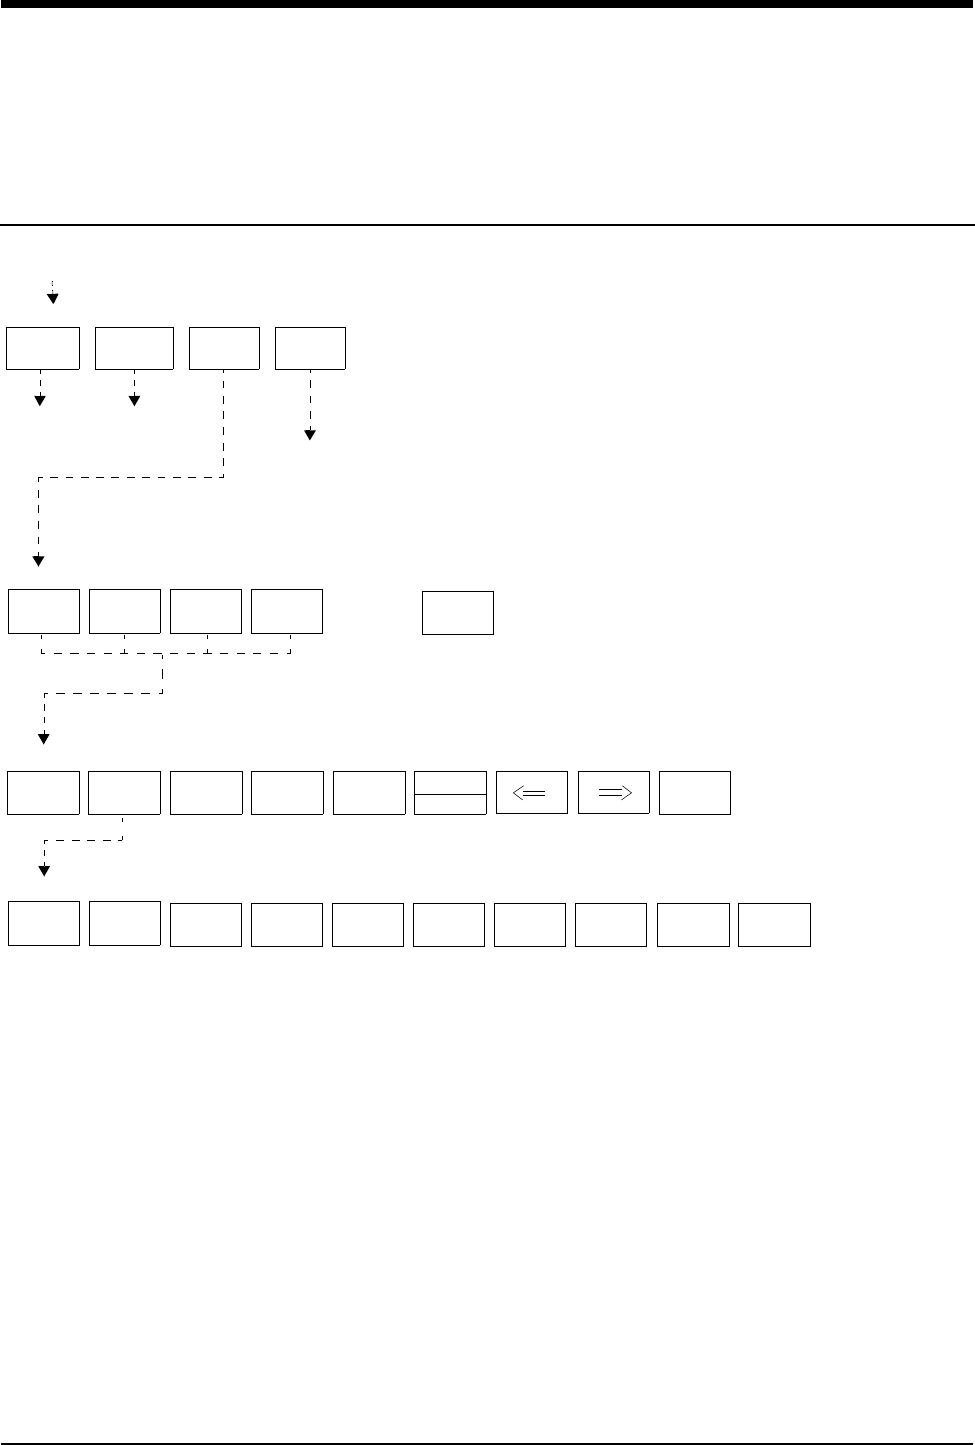
Calculations Directory
!
• Based on features purchased, more or fewer keys may appear here than on your menu screens.
25-2
Directory of Keys - Clinical Calcs
HEMO
CALCS
RESP
CALCS
OXY
CALCS
RENAL
CALCS
UPDATE
DATA
NEW
ENTRY INPUTS
EDIT
DAY/TIME
EDIT STORE
ENTRY
DELETE
ENTRY SCROLL
PAGE PRINT
FIO2 PaO2 SpO2 PaCO2 PvO2 SvO2 Hgb
%mmHg%mmHg
mmHg %g/dlmmHgl/min
m2
PB CO BSA
NOTE: Labels are dependent on type of calculation
CLINICAL CALCS for BED X
X CALCS - Select a menu key
EDIT INPUTS MENU - Select input to change
GRAPHIC
TRENDS
TABULAR
TRENDS CALCS
TRENDS/CALCS for BED xxx
DRUG
CALCS
Refer to Trends chapter
Refer to page 25-3
Refer to page 25-1
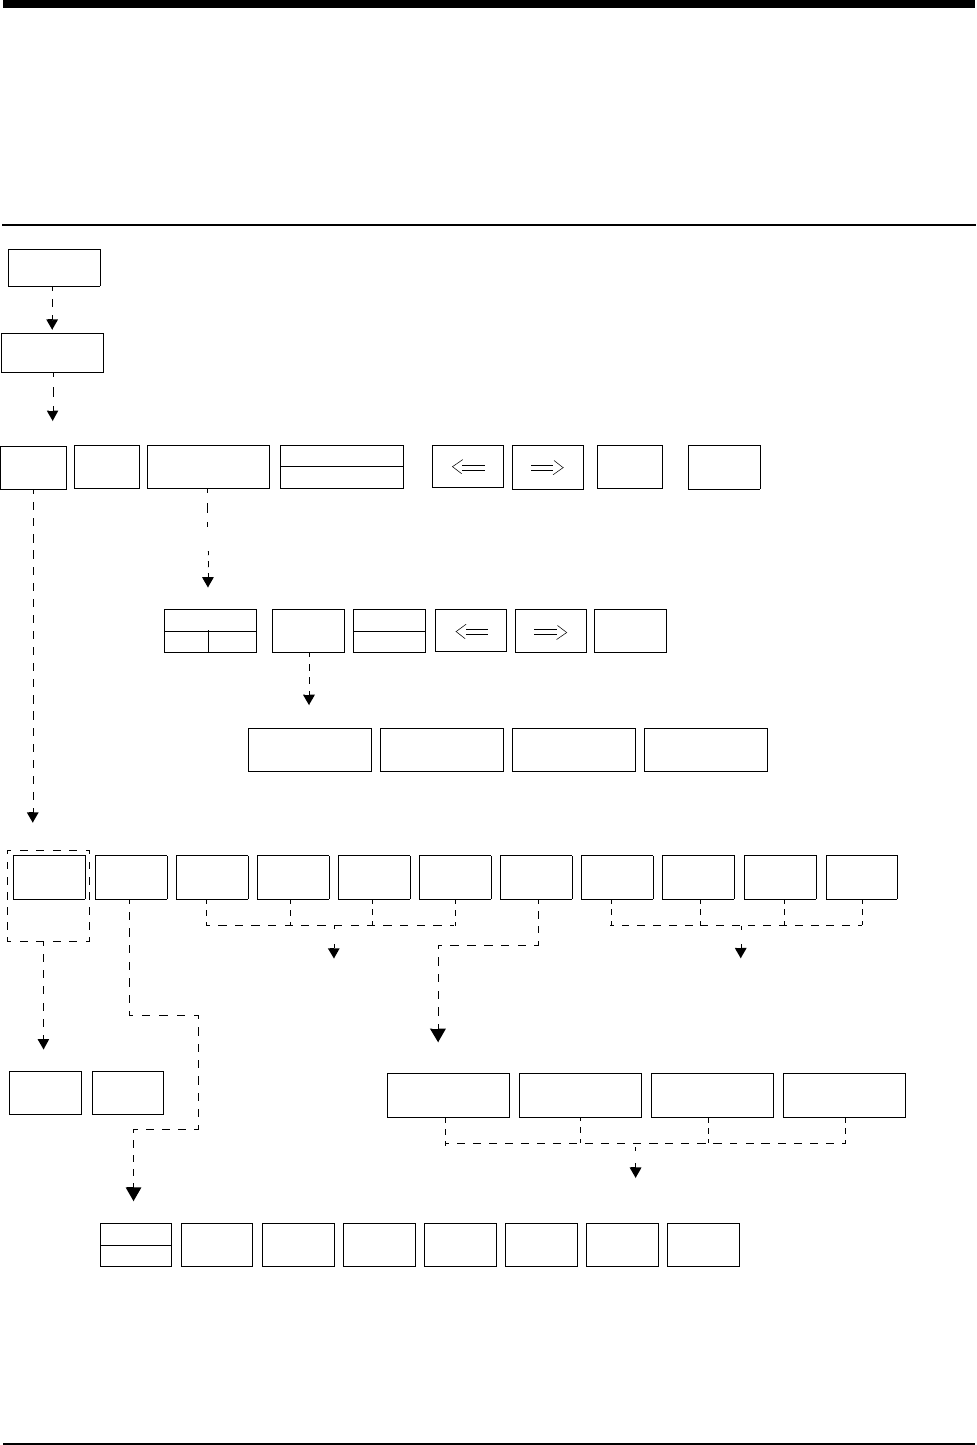
25-3
!
• Based on features purchased, more or fewer keys may appear here than on your menu screens.
EDIT
INPUTS
STORE
ENTRY
MIX
TITRATE
TITRATION
TABLE PRINT
UNITS AMT VOL CONC WEIGHT DOSE RATE DUR TOTAL
DOSE
TOTAL
VOL
AMOUNT
DOSE mcg mg g mEq units k units m units
DOSE/MIN
mcg/min
DOSE/HR
mcg/hr
DOSE/WT/MIN
mcg/kg/min
DOSE/WT/HR
mcg/kg/hr
VARY
RATE
DOSE
TYPE
DOSE/MIN
mcg/min
DOSE/HR
mcg/hr
DOSE/WT/MIN
mcg/kg/min
DOSE/WT/HR
mcg/kg/hr
Displays on-screen keypad
(Neonate Only)
Displays Titrate Tables
Displays on-screen keypad
Displays on-screen keypad
SCROLL
PAGE PRINT
UPDATE
DATA
DRUG
UCW/UV
1700 only
DRUG A ...
DRUG
CALCS Refer to page 25-2
Select units
ADULT/NEONATAL DRUG DOSAGE - Select dosage type
EDIT INPUTS MENU - Select input to change
Select name
ADULT DRUG DOSAGE - Select a drug or menu key
ADULT/NEONATAL DRUG DOSAGE - Select dose type
DRUGS A - F
DOSE
ADULT TITRATION TABLE - Select dose type
Directory of Keys - Drug Dosage
Calculations Directory


Contents
25-5
Overview . . . . . . . . . . . . . . . . . . . . . . . . . . . . . . . . . . . . . . . . . . . . . . . . . . . . . . 5
Setting Up Physiologic Calculations . . . . . . . . . . . . . . . . . . . . . . . . . . . . . . . . . 5
Setting Up Drug Dosage Calculations . . . . . . . . . . . . . . . . . . . . . . . . . . . . . . . . 6
Accessing Calculation Data . . . . . . . . . . . . . . . . . . . . . . . . . . . . . . . . . . . . . . . . 6
Updating Data Between Monitors . . . . . . . . . . . . . . . . . . . . . . . . . . . . . . . . . . . 6
Display Detail - Physiologic Calculations. . . . . . . . . . . . . . . . . . . . . . . . . . . . . . 6
Hemodynamic Calculations . . . . . . . . . . . . . . . . . . . . . . . . . . . . . . . . . . . . . . . 10
Respiration Calculations . . . . . . . . . . . . . . . . . . . . . . . . . . . . . . . . . . . . . . . . . 12
Oxygenation Calculations . . . . . . . . . . . . . . . . . . . . . . . . . . . . . . . . . . . . . . . . 13
Renal Calculations. . . . . . . . . . . . . . . . . . . . . . . . . . . . . . . . . . . . . . . . . . . . . . 15
Drug Dosage Calculations . . . . . . . . . . . . . . . . . . . . . . . . . . . . . . . . . . . . . . . . 16
Display Detail - Drug Dosage Calculations . . . . . . . . . . . . . . . . . . . . . . . . . . . 17
Configurable Drug Names (UCW and Ultraview 1700 Only) . . . . . . . . . . . . . . 24
Calculations
Overview
The Clinical Calculations feature can be divided into two types: (1) Physiologic
and (2) Drug Dosage. Physiologic calculations include hemodynamic, respiration,
oxygenation, and renal. These calculations use input values entered manually or
collected automatically by the system to produce a set of output values. Drug
Dosage calculations enable you to determine infusion rates for drugs based on
drug concentration, desired dose, patient weight, and type (adult or neonate).
Setting Up Physiologic Calculations
Values are entered into the system in several ways. You can take a snapshot of
currently monitored inputs by selecting the NEW ENTRY key (refer to Creating a
New Entry on page 25-8). You may also specify a day and time to gather input
data from the past, although this function is generally limited to the past 24-hours.
The system displays a combined total of 200 entries into the four physiologic
calculations tables. Each table has an Edit Inputs menu that is used to edit input
data. You can also create a record of both input and output data by printing the
displayed table.

Ultraview Care Network
25-6
Setting Up Drug Dosage Calculations
The Drug Dosage calculation feature enables you to edit the inputs and to store
up to six drug records. Titration tables are displayed for each drug record entered.
Drug dosage calculations operate similarly to physiologic calculations except that
weight is handled differently, and that you must select an ADULT or NEONATE
patient type. Refer to Entering Patient Type and Gender on page 3-9 for details on
adult/neonate selection.
Accessing Calculation Data
Calculations can be accessed via the local bedside monitor or from a remote
monitor on the network depending upon the options purchased. Contact your
system administrator for details if you are unable to access this function.
The data displayed in the Calculations table is from the local bedside or the
specified remote monitor as selected.
Updating Data Between Monitors
The UPDATE DATA key is used to synchronize calculation data between multiple
monitors. For example, if lab data for calculations were entered at the central
monitor and stored in the bedside monitor database, using the UPDATE DATA
key would provide those values for calculations performed at the bedside.
Display Detail - Physiologic Calculations
Tables for Physiologic calculations occupy several display zones above the
message line, allowing display of waveforms on the remaining display zones of
the screen. The Drug Dosage calculations table has a different format, but
occupies the same four lower display zones.
WARNING:
• If the monitor is turned OFF, all clinical calculations data
will be lost.
To access local or remote calcs:
1Touch SPECIAL FUNCTIONS.
2a Select LOCAL or REMOTE
TRENDS/CALCS.
2b If you selected REMOTE
TRENDS/CALCS, select a bed.
3Touch CALCS.
4Select a calcs key (HEMO,
RESP, OXY, RENAL).
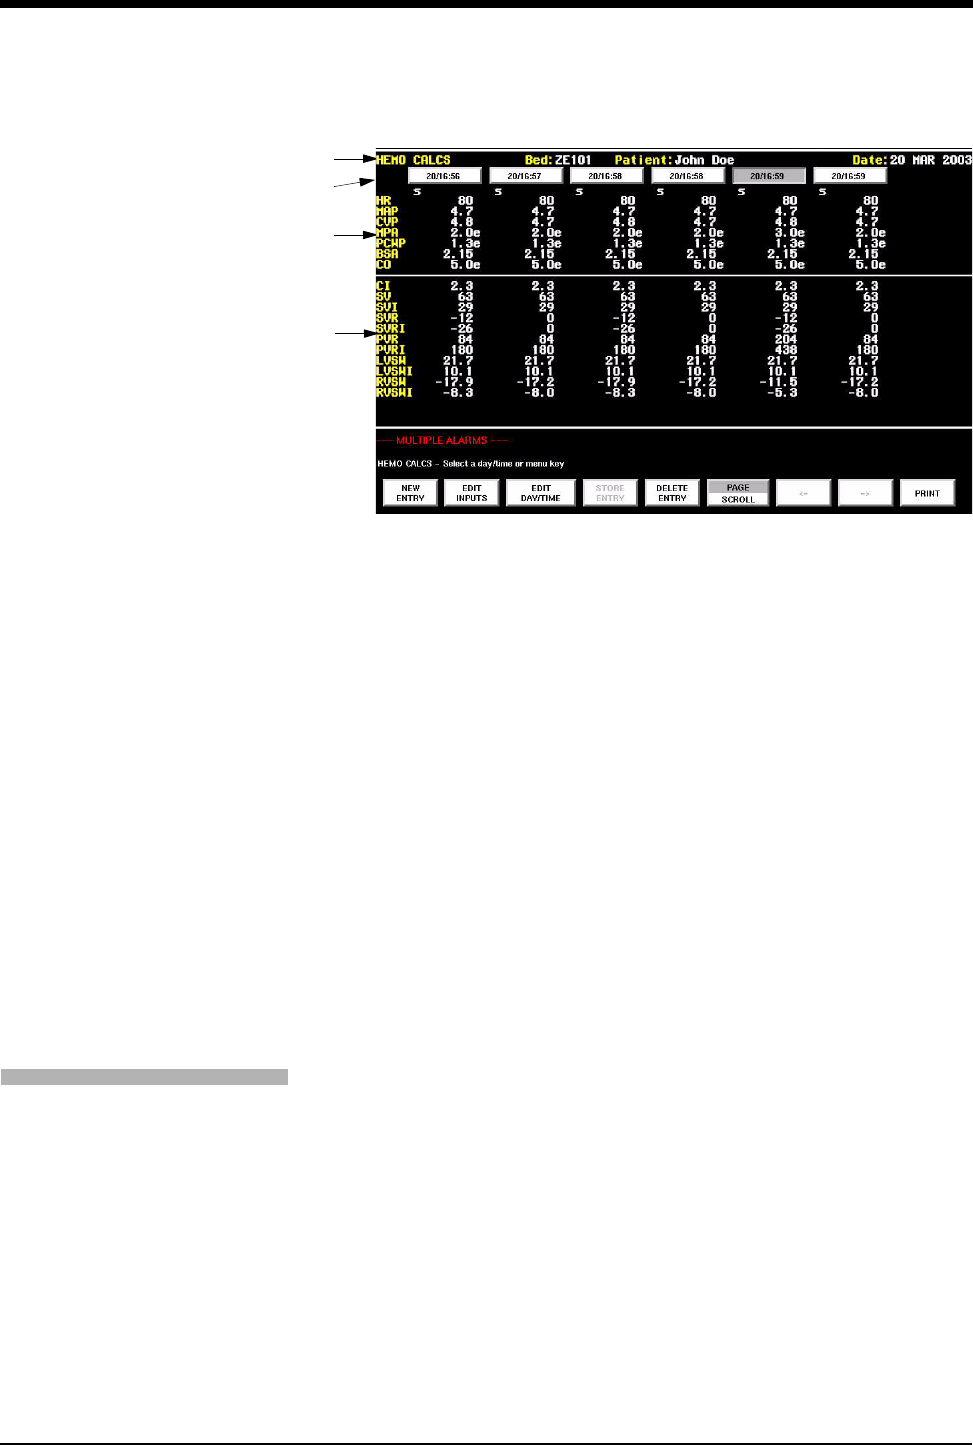
Calculations
25-7
Figure 25-1: Physiologic calculations table
The top line of the table shows the type of calculations performed, the bed
name, and the patient name.
A day/time key is displayed at the top of each data column. Each day/time
key indicates the day, hour, and minute. The hours can be in either 12-hour
or 24-hour format, depending on the system setup. When you use the
12-hour format, A or P are displayed to indicate either a.m. or p.m.
Calculation inputs are listed on the top of the table. Output from the
calculations are listed under the dividing line at the bottom of the table. Eight
columns of data can display on the screen at once, each column appears
under the key which corresponds to the day and time at which the data was
collected. New data values are entered to the right of existing ones. If the
table is full, older entries are shifted left one column. Data columns that do
not display remain in memory. A highlighted key indicates a selected column.
Scrolling and Paging
Toggle the PAGE/SCROLL key to SCROLL and use the left or right arrows to
move the Calculations table over one column in the desired direction. Newer
records display to the right, older records to the left.
Toggle the PAGE/SCROLL key to PAGE and use the left or right arrows to move
the calculations table over seven columns, or one whole page, in the desired
direction. Touch the right arrow key to display the next newer page (seven
columns) of records. This key does not function when the newest record is
displayed in the table. Touch the left arrow key to display the next oldest page
(seven columns) of records. The scrolling stops when the oldest record is
displayed on the table.
!
• All keys appear disabled except for NEW ENTRY and PRINT
until at least one record (data column) is displayed in the table.
To view calcs data:
1Touch CALCS.
2Select a calcs key.
3a Toggle the PAGE/SCROLL key
to SCROLL.
3b Use the → or ← keys to move
data by one column.
-OR-
4a Toggle the PAGE/SCROLL key
to PAGE.
4b Use the → or ← keys to move
data by seven columns.

Ultraview Care Network
25-8
Creating a New Entry
Touch the NEW ENTRY key to create a new record for the current day and time
and to add the record to the Calculations table. The new record is positioned
immediately to the right of existing records. If all the columns on the screen are
filled, the display shifts to the left and the new record is displayed in the far right
column.
The new record’s DAY/TIME key is highlighted and contains the current day and
time. The available input values are displayed in the input column and calculated
results appear in the output column. Any unavailable inputs or outputs are
displayed as question marks.
NEW ENTRY does not function when a total of 200 records exist in all the
Physiologic calculations tables for the selected system. If you want to make
further entries, you must first delete some of the existing entries from one or more
of the calculations tables.
Editing Inputs
Each type of calculation displays its own Edit Inputs menu containing the inputs
listed in the upper part of the Calcs table. The name of the input and units of
measure appear on each EDIT INPUTS key for the Physiologic calculations. Once
an input has been edited, the letter e is displayed immediately after the edited
value in the table.
When you select an input key, the on-screen keypad appears. Refer to Using the
On-Screen Keypad (Ultraview 1030/1050/1500/1600 only) on page 3-7 for on-
screen keypad operating instructions.
If you enter a height and weight in the BSA menu, the system automatically
computes a BSA. However, changing the BSA directly invalidates any height or
weight previously entered.
!
• Touch NEW ENTRY, then touch STORE ENTRY to store the
entry in the database. Entries that have not been stored remain
in the table until you select a different bed or patient, then they
disappear.
!
• The displayed units for pressure values, height, and weight may
vary based on your monitor's configuration. Contact your
system administrator for details.
!
• Changing the height and weight in the BSA menu does not
affect the height and weight in the Admit/Discharge menu.
To create a new entry:
1Access Local or Remote Calcs.
2Touch NEW ENTRY.
3Touch EDIT INPUTS to input
new data not available in the
system.
4Select an input key.
5Use the on-screen keypad to
input the value.
6Touch ENTER on the on-
screen keypad.
7Touch PREVIOUS MENU.
8Touch STORE ENTRY to
retain entry in Calcs table.
To edit a record:
1Access Local or Remote Calcs.
2Touch EDIT INPUTS.
3Select an input value to edit.
4Use the on-screen keypad to
change the input value.
5Touch ENTER on the on-screen
keypad.
6Touch PREVIOUS MENU, then
STORE ENTRY to retain entry
in Calcs table.

Calculations
25-9
Refer to Table 1 for adult and neonatal BSA, height and weight values for
hemodynamics, oxygenation, and renal calculations.
Editing Day and Time
To create a Calculations record for a specified day and time, create a new entry
and highlight the DAY/TIME key. Then touch EDIT DAY/TIME and enter the day
and time for the record you want to create.
Touch the DAY, HOUR, or MINUTE keys to highlight that key and display the on-
screen keypad. The selected parameter and value appear in the on-screen
keypad.
The hour can appear in either 12-hour or 24-hour format. If the system is set for
12-hour format, use the AM/PM key to select a.m. and p.m. on the DAY/TIME key.
When editing minutes and hours, you cannot change the value to a future time.
When you have entered the day, hour, and minute via the on-screen keypad, the
input values and output calculations reflect data available from the system at the
entered time. An e appears under any edited DAY/TIME key.
Storing an Entry
Touching the STORE ENTRY key after touching the DAY/TIME key stores the
record of input values and output calculations in the selected monitor’s database.
Up to 100 stored records may be saved in each system.
The letter s is displayed under the DAY/TIME key to indicate that the record has
been stored. If you edit a record after it has been stored, the letter s is removed
because the newly edited changes have not been stored. Storing a record
overwrites the data already stored.
Table 1: BSA, Height, and Weight Calculations
Label Name Units
Default Value
(1030, 1050, 1500, 1600 only) Valid Range
Adult Neonatal
BSA Body Surface Area m21.81 0.11 0.03 - 3.69
HT Height cm
in
170
66.9
35
13.8
20 - 215
7.9 - 84.6
WT Weight kg
lb
70.000
154.324
1.500
3.307
0.2 - 250.0
0.441- 551.156
!
• Stored records are saved until the system is powered down or
until patient data is purged via the Admit/Discharge function.
To create a record for a past
time:
1Access Local or Remote Calcs.
2Touch NEW ENTRY.
3Highlight the DAY/TIME key on
a new or prior entry.
4Touch EDIT DAY/TIME.
5Select DAY, HOURS, or
MINUTES.
6Use the on-screen keypad to
change.
7Touch ENTER on the on-
screen keypad.
8Touch PREVIOUS MENU,
then STORE ENTRY to retain
entry in Calcs table.
To store an entry:
1Access Local or Remote Calcs.
2Highlight DAY/TIME key of the
entry to be stored.
3Touch STORE ENTRY.

Ultraview Care Network
25-10
Deleting an Entry
After selecting a DAY/TIME key, you may delete a record by touching the
DELETE ENTRY key. A menu is displayed to confirm the deletion. A record
previously stored in the database via the STORE ENTRY key will be deleted from
the database, as well as from the table.
Automatically displayed records, such as cardiac output data, remain in the
database. These records reappear, even if deleted, when you leave and then
return to a patient or bed.
Printing
Touch the PRINT key to print the currently displayed page of the Calculations
table. The complete table prints on a 4-channel recorder. On a 2-channel
recorder, the top half of the table prints first followed by the bottom half.
Hemodynamic Calculations
Hemodynamic calculations provide significant data describing cardiovascular
system performance.
Cardiac output values from a Cardiac Output (CO) module automatically create
records in the Hemodynamic Calculation table.
When you create a new entry, any current values for HR, MAP, CVP, MPA, and
PCWP are displayed in the table. The system will enter the current body surface
value into the table, if available. The most recent CO value (if less than
15-minutes old) is also put into the table. If the system locates a CO value, then
values for MAP, CVP, MPA, or PCWP not currently available are put into the table
from the CO record. Any inputs which remain unavailable display question marks.
The DAY/TIME key displays the current time.
Table 2: Hemodynamic Input
Label Name Units Default
Value
Valid
Range
HR Heart Rate beats/min 70 0 - 300
MAP Mean Arterial Pressure mmHg
kPa 80 10.7 -50 - 300 -
6.7 - 40.0
CVP Central Venous Pressure mmHg
kPa
10
1.3
-50 - 99
-6.7 - 15.0
MPA Mean Pulmonary Artery
Pressure
mmHg
kPa
15
2.0
-50 - 99
-6.7 - 15.0
PCWP Pulmonary Capillary
Wedge Pressure
mmHg
kPa
10
1.3
-50 - 99
-6.7 - 15.0
CO Cardiac Output I/min 5.0 0 - 40.0
To delete an entry:
1Access Local or Remote Calcs.
2Highlight DAY/TIME of the entry
to be deleted.
3Touch DELETE ENTRY.
4Touch YES.
To print calcs data:
1Access Local or Remote Calcs.
2Touch PRINT.
To view current hemodynamic
calcs:
1Touch CALCS.
2Touch HEMO CALCS.

Calculations
25-11
Hemodynamic Calculations require several specific pressure values, including
CVP, MAP, and PCWP. CVP and MAP are monitored continuously; PCWP is an
episodic value. A data substitution may occur if any of these pressure values are
not available when you touch NEW ENTRY. When a substitution occurs, one of
the error messages listed here displays on the message line.
•Warning...RAP has been substituted for CVP.
A continuous RAP value is used instead of the continuous CVP value if CVP
is not available.
•Warning...NIBP has been substituted for MAP.
An episodic mean NIBP value which is less than 15-minutes old is used
instead of MAP if the continuous MAP value is not available.
•Warning...LAP has been substituted for PCWP.
A continuous LAP value is used instead of the episodic PCWP value if the
PCWP value is not available or is more than 15-minutes old.
Table 3: Hemodynamic Output
Label Name Units
CI Cardiac Index L/min2
SV Stroke Volume ml/beat
SVI Stroke Volume Index ml/beat/m2
SVR Systemic Vascular Resistance dynes x sec/cm5
SVRI Systemic Vascular Resistance Index (dynes x sec/cm5) x m2
PVR Pulmonary Vascular Resistance dynes x sec/cm5
PVRI Pulmonary Vascular Resistance Index (dynes x sec/cm5) x m2
LVSW Left Ventricular Stroke Work g x min/beat
RVSW Right Ventricular Stroke Work g x min/beat
LVSWI Left Ventricular Stroke Work Index g x min/beat/m2
RVSWI Right Ventricular Stroke Work Index g x min/beat/m2
Table 4: Hemodynamic Equations
BSA = Ht 0.725 x Wt 0.425 x 0.007184
CI = CO/BSA
SV = (CO/HR) x 1000
SVI = SV/BSA
SVR = 79.9 x [(MAP-CVP)/CO]
SVRI
= 79.9 x [(MAP-CVP)/CI]
= 79.9 x [(MAP-CVP)]/[CO/BSA]
= 79.9 x [(MAP-CVP)]/[CO x 1/BSA]
= 79.9 x [(MAP-CVP)/CO] x BSA
= SVR x BSA

Ultraview Care Network
25-12
Respiration Calculations
Respiration calculations describe the performance of the lungs in the ventilation
process.
Unless you have a ventilator Flexport interface, most input values for Respiration
calculations must be manually entered.
PVR = 79.9 x [(MPA-PCWP)/CO]
PVRI
= 79.9 x [(MPA-PCWP)/CI]
= 79.9 x [(MPA-PCWP)]/[CO/BSA]
= 79.9 x [(MPA-PCWP)]/[CO x 1/BSA]
= 79.9 x [(MPA-PCWP)/CO] x BSA
= PVR x BSA
LVSW = 0.0136 x SV x (MAP - PCWP)
RVSW = 0.0136 x SV x (MPA - CVP)
LVSWI = LVSW / BSA
RVSWI = RVSW / BSA
Assumes pressures are measured in mmHg
Table 5: Respiration Input
Label Name Units Default
Value
Valid
Range
RR Respiration Rate breaths/min 20 0-200
PaCO2
Partial Pressure of Arterial
Carbon Dioxide
mmHg
kPa
40
5.3
0-150
0-20.0
VT Tidal Volume ml/breath 500 0-3000
PIP Peak Inspiratory Pressure cmH2O 50 0-200
PLT Plateau Pressure cmH2O 30 0-200
PEEP Positive End Expiratory
Pressure cmH2O100-50
PECO2
Partial Pressure of Expired
Carbon Dioxide
mmHg
kPa
35
4.7
0-150
0-20.0
Table 4: Hemodynamic Equations (continued)
To view current respiration calcs:
1Touch CALCS.
2Touch RESP CALCS.

Calculations
25-13
Oxygenation Calculations
Oxygenation calculations provide specific data describing the efficiency with
which the body acquires, circulates, and utilizes oxygen in the cardiopulmonary
system. Input values for Oxygenation calculations are automatically obtained from
SpO2, SvO2, cardiac output modules, or Flexport interfaces. You must manually
enter inputs for laboratory blood analysis values.
Table 6: Respiration Output
Label Name Units
VMIN Minute Volume l/min
Cst Static Compliance ml/cmH2O
Cdyn Dynamic Compliance ml/cmH2O
VD Dead Space Volume ml
VD/VT Dead Space to Tidal Volume Ratio Ratio
VA Alveolar Ventilation ml/min
Table 7: Respiration Equations
VMIN = VT x RR/1000
Cst = VT/(PLT-PEEP)
Cdyn = VT/(PIP-PEEP)
VD = (PaCO2 - PECO2) x (VT/PaCO2)
VD/VT = VD/VT
VA = (VT - VD) x RR
Table 8: Oxygenation Input
Label Name Units Default
Value
Valid
Range
Fi02Fractional Inspired Oxygen % 50 0 - 100
PaO2Partial Pressure of Arterial Oxygen mmHg
kPa
100
13.3
0 - 500
0 - 70.0
SpO2Arterial Oxygen Saturation % 97 0 - 100
PaCO2
Partial Pressure of Arterial Carbon
Dioxide
mmHg
kPa
40
5.3
0 - 150
0 - 20.0
PvO2
Partial Pressure of Mixed Venous
Oxygen
mmHg
kPa
38
5.1
0 - 99
0 - 15.0
SvO2Mixed Venous Oxygen Saturation % 75 0 - 99
To view current oxygenation
calcs:
1Touch CALCS.
2Touch OXY CALCS.

Ultraview Care Network
25-14
Calculating O2AV, O2AVI, VO2, and VO2I requires a CO value to complete the
calculations. The most recent CO value (less than 15-minutes old) is used for
these calculations if it is available.
Table 9: Oxygenation Output
Label Name Units
CTaO2Arterial Oxygen Content ml/dl
CTvO2Venous Oxygen Content ml/dl
avDO2Arteriovenous Oxygen Content difference ml/dl
O2AV Oxygen Availability ml/min
O2AVIOxygen Availability Index ml/min/m2
VO2Oxygen Consumption ml/min
VO2IOxygen Consumption Index ml/min/m2
O2ER Oxygen Extraction Ratio None
PAO2Partial Pressure of Alveolar Oxygen mmHg
kPa
Qs/Qt Pulmonary Venous Admixture Shunt %
P/F PaO2/FiO2 ratio None
Table 10: Oxygenation Equations
CTaO2= (1.34 x Hgb x SpO2100) + (0.0031 x PaO2)
CTvO2= (1.34 x Hgb x SvO2/100) + (0.0031 x PvO2)
avDO2= CTaO2 - CTvO2
O2AV = CTaO2 x CO x 10
O2AVI= O2AV/BSA
VO2= avDO2 x CO x 10
VO2I= VO2/BSA
O2ER = (CTaO2 - CTvO2)/CTaO2
PAO2= [(FiO2/100) x (PB*-47)] - PaCO2 /0.8
Qs/Qt = 100 x [(1.34 x Hgb) + (0.0031 x PAO2) - CTaO2]
[(1.34 x Hgb) + (0.0031 x PAO2) - CTvO2]
* PB = Barometric Pressure

Calculations
25-15
Renal Calculations
Renal calculations provide data related to kidney function. Input for Renal
calculations, other than a previously entered BSA, must be manually entered. The
system automatically computes BSA when you enter a height and weight into this
menu.
Table 11: Renal Input
Label Name Units
Default
Value
Valid
Range
URK Urine Potassium mEq/l 60 0 - 300
PLOSM Plasma Osmolality mOsm/L 290 0 - 999
UROSM Urine Osmolality mOsm/L 575 0 - 9999
SerNa Serum Sodium mEq/l 140 0 - 999
CR Serum Creatinine mg/dl 1.10 0 - 9.99
UCR Urine Creatinine mg/dl 50.0 0 - 999.9
BUN Blood Urea Nitrogen mg/dl 12 0 - 999
URNa Urine Sodium mEq/L 90 0 - 999
URINE Urine Volume ml/day 2000 0 - 9999
Table 12: Renal Output
Label Name Units
URNaEX Urine Sodium Excretion mEq/day
URKEX Urine Potassium Excretion mEq/day
Na/K Urine Sodium: Potassium Ratio Ratio
COSM Osmolal Clearance ml/day
CH2O Water Clearance ml/day
U/POSM Urine: Plasma Osmolality Ratio Ratio
FENa Fractional Sodium Excretion %
CRCL Creatinine Clearance ml/min/m2
NSLOSS Non-Saline Loss ml/day
BUN/CR BUN: Creatinine Ratio Ratio
U/CR Urine: Serum Creatinine Ratio Ratio
To view current renal calcs:
1Touch CALCS.
2Touch RENAL CALCS.

Ultraview Care Network
25-16
Drug Dosage Calculations
When you touch DRUG CALCS, either the Adult Drug Calcs screen or the
Neonatal Drug Calcs screen displays, along with the Drug Dosage menu
(refer to Figure 25-2 and Figure 25-3).
Table 13: Renal Equations
URNaEX = URNa x URINE/1000
URKEX = URK x URINE/1000
Na/K = URNa/URK
COSM = (UROSM/PLOSM) x URINE
CH2O = URINE - COSM
U/POSM = UROSM/PLOSM
FENa = (URNa/SerNa) x (CR/UCR) x 100
CRCL = (UCR/CR) x (URINE/1440) x 1.73/BSA
NSLOSS = URINE - (URINE x UrNa/SerNa)
BUN/CR = BUN/CR
U/CR = UCR/CR
!
• Since only three columns appear on the screen at one time,
each illustration includes two screens — one with columns for
Drug A, B, and C, and one with columns for Drug D, E, and F.
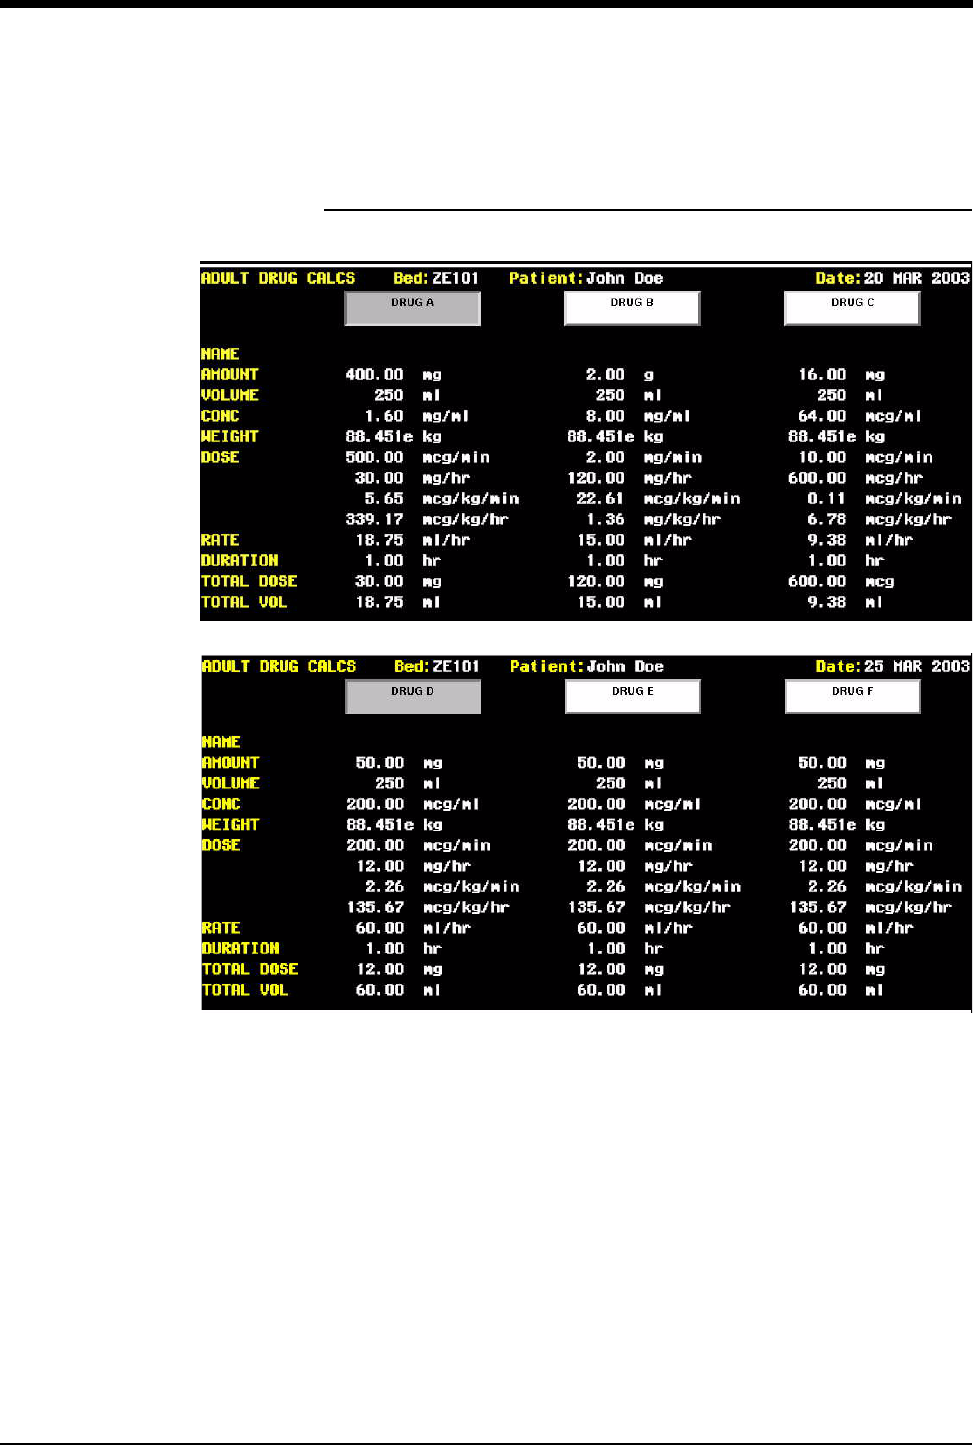
Calculations
25-17
Display Detail -
Drug Dosage Calculations
Figure 25-2: Adult drug calcs (drug keys A - F)
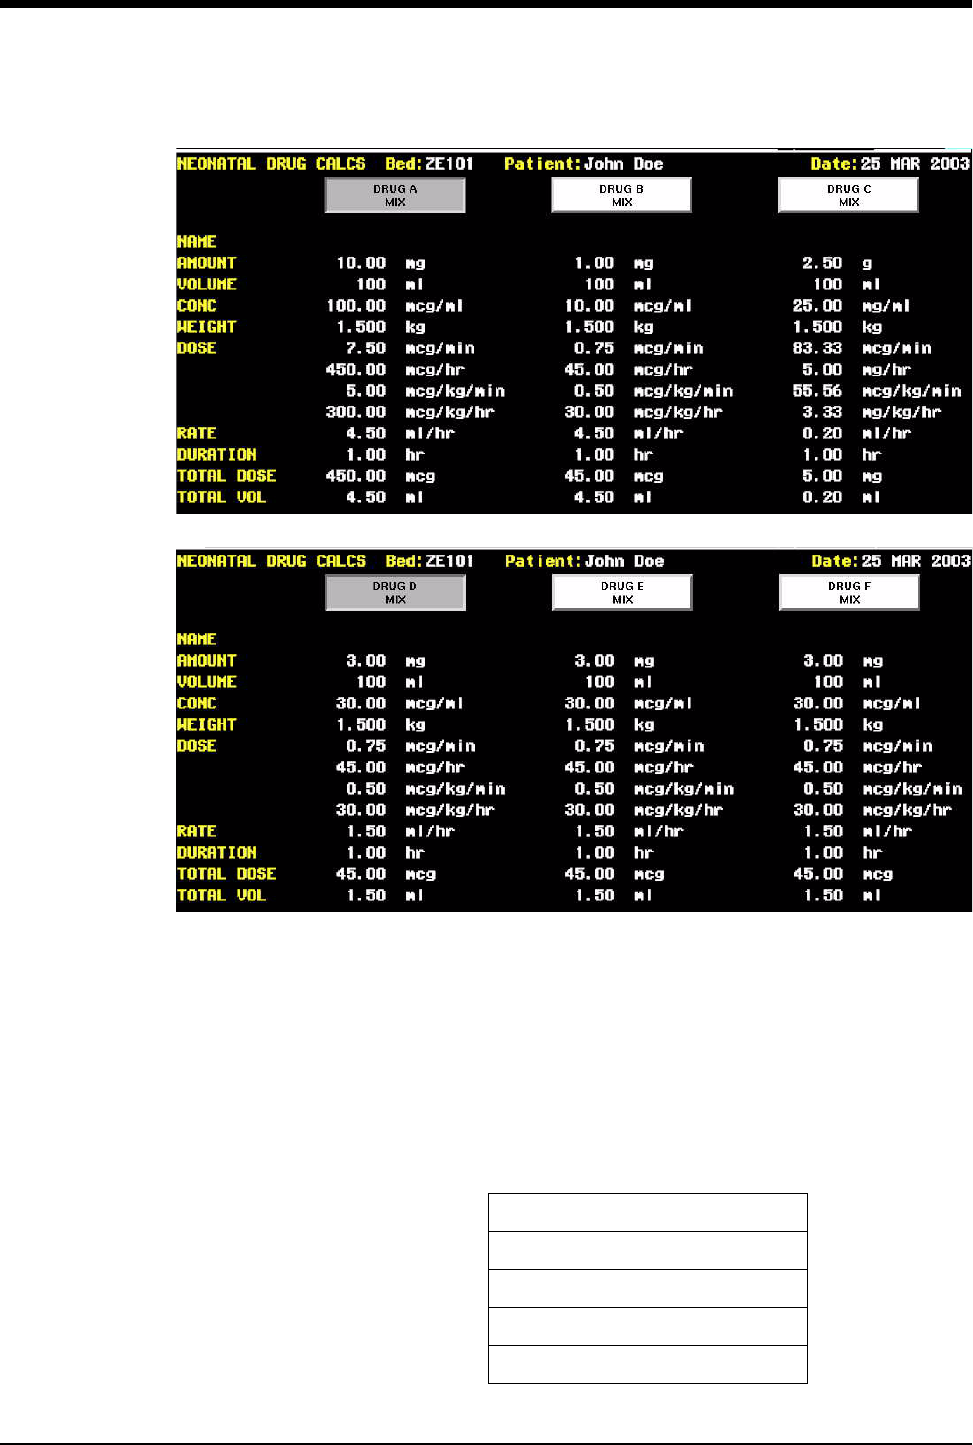
Ultraview Care Network
25-18
Figure 25-3: Neonatal drug calcs (drug keys A - F)
Select the DRUG A - F keys as you selected the DAY/TIME keys in other
calculations tables. When you begin drug dosage calculations, the patient’s
currently stored weight (automatically converted to kilograms) appears in the
table. Thereafter, selecting a drug key allows you to edit the data in the column
below it.
The DRUG A - F keys do not display actual drug names. However each column’s
default values are derived from common mixtures of frequently used drugs.
Table 14: Drug Dosage Equations
CONC = Amount/Volume
RATE = Dose/Conc
DOSE = Rate x Conc
TOTAL VOL = Rate x Duration
TOTAL DOSE = Dose x Duration

Calculations
25-19
Entering Drug Dosage Values
From the Drug Dosage menu you can edit the inputs, store up to six drug records,
display two titration tables for each of these drug records, and print any of the
displayed information.
You can enter drug values for adults or neonates, depending on the current
patient type selection (refer to Discharging a Patient on page 3-9 for more
information). If NEONATE was selected, the MIX/TITRATE key is displayed. The
MIX/TITRATE key toggles to highlight either MIX or TITRATE and affects how
calculations are performed when the DOSE is edited.
While WEIGHT is the only drug dosage input automatically entered by the system,
default values are present when you first display the table. You can edit any value
by manually entering a new value. Weight must be entered in kilograms.
To begin editing input values, touch a DRUG key. Touch EDIT INPUTS to display
the Edit Inputs menu. Touch any input key on the Edit Inputs menu, except UNITS
and DOSE (described later), to display the on-screen keypad. During editing, the
menu prompt shows the minimum and maximum values you can enter. Touch
ENTER in the on-screen keypad to update the Drug Dosage table.
Table 15: Drug Dosage Calculations
Label Name Valid
Range Possible Units of Measure
AMT Amount 0.01-
9999.99
mcg, mg, g, mEq, units,
k units, m units
VOL Volume 1-9999 ml
CONC Concentration 0.01-
9999.99
mcg/ml, mg/ml, g/ml, mEq/ml,
units/ml, k units/ml, m units/ml
WEIGHT Weight 0.2-250.0 kg
DOSE/MIN &
DOSE/HR Dose/Time 0.01-
9999.99
* mcg/xx, mg/xx, g/xx,
mEq/xx, units/xx, k units/xx,
munits/xx
DOSE/WT/MIN
&
DOSE/WT/HR
Dose/Weight/
Time
0.01-
9999.99
* mcg/kg/xx, mg/kg/xx,
g/kg/xx, mEq/kg/xx,
units/kg/xx, k units/kg/xx,
munits/kg/xx
RATE Flow Rates 0.1-999.99 ml/hr
DUR Duration 0.1-999.99 hr
TOTAL DOSE Total Dose 0.01-9999.9 mcg, mg, g, mEq, units,
kunits, m units
TOTAL VOL Total Volume 0.1-9999.99 ml
* where xx is minutes or hours
To access local or remote calcs
and drug calcs:
1Touch SPECIAL FUNCTIONS.
2a Select LOCAL or REMOTE
TRENDS/CALCS.
2b If you selected REMOTE
TRENDS/CALCS, select a bed.
3Touch DRUG CALCS.
4Select DRUG A, B, C, D, E, or F.
To enter a drug dose value:
1Access Local or Remote Drug
Calcs.
2Touch EDIT INPUTS.
3Select the desired key.
4Use on-screen keypad to
change value.
5Touch ENTER on the on-screen
keypad.

Ultraview Care Network
25-20
Changing Units of Measure
Units of measurement are displayed on the table to the right of the data values.
Changing the selected units for AMOUNT may also change the displayed units for
CONC. Changing the selected units for DOSE may also change the displayed
units for DOSE/WT and TOTAL DOSE.
If the values for CONC, DOSE/HR, DOSE/WT/HR, and TOTAL DOSE exceed the
range of their currently selected units, that value is divided by 1000 and the units
change accordingly. For example, if the value for TOTAL DOSE is 123,456 mg, it
will be displayed as 123.46 g. This value is rounded because only two digits can
be displayed to the right of the decimal point.
WEIGHT is displayed in kilograms (kg), regardless of the system’s setting for
weight. Weights in pounds automatically convert to kilograms prior to being
displayed.
Units Submenu
This menu allows you to choose one of three types of units (grams, mEq, and
units) for AMOUNT or DOSE.
Changing the units for AMOUNT may change the units for CONC. Changing the
unit type for AMOUNT changes the unit type for DOSE. Either may scale the
values and units for CONC, DOSE, DOSE/WT, and TOTAL DOSE up or down for
values less than 0.01 or greater than 9999.99.
Changing the units for DOSE may change the units for DOSE/WT and TOTAL
DOSE. As a result, both the minute and hour values for DOSE and DOSE/WT
may change.
Dose Submenu
When you select DOSE in the Edit Inputs menu, four dose type keys are
displayed. Select any of these keys to edit the corresponding value shown in the
Drug Dosage Calculations table. The system automatically calculates and
displays the changes for the other three dose types in the Drug Dosage
Calculations table.
The dose type selected for a specific drug defines the dose unit used for that
drug’s titration tables. When you store a Drug Calculation record, the dose type is
also stored.
Storing a Record
Touch STORE ENTRY to store the record and to display the letter s under the
associated DRUG key. You can store six records, one for each DRUG key. If you
edit a record that has been stored, the system removes the letter s because the
newly edited changes have not been stored.
To change drug units:
1Access Local or Remote Drug
Calcs.
2Touch EDIT INPUTS.
3Touch UNITS.
4Select units to change.
To store a drug record entry:
1Access Local or Remote Drug
Calcs.
2Select a Drug key.
3Touch STORE ENTRY.
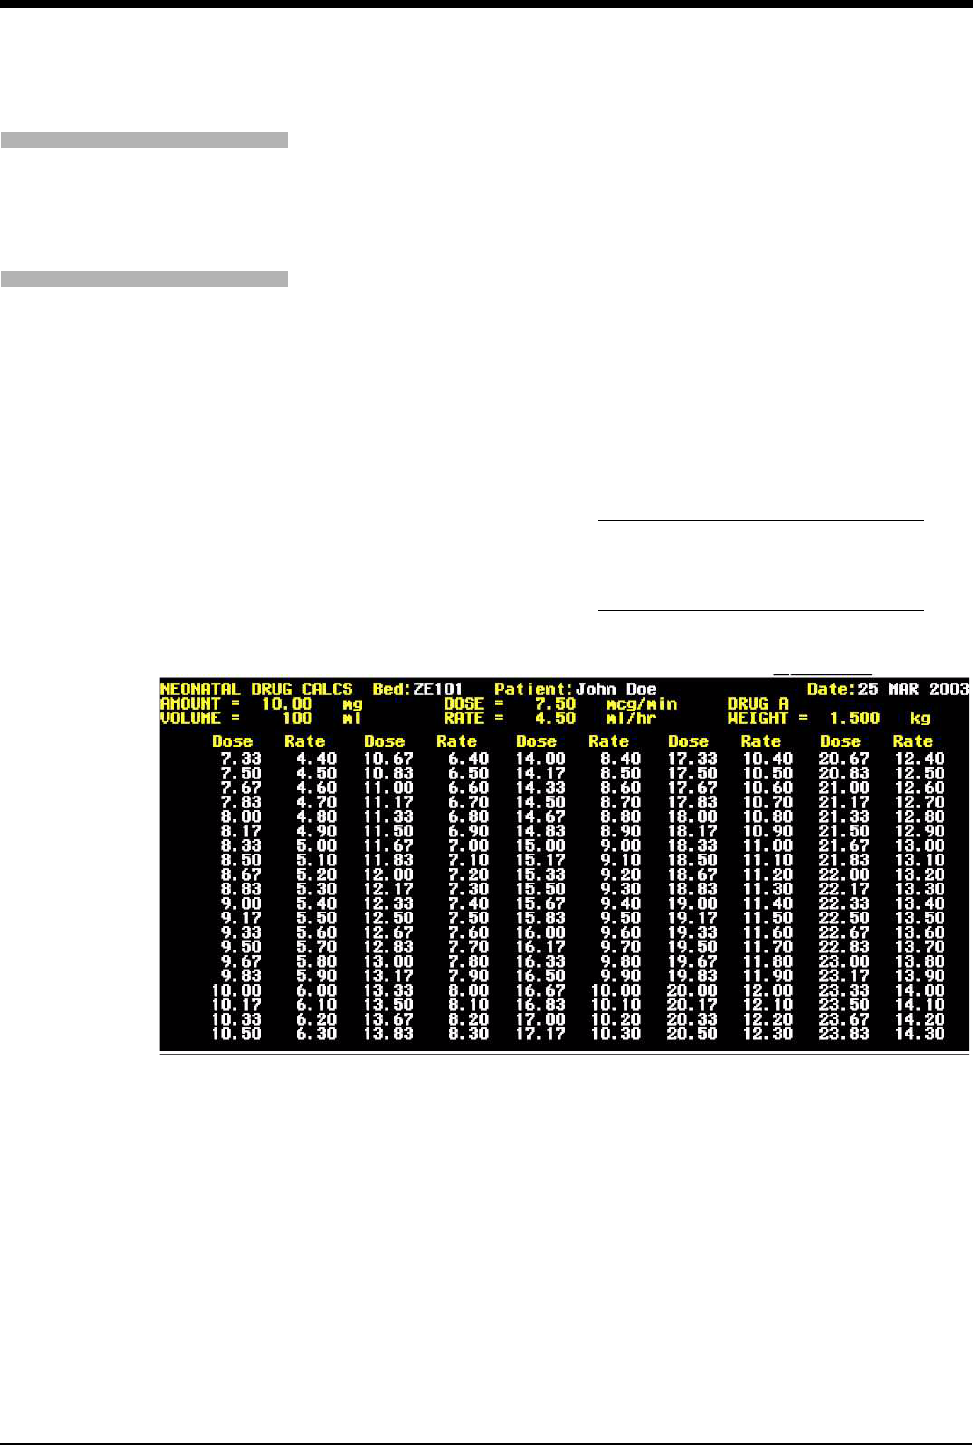
Calculations
25-21
Displaying Titration Tables
The VARY RATE/DOSE toggle key and DOSE TYPE keys are displayed when
you touch TITRATION TABLE. VARY RATE varies the rate (holding the
concentration constant) and calculates (titrates) the corresponding dose using the
selected dose unit type. VARY DOSE varies the dose (holding the drug
concentration constant) and calculates (titrates) the corresponding delivery rate in
ml/hr.
The DOSE TYPE key displays the DOSE TYPE menu where the dose values are
displayed and the Titration table is updated with the selected dose type. This key
is disabled whenever VARY RATE is selected, and enabled when VARY DOSE is
selected.
In the titration tables, flow rate and dose are calculated using the equations below.
Figure 25-4: Titration table
Figure 25-4 displays a sample Vary Rate Titration table. The amount and volume
is displayed at the top of the table along with the dose and rate units. The units for
amount and dose are the same units used in the Drug Dosage table.
The drug (A through F) and patient weight are displayed at the top of the table.
Dosages can vary between 0.01 and 9999.99 mg/min, and rates can vary
between 0.1 and 999.99 ml/hr.
The patient type (ADULT or NEONATE) is displayed in the upper left corner of the
table.
FLOW RATE in ml/hr = DOSE x 60 min/1 hr
AMOUNT/VOLUME
DOSE in xx/min = FLOW RATE x AMOUNT x 1hr/60 min
VOLUME
To display titration tables:
1Access Local or Remote Drug
Calcs.
2Touch TITRATION TABLE.
To vary based on rate/dose:
1Access Local or Remote Drug
Calcs.
2Touch TITRATION TABLE.
3Touch VARY RATE/DOSE.

Ultraview Care Network
25-22
Adjusting the Table Range
Use the SCROLL and PAGE keys in the Titration Table menu to select the range
of data displayed in the titration table. The default range is 1-100.
Printing
Touch the PRINT key to print the currently displayed page of the Calculations
table. The complete table prints on a 4-channel recorder. On a 2-channel
recorder, the top half of the table prints first followed by the bottom half
Recalculations
You can recalculate all Drug Dosage inputs except for the amount/hour entries
shown for DOSE and DOSE/WT. In most cases, changing one parameter
automatically recalculates and redisplays other parameters under that DRUG key.
Table 16 shows adult patient recalculation rules, except where noted in AMOUNT
and VOLUME. When TITRATE on the MIX/TITRATE key is selected, DOSE,
DOSE/WEIGHT, and FLOW RATE results are the same for Adult and Neonatal.
CAUTION:
• If any value in the Drug Calculation table is over its
designated range, ++++.++ will be displayed for values of
AMOUNT, CONC or DOSE, or RATE and the Titration Table
becomes inaccessible.
To print calcs data:
1Access Local or Remote Drug
Calcs.
2Touch PRINT.

Calculations
25-23
Table 16: Drug Dosage Recalculations
Edit Constants Results
AMOUNT
Holds VOLUME constant Calculates CONC
Holds DOSE (dose/min) constant Calculates FLOW RATE (ADULT only)
Holds DUR constant Calculates TOTAL VOL (ADULT only)
Holds DOSE constant Calculates FLOW RATE
Holds DUR constant Calculates TOTAL DOSE (NEONATAL only)
VOLUME
Holds AMOUNT constant Calculates CONC
Holds DOSE/MIN constant Calculates FLOW RATE (ADULT only)
Holds DUR constant Calculates TOTAL VOL (ADULT only)
Holds DOSE constant Calculates FLOW RATE
Holds DUR constant Calculates TOTAL DOSE and VOL (NEONATAL)
CONC
Holds VOLUME constant Calculates AMOUNT
Holds DOSE/MIN constant Calculates FLOW RATE
Holds DUR constant Calculates TOTAL VOL
WEIGHT Holds DOSE/MIN constant Calculates DOSE/WEIGHT/MIN
Holds DOSE/HR constant Calculates DOSE/WEIGHT/HR
DOSE or
DOSE/WEIGHT
(TITRATE)
Holds WEIGHT constant Calculates other 3 DOSE and DOSE/WEIGHTS
Holds CONC constant Calculates FLOW RATE
Holds DUR constant Calculates TOTAL DOSE and TOTAL VOL
DOSE or
DOSE/WEIGHT
(MIX)
Holds WEIGHT constant Calculates other 3 DOSE and DOSE/WEIGHTS
Holds FLOW RATE constant Calculates CONC
Holds VOLUME constant Calculates AMOUNT
Holds DUR constant Calculates TOTAL DOSE
FLOW RATE
(TITRATE)
Holds CONC constant Calculates DOSE/MIN and DOSE/HR
Holds WEIGHT constant Calculates DOSE/WEIGHT/MIN and DOSE/WEIGHT/HR
Holds DUR constant Calculates TOTAL VOL
FLOW RATE
(MIX)
Holds DOSE/HR constant Calculates CONC
Holds VOLUME constant Calculates AMOUNT
Holds DUR constant Calculates TOTAL DOSE and TOTAL VOL
DUR Holds DOSE/MIN constant Calculates TOTAL DOSE
Holds FLOW RATE constant Calculates TOTAL VOL
TOTAL DOSE
Holds CONC constant Calculates FLOW RATE
Holds DUR constant Calculates DOSE/MIN, DOSE/HR, and TOTAL VOL
Holds WEIGHT constant Calculates DOSE/WEIGHT/MIN and DOSE/WEIGHT/HR
TOTAL VOL
Holds DUR constant Calculates FLOW RATE
Holds CONC constant Calculates DOSE/WEIGHT/MIN and DOSE/WEIGHT/HR
Holds WEIGHT constant Calculates DOSE/WEIGHT/MIN and DOSE/WEIGHT/HR
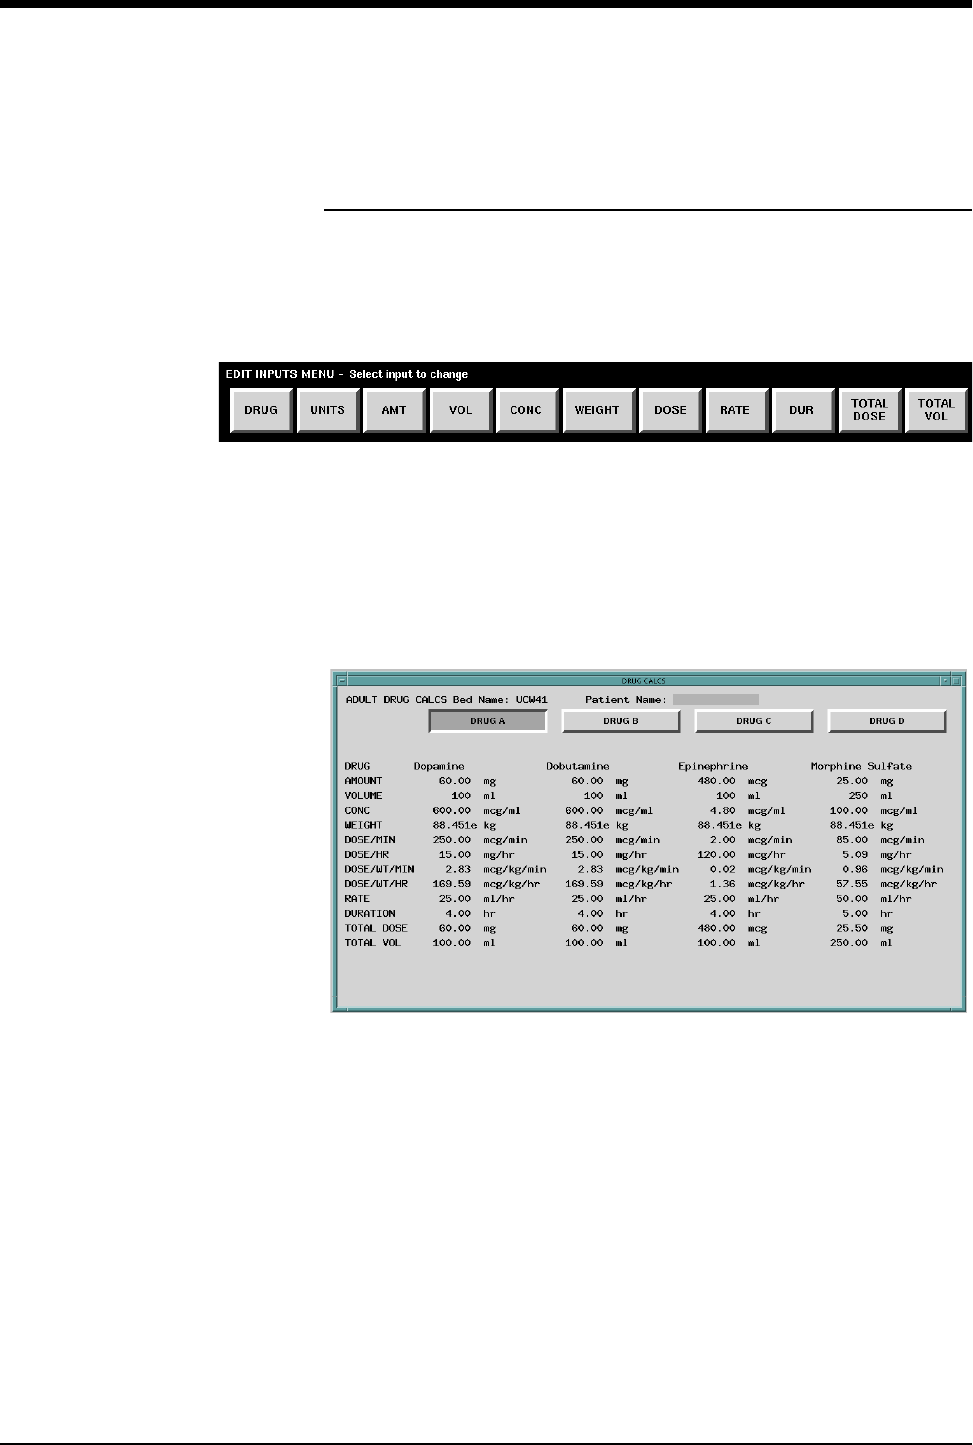
Ultraview Care Network
25-24
Configurable Drug Names
(UCW and Ultraview 1700 Only)
Using the Drug Name List
To use the list of drug names:
1. Touch the DRUG key in the Drug Calcs Edit Inputs menu.
Figure 25-5: Edit Inputs menu
2. The DRUG NAME LIST menu appears, enabling you to choose from the
master drug list. Select the appropriate drug name and then touch ACCEPT.
The drug name and stored default values are transferred into the currently
selected drug (A through F). Select CANCEL to remove the selection menu
without changing the current settings for the drug. Drug Calcs will display the
selected drug name below the key.
Figure 25-6: Drug Calcs display
Remote Drug Names
Drug names on local bedside monitors can be edited remotely from the host
monitor. The local names can be stored in the remote monitor even if the remote
bed does not include the drug in its own stored list. Drug names can be kept
consistent by transferring master drugs lists from one bed to another allowing
remote bed access to the master drug list.
!
• The drug default values for drugs A through F can be overwritten
and not affect the master drug list entry. However, selecting
another drug name for drug A, B, C, D, E, or F will override all
previously-edited values and will insert the master default
settings. Ensure that the changes are effected after selecting the
drug name (and not before).

Note: The values listed here represent commonly published
ranges for adults and are for reference purposes only.
Note: Acceptable values for individual patients should be
determined by hospital protocol and the attending physician.
Table 17: Hemodynamic Calculations
Variable Calculation Normal Range*
Cardiac Index (CI) CO
BSA
2.5 - 4.0
liters/min/m2
Stroke Volume (SV) CO x 1000 HR 60 - 130 ml/beat
Stroke Volume Index (SVI) SV
BSA
30 - 65
ml/beat/m2
Systemic Vascular Resistance (SVR) MAP - CVP x 79.9 CO 900 - 1400 dynes
x sec/cm5
Systemic Vascular Resistance Index
(SVRI)
MAP - CVP x 79.9 CI
(Converts to SVR x BSA)
1760 - 2600
(dynes x
sec/cm5) x m2
Pulmonary Vascular Resistance
(PVR) MPA - PCWP x 79.9 CO 20 - 130 dynes x
sec/cm5
Pulmonary Vascular Resistance
Index (PVRI)
MPA - PCWP x 79.9 CI
(Converts to PVR x BSA)
36 - 235 (dynes x
sec/cm5) x m2
Left Ventricular Stroke Work (LVSW) (MAP - PCWP) x SV x 0.0136
Left Ventricular Stroke Work Index
(LVSWI)
(MAP - PCWP) x SVI x 0.0136
(Converts to LVSW/BSA)
45 - 75 g x
min/m2/beat
Right Ventricular Stroke Work
(RSVW) (MPA - CVP) x SV x 0.0136
Right Ventricular Stroke Work Index
(RVSWI))
(MPA - CVP) x SVI x 0.0136
(Converts to RVSW/BSA)
4 - 8 g x
min/m2/beat
(HR = Heart Rate; BSA = Body Surface Area; MAP = Mean Arterial Pulse; CVP = Central
Venous Pressure; MPA = Mean Pulmonary Artery Pressure; PCWP = Pulmonary Capillary
Wedge Pressure)
Table 18: Renal Calculations
Variable Acquisition Method or
Calculation Units
Urine Potassium (URK) Laboratory Measurement mEq/L
Plasma Osmolality (PLOSM) Laboratory Measurement mOsm/L
Urine Osmolality (UROSM) Laboratory Measurement mOsm/L
Serum Sodium (SerNa) Laboratory Measurement mEq/L
Serum Creatinine (CR) Laboratory Measurement mg/dl
Urine Creatinine (UCR) Laboratory Measurement mg/dl
Blood Urea Nitrogen (BUN) Laboratory Measurement mg/dl
Urine Sodium (URNa) Laboratory Measurement mEq/L
Urine Volume (URINE) Data Entry ml/day
Urine Sodium Excretion (URNaEX) URNa x URINE/1000 mEq/day
Urine Potassium Excretion (URKEX) URK x URINE/1000 mEq/day
Urine Sodium to Urine Potassium Ratio (Na/K) URNa/URK (ratio)
Osmolar Clearance (COSM) (UROSM/PLOSM) x
URINE ml/day
Water Clearance (CH2O) URINE - COSM ml/day
Urine Osmolality to Plasma Osmolality Ratio
(U/POSM) UROSM/PLOSM (ratio)
Fractional Sodium Excretion (FENa) (URNa/SerNa) x (CR/UCR)
x 100 %
Creatinine Clearance (CRCL) (UCR/CR) x URINE/1440)
x 1.73/BSA ml/min/m2
Non-Saline Loss (NSLOSS) URINE - (URINE x
URNa/SerNa) ml/day
BUN to Creatinine Ratio (BUN/CR) BUN/CR (ratio)
Urine Creatinine to Serum Creatinine Ratio
(U/CR) UCR/CR (ratio)
Table 19: Oxygenation Calculations
Variable Calculation Normal
Range*
Arterial Oxygen Saturation
(SaO2)
Laboratory Measurement (SaO2) or Pulse
Oximetry (SpO2)95 - 100%
Partial Pressure of Arterial
Oxygen (PaO2)Laboratory Measurement 80 - 100
mmHg
Mixed Venous Oxygen
Saturation (SvO2)
Laboratory Measurement or Monitored
Valu e 60 - 80%
Partial Pressure of Mixed
Venous Oxygen (PvO2)Laboratory Measurement 35 - 45
mmHg
Oxygen Availability (O2AV) CTaO2 x CO x 10 900 - 1100
ml/min
Oxygen Availability Index
(O2AVI) O2AV/BSA 497 - 608
ml/min/m2
Arterial Oxygen Content
(CTaO2)(1.34 x Hgb x SpO2/100) + (PaO2 x 0.0031) 18 - 20 ml/dl
Mixed Venous Oxygen
Content (CTvO2)(1.34 x Hgb x SvO2/100) + (PvO2 x 0.0031) 14 - 16 ml/dl
Arterial/Venous Oxygen
Difference (avDO2)CTaO2 - CTvO23 - 5.5 ml/dl
Oxygen Consumption
(VO2)avDO2 x CO x 10 200 - 300
ml/min
Oxygen Consumption
Index (VO2I) VO2/BSA 110 - 166
ml/min/m2
Oxygen Extraction Ratio
(O2ER) VO2/O2AV (Simplifies to avDO2/CTaO2) 1/4 or 0.25
Partial Pressure of Alveolar
Oxygen (PAO2)[(FiO2/100) x (PB - 47)] - PaCO2/0.8 100 mm Hg
Pulmonary Venous
Admixture Shunt (Qs/Qt)
100 x[ (1.34 x Hgb) + (0.0031 x PAO2) -
CTaO2)]
(1.34 x Hgb) + (0.0031 x PAO2) - CTvO2
Varia ble,
depending on
FiO2
PaO2/FiO2 Ratio (P/F) PaO2/FiO2
Varia ble,
depending on
FiO2
(Hgb = Hemoglobin; PB = Barometric Pressure)
Table 20: Respiration Calculations
Variable Calculation Units
Respiratory Rate (RR) Monitored Value or
Ventilator breaths/min
Partial Pressure of Arterial Carbon Dioxide
(PaCO2)Laboratory Measurement mmHg
Tidal Volume (VT) Ventilator ml/breath
Peak Inspiratory Pressure (PIP) Ventilator cmH2O
Plateau Pressure (PLT) Ventilator cmH2O
Positive End Expiratory Pressure (PEEP) Ventilator cmH2O
Partial Pressure of Expired Carbon Dioxide
(PECO2)Data Entry mmHg
Minute Volume (VMIN) VT x RR/1000 L/min
Static Compliance (Cst) VT/(PLT - PEEP) ml/cmH2O
Dynamic Compliance (Cdyn) VT/(PIP - PEEP) ml/cmH2O
Dead Space Volume (VD) (PaCO2 - PECO2) x
(VT/PaCO2)ml
Dead Space to Tidal Volume Ratio (VD/VT) VD/VT (ratio)
Alveolar Ventilation (VA) (VT - VD) x RR ml/min

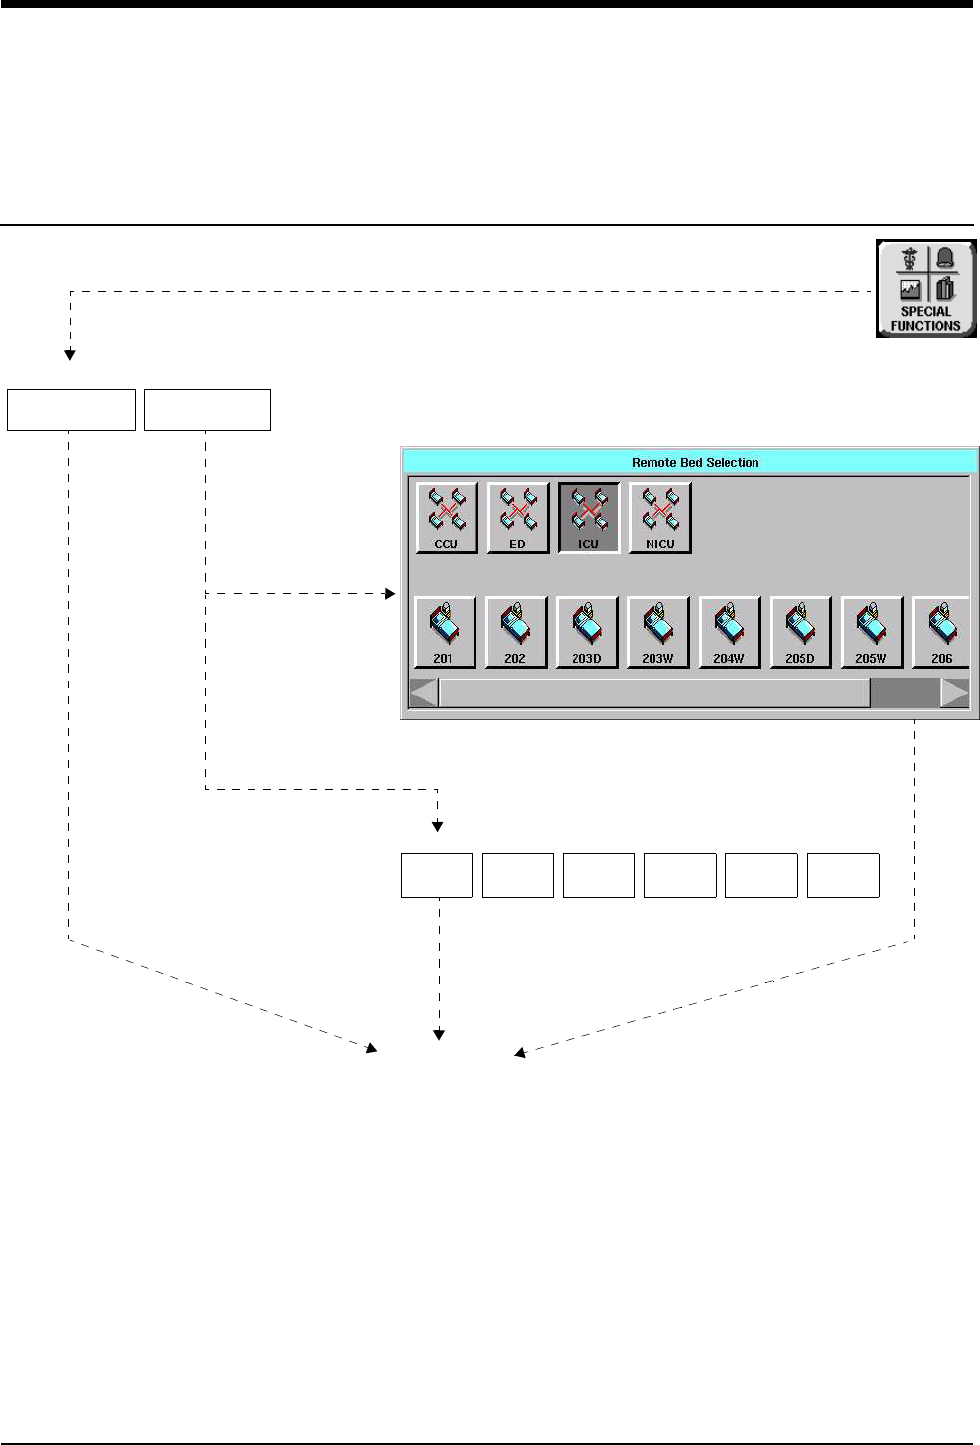
26-1
!
• Based on features purchased, more or fewer keys may appear here than on your menu screens.
Trends Directory
Directory of Keys
LOCAL
TRENDS/CALCS
REMOTE
TRENDS/CALCS
SPECIAL FUNCTIONS
NOTE: Requires Trend/Calcs enabled
Ultraview 1030/1050/1500/1600
UCW/Ultraview 1700
See next page
BED 1 BED 2 BED 3 BED 4 BED 5 MORE
REMOTE TRENDS/CALCS - Select bed
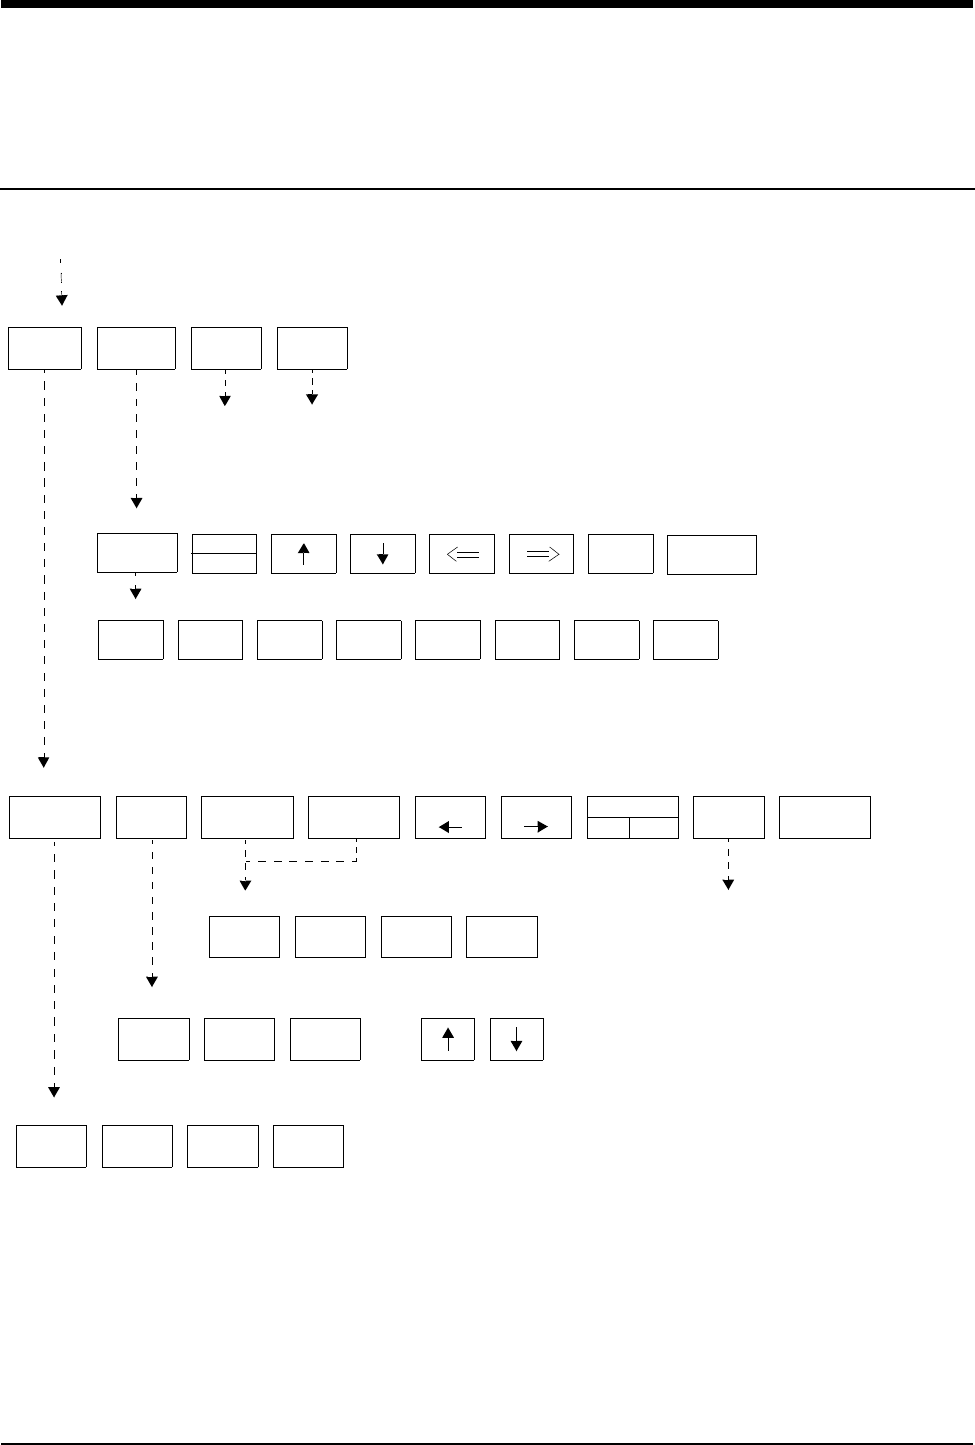
Trends Directory
!
• Based on features purchased, more or fewer keys may appear here than on your menu screens.
26-2
Directory of Keys
GRAPHIC
TRENDS
TABULAR
TRENDS CALCS
2
HRS
6
HRS
12
HRS
24
HRS
ART
ECG
HR
CHANGE TIME BASE
TIME
BASE
TOP
GRAPH
BOTTOM
GRAPH
EXPAND
ON OFF
TABULAR
TRENDS
PRINTSIZE CURSOR CURSOR
RESP
RR TEMP
TREND PARAMETERS
RESP
RR
ECG
HR
ECG
ABN
CHANGE SIZE
GRAPHIC TRENDS
NOTE: Keys are labeled according to parameters currently being trended
NOTE: Keys are labeled according to parameters currently being trended
1
MIN
5
MIN
10
MIN
30
MIN
15
MIN
1.5
HR
1
HR
3
HR
PRINT GRAPHIC
TRENDS
TIME
INTERVAL
PAGE
SCROLL
TABULAR TRENDS
CHANGE TIME INTERVAL
Refer to Printing the Trend Display
in this chapter
TRENDS/CALCS for BED xxx
DRUG
CALCS
Refer to Calculations chapter
Refer to page 26-1

Contents
26-3
Trends
Overview
Trends are a convenient way of displaying numeric data that has been collected
for a patient over the last 24-hours. Your monitor can display a graphic trend or
tabular trend (depending on the option purchased) of collected numeric data for
every parameter except delta temperature and EEG. This data appears in a table
format similar to common flowsheets or spreadsheets.
Graphic trends can appear in three formats.
• Continuous trends represent parameters with continuous monitoring. A solid
line connects trend points.
• Episodic trends represent parameters that produce individual events.
Episodic values are displayed as an x,+, or 0. A dotted line connects each
episode.
• Histogram trends are displayed as vertical bars starting at a base of zero.
The system collects trend values every minute and episodic trend values as they
become available. Up to the last 24-hours of collected data in memory is
displayed and the system saves trend values for as long as memory limitations
allow. In most cases, an episodic trend contains at least 30 values.
!
• When you suspend alarms with the TONE RESET/ALM
SUSPEND key the system may not collect trend data. Contact
your system administrator to enable this function.
To display a trend:
1Touch SPECIAL FUNCTIONS.
2a Select LOCAL TRENDS/
CALCS or REMOTE TRENDS/
CALCS.
2b If you touched REMOTE
TRENDS/CALCS, select a bed.
3a Touch GRAPHIC TRENDS.
-OR-
3b Touch TABULAR TRENDS.
(Follow these three steps to start
each quickstart in this chapter.)
Overview . . . . . . . . . . . . . . . . . . . . . . . . . . . . . . . . . . . . . . . . . . . . . . . . . . . . . . 3
Display Detail. . . . . . . . . . . . . . . . . . . . . . . . . . . . . . . . . . . . . . . . . . . . . . . . . . . 4
Printing the Trend Display . . . . . . . . . . . . . . . . . . . . . . . . . . . . . . . . . . . . . . . . . 5
Graphic Trends Features. . . . . . . . . . . . . . . . . . . . . . . . . . . . . . . . . . . . . . . . . . 6
Tabular Trends Features . . . . . . . . . . . . . . . . . . . . . . . . . . . . . . . . . . . . . . . . . . 7
Trends Troubleshooting Guide . . . . . . . . . . . . . . . . . . . . . . . . . . . . . . . . . . . . . 8
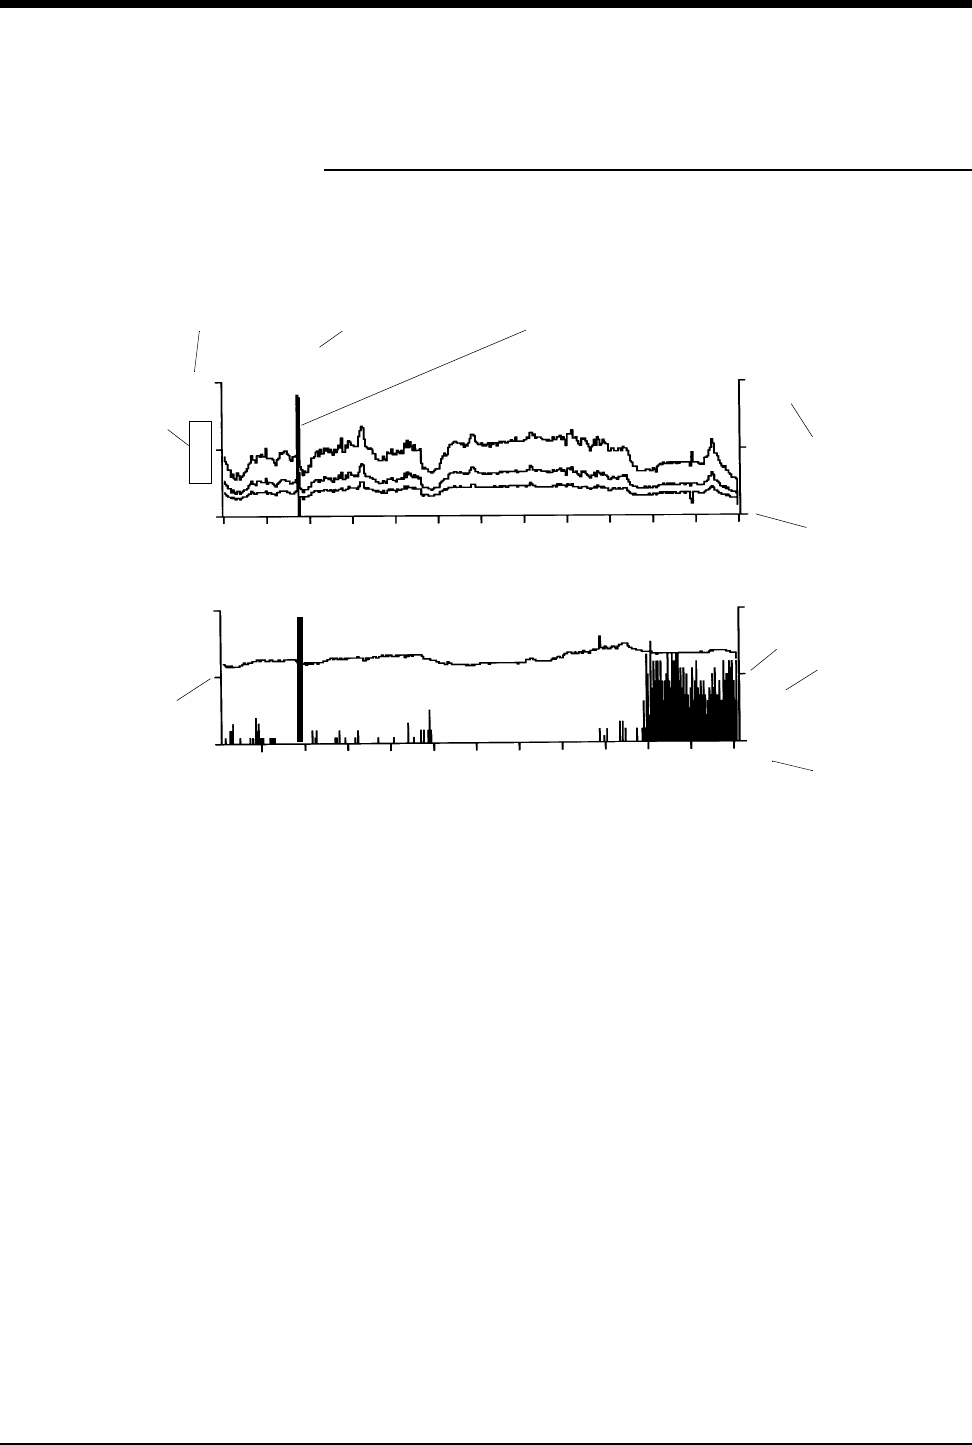
Ultraview Care Network
26-4
Display Detail
Graphic Trend Display
Figure 26-1: Graphic trends display
Trend unit of measure (unit labels are not displayed for parameters with one
acknowledged unit of measure for example, ECG, RESP, and CO.)
Scale value - use SIZE key to select
Bed and patient identification
Cursor
Data values for top graph*
Upper trend time axis
Right axis for bottom graph
Data values for bottom graph*
Lower trend time axis
쐅Left axis for bottom graph
* When the cursor is displayed, data values reflect those at the cursor location,
and the Values at label is displayed. When the cursor is not displayed, data
values reflect current values, and the Current Values label is displayed.
The system maintains settings for trend displays (time base, parameters, size,
etc.) until you change them or display a new patient’s trend.
Bed: S114
Values at
Time: 08:27
Left axis:
ART (mmHg)
SYS = 136
MEAN = (96)
DIA = 74
Left axis:
ECG
HR = 128
Right axis:
ABN = 10
-6 -5 -4 -3 -2 -1 0 hr
0
300
200
08:30a 9:30a 10:30a 11:30a 12:30a 1:30p
0
20
k
p
a
m
m
H
g
Date: 01 Jun 2003
Patient: Smith, A.
쐅

Trends
26-5
The messages “No trends available for this bed” or “Trend data not available”
appear when trend data has yet to be accumulated for the selected bed.
Tabular Trends Display
You can view a tabular trend of continuous patient data and episodic patient data
acquired within the last 24-hours by touching the TABULAR TRENDS key.
Figure 26-2: Tabular trends display
Bed identification
Patient name
Times that data was collected
Date of tabular trend
Trended data
Unit of measure for each parameter
List of parameters
Parameters always appear in descending order of priority. Data that is monitored
on a continuous basis always precedes episodic data. Episodic values are
presented according to the sequence in which they were originally stored. Data
older than 24-hours is not displayed.
Calculations data does not appear in tabular trends.
Printing the Trend Display
You can print a copy of the displayed graphic trend or tabular trend at any time.
!
• When using a 2-channel printer, the top and bottom half of the
trend display print consecutively.
Bed: 220 Patient: SMITH, JOHN Date: 18 JUN 2003 CURRENT
Time 05:30 06:00 06:30 07:00 07:30 08:00 08:30 09:00
HR(ECG) b/min 70 75 82 67 76 85 72 77
ABN b/min0 0 0000 0 0
RR(RESPbr/min814998814 14
ART/s mmHg 165 137 165 165 165 165 137 138
MAP mmHg 136 136 136 136 136 136 108 109
ART/d mmHg 108 80 108 108 108 108 80 81
To print the trend display:
1Adjust trend display as desired.
2Touch PRINT.

Ultraview Care Network
26-6
Graphic Trends Features
Selecting Trend Parameters
The first time you display a patient’s graphic trend, the highest priority parameter
is displayed on the bottom trend graph and the next highest priority parameter is
displayed on the top graph. You can view other trends by selecting them from the
Trend Parameter menu.
Using the Cursor
The graphic trends cursor is a solid, vertical line that moves across the entire
trend graph (refer to Figure 26-1 on page 26-4). The home position of the cursor is
at the extreme right end of the graph. Once the cursor moves from its home
position, the CURRENT VALUES label changes to reflect the cursor’s current
position. The CURRENT VALUES label now displays VALUES at and the time.
These values represent the data acquired from the patient.
Selecting a Time Base
The time base for each trend graph can be set for 2-, 6-, 12-, or 24-hours. The
displayed resolution for each time base is:
Selecting a Scale Size
You can adjust the scale for each parameter. Initially, the system selects a scale
that includes all monitored values for the displayed parameter. You may adjust the
scales using the arrow keys.
!
• The trend graph continues to update EXCEPT when the cursor
is moved from its home position. It updates again when the
cursor returns to its home position.
• When switching between Graphic Trends and Tabular Trends,
the cursor remains in the same position. For example, if the
cursor is placed on data 2-hours previous to the current time in
Graphic Trends, when moving directly to Tabular Trends, the
screen will display the same time frame, and the corresponding
data column will be highlighted.
2-hours = 1-minute
6-hours = 1-minute
12-hours = 2-minutes
24-hours = 4-minutes
To select a parameter for the top
or bottom graph:
1Select TOP GRAPH or
BOTTOM GRAPH.
2Select desired parameter.
To move the cursor:
1Touch cursor keys as needed.
To set a trend graph time base:
1Touch TIME BASE.
2Select 2, 6, 12, or 24 HRS.
To adjust the scale size:
1Touch SIZE.
2Select desired parameter key.
3Use arrow keys to adjust.

Trends
26-7
Expanding the Trend Display
You may expand the trend display to include only an hour’s worth of information.
With EXPAND ON, the TIME BASE key does not operate and updating of the
trend graph is suspended on the graph as it is currently displayed. When
EXPAND is OFF, the trend graph returns to its original display. Moving the cursor
while EXPAND is ON does not change the cursor’s position in the OFF mode.
Tabular Trends Features
Setting a Time Interval
You can display acquired data at various time intervals: 1-, 5-, 10-, 15-, and
30-minutes; and 1-, 1.5-, and 3-hours.
For continuous data, the value displayed in the tabular trend table is the value
taken at the displayed time. It is not an average of all readings taken during that
time period.
When more than one episodic reading occurs in the same time interval, only the
most recent value is displayed. Asterisks to the right of the episodic value
indicates that more data entries are available for that time interval.
The trend table automatically updates at the end of each time interval. This shifts
all data columns to the left to include the new interval.
Viewing Off-Screen Information
You can view up to 22 rows and 7 columns of parameter data on a single screen
in a tabular trend.
You can view additional parameters by moving rows up or down. When you select
PAGE, the arrow keys move the entire page up or down. When you select
SCROLL, the arrow keys move the display up or down one parameter row at a
time.
You can view data collected at other times by moving columns left or right. When
you select PAGE, the arrow keys move the display to show an entirely new set of
columns. When you select SCROLL, the arrow keys move the display left or right
by one column.
!
• Updating is suspended when you review data while paging or
scrolling.
To expand the trend display:
1Touch either CURSOR key to
move the cursor to the desired
location.
2Select EXPAND ON.
To set a time interval
1Touch TIME INTERVAL.
2Select the desired time interval.
To view additional parameters
and data (for Tabular Trends):
1Select PAGE or SCROLL.
2Use the ↑ and ↓ arrow keys to
move parameter rows up or
down.
To view additional parameters
and data (from a different time):
1Use the PAGE and SCROLL up
and down arrow keys to move
parameter rows vertically.
-OR-
2Use the PAGE and SCROLL left
and right keys to move data
columns horizontally.

26-8
Trends Troubleshooting Guide
Clinical Situation Possible Cause Solution
Current patient data not
being added to trends
■If alarms are suspended data may not
be trended at the bedside monitor.
■Turn ON alarms or have your system
administrator enable your system to
trend while alarms are suspended.
■EXPAND key ON
(trend data will not be lost).
■Change EXPAND to OFF.
Resume ECG processing.
■Cursor not in home position
(trend data will not be lost).
■Move the cursor to the extreme right
position.
PCWP trend not
available
■PCWP values not saved. ■Save the PCWP values.
Incorrect unit of
measure displayed
■Incorrect unit of measure configured
for system.
■Contact your system administrator.
CALCS data not
trending
■Trends cannot trend CALCS. ■Use the CALCS menu to display this
data.
NO TRENDS
AVAILABLE FOR THIS
BED message is
displayed
■No trend data has yet accumulated for
the selected parameter.
■Allow sufficient time for data to
accumulate.
Numerous entries with
??? instead of vital
signs
■Alarm Suspend was selected
frequently.
■Contact your system administrator to
collect data during Alarm Suspend
periods.
■ECG/Resp processing suspended. ■Do not suspend ECG processing unless
the patient is off the system.
■Ensure that ECG/Resp amplitude and
signal quality are sufficient.
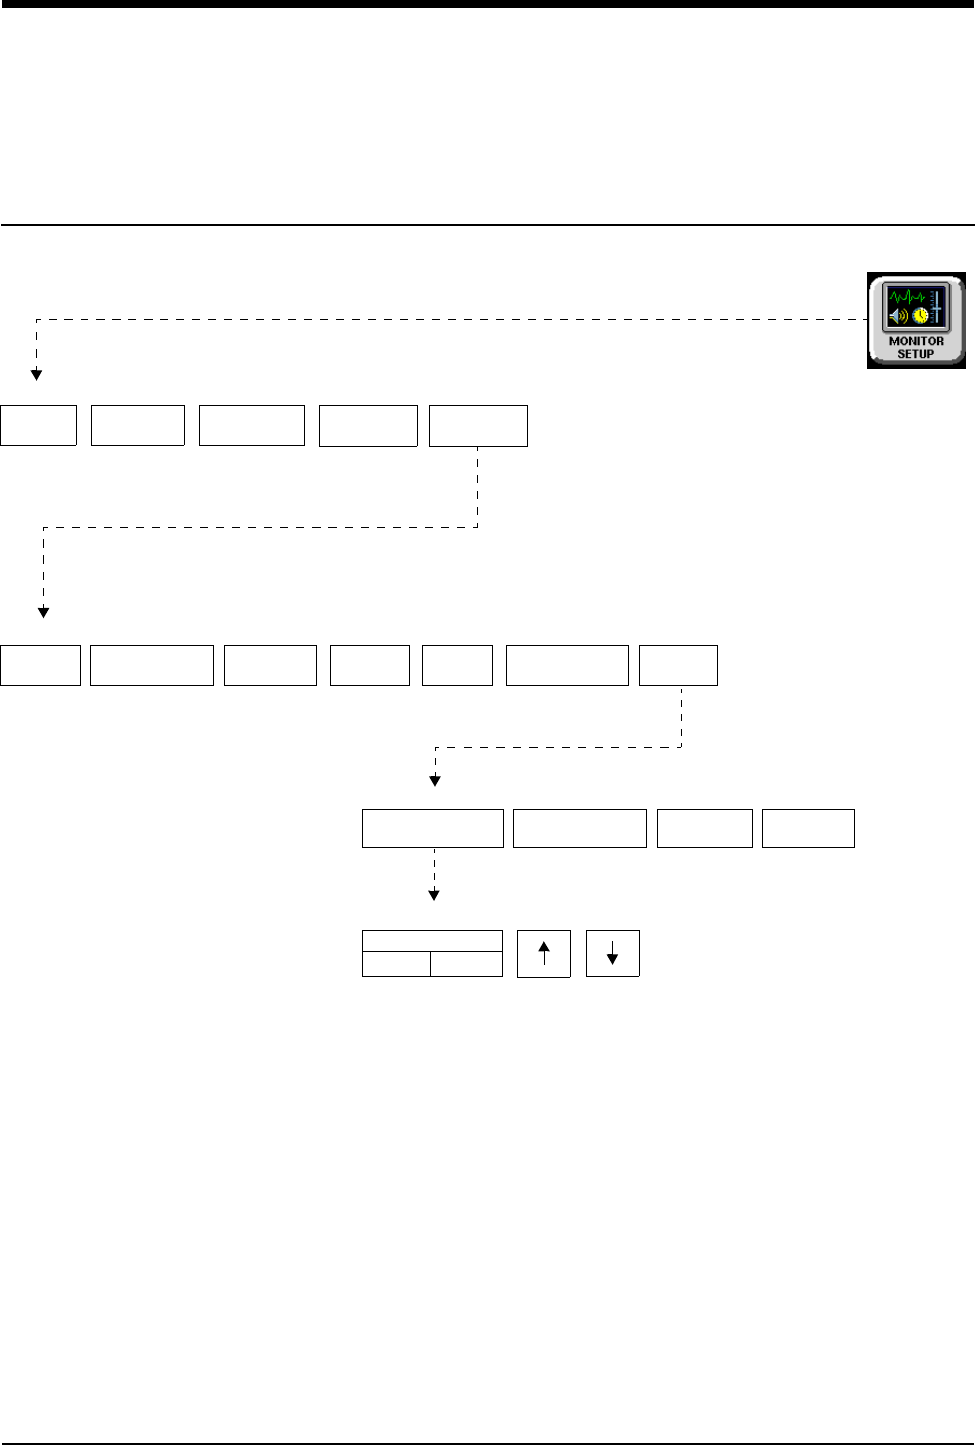
27-1
!
• Based on features purchased, more or fewer keys may appear here than on your menu screens.
Remote Keypad
Directory of Keys - UCW and Ultraview 1700
ADMIT/
DISCHARGE
MONITOR
CONFIG.
TONES
MONITOR SETUP
PRIVILEGED
ACCESS
SECURE MODE
ON OFF
RESET
MONITOR
REMOTE KEYPAD
STATION ADDRESS
CHANGE CLINICAL
PASSWORD
CLINICAL LEVEL - Select Parameter
UNITS OF
MEASURE
USER MORE
ALARM
SETUP
PRESELECTED
RECORDINGS
CLINICAL LEVEL: Select Parameter
TIME/
DATE ACCESS
ALARM WATCH
SETUP
CLINICAL LEVEL - Set remote keypad station address: X
RECORDER
CONFIG.
MOUSE
CONTROL


Contents
27-3
Remote Keypad
Overview
The remote keypad option allows you to remotely suspend or adjust alarms,
access graphic trends, adjust waveform size, initiate recordings, etc. The zoom
function enlarges menu keys on the monitor making them easy to read from
across the room.
Setting Up the Remote Keypad
The remote keypad is a cordless, hand-held transmitter powered by an internal
battery (refer to Figure 27-1). It sends your instructions via infrared signals to the
monitor’s receiver. The maximum operating range is 20 feet at an angle of up to
45 degrees on either side of the receiver.
The remote keypad provides all of the functions you need to operate your monitor
remotely.
!
• The operational range of the remote keypad is approximately
20 feet.
Overview . . . . . . . . . . . . . . . . . . . . . . . . . . . . . . . . . . . . . . . . . . . . . . . . . . . . . . . 3
Setting Up the Remote Keypad . . . . . . . . . . . . . . . . . . . . . . . . . . . . . . . . . . . . . . 3
Selecting a Parameter . . . . . . . . . . . . . . . . . . . . . . . . . . . . . . . . . . . . . . . . . . . . . 5
Operating Menu Keys . . . . . . . . . . . . . . . . . . . . . . . . . . . . . . . . . . . . . . . . . . . . . 5
Recording a Waveform . . . . . . . . . . . . . . . . . . . . . . . . . . . . . . . . . . . . . . . . . . . . 5
Programming Access Codes . . . . . . . . . . . . . . . . . . . . . . . . . . . . . . . . . . . . . . . . 6
Remote Keypad Troubleshooting Guide . . . . . . . . . . . . . . . . . . . . . . . . . . . . . . . 7
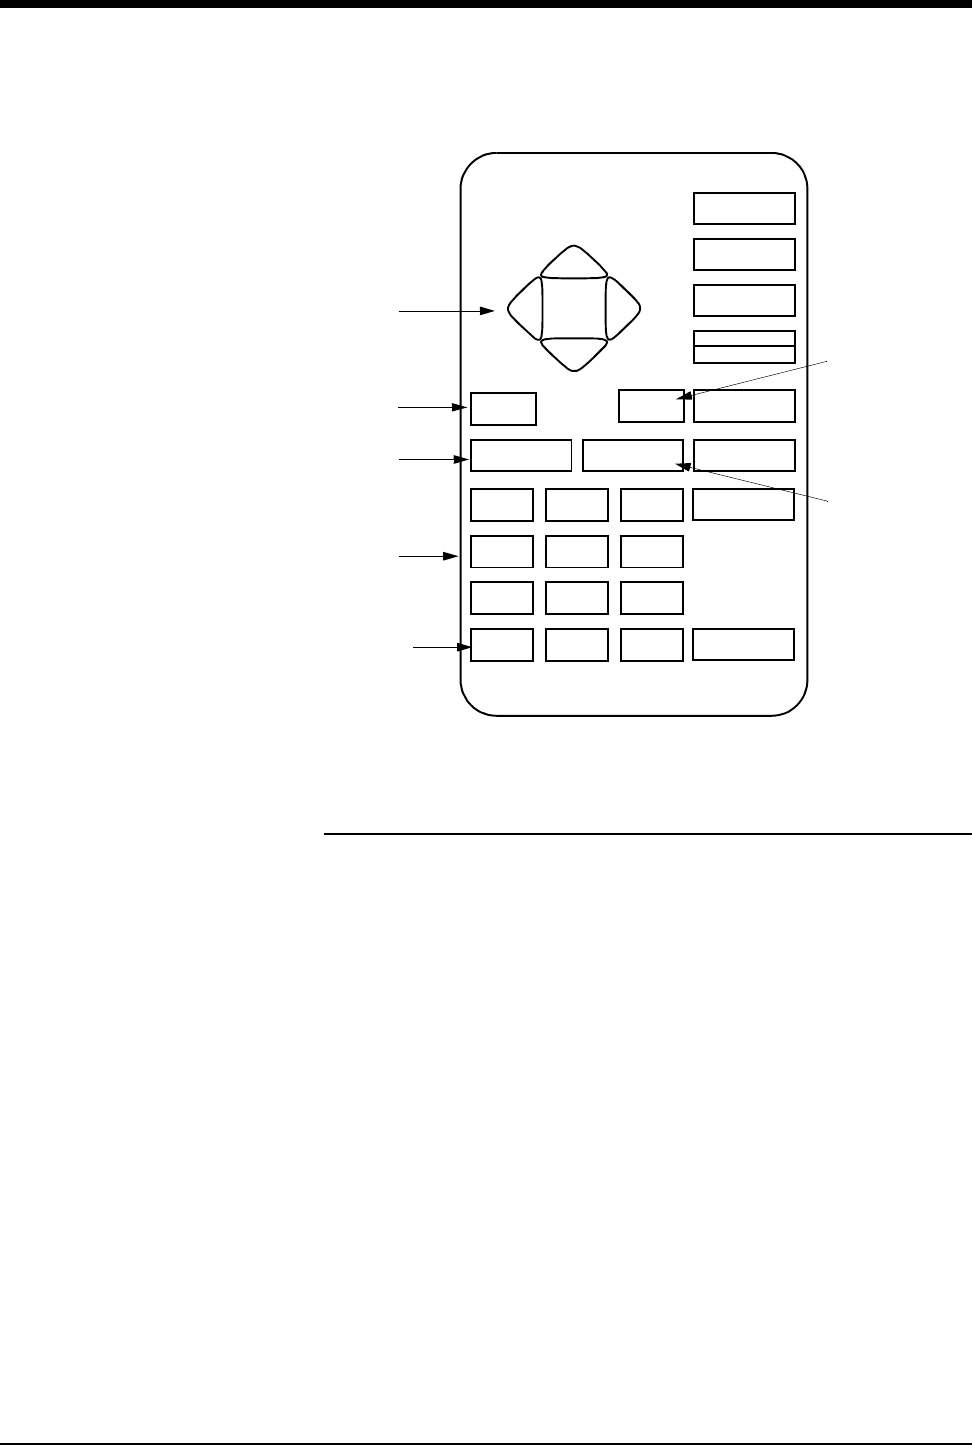
Ultraview Care Network
27-4
Figure 27-1: Remote keypad
Setting Up the Receiver
An optional receiver is required for the Ultraview 1700. The receiver attaches to
the side of the monitor and connects to the nurse alert port (J14) on the back of
the monitor. A nurse alert may still be used with the monitor by plugging the nurse
alert into the port on the rear of the receiver.
!
• The 90360-03 receiver is only compatible with the Ultraview
1700 S/N 387-1xxxxxx and higher.
• The receiver is integrated into the UCW, and no external
receiver is required.
SPECIAL
FUNCTIONS
HELP
ZOOM ENTER RECORD
TONE RESET
ALM SUSPEND
MONITOR
SETUP
WAVEFORMMENU PREVIOUS
MENU
NORMAL
SCREEN
97 8
64 5
31 2
.DEL 0ACCESS
CODE
Press to activate the key
highlighted with the cursor
Press to place cursor on
Press to move cursor
up, down, right, or left
Press to enlarge keys for
ease of viewing at a distance
Press to change focus
among multiple applications,
Press as necessary to
enter a numeric value
Press to delete a previous entry
first parameter key
within an application
or to place cursor on first
or to enter the security
code in access mode
menu key (or icon)
or to position cursor

Remote Keypad
27-5
Selecting a Parameter
The parameter (waveform) keys display vertically near the right side of the screen,
with parameter number one at the top (except on a split screen central display).
Press the WAVEFORM key to activate the parameter (waveform) selection mode.
Operating Menu Keys
The menu keys display horizontally across the bottom of the screen with menu
key number one at the far left. Press the ZOOM key once to activate the zoom
feature, making each key easier to see. Press the ZOOM key again to turn OFF
the zoom feature.
Recording a Waveform
After you activate the RECORD key, you have 2-seconds to highlight a parameter
(waveform) key. To ensure enough time in making a selection, place the cursor on
the parameter (waveform) key and press the cursor for an additional 2-seconds,
before you press the RECORD key on the remote keypad.
!
• The remote keypad cursor remains on the screen for
approximately one minute following the last keypad activity or
until you touch the touchscreen itself.
!
• When printing several parameters at the same time or when
trying to print an event such as a single abnormal beat, it is
easier to use keys on the monitor rather than on the remote
keypad to direct the recording.
To select a parameter:
1Point the remote keypad at the
monitor’s receiver.
2Press WAVEFORM for
parameter number 1.
3a Press up or down arrow keys to
desired parameter.
-OR-
3b Press the number of the desired
parameter.
4Press ENTER.
To operate menu keys:
1Point the remote keypad at the
monitor’s receiver.
2Select a parameter key.
3Press MENU.
4a Press left or right arrow key to
desired position.
-OR-
4b Press the number of the desired
menu key.
To print data from a waveform
zone:
1Point remote keypad at the
monitor’s receiver.
2a Press up or down arrow keys to
desired parameter.
-OR-
2b Press the number of the desired
parameter.
3Press RECORD.
4Repeat step 2a.
5Press ENTER.

Ultraview Care Network
27-6
Programming Access Codes
Access codes ensure that the receiver responds only to a remote keypad with a
matching code number. If a keypad’s access code differs from the receiver’s, the
command is ignored. This prevents interference from other remote keypads.
The programmed access code (1 to 32) is displayed on the monitor. This code is
stored in the monitor’s memory and retained whenever the monitor is reset or
powered OFF.
When programming a monitor's access code, the keypad's access code must
initially match the receiver's. The new access code is programmed simultaneously
with the keypad's. The monitor temporarily displays the remote keypad's access
code, then returns to displaying its own code.
!
• Remote keypad systems can be operated in an unsecured
mode without access codes so that the receiver accepts
commands from any remote keypad. When in the unsecured
mode, the word ALL appears on the monitor.
!
• To prevent inadvertently changing other access codes, unplug
all other monitors (or move the remote keypad directly in front of
the monitor to be programmed) and place your finger over the
remote keypad's infrared window during programming
(sufficient signal transmits through your finger to program the
receiver).
To select the unsecured mode:
1Touch MONITOR SETUP.
2Touch PRIVILEGED ACCESS.
3Enter Clinical password.
4Touch MORE.
5Touch REMOTE KEYPAD
STATION ADDRESS.
6Select SECURED MODE OFF.
To verify a remote keypad’s
current access code:
1Point the remote keypad at the
monitor’s receiver.
2Touch ACCESS CODE.
3Touch ENTER.
To set a remote keypad’s access
code:
1Point the remote keypad at the
monitor’s receiver.
2Touch ACCESS CODE.
3Select first digit.
4Select second digit.
5Touch ENTER.
To set the monitor’s access
code:
1Touch MONITOR SETUP.
2Touch PRIVILEGED ACCESS.
3Enter Clinical password.
4Touch MORE.
5Touch REMOTE KEYPAD
STATION ADDRESS.
6Select SECURED MODE ON.
7Use the arrow keys to select
the number.

27-7
Remote Keypad Troubleshooting Guide
Clinical Situation Possible Cause Solution
Monitor accepts
commands from any
keypad
■Monitor operating in an unsecured
mode.
■Select an access code and program
both the monitor/receiver and the
keypad to that code.
During programming,
another receiver was
inadvertently changed
■Remote keypad placed too close to
another monitor’s receiver.
■Move the keypad directly in front of
the receiver to be programmed and
place your finger over the keypad
window during programming.
Monitor does not respond ■Monitor may not support remote
keypad.
■Press the ACCESS CODE key.
If an A is not displayed (below the
NORMAL SCREEN key), contact
your system administrator or biomed.
■Depleted battery in remote keypad. ■Replace battery in remote keypad.


Contents
28-1
Overview . . . . . . . . . . . . . . . . . . . . . . . . . . . . . . . . . . . . . . . . . . . . . . . . . . . . . . . 1
Setting Up the Secondary Display . . . . . . . . . . . . . . . . . . . . . . . . . . . . . . . . . . . . 1
Copying Stored Values of the Primary Monitor . . . . . . . . . . . . . . . . . . . . . . . . . . 2
Restoring a Stored Value. . . . . . . . . . . . . . . . . . . . . . . . . . . . . . . . . . . . . . . . . . . 2
Copying Primary Attributes to the Secondary . . . . . . . . . . . . . . . . . . . . . . . . . . . 2
Resetting Default Values . . . . . . . . . . . . . . . . . . . . . . . . . . . . . . . . . . . . . . . . . . . 3
Tracking or Locking Displays. . . . . . . . . . . . . . . . . . . . . . . . . . . . . . . . . . . . . . . . 3
Adjusting Scaled Display . . . . . . . . . . . . . . . . . . . . . . . . . . . . . . . . . . . . . . . . . . . 4
Remote Display
Overview
The Ultraview 1700 provides an optional output to a remote-configurable
secondary display. This secondary display enables you to view selected
parameters from the primary display.
The primary monitor is used to control the configuration and waveform display
characteristics of the secondary remote display. The secondary display has no
touchscreen surface or functional keys.
Setting Up the Secondary Display
The Configuration menu for the secondary display appears on the primary
monitor. The menu functions identically to the primary monitor’s menu although it
has three additional keys.
Selecting Colors and Priorities
Each parameter has a specific default color and priority. You can change the
colors or priority levels of the parameters to customize the monitor to your specific
needs.
After making any configuration change, touch STORE to make the secondary
display changes permanent. If you do not touch STORE, the system disregards
your changes.
The PARAMETER CONFIG key allows you to change the system default priorities
and colors. The current parameter priority and color default is visible from the
DISPLAY PRIORITIES toggle key. The LOCAL key displays the current active
!
• Your display may not be configured to allow changes to
parameter priorities or colors. Contact your hospital system
administrator for details.
To set up the remote display:
1Touch MONITOR SETUP.
2Touch SECONDARY CONFIG.
3Touch PARAMETER CONFIG.
4Select a parameter.
5Select the destination priority.
6Select a color.
7Select the parameter key to be
colored (the key and waveform
will appear in the chosen color).
8Touch STORE to store local
color and priority settings.

Ultraview Care Network
28-2
parameters and the ALL key displays all possible parameters. Each parameter is
assigned a display priority, with the highest priority appearing at the top of the
screen.
Blank parameter keys allow you to force a space above, between, or below other
parameters. Blanks can be inserted into any priority template by selecting the
blank and putting it into the desired location. This causes a blank zone to be
inserted into the corresponding display area and all active parameters with a
lower priority to be pushed down.
The STORE key stores the current local priority and color settings into non-volatile
memory.
The RESTORE key restores the last stored local priorities and color settings from
memory.
The FACTORY DEFAULTS key restores the factory default priority and color
settings.
Copying Stored Values of the Primary
Monitor
Touch COPY PRIMARY PRIO/COLOR to duplicate the primary display’s stored
settings for priorities and colors on the secondary display. Touch STORE to put
these changes into effect.
You can use the Copy Primary Prio/Color function to remove blank zones
resulting from parameters that were deleted while the secondary display was in
Lock mode.
Restoring a Stored Value
Touch RESTORE to reset the secondary display’s configuration screen to its last
stored changes. Restoring the screen also stops the Copy Primary function (if
STORE has not yet been touched).
Copying Primary Attributes to the
Secondary
Touch COPY PRIMARY PARAM ATTR to copy the primary's current parameter
attributes or settings to the secondary display. Parameter colors and priorities are
not copied.
Use this key to:
• Remove any blank zones caused by deleting a parameter while the
secondary was locked.
• Insert any new parameters added while the secondary was locked.
• Change sizes, sweep speeds, full scales ON/OFF, etc., to match the primary
monitor’s configuration.
To copy the stored values of the
primary:
1Touch MONITOR SETUP.
2Touch SECONDARY CONFIG.
3Touch PARAMETER CONFIG.
4Touch COPY PRIMARY
PRIO/COLOR.
5Touch STORE.
To restore the last stored
configuration:
1Touch MONITOR SETUP.
2Touch SECONDARY CONFIG.
3Touch PARAMETER CONFIG.
4Touch RESTORE.
To copy the primary monitors
configuration:
1Touch MONITOR SETUP.
2Touch SECONDARY CONFIG.
3Touch PARAMETER CONFIG.
4Touch COPY PRIMARY
PARAM ATTR.

Remote Display
28-3
Resetting Default Values
Touching FACTORY DEFAULTS resets the secondary display to its factory
values. Touch STORE to make these changes permanent.
Options that can be reset include:
• Relative priorities and colors to factory default configuration of primary
• Blanks caused by deleting a parameter while in Lock Mode
Touching this key does not insert any new parameters added while the secondary
display was in Lock Mode.
Tracking or Locking Displays
In addition to parameter color and priority, you may configure other attributes of
the secondary display to be different from the primary monitor. To make additional
adjustments to each display separately, select LOCK after you configure the
secondary display. This allows the secondary display to remain largely
unchanged when you adjust the primary display. If you need the secondary
display to duplicate changes to the primary, set the secondary display to TRACK.
Refer to the Table 1 (where X = yes) for the effect of Track and Lock on each
display characteristic.
To make additional changes to the secondary screen after you select LOCK,
return to the Secondary Configuration menu and touch TRACK.
Table 1: Remote Display Track and Lock Chart
Always
independent
of primary
Track
mode
copies
primary
Lock
mode
copies
primary
Lock mode
does not
copy primary
Colors/priorities X
Waveform size XX
Sweep speed XX
Full scales ON/OFF XX
Full scales 4/6 zones X
# of minor graticules X
Screen/waveform
attributes XX
Addition of parameter
on primary XX
Deletion of parameter
on primary XX
Pressure/ECG key
labels XX
Zone size of certain
displayed parameters XX
To set factory default values of
secondary display:
1Touch MONITOR SETUP.
2Touch SECONDARY CONFIG.
3Touch PARAMETER CONFIG.
4Touch FACTORY DEFAULTS.
5Touch STORE.
To lock the secondary display:
1Adjust parameter attributes on
primary to reflect how you want
the secondary to appear.
2Touch MONITOR SETUP.
3Touch SECONDARY
CONFIGURATION.
4Touch PARAMETER
CONFIGURATION.
5Touch LOCK.

Ultraview Care Network
28-4
Adjusting Scaled Display
The display of parameters in scales for the secondary display is independent of
the primary monitor. Scales are adjusted using the same menu as the primary
except when a secondary display is enabled, the PRIMARY/SECONDARY key
appears in the menu. This key allows you to choose which display you want to
change.
To adjust the scaled display:
1Touch MONITOR SETUP.
2Touch PRIVILEGED ACCESS.
3Enter Clinical password.
4Touch SCALED DISPLAY.
5Touch PRIMARY/
SECONDARY key to choose
display to change.
6Select MINOR GRATICULE
ON.
7Use arrow keys to adjust.
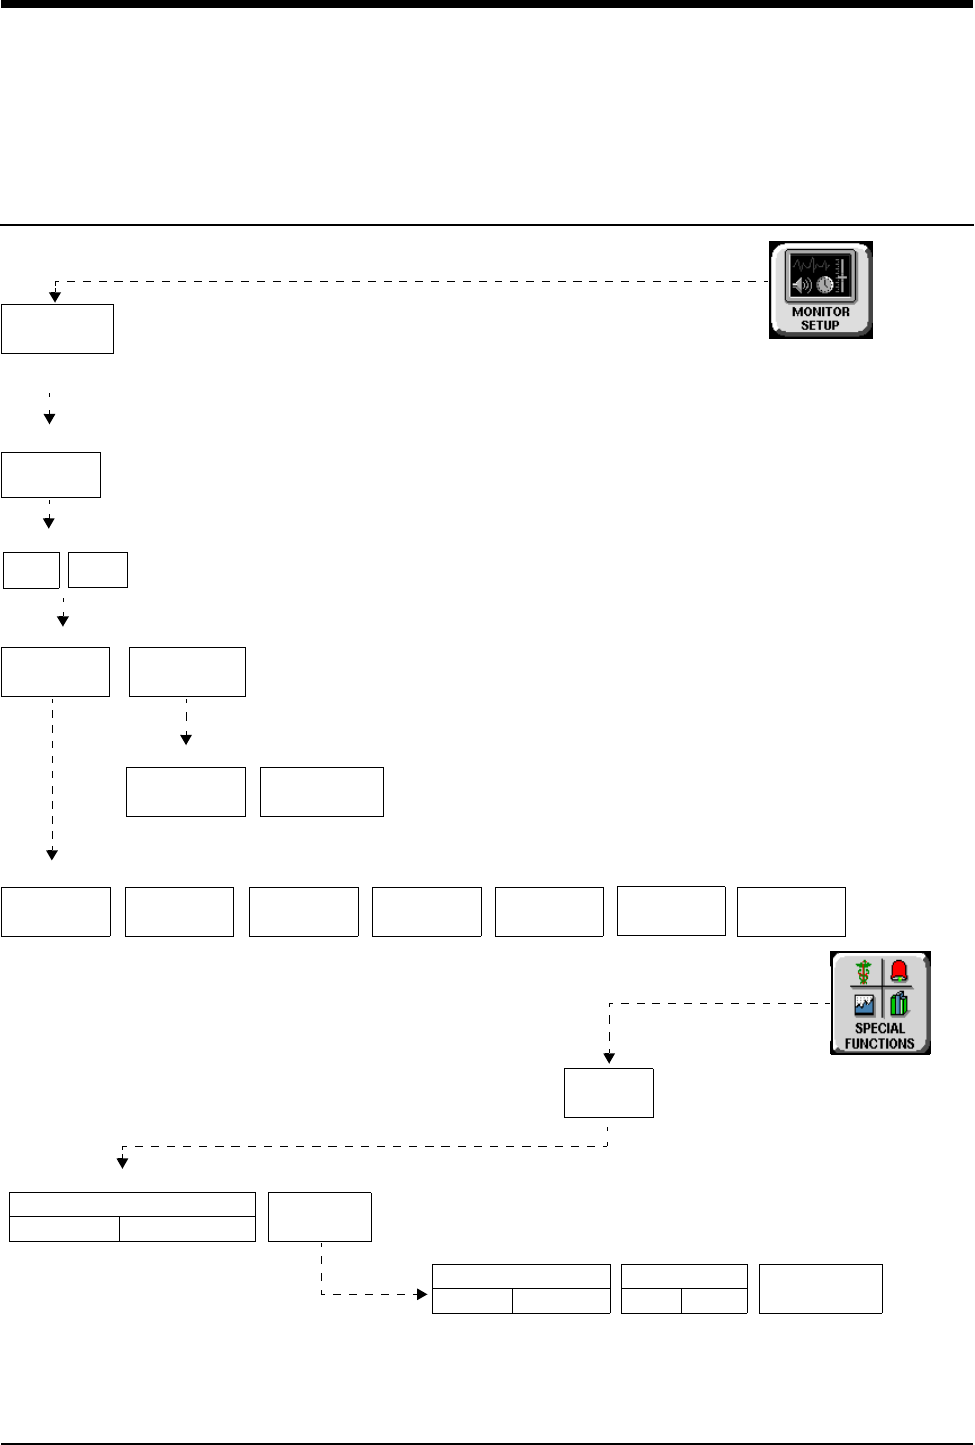
29-1
!
• Based on features purchased, more or fewer keys may appear here than on your menu screens.
Patient Data Logger Directory
Directory of Keys - Bedside only
PRIVILEGED
Enter BIOMED
BIOMED LEVEL - Serial Port Configuration
BIOMED LEVEL - Serial Port Settings: Changes committed on exit
DIAGNOSTICS DATA
ACCESS
SETTINGS ASSIGNMENT
DATA BITS
8STOP BITS
1
ECHO
NONE
CR/LF
NONE
PARITY
NONE
XON/XOFF
DISABLE
BAUD RATE
9600
Restart monitor after selecting owner for serial port
PATIENT DATA LOGGER
ON OFF
LOGGER
SETUP
ALARM LOGGING
ON OFF
CHECKSUMS
ON OFF
SERIAL
PORTS
1 2
Patient Data Logger
Patient Data Logger - SETUP: Change the settings
SAMPLE RATE
15 sec
password
DATA
LOGGER
To access Patient Data Logger
BIOMED LEVEL - Select Parameter
Select serial port to assign owner to


Contents
29-3
Patient Data Logger
Overview
The Patient Data Logger option automatically sends patient vital signs from the
monitor to an external device, such as a printer or a terminal. Episodic patient
data is also sampled and transmitted. The output is in the form of ASCII text byte
strings, and is printed using standard RS232 serial communications via the
monitor’s serial port. Refer to the Display Detail on page 29-5 for further
information.
This option continues to send data whether the external device is on-line or off-
line. Data transmission can be stopped by reassigning the data port or disabling
the Patient Data Logger.
Your system administrator (or other designated personnel) must first set up
communication between the monitor and the external device by assigning the
serial port to Patient Data Logger, and then adjusting the serial port settings. The
various serial settings can be adjusted to suit the device attached to the serial
port. Refer to the appropriate service manual for more details.
Overview . . . . . . . . . . . . . . . . . . . . . . . . . . . . . . . . . . . . . . . . . . . . . . . . . . . . . . 3
Display Detail. . . . . . . . . . . . . . . . . . . . . . . . . . . . . . . . . . . . . . . . . . . . . . . . . . . 5
Data Printouts . . . . . . . . . . . . . . . . . . . . . . . . . . . . . . . . . . . . . . . . . . . . . . . . . . 6
Patient Data Logger Troubleshooting Guide . . . . . . . . . . . . . . . . . . . . . . . . . . . 7

Ultraview Care Network
29-4
The sample rate refers to the frequency of data sampling and can be set to time
intervals ranging from 5-seconds to 60-minutes. The new sample rate takes effect
at once.
The data logger output requires a serial cable that swaps pins (refer to Table 1).
The serial cable must be properly connected at both ends and the data logger
output enabled.
!
• The option is only available on bedside monitors.
• Ensure that any cables or other computer or communications
equipment connected to the bedside monitor comply with
applicable medical standards.
• The combination of PDL baud rate and sample rate must be
selected carefully. Slow baud rates, in combination with
frequent data transmissions, may cause loss of data. This is
especially true if a large amount of patient vital sign data is
being monitored. However, some devices cannot accept data at
high baud rates. This may limit the range of sample rates at
which your device can accept data readings from the monitors.
Table 1: Serial Cable Pinout
Input Output
23
32
45
54
To set up Patient Data Logger
(the user must have System
Administrator access):
1Touch MONITOR SETUP.
2Touch PRIVILEGED ACCESS.
3Enter biomed password.
4Touch SERIAL PORTS and
select a port.
5Touch ASSIGNMENT.
6Touch DATALOGGER.
7Touch PREVIOUS MENU.
To set serial settings:
8Touch SETTINGS.
9Touch the desired setting
key(s) to display desired
settings.
10 Touch NORMAL SCREEN to
effect changes.

Patient Data Logger
29-5
Display Detail
The Patient Data Logger report is automatically sent to an external device, such
as a printer or terminal, once the serial port is assigned and toggled ON.
The data fields that appear on this report (ECG, RESP, ART, SpO2, and EtCO2)
will vary depending on the parameter modules installed on the system.
Figure 29-1: Patient Data Logger report sample
SPACELABS MEDICAL PATIENT DATA LOGGER
PATIENT NAME DOE, JOHN Bed # 01 DATE 08 JUN 2003
ECG RESP ART mmHg SPO2 EtCO2
TIME HR ABN LEAD LEAD2 ST1 ST2 RATE SYS/DIA MEAN % RESP % AGENT %
14:55:49 212 0 VI II 2.08 -2.00 52 138/81 109 93 0 0.1 HAL 0.0
14:55:54 158 0 VI II 2.08 -2.00 47 138/81 109 95 0 0.1 HAL 0.0
14:55:59 146 0 VI II 2.08 -2.00 39 138/81 110 96 0 0.1 HAL 0.0
14:56:04 146 0 VI II 2.08 -2.00 36 138/81 110 97 0 0.1 HAL 0.0
14:56:10 212 0 VI II 2.08 -2.00 47 138/81 109 97 0 0.1 HAL 0.0
14:56:15 200 0 VI II 2.08 -2.00 53 138/81 110 97 16 5.2 HAL 0.1
14:56:20 146 0 VI II 2.08 -2.00 43 138/81 110 97 16 5.2 HAL 0.1
14:56:25 146 0 VI II 1.84 -2.56 36 138/81 109 97 16 5.2 HAL 0.1
14:56:30 211 0 VI II 1.84 -2.56 43 138/81 110 97 16 5.2 HAL 0.1
14:56:35 212 0 VI II 1.84 -2.56 53 138/81 110 97 16 5.2 HAL 0.1
14:56:45 146 0 VI II 1.84 -2.56 36 138/81 110 97 16 5.2 HAL 0.1
14:56:52 200 0 VI II 1.84 -2.56 39 138/81 109 79 16 5.2 HAL 0.1
!
• All lines on this report are terminated by a line-feed, carriage-
return combination.
• Lines may wrap if the line length exceeds the display or printer
width.
• The report prints a maximum of 132 characters per line and
2 lines per entry.
• The report prints data from a maximum of 11 parameter groups
(for example, ECG, RESP, ART, etc.). (Fewer parameters are
printed if the line length limit is reached.)

Ultraview Care Network
29-6
Data Printouts
Each line of the data printout may contain up to 132 characters and is terminated
with line feed and carriage return characters.
The PDL transmits two types of information: page headers and data lines. The
page header appears at the top of each page and contains the patient’s name, the
bed number, and the current date. A new page is generated when any the
following situations occur:
• The end of a page is reached (that is, 50 data lines have been transmitted).
• The monitored vital signs parameters change.
• The patient name or bed number changes.
• The current date changes.
Data lines are transmitted at the interval specified at configuration. Each data line
contains the time that the data was collected, as well as the data collected for
each vital sign parameter being monitored.
!
• If you are monitoring a large number of parameters and have an
80-column printer, the data from one reading may require more
than one line. If your printer has a wrap-around feature, this will
be handled automatically. If you prefer that each data reading fit
onto one line, condense the printer’s type or use a wide-
carriage (132 column) printer.

29-7
Patient Data Logger Troubleshooting Guide
Clinical Situation Possible Causes Solution
Data is displayed with
improper spacing or double
spacing
■The PDL interface sends a
carriage return/line feed
sequence at each end-of-line.
The external device may not be
set up properly.
■Set the external device for “0” line
feed.
No data is displayed or
printed on the external
device
■There is a power problem or the
cables are faulty. The device may
not be set up properly.
■Check the power and cables. Ensure
that the device is in the online mode
and that RS-232 port requirements
are satisfied.
■Check for RS-232 compatibility at the
monitor and at the external device.
■Check the monitor port assignments
and port connections.
Data is lost or garbled ■The cable is faulty. ■Check the cables.
■The parity is set incorrectly. ■Verify the baud rates and parity
settings.
■Baud rate settings may be
inappropriate.

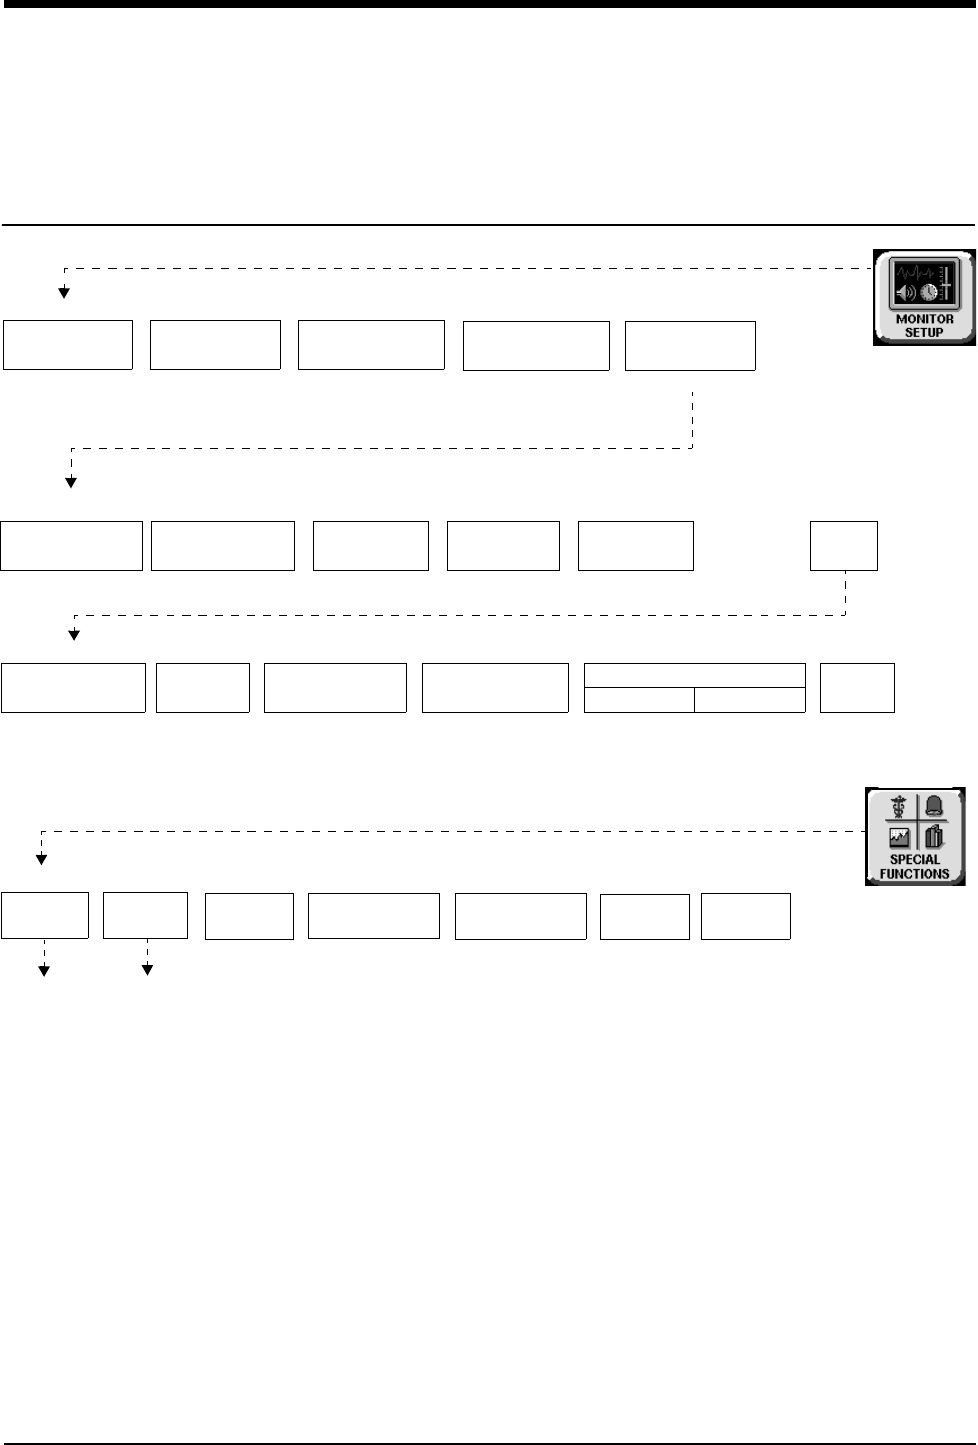
30-1
!
• Based on features purchased, more or fewer keys may appear here than on your menu screens.
DNA Directory
Directory of Keys - UCW and Ultraview 1700
TONES ADMIT/
DISCHARGE
MONITOR
CONFIG
PRIVILEGED
Enter BIOMED password
ACCESS
BIOMED LEVEL: Select Parameter
MONITOR SETUP
NETWORK
SETUP
MONITOR
CALIBRATION
CHANGE BIOMED
PASSWORD
TELEMETRY
CONFIGURATION
CLINICAL
MENU
MORE
SERIAL
PORTS
TONE
CONFIGURATION
BIOMED LEVEL: Select Parameter
D N A
CONFIGURATION
SECONDARY DISPLAY
ENABLE DISABLE MORE
RECORDER
SETUP
RECORDER
CONFIG
Refer to
Introduction
Refer to
chapter
chapter
System Alarms
REMOTE
VIEW
ALARM
WATCH
RV/AW
OFF
LOCAL
TRENDS/CALCS
REMOTE
TRENDS/CALCS
SPECIAL FUNCTIONS
DATA
LOGGER DNA


Contents
30-3
DNA
Overview
The Dynamic Network Access (DNA) feature allows you to view and control a
remote application.
Your hospital system administrator (or other designated personnel) must first set
up communication between the UCW and Ultraview 1700 and the external
computer(s) before DNA can be accessed. Refer to the Universal Clinical
Workstation (UCW) and Ultraview 1700 Monitors Service Manual
(P/N 070-0470-xx) for more details.
!
• Ensure that any computer or communications equipment
connected to the network comply with applicable medical
standards.
To set up DNA (must have
System Administrator menu
access):
1Touch MONITOR SETUP.
2Touch PRIVILEGED ACCESS.
3Enter biomed password.
4Touch MORE.
5Touch DNA
CONFIGURATION.
6Enter desired configuration
using the keyboard.
7Touch OK.
8Touch RESET MONITOR.
To access DNA:
1Touch SPECIAL FUNCTIONS.
2Touch DNA.
3Touch the desired application
icon.
Overview . . . . . . . . . . . . . . . . . . . . . . . . . . . . . . . . . . . . . . . . . . . . . . . . . . . . . . 3


Contents
31-1
System Safety Specifications . . . . . . . . . . . . . . . . . . . . . . . . . . . . . . . . . . . . . . 1
Equipment Classification . . . . . . . . . . . . . . . . . . . . . . . . . . . . . . . . . . . . . . . . . . 3
Equipment Maintenance Requirements. . . . . . . . . . . . . . . . . . . . . . . . . . . . . . . 4
Ultraview Care Network Module Compatibility. . . . . . . . . . . . . . . . . . . . . . . . . . 4
Ultraview Care Network Product
Specifications
System Safety Specifications
System Introduction and Network Basics on page 1-1 includes information
concerning the interconnection of equipment within the Ultraview Care Network.
Initial connection of auxiliary line-operated equipment to a monitor must be
performed by a hospital biomedical engineer or a Spacelabs Medical Customer
Service Representative. For further information or instructions regarding
interconnection of units, contact a qualified service person or your local Spacelabs
Medical representative.
After installation and/or interconnection with other units, the equipment leakage
current shall not exceed the local (provincial) acceptable values.
Accessory equipment connected to the analog and digital interfaces must be
certified according to the respective IEC standards (that is, IEC 950 for data
processing equipment and IEC 601-1 for medical equipment). All configurations
shall comply with the system standard IEC 601-1-1+A1. Everyone who connects
additional equipment to the signal input part or signal output part configures a
medical system, and is, therefore, responsible to ensure that the system complies
with the requirements of the system standard IEC 601-1-1+A1. If in doubt, consult
the technical service department or your local customer service representative.
All Spacelabs Medical equipment is intended for use with a fixed mains socket-
outlet. If a system is configured using multiple portable socket-outlets, this system
must be reviewed for compliance with IEC 601-1-1+A1, including the maximum
load and enclosure leakage currents requirements. The multiple portable socket
outlet cannot be placed on the floor. If the leakage limit is exceeded, a second
Protective Earth, fixed at both ends with a tool, may be necessary. This second
Protective Earth must be tested to the requirements of clause 18 of IEC 601-1.
Equipment weighing more than 20 kg is not portable. To lift heavy equipment,
support under corners and lift according to hospital procedures.
Use of patient cables, transducers, sensors and supplies other than those
specified by Spacelabs Medical may degrade equipment performance, including
defibrillation protection.
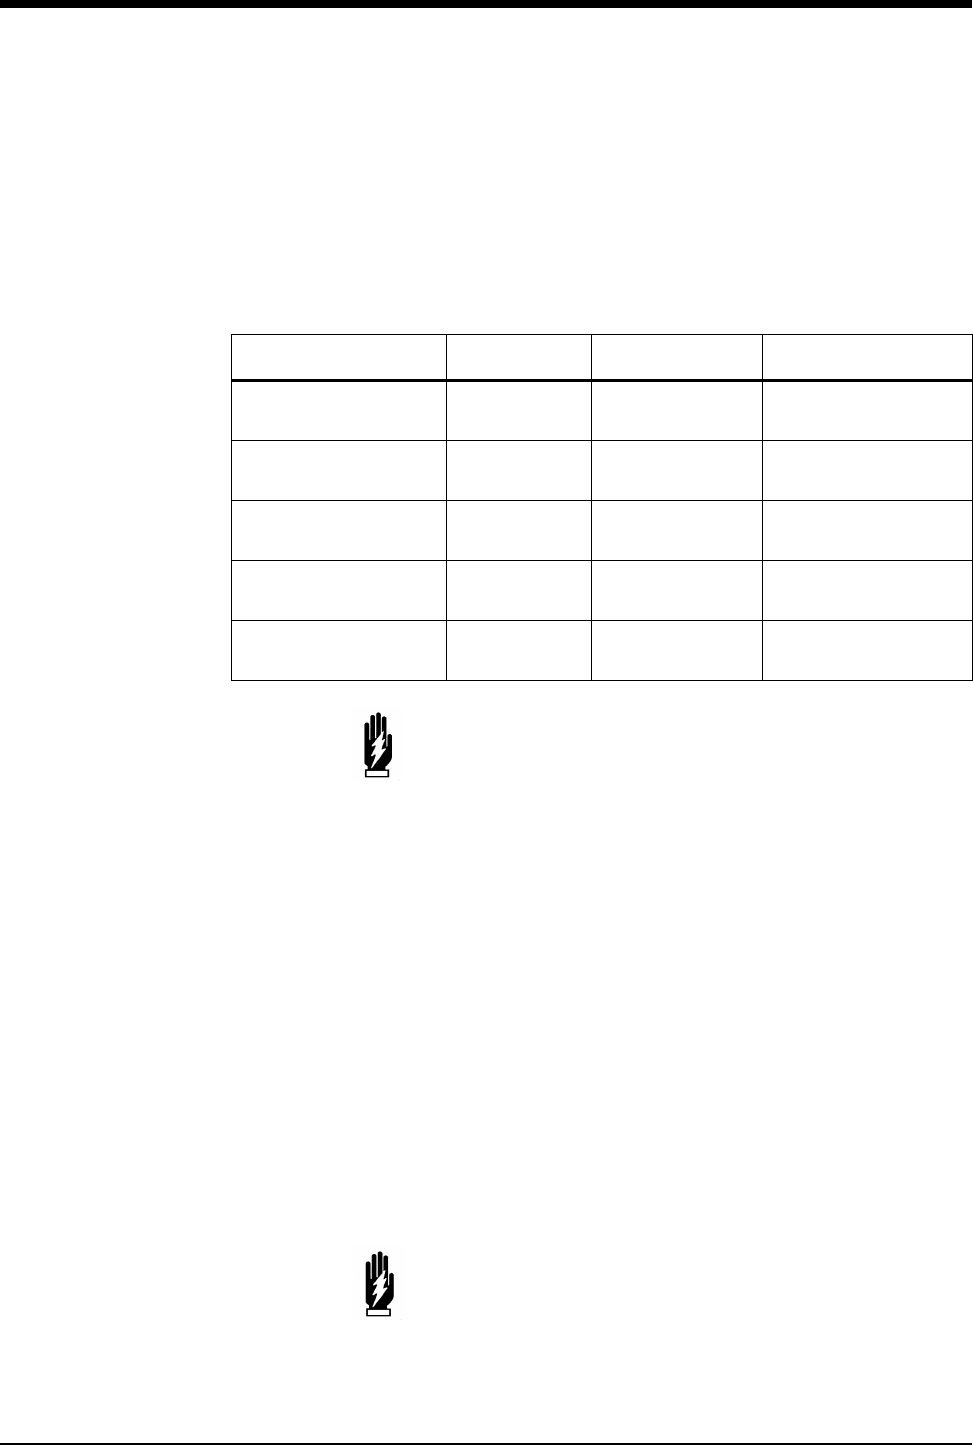
Ultraview Care Network
31-2
Input leakage current for all patient input channels is less than 10 µA making ECG
units suitable for direct cardiac application. The maximum non-destructive voltage
that can be applied to any input or output connector on the monitors, modules or
printers is +5 V. All signal inputs or outputs are for exclusive connection to
equipment specified by Spacelabs Medical.
Disposal of these devices and all accessories must be in accordance with local
and federal laws.
When interconnecting equipment, avoid using optional battery operation. If such
operation cannot be avoided, the battery-operated instrument must be grounded
using the ground terminal on the rear panel or the protective ground (earth) in the
power cord.
Power Cord:
• 3-wire, 18-gauge, hospital grade, or
• 3-wire, 0.75mm2, European harmonized.
Plug:
• 3-terminal polarized, with protective ground.
Table 1: Ultraview Care Network Products Power Rating
Product Frequency Electrical Rating Fuse Rating
90367/90369 50/60 Hz 100-240VAC
2.0-1.0A N/A
90385/90363 50/60 Hz 2.5A/100-120V
1.3A/220-240V
2-T3A/250V
2-T3.15A/250V
90386 50/60 Hz 1.35A/100-120V
0.8A/220-240V
2T2A/250V
2-T1.25A/250V
90479-A 50/60 Hz 2A/115V
1A/230-240V
2-T2.5A/250V (Slow)
2-T1.6A/250V
90364/90387/90491/
90499/94000 50/60 Hz 100-240V
2.0-1.0A N/A
WARNING:
• To protect against electrical shock, proper grounding is
essential.
• If a monitor is in battery mode during defibrillation, the
monitor must be properly grounded using the ground
terminal provided on the rear panel or by using the
protective ground in the power cord.
• If the integrity of the external protective earth conductor
is in doubt, the equipment must be operated from its
internal power source (if applicable).
WARNING:
• Do not use a 3-to-2 plug adapter.
• Ground terminal of the plug is connected directly to the
frame of the instrument. Any interruption of the grounding
connector can create an electric shock hazard.

Ultraview Care Network Product Specifications
31-3
Equipment Classification
All of the products listed below are classified as “Class 1- ordinary equipment (not
protected against harmful ingress of liquids or flammable anesthetic mixtures),
continuous operation.” In addition, the 90367, 90369, and 94000 are internally
powered.
* Refer to Symbols on page 34-1 for type definitions.
Table 2: Equipment Classification
Product Type* Product Type*
90367/90369
Depends on module used
BF-Defibrillator-proof with
O2/CO2 option*
94000
B-FHR (Ultrasound)
BF-UA
CF-FECG
Depends on module used
90478 B 90424 CF-Defibrillator-proof
90385/90363 Depends on module used 90482 BF
90386 Depends on module used 90496 CF-Defibrillator-proof
90387/90364 Depends on module used 90491 Depends on module used
90426/29/30 BF-Defibrillator-proof 90513/14 BF-Defibrillator-proof
90449/69 B 90515/16 BF-Defibrillator-proof
90479 Depends on module used 90499 Depends on module used

Ultraview Care Network
31-4
Equipment Maintenance Requirements
Corrective or maintenance procedures must be performed by qualified personnel.
Periodic maintenance procedures are required every 12 months to verify that:
• the equipment is physically sound.
• resistance between the chassis ground connector on the rear panel and the
protective ground of the mains input is not greater than 0.1 ohm.
• isolation resistance between ground and mains is greater than 2 meg-ohm.
While the equipment is operating normally verify that:
• chassis leakage current is less than 100 µA.
• patient leakage current is less than 10 µA (Type CF),
100 µA (Types B and BF).
While the equipment is operating in single fault condition verify that:
• chassis leakage current is less than 300 µA (100-120 V), 500 µA (220-240 V);
• patient leakage current is less than 50 µA (Type CF),
500 µA (Types B and BF).
Under non-optimal environmental conditions or periods of intense use, more
frequent checks are recommended.
If the equipment has been dropped, abused or damaged in any way (if the monitor
or module becomes wet, for example), a qualified service person must verify that
the unit is working correctly and that all safety features are intact.
Visually inspect all patient cables each time the unit is used. Check for worn or
damaged plastic covering, frayed or broken wires, cracked connections or any
other signs of damage. Do not use cables which exhibit obvious damage.
Ultraview Care Network Module
Compatibility
If any function (NIBP, ECG, SpO2, etc.) on your system does not contain a feature
described in this manual:
• Your product may contain an earlier version of software. Contact your
customer service representative and refer to the original documentation that
accompanied your system.
• Your system configuration may be different from that described in this
manual. Refer to notes in this manual describing features where system
configuration is likely to impact the available features.
Before moving a Ultraview Care Network module from one network to another, be
certain that the module software version is compatible with that required by the
second network. If in doubt, have a qualified service person verify compatibility
between the module and the network.

Contents
32-1
Monitors . . . . . . . . . . . . . . . . . . . . . . . . . . . . . . . . . . . . . . . . . . . . . . . . . . . . . . . 1
Accessories . . . . . . . . . . . . . . . . . . . . . . . . . . . . . . . . . . . . . . . . . . . . . . . . . . . . 1
TRU-CUFF Noninvasive Blood Pressure Cuffs . . . . . . . . . . . . . . . . . . . . . . . . . 2
Cables and Lead Wires . . . . . . . . . . . . . . . . . . . . . . . . . . . . . . . . . . . . . . . . . . . 3
Pulse Oximetry Sensors . . . . . . . . . . . . . . . . . . . . . . . . . . . . . . . . . . . . . . . . . . 4
Capnography Sensors . . . . . . . . . . . . . . . . . . . . . . . . . . . . . . . . . . . . . . . . . . . . 4
90518 Multigas Analyzer . . . . . . . . . . . . . . . . . . . . . . . . . . . . . . . . . . . . . . . . . . 5
Ultrasound Transducers . . . . . . . . . . . . . . . . . . . . . . . . . . . . . . . . . . . . . . . . . . 6
Cleaning and Sterilization
Monitors
To clean Ultraview Care Network monitor screens and covers, modules,
processors, and printers use a cloth or swab that has been slightly dampened in a
solution of warm water and a mild detergent. Avoid solvents which may damage
the product cases. Follow your hospital protocol.
Touchscreen Cleaning
There is not a separate shield over the face of the screen on the UCW or
Ultraview 1500. Clean the screen with a soft cloth moistened with either 70%
alcohol OR soapy water.
Accessories
• Where provided, follow the manufacturers' instructions concerning
disposable and reusable supplies.
• As applicable, follow your hospital protocol concerning cleaning, disinfection
and/or sterilization of reusable supplies.
Use of patient cables, transducers, sensors or supplies other than those specified
by Spacelabs Medical may degrade module performance.
CAUTION:
• Use of cleaning agents other than those listed may cause
degradation to the product’s plastic enclosure and labels.
Questions or concerns regarding cleaning issues should
be directed to Spacelabs Medical Technical Support.
!
• Follow your hospital protocol for the handling of blood and body
fluids.
• Do not allow liquid to enter the monitor.

Ultraview Care Network
32-2
TRU-CUFF Noninvasive Blood Pressure
Cuffs
TRU-CUFF®Disposable Cuff
The disposable cuff wrap is designed for single patient use. It is packaged non-
sterile and cannot be soaked, rinsed or sterilized.
TRU-CUFF Reusable Cuff
The reusable cuff is packaged non-sterile. It may be cleaned and disinfected with
an enzymatic detergent and 10% solution of household bleach (5.25% sodium
hypochlorite).
Cuff Cleaning and Disinfection
Materials
• Enzymatic detergent such as ENZOL (US) or CEDEZYME (UK)
• 10% solution of household bleach (5.25% sodium hypochlorite) in distilled
water
• Soft cloths or bristle brushes
• Spray bottles
Procedure
1. Prepare the enzymatic detergent and bleach solutions in separate bottles per
the manufacturer’s instructions.
2. Spray detergent liberally on cuff, allow to sit for one minute.
3. Remove detergent with a soft cloth. For persistent contamination, scrub with a
soft bristled brush.
4. Rinse cuff thoroughly with distilled water.
5. Spray bleach solution on the affected area until saturated. Allow the cuff to sit
for 5-minutes.
6. Remove any excess solution with a soft cloth and rinse again with distilled
water. Allow 2-hours for air drying at ambient temperature.

Cleaning and Sterilization
32-3
Cables and Lead Wires
Cleaning
TRU-LINK® cables and lead wires may be cleaned with the following agents:
• Mild soap and water solution
• U.S. Pharmacopeia (USP) green soap
• Sodium hypochlorite solution (1:10 dilution of household bleach in water)
• Phenolic germicidal detergent solutions (1% aqueous solutions)
• Isopropyl alcohol solution (70%)
To clean product:
1. Prepare cleaning agent according to manufacturer’s instructions.
2. Saturate a clean cloth with designated cleaning agent.
3. Wipe off exposed surfaces of product.
4. Re-wipe product with clean water.
5. Wipe dry.
Tape adhesive may be removed with Spacelabs Medical’s adhesive tape remover
pads (P/N 392196-001).
Sterilization
TRU-LINK cable and lead wires are provided non-sterile. Following use they may
be ethylene oxide (EO) sterilized. Follow standard hospital protocol for
processing.
!
• The compatibility of TRU-LINK products with chemical agents
other than the type identified is unknown.
• The effective use of any cleaning or disinfecting procedure is
subject to the proper preparation of each agent per the
manufacturer’s instructions.
CAUTION:
• Do not immerse connector ends or cables in liquid.
CAUTION:
• Do not steam autoclave.
!
• Product is compatible with sterilization process. Actual product
sterility is dependent on a qualified sterilization cycle and
procedure.

Ultraview Care Network
32-4
Pulse Oximetry Sensors
For cleaning information see the manufacturer’s instructions enclosed with each
sensor.
Capnography Sensors
The capnography sensor and cable should be cleaned routinely, especially
between patient uses. Before cleaning, make sure the sensor is disconnected
from the module and/or monitor. Sensors and cable assemblies may be wiped
using a cloth or swab dampened in alcohol or 10% bleach solutions. Mild
detergents may also be used initially to remove any residual buildup. Sensor
should be wiped immediately following cleaning with distilled water and then dried
to remove any cleaning residue.
Visually inspect the sensor, cable, and the airway adapters for any sign of
physical damage. Verify that the plugs and connectors are in good working
condition and that the pins and prongs are not bent. Use a cotton swab dampened
with alcohol, or a mild soap, to carefully clean the windows of the sensor head and
the calibration cells. Always remove any damaged or questionable sensor or
airway adapter from service.
CAUTION:
• Under no circumstances should sensors be immersed in a
solution of any type.
• Do not autoclave the sensor.
• Never use solvents, acetone, or abrasive cleaning agents.
• Do not force the sensor onto the airway adapter.
• Avoid undue stress on the sensor head and cable.
!
• After unpacking, keep the sensor container. When not in use,
disconnect the sensor from the module and/or monitor, clean,
and place it into the container for safe keeping.
• Sensor exposure to cleaning agents should be limited to a
maximum of 15- to 20-minutes. Longer intervals of exposure
could produce a slight dulling of the original surface finish.

Cleaning and Sterilization
32-5
90518 Multigas Analyzer
Exterior
The exterior of the 90518 should be cleaned and disinfected as necessary. Use a
clean cloth or swab dampened in a solution of warm water and mild detergent.
Squeeze the cloth out thoroughly before use. Disinfect the unit with Hemosol or
similar disinfectant.
Disposable and reusable patient accessories are available for the 90518.
• Disposable accessories are for single-patient use only and must not be
sterilized or cleaned for reuse on other patients. Refer to the instructions
provided with each patient accessory to determine if the accessory may be
cleaned and reused on the same patient.
• Reusable accessories can be used on multiple patients after cleaning and/or
sterilizing. Refer to the instructions provided with these accessories for
details.
Instructions provided with patient accessories may contain warnings regarding
their use. Read these instructions carefully prior to use.
Fan Grill
The analyzer has a fan grill located on the rear panel. It must be kept free from
dust and other contaminants.
WARNING:
• Always turn the unit off and unplug the power cord before
cleaning to protect against electrical shock.
CAUTION:
• Do not allow liquid to enter the interior of the 90518. If this
should occur, check the unit for proper operation and
verify its performance accuracy prior to reuse.
!
• The Spacelabs Medical sampling lines are for single-patient use
only. Cleaning deteriorates the properties of the sampling line,
resulting in slower response time and more frequent occlusions.

Ultraview Care Network
32-6
Batteries
The analyzer contains two lead-acid batteries used to provide short-term
operation during a power failure. The analyzer retains the operating configuration
for up to 5-minutes during an AC power interruption. The batteries should be
replaced every year.
CO2 Scrubber
The analyzer contains an internal CO2 scrubber which must be replaced every
year.
Refer to the 90518 Multigas Analyzer Service Manual (P/N 070-0643-xx) for
details on replacing the CO2 scrubber, cleaning and sterilization procedures.
Ultrasound Transducers
Basic cleaning should be performed regularly to ensure continued reliability.
1. Keep accessories clean.
2. Wipe transducers with a soft cloth moistened with a germicidal solution after
each use.
3. Wipe off any ultrasound gel on the ultrasound transducers or the monitor as
soon as possible.
!
All batteries should be disposed of properly to
protect the environment. Lithium batteries
should be fully discharged before disposal.
Batteries such as lead-acid (Pb) and nickel-
cadmium (Ni-Cd) must be recycled. Please
follow your internal procedures and/or local
(provincial) laws regarding disposal or recycling.

33-1
Diagnostic Messages
Message Cause/Action
MONITOR SUPPORTS xx PARAMETERS.
ADDITIONAL PARAMETERS MAY OVERLOAD IT
Data for more than xx parameters is being input to the monitor.
System performance may decline. Unplug modules to improve
performance.
UNABLE TO SUPPORT A NEW MODULE AT THIS
TIME
There is not enough system memory to support a new module.
Unplug modules to free memory.
UNABLE TO SUPPORT A NEW CHANNEL AT
THIS TIME
There is not enough system memory available to support a new
channel. Detach channels to free memory.
DIAGNOSTIC ERROR ENCOUNTERED LOADING
MODULE Checksum error detected loading module. Module is unsupported.
DIAGNOSTIC ERROR ENCOUNTERED LOADING
CHANNEL Checksum error detected loading channel. Channel is unsupported.
OUT OF MEMORY - DELETING HEMO ENTRY There is not enough system memory available to the application to
complete the requested operation. Try again later.
OUT OF MEMORY - DELETING RESP ENTRY There is not enough system memory available to the application to
complete the requested operation. Try again later.
OUT OF MEMORY - DELETING OXY ENTRY There is not enough system memory available to the application to
complete the requested operation. Try again later.
OUT OF MEMORY - DELETING RENAL ENTRY There is not enough system memory available to the application to
complete the requested operation. Try again later.
CREATE NEW ENTRY FAILURE - MAXIMUM NUM
ENTRIES EXCEEDED
The maximum number of Calcs entries are in use. Delete existing
entries to create new ones.
REMOTE MONITOR NOT RESPONDING Calcs timeout expired waiting for remote GDS response. Verify
remote monitor is on network, and try again.
ERROR READING STORED CALCS DATA Bad return code from GDS on data read. GDS is possibly corrupt.
Reboot monitor.
ERROR STORING CALCS DATA Bad return code from GDS on data store. GDS is possibly corrupt.
Reboot monitor.
ERROR DELETING STORED CALCS DATA Bad return code from GDS on data delete. GDS is possibly corrupt.
Reboot monitor.
NO TRENDS AVAILABLE FOR THIS BED There is no trend data in GDS. Wait one minute and try again.
NO OTHER BED ON THE NETWORK HAS ACTIVE
PARAMETERS
This message is in response to a remote request. The monitor has
determined that there are no beds on the network with active
parameters so remote operations are not possible at this time.
THERE ARE NO PARAMETERS ACTIVE ON THIS
BED
The selected bed has no active parameters. In order to remotely
work with the monitor at the selected bed, it must have active
parameters.
PARAMETER IS NOT AVAILABLE TO MONITOR Failed attempt to attach to channel. Try again.
COMMUNICATIONS WITH REMOTE MONITOR
INTERRUPTED
Lost connection to remote monitor. Verify that the remote monitor is
on the network and retry remote operation.
THIS OPERATION WILL CAUSE THE MONITOR
TO RESET
The requested operation will reboot the monitor. If you do not want
this to occur, touch PREVIOUS MENU or NORMAL SCREEN.
THIS INSERTION WILL CAUSE PRIOR
ASSIGNMENT TO BE LOST
The requested zone assignment will cause a previously assigned
zone to be lost. Touch PREVIOUS MENU or NORMAL SCREEN to
abort the operation.

Ultraview Care Network
33-2
REMOTE BED SELECT FEATURE IS IN USE BY
ANOTHER APPLICATION
The Remote Bed Select window is in use by another application.
Only one application may use this window at one time. Touch the
application which is using the Remote Bed Select feature and touch
PREVOUS MENU or NORMAL SCREEN to abort the selection.
The window will now be available for use.
UNABLE TO RECORD THE REQUESTED ALARM
CHANNEL(S)
Unable to perform the requested operation. Verify that a recorder is
selected and operational (has paper) and try again.
UNABLE TO RECORD THE REQUESTED
CHANNEL(S)
Unable to perform the requested operation. Verify that a recorder is
selected and operational (has paper) and try again.
PARAMETERS NOT AVAILABLE FOR
RECORDING
Unable to perform the requested operation. Verify that a recorder is
selected and operational (has paper) and try again.
CAUTION - MONITOR SETTINGS MAY HAVE
CHANGED
The battery for non-volatile memory has failed. That memory resets
the monitor to the default settings and the default settings may not
match hospital preferences. Contact your hospital biomed to check
Biomed and Clinical Menu settings and Alarm Watch setup.
PAPER OUT There is no paper in the fetal chart recorder. Load paper.
RECORDER OFF Indication that the fetal chart recorder is powered OFF. Power ON
fetal chart recorder.
“CHECK CABLE”
“NO CONNECTION”
Invalid CIM address. Verify that the CIM cable is properly
connected to the monitor and the wall outlet.
“CHECK CABLE” then “OLD XXX NEWXXX”
then “ID CHANGE!” ALTERNATELY
The CIM ID has changed unexpectedly during operation. Verify that
the CIM cable is properly connected to the monitor and the wall
outlet.
ADMIT PATIENT No patient name has been entered. Enter patient name into
BirthNet or standalone monitor.
Message Cause/Action
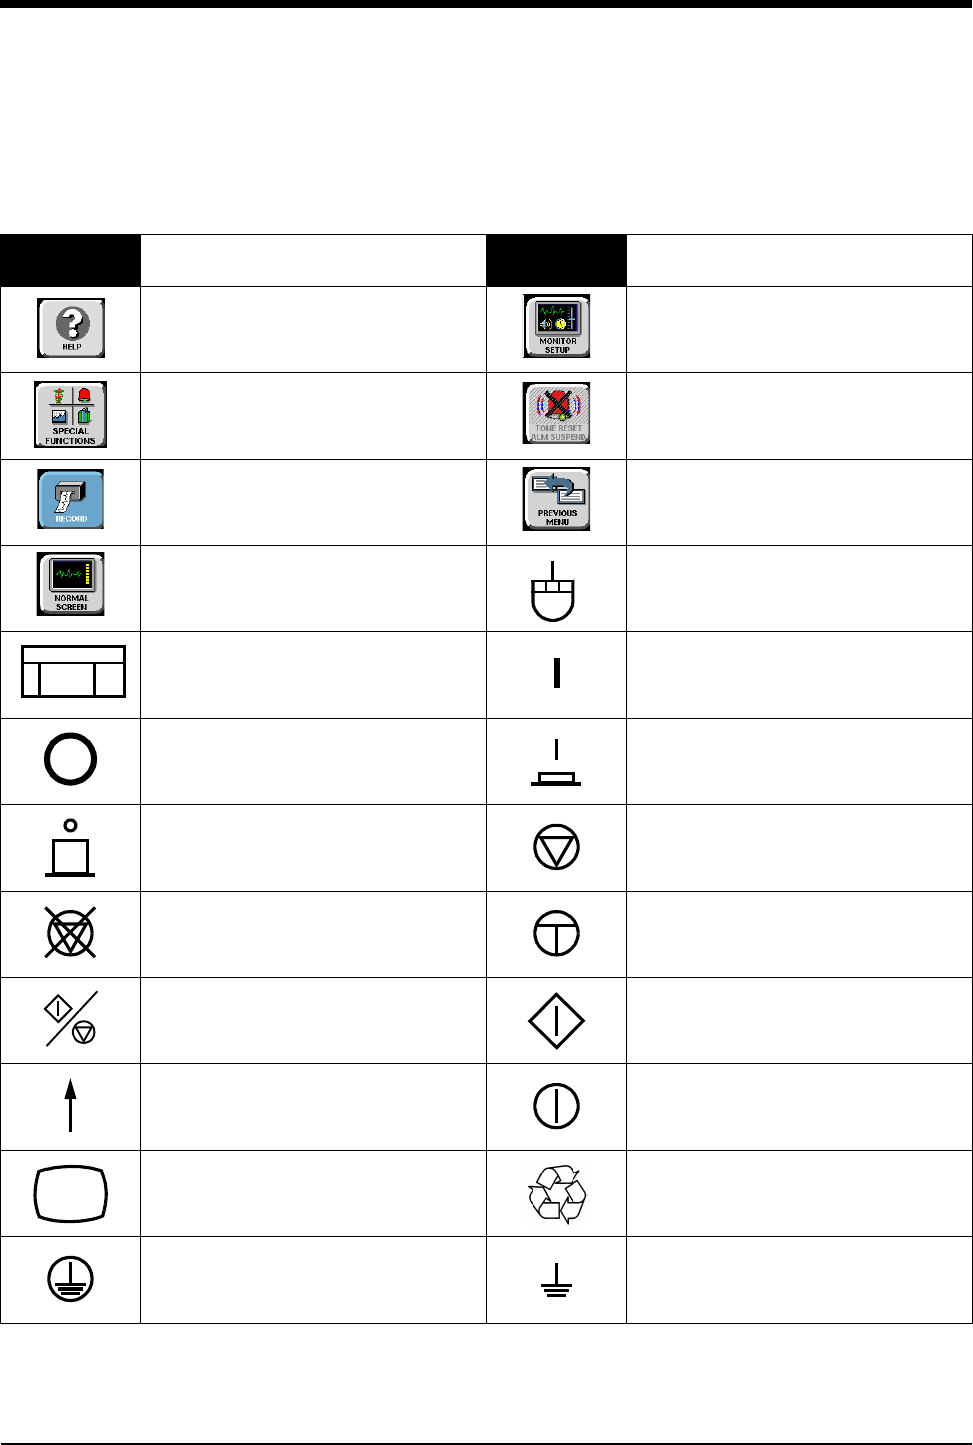
34-1
Symbols
The following list of international and safety symbols describes all symbols used on Spacelabs Medical products. No one
product contains every symbol.
Symbol Description Symbol Description
UCW or Ultraview 1700
HELP Key
UCW or Ultraview 1700
MONITOR SETUP Key
UCW or Ultraview 1700
SPECIAL FUNCTIONS Key
UCW or Ultraview 1700
ALARMS Key
UCW or Ultraview 1700
RECORD Key
UCW or Ultraview 1700
PREVIOUS MENU Key
UCW or Ultraview 1700
NORMAL SCREEN Key
UCW or Ultraview 1700 mouse
connection
UCW or Ultraview 1700
Keyboard Connection ON — Power Connection to Mains
OFF — Power Disconnection from
Mains
On Position for Push button Power
Switch
Off Position for Push button Power
Switch STOP or CANCEL Key
CONTINUE Key START/STOP Key
START/STOP START (NIBP) Key
On Direction ON/OFF
Television; Video Display Recycle
Protective Earth Ground Functional Earth Ground
TOnE RESET
ALM SUSPEND
RECORD
Ultraview Care Network
34-2
ON — Part of the Instrument Only OFF — Part of the Instrument Only
Partial ON/OFF STAND-BY Key
All batteries should be disposed of
properly to protect the environment.
Lithium batteries should be fully
discharged before disposal. Batteries
such as lead-acid (Pb) and nickel-
cadmium (Ni-Cd) must be recycled.
Please follow your internal procedures
and or local (provincial) laws regarding
disposal or recycling.
Caution - hazardous voltages. To reduce
risk of electric shock, do not remove the
cover or back. Refer servicing to a
qualified service personnel (U.S.A.).
DANGER - High Voltage (International)
PAUSE or INTERRUPT Slow Run
Replace Fuse Only as Marked Fuse
Power supply jack polarity.
(+ / - Signs May be Reversed) Equipotentiality Terminal
Battery
Replace only with the appropriate
battery.
Replace only with the appropriate
battery.
(+ / - Signs May be Reversed)
Alternating Current Direct Current
Both Direct and Alternating Current AC/DC Input
Amperes Hertz
Volts Watts
Temporary Shut Off of Alarm Tone or
Screen Indicators Alarm
Symbol Description Symbol Description
AHz
VW
Symbols
34-3
ENTER Key PRINT REPORT Key
Attention - Consult Operations or
Service Manual for Description
Risk of Explosion if Used in the
Presence of Flammable Anesthetics
Indicator — Remote control Indicator — Local Control
Return Unit to Monitor Mode Indicator — Out of Paper
Activate Recorder for Graphics Recorder Paper
Indoor Use Only Auto Mode (NIBP)
Output No Output (Terminated)
Data Input/Output HELP (Explain Prior Screen) Key
Clock/Time Setting Key Input/Output
Monitor Setup
Select Program Options Set Initial Conditions Menu
Access Special Function Menu Normal Screen
Return to Prior Menu TREND/TIMER Key
Gas Exhaust Electrocardiograph or
Defibrillator Synchronization
Symbol Description Symbol Description
!
1
2
3
?
1
2
3
1
2
3
A
1
2
3
B
1
2
31
2
3
Ultraview Care Network
34-4
Arterial Pulse
IEC 601-1 Type BF equipment. The unit
displaying this symbol contains an F-
type isolated (floating) patient-applied
part providing an adequate degree of
protection against electric shock.
IEC 601-1 Type BF equipment which is
defibrillator-proof. The unit displaying
this symbol contains an F-type isolated
(floating) patient-applied part which
contains an adequate degree of
protection against electric shock, and is
defibrillator-proof.
IEC 601-1 Type CF equipment. The unit
displaying this symbol contains an F-
type isolated (floating) patient-applied
part providing a high degree of
protection against electric shock.
IEC 601-1 Type CF equipment. The unit
displaying this symbol contains an F-
type isolated (floating) patient-applied
part providing a high degree of
protection against electric shock, and is
defibrillator-proof.
ETL Laboratory Approved
IEC 601-1 Type B equipment. The unit
displaying this symbol contains an
adequate degree of protection against
electric shock.
Canadian Standards Association
Approved
Keypad Enlarge, Zoom
Menu Keys Delete
Waveform/Parameter Keys PCMCIA Card
Keep Dry Fragile; handle with care
Foot Switch This Way Up
Environmental Shipping/Storage
Temperature Limitations
Environmental Shipping/Storage
Humidity Limitations
Symbol Description Symbol Description
x
Symbols
34-5
Open Padlock Closed Padlock
Down Arrow Up Arrow
Event TEMP
temp Temperature
Antenna Environmental Shipping/Storage
Altitude Limitations
Network Connection Audio Output, Speaker
Remote Alarm; Nurse Alert Nurse Call
Serial Port 1 Serial Port 2
External marker push button connection SDLC Port
Microphone Mermaid Connector
Symbol Description Symbol Description
12,200 m
1 2
SDLC
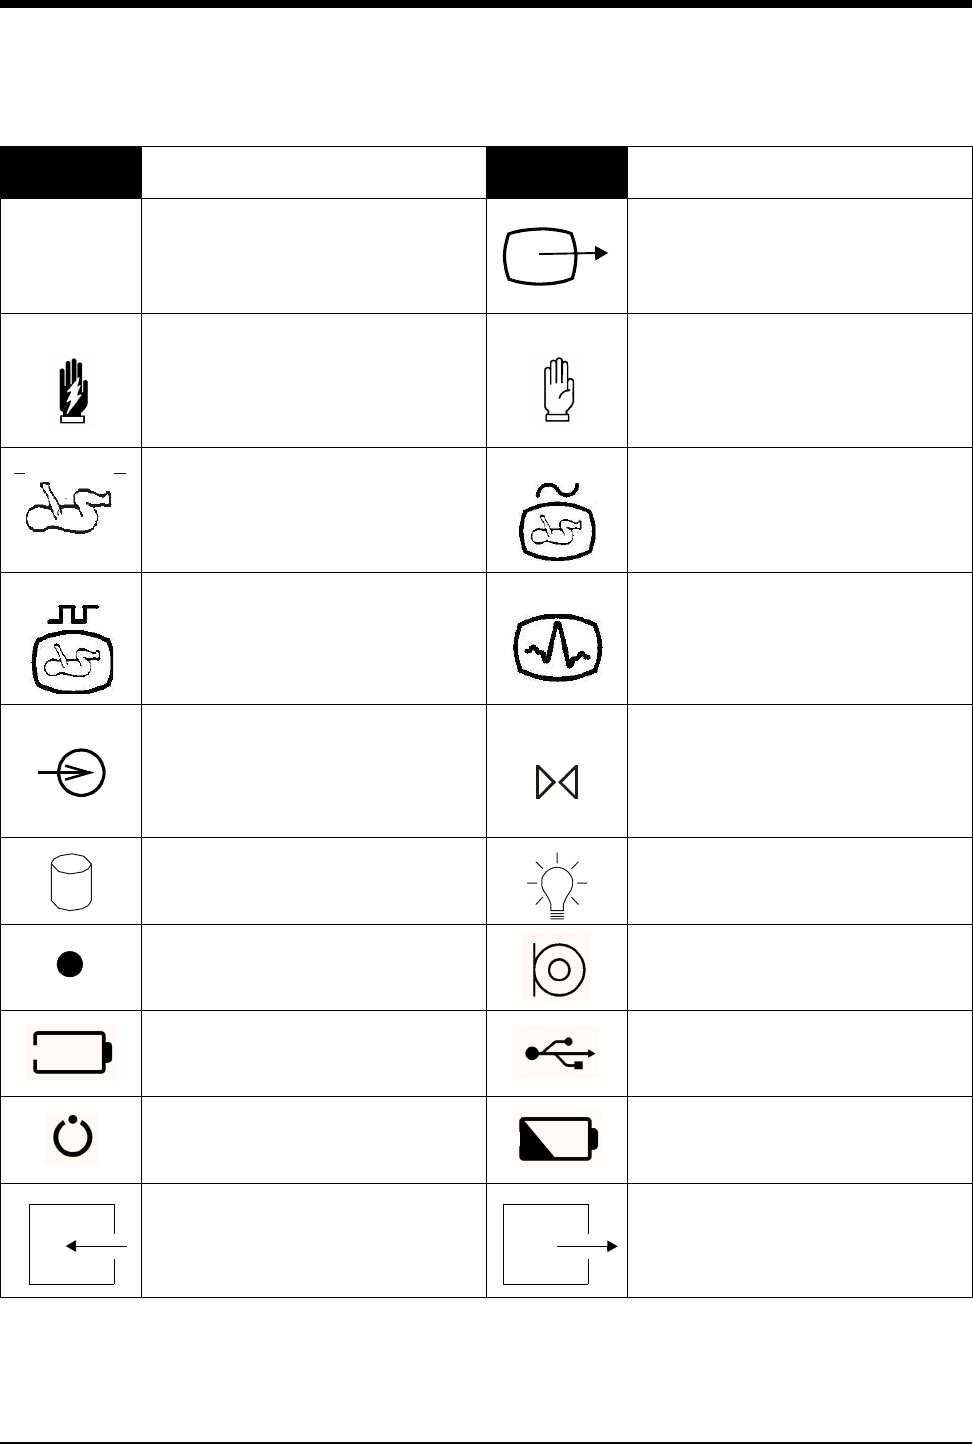
Ultraview Care Network
34-6
Note Video Output
Warning About Potential Danger to
Human Beings
Caution About Potential Danger to
Equipment
Non-Invasive Blood Pressure (NIBP),
Neonate Fetal Monitor Connection (Analog)
Fetal Monitor Connection
RS232 (Digital)
Physiological Monitor Connection
RS232 (Digital)
Input Reset
Hard Drive Power Indicator LED
Activate Telemetry Recorder Omnidirectional Microphone
Battery Status Universal Serial Bus
Stand-by Low Battery
Gas Sampling Port Gas Return Port
Symbol Description Symbol Description
!
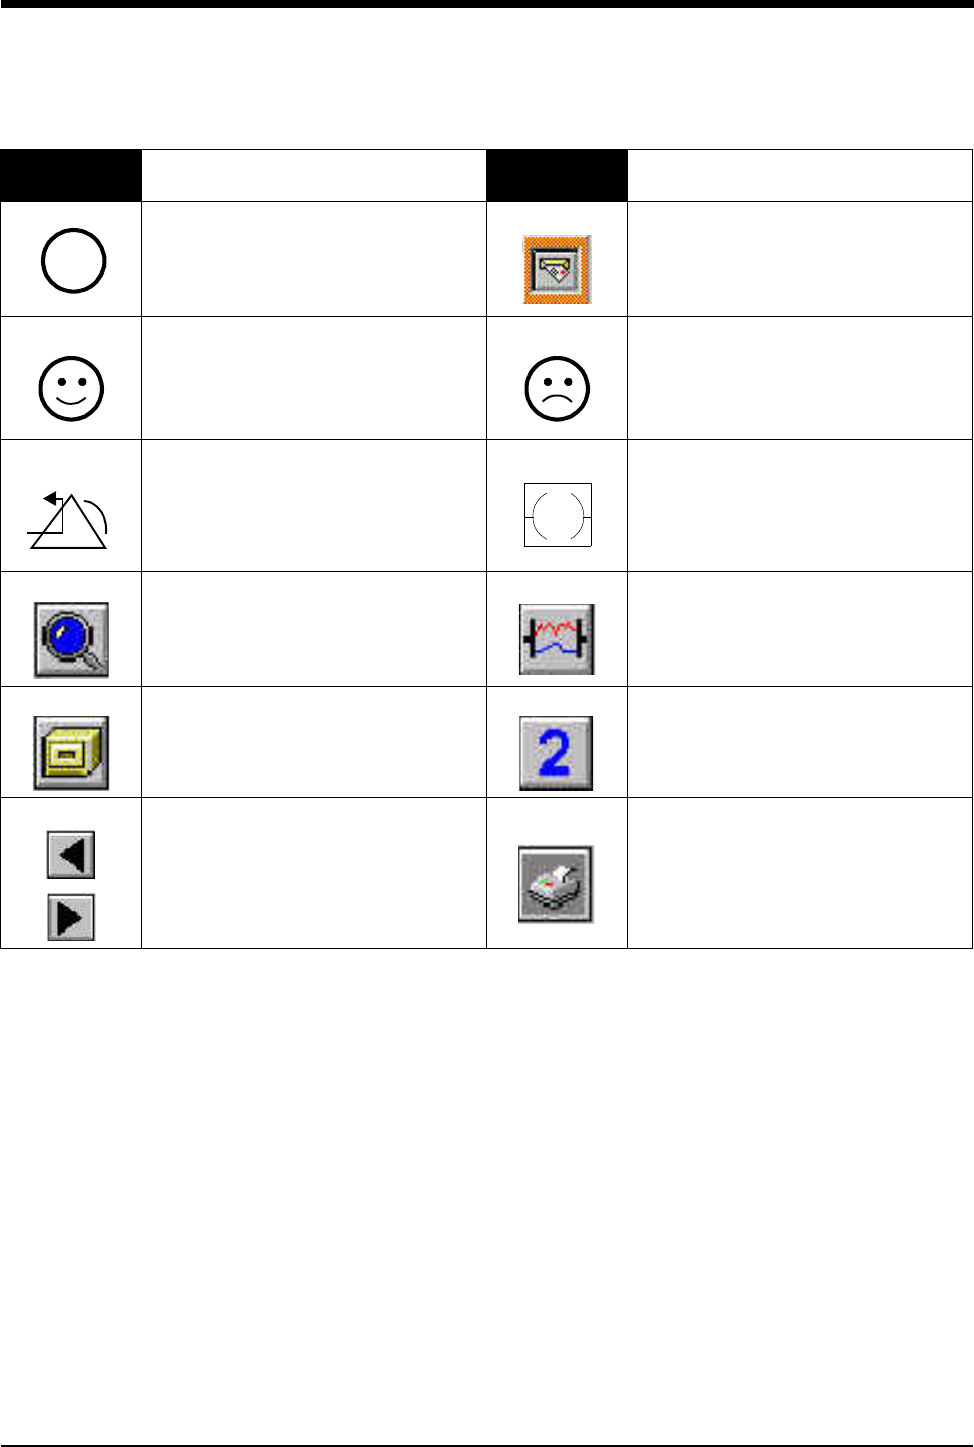
Symbols
34-7
Operates on Non-Harmonized Radio
Frequencies in Europe Service Message
Happy Face Sad Face
Reset Power Indicator LED
Magnifying Glass Compression
File Cabinet List of Rooms
Arrows Printer
Symbol Description Symbol Description
!

Ultraview Care Network
34-8
Abbreviations used as symbols are shown below.
Symbol Description Symbol Description
1 - 32 Access Codes
1 Through 32 AIR Air
ANT 1
ANT 2
Diversity Antenna System 1
Diversity Antenna System 2
Arr1
ArrNet2
Arrhythmia Net 1
Arrhythmia Net 2
CH
ch
EEG, EMG, or ECG Channel
EEG Channels - CH1, CH2, CH3, CH4
EMG Channel - CH5
cmH2OCentimeters of Water
CMV Controlled Mechanical Ventilation
C.O.
CO
co
Cardiac Output
DIA
dia Diastolic ECG
ecg Electrocardiogram
EEG
eeg Electroencephalogram EMG
emg Electromyogram
ESIS Electrosurgical Interference
Suppression EXT External
FECG Fetal Electrocardiogram FHR1
FHR2
Fetal Heart Rate, Channel 1
Fetal Heart Rate, Channel 2
GND
gnd Patient Isolated Ground HLO
hlo High-Level Output
I:E Inspiration Expiration Ratio Multiview Multi-Lead Electrocardiogram
NIBP
nibp Non-Invasive Blood Pressure N2ONitrous Oxide
O2Oxygen PEEP Positive End Expiratory Pressure
PRESS
press
PRS
Pressure Pmin Minimum Inspiratory Pressure

Symbols
34-9
BirthNet, Clinical Browser, CVScan, Data Shuttle, Express Charting, FT1000, FT3000A, Flexchart, Flexform, Flexport,
Flextable, Flextools, Flexview, Global Participant Index, Intesys, Maternal Obstetrical Monitor, MOM, Mermaid, Multiview,
Neoscan, PCIS, PCMS, PrintMaster, Quicknet, Sensorwatch, Spaceview, TRU-CAP, TRU-CUFF, TRU-LINK, UCW,
Ultralite, Ultraview, Ultraview Clinical Messenger, Uni-Pouch, Universal Flexport, Varitrend, Web Source and WinDNA are
trademarks of Datex-Ohmeda, Inc.
Other brands and product names are trademarks of their respective owners.
Ppeak Peak Inspiratory Pressure RESP
resp Respiration
SDLC Synchronous Data Link Control
SPO2
SpO2
SpO2
SaO2
Arterial Oxygen Saturation
as Measured by Pulse Oximetry
SVO2
SvO2
SvO2
Mixed Venous Oxygen Saturation SYS
sys Systolic
T1
T2
T3
T4
Temperature 1
Temperature 2
Temperature 3
Temperature 4
UA Uterine Activity or Umbilical Artery
VAC Vacuum connection
Symbol Description Symbol Description