Spacelabs Healthcare 76A90341-WMTS 90341-05 User Manual 3 of 3
Spacelabs Healthcare, Inc. 90341-05 3 of 3
UserManual.wiki
>
Spacelabs Healthcare
>
76A90341-WMTS User Manual
>
User Manual 3 of 3
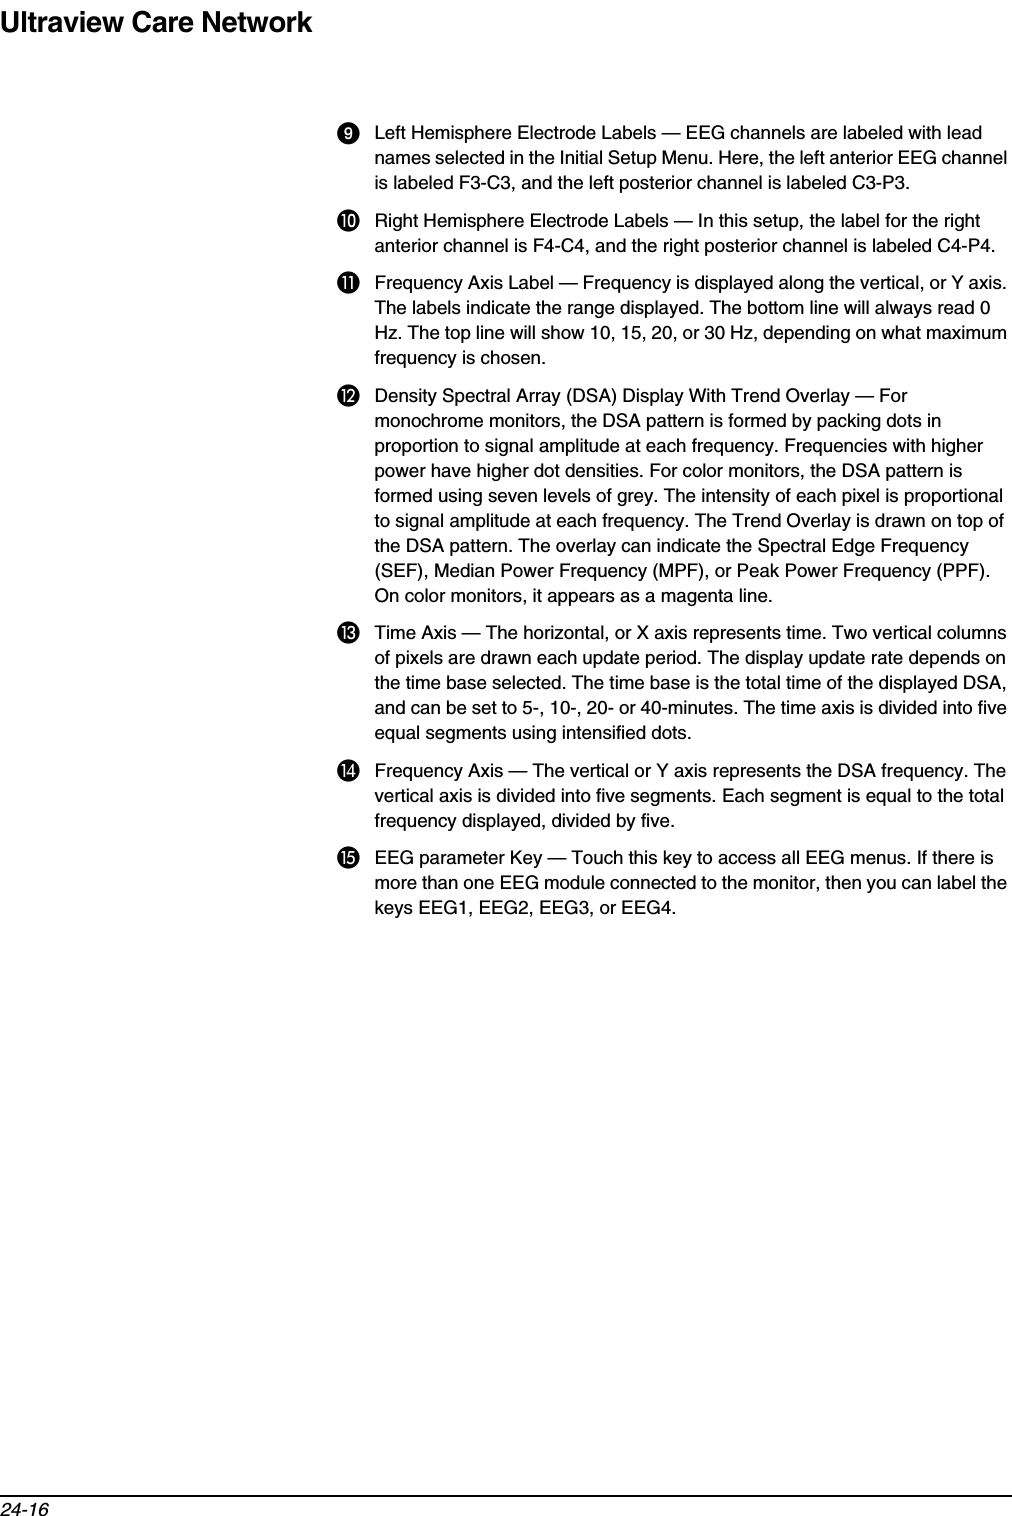
Contents
1.
User Manual 1 of 3
2.
User Manual 2 of 3
3.
User Manual 3 of 3
User Manual 3 of 3
Navigation menu
Upload a User Manual
Namespaces
Wiki Guide
HTML
PDF
Info
Views
User Manual
Discussion / Help
Navigation
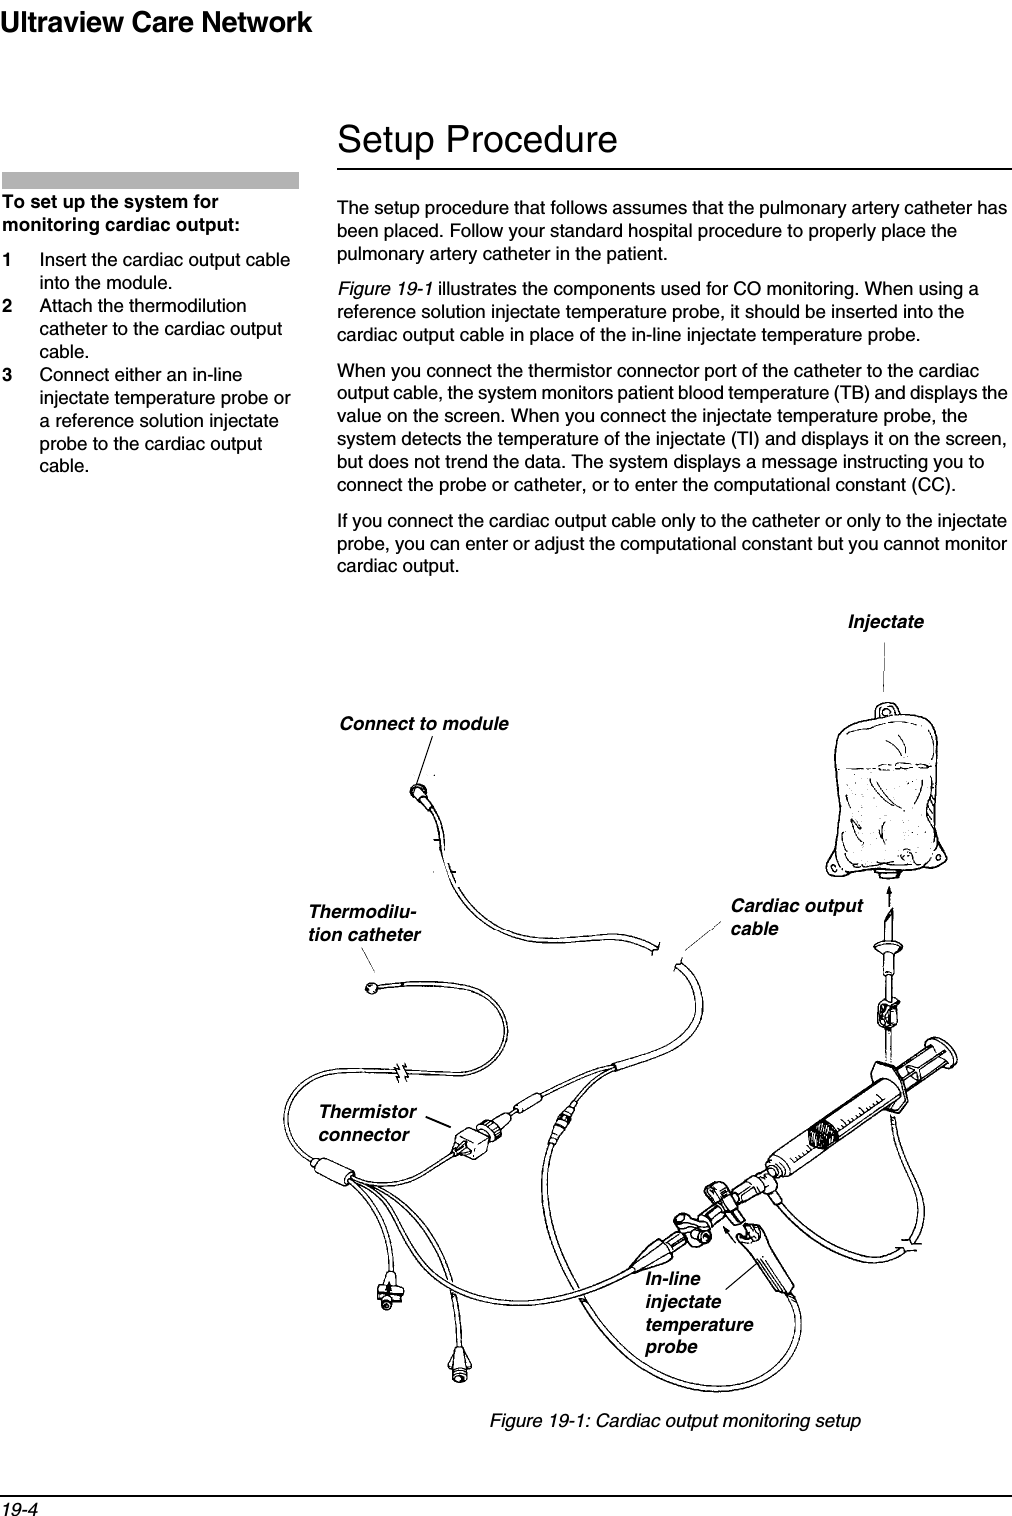
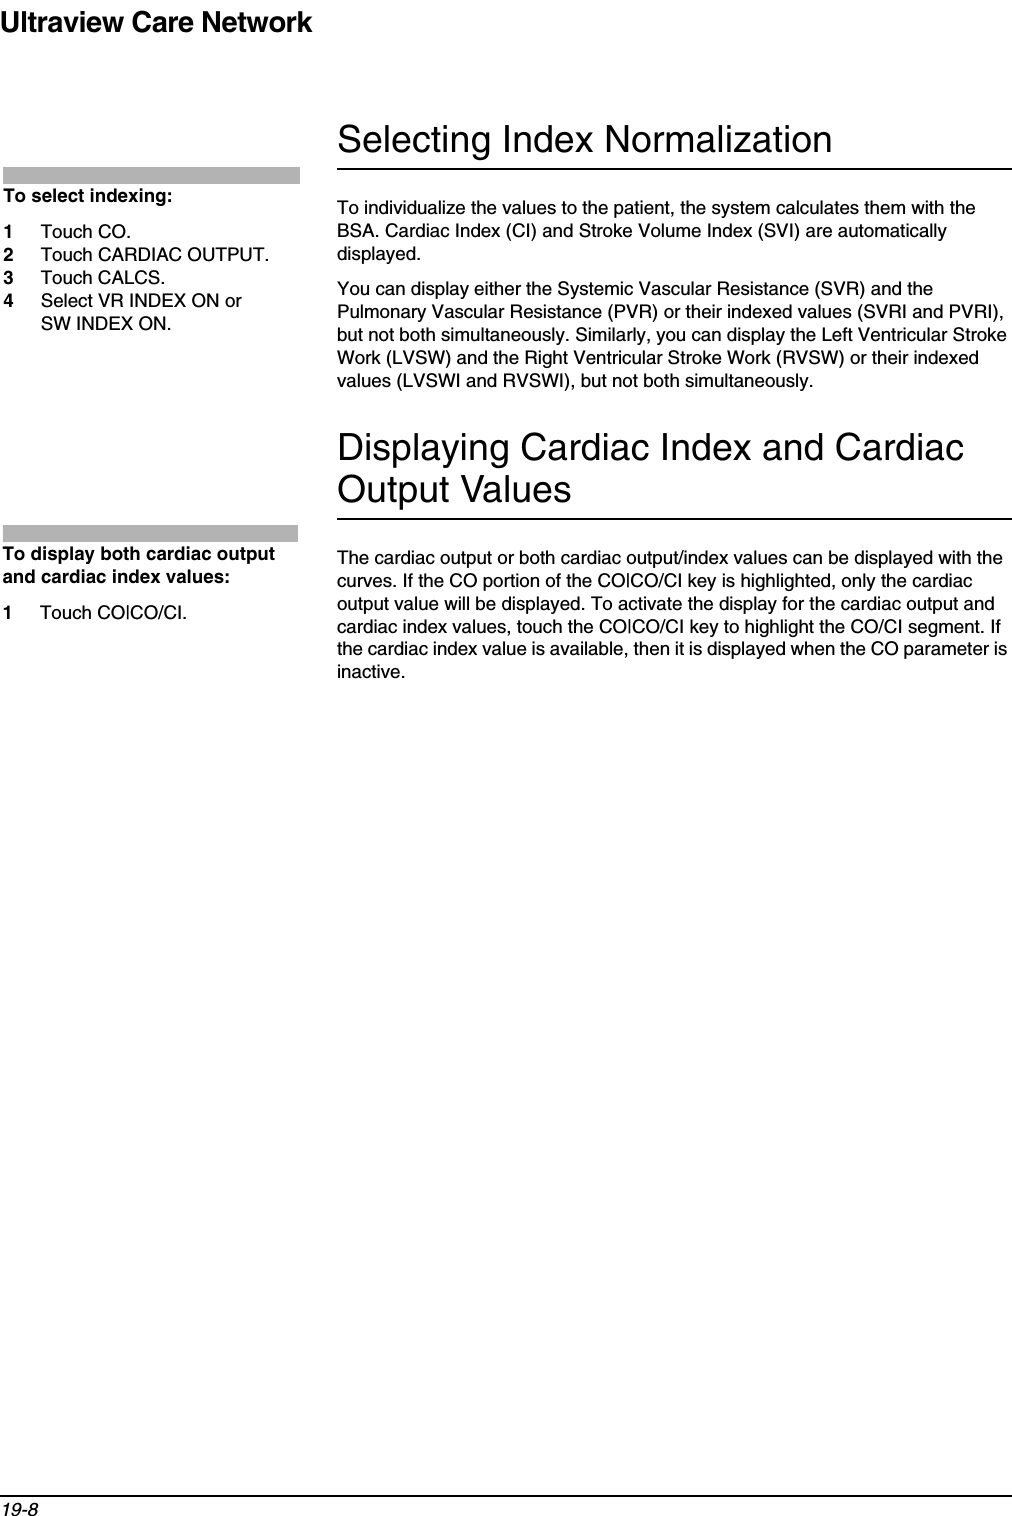
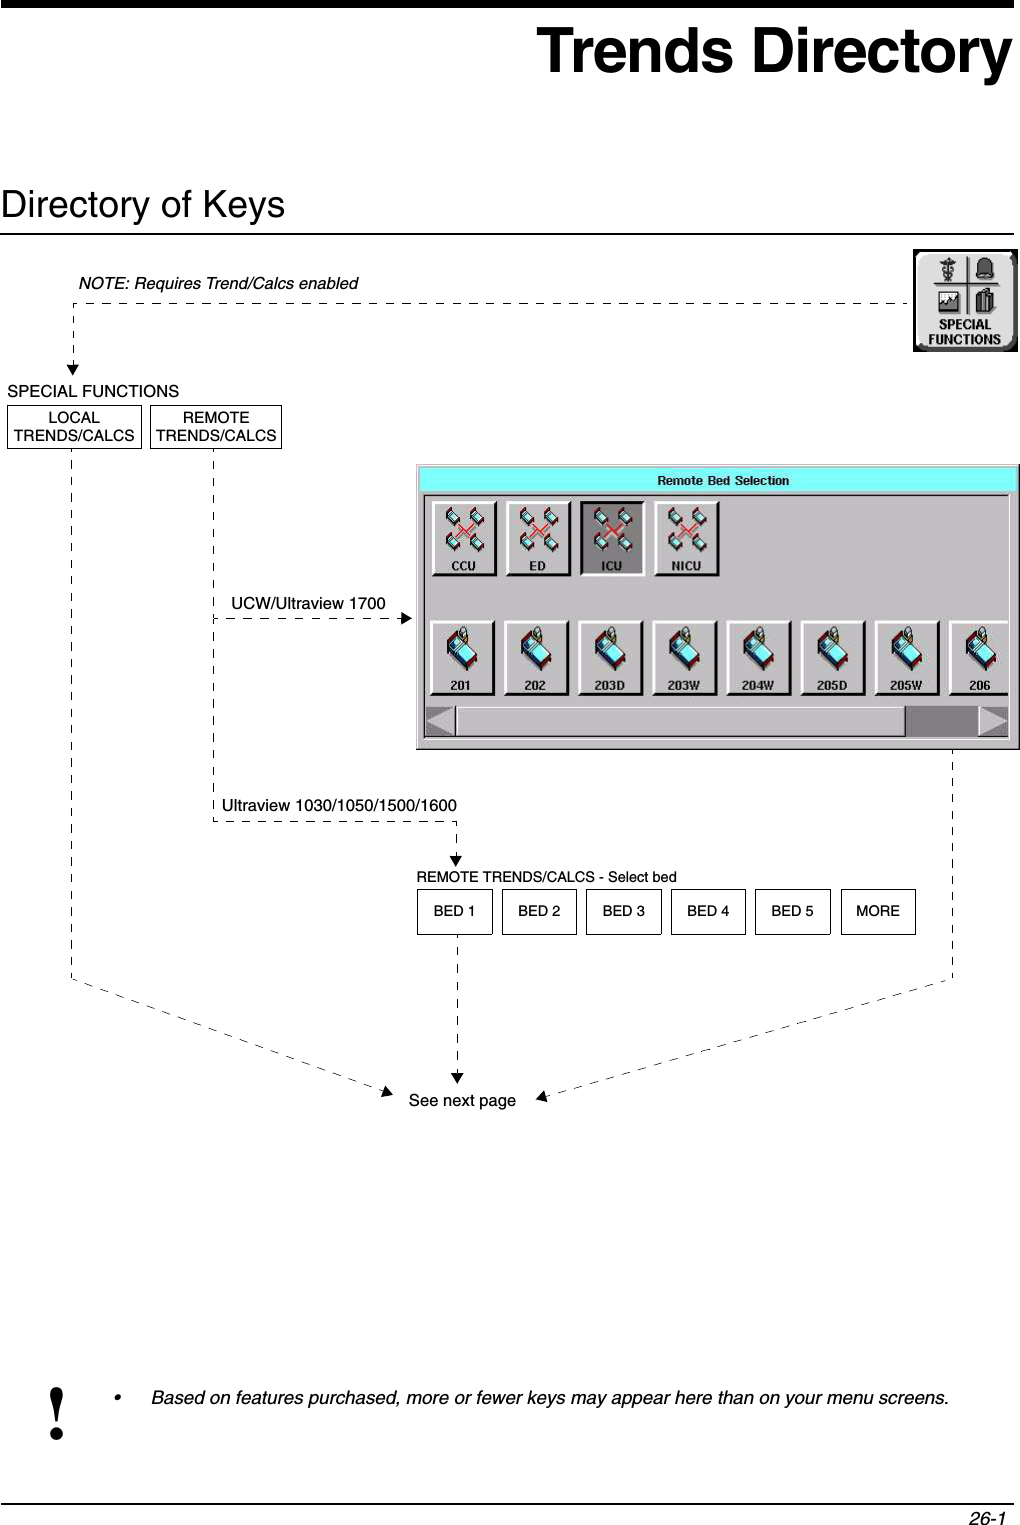
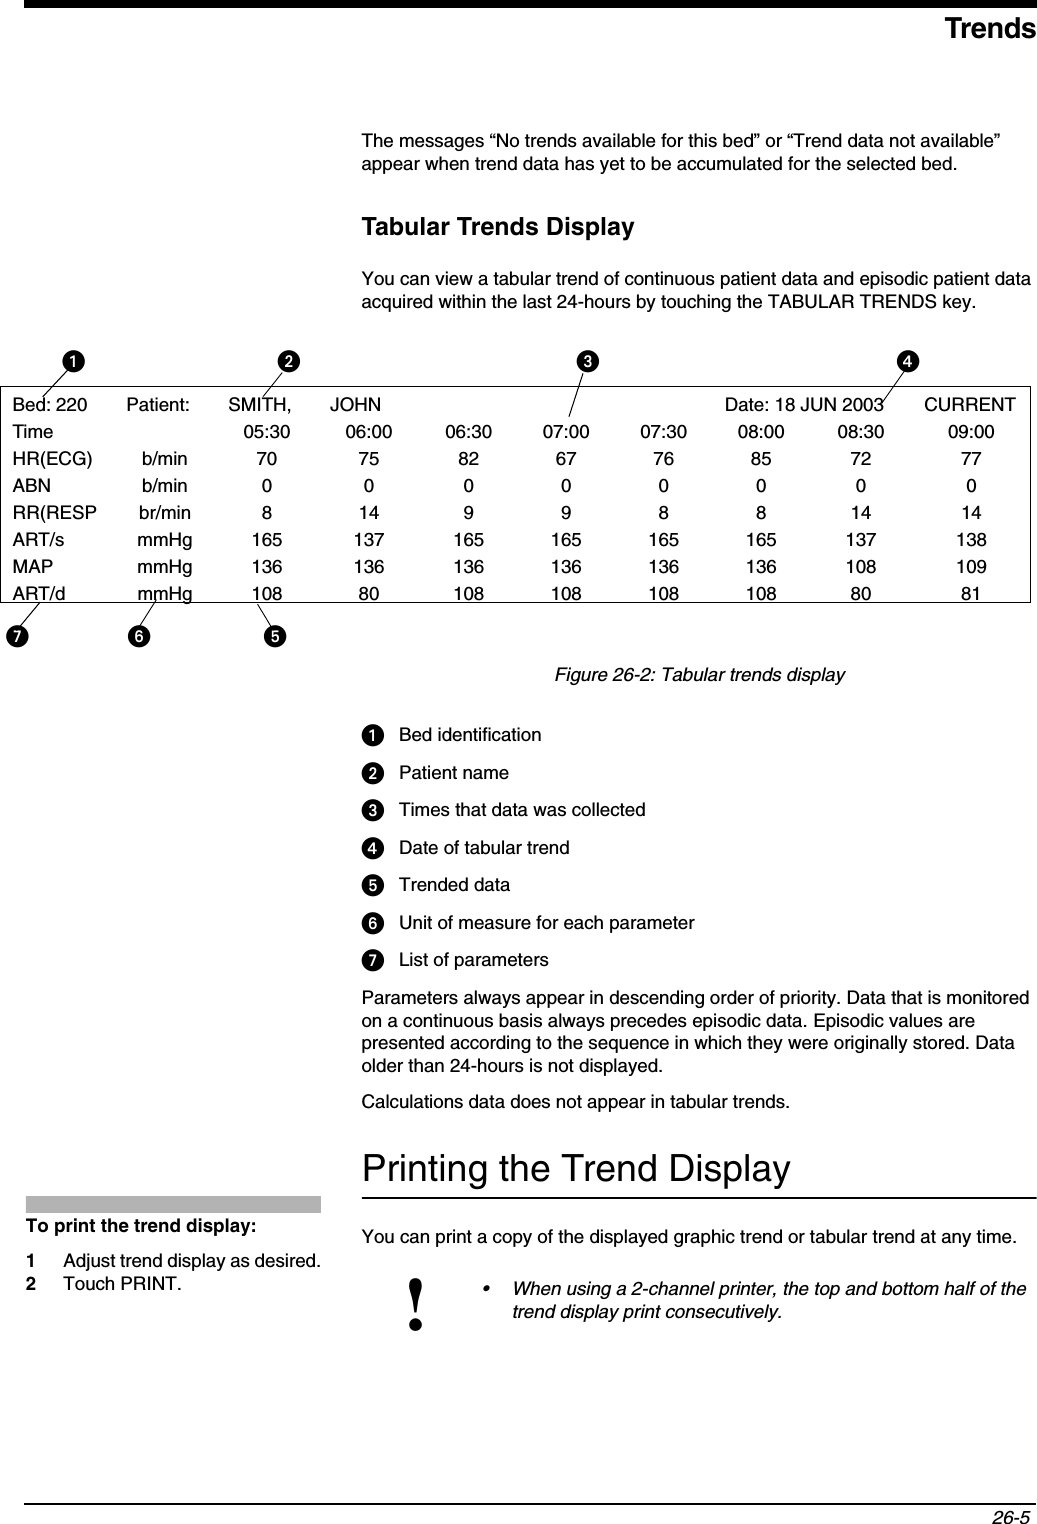
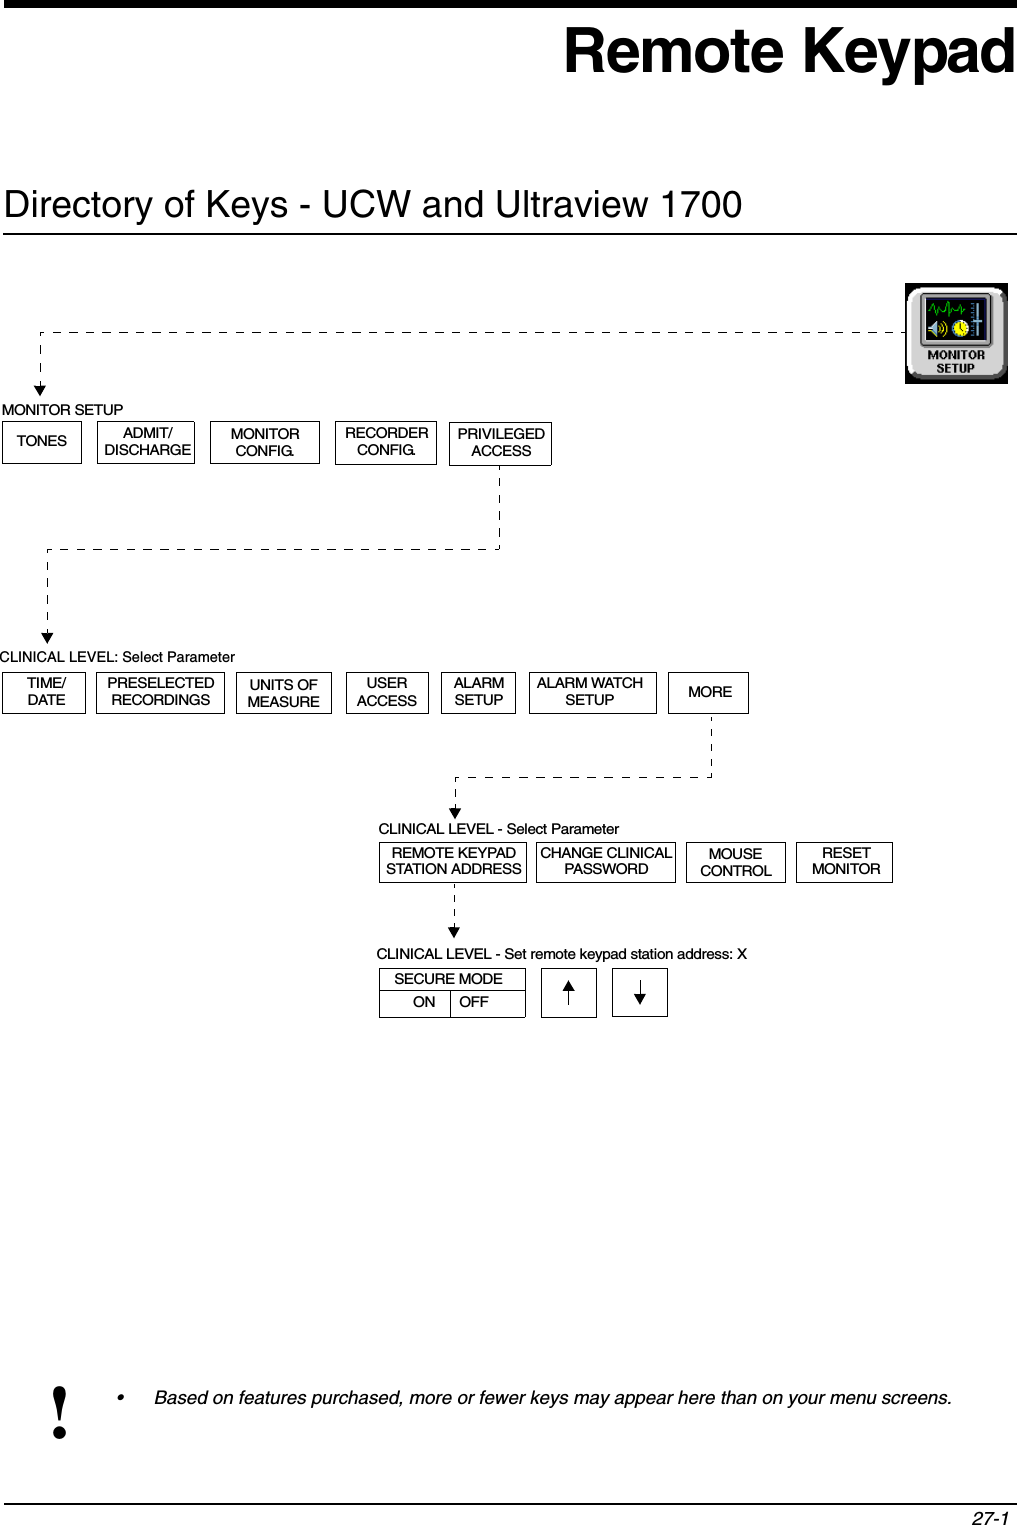
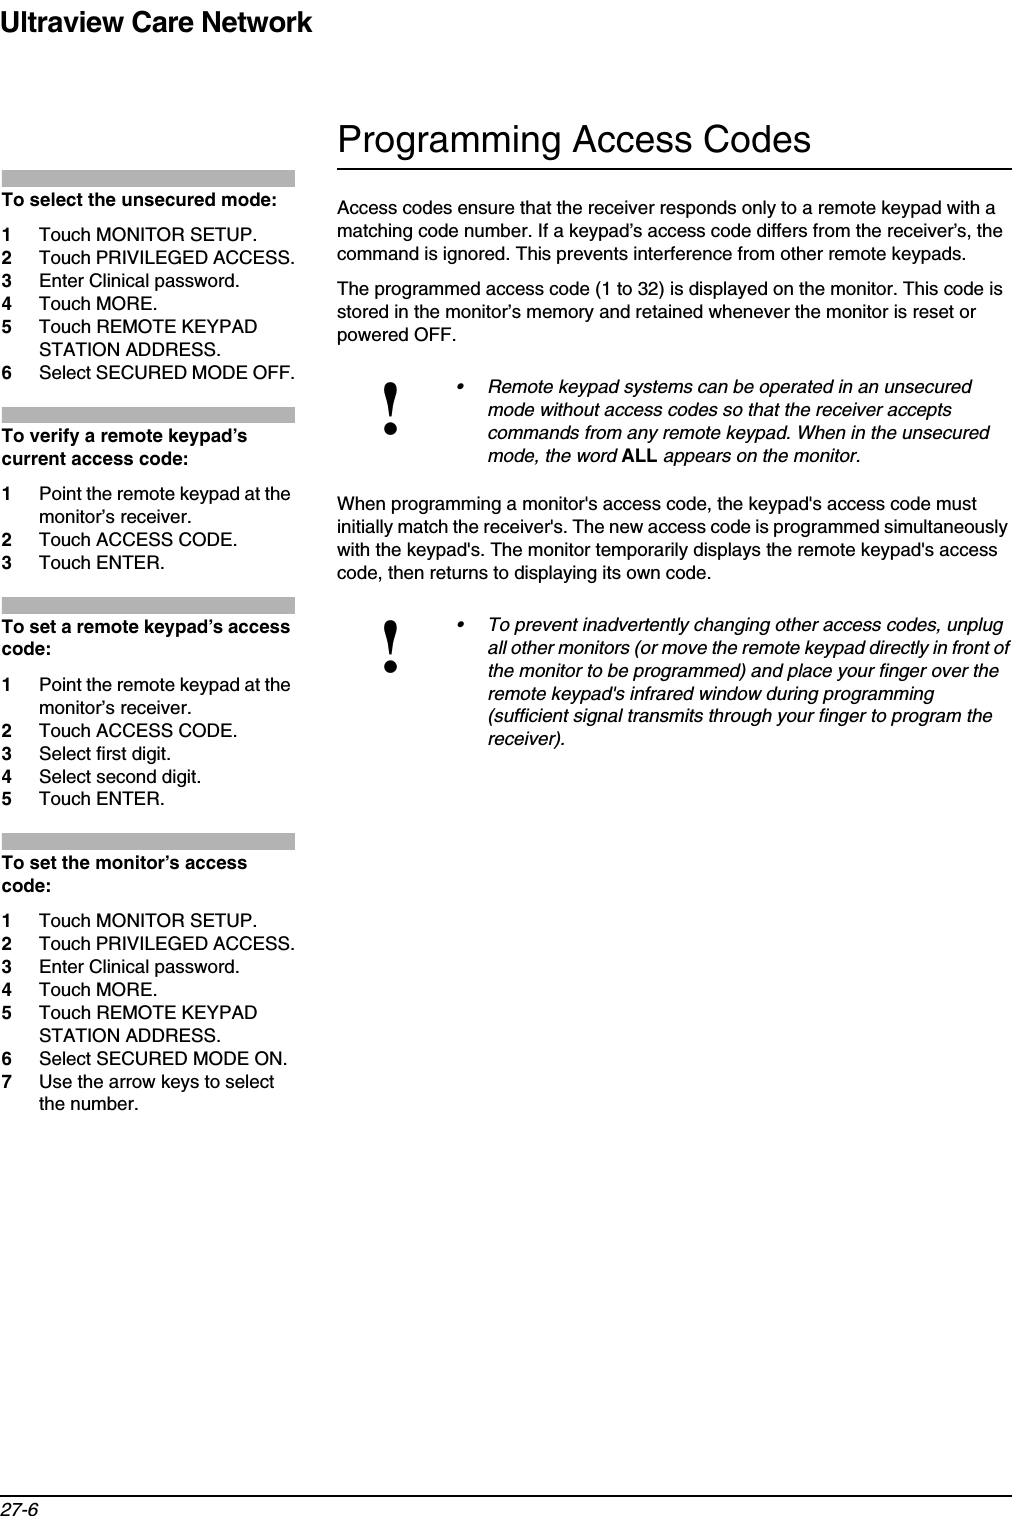
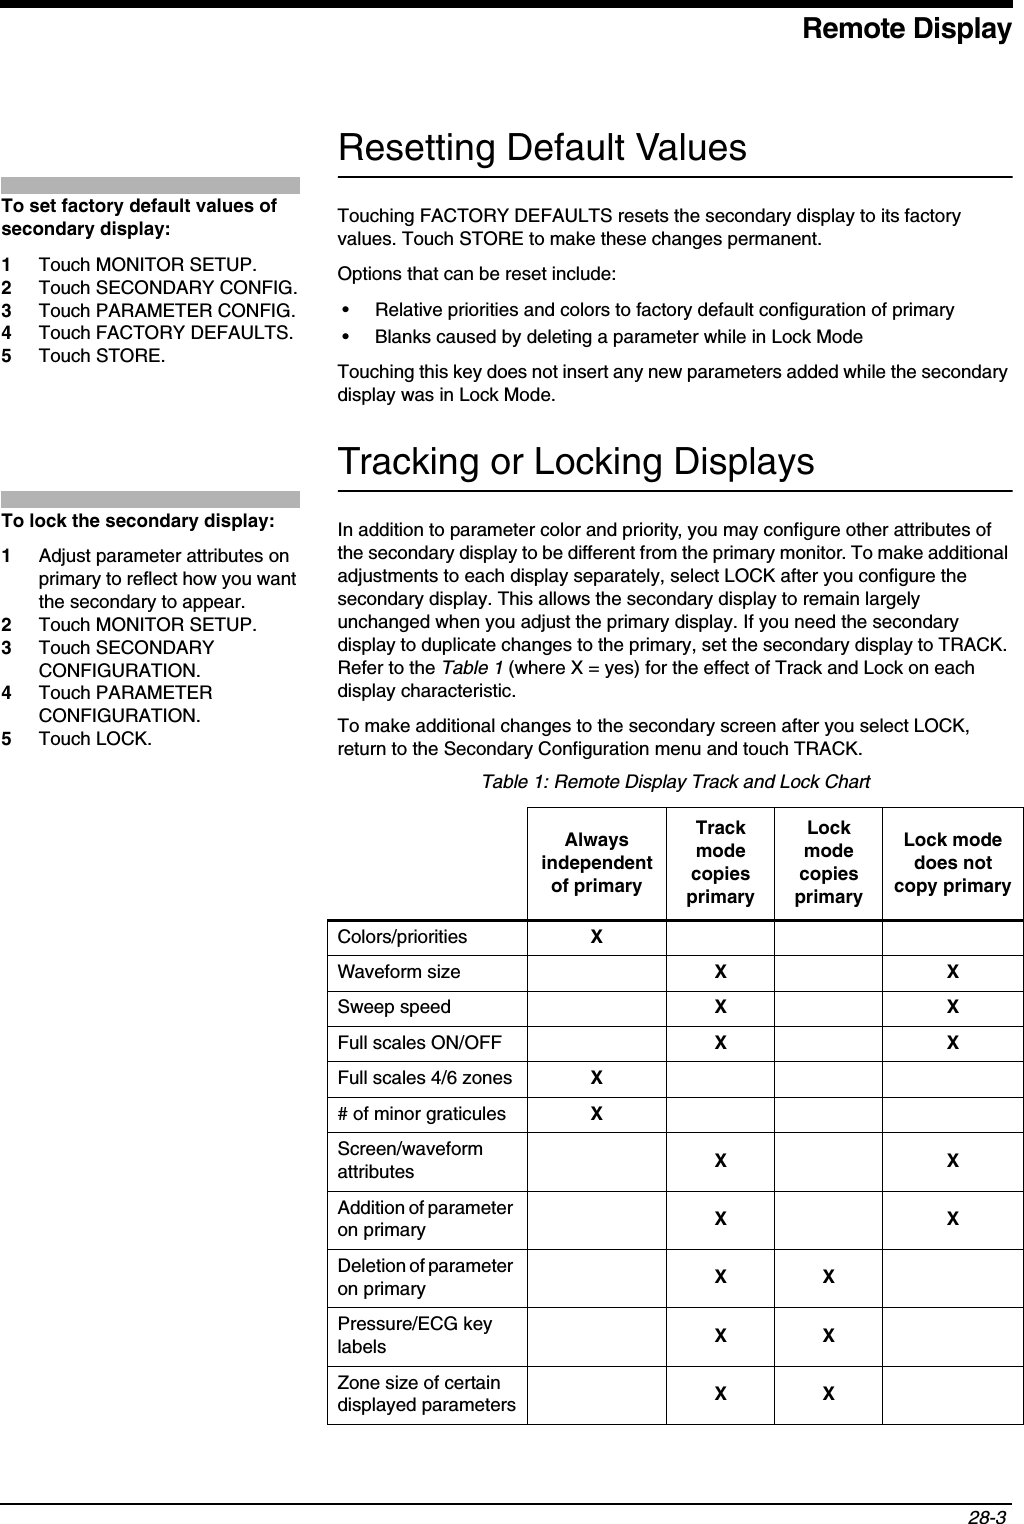
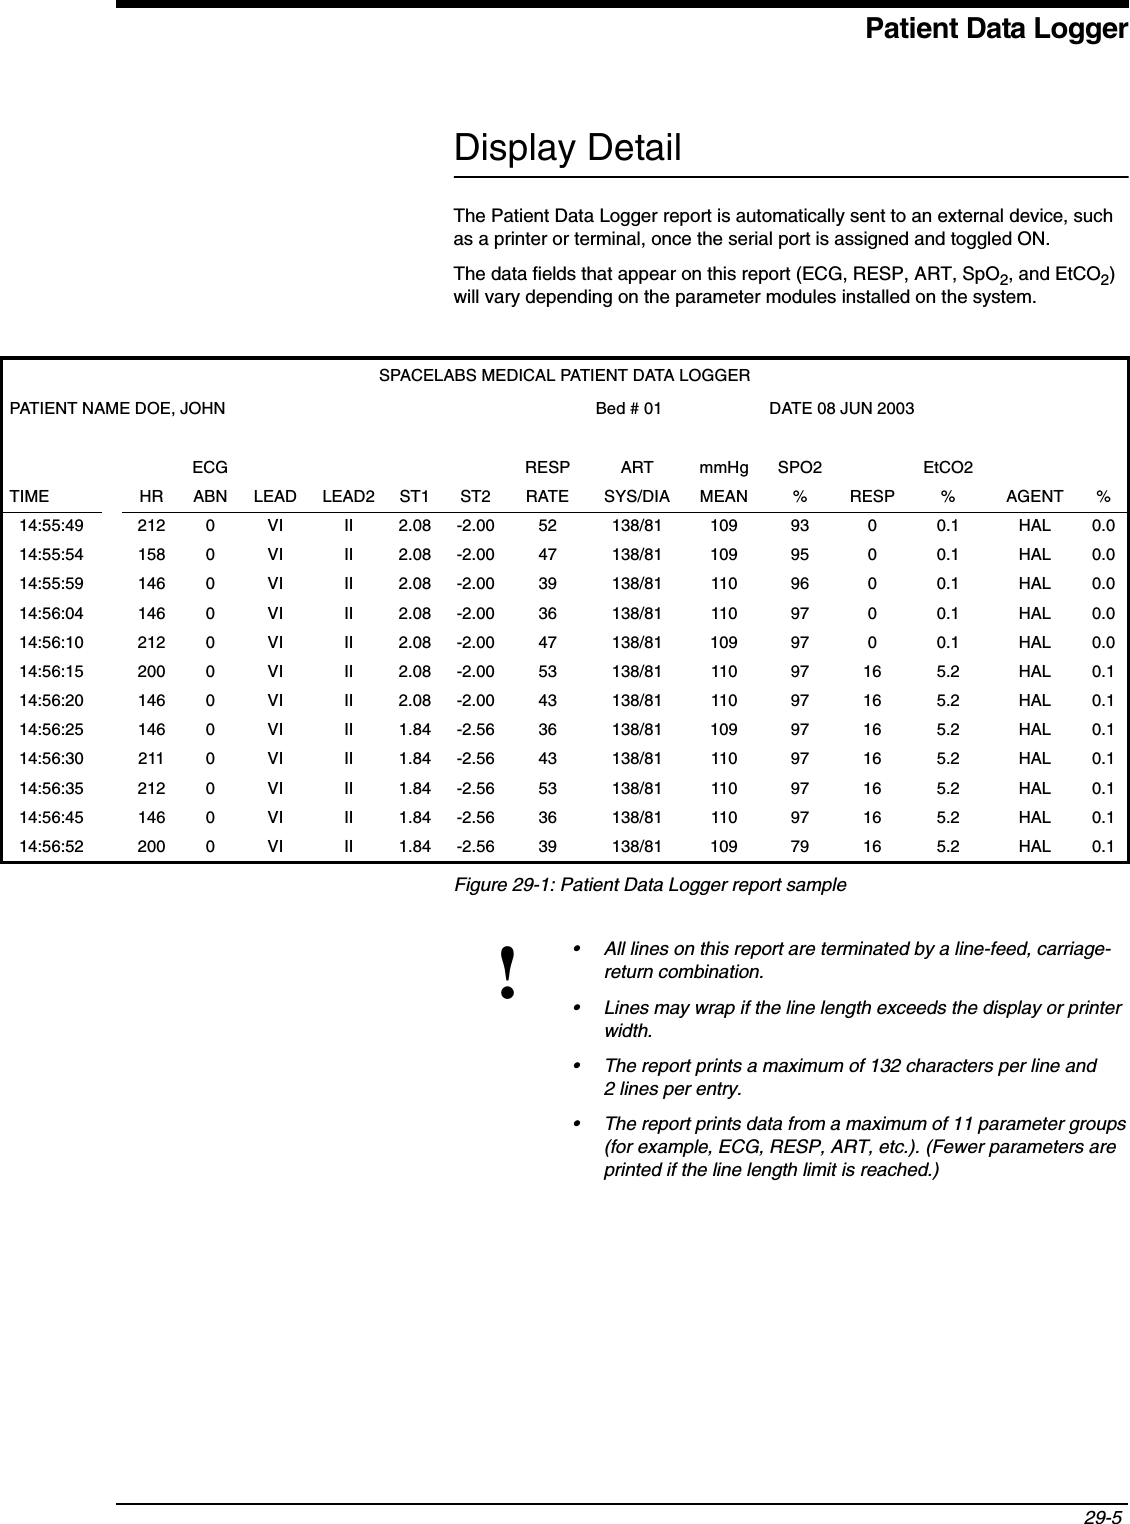
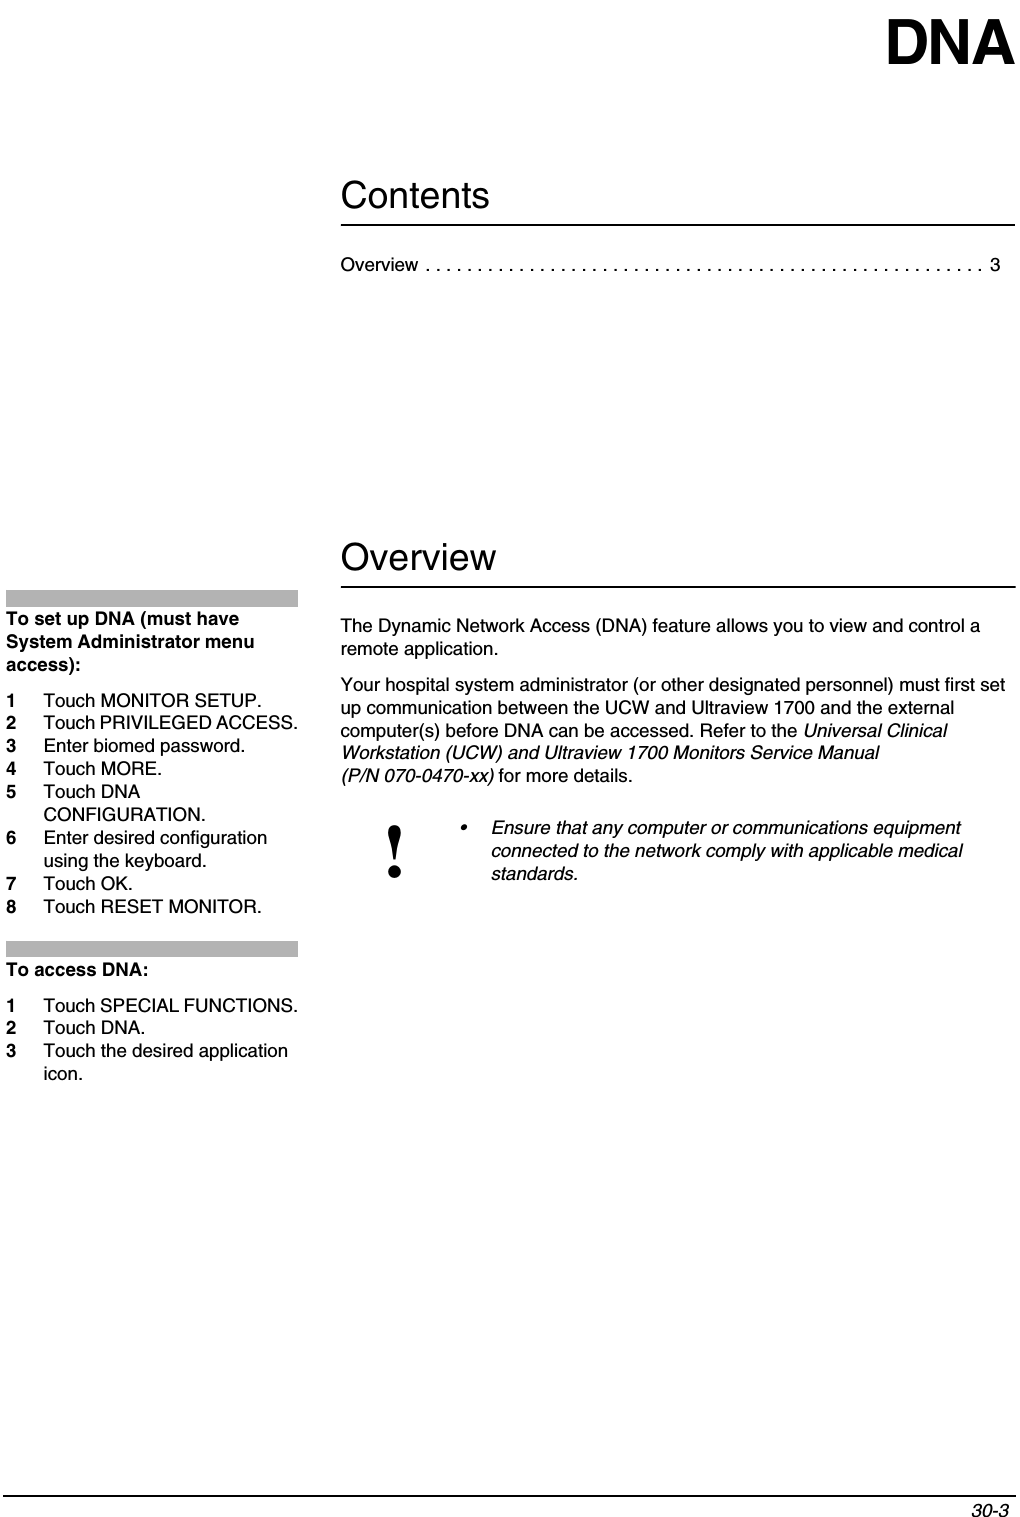
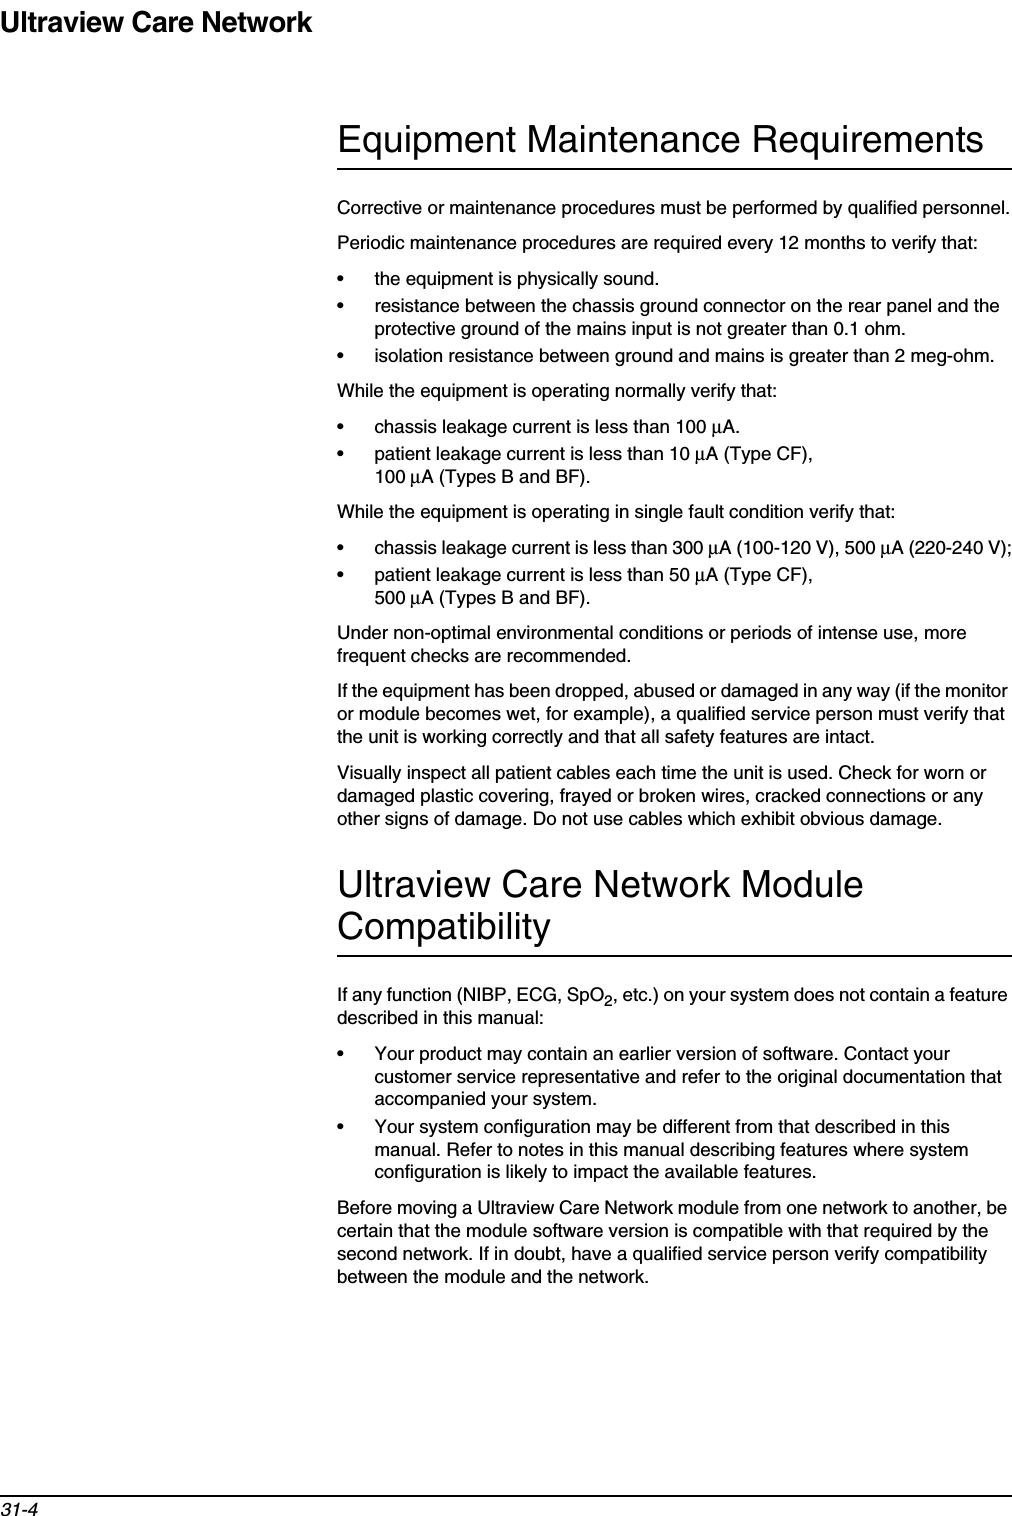
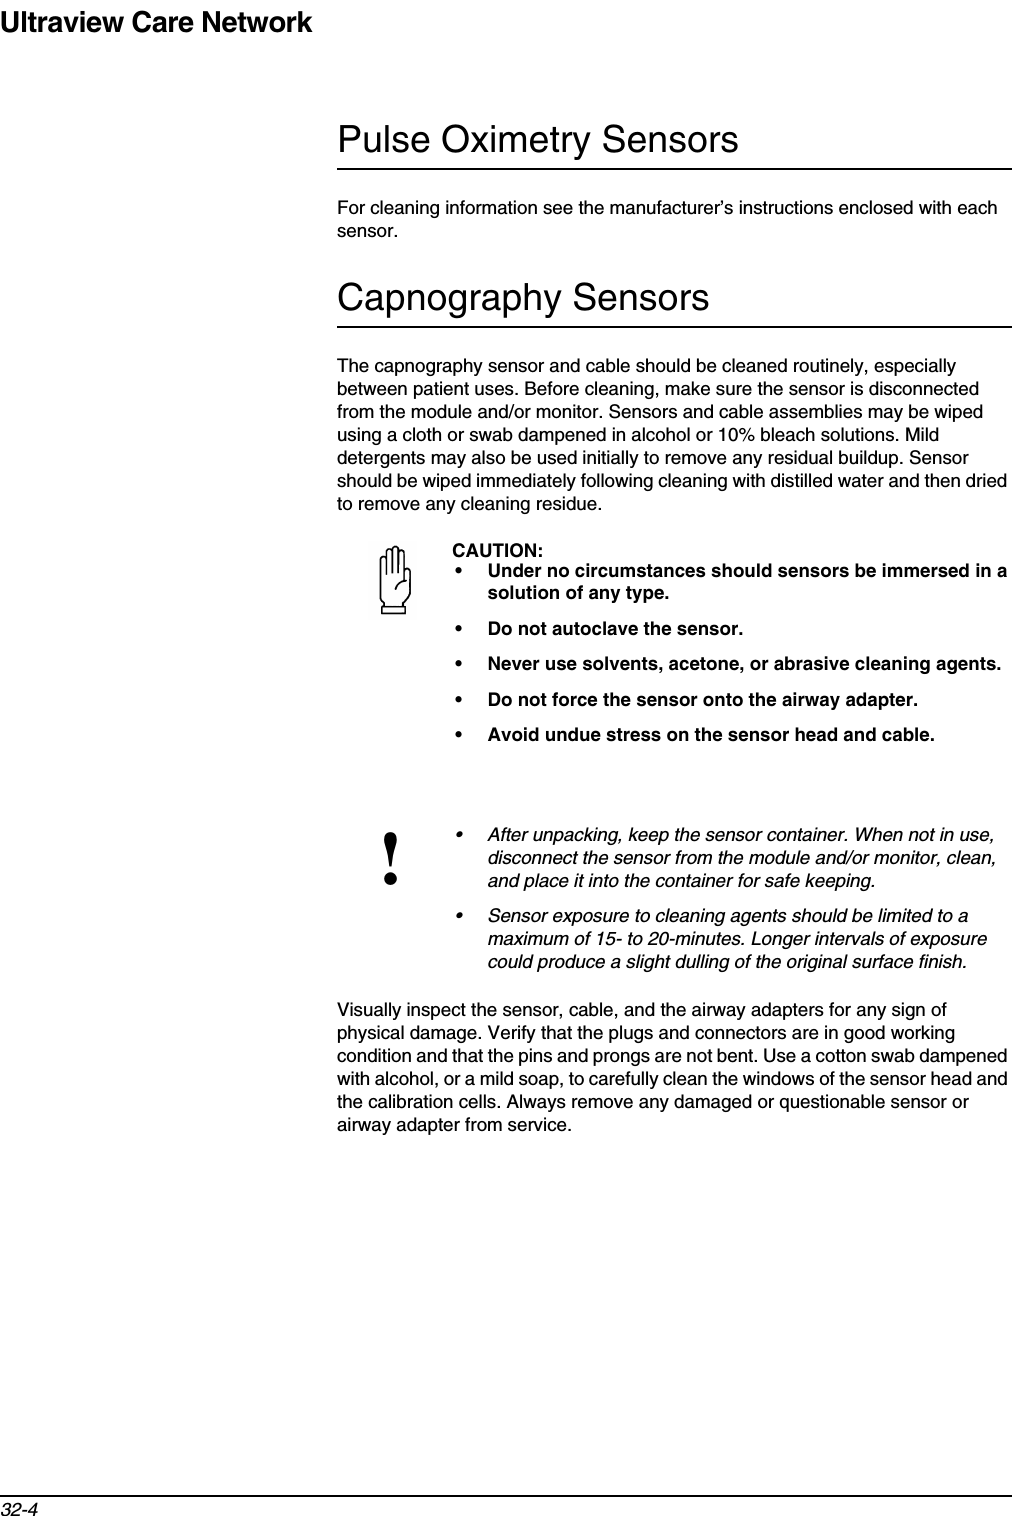
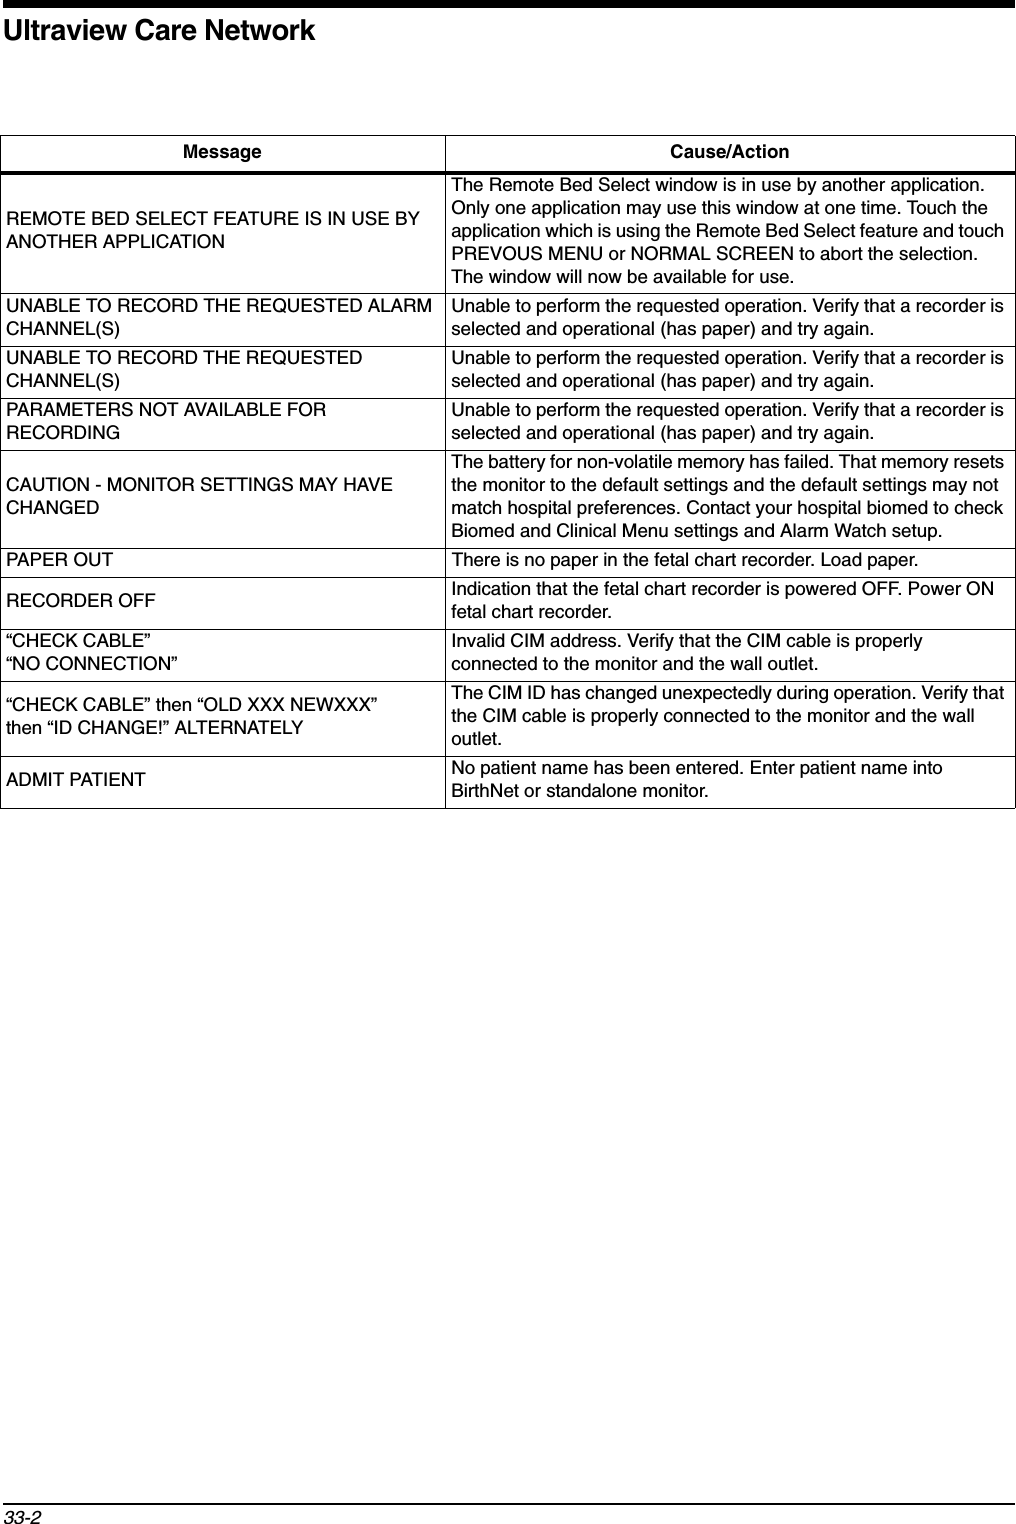
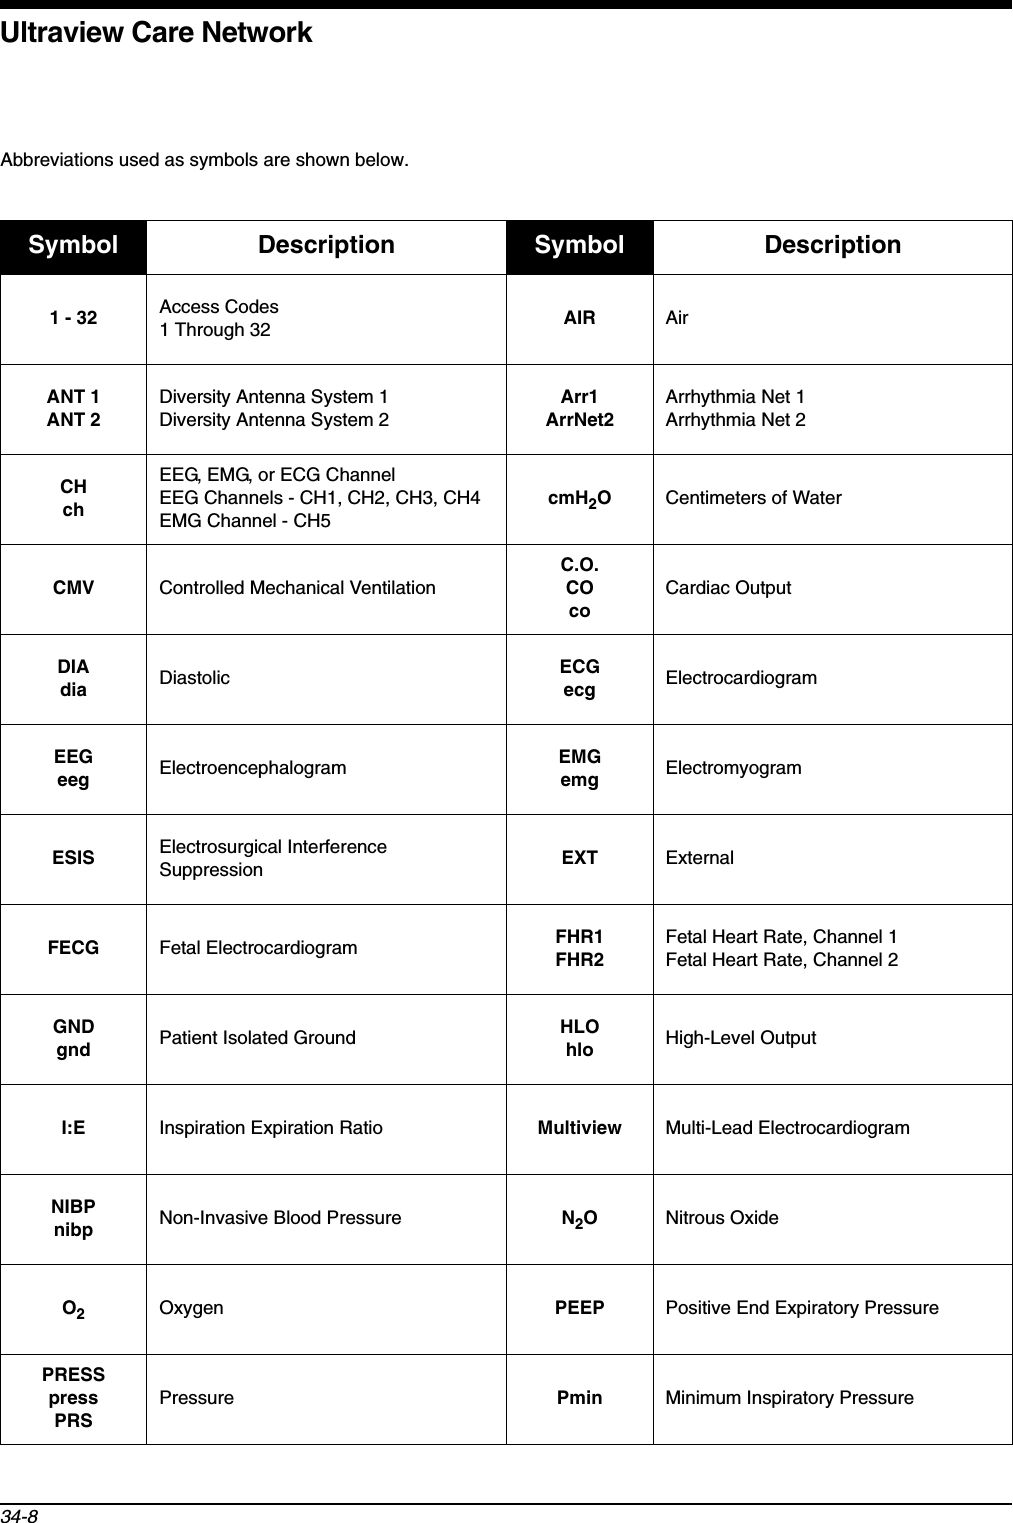
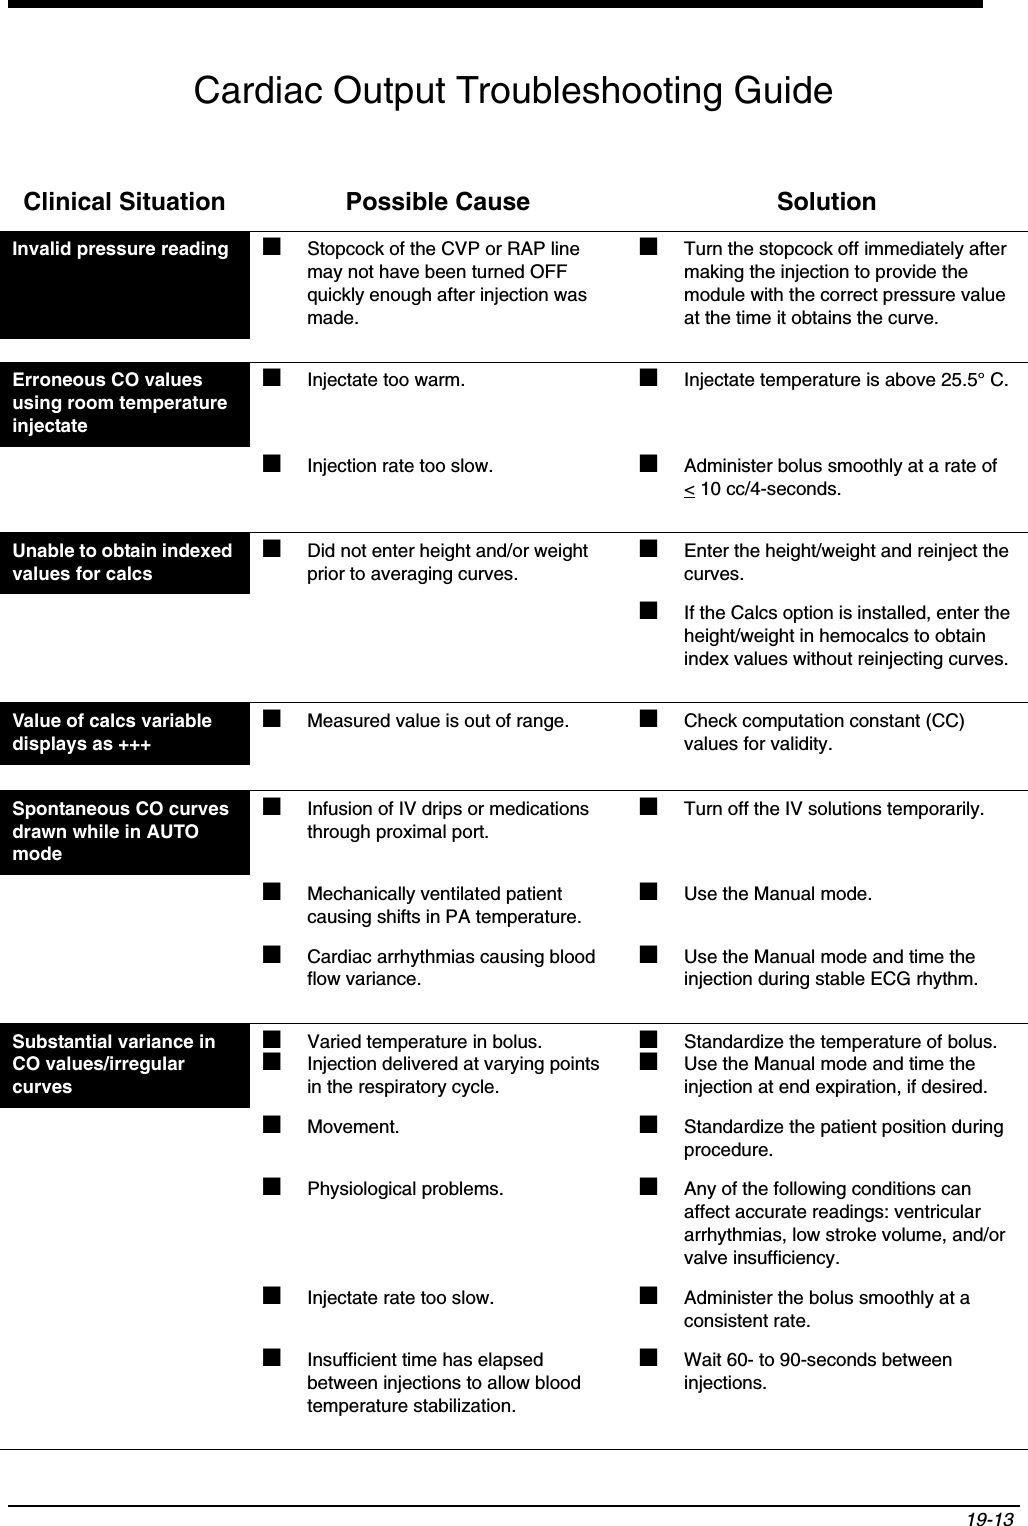
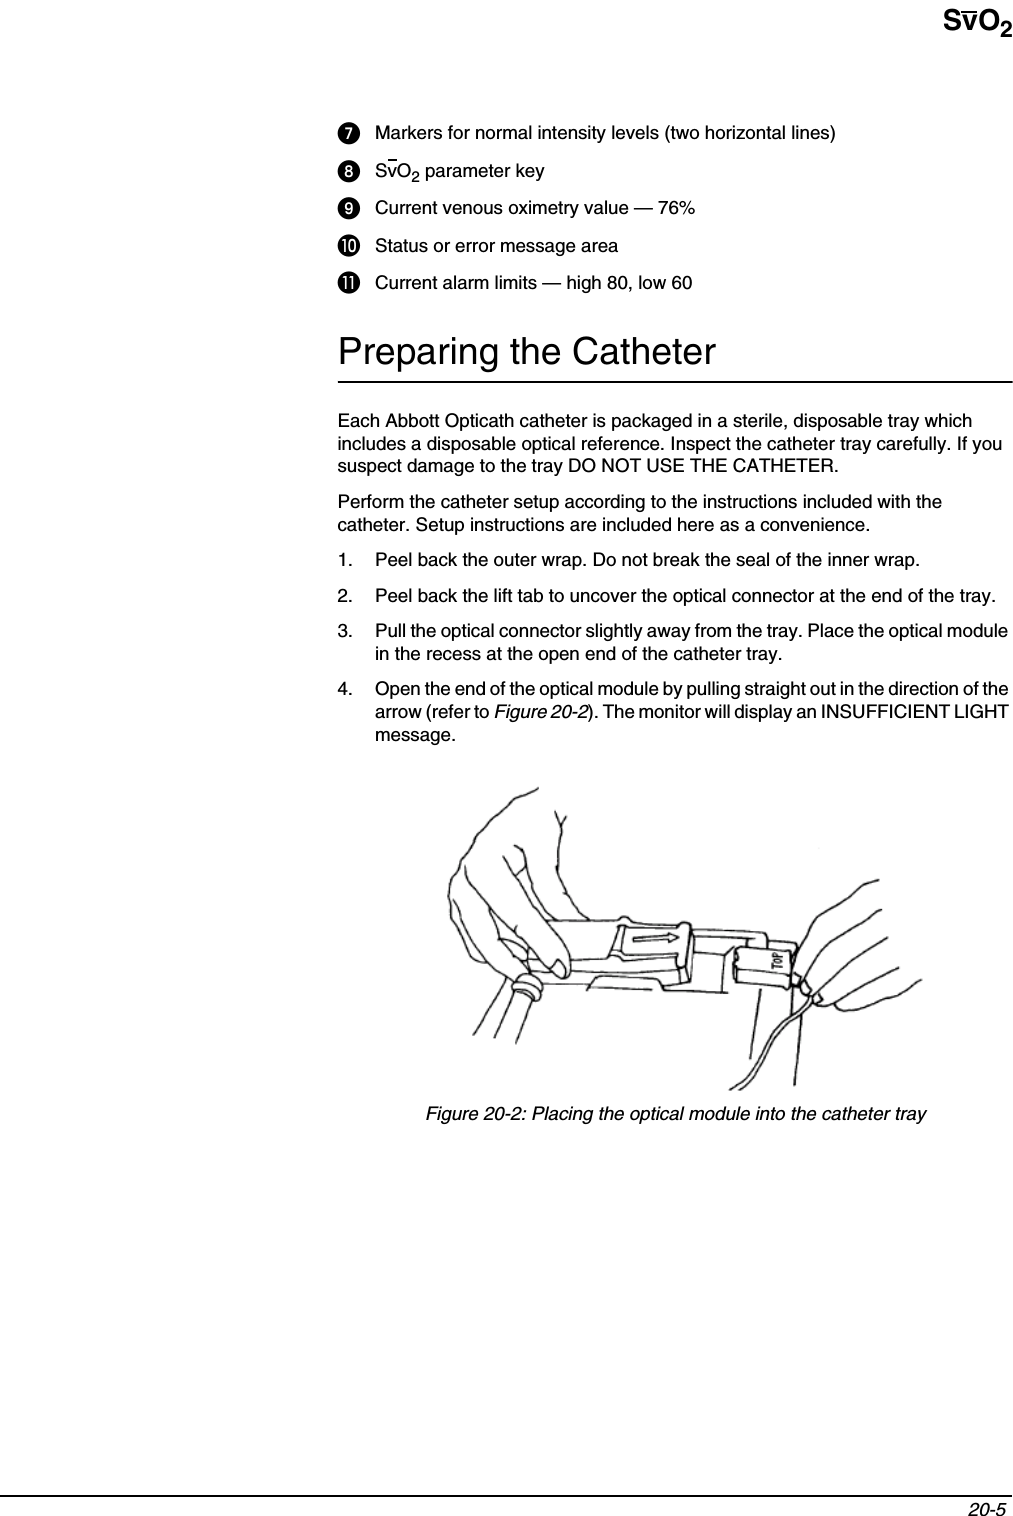
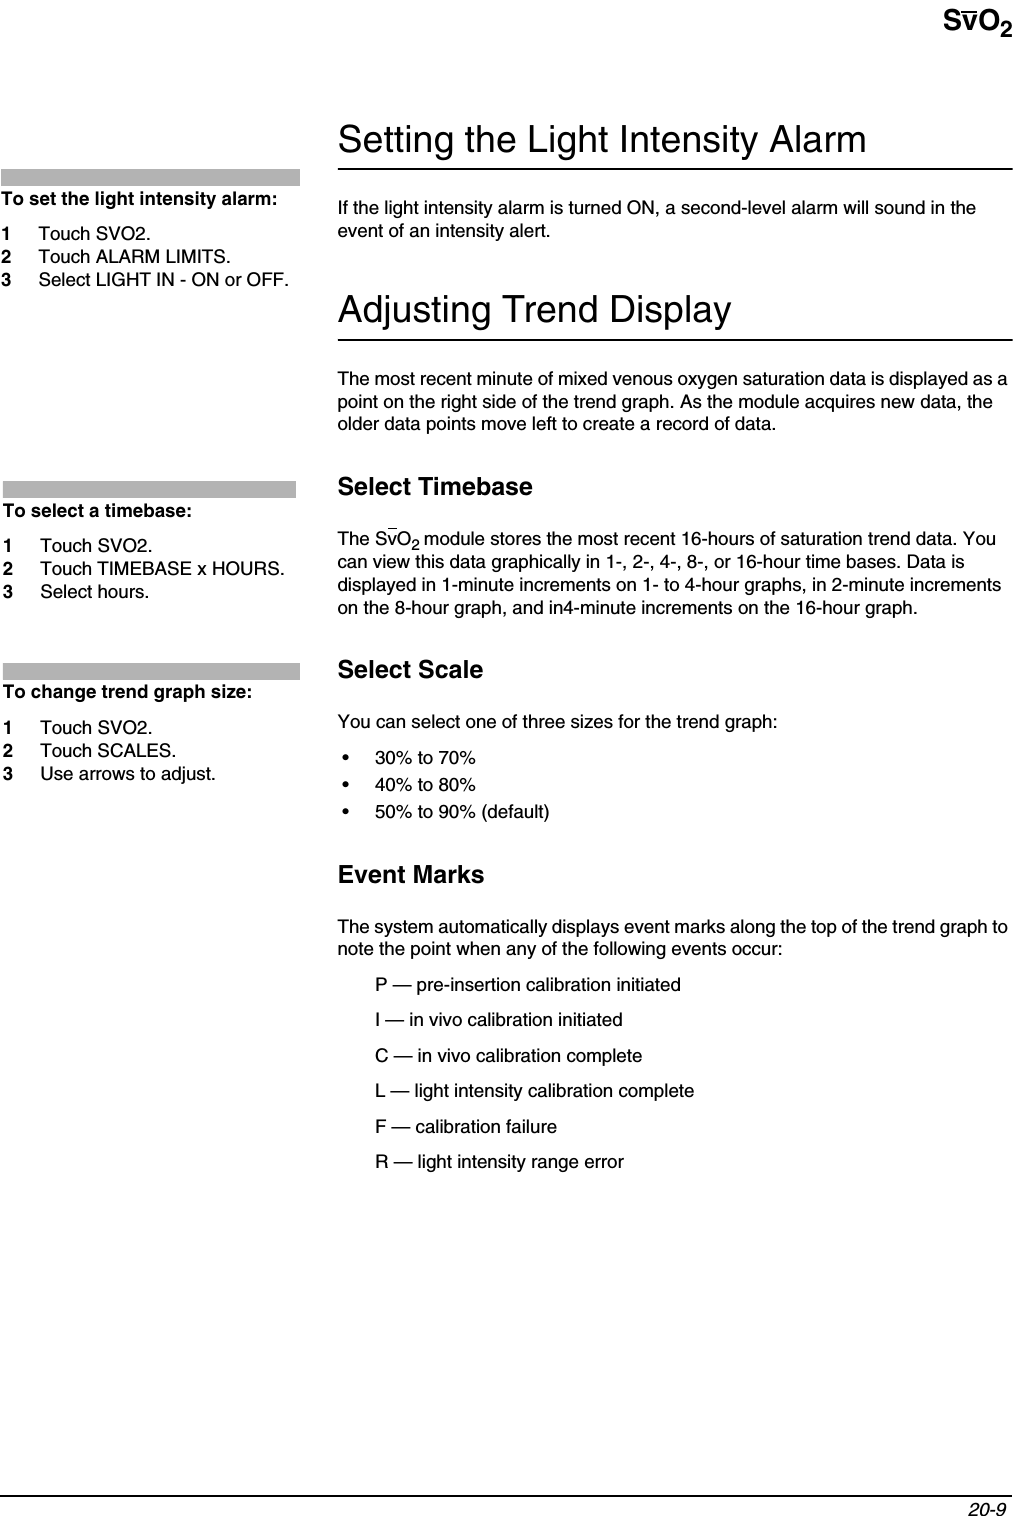
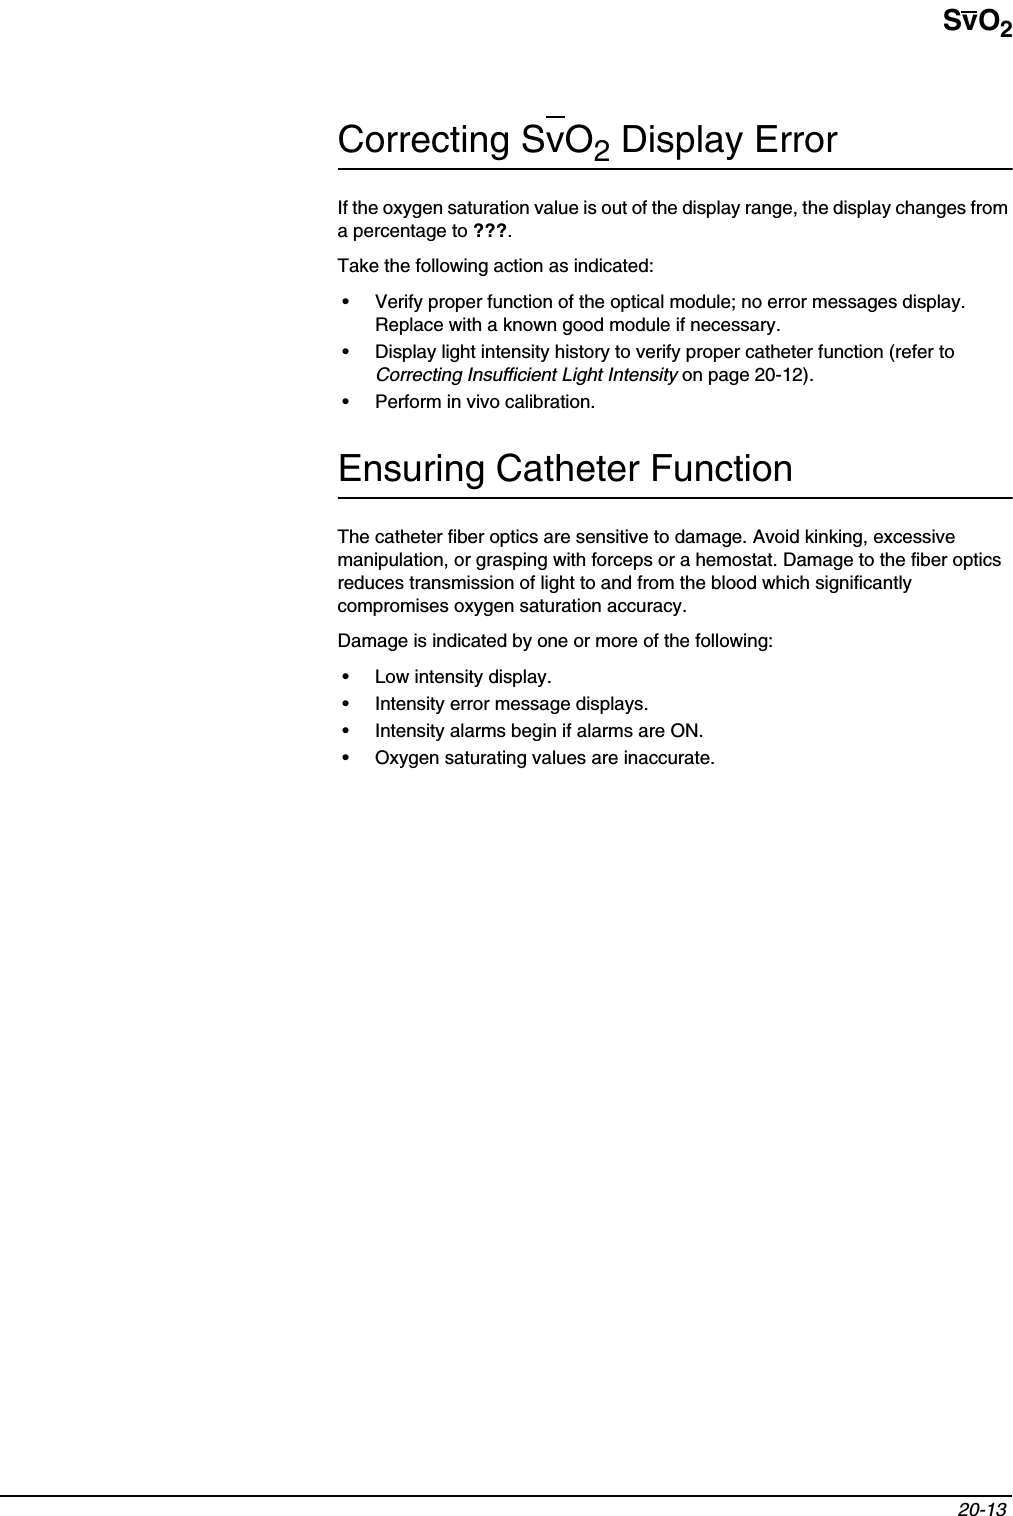
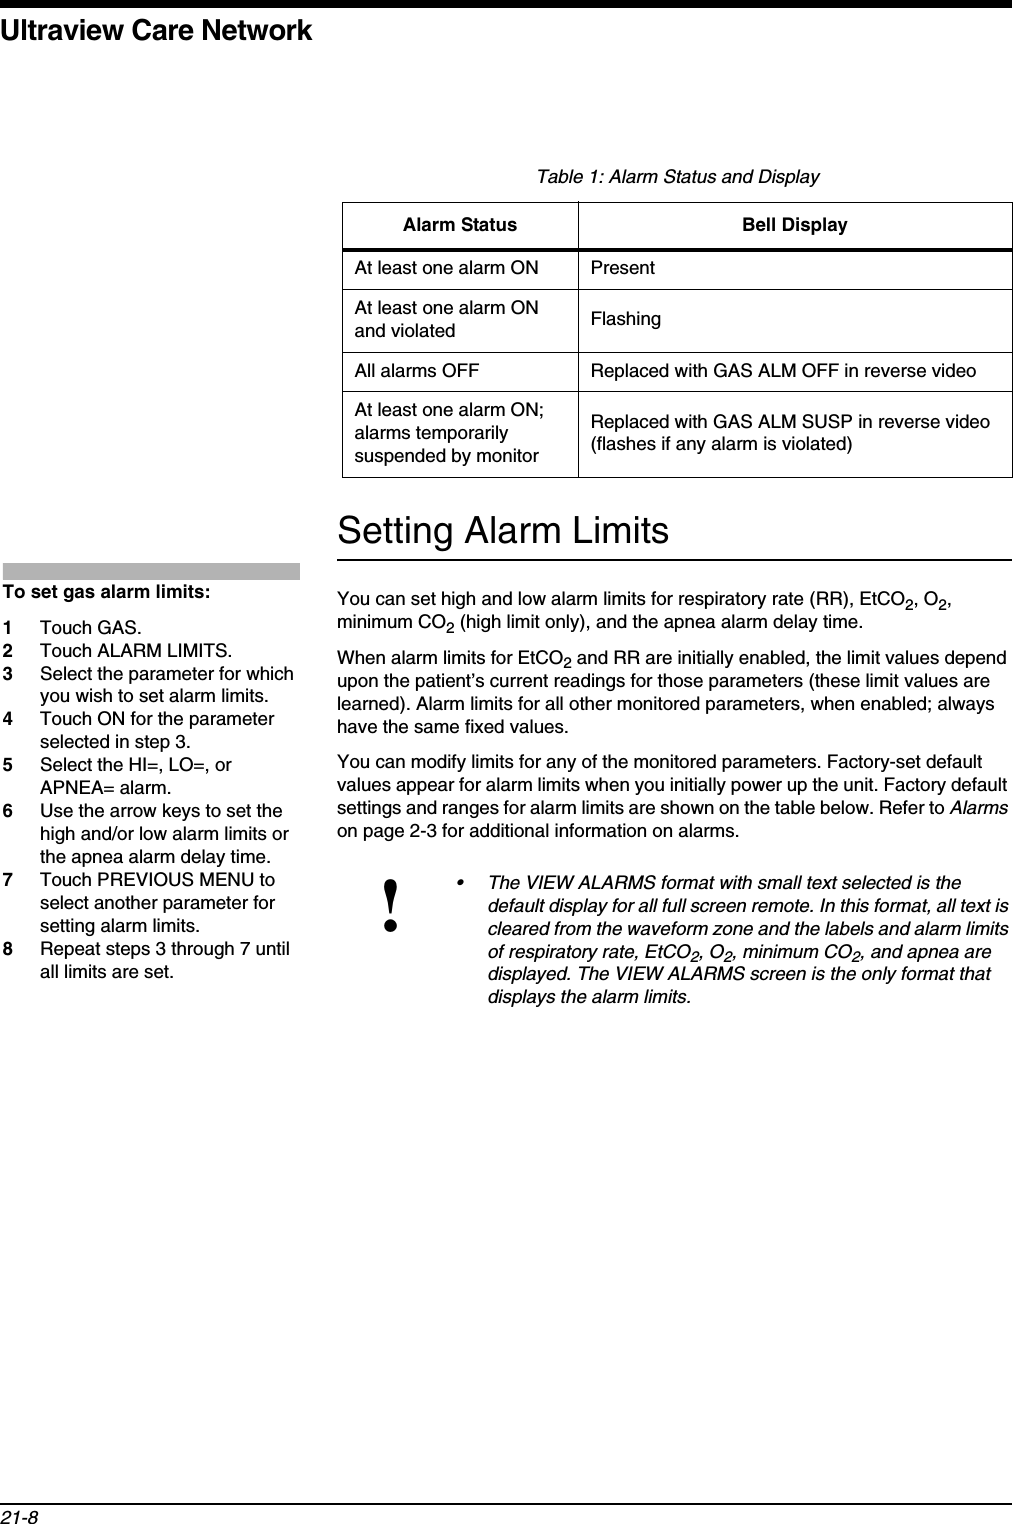
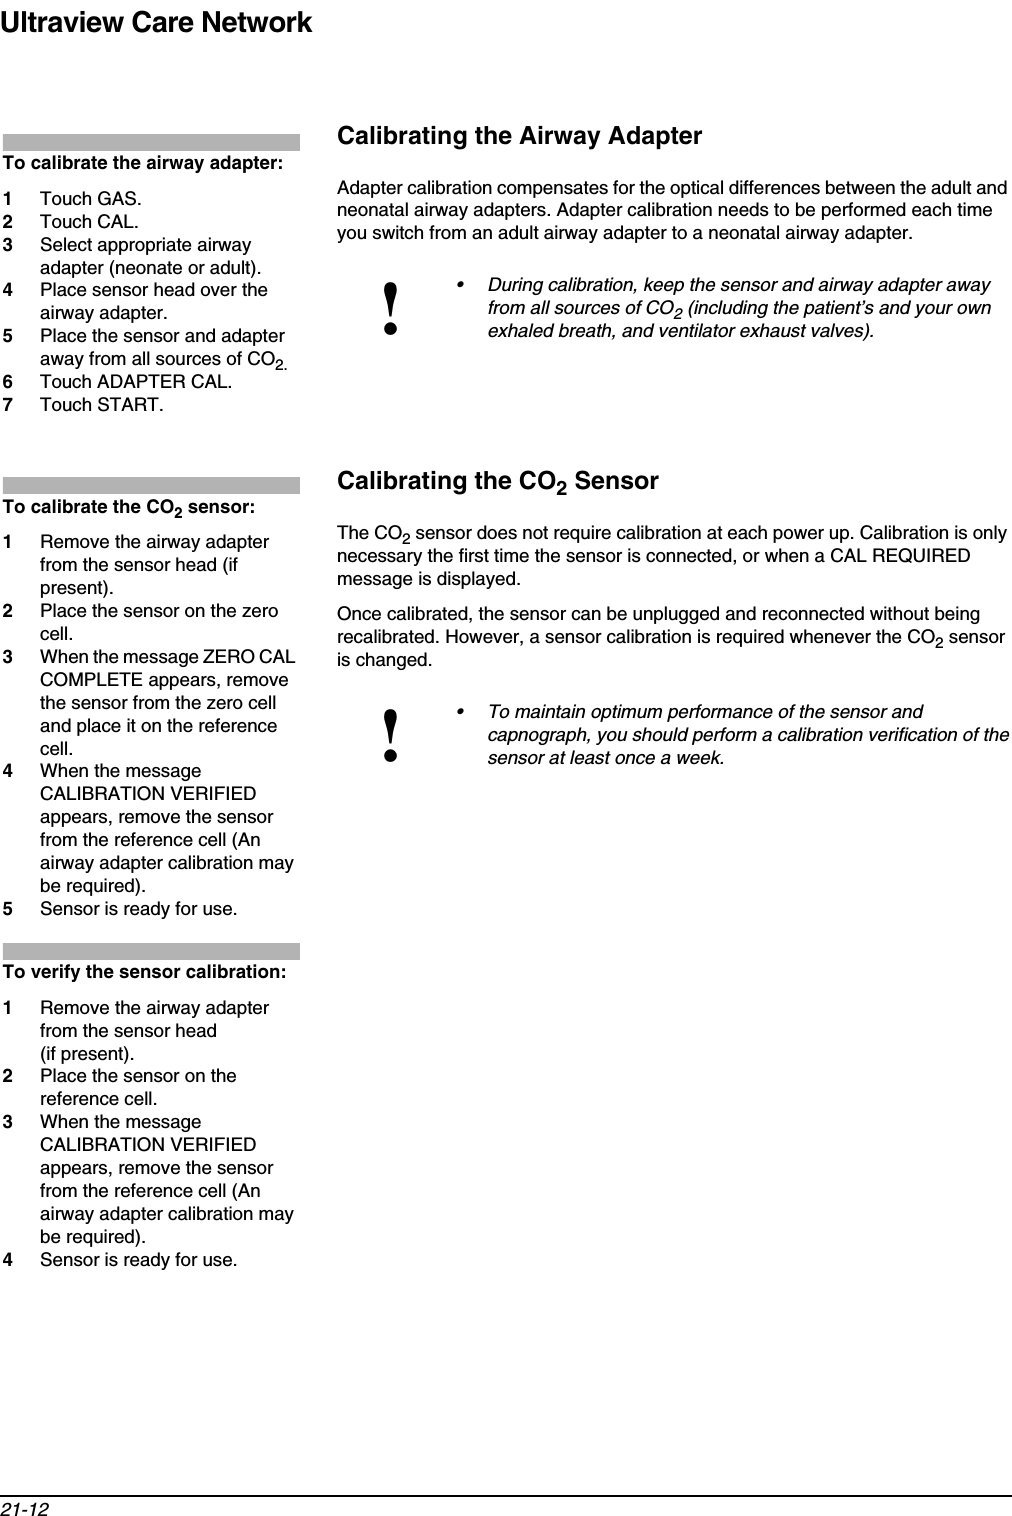
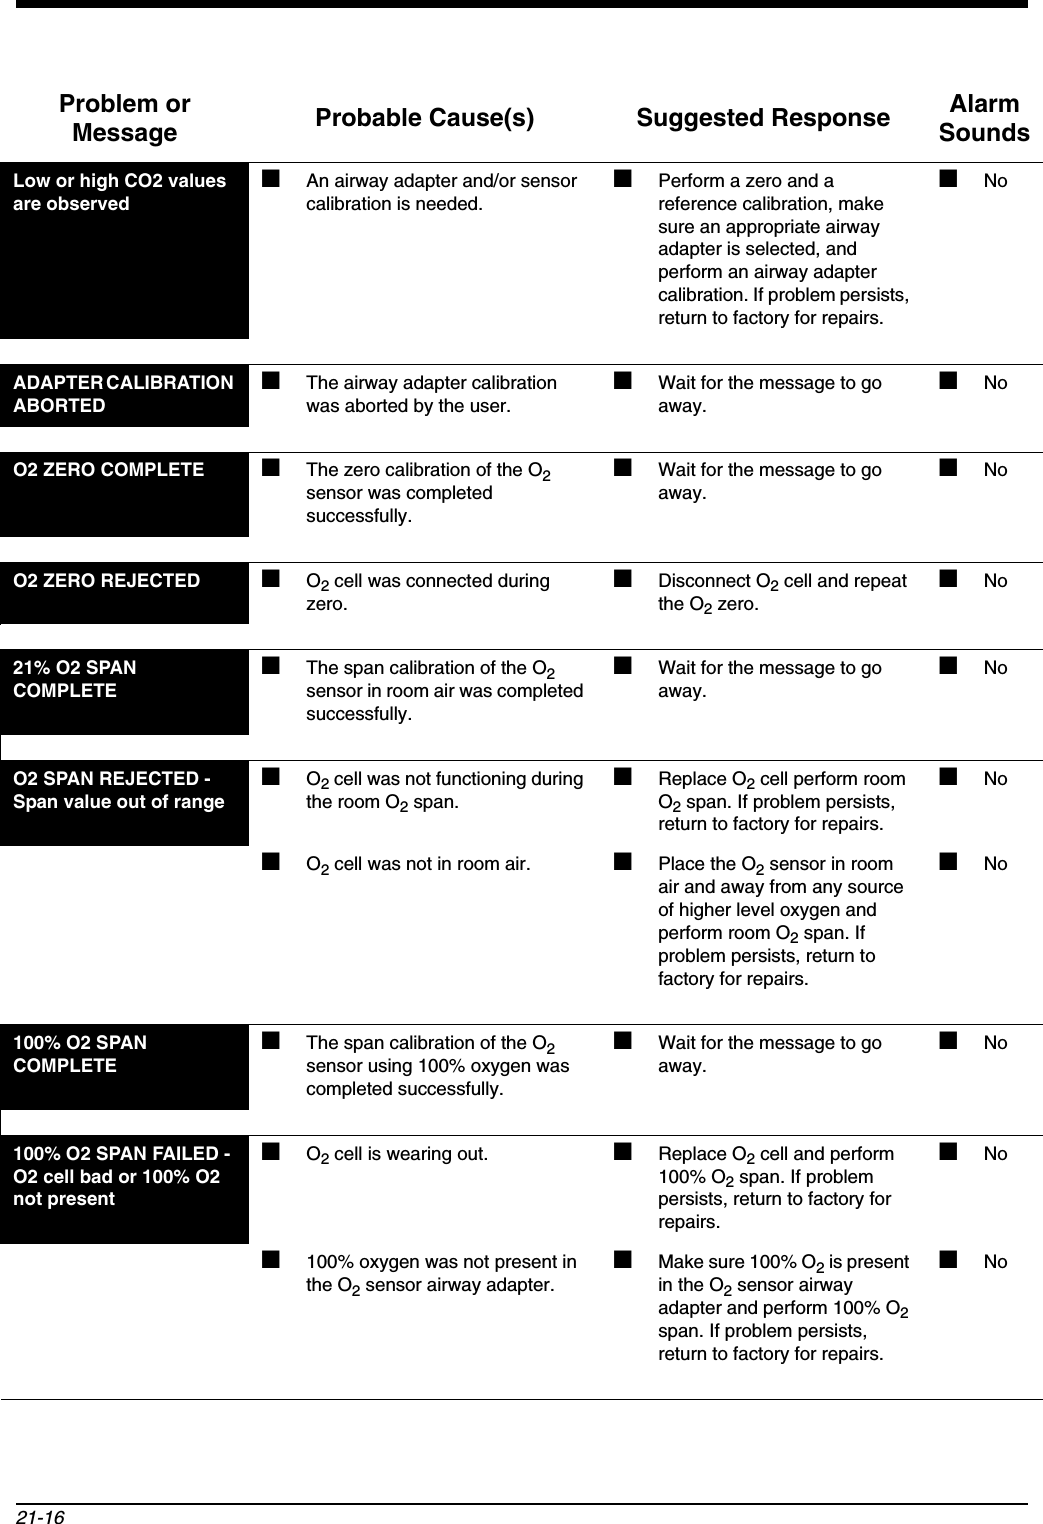
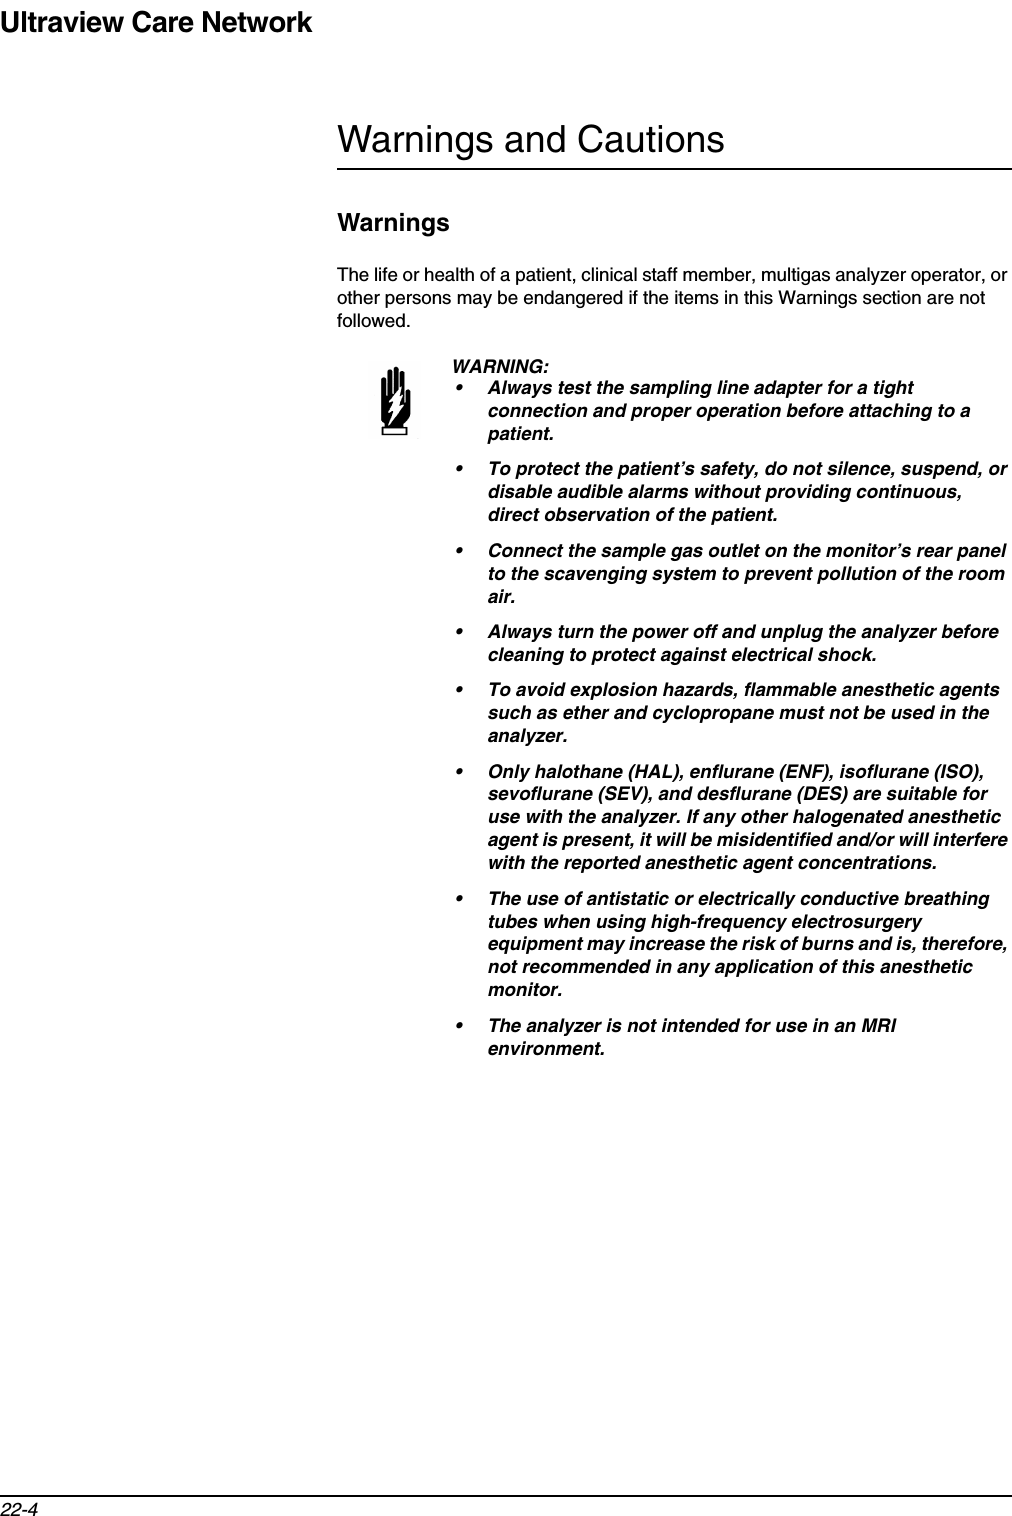
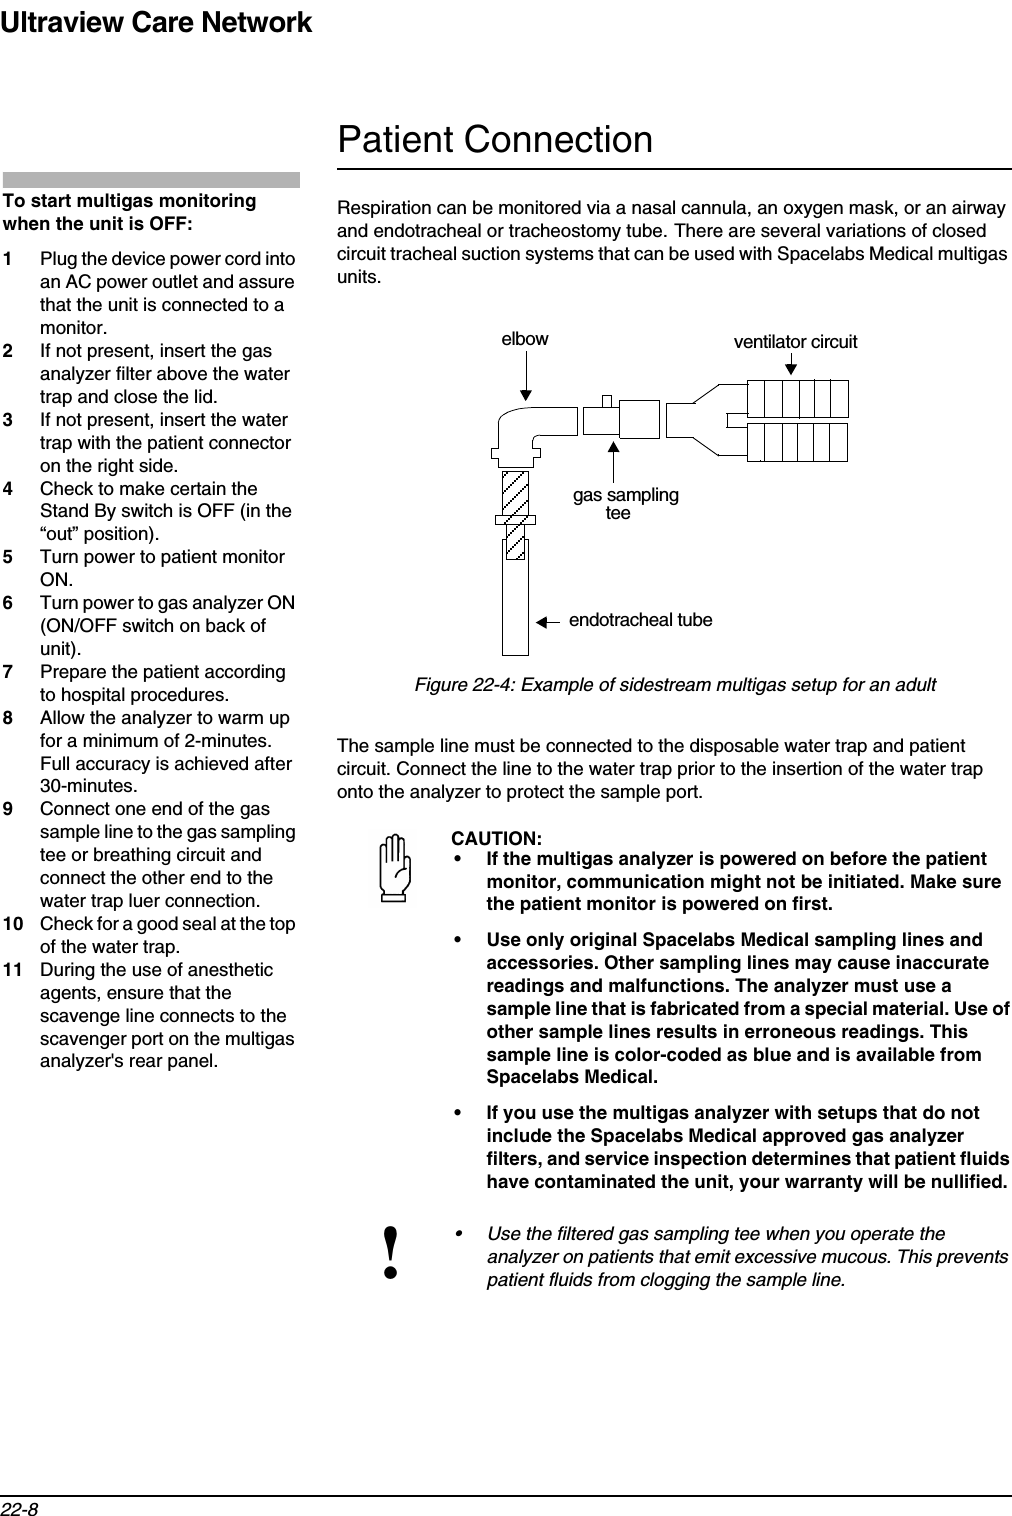
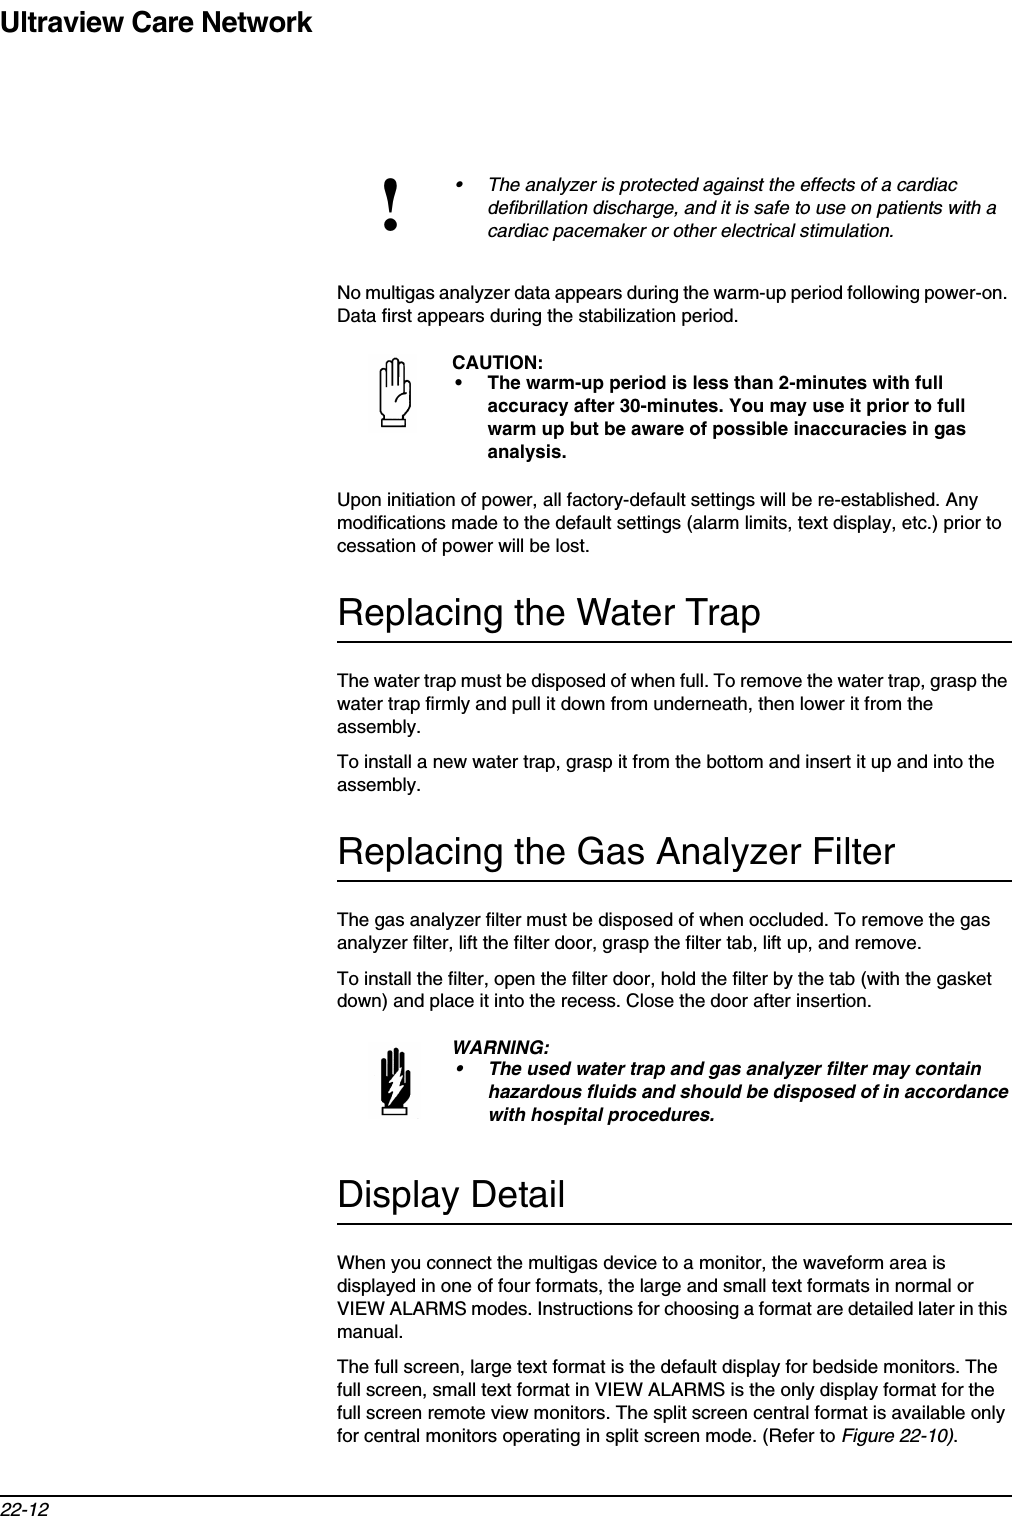
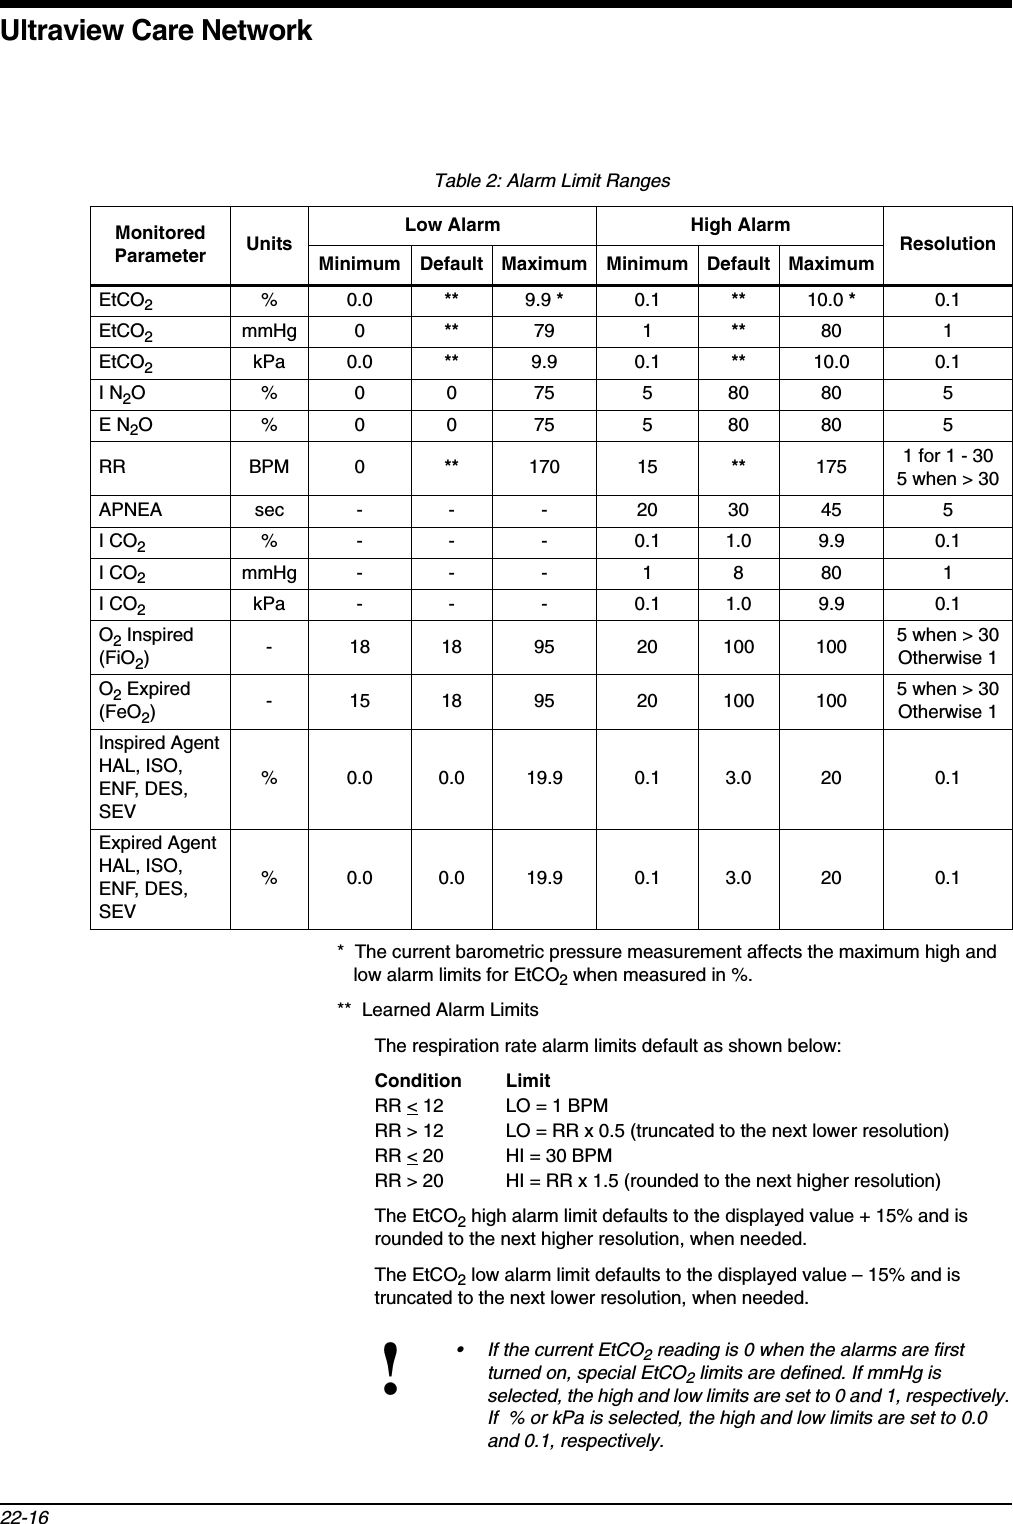
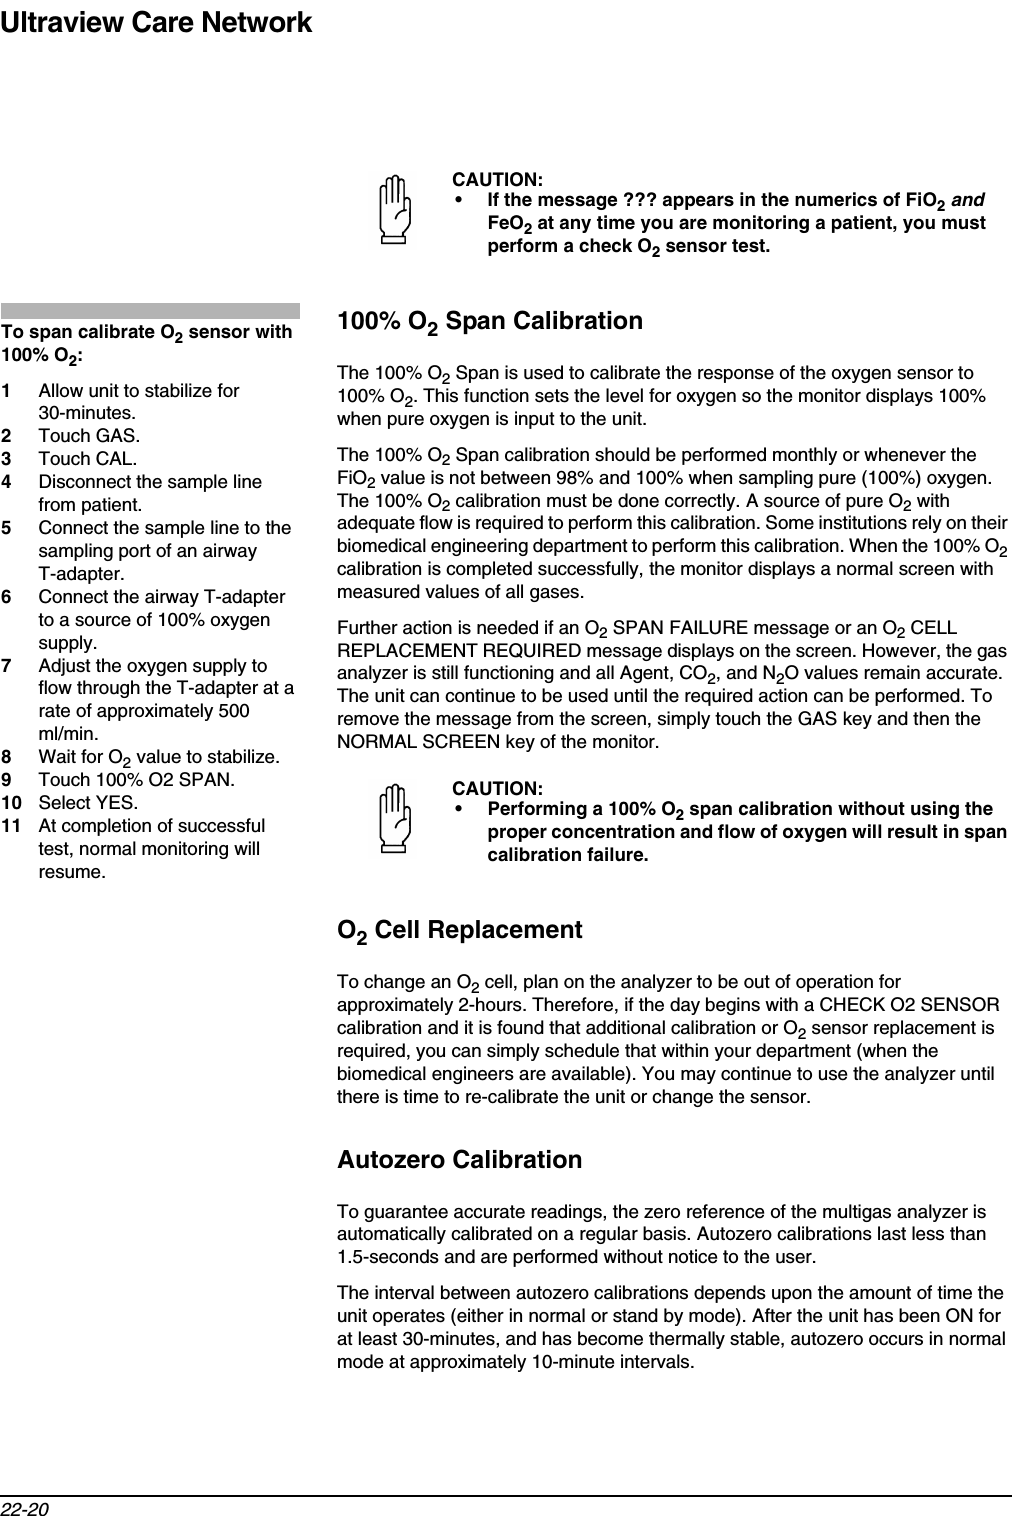
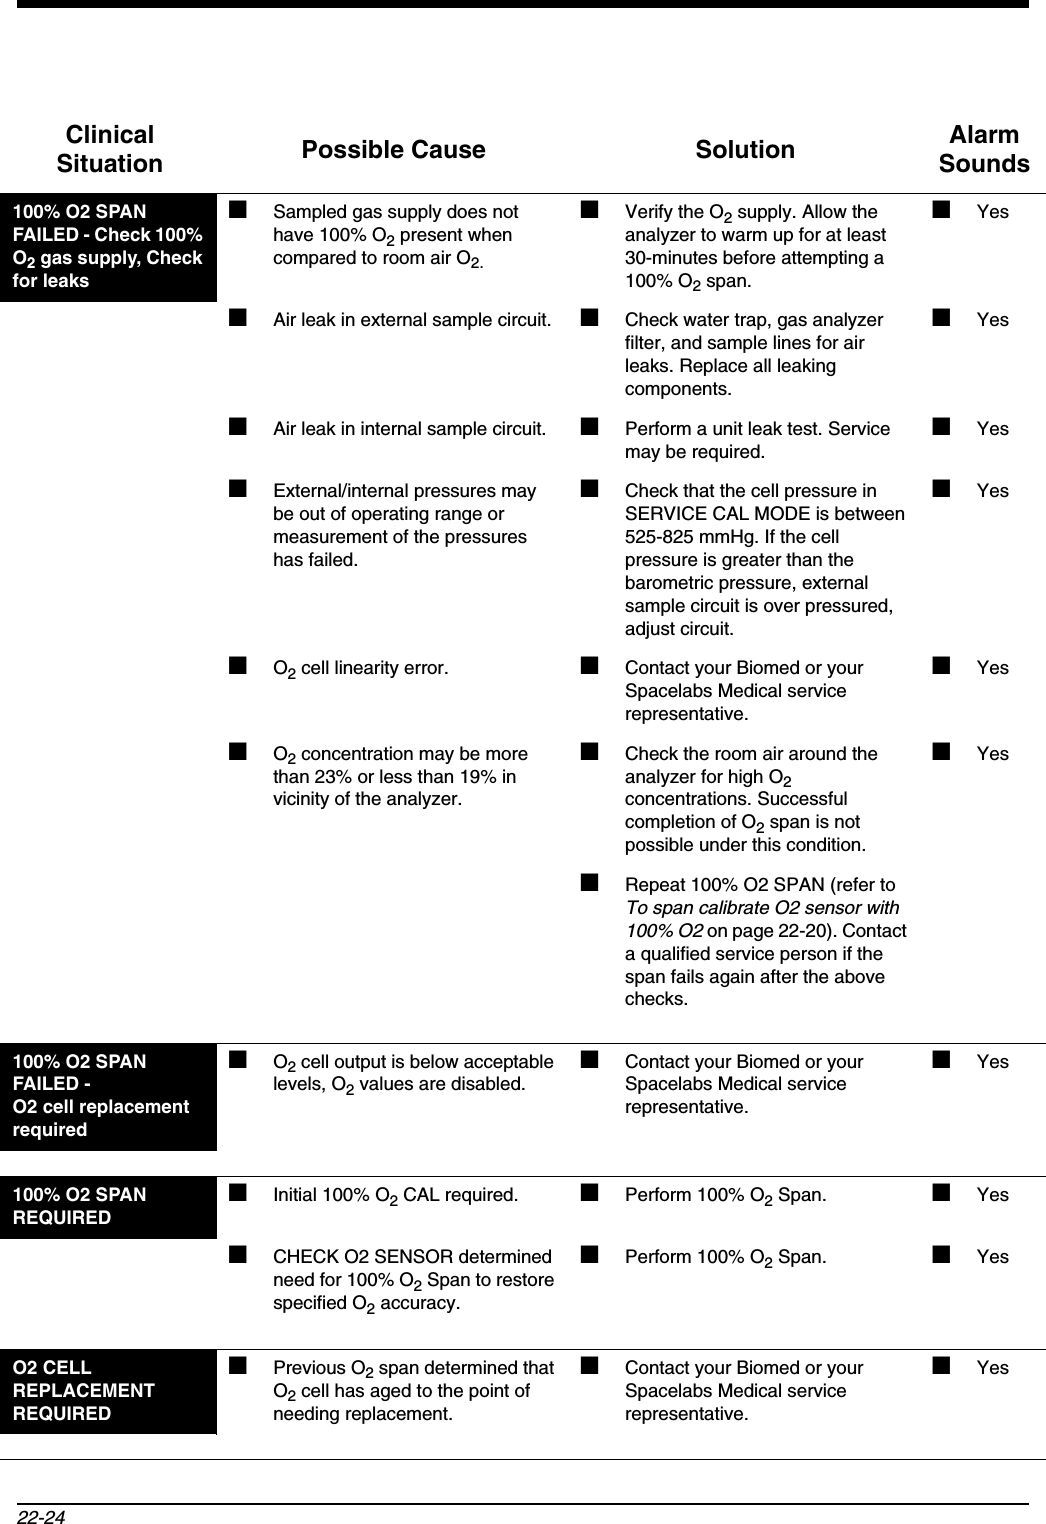
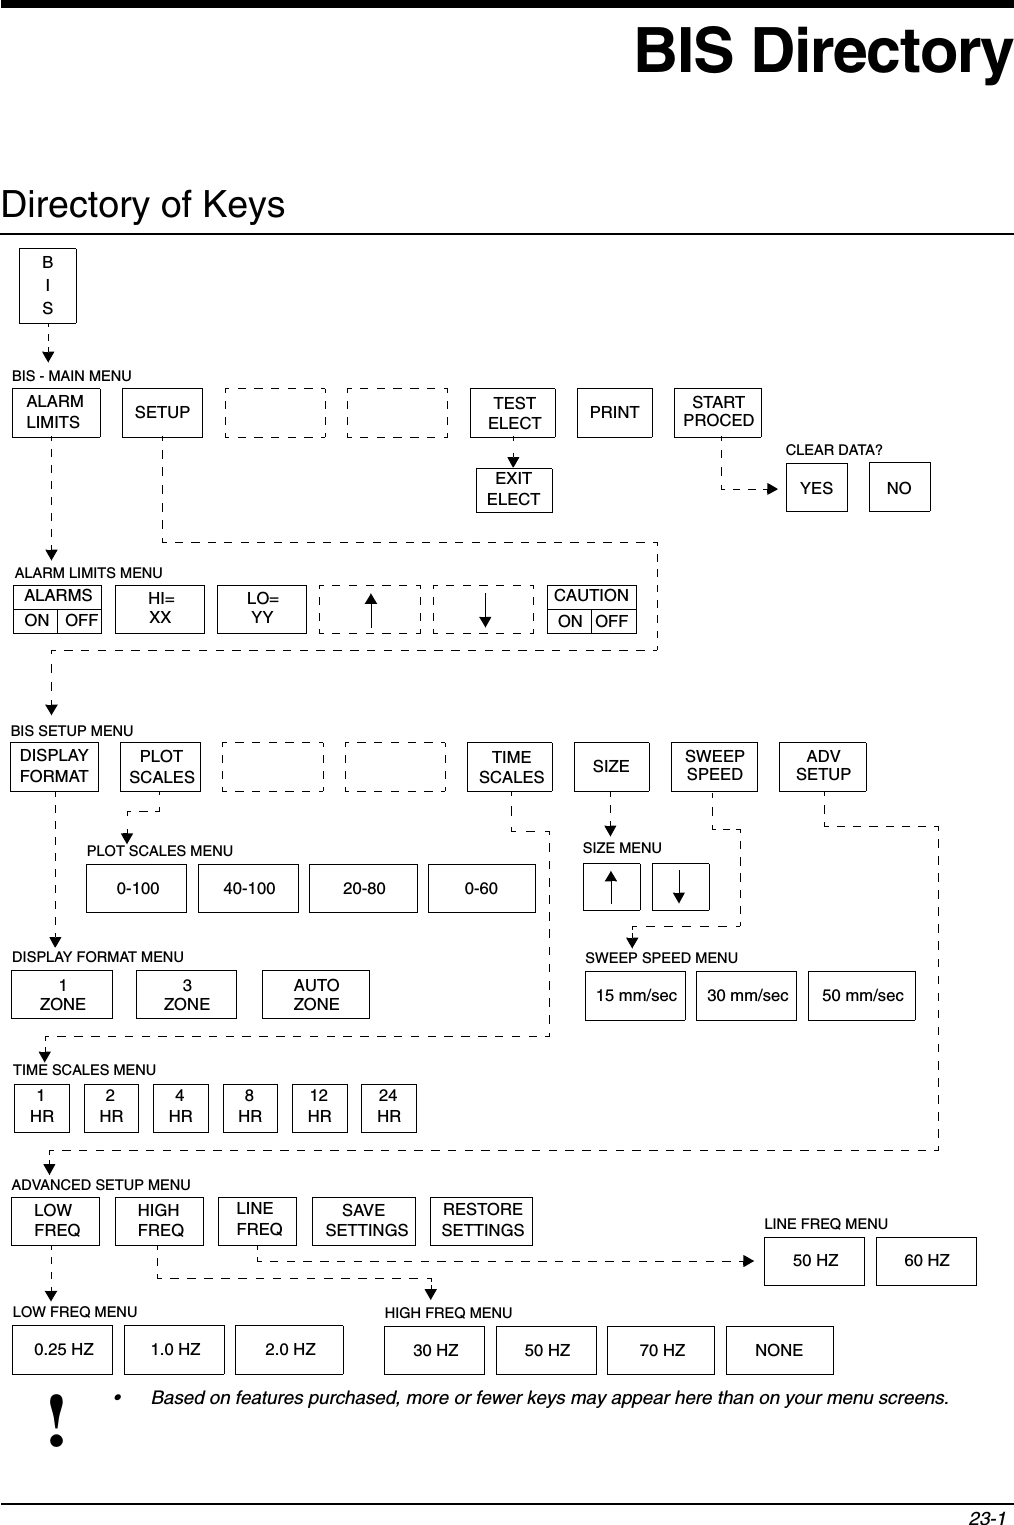
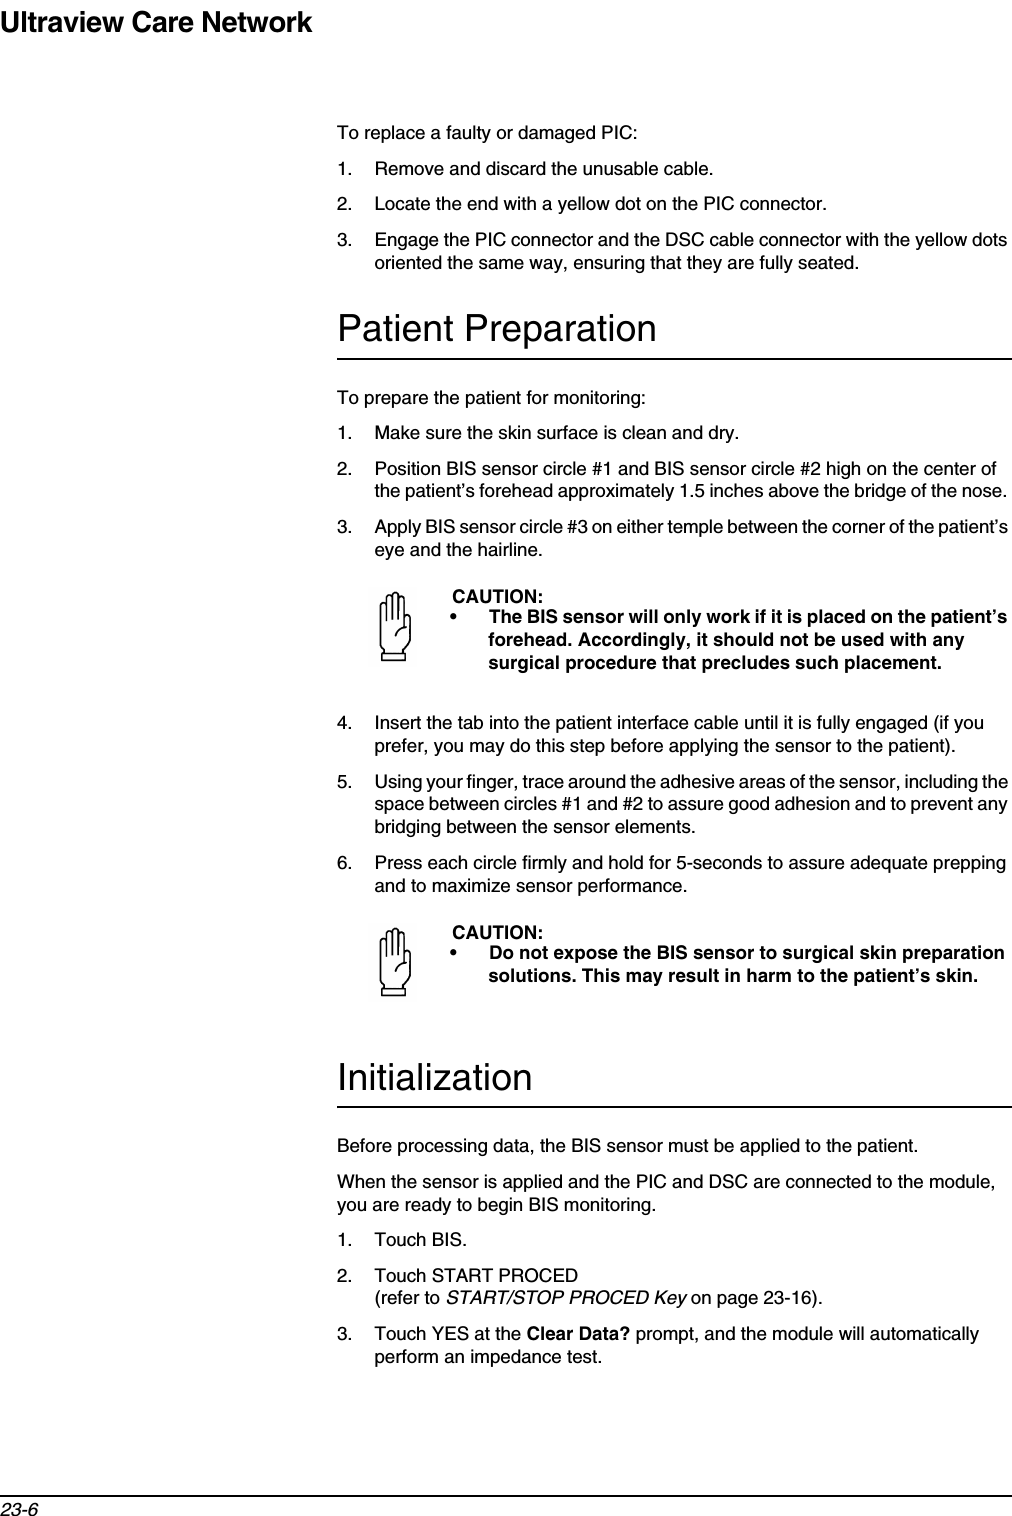
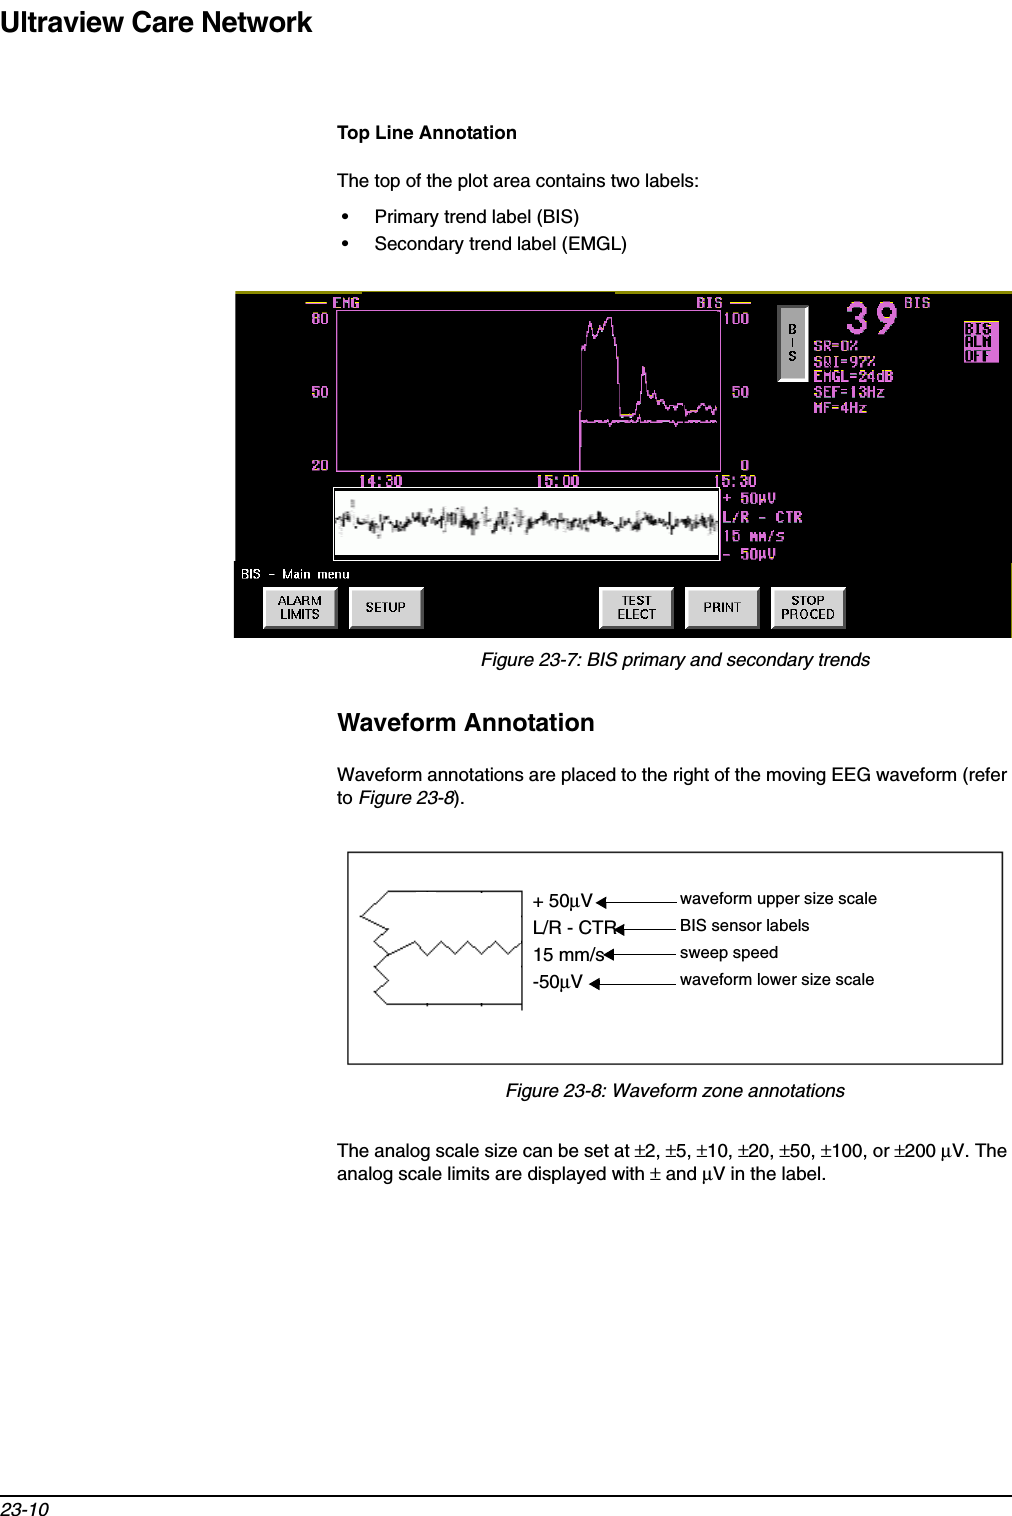
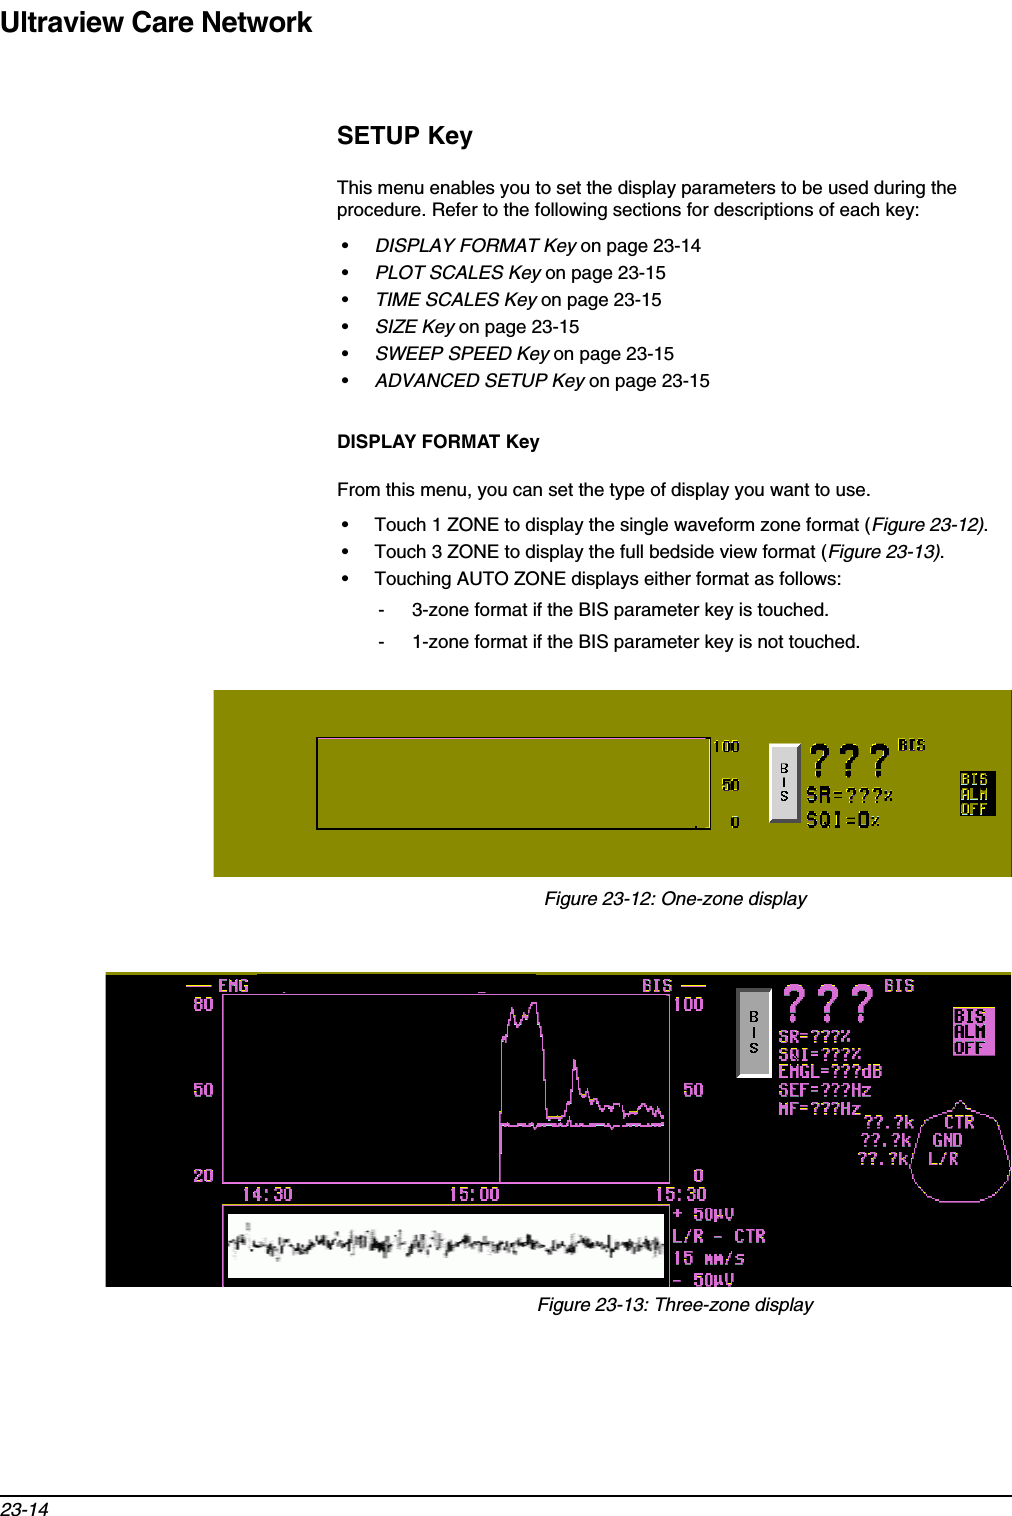
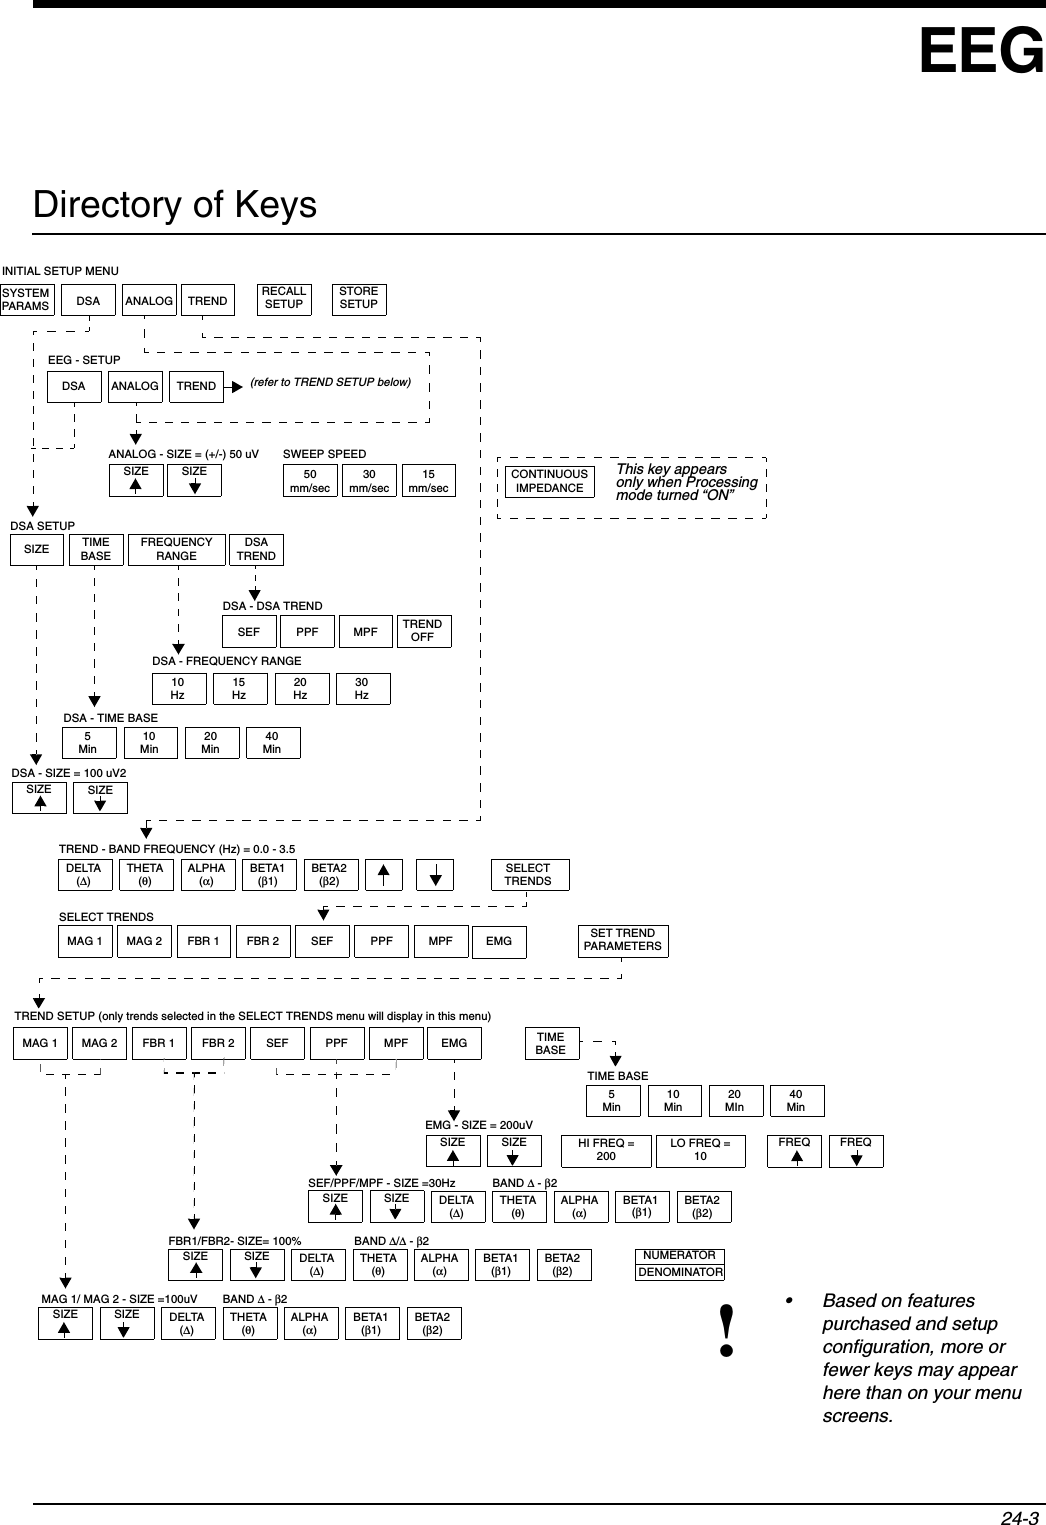
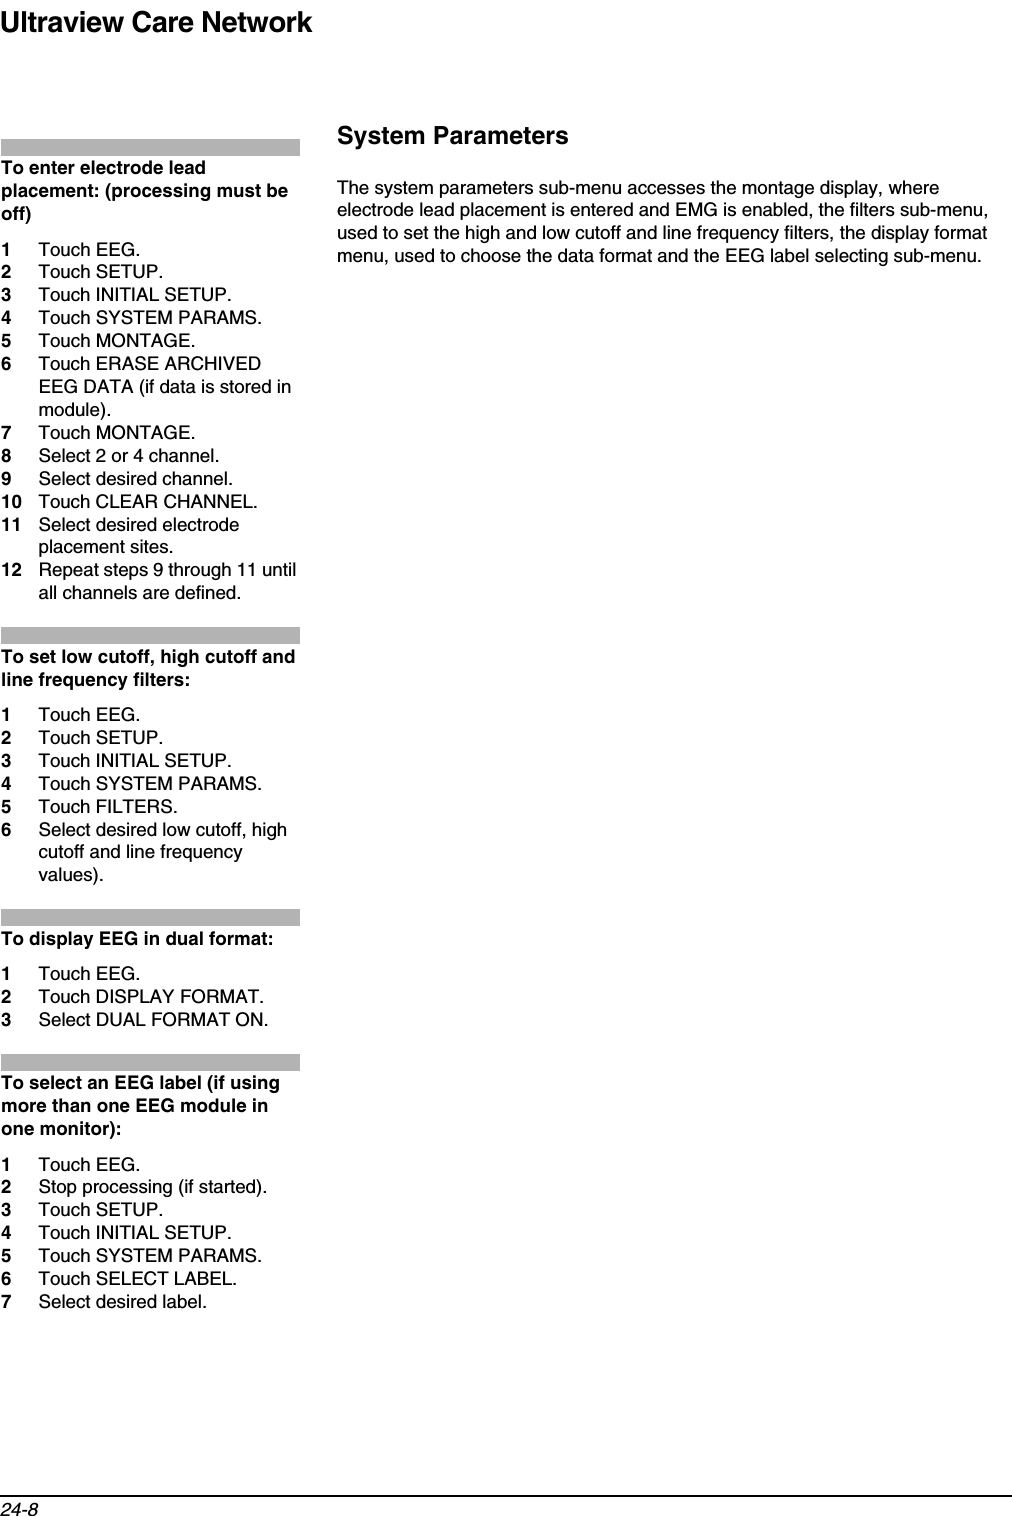
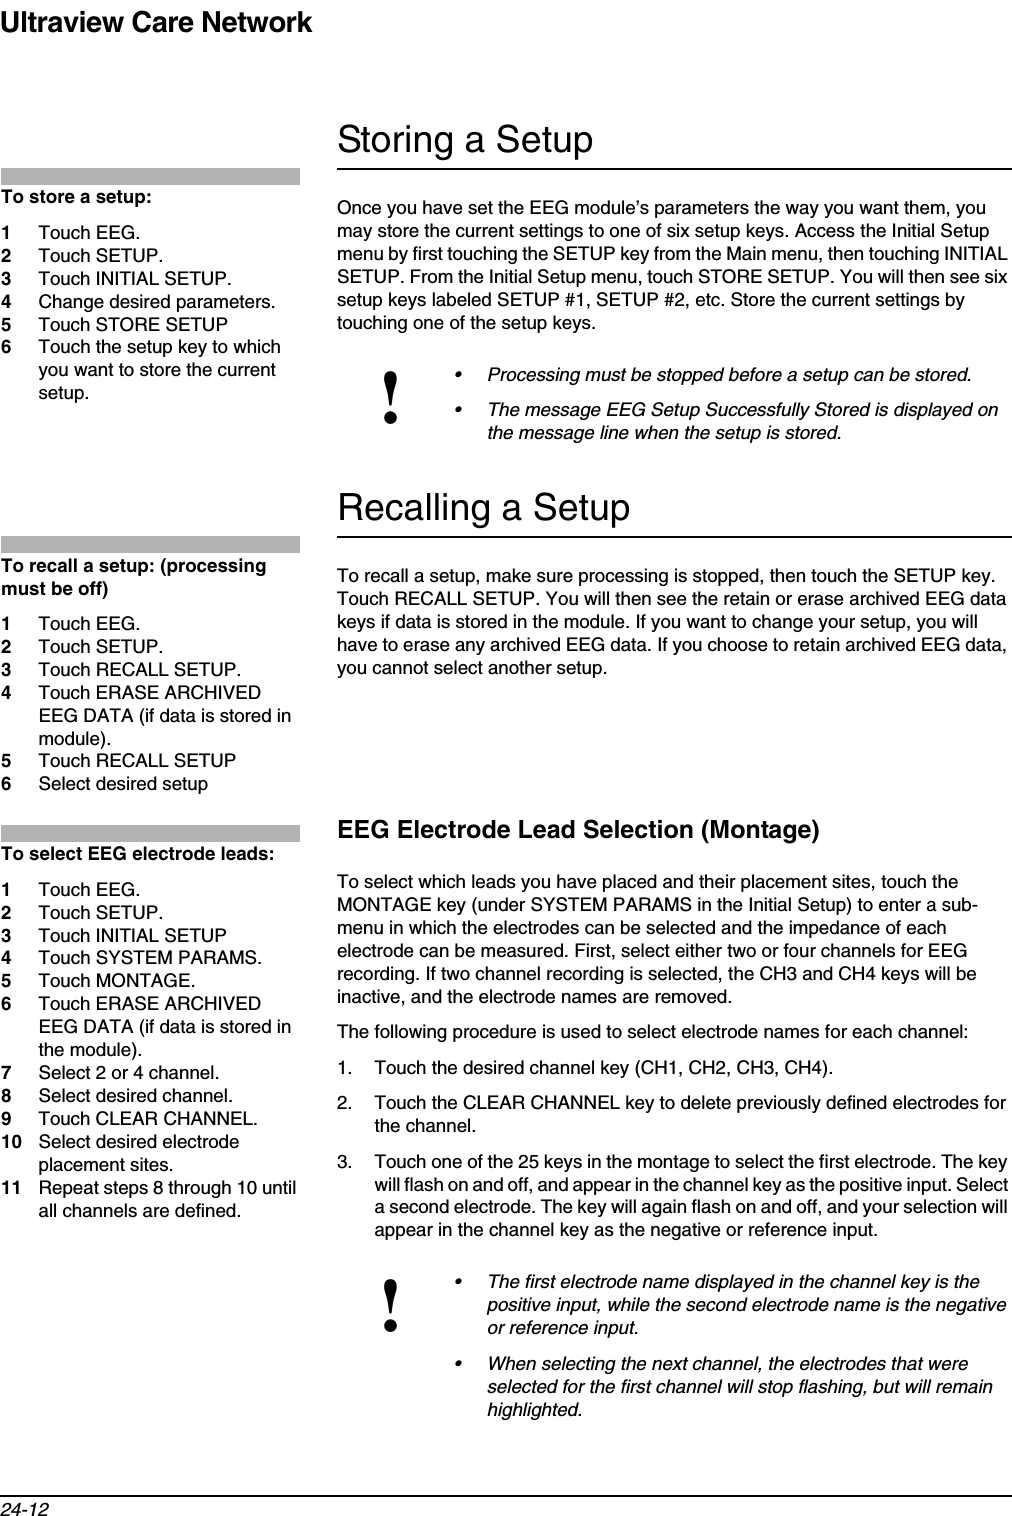
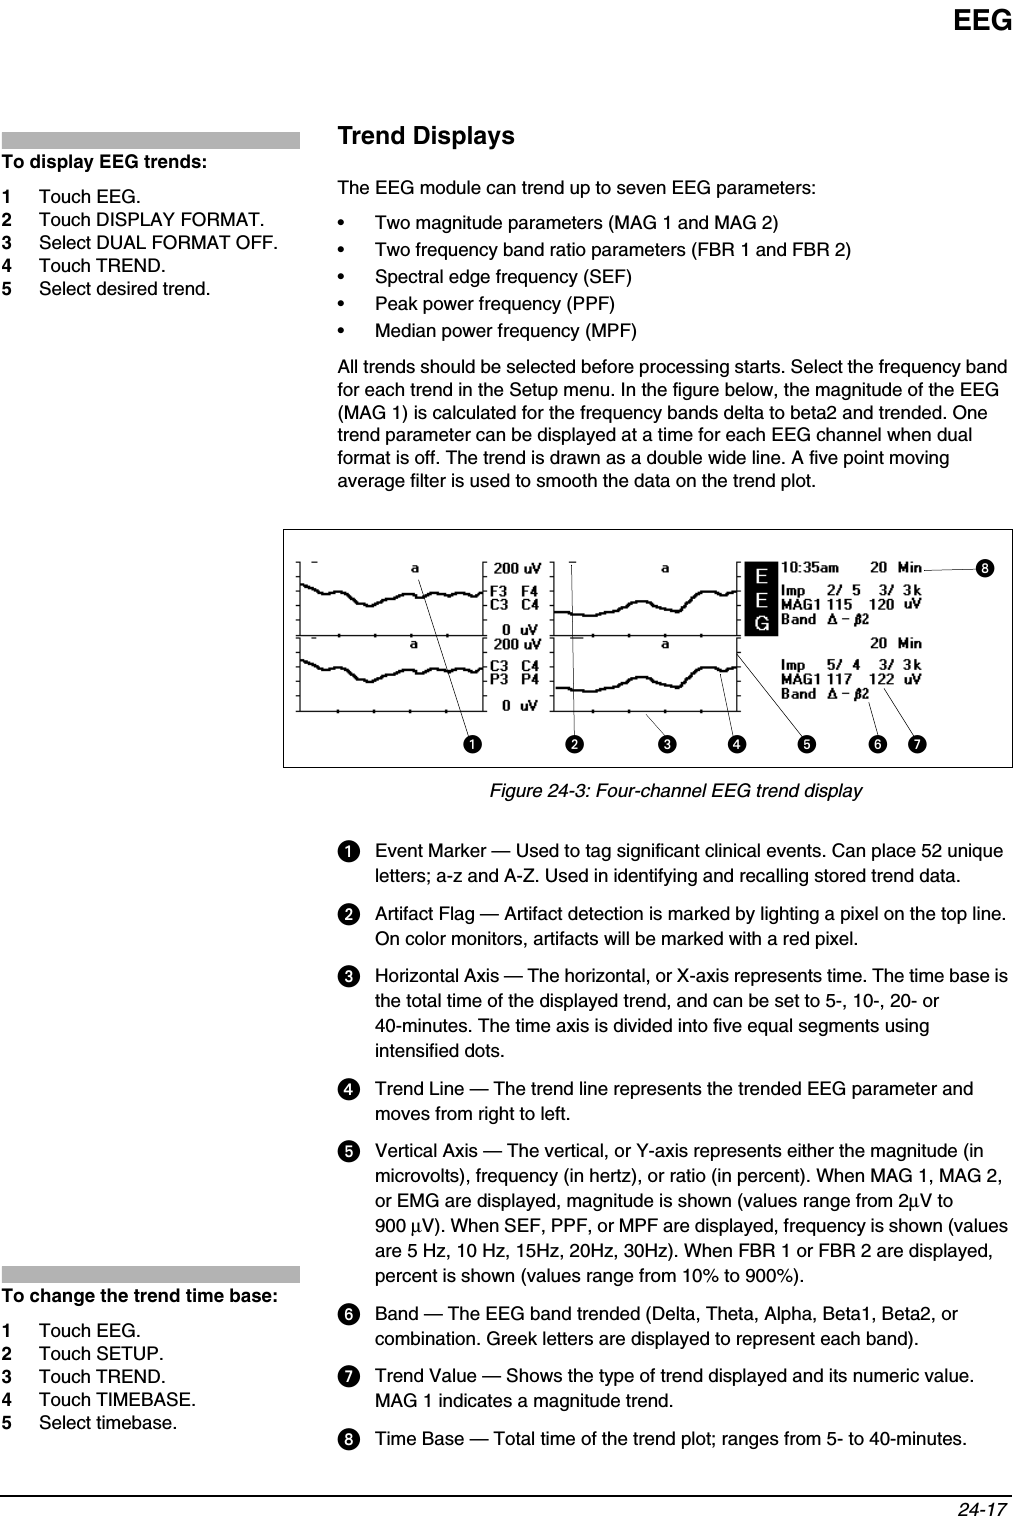
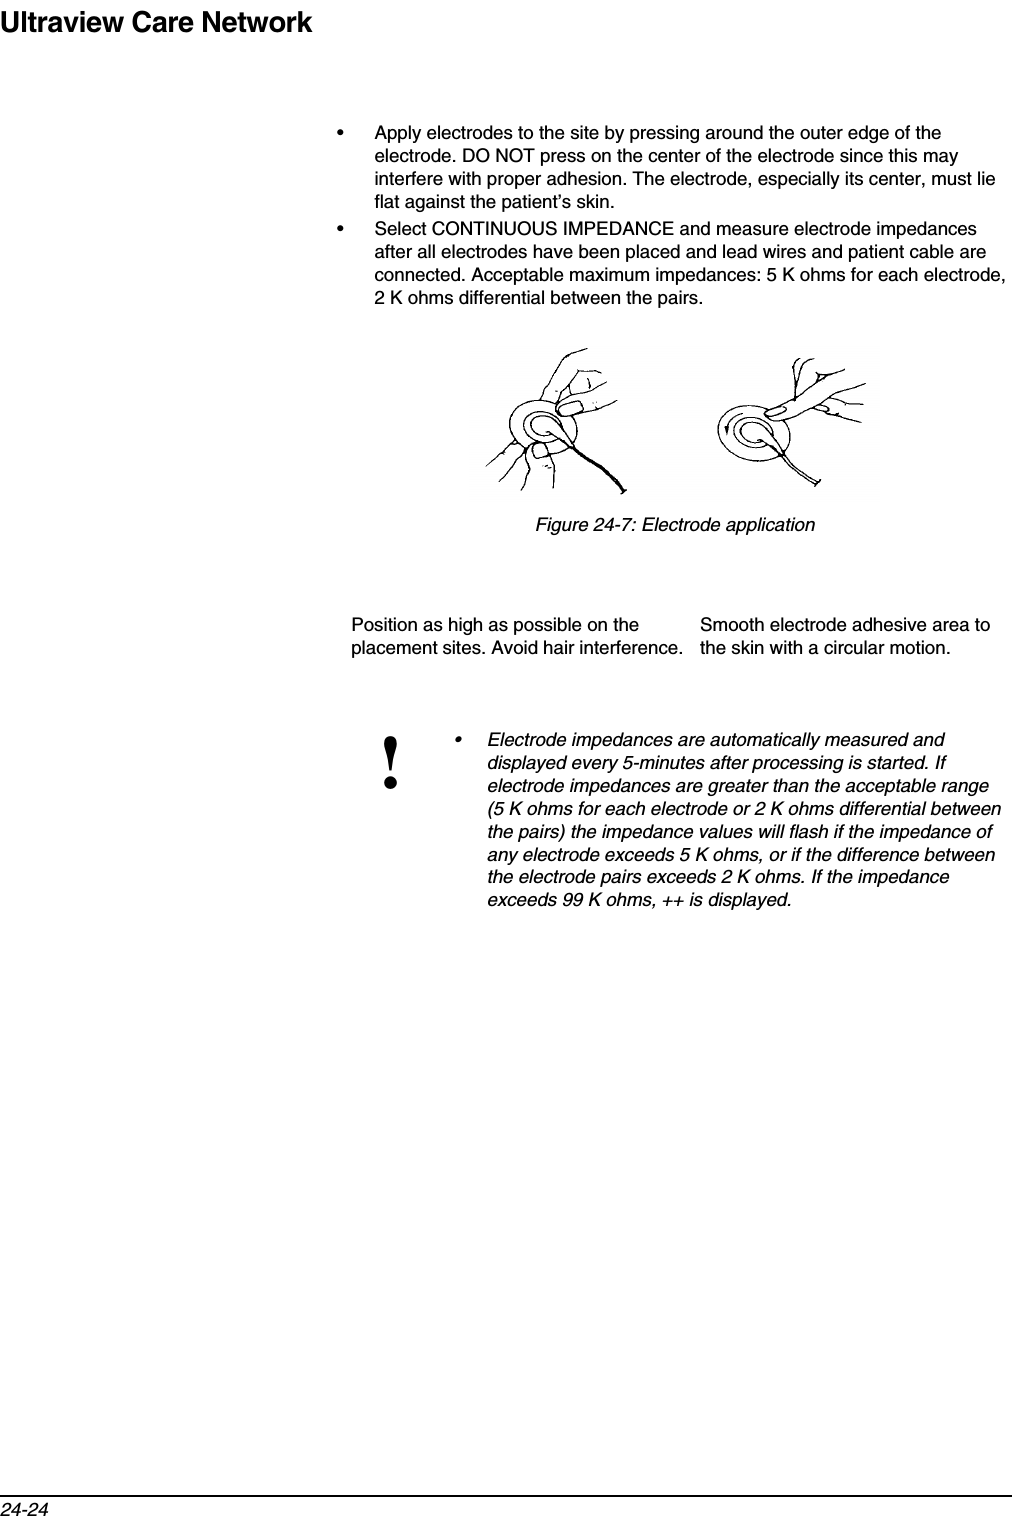
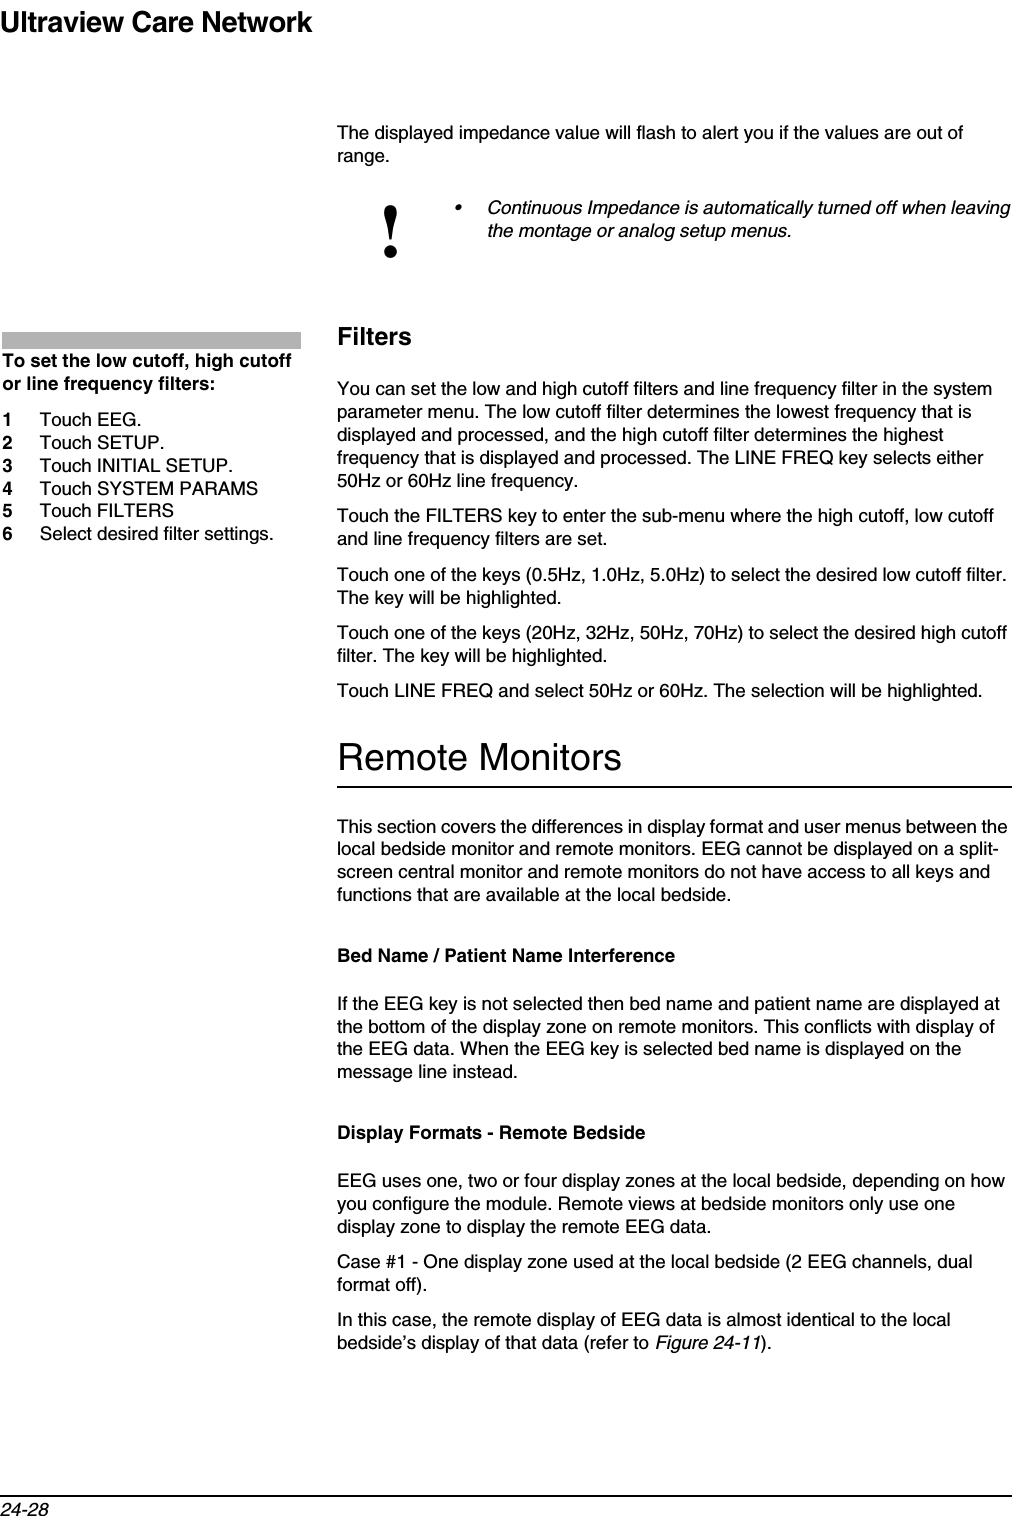
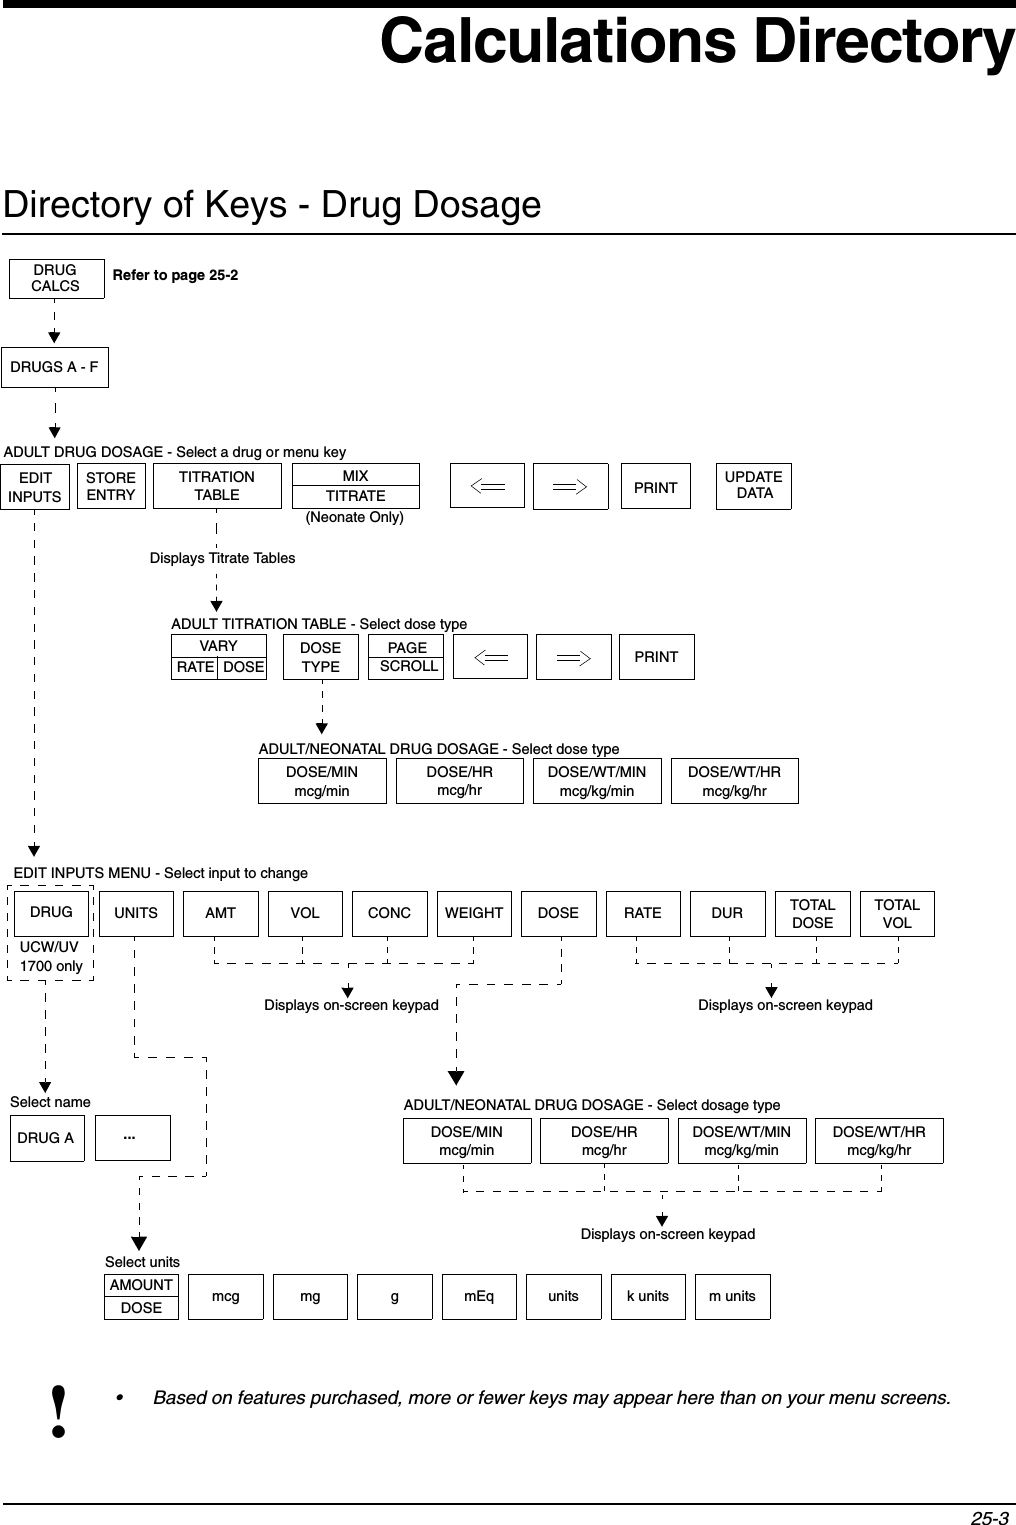
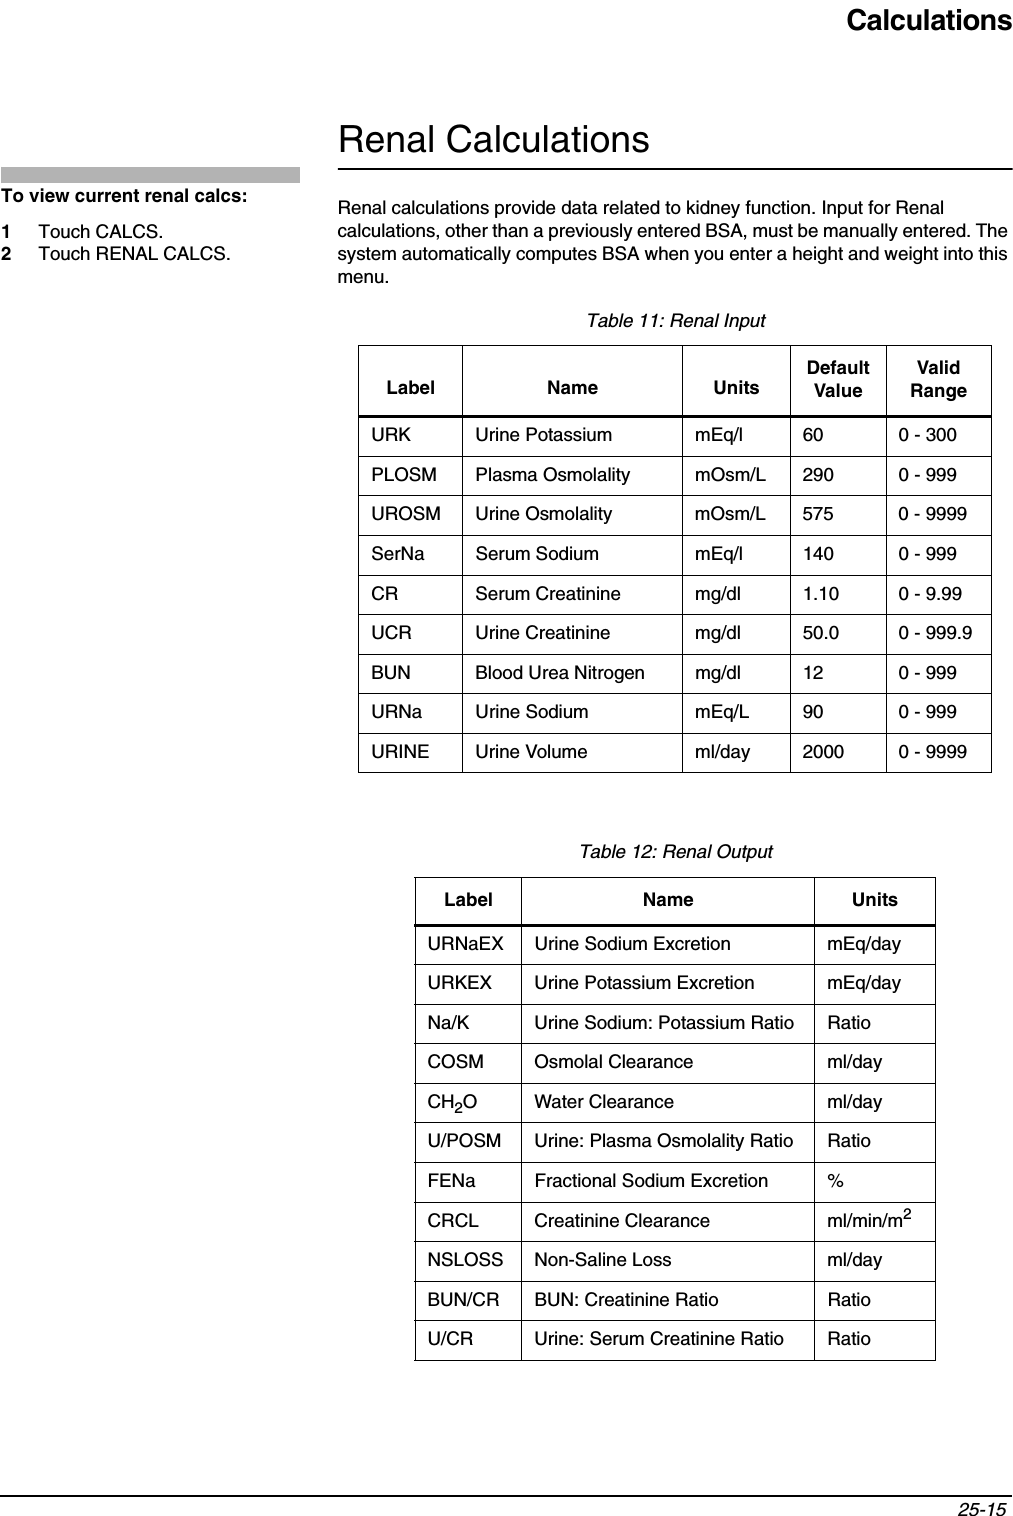
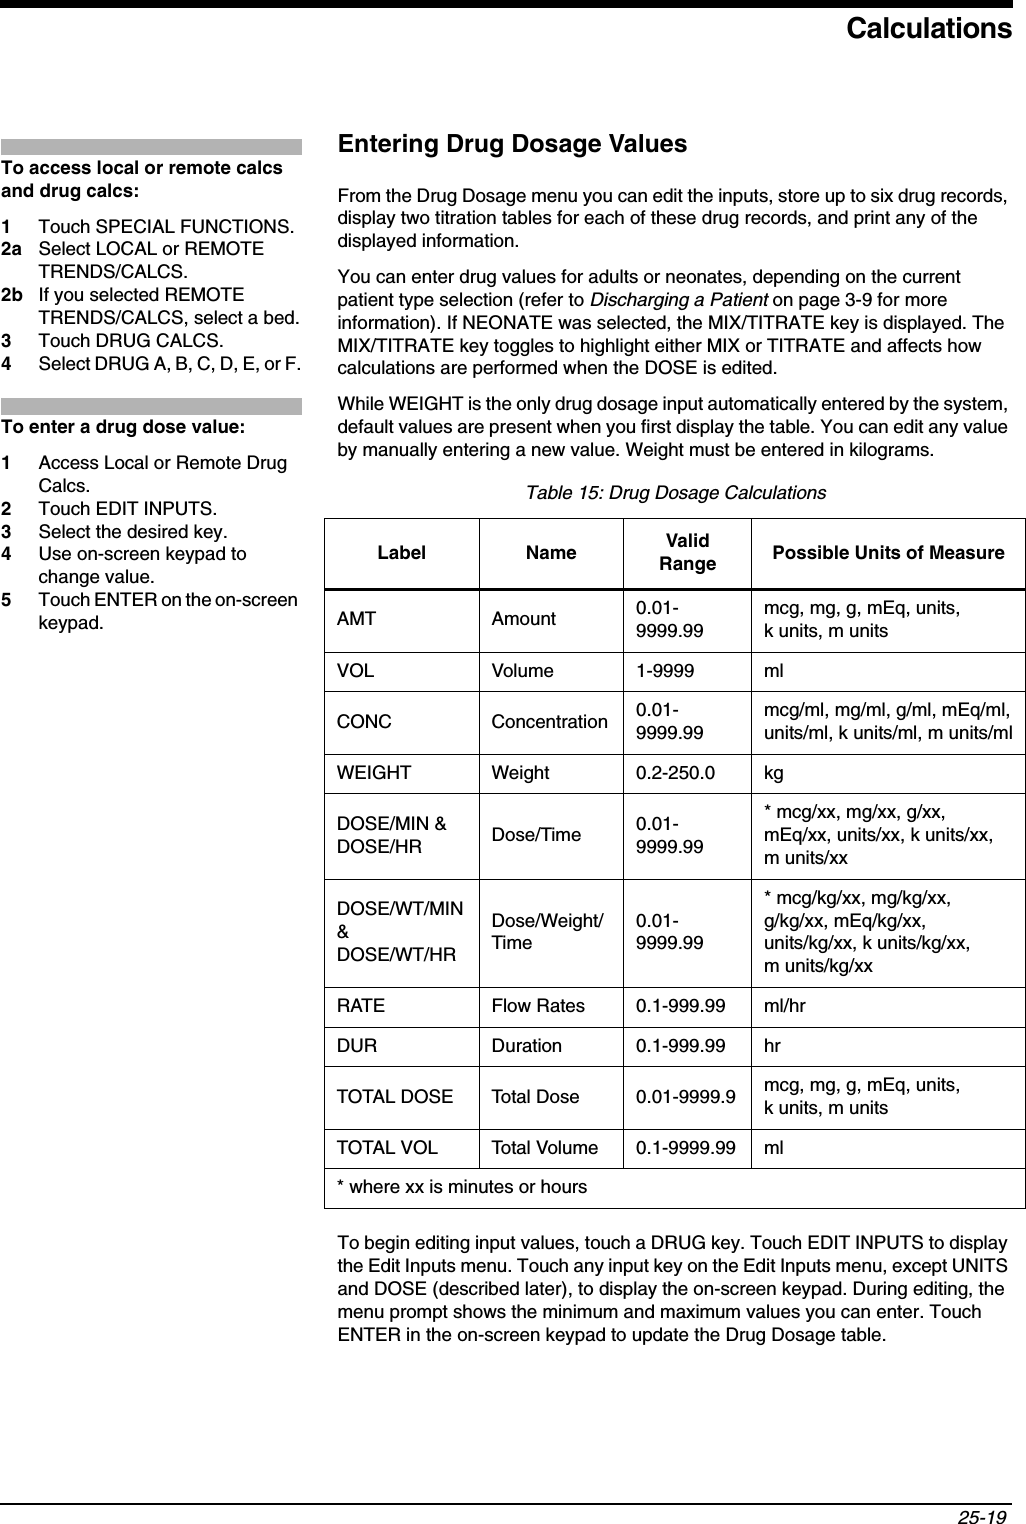
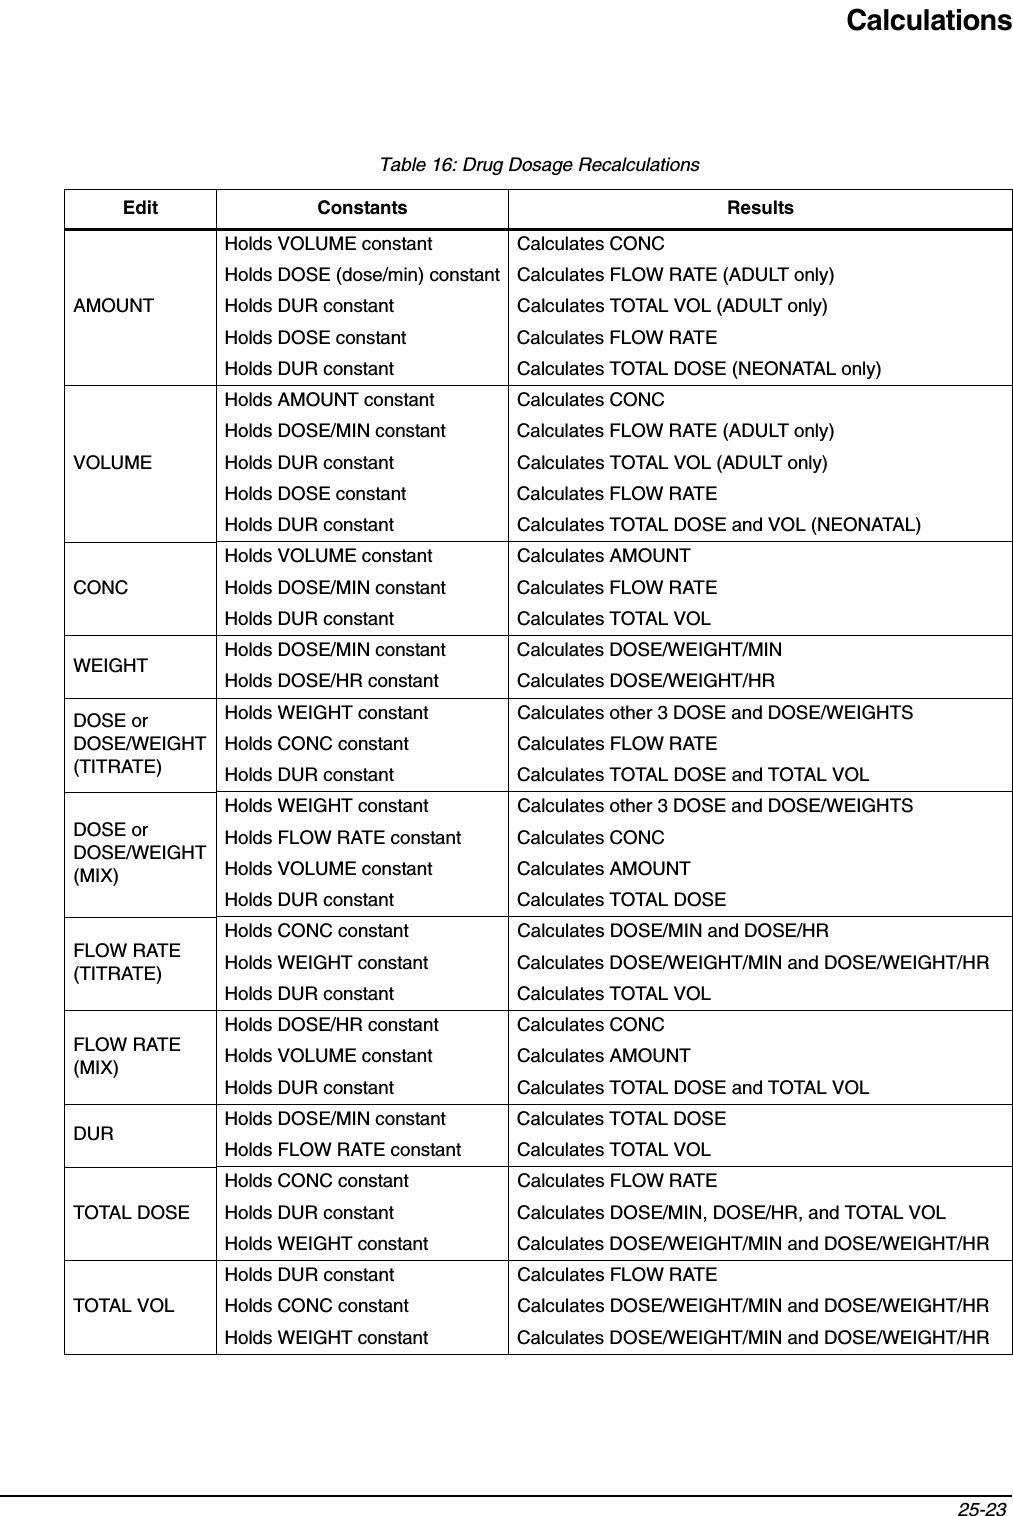
![Cardiac Output19-9 Displaying Calculations TableYou can view hemodynamic calculations after storing or averaging data. The table includes only those calculations that have been stored or averaged.Table 1 shows an example of the hemodynamic calculations table displayed when you touch the CALCS key. Each horizontal row is one complete set of data. Each new value appears at the bottom of the table. The system defaults to VR INDEX OFF and SW INDEX OFF. The system automatically calculates and enters CO and CI values in the table. Values in the columns SV, SVI, SVR, PVR, LVSW, and RVSW are automatically calculated from the vital sign values entered in the columns HR, MAP, CVP, MPA, and PCWP.The values under the columns HR, MAP, CVP, MPA, and PCWP are parameter values obtained from other channels in the bedside monitor at the time a CO value is calculated or those values you have entered manually. To enter values in these columns refer to Editing Vital Sign Values on page 19-10.If you do not enter height and weight values prior to generating CO curves, the monitor displays any value that uses BSA (e.g. CI, SVI, LVSWI and RVSWI) as ?.?. If a calculated value is out of the displayable range, the monitor displays the value as ++++. If any of the vital signs in the hemodynamics table are negative, the system uses the value 0 (zero) in the calculations.The equations used for the hemodynamics table are defined in the table to the left. Table 1: Sample CalculationsDAY/TIME CO CI SV SVI SVR PVR LVSW RVSW HR MAP CVP MPA PCWP26/02:25p 5.1 2.9 70.8 40.4 1629 235 54.9 10.4 72 110 6 25 1027/09:30p 4.9 2.8 65.3 37.8 1712 211 51.4 9.2 75 112 7 25 1228/10:15p 4.5 2.5 56.2 32.1 1917 213 44.5 7.8 80 115 7 25 1329/07:30a 4.0 2.2 47.0 26.8 2237 219 38.2 6.5 85 120 8 26 1530/08:30a 4.0 2.2 47.0 26.8 2237 219 38.2 6.5 85 120 8 26 15!• The vital sign values shown in Table 1 are typical if your monitor's UNITS OF MEASURE key is set to mmHg. Consult your system administrator if your display is different from that shown here.To display the calculations table: 1Touch CO.2Touch CALCS.Hemodynamic EquationsBSA = Ht 0.725 x Wt 0.425 x 0.007184CI = CO/BSASV = (CO/HR) x 1000SVI = SV/BSASVR = 79.9 x [(MAP-CVP)/CO]SVRI= 79.9 x [(MAP-CVP)/CI]= 79.9 x [(MAP-CVP)]/[CO/BSA]= 79.9 x [(MAP-CVP)]/[CO x 1/BSA]= 79.9 x [(MAP-CVP)/CO] x BSA= SVR x BSAPVR = 79.9 x [(MPA-PCWP)/CO]PVRI= 79.9 x [(MPA-PCWP)/CI]= 79.9 x [(MPA-PCWP)]/[CO/BSA]= 79.9 x [(MPA-PCWP)]/[CO x 1/BSA]= 79.9 x [(MPA-PCWP)/CO] x BSA= PVR x BSA](https://usermanual.wiki/Spacelabs-Healthcare/76A90341-WMTS.User-Manual-3-of-3/User-Guide-347485-Page-9.png)
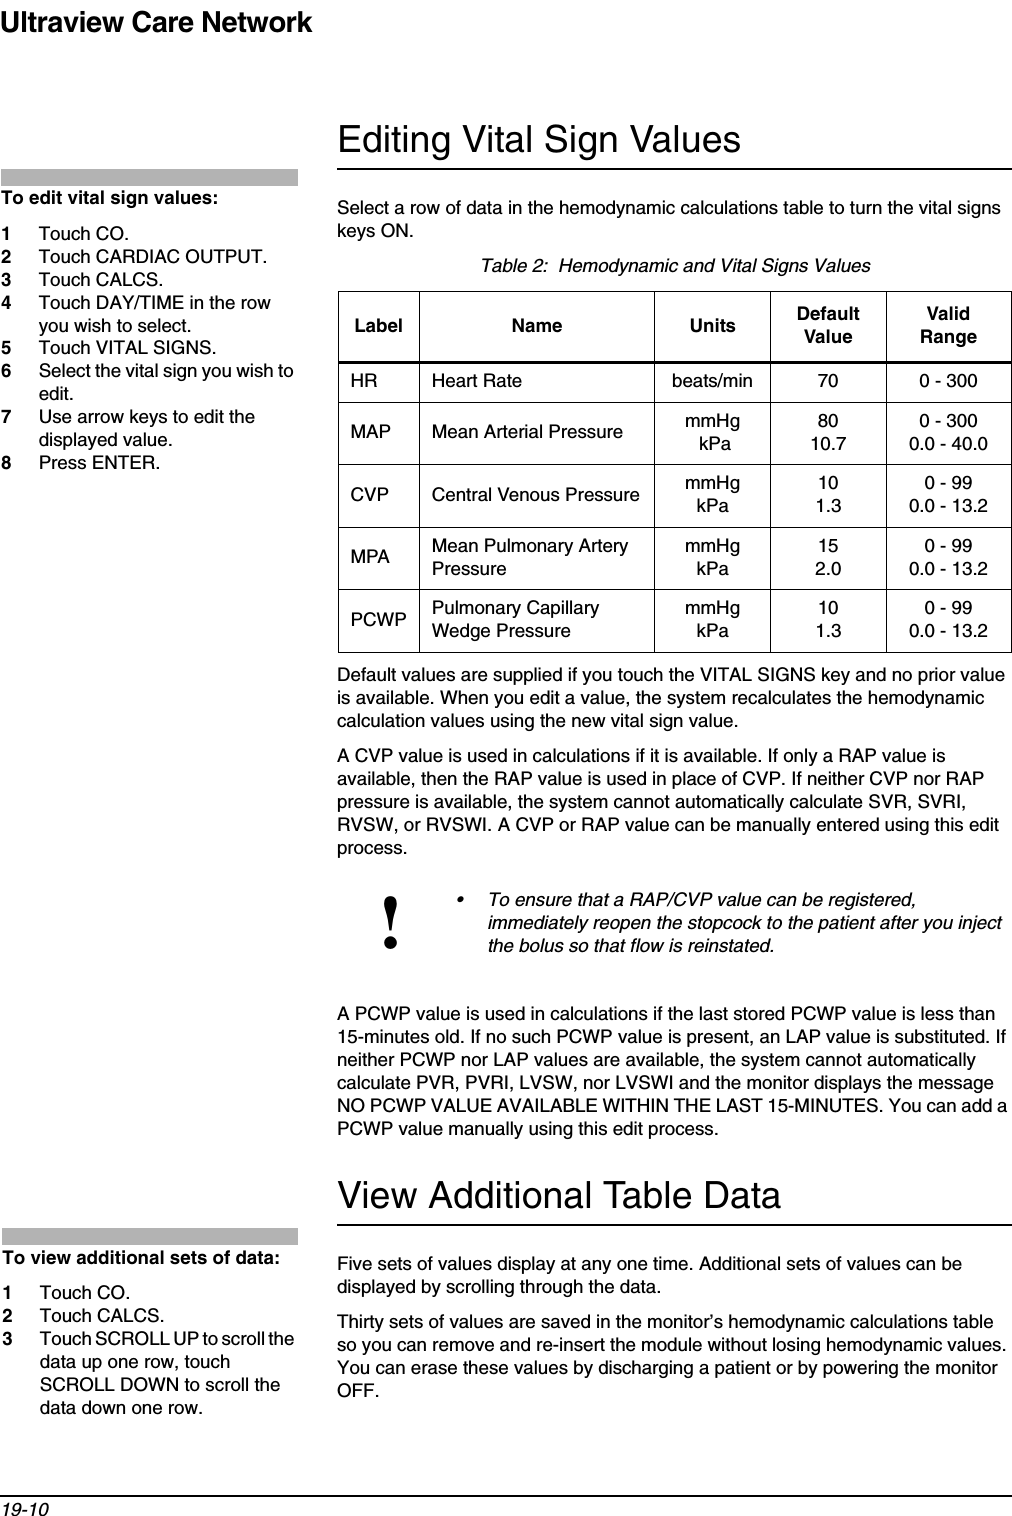
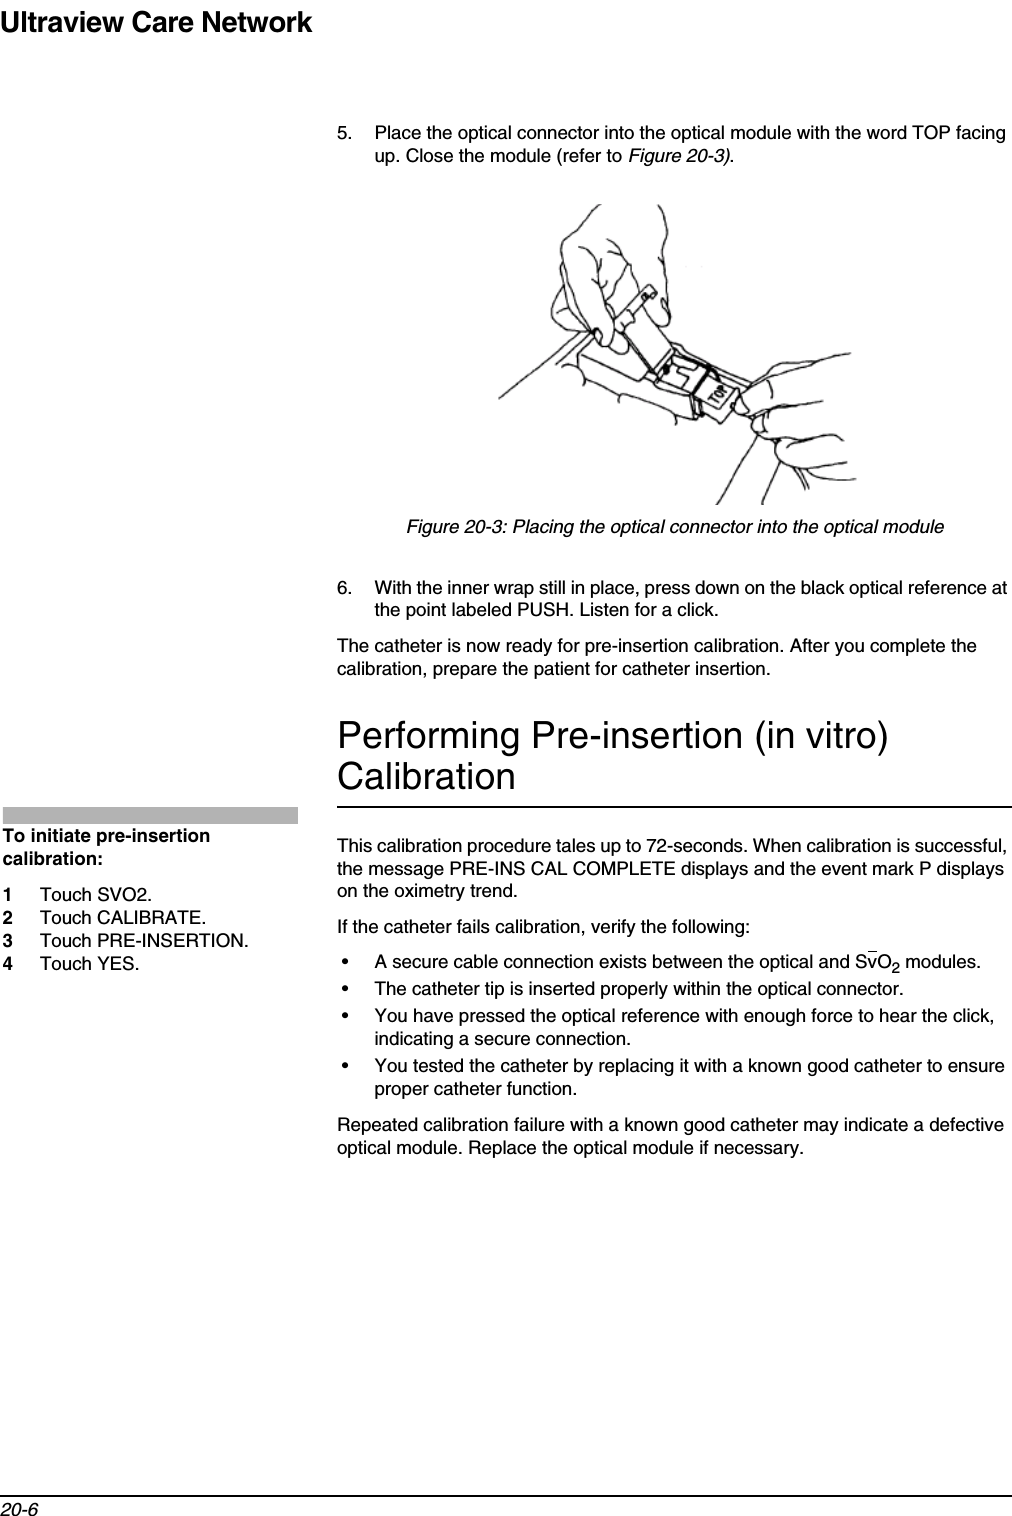
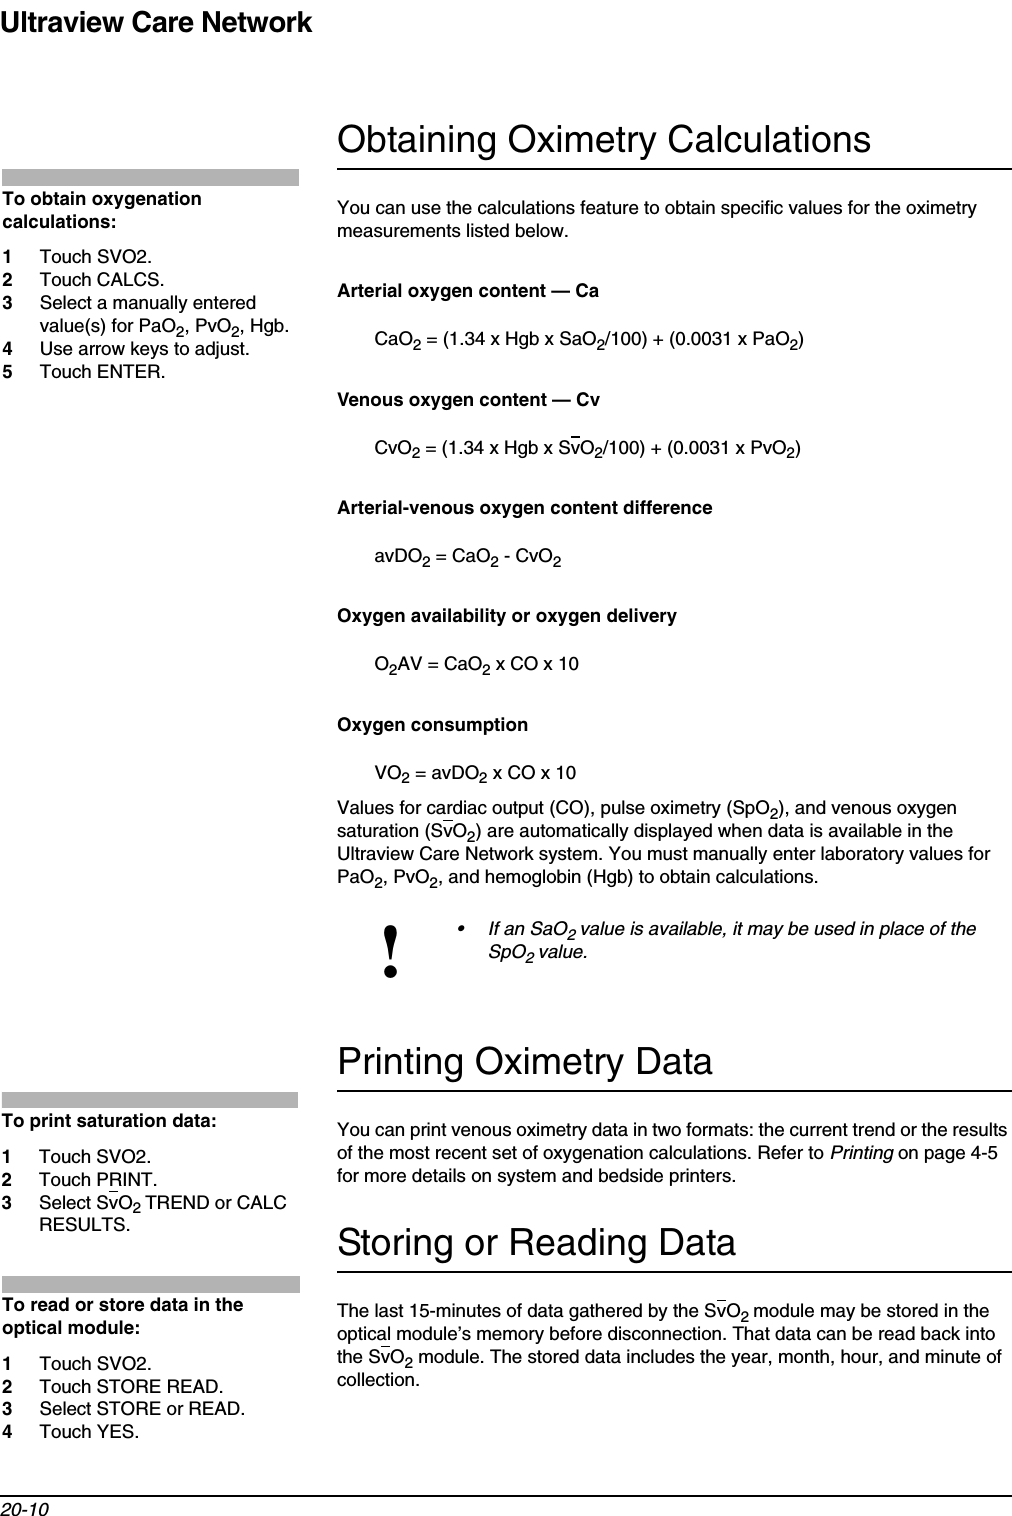
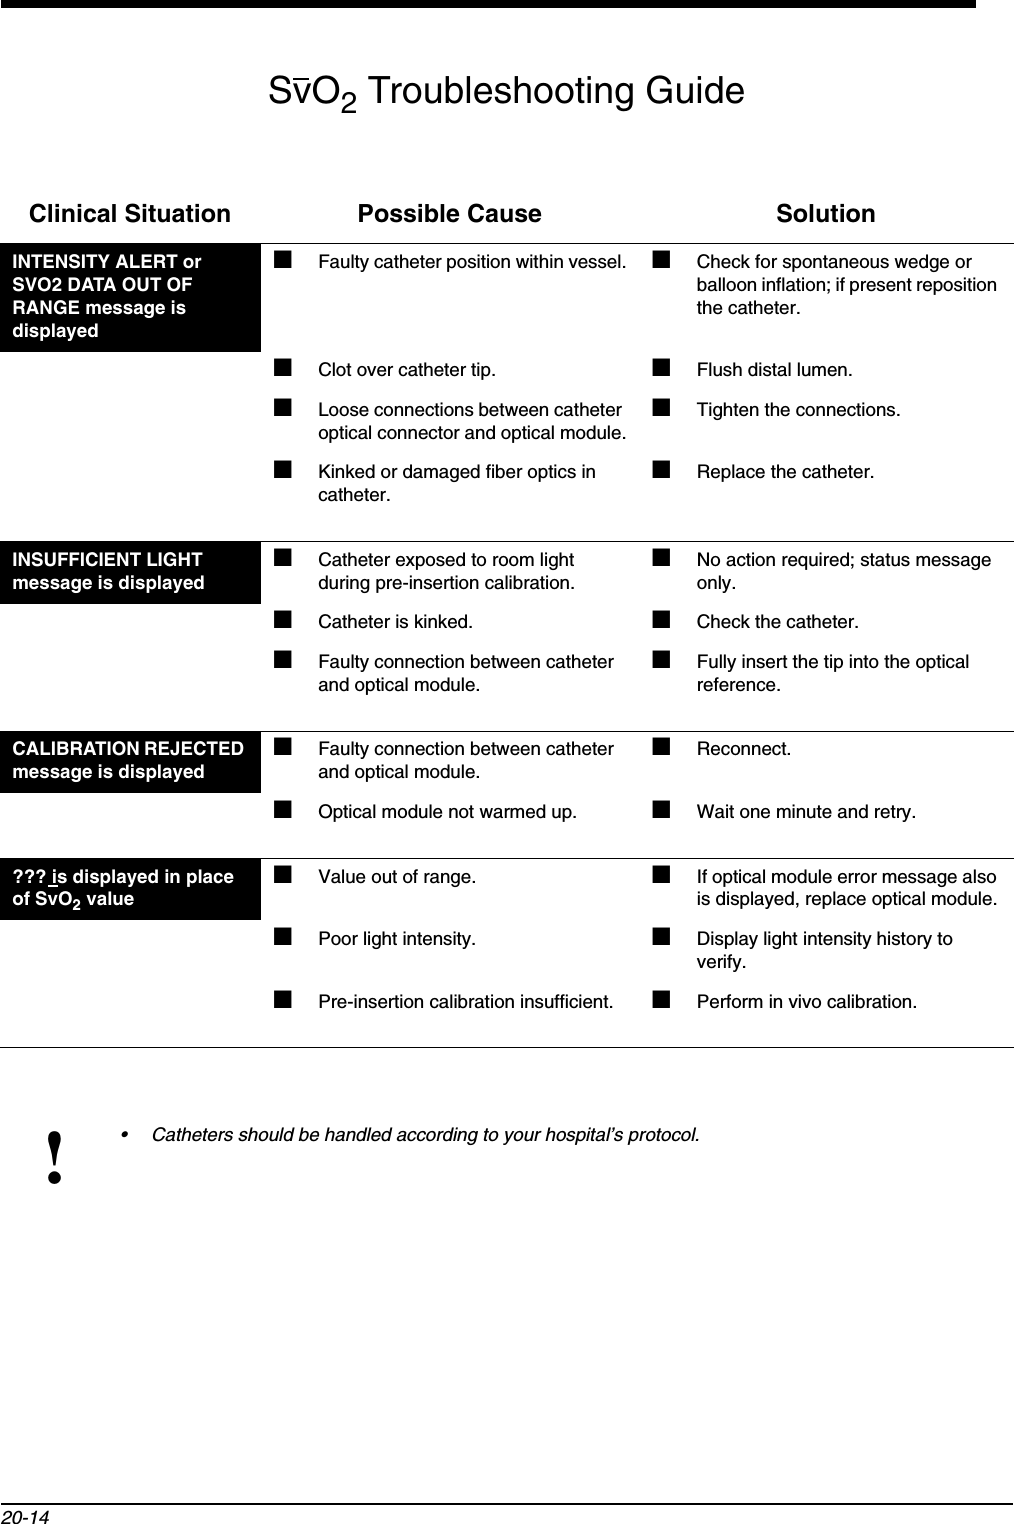
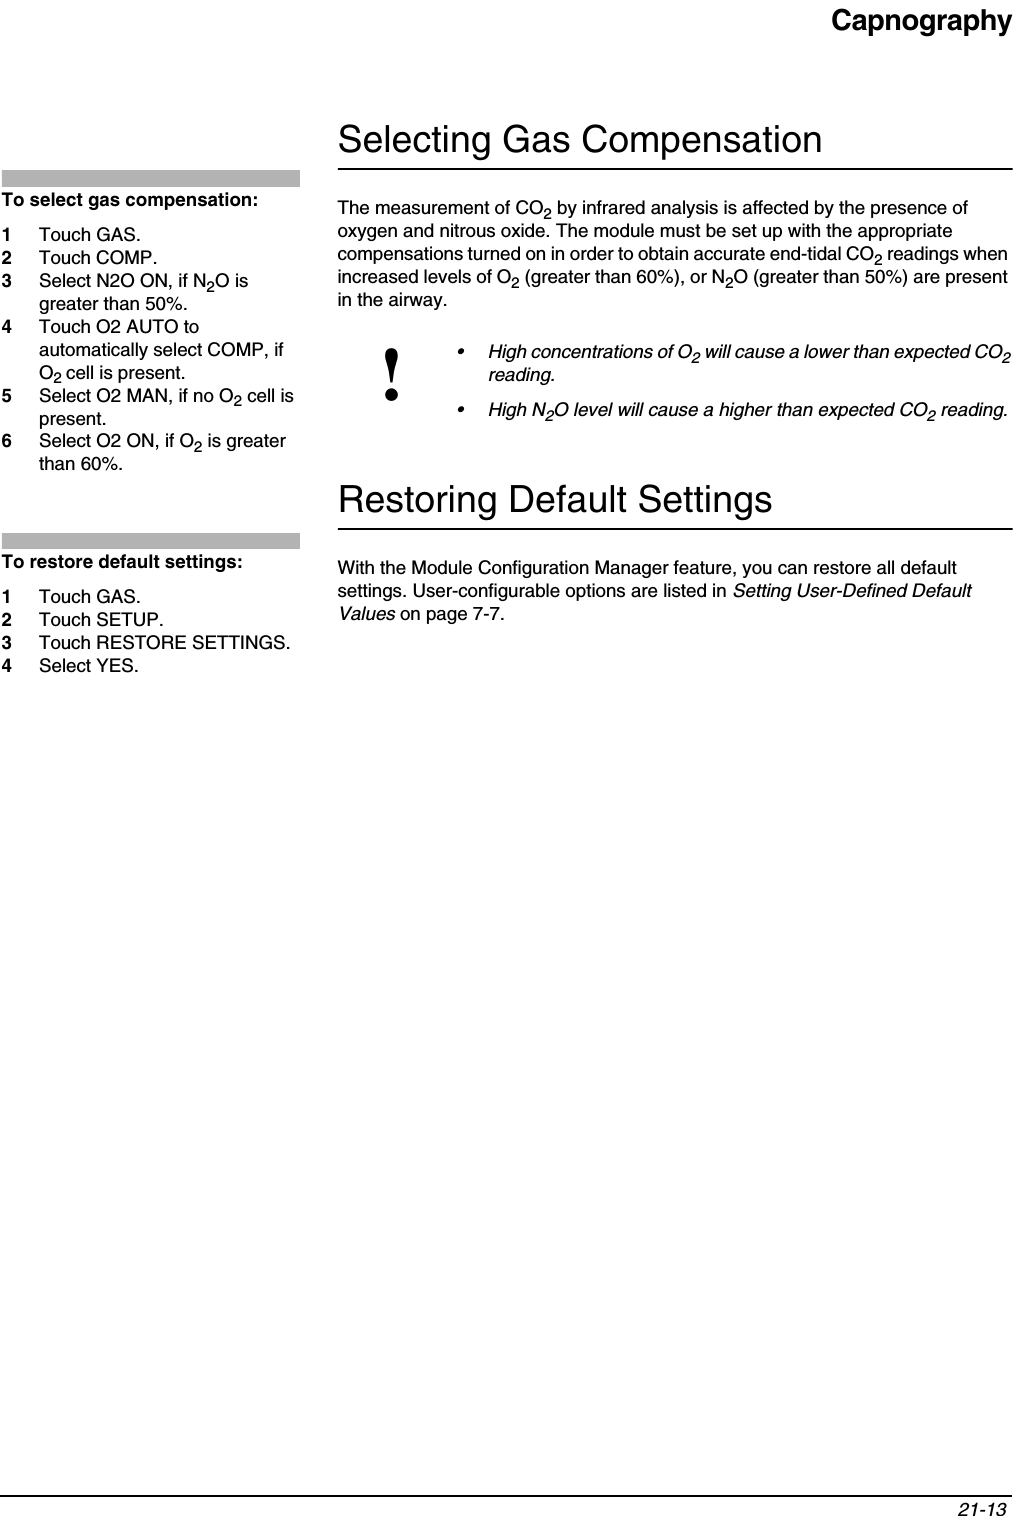
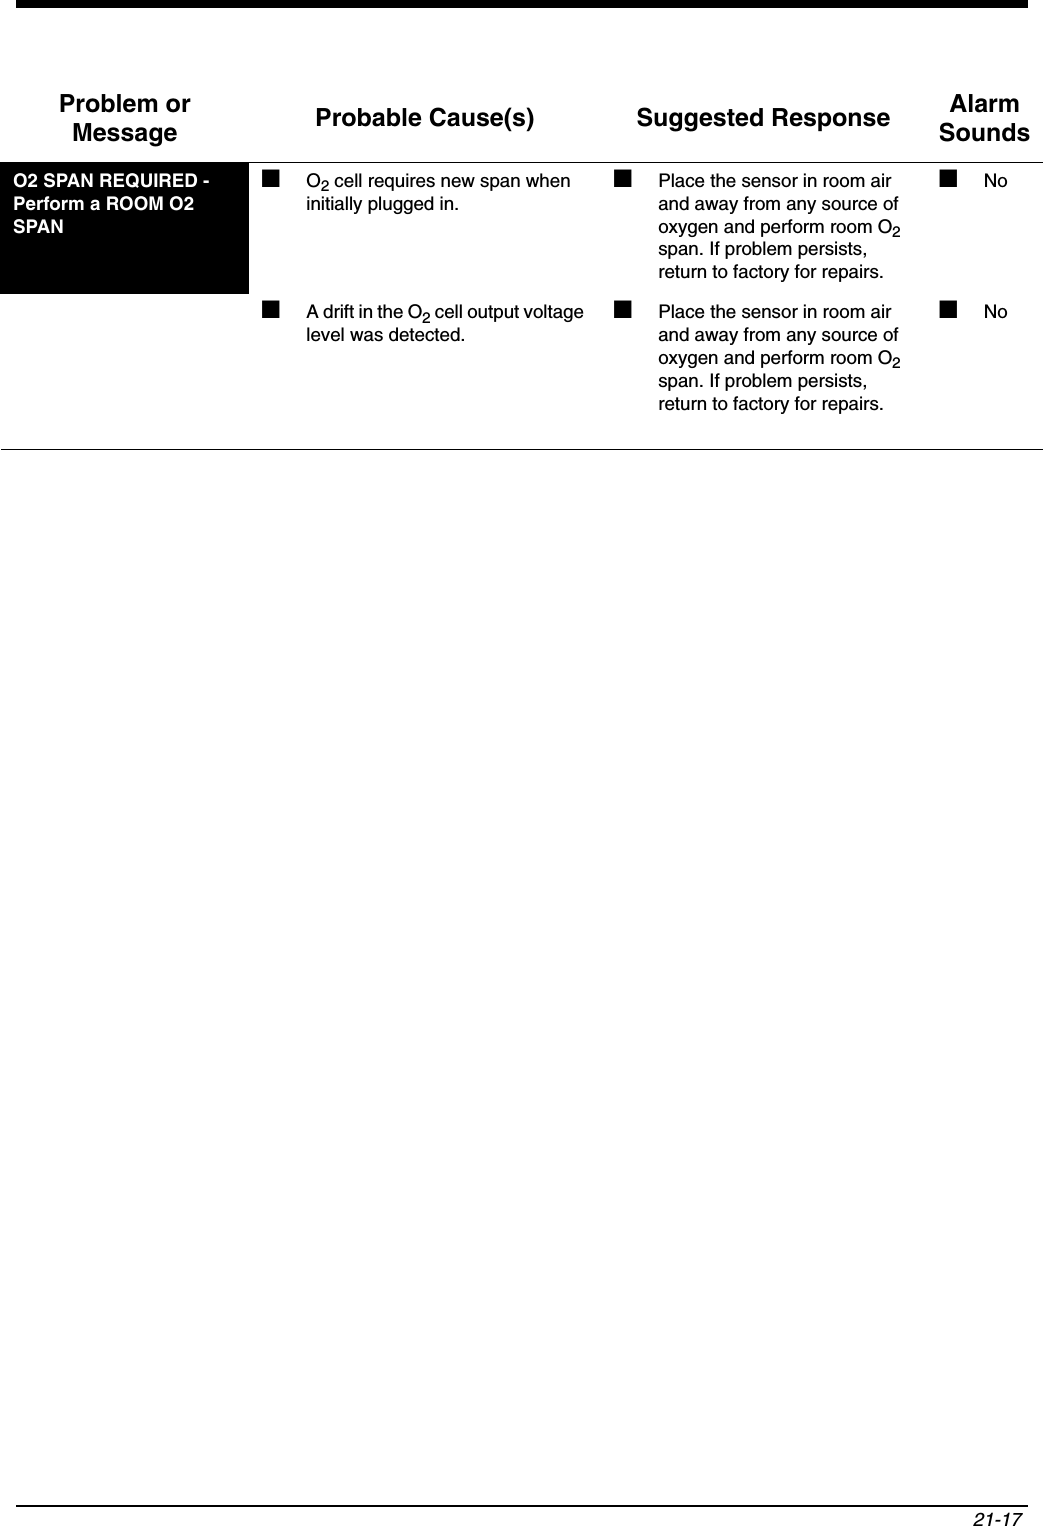
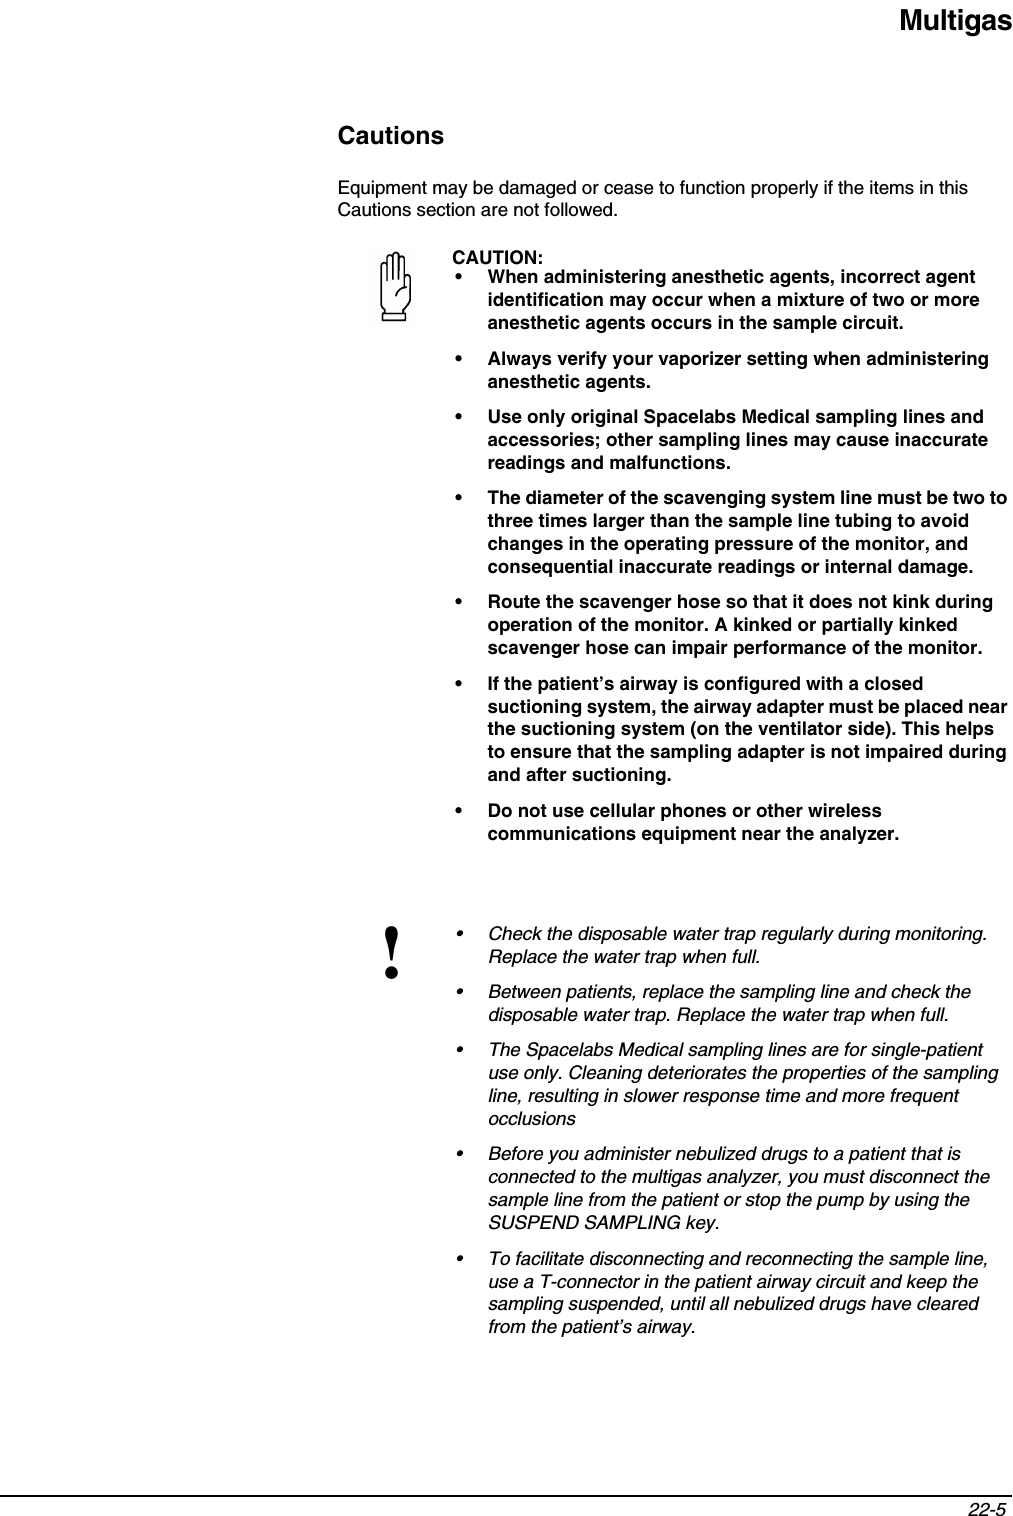
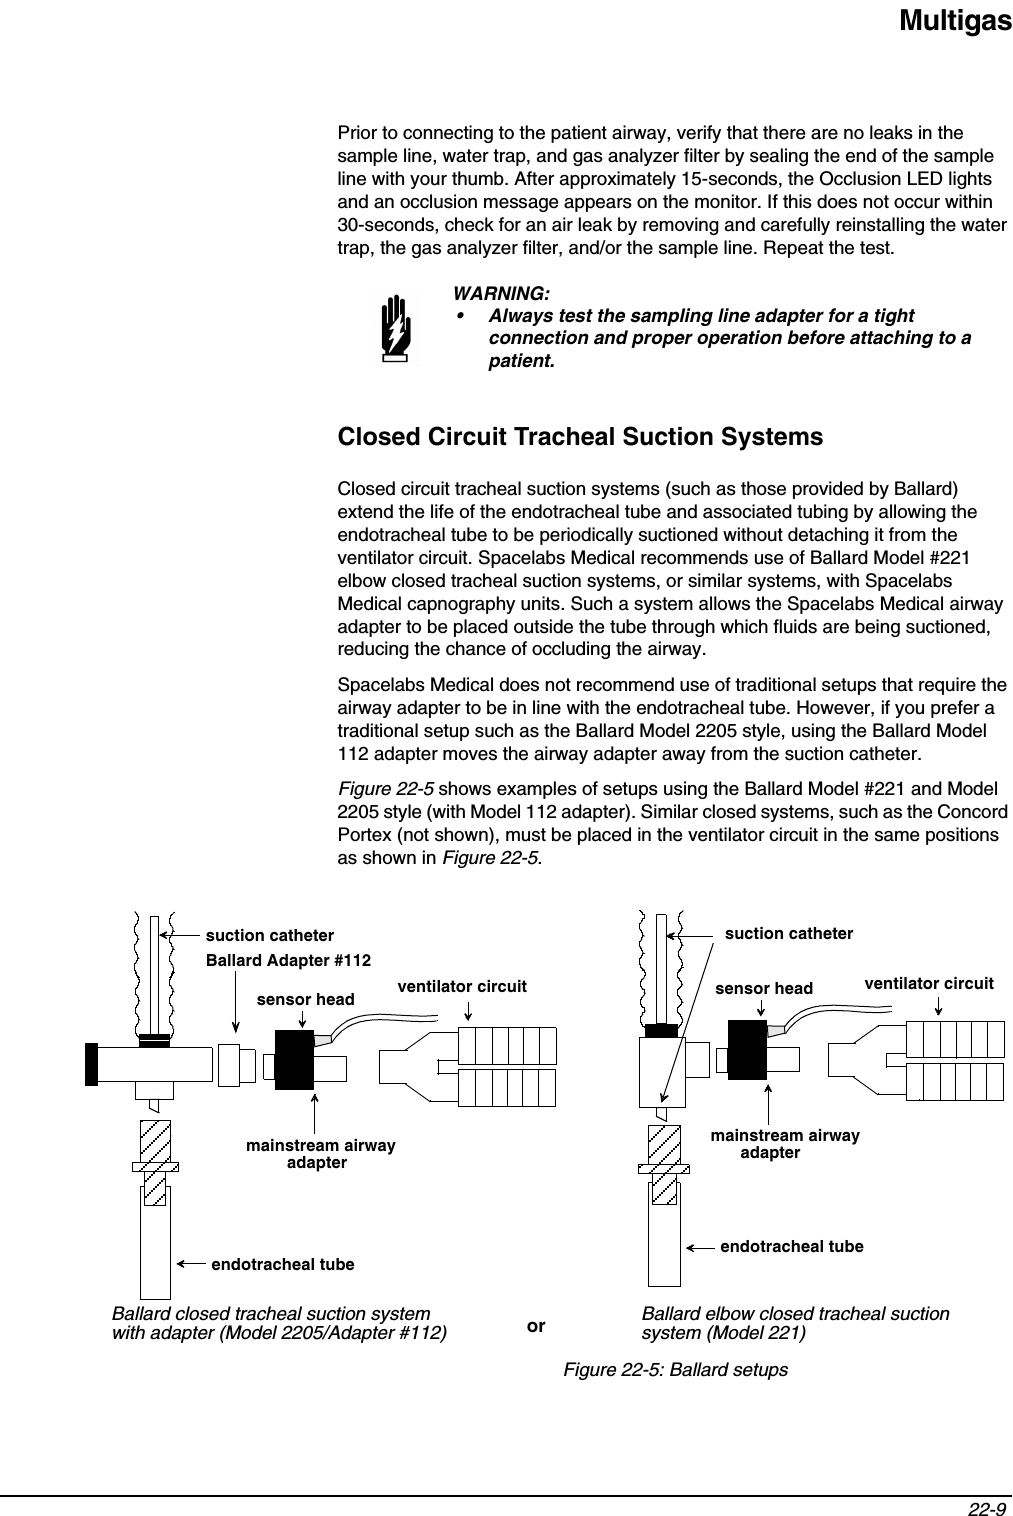
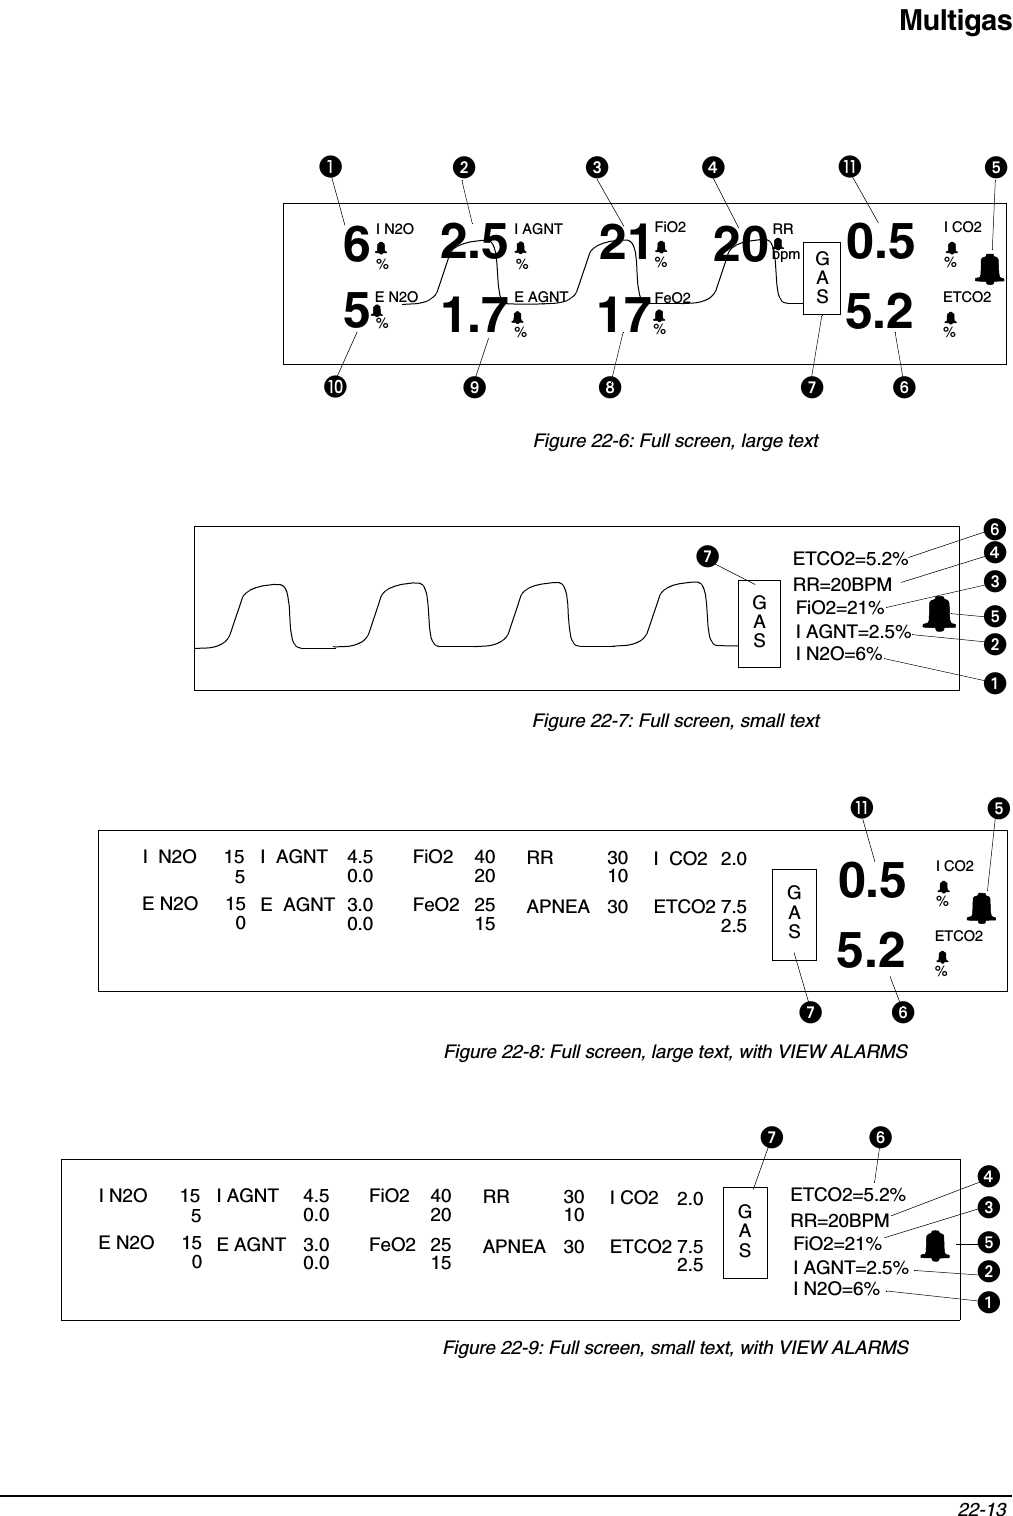
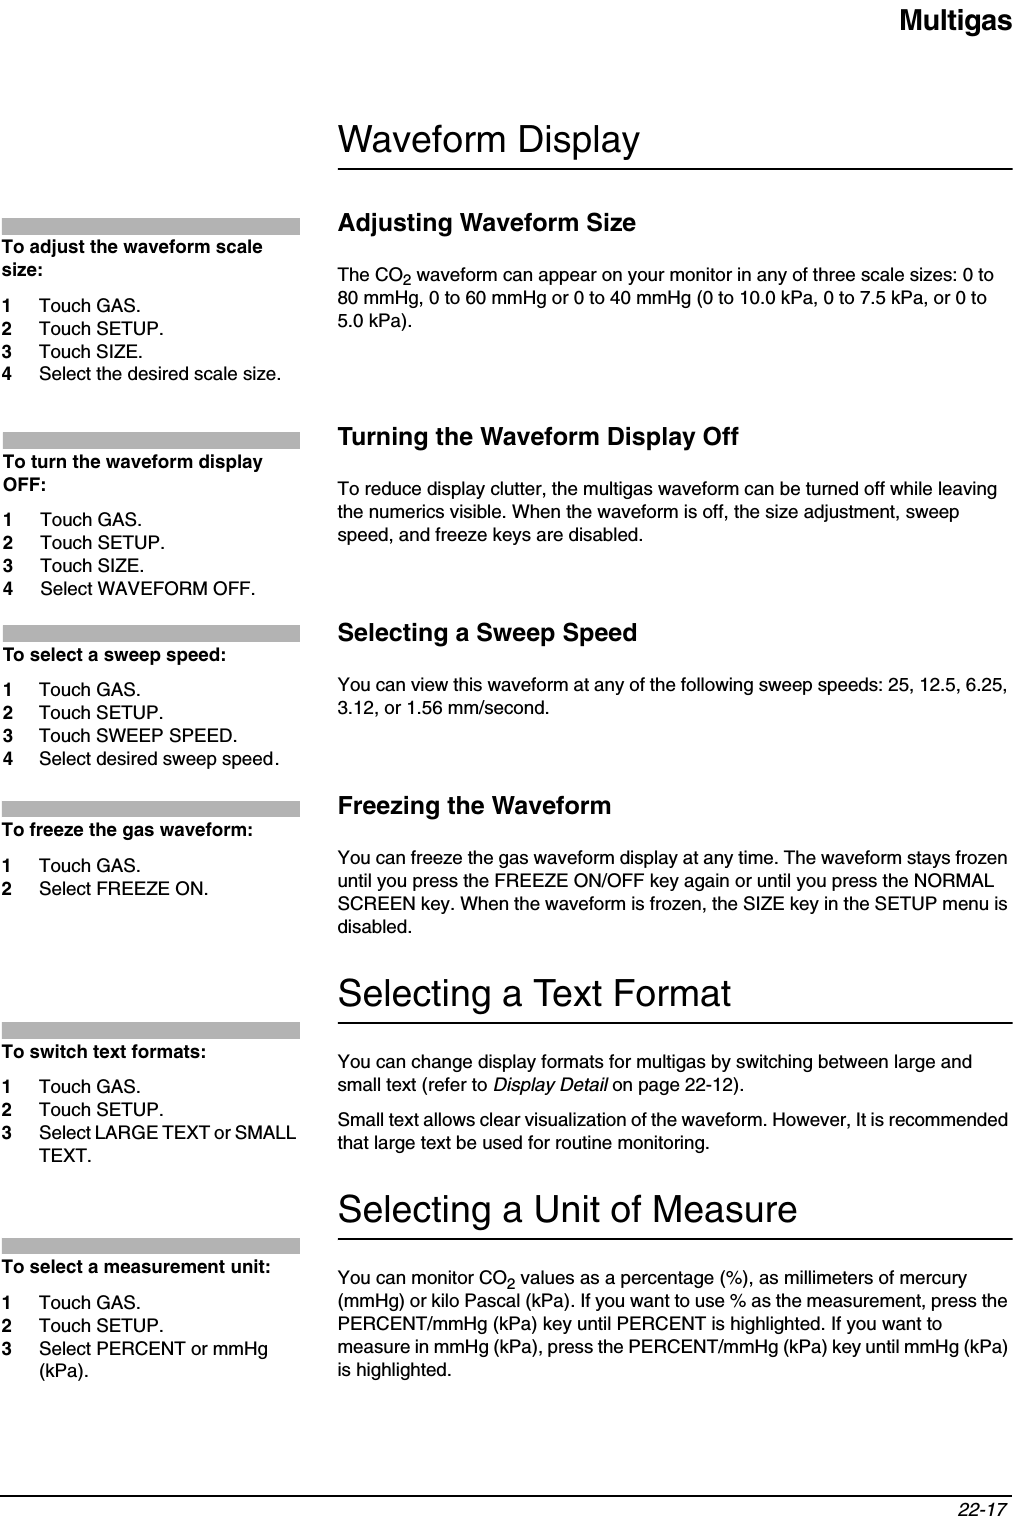
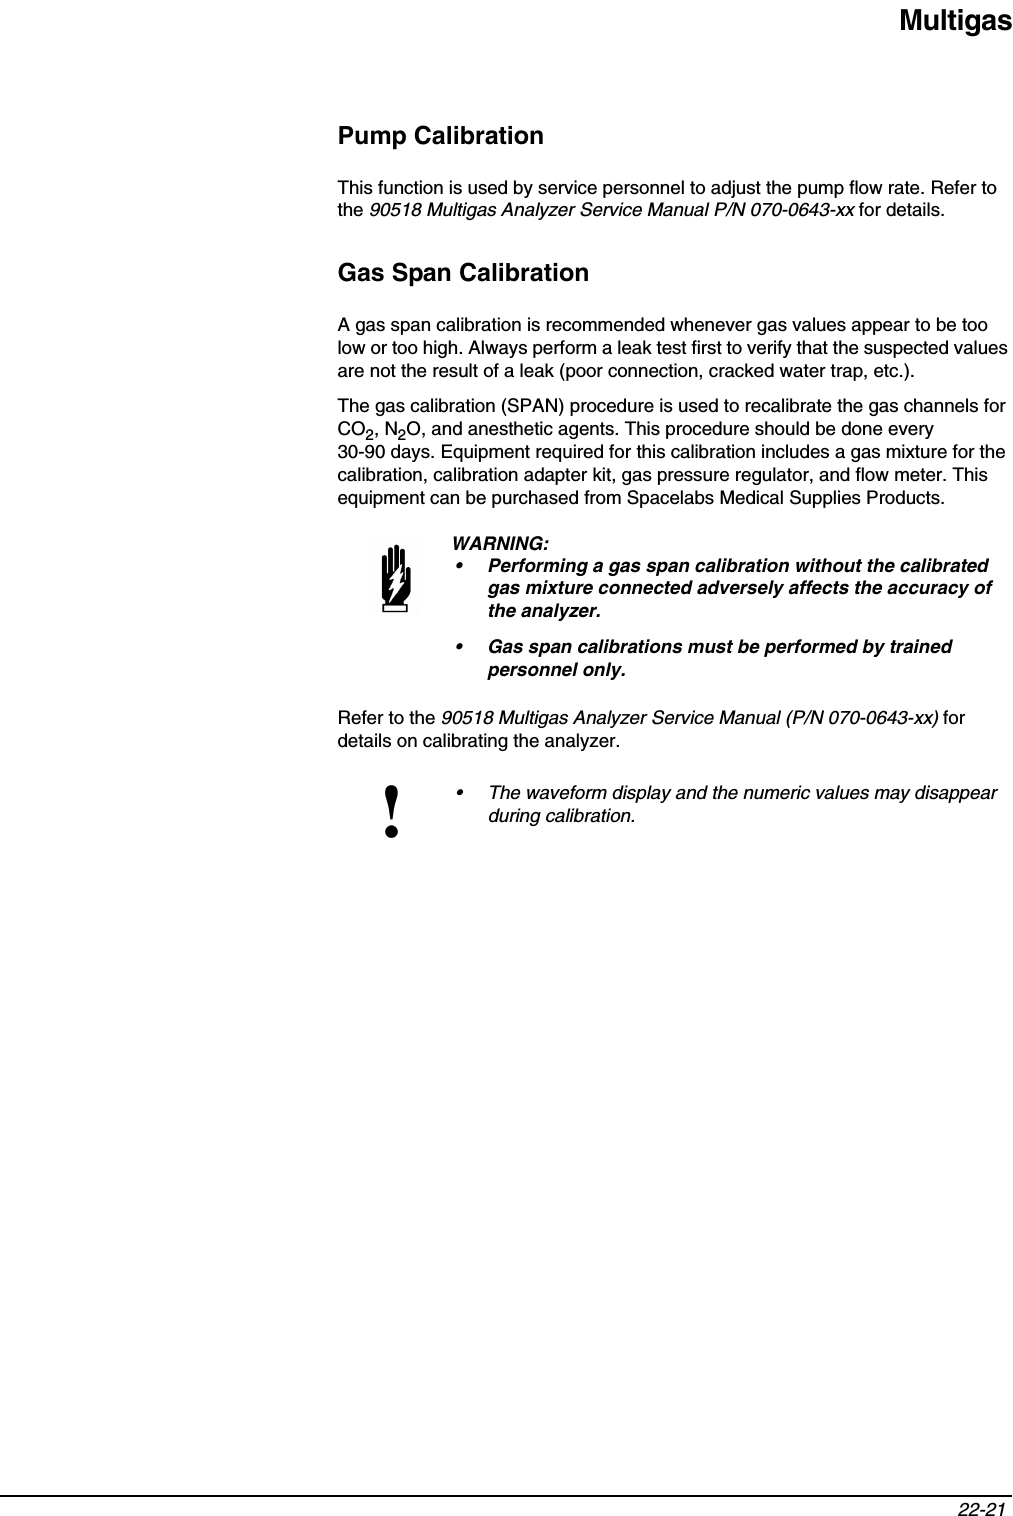
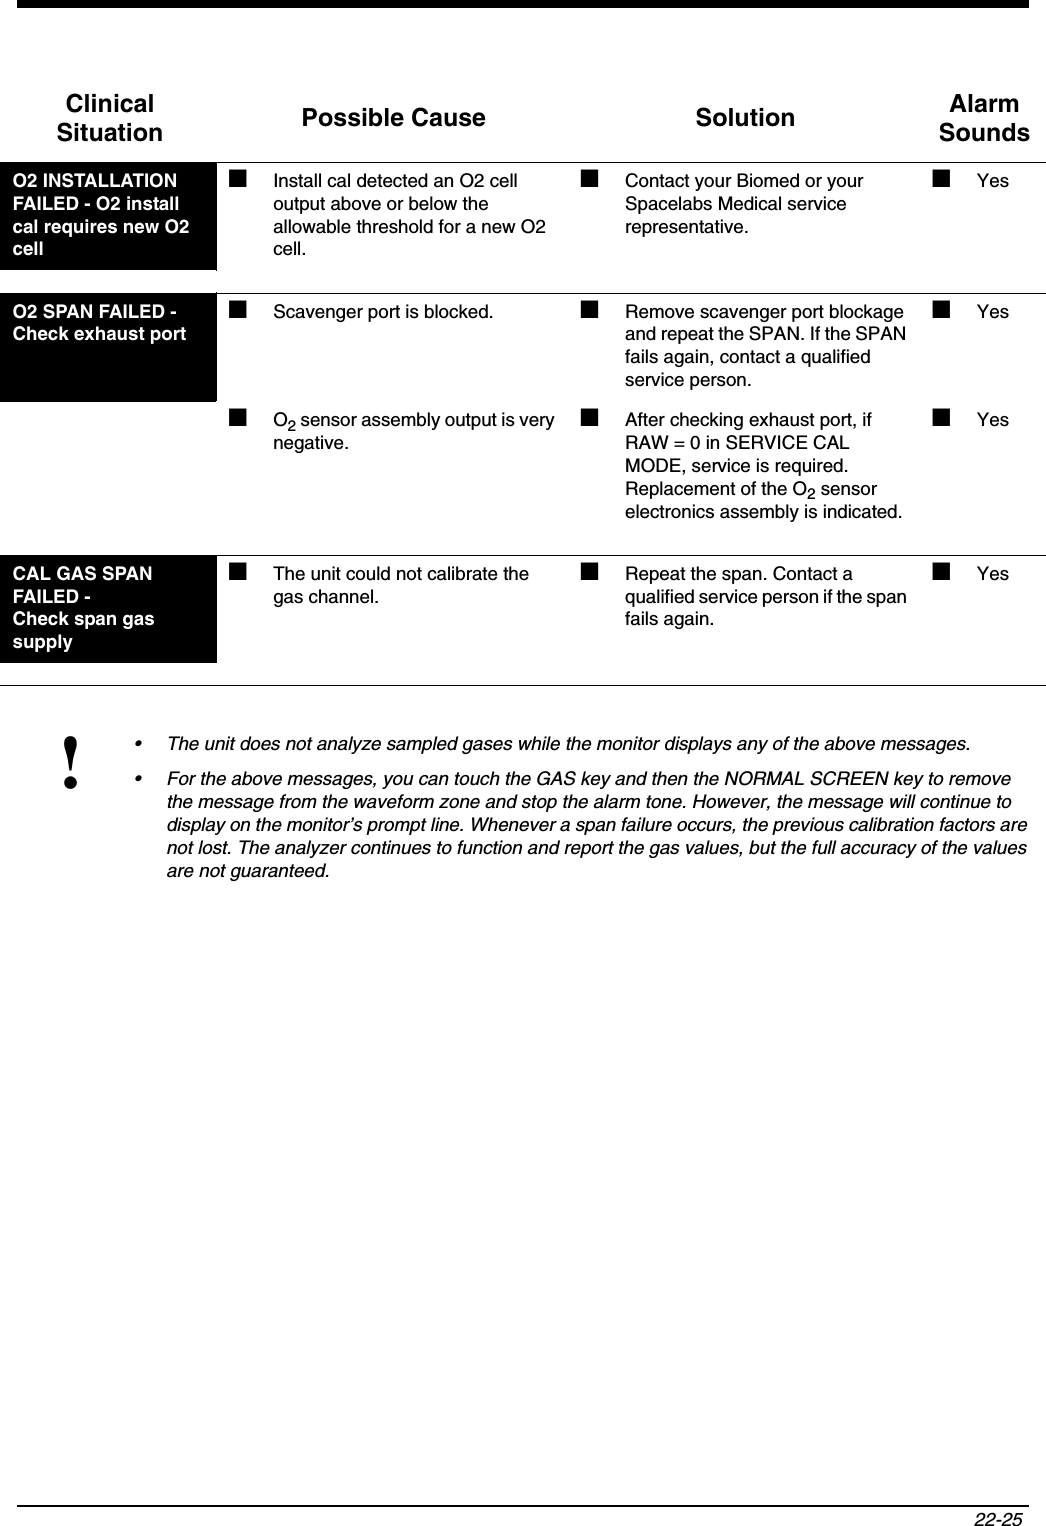
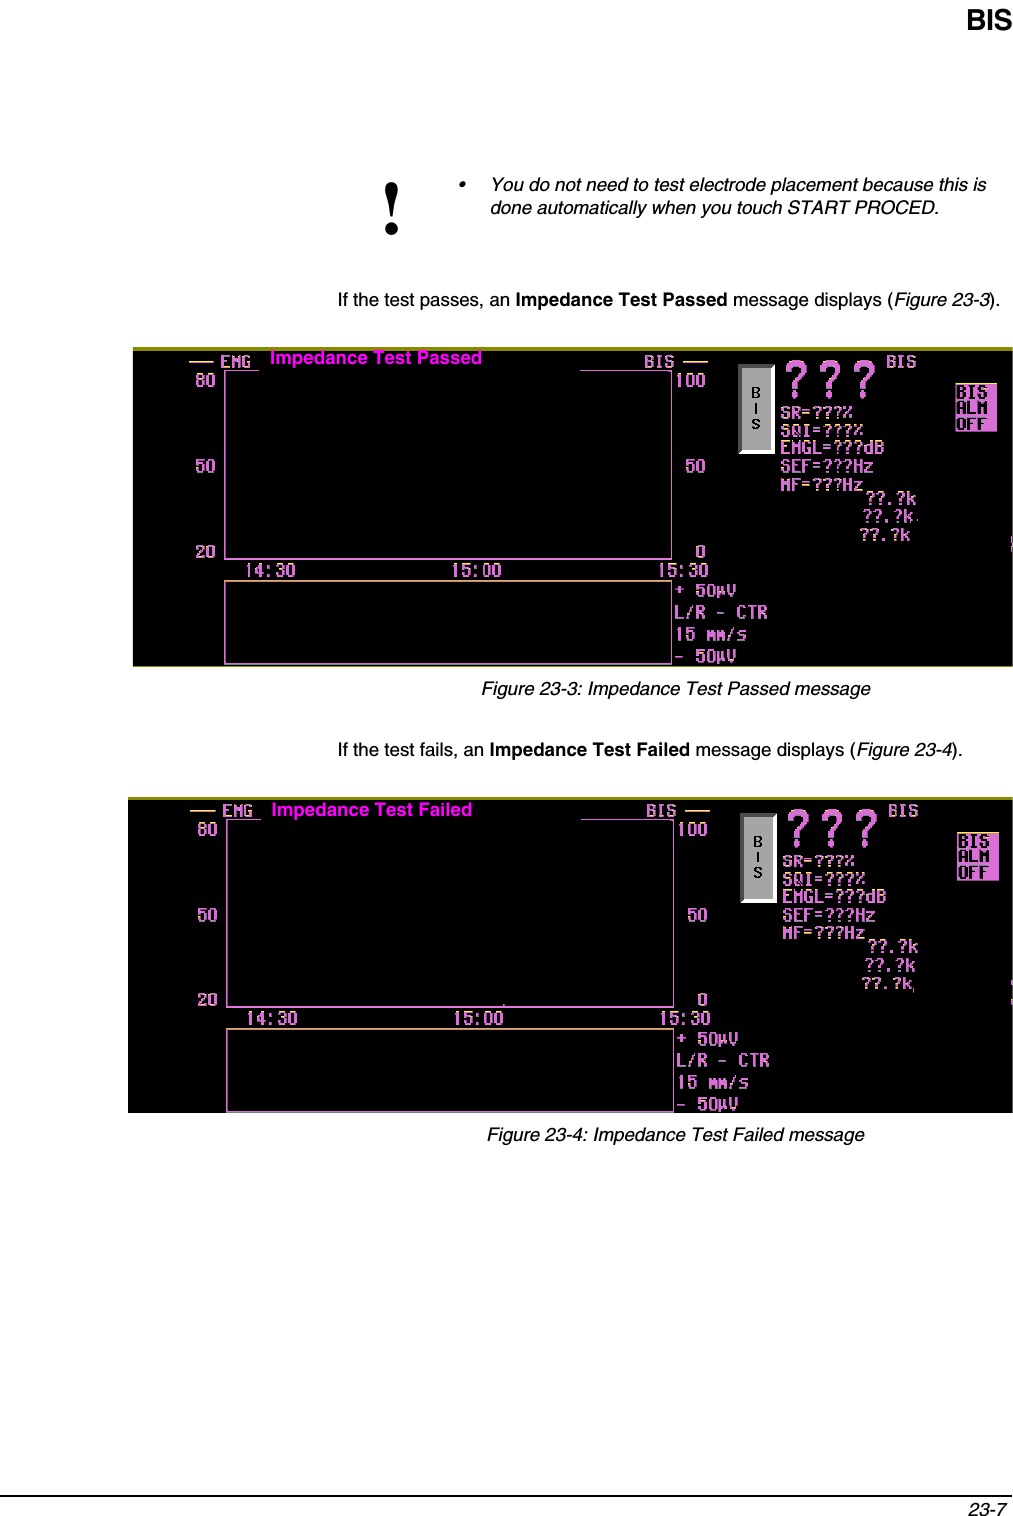
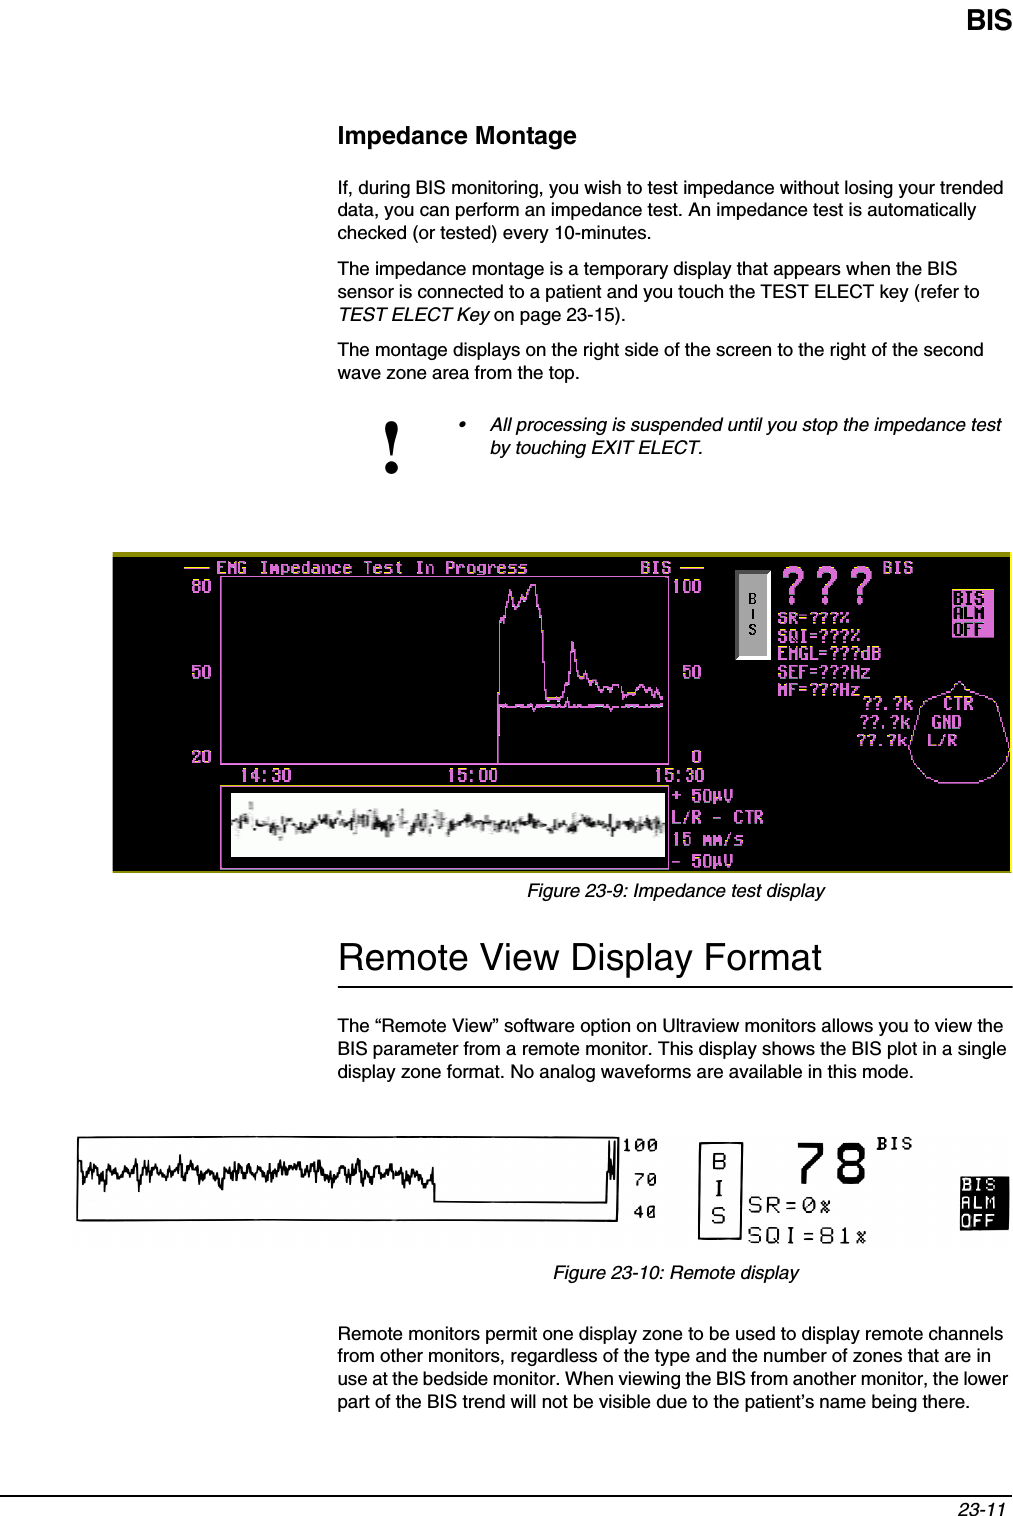
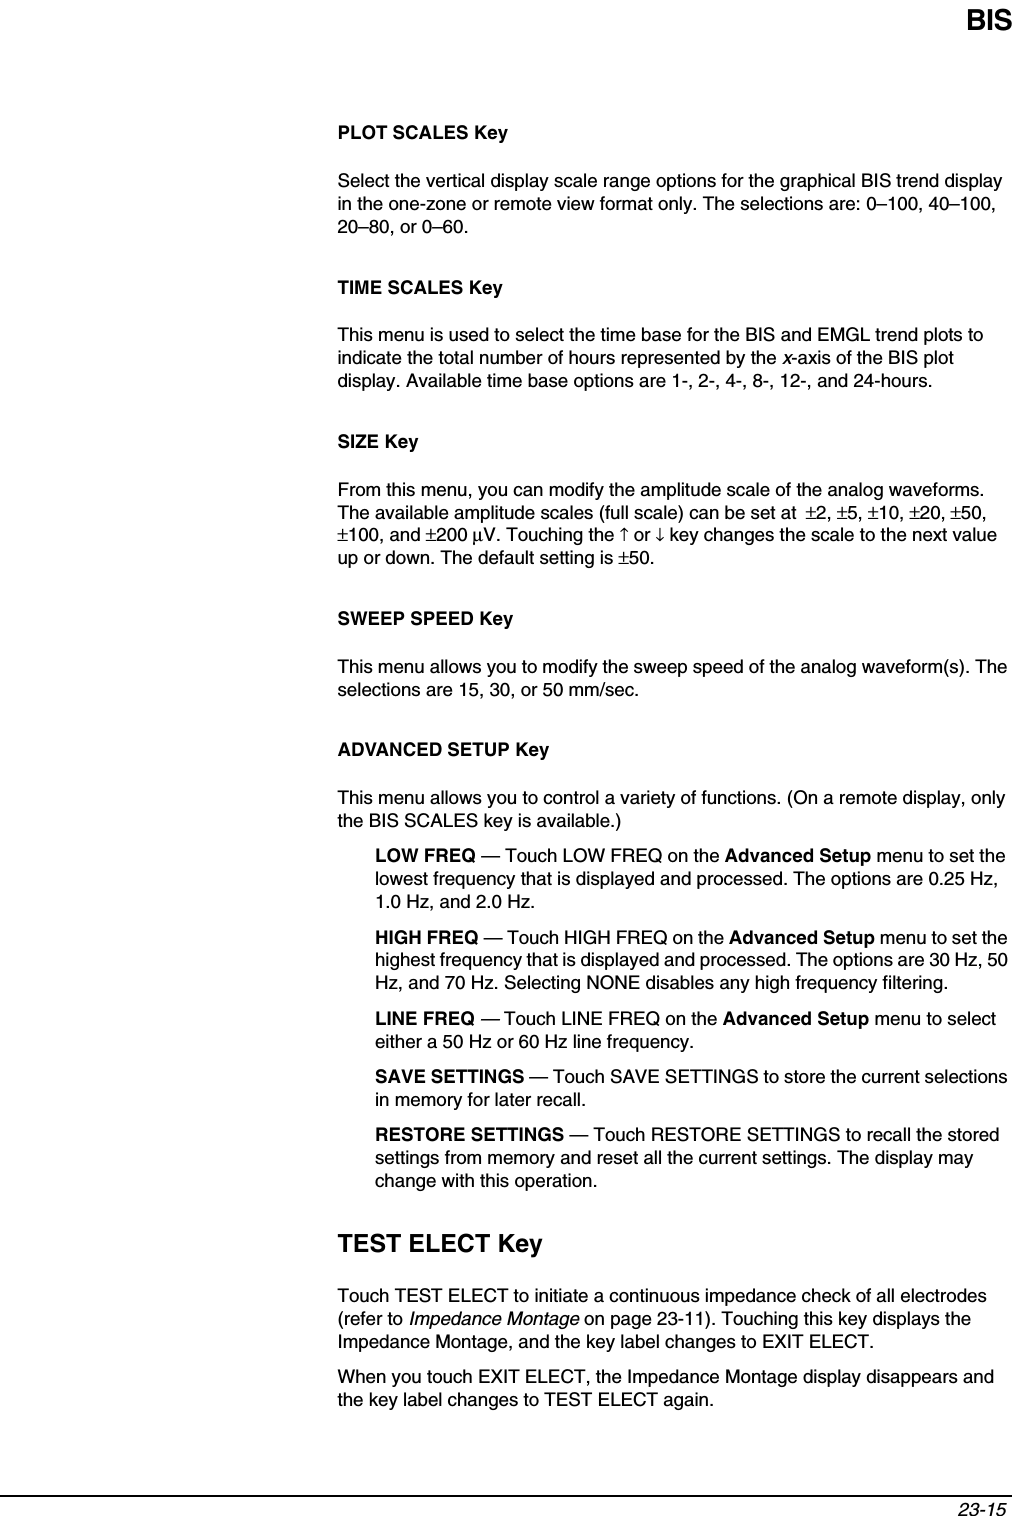
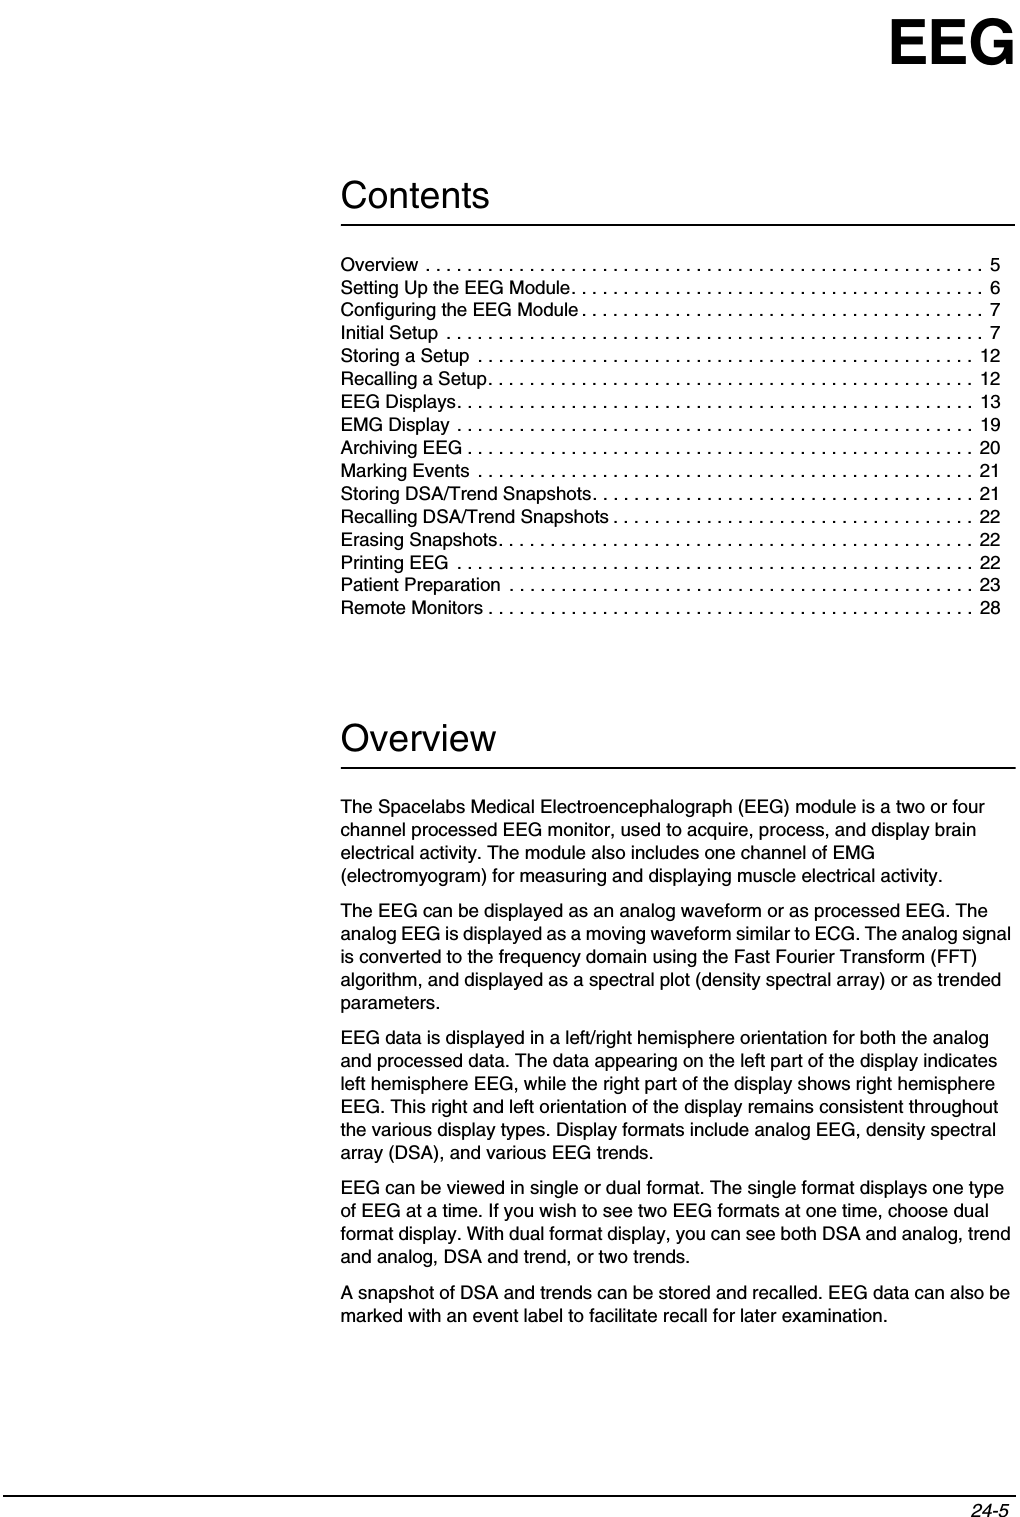
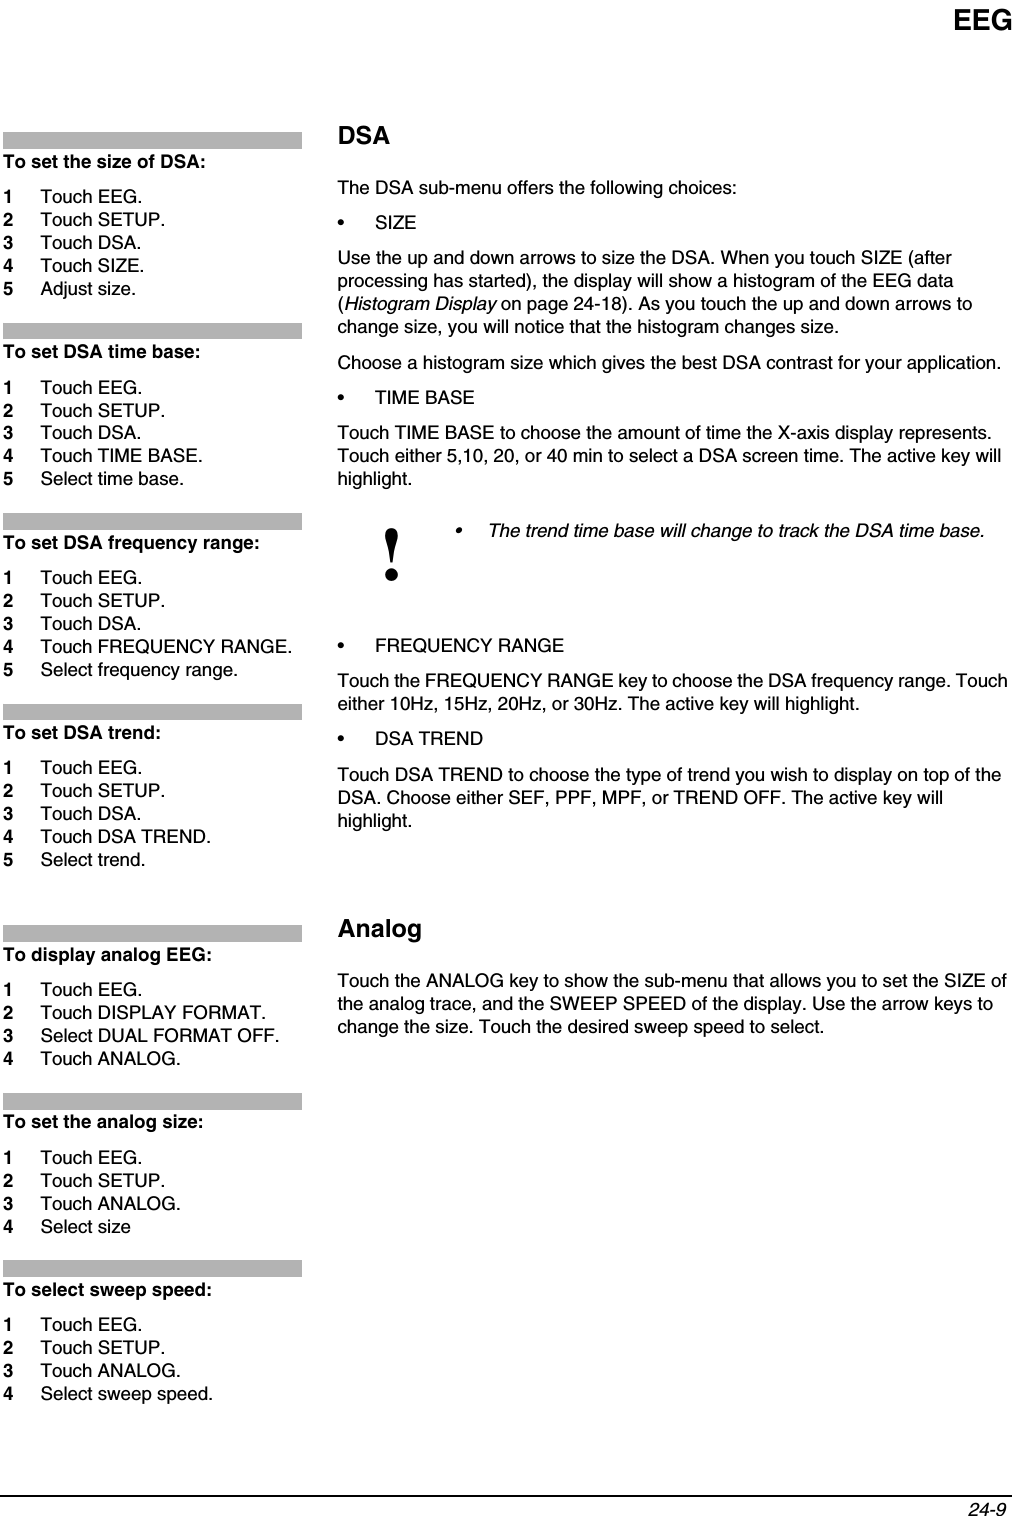
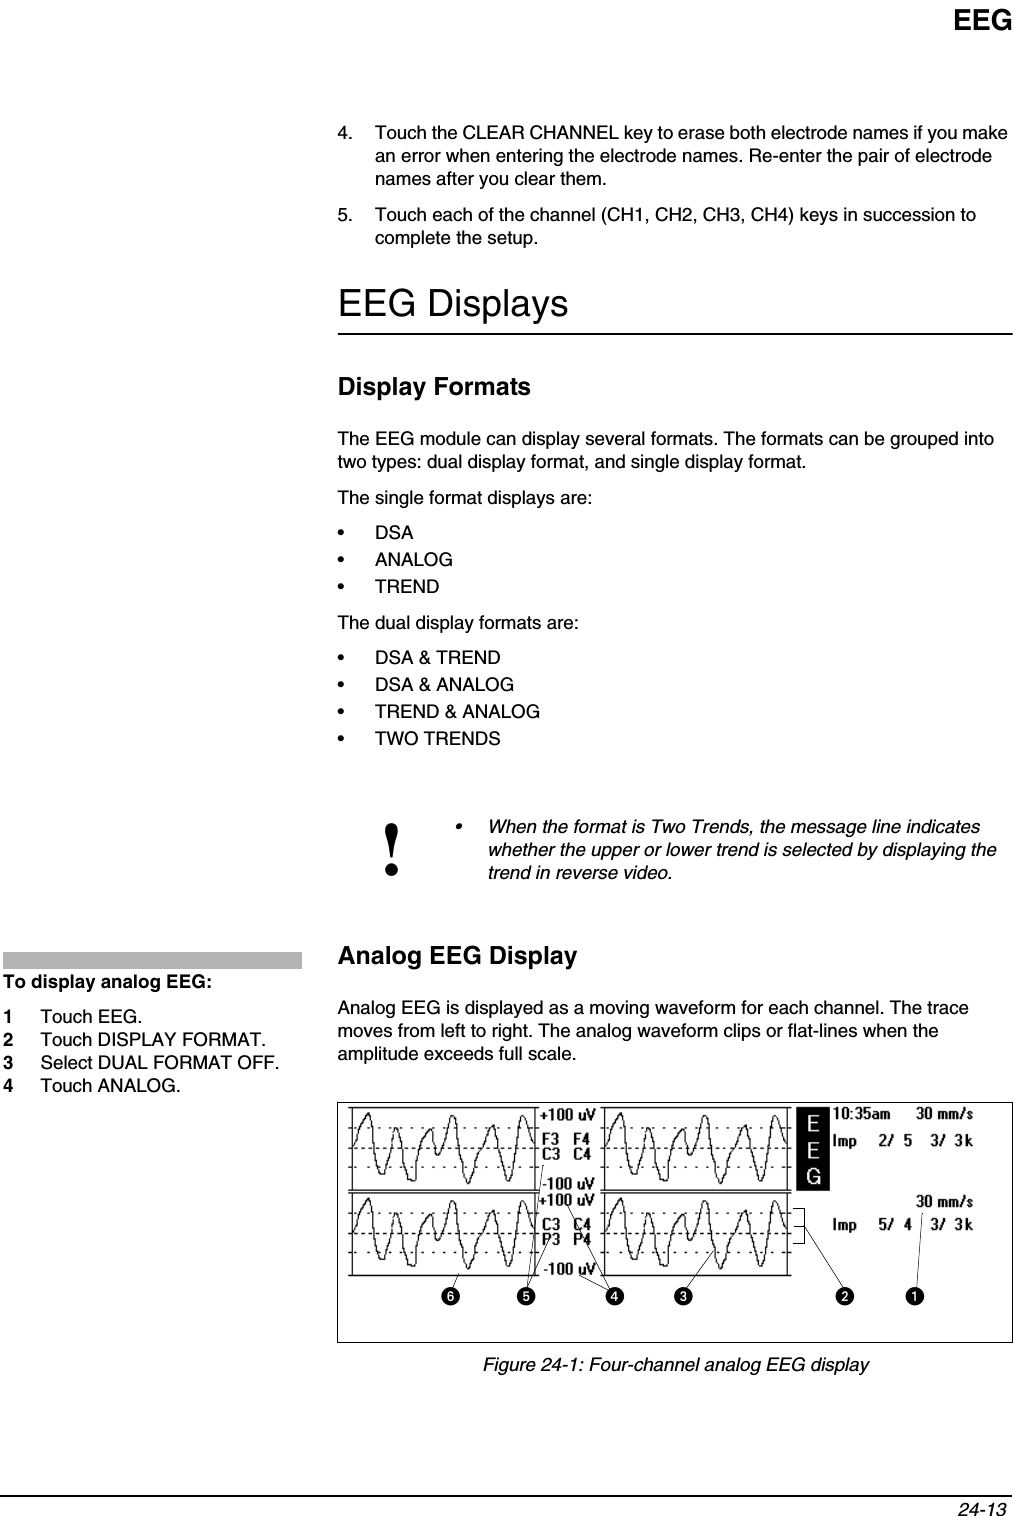
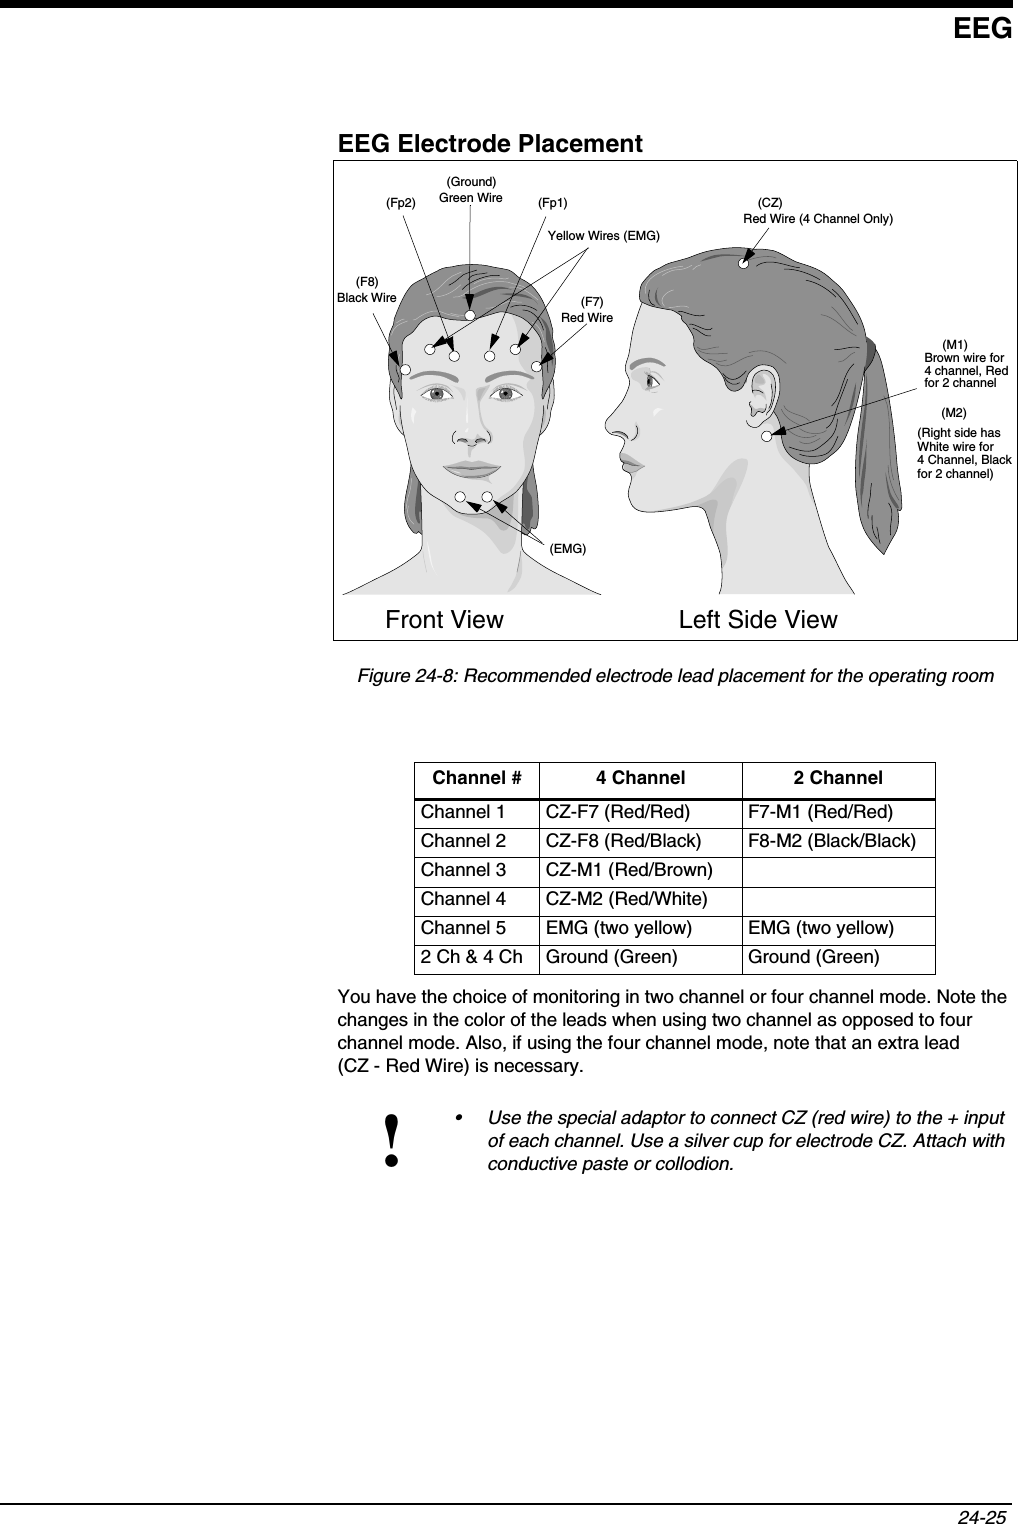
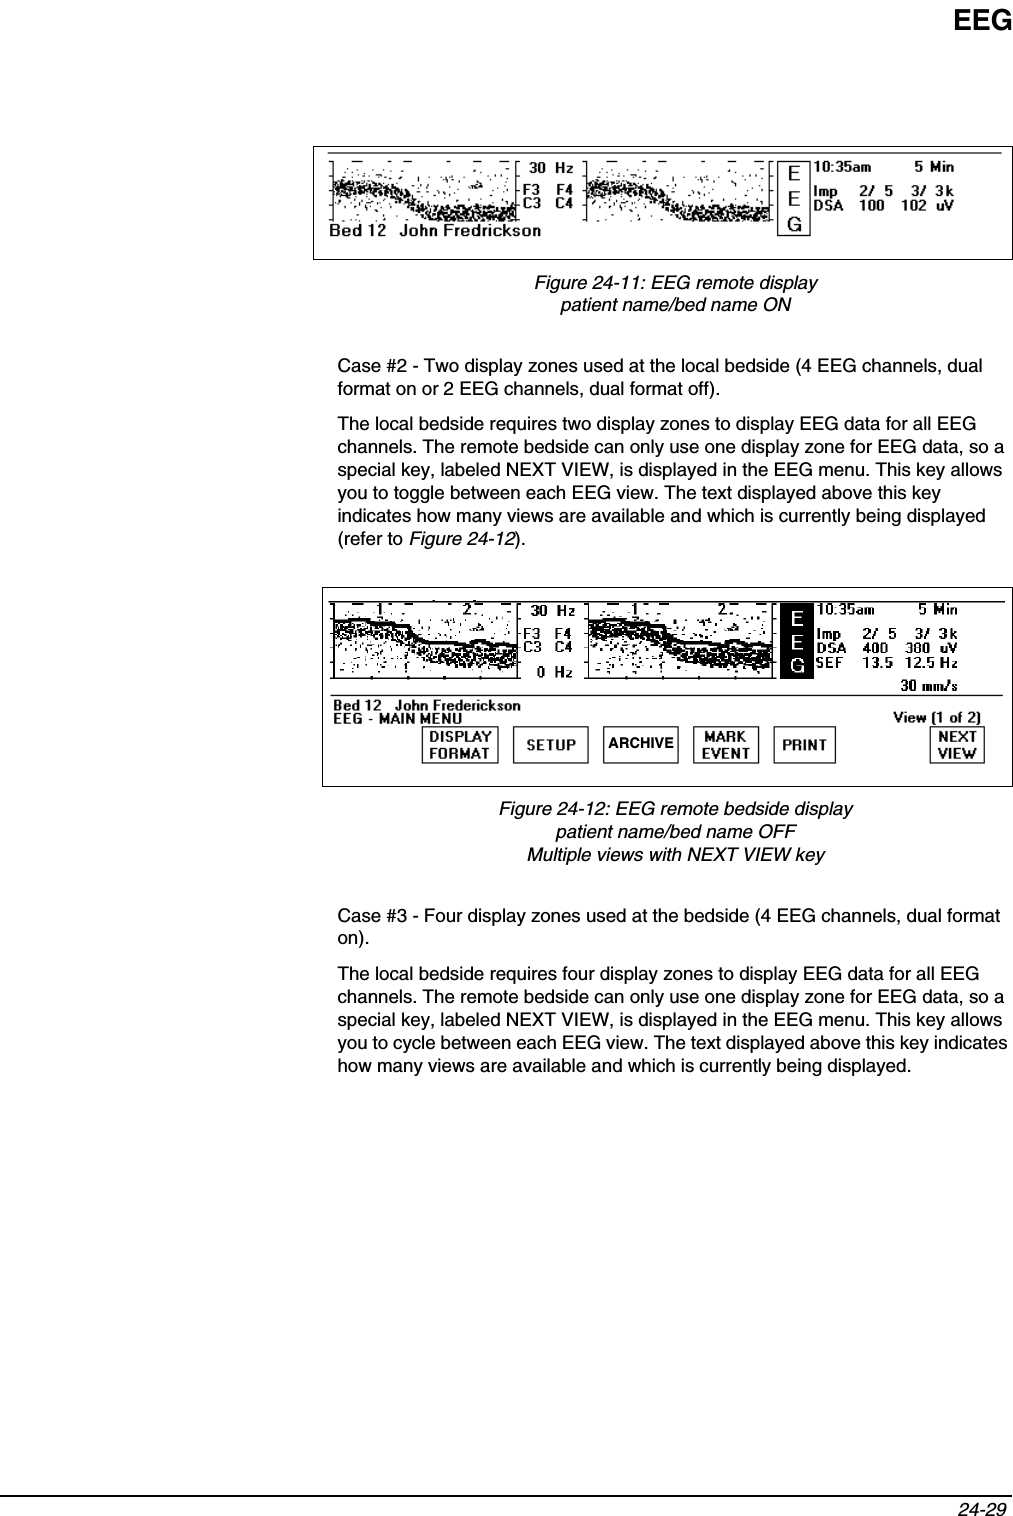
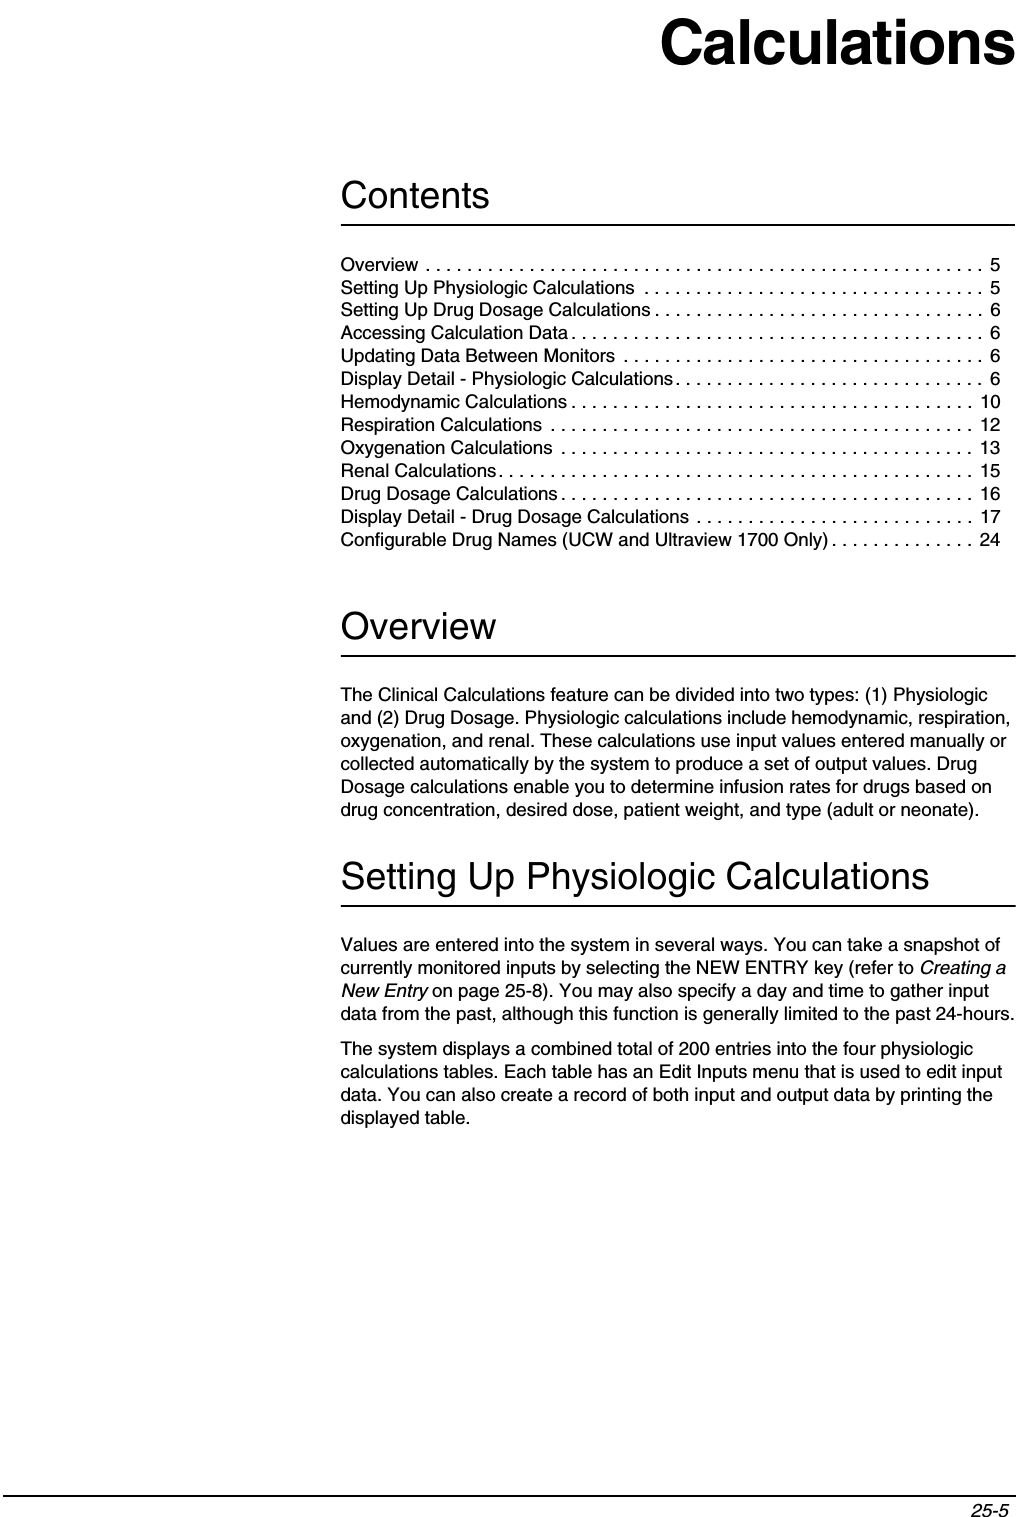
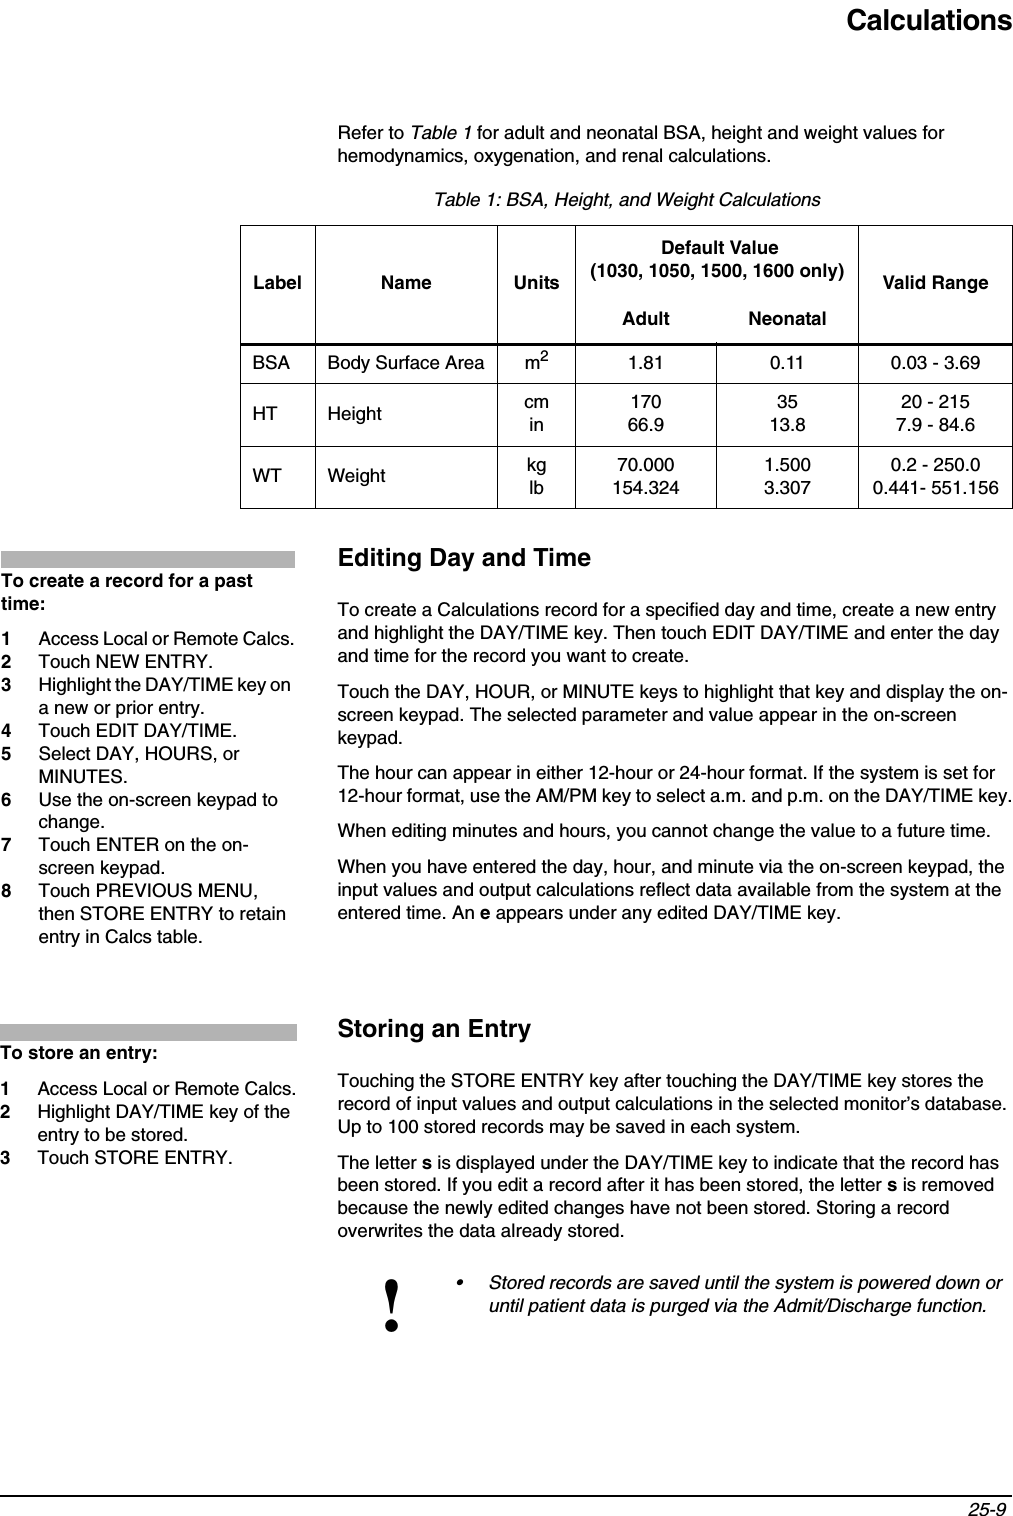
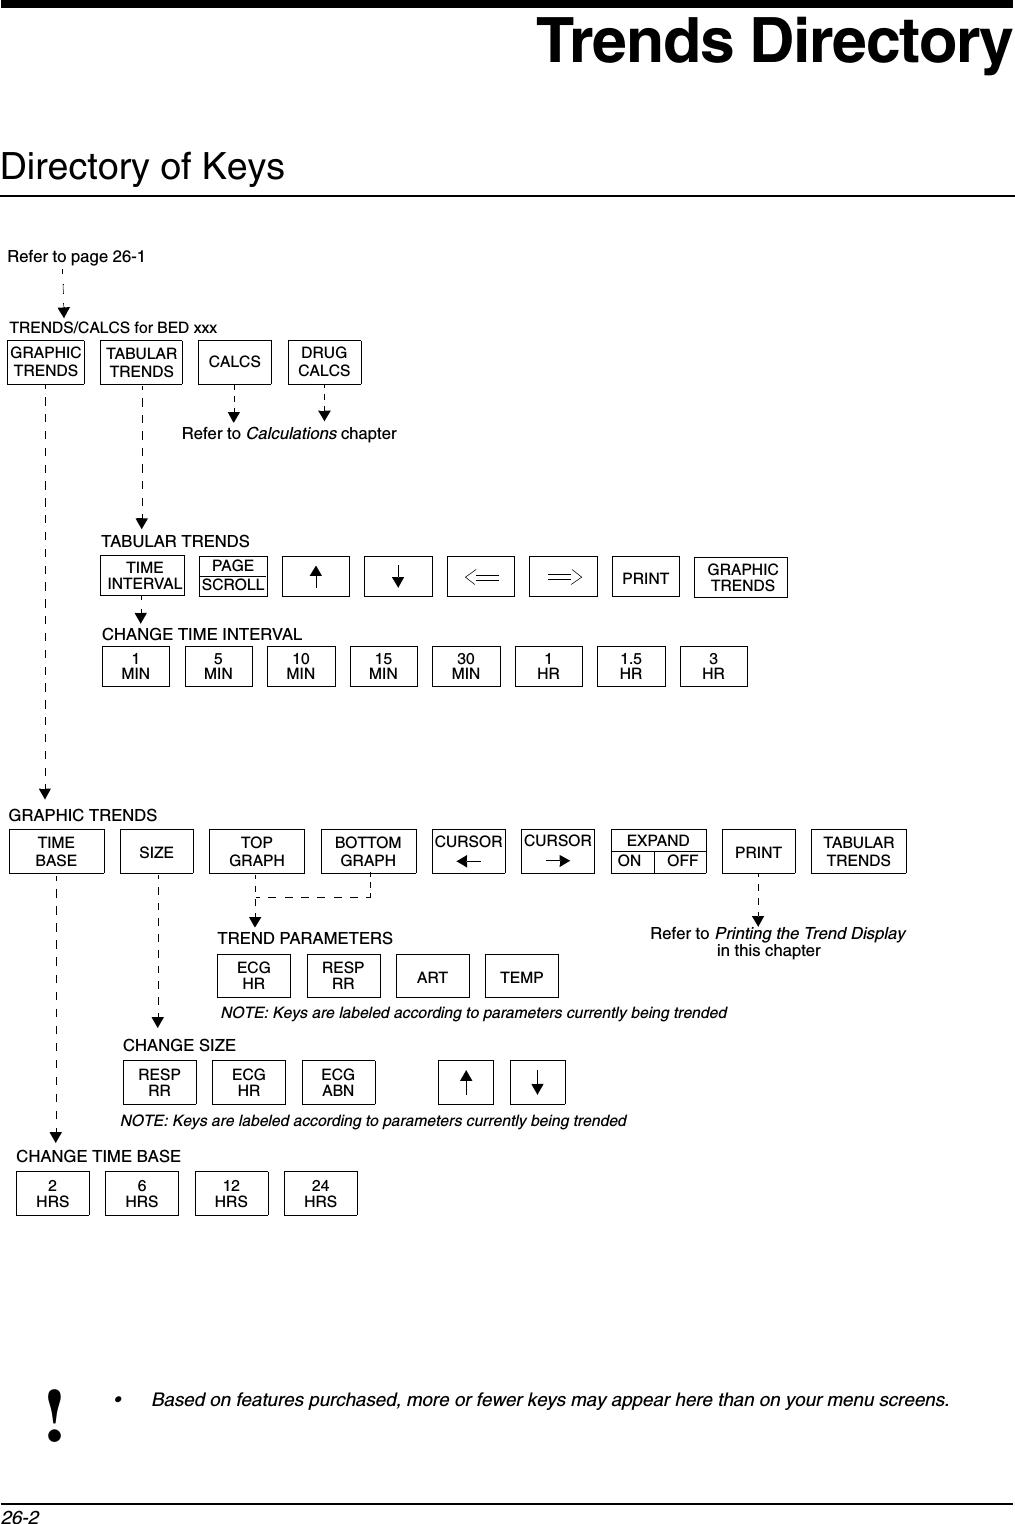
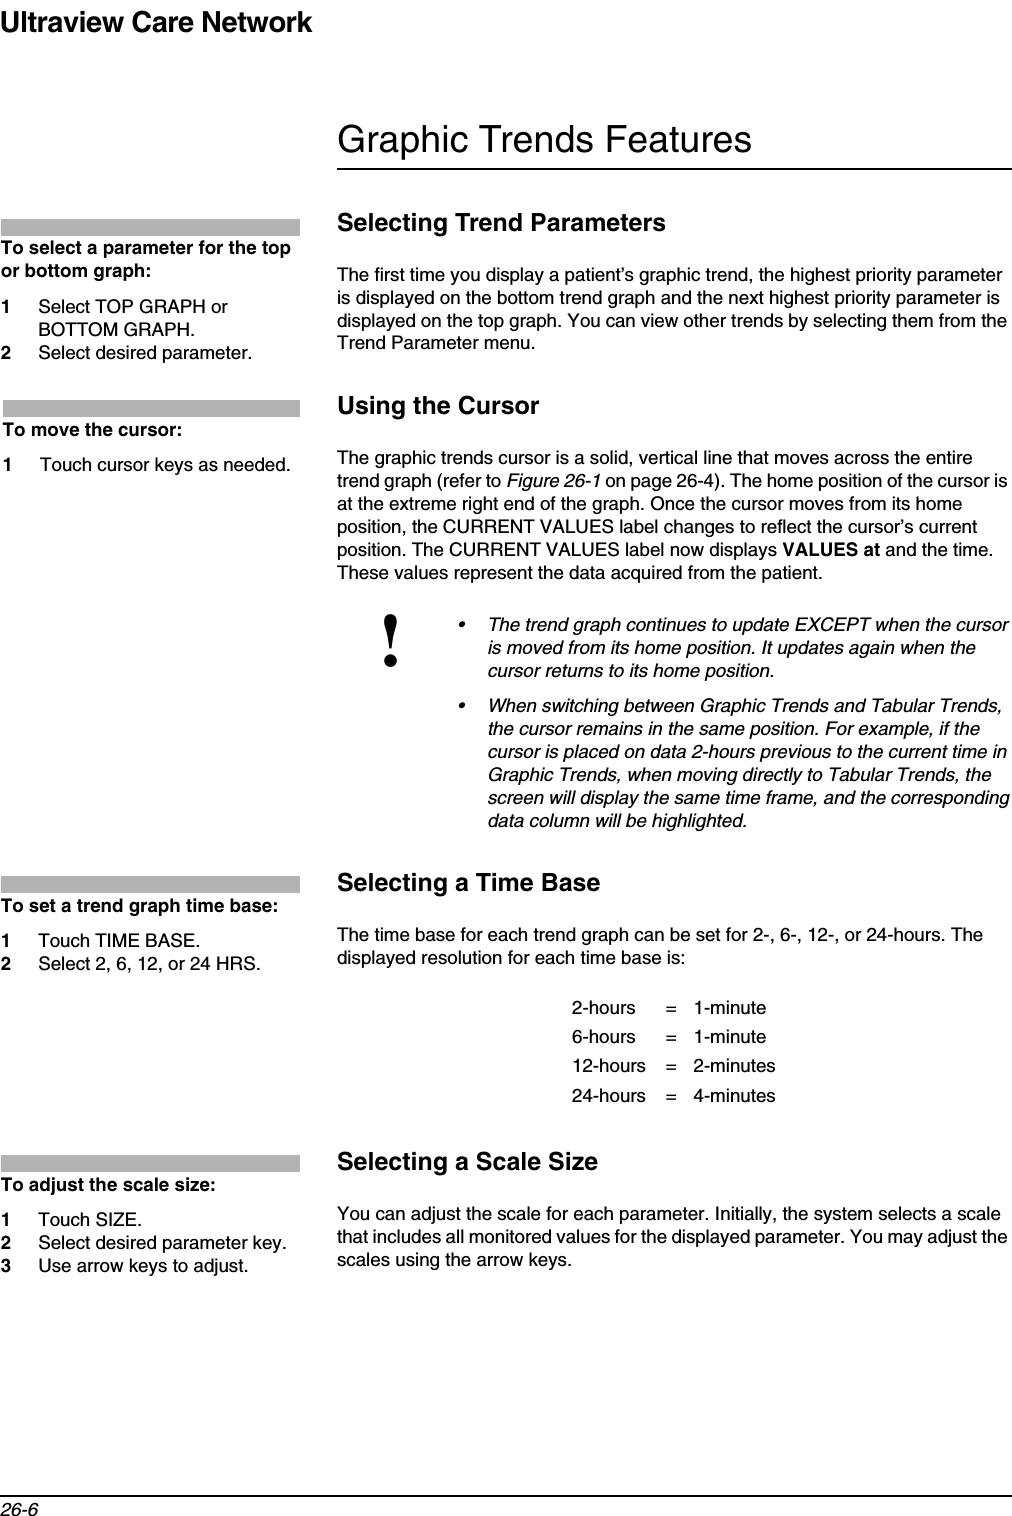
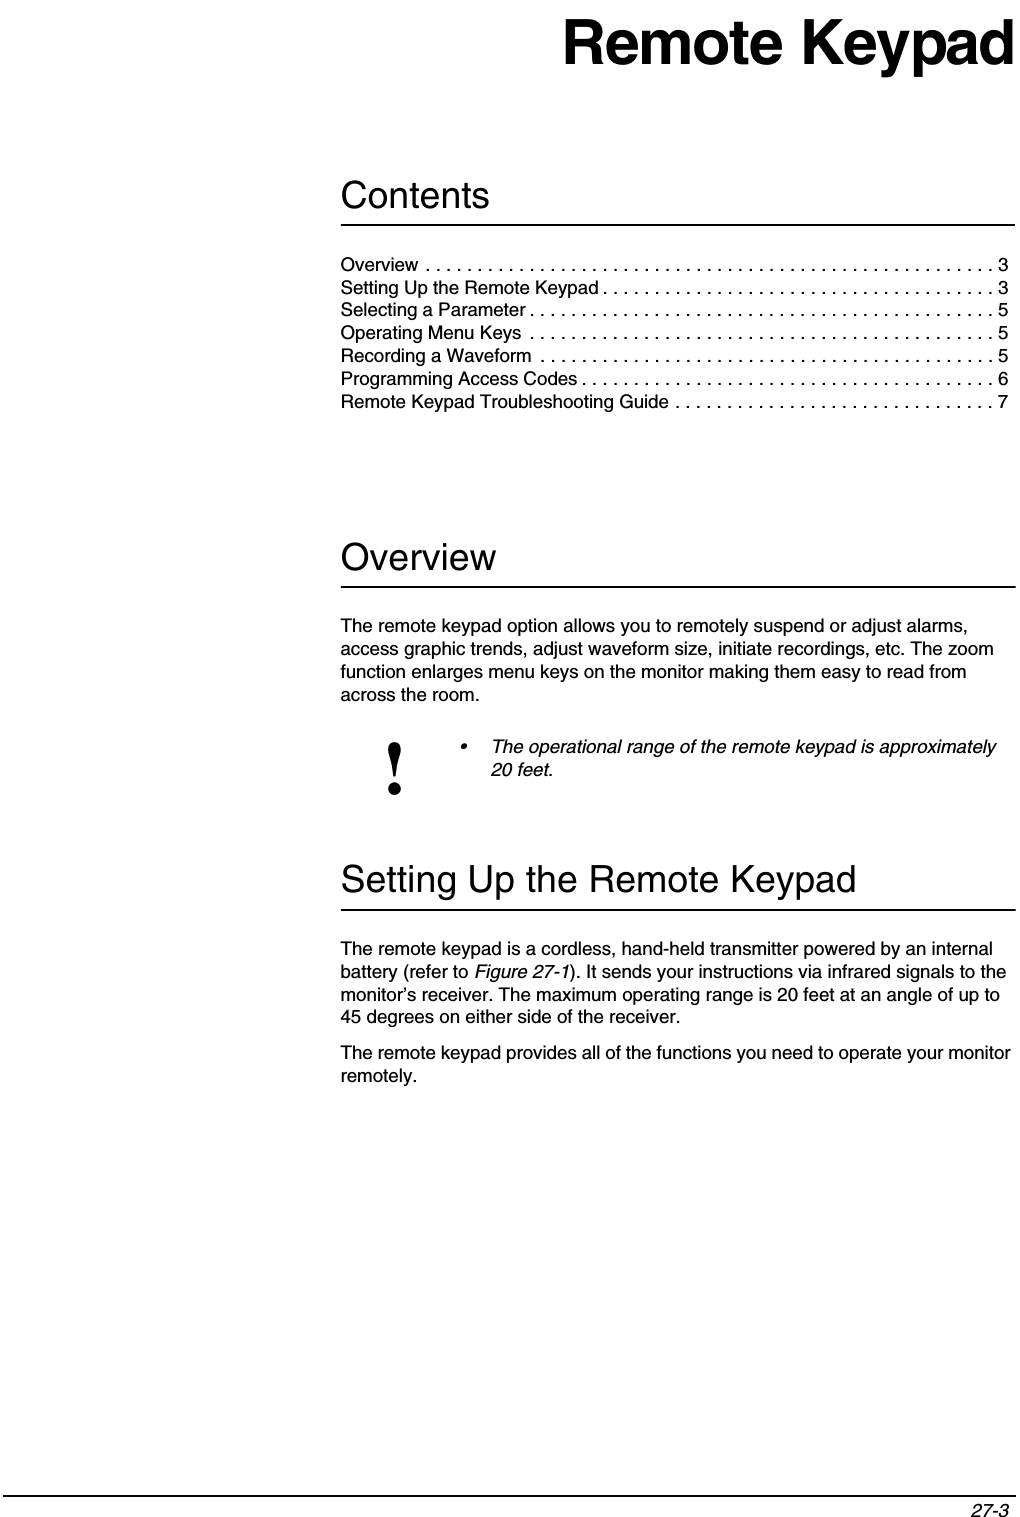
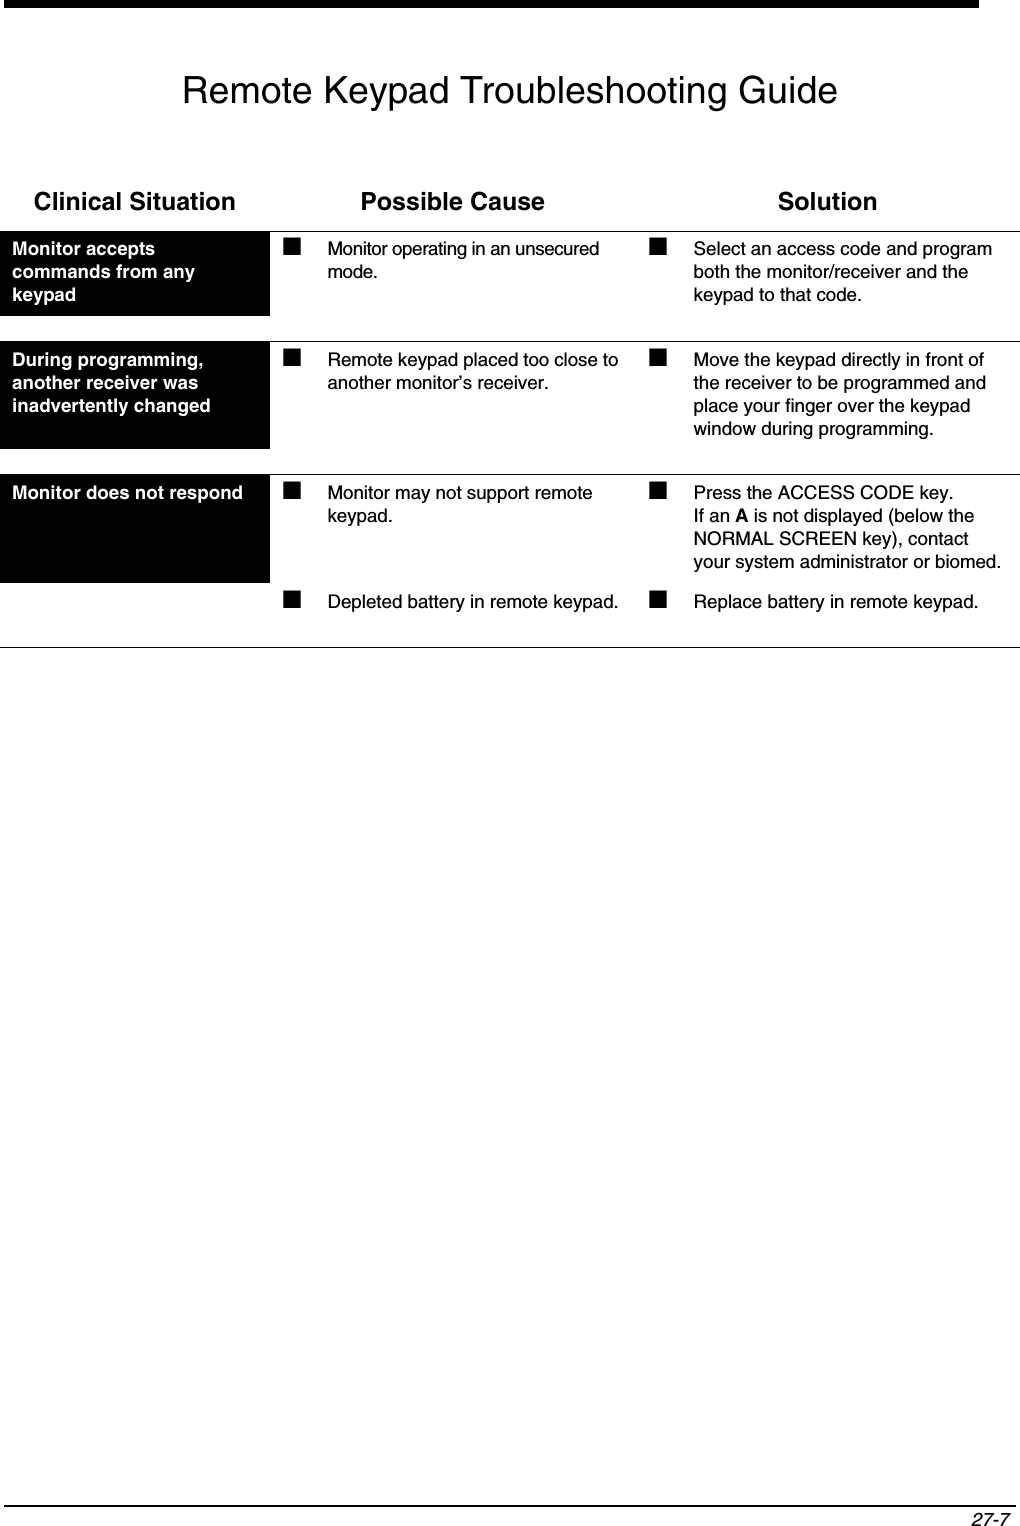
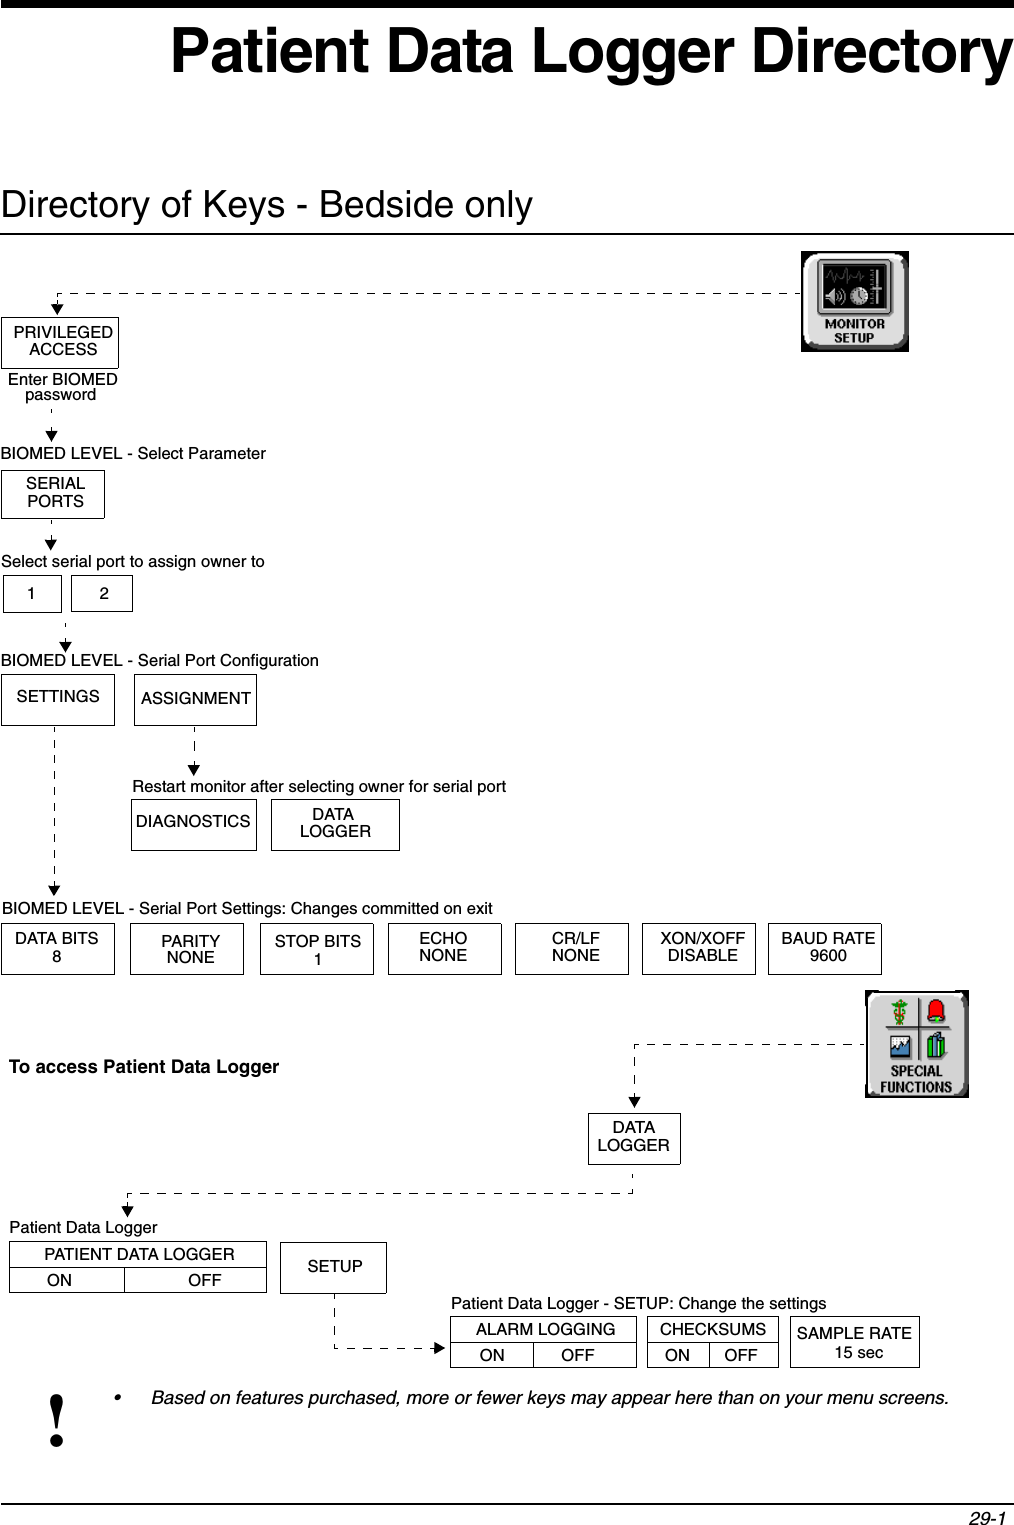
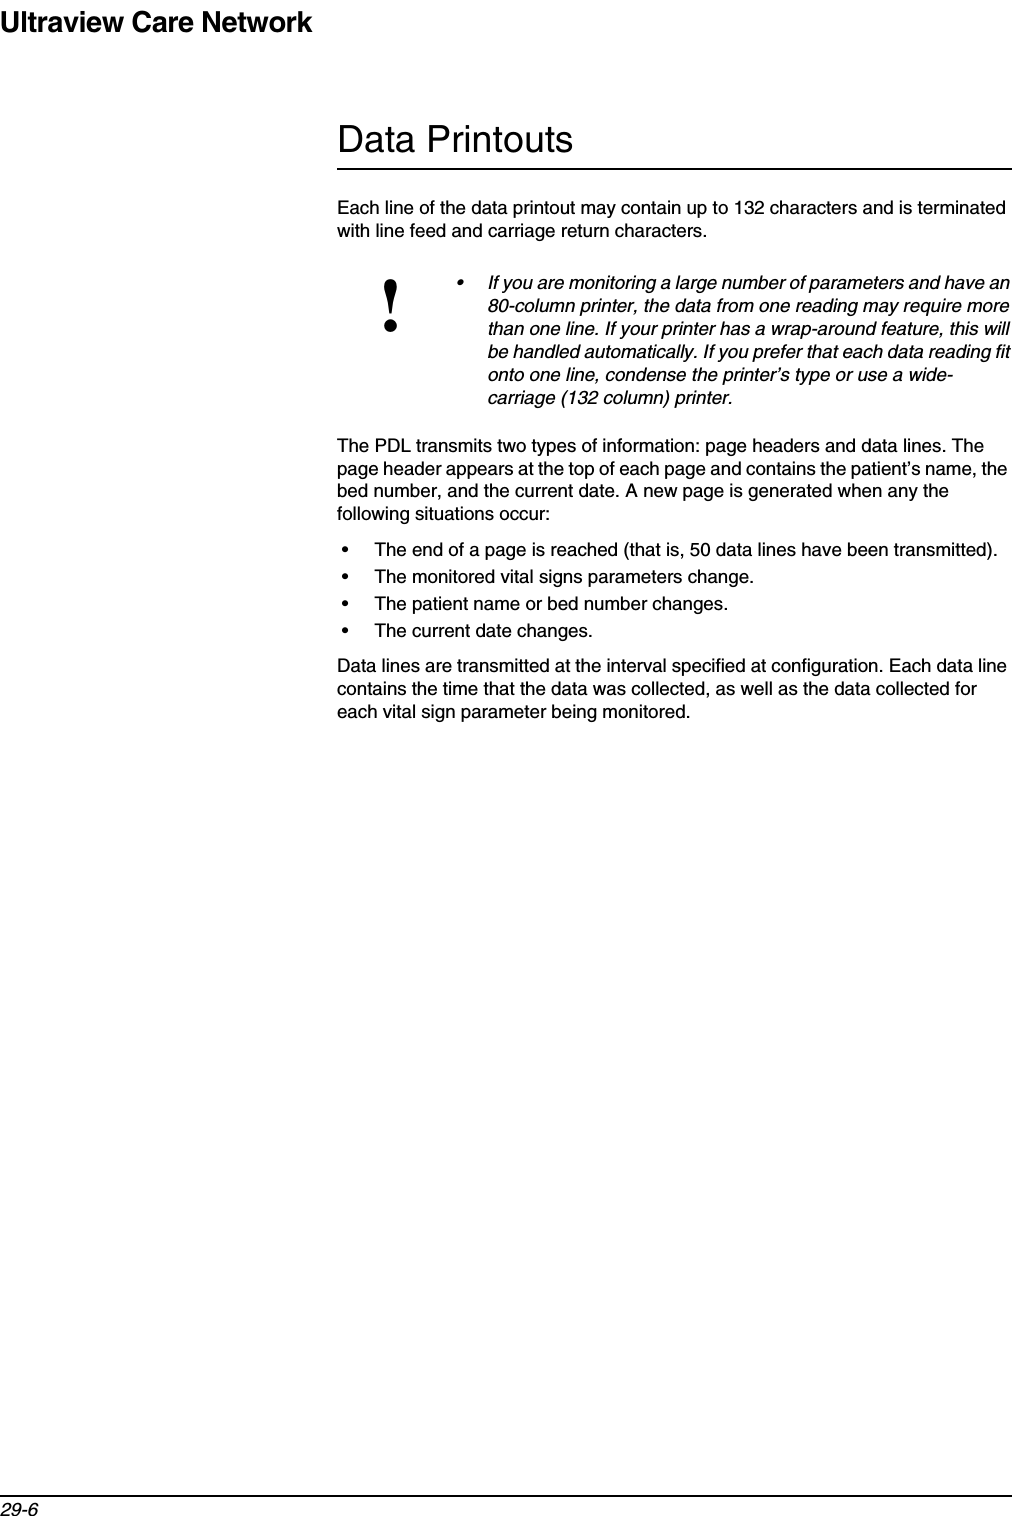
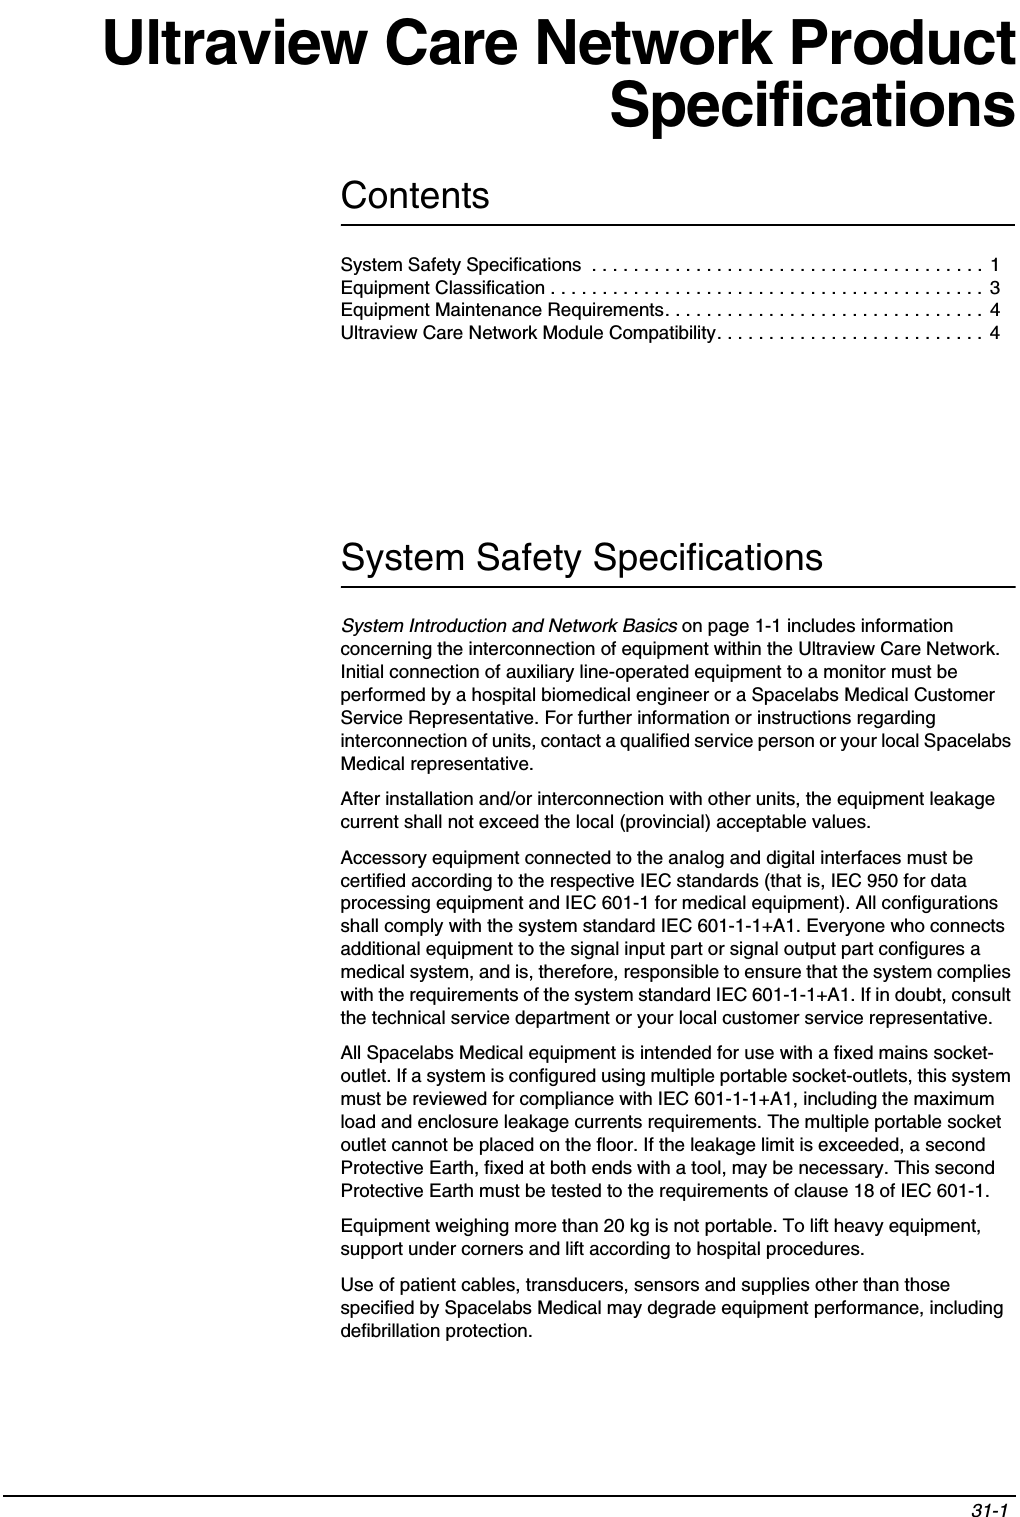
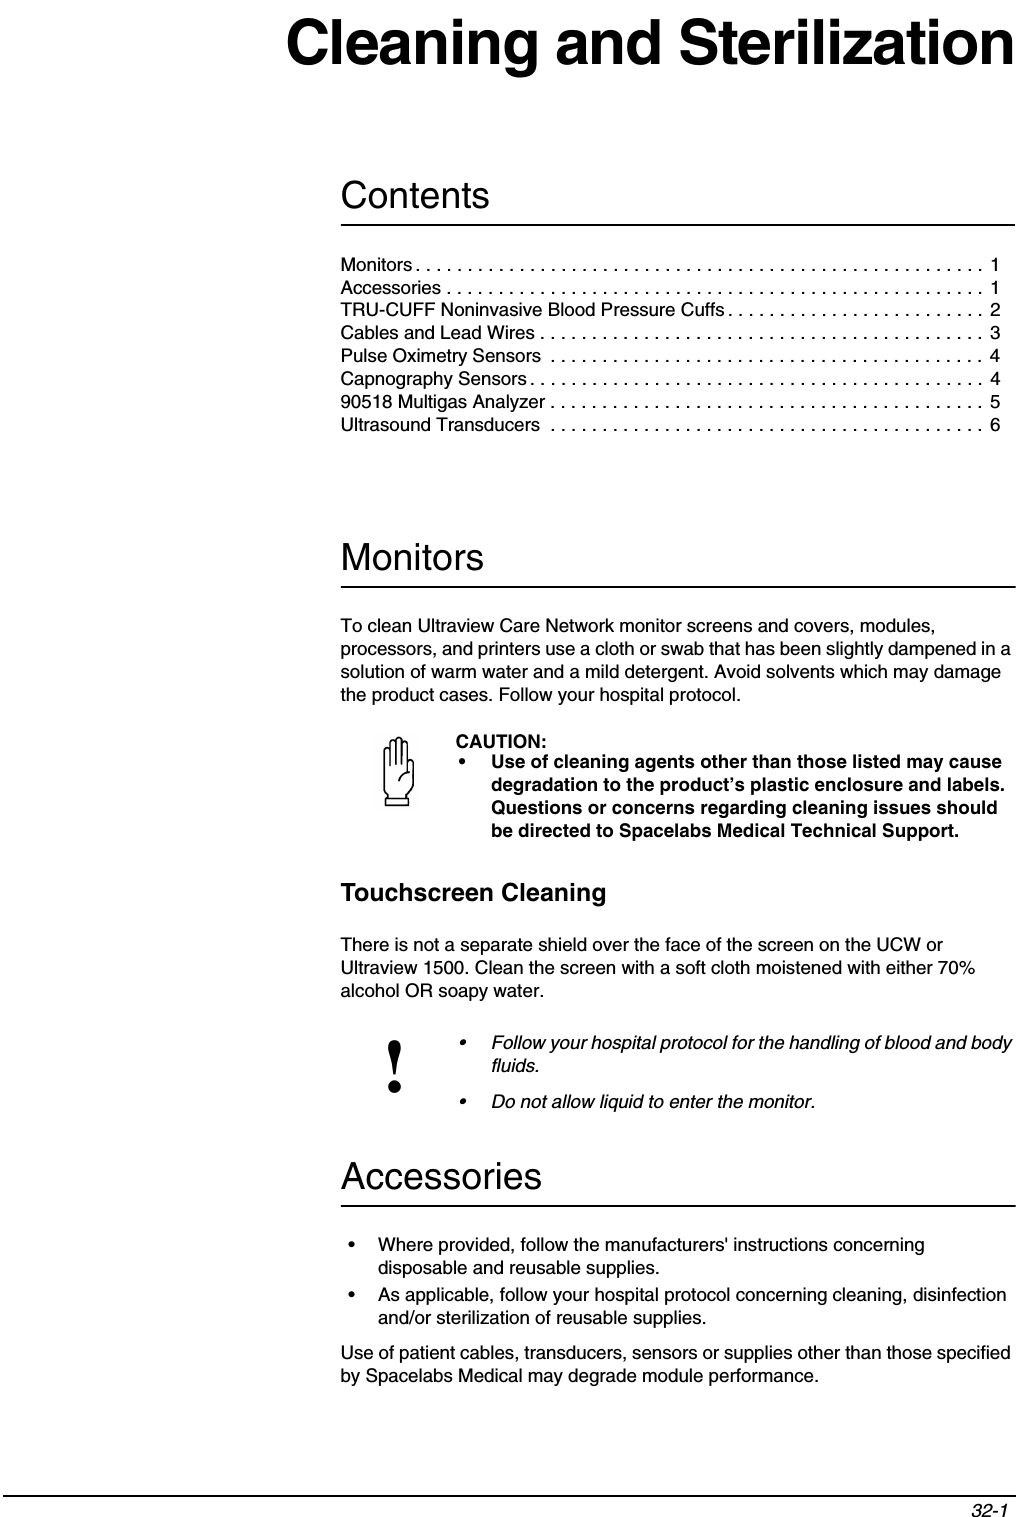
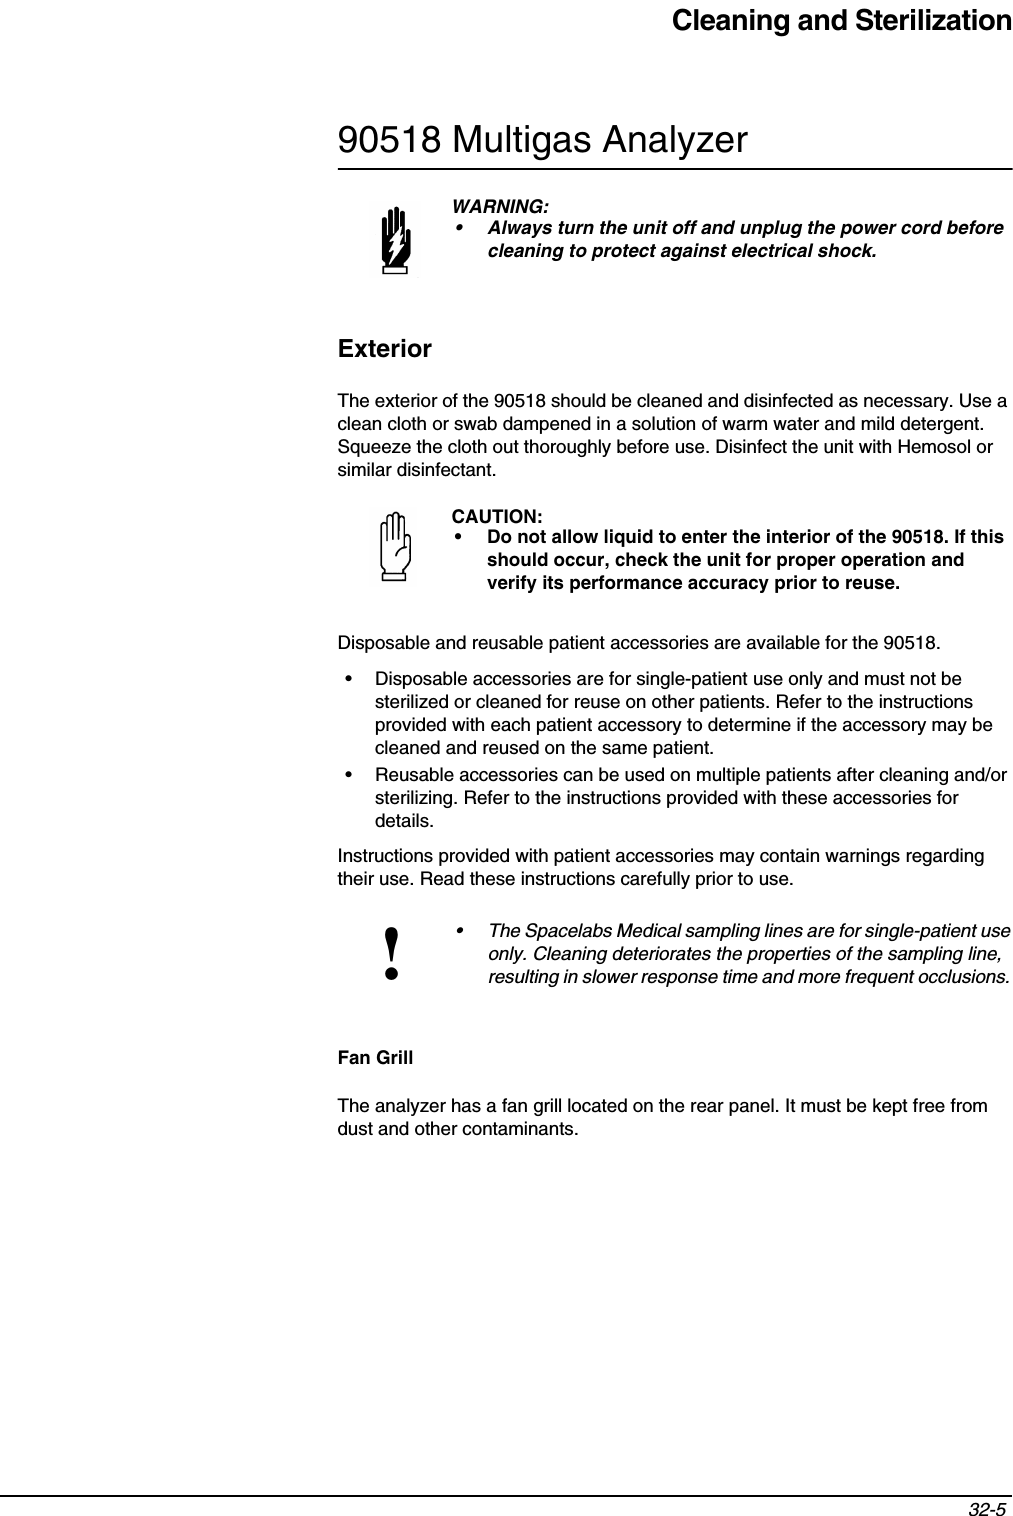
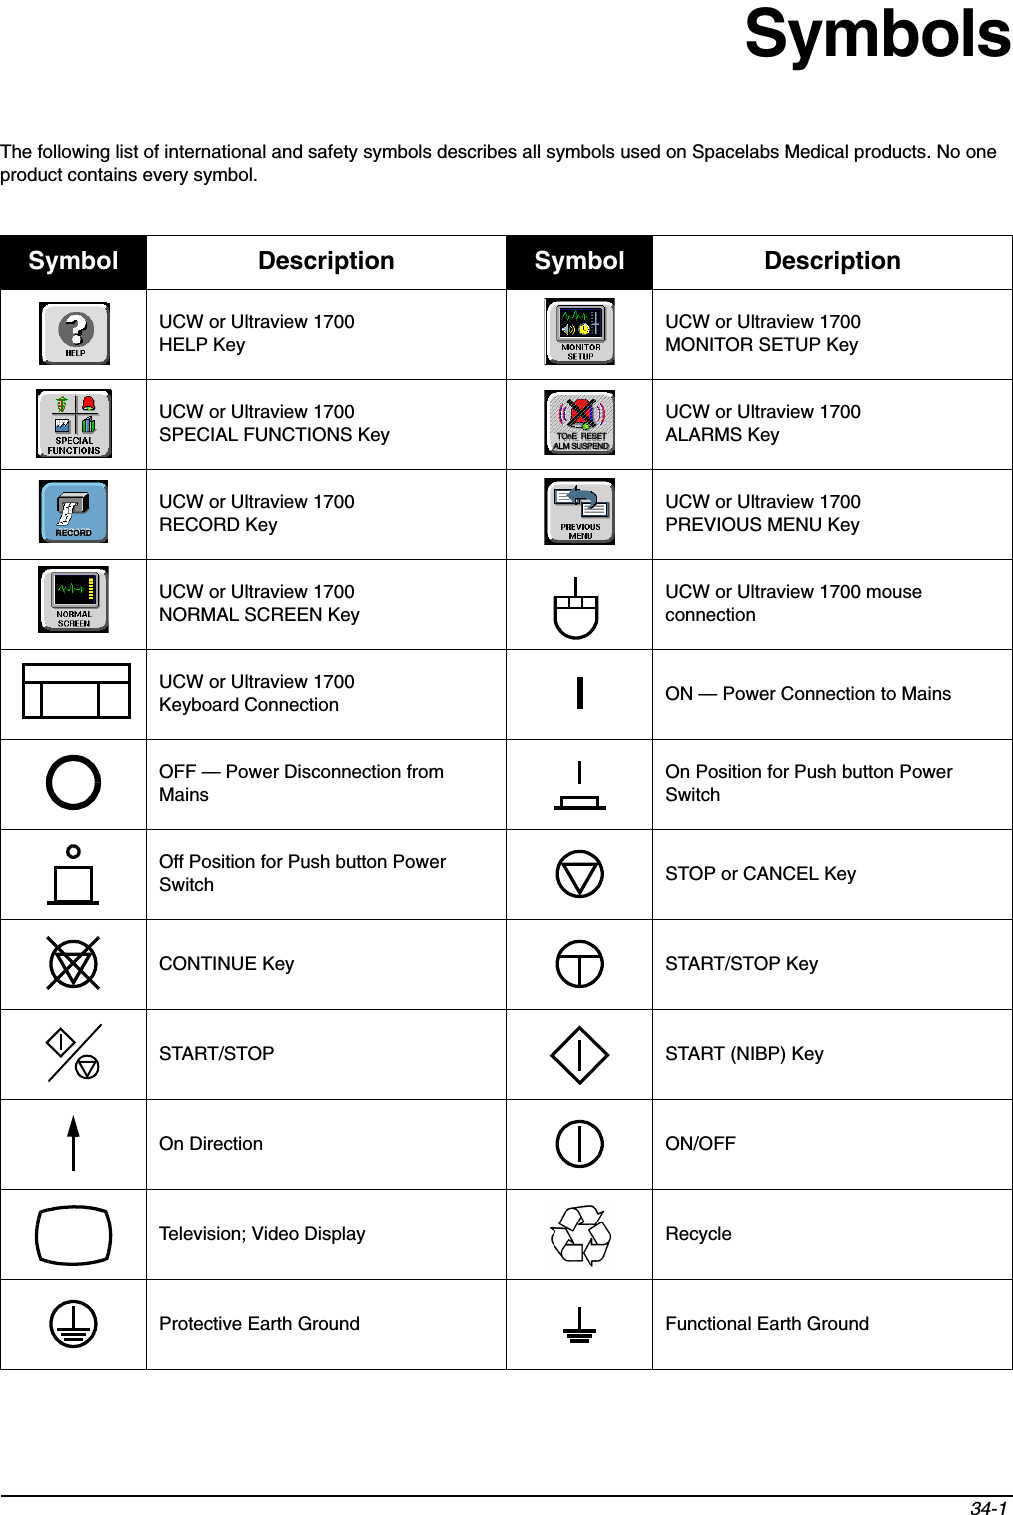
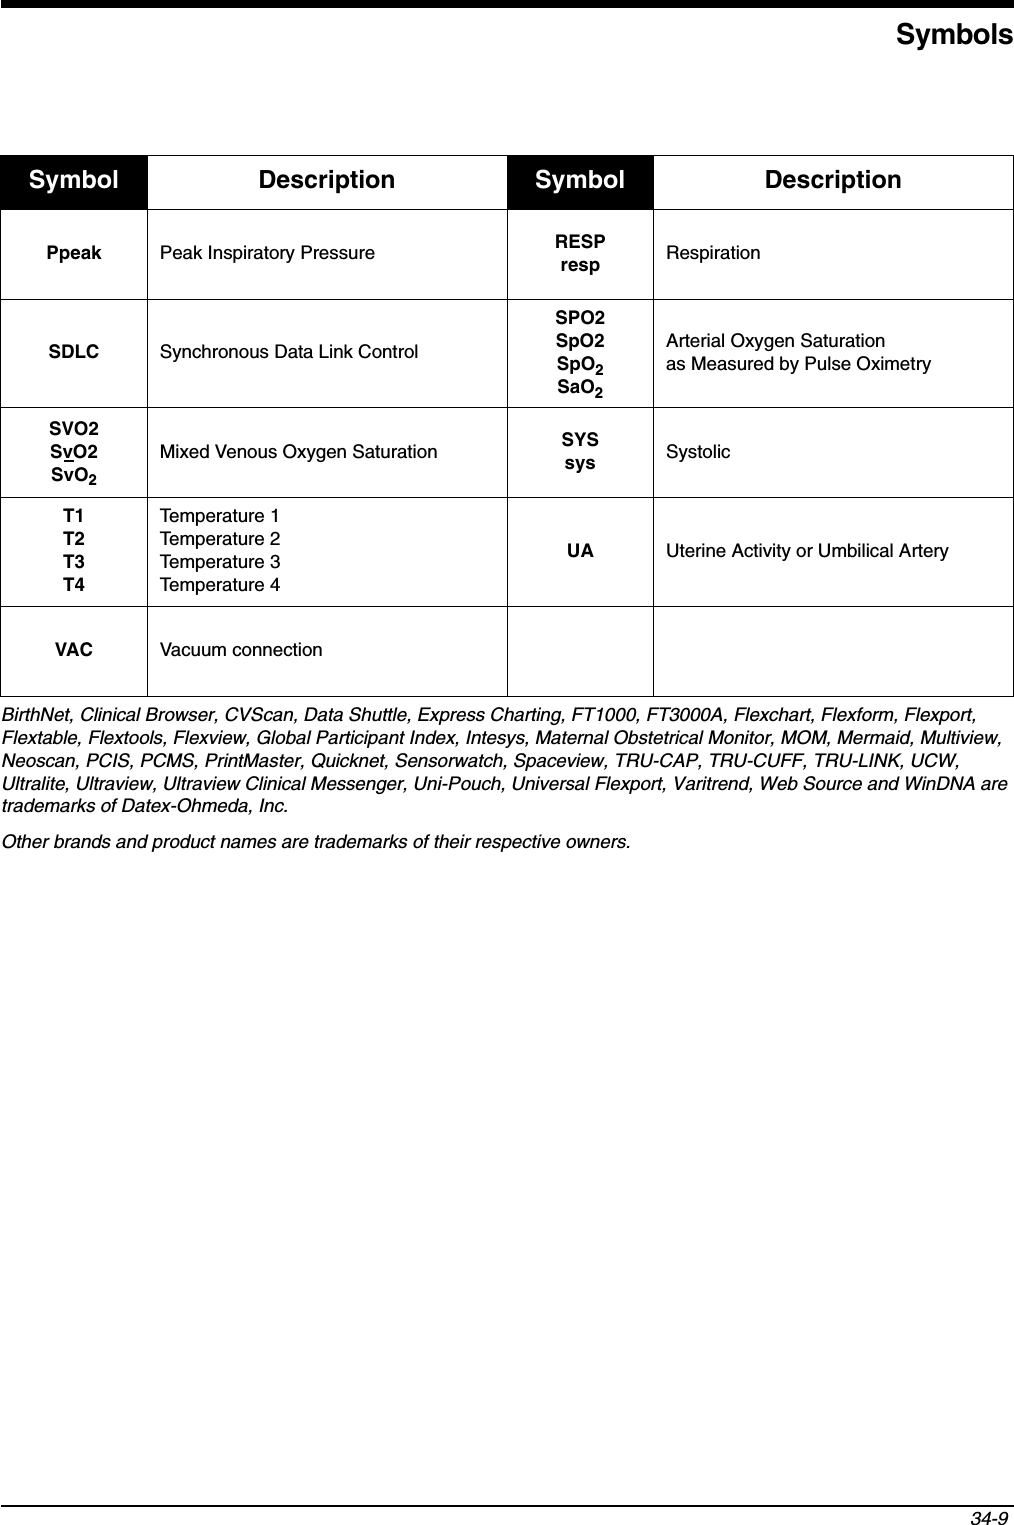
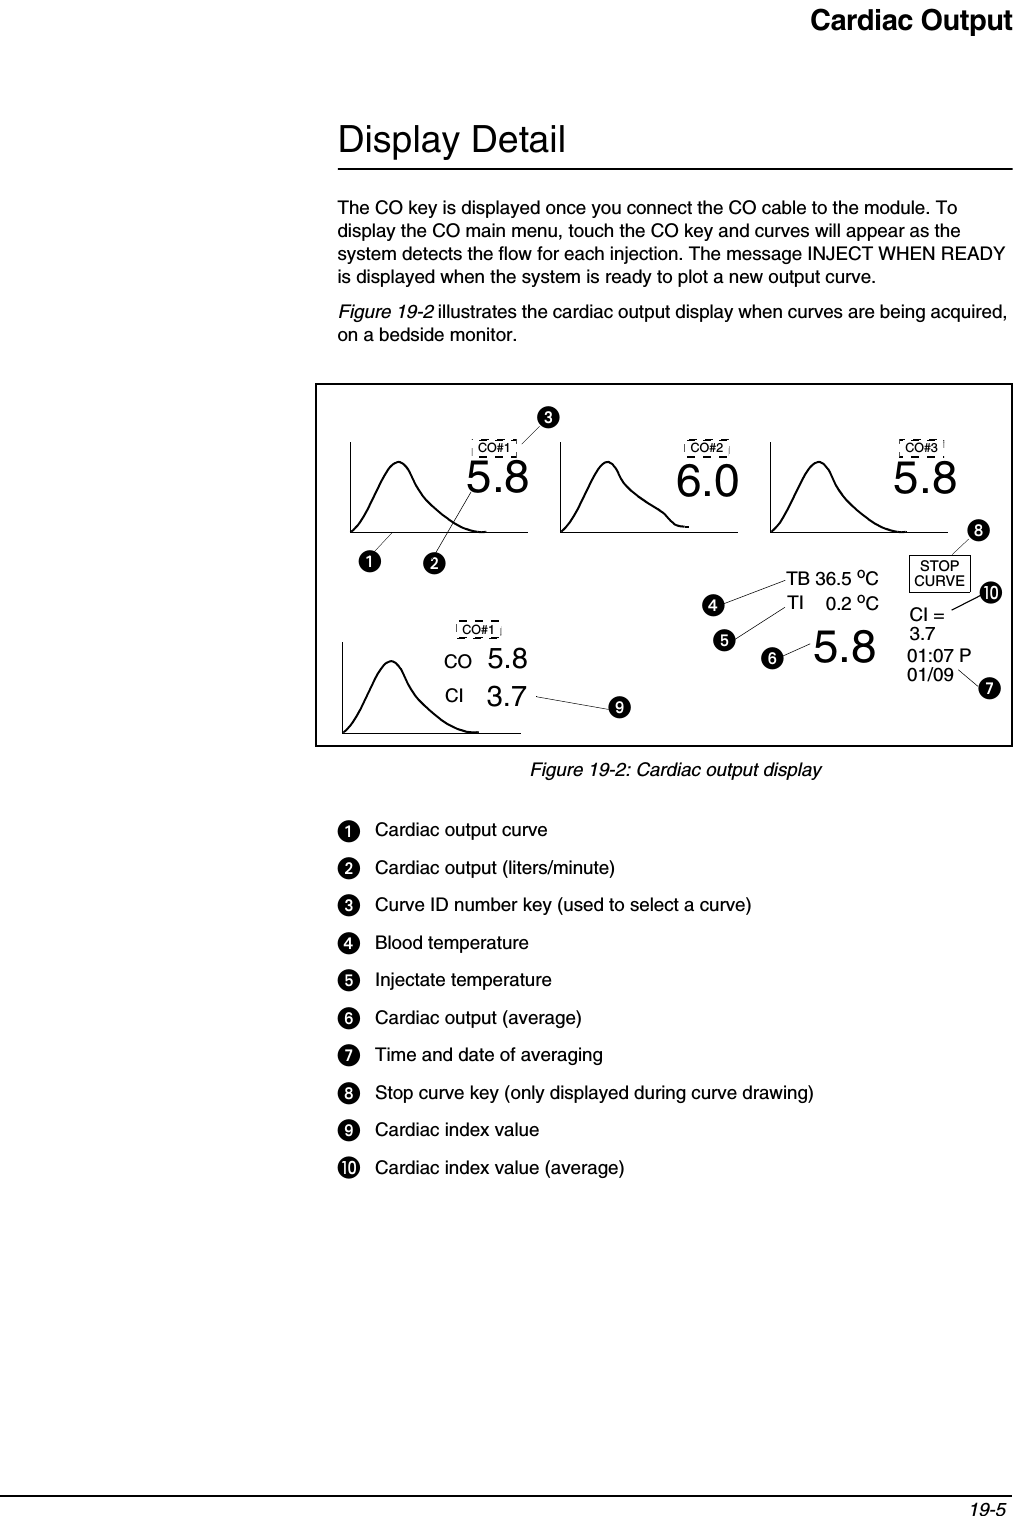
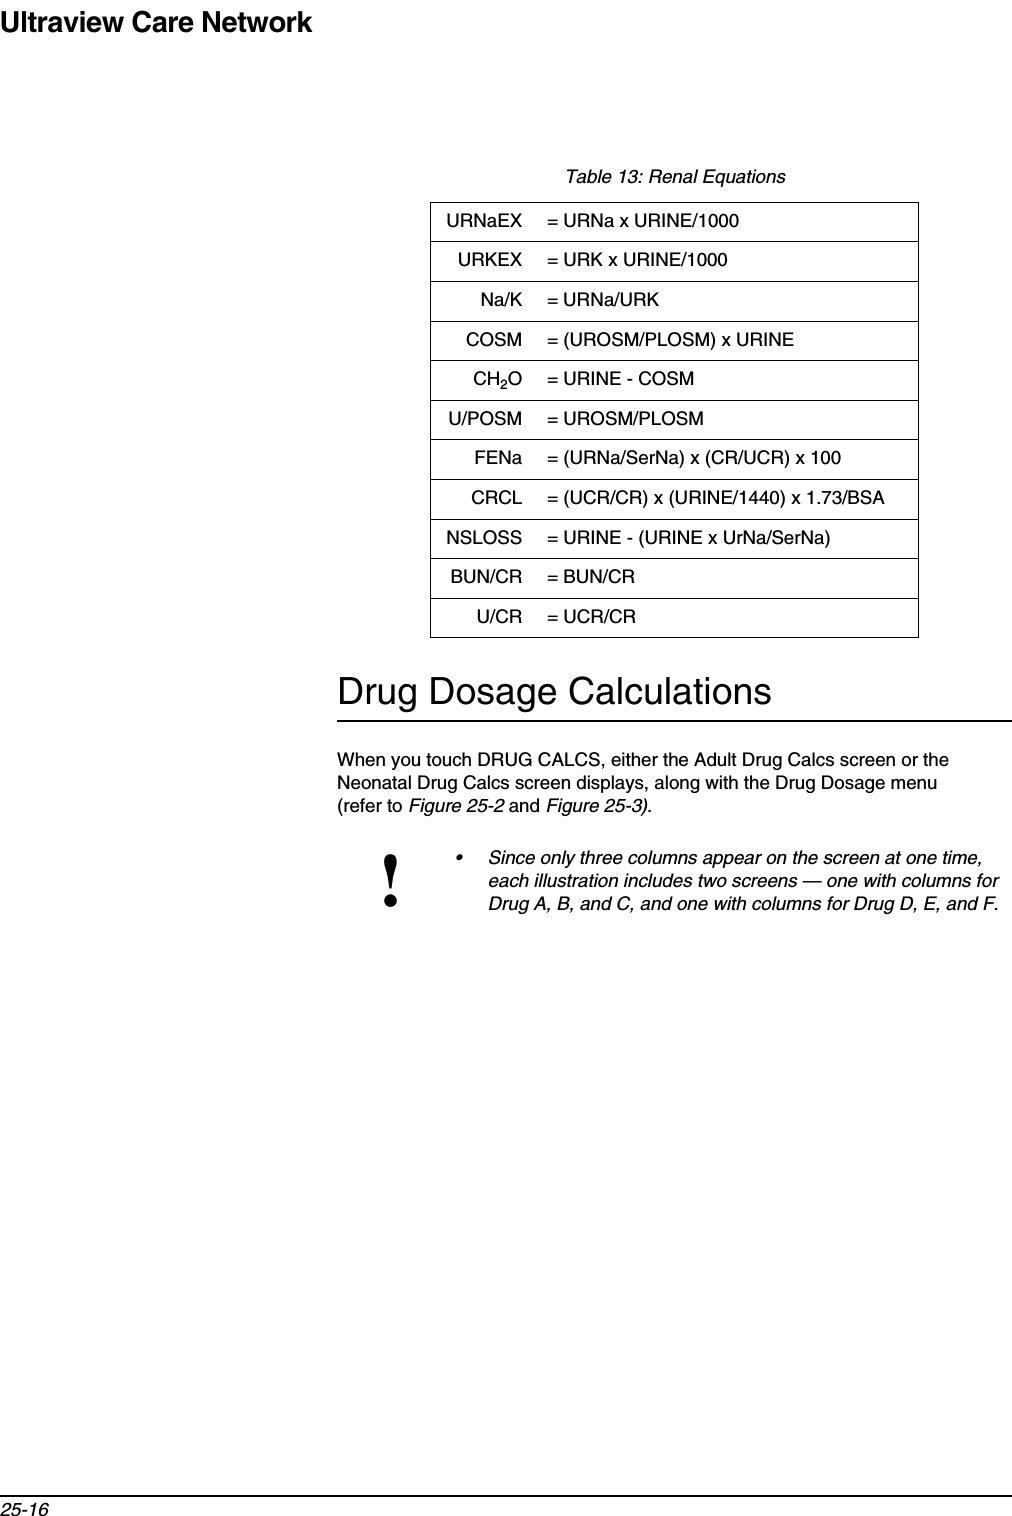
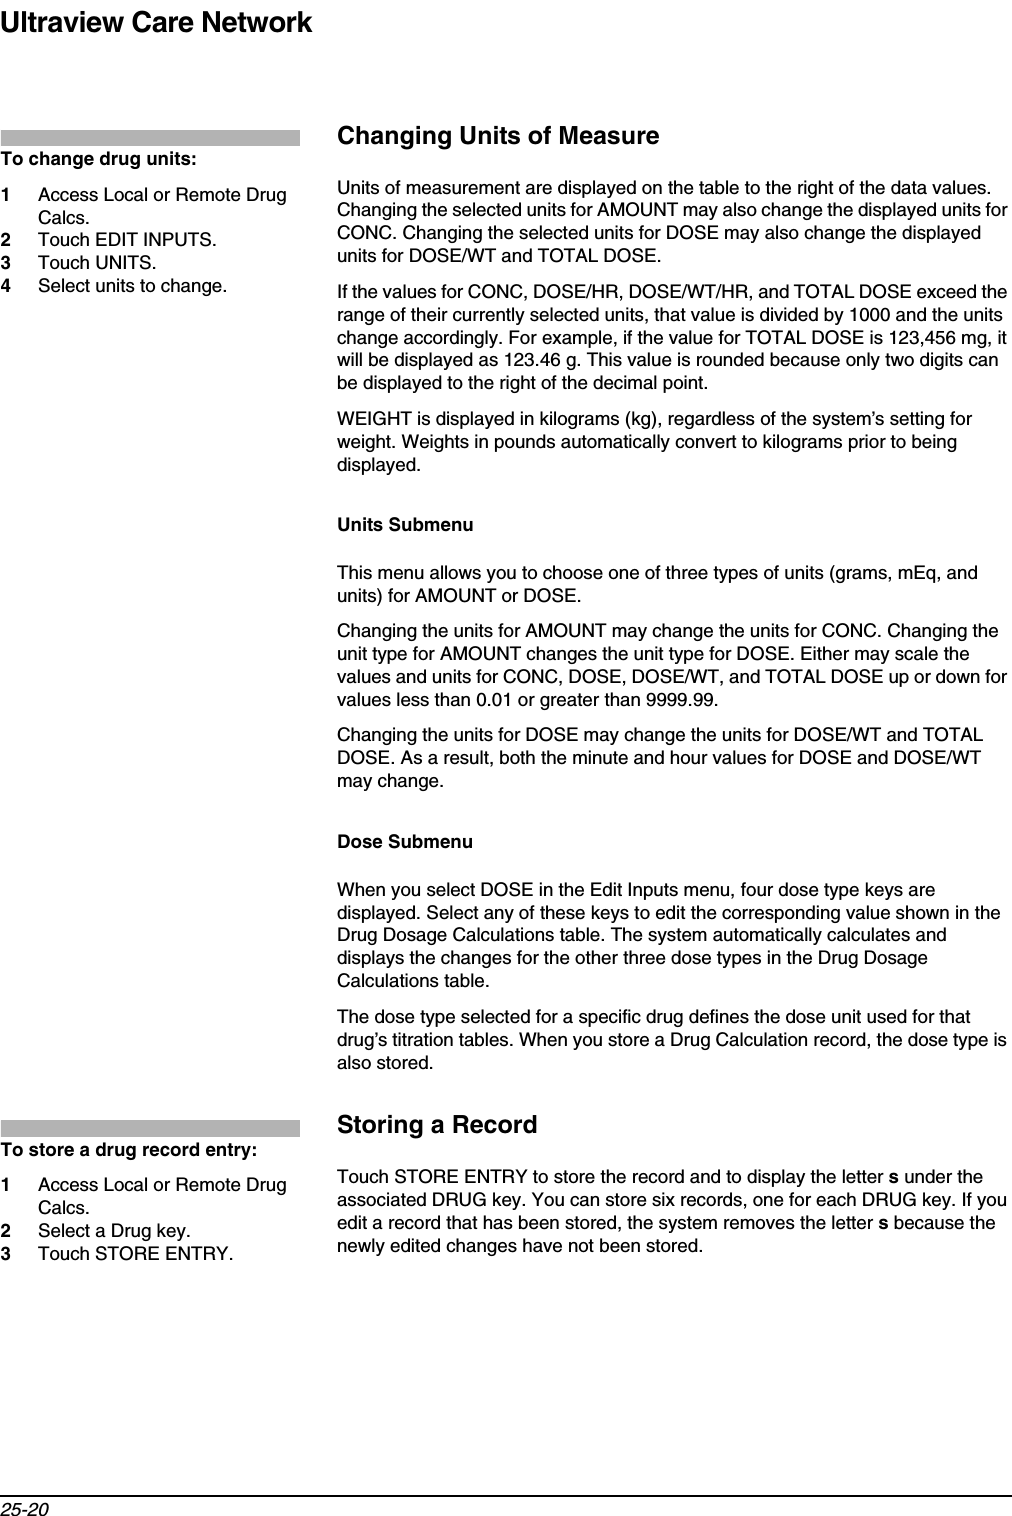
![Calculations25-11 Hemodynamic Calculations require several specific pressure values, including CVP, MAP, and PCWP. CVP and MAP are monitored continuously; PCWP is an episodic value. A data substitution may occur if any of these pressure values are not available when you touch NEW ENTRY. When a substitution occurs, one of the error messages listed here displays on the message line.•Warning...RAP has been substituted for CVP.A continuous RAP value is used instead of the continuous CVP value if CVP is not available.•Warning...NIBP has been substituted for MAP.An episodic mean NIBP value which is less than 15-minutes old is used instead of MAP if the continuous MAP value is not available.•Warning...LAP has been substituted for PCWP.A continuous LAP value is used instead of the episodic PCWP value if the PCWP value is not available or is more than 15-minutes old. Table 3: Hemodynamic Output Label Name UnitsCI Cardiac Index L/min2SV Stroke Volume ml/beatSVI Stroke Volume Index ml/beat/m2SVR Systemic Vascular Resistance dynes x sec/cm5SVRI Systemic Vascular Resistance Index (dynes x sec/cm5) x m2PVR Pulmonary Vascular Resistance dynes x sec/cm5PVRI Pulmonary Vascular Resistance Index (dynes x sec/cm5) x m2LVSW Left Ventricular Stroke Work g x min/beatRVSW Right Ventricular Stroke Work g x min/beatLVSWI Left Ventricular Stroke Work Index g x min/beat/m2RVSWI Right Ventricular Stroke Work Index g x min/beat/m2Table 4: Hemodynamic EquationsBSA = Ht 0.725 x Wt 0.425 x 0.007184CI = CO/BSASV = (CO/HR) x 1000SVI = SV/BSASVR = 79.9 x [(MAP-CVP)/CO]SVRI= 79.9 x [(MAP-CVP)/CI]= 79.9 x [(MAP-CVP)]/[CO/BSA]= 79.9 x [(MAP-CVP)]/[CO x 1/BSA]= 79.9 x [(MAP-CVP)/CO] x BSA= SVR x BSA](https://usermanual.wiki/Spacelabs-Healthcare/76A90341-WMTS.User-Manual-3-of-3/User-Guide-347485-Page-135.png)
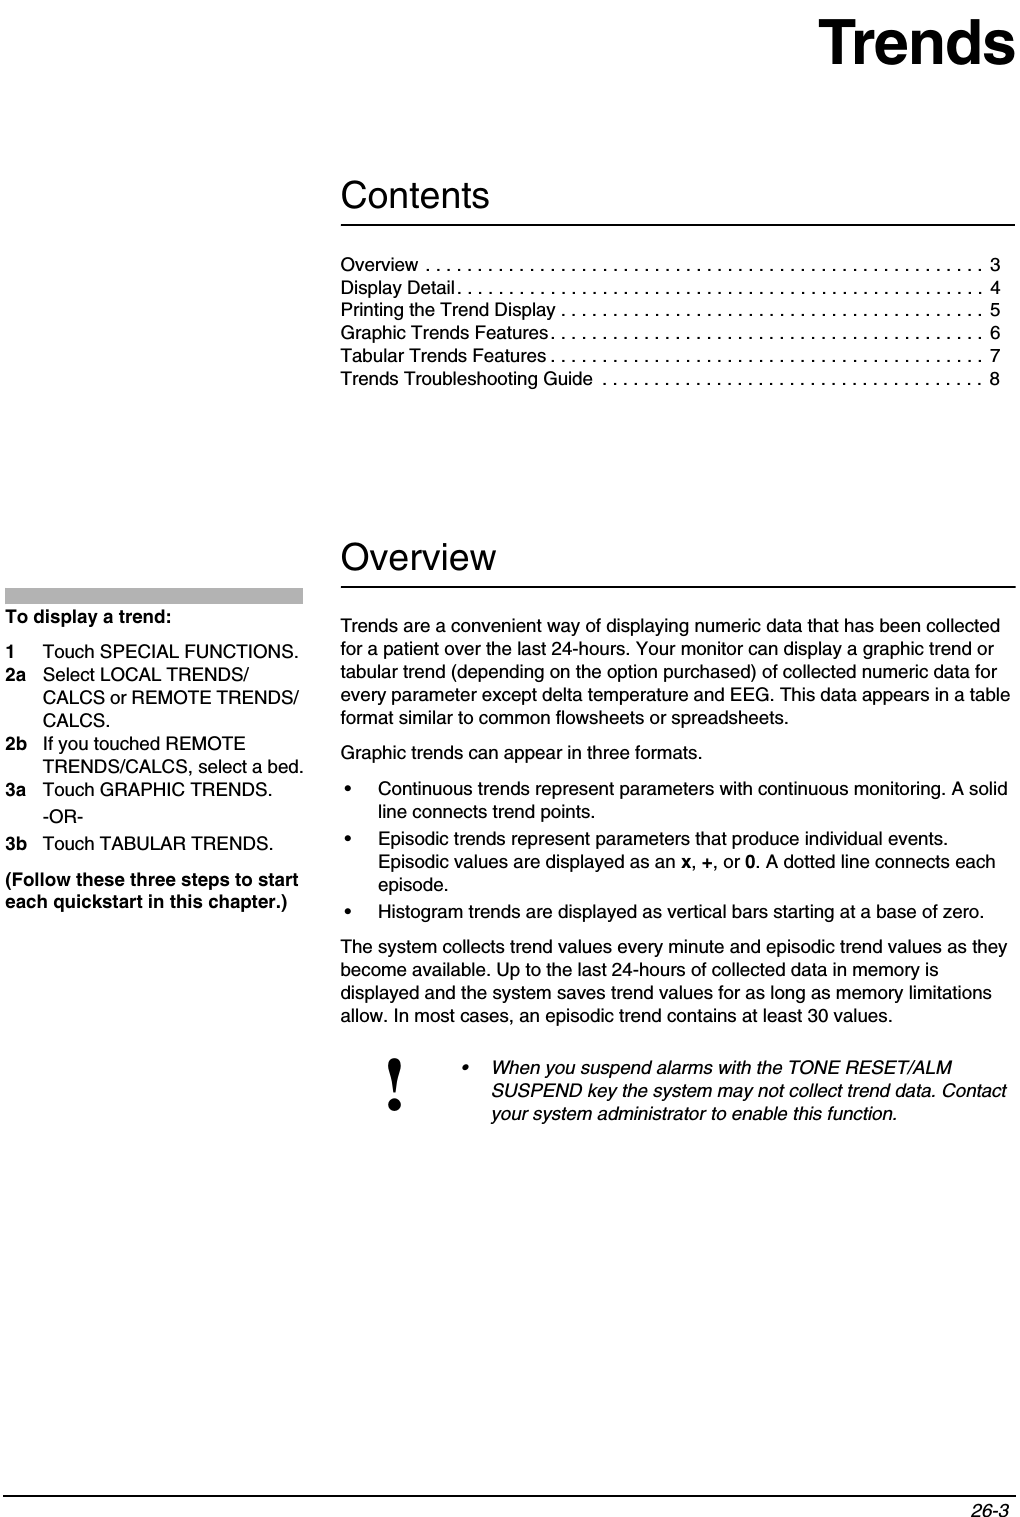
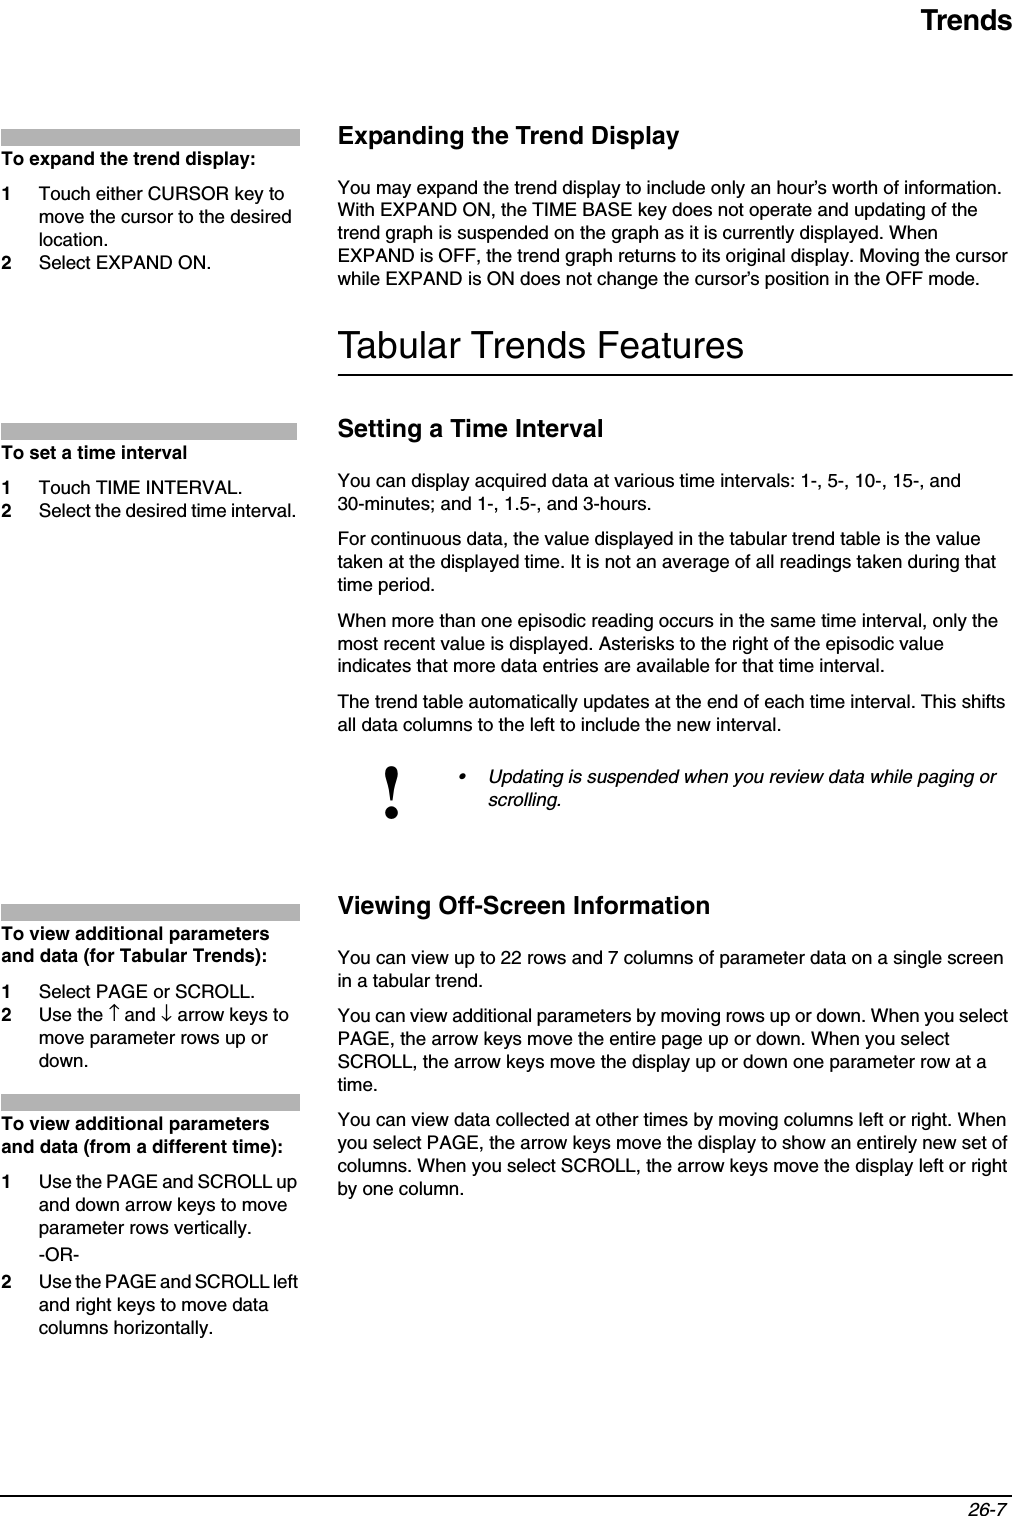
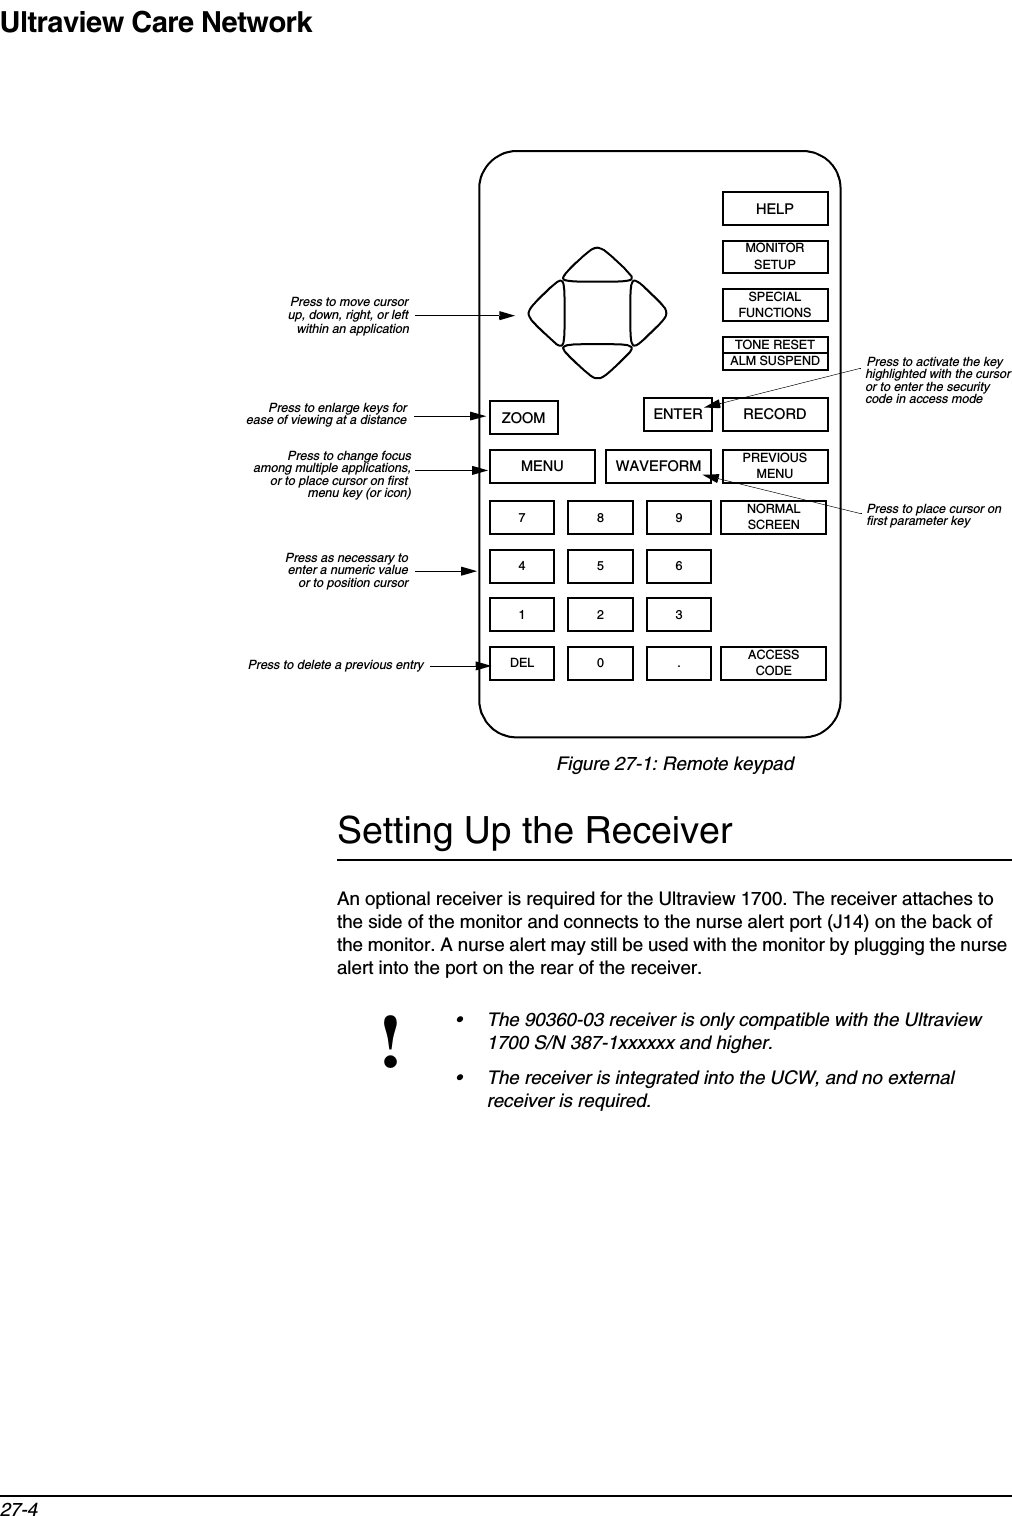
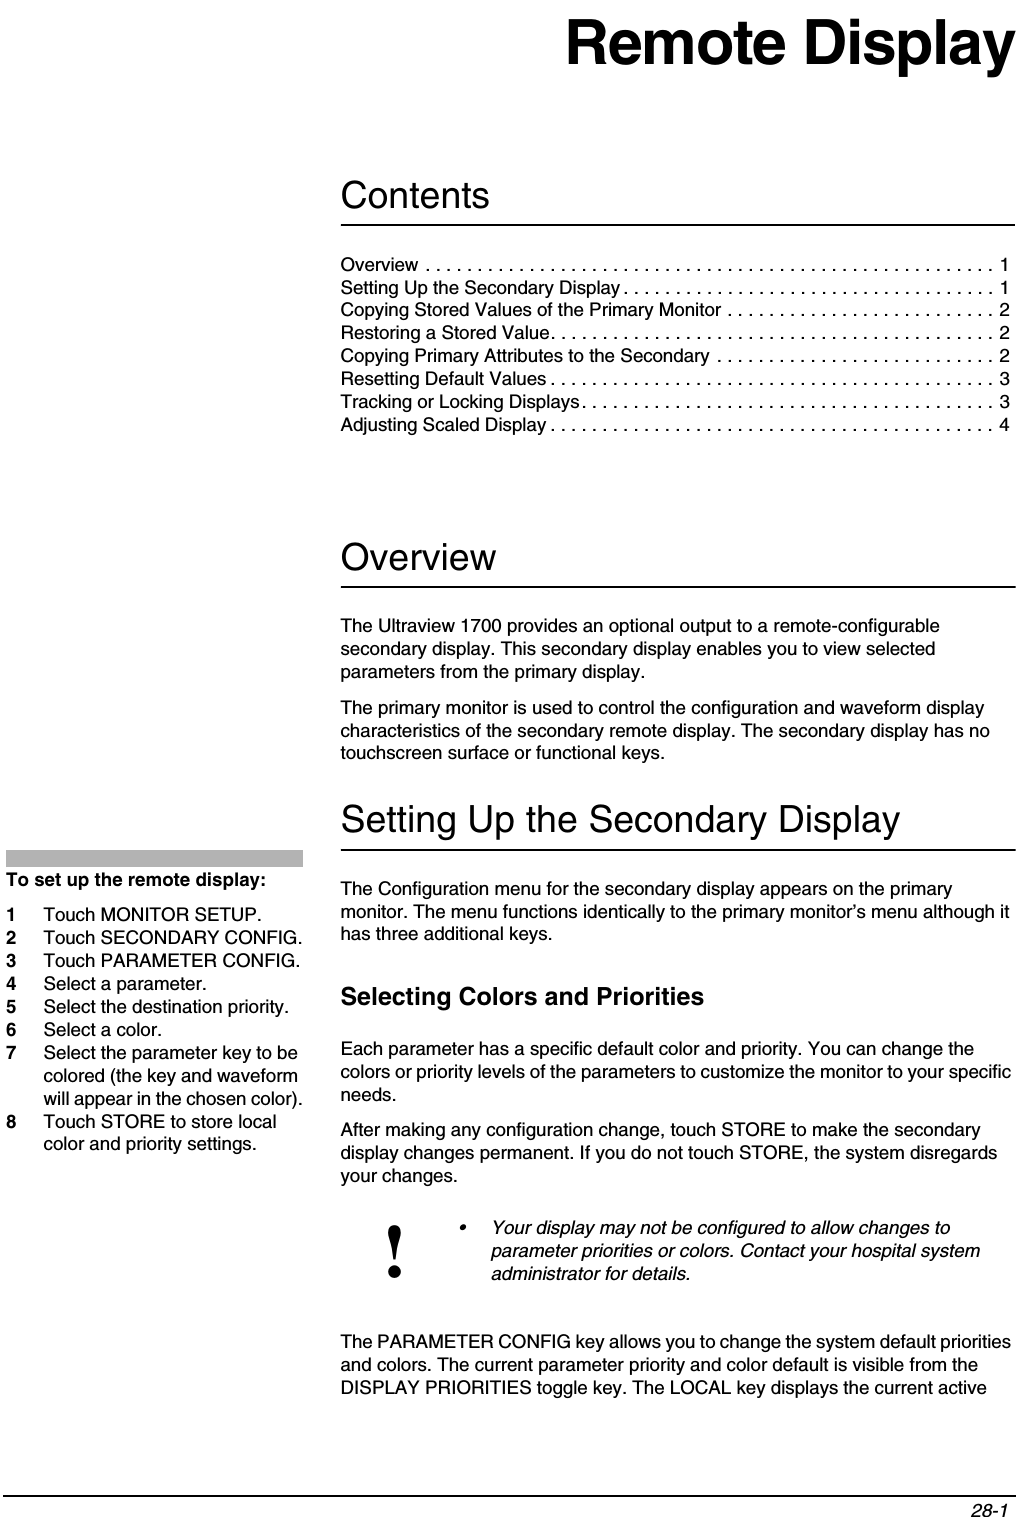
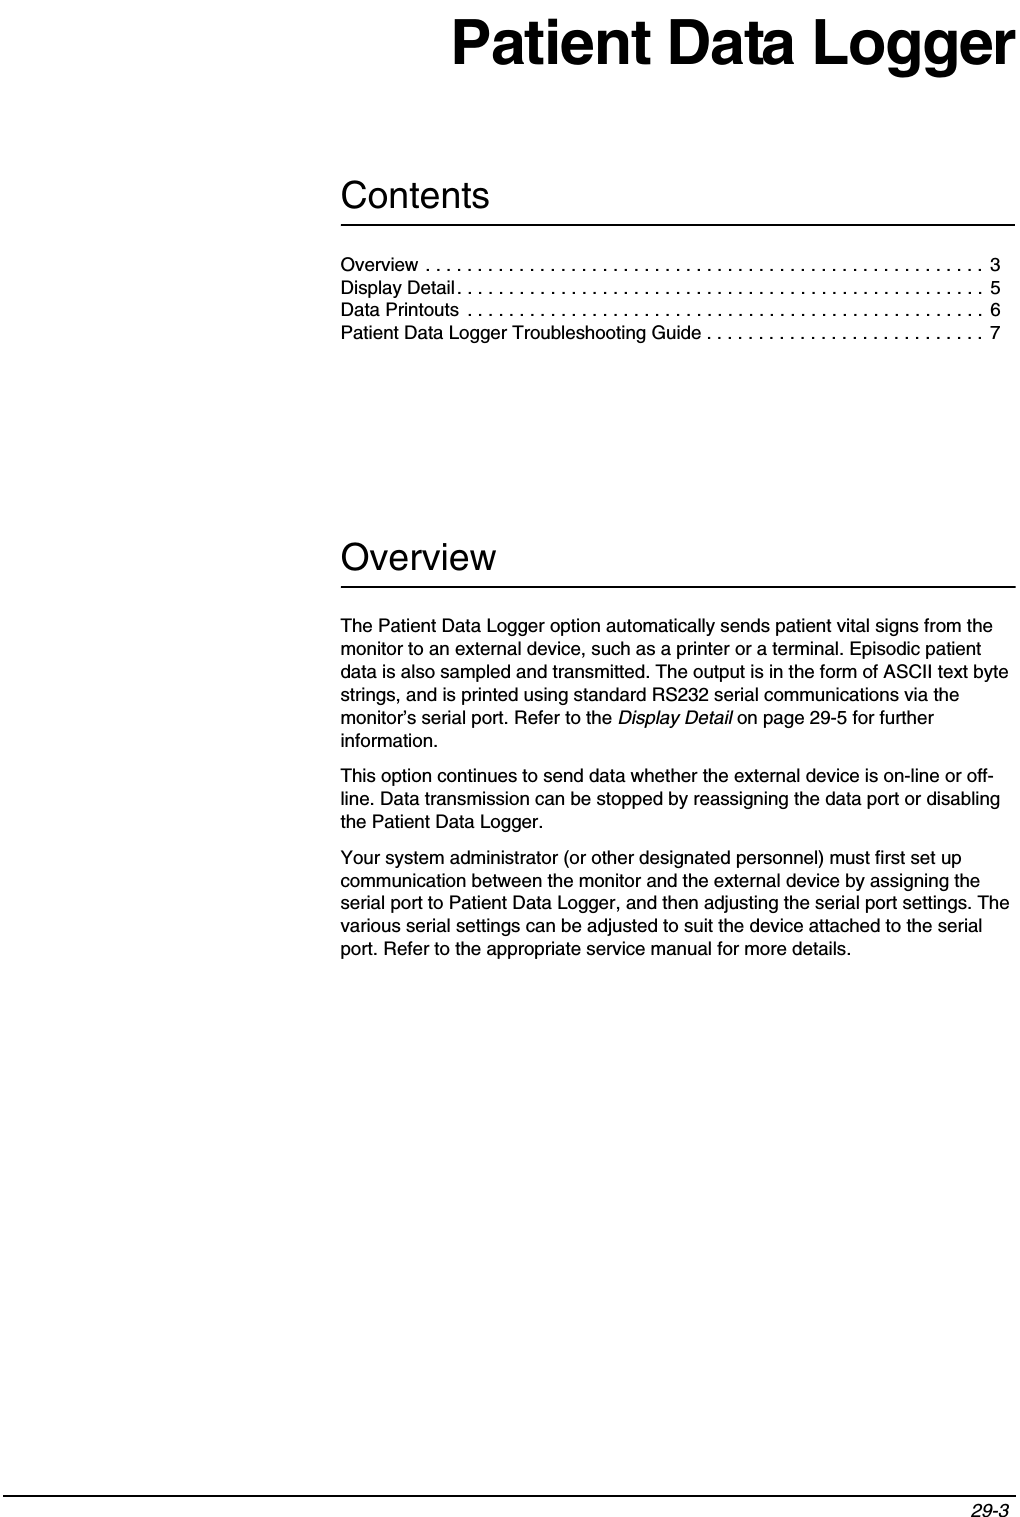
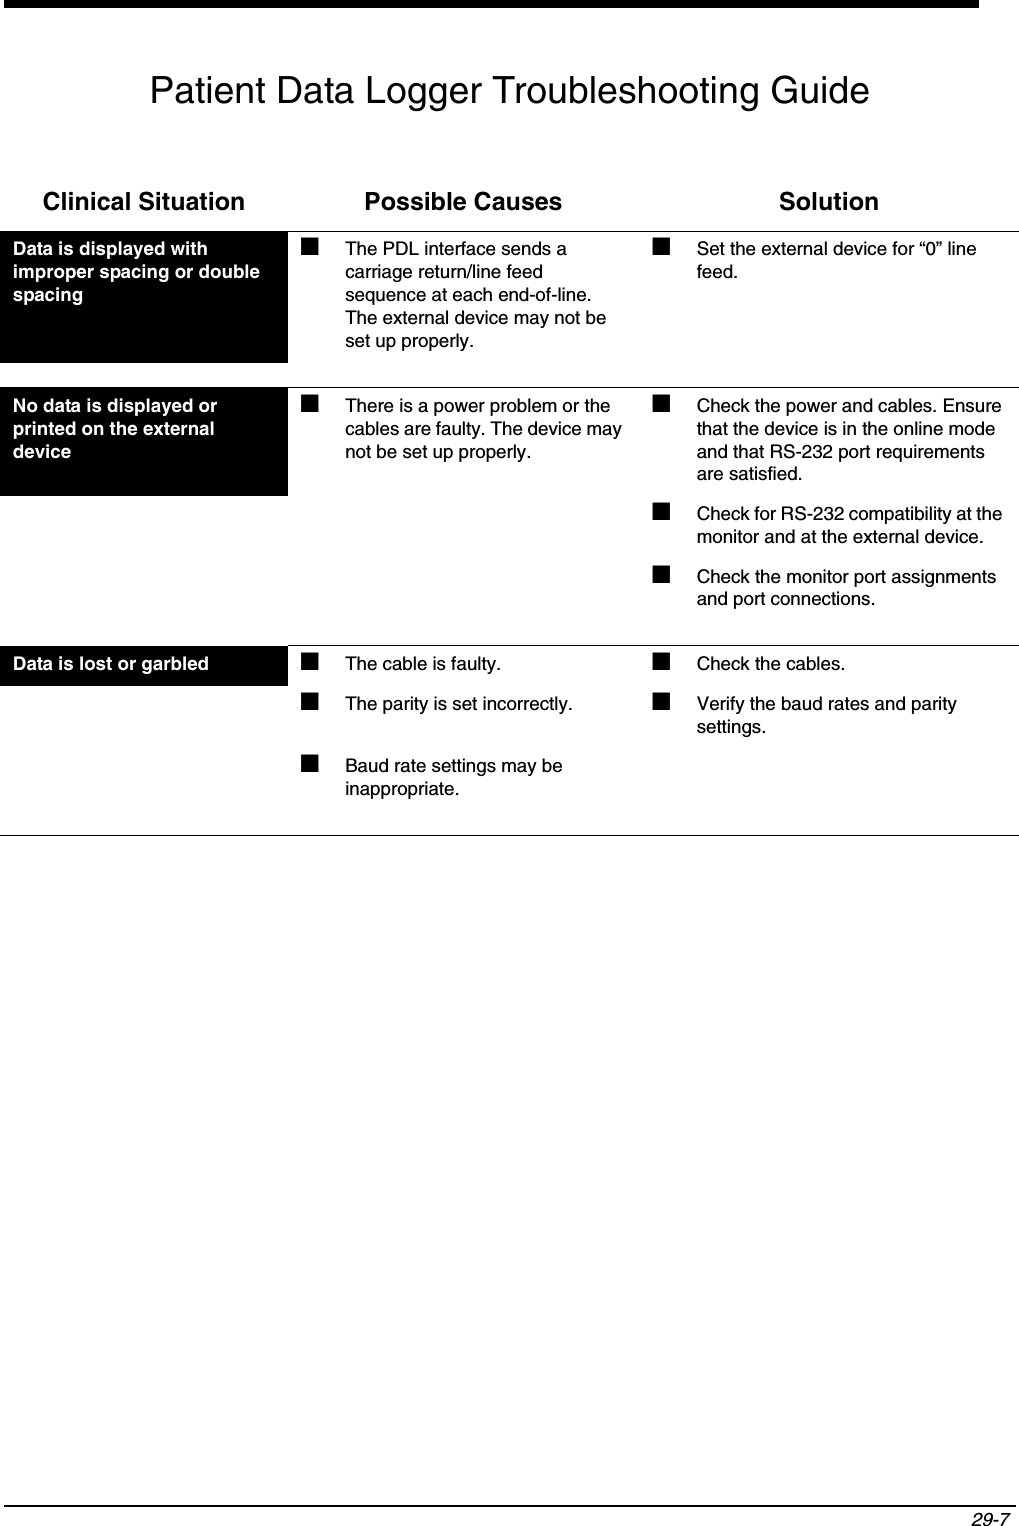
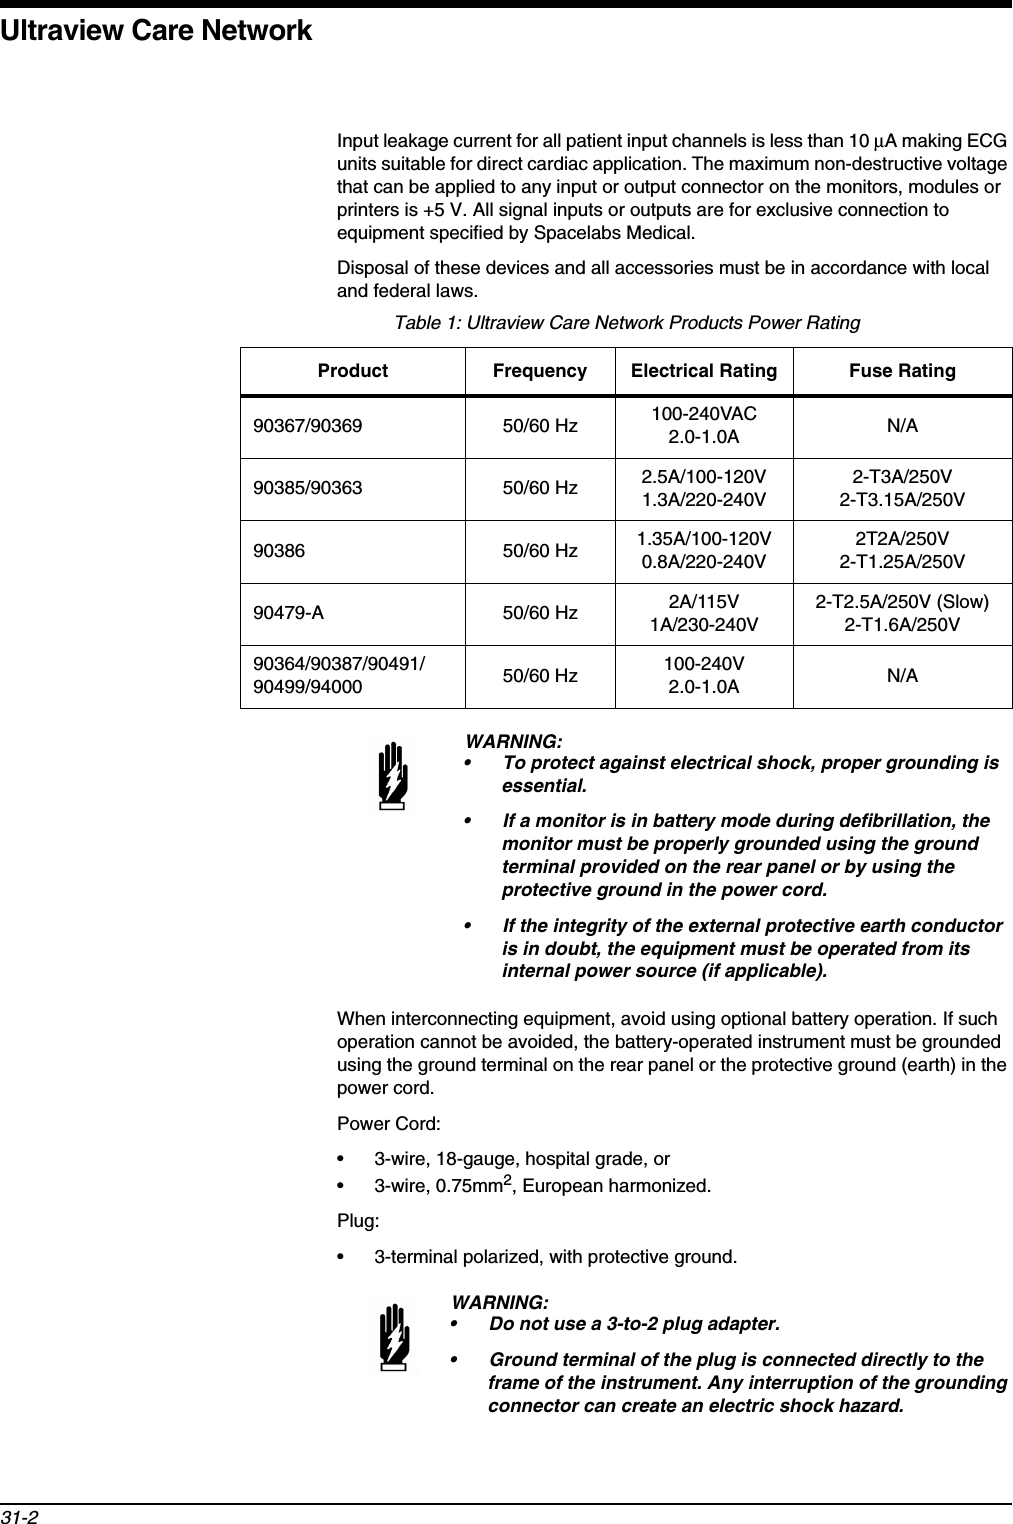
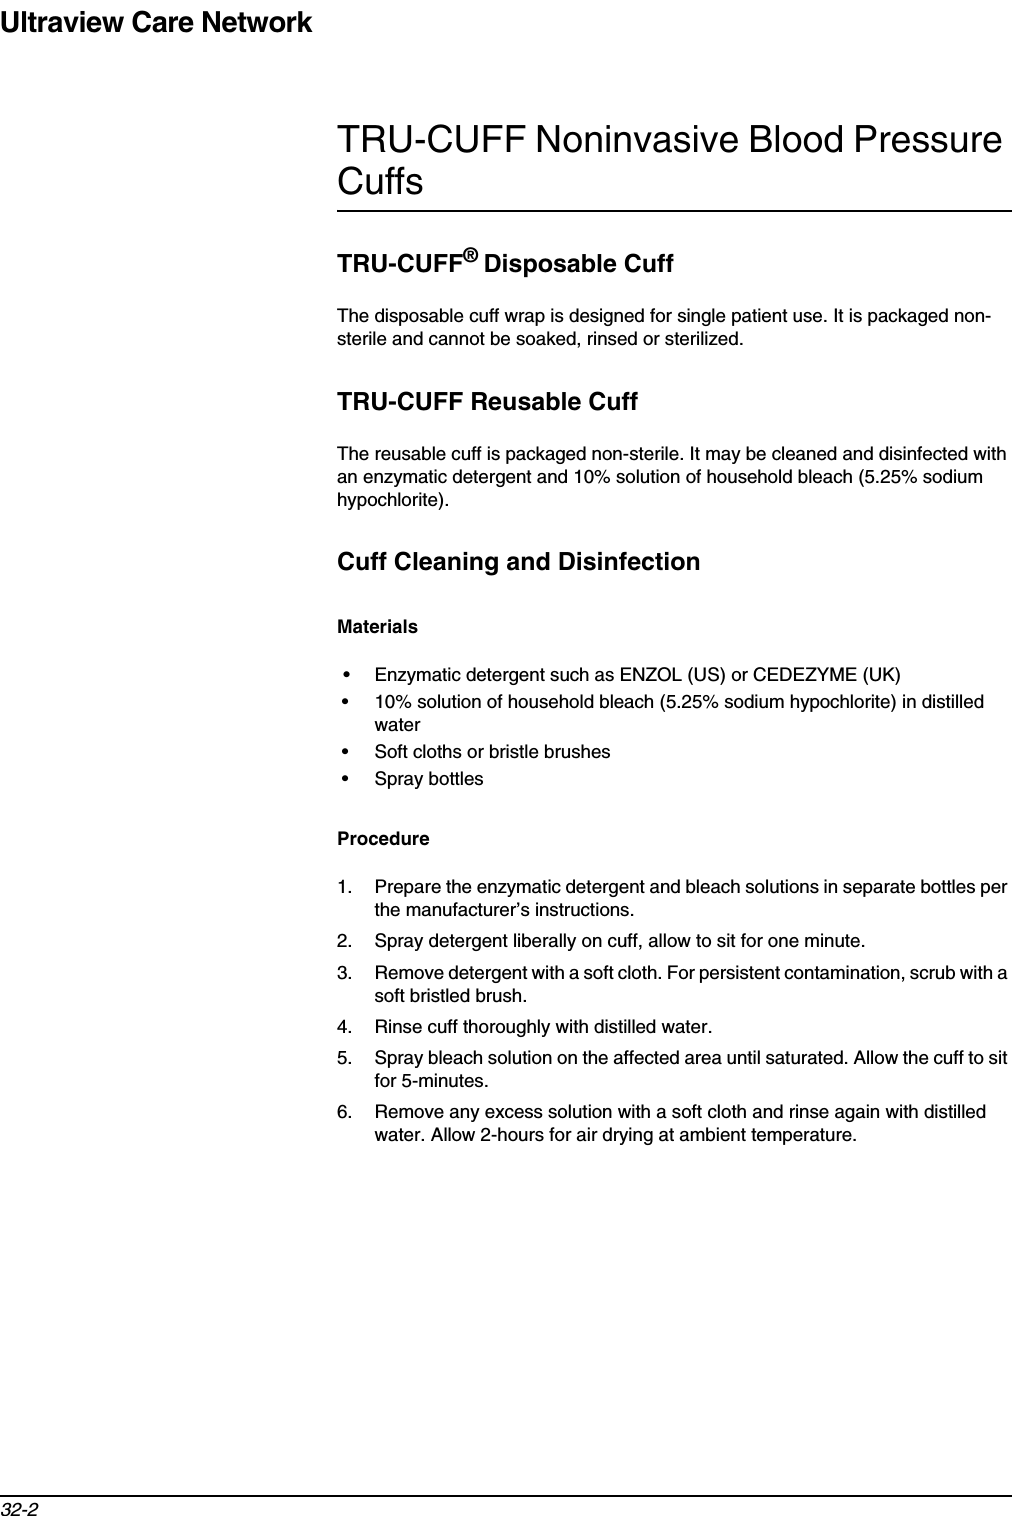
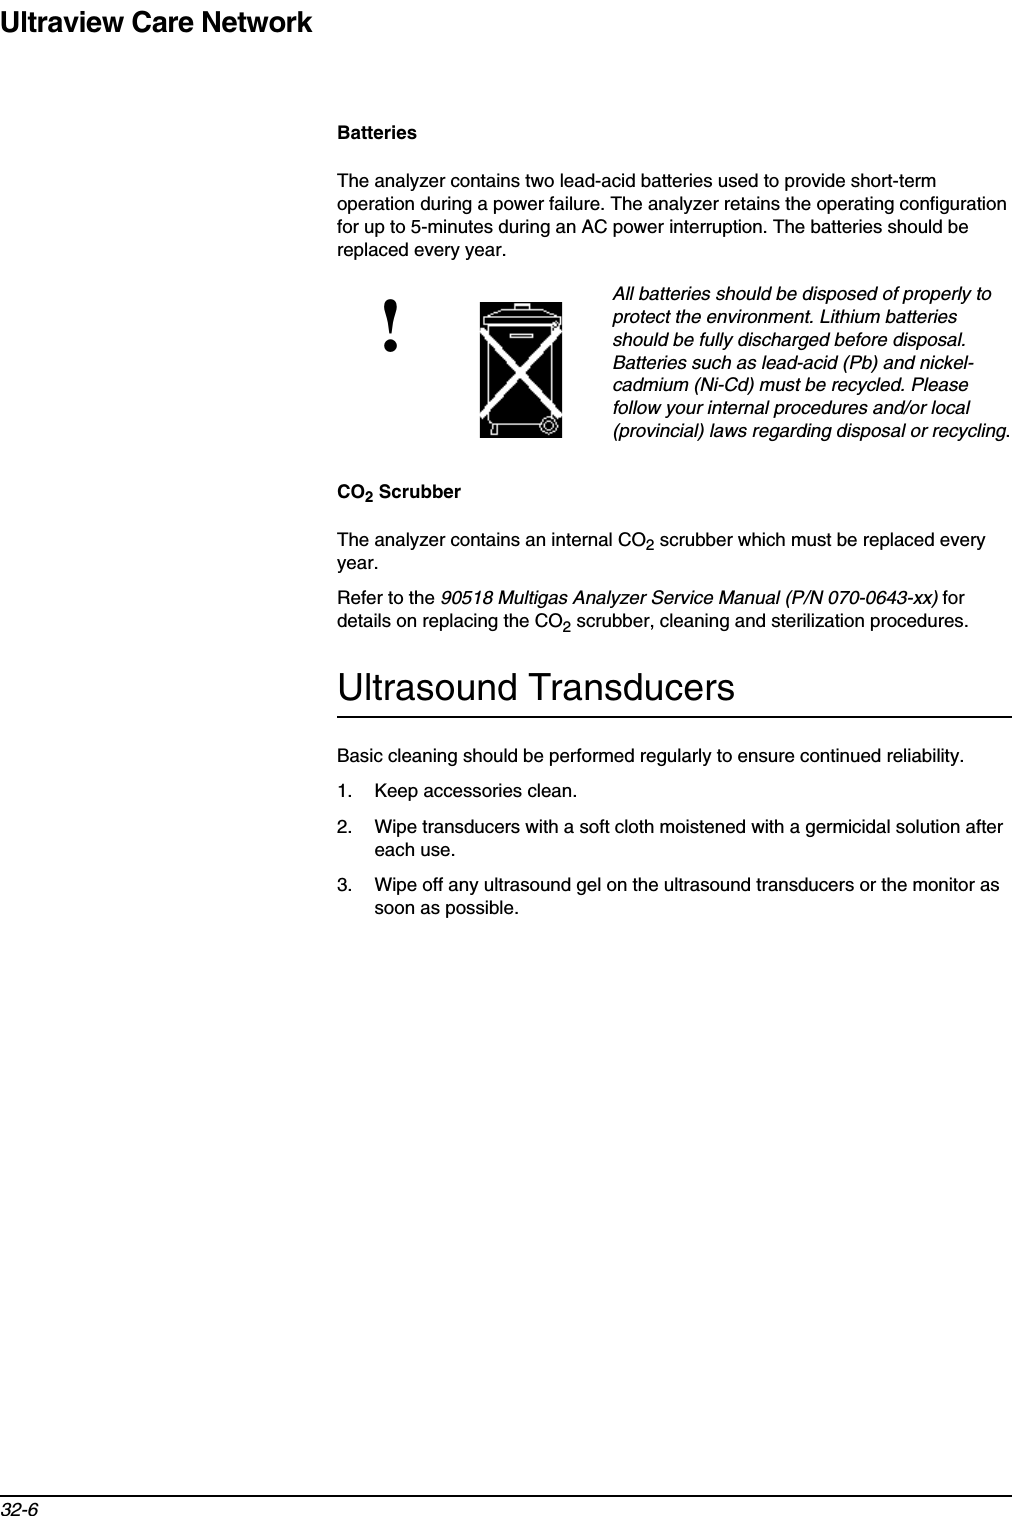
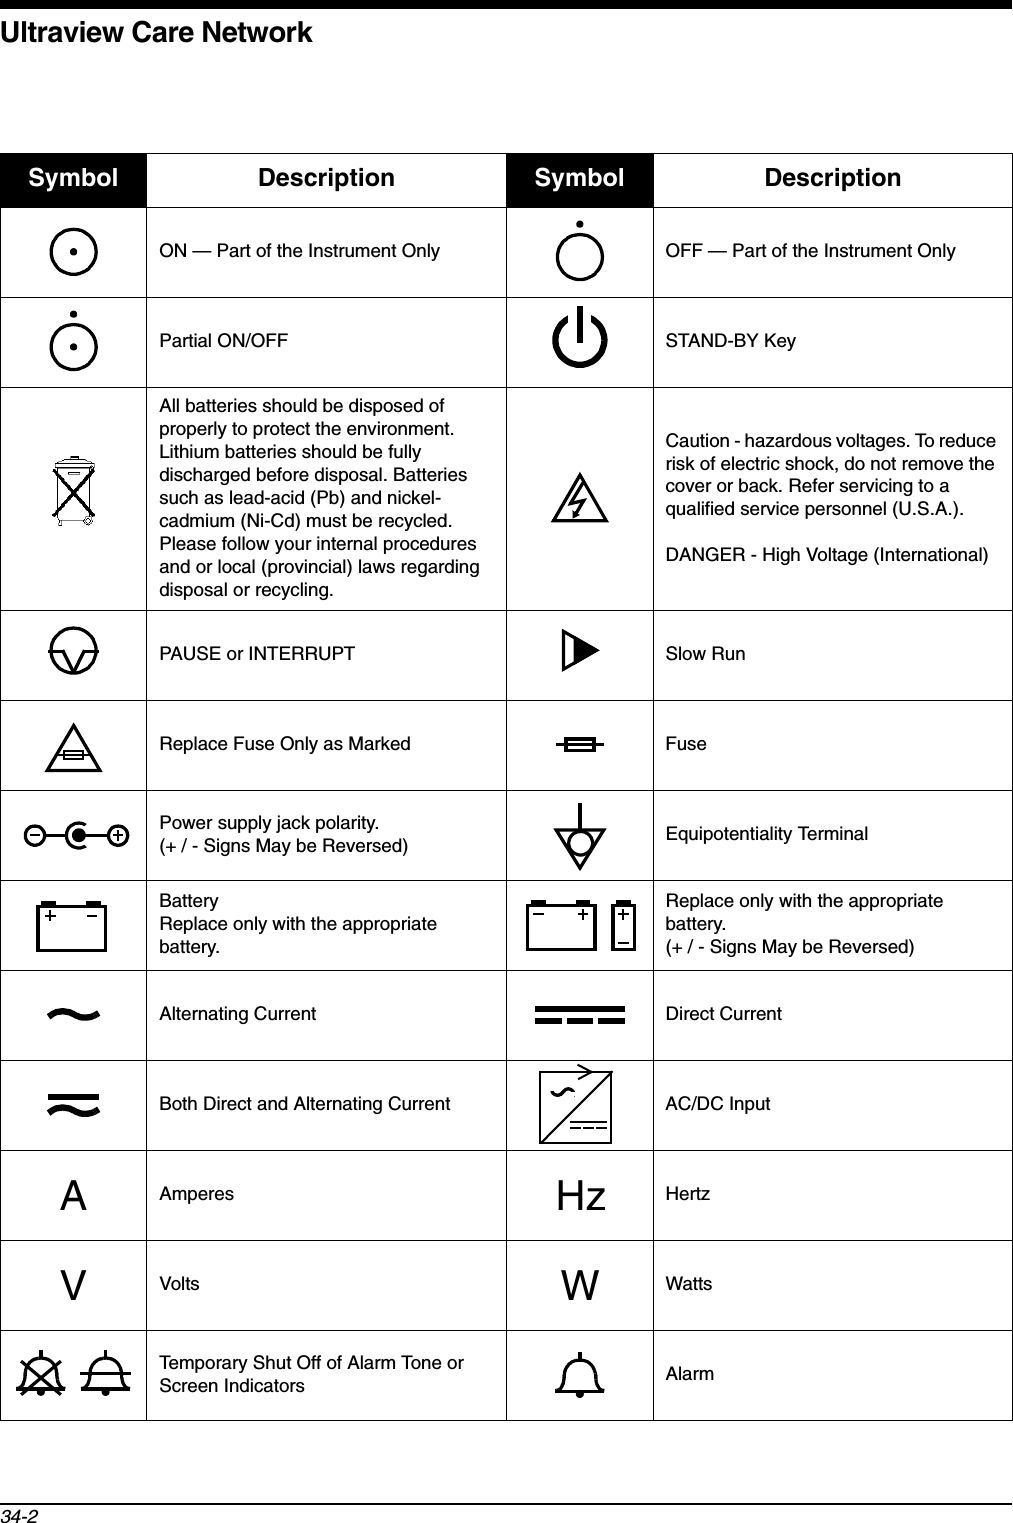
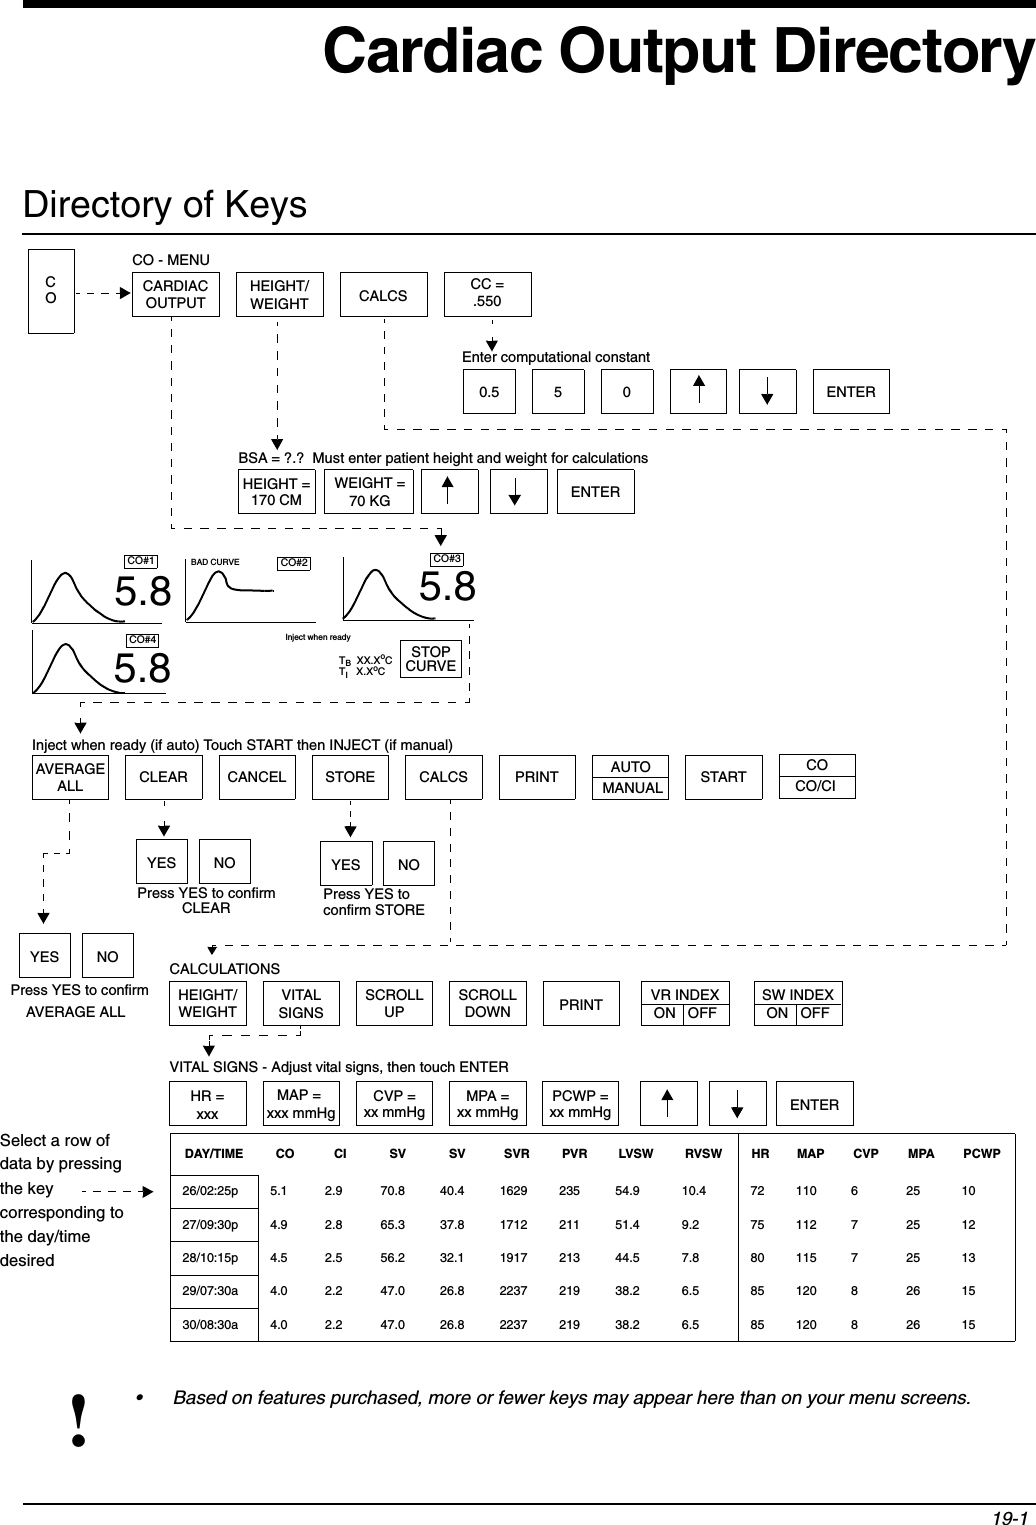
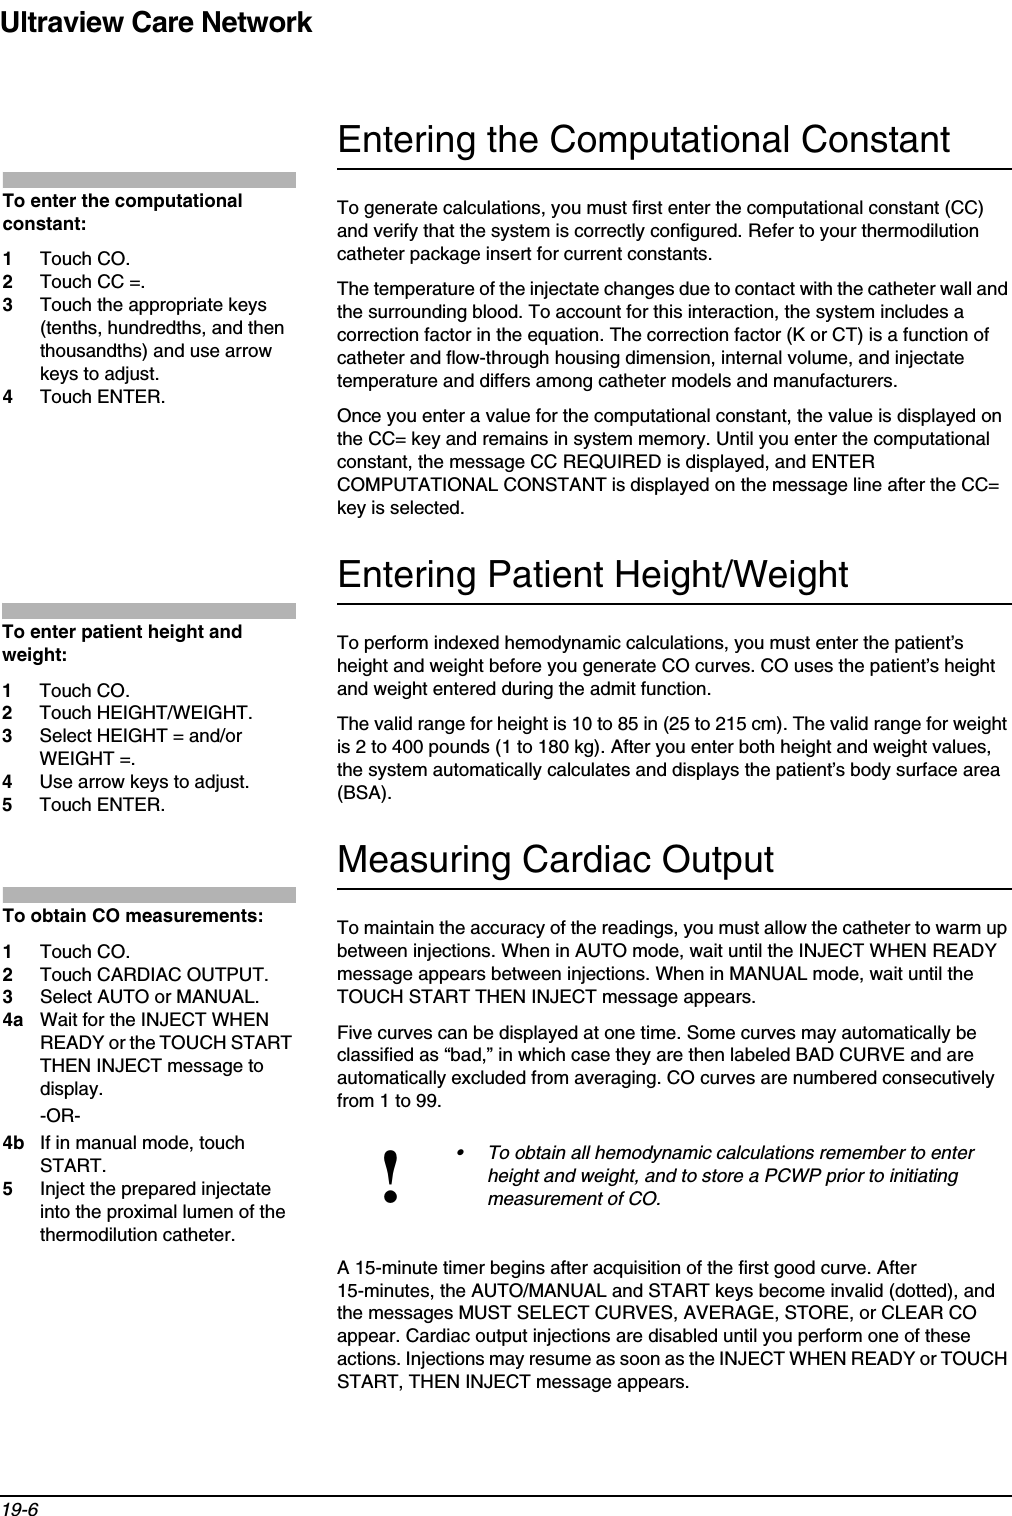
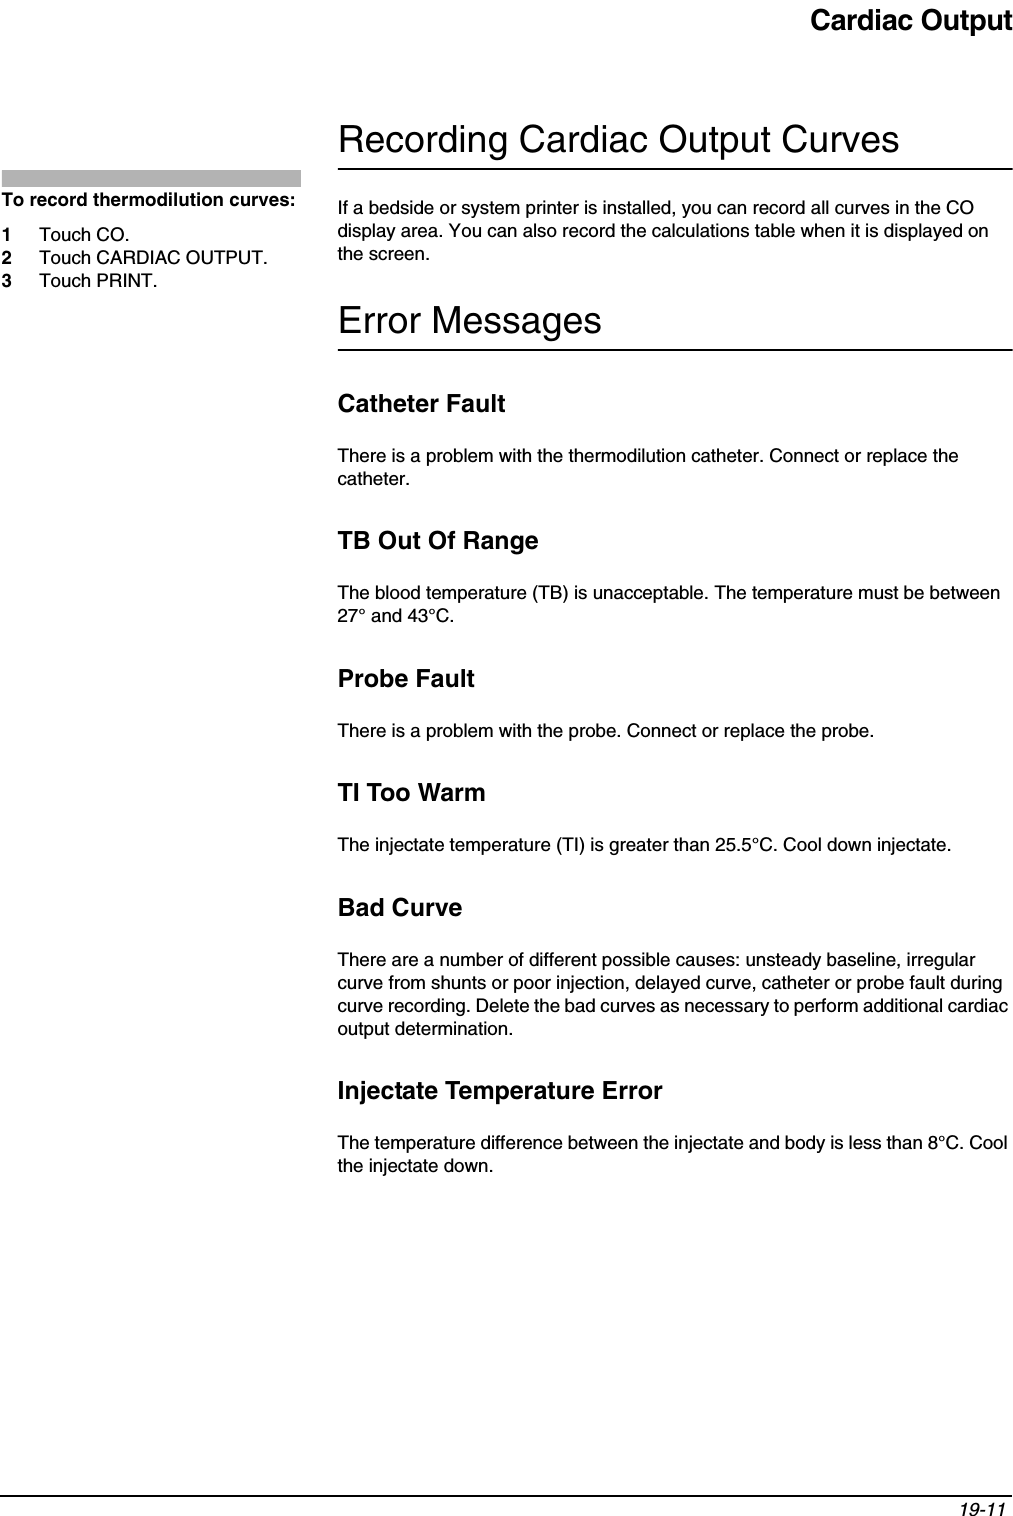
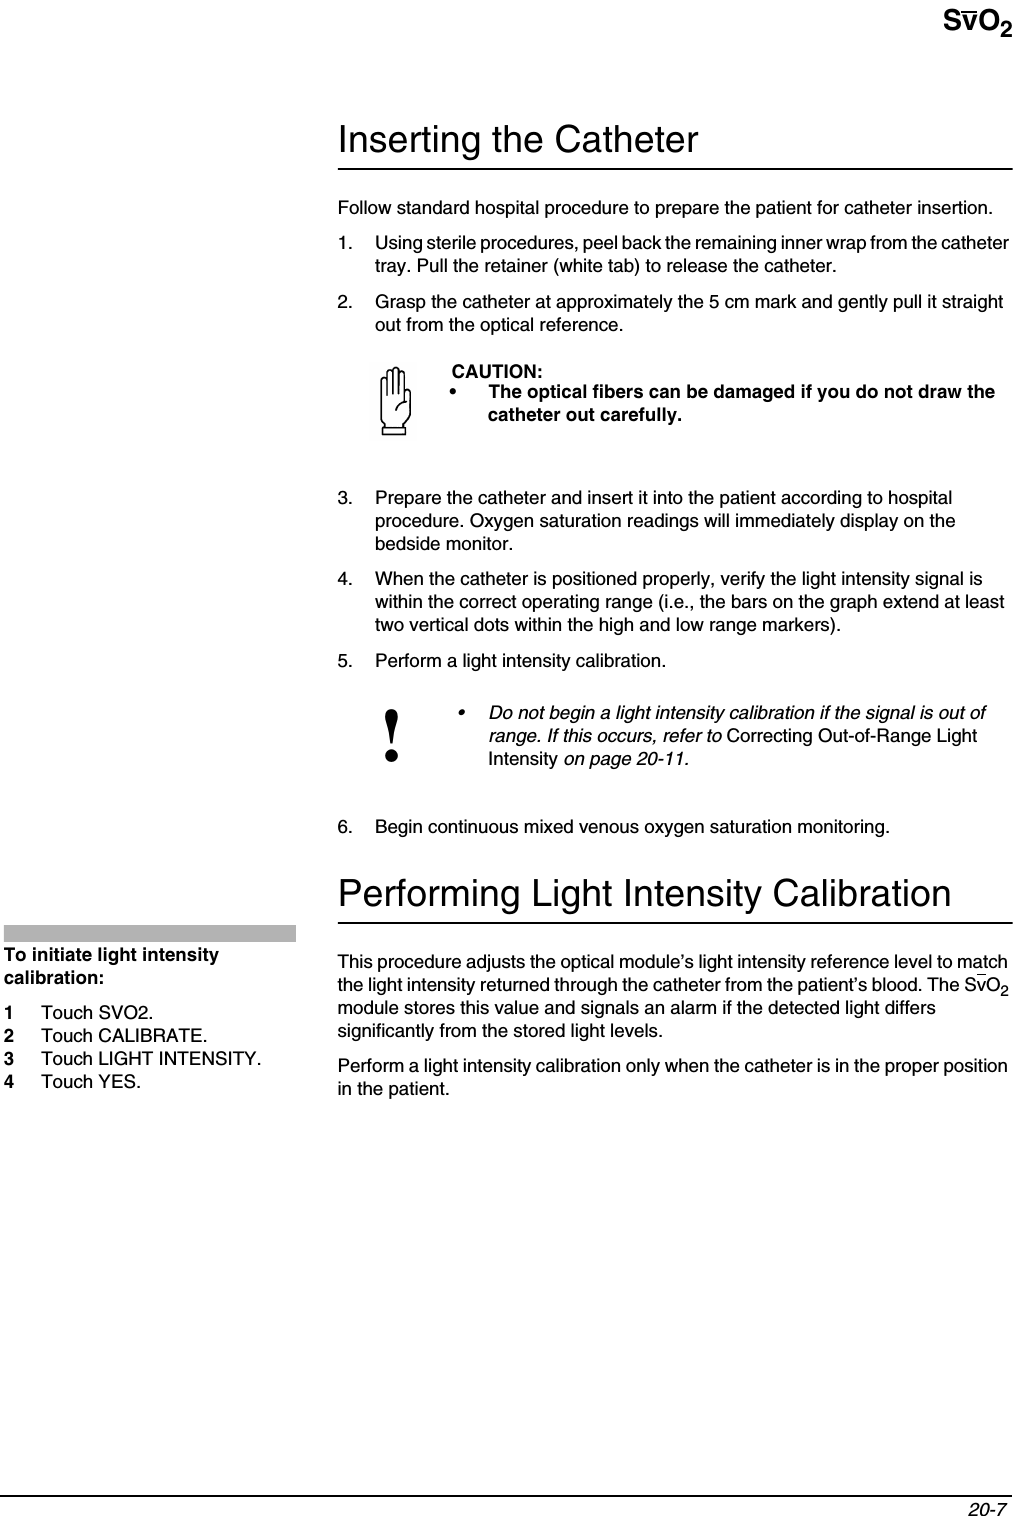
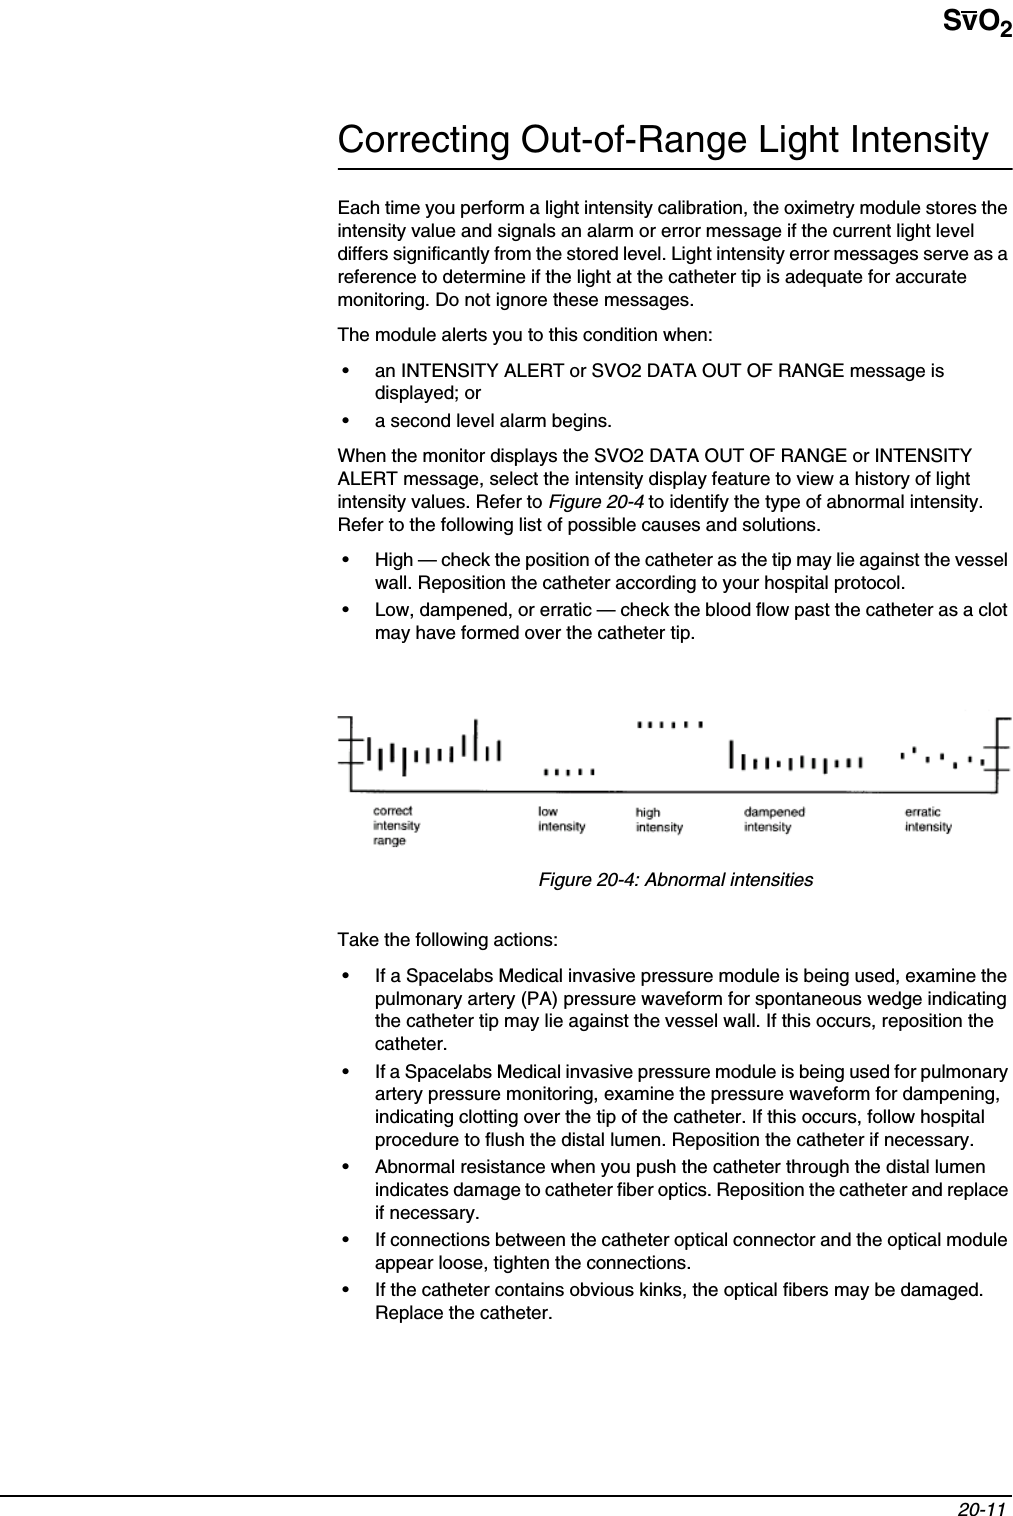
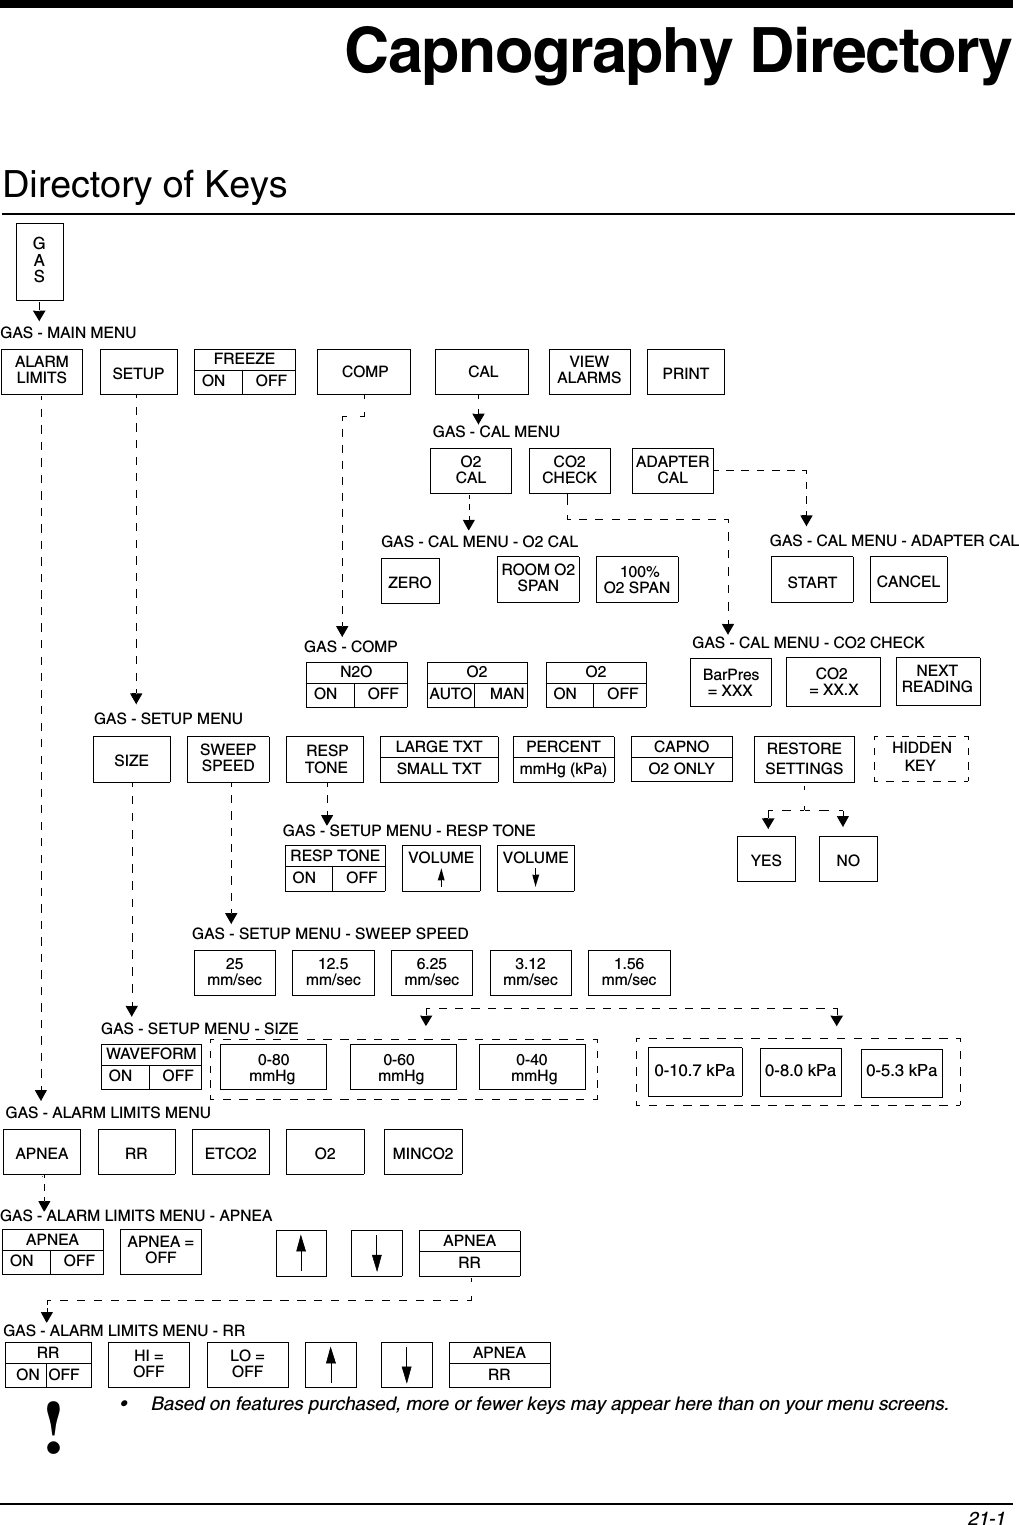
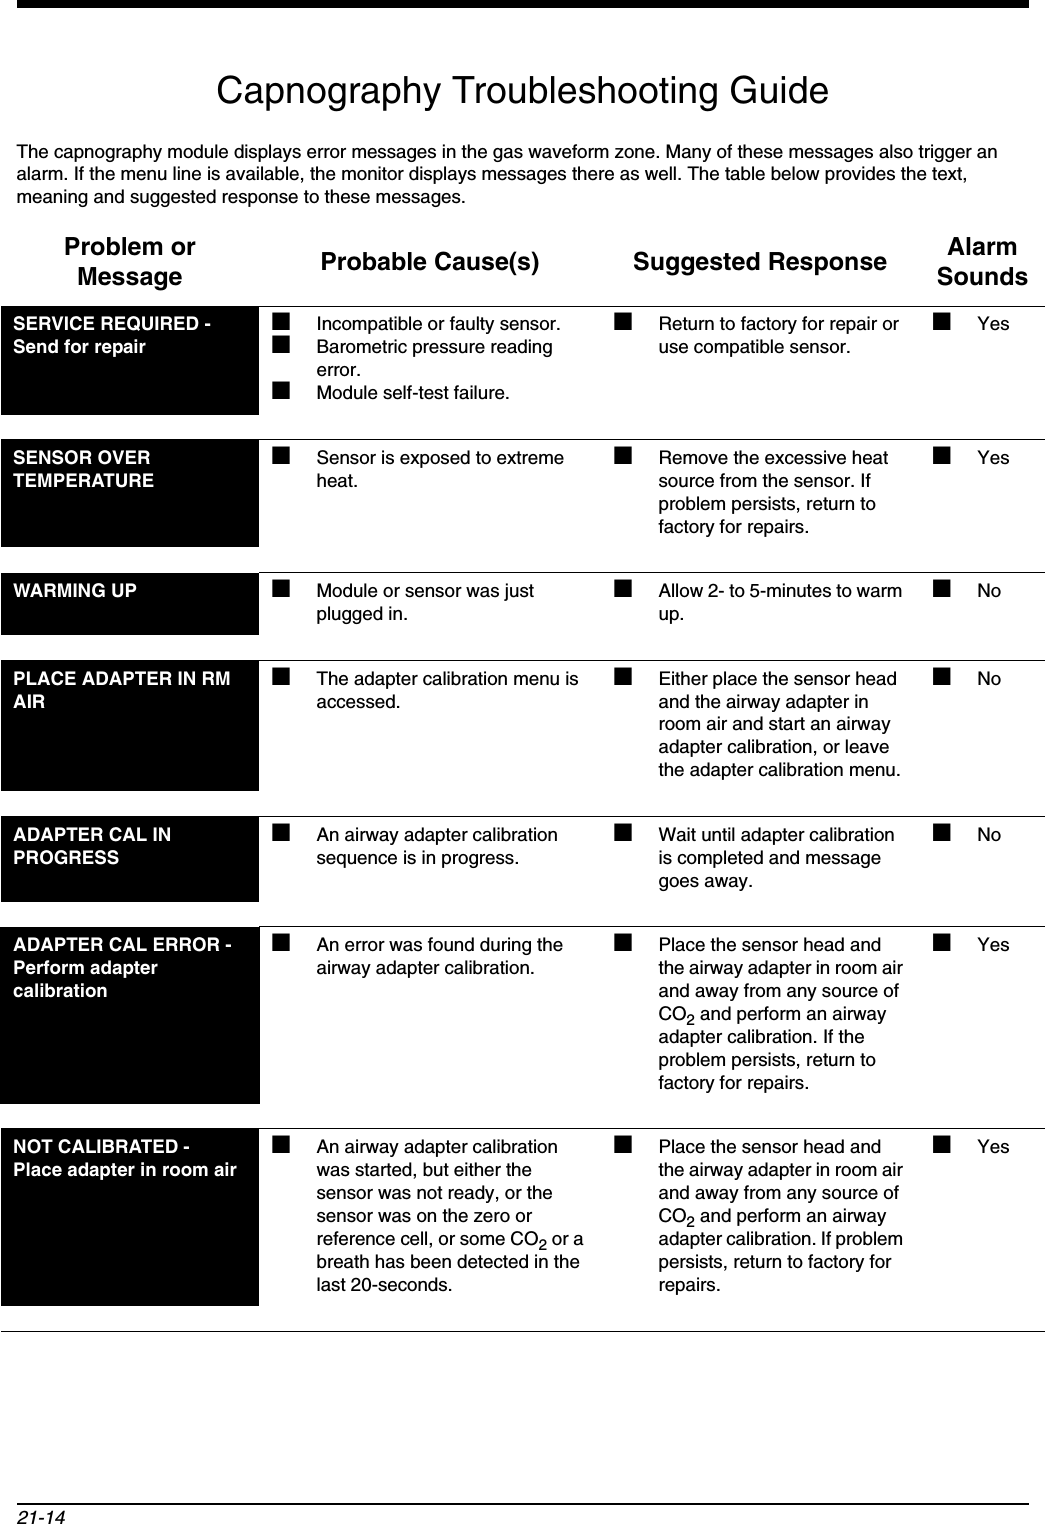
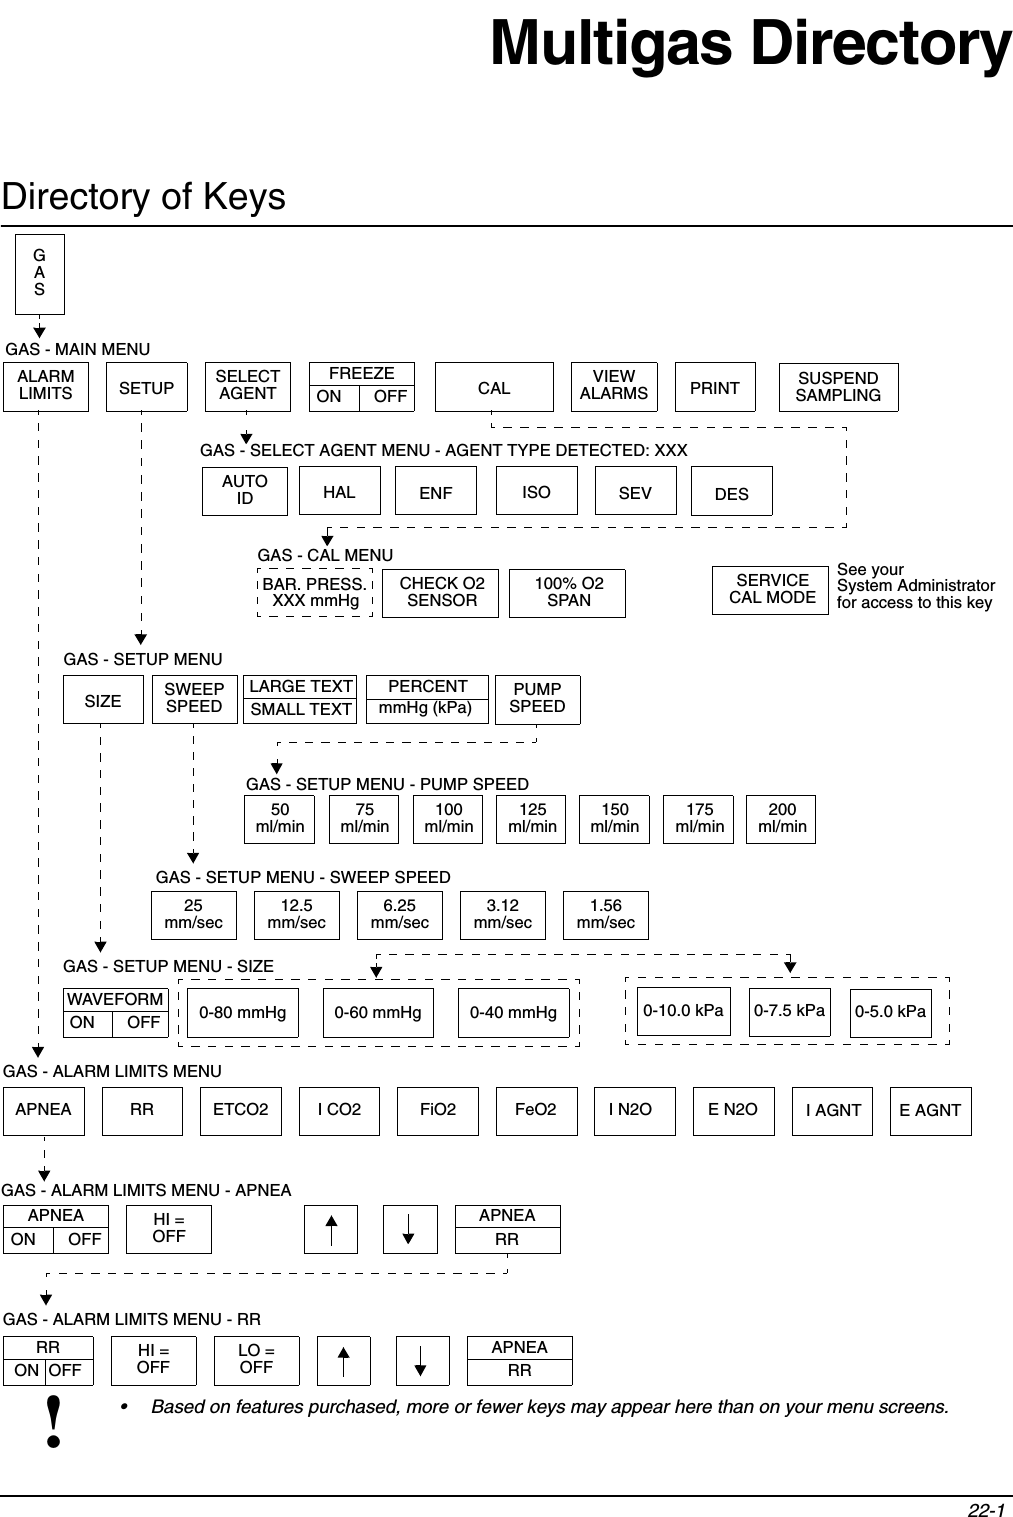
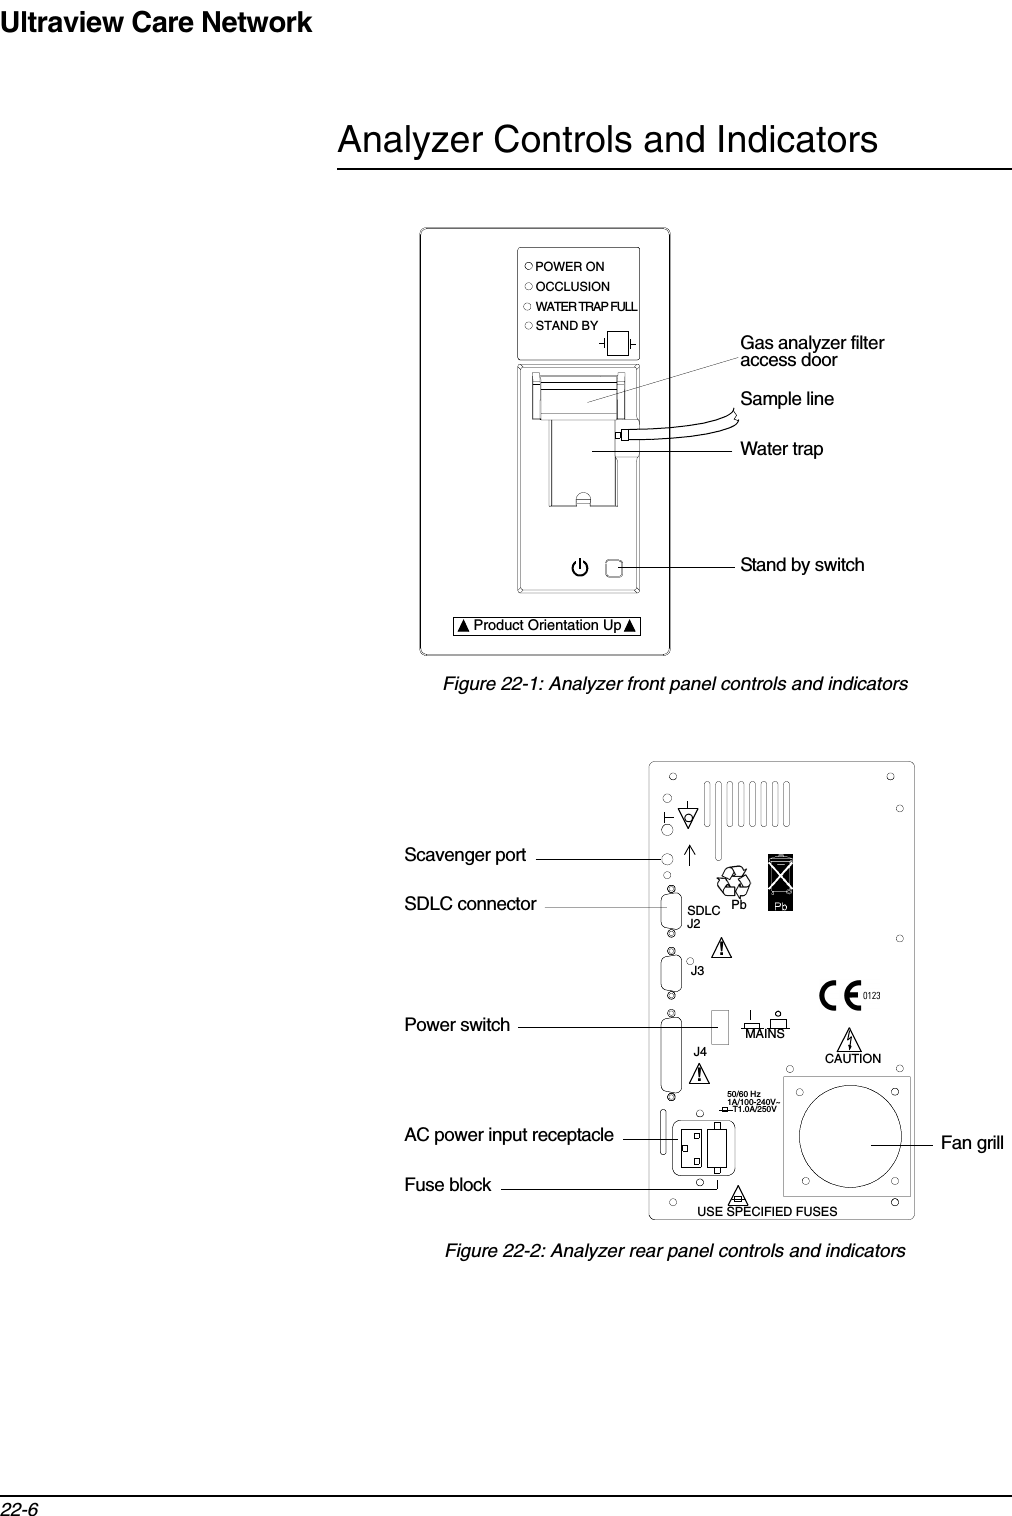
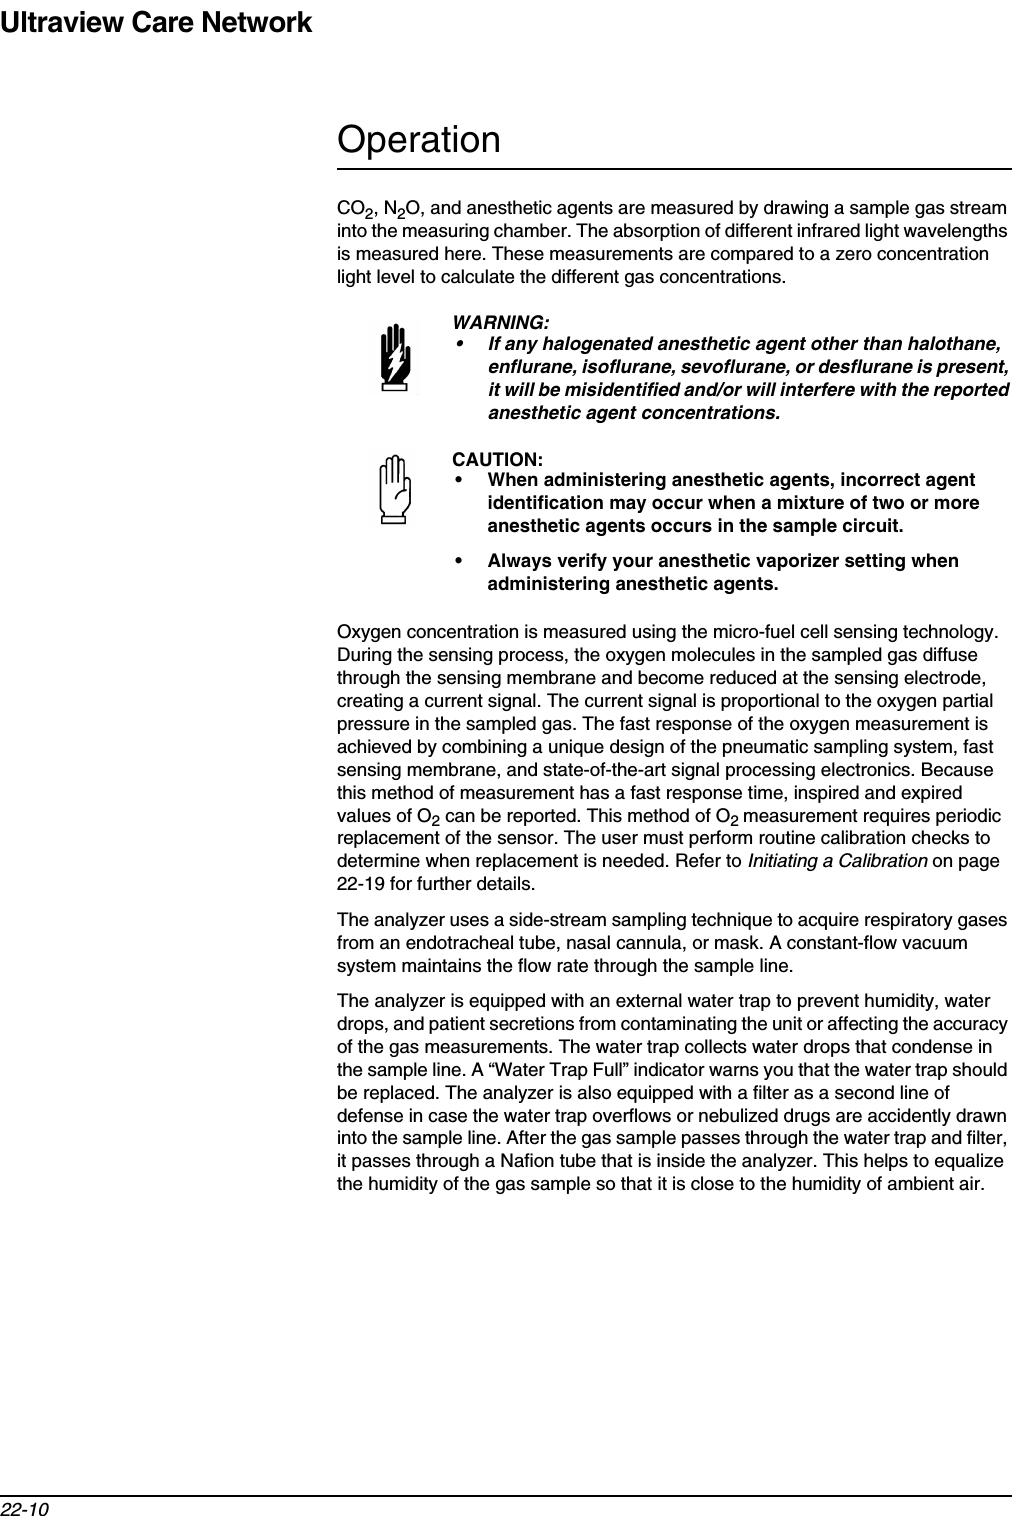
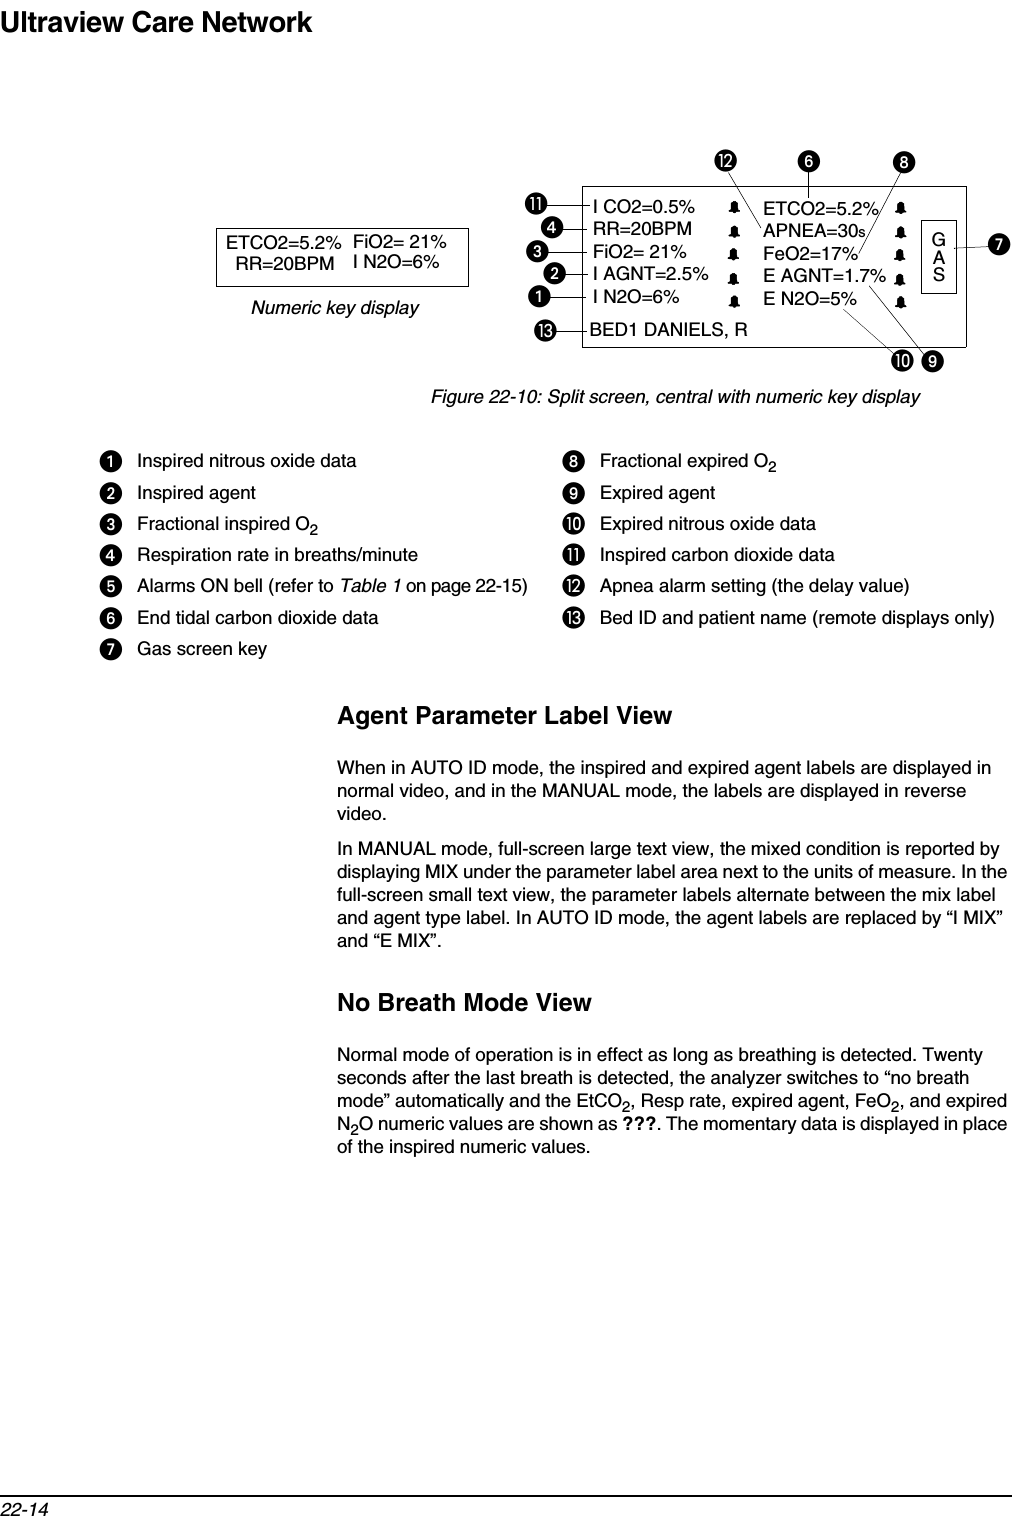
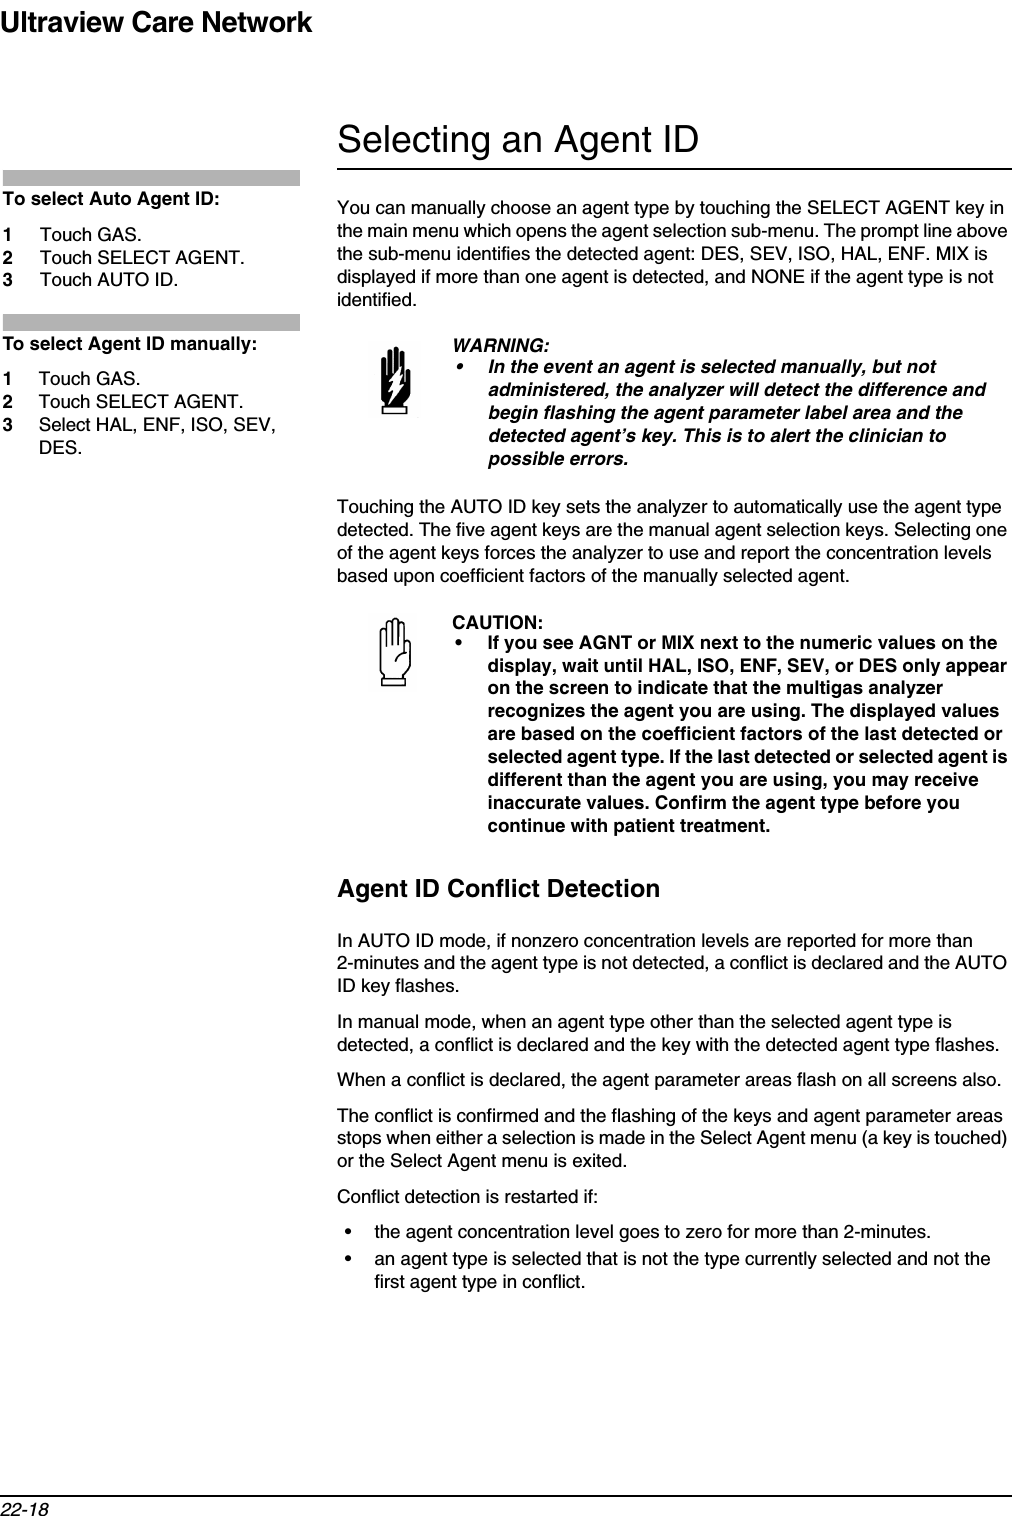
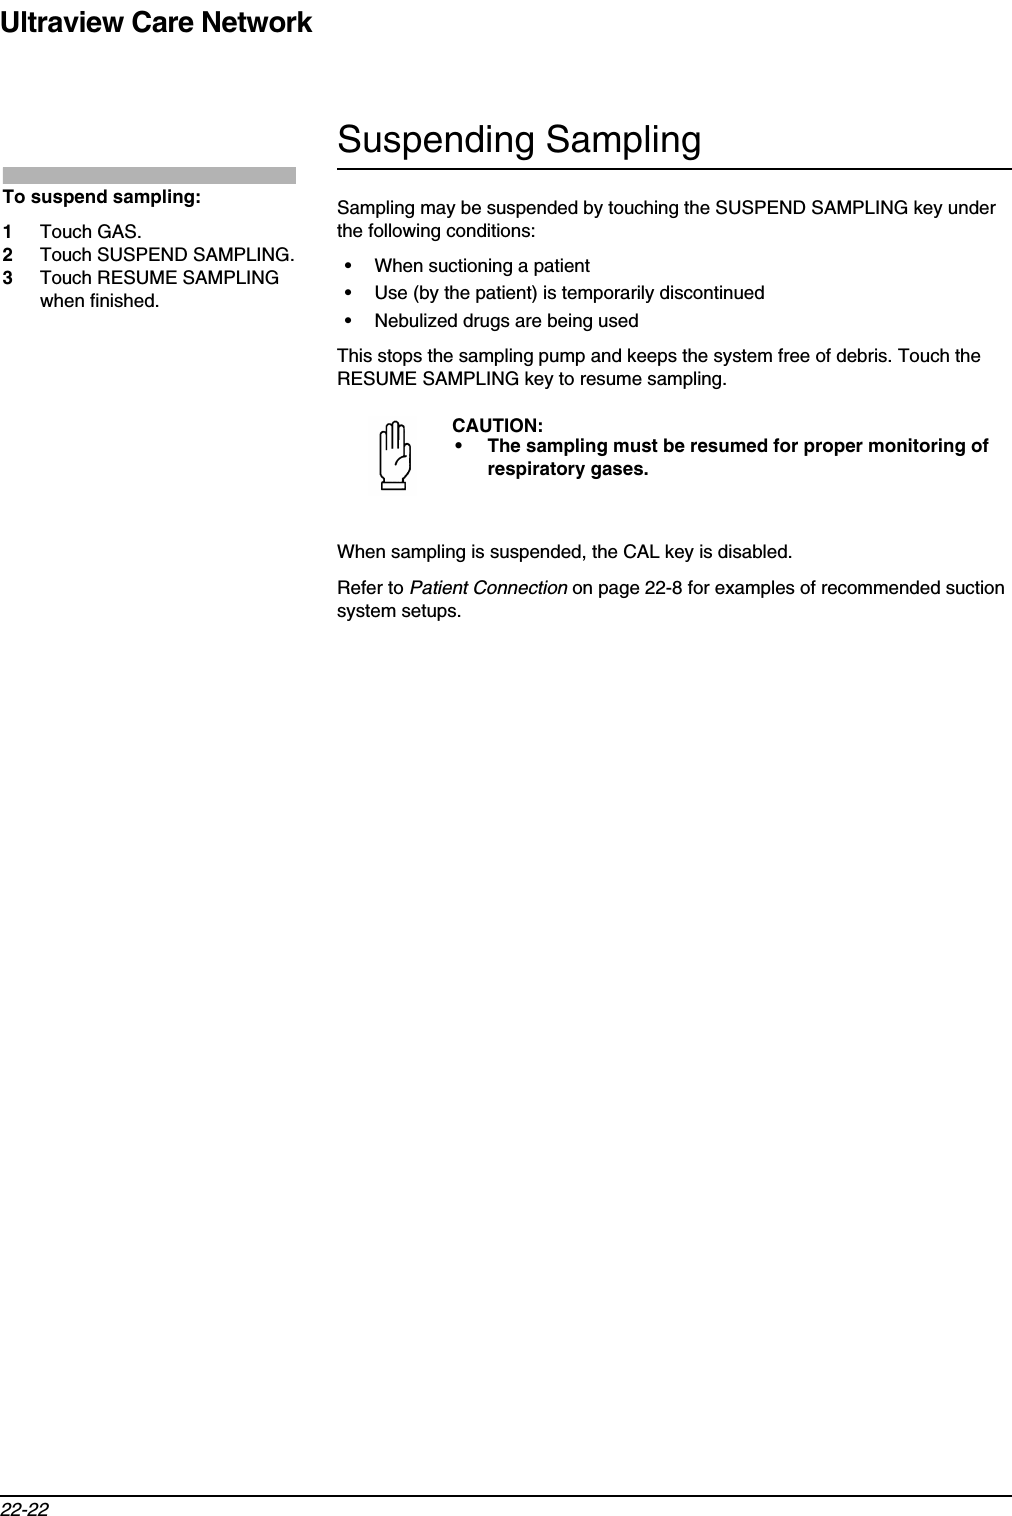
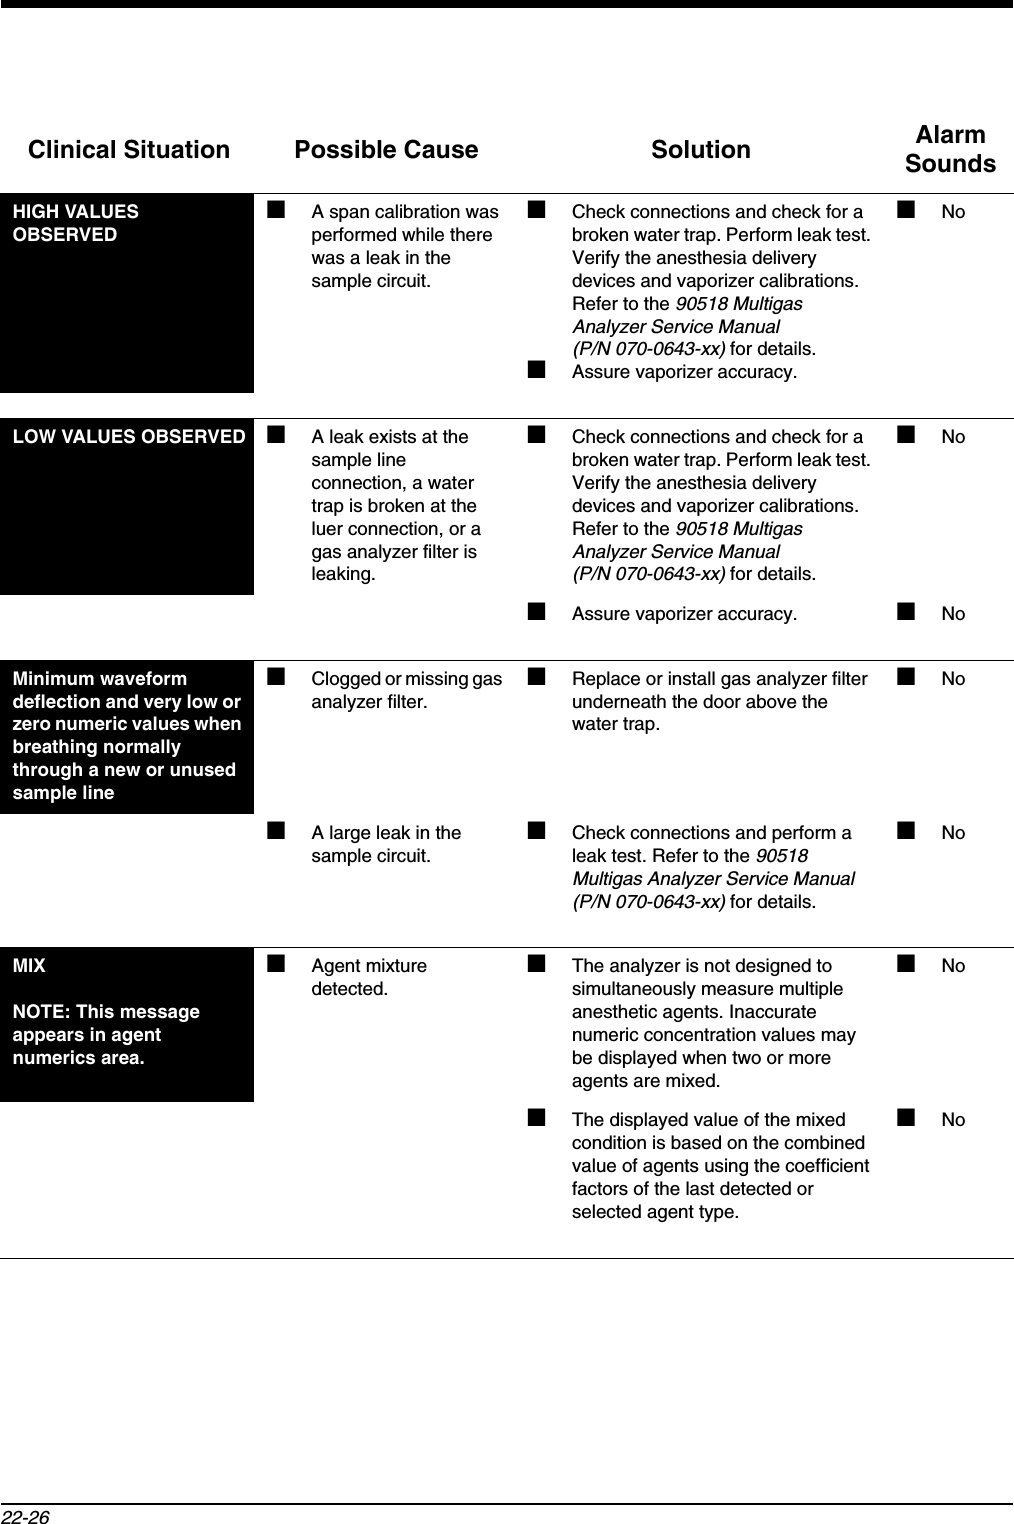
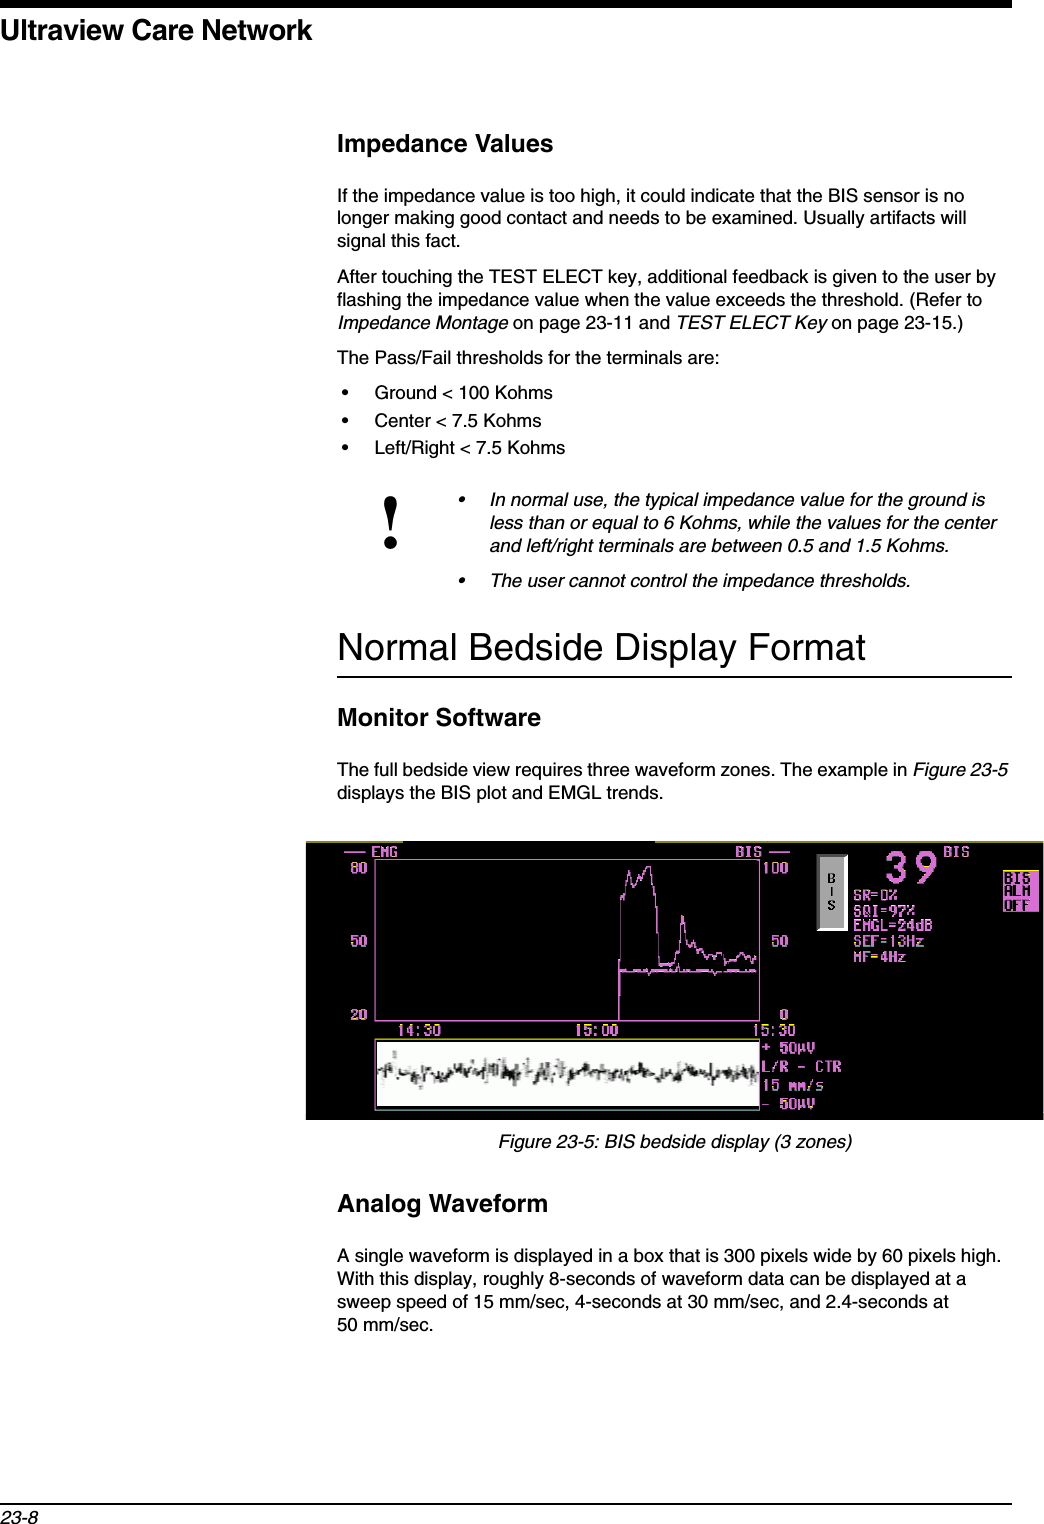
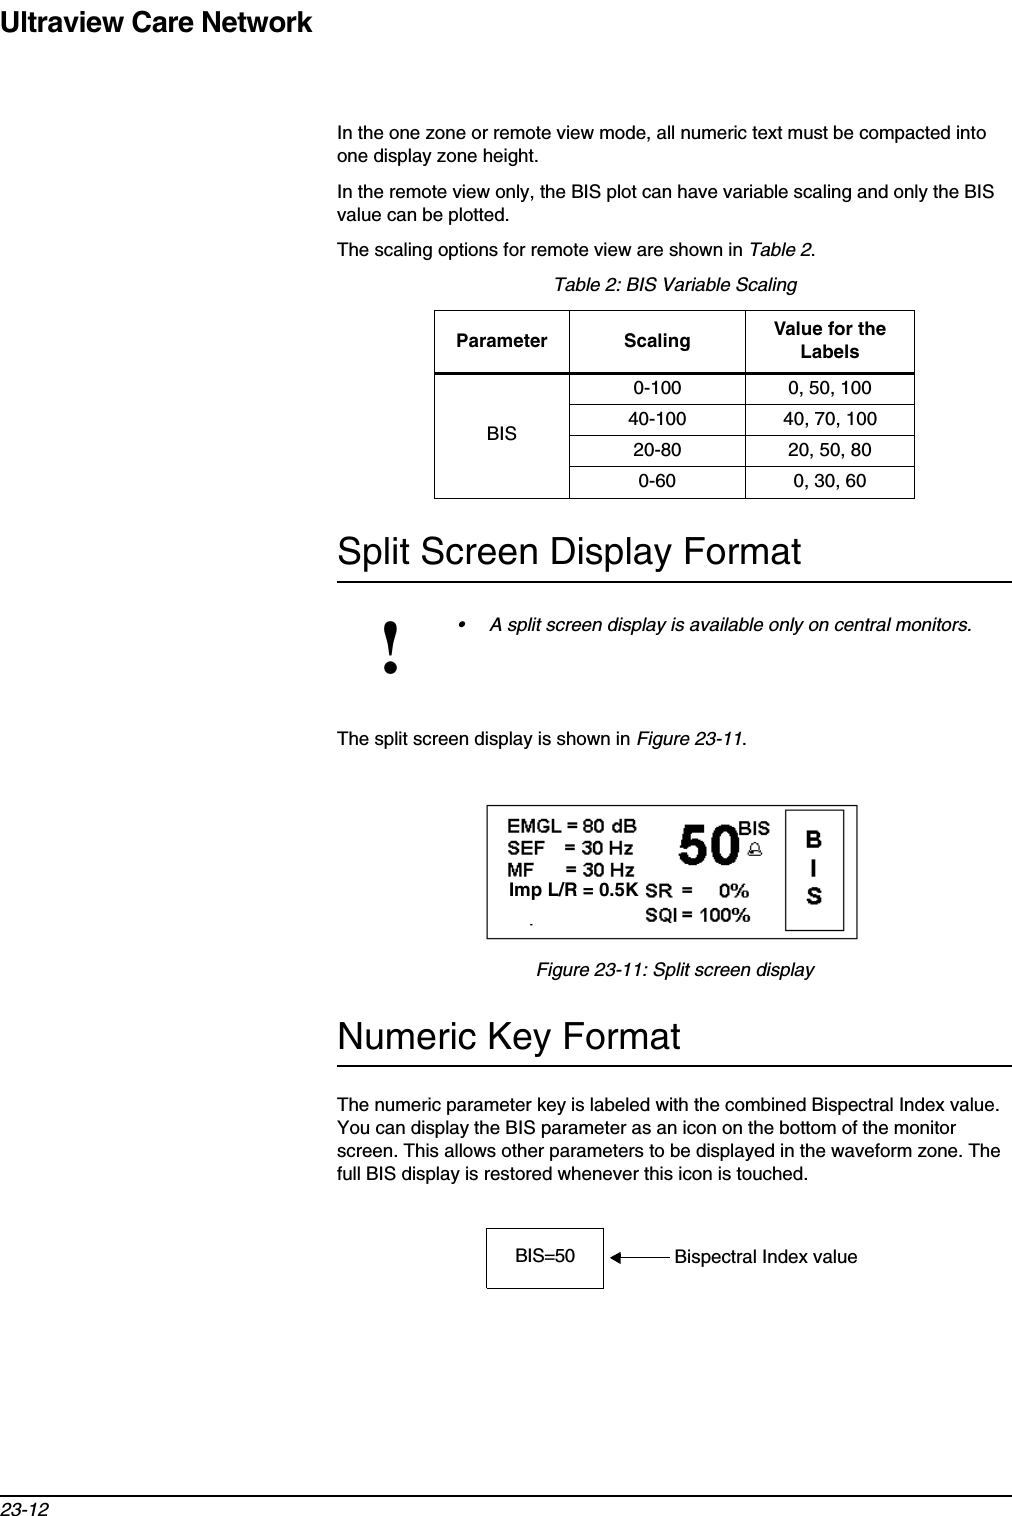
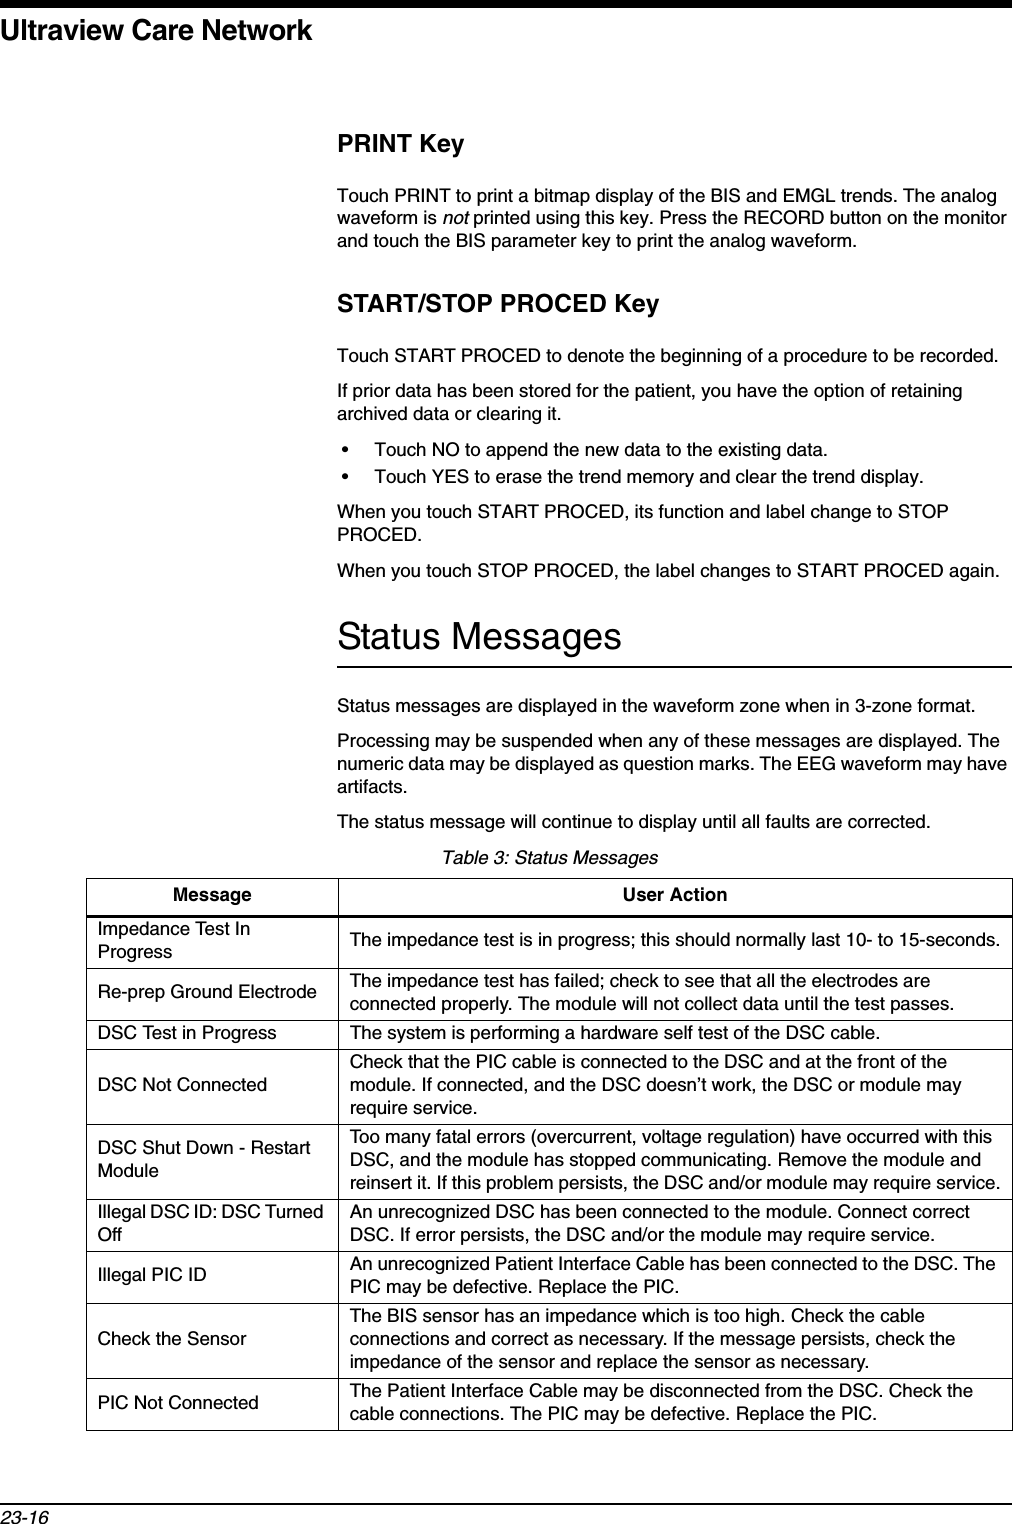
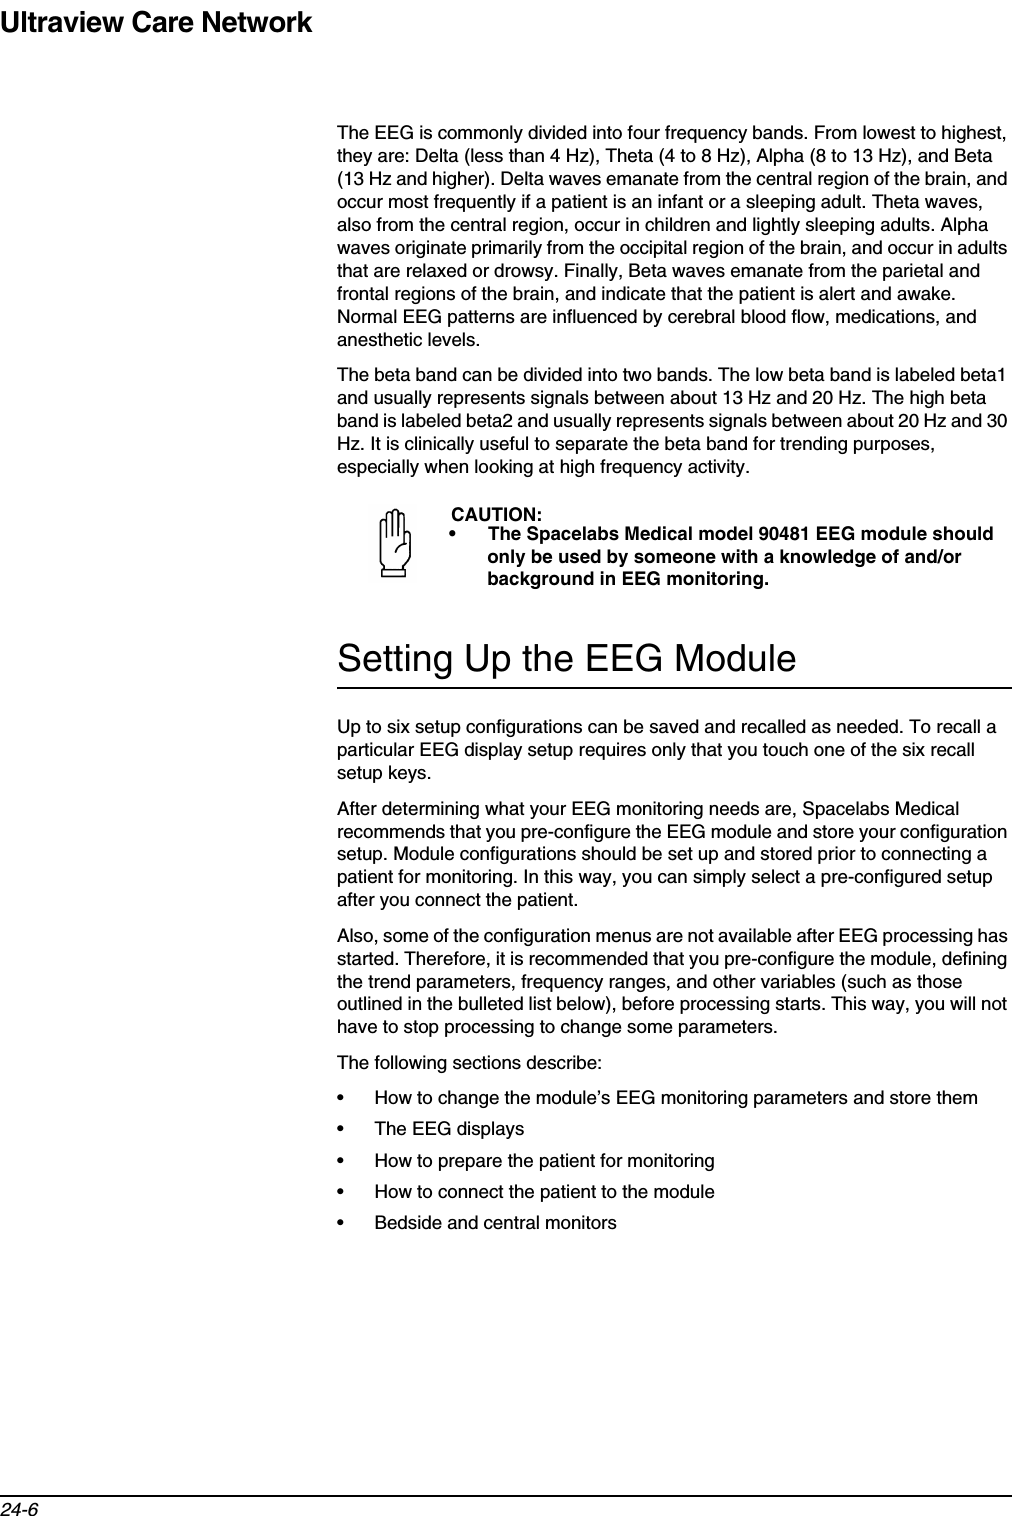
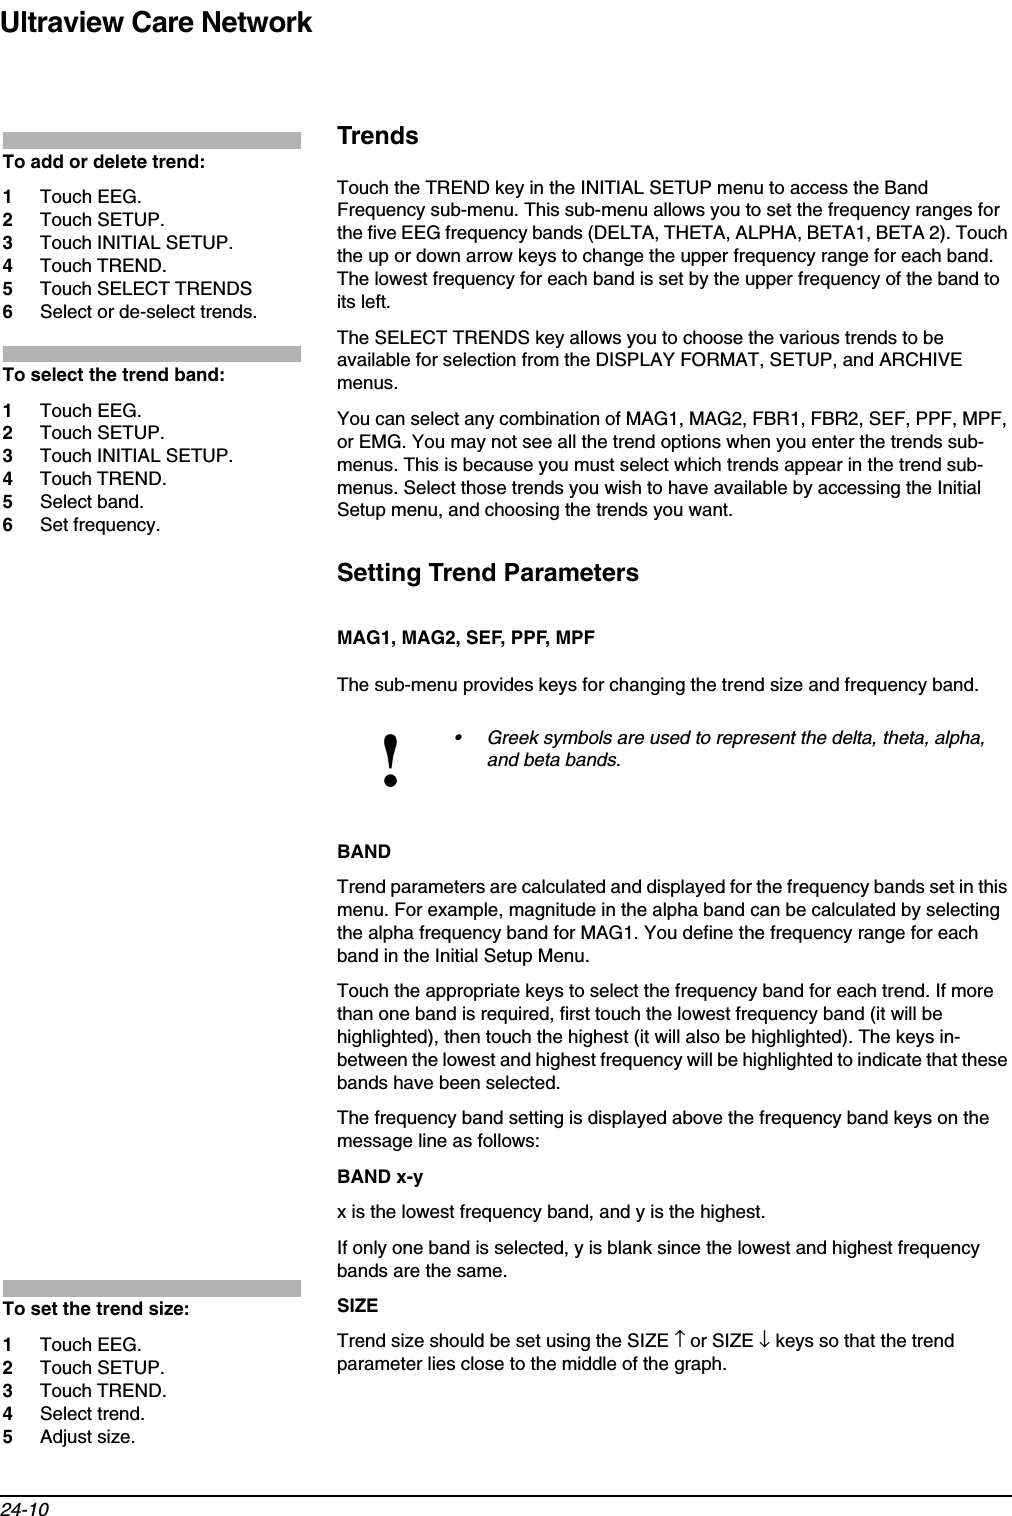
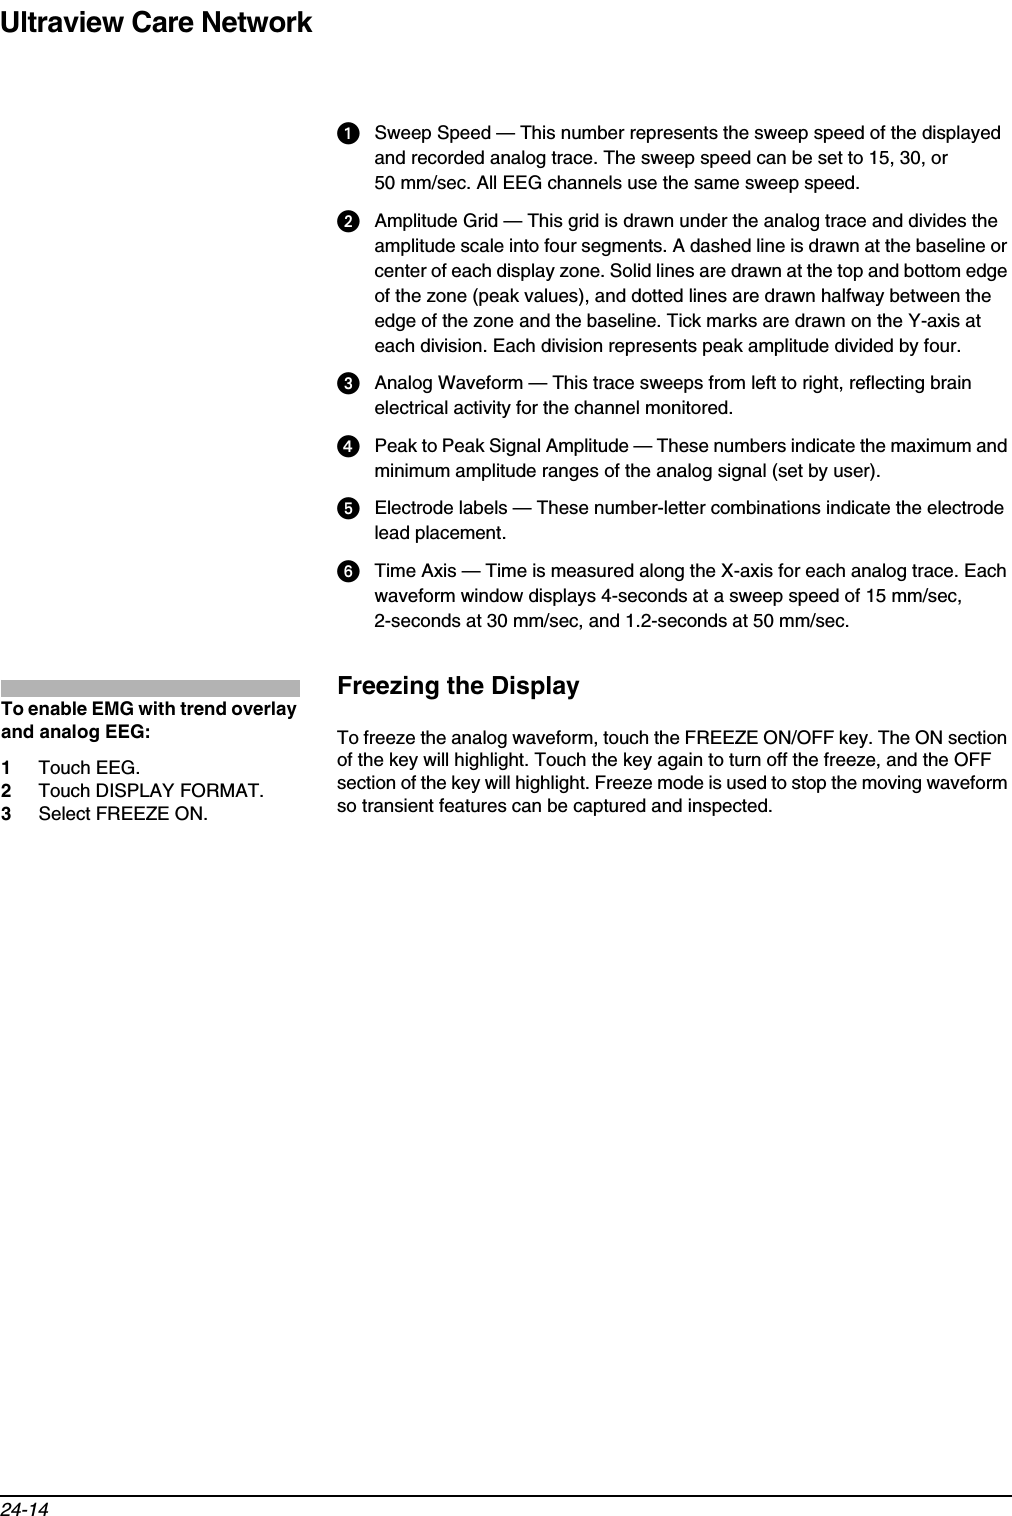
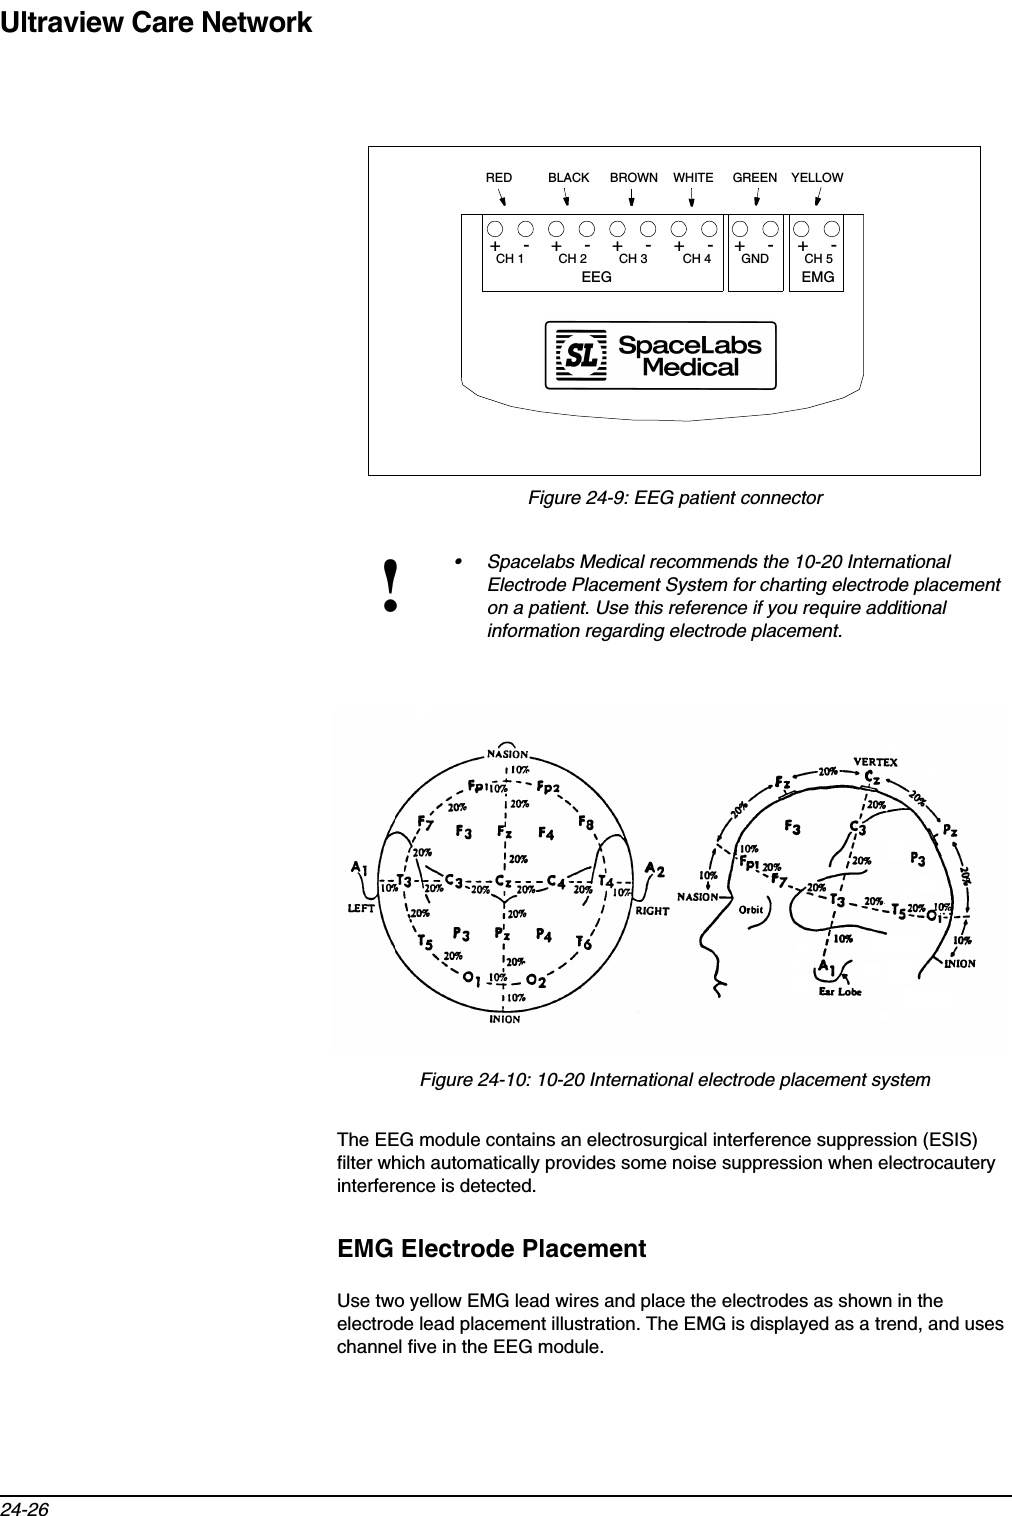
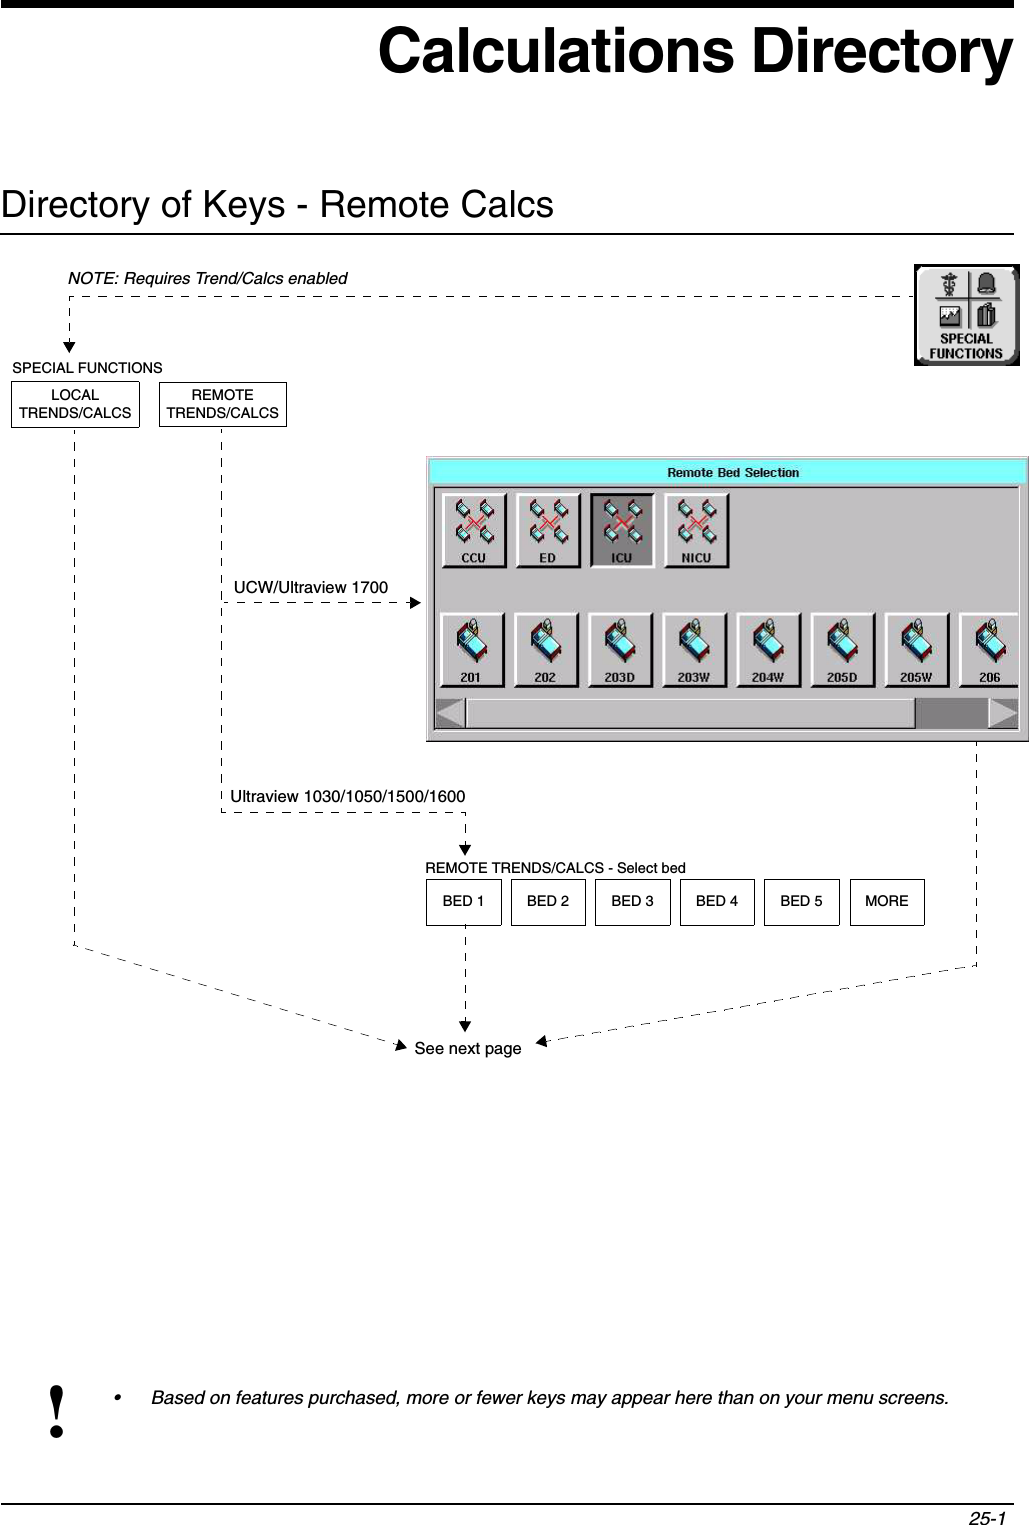
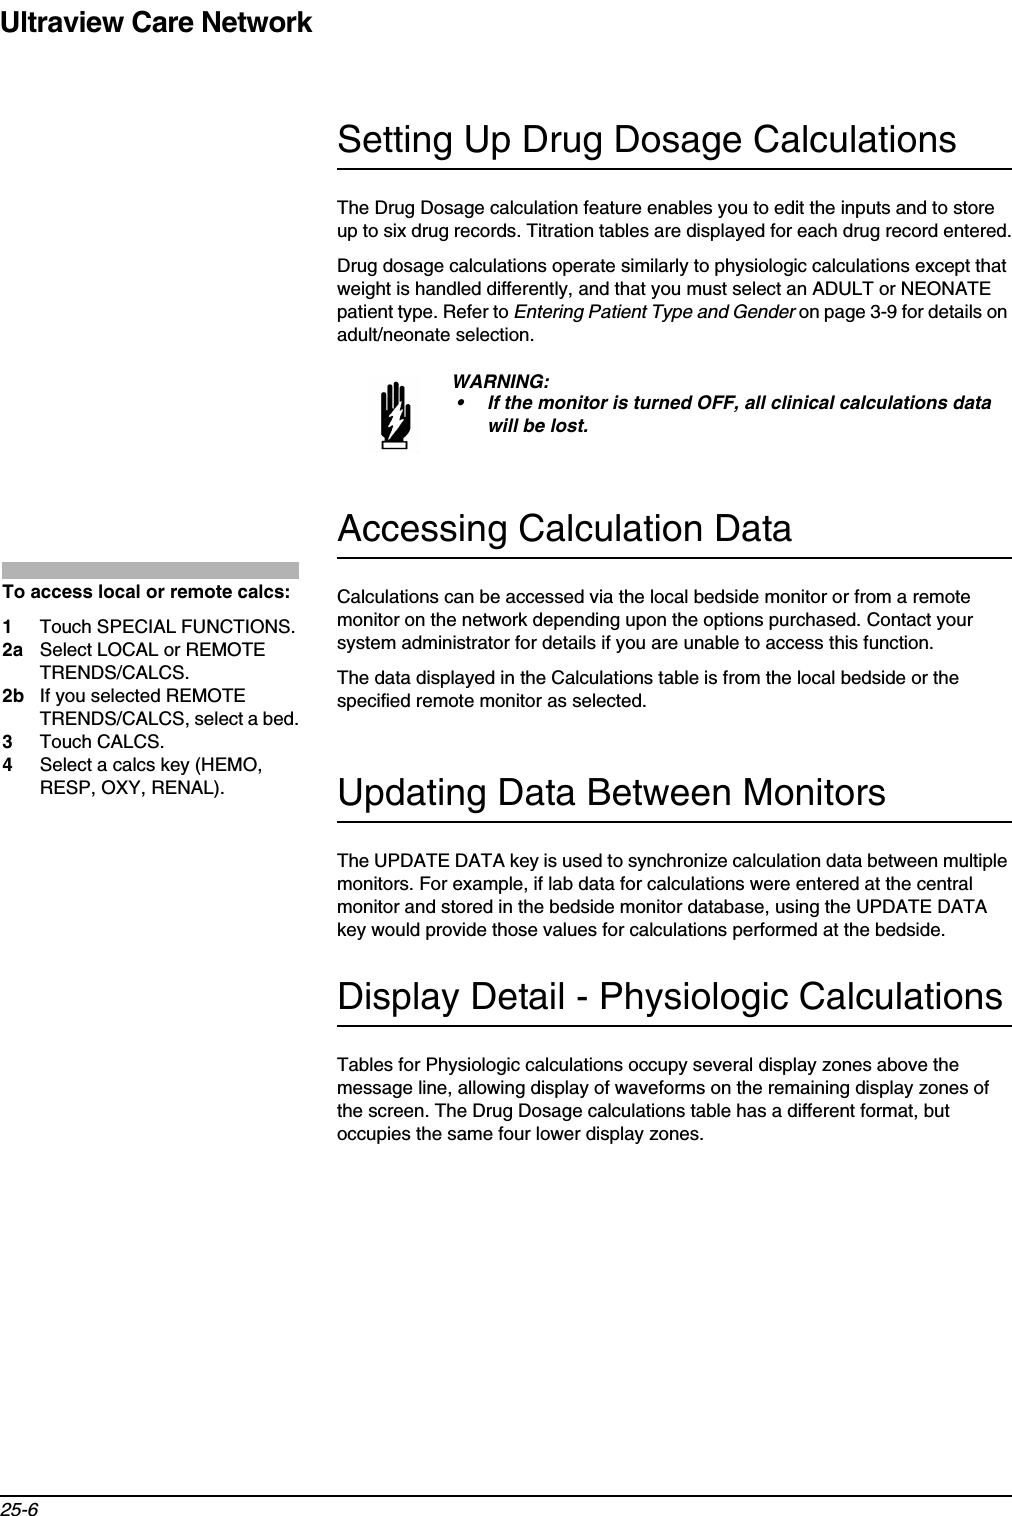
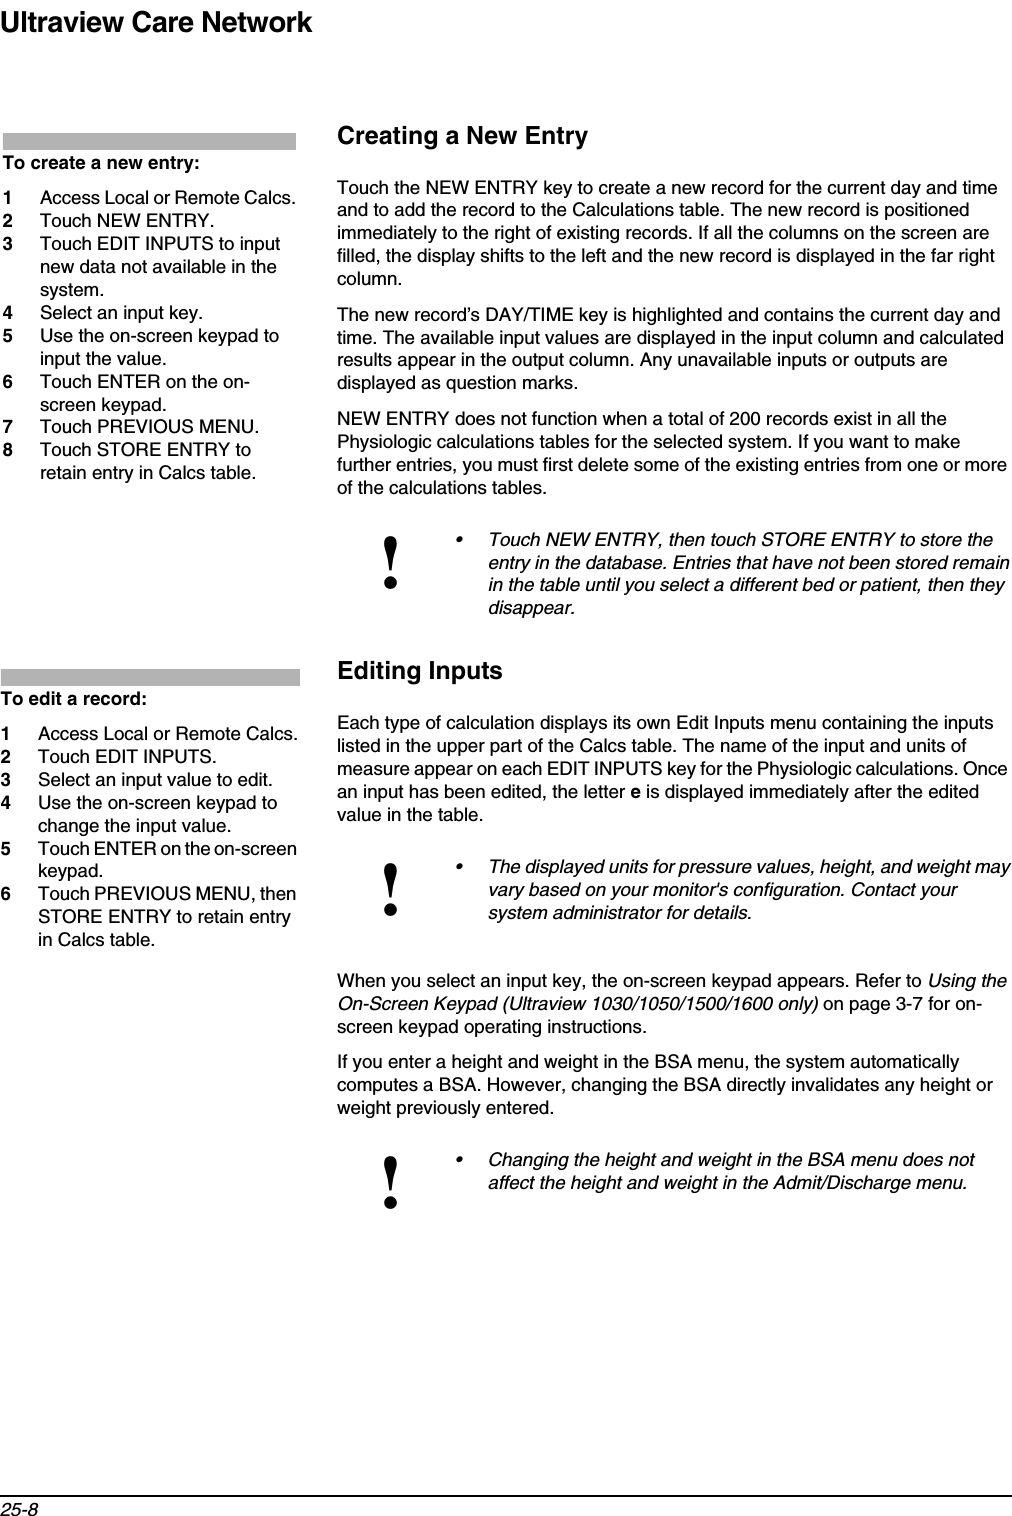
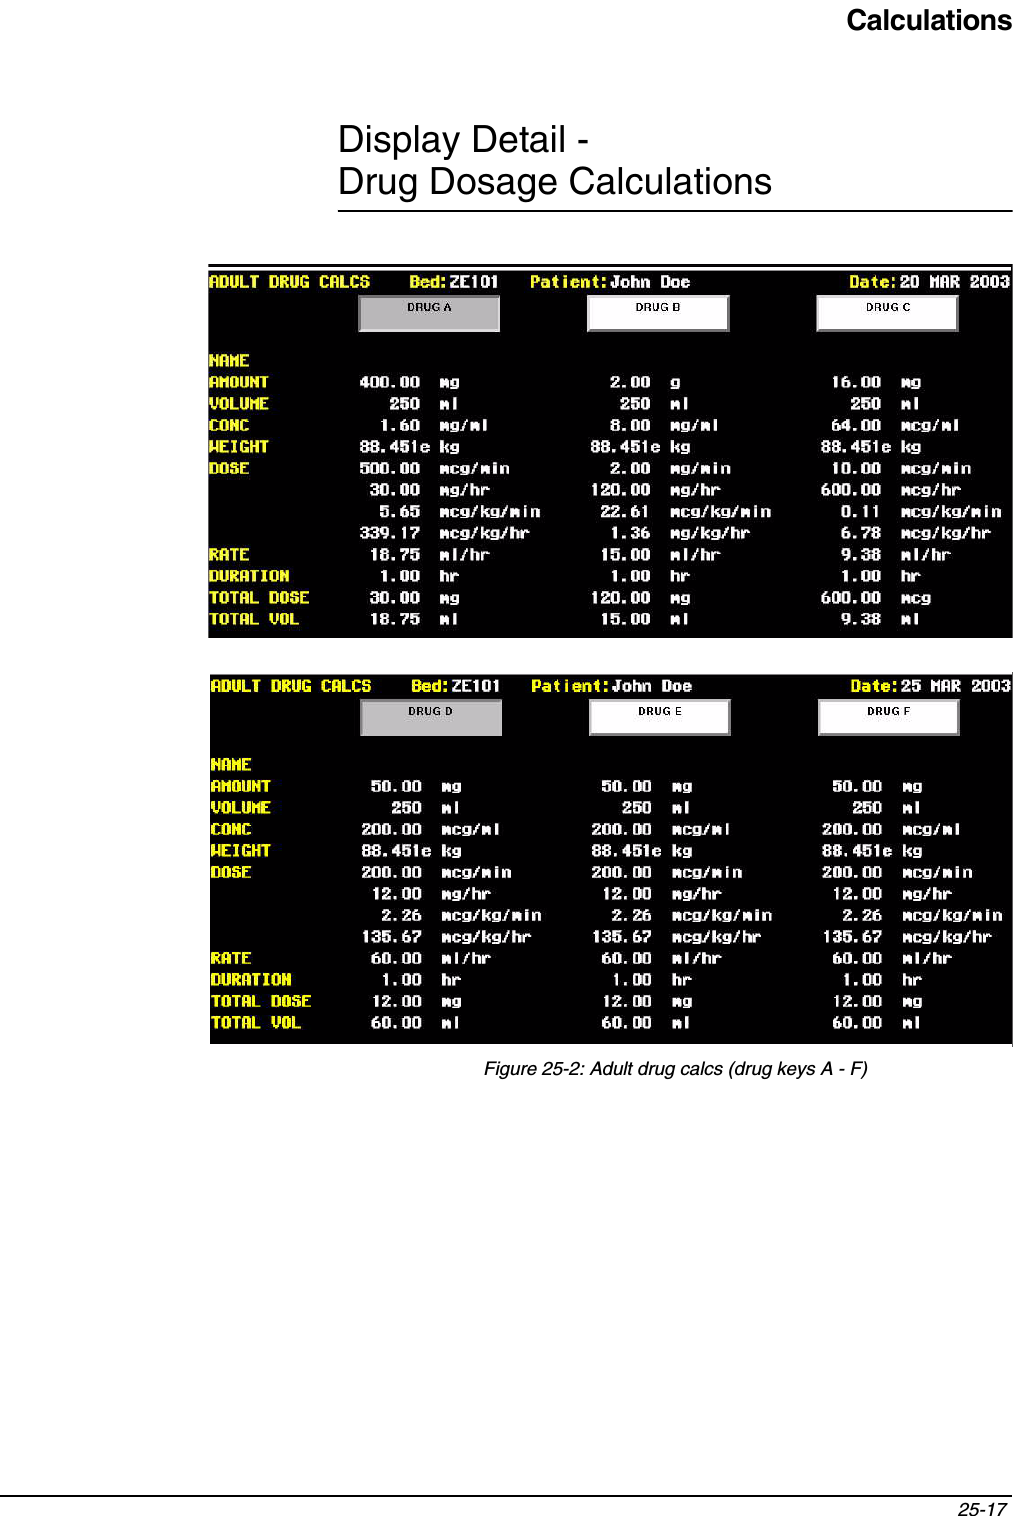
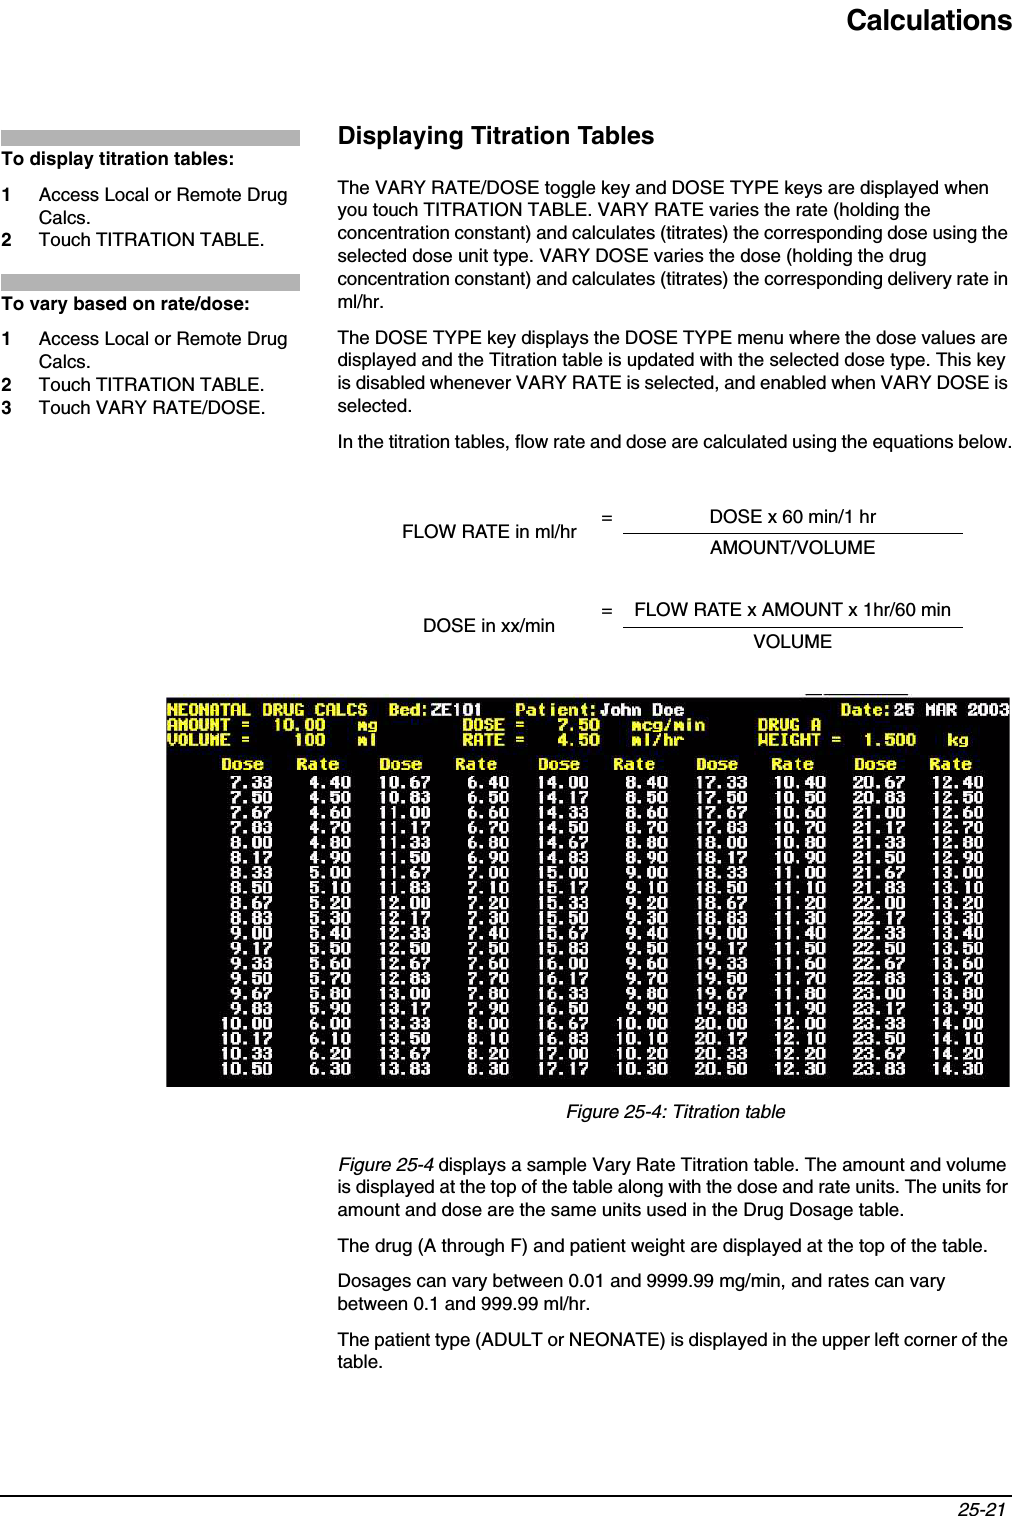
![Ultraview Care Network25-12Respiration CalculationsRespiration calculations describe the performance of the lungs in the ventilation process.Unless you have a ventilator Flexport interface, most input values for Respiration calculations must be manually entered. PVR = 79.9 x [(MPA-PCWP)/CO]PVRI= 79.9 x [(MPA-PCWP)/CI]= 79.9 x [(MPA-PCWP)]/[CO/BSA]= 79.9 x [(MPA-PCWP)]/[CO x 1/BSA]= 79.9 x [(MPA-PCWP)/CO] x BSA= PVR x BSALVSW = 0.0136 x SV x (MAP - PCWP)RVSW = 0.0136 x SV x (MPA - CVP)LVSWI = LVSW / BSARVSWI = RVSW / BSAAssumes pressures are measured in mmHgTable 5: Respiration InputLabel Name Units DefaultValueValidRangeRR Respiration Rate breaths/min 20 0-200PaCO2Partial Pressure of Arterial Carbon DioxidemmHgkPa405.30-1500-20.0VT Tidal Volume ml/breath 500 0-3000PIP Peak Inspiratory Pressure cmH2O 50 0-200PLT Plateau Pressure cmH2O 30 0-200PEEP Positive End Expiratory Pressure cmH2O100-50PECO2Partial Pressure of Expired Carbon DioxidemmHgkPa354.70-1500-20.0Table 4: Hemodynamic Equations (continued)To view current respiration calcs:1Touch CALCS.2Touch RESP CALCS.](https://usermanual.wiki/Spacelabs-Healthcare/76A90341-WMTS.User-Manual-3-of-3/User-Guide-347485-Page-136.png)
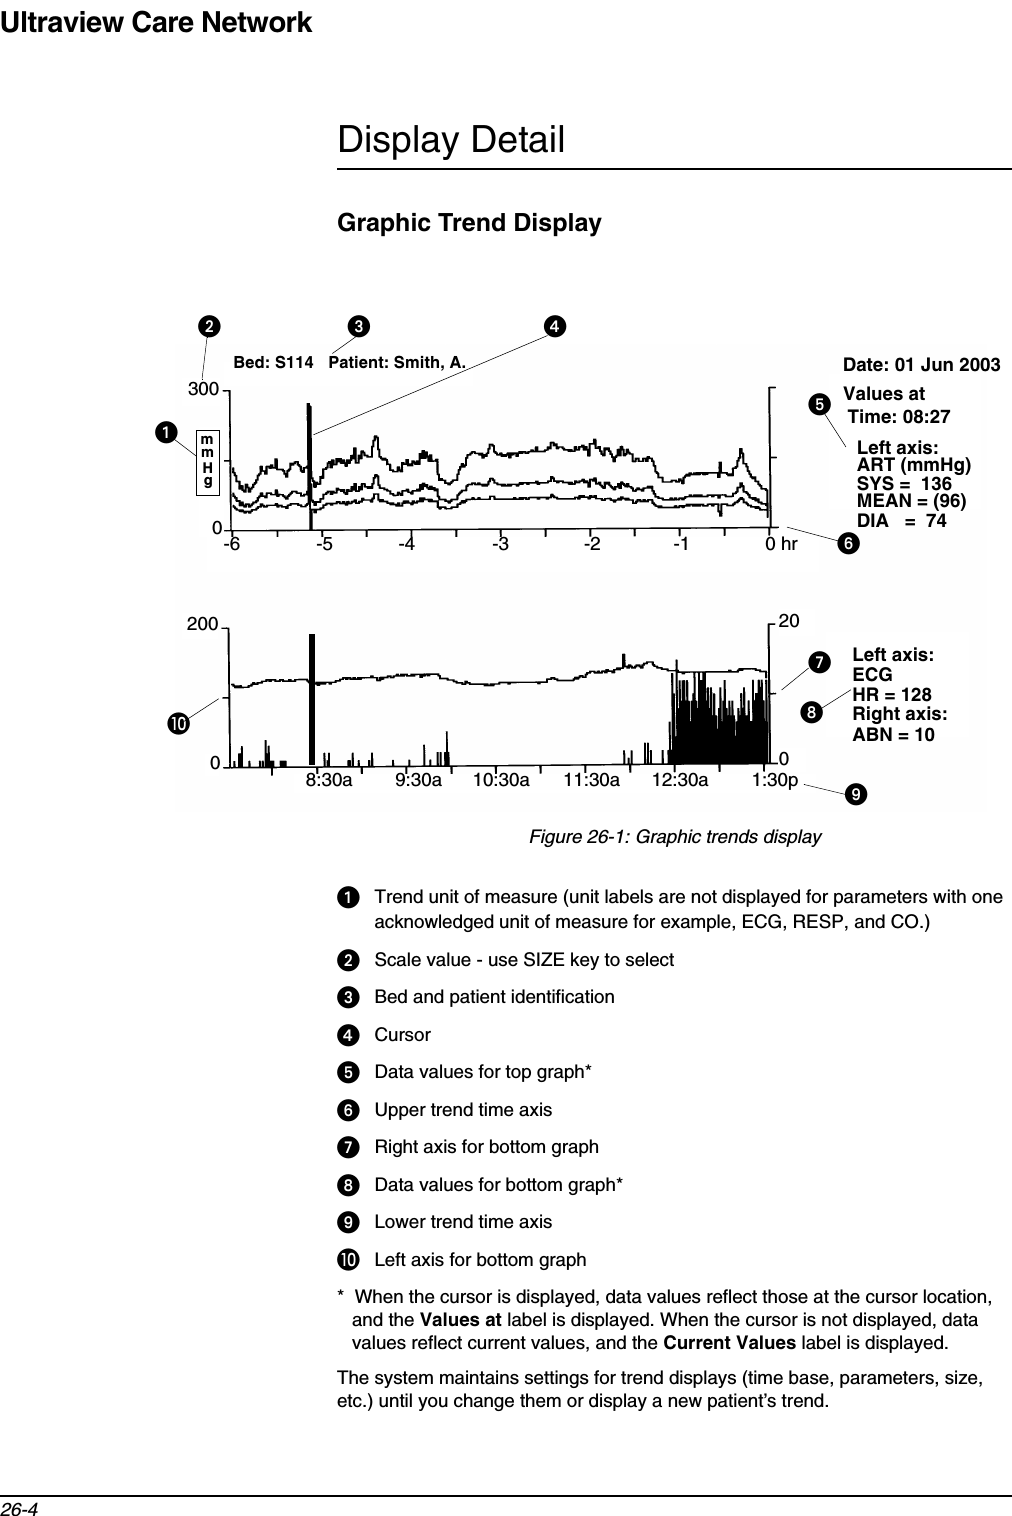
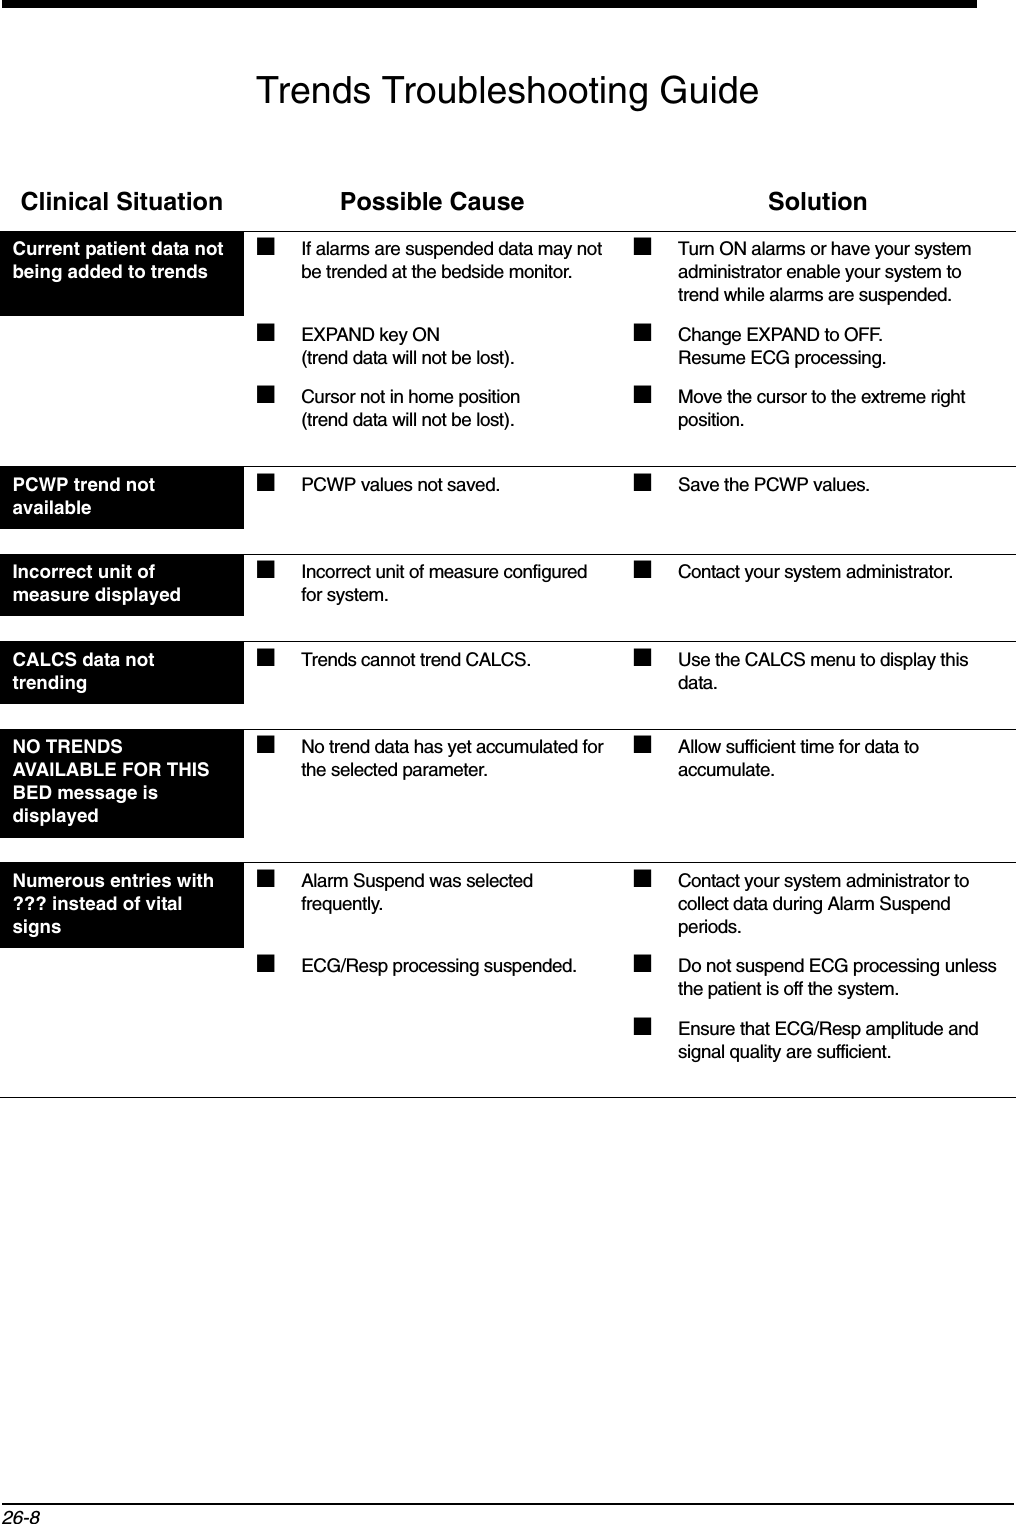
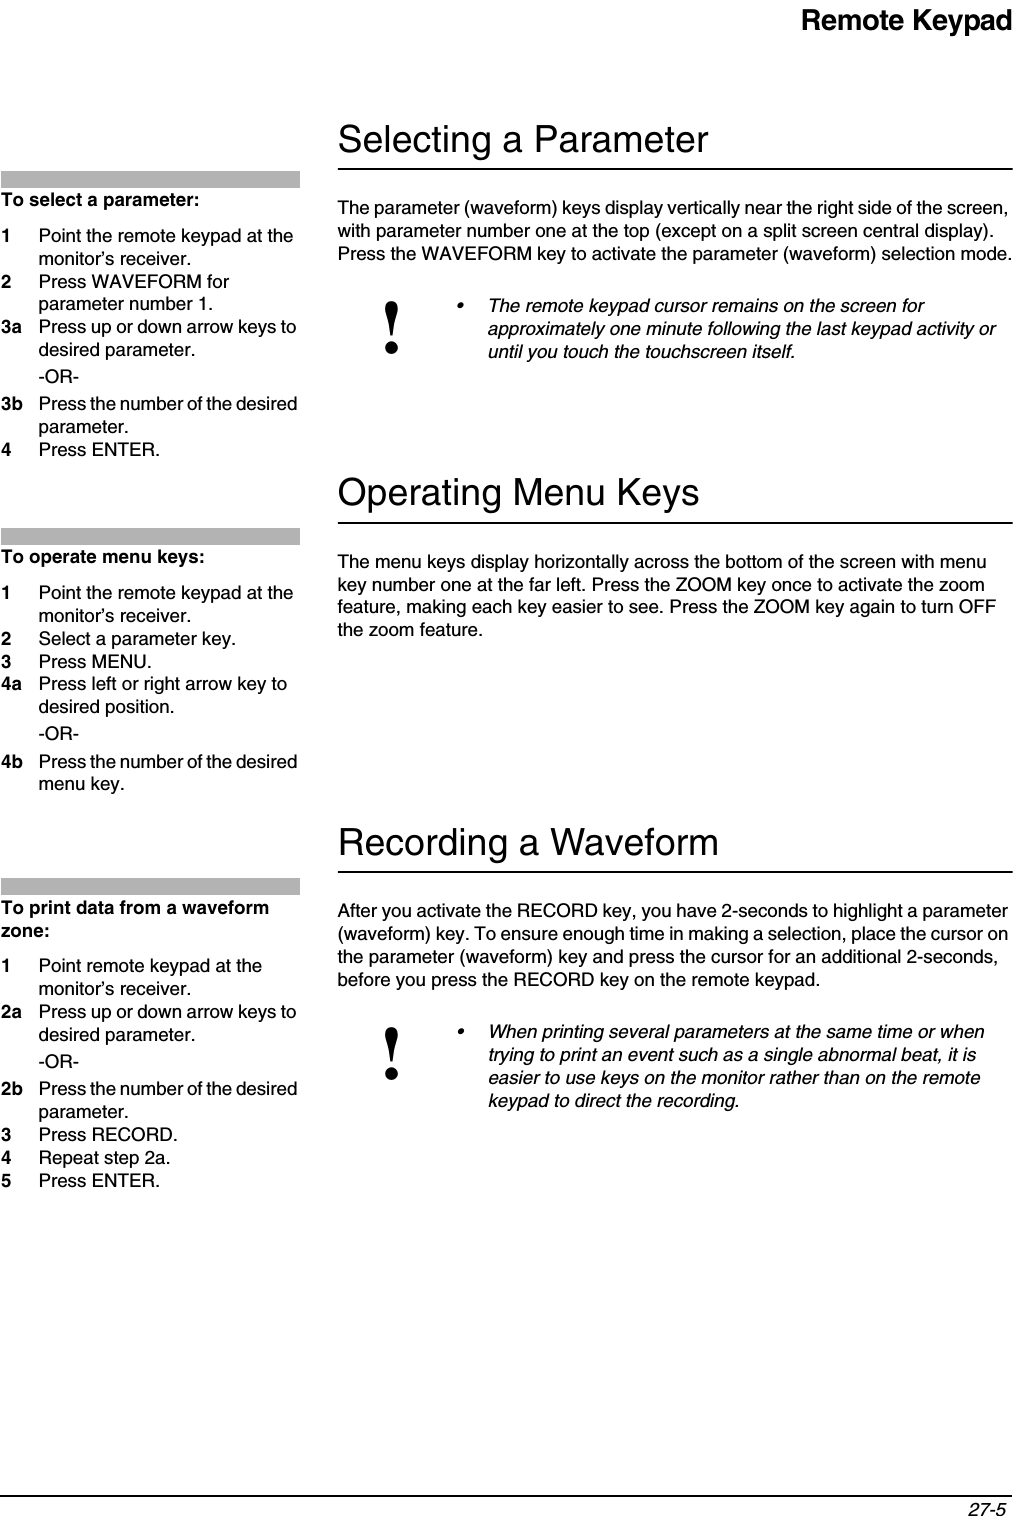
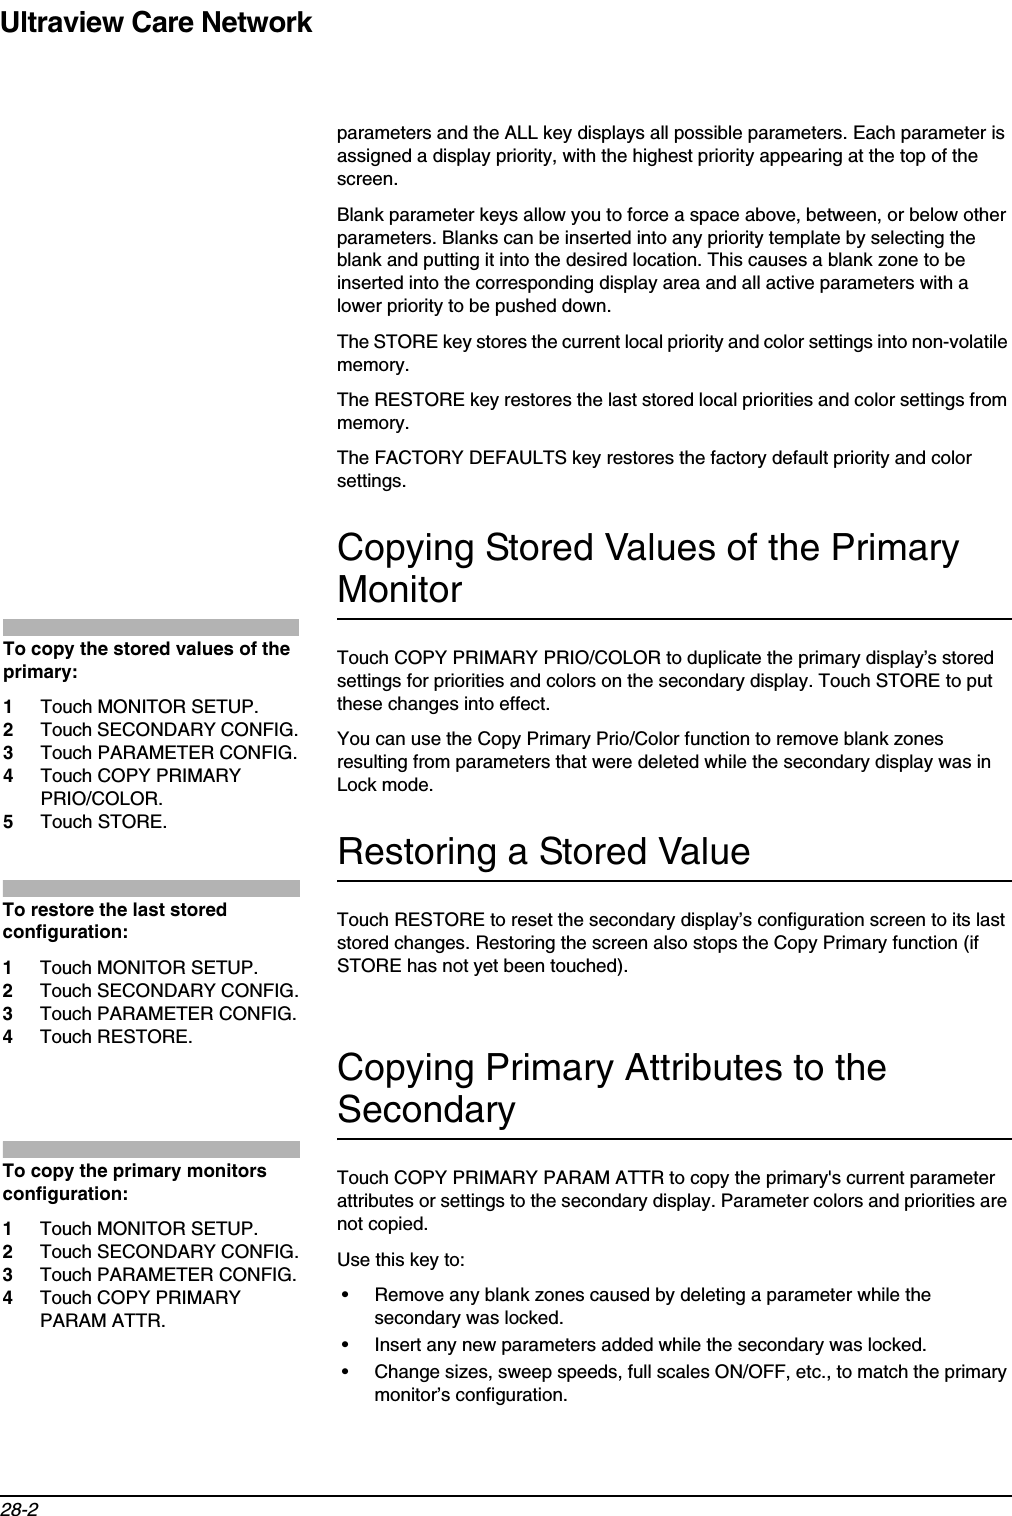
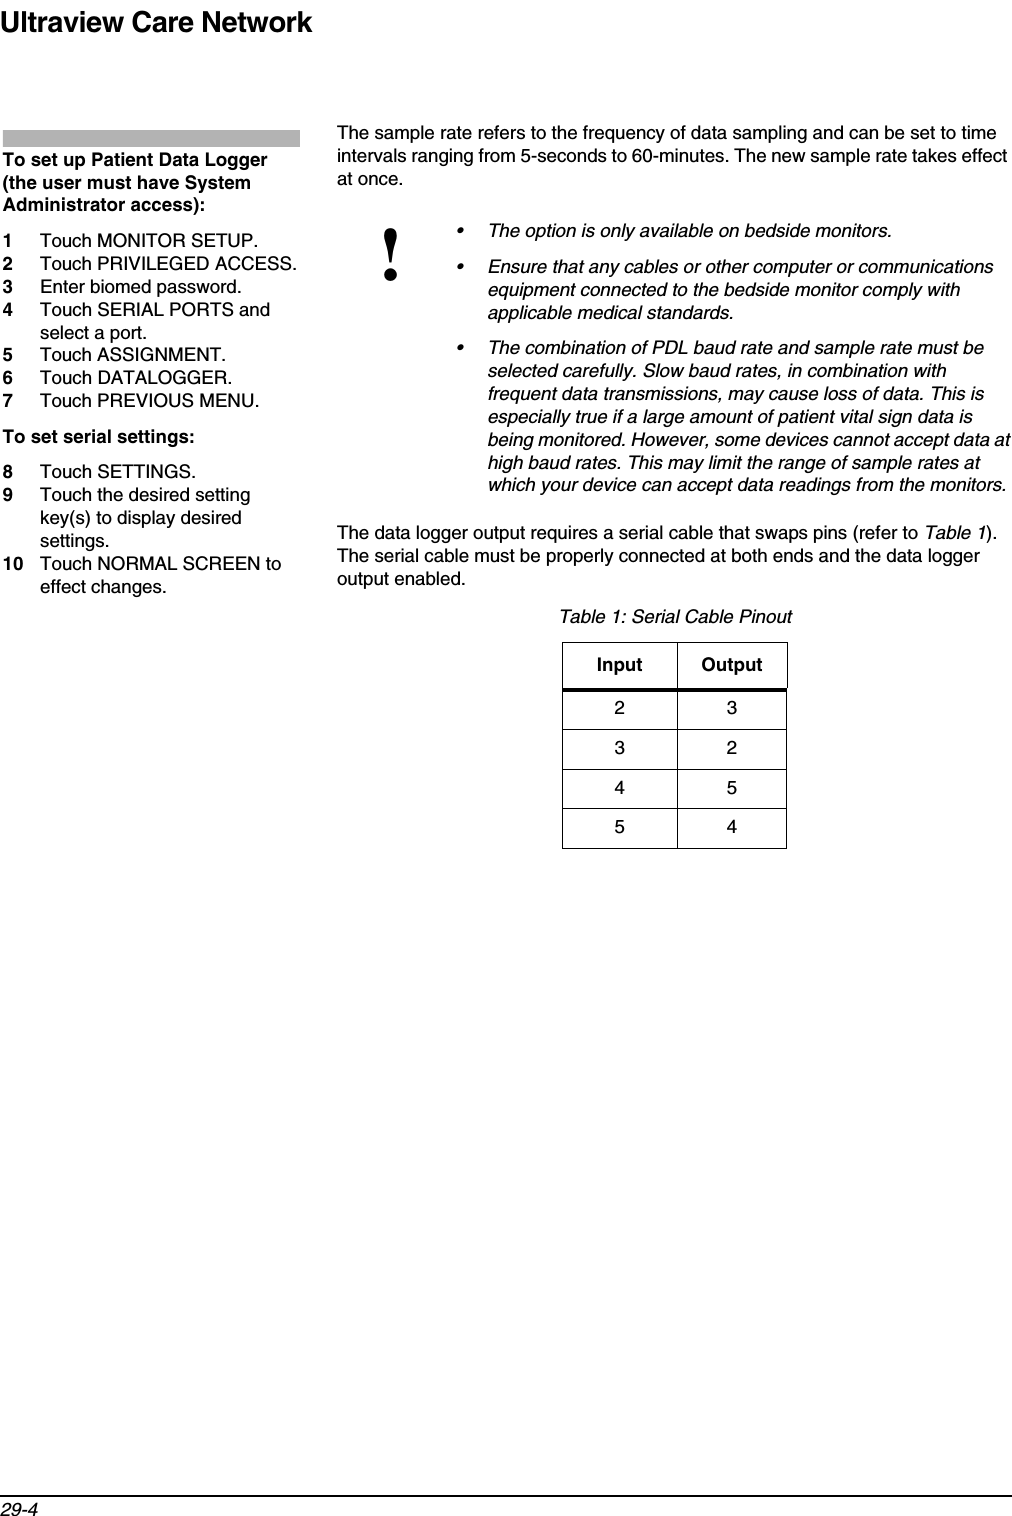
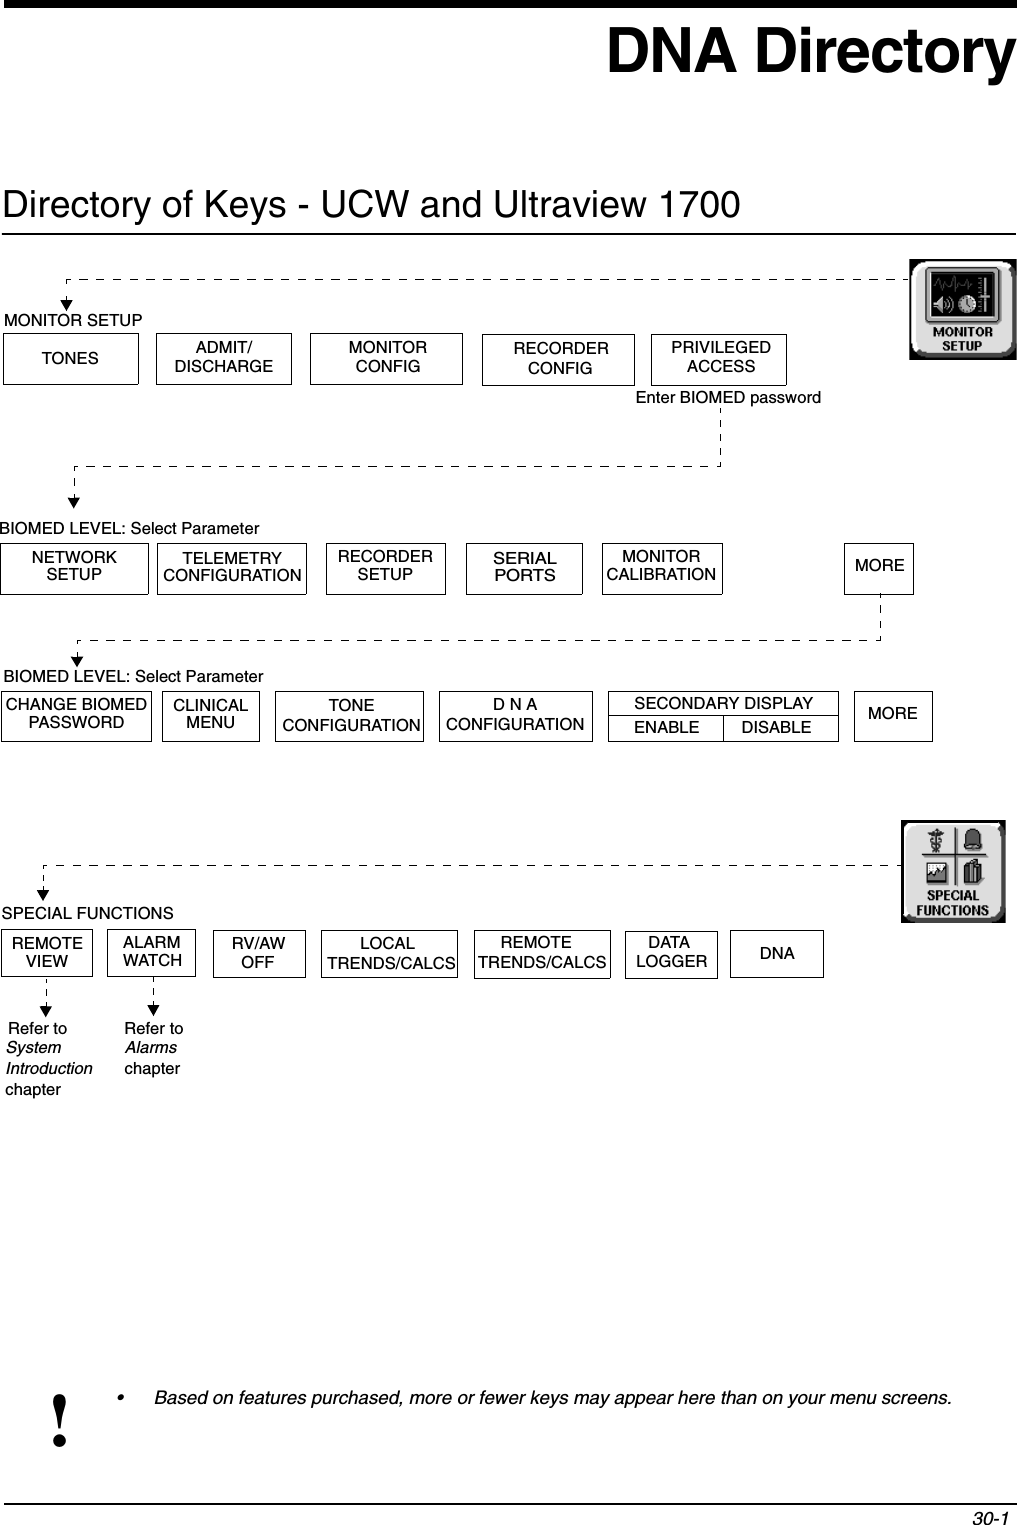
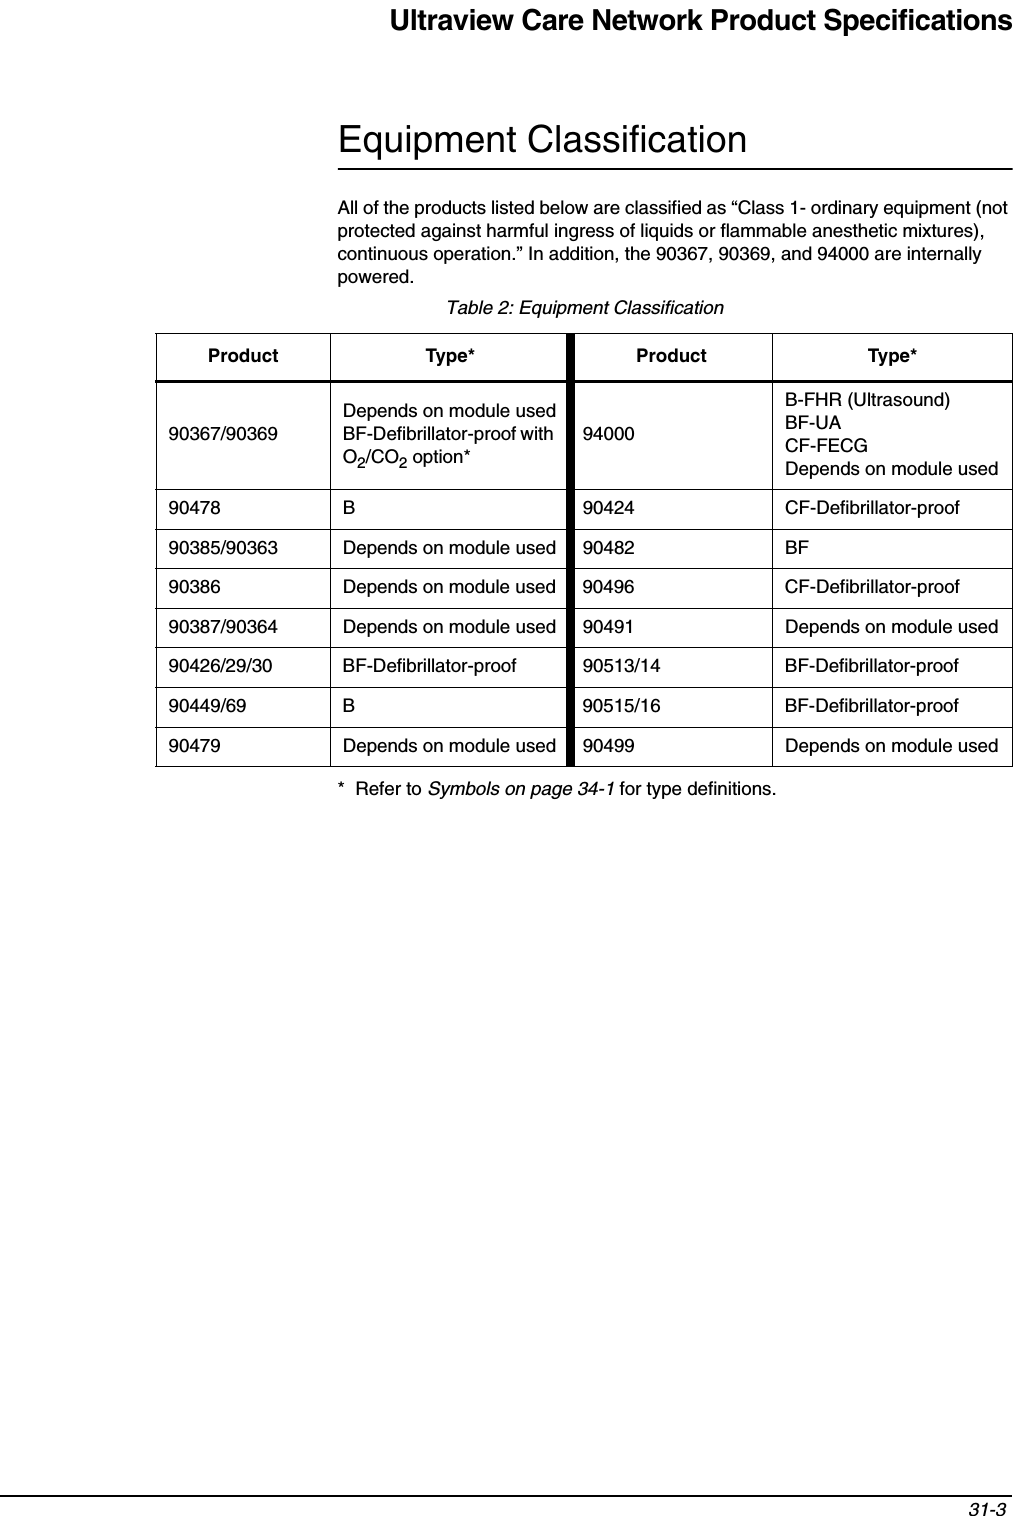
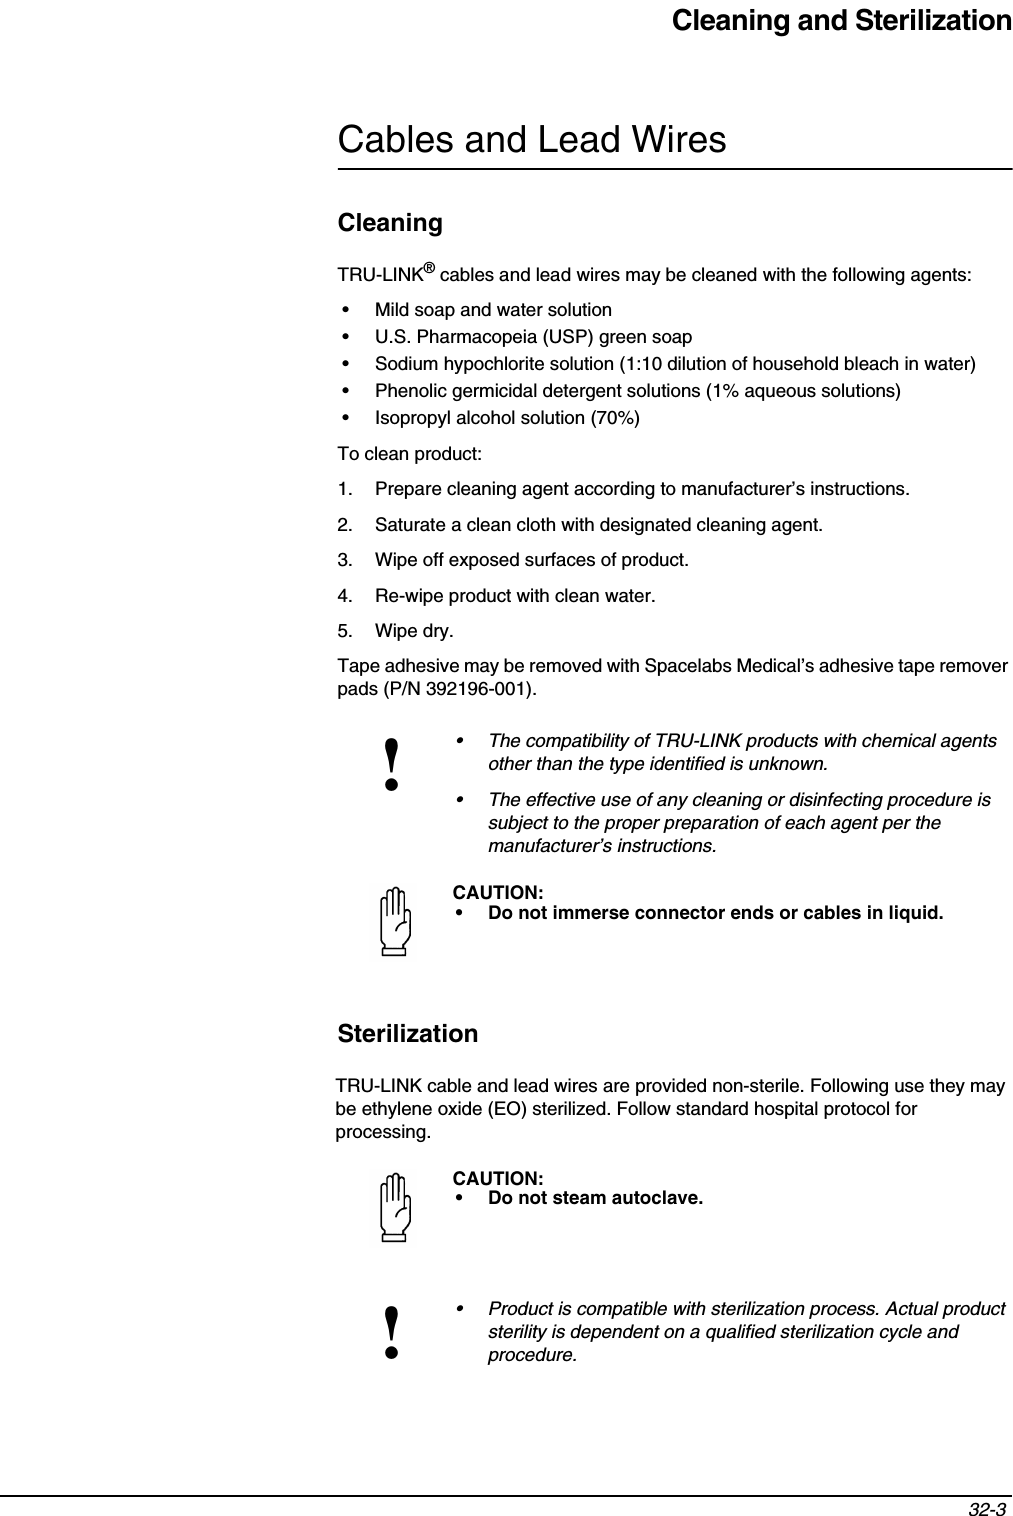
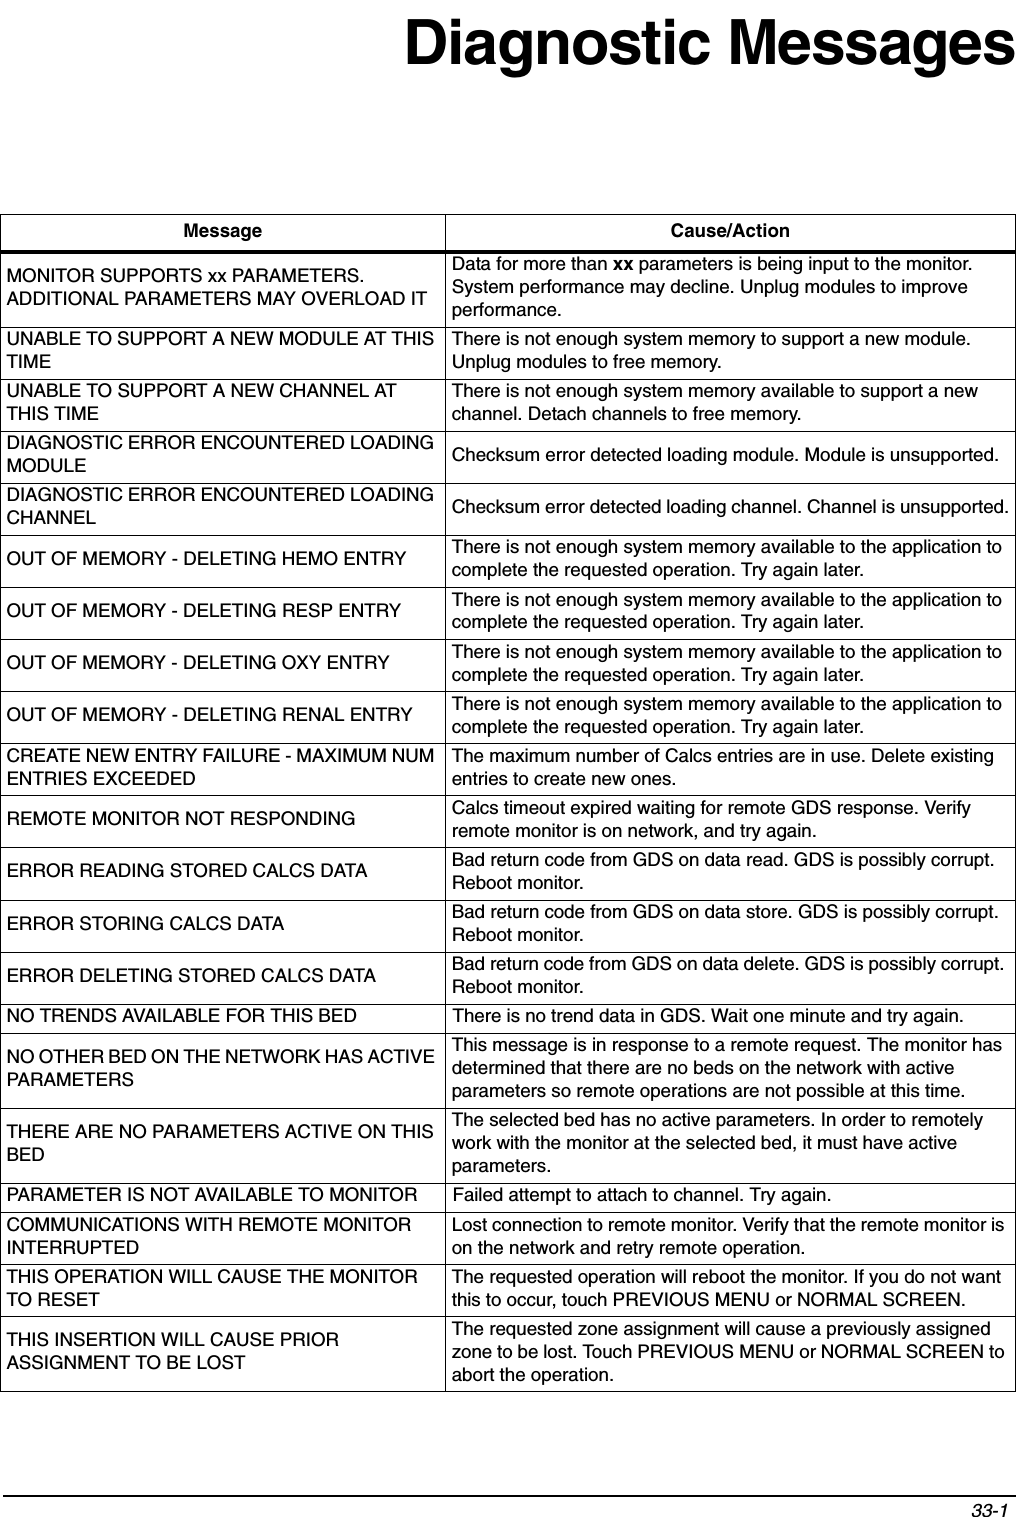
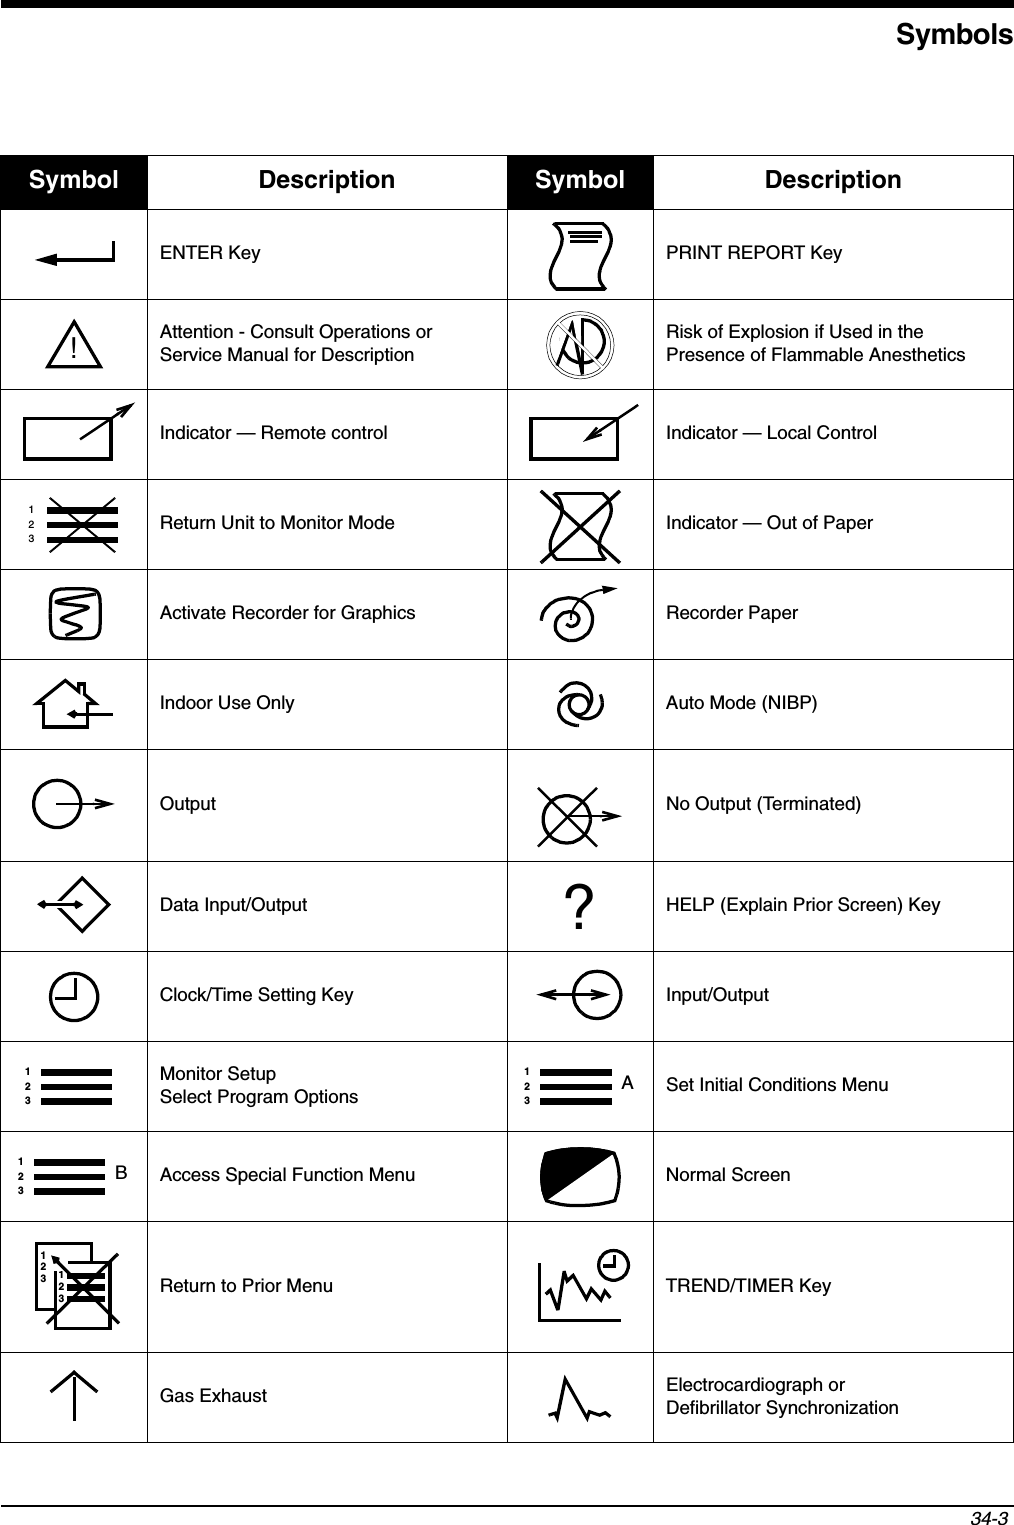
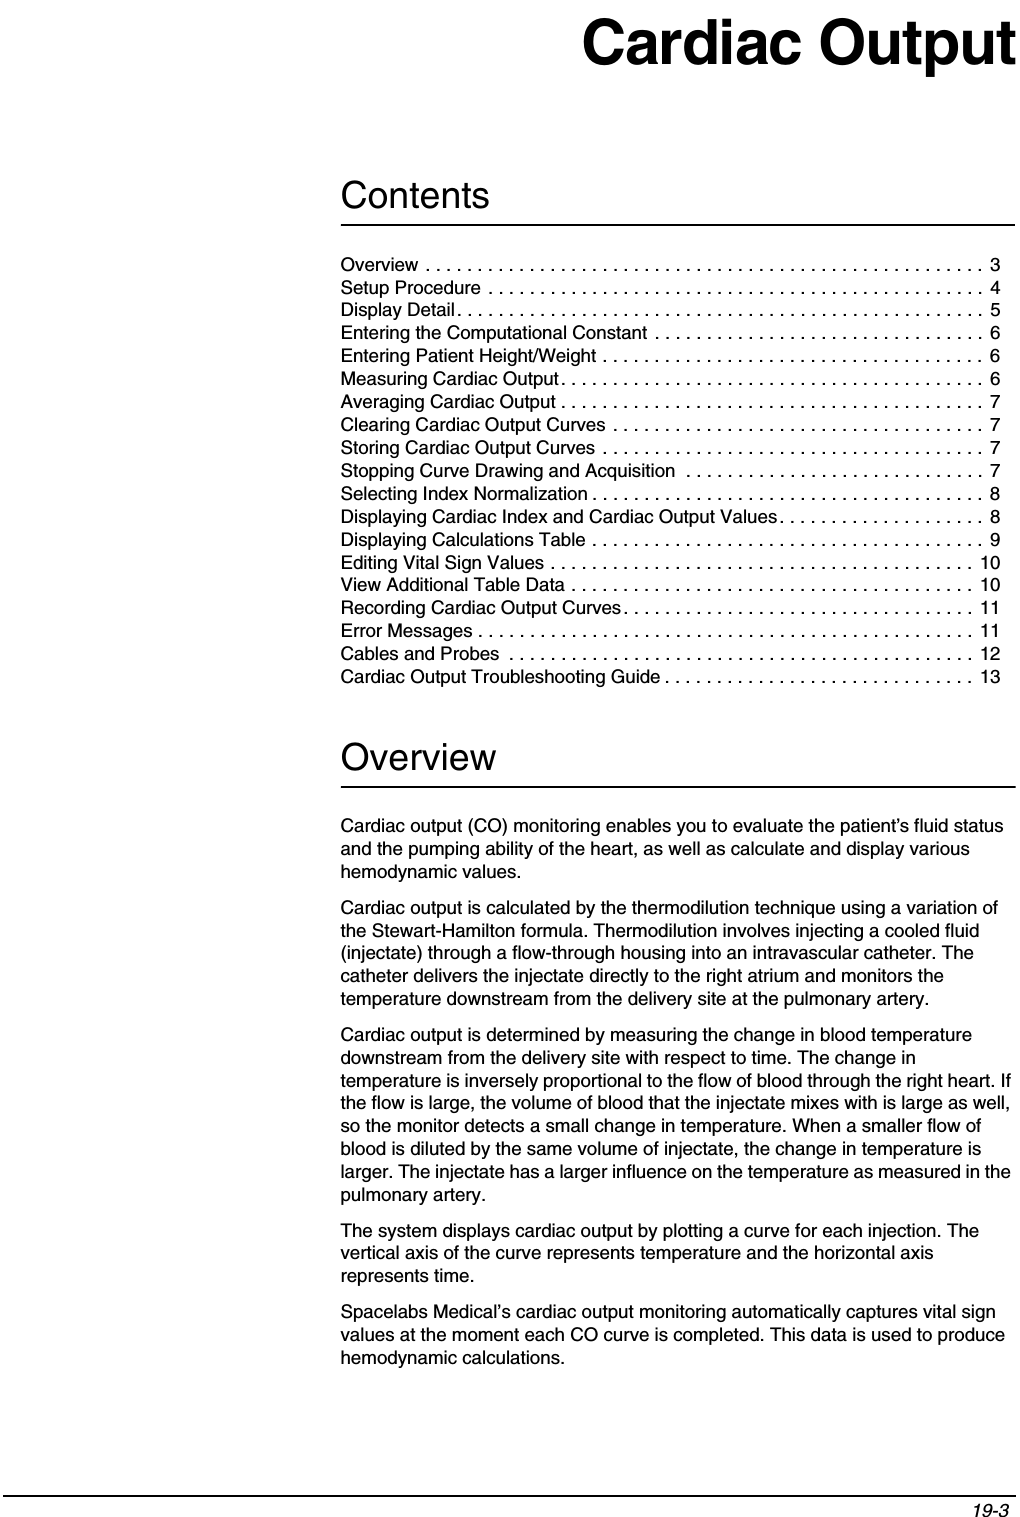
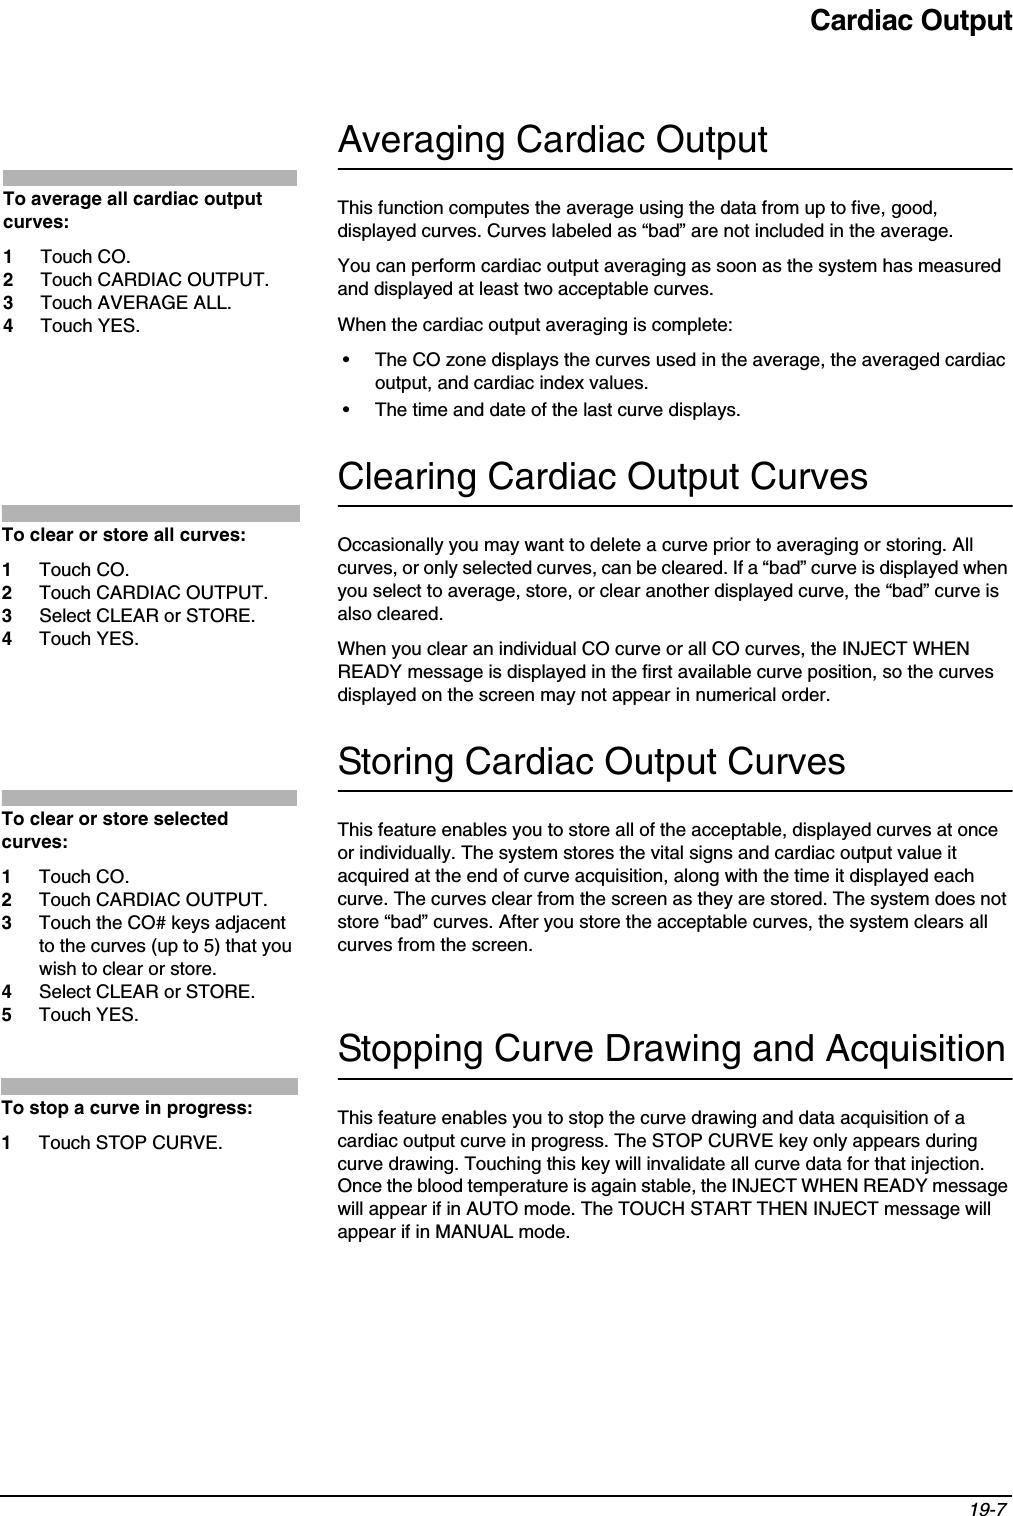
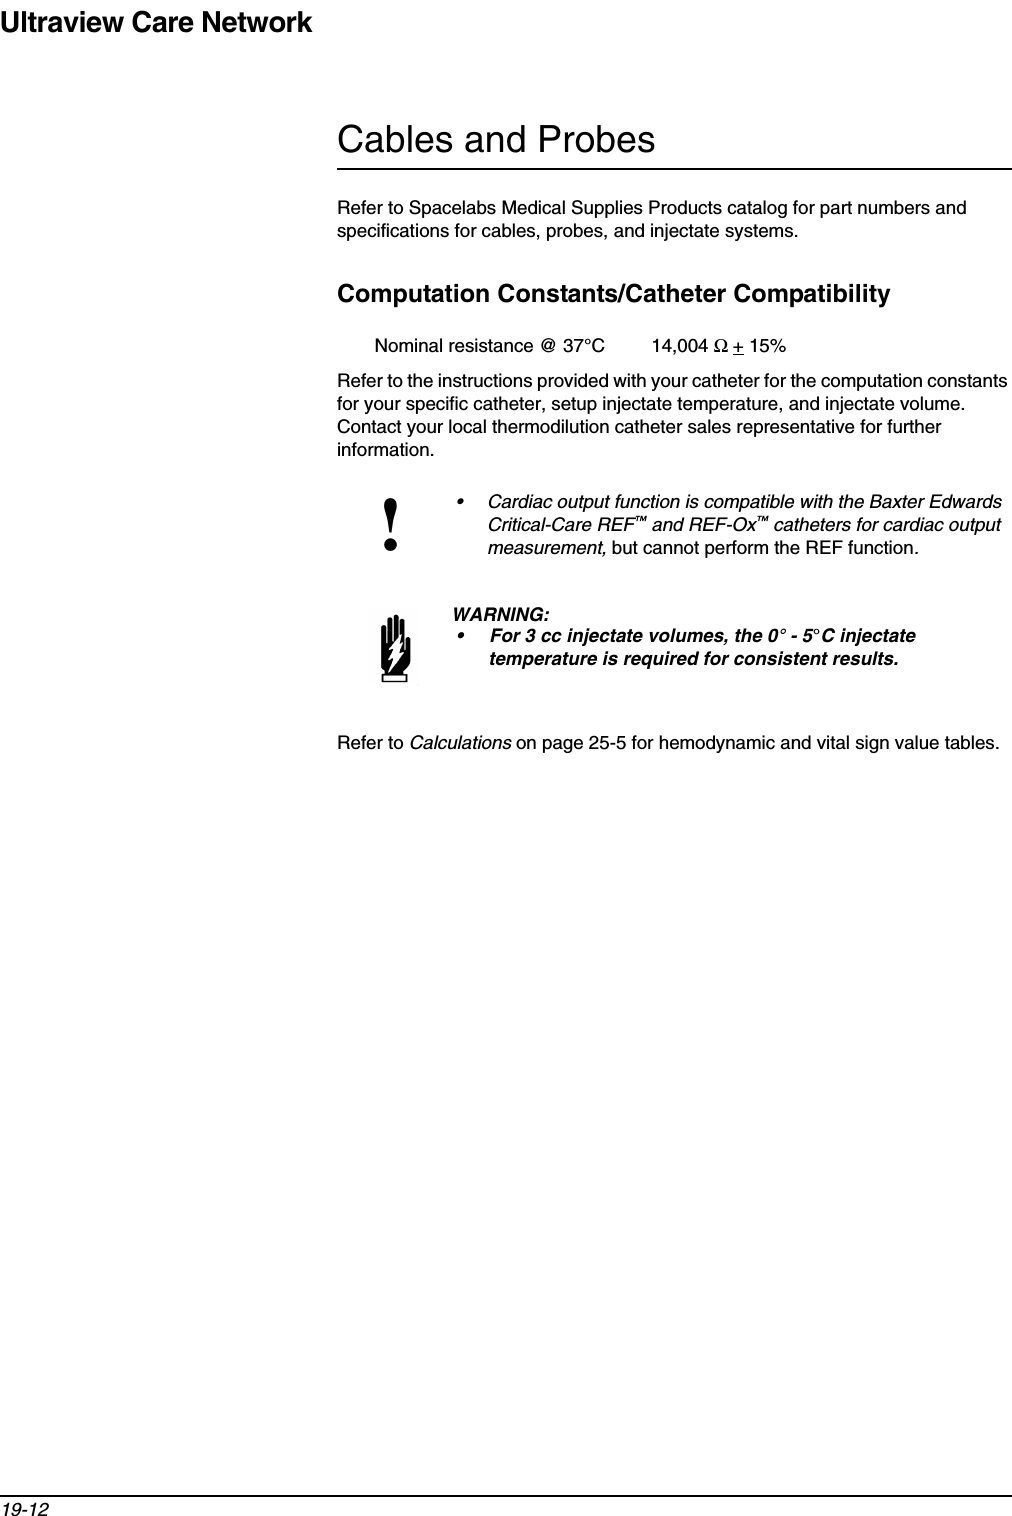
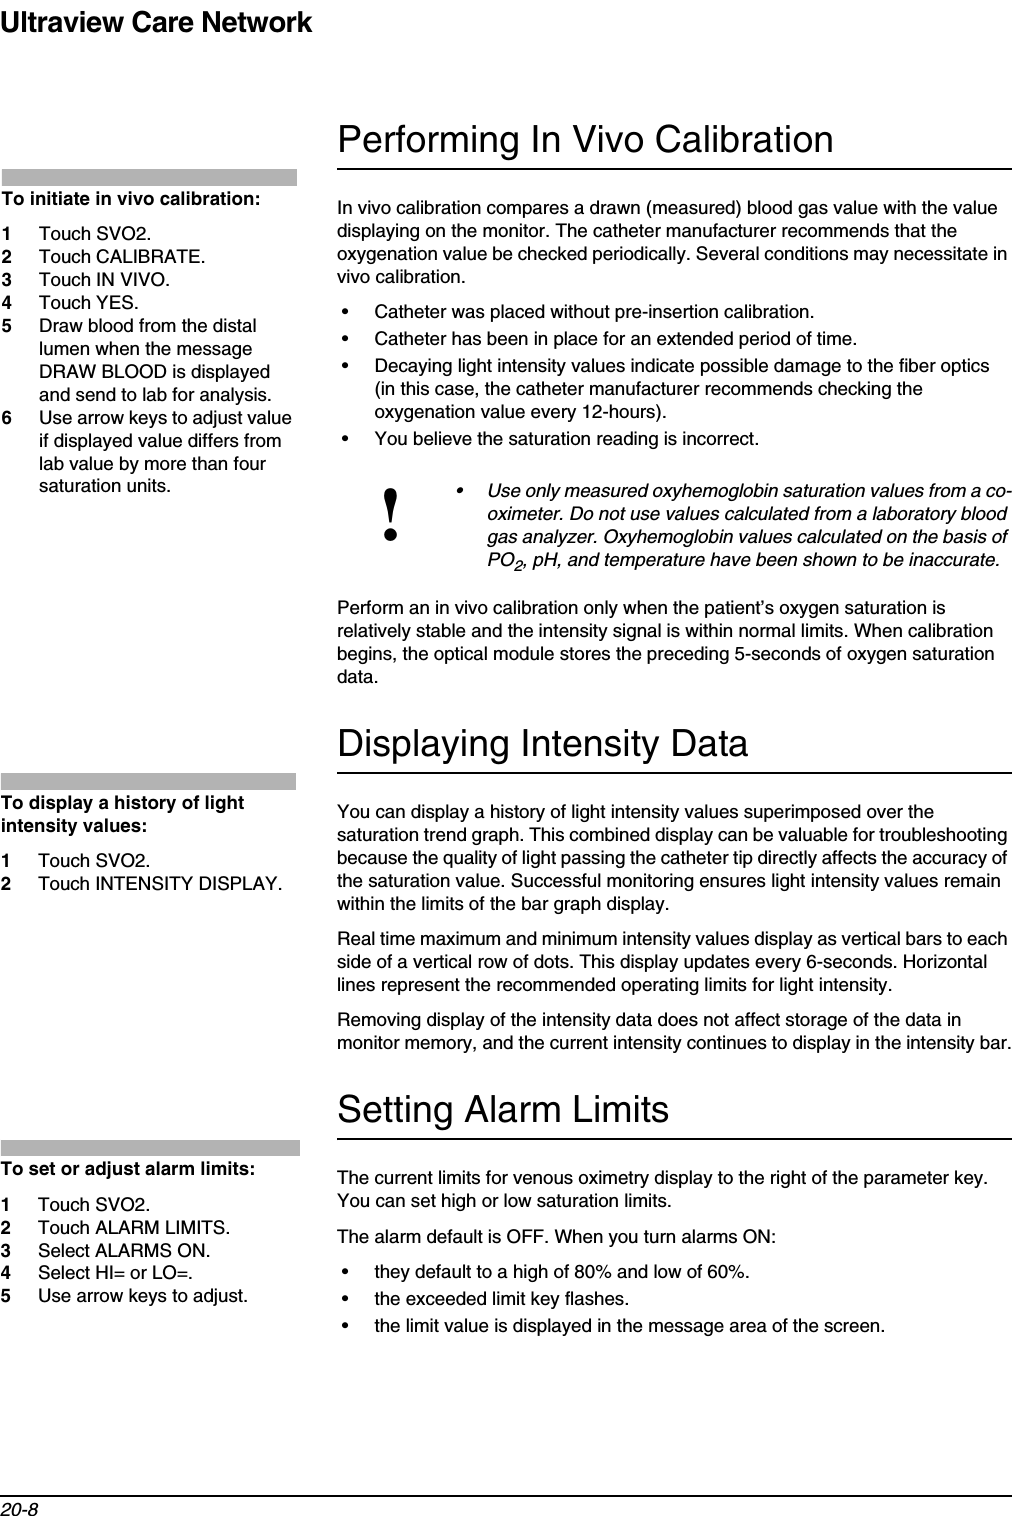
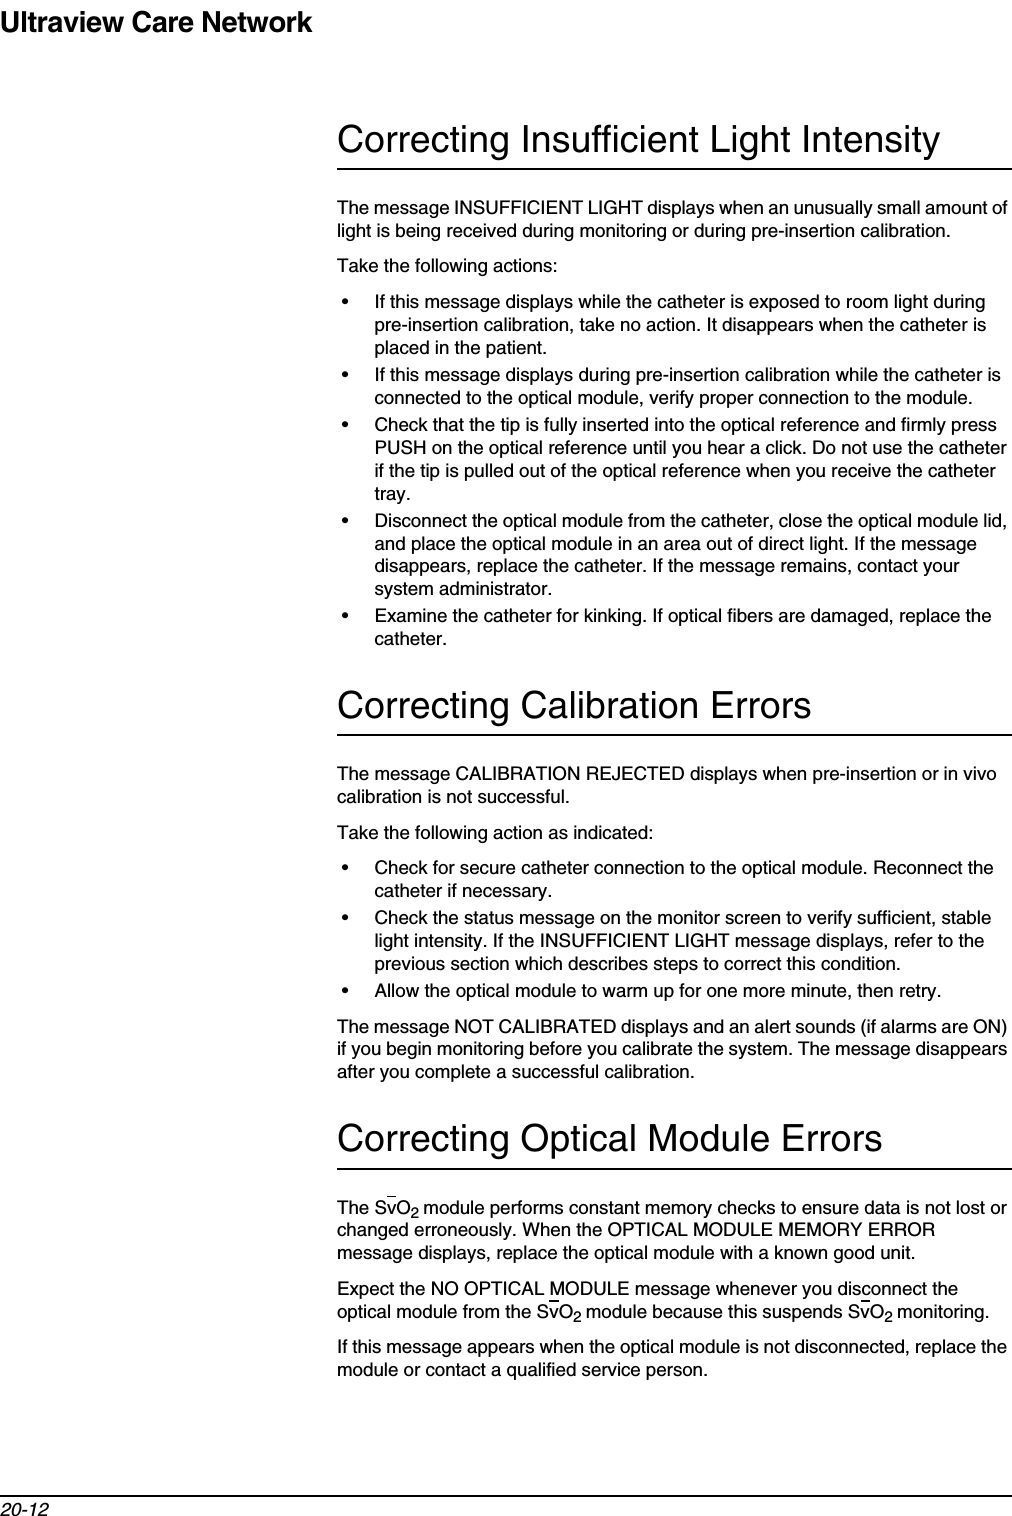
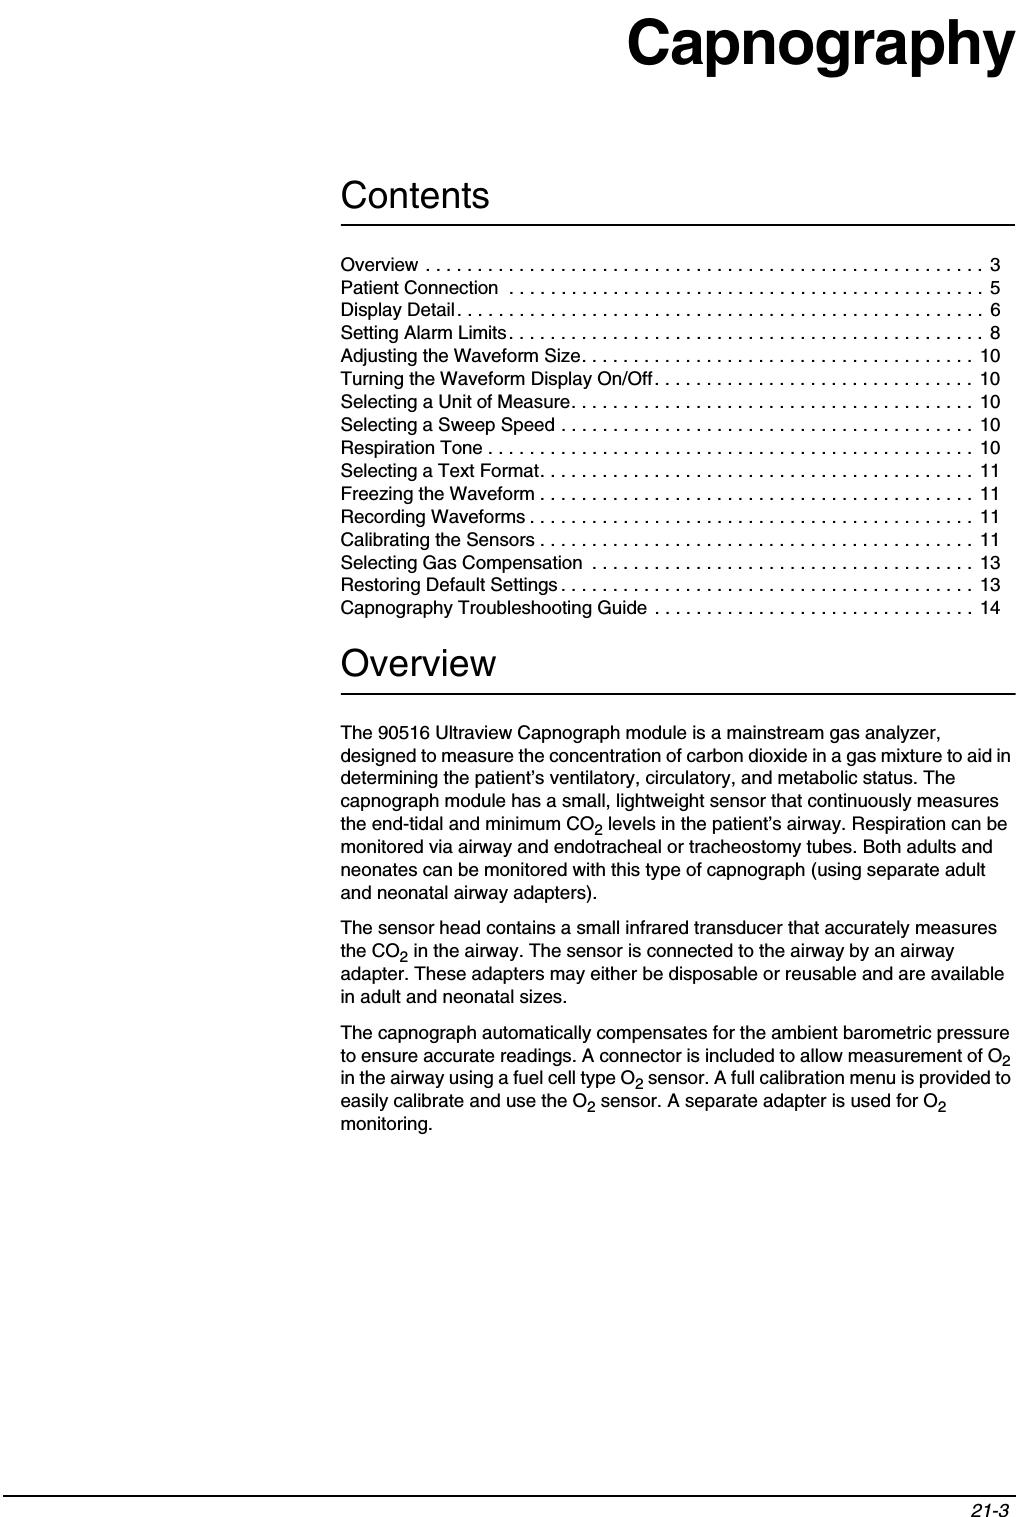
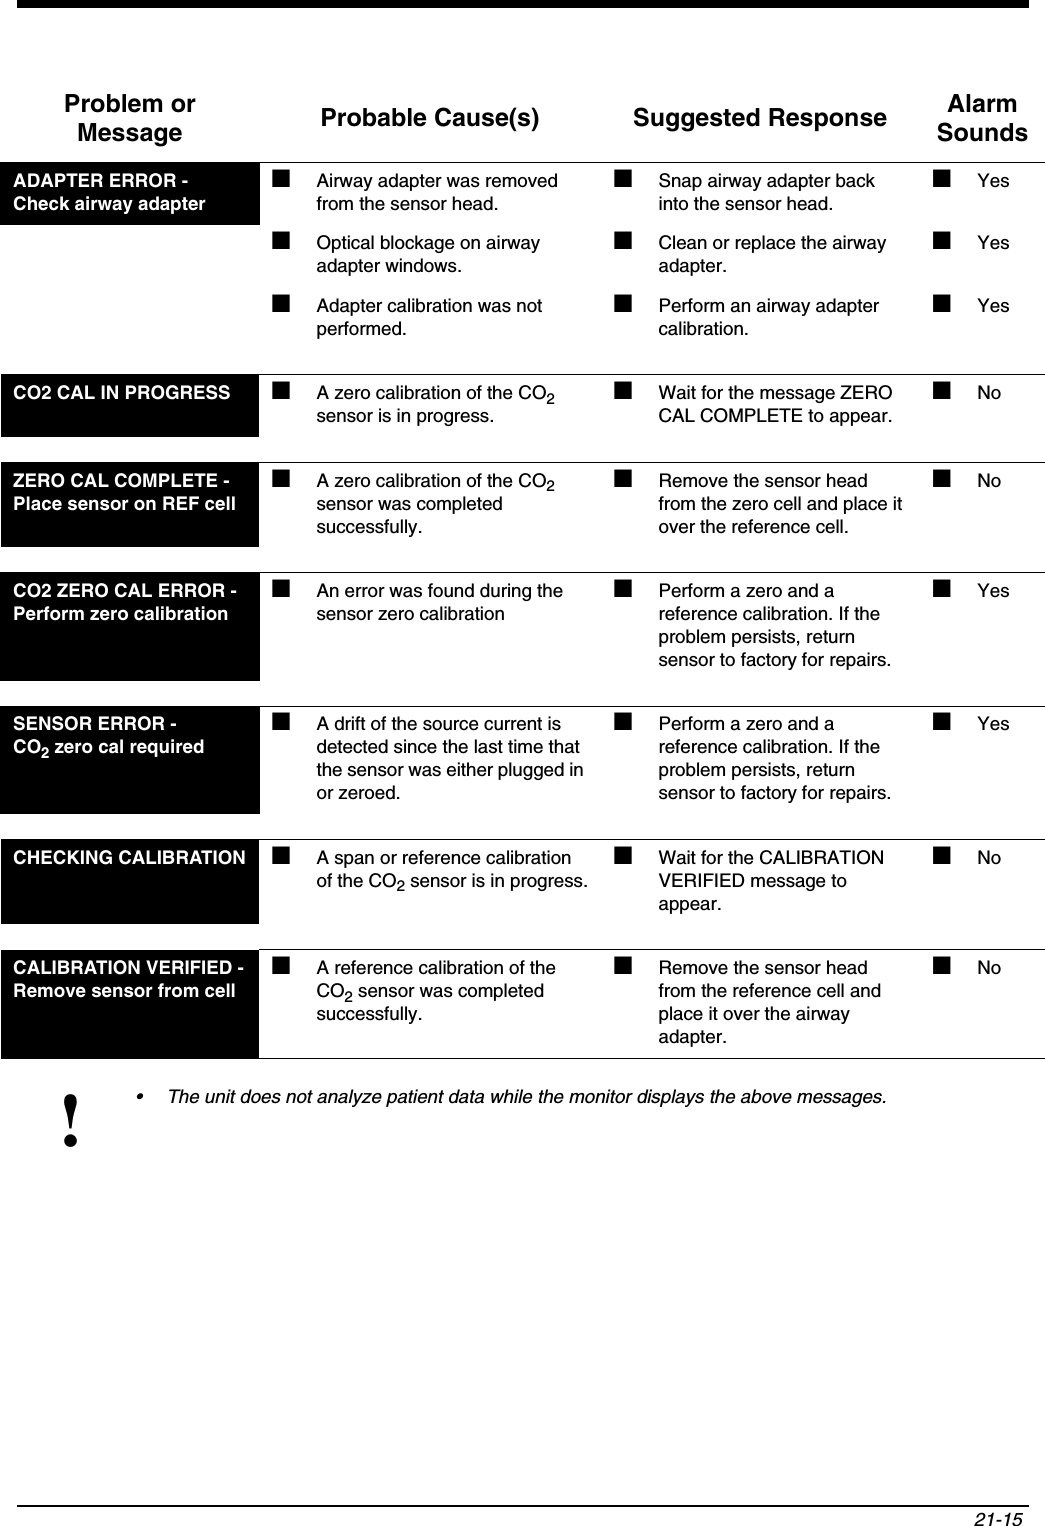
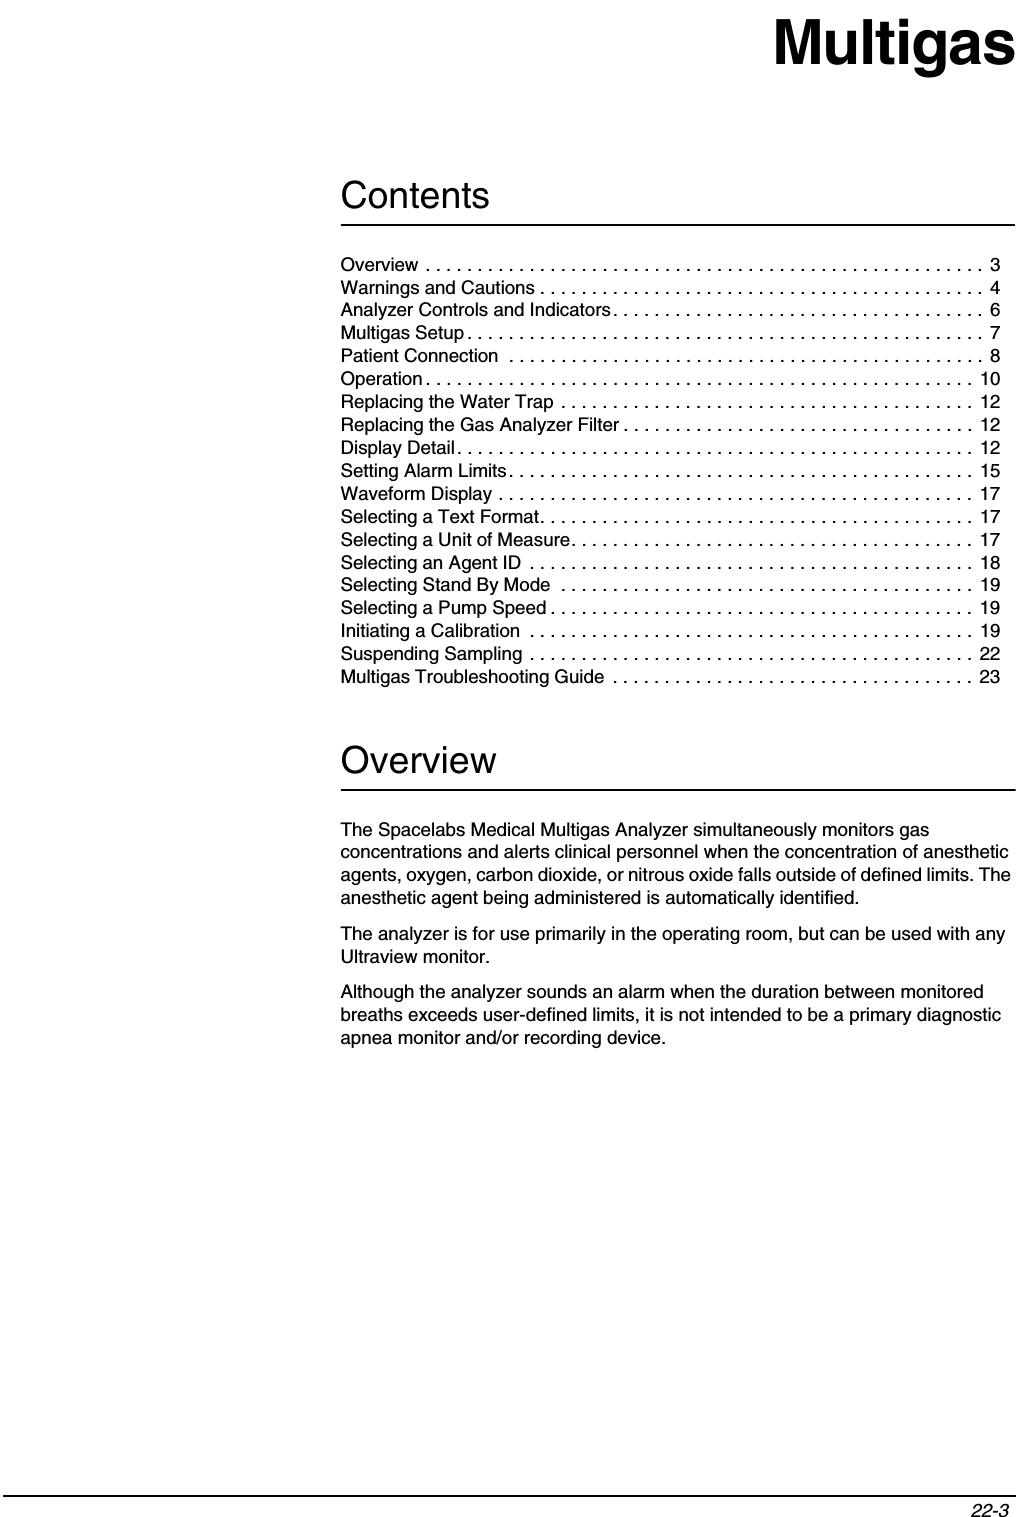
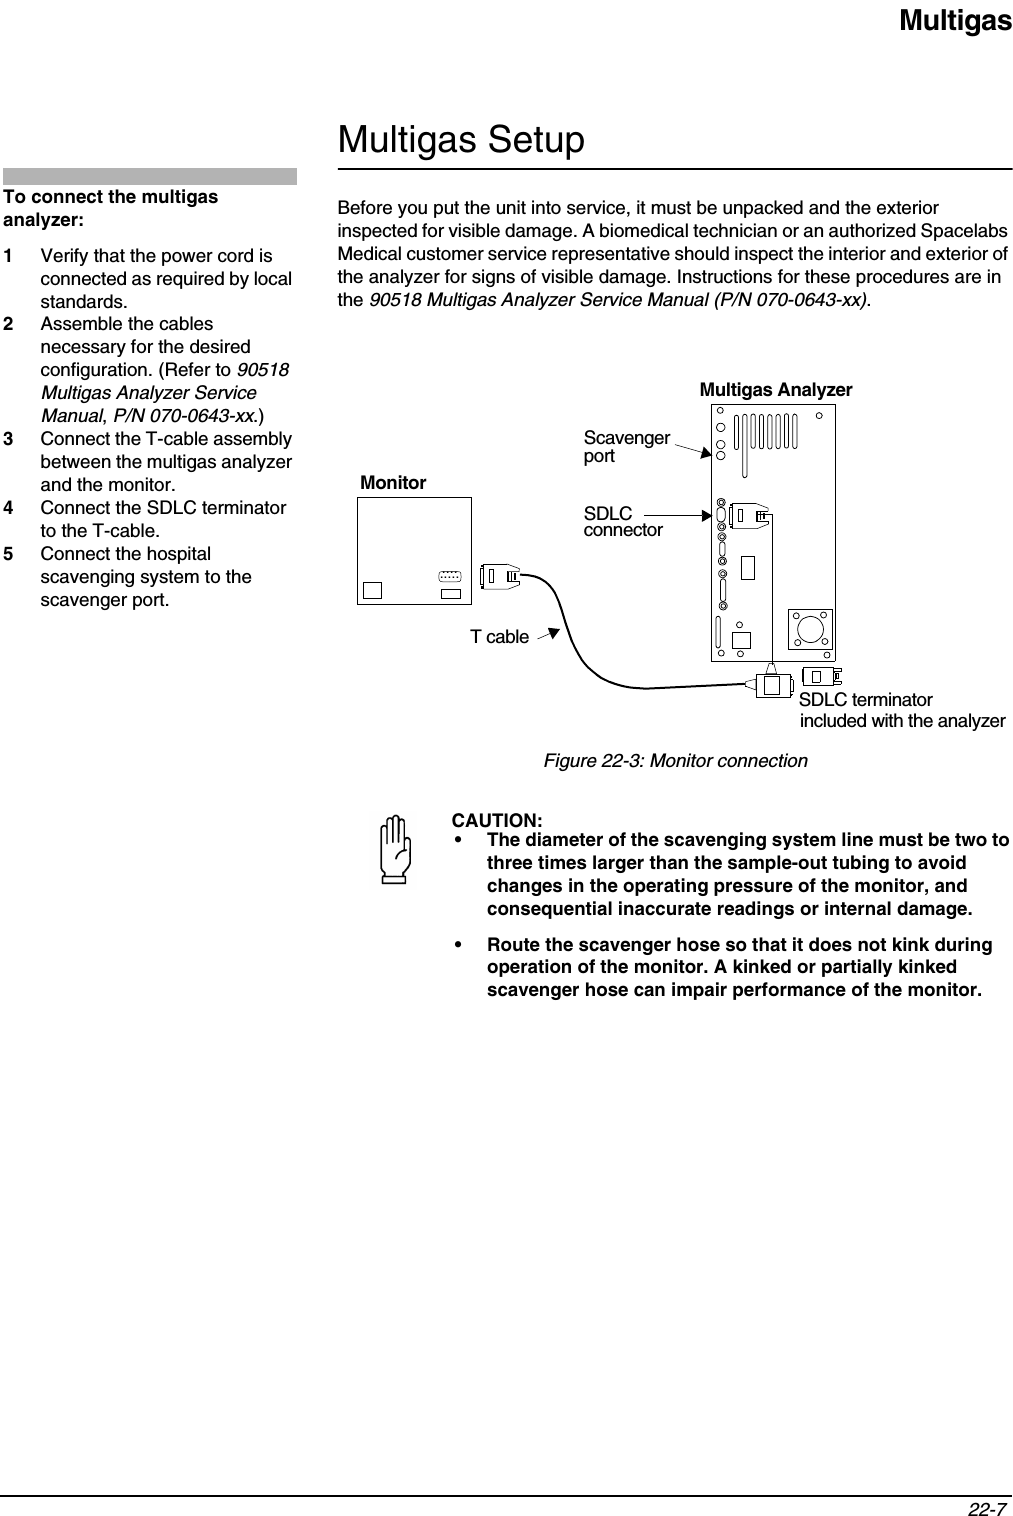
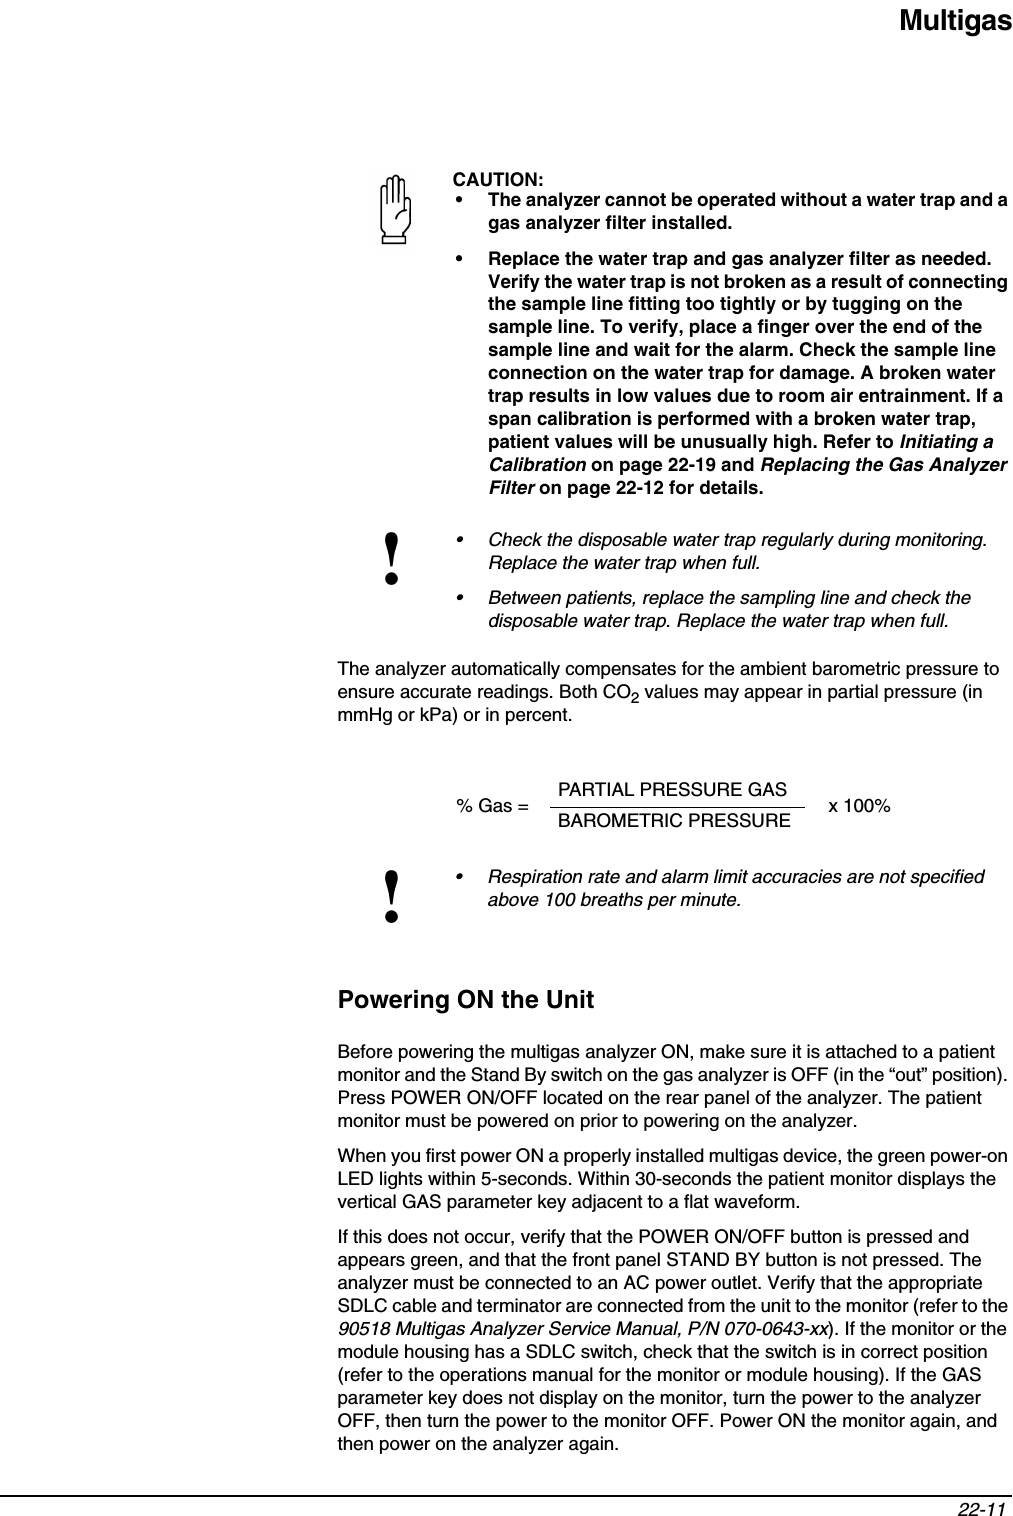
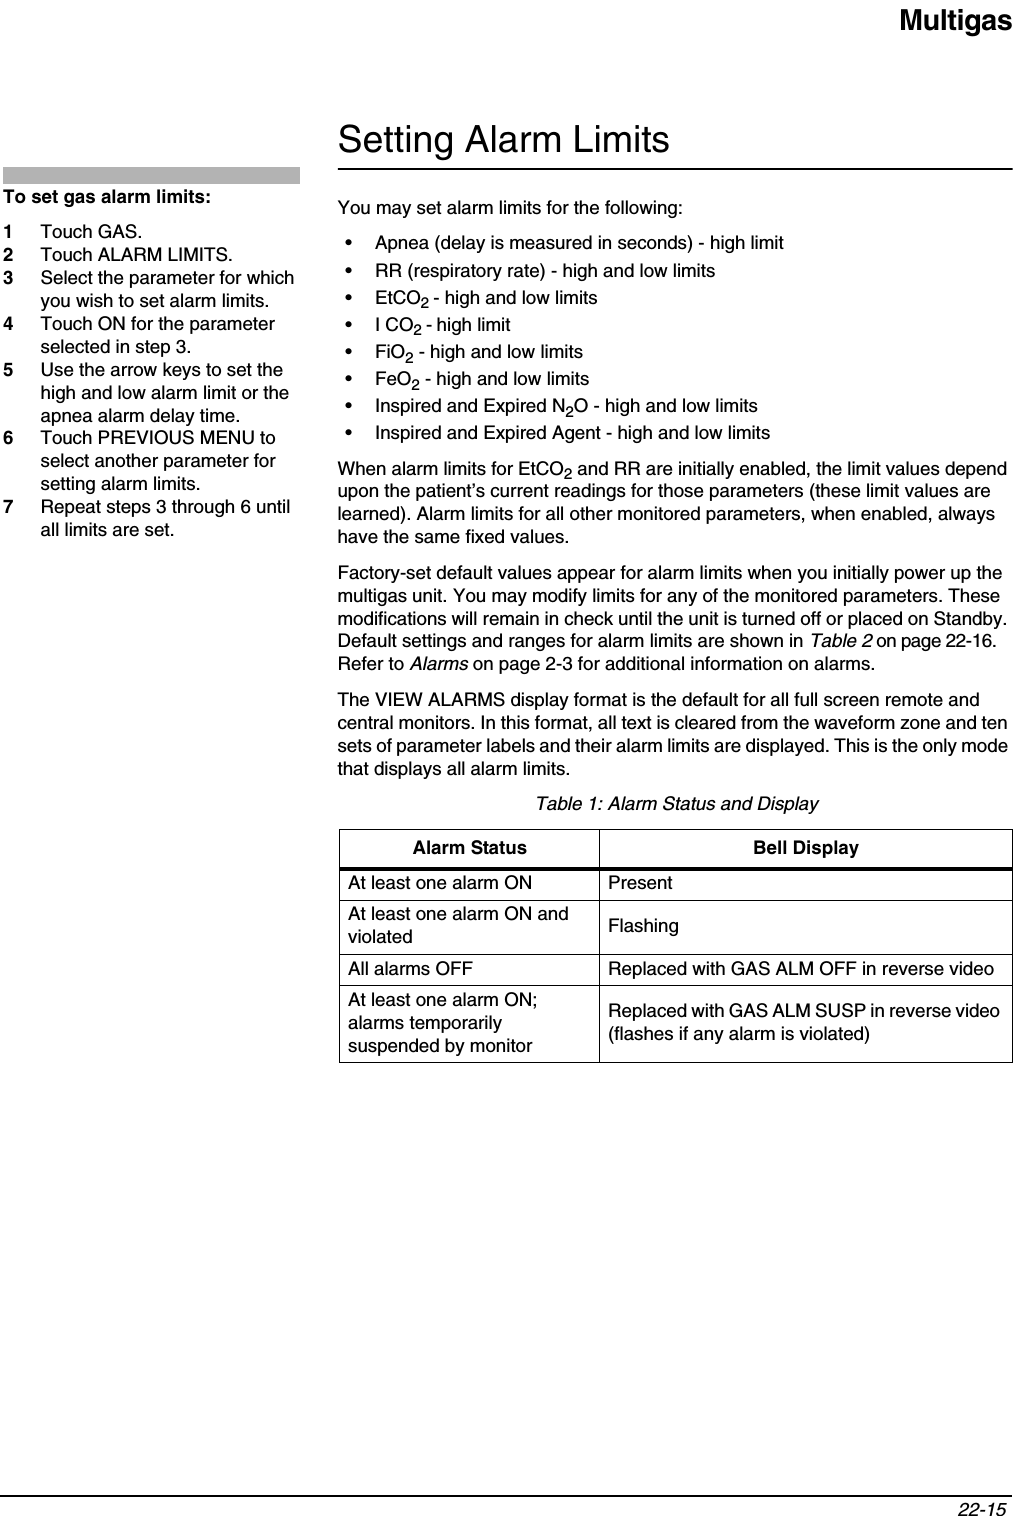
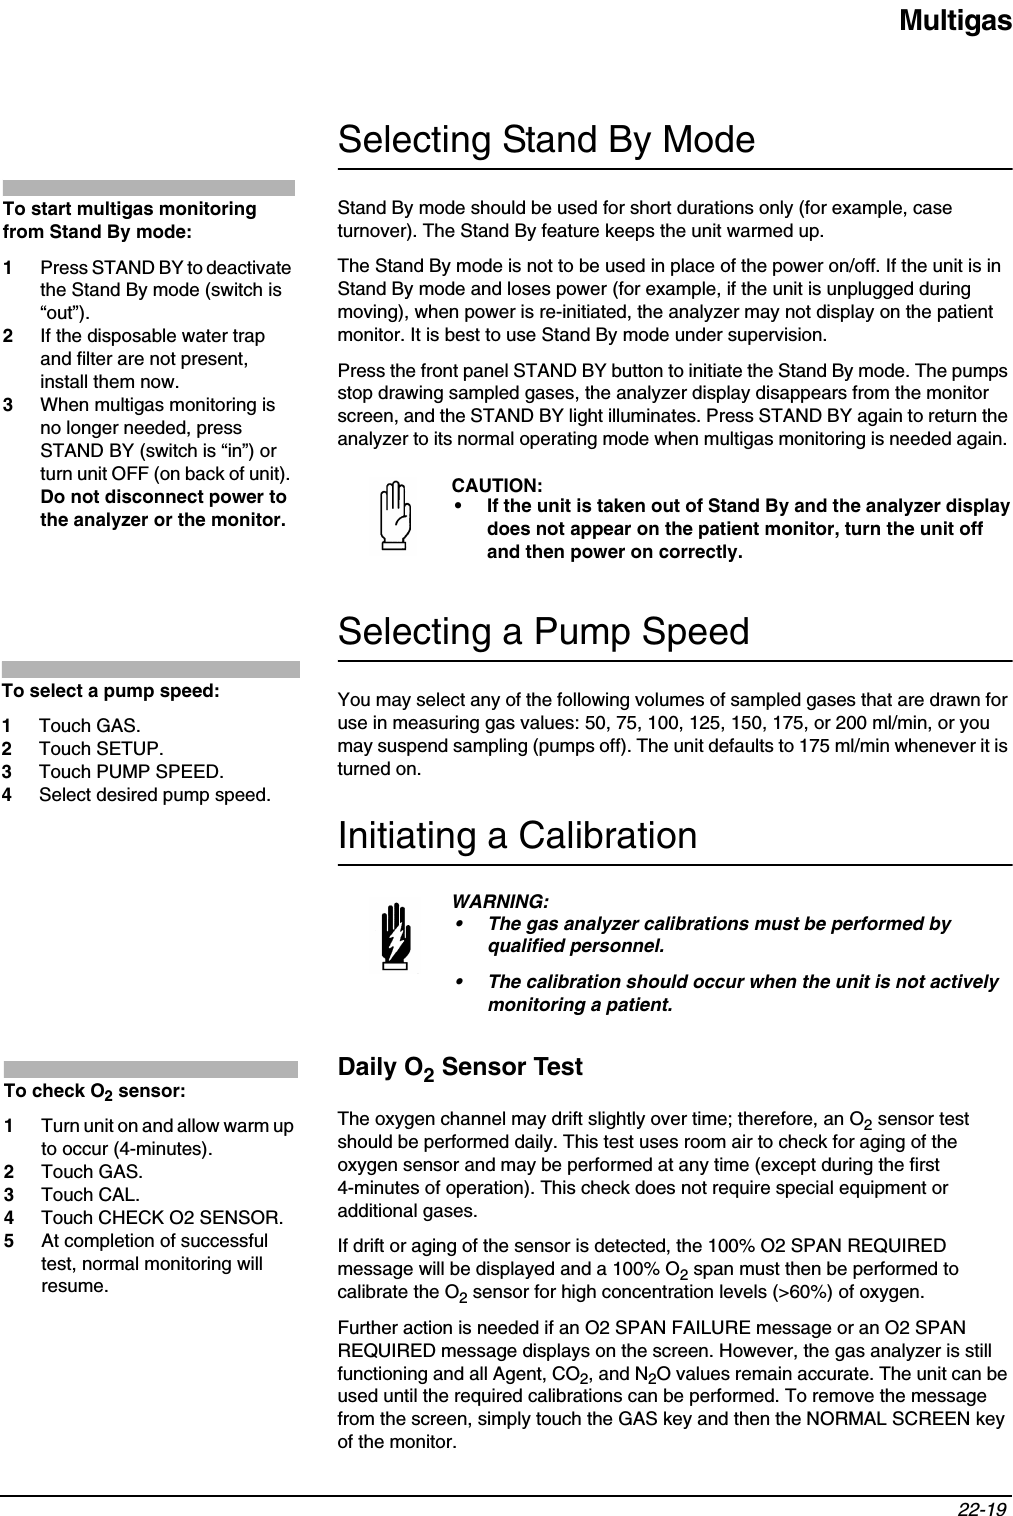
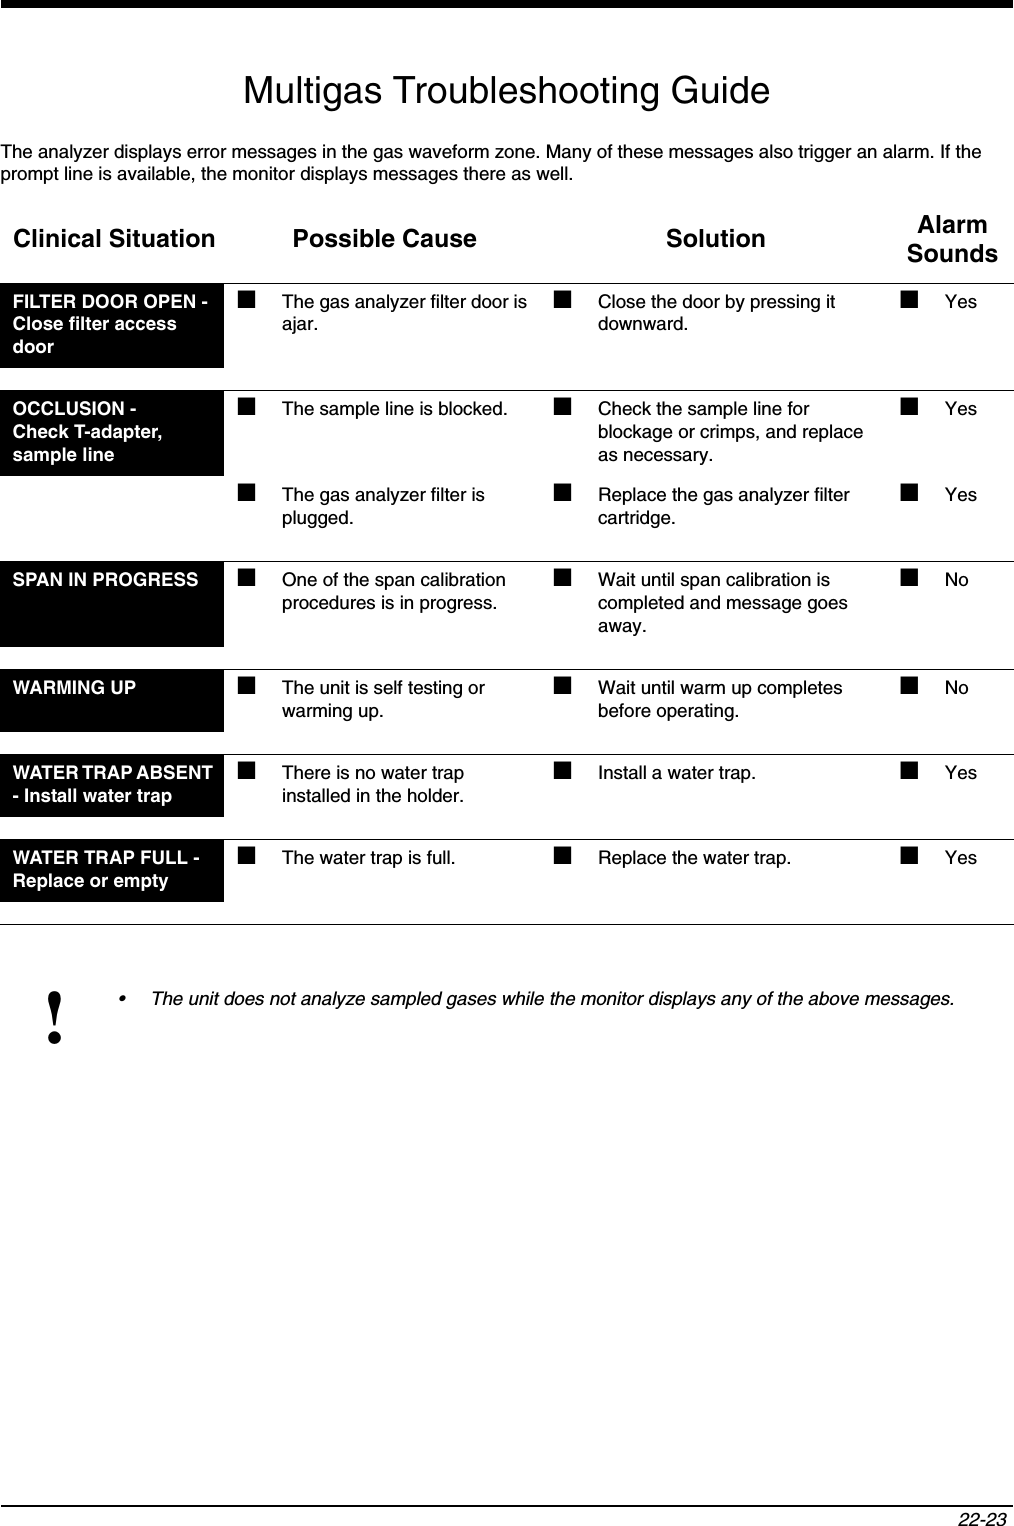
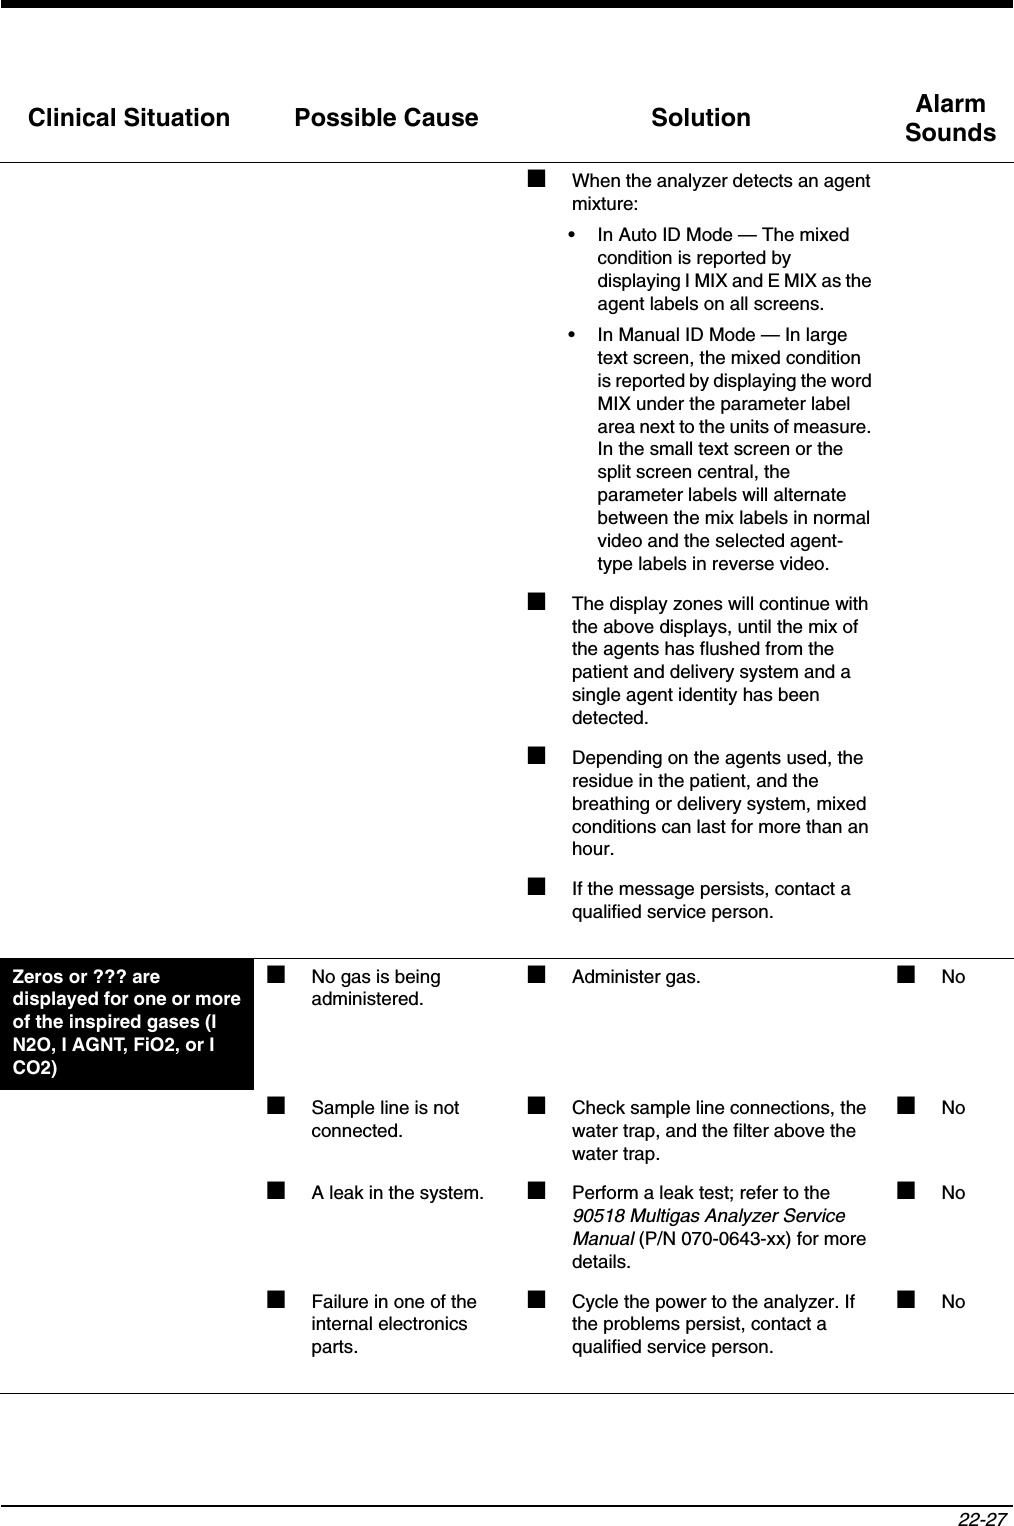
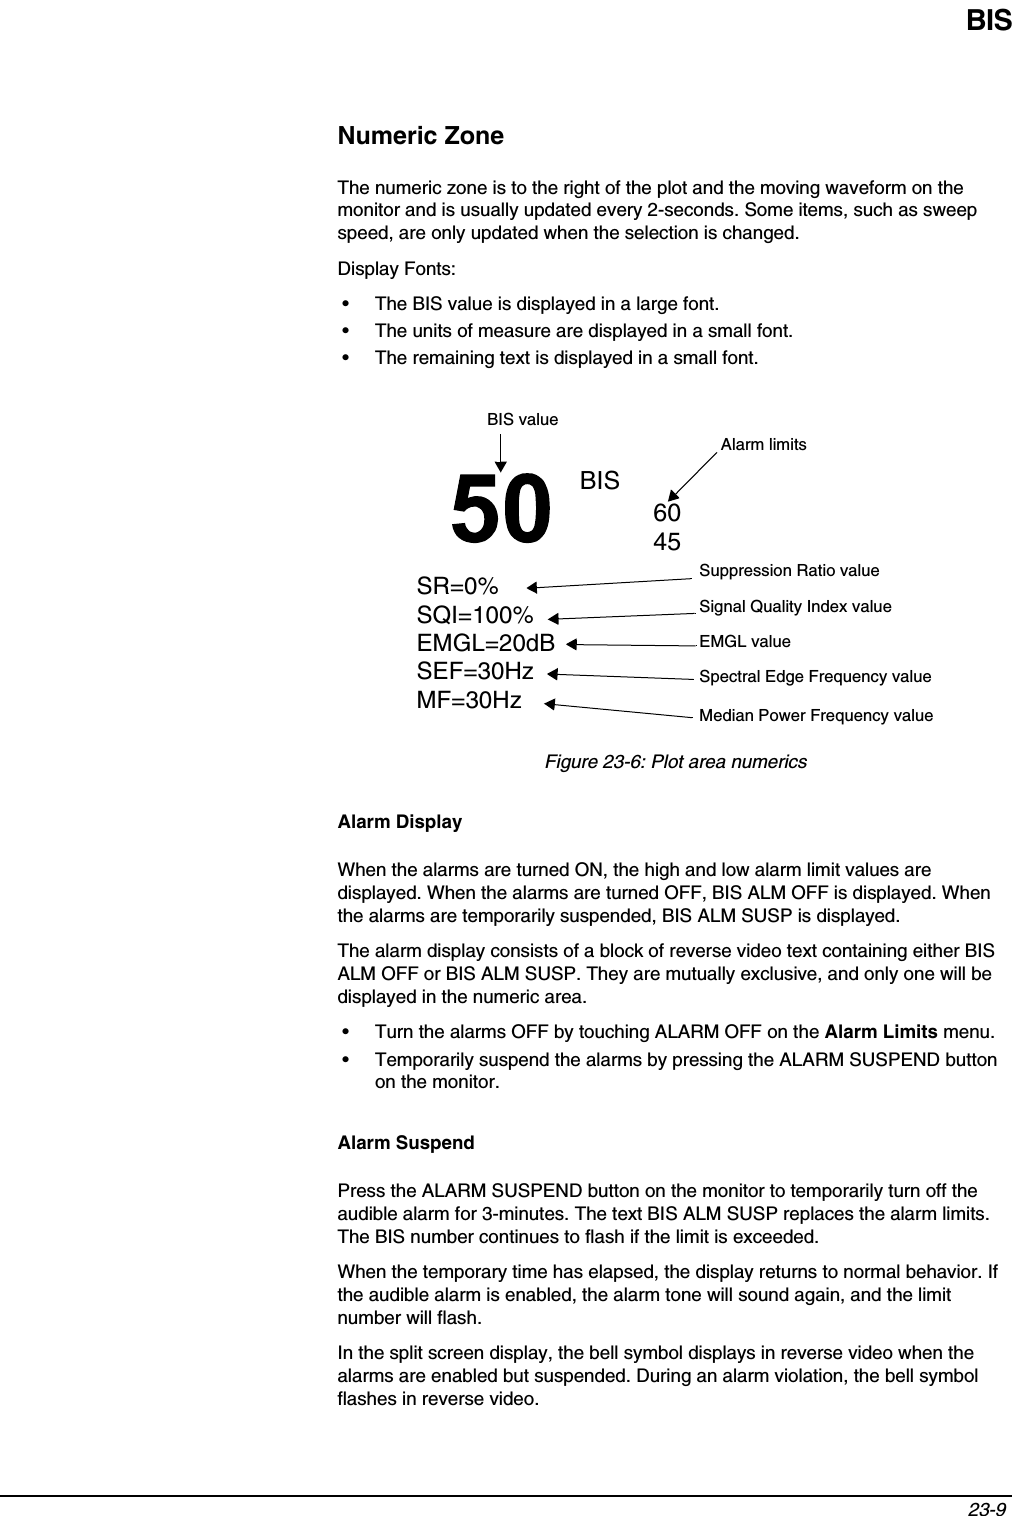
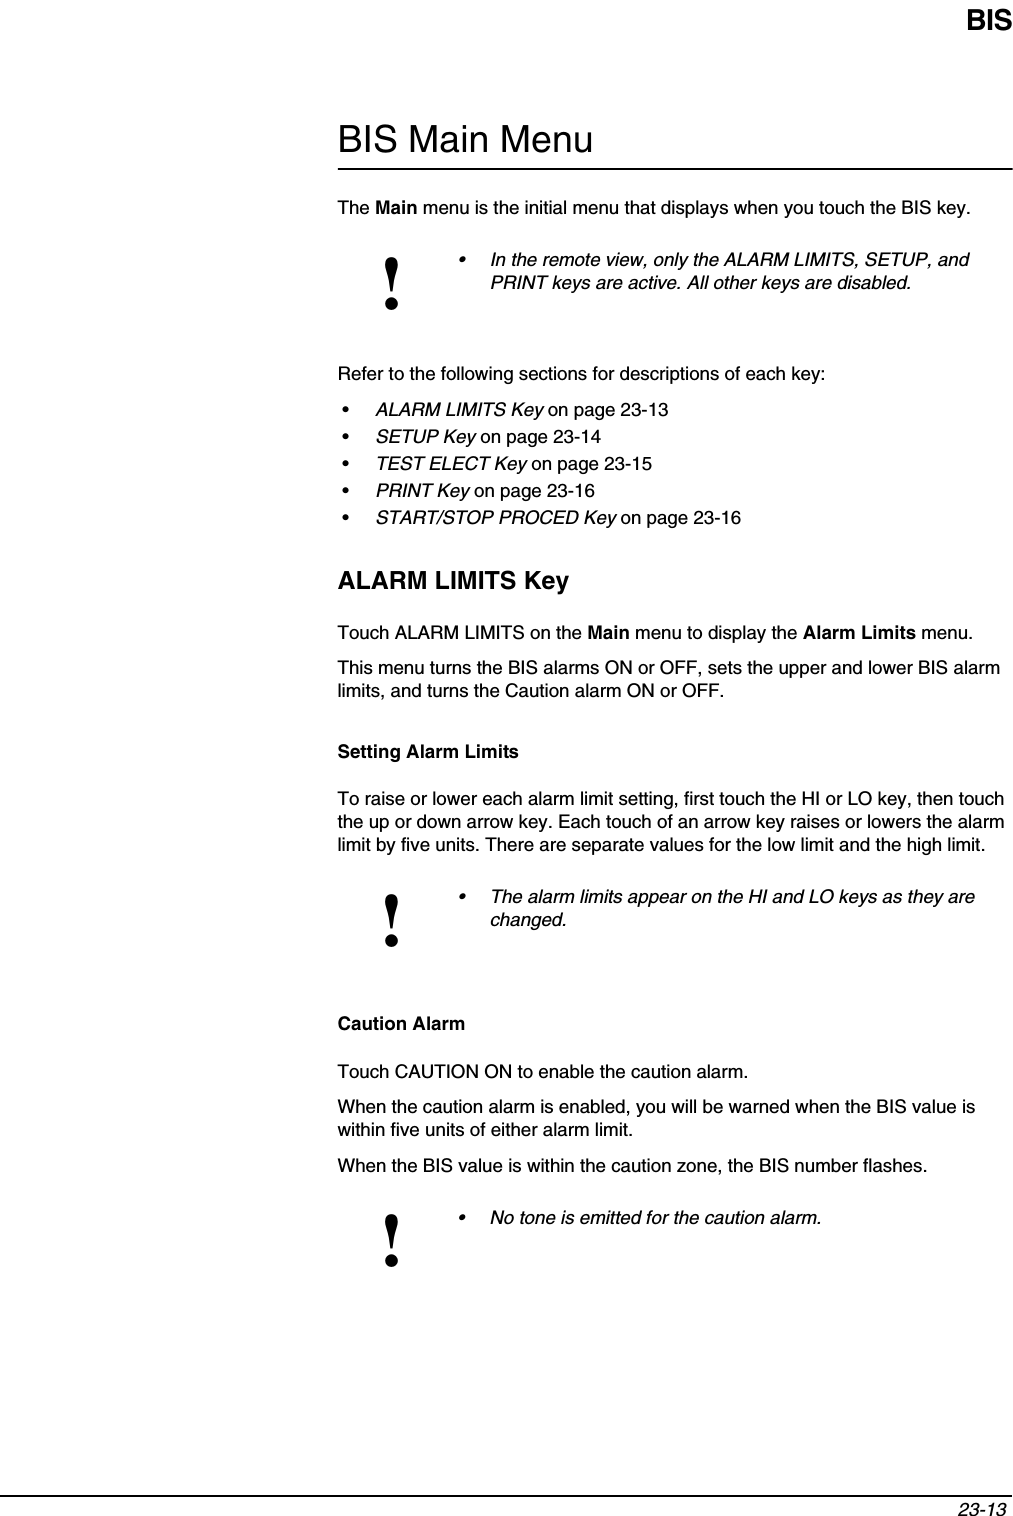
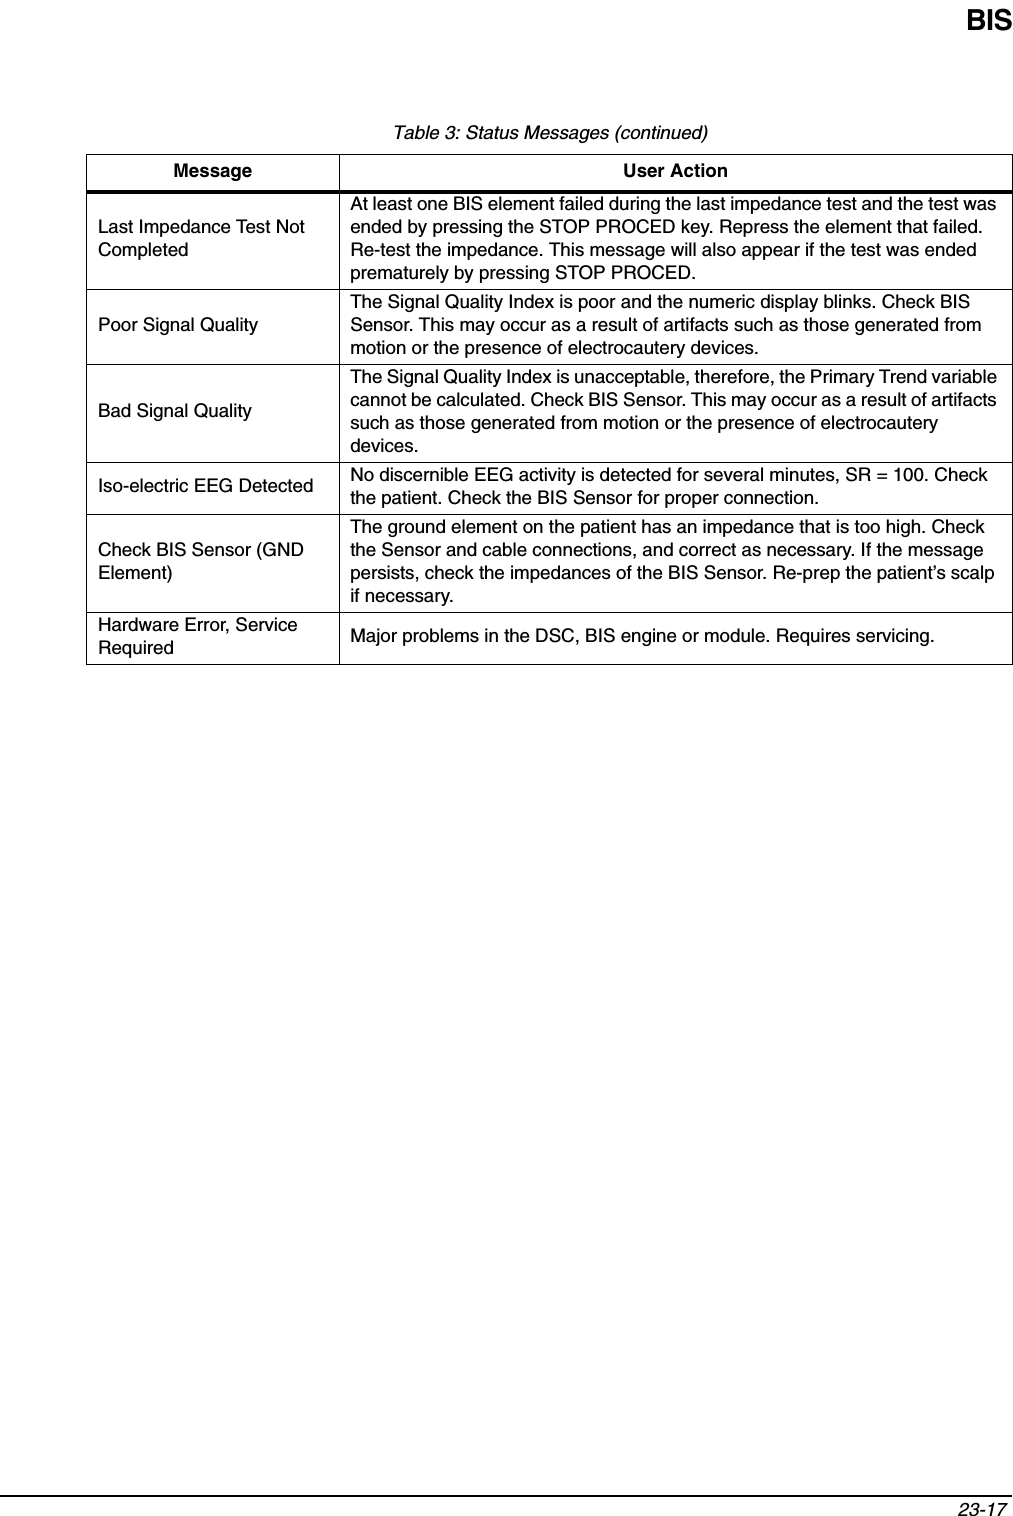
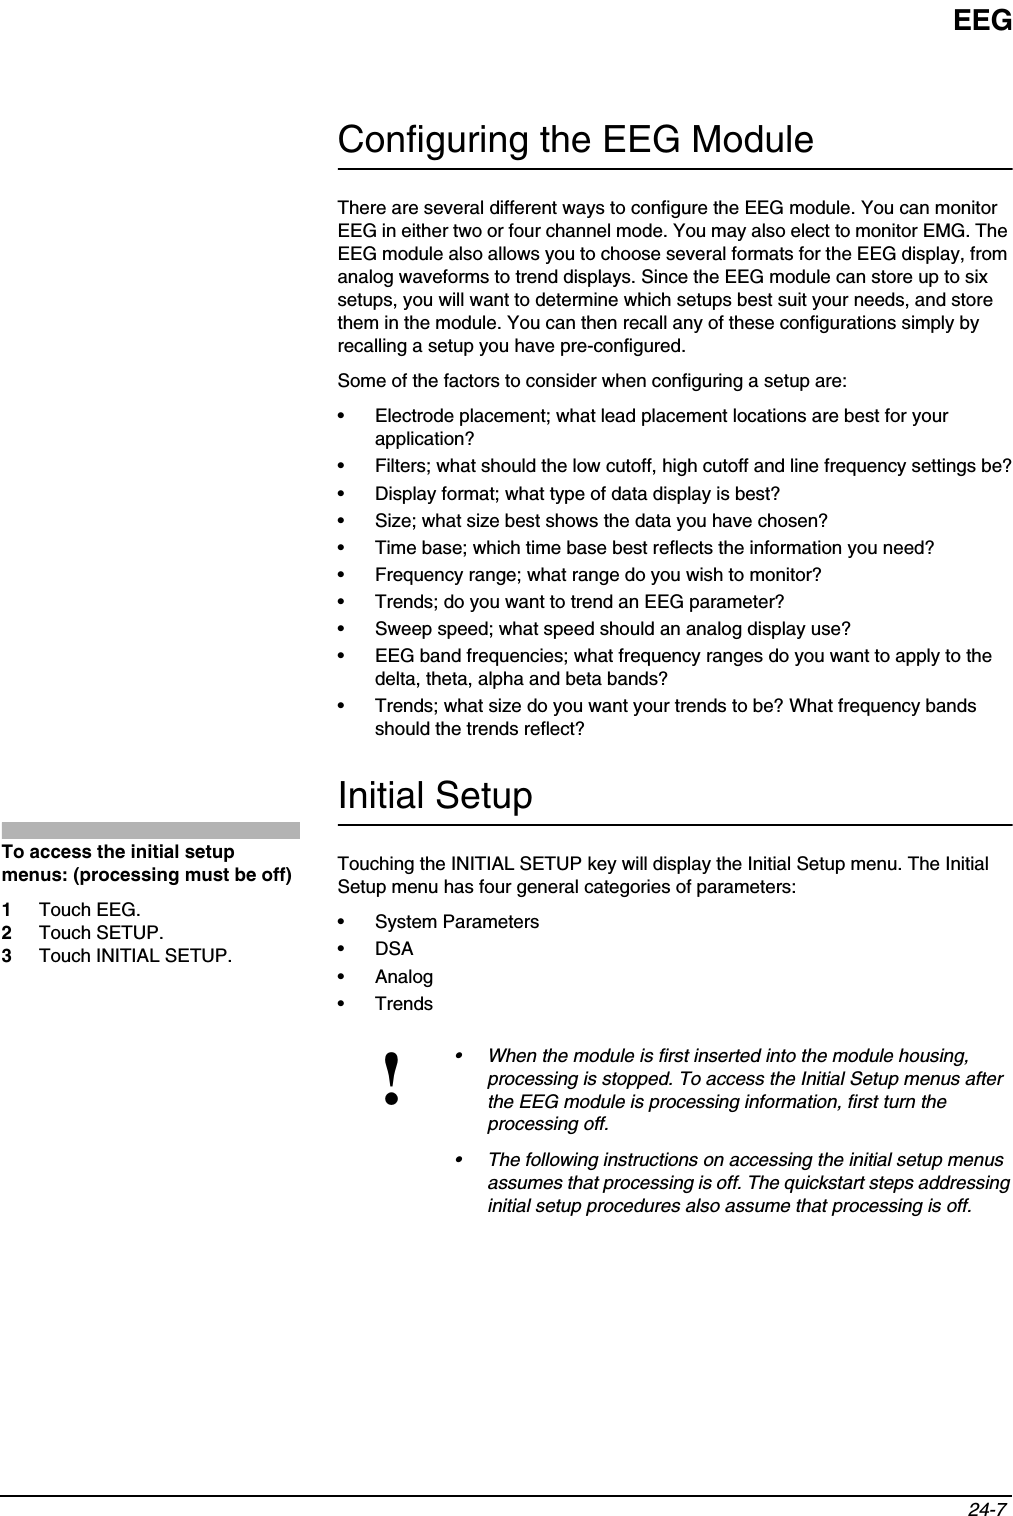
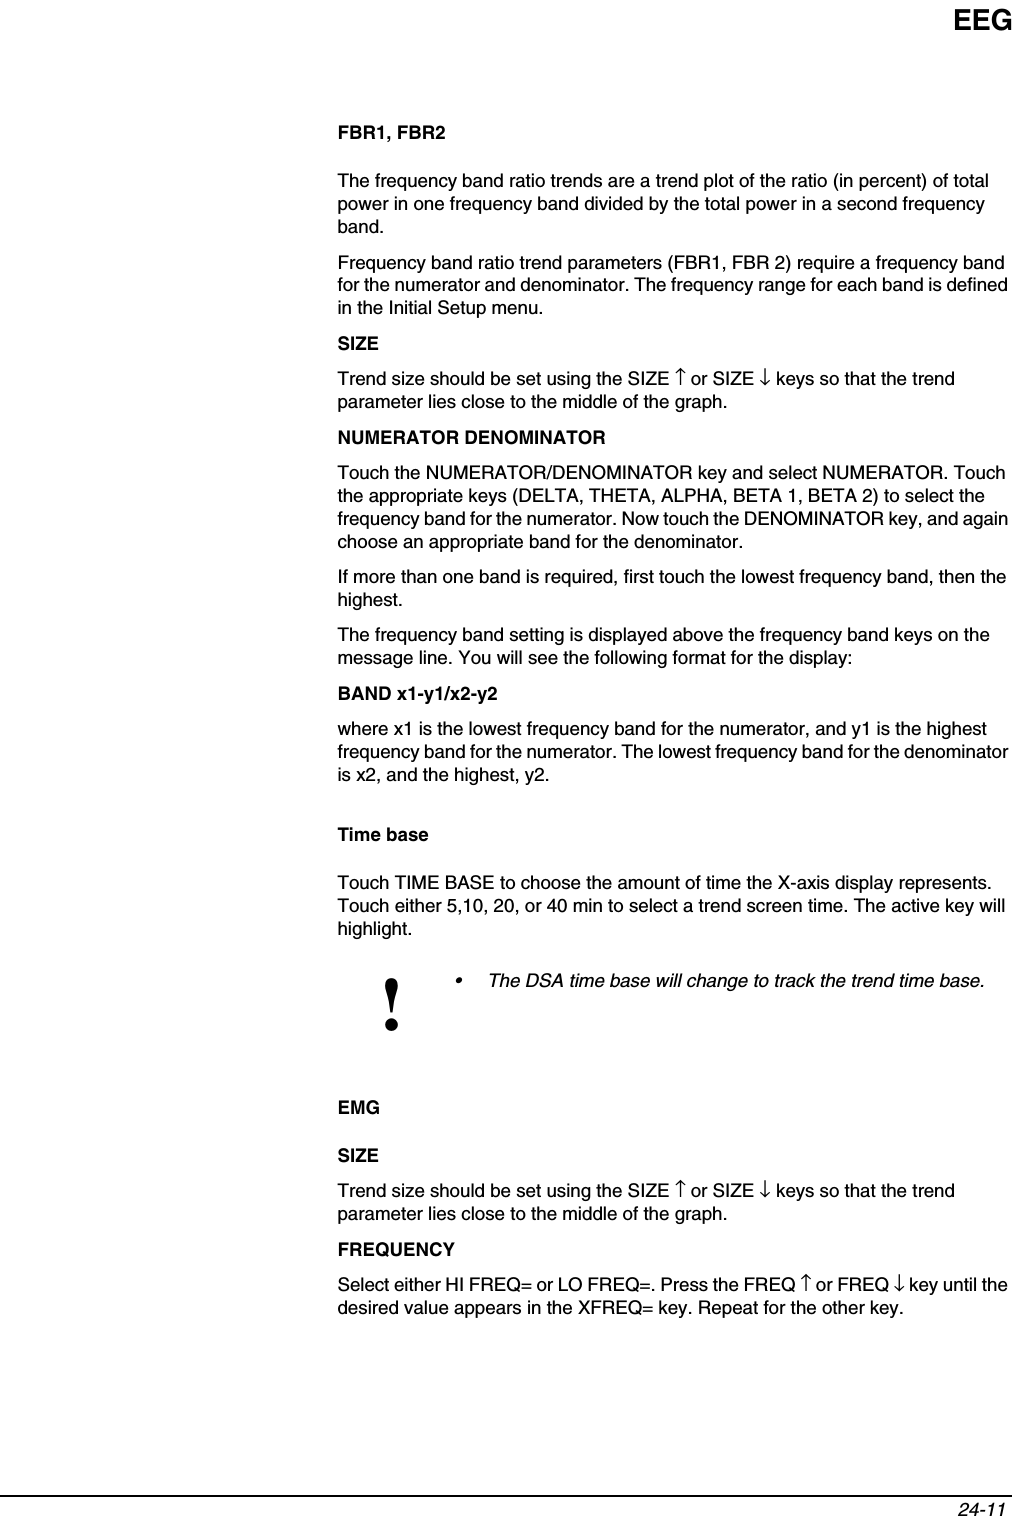
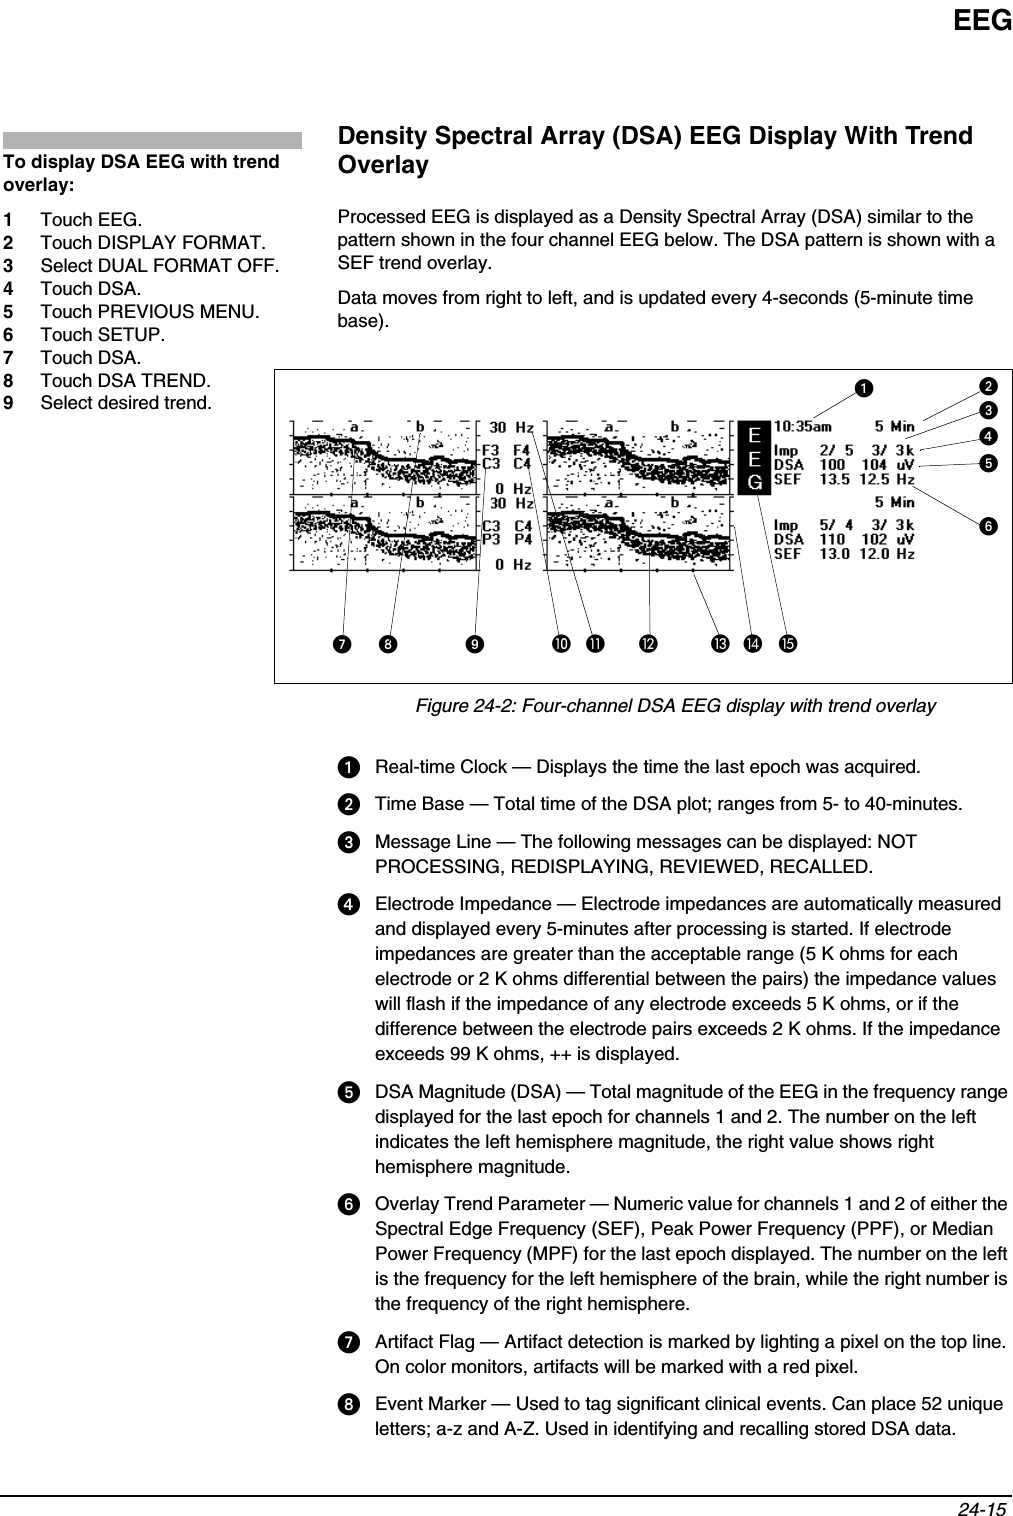
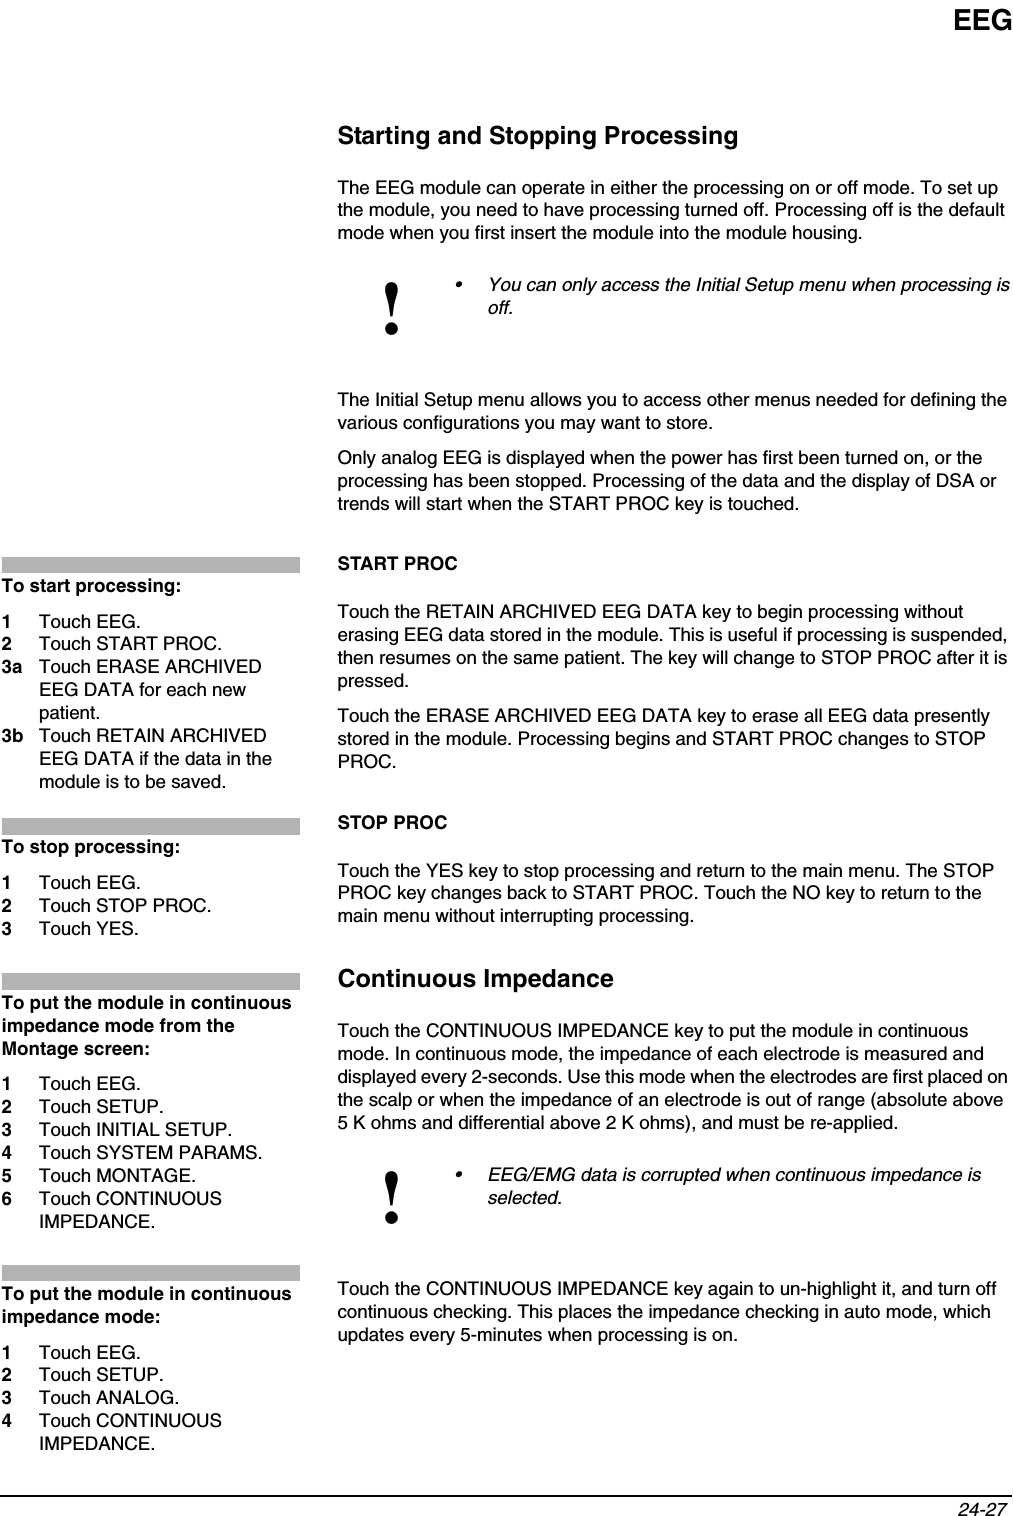
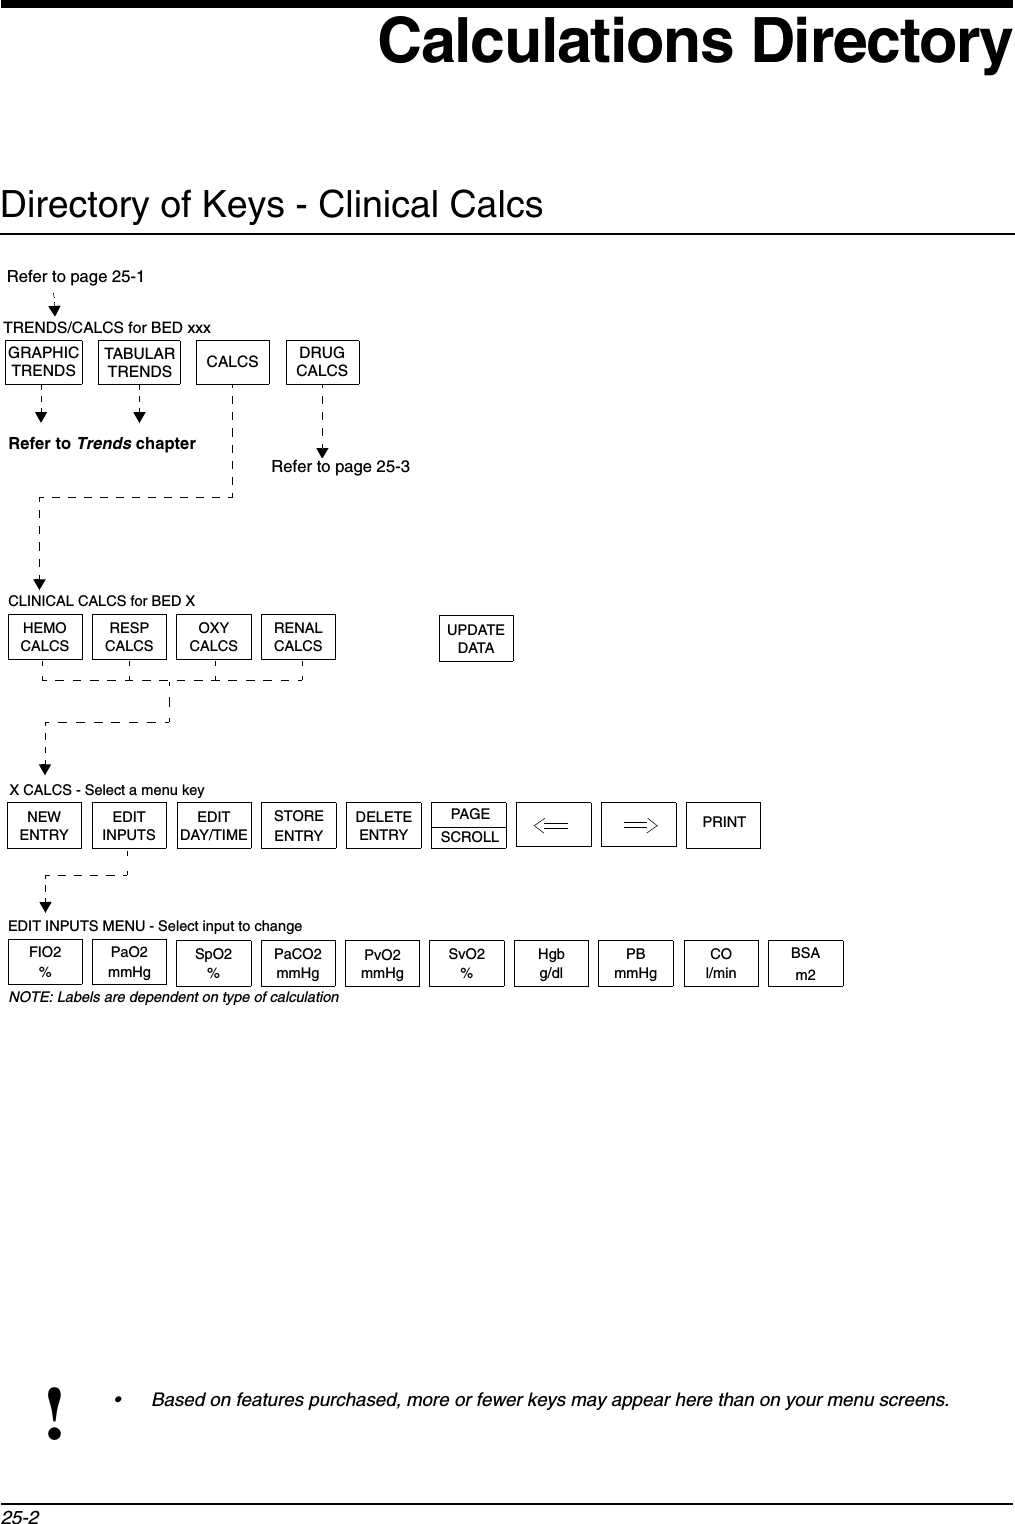
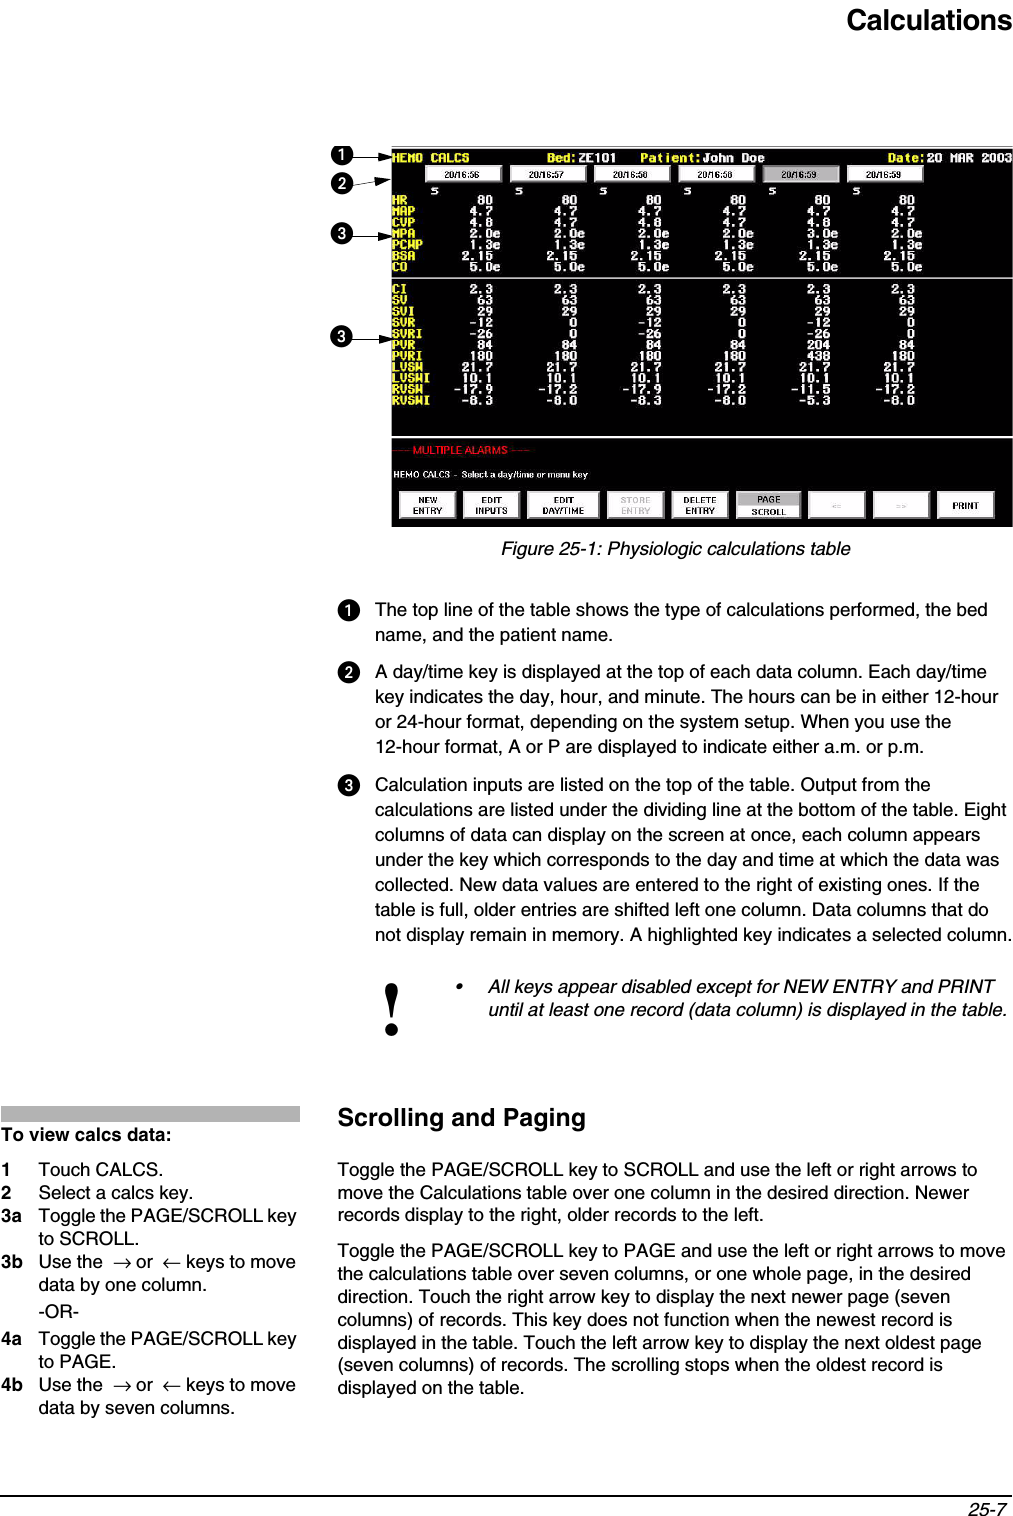
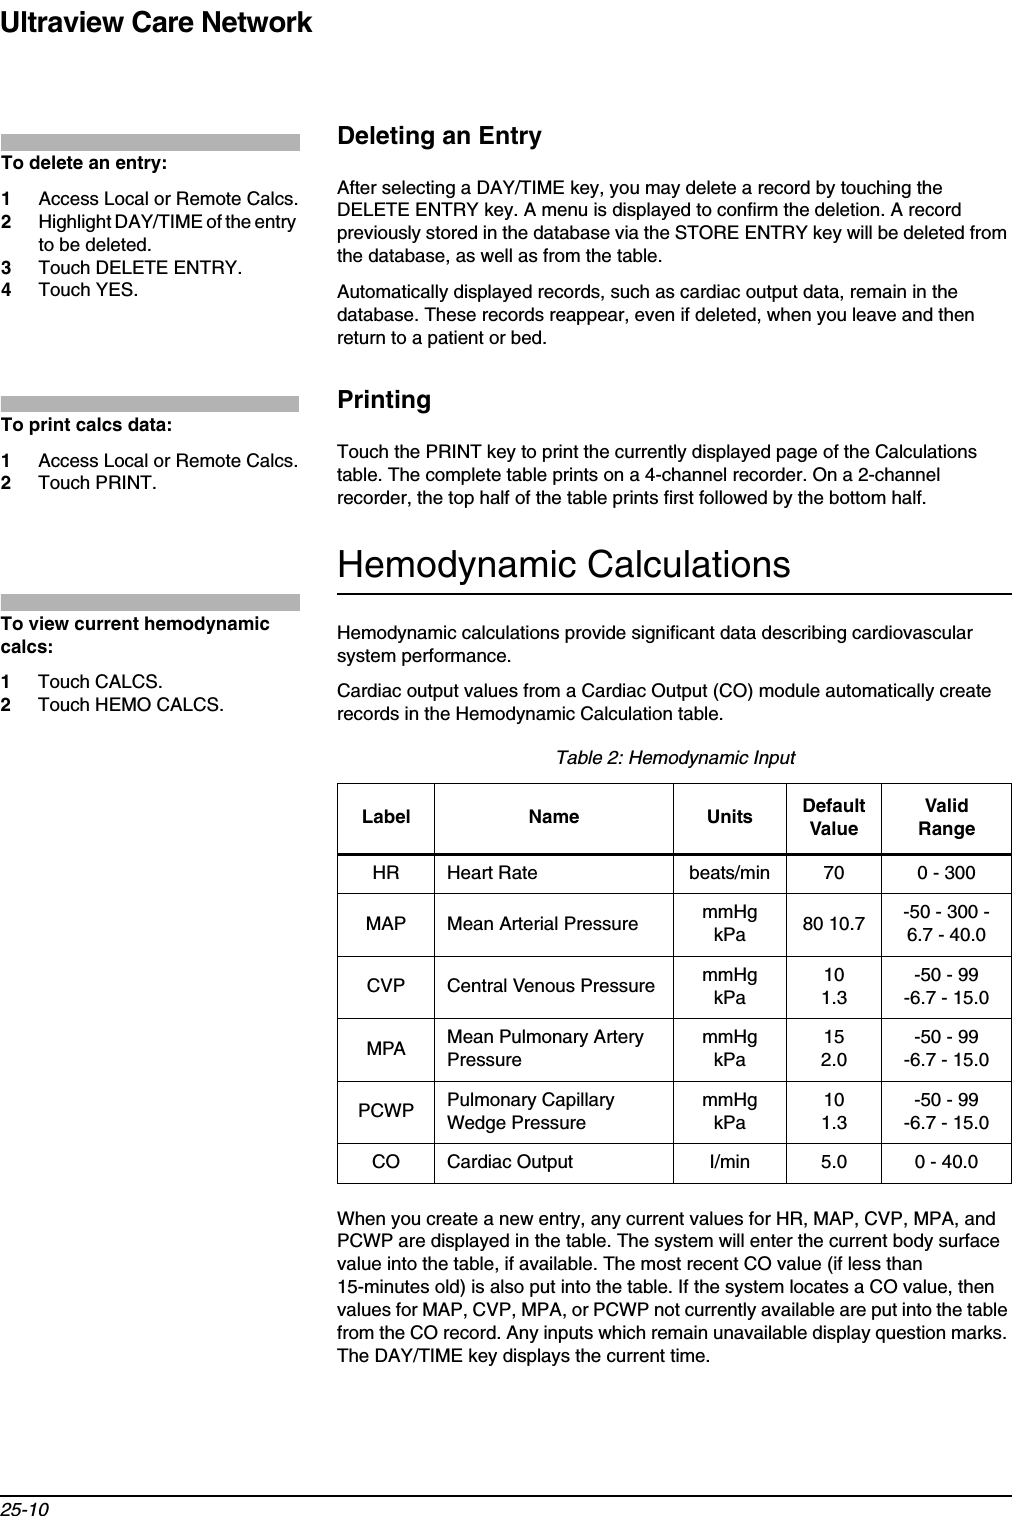
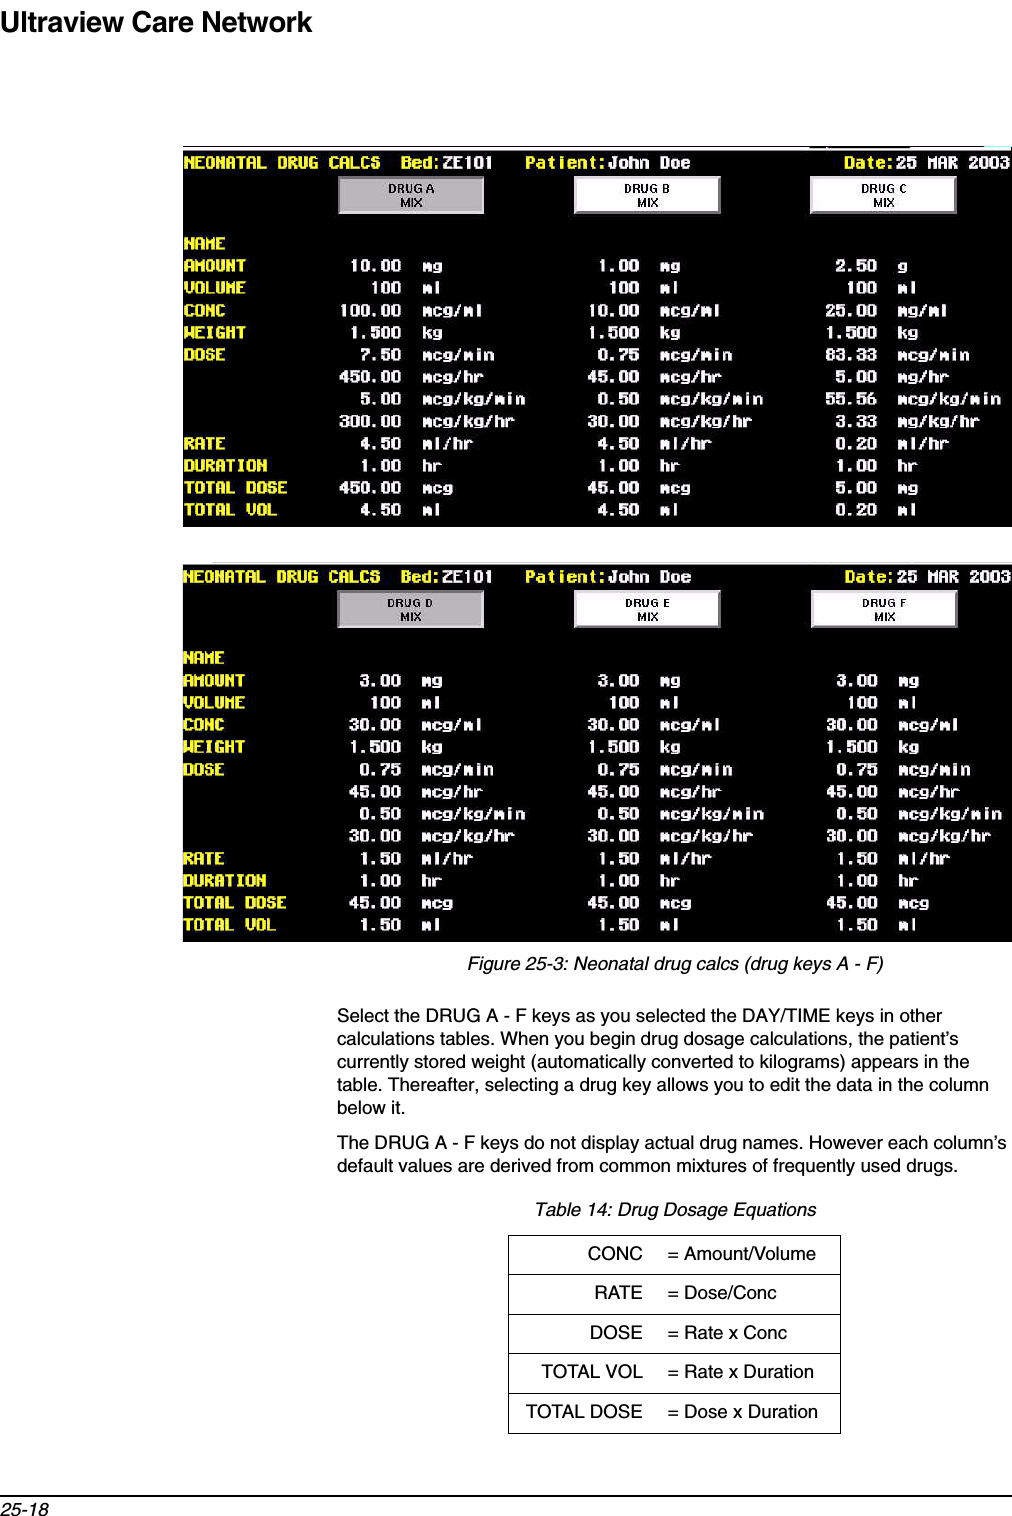
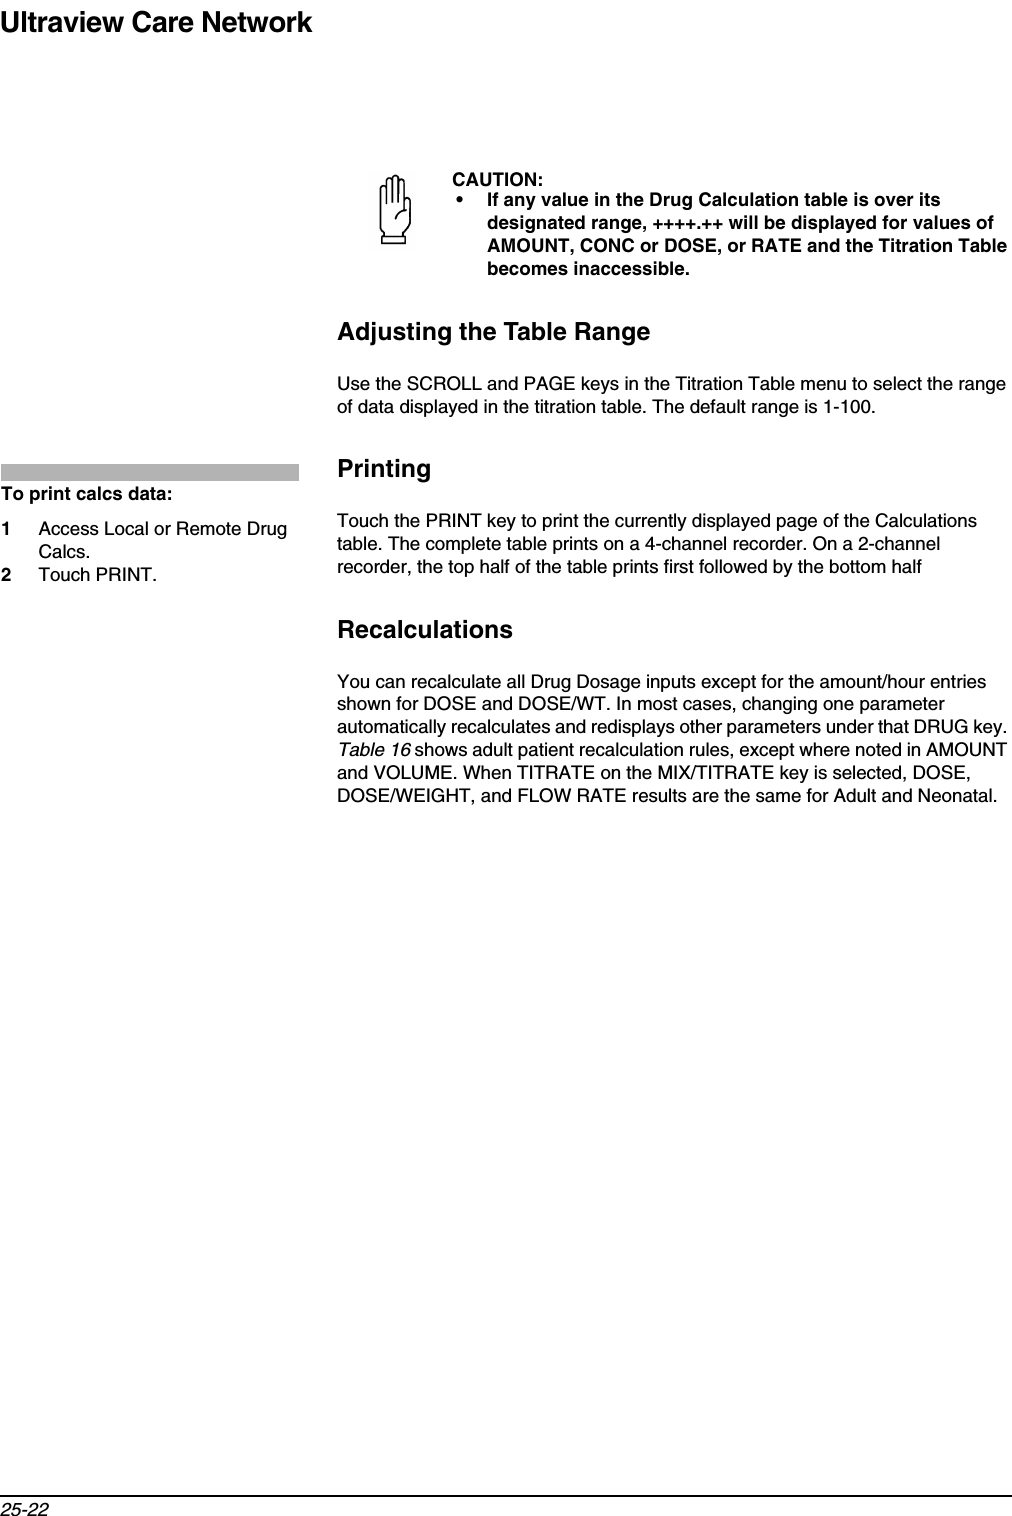
![Ultraview Care Network25-14Calculating O2AV, O2AVI, VO2, and VO2I requires a CO value to complete the calculations. The most recent CO value (less than 15-minutes old) is used for these calculations if it is available.Table 9: Oxygenation OutputLabel Name UnitsCTaO2Arterial Oxygen Content ml/dlCTvO2Venous Oxygen Content ml/dlavDO2Arteriovenous Oxygen Content difference ml/dlO2AV Oxygen Availability ml/minO2AVIOxygen Availability Index ml/min/m2VO2Oxygen Consumption ml/minVO2IOxygen Consumption Index ml/min/m2O2ER Oxygen Extraction Ratio NonePAO2Partial Pressure of Alveolar Oxygen mmHgkPaQs/Qt Pulmonary Venous Admixture Shunt %P/F PaO2/FiO2 ratio NoneTable 10: Oxygenation EquationsCTaO2= (1.34 x Hgb x SpO2100) + (0.0031 x PaO2)CTvO2= (1.34 x Hgb x SvO2/100) + (0.0031 x PvO2)avDO2= CTaO2 - CTvO2O2AV = CTaO2 x CO x 10O2AVI= O2AV/BSAVO2= avDO2 x CO x 10VO2I= VO2/BSAO2ER = (CTaO2 - CTvO2)/CTaO2PAO2= [(FiO2/100) x (PB*-47)] - PaCO2 /0.8 Qs/Qt = 100 x [(1.34 x Hgb) + (0.0031 x PAO2) - CTaO2][(1.34 x Hgb) + (0.0031 x PAO2) - CTvO2]* PB = Barometric Pressure](https://usermanual.wiki/Spacelabs-Healthcare/76A90341-WMTS.User-Manual-3-of-3/User-Guide-347485-Page-138.png)
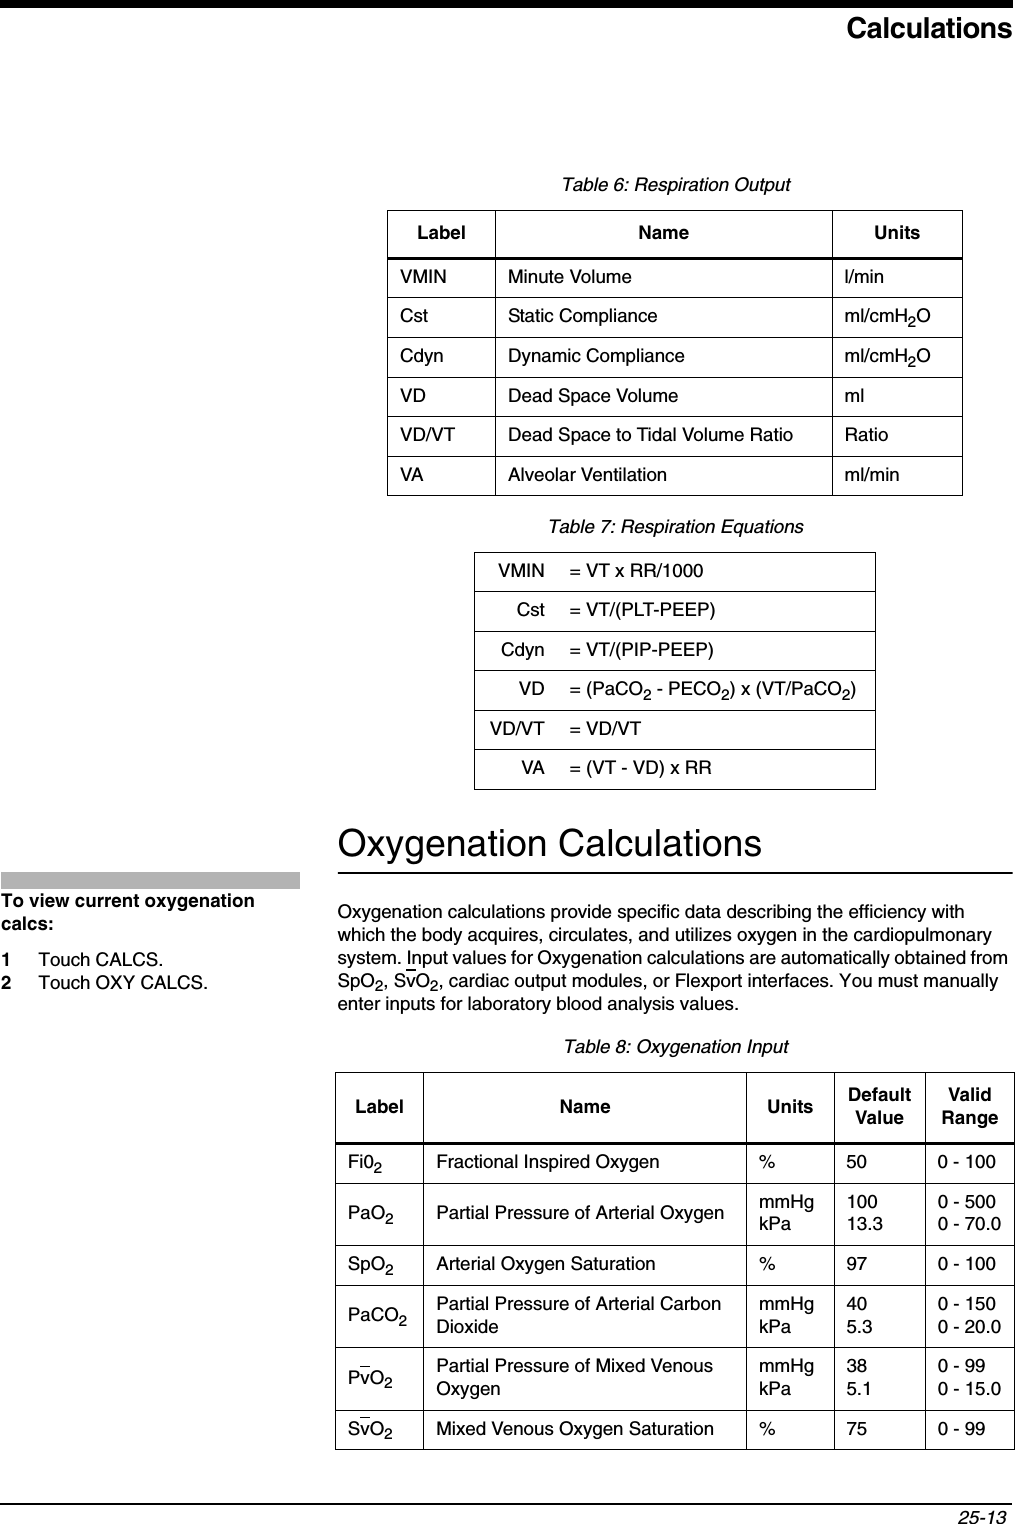
![Note: The values listed here represent commonly published ranges for adults and are for reference purposes only.Note: Acceptable values for individual patients should be determined by hospital protocol and the attending physician.Table 17: Hemodynamic CalculationsVariable Calculation Normal Range*Cardiac Index (CI) COBSA2.5 - 4.0 liters/min/m2Stroke Volume (SV) CO x 1000 HR 60 - 130 ml/beatStroke Volume Index (SVI) SVBSA30 - 65 ml/beat/m2Systemic Vascular Resistance (SVR) MAP - CVP x 79.9 CO 900 - 1400 dynes x sec/cm5Systemic Vascular Resistance Index (SVRI)MAP - CVP x 79.9 CI(Converts to SVR x BSA)1760 - 2600 (dynes x sec/cm5) x m2Pulmonary Vascular Resistance (PVR) MPA - PCWP x 79.9 CO 20 - 130 dynes x sec/cm5Pulmonary Vascular Resistance Index (PVRI)MPA - PCWP x 79.9 CI(Converts to PVR x BSA)36 - 235 (dynes x sec/cm5) x m2Left Ventricular Stroke Work (LVSW) (MAP - PCWP) x SV x 0.0136Left Ventricular Stroke Work Index (LVSWI)(MAP - PCWP) x SVI x 0.0136(Converts to LVSW/BSA)45 - 75 g x min/m2/beatRight Ventricular Stroke Work (RSVW) (MPA - CVP) x SV x 0.0136Right Ventricular Stroke Work Index (RVSWI))(MPA - CVP) x SVI x 0.0136(Converts to RVSW/BSA)4 - 8 g x min/m2/beat(HR = Heart Rate; BSA = Body Surface Area; MAP = Mean Arterial Pulse; CVP = Central Venous Pressure; MPA = Mean Pulmonary Artery Pressure; PCWP = Pulmonary Capillary Wedge Pressure)Table 18: Renal CalculationsVariable Acquisition Method or Calculation UnitsUrine Potassium (URK) Laboratory Measurement mEq/LPlasma Osmolality (PLOSM) Laboratory Measurement mOsm/LUrine Osmolality (UROSM) Laboratory Measurement mOsm/LSerum Sodium (SerNa) Laboratory Measurement mEq/LSerum Creatinine (CR) Laboratory Measurement mg/dlUrine Creatinine (UCR) Laboratory Measurement mg/dlBlood Urea Nitrogen (BUN) Laboratory Measurement mg/dlUrine Sodium (URNa) Laboratory Measurement mEq/LUrine Volume (URINE) Data Entry ml/dayUrine Sodium Excretion (URNaEX) URNa x URINE/1000 mEq/dayUrine Potassium Excretion (URKEX) URK x URINE/1000 mEq/dayUrine Sodium to Urine Potassium Ratio (Na/K) URNa/URK (ratio)Osmolar Clearance (COSM) (UROSM/PLOSM) x URINE ml/dayWater Clearance (CH2O) URINE - COSM ml/dayUrine Osmolality to Plasma Osmolality Ratio (U/POSM) UROSM/PLOSM (ratio)Fractional Sodium Excretion (FENa) (URNa/SerNa) x (CR/UCR) x 100 %Creatinine Clearance (CRCL) (UCR/CR) x URINE/1440) x 1.73/BSA ml/min/m2Non-Saline Loss (NSLOSS) URINE - (URINE x URNa/SerNa) ml/dayBUN to Creatinine Ratio (BUN/CR) BUN/CR (ratio)Urine Creatinine to Serum Creatinine Ratio (U/CR) UCR/CR (ratio)Table 19: Oxygenation CalculationsVariable Calculation Normal Range*Arterial Oxygen Saturation (SaO2)Laboratory Measurement (SaO2) or Pulse Oximetry (SpO2)95 - 100%Partial Pressure of Arterial Oxygen (PaO2)Laboratory Measurement 80 - 100 mmHgMixed Venous Oxygen Saturation (SvO2)Laboratory Measurement or Monitored Valu e 60 - 80%Partial Pressure of Mixed Venous Oxygen (PvO2)Laboratory Measurement 35 - 45 mmHgOxygen Availability (O2AV) CTaO2 x CO x 10 900 - 1100 ml/minOxygen Availability Index (O2AVI) O2AV/BSA 497 - 608 ml/min/m2Arterial Oxygen Content (CTaO2)(1.34 x Hgb x SpO2/100) + (PaO2 x 0.0031) 18 - 20 ml/dlMixed Venous Oxygen Content (CTvO2)(1.34 x Hgb x SvO2/100) + (PvO2 x 0.0031) 14 - 16 ml/dlArterial/Venous Oxygen Difference (avDO2)CTaO2 - CTvO23 - 5.5 ml/dlOxygen Consumption (VO2)avDO2 x CO x 10 200 - 300 ml/minOxygen Consumption Index (VO2I) VO2/BSA 110 - 166 ml/min/m2Oxygen Extraction Ratio (O2ER) VO2/O2AV (Simplifies to avDO2/CTaO2) 1/4 or 0.25Partial Pressure of Alveolar Oxygen (PAO2)[(FiO2/100) x (PB - 47)] - PaCO2/0.8 100 mm HgPulmonary Venous Admixture Shunt (Qs/Qt)100 x[ (1.34 x Hgb) + (0.0031 x PAO2) - CTaO2)](1.34 x Hgb) + (0.0031 x PAO2) - CTvO2Varia ble, depending on FiO2PaO2/FiO2 Ratio (P/F) PaO2/FiO2Varia ble, depending on FiO2(Hgb = Hemoglobin; PB = Barometric Pressure)Table 20: Respiration CalculationsVariable Calculation UnitsRespiratory Rate (RR) Monitored Value or Ventilator breaths/minPartial Pressure of Arterial Carbon Dioxide (PaCO2)Laboratory Measurement mmHgTidal Volume (VT) Ventilator ml/breathPeak Inspiratory Pressure (PIP) Ventilator cmH2OPlateau Pressure (PLT) Ventilator cmH2OPositive End Expiratory Pressure (PEEP) Ventilator cmH2OPartial Pressure of Expired Carbon Dioxide (PECO2)Data Entry mmHgMinute Volume (VMIN) VT x RR/1000 L/minStatic Compliance (Cst) VT/(PLT - PEEP) ml/cmH2ODynamic Compliance (Cdyn) VT/(PIP - PEEP) ml/cmH2ODead Space Volume (VD) (PaCO2 - PECO2) x (VT/PaCO2)mlDead Space to Tidal Volume Ratio (VD/VT) VD/VT (ratio)Alveolar Ventilation (VA) (VT - VD) x RR ml/min](https://usermanual.wiki/Spacelabs-Healthcare/76A90341-WMTS.User-Manual-3-of-3/User-Guide-347485-Page-149.png)